FY15-Essex-County-College-Audited-Financial-Statements-6 ...
Upload
khangminh22Category
view
1download
0
Annual report and auditedfinancial statements
BlackRock Strategic Funds
R.C.S. Luxembourg: B 127481
For the financial year ended 31 May 2020


ContentsGeneral Information 2
Chairman’s Letter to Shareholders 5
Investment Advisers’ Report 7
Directors’ Report 11
Report on Remuneration (Unaudited) 15
Statement of Net Assets 19
Three Year Summary of Net Asset Values 26
Statement of Operations and Changes in Net Assets 38
Statement of Changes in Shares Outstanding 47
Portfolio of Investments 57BlackRock Americas Diversified Equity Absolute Return Fund 57BlackRock Asia Extension Fund 209BlackRock Asia Pacific Absolute Return Fund 212BlackRock Asia Pacific Diversified Equity Absolute Return Fund 215BlackRock Dynamic Diversified Growth Fund 254BlackRock Emerging Markets Absolute Return Fund 259BlackRock Emerging Markets Equity Strategies Fund 263BlackRock Emerging Markets Flexi Dynamic Bond Fund 267BlackRock Emerging Markets Short Duration Bond Fund 275BlackRock ESG Euro Bond Fund 281BlackRock ESG Euro Corporate Bond Fund 296BlackRock European Absolute Return Fund 307BlackRock European Diversified Equity Absolute Return Fund 312BlackRock European Opportunities Extension Fund 315BlackRock European Select Strategies Fund 320BlackRock European Unconstrained Equity Fund 343BlackRock Fixed Income Credit Strategies Fund 344BlackRock Fixed Income Strategies Fund 356BlackRock Global Absolute Return Bond Fund 386BlackRock Global Equity Absolute Return Fund 438BlackRock Global Event Driven Fund 441BlackRock Global Long/Short Equity Fund 447BlackRock Global Real Asset Securities Fund 500BlackRock Macro Opportunities Fund 504BlackRock Managed Index Portfolios - Conservative 509BlackRock Managed Index Portfolios - Defensive 511BlackRock Managed Index Portfolios - Growth 513BlackRock Managed Index Portfolios - Moderate 515BlackRock Style Advantage Fund 517BlackRock Style Advantage Screened Fund 595BlackRock Systematic ESG World Equity Fund 617BlackRock Systematic Global Equity Fund 624BlackRock Total Advantage Fund 633BlackRock UK Emerging Companies Absolute Return Fund 682BlackRock UK Equity Absolute Return Fund 687
Notes to the Financial Statements 691
Report of the Independent Auditor 712
Appendix I – Share Classes (Unaudited) 715
Appendix II – Global Market Risk Exposure (Unaudited) 718
Supplementary Information (Unaudited) 721
Subscriptions can only be made on the basis of the current Prospectus, the Key Investor Information Document (“KIID”) supplemented by the most recent Annual report and audited financial
statements and Interim report and unaudited financial statements, if published after such Annual report and audited financial statements. Copies are available at the registered office of BlackRock
Strategic Funds (the �Company�) from the Local Investor Servicing team, the Transfer Agent, the Management Company or any of the Distributors. See General Information section for further details.
Annual report and audited financial statements [1]
Board of DirectorsPaul Freeman, ChairmanMichael GruenerRobert HayesBarry O’DwyerGeoffrey D. RadcliffeDenise Voss (appointed effective 18 May 2020)
All Directors are non-executive.
Michael Gruener, Robert Hayes, Barry O’Dwyer and Geoffrey D. Radcliffe are employees of the
BlackRock Group (the BlackRock Group of companies, the ultimate holding company of which
is BlackRock, Inc., of which the Management Company and Investment Advisers are part of).
Paul Freeman is a former employee of the BlackRock Group.
Management CompanyBlackRock (Luxembourg) S.A.35A, avenue J.F. Kennedy,L-1855 Luxembourg,Grand Duchy of Luxembourg
Investment AdvisersBlackRock Financial Management, Inc.Park Avenue Plaza,55 East 52nd Street,New York, NY 10055,USA
BlackRock Institutional Trust Company N.A.400 Howard Street,San Francisco CA 94105,USA
BlackRock Investment Management LLC100 Bellevue Parkway,Wilmington, Delaware 19809,USA
BlackRock Investment Management (UK) Limited12 Throgmorton Avenue,London EC2N 2DL,United Kingdom
BlackRock (Singapore) Limited#18-01 Twenty Anson,20 Anson Road,Singapore, 079912
Sub-Investment AdvisersBlackRock Asset Management North Asia Limited16/F Cheung Kong Center,2 Queen’s Road Central,Hong Kong
BlackRock Investment Management (Australia) LimitedLevel 26, 101 Collins Street,Melbourne 3000,Australia
BlackRock Japan Co., Ltd.1-8-3 Marunouchi,Chiyoda-ku,Tokyo 100-8217,Japan
Principal DistributorBlackRock Investment Management (UK) Limited12 Throgmorton Avenue,London EC2N 2DL,United Kingdom
Depositary and Fund AccountantState Street Bank International GmbH, Luxembourg Branch49, avenue J.F. Kennedy,L-1855 Luxembourg,Grand Duchy of Luxembourg
Transfer Agent and RegistrarJ.P. Morgan Bank Luxembourg S.A.6C, route de Trèves,L-2633 Senningerberg,Grand Duchy of Luxembourg
Independent AuditorDeloitte Audit, S.à.r.l.20 Boulevard de KockelscheuerL-1821 Luxembourg,Grand Duchy of Luxembourg
Legal AdvisersLinklaters LLP35, avenue J.F. Kennedy,L-1855 Luxembourg,Grand Duchy of Luxembourg
Securities Lending AgentBlackRock Advisors (UK) Limited12 Throgmorton Avenue,London EC2N 2DL,United Kingdom
Paying AgentsAustriaRaiffeisen Bank International AGAm Stadtpark 9,1030 Vienna,Austria
BelgiumJ.P. Morgan Chase Bank N.A.Brussels Branch1 Boulevard du Roi Albert II,B-1210 Brussels,Belgium
Czech RepublicUniCredit Bank Czech Republic and Slovakia a.s.Prague 4 – Michle, Želetavská 1525/1,Postal Code 140 92,Czech Republic
General Information
BlackRock Strategic Funds[2]

FranceCACEIS Bank1-3 Place Valhubert,75013 Paris,France
GermanyJ.P. Morgan AGCIB / Investor Services – Trustee & FiduciaryTaunustor 1 (TaunusTurm),60310 Frankfurt am Main,Germany
Ireland (Facilities Agent)J.P. Morgan200 Capital Dock,Sir John Rogerson’s Quay, 79D02 RK57 Dublin 2,Ireland
ItalyAllfunds Bank, S.A.Milan branchVia Bocchetto, 620123 Milan,Italy
BNP Paribas Securities ServicesSuccursale di MilanoPiazza Lina Bo Bardi, 320124 Milan,Italy
Société Générale Securities Services S.p.A.Via Benigno Crespi19/A, MAC II,20159 Milan,Italy
Banca Monte dei Paschi di Siena S.p.A.Piazza Salimbeni 3,53100 Siena,Italy
State Street Bank International GmbHSuccursale ItaliaVia Ferrante Aporti 10,20125 Milan,Italy
Banca Sella Holding S.p.A.Piazza Gaudenzio Sella 1,13900 Biella,Italy
CACEIS Bank S.A.Italy BranchPiazza Cavour, 2,20121 Milan,Italy
ICCREA Banca S.p.A.Via Lucrezia Romana 41/47,00178 Rome,Italy
Luxembourg(Central Paying Agent)J.P. Morgan Bank Luxembourg S.A.European Bank & Business Centre,6C, route de Trèves,L-2633 Senningerberg,Grand Duchy of Luxembourg
MaltaMeDirect Bank PlcThe Centre, Tigne Point, Sliema TPO, 0001Malta
PolandCiti HadlowyBank Handlowy w Warszawie S.A.ul. Senatorska 16PL-00-923 WarsawPoland
SwedenBlackRock Investment Management (UK)Limited Stockholm BranchNorrlandsgatan 16111 43 StockholmSweden
SwitzerlandState Street Bank International GmbHMunich, Zurich branchBeethovenstrasse 19,CH-8027 Zurich, Switzerland
United KingdomJ.P. Morgan Trustee and Depositary Company LimitedHampshire Building, 1st Floor,Chaseside,Bournemouth BH7 7DA,United Kingdom
Registered Office49, avenue J.F. Kennedy,L-1855 Luxembourg,Grand Duchy of Luxembourg
General Informationcontinued
Annual report and audited financial statements [3]
EnquiriesIn the absence of other arrangements, enquiries regardingthe Company should be addressed as follows:Written Enquiries:BlackRock Investment Management (UK) Limited,c/o BlackRock (Luxembourg) S.A.P.O. Box 1058,L-1010 Luxembourg,Grand Duchy of Luxembourg
All other enquiries:Telephone: + 44 207 743 3300,Fax: + 44 207 743 1143.Email: [email protected]
Current ProspectusThe Company’s Prospectus and the relevant KIID along with copies of the Application Form may be obtained from the InvestorService Centre, the Management Company or any of the Representatives or Distributors. Copies of the Company’s Articles ofIncorporation, the Annual report and audited financial statements and Interim report and unaudited financial statements may alsobe obtained free of charge from any of these offices and from the Paying Agents. All these documents are also available fromwww.blackrockinternational.com.
RepresentativesThe representative in Denmark is BlackRock Copenhagen Branch, subsidiary of BlackRock Investment Management (UK) Limited,United Kingdom, Harbour House, Sundkrogsgade 21, Copenhagen, DK 2100, Denmark.
The representative in Israel is Altshuler Shaham Group, 19A Habarzel St, Ramat Hahayal, Tel Aviv, Israel.
The representative in Poland is Dubinski Fabrycki Jelenski, ul. Zielna 37, 00-108 Warsaw, Poland.
The representative in Switzerland is BlackRock Asset Management Switzerland Limited, Bahnhofstrasse 39, 8001 Zurich,Switzerland.
Portfolio of InvestmentsEquities are primarily classified by the country of incorporation of the entity in which the Funds (each a “Fund”, together the“Funds”) holds shares.
Corporate and government fixed and variable income securities are primarily classified by the country of incorporation of the issuer.
Liquidity instruments are primarily classified by the country of incorporation of the issuer.
Collective Investment Schemes (“CIS”) and Exchange Traded Funds (“ETF”) are primarily classified by the country of domicile ofthe CIS or ETF.
Purchases and SalesA detailed list of investments purchased and sold for any Fund during the year is available upon request, free of charge, from theRegistered Office, or the offices of the Representatives as mentioned above.
Authorised StatusThe Company is an undertaking for collective investment in transferable securities (“UCITS”) under the Part I of the LuxembourgLaw of 17 December 2010 (�the 2010 Law�) relating to undertakings for collective investment in transferable securities, as amended(�the 2010 Law�). Regulatory consents have been obtained or appropriate notifications have been made for the distribution ofshares of the Company’s Funds in the following countries: Austria, Belgium, Chile, China, Czech Republic, Denmark, Finland,France, Germany, Greece, Hungary, Iceland, Ireland, Italy, Luxembourg, Malta, the Netherlands, Norway, Poland, Portugal,Singapore, Slovakia Republic, South Korea, Spain, Sweden, Switzerland, Taiwan, United Arab Emirates and the United Kingdom.
Shares of certain of the Company’s Funds may also be offered in Singapore by private placement.
The Company is duly registered with the Comisión Nacional de Mercado de Valores in Spain under number 626.
General Informationcontinued
BlackRock Strategic Funds[4]

Dear Shareholder,
I am writing to update you on the activities of BlackRock Strategic Funds (the “Company” or “BSF”) over the year to 31 May 2020.The Company offered shares in 35 funds (each a “Fund” and together the “Funds”) at 31 May 2020.
The period was dominated by an outbreak of an infectious respiratory illness caused by a novel coronavirus known as COVID-19,which was first detected in China in December 2019 and has now developed into a global pandemic.
This coronavirus has resulted in travel restrictions, closed international borders, enhanced health screenings at ports of entry andelsewhere, disruption of and delays in healthcare service preparation and delivery, prolonged quarantines, cancellations, supplychain disruptions, and lower consumer demand, as well as general concern and uncertainty. The impact of COVID-19 has adverselyaffected the economies of many nations across the entire global economy, individual issuers and capital markets, and couldcontinue to extents that cannot necessarily be foreseen.
In addition, the impact of infectious illnesses in emerging market countries may be greater due to generally less establishedhealthcare systems. Public health crises caused by the COVID-19 outbreak may exacerbate other pre-existing political, social andeconomic risks in certain countries or globally. The duration of the COVID-19 outbreak and its full impact cannot be determined withcertainty.
This pandemic has seen a near-decade long bull market came to an abrupt halt, with markets sinking around 30% over just a fewdays in mid-March, as it became clear that the virus was spreading beyond Asia. Governments enforced lockdown creating animmediate and seismic hit to individual economies. Unemployment numbers were already hitting new highs by the end of March2020. Subsequently, the economic consequence has been grisly. Gross domestic product (“GDP”) levels of the United States ofAmerica (“US”) contracting 5% in the first quarter was an early sign of the impact, but more recent statistics have been far worse.The United Kingdom (“UK”), for example, saw GDP drop 20.4% in April; while the European Central Bank (�ECB�) expects theEurozone GDP to contract by 8.7% in 2020.
Governments and central banks were galvanised into drastic action to support jobs and prop up ailing companies, particularly inhard-hit sectors such as travel, leisure or hospitality. Central banks across the globe dropped rates to new lows. The FederalReserve lowered its rate to near zero; the Bank of England followed suit. The ECB chose not to lower its already negative interestrate but announced another round of quantitative easing.
Governments launched sophisticated support schemes, designed to pay people’s wages in the short term and discouragecompanies from making redundancies. The Senate passed a USD 2 trillion coronavirus aid bill, the largest economic stimulus in UShistory. After some debate, the European Union (“EU”) also announced a EUR 750 billion economic stimulus plan designed tolessen the economic shock from the coronavirus pandemic and pave the way for sustainable growth.
Markets sold off rapidly in response. At the start of 2020, many asset allocators had been broadly positive and valuations wererelatively high. The initial slump was rapid and universal. However, some growth stocks started to bounce back as investors startedto reappraise their prospects. Investors saw that there would be key beneficiaries from the outbreak – video-conferencing,e-commerce and digital services providers. As the stock market recovery matured, some economically sensitive companies alsostarted to participate in the rally.
Initially, there was a surge in demand for ‘safe haven’ bonds, and US 10-year treasury yields dipped as low as 0.5%. However,investors have subsequently had to weigh up central bank easing policies against an expected surge in borrowing. This has createdsome volatility in government bond markets. Corporate bonds saw a significant widening of spreads in the early part of the crisisbut recovered significantly in the subsequent months.
By the end of May 2020, markets had recovered somewhat even if economies had not. The MSCI World index was down 8.2% forthe 2020 year to date. The US and Asian markets have generally held up well, once again largely driven by their dominanttechnology stocks. European markets, the UK and emerging markets have been far weaker.
The performance of the Funds is covered in more detail in the Investment Advisers’ Report, which also sets out some viewsregarding the investment outlook. Overall, the Company’s assets under management (“AUM”) fell 9.7% from USD 26.4 billion toUSD 23.9 billion, with particular strength in the Funds’ managed index portfolios, and weaknesses in emerging market bonds andsome absolute return funds.
The strongest percentage growth was seen in BlackRock Global Real Asset Securities Fund, which climbed 1,627.1% to USD96.0 million. BlackRock UK Emerging Companies Absolute Return Fund also saw strong growth, rising 232.3% to GBP633.3 million. At a time when UK assets were generally out of favour, BlackRock UK Equity Absolute Return Fund saw assets rise114.2% to GBP 153.7 million. BlackRock Global Event Driven Fund also found favour, rising 50.6% to USD 3.3 billion.
Chairman’s Letter to ShareholdersMay 2020
Annual report and audited financial statements [5]

The collective BlackRock Managed Index Portfolio funds also saw assets rise. The ‘Defensive’ portfolio saw the strongest rise, up45.8% to EUR 203.0 million. The ‘Growth’ portfolio rose 31.7% to EUR 278.5 million; the ‘Moderate’ portfolio rose 26.3% to EUR695.7 million; and the ‘Conservative’ portfolio was also up 11.7% to EUR 155.7 million.
The weak spots included BlackRock Macro Opportunities Fund, which lost 76.1% of its assets, falling to USD 38.1 million. Assets inBlackRock Global Absolute Return Bond fell 68.2% to USD 135.1 million, while BlackRock Emerging Markets Flexi Dynamic BondFund was also weak, dropping 43.9% to USD 1.6 billion. BlackRock European Diversified Equity Absolute Return Fund fell 91.6% toEUR 3.7 million, largely due to wind-down activities as the Fund terminated immediately following the financial year end.
Regulatory change continued throughout Europe which could have implications for investors. Key developments during the periodincluded:
�
�
�
New legislation surrounding Packaged Retail Investment and Insurance-based Investment Products (“PRIIPs”), which governs the marketing and distribution of financial products, was introduced in 2017 and came into effect for all funds in 2018 - with the exception of UCITS funds. A European-level review of the legislation to judge initial experiences and gather feedback was initially scheduled by 31 December 2018. However, this has now been delayed until potentially the end of 2020. The European Supervisory Authorities (ESAs) published a consultation paper in October 2019 on the content of PRIIPs Key Information Documents (KIDs). The paper focuses on performance scenarios and costs. The Company will benefit from the transitional period available for a UCITS, and the legislation will not be applicable to the Company until 31 December 2021.
The European Commission has launched a consultation on the renewed sustainable finance strategy. This will provide a roadmap to increase private investment in sustainable projects and activities to support the different actions set out in the European Green Deal and to manage and integrate climate and environmental risks into the financial system.
In June 2020, the European Securities and Markets Authority (ESMA) issued a supervisory briefing aimed at local regulators, looking at the supervision of costs and charges applicable to Undertakings for the Collective Investment in Transferable Securities (UCITS) funds and Alternative Investment Funds (AIFs). Costs can have a significant impact on final returns for investors and, with this issuance, ESMA looks to ensure that charges on retail investment products is fair and transparent, with an emphasis on prevention of undue costs.
Should you have any questions on any of this letter, please contact us via our website: www.blackrockinternational.com.
Yours faithfully,
Paul FreemanMay 2020
Chairman’s Letter to ShareholdersMay 2020 continued
BlackRock Strategic Funds[6]

Market ReviewMarkets were strong in the first half of the year under review asthe US and China appeared to make progress on trade talksand the global economy hit its stride. However, these early gainswere overshadowed by the devastating impact of theCOVID-19 outbreak. This hit Asian markets from Decemberonwards and prompted a devastating slide in US and Europeanmarkets from March 2020. However, investors soon realised thatthe problems were not evenly spread. While the sociallockdowns used to contain the virus dealt a devastating blow toareas such as travel and tourism, they accelerated a number ofstructural shifts and there were many companies that benefited.
As such, online retailers benefited at the expense of high streetretailers; energy transition stocks benefited at the expense ofthe oil majors; while technology stocks benefited from an abruptand urgent need for digital solutions. The effect, in aggregate,was a swift recovery in markets, but there were still manycompanies who saw devastating falls in their share prices.There were already some early casualties: Hertz filed forbankruptcy protection, along with a number of retail chains.
The ‘growth’ flavour benefited certain countries. The S&P500 was only a little short of its peak by the end of the year.However, stock markets such as Brazil, where the currency washit hard as well, observed markets selling off precipitously.Having been at the vanguard of the outbreak, China appearedto recover more quickly, as seen by the region’s earlier easing oflockdown. By the end of the year under review, manufacturingdata was bouncing back. China’s stock market also followedsuit.
Government bond yields, which move inversely to prices, initiallybenefited from a flight to quality; but then proved volatile. On theone hand, this year is likely to see vast issuance of governmentbonds, which should depress prices, on the other, central banksremain poised to mop up any excess, which provides a supportto prices. Having seen the gap between yields on corporatebonds and government bonds widen considerably, corporatebonds saw a strong recovery in April and May 2020.
Fund Performance
Equity Fund PerformanceThe absolute return funds provided mixed performance.BlackRock European Diversified Equity Absolute Return Fundfell 8.3% over the period, behind its benchmark, 3 Month LIBOR(EUR), which fell 0.4%. BlackRock Emerging Markets AbsoluteReturn Fund fell 21.5% over the period, well behind itsbenchmark, 3 Month LIBOR Index (USD), which was up 2.3%.Certain absolute return funds proved stronger during the period,albeit trailing their respective benchmarks: BlackRock UK EquityAbsolute Return Fund rose 0.6% against a benchmark return of0.7%; and BlackRock Asia Pacific Diversified Equity AbsoluteReturn Fund rose 1.9% over the period, behind its benchmark,which was up 2.3%. For the outperformers, BlackRockEuropean Absolute Return Strategies Fund rose 4.4% (EUR) –outperforming its benchmark, which fell 0.4%; BlackRock AsiaPacific Absolute Return Fund rose 2.4%, against a rise in the
benchmark of 2.3%; and BlackRock Americas Diversified EquityAbsolute Return Fund rose 2.8% (USD), just ahead of the3 Month LIBOR Index (USD), which was up by 2.3%.
BlackRock Emerging Markets Equity Strategies Fund fell 18.3%,some way behind its benchmark, the MSCI Emerging MarketsIndex (USD), which was down 4.4%. BlackRock AsiaExtension Fund fell 6.9%, performing behind its benchmark, theMSCI All Country Asia ex Japan (USD), which returned 0.2%.BlackRock Global Long/Short Equity Fund was down 3.3%(USD), behind its benchmark, the BofA Merrill Lynch 3 MonthUS Treasury Bill (USD), which was up 1.8%.
BlackRock European Opportunities Extension Fund rose 4.7%(EUR) outperforming its benchmark, the S&P Europe BMI Index(Developed Markets Only) (EUR), which dropped 3.4%.BlackRock European Select Strategies Fund rose 0.8%, justbehind its benchmark. BlackRock Global Event Driven Fundrose 4.1%, compared to a rise of 1.8% in its benchmark.BlackRock Systematic ESG World Equity Fund rose 7.1%,ahead of its benchmark, which rose 6.8%. BlackRock StyleAdvantage Fund fell 19.0%, against a benchmark return of2.3%; while BlackRock Style Advantage Screened Fund fell10.7% against the same benchmark. BlackRock SystematicGlobal Equity Fund rose 3.1%, behind its benchmark, whichrose 5.4%. BlackRock Global Real Assets Securities Funddropped 1.6%, against a fall in its benchmark of 12.2%.
Bond Fund PerformanceBlackRock Emerging Markets Flexi Dynamic Bond Fund, whichdoes not measure its performance relative to a benchmark, roseby 2.4% (USD) over the period. BlackRock Fixed IncomeStrategies Fund rose 0.1% over the period, ahead of itsbenchmark (in EUR terms), the Euro Overnight Index Average,which was down 0.4%. BlackRock Global Absolute Return BondFund dropped 1.1% (EUR), behind its benchmark, the 3 MonthEuribor Index, which was down 0.4%.
BlackRock ESG Euro Bond Fund rose 2.6%, just slightly behindits benchmark, the Bloomberg Barclays MSCI Euro CorporateSustainable SRI Index (EUR). Meanwhile BlackRock ESG EuroCorporate Bond Fund fell 1.6% during the period from launch(21 June 2019) to 31 May 2020, also trailing the samebenchmark, which fell 1.5% during this period.
From 11 June 2019 (date of commencement of operations) to31 May 2020, BlackRock Fixed Income Credit Strategies Fundfell by 1.37%, performing behind its benchmark, which fell 0.4%.
Mixed Fund PerformanceBlackRock Dynamic Diversified Growth Fund rose 2.3% (EUR)over the year, outperforming its benchmark, the Euro OvernightIndex Average (EUR), which fell by 0.4%.
Fund of Funds PerformanceBlackRock Managed Index Portfolios – Conservative, Defensive,Growth and Moderate - were up 0.7%, 1.3%, 4.4% and 1.4%respectively. The Fund of Funds portfolios do not measure theirperformance relative to a benchmark.
Investment Advisers’ ReportPerformance Overview1 June 2019 to 31 May 2020
The information stated in this report is historical and not necessarily indicative of future performance.
Annual report and audited financial statements [7]
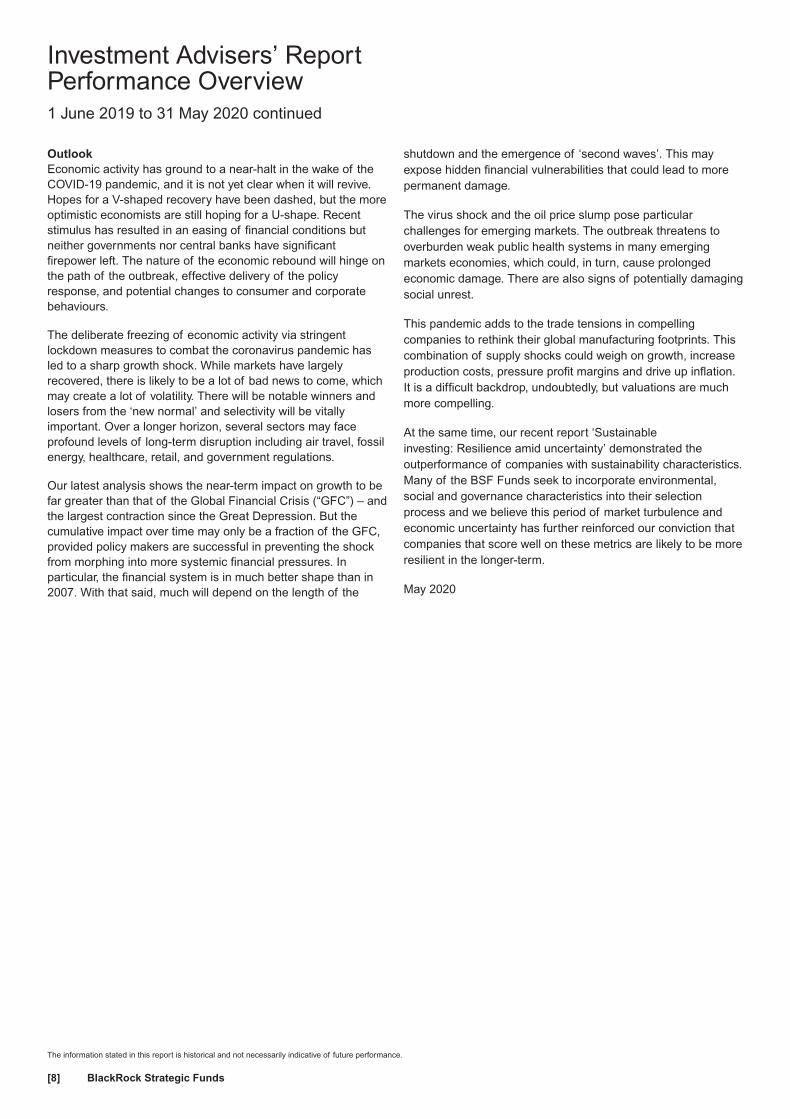
OutlookEconomic activity has ground to a near-halt in the wake of theCOVID-19 pandemic, and it is not yet clear when it will revive.Hopes for a V-shaped recovery have been dashed, but the moreoptimistic economists are still hoping for a U-shape. Recentstimulus has resulted in an easing of financial conditions butneither governments nor central banks have significantfirepower left. The nature of the economic rebound will hinge onthe path of the outbreak, effective delivery of the policyresponse, and potential changes to consumer and corporatebehaviours.
The deliberate freezing of economic activity via stringentlockdown measures to combat the coronavirus pandemic hasled to a sharp growth shock. While markets have largelyrecovered, there is likely to be a lot of bad news to come, whichmay create a lot of volatility. There will be notable winners andlosers from the ‘new normal’ and selectivity will be vitallyimportant. Over a longer horizon, several sectors may faceprofound levels of long-term disruption including air travel, fossilenergy, healthcare, retail, and government regulations.
Our latest analysis shows the near-term impact on growth to befar greater than that of the Global Financial Crisis (“GFC”) – andthe largest contraction since the Great Depression. But thecumulative impact over time may only be a fraction of the GFC,provided policy makers are successful in preventing the shockfrom morphing into more systemic financial pressures. Inparticular, the financial system is in much better shape than in2007. With that said, much will depend on the length of the
shutdown and the emergence of ‘second waves’. This mayexpose hidden financial vulnerabilities that could lead to morepermanent damage.
The virus shock and the oil price slump pose particularchallenges for emerging markets. The outbreak threatens tooverburden weak public health systems in many emergingmarkets economies, which could, in turn, cause prolongedeconomic damage. There are also signs of potentially damagingsocial unrest.
This pandemic adds to the trade tensions in compellingcompanies to rethink their global manufacturing footprints. Thiscombination of supply shocks could weigh on growth, increaseproduction costs, pressure profit margins and drive up inflation.It is a difficult backdrop, undoubtedly, but valuations are muchmore compelling.
At the same time, our recent report ‘Sustainableinvesting: Resilience amid uncertainty’ demonstrated theoutperformance of companies with sustainability characteristics.Many of the BSF Funds seek to incorporate environmental,social and governance characteristics into their selectionprocess and we believe this period of market turbulence andeconomic uncertainty has further reinforced our conviction thatcompanies that score well on these metrics are likely to be moreresilient in the longer-term.
May 2020
Investment Advisers’ ReportPerformance Overview1 June 2019 to 31 May 2020 continued
The information stated in this report is historical and not necessarily indicative of future performance.
BlackRock Strategic Funds[8]
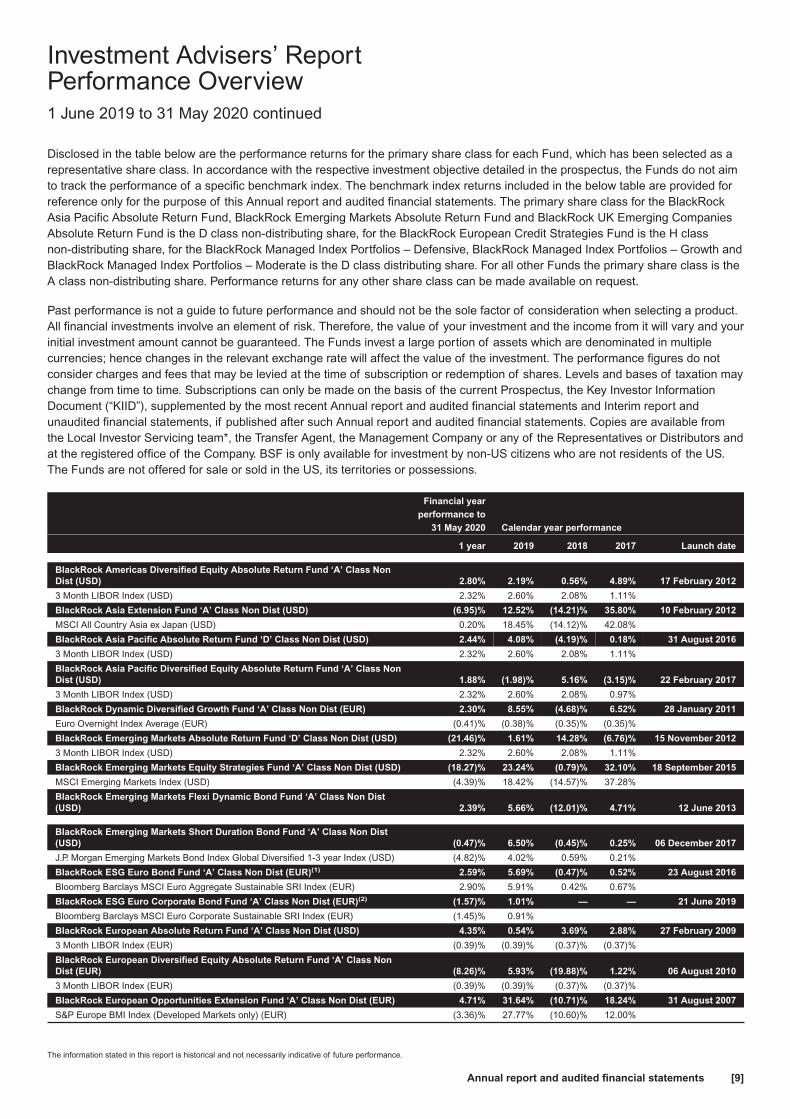
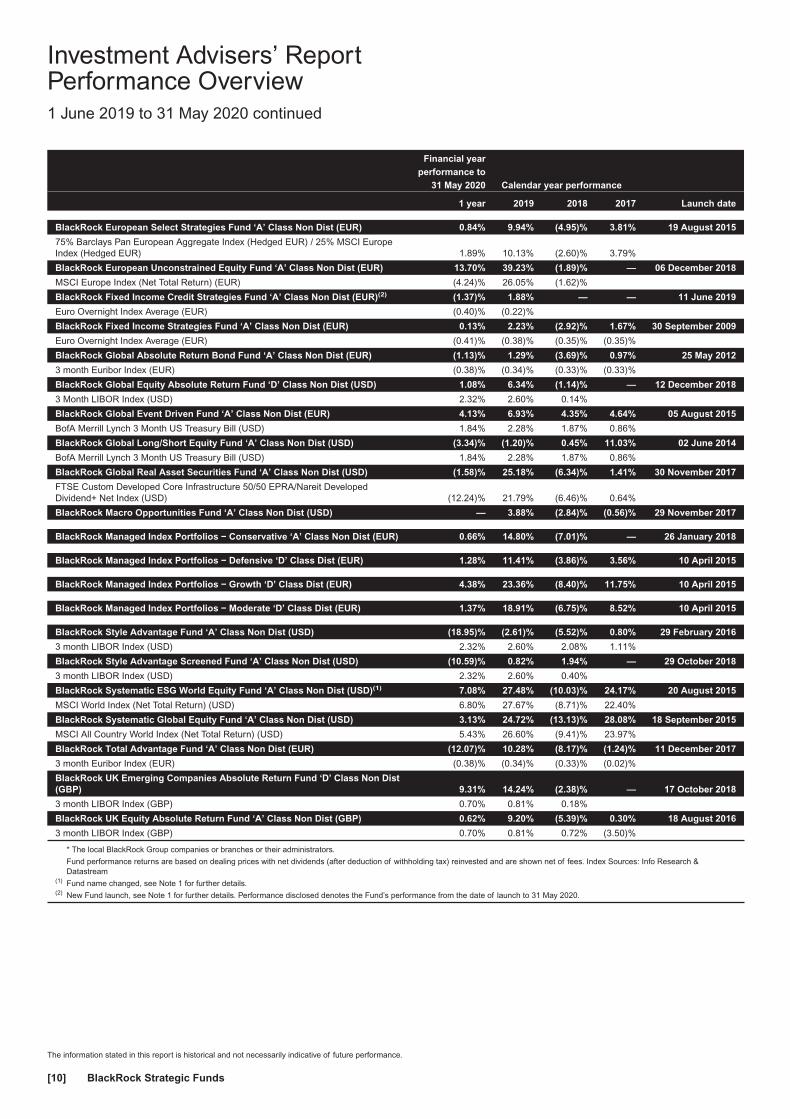
Disclosed in the table below are the performance returns for the primary share class for each Fund, which has been selected as arepresentative share class. In accordance with the respective investment objective detailed in the prospectus, the Funds do not aimto track the performance of a specific benchmark index. The benchmark index returns included in the below table are provided forreference only for the purpose of this Annual report and audited financial statements. The primary share class for the BlackRockAsia Pacific Absolute Return Fund, BlackRock Emerging Markets Absolute Return Fund and BlackRock UK Emerging CompaniesAbsolute Return Fund is the D class non-distributing share, for the BlackRock European Credit Strategies Fund is the H classnon-distributing share, for the BlackRock Managed Index Portfolios – Defensive, BlackRock Managed Index Portfolios – Growth andBlackRock Managed Index Portfolios – Moderate is the D class distributing share. For all other Funds the primary share class is theA class non-distributing share. Performance returns for any other share class can be made available on request.
Past performance is not a guide to future performance and should not be the sole factor of consideration when selecting a product.All financial investments involve an element of risk. Therefore, the value of your investment and the income from it will vary and yourinitial investment amount cannot be guaranteed. The Funds invest a large portion of assets which are denominated in multiplecurrencies; hence changes in the relevant exchange rate will affect the value of the investment. The performance figures do notconsider charges and fees that may be levied at the time of subscription or redemption of shares. Levels and bases of taxation maychange from time to time. Subscriptions can only be made on the basis of the current Prospectus, the Key Investor InformationDocument (“KIID”), supplemented by the most recent Annual report and audited financial statements and Interim report andunaudited financial statements, if published after such Annual report and audited financial statements. Copies are available fromthe Local Investor Servicing team*, the Transfer Agent, the Management Company or any of the Representatives or Distributors andat the registered office of the Company. BSF is only available for investment by non-US citizens who are not residents of the US.The Funds are not offered for sale or sold in the US, its territories or possessions.
Financial yearperformance to
31 May 2020 Calendar year performance
1 year 2019 2018 2017 Launch date
BlackRock Americas Diversified Equity Absolute Return Fund ‘A’ Class NonDist (USD) 2.80% 2.19% 0.56% 4.89% 17 February 2012
3 Month LIBOR Index (USD) 2.32% 2.60% 2.08% 1.11%
BlackRock Asia Extension Fund ‘A’ Class Non Dist (USD) (6.95)% 12.52% (14.21)% 35.80% 10 February 2012
MSCI All Country Asia ex Japan (USD) 0.20% 18.45% (14.12)% 42.08%
BlackRock Asia Pacific Absolute Return Fund ‘D’ Class Non Dist (USD) 2.44% 4.08% (4.19)% 0.18% 31 August 2016
3 Month LIBOR Index (USD) 2.32% 2.60% 2.08% 1.11%
BlackRock Asia Pacific Diversified Equity Absolute Return Fund ‘A’ Class NonDist (USD) 1.88% (1.98)% 5.16% (3.15)% 22 February 2017
3 Month LIBOR Index (USD) 2.32% 2.60% 2.08% 0.97%
BlackRock Dynamic Diversified Growth Fund ‘A’ Class Non Dist (EUR) 2.30% 8.55% (4.68)% 6.52% 28 January 2011
Euro Overnight Index Average (EUR) (0.41)% (0.38)% (0.35)% (0.35)%
BlackRock Emerging Markets Absolute Return Fund ‘D’ Class Non Dist (USD) (21.46)% 1.61% 14.28% (6.76)% 15 November 2012
3 Month LIBOR Index (USD) 2.32% 2.60% 2.08% 1.11%
BlackRock Emerging Markets Equity Strategies Fund ‘A’ Class Non Dist (USD) (18.27)% 23.24% (0.79)% 32.10% 18 September 2015
MSCI Emerging Markets Index (USD) (4.39)% 18.42% (14.57)% 37.28%
BlackRock Emerging Markets Flexi Dynamic Bond Fund ‘A’ Class Non Dist(USD) 2.39% 5.66% (12.01)% 4.71% 12 June 2013
BlackRock Emerging Markets Short Duration Bond Fund ‘A’ Class Non Dist(USD) (0.47)% 6.50% (0.45)% 0.25% 06 December 2017
J.P. Morgan Emerging Markets Bond Index Global Diversified 1-3 year Index (USD) (4.82)% 4.02% 0.59% 0.21%
BlackRock ESG Euro Bond Fund ‘A’ Class Non Dist (EUR)(1) 2.59% 5.69% (0.47)% 0.52% 23 August 2016
Bloomberg Barclays MSCI Euro Aggregate Sustainable SRI Index (EUR) 2.90% 5.91% 0.42% 0.67%
BlackRock ESG Euro Corporate Bond Fund ‘A’ Class Non Dist (EUR)(2) (1.57)% 1.01% — — 21 June 2019
Bloomberg Barclays MSCI Euro Corporate Sustainable SRI Index (EUR) (1.45)% 0.91%
BlackRock European Absolute Return Fund ‘A’ Class Non Dist (USD) 4.35% 0.54% 3.69% 2.88% 27 February 2009
3 Month LIBOR Index (EUR) (0.39)% (0.39)% (0.37)% (0.37)%
BlackRock European Diversified Equity Absolute Return Fund ‘A’ Class NonDist (EUR) (8.26)% 5.93% (19.88)% 1.22% 06 August 2010
3 Month LIBOR Index (EUR) (0.39)% (0.39)% (0.37)% (0.37)%
BlackRock European Opportunities Extension Fund ‘A’ Class Non Dist (EUR) 4.71% 31.64% (10.71)% 18.24% 31 August 2007
S&P Europe BMI Index (Developed Markets only) (EUR) (3.36)% 27.77% (10.60)% 12.00%
Investment Advisers’ ReportPerformance Overview1 June 2019 to 31 May 2020 continued
The information stated in this report is historical and not necessarily indicative of future performance.
Annual report and audited financial statements [9]
Financial yearperformance to
31 May 2020 Calendar year performance
1 year 2019 2018 2017 Launch date
BlackRock European Select Strategies Fund ‘A’ Class Non Dist (EUR) 0.84% 9.94% (4.95)% 3.81% 19 August 2015
75% Barclays Pan European Aggregate Index (Hedged EUR) / 25% MSCI EuropeIndex (Hedged EUR) 1.89% 10.13% (2.60)% 3.79%
BlackRock European Unconstrained Equity Fund ‘A’ Class Non Dist (EUR) 13.70% 39.23% (1.89)% — 06 December 2018
MSCI Europe Index (Net Total Return) (EUR) (4.24)% 26.05% (1.62)%
BlackRock Fixed Income Credit Strategies Fund ‘A’ Class Non Dist (EUR)(2) (1.37)% 1.88% — — 11 June 2019
Euro Overnight Index Average (EUR) (0.40)% (0.22)%
BlackRock Fixed Income Strategies Fund ‘A’ Class Non Dist (EUR) 0.13% 2.23% (2.92)% 1.67% 30 September 2009
Euro Overnight Index Average (EUR) (0.41)% (0.38)% (0.35)% (0.35)%
BlackRock Global Absolute Return Bond Fund ‘A’ Class Non Dist (EUR) (1.13)% 1.29% (3.69)% 0.97% 25 May 2012
3 month Euribor Index (EUR) (0.38)% (0.34)% (0.33)% (0.33)%
BlackRock Global Equity Absolute Return Fund ‘D’ Class Non Dist (USD) 1.08% 6.34% (1.14)% — 12 December 2018
3 Month LIBOR Index (USD) 2.32% 2.60% 0.14%
BlackRock Global Event Driven Fund ‘A’ Class Non Dist (EUR) 4.13% 6.93% 4.35% 4.64% 05 August 2015
BofA Merrill Lynch 3 Month US Treasury Bill (USD) 1.84% 2.28% 1.87% 0.86%
BlackRock Global Long/Short Equity Fund ‘A’ Class Non Dist (USD) (3.34)% (1.20)% 0.45% 11.03% 02 June 2014
BofA Merrill Lynch 3 Month US Treasury Bill (USD) 1.84% 2.28% 1.87% 0.86%
BlackRock Global Real Asset Securities Fund ‘A’ Class Non Dist (USD) (1.58)% 25.18% (6.34)% 1.41% 30 November 2017
FTSE Custom Developed Core Infrastructure 50/50 EPRA/Nareit DevelopedDividend+ Net Index (USD) (12.24)% 21.79% (6.46)% 0.64%
BlackRock Macro Opportunities Fund ‘A’ Class Non Dist (USD) — 3.88% (2.84)% (0.56)% 29 November 2017
BlackRock Managed Index Portfolios − Conservative ‘A’ Class Non Dist (EUR) 0.66% 14.80% (7.01)% — 26 January 2018
BlackRock Managed Index Portfolios − Defensive ‘D’ Class Dist (EUR) 1.28% 11.41% (3.86)% 3.56% 10 April 2015
BlackRock Managed Index Portfolios − Growth ‘D’ Class Dist (EUR) 4.38% 23.36% (8.40)% 11.75% 10 April 2015
BlackRock Managed Index Portfolios − Moderate ‘D’ Class Dist (EUR) 1.37% 18.91% (6.75)% 8.52% 10 April 2015
BlackRock Style Advantage Fund ‘A’ Class Non Dist (USD) (18.95)% (2.61)% (5.52)% 0.80% 29 February 2016
3 month LIBOR Index (USD) 2.32% 2.60% 2.08% 1.11%
BlackRock Style Advantage Screened Fund ‘A’ Class Non Dist (USD) (10.59)% 0.82% 1.94% — 29 October 2018
3 month LIBOR Index (USD) 2.32% 2.60% 0.40%
BlackRock Systematic ESG World Equity Fund ‘A’ Class Non Dist (USD)(1) 7.08% 27.48% (10.03)% 24.17% 20 August 2015
MSCI World Index (Net Total Return) (USD) 6.80% 27.67% (8.71)% 22.40%
BlackRock Systematic Global Equity Fund ‘A’ Class Non Dist (USD) 3.13% 24.72% (13.13)% 28.08% 18 September 2015
MSCI All Country World Index (Net Total Return) (USD) 5.43% 26.60% (9.41)% 23.97%
BlackRock Total Advantage Fund ‘A’ Class Non Dist (EUR) (12.07)% 10.28% (8.17)% (1.24)% 11 December 2017
3 month Euribor Index (EUR) (0.38)% (0.34)% (0.33)% (0.02)%
BlackRock UK Emerging Companies Absolute Return Fund ‘D’ Class Non Dist(GBP) 9.31% 14.24% (2.38)% — 17 October 2018
3 month LIBOR Index (GBP) 0.70% 0.81% 0.18%
BlackRock UK Equity Absolute Return Fund ‘A’ Class Non Dist (GBP) 0.62% 9.20% (5.39)% 0.30% 18 August 2016
3 month LIBOR Index (GBP) 0.70% 0.81% 0.72% (3.50)%
* The local BlackRock Group companies or branches or their administrators.
Fund performance returns are based on dealing prices with net dividends (after deduction of withholding tax) reinvested and are shown net of fees. Index Sources: Info Research &Datastream
(1) Fund name changed, see Note 1 for further details.(2) New Fund launch, see Note 1 for further details. Performance disclosed denotes the Fund’s performance from the date of launch to 31 May 2020.
Investment Advisers’ ReportPerformance Overview1 June 2019 to 31 May 2020 continued
The information stated in this report is historical and not necessarily indicative of future performance.
BlackRock Strategic Funds[10]

Corporate Governance Statement
IntroductionBlackRock Strategic Funds (the “Company”) is a public limitedcompany (société anonyme) established under the laws of theGrand Duchy of Luxembourg as an open-ended variable capitalinvestment company (société d’investissement à capitalvariable). The Company has been authorised by theCommission de Surveillance du Secteur Financier (the “CSSF”)as an undertaking for collective investment in transferablesecurities (“UCITS”) pursuant to the provisions of Part I of thelaw of 17 December 2010, as amended from time to time and isregulated pursuant to such law. The Company complies with theprinciples set out in the Association of the Luxembourg FundIndustry (“ALFI”) Code of Conduct Revision 2013 (the “Code”)issued by ALFI in June 2013.
The Board of Directors of the Company (the “Board”) iscommitted to maintaining the highest standards of corporategovernance and is accountable to shareholders for thegovernance of the Company’s affairs. The Board hasconsidered the principles and recommendations of the Codeand has put in place a framework for corporate governancewhich it believes is appropriate for adherence to the principals ofthe Code given the nature of its structure as an InvestmentCompany. This statement summarises the corporategovernance structure and processes in place for the Companyfor the period under review from 1 June 2019 to 31 May 2020.
Board CompositionThe Board currently consists of six non-executive Directors,(including one independent Director). The Board is committed tomaintaining an appropriate balance of skills, experience,independence and knowledge amongst its members.
The Directors’ biographies, on pages 13 and 14, collectivelydemonstrate a breadth of investment knowledge andexperience, business and financial skills and legal andregulatory familiarity which enables them to provide effectivestrategic leadership, oversight and proper governance of theCompany. BlackRock considers the current composition to be asuitable and appropriate balance for the Board.
Article 13 of the Company’s Articles of Incorporation inaccordance with Luxembourg law, provides that Directors shallbe elected by the shareholders at their annual general meetingfor a period ending at the next annual general meeting and untiltheir successors are elected. Any Director who resigns his/herposition is obliged to confirm to the Board and the CSSF thatthe resignation is not connected with any issues with or claimsagainst the Company.
The Board supports a planned and progressive renewal of theBoard. BlackRock is committed to ensuring that Directors putforward for election by the shareholders possess the skillsneeded to maintain this balance. The Board is committed tocarrying out an annual review of its performance and activities.
The Directors have a continuing obligation to ensure they havesufficient time to discharge their duties. The details of eachDirector’s (including the Chairman) other appointments andcommitments are made available to the Board and BlackRockInvestment Management (U.K.) Limited (“BIM UK”) forinspection. All new appointments or significant commitmentsrequire the prior approval of BIM UK.
Before a new Director is proposed to the shareholders forappointment, he or she will receive a full induction incorporatingrelevant information regarding the Company and his or herduties and responsibilities as a Director. In addition, a newDirector is required to spend some time with representatives ofBIM UK so that the new Director will become familiar with thevarious processes which are considered necessary for theproper performance of his or her duties and responsibilities tothe Company.
The Company’s policy is to encourage Directors to keep up todate with developments relevant to the Company. The Directorshave attended and will continue to attend updates and briefingsrun by BIM UK and affiliated entities in the US and elsewhere.The Directors also receive regular briefings from, amongstothers, the auditors, investment strategists, risk specialists,depositary and legal advisers regarding any proposed productdevelopments or changes in laws or regulations that could affectthe Company.
Board’s ResponsibilitiesThe Board meets at least quarterly and also on an ad hoc basisas required. The Board is supplied with information in a timelymanner and in a form and of a quality appropriate to enable it todischarge its duties. The Board is responsible for the long-termsuccess of the Company and recognises its responsibility toprovide leadership, direction and control to the Company withina framework of prudent and effective controls which enablesrisk to be assessed and managed. The Board reserves to itselfdecisions relating to the determination of investment policy andobjectives, any change in investment strategy and entering intoany material contracts. The Board also approves the prospectusand any addenda to it, circulars to shareholders, financialstatements and other relevant legal documentation.
The Chairman’s main responsibility is to lead and manage theBoard, encourage critical discussions and promote effectivecommunication within the Board. In addition, he is responsiblefor promoting best practice corporate governance and effectivecommunication with shareholders.
The Directors have access to the advice and services ofexternal counsel and the resources of BIM UK and BlackRock(Luxembourg) S.A. (the “Management Company”) should theybe needed. Where necessary, in the furtherance of their duties,the Board and individual Directors may seek independentprofessional advice. The Board has responsibility for ensuringthat the Company keeps proper accounting records whichdisclose with reasonable accuracy at any time the financialposition of the Company and which enable it to ensure that thefinancial statements comply with relevant accounting standards.It is the Board’s responsibility to present a balanced and
Directors’ Report
Annual report and audited financial statements [11]
understandable assessment of the Company’s financialposition, which extends to interim financial statements and otherreports made available to shareholders and the public. TheBoard is responsible for taking reasonable steps forsafeguarding the assets of the Company and for takingreasonable steps in the prevention and detection of fraud andother irregularities.
InsuranceThe Company maintains appropriate Directors’ and Officers’liability insurance cover.
Delegation of ResponsibilitiesAs an open ended variable capital investment company most ofthe Company’s day-to-day management and administration isdelegated to BlackRock group companies such as theManagement Company which employs dedicated complianceand risk professionals, the Investment Advisers and other thirdparty service providers. The Board has delegated the followingareas of responsibility:
Management and Administration
The Board has delegated the investment management,distribution and administration of the Company and its Funds tothe Management Company. The Management Company hasdelegated the management of the investment portfolio to theInvestment Advisers. The Investment Advisers operate underguidelines determined by the Board and as detailed in theCompany’s prospectus relating to the Company’s Funds. Therelevant Investment Advisers have direct responsibility for thedecisions relating to the day-to-day running of the Company’sFunds and are accountable to both the Management Companyand the Company for the investment performance of the Funds.The Board has also delegated the exercise of voting rightsattaching to the securities held in the portfolio to the respectiveInvestment Advisers who may in turn delegate to BIM UK.Voting on behalf of shareholders is done in a manner which isbelieved to be in the best economic interest of shareholders aslong-term investors. The Management Company has delegatedits responsibilities for administrative services of the Companyand its Funds to:
The Management Company has delegated its responsibilities foradministrative services of the Company and its Funds to StateStreet International GmbH (“the Administrator”). TheAdministrator has responsibility for the administration of theCompany’s affairs including the calculation of the net assetvalue and preparation of the financial statements of theCompany, subject to the overall supervision of the Directors andthe Management Company. The Administrator is a subsidiary ofState Street Bank & Trust Co. The Company has appointedState Street International GmbH as Depositary of its assets,which has responsibility for safe-keeping of such assets,pursuant to the regulations. The Depositary is a subsidiary ofState Street Bank & Trust Co. The Management Company hasdelegated transfer agent and share registration services to J.P.Morgan Bank Luxembourg S.A. The Management Company
reports to the Board on a quarterly basis and by exceptionwhere necessary. Reporting is in place to ensure that the Boardcan effectively oversee the actions of its delegates.
The Management Company is responsible for the riskmanagement and internal controls of the Company and forreviewing their effectiveness, for ensuring that financialinformation published or used within the business is reliable,and for regularly monitoring compliance with regulationsgoverning the operation of the Company. The ManagementCompany reviews the effectiveness of the internal control andrisk management systems on an ongoing basis to identify,evaluate and manage the Company’s significant risks. As part ofthat process, there are procedures designed to capture andevaluate any failings or weaknesses. Should a case becategorised by the Board as significant, procedures exist toensure that necessary action is taken to remedy the failings.
The Board is also responsible for establishing and maintainingadequate internal control and risk management systems of theCompany in relation to the financial reporting process. Suchsystems are designed to manage rather than eliminate the riskof failure to achieve the Company’s financial reportingobjectives. The Company has procedures in place to ensure allrelevant accounting records are properly maintained and arereadily available, including production of annual and half-yearlyfinancial statements. These procedures include appointing theAdministrator to maintain the accounting records of theCompany independently of the Investment Manager and theCustodian. The financial statements are prepared in accordancewith applicable law and Generally Accepted AccountingPrinciples (“GAAP”) and are approved by the Board of Directorsof the Company. The accounting information given in the annualreport is required to be audited and the Audit report, includingany qualifications, is reproduced in full in the annual report ofthe Company.
The control processes over the risks identified, coveringfinancial, operational, compliance and risk management, isembedded in the operations of the Management Company, BIMUK and other parties including the Administrator and theDepositary. There is a monitoring and reporting process toreview these controls, which has been in place throughout theperiod under review and up to the date of this report, carried outby BIM UK’s corporate audit department.
BIM UK’s internal audit and operational risk units report to theBoard through the Management Company on a quarterly basis.The Management Company also receives a report from theAdministrator and the Depositary on the internal controls of theadministrative and custodial operations of the Company. TheBoard recognises that these control systems can only bedesigned to manage rather than eliminate the risk of failure toachieve fund objectives, and to provide reasonable, but notabsolute, assurance against material misstatement or loss, andrelies on the operating controls established by the serviceproviders.
Directors’ Report continued
BlackRock Strategic Funds[12]
Financial ReportingThe Company prepares its financial statements underLuxembourg GAAP and on a going concern basis.
RemunerationThe Company is an investment company and has no employeesor executive Directors. No Director (past or present) has anyentitlement to a pension from the Company, and the Companyhas not awarded any share options or long-term performanceincentives. No element of Directors’ remuneration isperformance related. Those Directors who are also employeesof the BlackRock group are not entitled to receive a Director’sfee. All other Directors are paid fees which are submitted forapproval by the shareholders at the annual general meeting andare disclosed on page 697. The Board believes that the level ofremuneration for those Directors who take a fee properly reflectsthe time commitment and responsibilities of their roles. Themaximum amount of remuneration payable to the Directors isapproved by the Board.
Communication with ShareholdersThe Board is responsible for convening the annual generalmeeting and all other general meetings of the Company.Shareholders are encouraged to attend and vote at generalmeetings. Notice of general meetings is issued in accordancewith the Articles of Incorporation of the Company and notice ofthe annual general meeting is sent out at least 8 days inadvance of the meeting. All substantive matters put before ageneral meeting are dealt with by way of separate resolution.Proxy voting figures are noted by the chairman of the generalmeeting.
The proceedings of general meetings are governed by theArticles of Incorporation of the Company.
The Board has reporting procedures in place such that clientcommunication with BIM UK is reported to the Board, includingshareholder complaints. In addition to this BIM UK has beenappointed as Principal Distributor and is tasked with activelymanaging the relationship between the Company and itsshareholders.
Directors’ BiographiesPaul Freeman (Chairman) (British): Mr Freeman currentlyserves as a director on the boards of a number of BlackRockGroup companies and investment funds. He was until December2015 a Managing Director of BlackRock, which he had joined inAugust 2005 (which then was Merrill Lynch InvestmentManagers). Up until July 2011 Mr Freeman was the Head ofProduct Development and Range Management for the EMEAregion with responsibility for the development and ongoingproduct management of all funds domiciled in EMEA anddistributed on a cross-border basis by BlackRock. Between July2011 and December 2015 Mr Freeman worked closely withBlackRock’s Government affairs team and served on variousinternal governance committees and on the boards of a numberof group subsidiaries and managed funds. Mr Freeman hasworked in the financial services industry for over 35 years and,
prior to BlackRock, has held senior management positions atSchroders, Rothschild Asset Management, Henderson Investorsand GT Management (now part of Invesco). Mr Freeman is aChartered Accountant.
Michael Gruener (German): Mr Gruener is a ManagingDirector of BlackRock and is Head of Europe, Middle East andAfrica Retail business. He is a member of BlackRock’sEuropean Executive Committee and the BlackRock EuropeanSteering Committee. Mr Gruener joined BlackRock in January2012 as the Head of BlackRock’s German, Austria and EasternEurope iShares sales team and became Head of the iSharesWealth and Retail client segment in EMEA in January 2014. In2015 he became the Co-Head of the EMEA Sales for iShares.Michael began his current role in July 2017. Mr Gruener hasmore than 20 years of experience in the financial servicesindustry. Prior to joining BlackRock, Michael worked for 10 yearsat Goldman Sachs Asset Management in multiple distributionroles in Chicago, London and Frankfurt. Mr Gruener holds aGerman Banker qualification and a BA honors degree from theCambridge Polytechnic University in Finance and Controlling.He also holds a degree from the Berlin School of Economics inBusiness Administration and Finance.
Robert Hayes (British): Mr Hayes is a Managing Director, isInvestment Director for our UK Charity and Endowmentsbusiness and CEO of BlackRock Fund Managers Limited. Hewas previously Head of Investment Oversight for the BlackRockEMEA business within Global Product Management,responsible for establishing and reviewing investmentexpectations for all BlackRock’s Retail Funds in the EMEAregion. He also serves as a Director of BlackRock Life Limited,BlackRock Global Funds SICAV and BlackRock Strategic FundsSICAV. Mr. Hayes’ service with the firm dates back to 2001,including his years with Merrill Lynch Investment Managers(MLIM), which merged with BlackRock in 2006. At MLIM he wasHead of Strategic Advice and was subsequently Head of ClientStrategy in our Client Solutions business. Prior to joining thefirm, Mr. Hayes was a Partner with Watson Wyatt Partners, asan investment consultant for large pension funds andinstitutional investors. Earlier in his career, Mr Hayes was a UKEquity Investment Manager at ICI Pension Fund and Head ofInstitutional Investment at M&G Investment Management. Mr.Hayes earned a BSc degree in Mathematics from SouthamptonUniversity in 1983.
Barry O’Dwyer (Irish): Mr O’Dwyer is a Managing Director atBlackRock. He is the Head of Fund Governance forBlackRock’s European open-ended fund ranges and waspreviously the Chief Operating Officer for BlackRock’s Irishbusiness. He serves as a director on the boards of a number ofBlackRock corporate, fund, and management companiesdomiciled in Ireland, Luxembourg, Switzerland and Germanyand on the board of BlackRock’s UK Life company. He was thechairman of the Irish Funds Industry Association 2014-2015, isa board director of Financial Services Ireland and is a memberof An Taoiseach’s Financial Services Industry AdvisoryCommittee. He joined BlackRock Advisors (UK) Limited in1999 as head of risk management and moved to his presentrole in 2006. Prior to joining BlackRock Advisors (UK) Limited,
Directors’ Report continued
Annual report and audited financial statements [13]

Mr O’Dwyer worked as risk manager at Gartmore InvestmentManagement and at HypoVereinsbank and NationalWestminster Bank. Mr O’Dwyer graduated from Trinity CollegeDublin with a degree in Business Studies and Economics in1991. He holds a Chartered Association of CertifiedAccountants qualification and an MBA from London CityUniversity Business School.
Geoffrey D. Radcliffe (British & Luxembourgish dualnationality, Luxembourg resident): Mr Radcliffe is aManaging Director of BlackRock and is based in Luxembourg.He is a member of the BlackRock Business Operations &Technology, Global Accounting and Product Services team andheads Product Oversight and Governance International andAlternatives International for BlackRock EMEA & Asia Pacific.Mr Radcliffe is a Fellow of The Institute of CharteredAccountants in England and Wales and an Associate of TheChartered Institute of Bankers. He has 30+ years of mutualfund, accounting and banking experience in Luxembourg,Bermuda, London and the Isle of Man. Mr Radcliffe joined theBlackRock Group in 1998. He serves as a Director on theBoards of BlackRock Luxembourg S.A. and BlackRock FundManagement Company S.A. and also on the Boards of a
number of BlackRock investment funds. He has been a Memberof the Board of Directors of ALFI (Luxembourg Fund IndustryAssociation) since 2013.
Denise Voss (American): Ms Voss is a Non-Executive Directorof financial services companies and is based in Luxembourg.She serves as a Director on the Boards of flagship funds ofmajor fund promoters, including BlackRock Global Funds andBlackRock Strategic Funds. Ms. Voss previously worked forFranklin Templeton in Luxembourg for over 25 years as aConducting Officer and Director of the firm’s UCITS andalternative investment fund management business. Prior tojoining Franklin Templeton, she worked for 10 years at Coopers& Lybrand in Boston, USA and in Luxembourg. She holds aMassachusetts CPA license and earned an undergraduatedegree from Tufts University, as well as a masters degree inaccountancy from Bentley University. Ms. Voss is Chairwomanof LuxFLAG, an independent agency based in Luxembourg thatawards recognised sustainable finance labels to eligibleinvestment vehicles. She was Chairman of the Association ofthe Luxembourg Fund Industry (ALFI) from 2015-2019, and amember of the ALFI Board of Directors from 2007-2019.
Directors’ Report continued
BlackRock Strategic Funds[14]

The below disclosures are made in respect of the remunerationpolicies of the BlackRock group (�BlackRock�), as they apply toBlackRock (Luxembourg) SA (the �Manager�). The disclosuresare made in accordance with the Directive 2009/65/EC on thecoordination of laws, regulations and administrative provisionsrelating to undertakings for collective investment in transferablesecurities (“UCITS”), as amended, including in particular byDirective 2014/91/EU of the European Parliament and of thecouncil of 23 July 2014, (the “Directive”), and the �Guidelines onsound remuneration policies under the UCITS Directive andAIFMD� issued by the European Securities and MarketsAuthority.
BlackRock’s UCITS Remuneration Policy (the “UCITSRemuneration Policy”) will apply to the EEA entities within theBlackRock group authorised as a manager of UCITS funds inaccordance with the Directive and will ensure compliance withthe requirements of Article 14b of the Directive.
The Manager has adopted the UCITS Remuneration Policy, asummary of which is set out below.
Remuneration GovernanceBlackRock’s remuneration governance in EMEA operates as atiered structure which includes: (a) the ManagementDevelopment and Compensation Committee (“MDCC”) (which isthe global, independent remuneration committee for BlackRock,Inc. and all of its subsidiaries, including the Manager); and(b) the Manager’s board of directors (the “Manager’s Board”).These bodies are responsible for the determination ofBlackRock’s remuneration policies.
(a) MDCCThe MDCC’s purposes include:
providing oversight of:� BlackRock’s executive compensation programmes;� BlackRock’s employee benefit plans; and� such other compensation plans as may be established by
BlackRock from time to time for which the MDCC is deemedas administrator;
� reviewing and discussing the compensation discussion andanalysis included in the BlackRock, Inc. annual proxystatement with management and approving the MDCC’sreport for inclusion in the proxy statement;
� reviewing, assessing and making reports andrecommendations to the BlackRock, Inc. board of directors(the “BlackRock, Inc. Board”) as appropriate on BlackRock’stalent development and succession planning, with theemphasis on performance and succession at the highestmanagement levels; and
� supporting the boards of the Company’s EMEA regulatedentities in meeting their remuneration-related obligations byoverseeing the design and implementation of EMEAremuneration policy in accordance with applicable regulation.
The MDCC directly retains its own independent compensationconsultant, Semler Brossy Consulting Group LLC, who has no
relationship with BlackRock, Inc. or the BlackRock, Inc. Boardthat would interfere with its ability to provide independent adviceto the MDCC on compensation matters.
The BlackRock, Inc. Board has determined that all of themembers of the MDCC are “independent” within the meaning ofthe listing standards of the New York Stock Exchange (NYSE),which requires each meet a “non-employee director” standard.
The MDCC held 8 meetings during 2019. The MDCC charter isavailable on BlackRock, Inc.’s website (www.blackrock.com).
Through its regular reviews, the MDCC continues to be satisfiedwith the principles of BlackRock’s compensation policy andapproach.
(b) The Manager’s BoardThe Manager’s Board has the task of supervising and providingoversight of the UCITS Remuneration Policy as it applies to theManager and its Identified Staff.
The Manager’s Board (through independent review by therelevant control functions) remains satisfied with theimplementation of the UCITS Remuneration Policy as it appliesto the Manager and its Identified Staff.
Decision-making processRemuneration decisions for employees are made once annuallyin January following the end of the performance year. Thistiming allows full-year financial results to be considered alongwith other non-financial goals and objectives. Although theframework for remuneration decision-making is tied to financialperformance, significant discretion is used to determineindividual variable remuneration based on achievement ofstrategic and operating results and other considerations such asmanagement and leadership capabilities.
No set formulas are established, and no fixed benchmarks areused in determining annual incentive awards. In determiningspecific individual remuneration amounts, a number of factorsare considered including non-financial goals and objectives andoverall financial and investment performance. These results areviewed in the aggregate without any specific weighting, andthere is no direct correlation between any particularperformance measure and the resulting annual incentive award.The variable remuneration awarded to any individual(s) for aparticular performance year may also be zero.
Annual incentive awards are paid from a bonus pool.
The size of the projected bonus pool, including cash and equityawards, is reviewed throughout the year by the MDCC and thefinal total bonus pool is approved after year-end. As part of thisreview, the MDCC receives actual and projected financialinformation over the course of the year as well as final year-endinformation. The financial information that the MDCC receivesand considers includes the current year projected incomestatement and other financial measures compared with prioryear results and the current year budget. The MDCCadditionally reviews other metrics of BlackRock’s financial
Report on Remuneration (Unaudited)
Annual report and audited financial statements [15]

performance (e.g., net inflows of AUM and investmentperformance) as well as information regarding market conditionsand competitive compensation levels.
The MDCC regularly considers management’s recommendationas to the percentage of preincentive operating income that willbe accrued and reflected as a compensation expensethroughout the year for the cash portion of the total annualbonus pool (the “accrual rate”). The accrual rate of the cashportion of the total annual bonus pool may be modified by theMDCC during the year based on its review of the financialinformation described above. The MDCC does not apply anyparticular weighting or formula to the information it considerswhen determining the size of the total bonus pool or theaccruals made for the cash portion of the total bonus pool.
Following the end of the performance year, the MDCC approvesthe final bonus pool amount.
As part of the year-end review process the Enterprise Risk andRegulatory Compliance departments report to the MDCC onany activities, incidents or events that warrant consideration inmaking compensation decisions.
Individuals are not involved in setting their own remuneration.
Control functionsEach of the control functions (Enterprise Risk, Legal &Compliance, and Internal Audit) has its own organisationalstructure which is independent of the business units. The headof each control function is either a member of the GlobalExecutive Committee (“GEC”), the global managementcommittee, or has a reporting obligation to the board ofdirectors of BlackRock Group Limited, the parent company of allof BlackRock’s EMEA regulated entities, including the Manager.
Functional bonus pools are determined with reference to theperformance of each individual function. The remuneration ofthe senior members of control functions is directly overseen bythe MDCC.
Link between pay and performanceThere is a clear and well-defined pay-for-performancephilosophy and compensation programmes which are designedto meet the following key objectives as detailed below:
� appropriately balance BlackRock’s financial results betweenshareholders and employees;
� attract, retain and motivate employees capable of makingsignificant contributions to the long-term success of thebusiness;
� align the interests of senior employees with those ofshareholders by awarding BlackRock Inc.’s stock as asignificant part of both annual and long-term incentiveawards;
� control fixed costs by ensuring that compensation expensevaries with profitability;
� link a significant portion of an employee’s total compensationto the financial and operational performance of the businessas well as its common stock performance;
� discourage excessive risk-taking; and
� ensure that client interests are not negatively impacted byremuneration awarded on a short-term, mid-term and/orlong-term basis.
Driving a high-performance culture is dependent on the ability tomeasure performance against objectives, values andbehaviours in a clear and consistent way. Managers use a5-point rating scale to provide an overall assessment of anemployee’s performance, and employees also provide aself-evaluation. The overall, final rating is reconciled during eachemployee’s performance appraisal. Employees are assessed onthe manner in which performance is attained as well as theabsolute performance itself.
In keeping with the pay-for-performance philosophy, ratings areused to differentiate and reward individual performance – butdon’t pre-determine compensation outcomes. Compensationdecisions remain discretionary and are made as part of theyear-end compensation process.
When setting remuneration levels other factors are considered,as well as individual performance, which may include:
� the performance of the Manager, the funds managed by theManager and/or the relevant functional department;
� factors relevant to an employee individually; relationships withclients and colleagues; teamwork; skills; any conduct issues;and, subject to any applicable policy, the impact that anyrelevant leave of absence may have on contribution to thebusiness);
� the management of risk within the risk profiles appropriate forBlackRocks clients;
� strategic business needs, including intentions regardingretention;
� market intelligence; and
� criticality to business.
A primary product tool is risk management and, whileemployees are compensated for strong performance in theirmanagement of client assets, they are required to manage riskwithin the risk profiles appropriate for their clients. Therefore,employees are not rewarded for engaging in high-risktransactions outside of established parameters. Remunerationpractices do not provide undue incentives for short-termplanning or short-term financial rewards, do not rewardunreasonable risk and provide a reasonable balance betweenthe many and substantial risks inherent within the business ofinvestment management, risk management and advisoryservices.
Report on Remuneration (Unaudited)continued
BlackRock Strategic Funds[16]

BlackRock operates a total compensation model forremuneration which includes a base salary, which is contractual,and a discretionary bonus scheme.
BlackRock operates an annual discretionary bonus scheme.Although all employees are eligible to be considered for adiscretionary bonus, there is no contractual obligation to makeany award to an employee under its discretionary bonusscheme. In exercising discretion to award a discretionary bonus,the factors listed above (under the heading “Link between payand performance”) may be taken into account in addition to anyother matters which become relevant to the exercise ofdiscretion in the course of the performance year.
Discretionary bonus awards for all employees, includingexecutive officers, are subject to a guideline that determines theportion paid in cash and the portion paid in BlackRock, Inc.stock and subject to additional vesting/clawback conditions.Stock awards are subject to further performance adjustmentthrough variation in BlackRock, Inc.’s share price over thevesting period. As total annual compensation increases, agreater portion is deferred into stock. The MDCC adopted thisapproach in 2006 to substantially increase the retention valueand shareholder alignment of the compensation package foreligible employees, including the executive officers. The portiondeferred into stock vests into three equal instalments over thethree years following grant.
Supplementary to the annual discretionary bonus as describedabove, equity awards may be made to select individuals toprovide greater linkage with future business results. Theselong-term incentive awards have been established individually toprovide meaningful incentive for continued performance over amulti-year period recognising the scope of the individual’s role,business expertise and leadership skills.
Selected senior leaders are eligible to receiveperformance-adjusted equity-based awards from the“BlackRock Performance Incentive Plan” (“BPIP”). Awards madefrom the BPIP have a three-year performance period based on ameasurement of As Adjusted Operating Margin(1) Determinationof pay-out will be made based on the firm’s achievement relativeto target financial results at the conclusion of the performanceperiod. The maximum number of shares that can be earned is165% of the award in those situations where both metricsachieve pre-determined financial targets. No shares will beearned where the firm’s financial performance in both of theabove metrics is below a pre-determined performancethreshold. These metrics have been selected as key measuresof shareholder value which endure across market cycles.
A limited number of investment professionals have a portion oftheir annual discretionary bonus (as described above) awardedas deferred cash that notionally tracks investment in selectedproducts managed by the employee. The intention of theseawards is to align investment professionals with the investmentreturns of the products they manage through the deferral ofcompensation into those products. Clients and external
evaluators have increasingly viewed more favourably thoseproducts where key investors have “skin in the game” throughsignificant personal investments.
Identified StaffThe UCITS Remuneration Policy sets out the process that willbe applied to identify staff as Identified Staff, being categories ofstaff of the Management Company, including seniormanagement, risk takers, control functions and any employeereceiving total remuneration that takes them into the sameremuneration bracket as senior management and risk takers,whose professional activities have a material impact on the riskprofiles of the Management Company or of the funds itmanages.
The list of Identified Staff will be subject to regular review, beingformally reviewed in the event of, but not limited to:
� organisational changes;
� new business initiatives;
� changes in significant influence function lists;
� changes in role responsibilities; and
� revised regulatory direction.
Quantitative Remuneration DisclosureThe Manager is required under UCITS to make quantitativedisclosures of remuneration. These disclosures are made in linewith BlackRock’s interpretation of currently available regulatoryguidance on quantitative remuneration disclosures. As market orregulatory practice develops BlackRock may consider itappropriate to make changes to the way in which quantitativeremuneration disclosures are calculated. Where such changesare made, this may result in disclosures in relation to a fund notbeing comparable to the disclosures made in the prior year, or inrelation to other BlackRock fund disclosures in that same year.
Disclosures are provided in relation to (a) the staff of theManager; (b) staff who are senior management; and (c) staffwho have the ability to materially affect the risk profile of theFund, including individuals who, although not directly employedby the Manager, are assigned by their employer to carry outservices directly for the Manager.
All individuals included in the aggregated figures disclosed arerewarded in line with BlackRock’s remuneration policy for theirresponsibilities across the relevant BlackRock business area. Asall individuals have a number of areas of responsibilities, onlythe portion of remuneration for those individuals’ servicesattributable to the Fund is included in the aggregate figuresdisclosed.
Members of staff and senior management of the Managertypically provide both UCITS and non-UCITS related services inrespect of multiple funds, clients and functions of the Manager
(1) As Adjusted Operating Margin: As reported in BlackRock’s external filings, reflects adjusted Operating Income divided by Total Revenue net of distribution and servicing expenses and
amortisation of deferred sales commissions. and Organic Revenue Growth(2)
Report on Remuneration (Unaudited)continued
Annual report and audited financial statements [17]

and across the broader BlackRock group. Therefore, the figuresdisclosed are a sum of each individual’s portion of remunerationattributable to the Manager according to an objectiveapportionment methodology which acknowledges themultiple-service nature of the Manager. Accordingly, the figuresare not representative of any individual’s actual remuneration ortheir remuneration structure.
The amount of the total remuneration awarded by the Managerto its staff which has been attributed to the Manager’sUCITS-related business in respect of the Manager’s financialyear ending 31 December 2019 is USD 109.5 million. This figure
is comprised of fixed remuneration of 9.4 million and variableremuneration of USD 100.1 million. There was a total of153 beneficiaries of the remuneration described above.
The amount of the aggregate remuneration awarded by theManager, which has been attributed to the Manager’sUCITS-related business in respect of the Manager’s financialyear ending 31 December 2019, to its senior management wasUSD 0.5 million, and to other members of its staff whoseactions have a material impact on the risk profile of the Fundwas USD 109.0 million.
Report on Remuneration (Unaudited)continued
BlackRock Strategic Funds[18]
BlackRockStrategic
FundsCombined
BlackRockAmericas
DiversifiedEquity
AbsoluteReturn Fund
BlackRockAsia
Extension Fund
BlackRockAsia Pacific
AbsoluteReturn Fund
BlackRockAsia PacificDiversified
EquityAbsolute
Return Fund
BlackRockDynamic
DiversifiedGrowth Fund
Note USD USD USD USD USD EUR
Assets
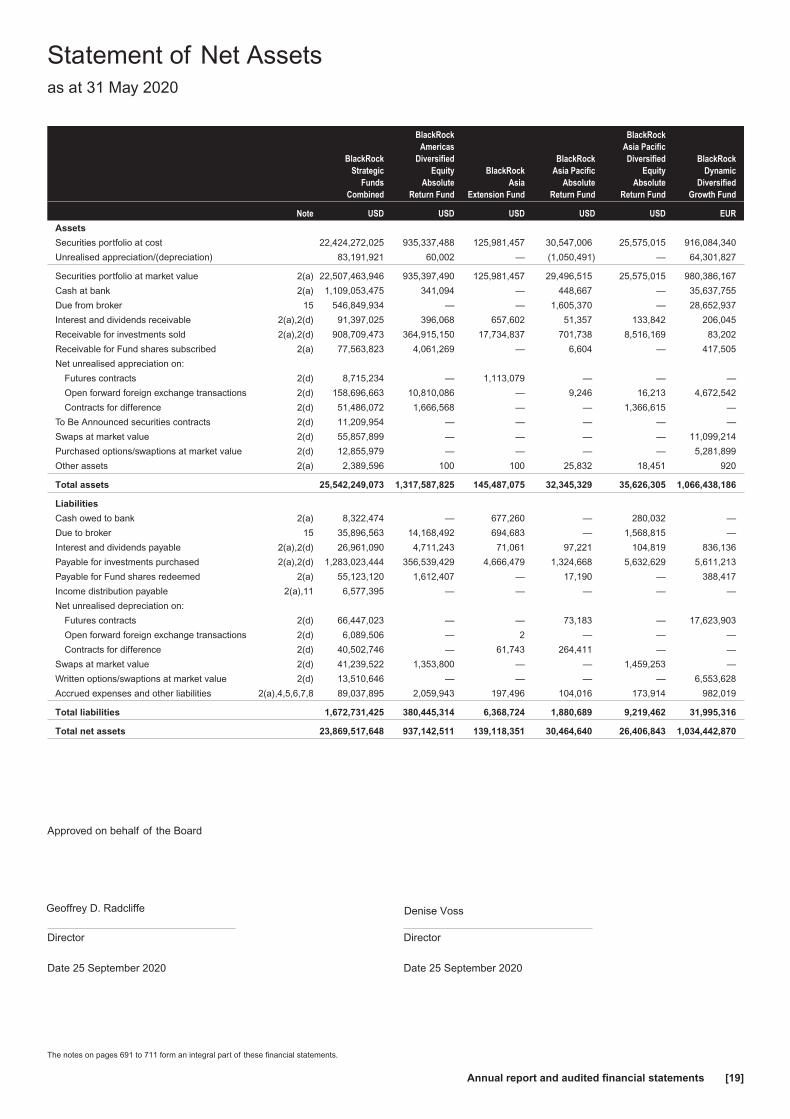
Securities portfolio at cost 22,424,272,025 935,337,488 125,981,457 30,547,006 25,575,015 916,084,340
Unrealised appreciation/(depreciation) 83,191,921 60,002 — (1,050,491) — 64,301,827
Securities portfolio at market value 2(a) 22,507,463,946 935,397,490 125,981,457 29,496,515 25,575,015 980,386,167
Cash at bank 2(a) 1,109,053,475 341,094 — 448,667 — 35,637,755
Due from broker 15 546,849,934 — — 1,605,370 — 28,652,937
Interest and dividends receivable 2(a),2(d) 91,397,025 396,068 657,602 51,357 133,842 206,045
Receivable for investments sold 2(a),2(d) 908,709,473 364,915,150 17,734,837 701,738 8,516,169 83,202
Receivable for Fund shares subscribed 2(a) 77,563,823 4,061,269 — 6,604 — 417,505
Net unrealised appreciation on:
Futures contracts 2(d) 8,715,234 — 1,113,079 — — —
Open forward foreign exchange transactions 2(d) 158,696,663 10,810,086 — 9,246 16,213 4,672,542
Contracts for difference 2(d) 51,486,072 1,666,568 — — 1,366,615 —
To Be Announced securities contracts 2(d) 11,209,954 — — — — —
Swaps at market value 2(d) 55,857,899 — — — — 11,099,214
Purchased options/swaptions at market value 2(d) 12,855,979 — — — — 5,281,899
Other assets 2(a) 2,389,596 100 100 25,832 18,451 920
Total assets 25,542,249,073 1,317,587,825 145,487,075 32,345,329 35,626,305 1,066,438,186
Liabilities
Cash owed to bank 2(a) 8,322,474 — 677,260 — 280,032 —
Due to broker 15 35,896,563 14,168,492 694,683 — 1,568,815 —
Interest and dividends payable 2(a),2(d) 26,961,090 4,711,243 71,061 97,221 104,819 836,136
Payable for investments purchased 2(a),2(d) 1,283,023,444 356,539,429 4,666,479 1,324,668 5,632,629 5,611,213
Payable for Fund shares redeemed 2(a) 55,123,120 1,612,407 — 17,190 — 388,417
Income distribution payable 2(a),11 6,577,395 — — — — —
Net unrealised depreciation on:
Futures contracts 2(d) 66,447,023 — — 73,183 — 17,623,903
Open forward foreign exchange transactions 2(d) 6,089,506 — 2 — — —
Contracts for difference 2(d) 40,502,746 — 61,743 264,411 — —
Swaps at market value 2(d) 41,239,522 1,353,800 — — 1,459,253 —
Written options/swaptions at market value 2(d) 13,510,646 — — — — 6,553,628
Accrued expenses and other liabilities 2(a),4,5,6,7,8 89,037,895 2,059,943 197,496 104,016 173,914 982,019
Total liabilities 1,672,731,425 380,445,314 6,368,724 1,880,689 9,219,462 31,995,316
Total net assets 23,869,517,648 937,142,511 139,118,351 30,464,640 26,406,843 1,034,442,870
Approved on behalf of the Board
Director Director
Date 25 September 2020 Date 25 September 2020
Statement of Net Assetsas at 31 May 2020
The notes on pages 691 to 711 form an integral part of these financial statements.
Annual report and audited financial statements [19]
Geoffrey D. Radcliffe Denise Voss
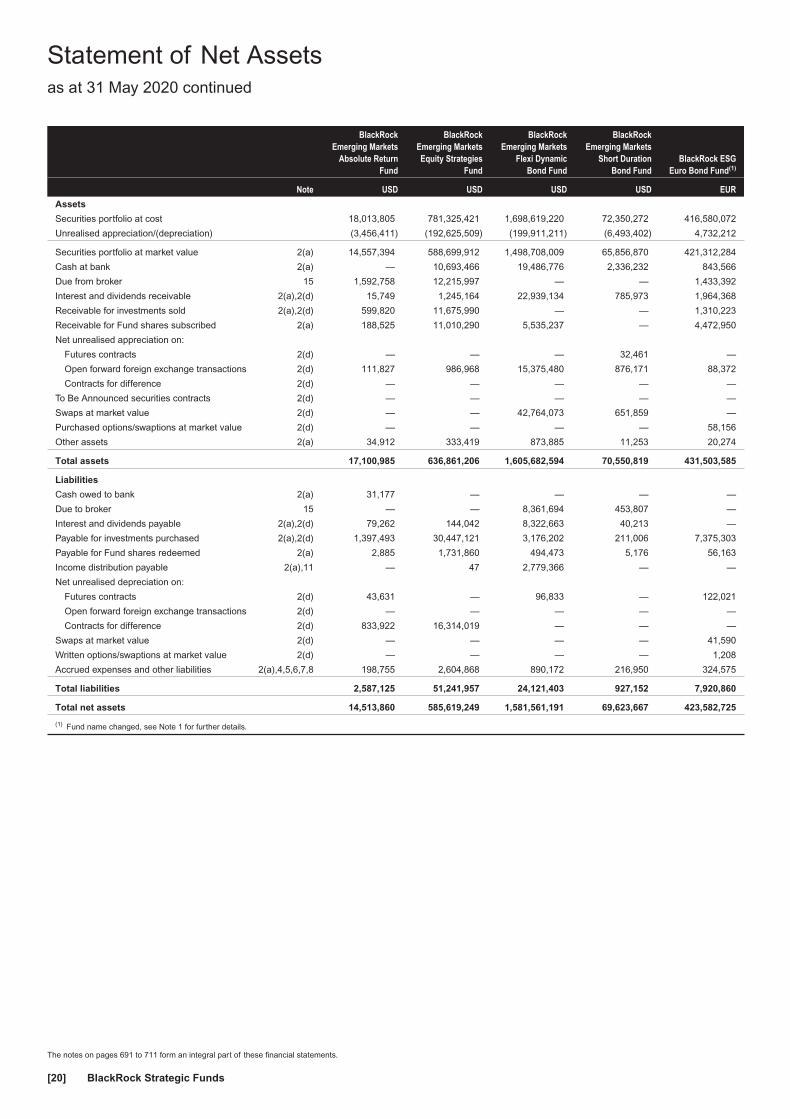
BlackRockEmerging Markets
Absolute ReturnFund
BlackRockEmerging MarketsEquity Strategies
Fund
BlackRockEmerging Markets
Flexi DynamicBond Fund
BlackRockEmerging Markets
Short DurationBond Fund
BlackRock ESGEuro Bond Fund(1)
Note USD USD USD USD EUR
Assets
Securities portfolio at cost 18,013,805 781,325,421 1,698,619,220 72,350,272 416,580,072
Unrealised appreciation/(depreciation) (3,456,411) (192,625,509) (199,911,211) (6,493,402) 4,732,212
Securities portfolio at market value 2(a) 14,557,394 588,699,912 1,498,708,009 65,856,870 421,312,284
Cash at bank 2(a) — 10,693,466 19,486,776 2,336,232 843,566
Due from broker 15 1,592,758 12,215,997 — — 1,433,392
Interest and dividends receivable 2(a),2(d) 15,749 1,245,164 22,939,134 785,973 1,964,368
Receivable for investments sold 2(a),2(d) 599,820 11,675,990 — — 1,310,223
Receivable for Fund shares subscribed 2(a) 188,525 11,010,290 5,535,237 — 4,472,950
Net unrealised appreciation on:
Futures contracts 2(d) — — — 32,461 —
Open forward foreign exchange transactions 2(d) 111,827 986,968 15,375,480 876,171 88,372
Contracts for difference 2(d) — — — — —
To Be Announced securities contracts 2(d) — — — — —
Swaps at market value 2(d) — — 42,764,073 651,859 —
Purchased options/swaptions at market value 2(d) — — — — 58,156
Other assets 2(a) 34,912 333,419 873,885 11,253 20,274
Total assets 17,100,985 636,861,206 1,605,682,594 70,550,819 431,503,585
Liabilities
Cash owed to bank 2(a) 31,177 — — — —
Due to broker 15 — — 8,361,694 453,807 —
Interest and dividends payable 2(a),2(d) 79,262 144,042 8,322,663 40,213 —
Payable for investments purchased 2(a),2(d) 1,397,493 30,447,121 3,176,202 211,006 7,375,303
Payable for Fund shares redeemed 2(a) 2,885 1,731,860 494,473 5,176 56,163
Income distribution payable 2(a),11 — 47 2,779,366 — —
Net unrealised depreciation on:
Futures contracts 2(d) 43,631 — 96,833 — 122,021
Open forward foreign exchange transactions 2(d) — — — — —
Contracts for difference 2(d) 833,922 16,314,019 — — —
Swaps at market value 2(d) — — — — 41,590
Written options/swaptions at market value 2(d) — — — — 1,208
Accrued expenses and other liabilities 2(a),4,5,6,7,8 198,755 2,604,868 890,172 216,950 324,575
Total liabilities 2,587,125 51,241,957 24,121,403 927,152 7,920,860
Total net assets 14,513,860 585,619,249 1,581,561,191 69,623,667 423,582,725
(1) Fund name changed, see Note 1 for further details.
Statement of Net Assetsas at 31 May 2020 continued
The notes on pages 691 to 711 form an integral part of these financial statements.
BlackRock Strategic Funds[20]
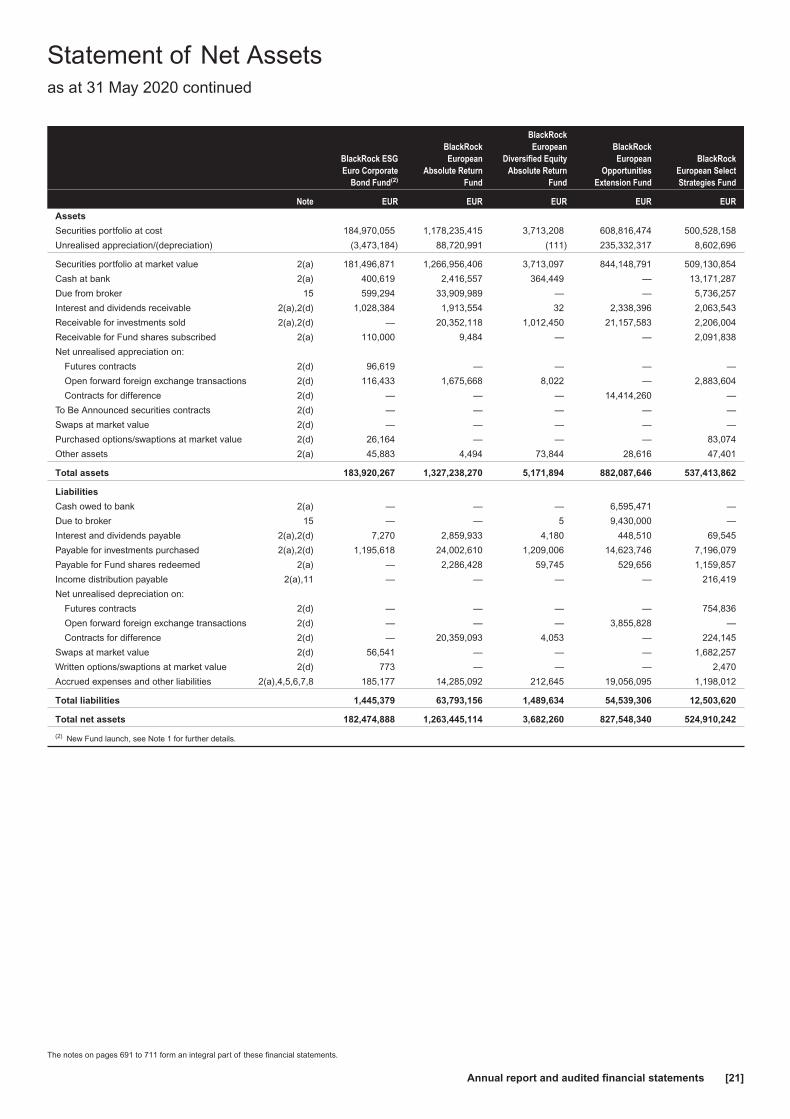
BlackRock ESGEuro Corporate
Bond Fund(2)
BlackRockEuropean
Absolute ReturnFund
BlackRockEuropean
Diversified EquityAbsolute Return
Fund
BlackRockEuropean
OpportunitiesExtension Fund
BlackRockEuropean SelectStrategies Fund
Note EUR EUR EUR EUR EUR
Assets
Securities portfolio at cost 184,970,055 1,178,235,415 3,713,208 608,816,474 500,528,158
Unrealised appreciation/(depreciation) (3,473,184) 88,720,991 (111) 235,332,317 8,602,696
Securities portfolio at market value 2(a) 181,496,871 1,266,956,406 3,713,097 844,148,791 509,130,854
Cash at bank 2(a) 400,619 2,416,557 364,449 — 13,171,287
Due from broker 15 599,294 33,909,989 — — 5,736,257
Interest and dividends receivable 2(a),2(d) 1,028,384 1,913,554 32 2,338,396 2,063,543
Receivable for investments sold 2(a),2(d) — 20,352,118 1,012,450 21,157,583 2,206,004
Receivable for Fund shares subscribed 2(a) 110,000 9,484 — — 2,091,838
Net unrealised appreciation on:
Futures contracts 2(d) 96,619 — — — —
Open forward foreign exchange transactions 2(d) 116,433 1,675,668 8,022 — 2,883,604
Contracts for difference 2(d) — — — 14,414,260 —
To Be Announced securities contracts 2(d) — — — — —
Swaps at market value 2(d) — — — — —
Purchased options/swaptions at market value 2(d) 26,164 — — — 83,074
Other assets 2(a) 45,883 4,494 73,844 28,616 47,401
Total assets 183,920,267 1,327,238,270 5,171,894 882,087,646 537,413,862
Liabilities
Cash owed to bank 2(a) — — — 6,595,471 —
Due to broker 15 — — 5 9,430,000 —
Interest and dividends payable 2(a),2(d) 7,270 2,859,933 4,180 448,510 69,545
Payable for investments purchased 2(a),2(d) 1,195,618 24,002,610 1,209,006 14,623,746 7,196,079
Payable for Fund shares redeemed 2(a) — 2,286,428 59,745 529,656 1,159,857
Income distribution payable 2(a),11 — — — — 216,419
Net unrealised depreciation on:
Futures contracts 2(d) — — — — 754,836
Open forward foreign exchange transactions 2(d) — — — 3,855,828 —
Contracts for difference 2(d) — 20,359,093 4,053 — 224,145
Swaps at market value 2(d) 56,541 — — — 1,682,257
Written options/swaptions at market value 2(d) 773 — — — 2,470
Accrued expenses and other liabilities 2(a),4,5,6,7,8 185,177 14,285,092 212,645 19,056,095 1,198,012
Total liabilities 1,445,379 63,793,156 1,489,634 54,539,306 12,503,620
Total net assets 182,474,888 1,263,445,114 3,682,260 827,548,340 524,910,242
(2) New Fund launch, see Note 1 for further details.
Statement of Net Assetsas at 31 May 2020 continued
The notes on pages 691 to 711 form an integral part of these financial statements.
Annual report and audited financial statements [21]
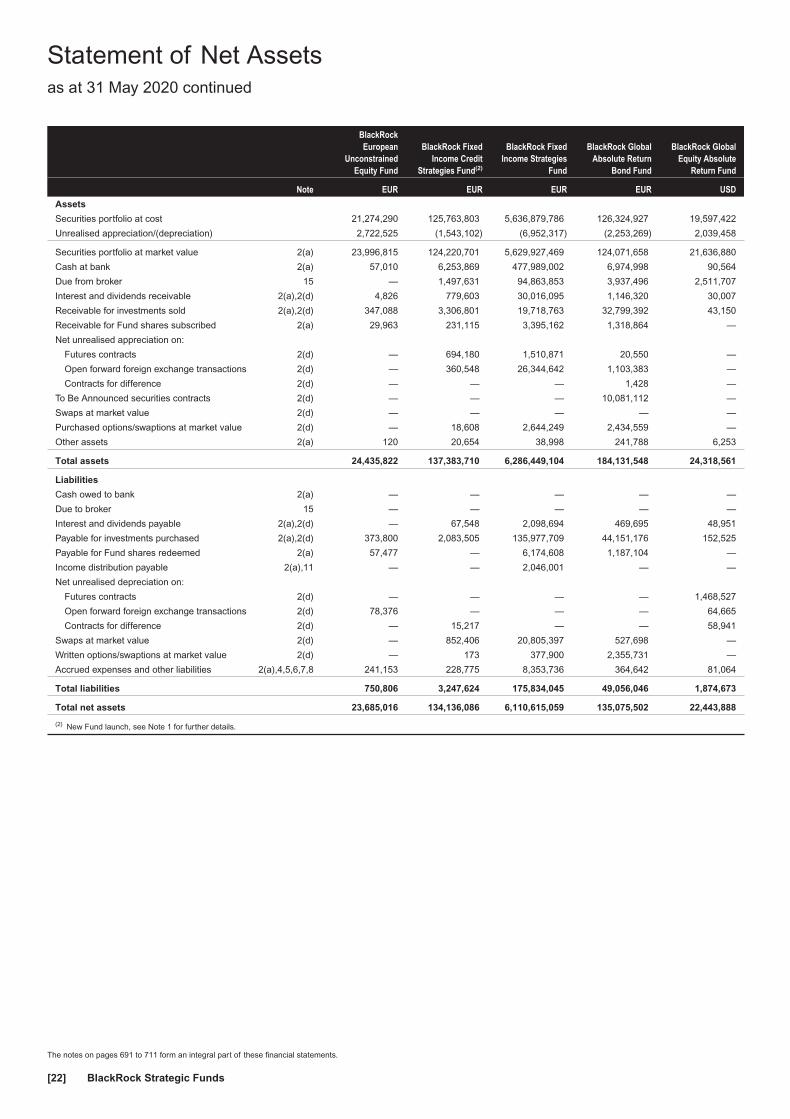
BlackRockEuropean
UnconstrainedEquity Fund
BlackRock FixedIncome Credit
Strategies Fund(2)
BlackRock FixedIncome Strategies
Fund
BlackRock GlobalAbsolute Return
Bond Fund
BlackRock GlobalEquity Absolute
Return Fund
Note EUR EUR EUR EUR USD
Assets
Securities portfolio at cost 21,274,290 125,763,803 5,636,879,786 126,324,927 19,597,422
Unrealised appreciation/(depreciation) 2,722,525 (1,543,102) (6,952,317) (2,253,269) 2,039,458
Securities portfolio at market value 2(a) 23,996,815 124,220,701 5,629,927,469 124,071,658 21,636,880
Cash at bank 2(a) 57,010 6,253,869 477,989,002 6,974,998 90,564
Due from broker 15 — 1,497,631 94,863,853 3,937,496 2,511,707
Interest and dividends receivable 2(a),2(d) 4,826 779,603 30,016,095 1,146,320 30,007
Receivable for investments sold 2(a),2(d) 347,088 3,306,801 19,718,763 32,799,392 43,150
Receivable for Fund shares subscribed 2(a) 29,963 231,115 3,395,162 1,318,864 —
Net unrealised appreciation on:
Futures contracts 2(d) — 694,180 1,510,871 20,550 —
Open forward foreign exchange transactions 2(d) — 360,548 26,344,642 1,103,383 —
Contracts for difference 2(d) — — — 1,428 —
To Be Announced securities contracts 2(d) — — — 10,081,112 —
Swaps at market value 2(d) — — — — —
Purchased options/swaptions at market value 2(d) — 18,608 2,644,249 2,434,559 —
Other assets 2(a) 120 20,654 38,998 241,788 6,253
Total assets 24,435,822 137,383,710 6,286,449,104 184,131,548 24,318,561
Liabilities
Cash owed to bank 2(a) — — — — —
Due to broker 15 — — — — —
Interest and dividends payable 2(a),2(d) — 67,548 2,098,694 469,695 48,951
Payable for investments purchased 2(a),2(d) 373,800 2,083,505 135,977,709 44,151,176 152,525
Payable for Fund shares redeemed 2(a) 57,477 — 6,174,608 1,187,104 —
Income distribution payable 2(a),11 — — 2,046,001 — —
Net unrealised depreciation on:
Futures contracts 2(d) — — — — 1,468,527
Open forward foreign exchange transactions 2(d) 78,376 — — — 64,665
Contracts for difference 2(d) — 15,217 — — 58,941
Swaps at market value 2(d) — 852,406 20,805,397 527,698 —
Written options/swaptions at market value 2(d) — 173 377,900 2,355,731 —
Accrued expenses and other liabilities 2(a),4,5,6,7,8 241,153 228,775 8,353,736 364,642 81,064
Total liabilities 750,806 3,247,624 175,834,045 49,056,046 1,874,673
Total net assets 23,685,016 134,136,086 6,110,615,059 135,075,502 22,443,888
(2) New Fund launch, see Note 1 for further details.
Statement of Net Assetsas at 31 May 2020 continued
The notes on pages 691 to 711 form an integral part of these financial statements.
BlackRock Strategic Funds[22]

BlackRock GlobalEvent Driven Fund
BlackRock GlobalLong/Short Equity
Fund
BlackRock GlobalReal Asset
Securities Fund
BlackRock MacroOpportunities
Fund
BlackRockManaged Index
Portfolios −Conservative
Note USD USD USD USD EUR
Assets
Securities portfolio at cost 3,216,845,937 59,026,345 96,791,626 33,018,313 150,712,092
Unrealised appreciation/(depreciation) (1,595,310) — (5,262,530) 356,977 4,282,984
Securities portfolio at market value 2(a) 3,215,250,627 59,026,345 91,529,096 33,375,290 154,995,076
Cash at bank 2(a) 85,643,908 8,210,502 3,202,048 1,829,190 212,128
Due from broker 15 3,285,571 1,864,061 2,953,622 2,065,350 —
Interest and dividends receivable 2(a),2(d) 7,736,849 — 211,555 232,887 —
Receivable for investments sold 2(a),2(d) 70,154,886 12,797,094 203,800 4,694,995 —
Receivable for Fund shares subscribed 2(a) 32,524,314 442,251 204,420 47,720 203,050
Net unrealised appreciation on:
Futures contracts 2(d) 4,554,363 — — 34,869 —
Open forward foreign exchange transactions 2(d) 47,045,479 1,334,000 2,419 — 938,449
Contracts for difference 2(d) 3,373,525 — — — —
To Be Announced securities contracts 2(d) — — — — —
Swaps at market value 2(d) — — — 17,152 —
Purchased options/swaptions at market value 2(d) — 22,230 — 1,104,102 —
Other assets 2(a) 170,941 5,142 61,703 14,105 9,697
Total assets 3,469,740,463 83,701,625 98,368,663 43,415,660 156,358,400
Liabilities
Cash owed to bank 2(a) — — — — —
Due to broker 15 — — — — —
Interest and dividends payable 2(a),2(d) 1,427,365 250,718 — 12,118 —
Payable for investments purchased 2(a),2(d) 92,600,927 10,635,286 — 3,508,709 —
Payable for Fund shares redeemed 2(a) 2,579,493 65,104 4,795 1,882 344,595
Income distribution payable 2(a),11 — — 294,484 — 109,982
Net unrealised depreciation on:
Futures contracts 2(d) — 276,414 — — —
Open forward foreign exchange transactions 2(d) — — — 222,953 —
Contracts for difference 2(d) — 3,890 — — —
Swaps at market value 2(d) 6,921,556 — — — —
Written options/swaptions at market value 2(d) — 17,940 1,853,317 1,304,606 —
Accrued expenses and other liabilities 2(a),4,5,6,7,8 16,954,555 251,877 186,592 276,317 164,926
Total liabilities 120,483,896 11,501,229 2,339,188 5,326,585 619,503
Total net assets 3,349,256,567 72,200,396 96,029,475 38,089,075 155,738,897
Statement of Net Assetsas at 31 May 2020 continued
The notes on pages 691 to 711 form an integral part of these financial statements.
Annual report and audited financial statements [23]

BlackRockManaged Index
Portfolios −Defensive
BlackRockManaged Index
Portfolios −Growth
BlackRockManaged Index
Portfolios −Moderate
BlackRock StyleAdvantage Fund
BlackRock StyleAdvantage
Screened Fund
Note EUR EUR EUR USD USD
Assets
Securities portfolio at cost 200,076,286 272,635,667 679,949,331 1,637,024,758 26,361,691
Unrealised appreciation/(depreciation) 3,754,081 5,498,667 16,593,517 1,102,305 246,700
Securities portfolio at market value 2(a) 203,830,367 278,134,334 696,542,848 1,638,127,063 26,608,391
Cash at bank 2(a) 216,629 260,027 692,697 338,233,216 2,265,444
Due from broker 15 — — — 312,297,224 —
Interest and dividends receivable 2(a),2(d) — — — 8,233,121 60,165
Receivable for investments sold 2(a),2(d) — — — 291,182,427 1,044,828
Receivable for Fund shares subscribed 2(a) 786,242 1,790,060 2,260,611 87,842 —
Net unrealised appreciation on:
Futures contracts 2(d) — — — — —
Open forward foreign exchange transactions 2(d) — 386,788 — 27,927,959 —
Contracts for difference 2(d) — — — 4,568,937 3,313
To Be Announced securities contracts 2(d) — — — — —
Swaps at market value 2(d) — — — — —
Purchased options/swaptions at market value 2(d) — — — — —
Other assets 2(a) 33,965 27,805 46,824 8,381 11,486
Total assets 204,867,203 280,599,014 699,542,980 2,620,666,170 29,993,627
Liabilities
Cash owed to bank 2(a) — — — — —
Due to broker 15 — — — — 163,133
Interest and dividends payable 2(a),2(d) — — — 3,791,749 23,829
Payable for investments purchased 2(a),2(d) — 1,425,343 1,356,688 403,324,819 1,558,841
Payable for Fund shares redeemed 2(a) 579,414 352,617 972,436 31,066,510 —
Income distribution payable 2(a),11 320,212 535 457,547 — —
Net unrealised depreciation on:
Futures contracts 2(d) — — — 25,367,889 30,569
Open forward foreign exchange transactions 2(d) 739,165 — 397,331 — 7,614
Contracts for difference 2(d) — — — — —
Swaps at market value 2(d) — — — 4,793,293 62,127
Written options/swaptions at market value 2(d) — — — — —
Accrued expenses and other liabilities 2(a),4,5,6,7,8 256,563 322,531 633,490 2,155,906 149,290
Total liabilities 1,895,354 2,101,026 3,817,492 470,500,166 1,995,403
Total net assets 202,971,849 278,497,988 695,725,488 2,150,166,004 27,998,224
Statement of Net Assetsas at 31 May 2020 continued
The notes on pages 691 to 711 form an integral part of these financial statements.
BlackRock Strategic Funds[24]

BlackRockSystematic ESG
World EquityFund(1)
BlackRockSystematic Global
Equity FundBlackRock TotalAdvantage Fund
BlackRock UKEmerging
CompaniesAbsolute Return
Fund
BlackRock UKEquity Absolute
Return Fund
Note USD USD EUR GBP GBP
Assets
Securities portfolio at cost 201,741,928 153,348,666 28,344,255 655,785,673 157,236,945
Unrealised appreciation/(depreciation) 15,893,623 6,243,125 69,321 53,706 74,301
Securities portfolio at market value 2(a) 217,635,551 159,591,791 28,413,576 655,839,379 157,311,246
Cash at bank 2(a) 2,200,677 1,617,331 2,060,541 16,029,632 3,061,010
Due from broker 15 87,028 61,814 1,291,002 11,431,139 816,246
Interest and dividends receivable 2(a),2(d) 550,486 414,342 58,300 505,474 736,605
Receivable for investments sold 2(a),2(d) 37,440 — 2,692,044 1,244,075 4,962,743
Receivable for Fund shares subscribed 2(a) 278,983 237,067 — 3,162,386 —
Net unrealised appreciation on:
Futures contracts 2(d) 136,984 108,146 137,664 — —
Open forward foreign exchange transactions 2(d) — 8,887 — 8,654,421 488,617
Contracts for difference 2(d) — — — 18,675,283 1,143,918
To Be Announced securities contracts 2(d) — — — — —
Swaps at market value 2(d) — — 70,718 — —
Purchased options/swaptions at market value 2(d) — — — — —
Other assets 2(a) 3,725 24,901 32,370 7,446 21,639
Total assets 220,930,874 162,064,279 34,756,215 715,549,235 168,542,024
Liabilities
Cash owed to bank 2(a) — — — — —
Due to broker 15 — — — — —
Interest and dividends payable 2(a),2(d) — 8 24,523 104,300 40,161
Payable for investments purchased 2(a),2(d) — 11,337 3,438,468 59,617,138 13,107,980
Payable for Fund shares redeemed 2(a) 16,042 — — 1,451,264 —
Income distribution payable 2(a),11 — — — — —
Net unrealised depreciation on:
Futures contracts 2(d) — — — 13,598,388 1,389,998
Open forward foreign exchange transactions 2(d) 2,005 — 138,286 — —
Contracts for difference 2(d) — — 50,654 — —
Swaps at market value 2(d) — — — — —
Written options/swaptions at market value 2(d) — — — — —
Accrued expenses and other liabilities 2(a),4,5,6,7,8 215,541 468,090 136,465 7,460,023 353,159
Total liabilities 233,588 479,435 3,788,396 82,231,113 14,891,298
Total net assets 220,697,286 161,584,844 30,967,819 633,318,122 153,650,726
(1) Fund name changed, see Note 1 for further details.
Statement of Net Assetsas at 31 May 2020 continued
The notes on pages 691 to 711 form an integral part of these financial statements.
Annual report and audited financial statements [25]
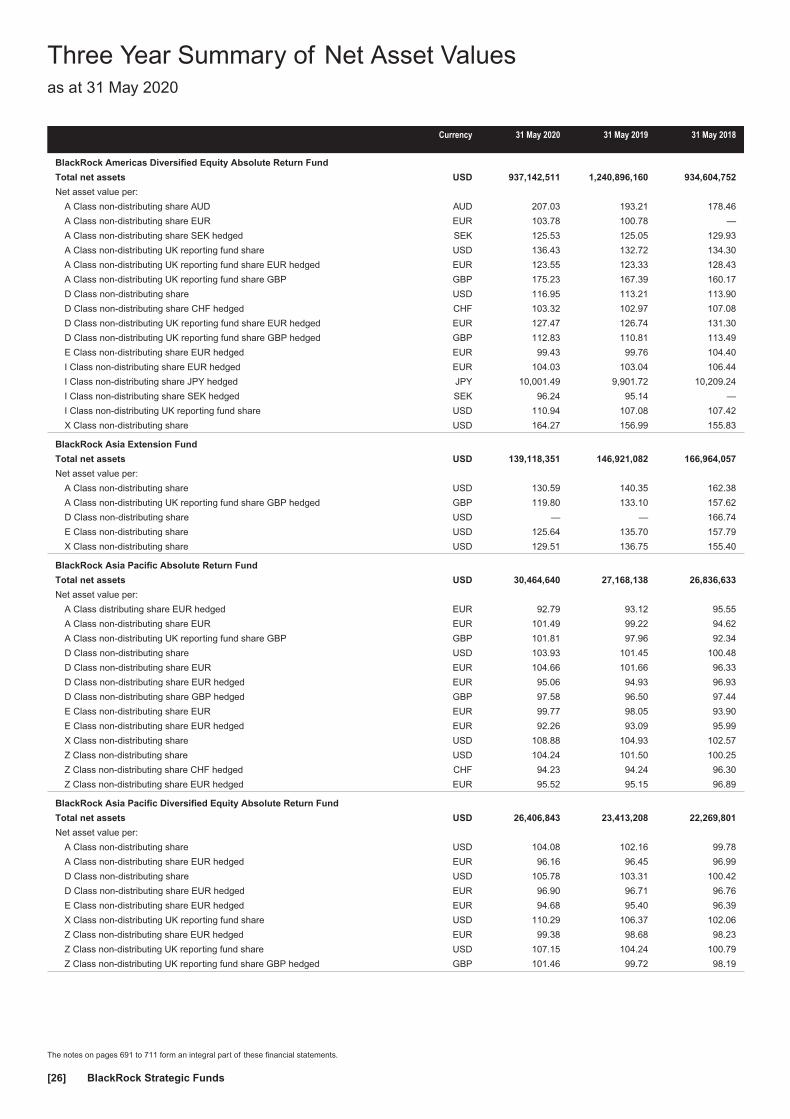
Currency 31 May 2020 31 May 2019 31 May 2018
BlackRock Americas Diversified Equity Absolute Return Fund
Total net assets USD 937,142,511 1,240,896,160 934,604,752
Net asset value per:
A Class non-distributing share AUD AUD 207.03 193.21 178.46
A Class non-distributing share EUR EUR 103.78 100.78 —
A Class non-distributing share SEK hedged SEK 125.53 125.05 129.93
A Class non-distributing UK reporting fund share USD 136.43 132.72 134.30
A Class non-distributing UK reporting fund share EUR hedged EUR 123.55 123.33 128.43
A Class non-distributing UK reporting fund share GBP GBP 175.23 167.39 160.17
D Class non-distributing share USD 116.95 113.21 113.90
D Class non-distributing share CHF hedged CHF 103.32 102.97 107.08
D Class non-distributing UK reporting fund share EUR hedged EUR 127.47 126.74 131.30
D Class non-distributing UK reporting fund share GBP hedged GBP 112.83 110.81 113.49
E Class non-distributing share EUR hedged EUR 99.43 99.76 104.40
I Class non-distributing share EUR hedged EUR 104.03 103.04 106.44
I Class non-distributing share JPY hedged JPY 10,001.49 9,901.72 10,209.24
I Class non-distributing share SEK hedged SEK 96.24 95.14 —
I Class non-distributing UK reporting fund share USD 110.94 107.08 107.42
X Class non-distributing share USD 164.27 156.99 155.83
BlackRock Asia Extension Fund
Total net assets USD 139,118,351 146,921,082 166,964,057
Net asset value per:
A Class non-distributing share USD 130.59 140.35 162.38
A Class non-distributing UK reporting fund share GBP hedged GBP 119.80 133.10 157.62
D Class non-distributing share USD — — 166.74
E Class non-distributing share USD 125.64 135.70 157.79
X Class non-distributing share USD 129.51 136.75 155.40
BlackRock Asia Pacific Absolute Return Fund
Total net assets USD 30,464,640 27,168,138 26,836,633
Net asset value per:
A Class distributing share EUR hedged EUR 92.79 93.12 95.55
A Class non-distributing share EUR EUR 101.49 99.22 94.62
A Class non-distributing UK reporting fund share GBP GBP 101.81 97.96 92.34
D Class non-distributing share USD 103.93 101.45 100.48
D Class non-distributing share EUR EUR 104.66 101.66 96.33
D Class non-distributing share EUR hedged EUR 95.06 94.93 96.93
D Class non-distributing share GBP hedged GBP 97.58 96.50 97.44
E Class non-distributing share EUR EUR 99.77 98.05 93.90
E Class non-distributing share EUR hedged EUR 92.26 93.09 95.99
X Class non-distributing share USD 108.88 104.93 102.57
Z Class non-distributing share USD 104.24 101.50 100.25
Z Class non-distributing share CHF hedged CHF 94.23 94.24 96.30
Z Class non-distributing share EUR hedged EUR 95.52 95.15 96.89
BlackRock Asia Pacific Diversified Equity Absolute Return Fund
Total net assets USD 26,406,843 23,413,208 22,269,801
Net asset value per:
A Class non-distributing share USD 104.08 102.16 99.78
A Class non-distributing share EUR hedged EUR 96.16 96.45 96.99
D Class non-distributing share USD 105.78 103.31 100.42
D Class non-distributing share EUR hedged EUR 96.90 96.71 96.76
E Class non-distributing share EUR hedged EUR 94.68 95.40 96.39
X Class non-distributing UK reporting fund share USD 110.29 106.37 102.06
Z Class non-distributing share EUR hedged EUR 99.38 98.68 98.23
Z Class non-distributing UK reporting fund share USD 107.15 104.24 100.79
Z Class non-distributing UK reporting fund share GBP hedged GBP 101.46 99.72 98.19
Three Year Summary of Net Asset Valuesas at 31 May 2020
The notes on pages 691 to 711 form an integral part of these financial statements.
BlackRock Strategic Funds[26]

Currency 31 May 2020 31 May 2019 31 May 2018
BlackRock Dynamic Diversified Growth Fund
Total net assets EUR 1,034,442,870 941,468,821 760,180,610
Net asset value per:
A Class non-distributing share EUR 118.63 115.96 116.23
A Class non-distributing share SEK hedged SEK 120.70 117.97 118.35
AI Class non-distributing share(1) EUR 99.81 — —
D Class non-distributing share EUR 125.59 121.93 121.40
E Class non-distributing share EUR 113.84 111.85 112.68
I Class non-distributing share EUR 128.63 124.61 123.73
I Class non-distributing share CAD hedged CAD 118.58 112.99 109.89
I Class non-distributing share JPY hedged JPY 10,348.04 10,000.51 —
I Class non-distributing share SEK hedged SEK 128.76 124.71 123.92
I Class non-distributing UK reporting share USD hedged(1) USD 100.92 — —
X Class non-distributing share EUR 135.55 130.59 128.96
BlackRock Emerging Markets Absolute Return Fund
Total net assets USD 14,513,860 34,564,157 20,718,883
Net asset value per:
A Class distributing UK reporting fund share GBP hedged GBP 85.25 110.63 100.76
A Class non-distributing share USD 91.79 117.37 103.91
A Class non-distributing share EUR hedged EUR 82.05 107.09 97.69
D Class distributing UK reporting fund share GBP hedged GBP 88.78 114.60 103.80
D Class non-distributing UK reporting fund share USD 98.42 125.31 111.06
D Class non-distributing UK reporting fund share EUR hedged EUR 89.07 115.69 105.22
E Class non-distributing share EUR hedged EUR 79.52 104.32 95.94
I Class distributing UK reporting fund share GBP GBP 111.75 138.99 116.28
I Class distributing UK reporting fund share GBP hedged(1) GBP 75.99 — —
I Class non-distributing share EUR EUR 124.77 157.75 132.58
I Class non-distributing share EUR hedged EUR 91.46 118.46 107.47
I Class non-distributing UK reporting fund share USD 86.39 109.61 —
X Class non-distributing share USD 97.57 122.61 106.19
BlackRock Emerging Markets Equity Strategies Fund
Total net assets USD 585,619,249 614,966,478 138,921,851
Net asset value per:
A Class non-distributing share USD 148.70 181.95 173.70
A Class non-distributing share CHF hedged CHF 72.45 91.08 —
D Class distributing share USD 78.17 95.52 —
D Class non-distributing share CHF hedged CHF 72.97 91.13 —
D Class non-distributing share EUR hedged EUR 129.96 161.91 159.02
D Class non-distributing UK reporting fund share USD 142.15 173.07 164.39
D Class non-distributing UK reporting fund share EUR EUR 136.16 165.26 150.47
D Class non-distributing UK reporting fund share GBP GBP 97.28 116.26 —
E Class non-distributing share EUR EUR 130.10 159.43 146.55
I Class non-distributing share USD 82.54 100.20 —
I Class non-distributing share EUR EUR 81.91 99.09 —
X Class non-distributing share USD 161.71 194.37 182.24
Z Class non-distributing share GBP GBP 102.56 121.78 108.87
Z Class non-distributing UK reporting fund share USD 156.72 189.66 179.06
Three Year Summary of Net Asset Valuesas at 31 May 2020 continued
The notes on pages 691 to 711 form an integral part of these financial statements.
Annual report and audited financial statements [27]
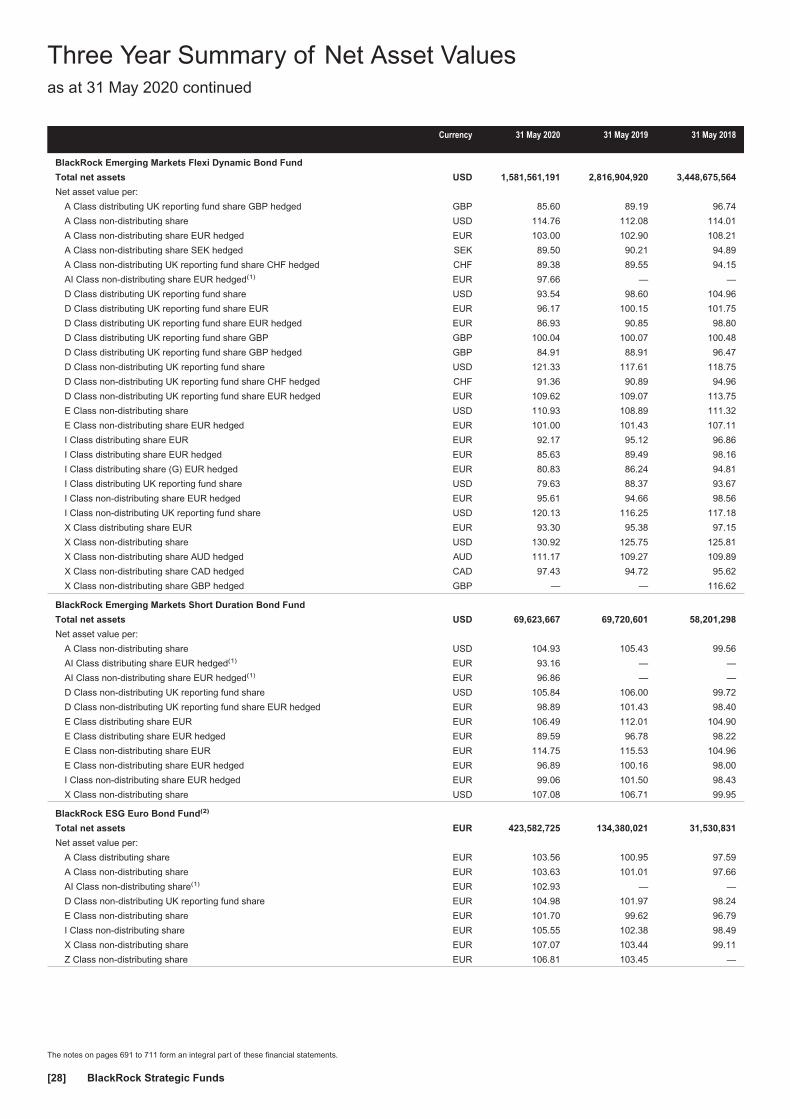
Currency 31 May 2020 31 May 2019 31 May 2018
BlackRock Emerging Markets Flexi Dynamic Bond Fund
Total net assets USD 1,581,561,191 2,816,904,920 3,448,675,564
Net asset value per:
A Class distributing UK reporting fund share GBP hedged GBP 85.60 89.19 96.74
A Class non-distributing share USD 114.76 112.08 114.01
A Class non-distributing share EUR hedged EUR 103.00 102.90 108.21
A Class non-distributing share SEK hedged SEK 89.50 90.21 94.89
A Class non-distributing UK reporting fund share CHF hedged CHF 89.38 89.55 94.15
AI Class non-distributing share EUR hedged(1) EUR 97.66 — —
D Class distributing UK reporting fund share USD 93.54 98.60 104.96
D Class distributing UK reporting fund share EUR EUR 96.17 100.15 101.75
D Class distributing UK reporting fund share EUR hedged EUR 86.93 90.85 98.80
D Class distributing UK reporting fund share GBP GBP 100.04 100.07 100.48
D Class distributing UK reporting fund share GBP hedged GBP 84.91 88.91 96.47
D Class non-distributing UK reporting fund share USD 121.33 117.61 118.75
D Class non-distributing UK reporting fund share CHF hedged CHF 91.36 90.89 94.96
D Class non-distributing UK reporting fund share EUR hedged EUR 109.62 109.07 113.75
E Class non-distributing share USD 110.93 108.89 111.32
E Class non-distributing share EUR hedged EUR 101.00 101.43 107.11
I Class distributing share EUR EUR 92.17 95.12 96.86
I Class distributing share EUR hedged EUR 85.63 89.49 98.16
I Class distributing share (G) EUR hedged EUR 80.83 86.24 94.81
I Class distributing UK reporting fund share USD 79.63 88.37 93.67
I Class non-distributing share EUR hedged EUR 95.61 94.66 98.56
I Class non-distributing UK reporting fund share USD 120.13 116.25 117.18
X Class distributing share EUR EUR 93.30 95.38 97.15
X Class non-distributing share USD 130.92 125.75 125.81
X Class non-distributing share AUD hedged AUD 111.17 109.27 109.89
X Class non-distributing share CAD hedged CAD 97.43 94.72 95.62
X Class non-distributing share GBP hedged GBP — — 116.62
BlackRock Emerging Markets Short Duration Bond Fund
Total net assets USD 69,623,667 69,720,601 58,201,298
Net asset value per:
A Class non-distributing share USD 104.93 105.43 99.56
AI Class distributing share EUR hedged(1) EUR 93.16 — —
AI Class non-distributing share EUR hedged(1) EUR 96.86 — —
D Class non-distributing UK reporting fund share USD 105.84 106.00 99.72
D Class non-distributing UK reporting fund share EUR hedged EUR 98.89 101.43 98.40
E Class distributing share EUR EUR 106.49 112.01 104.90
E Class distributing share EUR hedged EUR 89.59 96.78 98.22
E Class non-distributing share EUR EUR 114.75 115.53 104.96
E Class non-distributing share EUR hedged EUR 96.89 100.16 98.00
I Class non-distributing share EUR hedged EUR 99.06 101.50 98.43
X Class non-distributing share USD 107.08 106.71 99.95
BlackRock ESG Euro Bond Fund(2)
Total net assets EUR 423,582,725 134,380,021 31,530,831
Net asset value per:
A Class distributing share EUR 103.56 100.95 97.59
A Class non-distributing share EUR 103.63 101.01 97.66
AI Class non-distributing share(1) EUR 102.93 — —
D Class non-distributing UK reporting fund share EUR 104.98 101.97 98.24
E Class non-distributing share EUR 101.70 99.62 96.79
I Class non-distributing share EUR 105.55 102.38 98.49
X Class non-distributing share EUR 107.07 103.44 99.11
Z Class non-distributing share EUR 106.81 103.45 —
Three Year Summary of Net Asset Valuesas at 31 May 2020 continued
The notes on pages 691 to 711 form an integral part of these financial statements.
BlackRock Strategic Funds[28]

Currency 31 May 2020 31 May 2019 31 May 2018
BlackRock ESG Euro Corporate Bond Fund(3)
Total net assets EUR 182,474,888 — —
Net asset value per:
A Class non-distributing share EUR 98.43 — —
AI Class non-distributing share EUR 97.51 — —
D Class non-distributing share EUR 98.80 — —
E Class non-distributing share EUR 97.09 — —
I Class non-distributing share EUR 98.93 — —
X Class non-distributing share EUR 99.28 — —
BlackRock European Absolute Return Fund
Total net assets EUR 1,263,445,114 1,712,365,331 1,072,050,777
Net asset value per:
A Class distributing share EUR 141.59 135.67 128.62
A Class non-distributing share EUR 141.64 135.73 128.77
D Class distributing share EUR 145.45 138.79 131.36
D Class non-distributing share EUR 147.85 141.09 133.58
D Class non-distributing share CHF hedged CHF 143.54 137.57 130.60
D Class non-distributing UK reporting fund share GBP hedged GBP 156.14 147.50 138.17
E Class non-distributing share EUR 135.47 130.35 124.06
I Class non-distributing UK reporting fund share EUR 150.59 143.35 135.51
S Class non-distributing share(1) EUR 105.03 — —
BlackRock European Diversified Equity Absolute Return Fund
Total net assets EUR 3,682,260 43,682,999 254,103,460
Net asset value per:
A Class non-distributing share EUR 95.44 104.03 119.43
A Class non-distributing share CHF hedged CHF 91.96 100.57 116.01
A Class non-distributing share SEK hedged SEK 97.84 106.54 122.35
A Class non-distributing UK reporting fund share GBP hedged GBP 99.94 108.97 123.94
D Class non-distributing share CHF hedged CHF 72.78 78.74 90.42
D Class non-distributing share USD hedged USD 106.97 113.88 126.32
D Class non-distributing UK reporting fund share EUR 98.59 106.88 122.06
D Class non-distributing UK reporting fund share GBP hedged GBP 107.54 114.78 129.04
E Class non-distributing share EUR 91.63 100.33 115.79
I Class non-distributing share EUR 103.15 111.45 126.98
I Class non-distributing share SEK hedged SEK — — 903.17
X Class non-distributing share EUR 124.54 132.57 149.53
BlackRock European Opportunities Extension Fund
Total net assets EUR 827,548,340 976,232,401 1,124,378,931
Net asset value per:
A Class distributing UK reporting fund share GBP GBP 335.26 315.20 316.35
A Class non-distributing share EUR 375.58 358.68 363.99
D Class distributing (G) share EUR 137.68 131.74 135.63
D Class distributing UK reporting fund share GBP GBP 343.60 321.74 321.60
D Class non-distributing share EUR 387.37 368.46 372.41
E Class non-distributing share EUR 359.94 344.92 351.69
I Class non-distributing share EUR 205.25 194.77 196.43
X Class non-distributing share EUR 237.37 218.69 217.94
Three Year Summary of Net Asset Valuesas at 31 May 2020 continued
The notes on pages 691 to 711 form an integral part of these financial statements.
Annual report and audited financial statements [29]
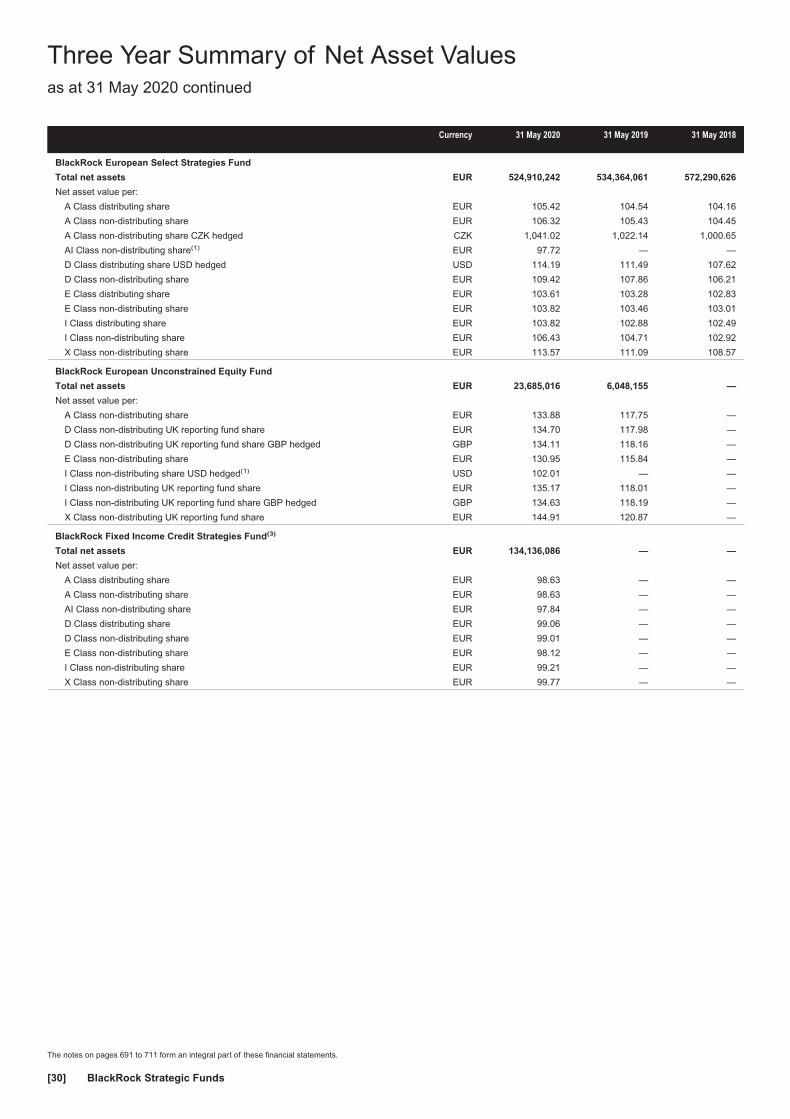
Currency 31 May 2020 31 May 2019 31 May 2018
BlackRock European Select Strategies Fund
Total net assets EUR 524,910,242 534,364,061 572,290,626
Net asset value per:
A Class distributing share EUR 105.42 104.54 104.16
A Class non-distributing share EUR 106.32 105.43 104.45
A Class non-distributing share CZK hedged CZK 1,041.02 1,022.14 1,000.65
AI Class non-distributing share(1) EUR 97.72 — —
D Class distributing share USD hedged USD 114.19 111.49 107.62
D Class non-distributing share EUR 109.42 107.86 106.21
E Class distributing share EUR 103.61 103.28 102.83
E Class non-distributing share EUR 103.82 103.46 103.01
I Class distributing share EUR 103.82 102.88 102.49
I Class non-distributing share EUR 106.43 104.71 102.92
X Class non-distributing share EUR 113.57 111.09 108.57
BlackRock European Unconstrained Equity Fund
Total net assets EUR 23,685,016 6,048,155 —
Net asset value per:
A Class non-distributing share EUR 133.88 117.75 —
D Class non-distributing UK reporting fund share EUR 134.70 117.98 —
D Class non-distributing UK reporting fund share GBP hedged GBP 134.11 118.16 —
E Class non-distributing share EUR 130.95 115.84 —
I Class non-distributing share USD hedged(1) USD 102.01 — —
I Class non-distributing UK reporting fund share EUR 135.17 118.01 —
I Class non-distributing UK reporting fund share GBP hedged GBP 134.63 118.19 —
X Class non-distributing UK reporting fund share EUR 144.91 120.87 —
BlackRock Fixed Income Credit Strategies Fund(3)
Total net assets EUR 134,136,086 — —
Net asset value per:
A Class distributing share EUR 98.63 — —
A Class non-distributing share EUR 98.63 — —
AI Class non-distributing share EUR 97.84 — —
D Class distributing share EUR 99.06 — —
D Class non-distributing share EUR 99.01 — —
E Class non-distributing share EUR 98.12 — —
I Class non-distributing share EUR 99.21 — —
X Class non-distributing share EUR 99.77 — —
Three Year Summary of Net Asset Valuesas at 31 May 2020 continued
The notes on pages 691 to 711 form an integral part of these financial statements.
BlackRock Strategic Funds[30]

Currency 31 May 2020 31 May 2019 31 May 2018
BlackRock Fixed Income Strategies Fund
Total net assets EUR 6,110,615,059 7,468,536,607 9,955,457,513
Net asset value per:
A Class distributing share EUR 103.80 103.67 104.56
A Class distributing share CHF hedged CHF 100.07 100.36 101.67
A Class distributing share USD hedged USD 113.77 111.17 108.85
A Class non-distributing share CHF hedged CHF 100.38 100.67 101.98
A Class non-distributing share JPY hedged JPY 10,012.68 10,011.78 —
A Class non-distributing share USD hedged USD 114.18 111.57 109.24
A Class non-distributing UK reporting fund share EUR 119.18 119.02 120.04
A Class non-distributing UK reporting fund share GBP hedged GBP 104.59 103.72 103.48
AI Class non-distributing share(1) EUR 99.23 — —
D Class distributing share EUR 102.86 102.59 103.54
D Class distributing UK reporting fund share GBP hedged GBP 107.27 106.33 106.18
D Class distributing UK reporting fund share USD hedged USD 112.21 109.44 107.22
D Class non-distributing share CHF hedged CHF 102.05 101.95 102.86
D Class non-distributing share USD hedged USD 115.83 112.73 109.96
D Class non-distributing UK reporting fund share EUR 124.27 123.61 124.17
D Class non-distributing UK reporting fund share GBP hedged GBP 109.40 107.93 107.23
E Class non-distributing share EUR 113.23 113.65 115.20
I Class distributing share EUR 121.52 121.21 122.42
I Class non-distributing share EUR 125.08 124.19 124.51
I Class non-distributing share SEK hedged(4) SEK — 1,046.06 1,048.88
I Class non-distributing share USD hedged USD 106.08 103.06 100.36
X Class distributing share EUR 100.85 100.57 101.50
X Class non-distributing share EUR 133.00 131.26 130.82
BlackRock Global Absolute Return Bond Fund
Total net assets EUR 135,075,502 403,117,483 451,159,431
Net asset value per:
A Class non-distributing share EUR 100.01 101.15 103.33
A Class non-distributing share SEK hedged SEK 976.61 986.30 1,007.84
A Class non-distributing share USD hedged USD 107.93 106.30 105.39
D Class non-distributing share EUR 103.91 104.56 106.28
D Class non-distributing share CHF hedged CHF 96.83 97.61 99.65
E Class non-distributing share EUR 96.21 97.78 100.39
I Class non-distributing share EUR 100.37 100.81 102.28
I Class non-distributing share GBP hedged GBP 100.12 99.98 —
I Class non-distributing share SEK hedged SEK 997.97 1,000.48 1,015.24
X Class non-distributing share EUR 110.47 110.41 111.46
BlackRock Global Equity Absolute Return Fund
Total net assets USD 22,443,888 20,798,321 —
Net asset value per:
A Class distributing share EUR hedged EUR 99.47 101.20 —
D Class non-distributing share USD 103.99 102.88 —
D Class non-distributing UK reporting fund share EUR EUR 107.26 105.74 —
E Class non-distributing share EUR EUR 105.79 105.38 —
I Class non-distributing share EUR EUR 103.47 101.62 —
X Class non-distributing share USD 106.39 103.92 —
Z Class non-distributing share USD 104.52 103.16 —
Z Class non-distributing share CHF hedged CHF 100.36 101.52 —
Z Class non-distributing share EUR hedged EUR 100.87 101.66 —
Z Class non-distributing UK reporting fund share GBP hedged GBP 102.19 102.12 —
Three Year Summary of Net Asset Valuesas at 31 May 2020 continued
The notes on pages 691 to 711 form an integral part of these financial statements.
Annual report and audited financial statements [31]
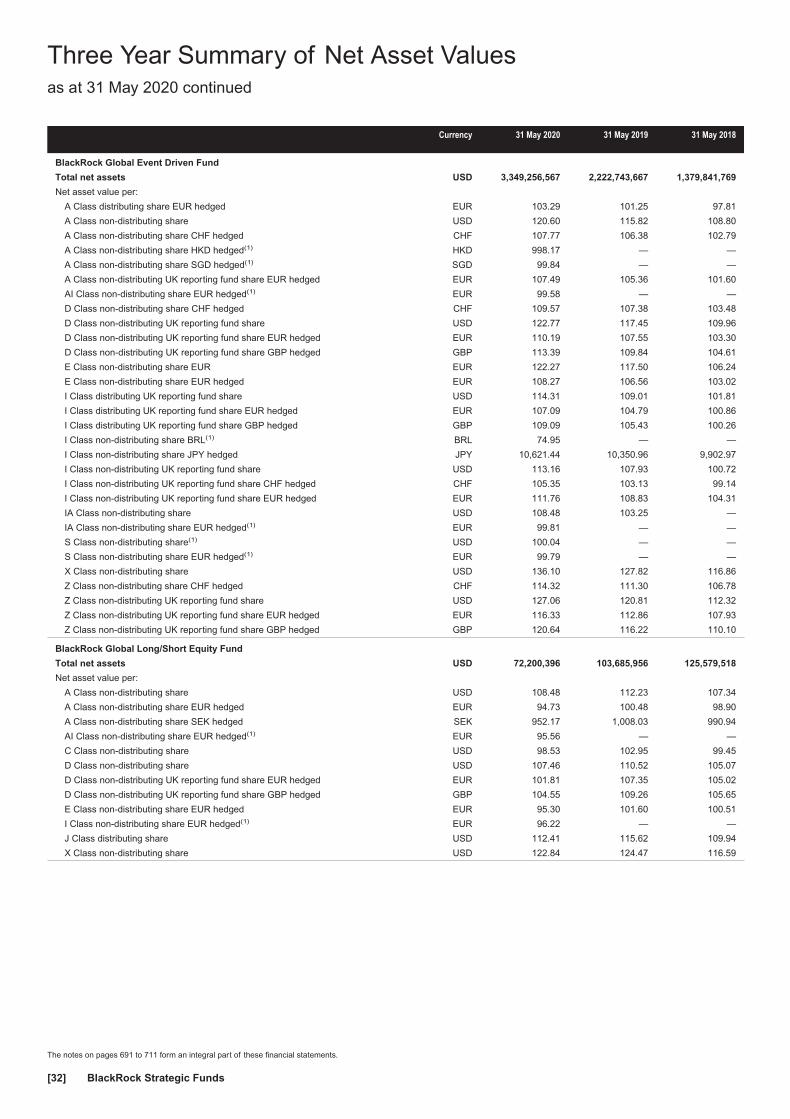
Currency 31 May 2020 31 May 2019 31 May 2018
BlackRock Global Event Driven Fund
Total net assets USD 3,349,256,567 2,222,743,667 1,379,841,769
Net asset value per:
A Class distributing share EUR hedged EUR 103.29 101.25 97.81
A Class non-distributing share USD 120.60 115.82 108.80
A Class non-distributing share CHF hedged CHF 107.77 106.38 102.79
A Class non-distributing share HKD hedged(1) HKD 998.17 — —
A Class non-distributing share SGD hedged(1) SGD 99.84 — —
A Class non-distributing UK reporting fund share EUR hedged EUR 107.49 105.36 101.60
AI Class non-distributing share EUR hedged(1) EUR 99.58 — —
D Class non-distributing share CHF hedged CHF 109.57 107.38 103.48
D Class non-distributing UK reporting fund share USD 122.77 117.45 109.96
D Class non-distributing UK reporting fund share EUR hedged EUR 110.19 107.55 103.30
D Class non-distributing UK reporting fund share GBP hedged GBP 113.39 109.84 104.61
E Class non-distributing share EUR EUR 122.27 117.50 106.24
E Class non-distributing share EUR hedged EUR 108.27 106.56 103.02
I Class distributing UK reporting fund share USD 114.31 109.01 101.81
I Class distributing UK reporting fund share EUR hedged EUR 107.09 104.79 100.86
I Class distributing UK reporting fund share GBP hedged GBP 109.09 105.43 100.26
I Class non-distributing share BRL(1) BRL 74.95 — —
I Class non-distributing share JPY hedged JPY 10,621.44 10,350.96 9,902.97
I Class non-distributing UK reporting fund share USD 113.16 107.93 100.72
I Class non-distributing UK reporting fund share CHF hedged CHF 105.35 103.13 99.14
I Class non-distributing UK reporting fund share EUR hedged EUR 111.76 108.83 104.31
IA Class non-distributing share USD 108.48 103.25 —
IA Class non-distributing share EUR hedged(1) EUR 99.81 — —
S Class non-distributing share(1) USD 100.04 — —
S Class non-distributing share EUR hedged(1) EUR 99.79 — —
X Class non-distributing share USD 136.10 127.82 116.86
Z Class non-distributing share CHF hedged CHF 114.32 111.30 106.78
Z Class non-distributing UK reporting fund share USD 127.06 120.81 112.32
Z Class non-distributing UK reporting fund share EUR hedged EUR 116.33 112.86 107.93
Z Class non-distributing UK reporting fund share GBP hedged GBP 120.64 116.22 110.10
BlackRock Global Long/Short Equity Fund
Total net assets USD 72,200,396 103,685,956 125,579,518
Net asset value per:
A Class non-distributing share USD 108.48 112.23 107.34
A Class non-distributing share EUR hedged EUR 94.73 100.48 98.90
A Class non-distributing share SEK hedged SEK 952.17 1,008.03 990.94
AI Class non-distributing share EUR hedged(1) EUR 95.56 — —
C Class non-distributing share USD 98.53 102.95 99.45
D Class non-distributing share USD 107.46 110.52 105.07
D Class non-distributing UK reporting fund share EUR hedged EUR 101.81 107.35 105.02
D Class non-distributing UK reporting fund share GBP hedged GBP 104.55 109.26 105.65
E Class non-distributing share EUR hedged EUR 95.30 101.60 100.51
I Class non-distributing share EUR hedged(1) EUR 96.22 — —
J Class distributing share USD 112.41 115.62 109.94
X Class non-distributing share USD 122.84 124.47 116.59
Three Year Summary of Net Asset Valuesas at 31 May 2020 continued
The notes on pages 691 to 711 form an integral part of these financial statements.
BlackRock Strategic Funds[32]
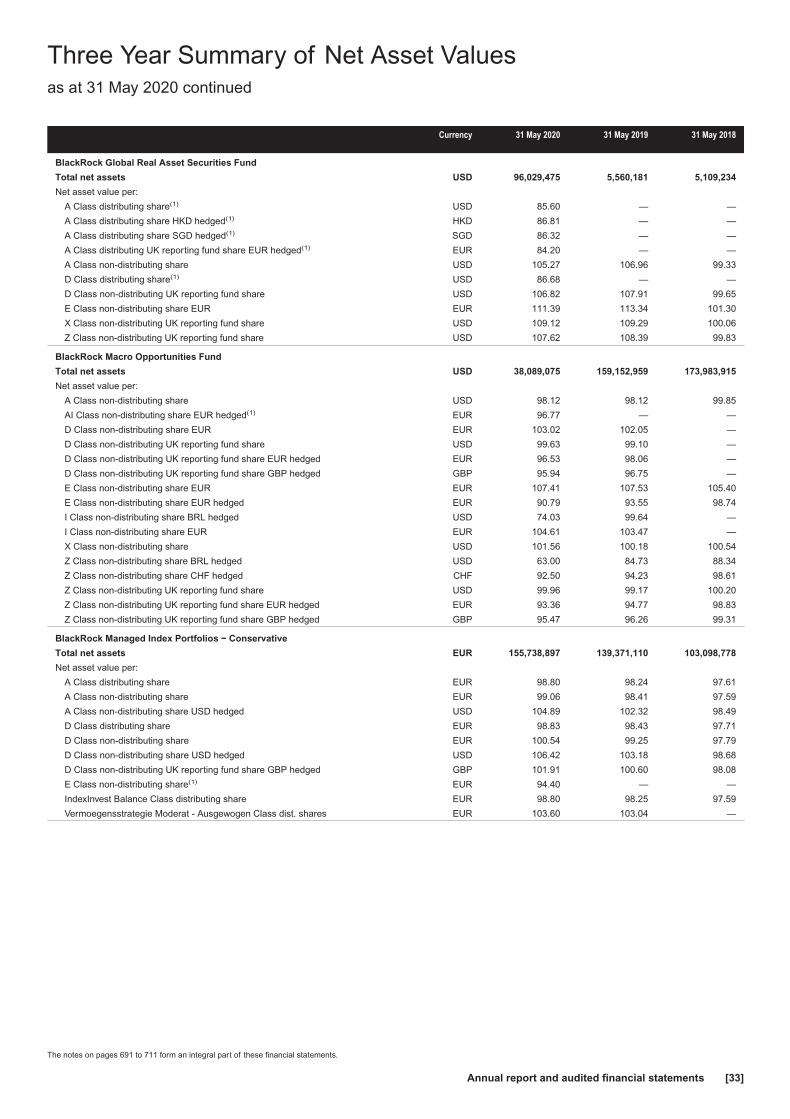
Currency 31 May 2020 31 May 2019 31 May 2018
BlackRock Global Real Asset Securities Fund
Total net assets USD 96,029,475 5,560,181 5,109,234
Net asset value per:
A Class distributing share(1) USD 85.60 — —
A Class distributing share HKD hedged(1) HKD 86.81 — —
A Class distributing share SGD hedged(1) SGD 86.32 — —
A Class distributing UK reporting fund share EUR hedged(1) EUR 84.20 — —
A Class non-distributing share USD 105.27 106.96 99.33
D Class distributing share(1) USD 86.68 — —
D Class non-distributing UK reporting fund share USD 106.82 107.91 99.65
E Class non-distributing share EUR EUR 111.39 113.34 101.30
X Class non-distributing UK reporting fund share USD 109.12 109.29 100.06
Z Class non-distributing UK reporting fund share USD 107.62 108.39 99.83
BlackRock Macro Opportunities Fund
Total net assets USD 38,089,075 159,152,959 173,983,915
Net asset value per:
A Class non-distributing share USD 98.12 98.12 99.85
AI Class non-distributing share EUR hedged(1) EUR 96.77 — —
D Class non-distributing share EUR EUR 103.02 102.05 —
D Class non-distributing UK reporting fund share USD 99.63 99.10 —
D Class non-distributing UK reporting fund share EUR hedged EUR 96.53 98.06 —
D Class non-distributing UK reporting fund share GBP hedged GBP 95.94 96.75 —
E Class non-distributing share EUR EUR 107.41 107.53 105.40
E Class non-distributing share EUR hedged EUR 90.79 93.55 98.74
I Class non-distributing share BRL hedged USD 74.03 99.64 —
I Class non-distributing share EUR EUR 104.61 103.47 —
X Class non-distributing share USD 101.56 100.18 100.54
Z Class non-distributing share BRL hedged USD 63.00 84.73 88.34
Z Class non-distributing share CHF hedged CHF 92.50 94.23 98.61
Z Class non-distributing UK reporting fund share USD 99.96 99.17 100.20
Z Class non-distributing UK reporting fund share EUR hedged EUR 93.36 94.77 98.83
Z Class non-distributing UK reporting fund share GBP hedged GBP 95.47 96.26 99.31
BlackRock Managed Index Portfolios − Conservative
Total net assets EUR 155,738,897 139,371,110 103,098,778
Net asset value per:
A Class distributing share EUR 98.80 98.24 97.61
A Class non-distributing share EUR 99.06 98.41 97.59
A Class non-distributing share USD hedged USD 104.89 102.32 98.49
D Class distributing share EUR 98.83 98.43 97.71
D Class non-distributing share EUR 100.54 99.25 97.79
D Class non-distributing share USD hedged USD 106.42 103.18 98.68
D Class non-distributing UK reporting fund share GBP hedged GBP 101.91 100.60 98.08
E Class non-distributing share(1) EUR 94.40 — —
IndexInvest Balance Class distributing share EUR 98.80 98.25 97.59
Vermoegensstrategie Moderat - Ausgewogen Class dist. shares EUR 103.60 103.04 —
Three Year Summary of Net Asset Valuesas at 31 May 2020 continued
The notes on pages 691 to 711 form an integral part of these financial statements.
Annual report and audited financial statements [33]

Currency 31 May 2020 31 May 2019 31 May 2018
BlackRock Managed Index Portfolios − Defensive
Total net assets EUR 202,971,849 139,233,055 117,356,110
Net asset value per:
A Class distributing share EUR 103.36 103.16 102.19
A Class non-distributing share GBP hedged GBP 103.54 102.71 100.15
A Class non-distributing share USD hedged USD 117.42 114.60 109.60
A Class non-distributing UK reporting fund share EUR 105.97 105.28 103.71
D Class distributing UK reporting fund share EUR 99.47 99.41 98.49
D Class distributing UK reporting fund share GBP hedged GBP 103.23 103.01 100.99
D Class distributing UK reporting fund share USD hedged USD 114.53 112.39 108.13
D Class non-distributing share CHF hedged CHF 102.45 101.58 99.88
D Class non-distributing share USD hedged USD 121.25 117.46 111.64
D Class non-distributing UK reporting fund share EUR 109.56 108.17 105.89
D Class non-distributing UK reporting fund share GBP hedged GBP 109.22 107.57 104.16
E Class non-distributing share(1) EUR 95.77 — —
I Class non-distributing share USD hedged USD 109.56 106.15 100.89
IndexInvest Substanz Class distributing share EUR 98.84 98.65 97.72
Vermoegensstrategie Defensiv Class distributing share EUR 103.30 103.12 —
X Class non-distributing share EUR 107.63 105.82 103.15
BlackRock Managed Index Portfolios − Growth
Total net assets EUR 278,497,988 211,502,093 153,450,033
Net asset value per:
A Class distributing share EUR 120.00 115.69 116.45
A Class non-distributing share GBP hedged GBP 103.16 100.01 99.76
A Class non-distributing share USD hedged USD 139.89 132.97 129.86
A Class non-distributing UK reporting fund share EUR 117.07 112.86 113.60
D Class distributing share EUR 114.36 109.60 109.64
D Class distributing share USD hedged USD 131.95 124.63 120.93
D Class distributing UK reporting fund share GBP hedged GBP 116.31 112.01 110.99
D Class non-distributing share EUR 128.88 123.48 123.52
D Class non-distributing share CHF hedged CHF 112.05 107.63 108.14
D Class non-distributing share USD hedged USD 142.88 135.05 131.05
D Class non-distributing UK reporting fund share GBP hedged GBP 116.68 112.36 111.34
E Class non-distributing share(1) EUR 94.40 — —
I Class non-distributing share USD hedged USD 112.30 106.05 102.85
IndexInvest Chance Class distributing share EUR 99.08 95.52 96.15
Vermoegensstrategie Wachstum Class distributing share EUR 107.33 102.83 —
X Class non-distributing share EUR 117.67 112.25 111.81
Three Year Summary of Net Asset Valuesas at 31 May 2020 continued
The notes on pages 691 to 711 form an integral part of these financial statements.
BlackRock Strategic Funds[34]

Currency 31 May 2020 31 May 2019 31 May 2018
BlackRock Managed Index Portfolios − Moderate
Total net assets EUR 695,725,488 550,633,567 418,711,443
Net asset value per:
A Class distributing share EUR 112.26 111.44 111.05
A Class non-distributing share GBP hedged GBP 101.71 101.27 99.92
A Class non-distributing share USD hedged USD 128.81 125.54 121.39
A Class non-distributing UK reporting fund share EUR 110.85 110.05 109.65
D Class distributing UK reporting fund share EUR 106.12 105.36 104.95
D Class distributing UK reporting fund share GBP hedged GBP 109.18 108.19 106.72
D Class distributing UK reporting fund share USD hedged USD 122.94 120.15 115.75
D Class non-distributing share CHF hedged CHF 106.55 105.42 104.84
D Class non-distributing share USD hedged USD 132.11 127.94 122.94
D Class non-distributing UK reporting fund share EUR 118.93 117.33 116.17
D Class non-distributing UK reporting fund share GBP hedged GBP 111.86 110.66 108.51
E Class non-distributing share(1) EUR 93.35 — —
I Class distributing share EUR 103.04 102.26 101.79
I Class non-distributing share USD hedged USD 109.47 106.27 102.07
IndexInvest Wachstum Class distributing share EUR 97.70 96.99 96.64
IndexInvest Wachstum Class distributing share CHF hedged CHF 106.20 105.74 —
Vermoegensstrategie Ausgewogen Class distributing share EUR 103.90 103.11 —
X Class non-distributing share EUR 111.99 109.97 108.38
X Class non-distributing share GBP hedged GBP 107.26 105.59 —
X Class non-distributing share USD hedged USD 110.47 106.85 —
BlackRock Style Advantage Fund
Total net assets USD 2,150,166,004 3,245,426,903 3,328,390,128
Net asset value per:
A Class distributing share USD 86.16 106.29 108.61
A Class distributing share EUR hedged EUR 78.78 99.40 104.64
A Class non-distributing share USD 84.79 104.62 106.88
A Class non-distributing share EUR hedged EUR 69.57 87.87 92.47
A Class non-distributing share SEK hedged SEK 71.25 89.53 94.21
D Class non-distributing share CHF hedged CHF 71.55 89.83 94.16
D Class non-distributing share EUR EUR 87.23 106.55 103.48
D Class non-distributing UK reporting fund share USD 87.73 107.43 108.95
D Class non-distributing UK reporting fund share EUR hedged EUR 79.82 100.01 104.46
D Class non-distributing UK reporting fund share GBP hedged GBP 76.20 94.37 97.66
E Class non-distributing share EUR EUR 83.25 102.91 101.13
E Class non-distributing share EUR hedged EUR 76.34 96.82 102.41
I Class non-distributing PF share CHF hedged CHF 73.69 92.11 96.06
I Class non-distributing PF share EUR hedged EUR 81.13 101.38 105.47
I Class non-distributing share BRL hedged USD 50.61 83.34 86.97
I Class non-distributing share CHF hedged CHF 71.90 90.29 94.43
I Class non-distributing UK reporting fund share USD 77.97 95.35 96.53
I Class non-distributing UK reporting fund share EUR hedged EUR 80.42 100.61 104.90
I Class non-distributing UK reporting fund share GBP hedged GBP 76.24 94.73 97.80
I Class non-distributing UK reporting fund share JPY hedged JPY 8,162.20 10,175.36 10,592.54
X Class non-distributing share USD 91.12 110.60 111.12
X Class non-distributing share AUD hedged(5) AUD 91.81 111.75 112.90
X Class non-distributing share EUR hedged EUR 75.30 93.42 96.68
X Class non-distributing share NZD hedged NZD 91.00 110.98 112.02
X Class non-distributing UK reporting fund share GBP hedged GBP 86.47 106.63 109.28
Z Class non-distributing share USD 88.28 107.92 109.28
Z Class non-distributing share EUR hedged EUR 80.39 100.55 104.87
Three Year Summary of Net Asset Valuesas at 31 May 2020 continued
The notes on pages 691 to 711 form an integral part of these financial statements.
Annual report and audited financial statements [35]

Currency 31 May 2020 31 May 2019 31 May 2018
BlackRock Style Advantage Screened Fund
Total net assets USD 27,998,224 25,907,945 —
Net asset value per:
A Class non-distributing share USD 91.86 102.74 —
D Class non-distributing share USD 92.73 103.10 —
D Class non-distributing share EUR hedged EUR 88.73 101.23 —
D Class non-distributing share GBP hedged GBP 90.11 101.87 —
E Class non-distributing share EUR EUR 94.49 105.82 —
I Class non-distributing share USD 93.05 103.25 —
I Class non-distributing share EUR EUR 96.34 106.46 —
I Class non-distributing share EUR hedged EUR 89.05 101.38 —
I Class non-distributing share GBP hedged GBP 90.40 102.01 —
X Class non-distributing share USD 93.88 103.59 —
X Class non-distributing share AUD hedged(1) AUD 88.17 — —
BlackRock Systematic ESG World Equity Fund(2)
Total net assets USD 220,697,286 186,266,828 191,191,688
Net asset value per:
A Class non-distributing share USD 137.96 128.84 130.51
D Class non-distributing share EUR EUR 141.09 130.80 126.43
E Class non-distributing share EUR EUR 143.36 134.07 130.76
I Class non-distributing share EUR hedged EUR 123.47 116.58 121.31
I Class non-distributing share JPY JPY 13,336.58 12,536.81 12,596.01
I Class non-distributing share JPY hedged JPY 13,794.26 13,076.90 13,560.05
X Class distributing share AUD AUD — — 265.59
X Class non-distributing UK reporting fund share GBP GBP 182.81 165.92 157.72
BlackRock Systematic Global Equity Fund
Total net assets USD 161,584,844 288,073,809 585,615,102
Net asset value per:
A Class non-distributing share USD 134.52 130.44 135.81
D Class non-distributing share EUR EUR 140.40 135.23 134.32
E Class non-distributing share EUR EUR 134.71 130.82 131.11
E Class non-distributing share EUR hedged EUR 119.92 118.56 128.22
I Class non-distributing share USD 115.34 111.14 115.00
I Class non-distributing share EUR EUR 138.98 133.45 132.27
X Class non-distributing share USD 103.94 99.76 102.79
X Class non-distributing share EUR EUR 111.64 106.77 105.39
X Class non-distributing share GBP GBP 178.42 167.99 163.96
X Class non-distributing share JPY JPY 9,634.73 9,353.57 —
BlackRock Total Advantage Fund
Total net assets EUR 30,967,819 34,507,624 33,813,270
Net asset value per:
A Class non-distributing share EUR 85.02 96.69 95.99
D Class non-distributing share EUR 86.20 97.48 96.23
D Class non-distributing share USD hedged USD 91.61 101.48 97.36
D Class non-distributing UK reporting fund share GBP hedged GBP 87.65 99.00 96.66
E Class non-distributing share EUR 88.55 100.70 99.53
I Class non-distributing share EUR 86.61 97.75 96.32
X Class non-distributing share EUR 87.75 98.55 96.60
Three Year Summary of Net Asset Valuesas at 31 May 2020 continued
The notes on pages 691 to 711 form an integral part of these financial statements.
BlackRock Strategic Funds[36]
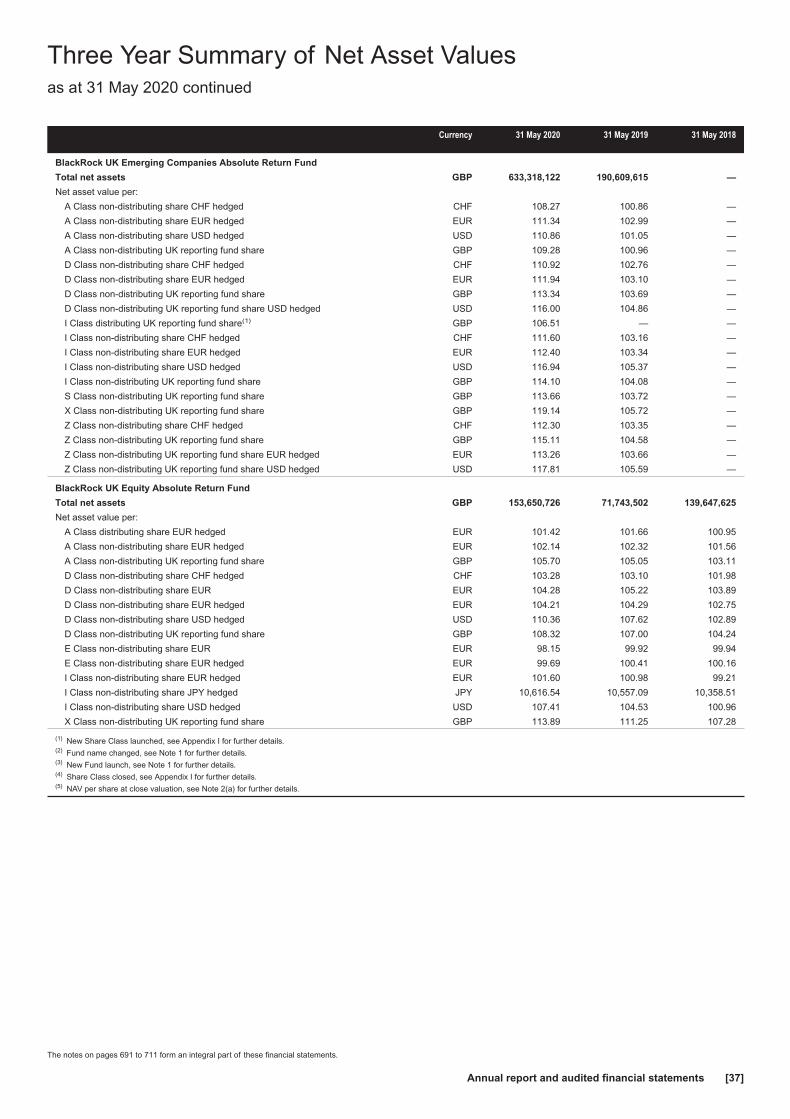
Currency 31 May 2020 31 May 2019 31 May 2018
BlackRock UK Emerging Companies Absolute Return Fund
Total net assets GBP 633,318,122 190,609,615 —
Net asset value per:
A Class non-distributing share CHF hedged CHF 108.27 100.86 —
A Class non-distributing share EUR hedged EUR 111.34 102.99 —
A Class non-distributing share USD hedged USD 110.86 101.05 —
A Class non-distributing UK reporting fund share GBP 109.28 100.96 —
D Class non-distributing share CHF hedged CHF 110.92 102.76 —
D Class non-distributing share EUR hedged EUR 111.94 103.10 —
D Class non-distributing UK reporting fund share GBP 113.34 103.69 —
D Class non-distributing UK reporting fund share USD hedged USD 116.00 104.86 —
I Class distributing UK reporting fund share(1) GBP 106.51 — —
I Class non-distributing share CHF hedged CHF 111.60 103.16 —
I Class non-distributing share EUR hedged EUR 112.40 103.34 —
I Class non-distributing share USD hedged USD 116.94 105.37 —
I Class non-distributing UK reporting fund share GBP 114.10 104.08 —
S Class non-distributing UK reporting fund share GBP 113.66 103.72 —
X Class non-distributing UK reporting fund share GBP 119.14 105.72 —
Z Class non-distributing share CHF hedged CHF 112.30 103.35 —
Z Class non-distributing UK reporting fund share GBP 115.11 104.58 —
Z Class non-distributing UK reporting fund share EUR hedged EUR 113.26 103.66 —
Z Class non-distributing UK reporting fund share USD hedged USD 117.81 105.59 —
BlackRock UK Equity Absolute Return Fund
Total net assets GBP 153,650,726 71,743,502 139,647,625
Net asset value per:
A Class distributing share EUR hedged EUR 101.42 101.66 100.95
A Class non-distributing share EUR hedged EUR 102.14 102.32 101.56
A Class non-distributing UK reporting fund share GBP 105.70 105.05 103.11
D Class non-distributing share CHF hedged CHF 103.28 103.10 101.98
D Class non-distributing share EUR EUR 104.28 105.22 103.89
D Class non-distributing share EUR hedged EUR 104.21 104.29 102.75
D Class non-distributing share USD hedged USD 110.36 107.62 102.89
D Class non-distributing UK reporting fund share GBP 108.32 107.00 104.24
E Class non-distributing share EUR EUR 98.15 99.92 99.94
E Class non-distributing share EUR hedged EUR 99.69 100.41 100.16
I Class non-distributing share EUR hedged EUR 101.60 100.98 99.21
I Class non-distributing share JPY hedged JPY 10,616.54 10,557.09 10,358.51
I Class non-distributing share USD hedged USD 107.41 104.53 100.96
X Class non-distributing UK reporting fund share GBP 113.89 111.25 107.28
(1) New Share Class launched, see Appendix I for further details.(2) Fund name changed, see Note 1 for further details.(3) New Fund launch, see Note 1 for further details.(4) Share Class closed, see Appendix I for further details.(5) NAV per share at close valuation, see Note 2(a) for further details.
Three Year Summary of Net Asset Valuesas at 31 May 2020 continued
The notes on pages 691 to 711 form an integral part of these financial statements.
Annual report and audited financial statements [37]
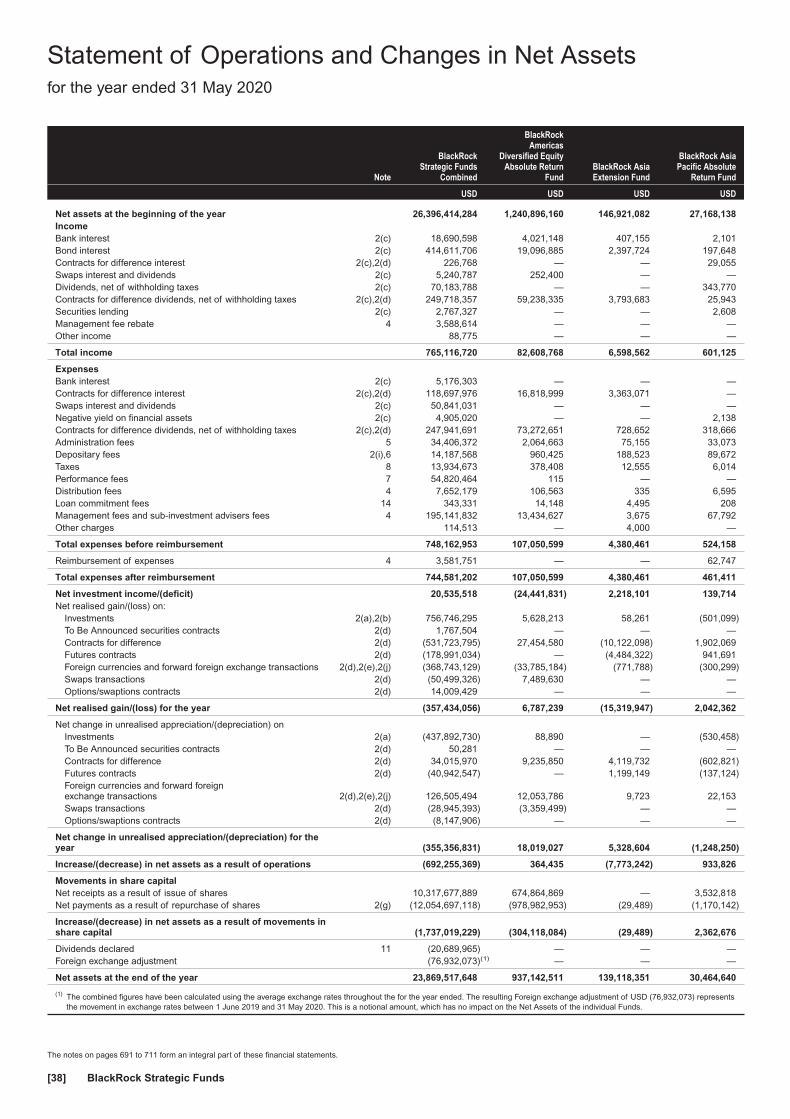
Note
BlackRockStrategic Funds
Combined
BlackRockAmericas
Diversified EquityAbsolute Return
FundBlackRock AsiaExtension Fund
BlackRock AsiaPacific Absolute
Return Fund
USD USD USD USD
Net assets at the beginning of the year 26,396,414,284 1,240,896,160 146,921,082 27,168,138IncomeBank interest 2(c) 18,690,598 4,021,148 407,155 2,101Bond interest 2(c) 414,611,706 19,096,885 2,397,724 197,648Contracts for difference interest 2(c),2(d) 226,768 — — 29,055Swaps interest and dividends 2(c) 5,240,787 252,400 — —Dividends, net of withholding taxes 2(c) 70,183,788 — — 343,770Contracts for difference dividends, net of withholding taxes 2(c),2(d) 249,718,357 59,238,335 3,793,683 25,943Securities lending 2(c) 2,767,327 — — 2,608Management fee rebate 4 3,588,614 — — —Other income 88,775 — — —
Total income 765,116,720 82,608,768 6,598,562 601,125
ExpensesBank interest 2(c) 5,176,303 — — —Contracts for difference interest 2(c),2(d) 118,697,976 16,818,999 3,363,071 —Swaps interest and dividends 2(c) 50,841,031 — — —Negative yield on financial assets 2(c) 4,905,020 — — 2,138Contracts for difference dividends, net of withholding taxes 2(c),2(d) 247,941,691 73,272,651 728,652 318,666Administration fees 5 34,406,372 2,064,663 75,155 33,073Depositary fees 2(i),6 14,187,568 960,425 188,523 89,672Taxes 8 13,934,673 378,408 12,555 6,014Performance fees 7 54,820,464 115 — —Distribution fees 4 7,652,179 106,563 335 6,595Loan commitment fees 14 343,331 14,148 4,495 208Management fees and sub-investment advisers fees 4 195,141,832 13,434,627 3,675 67,792Other charges 114,513 — 4,000 —
Total expenses before reimbursement 748,162,953 107,050,599 4,380,461 524,158
Reimbursement of expenses 4 3,581,751 — — 62,747
Total expenses after reimbursement 744,581,202 107,050,599 4,380,461 461,411
Net investment income/(deficit) 20,535,518 (24,441,831) 2,218,101 139,714Net realised gain/(loss) on:
Investments 2(a),2(b) 756,746,295 5,628,213 58,261 (501,099)To Be Announced securities contracts 2(d) 1,767,504 — — —Contracts for difference 2(d) (531,723,795) 27,454,580 (10,122,098) 1,902,069Futures contracts 2(d) (178,991,034) — (4,484,322) 941,691Foreign currencies and forward foreign exchange transactions 2(d),2(e),2(j) (368,743,129) (33,785,184) (771,788) (300,299)Swaps transactions 2(d) (50,499,326) 7,489,630 — —Options/swaptions contracts 2(d) 14,009,429 — — —
Net realised gain/(loss) for the year (357,434,056) 6,787,239 (15,319,947) 2,042,362
Net change in unrealised appreciation/(depreciation) onInvestments 2(a) (437,892,730) 88,890 — (530,458)To Be Announced securities contracts 2(d) 50,281 — — —Contracts for difference 2(d) 34,015,970 9,235,850 4,119,732 (602,821)Futures contracts 2(d) (40,942,547) — 1,199,149 (137,124)Foreign currencies and forward foreignexchange transactions 2(d),2(e),2(j) 126,505,494 12,053,786 9,723 22,153Swaps transactions 2(d) (28,945,393) (3,359,499) — —Options/swaptions contracts 2(d) (8,147,906) — — —
Net change in unrealised appreciation/(depreciation) for theyear (355,356,831) 18,019,027 5,328,604 (1,248,250)
Increase/(decrease) in net assets as a result of operations (692,255,369) 364,435 (7,773,242) 933,826
Movements in share capitalNet receipts as a result of issue of shares 10,317,677,889 674,864,869 — 3,532,818Net payments as a result of repurchase of shares 2(g) (12,054,697,118) (978,982,953) (29,489) (1,170,142)
Increase/(decrease) in net assets as a result of movements inshare capital (1,737,019,229) (304,118,084) (29,489) 2,362,676
Dividends declared 11 (20,689,965) — — —Foreign exchange adjustment (76,932,073)(1) — — —
Net assets at the end of the year 23,869,517,648 937,142,511 139,118,351 30,464,640
(1) The combined figures have been calculated using the average exchange rates throughout the for the year ended. The resulting Foreign exchange adjustment of USD (76,932,073) representsthe movement in exchange rates between 1 June 2019 and 31 May 2020. This is a notional amount, which has no impact on the Net Assets of the individual Funds.
Statement of Operations and Changes in Net Assetsfor the year ended 31 May 2020
The notes on pages 691 to 711 form an integral part of these financial statements.
BlackRock Strategic Funds[38]
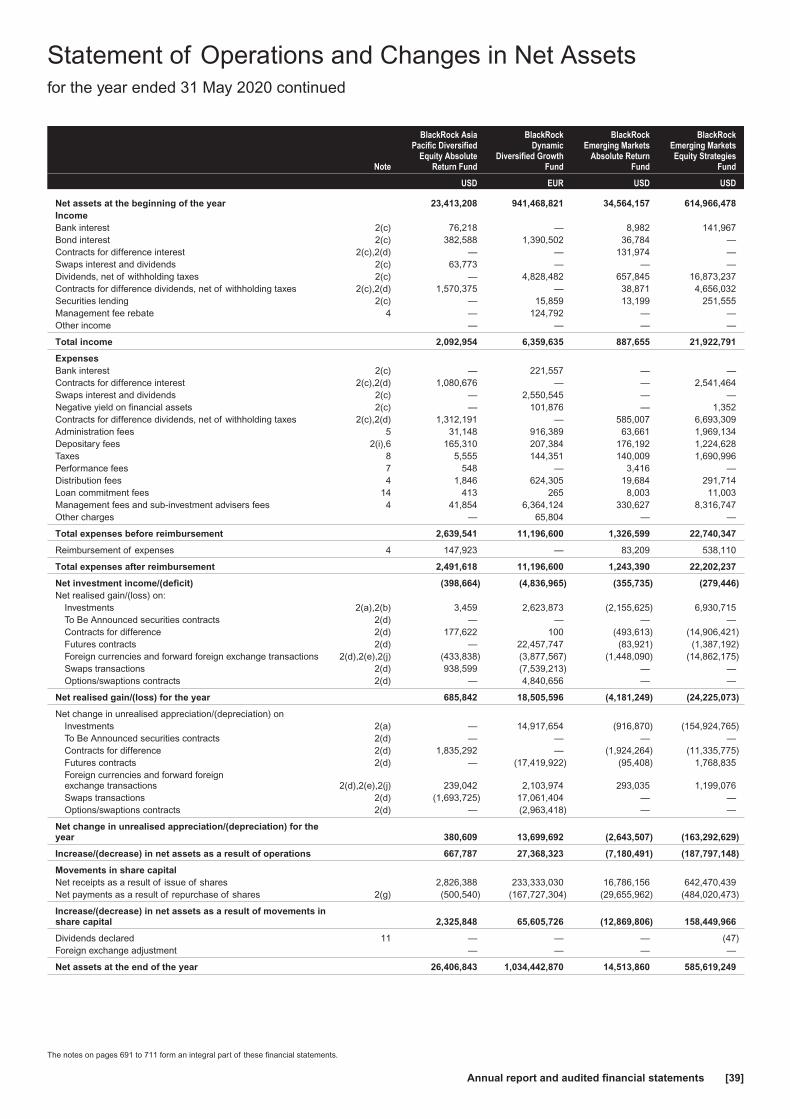
Note
BlackRock AsiaPacific Diversified
Equity AbsoluteReturn Fund
BlackRockDynamic
Diversified GrowthFund
BlackRockEmerging Markets
Absolute ReturnFund
BlackRockEmerging MarketsEquity Strategies
Fund
USD EUR USD USD
Net assets at the beginning of the year 23,413,208 941,468,821 34,564,157 614,966,478IncomeBank interest 2(c) 76,218 — 8,982 141,967Bond interest 2(c) 382,588 1,390,502 36,784 —Contracts for difference interest 2(c),2(d) — — 131,974 —Swaps interest and dividends 2(c) 63,773 — — —Dividends, net of withholding taxes 2(c) — 4,828,482 657,845 16,873,237Contracts for difference dividends, net of withholding taxes 2(c),2(d) 1,570,375 — 38,871 4,656,032Securities lending 2(c) — 15,859 13,199 251,555Management fee rebate 4 — 124,792 — —Other income — — — —
Total income 2,092,954 6,359,635 887,655 21,922,791
ExpensesBank interest 2(c) — 221,557 — —Contracts for difference interest 2(c),2(d) 1,080,676 — — 2,541,464Swaps interest and dividends 2(c) — 2,550,545 — —Negative yield on financial assets 2(c) — 101,876 — 1,352Contracts for difference dividends, net of withholding taxes 2(c),2(d) 1,312,191 — 585,007 6,693,309Administration fees 5 31,148 916,389 63,661 1,969,134Depositary fees 2(i),6 165,310 207,384 176,192 1,224,628Taxes 8 5,555 144,351 140,009 1,690,996Performance fees 7 548 — 3,416 —Distribution fees 4 1,846 624,305 19,684 291,714Loan commitment fees 14 413 265 8,003 11,003Management fees and sub-investment advisers fees 4 41,854 6,364,124 330,627 8,316,747Other charges — 65,804 — —
Total expenses before reimbursement 2,639,541 11,196,600 1,326,599 22,740,347
Reimbursement of expenses 4 147,923 — 83,209 538,110
Total expenses after reimbursement 2,491,618 11,196,600 1,243,390 22,202,237
Net investment income/(deficit) (398,664) (4,836,965) (355,735) (279,446)Net realised gain/(loss) on:
Investments 2(a),2(b) 3,459 2,623,873 (2,155,625) 6,930,715To Be Announced securities contracts 2(d) — — — —Contracts for difference 2(d) 177,622 100 (493,613) (14,906,421)Futures contracts 2(d) — 22,457,747 (83,921) (1,387,192)Foreign currencies and forward foreign exchange transactions 2(d),2(e),2(j) (433,838) (3,877,567) (1,448,090) (14,862,175)Swaps transactions 2(d) 938,599 (7,539,213) — —Options/swaptions contracts 2(d) — 4,840,656 — —
Net realised gain/(loss) for the year 685,842 18,505,596 (4,181,249) (24,225,073)
Net change in unrealised appreciation/(depreciation) onInvestments 2(a) — 14,917,654 (916,870) (154,924,765)To Be Announced securities contracts 2(d) — — — —Contracts for difference 2(d) 1,835,292 — (1,924,264) (11,335,775)Futures contracts 2(d) — (17,419,922) (95,408) 1,768,835Foreign currencies and forward foreignexchange transactions 2(d),2(e),2(j) 239,042 2,103,974 293,035 1,199,076Swaps transactions 2(d) (1,693,725) 17,061,404 — —Options/swaptions contracts 2(d) — (2,963,418) — —
Net change in unrealised appreciation/(depreciation) for theyear 380,609 13,699,692 (2,643,507) (163,292,629)
Increase/(decrease) in net assets as a result of operations 667,787 27,368,323 (7,180,491) (187,797,148)
Movements in share capitalNet receipts as a result of issue of shares 2,826,388 233,333,030 16,786,156 642,470,439Net payments as a result of repurchase of shares 2(g) (500,540) (167,727,304) (29,655,962) (484,020,473)
Increase/(decrease) in net assets as a result of movements inshare capital 2,325,848 65,605,726 (12,869,806) 158,449,966
Dividends declared 11 — — — (47)Foreign exchange adjustment — — — —
Net assets at the end of the year 26,406,843 1,034,442,870 14,513,860 585,619,249
Statement of Operations and Changes in Net Assetsfor the year ended 31 May 2020 continued
The notes on pages 691 to 711 form an integral part of these financial statements.
Annual report and audited financial statements [39]
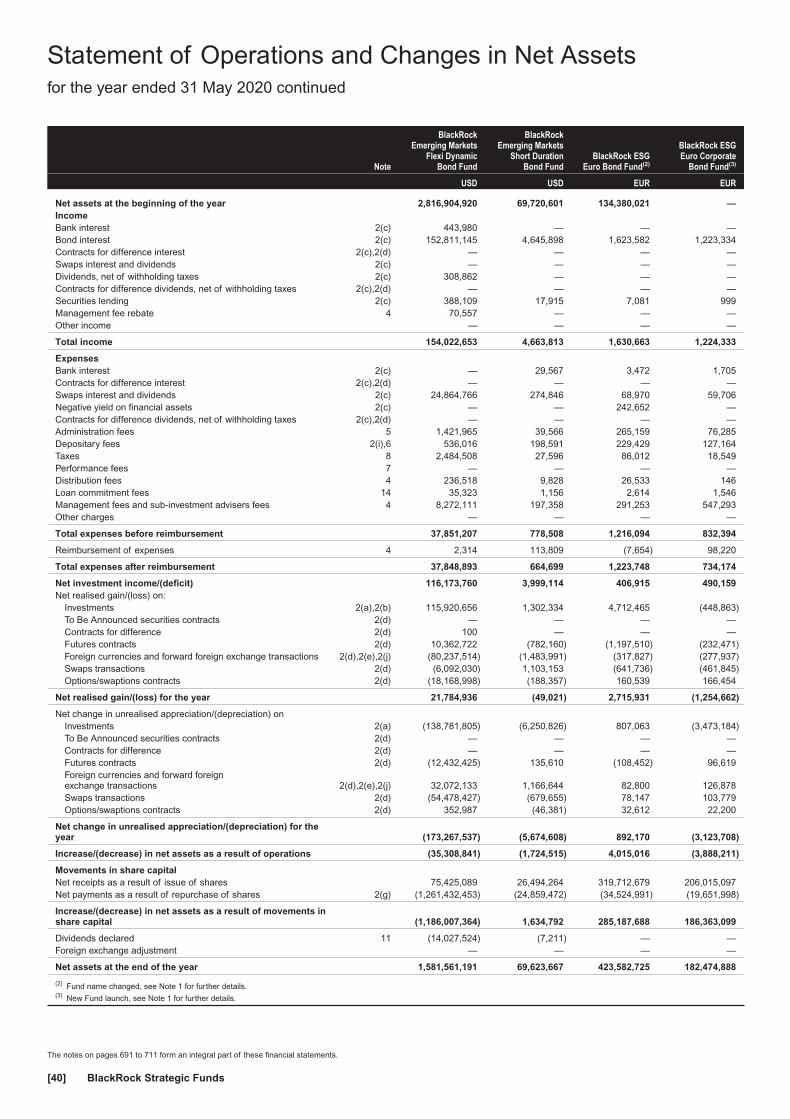
Note
BlackRockEmerging Markets
Flexi DynamicBond Fund
BlackRockEmerging Markets
Short DurationBond Fund
BlackRock ESGEuro Bond Fund(2)
BlackRock ESGEuro Corporate
Bond Fund(3)
USD USD EUR EUR
Net assets at the beginning of the year 2,816,904,920 69,720,601 134,380,021 —IncomeBank interest 2(c) 443,980 — — —Bond interest 2(c) 152,811,145 4,645,898 1,623,582 1,223,334Contracts for difference interest 2(c),2(d) — — — —Swaps interest and dividends 2(c) — — — —Dividends, net of withholding taxes 2(c) 308,862 — — —Contracts for difference dividends, net of withholding taxes 2(c),2(d) — — — —Securities lending 2(c) 388,109 17,915 7,081 999Management fee rebate 4 70,557 — — —Other income — — — —
Total income 154,022,653 4,663,813 1,630,663 1,224,333
ExpensesBank interest 2(c) — 29,567 3,472 1,705Contracts for difference interest 2(c),2(d) — — — —Swaps interest and dividends 2(c) 24,864,766 274,846 68,970 59,706Negative yield on financial assets 2(c) — — 242,652 —Contracts for difference dividends, net of withholding taxes 2(c),2(d) — — — —Administration fees 5 1,421,965 39,566 265,159 76,285Depositary fees 2(i),6 536,016 198,591 229,429 127,164Taxes 8 2,484,508 27,596 86,012 18,549Performance fees 7 — — — —Distribution fees 4 236,518 9,828 26,533 146Loan commitment fees 14 35,323 1,156 2,614 1,546Management fees and sub-investment advisers fees 4 8,272,111 197,358 291,253 547,293Other charges — — — —
Total expenses before reimbursement 37,851,207 778,508 1,216,094 832,394
Reimbursement of expenses 4 2,314 113,809 (7,654) 98,220
Total expenses after reimbursement 37,848,893 664,699 1,223,748 734,174
Net investment income/(deficit) 116,173,760 3,999,114 406,915 490,159Net realised gain/(loss) on:
Investments 2(a),2(b) 115,920,656 1,302,334 4,712,465 (448,863)To Be Announced securities contracts 2(d) — — — —Contracts for difference 2(d) 100 — — —Futures contracts 2(d) 10,362,722 (782,160) (1,197,510) (232,471)Foreign currencies and forward foreign exchange transactions 2(d),2(e),2(j) (80,237,514) (1,483,991) (317,827) (277,937)Swaps transactions 2(d) (6,092,030) 1,103,153 (641,736) (461,845)Options/swaptions contracts 2(d) (18,168,998) (188,357) 160,539 166,454
Net realised gain/(loss) for the year 21,784,936 (49,021) 2,715,931 (1,254,662)
Net change in unrealised appreciation/(depreciation) onInvestments 2(a) (138,781,805) (6,250,826) 807,063 (3,473,184)To Be Announced securities contracts 2(d) — — — —Contracts for difference 2(d) — — — —Futures contracts 2(d) (12,432,425) 135,610 (108,452) 96,619Foreign currencies and forward foreignexchange transactions 2(d),2(e),2(j) 32,072,133 1,166,644 82,800 126,878Swaps transactions 2(d) (54,478,427) (679,655) 78,147 103,779Options/swaptions contracts 2(d) 352,987 (46,381) 32,612 22,200
Net change in unrealised appreciation/(depreciation) for theyear (173,267,537) (5,674,608) 892,170 (3,123,708)
Increase/(decrease) in net assets as a result of operations (35,308,841) (1,724,515) 4,015,016 (3,888,211)
Movements in share capitalNet receipts as a result of issue of shares 75,425,089 26,494,264 319,712,679 206,015,097Net payments as a result of repurchase of shares 2(g) (1,261,432,453) (24,859,472) (34,524,991) (19,651,998)
Increase/(decrease) in net assets as a result of movements inshare capital (1,186,007,364) 1,634,792 285,187,688 186,363,099
Dividends declared 11 (14,027,524) (7,211) — —Foreign exchange adjustment — — — —
Net assets at the end of the year 1,581,561,191 69,623,667 423,582,725 182,474,888
(2) Fund name changed, see Note 1 for further details.(3) New Fund launch, see Note 1 for further details.
Statement of Operations and Changes in Net Assetsfor the year ended 31 May 2020 continued
The notes on pages 691 to 711 form an integral part of these financial statements.
BlackRock Strategic Funds[40]

Note
BlackRockEuropean Absolute
Return Fund
BlackRockEuropean
Diversified EquityAbsolute Return
Fund
BlackRockEuropean
OpportunitiesExtension Fund
BlackRockEuropean SelectStrategies Fund
EUR EUR EUR EUR
Net assets at the beginning of the year 1,712,365,331 43,682,999 976,232,401 534,364,061IncomeBank interest 2(c) — — — —Bond interest 2(c) 1,731 4,072 741 4,104,478Contracts for difference interest 2(c),2(d) — — — —Swaps interest and dividends 2(c) — — — —Dividends, net of withholding taxes 2(c) 5,225,208 — 6,986,066 4,399,920Contracts for difference dividends, net of withholding taxes 2(c),2(d) 3,886,010 891,603 5,229,525 —Securities lending 2(c) 116,505 — 183,169 46,044Management fee rebate 4 — — — 18,370Other income — 3,540 — —
Total income 9,229,454 899,215 12,399,501 8,568,812
ExpensesBank interest 2(c) 34,970 4,806 35,362 123,260Contracts for difference interest 2(c),2(d) 8,986,495 242,014 4,532,596 13,206Swaps interest and dividends 2(c) — — — 489,931Negative yield on financial assets 2(c) 3,231,728 68,562 495,408 —Contracts for difference dividends, net of withholding taxes 2(c),2(d) 15,284,046 762,819 6,949,253 116,454Administration fees 5 3,140,776 26,864 2,545,233 700,032Depositary fees 2(i),6 483,879 185,126 424,388 649,378Taxes 8 543,343 3,968 437,703 208,270Performance fees 7 12,179,070 — 17,576,603 —Distribution fees 4 140,941 17,037 432,630 1,232,229Loan commitment fees 14 16,854 — 18,039 8,920Management fees and sub-investment advisers fees 4 18,433,798 180,831 11,725,574 5,106,107Other charges 5,326 11,400 4,739 1,283
Total expenses before reimbursement 62,481,226 1,503,427 45,177,528 8,649,070
Reimbursement of expenses 4 — 177,677 — 290,507
Total expenses after reimbursement 62,481,226 1,325,750 45,177,528 8,358,563
Net investment income/(deficit) (53,251,772) (426,535) (32,778,027) 210,249Net realised gain/(loss) on:
Investments 2(a),2(b) 36,355,361 136,501 49,980,775 15,367,760To Be Announced securities contracts 2(d) — — — —Contracts for difference 2(d) 98,097,452 (516,902) (7,064,367) 967,878Futures contracts 2(d) — — — (6,165,961)Foreign currencies and forward foreign exchange transactions 2(d),2(e),2(j) (3,525,765) (65,417) (7,620,741) (2,985,329)Swaps transactions 2(d) — — — (2,504,180)Options/swaptions contracts 2(d) — (43,669) — (328,901)
Net realised gain/(loss) for the year 130,927,048 (489,487) 35,295,667 4,351,267
Net change in unrealised appreciation/(depreciation) onInvestments 2(a) 27,998,364 (549) 23,827,405 (256,859)To Be Announced securities contracts 2(d) — — — —Contracts for difference 2(d) (53,200,541) (583,849) 13,107,817 (316,872)Futures contracts 2(d) — — — 175,244Foreign currencies and forward foreignexchange transactions 2(d),2(e),2(j) 2,294,091 (26,859) 3,558,313 1,050,999Swaps transactions 2(d) — — — (137,753)Options/swaptions contracts 2(d) — 21,590 — (38,790)
Net change in unrealised appreciation/(depreciation) for theyear (22,908,086) (589,667) 40,493,535 475,969
Increase/(decrease) in net assets as a result of operations 54,767,190 (1,505,689) 43,011,175 5,037,485
Movements in share capitalNet receipts as a result of issue of shares 135,277,257 3,944,521 10,130,338 153,427,871Net payments as a result of repurchase of shares 2(g) (638,964,664) (42,439,571) (201,439,677) (167,670,525)
Increase/(decrease) in net assets as a result of movements inshare capital (503,687,407) (38,495,050) (191,309,339) (14,242,654)
Dividends declared 11 — — (385,897) (248,650)Foreign exchange adjustment — — — —
Net assets at the end of the year 1,263,445,114 3,682,260 827,548,340 524,910,242
Statement of Operations and Changes in Net Assetsfor the year ended 31 May 2020 continued
The notes on pages 691 to 711 form an integral part of these financial statements.
Annual report and audited financial statements [41]

Note
BlackRockEuropean
UnconstrainedEquity Fund
BlackRock FixedIncome Credit
Strategies Fund(3)
BlackRock FixedIncome Strategies
Fund
BlackRock GlobalAbsolute Return
Bond Fund
EUR EUR EUR EUR
Net assets at the beginning of the year 6,048,155 — 7,468,536,607 403,117,483IncomeBank interest 2(c) — — — —Bond interest 2(c) — 826,131 94,995,137 7,955,323Contracts for difference interest 2(c),2(d) — 23 — —Swaps interest and dividends 2(c) — — — —Dividends, net of withholding taxes 2(c) 162,304 83,665 3,723,317 275,259Contracts for difference dividends, net of withholding taxes 2(c),2(d) — — — 299Securities lending 2(c) — 736 266,810 19,702Management fee rebate 4 — 7,980 491,288 29,890Other income — — — 1,844
Total income 162,304 918,535 99,476,552 8,282,317
ExpensesBank interest 2(c) 108 42,799 3,912,541 178,945Contracts for difference interest 2(c),2(d) — — — 120Swaps interest and dividends 2(c) — 270,626 14,891,758 1,161,728Negative yield on financial assets 2(c) — — — —Contracts for difference dividends, net of withholding taxes 2(c),2(d) — 12,587 — —Administration fees 5 12,875 38,596 9,673,237 134,586Depositary fees 2(i),6 24,064 213,248 2,564,084 313,800Taxes 8 2,820 10,604 4,758,682 120,281Performance fees 7 210,610 — — —Distribution fees 4 2,140 14,885 3,192,435 2,876Loan commitment fees 14 127 545 77,548 —Management fees and sub-investment advisers fees 4 24,260 30,979 50,600,693 633,097Other charges 1,757 — — —
Total expenses before reimbursement 278,761 634,869 89,670,978 2,545,433
Reimbursement of expenses 4 — 232,743 — 148,319
Total expenses after reimbursement 278,761 402,126 89,670,978 2,397,114
Net investment income/(deficit) (116,457) 516,409 9,805,574 5,885,203Net realised gain/(loss) on:
Investments 2(a),2(b) 159,545 1,373,628 425,745,874 (1,021,973)To Be Announced securities contracts 2(d) — — — 1,598,574Contracts for difference 2(d) — 77,021 23,273 188,133Futures contracts 2(d) — (1,043,571) (175,463,659) (8,301,179)Foreign currencies and forward foreign exchange transactions 2(d),2(e),2(j) 39,708 (208,729) (3,932,466) 2,324,666Swaps transactions 2(d) — (455,348) (77,422,310) 1,195,056Options/swaptions contracts 2(d) — 65,873 24,889,415 769,543
Net realised gain/(loss) for the year 199,253 (191,126) 193,840,127 (3,247,180)
Net change in unrealised appreciation/(depreciation) onInvestments 2(a) 1,858,987 (1,543,102) (198,182,402) (4,272,930)To Be Announced securities contracts 2(d) — — — 45,475Contracts for difference 2(d) — (15,217) — 1,428Futures contracts 2(d) — 694,180 29,348,779 1,331,050Foreign currencies and forward foreignexchange transactions 2(d),2(e),2(j) (78,088) 353,415 (8,714,567) (3,347,549)Swaps transactions 2(d) — (379,745) 4,027,100 (884,716)Options/swaptions contracts 2(d) — 9,564 (4,786,262) 118,251
Net change in unrealised appreciation/(depreciation) for theyear 1,780,899 (880,905) (178,307,352) (7,008,991)
Increase/(decrease) in net assets as a result of operations 1,863,695 (555,622) 25,338,349 (4,370,968)
Movements in share capitalNet receipts as a result of issue of shares 20,006,489 137,551,434 2,567,199,006 27,003,813Net payments as a result of repurchase of shares 2(g) (4,233,323) (2,859,726) (3,947,901,189) (290,674,826)
Increase/(decrease) in net assets as a result of movements inshare capital 15,773,166 134,691,708 (1,380,702,183) (263,671,013)
Dividends declared 11 — — (2,557,714) —Foreign exchange adjustment — — — —
Net assets at the end of the year 23,685,016 134,136,086 6,110,615,059 135,075,502
(3) New Fund launch, see Note 1 for further details.
Statement of Operations and Changes in Net Assetsfor the year ended 31 May 2020 continued
The notes on pages 691 to 711 form an integral part of these financial statements.
BlackRock Strategic Funds[42]
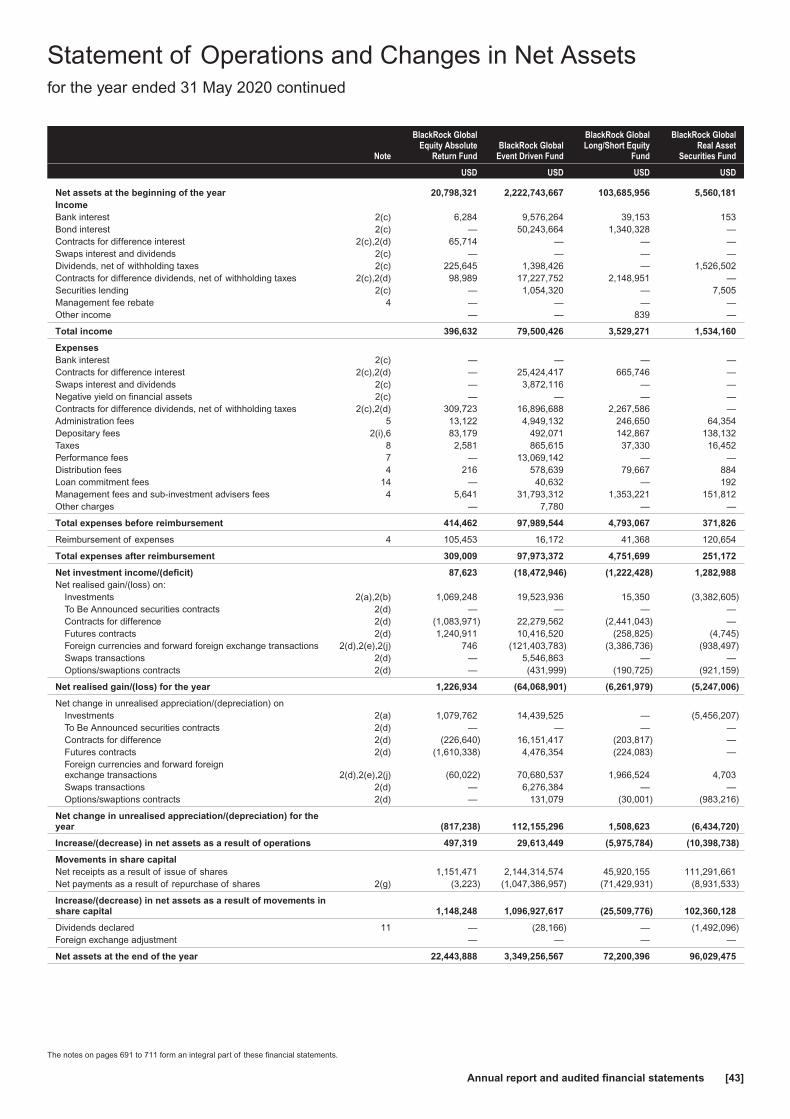
Note
BlackRock GlobalEquity Absolute
Return FundBlackRock Global
Event Driven Fund
BlackRock GlobalLong/Short Equity
Fund
BlackRock GlobalReal Asset
Securities Fund
USD USD USD USD
Net assets at the beginning of the year 20,798,321 2,222,743,667 103,685,956 5,560,181IncomeBank interest 2(c) 6,284 9,576,264 39,153 153Bond interest 2(c) — 50,243,664 1,340,328 —Contracts for difference interest 2(c),2(d) 65,714 — — —Swaps interest and dividends 2(c) — — — —Dividends, net of withholding taxes 2(c) 225,645 1,398,426 — 1,526,502Contracts for difference dividends, net of withholding taxes 2(c),2(d) 98,989 17,227,752 2,148,951 —Securities lending 2(c) — 1,054,320 — 7,505Management fee rebate 4 — — — —Other income — — 839 —
Total income 396,632 79,500,426 3,529,271 1,534,160
ExpensesBank interest 2(c) — — — —Contracts for difference interest 2(c),2(d) — 25,424,417 665,746 —Swaps interest and dividends 2(c) — 3,872,116 — —Negative yield on financial assets 2(c) — — — —Contracts for difference dividends, net of withholding taxes 2(c),2(d) 309,723 16,896,688 2,267,586 —Administration fees 5 13,122 4,949,132 246,650 64,354Depositary fees 2(i),6 83,179 492,071 142,867 138,132Taxes 8 2,581 865,615 37,330 16,452Performance fees 7 — 13,069,142 — —Distribution fees 4 216 578,639 79,667 884Loan commitment fees 14 — 40,632 — 192Management fees and sub-investment advisers fees 4 5,641 31,793,312 1,353,221 151,812Other charges — 7,780 — —
Total expenses before reimbursement 414,462 97,989,544 4,793,067 371,826
Reimbursement of expenses 4 105,453 16,172 41,368 120,654
Total expenses after reimbursement 309,009 97,973,372 4,751,699 251,172
Net investment income/(deficit) 87,623 (18,472,946) (1,222,428) 1,282,988Net realised gain/(loss) on:
Investments 2(a),2(b) 1,069,248 19,523,936 15,350 (3,382,605)To Be Announced securities contracts 2(d) — — — —Contracts for difference 2(d) (1,083,971) 22,279,562 (2,441,043) —Futures contracts 2(d) 1,240,911 10,416,520 (258,825) (4,745)Foreign currencies and forward foreign exchange transactions 2(d),2(e),2(j) 746 (121,403,783) (3,386,736) (938,497)Swaps transactions 2(d) — 5,546,863 — —Options/swaptions contracts 2(d) — (431,999) (190,725) (921,159)
Net realised gain/(loss) for the year 1,226,934 (64,068,901) (6,261,979) (5,247,006)
Net change in unrealised appreciation/(depreciation) onInvestments 2(a) 1,079,762 14,439,525 — (5,456,207)To Be Announced securities contracts 2(d) — — — —Contracts for difference 2(d) (226,640) 16,151,417 (203,817) —Futures contracts 2(d) (1,610,338) 4,476,354 (224,083) —Foreign currencies and forward foreignexchange transactions 2(d),2(e),2(j) (60,022) 70,680,537 1,966,524 4,703Swaps transactions 2(d) — 6,276,384 — —Options/swaptions contracts 2(d) — 131,079 (30,001) (983,216)
Net change in unrealised appreciation/(depreciation) for theyear (817,238) 112,155,296 1,508,623 (6,434,720)
Increase/(decrease) in net assets as a result of operations 497,319 29,613,449 (5,975,784) (10,398,738)
Movements in share capitalNet receipts as a result of issue of shares 1,151,471 2,144,314,574 45,920,155 111,291,661Net payments as a result of repurchase of shares 2(g) (3,223) (1,047,386,957) (71,429,931) (8,931,533)
Increase/(decrease) in net assets as a result of movements inshare capital 1,148,248 1,096,927,617 (25,509,776) 102,360,128
Dividends declared 11 — (28,166) — (1,492,096)Foreign exchange adjustment — — — —
Net assets at the end of the year 22,443,888 3,349,256,567 72,200,396 96,029,475
Statement of Operations and Changes in Net Assetsfor the year ended 31 May 2020 continued
The notes on pages 691 to 711 form an integral part of these financial statements.
Annual report and audited financial statements [43]

Note
BlackRock MacroOpportunities
Fund
BlackRockManaged Index
Portfolios −Conservative
BlackRockManaged Index
Portfolios −Defensive
BlackRockManaged Index
Portfolios −Growth
USD EUR EUR EUR
Net assets at the beginning of the year 159,152,959 139,371,110 139,233,055 211,502,093IncomeBank interest 2(c) 39,372 — — —Bond interest 2(c) 1,642,303 — — —Contracts for difference interest 2(c),2(d) — — — —Swaps interest and dividends 2(c) — — — —Dividends, net of withholding taxes 2(c) 643,715 1,405,989 2,323,813 752,411Contracts for difference dividends, net of withholding taxes 2(c),2(d) — — — —Securities lending 2(c) 14,421 37,426 44,113 44,017Management fee rebate 4 40,873 285,230 358,096 490,438Other income — — — —
Total income 2,380,684 1,728,645 2,726,022 1,286,866
ExpensesBank interest 2(c) — 6,257 4,496 10,752Contracts for difference interest 2(c),2(d) — — — —Swaps interest and dividends 2(c) 276,334 — — —Negative yield on financial assets 2(c) 11,333 — — —Contracts for difference dividends, net of withholding taxes 2(c),2(d) — — — —Administration fees 5 218,921 84,634 104,475 150,960Depositary fees 2(i),6 248,660 67,651 147,314 157,146Taxes 8 46,525 64,754 82,934 122,577Performance fees 7 405 — — —Distribution fees 4 1,515 12 12 19Loan commitment fees 14 2,516 2,346 2,608 3,844Management fees and sub-investment advisers fees 4 621,005 1,218,246 1,259,878 2,052,288Other charges — — — —
Total expenses before reimbursement 1,427,214 1,443,900 1,601,717 2,497,586
Reimbursement of expenses 4 94,969 46,880 113,655 108,861
Total expenses after reimbursement 1,332,245 1,397,020 1,488,062 2,388,725
Net investment income/(deficit) 1,048,439 331,625 1,237,960 (1,101,859)Net realised gain/(loss) on:
Investments 2(a),2(b) 4,288,276 3,818,112 584,547 11,422,073To Be Announced securities contracts 2(d) — — — —Contracts for difference 2(d) — — — —Futures contracts 2(d) (762,707) — — —Foreign currencies and forward foreign exchange transactions 2(d),2(e),2(j) (15,525,788) (2,640,751) 1,345,976 (2,195,211)Swaps transactions 2(d) (8,486,629) — — —Options/swaptions contracts 2(d) 166,034 — — —
Net realised gain/(loss) for the year (20,320,814) 1,177,361 1,930,523 9,226,862
Net change in unrealised appreciation/(depreciation) onInvestments 2(a) 667,865 (2,959,648) (2,580,680) (2,193,431)To Be Announced securities contracts 2(d) — — — —Contracts for difference 2(d) — — — —Futures contracts 2(d) 533,287 — — —Foreign currencies and forward foreignexchange transactions 2(d),2(e),2(j) 1,834,152 1,276,931 (543,868) 977,912Swaps transactions 2(d) 1,470,394 — — —Options/swaptions contracts 2(d) 813,055 — — —
Net change in unrealised appreciation/(depreciation) for theyear 5,318,753 (1,682,717) (3,124,548) (1,215,519)
Increase/(decrease) in net assets as a result of operations (13,953,622) (173,731) 43,935 6,909,484
Movements in share capitalNet receipts as a result of issue of shares 28,019,769 54,550,200 149,388,206 212,655,209Net payments as a result of repurchase of shares 2(g) (135,130,031) (37,881,805) (85,168,780) (152,562,827)
Increase/(decrease) in net assets as a result of movements inshare capital (107,110,262) 16,668,395 64,219,426 60,092,382
Dividends declared 11 — (126,877) (524,567) (5,971)Foreign exchange adjustment — — — —
Net assets at the end of the year 38,089,075 155,738,897 202,971,849 278,497,988
Statement of Operations and Changes in Net Assetsfor the year ended 31 May 2020 continued
The notes on pages 691 to 711 form an integral part of these financial statements.
BlackRock Strategic Funds[44]
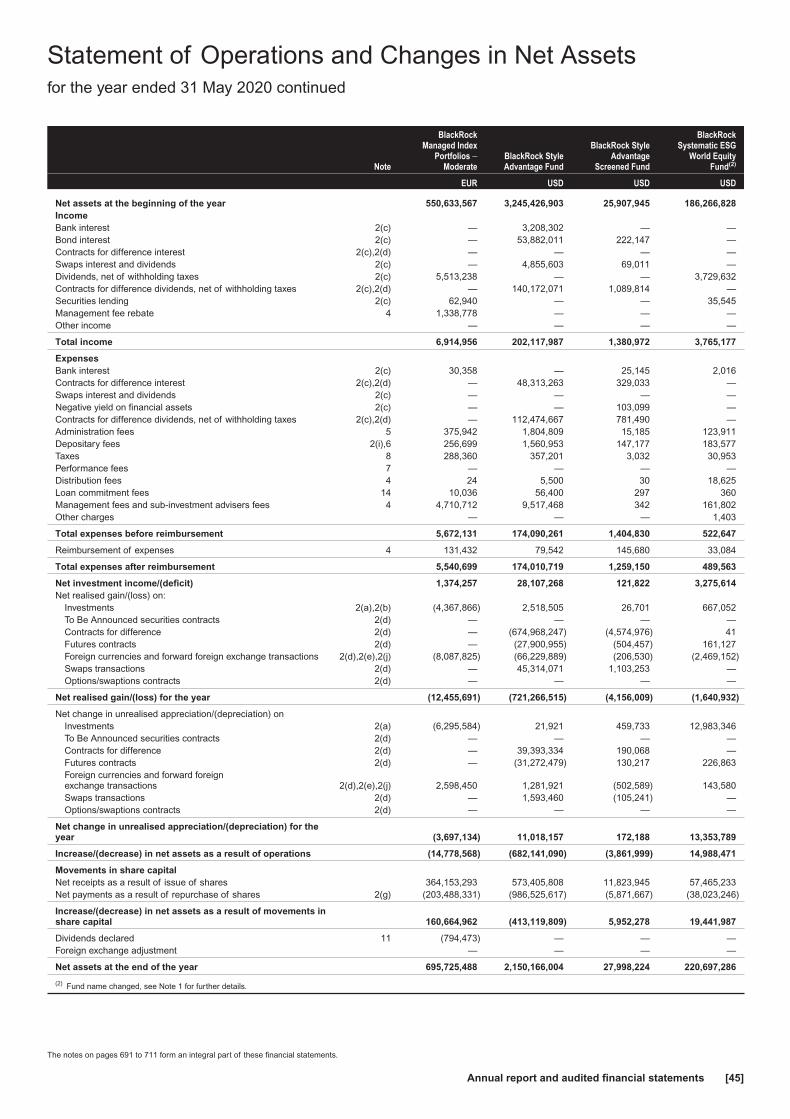
Note
BlackRockManaged Index
Portfolios −Moderate
BlackRock StyleAdvantage Fund
BlackRock StyleAdvantage
Screened Fund
BlackRockSystematic ESG
World EquityFund(2)
EUR USD USD USD
Net assets at the beginning of the year 550,633,567 3,245,426,903 25,907,945 186,266,828IncomeBank interest 2(c) — 3,208,302 — —Bond interest 2(c) — 53,882,011 222,147 —Contracts for difference interest 2(c),2(d) — — — —Swaps interest and dividends 2(c) — 4,855,603 69,011 —Dividends, net of withholding taxes 2(c) 5,513,238 — — 3,729,632Contracts for difference dividends, net of withholding taxes 2(c),2(d) — 140,172,071 1,089,814 —Securities lending 2(c) 62,940 — — 35,545Management fee rebate 4 1,338,778 — — —Other income — — — —
Total income 6,914,956 202,117,987 1,380,972 3,765,177
ExpensesBank interest 2(c) 30,358 — 25,145 2,016Contracts for difference interest 2(c),2(d) — 48,313,263 329,033 —Swaps interest and dividends 2(c) — — — —Negative yield on financial assets 2(c) — — 103,099 —Contracts for difference dividends, net of withholding taxes 2(c),2(d) — 112,474,667 781,490 —Administration fees 5 375,942 1,804,809 15,185 123,911Depositary fees 2(i),6 256,699 1,560,953 147,177 183,577Taxes 8 288,360 357,201 3,032 30,953Performance fees 7 — — — —Distribution fees 4 24 5,500 30 18,625Loan commitment fees 14 10,036 56,400 297 360Management fees and sub-investment advisers fees 4 4,710,712 9,517,468 342 161,802Other charges — — — 1,403
Total expenses before reimbursement 5,672,131 174,090,261 1,404,830 522,647
Reimbursement of expenses 4 131,432 79,542 145,680 33,084
Total expenses after reimbursement 5,540,699 174,010,719 1,259,150 489,563
Net investment income/(deficit) 1,374,257 28,107,268 121,822 3,275,614Net realised gain/(loss) on:
Investments 2(a),2(b) (4,367,866) 2,518,505 26,701 667,052To Be Announced securities contracts 2(d) — — — —Contracts for difference 2(d) — (674,968,247) (4,574,976) 41Futures contracts 2(d) — (27,900,955) (504,457) 161,127Foreign currencies and forward foreign exchange transactions 2(d),2(e),2(j) (8,087,825) (66,229,889) (206,530) (2,469,152)Swaps transactions 2(d) — 45,314,071 1,103,253 —Options/swaptions contracts 2(d) — — — —
Net realised gain/(loss) for the year (12,455,691) (721,266,515) (4,156,009) (1,640,932)
Net change in unrealised appreciation/(depreciation) onInvestments 2(a) (6,295,584) 21,921 459,733 12,983,346To Be Announced securities contracts 2(d) — — — —Contracts for difference 2(d) — 39,393,334 190,068 —Futures contracts 2(d) — (31,272,479) 130,217 226,863Foreign currencies and forward foreignexchange transactions 2(d),2(e),2(j) 2,598,450 1,281,921 (502,589) 143,580Swaps transactions 2(d) — 1,593,460 (105,241) —Options/swaptions contracts 2(d) — — — —
Net change in unrealised appreciation/(depreciation) for theyear (3,697,134) 11,018,157 172,188 13,353,789
Increase/(decrease) in net assets as a result of operations (14,778,568) (682,141,090) (3,861,999) 14,988,471
Movements in share capitalNet receipts as a result of issue of shares 364,153,293 573,405,808 11,823,945 57,465,233Net payments as a result of repurchase of shares 2(g) (203,488,331) (986,525,617) (5,871,667) (38,023,246)
Increase/(decrease) in net assets as a result of movements inshare capital 160,664,962 (413,119,809) 5,952,278 19,441,987
Dividends declared 11 (794,473) — — —Foreign exchange adjustment — — — —
Net assets at the end of the year 695,725,488 2,150,166,004 27,998,224 220,697,286
(2) Fund name changed, see Note 1 for further details.
Statement of Operations and Changes in Net Assetsfor the year ended 31 May 2020 continued
The notes on pages 691 to 711 form an integral part of these financial statements.
Annual report and audited financial statements [45]

Note
BlackRockSystematic Global
Equity FundBlackRock TotalAdvantage Fund
BlackRock UKEmerging
CompaniesAbsolute Return
Fund
BlackRock UKEquity Absolute
Return Fund
USD EUR GBP GBP
Net assets at the beginning of the year 288,073,809 34,507,624 190,609,615 71,743,502IncomeBank interest 2(c) 1,404 — 452,250 117,495Bond interest 2(c) — 84,336 2,258,137 634,243Contracts for difference interest 2(c),2(d) — — — —Swaps interest and dividends 2(c) — — — —Dividends, net of withholding taxes 2(c) 4,560,647 — 294,269 75,333Contracts for difference dividends, net of withholding taxes 2(c),2(d) — 815,452 3,986,808 2,115,106Securities lending 2(c) 44,046 — 2,671 —Management fee rebate 4 — — — —Other income 26,526 — 43,999 —
Total income 4,632,623 899,788 7,038,134 2,942,177
ExpensesBank interest 2(c) — 18,902 — —Contracts for difference interest 2(c),2(d) — 267,109 3,265,211 412,884Swaps interest and dividends 2(c) — — — —Negative yield on financial assets 2(c) — 189,353 — —Contracts for difference dividends, net of withholding taxes 2(c),2(d) — 643,217 3,630,180 1,146,785Administration fees 5 130,839 18,107 686,962 64,343Depositary fees 2(i),6 412,633 130,654 226,916 93,893Taxes 8 23,833 3,588 128,917 13,819Performance fees 7 — — 6,672,520 161,629Distribution fees 4 4,851 1,061 — 746Loan commitment fees 14 — 614 3,828 1,616Management fees and sub-investment advisers fees 4 629,586 2,031 4,028,604 857,581Other charges 1,484 — — —
Total expenses before reimbursement 1,203,226 1,274,636 18,643,138 2,753,296
Reimbursement of expenses 4 245,174 113,419 53,804 60,306
Total expenses after reimbursement 958,052 1,161,217 18,589,334 2,692,990
Net investment income/(deficit) 3,674,571 (261,429) (11,551,200) 249,187Net realised gain/(loss) on:
Investments 2(a),2(b) (5,669,838) 17,279 4,908,237 87,517To Be Announced securities contracts 2(d) — — — —Contracts for difference 2(d) (16) (3,749,733) 23,022,237 (1,023,184)Futures contracts 2(d) 176,150 (154,939) 15,577,695 1,843,880Foreign currencies and forward foreign exchange transactions 2(d),2(e),2(j) (4,172,221) 1,398,922 5,951,607 4,183,118Swaps transactions 2(d) — (276,744) — —Options/swaptions contracts 2(d) — — — —
Net realised gain/(loss) for the year (9,665,925) (2,765,215) 49,459,776 5,091,331
Net change in unrealised appreciation/(depreciation) onInvestments 2(a) 8,572,109 (227,827) (583,209) 72,920To Be Announced securities contracts 2(d) — — — —Contracts for difference 2(d) — 99,792 16,243,839 1,697,832Futures contracts 2(d) 165,706 (87,518) (13,958,835) (1,370,271)Foreign currencies and forward foreignexchange transactions 2(d),2(e),2(j) 20,862 (645,520) 4,409,745 (2,108,644)Swaps transactions 2(d) — 58,606 — —Options/swaptions contracts 2(d) — — — —
Net change in unrealised appreciation/(depreciation) for theyear 8,758,677 (802,467) 6,111,540 (1,708,163)
Increase/(decrease) in net assets as a result of operations 2,767,323 (3,829,111) 44,020,116 3,632,355
Movements in share capitalNet receipts as a result of issue of shares 14,330,063 794,799 540,853,302 99,286,915Net payments as a result of repurchase of shares 2(g) (143,586,351) (505,493) (142,164,911) (21,012,046)
Increase/(decrease) in net assets as a result of movements inshare capital (129,256,288) 289,306 398,688,391 78,274,869
Dividends declared 11 — — — —Foreign exchange adjustment — — — —
Net assets at the end of the year 161,584,844 30,967,819 633,318,122 153,650,726
Statement of Operations and Changes in Net Assetsfor the year ended 31 May 2020 continued
The notes on pages 691 to 711 form an integral part of these financial statements.
BlackRock Strategic Funds[46]
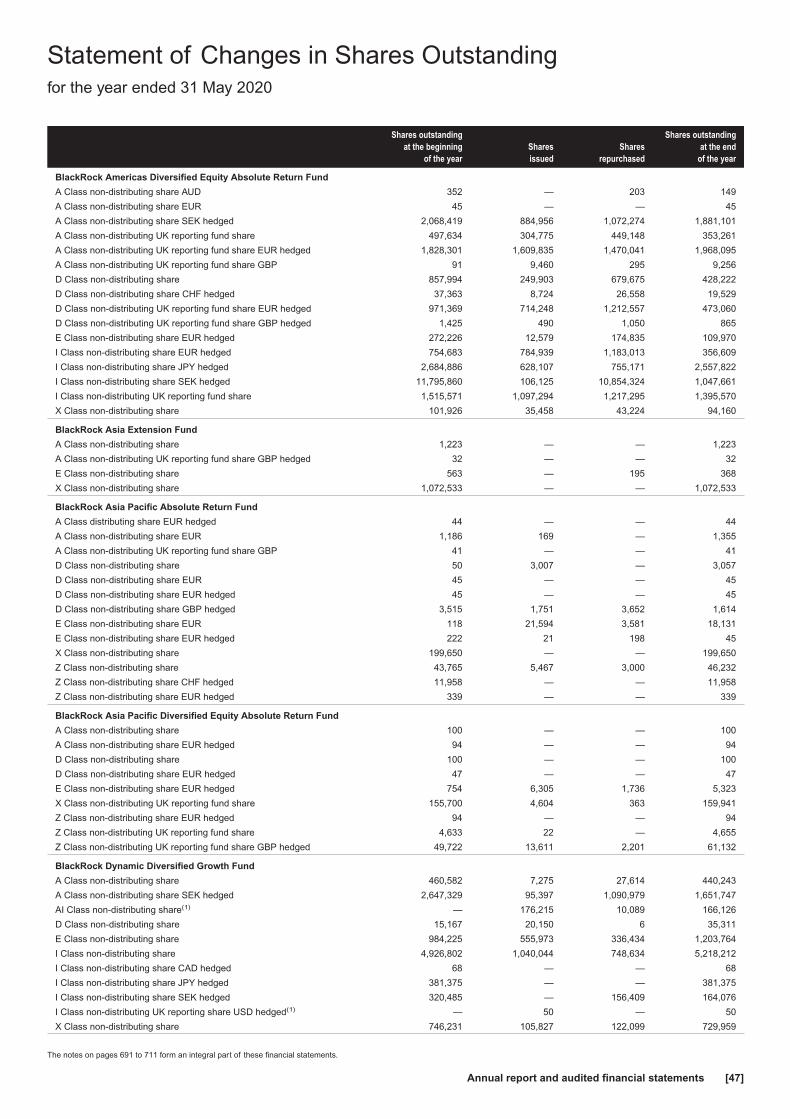
Shares outstandingat the beginning
of the yearSharesissued
Sharesrepurchased
Shares outstandingat the end
of the year
BlackRock Americas Diversified Equity Absolute Return Fund
A Class non-distributing share AUD 352 — 203 149
A Class non-distributing share EUR 45 — — 45
A Class non-distributing share SEK hedged 2,068,419 884,956 1,072,274 1,881,101
A Class non-distributing UK reporting fund share 497,634 304,775 449,148 353,261
A Class non-distributing UK reporting fund share EUR hedged 1,828,301 1,609,835 1,470,041 1,968,095
A Class non-distributing UK reporting fund share GBP 91 9,460 295 9,256
D Class non-distributing share 857,994 249,903 679,675 428,222
D Class non-distributing share CHF hedged 37,363 8,724 26,558 19,529
D Class non-distributing UK reporting fund share EUR hedged 971,369 714,248 1,212,557 473,060
D Class non-distributing UK reporting fund share GBP hedged 1,425 490 1,050 865
E Class non-distributing share EUR hedged 272,226 12,579 174,835 109,970
I Class non-distributing share EUR hedged 754,683 784,939 1,183,013 356,609
I Class non-distributing share JPY hedged 2,684,886 628,107 755,171 2,557,822
I Class non-distributing share SEK hedged 11,795,860 106,125 10,854,324 1,047,661
I Class non-distributing UK reporting fund share 1,515,571 1,097,294 1,217,295 1,395,570
X Class non-distributing share 101,926 35,458 43,224 94,160
BlackRock Asia Extension Fund
A Class non-distributing share 1,223 — — 1,223
A Class non-distributing UK reporting fund share GBP hedged 32 — — 32
E Class non-distributing share 563 — 195 368
X Class non-distributing share 1,072,533 — — 1,072,533
BlackRock Asia Pacific Absolute Return Fund
A Class distributing share EUR hedged 44 — — 44
A Class non-distributing share EUR 1,186 169 — 1,355
A Class non-distributing UK reporting fund share GBP 41 — — 41
D Class non-distributing share 50 3,007 — 3,057
D Class non-distributing share EUR 45 — — 45
D Class non-distributing share EUR hedged 45 — — 45
D Class non-distributing share GBP hedged 3,515 1,751 3,652 1,614
E Class non-distributing share EUR 118 21,594 3,581 18,131
E Class non-distributing share EUR hedged 222 21 198 45
X Class non-distributing share 199,650 — — 199,650
Z Class non-distributing share 43,765 5,467 3,000 46,232
Z Class non-distributing share CHF hedged 11,958 — — 11,958
Z Class non-distributing share EUR hedged 339 — — 339
BlackRock Asia Pacific Diversified Equity Absolute Return Fund
A Class non-distributing share 100 — — 100
A Class non-distributing share EUR hedged 94 — — 94
D Class non-distributing share 100 — — 100
D Class non-distributing share EUR hedged 47 — — 47
E Class non-distributing share EUR hedged 754 6,305 1,736 5,323
X Class non-distributing UK reporting fund share 155,700 4,604 363 159,941
Z Class non-distributing share EUR hedged 94 — — 94
Z Class non-distributing UK reporting fund share 4,633 22 — 4,655
Z Class non-distributing UK reporting fund share GBP hedged 49,722 13,611 2,201 61,132
BlackRock Dynamic Diversified Growth Fund
A Class non-distributing share 460,582 7,275 27,614 440,243
A Class non-distributing share SEK hedged 2,647,329 95,397 1,090,979 1,651,747
AI Class non-distributing share(1) — 176,215 10,089 166,126
D Class non-distributing share 15,167 20,150 6 35,311
E Class non-distributing share 984,225 555,973 336,434 1,203,764
I Class non-distributing share 4,926,802 1,040,044 748,634 5,218,212
I Class non-distributing share CAD hedged 68 — — 68
I Class non-distributing share JPY hedged 381,375 — — 381,375
I Class non-distributing share SEK hedged 320,485 — 156,409 164,076
I Class non-distributing UK reporting share USD hedged(1) — 50 — 50
X Class non-distributing share 746,231 105,827 122,099 729,959
Statement of Changes in Shares Outstandingfor the year ended 31 May 2020
The notes on pages 691 to 711 form an integral part of these financial statements.
Annual report and audited financial statements [47]

Shares outstandingat the beginning
of the yearSharesissued
Sharesrepurchased
Shares outstandingat the end
of the year
BlackRock Emerging Markets Absolute Return Fund
A Class distributing UK reporting fund share GBP hedged 586 534 1,084 36
A Class non-distributing share 55,828 6,245 47,548 14,525
A Class non-distributing share EUR hedged 26,849 4,600 4,653 26,796
D Class distributing UK reporting fund share GBP hedged 121 — — 121
D Class non-distributing UK reporting fund share 7,730 37,361 22,274 22,817
D Class non-distributing UK reporting fund share EUR hedged 71,383 23,069 83,546 10,906
E Class non-distributing share EUR hedged 30,779 24,252 28,356 26,675
I Class distributing UK reporting fund share GBP 33 — — 33
I Class distributing UK reporting fund share GBP hedged(1) — 39 — 39
I Class non-distributing share EUR 234 18 199 53
I Class non-distributing share EUR hedged 31,905 13,545 45,449 1
I Class non-distributing UK reporting fund share 58,452 1,746 4,141 56,057
X Class non-distributing share 2,172 28,839 29,207 1,804
BlackRock Emerging Markets Equity Strategies Fund
A Class non-distributing share 567,779 860,326 440,916 987,189
A Class non-distributing share CHF hedged 12,390 5,768 12,561 5,597
D Class distributing share 50 16,874 16,754 170
D Class non-distributing share CHF hedged 1,222 72,004 2,762 70,464
D Class non-distributing share EUR hedged 132,140 360,375 212,112 280,403
D Class non-distributing UK reporting fund share 877,712 764,543 859,530 782,725
D Class non-distributing UK reporting fund share EUR 351,297 354,674 476,023 229,948
D Class non-distributing UK reporting fund share GBP 72,958 90,386 58,751 104,593
E Class non-distributing share EUR 235,287 341,121 236,484 339,924
I Class non-distributing share 704,892 950,764 1,039,154 616,502
I Class non-distributing share EUR 180,045 348,259 33,181 495,123
X Class non-distributing share 133,569 9,576 34,070 109,075
Z Class non-distributing share GBP 2,797 19 881 1,935
Z Class non-distributing UK reporting fund share 540,021 — 87,921 452,100
BlackRock Emerging Markets Flexi Dynamic Bond Fund
A Class distributing UK reporting fund share GBP hedged 5,539 — — 5,539
A Class non-distributing share 160,978 13,745 100,338 74,385
A Class non-distributing share EUR hedged 55,670 6,052 31,657 30,065
A Class non-distributing share SEK hedged 1,380 31,877 23,072 10,185
A Class non-distributing UK reporting fund share CHF hedged 51 — — 51
AI Class non-distributing share EUR hedged(1) — 45 — 45
D Class distributing UK reporting fund share 480,704 46,984 419,157 108,531
D Class distributing UK reporting fund share EUR 141 — 100 41
D Class distributing UK reporting fund share EUR hedged 2,720 17,539 5,907 14,352
D Class distributing UK reporting fund share GBP 70,085 8,032 30,930 47,187
D Class distributing UK reporting fund share GBP hedged 843,625 100,816 820,482 123,959
D Class non-distributing UK reporting fund share 336,994 33,992 305,143 65,843
D Class non-distributing UK reporting fund share CHF hedged 3,134 — 1,083 2,051
D Class non-distributing UK reporting fund share EUR hedged 811,970 144,121 784,611 171,480
E Class non-distributing share 81,066 9,827 34,635 56,258
E Class non-distributing share EUR hedged 446,653 10,999 157,211 300,441
I Class distributing share EUR 257,991 — 132,777 125,214
I Class distributing share EUR hedged 6,166,870 171,273 6,001,364 336,779
I Class distributing share (G) EUR hedged 2,061,077 — 1,306,966 754,111
I Class distributing UK reporting fund share 509,975 — 509,925 50
I Class non-distributing share EUR hedged 701,961 24,617 566,711 159,867
I Class non-distributing UK reporting fund share 3,125,449 89,822 1,131,893 2,083,378
X Class distributing share EUR 44 — — 44
X Class non-distributing share 3,127,196 3,356 138,292 2,992,260
X Class non-distributing share AUD hedged 7,184,515 — — 7,184,515
X Class non-distributing share CAD hedged 2,600,064 — 229,938 2,370,126
Statement of Changes in Shares Outstandingfor the year ended 31 May 2020 continued
The notes on pages 691 to 711 form an integral part of these financial statements.
BlackRock Strategic Funds[48]

Shares outstandingat the beginning
of the yearSharesissued
Sharesrepurchased
Shares outstandingat the end
of the year
BlackRock Emerging Markets Short Duration Bond Fund
A Class non-distributing share 741 — 691 50
AI Class distributing share EUR hedged(1) — 45 — 45
AI Class non-distributing share EUR hedged(1) — 45 — 45
D Class non-distributing UK reporting fund share 88,737 33,781 121,481 1,037
D Class non-distributing UK reporting fund share EUR hedged 12,317 108 9,108 3,317
E Class distributing share EUR 340 898 — 1,238
E Class distributing share EUR hedged 631 476 — 1,107
E Class non-distributing share EUR 3,645 18,965 5,048 17,562
E Class non-distributing share EUR hedged 43 85 — 128
I Class non-distributing share EUR hedged 279,043 183,000 100,000 362,043
X Class non-distributing share 249,750 — — 249,750
BlackRock ESG Euro Bond Fund(2)
A Class distributing share 4,211 34,608 451 38,368
A Class non-distributing share 157 33,466 20,415 13,208
AI Class non-distributing share(1) — 47 — 47
D Class non-distributing UK reporting fund share 48,243 84,311 7,424 125,130
E Class non-distributing share 16,450 93,586 11,957 98,079
I Class non-distributing share 57,236 814,702 86,292 785,646
X Class non-distributing share 278,669 1,502,794 133,379 1,648,084
Z Class non-distributing share 896,002 442,424 67,575 1,270,851
BlackRock ESG Euro Corporate Bond Fund(3)
A Class non-distributing share — 44 — 44
AI Class non-distributing share — 44 — 44
D Class non-distributing share — 44 — 44
E Class non-distributing share — 6,201 — 6,201
I Class non-distributing share — 1,717,574 206,124 1,511,450
X Class non-distributing share — 325,711 — 325,711
BlackRock European Absolute Return Fund
A Class distributing share 115,247 — 15,271 99,976
A Class non-distributing share 5,018,059 927,484 1,729,781 4,215,762
D Class distributing share 30,107 — 16,441 13,666
D Class non-distributing share 1,888,261 22,495 545,755 1,365,001
D Class non-distributing share CHF hedged 61,563 — 7,702 53,861
D Class non-distributing UK reporting fund share GBP hedged 2,024 — 542 1,482
E Class non-distributing share 241,773 929 52,394 190,308
I Class non-distributing UK reporting fund share 4,922,399 41,476 2,207,342 2,756,533
S Class non-distributing share(1) — 45 — 45
BlackRock European Diversified Equity Absolute Return Fund
A Class non-distributing share 29,486 12,374 34,214 7,646
A Class non-distributing share CHF hedged 159 15 103 71
A Class non-distributing share SEK hedged 249,639 10,942 170,691 89,890
A Class non-distributing UK reporting fund share GBP hedged 1,059 — 177 882
D Class non-distributing share CHF hedged 176 — 175 1
D Class non-distributing share USD hedged 380 — 84 296
D Class non-distributing UK reporting fund share 12,291 3,455 12,453 3,293
D Class non-distributing UK reporting fund share GBP hedged 2 — 1 1
E Class non-distributing share 36,015 22,862 40,784 18,093
I Class non-distributing share 264,145 — 264,144 1
X Class non-distributing share 26,792 220 27,011 1
Statement of Changes in Shares Outstandingfor the year ended 31 May 2020 continued
The notes on pages 691 to 711 form an integral part of these financial statements.
Annual report and audited financial statements [49]

Shares outstandingat the beginning
of the yearSharesissued
Sharesrepurchased
Shares outstandingat the end
of the year
BlackRock European Opportunities Extension Fund
A Class distributing UK reporting fund share GBP 5,719 — 305 5,414
A Class non-distributing share 996,374 1,287 200,277 797,384
D Class distributing (G) share 476,519 19 3,199 473,339
D Class distributing UK reporting fund share GBP 23,951 — 2,046 21,905
D Class non-distributing share 862,633 21,538 171,981 712,190
E Class non-distributing share 257,859 449 51,266 207,042
I Class non-distributing share 711,330 1,299 215,144 497,485
X Class non-distributing share 37 — — 37
BlackRock European Select Strategies Fund
A Class distributing share 38,166 54,762 14,305 78,623
A Class non-distributing share 203,260 110,777 101,171 212,866
A Class non-distributing share CZK hedged 55,358 904 13,895 42,367
AI Class non-distributing share(1) — 94,682 7,607 87,075
D Class distributing share USD hedged 4,987 9 9 4,987
D Class non-distributing share 80,122 101,715 55,506 126,331
E Class distributing share 1,083,702 154,457 451,254 786,905
E Class non-distributing share 1,613,448 256,035 528,252 1,341,231
I Class distributing share 327,050 37,195 73,001 291,244
I Class non-distributing share 1,767,844 610,394 325,446 2,052,792
X Class non-distributing share 43 — — 43
BlackRock European Unconstrained Equity Fund
A Class non-distributing share 50 17,204 16,969 285
D Class non-distributing UK reporting fund share 50 33,321 1,465 31,906
D Class non-distributing UK reporting fund share GBP hedged 45 7,106 1,316 5,835
E Class non-distributing share 44 10,050 699 9,395
I Class non-distributing share USD hedged(1) — 24,869 — 24,869
I Class non-distributing UK reporting fund share 50 3,830 3,800 80
I Class non-distributing UK reporting fund share GBP hedged 45 60 — 105
X Class non-distributing UK reporting fund share 49,750 59,183 5,819 103,114
BlackRock Fixed Income Credit Strategies Fund(3)
A Class distributing share — 50 — 50
A Class non-distributing share — 50 — 50
AI Class non-distributing share — 5,955 — 5,955
D Class distributing share — 50 — 50
D Class non-distributing share — 50 — 50
E Class non-distributing share — 72,966 10,775 62,191
I Class non-distributing share — 2,013 — 2,013
X Class non-distributing share — 1,294,123 18,851 1,275,272
Statement of Changes in Shares Outstandingfor the year ended 31 May 2020 continued
The notes on pages 691 to 711 form an integral part of these financial statements.
BlackRock Strategic Funds[50]

Shares outstandingat the beginning
of the yearSharesissued
Sharesrepurchased
Shares outstandingat the end
of the year
BlackRock Fixed Income Strategies Fund
A Class distributing share 4,093,317 331,710 1,259,791 3,165,236
A Class distributing share CHF hedged 75,380 32,411 15,187 92,604
A Class distributing share USD hedged 19,109 10,407 8,764 20,752
A Class non-distributing share CHF hedged 1,082,892 21,028 214,261 889,659
A Class non-distributing share JPY hedged 56 106,985 102,167 4,874
A Class non-distributing share USD hedged 469,508 96,968 147,357 419,119
A Class non-distributing UK reporting fund share 11,575,781 7,562,081 5,094,279 14,043,583
A Class non-distributing UK reporting fund share GBP hedged 22,290 21,207 5,833 37,664
AI Class non-distributing share(1) — 5,289 1,229 4,060
D Class distributing share 2,458,844 509,151 990,616 1,977,379
D Class distributing UK reporting fund share GBP hedged 52,964 6,864 13,584 46,244
D Class distributing UK reporting fund share USD hedged 9,792 2,620 9,450 2,962
D Class non-distributing share CHF hedged 786,821 81,091 397,975 469,937
D Class non-distributing share USD hedged 449,591 54,508 81,069 423,030
D Class non-distributing UK reporting fund share 10,473,915 2,462,765 6,805,176 6,131,504
D Class non-distributing UK reporting fund share GBP hedged 94,390 2,510 81,429 15,471
E Class non-distributing share 7,118,696 341,591 2,971,644 4,488,643
I Class distributing share 360,184 1,606,292 222,745 1,743,731
I Class non-distributing share 17,236,561 5,947,604 10,735,672 12,448,493
I Class non-distributing share SEK hedged(4) 3,001 — 3,001 —
I Class non-distributing share USD hedged 3,005,596 2,329,488 3,732,313 1,602,771
X Class distributing share 1,487,937 — — 1,487,937
X Class non-distributing share 3,104,221 161,968 830,330 2,435,859
BlackRock Global Absolute Return Bond Fund
A Class non-distributing share 14,743 661 10,426 4,978
A Class non-distributing share SEK hedged 1,658,040 883 1,650,418 8,505
A Class non-distributing share USD hedged 740 1,558 679 1,619
D Class non-distributing share 166,206 30,084 95,883 100,407
D Class non-distributing share CHF hedged 2,728 45 2,771 2
E Class non-distributing share 7,608 1,937 4,323 5,222
I Class non-distributing share 1,158,042 89,702 539,727 708,017
I Class non-distributing share GBP hedged 33,555 361 3,616 30,300
I Class non-distributing share SEK hedged 31,683 10,633 17,639 24,677
X Class non-distributing share 951,216 118,367 653,905 415,678
BlackRock Global Equity Absolute Return Fund
A Class distributing share EUR hedged 44 — — 44
D Class non-distributing share 50 — — 50
D Class non-distributing UK reporting fund share EUR 44 — — 44
E Class non-distributing share EUR 44 605 27 622
I Class non-distributing share EUR 45 — — 45
X Class non-distributing share 199,700 — — 199,700
Z Class non-distributing share 50 2,824 — 2,874
Z Class non-distributing share CHF hedged 49 — — 49
Z Class non-distributing share EUR hedged 44 — — 44
Z Class non-distributing UK reporting fund share GBP hedged 40 6,253 — 6,293
Statement of Changes in Shares Outstandingfor the year ended 31 May 2020 continued
The notes on pages 691 to 711 form an integral part of these financial statements.
Annual report and audited financial statements [51]

Shares outstandingat the beginning
of the yearSharesissued
Sharesrepurchased
Shares outstandingat the end
of the year
BlackRock Global Event Driven Fund
A Class distributing share EUR hedged 3,277 3,384 3,792 2,869
A Class non-distributing share 138,935 387,353 89,174 437,114
A Class non-distributing share CHF hedged 36,420 38,289 20,401 54,308
A Class non-distributing share HKD hedged(1) — 39 — 39
A Class non-distributing share SGD hedged(1) — 70 — 70
A Class non-distributing UK reporting fund share EUR hedged 3,058,227 4,264,936 1,964,475 5,358,688
AI Class non-distributing share EUR hedged(1) — 45 — 45
D Class non-distributing share CHF hedged 325,729 224,649 325,807 224,571
D Class non-distributing UK reporting fund share 1,038,428 1,167,867 728,659 1,477,636
D Class non-distributing UK reporting fund share EUR hedged 1,362,680 1,279,389 1,123,755 1,518,314
D Class non-distributing UK reporting fund share GBP hedged 972,889 913,833 235,296 1,651,426
E Class non-distributing share EUR 250,884 262,531 135,955 377,460
E Class non-distributing share EUR hedged 294,231 799,661 231,746 862,146
I Class distributing UK reporting fund share 166,232 62,043 44,647 183,628
I Class distributing UK reporting fund share EUR hedged 4,351 10,591 2,006 12,936
I Class distributing UK reporting fund share GBP hedged 1,911,748 1,909,169 443,805 3,377,112
I Class non-distributing share BRL(1) — 43,015 444 42,571
I Class non-distributing share JPY hedged 1,455,057 300,275 248,772 1,506,560
I Class non-distributing UK reporting fund share 1,380,391 1,008,090 653,291 1,735,190
I Class non-distributing UK reporting fund share CHF hedged 154,959 300,510 272,485 182,984
I Class non-distributing UK reporting fund share EUR hedged 4,606,165 4,461,849 2,166,517 6,901,497
IA Class non-distributing share 458,956 68,244 12,552 514,648
IA Class non-distributing share EUR hedged(1) — 65,835 — 65,835
S Class non-distributing share(1) — 50 — 50
S Class non-distributing share EUR hedged(1) — 45 — 45
X Class non-distributing share 7,443 52,207 28,090 31,560
Z Class non-distributing share CHF hedged 52,882 — 450 52,432
Z Class non-distributing UK reporting fund share 128,324 — 3,178 125,146
Z Class non-distributing UK reporting fund share EUR hedged 650,069 — 274,787 375,282
Z Class non-distributing UK reporting fund share GBP hedged 229,269 — 3,830 225,439
BlackRock Global Long/Short Equity Fund
A Class non-distributing share 48,717 12,311 12,932 48,096
A Class non-distributing share EUR hedged 345,640 47,654 258,359 134,935
A Class non-distributing share SEK hedged 553 867 836 584
AI Class non-distributing share EUR hedged(1) — 45 — 45
C Class non-distributing share 3,457 621 2,930 1,148
D Class non-distributing share 80,817 18,140 56,256 42,701
D Class non-distributing UK reporting fund share EUR hedged 179,653 264,346 197,227 246,772
D Class non-distributing UK reporting fund share GBP hedged 7,085 2,555 5,134 4,506
E Class non-distributing share EUR hedged 149,425 31,656 67,826 113,255
I Class non-distributing share EUR hedged(1) — 20,318 9,233 11,085
J Class distributing share 62,693 — 18,279 44,414
X Class non-distributing share 27,615 8,574 25,556 10,633
BlackRock Global Real Asset Securities Fund
A Class distributing share(1) — 73,419 24,539 48,880
A Class distributing share HKD hedged(1) — 15,353 — 15,353
A Class distributing share SGD hedged(1) — 32,935 — 32,935
A Class distributing UK reporting fund share EUR hedged(1) — 45 — 45
A Class non-distributing share 838 87,476 3,398 84,916
D Class distributing share(1) — 399,800 57,261 342,539
D Class non-distributing UK reporting fund share 50 49,387 11,137 38,300
E Class non-distributing share EUR 135 3,290 732 2,693
X Class non-distributing UK reporting fund share 49,800 332,457 — 382,257
Z Class non-distributing UK reporting fund share 50 46,541 — 46,591
Statement of Changes in Shares Outstandingfor the year ended 31 May 2020 continued
The notes on pages 691 to 711 form an integral part of these financial statements.
BlackRock Strategic Funds[52]

Shares outstandingat the beginning
of the yearSharesissued
Sharesrepurchased
Shares outstandingat the end
of the year
BlackRock Macro Opportunities Fund
A Class non-distributing share 382 170 332 220
AI Class non-distributing share EUR hedged(1) — 45 — 45
D Class non-distributing share EUR 758 50 764 44
D Class non-distributing UK reporting fund share 43,144 40,354 83,129 369
D Class non-distributing UK reporting fund share EUR hedged 22,835 65,997 88,788 44
D Class non-distributing UK reporting fund share GBP hedged 100,591 59,576 147,812 12,355
E Class non-distributing share EUR 818 1,147 325 1,640
E Class non-distributing share EUR hedged 1,460 1,769 2,661 568
I Class non-distributing share BRL hedged 22,233 42,914 55,834 9,313
I Class non-distributing share EUR 40,683 40,471 4,323 76,831
X Class non-distributing share 193,530 — 193,479 51
Z Class non-distributing share BRL hedged 672,870 — 596,219 76,651
Z Class non-distributing share CHF hedged 50 — — 50
Z Class non-distributing UK reporting fund share 4,674 — 4,624 50
Z Class non-distributing UK reporting fund share EUR hedged 278,857 — 72,814 206,043
Z Class non-distributing UK reporting fund share GBP hedged 218,494 — 214,778 3,716
BlackRock Managed Index Portfolios − Conservative
A Class distributing share 5,501 6,180 1,692 9,989
A Class non-distributing share 5,512 11,689 921 16,280
A Class non-distributing share USD hedged 644 3,409 825 3,228
D Class distributing share 15,697 11,316 3,788 23,225
D Class non-distributing share 140,456 99,001 23,454 216,003
D Class non-distributing share USD hedged 120,868 288,879 114,962 294,785
D Class non-distributing UK reporting fund share GBP hedged 50 7,331 — 7,381
E Class non-distributing share(1) — 45 — 45
IndexInvest Balance Class distributing share 1,135,500 114,811 240,503 1,009,808
Vermoegensstrategie Moderat - Ausgewogen Class dist. shares 45 275 275 45
BlackRock Managed Index Portfolios − Defensive
A Class distributing share 301,072 206,768 91,494 416,346
A Class non-distributing share GBP hedged 4,505 14,542 6,849 12,198
A Class non-distributing share USD hedged 76,735 204,684 82,268 199,151
A Class non-distributing UK reporting fund share 82,771 72,628 49,276 106,123
D Class distributing UK reporting fund share 43,458 153,498 26,256 170,700
D Class distributing UK reporting fund share GBP hedged 3,529 3,500 1,224 5,805
D Class distributing UK reporting fund share USD hedged 19,111 128,062 15,847 131,326
D Class non-distributing share CHF hedged 6,560 7,356 1,252 12,664
D Class non-distributing share USD hedged 290,140 474,862 353,726 411,276
D Class non-distributing UK reporting fund share 70,531 48,965 31,000 88,496
D Class non-distributing UK reporting fund share GBP hedged 57,286 20,916 17,458 60,744
E Class non-distributing share(1) — 45 — 45
I Class non-distributing share USD hedged 55,096 12,520 16,714 50,902
IndexInvest Substanz Class distributing share 338,902 29,136 97,957 270,081
Vermoegensstrategie Defensiv Class distributing share 45 2,320 — 2,365
X Class non-distributing share 50 — — 50
Statement of Changes in Shares Outstandingfor the year ended 31 May 2020 continued
The notes on pages 691 to 711 form an integral part of these financial statements.
Annual report and audited financial statements [53]
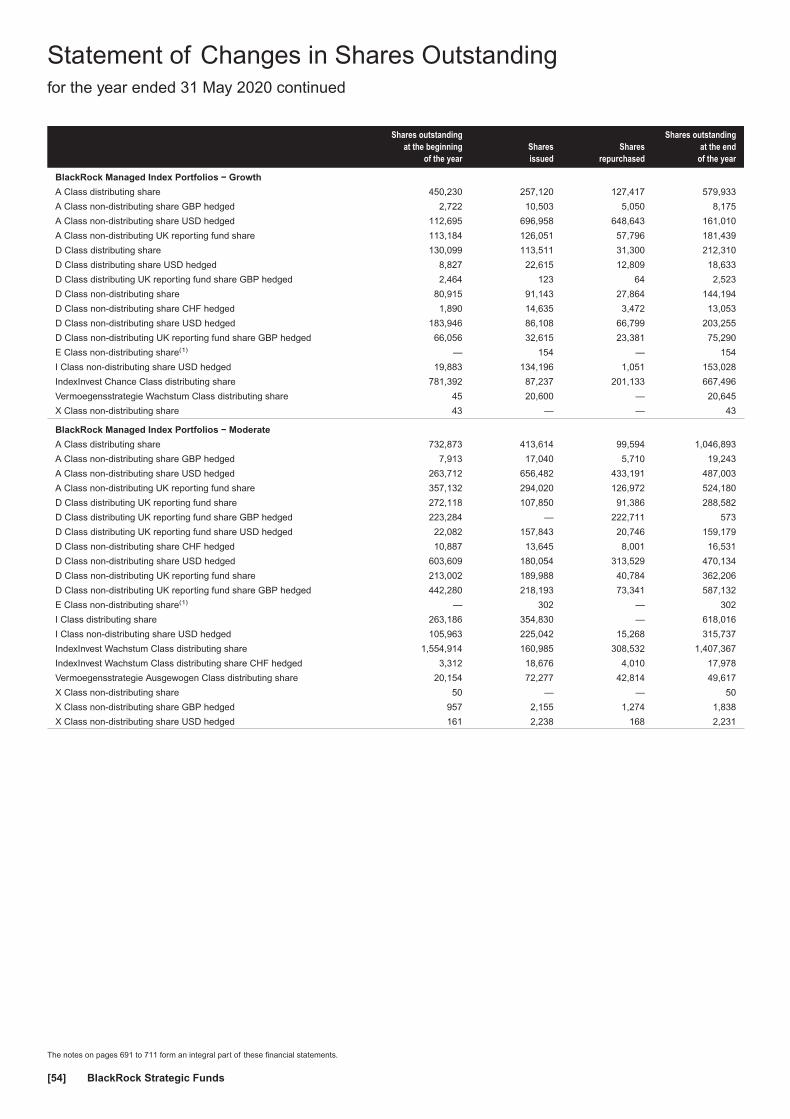
Shares outstandingat the beginning
of the yearSharesissued
Sharesrepurchased
Shares outstandingat the end
of the year
BlackRock Managed Index Portfolios − Growth
A Class distributing share 450,230 257,120 127,417 579,933
A Class non-distributing share GBP hedged 2,722 10,503 5,050 8,175
A Class non-distributing share USD hedged 112,695 696,958 648,643 161,010
A Class non-distributing UK reporting fund share 113,184 126,051 57,796 181,439
D Class distributing share 130,099 113,511 31,300 212,310
D Class distributing share USD hedged 8,827 22,615 12,809 18,633
D Class distributing UK reporting fund share GBP hedged 2,464 123 64 2,523
D Class non-distributing share 80,915 91,143 27,864 144,194
D Class non-distributing share CHF hedged 1,890 14,635 3,472 13,053
D Class non-distributing share USD hedged 183,946 86,108 66,799 203,255
D Class non-distributing UK reporting fund share GBP hedged 66,056 32,615 23,381 75,290
E Class non-distributing share(1) — 154 — 154
I Class non-distributing share USD hedged 19,883 134,196 1,051 153,028
IndexInvest Chance Class distributing share 781,392 87,237 201,133 667,496
Vermoegensstrategie Wachstum Class distributing share 45 20,600 — 20,645
X Class non-distributing share 43 — — 43
BlackRock Managed Index Portfolios − Moderate
A Class distributing share 732,873 413,614 99,594 1,046,893
A Class non-distributing share GBP hedged 7,913 17,040 5,710 19,243
A Class non-distributing share USD hedged 263,712 656,482 433,191 487,003
A Class non-distributing UK reporting fund share 357,132 294,020 126,972 524,180
D Class distributing UK reporting fund share 272,118 107,850 91,386 288,582
D Class distributing UK reporting fund share GBP hedged 223,284 — 222,711 573
D Class distributing UK reporting fund share USD hedged 22,082 157,843 20,746 159,179
D Class non-distributing share CHF hedged 10,887 13,645 8,001 16,531
D Class non-distributing share USD hedged 603,609 180,054 313,529 470,134
D Class non-distributing UK reporting fund share 213,002 189,988 40,784 362,206
D Class non-distributing UK reporting fund share GBP hedged 442,280 218,193 73,341 587,132
E Class non-distributing share(1) — 302 — 302
I Class distributing share 263,186 354,830 — 618,016
I Class non-distributing share USD hedged 105,963 225,042 15,268 315,737
IndexInvest Wachstum Class distributing share 1,554,914 160,985 308,532 1,407,367
IndexInvest Wachstum Class distributing share CHF hedged 3,312 18,676 4,010 17,978
Vermoegensstrategie Ausgewogen Class distributing share 20,154 72,277 42,814 49,617
X Class non-distributing share 50 — — 50
X Class non-distributing share GBP hedged 957 2,155 1,274 1,838
X Class non-distributing share USD hedged 161 2,238 168 2,231
Statement of Changes in Shares Outstandingfor the year ended 31 May 2020 continued
The notes on pages 691 to 711 form an integral part of these financial statements.
BlackRock Strategic Funds[54]

Shares outstandingat the beginning
of the yearSharesissued
Sharesrepurchased
Shares outstandingat the end
of the year
BlackRock Style Advantage Fund
A Class distributing share 1,585 74 1,507 152
A Class distributing share EUR hedged 2,014 160 317 1,857
A Class non-distributing share 13,673 179 5,215 8,637
A Class non-distributing share EUR hedged 64,678 — 64,549 129
A Class non-distributing share SEK hedged 440 — — 440
D Class non-distributing share CHF hedged 5,369 — — 5,369
D Class non-distributing share EUR 1,106 — 1,060 46
D Class non-distributing UK reporting fund share 139,627 55,986 141,343 54,270
D Class non-distributing UK reporting fund share EUR hedged 1,750,961 249,187 970,714 1,029,434
D Class non-distributing UK reporting fund share GBP hedged 12,888 3,483 12,653 3,718
E Class non-distributing share EUR 1,307 7,348 1,754 6,901
E Class non-distributing share EUR hedged 9,435 103 6,373 3,165
I Class non-distributing PF share CHF hedged 288,992 — 12,454 276,538
I Class non-distributing PF share EUR hedged 19,122 774,823 778,816 15,129
I Class non-distributing share BRL hedged 179,141 7,522 136,477 50,186
I Class non-distributing share CHF hedged 257,389 29,826 287,167 48
I Class non-distributing UK reporting fund share 786,275 286,308 219,470 853,113
I Class non-distributing UK reporting fund share EUR hedged 3,890,337 150,167 1,936,142 2,104,362
I Class non-distributing UK reporting fund share GBP hedged 1,716,312 225,584 264,277 1,677,619
I Class non-distributing UK reporting fund share JPY hedged 5,634,109 45,898 3,817,481 1,862,526
X Class non-distributing share 231,662 751,680 412,156 571,186
X Class non-distributing share AUD hedged 15,934,322 3,358,991 2,151,434 17,141,879
X Class non-distributing share EUR hedged 42 81,126 81,126 42
X Class non-distributing share NZD hedged 952,003 — 110,217 841,786
X Class non-distributing UK reporting fund share GBP hedged 2,800,648 240,893 2,951 3,038,590
Z Class non-distributing share 50 — — 50
Z Class non-distributing share EUR hedged 79,409 — — 79,409
BlackRock Style Advantage Screened Fund
A Class non-distributing share 50 — — 50
D Class non-distributing share 50 — — 50
D Class non-distributing share EUR hedged 44 — — 44
D Class non-distributing share GBP hedged 39 — — 39
E Class non-distributing share EUR 44 175 — 219
I Class non-distributing share 50 — — 50
I Class non-distributing share EUR 44 — — 44
I Class non-distributing share EUR hedged 44 — — 44
I Class non-distributing share GBP hedged 39 — — 39
X Class non-distributing share 249,650 — — 249,650
X Class non-distributing share AUD hedged(1) — 174,573 97,635 76,938
BlackRock Systematic ESG World Equity Fund(2)
A Class non-distributing share 22,955 18,558 12,348 29,165
D Class non-distributing share EUR 73,864 116,378 37,708 152,534
E Class non-distributing share EUR 11,704 39,613 7,280 44,037
I Class non-distributing share EUR hedged 132,384 — 132,335 49
I Class non-distributing share JPY 7,422 64,065 955 70,532
I Class non-distributing share JPY hedged 5,745 11,449 1,927 15,267
X Class non-distributing UK reporting fund share GBP 728,309 94,411 47,549 775,171
Statement of Changes in Shares Outstandingfor the year ended 31 May 2020 continued
The notes on pages 691 to 711 form an integral part of these financial statements.
Annual report and audited financial statements [55]
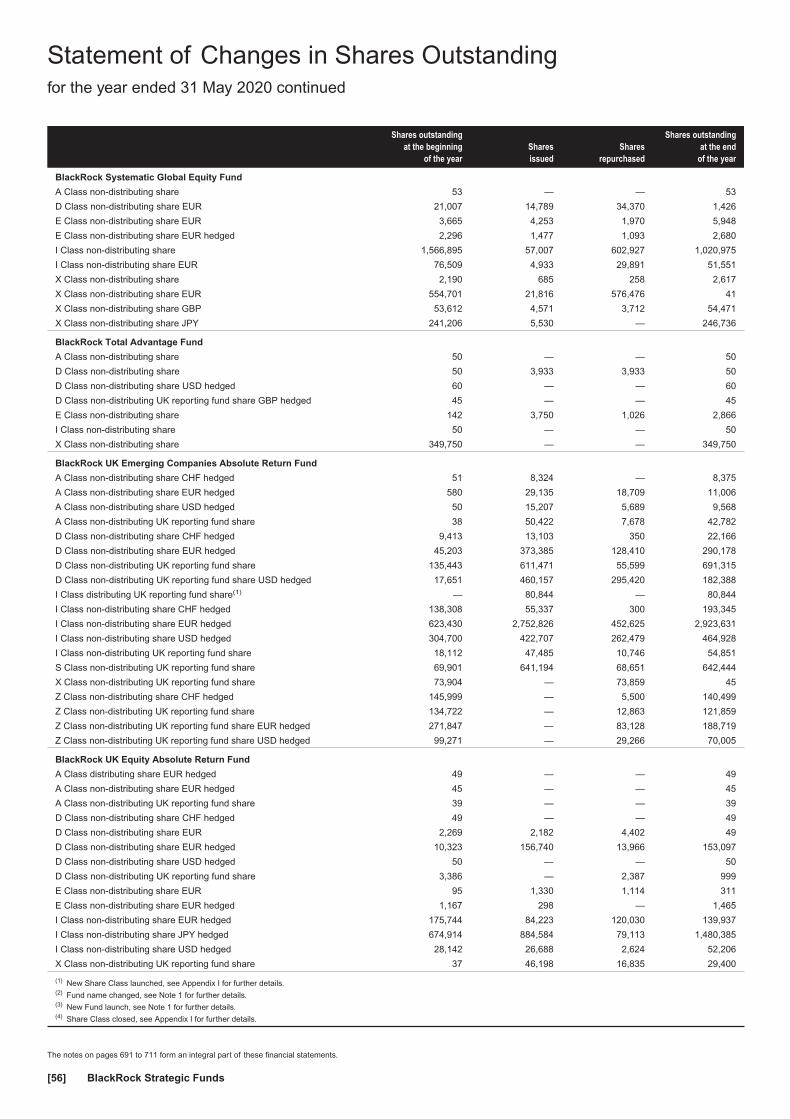
Shares outstandingat the beginning
of the yearSharesissued
Sharesrepurchased
Shares outstandingat the end
of the year
BlackRock Systematic Global Equity Fund
A Class non-distributing share 53 — — 53
D Class non-distributing share EUR 21,007 14,789 34,370 1,426
E Class non-distributing share EUR 3,665 4,253 1,970 5,948
E Class non-distributing share EUR hedged 2,296 1,477 1,093 2,680
I Class non-distributing share 1,566,895 57,007 602,927 1,020,975
I Class non-distributing share EUR 76,509 4,933 29,891 51,551
X Class non-distributing share 2,190 685 258 2,617
X Class non-distributing share EUR 554,701 21,816 576,476 41
X Class non-distributing share GBP 53,612 4,571 3,712 54,471
X Class non-distributing share JPY 241,206 5,530 — 246,736
BlackRock Total Advantage Fund
A Class non-distributing share 50 — — 50
D Class non-distributing share 50 3,933 3,933 50
D Class non-distributing share USD hedged 60 — — 60
D Class non-distributing UK reporting fund share GBP hedged 45 — — 45
E Class non-distributing share 142 3,750 1,026 2,866
I Class non-distributing share 50 — — 50
X Class non-distributing share 349,750 — — 349,750
BlackRock UK Emerging Companies Absolute Return Fund
A Class non-distributing share CHF hedged 51 8,324 — 8,375
A Class non-distributing share EUR hedged 580 29,135 18,709 11,006
A Class non-distributing share USD hedged 50 15,207 5,689 9,568
A Class non-distributing UK reporting fund share 38 50,422 7,678 42,782
D Class non-distributing share CHF hedged 9,413 13,103 350 22,166
D Class non-distributing share EUR hedged 45,203 373,385 128,410 290,178
D Class non-distributing UK reporting fund share 135,443 611,471 55,599 691,315
D Class non-distributing UK reporting fund share USD hedged 17,651 460,157 295,420 182,388
I Class distributing UK reporting fund share(1) — 80,844 — 80,844
I Class non-distributing share CHF hedged 138,308 55,337 300 193,345
I Class non-distributing share EUR hedged 623,430 2,752,826 452,625 2,923,631
I Class non-distributing share USD hedged 304,700 422,707 262,479 464,928
I Class non-distributing UK reporting fund share 18,112 47,485 10,746 54,851
S Class non-distributing UK reporting fund share 69,901 641,194 68,651 642,444
X Class non-distributing UK reporting fund share 73,904 — 73,859 45
Z Class non-distributing share CHF hedged 145,999 — 5,500 140,499
Z Class non-distributing UK reporting fund share 134,722 — 12,863 121,859
Z Class non-distributing UK reporting fund share EUR hedged 271,847 — 83,128 188,719
Z Class non-distributing UK reporting fund share USD hedged 99,271 — 29,266 70,005
BlackRock UK Equity Absolute Return Fund
A Class distributing share EUR hedged 49 — — 49
A Class non-distributing share EUR hedged 45 — — 45
A Class non-distributing UK reporting fund share 39 — — 39
D Class non-distributing share CHF hedged 49 — — 49
D Class non-distributing share EUR 2,269 2,182 4,402 49
D Class non-distributing share EUR hedged 10,323 156,740 13,966 153,097
D Class non-distributing share USD hedged 50 — — 50
D Class non-distributing UK reporting fund share 3,386 — 2,387 999
E Class non-distributing share EUR 95 1,330 1,114 311
E Class non-distributing share EUR hedged 1,167 298 — 1,465
I Class non-distributing share EUR hedged 175,744 84,223 120,030 139,937
I Class non-distributing share JPY hedged 674,914 884,584 79,113 1,480,385
I Class non-distributing share USD hedged 28,142 26,688 2,624 52,206
X Class non-distributing UK reporting fund share 37 46,198 16,835 29,400
(1) New Share Class launched, see Appendix I for further details.(2) Fund name changed, see Note 1 for further details.(3) New Fund launch, see Note 1 for further details.(4) Share Class closed, see Appendix I for further details.
Statement of Changes in Shares Outstandingfor the year ended 31 May 2020 continued
The notes on pages 691 to 711 form an integral part of these financial statements.
BlackRock Strategic Funds[56]
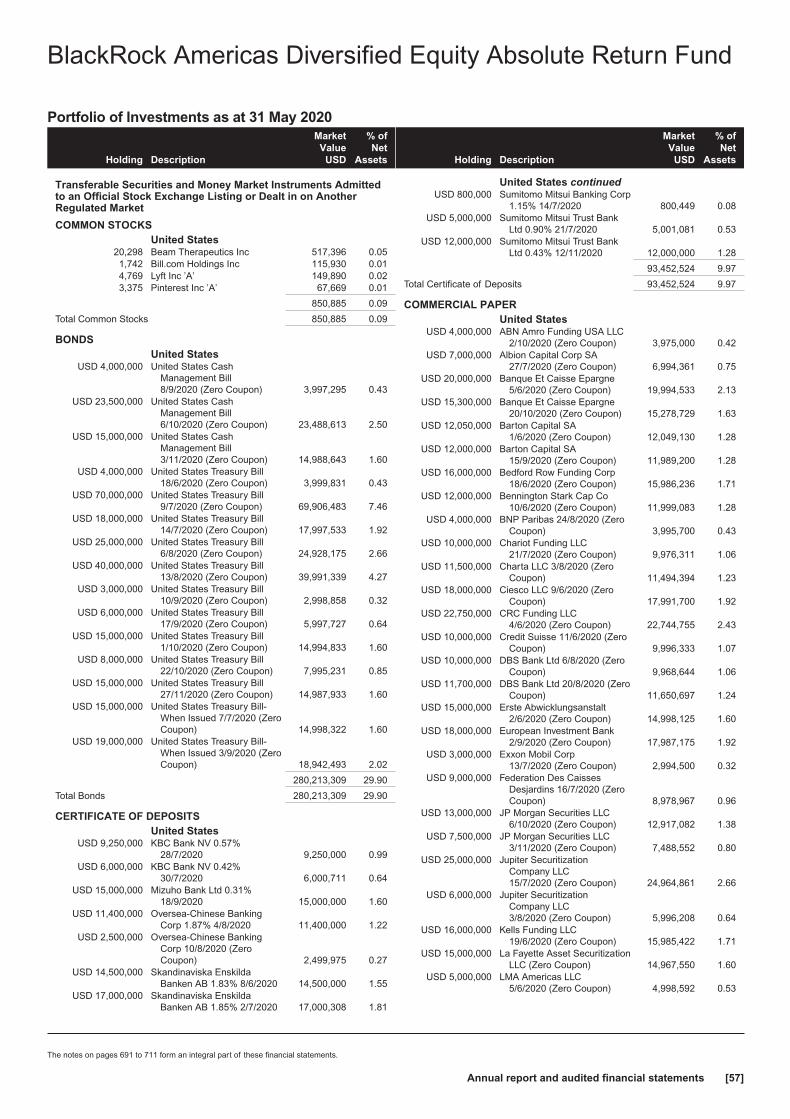
Portfolio of Investments as at 31 May 2020
Holding Description
MarketValue
USD
% ofNet
Assets
Transferable Securities and Money Market Instruments Admittedto an Official Stock Exchange Listing or Dealt in on AnotherRegulated Market
COMMON STOCKSUnited States
20,298 Beam Therapeutics Inc 517,396 0.051,742 Bill.com Holdings Inc 115,930 0.014,769 Lyft Inc ’A’ 149,890 0.023,375 Pinterest Inc ’A’ 67,669 0.01
850,885 0.09
Total Common Stocks 850,885 0.09
BONDSUnited States
USD 4,000,000 United States CashManagement Bill8/9/2020 (Zero Coupon) 3,997,295 0.43
USD 23,500,000 United States CashManagement Bill6/10/2020 (Zero Coupon) 23,488,613 2.50
USD 15,000,000 United States CashManagement Bill3/11/2020 (Zero Coupon) 14,988,643 1.60
USD 4,000,000 United States Treasury Bill18/6/2020 (Zero Coupon) 3,999,831 0.43
USD 70,000,000 United States Treasury Bill9/7/2020 (Zero Coupon) 69,906,483 7.46
USD 18,000,000 United States Treasury Bill14/7/2020 (Zero Coupon) 17,997,533 1.92
USD 25,000,000 United States Treasury Bill6/8/2020 (Zero Coupon) 24,928,175 2.66
USD 40,000,000 United States Treasury Bill13/8/2020 (Zero Coupon) 39,991,339 4.27
USD 3,000,000 United States Treasury Bill10/9/2020 (Zero Coupon) 2,998,858 0.32
USD 6,000,000 United States Treasury Bill17/9/2020 (Zero Coupon) 5,997,727 0.64
USD 15,000,000 United States Treasury Bill1/10/2020 (Zero Coupon) 14,994,833 1.60
USD 8,000,000 United States Treasury Bill22/10/2020 (Zero Coupon) 7,995,231 0.85
USD 15,000,000 United States Treasury Bill27/11/2020 (Zero Coupon) 14,987,933 1.60
USD 15,000,000 United States Treasury Bill-When Issued 7/7/2020 (ZeroCoupon) 14,998,322 1.60
USD 19,000,000 United States Treasury Bill-When Issued 3/9/2020 (ZeroCoupon) 18,942,493 2.02
280,213,309 29.90
Total Bonds 280,213,309 29.90
CERTIFICATE OF DEPOSITSUnited States
USD 9,250,000 KBC Bank NV 0.57%28/7/2020 9,250,000 0.99
USD 6,000,000 KBC Bank NV 0.42%30/7/2020 6,000,711 0.64
USD 15,000,000 Mizuho Bank Ltd 0.31%18/9/2020 15,000,000 1.60
USD 11,400,000 Oversea-Chinese BankingCorp 1.87% 4/8/2020 11,400,000 1.22
USD 2,500,000 Oversea-Chinese BankingCorp 10/8/2020 (ZeroCoupon) 2,499,975 0.27
USD 14,500,000 Skandinaviska EnskildaBanken AB 1.83% 8/6/2020 14,500,000 1.55
USD 17,000,000 Skandinaviska EnskildaBanken AB 1.85% 2/7/2020 17,000,308 1.81
Holding Description
MarketValue
USD
% ofNet
Assets
United States continuedUSD 800,000 Sumitomo Mitsui Banking Corp
1.15% 14/7/2020 800,449 0.08USD 5,000,000 Sumitomo Mitsui Trust Bank
Ltd 0.90% 21/7/2020 5,001,081 0.53USD 12,000,000 Sumitomo Mitsui Trust Bank
Ltd 0.43% 12/11/2020 12,000,000 1.28
93,452,524 9.97
Total Certificate of Deposits 93,452,524 9.97
COMMERCIAL PAPERUnited States
USD 4,000,000 ABN Amro Funding USA LLC2/10/2020 (Zero Coupon) 3,975,000 0.42
USD 7,000,000 Albion Capital Corp SA27/7/2020 (Zero Coupon) 6,994,361 0.75
USD 20,000,000 Banque Et Caisse Epargne5/6/2020 (Zero Coupon) 19,994,533 2.13
USD 15,300,000 Banque Et Caisse Epargne20/10/2020 (Zero Coupon) 15,278,729 1.63
USD 12,050,000 Barton Capital SA1/6/2020 (Zero Coupon) 12,049,130 1.28
USD 12,000,000 Barton Capital SA15/9/2020 (Zero Coupon) 11,989,200 1.28
USD 16,000,000 Bedford Row Funding Corp18/6/2020 (Zero Coupon) 15,986,236 1.71
USD 12,000,000 Bennington Stark Cap Co10/6/2020 (Zero Coupon) 11,999,083 1.28
USD 4,000,000 BNP Paribas 24/8/2020 (ZeroCoupon) 3,995,700 0.43
USD 10,000,000 Chariot Funding LLC21/7/2020 (Zero Coupon) 9,976,311 1.06
USD 11,500,000 Charta LLC 3/8/2020 (ZeroCoupon) 11,494,394 1.23
USD 18,000,000 Ciesco LLC 9/6/2020 (ZeroCoupon) 17,991,700 1.92
USD 22,750,000 CRC Funding LLC4/6/2020 (Zero Coupon) 22,744,755 2.43
USD 10,000,000 Credit Suisse 11/6/2020 (ZeroCoupon) 9,996,333 1.07
USD 10,000,000 DBS Bank Ltd 6/8/2020 (ZeroCoupon) 9,968,644 1.06
USD 11,700,000 DBS Bank Ltd 20/8/2020 (ZeroCoupon) 11,650,697 1.24
USD 15,000,000 Erste Abwicklungsanstalt2/6/2020 (Zero Coupon) 14,998,125 1.60
USD 18,000,000 European Investment Bank2/9/2020 (Zero Coupon) 17,987,175 1.92
USD 3,000,000 Exxon Mobil Corp13/7/2020 (Zero Coupon) 2,994,500 0.32
USD 9,000,000 Federation Des CaissesDesjardins 16/7/2020 (ZeroCoupon) 8,978,967 0.96
USD 13,000,000 JP Morgan Securities LLC6/10/2020 (Zero Coupon) 12,917,082 1.38
USD 7,500,000 JP Morgan Securities LLC3/11/2020 (Zero Coupon) 7,488,552 0.80
USD 25,000,000 Jupiter SecuritizationCompany LLC15/7/2020 (Zero Coupon) 24,964,861 2.66
USD 6,000,000 Jupiter SecuritizationCompany LLC3/8/2020 (Zero Coupon) 5,996,208 0.64
USD 16,000,000 Kells Funding LLC19/6/2020 (Zero Coupon) 15,985,422 1.71
USD 15,000,000 La Fayette Asset SecuritizationLLC (Zero Coupon) 14,967,550 1.60
USD 5,000,000 LMA Americas LLC5/6/2020 (Zero Coupon) 4,998,592 0.53
BlackRock Americas Diversified Equity Absolute Return Fund
The notes on pages 691 to 711 form an integral part of these financial statements.
Annual report and audited financial statements [57]
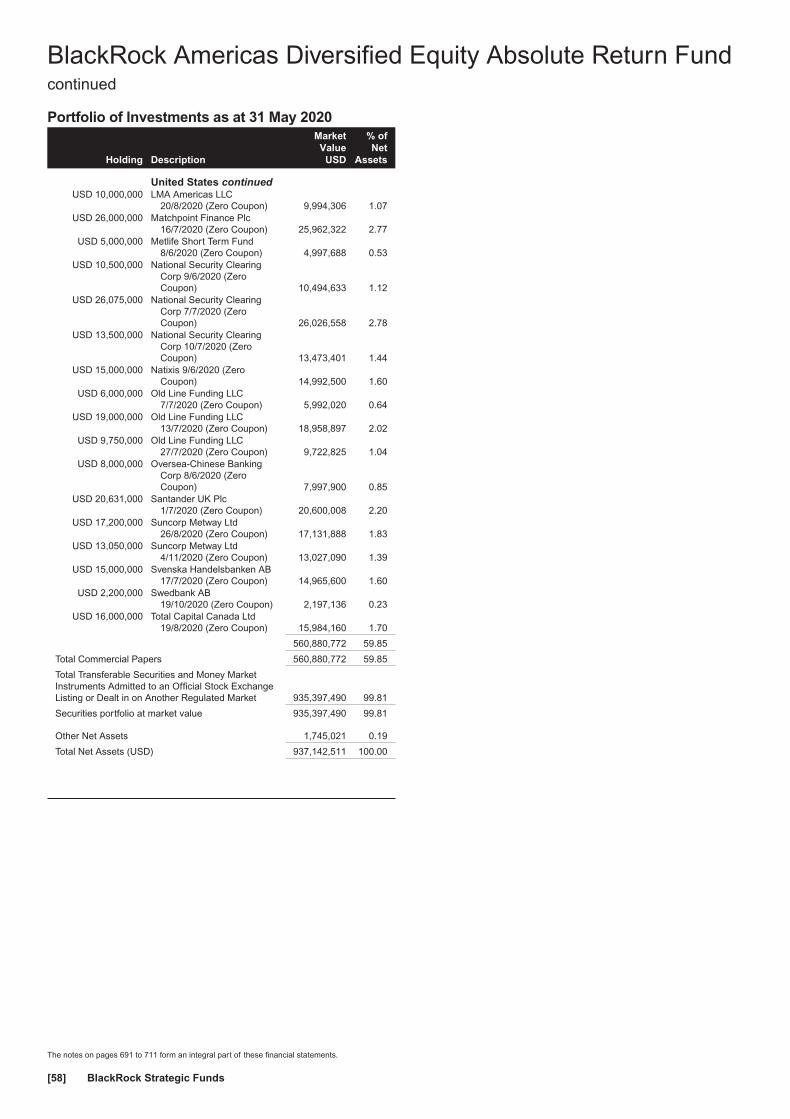
Portfolio of Investments as at 31 May 2020
Holding Description
MarketValue
USD
% ofNet
Assets
United States continuedUSD 10,000,000 LMA Americas LLC
20/8/2020 (Zero Coupon) 9,994,306 1.07USD 26,000,000 Matchpoint Finance Plc
16/7/2020 (Zero Coupon) 25,962,322 2.77USD 5,000,000 Metlife Short Term Fund
8/6/2020 (Zero Coupon) 4,997,688 0.53USD 10,500,000 National Security Clearing
Corp 9/6/2020 (ZeroCoupon) 10,494,633 1.12
USD 26,075,000 National Security ClearingCorp 7/7/2020 (ZeroCoupon) 26,026,558 2.78
USD 13,500,000 National Security ClearingCorp 10/7/2020 (ZeroCoupon) 13,473,401 1.44
USD 15,000,000 Natixis 9/6/2020 (ZeroCoupon) 14,992,500 1.60
USD 6,000,000 Old Line Funding LLC7/7/2020 (Zero Coupon) 5,992,020 0.64
USD 19,000,000 Old Line Funding LLC13/7/2020 (Zero Coupon) 18,958,897 2.02
USD 9,750,000 Old Line Funding LLC27/7/2020 (Zero Coupon) 9,722,825 1.04
USD 8,000,000 Oversea-Chinese BankingCorp 8/6/2020 (ZeroCoupon) 7,997,900 0.85
USD 20,631,000 Santander UK Plc1/7/2020 (Zero Coupon) 20,600,008 2.20
USD 17,200,000 Suncorp Metway Ltd26/8/2020 (Zero Coupon) 17,131,888 1.83
USD 13,050,000 Suncorp Metway Ltd4/11/2020 (Zero Coupon) 13,027,090 1.39
USD 15,000,000 Svenska Handelsbanken AB17/7/2020 (Zero Coupon) 14,965,600 1.60
USD 2,200,000 Swedbank AB19/10/2020 (Zero Coupon) 2,197,136 0.23
USD 16,000,000 Total Capital Canada Ltd19/8/2020 (Zero Coupon) 15,984,160 1.70
560,880,772 59.85
Total Commercial Papers 560,880,772 59.85
Total Transferable Securities and Money MarketInstruments Admitted to an Official Stock ExchangeListing or Dealt in on Another Regulated Market 935,397,490 99.81
Securities portfolio at market value 935,397,490 99.81
Other Net Assets 1,745,021 0.19
Total Net Assets (USD) 937,142,511 100.00
BlackRock Americas Diversified Equity Absolute Return Fundcontinued
The notes on pages 691 to 711 form an integral part of these financial statements.
BlackRock Strategic Funds[58]
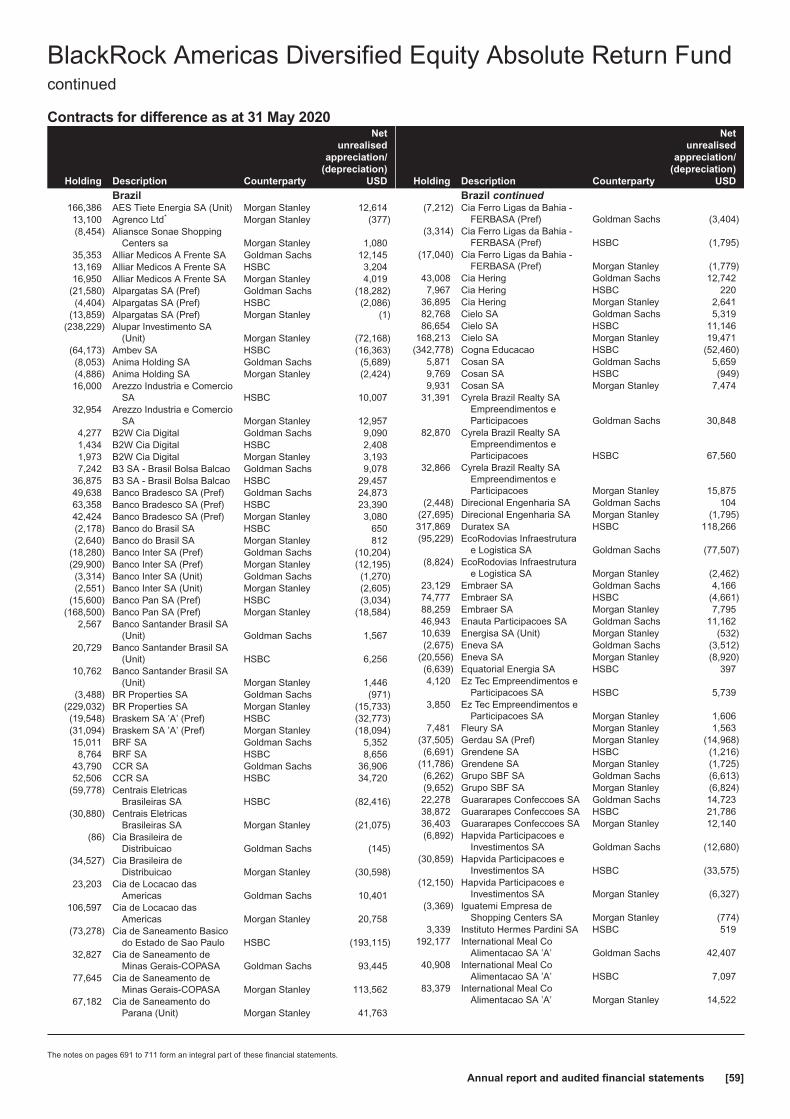
Contracts for difference as at 31 May 2020
Holding Description Counterparty
Netunrealised
appreciation/(depreciation)
USD
Brazil166,386 AES Tiete Energia SA (Unit) Morgan Stanley 12,61413,100 Agrenco Ltd* Morgan Stanley (377)(8,454) Aliansce Sonae Shopping
Centers sa Morgan Stanley 1,08035,353 Alliar Medicos A Frente SA Goldman Sachs 12,14513,169 Alliar Medicos A Frente SA HSBC 3,20416,950 Alliar Medicos A Frente SA Morgan Stanley 4,019
(21,580) Alpargatas SA (Pref) Goldman Sachs (18,282)(4,404) Alpargatas SA (Pref) HSBC (2,086)
(13,859) Alpargatas SA (Pref) Morgan Stanley (1)(238,229) Alupar Investimento SA
(Unit) Morgan Stanley (72,168)(64,173) Ambev SA HSBC (16,363)(8,053) Anima Holding SA Goldman Sachs (5,689)(4,886) Anima Holding SA Morgan Stanley (2,424)16,000 Arezzo Industria e Comercio
SA HSBC 10,00732,954 Arezzo Industria e Comercio
SA Morgan Stanley 12,9574,277 B2W Cia Digital Goldman Sachs 9,0901,434 B2W Cia Digital HSBC 2,4081,973 B2W Cia Digital Morgan Stanley 3,1937,242 B3 SA - Brasil Bolsa Balcao Goldman Sachs 9,078
36,875 B3 SA - Brasil Bolsa Balcao HSBC 29,45749,638 Banco Bradesco SA (Pref) Goldman Sachs 24,87363,358 Banco Bradesco SA (Pref) HSBC 23,39042,424 Banco Bradesco SA (Pref) Morgan Stanley 3,080(2,178) Banco do Brasil SA HSBC 650(2,640) Banco do Brasil SA Morgan Stanley 812
(18,280) Banco Inter SA (Pref) Goldman Sachs (10,204)(29,900) Banco Inter SA (Pref) Morgan Stanley (12,195)(3,314) Banco Inter SA (Unit) Goldman Sachs (1,270)(2,551) Banco Inter SA (Unit) Morgan Stanley (2,605)
(15,600) Banco Pan SA (Pref) HSBC (3,034)(168,500) Banco Pan SA (Pref) Morgan Stanley (18,584)
2,567 Banco Santander Brasil SA(Unit) Goldman Sachs 1,567
20,729 Banco Santander Brasil SA(Unit) HSBC 6,256
10,762 Banco Santander Brasil SA(Unit) Morgan Stanley 1,446
(3,488) BR Properties SA Goldman Sachs (971)(229,032) BR Properties SA Morgan Stanley (15,733)(19,548) Braskem SA ’A’ (Pref) HSBC (32,773)(31,094) Braskem SA ’A’ (Pref) Morgan Stanley (18,094)15,011 BRF SA Goldman Sachs 5,3528,764 BRF SA HSBC 8,656
43,790 CCR SA Goldman Sachs 36,90652,506 CCR SA HSBC 34,720
(59,778) Centrais EletricasBrasileiras SA HSBC (82,416)
(30,880) Centrais EletricasBrasileiras SA Morgan Stanley (21,075)
(86) Cia Brasileira deDistribuicao Goldman Sachs (145)
(34,527) Cia Brasileira deDistribuicao Morgan Stanley (30,598)
23,203 Cia de Locacao dasAmericas Goldman Sachs 10,401
106,597 Cia de Locacao dasAmericas Morgan Stanley 20,758
(73,278) Cia de Saneamento Basicodo Estado de Sao Paulo HSBC (193,115)
32,827 Cia de Saneamento deMinas Gerais-COPASA Goldman Sachs 93,445
77,645 Cia de Saneamento deMinas Gerais-COPASA Morgan Stanley 113,562
67,182 Cia de Saneamento doParana (Unit) Morgan Stanley 41,763
Holding Description Counterparty
Netunrealised
appreciation/(depreciation)
USD
Brazil continued(7,212) Cia Ferro Ligas da Bahia -
FERBASA (Pref) Goldman Sachs (3,404)(3,314) Cia Ferro Ligas da Bahia -
FERBASA (Pref) HSBC (1,795)(17,040) Cia Ferro Ligas da Bahia -
FERBASA (Pref) Morgan Stanley (1,779)43,008 Cia Hering Goldman Sachs 12,7427,967 Cia Hering HSBC 220
36,895 Cia Hering Morgan Stanley 2,64182,768 Cielo SA Goldman Sachs 5,31986,654 Cielo SA HSBC 11,146
168,213 Cielo SA Morgan Stanley 19,471(342,778) Cogna Educacao HSBC (52,460)
5,871 Cosan SA Goldman Sachs 5,6599,769 Cosan SA HSBC (949)9,931 Cosan SA Morgan Stanley 7,474
31,391 Cyrela Brazil Realty SAEmpreendimentos eParticipacoes Goldman Sachs 30,848
82,870 Cyrela Brazil Realty SAEmpreendimentos eParticipacoes HSBC 67,560
32,866 Cyrela Brazil Realty SAEmpreendimentos eParticipacoes Morgan Stanley 15,875
(2,448) Direcional Engenharia SA Goldman Sachs 104(27,695) Direcional Engenharia SA Morgan Stanley (1,795)317,869 Duratex SA HSBC 118,266(95,229) EcoRodovias Infraestrutura
e Logistica SA Goldman Sachs (77,507)(8,824) EcoRodovias Infraestrutura
e Logistica SA Morgan Stanley (2,462)23,129 Embraer SA Goldman Sachs 4,16674,777 Embraer SA HSBC (4,661)88,259 Embraer SA Morgan Stanley 7,79546,943 Enauta Participacoes SA Goldman Sachs 11,16210,639 Energisa SA (Unit) Morgan Stanley (532)(2,675) Eneva SA Goldman Sachs (3,512)
(20,556) Eneva SA Morgan Stanley (8,920)(6,639) Equatorial Energia SA HSBC 3974,120 Ez Tec Empreendimentos e
Participacoes SA HSBC 5,7393,850 Ez Tec Empreendimentos e
Participacoes SA Morgan Stanley 1,6067,481 Fleury SA Morgan Stanley 1,563
(37,505) Gerdau SA (Pref) Morgan Stanley (14,968)(6,691) Grendene SA HSBC (1,216)
(11,786) Grendene SA Morgan Stanley (1,725)(6,262) Grupo SBF SA Goldman Sachs (6,613)(9,652) Grupo SBF SA Morgan Stanley (6,824)22,278 Guararapes Confeccoes SA Goldman Sachs 14,72338,872 Guararapes Confeccoes SA HSBC 21,78636,403 Guararapes Confeccoes SA Morgan Stanley 12,140(6,892) Hapvida Participacoes e
Investimentos SA Goldman Sachs (12,680)(30,859) Hapvida Participacoes e
Investimentos SA HSBC (33,575)(12,150) Hapvida Participacoes e
Investimentos SA Morgan Stanley (6,327)(3,369) Iguatemi Empresa de
Shopping Centers SA Morgan Stanley (774)3,339 Instituto Hermes Pardini SA HSBC 519
192,177 International Meal CoAlimentacao SA ’A’ Goldman Sachs 42,407
40,908 International Meal CoAlimentacao SA ’A’ HSBC 7,097
83,379 International Meal CoAlimentacao SA ’A’ Morgan Stanley 14,522
BlackRock Americas Diversified Equity Absolute Return Fundcontinued
The notes on pages 691 to 711 form an integral part of these financial statements.
Annual report and audited financial statements [59]
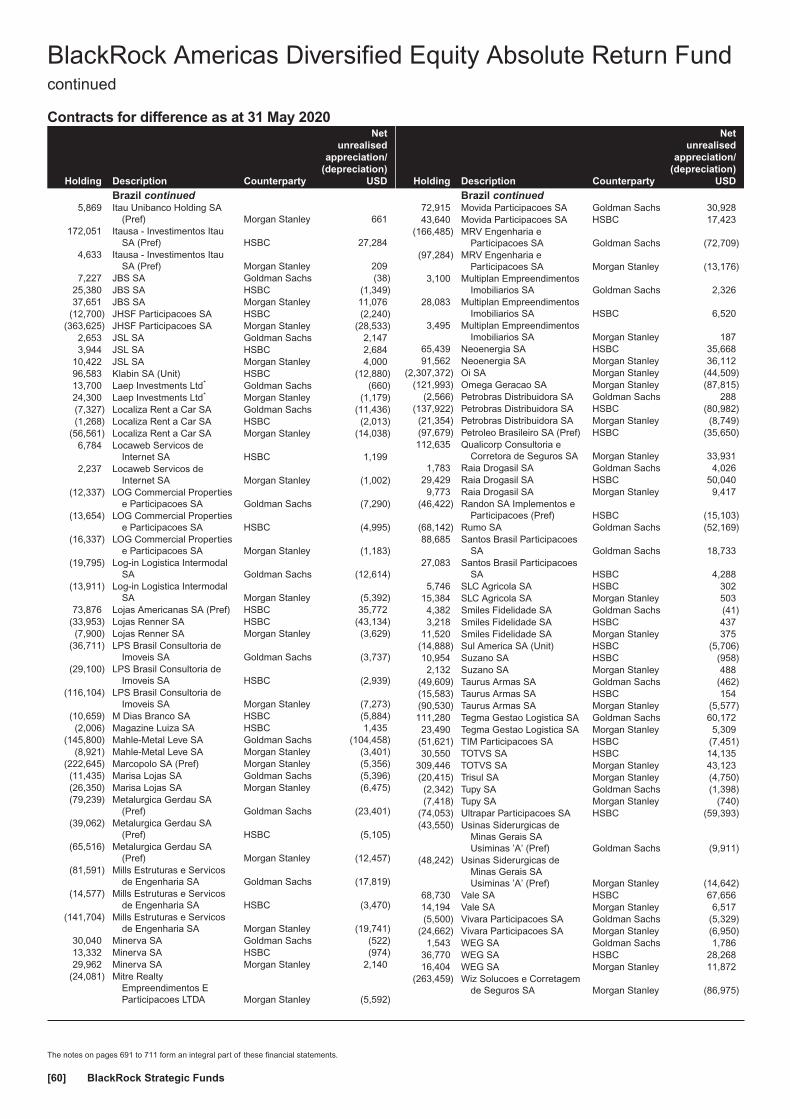
Contracts for difference as at 31 May 2020
Holding Description Counterparty
Netunrealised
appreciation/(depreciation)
USD
Brazil continued5,869 Itau Unibanco Holding SA
(Pref) Morgan Stanley 661172,051 Itausa - Investimentos Itau
SA (Pref) HSBC 27,2844,633 Itausa - Investimentos Itau
SA (Pref) Morgan Stanley 2097,227 JBS SA Goldman Sachs (38)
25,380 JBS SA HSBC (1,349)37,651 JBS SA Morgan Stanley 11,076
(12,700) JHSF Participacoes SA HSBC (2,240)(363,625) JHSF Participacoes SA Morgan Stanley (28,533)
2,653 JSL SA Goldman Sachs 2,1473,944 JSL SA HSBC 2,684
10,422 JSL SA Morgan Stanley 4,00096,583 Klabin SA (Unit) HSBC (12,880)13,700 Laep Investments Ltd* Goldman Sachs (660)24,300 Laep Investments Ltd* Morgan Stanley (1,179)(7,327) Localiza Rent a Car SA Goldman Sachs (11,436)(1,268) Localiza Rent a Car SA HSBC (2,013)
(56,561) Localiza Rent a Car SA Morgan Stanley (14,038)6,784 Locaweb Servicos de
Internet SA HSBC 1,1992,237 Locaweb Servicos de
Internet SA Morgan Stanley (1,002)(12,337) LOG Commercial Properties
e Participacoes SA Goldman Sachs (7,290)(13,654) LOG Commercial Properties
e Participacoes SA HSBC (4,995)(16,337) LOG Commercial Properties
e Participacoes SA Morgan Stanley (1,183)(19,795) Log-in Logistica Intermodal
SA Goldman Sachs (12,614)(13,911) Log-in Logistica Intermodal
SA Morgan Stanley (5,392)73,876 Lojas Americanas SA (Pref) HSBC 35,772
(33,953) Lojas Renner SA HSBC (43,134)(7,900) Lojas Renner SA Morgan Stanley (3,629)
(36,711) LPS Brasil Consultoria deImoveis SA Goldman Sachs (3,737)
(29,100) LPS Brasil Consultoria deImoveis SA HSBC (2,939)
(116,104) LPS Brasil Consultoria deImoveis SA Morgan Stanley (7,273)
(10,659) M Dias Branco SA HSBC (5,884)(2,006) Magazine Luiza SA HSBC 1,435
(145,800) Mahle-Metal Leve SA Goldman Sachs (104,458)(8,921) Mahle-Metal Leve SA Morgan Stanley (3,401)
(222,645) Marcopolo SA (Pref) Morgan Stanley (5,356)(11,435) Marisa Lojas SA Goldman Sachs (5,396)(26,350) Marisa Lojas SA Morgan Stanley (6,475)(79,239) Metalurgica Gerdau SA
(Pref) Goldman Sachs (23,401)(39,062) Metalurgica Gerdau SA
(Pref) HSBC (5,105)(65,516) Metalurgica Gerdau SA
(Pref) Morgan Stanley (12,457)(81,591) Mills Estruturas e Servicos
de Engenharia SA Goldman Sachs (17,819)(14,577) Mills Estruturas e Servicos
de Engenharia SA HSBC (3,470)(141,704) Mills Estruturas e Servicos
de Engenharia SA Morgan Stanley (19,741)30,040 Minerva SA Goldman Sachs (522)13,332 Minerva SA HSBC (974)29,962 Minerva SA Morgan Stanley 2,140
(24,081) Mitre RealtyEmpreendimentos EParticipacoes LTDA Morgan Stanley (5,592)
Holding Description Counterparty
Netunrealised
appreciation/(depreciation)
USD
Brazil continued72,915 Movida Participacoes SA Goldman Sachs 30,92843,640 Movida Participacoes SA HSBC 17,423
(166,485) MRV Engenharia eParticipacoes SA Goldman Sachs (72,709)
(97,284) MRV Engenharia eParticipacoes SA Morgan Stanley (13,176)
3,100 Multiplan EmpreendimentosImobiliarios SA Goldman Sachs 2,326
28,083 Multiplan EmpreendimentosImobiliarios SA HSBC 6,520
3,495 Multiplan EmpreendimentosImobiliarios SA Morgan Stanley 187
65,439 Neoenergia SA HSBC 35,66891,562 Neoenergia SA Morgan Stanley 36,112
(2,307,372) Oi SA Morgan Stanley (44,509)(121,993) Omega Geracao SA Morgan Stanley (87,815)
(2,566) Petrobras Distribuidora SA Goldman Sachs 288(137,922) Petrobras Distribuidora SA HSBC (80,982)(21,354) Petrobras Distribuidora SA Morgan Stanley (8,749)(97,679) Petroleo Brasileiro SA (Pref) HSBC (35,650)112,635 Qualicorp Consultoria e
Corretora de Seguros SA Morgan Stanley 33,9311,783 Raia Drogasil SA Goldman Sachs 4,026
29,429 Raia Drogasil SA HSBC 50,0409,773 Raia Drogasil SA Morgan Stanley 9,417
(46,422) Randon SA Implementos eParticipacoes (Pref) HSBC (15,103)
(68,142) Rumo SA Goldman Sachs (52,169)88,685 Santos Brasil Participacoes
SA Goldman Sachs 18,73327,083 Santos Brasil Participacoes
SA HSBC 4,2885,746 SLC Agricola SA HSBC 302
15,384 SLC Agricola SA Morgan Stanley 5034,382 Smiles Fidelidade SA Goldman Sachs (41)3,218 Smiles Fidelidade SA HSBC 437
11,520 Smiles Fidelidade SA Morgan Stanley 375(14,888) Sul America SA (Unit) HSBC (5,706)10,954 Suzano SA HSBC (958)2,132 Suzano SA Morgan Stanley 488
(49,609) Taurus Armas SA Goldman Sachs (462)(15,583) Taurus Armas SA HSBC 154(90,530) Taurus Armas SA Morgan Stanley (5,577)111,280 Tegma Gestao Logistica SA Goldman Sachs 60,17223,490 Tegma Gestao Logistica SA Morgan Stanley 5,309
(51,621) TIM Participacoes SA HSBC (7,451)30,550 TOTVS SA HSBC 14,135
309,446 TOTVS SA Morgan Stanley 43,123(20,415) Trisul SA Morgan Stanley (4,750)(2,342) Tupy SA Goldman Sachs (1,398)(7,418) Tupy SA Morgan Stanley (740)
(74,053) Ultrapar Participacoes SA HSBC (59,393)(43,550) Usinas Siderurgicas de
Minas Gerais SAUsiminas ’A’ (Pref) Goldman Sachs (9,911)
(48,242) Usinas Siderurgicas deMinas Gerais SAUsiminas ’A’ (Pref) Morgan Stanley (14,642)
68,730 Vale SA HSBC 67,65614,194 Vale SA Morgan Stanley 6,517(5,500) Vivara Participacoes SA Goldman Sachs (5,329)
(24,662) Vivara Participacoes SA Morgan Stanley (6,950)1,543 WEG SA Goldman Sachs 1,786
36,770 WEG SA HSBC 28,26816,404 WEG SA Morgan Stanley 11,872
(263,459) Wiz Solucoes e Corretagemde Seguros SA Morgan Stanley (86,975)
BlackRock Americas Diversified Equity Absolute Return Fundcontinued
The notes on pages 691 to 711 form an integral part of these financial statements.
BlackRock Strategic Funds[60]

Contracts for difference as at 31 May 2020
Holding Description Counterparty
Netunrealised
appreciation/(depreciation)
USD
Brazil continued(3,152) YDUQS Participacoes SA Goldman Sachs (3,551)(2,730) YDUQS Participacoes SA Morgan Stanley (1,699)
(259,253)
Canada53,301 Absolute Software Corp Goldman Sachs 51,268
(99,161) Advantage Oil & Gas Ltd Goldman Sachs (12,777)(11,516) Advantage Oil & Gas Ltd Morgan Stanley (612)
744 Advanz Pharma Corp Ltd Morgan Stanley (6,576)1,148 Aecon Group Inc Goldman Sachs (309)
34,368 Aecon Group Inc HSBC 6047,373 Aecon Group Inc Morgan Stanley 11,827(2,579) Ag Growth International Inc Goldman Sachs (4,072)(3,987) Ag Growth International Inc HSBC 4,270(5,111) Ag Growth International Inc Morgan Stanley 683
(577) Agnico Eagle Mines Ltd Goldman Sachs 2,892(1,450) Agnico Eagle Mines Ltd HSBC 2,630(1,297) Agnico Eagle Mines Ltd Morgan Stanley 1,719
(20,275) Aimia Inc Goldman Sachs 1,186(12,007) Aimia Inc HSBC (3,958)(49,936) Aimia Inc Morgan Stanley 6,080(12,206) Air Canada Morgan Stanley 6,67633,473 AKITA Drilling Ltd ’A’ Morgan Stanley 2,0627,950 Alacer Gold Corp Goldman Sachs (5,437)1,337 Alacer Gold Corp Morgan Stanley (677)
(6,560) Alamos Gold Inc ’A’ Goldman Sachs 2,303(9,491) Alamos Gold Inc ’A’ Morgan Stanley 747(4,425) Alaris Royalty Corp Goldman Sachs (2,370)(1,644) Alaris Royalty Corp HSBC (163)
143,655 Algonquin Power & UtilitiesCorp Goldman Sachs 114,822
2,997 Algonquin Power & UtilitiesCorp HSBC 1,300
2,220 Algonquin Power & UtilitiesCorp Morgan Stanley 1,188
2,707 Alimentation Couche-TardInc ’B’ Goldman Sachs 6,960
12,928 Alimentation Couche-TardInc ’B’ HSBC 26,127
46,303 Alimentation Couche-TardInc ’B’ Morgan Stanley 45,229
25,139 Allied Properties RealEstate Investment Trust(REIT) Goldman Sachs (3,201)
15,029 Allied Properties RealEstate Investment Trust(REIT) HSBC (21,950)
28,662 Allied Properties RealEstate Investment Trust(REIT) Morgan Stanley (787)
(17,476) AltaGas Ltd Goldman Sachs (1,960)(32,039) AltaGas Ltd HSBC 25,117(21,376) AltaGas Ltd Morgan Stanley 888
478 Altius Minerals Corp Goldman Sachs 30367,499 Altius Minerals Corp Morgan Stanley 10,027(4,533) Altus Group Ltd Goldman Sachs (14,970)(1,331) Altus Group Ltd HSBC (2,433)
(13,496) Altus Group Ltd Morgan Stanley (24,708)5,843 Andlauer Healthcare Group
Inc Goldman Sachs 1,5181,303 Andlauer Healthcare Group
Inc HSBC 5,1182,192 Andlauer Healthcare Group
Inc Morgan Stanley 2932,774 Aptose Biosciences Inc Goldman Sachs (2,133)2,394 Aptose Biosciences Inc HSBC (1,342)
(9,121) ARC Resources Ltd Goldman Sachs (3,716)(34,144) ARC Resources Ltd HSBC (3,975)
Holding Description Counterparty
Netunrealised
appreciation/(depreciation)
USD
Canada continued(39,710) ARC Resources Ltd Morgan Stanley 1,832
8,199 Aritzia Inc Goldman Sachs 21,2098,148 Aritzia Inc HSBC 7,907
18,425 Aritzia Inc Morgan Stanley 20,007(51,144) Artis Real Estate Investment
Trust (REIT) Goldman Sachs (7,884)(6,805) Artis Real Estate Investment
Trust (REIT) HSBC (732)(22,088) Artis Real Estate Investment
Trust (REIT) Morgan Stanley (1,950)(15,307) Atco Ltd ’I’ Goldman Sachs (49,603)(6,693) Atco Ltd ’I’ HSBC (10,139)(6,795) Atco Ltd ’I’ Morgan Stanley (15,792)12,075 Atlantic Power Corp HSBC 2,44588,599 Atlantic Power Corp Morgan Stanley 3,423(5,258) ATS Automation Tooling
Systems Inc Goldman Sachs (1,645)(5,166) ATS Automation Tooling
Systems Inc HSBC 2,424(25,704) ATS Automation Tooling
Systems Inc Morgan Stanley 24,473(809) Aurinia Pharmaceuticals Inc Goldman Sachs 1,603
(2,087) Aurinia Pharmaceuticals Inc Morgan Stanley 2,1983,201 B2Gold Corp Goldman Sachs (155)9,175 B2Gold Corp HSBC (1,110)
23,093 B2Gold Corp Morgan Stanley 463(15,940) Badger Daylighting Ltd HSBC (23,756)(1,603) Badger Daylighting Ltd Morgan Stanley (526)
611 Ballard Power Systems Inc Goldman Sachs 5503,193 Ballard Power Systems Inc Morgan Stanley 2,4131,621 Bank of Montreal Goldman Sachs 8,5303,798 Bank of Montreal HSBC 11,2476,522 Bank of Montreal Morgan Stanley 25,1754,501 Bank of Nova Scotia HSBC 12,1496,311 Bank of Nova Scotia Morgan Stanley 27,159
(12,989) Barrick Gold Corp Goldman Sachs 48,387(935) Barrick Gold Corp Morgan Stanley 1,734
(9,179) Bausch Health Cos Inc Goldman Sachs (23,965)(3,456) Bausch Health Cos Inc HSBC (4,664)(4,629) Bausch Health Cos Inc Morgan Stanley (3,145)
128,778 Baytex Energy Corp Goldman Sachs 7,26697,749 Baytex Energy Corp HSBC 2,79012,029 Baytex Energy Corp Morgan Stanley 15525,511 BCE Inc Goldman Sachs 61,9927,317 BCE Inc HSBC 4,990
60,996 BCE Inc Morgan Stanley 152,8751,858 Bellatrix Exploration Ltd* Morgan Stanley (490)
(1,781) BELLUS Health Inc Goldman Sachs 970(5,305) BELLUS Health Inc Morgan Stanley (216)96,031 Birchcliff Energy Ltd Morgan Stanley 2,463
(53,694) BlackBerry Ltd Goldman Sachs (9,125)(47,434) BlackBerry Ltd Morgan Stanley (2,999)15,799 Boardwalk Real Estate
Investment Trust (REIT) Goldman Sachs 48,6644,419 Boardwalk Real Estate
Investment Trust (REIT) Morgan Stanley 1,298(248,108) Bombardier Inc ’B’ Morgan Stanley 4,668153,318 Bonavista Energy Corp Morgan Stanley 317(31,199) Boralex Inc ’A’ Morgan Stanley (25,031)
5,557 Brookfield AssetManagement Inc ’A’ Goldman Sachs 6,872
172 Brookfield AssetManagement Inc ’A’ HSBC (279)
10,966 Brookfield AssetManagement Inc ’A’ Morgan Stanley 17,021
12,879 Brookfield BusinessPartners LP Goldman Sachs 25,986
BlackRock Americas Diversified Equity Absolute Return Fundcontinued
The notes on pages 691 to 711 form an integral part of these financial statements.
Annual report and audited financial statements [61]
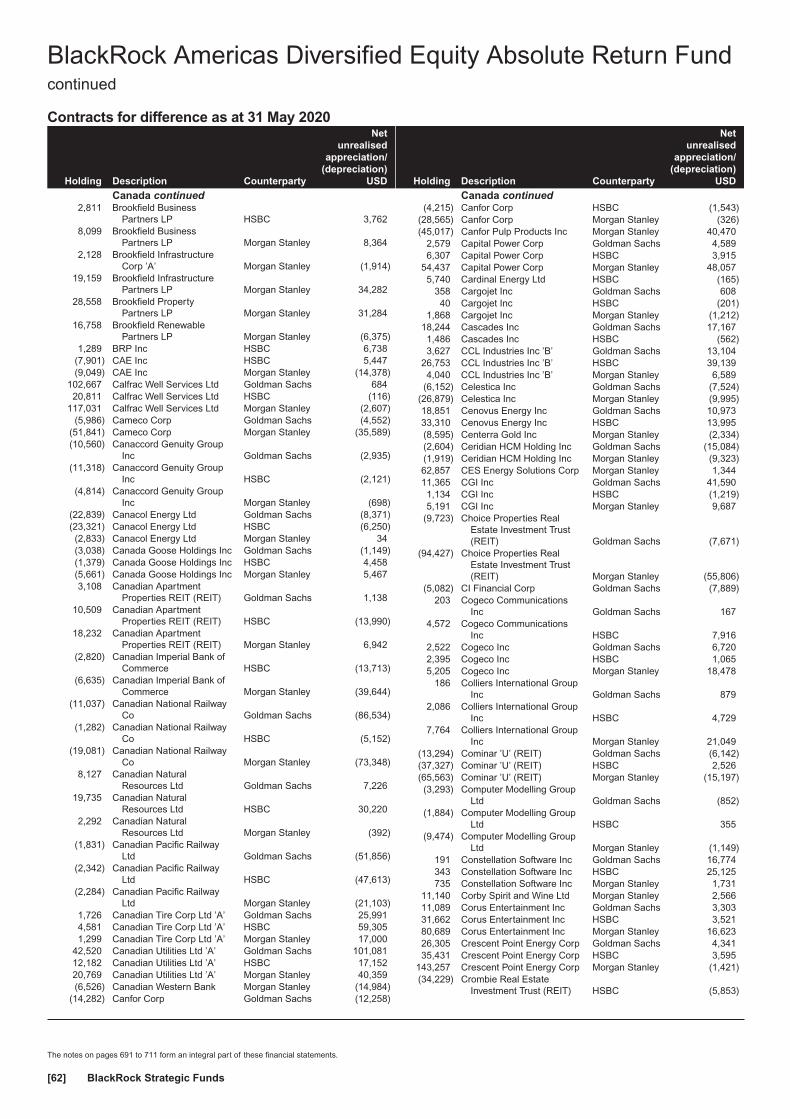
Contracts for difference as at 31 May 2020
Holding Description Counterparty
Netunrealised
appreciation/(depreciation)
USD
Canada continued2,811 Brookfield Business
Partners LP HSBC 3,7628,099 Brookfield Business
Partners LP Morgan Stanley 8,3642,128 Brookfield Infrastructure
Corp ’A’ Morgan Stanley (1,914)19,159 Brookfield Infrastructure
Partners LP Morgan Stanley 34,28228,558 Brookfield Property
Partners LP Morgan Stanley 31,28416,758 Brookfield Renewable
Partners LP Morgan Stanley (6,375)1,289 BRP Inc HSBC 6,738
(7,901) CAE Inc HSBC 5,447(9,049) CAE Inc Morgan Stanley (14,378)
102,667 Calfrac Well Services Ltd Goldman Sachs 68420,811 Calfrac Well Services Ltd HSBC (116)
117,031 Calfrac Well Services Ltd Morgan Stanley (2,607)(5,986) Cameco Corp Goldman Sachs (4,552)
(51,841) Cameco Corp Morgan Stanley (35,589)(10,560) Canaccord Genuity Group
Inc Goldman Sachs (2,935)(11,318) Canaccord Genuity Group
Inc HSBC (2,121)(4,814) Canaccord Genuity Group
Inc Morgan Stanley (698)(22,839) Canacol Energy Ltd Goldman Sachs (8,371)(23,321) Canacol Energy Ltd HSBC (6,250)(2,833) Canacol Energy Ltd Morgan Stanley 34(3,038) Canada Goose Holdings Inc Goldman Sachs (1,149)(1,379) Canada Goose Holdings Inc HSBC 4,458(5,661) Canada Goose Holdings Inc Morgan Stanley 5,4673,108 Canadian Apartment
Properties REIT (REIT) Goldman Sachs 1,13810,509 Canadian Apartment
Properties REIT (REIT) HSBC (13,990)18,232 Canadian Apartment
Properties REIT (REIT) Morgan Stanley 6,942(2,820) Canadian Imperial Bank of
Commerce HSBC (13,713)(6,635) Canadian Imperial Bank of
Commerce Morgan Stanley (39,644)(11,037) Canadian National Railway
Co Goldman Sachs (86,534)(1,282) Canadian National Railway
Co HSBC (5,152)(19,081) Canadian National Railway
Co Morgan Stanley (73,348)8,127 Canadian Natural
Resources Ltd Goldman Sachs 7,22619,735 Canadian Natural
Resources Ltd HSBC 30,2202,292 Canadian Natural
Resources Ltd Morgan Stanley (392)(1,831) Canadian Pacific Railway
Ltd Goldman Sachs (51,856)(2,342) Canadian Pacific Railway
Ltd HSBC (47,613)(2,284) Canadian Pacific Railway
Ltd Morgan Stanley (21,103)1,726 Canadian Tire Corp Ltd ’A’ Goldman Sachs 25,9914,581 Canadian Tire Corp Ltd ’A’ HSBC 59,3051,299 Canadian Tire Corp Ltd ’A’ Morgan Stanley 17,000
42,520 Canadian Utilities Ltd ’A’ Goldman Sachs 101,08112,182 Canadian Utilities Ltd ’A’ HSBC 17,15220,769 Canadian Utilities Ltd ’A’ Morgan Stanley 40,359(6,526) Canadian Western Bank Morgan Stanley (14,984)
(14,282) Canfor Corp Goldman Sachs (12,258)
Holding Description Counterparty
Netunrealised
appreciation/(depreciation)
USD
Canada continued(4,215) Canfor Corp HSBC (1,543)
(28,565) Canfor Corp Morgan Stanley (326)(45,017) Canfor Pulp Products Inc Morgan Stanley 40,470
2,579 Capital Power Corp Goldman Sachs 4,5896,307 Capital Power Corp HSBC 3,915
54,437 Capital Power Corp Morgan Stanley 48,0575,740 Cardinal Energy Ltd HSBC (165)
358 Cargojet Inc Goldman Sachs 60840 Cargojet Inc HSBC (201)
1,868 Cargojet Inc Morgan Stanley (1,212)18,244 Cascades Inc Goldman Sachs 17,1671,486 Cascades Inc HSBC (562)3,627 CCL Industries Inc ’B’ Goldman Sachs 13,104
26,753 CCL Industries Inc ’B’ HSBC 39,1394,040 CCL Industries Inc ’B’ Morgan Stanley 6,589
(6,152) Celestica Inc Goldman Sachs (7,524)(26,879) Celestica Inc Morgan Stanley (9,995)18,851 Cenovus Energy Inc Goldman Sachs 10,97333,310 Cenovus Energy Inc HSBC 13,995(8,595) Centerra Gold Inc Morgan Stanley (2,334)(2,604) Ceridian HCM Holding Inc Goldman Sachs (15,084)(1,919) Ceridian HCM Holding Inc Morgan Stanley (9,323)62,857 CES Energy Solutions Corp Morgan Stanley 1,34411,365 CGI Inc Goldman Sachs 41,5901,134 CGI Inc HSBC (1,219)5,191 CGI Inc Morgan Stanley 9,687
(9,723) Choice Properties RealEstate Investment Trust(REIT) Goldman Sachs (7,671)
(94,427) Choice Properties RealEstate Investment Trust(REIT) Morgan Stanley (55,806)
(5,082) CI Financial Corp Goldman Sachs (7,889)203 Cogeco Communications
Inc Goldman Sachs 1674,572 Cogeco Communications
Inc HSBC 7,9162,522 Cogeco Inc Goldman Sachs 6,7202,395 Cogeco Inc HSBC 1,0655,205 Cogeco Inc Morgan Stanley 18,478
186 Colliers International GroupInc Goldman Sachs 879
2,086 Colliers International GroupInc HSBC 4,729
7,764 Colliers International GroupInc Morgan Stanley 21,049
(13,294) Cominar ’U’ (REIT) Goldman Sachs (6,142)(37,327) Cominar ’U’ (REIT) HSBC 2,526(65,563) Cominar ’U’ (REIT) Morgan Stanley (15,197)(3,293) Computer Modelling Group
Ltd Goldman Sachs (852)(1,884) Computer Modelling Group
Ltd HSBC 355(9,474) Computer Modelling Group
Ltd Morgan Stanley (1,149)191 Constellation Software Inc Goldman Sachs 16,774343 Constellation Software Inc HSBC 25,125735 Constellation Software Inc Morgan Stanley 1,731
11,140 Corby Spirit and Wine Ltd Morgan Stanley 2,56611,089 Corus Entertainment Inc Goldman Sachs 3,30331,662 Corus Entertainment Inc HSBC 3,52180,689 Corus Entertainment Inc Morgan Stanley 16,62326,305 Crescent Point Energy Corp Goldman Sachs 4,34135,431 Crescent Point Energy Corp HSBC 3,595
143,257 Crescent Point Energy Corp Morgan Stanley (1,421)(34,229) Crombie Real Estate
Investment Trust (REIT) HSBC (5,853)
BlackRock Americas Diversified Equity Absolute Return Fundcontinued
The notes on pages 691 to 711 form an integral part of these financial statements.
BlackRock Strategic Funds[62]
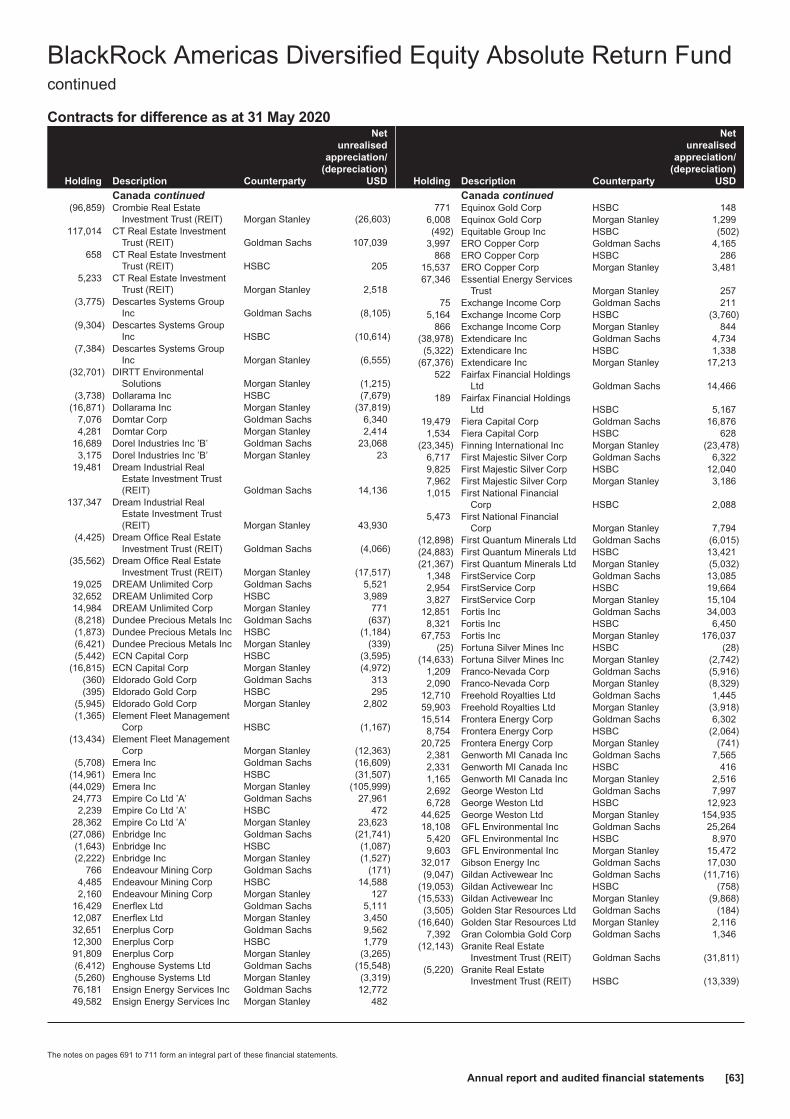
Contracts for difference as at 31 May 2020
Holding Description Counterparty
Netunrealised
appreciation/(depreciation)
USD
Canada continued(96,859) Crombie Real Estate
Investment Trust (REIT) Morgan Stanley (26,603)117,014 CT Real Estate Investment
Trust (REIT) Goldman Sachs 107,039658 CT Real Estate Investment
Trust (REIT) HSBC 2055,233 CT Real Estate Investment
Trust (REIT) Morgan Stanley 2,518(3,775) Descartes Systems Group
Inc Goldman Sachs (8,105)(9,304) Descartes Systems Group
Inc HSBC (10,614)(7,384) Descartes Systems Group
Inc Morgan Stanley (6,555)(32,701) DIRTT Environmental
Solutions Morgan Stanley (1,215)(3,738) Dollarama Inc HSBC (7,679)
(16,871) Dollarama Inc Morgan Stanley (37,819)7,076 Domtar Corp Goldman Sachs 6,3404,281 Domtar Corp Morgan Stanley 2,414
16,689 Dorel Industries Inc ’B’ Goldman Sachs 23,0683,175 Dorel Industries Inc ’B’ Morgan Stanley 23
19,481 Dream Industrial RealEstate Investment Trust(REIT) Goldman Sachs 14,136
137,347 Dream Industrial RealEstate Investment Trust(REIT) Morgan Stanley 43,930
(4,425) Dream Office Real EstateInvestment Trust (REIT) Goldman Sachs (4,066)
(35,562) Dream Office Real EstateInvestment Trust (REIT) Morgan Stanley (17,517)
19,025 DREAM Unlimited Corp Goldman Sachs 5,52132,652 DREAM Unlimited Corp HSBC 3,98914,984 DREAM Unlimited Corp Morgan Stanley 771(8,218) Dundee Precious Metals Inc Goldman Sachs (637)(1,873) Dundee Precious Metals Inc HSBC (1,184)(6,421) Dundee Precious Metals Inc Morgan Stanley (339)(5,442) ECN Capital Corp HSBC (3,595)
(16,815) ECN Capital Corp Morgan Stanley (4,972)(360) Eldorado Gold Corp Goldman Sachs 313(395) Eldorado Gold Corp HSBC 295
(5,945) Eldorado Gold Corp Morgan Stanley 2,802(1,365) Element Fleet Management
Corp HSBC (1,167)(13,434) Element Fleet Management
Corp Morgan Stanley (12,363)(5,708) Emera Inc Goldman Sachs (16,609)
(14,961) Emera Inc HSBC (31,507)(44,029) Emera Inc Morgan Stanley (105,999)24,773 Empire Co Ltd ’A’ Goldman Sachs 27,9612,239 Empire Co Ltd ’A’ HSBC 472
28,362 Empire Co Ltd ’A’ Morgan Stanley 23,623(27,086) Enbridge Inc Goldman Sachs (21,741)(1,643) Enbridge Inc HSBC (1,087)(2,222) Enbridge Inc Morgan Stanley (1,527)
766 Endeavour Mining Corp Goldman Sachs (171)4,485 Endeavour Mining Corp HSBC 14,5882,160 Endeavour Mining Corp Morgan Stanley 127
16,429 Enerflex Ltd Goldman Sachs 5,11112,087 Enerflex Ltd Morgan Stanley 3,45032,651 Enerplus Corp Goldman Sachs 9,56212,300 Enerplus Corp HSBC 1,77991,809 Enerplus Corp Morgan Stanley (3,265)(6,412) Enghouse Systems Ltd Goldman Sachs (15,548)(5,260) Enghouse Systems Ltd Morgan Stanley (3,319)76,181 Ensign Energy Services Inc Goldman Sachs 12,77249,582 Ensign Energy Services Inc Morgan Stanley 482
Holding Description Counterparty
Netunrealised
appreciation/(depreciation)
USD
Canada continued771 Equinox Gold Corp HSBC 148
6,008 Equinox Gold Corp Morgan Stanley 1,299(492) Equitable Group Inc HSBC (502)
3,997 ERO Copper Corp Goldman Sachs 4,165868 ERO Copper Corp HSBC 286
15,537 ERO Copper Corp Morgan Stanley 3,48167,346 Essential Energy Services
Trust Morgan Stanley 25775 Exchange Income Corp Goldman Sachs 211
5,164 Exchange Income Corp HSBC (3,760)866 Exchange Income Corp Morgan Stanley 844
(38,978) Extendicare Inc Goldman Sachs 4,734(5,322) Extendicare Inc HSBC 1,338
(67,376) Extendicare Inc Morgan Stanley 17,213522 Fairfax Financial Holdings
Ltd Goldman Sachs 14,466189 Fairfax Financial Holdings
Ltd HSBC 5,16719,479 Fiera Capital Corp Goldman Sachs 16,8761,534 Fiera Capital Corp HSBC 628
(23,345) Finning International Inc Morgan Stanley (23,478)6,717 First Majestic Silver Corp Goldman Sachs 6,3229,825 First Majestic Silver Corp HSBC 12,0407,962 First Majestic Silver Corp Morgan Stanley 3,1861,015 First National Financial
Corp HSBC 2,0885,473 First National Financial
Corp Morgan Stanley 7,794(12,898) First Quantum Minerals Ltd Goldman Sachs (6,015)(24,883) First Quantum Minerals Ltd HSBC 13,421(21,367) First Quantum Minerals Ltd Morgan Stanley (5,032)
1,348 FirstService Corp Goldman Sachs 13,0852,954 FirstService Corp HSBC 19,6643,827 FirstService Corp Morgan Stanley 15,104
12,851 Fortis Inc Goldman Sachs 34,0038,321 Fortis Inc HSBC 6,450
67,753 Fortis Inc Morgan Stanley 176,037(25) Fortuna Silver Mines Inc HSBC (28)
(14,633) Fortuna Silver Mines Inc Morgan Stanley (2,742)1,209 Franco-Nevada Corp Goldman Sachs (5,916)2,090 Franco-Nevada Corp Morgan Stanley (8,329)
12,710 Freehold Royalties Ltd Goldman Sachs 1,44559,903 Freehold Royalties Ltd Morgan Stanley (3,918)15,514 Frontera Energy Corp Goldman Sachs 6,3028,754 Frontera Energy Corp HSBC (2,064)
20,725 Frontera Energy Corp Morgan Stanley (741)2,381 Genworth MI Canada Inc Goldman Sachs 7,5652,331 Genworth MI Canada Inc HSBC 4161,165 Genworth MI Canada Inc Morgan Stanley 2,5162,692 George Weston Ltd Goldman Sachs 7,9976,728 George Weston Ltd HSBC 12,923
44,625 George Weston Ltd Morgan Stanley 154,93518,108 GFL Environmental Inc Goldman Sachs 25,2645,420 GFL Environmental Inc HSBC 8,9709,603 GFL Environmental Inc Morgan Stanley 15,472
32,017 Gibson Energy Inc Goldman Sachs 17,030(9,047) Gildan Activewear Inc Goldman Sachs (11,716)
(19,053) Gildan Activewear Inc HSBC (758)(15,533) Gildan Activewear Inc Morgan Stanley (9,868)(3,505) Golden Star Resources Ltd Goldman Sachs (184)
(16,640) Golden Star Resources Ltd Morgan Stanley 2,1167,392 Gran Colombia Gold Corp Goldman Sachs 1,346
(12,143) Granite Real EstateInvestment Trust (REIT) Goldman Sachs (31,811)
(5,220) Granite Real EstateInvestment Trust (REIT) HSBC (13,339)
BlackRock Americas Diversified Equity Absolute Return Fundcontinued
The notes on pages 691 to 711 form an integral part of these financial statements.
Annual report and audited financial statements [63]
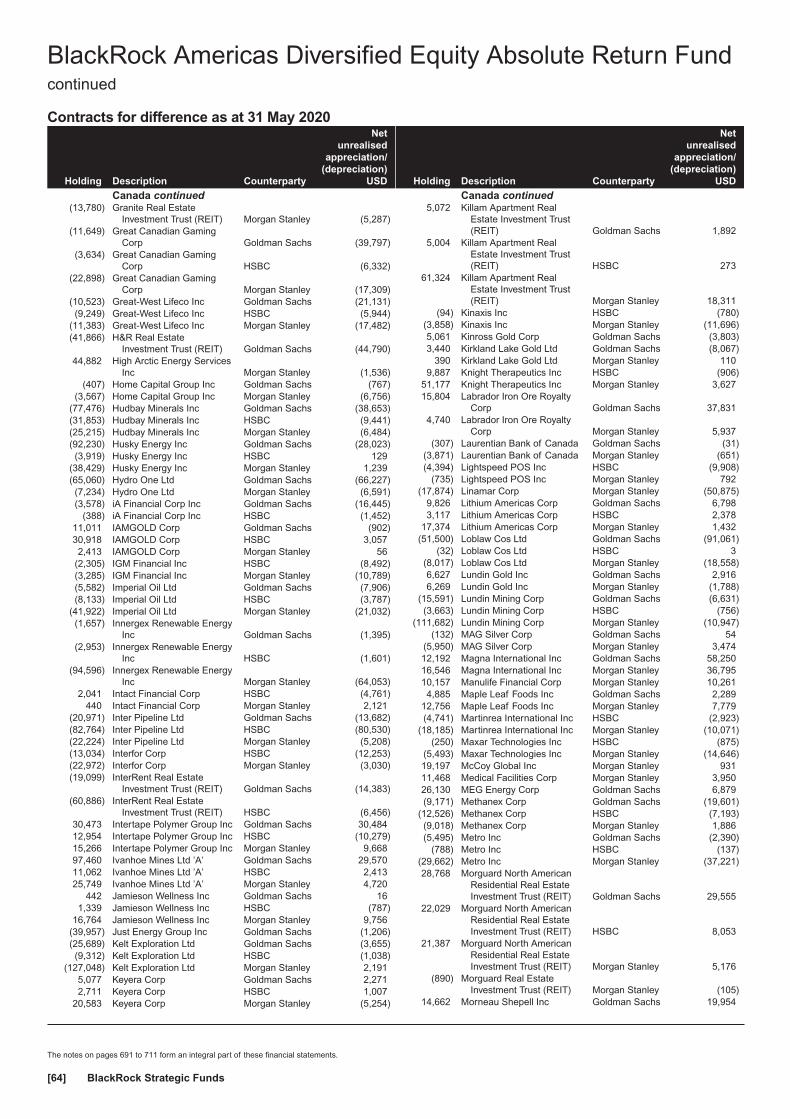
Contracts for difference as at 31 May 2020
Holding Description Counterparty
Netunrealised
appreciation/(depreciation)
USD
Canada continued(13,780) Granite Real Estate
Investment Trust (REIT) Morgan Stanley (5,287)(11,649) Great Canadian Gaming
Corp Goldman Sachs (39,797)(3,634) Great Canadian Gaming
Corp HSBC (6,332)(22,898) Great Canadian Gaming
Corp Morgan Stanley (17,309)(10,523) Great-West Lifeco Inc Goldman Sachs (21,131)(9,249) Great-West Lifeco Inc HSBC (5,944)
(11,383) Great-West Lifeco Inc Morgan Stanley (17,482)(41,866) H&R Real Estate
Investment Trust (REIT) Goldman Sachs (44,790)44,882 High Arctic Energy Services
Inc Morgan Stanley (1,536)(407) Home Capital Group Inc Goldman Sachs (767)
(3,567) Home Capital Group Inc Morgan Stanley (6,756)(77,476) Hudbay Minerals Inc Goldman Sachs (38,653)(31,853) Hudbay Minerals Inc HSBC (9,441)(25,215) Hudbay Minerals Inc Morgan Stanley (6,484)(92,230) Husky Energy Inc Goldman Sachs (28,023)(3,919) Husky Energy Inc HSBC 129
(38,429) Husky Energy Inc Morgan Stanley 1,239(65,060) Hydro One Ltd Goldman Sachs (66,227)(7,234) Hydro One Ltd Morgan Stanley (6,591)(3,578) iA Financial Corp Inc Goldman Sachs (16,445)
(388) iA Financial Corp Inc HSBC (1,452)11,011 IAMGOLD Corp Goldman Sachs (902)30,918 IAMGOLD Corp HSBC 3,0572,413 IAMGOLD Corp Morgan Stanley 56
(2,305) IGM Financial Inc HSBC (8,492)(3,285) IGM Financial Inc Morgan Stanley (10,789)(5,582) Imperial Oil Ltd Goldman Sachs (7,906)(8,133) Imperial Oil Ltd HSBC (3,787)
(41,922) Imperial Oil Ltd Morgan Stanley (21,032)(1,657) Innergex Renewable Energy
Inc Goldman Sachs (1,395)(2,953) Innergex Renewable Energy
Inc HSBC (1,601)(94,596) Innergex Renewable Energy
Inc Morgan Stanley (64,053)2,041 Intact Financial Corp HSBC (4,761)
440 Intact Financial Corp Morgan Stanley 2,121(20,971) Inter Pipeline Ltd Goldman Sachs (13,682)(82,764) Inter Pipeline Ltd HSBC (80,530)(22,224) Inter Pipeline Ltd Morgan Stanley (5,208)(13,034) Interfor Corp HSBC (12,253)(22,972) Interfor Corp Morgan Stanley (3,030)(19,099) InterRent Real Estate
Investment Trust (REIT) Goldman Sachs (14,383)(60,886) InterRent Real Estate
Investment Trust (REIT) HSBC (6,456)30,473 Intertape Polymer Group Inc Goldman Sachs 30,48412,954 Intertape Polymer Group Inc HSBC (10,279)15,266 Intertape Polymer Group Inc Morgan Stanley 9,66897,460 Ivanhoe Mines Ltd ’A’ Goldman Sachs 29,57011,062 Ivanhoe Mines Ltd ’A’ HSBC 2,41325,749 Ivanhoe Mines Ltd ’A’ Morgan Stanley 4,720
442 Jamieson Wellness Inc Goldman Sachs 161,339 Jamieson Wellness Inc HSBC (787)
16,764 Jamieson Wellness Inc Morgan Stanley 9,756(39,957) Just Energy Group Inc Goldman Sachs (1,206)(25,689) Kelt Exploration Ltd Goldman Sachs (3,655)(9,312) Kelt Exploration Ltd HSBC (1,038)
(127,048) Kelt Exploration Ltd Morgan Stanley 2,1915,077 Keyera Corp Goldman Sachs 2,2712,711 Keyera Corp HSBC 1,007
20,583 Keyera Corp Morgan Stanley (5,254)
Holding Description Counterparty
Netunrealised
appreciation/(depreciation)
USD
Canada continued5,072 Killam Apartment Real
Estate Investment Trust(REIT) Goldman Sachs 1,892
5,004 Killam Apartment RealEstate Investment Trust(REIT) HSBC 273
61,324 Killam Apartment RealEstate Investment Trust(REIT) Morgan Stanley 18,311
(94) Kinaxis Inc HSBC (780)(3,858) Kinaxis Inc Morgan Stanley (11,696)5,061 Kinross Gold Corp Goldman Sachs (3,803)3,440 Kirkland Lake Gold Ltd Goldman Sachs (8,067)
390 Kirkland Lake Gold Ltd Morgan Stanley 1109,887 Knight Therapeutics Inc HSBC (906)
51,177 Knight Therapeutics Inc Morgan Stanley 3,62715,804 Labrador Iron Ore Royalty
Corp Goldman Sachs 37,8314,740 Labrador Iron Ore Royalty
Corp Morgan Stanley 5,937(307) Laurentian Bank of Canada Goldman Sachs (31)
(3,871) Laurentian Bank of Canada Morgan Stanley (651)(4,394) Lightspeed POS Inc HSBC (9,908)
(735) Lightspeed POS Inc Morgan Stanley 792(17,874) Linamar Corp Morgan Stanley (50,875)
9,826 Lithium Americas Corp Goldman Sachs 6,7983,117 Lithium Americas Corp HSBC 2,378
17,374 Lithium Americas Corp Morgan Stanley 1,432(51,500) Loblaw Cos Ltd Goldman Sachs (91,061)
(32) Loblaw Cos Ltd HSBC 3(8,017) Loblaw Cos Ltd Morgan Stanley (18,558)6,627 Lundin Gold Inc Goldman Sachs 2,9166,269 Lundin Gold Inc Morgan Stanley (1,788)
(15,591) Lundin Mining Corp Goldman Sachs (6,631)(3,663) Lundin Mining Corp HSBC (756)
(111,682) Lundin Mining Corp Morgan Stanley (10,947)(132) MAG Silver Corp Goldman Sachs 54
(5,950) MAG Silver Corp Morgan Stanley 3,47412,192 Magna International Inc Goldman Sachs 58,25016,546 Magna International Inc Morgan Stanley 36,79510,157 Manulife Financial Corp Morgan Stanley 10,2614,885 Maple Leaf Foods Inc Goldman Sachs 2,289
12,756 Maple Leaf Foods Inc Morgan Stanley 7,779(4,741) Martinrea International Inc HSBC (2,923)
(18,185) Martinrea International Inc Morgan Stanley (10,071)(250) Maxar Technologies Inc HSBC (875)
(5,493) Maxar Technologies Inc Morgan Stanley (14,646)19,197 McCoy Global Inc Morgan Stanley 93111,468 Medical Facilities Corp Morgan Stanley 3,95026,130 MEG Energy Corp Goldman Sachs 6,879(9,171) Methanex Corp Goldman Sachs (19,601)
(12,526) Methanex Corp HSBC (7,193)(9,018) Methanex Corp Morgan Stanley 1,886(5,495) Metro Inc Goldman Sachs (2,390)
(788) Metro Inc HSBC (137)(29,662) Metro Inc Morgan Stanley (37,221)28,768 Morguard North American
Residential Real EstateInvestment Trust (REIT) Goldman Sachs 29,555
22,029 Morguard North AmericanResidential Real EstateInvestment Trust (REIT) HSBC 8,053
21,387 Morguard North AmericanResidential Real EstateInvestment Trust (REIT) Morgan Stanley 5,176
(890) Morguard Real EstateInvestment Trust (REIT) Morgan Stanley (105)
14,662 Morneau Shepell Inc Goldman Sachs 19,954
BlackRock Americas Diversified Equity Absolute Return Fundcontinued
The notes on pages 691 to 711 form an integral part of these financial statements.
BlackRock Strategic Funds[64]
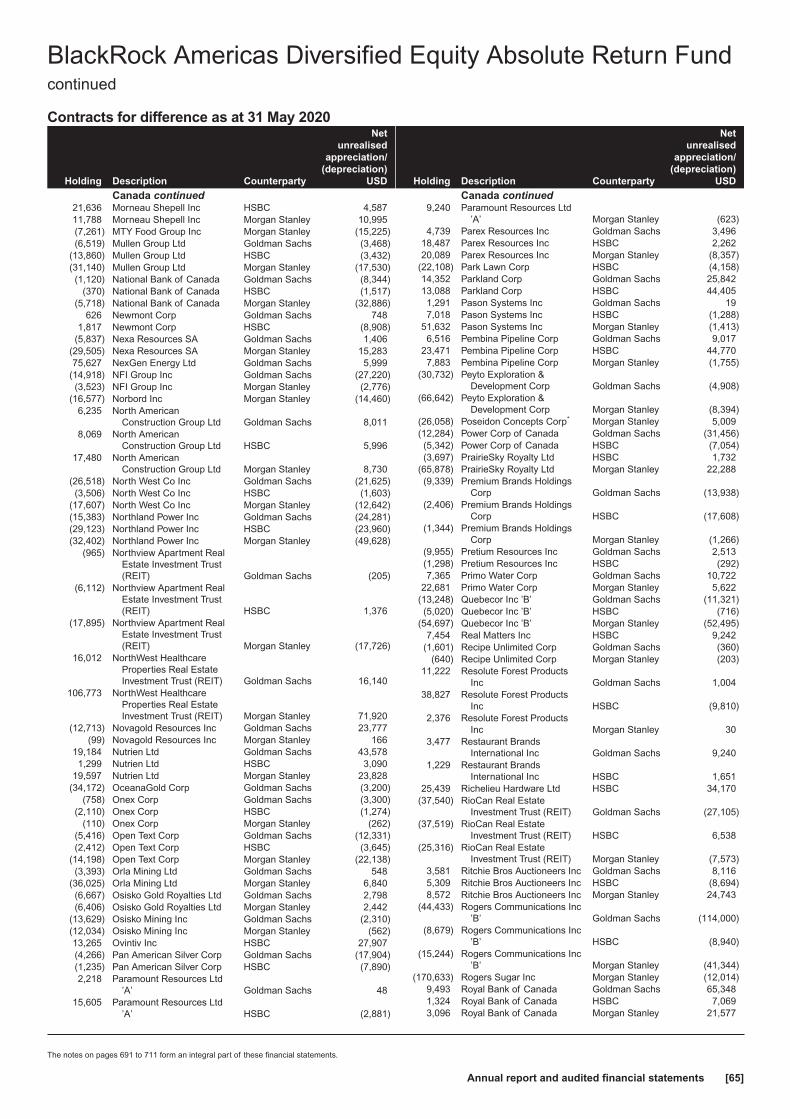
Contracts for difference as at 31 May 2020
Holding Description Counterparty
Netunrealised
appreciation/(depreciation)
USD
Canada continued21,636 Morneau Shepell Inc HSBC 4,58711,788 Morneau Shepell Inc Morgan Stanley 10,995(7,261) MTY Food Group Inc Morgan Stanley (15,225)(6,519) Mullen Group Ltd Goldman Sachs (3,468)
(13,860) Mullen Group Ltd HSBC (3,432)(31,140) Mullen Group Ltd Morgan Stanley (17,530)(1,120) National Bank of Canada Goldman Sachs (8,344)
(370) National Bank of Canada HSBC (1,517)(5,718) National Bank of Canada Morgan Stanley (32,886)
626 Newmont Corp Goldman Sachs 7481,817 Newmont Corp HSBC (8,908)
(5,837) Nexa Resources SA Goldman Sachs 1,406(29,505) Nexa Resources SA Morgan Stanley 15,28375,627 NexGen Energy Ltd Goldman Sachs 5,999
(14,918) NFI Group Inc Goldman Sachs (27,220)(3,523) NFI Group Inc Morgan Stanley (2,776)
(16,577) Norbord Inc Morgan Stanley (14,460)6,235 North American
Construction Group Ltd Goldman Sachs 8,0118,069 North American
Construction Group Ltd HSBC 5,99617,480 North American
Construction Group Ltd Morgan Stanley 8,730(26,518) North West Co Inc Goldman Sachs (21,625)(3,506) North West Co Inc HSBC (1,603)
(17,607) North West Co Inc Morgan Stanley (12,642)(15,383) Northland Power Inc Goldman Sachs (24,281)(29,123) Northland Power Inc HSBC (23,960)(32,402) Northland Power Inc Morgan Stanley (49,628)
(965) Northview Apartment RealEstate Investment Trust(REIT) Goldman Sachs (205)
(6,112) Northview Apartment RealEstate Investment Trust(REIT) HSBC 1,376
(17,895) Northview Apartment RealEstate Investment Trust(REIT) Morgan Stanley (17,726)
16,012 NorthWest HealthcareProperties Real EstateInvestment Trust (REIT) Goldman Sachs 16,140
106,773 NorthWest HealthcareProperties Real EstateInvestment Trust (REIT) Morgan Stanley 71,920
(12,713) Novagold Resources Inc Goldman Sachs 23,777(99) Novagold Resources Inc Morgan Stanley 166
19,184 Nutrien Ltd Goldman Sachs 43,5781,299 Nutrien Ltd HSBC 3,090
19,597 Nutrien Ltd Morgan Stanley 23,828(34,172) OceanaGold Corp Goldman Sachs (3,200)
(758) Onex Corp Goldman Sachs (3,300)(2,110) Onex Corp HSBC (1,274)
(110) Onex Corp Morgan Stanley (262)(5,416) Open Text Corp Goldman Sachs (12,331)(2,412) Open Text Corp HSBC (3,645)
(14,198) Open Text Corp Morgan Stanley (22,138)(3,393) Orla Mining Ltd Goldman Sachs 548
(36,025) Orla Mining Ltd Morgan Stanley 6,840(6,667) Osisko Gold Royalties Ltd Goldman Sachs 2,798(6,406) Osisko Gold Royalties Ltd Morgan Stanley 2,442
(13,629) Osisko Mining Inc Goldman Sachs (2,310)(12,034) Osisko Mining Inc Morgan Stanley (562)13,265 Ovintiv Inc HSBC 27,907(4,266) Pan American Silver Corp Goldman Sachs (17,904)(1,235) Pan American Silver Corp HSBC (7,890)2,218 Paramount Resources Ltd
’A’ Goldman Sachs 4815,605 Paramount Resources Ltd
’A’ HSBC (2,881)
Holding Description Counterparty
Netunrealised
appreciation/(depreciation)
USD
Canada continued9,240 Paramount Resources Ltd
’A’ Morgan Stanley (623)4,739 Parex Resources Inc Goldman Sachs 3,496
18,487 Parex Resources Inc HSBC 2,26220,089 Parex Resources Inc Morgan Stanley (8,357)
(22,108) Park Lawn Corp HSBC (4,158)14,352 Parkland Corp Goldman Sachs 25,84213,088 Parkland Corp HSBC 44,4051,291 Pason Systems Inc Goldman Sachs 197,018 Pason Systems Inc HSBC (1,288)
51,632 Pason Systems Inc Morgan Stanley (1,413)6,516 Pembina Pipeline Corp Goldman Sachs 9,017
23,471 Pembina Pipeline Corp HSBC 44,7707,883 Pembina Pipeline Corp Morgan Stanley (1,755)
(30,732) Peyto Exploration &Development Corp Goldman Sachs (4,908)
(66,642) Peyto Exploration &Development Corp Morgan Stanley (8,394)
(26,058) Poseidon Concepts Corp* Morgan Stanley 5,009(12,284) Power Corp of Canada Goldman Sachs (31,456)(5,342) Power Corp of Canada HSBC (7,054)(3,697) PrairieSky Royalty Ltd HSBC 1,732
(65,878) PrairieSky Royalty Ltd Morgan Stanley 22,288(9,339) Premium Brands Holdings
Corp Goldman Sachs (13,938)(2,406) Premium Brands Holdings
Corp HSBC (17,608)(1,344) Premium Brands Holdings
Corp Morgan Stanley (1,266)(9,955) Pretium Resources Inc Goldman Sachs 2,513(1,298) Pretium Resources Inc HSBC (292)7,365 Primo Water Corp Goldman Sachs 10,722
22,681 Primo Water Corp Morgan Stanley 5,622(13,248) Quebecor Inc ’B’ Goldman Sachs (11,321)(5,020) Quebecor Inc ’B’ HSBC (716)
(54,697) Quebecor Inc ’B’ Morgan Stanley (52,495)7,454 Real Matters Inc HSBC 9,242
(1,601) Recipe Unlimited Corp Goldman Sachs (360)(640) Recipe Unlimited Corp Morgan Stanley (203)
11,222 Resolute Forest ProductsInc Goldman Sachs 1,004
38,827 Resolute Forest ProductsInc HSBC (9,810)
2,376 Resolute Forest ProductsInc Morgan Stanley 30
3,477 Restaurant BrandsInternational Inc Goldman Sachs 9,240
1,229 Restaurant BrandsInternational Inc HSBC 1,651
25,439 Richelieu Hardware Ltd HSBC 34,170(37,540) RioCan Real Estate
Investment Trust (REIT) Goldman Sachs (27,105)(37,519) RioCan Real Estate
Investment Trust (REIT) HSBC 6,538(25,316) RioCan Real Estate
Investment Trust (REIT) Morgan Stanley (7,573)3,581 Ritchie Bros Auctioneers Inc Goldman Sachs 8,1165,309 Ritchie Bros Auctioneers Inc HSBC (8,694)8,572 Ritchie Bros Auctioneers Inc Morgan Stanley 24,743
(44,433) Rogers Communications Inc’B’ Goldman Sachs (114,000)
(8,679) Rogers Communications Inc’B’ HSBC (8,940)
(15,244) Rogers Communications Inc’B’ Morgan Stanley (41,344)
(170,633) Rogers Sugar Inc Morgan Stanley (12,014)9,493 Royal Bank of Canada Goldman Sachs 65,3481,324 Royal Bank of Canada HSBC 7,0693,096 Royal Bank of Canada Morgan Stanley 21,577
BlackRock Americas Diversified Equity Absolute Return Fundcontinued
The notes on pages 691 to 711 form an integral part of these financial statements.
Annual report and audited financial statements [65]
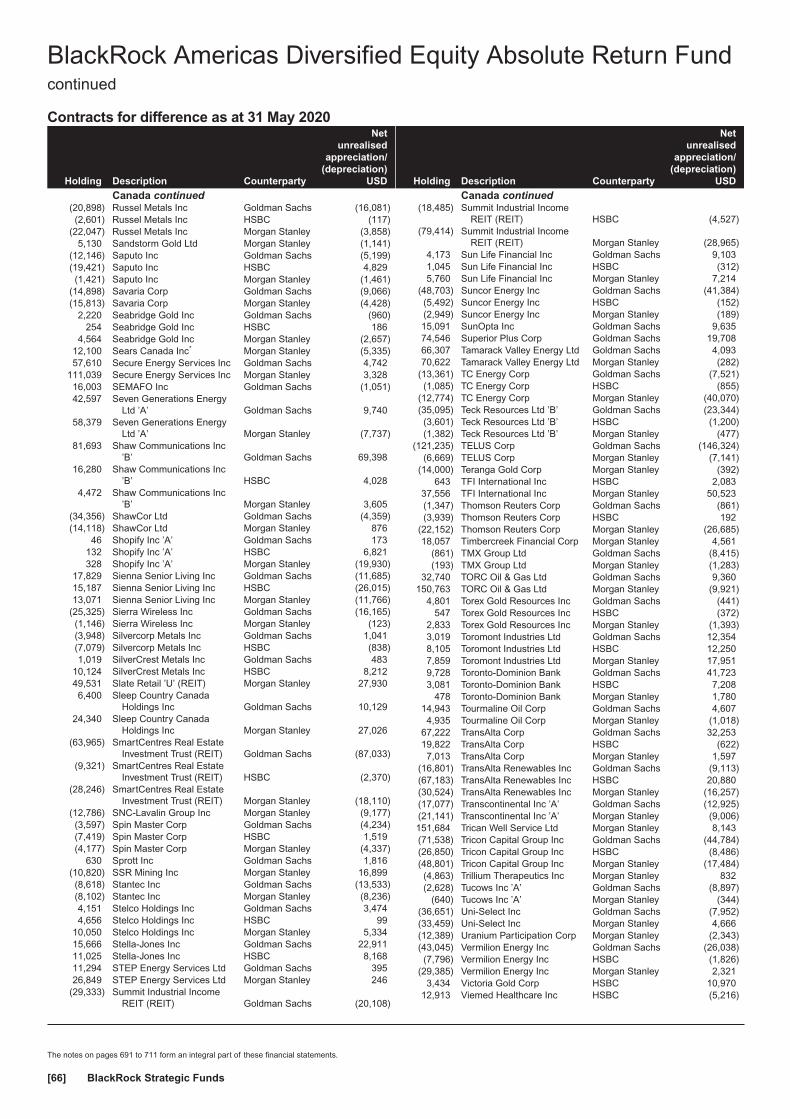
Contracts for difference as at 31 May 2020
Holding Description Counterparty
Netunrealised
appreciation/(depreciation)
USD
Canada continued(20,898) Russel Metals Inc Goldman Sachs (16,081)(2,601) Russel Metals Inc HSBC (117)
(22,047) Russel Metals Inc Morgan Stanley (3,858)5,130 Sandstorm Gold Ltd Morgan Stanley (1,141)
(12,146) Saputo Inc Goldman Sachs (5,199)(19,421) Saputo Inc HSBC 4,829(1,421) Saputo Inc Morgan Stanley (1,461)
(14,898) Savaria Corp Goldman Sachs (9,066)(15,813) Savaria Corp Morgan Stanley (4,428)
2,220 Seabridge Gold Inc Goldman Sachs (960)254 Seabridge Gold Inc HSBC 186
4,564 Seabridge Gold Inc Morgan Stanley (2,657)12,100 Sears Canada Inc* Morgan Stanley (5,335)57,610 Secure Energy Services Inc Goldman Sachs 4,742
111,039 Secure Energy Services Inc Morgan Stanley 3,32816,003 SEMAFO Inc Goldman Sachs (1,051)42,597 Seven Generations Energy
Ltd ’A’ Goldman Sachs 9,74058,379 Seven Generations Energy
Ltd ’A’ Morgan Stanley (7,737)81,693 Shaw Communications Inc
’B’ Goldman Sachs 69,39816,280 Shaw Communications Inc
’B’ HSBC 4,0284,472 Shaw Communications Inc
’B’ Morgan Stanley 3,605(34,356) ShawCor Ltd Goldman Sachs (4,359)(14,118) ShawCor Ltd Morgan Stanley 876
46 Shopify Inc ’A’ Goldman Sachs 173132 Shopify Inc ’A’ HSBC 6,821328 Shopify Inc ’A’ Morgan Stanley (19,930)
17,829 Sienna Senior Living Inc Goldman Sachs (11,685)15,187 Sienna Senior Living Inc HSBC (26,015)13,071 Sienna Senior Living Inc Morgan Stanley (11,766)
(25,325) Sierra Wireless Inc Goldman Sachs (16,165)(1,146) Sierra Wireless Inc Morgan Stanley (123)(3,948) Silvercorp Metals Inc Goldman Sachs 1,041(7,079) Silvercorp Metals Inc HSBC (838)1,019 SilverCrest Metals Inc Goldman Sachs 483
10,124 SilverCrest Metals Inc HSBC 8,21249,531 Slate Retail ’U’ (REIT) Morgan Stanley 27,9306,400 Sleep Country Canada
Holdings Inc Goldman Sachs 10,12924,340 Sleep Country Canada
Holdings Inc Morgan Stanley 27,026(63,965) SmartCentres Real Estate
Investment Trust (REIT) Goldman Sachs (87,033)(9,321) SmartCentres Real Estate
Investment Trust (REIT) HSBC (2,370)(28,246) SmartCentres Real Estate
Investment Trust (REIT) Morgan Stanley (18,110)(12,786) SNC-Lavalin Group Inc Morgan Stanley (9,177)(3,597) Spin Master Corp Goldman Sachs (4,234)(7,419) Spin Master Corp HSBC 1,519(4,177) Spin Master Corp Morgan Stanley (4,337)
630 Sprott Inc Goldman Sachs 1,816(10,820) SSR Mining Inc Morgan Stanley 16,899(8,618) Stantec Inc Goldman Sachs (13,533)(8,102) Stantec Inc Morgan Stanley (8,236)4,151 Stelco Holdings Inc Goldman Sachs 3,4744,656 Stelco Holdings Inc HSBC 99
10,050 Stelco Holdings Inc Morgan Stanley 5,33415,666 Stella-Jones Inc Goldman Sachs 22,91111,025 Stella-Jones Inc HSBC 8,16811,294 STEP Energy Services Ltd Goldman Sachs 39526,849 STEP Energy Services Ltd Morgan Stanley 246
(29,333) Summit Industrial IncomeREIT (REIT) Goldman Sachs (20,108)
Holding Description Counterparty
Netunrealised
appreciation/(depreciation)
USD
Canada continued(18,485) Summit Industrial Income
REIT (REIT) HSBC (4,527)(79,414) Summit Industrial Income
REIT (REIT) Morgan Stanley (28,965)4,173 Sun Life Financial Inc Goldman Sachs 9,1031,045 Sun Life Financial Inc HSBC (312)5,760 Sun Life Financial Inc Morgan Stanley 7,214
(48,703) Suncor Energy Inc Goldman Sachs (41,384)(5,492) Suncor Energy Inc HSBC (152)(2,949) Suncor Energy Inc Morgan Stanley (189)15,091 SunOpta Inc Goldman Sachs 9,63574,546 Superior Plus Corp Goldman Sachs 19,70866,307 Tamarack Valley Energy Ltd Goldman Sachs 4,09370,622 Tamarack Valley Energy Ltd Morgan Stanley (282)
(13,361) TC Energy Corp Goldman Sachs (7,521)(1,085) TC Energy Corp HSBC (855)
(12,774) TC Energy Corp Morgan Stanley (40,070)(35,095) Teck Resources Ltd ’B’ Goldman Sachs (23,344)(3,601) Teck Resources Ltd ’B’ HSBC (1,200)(1,382) Teck Resources Ltd ’B’ Morgan Stanley (477)
(121,235) TELUS Corp Goldman Sachs (146,324)(6,669) TELUS Corp Morgan Stanley (7,141)
(14,000) Teranga Gold Corp Morgan Stanley (392)643 TFI International Inc HSBC 2,083
37,556 TFI International Inc Morgan Stanley 50,523(1,347) Thomson Reuters Corp Goldman Sachs (861)(3,939) Thomson Reuters Corp HSBC 192
(22,152) Thomson Reuters Corp Morgan Stanley (26,685)18,057 Timbercreek Financial Corp Morgan Stanley 4,561
(861) TMX Group Ltd Goldman Sachs (8,415)(193) TMX Group Ltd Morgan Stanley (1,283)
32,740 TORC Oil & Gas Ltd Goldman Sachs 9,360150,763 TORC Oil & Gas Ltd Morgan Stanley (9,921)
4,801 Torex Gold Resources Inc Goldman Sachs (441)547 Torex Gold Resources Inc HSBC (372)
2,833 Torex Gold Resources Inc Morgan Stanley (1,393)3,019 Toromont Industries Ltd Goldman Sachs 12,3548,105 Toromont Industries Ltd HSBC 12,2507,859 Toromont Industries Ltd Morgan Stanley 17,9519,728 Toronto-Dominion Bank Goldman Sachs 41,7233,081 Toronto-Dominion Bank HSBC 7,208
478 Toronto-Dominion Bank Morgan Stanley 1,78014,943 Tourmaline Oil Corp Goldman Sachs 4,6074,935 Tourmaline Oil Corp Morgan Stanley (1,018)
67,222 TransAlta Corp Goldman Sachs 32,25319,822 TransAlta Corp HSBC (622)7,013 TransAlta Corp Morgan Stanley 1,597
(16,801) TransAlta Renewables Inc Goldman Sachs (9,113)(67,183) TransAlta Renewables Inc HSBC 20,880(30,524) TransAlta Renewables Inc Morgan Stanley (16,257)(17,077) Transcontinental Inc ’A’ Goldman Sachs (12,925)(21,141) Transcontinental Inc ’A’ Morgan Stanley (9,006)151,684 Trican Well Service Ltd Morgan Stanley 8,143(71,538) Tricon Capital Group Inc Goldman Sachs (44,784)(26,850) Tricon Capital Group Inc HSBC (8,486)(48,801) Tricon Capital Group Inc Morgan Stanley (17,484)(4,863) Trillium Therapeutics Inc Morgan Stanley 832(2,628) Tucows Inc ’A’ Goldman Sachs (8,897)
(640) Tucows Inc ’A’ Morgan Stanley (344)(36,651) Uni-Select Inc Goldman Sachs (7,952)(33,459) Uni-Select Inc Morgan Stanley 4,666(12,389) Uranium Participation Corp Morgan Stanley (2,343)(43,045) Vermilion Energy Inc Goldman Sachs (26,038)(7,796) Vermilion Energy Inc HSBC (1,826)
(29,385) Vermilion Energy Inc Morgan Stanley 2,3213,434 Victoria Gold Corp HSBC 10,970
12,913 Viemed Healthcare Inc HSBC (5,216)
BlackRock Americas Diversified Equity Absolute Return Fundcontinued
The notes on pages 691 to 711 form an integral part of these financial statements.
BlackRock Strategic Funds[66]
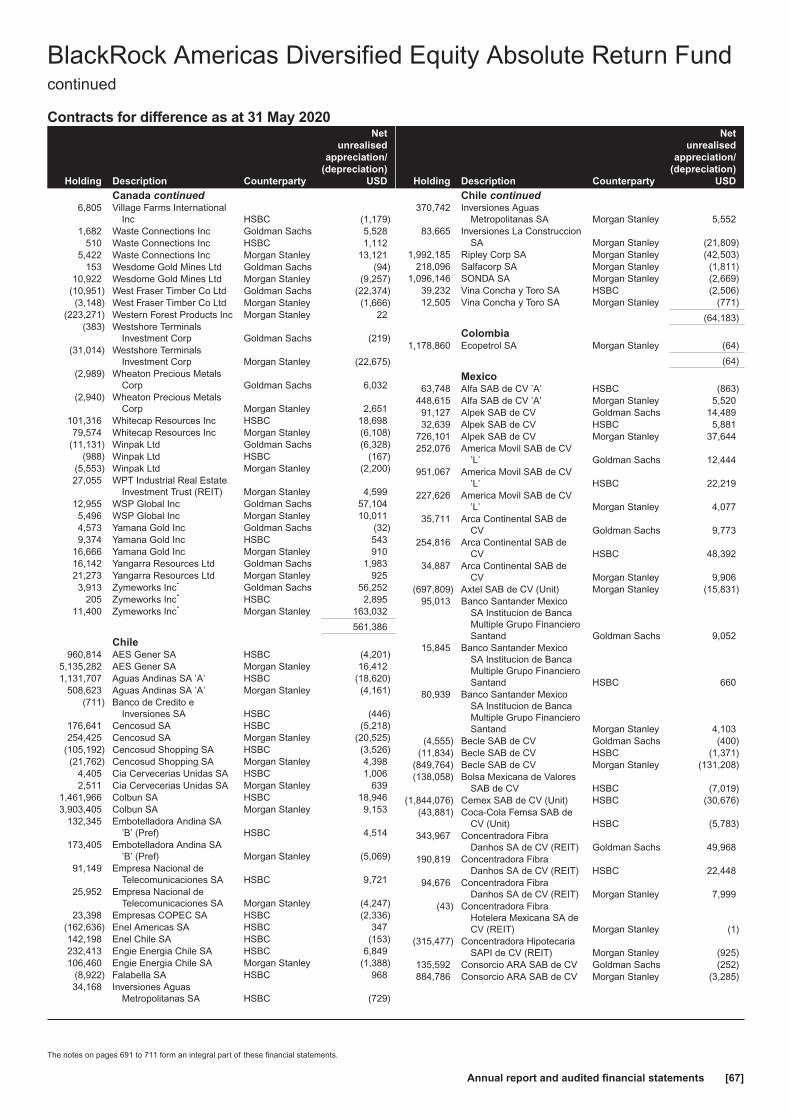
Contracts for difference as at 31 May 2020
Holding Description Counterparty
Netunrealised
appreciation/(depreciation)
USD
Canada continued6,805 Village Farms International
Inc HSBC (1,179)1,682 Waste Connections Inc Goldman Sachs 5,528
510 Waste Connections Inc HSBC 1,1125,422 Waste Connections Inc Morgan Stanley 13,121
153 Wesdome Gold Mines Ltd Goldman Sachs (94)10,922 Wesdome Gold Mines Ltd Morgan Stanley (9,257)
(10,951) West Fraser Timber Co Ltd Goldman Sachs (22,374)(3,148) West Fraser Timber Co Ltd Morgan Stanley (1,666)
(223,271) Western Forest Products Inc Morgan Stanley 22(383) Westshore Terminals
Investment Corp Goldman Sachs (219)(31,014) Westshore Terminals
Investment Corp Morgan Stanley (22,675)(2,989) Wheaton Precious Metals
Corp Goldman Sachs 6,032(2,940) Wheaton Precious Metals
Corp Morgan Stanley 2,651101,316 Whitecap Resources Inc HSBC 18,69879,574 Whitecap Resources Inc Morgan Stanley (6,108)
(11,131) Winpak Ltd Goldman Sachs (6,328)(988) Winpak Ltd HSBC (167)
(5,553) Winpak Ltd Morgan Stanley (2,200)27,055 WPT Industrial Real Estate
Investment Trust (REIT) Morgan Stanley 4,59912,955 WSP Global Inc Goldman Sachs 57,1045,496 WSP Global Inc Morgan Stanley 10,0114,573 Yamana Gold Inc Goldman Sachs (32)9,374 Yamana Gold Inc HSBC 543
16,666 Yamana Gold Inc Morgan Stanley 91016,142 Yangarra Resources Ltd Goldman Sachs 1,98321,273 Yangarra Resources Ltd Morgan Stanley 9253,913 Zymeworks Inc* Goldman Sachs 56,252
205 Zymeworks Inc* HSBC 2,89511,400 Zymeworks Inc* Morgan Stanley 163,032
561,386
Chile960,814 AES Gener SA HSBC (4,201)
5,135,282 AES Gener SA Morgan Stanley 16,4121,131,707 Aguas Andinas SA ’A’ HSBC (18,620)
508,623 Aguas Andinas SA ’A’ Morgan Stanley (4,161)(711) Banco de Credito e
Inversiones SA HSBC (446)176,641 Cencosud SA HSBC (5,218)254,425 Cencosud SA Morgan Stanley (20,525)
(105,192) Cencosud Shopping SA HSBC (3,526)(21,762) Cencosud Shopping SA Morgan Stanley 4,398
4,405 Cia Cervecerias Unidas SA HSBC 1,0062,511 Cia Cervecerias Unidas SA Morgan Stanley 639
1,461,966 Colbun SA HSBC 18,9463,903,405 Colbun SA Morgan Stanley 9,153
132,345 Embotelladora Andina SA’B’ (Pref) HSBC 4,514
173,405 Embotelladora Andina SA’B’ (Pref) Morgan Stanley (5,069)
91,149 Empresa Nacional deTelecomunicaciones SA HSBC 9,721
25,952 Empresa Nacional deTelecomunicaciones SA Morgan Stanley (4,247)
23,398 Empresas COPEC SA HSBC (2,336)(162,636) Enel Americas SA HSBC 347142,198 Enel Chile SA HSBC (153)232,413 Engie Energia Chile SA HSBC 6,849106,460 Engie Energia Chile SA Morgan Stanley (1,388)
(8,922) Falabella SA HSBC 96834,168 Inversiones Aguas
Metropolitanas SA HSBC (729)
Holding Description Counterparty
Netunrealised
appreciation/(depreciation)
USD
Chile continued370,742 Inversiones Aguas
Metropolitanas SA Morgan Stanley 5,55283,665 Inversiones La Construccion
SA Morgan Stanley (21,809)1,992,185 Ripley Corp SA Morgan Stanley (42,503)
218,096 Salfacorp SA Morgan Stanley (1,811)1,096,146 SONDA SA Morgan Stanley (2,669)
39,232 Vina Concha y Toro SA HSBC (2,506)12,505 Vina Concha y Toro SA Morgan Stanley (771)
(64,183)
Colombia1,178,860 Ecopetrol SA Morgan Stanley (64)
(64)
Mexico63,748 Alfa SAB de CV ’A’ HSBC (863)
448,615 Alfa SAB de CV ’A’ Morgan Stanley 5,52091,127 Alpek SAB de CV Goldman Sachs 14,48932,639 Alpek SAB de CV HSBC 5,881
726,101 Alpek SAB de CV Morgan Stanley 37,644252,076 America Movil SAB de CV
’L’ Goldman Sachs 12,444951,067 America Movil SAB de CV
’L’ HSBC 22,219227,626 America Movil SAB de CV
’L’ Morgan Stanley 4,07735,711 Arca Continental SAB de
CV Goldman Sachs 9,773254,816 Arca Continental SAB de
CV HSBC 48,39234,887 Arca Continental SAB de
CV Morgan Stanley 9,906(697,809) Axtel SAB de CV (Unit) Morgan Stanley (15,831)
95,013 Banco Santander MexicoSA Institucion de BancaMultiple Grupo FinancieroSantand Goldman Sachs 9,052
15,845 Banco Santander MexicoSA Institucion de BancaMultiple Grupo FinancieroSantand HSBC 660
80,939 Banco Santander MexicoSA Institucion de BancaMultiple Grupo FinancieroSantand Morgan Stanley 4,103
(4,555) Becle SAB de CV Goldman Sachs (400)(11,834) Becle SAB de CV HSBC (1,371)
(849,764) Becle SAB de CV Morgan Stanley (131,208)(138,058) Bolsa Mexicana de Valores
SAB de CV HSBC (7,019)(1,844,076) Cemex SAB de CV (Unit) HSBC (30,676)
(43,881) Coca-Cola Femsa SAB deCV (Unit) HSBC (5,783)
343,967 Concentradora FibraDanhos SA de CV (REIT) Goldman Sachs 49,968
190,819 Concentradora FibraDanhos SA de CV (REIT) HSBC 22,448
94,676 Concentradora FibraDanhos SA de CV (REIT) Morgan Stanley 7,999
(43) Concentradora FibraHotelera Mexicana SA deCV (REIT) Morgan Stanley (1)
(315,477) Concentradora HipotecariaSAPI de CV (REIT) Morgan Stanley (925)
135,592 Consorcio ARA SAB de CV Goldman Sachs (252)884,786 Consorcio ARA SAB de CV Morgan Stanley (3,285)
BlackRock Americas Diversified Equity Absolute Return Fundcontinued
The notes on pages 691 to 711 form an integral part of these financial statements.
Annual report and audited financial statements [67]

Contracts for difference as at 31 May 2020
Holding Description Counterparty
Netunrealised
appreciation/(depreciation)
USD
Mexico continued(416,061) Controladora Vuela Cia de
Aviacion SAB de CV ’A’ Morgan Stanley (7,410)147,936 Credito Real SAB de CV
SOFOM ER Goldman Sachs 954381,992 Credito Real SAB de CV
SOFOM ER Morgan Stanley (749)17,689 Fibra Uno Administracion
SA de CV (REIT) Goldman Sachs 11932,454 Fibra Uno Administracion
SA de CV (REIT) HSBC 13935,921 Fibra Uno Administracion
SA de CV (REIT) Morgan Stanley (590)77,077 Gentera SAB de CV HSBC (1,845)
117,118 Gentera SAB de CV Morgan Stanley (873)(63,500) Gruma SAB de CV ’B’ HSBC 24,300(1,895) Gruma SAB de CV ’B’ Morgan Stanley (177)
138,794 Grupo Aeromexico SAB deCV Goldman Sachs 904
174,947 Grupo Aeromexico SAB deCV Morgan Stanley 845
39,406 Grupo Aeroportuario delCentro Norte SAB de CV Morgan Stanley 16,614
4,973 Grupo Aeroportuario delPacifico SAB de CV ’B’ HSBC 131
51,893 Grupo Aeroportuario delPacifico SAB de CV ’B’ Morgan Stanley 26,168
69,320 Grupo Bimbo SAB de CV ’A’ Goldman Sachs 5,164122,013 Grupo Bimbo SAB de CV ’A’ HSBC 12,09133,100 Grupo Bimbo SAB de CV ’A’ Morgan Stanley 510
(364,068) Grupo Carso SAB de CV’A1’ HSBC (33,080)
30,815 Grupo Cementos deChihuahua SAB de CV Goldman Sachs 17,590
48,482 Grupo Cementos deChihuahua SAB de CV HSBC 20,567
46,882 Grupo Cementos deChihuahua SAB de CV Morgan Stanley 19,391
32,666 Grupo Comercial ChedrauiSA de CV Morgan Stanley 1,660
(8,107) Grupo Elektra SAB DE CV Goldman Sachs (8,281)(2,833) Grupo Elektra SAB DE CV HSBC (2,364)
(776) Grupo Elektra SAB DE CV Morgan Stanley 482137,689 Grupo Financiero Banorte
SAB de CV ’O’ Morgan Stanley 14,73641,451 Grupo Financiero Inbursa
SAB de CV ’O’ Goldman Sachs 1,70631,419 Grupo Financiero Inbursa
SAB de CV ’O’ Morgan Stanley 1,048(124,157) Grupo GICSA SAB de CV Goldman Sachs (37)(330,808) Grupo GICSA SAB de CV Morgan Stanley (889)(439,836) Grupo Herdez SAB de CV Goldman Sachs (67,960)
(1,110,836) Grupo Lala SAB de CV Morgan Stanley (17,220)(317,875) Grupo Mexico SAB de CV
’B’ HSBC 24,109(134,606) Grupo Rotoplas SAB de CV Goldman Sachs (7,129)(424,193) Grupo Rotoplas SAB de CV Morgan Stanley (4,578)
49,727 Grupo Televisa SAB (Unit) Goldman Sachs 8,09377,581 Grupo Televisa SAB (Unit) HSBC 7,77987,718 Grupo Televisa SAB (Unit) Morgan Stanley 3,088(3,289) Hoteles City Express SAB
de CV Goldman Sachs 37(934,386) Hoteles City Express SAB
de CV Morgan Stanley 10,40422,577 Industrias Bachoco SAB de
CV ’B’ Goldman Sachs 5,8324,941 Industrias Bachoco SAB de
CV ’B’ HSBC 711
Holding Description Counterparty
Netunrealised
appreciation/(depreciation)
USD
Mexico continued99,462 Industrias Bachoco SAB de
CV ’B’ Morgan Stanley 15,901(19,987) Industrias Penoles SAB de
CV HSBC (29,250)(2,558) Industrias Penoles SAB de
CV Morgan Stanley 93(313,571) Infraestructura Energetica
Nova SAB de CV HSBC 123,626(22,887) Infraestructura Energetica
Nova SAB de CV Morgan Stanley (3,778)159,732 Kimberly-Clark de Mexico
SAB de CV ’A’ HSBC 17,750509,953 Kimberly-Clark de Mexico
SAB de CV ’A’ Morgan Stanley 58,077(519,397) La Comer SAB de CV Morgan Stanley (24,966)841,288 Macquarie Mexico Real
Estate Management SAde CV (REIT) Goldman Sachs 99,143
(17,440) Megacable Holdings SABde CV (Unit) HSBC (2,374)
(6,679) Megacable Holdings SABde CV (Unit) Morgan Stanley (370)
(40,785) Nemak SAB de CV HSBC 11(31,680) Nemak SAB de CV Morgan Stanley 825,351 Orbia Advance Corp SAB
de CV Goldman Sachs 2,05827,499 Orbia Advance Corp SAB
de CV Morgan Stanley 3,684280,148 PLA Administradora
Industrial S de RL de CV(REIT) Goldman Sachs 59,167
357,434 PLA AdministradoraIndustrial S de RL de CV(REIT) Morgan Stanley 29,486
359,730 Prologis Property MexicoSA de CV (REIT) Morgan Stanley 18,881
(1,472) Promotora y Operadora deInfraestructura SAB deCV Goldman Sachs (452)
(4,546) Promotora y Operadora deInfraestructura SAB deCV HSBC (402)
58,549 Regional SAB de CV Goldman Sachs 17,24965,919 Regional SAB de CV HSBC 5,69659,044 Regional SAB de CV Morgan Stanley 3,571
(1,368,092) Telesites SAB de CV Morgan Stanley (13,615)(7,400) Unifin Financiera SAB de
CV Goldman Sachs (718)(55,293) Unifin Financiera SAB de
CV Morgan Stanley (2,624)27,639 Wal-Mart de Mexico SAB de
CV HSBC (15)
514,788
Netherlands2,997 uniQure NV Bank of America
Merrill Lynch 15,2552,616 uniQure NV Barclays Bank (732)
932 uniQure NV Goldman Sachs 4,7444,939 uniQure NV HSBC 20,568
39,835
Peru7,452 Tahoe Resources Inc Morgan Stanley 671
671
BlackRock Americas Diversified Equity Absolute Return Fundcontinued
The notes on pages 691 to 711 form an integral part of these financial statements.
BlackRock Strategic Funds[68]

Contracts for difference as at 31 May 2020
Holding Description Counterparty
Netunrealised
appreciation/(depreciation)
USD
United Kingdom(128) Flutter Entertainment Plc HSBC (4,844)
(4,844)
United States(793) 10X Genomics Inc ’A’ Bank of America
Merrill Lynch 1,467(1,492) 10X Genomics Inc ’A’ Barclays Bank (1,865)(1,100) 10X Genomics Inc ’A’ Goldman Sachs 2,0352,365 10X Genomics Inc ’A’ Goldman Sachs (766)
(1,443) 10X Genomics Inc ’A’ HSBC 9,899(2,287) 10X Genomics Inc ’A’ Morgan Stanley (2,859)2,622 10X Genomics Inc ’A’ Morgan Stanley 108
(4,271) 1-800-Flowers.com Inc ’A’ Bank of AmericaMerrill Lynch 2,073
(6,876) 1-800-Flowers.com Inc ’A’ Barclays Bank 11,0905,793 1-800-Flowers.com Inc ’A’ Goldman Sachs 463
(4,158) 1-800-Flowers.com Inc ’A’ Goldman Sachs 2,34530,320 1-800-Flowers.com Inc ’A’ HSBC (12,261)27,151 1-800-Flowers.com Inc ’A’ Morgan Stanley (74,122)6,202 1Life Healthcare Inc Bank of America
Merrill Lynch (14,389)(32,581) 1Life Healthcare Inc Barclays Bank 268,142(4,044) 1Life Healthcare Inc Goldman Sachs 9,38218,620 1Life Healthcare Inc Goldman Sachs (43,198)4,211 1st Constitution Bancorp Bank of America
Merrill Lynch 3,7901,376 1st Constitution Bancorp Barclays Bank 1,087
22,652 1st Constitution Bancorp HSBC (6,116)16,704 1st Constitution Bancorp Morgan Stanley 13,196(2,184) 1st Source Corp Bank of America
Merrill Lynch (12,099)(1,311) 1st Source Corp Barclays Bank (3,658)
(19,920) 1st Source Corp Goldman Sachs (106,363)(19,856) 1st Source Corp HSBC (28,990)(6,558) 1st Source Corp Morgan Stanley (18,297)1,155 2U Inc HSBC (78)8,413 2U Inc Morgan Stanley (18,761)
(4,296) 3D Systems Corp Bank of AmericaMerrill Lynch (1,847)
(29,108) 3D Systems Corp Barclays Bank (2,329)(46,548) 3D Systems Corp Goldman Sachs (20,016)(18,775) 3D Systems Corp HSBC 7,698(18,915) 3D Systems Corp Morgan Stanley (1,513)(5,489) 3M Co Bank of America
Merrill Lynch (74,638)(4,063) 3M Co Barclays Bank (30,571)(7,533) 3M Co Goldman Sachs (97,111)(6,603) 3M Co HSBC (77,872)
(22,853) 3M Co Morgan Stanley (188,537)(10,671) 89bio Inc Barclays Bank (14,619)
(731) 89bio Inc HSBC 2,8003,530 8x8 Inc Bank of America
Merrill Lynch (811)7,200 8x8 Inc Barclays Bank (7,056)
76,307 8x8 Inc HSBC (277,254)50,599 8x8 Inc Morgan Stanley (49,587)78,492 A10 Networks Inc Bank of America
Merrill Lynch 7,84923,452 A10 Networks Inc Goldman Sachs 2,345(4,285) AAON Inc Bank of America
Merrill Lynch (25,067)(3,072) AAON Inc Barclays Bank (5,837)(1,954) AAON Inc Goldman Sachs (11,431)(6,745) AAON Inc HSBC (31,432)(5,120) AAON Inc Morgan Stanley (9,728)1,473 AAR Corp Bank of America
Merrill Lynch 6,6149,513 AAR Corp Barclays Bank 17,219
Holding Description Counterparty
Netunrealised
appreciation/(depreciation)
USD
United States continued16,307 AAR Corp Goldman Sachs 73,2189,580 AAR Corp HSBC 14,657
16,760 AAR Corp Morgan Stanley 30,3363,129 Aaron’s Inc Barclays Bank 6,602(644) Aaron’s Inc Barclays Bank (1,359)
(12,879) Aaron’s Inc Goldman Sachs (61,690)2,185 Aaron’s Inc HSBC 4,751
(3,596) Aaron’s Inc HSBC (1,115)(9,446) Aaron’s Inc Morgan Stanley (19,931)10,643 Aaron’s Inc Morgan Stanley 19,8525,598 Abbott Laboratories Goldman Sachs 15,954
(5,214) Abbott Laboratories Goldman Sachs (15,578)528 Abbott Laboratories HSBC 134
(21,850) Abbott Laboratories HSBC 20,97641,274 Abbott Laboratories Morgan Stanley 52,4189,061 AbbVie Inc Bank of America
Merrill Lynch 1,81324,205 AbbVie Inc Barclays Bank (28,804)24,177 AbbVie Inc Goldman Sachs 4,6973,029 AbbVie Inc Morgan Stanley 3,801
(13,274) Abeona Therapeutics Inc Goldman Sachs (2,257)(31,440) Abeona Therapeutics Inc HSBC (16,663)
(109,590) Abeona Therapeutics Inc Morgan Stanley 1,09669,707 Abercrombie & Fitch Co ’A’ HSBC 77,37525,742 Abercrombie & Fitch Co ’A’ Morgan Stanley (2,832)
(631) ABIOMED Inc Bank of AmericaMerrill Lynch (21,801)
(572) ABIOMED Inc Barclays Bank (7,613)2,450 ABIOMED Inc Barclays Bank 23,663
(2,676) ABIOMED Inc Goldman Sachs (92,456)(1,082) ABIOMED Inc HSBC (35,057)
(755) ABIOMED Inc Morgan Stanley (10,049)(19,817) ABM Industries Inc Bank of America
Merrill Lynch (18,430)(2,186) ABM Industries Inc Barclays Bank 175
(14,931) ABM Industries Inc Goldman Sachs (13,886)(3,118) ABM Industries Inc HSBC 3,118
(47,442) ABM Industries Inc Morgan Stanley 3,795(24,084) Acacia Research Corp Bank of America
Merrill Lynch (7,707)(41,114) Acacia Research Corp Barclays Bank 1,645
(124,485) Acacia Research Corp Goldman Sachs (39,835)(20,774) Acacia Research Corp HSBC (2,285)(44,308) Acacia Research Corp Morgan Stanley 1,772
2,958 Acadia Healthcare Co Inc Bank of AmericaMerrill Lynch 10,915
(4,281) Acadia Healthcare Co Inc Barclays Bank (3,810)1,870 Acadia Healthcare Co Inc Barclays Bank 1,664
(1,531) Acadia Healthcare Co Inc Goldman Sachs (5,649)13,014 Acadia Healthcare Co Inc HSBC 23,708
(17,989) Acadia Healthcare Co Inc Morgan Stanley (16,010)1,648 Acadia Healthcare Co Inc Morgan Stanley 1,467
(4,136) ACADIA PharmaceuticalsInc
Bank of AmericaMerrill Lynch 2,812
2,962 ACADIA PharmaceuticalsInc
Bank of AmericaMerrill Lynch (2,014)
7,701 ACADIA PharmaceuticalsInc Barclays Bank (8,394)
(7,051) ACADIA PharmaceuticalsInc Barclays Bank 7,686
8,060 ACADIA PharmaceuticalsInc Goldman Sachs (5,481)
2,125 ACADIA PharmaceuticalsInc HSBC (1,211)
(2,762) ACADIA PharmaceuticalsInc HSBC 2,234
BlackRock Americas Diversified Equity Absolute Return Fundcontinued
The notes on pages 691 to 711 form an integral part of these financial statements.
Annual report and audited financial statements [69]
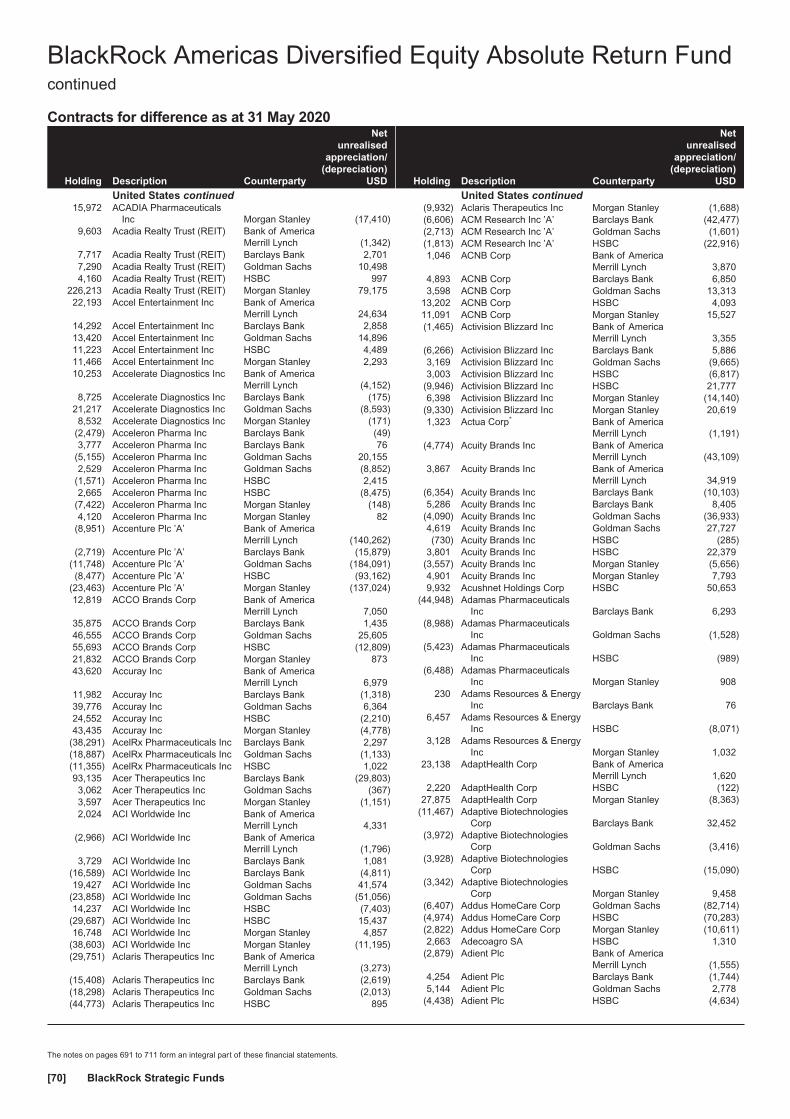
Contracts for difference as at 31 May 2020
Holding Description Counterparty
Netunrealised
appreciation/(depreciation)
USD
United States continued15,972 ACADIA Pharmaceuticals
Inc Morgan Stanley (17,410)9,603 Acadia Realty Trust (REIT) Bank of America
Merrill Lynch (1,342)7,717 Acadia Realty Trust (REIT) Barclays Bank 2,7017,290 Acadia Realty Trust (REIT) Goldman Sachs 10,4984,160 Acadia Realty Trust (REIT) HSBC 997
226,213 Acadia Realty Trust (REIT) Morgan Stanley 79,17522,193 Accel Entertainment Inc Bank of America
Merrill Lynch 24,63414,292 Accel Entertainment Inc Barclays Bank 2,85813,420 Accel Entertainment Inc Goldman Sachs 14,89611,223 Accel Entertainment Inc HSBC 4,48911,466 Accel Entertainment Inc Morgan Stanley 2,29310,253 Accelerate Diagnostics Inc Bank of America
Merrill Lynch (4,152)8,725 Accelerate Diagnostics Inc Barclays Bank (175)
21,217 Accelerate Diagnostics Inc Goldman Sachs (8,593)8,532 Accelerate Diagnostics Inc Morgan Stanley (171)
(2,479) Acceleron Pharma Inc Barclays Bank (49)3,777 Acceleron Pharma Inc Barclays Bank 76
(5,155) Acceleron Pharma Inc Goldman Sachs 20,1552,529 Acceleron Pharma Inc Goldman Sachs (8,852)
(1,571) Acceleron Pharma Inc HSBC 2,4152,665 Acceleron Pharma Inc HSBC (8,475)
(7,422) Acceleron Pharma Inc Morgan Stanley (148)4,120 Acceleron Pharma Inc Morgan Stanley 82
(8,951) Accenture Plc ’A’ Bank of AmericaMerrill Lynch (140,262)
(2,719) Accenture Plc ’A’ Barclays Bank (15,879)(11,748) Accenture Plc ’A’ Goldman Sachs (184,091)(8,477) Accenture Plc ’A’ HSBC (93,162)
(23,463) Accenture Plc ’A’ Morgan Stanley (137,024)12,819 ACCO Brands Corp Bank of America
Merrill Lynch 7,05035,875 ACCO Brands Corp Barclays Bank 1,43546,555 ACCO Brands Corp Goldman Sachs 25,60555,693 ACCO Brands Corp HSBC (12,809)21,832 ACCO Brands Corp Morgan Stanley 87343,620 Accuray Inc Bank of America
Merrill Lynch 6,97911,982 Accuray Inc Barclays Bank (1,318)39,776 Accuray Inc Goldman Sachs 6,36424,552 Accuray Inc HSBC (2,210)43,435 Accuray Inc Morgan Stanley (4,778)
(38,291) AcelRx Pharmaceuticals Inc Barclays Bank 2,297(18,887) AcelRx Pharmaceuticals Inc Goldman Sachs (1,133)(11,355) AcelRx Pharmaceuticals Inc HSBC 1,02293,135 Acer Therapeutics Inc Barclays Bank (29,803)3,062 Acer Therapeutics Inc Goldman Sachs (367)3,597 Acer Therapeutics Inc Morgan Stanley (1,151)2,024 ACI Worldwide Inc Bank of America
Merrill Lynch 4,331(2,966) ACI Worldwide Inc Bank of America
Merrill Lynch (1,796)3,729 ACI Worldwide Inc Barclays Bank 1,081
(16,589) ACI Worldwide Inc Barclays Bank (4,811)19,427 ACI Worldwide Inc Goldman Sachs 41,574
(23,858) ACI Worldwide Inc Goldman Sachs (51,056)14,237 ACI Worldwide Inc HSBC (7,403)
(29,687) ACI Worldwide Inc HSBC 15,43716,748 ACI Worldwide Inc Morgan Stanley 4,857
(38,603) ACI Worldwide Inc Morgan Stanley (11,195)(29,751) Aclaris Therapeutics Inc Bank of America
Merrill Lynch (3,273)(15,408) Aclaris Therapeutics Inc Barclays Bank (2,619)(18,298) Aclaris Therapeutics Inc Goldman Sachs (2,013)(44,773) Aclaris Therapeutics Inc HSBC 895
Holding Description Counterparty
Netunrealised
appreciation/(depreciation)
USD
United States continued(9,932) Aclaris Therapeutics Inc Morgan Stanley (1,688)(6,606) ACM Research Inc ’A’ Barclays Bank (42,477)(2,713) ACM Research Inc ’A’ Goldman Sachs (1,601)(1,813) ACM Research Inc ’A’ HSBC (22,916)1,046 ACNB Corp Bank of America
Merrill Lynch 3,8704,893 ACNB Corp Barclays Bank 6,8503,598 ACNB Corp Goldman Sachs 13,313
13,202 ACNB Corp HSBC 4,09311,091 ACNB Corp Morgan Stanley 15,527(1,465) Activision Blizzard Inc Bank of America
Merrill Lynch 3,355(6,266) Activision Blizzard Inc Barclays Bank 5,8863,169 Activision Blizzard Inc Goldman Sachs (9,665)3,003 Activision Blizzard Inc HSBC (6,817)
(9,946) Activision Blizzard Inc HSBC 21,7776,398 Activision Blizzard Inc Morgan Stanley (14,140)
(9,330) Activision Blizzard Inc Morgan Stanley 20,6191,323 Actua Corp* Bank of America
Merrill Lynch (1,191)(4,774) Acuity Brands Inc Bank of America
Merrill Lynch (43,109)3,867 Acuity Brands Inc Bank of America
Merrill Lynch 34,919(6,354) Acuity Brands Inc Barclays Bank (10,103)5,286 Acuity Brands Inc Barclays Bank 8,405
(4,090) Acuity Brands Inc Goldman Sachs (36,933)4,619 Acuity Brands Inc Goldman Sachs 27,727(730) Acuity Brands Inc HSBC (285)
3,801 Acuity Brands Inc HSBC 22,379(3,557) Acuity Brands Inc Morgan Stanley (5,656)4,901 Acuity Brands Inc Morgan Stanley 7,7939,932 Acushnet Holdings Corp HSBC 50,653
(44,948) Adamas PharmaceuticalsInc Barclays Bank 6,293
(8,988) Adamas PharmaceuticalsInc Goldman Sachs (1,528)
(5,423) Adamas PharmaceuticalsInc HSBC (989)
(6,488) Adamas PharmaceuticalsInc Morgan Stanley 908
230 Adams Resources & EnergyInc Barclays Bank 76
6,457 Adams Resources & EnergyInc HSBC (8,071)
3,128 Adams Resources & EnergyInc Morgan Stanley 1,032
23,138 AdaptHealth Corp Bank of AmericaMerrill Lynch 1,620
2,220 AdaptHealth Corp HSBC (122)27,875 AdaptHealth Corp Morgan Stanley (8,363)
(11,467) Adaptive BiotechnologiesCorp Barclays Bank 32,452
(3,972) Adaptive BiotechnologiesCorp Goldman Sachs (3,416)
(3,928) Adaptive BiotechnologiesCorp HSBC (15,090)
(3,342) Adaptive BiotechnologiesCorp Morgan Stanley 9,458
(6,407) Addus HomeCare Corp Goldman Sachs (82,714)(4,974) Addus HomeCare Corp HSBC (70,283)(2,822) Addus HomeCare Corp Morgan Stanley (10,611)2,663 Adecoagro SA HSBC 1,310
(2,879) Adient Plc Bank of AmericaMerrill Lynch (1,555)
4,254 Adient Plc Barclays Bank (1,744)5,144 Adient Plc Goldman Sachs 2,778
(4,438) Adient Plc HSBC (4,634)
BlackRock Americas Diversified Equity Absolute Return Fundcontinued
The notes on pages 691 to 711 form an integral part of these financial statements.
BlackRock Strategic Funds[70]

Contracts for difference as at 31 May 2020
Holding Description Counterparty
Netunrealised
appreciation/(depreciation)
USD
United States continued8,794 Adient Plc HSBC (9,665)
(34,884) ADMA Biologics Inc Bank of AmericaMerrill Lynch (20,930)
(38,942) ADMA Biologics Inc Goldman Sachs (23,365)(26,311) ADMA Biologics Inc HSBC (21,180)
299 Adobe Inc Bank of AmericaMerrill Lynch 2,767
1,124 Adobe Inc Barclays Bank (2,866)4,344 Adobe Inc HSBC 67,790
15,131 Adobe Inc Morgan Stanley (38,584)42,463 ADT Inc Bank of America
Merrill Lynch 42,03923,596 ADT Inc Barclays Bank 11,56251,121 ADT Inc Goldman Sachs 50,60940,356 ADT Inc Morgan Stanley 19,774
(53,707) Adtalem Global EducationInc
Bank of AmericaMerrill Lynch (45,381)
(13,743) Adtalem Global EducationInc Barclays Bank 1,787
(6,095) Adtalem Global EducationInc Goldman Sachs (5,607)
(35,891) Adtalem Global EducationInc HSBC 54,254
(13,873) Adtalem Global EducationInc Morgan Stanley 1,803
3,761 ADTRAN Inc Barclays Bank (1,204)8,845 ADTRAN Inc Goldman Sachs 4,246
32,969 ADTRAN Inc HSBC (16,649)11,145 ADTRAN Inc Morgan Stanley (3,566)9,201 Aduro Biotech Inc Barclays Bank 92
14,922 Aduro Biotech Inc Goldman Sachs 4,62623,328 Aduro Biotech Inc Morgan Stanley 233(7,055) Advance Auto Parts Inc Bank of America
Merrill Lynch (76,617)(489) Advance Auto Parts Inc Barclays Bank (1,682)
(4,042) Advance Auto Parts Inc Goldman Sachs (43,896)(5,869) Advance Auto Parts Inc HSBC (70,838)
(10,484) Advance Auto Parts Inc Morgan Stanley (36,065)6,610 Advanced Drainage
Systems IncBank of AmericaMerrill Lynch 23,110
1,906 Advanced DrainageSystems Inc Barclays Bank (1,734)
10,502 Advanced DrainageSystems Inc Goldman Sachs 51,901
21,692 Advanced DrainageSystems Inc HSBC 61,824
47,955 Advanced DrainageSystems Inc Morgan Stanley (43,639)
(16,383) AdvancedEmissions Solutions Inc
Bank of AmericaMerrill Lynch (3,113)
(45,011) AdvancedEmissions Solutions Inc Barclays Bank 450
(2,280) AdvancedEmissions Solutions Inc Goldman Sachs (433)
(16,175) AdvancedEmissions Solutions Inc HSBC 39,144
(69,868) AdvancedEmissions Solutions Inc Morgan Stanley 699
1,989 Advanced Energy IndustriesInc Barclays Bank 6,424
3,530 Advanced Energy IndustriesInc Goldman Sachs 24,992
(5,177) Advanced Energy IndustriesInc HSBC (13,098)
11,361 Advanced Energy IndustriesInc HSBC 28,743
(3,800) Advanced Energy IndustriesInc Morgan Stanley (12,274)
Holding Description Counterparty
Netunrealised
appreciation/(depreciation)
USD
United States continued18,943 Advanced Energy Industries
Inc Morgan Stanley 61,186(15,571) Advanced Micro Devices Inc Barclays Bank 35,813(8,307) Advanced Micro Devices Inc Goldman Sachs 11,048(6,963) Advanced Micro Devices Inc HSBC 2,228
(10,803) Advanced Micro Devices Inc Morgan Stanley 24,84718,952 Advanced Micro Devices Inc Morgan Stanley 8,410
(32,395) AdvanSix Inc HSBC (1,620)(6,646) AdvanSix Inc Morgan Stanley (3,921)(6,511) Adverum Biotechnologies
IncBank of AmericaMerrill Lynch (4,493)
(6,166) Adverum BiotechnologiesInc Goldman Sachs (4,255)
(19,374) Adverum BiotechnologiesInc HSBC 15,499
(1,773) Adverum BiotechnologiesInc Morgan Stanley 3,138
8,915 AECOM Bank of AmericaMerrill Lynch 58,572
(5,713) AECOM Bank of AmericaMerrill Lynch (37,534)
1,830 AECOM Barclays Bank 5,069(3,327) AECOM Barclays Bank (9,216)3,066 AECOM Goldman Sachs 20,144
10,461 AECOM HSBC 25,629(8,027) AECOM HSBC (19,666)17,432 AECOM Morgan Stanley 48,287
(15,383) AECOM Morgan Stanley (42,611)(81,580) Aegion Corp Bank of America
Merrill Lynch (171,318)(10,918) Aegion Corp HSBC (2,511)(9,647) Aegion Corp Morgan Stanley (1,833)3,220 Aeglea BioTherapeutics Inc Bank of America
Merrill Lynch 5,34515,955 Aeglea BioTherapeutics Inc Goldman Sachs 26,4855,024 Aeglea BioTherapeutics Inc HSBC 2,663
19,844 Aeglea BioTherapeutics Inc Morgan Stanley (2,183)(5,065) AerCap Holdings NV Barclays Bank (16,208)(7,040) AerCap Holdings NV Goldman Sachs (27,629)(2,768) AerCap Holdings NV HSBC (4,373)
(26,785) AerCap Holdings NV Morgan Stanley (85,712)4,610 Aerie Pharmaceuticals Inc Bank of America
Merrill Lynch (2,881)24,881 Aerie Pharmaceuticals Inc Barclays Bank (37,819)11,571 Aerie Pharmaceuticals Inc Goldman Sachs (8,347)10,187 Aerie Pharmaceuticals Inc HSBC (11,973)7,208 Aerie Pharmaceuticals Inc Morgan Stanley (10,956)
(1,254) AeroVironment Inc Bank of AmericaMerrill Lynch (8,189)
(463) AeroVironment Inc Barclays Bank (1,417)(1,262) AeroVironment Inc Goldman Sachs (8,241)(7,035) AeroVironment Inc HSBC (50,230)(7,325) AeroVironment Inc Morgan Stanley (22,415)10,151 Aerpio Pharmaceuticals Inc Bank of America
Merrill Lynch 3,654(120,160) AES Corp Bank of America
Merrill Lynch (72,884)(68,996) AES Corp Goldman Sachs (38,623)(73,287) AES Corp HSBC 14,998(53,506) AES Corp Morgan Stanley (16,052)
3,053 Affiliated Managers GroupInc
Bank of AmericaMerrill Lynch 15,509
817 Affiliated Managers GroupInc Barclays Bank 2,574
1,946 Affiliated Managers GroupInc Goldman Sachs 9,886
BlackRock Americas Diversified Equity Absolute Return Fundcontinued
The notes on pages 691 to 711 form an integral part of these financial statements.
Annual report and audited financial statements [71]
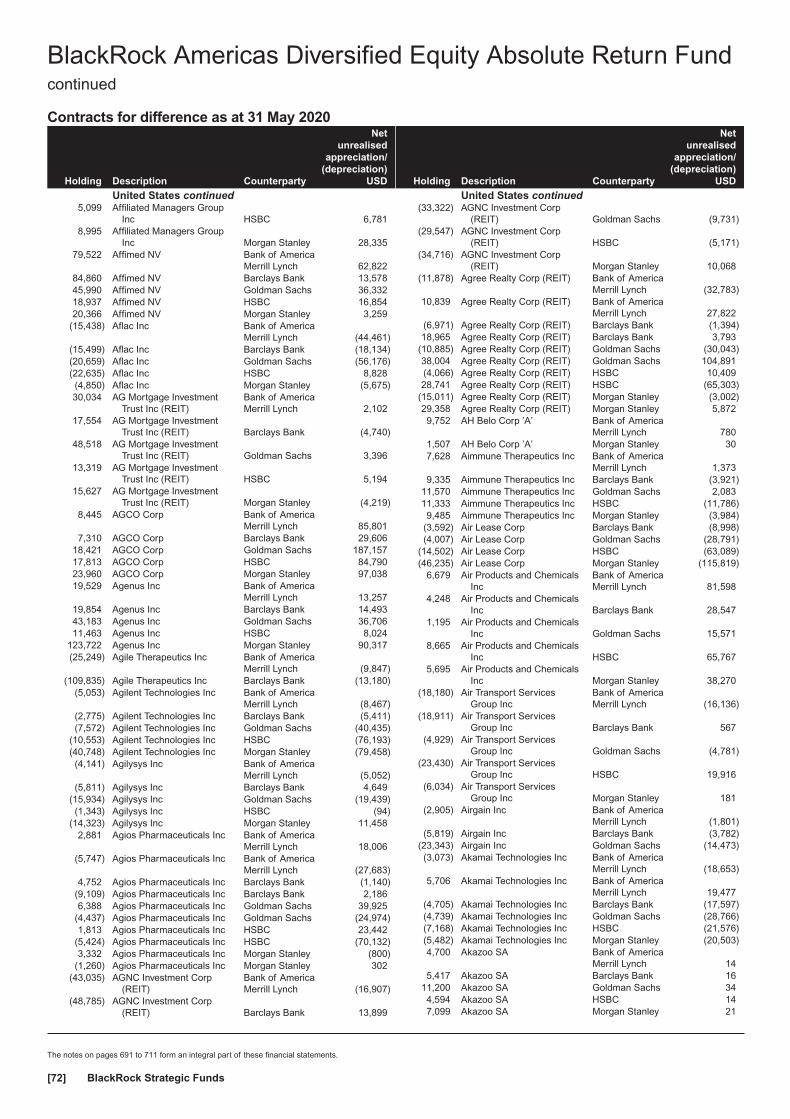
Contracts for difference as at 31 May 2020
Holding Description Counterparty
Netunrealised
appreciation/(depreciation)
USD
United States continued5,099 Affiliated Managers Group
Inc HSBC 6,7818,995 Affiliated Managers Group
Inc Morgan Stanley 28,33579,522 Affimed NV Bank of America
Merrill Lynch 62,82284,860 Affimed NV Barclays Bank 13,57845,990 Affimed NV Goldman Sachs 36,33218,937 Affimed NV HSBC 16,85420,366 Affimed NV Morgan Stanley 3,259
(15,438) Aflac Inc Bank of AmericaMerrill Lynch (44,461)
(15,499) Aflac Inc Barclays Bank (18,134)(20,659) Aflac Inc Goldman Sachs (56,176)(22,635) Aflac Inc HSBC 8,828(4,850) Aflac Inc Morgan Stanley (5,675)30,034 AG Mortgage Investment
Trust Inc (REIT)Bank of AmericaMerrill Lynch 2,102
17,554 AG Mortgage InvestmentTrust Inc (REIT) Barclays Bank (4,740)
48,518 AG Mortgage InvestmentTrust Inc (REIT) Goldman Sachs 3,396
13,319 AG Mortgage InvestmentTrust Inc (REIT) HSBC 5,194
15,627 AG Mortgage InvestmentTrust Inc (REIT) Morgan Stanley (4,219)
8,445 AGCO Corp Bank of AmericaMerrill Lynch 85,801
7,310 AGCO Corp Barclays Bank 29,60618,421 AGCO Corp Goldman Sachs 187,15717,813 AGCO Corp HSBC 84,79023,960 AGCO Corp Morgan Stanley 97,03819,529 Agenus Inc Bank of America
Merrill Lynch 13,25719,854 Agenus Inc Barclays Bank 14,49343,183 Agenus Inc Goldman Sachs 36,70611,463 Agenus Inc HSBC 8,024
123,722 Agenus Inc Morgan Stanley 90,317(25,249) Agile Therapeutics Inc Bank of America
Merrill Lynch (9,847)(109,835) Agile Therapeutics Inc Barclays Bank (13,180)
(5,053) Agilent Technologies Inc Bank of AmericaMerrill Lynch (8,467)
(2,775) Agilent Technologies Inc Barclays Bank (5,411)(7,572) Agilent Technologies Inc Goldman Sachs (40,435)
(10,553) Agilent Technologies Inc HSBC (76,193)(40,748) Agilent Technologies Inc Morgan Stanley (79,458)(4,141) Agilysys Inc Bank of America
Merrill Lynch (5,052)(5,811) Agilysys Inc Barclays Bank 4,649
(15,934) Agilysys Inc Goldman Sachs (19,439)(1,343) Agilysys Inc HSBC (94)
(14,323) Agilysys Inc Morgan Stanley 11,4582,881 Agios Pharmaceuticals Inc Bank of America
Merrill Lynch 18,006(5,747) Agios Pharmaceuticals Inc Bank of America
Merrill Lynch (27,683)4,752 Agios Pharmaceuticals Inc Barclays Bank (1,140)
(9,109) Agios Pharmaceuticals Inc Barclays Bank 2,1866,388 Agios Pharmaceuticals Inc Goldman Sachs 39,925
(4,437) Agios Pharmaceuticals Inc Goldman Sachs (24,974)1,813 Agios Pharmaceuticals Inc HSBC 23,442
(5,424) Agios Pharmaceuticals Inc HSBC (70,132)3,332 Agios Pharmaceuticals Inc Morgan Stanley (800)
(1,260) Agios Pharmaceuticals Inc Morgan Stanley 302(43,035) AGNC Investment Corp
(REIT)Bank of AmericaMerrill Lynch (16,907)
(48,785) AGNC Investment Corp(REIT) Barclays Bank 13,899
Holding Description Counterparty
Netunrealised
appreciation/(depreciation)
USD
United States continued(33,322) AGNC Investment Corp
(REIT) Goldman Sachs (9,731)(29,547) AGNC Investment Corp
(REIT) HSBC (5,171)(34,716) AGNC Investment Corp
(REIT) Morgan Stanley 10,068(11,878) Agree Realty Corp (REIT) Bank of America
Merrill Lynch (32,783)10,839 Agree Realty Corp (REIT) Bank of America
Merrill Lynch 27,822(6,971) Agree Realty Corp (REIT) Barclays Bank (1,394)18,965 Agree Realty Corp (REIT) Barclays Bank 3,793
(10,885) Agree Realty Corp (REIT) Goldman Sachs (30,043)38,004 Agree Realty Corp (REIT) Goldman Sachs 104,891(4,066) Agree Realty Corp (REIT) HSBC 10,40928,741 Agree Realty Corp (REIT) HSBC (65,303)
(15,011) Agree Realty Corp (REIT) Morgan Stanley (3,002)29,358 Agree Realty Corp (REIT) Morgan Stanley 5,8729,752 AH Belo Corp ’A’ Bank of America
Merrill Lynch 7801,507 AH Belo Corp ’A’ Morgan Stanley 307,628 Aimmune Therapeutics Inc Bank of America
Merrill Lynch 1,3739,335 Aimmune Therapeutics Inc Barclays Bank (3,921)
11,570 Aimmune Therapeutics Inc Goldman Sachs 2,08311,333 Aimmune Therapeutics Inc HSBC (11,786)9,485 Aimmune Therapeutics Inc Morgan Stanley (3,984)
(3,592) Air Lease Corp Barclays Bank (8,998)(4,007) Air Lease Corp Goldman Sachs (28,791)
(14,502) Air Lease Corp HSBC (63,089)(46,235) Air Lease Corp Morgan Stanley (115,819)
6,679 Air Products and ChemicalsInc
Bank of AmericaMerrill Lynch 81,598
4,248 Air Products and ChemicalsInc Barclays Bank 28,547
1,195 Air Products and ChemicalsInc Goldman Sachs 15,571
8,665 Air Products and ChemicalsInc HSBC 65,767
5,695 Air Products and ChemicalsInc Morgan Stanley 38,270
(18,180) Air Transport ServicesGroup Inc
Bank of AmericaMerrill Lynch (16,136)
(18,911) Air Transport ServicesGroup Inc Barclays Bank 567
(4,929) Air Transport ServicesGroup Inc Goldman Sachs (4,781)
(23,430) Air Transport ServicesGroup Inc HSBC 19,916
(6,034) Air Transport ServicesGroup Inc Morgan Stanley 181
(2,905) Airgain Inc Bank of AmericaMerrill Lynch (1,801)
(5,819) Airgain Inc Barclays Bank (3,782)(23,343) Airgain Inc Goldman Sachs (14,473)(3,073) Akamai Technologies Inc Bank of America
Merrill Lynch (18,653)5,706 Akamai Technologies Inc Bank of America
Merrill Lynch 19,477(4,705) Akamai Technologies Inc Barclays Bank (17,597)(4,739) Akamai Technologies Inc Goldman Sachs (28,766)(7,168) Akamai Technologies Inc HSBC (21,576)(5,482) Akamai Technologies Inc Morgan Stanley (20,503)4,700 Akazoo SA Bank of America
Merrill Lynch 145,417 Akazoo SA Barclays Bank 16
11,200 Akazoo SA Goldman Sachs 344,594 Akazoo SA HSBC 147,099 Akazoo SA Morgan Stanley 21
BlackRock Americas Diversified Equity Absolute Return Fundcontinued
The notes on pages 691 to 711 form an integral part of these financial statements.
BlackRock Strategic Funds[72]

Contracts for difference as at 31 May 2020
Holding Description Counterparty
Netunrealised
appreciation/(depreciation)
USD
United States continued5,851 Akcea Therapeutics Inc Bank of America
Merrill Lynch (761)16,545 Akcea Therapeutics Inc Barclays Bank 9931,558 Akcea Therapeutics Inc Goldman Sachs (203)2,408 Akcea Therapeutics Inc HSBC (1,830)6,846 Akcea Therapeutics Inc Morgan Stanley 4116,906 Akebia Therapeutics Inc Bank of America
Merrill Lynch (7,528)24,400 Akebia Therapeutics Inc HSBC (15,860)8,682 Akebia Therapeutics Inc Morgan Stanley (7,206)6,996 Akero Therapeutics Inc HSBC 19,7994,307 Akero Therapeutics Inc Morgan Stanley 2,713
(26,815) Akorn Inc Bank of AmericaMerrill Lynch 2,671
(66,256) Akorn Inc Barclays Bank (1,067)(18,503) Akorn Inc Goldman Sachs 1,843(34,700) Akorn Inc Morgan Stanley (559)(41,675) Akoustis Technologies Inc Barclays Bank 31,673(4,969) Akoustis Technologies Inc HSBC 6,286
(446) Alamo Group Inc Bank of AmericaMerrill Lynch (3,388)
(3,152) Alamo Group Inc Barclays Bank (20,267)(6,372) Alamo Group Inc Goldman Sachs (85,519)(5,062) Alamo Group Inc HSBC (13,212)(6,748) Alamo Group Inc Morgan Stanley (43,390)(4,679) Alarm.com Holdings Inc Bank of America
Merrill Lynch 16,4705,658 Alarm.com Holdings Inc Barclays Bank 2,546
21,881 Alarm.com Holdings Inc Goldman Sachs (74,708)7,270 Alarm.com Holdings Inc HSBC (23,555)3,586 Alarm.com Holdings Inc Morgan Stanley 1,6138,144 Alaska Air Group Inc Bank of America
Merrill Lynch 60,897(9,888) Alaska Air Group Inc Bank of America
Merrill Lynch (79,104)10,290 Alaska Air Group Inc Barclays Bank 26,8576,778 Alaska Air Group Inc Goldman Sachs 54,224
(8,659) Alaska Air Group Inc Goldman Sachs (69,272)33,157 Alaska Air Group Inc HSBC 120,360(4,014) Alaska Air Group Inc HSBC (31,355)13,656 Alaska Air Group Inc Morgan Stanley 35,642(2,047) Alaska Air Group Inc Morgan Stanley (5,343)(3,625) Albany International Corp
’A’Bank of AmericaMerrill Lynch (40,709)
(11,667) Albany International Corp’A’ Barclays Bank (65,335)
(12,867) Albany International Corp’A’ Goldman Sachs (141,007)
(9,554) Albany International Corp’A’ HSBC (59,161)
(11,946) Albany International Corp’A’ Morgan Stanley (66,897)
(1,121) Albemarle Corp Bank of AmericaMerrill Lynch (17,499)
(429) Albemarle Corp Barclays Bank (3,797)(1,796) Albemarle Corp Goldman Sachs (28,036)
(10,163) Albemarle Corp HSBC (129,172)6,952 Albemarle Corp HSBC 88,360
(4,977) Albemarle Corp Morgan Stanley (44,046)(11,148) Albireo Pharma Inc Bank of America
Merrill Lynch (10,145)(1,833) Albireo Pharma Inc Barclays Bank (2,475)(5,905) Albireo Pharma Inc Goldman Sachs (5,374)(2,868) Albireo Pharma Inc HSBC (4,245)(1,181) Albireo Pharma Inc Morgan Stanley (1,594)2,369 Alcoa Corp Bank of America
Merrill Lynch 5,94611,722 Alcoa Corp Barclays Bank 11,25326,384 Alcoa Corp Goldman Sachs 66,224
Holding Description Counterparty
Netunrealised
appreciation/(depreciation)
USD
United States continued109,187 Alcoa Corp HSBC 120,10592,832 Alcoa Corp Morgan Stanley 89,1191,527 Alcon Inc Bank of America
Merrill Lynch 11,66612,466 Alcon Inc Barclays Bank 37,532
(25,555) Aldeyra Therapeutics Inc Bank of AmericaMerrill Lynch (16,866)
(3,800) Aldeyra Therapeutics Inc Barclays Bank (3,382)(7,095) Aldeyra Therapeutics Inc Goldman Sachs (4,683)
(38,135) Aldeyra Therapeutics Inc HSBC (88,092)(8,809) Aldeyra Therapeutics Inc Morgan Stanley (7,840)2,480 Alector Inc Bank of America
Merrill Lynch 11,6564,342 Alector Inc Barclays Bank (3,040)2,423 Alector Inc Goldman Sachs 11,3886,958 Alector Inc HSBC 35,9038,248 Alector Inc Morgan Stanley (5,774)4,158 Alerus Financial Corp Bank of America
Merrill Lynch 2,3706,768 Alerus Financial Corp Barclays Bank 1,4895,275 Alerus Financial Corp Goldman Sachs 3,007
19,050 Alerus Financial Corp HSBC 13,71611,802 Alerus Financial Corp Morgan Stanley 2,596
(36,966) Alexander & Baldwin Inc(REIT) HSBC 34,009
(108,393) Alexander & Baldwin Inc(REIT) Morgan Stanley (56,364)
(1,165) Alexander’s Inc (REIT) Bank of AmericaMerrill Lynch (42,161)
(719) Alexander’s Inc (REIT) Barclays Bank (13,913)(2,174) Alexander’s Inc (REIT) Goldman Sachs (78,677)(1,213) Alexander’s Inc (REIT) HSBC (13,063)(2,246) Alexander’s Inc (REIT) Morgan Stanley (43,460)1,278 Alexandria Real Estate
Equities Inc (REIT)Bank of AmericaMerrill Lynch 16,077
11,565 Alexandria Real EstateEquities Inc (REIT) Barclays Bank 80,232
17,760 Alexandria Real EstateEquities Inc (REIT) Goldman Sachs 223,421
1,645 Alexandria Real EstateEquities Inc (REIT) HSBC 13,291
8,182 Alexandria Real EstateEquities Inc (REIT) Morgan Stanley 57,438
992 Alexion Pharmaceuticals Inc Bank of AmericaMerrill Lynch 14,186
(3,081) Alexion Pharmaceuticals Inc Bank of AmericaMerrill Lynch (46,258)
2,647 Alexion Pharmaceuticals Inc Barclays Bank 39,0171,085 Alexion Pharmaceuticals Inc Goldman Sachs 15,516
(5,044) Alexion Pharmaceuticals Inc Goldman Sachs (72,129)1,568 Alexion Pharmaceuticals Inc HSBC 29,635
(2,513) Alexion Pharmaceuticals Inc HSBC (47,496)15,374 Alexion Pharmaceuticals Inc Morgan Stanley 226,613(3,478) Alico Inc Bank of America
Merrill Lynch (12,138)(7,107) Alico Inc Barclays Bank (1,350)(6,898) Alico Inc Goldman Sachs (19,146)(1,436) Alico Inc HSBC (2,958)(3,974) Alico Inc Morgan Stanley (755)
(406) Align Technology Inc Barclays Bank (2,241)(1,832) Align Technology Inc Goldman Sachs (83,521)(1,761) Align Technology Inc HSBC (69,084)(5,195) Align Technology Inc Morgan Stanley (28,677)3,467 Alkermes Plc Bank of America
Merrill Lynch 4,47211,985 Alkermes Plc Barclays Bank (3,596)14,958 Alkermes Plc Goldman Sachs 19,296
(53,385) Alkermes Plc Goldman Sachs 4,31710,167 Alkermes Plc HSBC 15,962
BlackRock Americas Diversified Equity Absolute Return Fundcontinued
The notes on pages 691 to 711 form an integral part of these financial statements.
Annual report and audited financial statements [73]

Contracts for difference as at 31 May 2020
Holding Description Counterparty
Netunrealised
appreciation/(depreciation)
USD
United States continued15,575 Alkermes Plc Morgan Stanley (4,673)(3,179) Allakos Inc Bank of America
Merrill Lynch (10,396)(13,936) Allakos Inc Barclays Bank 76,512(3,167) Allakos Inc HSBC (24,300)
(432) Alleghany Corp Bank of AmericaMerrill Lynch (26,015)
(729) Alleghany Corp Barclays Bank (12,962)903 Alleghany Corp Barclays Bank 16,055
(428) Alleghany Corp Goldman Sachs (25,774)536 Alleghany Corp Goldman Sachs 32,278
(272) Alleghany Corp HSBC 3,1993,105 Alleghany Corp HSBC 33,414(831) Alleghany Corp Morgan Stanley (14,775)
3,038 Alleghany Corp Morgan Stanley 54,016(12,587) Allegheny Technologies Inc Bank of America
Merrill Lynch (19,384)(28,356) Allegheny Technologies Inc Barclays Bank (16,730)(30,898) Allegheny Technologies Inc Goldman Sachs (47,583)(21,998) Allegheny Technologies Inc HSBC (3,300)(40,809) Allegheny Technologies Inc Morgan Stanley (24,077)(4,889) Allegiance Bancshares Inc Bank of America
Merrill Lynch (15,058)(5,065) Allegiance Bancshares Inc Barclays Bank (1,515)
(16,004) Allegiance Bancshares Inc Goldman Sachs (46,728)(20,467) Allegiance Bancshares Inc HSBC (28,566)(15,761) Allegiance Bancshares Inc Morgan Stanley (9,299)
1,787 Allegiant Travel Co Bank of AmericaMerrill Lynch 51,573
(2,194) Allegiant Travel Co Goldman Sachs (55,727)1,031 Allegiant Travel Co Goldman Sachs 29,755
(3,891) Allegiant Travel Co HSBC (112,683)(2,753) Allegiant Travel Co Morgan Stanley (46,443)9,322 Allegion Plc Bank of America
Merrill Lynch 52,3905,870 Allegion Plc Barclays Bank 27,002
33,064 Allegion Plc Goldman Sachs 196,7319,826 Allegion Plc HSBC (15,085)7,630 Allegion Plc Morgan Stanley 35,098
32,601 ALLETE Inc Bank of AmericaMerrill Lynch 249,072
25,099 ALLETE Inc Barclays Bank 94,12220,046 ALLETE Inc Goldman Sachs 149,973
(11,649) ALLETE Inc Goldman Sachs (88,998)14,650 ALLETE Inc HSBC 21,389
(31,776) ALLETE Inc HSBC (46,393)23,855 ALLETE Inc Morgan Stanley 89,456
(47,854) ALLETE Inc Morgan Stanley (179,453)(1,075) Alliance Data Systems Corp Barclays Bank (5,225)(5,746) Alliance Data Systems Corp Goldman Sachs (50,163)2,674 Alliance Data Systems Corp Goldman Sachs 23,344
(2,272) Alliance Data Systems Corp HSBC 613(1,168) Alliance Data Systems Corp Morgan Stanley (5,676)4,543 Alliance Data Systems Corp Morgan Stanley 22,079
19,770 Alliant Energy Corp Barclays Bank 46,65799,400 Alliant Energy Corp Goldman Sachs 277,32640,591 Alliant Energy Corp HSBC 39,362
108,266 Alliant Energy Corp Morgan Stanley 255,508(638) Allied Motion Technologies
Inc Barclays Bank (1,340)(4,791) Allied Motion Technologies
Inc Goldman Sachs (33,824)(5,932) Allied Motion Technologies
Inc HSBC (34,228)(14,504) Allied Motion Technologies
Inc Morgan Stanley (30,458)26,445 Allison Transmission
Holdings IncBank of AmericaMerrill Lynch 88,062
Holding Description Counterparty
Netunrealised
appreciation/(depreciation)
USD
United States continued17,216 Allison Transmission
Holdings Inc Barclays Bank 24,27422,907 Allison Transmission
Holdings Inc Goldman Sachs 76,28028,297 Allison Transmission
Holdings Inc HSBC (9,338)47,599 Allison Transmission
Holdings Inc Morgan Stanley 67,114(20,057) Allogene Therapeutics Inc Barclays Bank 162,349
400 Allogene Therapeutics Inc HSBC 5,7527,808 Allogene Therapeutics Inc Morgan Stanley (64,416)
71,858 Allscripts HealthcareSolutions Inc
Bank of AmericaMerrill Lynch 32,336
46,861 Allscripts HealthcareSolutions Inc Barclays Bank (7,498)
16,898 Allscripts HealthcareSolutions Inc Goldman Sachs 7,604
100,474 Allscripts HealthcareSolutions Inc HSBC (14,066)
144,101 Allscripts HealthcareSolutions Inc Morgan Stanley (23,056)
3,671 Allstate Corp Bank of AmericaMerrill Lynch 6,078
(9,331) Allstate Corp Barclays Bank (19,269)5,676 Allstate Corp Goldman Sachs 4,8854,893 Allstate Corp HSBC (11,810)
(9,243) Allstate Corp HSBC 36,09413,194 Allstate Corp Morgan Stanley 27,246(4,333) Allstate Corp Morgan Stanley (8,948)27,952 Ally Financial Inc Bank of America
Merrill Lynch 68,06448,019 Ally Financial Inc Barclays Bank 85,71424,217 Ally Financial Inc Goldman Sachs 58,96824,304 Ally Financial Inc HSBC 47,0606,705 Ally Financial Inc Morgan Stanley 11,969
(2,978) Alnylam PharmaceuticalsInc Barclays Bank 22,513
(3,167) Alnylam PharmaceuticalsInc Goldman Sachs 15,551
(5,242) Alnylam PharmaceuticalsInc HSBC 16,565
(9,475) Alnylam PharmaceuticalsInc Morgan Stanley 71,631
(10,387) Alpha & OmegaSemiconductor Ltd Barclays Bank (1,870)
(27,937) Alpha & OmegaSemiconductor Ltd Goldman Sachs (26,820)
(5,102) Alpha & OmegaSemiconductor Ltd HSBC 1,837
(10,137) Alpha & OmegaSemiconductor Ltd Morgan Stanley (1,825)
(1,461) Alphabet Inc ’A’ Barclays Bank (23,902)1,766 Alphabet Inc ’A’ Barclays Bank 28,892
214 Alphabet Inc ’A’ Goldman Sachs 42(757) Alphabet Inc ’A’ HSBC (34,262)
(1,192) Alphabet Inc ’A’ Morgan Stanley (19,501)347 Alphabet Inc ’A’ Morgan Stanley 5,677
(5,515) Alphatec Holdings Inc Barclays Bank 938(13,433) Alphatec Holdings Inc Goldman Sachs (2,552)(45,179) Alphatec Holdings Inc Morgan Stanley 7,680(55,234) Alta Equipment Group Inc Bank of America
Merrill Lynch (70,147)(2,497) Altair Engineering Inc ’A’ Bank of America
Merrill Lynch (14,982)(2,463) Altair Engineering Inc ’A’ Barclays Bank (4,827)(1,901) Altair Engineering Inc ’A’ Goldman Sachs (11,406)(2,576) Altair Engineering Inc ’A’ HSBC (10,072)
(33,465) Altair Engineering Inc ’A’ Morgan Stanley (65,591)
BlackRock Americas Diversified Equity Absolute Return Fundcontinued
The notes on pages 691 to 711 form an integral part of these financial statements.
BlackRock Strategic Funds[74]
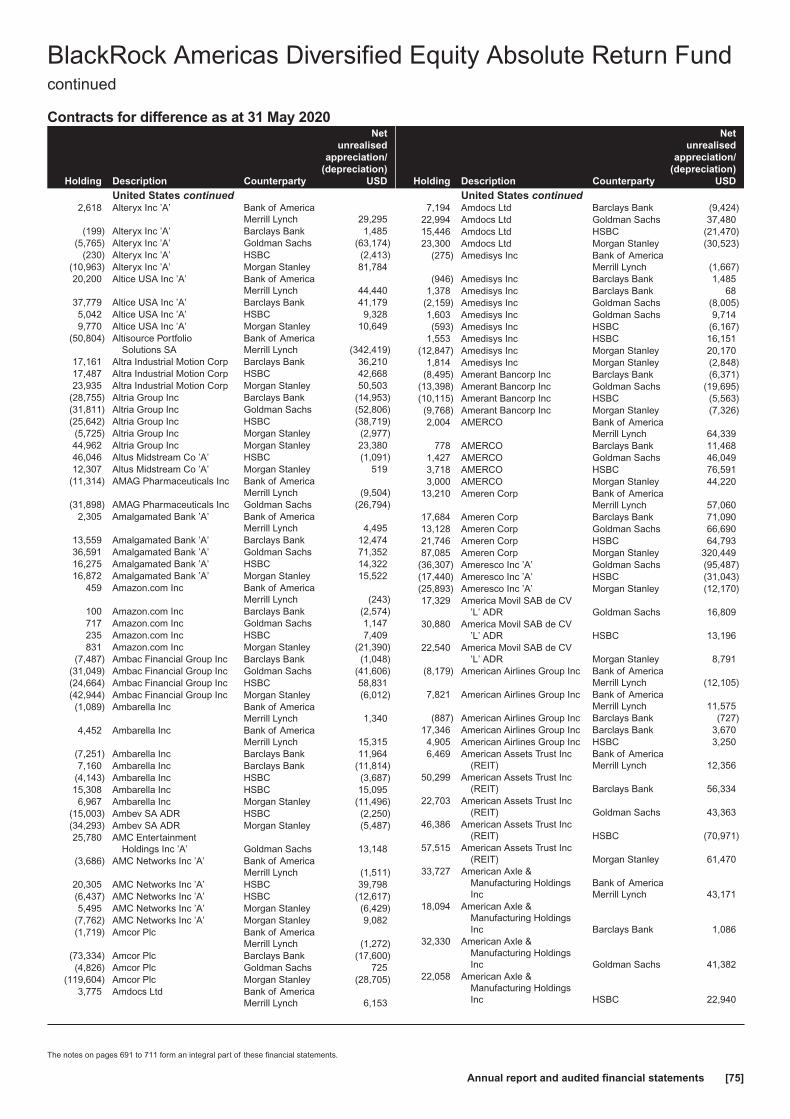
Contracts for difference as at 31 May 2020
Holding Description Counterparty
Netunrealised
appreciation/(depreciation)
USD
United States continued2,618 Alteryx Inc ’A’ Bank of America
Merrill Lynch 29,295(199) Alteryx Inc ’A’ Barclays Bank 1,485
(5,765) Alteryx Inc ’A’ Goldman Sachs (63,174)(230) Alteryx Inc ’A’ HSBC (2,413)
(10,963) Alteryx Inc ’A’ Morgan Stanley 81,78420,200 Altice USA Inc ’A’ Bank of America
Merrill Lynch 44,44037,779 Altice USA Inc ’A’ Barclays Bank 41,1795,042 Altice USA Inc ’A’ HSBC 9,3289,770 Altice USA Inc ’A’ Morgan Stanley 10,649
(50,804) Altisource PortfolioSolutions SA
Bank of AmericaMerrill Lynch (342,419)
17,161 Altra Industrial Motion Corp Barclays Bank 36,21017,487 Altra Industrial Motion Corp HSBC 42,66823,935 Altra Industrial Motion Corp Morgan Stanley 50,503
(28,755) Altria Group Inc Barclays Bank (14,953)(31,811) Altria Group Inc Goldman Sachs (52,806)(25,642) Altria Group Inc HSBC (38,719)(5,725) Altria Group Inc Morgan Stanley (2,977)44,962 Altria Group Inc Morgan Stanley 23,38046,046 Altus Midstream Co ’A’ HSBC (1,091)12,307 Altus Midstream Co ’A’ Morgan Stanley 519
(11,314) AMAG Pharmaceuticals Inc Bank of AmericaMerrill Lynch (9,504)
(31,898) AMAG Pharmaceuticals Inc Goldman Sachs (26,794)2,305 Amalgamated Bank ’A’ Bank of America
Merrill Lynch 4,49513,559 Amalgamated Bank ’A’ Barclays Bank 12,47436,591 Amalgamated Bank ’A’ Goldman Sachs 71,35216,275 Amalgamated Bank ’A’ HSBC 14,32216,872 Amalgamated Bank ’A’ Morgan Stanley 15,522
459 Amazon.com Inc Bank of AmericaMerrill Lynch (243)
100 Amazon.com Inc Barclays Bank (2,574)717 Amazon.com Inc Goldman Sachs 1,147235 Amazon.com Inc HSBC 7,409831 Amazon.com Inc Morgan Stanley (21,390)
(7,487) Ambac Financial Group Inc Barclays Bank (1,048)(31,049) Ambac Financial Group Inc Goldman Sachs (41,606)(24,664) Ambac Financial Group Inc HSBC 58,831(42,944) Ambac Financial Group Inc Morgan Stanley (6,012)(1,089) Ambarella Inc Bank of America
Merrill Lynch 1,3404,452 Ambarella Inc Bank of America
Merrill Lynch 15,315(7,251) Ambarella Inc Barclays Bank 11,9647,160 Ambarella Inc Barclays Bank (11,814)
(4,143) Ambarella Inc HSBC (3,687)15,308 Ambarella Inc HSBC 15,0956,967 Ambarella Inc Morgan Stanley (11,496)
(15,003) Ambev SA ADR HSBC (2,250)(34,293) Ambev SA ADR Morgan Stanley (5,487)25,780 AMC Entertainment
Holdings Inc ’A’ Goldman Sachs 13,148(3,686) AMC Networks Inc ’A’ Bank of America
Merrill Lynch (1,511)20,305 AMC Networks Inc ’A’ HSBC 39,798(6,437) AMC Networks Inc ’A’ HSBC (12,617)5,495 AMC Networks Inc ’A’ Morgan Stanley (6,429)
(7,762) AMC Networks Inc ’A’ Morgan Stanley 9,082(1,719) Amcor Plc Bank of America
Merrill Lynch (1,272)(73,334) Amcor Plc Barclays Bank (17,600)(4,826) Amcor Plc Goldman Sachs 725
(119,604) Amcor Plc Morgan Stanley (28,705)3,775 Amdocs Ltd Bank of America
Merrill Lynch 6,153
Holding Description Counterparty
Netunrealised
appreciation/(depreciation)
USD
United States continued7,194 Amdocs Ltd Barclays Bank (9,424)
22,994 Amdocs Ltd Goldman Sachs 37,48015,446 Amdocs Ltd HSBC (21,470)23,300 Amdocs Ltd Morgan Stanley (30,523)
(275) Amedisys Inc Bank of AmericaMerrill Lynch (1,667)
(946) Amedisys Inc Barclays Bank 1,4851,378 Amedisys Inc Barclays Bank 68
(2,159) Amedisys Inc Goldman Sachs (8,005)1,603 Amedisys Inc Goldman Sachs 9,714(593) Amedisys Inc HSBC (6,167)
1,553 Amedisys Inc HSBC 16,151(12,847) Amedisys Inc Morgan Stanley 20,170
1,814 Amedisys Inc Morgan Stanley (2,848)(8,495) Amerant Bancorp Inc Barclays Bank (6,371)
(13,398) Amerant Bancorp Inc Goldman Sachs (19,695)(10,115) Amerant Bancorp Inc HSBC (5,563)(9,768) Amerant Bancorp Inc Morgan Stanley (7,326)2,004 AMERCO Bank of America
Merrill Lynch 64,339778 AMERCO Barclays Bank 11,468
1,427 AMERCO Goldman Sachs 46,0493,718 AMERCO HSBC 76,5913,000 AMERCO Morgan Stanley 44,220
13,210 Ameren Corp Bank of AmericaMerrill Lynch 57,060
17,684 Ameren Corp Barclays Bank 71,09013,128 Ameren Corp Goldman Sachs 66,69021,746 Ameren Corp HSBC 64,79387,085 Ameren Corp Morgan Stanley 320,449
(36,307) Ameresco Inc ’A’ Goldman Sachs (95,487)(17,440) Ameresco Inc ’A’ HSBC (31,043)(25,893) Ameresco Inc ’A’ Morgan Stanley (12,170)17,329 America Movil SAB de CV
’L’ ADR Goldman Sachs 16,80930,880 America Movil SAB de CV
’L’ ADR HSBC 13,19622,540 America Movil SAB de CV
’L’ ADR Morgan Stanley 8,791(8,179) American Airlines Group Inc Bank of America
Merrill Lynch (12,105)7,821 American Airlines Group Inc Bank of America
Merrill Lynch 11,575(887) American Airlines Group Inc Barclays Bank (727)
17,346 American Airlines Group Inc Barclays Bank 3,6704,905 American Airlines Group Inc HSBC 3,2506,469 American Assets Trust Inc
(REIT)Bank of AmericaMerrill Lynch 12,356
50,299 American Assets Trust Inc(REIT) Barclays Bank 56,334
22,703 American Assets Trust Inc(REIT) Goldman Sachs 43,363
46,386 American Assets Trust Inc(REIT) HSBC (70,971)
57,515 American Assets Trust Inc(REIT) Morgan Stanley 61,470
33,727 American Axle &Manufacturing HoldingsInc
Bank of AmericaMerrill Lynch 43,171
18,094 American Axle &Manufacturing HoldingsInc Barclays Bank 1,086
32,330 American Axle &Manufacturing HoldingsInc Goldman Sachs 41,382
22,058 American Axle &Manufacturing HoldingsInc HSBC 22,940
BlackRock Americas Diversified Equity Absolute Return Fundcontinued
The notes on pages 691 to 711 form an integral part of these financial statements.
Annual report and audited financial statements [75]
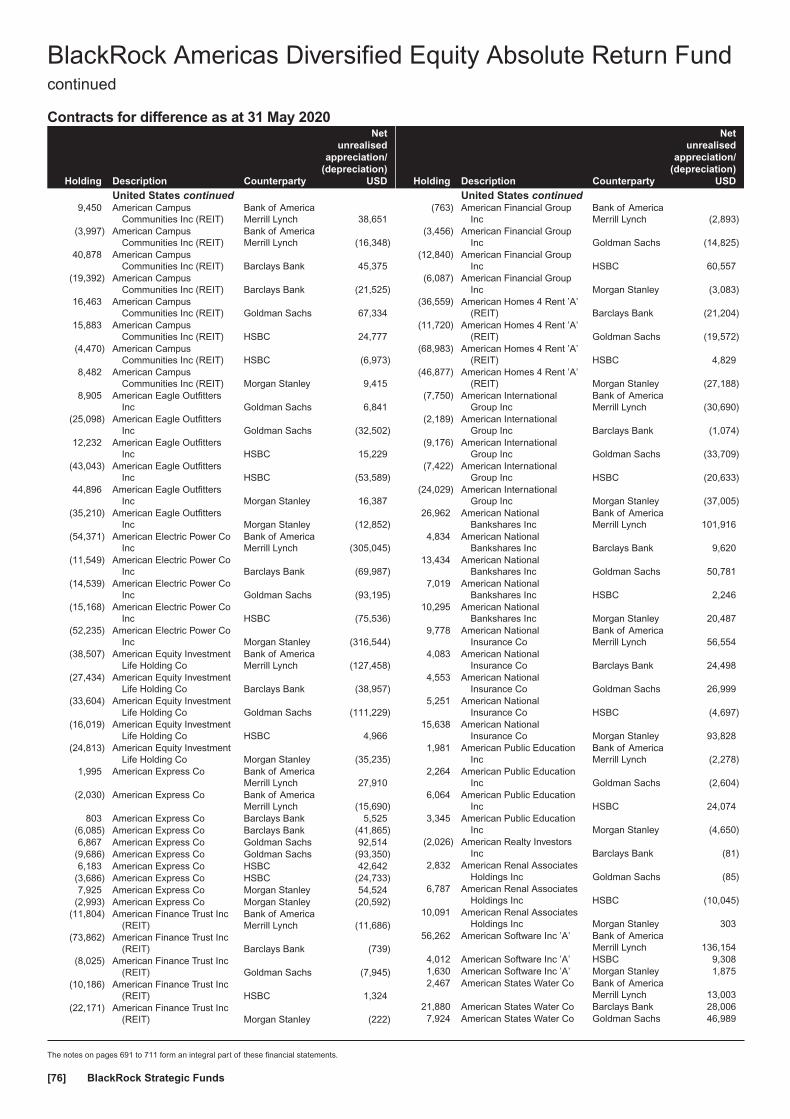
Contracts for difference as at 31 May 2020
Holding Description Counterparty
Netunrealised
appreciation/(depreciation)
USD
United States continued9,450 American Campus
Communities Inc (REIT)Bank of AmericaMerrill Lynch 38,651
(3,997) American CampusCommunities Inc (REIT)
Bank of AmericaMerrill Lynch (16,348)
40,878 American CampusCommunities Inc (REIT) Barclays Bank 45,375
(19,392) American CampusCommunities Inc (REIT) Barclays Bank (21,525)
16,463 American CampusCommunities Inc (REIT) Goldman Sachs 67,334
15,883 American CampusCommunities Inc (REIT) HSBC 24,777
(4,470) American CampusCommunities Inc (REIT) HSBC (6,973)
8,482 American CampusCommunities Inc (REIT) Morgan Stanley 9,415
8,905 American Eagle OutfittersInc Goldman Sachs 6,841
(25,098) American Eagle OutfittersInc Goldman Sachs (32,502)
12,232 American Eagle OutfittersInc HSBC 15,229
(43,043) American Eagle OutfittersInc HSBC (53,589)
44,896 American Eagle OutfittersInc Morgan Stanley 16,387
(35,210) American Eagle OutfittersInc Morgan Stanley (12,852)
(54,371) American Electric Power CoInc
Bank of AmericaMerrill Lynch (305,045)
(11,549) American Electric Power CoInc Barclays Bank (69,987)
(14,539) American Electric Power CoInc Goldman Sachs (93,195)
(15,168) American Electric Power CoInc HSBC (75,536)
(52,235) American Electric Power CoInc Morgan Stanley (316,544)
(38,507) American Equity InvestmentLife Holding Co
Bank of AmericaMerrill Lynch (127,458)
(27,434) American Equity InvestmentLife Holding Co Barclays Bank (38,957)
(33,604) American Equity InvestmentLife Holding Co Goldman Sachs (111,229)
(16,019) American Equity InvestmentLife Holding Co HSBC 4,966
(24,813) American Equity InvestmentLife Holding Co Morgan Stanley (35,235)
1,995 American Express Co Bank of AmericaMerrill Lynch 27,910
(2,030) American Express Co Bank of AmericaMerrill Lynch (15,690)
803 American Express Co Barclays Bank 5,525(6,085) American Express Co Barclays Bank (41,865)6,867 American Express Co Goldman Sachs 92,514
(9,686) American Express Co Goldman Sachs (93,350)6,183 American Express Co HSBC 42,642
(3,686) American Express Co HSBC (24,733)7,925 American Express Co Morgan Stanley 54,524
(2,993) American Express Co Morgan Stanley (20,592)(11,804) American Finance Trust Inc
(REIT)Bank of AmericaMerrill Lynch (11,686)
(73,862) American Finance Trust Inc(REIT) Barclays Bank (739)
(8,025) American Finance Trust Inc(REIT) Goldman Sachs (7,945)
(10,186) American Finance Trust Inc(REIT) HSBC 1,324
(22,171) American Finance Trust Inc(REIT) Morgan Stanley (222)
Holding Description Counterparty
Netunrealised
appreciation/(depreciation)
USD
United States continued(763) American Financial Group
IncBank of AmericaMerrill Lynch (2,893)
(3,456) American Financial GroupInc Goldman Sachs (14,825)
(12,840) American Financial GroupInc HSBC 60,557
(6,087) American Financial GroupInc Morgan Stanley (3,083)
(36,559) American Homes 4 Rent ’A’(REIT) Barclays Bank (21,204)
(11,720) American Homes 4 Rent ’A’(REIT) Goldman Sachs (19,572)
(68,983) American Homes 4 Rent ’A’(REIT) HSBC 4,829
(46,877) American Homes 4 Rent ’A’(REIT) Morgan Stanley (27,188)
(7,750) American InternationalGroup Inc
Bank of AmericaMerrill Lynch (30,690)
(2,189) American InternationalGroup Inc Barclays Bank (1,074)
(9,176) American InternationalGroup Inc Goldman Sachs (33,709)
(7,422) American InternationalGroup Inc HSBC (20,633)
(24,029) American InternationalGroup Inc Morgan Stanley (37,005)
26,962 American NationalBankshares Inc
Bank of AmericaMerrill Lynch 101,916
4,834 American NationalBankshares Inc Barclays Bank 9,620
13,434 American NationalBankshares Inc Goldman Sachs 50,781
7,019 American NationalBankshares Inc HSBC 2,246
10,295 American NationalBankshares Inc Morgan Stanley 20,487
9,778 American NationalInsurance Co
Bank of AmericaMerrill Lynch 56,554
4,083 American NationalInsurance Co Barclays Bank 24,498
4,553 American NationalInsurance Co Goldman Sachs 26,999
5,251 American NationalInsurance Co HSBC (4,697)
15,638 American NationalInsurance Co Morgan Stanley 93,828
1,981 American Public EducationInc
Bank of AmericaMerrill Lynch (2,278)
2,264 American Public EducationInc Goldman Sachs (2,604)
6,064 American Public EducationInc HSBC 24,074
3,345 American Public EducationInc Morgan Stanley (4,650)
(2,026) American Realty InvestorsInc Barclays Bank (81)
2,832 American Renal AssociatesHoldings Inc Goldman Sachs (85)
6,787 American Renal AssociatesHoldings Inc HSBC (10,045)
10,091 American Renal AssociatesHoldings Inc Morgan Stanley 303
56,262 American Software Inc ’A’ Bank of AmericaMerrill Lynch 136,154
4,012 American Software Inc ’A’ HSBC 9,3081,630 American Software Inc ’A’ Morgan Stanley 1,8752,467 American States Water Co Bank of America
Merrill Lynch 13,00321,880 American States Water Co Barclays Bank 28,0067,924 American States Water Co Goldman Sachs 46,989
BlackRock Americas Diversified Equity Absolute Return Fundcontinued
The notes on pages 691 to 711 form an integral part of these financial statements.
BlackRock Strategic Funds[76]
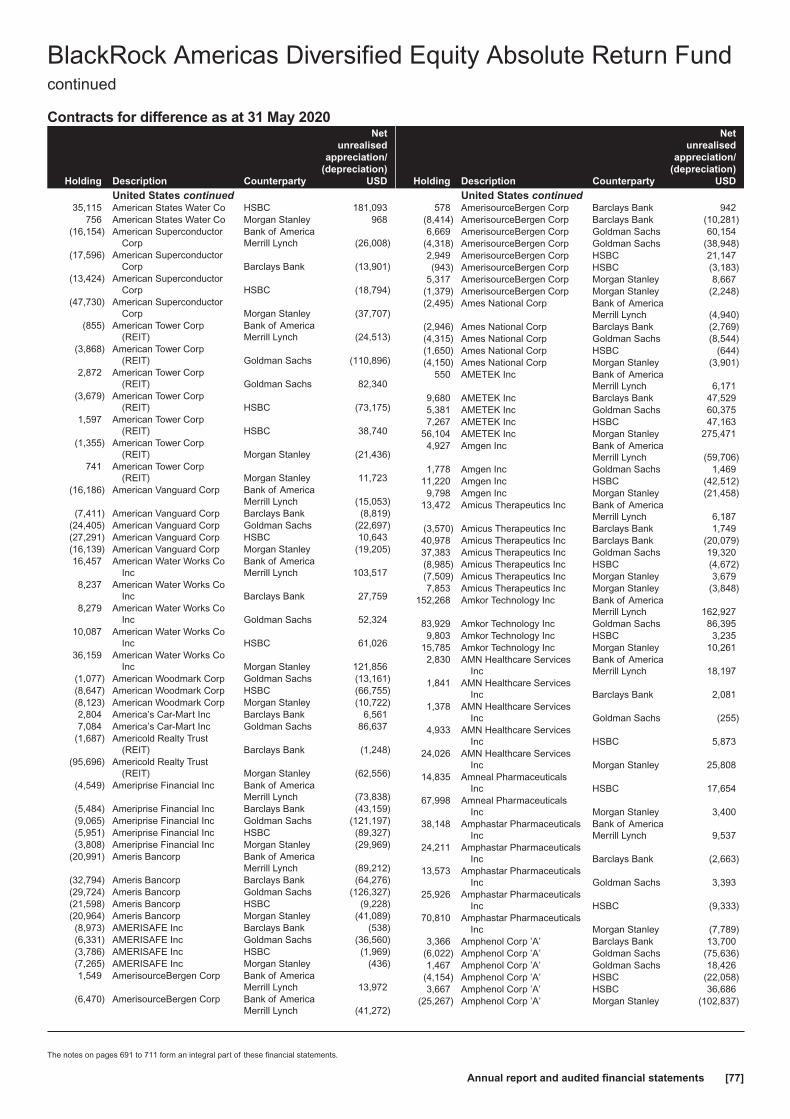
Contracts for difference as at 31 May 2020
Holding Description Counterparty
Netunrealised
appreciation/(depreciation)
USD
United States continued35,115 American States Water Co HSBC 181,093
756 American States Water Co Morgan Stanley 968(16,154) American Superconductor
CorpBank of AmericaMerrill Lynch (26,008)
(17,596) American SuperconductorCorp Barclays Bank (13,901)
(13,424) American SuperconductorCorp HSBC (18,794)
(47,730) American SuperconductorCorp Morgan Stanley (37,707)
(855) American Tower Corp(REIT)
Bank of AmericaMerrill Lynch (24,513)
(3,868) American Tower Corp(REIT) Goldman Sachs (110,896)
2,872 American Tower Corp(REIT) Goldman Sachs 82,340
(3,679) American Tower Corp(REIT) HSBC (73,175)
1,597 American Tower Corp(REIT) HSBC 38,740
(1,355) American Tower Corp(REIT) Morgan Stanley (21,436)
741 American Tower Corp(REIT) Morgan Stanley 11,723
(16,186) American Vanguard Corp Bank of AmericaMerrill Lynch (15,053)
(7,411) American Vanguard Corp Barclays Bank (8,819)(24,405) American Vanguard Corp Goldman Sachs (22,697)(27,291) American Vanguard Corp HSBC 10,643(16,139) American Vanguard Corp Morgan Stanley (19,205)16,457 American Water Works Co
IncBank of AmericaMerrill Lynch 103,517
8,237 American Water Works CoInc Barclays Bank 27,759
8,279 American Water Works CoInc Goldman Sachs 52,324
10,087 American Water Works CoInc HSBC 61,026
36,159 American Water Works CoInc Morgan Stanley 121,856
(1,077) American Woodmark Corp Goldman Sachs (13,161)(8,647) American Woodmark Corp HSBC (66,755)(8,123) American Woodmark Corp Morgan Stanley (10,722)2,804 America’s Car-Mart Inc Barclays Bank 6,5617,084 America’s Car-Mart Inc Goldman Sachs 86,637
(1,687) Americold Realty Trust(REIT) Barclays Bank (1,248)
(95,696) Americold Realty Trust(REIT) Morgan Stanley (62,556)
(4,549) Ameriprise Financial Inc Bank of AmericaMerrill Lynch (73,838)
(5,484) Ameriprise Financial Inc Barclays Bank (43,159)(9,065) Ameriprise Financial Inc Goldman Sachs (121,197)(5,951) Ameriprise Financial Inc HSBC (89,327)(3,808) Ameriprise Financial Inc Morgan Stanley (29,969)
(20,991) Ameris Bancorp Bank of AmericaMerrill Lynch (89,212)
(32,794) Ameris Bancorp Barclays Bank (64,276)(29,724) Ameris Bancorp Goldman Sachs (126,327)(21,598) Ameris Bancorp HSBC (9,228)(20,964) Ameris Bancorp Morgan Stanley (41,089)(8,973) AMERISAFE Inc Barclays Bank (538)(6,331) AMERISAFE Inc Goldman Sachs (36,560)(3,786) AMERISAFE Inc HSBC (1,969)(7,265) AMERISAFE Inc Morgan Stanley (436)1,549 AmerisourceBergen Corp Bank of America
Merrill Lynch 13,972(6,470) AmerisourceBergen Corp Bank of America
Merrill Lynch (41,272)
Holding Description Counterparty
Netunrealised
appreciation/(depreciation)
USD
United States continued578 AmerisourceBergen Corp Barclays Bank 942
(8,414) AmerisourceBergen Corp Barclays Bank (10,281)6,669 AmerisourceBergen Corp Goldman Sachs 60,154
(4,318) AmerisourceBergen Corp Goldman Sachs (38,948)2,949 AmerisourceBergen Corp HSBC 21,147(943) AmerisourceBergen Corp HSBC (3,183)
5,317 AmerisourceBergen Corp Morgan Stanley 8,667(1,379) AmerisourceBergen Corp Morgan Stanley (2,248)(2,495) Ames National Corp Bank of America
Merrill Lynch (4,940)(2,946) Ames National Corp Barclays Bank (2,769)(4,315) Ames National Corp Goldman Sachs (8,544)(1,650) Ames National Corp HSBC (644)(4,150) Ames National Corp Morgan Stanley (3,901)
550 AMETEK Inc Bank of AmericaMerrill Lynch 6,171
9,680 AMETEK Inc Barclays Bank 47,5295,381 AMETEK Inc Goldman Sachs 60,3757,267 AMETEK Inc HSBC 47,163
56,104 AMETEK Inc Morgan Stanley 275,4714,927 Amgen Inc Bank of America
Merrill Lynch (59,706)1,778 Amgen Inc Goldman Sachs 1,469
11,220 Amgen Inc HSBC (42,512)9,798 Amgen Inc Morgan Stanley (21,458)
13,472 Amicus Therapeutics Inc Bank of AmericaMerrill Lynch 6,187
(3,570) Amicus Therapeutics Inc Barclays Bank 1,74940,978 Amicus Therapeutics Inc Barclays Bank (20,079)37,383 Amicus Therapeutics Inc Goldman Sachs 19,320(8,985) Amicus Therapeutics Inc HSBC (4,672)(7,509) Amicus Therapeutics Inc Morgan Stanley 3,6797,853 Amicus Therapeutics Inc Morgan Stanley (3,848)
152,268 Amkor Technology Inc Bank of AmericaMerrill Lynch 162,927
83,929 Amkor Technology Inc Goldman Sachs 86,3959,803 Amkor Technology Inc HSBC 3,235
15,785 Amkor Technology Inc Morgan Stanley 10,2612,830 AMN Healthcare Services
IncBank of AmericaMerrill Lynch 18,197
1,841 AMN Healthcare ServicesInc Barclays Bank 2,081
1,378 AMN Healthcare ServicesInc Goldman Sachs (255)
4,933 AMN Healthcare ServicesInc HSBC 5,873
24,026 AMN Healthcare ServicesInc Morgan Stanley 25,808
14,835 Amneal PharmaceuticalsInc HSBC 17,654
67,998 Amneal PharmaceuticalsInc Morgan Stanley 3,400
38,148 Amphastar PharmaceuticalsInc
Bank of AmericaMerrill Lynch 9,537
24,211 Amphastar PharmaceuticalsInc Barclays Bank (2,663)
13,573 Amphastar PharmaceuticalsInc Goldman Sachs 3,393
25,926 Amphastar PharmaceuticalsInc HSBC (9,333)
70,810 Amphastar PharmaceuticalsInc Morgan Stanley (7,789)
3,366 Amphenol Corp ’A’ Barclays Bank 13,700(6,022) Amphenol Corp ’A’ Goldman Sachs (75,636)1,467 Amphenol Corp ’A’ Goldman Sachs 18,426
(4,154) Amphenol Corp ’A’ HSBC (22,058)3,667 Amphenol Corp ’A’ HSBC 36,686
(25,267) Amphenol Corp ’A’ Morgan Stanley (102,837)
BlackRock Americas Diversified Equity Absolute Return Fundcontinued
The notes on pages 691 to 711 form an integral part of these financial statements.
Annual report and audited financial statements [77]

Contracts for difference as at 31 May 2020
Holding Description Counterparty
Netunrealised
appreciation/(depreciation)
USD
United States continued11,474 Amphenol Corp ’A’ Morgan Stanley 46,699
(11,909) Amplify Energy Corp HSBC 1,548(25,786) Amplify Energy Corp Morgan Stanley 774(20,569) Amyris Inc Barclays Bank 5,759(36,039) Amyris Inc Goldman Sachs 6,847
6,363 Analog Devices Inc Bank of AmericaMerrill Lynch 58,336
3,570 Analog Devices Inc Barclays Bank 2,1063,430 Analog Devices Inc Goldman Sachs 13,474
818 Analog Devices Inc HSBC 1,48942,248 Analog Devices Inc Morgan Stanley 24,926
(21,811) Anaplan Inc Bank of AmericaMerrill Lynch (58,452)
(2,783) Anaplan Inc Barclays Bank 14,166(8,468) Anaplan Inc Goldman Sachs (20,884)
(14,871) Anaplan Inc HSBC (57,198)(11,592) Anaplan Inc Morgan Stanley 59,003
6,005 AnaptysBio Inc Bank of AmericaMerrill Lynch 540
10,054 AnaptysBio Inc Barclays Bank (9,652)8,470 AnaptysBio Inc Goldman Sachs 7623,552 AnaptysBio Inc HSBC 2,309
14,317 AnaptysBio Inc Morgan Stanley (13,744)(39,968) Anavex Life Sciences Corp Barclays Bank 9,592(20,841) Anavex Life Sciences Corp Goldman Sachs (10,421)(6,055) Anavex Life Sciences Corp Morgan Stanley 1,453
523 Andersons Inc Bank of AmericaMerrill Lynch 737
3,254 Andersons Inc Barclays Bank 2,2785,372 Andersons Inc Goldman Sachs 7,5753,970 Andersons Inc HSBC (7,345)
12,946 Andersons Inc Morgan Stanley 9,062(6,199) ANGI Homeservices Inc ’A’ Bank of America
Merrill Lynch (6,230)(35,215) ANGI Homeservices Inc ’A’ Barclays Bank 2,323(8,590) ANGI Homeservices Inc ’A’ Morgan Stanley 60126,855 AngioDynamics Inc Bank of America
Merrill Lynch 8,05724,684 AngioDynamics Inc Barclays Bank (19,500)24,368 AngioDynamics Inc Goldman Sachs 7,31017,440 AngioDynamics Inc HSBC (7,499)30,388 AngioDynamics Inc Morgan Stanley (24,007)(2,924) ANI Pharmaceuticals Inc Barclays Bank 3,216(9,772) ANI Pharmaceuticals Inc Goldman Sachs 5,375(2,632) ANI Pharmaceuticals Inc HSBC 10,291(2,963) ANI Pharmaceuticals Inc Morgan Stanley 3,2598,868 Anika Therapeutics Inc Bank of America
Merrill Lynch 30,15111,151 Anika Therapeutics Inc Barclays Bank 2,5659,193 Anika Therapeutics Inc Goldman Sachs 31,2564,891 Anika Therapeutics Inc HSBC 14,9663,811 Anika Therapeutics Inc Morgan Stanley 877
(23,753) Annaly Capital ManagementInc (REIT)
Bank of AmericaMerrill Lynch (3,832)
(165,533) Annaly Capital ManagementInc (REIT) Barclays Bank 25,657
(41,466) Annaly Capital ManagementInc (REIT) Goldman Sachs (15,550)
(82,929) Annaly Capital ManagementInc (REIT) HSBC 2,073
(49,989) Annaly Capital ManagementInc (REIT) Morgan Stanley 7,748
(1) ANSYS Inc Bank of AmericaMerrill Lynch (24)
126 ANSYS Inc Bank of AmericaMerrill Lynch 1,052
1,834 ANSYS Inc Barclays Bank 198(4,111) ANSYS Inc Goldman Sachs (99,322)5,006 ANSYS Inc Goldman Sachs 120,945
Holding Description Counterparty
Netunrealised
appreciation/(depreciation)
USD
United States continued(2,581) ANSYS Inc HSBC (40,226)
711 ANSYS Inc HSBC 10,715(3,773) ANSYS Inc Morgan Stanley (31,014)1,347 ANSYS Inc Morgan Stanley 11,072
(135,865) Antares Pharma Inc Bank of AmericaMerrill Lynch (48,911)
(13,570) Antares Pharma Inc Barclays Bank 136(10,116) Antares Pharma Inc Goldman Sachs (3,642)(24,065) Antares Pharma Inc HSBC (2,647)(9,830) Antares Pharma Inc Morgan Stanley 98
(15,716) Anterix Inc Bank of AmericaMerrill Lynch 24,988
(606) Anterix Inc Morgan Stanley 1,41821,262 Antero Midstream Corp Bank of America
Merrill Lynch 8,803(36,535) Antero Midstream Corp Barclays Bank (14,249)
1,470 Antero Midstream Corp Barclays Bank 57313,505 Antero Midstream Corp HSBC 14,51059,847 Antero Midstream Corp Morgan Stanley 23,34087,974 Antero Resources Corp Morgan Stanley (880)
50 Anthem Inc Bank of AmericaMerrill Lynch 492
3,071 Anthem Inc Morgan Stanley 33,19843,753 Anworth Mortgage Asset
Corp (REIT)Bank of AmericaMerrill Lynch 1,313
38,672 Anworth Mortgage AssetCorp (REIT) Barclays Bank (2,707)
30,037 Anworth Mortgage AssetCorp (REIT) Goldman Sachs 901
59,412 Anworth Mortgage AssetCorp (REIT) HSBC (11,288)
83,545 Anworth Mortgage AssetCorp (REIT) Morgan Stanley (5,848)
11,924 AO Smith Corp Barclays Bank 46,58111,300 AO Smith Corp Goldman Sachs 73,33723,195 AO Smith Corp HSBC 53,158
591 AO Smith Corp Morgan Stanley 2,766(4,232) Aon Plc ’A’ Barclays Bank (27,254)(4,687) Aon Plc ’A’ Goldman Sachs (31,590)7,318 Aon Plc ’A’ HSBC 63,301(286) Aon Plc ’A’ HSBC (1,580)
12,794 Apache Corp Bank of AmericaMerrill Lynch (2,003)
31,953 Apache Corp Barclays Bank (29,716)29,024 Apache Corp Morgan Stanley (26,993)(1,261) Apartment Investment and
Management Co ’A’(REIT)
Bank of AmericaMerrill Lynch (3,682)
(3,154) Apartment Investment andManagement Co ’A’(REIT) Barclays Bank (1,987)
(5,591) Apartment Investment andManagement Co ’A’(REIT) Goldman Sachs (15,273)
(27,972) Apartment Investment andManagement Co ’A’(REIT) HSBC 27,781
(13,036) Apartment Investment andManagement Co ’A’(REIT) Morgan Stanley (8,213)
4,543 Apellis Pharmaceuticals Inc Bank of AmericaMerrill Lynch 7,048
11,816 Apellis Pharmaceuticals Inc Barclays Bank (19,260)6,576 Apellis Pharmaceuticals Inc Goldman Sachs 14,8611,646 Apellis Pharmaceuticals Inc HSBC 2,864
743 Apellis Pharmaceuticals Inc Morgan Stanley (1,211)(514) Apergy Corp Bank of America
Merrill Lynch (206)(32,742) Apergy Corp Goldman Sachs (13,097)
BlackRock Americas Diversified Equity Absolute Return Fundcontinued
The notes on pages 691 to 711 form an integral part of these financial statements.
BlackRock Strategic Funds[78]
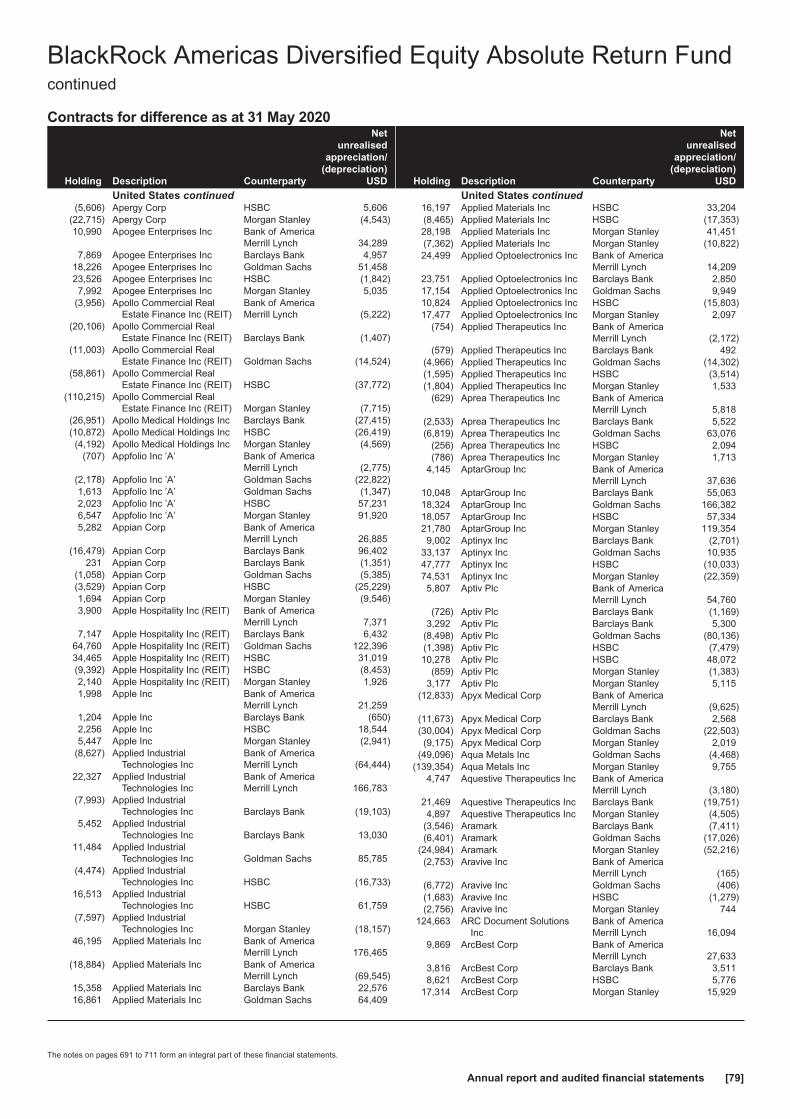
Contracts for difference as at 31 May 2020
Holding Description Counterparty
Netunrealised
appreciation/(depreciation)
USD
United States continued(5,606) Apergy Corp HSBC 5,606
(22,715) Apergy Corp Morgan Stanley (4,543)10,990 Apogee Enterprises Inc Bank of America
Merrill Lynch 34,2897,869 Apogee Enterprises Inc Barclays Bank 4,957
18,226 Apogee Enterprises Inc Goldman Sachs 51,45823,526 Apogee Enterprises Inc HSBC (1,842)7,992 Apogee Enterprises Inc Morgan Stanley 5,035
(3,956) Apollo Commercial RealEstate Finance Inc (REIT)
Bank of AmericaMerrill Lynch (5,222)
(20,106) Apollo Commercial RealEstate Finance Inc (REIT) Barclays Bank (1,407)
(11,003) Apollo Commercial RealEstate Finance Inc (REIT) Goldman Sachs (14,524)
(58,861) Apollo Commercial RealEstate Finance Inc (REIT) HSBC (37,772)
(110,215) Apollo Commercial RealEstate Finance Inc (REIT) Morgan Stanley (7,715)
(26,951) Apollo Medical Holdings Inc Barclays Bank (27,415)(10,872) Apollo Medical Holdings Inc HSBC (26,419)(4,192) Apollo Medical Holdings Inc Morgan Stanley (4,569)
(707) Appfolio Inc ’A’ Bank of AmericaMerrill Lynch (2,775)
(2,178) Appfolio Inc ’A’ Goldman Sachs (22,822)1,613 Appfolio Inc ’A’ Goldman Sachs (1,347)2,023 Appfolio Inc ’A’ HSBC 57,2316,547 Appfolio Inc ’A’ Morgan Stanley 91,9205,282 Appian Corp Bank of America
Merrill Lynch 26,885(16,479) Appian Corp Barclays Bank 96,402
231 Appian Corp Barclays Bank (1,351)(1,058) Appian Corp Goldman Sachs (5,385)(3,529) Appian Corp HSBC (25,229)1,694 Appian Corp Morgan Stanley (9,546)3,900 Apple Hospitality Inc (REIT) Bank of America
Merrill Lynch 7,3717,147 Apple Hospitality Inc (REIT) Barclays Bank 6,432
64,760 Apple Hospitality Inc (REIT) Goldman Sachs 122,39634,465 Apple Hospitality Inc (REIT) HSBC 31,019(9,392) Apple Hospitality Inc (REIT) HSBC (8,453)2,140 Apple Hospitality Inc (REIT) Morgan Stanley 1,9261,998 Apple Inc Bank of America
Merrill Lynch 21,2591,204 Apple Inc Barclays Bank (650)2,256 Apple Inc HSBC 18,5445,447 Apple Inc Morgan Stanley (2,941)
(8,627) Applied IndustrialTechnologies Inc
Bank of AmericaMerrill Lynch (64,444)
22,327 Applied IndustrialTechnologies Inc
Bank of AmericaMerrill Lynch 166,783
(7,993) Applied IndustrialTechnologies Inc Barclays Bank (19,103)
5,452 Applied IndustrialTechnologies Inc Barclays Bank 13,030
11,484 Applied IndustrialTechnologies Inc Goldman Sachs 85,785
(4,474) Applied IndustrialTechnologies Inc HSBC (16,733)
16,513 Applied IndustrialTechnologies Inc HSBC 61,759
(7,597) Applied IndustrialTechnologies Inc Morgan Stanley (18,157)
46,195 Applied Materials Inc Bank of AmericaMerrill Lynch 176,465
(18,884) Applied Materials Inc Bank of AmericaMerrill Lynch (69,545)
15,358 Applied Materials Inc Barclays Bank 22,57616,861 Applied Materials Inc Goldman Sachs 64,409
Holding Description Counterparty
Netunrealised
appreciation/(depreciation)
USD
United States continued16,197 Applied Materials Inc HSBC 33,204(8,465) Applied Materials Inc HSBC (17,353)28,198 Applied Materials Inc Morgan Stanley 41,451(7,362) Applied Materials Inc Morgan Stanley (10,822)24,499 Applied Optoelectronics Inc Bank of America
Merrill Lynch 14,20923,751 Applied Optoelectronics Inc Barclays Bank 2,85017,154 Applied Optoelectronics Inc Goldman Sachs 9,94910,824 Applied Optoelectronics Inc HSBC (15,803)17,477 Applied Optoelectronics Inc Morgan Stanley 2,097
(754) Applied Therapeutics Inc Bank of AmericaMerrill Lynch (2,172)
(579) Applied Therapeutics Inc Barclays Bank 492(4,966) Applied Therapeutics Inc Goldman Sachs (14,302)(1,595) Applied Therapeutics Inc HSBC (3,514)(1,804) Applied Therapeutics Inc Morgan Stanley 1,533
(629) Aprea Therapeutics Inc Bank of AmericaMerrill Lynch 5,818
(2,533) Aprea Therapeutics Inc Barclays Bank 5,522(6,819) Aprea Therapeutics Inc Goldman Sachs 63,076
(256) Aprea Therapeutics Inc HSBC 2,094(786) Aprea Therapeutics Inc Morgan Stanley 1,713
4,145 AptarGroup Inc Bank of AmericaMerrill Lynch 37,636
10,048 AptarGroup Inc Barclays Bank 55,06318,324 AptarGroup Inc Goldman Sachs 166,38218,057 AptarGroup Inc HSBC 57,33421,780 AptarGroup Inc Morgan Stanley 119,3549,002 Aptinyx Inc Barclays Bank (2,701)
33,137 Aptinyx Inc Goldman Sachs 10,93547,777 Aptinyx Inc HSBC (10,033)74,531 Aptinyx Inc Morgan Stanley (22,359)5,807 Aptiv Plc Bank of America
Merrill Lynch 54,760(726) Aptiv Plc Barclays Bank (1,169)
3,292 Aptiv Plc Barclays Bank 5,300(8,498) Aptiv Plc Goldman Sachs (80,136)(1,398) Aptiv Plc HSBC (7,479)10,278 Aptiv Plc HSBC 48,072
(859) Aptiv Plc Morgan Stanley (1,383)3,177 Aptiv Plc Morgan Stanley 5,115
(12,833) Apyx Medical Corp Bank of AmericaMerrill Lynch (9,625)
(11,673) Apyx Medical Corp Barclays Bank 2,568(30,004) Apyx Medical Corp Goldman Sachs (22,503)(9,175) Apyx Medical Corp Morgan Stanley 2,019
(49,096) Aqua Metals Inc Goldman Sachs (4,468)(139,354) Aqua Metals Inc Morgan Stanley 9,755
4,747 Aquestive Therapeutics Inc Bank of AmericaMerrill Lynch (3,180)
21,469 Aquestive Therapeutics Inc Barclays Bank (19,751)4,897 Aquestive Therapeutics Inc Morgan Stanley (4,505)
(3,546) Aramark Barclays Bank (7,411)(6,401) Aramark Goldman Sachs (17,026)
(24,984) Aramark Morgan Stanley (52,216)(2,753) Aravive Inc Bank of America
Merrill Lynch (165)(6,772) Aravive Inc Goldman Sachs (406)(1,683) Aravive Inc HSBC (1,279)(2,756) Aravive Inc Morgan Stanley 744
124,663 ARC Document SolutionsInc
Bank of AmericaMerrill Lynch 16,094
9,869 ArcBest Corp Bank of AmericaMerrill Lynch 27,633
3,816 ArcBest Corp Barclays Bank 3,5118,621 ArcBest Corp HSBC 5,776
17,314 ArcBest Corp Morgan Stanley 15,929
BlackRock Americas Diversified Equity Absolute Return Fundcontinued
The notes on pages 691 to 711 form an integral part of these financial statements.
Annual report and audited financial statements [79]

Contracts for difference as at 31 May 2020
Holding Description Counterparty
Netunrealised
appreciation/(depreciation)
USD
United States continued(1,353) Arch Capital Group Ltd Bank of America
Merrill Lynch (7,279)(9,138) Arch Capital Group Ltd Barclays Bank (548)(4,107) Arch Capital Group Ltd Goldman Sachs (22,096)(7,418) Arch Capital Group Ltd HSBC (17,877)16,678 Arch Capital Group Ltd HSBC 40,194
(13,610) Arch Capital Group Ltd Morgan Stanley (817)(7,139) Archer-Daniels-Midland Co Bank of America
Merrill Lynch (31,983)(10,794) Archer-Daniels-Midland Co Barclays Bank (34,756)(61,618) Archer-Daniels-Midland Co Goldman Sachs (276,049)(31,222) Archer-Daniels-Midland Co HSBC (69,001)
(111,831) Archer-Daniels-Midland Co Morgan Stanley (360,096)33,404 Archrock Inc Bank of America
Merrill Lynch 39,41732,850 Archrock Inc Goldman Sachs 38,76375,308 Archrock Inc Morgan Stanley 25,605
(687) Arco Platform Ltd ’A’ HSBC 3,286(2,670) Arco Platform Ltd ’A’ Morgan Stanley 5,687
(17,046) Arconic Corp Bank of AmericaMerrill Lynch (88,298)
(2,395) Arconic Corp Barclays Bank (1,629)(7,227) Arconic Corp Goldman Sachs (37,436)(4,078) Arconic Corp HSBC (17,943)86,355 Arconic Corp HSBC 379,962
(37,486) Arconic Corp Morgan Stanley (25,490)(7,675) Arcosa Inc Bank of America
Merrill Lynch (31,554)(15,584) Arcosa Inc Barclays Bank (27,740)(15,505) Arcosa Inc Goldman Sachs (80,626)(21,024) Arcosa Inc HSBC (100,271)(35,494) Arcosa Inc Morgan Stanley (63,179)
2,298 Arcturus TherapeuticsHoldings Inc Morgan Stanley (46,351)
9,692 Arcus Biosciences Inc Goldman Sachs (46,328)1,466 Arcutis Biotherapeutics Inc Bank of America
Merrill Lynch 6,450(2,277) Arcutis Biotherapeutics Inc Barclays Bank (865)4,512 Arcutis Biotherapeutics Inc Barclays Bank 1,7154,347 Arcutis Biotherapeutics Inc Goldman Sachs 19,1275,247 Arcutis Biotherapeutics Inc HSBC 28,6493,412 Arcutis Biotherapeutics Inc Morgan Stanley 1,2976,627 Ardagh Group SA Goldman Sachs 5,964
36,549 Ardagh Group SA Morgan Stanley 1,827(14,615) Ardelyx Inc Bank of America
Merrill Lynch 2,631(6,749) Ardelyx Inc Barclays Bank 4,184
(32,981) Ardelyx Inc Goldman Sachs 5,937(2,921) Ardelyx Inc HSBC 409
(17,672) Ardelyx Inc Morgan Stanley 10,95770,372 Ardmore Shipping Corp Goldman Sachs 72,483(6,796) Arena Pharmaceuticals Inc Bank of America
Merrill Lynch (53,009)(5,182) Arena Pharmaceuticals Inc Barclays Bank 19,951(6,479) Arena Pharmaceuticals Inc Goldman Sachs (50,537)(2,815) Arena Pharmaceuticals Inc HSBC (14,204)
(19,924) Arena Pharmaceuticals Inc Morgan Stanley 76,70790,935 Ares Commercial Real
Estate Corp (REIT)Bank of AmericaMerrill Lynch 132,765
(3,466) Ares Management Corp ’A’ Bank of AmericaMerrill Lynch (9,790)
13,701 Ares Management Corp ’A’ Bank of AmericaMerrill Lynch 45,761
(2,176) Ares Management Corp ’A’ Barclays Bank (4,156)17,011 Ares Management Corp ’A’ Barclays Bank 32,491(6,584) Ares Management Corp ’A’ Goldman Sachs (18,792)10,541 Ares Management Corp ’A’ Goldman Sachs 30,335(6,392) Ares Management Corp ’A’ HSBC (16,555)
Holding Description Counterparty
Netunrealised
appreciation/(depreciation)
USD
United States continued15,714 Ares Management Corp ’A’ HSBC 40,589(1,359) Ares Management Corp ’A’ Morgan Stanley (2,596)8,788 Ares Management Corp ’A’ Morgan Stanley 16,785
(19,637) Argan Inc Bank of AmericaMerrill Lynch (55,372)
(6,358) Argan Inc HSBC (7,630)(4,169) Argan Inc Morgan Stanley 1,834(3,389) Argo Group International
Holdings Ltd Goldman Sachs (16,742)(7,416) Argo Group International
Holdings Ltd HSBC 3,189(11,475) Argo Group International
Holdings Ltd Morgan Stanley (32,245)(1,188) Arista Networks Inc Bank of America
Merrill Lynch (19,661)3,372 Arista Networks Inc Bank of America
Merrill Lynch 21,363(1,967) Arista Networks Inc Barclays Bank (13,435)3,535 Arista Networks Inc Barclays Bank 22,229
(2,125) Arista Networks Inc Goldman Sachs (35,169)3,867 Arista Networks Inc Goldman Sachs 63,209
(3,494) Arista Networks Inc HSBC (31,411)369 Arista Networks Inc HSBC 3,317
(3,017) Arista Networks Inc Morgan Stanley (20,606)(38,005) Arlington Asset Investment
Corp ’A’ (REIT)Bank of AmericaMerrill Lynch (5,701)
(182,113) Arlington Asset InvestmentCorp ’A’ (REIT) Goldman Sachs (27,317)
(74,648) Arlington Asset InvestmentCorp ’A’ (REIT) HSBC 14,221
(18,161) Arlington Asset InvestmentCorp ’A’ (REIT) Morgan Stanley (1,090)
39,633 Arlo Technologies Inc Bank of AmericaMerrill Lynch 2,774
10,608 Arlo Technologies Inc Barclays Bank (1,167)36,345 Arlo Technologies Inc Goldman Sachs 2,54416,827 Arlo Technologies Inc HSBC (4,880)24,856 Arlo Technologies Inc Morgan Stanley (2,734)7,993 Armada Hoffler Properties
Inc (REIT) Barclays Bank 7,59374,977 Armada Hoffler Properties
Inc (REIT) Goldman Sachs 117,714102,237 Armada Hoffler Properties
Inc (REIT) HSBC (26,582)131,893 Armada Hoffler Properties
Inc (REIT) Morgan Stanley 125,298(5,098) ARMOUR Residential Inc
(REIT)Bank of AmericaMerrill Lynch (3,773)
(11,379) ARMOUR Residential Inc(REIT) Goldman Sachs (8,420)
(58,255) ARMOUR Residential Inc(REIT) HSBC (2,330)
(68,144) ARMOUR Residential Inc(REIT) Morgan Stanley 3,407
(11,741) Armstrong Flooring Inc Goldman Sachs (11,624)(32,036) Armstrong Flooring Inc Morgan Stanley (11,533)(15,162) Armstrong World Industries
IncBank of AmericaMerrill Lynch (126,072)
(1,313) Armstrong World IndustriesInc Barclays Bank (7,267)
(4,544) Armstrong World IndustriesInc Goldman Sachs (37,783)
12,715 Armstrong World IndustriesInc Goldman Sachs 39,491
(4,911) Armstrong World IndustriesInc HSBC (12,695)
8,050 Armstrong World IndustriesInc HSBC 747
BlackRock Americas Diversified Equity Absolute Return Fundcontinued
The notes on pages 691 to 711 form an integral part of these financial statements.
BlackRock Strategic Funds[80]

Contracts for difference as at 31 May 2020
Holding Description Counterparty
Netunrealised
appreciation/(depreciation)
USD
United States continued(4,890) Armstrong World Industries
Inc Morgan Stanley (27,066)(4,774) Arrow Electronics Inc Bank of America
Merrill Lynch (12,224)(6,344) Arrow Electronics Inc Barclays Bank (6,852)
(14,782) Arrow Electronics Inc Goldman Sachs (77,750)(14,618) Arrow Electronics Inc HSBC (51,209)(31,883) Arrow Electronics Inc Morgan Stanley (34,434)
9,451 Arrow Financial Corp Bank of AmericaMerrill Lynch 34,118
18,633 Arrow Financial Corp Barclays Bank 33,53910,499 Arrow Financial Corp Goldman Sachs 37,90118,012 Arrow Financial Corp HSBC 30,26013,810 Arrow Financial Corp Morgan Stanley 22,845
(830) Arrowhead PharmaceuticalsInc
Bank of AmericaMerrill Lynch 2,656
3,440 Arrowhead PharmaceuticalsInc
Bank of AmericaMerrill Lynch (8,863)
(1,141) Arrowhead PharmaceuticalsInc Barclays Bank 3,469
9,927 Arrowhead PharmaceuticalsInc Barclays Bank (30,178)
(5,458) Arrowhead PharmaceuticalsInc Goldman Sachs 17,466
19,273 Arrowhead PharmaceuticalsInc Goldman Sachs (58,450)
(4,381) Arrowhead PharmaceuticalsInc HSBC 6,528
6,734 Arrowhead PharmaceuticalsInc HSBC (9,504)
(5,328) Arrowhead PharmaceuticalsInc Morgan Stanley 16,197
5,276 Arrowhead PharmaceuticalsInc Morgan Stanley (16,039)
3,014 Artesian Resources Corp ’A’ Bank of AmericaMerrill Lynch 6,661
5,290 Artesian Resources Corp ’A’ Goldman Sachs 11,6915,349 Artesian Resources Corp ’A’ HSBC (3,691)
12,604 Artesian Resources Corp ’A’ Morgan Stanley 12,3525,412 Arthur J Gallagher & Co Bank of America
Merrill Lynch 36,531(10,115) Arthur J Gallagher & Co Bank of America
Merrill Lynch (68,276)10,872 Arthur J Gallagher & Co Barclays Bank 31,311(4,951) Arthur J Gallagher & Co Barclays Bank (14,259)(2,255) Arthur J Gallagher & Co Goldman Sachs 89
200 Arthur J Gallagher & Co HSBC 650(6,945) Arthur J Gallagher & Co HSBC (52,643)5,836 Arthur J Gallagher & Co Morgan Stanley 16,808
(10,660) Arthur J Gallagher & Co Morgan Stanley (30,701)9,101 Artisan Partners Asset
Management Inc ’A’Bank of AmericaMerrill Lynch 21,478
5,856 Artisan Partners AssetManagement Inc ’A’ Barclays Bank 6,969
6,567 Artisan Partners AssetManagement Inc ’A’ Goldman Sachs 15,498
14,765 Artisan Partners AssetManagement Inc ’A’ HSBC (1,919)
41,445 Artisan Partners AssetManagement Inc ’A’ Morgan Stanley 49,319
1,668 Arvinas Inc Bank of AmericaMerrill Lynch (16,780)
1,194 Arvinas Inc Barclays Bank (10,531)9,809 Arvinas Inc Goldman Sachs (94,908)4,474 Arvinas Inc HSBC (46,677)5,274 Arvinas Inc Morgan Stanley (46,517)5,090 Asbury Automotive Group
IncBank of AmericaMerrill Lynch 62,760
Holding Description Counterparty
Netunrealised
appreciation/(depreciation)
USD
United States continued5,789 Asbury Automotive Group
Inc HSBC 29,582(31,414) Ascena Retail Group Inc Goldman Sachs (24,817)(1,270) ASGN Inc Bank of America
Merrill Lynch (5,438)(4,620) ASGN Inc Barclays Bank (11,134)(7,315) ASGN Inc Goldman Sachs (58,234)(9,472) ASGN Inc HSBC (77,932)(1,247) ASGN Inc Morgan Stanley (3,005)35,934 ASGN Inc Morgan Stanley 86,601
(12,863) Ashford Hospitality Trust Inc(REIT) Barclays Bank (1,490)
(110,118) Ashford Hospitality Trust Inc(REIT) HSBC 540
(20,072) Ashford Hospitality Trust Inc(REIT) Morgan Stanley (2,324)
(905) Ashford Inc Bank of AmericaMerrill Lynch (407)
(141) Ashford Inc HSBC 93(8,670) Ashford Inc Morgan Stanley (867)
(555) Ashland Global Holdings Inc Bank of AmericaMerrill Lynch (4,351)
(2,361) Ashland Global Holdings Inc Barclays Bank (8,099)(13,657) Ashland Global Holdings Inc Goldman Sachs (107,071)(17,975) Ashland Global Holdings Inc HSBC (83,404)(8,403) Ashland Global Holdings Inc Morgan Stanley (28,822)65,304 Aspen Aerogels Inc Morgan Stanley 33,958
(19,232) Aspen Group Inc/CO Bank of AmericaMerrill Lynch (23,655)
(19,979) Aspen Group Inc/CO Barclays Bank (1,598)(3,331) Aspen Group Inc/CO Goldman Sachs (4,097)
(16,808) Aspen Group Inc/CO Morgan Stanley (1,345)(21,435) Aspen Technology Inc Bank of America
Merrill Lynch (242,430)2,390 Aspen Technology Inc Bank of America
Merrill Lynch 25,297(4,795) Aspen Technology Inc Barclays Bank (48,430)7,542 Aspen Technology Inc Barclays Bank 76,174
(2,385) Aspen Technology Inc Goldman Sachs (26,974)1,315 Aspen Technology Inc Goldman Sachs 14,873
(4,781) Aspen Technology Inc HSBC (21,706)7,467 Aspen Technology Inc HSBC 44,832
(8,713) Aspen Technology Inc Morgan Stanley (88,001)2,518 Aspen Technology Inc Morgan Stanley 25,432
(11,233) Assembly Biosciences Inc Barclays Bank 15,389(7,221) Assembly Biosciences Inc Goldman Sachs 9,748(1,234) Assembly Biosciences Inc HSBC 271(1,457) Assembly Biosciences Inc Morgan Stanley 1,996(6,855) Assetmark Financial
Holdings IncBank of AmericaMerrill Lynch (4,319)
(9,212) Assetmark FinancialHoldings Inc Barclays Bank 10,594
(16,764) Assetmark FinancialHoldings Inc Goldman Sachs (10,561)
(5,278) Assetmark FinancialHoldings Inc HSBC (2,164)
(12,970) Assetmark FinancialHoldings Inc Morgan Stanley 14,916
62,978 Associated Banc-Corp Bank of AmericaMerrill Lynch 120,288
56,481 Associated Banc-Corp Barclays Bank 57,04624,681 Associated Banc-Corp Goldman Sachs 47,14178,760 Associated Banc-Corp HSBC (4,721)56,757 Associated Banc-Corp Morgan Stanley 57,325(6,930) Associated Capital Group
Inc ’A’Bank of AmericaMerrill Lynch (55,163)
BlackRock Americas Diversified Equity Absolute Return Fundcontinued
The notes on pages 691 to 711 form an integral part of these financial statements.
Annual report and audited financial statements [81]
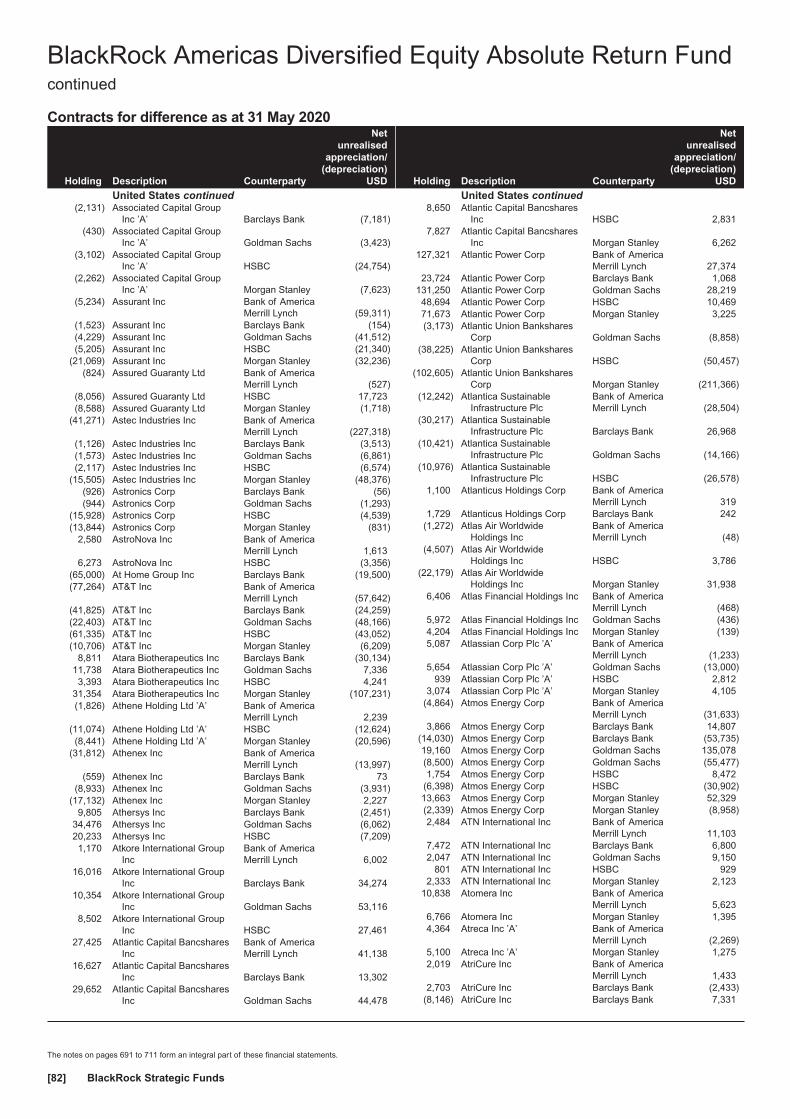
Contracts for difference as at 31 May 2020
Holding Description Counterparty
Netunrealised
appreciation/(depreciation)
USD
United States continued(2,131) Associated Capital Group
Inc ’A’ Barclays Bank (7,181)(430) Associated Capital Group
Inc ’A’ Goldman Sachs (3,423)(3,102) Associated Capital Group
Inc ’A’ HSBC (24,754)(2,262) Associated Capital Group
Inc ’A’ Morgan Stanley (7,623)(5,234) Assurant Inc Bank of America
Merrill Lynch (59,311)(1,523) Assurant Inc Barclays Bank (154)(4,229) Assurant Inc Goldman Sachs (41,512)(5,205) Assurant Inc HSBC (21,340)
(21,069) Assurant Inc Morgan Stanley (32,236)(824) Assured Guaranty Ltd Bank of America
Merrill Lynch (527)(8,056) Assured Guaranty Ltd HSBC 17,723(8,588) Assured Guaranty Ltd Morgan Stanley (1,718)
(41,271) Astec Industries Inc Bank of AmericaMerrill Lynch (227,318)
(1,126) Astec Industries Inc Barclays Bank (3,513)(1,573) Astec Industries Inc Goldman Sachs (6,861)(2,117) Astec Industries Inc HSBC (6,574)
(15,505) Astec Industries Inc Morgan Stanley (48,376)(926) Astronics Corp Barclays Bank (56)(944) Astronics Corp Goldman Sachs (1,293)
(15,928) Astronics Corp HSBC (4,539)(13,844) Astronics Corp Morgan Stanley (831)
2,580 AstroNova Inc Bank of AmericaMerrill Lynch 1,613
6,273 AstroNova Inc HSBC (3,356)(65,000) At Home Group Inc Barclays Bank (19,500)(77,264) AT&T Inc Bank of America
Merrill Lynch (57,642)(41,825) AT&T Inc Barclays Bank (24,259)(22,403) AT&T Inc Goldman Sachs (48,166)(61,335) AT&T Inc HSBC (43,052)(10,706) AT&T Inc Morgan Stanley (6,209)
8,811 Atara Biotherapeutics Inc Barclays Bank (30,134)11,738 Atara Biotherapeutics Inc Goldman Sachs 7,3363,393 Atara Biotherapeutics Inc HSBC 4,241
31,354 Atara Biotherapeutics Inc Morgan Stanley (107,231)(1,826) Athene Holding Ltd ’A’ Bank of America
Merrill Lynch 2,239(11,074) Athene Holding Ltd ’A’ HSBC (12,624)(8,441) Athene Holding Ltd ’A’ Morgan Stanley (20,596)
(31,812) Athenex Inc Bank of AmericaMerrill Lynch (13,997)
(559) Athenex Inc Barclays Bank 73(8,933) Athenex Inc Goldman Sachs (3,931)
(17,132) Athenex Inc Morgan Stanley 2,2279,805 Athersys Inc Barclays Bank (2,451)
34,476 Athersys Inc Goldman Sachs (6,062)20,233 Athersys Inc HSBC (7,209)1,170 Atkore International Group
IncBank of AmericaMerrill Lynch 6,002
16,016 Atkore International GroupInc Barclays Bank 34,274
10,354 Atkore International GroupInc Goldman Sachs 53,116
8,502 Atkore International GroupInc HSBC 27,461
27,425 Atlantic Capital BancsharesInc
Bank of AmericaMerrill Lynch 41,138
16,627 Atlantic Capital BancsharesInc Barclays Bank 13,302
29,652 Atlantic Capital BancsharesInc Goldman Sachs 44,478
Holding Description Counterparty
Netunrealised
appreciation/(depreciation)
USD
United States continued8,650 Atlantic Capital Bancshares
Inc HSBC 2,8317,827 Atlantic Capital Bancshares
Inc Morgan Stanley 6,262127,321 Atlantic Power Corp Bank of America
Merrill Lynch 27,37423,724 Atlantic Power Corp Barclays Bank 1,068
131,250 Atlantic Power Corp Goldman Sachs 28,21948,694 Atlantic Power Corp HSBC 10,46971,673 Atlantic Power Corp Morgan Stanley 3,225(3,173) Atlantic Union Bankshares
Corp Goldman Sachs (8,858)(38,225) Atlantic Union Bankshares
Corp HSBC (50,457)(102,605) Atlantic Union Bankshares
Corp Morgan Stanley (211,366)(12,242) Atlantica Sustainable
Infrastructure PlcBank of AmericaMerrill Lynch (28,504)
(30,217) Atlantica SustainableInfrastructure Plc Barclays Bank 26,968
(10,421) Atlantica SustainableInfrastructure Plc Goldman Sachs (14,166)
(10,976) Atlantica SustainableInfrastructure Plc HSBC (26,578)
1,100 Atlanticus Holdings Corp Bank of AmericaMerrill Lynch 319
1,729 Atlanticus Holdings Corp Barclays Bank 242(1,272) Atlas Air Worldwide
Holdings IncBank of AmericaMerrill Lynch (48)
(4,507) Atlas Air WorldwideHoldings Inc HSBC 3,786
(22,179) Atlas Air WorldwideHoldings Inc Morgan Stanley 31,938
6,406 Atlas Financial Holdings Inc Bank of AmericaMerrill Lynch (468)
5,972 Atlas Financial Holdings Inc Goldman Sachs (436)4,204 Atlas Financial Holdings Inc Morgan Stanley (139)5,087 Atlassian Corp Plc ’A’ Bank of America
Merrill Lynch (1,233)5,654 Atlassian Corp Plc ’A’ Goldman Sachs (13,000)
939 Atlassian Corp Plc ’A’ HSBC 2,8123,074 Atlassian Corp Plc ’A’ Morgan Stanley 4,105
(4,864) Atmos Energy Corp Bank of AmericaMerrill Lynch (31,633)
3,866 Atmos Energy Corp Barclays Bank 14,807(14,030) Atmos Energy Corp Barclays Bank (53,735)19,160 Atmos Energy Corp Goldman Sachs 135,078(8,500) Atmos Energy Corp Goldman Sachs (55,477)1,754 Atmos Energy Corp HSBC 8,472
(6,398) Atmos Energy Corp HSBC (30,902)13,663 Atmos Energy Corp Morgan Stanley 52,329(2,339) Atmos Energy Corp Morgan Stanley (8,958)2,484 ATN International Inc Bank of America
Merrill Lynch 11,1037,472 ATN International Inc Barclays Bank 6,8002,047 ATN International Inc Goldman Sachs 9,150
801 ATN International Inc HSBC 9292,333 ATN International Inc Morgan Stanley 2,123
10,838 Atomera Inc Bank of AmericaMerrill Lynch 5,623
6,766 Atomera Inc Morgan Stanley 1,3954,364 Atreca Inc ’A’ Bank of America
Merrill Lynch (2,269)5,100 Atreca Inc ’A’ Morgan Stanley 1,2752,019 AtriCure Inc Bank of America
Merrill Lynch 1,4332,703 AtriCure Inc Barclays Bank (2,433)
(8,146) AtriCure Inc Barclays Bank 7,331
BlackRock Americas Diversified Equity Absolute Return Fundcontinued
The notes on pages 691 to 711 form an integral part of these financial statements.
BlackRock Strategic Funds[82]
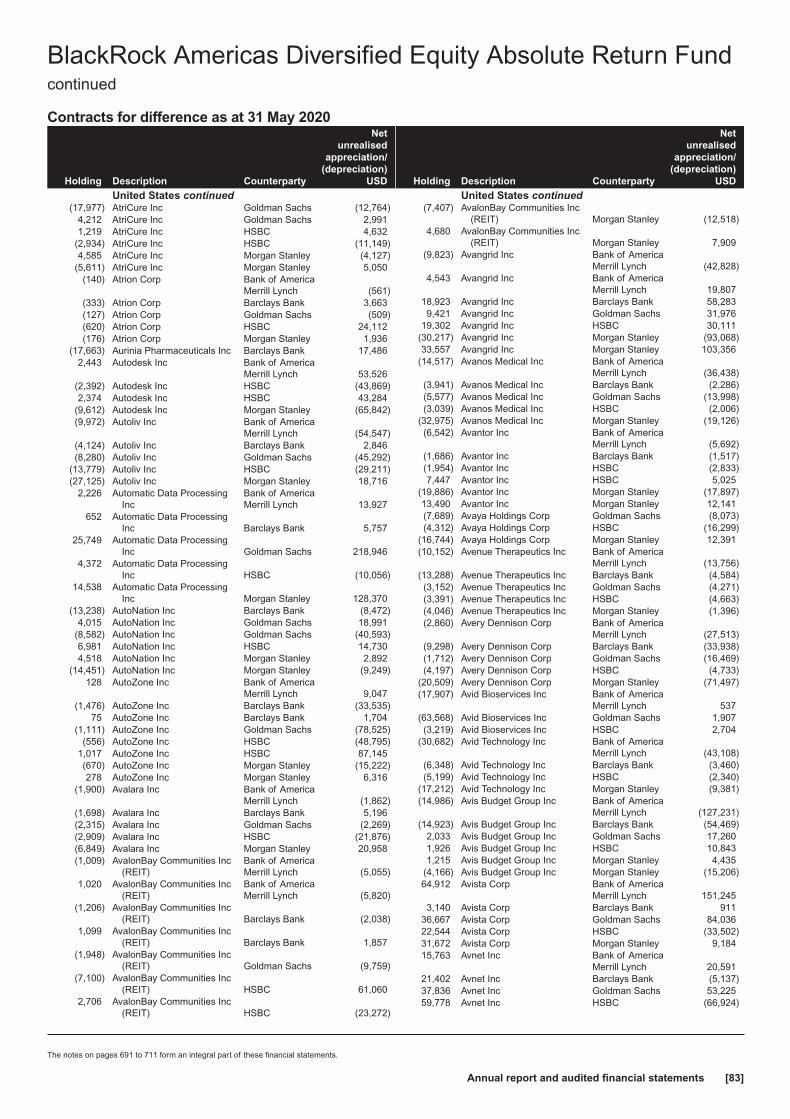
Contracts for difference as at 31 May 2020
Holding Description Counterparty
Netunrealised
appreciation/(depreciation)
USD
United States continued(17,977) AtriCure Inc Goldman Sachs (12,764)
4,212 AtriCure Inc Goldman Sachs 2,9911,219 AtriCure Inc HSBC 4,632
(2,934) AtriCure Inc HSBC (11,149)4,585 AtriCure Inc Morgan Stanley (4,127)
(5,611) AtriCure Inc Morgan Stanley 5,050(140) Atrion Corp Bank of America
Merrill Lynch (561)(333) Atrion Corp Barclays Bank 3,663(127) Atrion Corp Goldman Sachs (509)(620) Atrion Corp HSBC 24,112(176) Atrion Corp Morgan Stanley 1,936
(17,663) Aurinia Pharmaceuticals Inc Barclays Bank 17,4862,443 Autodesk Inc Bank of America
Merrill Lynch 53,526(2,392) Autodesk Inc HSBC (43,869)2,374 Autodesk Inc HSBC 43,284
(9,612) Autodesk Inc Morgan Stanley (65,842)(9,972) Autoliv Inc Bank of America
Merrill Lynch (54,547)(4,124) Autoliv Inc Barclays Bank 2,846(8,280) Autoliv Inc Goldman Sachs (45,292)
(13,779) Autoliv Inc HSBC (29,211)(27,125) Autoliv Inc Morgan Stanley 18,716
2,226 Automatic Data ProcessingInc
Bank of AmericaMerrill Lynch 13,927
652 Automatic Data ProcessingInc Barclays Bank 5,757
25,749 Automatic Data ProcessingInc Goldman Sachs 218,946
4,372 Automatic Data ProcessingInc HSBC (10,056)
14,538 Automatic Data ProcessingInc Morgan Stanley 128,370
(13,238) AutoNation Inc Barclays Bank (8,472)4,015 AutoNation Inc Goldman Sachs 18,991
(8,582) AutoNation Inc Goldman Sachs (40,593)6,981 AutoNation Inc HSBC 14,7304,518 AutoNation Inc Morgan Stanley 2,892
(14,451) AutoNation Inc Morgan Stanley (9,249)128 AutoZone Inc Bank of America
Merrill Lynch 9,047(1,476) AutoZone Inc Barclays Bank (33,535)
75 AutoZone Inc Barclays Bank 1,704(1,111) AutoZone Inc Goldman Sachs (78,525)
(556) AutoZone Inc HSBC (48,795)1,017 AutoZone Inc HSBC 87,145(670) AutoZone Inc Morgan Stanley (15,222)278 AutoZone Inc Morgan Stanley 6,316
(1,900) Avalara Inc Bank of AmericaMerrill Lynch (1,862)
(1,698) Avalara Inc Barclays Bank 5,196(2,315) Avalara Inc Goldman Sachs (2,269)(2,909) Avalara Inc HSBC (21,876)(6,849) Avalara Inc Morgan Stanley 20,958(1,009) AvalonBay Communities Inc
(REIT)Bank of AmericaMerrill Lynch (5,055)
1,020 AvalonBay Communities Inc(REIT)
Bank of AmericaMerrill Lynch (5,820)
(1,206) AvalonBay Communities Inc(REIT) Barclays Bank (2,038)
1,099 AvalonBay Communities Inc(REIT) Barclays Bank 1,857
(1,948) AvalonBay Communities Inc(REIT) Goldman Sachs (9,759)
(7,100) AvalonBay Communities Inc(REIT) HSBC 61,060
2,706 AvalonBay Communities Inc(REIT) HSBC (23,272)
Holding Description Counterparty
Netunrealised
appreciation/(depreciation)
USD
United States continued(7,407) AvalonBay Communities Inc
(REIT) Morgan Stanley (12,518)4,680 AvalonBay Communities Inc
(REIT) Morgan Stanley 7,909(9,823) Avangrid Inc Bank of America
Merrill Lynch (42,828)4,543 Avangrid Inc Bank of America
Merrill Lynch 19,80718,923 Avangrid Inc Barclays Bank 58,2839,421 Avangrid Inc Goldman Sachs 31,976
19,302 Avangrid Inc HSBC 30,111(30,217) Avangrid Inc Morgan Stanley (93,068)33,557 Avangrid Inc Morgan Stanley 103,356
(14,517) Avanos Medical Inc Bank of AmericaMerrill Lynch (36,438)
(3,941) Avanos Medical Inc Barclays Bank (2,286)(5,577) Avanos Medical Inc Goldman Sachs (13,998)(3,039) Avanos Medical Inc HSBC (2,006)
(32,975) Avanos Medical Inc Morgan Stanley (19,126)(6,542) Avantor Inc Bank of America
Merrill Lynch (5,692)(1,686) Avantor Inc Barclays Bank (1,517)(1,954) Avantor Inc HSBC (2,833)7,447 Avantor Inc HSBC 5,025
(19,886) Avantor Inc Morgan Stanley (17,897)13,490 Avantor Inc Morgan Stanley 12,141(7,689) Avaya Holdings Corp Goldman Sachs (8,073)(4,312) Avaya Holdings Corp HSBC (16,299)
(16,744) Avaya Holdings Corp Morgan Stanley 12,391(10,152) Avenue Therapeutics Inc Bank of America
Merrill Lynch (13,756)(13,288) Avenue Therapeutics Inc Barclays Bank (4,584)(3,152) Avenue Therapeutics Inc Goldman Sachs (4,271)(3,391) Avenue Therapeutics Inc HSBC (4,663)(4,046) Avenue Therapeutics Inc Morgan Stanley (1,396)(2,860) Avery Dennison Corp Bank of America
Merrill Lynch (27,513)(9,298) Avery Dennison Corp Barclays Bank (33,938)(1,712) Avery Dennison Corp Goldman Sachs (16,469)(4,197) Avery Dennison Corp HSBC (4,733)
(20,509) Avery Dennison Corp Morgan Stanley (71,497)(17,907) Avid Bioservices Inc Bank of America
Merrill Lynch 537(63,568) Avid Bioservices Inc Goldman Sachs 1,907(3,219) Avid Bioservices Inc HSBC 2,704
(30,682) Avid Technology Inc Bank of AmericaMerrill Lynch (43,108)
(6,348) Avid Technology Inc Barclays Bank (3,460)(5,199) Avid Technology Inc HSBC (2,340)
(17,212) Avid Technology Inc Morgan Stanley (9,381)(14,986) Avis Budget Group Inc Bank of America
Merrill Lynch (127,231)(14,923) Avis Budget Group Inc Barclays Bank (54,469)
2,033 Avis Budget Group Inc Goldman Sachs 17,2601,926 Avis Budget Group Inc HSBC 10,8431,215 Avis Budget Group Inc Morgan Stanley 4,435
(4,166) Avis Budget Group Inc Morgan Stanley (15,206)64,912 Avista Corp Bank of America
Merrill Lynch 151,2453,140 Avista Corp Barclays Bank 911
36,667 Avista Corp Goldman Sachs 84,03622,544 Avista Corp HSBC (33,502)31,672 Avista Corp Morgan Stanley 9,18415,763 Avnet Inc Bank of America
Merrill Lynch 20,59121,402 Avnet Inc Barclays Bank (5,137)37,836 Avnet Inc Goldman Sachs 53,22559,778 Avnet Inc HSBC (66,924)
BlackRock Americas Diversified Equity Absolute Return Fundcontinued
The notes on pages 691 to 711 form an integral part of these financial statements.
Annual report and audited financial statements [83]
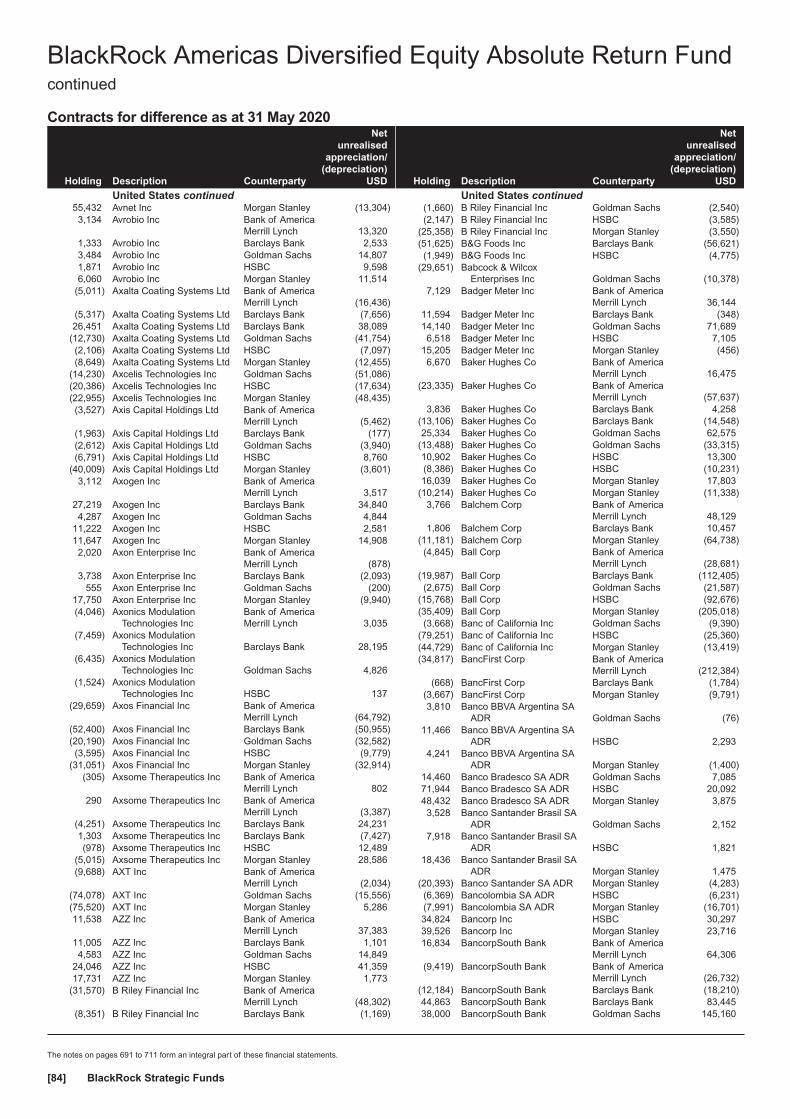
Contracts for difference as at 31 May 2020
Holding Description Counterparty
Netunrealised
appreciation/(depreciation)
USD
United States continued55,432 Avnet Inc Morgan Stanley (13,304)3,134 Avrobio Inc Bank of America
Merrill Lynch 13,3201,333 Avrobio Inc Barclays Bank 2,5333,484 Avrobio Inc Goldman Sachs 14,8071,871 Avrobio Inc HSBC 9,5986,060 Avrobio Inc Morgan Stanley 11,514
(5,011) Axalta Coating Systems Ltd Bank of AmericaMerrill Lynch (16,436)
(5,317) Axalta Coating Systems Ltd Barclays Bank (7,656)26,451 Axalta Coating Systems Ltd Barclays Bank 38,089
(12,730) Axalta Coating Systems Ltd Goldman Sachs (41,754)(2,106) Axalta Coating Systems Ltd HSBC (7,097)(8,649) Axalta Coating Systems Ltd Morgan Stanley (12,455)
(14,230) Axcelis Technologies Inc Goldman Sachs (51,086)(20,386) Axcelis Technologies Inc HSBC (17,634)(22,955) Axcelis Technologies Inc Morgan Stanley (48,435)(3,527) Axis Capital Holdings Ltd Bank of America
Merrill Lynch (5,462)(1,963) Axis Capital Holdings Ltd Barclays Bank (177)(2,612) Axis Capital Holdings Ltd Goldman Sachs (3,940)(6,791) Axis Capital Holdings Ltd HSBC 8,760
(40,009) Axis Capital Holdings Ltd Morgan Stanley (3,601)3,112 Axogen Inc Bank of America
Merrill Lynch 3,51727,219 Axogen Inc Barclays Bank 34,8404,287 Axogen Inc Goldman Sachs 4,844
11,222 Axogen Inc HSBC 2,58111,647 Axogen Inc Morgan Stanley 14,9082,020 Axon Enterprise Inc Bank of America
Merrill Lynch (878)3,738 Axon Enterprise Inc Barclays Bank (2,093)
555 Axon Enterprise Inc Goldman Sachs (200)17,750 Axon Enterprise Inc Morgan Stanley (9,940)(4,046) Axonics Modulation
Technologies IncBank of AmericaMerrill Lynch 3,035
(7,459) Axonics ModulationTechnologies Inc Barclays Bank 28,195
(6,435) Axonics ModulationTechnologies Inc Goldman Sachs 4,826
(1,524) Axonics ModulationTechnologies Inc HSBC 137
(29,659) Axos Financial Inc Bank of AmericaMerrill Lynch (64,792)
(52,400) Axos Financial Inc Barclays Bank (50,955)(20,190) Axos Financial Inc Goldman Sachs (32,582)(3,595) Axos Financial Inc HSBC (9,779)
(31,051) Axos Financial Inc Morgan Stanley (32,914)(305) Axsome Therapeutics Inc Bank of America
Merrill Lynch 802290 Axsome Therapeutics Inc Bank of America
Merrill Lynch (3,387)(4,251) Axsome Therapeutics Inc Barclays Bank 24,2311,303 Axsome Therapeutics Inc Barclays Bank (7,427)(978) Axsome Therapeutics Inc HSBC 12,489
(5,015) Axsome Therapeutics Inc Morgan Stanley 28,586(9,688) AXT Inc Bank of America
Merrill Lynch (2,034)(74,078) AXT Inc Goldman Sachs (15,556)(75,520) AXT Inc Morgan Stanley 5,28611,538 AZZ Inc Bank of America
Merrill Lynch 37,38311,005 AZZ Inc Barclays Bank 1,1014,583 AZZ Inc Goldman Sachs 14,849
24,046 AZZ Inc HSBC 41,35917,731 AZZ Inc Morgan Stanley 1,773
(31,570) B Riley Financial Inc Bank of AmericaMerrill Lynch (48,302)
(8,351) B Riley Financial Inc Barclays Bank (1,169)
Holding Description Counterparty
Netunrealised
appreciation/(depreciation)
USD
United States continued(1,660) B Riley Financial Inc Goldman Sachs (2,540)(2,147) B Riley Financial Inc HSBC (3,585)
(25,358) B Riley Financial Inc Morgan Stanley (3,550)(51,625) B&G Foods Inc Barclays Bank (56,621)(1,949) B&G Foods Inc HSBC (4,775)
(29,651) Babcock & WilcoxEnterprises Inc Goldman Sachs (10,378)
7,129 Badger Meter Inc Bank of AmericaMerrill Lynch 36,144
11,594 Badger Meter Inc Barclays Bank (348)14,140 Badger Meter Inc Goldman Sachs 71,6896,518 Badger Meter Inc HSBC 7,105
15,205 Badger Meter Inc Morgan Stanley (456)6,670 Baker Hughes Co Bank of America
Merrill Lynch 16,475(23,335) Baker Hughes Co Bank of America
Merrill Lynch (57,637)3,836 Baker Hughes Co Barclays Bank 4,258
(13,106) Baker Hughes Co Barclays Bank (14,548)25,334 Baker Hughes Co Goldman Sachs 62,575
(13,488) Baker Hughes Co Goldman Sachs (33,315)10,902 Baker Hughes Co HSBC 13,300(8,386) Baker Hughes Co HSBC (10,231)16,039 Baker Hughes Co Morgan Stanley 17,803
(10,214) Baker Hughes Co Morgan Stanley (11,338)3,766 Balchem Corp Bank of America
Merrill Lynch 48,1291,806 Balchem Corp Barclays Bank 10,457
(11,181) Balchem Corp Morgan Stanley (64,738)(4,845) Ball Corp Bank of America
Merrill Lynch (28,681)(19,987) Ball Corp Barclays Bank (112,405)(2,675) Ball Corp Goldman Sachs (21,587)
(15,768) Ball Corp HSBC (92,676)(35,409) Ball Corp Morgan Stanley (205,018)(3,668) Banc of California Inc Goldman Sachs (9,390)
(79,251) Banc of California Inc HSBC (25,360)(44,729) Banc of California Inc Morgan Stanley (13,419)(34,817) BancFirst Corp Bank of America
Merrill Lynch (212,384)(668) BancFirst Corp Barclays Bank (1,784)
(3,667) BancFirst Corp Morgan Stanley (9,791)3,810 Banco BBVA Argentina SA
ADR Goldman Sachs (76)11,466 Banco BBVA Argentina SA
ADR HSBC 2,2934,241 Banco BBVA Argentina SA
ADR Morgan Stanley (1,400)14,460 Banco Bradesco SA ADR Goldman Sachs 7,08571,944 Banco Bradesco SA ADR HSBC 20,09248,432 Banco Bradesco SA ADR Morgan Stanley 3,8753,528 Banco Santander Brasil SA
ADR Goldman Sachs 2,1527,918 Banco Santander Brasil SA
ADR HSBC 1,82118,436 Banco Santander Brasil SA
ADR Morgan Stanley 1,475(20,393) Banco Santander SA ADR Morgan Stanley (4,283)(6,369) Bancolombia SA ADR HSBC (6,231)(7,991) Bancolombia SA ADR Morgan Stanley (16,701)34,824 Bancorp Inc HSBC 30,29739,526 Bancorp Inc Morgan Stanley 23,71616,834 BancorpSouth Bank Bank of America
Merrill Lynch 64,306(9,419) BancorpSouth Bank Bank of America
Merrill Lynch (26,732)(12,184) BancorpSouth Bank Barclays Bank (18,210)44,863 BancorpSouth Bank Barclays Bank 83,44538,000 BancorpSouth Bank Goldman Sachs 145,160
BlackRock Americas Diversified Equity Absolute Return Fundcontinued
The notes on pages 691 to 711 form an integral part of these financial statements.
BlackRock Strategic Funds[84]
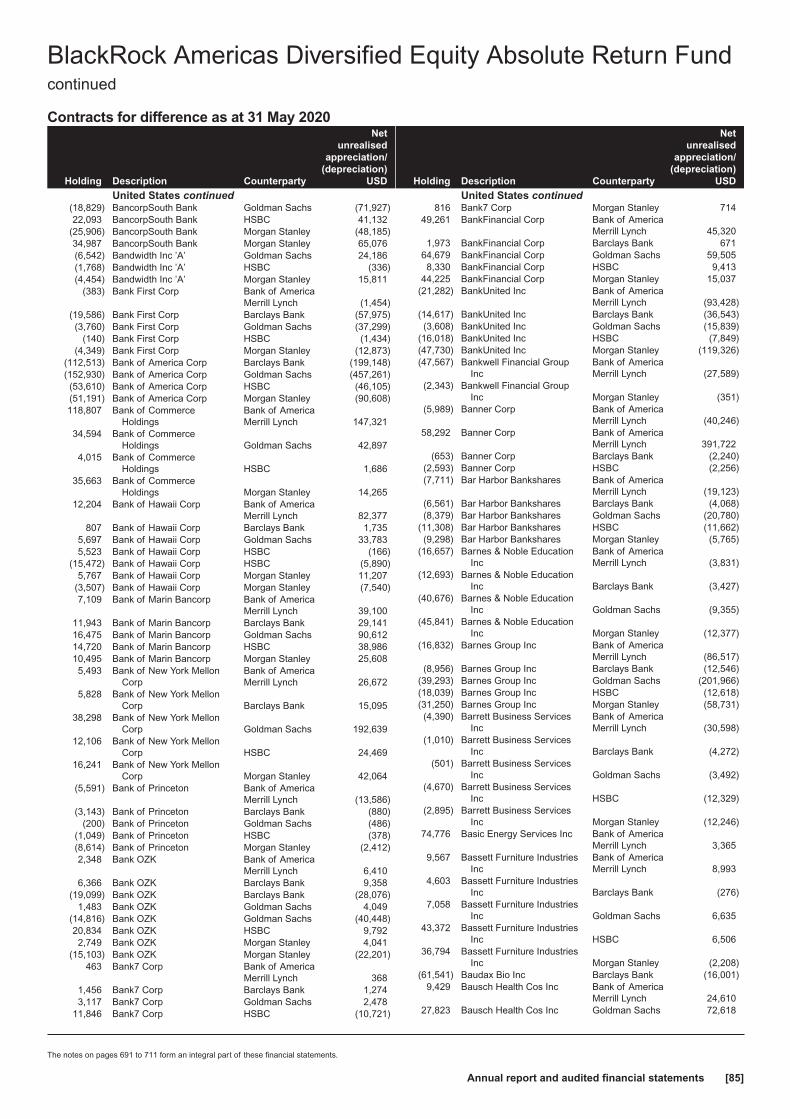
Contracts for difference as at 31 May 2020
Holding Description Counterparty
Netunrealised
appreciation/(depreciation)
USD
United States continued(18,829) BancorpSouth Bank Goldman Sachs (71,927)22,093 BancorpSouth Bank HSBC 41,132
(25,906) BancorpSouth Bank Morgan Stanley (48,185)34,987 BancorpSouth Bank Morgan Stanley 65,076(6,542) Bandwidth Inc ’A’ Goldman Sachs 24,186(1,768) Bandwidth Inc ’A’ HSBC (336)(4,454) Bandwidth Inc ’A’ Morgan Stanley 15,811
(383) Bank First Corp Bank of AmericaMerrill Lynch (1,454)
(19,586) Bank First Corp Barclays Bank (57,975)(3,760) Bank First Corp Goldman Sachs (37,299)
(140) Bank First Corp HSBC (1,434)(4,349) Bank First Corp Morgan Stanley (12,873)
(112,513) Bank of America Corp Barclays Bank (199,148)(152,930) Bank of America Corp Goldman Sachs (457,261)(53,610) Bank of America Corp HSBC (46,105)(51,191) Bank of America Corp Morgan Stanley (90,608)118,807 Bank of Commerce
HoldingsBank of AmericaMerrill Lynch 147,321
34,594 Bank of CommerceHoldings Goldman Sachs 42,897
4,015 Bank of CommerceHoldings HSBC 1,686
35,663 Bank of CommerceHoldings Morgan Stanley 14,265
12,204 Bank of Hawaii Corp Bank of AmericaMerrill Lynch 82,377
807 Bank of Hawaii Corp Barclays Bank 1,7355,697 Bank of Hawaii Corp Goldman Sachs 33,7835,523 Bank of Hawaii Corp HSBC (166)
(15,472) Bank of Hawaii Corp HSBC (5,890)5,767 Bank of Hawaii Corp Morgan Stanley 11,207
(3,507) Bank of Hawaii Corp Morgan Stanley (7,540)7,109 Bank of Marin Bancorp Bank of America
Merrill Lynch 39,10011,943 Bank of Marin Bancorp Barclays Bank 29,14116,475 Bank of Marin Bancorp Goldman Sachs 90,61214,720 Bank of Marin Bancorp HSBC 38,98610,495 Bank of Marin Bancorp Morgan Stanley 25,6085,493 Bank of New York Mellon
CorpBank of AmericaMerrill Lynch 26,672
5,828 Bank of New York MellonCorp Barclays Bank 15,095
38,298 Bank of New York MellonCorp Goldman Sachs 192,639
12,106 Bank of New York MellonCorp HSBC 24,469
16,241 Bank of New York MellonCorp Morgan Stanley 42,064
(5,591) Bank of Princeton Bank of AmericaMerrill Lynch (13,586)
(3,143) Bank of Princeton Barclays Bank (880)(200) Bank of Princeton Goldman Sachs (486)
(1,049) Bank of Princeton HSBC (378)(8,614) Bank of Princeton Morgan Stanley (2,412)2,348 Bank OZK Bank of America
Merrill Lynch 6,4106,366 Bank OZK Barclays Bank 9,358
(19,099) Bank OZK Barclays Bank (28,076)1,483 Bank OZK Goldman Sachs 4,049
(14,816) Bank OZK Goldman Sachs (40,448)20,834 Bank OZK HSBC 9,7922,749 Bank OZK Morgan Stanley 4,041
(15,103) Bank OZK Morgan Stanley (22,201)463 Bank7 Corp Bank of America
Merrill Lynch 3681,456 Bank7 Corp Barclays Bank 1,2743,117 Bank7 Corp Goldman Sachs 2,478
11,846 Bank7 Corp HSBC (10,721)
Holding Description Counterparty
Netunrealised
appreciation/(depreciation)
USD
United States continued816 Bank7 Corp Morgan Stanley 714
49,261 BankFinancial Corp Bank of AmericaMerrill Lynch 45,320
1,973 BankFinancial Corp Barclays Bank 67164,679 BankFinancial Corp Goldman Sachs 59,5058,330 BankFinancial Corp HSBC 9,413
44,225 BankFinancial Corp Morgan Stanley 15,037(21,282) BankUnited Inc Bank of America
Merrill Lynch (93,428)(14,617) BankUnited Inc Barclays Bank (36,543)(3,608) BankUnited Inc Goldman Sachs (15,839)
(16,018) BankUnited Inc HSBC (7,849)(47,730) BankUnited Inc Morgan Stanley (119,326)(47,567) Bankwell Financial Group
IncBank of AmericaMerrill Lynch (27,589)
(2,343) Bankwell Financial GroupInc Morgan Stanley (351)
(5,989) Banner Corp Bank of AmericaMerrill Lynch (40,246)
58,292 Banner Corp Bank of AmericaMerrill Lynch 391,722
(653) Banner Corp Barclays Bank (2,240)(2,593) Banner Corp HSBC (2,256)(7,711) Bar Harbor Bankshares Bank of America
Merrill Lynch (19,123)(6,561) Bar Harbor Bankshares Barclays Bank (4,068)(8,379) Bar Harbor Bankshares Goldman Sachs (20,780)
(11,308) Bar Harbor Bankshares HSBC (11,662)(9,298) Bar Harbor Bankshares Morgan Stanley (5,765)
(16,657) Barnes & Noble EducationInc
Bank of AmericaMerrill Lynch (3,831)
(12,693) Barnes & Noble EducationInc Barclays Bank (3,427)
(40,676) Barnes & Noble EducationInc Goldman Sachs (9,355)
(45,841) Barnes & Noble EducationInc Morgan Stanley (12,377)
(16,832) Barnes Group Inc Bank of AmericaMerrill Lynch (86,517)
(8,956) Barnes Group Inc Barclays Bank (12,546)(39,293) Barnes Group Inc Goldman Sachs (201,966)(18,039) Barnes Group Inc HSBC (12,618)(31,250) Barnes Group Inc Morgan Stanley (58,731)(4,390) Barrett Business Services
IncBank of AmericaMerrill Lynch (30,598)
(1,010) Barrett Business ServicesInc Barclays Bank (4,272)
(501) Barrett Business ServicesInc Goldman Sachs (3,492)
(4,670) Barrett Business ServicesInc HSBC (12,329)
(2,895) Barrett Business ServicesInc Morgan Stanley (12,246)
74,776 Basic Energy Services Inc Bank of AmericaMerrill Lynch 3,365
9,567 Bassett Furniture IndustriesInc
Bank of AmericaMerrill Lynch 8,993
4,603 Bassett Furniture IndustriesInc Barclays Bank (276)
7,058 Bassett Furniture IndustriesInc Goldman Sachs 6,635
43,372 Bassett Furniture IndustriesInc HSBC 6,506
36,794 Bassett Furniture IndustriesInc Morgan Stanley (2,208)
(61,541) Baudax Bio Inc Barclays Bank (16,001)9,429 Bausch Health Cos Inc Bank of America
Merrill Lynch 24,61027,823 Bausch Health Cos Inc Goldman Sachs 72,618
BlackRock Americas Diversified Equity Absolute Return Fundcontinued
The notes on pages 691 to 711 form an integral part of these financial statements.
Annual report and audited financial statements [85]
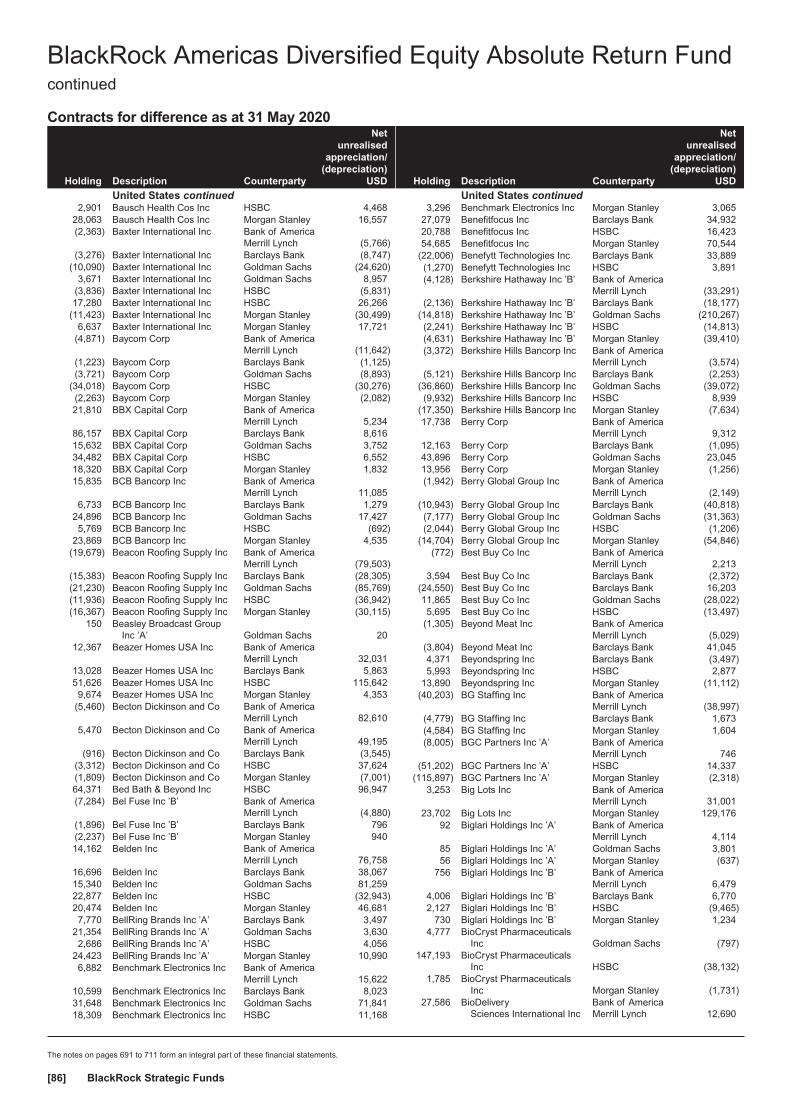
Contracts for difference as at 31 May 2020
Holding Description Counterparty
Netunrealised
appreciation/(depreciation)
USD
United States continued2,901 Bausch Health Cos Inc HSBC 4,468
28,063 Bausch Health Cos Inc Morgan Stanley 16,557(2,363) Baxter International Inc Bank of America
Merrill Lynch (5,766)(3,276) Baxter International Inc Barclays Bank (8,747)
(10,090) Baxter International Inc Goldman Sachs (24,620)3,671 Baxter International Inc Goldman Sachs 8,957
(3,836) Baxter International Inc HSBC (5,831)17,280 Baxter International Inc HSBC 26,266
(11,423) Baxter International Inc Morgan Stanley (30,499)6,637 Baxter International Inc Morgan Stanley 17,721
(4,871) Baycom Corp Bank of AmericaMerrill Lynch (11,642)
(1,223) Baycom Corp Barclays Bank (1,125)(3,721) Baycom Corp Goldman Sachs (8,893)
(34,018) Baycom Corp HSBC (30,276)(2,263) Baycom Corp Morgan Stanley (2,082)21,810 BBX Capital Corp Bank of America
Merrill Lynch 5,23486,157 BBX Capital Corp Barclays Bank 8,61615,632 BBX Capital Corp Goldman Sachs 3,75234,482 BBX Capital Corp HSBC 6,55218,320 BBX Capital Corp Morgan Stanley 1,83215,835 BCB Bancorp Inc Bank of America
Merrill Lynch 11,0856,733 BCB Bancorp Inc Barclays Bank 1,279
24,896 BCB Bancorp Inc Goldman Sachs 17,4275,769 BCB Bancorp Inc HSBC (692)
23,869 BCB Bancorp Inc Morgan Stanley 4,535(19,679) Beacon Roofing Supply Inc Bank of America
Merrill Lynch (79,503)(15,383) Beacon Roofing Supply Inc Barclays Bank (28,305)(21,230) Beacon Roofing Supply Inc Goldman Sachs (85,769)(11,936) Beacon Roofing Supply Inc HSBC (36,942)(16,367) Beacon Roofing Supply Inc Morgan Stanley (30,115)
150 Beasley Broadcast GroupInc ’A’ Goldman Sachs 20
12,367 Beazer Homes USA Inc Bank of AmericaMerrill Lynch 32,031
13,028 Beazer Homes USA Inc Barclays Bank 5,86351,626 Beazer Homes USA Inc HSBC 115,6429,674 Beazer Homes USA Inc Morgan Stanley 4,353
(5,460) Becton Dickinson and Co Bank of AmericaMerrill Lynch 82,610
5,470 Becton Dickinson and Co Bank of AmericaMerrill Lynch 49,195
(916) Becton Dickinson and Co Barclays Bank (3,545)(3,312) Becton Dickinson and Co HSBC 37,624(1,809) Becton Dickinson and Co Morgan Stanley (7,001)64,371 Bed Bath & Beyond Inc HSBC 96,947(7,284) Bel Fuse Inc ’B’ Bank of America
Merrill Lynch (4,880)(1,896) Bel Fuse Inc ’B’ Barclays Bank 796(2,237) Bel Fuse Inc ’B’ Morgan Stanley 94014,162 Belden Inc Bank of America
Merrill Lynch 76,75816,696 Belden Inc Barclays Bank 38,06715,340 Belden Inc Goldman Sachs 81,25922,877 Belden Inc HSBC (32,943)20,474 Belden Inc Morgan Stanley 46,6817,770 BellRing Brands Inc ’A’ Barclays Bank 3,497
21,354 BellRing Brands Inc ’A’ Goldman Sachs 3,6302,686 BellRing Brands Inc ’A’ HSBC 4,056
24,423 BellRing Brands Inc ’A’ Morgan Stanley 10,9906,882 Benchmark Electronics Inc Bank of America
Merrill Lynch 15,62210,599 Benchmark Electronics Inc Barclays Bank 8,02331,648 Benchmark Electronics Inc Goldman Sachs 71,84118,309 Benchmark Electronics Inc HSBC 11,168
Holding Description Counterparty
Netunrealised
appreciation/(depreciation)
USD
United States continued3,296 Benchmark Electronics Inc Morgan Stanley 3,065
27,079 Benefitfocus Inc Barclays Bank 34,93220,788 Benefitfocus Inc HSBC 16,42354,685 Benefitfocus Inc Morgan Stanley 70,544
(22,006) Benefytt Technologies Inc Barclays Bank 33,889(1,270) Benefytt Technologies Inc HSBC 3,891(4,128) Berkshire Hathaway Inc ’B’ Bank of America
Merrill Lynch (33,291)(2,136) Berkshire Hathaway Inc ’B’ Barclays Bank (18,177)
(14,818) Berkshire Hathaway Inc ’B’ Goldman Sachs (210,267)(2,241) Berkshire Hathaway Inc ’B’ HSBC (14,813)(4,631) Berkshire Hathaway Inc ’B’ Morgan Stanley (39,410)(3,372) Berkshire Hills Bancorp Inc Bank of America
Merrill Lynch (3,574)(5,121) Berkshire Hills Bancorp Inc Barclays Bank (2,253)
(36,860) Berkshire Hills Bancorp Inc Goldman Sachs (39,072)(9,932) Berkshire Hills Bancorp Inc HSBC 8,939
(17,350) Berkshire Hills Bancorp Inc Morgan Stanley (7,634)17,738 Berry Corp Bank of America
Merrill Lynch 9,31212,163 Berry Corp Barclays Bank (1,095)43,896 Berry Corp Goldman Sachs 23,04513,956 Berry Corp Morgan Stanley (1,256)(1,942) Berry Global Group Inc Bank of America
Merrill Lynch (2,149)(10,943) Berry Global Group Inc Barclays Bank (40,818)(7,177) Berry Global Group Inc Goldman Sachs (31,363)(2,044) Berry Global Group Inc HSBC (1,206)
(14,704) Berry Global Group Inc Morgan Stanley (54,846)(772) Best Buy Co Inc Bank of America
Merrill Lynch 2,2133,594 Best Buy Co Inc Barclays Bank (2,372)
(24,550) Best Buy Co Inc Barclays Bank 16,20311,865 Best Buy Co Inc Goldman Sachs (28,022)5,695 Best Buy Co Inc HSBC (13,497)
(1,305) Beyond Meat Inc Bank of AmericaMerrill Lynch (5,029)
(3,804) Beyond Meat Inc Barclays Bank 41,0454,371 Beyondspring Inc Barclays Bank (3,497)5,993 Beyondspring Inc HSBC 2,877
13,890 Beyondspring Inc Morgan Stanley (11,112)(40,203) BG Staffing Inc Bank of America
Merrill Lynch (38,997)(4,779) BG Staffing Inc Barclays Bank 1,673(4,584) BG Staffing Inc Morgan Stanley 1,604(8,005) BGC Partners Inc ’A’ Bank of America
Merrill Lynch 746(51,202) BGC Partners Inc ’A’ HSBC 14,337
(115,897) BGC Partners Inc ’A’ Morgan Stanley (2,318)3,253 Big Lots Inc Bank of America
Merrill Lynch 31,00123,702 Big Lots Inc Morgan Stanley 129,176
92 Biglari Holdings Inc ’A’ Bank of AmericaMerrill Lynch 4,114
85 Biglari Holdings Inc ’A’ Goldman Sachs 3,80156 Biglari Holdings Inc ’A’ Morgan Stanley (637)
756 Biglari Holdings Inc ’B’ Bank of AmericaMerrill Lynch 6,479
4,006 Biglari Holdings Inc ’B’ Barclays Bank 6,7702,127 Biglari Holdings Inc ’B’ HSBC (9,465)
730 Biglari Holdings Inc ’B’ Morgan Stanley 1,2344,777 BioCryst Pharmaceuticals
Inc Goldman Sachs (797)147,193 BioCryst Pharmaceuticals
Inc HSBC (38,132)1,785 BioCryst Pharmaceuticals
Inc Morgan Stanley (1,731)27,586 BioDelivery
Sciences International IncBank of AmericaMerrill Lynch 12,690
BlackRock Americas Diversified Equity Absolute Return Fundcontinued
The notes on pages 691 to 711 form an integral part of these financial statements.
BlackRock Strategic Funds[86]
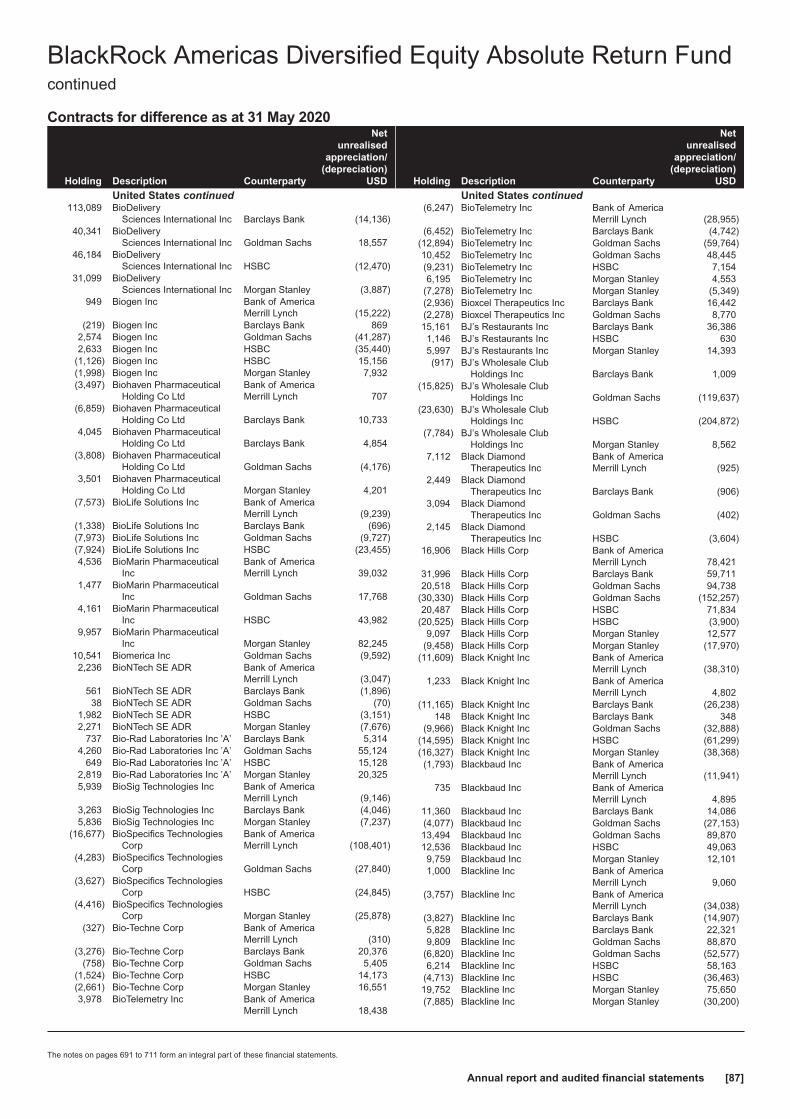
Contracts for difference as at 31 May 2020
Holding Description Counterparty
Netunrealised
appreciation/(depreciation)
USD
United States continued113,089 BioDelivery
Sciences International Inc Barclays Bank (14,136)40,341 BioDelivery
Sciences International Inc Goldman Sachs 18,55746,184 BioDelivery
Sciences International Inc HSBC (12,470)31,099 BioDelivery
Sciences International Inc Morgan Stanley (3,887)949 Biogen Inc Bank of America
Merrill Lynch (15,222)(219) Biogen Inc Barclays Bank 869
2,574 Biogen Inc Goldman Sachs (41,287)2,633 Biogen Inc HSBC (35,440)
(1,126) Biogen Inc HSBC 15,156(1,998) Biogen Inc Morgan Stanley 7,932(3,497) Biohaven Pharmaceutical
Holding Co LtdBank of AmericaMerrill Lynch 707
(6,859) Biohaven PharmaceuticalHolding Co Ltd Barclays Bank 10,733
4,045 Biohaven PharmaceuticalHolding Co Ltd Barclays Bank 4,854
(3,808) Biohaven PharmaceuticalHolding Co Ltd Goldman Sachs (4,176)
3,501 Biohaven PharmaceuticalHolding Co Ltd Morgan Stanley 4,201
(7,573) BioLife Solutions Inc Bank of AmericaMerrill Lynch (9,239)
(1,338) BioLife Solutions Inc Barclays Bank (696)(7,973) BioLife Solutions Inc Goldman Sachs (9,727)(7,924) BioLife Solutions Inc HSBC (23,455)4,536 BioMarin Pharmaceutical
IncBank of AmericaMerrill Lynch 39,032
1,477 BioMarin PharmaceuticalInc Goldman Sachs 17,768
4,161 BioMarin PharmaceuticalInc HSBC 43,982
9,957 BioMarin PharmaceuticalInc Morgan Stanley 82,245
10,541 Biomerica Inc Goldman Sachs (9,592)2,236 BioNTech SE ADR Bank of America
Merrill Lynch (3,047)561 BioNTech SE ADR Barclays Bank (1,896)38 BioNTech SE ADR Goldman Sachs (70)
1,982 BioNTech SE ADR HSBC (3,151)2,271 BioNTech SE ADR Morgan Stanley (7,676)
737 Bio-Rad Laboratories Inc ’A’ Barclays Bank 5,3144,260 Bio-Rad Laboratories Inc ’A’ Goldman Sachs 55,124
649 Bio-Rad Laboratories Inc ’A’ HSBC 15,1282,819 Bio-Rad Laboratories Inc ’A’ Morgan Stanley 20,3255,939 BioSig Technologies Inc Bank of America
Merrill Lynch (9,146)3,263 BioSig Technologies Inc Barclays Bank (4,046)5,836 BioSig Technologies Inc Morgan Stanley (7,237)
(16,677) BioSpecifics TechnologiesCorp
Bank of AmericaMerrill Lynch (108,401)
(4,283) BioSpecifics TechnologiesCorp Goldman Sachs (27,840)
(3,627) BioSpecifics TechnologiesCorp HSBC (24,845)
(4,416) BioSpecifics TechnologiesCorp Morgan Stanley (25,878)
(327) Bio-Techne Corp Bank of AmericaMerrill Lynch (310)
(3,276) Bio-Techne Corp Barclays Bank 20,376(758) Bio-Techne Corp Goldman Sachs 5,405
(1,524) Bio-Techne Corp HSBC 14,173(2,661) Bio-Techne Corp Morgan Stanley 16,5513,978 BioTelemetry Inc Bank of America
Merrill Lynch 18,438
Holding Description Counterparty
Netunrealised
appreciation/(depreciation)
USD
United States continued(6,247) BioTelemetry Inc Bank of America
Merrill Lynch (28,955)(6,452) BioTelemetry Inc Barclays Bank (4,742)
(12,894) BioTelemetry Inc Goldman Sachs (59,764)10,452 BioTelemetry Inc Goldman Sachs 48,445(9,231) BioTelemetry Inc HSBC 7,1546,195 BioTelemetry Inc Morgan Stanley 4,553
(7,278) BioTelemetry Inc Morgan Stanley (5,349)(2,936) Bioxcel Therapeutics Inc Barclays Bank 16,442(2,278) Bioxcel Therapeutics Inc Goldman Sachs 8,77015,161 BJ’s Restaurants Inc Barclays Bank 36,3861,146 BJ’s Restaurants Inc HSBC 6305,997 BJ’s Restaurants Inc Morgan Stanley 14,393(917) BJ’s Wholesale Club
Holdings Inc Barclays Bank 1,009(15,825) BJ’s Wholesale Club
Holdings Inc Goldman Sachs (119,637)(23,630) BJ’s Wholesale Club
Holdings Inc HSBC (204,872)(7,784) BJ’s Wholesale Club
Holdings Inc Morgan Stanley 8,5627,112 Black Diamond
Therapeutics IncBank of AmericaMerrill Lynch (925)
2,449 Black DiamondTherapeutics Inc Barclays Bank (906)
3,094 Black DiamondTherapeutics Inc Goldman Sachs (402)
2,145 Black DiamondTherapeutics Inc HSBC (3,604)
16,906 Black Hills Corp Bank of AmericaMerrill Lynch 78,421
31,996 Black Hills Corp Barclays Bank 59,71120,518 Black Hills Corp Goldman Sachs 94,738
(30,330) Black Hills Corp Goldman Sachs (152,257)20,487 Black Hills Corp HSBC 71,834
(20,525) Black Hills Corp HSBC (3,900)9,097 Black Hills Corp Morgan Stanley 12,577
(9,458) Black Hills Corp Morgan Stanley (17,970)(11,609) Black Knight Inc Bank of America
Merrill Lynch (38,310)1,233 Black Knight Inc Bank of America
Merrill Lynch 4,802(11,165) Black Knight Inc Barclays Bank (26,238)
148 Black Knight Inc Barclays Bank 348(9,966) Black Knight Inc Goldman Sachs (32,888)
(14,595) Black Knight Inc HSBC (61,299)(16,327) Black Knight Inc Morgan Stanley (38,368)(1,793) Blackbaud Inc Bank of America
Merrill Lynch (11,941)735 Blackbaud Inc Bank of America
Merrill Lynch 4,89511,360 Blackbaud Inc Barclays Bank 14,086(4,077) Blackbaud Inc Goldman Sachs (27,153)13,494 Blackbaud Inc Goldman Sachs 89,87012,536 Blackbaud Inc HSBC 49,0639,759 Blackbaud Inc Morgan Stanley 12,1011,000 Blackline Inc Bank of America
Merrill Lynch 9,060(3,757) Blackline Inc Bank of America
Merrill Lynch (34,038)(3,827) Blackline Inc Barclays Bank (14,907)5,828 Blackline Inc Barclays Bank 22,3219,809 Blackline Inc Goldman Sachs 88,870
(6,820) Blackline Inc Goldman Sachs (52,577)6,214 Blackline Inc HSBC 58,163
(4,713) Blackline Inc HSBC (36,463)19,752 Blackline Inc Morgan Stanley 75,650(7,885) Blackline Inc Morgan Stanley (30,200)
BlackRock Americas Diversified Equity Absolute Return Fundcontinued
The notes on pages 691 to 711 form an integral part of these financial statements.
Annual report and audited financial statements [87]
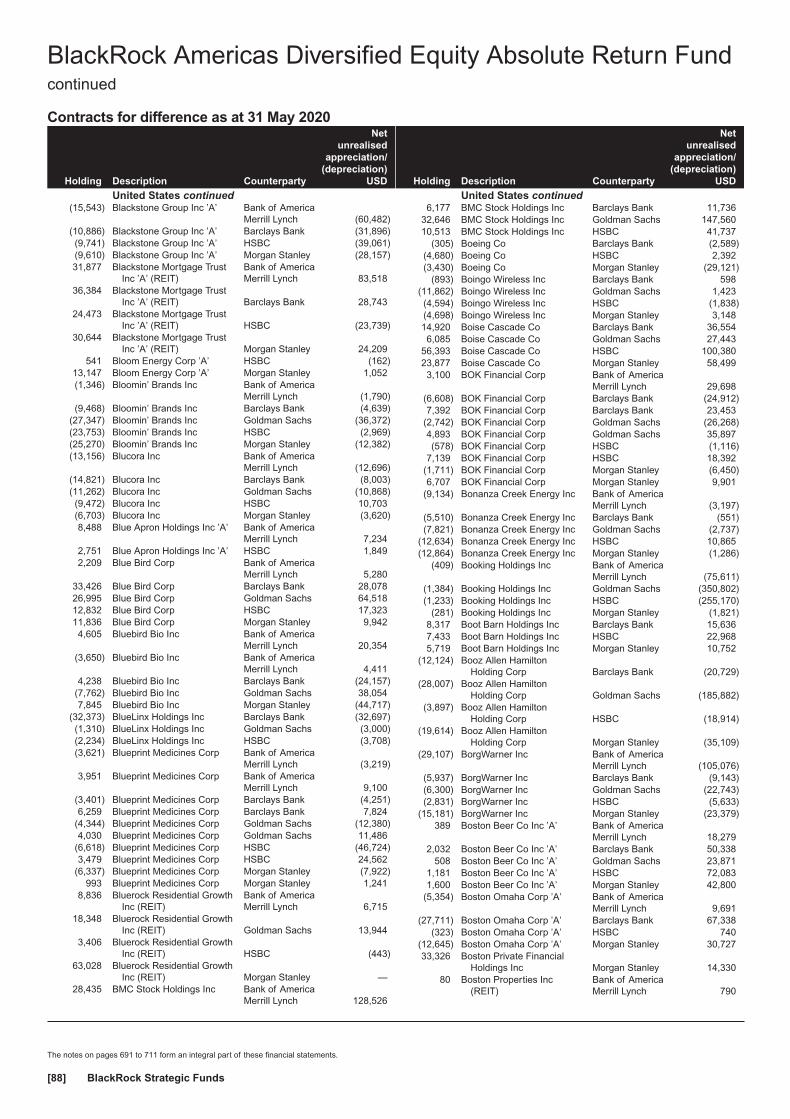
Contracts for difference as at 31 May 2020
Holding Description Counterparty
Netunrealised
appreciation/(depreciation)
USD
United States continued(15,543) Blackstone Group Inc ’A’ Bank of America
Merrill Lynch (60,482)(10,886) Blackstone Group Inc ’A’ Barclays Bank (31,896)(9,741) Blackstone Group Inc ’A’ HSBC (39,061)(9,610) Blackstone Group Inc ’A’ Morgan Stanley (28,157)31,877 Blackstone Mortgage Trust
Inc ’A’ (REIT)Bank of AmericaMerrill Lynch 83,518
36,384 Blackstone Mortgage TrustInc ’A’ (REIT) Barclays Bank 28,743
24,473 Blackstone Mortgage TrustInc ’A’ (REIT) HSBC (23,739)
30,644 Blackstone Mortgage TrustInc ’A’ (REIT) Morgan Stanley 24,209
541 Bloom Energy Corp ’A’ HSBC (162)13,147 Bloom Energy Corp ’A’ Morgan Stanley 1,052(1,346) Bloomin’ Brands Inc Bank of America
Merrill Lynch (1,790)(9,468) Bloomin’ Brands Inc Barclays Bank (4,639)
(27,347) Bloomin’ Brands Inc Goldman Sachs (36,372)(23,753) Bloomin’ Brands Inc HSBC (2,969)(25,270) Bloomin’ Brands Inc Morgan Stanley (12,382)(13,156) Blucora Inc Bank of America
Merrill Lynch (12,696)(14,821) Blucora Inc Barclays Bank (8,003)(11,262) Blucora Inc Goldman Sachs (10,868)(9,472) Blucora Inc HSBC 10,703(6,703) Blucora Inc Morgan Stanley (3,620)8,488 Blue Apron Holdings Inc ’A’ Bank of America
Merrill Lynch 7,2342,751 Blue Apron Holdings Inc ’A’ HSBC 1,8492,209 Blue Bird Corp Bank of America
Merrill Lynch 5,28033,426 Blue Bird Corp Barclays Bank 28,07826,995 Blue Bird Corp Goldman Sachs 64,51812,832 Blue Bird Corp HSBC 17,32311,836 Blue Bird Corp Morgan Stanley 9,9424,605 Bluebird Bio Inc Bank of America
Merrill Lynch 20,354(3,650) Bluebird Bio Inc Bank of America
Merrill Lynch 4,4114,238 Bluebird Bio Inc Barclays Bank (24,157)
(7,762) Bluebird Bio Inc Goldman Sachs 38,0547,845 Bluebird Bio Inc Morgan Stanley (44,717)
(32,373) BlueLinx Holdings Inc Barclays Bank (32,697)(1,310) BlueLinx Holdings Inc Goldman Sachs (3,000)(2,234) BlueLinx Holdings Inc HSBC (3,708)(3,621) Blueprint Medicines Corp Bank of America
Merrill Lynch (3,219)3,951 Blueprint Medicines Corp Bank of America
Merrill Lynch 9,100(3,401) Blueprint Medicines Corp Barclays Bank (4,251)6,259 Blueprint Medicines Corp Barclays Bank 7,824
(4,344) Blueprint Medicines Corp Goldman Sachs (12,380)4,030 Blueprint Medicines Corp Goldman Sachs 11,486
(6,618) Blueprint Medicines Corp HSBC (46,724)3,479 Blueprint Medicines Corp HSBC 24,562
(6,337) Blueprint Medicines Corp Morgan Stanley (7,922)993 Blueprint Medicines Corp Morgan Stanley 1,241
8,836 Bluerock Residential GrowthInc (REIT)
Bank of AmericaMerrill Lynch 6,715
18,348 Bluerock Residential GrowthInc (REIT) Goldman Sachs 13,944
3,406 Bluerock Residential GrowthInc (REIT) HSBC (443)
63,028 Bluerock Residential GrowthInc (REIT) Morgan Stanley —
28,435 BMC Stock Holdings Inc Bank of AmericaMerrill Lynch 128,526
Holding Description Counterparty
Netunrealised
appreciation/(depreciation)
USD
United States continued6,177 BMC Stock Holdings Inc Barclays Bank 11,736
32,646 BMC Stock Holdings Inc Goldman Sachs 147,56010,513 BMC Stock Holdings Inc HSBC 41,737
(305) Boeing Co Barclays Bank (2,589)(4,680) Boeing Co HSBC 2,392(3,430) Boeing Co Morgan Stanley (29,121)
(893) Boingo Wireless Inc Barclays Bank 598(11,862) Boingo Wireless Inc Goldman Sachs 1,423(4,594) Boingo Wireless Inc HSBC (1,838)(4,698) Boingo Wireless Inc Morgan Stanley 3,14814,920 Boise Cascade Co Barclays Bank 36,5546,085 Boise Cascade Co Goldman Sachs 27,443
56,393 Boise Cascade Co HSBC 100,38023,877 Boise Cascade Co Morgan Stanley 58,4993,100 BOK Financial Corp Bank of America
Merrill Lynch 29,698(6,608) BOK Financial Corp Barclays Bank (24,912)7,392 BOK Financial Corp Barclays Bank 23,453
(2,742) BOK Financial Corp Goldman Sachs (26,268)4,893 BOK Financial Corp Goldman Sachs 35,897(578) BOK Financial Corp HSBC (1,116)
7,139 BOK Financial Corp HSBC 18,392(1,711) BOK Financial Corp Morgan Stanley (6,450)6,707 BOK Financial Corp Morgan Stanley 9,901
(9,134) Bonanza Creek Energy Inc Bank of AmericaMerrill Lynch (3,197)
(5,510) Bonanza Creek Energy Inc Barclays Bank (551)(7,821) Bonanza Creek Energy Inc Goldman Sachs (2,737)
(12,634) Bonanza Creek Energy Inc HSBC 10,865(12,864) Bonanza Creek Energy Inc Morgan Stanley (1,286)
(409) Booking Holdings Inc Bank of AmericaMerrill Lynch (75,611)
(1,384) Booking Holdings Inc Goldman Sachs (350,802)(1,233) Booking Holdings Inc HSBC (255,170)
(281) Booking Holdings Inc Morgan Stanley (1,821)8,317 Boot Barn Holdings Inc Barclays Bank 15,6367,433 Boot Barn Holdings Inc HSBC 22,9685,719 Boot Barn Holdings Inc Morgan Stanley 10,752
(12,124) Booz Allen HamiltonHolding Corp Barclays Bank (20,729)
(28,007) Booz Allen HamiltonHolding Corp Goldman Sachs (185,882)
(3,897) Booz Allen HamiltonHolding Corp HSBC (18,914)
(19,614) Booz Allen HamiltonHolding Corp Morgan Stanley (35,109)
(29,107) BorgWarner Inc Bank of AmericaMerrill Lynch (105,076)
(5,937) BorgWarner Inc Barclays Bank (9,143)(6,300) BorgWarner Inc Goldman Sachs (22,743)(2,831) BorgWarner Inc HSBC (5,633)
(15,181) BorgWarner Inc Morgan Stanley (23,379)389 Boston Beer Co Inc ’A’ Bank of America
Merrill Lynch 18,2792,032 Boston Beer Co Inc ’A’ Barclays Bank 50,338
508 Boston Beer Co Inc ’A’ Goldman Sachs 23,8711,181 Boston Beer Co Inc ’A’ HSBC 72,0831,600 Boston Beer Co Inc ’A’ Morgan Stanley 42,800
(5,354) Boston Omaha Corp ’A’ Bank of AmericaMerrill Lynch 9,691
(27,711) Boston Omaha Corp ’A’ Barclays Bank 67,338(323) Boston Omaha Corp ’A’ HSBC 740
(12,645) Boston Omaha Corp ’A’ Morgan Stanley 30,72733,326 Boston Private Financial
Holdings Inc Morgan Stanley 14,33080 Boston Properties Inc
(REIT)Bank of AmericaMerrill Lynch 790
BlackRock Americas Diversified Equity Absolute Return Fundcontinued
The notes on pages 691 to 711 form an integral part of these financial statements.
BlackRock Strategic Funds[88]
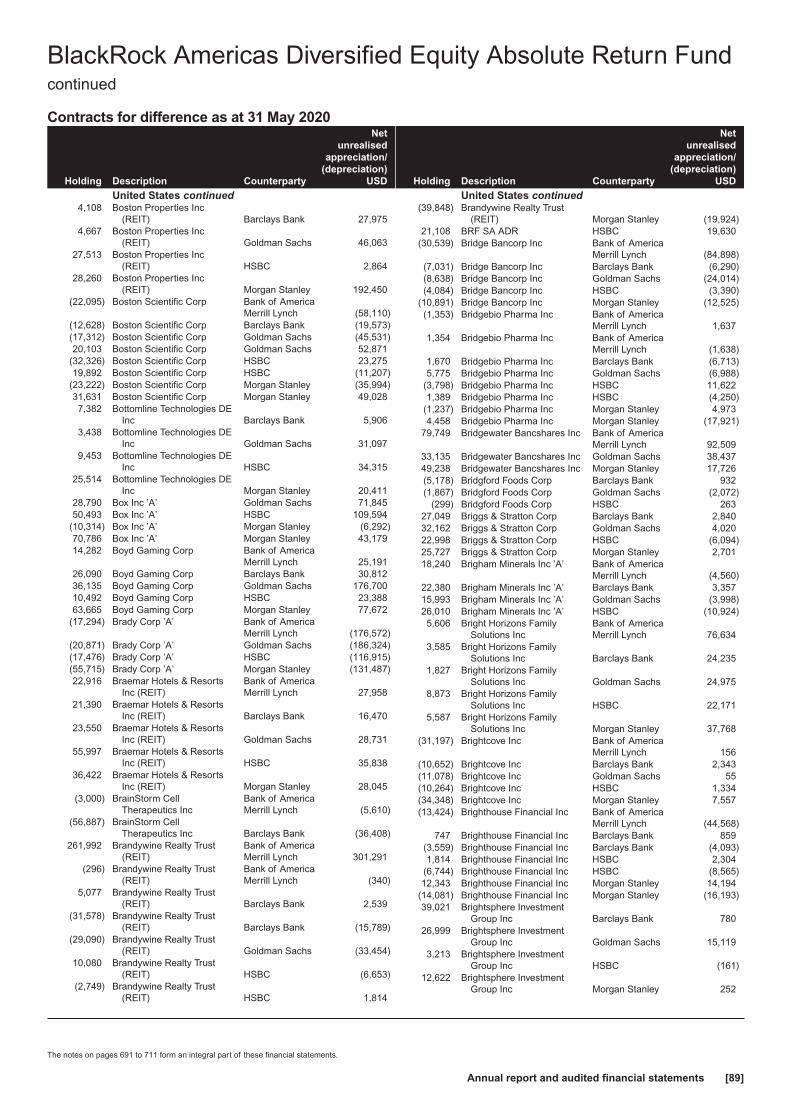
Contracts for difference as at 31 May 2020
Holding Description Counterparty
Netunrealised
appreciation/(depreciation)
USD
United States continued4,108 Boston Properties Inc
(REIT) Barclays Bank 27,9754,667 Boston Properties Inc
(REIT) Goldman Sachs 46,06327,513 Boston Properties Inc
(REIT) HSBC 2,86428,260 Boston Properties Inc
(REIT) Morgan Stanley 192,450(22,095) Boston Scientific Corp Bank of America
Merrill Lynch (58,110)(12,628) Boston Scientific Corp Barclays Bank (19,573)(17,312) Boston Scientific Corp Goldman Sachs (45,531)20,103 Boston Scientific Corp Goldman Sachs 52,871
(32,326) Boston Scientific Corp HSBC 23,27519,892 Boston Scientific Corp HSBC (11,207)
(23,222) Boston Scientific Corp Morgan Stanley (35,994)31,631 Boston Scientific Corp Morgan Stanley 49,0287,382 Bottomline Technologies DE
Inc Barclays Bank 5,9063,438 Bottomline Technologies DE
Inc Goldman Sachs 31,0979,453 Bottomline Technologies DE
Inc HSBC 34,31525,514 Bottomline Technologies DE
Inc Morgan Stanley 20,41128,790 Box Inc ’A’ Goldman Sachs 71,84550,493 Box Inc ’A’ HSBC 109,594
(10,314) Box Inc ’A’ Morgan Stanley (6,292)70,786 Box Inc ’A’ Morgan Stanley 43,17914,282 Boyd Gaming Corp Bank of America
Merrill Lynch 25,19126,090 Boyd Gaming Corp Barclays Bank 30,81236,135 Boyd Gaming Corp Goldman Sachs 176,70010,492 Boyd Gaming Corp HSBC 23,38863,665 Boyd Gaming Corp Morgan Stanley 77,672
(17,294) Brady Corp ’A’ Bank of AmericaMerrill Lynch (176,572)
(20,871) Brady Corp ’A’ Goldman Sachs (186,324)(17,476) Brady Corp ’A’ HSBC (116,915)(55,715) Brady Corp ’A’ Morgan Stanley (131,487)22,916 Braemar Hotels & Resorts
Inc (REIT)Bank of AmericaMerrill Lynch 27,958
21,390 Braemar Hotels & ResortsInc (REIT) Barclays Bank 16,470
23,550 Braemar Hotels & ResortsInc (REIT) Goldman Sachs 28,731
55,997 Braemar Hotels & ResortsInc (REIT) HSBC 35,838
36,422 Braemar Hotels & ResortsInc (REIT) Morgan Stanley 28,045
(3,000) BrainStorm CellTherapeutics Inc
Bank of AmericaMerrill Lynch (5,610)
(56,887) BrainStorm CellTherapeutics Inc Barclays Bank (36,408)
261,992 Brandywine Realty Trust(REIT)
Bank of AmericaMerrill Lynch 301,291
(296) Brandywine Realty Trust(REIT)
Bank of AmericaMerrill Lynch (340)
5,077 Brandywine Realty Trust(REIT) Barclays Bank 2,539
(31,578) Brandywine Realty Trust(REIT) Barclays Bank (15,789)
(29,090) Brandywine Realty Trust(REIT) Goldman Sachs (33,454)
10,080 Brandywine Realty Trust(REIT) HSBC (6,653)
(2,749) Brandywine Realty Trust(REIT) HSBC 1,814
Holding Description Counterparty
Netunrealised
appreciation/(depreciation)
USD
United States continued(39,848) Brandywine Realty Trust
(REIT) Morgan Stanley (19,924)21,108 BRF SA ADR HSBC 19,630
(30,539) Bridge Bancorp Inc Bank of AmericaMerrill Lynch (84,898)
(7,031) Bridge Bancorp Inc Barclays Bank (6,290)(8,638) Bridge Bancorp Inc Goldman Sachs (24,014)(4,084) Bridge Bancorp Inc HSBC (3,390)
(10,891) Bridge Bancorp Inc Morgan Stanley (12,525)(1,353) Bridgebio Pharma Inc Bank of America
Merrill Lynch 1,6371,354 Bridgebio Pharma Inc Bank of America
Merrill Lynch (1,638)1,670 Bridgebio Pharma Inc Barclays Bank (6,713)5,775 Bridgebio Pharma Inc Goldman Sachs (6,988)
(3,798) Bridgebio Pharma Inc HSBC 11,6221,389 Bridgebio Pharma Inc HSBC (4,250)
(1,237) Bridgebio Pharma Inc Morgan Stanley 4,9734,458 Bridgebio Pharma Inc Morgan Stanley (17,921)
79,749 Bridgewater Bancshares Inc Bank of AmericaMerrill Lynch 92,509
33,135 Bridgewater Bancshares Inc Goldman Sachs 38,43749,238 Bridgewater Bancshares Inc Morgan Stanley 17,726(5,178) Bridgford Foods Corp Barclays Bank 932(1,867) Bridgford Foods Corp Goldman Sachs (2,072)
(299) Bridgford Foods Corp HSBC 26327,049 Briggs & Stratton Corp Barclays Bank 2,84032,162 Briggs & Stratton Corp Goldman Sachs 4,02022,998 Briggs & Stratton Corp HSBC (6,094)25,727 Briggs & Stratton Corp Morgan Stanley 2,70118,240 Brigham Minerals Inc ’A’ Bank of America
Merrill Lynch (4,560)22,380 Brigham Minerals Inc ’A’ Barclays Bank 3,35715,993 Brigham Minerals Inc ’A’ Goldman Sachs (3,998)26,010 Brigham Minerals Inc ’A’ HSBC (10,924)5,606 Bright Horizons Family
Solutions IncBank of AmericaMerrill Lynch 76,634
3,585 Bright Horizons FamilySolutions Inc Barclays Bank 24,235
1,827 Bright Horizons FamilySolutions Inc Goldman Sachs 24,975
8,873 Bright Horizons FamilySolutions Inc HSBC 22,171
5,587 Bright Horizons FamilySolutions Inc Morgan Stanley 37,768
(31,197) Brightcove Inc Bank of AmericaMerrill Lynch 156
(10,652) Brightcove Inc Barclays Bank 2,343(11,078) Brightcove Inc Goldman Sachs 55(10,264) Brightcove Inc HSBC 1,334(34,348) Brightcove Inc Morgan Stanley 7,557(13,424) Brighthouse Financial Inc Bank of America
Merrill Lynch (44,568)747 Brighthouse Financial Inc Barclays Bank 859
(3,559) Brighthouse Financial Inc Barclays Bank (4,093)1,814 Brighthouse Financial Inc HSBC 2,304
(6,744) Brighthouse Financial Inc HSBC (8,565)12,343 Brighthouse Financial Inc Morgan Stanley 14,194
(14,081) Brighthouse Financial Inc Morgan Stanley (16,193)39,021 Brightsphere Investment
Group Inc Barclays Bank 78026,999 Brightsphere Investment
Group Inc Goldman Sachs 15,1193,213 Brightsphere Investment
Group Inc HSBC (161)12,622 Brightsphere Investment
Group Inc Morgan Stanley 252
BlackRock Americas Diversified Equity Absolute Return Fundcontinued
The notes on pages 691 to 711 form an integral part of these financial statements.
Annual report and audited financial statements [89]
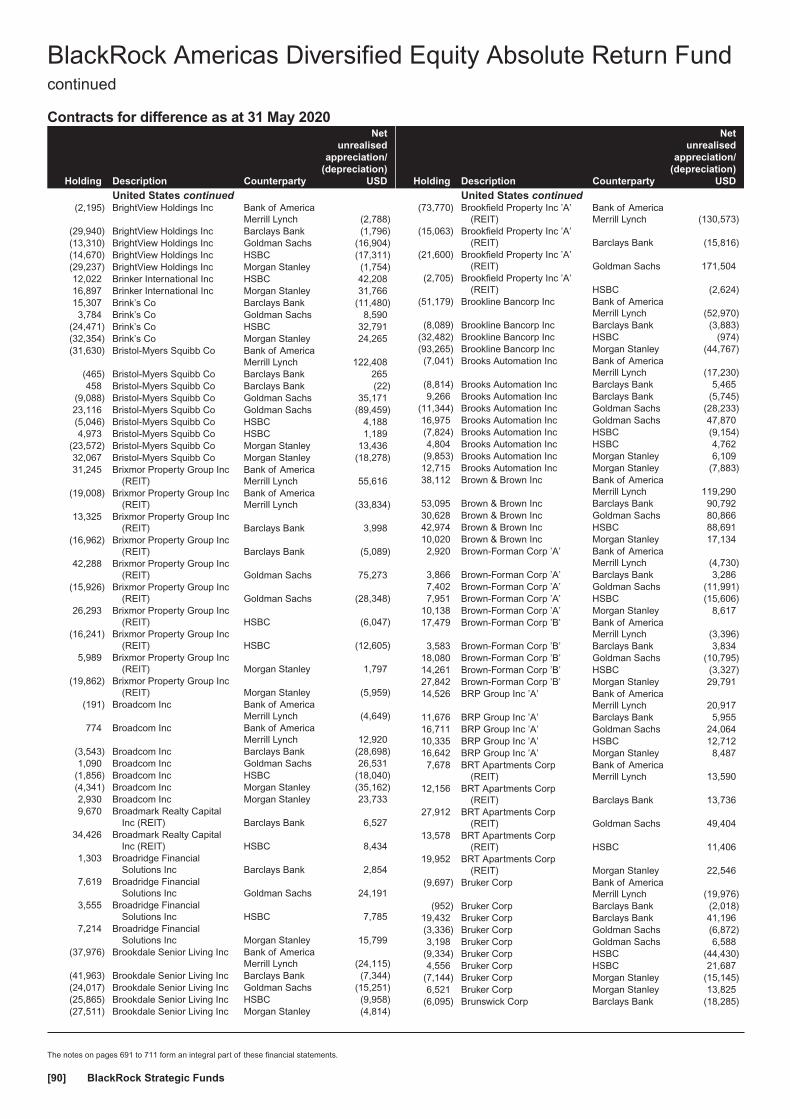
Contracts for difference as at 31 May 2020
Holding Description Counterparty
Netunrealised
appreciation/(depreciation)
USD
United States continued(2,195) BrightView Holdings Inc Bank of America
Merrill Lynch (2,788)(29,940) BrightView Holdings Inc Barclays Bank (1,796)(13,310) BrightView Holdings Inc Goldman Sachs (16,904)(14,670) BrightView Holdings Inc HSBC (17,311)(29,237) BrightView Holdings Inc Morgan Stanley (1,754)12,022 Brinker International Inc HSBC 42,20816,897 Brinker International Inc Morgan Stanley 31,76615,307 Brink’s Co Barclays Bank (11,480)3,784 Brink’s Co Goldman Sachs 8,590
(24,471) Brink’s Co HSBC 32,791(32,354) Brink’s Co Morgan Stanley 24,265(31,630) Bristol-Myers Squibb Co Bank of America
Merrill Lynch 122,408(465) Bristol-Myers Squibb Co Barclays Bank 265458 Bristol-Myers Squibb Co Barclays Bank (22)
(9,088) Bristol-Myers Squibb Co Goldman Sachs 35,17123,116 Bristol-Myers Squibb Co Goldman Sachs (89,459)(5,046) Bristol-Myers Squibb Co HSBC 4,1884,973 Bristol-Myers Squibb Co HSBC 1,189
(23,572) Bristol-Myers Squibb Co Morgan Stanley 13,43632,067 Bristol-Myers Squibb Co Morgan Stanley (18,278)31,245 Brixmor Property Group Inc
(REIT)Bank of AmericaMerrill Lynch 55,616
(19,008) Brixmor Property Group Inc(REIT)
Bank of AmericaMerrill Lynch (33,834)
13,325 Brixmor Property Group Inc(REIT) Barclays Bank 3,998
(16,962) Brixmor Property Group Inc(REIT) Barclays Bank (5,089)
42,288 Brixmor Property Group Inc(REIT) Goldman Sachs 75,273
(15,926) Brixmor Property Group Inc(REIT) Goldman Sachs (28,348)
26,293 Brixmor Property Group Inc(REIT) HSBC (6,047)
(16,241) Brixmor Property Group Inc(REIT) HSBC (12,605)
5,989 Brixmor Property Group Inc(REIT) Morgan Stanley 1,797
(19,862) Brixmor Property Group Inc(REIT) Morgan Stanley (5,959)
(191) Broadcom Inc Bank of AmericaMerrill Lynch (4,649)
774 Broadcom Inc Bank of AmericaMerrill Lynch 12,920
(3,543) Broadcom Inc Barclays Bank (28,698)1,090 Broadcom Inc Goldman Sachs 26,531
(1,856) Broadcom Inc HSBC (18,040)(4,341) Broadcom Inc Morgan Stanley (35,162)2,930 Broadcom Inc Morgan Stanley 23,7339,670 Broadmark Realty Capital
Inc (REIT) Barclays Bank 6,52734,426 Broadmark Realty Capital
Inc (REIT) HSBC 8,4341,303 Broadridge Financial
Solutions Inc Barclays Bank 2,8547,619 Broadridge Financial
Solutions Inc Goldman Sachs 24,1913,555 Broadridge Financial
Solutions Inc HSBC 7,7857,214 Broadridge Financial
Solutions Inc Morgan Stanley 15,799(37,976) Brookdale Senior Living Inc Bank of America
Merrill Lynch (24,115)(41,963) Brookdale Senior Living Inc Barclays Bank (7,344)(24,017) Brookdale Senior Living Inc Goldman Sachs (15,251)(25,865) Brookdale Senior Living Inc HSBC (9,958)(27,511) Brookdale Senior Living Inc Morgan Stanley (4,814)
Holding Description Counterparty
Netunrealised
appreciation/(depreciation)
USD
United States continued(73,770) Brookfield Property Inc ’A’
(REIT)Bank of AmericaMerrill Lynch (130,573)
(15,063) Brookfield Property Inc ’A’(REIT) Barclays Bank (15,816)
(21,600) Brookfield Property Inc ’A’(REIT) Goldman Sachs 171,504
(2,705) Brookfield Property Inc ’A’(REIT) HSBC (2,624)
(51,179) Brookline Bancorp Inc Bank of AmericaMerrill Lynch (52,970)
(8,089) Brookline Bancorp Inc Barclays Bank (3,883)(32,482) Brookline Bancorp Inc HSBC (974)(93,265) Brookline Bancorp Inc Morgan Stanley (44,767)(7,041) Brooks Automation Inc Bank of America
Merrill Lynch (17,230)(8,814) Brooks Automation Inc Barclays Bank 5,4659,266 Brooks Automation Inc Barclays Bank (5,745)
(11,344) Brooks Automation Inc Goldman Sachs (28,233)16,975 Brooks Automation Inc Goldman Sachs 47,870(7,824) Brooks Automation Inc HSBC (9,154)4,804 Brooks Automation Inc HSBC 4,762
(9,853) Brooks Automation Inc Morgan Stanley 6,10912,715 Brooks Automation Inc Morgan Stanley (7,883)38,112 Brown & Brown Inc Bank of America
Merrill Lynch 119,29053,095 Brown & Brown Inc Barclays Bank 90,79230,628 Brown & Brown Inc Goldman Sachs 80,86642,974 Brown & Brown Inc HSBC 88,69110,020 Brown & Brown Inc Morgan Stanley 17,1342,920 Brown-Forman Corp ’A’ Bank of America
Merrill Lynch (4,730)3,866 Brown-Forman Corp ’A’ Barclays Bank 3,2867,402 Brown-Forman Corp ’A’ Goldman Sachs (11,991)7,951 Brown-Forman Corp ’A’ HSBC (15,606)
10,138 Brown-Forman Corp ’A’ Morgan Stanley 8,61717,479 Brown-Forman Corp ’B’ Bank of America
Merrill Lynch (3,396)3,583 Brown-Forman Corp ’B’ Barclays Bank 3,834
18,080 Brown-Forman Corp ’B’ Goldman Sachs (10,795)14,261 Brown-Forman Corp ’B’ HSBC (3,327)27,842 Brown-Forman Corp ’B’ Morgan Stanley 29,79114,526 BRP Group Inc ’A’ Bank of America
Merrill Lynch 20,91711,676 BRP Group Inc ’A’ Barclays Bank 5,95516,711 BRP Group Inc ’A’ Goldman Sachs 24,06410,335 BRP Group Inc ’A’ HSBC 12,71216,642 BRP Group Inc ’A’ Morgan Stanley 8,4877,678 BRT Apartments Corp
(REIT)Bank of AmericaMerrill Lynch 13,590
12,156 BRT Apartments Corp(REIT) Barclays Bank 13,736
27,912 BRT Apartments Corp(REIT) Goldman Sachs 49,404
13,578 BRT Apartments Corp(REIT) HSBC 11,406
19,952 BRT Apartments Corp(REIT) Morgan Stanley 22,546
(9,697) Bruker Corp Bank of AmericaMerrill Lynch (19,976)
(952) Bruker Corp Barclays Bank (2,018)19,432 Bruker Corp Barclays Bank 41,196(3,336) Bruker Corp Goldman Sachs (6,872)3,198 Bruker Corp Goldman Sachs 6,588
(9,334) Bruker Corp HSBC (44,430)4,556 Bruker Corp HSBC 21,687
(7,144) Bruker Corp Morgan Stanley (15,145)6,521 Bruker Corp Morgan Stanley 13,825
(6,095) Brunswick Corp Barclays Bank (18,285)
BlackRock Americas Diversified Equity Absolute Return Fundcontinued
The notes on pages 691 to 711 form an integral part of these financial statements.
BlackRock Strategic Funds[90]
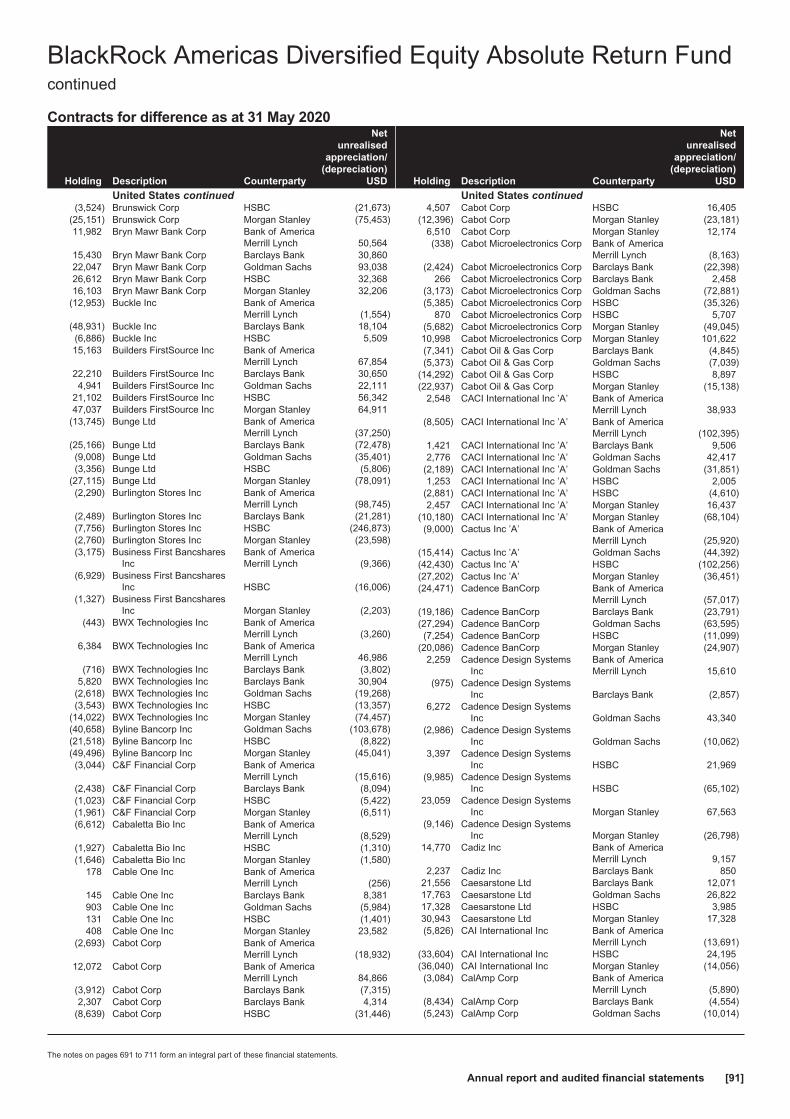
Contracts for difference as at 31 May 2020
Holding Description Counterparty
Netunrealised
appreciation/(depreciation)
USD
United States continued(3,524) Brunswick Corp HSBC (21,673)
(25,151) Brunswick Corp Morgan Stanley (75,453)11,982 Bryn Mawr Bank Corp Bank of America
Merrill Lynch 50,56415,430 Bryn Mawr Bank Corp Barclays Bank 30,86022,047 Bryn Mawr Bank Corp Goldman Sachs 93,03826,612 Bryn Mawr Bank Corp HSBC 32,36816,103 Bryn Mawr Bank Corp Morgan Stanley 32,206
(12,953) Buckle Inc Bank of AmericaMerrill Lynch (1,554)
(48,931) Buckle Inc Barclays Bank 18,104(6,886) Buckle Inc HSBC 5,50915,163 Builders FirstSource Inc Bank of America
Merrill Lynch 67,85422,210 Builders FirstSource Inc Barclays Bank 30,6504,941 Builders FirstSource Inc Goldman Sachs 22,111
21,102 Builders FirstSource Inc HSBC 56,34247,037 Builders FirstSource Inc Morgan Stanley 64,911
(13,745) Bunge Ltd Bank of AmericaMerrill Lynch (37,250)
(25,166) Bunge Ltd Barclays Bank (72,478)(9,008) Bunge Ltd Goldman Sachs (35,401)(3,356) Bunge Ltd HSBC (5,806)
(27,115) Bunge Ltd Morgan Stanley (78,091)(2,290) Burlington Stores Inc Bank of America
Merrill Lynch (98,745)(2,489) Burlington Stores Inc Barclays Bank (21,281)(7,756) Burlington Stores Inc HSBC (246,873)(2,760) Burlington Stores Inc Morgan Stanley (23,598)(3,175) Business First Bancshares
IncBank of AmericaMerrill Lynch (9,366)
(6,929) Business First BancsharesInc HSBC (16,006)
(1,327) Business First BancsharesInc Morgan Stanley (2,203)
(443) BWX Technologies Inc Bank of AmericaMerrill Lynch (3,260)
6,384 BWX Technologies Inc Bank of AmericaMerrill Lynch 46,986
(716) BWX Technologies Inc Barclays Bank (3,802)5,820 BWX Technologies Inc Barclays Bank 30,904
(2,618) BWX Technologies Inc Goldman Sachs (19,268)(3,543) BWX Technologies Inc HSBC (13,357)
(14,022) BWX Technologies Inc Morgan Stanley (74,457)(40,658) Byline Bancorp Inc Goldman Sachs (103,678)(21,518) Byline Bancorp Inc HSBC (8,822)(49,496) Byline Bancorp Inc Morgan Stanley (45,041)(3,044) C&F Financial Corp Bank of America
Merrill Lynch (15,616)(2,438) C&F Financial Corp Barclays Bank (8,094)(1,023) C&F Financial Corp HSBC (5,422)(1,961) C&F Financial Corp Morgan Stanley (6,511)(6,612) Cabaletta Bio Inc Bank of America
Merrill Lynch (8,529)(1,927) Cabaletta Bio Inc HSBC (1,310)(1,646) Cabaletta Bio Inc Morgan Stanley (1,580)
178 Cable One Inc Bank of AmericaMerrill Lynch (256)
145 Cable One Inc Barclays Bank 8,381903 Cable One Inc Goldman Sachs (5,984)131 Cable One Inc HSBC (1,401)408 Cable One Inc Morgan Stanley 23,582
(2,693) Cabot Corp Bank of AmericaMerrill Lynch (18,932)
12,072 Cabot Corp Bank of AmericaMerrill Lynch 84,866
(3,912) Cabot Corp Barclays Bank (7,315)2,307 Cabot Corp Barclays Bank 4,314
(8,639) Cabot Corp HSBC (31,446)
Holding Description Counterparty
Netunrealised
appreciation/(depreciation)
USD
United States continued4,507 Cabot Corp HSBC 16,405
(12,396) Cabot Corp Morgan Stanley (23,181)6,510 Cabot Corp Morgan Stanley 12,174(338) Cabot Microelectronics Corp Bank of America
Merrill Lynch (8,163)(2,424) Cabot Microelectronics Corp Barclays Bank (22,398)
266 Cabot Microelectronics Corp Barclays Bank 2,458(3,173) Cabot Microelectronics Corp Goldman Sachs (72,881)(5,385) Cabot Microelectronics Corp HSBC (35,326)
870 Cabot Microelectronics Corp HSBC 5,707(5,682) Cabot Microelectronics Corp Morgan Stanley (49,045)10,998 Cabot Microelectronics Corp Morgan Stanley 101,622(7,341) Cabot Oil & Gas Corp Barclays Bank (4,845)(5,373) Cabot Oil & Gas Corp Goldman Sachs (7,039)
(14,292) Cabot Oil & Gas Corp HSBC 8,897(22,937) Cabot Oil & Gas Corp Morgan Stanley (15,138)
2,548 CACI International Inc ’A’ Bank of AmericaMerrill Lynch 38,933
(8,505) CACI International Inc ’A’ Bank of AmericaMerrill Lynch (102,395)
1,421 CACI International Inc ’A’ Barclays Bank 9,5062,776 CACI International Inc ’A’ Goldman Sachs 42,417
(2,189) CACI International Inc ’A’ Goldman Sachs (31,851)1,253 CACI International Inc ’A’ HSBC 2,005
(2,881) CACI International Inc ’A’ HSBC (4,610)2,457 CACI International Inc ’A’ Morgan Stanley 16,437
(10,180) CACI International Inc ’A’ Morgan Stanley (68,104)(9,000) Cactus Inc ’A’ Bank of America
Merrill Lynch (25,920)(15,414) Cactus Inc ’A’ Goldman Sachs (44,392)(42,430) Cactus Inc ’A’ HSBC (102,256)(27,202) Cactus Inc ’A’ Morgan Stanley (36,451)(24,471) Cadence BanCorp Bank of America
Merrill Lynch (57,017)(19,186) Cadence BanCorp Barclays Bank (23,791)(27,294) Cadence BanCorp Goldman Sachs (63,595)(7,254) Cadence BanCorp HSBC (11,099)
(20,086) Cadence BanCorp Morgan Stanley (24,907)2,259 Cadence Design Systems
IncBank of AmericaMerrill Lynch 15,610
(975) Cadence Design SystemsInc Barclays Bank (2,857)
6,272 Cadence Design SystemsInc Goldman Sachs 43,340
(2,986) Cadence Design SystemsInc Goldman Sachs (10,062)
3,397 Cadence Design SystemsInc HSBC 21,969
(9,985) Cadence Design SystemsInc HSBC (65,102)
23,059 Cadence Design SystemsInc Morgan Stanley 67,563
(9,146) Cadence Design SystemsInc Morgan Stanley (26,798)
14,770 Cadiz Inc Bank of AmericaMerrill Lynch 9,157
2,237 Cadiz Inc Barclays Bank 85021,556 Caesarstone Ltd Barclays Bank 12,07117,763 Caesarstone Ltd Goldman Sachs 26,82217,328 Caesarstone Ltd HSBC 3,98530,943 Caesarstone Ltd Morgan Stanley 17,328(5,826) CAI International Inc Bank of America
Merrill Lynch (13,691)(33,604) CAI International Inc HSBC 24,195(36,040) CAI International Inc Morgan Stanley (14,056)(3,084) CalAmp Corp Bank of America
Merrill Lynch (5,890)(8,434) CalAmp Corp Barclays Bank (4,554)(5,243) CalAmp Corp Goldman Sachs (10,014)
BlackRock Americas Diversified Equity Absolute Return Fundcontinued
The notes on pages 691 to 711 form an integral part of these financial statements.
Annual report and audited financial statements [91]
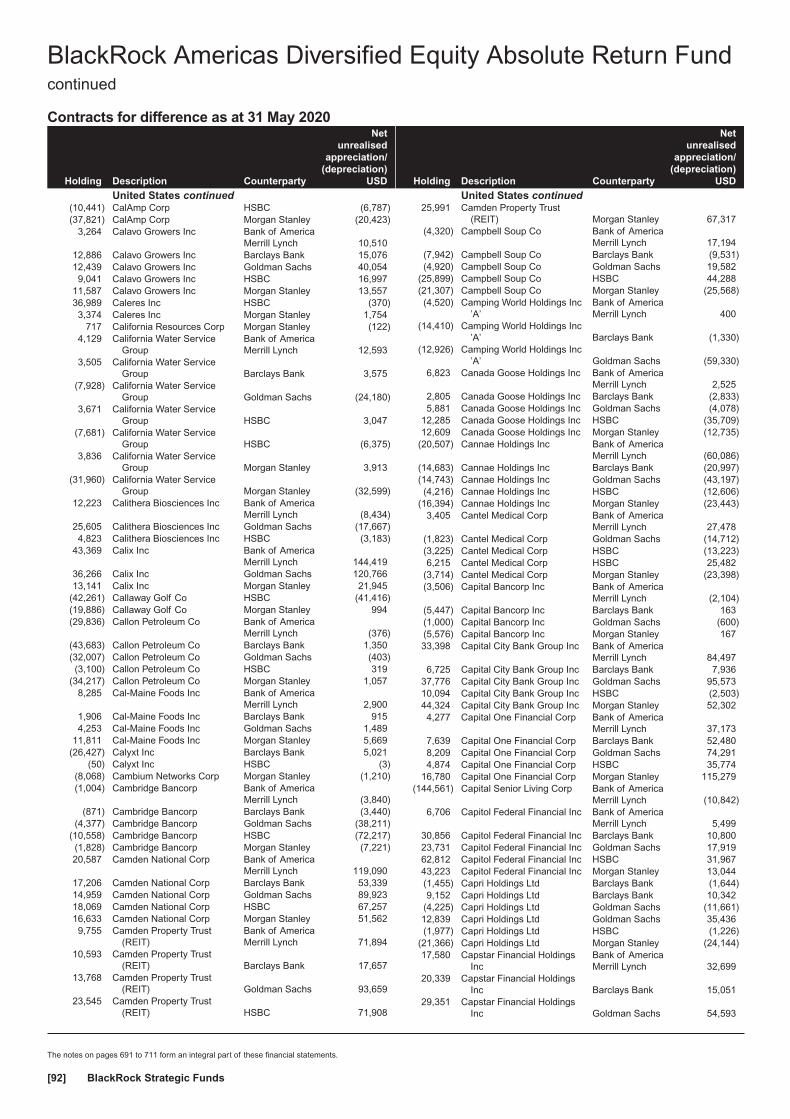
Contracts for difference as at 31 May 2020
Holding Description Counterparty
Netunrealised
appreciation/(depreciation)
USD
United States continued(10,441) CalAmp Corp HSBC (6,787)(37,821) CalAmp Corp Morgan Stanley (20,423)
3,264 Calavo Growers Inc Bank of AmericaMerrill Lynch 10,510
12,886 Calavo Growers Inc Barclays Bank 15,07612,439 Calavo Growers Inc Goldman Sachs 40,0549,041 Calavo Growers Inc HSBC 16,997
11,587 Calavo Growers Inc Morgan Stanley 13,55736,989 Caleres Inc HSBC (370)3,374 Caleres Inc Morgan Stanley 1,754
717 California Resources Corp Morgan Stanley (122)4,129 California Water Service
GroupBank of AmericaMerrill Lynch 12,593
3,505 California Water ServiceGroup Barclays Bank 3,575
(7,928) California Water ServiceGroup Goldman Sachs (24,180)
3,671 California Water ServiceGroup HSBC 3,047
(7,681) California Water ServiceGroup HSBC (6,375)
3,836 California Water ServiceGroup Morgan Stanley 3,913
(31,960) California Water ServiceGroup Morgan Stanley (32,599)
12,223 Calithera Biosciences Inc Bank of AmericaMerrill Lynch (8,434)
25,605 Calithera Biosciences Inc Goldman Sachs (17,667)4,823 Calithera Biosciences Inc HSBC (3,183)
43,369 Calix Inc Bank of AmericaMerrill Lynch 144,419
36,266 Calix Inc Goldman Sachs 120,76613,141 Calix Inc Morgan Stanley 21,945
(42,261) Callaway Golf Co HSBC (41,416)(19,886) Callaway Golf Co Morgan Stanley 994(29,836) Callon Petroleum Co Bank of America
Merrill Lynch (376)(43,683) Callon Petroleum Co Barclays Bank 1,350(32,007) Callon Petroleum Co Goldman Sachs (403)(3,100) Callon Petroleum Co HSBC 319
(34,217) Callon Petroleum Co Morgan Stanley 1,0578,285 Cal-Maine Foods Inc Bank of America
Merrill Lynch 2,9001,906 Cal-Maine Foods Inc Barclays Bank 9154,253 Cal-Maine Foods Inc Goldman Sachs 1,489
11,811 Cal-Maine Foods Inc Morgan Stanley 5,669(26,427) Calyxt Inc Barclays Bank 5,021
(50) Calyxt Inc HSBC (3)(8,068) Cambium Networks Corp Morgan Stanley (1,210)(1,004) Cambridge Bancorp Bank of America
Merrill Lynch (3,840)(871) Cambridge Bancorp Barclays Bank (3,440)
(4,377) Cambridge Bancorp Goldman Sachs (38,211)(10,558) Cambridge Bancorp HSBC (72,217)(1,828) Cambridge Bancorp Morgan Stanley (7,221)20,587 Camden National Corp Bank of America
Merrill Lynch 119,09017,206 Camden National Corp Barclays Bank 53,33914,959 Camden National Corp Goldman Sachs 89,92318,069 Camden National Corp HSBC 67,25716,633 Camden National Corp Morgan Stanley 51,5629,755 Camden Property Trust
(REIT)Bank of AmericaMerrill Lynch 71,894
10,593 Camden Property Trust(REIT) Barclays Bank 17,657
13,768 Camden Property Trust(REIT) Goldman Sachs 93,659
23,545 Camden Property Trust(REIT) HSBC 71,908
Holding Description Counterparty
Netunrealised
appreciation/(depreciation)
USD
United States continued25,991 Camden Property Trust
(REIT) Morgan Stanley 67,317(4,320) Campbell Soup Co Bank of America
Merrill Lynch 17,194(7,942) Campbell Soup Co Barclays Bank (9,531)(4,920) Campbell Soup Co Goldman Sachs 19,582
(25,899) Campbell Soup Co HSBC 44,288(21,307) Campbell Soup Co Morgan Stanley (25,568)(4,520) Camping World Holdings Inc
’A’Bank of AmericaMerrill Lynch 400
(14,410) Camping World Holdings Inc’A’ Barclays Bank (1,330)
(12,926) Camping World Holdings Inc’A’ Goldman Sachs (59,330)
6,823 Canada Goose Holdings Inc Bank of AmericaMerrill Lynch 2,525
2,805 Canada Goose Holdings Inc Barclays Bank (2,833)5,881 Canada Goose Holdings Inc Goldman Sachs (4,078)
12,285 Canada Goose Holdings Inc HSBC (35,709)12,609 Canada Goose Holdings Inc Morgan Stanley (12,735)
(20,507) Cannae Holdings Inc Bank of AmericaMerrill Lynch (60,086)
(14,683) Cannae Holdings Inc Barclays Bank (20,997)(14,743) Cannae Holdings Inc Goldman Sachs (43,197)(4,216) Cannae Holdings Inc HSBC (12,606)
(16,394) Cannae Holdings Inc Morgan Stanley (23,443)3,405 Cantel Medical Corp Bank of America
Merrill Lynch 27,478(1,823) Cantel Medical Corp Goldman Sachs (14,712)(3,225) Cantel Medical Corp HSBC (13,223)6,215 Cantel Medical Corp HSBC 25,482
(3,714) Cantel Medical Corp Morgan Stanley (23,398)(3,506) Capital Bancorp Inc Bank of America
Merrill Lynch (2,104)(5,447) Capital Bancorp Inc Barclays Bank 163(1,000) Capital Bancorp Inc Goldman Sachs (600)(5,576) Capital Bancorp Inc Morgan Stanley 16733,398 Capital City Bank Group Inc Bank of America
Merrill Lynch 84,4976,725 Capital City Bank Group Inc Barclays Bank 7,936
37,776 Capital City Bank Group Inc Goldman Sachs 95,57310,094 Capital City Bank Group Inc HSBC (2,503)44,324 Capital City Bank Group Inc Morgan Stanley 52,3024,277 Capital One Financial Corp Bank of America
Merrill Lynch 37,1737,639 Capital One Financial Corp Barclays Bank 52,4808,209 Capital One Financial Corp Goldman Sachs 74,2914,874 Capital One Financial Corp HSBC 35,774
16,780 Capital One Financial Corp Morgan Stanley 115,279(144,561) Capital Senior Living Corp Bank of America
Merrill Lynch (10,842)6,706 Capitol Federal Financial Inc Bank of America
Merrill Lynch 5,49930,856 Capitol Federal Financial Inc Barclays Bank 10,80023,731 Capitol Federal Financial Inc Goldman Sachs 17,91962,812 Capitol Federal Financial Inc HSBC 31,96743,223 Capitol Federal Financial Inc Morgan Stanley 13,044(1,455) Capri Holdings Ltd Barclays Bank (1,644)9,152 Capri Holdings Ltd Barclays Bank 10,342
(4,225) Capri Holdings Ltd Goldman Sachs (11,661)12,839 Capri Holdings Ltd Goldman Sachs 35,436(1,977) Capri Holdings Ltd HSBC (1,226)
(21,366) Capri Holdings Ltd Morgan Stanley (24,144)17,580 Capstar Financial Holdings
IncBank of AmericaMerrill Lynch 32,699
20,339 Capstar Financial HoldingsInc Barclays Bank 15,051
29,351 Capstar Financial HoldingsInc Goldman Sachs 54,593
BlackRock Americas Diversified Equity Absolute Return Fundcontinued
The notes on pages 691 to 711 form an integral part of these financial statements.
BlackRock Strategic Funds[92]
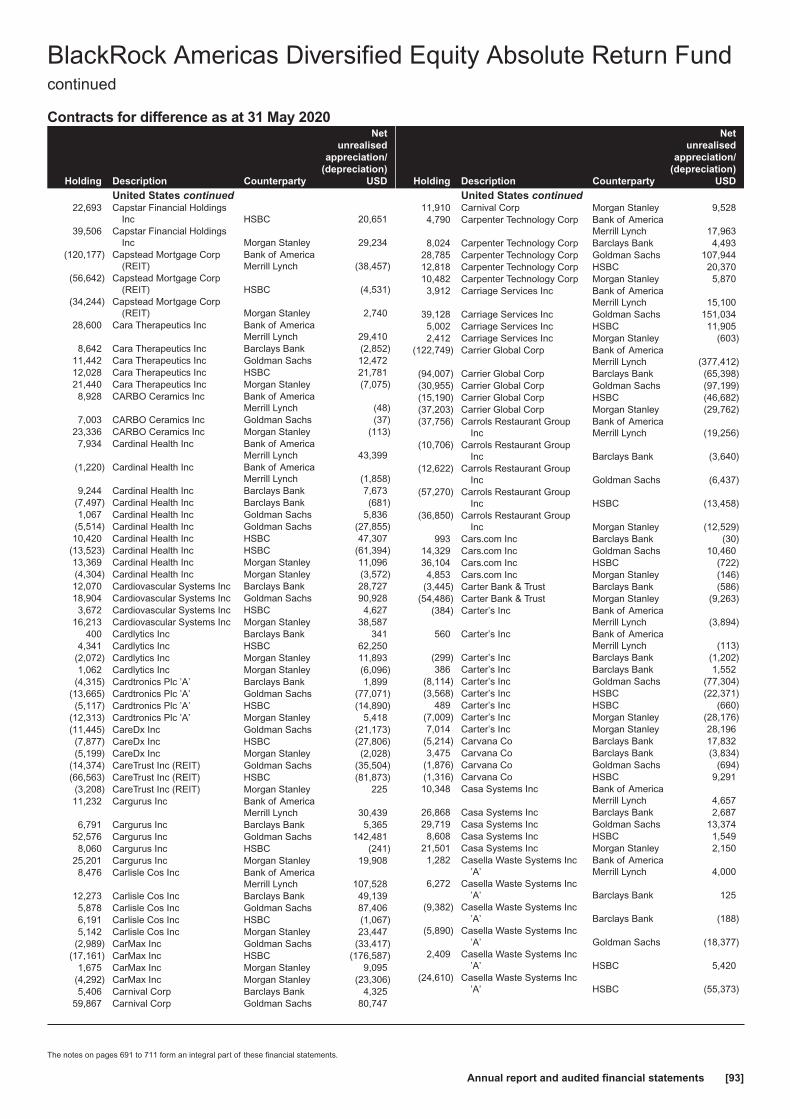
Contracts for difference as at 31 May 2020
Holding Description Counterparty
Netunrealised
appreciation/(depreciation)
USD
United States continued22,693 Capstar Financial Holdings
Inc HSBC 20,65139,506 Capstar Financial Holdings
Inc Morgan Stanley 29,234(120,177) Capstead Mortgage Corp
(REIT)Bank of AmericaMerrill Lynch (38,457)
(56,642) Capstead Mortgage Corp(REIT) HSBC (4,531)
(34,244) Capstead Mortgage Corp(REIT) Morgan Stanley 2,740
28,600 Cara Therapeutics Inc Bank of AmericaMerrill Lynch 29,410
8,642 Cara Therapeutics Inc Barclays Bank (2,852)11,442 Cara Therapeutics Inc Goldman Sachs 12,47212,028 Cara Therapeutics Inc HSBC 21,78121,440 Cara Therapeutics Inc Morgan Stanley (7,075)8,928 CARBO Ceramics Inc Bank of America
Merrill Lynch (48)7,003 CARBO Ceramics Inc Goldman Sachs (37)
23,336 CARBO Ceramics Inc Morgan Stanley (113)7,934 Cardinal Health Inc Bank of America
Merrill Lynch 43,399(1,220) Cardinal Health Inc Bank of America
Merrill Lynch (1,858)9,244 Cardinal Health Inc Barclays Bank 7,673
(7,497) Cardinal Health Inc Barclays Bank (681)1,067 Cardinal Health Inc Goldman Sachs 5,836
(5,514) Cardinal Health Inc Goldman Sachs (27,855)10,420 Cardinal Health Inc HSBC 47,307
(13,523) Cardinal Health Inc HSBC (61,394)13,369 Cardinal Health Inc Morgan Stanley 11,096(4,304) Cardinal Health Inc Morgan Stanley (3,572)12,070 Cardiovascular Systems Inc Barclays Bank 28,72718,904 Cardiovascular Systems Inc Goldman Sachs 90,9283,672 Cardiovascular Systems Inc HSBC 4,627
16,213 Cardiovascular Systems Inc Morgan Stanley 38,587400 Cardlytics Inc Barclays Bank 341
4,341 Cardlytics Inc HSBC 62,250(2,072) Cardlytics Inc Morgan Stanley 11,8931,062 Cardlytics Inc Morgan Stanley (6,096)
(4,315) Cardtronics Plc ’A’ Barclays Bank 1,899(13,665) Cardtronics Plc ’A’ Goldman Sachs (77,071)(5,117) Cardtronics Plc ’A’ HSBC (14,890)
(12,313) Cardtronics Plc ’A’ Morgan Stanley 5,418(11,445) CareDx Inc Goldman Sachs (21,173)(7,877) CareDx Inc HSBC (27,806)(5,199) CareDx Inc Morgan Stanley (2,028)
(14,374) CareTrust Inc (REIT) Goldman Sachs (35,504)(66,563) CareTrust Inc (REIT) HSBC (81,873)(3,208) CareTrust Inc (REIT) Morgan Stanley 22511,232 Cargurus Inc Bank of America
Merrill Lynch 30,4396,791 Cargurus Inc Barclays Bank 5,365
52,576 Cargurus Inc Goldman Sachs 142,4818,060 Cargurus Inc HSBC (241)
25,201 Cargurus Inc Morgan Stanley 19,9088,476 Carlisle Cos Inc Bank of America
Merrill Lynch 107,52812,273 Carlisle Cos Inc Barclays Bank 49,1395,878 Carlisle Cos Inc Goldman Sachs 87,4066,191 Carlisle Cos Inc HSBC (1,067)5,142 Carlisle Cos Inc Morgan Stanley 23,447
(2,989) CarMax Inc Goldman Sachs (33,417)(17,161) CarMax Inc HSBC (176,587)
1,675 CarMax Inc Morgan Stanley 9,095(4,292) CarMax Inc Morgan Stanley (23,306)5,406 Carnival Corp Barclays Bank 4,325
59,867 Carnival Corp Goldman Sachs 80,747
Holding Description Counterparty
Netunrealised
appreciation/(depreciation)
USD
United States continued11,910 Carnival Corp Morgan Stanley 9,5284,790 Carpenter Technology Corp Bank of America
Merrill Lynch 17,9638,024 Carpenter Technology Corp Barclays Bank 4,493
28,785 Carpenter Technology Corp Goldman Sachs 107,94412,818 Carpenter Technology Corp HSBC 20,37010,482 Carpenter Technology Corp Morgan Stanley 5,8703,912 Carriage Services Inc Bank of America
Merrill Lynch 15,10039,128 Carriage Services Inc Goldman Sachs 151,0345,002 Carriage Services Inc HSBC 11,9052,412 Carriage Services Inc Morgan Stanley (603)
(122,749) Carrier Global Corp Bank of AmericaMerrill Lynch (377,412)
(94,007) Carrier Global Corp Barclays Bank (65,398)(30,955) Carrier Global Corp Goldman Sachs (97,199)(15,190) Carrier Global Corp HSBC (46,682)(37,203) Carrier Global Corp Morgan Stanley (29,762)(37,756) Carrols Restaurant Group
IncBank of AmericaMerrill Lynch (19,256)
(10,706) Carrols Restaurant GroupInc Barclays Bank (3,640)
(12,622) Carrols Restaurant GroupInc Goldman Sachs (6,437)
(57,270) Carrols Restaurant GroupInc HSBC (13,458)
(36,850) Carrols Restaurant GroupInc Morgan Stanley (12,529)
993 Cars.com Inc Barclays Bank (30)14,329 Cars.com Inc Goldman Sachs 10,46036,104 Cars.com Inc HSBC (722)4,853 Cars.com Inc Morgan Stanley (146)
(3,445) Carter Bank & Trust Barclays Bank (586)(54,486) Carter Bank & Trust Morgan Stanley (9,263)
(384) Carter’s Inc Bank of AmericaMerrill Lynch (3,894)
560 Carter’s Inc Bank of AmericaMerrill Lynch (113)
(299) Carter’s Inc Barclays Bank (1,202)386 Carter’s Inc Barclays Bank 1,552
(8,114) Carter’s Inc Goldman Sachs (77,304)(3,568) Carter’s Inc HSBC (22,371)
489 Carter’s Inc HSBC (660)(7,009) Carter’s Inc Morgan Stanley (28,176)7,014 Carter’s Inc Morgan Stanley 28,196
(5,214) Carvana Co Barclays Bank 17,8323,475 Carvana Co Barclays Bank (3,834)
(1,876) Carvana Co Goldman Sachs (694)(1,316) Carvana Co HSBC 9,29110,348 Casa Systems Inc Bank of America
Merrill Lynch 4,65726,868 Casa Systems Inc Barclays Bank 2,68729,719 Casa Systems Inc Goldman Sachs 13,3748,608 Casa Systems Inc HSBC 1,549
21,501 Casa Systems Inc Morgan Stanley 2,1501,282 Casella Waste Systems Inc
’A’Bank of AmericaMerrill Lynch 4,000
6,272 Casella Waste Systems Inc’A’ Barclays Bank 125
(9,382) Casella Waste Systems Inc’A’ Barclays Bank (188)
(5,890) Casella Waste Systems Inc’A’ Goldman Sachs (18,377)
2,409 Casella Waste Systems Inc’A’ HSBC 5,420
(24,610) Casella Waste Systems Inc’A’ HSBC (55,373)
BlackRock Americas Diversified Equity Absolute Return Fundcontinued
The notes on pages 691 to 711 form an integral part of these financial statements.
Annual report and audited financial statements [93]
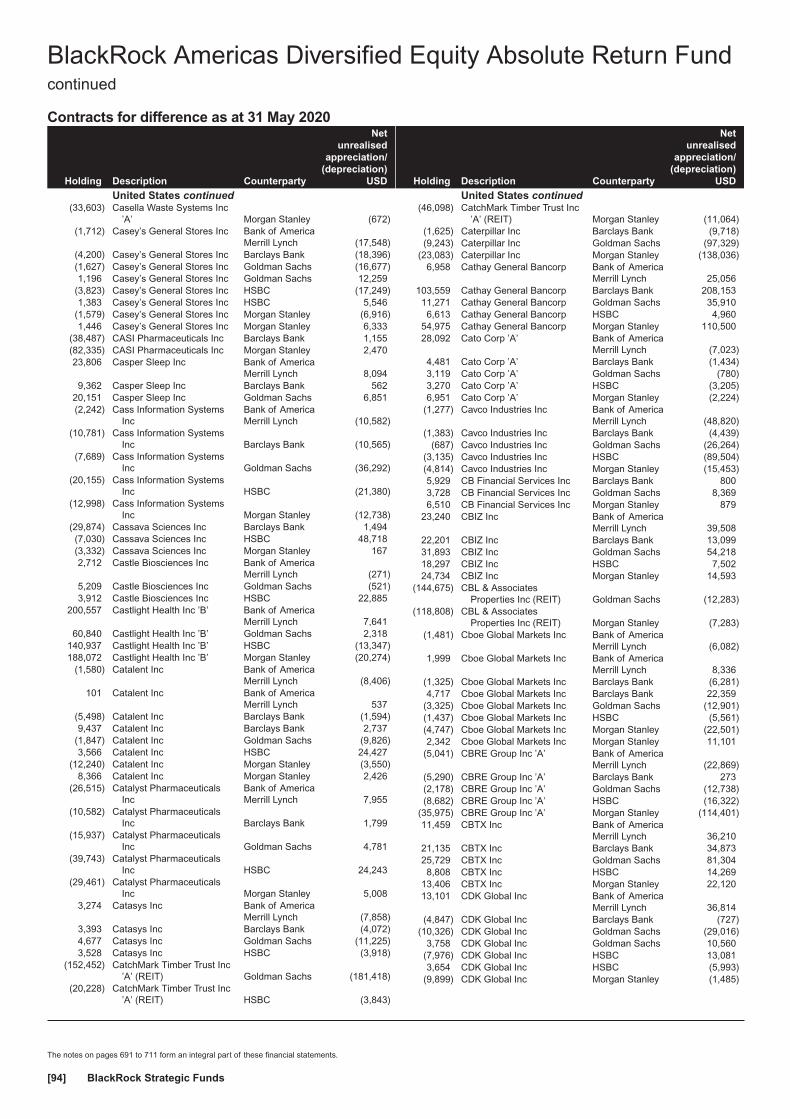
Contracts for difference as at 31 May 2020
Holding Description Counterparty
Netunrealised
appreciation/(depreciation)
USD
United States continued(33,603) Casella Waste Systems Inc
’A’ Morgan Stanley (672)(1,712) Casey’s General Stores Inc Bank of America
Merrill Lynch (17,548)(4,200) Casey’s General Stores Inc Barclays Bank (18,396)(1,627) Casey’s General Stores Inc Goldman Sachs (16,677)1,196 Casey’s General Stores Inc Goldman Sachs 12,259
(3,823) Casey’s General Stores Inc HSBC (17,249)1,383 Casey’s General Stores Inc HSBC 5,546
(1,579) Casey’s General Stores Inc Morgan Stanley (6,916)1,446 Casey’s General Stores Inc Morgan Stanley 6,333
(38,487) CASI Pharmaceuticals Inc Barclays Bank 1,155(82,335) CASI Pharmaceuticals Inc Morgan Stanley 2,47023,806 Casper Sleep Inc Bank of America
Merrill Lynch 8,0949,362 Casper Sleep Inc Barclays Bank 562
20,151 Casper Sleep Inc Goldman Sachs 6,851(2,242) Cass Information Systems
IncBank of AmericaMerrill Lynch (10,582)
(10,781) Cass Information SystemsInc Barclays Bank (10,565)
(7,689) Cass Information SystemsInc Goldman Sachs (36,292)
(20,155) Cass Information SystemsInc HSBC (21,380)
(12,998) Cass Information SystemsInc Morgan Stanley (12,738)
(29,874) Cassava Sciences Inc Barclays Bank 1,494(7,030) Cassava Sciences Inc HSBC 48,718(3,332) Cassava Sciences Inc Morgan Stanley 1672,712 Castle Biosciences Inc Bank of America
Merrill Lynch (271)5,209 Castle Biosciences Inc Goldman Sachs (521)3,912 Castle Biosciences Inc HSBC 22,885
200,557 Castlight Health Inc ’B’ Bank of AmericaMerrill Lynch 7,641
60,840 Castlight Health Inc ’B’ Goldman Sachs 2,318140,937 Castlight Health Inc ’B’ HSBC (13,347)188,072 Castlight Health Inc ’B’ Morgan Stanley (20,274)
(1,580) Catalent Inc Bank of AmericaMerrill Lynch (8,406)
101 Catalent Inc Bank of AmericaMerrill Lynch 537
(5,498) Catalent Inc Barclays Bank (1,594)9,437 Catalent Inc Barclays Bank 2,737
(1,847) Catalent Inc Goldman Sachs (9,826)3,566 Catalent Inc HSBC 24,427
(12,240) Catalent Inc Morgan Stanley (3,550)8,366 Catalent Inc Morgan Stanley 2,426
(26,515) Catalyst PharmaceuticalsInc
Bank of AmericaMerrill Lynch 7,955
(10,582) Catalyst PharmaceuticalsInc Barclays Bank 1,799
(15,937) Catalyst PharmaceuticalsInc Goldman Sachs 4,781
(39,743) Catalyst PharmaceuticalsInc HSBC 24,243
(29,461) Catalyst PharmaceuticalsInc Morgan Stanley 5,008
3,274 Catasys Inc Bank of AmericaMerrill Lynch (7,858)
3,393 Catasys Inc Barclays Bank (4,072)4,677 Catasys Inc Goldman Sachs (11,225)3,528 Catasys Inc HSBC (3,918)
(152,452) CatchMark Timber Trust Inc’A’ (REIT) Goldman Sachs (181,418)
(20,228) CatchMark Timber Trust Inc’A’ (REIT) HSBC (3,843)
Holding Description Counterparty
Netunrealised
appreciation/(depreciation)
USD
United States continued(46,098) CatchMark Timber Trust Inc
’A’ (REIT) Morgan Stanley (11,064)(1,625) Caterpillar Inc Barclays Bank (9,718)(9,243) Caterpillar Inc Goldman Sachs (97,329)
(23,083) Caterpillar Inc Morgan Stanley (138,036)6,958 Cathay General Bancorp Bank of America
Merrill Lynch 25,056103,559 Cathay General Bancorp Barclays Bank 208,15311,271 Cathay General Bancorp Goldman Sachs 35,9106,613 Cathay General Bancorp HSBC 4,960
54,975 Cathay General Bancorp Morgan Stanley 110,50028,092 Cato Corp ’A’ Bank of America
Merrill Lynch (7,023)4,481 Cato Corp ’A’ Barclays Bank (1,434)3,119 Cato Corp ’A’ Goldman Sachs (780)3,270 Cato Corp ’A’ HSBC (3,205)6,951 Cato Corp ’A’ Morgan Stanley (2,224)
(1,277) Cavco Industries Inc Bank of AmericaMerrill Lynch (48,820)
(1,383) Cavco Industries Inc Barclays Bank (4,439)(687) Cavco Industries Inc Goldman Sachs (26,264)
(3,135) Cavco Industries Inc HSBC (89,504)(4,814) Cavco Industries Inc Morgan Stanley (15,453)5,929 CB Financial Services Inc Barclays Bank 8003,728 CB Financial Services Inc Goldman Sachs 8,3696,510 CB Financial Services Inc Morgan Stanley 879
23,240 CBIZ Inc Bank of AmericaMerrill Lynch 39,508
22,201 CBIZ Inc Barclays Bank 13,09931,893 CBIZ Inc Goldman Sachs 54,21818,297 CBIZ Inc HSBC 7,50224,734 CBIZ Inc Morgan Stanley 14,593
(144,675) CBL & AssociatesProperties Inc (REIT) Goldman Sachs (12,283)
(118,808) CBL & AssociatesProperties Inc (REIT) Morgan Stanley (7,283)
(1,481) Cboe Global Markets Inc Bank of AmericaMerrill Lynch (6,082)
1,999 Cboe Global Markets Inc Bank of AmericaMerrill Lynch 8,336
(1,325) Cboe Global Markets Inc Barclays Bank (6,281)4,717 Cboe Global Markets Inc Barclays Bank 22,359
(3,325) Cboe Global Markets Inc Goldman Sachs (12,901)(1,437) Cboe Global Markets Inc HSBC (5,561)(4,747) Cboe Global Markets Inc Morgan Stanley (22,501)2,342 Cboe Global Markets Inc Morgan Stanley 11,101
(5,041) CBRE Group Inc ’A’ Bank of AmericaMerrill Lynch (22,869)
(5,290) CBRE Group Inc ’A’ Barclays Bank 273(2,178) CBRE Group Inc ’A’ Goldman Sachs (12,738)(8,682) CBRE Group Inc ’A’ HSBC (16,322)
(35,975) CBRE Group Inc ’A’ Morgan Stanley (114,401)11,459 CBTX Inc Bank of America
Merrill Lynch 36,21021,135 CBTX Inc Barclays Bank 34,87325,729 CBTX Inc Goldman Sachs 81,3048,808 CBTX Inc HSBC 14,269
13,406 CBTX Inc Morgan Stanley 22,12013,101 CDK Global Inc Bank of America
Merrill Lynch 36,814(4,847) CDK Global Inc Barclays Bank (727)
(10,326) CDK Global Inc Goldman Sachs (29,016)3,758 CDK Global Inc Goldman Sachs 10,560
(7,976) CDK Global Inc HSBC 13,0813,654 CDK Global Inc HSBC (5,993)
(9,899) CDK Global Inc Morgan Stanley (1,485)
BlackRock Americas Diversified Equity Absolute Return Fundcontinued
The notes on pages 691 to 711 form an integral part of these financial statements.
BlackRock Strategic Funds[94]

Contracts for difference as at 31 May 2020
Holding Description Counterparty
Netunrealised
appreciation/(depreciation)
USD
United States continued3,443 CDW Corp Bank of America
Merrill Lynch 25,5115,104 CDW Corp Barclays Bank 18,0688,775 CDW Corp Goldman Sachs 100,650
12,552 CDW Corp HSBC 34,57416,389 CDW Corp Morgan Stanley 56,78082,643 CECO Environmental Corp Bank of America
Merrill Lynch 33,05714,982 CECO Environmental Corp Barclays Bank 44916,078 CECO Environmental Corp Goldman Sachs 6,4315,377 CECO Environmental Corp HSBC 2,205
153,842 Cedar Realty Trust Inc(REIT) HSBC (18,230)
173,542 Cedar Realty Trust Inc(REIT) Morgan Stanley 3,054
(5,728) Celanese Corp Bank of AmericaMerrill Lynch (67,562)
(13,480) Celanese Corp Barclays Bank (27,746)(5,967) Celanese Corp Goldman Sachs (68,795)
(29,480) Celanese Corp HSBC (178,362)(21,162) Celanese Corp Morgan Stanley (63,169)(40,188) Cellular Biomedicine Group
Inc Barclays Bank 44,207(8,586) Celsius Holdings Inc Bank of America
Merrill Lynch (20,521)(50,962) Celsius Holdings Inc Barclays Bank 6,115(32,501) Celsius Holdings Inc HSBC (122,854)(59,025) Cemex SAB de CV ADR HSBC (9,444)
(226,872) Cemex SAB de CV ADR Morgan Stanley (56,718)(1,264) Centene Corp Bank of America
Merrill Lynch 3,12213,640 Centene Corp Bank of America
Merrill Lynch 13,656(760) Centene Corp Barclays Bank (1,056)
(4,015) Centene Corp HSBC (1,405)7,110 Centene Corp HSBC (5,447)
(1,509) Centene Corp Morgan Stanley (2,098)10,356 Centennial Resource
Development Inc ’A’ Barclays Bank 10426,224 Centennial Resource
Development Inc ’A’ Goldman Sachs 4,63922,928 Centennial Resource
Development Inc ’A’ HSBC 4,588(23,532) CenterPoint Energy Inc Bank of America
Merrill Lynch (16,708)(64,934) CenterPoint Energy Inc Barclays Bank (38,311)(31,485) CenterPoint Energy Inc Goldman Sachs (22,354)(15,294) CenterPoint Energy Inc HSBC 2,202(4,035) CenterPoint Energy Inc Morgan Stanley (2,381)30,459 CenterState Bank Corp Bank of America
Merrill Lynch 75,38554,770 CenterState Bank Corp Barclays Bank 94,20570,318 CenterState Bank Corp Goldman Sachs 182,69886,054 CenterState Bank Corp HSBC 68,804
104,912 CenterState Bank Corp Morgan Stanley 180,449(1,298) Centogene NV Bank of America
Merrill Lynch 545(773) Centogene NV HSBC 951
(2,091) Centogene NV Morgan Stanley (2,196)14,475 Central Garden & Pet Co ’A’ Bank of America
Merrill Lynch 21,42313,554 Central Garden & Pet Co ’A’ Barclays Bank 17,21415,665 Central Garden & Pet Co ’A’ Goldman Sachs 23,1847,590 Central Garden & Pet Co ’A’ HSBC 7,9709,963 Central Garden & Pet Co ’A’ Morgan Stanley 12,653
52,199 Central Pacific FinancialCorp
Bank of AmericaMerrill Lynch 94,480
109,793 Central Pacific FinancialCorp Morgan Stanley 48,309
Holding Description Counterparty
Netunrealised
appreciation/(depreciation)
USD
United States continued(6,430) Central Valley Community
BancorpBank of AmericaMerrill Lynch (12,281)
(1,634) Central Valley CommunityBancorp Barclays Bank (817)
(2,691) Central Valley CommunityBancorp Goldman Sachs (5,140)
(9,618) Central Valley CommunityBancorp HSBC (6,439)
(1,300) Central Valley CommunityBancorp Morgan Stanley (650)
(19,049) Centric Brands Inc Morgan Stanley 3,124(53,440) Century Aluminum Co Bank of America
Merrill Lynch (72,678)(13,882) Century Aluminum Co Barclays Bank (11,661)(25,284) Century Aluminum Co Goldman Sachs (30,855)(65,907) Century Aluminum Co HSBC (58,657)(37,393) Century Aluminum Co Morgan Stanley (31,410)(2,872) Century Bancorp Inc/MA ’A’ Bank of America
Merrill Lynch (42,407)(2,148) Century Bancorp Inc/MA ’A’ Barclays Bank (17,184)(3,027) Century Bancorp Inc/MA ’A’ Goldman Sachs (47,161)(1,752) Century Bancorp Inc/MA ’A’ HSBC (17,432)(4,397) Century Bancorp Inc/MA ’A’ Morgan Stanley (35,176)22,415 Century Casinos Inc Barclays Bank 5,38030,787 Century Casinos Inc Morgan Stanley 7,3893,304 Century Communities Inc Barclays Bank (595)
29,520 Century Communities Inc HSBC 155,8665,524 Century Communities Inc Morgan Stanley (994)
31,447 CenturyLink Inc HSBC (9,120)94,318 CenturyLink Inc Morgan Stanley (16,034)
(49,534) Cerecor Inc Bank of AmericaMerrill Lynch (27,739)
(11,196) Cerecor Inc HSBC (6,606)691 Cerence Inc HSBC 3,856
4,952 Cerence Inc Morgan Stanley (27,087)(10,753) Ceridian HCM Holding Inc Bank of America
Merrill Lynch (58,712)(11,601) Ceridian HCM Holding Inc Barclays Bank (61,717)(18,626) Ceridian HCM Holding Inc HSBC (113,805)(1,606) Cerner Corp Bank of America
Merrill Lynch (8,560)(1,427) Cerner Corp Barclays Bank (4,509)
(11,063) Cerner Corp Goldman Sachs (58,626)(24,109) Cerner Corp HSBC (40,745)(36,880) Cerner Corp Morgan Stanley (116,541)24,995 Cerus Corp Bank of America
Merrill Lynch 18,85345,839 Cerus Corp Barclays Bank 8,93939,717 Cerus Corp Goldman Sachs 34,75260,333 Cerus Corp HSBC 36,6144,318 Cerus Corp Morgan Stanley 8423,442 CEVA Inc Bank of America
Merrill Lynch 1,96212,890 CEVA Inc Barclays Bank (31,323)12,736 CEVA Inc Goldman Sachs 7,2608,972 CEVA Inc HSBC (12,022)8,743 CEVA Inc Morgan Stanley (21,245)5,877 CF Industries Holdings Inc Bank of America
Merrill Lynch 24,448(9,345) CF Industries Holdings Inc Bank of America
Merrill Lynch (38,875)8,160 CF Industries Holdings Inc Barclays Bank 11,342
(5,566) CF Industries Holdings Inc Barclays Bank (7,737)1,210 CF Industries Holdings Inc Goldman Sachs 5,034
(2,988) CF Industries Holdings Inc Goldman Sachs (12,430)23,877 CF Industries Holdings Inc HSBC (1,194)
(11,008) CF Industries Holdings Inc HSBC 55016,587 CF Industries Holdings Inc Morgan Stanley 23,056
BlackRock Americas Diversified Equity Absolute Return Fundcontinued
The notes on pages 691 to 711 form an integral part of these financial statements.
Annual report and audited financial statements [95]
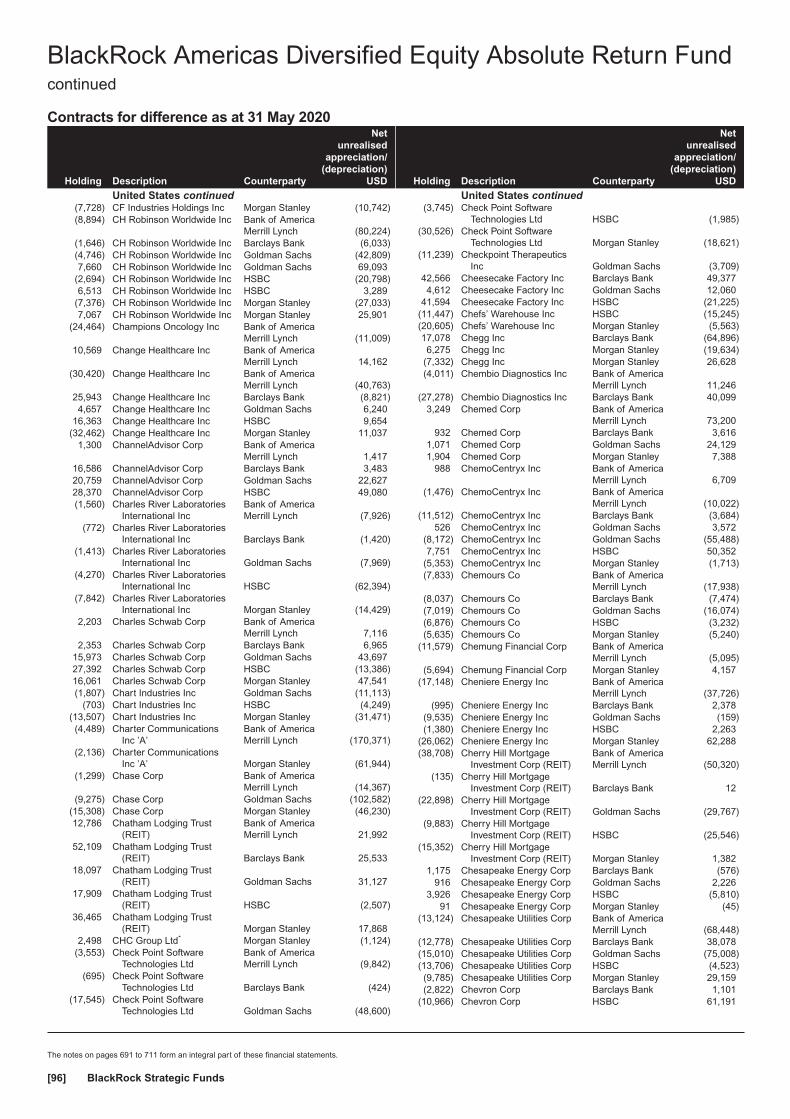
Contracts for difference as at 31 May 2020
Holding Description Counterparty
Netunrealised
appreciation/(depreciation)
USD
United States continued(7,728) CF Industries Holdings Inc Morgan Stanley (10,742)(8,894) CH Robinson Worldwide Inc Bank of America
Merrill Lynch (80,224)(1,646) CH Robinson Worldwide Inc Barclays Bank (6,033)(4,746) CH Robinson Worldwide Inc Goldman Sachs (42,809)7,660 CH Robinson Worldwide Inc Goldman Sachs 69,093
(2,694) CH Robinson Worldwide Inc HSBC (20,798)6,513 CH Robinson Worldwide Inc HSBC 3,289
(7,376) CH Robinson Worldwide Inc Morgan Stanley (27,033)7,067 CH Robinson Worldwide Inc Morgan Stanley 25,901
(24,464) Champions Oncology Inc Bank of AmericaMerrill Lynch (11,009)
10,569 Change Healthcare Inc Bank of AmericaMerrill Lynch 14,162
(30,420) Change Healthcare Inc Bank of AmericaMerrill Lynch (40,763)
25,943 Change Healthcare Inc Barclays Bank (8,821)4,657 Change Healthcare Inc Goldman Sachs 6,240
16,363 Change Healthcare Inc HSBC 9,654(32,462) Change Healthcare Inc Morgan Stanley 11,037
1,300 ChannelAdvisor Corp Bank of AmericaMerrill Lynch 1,417
16,586 ChannelAdvisor Corp Barclays Bank 3,48320,759 ChannelAdvisor Corp Goldman Sachs 22,62728,370 ChannelAdvisor Corp HSBC 49,080(1,560) Charles River Laboratories
International IncBank of AmericaMerrill Lynch (7,926)
(772) Charles River LaboratoriesInternational Inc Barclays Bank (1,420)
(1,413) Charles River LaboratoriesInternational Inc Goldman Sachs (7,969)
(4,270) Charles River LaboratoriesInternational Inc HSBC (62,394)
(7,842) Charles River LaboratoriesInternational Inc Morgan Stanley (14,429)
2,203 Charles Schwab Corp Bank of AmericaMerrill Lynch 7,116
2,353 Charles Schwab Corp Barclays Bank 6,96515,973 Charles Schwab Corp Goldman Sachs 43,69727,392 Charles Schwab Corp HSBC (13,386)16,061 Charles Schwab Corp Morgan Stanley 47,541(1,807) Chart Industries Inc Goldman Sachs (11,113)
(703) Chart Industries Inc HSBC (4,249)(13,507) Chart Industries Inc Morgan Stanley (31,471)(4,489) Charter Communications
Inc ’A’Bank of AmericaMerrill Lynch (170,371)
(2,136) Charter CommunicationsInc ’A’ Morgan Stanley (61,944)
(1,299) Chase Corp Bank of AmericaMerrill Lynch (14,367)
(9,275) Chase Corp Goldman Sachs (102,582)(15,308) Chase Corp Morgan Stanley (46,230)12,786 Chatham Lodging Trust
(REIT)Bank of AmericaMerrill Lynch 21,992
52,109 Chatham Lodging Trust(REIT) Barclays Bank 25,533
18,097 Chatham Lodging Trust(REIT) Goldman Sachs 31,127
17,909 Chatham Lodging Trust(REIT) HSBC (2,507)
36,465 Chatham Lodging Trust(REIT) Morgan Stanley 17,868
2,498 CHC Group Ltd* Morgan Stanley (1,124)(3,553) Check Point Software
Technologies LtdBank of AmericaMerrill Lynch (9,842)
(695) Check Point SoftwareTechnologies Ltd Barclays Bank (424)
(17,545) Check Point SoftwareTechnologies Ltd Goldman Sachs (48,600)
Holding Description Counterparty
Netunrealised
appreciation/(depreciation)
USD
United States continued(3,745) Check Point Software
Technologies Ltd HSBC (1,985)(30,526) Check Point Software
Technologies Ltd Morgan Stanley (18,621)(11,239) Checkpoint Therapeutics
Inc Goldman Sachs (3,709)42,566 Cheesecake Factory Inc Barclays Bank 49,3774,612 Cheesecake Factory Inc Goldman Sachs 12,060
41,594 Cheesecake Factory Inc HSBC (21,225)(11,447) Chefs’ Warehouse Inc HSBC (15,245)(20,605) Chefs’ Warehouse Inc Morgan Stanley (5,563)17,078 Chegg Inc Barclays Bank (64,896)6,275 Chegg Inc Morgan Stanley (19,634)
(7,332) Chegg Inc Morgan Stanley 26,628(4,011) Chembio Diagnostics Inc Bank of America
Merrill Lynch 11,246(27,278) Chembio Diagnostics Inc Barclays Bank 40,099
3,249 Chemed Corp Bank of AmericaMerrill Lynch 73,200
932 Chemed Corp Barclays Bank 3,6161,071 Chemed Corp Goldman Sachs 24,1291,904 Chemed Corp Morgan Stanley 7,388
988 ChemoCentryx Inc Bank of AmericaMerrill Lynch 6,709
(1,476) ChemoCentryx Inc Bank of AmericaMerrill Lynch (10,022)
(11,512) ChemoCentryx Inc Barclays Bank (3,684)526 ChemoCentryx Inc Goldman Sachs 3,572
(8,172) ChemoCentryx Inc Goldman Sachs (55,488)7,751 ChemoCentryx Inc HSBC 50,352
(5,353) ChemoCentryx Inc Morgan Stanley (1,713)(7,833) Chemours Co Bank of America
Merrill Lynch (17,938)(8,037) Chemours Co Barclays Bank (7,474)(7,019) Chemours Co Goldman Sachs (16,074)(6,876) Chemours Co HSBC (3,232)(5,635) Chemours Co Morgan Stanley (5,240)
(11,579) Chemung Financial Corp Bank of AmericaMerrill Lynch (5,095)
(5,694) Chemung Financial Corp Morgan Stanley 4,157(17,148) Cheniere Energy Inc Bank of America
Merrill Lynch (37,726)(995) Cheniere Energy Inc Barclays Bank 2,378
(9,535) Cheniere Energy Inc Goldman Sachs (159)(1,380) Cheniere Energy Inc HSBC 2,263
(26,062) Cheniere Energy Inc Morgan Stanley 62,288(38,708) Cherry Hill Mortgage
Investment Corp (REIT)Bank of AmericaMerrill Lynch (50,320)
(135) Cherry Hill MortgageInvestment Corp (REIT) Barclays Bank 12
(22,898) Cherry Hill MortgageInvestment Corp (REIT) Goldman Sachs (29,767)
(9,883) Cherry Hill MortgageInvestment Corp (REIT) HSBC (25,546)
(15,352) Cherry Hill MortgageInvestment Corp (REIT) Morgan Stanley 1,382
1,175 Chesapeake Energy Corp Barclays Bank (576)916 Chesapeake Energy Corp Goldman Sachs 2,226
3,926 Chesapeake Energy Corp HSBC (5,810)91 Chesapeake Energy Corp Morgan Stanley (45)
(13,124) Chesapeake Utilities Corp Bank of AmericaMerrill Lynch (68,448)
(12,778) Chesapeake Utilities Corp Barclays Bank 38,078(15,010) Chesapeake Utilities Corp Goldman Sachs (75,008)(13,706) Chesapeake Utilities Corp HSBC (4,523)(9,785) Chesapeake Utilities Corp Morgan Stanley 29,159(2,822) Chevron Corp Barclays Bank 1,101
(10,966) Chevron Corp HSBC 61,191
BlackRock Americas Diversified Equity Absolute Return Fundcontinued
The notes on pages 691 to 711 form an integral part of these financial statements.
BlackRock Strategic Funds[96]
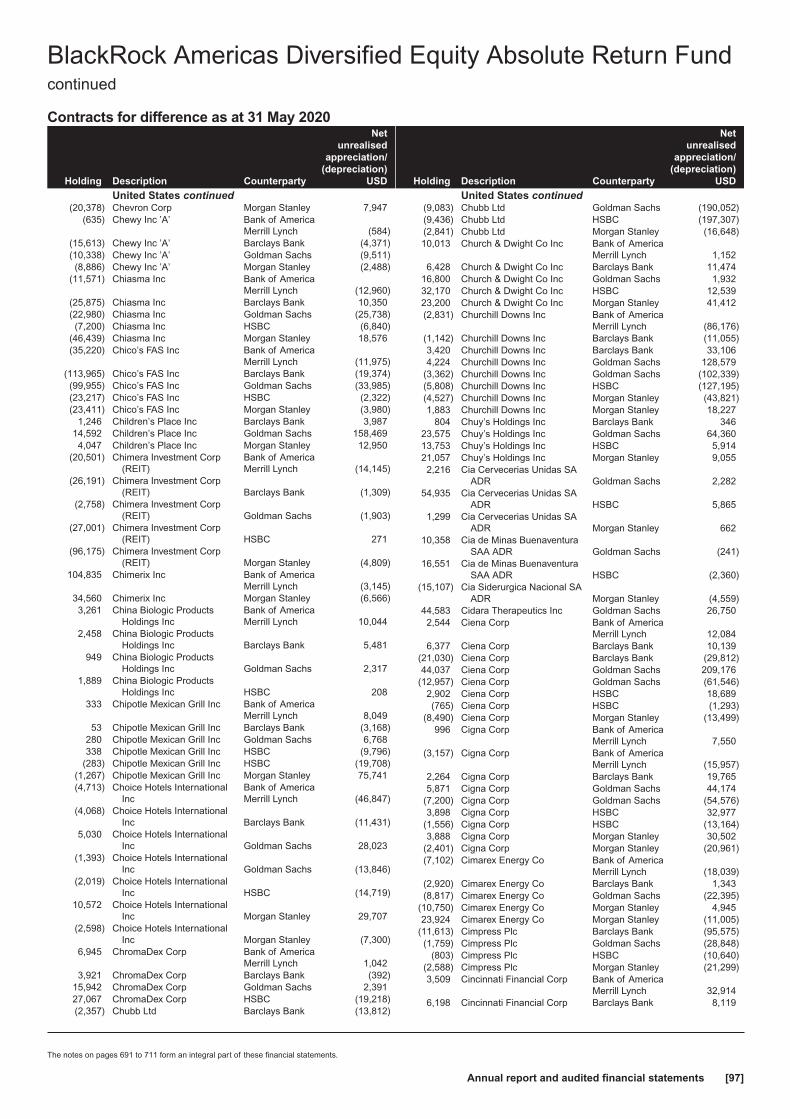
Contracts for difference as at 31 May 2020
Holding Description Counterparty
Netunrealised
appreciation/(depreciation)
USD
United States continued(20,378) Chevron Corp Morgan Stanley 7,947
(635) Chewy Inc ’A’ Bank of AmericaMerrill Lynch (584)
(15,613) Chewy Inc ’A’ Barclays Bank (4,371)(10,338) Chewy Inc ’A’ Goldman Sachs (9,511)(8,886) Chewy Inc ’A’ Morgan Stanley (2,488)
(11,571) Chiasma Inc Bank of AmericaMerrill Lynch (12,960)
(25,875) Chiasma Inc Barclays Bank 10,350(22,980) Chiasma Inc Goldman Sachs (25,738)(7,200) Chiasma Inc HSBC (6,840)
(46,439) Chiasma Inc Morgan Stanley 18,576(35,220) Chico’s FAS Inc Bank of America
Merrill Lynch (11,975)(113,965) Chico’s FAS Inc Barclays Bank (19,374)(99,955) Chico’s FAS Inc Goldman Sachs (33,985)(23,217) Chico’s FAS Inc HSBC (2,322)(23,411) Chico’s FAS Inc Morgan Stanley (3,980)
1,246 Children’s Place Inc Barclays Bank 3,98714,592 Children’s Place Inc Goldman Sachs 158,4694,047 Children’s Place Inc Morgan Stanley 12,950
(20,501) Chimera Investment Corp(REIT)
Bank of AmericaMerrill Lynch (14,145)
(26,191) Chimera Investment Corp(REIT) Barclays Bank (1,309)
(2,758) Chimera Investment Corp(REIT) Goldman Sachs (1,903)
(27,001) Chimera Investment Corp(REIT) HSBC 271
(96,175) Chimera Investment Corp(REIT) Morgan Stanley (4,809)
104,835 Chimerix Inc Bank of AmericaMerrill Lynch (3,145)
34,560 Chimerix Inc Morgan Stanley (6,566)3,261 China Biologic Products
Holdings IncBank of AmericaMerrill Lynch 10,044
2,458 China Biologic ProductsHoldings Inc Barclays Bank 5,481
949 China Biologic ProductsHoldings Inc Goldman Sachs 2,317
1,889 China Biologic ProductsHoldings Inc HSBC 208
333 Chipotle Mexican Grill Inc Bank of AmericaMerrill Lynch 8,049
53 Chipotle Mexican Grill Inc Barclays Bank (3,168)280 Chipotle Mexican Grill Inc Goldman Sachs 6,768338 Chipotle Mexican Grill Inc HSBC (9,796)
(283) Chipotle Mexican Grill Inc HSBC (19,708)(1,267) Chipotle Mexican Grill Inc Morgan Stanley 75,741(4,713) Choice Hotels International
IncBank of AmericaMerrill Lynch (46,847)
(4,068) Choice Hotels InternationalInc Barclays Bank (11,431)
5,030 Choice Hotels InternationalInc Goldman Sachs 28,023
(1,393) Choice Hotels InternationalInc Goldman Sachs (13,846)
(2,019) Choice Hotels InternationalInc HSBC (14,719)
10,572 Choice Hotels InternationalInc Morgan Stanley 29,707
(2,598) Choice Hotels InternationalInc Morgan Stanley (7,300)
6,945 ChromaDex Corp Bank of AmericaMerrill Lynch 1,042
3,921 ChromaDex Corp Barclays Bank (392)15,942 ChromaDex Corp Goldman Sachs 2,39127,067 ChromaDex Corp HSBC (19,218)(2,357) Chubb Ltd Barclays Bank (13,812)
Holding Description Counterparty
Netunrealised
appreciation/(depreciation)
USD
United States continued(9,083) Chubb Ltd Goldman Sachs (190,052)(9,436) Chubb Ltd HSBC (197,307)(2,841) Chubb Ltd Morgan Stanley (16,648)10,013 Church & Dwight Co Inc Bank of America
Merrill Lynch 1,1526,428 Church & Dwight Co Inc Barclays Bank 11,474
16,800 Church & Dwight Co Inc Goldman Sachs 1,93232,170 Church & Dwight Co Inc HSBC 12,53923,200 Church & Dwight Co Inc Morgan Stanley 41,412(2,831) Churchill Downs Inc Bank of America
Merrill Lynch (86,176)(1,142) Churchill Downs Inc Barclays Bank (11,055)3,420 Churchill Downs Inc Barclays Bank 33,1064,224 Churchill Downs Inc Goldman Sachs 128,579
(3,362) Churchill Downs Inc Goldman Sachs (102,339)(5,808) Churchill Downs Inc HSBC (127,195)(4,527) Churchill Downs Inc Morgan Stanley (43,821)1,883 Churchill Downs Inc Morgan Stanley 18,227
804 Chuy’s Holdings Inc Barclays Bank 34623,575 Chuy’s Holdings Inc Goldman Sachs 64,36013,753 Chuy’s Holdings Inc HSBC 5,91421,057 Chuy’s Holdings Inc Morgan Stanley 9,0552,216 Cia Cervecerias Unidas SA
ADR Goldman Sachs 2,28254,935 Cia Cervecerias Unidas SA
ADR HSBC 5,8651,299 Cia Cervecerias Unidas SA
ADR Morgan Stanley 66210,358 Cia de Minas Buenaventura
SAA ADR Goldman Sachs (241)16,551 Cia de Minas Buenaventura
SAA ADR HSBC (2,360)(15,107) Cia Siderurgica Nacional SA
ADR Morgan Stanley (4,559)44,583 Cidara Therapeutics Inc Goldman Sachs 26,7502,544 Ciena Corp Bank of America
Merrill Lynch 12,0846,377 Ciena Corp Barclays Bank 10,139
(21,030) Ciena Corp Barclays Bank (29,812)44,037 Ciena Corp Goldman Sachs 209,176
(12,957) Ciena Corp Goldman Sachs (61,546)2,902 Ciena Corp HSBC 18,689(765) Ciena Corp HSBC (1,293)
(8,490) Ciena Corp Morgan Stanley (13,499)996 Cigna Corp Bank of America
Merrill Lynch 7,550(3,157) Cigna Corp Bank of America
Merrill Lynch (15,957)2,264 Cigna Corp Barclays Bank 19,7655,871 Cigna Corp Goldman Sachs 44,174
(7,200) Cigna Corp Goldman Sachs (54,576)3,898 Cigna Corp HSBC 32,977
(1,556) Cigna Corp HSBC (13,164)3,888 Cigna Corp Morgan Stanley 30,502
(2,401) Cigna Corp Morgan Stanley (20,961)(7,102) Cimarex Energy Co Bank of America
Merrill Lynch (18,039)(2,920) Cimarex Energy Co Barclays Bank 1,343(8,817) Cimarex Energy Co Goldman Sachs (22,395)
(10,750) Cimarex Energy Co Morgan Stanley 4,94523,924 Cimarex Energy Co Morgan Stanley (11,005)
(11,613) Cimpress Plc Barclays Bank (95,575)(1,759) Cimpress Plc Goldman Sachs (28,848)
(803) Cimpress Plc HSBC (10,640)(2,588) Cimpress Plc Morgan Stanley (21,299)3,509 Cincinnati Financial Corp Bank of America
Merrill Lynch 32,9146,198 Cincinnati Financial Corp Barclays Bank 8,119
BlackRock Americas Diversified Equity Absolute Return Fundcontinued
The notes on pages 691 to 711 form an integral part of these financial statements.
Annual report and audited financial statements [97]
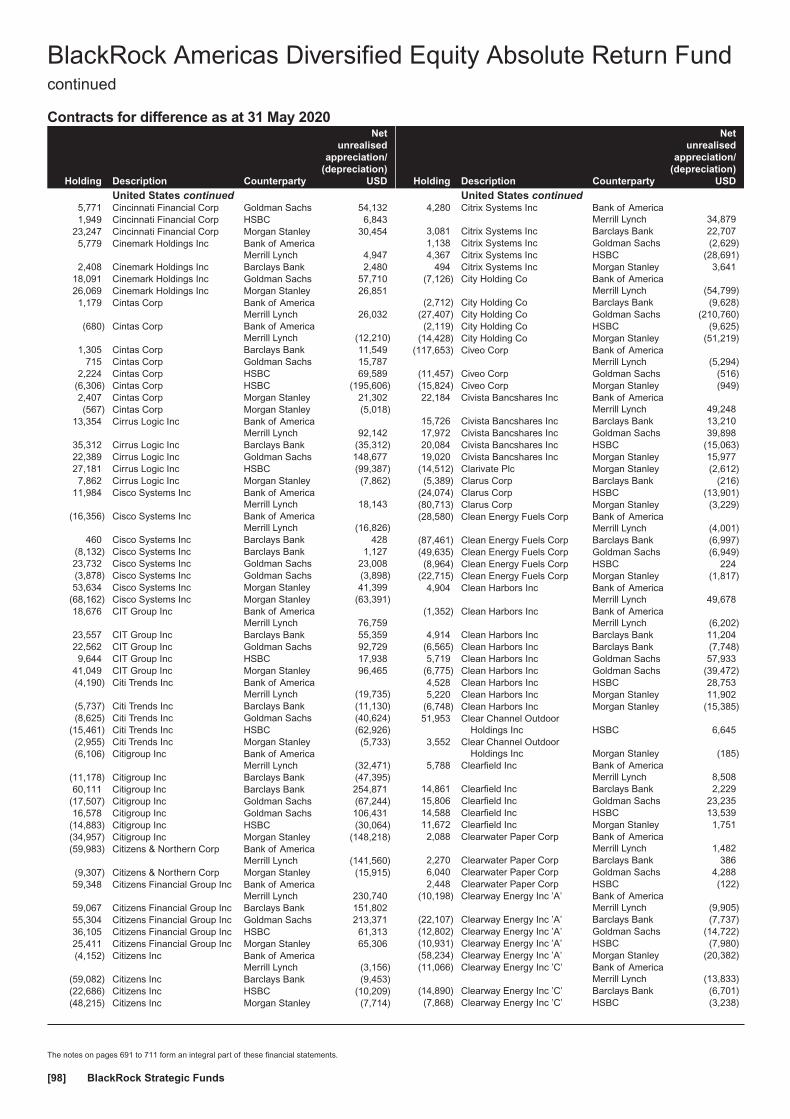
Contracts for difference as at 31 May 2020
Holding Description Counterparty
Netunrealised
appreciation/(depreciation)
USD
United States continued5,771 Cincinnati Financial Corp Goldman Sachs 54,1321,949 Cincinnati Financial Corp HSBC 6,843
23,247 Cincinnati Financial Corp Morgan Stanley 30,4545,779 Cinemark Holdings Inc Bank of America
Merrill Lynch 4,9472,408 Cinemark Holdings Inc Barclays Bank 2,480
18,091 Cinemark Holdings Inc Goldman Sachs 57,71026,069 Cinemark Holdings Inc Morgan Stanley 26,8511,179 Cintas Corp Bank of America
Merrill Lynch 26,032(680) Cintas Corp Bank of America
Merrill Lynch (12,210)1,305 Cintas Corp Barclays Bank 11,549
715 Cintas Corp Goldman Sachs 15,7872,224 Cintas Corp HSBC 69,589
(6,306) Cintas Corp HSBC (195,606)2,407 Cintas Corp Morgan Stanley 21,302(567) Cintas Corp Morgan Stanley (5,018)
13,354 Cirrus Logic Inc Bank of AmericaMerrill Lynch 92,142
35,312 Cirrus Logic Inc Barclays Bank (35,312)22,389 Cirrus Logic Inc Goldman Sachs 148,67727,181 Cirrus Logic Inc HSBC (99,387)7,862 Cirrus Logic Inc Morgan Stanley (7,862)
11,984 Cisco Systems Inc Bank of AmericaMerrill Lynch 18,143
(16,356) Cisco Systems Inc Bank of AmericaMerrill Lynch (16,826)
460 Cisco Systems Inc Barclays Bank 428(8,132) Cisco Systems Inc Barclays Bank 1,12723,732 Cisco Systems Inc Goldman Sachs 23,008(3,878) Cisco Systems Inc Goldman Sachs (3,898)53,634 Cisco Systems Inc Morgan Stanley 41,399
(68,162) Cisco Systems Inc Morgan Stanley (63,391)18,676 CIT Group Inc Bank of America
Merrill Lynch 76,75923,557 CIT Group Inc Barclays Bank 55,35922,562 CIT Group Inc Goldman Sachs 92,7299,644 CIT Group Inc HSBC 17,938
41,049 CIT Group Inc Morgan Stanley 96,465(4,190) Citi Trends Inc Bank of America
Merrill Lynch (19,735)(5,737) Citi Trends Inc Barclays Bank (11,130)(8,625) Citi Trends Inc Goldman Sachs (40,624)
(15,461) Citi Trends Inc HSBC (62,926)(2,955) Citi Trends Inc Morgan Stanley (5,733)(6,106) Citigroup Inc Bank of America
Merrill Lynch (32,471)(11,178) Citigroup Inc Barclays Bank (47,395)60,111 Citigroup Inc Barclays Bank 254,871
(17,507) Citigroup Inc Goldman Sachs (67,244)16,578 Citigroup Inc Goldman Sachs 106,431
(14,883) Citigroup Inc HSBC (30,064)(34,957) Citigroup Inc Morgan Stanley (148,218)(59,983) Citizens & Northern Corp Bank of America
Merrill Lynch (141,560)(9,307) Citizens & Northern Corp Morgan Stanley (15,915)59,348 Citizens Financial Group Inc Bank of America
Merrill Lynch 230,74059,067 Citizens Financial Group Inc Barclays Bank 151,80255,304 Citizens Financial Group Inc Goldman Sachs 213,37136,105 Citizens Financial Group Inc HSBC 61,31325,411 Citizens Financial Group Inc Morgan Stanley 65,306(4,152) Citizens Inc Bank of America
Merrill Lynch (3,156)(59,082) Citizens Inc Barclays Bank (9,453)(22,686) Citizens Inc HSBC (10,209)(48,215) Citizens Inc Morgan Stanley (7,714)
Holding Description Counterparty
Netunrealised
appreciation/(depreciation)
USD
United States continued4,280 Citrix Systems Inc Bank of America
Merrill Lynch 34,8793,081 Citrix Systems Inc Barclays Bank 22,7071,138 Citrix Systems Inc Goldman Sachs (2,629)4,367 Citrix Systems Inc HSBC (28,691)
494 Citrix Systems Inc Morgan Stanley 3,641(7,126) City Holding Co Bank of America
Merrill Lynch (54,799)(2,712) City Holding Co Barclays Bank (9,628)
(27,407) City Holding Co Goldman Sachs (210,760)(2,119) City Holding Co HSBC (9,625)
(14,428) City Holding Co Morgan Stanley (51,219)(117,653) Civeo Corp Bank of America
Merrill Lynch (5,294)(11,457) Civeo Corp Goldman Sachs (516)(15,824) Civeo Corp Morgan Stanley (949)22,184 Civista Bancshares Inc Bank of America
Merrill Lynch 49,24815,726 Civista Bancshares Inc Barclays Bank 13,21017,972 Civista Bancshares Inc Goldman Sachs 39,89820,084 Civista Bancshares Inc HSBC (15,063)19,020 Civista Bancshares Inc Morgan Stanley 15,977
(14,512) Clarivate Plc Morgan Stanley (2,612)(5,389) Clarus Corp Barclays Bank (216)
(24,074) Clarus Corp HSBC (13,901)(80,713) Clarus Corp Morgan Stanley (3,229)(28,580) Clean Energy Fuels Corp Bank of America
Merrill Lynch (4,001)(87,461) Clean Energy Fuels Corp Barclays Bank (6,997)(49,635) Clean Energy Fuels Corp Goldman Sachs (6,949)(8,964) Clean Energy Fuels Corp HSBC 224
(22,715) Clean Energy Fuels Corp Morgan Stanley (1,817)4,904 Clean Harbors Inc Bank of America
Merrill Lynch 49,678(1,352) Clean Harbors Inc Bank of America
Merrill Lynch (6,202)4,914 Clean Harbors Inc Barclays Bank 11,204
(6,565) Clean Harbors Inc Barclays Bank (7,748)5,719 Clean Harbors Inc Goldman Sachs 57,933
(6,775) Clean Harbors Inc Goldman Sachs (39,472)4,528 Clean Harbors Inc HSBC 28,7535,220 Clean Harbors Inc Morgan Stanley 11,902
(6,748) Clean Harbors Inc Morgan Stanley (15,385)51,953 Clear Channel Outdoor
Holdings Inc HSBC 6,6453,552 Clear Channel Outdoor
Holdings Inc Morgan Stanley (185)5,788 Clearfield Inc Bank of America
Merrill Lynch 8,50814,861 Clearfield Inc Barclays Bank 2,22915,806 Clearfield Inc Goldman Sachs 23,23514,588 Clearfield Inc HSBC 13,53911,672 Clearfield Inc Morgan Stanley 1,7512,088 Clearwater Paper Corp Bank of America
Merrill Lynch 1,4822,270 Clearwater Paper Corp Barclays Bank 3866,040 Clearwater Paper Corp Goldman Sachs 4,2882,448 Clearwater Paper Corp HSBC (122)
(10,198) Clearway Energy Inc ’A’ Bank of AmericaMerrill Lynch (9,905)
(22,107) Clearway Energy Inc ’A’ Barclays Bank (7,737)(12,802) Clearway Energy Inc ’A’ Goldman Sachs (14,722)(10,931) Clearway Energy Inc ’A’ HSBC (7,980)(58,234) Clearway Energy Inc ’A’ Morgan Stanley (20,382)(11,066) Clearway Energy Inc ’C’ Bank of America
Merrill Lynch (13,833)(14,890) Clearway Energy Inc ’C’ Barclays Bank (6,701)(7,868) Clearway Energy Inc ’C’ HSBC (3,238)
BlackRock Americas Diversified Equity Absolute Return Fundcontinued
The notes on pages 691 to 711 form an integral part of these financial statements.
BlackRock Strategic Funds[98]
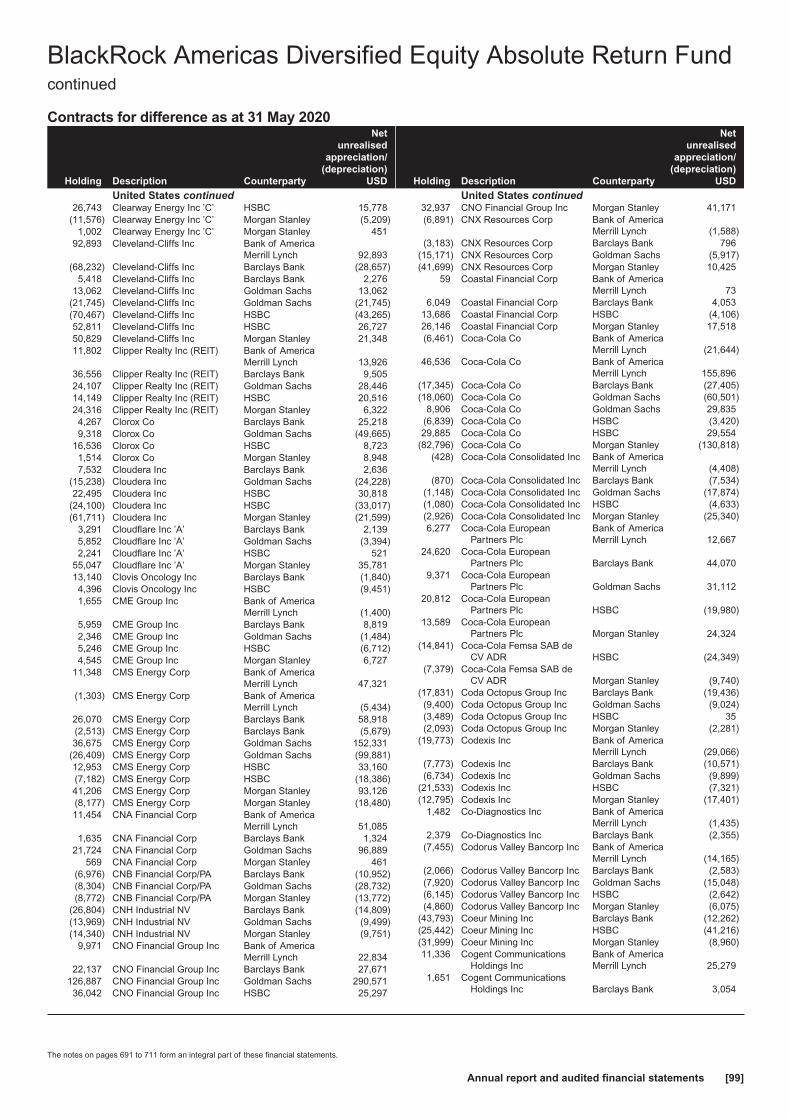
Contracts for difference as at 31 May 2020
Holding Description Counterparty
Netunrealised
appreciation/(depreciation)
USD
United States continued26,743 Clearway Energy Inc ’C’ HSBC 15,778
(11,576) Clearway Energy Inc ’C’ Morgan Stanley (5,209)1,002 Clearway Energy Inc ’C’ Morgan Stanley 451
92,893 Cleveland-Cliffs Inc Bank of AmericaMerrill Lynch 92,893
(68,232) Cleveland-Cliffs Inc Barclays Bank (28,657)5,418 Cleveland-Cliffs Inc Barclays Bank 2,276
13,062 Cleveland-Cliffs Inc Goldman Sachs 13,062(21,745) Cleveland-Cliffs Inc Goldman Sachs (21,745)(70,467) Cleveland-Cliffs Inc HSBC (43,265)52,811 Cleveland-Cliffs Inc HSBC 26,72750,829 Cleveland-Cliffs Inc Morgan Stanley 21,34811,802 Clipper Realty Inc (REIT) Bank of America
Merrill Lynch 13,92636,556 Clipper Realty Inc (REIT) Barclays Bank 9,50524,107 Clipper Realty Inc (REIT) Goldman Sachs 28,44614,149 Clipper Realty Inc (REIT) HSBC 20,51624,316 Clipper Realty Inc (REIT) Morgan Stanley 6,3224,267 Clorox Co Barclays Bank 25,2189,318 Clorox Co Goldman Sachs (49,665)
16,536 Clorox Co HSBC 8,7231,514 Clorox Co Morgan Stanley 8,9487,532 Cloudera Inc Barclays Bank 2,636
(15,238) Cloudera Inc Goldman Sachs (24,228)22,495 Cloudera Inc HSBC 30,818
(24,100) Cloudera Inc HSBC (33,017)(61,711) Cloudera Inc Morgan Stanley (21,599)
3,291 Cloudflare Inc ’A’ Barclays Bank 2,1395,852 Cloudflare Inc ’A’ Goldman Sachs (3,394)2,241 Cloudflare Inc ’A’ HSBC 521
55,047 Cloudflare Inc ’A’ Morgan Stanley 35,78113,140 Clovis Oncology Inc Barclays Bank (1,840)4,396 Clovis Oncology Inc HSBC (9,451)1,655 CME Group Inc Bank of America
Merrill Lynch (1,400)5,959 CME Group Inc Barclays Bank 8,8192,346 CME Group Inc Goldman Sachs (1,484)5,246 CME Group Inc HSBC (6,712)4,545 CME Group Inc Morgan Stanley 6,727
11,348 CMS Energy Corp Bank of AmericaMerrill Lynch 47,321
(1,303) CMS Energy Corp Bank of AmericaMerrill Lynch (5,434)
26,070 CMS Energy Corp Barclays Bank 58,918(2,513) CMS Energy Corp Barclays Bank (5,679)36,675 CMS Energy Corp Goldman Sachs 152,331
(26,409) CMS Energy Corp Goldman Sachs (99,881)12,953 CMS Energy Corp HSBC 33,160(7,182) CMS Energy Corp HSBC (18,386)41,206 CMS Energy Corp Morgan Stanley 93,126(8,177) CMS Energy Corp Morgan Stanley (18,480)11,454 CNA Financial Corp Bank of America
Merrill Lynch 51,0851,635 CNA Financial Corp Barclays Bank 1,324
21,724 CNA Financial Corp Goldman Sachs 96,889569 CNA Financial Corp Morgan Stanley 461
(6,976) CNB Financial Corp/PA Barclays Bank (10,952)(8,304) CNB Financial Corp/PA Goldman Sachs (28,732)(8,772) CNB Financial Corp/PA Morgan Stanley (13,772)
(26,804) CNH Industrial NV Barclays Bank (14,809)(13,969) CNH Industrial NV Goldman Sachs (9,499)(14,340) CNH Industrial NV Morgan Stanley (9,751)
9,971 CNO Financial Group Inc Bank of AmericaMerrill Lynch 22,834
22,137 CNO Financial Group Inc Barclays Bank 27,671126,887 CNO Financial Group Inc Goldman Sachs 290,57136,042 CNO Financial Group Inc HSBC 25,297
Holding Description Counterparty
Netunrealised
appreciation/(depreciation)
USD
United States continued32,937 CNO Financial Group Inc Morgan Stanley 41,171(6,891) CNX Resources Corp Bank of America
Merrill Lynch (1,588)(3,183) CNX Resources Corp Barclays Bank 796
(15,171) CNX Resources Corp Goldman Sachs (5,917)(41,699) CNX Resources Corp Morgan Stanley 10,425
59 Coastal Financial Corp Bank of AmericaMerrill Lynch 73
6,049 Coastal Financial Corp Barclays Bank 4,05313,686 Coastal Financial Corp HSBC (4,106)26,146 Coastal Financial Corp Morgan Stanley 17,518(6,461) Coca-Cola Co Bank of America
Merrill Lynch (21,644)46,536 Coca-Cola Co Bank of America
Merrill Lynch 155,896(17,345) Coca-Cola Co Barclays Bank (27,405)(18,060) Coca-Cola Co Goldman Sachs (60,501)
8,906 Coca-Cola Co Goldman Sachs 29,835(6,839) Coca-Cola Co HSBC (3,420)29,885 Coca-Cola Co HSBC 29,554
(82,796) Coca-Cola Co Morgan Stanley (130,818)(428) Coca-Cola Consolidated Inc Bank of America
Merrill Lynch (4,408)(870) Coca-Cola Consolidated Inc Barclays Bank (7,534)
(1,148) Coca-Cola Consolidated Inc Goldman Sachs (17,874)(1,080) Coca-Cola Consolidated Inc HSBC (4,633)(2,926) Coca-Cola Consolidated Inc Morgan Stanley (25,340)6,277 Coca-Cola European
Partners PlcBank of AmericaMerrill Lynch 12,667
24,620 Coca-Cola EuropeanPartners Plc Barclays Bank 44,070
9,371 Coca-Cola EuropeanPartners Plc Goldman Sachs 31,112
20,812 Coca-Cola EuropeanPartners Plc HSBC (19,980)
13,589 Coca-Cola EuropeanPartners Plc Morgan Stanley 24,324
(14,841) Coca-Cola Femsa SAB deCV ADR HSBC (24,349)
(7,379) Coca-Cola Femsa SAB deCV ADR Morgan Stanley (9,740)
(17,831) Coda Octopus Group Inc Barclays Bank (19,436)(9,400) Coda Octopus Group Inc Goldman Sachs (9,024)(3,489) Coda Octopus Group Inc HSBC 35(2,093) Coda Octopus Group Inc Morgan Stanley (2,281)
(19,773) Codexis Inc Bank of AmericaMerrill Lynch (29,066)
(7,773) Codexis Inc Barclays Bank (10,571)(6,734) Codexis Inc Goldman Sachs (9,899)
(21,533) Codexis Inc HSBC (7,321)(12,795) Codexis Inc Morgan Stanley (17,401)
1,482 Co-Diagnostics Inc Bank of AmericaMerrill Lynch (1,435)
2,379 Co-Diagnostics Inc Barclays Bank (2,355)(7,455) Codorus Valley Bancorp Inc Bank of America
Merrill Lynch (14,165)(2,066) Codorus Valley Bancorp Inc Barclays Bank (2,583)(7,920) Codorus Valley Bancorp Inc Goldman Sachs (15,048)(6,145) Codorus Valley Bancorp Inc HSBC (2,642)(4,860) Codorus Valley Bancorp Inc Morgan Stanley (6,075)
(43,793) Coeur Mining Inc Barclays Bank (12,262)(25,442) Coeur Mining Inc HSBC (41,216)(31,999) Coeur Mining Inc Morgan Stanley (8,960)11,336 Cogent Communications
Holdings IncBank of AmericaMerrill Lynch 25,279
1,651 Cogent CommunicationsHoldings Inc Barclays Bank 3,054
BlackRock Americas Diversified Equity Absolute Return Fundcontinued
The notes on pages 691 to 711 form an integral part of these financial statements.
Annual report and audited financial statements [99]

Contracts for difference as at 31 May 2020
Holding Description Counterparty
Netunrealised
appreciation/(depreciation)
USD
United States continued649 Cogent Communications
Holdings Inc Goldman Sachs 1,7055,645 Cogent Communications
Holdings Inc Morgan Stanley 10,4431,604 Cognex Corp Bank of America
Merrill Lynch 3,256(2,334) Cognex Corp Barclays Bank 5,648(5,382) Cognex Corp Goldman Sachs (10,925)
486 Cognex Corp Goldman Sachs 987(4,367) Cognex Corp HSBC (7,555)5,444 Cognex Corp HSBC 12,432
(5,183) Cognex Corp Morgan Stanley 12,543(4,228) Cognizant Technology
Solutions Corp ’A’ Barclays Bank (6,427)24,897 Cognizant Technology
Solutions Corp ’A’ Goldman Sachs (53,978)(13,495) Cognizant Technology
Solutions Corp ’A’ HSBC 56,544(18,955) Cognizant Technology
Solutions Corp ’A’ Morgan Stanley (28,812)8,062 Cognizant Technology
Solutions Corp ’A’ Morgan Stanley (7,708)9,448 Cohen & Steers Inc Bank of America
Merrill Lynch 46,9564,628 Cohen & Steers Inc Barclays Bank 2,7303,942 Cohen & Steers Inc Goldman Sachs 19,5916,894 Cohen & Steers Inc HSBC 3,9309,365 Cohen & Steers Inc Morgan Stanley 4,345
(4,190) Coherent Inc Bank of AmericaMerrill Lynch (40,978)
(2,930) Coherent Inc Barclays Bank (2,813)(2,800) Coherent Inc Goldman Sachs (27,384)(1,480) Coherent Inc HSBC (7,900)(6,112) Coherent Inc Morgan Stanley (5,868)1,362 Coherus Biosciences Inc Bank of America
Merrill Lynch 2,16619,703 Coherus Biosciences Inc Barclays Bank 22,0671,943 Coherus Biosciences Inc Goldman Sachs 3,089
12,871 Coherus Biosciences Inc HSBC 11,71328,862 Coherus Biosciences Inc Morgan Stanley 32,325
(12,469) Cohu Inc Bank of AmericaMerrill Lynch (26,310)
(17,098) Cohu Inc Barclays Bank 1,197(26,841) Cohu Inc Goldman Sachs (56,635)(8,286) Cohu Inc HSBC (1,077)
(22,595) Cohu Inc Morgan Stanley 1,582(2,535) Colfax Corp Bank of America
Merrill Lynch (3,857)5,149 Colfax Corp Barclays Bank 8,187
(16,792) Colfax Corp Barclays Bank (26,699)16,233 Colfax Corp Goldman Sachs 41,39413,836 Colfax Corp HSBC 10,239(8,209) Colfax Corp HSBC (14,861)10,723 Colfax Corp Morgan Stanley 17,050
(11,492) Colfax Corp Morgan Stanley (18,272)(11,172) Colgate-Palmolive Co Bank of America
Merrill Lynch (35,862)28,161 Colgate-Palmolive Co Bank of America
Merrill Lynch 90,397(12,145) Colgate-Palmolive Co Barclays Bank (17,124)(29,261) Colgate-Palmolive Co Goldman Sachs (93,928)
4,362 Colgate-Palmolive Co Goldman Sachs 14,002(19,332) Colgate-Palmolive Co HSBC (53,936)14,927 Colgate-Palmolive Co HSBC 41,646
(21,791) Colgate-Palmolive Co Morgan Stanley (30,725)22,853 Colgate-Palmolive Co Morgan Stanley 32,223(7,355) Collectors Universe Inc Bank of America
Merrill Lynch (16,622)(2,538) Collectors Universe Inc Barclays Bank (4,568)
Holding Description Counterparty
Netunrealised
appreciation/(depreciation)
USD
United States continued(8,526) Collectors Universe Inc Goldman Sachs (19,269)(1,563) Collectors Universe Inc HSBC (2,829)
(11,935) Collectors Universe Inc Morgan Stanley (21,483)(10,293) Collegium Pharmaceutical
Inc Barclays Bank (3,500)(16,350) Collegium Pharmaceutical
Inc Goldman Sachs (13,571)(2,089) Collegium Pharmaceutical
Inc HSBC (2,904)(8,022) Collegium Pharmaceutical
Inc Morgan Stanley (2,727)4,140 Colony Bankcorp Inc Bank of America
Merrill Lynch 9,2325,483 Colony Bankcorp Inc Barclays Bank 9,5955,118 Colony Bankcorp Inc Goldman Sachs 11,4134,818 Colony Bankcorp Inc HSBC 5,5896,173 Colony Bankcorp Inc Morgan Stanley 10,803
(8,307) Colony Capital Inc (REIT) Bank of AmericaMerrill Lynch (3,904)
(13,559) Colony Capital Inc (REIT) Barclays Bank (2,712)(7,503) Colony Capital Inc (REIT) Goldman Sachs (3,526)
(25,129) Colony Capital Inc (REIT) HSBC 754(20,370) Colony Capital Inc (REIT) Morgan Stanley (4,074)(9,867) Colony Credit Real Estate
Inc (REIT)Bank of AmericaMerrill Lynch (11,742)
(10,630) Colony Credit Real EstateInc (REIT) Barclays Bank (4,252)
(19,822) Colony Credit Real EstateInc (REIT) Goldman Sachs (23,588)
(10,905) Colony Credit Real EstateInc (REIT) HSBC 2,508
(44,318) Colony Credit Real EstateInc (REIT) Morgan Stanley (17,727)
(33,771) Columbia Banking SystemInc
Bank of AmericaMerrill Lynch (128,667)
(6,243) Columbia Banking SystemInc Barclays Bank (11,674)
(18,446) Columbia Banking SystemInc Goldman Sachs (70,279)
(47,918) Columbia Banking SystemInc HSBC (10,062)
(51,754) Columbia Banking SystemInc Morgan Stanley (96,780)
(13,575) Columbia Financial Inc Bank of AmericaMerrill Lynch (13,208)
(7,902) Columbia Financial Inc Barclays Bank (5,927)(15,970) Columbia Financial Inc Goldman Sachs (18,768)(59,484) Columbia Financial Inc HSBC (15,384)(67,497) Columbia Financial Inc Morgan Stanley (50,623)(56,520) Columbia Property Trust Inc
(REIT)Bank of AmericaMerrill Lynch (66,129)
(5,051) Columbia Property Trust Inc(REIT) Barclays Bank (3,081)
(24,486) Columbia Property Trust Inc(REIT) Goldman Sachs (27,390)
(8,729) Columbia Property Trust Inc(REIT) HSBC 6,896
(15,916) Columbia Property Trust Inc(REIT) Morgan Stanley (9,709)
8,393 Columbia Sportswear Co Bank of AmericaMerrill Lynch 84,518
(3,013) Columbia Sportswear Co Bank of AmericaMerrill Lynch (25,536)
2,668 Columbia Sportswear Co Barclays Bank 9,685(3,889) Columbia Sportswear Co Barclays Bank (14,117)6,678 Columbia Sportswear Co Goldman Sachs 67,247
(3,778) Columbia Sportswear Co Goldman Sachs (23,133)4,971 Columbia Sportswear Co HSBC 25,849
(7,049) Columbia Sportswear Co HSBC (36,655)
BlackRock Americas Diversified Equity Absolute Return Fundcontinued
The notes on pages 691 to 711 form an integral part of these financial statements.
BlackRock Strategic Funds[100]

Contracts for difference as at 31 May 2020
Holding Description Counterparty
Netunrealised
appreciation/(depreciation)
USD
United States continued2,022 Columbia Sportswear Co Morgan Stanley 7,340(903) Columbia Sportswear Co Morgan Stanley (3,278)
12,904 Columbus McKinnon Corp Bank of AmericaMerrill Lynch 80,134
6,805 Columbus McKinnon Corp Barclays Bank 24,7705,617 Columbus McKinnon Corp Goldman Sachs 34,882
33,407 Columbus McKinnon Corp HSBC 112,80215,134 Columbus McKinnon Corp Morgan Stanley 55,08835,886 Comcast Corp ’A’ Barclays Bank 15,79061,073 Comcast Corp ’A’ Goldman Sachs 199,09841,112 Comcast Corp ’A’ HSBC 101,48526,008 Comcast Corp ’A’ Morgan Stanley 11,4443,416 Comerica Inc Bank of America
Merrill Lynch 22,6483,530 Comerica Inc Barclays Bank 14,1918,453 Comerica Inc Goldman Sachs 56,043
19,552 Comerica Inc HSBC 63,91232,829 Comerica Inc Morgan Stanley 131,973
432 Comfort Systems USA Inc Bank of AmericaMerrill Lynch 1,391
4,788 Comfort Systems USA Inc Barclays Bank 18,05114,082 Comfort Systems USA Inc Goldman Sachs 98,01132,837 Comfort Systems USA Inc HSBC 143,57049,585 Comfort Systems USA Inc Morgan Stanley 186,935(7,402) Commerce Bancshares Inc Bank of America
Merrill Lynch (58,375)2,539 Commerce Bancshares Inc Bank of America
Merrill Lynch 22,165(1,665) Commerce Bancshares Inc Barclays Bank (5,728)3,390 Commerce Bancshares Inc Barclays Bank 11,662
(4,581) Commerce Bancshares Inc Goldman Sachs (28,372)(3,529) Commerce Bancshares Inc HSBC (14,469)1,513 Commerce Bancshares Inc HSBC 6,313
(2,504) Commerce Bancshares Inc Morgan Stanley (8,614)7,069 Commerce Bancshares Inc Morgan Stanley 17,347
(17,465) Commercial Metals Co Bank of AmericaMerrill Lynch (40,693)
12,319 Commercial Metals Co Bank of AmericaMerrill Lynch 28,703
41,627 Commercial Metals Co Barclays Bank 39,12945,313 Commercial Metals Co Goldman Sachs 105,58066,512 Commercial Metals Co HSBC 59,23257,876 Commercial Metals Co Morgan Stanley 54,403(9,169) Commercial Vehicle Group
IncBank of AmericaMerrill Lynch (8,619)
(16,761) Commercial Vehicle GroupInc Barclays Bank (10,057)
(8,404) Commercial Vehicle GroupInc Goldman Sachs (7,900)
(90,609) Commercial Vehicle GroupInc HSBC (36,244)
(52,683) Commercial Vehicle GroupInc Morgan Stanley (31,610)
31,954 CommScope Holding Co Inc Bank of AmericaMerrill Lynch 40,497
(2,215) CommScope Holding Co Inc Goldman Sachs (2,924)6,786 CommScope Holding Co Inc Goldman Sachs 4,757
(2,288) CommScope Holding Co Inc HSBC 2,47146,592 CommScope Holding Co Inc HSBC 54,730
(22,715) CommScope Holding Co Inc Morgan Stanley (20,671)(15,328) Community Bank System
IncBank of AmericaMerrill Lynch (117,259)
(18,960) Community Bank SystemInc Barclays Bank (69,394)
(16,622) Community Bank SystemInc Goldman Sachs (126,081)
(5,176) Community Bank SystemInc HSBC (3,313)
Holding Description Counterparty
Netunrealised
appreciation/(depreciation)
USD
United States continued(29,066) Community Bank System
Inc Morgan Stanley (106,381)36,667 Community Bankers Trust
CorpBank of AmericaMerrill Lynch 30,800
22,075 Community Bankers TrustCorp Barclays Bank 5,960
29,709 Community Bankers TrustCorp Goldman Sachs 24,956
6,262 Community Bankers TrustCorp HSBC 2,004
51,249 Community Bankers TrustCorp Morgan Stanley 13,837
(1,642) Community Financial Corp Barclays Bank (361)(4,083) Community Financial Corp Goldman Sachs (7,676)(5,345) Community Financial Corp HSBC (5,024)(4,173) Community Financial Corp Morgan Stanley (918)
(16,309) Community Health SystemsInc
Bank of AmericaMerrill Lynch (6,850)
(49,505) Community Health SystemsInc Barclays Bank 2,970
(29,780) Community Health SystemsInc HSBC (7,241)
(20,457) Community Health SystemsInc Morgan Stanley 1,227
(7,932) Community HealthcareTrust Inc (REIT)
Bank of AmericaMerrill Lynch (18,561)
(6,550) Community HealthcareTrust Inc (REIT) Barclays Bank 12,183
(10,050) Community HealthcareTrust Inc (REIT) Goldman Sachs (23,517)
(7,160) Community HealthcareTrust Inc (REIT) HSBC 12,100
(12,049) Community HealthcareTrust Inc (REIT) Morgan Stanley 22,411
13,351 Community Trust BancorpInc
Bank of AmericaMerrill Lynch 55,598
16,577 Community Trust BancorpInc Barclays Bank 30,170
13,924 Community Trust BancorpInc Goldman Sachs 59,734
13,622 Community Trust BancorpInc HSBC 26,359
30,582 Community Trust BancorpInc Morgan Stanley 55,659
2,838 CommVault Systems Inc Barclays Bank 7,43630,832 CommVault Systems Inc Goldman Sachs 96,5049,046 CommVault Systems Inc HSBC (56,447)8,419 CommVault Systems Inc Morgan Stanley 22,058
(2,773) Compass MineralsInternational Inc
Bank of AmericaMerrill Lynch (13,144)
(13,773) Compass MineralsInternational Inc Barclays Bank 14,462
(4,637) Compass MineralsInternational Inc Goldman Sachs (18,019)
(8,586) Compass MineralsInternational Inc HSBC (4,294)
(8,603) Compass MineralsInternational Inc Morgan Stanley 9,034
(4,892) Computer Programs andSystems Inc Barclays Bank (3,058)
(16,365) Computer Programs andSystems Inc Goldman Sachs (16,938)
(2,220) Computer Programs andSystems Inc HSBC 3,297
(12,621) Computer Programs andSystems Inc Morgan Stanley (7,888)
(485) comScore Inc HSBC (216)(66,647) comScore Inc Morgan Stanley (32,657)
BlackRock Americas Diversified Equity Absolute Return Fundcontinued
The notes on pages 691 to 711 form an integral part of these financial statements.
Annual report and audited financial statements [101]

Contracts for difference as at 31 May 2020
Holding Description Counterparty
Netunrealised
appreciation/(depreciation)
USD
United States continued13,815 Comstock Resources Inc HSBC (31,084)15,608 Comtech
Telecommunications CorpBank of AmericaMerrill Lynch 26,221
8,734 ComtechTelecommunications Corp Barclays Bank 1,834
6,891 ComtechTelecommunications Corp Goldman Sachs 11,577
10,425 ComtechTelecommunications Corp HSBC (11,885)
13,316 ComtechTelecommunications Corp Morgan Stanley 2,796
(8,696) Conagra Brands Inc Bank of AmericaMerrill Lynch 2,435
31,971 Conagra Brands Inc Bank of AmericaMerrill Lynch 57,563
(9,926) Conagra Brands Inc Barclays Bank (12,010)(9,834) Conagra Brands Inc HSBC (3,639)
(17,303) Conagra Brands Inc Morgan Stanley (20,937)3,677 Conagra Brands Inc Morgan Stanley 4,449
(11,094) Concert PharmaceuticalsInc Barclays Bank (2,552)
(13,854) Concert PharmaceuticalsInc Goldman Sachs (27,847)
(9,925) Concert PharmaceuticalsInc HSBC (19,949)
(15,111) Concert PharmaceuticalsInc Morgan Stanley (3,476)
(6,801) Concho Resources Inc Bank of AmericaMerrill Lynch 6,461
(9,159) Concho Resources Inc Barclays Bank 23,081(7,135) Concho Resources Inc Goldman Sachs 6,778
(485) Concho Resources Inc HSBC 2,585(3,314) Concho Resources Inc Morgan Stanley 8,351
(23,132) Concrete Pumping HoldingsInc Barclays Bank (9,021)
(20,281) Concrete Pumping HoldingsInc Goldman Sachs (14,400)
(16,150) Concrete Pumping HoldingsInc HSBC (12,920)
(8,349) Concrete Pumping HoldingsInc Morgan Stanley (3,256)
61,935 Conduent Inc Bank of AmericaMerrill Lynch 41,496
49,446 Conduent Inc Barclays Bank 11,86760,177 Conduent Inc Goldman Sachs 40,31942,331 Conduent Inc HSBC 7,17476,012 Conduent Inc Morgan Stanley 18,243
(59,747) Conformis Inc Barclays Bank (7,767)(80,008) Conformis Inc Goldman Sachs (7,193)(88,743) Conformis Inc HSBC (5,200)(31,597) Conformis Inc Morgan Stanley (4,108)
4,125 CONMED Corp Barclays Bank (1,733)(1,196) CONMED Corp Barclays Bank 502(2,068) CONMED Corp Goldman Sachs (11,105)
(14,751) CONMED Corp HSBC (46,940)2,866 CONMED Corp Morgan Stanley (1,204)
(2,548) CONMED Corp Morgan Stanley 1,070(6,702) ConnectOne Bancorp Inc Bank of America
Merrill Lynch (21,245)(4,844) ConnectOne Bancorp Inc Barclays Bank (5,328)(8,319) ConnectOne Bancorp Inc Goldman Sachs (26,371)
(26,648) ConnectOne Bancorp Inc HSBC 2,265(6,252) ConnectOne Bancorp Inc Morgan Stanley (6,877)
(89,812) Conn’s Inc Barclays Bank (67,359)(1,635) Conn’s Inc Goldman Sachs (2,714)4,187 ConocoPhillips Bank of America
Merrill Lynch 5,1927,279 ConocoPhillips Barclays Bank (8,516)
(13,552) ConocoPhillips Barclays Bank 15,856
Holding Description Counterparty
Netunrealised
appreciation/(depreciation)
USD
United States continued24,714 ConocoPhillips Goldman Sachs 30,645(7,462) ConocoPhillips Goldman Sachs (9,253)4,799 ConocoPhillips HSBC (4,655)
(7,204) ConocoPhillips HSBC 4,8247,078 ConocoPhillips Morgan Stanley (8,281)
(7,411) ConocoPhillips Morgan Stanley 8,67133,189 Consolidated
Communications HoldingsInc HSBC 15,931
15,489 ConsolidatedCommunications HoldingsInc Morgan Stanley 7,435
34,192 Consolidated Edison Inc Bank of AmericaMerrill Lynch 97,939
5,306 Consolidated Edison Inc Barclays Bank 16,2908,609 Consolidated Edison Inc Goldman Sachs 25,7736,550 Consolidated Edison Inc HSBC (3,607)
51,662 Consolidated Edison Inc Morgan Stanley 158,6038,039 Consolidated Water Co Ltd Bank of America
Merrill Lynch 10,53119,225 Consolidated Water Co Ltd Barclays Bank 2,8847,598 Consolidated Water Co Ltd HSBC 3,495
29,412 Consolidated Water Co Ltd Morgan Stanley 4,412(2,932) Constellation Brands Inc ’A’ Bank of America
Merrill Lynch (43,921)(1,245) Constellation Brands Inc ’A’ Goldman Sachs (18,650)
(176) Constellation Brands Inc ’A’ HSBC (1,304)(4,192) Constellation Brands Inc ’A’ Morgan Stanley (4,862)
(897) ConstellationPharmaceuticals Inc
Bank of AmericaMerrill Lynch 8,459
806 ConstellationPharmaceuticals Inc Barclays Bank (2,402)
(8,147) ConstellationPharmaceuticals Inc Barclays Bank 24,278
(2,518) ConstellationPharmaceuticals Inc Goldman Sachs 23,745
2,701 ConstellationPharmaceuticals Inc HSBC (29,248)
(1,772) ConstellationPharmaceuticals Inc HSBC 26,669
3,710 ConstellationPharmaceuticals Inc Morgan Stanley (11,056)
(1,312) Construction Partners Inc’A’
Bank of AmericaMerrill Lynch (2,755)
(9,660) Construction Partners Inc’A’ Barclays Bank (8,887)
(15,851) Construction Partners Inc’A’ Goldman Sachs (33,287)
(7,869) Construction Partners Inc’A’ HSBC (315)
(28,083) Construction Partners Inc’A’ Morgan Stanley (25,836)
63,314 Consumer PortfolioServices Inc Morgan Stanley (6,648)
9,491 Container Store Group Inc Barclays Bank 5,60032,874 Container Store Group Inc Goldman Sachs 26,95756,723 Container Store Group Inc Morgan Stanley 33,467
(20,947) Contango Oil & Gas Co Barclays Bank 4,189(50,068) Contango Oil & Gas Co Goldman Sachs (1,001)(15,759) Contango Oil & Gas Co HSBC (1,891)(9,659) Contango Oil & Gas Co Morgan Stanley 1,9322,271 Continental Resources Inc Bank of America
Merrill Lynch 11410,937 Continental Resources Inc Barclays Bank (12,249)13,337 Continental Resources Inc Goldman Sachs (7,684)38,002 Continental Resources Inc HSBC (82,464)59,813 Continental Resources Inc Morgan Stanley (58,529)
(15,220) Contura Energy Inc Goldman Sachs (20,699)(26,906) Contura Energy Inc HSBC (24,215)
BlackRock Americas Diversified Equity Absolute Return Fundcontinued
The notes on pages 691 to 711 form an integral part of these financial statements.
BlackRock Strategic Funds[102]
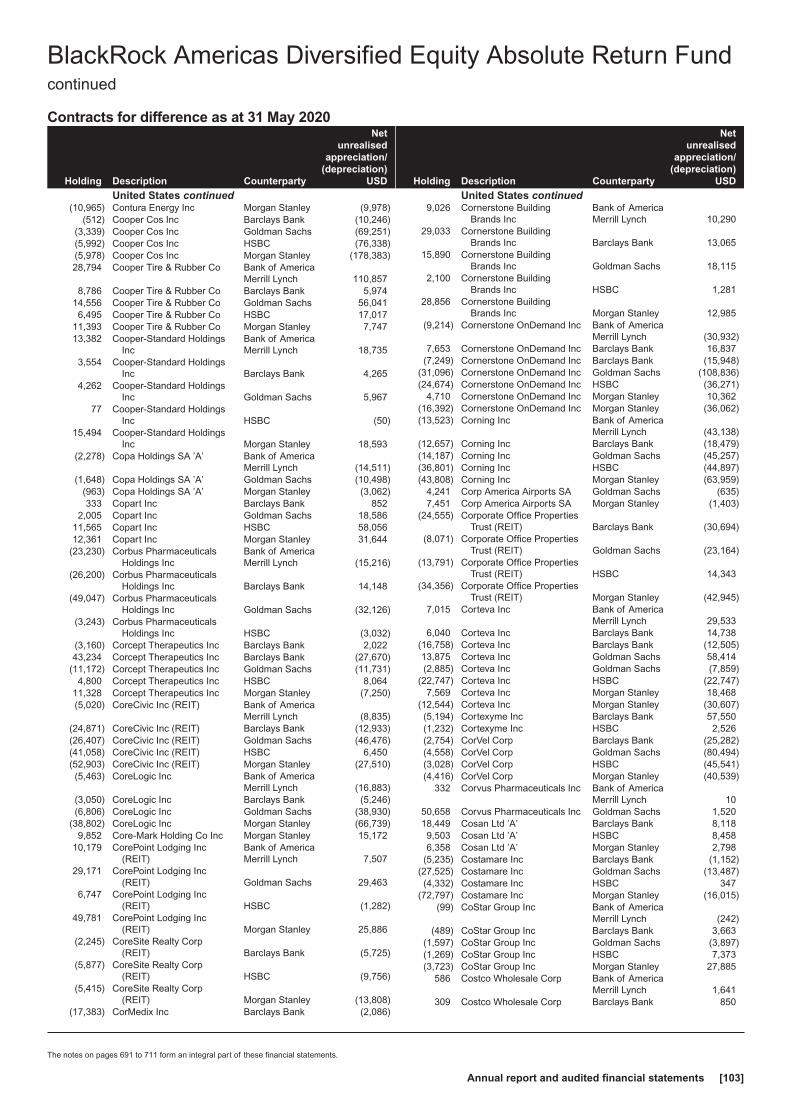
Contracts for difference as at 31 May 2020
Holding Description Counterparty
Netunrealised
appreciation/(depreciation)
USD
United States continued(10,965) Contura Energy Inc Morgan Stanley (9,978)
(512) Cooper Cos Inc Barclays Bank (10,246)(3,339) Cooper Cos Inc Goldman Sachs (69,251)(5,992) Cooper Cos Inc HSBC (76,338)(5,978) Cooper Cos Inc Morgan Stanley (178,383)28,794 Cooper Tire & Rubber Co Bank of America
Merrill Lynch 110,8578,786 Cooper Tire & Rubber Co Barclays Bank 5,974
14,556 Cooper Tire & Rubber Co Goldman Sachs 56,0416,495 Cooper Tire & Rubber Co HSBC 17,017
11,393 Cooper Tire & Rubber Co Morgan Stanley 7,74713,382 Cooper-Standard Holdings
IncBank of AmericaMerrill Lynch 18,735
3,554 Cooper-Standard HoldingsInc Barclays Bank 4,265
4,262 Cooper-Standard HoldingsInc Goldman Sachs 5,967
77 Cooper-Standard HoldingsInc HSBC (50)
15,494 Cooper-Standard HoldingsInc Morgan Stanley 18,593
(2,278) Copa Holdings SA ’A’ Bank of AmericaMerrill Lynch (14,511)
(1,648) Copa Holdings SA ’A’ Goldman Sachs (10,498)(963) Copa Holdings SA ’A’ Morgan Stanley (3,062)333 Copart Inc Barclays Bank 852
2,005 Copart Inc Goldman Sachs 18,58611,565 Copart Inc HSBC 58,05612,361 Copart Inc Morgan Stanley 31,644
(23,230) Corbus PharmaceuticalsHoldings Inc
Bank of AmericaMerrill Lynch (15,216)
(26,200) Corbus PharmaceuticalsHoldings Inc Barclays Bank 14,148
(49,047) Corbus PharmaceuticalsHoldings Inc Goldman Sachs (32,126)
(3,243) Corbus PharmaceuticalsHoldings Inc HSBC (3,032)
(3,160) Corcept Therapeutics Inc Barclays Bank 2,02243,234 Corcept Therapeutics Inc Barclays Bank (27,670)
(11,172) Corcept Therapeutics Inc Goldman Sachs (11,731)4,800 Corcept Therapeutics Inc HSBC 8,064
11,328 Corcept Therapeutics Inc Morgan Stanley (7,250)(5,020) CoreCivic Inc (REIT) Bank of America
Merrill Lynch (8,835)(24,871) CoreCivic Inc (REIT) Barclays Bank (12,933)(26,407) CoreCivic Inc (REIT) Goldman Sachs (46,476)(41,058) CoreCivic Inc (REIT) HSBC 6,450(52,903) CoreCivic Inc (REIT) Morgan Stanley (27,510)(5,463) CoreLogic Inc Bank of America
Merrill Lynch (16,883)(3,050) CoreLogic Inc Barclays Bank (5,246)(6,806) CoreLogic Inc Goldman Sachs (38,930)
(38,802) CoreLogic Inc Morgan Stanley (66,739)9,852 Core-Mark Holding Co Inc Morgan Stanley 15,172
10,179 CorePoint Lodging Inc(REIT)
Bank of AmericaMerrill Lynch 7,507
29,171 CorePoint Lodging Inc(REIT) Goldman Sachs 29,463
6,747 CorePoint Lodging Inc(REIT) HSBC (1,282)
49,781 CorePoint Lodging Inc(REIT) Morgan Stanley 25,886
(2,245) CoreSite Realty Corp(REIT) Barclays Bank (5,725)
(5,877) CoreSite Realty Corp(REIT) HSBC (9,756)
(5,415) CoreSite Realty Corp(REIT) Morgan Stanley (13,808)
(17,383) CorMedix Inc Barclays Bank (2,086)
Holding Description Counterparty
Netunrealised
appreciation/(depreciation)
USD
United States continued9,026 Cornerstone Building
Brands IncBank of AmericaMerrill Lynch 10,290
29,033 Cornerstone BuildingBrands Inc Barclays Bank 13,065
15,890 Cornerstone BuildingBrands Inc Goldman Sachs 18,115
2,100 Cornerstone BuildingBrands Inc HSBC 1,281
28,856 Cornerstone BuildingBrands Inc Morgan Stanley 12,985
(9,214) Cornerstone OnDemand Inc Bank of AmericaMerrill Lynch (30,932)
7,653 Cornerstone OnDemand Inc Barclays Bank 16,837(7,249) Cornerstone OnDemand Inc Barclays Bank (15,948)
(31,096) Cornerstone OnDemand Inc Goldman Sachs (108,836)(24,674) Cornerstone OnDemand Inc HSBC (36,271)
4,710 Cornerstone OnDemand Inc Morgan Stanley 10,362(16,392) Cornerstone OnDemand Inc Morgan Stanley (36,062)(13,523) Corning Inc Bank of America
Merrill Lynch (43,138)(12,657) Corning Inc Barclays Bank (18,479)(14,187) Corning Inc Goldman Sachs (45,257)(36,801) Corning Inc HSBC (44,897)(43,808) Corning Inc Morgan Stanley (63,959)
4,241 Corp America Airports SA Goldman Sachs (635)7,451 Corp America Airports SA Morgan Stanley (1,403)
(24,555) Corporate Office PropertiesTrust (REIT) Barclays Bank (30,694)
(8,071) Corporate Office PropertiesTrust (REIT) Goldman Sachs (23,164)
(13,791) Corporate Office PropertiesTrust (REIT) HSBC 14,343
(34,356) Corporate Office PropertiesTrust (REIT) Morgan Stanley (42,945)
7,015 Corteva Inc Bank of AmericaMerrill Lynch 29,533
6,040 Corteva Inc Barclays Bank 14,738(16,758) Corteva Inc Barclays Bank (12,505)13,875 Corteva Inc Goldman Sachs 58,414(2,885) Corteva Inc Goldman Sachs (7,859)
(22,747) Corteva Inc HSBC (22,747)7,569 Corteva Inc Morgan Stanley 18,468
(12,544) Corteva Inc Morgan Stanley (30,607)(5,194) Cortexyme Inc Barclays Bank 57,550(1,232) Cortexyme Inc HSBC 2,526(2,754) CorVel Corp Barclays Bank (25,282)(4,558) CorVel Corp Goldman Sachs (80,494)(3,028) CorVel Corp HSBC (45,541)(4,416) CorVel Corp Morgan Stanley (40,539)
332 Corvus Pharmaceuticals Inc Bank of AmericaMerrill Lynch 10
50,658 Corvus Pharmaceuticals Inc Goldman Sachs 1,52018,449 Cosan Ltd ’A’ Barclays Bank 8,1189,503 Cosan Ltd ’A’ HSBC 8,4586,358 Cosan Ltd ’A’ Morgan Stanley 2,798
(5,235) Costamare Inc Barclays Bank (1,152)(27,525) Costamare Inc Goldman Sachs (13,487)(4,332) Costamare Inc HSBC 347
(72,797) Costamare Inc Morgan Stanley (16,015)(99) CoStar Group Inc Bank of America
Merrill Lynch (242)(489) CoStar Group Inc Barclays Bank 3,663
(1,597) CoStar Group Inc Goldman Sachs (3,897)(1,269) CoStar Group Inc HSBC 7,373(3,723) CoStar Group Inc Morgan Stanley 27,885
586 Costco Wholesale Corp Bank of AmericaMerrill Lynch 1,641
309 Costco Wholesale Corp Barclays Bank 850
BlackRock Americas Diversified Equity Absolute Return Fundcontinued
The notes on pages 691 to 711 form an integral part of these financial statements.
Annual report and audited financial statements [103]
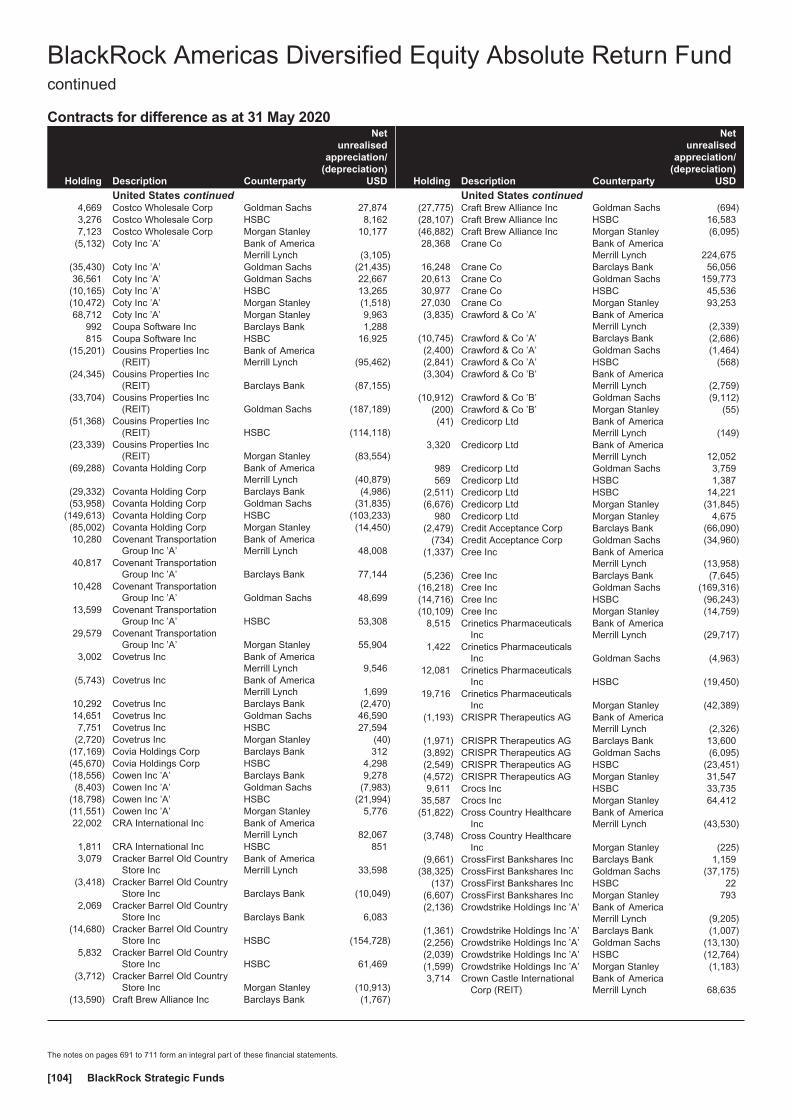
Contracts for difference as at 31 May 2020
Holding Description Counterparty
Netunrealised
appreciation/(depreciation)
USD
United States continued4,669 Costco Wholesale Corp Goldman Sachs 27,8743,276 Costco Wholesale Corp HSBC 8,1627,123 Costco Wholesale Corp Morgan Stanley 10,177
(5,132) Coty Inc ’A’ Bank of AmericaMerrill Lynch (3,105)
(35,430) Coty Inc ’A’ Goldman Sachs (21,435)36,561 Coty Inc ’A’ Goldman Sachs 22,667
(10,165) Coty Inc ’A’ HSBC 13,265(10,472) Coty Inc ’A’ Morgan Stanley (1,518)68,712 Coty Inc ’A’ Morgan Stanley 9,963
992 Coupa Software Inc Barclays Bank 1,288815 Coupa Software Inc HSBC 16,925
(15,201) Cousins Properties Inc(REIT)
Bank of AmericaMerrill Lynch (95,462)
(24,345) Cousins Properties Inc(REIT) Barclays Bank (87,155)
(33,704) Cousins Properties Inc(REIT) Goldman Sachs (187,189)
(51,368) Cousins Properties Inc(REIT) HSBC (114,118)
(23,339) Cousins Properties Inc(REIT) Morgan Stanley (83,554)
(69,288) Covanta Holding Corp Bank of AmericaMerrill Lynch (40,879)
(29,332) Covanta Holding Corp Barclays Bank (4,986)(53,958) Covanta Holding Corp Goldman Sachs (31,835)
(149,613) Covanta Holding Corp HSBC (103,233)(85,002) Covanta Holding Corp Morgan Stanley (14,450)10,280 Covenant Transportation
Group Inc ’A’Bank of AmericaMerrill Lynch 48,008
40,817 Covenant TransportationGroup Inc ’A’ Barclays Bank 77,144
10,428 Covenant TransportationGroup Inc ’A’ Goldman Sachs 48,699
13,599 Covenant TransportationGroup Inc ’A’ HSBC 53,308
29,579 Covenant TransportationGroup Inc ’A’ Morgan Stanley 55,904
3,002 Covetrus Inc Bank of AmericaMerrill Lynch 9,546
(5,743) Covetrus Inc Bank of AmericaMerrill Lynch 1,699
10,292 Covetrus Inc Barclays Bank (2,470)14,651 Covetrus Inc Goldman Sachs 46,5907,751 Covetrus Inc HSBC 27,594
(2,720) Covetrus Inc Morgan Stanley (40)(17,169) Covia Holdings Corp Barclays Bank 312(45,670) Covia Holdings Corp HSBC 4,298(18,556) Cowen Inc ’A’ Barclays Bank 9,278(8,403) Cowen Inc ’A’ Goldman Sachs (7,983)
(18,798) Cowen Inc ’A’ HSBC (21,994)(11,551) Cowen Inc ’A’ Morgan Stanley 5,77622,002 CRA International Inc Bank of America
Merrill Lynch 82,0671,811 CRA International Inc HSBC 8513,079 Cracker Barrel Old Country
Store IncBank of AmericaMerrill Lynch 33,598
(3,418) Cracker Barrel Old CountryStore Inc Barclays Bank (10,049)
2,069 Cracker Barrel Old CountryStore Inc Barclays Bank 6,083
(14,680) Cracker Barrel Old CountryStore Inc HSBC (154,728)
5,832 Cracker Barrel Old CountryStore Inc HSBC 61,469
(3,712) Cracker Barrel Old CountryStore Inc Morgan Stanley (10,913)
(13,590) Craft Brew Alliance Inc Barclays Bank (1,767)
Holding Description Counterparty
Netunrealised
appreciation/(depreciation)
USD
United States continued(27,775) Craft Brew Alliance Inc Goldman Sachs (694)(28,107) Craft Brew Alliance Inc HSBC 16,583(46,882) Craft Brew Alliance Inc Morgan Stanley (6,095)28,368 Crane Co Bank of America
Merrill Lynch 224,67516,248 Crane Co Barclays Bank 56,05620,613 Crane Co Goldman Sachs 159,77330,977 Crane Co HSBC 45,53627,030 Crane Co Morgan Stanley 93,253(3,835) Crawford & Co ’A’ Bank of America
Merrill Lynch (2,339)(10,745) Crawford & Co ’A’ Barclays Bank (2,686)(2,400) Crawford & Co ’A’ Goldman Sachs (1,464)(2,841) Crawford & Co ’A’ HSBC (568)(3,304) Crawford & Co ’B’ Bank of America
Merrill Lynch (2,759)(10,912) Crawford & Co ’B’ Goldman Sachs (9,112)
(200) Crawford & Co ’B’ Morgan Stanley (55)(41) Credicorp Ltd Bank of America
Merrill Lynch (149)3,320 Credicorp Ltd Bank of America
Merrill Lynch 12,052989 Credicorp Ltd Goldman Sachs 3,759569 Credicorp Ltd HSBC 1,387
(2,511) Credicorp Ltd HSBC 14,221(6,676) Credicorp Ltd Morgan Stanley (31,845)
980 Credicorp Ltd Morgan Stanley 4,675(2,479) Credit Acceptance Corp Barclays Bank (66,090)
(734) Credit Acceptance Corp Goldman Sachs (34,960)(1,337) Cree Inc Bank of America
Merrill Lynch (13,958)(5,236) Cree Inc Barclays Bank (7,645)
(16,218) Cree Inc Goldman Sachs (169,316)(14,716) Cree Inc HSBC (96,243)(10,109) Cree Inc Morgan Stanley (14,759)
8,515 Crinetics PharmaceuticalsInc
Bank of AmericaMerrill Lynch (29,717)
1,422 Crinetics PharmaceuticalsInc Goldman Sachs (4,963)
12,081 Crinetics PharmaceuticalsInc HSBC (19,450)
19,716 Crinetics PharmaceuticalsInc Morgan Stanley (42,389)
(1,193) CRISPR Therapeutics AG Bank of AmericaMerrill Lynch (2,326)
(1,971) CRISPR Therapeutics AG Barclays Bank 13,600(3,892) CRISPR Therapeutics AG Goldman Sachs (6,095)(2,549) CRISPR Therapeutics AG HSBC (23,451)(4,572) CRISPR Therapeutics AG Morgan Stanley 31,5479,611 Crocs Inc HSBC 33,735
35,587 Crocs Inc Morgan Stanley 64,412(51,822) Cross Country Healthcare
IncBank of AmericaMerrill Lynch (43,530)
(3,748) Cross Country HealthcareInc Morgan Stanley (225)
(9,661) CrossFirst Bankshares Inc Barclays Bank 1,159(38,325) CrossFirst Bankshares Inc Goldman Sachs (37,175)
(137) CrossFirst Bankshares Inc HSBC 22(6,607) CrossFirst Bankshares Inc Morgan Stanley 793(2,136) Crowdstrike Holdings Inc ’A’ Bank of America
Merrill Lynch (9,205)(1,361) Crowdstrike Holdings Inc ’A’ Barclays Bank (1,007)(2,256) Crowdstrike Holdings Inc ’A’ Goldman Sachs (13,130)(2,039) Crowdstrike Holdings Inc ’A’ HSBC (12,764)(1,599) Crowdstrike Holdings Inc ’A’ Morgan Stanley (1,183)3,714 Crown Castle International
Corp (REIT)Bank of AmericaMerrill Lynch 68,635
BlackRock Americas Diversified Equity Absolute Return Fundcontinued
The notes on pages 691 to 711 form an integral part of these financial statements.
BlackRock Strategic Funds[104]

Contracts for difference as at 31 May 2020
Holding Description Counterparty
Netunrealised
appreciation/(depreciation)
USD
United States continued936 Crown Castle International
Corp (REIT) Barclays Bank 11,625(687) Crown Castle International
Corp (REIT) Goldman Sachs (12,696)728 Crown Castle International
Corp (REIT) Goldman Sachs 13,453(8,618) Crown Castle International
Corp (REIT) HSBC (94,109)2,537 Crown Castle International
Corp (REIT) HSBC 31,990(8,501) Crown Castle International
Corp (REIT) Morgan Stanley (105,582)1,509 Crown Castle International
Corp (REIT) Morgan Stanley 18,742(8,770) Crown Holdings Inc Bank of America
Merrill Lynch (48,323)(10,760) Crown Holdings Inc Barclays Bank (30,236)(15,615) Crown Holdings Inc Goldman Sachs (72,724)(28,580) Crown Holdings Inc HSBC (65,329)(19,535) Crown Holdings Inc Morgan Stanley (54,894)(3,465) CryoLife Inc Bank of America
Merrill Lynch (1,733)(10,088) CryoLife Inc Barclays Bank 2,118(8,393) CryoLife Inc Goldman Sachs (4,197)(5,902) CryoLife Inc HSBC (672)
(16,175) CryoLife Inc Morgan Stanley 3,397(56,606) CryoPort Inc Barclays Bank (83,211)
(589) CryoPort Inc HSBC (2,038)20,981 CSG Systems International
IncBank of AmericaMerrill Lynch 59,376
7,491 CSG Systems InternationalInc Barclays Bank 300
3,070 CSG Systems InternationalInc Goldman Sachs 7,737
30,237 CSG Systems InternationalInc Morgan Stanley 1,209
(2,334) CSW Industrials Inc Bank of AmericaMerrill Lynch (20,867)
(5,952) CSW Industrials Inc Barclays Bank (34,938)(14,049) CSW Industrials Inc Goldman Sachs (128,717)(7,235) CSW Industrials Inc HSBC (39,575)
(10,459) CSW Industrials Inc Morgan Stanley (61,394)(2,604) CSX Corp Bank of America
Merrill Lynch (22,446)(1,971) CSX Corp Barclays Bank 2,396
(12,148) CSX Corp Goldman Sachs (104,716)(19,581) CSX Corp HSBC (88,310)(18,480) CSX Corp Morgan Stanley (38,624)
2,012 CTO Realty Growth Inc Bank of AmericaMerrill Lynch 9,778
1,927 CTO Realty Growth Inc Barclays Bank 5,0297,307 CTO Realty Growth Inc Goldman Sachs 35,5122,667 CTO Realty Growth Inc HSBC (987)5,918 CTO Realty Growth Inc Morgan Stanley 15,446
(46,831) CTS Corp Bank of AmericaMerrill Lynch (118,482)
(17,127) CTS Corp Goldman Sachs (43,331)(1,230) CTS Corp HSBC 1,021
(15,292) CTS Corp Morgan Stanley (7,646)6,557 CubeSmart (REIT) Bank of America
Merrill Lynch 30,293(8,372) CubeSmart (REIT) Bank of America
Merrill Lynch (38,679)15,569 CubeSmart (REIT) Barclays Bank 39,857(3,545) CubeSmart (REIT) Barclays Bank (9,075)6,766 CubeSmart (REIT) Goldman Sachs 31,259
(5,117) CubeSmart (REIT) Goldman Sachs (19,204)4,236 CubeSmart (REIT) HSBC 5,719
Holding Description Counterparty
Netunrealised
appreciation/(depreciation)
USD
United States continued33,089 CubeSmart (REIT) Morgan Stanley 84,708
(21,979) CubeSmart (REIT) Morgan Stanley (56,266)(1,348) Cubic Corp Bank of America
Merrill Lynch (5,778)(6,500) Cubic Corp Barclays Bank (17,875)(4,884) Cubic Corp Goldman Sachs (39,365)(7,543) Cubic Corp HSBC (20,668)
(23,698) Cubic Corp Morgan Stanley (65,170)4,874 Cue Biopharma Inc Bank of America
Merrill Lynch 4,46011,940 Cue Biopharma Inc HSBC (6,715)1,294 Cullen/Frost Bankers Inc Bank of America
Merrill Lynch 7,0281,083 Cullen/Frost Bankers Inc Barclays Bank 6,601
(7,543) Cullen/Frost Bankers Inc Barclays Bank (45,975)4,314 Cullen/Frost Bankers Inc Goldman Sachs 44,887
10,990 Cullen/Frost Bankers Inc HSBC 65,2951,550 Cullen/Frost Bankers Inc Morgan Stanley 7,012
(6,766) Cullen/Frost Bankers Inc Morgan Stanley (41,239)17,241 Culp Inc Barclays Bank 31,72316,792 Culp Inc Goldman Sachs 42,65223,253 Culp Inc HSBC 43,94813,594 Culp Inc Morgan Stanley 25,0139,122 Cumberland
Pharmaceuticals Inc Morgan Stanley (1,961)(1,846) Cummins Inc Bank of America
Merrill Lynch (24,275)(8,364) Cummins Inc Barclays Bank (115,005)(8,462) Cummins Inc Goldman Sachs (111,275)
(13,847) Cummins Inc HSBC (113,843)(17,108) Cummins Inc Morgan Stanley (235,235)(19,730) Cumulus Media Inc ’A’ Bank of America
Merrill Lynch (45,182)(8,562) Cumulus Media Inc ’A’ Barclays Bank (11,816)(8,657) Cumulus Media Inc ’A’ Goldman Sachs (19,825)(4,305) Cumulus Media Inc ’A’ HSBC (6,759)15,930 Curis Inc Bank of America
Merrill Lynch 1,13914,576 Curis Inc Goldman Sachs 1,04219,593 Curis Inc Morgan Stanley 3926,200 Curo Group Holdings Corp Bank of America
Merrill Lynch 4,8364,339 Curo Group Holdings Corp Barclays Bank 1,0413,789 Curo Group Holdings Corp HSBC (682)3,670 Curo Group Holdings Corp Morgan Stanley 8817,841 Curtiss-Wright Corp Bank of America
Merrill Lynch 84,51110,741 Curtiss-Wright Corp Barclays Bank 71,69822,898 Curtiss-Wright Corp Goldman Sachs 332,25011,006 Curtiss-Wright Corp HSBC 29,32114,126 Curtiss-Wright Corp Morgan Stanley 111,878
(10,380) Cushman & Wakefield Plc Goldman Sachs (11,833)(30,006) Cushman & Wakefield Plc HSBC 20,668
(130,019) Cushman & Wakefield Plc Morgan Stanley (109,216)4,137 Customers Bancorp Inc Barclays Bank 2,317
(8,938) Cutera Inc Bank of AmericaMerrill Lynch (12,424)
(4,448) Cutera Inc Barclays Bank (4,359)(1,683) Cutera Inc Goldman Sachs (2,339)(1,533) Cutera Inc HSBC (1,502)
(10,593) Cutera Inc Morgan Stanley (10,381)(35,362) CVB Financial Corp Bank of America
Merrill Lynch (92,825)(54,247) CVB Financial Corp Barclays Bank (73,234)(69,051) CVB Financial Corp Goldman Sachs (173,637)(76,778) CVB Financial Corp HSBC 3,839(27,630) CVB Financial Corp Morgan Stanley (37,301)
BlackRock Americas Diversified Equity Absolute Return Fundcontinued
The notes on pages 691 to 711 form an integral part of these financial statements.
Annual report and audited financial statements [105]

Contracts for difference as at 31 May 2020
Holding Description Counterparty
Netunrealised
appreciation/(depreciation)
USD
United States continued(769) CVR Energy Inc Bank of America
Merrill Lynch (1,853)(5,259) CVR Energy Inc Barclays Bank (263)2,829 CVR Energy Inc Barclays Bank 141
(1,722) CVR Energy Inc Goldman Sachs (4,150)(2,413) CVR Energy Inc HSBC 2,63016,881 CVR Energy Inc HSBC (18,400)17,139 CVR Energy Inc Morgan Stanley 857
693 CVS Health Corp Goldman Sachs 1,8508,081 CVS Health Corp HSBC 22,142
34,001 CVS Health Corp Morgan Stanley 86,0235,289 CyberArk Software Ltd Goldman Sachs (3,816)
(1,451) CyberOptics Corp Bank of AmericaMerrill Lynch (4,222)
(14,350) CyberOptics Corp Goldman Sachs (41,759)(816) CyberOptics Corp HSBC (1,827)
(8,622) CyberOptics Corp Morgan Stanley (5,001)(19,840) Cyclerion Therapeutics Inc Barclays Bank 6,746(21,284) Cyclerion Therapeutics Inc Goldman Sachs (2,128)(14,484) Cyclerion Therapeutics Inc HSBC 3,186(54,123) Cyclerion Therapeutics Inc Morgan Stanley 18,402(48,589) Cymabay Therapeutics Inc Bank of America
Merrill Lynch 10,690(32,688) Cymabay Therapeutics Inc Barclays Bank 981(61,745) Cymabay Therapeutics Inc Goldman Sachs 13,584(4,779) Cymabay Therapeutics Inc HSBC (9,797)
4 CyrusOne Inc (REIT) Bank of AmericaMerrill Lynch 16
6,439 CyrusOne Inc (REIT) Goldman Sachs 25,692551 CyrusOne Inc (REIT) HSBC (105)
6,794 CyrusOne Inc (REIT) Morgan Stanley 1,323(4,080) Cytokinetics Inc Goldman Sachs 5,426(4,010) Cytokinetics Inc HSBC (18,266)
(20,561) Cytokinetics Inc Morgan Stanley 32,8986,173 CytomX Therapeutics Inc Barclays Bank (1,235)
11,936 CytomX Therapeutics Inc HSBC (61,590)16,668 CytomX Therapeutics Inc Morgan Stanley (3,334)
(43,877) CytoSorbents Corp Barclays Bank 29,398(8,756) CytoSorbents Corp Goldman Sachs 4,991(3,901) CytoSorbents Corp Morgan Stanley 2,614
88 Daily Journal Corp Bank of AmericaMerrill Lynch 656
88 Daily Journal Corp Barclays Bank 91360 Daily Journal Corp Goldman Sachs 447
3,263 Daily Journal Corp HSBC 53,024841 Daily Journal Corp Morgan Stanley 8,730
15,876 Daktronics Inc Bank of AmericaMerrill Lynch 8,256
72,448 Daktronics Inc Barclays Bank 2,17344,140 Daktronics Inc Goldman Sachs 22,95371,699 Daktronics Inc HSBC (2,868)55,929 Daktronics Inc Morgan Stanley 1,6782,543 Dana Inc Bank of America
Merrill Lynch 2,574(32,702) Dana Inc Bank of America
Merrill Lynch (97,452)23,652 Dana Inc Barclays Bank 22,942
(16,624) Dana Inc Barclays Bank (16,125)(73,888) Dana Inc Goldman Sachs (220,186)24,062 Dana Inc Goldman Sachs 71,70514,112 Dana Inc HSBC 24,080
(16,903) Dana Inc HSBC (29,749)36,619 Dana Inc Morgan Stanley 35,521
(14,754) Dana Inc Morgan Stanley (14,311)(2,563) Danaher Corp Bank of America
Merrill Lynch (4,229)(3,329) Danaher Corp Barclays Bank (24,102)
(16,344) Danaher Corp HSBC (66,520)4,004 Danaher Corp HSBC 25,348
Holding Description Counterparty
Netunrealised
appreciation/(depreciation)
USD
United States continued(7,089) Danaher Corp Morgan Stanley (51,324)15,036 Danaher Corp Morgan Stanley 108,8614,187 Darden Restaurants Inc Bank of America
Merrill Lynch 7,5512,633 Darden Restaurants Inc Barclays Bank 6,7144,067 Darden Restaurants Inc Goldman Sachs 27,387
(3,895) Darden Restaurants Inc HSBC (13,477)6,428 Darden Restaurants Inc Morgan Stanley 10,183
(2,174) Darden Restaurants Inc Morgan Stanley (5,544)(12,316) Darling Ingredients Inc Bank of America
Merrill Lynch (33,376)(6,247) Darling Ingredients Inc Barclays Bank (6,809)
(34,371) Darling Ingredients Inc Goldman Sachs (81,275)(62,924) Darling Ingredients Inc HSBC (56,632)(92,801) Darling Ingredients Inc Morgan Stanley (97,263)
3,232 DASAN Zhone Solutions Inc HSBC 2,4248,866 DASAN Zhone Solutions Inc Morgan Stanley 16,757
21,989 Daseke Inc Bank of AmericaMerrill Lynch 22,869
33,242 Daseke Inc Goldman Sachs 34,57236,427 Daseke Inc Morgan Stanley 1,093(3,582) Datadog Inc ’A’ Bank of America
Merrill Lynch (7,558)(5,837) Datadog Inc ’A’ Goldman Sachs (12,316)(2,819) Datadog Inc ’A’ Morgan Stanley 10,628(9,640) Dave & Buster’s
Entertainment IncBank of AmericaMerrill Lynch (32,680)
(19,251) Dave & Buster’sEntertainment Inc Barclays Bank (21,272)
(8,641) Dave & Buster’sEntertainment Inc HSBC (29,778)
(1,629) DaVita Inc Bank of AmericaMerrill Lynch (293)
(10,036) DaVita Inc Barclays Bank (26,294)(5,696) DaVita Inc Goldman Sachs (1,025)
(10,415) DaVita Inc HSBC 13,852(14,419) DaVita Inc Morgan Stanley (37,778)127,159 Dawson Geophysical Co Morgan Stanley (8,901)
2,452 Deciphera PharmaceuticalsInc
Bank of AmericaMerrill Lynch 13,143
1,218 Deciphera PharmaceuticalsInc Barclays Bank (2,655)
875 Deciphera PharmaceuticalsInc Goldman Sachs 4,690
5,062 Deciphera PharmaceuticalsInc HSBC 11,845
9,017 Deciphera PharmaceuticalsInc Morgan Stanley (19,657)
(1,728) Deckers Outdoor Corp Bank of AmericaMerrill Lynch (54,812)
(944) Deckers Outdoor Corp Barclays Bank (5,390)(2,367) Deckers Outdoor Corp Goldman Sachs (41,822)(8,299) Deckers Outdoor Corp HSBC (296,855)(8,375) Deckers Outdoor Corp Morgan Stanley (47,821)
(171) Deere & Co Bank of AmericaMerrill Lynch (3,930)
(2,831) Deere & Co Barclays Bank (23,441)(2,553) Deere & Co HSBC (30,610)
(12,374) Deere & Co Morgan Stanley (102,456)58,850 Del Taco Restaurants Inc Bank of America
Merrill Lynch 34,1339,297 Del Taco Restaurants Inc Barclays Bank 1,023
23,535 Del Taco Restaurants Inc Goldman Sachs 13,65037,015 Del Taco Restaurants Inc HSBC 17,76768,939 Del Taco Restaurants Inc Morgan Stanley 7,5835,593 Delek US Energy Inc Bank of America
Merrill Lynch (6,103)4,041 Delek US Energy Inc Barclays Bank (3,154)9,798 Delek US Energy Inc Goldman Sachs (222)
BlackRock Americas Diversified Equity Absolute Return Fundcontinued
The notes on pages 691 to 711 form an integral part of these financial statements.
BlackRock Strategic Funds[106]
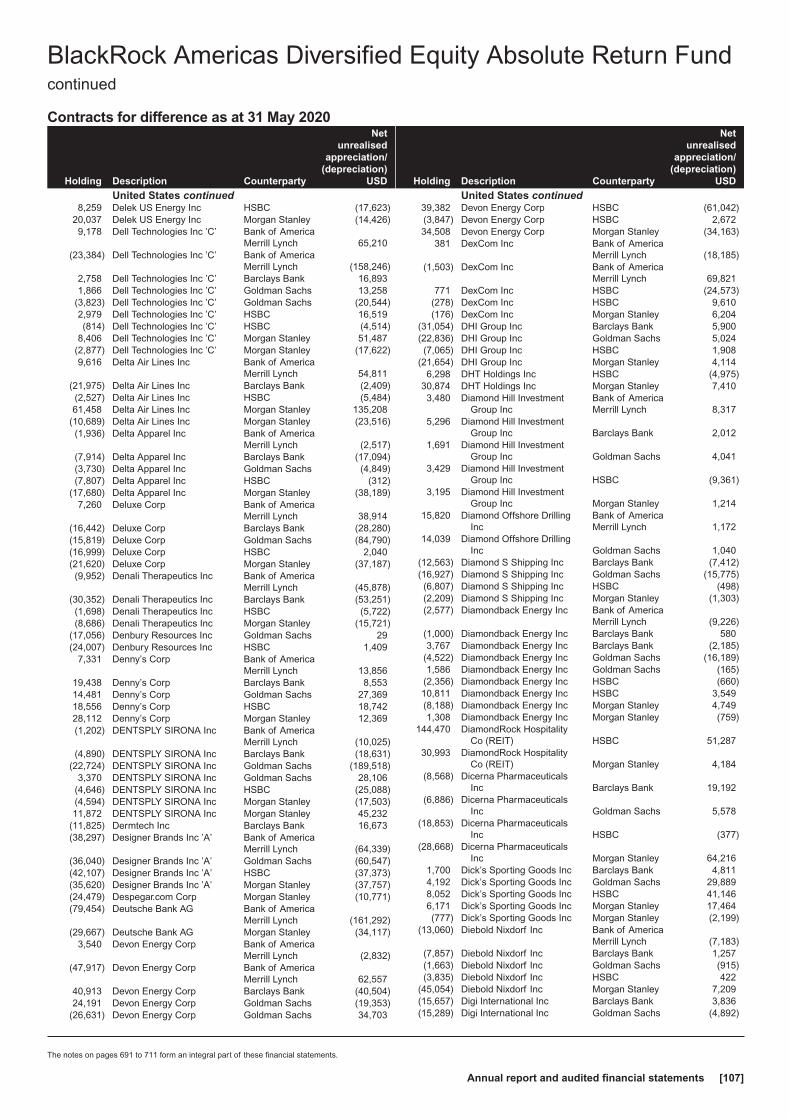
Contracts for difference as at 31 May 2020
Holding Description Counterparty
Netunrealised
appreciation/(depreciation)
USD
United States continued8,259 Delek US Energy Inc HSBC (17,623)
20,037 Delek US Energy Inc Morgan Stanley (14,426)9,178 Dell Technologies Inc ’C’ Bank of America
Merrill Lynch 65,210(23,384) Dell Technologies Inc ’C’ Bank of America
Merrill Lynch (158,246)2,758 Dell Technologies Inc ’C’ Barclays Bank 16,8931,866 Dell Technologies Inc ’C’ Goldman Sachs 13,258
(3,823) Dell Technologies Inc ’C’ Goldman Sachs (20,544)2,979 Dell Technologies Inc ’C’ HSBC 16,519(814) Dell Technologies Inc ’C’ HSBC (4,514)
8,406 Dell Technologies Inc ’C’ Morgan Stanley 51,487(2,877) Dell Technologies Inc ’C’ Morgan Stanley (17,622)9,616 Delta Air Lines Inc Bank of America
Merrill Lynch 54,811(21,975) Delta Air Lines Inc Barclays Bank (2,409)(2,527) Delta Air Lines Inc HSBC (5,484)61,458 Delta Air Lines Inc Morgan Stanley 135,208
(10,689) Delta Air Lines Inc Morgan Stanley (23,516)(1,936) Delta Apparel Inc Bank of America
Merrill Lynch (2,517)(7,914) Delta Apparel Inc Barclays Bank (17,094)(3,730) Delta Apparel Inc Goldman Sachs (4,849)(7,807) Delta Apparel Inc HSBC (312)
(17,680) Delta Apparel Inc Morgan Stanley (38,189)7,260 Deluxe Corp Bank of America
Merrill Lynch 38,914(16,442) Deluxe Corp Barclays Bank (28,280)(15,819) Deluxe Corp Goldman Sachs (84,790)(16,999) Deluxe Corp HSBC 2,040(21,620) Deluxe Corp Morgan Stanley (37,187)(9,952) Denali Therapeutics Inc Bank of America
Merrill Lynch (45,878)(30,352) Denali Therapeutics Inc Barclays Bank (53,251)(1,698) Denali Therapeutics Inc HSBC (5,722)(8,686) Denali Therapeutics Inc Morgan Stanley (15,721)
(17,056) Denbury Resources Inc Goldman Sachs 29(24,007) Denbury Resources Inc HSBC 1,409
7,331 Denny’s Corp Bank of AmericaMerrill Lynch 13,856
19,438 Denny’s Corp Barclays Bank 8,55314,481 Denny’s Corp Goldman Sachs 27,36918,556 Denny’s Corp HSBC 18,74228,112 Denny’s Corp Morgan Stanley 12,369(1,202) DENTSPLY SIRONA Inc Bank of America
Merrill Lynch (10,025)(4,890) DENTSPLY SIRONA Inc Barclays Bank (18,631)
(22,724) DENTSPLY SIRONA Inc Goldman Sachs (189,518)3,370 DENTSPLY SIRONA Inc Goldman Sachs 28,106
(4,646) DENTSPLY SIRONA Inc HSBC (25,088)(4,594) DENTSPLY SIRONA Inc Morgan Stanley (17,503)11,872 DENTSPLY SIRONA Inc Morgan Stanley 45,232
(11,825) Dermtech Inc Barclays Bank 16,673(38,297) Designer Brands Inc ’A’ Bank of America
Merrill Lynch (64,339)(36,040) Designer Brands Inc ’A’ Goldman Sachs (60,547)(42,107) Designer Brands Inc ’A’ HSBC (37,373)(35,620) Designer Brands Inc ’A’ Morgan Stanley (37,757)(24,479) Despegar.com Corp Morgan Stanley (10,771)(79,454) Deutsche Bank AG Bank of America
Merrill Lynch (161,292)(29,667) Deutsche Bank AG Morgan Stanley (34,117)
3,540 Devon Energy Corp Bank of AmericaMerrill Lynch (2,832)
(47,917) Devon Energy Corp Bank of AmericaMerrill Lynch 62,557
40,913 Devon Energy Corp Barclays Bank (40,504)24,191 Devon Energy Corp Goldman Sachs (19,353)
(26,631) Devon Energy Corp Goldman Sachs 34,703
Holding Description Counterparty
Netunrealised
appreciation/(depreciation)
USD
United States continued39,382 Devon Energy Corp HSBC (61,042)(3,847) Devon Energy Corp HSBC 2,67234,508 Devon Energy Corp Morgan Stanley (34,163)
381 DexCom Inc Bank of AmericaMerrill Lynch (18,185)
(1,503) DexCom Inc Bank of AmericaMerrill Lynch 69,821
771 DexCom Inc HSBC (24,573)(278) DexCom Inc HSBC 9,610(176) DexCom Inc Morgan Stanley 6,204
(31,054) DHI Group Inc Barclays Bank 5,900(22,836) DHI Group Inc Goldman Sachs 5,024(7,065) DHI Group Inc HSBC 1,908
(21,654) DHI Group Inc Morgan Stanley 4,1146,298 DHT Holdings Inc HSBC (4,975)
30,874 DHT Holdings Inc Morgan Stanley 7,4103,480 Diamond Hill Investment
Group IncBank of AmericaMerrill Lynch 8,317
5,296 Diamond Hill InvestmentGroup Inc Barclays Bank 2,012
1,691 Diamond Hill InvestmentGroup Inc Goldman Sachs 4,041
3,429 Diamond Hill InvestmentGroup Inc HSBC (9,361)
3,195 Diamond Hill InvestmentGroup Inc Morgan Stanley 1,214
15,820 Diamond Offshore DrillingInc
Bank of AmericaMerrill Lynch 1,172
14,039 Diamond Offshore DrillingInc Goldman Sachs 1,040
(12,563) Diamond S Shipping Inc Barclays Bank (7,412)(16,927) Diamond S Shipping Inc Goldman Sachs (15,775)(6,807) Diamond S Shipping Inc HSBC (498)(2,209) Diamond S Shipping Inc Morgan Stanley (1,303)(2,577) Diamondback Energy Inc Bank of America
Merrill Lynch (9,226)(1,000) Diamondback Energy Inc Barclays Bank 5803,767 Diamondback Energy Inc Barclays Bank (2,185)
(4,522) Diamondback Energy Inc Goldman Sachs (16,189)1,586 Diamondback Energy Inc Goldman Sachs (165)
(2,356) Diamondback Energy Inc HSBC (660)10,811 Diamondback Energy Inc HSBC 3,549(8,188) Diamondback Energy Inc Morgan Stanley 4,7491,308 Diamondback Energy Inc Morgan Stanley (759)
144,470 DiamondRock HospitalityCo (REIT) HSBC 51,287
30,993 DiamondRock HospitalityCo (REIT) Morgan Stanley 4,184
(8,568) Dicerna PharmaceuticalsInc Barclays Bank 19,192
(6,886) Dicerna PharmaceuticalsInc Goldman Sachs 5,578
(18,853) Dicerna PharmaceuticalsInc HSBC (377)
(28,668) Dicerna PharmaceuticalsInc Morgan Stanley 64,216
1,700 Dick’s Sporting Goods Inc Barclays Bank 4,8114,192 Dick’s Sporting Goods Inc Goldman Sachs 29,8898,052 Dick’s Sporting Goods Inc HSBC 41,1466,171 Dick’s Sporting Goods Inc Morgan Stanley 17,464(777) Dick’s Sporting Goods Inc Morgan Stanley (2,199)
(13,060) Diebold Nixdorf Inc Bank of AmericaMerrill Lynch (7,183)
(7,857) Diebold Nixdorf Inc Barclays Bank 1,257(1,663) Diebold Nixdorf Inc Goldman Sachs (915)(3,835) Diebold Nixdorf Inc HSBC 422
(45,054) Diebold Nixdorf Inc Morgan Stanley 7,209(15,657) Digi International Inc Barclays Bank 3,836(15,289) Digi International Inc Goldman Sachs (4,892)
BlackRock Americas Diversified Equity Absolute Return Fundcontinued
The notes on pages 691 to 711 form an integral part of these financial statements.
Annual report and audited financial statements [107]

Contracts for difference as at 31 May 2020
Holding Description Counterparty
Netunrealised
appreciation/(depreciation)
USD
United States continued(2,070) Digi International Inc HSBC 2,774(2,150) Digi International Inc Morgan Stanley 527(4,532) Digimarc Corp Bank of America
Merrill Lynch (6,209)(1,694) Digimarc Corp Barclays Bank (1,372)
(18,802) Digimarc Corp Goldman Sachs (25,759)(5,840) Digimarc Corp HSBC (1,226)(4,059) Digimarc Corp Morgan Stanley (3,288)
409 Digital Realty Trust Inc(REIT) Barclays Bank 3,297
(1,758) Digital Realty Trust Inc(REIT) Barclays Bank (14,169)
782 Digital Realty Trust Inc(REIT) Goldman Sachs 10,244
(294) Digital Realty Trust Inc(REIT) Goldman Sachs (3,851)
(423) Digital Realty Trust Inc(REIT) HSBC 503
1,002 Digital Realty Trust Inc(REIT) Morgan Stanley 8,076
(1,410) Digital Realty Trust Inc(REIT) Morgan Stanley (8,287)
(88,944) Digital Turbine Inc Barclays Bank (21,347)(39,947) Digital Turbine Inc HSBC (23,968)(7,801) Digital Turbine Inc Morgan Stanley (1,872)1,137 Dillard’s Inc ’A’ Bank of America
Merrill Lynch 4,1162,745 Dillard’s Inc ’A’ Barclays Bank 6,2864,165 Dillard’s Inc ’A’ Goldman Sachs 15,0774,354 Dillard’s Inc ’A’ HSBC 5,2681,624 Dillard’s Inc ’A’ Morgan Stanley 3,719
(18,353) Dime CommunityBancshares Inc
Bank of AmericaMerrill Lynch (30,869)
(40,733) Dime CommunityBancshares Inc Barclays Bank (39,918)
(28,260) Dime CommunityBancshares Inc Goldman Sachs (49,172)
(26,484) Dime CommunityBancshares Inc HSBC (2,530)
(27,138) Dime CommunityBancshares Inc Morgan Stanley (26,595)
(3,396) Dine Brands Global Inc Goldman Sachs (33,994)(10,056) Dine Brands Global Inc HSBC (66,738)(7,496) Dine Brands Global Inc Morgan Stanley (20,989)(9,964) Diodes Inc Bank of America
Merrill Lynch (47,374)(17,468) Diodes Inc Barclays Bank (11,703)(22,376) Diodes Inc Goldman Sachs (100,996)(8,902) Diodes Inc HSBC 14,778
(11,512) Diodes Inc Morgan Stanley (7,713)(3,078) Discover Financial Services Bank of America
Merrill Lynch (30,527)5,404 Discover Financial Services Bank of America
Merrill Lynch 51,4749,741 Discover Financial Services Barclays Bank 81,045
(1,170) Discover Financial Services HSBC (7,102)7,308 Discover Financial Services HSBC 45,953
(12,479) Discover Financial Services Morgan Stanley (103,825)7,754 Discovery Inc ’A’ Bank of America
Merrill Lynch 8,68420,168 Discovery Inc ’A’ Barclays Bank 26,11810,574 Discovery Inc ’A’ HSBC 5,34034,022 Discovery Inc ’A’ Morgan Stanley 44,058
(15,132) DISH Network Corp ’A’ Barclays Bank (18,915)19,363 DISH Network Corp ’A’ HSBC 98,364
(17,751) DISH Network Corp ’A’ HSBC (90,175)20,942 DISH Network Corp ’A’ Morgan Stanley 26,178
(24,764) Diversified Healthcare Trust(REIT)
Bank of AmericaMerrill Lynch (28,602)
Holding Description Counterparty
Netunrealised
appreciation/(depreciation)
USD
United States continued(28,486) Diversified Healthcare Trust
(REIT) Barclays Bank (21,934)(40,002) Diversified Healthcare Trust
(REIT) Goldman Sachs (46,202)(21,853) Diversified Healthcare Trust
(REIT) HSBC (8,741)(86,154) Diversified Healthcare Trust
(REIT) Morgan Stanley (66,339)(7,305) DMC Global Inc Bank of America
Merrill Lynch (28,124)(4,151) DMC Global Inc Barclays Bank (4,400)
(16,682) DMC Global Inc Goldman Sachs (64,226)(4,624) DMC Global Inc HSBC (9,618)2,045 DocuSign Inc Bank of America
Merrill Lynch 22,1884,499 DocuSign Inc Goldman Sachs 16,352
282 DocuSign Inc HSBC 3,4437,958 DocuSign Inc Morgan Stanley 31,421
(2,455) Dolby Laboratories Inc ’A’ Bank of AmericaMerrill Lynch (16,669)
(28) Dolby Laboratories Inc ’A’ Barclays Bank (47)(11,819) Dolby Laboratories Inc ’A’ Goldman Sachs (80,251)(20,536) Dolby Laboratories Inc ’A’ HSBC (48,465)(28,033) Dolby Laboratories Inc ’A’ Morgan Stanley (47,095)
1,852 Dollar General Corp Bank of AmericaMerrill Lynch 16,001
6,071 Dollar General Corp Barclays Bank 70,9105,852 Dollar General Corp Goldman Sachs 50,5614,608 Dollar General Corp HSBC 61,3659,186 Dollar General Corp Morgan Stanley 107,292
(23,422) Dollar Tree Inc Bank of AmericaMerrill Lynch (258,281)
(6,077) Dollar Tree Inc Barclays Bank (90,365)(4,242) Dollar Tree Inc Goldman Sachs (91,203)(4,722) Dollar Tree Inc HSBC (87,451)(3,073) Dollar Tree Inc Morgan Stanley (45,696)
(17,036) Dominion Energy Inc Bank of AmericaMerrill Lynch (80,893)
(3,569) Dominion Energy Inc Barclays Bank (9,525)(18,127) Dominion Energy Inc Goldman Sachs (86,390)(19,694) Dominion Energy Inc HSBC (96,501)(55,722) Dominion Energy Inc Morgan Stanley (155,464)
2,213 Domino’s Pizza Inc Bank of AmericaMerrill Lynch (5,124)
2,197 Domino’s Pizza Inc Barclays Bank 2,593(2,345) Domo Inc ’B’ HSBC (8,208)(8,942) Domo Inc ’B’ Morgan Stanley 6,1701,635 Domtar Corp Bank of America
Merrill Lynch 1,3903,197 Domtar Corp Barclays Bank 1,567
45,812 Domtar Corp Morgan Stanley 22,4488,818 Donaldson Co Inc Bank of America
Merrill Lynch 44,53117,216 Donaldson Co Inc Barclays Bank 35,46520,874 Donaldson Co Inc Goldman Sachs 105,41419,966 Donaldson Co Inc HSBC 50,51420,739 Donaldson Co Inc Morgan Stanley 42,723(3,889) Donegal Group Inc ’A’ Bank of America
Merrill Lynch (3,850)(29,920) Donegal Group Inc ’A’ Barclays Bank (898)(5,997) Donegal Group Inc ’A’ Goldman Sachs (5,937)(8,184) Donegal Group Inc ’A’ HSBC (3,818)(6,775) Donegal Group Inc ’A’ Morgan Stanley (203)2,939 Donnelley Financial
Solutions IncBank of AmericaMerrill Lynch 3,968
31,032 Donnelley FinancialSolutions Inc Barclays Bank 24,826
14,835 Donnelley FinancialSolutions Inc Goldman Sachs 20,027
BlackRock Americas Diversified Equity Absolute Return Fundcontinued
The notes on pages 691 to 711 form an integral part of these financial statements.
BlackRock Strategic Funds[108]
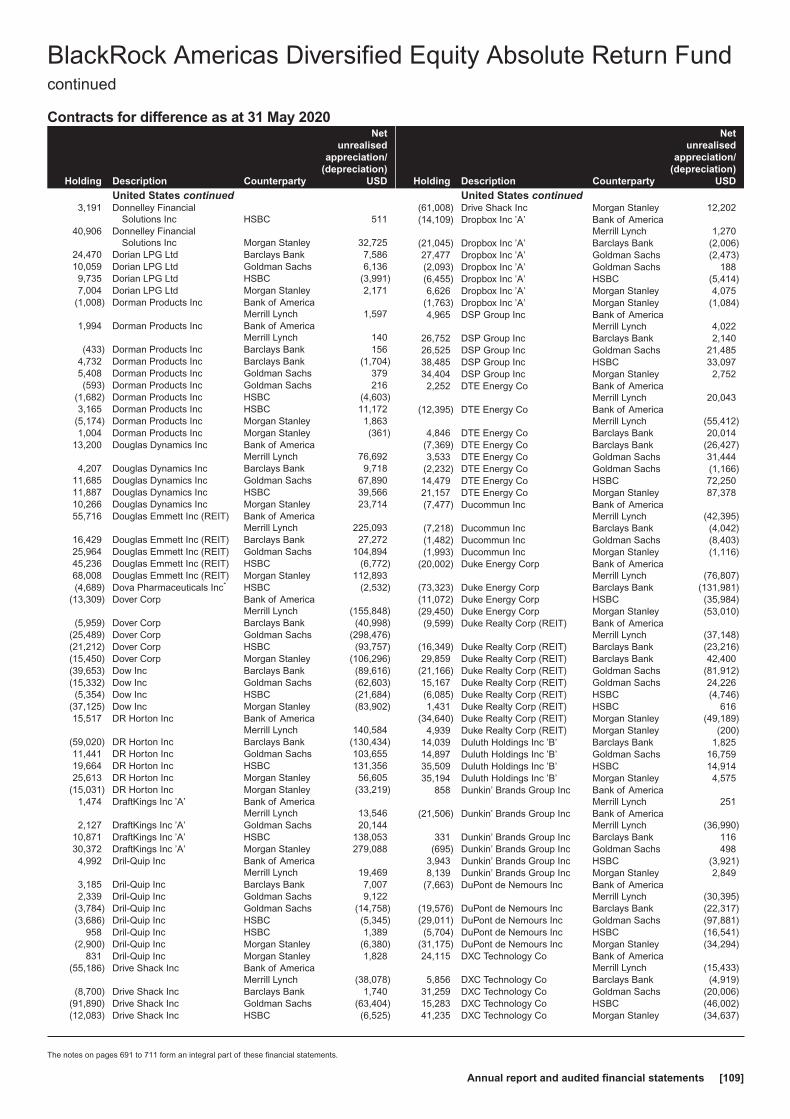
Contracts for difference as at 31 May 2020
Holding Description Counterparty
Netunrealised
appreciation/(depreciation)
USD
United States continued3,191 Donnelley Financial
Solutions Inc HSBC 51140,906 Donnelley Financial
Solutions Inc Morgan Stanley 32,72524,470 Dorian LPG Ltd Barclays Bank 7,58610,059 Dorian LPG Ltd Goldman Sachs 6,1369,735 Dorian LPG Ltd HSBC (3,991)7,004 Dorian LPG Ltd Morgan Stanley 2,171
(1,008) Dorman Products Inc Bank of AmericaMerrill Lynch 1,597
1,994 Dorman Products Inc Bank of AmericaMerrill Lynch 140
(433) Dorman Products Inc Barclays Bank 1564,732 Dorman Products Inc Barclays Bank (1,704)5,408 Dorman Products Inc Goldman Sachs 379(593) Dorman Products Inc Goldman Sachs 216
(1,682) Dorman Products Inc HSBC (4,603)3,165 Dorman Products Inc HSBC 11,172
(5,174) Dorman Products Inc Morgan Stanley 1,8631,004 Dorman Products Inc Morgan Stanley (361)
13,200 Douglas Dynamics Inc Bank of AmericaMerrill Lynch 76,692
4,207 Douglas Dynamics Inc Barclays Bank 9,71811,685 Douglas Dynamics Inc Goldman Sachs 67,89011,887 Douglas Dynamics Inc HSBC 39,56610,266 Douglas Dynamics Inc Morgan Stanley 23,71455,716 Douglas Emmett Inc (REIT) Bank of America
Merrill Lynch 225,09316,429 Douglas Emmett Inc (REIT) Barclays Bank 27,27225,964 Douglas Emmett Inc (REIT) Goldman Sachs 104,89445,236 Douglas Emmett Inc (REIT) HSBC (6,772)68,008 Douglas Emmett Inc (REIT) Morgan Stanley 112,893(4,689) Dova Pharmaceuticals Inc* HSBC (2,532)
(13,309) Dover Corp Bank of AmericaMerrill Lynch (155,848)
(5,959) Dover Corp Barclays Bank (40,998)(25,489) Dover Corp Goldman Sachs (298,476)(21,212) Dover Corp HSBC (93,757)(15,450) Dover Corp Morgan Stanley (106,296)(39,653) Dow Inc Barclays Bank (89,616)(15,332) Dow Inc Goldman Sachs (62,603)(5,354) Dow Inc HSBC (21,684)
(37,125) Dow Inc Morgan Stanley (83,902)15,517 DR Horton Inc Bank of America
Merrill Lynch 140,584(59,020) DR Horton Inc Barclays Bank (130,434)11,441 DR Horton Inc Goldman Sachs 103,65519,664 DR Horton Inc HSBC 131,35625,613 DR Horton Inc Morgan Stanley 56,605
(15,031) DR Horton Inc Morgan Stanley (33,219)1,474 DraftKings Inc ’A’ Bank of America
Merrill Lynch 13,5462,127 DraftKings Inc ’A’ Goldman Sachs 20,144
10,871 DraftKings Inc ’A’ HSBC 138,05330,372 DraftKings Inc ’A’ Morgan Stanley 279,0884,992 Dril-Quip Inc Bank of America
Merrill Lynch 19,4693,185 Dril-Quip Inc Barclays Bank 7,0072,339 Dril-Quip Inc Goldman Sachs 9,122
(3,784) Dril-Quip Inc Goldman Sachs (14,758)(3,686) Dril-Quip Inc HSBC (5,345)
958 Dril-Quip Inc HSBC 1,389(2,900) Dril-Quip Inc Morgan Stanley (6,380)
831 Dril-Quip Inc Morgan Stanley 1,828(55,186) Drive Shack Inc Bank of America
Merrill Lynch (38,078)(8,700) Drive Shack Inc Barclays Bank 1,740
(91,890) Drive Shack Inc Goldman Sachs (63,404)(12,083) Drive Shack Inc HSBC (6,525)
Holding Description Counterparty
Netunrealised
appreciation/(depreciation)
USD
United States continued(61,008) Drive Shack Inc Morgan Stanley 12,202(14,109) Dropbox Inc ’A’ Bank of America
Merrill Lynch 1,270(21,045) Dropbox Inc ’A’ Barclays Bank (2,006)27,477 Dropbox Inc ’A’ Goldman Sachs (2,473)(2,093) Dropbox Inc ’A’ Goldman Sachs 188(6,455) Dropbox Inc ’A’ HSBC (5,414)6,626 Dropbox Inc ’A’ Morgan Stanley 4,075
(1,763) Dropbox Inc ’A’ Morgan Stanley (1,084)4,965 DSP Group Inc Bank of America
Merrill Lynch 4,02226,752 DSP Group Inc Barclays Bank 2,14026,525 DSP Group Inc Goldman Sachs 21,48538,485 DSP Group Inc HSBC 33,09734,404 DSP Group Inc Morgan Stanley 2,7522,252 DTE Energy Co Bank of America
Merrill Lynch 20,043(12,395) DTE Energy Co Bank of America
Merrill Lynch (55,412)4,846 DTE Energy Co Barclays Bank 20,014
(7,369) DTE Energy Co Barclays Bank (26,427)3,533 DTE Energy Co Goldman Sachs 31,444
(2,232) DTE Energy Co Goldman Sachs (1,166)14,479 DTE Energy Co HSBC 72,25021,157 DTE Energy Co Morgan Stanley 87,378(7,477) Ducommun Inc Bank of America
Merrill Lynch (42,395)(7,218) Ducommun Inc Barclays Bank (4,042)(1,482) Ducommun Inc Goldman Sachs (8,403)(1,993) Ducommun Inc Morgan Stanley (1,116)
(20,002) Duke Energy Corp Bank of AmericaMerrill Lynch (76,807)
(73,323) Duke Energy Corp Barclays Bank (131,981)(11,072) Duke Energy Corp HSBC (35,984)(29,450) Duke Energy Corp Morgan Stanley (53,010)(9,599) Duke Realty Corp (REIT) Bank of America
Merrill Lynch (37,148)(16,349) Duke Realty Corp (REIT) Barclays Bank (23,216)29,859 Duke Realty Corp (REIT) Barclays Bank 42,400
(21,166) Duke Realty Corp (REIT) Goldman Sachs (81,912)15,167 Duke Realty Corp (REIT) Goldman Sachs 24,226(6,085) Duke Realty Corp (REIT) HSBC (4,746)1,431 Duke Realty Corp (REIT) HSBC 616
(34,640) Duke Realty Corp (REIT) Morgan Stanley (49,189)4,939 Duke Realty Corp (REIT) Morgan Stanley (200)
14,039 Duluth Holdings Inc ’B’ Barclays Bank 1,82514,897 Duluth Holdings Inc ’B’ Goldman Sachs 16,75935,509 Duluth Holdings Inc ’B’ HSBC 14,91435,194 Duluth Holdings Inc ’B’ Morgan Stanley 4,575
858 Dunkin’ Brands Group Inc Bank of AmericaMerrill Lynch 251
(21,506) Dunkin’ Brands Group Inc Bank of AmericaMerrill Lynch (36,990)
331 Dunkin’ Brands Group Inc Barclays Bank 116(695) Dunkin’ Brands Group Inc Goldman Sachs 498
3,943 Dunkin’ Brands Group Inc HSBC (3,921)8,139 Dunkin’ Brands Group Inc Morgan Stanley 2,849
(7,663) DuPont de Nemours Inc Bank of AmericaMerrill Lynch (30,395)
(19,576) DuPont de Nemours Inc Barclays Bank (22,317)(29,011) DuPont de Nemours Inc Goldman Sachs (97,881)(5,704) DuPont de Nemours Inc HSBC (16,541)
(31,175) DuPont de Nemours Inc Morgan Stanley (34,294)24,115 DXC Technology Co Bank of America
Merrill Lynch (15,433)5,856 DXC Technology Co Barclays Bank (4,919)
31,259 DXC Technology Co Goldman Sachs (20,006)15,283 DXC Technology Co HSBC (46,002)41,235 DXC Technology Co Morgan Stanley (34,637)
BlackRock Americas Diversified Equity Absolute Return Fundcontinued
The notes on pages 691 to 711 form an integral part of these financial statements.
Annual report and audited financial statements [109]
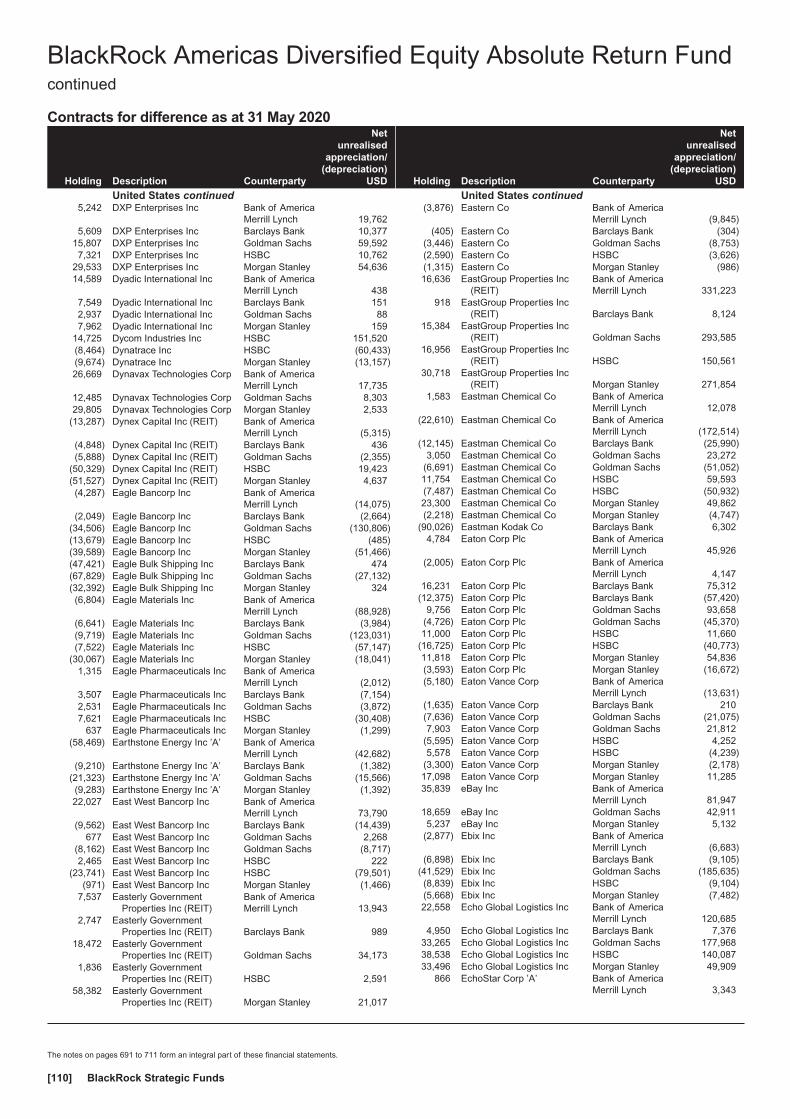
Contracts for difference as at 31 May 2020
Holding Description Counterparty
Netunrealised
appreciation/(depreciation)
USD
United States continued5,242 DXP Enterprises Inc Bank of America
Merrill Lynch 19,7625,609 DXP Enterprises Inc Barclays Bank 10,377
15,807 DXP Enterprises Inc Goldman Sachs 59,5927,321 DXP Enterprises Inc HSBC 10,762
29,533 DXP Enterprises Inc Morgan Stanley 54,63614,589 Dyadic International Inc Bank of America
Merrill Lynch 4387,549 Dyadic International Inc Barclays Bank 1512,937 Dyadic International Inc Goldman Sachs 887,962 Dyadic International Inc Morgan Stanley 159
14,725 Dycom Industries Inc HSBC 151,520(8,464) Dynatrace Inc HSBC (60,433)(9,674) Dynatrace Inc Morgan Stanley (13,157)26,669 Dynavax Technologies Corp Bank of America
Merrill Lynch 17,73512,485 Dynavax Technologies Corp Goldman Sachs 8,30329,805 Dynavax Technologies Corp Morgan Stanley 2,533
(13,287) Dynex Capital Inc (REIT) Bank of AmericaMerrill Lynch (5,315)
(4,848) Dynex Capital Inc (REIT) Barclays Bank 436(5,888) Dynex Capital Inc (REIT) Goldman Sachs (2,355)
(50,329) Dynex Capital Inc (REIT) HSBC 19,423(51,527) Dynex Capital Inc (REIT) Morgan Stanley 4,637(4,287) Eagle Bancorp Inc Bank of America
Merrill Lynch (14,075)(2,049) Eagle Bancorp Inc Barclays Bank (2,664)
(34,506) Eagle Bancorp Inc Goldman Sachs (130,806)(13,679) Eagle Bancorp Inc HSBC (485)(39,589) Eagle Bancorp Inc Morgan Stanley (51,466)(47,421) Eagle Bulk Shipping Inc Barclays Bank 474(67,829) Eagle Bulk Shipping Inc Goldman Sachs (27,132)(32,392) Eagle Bulk Shipping Inc Morgan Stanley 324(6,804) Eagle Materials Inc Bank of America
Merrill Lynch (88,928)(6,641) Eagle Materials Inc Barclays Bank (3,984)(9,719) Eagle Materials Inc Goldman Sachs (123,031)(7,522) Eagle Materials Inc HSBC (57,147)
(30,067) Eagle Materials Inc Morgan Stanley (18,041)1,315 Eagle Pharmaceuticals Inc Bank of America
Merrill Lynch (2,012)3,507 Eagle Pharmaceuticals Inc Barclays Bank (7,154)2,531 Eagle Pharmaceuticals Inc Goldman Sachs (3,872)7,621 Eagle Pharmaceuticals Inc HSBC (30,408)
637 Eagle Pharmaceuticals Inc Morgan Stanley (1,299)(58,469) Earthstone Energy Inc ’A’ Bank of America
Merrill Lynch (42,682)(9,210) Earthstone Energy Inc ’A’ Barclays Bank (1,382)
(21,323) Earthstone Energy Inc ’A’ Goldman Sachs (15,566)(9,283) Earthstone Energy Inc ’A’ Morgan Stanley (1,392)22,027 East West Bancorp Inc Bank of America
Merrill Lynch 73,790(9,562) East West Bancorp Inc Barclays Bank (14,439)
677 East West Bancorp Inc Goldman Sachs 2,268(8,162) East West Bancorp Inc Goldman Sachs (8,717)2,465 East West Bancorp Inc HSBC 222
(23,741) East West Bancorp Inc HSBC (79,501)(971) East West Bancorp Inc Morgan Stanley (1,466)
7,537 Easterly GovernmentProperties Inc (REIT)
Bank of AmericaMerrill Lynch 13,943
2,747 Easterly GovernmentProperties Inc (REIT) Barclays Bank 989
18,472 Easterly GovernmentProperties Inc (REIT) Goldman Sachs 34,173
1,836 Easterly GovernmentProperties Inc (REIT) HSBC 2,591
58,382 Easterly GovernmentProperties Inc (REIT) Morgan Stanley 21,017
Holding Description Counterparty
Netunrealised
appreciation/(depreciation)
USD
United States continued(3,876) Eastern Co Bank of America
Merrill Lynch (9,845)(405) Eastern Co Barclays Bank (304)
(3,446) Eastern Co Goldman Sachs (8,753)(2,590) Eastern Co HSBC (3,626)(1,315) Eastern Co Morgan Stanley (986)16,636 EastGroup Properties Inc
(REIT)Bank of AmericaMerrill Lynch 331,223
918 EastGroup Properties Inc(REIT) Barclays Bank 8,124
15,384 EastGroup Properties Inc(REIT) Goldman Sachs 293,585
16,956 EastGroup Properties Inc(REIT) HSBC 150,561
30,718 EastGroup Properties Inc(REIT) Morgan Stanley 271,854
1,583 Eastman Chemical Co Bank of AmericaMerrill Lynch 12,078
(22,610) Eastman Chemical Co Bank of AmericaMerrill Lynch (172,514)
(12,145) Eastman Chemical Co Barclays Bank (25,990)3,050 Eastman Chemical Co Goldman Sachs 23,272
(6,691) Eastman Chemical Co Goldman Sachs (51,052)11,754 Eastman Chemical Co HSBC 59,593(7,487) Eastman Chemical Co HSBC (50,932)23,300 Eastman Chemical Co Morgan Stanley 49,862(2,218) Eastman Chemical Co Morgan Stanley (4,747)
(90,026) Eastman Kodak Co Barclays Bank 6,3024,784 Eaton Corp Plc Bank of America
Merrill Lynch 45,926(2,005) Eaton Corp Plc Bank of America
Merrill Lynch 4,14716,231 Eaton Corp Plc Barclays Bank 75,312
(12,375) Eaton Corp Plc Barclays Bank (57,420)9,756 Eaton Corp Plc Goldman Sachs 93,658
(4,726) Eaton Corp Plc Goldman Sachs (45,370)11,000 Eaton Corp Plc HSBC 11,660
(16,725) Eaton Corp Plc HSBC (40,773)11,818 Eaton Corp Plc Morgan Stanley 54,836(3,593) Eaton Corp Plc Morgan Stanley (16,672)(5,180) Eaton Vance Corp Bank of America
Merrill Lynch (13,631)(1,635) Eaton Vance Corp Barclays Bank 210(7,636) Eaton Vance Corp Goldman Sachs (21,075)7,903 Eaton Vance Corp Goldman Sachs 21,812
(5,595) Eaton Vance Corp HSBC 4,2525,578 Eaton Vance Corp HSBC (4,239)
(3,300) Eaton Vance Corp Morgan Stanley (2,178)17,098 Eaton Vance Corp Morgan Stanley 11,28535,839 eBay Inc Bank of America
Merrill Lynch 81,94718,659 eBay Inc Goldman Sachs 42,9115,237 eBay Inc Morgan Stanley 5,132
(2,877) Ebix Inc Bank of AmericaMerrill Lynch (6,683)
(6,898) Ebix Inc Barclays Bank (9,105)(41,529) Ebix Inc Goldman Sachs (185,635)(8,839) Ebix Inc HSBC (9,104)(5,668) Ebix Inc Morgan Stanley (7,482)22,558 Echo Global Logistics Inc Bank of America
Merrill Lynch 120,6854,950 Echo Global Logistics Inc Barclays Bank 7,376
33,265 Echo Global Logistics Inc Goldman Sachs 177,96838,538 Echo Global Logistics Inc HSBC 140,08733,496 Echo Global Logistics Inc Morgan Stanley 49,909
866 EchoStar Corp ’A’ Bank of AmericaMerrill Lynch 3,343
BlackRock Americas Diversified Equity Absolute Return Fundcontinued
The notes on pages 691 to 711 form an integral part of these financial statements.
BlackRock Strategic Funds[110]

Contracts for difference as at 31 May 2020
Holding Description Counterparty
Netunrealised
appreciation/(depreciation)
USD
United States continued(6,826) EchoStar Corp ’A’ Bank of America
Merrill Lynch (26,348)(10,071) EchoStar Corp ’A’ Barclays Bank (11,078)10,185 EchoStar Corp ’A’ Goldman Sachs 39,314
(13,108) EchoStar Corp ’A’ Goldman Sachs (50,597)10,749 EchoStar Corp ’A’ HSBC 2,580(5,594) EchoStar Corp ’A’ HSBC (13,087)10,728 EchoStar Corp ’A’ Morgan Stanley 11,801(5,059) EchoStar Corp ’A’ Morgan Stanley (5,565)6,534 Ecolab Inc Bank of America
Merrill Lynch 91,28012,621 Ecolab Inc Barclays Bank 61,3917,562 Ecolab Inc Goldman Sachs 91,4176,870 Ecolab Inc HSBC 77,3396,323 Ecolab Inc Morgan Stanley 51,975
(7,781) Edgewell Personal Care Co Bank of AmericaMerrill Lynch (32,758)
(1,753) Edgewell Personal Care Co Barclays Bank (2,542)(4,293) Edgewell Personal Care Co Goldman Sachs (18,074)
(10,231) Edgewell Personal Care Co HSBC (11,254)(14,133) Edgewell Personal Care Co Morgan Stanley (20,493)(13,999) Edison International Bank of America
Merrill Lynch (25,618)(15,577) Edison International Goldman Sachs (28,506)(4,017) Edison International HSBC (2,932)(4,638) Edison International Morgan Stanley (6,261)2,096 Editas Medicine Inc Bank of America
Merrill Lynch 2,138(3,221) Editas Medicine Inc Barclays Bank 90711,524 Editas Medicine Inc Barclays Bank (32,267)20,668 Editas Medicine Inc Goldman Sachs 21,081(6,927) Editas Medicine Inc Goldman Sachs 2,5014,358 Editas Medicine Inc HSBC 11,287
11,911 Editas Medicine Inc Morgan Stanley (33,351)4,301 Edwards Lifesciences Corp Bank of America
Merrill Lynch 44,3433,644 Edwards Lifesciences Corp Barclays Bank 16,2522,729 Edwards Lifesciences Corp Goldman Sachs 25,461
10,906 Edwards Lifesciences Corp Morgan Stanley 47,272(20,121) eGain Corp Barclays Bank (1,408)(9,579) eGain Corp Goldman Sachs (2,682)
(15,984) eGain Corp HSBC 6,553(8,389) eGain Corp Morgan Stanley (587)
(870) eHealth Inc Bank of AmericaMerrill Lynch (7,486)
(1,730) eHealth Inc Barclays Bank 5,861(470) eHealth Inc Goldman Sachs (1,158)(416) eHealth Inc HSBC (5,183)
(6,841) eHealth Inc Morgan Stanley 34,3421,299 Eidos Therapeutics Inc Bank of America
Merrill Lynch 10,1586,280 Eidos Therapeutics Inc Barclays Bank 17,7103,490 Eidos Therapeutics Inc Goldman Sachs 27,2921,852 Eidos Therapeutics Inc HSBC 8,9642,287 Eidos Therapeutics Inc Morgan Stanley 6,449
20,341 Eiger BioPharmaceuticalsInc
Bank of AmericaMerrill Lynch 3,458
19,766 Eiger BioPharmaceuticalsInc Goldman Sachs 3,360
4,976 Eiger BioPharmaceuticalsInc HSBC 8,608
(2,411) El Paso Electric Co Goldman Sachs 4102,411 El Paso Electric Co Morgan Stanley (96)
(25,718) El Pollo Loco Holdings Inc Bank of AmericaMerrill Lynch (16,717)
(9,114) El Pollo Loco Holdings Inc Barclays Bank (1,003)(29,596) El Pollo Loco Holdings Inc Goldman Sachs (19,525)(24,777) El Pollo Loco Holdings Inc HSBC 4,708
Holding Description Counterparty
Netunrealised
appreciation/(depreciation)
USD
United States continued(35,492) El Pollo Loco Holdings Inc Morgan Stanley (3,904)
98 Elah Holdings Inc Bank of AmericaMerrill Lynch 343
87 Elah Holdings Inc Morgan Stanley 60811,902 Elanco Animal Health Inc Bank of America
Merrill Lynch 23,690(247) Elanco Animal Health Inc Barclays Bank (548)
35,429 Elanco Animal Health Inc Barclays Bank 78,652(24,634) Elanco Animal Health Inc HSBC (32,517)11,709 Elanco Animal Health Inc HSBC 15,456(5,359) Elanco Animal Health Inc Morgan Stanley (11,897)(3,638) Elastic NV Bank of America
Merrill Lynch (43,656)(6,706) Elastic NV Barclays Bank 5,499
(12,102) Elastic NV Goldman Sachs (134,209)(6,155) Elastic NV Morgan Stanley 5,0471,568 Eldorado Resorts Inc Bank of America
Merrill Lynch (2,408)19,850 Eldorado Resorts Inc Barclays Bank 11,3155,947 Eldorado Resorts Inc Goldman Sachs 64,8222,194 Electronic Arts Inc Bank of America
Merrill Lynch 6,275(1,257) Electronic Arts Inc Barclays Bank (1,471)
(648) Electronic Arts Inc Goldman Sachs (1,853)3,282 Electronic Arts Inc HSBC 14,342
(1,337) Electronic Arts Inc HSBC (5,843)7,947 Electronic Arts Inc Morgan Stanley 9,298
(10,493) Electronic Arts Inc Morgan Stanley (12,277)(7,942) Element Solutions Inc Bank of America
Merrill Lynch (9,530)(16,267) Element Solutions Inc Barclays Bank (1,301)(59,753) Element Solutions Inc Goldman Sachs (49,848)(32,354) Element Solutions Inc HSBC (20,707)
(131,130) Element Solutions Inc Morgan Stanley (10,490)39,876 Elevate Credit Inc Goldman Sachs 2,39350,314 Elevate Credit Inc HSBC (25,660)44,912 Elevate Credit Inc Morgan Stanley (1,347)3,795 elf Beauty Inc Bank of America
Merrill Lynch 10,7407,313 elf Beauty Inc Barclays Bank (1,828)
26,468 elf Beauty Inc HSBC 82,84525,446 elf Beauty Inc Morgan Stanley (6,362)
(11,888) Eli Lilly and Co Bank of AmericaMerrill Lynch 85,593
(2,945) Eli Lilly and Co Barclays Bank (2,853)(909) Eli Lilly and Co Goldman Sachs 6,545
(17,562) Eli Lilly and Co HSBC 30,515(10,908) Eli Lilly and Co Morgan Stanley (9,490)(26,322) Ellington Residential
Mortgage REIT (REIT)Bank of AmericaMerrill Lynch (12,898)
(27,062) Ellington ResidentialMortgage REIT (REIT) Morgan Stanley (2,165)
(6,350) Eloxx Pharmaceuticals Inc Barclays Bank 127(12,181) Eloxx Pharmaceuticals Inc Goldman Sachs (11,450)(6,669) Eloxx Pharmaceuticals Inc Morgan Stanley 13316,998 Embraer SA ADR Goldman Sachs 11,38916,787 Embraer SA ADR HSBC (5,036)17,401 Embraer SA ADR Morgan Stanley 6,26439,177 EMCOR Group Inc Bank of America
Merrill Lynch 281,88533,941 EMCOR Group Inc Barclays Bank 74,33129,930 EMCOR Group Inc Goldman Sachs 207,33830,147 EMCOR Group Inc HSBC 57,9879,079 EMCOR Group Inc Morgan Stanley 13,689
113,617 Emerald Holding Inc Bank of AmericaMerrill Lynch 82,940
24,804 Emerald Holding Inc Barclays Bank 6,20118,445 Emerald Holding Inc Goldman Sachs 13,465
BlackRock Americas Diversified Equity Absolute Return Fundcontinued
The notes on pages 691 to 711 form an integral part of these financial statements.
Annual report and audited financial statements [111]

Contracts for difference as at 31 May 2020
Holding Description Counterparty
Netunrealised
appreciation/(depreciation)
USD
United States continued11,899 Emerald Holding Inc Morgan Stanley 2,975
(686) Emergent BioSolutions Inc Bank of AmericaMerrill Lynch 329
1,178 Emergent BioSolutions Inc Bank of AmericaMerrill Lynch (565)
3,888 Emergent BioSolutions Inc Barclays Bank (5,700)(2,321) Emergent BioSolutions Inc Goldman Sachs 1,1143,673 Emergent BioSolutions Inc Goldman Sachs (1,763)
(1,343) Emergent BioSolutions Inc HSBC (2,874)3,790 Emergent BioSolutions Inc HSBC 6,618
(1,865) Emergent BioSolutions Inc Morgan Stanley 3,2083,522 Emergent BioSolutions Inc Morgan Stanley (6,058)
(11,866) Emerson Electric Co Bank of AmericaMerrill Lynch (82,824)
(9,581) Emerson Electric Co Barclays Bank (38,803)(13,747) Emerson Electric Co Goldman Sachs (95,954)(25,803) Emerson Electric Co HSBC (112,198)(70,460) Emerson Electric Co Morgan Stanley (285,363)
(102,669) Empire State Realty TrustInc ’A’ (REIT)
Bank of AmericaMerrill Lynch (14,374)
38,957 Empire State Realty TrustInc ’A’ (REIT)
Bank of AmericaMerrill Lynch 5,454
28,125 Empire State Realty TrustInc ’A’ (REIT) Goldman Sachs 3,938
40,276 Empire State Realty TrustInc ’A’ (REIT) HSBC (52,762)
(78,022) Empire State Realty TrustInc ’A’ (REIT) Morgan Stanley 1,560
60,985 Empire State Realty TrustInc ’A’ (REIT) Morgan Stanley (1,220)
6,241 Employers Holdings Inc Bank of AmericaMerrill Lynch 16,976
10,070 Employers Holdings Inc Goldman Sachs 27,3905,789 Employers Holdings Inc Morgan Stanley (521)
108 Enanta Pharmaceuticals Inc Bank of AmericaMerrill Lynch (631)
674 Enanta Pharmaceuticals Inc Barclays Bank (3,532)6,013 Enanta Pharmaceuticals Inc Goldman Sachs (30,907)
16,700 Enanta Pharmaceuticals Inc HSBC (23,714)11,303 Enanta Pharmaceuticals Inc Morgan Stanley (56,305)(2,382) Enbridge Inc Bank of America
Merrill Lynch (2,037)(7,770) Encompass Health Corp Bank of America
Merrill Lynch (42,325)(6,998) Encompass Health Corp Barclays Bank 4,827(8,423) Encompass Health Corp Goldman Sachs (34,718)
(17,044) Encompass Health Corp HSBC (87,435)(16,669) Encompass Health Corp Morgan Stanley 1,000
5,380 Encore Capital Group Inc Goldman Sachs 6,2411,029 Encore Capital Group Inc HSBC 56
764 Encore Capital Group Inc Morgan Stanley 18314,973 Encore Wire Corp Barclays Bank 33,6899,098 Encore Wire Corp Goldman Sachs 40,395
17,683 Encore Wire Corp HSBC 24,4037,864 Encore Wire Corp Morgan Stanley 17,694
(16,458) Endo International Plc Barclays Bank (987)(40,204) Endo International Plc Goldman Sachs (4,422)(26,039) Endo International Plc HSBC 4,29613,111 Endurance International
Group Holdings IncBank of AmericaMerrill Lynch 12,193
39,168 Endurance InternationalGroup Holdings Inc Barclays Bank 12,142
80,380 Endurance InternationalGroup Holdings Inc HSBC 72,342
16,865 Endurance InternationalGroup Holdings Inc Morgan Stanley 5,228
(2,383) Energizer Holdings Inc Bank of AmericaMerrill Lynch (5,195)
(4,192) Energizer Holdings Inc Barclays Bank 2,180
Holding Description Counterparty
Netunrealised
appreciation/(depreciation)
USD
United States continued(2,194) Energizer Holdings Inc Goldman Sachs (4,783)
(27,407) Energizer Holdings Inc HSBC (75,917)(7,356) Energizer Holdings Inc Morgan Stanley 3,8258,989 Energous Corp Barclays Bank 90
59,804 Energous Corp Morgan Stanley 59832,196 Energy Fuels Inc Barclays Bank 32238,556 Energy Fuels Inc Goldman Sachs 77117,257 Energy Fuels Inc HSBC (2,071)64,312 Energy Fuels Inc Morgan Stanley 643
(61,022) Energy Recovery Inc Bank of AmericaMerrill Lynch (26,850)
(73,354) Energy Recovery Inc Barclays Bank 3,668(5,941) Energy Recovery Inc Goldman Sachs (2,614)
(17,004) Energy Recovery Inc HSBC 5,020(53,419) Energy Recovery Inc Morgan Stanley 2,671(17,227) Enerpac Tool Group Corp Goldman Sachs (57,710)(21,104) Enerpac Tool Group Corp HSBC (38,620)(99,318) Enerpac Tool Group Corp Morgan Stanley (110,243)(14,807) EnerSys Bank of America
Merrill Lynch (85,880)(15,603) EnerSys Barclays Bank 5,689(24,312) EnerSys Goldman Sachs (119,752)(27,327) EnerSys HSBC (48,339)(35,047) EnerSys Morgan Stanley 4,20616,856 EnLink Midstream LLC
(Unit)Bank of AmericaMerrill Lynch 11,294
9,421 EnLink Midstream LLC(Unit) HSBC 5,370
54,166 EnLink Midstream LLC(Unit) Morgan Stanley (542)
107,780 Ennis Inc Bank of AmericaMerrill Lynch 188,615
1,257 Ennis Inc Barclays Bank 603800 Ennis Inc Goldman Sachs 1,400
4,862 Ennis Inc HSBC 2,9178,986 Ennis Inc Morgan Stanley 4,3131,764 Enova International Inc Bank of America
Merrill Lynch 4,7103,252 Enova International Inc Barclays Bank 2,764
17,991 Enova International Inc HSBC (1,439)7,088 Enova International Inc Morgan Stanley 6,025
(3,199) Enphase Energy Inc Bank of AmericaMerrill Lynch 4,559
(2,643) Enphase Energy Inc Goldman Sachs 3,766(25,065) Enphase Energy Inc HSBC 8,271(2,734) Enphase Energy Inc Morgan Stanley (1,449)6,763 EnPro Industries Inc Bank of America
Merrill Lynch 24,48211,229 EnPro Industries Inc Barclays Bank 7,9733,119 EnPro Industries Inc Goldman Sachs 11,291
15,823 EnPro Industries Inc HSBC (3,323)7,815 EnPro Industries Inc Morgan Stanley 5,549
13,078 Ensign Group Inc Barclays Bank 13,8639,794 Ensign Group Inc Goldman Sachs 58,079
14,813 Ensign Group Inc HSBC 102,358(321) Enstar Group Ltd Barclays Bank (2,199)(722) Enstar Group Ltd Goldman Sachs (12,317)
(3,603) Enstar Group Ltd HSBC 1,513(10,517) Enstar Group Ltd Morgan Stanley (72,041)
6,717 Entegris Inc Bank of AmericaMerrill Lynch 25,323
(8,999) Entegris Inc Bank of AmericaMerrill Lynch (28,823)
5,674 Entegris Inc Barclays Bank 4,482(2,573) Entegris Inc Barclays Bank (2,033)3,681 Entegris Inc Goldman Sachs 13,877
(9,211) Entegris Inc Goldman Sachs (34,725)5,288 Entegris Inc HSBC 13,696
BlackRock Americas Diversified Equity Absolute Return Fundcontinued
The notes on pages 691 to 711 form an integral part of these financial statements.
BlackRock Strategic Funds[112]
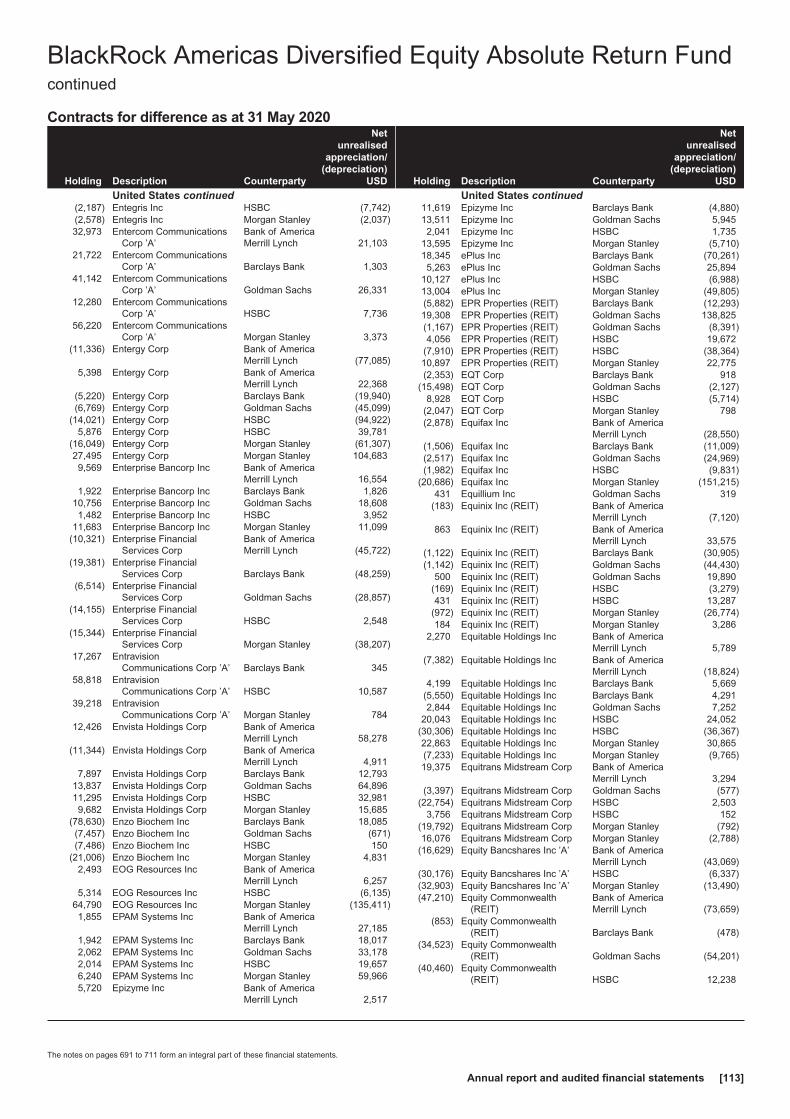
Contracts for difference as at 31 May 2020
Holding Description Counterparty
Netunrealised
appreciation/(depreciation)
USD
United States continued(2,187) Entegris Inc HSBC (7,742)(2,578) Entegris Inc Morgan Stanley (2,037)32,973 Entercom Communications
Corp ’A’Bank of AmericaMerrill Lynch 21,103
21,722 Entercom CommunicationsCorp ’A’ Barclays Bank 1,303
41,142 Entercom CommunicationsCorp ’A’ Goldman Sachs 26,331
12,280 Entercom CommunicationsCorp ’A’ HSBC 7,736
56,220 Entercom CommunicationsCorp ’A’ Morgan Stanley 3,373
(11,336) Entergy Corp Bank of AmericaMerrill Lynch (77,085)
5,398 Entergy Corp Bank of AmericaMerrill Lynch 22,368
(5,220) Entergy Corp Barclays Bank (19,940)(6,769) Entergy Corp Goldman Sachs (45,099)
(14,021) Entergy Corp HSBC (94,922)5,876 Entergy Corp HSBC 39,781
(16,049) Entergy Corp Morgan Stanley (61,307)27,495 Entergy Corp Morgan Stanley 104,6839,569 Enterprise Bancorp Inc Bank of America
Merrill Lynch 16,5541,922 Enterprise Bancorp Inc Barclays Bank 1,826
10,756 Enterprise Bancorp Inc Goldman Sachs 18,6081,482 Enterprise Bancorp Inc HSBC 3,952
11,683 Enterprise Bancorp Inc Morgan Stanley 11,099(10,321) Enterprise Financial
Services CorpBank of AmericaMerrill Lynch (45,722)
(19,381) Enterprise FinancialServices Corp Barclays Bank (48,259)
(6,514) Enterprise FinancialServices Corp Goldman Sachs (28,857)
(14,155) Enterprise FinancialServices Corp HSBC 2,548
(15,344) Enterprise FinancialServices Corp Morgan Stanley (38,207)
17,267 EntravisionCommunications Corp ’A’ Barclays Bank 345
58,818 EntravisionCommunications Corp ’A’ HSBC 10,587
39,218 EntravisionCommunications Corp ’A’ Morgan Stanley 784
12,426 Envista Holdings Corp Bank of AmericaMerrill Lynch 58,278
(11,344) Envista Holdings Corp Bank of AmericaMerrill Lynch 4,911
7,897 Envista Holdings Corp Barclays Bank 12,79313,837 Envista Holdings Corp Goldman Sachs 64,89611,295 Envista Holdings Corp HSBC 32,9819,682 Envista Holdings Corp Morgan Stanley 15,685
(78,630) Enzo Biochem Inc Barclays Bank 18,085(7,457) Enzo Biochem Inc Goldman Sachs (671)(7,486) Enzo Biochem Inc HSBC 150
(21,006) Enzo Biochem Inc Morgan Stanley 4,8312,493 EOG Resources Inc Bank of America
Merrill Lynch 6,2575,314 EOG Resources Inc HSBC (6,135)
64,790 EOG Resources Inc Morgan Stanley (135,411)1,855 EPAM Systems Inc Bank of America
Merrill Lynch 27,1851,942 EPAM Systems Inc Barclays Bank 18,0172,062 EPAM Systems Inc Goldman Sachs 33,1782,014 EPAM Systems Inc HSBC 19,6576,240 EPAM Systems Inc Morgan Stanley 59,9665,720 Epizyme Inc Bank of America
Merrill Lynch 2,517
Holding Description Counterparty
Netunrealised
appreciation/(depreciation)
USD
United States continued11,619 Epizyme Inc Barclays Bank (4,880)13,511 Epizyme Inc Goldman Sachs 5,9452,041 Epizyme Inc HSBC 1,735
13,595 Epizyme Inc Morgan Stanley (5,710)18,345 ePlus Inc Barclays Bank (70,261)5,263 ePlus Inc Goldman Sachs 25,894
10,127 ePlus Inc HSBC (6,988)13,004 ePlus Inc Morgan Stanley (49,805)(5,882) EPR Properties (REIT) Barclays Bank (12,293)19,308 EPR Properties (REIT) Goldman Sachs 138,825(1,167) EPR Properties (REIT) Goldman Sachs (8,391)4,056 EPR Properties (REIT) HSBC 19,672
(7,910) EPR Properties (REIT) HSBC (38,364)10,897 EPR Properties (REIT) Morgan Stanley 22,775(2,353) EQT Corp Barclays Bank 918
(15,498) EQT Corp Goldman Sachs (2,127)8,928 EQT Corp HSBC (5,714)
(2,047) EQT Corp Morgan Stanley 798(2,878) Equifax Inc Bank of America
Merrill Lynch (28,550)(1,506) Equifax Inc Barclays Bank (11,009)(2,517) Equifax Inc Goldman Sachs (24,969)(1,982) Equifax Inc HSBC (9,831)
(20,686) Equifax Inc Morgan Stanley (151,215)431 Equillium Inc Goldman Sachs 319
(183) Equinix Inc (REIT) Bank of AmericaMerrill Lynch (7,120)
863 Equinix Inc (REIT) Bank of AmericaMerrill Lynch 33,575
(1,122) Equinix Inc (REIT) Barclays Bank (30,905)(1,142) Equinix Inc (REIT) Goldman Sachs (44,430)
500 Equinix Inc (REIT) Goldman Sachs 19,890(169) Equinix Inc (REIT) HSBC (3,279)431 Equinix Inc (REIT) HSBC 13,287
(972) Equinix Inc (REIT) Morgan Stanley (26,774)184 Equinix Inc (REIT) Morgan Stanley 3,286
2,270 Equitable Holdings Inc Bank of AmericaMerrill Lynch 5,789
(7,382) Equitable Holdings Inc Bank of AmericaMerrill Lynch (18,824)
4,199 Equitable Holdings Inc Barclays Bank 5,669(5,550) Equitable Holdings Inc Barclays Bank 4,2912,844 Equitable Holdings Inc Goldman Sachs 7,252
20,043 Equitable Holdings Inc HSBC 24,052(30,306) Equitable Holdings Inc HSBC (36,367)22,863 Equitable Holdings Inc Morgan Stanley 30,865(7,233) Equitable Holdings Inc Morgan Stanley (9,765)19,375 Equitrans Midstream Corp Bank of America
Merrill Lynch 3,294(3,397) Equitrans Midstream Corp Goldman Sachs (577)
(22,754) Equitrans Midstream Corp HSBC 2,5033,756 Equitrans Midstream Corp HSBC 152
(19,792) Equitrans Midstream Corp Morgan Stanley (792)16,076 Equitrans Midstream Corp Morgan Stanley (2,788)
(16,629) Equity Bancshares Inc ’A’ Bank of AmericaMerrill Lynch (43,069)
(30,176) Equity Bancshares Inc ’A’ HSBC (6,337)(32,903) Equity Bancshares Inc ’A’ Morgan Stanley (13,490)(47,210) Equity Commonwealth
(REIT)Bank of AmericaMerrill Lynch (73,659)
(853) Equity Commonwealth(REIT) Barclays Bank (478)
(34,523) Equity Commonwealth(REIT) Goldman Sachs (54,201)
(40,460) Equity Commonwealth(REIT) HSBC 12,238
BlackRock Americas Diversified Equity Absolute Return Fundcontinued
The notes on pages 691 to 711 form an integral part of these financial statements.
Annual report and audited financial statements [113]
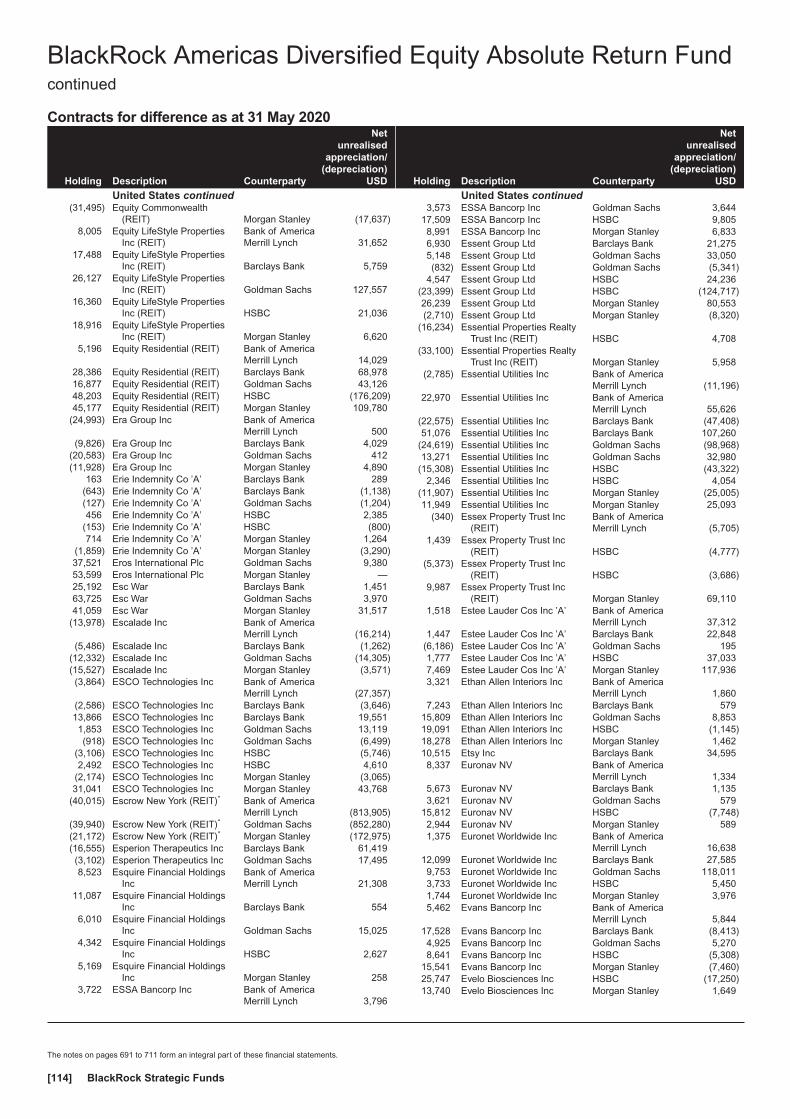
Contracts for difference as at 31 May 2020
Holding Description Counterparty
Netunrealised
appreciation/(depreciation)
USD
United States continued(31,495) Equity Commonwealth
(REIT) Morgan Stanley (17,637)8,005 Equity LifeStyle Properties
Inc (REIT)Bank of AmericaMerrill Lynch 31,652
17,488 Equity LifeStyle PropertiesInc (REIT) Barclays Bank 5,759
26,127 Equity LifeStyle PropertiesInc (REIT) Goldman Sachs 127,557
16,360 Equity LifeStyle PropertiesInc (REIT) HSBC 21,036
18,916 Equity LifeStyle PropertiesInc (REIT) Morgan Stanley 6,620
5,196 Equity Residential (REIT) Bank of AmericaMerrill Lynch 14,029
28,386 Equity Residential (REIT) Barclays Bank 68,97816,877 Equity Residential (REIT) Goldman Sachs 43,12648,203 Equity Residential (REIT) HSBC (176,209)45,177 Equity Residential (REIT) Morgan Stanley 109,780
(24,993) Era Group Inc Bank of AmericaMerrill Lynch 500
(9,826) Era Group Inc Barclays Bank 4,029(20,583) Era Group Inc Goldman Sachs 412(11,928) Era Group Inc Morgan Stanley 4,890
163 Erie Indemnity Co ’A’ Barclays Bank 289(643) Erie Indemnity Co ’A’ Barclays Bank (1,138)(127) Erie Indemnity Co ’A’ Goldman Sachs (1,204)456 Erie Indemnity Co ’A’ HSBC 2,385
(153) Erie Indemnity Co ’A’ HSBC (800)714 Erie Indemnity Co ’A’ Morgan Stanley 1,264
(1,859) Erie Indemnity Co ’A’ Morgan Stanley (3,290)37,521 Eros International Plc Goldman Sachs 9,38053,599 Eros International Plc Morgan Stanley —25,192 Esc War Barclays Bank 1,45163,725 Esc War Goldman Sachs 3,97041,059 Esc War Morgan Stanley 31,517
(13,978) Escalade Inc Bank of AmericaMerrill Lynch (16,214)
(5,486) Escalade Inc Barclays Bank (1,262)(12,332) Escalade Inc Goldman Sachs (14,305)(15,527) Escalade Inc Morgan Stanley (3,571)(3,864) ESCO Technologies Inc Bank of America
Merrill Lynch (27,357)(2,586) ESCO Technologies Inc Barclays Bank (3,646)13,866 ESCO Technologies Inc Barclays Bank 19,5511,853 ESCO Technologies Inc Goldman Sachs 13,119(918) ESCO Technologies Inc Goldman Sachs (6,499)
(3,106) ESCO Technologies Inc HSBC (5,746)2,492 ESCO Technologies Inc HSBC 4,610
(2,174) ESCO Technologies Inc Morgan Stanley (3,065)31,041 ESCO Technologies Inc Morgan Stanley 43,768
(40,015) Escrow New York (REIT)* Bank of AmericaMerrill Lynch (813,905)
(39,940) Escrow New York (REIT)* Goldman Sachs (852,280)(21,172) Escrow New York (REIT)* Morgan Stanley (172,975)(16,555) Esperion Therapeutics Inc Barclays Bank 61,419(3,102) Esperion Therapeutics Inc Goldman Sachs 17,4958,523 Esquire Financial Holdings
IncBank of AmericaMerrill Lynch 21,308
11,087 Esquire Financial HoldingsInc Barclays Bank 554
6,010 Esquire Financial HoldingsInc Goldman Sachs 15,025
4,342 Esquire Financial HoldingsInc HSBC 2,627
5,169 Esquire Financial HoldingsInc Morgan Stanley 258
3,722 ESSA Bancorp Inc Bank of AmericaMerrill Lynch 3,796
Holding Description Counterparty
Netunrealised
appreciation/(depreciation)
USD
United States continued3,573 ESSA Bancorp Inc Goldman Sachs 3,644
17,509 ESSA Bancorp Inc HSBC 9,8058,991 ESSA Bancorp Inc Morgan Stanley 6,8336,930 Essent Group Ltd Barclays Bank 21,2755,148 Essent Group Ltd Goldman Sachs 33,050(832) Essent Group Ltd Goldman Sachs (5,341)
4,547 Essent Group Ltd HSBC 24,236(23,399) Essent Group Ltd HSBC (124,717)26,239 Essent Group Ltd Morgan Stanley 80,553(2,710) Essent Group Ltd Morgan Stanley (8,320)
(16,234) Essential Properties RealtyTrust Inc (REIT) HSBC 4,708
(33,100) Essential Properties RealtyTrust Inc (REIT) Morgan Stanley 5,958
(2,785) Essential Utilities Inc Bank of AmericaMerrill Lynch (11,196)
22,970 Essential Utilities Inc Bank of AmericaMerrill Lynch 55,626
(22,575) Essential Utilities Inc Barclays Bank (47,408)51,076 Essential Utilities Inc Barclays Bank 107,260
(24,619) Essential Utilities Inc Goldman Sachs (98,968)13,271 Essential Utilities Inc Goldman Sachs 32,980
(15,308) Essential Utilities Inc HSBC (43,322)2,346 Essential Utilities Inc HSBC 4,054
(11,907) Essential Utilities Inc Morgan Stanley (25,005)11,949 Essential Utilities Inc Morgan Stanley 25,093
(340) Essex Property Trust Inc(REIT)
Bank of AmericaMerrill Lynch (5,705)
1,439 Essex Property Trust Inc(REIT) HSBC (4,777)
(5,373) Essex Property Trust Inc(REIT) HSBC (3,686)
9,987 Essex Property Trust Inc(REIT) Morgan Stanley 69,110
1,518 Estee Lauder Cos Inc ’A’ Bank of AmericaMerrill Lynch 37,312
1,447 Estee Lauder Cos Inc ’A’ Barclays Bank 22,848(6,186) Estee Lauder Cos Inc ’A’ Goldman Sachs 1951,777 Estee Lauder Cos Inc ’A’ HSBC 37,0337,469 Estee Lauder Cos Inc ’A’ Morgan Stanley 117,9363,321 Ethan Allen Interiors Inc Bank of America
Merrill Lynch 1,8607,243 Ethan Allen Interiors Inc Barclays Bank 579
15,809 Ethan Allen Interiors Inc Goldman Sachs 8,85319,091 Ethan Allen Interiors Inc HSBC (1,145)18,278 Ethan Allen Interiors Inc Morgan Stanley 1,46210,515 Etsy Inc Barclays Bank 34,5958,337 Euronav NV Bank of America
Merrill Lynch 1,3345,673 Euronav NV Barclays Bank 1,1353,621 Euronav NV Goldman Sachs 579
15,812 Euronav NV HSBC (7,748)2,944 Euronav NV Morgan Stanley 5891,375 Euronet Worldwide Inc Bank of America
Merrill Lynch 16,63812,099 Euronet Worldwide Inc Barclays Bank 27,5859,753 Euronet Worldwide Inc Goldman Sachs 118,0113,733 Euronet Worldwide Inc HSBC 5,4501,744 Euronet Worldwide Inc Morgan Stanley 3,9765,462 Evans Bancorp Inc Bank of America
Merrill Lynch 5,84417,528 Evans Bancorp Inc Barclays Bank (8,413)4,925 Evans Bancorp Inc Goldman Sachs 5,2708,641 Evans Bancorp Inc HSBC (5,308)
15,541 Evans Bancorp Inc Morgan Stanley (7,460)25,747 Evelo Biosciences Inc HSBC (17,250)13,740 Evelo Biosciences Inc Morgan Stanley 1,649
BlackRock Americas Diversified Equity Absolute Return Fundcontinued
The notes on pages 691 to 711 form an integral part of these financial statements.
BlackRock Strategic Funds[114]
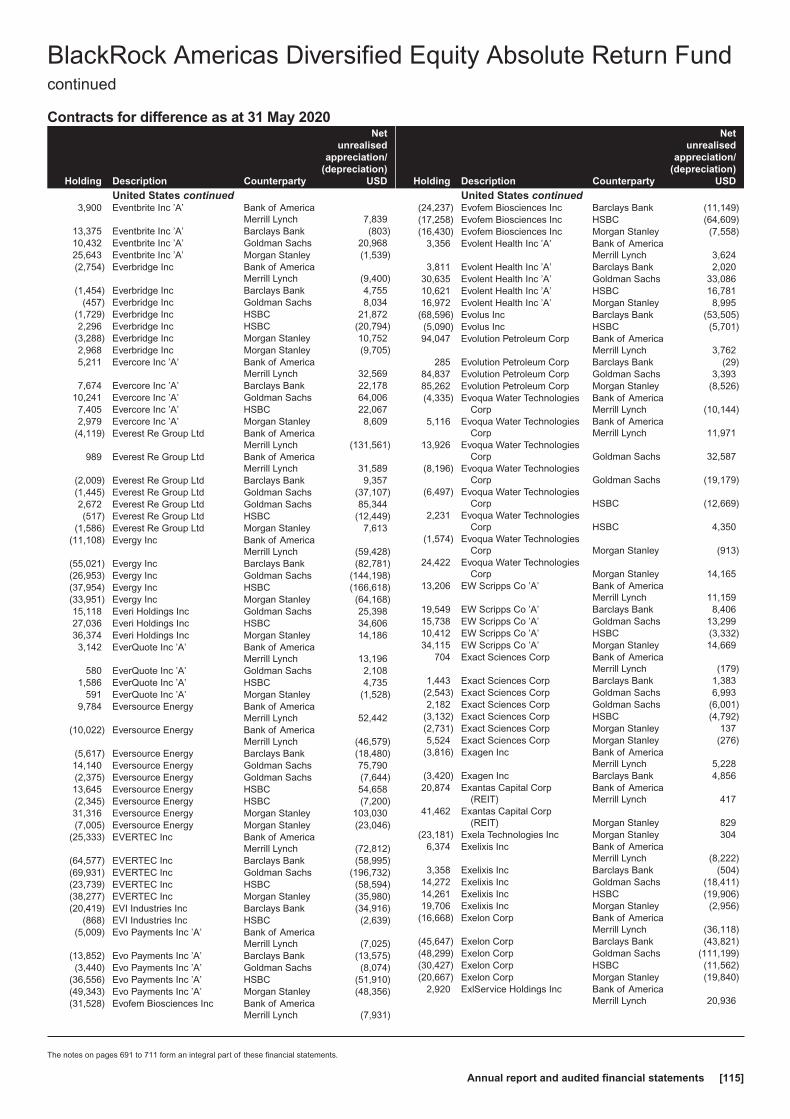
Contracts for difference as at 31 May 2020
Holding Description Counterparty
Netunrealised
appreciation/(depreciation)
USD
United States continued3,900 Eventbrite Inc ’A’ Bank of America
Merrill Lynch 7,83913,375 Eventbrite Inc ’A’ Barclays Bank (803)10,432 Eventbrite Inc ’A’ Goldman Sachs 20,96825,643 Eventbrite Inc ’A’ Morgan Stanley (1,539)(2,754) Everbridge Inc Bank of America
Merrill Lynch (9,400)(1,454) Everbridge Inc Barclays Bank 4,755
(457) Everbridge Inc Goldman Sachs 8,034(1,729) Everbridge Inc HSBC 21,8722,296 Everbridge Inc HSBC (20,794)
(3,288) Everbridge Inc Morgan Stanley 10,7522,968 Everbridge Inc Morgan Stanley (9,705)5,211 Evercore Inc ’A’ Bank of America
Merrill Lynch 32,5697,674 Evercore Inc ’A’ Barclays Bank 22,178
10,241 Evercore Inc ’A’ Goldman Sachs 64,0067,405 Evercore Inc ’A’ HSBC 22,0672,979 Evercore Inc ’A’ Morgan Stanley 8,609
(4,119) Everest Re Group Ltd Bank of AmericaMerrill Lynch (131,561)
989 Everest Re Group Ltd Bank of AmericaMerrill Lynch 31,589
(2,009) Everest Re Group Ltd Barclays Bank 9,357(1,445) Everest Re Group Ltd Goldman Sachs (37,107)2,672 Everest Re Group Ltd Goldman Sachs 85,344(517) Everest Re Group Ltd HSBC (12,449)
(1,586) Everest Re Group Ltd Morgan Stanley 7,613(11,108) Evergy Inc Bank of America
Merrill Lynch (59,428)(55,021) Evergy Inc Barclays Bank (82,781)(26,953) Evergy Inc Goldman Sachs (144,198)(37,954) Evergy Inc HSBC (166,618)(33,951) Evergy Inc Morgan Stanley (64,168)15,118 Everi Holdings Inc Goldman Sachs 25,39827,036 Everi Holdings Inc HSBC 34,60636,374 Everi Holdings Inc Morgan Stanley 14,1863,142 EverQuote Inc ’A’ Bank of America
Merrill Lynch 13,196580 EverQuote Inc ’A’ Goldman Sachs 2,108
1,586 EverQuote Inc ’A’ HSBC 4,735591 EverQuote Inc ’A’ Morgan Stanley (1,528)
9,784 Eversource Energy Bank of AmericaMerrill Lynch 52,442
(10,022) Eversource Energy Bank of AmericaMerrill Lynch (46,579)
(5,617) Eversource Energy Barclays Bank (18,480)14,140 Eversource Energy Goldman Sachs 75,790(2,375) Eversource Energy Goldman Sachs (7,644)13,645 Eversource Energy HSBC 54,658(2,345) Eversource Energy HSBC (7,200)31,316 Eversource Energy Morgan Stanley 103,030(7,005) Eversource Energy Morgan Stanley (23,046)
(25,333) EVERTEC Inc Bank of AmericaMerrill Lynch (72,812)
(64,577) EVERTEC Inc Barclays Bank (58,995)(69,931) EVERTEC Inc Goldman Sachs (196,732)(23,739) EVERTEC Inc HSBC (58,594)(38,277) EVERTEC Inc Morgan Stanley (35,980)(20,419) EVI Industries Inc Barclays Bank (34,916)
(868) EVI Industries Inc HSBC (2,639)(5,009) Evo Payments Inc ’A’ Bank of America
Merrill Lynch (7,025)(13,852) Evo Payments Inc ’A’ Barclays Bank (13,575)(3,440) Evo Payments Inc ’A’ Goldman Sachs (8,074)
(36,556) Evo Payments Inc ’A’ HSBC (51,910)(49,343) Evo Payments Inc ’A’ Morgan Stanley (48,356)(31,528) Evofem Biosciences Inc Bank of America
Merrill Lynch (7,931)
Holding Description Counterparty
Netunrealised
appreciation/(depreciation)
USD
United States continued(24,237) Evofem Biosciences Inc Barclays Bank (11,149)(17,258) Evofem Biosciences Inc HSBC (64,609)(16,430) Evofem Biosciences Inc Morgan Stanley (7,558)
3,356 Evolent Health Inc ’A’ Bank of AmericaMerrill Lynch 3,624
3,811 Evolent Health Inc ’A’ Barclays Bank 2,02030,635 Evolent Health Inc ’A’ Goldman Sachs 33,08610,621 Evolent Health Inc ’A’ HSBC 16,78116,972 Evolent Health Inc ’A’ Morgan Stanley 8,995
(68,596) Evolus Inc Barclays Bank (53,505)(5,090) Evolus Inc HSBC (5,701)94,047 Evolution Petroleum Corp Bank of America
Merrill Lynch 3,762285 Evolution Petroleum Corp Barclays Bank (29)
84,837 Evolution Petroleum Corp Goldman Sachs 3,39385,262 Evolution Petroleum Corp Morgan Stanley (8,526)(4,335) Evoqua Water Technologies
CorpBank of AmericaMerrill Lynch (10,144)
5,116 Evoqua Water TechnologiesCorp
Bank of AmericaMerrill Lynch 11,971
13,926 Evoqua Water TechnologiesCorp Goldman Sachs 32,587
(8,196) Evoqua Water TechnologiesCorp Goldman Sachs (19,179)
(6,497) Evoqua Water TechnologiesCorp HSBC (12,669)
2,231 Evoqua Water TechnologiesCorp HSBC 4,350
(1,574) Evoqua Water TechnologiesCorp Morgan Stanley (913)
24,422 Evoqua Water TechnologiesCorp Morgan Stanley 14,165
13,206 EW Scripps Co ’A’ Bank of AmericaMerrill Lynch 11,159
19,549 EW Scripps Co ’A’ Barclays Bank 8,40615,738 EW Scripps Co ’A’ Goldman Sachs 13,29910,412 EW Scripps Co ’A’ HSBC (3,332)34,115 EW Scripps Co ’A’ Morgan Stanley 14,669
704 Exact Sciences Corp Bank of AmericaMerrill Lynch (179)
1,443 Exact Sciences Corp Barclays Bank 1,383(2,543) Exact Sciences Corp Goldman Sachs 6,9932,182 Exact Sciences Corp Goldman Sachs (6,001)
(3,132) Exact Sciences Corp HSBC (4,792)(2,731) Exact Sciences Corp Morgan Stanley 1375,524 Exact Sciences Corp Morgan Stanley (276)
(3,816) Exagen Inc Bank of AmericaMerrill Lynch 5,228
(3,420) Exagen Inc Barclays Bank 4,85620,874 Exantas Capital Corp
(REIT)Bank of AmericaMerrill Lynch 417
41,462 Exantas Capital Corp(REIT) Morgan Stanley 829
(23,181) Exela Technologies Inc Morgan Stanley 3046,374 Exelixis Inc Bank of America
Merrill Lynch (8,222)3,358 Exelixis Inc Barclays Bank (504)
14,272 Exelixis Inc Goldman Sachs (18,411)14,261 Exelixis Inc HSBC (19,906)19,706 Exelixis Inc Morgan Stanley (2,956)
(16,668) Exelon Corp Bank of AmericaMerrill Lynch (36,118)
(45,647) Exelon Corp Barclays Bank (43,821)(48,299) Exelon Corp Goldman Sachs (111,199)(30,427) Exelon Corp HSBC (11,562)(20,667) Exelon Corp Morgan Stanley (19,840)
2,920 ExlService Holdings Inc Bank of AmericaMerrill Lynch 20,936
BlackRock Americas Diversified Equity Absolute Return Fundcontinued
The notes on pages 691 to 711 form an integral part of these financial statements.
Annual report and audited financial statements [115]
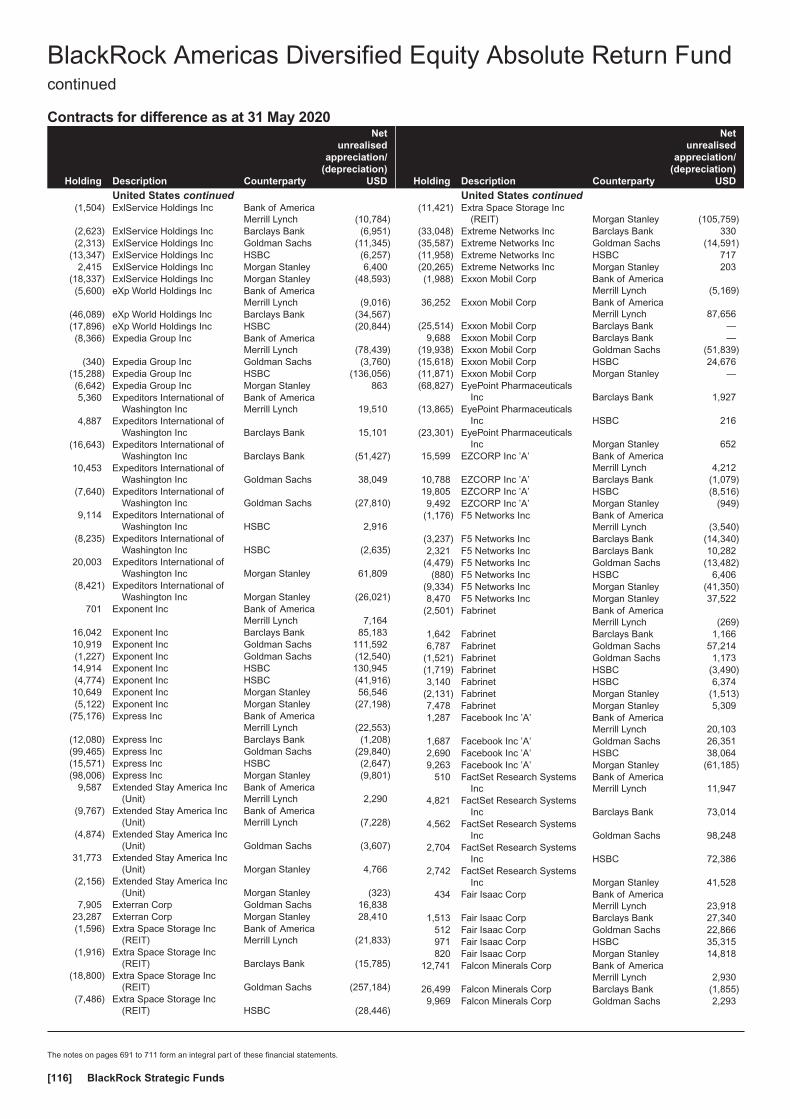
Contracts for difference as at 31 May 2020
Holding Description Counterparty
Netunrealised
appreciation/(depreciation)
USD
United States continued(1,504) ExlService Holdings Inc Bank of America
Merrill Lynch (10,784)(2,623) ExlService Holdings Inc Barclays Bank (6,951)(2,313) ExlService Holdings Inc Goldman Sachs (11,345)
(13,347) ExlService Holdings Inc HSBC (6,257)2,415 ExlService Holdings Inc Morgan Stanley 6,400
(18,337) ExlService Holdings Inc Morgan Stanley (48,593)(5,600) eXp World Holdings Inc Bank of America
Merrill Lynch (9,016)(46,089) eXp World Holdings Inc Barclays Bank (34,567)(17,896) eXp World Holdings Inc HSBC (20,844)(8,366) Expedia Group Inc Bank of America
Merrill Lynch (78,439)(340) Expedia Group Inc Goldman Sachs (3,760)
(15,288) Expedia Group Inc HSBC (136,056)(6,642) Expedia Group Inc Morgan Stanley 8635,360 Expeditors International of
Washington IncBank of AmericaMerrill Lynch 19,510
4,887 Expeditors International ofWashington Inc Barclays Bank 15,101
(16,643) Expeditors International ofWashington Inc Barclays Bank (51,427)
10,453 Expeditors International ofWashington Inc Goldman Sachs 38,049
(7,640) Expeditors International ofWashington Inc Goldman Sachs (27,810)
9,114 Expeditors International ofWashington Inc HSBC 2,916
(8,235) Expeditors International ofWashington Inc HSBC (2,635)
20,003 Expeditors International ofWashington Inc Morgan Stanley 61,809
(8,421) Expeditors International ofWashington Inc Morgan Stanley (26,021)
701 Exponent Inc Bank of AmericaMerrill Lynch 7,164
16,042 Exponent Inc Barclays Bank 85,18310,919 Exponent Inc Goldman Sachs 111,592(1,227) Exponent Inc Goldman Sachs (12,540)14,914 Exponent Inc HSBC 130,945(4,774) Exponent Inc HSBC (41,916)10,649 Exponent Inc Morgan Stanley 56,546(5,122) Exponent Inc Morgan Stanley (27,198)
(75,176) Express Inc Bank of AmericaMerrill Lynch (22,553)
(12,080) Express Inc Barclays Bank (1,208)(99,465) Express Inc Goldman Sachs (29,840)(15,571) Express Inc HSBC (2,647)(98,006) Express Inc Morgan Stanley (9,801)
9,587 Extended Stay America Inc(Unit)
Bank of AmericaMerrill Lynch 2,290
(9,767) Extended Stay America Inc(Unit)
Bank of AmericaMerrill Lynch (7,228)
(4,874) Extended Stay America Inc(Unit) Goldman Sachs (3,607)
31,773 Extended Stay America Inc(Unit) Morgan Stanley 4,766
(2,156) Extended Stay America Inc(Unit) Morgan Stanley (323)
7,905 Exterran Corp Goldman Sachs 16,83823,287 Exterran Corp Morgan Stanley 28,410(1,596) Extra Space Storage Inc
(REIT)Bank of AmericaMerrill Lynch (21,833)
(1,916) Extra Space Storage Inc(REIT) Barclays Bank (15,785)
(18,800) Extra Space Storage Inc(REIT) Goldman Sachs (257,184)
(7,486) Extra Space Storage Inc(REIT) HSBC (28,446)
Holding Description Counterparty
Netunrealised
appreciation/(depreciation)
USD
United States continued(11,421) Extra Space Storage Inc
(REIT) Morgan Stanley (105,759)(33,048) Extreme Networks Inc Barclays Bank 330(35,587) Extreme Networks Inc Goldman Sachs (14,591)(11,958) Extreme Networks Inc HSBC 717(20,265) Extreme Networks Inc Morgan Stanley 203(1,988) Exxon Mobil Corp Bank of America
Merrill Lynch (5,169)36,252 Exxon Mobil Corp Bank of America
Merrill Lynch 87,656(25,514) Exxon Mobil Corp Barclays Bank —
9,688 Exxon Mobil Corp Barclays Bank —(19,938) Exxon Mobil Corp Goldman Sachs (51,839)(15,618) Exxon Mobil Corp HSBC 24,676(11,871) Exxon Mobil Corp Morgan Stanley —(68,827) EyePoint Pharmaceuticals
Inc Barclays Bank 1,927(13,865) EyePoint Pharmaceuticals
Inc HSBC 216(23,301) EyePoint Pharmaceuticals
Inc Morgan Stanley 65215,599 EZCORP Inc ’A’ Bank of America
Merrill Lynch 4,21210,788 EZCORP Inc ’A’ Barclays Bank (1,079)19,805 EZCORP Inc ’A’ HSBC (8,516)9,492 EZCORP Inc ’A’ Morgan Stanley (949)
(1,176) F5 Networks Inc Bank of AmericaMerrill Lynch (3,540)
(3,237) F5 Networks Inc Barclays Bank (14,340)2,321 F5 Networks Inc Barclays Bank 10,282
(4,479) F5 Networks Inc Goldman Sachs (13,482)(880) F5 Networks Inc HSBC 6,406
(9,334) F5 Networks Inc Morgan Stanley (41,350)8,470 F5 Networks Inc Morgan Stanley 37,522
(2,501) Fabrinet Bank of AmericaMerrill Lynch (269)
1,642 Fabrinet Barclays Bank 1,1666,787 Fabrinet Goldman Sachs 57,214
(1,521) Fabrinet Goldman Sachs 1,173(1,719) Fabrinet HSBC (3,490)3,140 Fabrinet HSBC 6,374
(2,131) Fabrinet Morgan Stanley (1,513)7,478 Fabrinet Morgan Stanley 5,3091,287 Facebook Inc ’A’ Bank of America
Merrill Lynch 20,1031,687 Facebook Inc ’A’ Goldman Sachs 26,3512,690 Facebook Inc ’A’ HSBC 38,0649,263 Facebook Inc ’A’ Morgan Stanley (61,185)
510 FactSet Research SystemsInc
Bank of AmericaMerrill Lynch 11,947
4,821 FactSet Research SystemsInc Barclays Bank 73,014
4,562 FactSet Research SystemsInc Goldman Sachs 98,248
2,704 FactSet Research SystemsInc HSBC 72,386
2,742 FactSet Research SystemsInc Morgan Stanley 41,528
434 Fair Isaac Corp Bank of AmericaMerrill Lynch 23,918
1,513 Fair Isaac Corp Barclays Bank 27,340512 Fair Isaac Corp Goldman Sachs 22,866971 Fair Isaac Corp HSBC 35,315820 Fair Isaac Corp Morgan Stanley 14,818
12,741 Falcon Minerals Corp Bank of AmericaMerrill Lynch 2,930
26,499 Falcon Minerals Corp Barclays Bank (1,855)9,969 Falcon Minerals Corp Goldman Sachs 2,293
BlackRock Americas Diversified Equity Absolute Return Fundcontinued
The notes on pages 691 to 711 form an integral part of these financial statements.
BlackRock Strategic Funds[116]

Contracts for difference as at 31 May 2020
Holding Description Counterparty
Netunrealised
appreciation/(depreciation)
USD
United States continued48,697 Falcon Minerals Corp HSBC (974)55,340 Falcon Minerals Corp Morgan Stanley (3,874)
(17,949) Farfetch Ltd ’A’ Goldman Sachs 14,359(7,460) Farfetch Ltd ’A’ HSBC 21,709
(39,458) Farmer Bros Co Bank of AmericaMerrill Lynch (25,648)
(2,077) Farmer Bros Co Barclays Bank (2,243)(3,918) Farmer Bros Co HSBC 2,743
(16,552) Farmer Bros Co Morgan Stanley (17,876)2,739 Farmers & Merchants
Bancorp Inc/Archbold OHBank of AmericaMerrill Lynch 6,957
1,318 Farmers & MerchantsBancorp Inc/Archbold OH Goldman Sachs 3,348
2,851 Farmers & MerchantsBancorp Inc/Archbold OH Morgan Stanley 3,507
87,801 Farmers National BancCorp
Bank of AmericaMerrill Lynch 110,629
11,180 Farmers National BancCorp Barclays Bank 7,043
70,102 Farmers National BancCorp Goldman Sachs 88,329
15,764 Farmers National BancCorp HSBC 6,779
36,520 Farmers National BancCorp Morgan Stanley 23,008
(19,641) Farmland Partners Inc(REIT) Barclays Bank 1,178
(94,511) Farmland Partners Inc(REIT) Morgan Stanley 5,671
(6,344) FARO Technologies Inc Bank of AmericaMerrill Lynch (22,833)
(6,685) FARO Technologies Inc Barclays Bank 16,579(2,157) FARO Technologies Inc Goldman Sachs (8,563)
(11,168) FARO Technologies Inc HSBC (2,680)(441) FARO Technologies Inc Morgan Stanley 1,094
(6,644) Fastenal Co Barclays Bank (11,693)(12,290) Fastenal Co HSBC (18,243)(67,842) Fastenal Co Morgan Stanley (119,402)(2,009) Fastly Inc ’A’ Bank of America
Merrill Lynch (424)(8,826) Fastly Inc ’A’ Barclays Bank (4,095)(4,876) Fastly Inc ’A’ Goldman Sachs (3,354)1,630 Fate Therapeutics Inc Bank of America
Merrill Lynch 5,4132,275 Fate Therapeutics Inc Barclays Bank (6,211)8,636 Fate Therapeutics Inc Goldman Sachs 34,976
13,338 Fate Therapeutics Inc HSBC 47,3035,232 Fate Therapeutics Inc Morgan Stanley (14,283)
(6,176) FB Financial Corp Bank of AmericaMerrill Lynch (21,740)
(2,368) FB Financial Corp Barclays Bank (2,842)(6,066) FB Financial Corp Goldman Sachs (21,352)(7,370) FB Financial Corp HSBC (10,908)
(31,445) FB Financial Corp Morgan Stanley (37,734)2,437 FBL Financial Group Inc ’A’ Bank of America
Merrill Lynch 5,4593,637 FBL Financial Group Inc ’A’ Barclays Bank 6914,670 FBL Financial Group Inc ’A’ Goldman Sachs 10,4617,185 FBL Financial Group Inc ’A’ HSBC (16,813)5,723 FBL Financial Group Inc ’A’ Morgan Stanley 1,0876,582 Federal Agricultural
Mortgage Corp ’C’Bank of AmericaMerrill Lynch 40,413
10,183 Federal AgriculturalMortgage Corp ’C’ Barclays Bank 10,590
390 Federal AgriculturalMortgage Corp ’C’ Goldman Sachs 2,395
353 Federal AgriculturalMortgage Corp ’C’ HSBC 512
Holding Description Counterparty
Netunrealised
appreciation/(depreciation)
USD
United States continued2,566 Federal Agricultural
Mortgage Corp ’C’ Morgan Stanley 2,669(9,405) Federal Realty Investment
Trust (REIT) Goldman Sachs (67,152)9,319 Federal Realty Investment
Trust (REIT) Goldman Sachs (13,192)(11,201) Federal Realty Investment
Trust (REIT) HSBC (11,649)(2,438) Federal Realty Investment
Trust (REIT) Morgan Stanley (1,633)14,178 Federal Signal Corp Bank of America
Merrill Lynch 44,80268,430 Federal Signal Corp Barclays Bank 112,91018,439 Federal Signal Corp Goldman Sachs 58,26715,080 Federal Signal Corp HSBC 32,23737,459 Federal Signal Corp Morgan Stanley 61,8088,513 Federated Hermes Inc Bank of America
Merrill Lynch 17,659(7,622) Federated Hermes Inc Bank of America
Merrill Lynch (18,445)16,977 Federated Hermes Inc Barclays Bank 14,940
(12,990) Federated Hermes Inc Barclays Bank (11,431)(12,494) Federated Hermes Inc Goldman Sachs (30,235)
6,040 Federated Hermes Inc Goldman Sachs 14,617(15,573) Federated Hermes Inc HSBC (10,443)
4,048 Federated Hermes Inc HSBC 5,359(31,187) Federated Hermes Inc Morgan Stanley (27,444)11,555 Federated Hermes Inc Morgan Stanley 10,1681,552 FedEx Corp Bank of America
Merrill Lynch (6,952)(1,654) FedEx Corp Goldman Sachs (33,361)15,008 FedEx Corp Goldman Sachs 229,385(3,222) FedEx Corp HSBC (23,360)(7,519) FedEx Corp Morgan Stanley (80,378)10,062 FedNat Holding Co Barclays Bank 1,00611,207 FedNat Holding Co Goldman Sachs 9,1906,899 FedNat Holding Co HSBC 483
47,681 FedNat Holding Co Morgan Stanley 4,7684,692 Fennec Pharmaceuticals Inc Bank of America
Merrill Lynch (235)13,756 Fennec Pharmaceuticals Inc Goldman Sachs (688)3,680 Fennec Pharmaceuticals Inc HSBC 595
16,062 Fennec Pharmaceuticals Inc Morgan Stanley (2,731)1,026 Ferrari NV Bank of America
Merrill Lynch 11,8092,858 Ferrari NV Barclays Bank 24,064
974 Ferrari NV HSBC 9,0901,996 Ferrari NV Morgan Stanley 16,806
22,272 Ferro Corp Bank of AmericaMerrill Lynch 24,276
6,269 Ferro Corp Barclays Bank 1,56741,763 Ferro Corp Goldman Sachs 45,5229,085 Ferro Corp HSBC 16,353
63,729 Ferro Corp Morgan Stanley 15,932(13,151) Fiat Chrysler Automobiles
NV Goldman Sachs (13,677)(18,460) Fiat Chrysler Automobiles
NV Morgan Stanley (13,660)9,981 FibroGen Inc Bank of America
Merrill Lynch (13,566)(1,574) FibroGen Inc Barclays Bank 3,33719,148 FibroGen Inc Barclays Bank (40,594)11,785 FibroGen Inc Goldman Sachs (16,941)
(453) FibroGen Inc HSBC 7791,265 FibroGen Inc HSBC (3,317)
(13,603) FibroGen Inc Morgan Stanley 28,83822,670 FibroGen Inc Morgan Stanley (48,060)
BlackRock Americas Diversified Equity Absolute Return Fundcontinued
The notes on pages 691 to 711 form an integral part of these financial statements.
Annual report and audited financial statements [117]

Contracts for difference as at 31 May 2020
Holding Description Counterparty
Netunrealised
appreciation/(depreciation)
USD
United States continued(24) Fidelity D&D Bancorp Inc Barclays Bank (27)
(1,224) Fidelity D&D Bancorp Inc Morgan Stanley (1,401)2,008 Fidelity National Financial
Inc Barclays Bank 6,506(7,224) Fidelity National Financial
Inc Barclays Bank (8,156)6,064 Fidelity National Financial
Inc Goldman Sachs 34,444(2,017) Fidelity National Financial
Inc Goldman Sachs (5,953)3,688 Fidelity National Financial
Inc HSBC 17,8875,945 Fidelity National Financial
Inc Morgan Stanley 19,262(11,733) Fidelity National Financial
Inc Morgan Stanley (38,015)1,037 Fidelity National Information
Services IncBank of AmericaMerrill Lynch 5,278
1,469 Fidelity National InformationServices Inc Barclays Bank (2,832)
26,744 Fidelity National InformationServices Inc Goldman Sachs 136,127
19,593 Fidelity National InformationServices Inc Morgan Stanley 22,532
12,332 Fiesta Restaurant Group Inc Bank of AmericaMerrill Lynch 6,289
3,182 Fiesta Restaurant Group Inc HSBC 1,27319,245 Fiesta Restaurant Group Inc Morgan Stanley (5,389)34,938 Fifth Third Bancorp Bank of America
Merrill Lynch 118,09018,910 Fifth Third Bancorp Barclays Bank 35,74026,854 Fifth Third Bancorp Goldman Sachs 90,76738,540 Fifth Third Bancorp HSBC 62,84727,051 Fifth Third Bancorp Morgan Stanley 51,126
(17,953) Financial Institutions Inc Bank of AmericaMerrill Lynch (48,294)
(1,214) Financial Institutions Inc Barclays Bank (194)(18,754) Financial Institutions Inc Goldman Sachs (50,448)(9,697) Financial Institutions Inc Morgan Stanley (1,552)
(26,184) FireEye Inc Bank of AmericaMerrill Lynch (8,117)
(52,153) FireEye Inc Barclays Bank 11,474(8,610) FireEye Inc Goldman Sachs (2,669)
(10,701) FireEye Inc HSBC 5,779(57,067) FireEye Inc Morgan Stanley 12,55510,048 First American Financial
Corp Barclays Bank 7,737(1,744) First American Financial
Corp Barclays Bank (1,343)(5,216) First American Financial
Corp HSBC (16,639)726 First American Financial
Corp Morgan Stanley 559(8,650) First American Financial
Corp Morgan Stanley (6,661)(42,882) First BanCorp Bank of America
Merrill Lynch (31,304)(29,425) First BanCorp Barclays Bank (2,943)(98,709) First BanCorp Goldman Sachs (72,058)(14,599) First BanCorp HSBC 2,336(52,150) First BanCorp Morgan Stanley (5,215)
3,433 First Bancorp Inc Bank of AmericaMerrill Lynch 8,617
8,301 First Bancorp Inc Barclays Bank 10,6254,274 First Bancorp Inc Goldman Sachs 10,7287,227 First Bancorp Inc HSBC (650)
10,868 First Bancorp Inc Morgan Stanley 11,813(7,834) First Bancorp/Southern
Pines NCBank of AmericaMerrill Lynch (29,613)
Holding Description Counterparty
Netunrealised
appreciation/(depreciation)
USD
United States continued(4,959) First Bancorp/Southern
Pines NC Barclays Bank (11,505)(27,868) First Bancorp/Southern
Pines NC Goldman Sachs (105,341)(14,025) First Bancorp/Southern
Pines NC HSBC (6,311)(24,689) First Bancorp/Southern
Pines NC Morgan Stanley (57,278)(60) First Bancshares Inc Goldman Sachs (211)
(8,549) First Bancshares Inc HSBC (12,909)(44,596) First Bancshares Inc Morgan Stanley (52,623)40,949 First Bank/Hamilton NJ Bank of America
Merrill Lynch 30,71216,484 First Bank/Hamilton NJ Barclays Bank 2,30814,967 First Bank/Hamilton NJ Goldman Sachs 11,2252,987 First Bank/Hamilton NJ HSBC 3887,120 First Bank/Hamilton NJ Morgan Stanley 997
(5,932) First Busey Corp Bank of AmericaMerrill Lynch (15,216)
(38,329) First Busey Corp Barclays Bank (47,336)(36,620) First Busey Corp Goldman Sachs (90,053)(40,880) First Busey Corp HSBC (39,724)(41,429) First Busey Corp Morgan Stanley (51,165)15,221 First Business Financial
Services IncBank of AmericaMerrill Lynch 25,267
7,542 First Business FinancialServices Inc Barclays Bank 1,886
12,761 First Business FinancialServices Inc Goldman Sachs 21,183
13,145 First Business FinancialServices Inc HSBC 2,103
1,930 First Business FinancialServices Inc Morgan Stanley 483
(547) First Capital Inc Bank of AmericaMerrill Lynch (5,339)
(2,373) First Capital Inc Barclays Bank (3,465)(13,203) First Choice Bancorp Bank of America
Merrill Lynch (9,770)(3,463) First Choice Bancorp Barclays Bank (1,420)
(300) First Choice Bancorp Goldman Sachs (222)(3,316) First Choice Bancorp Morgan Stanley (1,360)
(818) First Citizens BancSharesInc ’A’
Bank of AmericaMerrill Lynch (44,154)
528 First Citizens BancSharesInc ’A’ Barclays Bank 17,524
(518) First Citizens BancSharesInc ’A’ Barclays Bank (17,192)
221 First Citizens BancSharesInc ’A’ Goldman Sachs 12,948
(1,027) First Citizens BancSharesInc ’A’ Goldman Sachs (58,242)
1,216 First Citizens BancSharesInc ’A’ HSBC 25,645
(282) First Citizens BancSharesInc ’A’ HSBC (5,947)
2,083 First Citizens BancSharesInc ’A’ Morgan Stanley 69,135
(1,941) First Citizens BancSharesInc ’A’ Morgan Stanley (64,422)
(83,808) First CommonwealthFinancial Corp
Bank of AmericaMerrill Lynch (90,513)
(4,816) First CommonwealthFinancial Corp Barclays Bank (1,589)
(52,724) First CommonwealthFinancial Corp Goldman Sachs (56,942)
(72,970) First CommonwealthFinancial Corp HSBC 12,133
(43,926) First CommonwealthFinancial Corp Morgan Stanley (14,496)
BlackRock Americas Diversified Equity Absolute Return Fundcontinued
The notes on pages 691 to 711 form an integral part of these financial statements.
BlackRock Strategic Funds[118]

Contracts for difference as at 31 May 2020
Holding Description Counterparty
Netunrealised
appreciation/(depreciation)
USD
United States continued6,554 First Community
Bankshares IncBank of AmericaMerrill Lynch 19,596
21,641 First CommunityBankshares Inc Barclays Bank 27,700
15,968 First CommunityBankshares Inc Goldman Sachs 47,744
57,119 First CommunityBankshares Inc HSBC (11,205)
32,533 First CommunityBankshares Inc Morgan Stanley 41,642
2,437 First Community Corp/SC Barclays Bank (902)16,312 First Community Corp/SC Goldman Sachs (5,872)28,408 First Community Corp/SC Morgan Stanley (10,511)97,421 First Defiance Financial
CorpBank of AmericaMerrill Lynch 233,882
9,159 First Defiance FinancialCorp Barclays Bank 6,045
2,463 First Defiance FinancialCorp HSBC (222)
10,043 First Defiance FinancialCorp Morgan Stanley 4,307
(23,508) First Financial Bancorp Bank of AmericaMerrill Lynch (36,320)
(53,965) First Financial Bancorp Barclays Bank (58,552)(11,009) First Financial Bancorp Goldman Sachs (17,009)(8,432) First Financial Bancorp HSBC 8,458
(29,603) First Financial Bancorp Morgan Stanley (32,119)(14,508) First Financial Bankshares
IncBank of AmericaMerrill Lynch (56,842)
(40,453) First Financial BanksharesInc Barclays Bank (81,715)
(69,455) First Financial BanksharesInc Goldman Sachs (296,039)
(40,404) First Financial BanksharesInc HSBC (115,270)
(37,131) First Financial BanksharesInc Morgan Stanley (75,004)
64,551 First Financial Corp Bank of AmericaMerrill Lynch 224,637
3,531 First Financial Corp Barclays Bank 5,0851,380 First Financial Corp Goldman Sachs 4,8022,248 First Financial Corp HSBC 3,4393,247 First Financial Corp Morgan Stanley 4,676
70,226 First Financial NorthwestInc
Bank of AmericaMerrill Lynch 113,064
41,282 First Financial NorthwestInc Goldman Sachs 66,464
(89,491) First Foundation Inc Goldman Sachs (181,667)(9,664) First Foundation Inc HSBC (12,950)
(49,019) First Foundation Inc Morgan Stanley (22,549)(2,148) First Guaranty Bancshares
IncBank of AmericaMerrill Lynch (2,835)
(2,205) First Guaranty BancsharesInc Morgan Stanley (2,624)
2,452 First Hawaiian Inc Bank of AmericaMerrill Lynch 7,307
(5,139) First Hawaiian Inc Bank of AmericaMerrill Lynch (15,314)
1,323 First Hawaiian Inc Barclays Bank 1,416(6,491) First Hawaiian Inc Barclays Bank (6,945)2,293 First Hawaiian Inc Goldman Sachs 6,8339,584 First Hawaiian Inc HSBC 4,265
(16,607) First Hawaiian Inc HSBC (7,390)36,267 First Hawaiian Inc Morgan Stanley 38,806(9,581) First Hawaiian Inc Morgan Stanley (10,252)18,719 First Horizon National Corp Bank of America
Merrill Lynch 32,57224,557 First Horizon National Corp Barclays Bank 12,21664,356 First Horizon National Corp Goldman Sachs 111,980
Holding Description Counterparty
Netunrealised
appreciation/(depreciation)
USD
United States continued129,789 First Horizon National Corp HSBC 76,09150,088 First Horizon National Corp Morgan Stanley 35,56264,854 First Industrial Realty Trust
Inc (REIT)Bank of AmericaMerrill Lynch 236,717
162,288 First Industrial Realty TrustInc (REIT) Goldman Sachs 592,351
31,903 First Industrial Realty TrustInc (REIT) HSBC 29,999
21,305 First Industrial Realty TrustInc (REIT) Morgan Stanley 29,188
(8,228) First Internet Bancorp Bank of AmericaMerrill Lynch (25,918)
(1,666) First Internet Bancorp Barclays Bank (3,365)(5,968) First Internet Bancorp Goldman Sachs (18,799)(2,930) First Internet Bancorp HSBC (3,692)
(11,667) First Internet Bancorp Morgan Stanley (23,567)3,802 First Interstate BancSystem
Inc ’A’Bank of AmericaMerrill Lynch 11,824
54,625 First Interstate BancSystemInc ’A’ Barclays Bank 82,522
1,757 First Interstate BancSystemInc ’A’ Goldman Sachs 3,550
20,065 First Interstate BancSystemInc ’A’ HSBC (14,985)
6,722 First Interstate BancSystemInc ’A’ Morgan Stanley 10,554
(48,074) First Merchants Corp Bank of AmericaMerrill Lynch (226,452)
(51,146) First Merchants Corp Barclays Bank (150,369)(17,539) First Merchants Corp HSBC (23,892)(15,724) First Merchants Corp Morgan Stanley (46,229)(79,031) First Mid Bancshares Inc Bank of America
Merrill Lynch (183,352)(34,032) First Mid Bancshares Inc Goldman Sachs (78,954)(2,689) First Mid Bancshares Inc HSBC 484
(13,824) First Mid Bancshares Inc Morgan Stanley (17,695)(79,163) First Midwest Bancorp Inc Bank of America
Merrill Lynch (147,345)(58,420) First Midwest Bancorp Inc Barclays Bank (54,915)
(113,408) First Midwest Bancorp Inc Goldman Sachs (223,413)(34,972) First Midwest Bancorp Inc HSBC (7,422)(39,693) First Midwest Bancorp Inc Morgan Stanley (37,311)58,552 First Northwest Bancorp Bank of America
Merrill Lynch 131,1561,455 First Northwest Bancorp Barclays Bank 1,4991,569 First Northwest Bancorp Goldman Sachs 3,5151,178 First Northwest Bancorp HSBC 2,9571,593 First Northwest Bancorp Morgan Stanley 1,641
(4,526) First of Long Island Corp Bank of AmericaMerrill Lynch (9,097)
(6,996) First of Long Island Corp Barclays Bank (3,078)(6,326) First of Long Island Corp Goldman Sachs (12,715)
(27,209) First of Long Island Corp HSBC (23,400)(25,817) First of Long Island Corp Morgan Stanley (11,359)(10,204) First Republic Bank Bank of America
Merrill Lynch (117,506)(6,702) First Republic Bank Barclays Bank (77,073)
(737) First Republic Bank Goldman Sachs (7,534)(8,238) First Republic Bank HSBC (48,314)
(10,096) First Republic Bank Morgan Stanley (116,105)6,994 First Savings Financial
Group IncBank of AmericaMerrill Lynch (350)
1,107 First Savings FinancialGroup Inc Goldman Sachs (55)
634 First Savings FinancialGroup Inc Morgan Stanley 552
(9,817) First Solar Inc Barclays Bank (20,813)(7,963) First Solar Inc Goldman Sachs (38,659)
BlackRock Americas Diversified Equity Absolute Return Fundcontinued
The notes on pages 691 to 711 form an integral part of these financial statements.
Annual report and audited financial statements [119]
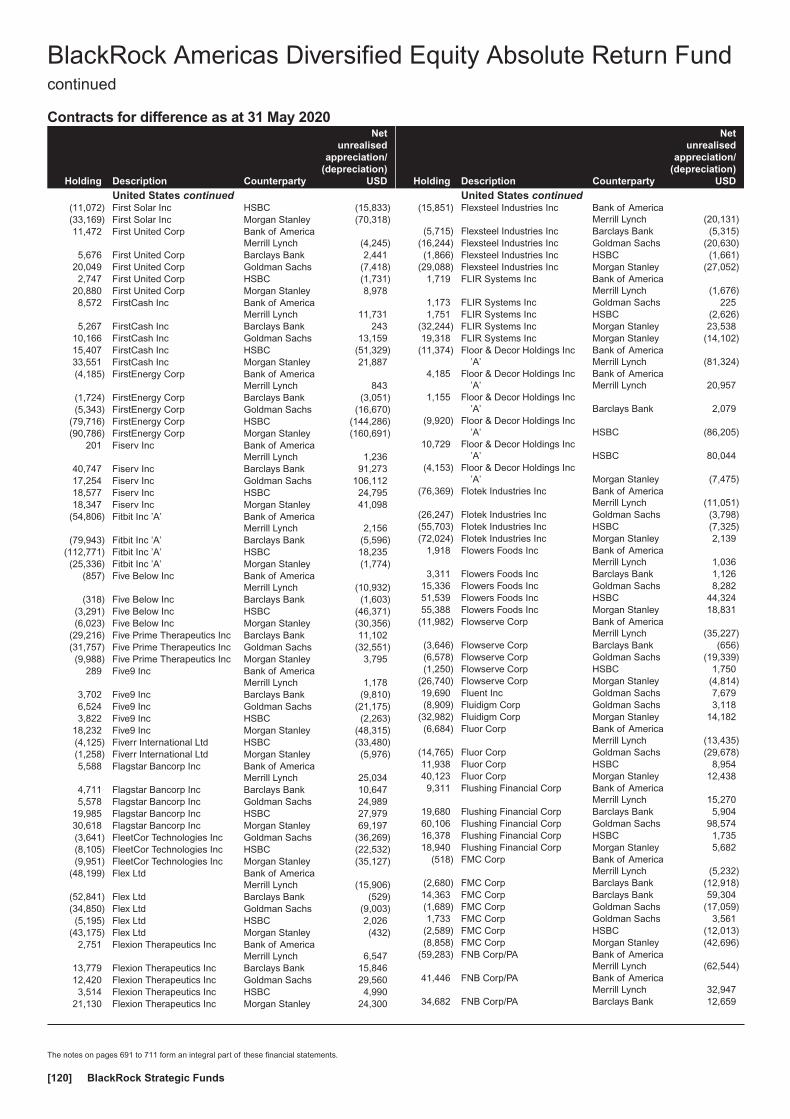
Contracts for difference as at 31 May 2020
Holding Description Counterparty
Netunrealised
appreciation/(depreciation)
USD
United States continued(11,072) First Solar Inc HSBC (15,833)(33,169) First Solar Inc Morgan Stanley (70,318)11,472 First United Corp Bank of America
Merrill Lynch (4,245)5,676 First United Corp Barclays Bank 2,441
20,049 First United Corp Goldman Sachs (7,418)2,747 First United Corp HSBC (1,731)
20,880 First United Corp Morgan Stanley 8,9788,572 FirstCash Inc Bank of America
Merrill Lynch 11,7315,267 FirstCash Inc Barclays Bank 243
10,166 FirstCash Inc Goldman Sachs 13,15915,407 FirstCash Inc HSBC (51,329)33,551 FirstCash Inc Morgan Stanley 21,887(4,185) FirstEnergy Corp Bank of America
Merrill Lynch 843(1,724) FirstEnergy Corp Barclays Bank (3,051)(5,343) FirstEnergy Corp Goldman Sachs (16,670)
(79,716) FirstEnergy Corp HSBC (144,286)(90,786) FirstEnergy Corp Morgan Stanley (160,691)
201 Fiserv Inc Bank of AmericaMerrill Lynch 1,236
40,747 Fiserv Inc Barclays Bank 91,27317,254 Fiserv Inc Goldman Sachs 106,11218,577 Fiserv Inc HSBC 24,79518,347 Fiserv Inc Morgan Stanley 41,098
(54,806) Fitbit Inc ’A’ Bank of AmericaMerrill Lynch 2,156
(79,943) Fitbit Inc ’A’ Barclays Bank (5,596)(112,771) Fitbit Inc ’A’ HSBC 18,235(25,336) Fitbit Inc ’A’ Morgan Stanley (1,774)
(857) Five Below Inc Bank of AmericaMerrill Lynch (10,932)
(318) Five Below Inc Barclays Bank (1,603)(3,291) Five Below Inc HSBC (46,371)(6,023) Five Below Inc Morgan Stanley (30,356)
(29,216) Five Prime Therapeutics Inc Barclays Bank 11,102(31,757) Five Prime Therapeutics Inc Goldman Sachs (32,551)(9,988) Five Prime Therapeutics Inc Morgan Stanley 3,795
289 Five9 Inc Bank of AmericaMerrill Lynch 1,178
3,702 Five9 Inc Barclays Bank (9,810)6,524 Five9 Inc Goldman Sachs (21,175)3,822 Five9 Inc HSBC (2,263)
18,232 Five9 Inc Morgan Stanley (48,315)(4,125) Fiverr International Ltd HSBC (33,480)(1,258) Fiverr International Ltd Morgan Stanley (5,976)5,588 Flagstar Bancorp Inc Bank of America
Merrill Lynch 25,0344,711 Flagstar Bancorp Inc Barclays Bank 10,6475,578 Flagstar Bancorp Inc Goldman Sachs 24,989
19,985 Flagstar Bancorp Inc HSBC 27,97930,618 Flagstar Bancorp Inc Morgan Stanley 69,197(3,641) FleetCor Technologies Inc Goldman Sachs (36,269)(8,105) FleetCor Technologies Inc HSBC (22,532)(9,951) FleetCor Technologies Inc Morgan Stanley (35,127)
(48,199) Flex Ltd Bank of AmericaMerrill Lynch (15,906)
(52,841) Flex Ltd Barclays Bank (529)(34,850) Flex Ltd Goldman Sachs (9,003)(5,195) Flex Ltd HSBC 2,026
(43,175) Flex Ltd Morgan Stanley (432)2,751 Flexion Therapeutics Inc Bank of America
Merrill Lynch 6,54713,779 Flexion Therapeutics Inc Barclays Bank 15,84612,420 Flexion Therapeutics Inc Goldman Sachs 29,5603,514 Flexion Therapeutics Inc HSBC 4,990
21,130 Flexion Therapeutics Inc Morgan Stanley 24,300
Holding Description Counterparty
Netunrealised
appreciation/(depreciation)
USD
United States continued(15,851) Flexsteel Industries Inc Bank of America
Merrill Lynch (20,131)(5,715) Flexsteel Industries Inc Barclays Bank (5,315)
(16,244) Flexsteel Industries Inc Goldman Sachs (20,630)(1,866) Flexsteel Industries Inc HSBC (1,661)
(29,088) Flexsteel Industries Inc Morgan Stanley (27,052)1,719 FLIR Systems Inc Bank of America
Merrill Lynch (1,676)1,173 FLIR Systems Inc Goldman Sachs 2251,751 FLIR Systems Inc HSBC (2,626)
(32,244) FLIR Systems Inc Morgan Stanley 23,53819,318 FLIR Systems Inc Morgan Stanley (14,102)
(11,374) Floor & Decor Holdings Inc’A’
Bank of AmericaMerrill Lynch (81,324)
4,185 Floor & Decor Holdings Inc’A’
Bank of AmericaMerrill Lynch 20,957
1,155 Floor & Decor Holdings Inc’A’ Barclays Bank 2,079
(9,920) Floor & Decor Holdings Inc’A’ HSBC (86,205)
10,729 Floor & Decor Holdings Inc’A’ HSBC 80,044
(4,153) Floor & Decor Holdings Inc’A’ Morgan Stanley (7,475)
(76,369) Flotek Industries Inc Bank of AmericaMerrill Lynch (11,051)
(26,247) Flotek Industries Inc Goldman Sachs (3,798)(55,703) Flotek Industries Inc HSBC (7,325)(72,024) Flotek Industries Inc Morgan Stanley 2,139
1,918 Flowers Foods Inc Bank of AmericaMerrill Lynch 1,036
3,311 Flowers Foods Inc Barclays Bank 1,12615,336 Flowers Foods Inc Goldman Sachs 8,28251,539 Flowers Foods Inc HSBC 44,32455,388 Flowers Foods Inc Morgan Stanley 18,831
(11,982) Flowserve Corp Bank of AmericaMerrill Lynch (35,227)
(3,646) Flowserve Corp Barclays Bank (656)(6,578) Flowserve Corp Goldman Sachs (19,339)(1,250) Flowserve Corp HSBC 1,750
(26,740) Flowserve Corp Morgan Stanley (4,814)19,690 Fluent Inc Goldman Sachs 7,679(8,909) Fluidigm Corp Goldman Sachs 3,118
(32,982) Fluidigm Corp Morgan Stanley 14,182(6,684) Fluor Corp Bank of America
Merrill Lynch (13,435)(14,765) Fluor Corp Goldman Sachs (29,678)11,938 Fluor Corp HSBC 8,95440,123 Fluor Corp Morgan Stanley 12,4389,311 Flushing Financial Corp Bank of America
Merrill Lynch 15,27019,680 Flushing Financial Corp Barclays Bank 5,90460,106 Flushing Financial Corp Goldman Sachs 98,57416,378 Flushing Financial Corp HSBC 1,73518,940 Flushing Financial Corp Morgan Stanley 5,682
(518) FMC Corp Bank of AmericaMerrill Lynch (5,232)
(2,680) FMC Corp Barclays Bank (12,918)14,363 FMC Corp Barclays Bank 59,304(1,689) FMC Corp Goldman Sachs (17,059)1,733 FMC Corp Goldman Sachs 3,561
(2,589) FMC Corp HSBC (12,013)(8,858) FMC Corp Morgan Stanley (42,696)
(59,283) FNB Corp/PA Bank of AmericaMerrill Lynch (62,544)
41,446 FNB Corp/PA Bank of AmericaMerrill Lynch 32,947
34,682 FNB Corp/PA Barclays Bank 12,659
BlackRock Americas Diversified Equity Absolute Return Fundcontinued
The notes on pages 691 to 711 form an integral part of these financial statements.
BlackRock Strategic Funds[120]

Contracts for difference as at 31 May 2020
Holding Description Counterparty
Netunrealised
appreciation/(depreciation)
USD
United States continued95,901 FNB Corp/PA Goldman Sachs 101,176
(61,265) FNB Corp/PA HSBC 20,52479,447 FNB Corp/PA HSBC (11,365)
(24,540) FNB Corp/PA Morgan Stanley (8,957)123,198 FNB Corp/PA Morgan Stanley 35,093
(2,060) FNCB Bancorp Inc Bank of AmericaMerrill Lynch 21
(3,774) FNCB Bancorp Inc Barclays Bank 1,208(10,852) FNCB Bancorp Inc Goldman Sachs 109
(410) FNCB Bancorp Inc HSBC 221(11,032) FNCB Bancorp Inc Morgan Stanley 3,530
7,726 Focus Financial PartnersInc ’A’ Goldman Sachs 41,257
11,404 Focus Financial PartnersInc ’A’ Morgan Stanley (1,140)
(2,759) Fomento EconomicoMexicano SAB de CVADR HSBC 3,559
1,369 FONAR Corp Bank of AmericaMerrill Lynch 5,859
10,051 FONAR Corp Barclays Bank 10,15212,716 FONAR Corp Goldman Sachs 54,4246,214 FONAR Corp HSBC 21,1287,563 FONAR Corp Morgan Stanley 7,6392,140 Foot Locker Inc Bank of America
Merrill Lynch 4,066(8,423) Foot Locker Inc Bank of America
Merrill Lynch (16,004)3,023 Foot Locker Inc Barclays Bank 1,4815,727 Foot Locker Inc Goldman Sachs 10,881
(8,470) Foot Locker Inc Goldman Sachs (16,093)5,452 Foot Locker Inc HSBC 8,5055,937 Foot Locker Inc Morgan Stanley 2,909
(15,397) Foot Locker Inc Morgan Stanley (7,545)172,671 Ford Motor Co Goldman Sachs 136,410185,473 Ford Motor Co HSBC 83,46375,063 Ford Motor Co Morgan Stanley 3,003
(14,748) Forestar Group Inc Bank of AmericaMerrill Lynch (33,036)
(4,364) Forestar Group Inc Barclays Bank (2,880)(16,252) Forestar Group Inc Goldman Sachs (36,404)(7,625) Forestar Group Inc HSBC (10,370)(9,121) Forestar Group Inc Morgan Stanley (6,020)13,007 FormFactor Inc Bank of America
Merrill Lynch 22,27339,567 FormFactor Inc Barclays Bank 41,15033,712 FormFactor Inc Goldman Sachs 65,06481,057 FormFactor Inc HSBC (7,043)83,171 FormFactor Inc Morgan Stanley 84,4827,146 Forrester Research Inc Bank of America
Merrill Lynch 5,8603,339 Forrester Research Inc Barclays Bank (3,005)
22,337 Forrester Research Inc Goldman Sachs 18,3161,676 Forrester Research Inc HSBC (7,743)2,053 Forrester Research Inc Morgan Stanley (1,848)
(25,999) Forterra Inc Bank of AmericaMerrill Lynch (21,579)
(8,070) Forterra Inc Goldman Sachs (6,698)(26,503) Forterra Inc HSBC (8,652)(2,894) Forterra Inc Morgan Stanley (203)(3,101) Fortinet Inc Barclays Bank 16,6214,045 Fortinet Inc Morgan Stanley (21,681)
(3,903) Fortinet Inc Morgan Stanley 20,920(6,401) Fortive Corp Bank of America
Merrill Lynch (34,949)13,051 Fortive Corp Bank of America
Merrill Lynch 64,323(12,211) Fortive Corp Barclays Bank (26,620)
1,908 Fortive Corp Barclays Bank 4,159
Holding Description Counterparty
Netunrealised
appreciation/(depreciation)
USD
United States continued(3,418) Fortive Corp Goldman Sachs (18,662)10,534 Fortive Corp Goldman Sachs 57,516(9,749) Fortive Corp HSBC (15,849)23,756 Fortive Corp HSBC 80,222(6,312) Fortive Corp Morgan Stanley (13,760)9,768 Fortive Corp Morgan Stanley 21,2943,964 Fortune Brands Home &
Security IncBank of AmericaMerrill Lynch 27,827
5,479 Fortune Brands Home &Security Inc Barclays Bank 219
(4,787) Fortune Brands Home &Security Inc Barclays Bank 9,310
5,588 Fortune Brands Home &Security Inc Goldman Sachs 39,228
(12,667) Fortune Brands Home &Security Inc Goldman Sachs (823)
8,949 Fortune Brands Home &Security Inc HSBC 40,181
25,610 Fortune Brands Home &Security Inc Morgan Stanley 1,024
(17,624) Fortune Brands Home &Security Inc Morgan Stanley (705)
99,299 Forum Energy TechnologiesInc Barclays Bank (1,589)
200,946 Forum Energy TechnologiesInc HSBC (29,619)
193,215 Forum Energy TechnologiesInc Morgan Stanley (3,091)
(1,217) Forward Air Corp Bank of AmericaMerrill Lynch (6,328)
(25,232) Forward Air Corp HSBC 9,588(15,853) Forward Air Corp Morgan Stanley (38,998)(32,906) Fossil Group Inc Bank of America
Merrill Lynch (5,594)(12,680) Fossil Group Inc Barclays Bank 2,282(39,065) Fossil Group Inc Goldman Sachs (6,641)(23,801) Fossil Group Inc HSBC 12,139(68,028) Fossil Group Inc Morgan Stanley 12,24531,751 Foundation Building
Materials IncBank of AmericaMerrill Lynch 44,134
32,101 Foundation BuildingMaterials Inc Goldman Sachs 44,620
27,703 Foundation BuildingMaterials Inc Morgan Stanley (1,662)
137,672 Four Corners Property TrustInc (REIT)
Bank of AmericaMerrill Lynch 245,056
19,695 Four Corners Property TrustInc (REIT) HSBC (18,215)
17,407 Four Corners Property TrustInc (REIT) Morgan Stanley (6,196)
9,136 Fox Corp ’A’ HSBC 22,931(6,956) Fox Corp ’B’ Bank of America
Merrill Lynch (19,268)(20,327) Fox Corp ’B’ Barclays Bank (18,294)(18,602) Fox Corp ’B’ Goldman Sachs (51,528)
(841) Fox Corp ’B’ HSBC (2,136)(20,100) Fox Corp ’B’ Morgan Stanley (18,090)
9,318 Fox Factory Holding Corp Bank of AmericaMerrill Lynch 136,323
1,502 Fox Factory Holding Corp Barclays Bank 4,7911,999 Fox Factory Holding Corp Goldman Sachs 29,2462,701 Fox Factory Holding Corp HSBC 37,7062,894 Fox Factory Holding Corp Morgan Stanley 9,232
(1,454) Franchise Group Inc Bank of AmericaMerrill Lynch (2,574)
(7,778) Franchise Group Inc Barclays Bank 233(14,160) Franchise Group Inc Goldman Sachs (25,063)(2,157) Franchise Group Inc Morgan Stanley 654,243 Franklin Covey Co Barclays Bank 424
BlackRock Americas Diversified Equity Absolute Return Fundcontinued
The notes on pages 691 to 711 form an integral part of these financial statements.
Annual report and audited financial statements [121]

Contracts for difference as at 31 May 2020
Holding Description Counterparty
Netunrealised
appreciation/(depreciation)
USD
United States continued25,754 Franklin Covey Co Goldman Sachs 39,91912,886 Franklin Covey Co HSBC (3,608)29,828 Franklin Covey Co Morgan Stanley 2,983
(761) Franklin Electric Co Inc Bank of AmericaMerrill Lynch (3,904)
2,851 Franklin Electric Co Inc Bank of AmericaMerrill Lynch 14,626
(3,573) Franklin Electric Co Inc Barclays Bank (9,254)14,375 Franklin Electric Co Inc Barclays Bank 37,2314,185 Franklin Electric Co Inc Goldman Sachs 21,469
(7,797) Franklin Electric Co Inc Goldman Sachs (39,999)(562) Franklin Electric Co Inc HSBC (821)
5,167 Franklin Electric Co Inc HSBC 7,544(628) Franklin Electric Co Inc Morgan Stanley (1,627)
9,106 Franklin Electric Co Inc Morgan Stanley 23,585(30,692) Franklin Financial Network
IncBank of AmericaMerrill Lynch (97,294)
(1,994) Franklin Financial NetworkInc Barclays Bank (1,894)
(16,025) Franklin Financial NetworkInc HSBC (25,320)
(10,990) Franklin Financial NetworkInc Morgan Stanley (10,441)
4,637 Franklin Financial ServicesCorp
Bank of AmericaMerrill Lynch 5,704
2,489 Franklin Financial ServicesCorp Barclays Bank 2,315
3,421 Franklin Financial ServicesCorp Goldman Sachs 4,208
2,184 Franklin Financial ServicesCorp HSBC (3,975)
815 Franklin Financial ServicesCorp Morgan Stanley 758
(9,272) Franklin Resources Inc Bank of AmericaMerrill Lynch (8,808)
10,854 Franklin Resources Inc Bank of AmericaMerrill Lynch 10,311
(8,915) Franklin Resources Inc Barclays Bank (7,310)6,769 Franklin Resources Inc Barclays Bank 5,551
(1,946) Franklin Resources Inc Goldman Sachs (1,849)(7,395) Franklin Resources Inc HSBC 3,62445,812 Franklin Resources Inc HSBC (9,115)
(10,289) Franklin Resources Inc Morgan Stanley (8,437)18,189 Franklin Resources Inc Morgan Stanley (5,514)46,502 Franklin Street Properties
Corp (REIT)Bank of AmericaMerrill Lynch 36,737
64,878 Franklin Street PropertiesCorp (REIT) Barclays Bank 20,761
12,923 Franklin Street PropertiesCorp (REIT) Goldman Sachs 10,209
54,750 Franklin Street PropertiesCorp (REIT) HSBC 2,190
58,638 Franklin Street PropertiesCorp (REIT) Morgan Stanley 18,764
3,180 Frank’s International NV Goldman Sachs 92267,074 Frank’s International NV Morgan Stanley 25,4884,158 Freeport-McMoRan Inc Bank of America
Merrill Lynch 2,32857,584 Freeport-McMoRan Inc Barclays Bank 17,275
(30,994) Freeport-McMoRan Inc Barclays Bank (9,298)2,822 Freeport-McMoRan Inc Goldman Sachs 1,580
43,595 Freeport-McMoRan Inc HSBC (7,411)(49,255) Freeport-McMoRan Inc HSBC 8,373102,349 Freeport-McMoRan Inc Morgan Stanley 30,705(69,327) FreightCar America Inc Bank of America
Merrill Lynch (13,172)6,469 Frequency Therapeutics Inc Barclays Bank (7,827)4,614 Frequency Therapeutics Inc Goldman Sachs (4,429)
Holding Description Counterparty
Netunrealised
appreciation/(depreciation)
USD
United States continued5,099 Frequency Therapeutics Inc HSBC 2,3976,376 Frequency Therapeutics Inc Morgan Stanley (7,715)
(4,174) Fresh Del Monte ProduceInc
Bank of AmericaMerrill Lynch (7,124)
(5,721) Fresh Del Monte ProduceInc Barclays Bank (10,355)
(3,220) Fresh Del Monte ProduceInc Goldman Sachs (7,567)
(18,333) Fresh Del Monte ProduceInc HSBC 14,483
(22,946) Fresh Del Monte ProduceInc Morgan Stanley (41,533)
3,332 Freshpet Inc Bank of AmericaMerrill Lynch 11,426
4,520 Freshpet Inc Barclays Bank 18,56215,293 Freshpet Inc Goldman Sachs 52,2517,118 Freshpet Inc HSBC 19,684
16,710 Freshpet Inc Morgan Stanley 82,5481,137 frontdoor Inc Bank of America
Merrill Lynch 3,1951,888 frontdoor Inc Barclays Bank 3,4743,374 frontdoor Inc Goldman Sachs 9,4816,002 frontdoor Inc HSBC 17,526
10,661 frontdoor Inc Morgan Stanley 19,6169,910 Frontline Ltd Goldman Sachs 13,180
14,010 Frontline Ltd HSBC 11,348(9,637) FRP Holdings Inc Bank of America
Merrill Lynch (964)(3,610) FRP Holdings Inc Goldman Sachs (361)
(928) FRP Holdings Inc HSBC 3,740(2,846) FRP Holdings Inc Morgan Stanley (1,964)8,345 FS Bancorp Inc Bank of America
Merrill Lynch 35,9675,647 FS Bancorp Inc Barclays Bank 5,082
861 FS Bancorp Inc Goldman Sachs 3,7114,582 FS Bancorp Inc HSBC 7,9732,814 FS Bancorp Inc Morgan Stanley 2,533
(1,131) FTI Consulting Inc Bank of AmericaMerrill Lynch (9,150)
(3,139) FTI Consulting Inc Barclays Bank (23,950)(6,461) FTI Consulting Inc Goldman Sachs (52,027)
(12,725) FTI Consulting Inc HSBC 5,218(9,236) FTI Consulting Inc Morgan Stanley (70,471)
(21,129) FTS International Inc Barclays Bank (20,495)(15,438) FTS International Inc Goldman Sachs (14,718)(19,476) Fulgent Genetics Inc Barclays Bank (30,772)(2,539) Fulgent Genetics Inc HSBC (2,084)(2,211) Fulgent Genetics Inc Morgan Stanley (3,493)21,997 Fulton Financial Corp Bank of America
Merrill Lynch 18,48944,115 Fulton Financial Corp Barclays Bank 22,82260,868 Fulton Financial Corp Goldman Sachs 75,912
123,463 Fulton Financial Corp HSBC 60,600176,944 Fulton Financial Corp Morgan Stanley 99,550(16,198) Funko Inc ’A’ Bank of America
Merrill Lynch (18,790)(109,432) Funko Inc ’A’ Barclays Bank (65,659)
(6,851) Funko Inc ’A’ HSBC (4,453)(2,126) Funko Inc ’A’ Morgan Stanley (1,276)15,889 FutureFuel Corp Bank of America
Merrill Lynch 25,5812,943 FutureFuel Corp Barclays Bank 2,266
24,539 FutureFuel Corp Goldman Sachs 39,5086,042 FutureFuel Corp HSBC 13,836
20,242 FutureFuel Corp Morgan Stanley 15,586(9,453) FVCBankcorp Inc Barclays Bank (1,323)
(27,591) FVCBankcorp Inc HSBC (5,794)
BlackRock Americas Diversified Equity Absolute Return Fundcontinued
The notes on pages 691 to 711 form an integral part of these financial statements.
BlackRock Strategic Funds[122]

Contracts for difference as at 31 May 2020
Holding Description Counterparty
Netunrealised
appreciation/(depreciation)
USD
United States continued(10,194) G1 Therapeutics Inc Bank of America
Merrill Lynch (13,660)(2,829) G1 Therapeutics Inc Barclays Bank 1,245(2,424) G1 Therapeutics Inc Goldman Sachs (3,248)(2,842) G1 Therapeutics Inc HSBC (9,094)(2,294) G1 Therapeutics Inc Morgan Stanley 1,009(3,368) Gafisa SA ADR Goldman Sachs (236)
(11,535) Gafisa SA ADR Morgan Stanley 923(23,989) Gaia Inc Morgan Stanley 14,393(8,007) GAIN Capital Holdings Inc Bank of America
Merrill Lynch 2,361(32,177) GAIN Capital Holdings Inc Barclays Bank 2,574(8,910) GAIN Capital Holdings Inc HSBC 1,444
(76,233) GAIN Capital Holdings Inc Morgan Stanley 6,099(17,674) Galectin Therapeutics Inc Barclays Bank 2,828(8,969) Galectin Therapeutics Inc HSBC (1,973)(9,139) GAMCO Investors Inc ’A’ Bank of America
Merrill Lynch (15,902)(3,709) GAMCO Investors Inc ’A’ Barclays Bank (3,153)(3,352) GAMCO Investors Inc ’A’ HSBC (5,397)24,544 GameStop Corp ’A’ Goldman Sachs 4,66376,237 GameStop Corp ’A’ HSBC (43,455)
(16,892) Gaming and LeisureProperties Inc (REIT) Barclays Bank 8,436
(5,036) Gaming and LeisureProperties Inc (REIT) Goldman Sachs (33,641)
(24,275) Gaming and LeisureProperties Inc (REIT) HSBC (139,339)
(39,835) Gaming and LeisureProperties Inc (REIT) Morgan Stanley 18,324
10,118 Gannett Co Inc Bank of AmericaMerrill Lynch 3,585
34,121 Gannett Co Inc Goldman Sachs 12,08911,800 Gannett Co Inc HSBC 2,47871,236 Gannett Co Inc Morgan Stanley (4,987)30,640 Gap Inc Bank of America
Merrill Lynch 46,57334,381 Gap Inc Barclays Bank 31,287
(22,622) Gap Inc Barclays Bank (20,586)2,777 Gap Inc Goldman Sachs 4,221
53,236 Gap Inc HSBC 56,18337,938 Gap Inc Morgan Stanley 34,524
(12,114) Gap Inc Morgan Stanley (11,024)(584) Garmin Ltd Bank of America
Merrill Lynch (7,428)5,795 Garmin Ltd Barclays Bank 39,783
(12,017) Garmin Ltd Barclays Bank (75,044)2,795 Garmin Ltd Goldman Sachs 35,552
(20,258) Garmin Ltd Goldman Sachs (254,582)11,733 Garmin Ltd HSBC 110,408
(996) Garmin Ltd HSBC (9,372)13,115 Garmin Ltd Morgan Stanley 90,034(3,632) Garmin Ltd Morgan Stanley (24,934)(8,441) Garrett Motion Inc Morgan Stanley (6,162)5,257 Gartner Inc Bank of America
Merrill Lynch 59,1944,098 Gartner Inc Barclays Bank 21,2285,855 Gartner Inc Goldman Sachs 55,0952,530 Gartner Inc HSBC 531
15,765 Gartner Inc Morgan Stanley 81,663(4,574) GasLog Ltd Barclays Bank 1,052
(37,427) GasLog Ltd Goldman Sachs 8,982(25,897) GasLog Ltd Morgan Stanley 5,956(3,192) Gates Industrial Corp Plc Barclays Bank (1,404)(9,415) Gates Industrial Corp Plc Goldman Sachs (13,087)
(10,610) Gates Industrial Corp Plc HSBC (11,141)(9,929) Gates Industrial Corp Plc Morgan Stanley (4,369)2,748 GATX Corp Bank of America
Merrill Lynch (6,307)
Holding Description Counterparty
Netunrealised
appreciation/(depreciation)
USD
United States continued825 GATX Corp Barclays Bank 792
10,521 GATX Corp Goldman Sachs 81,222891 GATX Corp HSBC 1,354
49,464 GATX Corp Morgan Stanley 47,485(1,947) GCI Liberty Inc ’A’ Bank of America
Merrill Lynch (14,739)6,658 GCI Liberty Inc ’A’ Bank of America
Merrill Lynch 50,401(283) GCI Liberty Inc ’A’ Goldman Sachs (2,142)(547) GCI Liberty Inc ’A’ HSBC (2,976)
(17,907) GCI Liberty Inc ’A’ Morgan Stanley (61,958)(14,811) GCP Applied Technologies
Inc Barclays Bank (7,406)(17,931) GCP Applied Technologies
Inc Goldman Sachs (53,613)(19,079) GCP Applied Technologies
Inc HSBC (15,263)(73,582) GCP Applied Technologies
Inc Morgan Stanley (36,792)(9,508) Genasys Inc Bank of America
Merrill Lynch (1,646)(18,950) Genasys Inc HSBC (3,224)(15,271) Genco Shipping & Trading
Ltd Goldman Sachs (76)(8,794) Genco Shipping & Trading
Ltd HSBC 7,079(43,831) Genco Shipping & Trading
Ltd Morgan Stanley 8,98523,474 Gencor Industries Inc Bank of America
Merrill Lynch 18,77911,730 Gencor Industries Inc Barclays Bank 2,34620,117 Gencor Industries Inc Goldman Sachs 16,09411,676 Gencor Industries Inc HSBC (2,685)17,568 Gencor Industries Inc Morgan Stanley 3,51411,272 Generac Holdings Inc Bank of America
Merrill Lynch 133,0106,447 Generac Holdings Inc Barclays Bank 8,778
15,953 Generac Holdings Inc Goldman Sachs 188,2463,992 Generac Holdings Inc HSBC 51,680
20,161 Generac Holdings Inc Morgan Stanley 42,338(75,919) General Electric Co Bank of America
Merrill Lynch (82,752)(84,401) General Electric Co Barclays Bank (14,348)(50,170) General Electric Co Goldman Sachs (54,686)
(135,012) General Electric Co HSBC (61,002)(190,275) General Electric Co Morgan Stanley (32,347)(10,764) General Finance Corp Bank of America
Merrill Lynch (13,563)(2,974) General Finance Corp Barclays Bank (952)(2,863) General Finance Corp Goldman Sachs (3,607)3,226 General Mills Inc Bank of America
Merrill Lynch 8,58329,769 General Mills Inc Barclays Bank 74,72129,794 General Mills Inc Goldman Sachs (596)27,166 General Mills Inc HSBC 65,27629,042 General Mills Inc Morgan Stanley 72,896(9,400) General Motors Co Bank of America
Merrill Lynch (13,803)34,450 General Motors Co Barclays Bank (861)
(11,295) General Motors Co Barclays Bank 282(9,854) General Motors Co Goldman Sachs (16,977)26,267 General Motors Co HSBC 53,19137,755 General Motors Co Morgan Stanley (944)
(53,385) General Motors Co Morgan Stanley 1,3357,847 Genesco Inc Bank of America
Merrill Lynch 33,7427,973 Genesco Inc Barclays Bank 16,265
15,481 Genesco Inc Goldman Sachs 61,5957,009 Genesco Inc Morgan Stanley 14,298
BlackRock Americas Diversified Equity Absolute Return Fundcontinued
The notes on pages 691 to 711 form an integral part of these financial statements.
Annual report and audited financial statements [123]
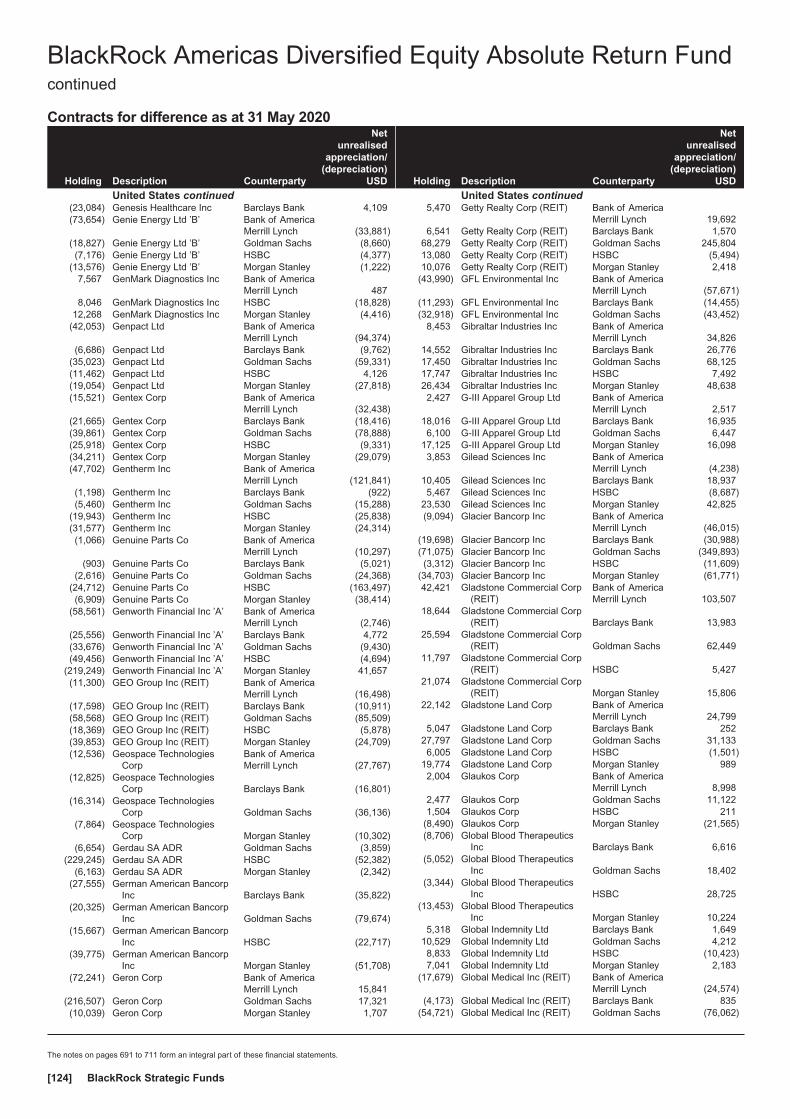
Contracts for difference as at 31 May 2020
Holding Description Counterparty
Netunrealised
appreciation/(depreciation)
USD
United States continued(23,084) Genesis Healthcare Inc Barclays Bank 4,109(73,654) Genie Energy Ltd ’B’ Bank of America
Merrill Lynch (33,881)(18,827) Genie Energy Ltd ’B’ Goldman Sachs (8,660)(7,176) Genie Energy Ltd ’B’ HSBC (4,377)
(13,576) Genie Energy Ltd ’B’ Morgan Stanley (1,222)7,567 GenMark Diagnostics Inc Bank of America
Merrill Lynch 4878,046 GenMark Diagnostics Inc HSBC (18,828)
12,268 GenMark Diagnostics Inc Morgan Stanley (4,416)(42,053) Genpact Ltd Bank of America
Merrill Lynch (94,374)(6,686) Genpact Ltd Barclays Bank (9,762)
(35,023) Genpact Ltd Goldman Sachs (59,331)(11,462) Genpact Ltd HSBC 4,126(19,054) Genpact Ltd Morgan Stanley (27,818)(15,521) Gentex Corp Bank of America
Merrill Lynch (32,438)(21,665) Gentex Corp Barclays Bank (18,416)(39,861) Gentex Corp Goldman Sachs (78,888)(25,918) Gentex Corp HSBC (9,331)(34,211) Gentex Corp Morgan Stanley (29,079)(47,702) Gentherm Inc Bank of America
Merrill Lynch (121,841)(1,198) Gentherm Inc Barclays Bank (922)(5,460) Gentherm Inc Goldman Sachs (15,288)
(19,943) Gentherm Inc HSBC (25,838)(31,577) Gentherm Inc Morgan Stanley (24,314)(1,066) Genuine Parts Co Bank of America
Merrill Lynch (10,297)(903) Genuine Parts Co Barclays Bank (5,021)
(2,616) Genuine Parts Co Goldman Sachs (24,368)(24,712) Genuine Parts Co HSBC (163,497)(6,909) Genuine Parts Co Morgan Stanley (38,414)
(58,561) Genworth Financial Inc ’A’ Bank of AmericaMerrill Lynch (2,746)
(25,556) Genworth Financial Inc ’A’ Barclays Bank 4,772(33,676) Genworth Financial Inc ’A’ Goldman Sachs (9,430)(49,456) Genworth Financial Inc ’A’ HSBC (4,694)
(219,249) Genworth Financial Inc ’A’ Morgan Stanley 41,657(11,300) GEO Group Inc (REIT) Bank of America
Merrill Lynch (16,498)(17,598) GEO Group Inc (REIT) Barclays Bank (10,911)(58,568) GEO Group Inc (REIT) Goldman Sachs (85,509)(18,369) GEO Group Inc (REIT) HSBC (5,878)(39,853) GEO Group Inc (REIT) Morgan Stanley (24,709)(12,536) Geospace Technologies
CorpBank of AmericaMerrill Lynch (27,767)
(12,825) Geospace TechnologiesCorp Barclays Bank (16,801)
(16,314) Geospace TechnologiesCorp Goldman Sachs (36,136)
(7,864) Geospace TechnologiesCorp Morgan Stanley (10,302)
(6,654) Gerdau SA ADR Goldman Sachs (3,859)(229,245) Gerdau SA ADR HSBC (52,382)
(6,163) Gerdau SA ADR Morgan Stanley (2,342)(27,555) German American Bancorp
Inc Barclays Bank (35,822)(20,325) German American Bancorp
Inc Goldman Sachs (79,674)(15,667) German American Bancorp
Inc HSBC (22,717)(39,775) German American Bancorp
Inc Morgan Stanley (51,708)(72,241) Geron Corp Bank of America
Merrill Lynch 15,841(216,507) Geron Corp Goldman Sachs 17,321(10,039) Geron Corp Morgan Stanley 1,707
Holding Description Counterparty
Netunrealised
appreciation/(depreciation)
USD
United States continued5,470 Getty Realty Corp (REIT) Bank of America
Merrill Lynch 19,6926,541 Getty Realty Corp (REIT) Barclays Bank 1,570
68,279 Getty Realty Corp (REIT) Goldman Sachs 245,80413,080 Getty Realty Corp (REIT) HSBC (5,494)10,076 Getty Realty Corp (REIT) Morgan Stanley 2,418
(43,990) GFL Environmental Inc Bank of AmericaMerrill Lynch (57,671)
(11,293) GFL Environmental Inc Barclays Bank (14,455)(32,918) GFL Environmental Inc Goldman Sachs (43,452)
8,453 Gibraltar Industries Inc Bank of AmericaMerrill Lynch 34,826
14,552 Gibraltar Industries Inc Barclays Bank 26,77617,450 Gibraltar Industries Inc Goldman Sachs 68,12517,747 Gibraltar Industries Inc HSBC 7,49226,434 Gibraltar Industries Inc Morgan Stanley 48,6382,427 G-III Apparel Group Ltd Bank of America
Merrill Lynch 2,51718,016 G-III Apparel Group Ltd Barclays Bank 16,9356,100 G-III Apparel Group Ltd Goldman Sachs 6,447
17,125 G-III Apparel Group Ltd Morgan Stanley 16,0983,853 Gilead Sciences Inc Bank of America
Merrill Lynch (4,238)10,405 Gilead Sciences Inc Barclays Bank 18,9375,467 Gilead Sciences Inc HSBC (8,687)
23,530 Gilead Sciences Inc Morgan Stanley 42,825(9,094) Glacier Bancorp Inc Bank of America
Merrill Lynch (46,015)(19,698) Glacier Bancorp Inc Barclays Bank (30,988)(71,075) Glacier Bancorp Inc Goldman Sachs (349,893)(3,312) Glacier Bancorp Inc HSBC (11,609)
(34,703) Glacier Bancorp Inc Morgan Stanley (61,771)42,421 Gladstone Commercial Corp
(REIT)Bank of AmericaMerrill Lynch 103,507
18,644 Gladstone Commercial Corp(REIT) Barclays Bank 13,983
25,594 Gladstone Commercial Corp(REIT) Goldman Sachs 62,449
11,797 Gladstone Commercial Corp(REIT) HSBC 5,427
21,074 Gladstone Commercial Corp(REIT) Morgan Stanley 15,806
22,142 Gladstone Land Corp Bank of AmericaMerrill Lynch 24,799
5,047 Gladstone Land Corp Barclays Bank 25227,797 Gladstone Land Corp Goldman Sachs 31,1336,005 Gladstone Land Corp HSBC (1,501)
19,774 Gladstone Land Corp Morgan Stanley 9892,004 Glaukos Corp Bank of America
Merrill Lynch 8,9982,477 Glaukos Corp Goldman Sachs 11,1221,504 Glaukos Corp HSBC 211
(8,490) Glaukos Corp Morgan Stanley (21,565)(8,706) Global Blood Therapeutics
Inc Barclays Bank 6,616(5,052) Global Blood Therapeutics
Inc Goldman Sachs 18,402(3,344) Global Blood Therapeutics
Inc HSBC 28,725(13,453) Global Blood Therapeutics
Inc Morgan Stanley 10,2245,318 Global Indemnity Ltd Barclays Bank 1,649
10,529 Global Indemnity Ltd Goldman Sachs 4,2128,833 Global Indemnity Ltd HSBC (10,423)7,041 Global Indemnity Ltd Morgan Stanley 2,183
(17,679) Global Medical Inc (REIT) Bank of AmericaMerrill Lynch (24,574)
(4,173) Global Medical Inc (REIT) Barclays Bank 835(54,721) Global Medical Inc (REIT) Goldman Sachs (76,062)
BlackRock Americas Diversified Equity Absolute Return Fundcontinued
The notes on pages 691 to 711 form an integral part of these financial statements.
BlackRock Strategic Funds[124]

Contracts for difference as at 31 May 2020
Holding Description Counterparty
Netunrealised
appreciation/(depreciation)
USD
United States continued(35,654) Global Medical Inc (REIT) HSBC (14,618)(20,396) Global Medical Inc (REIT) Morgan Stanley 4,079
318 Global Payments Inc Bank of AmericaMerrill Lynch 2,639
(4,785) Global Payments Inc Goldman Sachs (39,716)2,621 Global Payments Inc Goldman Sachs 8,430
(6,744) Global Payments Inc HSBC (21,109)5,174 Global Payments Inc HSBC 19,092
(17,163) Global Payments Inc Morgan Stanley (24,371)4,284 Global Payments Inc Morgan Stanley 6,078
27,685 Global Water Resources Inc Bank of AmericaMerrill Lynch 7,198
24,234 Global Water Resources Inc Barclays Bank 21,08428,311 Global Water Resources Inc Goldman Sachs 7,3611,087 Global Water Resources Inc HSBC (565)
32,343 Global Water Resources Inc Morgan Stanley 28,138(20,835) GlobalSCAPE Inc Barclays Bank (2,917)(9,526) GlobalSCAPE Inc HSBC (342)
(23,170) GlobalSCAPE Inc Morgan Stanley (3,244)1,153 Globant SA Bank of America
Merrill Lynch 22,1151,230 Globant SA HSBC 21,550(293) Globant SA HSBC (1,699)(436) Globant SA Morgan Stanley (829)
5,159 Globe Life Inc Bank of AmericaMerrill Lynch 14,674
15,488 Globe Life Inc Barclays Bank 52,0403,687 Globe Life Inc Goldman Sachs 25,065
10,773 Globe Life Inc HSBC (7,665)20,747 Globe Life Inc Morgan Stanley 65,92318,874 Globus Medical Inc ’A’ Bank of America
Merrill Lynch 130,33211,318 Globus Medical Inc ’A’ Barclays Bank (905)5,490 Globus Medical Inc ’A’ Goldman Sachs 50,563
17,366 Globus Medical Inc ’A’ HSBC 109,07318,407 Globus Medical Inc ’A’ Morgan Stanley (1,473)
(10,546) Glu Mobile Inc Barclays Bank (3,586)(10,048) Glu Mobile Inc Goldman Sachs (3,199)(69,609) Glu Mobile Inc HSBC 33,412(2,853) Glu Mobile Inc Morgan Stanley (970)(2,264) GlycoMimetics Inc Barclays Bank 158(7,199) GlycoMimetics Inc Goldman Sachs 1,296
(52,340) GlycoMimetics Inc HSBC 2,61712,301 GMS Inc Bank of America
Merrill Lynch 27,1856,169 GMS Inc Barclays Bank (925)4,947 GMS Inc Goldman Sachs 10,9334,911 GMS Inc HSBC 7,661
17,760 GMS Inc Morgan Stanley (2,664)3,762 GoDaddy Inc ’A’ Bank of America
Merrill Lynch (640)(2,907) GoDaddy Inc ’A’ Bank of America
Merrill Lynch 2,1332,973 GoDaddy Inc ’A’ Barclays Bank 2,022
(5,594) GoDaddy Inc ’A’ Barclays Bank (2,870)3,409 GoDaddy Inc ’A’ Goldman Sachs (580)
(3,937) GoDaddy Inc ’A’ Goldman Sachs 6693,570 GoDaddy Inc ’A’ HSBC 4,6054,363 GoDaddy Inc ’A’ Morgan Stanley 2,967(897) GoDaddy Inc ’A’ Morgan Stanley (610)
13,958 Gogo Inc Goldman Sachs 2,93128,198 Gogo Inc HSBC 18,04757,985 Gogo Inc Morgan Stanley (9,857)
(34,698) Gol Linhas AereasInteligentes SA ADR HSBC (14,920)
12,441 Golar LNG Ltd Bank of AmericaMerrill Lynch 23,513
9,154 Golar LNG Ltd Barclays Bank 6,49911,005 Golar LNG Ltd Goldman Sachs 20,799
Holding Description Counterparty
Netunrealised
appreciation/(depreciation)
USD
United States continued14,608 Golar LNG Ltd HSBC 9,05712,846 Golar LNG Ltd Morgan Stanley 9,12124,705 Gold Resource Corp Bank of America
Merrill Lynch (6,917)40,681 Gold Resource Corp Barclays Bank (4,882)40,845 Gold Resource Corp Goldman Sachs (11,437)7,090 Gold Resource Corp HSBC (993)
75,849 Gold Resource Corp Morgan Stanley (9,102)11,369 Golden Entertainment Inc Bank of America
Merrill Lynch 40,13317,530 Golden Entertainment Inc Barclays Bank 6,31117,370 Golden Entertainment Inc HSBC 51,5897,664 Golden Entertainment Inc Morgan Stanley 2,759
(13,920) Goldman Sachs Group Inc Bank of AmericaMerrill Lynch (295,544)
(5,645) Goldman Sachs Group Inc Barclays Bank (110,134)(538) Goldman Sachs Group Inc HSBC (7,559)
(14,358) Goldman Sachs Group Inc Morgan Stanley (280,125)10,370 Goodrich Petroleum Corp Bank of America
Merrill Lynch 13,2747,786 Goodrich Petroleum Corp Goldman Sachs 9,966
13,631 Goodrich Petroleum Corp Morgan Stanley 9,26971,624 Goodyear Tire & Rubber Co Bank of America
Merrill Lynch 88,09862,166 Goodyear Tire & Rubber Co Barclays Bank 29,529
158,750 Goodyear Tire & Rubber Co Morgan Stanley 75,406(1,783) Goosehead Insurance Inc
’A’ Barclays Bank (89)(8,551) Goosehead Insurance Inc
’A’ Goldman Sachs (15,455)(1,234) Goosehead Insurance Inc
’A’ HSBC 1,740(7,835) Goosehead Insurance Inc
’A’ Morgan Stanley (392)(204,892) GoPro Inc ’A’ Barclays Bank (104,495)(10,977) GoPro Inc ’A’ Goldman Sachs (9,440)(13,780) Gorman-Rupp Co Bank of America
Merrill Lynch (45,474)(5,157) Gorman-Rupp Co Barclays Bank (5,105)
(21,594) Gorman-Rupp Co Goldman Sachs (67,774)(7,703) Gorman-Rupp Co HSBC (10,553)
(12,186) Gorman-Rupp Co Morgan Stanley (12,064)5,241 Gossamer Bio Inc Bank of America
Merrill Lynch (12,212)4,116 Gossamer Bio Inc Barclays Bank (3,334)1,653 Gossamer Bio Inc Goldman Sachs (3,851)7,247 Gossamer Bio Inc HSBC (18,408)
21,815 Gossamer Bio Inc Morgan Stanley (17,670)(61,304) GP Strategies Corp Bank of America
Merrill Lynch (80,921)29,069 Graco Inc Bank of America
Merrill Lynch 119,18315,481 Graco Inc Barclays Bank 37,7749,363 Graco Inc Goldman Sachs 38,388
29,015 Graco Inc HSBC 63,17135,436 Graco Inc Morgan Stanley 86,464(7,474) GrafTech International Ltd Bank of America
Merrill Lynch (7,698)2,384 GrafTech International Ltd Barclays Bank 1,049
(7,020) GrafTech International Ltd Barclays Bank (3,089)4,396 GrafTech International Ltd HSBC (1,934)
19,430 GrafTech International Ltd Morgan Stanley 8,549(7,938) GrafTech International Ltd Morgan Stanley (3,493)1,201 Graham Corp Bank of America
Merrill Lynch 3121,969 Graham Corp Barclays Bank (217)9,273 Graham Corp Goldman Sachs 2,411
12,459 Graham Corp HSBC 2,74112,970 Graham Corp Morgan Stanley (1,427)
BlackRock Americas Diversified Equity Absolute Return Fundcontinued
The notes on pages 691 to 711 form an integral part of these financial statements.
Annual report and audited financial statements [125]

Contracts for difference as at 31 May 2020
Holding Description Counterparty
Netunrealised
appreciation/(depreciation)
USD
United States continued(158) Graham Holdings Co ’B’ Bank of America
Merrill Lynch (3,408)145 Graham Holdings Co ’B’ Bank of America
Merrill Lynch 3,885(184) Graham Holdings Co ’B’ Barclays Bank (773)
1,244 Graham Holdings Co ’B’ Barclays Bank 5,225(126) Graham Holdings Co ’B’ Goldman Sachs (3,376)293 Graham Holdings Co ’B’ Goldman Sachs 7,849
(220) Graham Holdings Co ’B’ HSBC 4,418838 Graham Holdings Co ’B’ HSBC (9,221)
(1,162) Graham Holdings Co ’B’ Morgan Stanley (4,880)643 Graham Holdings Co ’B’ Morgan Stanley 2,701
1,750 Grand Canyon EducationInc Barclays Bank 2,258
586 Grand Canyon EducationInc Goldman Sachs 469
(5,280) Grand Canyon EducationInc HSBC (21,263)
4,464 Grand Canyon EducationInc Morgan Stanley 5,759
18,187 Granite Construction Inc Bank of AmericaMerrill Lynch 49,832
11,986 Granite Construction Inc Barclays Bank 5,87311,485 Granite Construction Inc Goldman Sachs 31,46914,785 Granite Construction Inc HSBC 14,4897,960 Granite Construction Inc Morgan Stanley 3,900
(80,109) Granite Point MortgageTrust Inc (REIT) HSBC (35,248)
(7,811) Granite Point MortgageTrust Inc (REIT) Morgan Stanley 1,094
22,388 Graphic Packaging HoldingCo
Bank of AmericaMerrill Lynch 37,164
2,792 Graphic Packaging HoldingCo Barclays Bank 2,904
24,216 Graphic Packaging HoldingCo Goldman Sachs 40,199
90,043 Graphic Packaging HoldingCo HSBC 76,537
49,031 Graphic Packaging HoldingCo Morgan Stanley 50,992
32,134 Gray Television Inc Bank of AmericaMerrill Lynch 47,559
25,482 Gray Television Inc Barclays Bank 9,42847,064 Gray Television Inc Goldman Sachs 69,6552,923 Gray Television Inc HSBC 2,192
42,785 Gray Television Inc Morgan Stanley 15,830(13,674) Great Lakes Dredge & Dock
CorpBank of AmericaMerrill Lynch (19,827)
(49,148) Great Lakes Dredge & DockCorp Barclays Bank (22,608)
(63,382) Great Lakes Dredge & DockCorp Goldman Sachs (91,904)
(27,640) Great Lakes Dredge & DockCorp HSBC (14,926)
(24,263) Great Lakes Dredge & DockCorp Morgan Stanley (11,161)
(13,219) Great Southern Bancorp Inc Bank of AmericaMerrill Lynch (82,222)
(8,163) Great Southern Bancorp Inc Barclays Bank (21,224)(8,779) Great Southern Bancorp Inc Goldman Sachs (54,605)(9,374) Great Southern Bancorp Inc HSBC (12,561)(4,367) Great Southern Bancorp Inc Morgan Stanley (11,354)
(31,880) Great Western Bancorp Inc Bank of AmericaMerrill Lynch (86,714)
(42,584) Great Western Bancorp Inc Barclays Bank (58,340)(14,911) Great Western Bancorp Inc HSBC 15,209(27,265) Great Western Bancorp Inc Morgan Stanley (37,353)34,274 Green Brick Partners Inc Bank of America
Merrill Lynch 39,415
Holding Description Counterparty
Netunrealised
appreciation/(depreciation)
USD
United States continued12,880 Green Brick Partners Inc Barclays Bank (5,667)44,526 Green Brick Partners Inc Goldman Sachs 51,2055,756 Green Brick Partners Inc HSBC 8,576
49,563 Green Brick Partners Inc Morgan Stanley (21,808)(7,919) Green Dot Corp ’A’ Goldman Sachs (21,856)(5,449) Green Dot Corp ’A’ HSBC (25,937)1,820 Green Dot Corp ’A’ Morgan Stanley (3,003)
(6,946) Green Dot Corp ’A’ Morgan Stanley 11,4617,320 Green Plains Inc Bank of America
Merrill Lynch 16,90911,499 Green Plains Inc Barclays Bank (2,415)24,252 Green Plains Inc Goldman Sachs 56,02217,685 Green Plains Inc HSBC 25,99717,802 Green Plains Inc Morgan Stanley (3,738)5,508 Greenbrier Cos Inc Bank of America
Merrill Lynch 26,6599,858 Greenbrier Cos Inc Barclays Bank 3944,119 Greenbrier Cos Inc Goldman Sachs 19,936
14,051 Greenbrier Cos Inc HSBC 57,89026,315 Greenbrier Cos Inc Morgan Stanley 1,053(1,070) Greene County Bancorp Inc Bank of America
Merrill Lynch (2,365)(1,261) Greene County Bancorp Inc Barclays Bank (1,160)(2,486) Greene County Bancorp Inc HSBC 796
(915) Greene County Bancorp Inc Morgan Stanley (842)(3,323) Greenhill & Co Inc Bank of America
Merrill Lynch (3,821)(3,247) Greenhill & Co Inc Goldman Sachs (3,734)
(15,105) Greenhill & Co Inc HSBC (14,803)(12,830) Greenhill & Co Inc Morgan Stanley (7,313)(29,323) Greenlane Holdings Inc ’A’ Bank of America
Merrill Lynch (35,188)(6,159) Greenlane Holdings Inc ’A’ Goldman Sachs (7,391)(8,690) Greenlane Holdings Inc ’A’ Morgan Stanley (8,516)7,780 Greenlight Capital Re Ltd ’A’ Bank of America
Merrill Lynch 2,25629,635 Greenlight Capital Re Ltd ’A’ Barclays Bank (2,667)26,227 Greenlight Capital Re Ltd ’A’ Goldman Sachs 7,60680,426 Greenlight Capital Re Ltd ’A’ HSBC 6,43432,967 Greenlight Capital Re Ltd ’A’ Morgan Stanley (2,967)9,127 GreenSky Inc ’A’ Bank of America
Merrill Lynch 2,784(12,227) GreenSky Inc ’A’ Bank of America
Merrill Lynch (3,729)(56,561) GreenSky Inc ’A’ Barclays Bank (1,131)(19,184) GreenSky Inc ’A’ Morgan Stanley (384)
797 Greif Inc ’A’ Bank of AmericaMerrill Lynch 4,280
20,318 Greif Inc ’A’ Barclays Bank 62,78317,025 Greif Inc ’A’ Goldman Sachs 91,4248,537 Greif Inc ’A’ HSBC 32,291
14,044 Greif Inc ’A’ Morgan Stanley 43,396(7,560) Greif Inc ’B’ Bank of America
Merrill Lynch (26,536)(2,287) Greif Inc ’B’ Barclays Bank (2,447)(3,141) Greif Inc ’B’ Goldman Sachs (11,025)(1,747) Greif Inc ’B’ HSBC (1,118)(2,018) Greif Inc ’B’ Morgan Stanley (2,159)
900 Grid Dynamics Holdings Inc Bank of AmericaMerrill Lynch (234)
7,419 Grid Dynamics Holdings Inc Barclays Bank (5,267)12,852 Grid Dynamics Holdings Inc Goldman Sachs (3,342)8,307 Grid Dynamics Holdings Inc HSBC (11,630)5,184 Grid Dynamics Holdings Inc Morgan Stanley (3,681)
(5,067) Griffin Industrial Realty Inc Bank of AmericaMerrill Lynch (8,513)
(1,274) Griffin Industrial Realty Inc Barclays Bank (1,071)(6,136) Griffin Industrial Realty Inc Goldman Sachs (10,308)
BlackRock Americas Diversified Equity Absolute Return Fundcontinued
The notes on pages 691 to 711 form an integral part of these financial statements.
BlackRock Strategic Funds[126]

Contracts for difference as at 31 May 2020
Holding Description Counterparty
Netunrealised
appreciation/(depreciation)
USD
United States continued(852) Griffin Industrial Realty Inc HSBC 34
(1,459) Griffin Industrial Realty Inc Morgan Stanley (1,853)(22,324) Griffon Corp Bank of America
Merrill Lynch (35,495)(1,495) Griffon Corp Barclays Bank (583)(5,891) Griffon Corp Goldman Sachs (9,367)(6,796) Griffon Corp HSBC (6,524)(9,383) Griffon Corp Morgan Stanley (3,659)3,598 Gritstone Oncology Inc Bank of America
Merrill Lynch (216)2,853 Gritstone Oncology Inc Goldman Sachs (171)6,959 Gritstone Oncology Inc HSBC 487
10,314 Gritstone Oncology Inc Morgan Stanley (2,063)(6,329) Grocery Outlet Holding
Corp Barclays Bank 10,316(28,538) Grocery Outlet Holding
Corp Goldman Sachs 39,944(7,391) Grocery Outlet Holding
Corp HSBC 4,298(15,387) Grocery Outlet Holding
Corp Morgan Stanley 25,0815,944 Group 1 Automotive Inc HSBC 63,125
(20,357) Groupon Inc Barclays Bank 814(47,830) Groupon Inc Goldman Sachs (5,979)(64,475) Groupon Inc HSBC (3,224)
(168,921) Groupon Inc Morgan Stanley 6,75720,447 GrowGeneration Corp Bank of America
Merrill Lynch 21,8785,828 GrowGeneration Corp HSBC 9,383
26,598 GrowGeneration Corp Morgan Stanley (6,118)4,237 Grubhub Inc Bank of America
Merrill Lynch (2,336)25,197 Grubhub Inc Barclays Bank (71,811)2,825 Grubhub Inc HSBC 277
15,477 Grubhub Inc Morgan Stanley (43,875)5,501 Grupo Aeroportuario del
Centro Norte SAB de CVADR Morgan Stanley 18,978
(1,077) Grupo Aeroportuario delSureste SAB de CV ADR HSBC (1,224)
(1,066) Grupo Aeroportuario delSureste SAB de CV ADR Morgan Stanley (4,424)
4,839 Grupo Supervielle SA ADR HSBC 11510,245 Grupo Televisa SAB ADR Goldman Sachs 8,29834,076 Grupo Televisa SAB ADR HSBC 14,94021,277 Grupo Televisa SAB ADR Morgan Stanley 1,70213,753 GSI Technology Inc Goldman Sachs 4,95132,880 GSI Technology Inc Morgan Stanley (3,617)2,311 GTT Communications Inc Bank of America
Merrill Lynch (1,294)1,968 GTT Communications Inc Morgan Stanley (1,082)
27,917 GTX Inc* Bank of AmericaMerrill Lynch 29,313
7,571 GTX Inc* Goldman Sachs 15,52159 GTX Inc* Morgan Stanley 121
(23,654) GTY Technology HoldingsInc Barclays Bank (12,064)
(4,708) GTY Technology HoldingsInc Goldman Sachs (2,778)
(15,497) GTY Technology HoldingsInc Morgan Stanley (7,903)
(31,171) Guaranty Bancshares Inc Bank of AmericaMerrill Lynch (64,524)
(4,038) Guaranty Bancshares Inc Barclays Bank (4,159)(7,062) Guaranty Bancshares Inc Goldman Sachs (14,618)(3,813) Guaranty Bancshares Inc HSBC (2,028)(9,770) Guaranty Bancshares Inc Morgan Stanley (10,063)(3,295) Guardant Health Inc Bank of America
Merrill Lynch 24,906
Holding Description Counterparty
Netunrealised
appreciation/(depreciation)
USD
United States continued(932) Guardant Health Inc Barclays Bank (259)
(3,422) Guardant Health Inc Goldman Sachs 29,943(526) Guardant Health Inc HSBC (316)
(7,858) Guardant Health Inc Morgan Stanley 64,122(6,135) Guess? Inc Bank of America
Merrill Lynch (15,614)(53,539) Guess? Inc Barclays Bank (101,456)(16,328) Guess? Inc HSBC (30,727)(44,335) Guess? Inc Morgan Stanley (84,015)(1,047) Guidewire Software Inc Bank of America
Merrill Lynch (9,517)6,784 Guidewire Software Inc Bank of America
Merrill Lynch 58,286(1,233) Guidewire Software Inc Barclays Bank (2,010)(6,140) Guidewire Software Inc Goldman Sachs (55,813)(6,417) Guidewire Software Inc HSBC (36,426)
(13,899) Guidewire Software Inc Morgan Stanley (22,655)(32,922) Gulf Island Fabrication Inc Goldman Sachs (4,938)(16,100) Gulf Island Fabrication Inc Morgan Stanley (1,127)(60,794) Gulfport Energy Corp Goldman Sachs 8,511(64,362) Gulfport Energy Corp HSBC 58,569(40,441) Gulfport Energy Corp Morgan Stanley 2,022(22,096) GWG Holdings Inc Morgan Stanley 7,73415,832 H&E Equipment Services
Inc Barclays Bank 22,64020,654 H&E Equipment Services
Inc Goldman Sachs 62,37510,381 H&E Equipment Services
Inc HSBC 14,74112,422 H&E Equipment Services
Inc Morgan Stanley 17,7633,953 H&R Block Inc Bank of America
Merrill Lynch 5,1394,073 H&R Block Inc Barclays Bank (41)
10,959 H&R Block Inc Goldman Sachs 12,65642,687 H&R Block Inc HSBC 30,84569,157 H&R Block Inc Morgan Stanley (692)10,126 Hackett Group Inc Bank of America
Merrill Lynch 12,25240,105 Hackett Group Inc Goldman Sachs 48,52759,055 Hackett Group Inc Morgan Stanley 27,7562,103 Haemonetics Corp Bank of America
Merrill Lynch 21,4722,066 Haemonetics Corp Barclays Bank 5,041(134) Haemonetics Corp Barclays Bank (327)
3,743 Haemonetics Corp Goldman Sachs 38,2162,453 Haemonetics Corp HSBC 10,499
(8,505) Haemonetics Corp HSBC (36,401)4,185 Haemonetics Corp Morgan Stanley 10,211
(6,400) Haemonetics Corp Morgan Stanley (15,616)(9,335) Hain Celestial Group Inc Bank of America
Merrill Lynch (11,042)(2,427) Hain Celestial Group Inc Barclays Bank (3,835)(6,513) Hain Celestial Group Inc Goldman Sachs (1,383)
(26,782) Hain Celestial Group Inc HSBC (26,246)(48,837) Hain Celestial Group Inc Morgan Stanley (77,162)
9,454 Hallador Energy Co Barclays Bank 60921,314 Hallador Energy Co Goldman Sachs 1,57512,761 Hallador Energy Co HSBC 60114,766 Hallador Energy Co Morgan Stanley 951(7,635) Halliburton Co Bank of America
Merrill Lynch (14,354)(9,663) Halliburton Co Barclays Bank (1,063)28,133 Halliburton Co Barclays Bank 3,095
(30,922) Halliburton Co Goldman Sachs (58,133)(29,030) Halliburton Co HSBC (29,030)(14,213) Halliburton Co Morgan Stanley (1,563)11,625 Halliburton Co Morgan Stanley 1,279
BlackRock Americas Diversified Equity Absolute Return Fundcontinued
The notes on pages 691 to 711 form an integral part of these financial statements.
Annual report and audited financial statements [127]

Contracts for difference as at 31 May 2020
Holding Description Counterparty
Netunrealised
appreciation/(depreciation)
USD
United States continued18,332 Hallmark Financial Services
IncBank of AmericaMerrill Lynch (6,783)
8,017 Hallmark Financial ServicesInc Goldman Sachs (2,966)
15,974 Hallmark Financial ServicesInc HSBC (20,447)
26,806 Hallmark Financial ServicesInc Morgan Stanley (6,970)
(5,804) Halozyme Therapeutics Inc Bank of AmericaMerrill Lynch 4,295
24,983 Halozyme Therapeutics Inc Bank of AmericaMerrill Lynch (18,286)
(1,402) Halozyme Therapeutics Inc Barclays Bank 1,52839,627 Halozyme Therapeutics Inc Barclays Bank (43,193)18,472 Halozyme Therapeutics Inc Goldman Sachs (9,750)(5,886) Halozyme Therapeutics Inc HSBC 58913,983 Halozyme Therapeutics Inc HSBC (2,690)(5,576) Halozyme Therapeutics Inc Morgan Stanley 6,07830,785 Halozyme Therapeutics Inc Morgan Stanley (33,556)
(26,003) Hamilton Beach BrandsHolding Co ’A’
Bank of AmericaMerrill Lynch 11,701
(3,659) Hamilton Beach BrandsHolding Co ’A’ Goldman Sachs 1,647
(5,227) Hamilton Beach BrandsHolding Co ’A’ HSBC 6,586
(2,000) Hamilton Beach BrandsHolding Co ’A’ Morgan Stanley 3,120
3,998 Hamilton Lane Inc ’A’ Bank of AmericaMerrill Lynch 36,022
12,748 Hamilton Lane Inc ’A’ Barclays Bank 52,64910,925 Hamilton Lane Inc ’A’ Goldman Sachs 83,25231,459 Hamilton Lane Inc ’A’ HSBC 193,8185,201 Hamilton Lane Inc ’A’ Morgan Stanley 21,480
(20,086) Hancock Whitney Corp Bank of AmericaMerrill Lynch (103,041)
9,603 Hancock Whitney Corp Bank of AmericaMerrill Lynch 49,263
29,940 Hancock Whitney Corp Barclays Bank 69,760(13,637) Hancock Whitney Corp Goldman Sachs (69,958)16,800 Hancock Whitney Corp Goldman Sachs 86,18412,240 Hancock Whitney Corp HSBC 15,973
(46,225) Hancock Whitney Corp HSBC (63,508)(40,143) Hancock Whitney Corp Morgan Stanley (93,534)19,341 Hancock Whitney Corp Morgan Stanley 45,065
(76,876) Hanesbrands Inc Bank of AmericaMerrill Lynch (95,327)
(7,842) Hanesbrands Inc Barclays Bank (1,333)(8,697) Hanesbrands Inc Goldman Sachs (10,784)
(11,526) Hanesbrands Inc HSBC (3,343)(40,941) Hanesbrands Inc Morgan Stanley (6,960)(11,589) Hanger Inc Bank of America
Merrill Lynch (31,754)(14,099) Hanger Inc Barclays Bank (3,384)(18,574) Hanger Inc Goldman Sachs (50,893)(8,800) Hanger Inc HSBC (14,277)
(10,353) Hanger Inc Morgan Stanley (2,485)(8,123) Hanmi Financial Corp Bank of America
Merrill Lynch (11,413)(20,175) Hanmi Financial Corp Barclays Bank (10,491)(26,308) Hanmi Financial Corp Goldman Sachs (36,963)(5,032) Hanmi Financial Corp HSBC 3,170
(18,289) Hanmi Financial Corp Morgan Stanley (9,510)(621) Hannon Armstrong
Sustainable InfrastructureCapital Inc (REIT)
Bank of AmericaMerrill Lynch (1,149)
7,005 Hannon ArmstrongSustainable InfrastructureCapital Inc (REIT) Barclays Bank (1,401)
Holding Description Counterparty
Netunrealised
appreciation/(depreciation)
USD
United States continued1,271 Hannon Armstrong
Sustainable InfrastructureCapital Inc (REIT) Goldman Sachs 2,351
(3,613) Hannon ArmstrongSustainable InfrastructureCapital Inc (REIT) Goldman Sachs (6,684)
(19,727) Hannon ArmstrongSustainable InfrastructureCapital Inc (REIT) HSBC 10,455
39,217 Hannon ArmstrongSustainable InfrastructureCapital Inc (REIT) Morgan Stanley (7,843)
9,149 Hanover Insurance GroupInc
Bank of AmericaMerrill Lynch 129,540
9,254 Hanover Insurance GroupInc Barclays Bank 37,294
7,190 Hanover Insurance GroupInc Goldman Sachs 111,804
11,396 Hanover Insurance GroupInc HSBC 60,081
20,266 Hanover Insurance GroupInc Morgan Stanley 81,135
(57,393) HarborOne Bancorp Inc Bank of AmericaMerrill Lynch (25,253)
(23,717) HarborOne Bancorp Inc Goldman Sachs (10,435)(25,161) HarborOne Bancorp Inc HSBC 1,510(43,889) HarborOne Bancorp Inc Morgan Stanley (3,072)15,343 Harley-Davidson Inc Bank of America
Merrill Lynch 32,8347,023 Harley-Davidson Inc Barclays Bank (18,119)
18,023 Harley-Davidson Inc HSBC 25,83557,692 Harley-Davidson Inc Morgan Stanley (142,969)
(37,830) Harmonic Inc Goldman Sachs (2,648)(106,425) Harmonic Inc Morgan Stanley 42,570
300 Harpoon Therapeutics Inc Bank of AmericaMerrill Lynch 1,551
11,768 Harpoon Therapeutics Inc Barclays Bank (37,658)3,671 Harpoon Therapeutics Inc Goldman Sachs 18,979
10,072 Harpoon Therapeutics Inc HSBC 61,23813,163 Harpoon Therapeutics Inc Morgan Stanley (42,122)
(12,309) Harrow Health Inc Bank of AmericaMerrill Lynch (12,309)
(26,663) Harrow Health Inc Barclays Bank 3,466(12,904) Harrow Health Inc HSBC (7,097)(19,092) Harsco Corp Bank of America
Merrill Lynch (50,785)(43,310) Harsco Corp Barclays Bank (72,328)(39,716) Harsco Corp Goldman Sachs (105,645)(19,421) Harsco Corp HSBC (21,363)(10,604) Harsco Corp Morgan Stanley (17,709)(3,275) Hartford Financial Services
Group Inc Barclays Bank (4,880)(8,928) Hartford Financial Services
Group Inc Goldman Sachs (41,579)(1,746) Hartford Financial Services
Group Inc HSBC (3,719)(11,374) Hartford Financial Services
Group Inc Morgan Stanley (16,947)(6,003) Hasbro Inc Bank of America
Merrill Lynch (50,052)(1,488) Hasbro Inc Barclays Bank (10,118)(3,092) Hasbro Inc Goldman Sachs (25,911)(6,269) Hasbro Inc HSBC (23,760)(3,490) Hasbro Inc Morgan Stanley (23,732)18,942 Haverty Furniture Cos Inc Goldman Sachs 37,69523,333 Haverty Furniture Cos Inc HSBC 83,53218,934 Haverty Furniture Cos Inc Morgan Stanley 9,467
BlackRock Americas Diversified Equity Absolute Return Fundcontinued
The notes on pages 691 to 711 form an integral part of these financial statements.
BlackRock Strategic Funds[128]
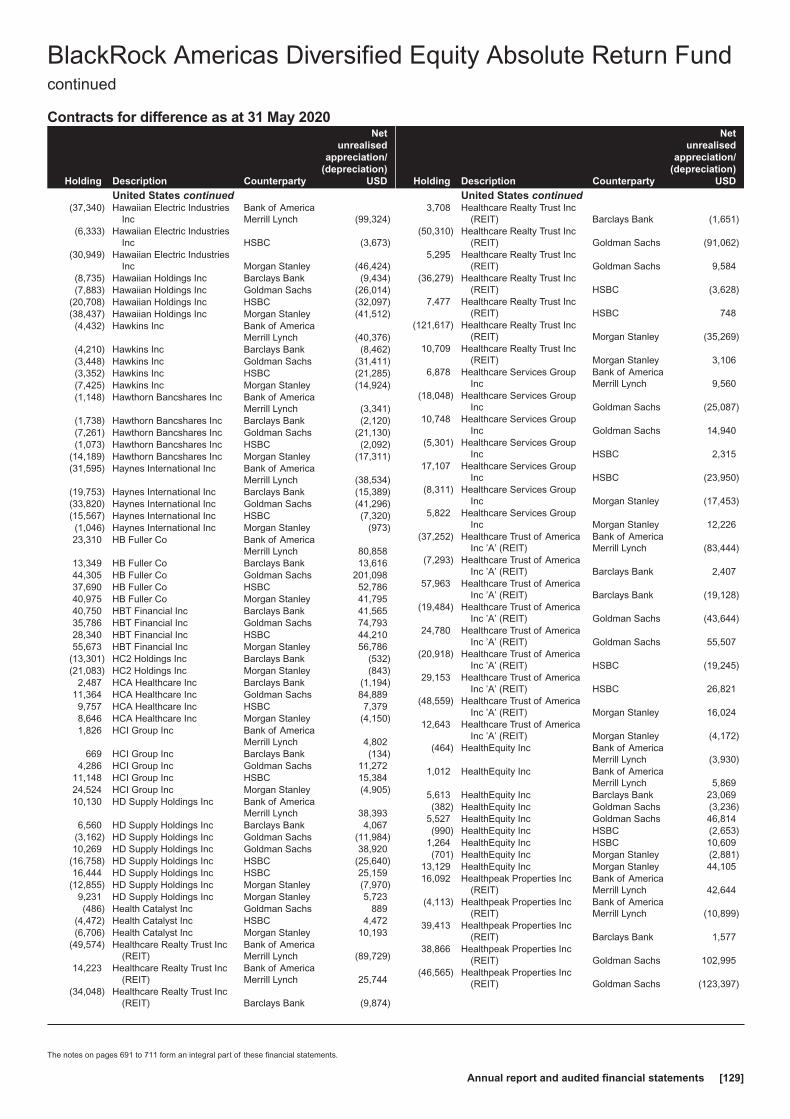
Contracts for difference as at 31 May 2020
Holding Description Counterparty
Netunrealised
appreciation/(depreciation)
USD
United States continued(37,340) Hawaiian Electric Industries
IncBank of AmericaMerrill Lynch (99,324)
(6,333) Hawaiian Electric IndustriesInc HSBC (3,673)
(30,949) Hawaiian Electric IndustriesInc Morgan Stanley (46,424)
(8,735) Hawaiian Holdings Inc Barclays Bank (9,434)(7,883) Hawaiian Holdings Inc Goldman Sachs (26,014)
(20,708) Hawaiian Holdings Inc HSBC (32,097)(38,437) Hawaiian Holdings Inc Morgan Stanley (41,512)(4,432) Hawkins Inc Bank of America
Merrill Lynch (40,376)(4,210) Hawkins Inc Barclays Bank (8,462)(3,448) Hawkins Inc Goldman Sachs (31,411)(3,352) Hawkins Inc HSBC (21,285)(7,425) Hawkins Inc Morgan Stanley (14,924)(1,148) Hawthorn Bancshares Inc Bank of America
Merrill Lynch (3,341)(1,738) Hawthorn Bancshares Inc Barclays Bank (2,120)(7,261) Hawthorn Bancshares Inc Goldman Sachs (21,130)(1,073) Hawthorn Bancshares Inc HSBC (2,092)
(14,189) Hawthorn Bancshares Inc Morgan Stanley (17,311)(31,595) Haynes International Inc Bank of America
Merrill Lynch (38,534)(19,753) Haynes International Inc Barclays Bank (15,389)(33,820) Haynes International Inc Goldman Sachs (41,296)(15,567) Haynes International Inc HSBC (7,320)(1,046) Haynes International Inc Morgan Stanley (973)23,310 HB Fuller Co Bank of America
Merrill Lynch 80,85813,349 HB Fuller Co Barclays Bank 13,61644,305 HB Fuller Co Goldman Sachs 201,09837,690 HB Fuller Co HSBC 52,78640,975 HB Fuller Co Morgan Stanley 41,79540,750 HBT Financial Inc Barclays Bank 41,56535,786 HBT Financial Inc Goldman Sachs 74,79328,340 HBT Financial Inc HSBC 44,21055,673 HBT Financial Inc Morgan Stanley 56,786
(13,301) HC2 Holdings Inc Barclays Bank (532)(21,083) HC2 Holdings Inc Morgan Stanley (843)
2,487 HCA Healthcare Inc Barclays Bank (1,194)11,364 HCA Healthcare Inc Goldman Sachs 84,8899,757 HCA Healthcare Inc HSBC 7,3798,646 HCA Healthcare Inc Morgan Stanley (4,150)1,826 HCI Group Inc Bank of America
Merrill Lynch 4,802669 HCI Group Inc Barclays Bank (134)
4,286 HCI Group Inc Goldman Sachs 11,27211,148 HCI Group Inc HSBC 15,38424,524 HCI Group Inc Morgan Stanley (4,905)10,130 HD Supply Holdings Inc Bank of America
Merrill Lynch 38,3936,560 HD Supply Holdings Inc Barclays Bank 4,067
(3,162) HD Supply Holdings Inc Goldman Sachs (11,984)10,269 HD Supply Holdings Inc Goldman Sachs 38,920
(16,758) HD Supply Holdings Inc HSBC (25,640)16,444 HD Supply Holdings Inc HSBC 25,159
(12,855) HD Supply Holdings Inc Morgan Stanley (7,970)9,231 HD Supply Holdings Inc Morgan Stanley 5,723(486) Health Catalyst Inc Goldman Sachs 889
(4,472) Health Catalyst Inc HSBC 4,472(6,706) Health Catalyst Inc Morgan Stanley 10,193
(49,574) Healthcare Realty Trust Inc(REIT)
Bank of AmericaMerrill Lynch (89,729)
14,223 Healthcare Realty Trust Inc(REIT)
Bank of AmericaMerrill Lynch 25,744
(34,048) Healthcare Realty Trust Inc(REIT) Barclays Bank (9,874)
Holding Description Counterparty
Netunrealised
appreciation/(depreciation)
USD
United States continued3,708 Healthcare Realty Trust Inc
(REIT) Barclays Bank (1,651)(50,310) Healthcare Realty Trust Inc
(REIT) Goldman Sachs (91,062)5,295 Healthcare Realty Trust Inc
(REIT) Goldman Sachs 9,584(36,279) Healthcare Realty Trust Inc
(REIT) HSBC (3,628)7,477 Healthcare Realty Trust Inc
(REIT) HSBC 748(121,617) Healthcare Realty Trust Inc
(REIT) Morgan Stanley (35,269)10,709 Healthcare Realty Trust Inc
(REIT) Morgan Stanley 3,1066,878 Healthcare Services Group
IncBank of AmericaMerrill Lynch 9,560
(18,048) Healthcare Services GroupInc Goldman Sachs (25,087)
10,748 Healthcare Services GroupInc Goldman Sachs 14,940
(5,301) Healthcare Services GroupInc HSBC 2,315
17,107 Healthcare Services GroupInc HSBC (23,950)
(8,311) Healthcare Services GroupInc Morgan Stanley (17,453)
5,822 Healthcare Services GroupInc Morgan Stanley 12,226
(37,252) Healthcare Trust of AmericaInc ’A’ (REIT)
Bank of AmericaMerrill Lynch (83,444)
(7,293) Healthcare Trust of AmericaInc ’A’ (REIT) Barclays Bank 2,407
57,963 Healthcare Trust of AmericaInc ’A’ (REIT) Barclays Bank (19,128)
(19,484) Healthcare Trust of AmericaInc ’A’ (REIT) Goldman Sachs (43,644)
24,780 Healthcare Trust of AmericaInc ’A’ (REIT) Goldman Sachs 55,507
(20,918) Healthcare Trust of AmericaInc ’A’ (REIT) HSBC (19,245)
29,153 Healthcare Trust of AmericaInc ’A’ (REIT) HSBC 26,821
(48,559) Healthcare Trust of AmericaInc ’A’ (REIT) Morgan Stanley 16,024
12,643 Healthcare Trust of AmericaInc ’A’ (REIT) Morgan Stanley (4,172)
(464) HealthEquity Inc Bank of AmericaMerrill Lynch (3,930)
1,012 HealthEquity Inc Bank of AmericaMerrill Lynch 5,869
5,613 HealthEquity Inc Barclays Bank 23,069(382) HealthEquity Inc Goldman Sachs (3,236)
5,527 HealthEquity Inc Goldman Sachs 46,814(990) HealthEquity Inc HSBC (2,653)
1,264 HealthEquity Inc HSBC 10,609(701) HealthEquity Inc Morgan Stanley (2,881)
13,129 HealthEquity Inc Morgan Stanley 44,10516,092 Healthpeak Properties Inc
(REIT)Bank of AmericaMerrill Lynch 42,644
(4,113) Healthpeak Properties Inc(REIT)
Bank of AmericaMerrill Lynch (10,899)
39,413 Healthpeak Properties Inc(REIT) Barclays Bank 1,577
38,866 Healthpeak Properties Inc(REIT) Goldman Sachs 102,995
(46,565) Healthpeak Properties Inc(REIT) Goldman Sachs (123,397)
BlackRock Americas Diversified Equity Absolute Return Fundcontinued
The notes on pages 691 to 711 form an integral part of these financial statements.
Annual report and audited financial statements [129]
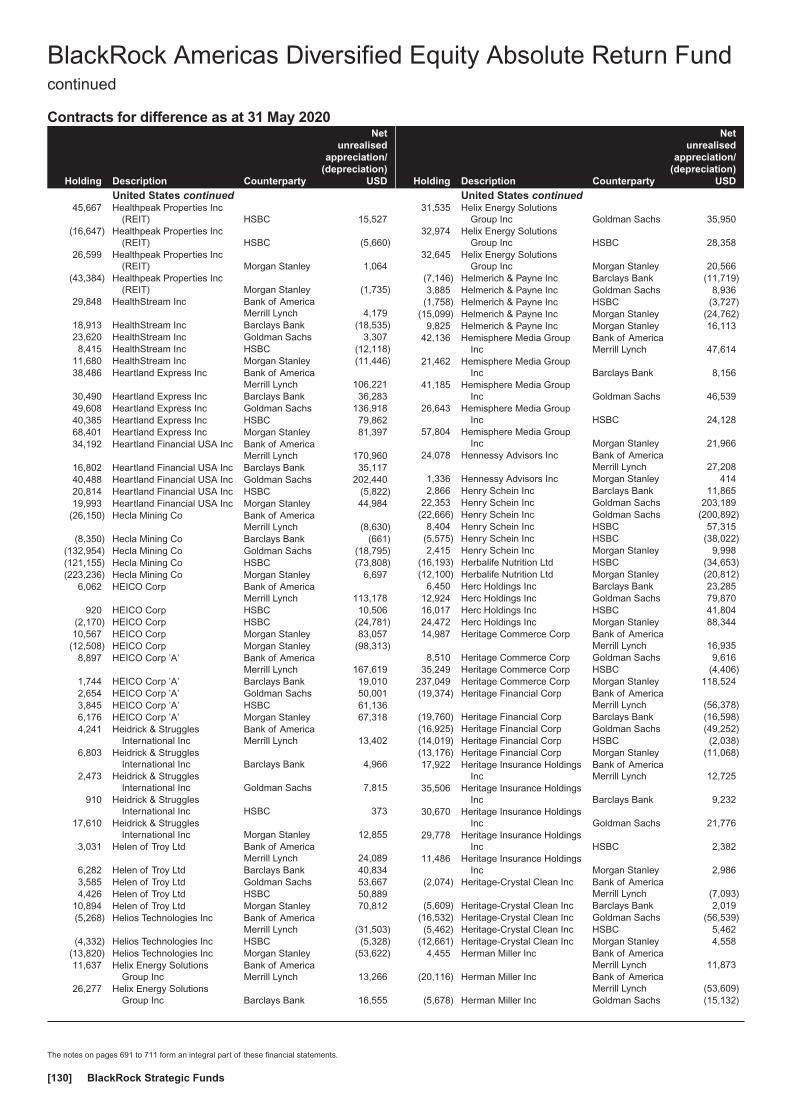
Contracts for difference as at 31 May 2020
Holding Description Counterparty
Netunrealised
appreciation/(depreciation)
USD
United States continued45,667 Healthpeak Properties Inc
(REIT) HSBC 15,527(16,647) Healthpeak Properties Inc
(REIT) HSBC (5,660)26,599 Healthpeak Properties Inc
(REIT) Morgan Stanley 1,064(43,384) Healthpeak Properties Inc
(REIT) Morgan Stanley (1,735)29,848 HealthStream Inc Bank of America
Merrill Lynch 4,17918,913 HealthStream Inc Barclays Bank (18,535)23,620 HealthStream Inc Goldman Sachs 3,3078,415 HealthStream Inc HSBC (12,118)
11,680 HealthStream Inc Morgan Stanley (11,446)38,486 Heartland Express Inc Bank of America
Merrill Lynch 106,22130,490 Heartland Express Inc Barclays Bank 36,28349,608 Heartland Express Inc Goldman Sachs 136,91840,385 Heartland Express Inc HSBC 79,86268,401 Heartland Express Inc Morgan Stanley 81,39734,192 Heartland Financial USA Inc Bank of America
Merrill Lynch 170,96016,802 Heartland Financial USA Inc Barclays Bank 35,11740,488 Heartland Financial USA Inc Goldman Sachs 202,44020,814 Heartland Financial USA Inc HSBC (5,822)19,993 Heartland Financial USA Inc Morgan Stanley 44,984
(26,150) Hecla Mining Co Bank of AmericaMerrill Lynch (8,630)
(8,350) Hecla Mining Co Barclays Bank (661)(132,954) Hecla Mining Co Goldman Sachs (18,795)(121,155) Hecla Mining Co HSBC (73,808)(223,236) Hecla Mining Co Morgan Stanley 6,697
6,062 HEICO Corp Bank of AmericaMerrill Lynch 113,178
920 HEICO Corp HSBC 10,506(2,170) HEICO Corp HSBC (24,781)10,567 HEICO Corp Morgan Stanley 83,057
(12,508) HEICO Corp Morgan Stanley (98,313)8,897 HEICO Corp ’A’ Bank of America
Merrill Lynch 167,6191,744 HEICO Corp ’A’ Barclays Bank 19,0102,654 HEICO Corp ’A’ Goldman Sachs 50,0013,845 HEICO Corp ’A’ HSBC 61,1366,176 HEICO Corp ’A’ Morgan Stanley 67,3184,241 Heidrick & Struggles
International IncBank of AmericaMerrill Lynch 13,402
6,803 Heidrick & StrugglesInternational Inc Barclays Bank 4,966
2,473 Heidrick & StrugglesInternational Inc Goldman Sachs 7,815
910 Heidrick & StrugglesInternational Inc HSBC 373
17,610 Heidrick & StrugglesInternational Inc Morgan Stanley 12,855
3,031 Helen of Troy Ltd Bank of AmericaMerrill Lynch 24,089
6,282 Helen of Troy Ltd Barclays Bank 40,8343,585 Helen of Troy Ltd Goldman Sachs 53,6674,426 Helen of Troy Ltd HSBC 50,889
10,894 Helen of Troy Ltd Morgan Stanley 70,812(5,268) Helios Technologies Inc Bank of America
Merrill Lynch (31,503)(4,332) Helios Technologies Inc HSBC (5,328)
(13,820) Helios Technologies Inc Morgan Stanley (53,622)11,637 Helix Energy Solutions
Group IncBank of AmericaMerrill Lynch 13,266
26,277 Helix Energy SolutionsGroup Inc Barclays Bank 16,555
Holding Description Counterparty
Netunrealised
appreciation/(depreciation)
USD
United States continued31,535 Helix Energy Solutions
Group Inc Goldman Sachs 35,95032,974 Helix Energy Solutions
Group Inc HSBC 28,35832,645 Helix Energy Solutions
Group Inc Morgan Stanley 20,566(7,146) Helmerich & Payne Inc Barclays Bank (11,719)3,885 Helmerich & Payne Inc Goldman Sachs 8,936
(1,758) Helmerich & Payne Inc HSBC (3,727)(15,099) Helmerich & Payne Inc Morgan Stanley (24,762)
9,825 Helmerich & Payne Inc Morgan Stanley 16,11342,136 Hemisphere Media Group
IncBank of AmericaMerrill Lynch 47,614
21,462 Hemisphere Media GroupInc Barclays Bank 8,156
41,185 Hemisphere Media GroupInc Goldman Sachs 46,539
26,643 Hemisphere Media GroupInc HSBC 24,128
57,804 Hemisphere Media GroupInc Morgan Stanley 21,966
24,078 Hennessy Advisors Inc Bank of AmericaMerrill Lynch 27,208
1,336 Hennessy Advisors Inc Morgan Stanley 4142,866 Henry Schein Inc Barclays Bank 11,865
22,353 Henry Schein Inc Goldman Sachs 203,189(22,666) Henry Schein Inc Goldman Sachs (200,892)
8,404 Henry Schein Inc HSBC 57,315(5,575) Henry Schein Inc HSBC (38,022)2,415 Henry Schein Inc Morgan Stanley 9,998
(16,193) Herbalife Nutrition Ltd HSBC (34,653)(12,100) Herbalife Nutrition Ltd Morgan Stanley (20,812)
6,450 Herc Holdings Inc Barclays Bank 23,28512,924 Herc Holdings Inc Goldman Sachs 79,87016,017 Herc Holdings Inc HSBC 41,80424,472 Herc Holdings Inc Morgan Stanley 88,34414,987 Heritage Commerce Corp Bank of America
Merrill Lynch 16,9358,510 Heritage Commerce Corp Goldman Sachs 9,616
35,249 Heritage Commerce Corp HSBC (4,406)237,049 Heritage Commerce Corp Morgan Stanley 118,524(19,374) Heritage Financial Corp Bank of America
Merrill Lynch (56,378)(19,760) Heritage Financial Corp Barclays Bank (16,598)(16,925) Heritage Financial Corp Goldman Sachs (49,252)(14,019) Heritage Financial Corp HSBC (2,038)(13,176) Heritage Financial Corp Morgan Stanley (11,068)17,922 Heritage Insurance Holdings
IncBank of AmericaMerrill Lynch 12,725
35,506 Heritage Insurance HoldingsInc Barclays Bank 9,232
30,670 Heritage Insurance HoldingsInc Goldman Sachs 21,776
29,778 Heritage Insurance HoldingsInc HSBC 2,382
11,486 Heritage Insurance HoldingsInc Morgan Stanley 2,986
(2,074) Heritage-Crystal Clean Inc Bank of AmericaMerrill Lynch (7,093)
(5,609) Heritage-Crystal Clean Inc Barclays Bank 2,019(16,532) Heritage-Crystal Clean Inc Goldman Sachs (56,539)(5,462) Heritage-Crystal Clean Inc HSBC 5,462
(12,661) Heritage-Crystal Clean Inc Morgan Stanley 4,5584,455 Herman Miller Inc Bank of America
Merrill Lynch 11,873(20,116) Herman Miller Inc Bank of America
Merrill Lynch (53,609)(5,678) Herman Miller Inc Goldman Sachs (15,132)
BlackRock Americas Diversified Equity Absolute Return Fundcontinued
The notes on pages 691 to 711 form an integral part of these financial statements.
BlackRock Strategic Funds[130]

Contracts for difference as at 31 May 2020
Holding Description Counterparty
Netunrealised
appreciation/(depreciation)
USD
United States continued5,503 Herman Miller Inc Goldman Sachs 14,6651,284 Herman Miller Inc HSBC (385)
(3,406) Herman Miller Inc HSBC 1,022(13,167) Herman Miller Inc Morgan Stanley 5,135
5,659 Heron Therapeutics Inc Bank of AmericaMerrill Lynch 16,298
(9,625) Heron Therapeutics Inc Bank of AmericaMerrill Lynch (27,720)
(14,550) Heron Therapeutics Inc Goldman Sachs (41,904)5,777 Heron Therapeutics Inc HSBC 18,775
(3,815) Heron Therapeutics Inc HSBC (12,399)16,715 Heron Therapeutics Inc Morgan Stanley (4,012)
(12,596) Heron Therapeutics Inc Morgan Stanley 3,02317,494 Hersha Hospitality Trust
(REIT)Bank of AmericaMerrill Lynch 17,669
100,218 Hersha Hospitality Trust(REIT) Goldman Sachs 101,220
39,619 Hersha Hospitality Trust(REIT) HSBC 14,263
21,458 Hersha Hospitality Trust(REIT) Morgan Stanley 8,583
19,389 Hershey Co Bank of AmericaMerrill Lynch 93,725
11,627 Hershey Co Barclays Bank 59,27711,509 Hershey Co Goldman Sachs 55,35811,456 Hershey Co HSBC 23,4118,332 Hershey Co Morgan Stanley 37,902
12,061 Hertz Global Holdings Inc Bank of AmericaMerrill Lynch (23,834)
43,002 Hertz Global Holdings Inc Barclays Bank (76,114)13,752 Hertz Global Holdings Inc Goldman Sachs (21,591)12,838 Hertz Global Holdings Inc HSBC (26,588)
(356) Heska Corp Bank of AmericaMerrill Lynch (4,560)
(2,428) Heska Corp Barclays Bank (9,785)(1,858) Heska Corp Goldman Sachs (23,801)(1,224) Heska Corp HSBC (5,055)(4,980) Heska Corp Morgan Stanley (20,069)(5,908) Hess Corp Bank of America
Merrill Lynch (20,146)(2,438) Hess Corp Barclays Bank (926)
(16,534) Hess Corp Goldman Sachs (56,381)(5,789) Hess Corp HSBC (2,096)
(18,007) Hess Corp Morgan Stanley (6,843)(35,045) Hess Midstream LP ’A’ Barclays Bank —(19,961) Hess Midstream LP ’A’ Goldman Sachs (40,321)(12,191) Hewlett Packard Enterprise
CoBank of AmericaMerrill Lynch (4,084)
4,820 Hewlett Packard EnterpriseCo
Bank of AmericaMerrill Lynch 1,615
26,101 Hewlett Packard EnterpriseCo Barclays Bank 7,178
(29,129) Hewlett Packard EnterpriseCo Goldman Sachs (9,758)
19,851 Hewlett Packard EnterpriseCo Goldman Sachs 6,650
(11,331) Hewlett Packard EnterpriseCo HSBC 9,121
61,004 Hewlett Packard EnterpriseCo HSBC (49,108)
(56,577) Hewlett Packard EnterpriseCo Morgan Stanley (15,559)
49,497 Hewlett Packard EnterpriseCo Morgan Stanley 13,612
396 Hexcel Corp Barclays Bank 1,7154,664 Hexcel Corp Goldman Sachs 34,7009,584 Hexcel Corp HSBC 50,9877,781 Hexcel Corp Morgan Stanley 33,692
(40,970) HF Foods Group Inc Barclays Bank (25,401)
Holding Description Counterparty
Netunrealised
appreciation/(depreciation)
USD
United States continued1,378 Hibbett Sports Inc Bank of America
Merrill Lynch 17414,101 Hibbett Sports Inc HSBC 36,80424,273 Hibbett Sports Inc Morgan Stanley (20,025)
(34,583) HighPoint Resources Corp Bank of AmericaMerrill Lynch 681
(4,808) HighPoint Resources Corp Goldman Sachs 95(142,192) HighPoint Resources Corp Morgan Stanley 1,863
(4,359) Highwoods Properties Inc(REIT)
Bank of AmericaMerrill Lynch (26,505)
(8,956) Highwoods Properties Inc(REIT) Goldman Sachs (40,386)
(44,055) Highwoods Properties Inc(REIT) HSBC (37,006)
(47,199) Highwoods Properties Inc(REIT) Morgan Stanley (165,197)
(145,151) Hill International Inc Bank of AmericaMerrill Lynch (18,870)
(41,500) Hill International Inc Morgan Stanley (830)4,758 Hillenbrand Inc Bank of America
Merrill Lynch 19,46030,508 Hillenbrand Inc Barclays Bank 24,71248,223 Hillenbrand Inc Goldman Sachs 197,23277,590 Hillenbrand Inc Morgan Stanley 62,848(3,812) Hill-Rom Holdings Inc Bank of America
Merrill Lynch (13,542)3,563 Hill-Rom Holdings Inc Barclays Bank 12,7914,633 Hill-Rom Holdings Inc Goldman Sachs 17,605
(2,300) Hill-Rom Holdings Inc Goldman Sachs (8,373)3,028 Hill-Rom Holdings Inc HSBC (1,696)2,494 Hill-Rom Holdings Inc Morgan Stanley 8,953
(3,558) Hill-Rom Holdings Inc Morgan Stanley (12,773)(25,564) Hilltop Holdings Inc Bank of America
Merrill Lynch (98,421)(22,375) Hilltop Holdings Inc Barclays Bank (27,521)(34,580) Hilltop Holdings Inc Goldman Sachs (129,365)(69,399) Hilltop Holdings Inc HSBC (87,246)(20,539) Hilltop Holdings Inc Morgan Stanley (25,263)(1,995) Hilton Worldwide Holdings
Inc Goldman Sachs (22,085)(10,478) Hilton Worldwide Holdings
Inc HSBC (77,747)(7,168) Hilton Worldwide Holdings
Inc Morgan Stanley (8,745)1,080 Hingham Institution For
SavingsBank of AmericaMerrill Lynch 23,447
782 Hingham Institution ForSavings Barclays Bank 11,378
2,082 Hingham Institution ForSavings Goldman Sachs 45,200
301 Hingham Institution ForSavings HSBC 3,308
3,411 Hingham Institution ForSavings Morgan Stanley 49,630
3 Histogen Inc Bank of AmericaMerrill Lynch (5)
(7,594) HMS Holdings Corp Barclays Bank (20,238)4,229 HMS Holdings Corp Barclays Bank 11,270
(6,390) HMS Holdings Corp Goldman Sachs (24,602)7,522 HMS Holdings Corp HSBC 17,526
(21,204) HMS Holdings Corp HSBC (49,405)(18,237) HMS Holdings Corp Morgan Stanley (48,602)
6,397 HMS Holdings Corp Morgan Stanley 17,048(5,104) HNI Corp Bank of America
Merrill Lynch (24,550)(17,734) HNI Corp Barclays Bank (27,310)(24,667) HNI Corp Goldman Sachs (118,648)(25,495) HNI Corp HSBC (54,049)(26,204) HNI Corp Morgan Stanley (40,354)
BlackRock Americas Diversified Equity Absolute Return Fundcontinued
The notes on pages 691 to 711 form an integral part of these financial statements.
Annual report and audited financial statements [131]

Contracts for difference as at 31 May 2020
Holding Description Counterparty
Netunrealised
appreciation/(depreciation)
USD
United States continued20,947 HollyFrontier Corp Bank of America
Merrill Lynch 83,99713,018 HollyFrontier Corp Barclays Bank 5,4689,229 HollyFrontier Corp Goldman Sachs 37,0097,839 HollyFrontier Corp HSBC (2,587)
11,828 HollyFrontier Corp Morgan Stanley 4,968(530) Hologic Inc Barclays Bank 80
9,920 Hologic Inc Goldman Sachs 2,48018,524 Hologic Inc HSBC 3,520
(18,779) Hologic Inc HSBC (3,568)17,022 Hologic Inc Morgan Stanley (2,553)(7,564) Hologic Inc Morgan Stanley 1,135(1,477) Home Bancorp Inc Bank of America
Merrill Lynch (6,573)(7,952) Home Bancorp Inc Barclays Bank (15,904)
(13,041) Home Bancorp Inc Goldman Sachs (58,032)(3,588) Home Bancorp Inc HSBC (4,736)
(12,656) Home Bancorp Inc Morgan Stanley (25,312)(21,186) Home BancShares Inc Bank of America
Merrill Lynch (48,516)72,654 Home BancShares Inc Bank of America
Merrill Lynch 166,378(12,072) Home BancShares Inc Barclays Bank (14,305)
7,625 Home BancShares Inc Barclays Bank 9,03691,960 Home BancShares Inc Goldman Sachs 205,964
(42,065) Home BancShares Inc Goldman Sachs (96,329)(27,171) Home BancShares Inc HSBC (8,966)39,089 Home BancShares Inc HSBC 18,807(7,852) Home BancShares Inc Morgan Stanley (9,305)33,678 Home BancShares Inc Morgan Stanley 39,9082,297 Home Depot Inc Bank of America
Merrill Lynch 14,7934,428 Home Depot Inc Barclays Bank 17,2251,329 Home Depot Inc Goldman Sachs 7,5187,280 Home Depot Inc HSBC 74,294
14,942 Home Depot Inc Morgan Stanley 58,125(1,964) HomeStreet Inc Bank of America
Merrill Lynch (5,833)(15,707) HomeStreet Inc Barclays Bank (15,864)(15,300) HomeStreet Inc Goldman Sachs (42,935)(8,201) HomeStreet Inc HSBC 276
(24,798) HomeStreet Inc Morgan Stanley (25,046)(1,380) HomeTrust Bancshares Inc Bank of America
Merrill Lynch (3,409)(7,074) HomeTrust Bancshares Inc Barclays Bank (7,357)
(23,014) HomeTrust Bancshares Inc Goldman Sachs (56,845)(6,362) HomeTrust Bancshares Inc HSBC (6,203)(5,215) HomeTrust Bancshares Inc Morgan Stanley (5,424)(6,112) Homology Medicines Inc Barclays Bank 7,457(5,423) Homology Medicines Inc Goldman Sachs (5,640)
(13,288) Homology Medicines Inc HSBC (23,387)(3,166) Homology Medicines Inc Morgan Stanley 3,8636,505 Honeywell International Inc Barclays Bank 39,095
18,994 Honeywell International Inc HSBC 333,40526,111 Honeywell International Inc Morgan Stanley 156,9273,081 Hooker Furniture Corp Bank of America
Merrill Lynch 8,01113,024 Hooker Furniture Corp Barclays Bank 9,24723,857 Hooker Furniture Corp HSBC 53,67812,751 Hooker Furniture Corp Morgan Stanley 9,0532,887 Hookipa Pharma Inc Bank of America
Merrill Lynch 3,2918,665 Hookipa Pharma Inc Barclays Bank 2,7735,134 Hookipa Pharma Inc Goldman Sachs 3,6002,370 Hookipa Pharma Inc HSBC 2,3948,538 Hookipa Pharma Inc Morgan Stanley 2,732
(49,139) Hope Bancorp Inc Bank of AmericaMerrill Lynch (61,212)
(9,518) Hope Bancorp Inc Barclays Bank (4,569)
Holding Description Counterparty
Netunrealised
appreciation/(depreciation)
USD
United States continued(144,338) Hope Bancorp Inc Goldman Sachs (190,526)(32,760) Hope Bancorp Inc HSBC (11,414)
(104,908) Hope Bancorp Inc Morgan Stanley (50,356)(11,168) Horace Mann Educators
CorpBank of AmericaMerrill Lynch (40,205)
(6,210) Horace Mann EducatorsCorp Barclays Bank (3,786)
(11,146) Horace Mann EducatorsCorp Goldman Sachs (40,126)
(8,057) Horace Mann EducatorsCorp HSBC (5,801)
(4,427) Horace Mann EducatorsCorp Morgan Stanley (4,206)
(9,170) Horizon Bancorp Inc Bank of AmericaMerrill Lynch (13,847)
(14,747) Horizon Bancorp Inc Barclays Bank (7,816)(53,819) Horizon Bancorp Inc Goldman Sachs (81,267)(33,323) Horizon Bancorp Inc HSBC 21,660(73,159) Horizon Bancorp Inc Morgan Stanley (38,774)(64,423) Horizon Global Corp Bank of America
Merrill Lynch (9,663)(9,686) Horizon Therapeutics Plc Bank of America
Merrill Lynch (20,009)(20,298) Horizon Therapeutics Plc Barclays Bank (7,713)(15,816) Horizon Therapeutics Plc Goldman Sachs (35,252)(16,211) Horizon Therapeutics Plc HSBC (105,372)(13,923) Horizon Therapeutics Plc Morgan Stanley (5,291)
6,498 Horizon Therapeutics Plc Morgan Stanley 2,46916,761 Hormel Foods Corp Bank of America
Merrill Lynch (666)27,044 Hormel Foods Corp Barclays Bank 22,71733,595 Hormel Foods Corp Goldman Sachs (4,381)12,678 Hormel Foods Corp HSBC 6,72042,149 Hormel Foods Corp Morgan Stanley 35,405
(41,788) Host Hotels & Resorts Inc(REIT)
Bank of AmericaMerrill Lynch (70,831)
1,598 Host Hotels & Resorts Inc(REIT) Barclays Bank 839
78,515 Host Hotels & Resorts Inc(REIT) HSBC 54,568
(11,102) Host Hotels & Resorts Inc(REIT) HSBC (12,560)
4,235 Host Hotels & Resorts Inc(REIT) Morgan Stanley 2,223
11,544 Hostess Brands Inc Bank of AmericaMerrill Lynch 2,771
60,882 Hostess Brands Inc Barclays Bank 14,30746,876 Hostess Brands Inc Goldman Sachs 11,250
155,436 Hostess Brands Inc HSBC (12,435)200,571 Hostess Brands Inc Morgan Stanley 47,13424,533 Houghton Mifflin Harcourt
CoBank of AmericaMerrill Lynch 12,389
10,986 Houghton Mifflin HarcourtCo Barclays Bank 1,813
14,493 Houghton Mifflin HarcourtCo Goldman Sachs 7,319
47,295 Houghton Mifflin HarcourtCo Morgan Stanley 7,804
1,143 Houlihan Lokey Inc Barclays Bank (663)(10,077) Houlihan Lokey Inc Barclays Bank 5,845
3,149 Houlihan Lokey Inc Goldman Sachs (7,382)844 Houlihan Lokey Inc HSBC (1,756)
(2,685) Houlihan Lokey Inc HSBC 5,58511,185 Houlihan Lokey Inc Morgan Stanley (6,802)(4,017) Houlihan Lokey Inc Morgan Stanley 2,3307,511 Houston Wire & Cable Co Bank of America
Merrill Lynch 1,2392,963 Houston Wire & Cable Co Goldman Sachs 489
19,133 Houston Wire & Cable Co Morgan Stanley (96)
BlackRock Americas Diversified Equity Absolute Return Fundcontinued
The notes on pages 691 to 711 form an integral part of these financial statements.
BlackRock Strategic Funds[132]

Contracts for difference as at 31 May 2020
Holding Description Counterparty
Netunrealised
appreciation/(depreciation)
USD
United States continued(2,571) Hovnanian Enterprises Inc
’A’ Barclays Bank (7,070)(3,452) Hovnanian Enterprises Inc
’A’ Goldman Sachs (17,847)(4,307) Hovnanian Enterprises Inc
’A’ HSBC (17,357)(69,605) Howard Bancorp Inc Bank of America
Merrill Lynch (102,319)(1,361) Howard Hughes Corp Barclays Bank (4,695)(6,585) Howard Hughes Corp Goldman Sachs (53,404)(7,146) Howard Hughes Corp HSBC 28,727(4,756) Howard Hughes Corp Morgan Stanley (16,408)
(60,829) Howmet Aerospace Inc Bank of AmericaMerrill Lynch (138,690)
(20,960) Howmet Aerospace Inc Barclays Bank (14,253)(6,745) Howmet Aerospace Inc Goldman Sachs (15,378)
(25,878) Howmet Aerospace Inc HSBC (11,128)(66,999) Howmet Aerospace Inc Morgan Stanley (45,559)17,629 HP Inc HSBC (13,045)
859 HP Inc Morgan Stanley (1,787)7,657 Hub Group Inc ’A’ Bank of America
Merrill Lynch 56,8927,126 Hub Group Inc ’A’ Barclays Bank 18,955
14,665 Hub Group Inc ’A’ Goldman Sachs 108,96118,802 Hub Group Inc ’A’ HSBC 21,62248,355 Hub Group Inc ’A’ Morgan Stanley 128,6253,487 Hubbell Inc Bank of America
Merrill Lynch 26,8344,340 Hubbell Inc Barclays Bank 14,7157,167 Hubbell Inc Goldman Sachs 50,9669,507 Hubbell Inc HSBC 414
33,976 Hubbell Inc Morgan Stanley 182,7913,752 HubSpot Inc Bank of America
Merrill Lynch 33,7302,421 HubSpot Inc Barclays Bank (4,067)1,981 HubSpot Inc Goldman Sachs 15,0984,151 HubSpot Inc HSBC 34,7641,361 HubSpot Inc Morgan Stanley (2,286)
(9,234) Hudson Ltd ’A’ Barclays Bank (2,770)(44,620) Hudson Ltd ’A’ Goldman Sachs (25,433)(18,901) Hudson Ltd ’A’ HSBC 17,389(27,488) Hudson Ltd ’A’ Morgan Stanley (8,246)
5,552 Hudson Pacific PropertiesInc (REIT)
Bank of AmericaMerrill Lynch 29,870
(7,299) Hudson Pacific PropertiesInc (REIT)
Bank of AmericaMerrill Lynch (39,269)
21,589 Hudson Pacific PropertiesInc (REIT) Barclays Bank 87,435
(14,643) Hudson Pacific PropertiesInc (REIT) Barclays Bank (59,304)
28,703 Hudson Pacific PropertiesInc (REIT) Goldman Sachs 154,422
(2,222) Hudson Pacific PropertiesInc (REIT) Goldman Sachs (11,954)
12,124 Hudson Pacific PropertiesInc (REIT) HSBC 21,944
(1,463) Hudson Pacific PropertiesInc (REIT) HSBC (2,648)
5,590 Hudson Pacific PropertiesInc (REIT) Morgan Stanley 22,640
(6,595) Hudson Pacific PropertiesInc (REIT) Morgan Stanley (26,710)
(2,005) Humana Inc Bank of AmericaMerrill Lynch (10,819)
(699) Humana Inc Barclays Bank (6,822)(5,202) Humana Inc Goldman Sachs (32,762)
(783) Humana Inc HSBC (20,898)
Holding Description Counterparty
Netunrealised
appreciation/(depreciation)
USD
United States continued(3,421) Humana Inc Morgan Stanley (33,389)
(20,032) Huntington Bancshares Inc Bank of AmericaMerrill Lynch (27,544)
(27,730) Huntington Bancshares Inc Barclays Bank (21,768)(86,087) Huntington Bancshares Inc Goldman Sachs (118,369)
(170,393) Huntington Bancshares Inc HSBC (39,190)(14,796) Huntington Bancshares Inc Morgan Stanley (11,615)(2,022) Huntington Ingalls Industries
IncBank of AmericaMerrill Lynch (52,605)
(5,246) Huntington Ingalls IndustriesInc Barclays Bank (76,329)
(5,248) Huntington Ingalls IndustriesInc Goldman Sachs (139,590)
(3,325) Huntington Ingalls IndustriesInc HSBC (55,660)
(4,635) Huntington Ingalls IndustriesInc Morgan Stanley (67,439)
(18,410) Huntsman Corp Bank of AmericaMerrill Lynch (44,808)
(52,039) Huntsman Corp Barclays Bank (11,638)(26,970) Huntsman Corp Goldman Sachs (67,789)(54,714) Huntsman Corp HSBC (101,788)(76,195) Huntsman Corp Morgan Stanley (27,431)
3,080 Hurco Cos Inc Bank of AmericaMerrill Lynch 5,051
2,189 Hurco Cos Inc Barclays Bank 1,1163,525 Hurco Cos Inc Goldman Sachs 5,7811,026 Hurco Cos Inc HSBC 1135,281 Hurco Cos Inc Morgan Stanley 2,693
(3,687) Huron Consulting Group Inc Bank of AmericaMerrill Lynch (25,035)
(3,345) Huron Consulting Group Inc Barclays Bank (19,401)(2,919) Huron Consulting Group Inc Goldman Sachs (19,820)(6,473) Huron Consulting Group Inc HSBC (5,567)
(10,917) Huron Consulting Group Inc Morgan Stanley (63,319)(2,978) Huttig Building Products Inc Bank of America
Merrill Lynch (328)(9,533) Huttig Building Products Inc Goldman Sachs (1,049)
(143,938) Huttig Building Products Inc Morgan Stanley (1,439)(7,293) Hyatt Hotels Corp ’A’ Barclays Bank (12,033)(4,012) Hyatt Hotels Corp ’A’ Goldman Sachs (29,328)(3,420) Hyatt Hotels Corp ’A’ HSBC (4,446)
(16,638) Hyatt Hotels Corp ’A’ Morgan Stanley (27,453)(654) Hyster-Yale Materials
Handling IncBank of AmericaMerrill Lynch (2,197)
(3,754) Hyster-Yale MaterialsHandling Inc Barclays Bank (638)
(5,033) Hyster-Yale MaterialsHandling Inc Goldman Sachs (16,911)
(5,802) Hyster-Yale MaterialsHandling Inc HSBC 4,816
(8,010) Hyster-Yale MaterialsHandling Inc Morgan Stanley (1,362)
3,768 I3 Verticals Inc ’A’ Bank of AmericaMerrill Lynch 10,852
2,367 I3 Verticals Inc ’A’ Barclays Bank 2,5332,735 I3 Verticals Inc ’A’ Goldman Sachs 7,8776,691 I3 Verticals Inc ’A’ Morgan Stanley 7,159
(3,550) IAA Inc Bank of AmericaMerrill Lynch (16,898)
1,988 IAA Inc Bank of AmericaMerrill Lynch 8,601
(8,558) IAA Inc Barclays Bank (29,354)12,894 IAA Inc Barclays Bank 44,226(1,281) IAA Inc Goldman Sachs (6,098)(2,778) IAA Inc HSBC (4,945)(3,404) IAA Inc Morgan Stanley (11,676)
BlackRock Americas Diversified Equity Absolute Return Fundcontinued
The notes on pages 691 to 711 form an integral part of these financial statements.
Annual report and audited financial statements [133]
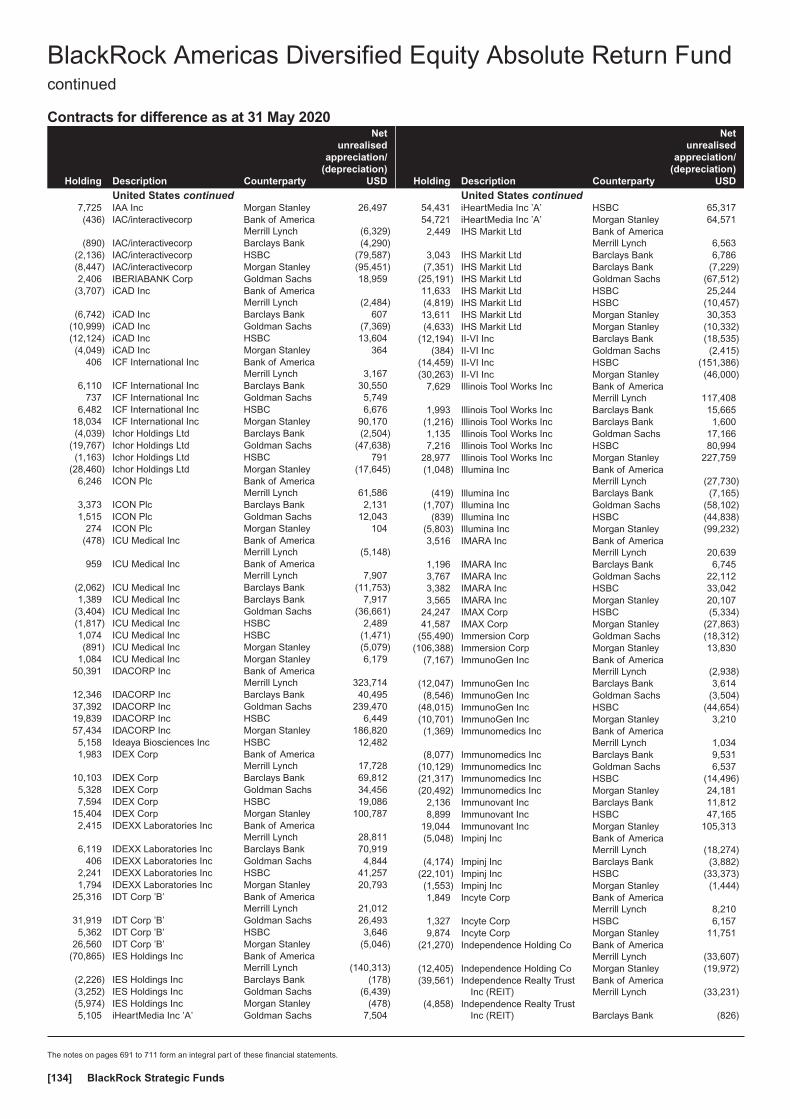
Contracts for difference as at 31 May 2020
Holding Description Counterparty
Netunrealised
appreciation/(depreciation)
USD
United States continued7,725 IAA Inc Morgan Stanley 26,497(436) IAC/interactivecorp Bank of America
Merrill Lynch (6,329)(890) IAC/interactivecorp Barclays Bank (4,290)
(2,136) IAC/interactivecorp HSBC (79,587)(8,447) IAC/interactivecorp Morgan Stanley (95,451)2,406 IBERIABANK Corp Goldman Sachs 18,959
(3,707) iCAD Inc Bank of AmericaMerrill Lynch (2,484)
(6,742) iCAD Inc Barclays Bank 607(10,999) iCAD Inc Goldman Sachs (7,369)(12,124) iCAD Inc HSBC 13,604(4,049) iCAD Inc Morgan Stanley 364
406 ICF International Inc Bank of AmericaMerrill Lynch 3,167
6,110 ICF International Inc Barclays Bank 30,550737 ICF International Inc Goldman Sachs 5,749
6,482 ICF International Inc HSBC 6,67618,034 ICF International Inc Morgan Stanley 90,170(4,039) Ichor Holdings Ltd Barclays Bank (2,504)
(19,767) Ichor Holdings Ltd Goldman Sachs (47,638)(1,163) Ichor Holdings Ltd HSBC 791
(28,460) Ichor Holdings Ltd Morgan Stanley (17,645)6,246 ICON Plc Bank of America
Merrill Lynch 61,5863,373 ICON Plc Barclays Bank 2,1311,515 ICON Plc Goldman Sachs 12,043
274 ICON Plc Morgan Stanley 104(478) ICU Medical Inc Bank of America
Merrill Lynch (5,148)959 ICU Medical Inc Bank of America
Merrill Lynch 7,907(2,062) ICU Medical Inc Barclays Bank (11,753)1,389 ICU Medical Inc Barclays Bank 7,917
(3,404) ICU Medical Inc Goldman Sachs (36,661)(1,817) ICU Medical Inc HSBC 2,4891,074 ICU Medical Inc HSBC (1,471)(891) ICU Medical Inc Morgan Stanley (5,079)
1,084 ICU Medical Inc Morgan Stanley 6,17950,391 IDACORP Inc Bank of America
Merrill Lynch 323,71412,346 IDACORP Inc Barclays Bank 40,49537,392 IDACORP Inc Goldman Sachs 239,47019,839 IDACORP Inc HSBC 6,44957,434 IDACORP Inc Morgan Stanley 186,8205,158 Ideaya Biosciences Inc HSBC 12,4821,983 IDEX Corp Bank of America
Merrill Lynch 17,72810,103 IDEX Corp Barclays Bank 69,8125,328 IDEX Corp Goldman Sachs 34,4567,594 IDEX Corp HSBC 19,086
15,404 IDEX Corp Morgan Stanley 100,7872,415 IDEXX Laboratories Inc Bank of America
Merrill Lynch 28,8116,119 IDEXX Laboratories Inc Barclays Bank 70,919
406 IDEXX Laboratories Inc Goldman Sachs 4,8442,241 IDEXX Laboratories Inc HSBC 41,2571,794 IDEXX Laboratories Inc Morgan Stanley 20,793
25,316 IDT Corp ’B’ Bank of AmericaMerrill Lynch 21,012
31,919 IDT Corp ’B’ Goldman Sachs 26,4935,362 IDT Corp ’B’ HSBC 3,646
26,560 IDT Corp ’B’ Morgan Stanley (5,046)(70,865) IES Holdings Inc Bank of America
Merrill Lynch (140,313)(2,226) IES Holdings Inc Barclays Bank (178)(3,252) IES Holdings Inc Goldman Sachs (6,439)(5,974) IES Holdings Inc Morgan Stanley (478)5,105 iHeartMedia Inc ’A’ Goldman Sachs 7,504
Holding Description Counterparty
Netunrealised
appreciation/(depreciation)
USD
United States continued54,431 iHeartMedia Inc ’A’ HSBC 65,31754,721 iHeartMedia Inc ’A’ Morgan Stanley 64,5712,449 IHS Markit Ltd Bank of America
Merrill Lynch 6,5633,043 IHS Markit Ltd Barclays Bank 6,786
(7,351) IHS Markit Ltd Barclays Bank (7,229)(25,191) IHS Markit Ltd Goldman Sachs (67,512)11,633 IHS Markit Ltd HSBC 25,244(4,819) IHS Markit Ltd HSBC (10,457)13,611 IHS Markit Ltd Morgan Stanley 30,353(4,633) IHS Markit Ltd Morgan Stanley (10,332)
(12,194) II-VI Inc Barclays Bank (18,535)(384) II-VI Inc Goldman Sachs (2,415)
(14,459) II-VI Inc HSBC (151,386)(30,263) II-VI Inc Morgan Stanley (46,000)
7,629 Illinois Tool Works Inc Bank of AmericaMerrill Lynch 117,408
1,993 Illinois Tool Works Inc Barclays Bank 15,665(1,216) Illinois Tool Works Inc Barclays Bank 1,6001,135 Illinois Tool Works Inc Goldman Sachs 17,1667,216 Illinois Tool Works Inc HSBC 80,994
28,977 Illinois Tool Works Inc Morgan Stanley 227,759(1,048) Illumina Inc Bank of America
Merrill Lynch (27,730)(419) Illumina Inc Barclays Bank (7,165)
(1,707) Illumina Inc Goldman Sachs (58,102)(839) Illumina Inc HSBC (44,838)
(5,803) Illumina Inc Morgan Stanley (99,232)3,516 IMARA Inc Bank of America
Merrill Lynch 20,6391,196 IMARA Inc Barclays Bank 6,7453,767 IMARA Inc Goldman Sachs 22,1123,382 IMARA Inc HSBC 33,0423,565 IMARA Inc Morgan Stanley 20,107
24,247 IMAX Corp HSBC (5,334)41,587 IMAX Corp Morgan Stanley (27,863)
(55,490) Immersion Corp Goldman Sachs (18,312)(106,388) Immersion Corp Morgan Stanley 13,830
(7,167) ImmunoGen Inc Bank of AmericaMerrill Lynch (2,938)
(12,047) ImmunoGen Inc Barclays Bank 3,614(8,546) ImmunoGen Inc Goldman Sachs (3,504)
(48,015) ImmunoGen Inc HSBC (44,654)(10,701) ImmunoGen Inc Morgan Stanley 3,210(1,369) Immunomedics Inc Bank of America
Merrill Lynch 1,034(8,077) Immunomedics Inc Barclays Bank 9,531
(10,129) Immunomedics Inc Goldman Sachs 6,537(21,317) Immunomedics Inc HSBC (14,496)(20,492) Immunomedics Inc Morgan Stanley 24,181
2,136 Immunovant Inc Barclays Bank 11,8128,899 Immunovant Inc HSBC 47,165
19,044 Immunovant Inc Morgan Stanley 105,313(5,048) Impinj Inc Bank of America
Merrill Lynch (18,274)(4,174) Impinj Inc Barclays Bank (3,882)
(22,101) Impinj Inc HSBC (33,373)(1,553) Impinj Inc Morgan Stanley (1,444)1,849 Incyte Corp Bank of America
Merrill Lynch 8,2101,327 Incyte Corp HSBC 6,1579,874 Incyte Corp Morgan Stanley 11,751
(21,270) Independence Holding Co Bank of AmericaMerrill Lynch (33,607)
(12,405) Independence Holding Co Morgan Stanley (19,972)(39,561) Independence Realty Trust
Inc (REIT)Bank of AmericaMerrill Lynch (33,231)
(4,858) Independence Realty TrustInc (REIT) Barclays Bank (826)
BlackRock Americas Diversified Equity Absolute Return Fundcontinued
The notes on pages 691 to 711 form an integral part of these financial statements.
BlackRock Strategic Funds[134]
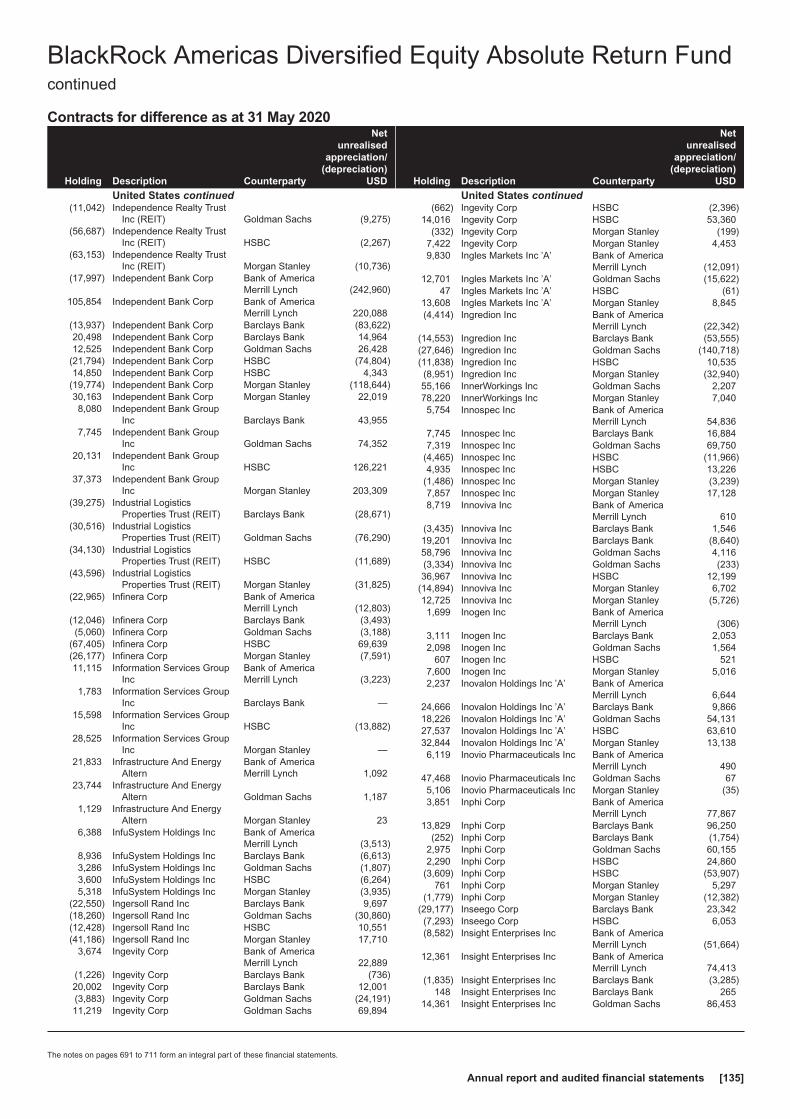
Contracts for difference as at 31 May 2020
Holding Description Counterparty
Netunrealised
appreciation/(depreciation)
USD
United States continued(11,042) Independence Realty Trust
Inc (REIT) Goldman Sachs (9,275)(56,687) Independence Realty Trust
Inc (REIT) HSBC (2,267)(63,153) Independence Realty Trust
Inc (REIT) Morgan Stanley (10,736)(17,997) Independent Bank Corp Bank of America
Merrill Lynch (242,960)105,854 Independent Bank Corp Bank of America
Merrill Lynch 220,088(13,937) Independent Bank Corp Barclays Bank (83,622)20,498 Independent Bank Corp Barclays Bank 14,96412,525 Independent Bank Corp Goldman Sachs 26,428
(21,794) Independent Bank Corp HSBC (74,804)14,850 Independent Bank Corp HSBC 4,343
(19,774) Independent Bank Corp Morgan Stanley (118,644)30,163 Independent Bank Corp Morgan Stanley 22,0198,080 Independent Bank Group
Inc Barclays Bank 43,9557,745 Independent Bank Group
Inc Goldman Sachs 74,35220,131 Independent Bank Group
Inc HSBC 126,22137,373 Independent Bank Group
Inc Morgan Stanley 203,309(39,275) Industrial Logistics
Properties Trust (REIT) Barclays Bank (28,671)(30,516) Industrial Logistics
Properties Trust (REIT) Goldman Sachs (76,290)(34,130) Industrial Logistics
Properties Trust (REIT) HSBC (11,689)(43,596) Industrial Logistics
Properties Trust (REIT) Morgan Stanley (31,825)(22,965) Infinera Corp Bank of America
Merrill Lynch (12,803)(12,046) Infinera Corp Barclays Bank (3,493)(5,060) Infinera Corp Goldman Sachs (3,188)
(67,405) Infinera Corp HSBC 69,639(26,177) Infinera Corp Morgan Stanley (7,591)11,115 Information Services Group
IncBank of AmericaMerrill Lynch (3,223)
1,783 Information Services GroupInc Barclays Bank —
15,598 Information Services GroupInc HSBC (13,882)
28,525 Information Services GroupInc Morgan Stanley —
21,833 Infrastructure And EnergyAltern
Bank of AmericaMerrill Lynch 1,092
23,744 Infrastructure And EnergyAltern Goldman Sachs 1,187
1,129 Infrastructure And EnergyAltern Morgan Stanley 23
6,388 InfuSystem Holdings Inc Bank of AmericaMerrill Lynch (3,513)
8,936 InfuSystem Holdings Inc Barclays Bank (6,613)3,286 InfuSystem Holdings Inc Goldman Sachs (1,807)3,600 InfuSystem Holdings Inc HSBC (6,264)5,318 InfuSystem Holdings Inc Morgan Stanley (3,935)
(22,550) Ingersoll Rand Inc Barclays Bank 9,697(18,260) Ingersoll Rand Inc Goldman Sachs (30,860)(12,428) Ingersoll Rand Inc HSBC 10,551(41,186) Ingersoll Rand Inc Morgan Stanley 17,710
3,674 Ingevity Corp Bank of AmericaMerrill Lynch 22,889
(1,226) Ingevity Corp Barclays Bank (736)20,002 Ingevity Corp Barclays Bank 12,001(3,883) Ingevity Corp Goldman Sachs (24,191)11,219 Ingevity Corp Goldman Sachs 69,894
Holding Description Counterparty
Netunrealised
appreciation/(depreciation)
USD
United States continued(662) Ingevity Corp HSBC (2,396)
14,016 Ingevity Corp HSBC 53,360(332) Ingevity Corp Morgan Stanley (199)
7,422 Ingevity Corp Morgan Stanley 4,4539,830 Ingles Markets Inc ’A’ Bank of America
Merrill Lynch (12,091)12,701 Ingles Markets Inc ’A’ Goldman Sachs (15,622)
47 Ingles Markets Inc ’A’ HSBC (61)13,608 Ingles Markets Inc ’A’ Morgan Stanley 8,845(4,414) Ingredion Inc Bank of America
Merrill Lynch (22,342)(14,553) Ingredion Inc Barclays Bank (53,555)(27,646) Ingredion Inc Goldman Sachs (140,718)(11,838) Ingredion Inc HSBC 10,535(8,951) Ingredion Inc Morgan Stanley (32,940)55,166 InnerWorkings Inc Goldman Sachs 2,20778,220 InnerWorkings Inc Morgan Stanley 7,0405,754 Innospec Inc Bank of America
Merrill Lynch 54,8367,745 Innospec Inc Barclays Bank 16,8847,319 Innospec Inc Goldman Sachs 69,750
(4,465) Innospec Inc HSBC (11,966)4,935 Innospec Inc HSBC 13,226
(1,486) Innospec Inc Morgan Stanley (3,239)7,857 Innospec Inc Morgan Stanley 17,1288,719 Innoviva Inc Bank of America
Merrill Lynch 610(3,435) Innoviva Inc Barclays Bank 1,54619,201 Innoviva Inc Barclays Bank (8,640)58,796 Innoviva Inc Goldman Sachs 4,116(3,334) Innoviva Inc Goldman Sachs (233)36,967 Innoviva Inc HSBC 12,199
(14,894) Innoviva Inc Morgan Stanley 6,70212,725 Innoviva Inc Morgan Stanley (5,726)1,699 Inogen Inc Bank of America
Merrill Lynch (306)3,111 Inogen Inc Barclays Bank 2,0532,098 Inogen Inc Goldman Sachs 1,564
607 Inogen Inc HSBC 5217,600 Inogen Inc Morgan Stanley 5,0162,237 Inovalon Holdings Inc ’A’ Bank of America
Merrill Lynch 6,64424,666 Inovalon Holdings Inc ’A’ Barclays Bank 9,86618,226 Inovalon Holdings Inc ’A’ Goldman Sachs 54,13127,537 Inovalon Holdings Inc ’A’ HSBC 63,61032,844 Inovalon Holdings Inc ’A’ Morgan Stanley 13,1386,119 Inovio Pharmaceuticals Inc Bank of America
Merrill Lynch 49047,468 Inovio Pharmaceuticals Inc Goldman Sachs 675,106 Inovio Pharmaceuticals Inc Morgan Stanley (35)3,851 Inphi Corp Bank of America
Merrill Lynch 77,86713,829 Inphi Corp Barclays Bank 96,250
(252) Inphi Corp Barclays Bank (1,754)2,975 Inphi Corp Goldman Sachs 60,1552,290 Inphi Corp HSBC 24,860
(3,609) Inphi Corp HSBC (53,907)761 Inphi Corp Morgan Stanley 5,297
(1,779) Inphi Corp Morgan Stanley (12,382)(29,177) Inseego Corp Barclays Bank 23,342(7,293) Inseego Corp HSBC 6,053(8,582) Insight Enterprises Inc Bank of America
Merrill Lynch (51,664)12,361 Insight Enterprises Inc Bank of America
Merrill Lynch 74,413(1,835) Insight Enterprises Inc Barclays Bank (3,285)
148 Insight Enterprises Inc Barclays Bank 26514,361 Insight Enterprises Inc Goldman Sachs 86,453
BlackRock Americas Diversified Equity Absolute Return Fundcontinued
The notes on pages 691 to 711 form an integral part of these financial statements.
Annual report and audited financial statements [135]
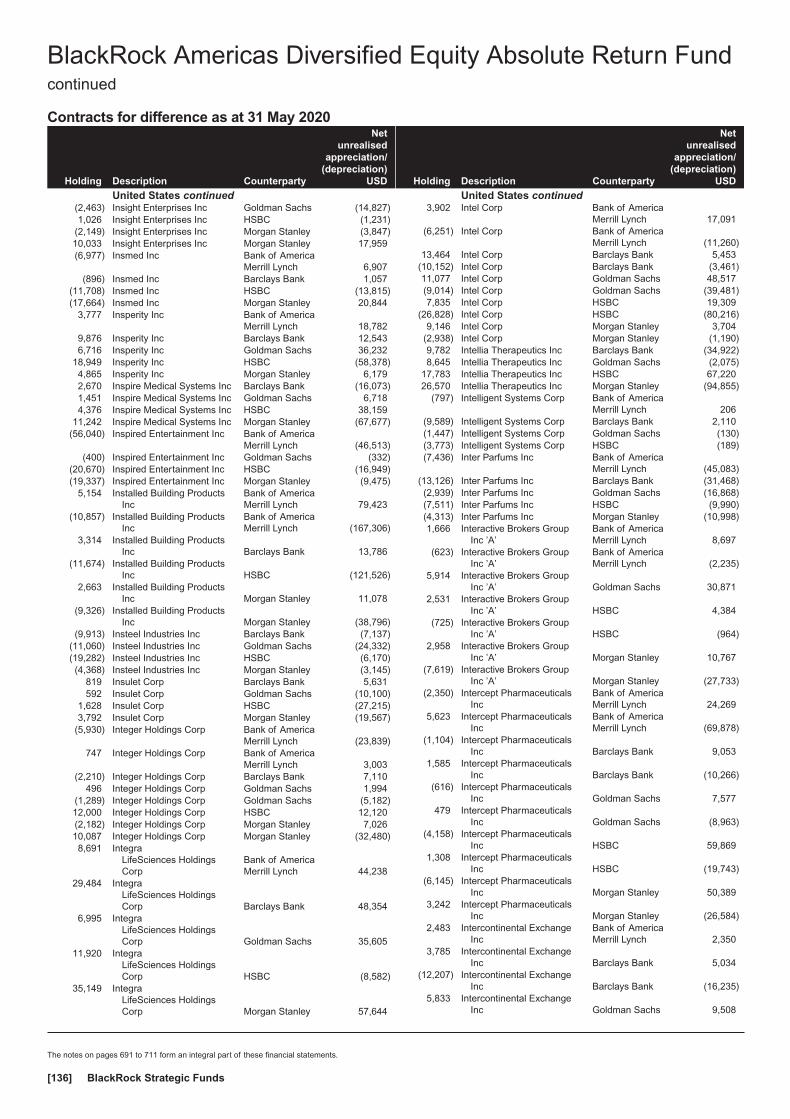
Contracts for difference as at 31 May 2020
Holding Description Counterparty
Netunrealised
appreciation/(depreciation)
USD
United States continued(2,463) Insight Enterprises Inc Goldman Sachs (14,827)1,026 Insight Enterprises Inc HSBC (1,231)
(2,149) Insight Enterprises Inc Morgan Stanley (3,847)10,033 Insight Enterprises Inc Morgan Stanley 17,959(6,977) Insmed Inc Bank of America
Merrill Lynch 6,907(896) Insmed Inc Barclays Bank 1,057
(11,708) Insmed Inc HSBC (13,815)(17,664) Insmed Inc Morgan Stanley 20,844
3,777 Insperity Inc Bank of AmericaMerrill Lynch 18,782
9,876 Insperity Inc Barclays Bank 12,5436,716 Insperity Inc Goldman Sachs 36,232
18,949 Insperity Inc HSBC (58,378)4,865 Insperity Inc Morgan Stanley 6,1792,670 Inspire Medical Systems Inc Barclays Bank (16,073)1,451 Inspire Medical Systems Inc Goldman Sachs 6,7184,376 Inspire Medical Systems Inc HSBC 38,159
11,242 Inspire Medical Systems Inc Morgan Stanley (67,677)(56,040) Inspired Entertainment Inc Bank of America
Merrill Lynch (46,513)(400) Inspired Entertainment Inc Goldman Sachs (332)
(20,670) Inspired Entertainment Inc HSBC (16,949)(19,337) Inspired Entertainment Inc Morgan Stanley (9,475)
5,154 Installed Building ProductsInc
Bank of AmericaMerrill Lynch 79,423
(10,857) Installed Building ProductsInc
Bank of AmericaMerrill Lynch (167,306)
3,314 Installed Building ProductsInc Barclays Bank 13,786
(11,674) Installed Building ProductsInc HSBC (121,526)
2,663 Installed Building ProductsInc Morgan Stanley 11,078
(9,326) Installed Building ProductsInc Morgan Stanley (38,796)
(9,913) Insteel Industries Inc Barclays Bank (7,137)(11,060) Insteel Industries Inc Goldman Sachs (24,332)(19,282) Insteel Industries Inc HSBC (6,170)(4,368) Insteel Industries Inc Morgan Stanley (3,145)
819 Insulet Corp Barclays Bank 5,631592 Insulet Corp Goldman Sachs (10,100)
1,628 Insulet Corp HSBC (27,215)3,792 Insulet Corp Morgan Stanley (19,567)
(5,930) Integer Holdings Corp Bank of AmericaMerrill Lynch (23,839)
747 Integer Holdings Corp Bank of AmericaMerrill Lynch 3,003
(2,210) Integer Holdings Corp Barclays Bank 7,110496 Integer Holdings Corp Goldman Sachs 1,994
(1,289) Integer Holdings Corp Goldman Sachs (5,182)12,000 Integer Holdings Corp HSBC 12,120(2,182) Integer Holdings Corp Morgan Stanley 7,02610,087 Integer Holdings Corp Morgan Stanley (32,480)8,691 Integra
LifeSciences HoldingsCorp
Bank of AmericaMerrill Lynch 44,238
29,484 IntegraLifeSciences HoldingsCorp Barclays Bank 48,354
6,995 IntegraLifeSciences HoldingsCorp Goldman Sachs 35,605
11,920 IntegraLifeSciences HoldingsCorp HSBC (8,582)
35,149 IntegraLifeSciences HoldingsCorp Morgan Stanley 57,644
Holding Description Counterparty
Netunrealised
appreciation/(depreciation)
USD
United States continued3,902 Intel Corp Bank of America
Merrill Lynch 17,091(6,251) Intel Corp Bank of America
Merrill Lynch (11,260)13,464 Intel Corp Barclays Bank 5,453
(10,152) Intel Corp Barclays Bank (3,461)11,077 Intel Corp Goldman Sachs 48,517(9,014) Intel Corp Goldman Sachs (39,481)7,835 Intel Corp HSBC 19,309
(26,828) Intel Corp HSBC (80,216)9,146 Intel Corp Morgan Stanley 3,704
(2,938) Intel Corp Morgan Stanley (1,190)9,782 Intellia Therapeutics Inc Barclays Bank (34,922)8,645 Intellia Therapeutics Inc Goldman Sachs (2,075)
17,783 Intellia Therapeutics Inc HSBC 67,22026,570 Intellia Therapeutics Inc Morgan Stanley (94,855)
(797) Intelligent Systems Corp Bank of AmericaMerrill Lynch 206
(9,589) Intelligent Systems Corp Barclays Bank 2,110(1,447) Intelligent Systems Corp Goldman Sachs (130)(3,773) Intelligent Systems Corp HSBC (189)(7,436) Inter Parfums Inc Bank of America
Merrill Lynch (45,083)(13,126) Inter Parfums Inc Barclays Bank (31,468)(2,939) Inter Parfums Inc Goldman Sachs (16,868)(7,511) Inter Parfums Inc HSBC (9,990)(4,313) Inter Parfums Inc Morgan Stanley (10,998)1,666 Interactive Brokers Group
Inc ’A’Bank of AmericaMerrill Lynch 8,697
(623) Interactive Brokers GroupInc ’A’
Bank of AmericaMerrill Lynch (2,235)
5,914 Interactive Brokers GroupInc ’A’ Goldman Sachs 30,871
2,531 Interactive Brokers GroupInc ’A’ HSBC 4,384
(725) Interactive Brokers GroupInc ’A’ HSBC (964)
2,958 Interactive Brokers GroupInc ’A’ Morgan Stanley 10,767
(7,619) Interactive Brokers GroupInc ’A’ Morgan Stanley (27,733)
(2,350) Intercept PharmaceuticalsInc
Bank of AmericaMerrill Lynch 24,269
5,623 Intercept PharmaceuticalsInc
Bank of AmericaMerrill Lynch (69,878)
(1,104) Intercept PharmaceuticalsInc Barclays Bank 9,053
1,585 Intercept PharmaceuticalsInc Barclays Bank (10,266)
(616) Intercept PharmaceuticalsInc Goldman Sachs 7,577
479 Intercept PharmaceuticalsInc Goldman Sachs (8,963)
(4,158) Intercept PharmaceuticalsInc HSBC 59,869
1,308 Intercept PharmaceuticalsInc HSBC (19,743)
(6,145) Intercept PharmaceuticalsInc Morgan Stanley 50,389
3,242 Intercept PharmaceuticalsInc Morgan Stanley (26,584)
2,483 Intercontinental ExchangeInc
Bank of AmericaMerrill Lynch 2,350
3,785 Intercontinental ExchangeInc Barclays Bank 5,034
(12,207) Intercontinental ExchangeInc Barclays Bank (16,235)
5,833 Intercontinental ExchangeInc Goldman Sachs 9,508
BlackRock Americas Diversified Equity Absolute Return Fundcontinued
The notes on pages 691 to 711 form an integral part of these financial statements.
BlackRock Strategic Funds[136]

Contracts for difference as at 31 May 2020
Holding Description Counterparty
Netunrealised
appreciation/(depreciation)
USD
United States continued(9,242) Intercontinental Exchange
Inc Goldman Sachs (15,064)2,200 Intercontinental Exchange
Inc HSBC 3,224(1,915) Intercontinental Exchange
Inc HSBC (3,026)13,803 Intercontinental Exchange
Inc Morgan Stanley 18,358(12,042) Intercontinental Exchange
Inc Morgan Stanley (16,016)7,130 InterDigital Inc Bank of America
Merrill Lynch 10,624(4,400) InterDigital Inc Bank of America
Merrill Lynch 4384,554 InterDigital Inc Barclays Bank 2,641
(15,356) InterDigital Inc Barclays Bank (8,906)(1,687) InterDigital Inc Goldman Sachs (2,514)1,062 InterDigital Inc HSBC (4,928)
(4,492) InterDigital Inc HSBC 20,843(6,792) InterDigital Inc Morgan Stanley (3,939)8,532 Interface Inc Bank of America
Merrill Lynch 11,2209,958 Interface Inc Barclays Bank 6,074
40,487 Interface Inc Goldman Sachs 53,2407,885 Interface Inc HSBC (1,656)2,568 Interface Inc Morgan Stanley 1,566
(6,533) International BancsharesCorp
Bank of AmericaMerrill Lynch (24,945)
(2,830) International BancsharesCorp Barclays Bank (7,132)
(1,610) International BancsharesCorp Goldman Sachs (7,438)
(29,854) International BancsharesCorp HSBC (64,243)
(44,697) International BancsharesCorp Morgan Stanley (112,636)
(7,704) International BusinessMachines Corp
Bank of AmericaMerrill Lynch (43,835)
(6,073) International BusinessMachines Corp Barclays Bank (18,852)
(6,041) International BusinessMachines Corp Goldman Sachs (21,704)
(20,816) International BusinessMachines Corp HSBC 6,661
(16,828) International BusinessMachines Corp Morgan Stanley (72,024)
(688) International Flavors &Fragrances Inc
Bank of AmericaMerrill Lynch (2,890)
6,125 International Flavors &Fragrances Inc
Bank of AmericaMerrill Lynch 17,090
(8,225) International Flavors &Fragrances Inc Barclays Bank (24,675)
6,782 International Flavors &Fragrances Inc Barclays Bank (3,447)
382 International Flavors &Fragrances Inc Goldman Sachs 1,412
(1,052) International Flavors &Fragrances Inc HSBC 2,157
211 International Flavors &Fragrances Inc HSBC 580
3,627 International Flavors &Fragrances Inc Morgan Stanley 4,176
15,117 International GameTechnology Plc
Bank of AmericaMerrill Lynch 13,669
27,798 International GameTechnology Plc Morgan Stanley 13,621
(22,966) International GameTechnology Plc Morgan Stanley (11,253)
43,605 International MoneyExpress Inc Goldman Sachs 53,634
Holding Description Counterparty
Netunrealised
appreciation/(depreciation)
USD
United States continued6,639 International Money
Express Inc HSBC 7,76835,805 International Money
Express Inc Morgan Stanley 23,6319,387 International Paper Co Bank of America
Merrill Lynch 29,006(9,979) International Paper Co Bank of America
Merrill Lynch (30,835)15,425 International Paper Co Barclays Bank 23,138(9,162) International Paper Co Barclays Bank (13,743)21,367 International Paper Co Goldman Sachs 66,02447,538 International Paper Co HSBC (9,983)12,128 International Paper Co Morgan Stanley 18,192
(14,912) International Paper Co Morgan Stanley (22,368)(4,380) International Seaways Inc Barclays Bank (1,183)
(13,276) International Seaways Inc Goldman Sachs (6,638)(8,150) International Seaways Inc HSBC (2,435)28,734 Interpublic Group of Cos Inc Bank of America
Merrill Lynch 23,75228,504 Interpublic Group of Cos Inc Barclays Bank 9,69180,149 Interpublic Group of Cos Inc Goldman Sachs 105,3287,464 Interpublic Group of Cos Inc HSBC 4,408
70,707 Interpublic Group of Cos Inc Morgan Stanley 17,16029,136 Intersect ENT Inc Barclays Bank 3,4489,089 Intersect ENT Inc HSBC (16,919)
11,380 Intersect ENT Inc Morgan Stanley 2,048(27,533) Intevac Inc Bank of America
Merrill Lynch (5,507)(5,815) Intevac Inc Goldman Sachs (1,163)
(900) Intevac Inc HSBC 108(4,634) INTL. FCStone Inc Bank of America
Merrill Lynch (55,608)(2,322) INTL. FCStone Inc Goldman Sachs (27,864)
(10,273) INTL. FCStone Inc HSBC (94,404)(13,622) INTL. FCStone Inc Morgan Stanley (119,601)(2,938) Intra-Cellular Therapies Inc Bank of America
Merrill Lynch 4,7307,401 Intra-Cellular Therapies Inc Barclays Bank (14,284)
(1,844) Intra-Cellular Therapies Inc Goldman Sachs 2,969(6,440) Intra-Cellular Therapies Inc HSBC (966)2,898 Intra-Cellular Therapies Inc HSBC 435
(3,642) Intra-Cellular Therapies Inc Morgan Stanley 7,0298,807 Intra-Cellular Therapies Inc Morgan Stanley (16,998)
(33,811) Intrepid Potash Inc Barclays Bank (6,086)(24,984) Intrepid Potash Inc Goldman Sachs (7,768)(16,246) Intrepid Potash Inc HSBC (3,249)(9,090) IntriCon Corp Bank of America
Merrill Lynch (24,816)(31,080) IntriCon Corp Goldman Sachs (84,848)(4,660) IntriCon Corp HSBC (8,901)(9,706) IntriCon Corp Morgan Stanley (6,697)3,190 Intuit Inc Bank of America
Merrill Lynch (1,218)2,810 Intuit Inc Barclays Bank (6,519)3,247 Intuit Inc Goldman Sachs 7151,635 Intuit Inc HSBC 4,0376,950 Intuit Inc Morgan Stanley (16,124)
(1,208) Intuitive Surgical Inc Barclays Bank (14,726)948 Intuitive Surgical Inc Goldman Sachs 21,282
(593) Intuitive Surgical Inc HSBC (22,071)(4,543) Intuitive Surgical Inc Morgan Stanley (55,379)2,063 Intuitive Surgical Inc Morgan Stanley 25,148
(28,212) Invacare Corp Bank of AmericaMerrill Lynch (12,695)
(10,204) Invacare Corp Barclays Bank 6,735(6,906) Invacare Corp Goldman Sachs (3,108)(5,309) Invacare Corp HSBC (2,389)(3,530) Invacare Corp Morgan Stanley 2,330
BlackRock Americas Diversified Equity Absolute Return Fundcontinued
The notes on pages 691 to 711 form an integral part of these financial statements.
Annual report and audited financial statements [137]

Contracts for difference as at 31 May 2020
Holding Description Counterparty
Netunrealised
appreciation/(depreciation)
USD
United States continued52,526 Invesco Ltd Bank of America
Merrill Lynch 61,71831,122 Invesco Ltd Barclays Bank 18,82960,313 Invesco Ltd Goldman Sachs 70,868
111,108 Invesco Ltd Morgan Stanley 67,22021,712 Invesco Mortgage Capital
Inc (REIT) Barclays Bank 21714,074 Invesco Mortgage Capital
Inc (REIT) Goldman Sachs 1,40736,450 Invesco Mortgage Capital
Inc (REIT) HSBC 1,094109,100 Invesco Mortgage Capital
Inc (REIT) Morgan Stanley 1,0914,312 Investar Holding Corp Bank of America
Merrill Lynch 8,9268,445 Investar Holding Corp Barclays Bank 7,094
10,254 Investar Holding Corp Goldman Sachs 21,22628,362 Investar Holding Corp HSBC 18,1529,843 Investar Holding Corp Morgan Stanley 8,268
30,588 Investors Bancorp Inc Bank of AmericaMerrill Lynch 29,193
(3,175) Investors Bancorp Inc Barclays Bank (1,810)42,587 Investors Bancorp Inc Barclays Bank 24,27569,676 Investors Bancorp Inc Goldman Sachs 79,431
(93,683) Investors Bancorp Inc Goldman Sachs (106,799)(22,912) Investors Bancorp Inc HSBC 2,062138,190 Investors Bancorp Inc HSBC (11,160)(24,179) Investors Bancorp Inc Morgan Stanley (13,782)52,909 Investors Bancorp Inc Morgan Stanley 30,158(3,394) Investors Real Estate Trust
(REIT)Bank of AmericaMerrill Lynch (24,403)
(485) Investors Real Estate Trust(REIT) Barclays Bank (873)
(5,262) Investors Real Estate Trust(REIT) HSBC (33,867)
(14,502) Investors Real Estate Trust(REIT) Morgan Stanley (26,104)
660 Investors Title Co Bank of AmericaMerrill Lynch 9,580
610 Investors Title Co Barclays Bank 4,9813,848 Investors Title Co Goldman Sachs 55,8541,192 Investors Title Co HSBC 5,1241,629 Investors Title Co Morgan Stanley 13,301
(7,850) Invitae Corp Bank of AmericaMerrill Lynch (3,690)
12,639 Invitae Corp Barclays Bank (5,049)(14,825) Invitae Corp Barclays Bank 8,302
3,001 Invitae Corp Goldman Sachs 1,4101,913 Invitae Corp Morgan Stanley (1,071)
(16,448) Invitation Homes Inc (REIT) Bank of AmericaMerrill Lynch 3,505
5,375 Invitation Homes Inc (REIT) Barclays Bank 2,580(13,282) Invitation Homes Inc (REIT) Barclays Bank (2,656)
7,580 Invitation Homes Inc (REIT) Goldman Sachs 13,871(31,074) Invitation Homes Inc (REIT) Goldman Sachs (24,999)42,165 Invitation Homes Inc (REIT) HSBC 42,16558,372 Invitation Homes Inc (REIT) Morgan Stanley 28,0193,112 ION Geophysical Corp Barclays Bank 280
10,739 ION Geophysical Corp Morgan Stanley 9676,088 Ionis Pharmaceuticals Inc Bank of America
Merrill Lynch 20,5785,622 Ionis Pharmaceuticals Inc Barclays Bank 11,1317,335 Ionis Pharmaceuticals Inc Goldman Sachs 23,879
14,562 Ionis Pharmaceuticals Inc HSBC 29,85220,319 Ionis Pharmaceuticals Inc Morgan Stanley 40,231(3,738) Iovance Biotherapeutics Inc Barclays Bank 30,615
(12,624) Iovance Biotherapeutics Inc Goldman Sachs 43,806(756) Iovance Biotherapeutics Inc HSBC 2,495
(12,903) Iovance Biotherapeutics Inc Morgan Stanley 105,676
Holding Description Counterparty
Netunrealised
appreciation/(depreciation)
USD
United States continued(2,209) IPG Photonics Corp Bank of America
Merrill Lynch (12,105)(1,319) IPG Photonics Corp Barclays Bank 7,558(1,065) IPG Photonics Corp Goldman Sachs (5,836)(1,753) IPG Photonics Corp HSBC 7012,317 IPG Photonics Corp HSBC (927)
(1,923) IPG Photonics Corp Morgan Stanley 11,019(3,268) IQVIA Holdings Inc Bank of America
Merrill Lynch (27,783)(2,413) IQVIA Holdings Inc Goldman Sachs (16,566)(3,910) IQVIA Holdings Inc HSBC (38,318)
(12,071) IQVIA Holdings Inc Morgan Stanley (54,923)11,856 iRadimed Corp Bank of America
Merrill Lynch 15,7687,152 iRadimed Corp Barclays Bank 2,4324,626 iRadimed Corp Goldman Sachs 6,1539,432 iRadimed Corp HSBC 9,526
10,698 iRadimed Corp Morgan Stanley 3,637(2,693) iRhythm Technologies Inc Bank of America
Merrill Lynch 14,153(589) iRhythm Technologies Inc Barclays Bank 1,125154 iRhythm Technologies Inc Barclays Bank (294)
(798) iRhythm Technologies Inc Goldman Sachs 5,171218 iRhythm Technologies Inc Goldman Sachs (582)
1,835 iRhythm Technologies Inc HSBC 3306,003 iRhythm Technologies Inc Morgan Stanley (11,466)
11,755 Iridium Communications Inc Bank of AmericaMerrill Lynch 24,215
(6,752) Iridium Communications Inc Bank of AmericaMerrill Lynch (1,836)
(10,811) Iridium Communications Inc Barclays Bank (8,087)5,388 Iridium Communications Inc Barclays Bank 4,903
18,866 Iridium Communications Inc Goldman Sachs 38,864(14,457) Iridium Communications Inc Goldman Sachs (29,781)12,893 Iridium Communications Inc HSBC 8,510
(13,818) Iridium Communications Inc HSBC (9,120)38,321 Iridium Communications Inc Morgan Stanley 34,872(5,763) Iridium Communications Inc Morgan Stanley (5,244)(4,900) iRobot Corp Barclays Bank 1,6911,345 iRobot Corp Barclays Bank (464)1,215 iRobot Corp Goldman Sachs 7,054
(1,062) iRobot Corp HSBC (8,608)3,762 iRobot Corp HSBC 31,2793,259 iRobot Corp Morgan Stanley (1,124)
(3,446) Iron Mountain Inc (REIT) Bank of AmericaMerrill Lynch (11,027)
(928) Iron Mountain Inc (REIT) Barclays Bank (1,346)4,026 Iron Mountain Inc (REIT) Barclays Bank 5,838(453) Iron Mountain Inc (REIT) Goldman Sachs (1,450)
(3,973) Iron Mountain Inc (REIT) HSBC (4,172)(29,035) Iron Mountain Inc (REIT) Morgan Stanley (42,101)13,526 Iron Mountain Inc (REIT) Morgan Stanley 19,61333,660 Ironwood Pharmaceuticals
IncBank of AmericaMerrill Lynch (44,936)
35,772 Ironwood PharmaceuticalsInc Barclays Bank (77,983)
41,679 Ironwood PharmaceuticalsInc Goldman Sachs (55,641)
65,568 Ironwood PharmaceuticalsInc HSBC (26,227)
60,531 Ironwood PharmaceuticalsInc Morgan Stanley (131,957)
(30,842) iStar Inc (REIT) Bank of AmericaMerrill Lynch (48,730)
(15,675) iStar Inc (REIT) Barclays Bank (10,502)(19,802) iStar Inc (REIT) Goldman Sachs (31,287)(31,680) iStar Inc (REIT) HSBC (24,394)(18,686) iStar Inc (REIT) Morgan Stanley (12,520)
BlackRock Americas Diversified Equity Absolute Return Fundcontinued
The notes on pages 691 to 711 form an integral part of these financial statements.
BlackRock Strategic Funds[138]
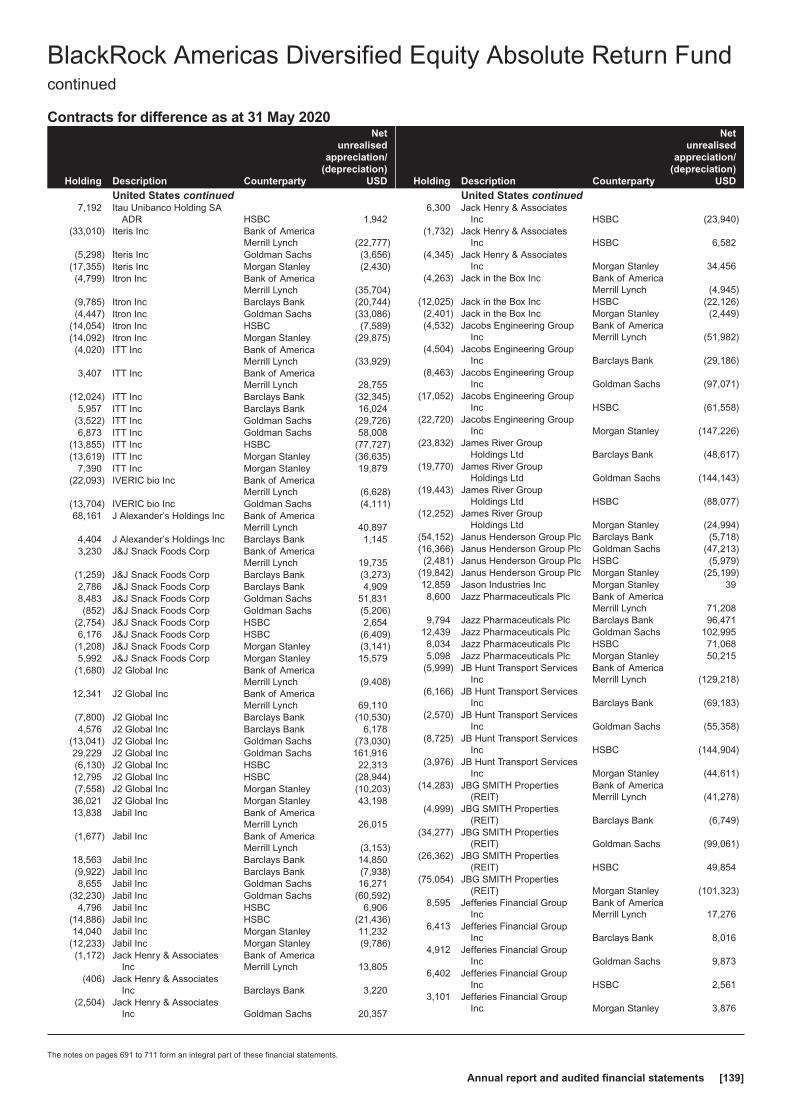
Contracts for difference as at 31 May 2020
Holding Description Counterparty
Netunrealised
appreciation/(depreciation)
USD
United States continued7,192 Itau Unibanco Holding SA
ADR HSBC 1,942(33,010) Iteris Inc Bank of America
Merrill Lynch (22,777)(5,298) Iteris Inc Goldman Sachs (3,656)
(17,355) Iteris Inc Morgan Stanley (2,430)(4,799) Itron Inc Bank of America
Merrill Lynch (35,704)(9,785) Itron Inc Barclays Bank (20,744)(4,447) Itron Inc Goldman Sachs (33,086)
(14,054) Itron Inc HSBC (7,589)(14,092) Itron Inc Morgan Stanley (29,875)(4,020) ITT Inc Bank of America
Merrill Lynch (33,929)3,407 ITT Inc Bank of America
Merrill Lynch 28,755(12,024) ITT Inc Barclays Bank (32,345)
5,957 ITT Inc Barclays Bank 16,024(3,522) ITT Inc Goldman Sachs (29,726)6,873 ITT Inc Goldman Sachs 58,008
(13,855) ITT Inc HSBC (77,727)(13,619) ITT Inc Morgan Stanley (36,635)
7,390 ITT Inc Morgan Stanley 19,879(22,093) IVERIC bio Inc Bank of America
Merrill Lynch (6,628)(13,704) IVERIC bio Inc Goldman Sachs (4,111)68,161 J Alexander’s Holdings Inc Bank of America
Merrill Lynch 40,8974,404 J Alexander’s Holdings Inc Barclays Bank 1,1453,230 J&J Snack Foods Corp Bank of America
Merrill Lynch 19,735(1,259) J&J Snack Foods Corp Barclays Bank (3,273)2,786 J&J Snack Foods Corp Barclays Bank 4,9098,483 J&J Snack Foods Corp Goldman Sachs 51,831(852) J&J Snack Foods Corp Goldman Sachs (5,206)
(2,754) J&J Snack Foods Corp HSBC 2,6546,176 J&J Snack Foods Corp HSBC (6,409)
(1,208) J&J Snack Foods Corp Morgan Stanley (3,141)5,992 J&J Snack Foods Corp Morgan Stanley 15,579
(1,680) J2 Global Inc Bank of AmericaMerrill Lynch (9,408)
12,341 J2 Global Inc Bank of AmericaMerrill Lynch 69,110
(7,800) J2 Global Inc Barclays Bank (10,530)4,576 J2 Global Inc Barclays Bank 6,178
(13,041) J2 Global Inc Goldman Sachs (73,030)29,229 J2 Global Inc Goldman Sachs 161,916(6,130) J2 Global Inc HSBC 22,31312,795 J2 Global Inc HSBC (28,944)(7,558) J2 Global Inc Morgan Stanley (10,203)36,021 J2 Global Inc Morgan Stanley 43,19813,838 Jabil Inc Bank of America
Merrill Lynch 26,015(1,677) Jabil Inc Bank of America
Merrill Lynch (3,153)18,563 Jabil Inc Barclays Bank 14,850(9,922) Jabil Inc Barclays Bank (7,938)8,655 Jabil Inc Goldman Sachs 16,271
(32,230) Jabil Inc Goldman Sachs (60,592)4,796 Jabil Inc HSBC 6,906
(14,886) Jabil Inc HSBC (21,436)14,040 Jabil Inc Morgan Stanley 11,232
(12,233) Jabil Inc Morgan Stanley (9,786)(1,172) Jack Henry & Associates
IncBank of AmericaMerrill Lynch 13,805
(406) Jack Henry & AssociatesInc Barclays Bank 3,220
(2,504) Jack Henry & AssociatesInc Goldman Sachs 20,357
Holding Description Counterparty
Netunrealised
appreciation/(depreciation)
USD
United States continued6,300 Jack Henry & Associates
Inc HSBC (23,940)(1,732) Jack Henry & Associates
Inc HSBC 6,582(4,345) Jack Henry & Associates
Inc Morgan Stanley 34,456(4,263) Jack in the Box Inc Bank of America
Merrill Lynch (4,945)(12,025) Jack in the Box Inc HSBC (22,126)(2,401) Jack in the Box Inc Morgan Stanley (2,449)(4,532) Jacobs Engineering Group
IncBank of AmericaMerrill Lynch (51,982)
(4,504) Jacobs Engineering GroupInc Barclays Bank (29,186)
(8,463) Jacobs Engineering GroupInc Goldman Sachs (97,071)
(17,052) Jacobs Engineering GroupInc HSBC (61,558)
(22,720) Jacobs Engineering GroupInc Morgan Stanley (147,226)
(23,832) James River GroupHoldings Ltd Barclays Bank (48,617)
(19,770) James River GroupHoldings Ltd Goldman Sachs (144,143)
(19,443) James River GroupHoldings Ltd HSBC (88,077)
(12,252) James River GroupHoldings Ltd Morgan Stanley (24,994)
(54,152) Janus Henderson Group Plc Barclays Bank (5,718)(16,366) Janus Henderson Group Plc Goldman Sachs (47,213)(2,481) Janus Henderson Group Plc HSBC (5,979)
(19,842) Janus Henderson Group Plc Morgan Stanley (25,199)12,859 Jason Industries Inc Morgan Stanley 398,600 Jazz Pharmaceuticals Plc Bank of America
Merrill Lynch 71,2089,794 Jazz Pharmaceuticals Plc Barclays Bank 96,471
12,439 Jazz Pharmaceuticals Plc Goldman Sachs 102,9958,034 Jazz Pharmaceuticals Plc HSBC 71,0685,098 Jazz Pharmaceuticals Plc Morgan Stanley 50,215
(5,999) JB Hunt Transport ServicesInc
Bank of AmericaMerrill Lynch (129,218)
(6,166) JB Hunt Transport ServicesInc Barclays Bank (69,183)
(2,570) JB Hunt Transport ServicesInc Goldman Sachs (55,358)
(8,725) JB Hunt Transport ServicesInc HSBC (144,904)
(3,976) JB Hunt Transport ServicesInc Morgan Stanley (44,611)
(14,283) JBG SMITH Properties(REIT)
Bank of AmericaMerrill Lynch (41,278)
(4,999) JBG SMITH Properties(REIT) Barclays Bank (6,749)
(34,277) JBG SMITH Properties(REIT) Goldman Sachs (99,061)
(26,362) JBG SMITH Properties(REIT) HSBC 49,854
(75,054) JBG SMITH Properties(REIT) Morgan Stanley (101,323)
8,595 Jefferies Financial GroupInc
Bank of AmericaMerrill Lynch 17,276
6,413 Jefferies Financial GroupInc Barclays Bank 8,016
4,912 Jefferies Financial GroupInc Goldman Sachs 9,873
6,402 Jefferies Financial GroupInc HSBC 2,561
3,101 Jefferies Financial GroupInc Morgan Stanley 3,876
BlackRock Americas Diversified Equity Absolute Return Fundcontinued
The notes on pages 691 to 711 form an integral part of these financial statements.
Annual report and audited financial statements [139]

Contracts for difference as at 31 May 2020
Holding Description Counterparty
Netunrealised
appreciation/(depreciation)
USD
United States continued(14,474) JELD-WEN Holding Inc Bank of America
Merrill Lynch (22,725)(838) JELD-WEN Holding Inc Barclays Bank 134
(4,224) JELD-WEN Holding Inc Goldman Sachs (6,632)(13,156) JELD-WEN Holding Inc HSBC (14,201)(65,929) JELD-WEN Holding Inc Morgan Stanley 10,549(8,294) Jernigan Capital Inc (REIT) Bank of America
Merrill Lynch (5,806)(12,764) Jernigan Capital Inc (REIT) Barclays Bank (2,936)(38,842) Jernigan Capital Inc (REIT) Goldman Sachs (27,189)(15,996) Jernigan Capital Inc (REIT) HSBC 16,156(13,914) Jernigan Capital Inc (REIT) Morgan Stanley (3,200)(9,689) JetBlue Airways Corp HSBC (8,817)
(111,866) JetBlue Airways Corp Morgan Stanley (85,018)5,033 JM Smucker Co Bank of America
Merrill Lynch (16,508)(1,984) JM Smucker Co Bank of America
Merrill Lynch (7,752)5,407 JM Smucker Co Barclays Bank 15,626
(5,621) JM Smucker Co Goldman Sachs (17,504)3,709 JM Smucker Co HSBC (15,497)3,816 JM Smucker Co Morgan Stanley 11,0286,801 John B Sanfilippo & Son Inc Bank of America
Merrill Lynch 23,1913,607 John B Sanfilippo & Son Inc Barclays Bank (794)5,234 John B Sanfilippo & Son Inc Goldman Sachs 17,8481,278 John B Sanfilippo & Son Inc HSBC (5,585)4,929 John B Sanfilippo & Son Inc Morgan Stanley (1,084)8,909 John Bean Technologies
CorpBank of AmericaMerrill Lynch 162,500
9,330 John Bean TechnologiesCorp Barclays Bank 40,305
9,895 John Bean TechnologiesCorp Goldman Sachs 180,484
18,502 John Bean TechnologiesCorp HSBC 212,412
12,864 John Bean TechnologiesCorp Morgan Stanley 55,573
1,858 John Wiley & Sons Inc ’A’ Bank of AmericaMerrill Lynch 8,565
(6,105) John Wiley & Sons Inc ’A’ Bank of AmericaMerrill Lynch (16,211)
3,995 John Wiley & Sons Inc ’A’ Barclays Bank 7,431(12,668) John Wiley & Sons Inc ’A’ Barclays Bank (21,417)
8,245 John Wiley & Sons Inc ’A’ Goldman Sachs 38,009(15,435) John Wiley & Sons Inc ’A’ Goldman Sachs (50,430)
5,176 John Wiley & Sons Inc ’A’ HSBC 8,954(5,302) John Wiley & Sons Inc ’A’ HSBC (15,220)6,189 John Wiley & Sons Inc ’A’ Morgan Stanley 11,512
(5,602) John Wiley & Sons Inc ’A’ Morgan Stanley (10,420)(772) Johnson & Johnson Bank of America
Merrill Lynch (2,204)(16,820) Johnson & Johnson Barclays Bank (51,806)(11,128) Johnson & Johnson Goldman Sachs 19,821
5,309 Johnson & Johnson HSBC (6,636)32,782 Johnson & Johnson Morgan Stanley 100,969(5,967) Johnson & Johnson Morgan Stanley (18,378)(5,511) Johnson Controls
International PlcBank of AmericaMerrill Lynch (15,596)
(24,855) Johnson ControlsInternational Plc Barclays Bank (43,744)
(56,508) Johnson ControlsInternational Plc Goldman Sachs (150,576)
(33,826) Johnson ControlsInternational Plc HSBC (64,574)
(143,992) Johnson ControlsInternational Plc Morgan Stanley (253,426)
1,729 Johnson Outdoors Inc ’A’ Bank of AmericaMerrill Lynch 19,365
Holding Description Counterparty
Netunrealised
appreciation/(depreciation)
USD
United States continued3,818 Johnson Outdoors Inc ’A’ Barclays Bank 16,1122,703 Johnson Outdoors Inc ’A’ Goldman Sachs 30,274
10,787 Johnson Outdoors Inc ’A’ HSBC 76,4801,749 Johnson Outdoors Inc ’A’ Morgan Stanley 7,3814,199 Joint Corp Bank of America
Merrill Lynch 9,7001,765 Joint Corp Barclays Bank 229
12,683 Joint Corp Goldman Sachs 29,29814,344 Joint Corp HSBC 25,38913,769 Joint Corp Morgan Stanley 1,790
(771) Jones Lang LaSalle Inc Bank of AmericaMerrill Lynch (6,738)
(199) Jones Lang LaSalle Inc Barclays Bank (1,532)(532) Jones Lang LaSalle Inc Goldman Sachs (8,081)
(4,939) Jones Lang LaSalle Inc HSBC 14,373(12,010) Jones Lang LaSalle Inc Morgan Stanley (92,477)
5,312 Jounce Therapeutics Inc Goldman Sachs 4,0907,232 Jounce Therapeutics Inc HSBC 4,484
31,820 Jounce Therapeutics Inc Morgan Stanley (8,910)(11,887) JPMorgan Chase & Co Bank of America
Merrill Lynch (148,136)1,095 JPMorgan Chase & Co Bank of America
Merrill Lynch (2,116)(5,585) JPMorgan Chase & Co Barclays Bank (49,662)25,031 JPMorgan Chase & Co Barclays Bank 222,5769,546 JPMorgan Chase & Co Goldman Sachs 118,962(752) JPMorgan Chase & Co HSBC (4,258)
(17,417) JPMorgan Chase & Co Morgan Stanley (154,872)25,611 Juniper Networks Inc Bank of America
Merrill Lynch 17,41519,228 Juniper Networks Inc Barclays Bank 4,00250,737 Juniper Networks Inc Goldman Sachs 34,50140,928 Juniper Networks Inc HSBC 22325,313 Juniper Networks Inc Morgan Stanley 11,898(4,807) K12 Inc Bank of America
Merrill Lynch (1,442)(16,422) K12 Inc Goldman Sachs (4,927)(3,246) K12 Inc HSBC (3,441)(7,002) K12 Inc Morgan Stanley 2,661(5,051) Kadant Inc Bank of America
Merrill Lynch (36,727)(2,378) Kadant Inc Barclays Bank (785)(8,453) Kadant Inc Goldman Sachs (62,241)(4,049) Kadant Inc HSBC (34,538)
(12,929) Kadant Inc Morgan Stanley (4,267)(9,805) Kadmon Holdings Inc Barclays Bank 2,549
(22,301) Kadmon Holdings Inc Goldman Sachs (2,676)(78,584) Kadmon Holdings Inc HSBC (1,572)(12,584) Kadmon Holdings Inc Morgan Stanley 3,272(2,266) Kaiser Aluminum Corp Bank of America
Merrill Lynch (30,387)8,207 Kaiser Aluminum Corp Bank of America
Merrill Lynch 110,056(2,320) Kaiser Aluminum Corp Barclays Bank (13,665)3,315 Kaiser Aluminum Corp Barclays Bank 19,5252,296 Kaiser Aluminum Corp Goldman Sachs 30,789
(2,563) Kaiser Aluminum Corp Goldman Sachs (34,370)(1,329) Kaiser Aluminum Corp HSBC (3,695)1,937 Kaiser Aluminum Corp HSBC 5,385
(1,309) Kaiser Aluminum Corp Morgan Stanley (2,367)3,446 Kaiser Aluminum Corp Morgan Stanley 20,297
(3,699) Kala Pharmaceuticals Inc Barclays Bank 2,700(6,339) Kala Pharmaceuticals Inc Goldman Sachs (1,648)
(28,188) Kala Pharmaceuticals Inc HSBC (29,879)(3,518) Kala Pharmaceuticals Inc Morgan Stanley 2,568(5,819) Kaleido Biosciences Inc Barclays Bank (4,073)5,098 KalVista Pharmaceuticals
IncBank of AmericaMerrill Lynch 3,263
BlackRock Americas Diversified Equity Absolute Return Fundcontinued
The notes on pages 691 to 711 form an integral part of these financial statements.
BlackRock Strategic Funds[140]

Contracts for difference as at 31 May 2020
Holding Description Counterparty
Netunrealised
appreciation/(depreciation)
USD
United States continued2,629 KalVista Pharmaceuticals
Inc Goldman Sachs 1,6836,880 KalVista Pharmaceuticals
Inc HSBC 4,61013,710 KalVista Pharmaceuticals
Inc Morgan Stanley (7,541)(26,291) Kaman Corp Bank of America
Merrill Lynch (187,192)(12,474) Kaman Corp Barclays Bank (27,069)(11,253) Kaman Corp Goldman Sachs (80,121)(9,777) Kaman Corp HSBC (14,802)
(10,664) Kaman Corp Morgan Stanley (23,141)(5,321) Kansas City Southern Bank of America
Merrill Lynch (90,510)(8,429) Kansas City Southern Barclays Bank (30,428)(1,043) Kansas City Southern Goldman Sachs 2,824
(10,257) Kansas City Southern Morgan Stanley (37,027)(2,205) KAR Auction Services Inc Bank of America
Merrill Lynch (5,270)(12,351) KAR Auction Services Inc Barclays Bank (20,997)(5,000) KAR Auction Services Inc Goldman Sachs (11,950)12,553 KAR Auction Services Inc Goldman Sachs 28,508(5,797) KAR Auction Services Inc HSBC (6,145)2,232 KAR Auction Services Inc HSBC 2,366
(24,942) KAR Auction Services Inc Morgan Stanley (42,401)21,407 KAR Auction Services Inc Morgan Stanley 36,392
(87) Karuna Therapeutics Inc Bank of AmericaMerrill Lynch (926)
(2,193) Karuna Therapeutics Inc Barclays Bank (10,746)(877) Karuna Therapeutics Inc Goldman Sachs (9,331)
(2,990) Karuna Therapeutics Inc HSBC (27,867)9,702 Karyopharm Therapeutics
IncBank of AmericaMerrill Lynch (9,260)
997 Karyopharm TherapeuticsInc Barclays Bank (1,854)
4,527 Karyopharm TherapeuticsInc Goldman Sachs (634)
18,915 Karyopharm TherapeuticsInc HSBC (1,048)
11,285 Karyopharm TherapeuticsInc Morgan Stanley (18,656)
7,614 KB Home Bank of AmericaMerrill Lynch 58,422
20,041 KB Home Barclays Bank 69,5422,451 KB Home Goldman Sachs 22,770
11,362 KB Home HSBC 66,86428,019 KB Home Morgan Stanley 97,226
(38,112) KBR Inc Bank of AmericaMerrill Lynch (153,973)
(17,396) KBR Inc Barclays Bank (20,788)(13,136) KBR Inc Goldman Sachs (30,043)(41,964) KBR Inc HSBC (104,071)(60,736) KBR Inc Morgan Stanley (127,546)41,317 Kearny Financial Corp Bank of America
Merrill Lynch 41,73036,112 Kearny Financial Corp Barclays Bank 23,83436,366 Kearny Financial Corp Goldman Sachs 36,73030,318 Kearny Financial Corp HSBC 3,63854,648 Kearny Financial Corp Morgan Stanley 36,06811,043 Kellogg Co Bank of America
Merrill Lynch 7,2883,272 Kellogg Co Barclays Bank 8,638
13,705 Kellogg Co Goldman Sachs 9,0455,952 Kellogg Co HSBC 6,250
(5,481) Kellogg Co HSBC (5,755)8,333 Kellogg Co Morgan Stanley 21,999
(12,259) Kellogg Co Morgan Stanley (32,364)(20,501) Kelly Services Inc ’A’ Bank of America
Merrill Lynch (67,038)
Holding Description Counterparty
Netunrealised
appreciation/(depreciation)
USD
United States continued(21,119) Kelly Services Inc ’A’ HSBC (26,821)(56,934) Kelly Services Inc ’A’ Morgan Stanley (80,277)
1,486 Kemper Corp Bank of AmericaMerrill Lynch 4,221
(1,429) Kemper Corp Bank of AmericaMerrill Lynch (7,016)
2,376 Kemper Corp Barclays Bank 1,402409 Kemper Corp Goldman Sachs 261
(3,714) Kemper Corp Goldman Sachs (18,236)3,042 Kemper Corp HSBC (4,108)
(1,785) Kemper Corp HSBC 3,7663,430 Kemper Corp Morgan Stanley 2,024
(4,137) Kemper Corp Morgan Stanley (2,441)(25,268) Kennametal Inc Bank of America
Merrill Lynch (123,814)15,057 Kennametal Inc Bank of America
Merrill Lynch 73,779(15,648) Kennametal Inc Barclays Bank (24,254)(11,984) Kennametal Inc Goldman Sachs (58,722)
3,867 Kennametal Inc Goldman Sachs 18,948(22,238) Kennametal Inc HSBC (62,266)(30,481) Kennametal Inc Morgan Stanley (47,245)42,686 Kennedy-Wilson Holdings
Inc Barclays Bank 28,17327,504 Kennedy-Wilson Holdings
Inc Goldman Sachs 36,58073,455 Kennedy-Wilson Holdings
Inc HSBC (34,524)35,089 Kennedy-Wilson Holdings
Inc Morgan Stanley 23,159(8,491) Keros Therapeutics Inc Goldman Sachs 6,623
(11,019) Keurig Dr Pepper Inc Bank of AmericaMerrill Lynch (17,851)
3,659 Keurig Dr Pepper Inc Bank of AmericaMerrill Lynch 2,931
(4,363) Keurig Dr Pepper Inc Barclays Bank (3,316)23,287 Keurig Dr Pepper Inc Barclays Bank 17,698(5,367) Keurig Dr Pepper Inc Goldman Sachs (8,695)18,798 Keurig Dr Pepper Inc Goldman Sachs 29,007
(14,958) Keurig Dr Pepper Inc HSBC (23,634)2,275 Keurig Dr Pepper Inc HSBC 2,532
(3,907) Keurig Dr Pepper Inc Morgan Stanley (2,969)10,712 Keurig Dr Pepper Inc Morgan Stanley (69)
518 Key Energy Svcs Inc Bank of AmericaMerrill Lynch 953
62,443 Key Tronic Corp Bank of AmericaMerrill Lynch (8,118)
10,881 Key Tronic Corp Morgan Stanley (2,176)(34,685) KeyCorp Bank of America
Merrill Lynch (70,931)(41,324) KeyCorp Barclays Bank (42,358)(41,907) KeyCorp Goldman Sachs (85,700)(64,416) KeyCorp HSBC (31,242)(66,598) KeyCorp Morgan Stanley (68,263)
932 Keysight Technologies Inc Bank of AmericaMerrill Lynch 10,914
2,642 Keysight Technologies Inc Barclays Bank 11,7041,666 Keysight Technologies Inc Goldman Sachs 19,5093,424 Keysight Technologies Inc HSBC 19,859
10,368 Keysight Technologies Inc Morgan Stanley 45,9309,669 Kezar Life Sciences Inc Bank of America
Merrill Lynch (1,547)18,006 Kezar Life Sciences Inc Barclays Bank (9,003)4,209 Kezar Life Sciences Inc Goldman Sachs (673)7,981 Kezar Life Sciences Inc HSBC (7,981)5,690 Kezar Life Sciences Inc Morgan Stanley (2,845)
15,395 Kforce Inc Bank of AmericaMerrill Lynch 24,478
17,748 Kforce Inc Barclays Bank (1,775)
BlackRock Americas Diversified Equity Absolute Return Fundcontinued
The notes on pages 691 to 711 form an integral part of these financial statements.
Annual report and audited financial statements [141]
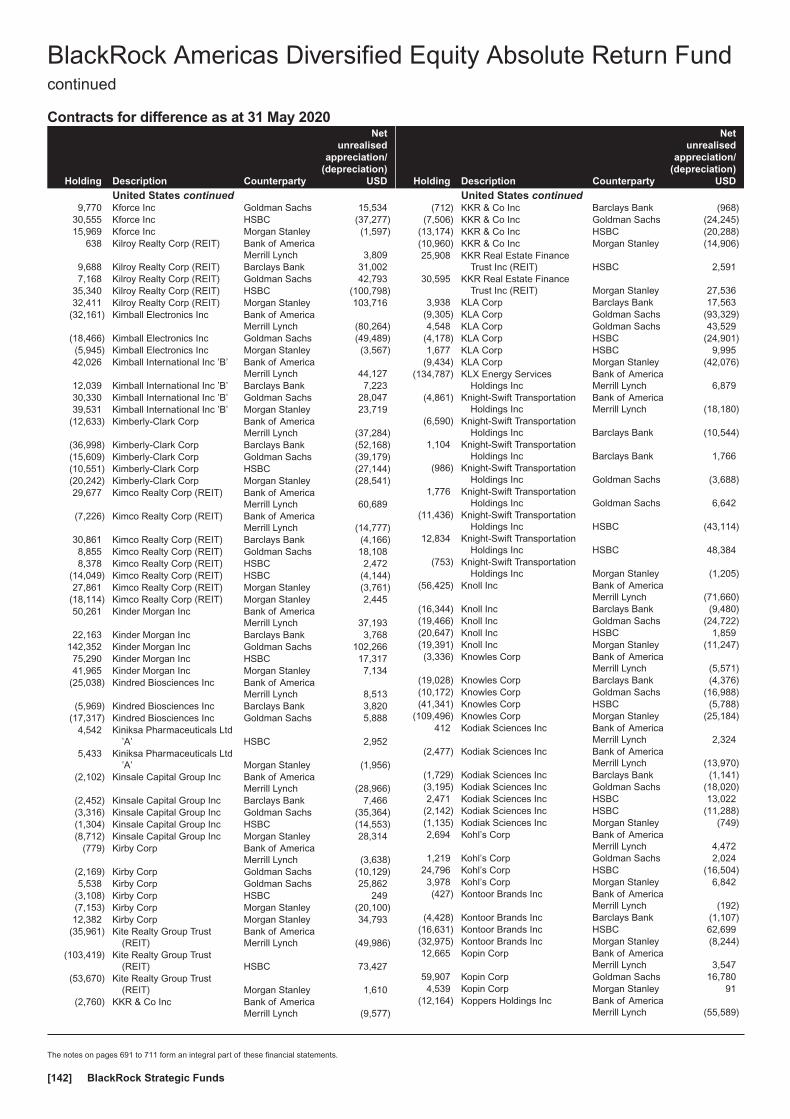
Contracts for difference as at 31 May 2020
Holding Description Counterparty
Netunrealised
appreciation/(depreciation)
USD
United States continued9,770 Kforce Inc Goldman Sachs 15,534
30,555 Kforce Inc HSBC (37,277)15,969 Kforce Inc Morgan Stanley (1,597)
638 Kilroy Realty Corp (REIT) Bank of AmericaMerrill Lynch 3,809
9,688 Kilroy Realty Corp (REIT) Barclays Bank 31,0027,168 Kilroy Realty Corp (REIT) Goldman Sachs 42,793
35,340 Kilroy Realty Corp (REIT) HSBC (100,798)32,411 Kilroy Realty Corp (REIT) Morgan Stanley 103,716
(32,161) Kimball Electronics Inc Bank of AmericaMerrill Lynch (80,264)
(18,466) Kimball Electronics Inc Goldman Sachs (49,489)(5,945) Kimball Electronics Inc Morgan Stanley (3,567)42,026 Kimball International Inc ’B’ Bank of America
Merrill Lynch 44,12712,039 Kimball International Inc ’B’ Barclays Bank 7,22330,330 Kimball International Inc ’B’ Goldman Sachs 28,04739,531 Kimball International Inc ’B’ Morgan Stanley 23,719
(12,633) Kimberly-Clark Corp Bank of AmericaMerrill Lynch (37,284)
(36,998) Kimberly-Clark Corp Barclays Bank (52,168)(15,609) Kimberly-Clark Corp Goldman Sachs (39,179)(10,551) Kimberly-Clark Corp HSBC (27,144)(20,242) Kimberly-Clark Corp Morgan Stanley (28,541)29,677 Kimco Realty Corp (REIT) Bank of America
Merrill Lynch 60,689(7,226) Kimco Realty Corp (REIT) Bank of America
Merrill Lynch (14,777)30,861 Kimco Realty Corp (REIT) Barclays Bank (4,166)8,855 Kimco Realty Corp (REIT) Goldman Sachs 18,1088,378 Kimco Realty Corp (REIT) HSBC 2,472
(14,049) Kimco Realty Corp (REIT) HSBC (4,144)27,861 Kimco Realty Corp (REIT) Morgan Stanley (3,761)
(18,114) Kimco Realty Corp (REIT) Morgan Stanley 2,44550,261 Kinder Morgan Inc Bank of America
Merrill Lynch 37,19322,163 Kinder Morgan Inc Barclays Bank 3,768
142,352 Kinder Morgan Inc Goldman Sachs 102,26675,290 Kinder Morgan Inc HSBC 17,31741,965 Kinder Morgan Inc Morgan Stanley 7,134
(25,038) Kindred Biosciences Inc Bank of AmericaMerrill Lynch 8,513
(5,969) Kindred Biosciences Inc Barclays Bank 3,820(17,317) Kindred Biosciences Inc Goldman Sachs 5,888
4,542 Kiniksa Pharmaceuticals Ltd’A’ HSBC 2,952
5,433 Kiniksa Pharmaceuticals Ltd’A’ Morgan Stanley (1,956)
(2,102) Kinsale Capital Group Inc Bank of AmericaMerrill Lynch (28,966)
(2,452) Kinsale Capital Group Inc Barclays Bank 7,466(3,316) Kinsale Capital Group Inc Goldman Sachs (35,364)(1,304) Kinsale Capital Group Inc HSBC (14,553)(8,712) Kinsale Capital Group Inc Morgan Stanley 28,314
(779) Kirby Corp Bank of AmericaMerrill Lynch (3,638)
(2,169) Kirby Corp Goldman Sachs (10,129)5,538 Kirby Corp Goldman Sachs 25,862
(3,108) Kirby Corp HSBC 249(7,153) Kirby Corp Morgan Stanley (20,100)12,382 Kirby Corp Morgan Stanley 34,793
(35,961) Kite Realty Group Trust(REIT)
Bank of AmericaMerrill Lynch (49,986)
(103,419) Kite Realty Group Trust(REIT) HSBC 73,427
(53,670) Kite Realty Group Trust(REIT) Morgan Stanley 1,610
(2,760) KKR & Co Inc Bank of AmericaMerrill Lynch (9,577)
Holding Description Counterparty
Netunrealised
appreciation/(depreciation)
USD
United States continued(712) KKR & Co Inc Barclays Bank (968)
(7,506) KKR & Co Inc Goldman Sachs (24,245)(13,174) KKR & Co Inc HSBC (20,288)(10,960) KKR & Co Inc Morgan Stanley (14,906)25,908 KKR Real Estate Finance
Trust Inc (REIT) HSBC 2,59130,595 KKR Real Estate Finance
Trust Inc (REIT) Morgan Stanley 27,5363,938 KLA Corp Barclays Bank 17,563
(9,305) KLA Corp Goldman Sachs (93,329)4,548 KLA Corp Goldman Sachs 43,529
(4,178) KLA Corp HSBC (24,901)1,677 KLA Corp HSBC 9,995
(9,434) KLA Corp Morgan Stanley (42,076)(134,787) KLX Energy Services
Holdings IncBank of AmericaMerrill Lynch 6,879
(4,861) Knight-Swift TransportationHoldings Inc
Bank of AmericaMerrill Lynch (18,180)
(6,590) Knight-Swift TransportationHoldings Inc Barclays Bank (10,544)
1,104 Knight-Swift TransportationHoldings Inc Barclays Bank 1,766
(986) Knight-Swift TransportationHoldings Inc Goldman Sachs (3,688)
1,776 Knight-Swift TransportationHoldings Inc Goldman Sachs 6,642
(11,436) Knight-Swift TransportationHoldings Inc HSBC (43,114)
12,834 Knight-Swift TransportationHoldings Inc HSBC 48,384
(753) Knight-Swift TransportationHoldings Inc Morgan Stanley (1,205)
(56,425) Knoll Inc Bank of AmericaMerrill Lynch (71,660)
(16,344) Knoll Inc Barclays Bank (9,480)(19,466) Knoll Inc Goldman Sachs (24,722)(20,647) Knoll Inc HSBC 1,859(19,391) Knoll Inc Morgan Stanley (11,247)(3,336) Knowles Corp Bank of America
Merrill Lynch (5,571)(19,028) Knowles Corp Barclays Bank (4,376)(10,172) Knowles Corp Goldman Sachs (16,988)(41,341) Knowles Corp HSBC (5,788)
(109,496) Knowles Corp Morgan Stanley (25,184)412 Kodiak Sciences Inc Bank of America
Merrill Lynch 2,324(2,477) Kodiak Sciences Inc Bank of America
Merrill Lynch (13,970)(1,729) Kodiak Sciences Inc Barclays Bank (1,141)(3,195) Kodiak Sciences Inc Goldman Sachs (18,020)2,471 Kodiak Sciences Inc HSBC 13,022
(2,142) Kodiak Sciences Inc HSBC (11,288)(1,135) Kodiak Sciences Inc Morgan Stanley (749)2,694 Kohl’s Corp Bank of America
Merrill Lynch 4,4721,219 Kohl’s Corp Goldman Sachs 2,024
24,796 Kohl’s Corp HSBC (16,504)3,978 Kohl’s Corp Morgan Stanley 6,842(427) Kontoor Brands Inc Bank of America
Merrill Lynch (192)(4,428) Kontoor Brands Inc Barclays Bank (1,107)
(16,631) Kontoor Brands Inc HSBC 62,699(32,975) Kontoor Brands Inc Morgan Stanley (8,244)12,665 Kopin Corp Bank of America
Merrill Lynch 3,54759,907 Kopin Corp Goldman Sachs 16,7804,539 Kopin Corp Morgan Stanley 91
(12,164) Koppers Holdings Inc Bank of AmericaMerrill Lynch (55,589)
BlackRock Americas Diversified Equity Absolute Return Fundcontinued
The notes on pages 691 to 711 form an integral part of these financial statements.
BlackRock Strategic Funds[142]
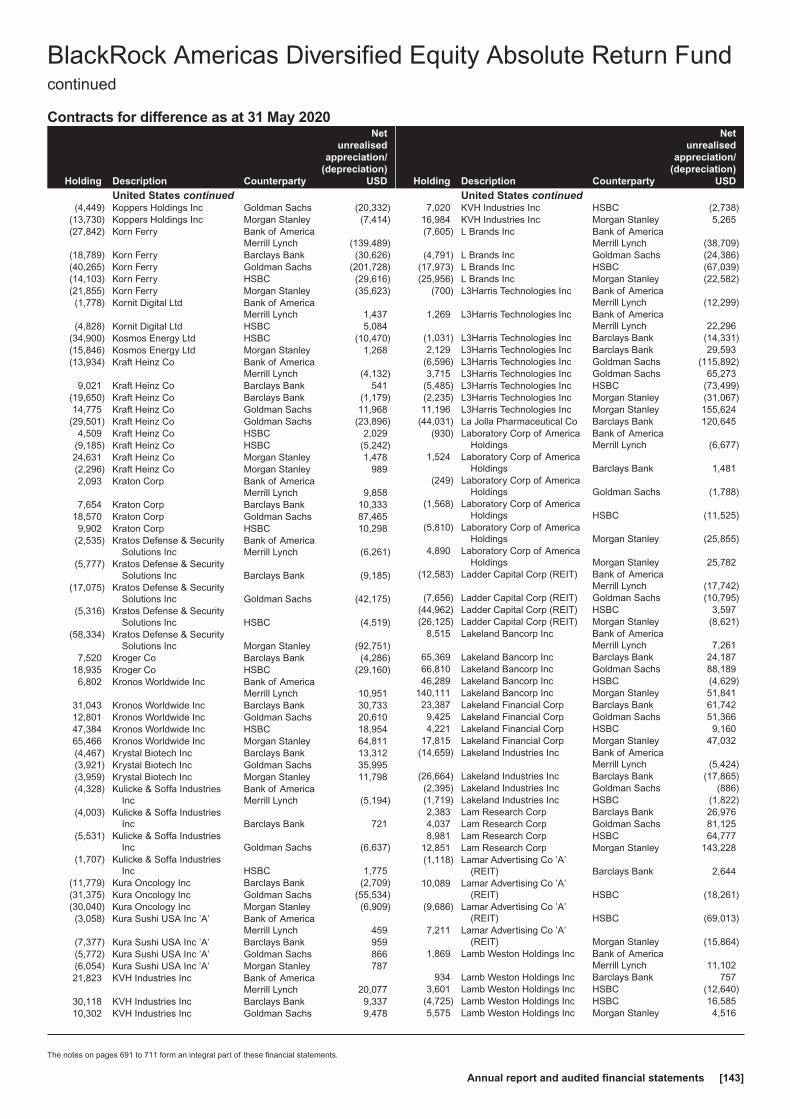
Contracts for difference as at 31 May 2020
Holding Description Counterparty
Netunrealised
appreciation/(depreciation)
USD
United States continued(4,449) Koppers Holdings Inc Goldman Sachs (20,332)
(13,730) Koppers Holdings Inc Morgan Stanley (7,414)(27,842) Korn Ferry Bank of America
Merrill Lynch (139,489)(18,789) Korn Ferry Barclays Bank (30,626)(40,265) Korn Ferry Goldman Sachs (201,728)(14,103) Korn Ferry HSBC (29,616)(21,855) Korn Ferry Morgan Stanley (35,623)(1,778) Kornit Digital Ltd Bank of America
Merrill Lynch 1,437(4,828) Kornit Digital Ltd HSBC 5,084
(34,900) Kosmos Energy Ltd HSBC (10,470)(15,846) Kosmos Energy Ltd Morgan Stanley 1,268(13,934) Kraft Heinz Co Bank of America
Merrill Lynch (4,132)9,021 Kraft Heinz Co Barclays Bank 541
(19,650) Kraft Heinz Co Barclays Bank (1,179)14,775 Kraft Heinz Co Goldman Sachs 11,968
(29,501) Kraft Heinz Co Goldman Sachs (23,896)4,509 Kraft Heinz Co HSBC 2,029
(9,185) Kraft Heinz Co HSBC (5,242)24,631 Kraft Heinz Co Morgan Stanley 1,478(2,296) Kraft Heinz Co Morgan Stanley 9892,093 Kraton Corp Bank of America
Merrill Lynch 9,8587,654 Kraton Corp Barclays Bank 10,333
18,570 Kraton Corp Goldman Sachs 87,4659,902 Kraton Corp HSBC 10,298
(2,535) Kratos Defense & SecuritySolutions Inc
Bank of AmericaMerrill Lynch (6,261)
(5,777) Kratos Defense & SecuritySolutions Inc Barclays Bank (9,185)
(17,075) Kratos Defense & SecuritySolutions Inc Goldman Sachs (42,175)
(5,316) Kratos Defense & SecuritySolutions Inc HSBC (4,519)
(58,334) Kratos Defense & SecuritySolutions Inc Morgan Stanley (92,751)
7,520 Kroger Co Barclays Bank (4,286)18,935 Kroger Co HSBC (29,160)6,802 Kronos Worldwide Inc Bank of America
Merrill Lynch 10,95131,043 Kronos Worldwide Inc Barclays Bank 30,73312,801 Kronos Worldwide Inc Goldman Sachs 20,61047,384 Kronos Worldwide Inc HSBC 18,95465,466 Kronos Worldwide Inc Morgan Stanley 64,811(4,467) Krystal Biotech Inc Barclays Bank 13,312(3,921) Krystal Biotech Inc Goldman Sachs 35,995(3,959) Krystal Biotech Inc Morgan Stanley 11,798(4,328) Kulicke & Soffa Industries
IncBank of AmericaMerrill Lynch (5,194)
(4,003) Kulicke & Soffa IndustriesInc Barclays Bank 721
(5,531) Kulicke & Soffa IndustriesInc Goldman Sachs (6,637)
(1,707) Kulicke & Soffa IndustriesInc HSBC 1,775
(11,779) Kura Oncology Inc Barclays Bank (2,709)(31,375) Kura Oncology Inc Goldman Sachs (55,534)(30,040) Kura Oncology Inc Morgan Stanley (6,909)(3,058) Kura Sushi USA Inc ’A’ Bank of America
Merrill Lynch 459(7,377) Kura Sushi USA Inc ’A’ Barclays Bank 959(5,772) Kura Sushi USA Inc ’A’ Goldman Sachs 866(6,054) Kura Sushi USA Inc ’A’ Morgan Stanley 78721,823 KVH Industries Inc Bank of America
Merrill Lynch 20,07730,118 KVH Industries Inc Barclays Bank 9,33710,302 KVH Industries Inc Goldman Sachs 9,478
Holding Description Counterparty
Netunrealised
appreciation/(depreciation)
USD
United States continued7,020 KVH Industries Inc HSBC (2,738)
16,984 KVH Industries Inc Morgan Stanley 5,265(7,605) L Brands Inc Bank of America
Merrill Lynch (38,709)(4,791) L Brands Inc Goldman Sachs (24,386)
(17,973) L Brands Inc HSBC (67,039)(25,956) L Brands Inc Morgan Stanley (22,582)
(700) L3Harris Technologies Inc Bank of AmericaMerrill Lynch (12,299)
1,269 L3Harris Technologies Inc Bank of AmericaMerrill Lynch 22,296
(1,031) L3Harris Technologies Inc Barclays Bank (14,331)2,129 L3Harris Technologies Inc Barclays Bank 29,593
(6,596) L3Harris Technologies Inc Goldman Sachs (115,892)3,715 L3Harris Technologies Inc Goldman Sachs 65,273
(5,485) L3Harris Technologies Inc HSBC (73,499)(2,235) L3Harris Technologies Inc Morgan Stanley (31,067)11,196 L3Harris Technologies Inc Morgan Stanley 155,624
(44,031) La Jolla Pharmaceutical Co Barclays Bank 120,645(930) Laboratory Corp of America
HoldingsBank of AmericaMerrill Lynch (6,677)
1,524 Laboratory Corp of AmericaHoldings Barclays Bank 1,481
(249) Laboratory Corp of AmericaHoldings Goldman Sachs (1,788)
(1,568) Laboratory Corp of AmericaHoldings HSBC (11,525)
(5,810) Laboratory Corp of AmericaHoldings Morgan Stanley (25,855)
4,890 Laboratory Corp of AmericaHoldings Morgan Stanley 25,782
(12,583) Ladder Capital Corp (REIT) Bank of AmericaMerrill Lynch (17,742)
(7,656) Ladder Capital Corp (REIT) Goldman Sachs (10,795)(44,962) Ladder Capital Corp (REIT) HSBC 3,597(26,125) Ladder Capital Corp (REIT) Morgan Stanley (8,621)
8,515 Lakeland Bancorp Inc Bank of AmericaMerrill Lynch 7,261
65,369 Lakeland Bancorp Inc Barclays Bank 24,18766,810 Lakeland Bancorp Inc Goldman Sachs 88,18946,289 Lakeland Bancorp Inc HSBC (4,629)
140,111 Lakeland Bancorp Inc Morgan Stanley 51,84123,387 Lakeland Financial Corp Barclays Bank 61,7429,425 Lakeland Financial Corp Goldman Sachs 51,3664,221 Lakeland Financial Corp HSBC 9,160
17,815 Lakeland Financial Corp Morgan Stanley 47,032(14,659) Lakeland Industries Inc Bank of America
Merrill Lynch (5,424)(26,664) Lakeland Industries Inc Barclays Bank (17,865)(2,395) Lakeland Industries Inc Goldman Sachs (886)(1,719) Lakeland Industries Inc HSBC (1,822)2,383 Lam Research Corp Barclays Bank 26,9764,037 Lam Research Corp Goldman Sachs 81,1258,981 Lam Research Corp HSBC 64,777
12,851 Lam Research Corp Morgan Stanley 143,228(1,118) Lamar Advertising Co ’A’
(REIT) Barclays Bank 2,64410,089 Lamar Advertising Co ’A’
(REIT) HSBC (18,261)(9,686) Lamar Advertising Co ’A’
(REIT) HSBC (69,013)7,211 Lamar Advertising Co ’A’
(REIT) Morgan Stanley (15,864)1,869 Lamb Weston Holdings Inc Bank of America
Merrill Lynch 11,102934 Lamb Weston Holdings Inc Barclays Bank 757
3,601 Lamb Weston Holdings Inc HSBC (12,640)(4,725) Lamb Weston Holdings Inc HSBC 16,5855,575 Lamb Weston Holdings Inc Morgan Stanley 4,516
BlackRock Americas Diversified Equity Absolute Return Fundcontinued
The notes on pages 691 to 711 form an integral part of these financial statements.
Annual report and audited financial statements [143]
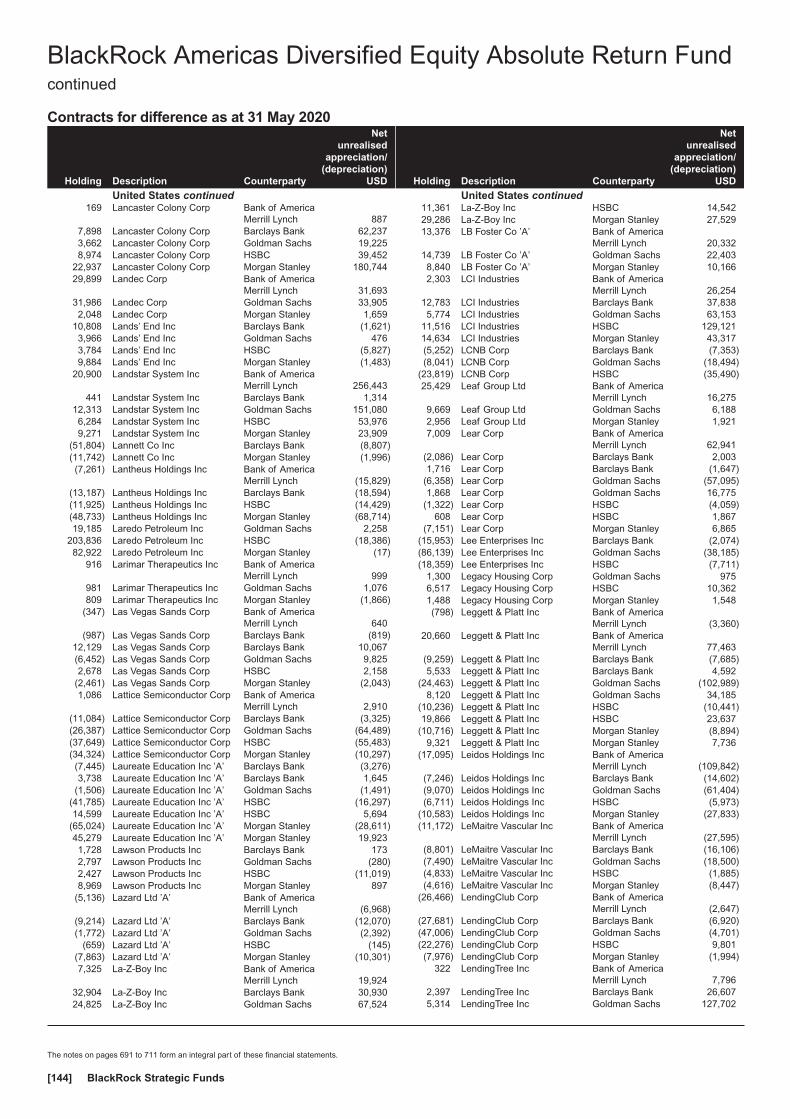
Contracts for difference as at 31 May 2020
Holding Description Counterparty
Netunrealised
appreciation/(depreciation)
USD
United States continued169 Lancaster Colony Corp Bank of America
Merrill Lynch 8877,898 Lancaster Colony Corp Barclays Bank 62,2373,662 Lancaster Colony Corp Goldman Sachs 19,2258,974 Lancaster Colony Corp HSBC 39,452
22,937 Lancaster Colony Corp Morgan Stanley 180,74429,899 Landec Corp Bank of America
Merrill Lynch 31,69331,986 Landec Corp Goldman Sachs 33,9052,048 Landec Corp Morgan Stanley 1,659
10,808 Lands’ End Inc Barclays Bank (1,621)3,966 Lands’ End Inc Goldman Sachs 4763,784 Lands’ End Inc HSBC (5,827)9,884 Lands’ End Inc Morgan Stanley (1,483)
20,900 Landstar System Inc Bank of AmericaMerrill Lynch 256,443
441 Landstar System Inc Barclays Bank 1,31412,313 Landstar System Inc Goldman Sachs 151,0806,284 Landstar System Inc HSBC 53,9769,271 Landstar System Inc Morgan Stanley 23,909
(51,804) Lannett Co Inc Barclays Bank (8,807)(11,742) Lannett Co Inc Morgan Stanley (1,996)(7,261) Lantheus Holdings Inc Bank of America
Merrill Lynch (15,829)(13,187) Lantheus Holdings Inc Barclays Bank (18,594)(11,925) Lantheus Holdings Inc HSBC (14,429)(48,733) Lantheus Holdings Inc Morgan Stanley (68,714)19,185 Laredo Petroleum Inc Goldman Sachs 2,258
203,836 Laredo Petroleum Inc HSBC (18,386)82,922 Laredo Petroleum Inc Morgan Stanley (17)
916 Larimar Therapeutics Inc Bank of AmericaMerrill Lynch 999
981 Larimar Therapeutics Inc Goldman Sachs 1,076809 Larimar Therapeutics Inc Morgan Stanley (1,866)
(347) Las Vegas Sands Corp Bank of AmericaMerrill Lynch 640
(987) Las Vegas Sands Corp Barclays Bank (819)12,129 Las Vegas Sands Corp Barclays Bank 10,067(6,452) Las Vegas Sands Corp Goldman Sachs 9,8252,678 Las Vegas Sands Corp HSBC 2,158
(2,461) Las Vegas Sands Corp Morgan Stanley (2,043)1,086 Lattice Semiconductor Corp Bank of America
Merrill Lynch 2,910(11,084) Lattice Semiconductor Corp Barclays Bank (3,325)(26,387) Lattice Semiconductor Corp Goldman Sachs (64,489)(37,649) Lattice Semiconductor Corp HSBC (55,483)(34,324) Lattice Semiconductor Corp Morgan Stanley (10,297)(7,445) Laureate Education Inc ’A’ Barclays Bank (3,276)3,738 Laureate Education Inc ’A’ Barclays Bank 1,645
(1,506) Laureate Education Inc ’A’ Goldman Sachs (1,491)(41,785) Laureate Education Inc ’A’ HSBC (16,297)14,599 Laureate Education Inc ’A’ HSBC 5,694
(65,024) Laureate Education Inc ’A’ Morgan Stanley (28,611)45,279 Laureate Education Inc ’A’ Morgan Stanley 19,9231,728 Lawson Products Inc Barclays Bank 1732,797 Lawson Products Inc Goldman Sachs (280)2,427 Lawson Products Inc HSBC (11,019)8,969 Lawson Products Inc Morgan Stanley 897
(5,136) Lazard Ltd ’A’ Bank of AmericaMerrill Lynch (6,968)
(9,214) Lazard Ltd ’A’ Barclays Bank (12,070)(1,772) Lazard Ltd ’A’ Goldman Sachs (2,392)
(659) Lazard Ltd ’A’ HSBC (145)(7,863) Lazard Ltd ’A’ Morgan Stanley (10,301)7,325 La-Z-Boy Inc Bank of America
Merrill Lynch 19,92432,904 La-Z-Boy Inc Barclays Bank 30,93024,825 La-Z-Boy Inc Goldman Sachs 67,524
Holding Description Counterparty
Netunrealised
appreciation/(depreciation)
USD
United States continued11,361 La-Z-Boy Inc HSBC 14,54229,286 La-Z-Boy Inc Morgan Stanley 27,52913,376 LB Foster Co ’A’ Bank of America
Merrill Lynch 20,33214,739 LB Foster Co ’A’ Goldman Sachs 22,4038,840 LB Foster Co ’A’ Morgan Stanley 10,1662,303 LCI Industries Bank of America
Merrill Lynch 26,25412,783 LCI Industries Barclays Bank 37,8385,774 LCI Industries Goldman Sachs 63,153
11,516 LCI Industries HSBC 129,12114,634 LCI Industries Morgan Stanley 43,317(5,252) LCNB Corp Barclays Bank (7,353)(8,041) LCNB Corp Goldman Sachs (18,494)
(23,819) LCNB Corp HSBC (35,490)25,429 Leaf Group Ltd Bank of America
Merrill Lynch 16,2759,669 Leaf Group Ltd Goldman Sachs 6,1882,956 Leaf Group Ltd Morgan Stanley 1,9217,009 Lear Corp Bank of America
Merrill Lynch 62,941(2,086) Lear Corp Barclays Bank 2,0031,716 Lear Corp Barclays Bank (1,647)
(6,358) Lear Corp Goldman Sachs (57,095)1,868 Lear Corp Goldman Sachs 16,775
(1,322) Lear Corp HSBC (4,059)608 Lear Corp HSBC 1,867
(7,151) Lear Corp Morgan Stanley 6,865(15,953) Lee Enterprises Inc Barclays Bank (2,074)(86,139) Lee Enterprises Inc Goldman Sachs (38,185)(18,359) Lee Enterprises Inc HSBC (7,711)
1,300 Legacy Housing Corp Goldman Sachs 9756,517 Legacy Housing Corp HSBC 10,3621,488 Legacy Housing Corp Morgan Stanley 1,548(798) Leggett & Platt Inc Bank of America
Merrill Lynch (3,360)20,660 Leggett & Platt Inc Bank of America
Merrill Lynch 77,463(9,259) Leggett & Platt Inc Barclays Bank (7,685)5,533 Leggett & Platt Inc Barclays Bank 4,592
(24,463) Leggett & Platt Inc Goldman Sachs (102,989)8,120 Leggett & Platt Inc Goldman Sachs 34,185
(10,236) Leggett & Platt Inc HSBC (10,441)19,866 Leggett & Platt Inc HSBC 23,637
(10,716) Leggett & Platt Inc Morgan Stanley (8,894)9,321 Leggett & Platt Inc Morgan Stanley 7,736
(17,095) Leidos Holdings Inc Bank of AmericaMerrill Lynch (109,842)
(7,246) Leidos Holdings Inc Barclays Bank (14,602)(9,070) Leidos Holdings Inc Goldman Sachs (61,404)(6,711) Leidos Holdings Inc HSBC (5,973)
(10,583) Leidos Holdings Inc Morgan Stanley (27,833)(11,172) LeMaitre Vascular Inc Bank of America
Merrill Lynch (27,595)(8,801) LeMaitre Vascular Inc Barclays Bank (16,106)(7,490) LeMaitre Vascular Inc Goldman Sachs (18,500)(4,833) LeMaitre Vascular Inc HSBC (1,885)(4,616) LeMaitre Vascular Inc Morgan Stanley (8,447)
(26,466) LendingClub Corp Bank of AmericaMerrill Lynch (2,647)
(27,681) LendingClub Corp Barclays Bank (6,920)(47,006) LendingClub Corp Goldman Sachs (4,701)(22,276) LendingClub Corp HSBC 9,801(7,976) LendingClub Corp Morgan Stanley (1,994)
322 LendingTree Inc Bank of AmericaMerrill Lynch 7,796
2,397 LendingTree Inc Barclays Bank 26,6075,314 LendingTree Inc Goldman Sachs 127,702
BlackRock Americas Diversified Equity Absolute Return Fundcontinued
The notes on pages 691 to 711 form an integral part of these financial statements.
BlackRock Strategic Funds[144]

Contracts for difference as at 31 May 2020
Holding Description Counterparty
Netunrealised
appreciation/(depreciation)
USD
United States continued1,741 LendingTree Inc HSBC 33,0444,585 Lennar Corp ’A’ Bank of America
Merrill Lynch 46,033(24,559) Lennar Corp ’A’ Bank of America
Merrill Lynch (246,572)15,991 Lennar Corp ’A’ Barclays Bank 9,4359,223 Lennar Corp ’A’ Goldman Sachs 92,599
(24,560) Lennar Corp ’A’ Goldman Sachs (246,582)25,412 Lennar Corp ’A’ HSBC 169,498
(25,691) Lennar Corp ’A’ HSBC (171,359)17,736 Lennar Corp ’A’ Morgan Stanley 10,464(1,581) Lennar Corp ’A’ Morgan Stanley (933)(4,150) Lennar Corp ’B’ Bank of America
Merrill Lynch (28,137)1,050 Lennox International Inc Bank of America
Merrill Lynch 31,3215,991 Lennox International Inc Barclays Bank 54,4022,494 Lennox International Inc Goldman Sachs 74,3965,714 Lennox International Inc HSBC 110,1096,612 Lennox International Inc Morgan Stanley 81,4601,190 Level One Bancorp Inc Barclays Bank 2,5471,509 Level One Bancorp Inc Goldman Sachs 4,8444,079 Level One Bancorp Inc HSBC 1,5912,378 Level One Bancorp Inc Morgan Stanley 5,089
(13,197) Levi Strauss & Co ’A’ Barclays Bank (5,015)(16,602) Levi Strauss & Co ’A’ Goldman Sachs (20,088)(22,120) Levi Strauss & Co ’A’ HSBC (10,175)(10,282) Levi Strauss & Co ’A’ Morgan Stanley (3,907)(10,250) Lexicon Pharmaceuticals
IncBank of AmericaMerrill Lynch (974)
(61,091) Lexicon PharmaceuticalsInc Barclays Bank 2,138
(6,000) Lexicon PharmaceuticalsInc Morgan Stanley 210
(4,402) Lexington Realty Trust(REIT)
Bank of AmericaMerrill Lynch (1,350)
(11,955) Lexington Realty Trust(REIT) Barclays Bank (3,706)
(25,916) Lexington Realty Trust(REIT) Goldman Sachs (18,553)
(87,886) Lexington Realty Trust(REIT) HSBC 59,899
(257,066) Lexington Realty Trust(REIT) Morgan Stanley (79,690)
2,454 LGI Homes Inc Barclays Bank 1,497(1,243) LGI Homes Inc HSBC (14,058)2,229 LGI Homes Inc HSBC 25,210
(3,855) LGI Homes Inc Morgan Stanley (2,352)4,320 LGI Homes Inc Morgan Stanley 2,6354,962 LHC Group Inc Bank of America
Merrill Lynch 43,8141,918 LHC Group Inc Barclays Bank (11,585)3,970 LHC Group Inc Goldman Sachs 35,0564,662 LHC Group Inc HSBC 111,9825,364 LHC Group Inc Morgan Stanley (32,399)
34,525 Libbey Inc Bank of AmericaMerrill Lynch (1,795)
10,189 Libbey Inc Goldman Sachs (530)7,687 Libbey Inc Morgan Stanley (493)
(13,050) Liberty Broadband Corp Bank of AmericaMerrill Lynch (154,773)
(2,944) Liberty Broadband Corp Barclays Bank (25,731)(2,118) Liberty Broadband Corp HSBC (16,351)(9,256) Liberty Broadband Corp Morgan Stanley (80,897)
(17,296) Liberty Broadband Corp ’A’ Bank of AmericaMerrill Lynch (237,301)
(2,065) Liberty Broadband Corp ’A’ Barclays Bank (20,278)(4,812) Liberty Broadband Corp ’A’ HSBC (45,473)
Holding Description Counterparty
Netunrealised
appreciation/(depreciation)
USD
United States continued(9,566) Liberty Broadband Corp ’A’ Morgan Stanley (93,938)
(25,813) Liberty Global Plc ’A’ Barclays Bank (10,584)4,755 Liberty Global Plc ’A’ Goldman Sachs (2,425)
(13,980) Liberty Global Plc ’A’ Goldman Sachs 7,13018,669 Liberty Global Plc ’A’ HSBC (7,841)19,772 Liberty Global Plc ’A’ Morgan Stanley 9,589(7,084) Liberty Latin America Ltd ’A’ Barclays Bank (708)
(41,113) Liberty Latin America Ltd ’A’ Goldman Sachs (22,612)(16,765) Liberty Latin America Ltd ’A’ HSBC 5,365(34,913) Liberty Latin America Ltd ’A’ Morgan Stanley (3,491)15,857 Liberty Latin America Ltd ’C’ Bank of America
Merrill Lynch 5,9058,113 Liberty Latin America Ltd ’C’ Barclays Bank 811
(49,207) Liberty Latin America Ltd ’C’ Barclays Bank (4,921)(31,364) Liberty Latin America Ltd ’C’ Goldman Sachs (12,859)
5,106 Liberty Latin America Ltd ’C’ Goldman Sachs 2,09328,607 Liberty Latin America Ltd ’C’ HSBC (5,961)35,075 Liberty Latin America Ltd ’C’ Morgan Stanley 316
(24,494) Liberty Latin America Ltd ’C’ Morgan Stanley (2,449)(11,640) Liberty Media Corp-Liberty
Braves ’A’Bank of AmericaMerrill Lynch (36,899)
(3,395) Liberty Media Corp-LibertyBraves ’A’ Barclays Bank (2,241)
(15,158) Liberty Media Corp-LibertyBraves ’A’ Goldman Sachs (48,051)
(8,369) Liberty Media Corp-LibertyBraves ’A’ HSBC (7,783)
(20,274) Liberty Media Corp-LibertyBraves ’A’ Morgan Stanley (13,381)
(48,222) Liberty Media Corp-LibertyBraves ’C’ HSBC (36,167)
(78,677) Liberty Media Corp-LibertyBraves ’C’ Morgan Stanley (48,780)
(10,761) Liberty Media Corp-LibertyFormula One ’A’
Bank of AmericaMerrill Lynch (51,760)
(12,510) Liberty Media Corp-LibertyFormula One ’A’ Barclays Bank (31,276)
(13,853) Liberty Media Corp-LibertyFormula One ’A’ Goldman Sachs (66,633)
(13,232) Liberty Media Corp-LibertyFormula One ’A’ HSBC (55,575)
(17,265) Liberty Media Corp-LibertyFormula One ’A’ Morgan Stanley (43,163)
(4,813) Liberty Media Corp-LibertyFormula One ’C’
Bank of AmericaMerrill Lynch (19,011)
(11,378) Liberty Media Corp-LibertyFormula One ’C’ Barclays Bank (13,995)
(8,212) Liberty Media Corp-LibertyFormula One ’C’ Goldman Sachs (32,437)
(35,812) Liberty Media Corp-LibertyFormula One ’C’ Morgan Stanley (44,049)
(2,297) Liberty Media Corp-LibertySiriusXM (Rights) HSBC (24,394)
(2,357) Liberty Media Corp-LibertySiriusXM (Rights) Morgan Stanley (7,825)
(24,467) Liberty Media Corp-LibertySiriusXM ’C’ HSBC (67,284)
(25,109) Liberty Media Corp-LibertySiriusXM ’C’ Morgan Stanley (75,829)
24,108 Liberty Oilfield Services Inc’A’
Bank of AmericaMerrill Lynch 19,527
45,919 Liberty Oilfield Services Inc’A’ Barclays Bank 6,888
21,231 Liberty Oilfield Services Inc’A’ Goldman Sachs 17,197
13,131 Liberty Oilfield Services Inc’A’ Morgan Stanley 1,970
BlackRock Americas Diversified Equity Absolute Return Fundcontinued
The notes on pages 691 to 711 form an integral part of these financial statements.
Annual report and audited financial statements [145]

Contracts for difference as at 31 May 2020
Holding Description Counterparty
Netunrealised
appreciation/(depreciation)
USD
United States continued(52,875) Liberty TripAdvisor Holdings
Inc ’A’Bank of AmericaMerrill Lynch (56,576)
(75,350) Liberty TripAdvisor HoldingsInc ’A’ Barclays Bank (26,373)
(16,467) Liberty TripAdvisor HoldingsInc ’A’ Goldman Sachs (17,620)
(75,849) Liberty TripAdvisor HoldingsInc ’A’ HSBC (62,196)
(74,325) Liberty TripAdvisor HoldingsInc ’A’ Morgan Stanley (26,014)
11,642 Life Storage Inc (REIT) Bank of AmericaMerrill Lynch 146,223
8,489 Life Storage Inc (REIT) Barclays Bank 58,4895,709 Life Storage Inc (REIT) Goldman Sachs 71,7051,512 Life Storage Inc (REIT) HSBC 6,033
15,986 Life Storage Inc (REIT) Morgan Stanley 110,144(7,588) Lifetime Brands Inc Bank of America
Merrill Lynch (7,702)(36,080) Lifetime Brands Inc Goldman Sachs (36,621)(4,210) Lifetime Brands Inc HSBC (1,116)(2,300) Lifetime Brands Inc Morgan Stanley (725)
(21,415) Lifevantage Corp Barclays Bank (6,210)(11,490) Lifevantage Corp Goldman Sachs (6,779)(5,667) Lifevantage Corp Morgan Stanley (1,643)
887 Ligand Pharmaceuticals Inc Bank of AmericaMerrill Lynch 1,455
8,857 Ligand Pharmaceuticals Inc HSBC (17,753)7,418 Ligand Pharmaceuticals Inc Morgan Stanley (61,199)
(12,233) Limelight Networks Inc Barclays Bank 2,691(54,970) Limelight Networks Inc Goldman Sachs 4,398(63,369) Limelight Networks Inc Morgan Stanley 13,941(9,236) Limoneira Co Bank of America
Merrill Lynch (12,284)(12,241) Limoneira Co Barclays Bank (8,569)(18,120) Limoneira Co Goldman Sachs (24,100)(8,898) Limoneira Co HSBC 712(5,195) Limoneira Co Morgan Stanley (3,637)
(34,037) Lincoln Electric Holdings Inc Bank of AmericaMerrill Lynch (325,394)
6,355 Lincoln Electric Holdings Inc Bank of AmericaMerrill Lynch 60,754
(302) Lincoln Electric Holdings Inc Barclays Bank (894)5,563 Lincoln Electric Holdings Inc Barclays Bank 16,4665,147 Lincoln Electric Holdings Inc Goldman Sachs 41,754(986) Lincoln Electric Holdings Inc HSBC (3,905)
1,392 Lincoln Electric Holdings Inc HSBC 4,045(1,114) Lincoln Electric Holdings Inc Morgan Stanley (3,297)1,162 Lincoln Electric Holdings Inc Morgan Stanley 3,4409,200 Lincoln National Corp Bank of America
Merrill Lynch 48,2084,185 Lincoln National Corp Goldman Sachs 21,929
15,373 Lincoln National Corp HSBC 24,392(9,180) Lincoln National Corp HSBC (12,301)2,445 Lincoln National Corp Morgan Stanley 7,311
(4,859) Lincoln National Corp Morgan Stanley (14,528)43,323 Lindblad Expeditions
Holdings IncBank of AmericaMerrill Lynch 75,382
14,809 Lindblad ExpeditionsHoldings Inc Barclays Bank 10,662
5,883 Lindblad ExpeditionsHoldings Inc Goldman Sachs 10,236
9,973 Lindblad ExpeditionsHoldings Inc HSBC 10,970
38,870 Lindblad ExpeditionsHoldings Inc Morgan Stanley 27,986
(1,634) Linde Plc Barclays Bank (16,798)3,656 Linde Plc Barclays Bank 37,584
(5,905) Linde Plc Goldman Sachs (109,597)4,964 Linde Plc Goldman Sachs 92,132
Holding Description Counterparty
Netunrealised
appreciation/(depreciation)
USD
United States continued(6,364) Linde Plc HSBC (81,077)5,988 Linde Plc HSBC 76,287
(13,393) Linde Plc Morgan Stanley (137,680)(8,205) Lindsay Corp Bank of America
Merrill Lynch (61,831)(521) Lindsay Corp Barclays Bank (610)(437) Lindsay Corp Goldman Sachs (3,684)
(6,681) Lindsay Corp HSBC (34,942)(3,842) Lindsay Corp Morgan Stanley (4,495)
(272,630) Lineage Cell TherapeuticsInc
Bank of AmericaMerrill Lynch 164
(85,028) Lineage Cell TherapeuticsInc Morgan Stanley (3,809)
6,917 Lions Gate EntertainmentCorp ’A’
Bank of AmericaMerrill Lynch 3,666
10,152 Lions Gate EntertainmentCorp ’A’ Barclays Bank (3,046)
47,508 Lions Gate EntertainmentCorp ’A’ Goldman Sachs 25,179
11,746 Lions Gate EntertainmentCorp ’A’ HSBC (353)
9,328 Lions Gate EntertainmentCorp ’A’ Morgan Stanley (2,798)
36,359 Lions Gate EntertainmentCorp ’B’ Goldman Sachs 19,634
2,593 Lions Gate EntertainmentCorp ’B’ HSBC 259
17,910 Lions Gate EntertainmentCorp ’B’ Morgan Stanley (4,119)
(7,721) Liquidia Technologies Inc Bank of AmericaMerrill Lynch (17,527)
(2,738) Liquidia Technologies Inc Barclays Bank (3,286)(2,153) Liquidia Technologies Inc Goldman Sachs (4,887)(7,523) Liquidia Technologies Inc Morgan Stanley (9,028)13,556 Liquidity Services Inc Goldman Sachs 8,26911,128 Liquidity Services Inc HSBC 8,6803,175 Liquidity Services Inc Morgan Stanley 8262,314 Lithia Motors Inc ’A’ Bank of America
Merrill Lynch 38,0651,279 Lithia Motors Inc ’A’ Barclays Bank (130)
983 Lithia Motors Inc ’A’ Goldman Sachs 16,170(2,276) Lithia Motors Inc ’A’ Goldman Sachs (37,440)(3,633) Lithia Motors Inc ’A’ HSBC (24,559)5,105 Lithia Motors Inc ’A’ Morgan Stanley 7,045(756) Lithia Motors Inc ’A’ Morgan Stanley (1,043)
(5,841) Littelfuse Inc Bank of AmericaMerrill Lynch (127,567)
1,979 Littelfuse Inc Bank of AmericaMerrill Lynch 43,221
(1,268) Littelfuse Inc Barclays Bank (6,873)505 Littelfuse Inc Barclays Bank 2,737
(933) Littelfuse Inc Goldman Sachs (20,377)4,456 Littelfuse Inc Goldman Sachs 97,319
(1,600) Littelfuse Inc HSBC (23,632)(5,146) Littelfuse Inc Morgan Stanley (27,891)4,182 Littelfuse Inc Morgan Stanley 22,6663,876 LivaNova Plc Barclays Bank 7,016
(4,311) LivaNova Plc Goldman Sachs (21,857)(2,161) LivaNova Plc HSBC (2,593)(9,471) LivaNova Plc Morgan Stanley (17,143)5,848 Live Nation Entertainment
Inc HSBC 63,70711,478 Live Nation Entertainment
Inc Morgan Stanley 19,627(1,883) Live Oak Bancshares Inc Bank of America
Merrill Lynch (2,862)(5,558) Live Oak Bancshares Inc Goldman Sachs (8,448)(6,522) Live Oak Bancshares Inc HSBC (2,271)
(48,580) Live Oak Bancshares Inc Morgan Stanley (24,776)
BlackRock Americas Diversified Equity Absolute Return Fundcontinued
The notes on pages 691 to 711 form an integral part of these financial statements.
BlackRock Strategic Funds[146]
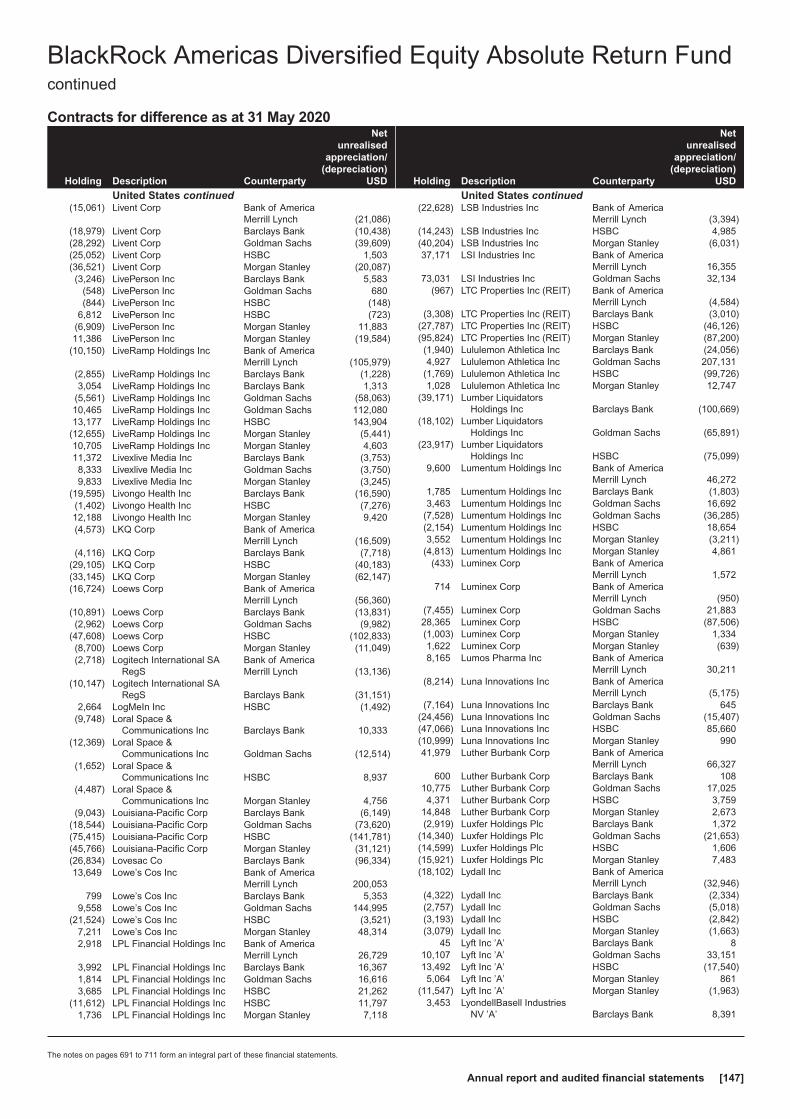
Contracts for difference as at 31 May 2020
Holding Description Counterparty
Netunrealised
appreciation/(depreciation)
USD
United States continued(15,061) Livent Corp Bank of America
Merrill Lynch (21,086)(18,979) Livent Corp Barclays Bank (10,438)(28,292) Livent Corp Goldman Sachs (39,609)(25,052) Livent Corp HSBC 1,503(36,521) Livent Corp Morgan Stanley (20,087)(3,246) LivePerson Inc Barclays Bank 5,583
(548) LivePerson Inc Goldman Sachs 680(844) LivePerson Inc HSBC (148)
6,812 LivePerson Inc HSBC (723)(6,909) LivePerson Inc Morgan Stanley 11,88311,386 LivePerson Inc Morgan Stanley (19,584)
(10,150) LiveRamp Holdings Inc Bank of AmericaMerrill Lynch (105,979)
(2,855) LiveRamp Holdings Inc Barclays Bank (1,228)3,054 LiveRamp Holdings Inc Barclays Bank 1,313
(5,561) LiveRamp Holdings Inc Goldman Sachs (58,063)10,465 LiveRamp Holdings Inc Goldman Sachs 112,08013,177 LiveRamp Holdings Inc HSBC 143,904
(12,655) LiveRamp Holdings Inc Morgan Stanley (5,441)10,705 LiveRamp Holdings Inc Morgan Stanley 4,60311,372 Livexlive Media Inc Barclays Bank (3,753)8,333 Livexlive Media Inc Goldman Sachs (3,750)9,833 Livexlive Media Inc Morgan Stanley (3,245)
(19,595) Livongo Health Inc Barclays Bank (16,590)(1,402) Livongo Health Inc HSBC (7,276)12,188 Livongo Health Inc Morgan Stanley 9,420(4,573) LKQ Corp Bank of America
Merrill Lynch (16,509)(4,116) LKQ Corp Barclays Bank (7,718)
(29,105) LKQ Corp HSBC (40,183)(33,145) LKQ Corp Morgan Stanley (62,147)(16,724) Loews Corp Bank of America
Merrill Lynch (56,360)(10,891) Loews Corp Barclays Bank (13,831)(2,962) Loews Corp Goldman Sachs (9,982)
(47,608) Loews Corp HSBC (102,833)(8,700) Loews Corp Morgan Stanley (11,049)(2,718) Logitech International SA
RegSBank of AmericaMerrill Lynch (13,136)
(10,147) Logitech International SARegS Barclays Bank (31,151)
2,664 LogMeIn Inc HSBC (1,492)(9,748) Loral Space &
Communications Inc Barclays Bank 10,333(12,369) Loral Space &
Communications Inc Goldman Sachs (12,514)(1,652) Loral Space &
Communications Inc HSBC 8,937(4,487) Loral Space &
Communications Inc Morgan Stanley 4,756(9,043) Louisiana-Pacific Corp Barclays Bank (6,149)
(18,544) Louisiana-Pacific Corp Goldman Sachs (73,620)(75,415) Louisiana-Pacific Corp HSBC (141,781)(45,766) Louisiana-Pacific Corp Morgan Stanley (31,121)(26,834) Lovesac Co Barclays Bank (96,334)13,649 Lowe’s Cos Inc Bank of America
Merrill Lynch 200,053799 Lowe’s Cos Inc Barclays Bank 5,353
9,558 Lowe’s Cos Inc Goldman Sachs 144,995(21,524) Lowe’s Cos Inc HSBC (3,521)
7,211 Lowe’s Cos Inc Morgan Stanley 48,3142,918 LPL Financial Holdings Inc Bank of America
Merrill Lynch 26,7293,992 LPL Financial Holdings Inc Barclays Bank 16,3671,814 LPL Financial Holdings Inc Goldman Sachs 16,6163,685 LPL Financial Holdings Inc HSBC 21,262
(11,612) LPL Financial Holdings Inc HSBC 11,7971,736 LPL Financial Holdings Inc Morgan Stanley 7,118
Holding Description Counterparty
Netunrealised
appreciation/(depreciation)
USD
United States continued(22,628) LSB Industries Inc Bank of America
Merrill Lynch (3,394)(14,243) LSB Industries Inc HSBC 4,985(40,204) LSB Industries Inc Morgan Stanley (6,031)37,171 LSI Industries Inc Bank of America
Merrill Lynch 16,35573,031 LSI Industries Inc Goldman Sachs 32,134
(967) LTC Properties Inc (REIT) Bank of AmericaMerrill Lynch (4,584)
(3,308) LTC Properties Inc (REIT) Barclays Bank (3,010)(27,787) LTC Properties Inc (REIT) HSBC (46,126)(95,824) LTC Properties Inc (REIT) Morgan Stanley (87,200)(1,940) Lululemon Athletica Inc Barclays Bank (24,056)4,927 Lululemon Athletica Inc Goldman Sachs 207,131
(1,769) Lululemon Athletica Inc HSBC (99,726)1,028 Lululemon Athletica Inc Morgan Stanley 12,747
(39,171) Lumber LiquidatorsHoldings Inc Barclays Bank (100,669)
(18,102) Lumber LiquidatorsHoldings Inc Goldman Sachs (65,891)
(23,917) Lumber LiquidatorsHoldings Inc HSBC (75,099)
9,600 Lumentum Holdings Inc Bank of AmericaMerrill Lynch 46,272
1,785 Lumentum Holdings Inc Barclays Bank (1,803)3,463 Lumentum Holdings Inc Goldman Sachs 16,692
(7,528) Lumentum Holdings Inc Goldman Sachs (36,285)(2,154) Lumentum Holdings Inc HSBC 18,6543,552 Lumentum Holdings Inc Morgan Stanley (3,211)
(4,813) Lumentum Holdings Inc Morgan Stanley 4,861(433) Luminex Corp Bank of America
Merrill Lynch 1,572714 Luminex Corp Bank of America
Merrill Lynch (950)(7,455) Luminex Corp Goldman Sachs 21,88328,365 Luminex Corp HSBC (87,506)(1,003) Luminex Corp Morgan Stanley 1,3341,622 Luminex Corp Morgan Stanley (639)8,165 Lumos Pharma Inc Bank of America
Merrill Lynch 30,211(8,214) Luna Innovations Inc Bank of America
Merrill Lynch (5,175)(7,164) Luna Innovations Inc Barclays Bank 645
(24,456) Luna Innovations Inc Goldman Sachs (15,407)(47,066) Luna Innovations Inc HSBC 85,660(10,999) Luna Innovations Inc Morgan Stanley 99041,979 Luther Burbank Corp Bank of America
Merrill Lynch 66,327600 Luther Burbank Corp Barclays Bank 108
10,775 Luther Burbank Corp Goldman Sachs 17,0254,371 Luther Burbank Corp HSBC 3,759
14,848 Luther Burbank Corp Morgan Stanley 2,673(2,919) Luxfer Holdings Plc Barclays Bank 1,372
(14,340) Luxfer Holdings Plc Goldman Sachs (21,653)(14,599) Luxfer Holdings Plc HSBC 1,606(15,921) Luxfer Holdings Plc Morgan Stanley 7,483(18,102) Lydall Inc Bank of America
Merrill Lynch (32,946)(4,322) Lydall Inc Barclays Bank (2,334)(2,757) Lydall Inc Goldman Sachs (5,018)(3,193) Lydall Inc HSBC (2,842)(3,079) Lydall Inc Morgan Stanley (1,663)
45 Lyft Inc ’A’ Barclays Bank 810,107 Lyft Inc ’A’ Goldman Sachs 33,15113,492 Lyft Inc ’A’ HSBC (17,540)5,064 Lyft Inc ’A’ Morgan Stanley 861
(11,547) Lyft Inc ’A’ Morgan Stanley (1,963)3,453 LyondellBasell Industries
NV ’A’ Barclays Bank 8,391
BlackRock Americas Diversified Equity Absolute Return Fundcontinued
The notes on pages 691 to 711 form an integral part of these financial statements.
Annual report and audited financial statements [147]
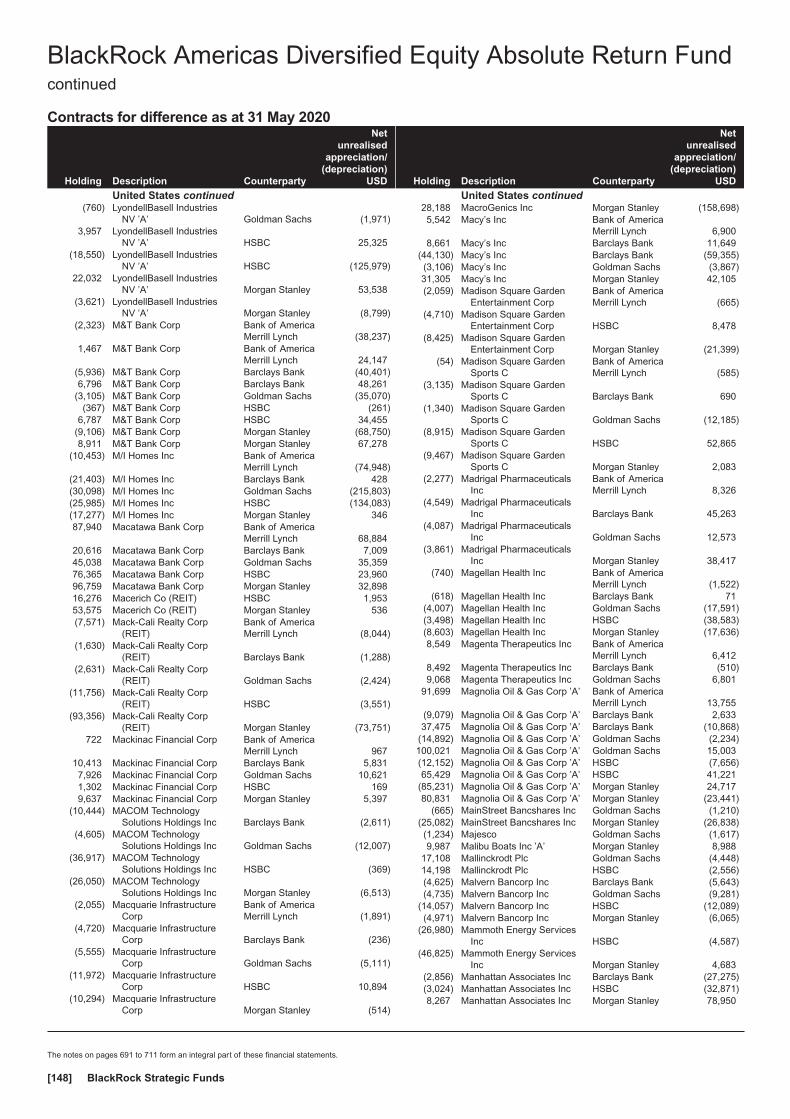
Contracts for difference as at 31 May 2020
Holding Description Counterparty
Netunrealised
appreciation/(depreciation)
USD
United States continued(760) LyondellBasell Industries
NV ’A’ Goldman Sachs (1,971)3,957 LyondellBasell Industries
NV ’A’ HSBC 25,325(18,550) LyondellBasell Industries
NV ’A’ HSBC (125,979)22,032 LyondellBasell Industries
NV ’A’ Morgan Stanley 53,538(3,621) LyondellBasell Industries
NV ’A’ Morgan Stanley (8,799)(2,323) M&T Bank Corp Bank of America
Merrill Lynch (38,237)1,467 M&T Bank Corp Bank of America
Merrill Lynch 24,147(5,936) M&T Bank Corp Barclays Bank (40,401)6,796 M&T Bank Corp Barclays Bank 48,261
(3,105) M&T Bank Corp Goldman Sachs (35,070)(367) M&T Bank Corp HSBC (261)
6,787 M&T Bank Corp HSBC 34,455(9,106) M&T Bank Corp Morgan Stanley (68,750)8,911 M&T Bank Corp Morgan Stanley 67,278
(10,453) M/I Homes Inc Bank of AmericaMerrill Lynch (74,948)
(21,403) M/I Homes Inc Barclays Bank 428(30,098) M/I Homes Inc Goldman Sachs (215,803)(25,985) M/I Homes Inc HSBC (134,083)(17,277) M/I Homes Inc Morgan Stanley 34687,940 Macatawa Bank Corp Bank of America
Merrill Lynch 68,88420,616 Macatawa Bank Corp Barclays Bank 7,00945,038 Macatawa Bank Corp Goldman Sachs 35,35976,365 Macatawa Bank Corp HSBC 23,96096,759 Macatawa Bank Corp Morgan Stanley 32,89816,276 Macerich Co (REIT) HSBC 1,95353,575 Macerich Co (REIT) Morgan Stanley 536(7,571) Mack-Cali Realty Corp
(REIT)Bank of AmericaMerrill Lynch (8,044)
(1,630) Mack-Cali Realty Corp(REIT) Barclays Bank (1,288)
(2,631) Mack-Cali Realty Corp(REIT) Goldman Sachs (2,424)
(11,756) Mack-Cali Realty Corp(REIT) HSBC (3,551)
(93,356) Mack-Cali Realty Corp(REIT) Morgan Stanley (73,751)
722 Mackinac Financial Corp Bank of AmericaMerrill Lynch 967
10,413 Mackinac Financial Corp Barclays Bank 5,8317,926 Mackinac Financial Corp Goldman Sachs 10,6211,302 Mackinac Financial Corp HSBC 1699,637 Mackinac Financial Corp Morgan Stanley 5,397
(10,444) MACOM TechnologySolutions Holdings Inc Barclays Bank (2,611)
(4,605) MACOM TechnologySolutions Holdings Inc Goldman Sachs (12,007)
(36,917) MACOM TechnologySolutions Holdings Inc HSBC (369)
(26,050) MACOM TechnologySolutions Holdings Inc Morgan Stanley (6,513)
(2,055) Macquarie InfrastructureCorp
Bank of AmericaMerrill Lynch (1,891)
(4,720) Macquarie InfrastructureCorp Barclays Bank (236)
(5,555) Macquarie InfrastructureCorp Goldman Sachs (5,111)
(11,972) Macquarie InfrastructureCorp HSBC 10,894
(10,294) Macquarie InfrastructureCorp Morgan Stanley (514)
Holding Description Counterparty
Netunrealised
appreciation/(depreciation)
USD
United States continued28,188 MacroGenics Inc Morgan Stanley (158,698)5,542 Macy’s Inc Bank of America
Merrill Lynch 6,9008,661 Macy’s Inc Barclays Bank 11,649
(44,130) Macy’s Inc Barclays Bank (59,355)(3,106) Macy’s Inc Goldman Sachs (3,867)31,305 Macy’s Inc Morgan Stanley 42,105(2,059) Madison Square Garden
Entertainment CorpBank of AmericaMerrill Lynch (665)
(4,710) Madison Square GardenEntertainment Corp HSBC 8,478
(8,425) Madison Square GardenEntertainment Corp Morgan Stanley (21,399)
(54) Madison Square GardenSports C
Bank of AmericaMerrill Lynch (585)
(3,135) Madison Square GardenSports C Barclays Bank 690
(1,340) Madison Square GardenSports C Goldman Sachs (12,185)
(8,915) Madison Square GardenSports C HSBC 52,865
(9,467) Madison Square GardenSports C Morgan Stanley 2,083
(2,277) Madrigal PharmaceuticalsInc
Bank of AmericaMerrill Lynch 8,326
(4,549) Madrigal PharmaceuticalsInc Barclays Bank 45,263
(4,087) Madrigal PharmaceuticalsInc Goldman Sachs 12,573
(3,861) Madrigal PharmaceuticalsInc Morgan Stanley 38,417
(740) Magellan Health Inc Bank of AmericaMerrill Lynch (1,522)
(618) Magellan Health Inc Barclays Bank 71(4,007) Magellan Health Inc Goldman Sachs (17,591)(3,498) Magellan Health Inc HSBC (38,583)(8,603) Magellan Health Inc Morgan Stanley (17,636)8,549 Magenta Therapeutics Inc Bank of America
Merrill Lynch 6,4128,492 Magenta Therapeutics Inc Barclays Bank (510)9,068 Magenta Therapeutics Inc Goldman Sachs 6,801
91,699 Magnolia Oil & Gas Corp ’A’ Bank of AmericaMerrill Lynch 13,755
(9,079) Magnolia Oil & Gas Corp ’A’ Barclays Bank 2,63337,475 Magnolia Oil & Gas Corp ’A’ Barclays Bank (10,868)
(14,892) Magnolia Oil & Gas Corp ’A’ Goldman Sachs (2,234)100,021 Magnolia Oil & Gas Corp ’A’ Goldman Sachs 15,003(12,152) Magnolia Oil & Gas Corp ’A’ HSBC (7,656)65,429 Magnolia Oil & Gas Corp ’A’ HSBC 41,221
(85,231) Magnolia Oil & Gas Corp ’A’ Morgan Stanley 24,71780,831 Magnolia Oil & Gas Corp ’A’ Morgan Stanley (23,441)
(665) MainStreet Bancshares Inc Goldman Sachs (1,210)(25,082) MainStreet Bancshares Inc Morgan Stanley (26,838)(1,234) Majesco Goldman Sachs (1,617)9,987 Malibu Boats Inc ’A’ Morgan Stanley 8,988
17,108 Mallinckrodt Plc Goldman Sachs (4,448)14,198 Mallinckrodt Plc HSBC (2,556)(4,625) Malvern Bancorp Inc Barclays Bank (5,643)(4,735) Malvern Bancorp Inc Goldman Sachs (9,281)
(14,057) Malvern Bancorp Inc HSBC (12,089)(4,971) Malvern Bancorp Inc Morgan Stanley (6,065)
(26,980) Mammoth Energy ServicesInc HSBC (4,587)
(46,825) Mammoth Energy ServicesInc Morgan Stanley 4,683
(2,856) Manhattan Associates Inc Barclays Bank (27,275)(3,024) Manhattan Associates Inc HSBC (32,871)8,267 Manhattan Associates Inc Morgan Stanley 78,950
BlackRock Americas Diversified Equity Absolute Return Fundcontinued
The notes on pages 691 to 711 form an integral part of these financial statements.
BlackRock Strategic Funds[148]

Contracts for difference as at 31 May 2020
Holding Description Counterparty
Netunrealised
appreciation/(depreciation)
USD
United States continued(1,376) Manitowoc Co Inc Barclays Bank (578)
(45,123) Manitowoc Co Inc Goldman Sachs (41,062)(10,271) Manitowoc Co Inc HSBC (1,335)(9,688) Manitowoc Co Inc Morgan Stanley (4,069)
(116,074) MannKind Corp Barclays Bank (1,161)(155,376) MannKind Corp Goldman Sachs (45,059)(48,232) MannKind Corp HSBC (9,646)(58,132) MannKind Corp Morgan Stanley (581)(5,588) ManpowerGroup Inc Bank of America
Merrill Lynch (36,266)(484) ManpowerGroup Inc Barclays Bank (281)
(4,632) ManpowerGroup Inc Goldman Sachs (30,062)(2,557) ManpowerGroup Inc HSBC 1,534
(17,077) ManpowerGroup Inc Morgan Stanley (9,905)3,112 ManTech International Corp
’A’Bank of AmericaMerrill Lynch 18,246
4,986 ManTech International Corp’A’ Barclays Bank 18,498
8,651 ManTech International Corp’A’ Goldman Sachs 64,543
17,810 ManTech International Corp’A’ HSBC 39,807
21,963 ManTech International Corp’A’ Morgan Stanley 81,482
73,004 Marathon Oil Corp Bank of AmericaMerrill Lynch (7,300)
44,476 Marathon Oil Corp Barclays Bank (16,901)65,836 Marathon Oil Corp Goldman Sachs (11,729)
254,896 Marathon Oil Corp Morgan Stanley (96,860)(1,066) Marathon Petroleum Corp Bank of America
Merrill Lynch (4,658)14,390 Marathon Petroleum Corp HSBC 23,600(4,223) Marathon Petroleum Corp HSBC (6,926)11,133 Marathon Petroleum Corp Morgan Stanley (10,020)
(10,268) Marathon Petroleum Corp Morgan Stanley 9,24198,359 Marchex Inc ’B’ Bank of America
Merrill Lynch 18,68890,924 Marchex Inc ’B’ Goldman Sachs 17,27674,950 Marchex Inc ’B’ Morgan Stanley 14,241(3,904) Marcus & Millichap Inc Bank of America
Merrill Lynch (7,418)(3,437) Marcus & Millichap Inc Barclays Bank (2,303)
(10,478) Marcus & Millichap Inc Goldman Sachs (19,908)(1,865) Marcus & Millichap Inc HSBC 1,511
(12,841) Marcus & Millichap Inc Morgan Stanley (8,603)3,022 Marcus Corp Bank of America
Merrill Lynch 9,1573,628 Marcus Corp Barclays Bank 6,4586,934 Marcus Corp Goldman Sachs 21,010
15,744 Marcus Corp HSBC 19,05014,508 Marcus Corp Morgan Stanley 25,8243,192 Marin Software Inc Bank of America
Merrill Lynch 1604,734 Marin Software Inc Goldman Sachs 2372,918 Marin Software Inc Morgan Stanley 58
(14,631) Marine Products Corp Bank of AmericaMerrill Lynch (32,188)
(8,602) Marine Products Corp Barclays Bank (9,634)(7,976) Marine Products Corp Goldman Sachs (17,547)(7,932) Marine Products Corp HSBC (15,740)(9,973) Marine Products Corp Morgan Stanley (11,170)5,028 MarineMax Inc Goldman Sachs 16,291
19,988 MarineMax Inc HSBC 75,55519,407 MarineMax Inc Morgan Stanley 14,167
(31,638) Marinus PharmaceuticalsInc
Bank of AmericaMerrill Lynch (9,808)
(36,634) Marinus PharmaceuticalsInc Goldman Sachs (11,357)
Holding Description Counterparty
Netunrealised
appreciation/(depreciation)
USD
United States continued(6,164) Marinus Pharmaceuticals
Inc HSBC (3,760)161 Markel Corp Bank of America
Merrill Lynch 12,327(312) Markel Corp Bank of America
Merrill Lynch (24,335)133 Markel Corp Barclays Bank 5,742
(744) Markel Corp Barclays Bank (32,118)321 Markel Corp Goldman Sachs 24,817654 Markel Corp HSBC 28,426
(203) Markel Corp HSBC (8,589)292 Markel Corp Morgan Stanley 11,652
(824) Markel Corp Morgan Stanley (35,572)8,686 Marker Therapeutics Inc Bank of America
Merrill Lynch 1,3039,217 Marker Therapeutics Inc Barclays Bank (2,673)
14,606 Marker Therapeutics Inc Goldman Sachs 2,19111,549 Marker Therapeutics Inc HSBC 63516,257 Marker Therapeutics Inc Morgan Stanley (4,715)
147 MarketAxess Holdings Inc Bank of AmericaMerrill Lynch 757
1,007 MarketAxess Holdings Inc Barclays Bank 10,956286 MarketAxess Holdings Inc Goldman Sachs 3,678192 MarketAxess Holdings Inc HSBC 1,707323 MarketAxess Holdings Inc Morgan Stanley 3,514
(16,418) Marlin Business ServicesCorp
Bank of AmericaMerrill Lynch 2,134
(25,127) Marlin Business ServicesCorp Morgan Stanley 7,538
(1,970) Marriott International Inc ’A’ Bank of AmericaMerrill Lynch (19,779)
(1,294) Marriott International Inc ’A’ Barclays Bank 1,618(4,386) Marriott International Inc ’A’ Goldman Sachs (44,035)(6,248) Marriott International Inc ’A’ HSBC (16,433)
(12,750) Marriott VacationsWorldwide Corp Barclays Bank (17,468)
(3,563) Marriott VacationsWorldwide Corp Goldman Sachs (43,335)
(8,266) Marriott VacationsWorldwide Corp HSBC (73,320)
(5,272) Marriott VacationsWorldwide Corp Morgan Stanley (7,223)
2,419 Marsh & McLennan Cos Inc Bank of AmericaMerrill Lynch 2,903
(14,243) Marsh & McLennan Cos Inc Bank of AmericaMerrill Lynch (18,089)
6,576 Marsh & McLennan Cos Inc Barclays Bank 8,1543,575 Marsh & McLennan Cos Inc Goldman Sachs 4,540
(3,415) Marsh & McLennan Cos Inc Goldman Sachs (4,337)4,376 Marsh & McLennan Cos Inc HSBC 7,702
198 Marsh & McLennan Cos Inc Morgan Stanley (157)11,010 Marten Transport Ltd Bank of America
Merrill Lynch 22,90116,841 Marten Transport Ltd Barclays Bank 19,70413,895 Marten Transport Ltd Goldman Sachs 28,90221,008 Marten Transport Ltd HSBC 11,76425,331 Marten Transport Ltd Morgan Stanley 29,6379,129 Martin Marietta Materials
IncBank of AmericaMerrill Lynch 230,781
4,622 Martin Marietta MaterialsInc Barclays Bank 63,137
4,645 Martin Marietta MaterialsInc Goldman Sachs 117,426
3,304 Martin Marietta MaterialsInc HSBC 52,298
3,022 Martin Marietta MaterialsInc Morgan Stanley 41,281
BlackRock Americas Diversified Equity Absolute Return Fundcontinued
The notes on pages 691 to 711 form an integral part of these financial statements.
Annual report and audited financial statements [149]

Contracts for difference as at 31 May 2020
Holding Description Counterparty
Netunrealised
appreciation/(depreciation)
USD
United States continued(31,308) Marvell Technology Group
LtdBank of AmericaMerrill Lynch (189,305)
(26,304) Marvell Technology GroupLtd Barclays Bank (67,995)
(24,805) Marvell Technology GroupLtd Goldman Sachs (143,918)
(7,711) Marvell Technology GroupLtd HSBC (45,225)
(24,394) Marvell Technology GroupLtd Morgan Stanley (63,059)
(17,393) Masco Corp Bank of AmericaMerrill Lynch (46,257)
(16,232) Masco Corp Goldman Sachs (51,780)(18,735) Masco Corp HSBC (70,631)(58,516) Masco Corp Morgan Stanley (63,783)
1,773 Masimo Corp Goldman Sachs (10,850)1,592 Masimo Corp HSBC 13,0537,179 Masimo Corp Morgan Stanley (31,157)
(4,804) Masonite International Corp Bank of AmericaMerrill Lynch (46,647)
1,967 Masonite International Corp Barclays Bank 806(9,986) Masonite International Corp Barclays Bank (4,094)(4,044) Masonite International Corp Goldman Sachs (39,267)1,673 Masonite International Corp Goldman Sachs 16,2453,613 Masonite International Corp Morgan Stanley 1,481
(6,520) Masonite International Corp Morgan Stanley (2,673)6,498 MasTec Inc Bank of America
Merrill Lynch 34,17911,837 MasTec Inc Barclays Bank 22,49017,117 MasTec Inc Goldman Sachs 90,036
(16,671) MasTec Inc Goldman Sachs (87,689)(2,263) MasTec Inc HSBC (4,254)5,246 MasTec Inc HSBC 8,666
46,772 MasTec Inc Morgan Stanley 88,867(2,504) MasTec Inc Morgan Stanley (4,758)3,100 Mastech Digital Inc Bank of America
Merrill Lynch 6,3241,100 Mastercard Inc ’A’ Goldman Sachs 16,333
10,637 Mastercard Inc ’A’ Morgan Stanley 76,161(14,961) Mastercard Inc ’A’ Morgan Stanley 41,392(13,123) MasterCraft Boat Holdings
IncBank of AmericaMerrill Lynch (43,306)
(13,260) MasterCraft Boat HoldingsInc Barclays Bank (19,227)
(10,355) MasterCraft Boat HoldingsInc Goldman Sachs (34,172)
(12,485) MasterCraft Boat HoldingsInc HSBC (48,192)
(4,674) MasterCraft Boat HoldingsInc Morgan Stanley (6,777)
5,778 Matador Resources Co Goldman Sachs 4,21844,184 Matador Resources Co HSBC 15,023(2,138) Match Group Inc Barclays Bank (9,386)3,592 Match Group Inc Barclays Bank 15,7692,201 Match Group Inc Morgan Stanley 9,6623,724 Materion Corp Barclays Bank 3,128
16,142 Materion Corp Goldman Sachs 20,0162,715 Materion Corp HSBC —
13,949 Materion Corp Morgan Stanley 11,71715,905 Matrix Service Co Bank of America
Merrill Lynch 44,6934,933 Matrix Service Co Barclays Bank 7,4985,030 Matrix Service Co Goldman Sachs 14,1343,928 Matrix Service Co HSBC 4,478
18,897 Matrix Service Co Morgan Stanley 28,723(1,303) Matson Inc Bank of America
Merrill Lynch (1,619)(1,625) Matson Inc Barclays Bank (2,681)
(14,771) Matson Inc Goldman Sachs (48,153)
Holding Description Counterparty
Netunrealised
appreciation/(depreciation)
USD
United States continued(28,162) Matson Inc HSBC (1,408)(5,989) Matson Inc Morgan Stanley (9,882)
(51,807) Mattel Inc Bank of AmericaMerrill Lynch (63,204)
(13,696) Mattel Inc Barclays Bank (10,272)(18,258) Mattel Inc HSBC (7,486)
(864) Matthews International Corp’A’ Barclays Bank (484)
(17,664) Matthews International Corp’A’ Goldman Sachs (17,664)
(8,484) Matthews International Corp’A’ HSBC 16,120
(23,369) Matthews International Corp’A’ Morgan Stanley (13,087)
(63,393) Maui Land & Pineapple CoInc
Bank of AmericaMerrill Lynch (7,607)
(1,410) Maui Land & Pineapple CoInc Goldman Sachs (169)
(31,783) Maxar Technologies Inc Barclays Bank (84,861)14,523 Maxim Integrated Products
IncBank of AmericaMerrill Lynch 69,565
16,626 Maxim Integrated ProductsInc Barclays Bank 12,137
8,637 Maxim Integrated ProductsInc Goldman Sachs 41,371
47,688 Maxim Integrated ProductsInc HSBC 127,948
26,416 Maxim Integrated ProductsInc Morgan Stanley 19,284
(8,263) MAXIMUS Inc Bank of AmericaMerrill Lynch (48,977)
(13,633) MAXIMUS Inc Barclays Bank (22,767)18,425 MAXIMUS Inc Barclays Bank 30,770
(10,401) MAXIMUS Inc Goldman Sachs (47,608)3,695 MAXIMUS Inc Goldman Sachs 23,537
(10,136) MAXIMUS Inc HSBC (31,523)9,811 MAXIMUS Inc HSBC 36,224
(32,335) MAXIMUS Inc Morgan Stanley (53,999)12,123 MAXIMUS Inc Morgan Stanley 20,24512,259 MaxLinear Inc Bank of America
Merrill Lynch 19,73715,302 MaxLinear Inc Barclays Bank 4,89723,568 MaxLinear Inc Goldman Sachs 37,94426,901 MaxLinear Inc HSBC 11,83623,333 MaxLinear Inc Morgan Stanley 7,46710,465 Mayville Engineering Co Inc HSBC 7858,081 Mayville Engineering Co Inc Morgan Stanley 4,081
(8,073) MBIA Inc Bank of AmericaMerrill Lynch (5,760)
(7,801) MBIA Inc Barclays Bank (1,716)(26,587) MBIA Inc Goldman Sachs (28,714)(21,900) MBIA Inc HSBC 5,037
(138,561) MBIA Inc Morgan Stanley (30,483)4,599 McCormick & Co Inc Bank of America
Merrill Lynch (24,145)(2,999) McCormick & Co Inc Barclays Bank (2,579)3,054 McCormick & Co Inc Goldman Sachs (16,034)5,232 McCormick & Co Inc HSBC 45,5181,084 McCormick & Co Inc Morgan Stanley 932
(7,641) McCormick & Co Inc Morgan Stanley (6,571)2,536 McDonald’s Corp Bank of America
Merrill Lynch 5,7606,657 McDonald’s Corp Barclays Bank 23,5669,731 McDonald’s Corp Goldman Sachs 131,257
15,045 McDonald’s Corp HSBC 104,08819,559 McDonald’s Corp Morgan Stanley 67,91428,164 McGrath RentCorp Bank of America
Merrill Lynch 185,8828,169 McGrath RentCorp HSBC 32,594
BlackRock Americas Diversified Equity Absolute Return Fundcontinued
The notes on pages 691 to 711 form an integral part of these financial statements.
BlackRock Strategic Funds[150]
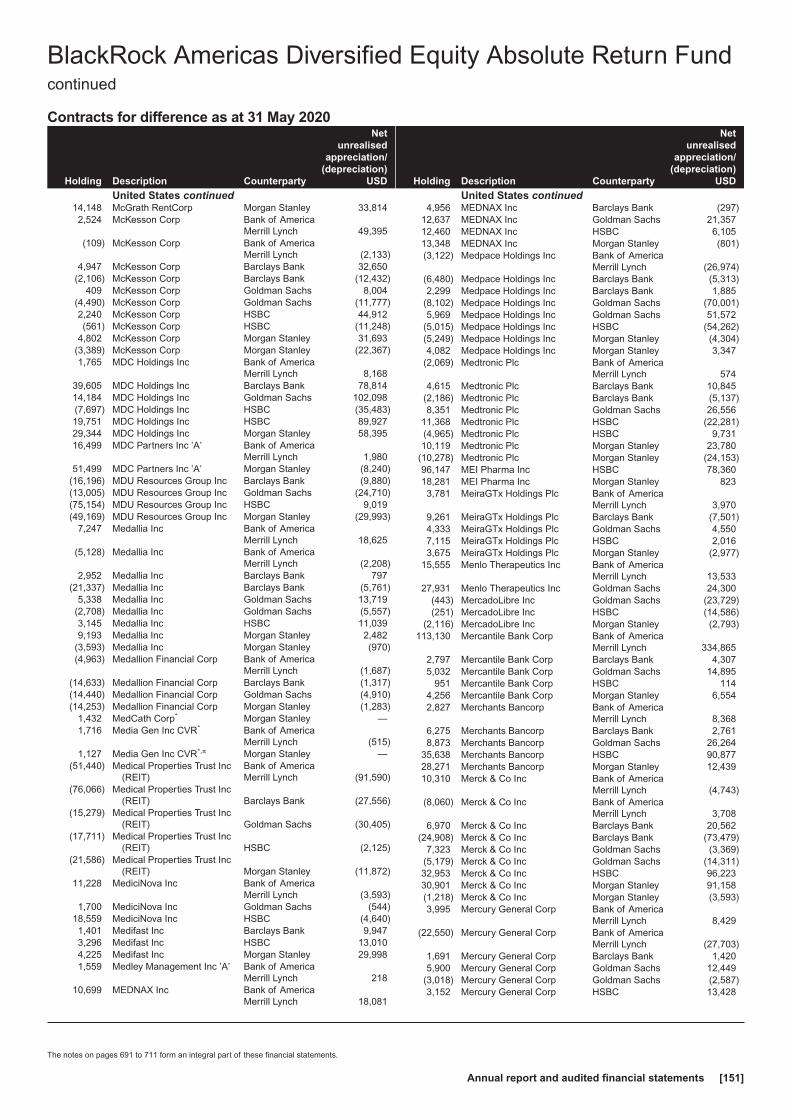
Contracts for difference as at 31 May 2020
Holding Description Counterparty
Netunrealised
appreciation/(depreciation)
USD
United States continued14,148 McGrath RentCorp Morgan Stanley 33,8142,524 McKesson Corp Bank of America
Merrill Lynch 49,395(109) McKesson Corp Bank of America
Merrill Lynch (2,133)4,947 McKesson Corp Barclays Bank 32,650
(2,106) McKesson Corp Barclays Bank (12,432)409 McKesson Corp Goldman Sachs 8,004
(4,490) McKesson Corp Goldman Sachs (11,777)2,240 McKesson Corp HSBC 44,912(561) McKesson Corp HSBC (11,248)
4,802 McKesson Corp Morgan Stanley 31,693(3,389) McKesson Corp Morgan Stanley (22,367)1,765 MDC Holdings Inc Bank of America
Merrill Lynch 8,16839,605 MDC Holdings Inc Barclays Bank 78,81414,184 MDC Holdings Inc Goldman Sachs 102,098(7,697) MDC Holdings Inc HSBC (35,483)19,751 MDC Holdings Inc HSBC 89,92729,344 MDC Holdings Inc Morgan Stanley 58,39516,499 MDC Partners Inc ’A’ Bank of America
Merrill Lynch 1,98051,499 MDC Partners Inc ’A’ Morgan Stanley (8,240)
(16,196) MDU Resources Group Inc Barclays Bank (9,880)(13,005) MDU Resources Group Inc Goldman Sachs (24,710)(75,154) MDU Resources Group Inc HSBC 9,019(49,169) MDU Resources Group Inc Morgan Stanley (29,993)
7,247 Medallia Inc Bank of AmericaMerrill Lynch 18,625
(5,128) Medallia Inc Bank of AmericaMerrill Lynch (2,208)
2,952 Medallia Inc Barclays Bank 797(21,337) Medallia Inc Barclays Bank (5,761)
5,338 Medallia Inc Goldman Sachs 13,719(2,708) Medallia Inc Goldman Sachs (5,557)3,145 Medallia Inc HSBC 11,0399,193 Medallia Inc Morgan Stanley 2,482
(3,593) Medallia Inc Morgan Stanley (970)(4,963) Medallion Financial Corp Bank of America
Merrill Lynch (1,687)(14,633) Medallion Financial Corp Barclays Bank (1,317)(14,440) Medallion Financial Corp Goldman Sachs (4,910)(14,253) Medallion Financial Corp Morgan Stanley (1,283)
1,432 MedCath Corp* Morgan Stanley —1,716 Media Gen Inc CVR* Bank of America
Merrill Lynch (515)1,127 Media Gen Inc CVR*,π Morgan Stanley —
(51,440) Medical Properties Trust Inc(REIT)
Bank of AmericaMerrill Lynch (91,590)
(76,066) Medical Properties Trust Inc(REIT) Barclays Bank (27,556)
(15,279) Medical Properties Trust Inc(REIT) Goldman Sachs (30,405)
(17,711) Medical Properties Trust Inc(REIT) HSBC (2,125)
(21,586) Medical Properties Trust Inc(REIT) Morgan Stanley (11,872)
11,228 MediciNova Inc Bank of AmericaMerrill Lynch (3,593)
1,700 MediciNova Inc Goldman Sachs (544)18,559 MediciNova Inc HSBC (4,640)1,401 Medifast Inc Barclays Bank 9,9473,296 Medifast Inc HSBC 13,0104,225 Medifast Inc Morgan Stanley 29,9981,559 Medley Management Inc ’A’ Bank of America
Merrill Lynch 21810,699 MEDNAX Inc Bank of America
Merrill Lynch 18,081
Holding Description Counterparty
Netunrealised
appreciation/(depreciation)
USD
United States continued4,956 MEDNAX Inc Barclays Bank (297)
12,637 MEDNAX Inc Goldman Sachs 21,35712,460 MEDNAX Inc HSBC 6,10513,348 MEDNAX Inc Morgan Stanley (801)(3,122) Medpace Holdings Inc Bank of America
Merrill Lynch (26,974)(6,480) Medpace Holdings Inc Barclays Bank (5,313)2,299 Medpace Holdings Inc Barclays Bank 1,885
(8,102) Medpace Holdings Inc Goldman Sachs (70,001)5,969 Medpace Holdings Inc Goldman Sachs 51,572
(5,015) Medpace Holdings Inc HSBC (54,262)(5,249) Medpace Holdings Inc Morgan Stanley (4,304)4,082 Medpace Holdings Inc Morgan Stanley 3,347
(2,069) Medtronic Plc Bank of AmericaMerrill Lynch 574
4,615 Medtronic Plc Barclays Bank 10,845(2,186) Medtronic Plc Barclays Bank (5,137)8,351 Medtronic Plc Goldman Sachs 26,556
11,368 Medtronic Plc HSBC (22,281)(4,965) Medtronic Plc HSBC 9,73110,119 Medtronic Plc Morgan Stanley 23,780
(10,278) Medtronic Plc Morgan Stanley (24,153)96,147 MEI Pharma Inc HSBC 78,36018,281 MEI Pharma Inc Morgan Stanley 8233,781 MeiraGTx Holdings Plc Bank of America
Merrill Lynch 3,9709,261 MeiraGTx Holdings Plc Barclays Bank (7,501)4,333 MeiraGTx Holdings Plc Goldman Sachs 4,5507,115 MeiraGTx Holdings Plc HSBC 2,0163,675 MeiraGTx Holdings Plc Morgan Stanley (2,977)
15,555 Menlo Therapeutics Inc Bank of AmericaMerrill Lynch 13,533
27,931 Menlo Therapeutics Inc Goldman Sachs 24,300(443) MercadoLibre Inc Goldman Sachs (23,729)(251) MercadoLibre Inc HSBC (14,586)
(2,116) MercadoLibre Inc Morgan Stanley (2,793)113,130 Mercantile Bank Corp Bank of America
Merrill Lynch 334,8652,797 Mercantile Bank Corp Barclays Bank 4,3075,032 Mercantile Bank Corp Goldman Sachs 14,895
951 Mercantile Bank Corp HSBC 1144,256 Mercantile Bank Corp Morgan Stanley 6,5542,827 Merchants Bancorp Bank of America
Merrill Lynch 8,3686,275 Merchants Bancorp Barclays Bank 2,7618,873 Merchants Bancorp Goldman Sachs 26,264
35,638 Merchants Bancorp HSBC 90,87728,271 Merchants Bancorp Morgan Stanley 12,43910,310 Merck & Co Inc Bank of America
Merrill Lynch (4,743)(8,060) Merck & Co Inc Bank of America
Merrill Lynch 3,7086,970 Merck & Co Inc Barclays Bank 20,562
(24,908) Merck & Co Inc Barclays Bank (73,479)7,323 Merck & Co Inc Goldman Sachs (3,369)
(5,179) Merck & Co Inc Goldman Sachs (14,311)32,953 Merck & Co Inc HSBC 96,22330,901 Merck & Co Inc Morgan Stanley 91,158(1,218) Merck & Co Inc Morgan Stanley (3,593)3,995 Mercury General Corp Bank of America
Merrill Lynch 8,429(22,550) Mercury General Corp Bank of America
Merrill Lynch (27,703)1,691 Mercury General Corp Barclays Bank 1,4205,900 Mercury General Corp Goldman Sachs 12,449
(3,018) Mercury General Corp Goldman Sachs (2,587)3,152 Mercury General Corp HSBC 13,428
BlackRock Americas Diversified Equity Absolute Return Fundcontinued
The notes on pages 691 to 711 form an integral part of these financial statements.
Annual report and audited financial statements [151]
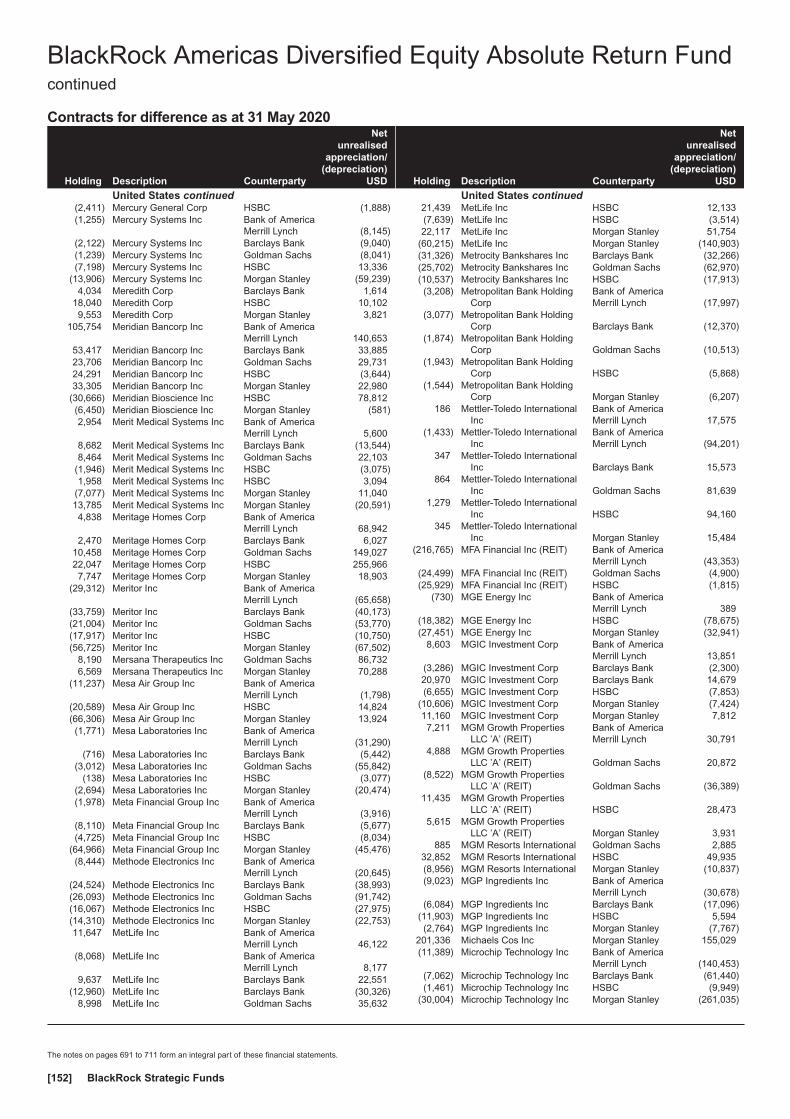
Contracts for difference as at 31 May 2020
Holding Description Counterparty
Netunrealised
appreciation/(depreciation)
USD
United States continued(2,411) Mercury General Corp HSBC (1,888)(1,255) Mercury Systems Inc Bank of America
Merrill Lynch (8,145)(2,122) Mercury Systems Inc Barclays Bank (9,040)(1,239) Mercury Systems Inc Goldman Sachs (8,041)(7,198) Mercury Systems Inc HSBC 13,336
(13,906) Mercury Systems Inc Morgan Stanley (59,239)4,034 Meredith Corp Barclays Bank 1,614
18,040 Meredith Corp HSBC 10,1029,553 Meredith Corp Morgan Stanley 3,821
105,754 Meridian Bancorp Inc Bank of AmericaMerrill Lynch 140,653
53,417 Meridian Bancorp Inc Barclays Bank 33,88523,706 Meridian Bancorp Inc Goldman Sachs 29,73124,291 Meridian Bancorp Inc HSBC (3,644)33,305 Meridian Bancorp Inc Morgan Stanley 22,980
(30,666) Meridian Bioscience Inc HSBC 78,812(6,450) Meridian Bioscience Inc Morgan Stanley (581)2,954 Merit Medical Systems Inc Bank of America
Merrill Lynch 5,6008,682 Merit Medical Systems Inc Barclays Bank (13,544)8,464 Merit Medical Systems Inc Goldman Sachs 22,103
(1,946) Merit Medical Systems Inc HSBC (3,075)1,958 Merit Medical Systems Inc HSBC 3,094
(7,077) Merit Medical Systems Inc Morgan Stanley 11,04013,785 Merit Medical Systems Inc Morgan Stanley (20,591)4,838 Meritage Homes Corp Bank of America
Merrill Lynch 68,9422,470 Meritage Homes Corp Barclays Bank 6,027
10,458 Meritage Homes Corp Goldman Sachs 149,02722,047 Meritage Homes Corp HSBC 255,9667,747 Meritage Homes Corp Morgan Stanley 18,903
(29,312) Meritor Inc Bank of AmericaMerrill Lynch (65,658)
(33,759) Meritor Inc Barclays Bank (40,173)(21,004) Meritor Inc Goldman Sachs (53,770)(17,917) Meritor Inc HSBC (10,750)(56,725) Meritor Inc Morgan Stanley (67,502)
8,190 Mersana Therapeutics Inc Goldman Sachs 86,7326,569 Mersana Therapeutics Inc Morgan Stanley 70,288
(11,237) Mesa Air Group Inc Bank of AmericaMerrill Lynch (1,798)
(20,589) Mesa Air Group Inc HSBC 14,824(66,306) Mesa Air Group Inc Morgan Stanley 13,924(1,771) Mesa Laboratories Inc Bank of America
Merrill Lynch (31,290)(716) Mesa Laboratories Inc Barclays Bank (5,442)
(3,012) Mesa Laboratories Inc Goldman Sachs (55,842)(138) Mesa Laboratories Inc HSBC (3,077)
(2,694) Mesa Laboratories Inc Morgan Stanley (20,474)(1,978) Meta Financial Group Inc Bank of America
Merrill Lynch (3,916)(8,110) Meta Financial Group Inc Barclays Bank (5,677)(4,725) Meta Financial Group Inc HSBC (8,034)
(64,966) Meta Financial Group Inc Morgan Stanley (45,476)(8,444) Methode Electronics Inc Bank of America
Merrill Lynch (20,645)(24,524) Methode Electronics Inc Barclays Bank (38,993)(26,093) Methode Electronics Inc Goldman Sachs (91,742)(16,067) Methode Electronics Inc HSBC (27,975)(14,310) Methode Electronics Inc Morgan Stanley (22,753)11,647 MetLife Inc Bank of America
Merrill Lynch 46,122(8,068) MetLife Inc Bank of America
Merrill Lynch 8,1779,637 MetLife Inc Barclays Bank 22,551
(12,960) MetLife Inc Barclays Bank (30,326)8,998 MetLife Inc Goldman Sachs 35,632
Holding Description Counterparty
Netunrealised
appreciation/(depreciation)
USD
United States continued21,439 MetLife Inc HSBC 12,133(7,639) MetLife Inc HSBC (3,514)22,117 MetLife Inc Morgan Stanley 51,754
(60,215) MetLife Inc Morgan Stanley (140,903)(31,326) Metrocity Bankshares Inc Barclays Bank (32,266)(25,702) Metrocity Bankshares Inc Goldman Sachs (62,970)(10,537) Metrocity Bankshares Inc HSBC (17,913)(3,208) Metropolitan Bank Holding
CorpBank of AmericaMerrill Lynch (17,997)
(3,077) Metropolitan Bank HoldingCorp Barclays Bank (12,370)
(1,874) Metropolitan Bank HoldingCorp Goldman Sachs (10,513)
(1,943) Metropolitan Bank HoldingCorp HSBC (5,868)
(1,544) Metropolitan Bank HoldingCorp Morgan Stanley (6,207)
186 Mettler-Toledo InternationalInc
Bank of AmericaMerrill Lynch 17,575
(1,433) Mettler-Toledo InternationalInc
Bank of AmericaMerrill Lynch (94,201)
347 Mettler-Toledo InternationalInc Barclays Bank 15,573
864 Mettler-Toledo InternationalInc Goldman Sachs 81,639
1,279 Mettler-Toledo InternationalInc HSBC 94,160
345 Mettler-Toledo InternationalInc Morgan Stanley 15,484
(216,765) MFA Financial Inc (REIT) Bank of AmericaMerrill Lynch (43,353)
(24,499) MFA Financial Inc (REIT) Goldman Sachs (4,900)(25,929) MFA Financial Inc (REIT) HSBC (1,815)
(730) MGE Energy Inc Bank of AmericaMerrill Lynch 389
(18,382) MGE Energy Inc HSBC (78,675)(27,451) MGE Energy Inc Morgan Stanley (32,941)
8,603 MGIC Investment Corp Bank of AmericaMerrill Lynch 13,851
(3,286) MGIC Investment Corp Barclays Bank (2,300)20,970 MGIC Investment Corp Barclays Bank 14,679(6,655) MGIC Investment Corp HSBC (7,853)
(10,606) MGIC Investment Corp Morgan Stanley (7,424)11,160 MGIC Investment Corp Morgan Stanley 7,8127,211 MGM Growth Properties
LLC ’A’ (REIT)Bank of AmericaMerrill Lynch 30,791
4,888 MGM Growth PropertiesLLC ’A’ (REIT) Goldman Sachs 20,872
(8,522) MGM Growth PropertiesLLC ’A’ (REIT) Goldman Sachs (36,389)
11,435 MGM Growth PropertiesLLC ’A’ (REIT) HSBC 28,473
5,615 MGM Growth PropertiesLLC ’A’ (REIT) Morgan Stanley 3,931
885 MGM Resorts International Goldman Sachs 2,88532,852 MGM Resorts International HSBC 49,935(8,956) MGM Resorts International Morgan Stanley (10,837)(9,023) MGP Ingredients Inc Bank of America
Merrill Lynch (30,678)(6,084) MGP Ingredients Inc Barclays Bank (17,096)
(11,903) MGP Ingredients Inc HSBC 5,594(2,764) MGP Ingredients Inc Morgan Stanley (7,767)
201,336 Michaels Cos Inc Morgan Stanley 155,029(11,389) Microchip Technology Inc Bank of America
Merrill Lynch (140,453)(7,062) Microchip Technology Inc Barclays Bank (61,440)(1,461) Microchip Technology Inc HSBC (9,949)
(30,004) Microchip Technology Inc Morgan Stanley (261,035)
BlackRock Americas Diversified Equity Absolute Return Fundcontinued
The notes on pages 691 to 711 form an integral part of these financial statements.
BlackRock Strategic Funds[152]

Contracts for difference as at 31 May 2020
Holding Description Counterparty
Netunrealised
appreciation/(depreciation)
USD
United States continued(15,250) Micron Technology Inc Bank of America
Merrill Lynch (42,852)(40,239) Micron Technology Inc Barclays Bank (91,745)(5,684) Micron Technology Inc Goldman Sachs (15,972)
(29,719) Micron Technology Inc HSBC 26,286(11,858) Micron Technology Inc Morgan Stanley (27,036)
3,757 Microsoft Corp Goldman Sachs (3,259)9,849 Microsoft Corp HSBC (16,448)
35,485 Microsoft Corp Morgan Stanley (17,743)(6,340) MicroStrategy Inc ’A’ Barclays Bank (13,187)(1,009) MicroStrategy Inc ’A’ Goldman Sachs (8,950)(2,236) MicroStrategy Inc ’A’ HSBC 492
(11,145) MicroStrategy Inc ’A’ Morgan Stanley (23,181)1,798 Mid Penn Bancorp Inc Bank of America
Merrill Lynch 2,8234,045 Mid Penn Bancorp Inc Barclays Bank 6471,731 Mid Penn Bancorp Inc Goldman Sachs 2,7184,583 Mid Penn Bancorp Inc HSBC (2,108)6,187 Mid Penn Bancorp Inc Morgan Stanley 990
(8,858) Mid-America ApartmentCommunities Inc (REIT)
Bank of AmericaMerrill Lynch (85,391)
(10,998) Mid-America ApartmentCommunities Inc (REIT) Barclays Bank (24,526)
(10,443) Mid-America ApartmentCommunities Inc (REIT) Goldman Sachs (100,671)
(9,487) Mid-America ApartmentCommunities Inc (REIT) HSBC (19,731)
(21,994) Mid-America ApartmentCommunities Inc (REIT) Morgan Stanley (49,047)
(455) Middleby Corp Bank of AmericaMerrill Lynch (3,026)
1,606 Middleby Corp Bank of AmericaMerrill Lynch 8,705
(1,658) Middleby Corp Barclays Bank (6,848)4,890 Middleby Corp Barclays Bank 20,196
(2,108) Middleby Corp HSBC (6,092)(3,133) Middleby Corp Morgan Stanley (12,939)
(27,477) Middlesex Water Co Bank of AmericaMerrill Lynch (133,988)
(10,104) Middlesex Water Co Goldman Sachs (51,328)(11,059) Middlesex Water Co HSBC (35,389)(23,271) Middlesex Water Co Morgan Stanley (34,907)(18,963) Midland States Bancorp Inc Bank of America
Merrill Lynch (27,117)(10,147) Midland States Bancorp Inc Barclays Bank (8,321)(32,283) Midland States Bancorp Inc Goldman Sachs (46,165)(12,933) Midland States Bancorp Inc HSBC 6,806(16,527) Midland States Bancorp Inc Morgan Stanley (13,552)11,069 MidWestOne Financial
Group IncBank of AmericaMerrill Lynch 28,447
15,442 MidWestOne FinancialGroup Inc Barclays Bank 13,731
22,026 MidWestOne FinancialGroup Inc Goldman Sachs 56,607
9,704 MidWestOne FinancialGroup Inc HSBC 6,528
28,433 MidWestOne FinancialGroup Inc Morgan Stanley 30,423
(21,843) Millendo Therapeutics Inc Bank of AmericaMerrill Lynch (5,898)
(31,808) Millendo Therapeutics Inc Barclays Bank 318(50,510) Millendo Therapeutics Inc Goldman Sachs (13,638)(32,935) Millendo Therapeutics Inc HSBC (12,515)(41,289) Millendo Therapeutics Inc Morgan Stanley 41361,854 Miller Industries Inc Bank of America
Merrill Lynch 129,2752,712 Miller Industries Inc Barclays Bank 2,4416,186 Miller Industries Inc Goldman Sachs 12,9291,995 Miller Industries Inc HSBC 2,765
Holding Description Counterparty
Netunrealised
appreciation/(depreciation)
USD
United States continued17,015 Miller Industries Inc Morgan Stanley 15,314
(10,031) Mimecast Ltd Barclays Bank (12,639)(4,431) Mimecast Ltd Goldman Sachs (18,344)(4,423) Mimecast Ltd HSBC (2,766)(4,197) Mimecast Ltd Morgan Stanley (5,692)
(14,375) Minerals Technologies Inc Bank of AmericaMerrill Lynch (111,337)
(4,226) Minerals Technologies Inc Barclays Bank (6,806)(6,130) Minerals Technologies Inc Goldman Sachs (45,247)
(13,325) Minerals Technologies Inc HSBC (63,294)(33,015) Minerals Technologies Inc Morgan Stanley (77,255)(41,704) Minerva Neurosciences Inc HSBC 291,511(9,178) Minerva Neurosciences Inc Morgan Stanley 89,76151,209 Miragen Therapeutics Inc Goldman Sachs 20,7401,884 Miragen Therapeutics Inc Morgan Stanley 738
(2,001) Mirati Therapeutics Inc Bank of AmericaMerrill Lynch 8,504
(1,101) Mirati Therapeutics Inc Barclays Bank 2,753(966) Mirati Therapeutics Inc Goldman Sachs 4,897
(3,944) Mirati Therapeutics Inc HSBC (66)(9,837) Mirati Therapeutics Inc Morgan Stanley 24,593(4,207) Mirum Pharmaceuticals Inc Bank of America
Merrill Lynch 1,178(2,707) Mirum Pharmaceuticals Inc Barclays Bank 758(6,116) Mirum Pharmaceuticals Inc Goldman Sachs 1,712(8,371) Misonix Inc Bank of America
Merrill Lynch (24,192)(7,551) Misonix Inc HSBC (16,839)
(41,075) Misonix Inc Morgan Stanley (23,824)53,004 Mistras Group Inc Bank of America
Merrill Lynch 34,98310,152 Mistras Group Inc Barclays Bank 1,01511,188 Mistras Group Inc Goldman Sachs 7,38419,159 Mistras Group Inc HSBC (3,640)38,707 Mistras Group Inc Morgan Stanley 3,871
(26,078) Mitek Systems Inc Bank of AmericaMerrill Lynch (7,563)
(19,989) Mitek Systems Inc Barclays Bank (1,999)(38,203) Mitek Systems Inc Goldman Sachs (11,079)(2,804) Mitek Systems Inc HSBC (182)(4,956) MKS Instruments Inc Bank of America
Merrill Lynch (32,780)(2,238) MKS Instruments Inc Barclays Bank (779)(4,502) MKS Instruments Inc Goldman Sachs (55,735)(5,286) MKS Instruments Inc HSBC (16,651)
(15,425) MKS Instruments Inc Morgan Stanley (81,907)(300) MMA Capital Holdings Inc Barclays Bank (18)
(4,160) MMA Capital Holdings Inc Goldman Sachs (4,202)(5,232) MMA Capital Holdings Inc HSBC 11,772(2,960) MMA Capital Holdings Inc Morgan Stanley (178)16,804 Mobile Mini Inc HSBC 42,51442,090 Mobile Mini Inc Morgan Stanley 35,77756,760 MobileIron Inc Bank of America
Merrill Lynch (5,676)13,510 MobileIron Inc Barclays Bank (3,107)85,495 MobileIron Inc Goldman Sachs (8,550)13,478 MobileIron Inc HSBC (7,143)30,192 MobileIron Inc Morgan Stanley (6,944)5,111 Model N Inc Barclays Bank 10,3241,560 Model N Inc Goldman Sachs (2,527)
30,062 Model N Inc HSBC (30,964)18,878 Model N Inc Morgan Stanley 38,134
533 Moderna Inc Barclays Bank (6,204)8,681 Moderna Inc HSBC (16,407)2,737 Moderna Inc Morgan Stanley 10,158
(40,350) Modine Manufacturing Co Barclays Bank (35,105)(27,138) Modine Manufacturing Co Goldman Sachs (47,492)(34,289) Modine Manufacturing Co HSBC (37,375)
BlackRock Americas Diversified Equity Absolute Return Fundcontinued
The notes on pages 691 to 711 form an integral part of these financial statements.
Annual report and audited financial statements [153]
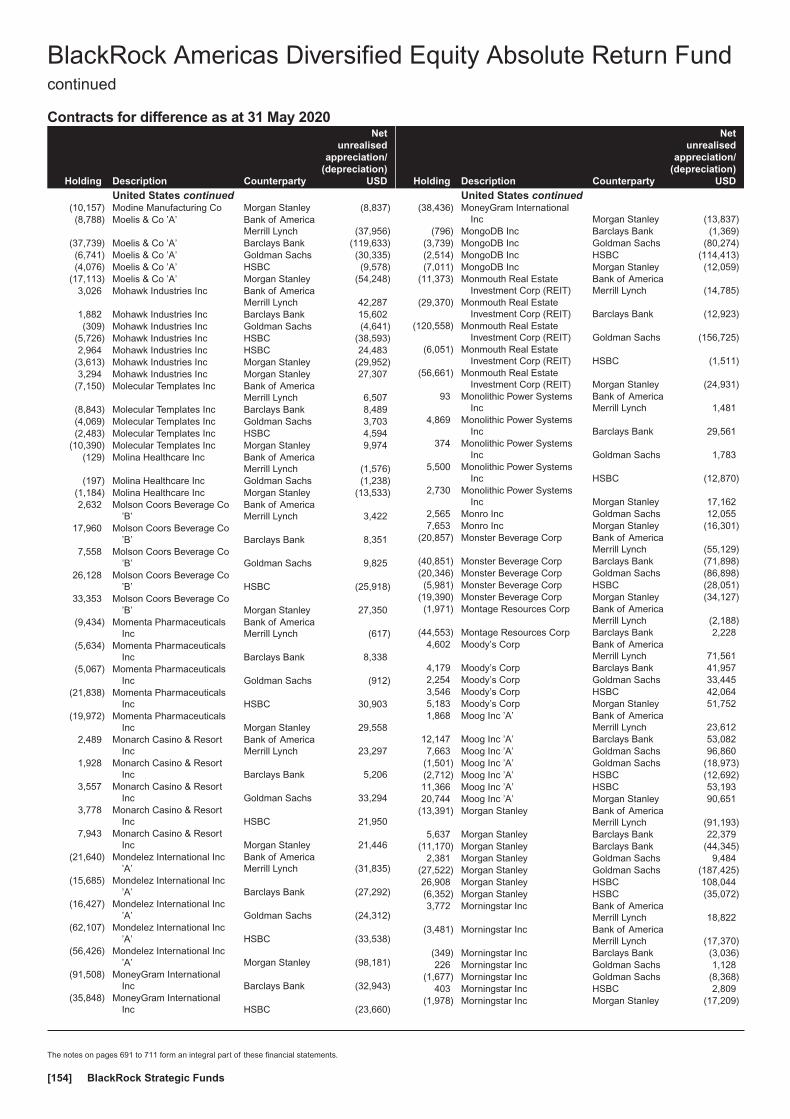
Contracts for difference as at 31 May 2020
Holding Description Counterparty
Netunrealised
appreciation/(depreciation)
USD
United States continued(10,157) Modine Manufacturing Co Morgan Stanley (8,837)(8,788) Moelis & Co ’A’ Bank of America
Merrill Lynch (37,956)(37,739) Moelis & Co ’A’ Barclays Bank (119,633)(6,741) Moelis & Co ’A’ Goldman Sachs (30,335)(4,076) Moelis & Co ’A’ HSBC (9,578)
(17,113) Moelis & Co ’A’ Morgan Stanley (54,248)3,026 Mohawk Industries Inc Bank of America
Merrill Lynch 42,2871,882 Mohawk Industries Inc Barclays Bank 15,602(309) Mohawk Industries Inc Goldman Sachs (4,641)
(5,726) Mohawk Industries Inc HSBC (38,593)2,964 Mohawk Industries Inc HSBC 24,483
(3,613) Mohawk Industries Inc Morgan Stanley (29,952)3,294 Mohawk Industries Inc Morgan Stanley 27,307
(7,150) Molecular Templates Inc Bank of AmericaMerrill Lynch 6,507
(8,843) Molecular Templates Inc Barclays Bank 8,489(4,069) Molecular Templates Inc Goldman Sachs 3,703(2,483) Molecular Templates Inc HSBC 4,594
(10,390) Molecular Templates Inc Morgan Stanley 9,974(129) Molina Healthcare Inc Bank of America
Merrill Lynch (1,576)(197) Molina Healthcare Inc Goldman Sachs (1,238)
(1,184) Molina Healthcare Inc Morgan Stanley (13,533)2,632 Molson Coors Beverage Co
’B’Bank of AmericaMerrill Lynch 3,422
17,960 Molson Coors Beverage Co’B’ Barclays Bank 8,351
7,558 Molson Coors Beverage Co’B’ Goldman Sachs 9,825
26,128 Molson Coors Beverage Co’B’ HSBC (25,918)
33,353 Molson Coors Beverage Co’B’ Morgan Stanley 27,350
(9,434) Momenta PharmaceuticalsInc
Bank of AmericaMerrill Lynch (617)
(5,634) Momenta PharmaceuticalsInc Barclays Bank 8,338
(5,067) Momenta PharmaceuticalsInc Goldman Sachs (912)
(21,838) Momenta PharmaceuticalsInc HSBC 30,903
(19,972) Momenta PharmaceuticalsInc Morgan Stanley 29,558
2,489 Monarch Casino & ResortInc
Bank of AmericaMerrill Lynch 23,297
1,928 Monarch Casino & ResortInc Barclays Bank 5,206
3,557 Monarch Casino & ResortInc Goldman Sachs 33,294
3,778 Monarch Casino & ResortInc HSBC 21,950
7,943 Monarch Casino & ResortInc Morgan Stanley 21,446
(21,640) Mondelez International Inc’A’
Bank of AmericaMerrill Lynch (31,835)
(15,685) Mondelez International Inc’A’ Barclays Bank (27,292)
(16,427) Mondelez International Inc’A’ Goldman Sachs (24,312)
(62,107) Mondelez International Inc’A’ HSBC (33,538)
(56,426) Mondelez International Inc’A’ Morgan Stanley (98,181)
(91,508) MoneyGram InternationalInc Barclays Bank (32,943)
(35,848) MoneyGram InternationalInc HSBC (23,660)
Holding Description Counterparty
Netunrealised
appreciation/(depreciation)
USD
United States continued(38,436) MoneyGram International
Inc Morgan Stanley (13,837)(796) MongoDB Inc Barclays Bank (1,369)
(3,739) MongoDB Inc Goldman Sachs (80,274)(2,514) MongoDB Inc HSBC (114,413)(7,011) MongoDB Inc Morgan Stanley (12,059)
(11,373) Monmouth Real EstateInvestment Corp (REIT)
Bank of AmericaMerrill Lynch (14,785)
(29,370) Monmouth Real EstateInvestment Corp (REIT) Barclays Bank (12,923)
(120,558) Monmouth Real EstateInvestment Corp (REIT) Goldman Sachs (156,725)
(6,051) Monmouth Real EstateInvestment Corp (REIT) HSBC (1,511)
(56,661) Monmouth Real EstateInvestment Corp (REIT) Morgan Stanley (24,931)
93 Monolithic Power SystemsInc
Bank of AmericaMerrill Lynch 1,481
4,869 Monolithic Power SystemsInc Barclays Bank 29,561
374 Monolithic Power SystemsInc Goldman Sachs 1,783
5,500 Monolithic Power SystemsInc HSBC (12,870)
2,730 Monolithic Power SystemsInc Morgan Stanley 17,162
2,565 Monro Inc Goldman Sachs 12,0557,653 Monro Inc Morgan Stanley (16,301)
(20,857) Monster Beverage Corp Bank of AmericaMerrill Lynch (55,129)
(40,851) Monster Beverage Corp Barclays Bank (71,898)(20,346) Monster Beverage Corp Goldman Sachs (86,898)(5,981) Monster Beverage Corp HSBC (28,051)
(19,390) Monster Beverage Corp Morgan Stanley (34,127)(1,971) Montage Resources Corp Bank of America
Merrill Lynch (2,188)(44,553) Montage Resources Corp Barclays Bank 2,228
4,602 Moody’s Corp Bank of AmericaMerrill Lynch 71,561
4,179 Moody’s Corp Barclays Bank 41,9572,254 Moody’s Corp Goldman Sachs 33,4453,546 Moody’s Corp HSBC 42,0645,183 Moody’s Corp Morgan Stanley 51,7521,868 Moog Inc ’A’ Bank of America
Merrill Lynch 23,61212,147 Moog Inc ’A’ Barclays Bank 53,0827,663 Moog Inc ’A’ Goldman Sachs 96,860
(1,501) Moog Inc ’A’ Goldman Sachs (18,973)(2,712) Moog Inc ’A’ HSBC (12,692)11,366 Moog Inc ’A’ HSBC 53,19320,744 Moog Inc ’A’ Morgan Stanley 90,651
(13,391) Morgan Stanley Bank of AmericaMerrill Lynch (91,193)
5,637 Morgan Stanley Barclays Bank 22,379(11,170) Morgan Stanley Barclays Bank (44,345)
2,381 Morgan Stanley Goldman Sachs 9,484(27,522) Morgan Stanley Goldman Sachs (187,425)26,908 Morgan Stanley HSBC 108,044(6,352) Morgan Stanley HSBC (35,072)3,772 Morningstar Inc Bank of America
Merrill Lynch 18,822(3,481) Morningstar Inc Bank of America
Merrill Lynch (17,370)(349) Morningstar Inc Barclays Bank (3,036)226 Morningstar Inc Goldman Sachs 1,128
(1,677) Morningstar Inc Goldman Sachs (8,368)403 Morningstar Inc HSBC 2,809
(1,978) Morningstar Inc Morgan Stanley (17,209)
BlackRock Americas Diversified Equity Absolute Return Fundcontinued
The notes on pages 691 to 711 form an integral part of these financial statements.
BlackRock Strategic Funds[154]

Contracts for difference as at 31 May 2020
Holding Description Counterparty
Netunrealised
appreciation/(depreciation)
USD
United States continued(4,191) Morphic Holding Inc Barclays Bank 2,766(8,579) Morphic Holding Inc Goldman Sachs (39,549)(3,429) Morphic Holding Inc Morgan Stanley 2,26357,697 Mosaic Co Barclays Bank 25,3872,659 Mosaic Co Goldman Sachs 5,105
59,486 Mosaic Co HSBC 5,35465,833 Mosaic Co Morgan Stanley 28,9668,563 Motorcar Parts of America
IncBank of AmericaMerrill Lynch 14,900
19,540 Motorcar Parts of AmericaInc Barclays Bank 12,506
7,537 Motorcar Parts of AmericaInc Goldman Sachs 13,114
19,716 Motorcar Parts of AmericaInc HSBC 27,208
27,862 Motorcar Parts of AmericaInc Morgan Stanley 17,832
8,646 Motorola Solutions Inc Barclays Bank 3,6664,467 Motorola Solutions Inc Goldman Sachs 24,7927,191 Motorola Solutions Inc HSBC 40,8477,243 Motorola Solutions Inc Morgan Stanley 2,387
(6,344) Movado Group Inc Bank of AmericaMerrill Lynch (2,094)
(16,218) Movado Group Inc Barclays Bank 6,649(13,412) Movado Group Inc Goldman Sachs (4,426)(6,770) Movado Group Inc HSBC (3,453)
(27,040) Movado Group Inc Morgan Stanley 11,086(7,952) Mr Cooper Group Inc Barclays Bank (9,781)
(27,384) Mr Cooper Group Inc Goldman Sachs (50,921)(25,850) Mr Cooper Group Inc HSBC (42,355)(60,796) Mr Cooper Group Inc Morgan Stanley (74,779)35,405 MRC Global Inc Bank of America
Merrill Lynch 38,59121,919 MRC Global Inc Barclays Bank 8,32925,613 MRC Global Inc Goldman Sachs 27,91841,086 MRC Global Inc HSBC 32,86930,086 MRC Global Inc Morgan Stanley 11,433
206 MSA Safety Inc Bank of AmericaMerrill Lynch 1,055
2,201 MSA Safety Inc Barclays Bank 7,8582,246 MSA Safety Inc Goldman Sachs 11,5008,056 MSA Safety Inc HSBC (22,203)
(11,023) MSA Safety Inc HSBC 27,0061,269 MSA Safety Inc Morgan Stanley 4,5302,518 MSC Industrial Direct Co Inc
’A’Bank of AmericaMerrill Lynch 23,216
5,097 MSC Industrial Direct Co Inc’A’ Barclays Bank 21,254
4,001 MSC Industrial Direct Co Inc’A’ Goldman Sachs 36,889
17,912 MSC Industrial Direct Co Inc’A’ HSBC 160,670
21,329 MSC Industrial Direct Co Inc’A’ Morgan Stanley 88,942
(1,945) MSCI Inc Bank of AmericaMerrill Lynch 15,818
(961) MSCI Inc Barclays Bank 8,101(1,239) MSCI Inc Goldman Sachs 18,072
(673) MSCI Inc HSBC 2,719(3,773) MSCI Inc Morgan Stanley 31,8064,263 MSCI Inc Morgan Stanley 66,876
12,427 MSG Networks Inc ’A’ Bank of AmericaMerrill Lynch 7,332
7,153 MSG Networks Inc ’A’ Barclays Bank (5,222)46,932 MSG Networks Inc ’A’ Goldman Sachs 27,69010,226 MSG Networks Inc ’A’ HSBC 8,38522,029 MSG Networks Inc ’A’ Morgan Stanley (16,081)(9,523) MTS Systems Corp Goldman Sachs (37,616)(6,082) MTS Systems Corp HSBC 3,892
Holding Description Counterparty
Netunrealised
appreciation/(depreciation)
USD
United States continued(16,757) MTS Systems Corp Morgan Stanley (19,103)(19,834) Mueller Industries Inc Bank of America
Merrill Lynch (80,328)(10,984) Mueller Industries Inc Barclays Bank (13,291)(17,642) Mueller Industries Inc Goldman Sachs (68,482)(37,090) Mueller Industries Inc HSBC (28,495)(58,851) Mueller Industries Inc Morgan Stanley (71,210)(38,687) Mueller Water Products Inc
’A’Bank of AmericaMerrill Lynch (37,140)
(123,969) Mueller Water Products Inc’A’ Barclays Bank (38,431)
(95,249) Mueller Water Products Inc’A’ Goldman Sachs (91,439)
(55,072) Mueller Water Products Inc’A’ HSBC (4,956)
(40,120) Mueller Water Products Inc’A’ Morgan Stanley (12,438)
1,630 Murphy Oil Corp Bank of AmericaMerrill Lynch 1,434
(13,911) Murphy Oil Corp Bank of AmericaMerrill Lynch (12,242)
13,249 Murphy Oil Corp Barclays Bank (1,325)(11,228) Murphy Oil Corp Barclays Bank 1,12326,928 Murphy Oil Corp Goldman Sachs 23,6974,906 Murphy Oil Corp HSBC 2,2576,627 Murphy Oil Corp Morgan Stanley (663)
(2,372) Murphy USA Inc Barclays Bank 8,871(3,050) Murphy USA Inc Goldman Sachs (1,891)(9,076) Murphy USA Inc HSBC 15,066
(13,375) Murphy USA Inc Morgan Stanley 50,023(14,410) Mustang Bio Inc Bank of America
Merrill Lynch (11,528)(7,937) Mustang Bio Inc Barclays Bank (3,651)
(21,072) Mustang Bio Inc Goldman Sachs (16,858)(6,463) Mustang Bio Inc HSBC (4,847)
(14,258) MVB Financial Corp Barclays Bank (5,846)(8,590) MVB Financial Corp Goldman Sachs (12,799)(5,108) MVB Financial Corp Morgan Stanley (2,094)
(78,477) Myers Industries Inc Bank of AmericaMerrill Lynch (99,666)
(5,450) Myers Industries Inc Barclays Bank (1,908)(11,368) Myers Industries Inc Goldman Sachs (14,437)(6,738) Myers Industries Inc HSBC (7,816)
(17,203) Myers Industries Inc Morgan Stanley (6,021)29,059 Mylan NV Bank of America
Merrill Lynch 51,2891,612 Mylan NV Barclays Bank 2,071
27,610 Mylan NV Goldman Sachs 48,73215,275 Mylan NV HSBC (9,852)22,615 Mylan NV Morgan Stanley 29,060
(658) MyoKardia Inc Bank of AmericaMerrill Lynch 1,562
3,215 MyoKardia Inc Barclays Bank (14,628)(1,100) MyoKardia Inc Barclays Bank (1,715)(5,955) MyoKardia Inc Goldman Sachs 80,532
(10,171) MyoKardia Inc Morgan Stanley 46,72321,312 MYR Group Inc Bank of America
Merrill Lynch 77,3636,268 MYR Group Inc Barclays Bank 8,838
13,432 MYR Group Inc Goldman Sachs 48,7583,669 MYR Group Inc HSBC 3,155
16,565 MYR Group Inc Morgan Stanley 23,357(6,642) Myriad Genetics Inc Bank of America
Merrill Lynch 2,458(11,226) Myriad Genetics Inc Goldman Sachs 4,154(12,562) Myriad Genetics Inc HSBC 3,266(37,210) Myriad Genetics Inc Morgan Stanley 13,768
(128) Nabors Industries Ltd Bank of AmericaMerrill Lynch (2,939)
BlackRock Americas Diversified Equity Absolute Return Fundcontinued
The notes on pages 691 to 711 form an integral part of these financial statements.
Annual report and audited financial statements [155]

Contracts for difference as at 31 May 2020
Holding Description Counterparty
Netunrealised
appreciation/(depreciation)
USD
United States continued(9,577) Nabors Industries Ltd Barclays Bank (132,153)(2,683) Nabors Industries Ltd Goldman Sachs (61,599)
(282) Nabors Industries Ltd HSBC (7,287)(501) Nabors Industries Ltd Morgan Stanley (6,913)
4,499 NanoString TechnologiesInc
Bank of AmericaMerrill Lynch (5,894)
2,481 NanoString TechnologiesInc Barclays Bank (3,126)
4,823 NanoString TechnologiesInc HSBC (5,161)
9,892 NanoString TechnologiesInc Morgan Stanley (12,464)
(55,389) NantKwest Inc Barclays Bank (60,374)(6,930) NantKwest Inc Goldman Sachs (16,043)(9,939) Napco Security
Technologies Inc Goldman Sachs (3,081)(21,422) Napco Security
Technologies Inc HSBC 14,567(4,136) Napco Security
Technologies Inc Morgan Stanley (1,034)3,352 Nasdaq Inc Bank of America
Merrill Lynch 9,2468,653 Nasdaq Inc Barclays Bank 12,3253,647 Nasdaq Inc Goldman Sachs 17,6522,017 Nasdaq Inc HSBC 11,7235,906 Nasdaq Inc Morgan Stanley 9,331(518) Natera Inc Bank of America
Merrill Lynch 8391,268 Natera Inc Bank of America
Merrill Lynch (1,126)(3,176) Natera Inc Barclays Bank 4,406(4,122) Natera Inc Goldman Sachs 7,1542,359 Natera Inc Goldman Sachs (3,723)6,380 Natera Inc HSBC 1,0855,901 Natera Inc Morgan Stanley (10,209)2,602 Nathan’s Famous Inc Bank of America
Merrill Lynch 7,988994 Nathan’s Famous Inc Barclays Bank 3,578883 Nathan’s Famous Inc Goldman Sachs 2,711400 Nathan’s Famous Inc HSBC (1,176)
1,965 Nathan’s Famous Inc Morgan Stanley 7,074600 National Bank Holdings
Corp ’A’Bank of AmericaMerrill Lynch 1,608
8,252 National Bank HoldingsCorp ’A’ Goldman Sachs 22,115
12,694 National Bank HoldingsCorp ’A’ HSBC 5,458
23,901 National Bank HoldingsCorp ’A’ Morgan Stanley 18,165
(729) National Bankshares Inc Barclays Bank (1,706)(1,171) National Bankshares Inc Goldman Sachs (4,473)
(12,807) National Bankshares Inc Morgan Stanley (29,968)3,320 National Beverage Corp Bank of America
Merrill Lynch 10,3251,403 National Beverage Corp Barclays Bank 449
587 National Beverage Corp Goldman Sachs 1,82612,467 National Beverage Corp HSBC 46,25312,423 National Beverage Corp Morgan Stanley 3,975(6,310) National CineMedia Inc Bank of America
Merrill Lynch (568)(54,263) National CineMedia Inc Goldman Sachs (4,884)(12,528) National CineMedia Inc HSBC 6,139(16,418) National CineMedia Inc Morgan Stanley 328
9,508 National Energy ServicesReunited Corp Goldman Sachs 11,505
24,365 National Energy ServicesReunited Corp Morgan Stanley 2,924
(17,204) National Fuel Gas Co Bank of AmericaMerrill Lynch (17,833)
Holding Description Counterparty
Netunrealised
appreciation/(depreciation)
USD
United States continued(4,070) National Fuel Gas Co Barclays Bank 3,582(5,009) National Fuel Gas Co Goldman Sachs (1,942)(3,597) National Fuel Gas Co HSBC 4,208
(35,297) National Fuel Gas Co Morgan Stanley 31,0619,538 National General Holdings
Corp Barclays Bank 6,58118,251 National General Holdings
Corp Goldman Sachs 48,91325,942 National General Holdings
Corp HSBC 22,82993,153 National General Holdings
Corp Morgan Stanley 64,276(17,834) National Health Investors
Inc (REIT)Bank of AmericaMerrill Lynch (164,073)
1,576 National Health InvestorsInc (REIT)
Bank of AmericaMerrill Lynch 14,499
1,517 National Health InvestorsInc (REIT) Barclays Bank 4,490
(2,302) National Health InvestorsInc (REIT) Barclays Bank (6,814)
9,179 National Health InvestorsInc (REIT) Goldman Sachs 84,447
713 National Health InvestorsInc (REIT) HSBC 2,310
(7,366) National Health InvestorsInc (REIT) HSBC (23,866)
1,033 National Health InvestorsInc (REIT) Morgan Stanley 3,058
(17,914) National Health InvestorsInc (REIT) Morgan Stanley (53,025)
(387) National HealthCare Corp Bank of AmericaMerrill Lynch (3,766)
(5,261) National HealthCare Corp Barclays Bank (15,573)(4,216) National HealthCare Corp Goldman Sachs (41,022)(7,223) National HealthCare Corp HSBC (10,979)
(374) National HealthCare Corp Morgan Stanley (1,107)926 National Instruments Corp Bank of America
Merrill Lynch 2,0842,269 National Instruments Corp Barclays Bank 487
17,275 National Instruments Corp Goldman Sachs 37,4828,642 National Instruments Corp HSBC 5,382
62,069 National Instruments Corp Morgan Stanley 52,9002,131 National Oilwell Varco Inc Bank of America
Merrill Lynch 2,152(6,869) National Oilwell Varco Inc Bank of America
Merrill Lynch (6,938)15,034 National Oilwell Varco Inc Barclays Bank 6,615
(32,990) National Oilwell Varco Inc Barclays Bank (14,516)16,893 National Oilwell Varco Inc Goldman Sachs 17,062
149 National Oilwell Varco Inc HSBC (98)(6,041) National Oilwell Varco Inc HSBC 3,98737,107 National Oilwell Varco Inc Morgan Stanley 16,327
(42,897) National Oilwell Varco Inc Morgan Stanley (18,875)(5,510) National Presto Industries
IncBank of AmericaMerrill Lynch (44,336)
(2,226) National Presto IndustriesInc Goldman Sachs (18,609)
(2,556) National Presto IndustriesInc Morgan Stanley (10,965)
3,464 National Research Corp Bank of AmericaMerrill Lynch 13,995
4,094 National Research Corp Barclays Bank 6,0596,902 National Research Corp Goldman Sachs 27,8841,543 National Research Corp HSBC (5,184)
14,093 National Research Corp Morgan Stanley 20,85826,608 National Retail Properties
Inc (REIT)Bank of AmericaMerrill Lynch 83,815
1,282 National Retail PropertiesInc (REIT) Barclays Bank 474
BlackRock Americas Diversified Equity Absolute Return Fundcontinued
The notes on pages 691 to 711 form an integral part of these financial statements.
BlackRock Strategic Funds[156]
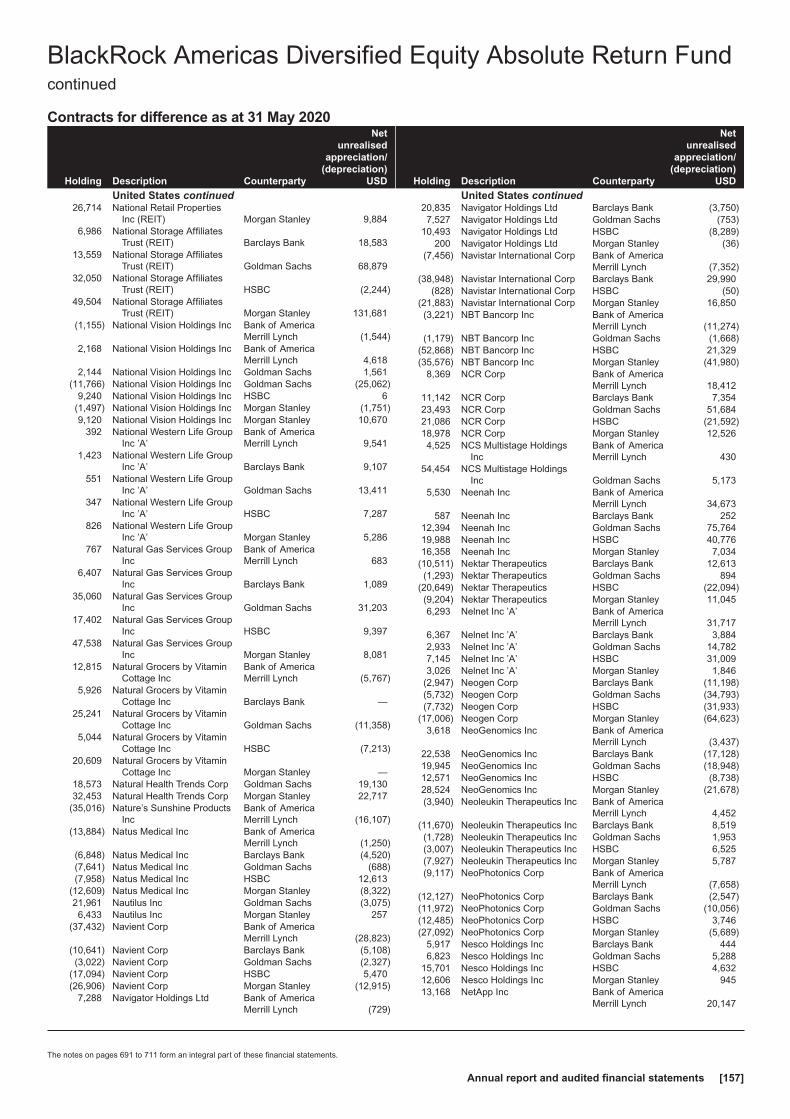
Contracts for difference as at 31 May 2020
Holding Description Counterparty
Netunrealised
appreciation/(depreciation)
USD
United States continued26,714 National Retail Properties
Inc (REIT) Morgan Stanley 9,8846,986 National Storage Affiliates
Trust (REIT) Barclays Bank 18,58313,559 National Storage Affiliates
Trust (REIT) Goldman Sachs 68,87932,050 National Storage Affiliates
Trust (REIT) HSBC (2,244)49,504 National Storage Affiliates
Trust (REIT) Morgan Stanley 131,681(1,155) National Vision Holdings Inc Bank of America
Merrill Lynch (1,544)2,168 National Vision Holdings Inc Bank of America
Merrill Lynch 4,6182,144 National Vision Holdings Inc Goldman Sachs 1,561
(11,766) National Vision Holdings Inc Goldman Sachs (25,062)9,240 National Vision Holdings Inc HSBC 6
(1,497) National Vision Holdings Inc Morgan Stanley (1,751)9,120 National Vision Holdings Inc Morgan Stanley 10,670
392 National Western Life GroupInc ’A’
Bank of AmericaMerrill Lynch 9,541
1,423 National Western Life GroupInc ’A’ Barclays Bank 9,107
551 National Western Life GroupInc ’A’ Goldman Sachs 13,411
347 National Western Life GroupInc ’A’ HSBC 7,287
826 National Western Life GroupInc ’A’ Morgan Stanley 5,286
767 Natural Gas Services GroupInc
Bank of AmericaMerrill Lynch 683
6,407 Natural Gas Services GroupInc Barclays Bank 1,089
35,060 Natural Gas Services GroupInc Goldman Sachs 31,203
17,402 Natural Gas Services GroupInc HSBC 9,397
47,538 Natural Gas Services GroupInc Morgan Stanley 8,081
12,815 Natural Grocers by VitaminCottage Inc
Bank of AmericaMerrill Lynch (5,767)
5,926 Natural Grocers by VitaminCottage Inc Barclays Bank —
25,241 Natural Grocers by VitaminCottage Inc Goldman Sachs (11,358)
5,044 Natural Grocers by VitaminCottage Inc HSBC (7,213)
20,609 Natural Grocers by VitaminCottage Inc Morgan Stanley —
18,573 Natural Health Trends Corp Goldman Sachs 19,13032,453 Natural Health Trends Corp Morgan Stanley 22,717
(35,016) Nature’s Sunshine ProductsInc
Bank of AmericaMerrill Lynch (16,107)
(13,884) Natus Medical Inc Bank of AmericaMerrill Lynch (1,250)
(6,848) Natus Medical Inc Barclays Bank (4,520)(7,641) Natus Medical Inc Goldman Sachs (688)(7,958) Natus Medical Inc HSBC 12,613
(12,609) Natus Medical Inc Morgan Stanley (8,322)21,961 Nautilus Inc Goldman Sachs (3,075)6,433 Nautilus Inc Morgan Stanley 257
(37,432) Navient Corp Bank of AmericaMerrill Lynch (28,823)
(10,641) Navient Corp Barclays Bank (5,108)(3,022) Navient Corp Goldman Sachs (2,327)
(17,094) Navient Corp HSBC 5,470(26,906) Navient Corp Morgan Stanley (12,915)
7,288 Navigator Holdings Ltd Bank of AmericaMerrill Lynch (729)
Holding Description Counterparty
Netunrealised
appreciation/(depreciation)
USD
United States continued20,835 Navigator Holdings Ltd Barclays Bank (3,750)7,527 Navigator Holdings Ltd Goldman Sachs (753)
10,493 Navigator Holdings Ltd HSBC (8,289)200 Navigator Holdings Ltd Morgan Stanley (36)
(7,456) Navistar International Corp Bank of AmericaMerrill Lynch (7,352)
(38,948) Navistar International Corp Barclays Bank 29,990(828) Navistar International Corp HSBC (50)
(21,883) Navistar International Corp Morgan Stanley 16,850(3,221) NBT Bancorp Inc Bank of America
Merrill Lynch (11,274)(1,179) NBT Bancorp Inc Goldman Sachs (1,668)
(52,868) NBT Bancorp Inc HSBC 21,329(35,576) NBT Bancorp Inc Morgan Stanley (41,980)
8,369 NCR Corp Bank of AmericaMerrill Lynch 18,412
11,142 NCR Corp Barclays Bank 7,35423,493 NCR Corp Goldman Sachs 51,68421,086 NCR Corp HSBC (21,592)18,978 NCR Corp Morgan Stanley 12,5264,525 NCS Multistage Holdings
IncBank of AmericaMerrill Lynch 430
54,454 NCS Multistage HoldingsInc Goldman Sachs 5,173
5,530 Neenah Inc Bank of AmericaMerrill Lynch 34,673
587 Neenah Inc Barclays Bank 25212,394 Neenah Inc Goldman Sachs 75,76419,988 Neenah Inc HSBC 40,77616,358 Neenah Inc Morgan Stanley 7,034
(10,511) Nektar Therapeutics Barclays Bank 12,613(1,293) Nektar Therapeutics Goldman Sachs 894
(20,649) Nektar Therapeutics HSBC (22,094)(9,204) Nektar Therapeutics Morgan Stanley 11,0456,293 Nelnet Inc ’A’ Bank of America
Merrill Lynch 31,7176,367 Nelnet Inc ’A’ Barclays Bank 3,8842,933 Nelnet Inc ’A’ Goldman Sachs 14,7827,145 Nelnet Inc ’A’ HSBC 31,0093,026 Nelnet Inc ’A’ Morgan Stanley 1,846
(2,947) Neogen Corp Barclays Bank (11,198)(5,732) Neogen Corp Goldman Sachs (34,793)(7,732) Neogen Corp HSBC (31,933)
(17,006) Neogen Corp Morgan Stanley (64,623)3,618 NeoGenomics Inc Bank of America
Merrill Lynch (3,437)22,538 NeoGenomics Inc Barclays Bank (17,128)19,945 NeoGenomics Inc Goldman Sachs (18,948)12,571 NeoGenomics Inc HSBC (8,738)28,524 NeoGenomics Inc Morgan Stanley (21,678)(3,940) Neoleukin Therapeutics Inc Bank of America
Merrill Lynch 4,452(11,670) Neoleukin Therapeutics Inc Barclays Bank 8,519(1,728) Neoleukin Therapeutics Inc Goldman Sachs 1,953(3,007) Neoleukin Therapeutics Inc HSBC 6,525(7,927) Neoleukin Therapeutics Inc Morgan Stanley 5,787(9,117) NeoPhotonics Corp Bank of America
Merrill Lynch (7,658)(12,127) NeoPhotonics Corp Barclays Bank (2,547)(11,972) NeoPhotonics Corp Goldman Sachs (10,056)(12,485) NeoPhotonics Corp HSBC 3,746(27,092) NeoPhotonics Corp Morgan Stanley (5,689)
5,917 Nesco Holdings Inc Barclays Bank 4446,823 Nesco Holdings Inc Goldman Sachs 5,288
15,701 Nesco Holdings Inc HSBC 4,63212,606 Nesco Holdings Inc Morgan Stanley 94513,168 NetApp Inc Bank of America
Merrill Lynch 20,147
BlackRock Americas Diversified Equity Absolute Return Fundcontinued
The notes on pages 691 to 711 form an integral part of these financial statements.
Annual report and audited financial statements [157]
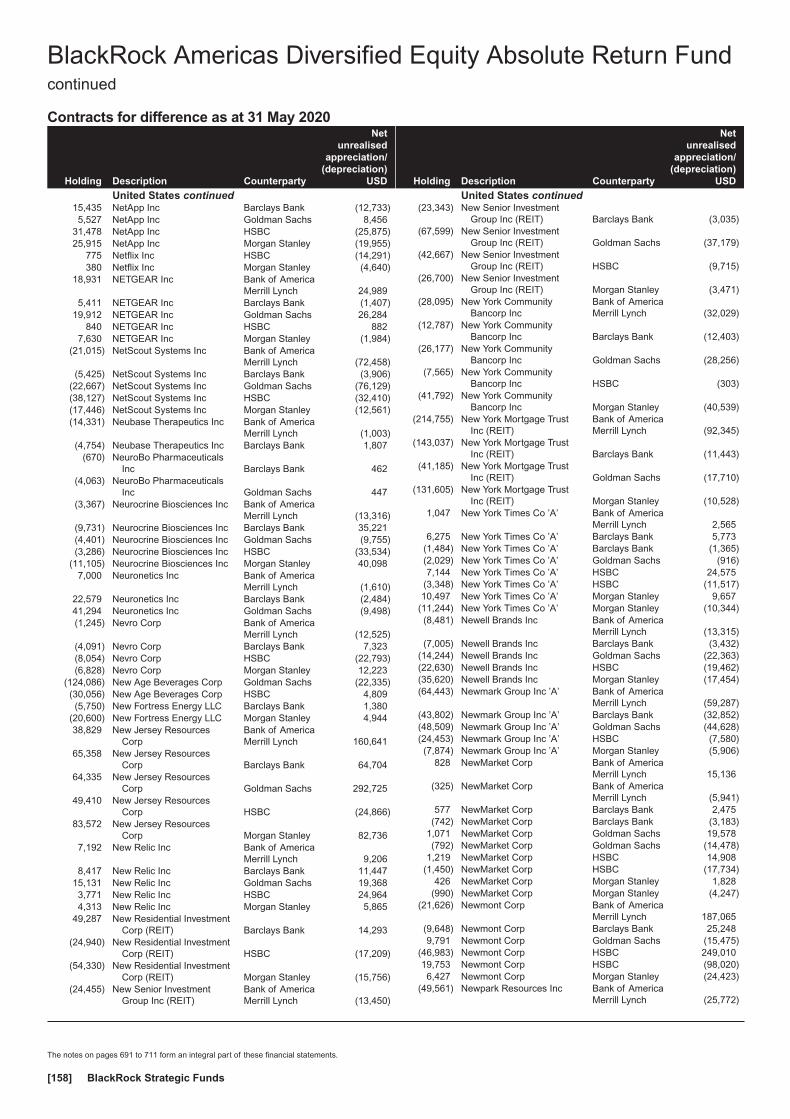
Contracts for difference as at 31 May 2020
Holding Description Counterparty
Netunrealised
appreciation/(depreciation)
USD
United States continued15,435 NetApp Inc Barclays Bank (12,733)5,527 NetApp Inc Goldman Sachs 8,456
31,478 NetApp Inc HSBC (25,875)25,915 NetApp Inc Morgan Stanley (19,955)
775 Netflix Inc HSBC (14,291)380 Netflix Inc Morgan Stanley (4,640)
18,931 NETGEAR Inc Bank of AmericaMerrill Lynch 24,989
5,411 NETGEAR Inc Barclays Bank (1,407)19,912 NETGEAR Inc Goldman Sachs 26,284
840 NETGEAR Inc HSBC 8827,630 NETGEAR Inc Morgan Stanley (1,984)
(21,015) NetScout Systems Inc Bank of AmericaMerrill Lynch (72,458)
(5,425) NetScout Systems Inc Barclays Bank (3,906)(22,667) NetScout Systems Inc Goldman Sachs (76,129)(38,127) NetScout Systems Inc HSBC (32,410)(17,446) NetScout Systems Inc Morgan Stanley (12,561)(14,331) Neubase Therapeutics Inc Bank of America
Merrill Lynch (1,003)(4,754) Neubase Therapeutics Inc Barclays Bank 1,807
(670) NeuroBo PharmaceuticalsInc Barclays Bank 462
(4,063) NeuroBo PharmaceuticalsInc Goldman Sachs 447
(3,367) Neurocrine Biosciences Inc Bank of AmericaMerrill Lynch (13,316)
(9,731) Neurocrine Biosciences Inc Barclays Bank 35,221(4,401) Neurocrine Biosciences Inc Goldman Sachs (9,755)(3,286) Neurocrine Biosciences Inc HSBC (33,534)
(11,105) Neurocrine Biosciences Inc Morgan Stanley 40,0987,000 Neuronetics Inc Bank of America
Merrill Lynch (1,610)22,579 Neuronetics Inc Barclays Bank (2,484)41,294 Neuronetics Inc Goldman Sachs (9,498)(1,245) Nevro Corp Bank of America
Merrill Lynch (12,525)(4,091) Nevro Corp Barclays Bank 7,323(8,054) Nevro Corp HSBC (22,793)(6,828) Nevro Corp Morgan Stanley 12,223
(124,086) New Age Beverages Corp Goldman Sachs (22,335)(30,056) New Age Beverages Corp HSBC 4,809(5,750) New Fortress Energy LLC Barclays Bank 1,380
(20,600) New Fortress Energy LLC Morgan Stanley 4,94438,829 New Jersey Resources
CorpBank of AmericaMerrill Lynch 160,641
65,358 New Jersey ResourcesCorp Barclays Bank 64,704
64,335 New Jersey ResourcesCorp Goldman Sachs 292,725
49,410 New Jersey ResourcesCorp HSBC (24,866)
83,572 New Jersey ResourcesCorp Morgan Stanley 82,736
7,192 New Relic Inc Bank of AmericaMerrill Lynch 9,206
8,417 New Relic Inc Barclays Bank 11,44715,131 New Relic Inc Goldman Sachs 19,3683,771 New Relic Inc HSBC 24,9644,313 New Relic Inc Morgan Stanley 5,865
49,287 New Residential InvestmentCorp (REIT) Barclays Bank 14,293
(24,940) New Residential InvestmentCorp (REIT) HSBC (17,209)
(54,330) New Residential InvestmentCorp (REIT) Morgan Stanley (15,756)
(24,455) New Senior InvestmentGroup Inc (REIT)
Bank of AmericaMerrill Lynch (13,450)
Holding Description Counterparty
Netunrealised
appreciation/(depreciation)
USD
United States continued(23,343) New Senior Investment
Group Inc (REIT) Barclays Bank (3,035)(67,599) New Senior Investment
Group Inc (REIT) Goldman Sachs (37,179)(42,667) New Senior Investment
Group Inc (REIT) HSBC (9,715)(26,700) New Senior Investment
Group Inc (REIT) Morgan Stanley (3,471)(28,095) New York Community
Bancorp IncBank of AmericaMerrill Lynch (32,029)
(12,787) New York CommunityBancorp Inc Barclays Bank (12,403)
(26,177) New York CommunityBancorp Inc Goldman Sachs (28,256)
(7,565) New York CommunityBancorp Inc HSBC (303)
(41,792) New York CommunityBancorp Inc Morgan Stanley (40,539)
(214,755) New York Mortgage TrustInc (REIT)
Bank of AmericaMerrill Lynch (92,345)
(143,037) New York Mortgage TrustInc (REIT) Barclays Bank (11,443)
(41,185) New York Mortgage TrustInc (REIT) Goldman Sachs (17,710)
(131,605) New York Mortgage TrustInc (REIT) Morgan Stanley (10,528)
1,047 New York Times Co ’A’ Bank of AmericaMerrill Lynch 2,565
6,275 New York Times Co ’A’ Barclays Bank 5,773(1,484) New York Times Co ’A’ Barclays Bank (1,365)(2,029) New York Times Co ’A’ Goldman Sachs (916)7,144 New York Times Co ’A’ HSBC 24,575
(3,348) New York Times Co ’A’ HSBC (11,517)10,497 New York Times Co ’A’ Morgan Stanley 9,657
(11,244) New York Times Co ’A’ Morgan Stanley (10,344)(8,481) Newell Brands Inc Bank of America
Merrill Lynch (13,315)(7,005) Newell Brands Inc Barclays Bank (3,432)
(14,244) Newell Brands Inc Goldman Sachs (22,363)(22,630) Newell Brands Inc HSBC (19,462)(35,620) Newell Brands Inc Morgan Stanley (17,454)(64,443) Newmark Group Inc ’A’ Bank of America
Merrill Lynch (59,287)(43,802) Newmark Group Inc ’A’ Barclays Bank (32,852)(48,509) Newmark Group Inc ’A’ Goldman Sachs (44,628)(24,453) Newmark Group Inc ’A’ HSBC (7,580)(7,874) Newmark Group Inc ’A’ Morgan Stanley (5,906)
828 NewMarket Corp Bank of AmericaMerrill Lynch 15,136
(325) NewMarket Corp Bank of AmericaMerrill Lynch (5,941)
577 NewMarket Corp Barclays Bank 2,475(742) NewMarket Corp Barclays Bank (3,183)
1,071 NewMarket Corp Goldman Sachs 19,578(792) NewMarket Corp Goldman Sachs (14,478)
1,219 NewMarket Corp HSBC 14,908(1,450) NewMarket Corp HSBC (17,734)
426 NewMarket Corp Morgan Stanley 1,828(990) NewMarket Corp Morgan Stanley (4,247)
(21,626) Newmont Corp Bank of AmericaMerrill Lynch 187,065
(9,648) Newmont Corp Barclays Bank 25,2489,791 Newmont Corp Goldman Sachs (15,475)
(46,983) Newmont Corp HSBC 249,01019,753 Newmont Corp HSBC (98,020)6,427 Newmont Corp Morgan Stanley (24,423)
(49,561) Newpark Resources Inc Bank of AmericaMerrill Lynch (25,772)
BlackRock Americas Diversified Equity Absolute Return Fundcontinued
The notes on pages 691 to 711 form an integral part of these financial statements.
BlackRock Strategic Funds[158]
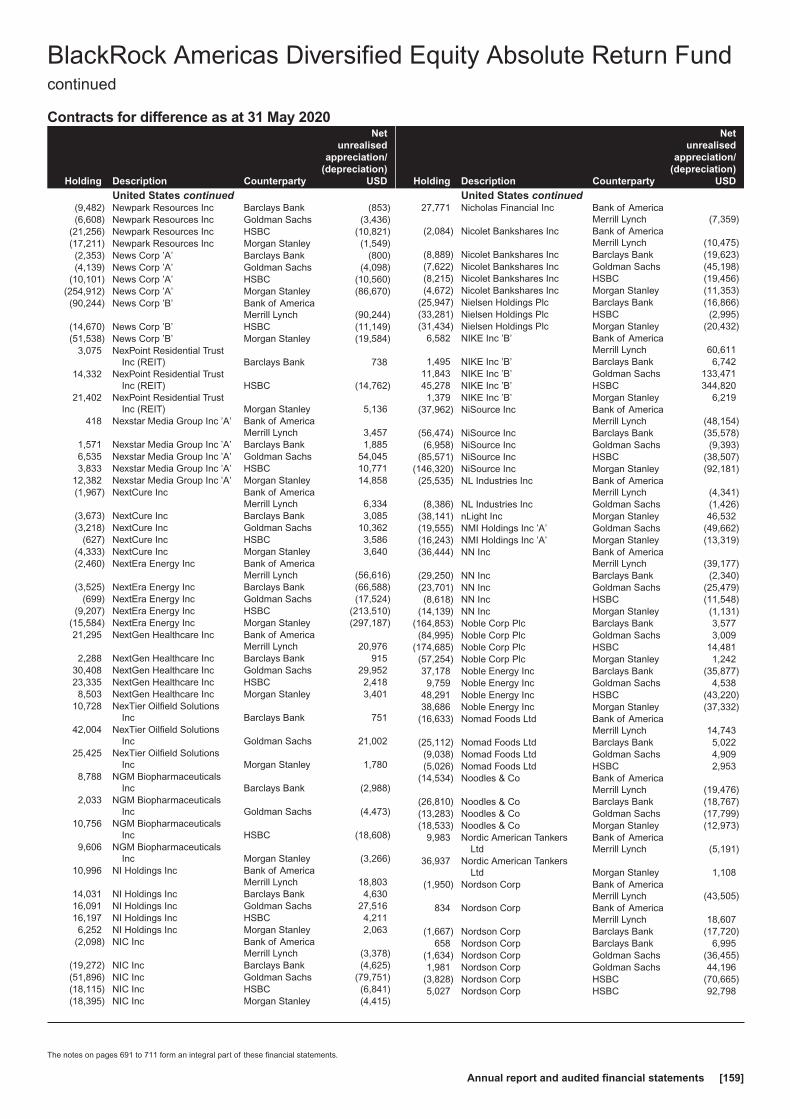
Contracts for difference as at 31 May 2020
Holding Description Counterparty
Netunrealised
appreciation/(depreciation)
USD
United States continued(9,482) Newpark Resources Inc Barclays Bank (853)(6,608) Newpark Resources Inc Goldman Sachs (3,436)
(21,256) Newpark Resources Inc HSBC (10,821)(17,211) Newpark Resources Inc Morgan Stanley (1,549)(2,353) News Corp ’A’ Barclays Bank (800)(4,139) News Corp ’A’ Goldman Sachs (4,098)
(10,101) News Corp ’A’ HSBC (10,560)(254,912) News Corp ’A’ Morgan Stanley (86,670)(90,244) News Corp ’B’ Bank of America
Merrill Lynch (90,244)(14,670) News Corp ’B’ HSBC (11,149)(51,538) News Corp ’B’ Morgan Stanley (19,584)
3,075 NexPoint Residential TrustInc (REIT) Barclays Bank 738
14,332 NexPoint Residential TrustInc (REIT) HSBC (14,762)
21,402 NexPoint Residential TrustInc (REIT) Morgan Stanley 5,136
418 Nexstar Media Group Inc ’A’ Bank of AmericaMerrill Lynch 3,457
1,571 Nexstar Media Group Inc ’A’ Barclays Bank 1,8856,535 Nexstar Media Group Inc ’A’ Goldman Sachs 54,0453,833 Nexstar Media Group Inc ’A’ HSBC 10,771
12,382 Nexstar Media Group Inc ’A’ Morgan Stanley 14,858(1,967) NextCure Inc Bank of America
Merrill Lynch 6,334(3,673) NextCure Inc Barclays Bank 3,085(3,218) NextCure Inc Goldman Sachs 10,362
(627) NextCure Inc HSBC 3,586(4,333) NextCure Inc Morgan Stanley 3,640(2,460) NextEra Energy Inc Bank of America
Merrill Lynch (56,616)(3,525) NextEra Energy Inc Barclays Bank (66,588)
(699) NextEra Energy Inc Goldman Sachs (17,524)(9,207) NextEra Energy Inc HSBC (213,510)
(15,584) NextEra Energy Inc Morgan Stanley (297,187)21,295 NextGen Healthcare Inc Bank of America
Merrill Lynch 20,9762,288 NextGen Healthcare Inc Barclays Bank 915
30,408 NextGen Healthcare Inc Goldman Sachs 29,95223,335 NextGen Healthcare Inc HSBC 2,4188,503 NextGen Healthcare Inc Morgan Stanley 3,401
10,728 NexTier Oilfield SolutionsInc Barclays Bank 751
42,004 NexTier Oilfield SolutionsInc Goldman Sachs 21,002
25,425 NexTier Oilfield SolutionsInc Morgan Stanley 1,780
8,788 NGM BiopharmaceuticalsInc Barclays Bank (2,988)
2,033 NGM BiopharmaceuticalsInc Goldman Sachs (4,473)
10,756 NGM BiopharmaceuticalsInc HSBC (18,608)
9,606 NGM BiopharmaceuticalsInc Morgan Stanley (3,266)
10,996 NI Holdings Inc Bank of AmericaMerrill Lynch 18,803
14,031 NI Holdings Inc Barclays Bank 4,63016,091 NI Holdings Inc Goldman Sachs 27,51616,197 NI Holdings Inc HSBC 4,2116,252 NI Holdings Inc Morgan Stanley 2,063
(2,098) NIC Inc Bank of AmericaMerrill Lynch (3,378)
(19,272) NIC Inc Barclays Bank (4,625)(51,896) NIC Inc Goldman Sachs (79,751)(18,115) NIC Inc HSBC (6,841)(18,395) NIC Inc Morgan Stanley (4,415)
Holding Description Counterparty
Netunrealised
appreciation/(depreciation)
USD
United States continued27,771 Nicholas Financial Inc Bank of America
Merrill Lynch (7,359)(2,084) Nicolet Bankshares Inc Bank of America
Merrill Lynch (10,475)(8,889) Nicolet Bankshares Inc Barclays Bank (19,623)(7,622) Nicolet Bankshares Inc Goldman Sachs (45,198)(8,215) Nicolet Bankshares Inc HSBC (19,456)(4,672) Nicolet Bankshares Inc Morgan Stanley (11,353)
(25,947) Nielsen Holdings Plc Barclays Bank (16,866)(33,281) Nielsen Holdings Plc HSBC (2,995)(31,434) Nielsen Holdings Plc Morgan Stanley (20,432)
6,582 NIKE Inc ’B’ Bank of AmericaMerrill Lynch 60,611
1,495 NIKE Inc ’B’ Barclays Bank 6,74211,843 NIKE Inc ’B’ Goldman Sachs 133,47145,278 NIKE Inc ’B’ HSBC 344,8201,379 NIKE Inc ’B’ Morgan Stanley 6,219
(37,962) NiSource Inc Bank of AmericaMerrill Lynch (48,154)
(56,474) NiSource Inc Barclays Bank (35,578)(6,958) NiSource Inc Goldman Sachs (9,393)
(85,571) NiSource Inc HSBC (38,507)(146,320) NiSource Inc Morgan Stanley (92,181)(25,535) NL Industries Inc Bank of America
Merrill Lynch (4,341)(8,386) NL Industries Inc Goldman Sachs (1,426)
(38,141) nLight Inc Morgan Stanley 46,532(19,555) NMI Holdings Inc ’A’ Goldman Sachs (49,662)(16,243) NMI Holdings Inc ’A’ Morgan Stanley (13,319)(36,444) NN Inc Bank of America
Merrill Lynch (39,177)(29,250) NN Inc Barclays Bank (2,340)(23,701) NN Inc Goldman Sachs (25,479)(8,618) NN Inc HSBC (11,548)
(14,139) NN Inc Morgan Stanley (1,131)(164,853) Noble Corp Plc Barclays Bank 3,577(84,995) Noble Corp Plc Goldman Sachs 3,009
(174,685) Noble Corp Plc HSBC 14,481(57,254) Noble Corp Plc Morgan Stanley 1,24237,178 Noble Energy Inc Barclays Bank (35,877)9,759 Noble Energy Inc Goldman Sachs 4,538
48,291 Noble Energy Inc HSBC (43,220)38,686 Noble Energy Inc Morgan Stanley (37,332)
(16,633) Nomad Foods Ltd Bank of AmericaMerrill Lynch 14,743
(25,112) Nomad Foods Ltd Barclays Bank 5,022(9,038) Nomad Foods Ltd Goldman Sachs 4,909(5,026) Nomad Foods Ltd HSBC 2,953
(14,534) Noodles & Co Bank of AmericaMerrill Lynch (19,476)
(26,810) Noodles & Co Barclays Bank (18,767)(13,283) Noodles & Co Goldman Sachs (17,799)(18,533) Noodles & Co Morgan Stanley (12,973)
9,983 Nordic American TankersLtd
Bank of AmericaMerrill Lynch (5,191)
36,937 Nordic American TankersLtd Morgan Stanley 1,108
(1,950) Nordson Corp Bank of AmericaMerrill Lynch (43,505)
834 Nordson Corp Bank of AmericaMerrill Lynch 18,607
(1,667) Nordson Corp Barclays Bank (17,720)658 Nordson Corp Barclays Bank 6,995
(1,634) Nordson Corp Goldman Sachs (36,455)1,981 Nordson Corp Goldman Sachs 44,196
(3,828) Nordson Corp HSBC (70,665)5,027 Nordson Corp HSBC 92,798
BlackRock Americas Diversified Equity Absolute Return Fundcontinued
The notes on pages 691 to 711 form an integral part of these financial statements.
Annual report and audited financial statements [159]
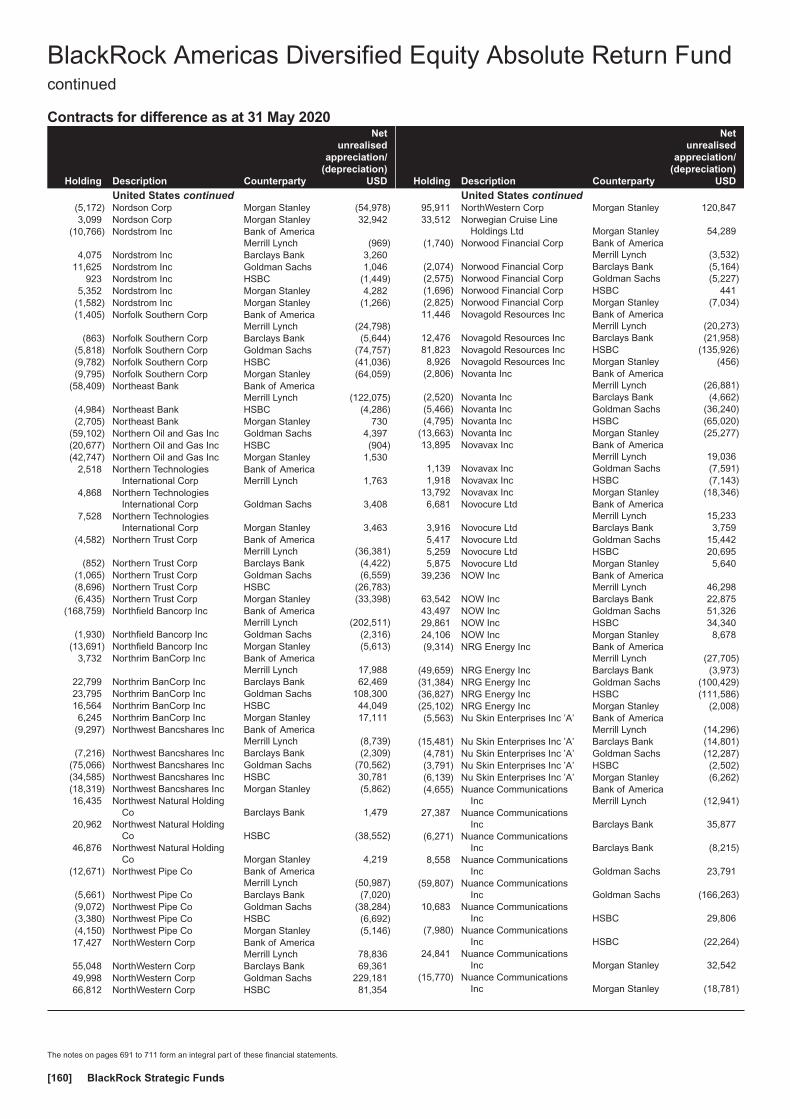
Contracts for difference as at 31 May 2020
Holding Description Counterparty
Netunrealised
appreciation/(depreciation)
USD
United States continued(5,172) Nordson Corp Morgan Stanley (54,978)3,099 Nordson Corp Morgan Stanley 32,942
(10,766) Nordstrom Inc Bank of AmericaMerrill Lynch (969)
4,075 Nordstrom Inc Barclays Bank 3,26011,625 Nordstrom Inc Goldman Sachs 1,046
923 Nordstrom Inc HSBC (1,449)5,352 Nordstrom Inc Morgan Stanley 4,282
(1,582) Nordstrom Inc Morgan Stanley (1,266)(1,405) Norfolk Southern Corp Bank of America
Merrill Lynch (24,798)(863) Norfolk Southern Corp Barclays Bank (5,644)
(5,818) Norfolk Southern Corp Goldman Sachs (74,757)(9,782) Norfolk Southern Corp HSBC (41,036)(9,795) Norfolk Southern Corp Morgan Stanley (64,059)
(58,409) Northeast Bank Bank of AmericaMerrill Lynch (122,075)
(4,984) Northeast Bank HSBC (4,286)(2,705) Northeast Bank Morgan Stanley 730
(59,102) Northern Oil and Gas Inc Goldman Sachs 4,397(20,677) Northern Oil and Gas Inc HSBC (904)(42,747) Northern Oil and Gas Inc Morgan Stanley 1,530
2,518 Northern TechnologiesInternational Corp
Bank of AmericaMerrill Lynch 1,763
4,868 Northern TechnologiesInternational Corp Goldman Sachs 3,408
7,528 Northern TechnologiesInternational Corp Morgan Stanley 3,463
(4,582) Northern Trust Corp Bank of AmericaMerrill Lynch (36,381)
(852) Northern Trust Corp Barclays Bank (4,422)(1,065) Northern Trust Corp Goldman Sachs (6,559)(8,696) Northern Trust Corp HSBC (26,783)(6,435) Northern Trust Corp Morgan Stanley (33,398)
(168,759) Northfield Bancorp Inc Bank of AmericaMerrill Lynch (202,511)
(1,930) Northfield Bancorp Inc Goldman Sachs (2,316)(13,691) Northfield Bancorp Inc Morgan Stanley (5,613)
3,732 Northrim BanCorp Inc Bank of AmericaMerrill Lynch 17,988
22,799 Northrim BanCorp Inc Barclays Bank 62,46923,795 Northrim BanCorp Inc Goldman Sachs 108,30016,564 Northrim BanCorp Inc HSBC 44,0496,245 Northrim BanCorp Inc Morgan Stanley 17,111
(9,297) Northwest Bancshares Inc Bank of AmericaMerrill Lynch (8,739)
(7,216) Northwest Bancshares Inc Barclays Bank (2,309)(75,066) Northwest Bancshares Inc Goldman Sachs (70,562)(34,585) Northwest Bancshares Inc HSBC 30,781(18,319) Northwest Bancshares Inc Morgan Stanley (5,862)16,435 Northwest Natural Holding
Co Barclays Bank 1,47920,962 Northwest Natural Holding
Co HSBC (38,552)46,876 Northwest Natural Holding
Co Morgan Stanley 4,219(12,671) Northwest Pipe Co Bank of America
Merrill Lynch (50,987)(5,661) Northwest Pipe Co Barclays Bank (7,020)(9,072) Northwest Pipe Co Goldman Sachs (38,284)(3,380) Northwest Pipe Co HSBC (6,692)(4,150) Northwest Pipe Co Morgan Stanley (5,146)17,427 NorthWestern Corp Bank of America
Merrill Lynch 78,83655,048 NorthWestern Corp Barclays Bank 69,36149,998 NorthWestern Corp Goldman Sachs 229,18166,812 NorthWestern Corp HSBC 81,354
Holding Description Counterparty
Netunrealised
appreciation/(depreciation)
USD
United States continued95,911 NorthWestern Corp Morgan Stanley 120,84733,512 Norwegian Cruise Line
Holdings Ltd Morgan Stanley 54,289(1,740) Norwood Financial Corp Bank of America
Merrill Lynch (3,532)(2,074) Norwood Financial Corp Barclays Bank (5,164)(2,575) Norwood Financial Corp Goldman Sachs (5,227)(1,696) Norwood Financial Corp HSBC 441(2,825) Norwood Financial Corp Morgan Stanley (7,034)11,446 Novagold Resources Inc Bank of America
Merrill Lynch (20,273)12,476 Novagold Resources Inc Barclays Bank (21,958)81,823 Novagold Resources Inc HSBC (135,926)8,926 Novagold Resources Inc Morgan Stanley (456)
(2,806) Novanta Inc Bank of AmericaMerrill Lynch (26,881)
(2,520) Novanta Inc Barclays Bank (4,662)(5,466) Novanta Inc Goldman Sachs (36,240)(4,795) Novanta Inc HSBC (65,020)
(13,663) Novanta Inc Morgan Stanley (25,277)13,895 Novavax Inc Bank of America
Merrill Lynch 19,0361,139 Novavax Inc Goldman Sachs (7,591)1,918 Novavax Inc HSBC (7,143)
13,792 Novavax Inc Morgan Stanley (18,346)6,681 Novocure Ltd Bank of America
Merrill Lynch 15,2333,916 Novocure Ltd Barclays Bank 3,7595,417 Novocure Ltd Goldman Sachs 15,4425,259 Novocure Ltd HSBC 20,6955,875 Novocure Ltd Morgan Stanley 5,640
39,236 NOW Inc Bank of AmericaMerrill Lynch 46,298
63,542 NOW Inc Barclays Bank 22,87543,497 NOW Inc Goldman Sachs 51,32629,861 NOW Inc HSBC 34,34024,106 NOW Inc Morgan Stanley 8,678(9,314) NRG Energy Inc Bank of America
Merrill Lynch (27,705)(49,659) NRG Energy Inc Barclays Bank (3,973)(31,384) NRG Energy Inc Goldman Sachs (100,429)(36,827) NRG Energy Inc HSBC (111,586)(25,102) NRG Energy Inc Morgan Stanley (2,008)(5,563) Nu Skin Enterprises Inc ’A’ Bank of America
Merrill Lynch (14,296)(15,481) Nu Skin Enterprises Inc ’A’ Barclays Bank (14,801)(4,781) Nu Skin Enterprises Inc ’A’ Goldman Sachs (12,287)(3,791) Nu Skin Enterprises Inc ’A’ HSBC (2,502)(6,139) Nu Skin Enterprises Inc ’A’ Morgan Stanley (6,262)(4,655) Nuance Communications
IncBank of AmericaMerrill Lynch (12,941)
27,387 Nuance CommunicationsInc Barclays Bank 35,877
(6,271) Nuance CommunicationsInc Barclays Bank (8,215)
8,558 Nuance CommunicationsInc Goldman Sachs 23,791
(59,807) Nuance CommunicationsInc Goldman Sachs (166,263)
10,683 Nuance CommunicationsInc HSBC 29,806
(7,980) Nuance CommunicationsInc HSBC (22,264)
24,841 Nuance CommunicationsInc Morgan Stanley 32,542
(15,770) Nuance CommunicationsInc Morgan Stanley (18,781)
BlackRock Americas Diversified Equity Absolute Return Fundcontinued
The notes on pages 691 to 711 form an integral part of these financial statements.
BlackRock Strategic Funds[160]
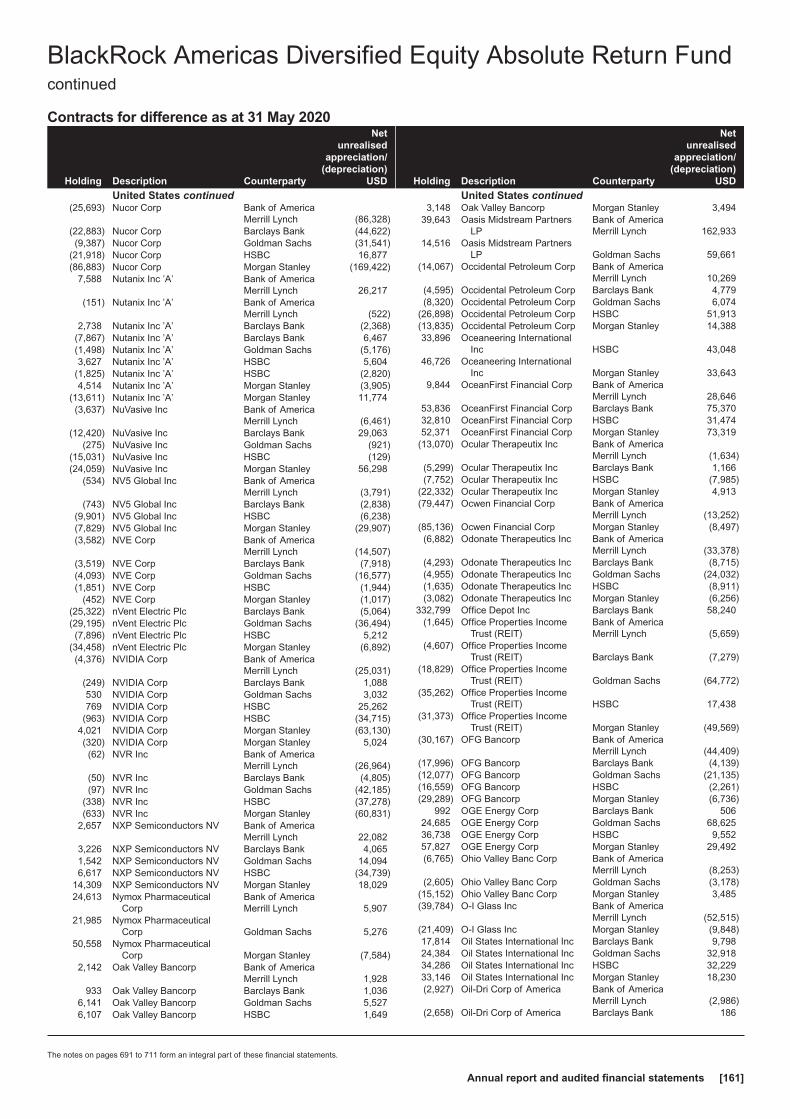
Contracts for difference as at 31 May 2020
Holding Description Counterparty
Netunrealised
appreciation/(depreciation)
USD
United States continued(25,693) Nucor Corp Bank of America
Merrill Lynch (86,328)(22,883) Nucor Corp Barclays Bank (44,622)(9,387) Nucor Corp Goldman Sachs (31,541)
(21,918) Nucor Corp HSBC 16,877(86,883) Nucor Corp Morgan Stanley (169,422)
7,588 Nutanix Inc ’A’ Bank of AmericaMerrill Lynch 26,217
(151) Nutanix Inc ’A’ Bank of AmericaMerrill Lynch (522)
2,738 Nutanix Inc ’A’ Barclays Bank (2,368)(7,867) Nutanix Inc ’A’ Barclays Bank 6,467(1,498) Nutanix Inc ’A’ Goldman Sachs (5,176)3,627 Nutanix Inc ’A’ HSBC 5,604
(1,825) Nutanix Inc ’A’ HSBC (2,820)4,514 Nutanix Inc ’A’ Morgan Stanley (3,905)
(13,611) Nutanix Inc ’A’ Morgan Stanley 11,774(3,637) NuVasive Inc Bank of America
Merrill Lynch (6,461)(12,420) NuVasive Inc Barclays Bank 29,063
(275) NuVasive Inc Goldman Sachs (921)(15,031) NuVasive Inc HSBC (129)(24,059) NuVasive Inc Morgan Stanley 56,298
(534) NV5 Global Inc Bank of AmericaMerrill Lynch (3,791)
(743) NV5 Global Inc Barclays Bank (2,838)(9,901) NV5 Global Inc HSBC (6,238)(7,829) NV5 Global Inc Morgan Stanley (29,907)(3,582) NVE Corp Bank of America
Merrill Lynch (14,507)(3,519) NVE Corp Barclays Bank (7,918)(4,093) NVE Corp Goldman Sachs (16,577)(1,851) NVE Corp HSBC (1,944)
(452) NVE Corp Morgan Stanley (1,017)(25,322) nVent Electric Plc Barclays Bank (5,064)(29,195) nVent Electric Plc Goldman Sachs (36,494)(7,896) nVent Electric Plc HSBC 5,212
(34,458) nVent Electric Plc Morgan Stanley (6,892)(4,376) NVIDIA Corp Bank of America
Merrill Lynch (25,031)(249) NVIDIA Corp Barclays Bank 1,088530 NVIDIA Corp Goldman Sachs 3,032769 NVIDIA Corp HSBC 25,262
(963) NVIDIA Corp HSBC (34,715)4,021 NVIDIA Corp Morgan Stanley (63,130)(320) NVIDIA Corp Morgan Stanley 5,024(62) NVR Inc Bank of America
Merrill Lynch (26,964)(50) NVR Inc Barclays Bank (4,805)(97) NVR Inc Goldman Sachs (42,185)
(338) NVR Inc HSBC (37,278)(633) NVR Inc Morgan Stanley (60,831)
2,657 NXP Semiconductors NV Bank of AmericaMerrill Lynch 22,082
3,226 NXP Semiconductors NV Barclays Bank 4,0651,542 NXP Semiconductors NV Goldman Sachs 14,0946,617 NXP Semiconductors NV HSBC (34,739)
14,309 NXP Semiconductors NV Morgan Stanley 18,02924,613 Nymox Pharmaceutical
CorpBank of AmericaMerrill Lynch 5,907
21,985 Nymox PharmaceuticalCorp Goldman Sachs 5,276
50,558 Nymox PharmaceuticalCorp Morgan Stanley (7,584)
2,142 Oak Valley Bancorp Bank of AmericaMerrill Lynch 1,928
933 Oak Valley Bancorp Barclays Bank 1,0366,141 Oak Valley Bancorp Goldman Sachs 5,5276,107 Oak Valley Bancorp HSBC 1,649
Holding Description Counterparty
Netunrealised
appreciation/(depreciation)
USD
United States continued3,148 Oak Valley Bancorp Morgan Stanley 3,494
39,643 Oasis Midstream PartnersLP
Bank of AmericaMerrill Lynch 162,933
14,516 Oasis Midstream PartnersLP Goldman Sachs 59,661
(14,067) Occidental Petroleum Corp Bank of AmericaMerrill Lynch 10,269
(4,595) Occidental Petroleum Corp Barclays Bank 4,779(8,320) Occidental Petroleum Corp Goldman Sachs 6,074
(26,898) Occidental Petroleum Corp HSBC 51,913(13,835) Occidental Petroleum Corp Morgan Stanley 14,38833,896 Oceaneering International
Inc HSBC 43,04846,726 Oceaneering International
Inc Morgan Stanley 33,6439,844 OceanFirst Financial Corp Bank of America
Merrill Lynch 28,64653,836 OceanFirst Financial Corp Barclays Bank 75,37032,810 OceanFirst Financial Corp HSBC 31,47452,371 OceanFirst Financial Corp Morgan Stanley 73,319
(13,070) Ocular Therapeutix Inc Bank of AmericaMerrill Lynch (1,634)
(5,299) Ocular Therapeutix Inc Barclays Bank 1,166(7,752) Ocular Therapeutix Inc HSBC (7,985)
(22,332) Ocular Therapeutix Inc Morgan Stanley 4,913(79,447) Ocwen Financial Corp Bank of America
Merrill Lynch (13,252)(85,136) Ocwen Financial Corp Morgan Stanley (8,497)(6,882) Odonate Therapeutics Inc Bank of America
Merrill Lynch (33,378)(4,293) Odonate Therapeutics Inc Barclays Bank (8,715)(4,955) Odonate Therapeutics Inc Goldman Sachs (24,032)(1,635) Odonate Therapeutics Inc HSBC (8,911)(3,082) Odonate Therapeutics Inc Morgan Stanley (6,256)
332,799 Office Depot Inc Barclays Bank 58,240(1,645) Office Properties Income
Trust (REIT)Bank of AmericaMerrill Lynch (5,659)
(4,607) Office Properties IncomeTrust (REIT) Barclays Bank (7,279)
(18,829) Office Properties IncomeTrust (REIT) Goldman Sachs (64,772)
(35,262) Office Properties IncomeTrust (REIT) HSBC 17,438
(31,373) Office Properties IncomeTrust (REIT) Morgan Stanley (49,569)
(30,167) OFG Bancorp Bank of AmericaMerrill Lynch (44,409)
(17,996) OFG Bancorp Barclays Bank (4,139)(12,077) OFG Bancorp Goldman Sachs (21,135)(16,559) OFG Bancorp HSBC (2,261)(29,289) OFG Bancorp Morgan Stanley (6,736)
992 OGE Energy Corp Barclays Bank 50624,685 OGE Energy Corp Goldman Sachs 68,62536,738 OGE Energy Corp HSBC 9,55257,827 OGE Energy Corp Morgan Stanley 29,492(6,765) Ohio Valley Banc Corp Bank of America
Merrill Lynch (8,253)(2,605) Ohio Valley Banc Corp Goldman Sachs (3,178)
(15,152) Ohio Valley Banc Corp Morgan Stanley 3,485(39,784) O-I Glass Inc Bank of America
Merrill Lynch (52,515)(21,409) O-I Glass Inc Morgan Stanley (9,848)17,814 Oil States International Inc Barclays Bank 9,79824,384 Oil States International Inc Goldman Sachs 32,91834,286 Oil States International Inc HSBC 32,22933,146 Oil States International Inc Morgan Stanley 18,230(2,927) Oil-Dri Corp of America Bank of America
Merrill Lynch (2,986)(2,658) Oil-Dri Corp of America Barclays Bank 186
BlackRock Americas Diversified Equity Absolute Return Fundcontinued
The notes on pages 691 to 711 form an integral part of these financial statements.
Annual report and audited financial statements [161]

Contracts for difference as at 31 May 2020
Holding Description Counterparty
Netunrealised
appreciation/(depreciation)
USD
United States continued(3,575) Oil-Dri Corp of America Goldman Sachs (3,647)(2,945) Oil-Dri Corp of America HSBC 5,301(4,229) Oil-Dri Corp of America Morgan Stanley 296(1,070) Okta Inc Bank of America
Merrill Lynch (6,918)(3,364) Okta Inc Barclays Bank 1,683(1,483) Okta Inc Goldman Sachs (13,043)(3,011) Okta Inc HSBC (68,079)(6,842) Okta Inc Morgan Stanley 3,422
241 Old Dominion Freight LineInc
Bank of AmericaMerrill Lynch 4,499
7,985 Old Dominion Freight LineInc Barclays Bank 71,306
6,972 Old Dominion Freight LineInc Goldman Sachs 118,152
4,828 Old Dominion Freight LineInc HSBC 74,379
10,496 Old Dominion Freight LineInc Morgan Stanley 93,729
(18,901) Old National Bancorp Bank of AmericaMerrill Lynch (29,296)
(35,350) Old National Bancorp Barclays Bank (17,676)(72,371) Old National Bancorp Goldman Sachs (112,175)(34,563) Old National Bancorp HSBC (5,891)
(155,577) Old National Bancorp Morgan Stanley (77,789)(4,070) Old Republic International
CorpBank of AmericaMerrill Lynch (5,495)
(39,055) Old Republic InternationalCorp Barclays Bank (22,261)
(10,701) Old Republic InternationalCorp Goldman Sachs (14,446)
(31,470) Old Republic InternationalCorp HSBC 8,182
(70,428) Old Republic InternationalCorp Morgan Stanley (40,144)
(15,947) Old Second Bancorp Inc Bank of AmericaMerrill Lynch (20,093)
(4,306) Old Second Bancorp Inc Barclays Bank (2,497)(7,973) Old Second Bancorp Inc Goldman Sachs (10,046)
(23,265) Old Second Bancorp Inc HSBC (8,143)(12,358) Old Second Bancorp Inc Morgan Stanley (7,168)(6,231) Olin Corp Bank of America
Merrill Lynch (5,733)(4,617) Olin Corp Barclays Bank (4,201)
(10,849) Olin Corp Goldman Sachs (9,981)(15,735) Olin Corp HSBC 3,147(1,962) Olin Corp Morgan Stanley (1,785)
(536) Ollie’s Bargain OutletHoldings Inc
Bank of AmericaMerrill Lynch (11,015)
(9,974) Ollie’s Bargain OutletHoldings Inc Barclays Bank (83,682)
(4,562) Ollie’s Bargain OutletHoldings Inc HSBC (111,222)
(10,890) Ollie’s Bargain OutletHoldings Inc Morgan Stanley (91,367)
2,067 Olympic Steel Inc Barclays Bank 1,0346,799 Olympic Steel Inc Goldman Sachs 9,7912,222 Olympic Steel Inc HSBC 1337,706 Olympic Steel Inc Morgan Stanley 3,853
388 Omega Flex Inc Barclays Bank (388)2,412 Omega Flex Inc Goldman Sachs 24,1201,939 Omega Flex Inc HSBC 22,2992,274 Omega Flex Inc Morgan Stanley (2,274)
(7,053) Omega HealthcareInvestors Inc (REIT)
Bank of AmericaMerrill Lynch (30,610)
(3,699) Omega HealthcareInvestors Inc (REIT) Barclays Bank (3,994)
(8,250) Omega HealthcareInvestors Inc (REIT) HSBC (25,327)
Holding Description Counterparty
Netunrealised
appreciation/(depreciation)
USD
United States continued(37,961) Omega Healthcare
Investors Inc (REIT) Morgan Stanley (40,998)2,068 Omeros Corp Bank of America
Merrill Lynch 1268,173 Omeros Corp Barclays Bank (4,822)
11,462 Omeros Corp Goldman Sachs 5,93911,487 Omeros Corp HSBC (11,758)11,731 Omeros Corp Morgan Stanley (6,921)5,311 Omnicell Inc Bank of America
Merrill Lynch 21,775(4,233) Omnicell Inc Bank of America
Merrill Lynch (17,355)7,958 Omnicell Inc Barclays Bank 8,674
(1,849) Omnicell Inc Barclays Bank (2,015)6,481 Omnicell Inc Goldman Sachs 26,572(831) Omnicell Inc Goldman Sachs (3,407)
8,914 Omnicell Inc HSBC (13,638)(2,503) Omnicell Inc HSBC 1,9069,040 Omnicell Inc Morgan Stanley 9,853
(2,123) Omnicell Inc Morgan Stanley (2,314)38,587 Omnicom Group Inc Bank of America
Merrill Lynch (79,289)5,918 Omnicom Group Inc Barclays Bank 12,960
10,084 Omnicom Group Inc Goldman Sachs 30,95831,482 Omnicom Group Inc HSBC (40,970)5,782 Omnicom Group Inc Morgan Stanley 12,663
80,879 On Deck Capital Inc HSBC (7,497)49,977 On Deck Capital Inc Morgan Stanley 2,229(1,622) ON Semiconductor Corp Bank of America
Merrill Lynch (3,471)(1,883) ON Semiconductor Corp Goldman Sachs (4,030)
404 ON Semiconductor Corp Goldman Sachs 865(4,285) ON Semiconductor Corp HSBC 3,557
(55,908) ON Semiconductor Corp Morgan Stanley (30,749)61,003 ON Semiconductor Corp Morgan Stanley 26,295
(14,193) Oncocyte Corp Goldman Sachs 4,116(49,437) Oncocyte Corp HSBC 10,876(46,133) Oncocyte Corp Morgan Stanley 8,76515,113 ONE Gas Inc Bank of America
Merrill Lynch 103,35476,650 ONE Gas Inc Barclays Bank 318,09725,691 ONE Gas Inc Goldman Sachs 187,88410,968 ONE Gas Inc HSBC 26,46572,108 ONE Gas Inc Morgan Stanley 299,24815,249 One Liberty Properties Inc
(REIT)Bank of AmericaMerrill Lynch 32,633
14,591 One Liberty Properties Inc(REIT) Barclays Bank 15,175
24,273 One Liberty Properties Inc(REIT) Goldman Sachs 51,944
11,828 One Liberty Properties Inc(REIT) HSBC (4,849)
17,529 One Liberty Properties Inc(REIT) Morgan Stanley 18,230
(5,329) OneMain Holdings Inc Bank of AmericaMerrill Lynch (19,824)
2,534 OneMain Holdings Inc Barclays Bank 5,727(3,903) OneMain Holdings Inc Barclays Bank (8,821)2,173 OneMain Holdings Inc Goldman Sachs 8,084
(13,564) OneMain Holdings Inc Goldman Sachs (50,458)8,779 OneMain Holdings Inc Morgan Stanley 19,841
(1,991) OneMain Holdings Inc Morgan Stanley (4,500)(5,897) ONEOK Inc Bank of America
Merrill Lynch (25,003)(4,557) ONEOK Inc Goldman Sachs (19,322)(9,340) ONEOK Inc HSBC (49,502)(3,731) ONEOK Inc Morgan Stanley (1,604)
BlackRock Americas Diversified Equity Absolute Return Fundcontinued
The notes on pages 691 to 711 form an integral part of these financial statements.
BlackRock Strategic Funds[162]
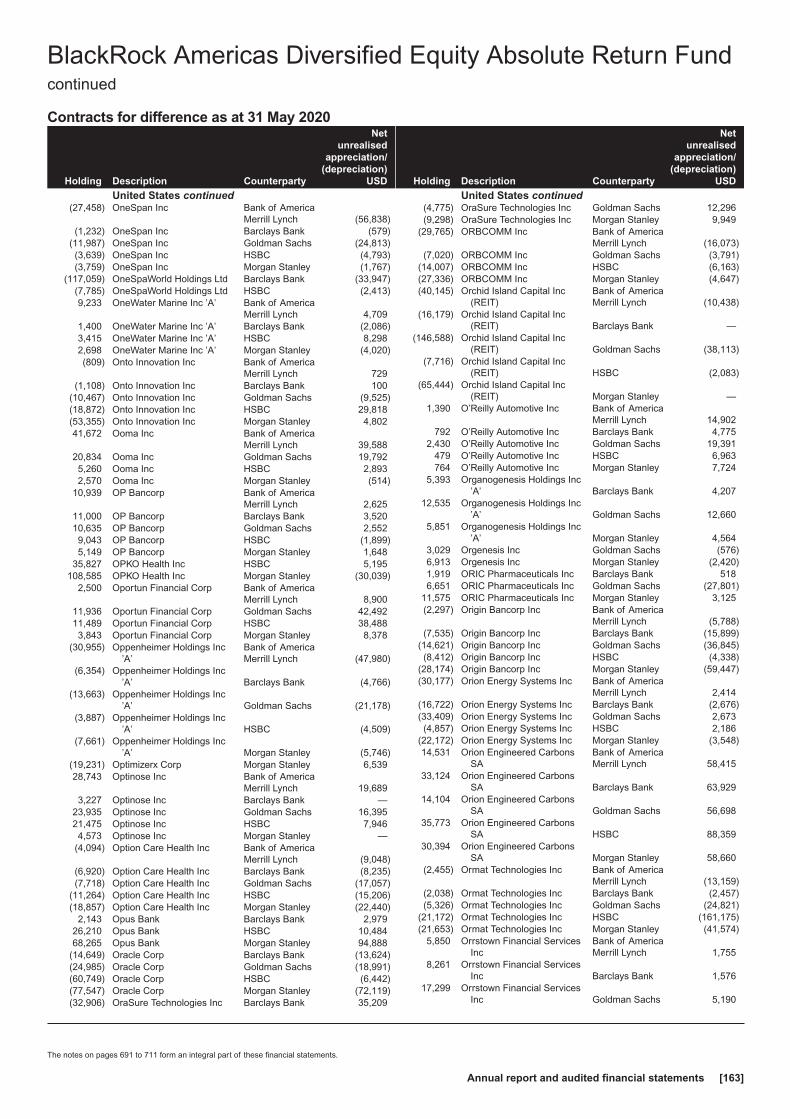
Contracts for difference as at 31 May 2020
Holding Description Counterparty
Netunrealised
appreciation/(depreciation)
USD
United States continued(27,458) OneSpan Inc Bank of America
Merrill Lynch (56,838)(1,232) OneSpan Inc Barclays Bank (579)
(11,987) OneSpan Inc Goldman Sachs (24,813)(3,639) OneSpan Inc HSBC (4,793)(3,759) OneSpan Inc Morgan Stanley (1,767)
(117,059) OneSpaWorld Holdings Ltd Barclays Bank (33,947)(7,785) OneSpaWorld Holdings Ltd HSBC (2,413)9,233 OneWater Marine Inc ’A’ Bank of America
Merrill Lynch 4,7091,400 OneWater Marine Inc ’A’ Barclays Bank (2,086)3,415 OneWater Marine Inc ’A’ HSBC 8,2982,698 OneWater Marine Inc ’A’ Morgan Stanley (4,020)(809) Onto Innovation Inc Bank of America
Merrill Lynch 729(1,108) Onto Innovation Inc Barclays Bank 100
(10,467) Onto Innovation Inc Goldman Sachs (9,525)(18,872) Onto Innovation Inc HSBC 29,818(53,355) Onto Innovation Inc Morgan Stanley 4,80241,672 Ooma Inc Bank of America
Merrill Lynch 39,58820,834 Ooma Inc Goldman Sachs 19,7925,260 Ooma Inc HSBC 2,8932,570 Ooma Inc Morgan Stanley (514)
10,939 OP Bancorp Bank of AmericaMerrill Lynch 2,625
11,000 OP Bancorp Barclays Bank 3,52010,635 OP Bancorp Goldman Sachs 2,5529,043 OP Bancorp HSBC (1,899)5,149 OP Bancorp Morgan Stanley 1,648
35,827 OPKO Health Inc HSBC 5,195108,585 OPKO Health Inc Morgan Stanley (30,039)
2,500 Oportun Financial Corp Bank of AmericaMerrill Lynch 8,900
11,936 Oportun Financial Corp Goldman Sachs 42,49211,489 Oportun Financial Corp HSBC 38,4883,843 Oportun Financial Corp Morgan Stanley 8,378
(30,955) Oppenheimer Holdings Inc’A’
Bank of AmericaMerrill Lynch (47,980)
(6,354) Oppenheimer Holdings Inc’A’ Barclays Bank (4,766)
(13,663) Oppenheimer Holdings Inc’A’ Goldman Sachs (21,178)
(3,887) Oppenheimer Holdings Inc’A’ HSBC (4,509)
(7,661) Oppenheimer Holdings Inc’A’ Morgan Stanley (5,746)
(19,231) Optimizerx Corp Morgan Stanley 6,53928,743 Optinose Inc Bank of America
Merrill Lynch 19,6893,227 Optinose Inc Barclays Bank —
23,935 Optinose Inc Goldman Sachs 16,39521,475 Optinose Inc HSBC 7,9464,573 Optinose Inc Morgan Stanley —
(4,094) Option Care Health Inc Bank of AmericaMerrill Lynch (9,048)
(6,920) Option Care Health Inc Barclays Bank (8,235)(7,718) Option Care Health Inc Goldman Sachs (17,057)
(11,264) Option Care Health Inc HSBC (15,206)(18,857) Option Care Health Inc Morgan Stanley (22,440)
2,143 Opus Bank Barclays Bank 2,97926,210 Opus Bank HSBC 10,48468,265 Opus Bank Morgan Stanley 94,888
(14,649) Oracle Corp Barclays Bank (13,624)(24,985) Oracle Corp Goldman Sachs (18,991)(60,749) Oracle Corp HSBC (6,442)(77,547) Oracle Corp Morgan Stanley (72,119)(32,906) OraSure Technologies Inc Barclays Bank 35,209
Holding Description Counterparty
Netunrealised
appreciation/(depreciation)
USD
United States continued(4,775) OraSure Technologies Inc Goldman Sachs 12,296(9,298) OraSure Technologies Inc Morgan Stanley 9,949
(29,765) ORBCOMM Inc Bank of AmericaMerrill Lynch (16,073)
(7,020) ORBCOMM Inc Goldman Sachs (3,791)(14,007) ORBCOMM Inc HSBC (6,163)(27,336) ORBCOMM Inc Morgan Stanley (4,647)(40,145) Orchid Island Capital Inc
(REIT)Bank of AmericaMerrill Lynch (10,438)
(16,179) Orchid Island Capital Inc(REIT) Barclays Bank —
(146,588) Orchid Island Capital Inc(REIT) Goldman Sachs (38,113)
(7,716) Orchid Island Capital Inc(REIT) HSBC (2,083)
(65,444) Orchid Island Capital Inc(REIT) Morgan Stanley —
1,390 O’Reilly Automotive Inc Bank of AmericaMerrill Lynch 14,902
792 O’Reilly Automotive Inc Barclays Bank 4,7752,430 O’Reilly Automotive Inc Goldman Sachs 19,391
479 O’Reilly Automotive Inc HSBC 6,963764 O’Reilly Automotive Inc Morgan Stanley 7,724
5,393 Organogenesis Holdings Inc’A’ Barclays Bank 4,207
12,535 Organogenesis Holdings Inc’A’ Goldman Sachs 12,660
5,851 Organogenesis Holdings Inc’A’ Morgan Stanley 4,564
3,029 Orgenesis Inc Goldman Sachs (576)6,913 Orgenesis Inc Morgan Stanley (2,420)1,919 ORIC Pharmaceuticals Inc Barclays Bank 5186,651 ORIC Pharmaceuticals Inc Goldman Sachs (27,801)
11,575 ORIC Pharmaceuticals Inc Morgan Stanley 3,125(2,297) Origin Bancorp Inc Bank of America
Merrill Lynch (5,788)(7,535) Origin Bancorp Inc Barclays Bank (15,899)
(14,621) Origin Bancorp Inc Goldman Sachs (36,845)(8,412) Origin Bancorp Inc HSBC (4,338)
(28,174) Origin Bancorp Inc Morgan Stanley (59,447)(30,177) Orion Energy Systems Inc Bank of America
Merrill Lynch 2,414(16,722) Orion Energy Systems Inc Barclays Bank (2,676)(33,409) Orion Energy Systems Inc Goldman Sachs 2,673(4,857) Orion Energy Systems Inc HSBC 2,186
(22,172) Orion Energy Systems Inc Morgan Stanley (3,548)14,531 Orion Engineered Carbons
SABank of AmericaMerrill Lynch 58,415
33,124 Orion Engineered CarbonsSA Barclays Bank 63,929
14,104 Orion Engineered CarbonsSA Goldman Sachs 56,698
35,773 Orion Engineered CarbonsSA HSBC 88,359
30,394 Orion Engineered CarbonsSA Morgan Stanley 58,660
(2,455) Ormat Technologies Inc Bank of AmericaMerrill Lynch (13,159)
(2,038) Ormat Technologies Inc Barclays Bank (2,457)(5,326) Ormat Technologies Inc Goldman Sachs (24,821)
(21,172) Ormat Technologies Inc HSBC (161,175)(21,653) Ormat Technologies Inc Morgan Stanley (41,574)
5,850 Orrstown Financial ServicesInc
Bank of AmericaMerrill Lynch 1,755
8,261 Orrstown Financial ServicesInc Barclays Bank 1,576
17,299 Orrstown Financial ServicesInc Goldman Sachs 5,190
BlackRock Americas Diversified Equity Absolute Return Fundcontinued
The notes on pages 691 to 711 form an integral part of these financial statements.
Annual report and audited financial statements [163]
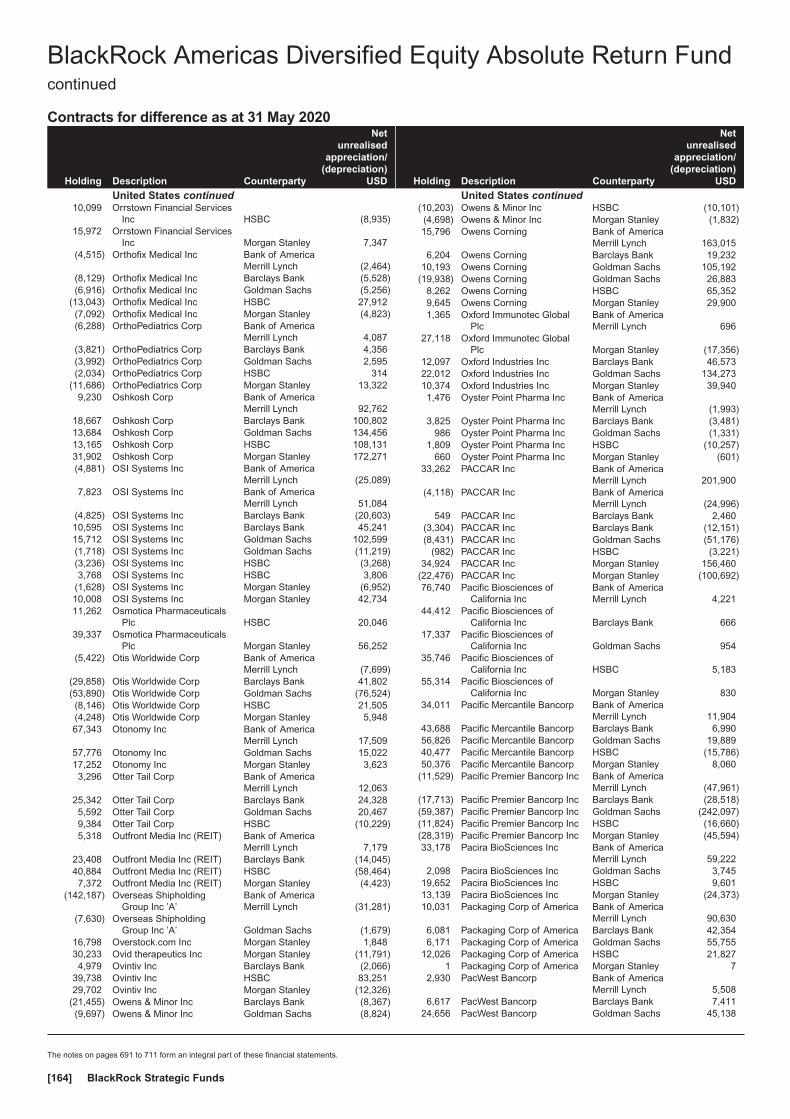
Contracts for difference as at 31 May 2020
Holding Description Counterparty
Netunrealised
appreciation/(depreciation)
USD
United States continued10,099 Orrstown Financial Services
Inc HSBC (8,935)15,972 Orrstown Financial Services
Inc Morgan Stanley 7,347(4,515) Orthofix Medical Inc Bank of America
Merrill Lynch (2,464)(8,129) Orthofix Medical Inc Barclays Bank (5,528)(6,916) Orthofix Medical Inc Goldman Sachs (5,256)
(13,043) Orthofix Medical Inc HSBC 27,912(7,092) Orthofix Medical Inc Morgan Stanley (4,823)(6,288) OrthoPediatrics Corp Bank of America
Merrill Lynch 4,087(3,821) OrthoPediatrics Corp Barclays Bank 4,356(3,992) OrthoPediatrics Corp Goldman Sachs 2,595(2,034) OrthoPediatrics Corp HSBC 314
(11,686) OrthoPediatrics Corp Morgan Stanley 13,3229,230 Oshkosh Corp Bank of America
Merrill Lynch 92,76218,667 Oshkosh Corp Barclays Bank 100,80213,684 Oshkosh Corp Goldman Sachs 134,45613,165 Oshkosh Corp HSBC 108,13131,902 Oshkosh Corp Morgan Stanley 172,271(4,881) OSI Systems Inc Bank of America
Merrill Lynch (25,089)7,823 OSI Systems Inc Bank of America
Merrill Lynch 51,084(4,825) OSI Systems Inc Barclays Bank (20,603)10,595 OSI Systems Inc Barclays Bank 45,24115,712 OSI Systems Inc Goldman Sachs 102,599(1,718) OSI Systems Inc Goldman Sachs (11,219)(3,236) OSI Systems Inc HSBC (3,268)3,768 OSI Systems Inc HSBC 3,806
(1,628) OSI Systems Inc Morgan Stanley (6,952)10,008 OSI Systems Inc Morgan Stanley 42,73411,262 Osmotica Pharmaceuticals
Plc HSBC 20,04639,337 Osmotica Pharmaceuticals
Plc Morgan Stanley 56,252(5,422) Otis Worldwide Corp Bank of America
Merrill Lynch (7,699)(29,858) Otis Worldwide Corp Barclays Bank 41,802(53,890) Otis Worldwide Corp Goldman Sachs (76,524)(8,146) Otis Worldwide Corp HSBC 21,505(4,248) Otis Worldwide Corp Morgan Stanley 5,94867,343 Otonomy Inc Bank of America
Merrill Lynch 17,50957,776 Otonomy Inc Goldman Sachs 15,02217,252 Otonomy Inc Morgan Stanley 3,6233,296 Otter Tail Corp Bank of America
Merrill Lynch 12,06325,342 Otter Tail Corp Barclays Bank 24,3285,592 Otter Tail Corp Goldman Sachs 20,4679,384 Otter Tail Corp HSBC (10,229)5,318 Outfront Media Inc (REIT) Bank of America
Merrill Lynch 7,17923,408 Outfront Media Inc (REIT) Barclays Bank (14,045)40,884 Outfront Media Inc (REIT) HSBC (58,464)7,372 Outfront Media Inc (REIT) Morgan Stanley (4,423)
(142,187) Overseas ShipholdingGroup Inc ’A’
Bank of AmericaMerrill Lynch (31,281)
(7,630) Overseas ShipholdingGroup Inc ’A’ Goldman Sachs (1,679)
16,798 Overstock.com Inc Morgan Stanley 1,84830,233 Ovid therapeutics Inc Morgan Stanley (11,791)4,979 Ovintiv Inc Barclays Bank (2,066)
39,738 Ovintiv Inc HSBC 83,25129,702 Ovintiv Inc Morgan Stanley (12,326)
(21,455) Owens & Minor Inc Barclays Bank (8,367)(9,697) Owens & Minor Inc Goldman Sachs (8,824)
Holding Description Counterparty
Netunrealised
appreciation/(depreciation)
USD
United States continued(10,203) Owens & Minor Inc HSBC (10,101)(4,698) Owens & Minor Inc Morgan Stanley (1,832)15,796 Owens Corning Bank of America
Merrill Lynch 163,0156,204 Owens Corning Barclays Bank 19,232
10,193 Owens Corning Goldman Sachs 105,192(19,938) Owens Corning Goldman Sachs 26,883
8,262 Owens Corning HSBC 65,3529,645 Owens Corning Morgan Stanley 29,9001,365 Oxford Immunotec Global
PlcBank of AmericaMerrill Lynch 696
27,118 Oxford Immunotec GlobalPlc Morgan Stanley (17,356)
12,097 Oxford Industries Inc Barclays Bank 46,57322,012 Oxford Industries Inc Goldman Sachs 134,27310,374 Oxford Industries Inc Morgan Stanley 39,9401,476 Oyster Point Pharma Inc Bank of America
Merrill Lynch (1,993)3,825 Oyster Point Pharma Inc Barclays Bank (3,481)
986 Oyster Point Pharma Inc Goldman Sachs (1,331)1,809 Oyster Point Pharma Inc HSBC (10,257)
660 Oyster Point Pharma Inc Morgan Stanley (601)33,262 PACCAR Inc Bank of America
Merrill Lynch 201,900(4,118) PACCAR Inc Bank of America
Merrill Lynch (24,996)549 PACCAR Inc Barclays Bank 2,460
(3,304) PACCAR Inc Barclays Bank (12,151)(8,431) PACCAR Inc Goldman Sachs (51,176)
(982) PACCAR Inc HSBC (3,221)34,924 PACCAR Inc Morgan Stanley 156,460
(22,476) PACCAR Inc Morgan Stanley (100,692)76,740 Pacific Biosciences of
California IncBank of AmericaMerrill Lynch 4,221
44,412 Pacific Biosciences ofCalifornia Inc Barclays Bank 666
17,337 Pacific Biosciences ofCalifornia Inc Goldman Sachs 954
35,746 Pacific Biosciences ofCalifornia Inc HSBC 5,183
55,314 Pacific Biosciences ofCalifornia Inc Morgan Stanley 830
34,011 Pacific Mercantile Bancorp Bank of AmericaMerrill Lynch 11,904
43,688 Pacific Mercantile Bancorp Barclays Bank 6,99056,826 Pacific Mercantile Bancorp Goldman Sachs 19,88940,477 Pacific Mercantile Bancorp HSBC (15,786)50,376 Pacific Mercantile Bancorp Morgan Stanley 8,060
(11,529) Pacific Premier Bancorp Inc Bank of AmericaMerrill Lynch (47,961)
(17,713) Pacific Premier Bancorp Inc Barclays Bank (28,518)(59,387) Pacific Premier Bancorp Inc Goldman Sachs (242,097)(11,824) Pacific Premier Bancorp Inc HSBC (16,660)(28,319) Pacific Premier Bancorp Inc Morgan Stanley (45,594)33,178 Pacira BioSciences Inc Bank of America
Merrill Lynch 59,2222,098 Pacira BioSciences Inc Goldman Sachs 3,745
19,652 Pacira BioSciences Inc HSBC 9,60113,139 Pacira BioSciences Inc Morgan Stanley (24,373)10,031 Packaging Corp of America Bank of America
Merrill Lynch 90,6306,081 Packaging Corp of America Barclays Bank 42,3546,171 Packaging Corp of America Goldman Sachs 55,755
12,026 Packaging Corp of America HSBC 21,8271 Packaging Corp of America Morgan Stanley 7
2,930 PacWest Bancorp Bank of AmericaMerrill Lynch 5,508
6,617 PacWest Bancorp Barclays Bank 7,41124,656 PacWest Bancorp Goldman Sachs 45,138
BlackRock Americas Diversified Equity Absolute Return Fundcontinued
The notes on pages 691 to 711 form an integral part of these financial statements.
BlackRock Strategic Funds[164]

Contracts for difference as at 31 May 2020
Holding Description Counterparty
Netunrealised
appreciation/(depreciation)
USD
United States continued25,930 PacWest Bancorp HSBC (47,822)50,811 PacWest Bancorp Morgan Stanley 56,909
(20,087) PAE Inc Barclays Bank 2,210(30,288) PAE Inc Morgan Stanley 3,332(5,039) PagerDuty Inc Bank of America
Merrill Lynch (1,310)10,207 PagerDuty Inc Bank of America
Merrill Lynch 2,654(1,260) PagerDuty Inc Barclays Bank 2,394(5,936) PagerDuty Inc Goldman Sachs (1,543)(1,858) PagerDuty Inc Morgan Stanley 3,530(2,831) Pagseguro Digital Ltd ’A’ Barclays Bank (15,033)(6,011) Pagseguro Digital Ltd ’A’ Goldman Sachs (41,837)(9,290) Pagseguro Digital Ltd ’A’ HSBC (33,207)
(16,160) Pagseguro Digital Ltd ’A’ Morgan Stanley (85,810)(79,383) Palatin Technologies Inc Goldman Sachs (6,025)(2,606) Palo Alto Networks Inc Bank of America
Merrill Lynch (20,223)(6,120) Palo Alto Networks Inc Goldman Sachs (29,822)(5,374) Palo Alto Networks Inc HSBC (89,370)(9,454) Palo Alto Networks Inc Morgan Stanley 25,7852,129 Palomar Holdings Inc Bank of America
Merrill Lynch 33,583713 Palomar Holdings Inc Barclays Bank 8,236
(2,228) Palomar Holdings Inc Barclays Bank (28,206)(10,321) Palomar Holdings Inc Goldman Sachs (173,560)
3,897 Palomar Holdings Inc Goldman Sachs 66,7171,158 Palomar Holdings Inc HSBC 15,074
(3,589) Palomar Holdings Inc HSBC (50,341)(4,044) Palomar Holdings Inc Morgan Stanley (51,197)(4,067) PAM Transportation
Services Inc Morgan Stanley (16,593)(3,314) Pampa Energia SA ADR Goldman Sachs 928(6,837) Pampa Energia SA ADR HSBC 684
748 Pan American Silver Corp Bank of AmericaMerrill Lynch 3,104
10,265 Pan American Silver Corp Bank of AmericaMerrill Lynch 3,080
9,059 Pan American Silver Corp Goldman Sachs 37,5953,896 Pan American Silver Corp Morgan Stanley 5,318
21,553 Pan American Silver Corp Morgan Stanley 1,94046,959 Pan American Silver Corp
(Rights) Goldman Sachs 2,348(31,171) Panhandle Oil and Gas Inc
’A’Bank of AmericaMerrill Lynch (20,885)
(17,887) Panhandle Oil and Gas Inc’A’ Barclays Bank (5,366)
(11,531) Panhandle Oil and Gas Inc’A’ Goldman Sachs (7,726)
(2,276) Panhandle Oil and Gas Inc’A’ HSBC (615)
11,289 Papa John’s InternationalInc
Bank of AmericaMerrill Lynch (45,358)
6,815 Papa John’s InternationalInc HSBC (21,786)
4,918 Papa John’s InternationalInc Morgan Stanley (393)
10,267 Par Pacific Holdings Inc Bank of AmericaMerrill Lynch 18,481
39,213 Par Pacific Holdings Inc Barclays Bank 60,38826,881 Par Pacific Holdings Inc Goldman Sachs 48,3869,708 Par Pacific Holdings Inc HSBC (1,747)
16,822 Par Pacific Holdings Inc Morgan Stanley 25,9068,211 PAR Technology Corp Bank of America
Merrill Lynch 27,2615,164 PAR Technology Corp Barclays Bank (8,676)
11,083 PAR Technology Corp Goldman Sachs 36,7965,573 PAR Technology Corp HSBC 17,9452,897 PAR Technology Corp Morgan Stanley (4,867)
Holding Description Counterparty
Netunrealised
appreciation/(depreciation)
USD
United States continued1,697 Paramount Group Inc
(REIT)Bank of AmericaMerrill Lynch 713
21,277 Paramount Group Inc(REIT) Barclays Bank 7,659
21,395 Paramount Group Inc(REIT) Goldman Sachs 8,986
180,866 Paramount Group Inc(REIT) HSBC (188,100)
230,996 Paramount Group Inc(REIT) Morgan Stanley 83,159
(71,034) Paratek PharmaceuticalsInc Goldman Sachs 710
(12,735) Paratek PharmaceuticalsInc Morgan Stanley 3,438
(12,754) Park Aerospace Corp Bank of AmericaMerrill Lynch (1,690)
(3,380) Park Aerospace Corp Barclays Bank (1,825)(10,808) Park Aerospace Corp Goldman Sachs (1,945)(10,173) Park Aerospace Corp HSBC 14,344(14,714) Park Aerospace Corp Morgan Stanley (7,946)82,328 Park Hotels & Resorts Inc
(REIT)Bank of AmericaMerrill Lynch 200,880
4,810 Park Hotels & Resorts Inc(REIT) Barclays Bank 1,732
(11,001) Park Hotels & Resorts Inc(REIT) HSBC (21,878)
(1,598) Park National Corp Bank of AmericaMerrill Lynch (8,837)
(3,411) Park National Corp Barclays Bank (32,302)(3,475) Park National Corp HSBC 279
(23,950) Park National Corp Morgan Stanley (226,807)(9,484) Parke Bancorp Inc Bank of America
Merrill Lynch (16,123)(7,848) Parke Bancorp Inc Morgan Stanley (4,944)11,431 Parker Drilling Co HSBC (6,859)4,143 Parker Drilling Co Morgan Stanley (621)2,482 Parker-Hannifin Corp Bank of America
Merrill Lynch 60,735(2,752) Parker-Hannifin Corp Bank of America
Merrill Lynch (56,172)4,073 Parker-Hannifin Corp Barclays Bank 44,314(688) Parker-Hannifin Corp Barclays Bank 2,079
(11,399) Parker-Hannifin Corp Goldman Sachs (267,735)2,993 Parker-Hannifin Corp HSBC 50,163
11,984 Parker-Hannifin Corp Morgan Stanley 130,38611,072 Park-Ohio Holdings Corp Bank of America
Merrill Lynch 23,91619,490 Park-Ohio Holdings Corp Goldman Sachs 42,0986,111 Park-Ohio Holdings Corp Morgan Stanley 4,583
(22,592) Parsley Energy Inc ’A’ Bank of AmericaMerrill Lynch (4,518)
(28,517) Parsley Energy Inc ’A’ Barclays Bank 10,55180,713 Parsley Energy Inc ’A’ Barclays Bank (29,864)
(20,299) Parsley Energy Inc ’A’ Goldman Sachs (4,060)(12,815) Parsley Energy Inc ’A’ HSBC 8,714
8,925 Parsley Energy Inc ’A’ Morgan Stanley (3,302)(26,104) Parsons Corp Bank of America
Merrill Lynch (40,899)(18,642) Parsons Corp Barclays Bank (20,080)(18,024) Parsons Corp Goldman Sachs (27,545)
2,810 Parsons Corp HSBC 4,580(14,295) Parsons Corp HSBC (23,300)
6,420 Parsons Corp Morgan Stanley 7,062(18,711) Parsons Corp Morgan Stanley (20,582)
(119,486) Party City Holdco Inc Barclays Bank (84,035)(261,177) Party City Holdco Inc Goldman Sachs (231,951)(19,031) Passage Bio Inc Bank of America
Merrill Lynch (20,173)(3,516) Passage Bio Inc Barclays Bank 8,052
BlackRock Americas Diversified Equity Absolute Return Fundcontinued
The notes on pages 691 to 711 form an integral part of these financial statements.
Annual report and audited financial statements [165]

Contracts for difference as at 31 May 2020
Holding Description Counterparty
Netunrealised
appreciation/(depreciation)
USD
United States continued(4,867) Passage Bio Inc Morgan Stanley 11,145(1,803) Patrick Industries Inc Bank of America
Merrill Lynch (14,712)(3,486) Patrick Industries Inc Goldman Sachs (28,446)(4,400) Patrick Industries Inc HSBC (27,324)
(12,437) Patrick Industries Inc Morgan Stanley 25,1232,997 Patterson Cos Inc Bank of America
Merrill Lynch 14,1764,894 Patterson Cos Inc Barclays Bank 10,8165,885 Patterson Cos Inc Goldman Sachs 27,836
11,713 Patterson Cos Inc HSBC 38,18570,181 Patterson Cos Inc Morgan Stanley 155,10015,302 Patterson-UTI Energy Inc Bank of America
Merrill Lynch 12,01260,314 Patterson-UTI Energy Inc Barclays Bank 30,45949,078 Patterson-UTI Energy Inc Goldman Sachs 38,526
135,755 Patterson-UTI Energy Inc HSBC 94,34928,916 Patterson-UTI Energy Inc Morgan Stanley 14,60319,201 Paychex Inc Bank of America
Merrill Lynch 152,26427,481 Paychex Inc Barclays Bank (27,224)19,253 Paychex Inc Goldman Sachs 152,676
457 Paychex Inc HSBC 2,8515,384 Paychex Inc Morgan Stanley 20,352
223 Paycom Software Inc Goldman Sachs 6,806966 Paycom Software Inc HSBC 27,572
2,844 Paycom Software Inc Morgan Stanley 64,9859,344 Paylocity Holding Corp Bank of America
Merrill Lynch 108,4745,212 Paylocity Holding Corp Goldman Sachs 59,633
374 Paylocity Holding Corp HSBC 2,9398,660 Paylocity Holding Corp Morgan Stanley 72,7448,149 PayPal Holdings Inc Bank of America
Merrill Lynch 35,36713,510 PayPal Holdings Inc HSBC 66,0644,545 PayPal Holdings Inc Morgan Stanley (4,590)
10,115 Paysign Inc Bank of AmericaMerrill Lynch (2,478)
10,732 Paysign Inc HSBC (8,371)(1,192) PBF Energy Inc ’A’ Bank of America
Merrill Lynch (1,848)(3,066) PBF Energy Inc ’A’ Barclays Bank (552)(8,012) PBF Energy Inc ’A’ Goldman Sachs (12,419)(3,950) PBF Energy Inc ’A’ HSBC (40)(7,578) PBF Energy Inc ’A’ Morgan Stanley (1,364)8,321 PC Connection Inc Bank of America
Merrill Lynch 40,60611,776 PC Connection Inc Goldman Sachs 57,4679,717 PC Connection Inc HSBC 20,211
16,469 PC Connection Inc Morgan Stanley 23,5514,001 PCB Bancorp Bank of America
Merrill Lynch 2,12114,564 PCB Bancorp Barclays Bank 3,78715,367 PCB Bancorp Goldman Sachs 8,1454,490 PCB Bancorp HSBC (225)
17,125 PCB Bancorp Morgan Stanley 4,45329,888 PCSB Financial Corp Bank of America
Merrill Lynch 51,70615,288 PCSB Financial Corp Barclays Bank 12,53640,599 PCSB Financial Corp Goldman Sachs 70,23633,558 PCSB Financial Corp HSBC 17,35039,558 PCSB Financial Corp Morgan Stanley 32,43891,810 PC-Tel Inc Morgan Stanley (9,181)
(46,111) PDC Energy Inc Barclays Bank 20,289(16,565) PDC Energy Inc Goldman Sachs (15,240)(7,162) PDC Energy Inc HSBC 1,576(6,319) PDF Solutions Inc Bank of America
Merrill Lynch (7,267)
Holding Description Counterparty
Netunrealised
appreciation/(depreciation)
USD
United States continued(5,724) PDF Solutions Inc Barclays Bank (572)(5,438) PDF Solutions Inc Goldman Sachs (6,254)
(18,613) PDF Solutions Inc HSBC —(24,222) PDF Solutions Inc Morgan Stanley (2,422)
(278,919) PDL BioPharma Inc Bank of AmericaMerrill Lynch (16,798)
(98,282) PDL BioPharma Inc HSBC 22,605(141,740) PDL BioPharma Inc Morgan Stanley 9,922(22,839) Peapack-Gladstone
Financial CorpBank of AmericaMerrill Lynch (70,801)
(9,620) Peapack-GladstoneFinancial Corp Goldman Sachs (29,822)
(2,116) Peapack-GladstoneFinancial Corp HSBC (973)
(10,889) Peapack-GladstoneFinancial Corp Morgan Stanley (7,949)
45,615 Pebblebrook Hotel Trust(REIT) Barclays Bank 20,071
43,866 Pebblebrook Hotel Trust(REIT) Goldman Sachs 152,215
9,549 Pebblebrook Hotel Trust(REIT) HSBC 21,867
(4,302) Pebblebrook Hotel Trust(REIT) HSBC (9,852)
67,599 Pebblebrook Hotel Trust(REIT) Morgan Stanley 29,743
(2,150) Pegasystems Inc Bank of AmericaMerrill Lynch (3,978)
(2,449) Pegasystems Inc Barclays Bank (5,976)(1,995) Pegasystems Inc Goldman Sachs (16,279)
(347) Pegasystems Inc HSBC (885)(38,980) Pegasystems Inc Morgan Stanley (94,064)(5,108) Peloton Interactive Inc ’A’ Bank of America
Merrill Lynch (221)(2,529) Peloton Interactive Inc ’A’ Barclays Bank 8,472
(11,791) Peloton Interactive Inc ’A’ Goldman Sachs 65,653(5,819) Peloton Interactive Inc ’A’ HSBC 3,1424,548 Penn National Gaming Inc Bank of America
Merrill Lynch 15,9539,011 Penn National Gaming Inc Goldman Sachs 54,1419,671 Penn National Gaming Inc HSBC 77,2259,864 Penn National Gaming Inc Morgan Stanley 13,1197,775 Penn Virginia Corp HSBC 20,1379,976 Penn Virginia Corp Morgan Stanley 15,064
(2,718) Pennant Group Inc Bank of AmericaMerrill Lynch (7,828)
(3,421) Pennant Group Inc Barclays Bank 1,403(5,207) Pennant Group Inc Goldman Sachs (14,996)(2,256) Pennant Group Inc HSBC (12,160)(6,645) Pennant Group Inc Morgan Stanley 2,7242,637 Penns Woods Bancorp Inc Bank of America
Merrill Lynch 1,74010,423 Penns Woods Bancorp Inc Barclays Bank 1,1472,609 Penns Woods Bancorp Inc Goldman Sachs 1,7221,964 Penns Woods Bancorp Inc HSBC (3,574)
12,345 Penns Woods Bancorp Inc Morgan Stanley 1,358(13,833) PennyMac Financial
Services Inc Goldman Sachs (53,119)(16,005) PennyMac Financial
Services Inc Morgan Stanley (5,922)7,340 Penske Automotive Group
IncBank of AmericaMerrill Lynch 26,457
6,424 Penske Automotive GroupInc Barclays Bank 11,563
15,898 Penske Automotive GroupInc Goldman Sachs 77,680
8,326 Penske Automotive GroupInc HSBC (3,959)
BlackRock Americas Diversified Equity Absolute Return Fundcontinued
The notes on pages 691 to 711 form an integral part of these financial statements.
BlackRock Strategic Funds[166]
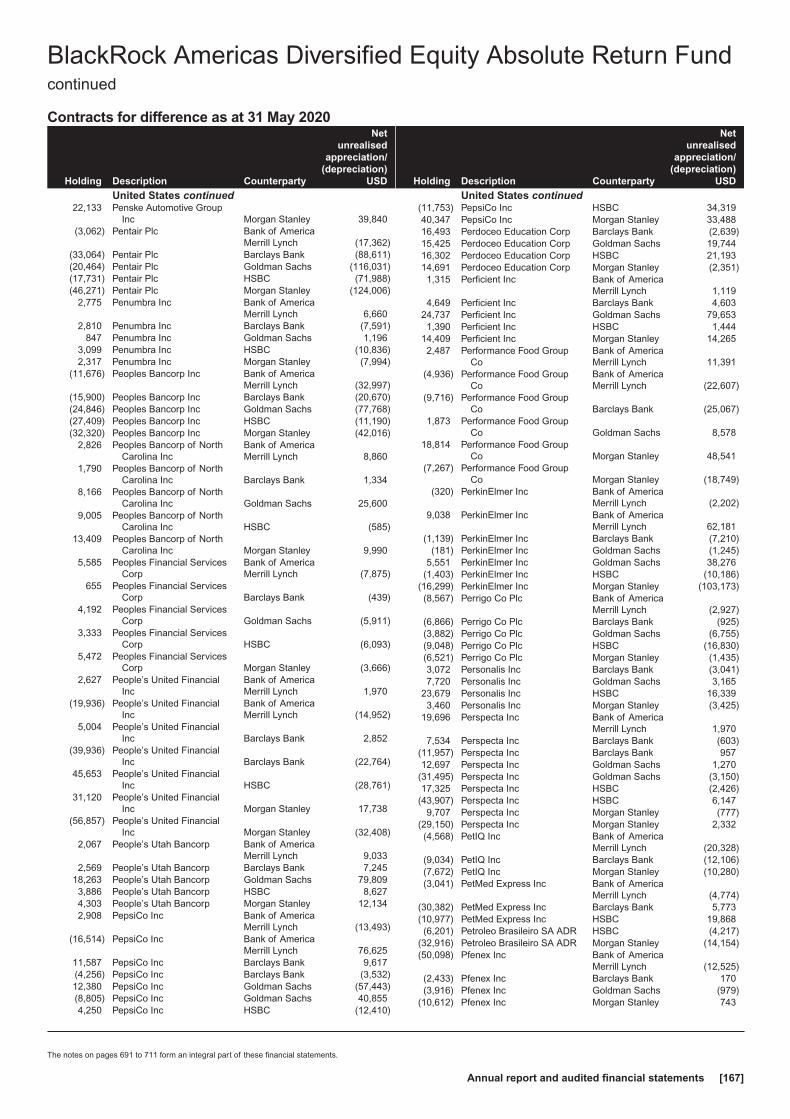
Contracts for difference as at 31 May 2020
Holding Description Counterparty
Netunrealised
appreciation/(depreciation)
USD
United States continued22,133 Penske Automotive Group
Inc Morgan Stanley 39,840(3,062) Pentair Plc Bank of America
Merrill Lynch (17,362)(33,064) Pentair Plc Barclays Bank (88,611)(20,464) Pentair Plc Goldman Sachs (116,031)(17,731) Pentair Plc HSBC (71,988)(46,271) Pentair Plc Morgan Stanley (124,006)
2,775 Penumbra Inc Bank of AmericaMerrill Lynch 6,660
2,810 Penumbra Inc Barclays Bank (7,591)847 Penumbra Inc Goldman Sachs 1,196
3,099 Penumbra Inc HSBC (10,836)2,317 Penumbra Inc Morgan Stanley (7,994)
(11,676) Peoples Bancorp Inc Bank of AmericaMerrill Lynch (32,997)
(15,900) Peoples Bancorp Inc Barclays Bank (20,670)(24,846) Peoples Bancorp Inc Goldman Sachs (77,768)(27,409) Peoples Bancorp Inc HSBC (11,190)(32,320) Peoples Bancorp Inc Morgan Stanley (42,016)
2,826 Peoples Bancorp of NorthCarolina Inc
Bank of AmericaMerrill Lynch 8,860
1,790 Peoples Bancorp of NorthCarolina Inc Barclays Bank 1,334
8,166 Peoples Bancorp of NorthCarolina Inc Goldman Sachs 25,600
9,005 Peoples Bancorp of NorthCarolina Inc HSBC (585)
13,409 Peoples Bancorp of NorthCarolina Inc Morgan Stanley 9,990
5,585 Peoples Financial ServicesCorp
Bank of AmericaMerrill Lynch (7,875)
655 Peoples Financial ServicesCorp Barclays Bank (439)
4,192 Peoples Financial ServicesCorp Goldman Sachs (5,911)
3,333 Peoples Financial ServicesCorp HSBC (6,093)
5,472 Peoples Financial ServicesCorp Morgan Stanley (3,666)
2,627 People’s United FinancialInc
Bank of AmericaMerrill Lynch 1,970
(19,936) People’s United FinancialInc
Bank of AmericaMerrill Lynch (14,952)
5,004 People’s United FinancialInc Barclays Bank 2,852
(39,936) People’s United FinancialInc Barclays Bank (22,764)
45,653 People’s United FinancialInc HSBC (28,761)
31,120 People’s United FinancialInc Morgan Stanley 17,738
(56,857) People’s United FinancialInc Morgan Stanley (32,408)
2,067 People’s Utah Bancorp Bank of AmericaMerrill Lynch 9,033
2,569 People’s Utah Bancorp Barclays Bank 7,24518,263 People’s Utah Bancorp Goldman Sachs 79,8093,886 People’s Utah Bancorp HSBC 8,6274,303 People’s Utah Bancorp Morgan Stanley 12,1342,908 PepsiCo Inc Bank of America
Merrill Lynch (13,493)(16,514) PepsiCo Inc Bank of America
Merrill Lynch 76,62511,587 PepsiCo Inc Barclays Bank 9,617(4,256) PepsiCo Inc Barclays Bank (3,532)12,380 PepsiCo Inc Goldman Sachs (57,443)(8,805) PepsiCo Inc Goldman Sachs 40,8554,250 PepsiCo Inc HSBC (12,410)
Holding Description Counterparty
Netunrealised
appreciation/(depreciation)
USD
United States continued(11,753) PepsiCo Inc HSBC 34,31940,347 PepsiCo Inc Morgan Stanley 33,48816,493 Perdoceo Education Corp Barclays Bank (2,639)15,425 Perdoceo Education Corp Goldman Sachs 19,74416,302 Perdoceo Education Corp HSBC 21,19314,691 Perdoceo Education Corp Morgan Stanley (2,351)1,315 Perficient Inc Bank of America
Merrill Lynch 1,1194,649 Perficient Inc Barclays Bank 4,603
24,737 Perficient Inc Goldman Sachs 79,6531,390 Perficient Inc HSBC 1,444
14,409 Perficient Inc Morgan Stanley 14,2652,487 Performance Food Group
CoBank of AmericaMerrill Lynch 11,391
(4,936) Performance Food GroupCo
Bank of AmericaMerrill Lynch (22,607)
(9,716) Performance Food GroupCo Barclays Bank (25,067)
1,873 Performance Food GroupCo Goldman Sachs 8,578
18,814 Performance Food GroupCo Morgan Stanley 48,541
(7,267) Performance Food GroupCo Morgan Stanley (18,749)
(320) PerkinElmer Inc Bank of AmericaMerrill Lynch (2,202)
9,038 PerkinElmer Inc Bank of AmericaMerrill Lynch 62,181
(1,139) PerkinElmer Inc Barclays Bank (7,210)(181) PerkinElmer Inc Goldman Sachs (1,245)
5,551 PerkinElmer Inc Goldman Sachs 38,276(1,403) PerkinElmer Inc HSBC (10,186)
(16,299) PerkinElmer Inc Morgan Stanley (103,173)(8,567) Perrigo Co Plc Bank of America
Merrill Lynch (2,927)(6,866) Perrigo Co Plc Barclays Bank (925)(3,882) Perrigo Co Plc Goldman Sachs (6,755)(9,048) Perrigo Co Plc HSBC (16,830)(6,521) Perrigo Co Plc Morgan Stanley (1,435)3,072 Personalis Inc Barclays Bank (3,041)7,720 Personalis Inc Goldman Sachs 3,165
23,679 Personalis Inc HSBC 16,3393,460 Personalis Inc Morgan Stanley (3,425)
19,696 Perspecta Inc Bank of AmericaMerrill Lynch 1,970
7,534 Perspecta Inc Barclays Bank (603)(11,957) Perspecta Inc Barclays Bank 95712,697 Perspecta Inc Goldman Sachs 1,270
(31,495) Perspecta Inc Goldman Sachs (3,150)17,325 Perspecta Inc HSBC (2,426)
(43,907) Perspecta Inc HSBC 6,1479,707 Perspecta Inc Morgan Stanley (777)
(29,150) Perspecta Inc Morgan Stanley 2,332(4,568) PetIQ Inc Bank of America
Merrill Lynch (20,328)(9,034) PetIQ Inc Barclays Bank (12,106)(7,672) PetIQ Inc Morgan Stanley (10,280)(3,041) PetMed Express Inc Bank of America
Merrill Lynch (4,774)(30,382) PetMed Express Inc Barclays Bank 5,773(10,977) PetMed Express Inc HSBC 19,868(6,201) Petroleo Brasileiro SA ADR HSBC (4,217)
(32,916) Petroleo Brasileiro SA ADR Morgan Stanley (14,154)(50,098) Pfenex Inc Bank of America
Merrill Lynch (12,525)(2,433) Pfenex Inc Barclays Bank 170(3,916) Pfenex Inc Goldman Sachs (979)
(10,612) Pfenex Inc Morgan Stanley 743
BlackRock Americas Diversified Equity Absolute Return Fundcontinued
The notes on pages 691 to 711 form an integral part of these financial statements.
Annual report and audited financial statements [167]

Contracts for difference as at 31 May 2020
Holding Description Counterparty
Netunrealised
appreciation/(depreciation)
USD
United States continued(88,373) Pfizer Inc Bank of America
Merrill Lynch (29,163)(48,364) Pfizer Inc Barclays Bank (28,535)(39,846) Pfizer Inc HSBC (34,666)(83,019) Pfizer Inc Morgan Stanley (48,981)16,269 PG&E Corp Morgan Stanley 813
(10,351) PGT Innovations Inc Barclays Bank (5,176)(7,280) PGT Innovations Inc Goldman Sachs (19,074)
(16,375) PGT Innovations Inc HSBC (52,728)(41,861) PGT Innovations Inc Morgan Stanley (20,931)(24,202) PH Glatfelter Co Bank of America
Merrill Lynch (42,838)(15,721) PH Glatfelter Co Barclays Bank (8,804)(41,365) PH Glatfelter Co Goldman Sachs (73,216)(40,452) PH Glatfelter Co HSBC (22,653)(11,950) PH Glatfelter Co Morgan Stanley (6,692)(39,670) PhaseBio Pharmaceuticals
Inc Barclays Bank (46,811)(8,843) Phathom Pharmaceuticals
Inc Barclays Bank (2,918)(3,534) Phathom Pharmaceuticals
Inc HSBC (10,143)(7,837) Phibro Animal Health Corp
’A’Bank of AmericaMerrill Lynch (32,014)
(7,524) Phibro Animal Health Corp’A’ Barclays Bank (14,935)
(8,359) Phibro Animal Health Corp’A’ Goldman Sachs (34,147)
(5,422) Phibro Animal Health Corp’A’ HSBC (22,583)
(23,589) Phibro Animal Health Corp’A’ Morgan Stanley (46,824)
(1,242) Philip Morris InternationalInc
Bank of AmericaMerrill Lynch 148
(19,387) Philip Morris InternationalInc Barclays Bank (29,274)
(7,009) Philip Morris InternationalInc Goldman Sachs (29,298)
(9,605) Philip Morris InternationalInc HSBC 384
(38,134) Philip Morris InternationalInc Morgan Stanley (57,582)
(10,260) Phillips 66 Bank of AmericaMerrill Lynch (73,462)
(11,843) Phillips 66 Barclays Bank (19,304)(12,003) Phillips 66 Goldman Sachs (85,941)(7,280) Phillips 66 HSBC (7,498)(2,434) Phillips 66 Morgan Stanley (3,967)
(10,248) Photronics Inc Bank of AmericaMerrill Lynch (5,380)
(7,038) Photronics Inc Barclays Bank 6,827(39,127) Photronics Inc Goldman Sachs (20,542)(25,293) Photronics Inc Morgan Stanley 24,534
9,435 Phreesia Inc Barclays Bank (4,434)14,224 Phreesia Inc Goldman Sachs 39,68520,283 Phreesia Inc HSBC 29,4107,762 Phreesia Inc Morgan Stanley (3,648)
(86,665) Physicians Realty Trust(REIT)
Bank of AmericaMerrill Lynch (171,597)
(11,093) Physicians Realty Trust(REIT) Barclays Bank (5,879)
52,880 Physicians Realty Trust(REIT) Barclays Bank 28,026
(18,278) Physicians Realty Trust(REIT) Goldman Sachs (36,190)
(17,830) Physicians Realty Trust(REIT) HSBC (22,822)
95,739 Physicians Realty Trust(REIT) HSBC 121,901
Holding Description Counterparty
Netunrealised
appreciation/(depreciation)
USD
United States continued(23,953) Physicians Realty Trust
(REIT) Morgan Stanley (12,695)158,534 Physicians Realty Trust
(REIT) Morgan Stanley 84,023(24,602) PICO Holdings Inc Bank of America
Merrill Lynch (18,698)(8,996) PICO Holdings Inc Barclays Bank (450)
(35,268) PICO Holdings Inc Goldman Sachs (26,804)(10,469) PICO Holdings Inc HSBC 3,141(9,357) PICO Holdings Inc Morgan Stanley (468)
(47,906) Piedmont Office RealtyTrust Inc ’A’ (REIT) Barclays Bank (102,998)
(136,480) Piedmont Office RealtyTrust Inc ’A’ (REIT) Goldman Sachs (438,101)
(172,887) Piedmont Office RealtyTrust Inc ’A’ (REIT) HSBC 28,653
(124,810) Piedmont Office RealtyTrust Inc ’A’ (REIT) Morgan Stanley (268,341)
(10,041) Pieris Pharmaceuticals Inc Bank of AmericaMerrill Lynch (5,422)
(8,795) Pieris Pharmaceuticals Inc Barclays Bank (1,671)(19,870) Pieris Pharmaceuticals Inc Goldman Sachs (10,730)(18,428) Pieris Pharmaceuticals Inc Morgan Stanley (3,501)
3,796 Pilgrim’s Pride Corp Bank of AmericaMerrill Lynch (1,708)
(6,462) Pilgrim’s Pride Corp Bank of AmericaMerrill Lynch 4,239
7,513 Pilgrim’s Pride Corp Barclays Bank (3,982)(17,838) Pilgrim’s Pride Corp Barclays Bank 9,45416,010 Pilgrim’s Pride Corp Goldman Sachs (7,205)(5,457) Pilgrim’s Pride Corp Goldman Sachs 2,45617,880 Pilgrim’s Pride Corp HSBC (20,383)(2,081) Pilgrim’s Pride Corp HSBC 2,37229,352 Pilgrim’s Pride Corp Morgan Stanley (15,557)
(18,725) Pilgrim’s Pride Corp Morgan Stanley 9,924(30,836) Ping Identity Holding Corp Barclays Bank (22,819)(4,311) Ping Identity Holding Corp Morgan Stanley (3,190)45,058 Pinnacle Financial Partners
IncBank of AmericaMerrill Lynch 254,127
17,278 Pinnacle Financial PartnersInc Barclays Bank 55,117
15,186 Pinnacle Financial PartnersInc Goldman Sachs 84,528
10,358 Pinnacle Financial PartnersInc HSBC 29,075
12,869 Pinnacle Financial PartnersInc Morgan Stanley 41,052
24,951 Pinnacle West Capital Corp Bank of AmericaMerrill Lynch 107,788
4,821 Pinnacle West Capital Corp Barclays Bank 14,849(3,160) Pinnacle West Capital Corp Barclays Bank (9,733)10,463 Pinnacle West Capital Corp Goldman Sachs 45,2009,427 Pinnacle West Capital Corp HSBC 19,305
(2,445) Pinnacle West Capital Corp HSBC (4,572)12,430 Pinnacle West Capital Corp Morgan Stanley 38,284(6,517) Pinnacle West Capital Corp Morgan Stanley (20,072)2,895 Pinterest Inc ’A’ Bank of America
Merrill Lynch 5,2407,519 Pinterest Inc ’A’ Goldman Sachs 13,610
29,748 Pinterest Inc ’A’ HSBC 33,63622,159 Pinterest Inc ’A’ Morgan Stanley 32,130
(104,756) Pioneer Bancorp Inc Morgan Stanley 14,666(2,668) Pioneer Natural Resources
Co Barclays Bank 4,776(18,344) Pioneer Natural Resources
Co Goldman Sachs (142,533)(9,592) Pioneer Natural Resources
Co HSBC (20,716)
BlackRock Americas Diversified Equity Absolute Return Fundcontinued
The notes on pages 691 to 711 form an integral part of these financial statements.
BlackRock Strategic Funds[168]
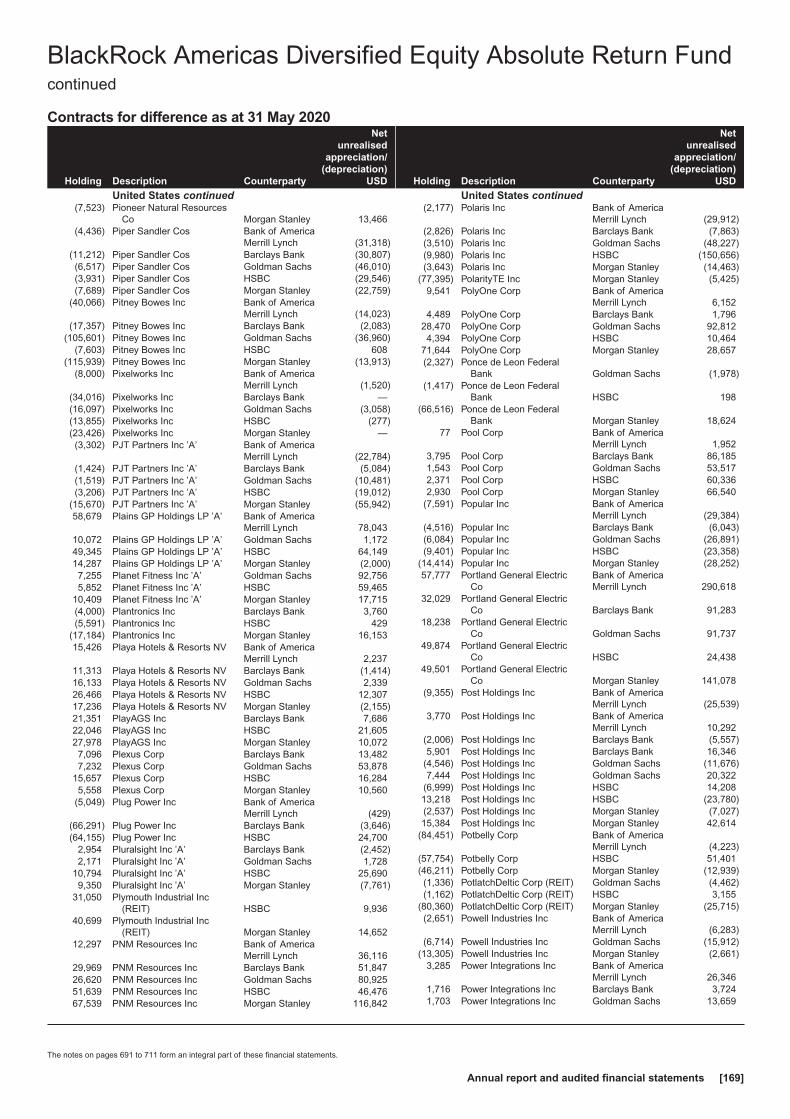
Contracts for difference as at 31 May 2020
Holding Description Counterparty
Netunrealised
appreciation/(depreciation)
USD
United States continued(7,523) Pioneer Natural Resources
Co Morgan Stanley 13,466(4,436) Piper Sandler Cos Bank of America
Merrill Lynch (31,318)(11,212) Piper Sandler Cos Barclays Bank (30,807)(6,517) Piper Sandler Cos Goldman Sachs (46,010)(3,931) Piper Sandler Cos HSBC (29,546)(7,689) Piper Sandler Cos Morgan Stanley (22,759)
(40,066) Pitney Bowes Inc Bank of AmericaMerrill Lynch (14,023)
(17,357) Pitney Bowes Inc Barclays Bank (2,083)(105,601) Pitney Bowes Inc Goldman Sachs (36,960)
(7,603) Pitney Bowes Inc HSBC 608(115,939) Pitney Bowes Inc Morgan Stanley (13,913)
(8,000) Pixelworks Inc Bank of AmericaMerrill Lynch (1,520)
(34,016) Pixelworks Inc Barclays Bank —(16,097) Pixelworks Inc Goldman Sachs (3,058)(13,855) Pixelworks Inc HSBC (277)(23,426) Pixelworks Inc Morgan Stanley —(3,302) PJT Partners Inc ’A’ Bank of America
Merrill Lynch (22,784)(1,424) PJT Partners Inc ’A’ Barclays Bank (5,084)(1,519) PJT Partners Inc ’A’ Goldman Sachs (10,481)(3,206) PJT Partners Inc ’A’ HSBC (19,012)
(15,670) PJT Partners Inc ’A’ Morgan Stanley (55,942)58,679 Plains GP Holdings LP ’A’ Bank of America
Merrill Lynch 78,04310,072 Plains GP Holdings LP ’A’ Goldman Sachs 1,17249,345 Plains GP Holdings LP ’A’ HSBC 64,14914,287 Plains GP Holdings LP ’A’ Morgan Stanley (2,000)7,255 Planet Fitness Inc ’A’ Goldman Sachs 92,7565,852 Planet Fitness Inc ’A’ HSBC 59,465
10,409 Planet Fitness Inc ’A’ Morgan Stanley 17,715(4,000) Plantronics Inc Barclays Bank 3,760(5,591) Plantronics Inc HSBC 429
(17,184) Plantronics Inc Morgan Stanley 16,15315,426 Playa Hotels & Resorts NV Bank of America
Merrill Lynch 2,23711,313 Playa Hotels & Resorts NV Barclays Bank (1,414)16,133 Playa Hotels & Resorts NV Goldman Sachs 2,33926,466 Playa Hotels & Resorts NV HSBC 12,30717,236 Playa Hotels & Resorts NV Morgan Stanley (2,155)21,351 PlayAGS Inc Barclays Bank 7,68622,046 PlayAGS Inc HSBC 21,60527,978 PlayAGS Inc Morgan Stanley 10,0727,096 Plexus Corp Barclays Bank 13,4827,232 Plexus Corp Goldman Sachs 53,878
15,657 Plexus Corp HSBC 16,2845,558 Plexus Corp Morgan Stanley 10,560
(5,049) Plug Power Inc Bank of AmericaMerrill Lynch (429)
(66,291) Plug Power Inc Barclays Bank (3,646)(64,155) Plug Power Inc HSBC 24,700
2,954 Pluralsight Inc ’A’ Barclays Bank (2,452)2,171 Pluralsight Inc ’A’ Goldman Sachs 1,728
10,794 Pluralsight Inc ’A’ HSBC 25,6909,350 Pluralsight Inc ’A’ Morgan Stanley (7,761)
31,050 Plymouth Industrial Inc(REIT) HSBC 9,936
40,699 Plymouth Industrial Inc(REIT) Morgan Stanley 14,652
12,297 PNM Resources Inc Bank of AmericaMerrill Lynch 36,116
29,969 PNM Resources Inc Barclays Bank 51,84726,620 PNM Resources Inc Goldman Sachs 80,92551,639 PNM Resources Inc HSBC 46,47667,539 PNM Resources Inc Morgan Stanley 116,842
Holding Description Counterparty
Netunrealised
appreciation/(depreciation)
USD
United States continued(2,177) Polaris Inc Bank of America
Merrill Lynch (29,912)(2,826) Polaris Inc Barclays Bank (7,863)(3,510) Polaris Inc Goldman Sachs (48,227)(9,980) Polaris Inc HSBC (150,656)(3,643) Polaris Inc Morgan Stanley (14,463)
(77,395) PolarityTE Inc Morgan Stanley (5,425)9,541 PolyOne Corp Bank of America
Merrill Lynch 6,1524,489 PolyOne Corp Barclays Bank 1,796
28,470 PolyOne Corp Goldman Sachs 92,8124,394 PolyOne Corp HSBC 10,464
71,644 PolyOne Corp Morgan Stanley 28,657(2,327) Ponce de Leon Federal
Bank Goldman Sachs (1,978)(1,417) Ponce de Leon Federal
Bank HSBC 198(66,516) Ponce de Leon Federal
Bank Morgan Stanley 18,62477 Pool Corp Bank of America
Merrill Lynch 1,9523,795 Pool Corp Barclays Bank 86,1851,543 Pool Corp Goldman Sachs 53,5172,371 Pool Corp HSBC 60,3362,930 Pool Corp Morgan Stanley 66,540
(7,591) Popular Inc Bank of AmericaMerrill Lynch (29,384)
(4,516) Popular Inc Barclays Bank (6,043)(6,084) Popular Inc Goldman Sachs (26,891)(9,401) Popular Inc HSBC (23,358)
(14,414) Popular Inc Morgan Stanley (28,252)57,777 Portland General Electric
CoBank of AmericaMerrill Lynch 290,618
32,029 Portland General ElectricCo Barclays Bank 91,283
18,238 Portland General ElectricCo Goldman Sachs 91,737
49,874 Portland General ElectricCo HSBC 24,438
49,501 Portland General ElectricCo Morgan Stanley 141,078
(9,355) Post Holdings Inc Bank of AmericaMerrill Lynch (25,539)
3,770 Post Holdings Inc Bank of AmericaMerrill Lynch 10,292
(2,006) Post Holdings Inc Barclays Bank (5,557)5,901 Post Holdings Inc Barclays Bank 16,346
(4,546) Post Holdings Inc Goldman Sachs (11,676)7,444 Post Holdings Inc Goldman Sachs 20,322
(6,999) Post Holdings Inc HSBC 14,20813,218 Post Holdings Inc HSBC (23,780)(2,537) Post Holdings Inc Morgan Stanley (7,027)15,384 Post Holdings Inc Morgan Stanley 42,614
(84,451) Potbelly Corp Bank of AmericaMerrill Lynch (4,223)
(57,754) Potbelly Corp HSBC 51,401(46,211) Potbelly Corp Morgan Stanley (12,939)(1,336) PotlatchDeltic Corp (REIT) Goldman Sachs (4,462)(1,162) PotlatchDeltic Corp (REIT) HSBC 3,155
(80,360) PotlatchDeltic Corp (REIT) Morgan Stanley (25,715)(2,651) Powell Industries Inc Bank of America
Merrill Lynch (6,283)(6,714) Powell Industries Inc Goldman Sachs (15,912)
(13,305) Powell Industries Inc Morgan Stanley (2,661)3,285 Power Integrations Inc Bank of America
Merrill Lynch 26,3461,716 Power Integrations Inc Barclays Bank 3,7241,703 Power Integrations Inc Goldman Sachs 13,659
BlackRock Americas Diversified Equity Absolute Return Fundcontinued
The notes on pages 691 to 711 form an integral part of these financial statements.
Annual report and audited financial statements [169]
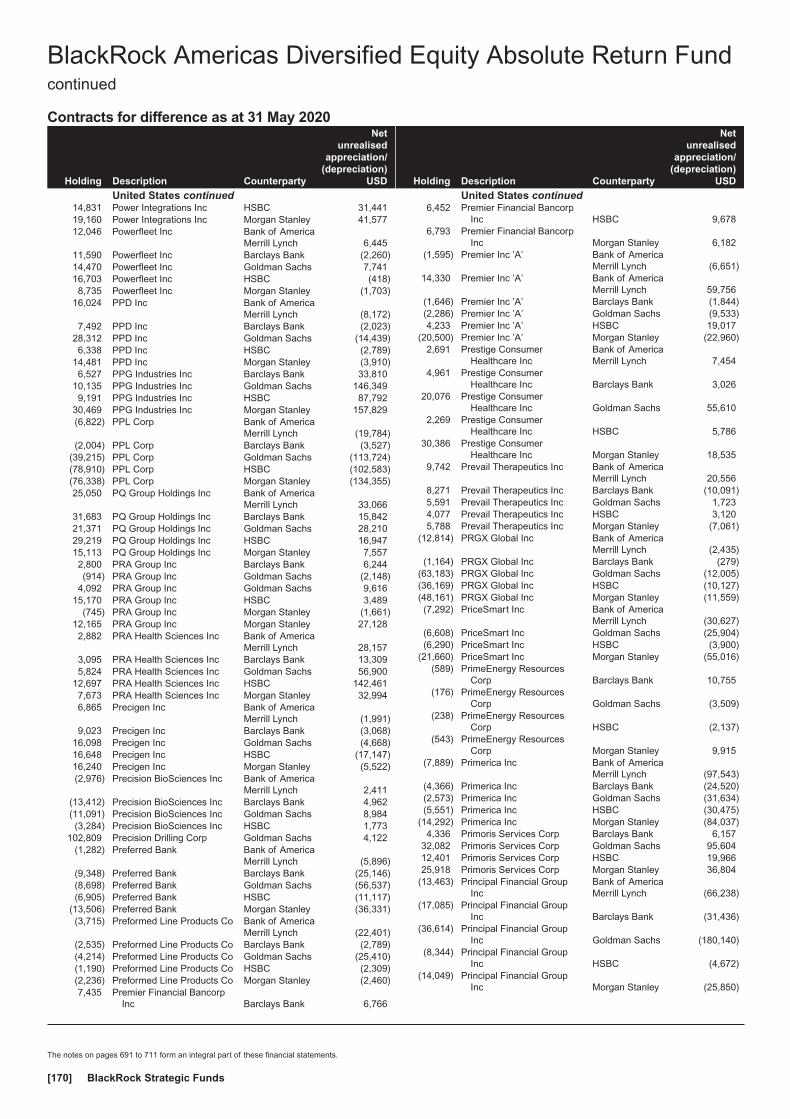
Contracts for difference as at 31 May 2020
Holding Description Counterparty
Netunrealised
appreciation/(depreciation)
USD
United States continued14,831 Power Integrations Inc HSBC 31,44119,160 Power Integrations Inc Morgan Stanley 41,57712,046 Powerfleet Inc Bank of America
Merrill Lynch 6,44511,590 Powerfleet Inc Barclays Bank (2,260)14,470 Powerfleet Inc Goldman Sachs 7,74116,703 Powerfleet Inc HSBC (418)8,735 Powerfleet Inc Morgan Stanley (1,703)
16,024 PPD Inc Bank of AmericaMerrill Lynch (8,172)
7,492 PPD Inc Barclays Bank (2,023)28,312 PPD Inc Goldman Sachs (14,439)6,338 PPD Inc HSBC (2,789)
14,481 PPD Inc Morgan Stanley (3,910)6,527 PPG Industries Inc Barclays Bank 33,810
10,135 PPG Industries Inc Goldman Sachs 146,3499,191 PPG Industries Inc HSBC 87,792
30,469 PPG Industries Inc Morgan Stanley 157,829(6,822) PPL Corp Bank of America
Merrill Lynch (19,784)(2,004) PPL Corp Barclays Bank (3,527)
(39,215) PPL Corp Goldman Sachs (113,724)(78,910) PPL Corp HSBC (102,583)(76,338) PPL Corp Morgan Stanley (134,355)25,050 PQ Group Holdings Inc Bank of America
Merrill Lynch 33,06631,683 PQ Group Holdings Inc Barclays Bank 15,84221,371 PQ Group Holdings Inc Goldman Sachs 28,21029,219 PQ Group Holdings Inc HSBC 16,94715,113 PQ Group Holdings Inc Morgan Stanley 7,5572,800 PRA Group Inc Barclays Bank 6,244(914) PRA Group Inc Goldman Sachs (2,148)
4,092 PRA Group Inc Goldman Sachs 9,61615,170 PRA Group Inc HSBC 3,489
(745) PRA Group Inc Morgan Stanley (1,661)12,165 PRA Group Inc Morgan Stanley 27,1282,882 PRA Health Sciences Inc Bank of America
Merrill Lynch 28,1573,095 PRA Health Sciences Inc Barclays Bank 13,3095,824 PRA Health Sciences Inc Goldman Sachs 56,900
12,697 PRA Health Sciences Inc HSBC 142,4617,673 PRA Health Sciences Inc Morgan Stanley 32,9946,865 Precigen Inc Bank of America
Merrill Lynch (1,991)9,023 Precigen Inc Barclays Bank (3,068)
16,098 Precigen Inc Goldman Sachs (4,668)16,648 Precigen Inc HSBC (17,147)16,240 Precigen Inc Morgan Stanley (5,522)(2,976) Precision BioSciences Inc Bank of America
Merrill Lynch 2,411(13,412) Precision BioSciences Inc Barclays Bank 4,962(11,091) Precision BioSciences Inc Goldman Sachs 8,984(3,284) Precision BioSciences Inc HSBC 1,773
102,809 Precision Drilling Corp Goldman Sachs 4,122(1,282) Preferred Bank Bank of America
Merrill Lynch (5,896)(9,348) Preferred Bank Barclays Bank (25,146)(8,698) Preferred Bank Goldman Sachs (56,537)(6,905) Preferred Bank HSBC (11,117)
(13,506) Preferred Bank Morgan Stanley (36,331)(3,715) Preformed Line Products Co Bank of America
Merrill Lynch (22,401)(2,535) Preformed Line Products Co Barclays Bank (2,789)(4,214) Preformed Line Products Co Goldman Sachs (25,410)(1,190) Preformed Line Products Co HSBC (2,309)(2,236) Preformed Line Products Co Morgan Stanley (2,460)7,435 Premier Financial Bancorp
Inc Barclays Bank 6,766
Holding Description Counterparty
Netunrealised
appreciation/(depreciation)
USD
United States continued6,452 Premier Financial Bancorp
Inc HSBC 9,6786,793 Premier Financial Bancorp
Inc Morgan Stanley 6,182(1,595) Premier Inc ’A’ Bank of America
Merrill Lynch (6,651)14,330 Premier Inc ’A’ Bank of America
Merrill Lynch 59,756(1,646) Premier Inc ’A’ Barclays Bank (1,844)(2,286) Premier Inc ’A’ Goldman Sachs (9,533)4,233 Premier Inc ’A’ HSBC 19,017
(20,500) Premier Inc ’A’ Morgan Stanley (22,960)2,691 Prestige Consumer
Healthcare IncBank of AmericaMerrill Lynch 7,454
4,961 Prestige ConsumerHealthcare Inc Barclays Bank 3,026
20,076 Prestige ConsumerHealthcare Inc Goldman Sachs 55,610
2,269 Prestige ConsumerHealthcare Inc HSBC 5,786
30,386 Prestige ConsumerHealthcare Inc Morgan Stanley 18,535
9,742 Prevail Therapeutics Inc Bank of AmericaMerrill Lynch 20,556
8,271 Prevail Therapeutics Inc Barclays Bank (10,091)5,591 Prevail Therapeutics Inc Goldman Sachs 1,7234,077 Prevail Therapeutics Inc HSBC 3,1205,788 Prevail Therapeutics Inc Morgan Stanley (7,061)
(12,814) PRGX Global Inc Bank of AmericaMerrill Lynch (2,435)
(1,164) PRGX Global Inc Barclays Bank (279)(63,183) PRGX Global Inc Goldman Sachs (12,005)(36,169) PRGX Global Inc HSBC (10,127)(48,161) PRGX Global Inc Morgan Stanley (11,559)(7,292) PriceSmart Inc Bank of America
Merrill Lynch (30,627)(6,608) PriceSmart Inc Goldman Sachs (25,904)(6,290) PriceSmart Inc HSBC (3,900)
(21,660) PriceSmart Inc Morgan Stanley (55,016)(589) PrimeEnergy Resources
Corp Barclays Bank 10,755(176) PrimeEnergy Resources
Corp Goldman Sachs (3,509)(238) PrimeEnergy Resources
Corp HSBC (2,137)(543) PrimeEnergy Resources
Corp Morgan Stanley 9,915(7,889) Primerica Inc Bank of America
Merrill Lynch (97,543)(4,366) Primerica Inc Barclays Bank (24,520)(2,573) Primerica Inc Goldman Sachs (31,634)(5,551) Primerica Inc HSBC (30,475)
(14,292) Primerica Inc Morgan Stanley (84,037)4,336 Primoris Services Corp Barclays Bank 6,157
32,082 Primoris Services Corp Goldman Sachs 95,60412,401 Primoris Services Corp HSBC 19,96625,918 Primoris Services Corp Morgan Stanley 36,804
(13,463) Principal Financial GroupInc
Bank of AmericaMerrill Lynch (66,238)
(17,085) Principal Financial GroupInc Barclays Bank (31,436)
(36,614) Principal Financial GroupInc Goldman Sachs (180,140)
(8,344) Principal Financial GroupInc HSBC (4,672)
(14,049) Principal Financial GroupInc Morgan Stanley (25,850)
BlackRock Americas Diversified Equity Absolute Return Fundcontinued
The notes on pages 691 to 711 form an integral part of these financial statements.
BlackRock Strategic Funds[170]
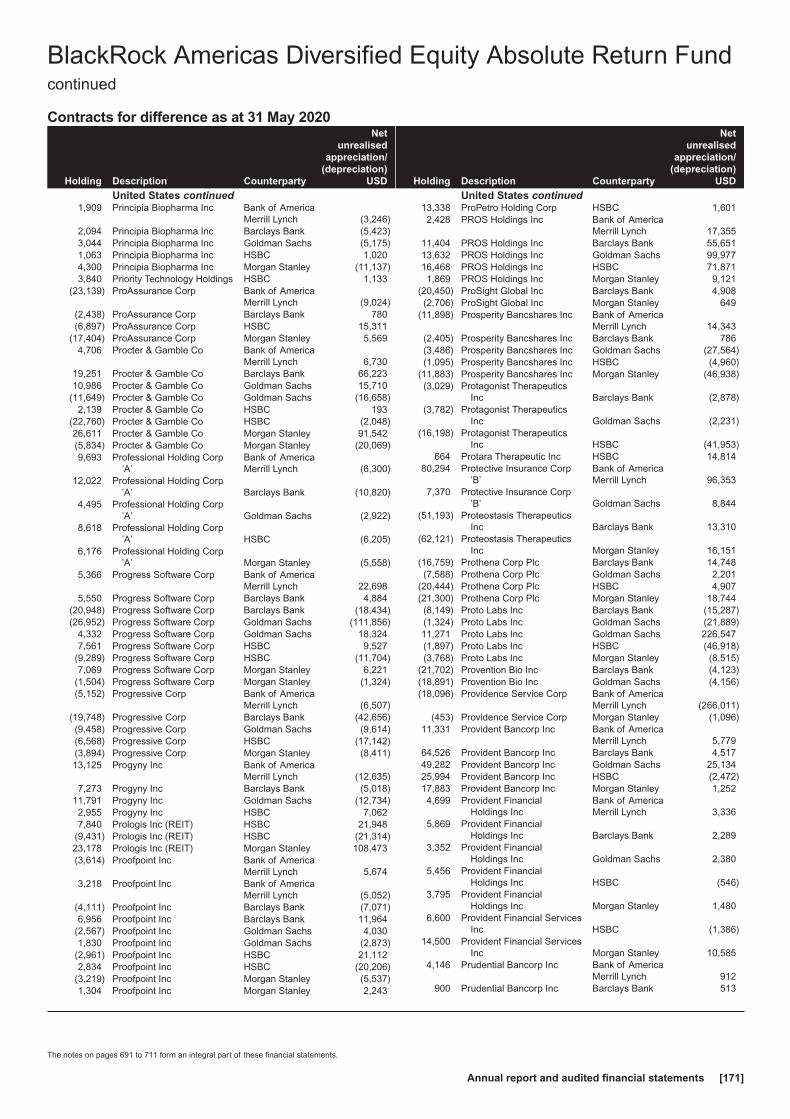
Contracts for difference as at 31 May 2020
Holding Description Counterparty
Netunrealised
appreciation/(depreciation)
USD
United States continued1,909 Principia Biopharma Inc Bank of America
Merrill Lynch (3,246)2,094 Principia Biopharma Inc Barclays Bank (5,423)3,044 Principia Biopharma Inc Goldman Sachs (5,175)1,063 Principia Biopharma Inc HSBC 1,0204,300 Principia Biopharma Inc Morgan Stanley (11,137)3,840 Priority Technology Holdings HSBC 1,133
(23,139) ProAssurance Corp Bank of AmericaMerrill Lynch (9,024)
(2,438) ProAssurance Corp Barclays Bank 780(6,897) ProAssurance Corp HSBC 15,311
(17,404) ProAssurance Corp Morgan Stanley 5,5694,706 Procter & Gamble Co Bank of America
Merrill Lynch 6,73019,251 Procter & Gamble Co Barclays Bank 66,22310,986 Procter & Gamble Co Goldman Sachs 15,710
(11,649) Procter & Gamble Co Goldman Sachs (16,658)2,139 Procter & Gamble Co HSBC 193
(22,760) Procter & Gamble Co HSBC (2,048)26,611 Procter & Gamble Co Morgan Stanley 91,542(5,834) Procter & Gamble Co Morgan Stanley (20,069)9,693 Professional Holding Corp
’A’Bank of AmericaMerrill Lynch (6,300)
12,022 Professional Holding Corp’A’ Barclays Bank (10,820)
4,495 Professional Holding Corp’A’ Goldman Sachs (2,922)
8,618 Professional Holding Corp’A’ HSBC (6,205)
6,176 Professional Holding Corp’A’ Morgan Stanley (5,558)
5,366 Progress Software Corp Bank of AmericaMerrill Lynch 22,698
5,550 Progress Software Corp Barclays Bank 4,884(20,948) Progress Software Corp Barclays Bank (18,434)(26,952) Progress Software Corp Goldman Sachs (111,856)
4,332 Progress Software Corp Goldman Sachs 18,3247,561 Progress Software Corp HSBC 9,527
(9,289) Progress Software Corp HSBC (11,704)7,069 Progress Software Corp Morgan Stanley 6,221
(1,504) Progress Software Corp Morgan Stanley (1,324)(5,152) Progressive Corp Bank of America
Merrill Lynch (6,507)(19,748) Progressive Corp Barclays Bank (42,656)(9,458) Progressive Corp Goldman Sachs (9,614)(6,568) Progressive Corp HSBC (17,142)(3,894) Progressive Corp Morgan Stanley (8,411)13,125 Progyny Inc Bank of America
Merrill Lynch (12,635)7,273 Progyny Inc Barclays Bank (5,018)
11,791 Progyny Inc Goldman Sachs (12,734)2,955 Progyny Inc HSBC 7,0627,840 Prologis Inc (REIT) HSBC 21,948
(9,431) Prologis Inc (REIT) HSBC (21,314)23,178 Prologis Inc (REIT) Morgan Stanley 108,473(3,614) Proofpoint Inc Bank of America
Merrill Lynch 5,6743,218 Proofpoint Inc Bank of America
Merrill Lynch (5,052)(4,111) Proofpoint Inc Barclays Bank (7,071)6,956 Proofpoint Inc Barclays Bank 11,964
(2,567) Proofpoint Inc Goldman Sachs 4,0301,830 Proofpoint Inc Goldman Sachs (2,873)
(2,961) Proofpoint Inc HSBC 21,1122,834 Proofpoint Inc HSBC (20,206)
(3,219) Proofpoint Inc Morgan Stanley (5,537)1,304 Proofpoint Inc Morgan Stanley 2,243
Holding Description Counterparty
Netunrealised
appreciation/(depreciation)
USD
United States continued13,338 ProPetro Holding Corp HSBC 1,6012,428 PROS Holdings Inc Bank of America
Merrill Lynch 17,35511,404 PROS Holdings Inc Barclays Bank 55,65113,632 PROS Holdings Inc Goldman Sachs 99,97716,468 PROS Holdings Inc HSBC 71,8711,869 PROS Holdings Inc Morgan Stanley 9,121
(20,450) ProSight Global Inc Barclays Bank 4,908(2,706) ProSight Global Inc Morgan Stanley 649
(11,898) Prosperity Bancshares Inc Bank of AmericaMerrill Lynch 14,343
(2,405) Prosperity Bancshares Inc Barclays Bank 786(3,486) Prosperity Bancshares Inc Goldman Sachs (27,564)(1,095) Prosperity Bancshares Inc HSBC (4,960)
(11,883) Prosperity Bancshares Inc Morgan Stanley (46,938)(3,029) Protagonist Therapeutics
Inc Barclays Bank (2,878)(3,782) Protagonist Therapeutics
Inc Goldman Sachs (2,231)(16,198) Protagonist Therapeutics
Inc HSBC (41,953)664 Protara Therapeutic Inc HSBC 14,814
80,294 Protective Insurance Corp’B’
Bank of AmericaMerrill Lynch 96,353
7,370 Protective Insurance Corp’B’ Goldman Sachs 8,844
(51,193) Proteostasis TherapeuticsInc Barclays Bank 13,310
(62,121) Proteostasis TherapeuticsInc Morgan Stanley 16,151
(16,759) Prothena Corp Plc Barclays Bank 14,748(7,588) Prothena Corp Plc Goldman Sachs 2,201
(20,444) Prothena Corp Plc HSBC 4,907(21,300) Prothena Corp Plc Morgan Stanley 18,744(8,149) Proto Labs Inc Barclays Bank (15,287)(1,324) Proto Labs Inc Goldman Sachs (21,889)11,271 Proto Labs Inc Goldman Sachs 226,547(1,897) Proto Labs Inc HSBC (46,918)(3,768) Proto Labs Inc Morgan Stanley (8,515)
(21,702) Provention Bio Inc Barclays Bank (4,123)(18,891) Provention Bio Inc Goldman Sachs (4,156)(18,096) Providence Service Corp Bank of America
Merrill Lynch (266,011)(453) Providence Service Corp Morgan Stanley (1,096)
11,331 Provident Bancorp Inc Bank of AmericaMerrill Lynch 5,779
64,526 Provident Bancorp Inc Barclays Bank 4,51749,282 Provident Bancorp Inc Goldman Sachs 25,13425,994 Provident Bancorp Inc HSBC (2,472)17,883 Provident Bancorp Inc Morgan Stanley 1,2524,699 Provident Financial
Holdings IncBank of AmericaMerrill Lynch 3,336
5,869 Provident FinancialHoldings Inc Barclays Bank 2,289
3,352 Provident FinancialHoldings Inc Goldman Sachs 2,380
5,456 Provident FinancialHoldings Inc HSBC (546)
3,795 Provident FinancialHoldings Inc Morgan Stanley 1,480
6,600 Provident Financial ServicesInc HSBC (1,386)
14,500 Provident Financial ServicesInc Morgan Stanley 10,585
4,146 Prudential Bancorp Inc Bank of AmericaMerrill Lynch 912
900 Prudential Bancorp Inc Barclays Bank 513
BlackRock Americas Diversified Equity Absolute Return Fundcontinued
The notes on pages 691 to 711 form an integral part of these financial statements.
Annual report and audited financial statements [171]

Contracts for difference as at 31 May 2020
Holding Description Counterparty
Netunrealised
appreciation/(depreciation)
USD
United States continued1,826 Prudential Bancorp Inc Goldman Sachs 4029,752 Prudential Financial Inc Bank of America
Merrill Lynch 71,38414,213 Prudential Financial Inc Barclays Bank 56,42617,709 Prudential Financial Inc Goldman Sachs 54,81538,722 Prudential Financial Inc HSBC 65,99280,890 Prudential Financial Inc Morgan Stanley 272,683(2,188) PS Business Parks Inc
(REIT)Bank of AmericaMerrill Lynch (44,395)
(3,026) PS Business Parks Inc(REIT) Barclays Bank (27,295)
(10,408) PS Business Parks Inc(REIT) Goldman Sachs (213,468)
(25,386) PS Business Parks Inc(REIT) HSBC (208,129)
(17,103) PS Business Parks Inc(REIT) Morgan Stanley (154,270)
(6,140) PTC Inc Bank of AmericaMerrill Lynch (59,988)
(8,537) PTC Inc Barclays Bank (38,929)(6,498) PTC Inc Goldman Sachs (63,485)(6,656) PTC Inc HSBC (21,432)
(17,102) PTC Inc Morgan Stanley (77,985)(3,470) PTC Therapeutics Inc Bank of America
Merrill Lynch (2,915)3,268 PTC Therapeutics Inc Bank of America
Merrill Lynch 2,745(7,098) PTC Therapeutics Inc Barclays Bank 6,6721,690 PTC Therapeutics Inc Barclays Bank (1,077)
(6,095) PTC Therapeutics Inc Goldman Sachs (5,120)2,465 PTC Therapeutics Inc Goldman Sachs 2,071
(14,247) PTC Therapeutics Inc HSBC (73,657)10,005 PTC Therapeutics Inc HSBC 51,726
(28,262) PTC Therapeutics Inc Morgan Stanley 26,5671,243 PTC Therapeutics Inc Morgan Stanley (1,168)
(7,283) Public Service EnterpriseGroup Inc
Bank of AmericaMerrill Lynch (37,143)
(997) Public Service EnterpriseGroup Inc Barclays Bank (2,433)
4,823 Public Service EnterpriseGroup Inc Barclays Bank 2,294
23,013 Public Service EnterpriseGroup Inc Goldman Sachs 117,366
(8,973) Public Service EnterpriseGroup Inc HSBC (16,062)
5,988 Public Service EnterpriseGroup Inc HSBC 10,719
(18,831) Public Service EnterpriseGroup Inc Morgan Stanley (45,948)
(1,843) Public Storage (REIT) Bank of AmericaMerrill Lynch (44,029)
3,648 Public Storage (REIT) Bank of AmericaMerrill Lynch 87,151
(971) Public Storage (REIT) Barclays Bank (13,002)1,224 Public Storage (REIT) Barclays Bank 16,389
(14,074) Public Storage (REIT) Goldman Sachs (336,228)3,456 Public Storage (REIT) Goldman Sachs 82,564
(5,459) Public Storage (REIT) HSBC (51,970)(1,019) Public Storage (REIT) Morgan Stanley (13,644)(1,462) Pulse Biosciences Inc Bank of America
Merrill Lynch 2,354(1,462) Pulse Biosciences Inc Bank of America
Merrill Lynch (762)(2,667) Pulse Biosciences Inc Barclays Bank 2,134(2,667) Pulse Biosciences Inc Barclays Bank (1,390)
(20,415) Pulse Biosciences Inc HSBC 36,747(20,415) Pulse Biosciences Inc HSBC (10,642)(8,017) Pulse Biosciences Inc Morgan Stanley 6,414(8,017) Pulse Biosciences Inc Morgan Stanley (4,179)
Holding Description Counterparty
Netunrealised
appreciation/(depreciation)
USD
United States continued(31,307) PulteGroup Inc Bank of America
Merrill Lynch (207,252)14,395 PulteGroup Inc Bank of America
Merrill Lynch 95,295(17,318) PulteGroup Inc Barclays Bank (17,838)(18,765) PulteGroup Inc Goldman Sachs (124,224)19,569 PulteGroup Inc Goldman Sachs 129,547(3,941) PulteGroup Inc HSBC (17,577)32,962 PulteGroup Inc HSBC 147,011
(35,576) PulteGroup Inc Morgan Stanley (36,643)10,148 PulteGroup Inc Morgan Stanley 10,45230,427 Puma Biotechnology Inc Barclays Bank (35,600)4,076 Puma Biotechnology Inc Goldman Sachs (8,560)
(18,640) Pure Cycle Corp Bank of AmericaMerrill Lynch (2,610)
(24,419) Pure Cycle Corp Barclays Bank 2,442(48,474) Pure Cycle Corp Goldman Sachs (5,651)(33,631) Pure Cycle Corp HSBC 3,914(28,782) Pure Cycle Corp Morgan Stanley 2,87837,249 Pure Storage Inc ’A’ Bank of America
Merrill Lynch 126,27432,577 Pure Storage Inc ’A’ Barclays Bank 45,93424,667 Pure Storage Inc ’A’ Goldman Sachs 83,6215,504 Pure Storage Inc ’A’ HSBC 11,944
37,986 Pure Storage Inc ’A’ Morgan Stanley 53,560(26,326) Purple Innovation Inc Bank of America
Merrill Lynch (37,909)(3,958) Purple Innovation Inc Barclays Bank (2,810)(6,736) Purple Innovation Inc Goldman Sachs (9,700)(4,721) Purple Innovation Inc HSBC (7,459)(3,495) PVH Corp Bank of America
Merrill Lynch (23,766)(8,592) PVH Corp Barclays Bank (24,573)(2,191) PVH Corp Goldman Sachs (14,899)(4,181) PVH Corp HSBC (4,139)
(16,213) PVH Corp Morgan Stanley (46,369)10,762 Pzena Investment
Management Inc ’A’Bank of AmericaMerrill Lynch 2,368
10,083 Pzena InvestmentManagement Inc ’A’ Barclays Bank 706
11,281 Pzena InvestmentManagement Inc ’A’ Goldman Sachs 2,482
50,812 Pzena InvestmentManagement Inc ’A’ HSBC (35,568)
45,307 Pzena InvestmentManagement Inc ’A’ Morgan Stanley 3,171
(4,838) Q2 Holdings Inc Bank of AmericaMerrill Lynch (11,969)
774 Q2 Holdings Inc Bank of AmericaMerrill Lynch 1,974
(2,673) Q2 Holdings Inc Barclays Bank (2,112)4,244 Q2 Holdings Inc Barclays Bank 150
(10,708) Q2 Holdings Inc Goldman Sachs (27,306)4,409 Q2 Holdings Inc Goldman Sachs 11,331
(6,039) Q2 Holdings Inc HSBC 1,0271,495 Q2 Holdings Inc HSBC 576
(13,220) Q2 Holdings Inc Morgan Stanley (10,443)8,064 Q2 Holdings Inc Morgan Stanley 6,371
(3,433) QAD Inc ’A’ Bank of AmericaMerrill Lynch (19,534)
(4,052) QAD Inc ’A’ Barclays Bank (11,021)(2,116) QAD Inc ’A’ Goldman Sachs (12,040)
(603) QAD Inc ’A’ HSBC (784)(19,735) QAD Inc ’A’ Morgan Stanley (53,679)(1,940) QCR Holdings Inc Bank of America
Merrill Lynch (9,739)(6,929) QCR Holdings Inc Barclays Bank (12,264)(7,297) QCR Holdings Inc Goldman Sachs (36,631)
BlackRock Americas Diversified Equity Absolute Return Fundcontinued
The notes on pages 691 to 711 form an integral part of these financial statements.
BlackRock Strategic Funds[172]
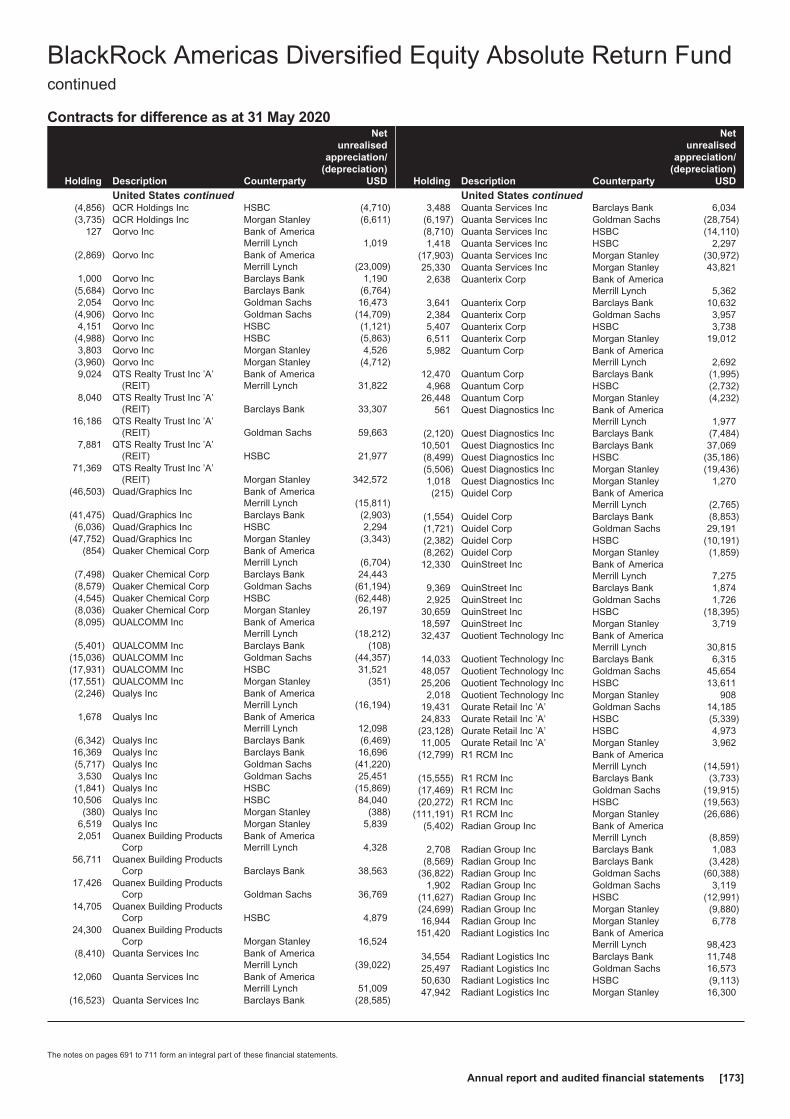
Contracts for difference as at 31 May 2020
Holding Description Counterparty
Netunrealised
appreciation/(depreciation)
USD
United States continued(4,856) QCR Holdings Inc HSBC (4,710)(3,735) QCR Holdings Inc Morgan Stanley (6,611)
127 Qorvo Inc Bank of AmericaMerrill Lynch 1,019
(2,869) Qorvo Inc Bank of AmericaMerrill Lynch (23,009)
1,000 Qorvo Inc Barclays Bank 1,190(5,684) Qorvo Inc Barclays Bank (6,764)2,054 Qorvo Inc Goldman Sachs 16,473
(4,906) Qorvo Inc Goldman Sachs (14,709)4,151 Qorvo Inc HSBC (1,121)
(4,988) Qorvo Inc HSBC (5,863)3,803 Qorvo Inc Morgan Stanley 4,526
(3,960) Qorvo Inc Morgan Stanley (4,712)9,024 QTS Realty Trust Inc ’A’
(REIT)Bank of AmericaMerrill Lynch 31,822
8,040 QTS Realty Trust Inc ’A’(REIT) Barclays Bank 33,307
16,186 QTS Realty Trust Inc ’A’(REIT) Goldman Sachs 59,663
7,881 QTS Realty Trust Inc ’A’(REIT) HSBC 21,977
71,369 QTS Realty Trust Inc ’A’(REIT) Morgan Stanley 342,572
(46,503) Quad/Graphics Inc Bank of AmericaMerrill Lynch (15,811)
(41,475) Quad/Graphics Inc Barclays Bank (2,903)(6,036) Quad/Graphics Inc HSBC 2,294
(47,752) Quad/Graphics Inc Morgan Stanley (3,343)(854) Quaker Chemical Corp Bank of America
Merrill Lynch (6,704)(7,498) Quaker Chemical Corp Barclays Bank 24,443(8,579) Quaker Chemical Corp Goldman Sachs (61,194)(4,545) Quaker Chemical Corp HSBC (62,448)(8,036) Quaker Chemical Corp Morgan Stanley 26,197(8,095) QUALCOMM Inc Bank of America
Merrill Lynch (18,212)(5,401) QUALCOMM Inc Barclays Bank (108)
(15,036) QUALCOMM Inc Goldman Sachs (44,357)(17,931) QUALCOMM Inc HSBC 31,521(17,551) QUALCOMM Inc Morgan Stanley (351)(2,246) Qualys Inc Bank of America
Merrill Lynch (16,194)1,678 Qualys Inc Bank of America
Merrill Lynch 12,098(6,342) Qualys Inc Barclays Bank (6,469)16,369 Qualys Inc Barclays Bank 16,696(5,717) Qualys Inc Goldman Sachs (41,220)3,530 Qualys Inc Goldman Sachs 25,451
(1,841) Qualys Inc HSBC (15,869)10,506 Qualys Inc HSBC 84,040
(380) Qualys Inc Morgan Stanley (388)6,519 Qualys Inc Morgan Stanley 5,8392,051 Quanex Building Products
CorpBank of AmericaMerrill Lynch 4,328
56,711 Quanex Building ProductsCorp Barclays Bank 38,563
17,426 Quanex Building ProductsCorp Goldman Sachs 36,769
14,705 Quanex Building ProductsCorp HSBC 4,879
24,300 Quanex Building ProductsCorp Morgan Stanley 16,524
(8,410) Quanta Services Inc Bank of AmericaMerrill Lynch (39,022)
12,060 Quanta Services Inc Bank of AmericaMerrill Lynch 51,009
(16,523) Quanta Services Inc Barclays Bank (28,585)
Holding Description Counterparty
Netunrealised
appreciation/(depreciation)
USD
United States continued3,488 Quanta Services Inc Barclays Bank 6,034
(6,197) Quanta Services Inc Goldman Sachs (28,754)(8,710) Quanta Services Inc HSBC (14,110)1,418 Quanta Services Inc HSBC 2,297
(17,903) Quanta Services Inc Morgan Stanley (30,972)25,330 Quanta Services Inc Morgan Stanley 43,8212,638 Quanterix Corp Bank of America
Merrill Lynch 5,3623,641 Quanterix Corp Barclays Bank 10,6322,384 Quanterix Corp Goldman Sachs 3,9575,407 Quanterix Corp HSBC 3,7386,511 Quanterix Corp Morgan Stanley 19,0125,982 Quantum Corp Bank of America
Merrill Lynch 2,69212,470 Quantum Corp Barclays Bank (1,995)4,968 Quantum Corp HSBC (2,732)
26,448 Quantum Corp Morgan Stanley (4,232)561 Quest Diagnostics Inc Bank of America
Merrill Lynch 1,977(2,120) Quest Diagnostics Inc Barclays Bank (7,484)10,501 Quest Diagnostics Inc Barclays Bank 37,069(8,499) Quest Diagnostics Inc HSBC (35,186)(5,506) Quest Diagnostics Inc Morgan Stanley (19,436)1,018 Quest Diagnostics Inc Morgan Stanley 1,270(215) Quidel Corp Bank of America
Merrill Lynch (2,765)(1,554) Quidel Corp Barclays Bank (8,853)(1,721) Quidel Corp Goldman Sachs 29,191(2,382) Quidel Corp HSBC (10,191)(8,262) Quidel Corp Morgan Stanley (1,859)12,330 QuinStreet Inc Bank of America
Merrill Lynch 7,2759,369 QuinStreet Inc Barclays Bank 1,8742,925 QuinStreet Inc Goldman Sachs 1,726
30,659 QuinStreet Inc HSBC (18,395)18,597 QuinStreet Inc Morgan Stanley 3,71932,437 Quotient Technology Inc Bank of America
Merrill Lynch 30,81514,033 Quotient Technology Inc Barclays Bank 6,31548,057 Quotient Technology Inc Goldman Sachs 45,65425,206 Quotient Technology Inc HSBC 13,6112,018 Quotient Technology Inc Morgan Stanley 908
19,431 Qurate Retail Inc ’A’ Goldman Sachs 14,18524,833 Qurate Retail Inc ’A’ HSBC (5,339)
(23,128) Qurate Retail Inc ’A’ HSBC 4,97311,005 Qurate Retail Inc ’A’ Morgan Stanley 3,962
(12,799) R1 RCM Inc Bank of AmericaMerrill Lynch (14,591)
(15,555) R1 RCM Inc Barclays Bank (3,733)(17,469) R1 RCM Inc Goldman Sachs (19,915)(20,272) R1 RCM Inc HSBC (19,563)
(111,191) R1 RCM Inc Morgan Stanley (26,686)(5,402) Radian Group Inc Bank of America
Merrill Lynch (8,859)2,708 Radian Group Inc Barclays Bank 1,083
(8,569) Radian Group Inc Barclays Bank (3,428)(36,822) Radian Group Inc Goldman Sachs (60,388)
1,902 Radian Group Inc Goldman Sachs 3,119(11,627) Radian Group Inc HSBC (12,991)(24,699) Radian Group Inc Morgan Stanley (9,880)16,944 Radian Group Inc Morgan Stanley 6,778
151,420 Radiant Logistics Inc Bank of AmericaMerrill Lynch 98,423
34,554 Radiant Logistics Inc Barclays Bank 11,74825,497 Radiant Logistics Inc Goldman Sachs 16,57350,630 Radiant Logistics Inc HSBC (9,113)47,942 Radiant Logistics Inc Morgan Stanley 16,300
BlackRock Americas Diversified Equity Absolute Return Fundcontinued
The notes on pages 691 to 711 form an integral part of these financial statements.
Annual report and audited financial statements [173]
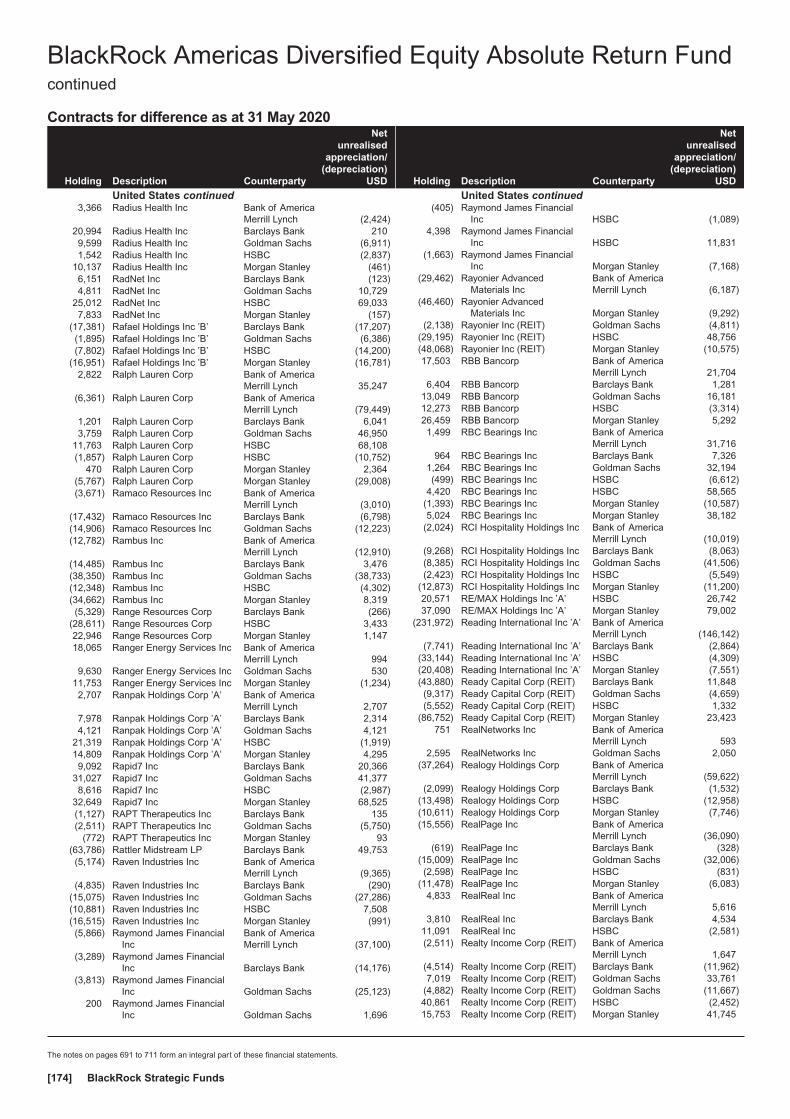
Contracts for difference as at 31 May 2020
Holding Description Counterparty
Netunrealised
appreciation/(depreciation)
USD
United States continued3,366 Radius Health Inc Bank of America
Merrill Lynch (2,424)20,994 Radius Health Inc Barclays Bank 2109,599 Radius Health Inc Goldman Sachs (6,911)1,542 Radius Health Inc HSBC (2,837)
10,137 Radius Health Inc Morgan Stanley (461)6,151 RadNet Inc Barclays Bank (123)4,811 RadNet Inc Goldman Sachs 10,729
25,012 RadNet Inc HSBC 69,0337,833 RadNet Inc Morgan Stanley (157)
(17,381) Rafael Holdings Inc ’B’ Barclays Bank (17,207)(1,895) Rafael Holdings Inc ’B’ Goldman Sachs (6,386)(7,802) Rafael Holdings Inc ’B’ HSBC (14,200)
(16,951) Rafael Holdings Inc ’B’ Morgan Stanley (16,781)2,822 Ralph Lauren Corp Bank of America
Merrill Lynch 35,247(6,361) Ralph Lauren Corp Bank of America
Merrill Lynch (79,449)1,201 Ralph Lauren Corp Barclays Bank 6,0413,759 Ralph Lauren Corp Goldman Sachs 46,950
11,763 Ralph Lauren Corp HSBC 68,108(1,857) Ralph Lauren Corp HSBC (10,752)
470 Ralph Lauren Corp Morgan Stanley 2,364(5,767) Ralph Lauren Corp Morgan Stanley (29,008)(3,671) Ramaco Resources Inc Bank of America
Merrill Lynch (3,010)(17,432) Ramaco Resources Inc Barclays Bank (6,798)(14,906) Ramaco Resources Inc Goldman Sachs (12,223)(12,782) Rambus Inc Bank of America
Merrill Lynch (12,910)(14,485) Rambus Inc Barclays Bank 3,476(38,350) Rambus Inc Goldman Sachs (38,733)(12,348) Rambus Inc HSBC (4,302)(34,662) Rambus Inc Morgan Stanley 8,319(5,329) Range Resources Corp Barclays Bank (266)
(28,611) Range Resources Corp HSBC 3,43322,946 Range Resources Corp Morgan Stanley 1,14718,065 Ranger Energy Services Inc Bank of America
Merrill Lynch 9949,630 Ranger Energy Services Inc Goldman Sachs 530
11,753 Ranger Energy Services Inc Morgan Stanley (1,234)2,707 Ranpak Holdings Corp ’A’ Bank of America
Merrill Lynch 2,7077,978 Ranpak Holdings Corp ’A’ Barclays Bank 2,3144,121 Ranpak Holdings Corp ’A’ Goldman Sachs 4,121
21,319 Ranpak Holdings Corp ’A’ HSBC (1,919)14,809 Ranpak Holdings Corp ’A’ Morgan Stanley 4,2959,092 Rapid7 Inc Barclays Bank 20,366
31,027 Rapid7 Inc Goldman Sachs 41,3778,616 Rapid7 Inc HSBC (2,987)
32,649 Rapid7 Inc Morgan Stanley 68,525(1,127) RAPT Therapeutics Inc Barclays Bank 135(2,511) RAPT Therapeutics Inc Goldman Sachs (5,750)
(772) RAPT Therapeutics Inc Morgan Stanley 93(63,786) Rattler Midstream LP Barclays Bank 49,753(5,174) Raven Industries Inc Bank of America
Merrill Lynch (9,365)(4,835) Raven Industries Inc Barclays Bank (290)
(15,075) Raven Industries Inc Goldman Sachs (27,286)(10,881) Raven Industries Inc HSBC 7,508(16,515) Raven Industries Inc Morgan Stanley (991)(5,866) Raymond James Financial
IncBank of AmericaMerrill Lynch (37,100)
(3,289) Raymond James FinancialInc Barclays Bank (14,176)
(3,813) Raymond James FinancialInc Goldman Sachs (25,123)
200 Raymond James FinancialInc Goldman Sachs 1,696
Holding Description Counterparty
Netunrealised
appreciation/(depreciation)
USD
United States continued(405) Raymond James Financial
Inc HSBC (1,089)4,398 Raymond James Financial
Inc HSBC 11,831(1,663) Raymond James Financial
Inc Morgan Stanley (7,168)(29,462) Rayonier Advanced
Materials IncBank of AmericaMerrill Lynch (6,187)
(46,460) Rayonier AdvancedMaterials Inc Morgan Stanley (9,292)
(2,138) Rayonier Inc (REIT) Goldman Sachs (4,811)(29,195) Rayonier Inc (REIT) HSBC 48,756(48,068) Rayonier Inc (REIT) Morgan Stanley (10,575)17,503 RBB Bancorp Bank of America
Merrill Lynch 21,7046,404 RBB Bancorp Barclays Bank 1,281
13,049 RBB Bancorp Goldman Sachs 16,18112,273 RBB Bancorp HSBC (3,314)26,459 RBB Bancorp Morgan Stanley 5,2921,499 RBC Bearings Inc Bank of America
Merrill Lynch 31,716964 RBC Bearings Inc Barclays Bank 7,326
1,264 RBC Bearings Inc Goldman Sachs 32,194(499) RBC Bearings Inc HSBC (6,612)
4,420 RBC Bearings Inc HSBC 58,565(1,393) RBC Bearings Inc Morgan Stanley (10,587)5,024 RBC Bearings Inc Morgan Stanley 38,182
(2,024) RCI Hospitality Holdings Inc Bank of AmericaMerrill Lynch (10,019)
(9,268) RCI Hospitality Holdings Inc Barclays Bank (8,063)(8,385) RCI Hospitality Holdings Inc Goldman Sachs (41,506)(2,423) RCI Hospitality Holdings Inc HSBC (5,549)
(12,873) RCI Hospitality Holdings Inc Morgan Stanley (11,200)20,571 RE/MAX Holdings Inc ’A’ HSBC 26,74237,090 RE/MAX Holdings Inc ’A’ Morgan Stanley 79,002
(231,972) Reading International Inc ’A’ Bank of AmericaMerrill Lynch (146,142)
(7,741) Reading International Inc ’A’ Barclays Bank (2,864)(33,144) Reading International Inc ’A’ HSBC (4,309)(20,408) Reading International Inc ’A’ Morgan Stanley (7,551)(43,880) Ready Capital Corp (REIT) Barclays Bank 11,848(9,317) Ready Capital Corp (REIT) Goldman Sachs (4,659)(5,552) Ready Capital Corp (REIT) HSBC 1,332
(86,752) Ready Capital Corp (REIT) Morgan Stanley 23,423751 RealNetworks Inc Bank of America
Merrill Lynch 5932,595 RealNetworks Inc Goldman Sachs 2,050
(37,264) Realogy Holdings Corp Bank of AmericaMerrill Lynch (59,622)
(2,099) Realogy Holdings Corp Barclays Bank (1,532)(13,498) Realogy Holdings Corp HSBC (12,958)(10,611) Realogy Holdings Corp Morgan Stanley (7,746)(15,556) RealPage Inc Bank of America
Merrill Lynch (36,090)(619) RealPage Inc Barclays Bank (328)
(15,009) RealPage Inc Goldman Sachs (32,006)(2,598) RealPage Inc HSBC (831)
(11,478) RealPage Inc Morgan Stanley (6,083)4,833 RealReal Inc Bank of America
Merrill Lynch 5,6163,810 RealReal Inc Barclays Bank 4,534
11,091 RealReal Inc HSBC (2,581)(2,511) Realty Income Corp (REIT) Bank of America
Merrill Lynch 1,647(4,514) Realty Income Corp (REIT) Barclays Bank (11,962)7,019 Realty Income Corp (REIT) Goldman Sachs 33,761
(4,882) Realty Income Corp (REIT) Goldman Sachs (11,667)40,861 Realty Income Corp (REIT) HSBC (2,452)15,753 Realty Income Corp (REIT) Morgan Stanley 41,745
BlackRock Americas Diversified Equity Absolute Return Fundcontinued
The notes on pages 691 to 711 form an integral part of these financial statements.
BlackRock Strategic Funds[174]

Contracts for difference as at 31 May 2020
Holding Description Counterparty
Netunrealised
appreciation/(depreciation)
USD
United States continued(150) Reata Pharmaceuticals Inc
’A’Bank of AmericaMerrill Lynch 1,677
1,507 Reata Pharmaceuticals Inc’A’
Bank of AmericaMerrill Lynch (16,848)
514 Reata Pharmaceuticals Inc’A’ Barclays Bank (8,435)
(555) Reata Pharmaceuticals Inc’A’ Goldman Sachs 6,205
2,636 Reata Pharmaceuticals Inc’A’ Goldman Sachs (29,471)
(737) Reata Pharmaceuticals Inc’A’ HSBC 13,738
714 Reata Pharmaceuticals Inc’A’ HSBC (7,057)
(138) Reata Pharmaceuticals Inc’A’ Morgan Stanley 2,265
2,358 Reata Pharmaceuticals Inc’A’ Morgan Stanley (33,040)
(24,451) Recro Pharma Inc Bank of AmericaMerrill Lynch (8,308)
(7,648) Recro Pharma Inc Barclays Bank 459(6,167) Recro Pharma Inc Goldman Sachs (2,158)(3,123) Recro Pharma Inc HSBC 11,586(7,345) Recro Pharma Inc Morgan Stanley 441
(94,037) Red Lion Hotels Corp Bank of AmericaMerrill Lynch (20,688)
(25,851) Red Lion Hotels Corp Barclays Bank 259(19,712) Red Lion Hotels Corp HSBC (1,577)(10,971) Red Lion Hotels Corp Morgan Stanley 110
(557) Red River Bancshares Inc Bank of AmericaMerrill Lynch (1,426)
(4,032) Red River Bancshares Inc Barclays Bank (1,976)(4,981) Red River Bancshares Inc Goldman Sachs (12,751)(1,238) Red River Bancshares Inc HSBC (3,021)(4,044) Red River Bancshares Inc Morgan Stanley (1,982)
(20,364) Red Robin GourmetBurgers Inc
Bank of AmericaMerrill Lynch (28,713)
(400) Red Robin GourmetBurgers Inc Barclays Bank (64)
(9,997) Red Robin GourmetBurgers Inc Goldman Sachs (14,096)
(3,931) Red Robin GourmetBurgers Inc Morgan Stanley (629)
521 Red Rock Resorts Inc ’A’ Bank of AmericaMerrill Lynch 2,365
52,483 Red Rock Resorts Inc ’A’ HSBC 166,896(4,993) Red Rock Resorts Inc ’A’ Morgan Stanley (3,146)21,367 Red Rock Resorts Inc ’A’ Morgan Stanley 13,461
(13,008) Red Violet Inc Barclays Bank (2,472)(821) Red Violet Inc Goldman Sachs (312)
(2,028) Red Violet Inc HSBC (520)(4,034) Redfin Corp Goldman Sachs (21,421)
(23,181) Redfin Corp HSBC (117,064)(13,091) Redfin Corp Morgan Stanley (916)(17,226) Redwood Trust Inc (REIT) Bank of America
Merrill Lynch (28,423)(53,328) Redwood Trust Inc (REIT) HSBC (61,860)
(101,046) Redwood Trust Inc (REIT) Morgan Stanley (27,282)(4,717) Regal Beloit Corp Bank of America
Merrill Lynch (35,218)(6,571) Regal Beloit Corp Barclays Bank (15,317)(7,928) Regal Beloit Corp Goldman Sachs (66,217)
(14,138) Regal Beloit Corp HSBC (51,321)(19,826) Regal Beloit Corp Morgan Stanley (52,935)(3,823) Regency Centers Corp
(REIT)Bank of AmericaMerrill Lynch (25,041)
(6,001) Regency Centers Corp(REIT) Barclays Bank (12,602)
Holding Description Counterparty
Netunrealised
appreciation/(depreciation)
USD
United States continued32,654 Regency Centers Corp
(REIT) HSBC 45,716(3,410) Regency Centers Corp
(REIT) HSBC (17,242)23,396 Regency Centers Corp
(REIT) Morgan Stanley 49,132(4,146) Regency Centers Corp
(REIT) Morgan Stanley (8,707)379 Regeneron Pharmaceuticals
IncBank of AmericaMerrill Lynch 3,316
261 Regeneron PharmaceuticalsInc Barclays Bank 1,809
185 Regeneron PharmaceuticalsInc Goldman Sachs 22
1,211 Regeneron PharmaceuticalsInc HSBC 16,276
2,326 Regeneron PharmaceuticalsInc Morgan Stanley 16,119
(903) REGENXBIO Inc Bank of AmericaMerrill Lynch 81
(6,739) REGENXBIO Inc Barclays Bank 35,245(4,318) REGENXBIO Inc Goldman Sachs 389(6,106) REGENXBIO Inc HSBC 4,702(5,312) REGENXBIO Inc Morgan Stanley 27,78214,354 Regional Management Corp Bank of America
Merrill Lynch 3,8762,063 Regional Management Corp Barclays Bank 1,073
14,754 Regional Management Corp Goldman Sachs 3,9845,804 Regional Management Corp HSBC 5,456
18,974 Regional Management Corp Morgan Stanley 9,86641,347 Regions Financial Corp Bank of America
Merrill Lynch 80,21343,258 Regions Financial Corp Barclays Bank 51,04486,665 Regions Financial Corp Goldman Sachs 168,13054,950 Regions Financial Corp HSBC 64,709
173,436 Regions Financial Corp Morgan Stanley 204,655(378) Regis Corp Goldman Sachs (571)
(16,599) Regis Corp HSBC 12,283(33,612) Regis Corp Morgan Stanley (336)
489 Reinsurance Group ofAmerica Inc
Bank of AmericaMerrill Lynch 3,883
7,300 Reinsurance Group ofAmerica Inc Barclays Bank 6,205
9,331 Reinsurance Group ofAmerica Inc Goldman Sachs 72,900
333 Reinsurance Group ofAmerica Inc HSBC 150
5,672 Reinsurance Group ofAmerica Inc Morgan Stanley 4,821
8,418 Reliance Steel & AluminumCo
Bank of AmericaMerrill Lynch 63,482
6,428 Reliance Steel & AluminumCo Barclays Bank 21,007
771 Reliance Steel & AluminumCo Goldman Sachs 5,976
9,421 Reliance Steel & AluminumCo HSBC 22,893
6,064 Reliance Steel & AluminumCo Morgan Stanley 23,286
(32,623) Reliant Bancorp Inc Goldman Sachs (70,139)(1,460) Relmada Therapeutics Inc Bank of America
Merrill Lynch (321)(4,148) Relmada Therapeutics Inc Barclays Bank 3,609(5,331) Relmada Therapeutics Inc Goldman Sachs (1,173)(1,262) Relmada Therapeutics Inc Morgan Stanley 1,098(3,451) RenaissanceRe Holdings
LtdBank of AmericaMerrill Lynch (12,072)
BlackRock Americas Diversified Equity Absolute Return Fundcontinued
The notes on pages 691 to 711 form an integral part of these financial statements.
Annual report and audited financial statements [175]
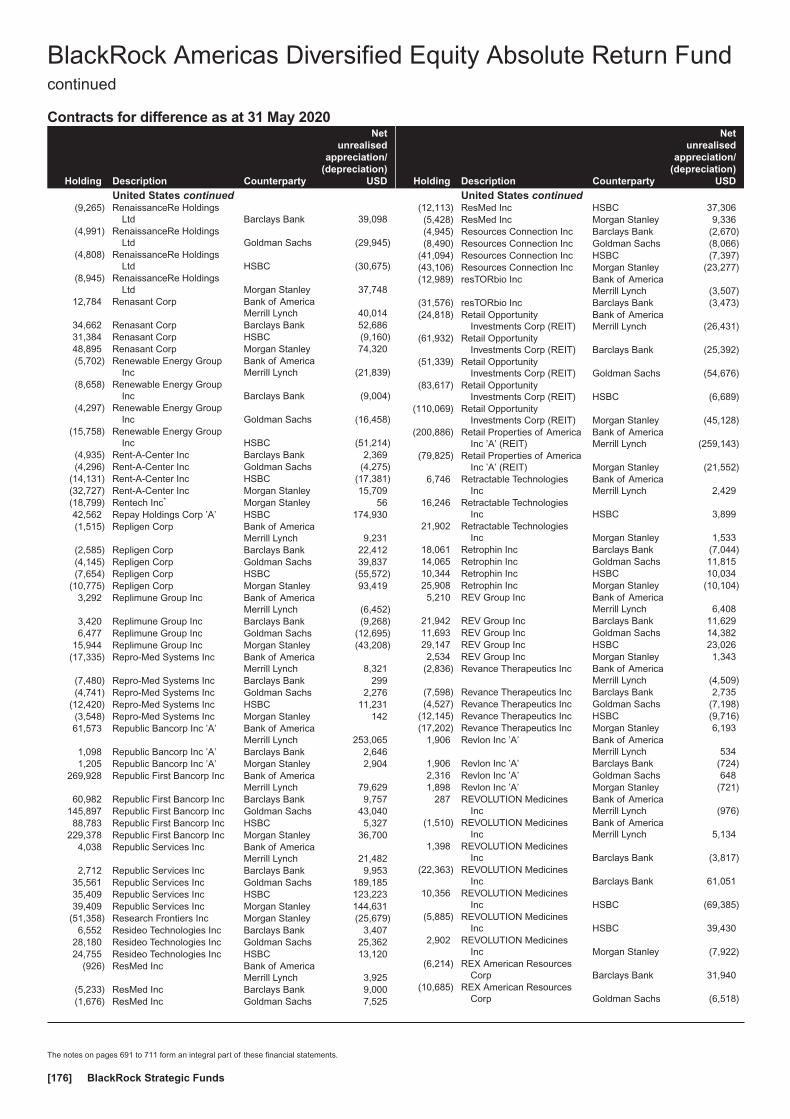
Contracts for difference as at 31 May 2020
Holding Description Counterparty
Netunrealised
appreciation/(depreciation)
USD
United States continued(9,265) RenaissanceRe Holdings
Ltd Barclays Bank 39,098(4,991) RenaissanceRe Holdings
Ltd Goldman Sachs (29,945)(4,808) RenaissanceRe Holdings
Ltd HSBC (30,675)(8,945) RenaissanceRe Holdings
Ltd Morgan Stanley 37,74812,784 Renasant Corp Bank of America
Merrill Lynch 40,01434,662 Renasant Corp Barclays Bank 52,68631,384 Renasant Corp HSBC (9,160)48,895 Renasant Corp Morgan Stanley 74,320(5,702) Renewable Energy Group
IncBank of AmericaMerrill Lynch (21,839)
(8,658) Renewable Energy GroupInc Barclays Bank (9,004)
(4,297) Renewable Energy GroupInc Goldman Sachs (16,458)
(15,758) Renewable Energy GroupInc HSBC (51,214)
(4,935) Rent-A-Center Inc Barclays Bank 2,369(4,296) Rent-A-Center Inc Goldman Sachs (4,275)
(14,131) Rent-A-Center Inc HSBC (17,381)(32,727) Rent-A-Center Inc Morgan Stanley 15,709(18,799) Rentech Inc* Morgan Stanley 5642,562 Repay Holdings Corp ’A’ HSBC 174,930(1,515) Repligen Corp Bank of America
Merrill Lynch 9,231(2,585) Repligen Corp Barclays Bank 22,412(4,145) Repligen Corp Goldman Sachs 39,837(7,654) Repligen Corp HSBC (55,572)
(10,775) Repligen Corp Morgan Stanley 93,4193,292 Replimune Group Inc Bank of America
Merrill Lynch (6,452)3,420 Replimune Group Inc Barclays Bank (9,268)6,477 Replimune Group Inc Goldman Sachs (12,695)
15,944 Replimune Group Inc Morgan Stanley (43,208)(17,335) Repro-Med Systems Inc Bank of America
Merrill Lynch 8,321(7,480) Repro-Med Systems Inc Barclays Bank 299(4,741) Repro-Med Systems Inc Goldman Sachs 2,276
(12,420) Repro-Med Systems Inc HSBC 11,231(3,548) Repro-Med Systems Inc Morgan Stanley 14261,573 Republic Bancorp Inc ’A’ Bank of America
Merrill Lynch 253,0651,098 Republic Bancorp Inc ’A’ Barclays Bank 2,6461,205 Republic Bancorp Inc ’A’ Morgan Stanley 2,904
269,928 Republic First Bancorp Inc Bank of AmericaMerrill Lynch 79,629
60,982 Republic First Bancorp Inc Barclays Bank 9,757145,897 Republic First Bancorp Inc Goldman Sachs 43,04088,783 Republic First Bancorp Inc HSBC 5,327
229,378 Republic First Bancorp Inc Morgan Stanley 36,7004,038 Republic Services Inc Bank of America
Merrill Lynch 21,4822,712 Republic Services Inc Barclays Bank 9,953
35,561 Republic Services Inc Goldman Sachs 189,18535,409 Republic Services Inc HSBC 123,22339,409 Republic Services Inc Morgan Stanley 144,631
(51,358) Research Frontiers Inc Morgan Stanley (25,679)6,552 Resideo Technologies Inc Barclays Bank 3,407
28,180 Resideo Technologies Inc Goldman Sachs 25,36224,755 Resideo Technologies Inc HSBC 13,120
(926) ResMed Inc Bank of AmericaMerrill Lynch 3,925
(5,233) ResMed Inc Barclays Bank 9,000(1,676) ResMed Inc Goldman Sachs 7,525
Holding Description Counterparty
Netunrealised
appreciation/(depreciation)
USD
United States continued(12,113) ResMed Inc HSBC 37,306(5,428) ResMed Inc Morgan Stanley 9,336(4,945) Resources Connection Inc Barclays Bank (2,670)(8,490) Resources Connection Inc Goldman Sachs (8,066)
(41,094) Resources Connection Inc HSBC (7,397)(43,106) Resources Connection Inc Morgan Stanley (23,277)(12,989) resTORbio Inc Bank of America
Merrill Lynch (3,507)(31,576) resTORbio Inc Barclays Bank (3,473)(24,818) Retail Opportunity
Investments Corp (REIT)Bank of AmericaMerrill Lynch (26,431)
(61,932) Retail OpportunityInvestments Corp (REIT) Barclays Bank (25,392)
(51,339) Retail OpportunityInvestments Corp (REIT) Goldman Sachs (54,676)
(83,617) Retail OpportunityInvestments Corp (REIT) HSBC (6,689)
(110,069) Retail OpportunityInvestments Corp (REIT) Morgan Stanley (45,128)
(200,886) Retail Properties of AmericaInc ’A’ (REIT)
Bank of AmericaMerrill Lynch (259,143)
(79,825) Retail Properties of AmericaInc ’A’ (REIT) Morgan Stanley (21,552)
6,746 Retractable TechnologiesInc
Bank of AmericaMerrill Lynch 2,429
16,246 Retractable TechnologiesInc HSBC 3,899
21,902 Retractable TechnologiesInc Morgan Stanley 1,533
18,061 Retrophin Inc Barclays Bank (7,044)14,065 Retrophin Inc Goldman Sachs 11,81510,344 Retrophin Inc HSBC 10,03425,908 Retrophin Inc Morgan Stanley (10,104)5,210 REV Group Inc Bank of America
Merrill Lynch 6,40821,942 REV Group Inc Barclays Bank 11,62911,693 REV Group Inc Goldman Sachs 14,38229,147 REV Group Inc HSBC 23,0262,534 REV Group Inc Morgan Stanley 1,343
(2,836) Revance Therapeutics Inc Bank of AmericaMerrill Lynch (4,509)
(7,598) Revance Therapeutics Inc Barclays Bank 2,735(4,527) Revance Therapeutics Inc Goldman Sachs (7,198)
(12,145) Revance Therapeutics Inc HSBC (9,716)(17,202) Revance Therapeutics Inc Morgan Stanley 6,193
1,906 Revlon Inc ’A’ Bank of AmericaMerrill Lynch 534
1,906 Revlon Inc ’A’ Barclays Bank (724)2,316 Revlon Inc ’A’ Goldman Sachs 6481,898 Revlon Inc ’A’ Morgan Stanley (721)
287 REVOLUTION MedicinesInc
Bank of AmericaMerrill Lynch (976)
(1,510) REVOLUTION MedicinesInc
Bank of AmericaMerrill Lynch 5,134
1,398 REVOLUTION MedicinesInc Barclays Bank (3,817)
(22,363) REVOLUTION MedicinesInc Barclays Bank 61,051
10,356 REVOLUTION MedicinesInc HSBC (69,385)
(5,885) REVOLUTION MedicinesInc HSBC 39,430
2,902 REVOLUTION MedicinesInc Morgan Stanley (7,922)
(6,214) REX American ResourcesCorp Barclays Bank 31,940
(10,685) REX American ResourcesCorp Goldman Sachs (6,518)
BlackRock Americas Diversified Equity Absolute Return Fundcontinued
The notes on pages 691 to 711 form an integral part of these financial statements.
BlackRock Strategic Funds[176]
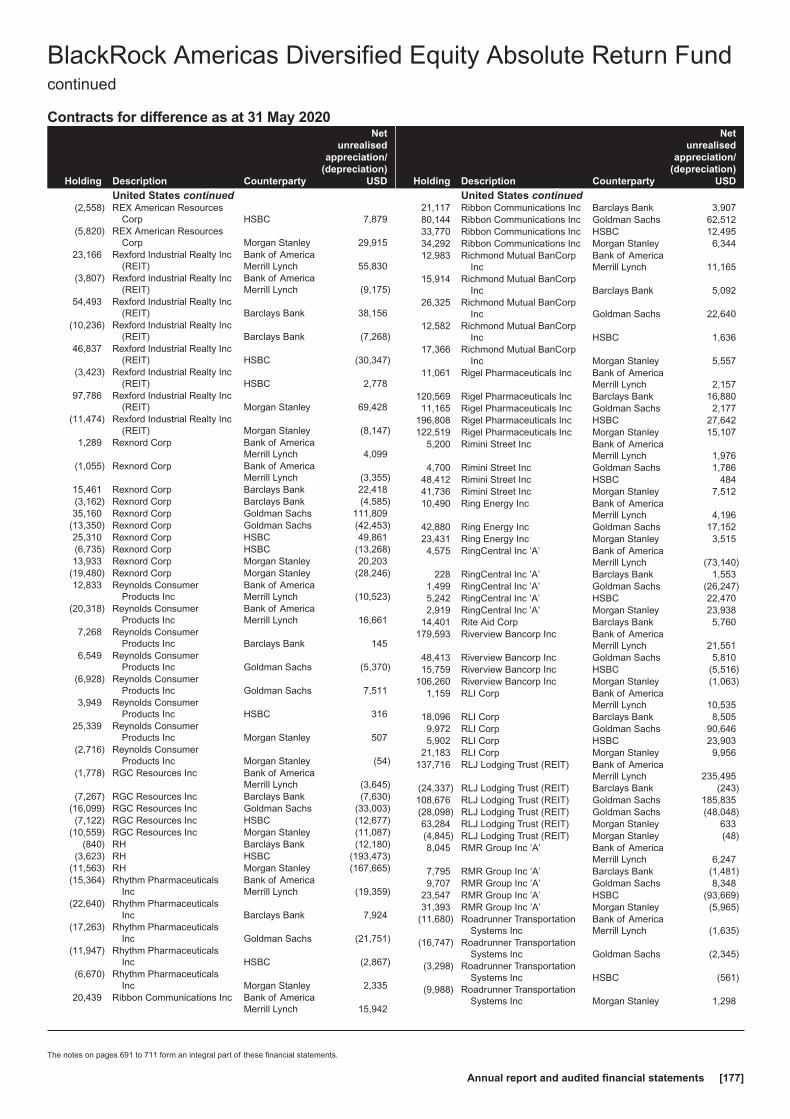
Contracts for difference as at 31 May 2020
Holding Description Counterparty
Netunrealised
appreciation/(depreciation)
USD
United States continued(2,558) REX American Resources
Corp HSBC 7,879(5,820) REX American Resources
Corp Morgan Stanley 29,91523,166 Rexford Industrial Realty Inc
(REIT)Bank of AmericaMerrill Lynch 55,830
(3,807) Rexford Industrial Realty Inc(REIT)
Bank of AmericaMerrill Lynch (9,175)
54,493 Rexford Industrial Realty Inc(REIT) Barclays Bank 38,156
(10,236) Rexford Industrial Realty Inc(REIT) Barclays Bank (7,268)
46,837 Rexford Industrial Realty Inc(REIT) HSBC (30,347)
(3,423) Rexford Industrial Realty Inc(REIT) HSBC 2,778
97,786 Rexford Industrial Realty Inc(REIT) Morgan Stanley 69,428
(11,474) Rexford Industrial Realty Inc(REIT) Morgan Stanley (8,147)
1,289 Rexnord Corp Bank of AmericaMerrill Lynch 4,099
(1,055) Rexnord Corp Bank of AmericaMerrill Lynch (3,355)
15,461 Rexnord Corp Barclays Bank 22,418(3,162) Rexnord Corp Barclays Bank (4,585)35,160 Rexnord Corp Goldman Sachs 111,809
(13,350) Rexnord Corp Goldman Sachs (42,453)25,310 Rexnord Corp HSBC 49,861(6,735) Rexnord Corp HSBC (13,268)13,933 Rexnord Corp Morgan Stanley 20,203
(19,480) Rexnord Corp Morgan Stanley (28,246)12,833 Reynolds Consumer
Products IncBank of AmericaMerrill Lynch (10,523)
(20,318) Reynolds ConsumerProducts Inc
Bank of AmericaMerrill Lynch 16,661
7,268 Reynolds ConsumerProducts Inc Barclays Bank 145
6,549 Reynolds ConsumerProducts Inc Goldman Sachs (5,370)
(6,928) Reynolds ConsumerProducts Inc Goldman Sachs 7,511
3,949 Reynolds ConsumerProducts Inc HSBC 316
25,339 Reynolds ConsumerProducts Inc Morgan Stanley 507
(2,716) Reynolds ConsumerProducts Inc Morgan Stanley (54)
(1,778) RGC Resources Inc Bank of AmericaMerrill Lynch (3,645)
(7,267) RGC Resources Inc Barclays Bank (7,630)(16,099) RGC Resources Inc Goldman Sachs (33,003)(7,122) RGC Resources Inc HSBC (12,677)
(10,559) RGC Resources Inc Morgan Stanley (11,087)(840) RH Barclays Bank (12,180)
(3,623) RH HSBC (193,473)(11,563) RH Morgan Stanley (167,665)(15,364) Rhythm Pharmaceuticals
IncBank of AmericaMerrill Lynch (19,359)
(22,640) Rhythm PharmaceuticalsInc Barclays Bank 7,924
(17,263) Rhythm PharmaceuticalsInc Goldman Sachs (21,751)
(11,947) Rhythm PharmaceuticalsInc HSBC (2,867)
(6,670) Rhythm PharmaceuticalsInc Morgan Stanley 2,335
20,439 Ribbon Communications Inc Bank of AmericaMerrill Lynch 15,942
Holding Description Counterparty
Netunrealised
appreciation/(depreciation)
USD
United States continued21,117 Ribbon Communications Inc Barclays Bank 3,90780,144 Ribbon Communications Inc Goldman Sachs 62,51233,770 Ribbon Communications Inc HSBC 12,49534,292 Ribbon Communications Inc Morgan Stanley 6,34412,983 Richmond Mutual BanCorp
IncBank of AmericaMerrill Lynch 11,165
15,914 Richmond Mutual BanCorpInc Barclays Bank 5,092
26,325 Richmond Mutual BanCorpInc Goldman Sachs 22,640
12,582 Richmond Mutual BanCorpInc HSBC 1,636
17,366 Richmond Mutual BanCorpInc Morgan Stanley 5,557
11,061 Rigel Pharmaceuticals Inc Bank of AmericaMerrill Lynch 2,157
120,569 Rigel Pharmaceuticals Inc Barclays Bank 16,88011,165 Rigel Pharmaceuticals Inc Goldman Sachs 2,177
196,808 Rigel Pharmaceuticals Inc HSBC 27,642122,519 Rigel Pharmaceuticals Inc Morgan Stanley 15,107
5,200 Rimini Street Inc Bank of AmericaMerrill Lynch 1,976
4,700 Rimini Street Inc Goldman Sachs 1,78648,412 Rimini Street Inc HSBC 48441,736 Rimini Street Inc Morgan Stanley 7,51210,490 Ring Energy Inc Bank of America
Merrill Lynch 4,19642,880 Ring Energy Inc Goldman Sachs 17,15223,431 Ring Energy Inc Morgan Stanley 3,5154,575 RingCentral Inc ’A’ Bank of America
Merrill Lynch (73,140)228 RingCentral Inc ’A’ Barclays Bank 1,553
1,499 RingCentral Inc ’A’ Goldman Sachs (26,247)5,242 RingCentral Inc ’A’ HSBC 22,4702,919 RingCentral Inc ’A’ Morgan Stanley 23,938
14,401 Rite Aid Corp Barclays Bank 5,760179,593 Riverview Bancorp Inc Bank of America
Merrill Lynch 21,55148,413 Riverview Bancorp Inc Goldman Sachs 5,81015,759 Riverview Bancorp Inc HSBC (5,516)
106,260 Riverview Bancorp Inc Morgan Stanley (1,063)1,159 RLI Corp Bank of America
Merrill Lynch 10,53518,096 RLI Corp Barclays Bank 8,5059,972 RLI Corp Goldman Sachs 90,6465,902 RLI Corp HSBC 23,903
21,183 RLI Corp Morgan Stanley 9,956137,716 RLJ Lodging Trust (REIT) Bank of America
Merrill Lynch 235,495(24,337) RLJ Lodging Trust (REIT) Barclays Bank (243)108,676 RLJ Lodging Trust (REIT) Goldman Sachs 185,835(28,098) RLJ Lodging Trust (REIT) Goldman Sachs (48,048)63,284 RLJ Lodging Trust (REIT) Morgan Stanley 633(4,845) RLJ Lodging Trust (REIT) Morgan Stanley (48)8,045 RMR Group Inc ’A’ Bank of America
Merrill Lynch 6,2477,795 RMR Group Inc ’A’ Barclays Bank (1,481)9,707 RMR Group Inc ’A’ Goldman Sachs 8,348
23,547 RMR Group Inc ’A’ HSBC (93,669)31,393 RMR Group Inc ’A’ Morgan Stanley (5,965)
(11,680) Roadrunner TransportationSystems Inc
Bank of AmericaMerrill Lynch (1,635)
(16,747) Roadrunner TransportationSystems Inc Goldman Sachs (2,345)
(3,298) Roadrunner TransportationSystems Inc HSBC (561)
(9,988) Roadrunner TransportationSystems Inc Morgan Stanley 1,298
BlackRock Americas Diversified Equity Absolute Return Fundcontinued
The notes on pages 691 to 711 form an integral part of these financial statements.
Annual report and audited financial statements [177]
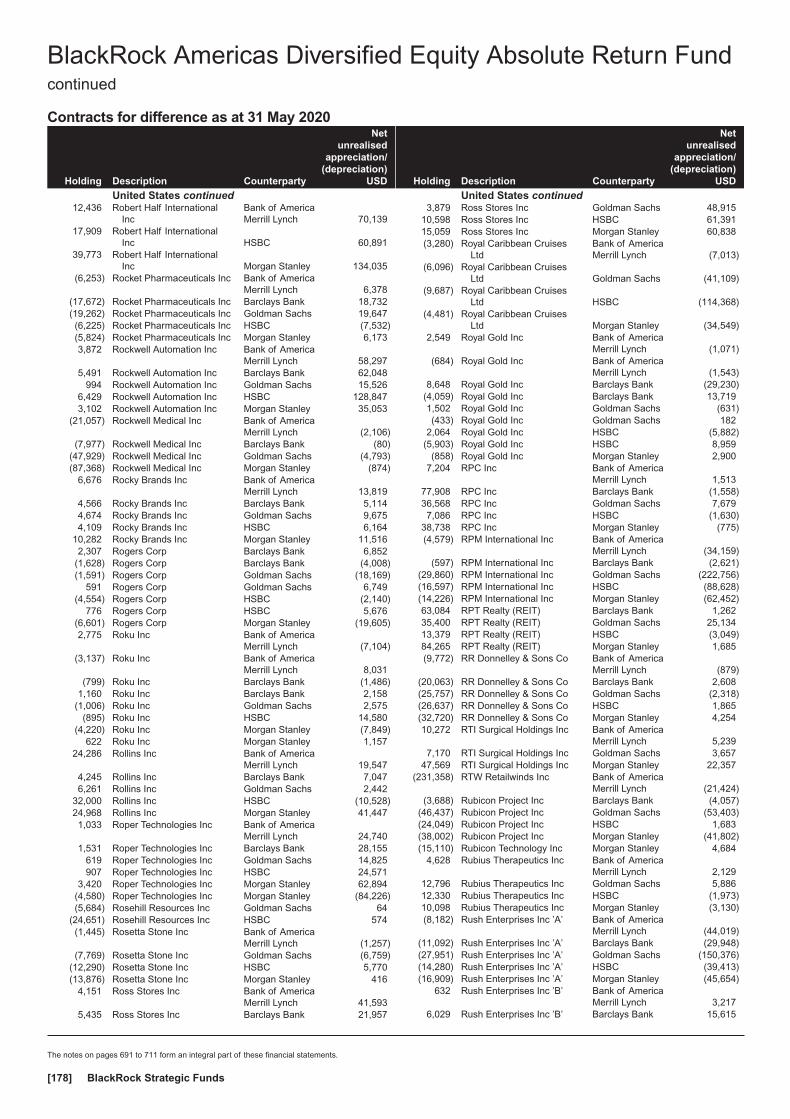
Contracts for difference as at 31 May 2020
Holding Description Counterparty
Netunrealised
appreciation/(depreciation)
USD
United States continued12,436 Robert Half International
IncBank of AmericaMerrill Lynch 70,139
17,909 Robert Half InternationalInc HSBC 60,891
39,773 Robert Half InternationalInc Morgan Stanley 134,035
(6,253) Rocket Pharmaceuticals Inc Bank of AmericaMerrill Lynch 6,378
(17,672) Rocket Pharmaceuticals Inc Barclays Bank 18,732(19,262) Rocket Pharmaceuticals Inc Goldman Sachs 19,647(6,225) Rocket Pharmaceuticals Inc HSBC (7,532)(5,824) Rocket Pharmaceuticals Inc Morgan Stanley 6,1733,872 Rockwell Automation Inc Bank of America
Merrill Lynch 58,2975,491 Rockwell Automation Inc Barclays Bank 62,048
994 Rockwell Automation Inc Goldman Sachs 15,5266,429 Rockwell Automation Inc HSBC 128,8473,102 Rockwell Automation Inc Morgan Stanley 35,053
(21,057) Rockwell Medical Inc Bank of AmericaMerrill Lynch (2,106)
(7,977) Rockwell Medical Inc Barclays Bank (80)(47,929) Rockwell Medical Inc Goldman Sachs (4,793)(87,368) Rockwell Medical Inc Morgan Stanley (874)
6,676 Rocky Brands Inc Bank of AmericaMerrill Lynch 13,819
4,566 Rocky Brands Inc Barclays Bank 5,1144,674 Rocky Brands Inc Goldman Sachs 9,6754,109 Rocky Brands Inc HSBC 6,164
10,282 Rocky Brands Inc Morgan Stanley 11,5162,307 Rogers Corp Barclays Bank 6,852
(1,628) Rogers Corp Barclays Bank (4,008)(1,591) Rogers Corp Goldman Sachs (18,169)
591 Rogers Corp Goldman Sachs 6,749(4,554) Rogers Corp HSBC (2,140)
776 Rogers Corp HSBC 5,676(6,601) Rogers Corp Morgan Stanley (19,605)2,775 Roku Inc Bank of America
Merrill Lynch (7,104)(3,137) Roku Inc Bank of America
Merrill Lynch 8,031(799) Roku Inc Barclays Bank (1,486)
1,160 Roku Inc Barclays Bank 2,158(1,006) Roku Inc Goldman Sachs 2,575
(895) Roku Inc HSBC 14,580(4,220) Roku Inc Morgan Stanley (7,849)
622 Roku Inc Morgan Stanley 1,15724,286 Rollins Inc Bank of America
Merrill Lynch 19,5474,245 Rollins Inc Barclays Bank 7,0476,261 Rollins Inc Goldman Sachs 2,442
32,000 Rollins Inc HSBC (10,528)24,968 Rollins Inc Morgan Stanley 41,4471,033 Roper Technologies Inc Bank of America
Merrill Lynch 24,7401,531 Roper Technologies Inc Barclays Bank 28,155
619 Roper Technologies Inc Goldman Sachs 14,825907 Roper Technologies Inc HSBC 24,571
3,420 Roper Technologies Inc Morgan Stanley 62,894(4,580) Roper Technologies Inc Morgan Stanley (84,226)(5,684) Rosehill Resources Inc Goldman Sachs 64
(24,651) Rosehill Resources Inc HSBC 574(1,445) Rosetta Stone Inc Bank of America
Merrill Lynch (1,257)(7,769) Rosetta Stone Inc Goldman Sachs (6,759)
(12,290) Rosetta Stone Inc HSBC 5,770(13,876) Rosetta Stone Inc Morgan Stanley 416
4,151 Ross Stores Inc Bank of AmericaMerrill Lynch 41,593
5,435 Ross Stores Inc Barclays Bank 21,957
Holding Description Counterparty
Netunrealised
appreciation/(depreciation)
USD
United States continued3,879 Ross Stores Inc Goldman Sachs 48,915
10,598 Ross Stores Inc HSBC 61,39115,059 Ross Stores Inc Morgan Stanley 60,838(3,280) Royal Caribbean Cruises
LtdBank of AmericaMerrill Lynch (7,013)
(6,096) Royal Caribbean CruisesLtd Goldman Sachs (41,109)
(9,687) Royal Caribbean CruisesLtd HSBC (114,368)
(4,481) Royal Caribbean CruisesLtd Morgan Stanley (34,549)
2,549 Royal Gold Inc Bank of AmericaMerrill Lynch (1,071)
(684) Royal Gold Inc Bank of AmericaMerrill Lynch (1,543)
8,648 Royal Gold Inc Barclays Bank (29,230)(4,059) Royal Gold Inc Barclays Bank 13,7191,502 Royal Gold Inc Goldman Sachs (631)(433) Royal Gold Inc Goldman Sachs 182
2,064 Royal Gold Inc HSBC (5,882)(5,903) Royal Gold Inc HSBC 8,959
(858) Royal Gold Inc Morgan Stanley 2,9007,204 RPC Inc Bank of America
Merrill Lynch 1,51377,908 RPC Inc Barclays Bank (1,558)36,568 RPC Inc Goldman Sachs 7,6797,086 RPC Inc HSBC (1,630)
38,738 RPC Inc Morgan Stanley (775)(4,579) RPM International Inc Bank of America
Merrill Lynch (34,159)(597) RPM International Inc Barclays Bank (2,621)
(29,860) RPM International Inc Goldman Sachs (222,756)(16,597) RPM International Inc HSBC (88,628)(14,226) RPM International Inc Morgan Stanley (62,452)63,084 RPT Realty (REIT) Barclays Bank 1,26235,400 RPT Realty (REIT) Goldman Sachs 25,13413,379 RPT Realty (REIT) HSBC (3,049)84,265 RPT Realty (REIT) Morgan Stanley 1,685(9,772) RR Donnelley & Sons Co Bank of America
Merrill Lynch (879)(20,063) RR Donnelley & Sons Co Barclays Bank 2,608(25,757) RR Donnelley & Sons Co Goldman Sachs (2,318)(26,637) RR Donnelley & Sons Co HSBC 1,865(32,720) RR Donnelley & Sons Co Morgan Stanley 4,25410,272 RTI Surgical Holdings Inc Bank of America
Merrill Lynch 5,2397,170 RTI Surgical Holdings Inc Goldman Sachs 3,657
47,569 RTI Surgical Holdings Inc Morgan Stanley 22,357(231,358) RTW Retailwinds Inc Bank of America
Merrill Lynch (21,424)(3,688) Rubicon Project Inc Barclays Bank (4,057)
(46,437) Rubicon Project Inc Goldman Sachs (53,403)(24,049) Rubicon Project Inc HSBC 1,683(38,002) Rubicon Project Inc Morgan Stanley (41,802)(15,110) Rubicon Technology Inc Morgan Stanley 4,684
4,628 Rubius Therapeutics Inc Bank of AmericaMerrill Lynch 2,129
12,796 Rubius Therapeutics Inc Goldman Sachs 5,88612,330 Rubius Therapeutics Inc HSBC (1,973)10,098 Rubius Therapeutics Inc Morgan Stanley (3,130)(8,182) Rush Enterprises Inc ’A’ Bank of America
Merrill Lynch (44,019)(11,092) Rush Enterprises Inc ’A’ Barclays Bank (29,948)(27,951) Rush Enterprises Inc ’A’ Goldman Sachs (150,376)(14,280) Rush Enterprises Inc ’A’ HSBC (39,413)(16,909) Rush Enterprises Inc ’A’ Morgan Stanley (45,654)
632 Rush Enterprises Inc ’B’ Bank of AmericaMerrill Lynch 3,217
6,029 Rush Enterprises Inc ’B’ Barclays Bank 15,615
BlackRock Americas Diversified Equity Absolute Return Fundcontinued
The notes on pages 691 to 711 form an integral part of these financial statements.
BlackRock Strategic Funds[178]

Contracts for difference as at 31 May 2020
Holding Description Counterparty
Netunrealised
appreciation/(depreciation)
USD
United States continued4,205 Rush Enterprises Inc ’B’ Goldman Sachs 21,4031,948 Rush Enterprises Inc ’B’ HSBC 3,6041,206 Rush Enterprises Inc ’B’ Morgan Stanley 3,124
16,806 Ruth’s Hospitality Group Inc Bank of AmericaMerrill Lynch 9,579
6,912 Ruth’s Hospitality Group Inc Goldman Sachs 3,9406,926 Ruth’s Hospitality Group Inc HSBC (6,649)
17,375 Ruth’s Hospitality Group Inc Morgan Stanley 11,468740 Ryder System Inc Bank of America
Merrill Lynch 3,0935,972 Ryder System Inc Barclays Bank 17,797
16,493 Ryder System Inc Goldman Sachs 68,9412,572 Ryder System Inc HSBC (3,627)7,957 Ryder System Inc Morgan Stanley 23,712
39,293 Ryerson Holding Corp Bank of AmericaMerrill Lynch 42,436
5,184 Ryerson Holding Corp Barclays Bank 2,33356,137 Ryerson Holding Corp Goldman Sachs 60,6287,483 Ryerson Holding Corp HSBC 2,844
15,303 Ryerson Holding Corp Morgan Stanley 6,8869,556 Ryman Hospitality
Properties Inc (REIT) Goldman Sachs 68,194(2,532) Ryman Hospitality
Properties Inc (REIT) Goldman Sachs 2,9417,524 Ryman Hospitality
Properties Inc (REIT) HSBC 17,6812,997 Ryman Hospitality
Properties Inc (REIT) Morgan Stanley 5,2151,173 S&P Global Inc Bank of America
Merrill Lynch 11,2768,907 S&P Global Inc Barclays Bank 46,3783,984 S&P Global Inc Goldman Sachs 71,409
462 S&P Global Inc HSBC 5,9311,406 S&P Global Inc Morgan Stanley 14,819
(18,926) S&T Bancorp Inc Bank of AmericaMerrill Lynch (25,834)
(39,043) S&T Bancorp Inc Barclays Bank (1,952)(30,725) S&T Bancorp Inc Goldman Sachs (44,551)(21,581) S&T Bancorp Inc HSBC 57,190(26,383) S&T Bancorp Inc Morgan Stanley (1,319)
6,156 Sabra Health Care Inc(REIT)
Bank of AmericaMerrill Lynch 9,911
9,767 Sabra Health Care Inc(REIT) Barclays Bank 1,660
16,939 Sabra Health Care Inc(REIT) Goldman Sachs 23,100
1,848 Sabra Health Care Inc(REIT) HSBC 1,497
(23,334) Sabra Health Care Inc(REIT) Morgan Stanley (3,967)
62,923 Sabra Health Care Inc(REIT) Morgan Stanley 10,697
6,390 Sabre Corp Barclays Bank 128(75,335) Sabre Corp Morgan Stanley (1,507)13,877 Sabre Corp Morgan Stanley 278
(224,157) Safeguard Scientifics Inc Bank of AmericaMerrill Lynch (70,609)
(7,446) Safety Insurance Group Inc Bank of AmericaMerrill Lynch (2,124)
(5,129) Safety Insurance Group Inc Barclays Bank 11,694(4,840) Safety Insurance Group Inc Goldman Sachs (3,340)(5,078) Safety Insurance Group Inc HSBC 15,059(2,147) Safety Insurance Group Inc Morgan Stanley 4,895
(23,022) Saga Communications Inc’A’ Morgan Stanley (19,108)
(1,117) Sage Therapeutics Inc Barclays Bank 2,0661,185 Sage Therapeutics Inc Barclays Bank (2,192)
10,447 Sage Therapeutics Inc Goldman Sachs 1,141(3,681) Sage Therapeutics Inc HSBC 7,767
Holding Description Counterparty
Netunrealised
appreciation/(depreciation)
USD
United States continued4,311 Sage Therapeutics Inc HSBC (9,276)
(3,552) Sage Therapeutics Inc Morgan Stanley 6,5712,039 Sage Therapeutics Inc Morgan Stanley (1,139)
(2,016) Saia Inc Bank of AmericaMerrill Lynch (25,906)
(1,505) Saia Inc Barclays Bank (8,744)(1,518) Saia Inc Goldman Sachs (19,507)(5,527) Saia Inc HSBC (57,701)(3,778) Saia Inc Morgan Stanley (21,951)(5,240) Sailpoint Technologies
Holdings IncBank of AmericaMerrill Lynch (6,735)
(7,375) Sailpoint TechnologiesHoldings Inc Barclays Bank 74
(9,164) Sailpoint TechnologiesHoldings Inc Goldman Sachs (19,519)
(32,577) Sailpoint TechnologiesHoldings Inc HSBC (52,743)
(34,517) Sailpoint TechnologiesHoldings Inc Morgan Stanley 345
(3,930) salesforce.com Inc Barclays Bank 20,6334,948 salesforce.com Inc Goldman Sachs 6,2848,435 salesforce.com Inc HSBC (27,836)7,912 salesforce.com Inc Morgan Stanley (41,538)
16,546 Sally Beauty Holdings Inc Bank of AmericaMerrill Lynch 23,553
10,461 Sally Beauty Holdings Inc Goldman Sachs 10,2864,705 Sally Beauty Holdings Inc HSBC 1,095
(4,830) Sanderson Farms Inc Bank of AmericaMerrill Lynch 10,853
(1,300) Sanderson Farms Inc Barclays Bank 3,354(9,119) Sanderson Farms Inc Goldman Sachs 31,740(6,586) Sanderson Farms Inc HSBC 92,467
(12,484) Sanderson Farms Inc Morgan Stanley 32,209(114,732) SandRidge Energy Inc Bank of America
Merrill Lynch (6,884)(10,314) SandRidge Energy Inc Goldman Sachs (619)(21,156) SandRidge Energy Inc HSBC 6,981(29,204) SandRidge Energy Inc Morgan Stanley (2,336)35,611 Sandy Spring Bancorp Inc Bank of America
Merrill Lynch 140,30744,727 Sandy Spring Bancorp Inc Barclays Bank 55,46132,172 Sandy Spring Bancorp Inc Goldman Sachs 126,7588,298 Sandy Spring Bancorp Inc HSBC 913
27,290 Sandy Spring Bancorp Inc Morgan Stanley 33,840(14,384) Sangamo Therapeutics Inc Bank of America
Merrill Lynch (2,856)35,673 Sangamo Therapeutics Inc Bank of America
Merrill Lynch 43,878(4,971) Sangamo Therapeutics Inc Barclays Bank 19830,709 Sangamo Therapeutics Inc Barclays Bank (7,370)33,024 Sangamo Therapeutics Inc Goldman Sachs 40,62024,962 Sangamo Therapeutics Inc HSBC 64,1528,821 Sangamo Therapeutics Inc Morgan Stanley (2,117)1,427 Sanmina Corp Bank of America
Merrill Lynch 2,2558,123 Sanmina Corp Barclays Bank 3,0871,066 Sanmina Corp Goldman Sachs 533
11,182 Sanmina Corp HSBC (25,383)59,244 Sanmina Corp Morgan Stanley 22,513
(23,369) Santander Consumer USAHoldings Inc
Bank of AmericaMerrill Lynch (45,739)
(18,188) Santander Consumer USAHoldings Inc Barclays Bank (10,450)
(2,845) Santander Consumer USAHoldings Inc HSBC (3,614)
(30,045) Santander Consumer USAHoldings Inc Morgan Stanley (34,852)
(4,300) Sarepta Therapeutics Inc Bank of AmericaMerrill Lynch (52,503)
BlackRock Americas Diversified Equity Absolute Return Fundcontinued
The notes on pages 691 to 711 form an integral part of these financial statements.
Annual report and audited financial statements [179]
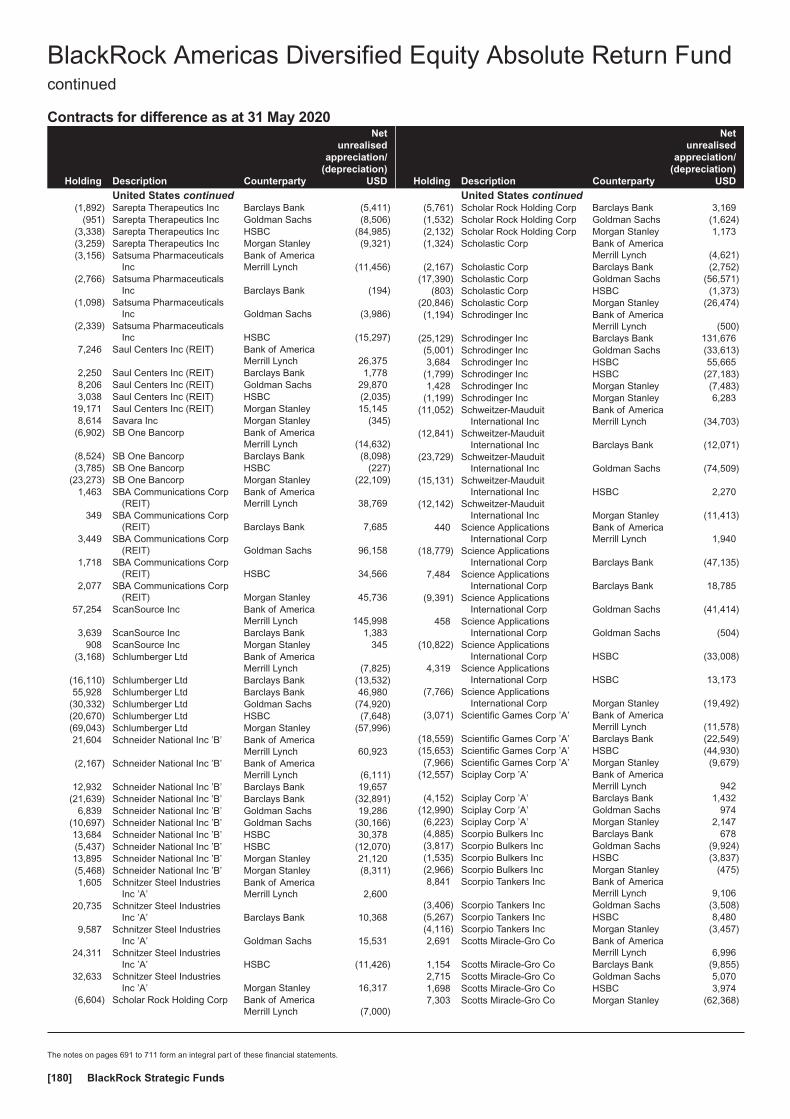
Contracts for difference as at 31 May 2020
Holding Description Counterparty
Netunrealised
appreciation/(depreciation)
USD
United States continued(1,892) Sarepta Therapeutics Inc Barclays Bank (5,411)
(951) Sarepta Therapeutics Inc Goldman Sachs (8,506)(3,338) Sarepta Therapeutics Inc HSBC (84,985)(3,259) Sarepta Therapeutics Inc Morgan Stanley (9,321)(3,156) Satsuma Pharmaceuticals
IncBank of AmericaMerrill Lynch (11,456)
(2,766) Satsuma PharmaceuticalsInc Barclays Bank (194)
(1,098) Satsuma PharmaceuticalsInc Goldman Sachs (3,986)
(2,339) Satsuma PharmaceuticalsInc HSBC (15,297)
7,246 Saul Centers Inc (REIT) Bank of AmericaMerrill Lynch 26,375
2,250 Saul Centers Inc (REIT) Barclays Bank 1,7788,206 Saul Centers Inc (REIT) Goldman Sachs 29,8703,038 Saul Centers Inc (REIT) HSBC (2,035)
19,171 Saul Centers Inc (REIT) Morgan Stanley 15,1458,614 Savara Inc Morgan Stanley (345)
(6,902) SB One Bancorp Bank of AmericaMerrill Lynch (14,632)
(8,524) SB One Bancorp Barclays Bank (8,098)(3,785) SB One Bancorp HSBC (227)
(23,273) SB One Bancorp Morgan Stanley (22,109)1,463 SBA Communications Corp
(REIT)Bank of AmericaMerrill Lynch 38,769
349 SBA Communications Corp(REIT) Barclays Bank 7,685
3,449 SBA Communications Corp(REIT) Goldman Sachs 96,158
1,718 SBA Communications Corp(REIT) HSBC 34,566
2,077 SBA Communications Corp(REIT) Morgan Stanley 45,736
57,254 ScanSource Inc Bank of AmericaMerrill Lynch 145,998
3,639 ScanSource Inc Barclays Bank 1,383908 ScanSource Inc Morgan Stanley 345
(3,168) Schlumberger Ltd Bank of AmericaMerrill Lynch (7,825)
(16,110) Schlumberger Ltd Barclays Bank (13,532)55,928 Schlumberger Ltd Barclays Bank 46,980
(30,332) Schlumberger Ltd Goldman Sachs (74,920)(20,670) Schlumberger Ltd HSBC (7,648)(69,043) Schlumberger Ltd Morgan Stanley (57,996)21,604 Schneider National Inc ’B’ Bank of America
Merrill Lynch 60,923(2,167) Schneider National Inc ’B’ Bank of America
Merrill Lynch (6,111)12,932 Schneider National Inc ’B’ Barclays Bank 19,657
(21,639) Schneider National Inc ’B’ Barclays Bank (32,891)6,839 Schneider National Inc ’B’ Goldman Sachs 19,286
(10,697) Schneider National Inc ’B’ Goldman Sachs (30,166)13,684 Schneider National Inc ’B’ HSBC 30,378(5,437) Schneider National Inc ’B’ HSBC (12,070)13,895 Schneider National Inc ’B’ Morgan Stanley 21,120(5,468) Schneider National Inc ’B’ Morgan Stanley (8,311)1,605 Schnitzer Steel Industries
Inc ’A’Bank of AmericaMerrill Lynch 2,600
20,735 Schnitzer Steel IndustriesInc ’A’ Barclays Bank 10,368
9,587 Schnitzer Steel IndustriesInc ’A’ Goldman Sachs 15,531
24,311 Schnitzer Steel IndustriesInc ’A’ HSBC (11,426)
32,633 Schnitzer Steel IndustriesInc ’A’ Morgan Stanley 16,317
(6,604) Scholar Rock Holding Corp Bank of AmericaMerrill Lynch (7,000)
Holding Description Counterparty
Netunrealised
appreciation/(depreciation)
USD
United States continued(5,761) Scholar Rock Holding Corp Barclays Bank 3,169(1,532) Scholar Rock Holding Corp Goldman Sachs (1,624)(2,132) Scholar Rock Holding Corp Morgan Stanley 1,173(1,324) Scholastic Corp Bank of America
Merrill Lynch (4,621)(2,167) Scholastic Corp Barclays Bank (2,752)
(17,390) Scholastic Corp Goldman Sachs (56,571)(803) Scholastic Corp HSBC (1,373)
(20,846) Scholastic Corp Morgan Stanley (26,474)(1,194) Schrodinger Inc Bank of America
Merrill Lynch (500)(25,129) Schrodinger Inc Barclays Bank 131,676(5,001) Schrodinger Inc Goldman Sachs (33,613)3,684 Schrodinger Inc HSBC 55,665
(1,799) Schrodinger Inc HSBC (27,183)1,428 Schrodinger Inc Morgan Stanley (7,483)
(1,199) Schrodinger Inc Morgan Stanley 6,283(11,052) Schweitzer-Mauduit
International IncBank of AmericaMerrill Lynch (34,703)
(12,841) Schweitzer-MauduitInternational Inc Barclays Bank (12,071)
(23,729) Schweitzer-MauduitInternational Inc Goldman Sachs (74,509)
(15,131) Schweitzer-MauduitInternational Inc HSBC 2,270
(12,142) Schweitzer-MauduitInternational Inc Morgan Stanley (11,413)
440 Science ApplicationsInternational Corp
Bank of AmericaMerrill Lynch 1,940
(18,779) Science ApplicationsInternational Corp Barclays Bank (47,135)
7,484 Science ApplicationsInternational Corp Barclays Bank 18,785
(9,391) Science ApplicationsInternational Corp Goldman Sachs (41,414)
458 Science ApplicationsInternational Corp Goldman Sachs (504)
(10,822) Science ApplicationsInternational Corp HSBC (33,008)
4,319 Science ApplicationsInternational Corp HSBC 13,173
(7,766) Science ApplicationsInternational Corp Morgan Stanley (19,492)
(3,071) Scientific Games Corp ’A’ Bank of AmericaMerrill Lynch (11,578)
(18,559) Scientific Games Corp ’A’ Barclays Bank (22,549)(15,653) Scientific Games Corp ’A’ HSBC (44,930)(7,966) Scientific Games Corp ’A’ Morgan Stanley (9,679)
(12,557) Sciplay Corp ’A’ Bank of AmericaMerrill Lynch 942
(4,152) Sciplay Corp ’A’ Barclays Bank 1,432(12,990) Sciplay Corp ’A’ Goldman Sachs 974(6,223) Sciplay Corp ’A’ Morgan Stanley 2,147(4,885) Scorpio Bulkers Inc Barclays Bank 678(3,817) Scorpio Bulkers Inc Goldman Sachs (9,924)(1,535) Scorpio Bulkers Inc HSBC (3,837)(2,966) Scorpio Bulkers Inc Morgan Stanley (475)8,841 Scorpio Tankers Inc Bank of America
Merrill Lynch 9,106(3,406) Scorpio Tankers Inc Goldman Sachs (3,508)(5,267) Scorpio Tankers Inc HSBC 8,480(4,116) Scorpio Tankers Inc Morgan Stanley (3,457)2,691 Scotts Miracle-Gro Co Bank of America
Merrill Lynch 6,9961,154 Scotts Miracle-Gro Co Barclays Bank (9,855)2,715 Scotts Miracle-Gro Co Goldman Sachs 5,0701,698 Scotts Miracle-Gro Co HSBC 3,9747,303 Scotts Miracle-Gro Co Morgan Stanley (62,368)
BlackRock Americas Diversified Equity Absolute Return Fundcontinued
The notes on pages 691 to 711 form an integral part of these financial statements.
BlackRock Strategic Funds[180]

Contracts for difference as at 31 May 2020
Holding Description Counterparty
Netunrealised
appreciation/(depreciation)
USD
United States continued(5,716) scPharmaceuticals Inc Bank of America
Merrill Lynch 12,804(8,209) scPharmaceuticals Inc Barclays Bank 575(1,635) Sculptor Capital
Management IncBank of AmericaMerrill Lynch 747
(10,189) Sculptor CapitalManagement Inc Barclays Bank (6,827)
(5,768) Sculptor CapitalManagement Inc HSBC (8,710)
(15,256) Sculptor CapitalManagement Inc Morgan Stanley (10,222)
(360) Seaboard Corp Bank of AmericaMerrill Lynch 27,020
(163) Seaboard Corp Barclays Bank 3,912(131) Seaboard Corp Goldman Sachs 8,691(108) Seaboard Corp HSBC 24,283(119) Seaboard Corp Morgan Stanley 2,856
(13,513) Seacoast Banking Corp ofFlorida
Bank of AmericaMerrill Lynch (39,211)
(17,446) Seacoast Banking Corp ofFlorida Barclays Bank (28,873)
(44,678) Seacoast Banking Corp ofFlorida Goldman Sachs (146,866)
(8,369) Seacoast Banking Corp ofFlorida HSBC (879)
(9,006) Seacoast Banking Corp ofFlorida Morgan Stanley (14,905)
(78) SEACOR Holdings Inc Bank of AmericaMerrill Lynch (207)
(21,082) SEACOR Holdings Inc Goldman Sachs (56,078)(5,515) SEACOR Holdings Inc HSBC 1,324(6,399) SEACOR Holdings Inc Morgan Stanley (4,543)
(13,469) SEACOR Marine HoldingsInc
Bank of AmericaMerrill Lynch 5,253
(4,617) SEACOR Marine HoldingsInc Barclays Bank 277
(7,905) SEACOR Marine HoldingsInc Goldman Sachs 3,083
(1,846) SEACOR Marine HoldingsInc Morgan Stanley 111
18,750 Seadrill Ltd Barclays Bank (600)99,587 Seadrill Ltd HSBC (6,941)
(10,649) Seagate Technology Plc Barclays Bank (9,797)(10,020) Seagate Technology Plc Goldman Sachs (41,183)(15,259) Seagate Technology Plc HSBC (12,512)(40,832) Seagate Technology Plc Morgan Stanley (37,565)(8,241) Sealed Air Corp Barclays Bank (13,845)2,432 Sealed Air Corp Barclays Bank 4,086
(13,683) Sealed Air Corp Goldman Sachs (37,218)(5,308) Sealed Air Corp HSBC (9,767)6,927 Sealed Air Corp HSBC 13,130
(2,831) Sealed Air Corp Morgan Stanley (4,756)3,355 Sealed Air Corp Morgan Stanley 5,6364,915 SeaSpine Holdings Corp Bank of America
Merrill Lynch 1,57312,604 SeaSpine Holdings Corp Barclays Bank 12626,580 SeaSpine Holdings Corp Goldman Sachs 8,50615,306 SeaSpine Holdings Corp HSBC 5,51019,708 SeaSpine Holdings Corp Morgan Stanley 1971,948 Seattle Genetics Inc Bank of America
Merrill Lynch 4,696861 Seattle Genetics Inc Barclays Bank (916)
7,222 Seattle Genetics Inc Goldman Sachs (39,076)1,016 Seattle Genetics Inc HSBC (3,627)1,132 Seattle Genetics Inc Morgan Stanley (1,891)
(14,197) SeaWorld Entertainment Inc Bank of AmericaMerrill Lynch (63,319)
(14,218) SeaWorld Entertainment Inc Barclays Bank (9,953)
Holding Description Counterparty
Netunrealised
appreciation/(depreciation)
USD
United States continued(14,931) SeaWorld Entertainment Inc Goldman Sachs (66,592)
373 SeaWorld Entertainment Inc HSBC 1,216(14,903) SeaWorld Entertainment Inc HSBC (48,584)(3,886) SeaWorld Entertainment Inc Morgan Stanley (2,720)(1,927) SecureWorks Corp ’A’ Bank of America
Merrill Lynch (2,505)(5,216) SecureWorks Corp ’A’ HSBC (3,286)
(37,301) SecureWorks Corp ’A’ Morgan Stanley (9,698)14,775 SEI Investments Co Bank of America
Merrill Lynch 37,49013,181 SEI Investments Co Barclays Bank 26,62524,888 SEI Investments Co Goldman Sachs 63,13723,241 SEI Investments Co HSBC 34,16420,502 SEI Investments Co Morgan Stanley 41,41451,300 Select Bancorp Inc Bank of America
Merrill Lynch 39,50157,271 Select Bancorp Inc Barclays Bank 12,02713,403 Select Bancorp Inc Goldman Sachs 10,32025,639 Select Bancorp Inc HSBC 8,20465,151 Select Bancorp Inc Morgan Stanley 13,682(6,060) Select Energy Services Inc
’A’Bank of AmericaMerrill Lynch (6,787)
(14,286) Select Energy Services Inc’A’ Barclays Bank (4,572)
(89,761) Select Energy Services Inc’A’ Goldman Sachs (100,532)
(28,160) Select Energy Services Inc’A’ HSBC (1,408)
(54,852) Select Energy Services Inc’A’ Morgan Stanley (17,553)
4,758 Select Interior Concepts Inc’A’
Bank of AmericaMerrill Lynch 3,949
5,948 Select Interior Concepts Inc’A’ Goldman Sachs 4,937
11,771 Select Interior Concepts Inc’A’ HSBC 353
11,788 Select Interior Concepts Inc’A’ Morgan Stanley 6,130
55,388 Select Medical HoldingsCorp
Bank of AmericaMerrill Lynch 99,698
23,484 Select Medical HoldingsCorp Barclays Bank 7,515
28,162 Select Medical HoldingsCorp Goldman Sachs 48,789
31,526 Select Medical HoldingsCorp HSBC 19,220
64,430 Select Medical HoldingsCorp Morgan Stanley 20,618
27,921 Selecta Biosciences Inc Bank of AmericaMerrill Lynch 15,077
27,934 Selecta Biosciences Inc Goldman Sachs 15,08413,429 Selecta Biosciences Inc Morgan Stanley (1,880)4,784 Selective Insurance Group
IncBank of AmericaMerrill Lynch 26,456
(3,383) Selective Insurance GroupInc
Bank of AmericaMerrill Lynch (18,708)
4,520 Selective Insurance GroupInc Barclays Bank (1,537)
(10,652) Selective Insurance GroupInc Barclays Bank 4,764
(9,519) Selective Insurance GroupInc Goldman Sachs (52,640)
10,714 Selective Insurance GroupInc Goldman Sachs 59,248
4,866 Selective Insurance GroupInc HSBC 18,977
(13,135) Selective Insurance GroupInc HSBC (51,227)
BlackRock Americas Diversified Equity Absolute Return Fundcontinued
The notes on pages 691 to 711 form an integral part of these financial statements.
Annual report and audited financial statements [181]
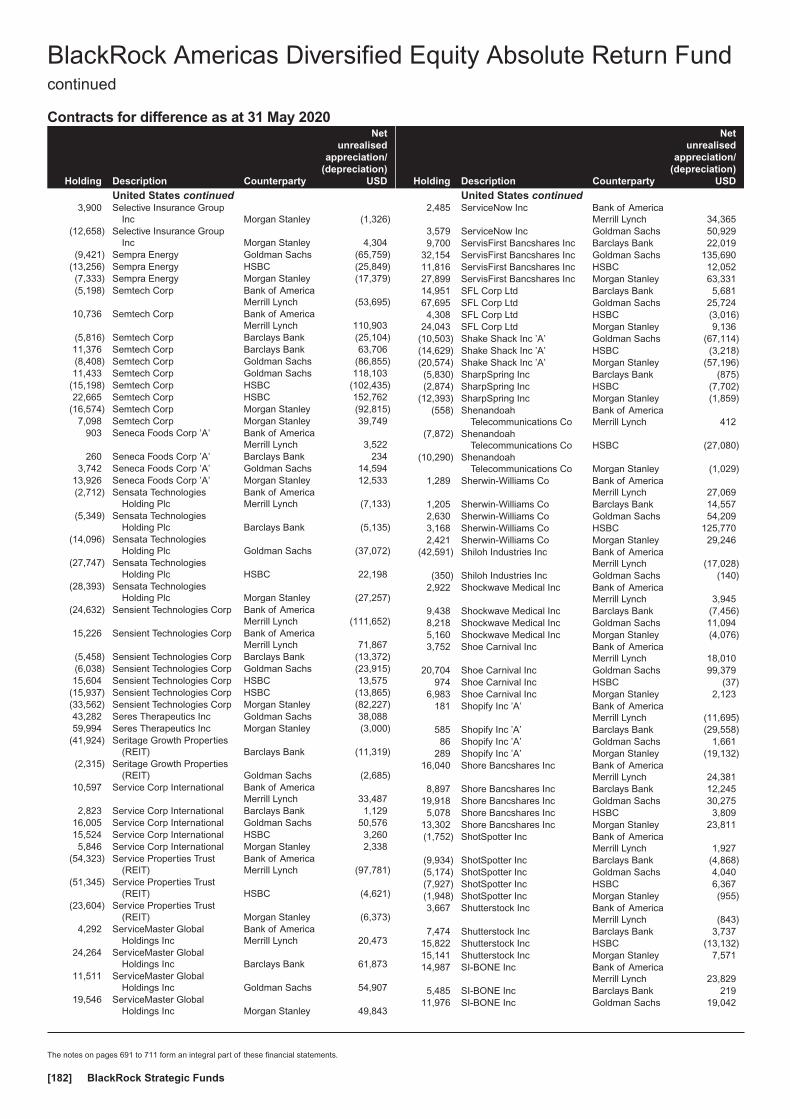
Contracts for difference as at 31 May 2020
Holding Description Counterparty
Netunrealised
appreciation/(depreciation)
USD
United States continued3,900 Selective Insurance Group
Inc Morgan Stanley (1,326)(12,658) Selective Insurance Group
Inc Morgan Stanley 4,304(9,421) Sempra Energy Goldman Sachs (65,759)
(13,256) Sempra Energy HSBC (25,849)(7,333) Sempra Energy Morgan Stanley (17,379)(5,198) Semtech Corp Bank of America
Merrill Lynch (53,695)10,736 Semtech Corp Bank of America
Merrill Lynch 110,903(5,816) Semtech Corp Barclays Bank (25,104)11,376 Semtech Corp Barclays Bank 63,706(8,408) Semtech Corp Goldman Sachs (86,855)11,433 Semtech Corp Goldman Sachs 118,103
(15,198) Semtech Corp HSBC (102,435)22,665 Semtech Corp HSBC 152,762
(16,574) Semtech Corp Morgan Stanley (92,815)7,098 Semtech Corp Morgan Stanley 39,749
903 Seneca Foods Corp ’A’ Bank of AmericaMerrill Lynch 3,522
260 Seneca Foods Corp ’A’ Barclays Bank 2343,742 Seneca Foods Corp ’A’ Goldman Sachs 14,594
13,926 Seneca Foods Corp ’A’ Morgan Stanley 12,533(2,712) Sensata Technologies
Holding PlcBank of AmericaMerrill Lynch (7,133)
(5,349) Sensata TechnologiesHolding Plc Barclays Bank (5,135)
(14,096) Sensata TechnologiesHolding Plc Goldman Sachs (37,072)
(27,747) Sensata TechnologiesHolding Plc HSBC 22,198
(28,393) Sensata TechnologiesHolding Plc Morgan Stanley (27,257)
(24,632) Sensient Technologies Corp Bank of AmericaMerrill Lynch (111,652)
15,226 Sensient Technologies Corp Bank of AmericaMerrill Lynch 71,867
(5,458) Sensient Technologies Corp Barclays Bank (13,372)(6,038) Sensient Technologies Corp Goldman Sachs (23,915)15,604 Sensient Technologies Corp HSBC 13,575
(15,937) Sensient Technologies Corp HSBC (13,865)(33,562) Sensient Technologies Corp Morgan Stanley (82,227)43,282 Seres Therapeutics Inc Goldman Sachs 38,08859,994 Seres Therapeutics Inc Morgan Stanley (3,000)
(41,924) Seritage Growth Properties(REIT) Barclays Bank (11,319)
(2,315) Seritage Growth Properties(REIT) Goldman Sachs (2,685)
10,597 Service Corp International Bank of AmericaMerrill Lynch 33,487
2,823 Service Corp International Barclays Bank 1,12916,005 Service Corp International Goldman Sachs 50,57615,524 Service Corp International HSBC 3,2605,846 Service Corp International Morgan Stanley 2,338
(54,323) Service Properties Trust(REIT)
Bank of AmericaMerrill Lynch (97,781)
(51,345) Service Properties Trust(REIT) HSBC (4,621)
(23,604) Service Properties Trust(REIT) Morgan Stanley (6,373)
4,292 ServiceMaster GlobalHoldings Inc
Bank of AmericaMerrill Lynch 20,473
24,264 ServiceMaster GlobalHoldings Inc Barclays Bank 61,873
11,511 ServiceMaster GlobalHoldings Inc Goldman Sachs 54,907
19,546 ServiceMaster GlobalHoldings Inc Morgan Stanley 49,843
Holding Description Counterparty
Netunrealised
appreciation/(depreciation)
USD
United States continued2,485 ServiceNow Inc Bank of America
Merrill Lynch 34,3653,579 ServiceNow Inc Goldman Sachs 50,9299,700 ServisFirst Bancshares Inc Barclays Bank 22,019
32,154 ServisFirst Bancshares Inc Goldman Sachs 135,69011,816 ServisFirst Bancshares Inc HSBC 12,05227,899 ServisFirst Bancshares Inc Morgan Stanley 63,33114,951 SFL Corp Ltd Barclays Bank 5,68167,695 SFL Corp Ltd Goldman Sachs 25,7244,308 SFL Corp Ltd HSBC (3,016)
24,043 SFL Corp Ltd Morgan Stanley 9,136(10,503) Shake Shack Inc ’A’ Goldman Sachs (67,114)(14,629) Shake Shack Inc ’A’ HSBC (3,218)(20,574) Shake Shack Inc ’A’ Morgan Stanley (57,196)(5,830) SharpSpring Inc Barclays Bank (875)(2,874) SharpSpring Inc HSBC (7,702)
(12,393) SharpSpring Inc Morgan Stanley (1,859)(558) Shenandoah
Telecommunications CoBank of AmericaMerrill Lynch 412
(7,872) ShenandoahTelecommunications Co HSBC (27,080)
(10,290) ShenandoahTelecommunications Co Morgan Stanley (1,029)
1,289 Sherwin-Williams Co Bank of AmericaMerrill Lynch 27,069
1,205 Sherwin-Williams Co Barclays Bank 14,5572,630 Sherwin-Williams Co Goldman Sachs 54,2093,168 Sherwin-Williams Co HSBC 125,7702,421 Sherwin-Williams Co Morgan Stanley 29,246
(42,591) Shiloh Industries Inc Bank of AmericaMerrill Lynch (17,028)
(350) Shiloh Industries Inc Goldman Sachs (140)2,922 Shockwave Medical Inc Bank of America
Merrill Lynch 3,9459,438 Shockwave Medical Inc Barclays Bank (7,456)8,218 Shockwave Medical Inc Goldman Sachs 11,0945,160 Shockwave Medical Inc Morgan Stanley (4,076)3,752 Shoe Carnival Inc Bank of America
Merrill Lynch 18,01020,704 Shoe Carnival Inc Goldman Sachs 99,379
974 Shoe Carnival Inc HSBC (37)6,983 Shoe Carnival Inc Morgan Stanley 2,123
181 Shopify Inc ’A’ Bank of AmericaMerrill Lynch (11,695)
585 Shopify Inc ’A’ Barclays Bank (29,558)86 Shopify Inc ’A’ Goldman Sachs 1,661
289 Shopify Inc ’A’ Morgan Stanley (19,132)16,040 Shore Bancshares Inc Bank of America
Merrill Lynch 24,3818,897 Shore Bancshares Inc Barclays Bank 12,245
19,918 Shore Bancshares Inc Goldman Sachs 30,2755,078 Shore Bancshares Inc HSBC 3,809
13,302 Shore Bancshares Inc Morgan Stanley 23,811(1,752) ShotSpotter Inc Bank of America
Merrill Lynch 1,927(9,934) ShotSpotter Inc Barclays Bank (4,868)(5,174) ShotSpotter Inc Goldman Sachs 4,040(7,927) ShotSpotter Inc HSBC 6,367(1,948) ShotSpotter Inc Morgan Stanley (955)3,667 Shutterstock Inc Bank of America
Merrill Lynch (843)7,474 Shutterstock Inc Barclays Bank 3,737
15,822 Shutterstock Inc HSBC (13,132)15,141 Shutterstock Inc Morgan Stanley 7,57114,987 SI-BONE Inc Bank of America
Merrill Lynch 23,8295,485 SI-BONE Inc Barclays Bank 219
11,976 SI-BONE Inc Goldman Sachs 19,042
BlackRock Americas Diversified Equity Absolute Return Fundcontinued
The notes on pages 691 to 711 form an integral part of these financial statements.
BlackRock Strategic Funds[182]
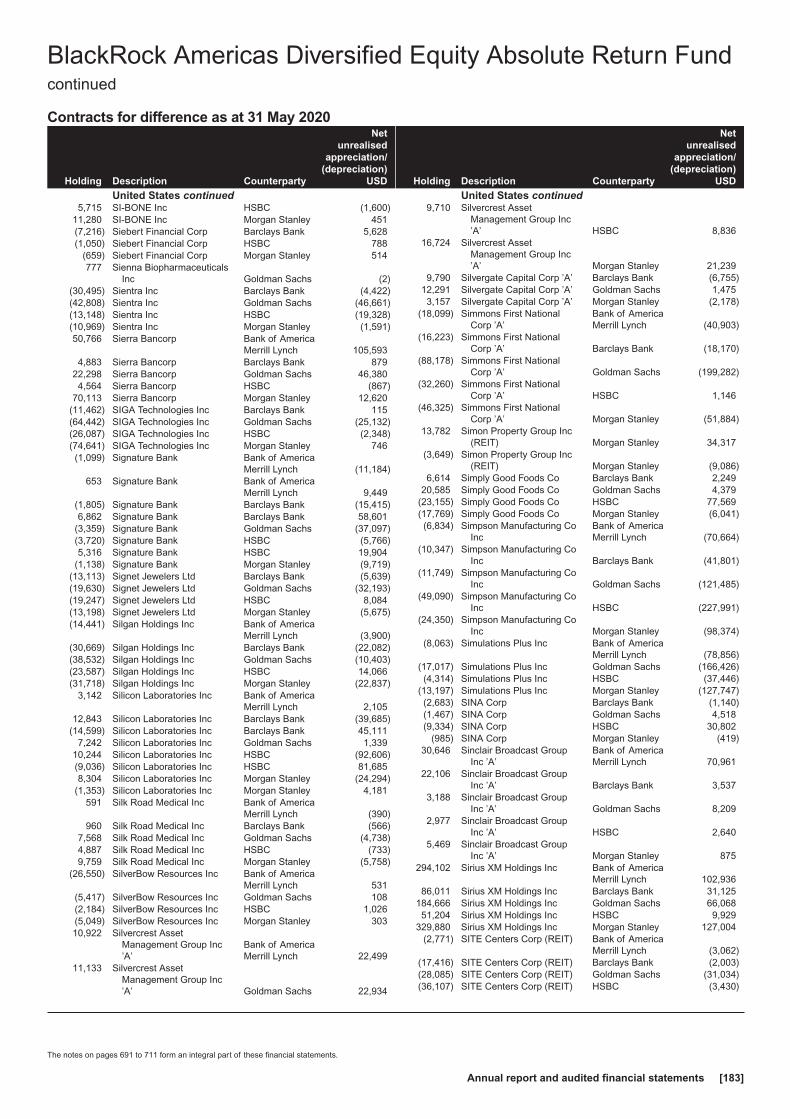
Contracts for difference as at 31 May 2020
Holding Description Counterparty
Netunrealised
appreciation/(depreciation)
USD
United States continued5,715 SI-BONE Inc HSBC (1,600)
11,280 SI-BONE Inc Morgan Stanley 451(7,216) Siebert Financial Corp Barclays Bank 5,628(1,050) Siebert Financial Corp HSBC 788
(659) Siebert Financial Corp Morgan Stanley 514777 Sienna Biopharmaceuticals
Inc Goldman Sachs (2)(30,495) Sientra Inc Barclays Bank (4,422)(42,808) Sientra Inc Goldman Sachs (46,661)(13,148) Sientra Inc HSBC (19,328)(10,969) Sientra Inc Morgan Stanley (1,591)50,766 Sierra Bancorp Bank of America
Merrill Lynch 105,5934,883 Sierra Bancorp Barclays Bank 879
22,298 Sierra Bancorp Goldman Sachs 46,3804,564 Sierra Bancorp HSBC (867)
70,113 Sierra Bancorp Morgan Stanley 12,620(11,462) SIGA Technologies Inc Barclays Bank 115(64,442) SIGA Technologies Inc Goldman Sachs (25,132)(26,087) SIGA Technologies Inc HSBC (2,348)(74,641) SIGA Technologies Inc Morgan Stanley 746(1,099) Signature Bank Bank of America
Merrill Lynch (11,184)653 Signature Bank Bank of America
Merrill Lynch 9,449(1,805) Signature Bank Barclays Bank (15,415)6,862 Signature Bank Barclays Bank 58,601
(3,359) Signature Bank Goldman Sachs (37,097)(3,720) Signature Bank HSBC (5,766)5,316 Signature Bank HSBC 19,904
(1,138) Signature Bank Morgan Stanley (9,719)(13,113) Signet Jewelers Ltd Barclays Bank (5,639)(19,630) Signet Jewelers Ltd Goldman Sachs (32,193)(19,247) Signet Jewelers Ltd HSBC 8,084(13,198) Signet Jewelers Ltd Morgan Stanley (5,675)(14,441) Silgan Holdings Inc Bank of America
Merrill Lynch (3,900)(30,669) Silgan Holdings Inc Barclays Bank (22,082)(38,532) Silgan Holdings Inc Goldman Sachs (10,403)(23,587) Silgan Holdings Inc HSBC 14,066(31,718) Silgan Holdings Inc Morgan Stanley (22,837)
3,142 Silicon Laboratories Inc Bank of AmericaMerrill Lynch 2,105
12,843 Silicon Laboratories Inc Barclays Bank (39,685)(14,599) Silicon Laboratories Inc Barclays Bank 45,111
7,242 Silicon Laboratories Inc Goldman Sachs 1,33910,244 Silicon Laboratories Inc HSBC (92,606)(9,036) Silicon Laboratories Inc HSBC 81,6858,304 Silicon Laboratories Inc Morgan Stanley (24,294)
(1,353) Silicon Laboratories Inc Morgan Stanley 4,181591 Silk Road Medical Inc Bank of America
Merrill Lynch (390)960 Silk Road Medical Inc Barclays Bank (566)
7,568 Silk Road Medical Inc Goldman Sachs (4,738)4,887 Silk Road Medical Inc HSBC (733)9,759 Silk Road Medical Inc Morgan Stanley (5,758)
(26,550) SilverBow Resources Inc Bank of AmericaMerrill Lynch 531
(5,417) SilverBow Resources Inc Goldman Sachs 108(2,184) SilverBow Resources Inc HSBC 1,026(5,049) SilverBow Resources Inc Morgan Stanley 30310,922 Silvercrest Asset
Management Group Inc’A’
Bank of AmericaMerrill Lynch 22,499
11,133 Silvercrest AssetManagement Group Inc’A’ Goldman Sachs 22,934
Holding Description Counterparty
Netunrealised
appreciation/(depreciation)
USD
United States continued9,710 Silvercrest Asset
Management Group Inc’A’ HSBC 8,836
16,724 Silvercrest AssetManagement Group Inc’A’ Morgan Stanley 21,239
9,790 Silvergate Capital Corp ’A’ Barclays Bank (6,755)12,291 Silvergate Capital Corp ’A’ Goldman Sachs 1,4753,157 Silvergate Capital Corp ’A’ Morgan Stanley (2,178)
(18,099) Simmons First NationalCorp ’A’
Bank of AmericaMerrill Lynch (40,903)
(16,223) Simmons First NationalCorp ’A’ Barclays Bank (18,170)
(88,178) Simmons First NationalCorp ’A’ Goldman Sachs (199,282)
(32,260) Simmons First NationalCorp ’A’ HSBC 1,146
(46,325) Simmons First NationalCorp ’A’ Morgan Stanley (51,884)
13,782 Simon Property Group Inc(REIT) Morgan Stanley 34,317
(3,649) Simon Property Group Inc(REIT) Morgan Stanley (9,086)
6,614 Simply Good Foods Co Barclays Bank 2,24920,585 Simply Good Foods Co Goldman Sachs 4,379
(23,155) Simply Good Foods Co HSBC 77,569(17,769) Simply Good Foods Co Morgan Stanley (6,041)(6,834) Simpson Manufacturing Co
IncBank of AmericaMerrill Lynch (70,664)
(10,347) Simpson Manufacturing CoInc Barclays Bank (41,801)
(11,749) Simpson Manufacturing CoInc Goldman Sachs (121,485)
(49,090) Simpson Manufacturing CoInc HSBC (227,991)
(24,350) Simpson Manufacturing CoInc Morgan Stanley (98,374)
(8,063) Simulations Plus Inc Bank of AmericaMerrill Lynch (78,856)
(17,017) Simulations Plus Inc Goldman Sachs (166,426)(4,314) Simulations Plus Inc HSBC (37,446)
(13,197) Simulations Plus Inc Morgan Stanley (127,747)(2,683) SINA Corp Barclays Bank (1,140)(1,467) SINA Corp Goldman Sachs 4,518(9,334) SINA Corp HSBC 30,802
(985) SINA Corp Morgan Stanley (419)30,646 Sinclair Broadcast Group
Inc ’A’Bank of AmericaMerrill Lynch 70,961
22,106 Sinclair Broadcast GroupInc ’A’ Barclays Bank 3,537
3,188 Sinclair Broadcast GroupInc ’A’ Goldman Sachs 8,209
2,977 Sinclair Broadcast GroupInc ’A’ HSBC 2,640
5,469 Sinclair Broadcast GroupInc ’A’ Morgan Stanley 875
294,102 Sirius XM Holdings Inc Bank of AmericaMerrill Lynch 102,936
86,011 Sirius XM Holdings Inc Barclays Bank 31,125184,666 Sirius XM Holdings Inc Goldman Sachs 66,06851,204 Sirius XM Holdings Inc HSBC 9,929
329,880 Sirius XM Holdings Inc Morgan Stanley 127,004(2,771) SITE Centers Corp (REIT) Bank of America
Merrill Lynch (3,062)(17,416) SITE Centers Corp (REIT) Barclays Bank (2,003)(28,085) SITE Centers Corp (REIT) Goldman Sachs (31,034)(36,107) SITE Centers Corp (REIT) HSBC (3,430)
BlackRock Americas Diversified Equity Absolute Return Fundcontinued
The notes on pages 691 to 711 form an integral part of these financial statements.
Annual report and audited financial statements [183]
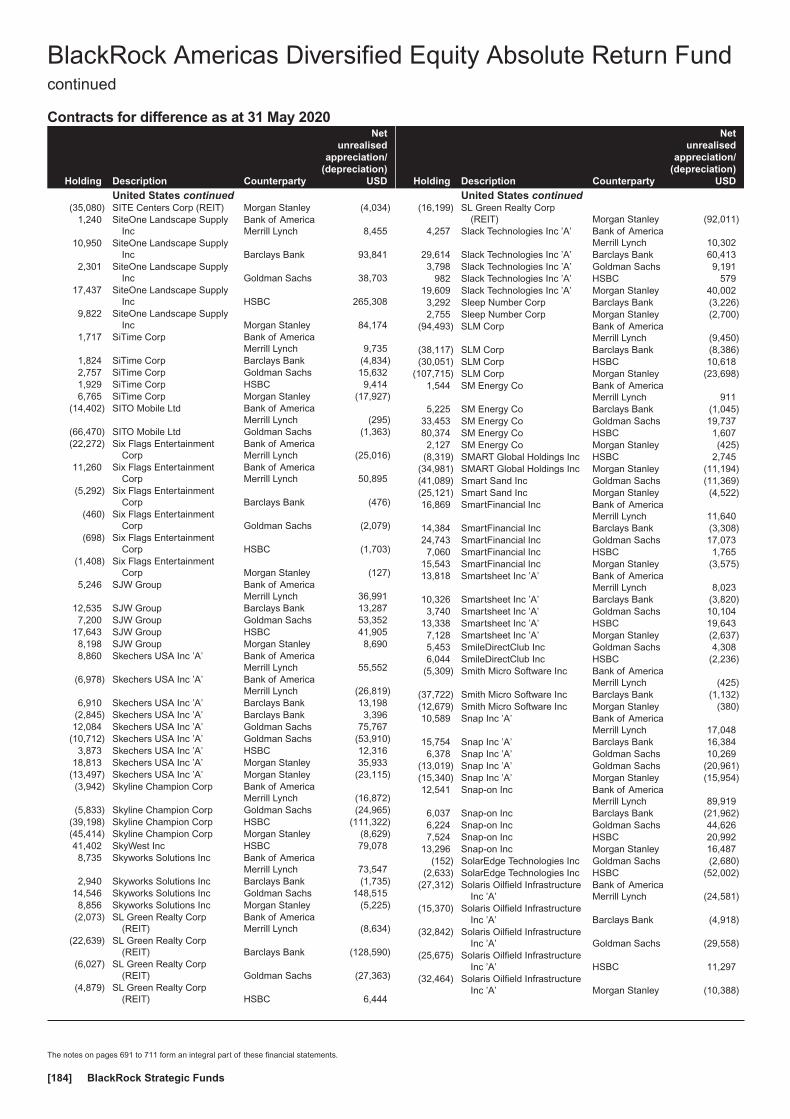
Contracts for difference as at 31 May 2020
Holding Description Counterparty
Netunrealised
appreciation/(depreciation)
USD
United States continued(35,080) SITE Centers Corp (REIT) Morgan Stanley (4,034)
1,240 SiteOne Landscape SupplyInc
Bank of AmericaMerrill Lynch 8,455
10,950 SiteOne Landscape SupplyInc Barclays Bank 93,841
2,301 SiteOne Landscape SupplyInc Goldman Sachs 38,703
17,437 SiteOne Landscape SupplyInc HSBC 265,308
9,822 SiteOne Landscape SupplyInc Morgan Stanley 84,174
1,717 SiTime Corp Bank of AmericaMerrill Lynch 9,735
1,824 SiTime Corp Barclays Bank (4,834)2,757 SiTime Corp Goldman Sachs 15,6321,929 SiTime Corp HSBC 9,4146,765 SiTime Corp Morgan Stanley (17,927)
(14,402) SITO Mobile Ltd Bank of AmericaMerrill Lynch (295)
(66,470) SITO Mobile Ltd Goldman Sachs (1,363)(22,272) Six Flags Entertainment
CorpBank of AmericaMerrill Lynch (25,016)
11,260 Six Flags EntertainmentCorp
Bank of AmericaMerrill Lynch 50,895
(5,292) Six Flags EntertainmentCorp Barclays Bank (476)
(460) Six Flags EntertainmentCorp Goldman Sachs (2,079)
(698) Six Flags EntertainmentCorp HSBC (1,703)
(1,408) Six Flags EntertainmentCorp Morgan Stanley (127)
5,246 SJW Group Bank of AmericaMerrill Lynch 36,991
12,535 SJW Group Barclays Bank 13,2877,200 SJW Group Goldman Sachs 53,352
17,643 SJW Group HSBC 41,9058,198 SJW Group Morgan Stanley 8,6908,860 Skechers USA Inc ’A’ Bank of America
Merrill Lynch 55,552(6,978) Skechers USA Inc ’A’ Bank of America
Merrill Lynch (26,819)6,910 Skechers USA Inc ’A’ Barclays Bank 13,198
(2,845) Skechers USA Inc ’A’ Barclays Bank 3,39612,084 Skechers USA Inc ’A’ Goldman Sachs 75,767
(10,712) Skechers USA Inc ’A’ Goldman Sachs (53,910)3,873 Skechers USA Inc ’A’ HSBC 12,316
18,813 Skechers USA Inc ’A’ Morgan Stanley 35,933(13,497) Skechers USA Inc ’A’ Morgan Stanley (23,115)(3,942) Skyline Champion Corp Bank of America
Merrill Lynch (16,872)(5,833) Skyline Champion Corp Goldman Sachs (24,965)
(39,198) Skyline Champion Corp HSBC (111,322)(45,414) Skyline Champion Corp Morgan Stanley (8,629)41,402 SkyWest Inc HSBC 79,0788,735 Skyworks Solutions Inc Bank of America
Merrill Lynch 73,5472,940 Skyworks Solutions Inc Barclays Bank (1,735)
14,546 Skyworks Solutions Inc Goldman Sachs 148,5158,856 Skyworks Solutions Inc Morgan Stanley (5,225)
(2,073) SL Green Realty Corp(REIT)
Bank of AmericaMerrill Lynch (8,634)
(22,639) SL Green Realty Corp(REIT) Barclays Bank (128,590)
(6,027) SL Green Realty Corp(REIT) Goldman Sachs (27,363)
(4,879) SL Green Realty Corp(REIT) HSBC 6,444
Holding Description Counterparty
Netunrealised
appreciation/(depreciation)
USD
United States continued(16,199) SL Green Realty Corp
(REIT) Morgan Stanley (92,011)4,257 Slack Technologies Inc ’A’ Bank of America
Merrill Lynch 10,30229,614 Slack Technologies Inc ’A’ Barclays Bank 60,4133,798 Slack Technologies Inc ’A’ Goldman Sachs 9,191
982 Slack Technologies Inc ’A’ HSBC 57919,609 Slack Technologies Inc ’A’ Morgan Stanley 40,0023,292 Sleep Number Corp Barclays Bank (3,226)2,755 Sleep Number Corp Morgan Stanley (2,700)
(94,493) SLM Corp Bank of AmericaMerrill Lynch (9,450)
(38,117) SLM Corp Barclays Bank (8,386)(30,051) SLM Corp HSBC 10,618
(107,715) SLM Corp Morgan Stanley (23,698)1,544 SM Energy Co Bank of America
Merrill Lynch 9115,225 SM Energy Co Barclays Bank (1,045)
33,453 SM Energy Co Goldman Sachs 19,73780,374 SM Energy Co HSBC 1,6072,127 SM Energy Co Morgan Stanley (425)
(8,319) SMART Global Holdings Inc HSBC 2,745(34,981) SMART Global Holdings Inc Morgan Stanley (11,194)(41,089) Smart Sand Inc Goldman Sachs (11,369)(25,121) Smart Sand Inc Morgan Stanley (4,522)16,869 SmartFinancial Inc Bank of America
Merrill Lynch 11,64014,384 SmartFinancial Inc Barclays Bank (3,308)24,743 SmartFinancial Inc Goldman Sachs 17,0737,060 SmartFinancial Inc HSBC 1,765
15,543 SmartFinancial Inc Morgan Stanley (3,575)13,818 Smartsheet Inc ’A’ Bank of America
Merrill Lynch 8,02310,326 Smartsheet Inc ’A’ Barclays Bank (3,820)3,740 Smartsheet Inc ’A’ Goldman Sachs 10,104
13,338 Smartsheet Inc ’A’ HSBC 19,6437,128 Smartsheet Inc ’A’ Morgan Stanley (2,637)5,453 SmileDirectClub Inc Goldman Sachs 4,3086,044 SmileDirectClub Inc HSBC (2,236)
(5,309) Smith Micro Software Inc Bank of AmericaMerrill Lynch (425)
(37,722) Smith Micro Software Inc Barclays Bank (1,132)(12,679) Smith Micro Software Inc Morgan Stanley (380)10,589 Snap Inc ’A’ Bank of America
Merrill Lynch 17,04815,754 Snap Inc ’A’ Barclays Bank 16,3846,378 Snap Inc ’A’ Goldman Sachs 10,269
(13,019) Snap Inc ’A’ Goldman Sachs (20,961)(15,340) Snap Inc ’A’ Morgan Stanley (15,954)12,541 Snap-on Inc Bank of America
Merrill Lynch 89,9196,037 Snap-on Inc Barclays Bank (21,962)6,224 Snap-on Inc Goldman Sachs 44,6267,524 Snap-on Inc HSBC 20,992
13,296 Snap-on Inc Morgan Stanley 16,487(152) SolarEdge Technologies Inc Goldman Sachs (2,680)
(2,633) SolarEdge Technologies Inc HSBC (52,002)(27,312) Solaris Oilfield Infrastructure
Inc ’A’Bank of AmericaMerrill Lynch (24,581)
(15,370) Solaris Oilfield InfrastructureInc ’A’ Barclays Bank (4,918)
(32,842) Solaris Oilfield InfrastructureInc ’A’ Goldman Sachs (29,558)
(25,675) Solaris Oilfield InfrastructureInc ’A’ HSBC 11,297
(32,464) Solaris Oilfield InfrastructureInc ’A’ Morgan Stanley (10,388)
BlackRock Americas Diversified Equity Absolute Return Fundcontinued
The notes on pages 691 to 711 form an integral part of these financial statements.
BlackRock Strategic Funds[184]
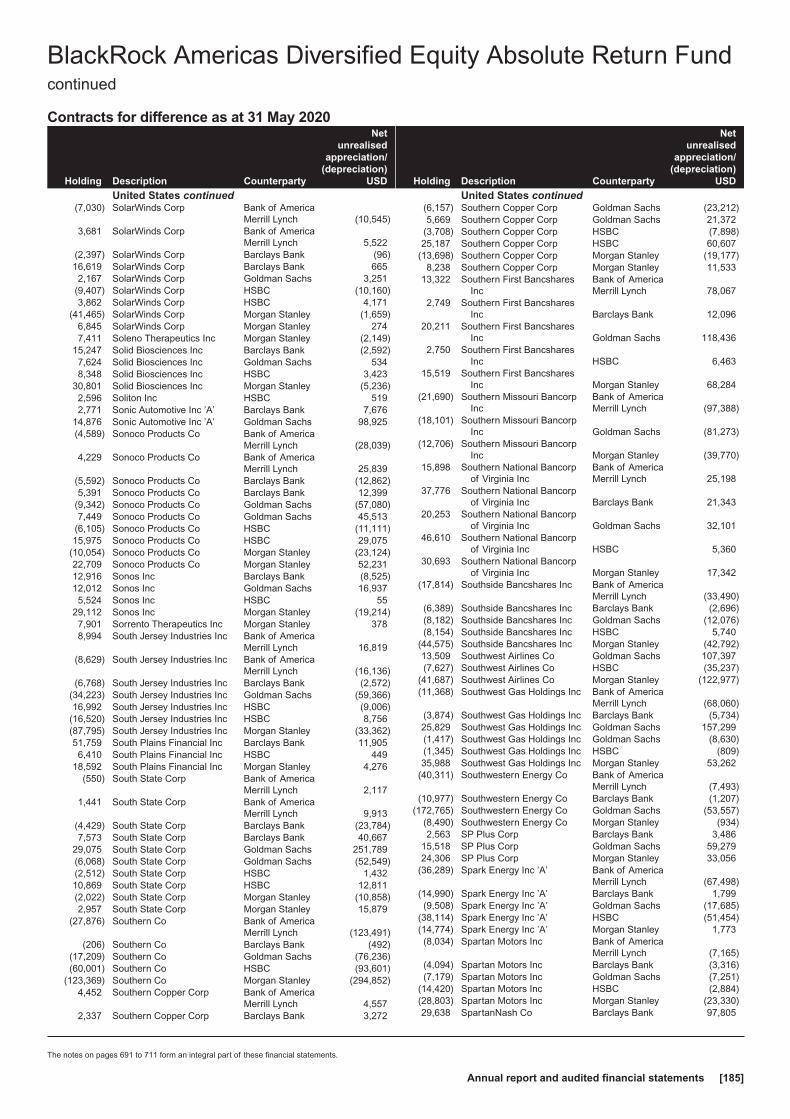
Contracts for difference as at 31 May 2020
Holding Description Counterparty
Netunrealised
appreciation/(depreciation)
USD
United States continued(7,030) SolarWinds Corp Bank of America
Merrill Lynch (10,545)3,681 SolarWinds Corp Bank of America
Merrill Lynch 5,522(2,397) SolarWinds Corp Barclays Bank (96)16,619 SolarWinds Corp Barclays Bank 6652,167 SolarWinds Corp Goldman Sachs 3,251
(9,407) SolarWinds Corp HSBC (10,160)3,862 SolarWinds Corp HSBC 4,171
(41,465) SolarWinds Corp Morgan Stanley (1,659)6,845 SolarWinds Corp Morgan Stanley 2747,411 Soleno Therapeutics Inc Morgan Stanley (2,149)
15,247 Solid Biosciences Inc Barclays Bank (2,592)7,624 Solid Biosciences Inc Goldman Sachs 5348,348 Solid Biosciences Inc HSBC 3,423
30,801 Solid Biosciences Inc Morgan Stanley (5,236)2,596 Soliton Inc HSBC 5192,771 Sonic Automotive Inc ’A’ Barclays Bank 7,676
14,876 Sonic Automotive Inc ’A’ Goldman Sachs 98,925(4,589) Sonoco Products Co Bank of America
Merrill Lynch (28,039)4,229 Sonoco Products Co Bank of America
Merrill Lynch 25,839(5,592) Sonoco Products Co Barclays Bank (12,862)5,391 Sonoco Products Co Barclays Bank 12,399
(9,342) Sonoco Products Co Goldman Sachs (57,080)7,449 Sonoco Products Co Goldman Sachs 45,513
(6,105) Sonoco Products Co HSBC (11,111)15,975 Sonoco Products Co HSBC 29,075
(10,054) Sonoco Products Co Morgan Stanley (23,124)22,709 Sonoco Products Co Morgan Stanley 52,23112,916 Sonos Inc Barclays Bank (8,525)12,012 Sonos Inc Goldman Sachs 16,9375,524 Sonos Inc HSBC 55
29,112 Sonos Inc Morgan Stanley (19,214)7,901 Sorrento Therapeutics Inc Morgan Stanley 3788,994 South Jersey Industries Inc Bank of America
Merrill Lynch 16,819(8,629) South Jersey Industries Inc Bank of America
Merrill Lynch (16,136)(6,768) South Jersey Industries Inc Barclays Bank (2,572)
(34,223) South Jersey Industries Inc Goldman Sachs (59,366)16,992 South Jersey Industries Inc HSBC (9,006)
(16,520) South Jersey Industries Inc HSBC 8,756(87,795) South Jersey Industries Inc Morgan Stanley (33,362)51,759 South Plains Financial Inc Barclays Bank 11,9056,410 South Plains Financial Inc HSBC 449
18,592 South Plains Financial Inc Morgan Stanley 4,276(550) South State Corp Bank of America
Merrill Lynch 2,1171,441 South State Corp Bank of America
Merrill Lynch 9,913(4,429) South State Corp Barclays Bank (23,784)7,573 South State Corp Barclays Bank 40,667
29,075 South State Corp Goldman Sachs 251,789(6,068) South State Corp Goldman Sachs (52,549)(2,512) South State Corp HSBC 1,43210,869 South State Corp HSBC 12,811(2,022) South State Corp Morgan Stanley (10,858)2,957 South State Corp Morgan Stanley 15,879
(27,876) Southern Co Bank of AmericaMerrill Lynch (123,491)
(206) Southern Co Barclays Bank (492)(17,209) Southern Co Goldman Sachs (76,236)(60,001) Southern Co HSBC (93,601)
(123,369) Southern Co Morgan Stanley (294,852)4,452 Southern Copper Corp Bank of America
Merrill Lynch 4,5572,337 Southern Copper Corp Barclays Bank 3,272
Holding Description Counterparty
Netunrealised
appreciation/(depreciation)
USD
United States continued(6,157) Southern Copper Corp Goldman Sachs (23,212)5,669 Southern Copper Corp Goldman Sachs 21,372
(3,708) Southern Copper Corp HSBC (7,898)25,187 Southern Copper Corp HSBC 60,607
(13,698) Southern Copper Corp Morgan Stanley (19,177)8,238 Southern Copper Corp Morgan Stanley 11,533
13,322 Southern First BancsharesInc
Bank of AmericaMerrill Lynch 78,067
2,749 Southern First BancsharesInc Barclays Bank 12,096
20,211 Southern First BancsharesInc Goldman Sachs 118,436
2,750 Southern First BancsharesInc HSBC 6,463
15,519 Southern First BancsharesInc Morgan Stanley 68,284
(21,690) Southern Missouri BancorpInc
Bank of AmericaMerrill Lynch (97,388)
(18,101) Southern Missouri BancorpInc Goldman Sachs (81,273)
(12,706) Southern Missouri BancorpInc Morgan Stanley (39,770)
15,898 Southern National Bancorpof Virginia Inc
Bank of AmericaMerrill Lynch 25,198
37,776 Southern National Bancorpof Virginia Inc Barclays Bank 21,343
20,253 Southern National Bancorpof Virginia Inc Goldman Sachs 32,101
46,610 Southern National Bancorpof Virginia Inc HSBC 5,360
30,693 Southern National Bancorpof Virginia Inc Morgan Stanley 17,342
(17,814) Southside Bancshares Inc Bank of AmericaMerrill Lynch (33,490)
(6,389) Southside Bancshares Inc Barclays Bank (2,696)(8,182) Southside Bancshares Inc Goldman Sachs (12,076)(8,154) Southside Bancshares Inc HSBC 5,740
(44,575) Southside Bancshares Inc Morgan Stanley (42,792)13,509 Southwest Airlines Co Goldman Sachs 107,397(7,627) Southwest Airlines Co HSBC (35,237)
(41,687) Southwest Airlines Co Morgan Stanley (122,977)(11,368) Southwest Gas Holdings Inc Bank of America
Merrill Lynch (68,060)(3,874) Southwest Gas Holdings Inc Barclays Bank (5,734)25,829 Southwest Gas Holdings Inc Goldman Sachs 157,299(1,417) Southwest Gas Holdings Inc Goldman Sachs (8,630)(1,345) Southwest Gas Holdings Inc HSBC (809)35,988 Southwest Gas Holdings Inc Morgan Stanley 53,262
(40,311) Southwestern Energy Co Bank of AmericaMerrill Lynch (7,493)
(10,977) Southwestern Energy Co Barclays Bank (1,207)(172,765) Southwestern Energy Co Goldman Sachs (53,557)
(8,490) Southwestern Energy Co Morgan Stanley (934)2,563 SP Plus Corp Barclays Bank 3,486
15,518 SP Plus Corp Goldman Sachs 59,27924,306 SP Plus Corp Morgan Stanley 33,056
(36,289) Spark Energy Inc ’A’ Bank of AmericaMerrill Lynch (67,498)
(14,990) Spark Energy Inc ’A’ Barclays Bank 1,799(9,508) Spark Energy Inc ’A’ Goldman Sachs (17,685)
(38,114) Spark Energy Inc ’A’ HSBC (51,454)(14,774) Spark Energy Inc ’A’ Morgan Stanley 1,773(8,034) Spartan Motors Inc Bank of America
Merrill Lynch (7,165)(4,094) Spartan Motors Inc Barclays Bank (3,316)(7,179) Spartan Motors Inc Goldman Sachs (7,251)
(14,420) Spartan Motors Inc HSBC (2,884)(28,803) Spartan Motors Inc Morgan Stanley (23,330)29,638 SpartanNash Co Barclays Bank 97,805
BlackRock Americas Diversified Equity Absolute Return Fundcontinued
The notes on pages 691 to 711 form an integral part of these financial statements.
Annual report and audited financial statements [185]
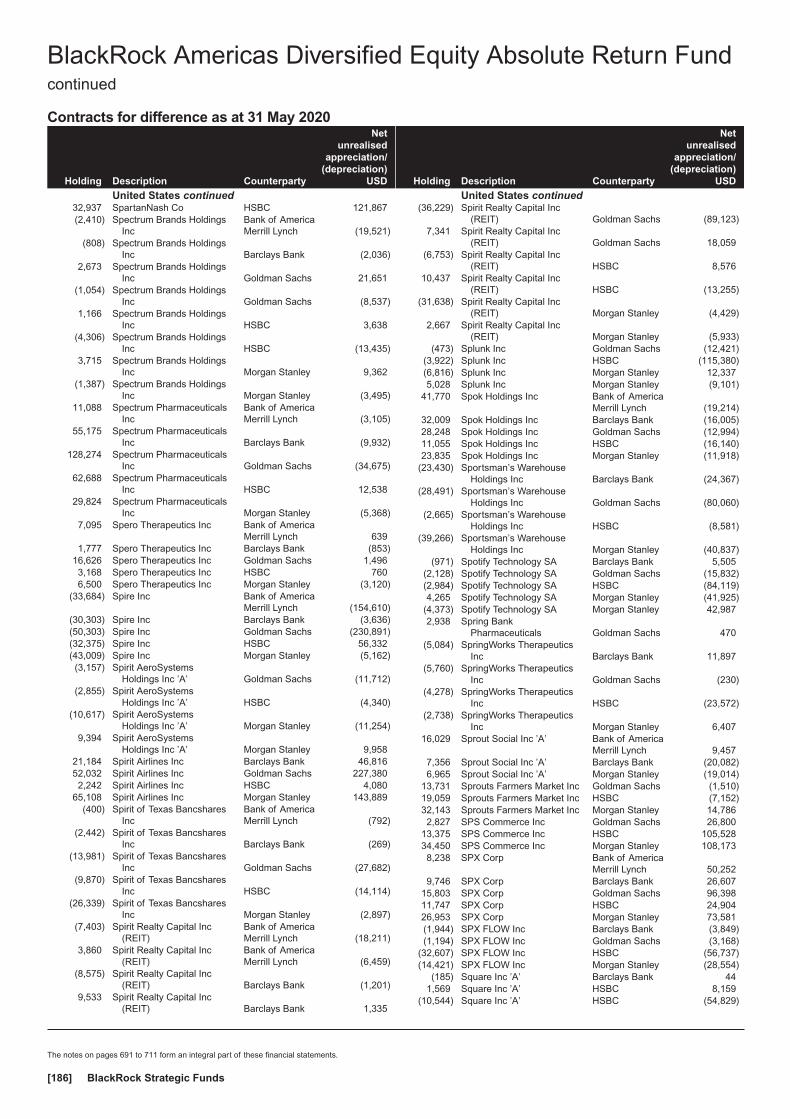
Contracts for difference as at 31 May 2020
Holding Description Counterparty
Netunrealised
appreciation/(depreciation)
USD
United States continued32,937 SpartanNash Co HSBC 121,867(2,410) Spectrum Brands Holdings
IncBank of AmericaMerrill Lynch (19,521)
(808) Spectrum Brands HoldingsInc Barclays Bank (2,036)
2,673 Spectrum Brands HoldingsInc Goldman Sachs 21,651
(1,054) Spectrum Brands HoldingsInc Goldman Sachs (8,537)
1,166 Spectrum Brands HoldingsInc HSBC 3,638
(4,306) Spectrum Brands HoldingsInc HSBC (13,435)
3,715 Spectrum Brands HoldingsInc Morgan Stanley 9,362
(1,387) Spectrum Brands HoldingsInc Morgan Stanley (3,495)
11,088 Spectrum PharmaceuticalsInc
Bank of AmericaMerrill Lynch (3,105)
55,175 Spectrum PharmaceuticalsInc Barclays Bank (9,932)
128,274 Spectrum PharmaceuticalsInc Goldman Sachs (34,675)
62,688 Spectrum PharmaceuticalsInc HSBC 12,538
29,824 Spectrum PharmaceuticalsInc Morgan Stanley (5,368)
7,095 Spero Therapeutics Inc Bank of AmericaMerrill Lynch 639
1,777 Spero Therapeutics Inc Barclays Bank (853)16,626 Spero Therapeutics Inc Goldman Sachs 1,4963,168 Spero Therapeutics Inc HSBC 7606,500 Spero Therapeutics Inc Morgan Stanley (3,120)
(33,684) Spire Inc Bank of AmericaMerrill Lynch (154,610)
(30,303) Spire Inc Barclays Bank (3,636)(50,303) Spire Inc Goldman Sachs (230,891)(32,375) Spire Inc HSBC 56,332(43,009) Spire Inc Morgan Stanley (5,162)(3,157) Spirit AeroSystems
Holdings Inc ’A’ Goldman Sachs (11,712)(2,855) Spirit AeroSystems
Holdings Inc ’A’ HSBC (4,340)(10,617) Spirit AeroSystems
Holdings Inc ’A’ Morgan Stanley (11,254)9,394 Spirit AeroSystems
Holdings Inc ’A’ Morgan Stanley 9,95821,184 Spirit Airlines Inc Barclays Bank 46,81652,032 Spirit Airlines Inc Goldman Sachs 227,3802,242 Spirit Airlines Inc HSBC 4,080
65,108 Spirit Airlines Inc Morgan Stanley 143,889(400) Spirit of Texas Bancshares
IncBank of AmericaMerrill Lynch (792)
(2,442) Spirit of Texas BancsharesInc Barclays Bank (269)
(13,981) Spirit of Texas BancsharesInc Goldman Sachs (27,682)
(9,870) Spirit of Texas BancsharesInc HSBC (14,114)
(26,339) Spirit of Texas BancsharesInc Morgan Stanley (2,897)
(7,403) Spirit Realty Capital Inc(REIT)
Bank of AmericaMerrill Lynch (18,211)
3,860 Spirit Realty Capital Inc(REIT)
Bank of AmericaMerrill Lynch (6,459)
(8,575) Spirit Realty Capital Inc(REIT) Barclays Bank (1,201)
9,533 Spirit Realty Capital Inc(REIT) Barclays Bank 1,335
Holding Description Counterparty
Netunrealised
appreciation/(depreciation)
USD
United States continued(36,229) Spirit Realty Capital Inc
(REIT) Goldman Sachs (89,123)7,341 Spirit Realty Capital Inc
(REIT) Goldman Sachs 18,059(6,753) Spirit Realty Capital Inc
(REIT) HSBC 8,57610,437 Spirit Realty Capital Inc
(REIT) HSBC (13,255)(31,638) Spirit Realty Capital Inc
(REIT) Morgan Stanley (4,429)2,667 Spirit Realty Capital Inc
(REIT) Morgan Stanley (5,933)(473) Splunk Inc Goldman Sachs (12,421)
(3,922) Splunk Inc HSBC (115,380)(6,816) Splunk Inc Morgan Stanley 12,3375,028 Splunk Inc Morgan Stanley (9,101)
41,770 Spok Holdings Inc Bank of AmericaMerrill Lynch (19,214)
32,009 Spok Holdings Inc Barclays Bank (16,005)28,248 Spok Holdings Inc Goldman Sachs (12,994)11,055 Spok Holdings Inc HSBC (16,140)23,835 Spok Holdings Inc Morgan Stanley (11,918)
(23,430) Sportsman’s WarehouseHoldings Inc Barclays Bank (24,367)
(28,491) Sportsman’s WarehouseHoldings Inc Goldman Sachs (80,060)
(2,665) Sportsman’s WarehouseHoldings Inc HSBC (8,581)
(39,266) Sportsman’s WarehouseHoldings Inc Morgan Stanley (40,837)
(971) Spotify Technology SA Barclays Bank 5,505(2,128) Spotify Technology SA Goldman Sachs (15,832)(2,984) Spotify Technology SA HSBC (84,119)4,265 Spotify Technology SA Morgan Stanley (41,925)
(4,373) Spotify Technology SA Morgan Stanley 42,9872,938 Spring Bank
Pharmaceuticals Goldman Sachs 470(5,084) SpringWorks Therapeutics
Inc Barclays Bank 11,897(5,760) SpringWorks Therapeutics
Inc Goldman Sachs (230)(4,278) SpringWorks Therapeutics
Inc HSBC (23,572)(2,738) SpringWorks Therapeutics
Inc Morgan Stanley 6,40716,029 Sprout Social Inc ’A’ Bank of America
Merrill Lynch 9,4577,356 Sprout Social Inc ’A’ Barclays Bank (20,082)6,965 Sprout Social Inc ’A’ Morgan Stanley (19,014)
13,731 Sprouts Farmers Market Inc Goldman Sachs (1,510)19,059 Sprouts Farmers Market Inc HSBC (7,152)32,143 Sprouts Farmers Market Inc Morgan Stanley 14,7862,827 SPS Commerce Inc Goldman Sachs 26,800
13,375 SPS Commerce Inc HSBC 105,52834,450 SPS Commerce Inc Morgan Stanley 108,1738,238 SPX Corp Bank of America
Merrill Lynch 50,2529,746 SPX Corp Barclays Bank 26,607
15,803 SPX Corp Goldman Sachs 96,39811,747 SPX Corp HSBC 24,90426,953 SPX Corp Morgan Stanley 73,581(1,944) SPX FLOW Inc Barclays Bank (3,849)(1,194) SPX FLOW Inc Goldman Sachs (3,168)
(32,607) SPX FLOW Inc HSBC (56,737)(14,421) SPX FLOW Inc Morgan Stanley (28,554)
(185) Square Inc ’A’ Barclays Bank 441,569 Square Inc ’A’ HSBC 8,159
(10,544) Square Inc ’A’ HSBC (54,829)
BlackRock Americas Diversified Equity Absolute Return Fundcontinued
The notes on pages 691 to 711 form an integral part of these financial statements.
BlackRock Strategic Funds[186]

Contracts for difference as at 31 May 2020
Holding Description Counterparty
Netunrealised
appreciation/(depreciation)
USD
United States continued3,194 Square Inc ’A’ Morgan Stanley (767)6,842 SS&C Technologies
Holdings IncBank of AmericaMerrill Lynch 17,994
(13,205) SS&C TechnologiesHoldings Inc
Bank of AmericaMerrill Lynch (34,729)
8,489 SS&C TechnologiesHoldings Inc Barclays Bank 11,715
(3,500) SS&C TechnologiesHoldings Inc Barclays Bank (3,125)
(7,748) SS&C TechnologiesHoldings Inc Goldman Sachs (20,377)
3,903 SS&C TechnologiesHoldings Inc HSBC (4,957)
(8,729) SS&C TechnologiesHoldings Inc HSBC 11,086
9,486 SS&C TechnologiesHoldings Inc Morgan Stanley 13,091
(10,109) SS&C TechnologiesHoldings Inc Morgan Stanley (13,950)
(14,081) St Joe Co Bank of AmericaMerrill Lynch (23,656)
(21,235) St Joe Co Barclays Bank (9,556)(10,929) St Joe Co Goldman Sachs (18,361)(22,751) St Joe Co HSBC (29,315)(23,486) St Joe Co Morgan Stanley (10,569)(3,079) STAAR Surgical Co Bank of America
Merrill Lynch (4,896)(6,941) STAAR Surgical Co Barclays Bank (6,733)
(20,271) STAAR Surgical Co Goldman Sachs (29,099)(9,353) STAAR Surgical Co HSBC (12,842)
(18,921) STAAR Surgical Co Morgan Stanley (18,354)9,312 STAG Industrial Inc (REIT) Bank of America
Merrill Lynch 32,312(12,010) STAG Industrial Inc (REIT) Barclays Bank (15,253)50,099 STAG Industrial Inc (REIT) Goldman Sachs 173,84435,438 STAG Industrial Inc (REIT) HSBC 29,059
(83,720) STAG Industrial Inc (REIT) HSBC (68,650)19,124 STAG Industrial Inc (REIT) Morgan Stanley 24,287
(41,345) STAG Industrial Inc (REIT) Morgan Stanley (52,508)(1,892) Stamps.com Inc Goldman Sachs 4,0474,609 Stamps.com Inc Morgan Stanley 29,0371,447 Standard Motor Products
IncBank of AmericaMerrill Lynch 6,367
5,110 Standard Motor ProductsInc Barclays Bank 11,191
24,305 Standard Motor ProductsInc Goldman Sachs 106,942
4,440 Standard Motor ProductsInc HSBC 5,905
17,451 Standard Motor ProductsInc Morgan Stanley 38,218
9,554 Standex International Corp Bank of AmericaMerrill Lynch 92,674
13,193 Standex International Corp Barclays Bank 45,6489,752 Standex International Corp Goldman Sachs 94,594
10,489 Standex International Corp HSBC 69,46310,202 Standex International Corp Morgan Stanley 35,299
(14,356) Stanley Black & Decker Inc Goldman Sachs (235,725)(5,010) Stanley Black & Decker Inc HSBC (37,267)(2,768) Stanley Black & Decker Inc Morgan Stanley (7,668)(6,359) Starbucks Corp Bank of America
Merrill Lynch (25,881)(61,323) Starbucks Corp Barclays Bank (37,407)(7,452) Starbucks Corp Goldman Sachs (23,842)(2,404) Starbucks Corp HSBC (75)
(14,190) Starbucks Corp Morgan Stanley (8,656)14,771 StarTek Inc Bank of America
Merrill Lynch 15,510
Holding Description Counterparty
Netunrealised
appreciation/(depreciation)
USD
United States continued6,513 StarTek Inc Goldman Sachs 6,8394,338 StarTek Inc Morgan Stanley 737
(36,572) Starwood Property Trust Inc(REIT)
Bank of AmericaMerrill Lynch (69,390)
(6,605) Starwood Property Trust Inc(REIT) Barclays Bank 3,123
(74,831) Starwood Property Trust Inc(REIT) Morgan Stanley (37,416)
(26,505) State Auto Financial Corp Bank of AmericaMerrill Lynch (31,541)
(6,462) State Auto Financial Corp HSBC 9,047(6,240) State Auto Financial Corp Morgan Stanley (1,123)(3,852) State Street Corp Bank of America
Merrill Lynch (27,888)(2,059) State Street Corp Barclays Bank 2,596
(801) State Street Corp Goldman Sachs (5,799)(2,989) State Street Corp HSBC (3,999)
(17,617) State Street Corp Morgan Stanley (111,516)43,398 Steel Dynamics Inc Bank of America
Merrill Lynch 156,23320,222 Steel Dynamics Inc Barclays Bank 34,17527,658 Steel Dynamics Inc Goldman Sachs 99,56950,569 Steel Dynamics Inc HSBC 40,96949,316 Steel Dynamics Inc Morgan Stanley 83,34419,250 Steelcase Inc ’A’ Bank of America
Merrill Lynch 41,77347,819 Steelcase Inc ’A’ Barclays Bank 18,17148,241 Steelcase Inc ’A’ Goldman Sachs 104,68318,353 Steelcase Inc ’A’ HSBC 13,76540,715 Steelcase Inc ’A’ Morgan Stanley 15,472
(240) Stepan Co Barclays Bank (518)1,092 Stepan Co Barclays Bank 2,359
(3,861) Stepan Co Goldman Sachs (23,657)(483) Stepan Co HSBC (1,584)
9,879 Stepan Co HSBC 32,403604 Stepan Co Morgan Stanley 1,305
(37,209) Stereotaxis Inc Bank of AmericaMerrill Lynch (22,697)
(21,085) Stereotaxis Inc Goldman Sachs (12,862)(6,942) Stereotaxis Inc HSBC (972)(6,753) Stereotaxis Inc Morgan Stanley (1,283)(6,360) Stericycle Inc Bank of America
Merrill Lynch (40,005)(6,441) Stericycle Inc Barclays Bank (20,611)
(999) Stericycle Inc Goldman Sachs (2,752)(24,258) Stericycle Inc HSBC (50,405)(9,469) Stericycle Inc Morgan Stanley (30,301)
715 STERIS Plc Bank of AmericaMerrill Lynch 9,102
(3,712) STERIS Plc Bank of AmericaMerrill Lynch (17,878)
1,063 STERIS Plc Barclays Bank 6,984(3,056) STERIS Plc Barclays Bank (20,078)11,964 STERIS Plc Goldman Sachs 152,302(9,262) STERIS Plc Goldman Sachs (108,644)1,593 STERIS Plc HSBC 25,169(519) STERIS Plc HSBC (8,200)
2,978 STERIS Plc Morgan Stanley 19,565(4,206) STERIS Plc Morgan Stanley (27,633)
(61,423) Sterling Bancorp Bank of AmericaMerrill Lynch (164,307)
17,019 Sterling Bancorp Bank of AmericaMerrill Lynch 45,526
21,485 Sterling Bancorp Barclays Bank 32,5507,611 Sterling Bancorp Goldman Sachs 20,359
20,498 Sterling Bancorp HSBC 14,246(1,760) Sterling Bancorp Morgan Stanley (2,666)
BlackRock Americas Diversified Equity Absolute Return Fundcontinued
The notes on pages 691 to 711 form an integral part of these financial statements.
Annual report and audited financial statements [187]
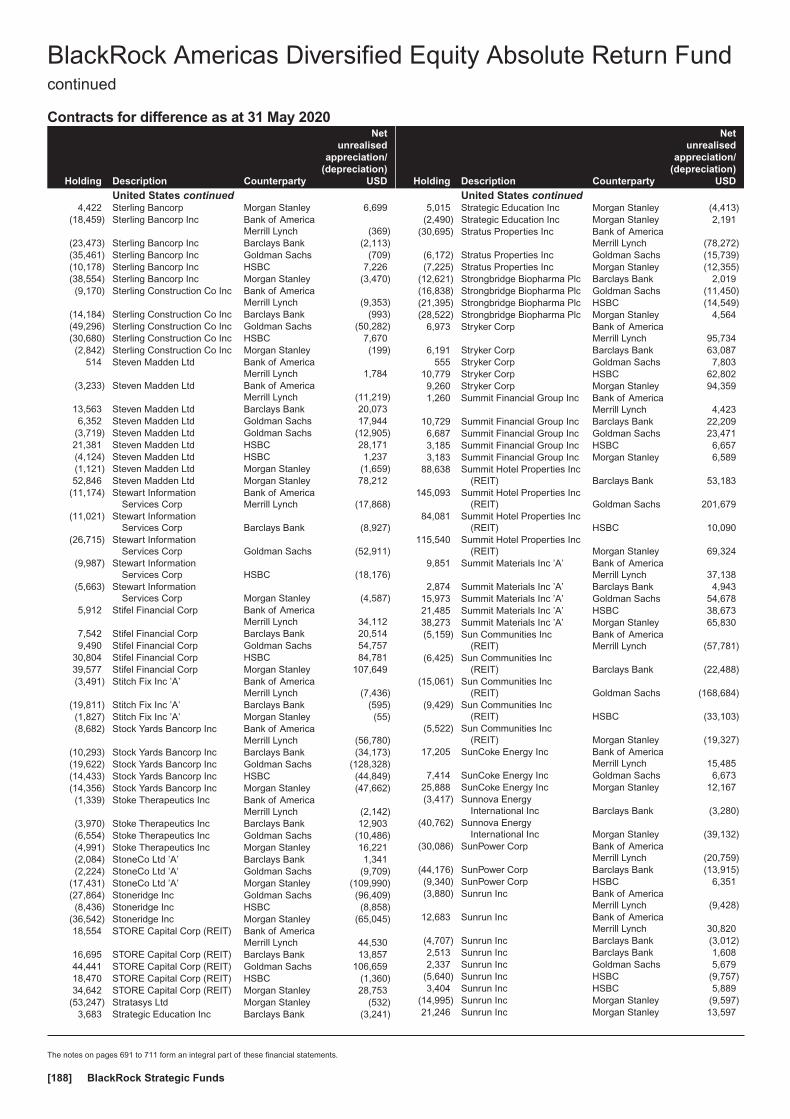
Contracts for difference as at 31 May 2020
Holding Description Counterparty
Netunrealised
appreciation/(depreciation)
USD
United States continued4,422 Sterling Bancorp Morgan Stanley 6,699
(18,459) Sterling Bancorp Inc Bank of AmericaMerrill Lynch (369)
(23,473) Sterling Bancorp Inc Barclays Bank (2,113)(35,461) Sterling Bancorp Inc Goldman Sachs (709)(10,178) Sterling Bancorp Inc HSBC 7,226(38,554) Sterling Bancorp Inc Morgan Stanley (3,470)(9,170) Sterling Construction Co Inc Bank of America
Merrill Lynch (9,353)(14,184) Sterling Construction Co Inc Barclays Bank (993)(49,296) Sterling Construction Co Inc Goldman Sachs (50,282)(30,680) Sterling Construction Co Inc HSBC 7,670(2,842) Sterling Construction Co Inc Morgan Stanley (199)
514 Steven Madden Ltd Bank of AmericaMerrill Lynch 1,784
(3,233) Steven Madden Ltd Bank of AmericaMerrill Lynch (11,219)
13,563 Steven Madden Ltd Barclays Bank 20,0736,352 Steven Madden Ltd Goldman Sachs 17,944
(3,719) Steven Madden Ltd Goldman Sachs (12,905)21,381 Steven Madden Ltd HSBC 28,171(4,124) Steven Madden Ltd HSBC 1,237(1,121) Steven Madden Ltd Morgan Stanley (1,659)52,846 Steven Madden Ltd Morgan Stanley 78,212
(11,174) Stewart InformationServices Corp
Bank of AmericaMerrill Lynch (17,868)
(11,021) Stewart InformationServices Corp Barclays Bank (8,927)
(26,715) Stewart InformationServices Corp Goldman Sachs (52,911)
(9,987) Stewart InformationServices Corp HSBC (18,176)
(5,663) Stewart InformationServices Corp Morgan Stanley (4,587)
5,912 Stifel Financial Corp Bank of AmericaMerrill Lynch 34,112
7,542 Stifel Financial Corp Barclays Bank 20,5149,490 Stifel Financial Corp Goldman Sachs 54,757
30,804 Stifel Financial Corp HSBC 84,78139,577 Stifel Financial Corp Morgan Stanley 107,649(3,491) Stitch Fix Inc ’A’ Bank of America
Merrill Lynch (7,436)(19,811) Stitch Fix Inc ’A’ Barclays Bank (595)(1,827) Stitch Fix Inc ’A’ Morgan Stanley (55)(8,682) Stock Yards Bancorp Inc Bank of America
Merrill Lynch (56,780)(10,293) Stock Yards Bancorp Inc Barclays Bank (34,173)(19,622) Stock Yards Bancorp Inc Goldman Sachs (128,328)(14,433) Stock Yards Bancorp Inc HSBC (44,849)(14,356) Stock Yards Bancorp Inc Morgan Stanley (47,662)(1,339) Stoke Therapeutics Inc Bank of America
Merrill Lynch (2,142)(3,970) Stoke Therapeutics Inc Barclays Bank 12,903(6,554) Stoke Therapeutics Inc Goldman Sachs (10,486)(4,991) Stoke Therapeutics Inc Morgan Stanley 16,221(2,084) StoneCo Ltd ’A’ Barclays Bank 1,341(2,224) StoneCo Ltd ’A’ Goldman Sachs (9,709)
(17,431) StoneCo Ltd ’A’ Morgan Stanley (109,990)(27,864) Stoneridge Inc Goldman Sachs (96,409)(8,436) Stoneridge Inc HSBC (8,858)
(36,542) Stoneridge Inc Morgan Stanley (65,045)18,554 STORE Capital Corp (REIT) Bank of America
Merrill Lynch 44,53016,695 STORE Capital Corp (REIT) Barclays Bank 13,85744,441 STORE Capital Corp (REIT) Goldman Sachs 106,65918,470 STORE Capital Corp (REIT) HSBC (1,360)34,642 STORE Capital Corp (REIT) Morgan Stanley 28,753
(53,247) Stratasys Ltd Morgan Stanley (532)3,683 Strategic Education Inc Barclays Bank (3,241)
Holding Description Counterparty
Netunrealised
appreciation/(depreciation)
USD
United States continued5,015 Strategic Education Inc Morgan Stanley (4,413)
(2,490) Strategic Education Inc Morgan Stanley 2,191(30,695) Stratus Properties Inc Bank of America
Merrill Lynch (78,272)(6,172) Stratus Properties Inc Goldman Sachs (15,739)(7,225) Stratus Properties Inc Morgan Stanley (12,355)
(12,621) Strongbridge Biopharma Plc Barclays Bank 2,019(16,838) Strongbridge Biopharma Plc Goldman Sachs (11,450)(21,395) Strongbridge Biopharma Plc HSBC (14,549)(28,522) Strongbridge Biopharma Plc Morgan Stanley 4,564
6,973 Stryker Corp Bank of AmericaMerrill Lynch 95,734
6,191 Stryker Corp Barclays Bank 63,087555 Stryker Corp Goldman Sachs 7,803
10,779 Stryker Corp HSBC 62,8029,260 Stryker Corp Morgan Stanley 94,3591,260 Summit Financial Group Inc Bank of America
Merrill Lynch 4,42310,729 Summit Financial Group Inc Barclays Bank 22,2096,687 Summit Financial Group Inc Goldman Sachs 23,4713,185 Summit Financial Group Inc HSBC 6,6573,183 Summit Financial Group Inc Morgan Stanley 6,589
88,638 Summit Hotel Properties Inc(REIT) Barclays Bank 53,183
145,093 Summit Hotel Properties Inc(REIT) Goldman Sachs 201,679
84,081 Summit Hotel Properties Inc(REIT) HSBC 10,090
115,540 Summit Hotel Properties Inc(REIT) Morgan Stanley 69,324
9,851 Summit Materials Inc ’A’ Bank of AmericaMerrill Lynch 37,138
2,874 Summit Materials Inc ’A’ Barclays Bank 4,94315,973 Summit Materials Inc ’A’ Goldman Sachs 54,67821,485 Summit Materials Inc ’A’ HSBC 38,67338,273 Summit Materials Inc ’A’ Morgan Stanley 65,830(5,159) Sun Communities Inc
(REIT)Bank of AmericaMerrill Lynch (57,781)
(6,425) Sun Communities Inc(REIT) Barclays Bank (22,488)
(15,061) Sun Communities Inc(REIT) Goldman Sachs (168,684)
(9,429) Sun Communities Inc(REIT) HSBC (33,103)
(5,522) Sun Communities Inc(REIT) Morgan Stanley (19,327)
17,205 SunCoke Energy Inc Bank of AmericaMerrill Lynch 15,485
7,414 SunCoke Energy Inc Goldman Sachs 6,67325,888 SunCoke Energy Inc Morgan Stanley 12,167(3,417) Sunnova Energy
International Inc Barclays Bank (3,280)(40,762) Sunnova Energy
International Inc Morgan Stanley (39,132)(30,086) SunPower Corp Bank of America
Merrill Lynch (20,759)(44,176) SunPower Corp Barclays Bank (13,915)(9,340) SunPower Corp HSBC 6,351(3,880) Sunrun Inc Bank of America
Merrill Lynch (9,428)12,683 Sunrun Inc Bank of America
Merrill Lynch 30,820(4,707) Sunrun Inc Barclays Bank (3,012)2,513 Sunrun Inc Barclays Bank 1,6082,337 Sunrun Inc Goldman Sachs 5,679
(5,640) Sunrun Inc HSBC (9,757)3,404 Sunrun Inc HSBC 5,889
(14,995) Sunrun Inc Morgan Stanley (9,597)21,246 Sunrun Inc Morgan Stanley 13,597
BlackRock Americas Diversified Equity Absolute Return Fundcontinued
The notes on pages 691 to 711 form an integral part of these financial statements.
BlackRock Strategic Funds[188]
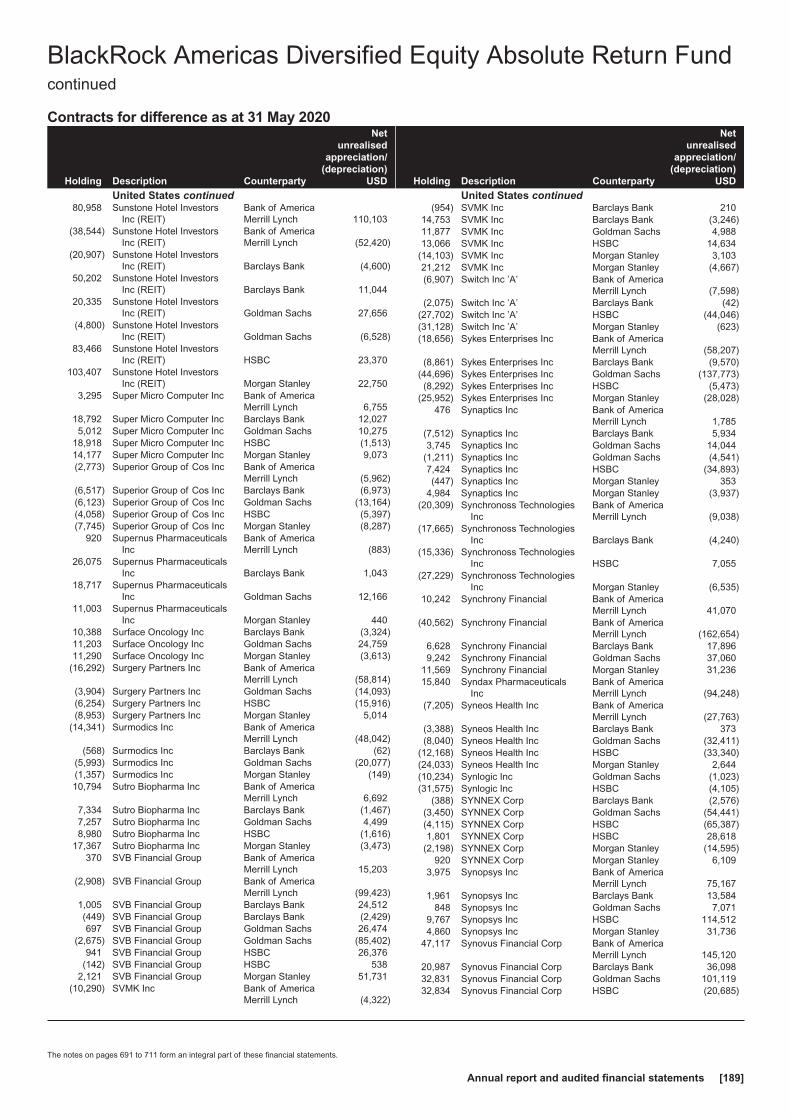
Contracts for difference as at 31 May 2020
Holding Description Counterparty
Netunrealised
appreciation/(depreciation)
USD
United States continued80,958 Sunstone Hotel Investors
Inc (REIT)Bank of AmericaMerrill Lynch 110,103
(38,544) Sunstone Hotel InvestorsInc (REIT)
Bank of AmericaMerrill Lynch (52,420)
(20,907) Sunstone Hotel InvestorsInc (REIT) Barclays Bank (4,600)
50,202 Sunstone Hotel InvestorsInc (REIT) Barclays Bank 11,044
20,335 Sunstone Hotel InvestorsInc (REIT) Goldman Sachs 27,656
(4,800) Sunstone Hotel InvestorsInc (REIT) Goldman Sachs (6,528)
83,466 Sunstone Hotel InvestorsInc (REIT) HSBC 23,370
103,407 Sunstone Hotel InvestorsInc (REIT) Morgan Stanley 22,750
3,295 Super Micro Computer Inc Bank of AmericaMerrill Lynch 6,755
18,792 Super Micro Computer Inc Barclays Bank 12,0275,012 Super Micro Computer Inc Goldman Sachs 10,275
18,918 Super Micro Computer Inc HSBC (1,513)14,177 Super Micro Computer Inc Morgan Stanley 9,073(2,773) Superior Group of Cos Inc Bank of America
Merrill Lynch (5,962)(6,517) Superior Group of Cos Inc Barclays Bank (6,973)(6,123) Superior Group of Cos Inc Goldman Sachs (13,164)(4,058) Superior Group of Cos Inc HSBC (5,397)(7,745) Superior Group of Cos Inc Morgan Stanley (8,287)
920 Supernus PharmaceuticalsInc
Bank of AmericaMerrill Lynch (883)
26,075 Supernus PharmaceuticalsInc Barclays Bank 1,043
18,717 Supernus PharmaceuticalsInc Goldman Sachs 12,166
11,003 Supernus PharmaceuticalsInc Morgan Stanley 440
10,388 Surface Oncology Inc Barclays Bank (3,324)11,203 Surface Oncology Inc Goldman Sachs 24,75911,290 Surface Oncology Inc Morgan Stanley (3,613)
(16,292) Surgery Partners Inc Bank of AmericaMerrill Lynch (58,814)
(3,904) Surgery Partners Inc Goldman Sachs (14,093)(6,254) Surgery Partners Inc HSBC (15,916)(8,953) Surgery Partners Inc Morgan Stanley 5,014
(14,341) Surmodics Inc Bank of AmericaMerrill Lynch (48,042)
(568) Surmodics Inc Barclays Bank (62)(5,993) Surmodics Inc Goldman Sachs (20,077)(1,357) Surmodics Inc Morgan Stanley (149)10,794 Sutro Biopharma Inc Bank of America
Merrill Lynch 6,6927,334 Sutro Biopharma Inc Barclays Bank (1,467)7,257 Sutro Biopharma Inc Goldman Sachs 4,4998,980 Sutro Biopharma Inc HSBC (1,616)
17,367 Sutro Biopharma Inc Morgan Stanley (3,473)370 SVB Financial Group Bank of America
Merrill Lynch 15,203(2,908) SVB Financial Group Bank of America
Merrill Lynch (99,423)1,005 SVB Financial Group Barclays Bank 24,512(449) SVB Financial Group Barclays Bank (2,429)697 SVB Financial Group Goldman Sachs 26,474
(2,675) SVB Financial Group Goldman Sachs (85,402)941 SVB Financial Group HSBC 26,376
(142) SVB Financial Group HSBC 5382,121 SVB Financial Group Morgan Stanley 51,731
(10,290) SVMK Inc Bank of AmericaMerrill Lynch (4,322)
Holding Description Counterparty
Netunrealised
appreciation/(depreciation)
USD
United States continued(954) SVMK Inc Barclays Bank 210
14,753 SVMK Inc Barclays Bank (3,246)11,877 SVMK Inc Goldman Sachs 4,98813,066 SVMK Inc HSBC 14,634
(14,103) SVMK Inc Morgan Stanley 3,10321,212 SVMK Inc Morgan Stanley (4,667)(6,907) Switch Inc ’A’ Bank of America
Merrill Lynch (7,598)(2,075) Switch Inc ’A’ Barclays Bank (42)
(27,702) Switch Inc ’A’ HSBC (44,046)(31,128) Switch Inc ’A’ Morgan Stanley (623)(18,656) Sykes Enterprises Inc Bank of America
Merrill Lynch (58,207)(8,861) Sykes Enterprises Inc Barclays Bank (9,570)
(44,696) Sykes Enterprises Inc Goldman Sachs (137,773)(8,292) Sykes Enterprises Inc HSBC (5,473)
(25,952) Sykes Enterprises Inc Morgan Stanley (28,028)476 Synaptics Inc Bank of America
Merrill Lynch 1,785(7,512) Synaptics Inc Barclays Bank 5,9343,745 Synaptics Inc Goldman Sachs 14,044
(1,211) Synaptics Inc Goldman Sachs (4,541)7,424 Synaptics Inc HSBC (34,893)(447) Synaptics Inc Morgan Stanley 353
4,984 Synaptics Inc Morgan Stanley (3,937)(20,309) Synchronoss Technologies
IncBank of AmericaMerrill Lynch (9,038)
(17,665) Synchronoss TechnologiesInc Barclays Bank (4,240)
(15,336) Synchronoss TechnologiesInc HSBC 7,055
(27,229) Synchronoss TechnologiesInc Morgan Stanley (6,535)
10,242 Synchrony Financial Bank of AmericaMerrill Lynch 41,070
(40,562) Synchrony Financial Bank of AmericaMerrill Lynch (162,654)
6,628 Synchrony Financial Barclays Bank 17,8969,242 Synchrony Financial Goldman Sachs 37,060
11,569 Synchrony Financial Morgan Stanley 31,23615,840 Syndax Pharmaceuticals
IncBank of AmericaMerrill Lynch (94,248)
(7,205) Syneos Health Inc Bank of AmericaMerrill Lynch (27,763)
(3,388) Syneos Health Inc Barclays Bank 373(8,040) Syneos Health Inc Goldman Sachs (32,411)
(12,168) Syneos Health Inc HSBC (33,340)(24,033) Syneos Health Inc Morgan Stanley 2,644(10,234) Synlogic Inc Goldman Sachs (1,023)(31,575) Synlogic Inc HSBC (4,105)
(388) SYNNEX Corp Barclays Bank (2,576)(3,450) SYNNEX Corp Goldman Sachs (54,441)(4,115) SYNNEX Corp HSBC (65,387)1,801 SYNNEX Corp HSBC 28,618
(2,198) SYNNEX Corp Morgan Stanley (14,595)920 SYNNEX Corp Morgan Stanley 6,109
3,975 Synopsys Inc Bank of AmericaMerrill Lynch 75,167
1,961 Synopsys Inc Barclays Bank 13,584848 Synopsys Inc Goldman Sachs 7,071
9,767 Synopsys Inc HSBC 114,5124,860 Synopsys Inc Morgan Stanley 31,736
47,117 Synovus Financial Corp Bank of AmericaMerrill Lynch 145,120
20,987 Synovus Financial Corp Barclays Bank 36,09832,831 Synovus Financial Corp Goldman Sachs 101,11932,834 Synovus Financial Corp HSBC (20,685)
BlackRock Americas Diversified Equity Absolute Return Fundcontinued
The notes on pages 691 to 711 form an integral part of these financial statements.
Annual report and audited financial statements [189]
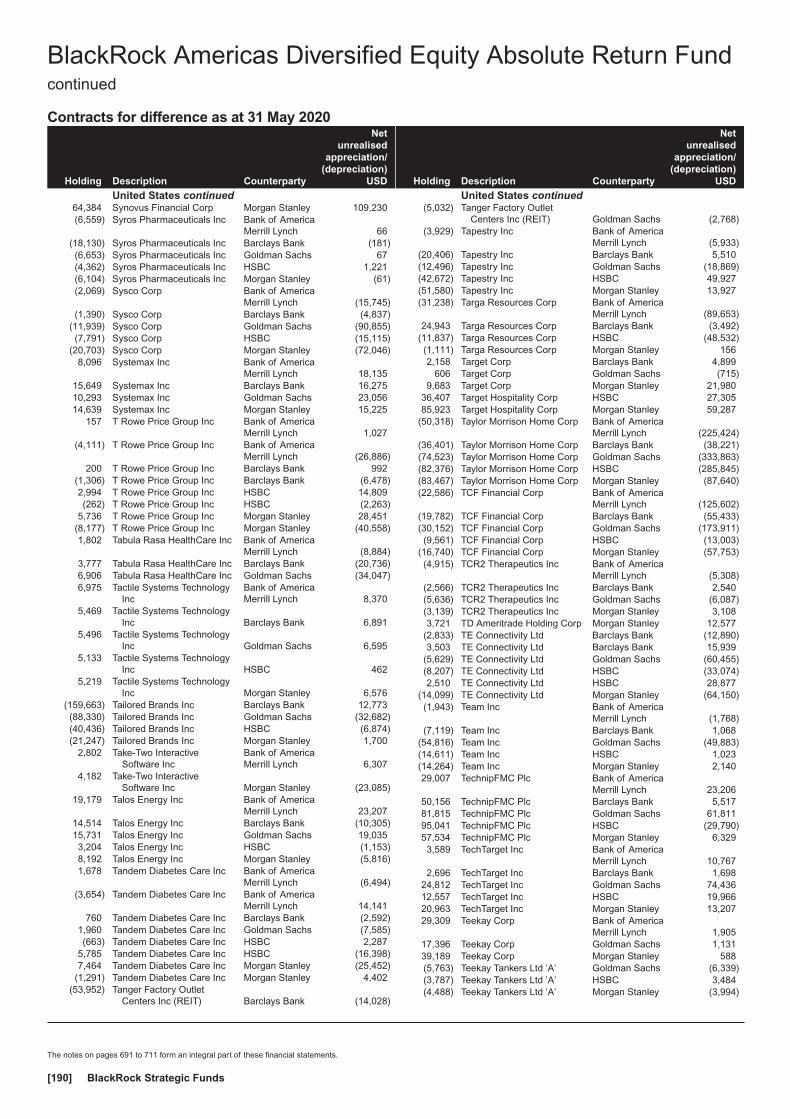
Contracts for difference as at 31 May 2020
Holding Description Counterparty
Netunrealised
appreciation/(depreciation)
USD
United States continued64,384 Synovus Financial Corp Morgan Stanley 109,230(6,559) Syros Pharmaceuticals Inc Bank of America
Merrill Lynch 66(18,130) Syros Pharmaceuticals Inc Barclays Bank (181)(6,653) Syros Pharmaceuticals Inc Goldman Sachs 67(4,362) Syros Pharmaceuticals Inc HSBC 1,221(6,104) Syros Pharmaceuticals Inc Morgan Stanley (61)(2,069) Sysco Corp Bank of America
Merrill Lynch (15,745)(1,390) Sysco Corp Barclays Bank (4,837)
(11,939) Sysco Corp Goldman Sachs (90,855)(7,791) Sysco Corp HSBC (15,115)
(20,703) Sysco Corp Morgan Stanley (72,046)8,096 Systemax Inc Bank of America
Merrill Lynch 18,13515,649 Systemax Inc Barclays Bank 16,27510,293 Systemax Inc Goldman Sachs 23,05614,639 Systemax Inc Morgan Stanley 15,225
157 T Rowe Price Group Inc Bank of AmericaMerrill Lynch 1,027
(4,111) T Rowe Price Group Inc Bank of AmericaMerrill Lynch (26,886)
200 T Rowe Price Group Inc Barclays Bank 992(1,306) T Rowe Price Group Inc Barclays Bank (6,478)2,994 T Rowe Price Group Inc HSBC 14,809(262) T Rowe Price Group Inc HSBC (2,263)
5,736 T Rowe Price Group Inc Morgan Stanley 28,451(8,177) T Rowe Price Group Inc Morgan Stanley (40,558)1,802 Tabula Rasa HealthCare Inc Bank of America
Merrill Lynch (8,884)3,777 Tabula Rasa HealthCare Inc Barclays Bank (20,736)6,906 Tabula Rasa HealthCare Inc Goldman Sachs (34,047)6,975 Tactile Systems Technology
IncBank of AmericaMerrill Lynch 8,370
5,469 Tactile Systems TechnologyInc Barclays Bank 6,891
5,496 Tactile Systems TechnologyInc Goldman Sachs 6,595
5,133 Tactile Systems TechnologyInc HSBC 462
5,219 Tactile Systems TechnologyInc Morgan Stanley 6,576
(159,663) Tailored Brands Inc Barclays Bank 12,773(88,330) Tailored Brands Inc Goldman Sachs (32,682)(40,436) Tailored Brands Inc HSBC (6,874)(21,247) Tailored Brands Inc Morgan Stanley 1,700
2,802 Take-Two InteractiveSoftware Inc
Bank of AmericaMerrill Lynch 6,307
4,182 Take-Two InteractiveSoftware Inc Morgan Stanley (23,085)
19,179 Talos Energy Inc Bank of AmericaMerrill Lynch 23,207
14,514 Talos Energy Inc Barclays Bank (10,305)15,731 Talos Energy Inc Goldman Sachs 19,0353,204 Talos Energy Inc HSBC (1,153)8,192 Talos Energy Inc Morgan Stanley (5,816)1,678 Tandem Diabetes Care Inc Bank of America
Merrill Lynch (6,494)(3,654) Tandem Diabetes Care Inc Bank of America
Merrill Lynch 14,141760 Tandem Diabetes Care Inc Barclays Bank (2,592)
1,960 Tandem Diabetes Care Inc Goldman Sachs (7,585)(663) Tandem Diabetes Care Inc HSBC 2,287
5,785 Tandem Diabetes Care Inc HSBC (16,398)7,464 Tandem Diabetes Care Inc Morgan Stanley (25,452)
(1,291) Tandem Diabetes Care Inc Morgan Stanley 4,402(53,952) Tanger Factory Outlet
Centers Inc (REIT) Barclays Bank (14,028)
Holding Description Counterparty
Netunrealised
appreciation/(depreciation)
USD
United States continued(5,032) Tanger Factory Outlet
Centers Inc (REIT) Goldman Sachs (2,768)(3,929) Tapestry Inc Bank of America
Merrill Lynch (5,933)(20,406) Tapestry Inc Barclays Bank 5,510(12,496) Tapestry Inc Goldman Sachs (18,869)(42,672) Tapestry Inc HSBC 49,927(51,580) Tapestry Inc Morgan Stanley 13,927(31,238) Targa Resources Corp Bank of America
Merrill Lynch (89,653)24,943 Targa Resources Corp Barclays Bank (3,492)
(11,837) Targa Resources Corp HSBC (48,532)(1,111) Targa Resources Corp Morgan Stanley 1562,158 Target Corp Barclays Bank 4,899
606 Target Corp Goldman Sachs (715)9,683 Target Corp Morgan Stanley 21,980
36,407 Target Hospitality Corp HSBC 27,30585,923 Target Hospitality Corp Morgan Stanley 59,287
(50,318) Taylor Morrison Home Corp Bank of AmericaMerrill Lynch (225,424)
(36,401) Taylor Morrison Home Corp Barclays Bank (38,221)(74,523) Taylor Morrison Home Corp Goldman Sachs (333,863)(82,376) Taylor Morrison Home Corp HSBC (285,845)(83,467) Taylor Morrison Home Corp Morgan Stanley (87,640)(22,586) TCF Financial Corp Bank of America
Merrill Lynch (125,602)(19,782) TCF Financial Corp Barclays Bank (55,433)(30,152) TCF Financial Corp Goldman Sachs (173,911)(9,561) TCF Financial Corp HSBC (13,003)
(16,740) TCF Financial Corp Morgan Stanley (57,753)(4,915) TCR2 Therapeutics Inc Bank of America
Merrill Lynch (5,308)(2,566) TCR2 Therapeutics Inc Barclays Bank 2,540(5,636) TCR2 Therapeutics Inc Goldman Sachs (6,087)(3,139) TCR2 Therapeutics Inc Morgan Stanley 3,1083,721 TD Ameritrade Holding Corp Morgan Stanley 12,577
(2,833) TE Connectivity Ltd Barclays Bank (12,890)3,503 TE Connectivity Ltd Barclays Bank 15,939
(5,629) TE Connectivity Ltd Goldman Sachs (60,455)(8,207) TE Connectivity Ltd HSBC (33,074)2,510 TE Connectivity Ltd HSBC 28,877
(14,099) TE Connectivity Ltd Morgan Stanley (64,150)(1,943) Team Inc Bank of America
Merrill Lynch (1,768)(7,119) Team Inc Barclays Bank 1,068
(54,816) Team Inc Goldman Sachs (49,883)(14,611) Team Inc HSBC 1,023(14,264) Team Inc Morgan Stanley 2,14029,007 TechnipFMC Plc Bank of America
Merrill Lynch 23,20650,156 TechnipFMC Plc Barclays Bank 5,51781,815 TechnipFMC Plc Goldman Sachs 61,81195,041 TechnipFMC Plc HSBC (29,790)57,534 TechnipFMC Plc Morgan Stanley 6,3293,589 TechTarget Inc Bank of America
Merrill Lynch 10,7672,696 TechTarget Inc Barclays Bank 1,698
24,812 TechTarget Inc Goldman Sachs 74,43612,557 TechTarget Inc HSBC 19,96620,963 TechTarget Inc Morgan Stanley 13,20729,309 Teekay Corp Bank of America
Merrill Lynch 1,90517,396 Teekay Corp Goldman Sachs 1,13139,189 Teekay Corp Morgan Stanley 588(5,763) Teekay Tankers Ltd ’A’ Goldman Sachs (6,339)(3,787) Teekay Tankers Ltd ’A’ HSBC 3,484(4,488) Teekay Tankers Ltd ’A’ Morgan Stanley (3,994)
BlackRock Americas Diversified Equity Absolute Return Fundcontinued
The notes on pages 691 to 711 form an integral part of these financial statements.
BlackRock Strategic Funds[190]

Contracts for difference as at 31 May 2020
Holding Description Counterparty
Netunrealised
appreciation/(depreciation)
USD
United States continued(37,425) TEGNA Inc Bank of America
Merrill Lynch (49,775)(21,774) TEGNA Inc Barclays Bank (5,444)(3,232) TEGNA Inc Goldman Sachs (4,299)
(73,683) TEGNA Inc HSBC (47,158)(15,528) TEGNA Inc Morgan Stanley (3,882)(24,576) Tejon Ranch Co Bank of America
Merrill Lynch (20,644)(22,100) Tejon Ranch Co Barclays Bank (7,072)(46,382) Tejon Ranch Co Goldman Sachs (38,961)(10,695) Tejon Ranch Co HSBC (1,711)(69,904) Tejon Ranch Co Morgan Stanley (22,369)
2,019 Teladoc Health Inc Bank of AmericaMerrill Lynch (19,446)
2,687 Teladoc Health Inc Barclays Bank (4,353)12,891 Teladoc Health Inc HSBC (41,988)5,891 Teladoc Health Inc Morgan Stanley (1,654)
732 Teledyne Technologies Inc Bank of AmericaMerrill Lynch 35,364
1,445 Teledyne Technologies Inc Barclays Bank 38,6691,161 Teledyne Technologies Inc Goldman Sachs 58,0271,647 Teledyne Technologies Inc HSBC 55,356
11,444 Teledyne Technologies Inc Morgan Stanley 306,242(2,804) Teleflex Inc Bank of America
Merrill Lynch (66,567)(1,558) Teleflex Inc Barclays Bank 5,936(1,614) Teleflex Inc Goldman Sachs (38,316)1,111 Teleflex Inc Goldman Sachs 25,150
(1,689) Teleflex Inc HSBC (32,311)1,637 Teleflex Inc HSBC 31,316(983) Teleflex Inc Morgan Stanley 3,745222 Teleflex Inc Morgan Stanley 3,374
(16,103) Telefonica Brasil SA ADR Morgan Stanley (1,685)(9,317) Telenav Inc Bank of America
Merrill Lynch (5,683)(10,405) Telenav Inc Barclays Bank (1,145)(33,657) Telenav Inc Goldman Sachs (20,531)(7,519) Telenav Inc HSBC 1,429(9,077) Telenav Inc Morgan Stanley (998)30,329 Telephone and Data
Systems IncBank of AmericaMerrill Lynch 73,093
5,947 Telephone and DataSystems Inc Barclays Bank 1,963
25,126 Telephone and DataSystems Inc Goldman Sachs 58,855
34,500 Telephone and DataSystems Inc HSBC 34,845
56,930 Telephone and DataSystems Inc Morgan Stanley 18,787
(125,902) Tellurian Inc Barclays Bank 5,036(65) Tellurian Inc HSBC 17
11,606 Tempur Sealy InternationalInc Goldman Sachs 142,282
531 Tempur Sealy InternationalInc HSBC 4,970
3,266 Tempur Sealy InternationalInc Morgan Stanley 19,792
19,650 Tenable Holdings Inc Bank of AmericaMerrill Lynch 32,030
(9,854) Tenable Holdings Inc Barclays Bank (14,584)7,555 Tenable Holdings Inc Barclays Bank 11,1815,761 Tenable Holdings Inc Goldman Sachs 9,390
(7,069) Tenable Holdings Inc Goldman Sachs (11,522)(1,318) Tenable Holdings Inc HSBC (3,216)18,086 Tenable Holdings Inc HSBC 44,130
(10,262) Tenable Holdings Inc Morgan Stanley (15,188)11,519 Tenable Holdings Inc Morgan Stanley 17,048(2,017) Tenet Healthcare Corp Bank of America
Merrill Lynch (9,016)
Holding Description Counterparty
Netunrealised
appreciation/(depreciation)
USD
United States continued3,422 Tenet Healthcare Corp Bank of America
Merrill Lynch 15,296(1,300) Tenet Healthcare Corp Barclays Bank 1,625(2,835) Tenet Healthcare Corp Goldman Sachs (12,672)
(21,084) Tenet Healthcare Corp HSBC (44,276)9,239 Tenet Healthcare Corp Morgan Stanley (11,549)
(12,398) Tenet Healthcare Corp Morgan Stanley 15,498(807) Tennant Co Bank of America
Merrill Lynch (9,434)(5,863) Tennant Co Barclays Bank (36,996)(7,968) Tennant Co Goldman Sachs (93,146)(5,027) Tennant Co HSBC (36,848)
(12,647) Tennant Co Morgan Stanley (79,803)10,054 Tenneco Inc ’A’ Goldman Sachs 20,91233,845 Tenneco Inc ’A’ HSBC 41,62927,728 Tenneco Inc ’A’ Morgan Stanley 29,1146,977 Teradata Corp Bank of America
Merrill Lynch 10,466(4,097) Teradata Corp Bank of America
Merrill Lynch (6,146)17,603 Teradata Corp Barclays Bank 12,674
(440) Teradata Corp Barclays Bank (317)15,510 Teradata Corp Goldman Sachs 23,265(7,530) Teradata Corp Goldman Sachs (11,295)4,752 Teradata Corp HSBC (11,880)
(6,135) Teradata Corp HSBC 15,3385,856 Teradata Corp Morgan Stanley 4,216
(5,758) Teradata Corp Morgan Stanley (4,146)(8,474) Teradyne Inc Bank of America
Merrill Lynch (77,283)(19,302) Teradyne Inc Barclays Bank (62,925)(27,626) Teradyne Inc Goldman Sachs (251,949)(10,155) Teradyne Inc HSBC (12,249)(28,598) Teradyne Inc Morgan Stanley (93,230)(27,844) Terex Corp Bank of America
Merrill Lynch (46,500)(12,935) Terex Corp Barclays Bank (16,816)(37,913) Terex Corp Goldman Sachs (63,315)(21,226) Terex Corp HSBC (20,165)(20,657) Terex Corp Morgan Stanley (26,854)(33,292) TerraForm Power Inc ’A’ Bank of America
Merrill Lynch (13,758)(88,248) TerraForm Power Inc ’A’ Barclays Bank 25,363(56,586) TerraForm Power Inc ’A’ Goldman Sachs (17,879)
(134,123) TerraForm Power Inc ’A’ HSBC 43,334(77,323) TerraForm Power Inc ’A’ Morgan Stanley 22,424(18,709) Terreno Realty Corp (REIT) Bank of America
Merrill Lynch (99,158)2,669 Terreno Realty Corp (REIT) Bank of America
Merrill Lynch 14,146(4,843) Terreno Realty Corp (REIT) Barclays Bank (15,933)5,353 Terreno Realty Corp (REIT) Barclays Bank 17,612
(17,740) Terreno Realty Corp (REIT) Goldman Sachs (94,022)5,334 Terreno Realty Corp (REIT) Goldman Sachs 28,270
(3,871) Terreno Realty Corp (REIT) HSBC 2,67119,823 Terreno Realty Corp (REIT) HSBC (13,678)(5,451) Terreno Realty Corp (REIT) Morgan Stanley (17,934)87,640 Terreno Realty Corp (REIT) Morgan Stanley 288,3369,938 Territorial Bancorp Inc Bank of America
Merrill Lynch 29,2188,498 Territorial Bancorp Inc Barclays Bank 12,0673,395 Territorial Bancorp Inc Goldman Sachs 9,981
15,019 Territorial Bancorp Inc HSBC 7,66014,198 Territorial Bancorp Inc Morgan Stanley 20,161
(209) Tesla Inc Barclays Bank 2(1,261) Tesla Inc Morgan Stanley 9,3065,495 TESSCO Technologies Inc Bank of America
Merrill Lynch 3,462
BlackRock Americas Diversified Equity Absolute Return Fundcontinued
The notes on pages 691 to 711 form an integral part of these financial statements.
Annual report and audited financial statements [191]

Contracts for difference as at 31 May 2020
Holding Description Counterparty
Netunrealised
appreciation/(depreciation)
USD
United States continued14,683 TESSCO Technologies Inc Barclays Bank 5,87316,368 TESSCO Technologies Inc Goldman Sachs 10,3126,417 TESSCO Technologies Inc HSBC (7,700)
32,182 TESSCO Technologies Inc Morgan Stanley 12,87311,906 Tetra Tech Inc Bank of America
Merrill Lynch 85,128(3,156) Tetra Tech Inc Bank of America
Merrill Lynch 2,3764,299 Tetra Tech Inc Barclays Bank 7,480(532) Tetra Tech Inc Barclays Bank 978
18,433 Tetra Tech Inc Goldman Sachs 131,7969,181 Tetra Tech Inc HSBC 48,8889,004 Tetra Tech Inc Morgan Stanley 15,667
(9,259) Tetra Tech Inc Morgan Stanley (16,111)(105,080) TETRA Technologies Inc Goldman Sachs 5,286
5,761 Texas Instruments Inc Bank of AmericaMerrill Lynch 53,059
31,372 Texas Instruments Inc Barclays Bank 119,35415,199 Texas Instruments Inc Goldman Sachs 135,6922,316 Texas Instruments Inc HSBC 5,674
36,418 Texas Instruments Inc Morgan Stanley 145,01711,669 Texas Roadhouse Inc Bank of America
Merrill Lynch 73,883(12,073) Texas Roadhouse Inc Bank of America
Merrill Lynch (78,837)3,630 Texas Roadhouse Inc Barclays Bank 6,0262,433 Texas Roadhouse Inc Goldman Sachs 13,738
26,248 Texas Roadhouse Inc HSBC 125,44634,061 Texas Roadhouse Inc Morgan Stanley 53,533(3,685) Texas Roadhouse Inc Morgan Stanley (6,117)
(31,652) Textainer Group HoldingsLtd
Bank of AmericaMerrill Lynch (24,689)
(4,471) Textainer Group HoldingsLtd Barclays Bank (671)
(22,511) Textainer Group HoldingsLtd Goldman Sachs (17,559)
(3,335) Textainer Group HoldingsLtd HSBC 2,568
(29,781) Textainer Group HoldingsLtd Morgan Stanley (4,467)
(53,896) TFS Financial Corp Bank of AmericaMerrill Lynch (63,910)
(5,915) TFS Financial Corp Goldman Sachs (7,157)(23,656) TFS Financial Corp HSBC (1,892)
(118,885) TFS Financial Corp Morgan Stanley (115,318)(194) TG Therapeutics Inc Goldman Sachs 25
(24,638) TG Therapeutics Inc HSBC (8,623)12,389 TG Therapeutics Inc Morgan Stanley (33,079)
(14,942) TG Therapeutics Inc Morgan Stanley 39,89535,182 TherapeuticsMD Inc Bank of America
Merrill Lynch (352)29,172 TherapeuticsMD Inc Barclays Bank (2,625)69,048 TherapeuticsMD Inc Goldman Sachs (690)14,380 TherapeuticsMD Inc HSBC (1,582)(4,396) Theravance Biopharma Inc Bank of America
Merrill Lynch 8,8802,040 Theravance Biopharma Inc Bank of America
Merrill Lynch (3,960)1,539 Theravance Biopharma Inc Barclays Bank (3,063)1,246 Theravance Biopharma Inc Goldman Sachs (2,517)
(1,288) Theravance Biopharma Inc HSBC 3,46510,443 Theravance Biopharma Inc HSBC (20,927)(5,405) Theravance Biopharma Inc Morgan Stanley 10,75613,387 Theravance Biopharma Inc Morgan Stanley (26,640)(1,481) Thermo Fisher Scientific Inc Bank of America
Merrill Lynch (14,095)(1,006) Thermo Fisher Scientific Inc Barclays Bank (5,503)(5,258) Thermo Fisher Scientific Inc Goldman Sachs (18,309)(7,899) Thermo Fisher Scientific Inc HSBC (100,476)
Holding Description Counterparty
Netunrealised
appreciation/(depreciation)
USD
United States continued(5,395) Thermo Fisher Scientific Inc Morgan Stanley (29,510)
(11,732) Thermon Group HoldingsInc
Bank of AmericaMerrill Lynch (26,866)
(19,903) Thermon Group HoldingsInc Barclays Bank (5,175)
(10,096) Thermon Group HoldingsInc Goldman Sachs (23,120)
(22,662) Thermon Group HoldingsInc HSBC (11,558)
(16,289) Thermon Group HoldingsInc Morgan Stanley (4,235)
(67,885) Third Point Reinsurance Ltd Barclays Bank 16,635(14,385) Third Point Reinsurance Ltd HSBC 6,114(21,188) Third Point Reinsurance Ltd Morgan Stanley 4,979
760 Thor Industries Inc Barclays Bank 2,4402,804 Thor Industries Inc Goldman Sachs 38,1902,104 Thor Industries Inc HSBC 17,1906,150 Thor Industries Inc Morgan Stanley 19,742
(3,102) Thor Industries Inc Morgan Stanley (9,957)(45,668) Tidewater Inc Bank of America
Merrill Lynch (32,881)(11,913) Tidewater Inc Barclays Bank 3,217(23,821) Tidewater Inc Goldman Sachs (17,151)(5,383) Tidewater Inc HSBC 1,669
(42,058) Tidewater Inc Morgan Stanley 11,356(88,880) Tile Shop Holdings Inc Goldman Sachs (15,554)(77,762) Tile Shop Holdings Inc Morgan Stanley (6,221)12,522 Tilly’s Inc Bank of America
Merrill Lynch 10,4563,151 Tilly’s Inc Barclays Bank 740
53,158 Tilly’s Inc Goldman Sachs 44,3873,399 Tilly’s Inc HSBC 187
23,374 Tilly’s Inc Morgan Stanley 5,493(3,606) TIM Participacoes SA ADR HSBC (3,451)
(14,556) TIM Participacoes SA ADR Morgan Stanley (10,771)11,679 Timberland Bancorp Inc Bank of America
Merrill Lynch 14,9493,672 Timberland Bancorp Inc Barclays Bank 2,827
24,108 Timberland Bancorp Inc Goldman Sachs 30,85852 Timberland Bancorp Inc HSBC 10
6,620 Timberland Bancorp Inc Morgan Stanley 5,097(18,884) Timken Co Bank of America
Merrill Lynch (81,389)(25,318) Timken Co Barclays Bank (35,445)(36,920) Timken Co Goldman Sachs (156,248)(21,228) Timken Co HSBC (64,108)(15,162) Timken Co Morgan Stanley (21,226)36,418 TimkenSteel Corp Barclays Bank 18,93713,113 TimkenSteel Corp Goldman Sachs 9,57261,471 TimkenSteel Corp HSBC 29,50642,657 TimkenSteel Corp Morgan Stanley 22,18210,314 Tiptree Inc Barclays Bank (103)5,627 Tiptree Inc Goldman Sachs 56
33,886 Tiptree Inc HSBC (2,711)7,422 Tiptree Inc Morgan Stanley (74)
(3,868) Titan International Inc Bank of AmericaMerrill Lynch (387)
(2,056) Titan International Inc Barclays Bank (123)(155,524) Titan International Inc Goldman Sachs (15,552)(36,970) Titan International Inc HSBC (1,109)(97,183) Titan International Inc Morgan Stanley (5,831)19,727 Titan Machinery Inc Bank of America
Merrill Lynch 44,3868,889 Titan Machinery Inc Barclays Bank 15,111
16,441 Titan Machinery Inc Goldman Sachs 36,9923,925 Titan Machinery Inc Morgan Stanley 6,673
(1,219) Tivity Health Inc Barclays Bank (731)(27,985) Tivity Health Inc Goldman Sachs (48,414)
BlackRock Americas Diversified Equity Absolute Return Fundcontinued
The notes on pages 691 to 711 form an integral part of these financial statements.
BlackRock Strategic Funds[192]
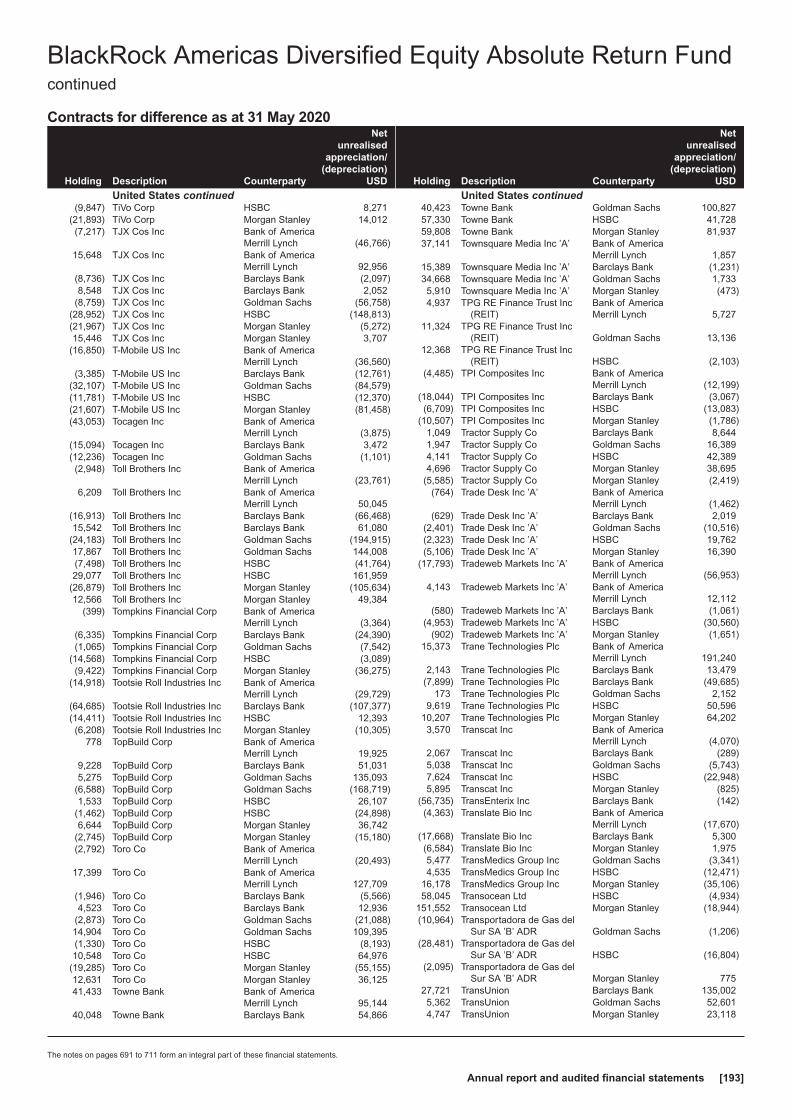
Contracts for difference as at 31 May 2020
Holding Description Counterparty
Netunrealised
appreciation/(depreciation)
USD
United States continued(9,847) TiVo Corp HSBC 8,271
(21,893) TiVo Corp Morgan Stanley 14,012(7,217) TJX Cos Inc Bank of America
Merrill Lynch (46,766)15,648 TJX Cos Inc Bank of America
Merrill Lynch 92,956(8,736) TJX Cos Inc Barclays Bank (2,097)8,548 TJX Cos Inc Barclays Bank 2,052
(8,759) TJX Cos Inc Goldman Sachs (56,758)(28,952) TJX Cos Inc HSBC (148,813)(21,967) TJX Cos Inc Morgan Stanley (5,272)15,446 TJX Cos Inc Morgan Stanley 3,707
(16,850) T-Mobile US Inc Bank of AmericaMerrill Lynch (36,560)
(3,385) T-Mobile US Inc Barclays Bank (12,761)(32,107) T-Mobile US Inc Goldman Sachs (84,579)(11,781) T-Mobile US Inc HSBC (12,370)(21,607) T-Mobile US Inc Morgan Stanley (81,458)(43,053) Tocagen Inc Bank of America
Merrill Lynch (3,875)(15,094) Tocagen Inc Barclays Bank 3,472(12,236) Tocagen Inc Goldman Sachs (1,101)(2,948) Toll Brothers Inc Bank of America
Merrill Lynch (23,761)6,209 Toll Brothers Inc Bank of America
Merrill Lynch 50,045(16,913) Toll Brothers Inc Barclays Bank (66,468)15,542 Toll Brothers Inc Barclays Bank 61,080
(24,183) Toll Brothers Inc Goldman Sachs (194,915)17,867 Toll Brothers Inc Goldman Sachs 144,008(7,498) Toll Brothers Inc HSBC (41,764)29,077 Toll Brothers Inc HSBC 161,959
(26,879) Toll Brothers Inc Morgan Stanley (105,634)12,566 Toll Brothers Inc Morgan Stanley 49,384
(399) Tompkins Financial Corp Bank of AmericaMerrill Lynch (3,364)
(6,335) Tompkins Financial Corp Barclays Bank (24,390)(1,065) Tompkins Financial Corp Goldman Sachs (7,542)
(14,568) Tompkins Financial Corp HSBC (3,089)(9,422) Tompkins Financial Corp Morgan Stanley (36,275)
(14,918) Tootsie Roll Industries Inc Bank of AmericaMerrill Lynch (29,729)
(64,685) Tootsie Roll Industries Inc Barclays Bank (107,377)(14,411) Tootsie Roll Industries Inc HSBC 12,393(6,208) Tootsie Roll Industries Inc Morgan Stanley (10,305)
778 TopBuild Corp Bank of AmericaMerrill Lynch 19,925
9,228 TopBuild Corp Barclays Bank 51,0315,275 TopBuild Corp Goldman Sachs 135,093
(6,588) TopBuild Corp Goldman Sachs (168,719)1,533 TopBuild Corp HSBC 26,107
(1,462) TopBuild Corp HSBC (24,898)6,644 TopBuild Corp Morgan Stanley 36,742
(2,745) TopBuild Corp Morgan Stanley (15,180)(2,792) Toro Co Bank of America
Merrill Lynch (20,493)17,399 Toro Co Bank of America
Merrill Lynch 127,709(1,946) Toro Co Barclays Bank (5,566)4,523 Toro Co Barclays Bank 12,936
(2,873) Toro Co Goldman Sachs (21,088)14,904 Toro Co Goldman Sachs 109,395(1,330) Toro Co HSBC (8,193)10,548 Toro Co HSBC 64,976
(19,285) Toro Co Morgan Stanley (55,155)12,631 Toro Co Morgan Stanley 36,12541,433 Towne Bank Bank of America
Merrill Lynch 95,14440,048 Towne Bank Barclays Bank 54,866
Holding Description Counterparty
Netunrealised
appreciation/(depreciation)
USD
United States continued40,423 Towne Bank Goldman Sachs 100,82757,330 Towne Bank HSBC 41,72859,808 Towne Bank Morgan Stanley 81,93737,141 Townsquare Media Inc ’A’ Bank of America
Merrill Lynch 1,85715,389 Townsquare Media Inc ’A’ Barclays Bank (1,231)34,668 Townsquare Media Inc ’A’ Goldman Sachs 1,7335,910 Townsquare Media Inc ’A’ Morgan Stanley (473)4,937 TPG RE Finance Trust Inc
(REIT)Bank of AmericaMerrill Lynch 5,727
11,324 TPG RE Finance Trust Inc(REIT) Goldman Sachs 13,136
12,368 TPG RE Finance Trust Inc(REIT) HSBC (2,103)
(4,485) TPI Composites Inc Bank of AmericaMerrill Lynch (12,199)
(18,044) TPI Composites Inc Barclays Bank (3,067)(6,709) TPI Composites Inc HSBC (13,083)
(10,507) TPI Composites Inc Morgan Stanley (1,786)1,049 Tractor Supply Co Barclays Bank 8,6441,947 Tractor Supply Co Goldman Sachs 16,3894,141 Tractor Supply Co HSBC 42,3894,696 Tractor Supply Co Morgan Stanley 38,695
(5,585) Tractor Supply Co Morgan Stanley (2,419)(764) Trade Desk Inc ’A’ Bank of America
Merrill Lynch (1,462)(629) Trade Desk Inc ’A’ Barclays Bank 2,019
(2,401) Trade Desk Inc ’A’ Goldman Sachs (10,516)(2,323) Trade Desk Inc ’A’ HSBC 19,762(5,106) Trade Desk Inc ’A’ Morgan Stanley 16,390
(17,793) Tradeweb Markets Inc ’A’ Bank of AmericaMerrill Lynch (56,953)
4,143 Tradeweb Markets Inc ’A’ Bank of AmericaMerrill Lynch 12,112
(580) Tradeweb Markets Inc ’A’ Barclays Bank (1,061)(4,953) Tradeweb Markets Inc ’A’ HSBC (30,560)
(902) Tradeweb Markets Inc ’A’ Morgan Stanley (1,651)15,373 Trane Technologies Plc Bank of America
Merrill Lynch 191,2402,143 Trane Technologies Plc Barclays Bank 13,479
(7,899) Trane Technologies Plc Barclays Bank (49,685)173 Trane Technologies Plc Goldman Sachs 2,152
9,619 Trane Technologies Plc HSBC 50,59610,207 Trane Technologies Plc Morgan Stanley 64,2023,570 Transcat Inc Bank of America
Merrill Lynch (4,070)2,067 Transcat Inc Barclays Bank (289)5,038 Transcat Inc Goldman Sachs (5,743)7,624 Transcat Inc HSBC (22,948)5,895 Transcat Inc Morgan Stanley (825)
(56,735) TransEnterix Inc Barclays Bank (142)(4,363) Translate Bio Inc Bank of America
Merrill Lynch (17,670)(17,668) Translate Bio Inc Barclays Bank 5,300(6,584) Translate Bio Inc Morgan Stanley 1,9755,477 TransMedics Group Inc Goldman Sachs (3,341)4,535 TransMedics Group Inc HSBC (12,471)
16,178 TransMedics Group Inc Morgan Stanley (35,106)58,045 Transocean Ltd HSBC (4,934)
151,552 Transocean Ltd Morgan Stanley (18,944)(10,964) Transportadora de Gas del
Sur SA ’B’ ADR Goldman Sachs (1,206)(28,481) Transportadora de Gas del
Sur SA ’B’ ADR HSBC (16,804)(2,095) Transportadora de Gas del
Sur SA ’B’ ADR Morgan Stanley 77527,721 TransUnion Barclays Bank 135,0025,362 TransUnion Goldman Sachs 52,6014,747 TransUnion Morgan Stanley 23,118
BlackRock Americas Diversified Equity Absolute Return Fundcontinued
The notes on pages 691 to 711 form an integral part of these financial statements.
Annual report and audited financial statements [193]
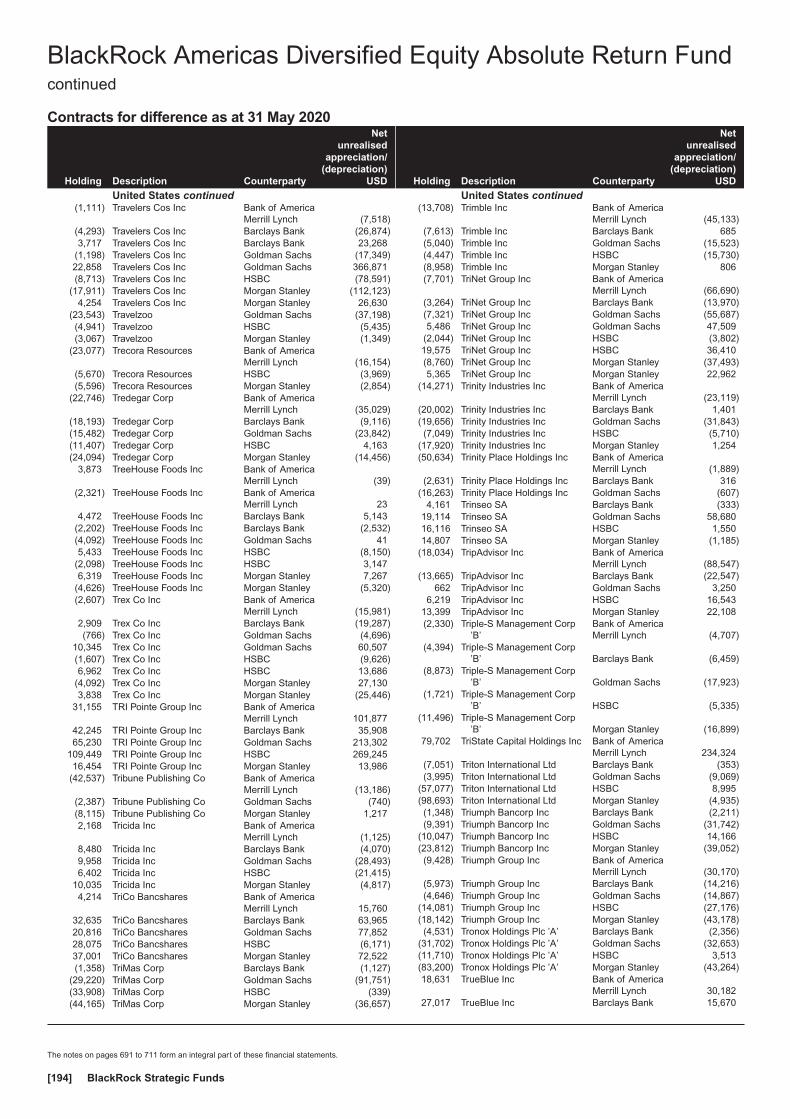
Contracts for difference as at 31 May 2020
Holding Description Counterparty
Netunrealised
appreciation/(depreciation)
USD
United States continued(1,111) Travelers Cos Inc Bank of America
Merrill Lynch (7,518)(4,293) Travelers Cos Inc Barclays Bank (26,874)3,717 Travelers Cos Inc Barclays Bank 23,268
(1,198) Travelers Cos Inc Goldman Sachs (17,349)22,858 Travelers Cos Inc Goldman Sachs 366,871(8,713) Travelers Cos Inc HSBC (78,591)
(17,911) Travelers Cos Inc Morgan Stanley (112,123)4,254 Travelers Cos Inc Morgan Stanley 26,630
(23,543) Travelzoo Goldman Sachs (37,198)(4,941) Travelzoo HSBC (5,435)(3,067) Travelzoo Morgan Stanley (1,349)
(23,077) Trecora Resources Bank of AmericaMerrill Lynch (16,154)
(5,670) Trecora Resources HSBC (3,969)(5,596) Trecora Resources Morgan Stanley (2,854)
(22,746) Tredegar Corp Bank of AmericaMerrill Lynch (35,029)
(18,193) Tredegar Corp Barclays Bank (9,116)(15,482) Tredegar Corp Goldman Sachs (23,842)(11,407) Tredegar Corp HSBC 4,163(24,094) Tredegar Corp Morgan Stanley (14,456)
3,873 TreeHouse Foods Inc Bank of AmericaMerrill Lynch (39)
(2,321) TreeHouse Foods Inc Bank of AmericaMerrill Lynch 23
4,472 TreeHouse Foods Inc Barclays Bank 5,143(2,202) TreeHouse Foods Inc Barclays Bank (2,532)(4,092) TreeHouse Foods Inc Goldman Sachs 415,433 TreeHouse Foods Inc HSBC (8,150)
(2,098) TreeHouse Foods Inc HSBC 3,1476,319 TreeHouse Foods Inc Morgan Stanley 7,267
(4,626) TreeHouse Foods Inc Morgan Stanley (5,320)(2,607) Trex Co Inc Bank of America
Merrill Lynch (15,981)2,909 Trex Co Inc Barclays Bank (19,287)(766) Trex Co Inc Goldman Sachs (4,696)
10,345 Trex Co Inc Goldman Sachs 60,507(1,607) Trex Co Inc HSBC (9,626)6,962 Trex Co Inc HSBC 13,686
(4,092) Trex Co Inc Morgan Stanley 27,1303,838 Trex Co Inc Morgan Stanley (25,446)
31,155 TRI Pointe Group Inc Bank of AmericaMerrill Lynch 101,877
42,245 TRI Pointe Group Inc Barclays Bank 35,90865,230 TRI Pointe Group Inc Goldman Sachs 213,302
109,449 TRI Pointe Group Inc HSBC 269,24516,454 TRI Pointe Group Inc Morgan Stanley 13,986
(42,537) Tribune Publishing Co Bank of AmericaMerrill Lynch (13,186)
(2,387) Tribune Publishing Co Goldman Sachs (740)(8,115) Tribune Publishing Co Morgan Stanley 1,2172,168 Tricida Inc Bank of America
Merrill Lynch (1,125)8,480 Tricida Inc Barclays Bank (4,070)9,958 Tricida Inc Goldman Sachs (28,493)6,402 Tricida Inc HSBC (21,415)
10,035 Tricida Inc Morgan Stanley (4,817)4,214 TriCo Bancshares Bank of America
Merrill Lynch 15,76032,635 TriCo Bancshares Barclays Bank 63,96520,816 TriCo Bancshares Goldman Sachs 77,85228,075 TriCo Bancshares HSBC (6,171)37,001 TriCo Bancshares Morgan Stanley 72,522(1,358) TriMas Corp Barclays Bank (1,127)
(29,220) TriMas Corp Goldman Sachs (91,751)(33,908) TriMas Corp HSBC (339)(44,165) TriMas Corp Morgan Stanley (36,657)
Holding Description Counterparty
Netunrealised
appreciation/(depreciation)
USD
United States continued(13,708) Trimble Inc Bank of America
Merrill Lynch (45,133)(7,613) Trimble Inc Barclays Bank 685(5,040) Trimble Inc Goldman Sachs (15,523)(4,447) Trimble Inc HSBC (15,730)(8,958) Trimble Inc Morgan Stanley 806(7,701) TriNet Group Inc Bank of America
Merrill Lynch (66,690)(3,264) TriNet Group Inc Barclays Bank (13,970)(7,321) TriNet Group Inc Goldman Sachs (55,687)5,486 TriNet Group Inc Goldman Sachs 47,509
(2,044) TriNet Group Inc HSBC (3,802)19,575 TriNet Group Inc HSBC 36,410(8,760) TriNet Group Inc Morgan Stanley (37,493)5,365 TriNet Group Inc Morgan Stanley 22,962
(14,271) Trinity Industries Inc Bank of AmericaMerrill Lynch (23,119)
(20,002) Trinity Industries Inc Barclays Bank 1,401(19,656) Trinity Industries Inc Goldman Sachs (31,843)(7,049) Trinity Industries Inc HSBC (5,710)
(17,920) Trinity Industries Inc Morgan Stanley 1,254(50,634) Trinity Place Holdings Inc Bank of America
Merrill Lynch (1,889)(2,631) Trinity Place Holdings Inc Barclays Bank 316
(16,263) Trinity Place Holdings Inc Goldman Sachs (607)4,161 Trinseo SA Barclays Bank (333)
19,114 Trinseo SA Goldman Sachs 58,68016,116 Trinseo SA HSBC 1,55014,807 Trinseo SA Morgan Stanley (1,185)
(18,034) TripAdvisor Inc Bank of AmericaMerrill Lynch (88,547)
(13,665) TripAdvisor Inc Barclays Bank (22,547)662 TripAdvisor Inc Goldman Sachs 3,250
6,219 TripAdvisor Inc HSBC 16,54313,399 TripAdvisor Inc Morgan Stanley 22,108(2,330) Triple-S Management Corp
’B’Bank of AmericaMerrill Lynch (4,707)
(4,394) Triple-S Management Corp’B’ Barclays Bank (6,459)
(8,873) Triple-S Management Corp’B’ Goldman Sachs (17,923)
(1,721) Triple-S Management Corp’B’ HSBC (5,335)
(11,496) Triple-S Management Corp’B’ Morgan Stanley (16,899)
79,702 TriState Capital Holdings Inc Bank of AmericaMerrill Lynch 234,324
(7,051) Triton International Ltd Barclays Bank (353)(3,995) Triton International Ltd Goldman Sachs (9,069)
(57,077) Triton International Ltd HSBC 8,995(98,693) Triton International Ltd Morgan Stanley (4,935)(1,348) Triumph Bancorp Inc Barclays Bank (2,211)(9,391) Triumph Bancorp Inc Goldman Sachs (31,742)
(10,047) Triumph Bancorp Inc HSBC 14,166(23,812) Triumph Bancorp Inc Morgan Stanley (39,052)(9,428) Triumph Group Inc Bank of America
Merrill Lynch (30,170)(5,973) Triumph Group Inc Barclays Bank (14,216)(4,646) Triumph Group Inc Goldman Sachs (14,867)
(14,081) Triumph Group Inc HSBC (27,176)(18,142) Triumph Group Inc Morgan Stanley (43,178)(4,531) Tronox Holdings Plc ’A’ Barclays Bank (2,356)
(31,702) Tronox Holdings Plc ’A’ Goldman Sachs (32,653)(11,710) Tronox Holdings Plc ’A’ HSBC 3,513(83,200) Tronox Holdings Plc ’A’ Morgan Stanley (43,264)18,631 TrueBlue Inc Bank of America
Merrill Lynch 30,18227,017 TrueBlue Inc Barclays Bank 15,670
BlackRock Americas Diversified Equity Absolute Return Fundcontinued
The notes on pages 691 to 711 form an integral part of these financial statements.
BlackRock Strategic Funds[194]

Contracts for difference as at 31 May 2020
Holding Description Counterparty
Netunrealised
appreciation/(depreciation)
USD
United States continued42,028 TrueBlue Inc Goldman Sachs 68,08535,075 TrueBlue Inc HSBC 35,42618,652 TrueBlue Inc Morgan Stanley 10,81855,922 TrueCar Inc Bank of America
Merrill Lynch 16,21782,745 TrueCar Inc Goldman Sachs 23,99653,706 TrueCar Inc Morgan Stanley 5,908(4,066) Truist Financial Corp Barclays Bank (15,979)5,942 Truist Financial Corp Barclays Bank 23,352
(19,353) Truist Financial Corp Goldman Sachs (63,019)39,729 Truist Financial Corp Goldman Sachs 147,081(3,015) Truist Financial Corp HSBC (2,955)
(12,155) Truist Financial Corp Morgan Stanley (47,769)6,852 Truist Financial Corp Morgan Stanley 5,7033,087 Trupanion Inc Bank of America
Merrill Lynch 11,9624,127 Trupanion Inc Barclays Bank 2,4565,830 Trupanion Inc Goldman Sachs 18,1857,627 Trupanion Inc HSBC 12,5591,207 Trupanion Inc Morgan Stanley 718
(148,238) TrustCo Bank Corp NY Barclays Bank (74,119)(131,283) TrustCo Bank Corp NY Goldman Sachs (141,786)(99,453) TrustCo Bank Corp NY HSBC (53,705)(41,214) TrustCo Bank Corp NY Morgan Stanley (20,607)
8,038 Trustmark Corp Bank of AmericaMerrill Lynch 18,889
6,542 Trustmark Corp Barclays Bank 5,69228,874 Trustmark Corp Goldman Sachs 67,85410,521 Trustmark Corp HSBC (13,151)35,780 Trustmark Corp Morgan Stanley 31,1294,114 TTEC Holdings Inc Bank of America
Merrill Lynch 19,4599,392 TTEC Holdings Inc Barclays Bank 23,9508,701 TTEC Holdings Inc Goldman Sachs 36,1593,651 TTEC Holdings Inc HSBC 11,1478,856 TTEC Holdings Inc Morgan Stanley 22,583
(47,484) TTM Technologies Inc Bank of AmericaMerrill Lynch (58,880)
(14,825) TTM Technologies Inc Barclays Bank (2,965)(13,518) TTM Technologies Inc Goldman Sachs (16,762)(12,588) TTM Technologies Inc HSBC 2,392(72,146) TTM Technologies Inc Morgan Stanley (14,429)(9,202) Tucows Inc ’A’ Barclays Bank (5,613)
(16,570) Tucows Inc ’A’ HSBC (43,911)(1,134) Tucows Inc ’A’ Morgan Stanley (692)
(50,035) Tupperware Brands Corp Bank of AmericaMerrill Lynch (39,528)
(62,865) Tupperware Brands Corp Barclays Bank (20,745)(23,065) Tupperware Brands Corp Goldman Sachs (18,221)(42,398) Tupperware Brands Corp HSBC (19,503)(41,976) Tupperware Brands Corp Morgan Stanley (13,852)(17,927) Turning Point Brands Inc Barclays Bank (37,467)(1,670) Turning Point Therapeutics
IncBank of AmericaMerrill Lynch (5,762)
4,292 Turning Point TherapeuticsInc Barclays Bank 34,839
(4,438) Turning Point TherapeuticsInc Barclays Bank (39,321)
1,677 Turning Point TherapeuticsInc Goldman Sachs 5,786
1,887 Turning Point TherapeuticsInc HSBC 22,349
(2,784) Turning Point TherapeuticsInc HSBC (39,756)
(4,046) Turning Point TherapeuticsInc Morgan Stanley (35,848)
(52,816) Turtle Beach Corp Barclays Bank (10,563)(4,778) Turtle Beach Corp Goldman Sachs (4,921)
(20,801) Turtle Beach Corp HSBC (28,497)
Holding Description Counterparty
Netunrealised
appreciation/(depreciation)
USD
United States continued35,226 Tutor Perini Corp Goldman Sachs 102,155
(618) Twilio Inc ’A’ Bank of AmericaMerrill Lynch (664)
1,432 Twilio Inc ’A’ Barclays Bank (18,988)(2,583) Twilio Inc ’A’ Barclays Bank 34,251
(319) Twilio Inc ’A’ Goldman Sachs (255)(266) Twilio Inc ’A’ Morgan Stanley 3,527
(1,211) Twin Disc Inc Bank of AmericaMerrill Lynch 412
(7,646) Twin Disc Inc Goldman Sachs 2,600(31,027) Twin Disc Inc HSBC 33,199(20,557) Twin Disc Inc Morgan Stanley 617(28,365) Twin River Worldwide
Holdings Inc Barclays Bank (55,595)(29,257) Twin River Worldwide
Holdings Inc HSBC (140,726)(2,993) Twist Bioscience Corp Barclays Bank 11,224(5,714) Twist Bioscience Corp Goldman Sachs 24,799(1,200) Twist Bioscience Corp HSBC 4,1163,899 Twist Bioscience Corp Morgan Stanley (13,569)
(5,803) Twist Bioscience Corp Morgan Stanley 21,76120,228 Twitter Inc Bank of America
Merrill Lynch 33,1744,062 Twitter Inc Barclays Bank (8,043)5,175 Twitter Inc HSBC 3,674
41,289 Twitter Inc Morgan Stanley (81,752)(42,249) Two Harbors Investment
Corp (REIT) HSBC (2,535)(53,078) Two Harbors Investment
Corp (REIT) Morgan Stanley 8,492(1,978) Tyler Technologies Inc Bank of America
Merrill Lynch (45,989)726 Tyler Technologies Inc Bank of America
Merrill Lynch 16,880(3,565) Tyler Technologies Inc Barclays Bank (63,992)
(300) Tyler Technologies Inc Goldman Sachs (6,975)(6,832) Tyler Technologies Inc HSBC (326,365)1,672 Tyler Technologies Inc HSBC 79,871
(4,733) Tyler Technologies Inc Morgan Stanley (84,957)2,014 Tyler Technologies Inc Morgan Stanley 36,151(694) Tyson Foods Inc ’A’ Barclays Bank (944)
(3,046) Tyson Foods Inc ’A’ Goldman Sachs (6,541)(5,383) Tyson Foods Inc ’A’ HSBC (862)
(22,418) Tyson Foods Inc ’A’ Morgan Stanley (30,488)(2,822) Uber Technologies Inc Bank of America
Merrill Lynch (7,083)(15,717) Uber Technologies Inc Goldman Sachs (30,746)(23,415) Uber Technologies Inc Morgan Stanley (3,512)
(951) Ubiquiti Inc Bank of AmericaMerrill Lynch (7,551)
2,346 Ubiquiti Inc Bank of AmericaMerrill Lynch 589
(3,082) Ubiquiti Inc Barclays Bank (8,907)(620) Ubiquiti Inc Goldman Sachs (4,923)(663) Ubiquiti Inc HSBC 5,112
(1,466) Ubiquiti Inc Morgan Stanley (4,237)(27,724) UBS Group AG Reg Barclays Bank (25,506)(81,204) UBS Group AG Reg Goldman Sachs (120,182)18,519 UDR Inc (REIT) Bank of America
Merrill Lynch 46,57348,370 UDR Inc (REIT) Barclays Bank 65,7837,961 UDR Inc (REIT) Goldman Sachs 22,928
52,985 UDR Inc (REIT) HSBC (37,090)81,032 UDR Inc (REIT) Morgan Stanley 110,203
(20,447) UFP Industries Inc Bank of AmericaMerrill Lynch (95,992)
(13,157) UFP Industries Inc Barclays Bank (14,999)(19,608) UFP Industries Inc Goldman Sachs (100,981)(15,862) UFP Industries Inc HSBC (17,131)
BlackRock Americas Diversified Equity Absolute Return Fundcontinued
The notes on pages 691 to 711 form an integral part of these financial statements.
Annual report and audited financial statements [195]
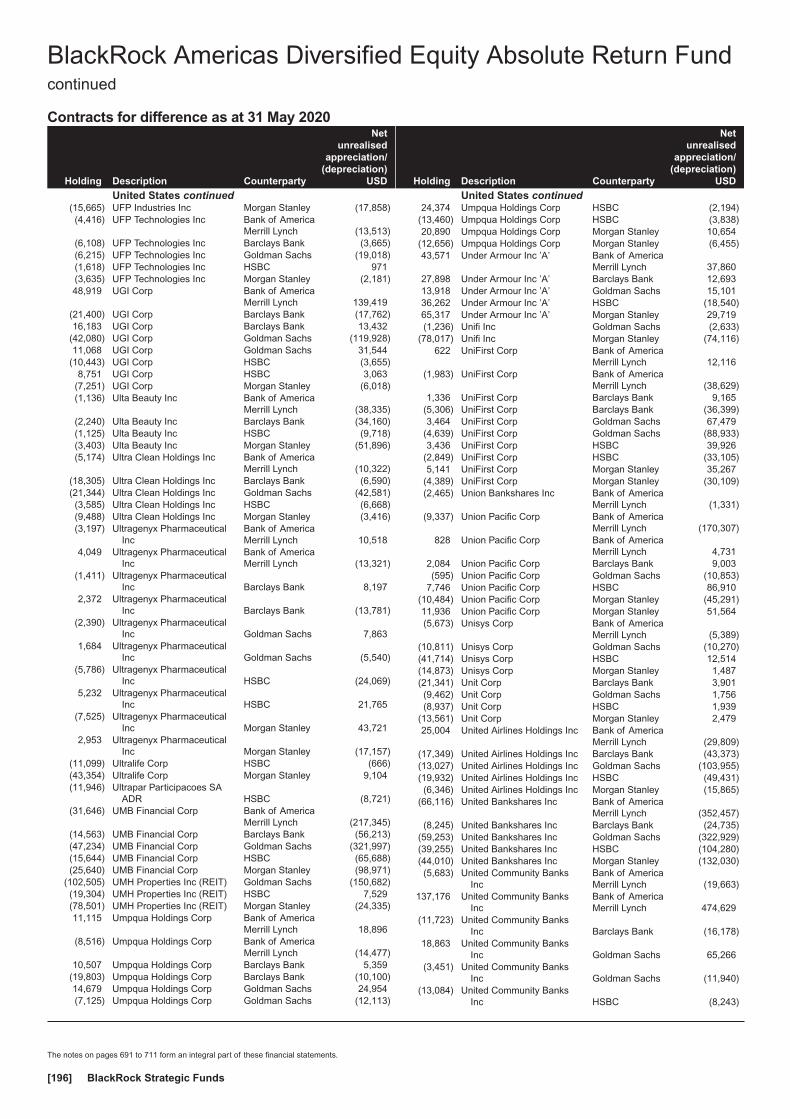
Contracts for difference as at 31 May 2020
Holding Description Counterparty
Netunrealised
appreciation/(depreciation)
USD
United States continued(15,665) UFP Industries Inc Morgan Stanley (17,858)(4,416) UFP Technologies Inc Bank of America
Merrill Lynch (13,513)(6,108) UFP Technologies Inc Barclays Bank (3,665)(6,215) UFP Technologies Inc Goldman Sachs (19,018)(1,618) UFP Technologies Inc HSBC 971(3,635) UFP Technologies Inc Morgan Stanley (2,181)48,919 UGI Corp Bank of America
Merrill Lynch 139,419(21,400) UGI Corp Barclays Bank (17,762)16,183 UGI Corp Barclays Bank 13,432
(42,080) UGI Corp Goldman Sachs (119,928)11,068 UGI Corp Goldman Sachs 31,544
(10,443) UGI Corp HSBC (3,655)8,751 UGI Corp HSBC 3,063
(7,251) UGI Corp Morgan Stanley (6,018)(1,136) Ulta Beauty Inc Bank of America
Merrill Lynch (38,335)(2,240) Ulta Beauty Inc Barclays Bank (34,160)(1,125) Ulta Beauty Inc HSBC (9,718)(3,403) Ulta Beauty Inc Morgan Stanley (51,896)(5,174) Ultra Clean Holdings Inc Bank of America
Merrill Lynch (10,322)(18,305) Ultra Clean Holdings Inc Barclays Bank (6,590)(21,344) Ultra Clean Holdings Inc Goldman Sachs (42,581)(3,585) Ultra Clean Holdings Inc HSBC (6,668)(9,488) Ultra Clean Holdings Inc Morgan Stanley (3,416)(3,197) Ultragenyx Pharmaceutical
IncBank of AmericaMerrill Lynch 10,518
4,049 Ultragenyx PharmaceuticalInc
Bank of AmericaMerrill Lynch (13,321)
(1,411) Ultragenyx PharmaceuticalInc Barclays Bank 8,197
2,372 Ultragenyx PharmaceuticalInc Barclays Bank (13,781)
(2,390) Ultragenyx PharmaceuticalInc Goldman Sachs 7,863
1,684 Ultragenyx PharmaceuticalInc Goldman Sachs (5,540)
(5,786) Ultragenyx PharmaceuticalInc HSBC (24,069)
5,232 Ultragenyx PharmaceuticalInc HSBC 21,765
(7,525) Ultragenyx PharmaceuticalInc Morgan Stanley 43,721
2,953 Ultragenyx PharmaceuticalInc Morgan Stanley (17,157)
(11,099) Ultralife Corp HSBC (666)(43,354) Ultralife Corp Morgan Stanley 9,104(11,946) Ultrapar Participacoes SA
ADR HSBC (8,721)(31,646) UMB Financial Corp Bank of America
Merrill Lynch (217,345)(14,563) UMB Financial Corp Barclays Bank (56,213)(47,234) UMB Financial Corp Goldman Sachs (321,997)(15,644) UMB Financial Corp HSBC (65,688)(25,640) UMB Financial Corp Morgan Stanley (98,971)
(102,505) UMH Properties Inc (REIT) Goldman Sachs (150,682)(19,304) UMH Properties Inc (REIT) HSBC 7,529(78,501) UMH Properties Inc (REIT) Morgan Stanley (24,335)11,115 Umpqua Holdings Corp Bank of America
Merrill Lynch 18,896(8,516) Umpqua Holdings Corp Bank of America
Merrill Lynch (14,477)10,507 Umpqua Holdings Corp Barclays Bank 5,359
(19,803) Umpqua Holdings Corp Barclays Bank (10,100)14,679 Umpqua Holdings Corp Goldman Sachs 24,954(7,125) Umpqua Holdings Corp Goldman Sachs (12,113)
Holding Description Counterparty
Netunrealised
appreciation/(depreciation)
USD
United States continued24,374 Umpqua Holdings Corp HSBC (2,194)
(13,460) Umpqua Holdings Corp HSBC (3,838)20,890 Umpqua Holdings Corp Morgan Stanley 10,654
(12,656) Umpqua Holdings Corp Morgan Stanley (6,455)43,571 Under Armour Inc ’A’ Bank of America
Merrill Lynch 37,86027,898 Under Armour Inc ’A’ Barclays Bank 12,69313,918 Under Armour Inc ’A’ Goldman Sachs 15,10136,262 Under Armour Inc ’A’ HSBC (18,540)65,317 Under Armour Inc ’A’ Morgan Stanley 29,719(1,236) Unifi Inc Goldman Sachs (2,633)
(78,017) Unifi Inc Morgan Stanley (74,116)622 UniFirst Corp Bank of America
Merrill Lynch 12,116(1,983) UniFirst Corp Bank of America
Merrill Lynch (38,629)1,336 UniFirst Corp Barclays Bank 9,165
(5,306) UniFirst Corp Barclays Bank (36,399)3,464 UniFirst Corp Goldman Sachs 67,479
(4,639) UniFirst Corp Goldman Sachs (88,933)3,436 UniFirst Corp HSBC 39,926
(2,849) UniFirst Corp HSBC (33,105)5,141 UniFirst Corp Morgan Stanley 35,267
(4,389) UniFirst Corp Morgan Stanley (30,109)(2,465) Union Bankshares Inc Bank of America
Merrill Lynch (1,331)(9,337) Union Pacific Corp Bank of America
Merrill Lynch (170,307)828 Union Pacific Corp Bank of America
Merrill Lynch 4,7312,084 Union Pacific Corp Barclays Bank 9,003(595) Union Pacific Corp Goldman Sachs (10,853)
7,746 Union Pacific Corp HSBC 86,910(10,484) Union Pacific Corp Morgan Stanley (45,291)11,936 Union Pacific Corp Morgan Stanley 51,564(5,673) Unisys Corp Bank of America
Merrill Lynch (5,389)(10,811) Unisys Corp Goldman Sachs (10,270)(41,714) Unisys Corp HSBC 12,514(14,873) Unisys Corp Morgan Stanley 1,487(21,341) Unit Corp Barclays Bank 3,901(9,462) Unit Corp Goldman Sachs 1,756(8,937) Unit Corp HSBC 1,939
(13,561) Unit Corp Morgan Stanley 2,47925,004 United Airlines Holdings Inc Bank of America
Merrill Lynch (29,809)(17,349) United Airlines Holdings Inc Barclays Bank (43,373)(13,027) United Airlines Holdings Inc Goldman Sachs (103,955)(19,932) United Airlines Holdings Inc HSBC (49,431)(6,346) United Airlines Holdings Inc Morgan Stanley (15,865)
(66,116) United Bankshares Inc Bank of AmericaMerrill Lynch (352,457)
(8,245) United Bankshares Inc Barclays Bank (24,735)(59,253) United Bankshares Inc Goldman Sachs (322,929)(39,255) United Bankshares Inc HSBC (104,280)(44,010) United Bankshares Inc Morgan Stanley (132,030)(5,683) United Community Banks
IncBank of AmericaMerrill Lynch (19,663)
137,176 United Community BanksInc
Bank of AmericaMerrill Lynch 474,629
(11,723) United Community BanksInc Barclays Bank (16,178)
18,863 United Community BanksInc Goldman Sachs 65,266
(3,451) United Community BanksInc Goldman Sachs (11,940)
(13,084) United Community BanksInc HSBC (8,243)
BlackRock Americas Diversified Equity Absolute Return Fundcontinued
The notes on pages 691 to 711 form an integral part of these financial statements.
BlackRock Strategic Funds[196]
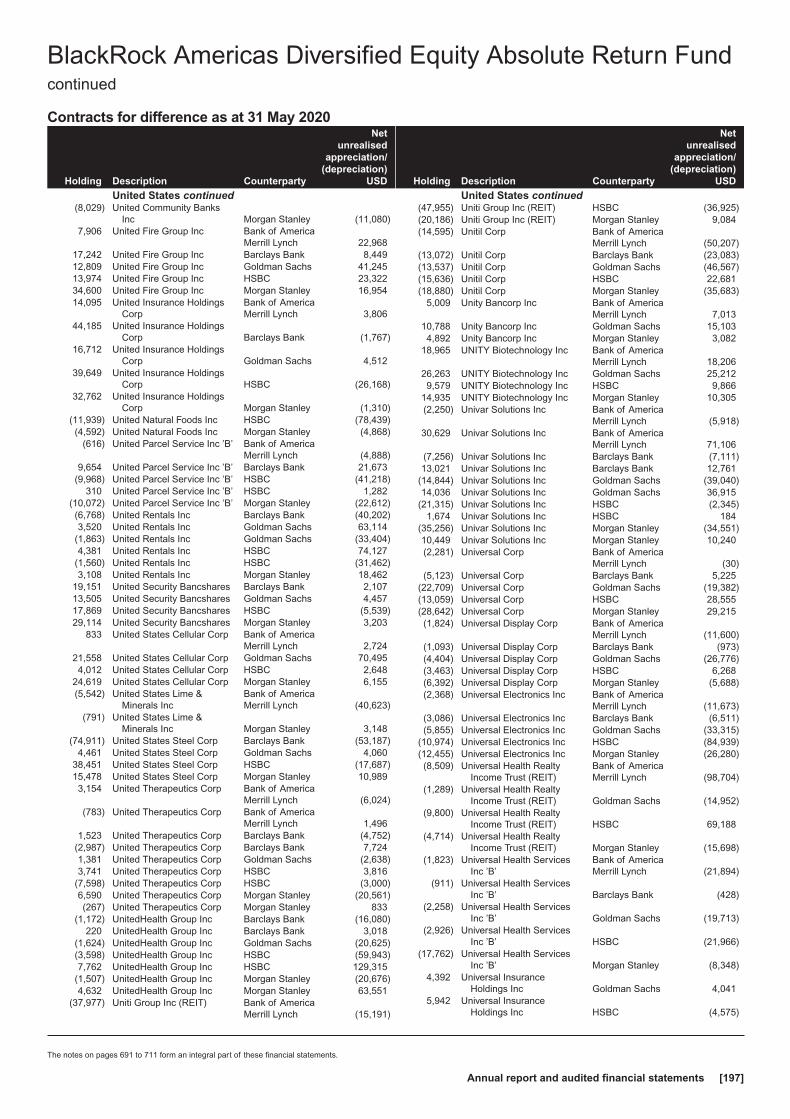
Contracts for difference as at 31 May 2020
Holding Description Counterparty
Netunrealised
appreciation/(depreciation)
USD
United States continued(8,029) United Community Banks
Inc Morgan Stanley (11,080)7,906 United Fire Group Inc Bank of America
Merrill Lynch 22,96817,242 United Fire Group Inc Barclays Bank 8,44912,809 United Fire Group Inc Goldman Sachs 41,24513,974 United Fire Group Inc HSBC 23,32234,600 United Fire Group Inc Morgan Stanley 16,95414,095 United Insurance Holdings
CorpBank of AmericaMerrill Lynch 3,806
44,185 United Insurance HoldingsCorp Barclays Bank (1,767)
16,712 United Insurance HoldingsCorp Goldman Sachs 4,512
39,649 United Insurance HoldingsCorp HSBC (26,168)
32,762 United Insurance HoldingsCorp Morgan Stanley (1,310)
(11,939) United Natural Foods Inc HSBC (78,439)(4,592) United Natural Foods Inc Morgan Stanley (4,868)
(616) United Parcel Service Inc ’B’ Bank of AmericaMerrill Lynch (4,888)
9,654 United Parcel Service Inc ’B’ Barclays Bank 21,673(9,968) United Parcel Service Inc ’B’ HSBC (41,218)
310 United Parcel Service Inc ’B’ HSBC 1,282(10,072) United Parcel Service Inc ’B’ Morgan Stanley (22,612)(6,768) United Rentals Inc Barclays Bank (40,202)3,520 United Rentals Inc Goldman Sachs 63,114
(1,863) United Rentals Inc Goldman Sachs (33,404)4,381 United Rentals Inc HSBC 74,127
(1,560) United Rentals Inc HSBC (31,462)3,108 United Rentals Inc Morgan Stanley 18,462
19,151 United Security Bancshares Barclays Bank 2,10713,505 United Security Bancshares Goldman Sachs 4,45717,869 United Security Bancshares HSBC (5,539)29,114 United Security Bancshares Morgan Stanley 3,203
833 United States Cellular Corp Bank of AmericaMerrill Lynch 2,724
21,558 United States Cellular Corp Goldman Sachs 70,4954,012 United States Cellular Corp HSBC 2,648
24,619 United States Cellular Corp Morgan Stanley 6,155(5,542) United States Lime &
Minerals IncBank of AmericaMerrill Lynch (40,623)
(791) United States Lime &Minerals Inc Morgan Stanley 3,148
(74,911) United States Steel Corp Barclays Bank (53,187)4,461 United States Steel Corp Goldman Sachs 4,060
38,451 United States Steel Corp HSBC (17,687)15,478 United States Steel Corp Morgan Stanley 10,9893,154 United Therapeutics Corp Bank of America
Merrill Lynch (6,024)(783) United Therapeutics Corp Bank of America
Merrill Lynch 1,4961,523 United Therapeutics Corp Barclays Bank (4,752)
(2,987) United Therapeutics Corp Barclays Bank 7,7241,381 United Therapeutics Corp Goldman Sachs (2,638)3,741 United Therapeutics Corp HSBC 3,816
(7,598) United Therapeutics Corp HSBC (3,000)6,590 United Therapeutics Corp Morgan Stanley (20,561)(267) United Therapeutics Corp Morgan Stanley 833
(1,172) UnitedHealth Group Inc Barclays Bank (16,080)220 UnitedHealth Group Inc Barclays Bank 3,018
(1,624) UnitedHealth Group Inc Goldman Sachs (20,625)(3,598) UnitedHealth Group Inc HSBC (59,943)7,762 UnitedHealth Group Inc HSBC 129,315
(1,507) UnitedHealth Group Inc Morgan Stanley (20,676)4,632 UnitedHealth Group Inc Morgan Stanley 63,551
(37,977) Uniti Group Inc (REIT) Bank of AmericaMerrill Lynch (15,191)
Holding Description Counterparty
Netunrealised
appreciation/(depreciation)
USD
United States continued(47,955) Uniti Group Inc (REIT) HSBC (36,925)(20,186) Uniti Group Inc (REIT) Morgan Stanley 9,084(14,595) Unitil Corp Bank of America
Merrill Lynch (50,207)(13,072) Unitil Corp Barclays Bank (23,083)(13,537) Unitil Corp Goldman Sachs (46,567)(15,636) Unitil Corp HSBC 22,681(18,880) Unitil Corp Morgan Stanley (35,683)
5,009 Unity Bancorp Inc Bank of AmericaMerrill Lynch 7,013
10,788 Unity Bancorp Inc Goldman Sachs 15,1034,892 Unity Bancorp Inc Morgan Stanley 3,082
18,965 UNITY Biotechnology Inc Bank of AmericaMerrill Lynch 18,206
26,263 UNITY Biotechnology Inc Goldman Sachs 25,2129,579 UNITY Biotechnology Inc HSBC 9,866
14,935 UNITY Biotechnology Inc Morgan Stanley 10,305(2,250) Univar Solutions Inc Bank of America
Merrill Lynch (5,918)30,629 Univar Solutions Inc Bank of America
Merrill Lynch 71,106(7,256) Univar Solutions Inc Barclays Bank (7,111)13,021 Univar Solutions Inc Barclays Bank 12,761
(14,844) Univar Solutions Inc Goldman Sachs (39,040)14,036 Univar Solutions Inc Goldman Sachs 36,915
(21,315) Univar Solutions Inc HSBC (2,345)1,674 Univar Solutions Inc HSBC 184
(35,256) Univar Solutions Inc Morgan Stanley (34,551)10,449 Univar Solutions Inc Morgan Stanley 10,240(2,281) Universal Corp Bank of America
Merrill Lynch (30)(5,123) Universal Corp Barclays Bank 5,225
(22,709) Universal Corp Goldman Sachs (19,382)(13,059) Universal Corp HSBC 28,555(28,642) Universal Corp Morgan Stanley 29,215(1,824) Universal Display Corp Bank of America
Merrill Lynch (11,600)(1,093) Universal Display Corp Barclays Bank (973)(4,404) Universal Display Corp Goldman Sachs (26,776)(3,463) Universal Display Corp HSBC 6,268(6,392) Universal Display Corp Morgan Stanley (5,688)(2,368) Universal Electronics Inc Bank of America
Merrill Lynch (11,673)(3,086) Universal Electronics Inc Barclays Bank (6,511)(5,855) Universal Electronics Inc Goldman Sachs (33,315)
(10,974) Universal Electronics Inc HSBC (84,939)(12,455) Universal Electronics Inc Morgan Stanley (26,280)(8,509) Universal Health Realty
Income Trust (REIT)Bank of AmericaMerrill Lynch (98,704)
(1,289) Universal Health RealtyIncome Trust (REIT) Goldman Sachs (14,952)
(9,800) Universal Health RealtyIncome Trust (REIT) HSBC 69,188
(4,714) Universal Health RealtyIncome Trust (REIT) Morgan Stanley (15,698)
(1,823) Universal Health ServicesInc ’B’
Bank of AmericaMerrill Lynch (21,894)
(911) Universal Health ServicesInc ’B’ Barclays Bank (428)
(2,258) Universal Health ServicesInc ’B’ Goldman Sachs (19,713)
(2,926) Universal Health ServicesInc ’B’ HSBC (21,966)
(17,762) Universal Health ServicesInc ’B’ Morgan Stanley (8,348)
4,392 Universal InsuranceHoldings Inc Goldman Sachs 4,041
5,942 Universal InsuranceHoldings Inc HSBC (4,575)
BlackRock Americas Diversified Equity Absolute Return Fundcontinued
The notes on pages 691 to 711 form an integral part of these financial statements.
Annual report and audited financial statements [197]
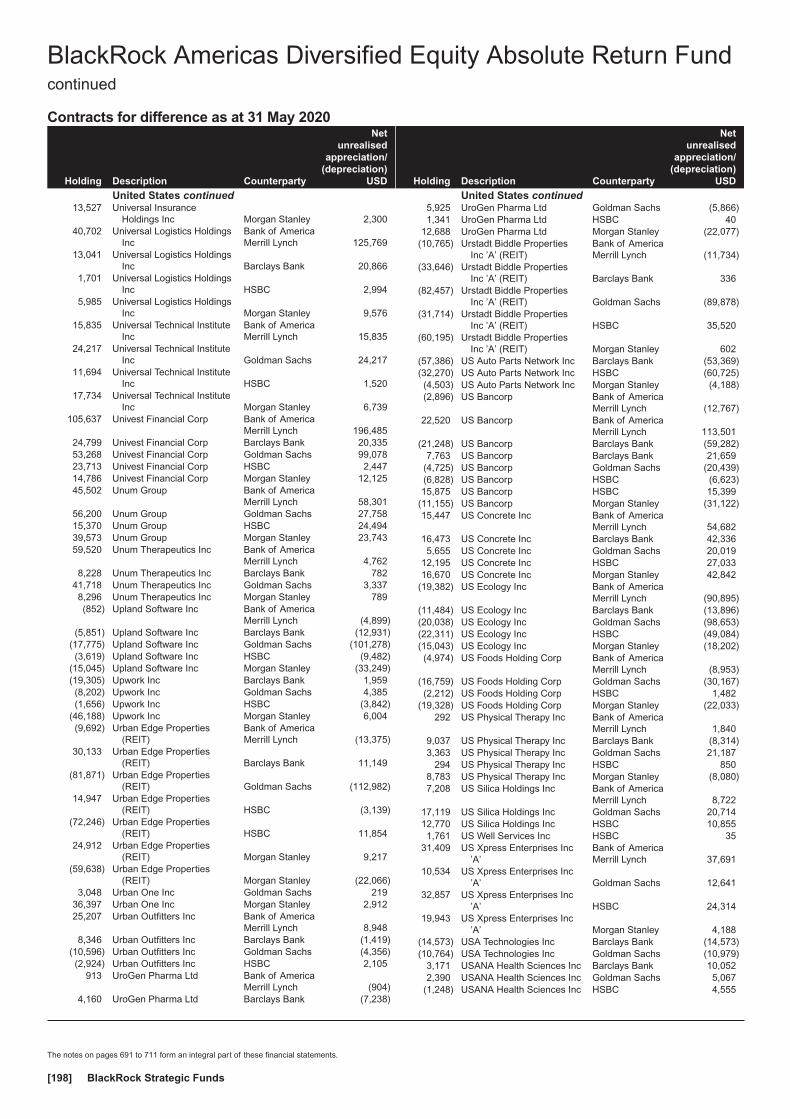
Contracts for difference as at 31 May 2020
Holding Description Counterparty
Netunrealised
appreciation/(depreciation)
USD
United States continued13,527 Universal Insurance
Holdings Inc Morgan Stanley 2,30040,702 Universal Logistics Holdings
IncBank of AmericaMerrill Lynch 125,769
13,041 Universal Logistics HoldingsInc Barclays Bank 20,866
1,701 Universal Logistics HoldingsInc HSBC 2,994
5,985 Universal Logistics HoldingsInc Morgan Stanley 9,576
15,835 Universal Technical InstituteInc
Bank of AmericaMerrill Lynch 15,835
24,217 Universal Technical InstituteInc Goldman Sachs 24,217
11,694 Universal Technical InstituteInc HSBC 1,520
17,734 Universal Technical InstituteInc Morgan Stanley 6,739
105,637 Univest Financial Corp Bank of AmericaMerrill Lynch 196,485
24,799 Univest Financial Corp Barclays Bank 20,33553,268 Univest Financial Corp Goldman Sachs 99,07823,713 Univest Financial Corp HSBC 2,44714,786 Univest Financial Corp Morgan Stanley 12,12545,502 Unum Group Bank of America
Merrill Lynch 58,30156,200 Unum Group Goldman Sachs 27,75815,370 Unum Group HSBC 24,49439,573 Unum Group Morgan Stanley 23,74359,520 Unum Therapeutics Inc Bank of America
Merrill Lynch 4,7628,228 Unum Therapeutics Inc Barclays Bank 782
41,718 Unum Therapeutics Inc Goldman Sachs 3,3378,296 Unum Therapeutics Inc Morgan Stanley 789(852) Upland Software Inc Bank of America
Merrill Lynch (4,899)(5,851) Upland Software Inc Barclays Bank (12,931)
(17,775) Upland Software Inc Goldman Sachs (101,278)(3,619) Upland Software Inc HSBC (9,482)
(15,045) Upland Software Inc Morgan Stanley (33,249)(19,305) Upwork Inc Barclays Bank 1,959(8,202) Upwork Inc Goldman Sachs 4,385(1,656) Upwork Inc HSBC (3,842)
(46,188) Upwork Inc Morgan Stanley 6,004(9,692) Urban Edge Properties
(REIT)Bank of AmericaMerrill Lynch (13,375)
30,133 Urban Edge Properties(REIT) Barclays Bank 11,149
(81,871) Urban Edge Properties(REIT) Goldman Sachs (112,982)
14,947 Urban Edge Properties(REIT) HSBC (3,139)
(72,246) Urban Edge Properties(REIT) HSBC 11,854
24,912 Urban Edge Properties(REIT) Morgan Stanley 9,217
(59,638) Urban Edge Properties(REIT) Morgan Stanley (22,066)
3,048 Urban One Inc Goldman Sachs 21936,397 Urban One Inc Morgan Stanley 2,91225,207 Urban Outfitters Inc Bank of America
Merrill Lynch 8,9488,346 Urban Outfitters Inc Barclays Bank (1,419)
(10,596) Urban Outfitters Inc Goldman Sachs (4,356)(2,924) Urban Outfitters Inc HSBC 2,105
913 UroGen Pharma Ltd Bank of AmericaMerrill Lynch (904)
4,160 UroGen Pharma Ltd Barclays Bank (7,238)
Holding Description Counterparty
Netunrealised
appreciation/(depreciation)
USD
United States continued5,925 UroGen Pharma Ltd Goldman Sachs (5,866)1,341 UroGen Pharma Ltd HSBC 40
12,688 UroGen Pharma Ltd Morgan Stanley (22,077)(10,765) Urstadt Biddle Properties
Inc ’A’ (REIT)Bank of AmericaMerrill Lynch (11,734)
(33,646) Urstadt Biddle PropertiesInc ’A’ (REIT) Barclays Bank 336
(82,457) Urstadt Biddle PropertiesInc ’A’ (REIT) Goldman Sachs (89,878)
(31,714) Urstadt Biddle PropertiesInc ’A’ (REIT) HSBC 35,520
(60,195) Urstadt Biddle PropertiesInc ’A’ (REIT) Morgan Stanley 602
(57,386) US Auto Parts Network Inc Barclays Bank (53,369)(32,270) US Auto Parts Network Inc HSBC (60,725)(4,503) US Auto Parts Network Inc Morgan Stanley (4,188)(2,896) US Bancorp Bank of America
Merrill Lynch (12,767)22,520 US Bancorp Bank of America
Merrill Lynch 113,501(21,248) US Bancorp Barclays Bank (59,282)
7,763 US Bancorp Barclays Bank 21,659(4,725) US Bancorp Goldman Sachs (20,439)(6,828) US Bancorp HSBC (6,623)15,875 US Bancorp HSBC 15,399
(11,155) US Bancorp Morgan Stanley (31,122)15,447 US Concrete Inc Bank of America
Merrill Lynch 54,68216,473 US Concrete Inc Barclays Bank 42,3365,655 US Concrete Inc Goldman Sachs 20,019
12,195 US Concrete Inc HSBC 27,03316,670 US Concrete Inc Morgan Stanley 42,842
(19,382) US Ecology Inc Bank of AmericaMerrill Lynch (90,895)
(11,484) US Ecology Inc Barclays Bank (13,896)(20,038) US Ecology Inc Goldman Sachs (98,653)(22,311) US Ecology Inc HSBC (49,084)(15,043) US Ecology Inc Morgan Stanley (18,202)(4,974) US Foods Holding Corp Bank of America
Merrill Lynch (8,953)(16,759) US Foods Holding Corp Goldman Sachs (30,167)(2,212) US Foods Holding Corp HSBC 1,482
(19,328) US Foods Holding Corp Morgan Stanley (22,033)292 US Physical Therapy Inc Bank of America
Merrill Lynch 1,8409,037 US Physical Therapy Inc Barclays Bank (8,314)3,363 US Physical Therapy Inc Goldman Sachs 21,187
294 US Physical Therapy Inc HSBC 8508,783 US Physical Therapy Inc Morgan Stanley (8,080)7,208 US Silica Holdings Inc Bank of America
Merrill Lynch 8,72217,119 US Silica Holdings Inc Goldman Sachs 20,71412,770 US Silica Holdings Inc HSBC 10,8551,761 US Well Services Inc HSBC 35
31,409 US Xpress Enterprises Inc’A’
Bank of AmericaMerrill Lynch 37,691
10,534 US Xpress Enterprises Inc’A’ Goldman Sachs 12,641
32,857 US Xpress Enterprises Inc’A’ HSBC 24,314
19,943 US Xpress Enterprises Inc’A’ Morgan Stanley 4,188
(14,573) USA Technologies Inc Barclays Bank (14,573)(10,764) USA Technologies Inc Goldman Sachs (10,979)
3,171 USANA Health Sciences Inc Barclays Bank 10,0522,390 USANA Health Sciences Inc Goldman Sachs 5,067
(1,248) USANA Health Sciences Inc HSBC 4,555
BlackRock Americas Diversified Equity Absolute Return Fundcontinued
The notes on pages 691 to 711 form an integral part of these financial statements.
BlackRock Strategic Funds[198]
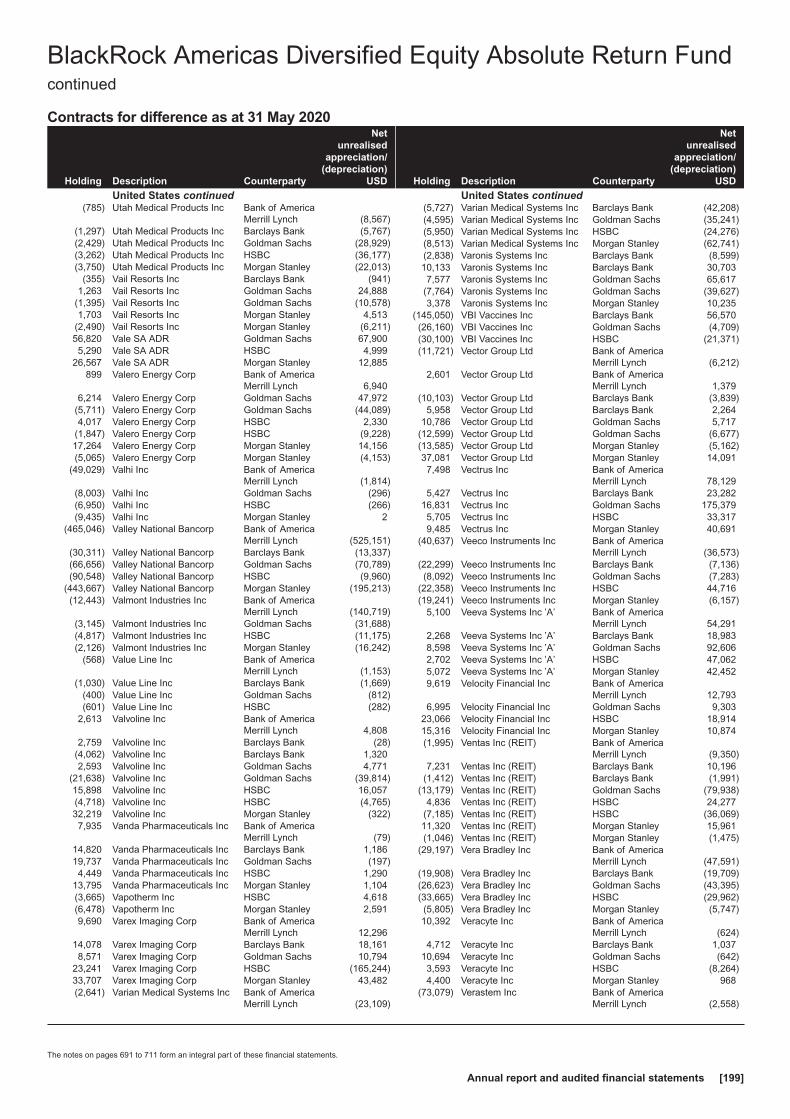
Contracts for difference as at 31 May 2020
Holding Description Counterparty
Netunrealised
appreciation/(depreciation)
USD
United States continued(785) Utah Medical Products Inc Bank of America
Merrill Lynch (8,567)(1,297) Utah Medical Products Inc Barclays Bank (5,767)(2,429) Utah Medical Products Inc Goldman Sachs (28,929)(3,262) Utah Medical Products Inc HSBC (36,177)(3,750) Utah Medical Products Inc Morgan Stanley (22,013)
(355) Vail Resorts Inc Barclays Bank (941)1,263 Vail Resorts Inc Goldman Sachs 24,888
(1,395) Vail Resorts Inc Goldman Sachs (10,578)1,703 Vail Resorts Inc Morgan Stanley 4,513
(2,490) Vail Resorts Inc Morgan Stanley (6,211)56,820 Vale SA ADR Goldman Sachs 67,9005,290 Vale SA ADR HSBC 4,999
26,567 Vale SA ADR Morgan Stanley 12,885899 Valero Energy Corp Bank of America
Merrill Lynch 6,9406,214 Valero Energy Corp Goldman Sachs 47,972
(5,711) Valero Energy Corp Goldman Sachs (44,089)4,017 Valero Energy Corp HSBC 2,330
(1,847) Valero Energy Corp HSBC (9,228)17,264 Valero Energy Corp Morgan Stanley 14,156(5,065) Valero Energy Corp Morgan Stanley (4,153)
(49,029) Valhi Inc Bank of AmericaMerrill Lynch (1,814)
(8,003) Valhi Inc Goldman Sachs (296)(6,950) Valhi Inc HSBC (266)(9,435) Valhi Inc Morgan Stanley 2
(465,046) Valley National Bancorp Bank of AmericaMerrill Lynch (525,151)
(30,311) Valley National Bancorp Barclays Bank (13,337)(66,656) Valley National Bancorp Goldman Sachs (70,789)(90,548) Valley National Bancorp HSBC (9,960)
(443,667) Valley National Bancorp Morgan Stanley (195,213)(12,443) Valmont Industries Inc Bank of America
Merrill Lynch (140,719)(3,145) Valmont Industries Inc Goldman Sachs (31,688)(4,817) Valmont Industries Inc HSBC (11,175)(2,126) Valmont Industries Inc Morgan Stanley (16,242)
(568) Value Line Inc Bank of AmericaMerrill Lynch (1,153)
(1,030) Value Line Inc Barclays Bank (1,669)(400) Value Line Inc Goldman Sachs (812)(601) Value Line Inc HSBC (282)
2,613 Valvoline Inc Bank of AmericaMerrill Lynch 4,808
2,759 Valvoline Inc Barclays Bank (28)(4,062) Valvoline Inc Barclays Bank 1,3202,593 Valvoline Inc Goldman Sachs 4,771
(21,638) Valvoline Inc Goldman Sachs (39,814)15,898 Valvoline Inc HSBC 16,057(4,718) Valvoline Inc HSBC (4,765)32,219 Valvoline Inc Morgan Stanley (322)7,935 Vanda Pharmaceuticals Inc Bank of America
Merrill Lynch (79)14,820 Vanda Pharmaceuticals Inc Barclays Bank 1,18619,737 Vanda Pharmaceuticals Inc Goldman Sachs (197)4,449 Vanda Pharmaceuticals Inc HSBC 1,290
13,795 Vanda Pharmaceuticals Inc Morgan Stanley 1,104(3,665) Vapotherm Inc HSBC 4,618(6,478) Vapotherm Inc Morgan Stanley 2,5919,690 Varex Imaging Corp Bank of America
Merrill Lynch 12,29614,078 Varex Imaging Corp Barclays Bank 18,1618,571 Varex Imaging Corp Goldman Sachs 10,794
23,241 Varex Imaging Corp HSBC (165,244)33,707 Varex Imaging Corp Morgan Stanley 43,482(2,641) Varian Medical Systems Inc Bank of America
Merrill Lynch (23,109)
Holding Description Counterparty
Netunrealised
appreciation/(depreciation)
USD
United States continued(5,727) Varian Medical Systems Inc Barclays Bank (42,208)(4,595) Varian Medical Systems Inc Goldman Sachs (35,241)(5,950) Varian Medical Systems Inc HSBC (24,276)(8,513) Varian Medical Systems Inc Morgan Stanley (62,741)(2,838) Varonis Systems Inc Barclays Bank (8,599)10,133 Varonis Systems Inc Barclays Bank 30,7037,577 Varonis Systems Inc Goldman Sachs 65,617
(7,764) Varonis Systems Inc Goldman Sachs (39,627)3,378 Varonis Systems Inc Morgan Stanley 10,235
(145,050) VBI Vaccines Inc Barclays Bank 56,570(26,160) VBI Vaccines Inc Goldman Sachs (4,709)(30,100) VBI Vaccines Inc HSBC (21,371)(11,721) Vector Group Ltd Bank of America
Merrill Lynch (6,212)2,601 Vector Group Ltd Bank of America
Merrill Lynch 1,379(10,103) Vector Group Ltd Barclays Bank (3,839)
5,958 Vector Group Ltd Barclays Bank 2,26410,786 Vector Group Ltd Goldman Sachs 5,717
(12,599) Vector Group Ltd Goldman Sachs (6,677)(13,585) Vector Group Ltd Morgan Stanley (5,162)37,081 Vector Group Ltd Morgan Stanley 14,0917,498 Vectrus Inc Bank of America
Merrill Lynch 78,1295,427 Vectrus Inc Barclays Bank 23,282
16,831 Vectrus Inc Goldman Sachs 175,3795,705 Vectrus Inc HSBC 33,3179,485 Vectrus Inc Morgan Stanley 40,691
(40,637) Veeco Instruments Inc Bank of AmericaMerrill Lynch (36,573)
(22,299) Veeco Instruments Inc Barclays Bank (7,136)(8,092) Veeco Instruments Inc Goldman Sachs (7,283)
(22,358) Veeco Instruments Inc HSBC 44,716(19,241) Veeco Instruments Inc Morgan Stanley (6,157)
5,100 Veeva Systems Inc ’A’ Bank of AmericaMerrill Lynch 54,291
2,268 Veeva Systems Inc ’A’ Barclays Bank 18,9838,598 Veeva Systems Inc ’A’ Goldman Sachs 92,6062,702 Veeva Systems Inc ’A’ HSBC 47,0625,072 Veeva Systems Inc ’A’ Morgan Stanley 42,4529,619 Velocity Financial Inc Bank of America
Merrill Lynch 12,7936,995 Velocity Financial Inc Goldman Sachs 9,303
23,066 Velocity Financial Inc HSBC 18,91415,316 Velocity Financial Inc Morgan Stanley 10,874(1,995) Ventas Inc (REIT) Bank of America
Merrill Lynch (9,350)7,231 Ventas Inc (REIT) Barclays Bank 10,196
(1,412) Ventas Inc (REIT) Barclays Bank (1,991)(13,179) Ventas Inc (REIT) Goldman Sachs (79,938)
4,836 Ventas Inc (REIT) HSBC 24,277(7,185) Ventas Inc (REIT) HSBC (36,069)11,320 Ventas Inc (REIT) Morgan Stanley 15,961(1,046) Ventas Inc (REIT) Morgan Stanley (1,475)
(29,197) Vera Bradley Inc Bank of AmericaMerrill Lynch (47,591)
(19,908) Vera Bradley Inc Barclays Bank (19,709)(26,623) Vera Bradley Inc Goldman Sachs (43,395)(33,665) Vera Bradley Inc HSBC (29,962)(5,805) Vera Bradley Inc Morgan Stanley (5,747)10,392 Veracyte Inc Bank of America
Merrill Lynch (624)4,712 Veracyte Inc Barclays Bank 1,037
10,694 Veracyte Inc Goldman Sachs (642)3,593 Veracyte Inc HSBC (8,264)4,400 Veracyte Inc Morgan Stanley 968
(73,079) Verastem Inc Bank of AmericaMerrill Lynch (2,558)
BlackRock Americas Diversified Equity Absolute Return Fundcontinued
The notes on pages 691 to 711 form an integral part of these financial statements.
Annual report and audited financial statements [199]

Contracts for difference as at 31 May 2020
Holding Description Counterparty
Netunrealised
appreciation/(depreciation)
USD
United States continued(25,545) Verastem Inc Morgan Stanley 2,555
(479,103) VEREIT Inc (REIT) Bank of AmericaMerrill Lynch (455,148)
(59,438) VEREIT Inc (REIT) Barclays Bank (594)(75,702) VEREIT Inc (REIT) Goldman Sachs (32,807)(14,078) VEREIT Inc (REIT) HSBC 282
(117,671) VEREIT Inc (REIT) Morgan Stanley (1,176)4,432 Vericel Corp Bank of America
Merrill Lynch (3,812)2,987 Vericel Corp Barclays Bank (209)9,448 Vericel Corp Goldman Sachs (8,125)9,929 Vericel Corp HSBC (9,830)4,566 Vericel Corp Morgan Stanley (320)
(6,824) Verint Systems Inc Bank of AmericaMerrill Lynch (11,403)
(6,685) Verint Systems Inc Barclays Bank 3,343(19,803) Verint Systems Inc Goldman Sachs (44,462)(50,305) Verint Systems Inc HSBC 112,180(36,360) Verint Systems Inc Morgan Stanley 18,181
5,192 VeriSign Inc Barclays Bank 5,555(2,217) VeriSign Inc Barclays Bank (2,372)7,228 VeriSign Inc Goldman Sachs (17,781)(703) VeriSign Inc Goldman Sachs 1,729
2,481 VeriSign Inc HSBC 11,785(1,046) VeriSign Inc HSBC (4,969)(2,818) VeriSign Inc Morgan Stanley (3,015)8,019 Verisk Analytics Inc Bank of America
Merrill Lynch 124,95311,180 Verisk Analytics Inc Barclays Bank 152,4962,322 Verisk Analytics Inc Goldman Sachs 37,988
12,857 Verisk Analytics Inc HSBC 146,33313,840 Verisk Analytics Inc Morgan Stanley 188,777(1,743) Veritex Holdings Inc Bank of America
Merrill Lynch (4,671)(9,048) Veritex Holdings Inc Barclays Bank (9,410)
(25,965) Veritex Holdings Inc Goldman Sachs (69,586)(20,845) Veritex Holdings Inc HSBC (14,175)(37,601) Veritex Holdings Inc Morgan Stanley (39,105)13,873 Veritiv Corp HSBC 40,6488,980 Veritiv Corp Morgan Stanley 19,487
23,754 Veritone Inc Barclays Bank 1,6633,121 Veritone Inc Goldman Sachs 3,683
16,272 Veritone Inc HSBC 22,7416,848 Veritone Inc Morgan Stanley 479
93,065 Verizon CommunicationsInc
Bank of AmericaMerrill Lynch 83,845
4,723 Verizon CommunicationsInc Barclays Bank 2,177
17,782 Verizon CommunicationsInc HSBC (29,162)
35,456 Verizon CommunicationsInc Morgan Stanley 39,276
8,327 Verra Mobility Corp Barclays Bank 3,99726,785 Verra Mobility Corp Goldman Sachs 28,39243,394 Verra Mobility Corp HSBC 69,43044,751 Verra Mobility Corp Morgan Stanley 21,480(4,709) Verrica Pharmaceuticals Inc Bank of America
Merrill Lynch (8,759)(3,298) Verrica Pharmaceuticals Inc Barclays Bank (3,232)
(10,892) Verrica Pharmaceuticals Inc Goldman Sachs (20,259)(2,085) Verrica Pharmaceuticals Inc HSBC (1,981)(2,050) Verrica Pharmaceuticals Inc Morgan Stanley (2,009)
(33,440) Verso Corp ’A’ Bank of AmericaMerrill Lynch (18,392)
(14,916) Verso Corp ’A’ Barclays Bank (4,773)(18,373) Verso Corp ’A’ Goldman Sachs (10,105)(3,501) Verso Corp ’A’ HSBC (595)
(11,075) Verso Corp ’A’ Morgan Stanley (3,544)
Holding Description Counterparty
Netunrealised
appreciation/(depreciation)
USD
United States continued6,243 Vertex Pharmaceuticals Inc Bank of America
Merrill Lynch (41,514)940 Vertex Pharmaceuticals Inc Barclays Bank (2,867)
1,602 Vertex Pharmaceuticals Inc Goldman Sachs (10,862)694 Vertex Pharmaceuticals Inc HSBC 4,697
9,654 Vertex Pharmaceuticals Inc Morgan Stanley (29,445)6,079 Vertiv Holdings Co Bank of America
Merrill Lynch 5,47128,245 Vertiv Holdings Co Barclays Bank 7,90912,077 Vertiv Holdings Co Goldman Sachs 10,86922,569 Vertiv Holdings Co HSBC 30,24219,269 Vertiv Holdings Co Morgan Stanley 5,395
(109,642) Veru Inc Barclays Bank (14,253)(22,920) Veru Inc Goldman Sachs 4,584(12,695) Veru Inc HSBC 998
4,987 VF Corp Bank of AmericaMerrill Lynch 24,935
7,941 VF Corp Barclays Bank 10,48229,525 VF Corp Goldman Sachs 137,85220,504 VF Corp HSBC (11,189)20,192 VF Corp Morgan Stanley 26,6544,501 ViacomCBS Inc ’A’ Bank of America
Merrill Lynch 20,8409,810 ViacomCBS Inc ’A’ HSBC 41,496
10,549 ViacomCBS Inc ’A’ Morgan Stanley 20,67629,707 ViacomCBS Inc ’B’ Barclays Bank 29,70731,569 ViacomCBS Inc ’B’ HSBC 71,56027,163 ViacomCBS Inc ’B’ Morgan Stanley 27,1632,871 Viad Corp Barclays Bank 5,1683,347 Viad Corp Goldman Sachs 10,7105,481 Viad Corp HSBC (17,649)6,554 Viad Corp Morgan Stanley 11,797
853 ViaSat Inc Bank of AmericaMerrill Lynch 5,749
16,330 ViaSat Inc Barclays Bank (5,062)12,285 ViaSat Inc Goldman Sachs 55,8155,936 ViaSat Inc HSBC 15,7949,786 ViaSat Inc Morgan Stanley (3,034)
(80,767) Viavi Solutions Inc Bank of AmericaMerrill Lynch (59,374)
(139,845) Viavi Solutions Inc Barclays Bank (11,187)(41,422) Viavi Solutions Inc Goldman Sachs (31,067)
(153,245) Viavi Solutions Inc HSBC 130,259(131,654) Viavi Solutions Inc Morgan Stanley (10,532)
19,016 VICI Properties Inc (REIT) Bank of AmericaMerrill Lynch 61,938
26,971 VICI Properties Inc (REIT) Barclays Bank 5,93443,943 VICI Properties Inc (REIT) HSBC 86,1289,915 VICI Properties Inc (REIT) Morgan Stanley 2,181(747) Vicor Corp Barclays Bank (1,345)
(1,426) Vicor Corp Goldman Sachs (9,041)(9,742) Vicor Corp HSBC (56,113)
(20,035) Vicor Corp Morgan Stanley (36,063)(24,326) ViewRay Inc Bank of America
Merrill Lynch 1,581(2,917) ViewRay Inc Barclays Bank 15
(80,473) ViewRay Inc Goldman Sachs 5,231(71,434) ViewRay Inc HSBC (1,072)(40,599) Viking Therapeutics Inc Bank of America
Merrill Lynch (1,624)(66,189) Viking Therapeutics Inc Barclays Bank 53,613(46,443) Viking Therapeutics Inc Goldman Sachs (1,858)(21,772) Viking Therapeutics Inc HSBC (13,499)(20,454) Village Super Market Inc ’A’ Bank of America
Merrill Lynch (7,661)(1,796) Village Super Market Inc ’A’ Barclays Bank (1,060)
(10,737) Village Super Market Inc ’A’ Goldman Sachs (4,080)(5,390) Village Super Market Inc ’A’ HSBC (2,185)
BlackRock Americas Diversified Equity Absolute Return Fundcontinued
The notes on pages 691 to 711 form an integral part of these financial statements.
BlackRock Strategic Funds[200]

Contracts for difference as at 31 May 2020
Holding Description Counterparty
Netunrealised
appreciation/(depreciation)
USD
United States continued(7,007) Village Super Market Inc ’A’ Morgan Stanley (4,134)
(11,185) Vince Holding Corp Barclays Bank (2,573)(13,891) Vince Holding Corp Morgan Stanley (3,195)
1,529 Vir Biotechnology Inc Bank of AmericaMerrill Lynch (2,823)
2,648 Vir Biotechnology Inc HSBC (4,045)19,866 Vir Biotechnology Inc Morgan Stanley (33,772)2,674 Virgin Galactic Holdings Inc Bank of America
Merrill Lynch 3,6634,118 Virgin Galactic Holdings Inc Goldman Sachs 1,4202,435 Virgin Galactic Holdings Inc HSBC 1,233(964) VirnetX Holding Corp Bank of America
Merrill Lynch (569)(26,683) VirnetX Holding Corp Barclays Bank 20,546(6,408) VirnetX Holding Corp Goldman Sachs (3,781)
(70,495) VirnetX Holding Corp HSBC 8,771(9,174) VirnetX Holding Corp Morgan Stanley 7,064(5,635) Virtu Financial Inc ’A’ Bank of America
Merrill Lynch (1,639)(4,134) Virtu Financial Inc ’A’ Barclays Bank (5,581)
(15,276) Virtu Financial Inc ’A’ Goldman Sachs (5,951)(5,669) Virtu Financial Inc ’A’ HSBC 2,948
(13,566) Virtu Financial Inc ’A’ Morgan Stanley (18,315)723 Virtus Investment Partners
Inc Barclays Bank 1,4031,425 Virtus Investment Partners
Inc Goldman Sachs 14,2886,017 Virtus Investment Partners
Inc HSBC (16,306)8,911 Virtus Investment Partners
Inc Morgan Stanley 17,2871,740 Virtusa Corp Bank of America
Merrill Lynch 2,9062,794 Virtusa Corp Barclays Bank 6,0634,057 Virtusa Corp Goldman Sachs 6,775
16,005 Virtusa Corp HSBC (86,427)960 Virtusa Corp Morgan Stanley 2,083
20,825 Visa Inc ’A’ Barclays Bank 65,80716,704 Visa Inc ’A’ Goldman Sachs 8,20325,682 Visa Inc ’A’ Morgan Stanley 78,597
(30,206) Vishay Intertechnology Inc Bank of AmericaMerrill Lynch (52,060)
(17,232) Vishay Intertechnology Inc Barclays Bank (5,083)(80,352) Vishay Intertechnology Inc Goldman Sachs (115,297)(96,521) Vishay Intertechnology Inc HSBC 77,133
(268,340) Vishay Intertechnology Inc Morgan Stanley (79,161)(4,277) Vishay Precision Group Inc Bank of America
Merrill Lynch (13,558)(5,721) Vishay Precision Group Inc Goldman Sachs (18,136)
(25,764) Vishay Precision Group Inc HSBC (9,017)(28,128) Vishay Precision Group Inc Morgan Stanley (37,129)
(462) Visteon Corp Bank of AmericaMerrill Lynch 1,863
(1,722) Visteon Corp Barclays Bank 6,595(1,095) Visteon Corp Goldman Sachs (2,420)(8,826) Visteon Corp HSBC (49,333)
(12,704) Visteon Corp Morgan Stanley 48,657(44,876) Vistra Energy Corp Bank of America
Merrill Lynch (91,996)(34,514) Vistra Energy Corp Barclays Bank (22,933)(28,517) Vistra Energy Corp Goldman Sachs (55,284)(5,711) Vistra Energy Corp HSBC (11,329)
(48,693) Vistra Energy Corp Morgan Stanley (39,441)6,237 Vivint Smart Home Inc Bank of America
Merrill Lynch (3,119)3,770 Vivint Smart Home Inc Barclays Bank 2263,757 Vivint Smart Home Inc Goldman Sachs (1,879)7,028 Vivint Smart Home Inc HSBC (703)3,203 Vivint Smart Home Inc Morgan Stanley 192
Holding Description Counterparty
Netunrealised
appreciation/(depreciation)
USD
United States continued(22,328) Vivint Solar Inc Barclays Bank (14,513)(63,742) Vivint Solar Inc HSBC (61,830)
2,297 VMware Inc ’A’ Bank of AmericaMerrill Lynch 46,032
8,014 VMware Inc ’A’ Barclays Bank 134,1311,199 VMware Inc ’A’ Goldman Sachs 20,792
(6,433) VMware Inc ’A’ HSBC (91,413)1,297 VMware Inc ’A’ HSBC 18,430
(4,017) VMware Inc ’A’ Morgan Stanley (80,019)704 VMware Inc ’A’ Morgan Stanley 12,132
4,509 Vocera Communications Inc Bank of AmericaMerrill Lynch 3,878
6,551 Vocera Communications Inc Barclays Bank 8525,399 Vocera Communications Inc Goldman Sachs 4,643
13,905 Vocera Communications Inc HSBC 5,51727,392 Vocera Communications Inc Morgan Stanley 3,56125,381 Vonage Holdings Corp Goldman Sachs 9,264
613 Vonage Holdings Corp HSBC 83(13,124) Vonage Holdings Corp HSBC (1,772)23,683 Vonage Holdings Corp Morgan Stanley 2,960
(39,805) Vonage Holdings Corp Morgan Stanley (4,976)(11,933) Vornado Realty Trust (REIT) Bank of America
Merrill Lynch (14,249)(13,717) Vornado Realty Trust (REIT) Barclays Bank (33,607)(35,741) Vornado Realty Trust (REIT) Goldman Sachs (38,200)(5,919) Vornado Realty Trust (REIT) HSBC 11,515
(14,475) Vornado Realty Trust (REIT) Morgan Stanley (35,464)23,885 VOXX International Corp Bank of America
Merrill Lynch (478)8,927 VOXX International Corp Goldman Sachs (179)
10,739 VOXX International Corp Morgan Stanley 2153,768 Voya Financial Inc Bank of America
Merrill Lynch 13,489(14,916) Voya Financial Inc Bank of America
Merrill Lynch (48,435)13,054 Voya Financial Inc Barclays Bank 29,502
(15,539) Voya Financial Inc Barclays Bank (35,118)1,214 Voya Financial Inc Goldman Sachs 4,346
(7,469) Voya Financial Inc Goldman Sachs (26,739)14,383 Voya Financial Inc HSBC (7,767)(2,710) Voya Financial Inc HSBC 1,4639,077 Voya Financial Inc Morgan Stanley 20,514
(22,645) Voya Financial Inc Morgan Stanley (51,178)(19,686) Voyager Therapeutics Inc Bank of America
Merrill Lynch 2,953(11,168) Voyager Therapeutics Inc Barclays Bank 14,072(2,946) Voyager Therapeutics Inc Goldman Sachs 442
(12,864) Voyager Therapeutics Inc HSBC (7,461)(5,325) Voyager Therapeutics Inc Morgan Stanley 6,710
(27,671) VSE Corp Bank of AmericaMerrill Lynch (120,646)
(3,484) VSE Corp Barclays Bank (8,362)(2,021) VSE Corp Goldman Sachs (8,812)(1,652) VSE Corp HSBC (8,937)(2,527) VSE Corp Morgan Stanley (6,065)4,508 Vulcan Materials Co Bank of America
Merrill Lynch 55,4124,480 Vulcan Materials Co Barclays Bank 39,603
10,657 Vulcan Materials Co HSBC 72,4289,843 Vulcan Materials Co Morgan Stanley 78,307
(32,962) W&T Offshore Inc Bank of AmericaMerrill Lynch 1,318
(100,969) W&T Offshore Inc Goldman Sachs 4,039(34,310) W&T Offshore Inc HSBC 6,519(47,265) W&T Offshore Inc Morgan Stanley 6,61759,332 Wabash National Corp Bank of America
Merrill Lynch 116,88435,593 Wabash National Corp Barclays Bank 24,559
BlackRock Americas Diversified Equity Absolute Return Fundcontinued
The notes on pages 691 to 711 form an integral part of these financial statements.
Annual report and audited financial statements [201]
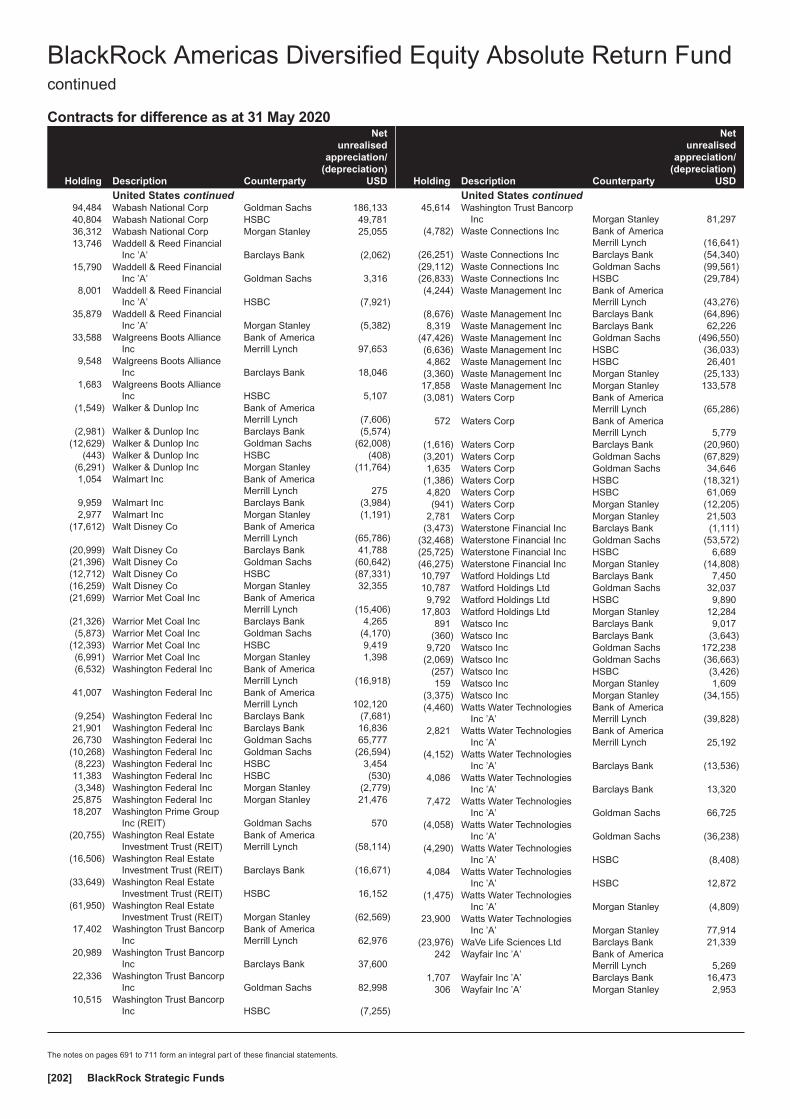
Contracts for difference as at 31 May 2020
Holding Description Counterparty
Netunrealised
appreciation/(depreciation)
USD
United States continued94,484 Wabash National Corp Goldman Sachs 186,13340,804 Wabash National Corp HSBC 49,78136,312 Wabash National Corp Morgan Stanley 25,05513,746 Waddell & Reed Financial
Inc ’A’ Barclays Bank (2,062)15,790 Waddell & Reed Financial
Inc ’A’ Goldman Sachs 3,3168,001 Waddell & Reed Financial
Inc ’A’ HSBC (7,921)35,879 Waddell & Reed Financial
Inc ’A’ Morgan Stanley (5,382)33,588 Walgreens Boots Alliance
IncBank of AmericaMerrill Lynch 97,653
9,548 Walgreens Boots AllianceInc Barclays Bank 18,046
1,683 Walgreens Boots AllianceInc HSBC 5,107
(1,549) Walker & Dunlop Inc Bank of AmericaMerrill Lynch (7,606)
(2,981) Walker & Dunlop Inc Barclays Bank (5,574)(12,629) Walker & Dunlop Inc Goldman Sachs (62,008)
(443) Walker & Dunlop Inc HSBC (408)(6,291) Walker & Dunlop Inc Morgan Stanley (11,764)1,054 Walmart Inc Bank of America
Merrill Lynch 2759,959 Walmart Inc Barclays Bank (3,984)2,977 Walmart Inc Morgan Stanley (1,191)
(17,612) Walt Disney Co Bank of AmericaMerrill Lynch (65,786)
(20,999) Walt Disney Co Barclays Bank 41,788(21,396) Walt Disney Co Goldman Sachs (60,642)(12,712) Walt Disney Co HSBC (87,331)(16,259) Walt Disney Co Morgan Stanley 32,355(21,699) Warrior Met Coal Inc Bank of America
Merrill Lynch (15,406)(21,326) Warrior Met Coal Inc Barclays Bank 4,265(5,873) Warrior Met Coal Inc Goldman Sachs (4,170)
(12,393) Warrior Met Coal Inc HSBC 9,419(6,991) Warrior Met Coal Inc Morgan Stanley 1,398(6,532) Washington Federal Inc Bank of America
Merrill Lynch (16,918)41,007 Washington Federal Inc Bank of America
Merrill Lynch 102,120(9,254) Washington Federal Inc Barclays Bank (7,681)21,901 Washington Federal Inc Barclays Bank 16,83626,730 Washington Federal Inc Goldman Sachs 65,777
(10,268) Washington Federal Inc Goldman Sachs (26,594)(8,223) Washington Federal Inc HSBC 3,45411,383 Washington Federal Inc HSBC (530)(3,348) Washington Federal Inc Morgan Stanley (2,779)25,875 Washington Federal Inc Morgan Stanley 21,47618,207 Washington Prime Group
Inc (REIT) Goldman Sachs 570(20,755) Washington Real Estate
Investment Trust (REIT)Bank of AmericaMerrill Lynch (58,114)
(16,506) Washington Real EstateInvestment Trust (REIT) Barclays Bank (16,671)
(33,649) Washington Real EstateInvestment Trust (REIT) HSBC 16,152
(61,950) Washington Real EstateInvestment Trust (REIT) Morgan Stanley (62,569)
17,402 Washington Trust BancorpInc
Bank of AmericaMerrill Lynch 62,976
20,989 Washington Trust BancorpInc Barclays Bank 37,600
22,336 Washington Trust BancorpInc Goldman Sachs 82,998
10,515 Washington Trust BancorpInc HSBC (7,255)
Holding Description Counterparty
Netunrealised
appreciation/(depreciation)
USD
United States continued45,614 Washington Trust Bancorp
Inc Morgan Stanley 81,297(4,782) Waste Connections Inc Bank of America
Merrill Lynch (16,641)(26,251) Waste Connections Inc Barclays Bank (54,340)(29,112) Waste Connections Inc Goldman Sachs (99,561)(26,833) Waste Connections Inc HSBC (29,784)(4,244) Waste Management Inc Bank of America
Merrill Lynch (43,276)(8,676) Waste Management Inc Barclays Bank (64,896)8,319 Waste Management Inc Barclays Bank 62,226
(47,426) Waste Management Inc Goldman Sachs (496,550)(6,636) Waste Management Inc HSBC (36,033)4,862 Waste Management Inc HSBC 26,401
(3,360) Waste Management Inc Morgan Stanley (25,133)17,858 Waste Management Inc Morgan Stanley 133,578(3,081) Waters Corp Bank of America
Merrill Lynch (65,286)572 Waters Corp Bank of America
Merrill Lynch 5,779(1,616) Waters Corp Barclays Bank (20,960)(3,201) Waters Corp Goldman Sachs (67,829)1,635 Waters Corp Goldman Sachs 34,646
(1,386) Waters Corp HSBC (18,321)4,820 Waters Corp HSBC 61,069(941) Waters Corp Morgan Stanley (12,205)
2,781 Waters Corp Morgan Stanley 21,503(3,473) Waterstone Financial Inc Barclays Bank (1,111)
(32,468) Waterstone Financial Inc Goldman Sachs (53,572)(25,725) Waterstone Financial Inc HSBC 6,689(46,275) Waterstone Financial Inc Morgan Stanley (14,808)10,797 Watford Holdings Ltd Barclays Bank 7,45010,787 Watford Holdings Ltd Goldman Sachs 32,0379,792 Watford Holdings Ltd HSBC 9,890
17,803 Watford Holdings Ltd Morgan Stanley 12,284891 Watsco Inc Barclays Bank 9,017
(360) Watsco Inc Barclays Bank (3,643)9,720 Watsco Inc Goldman Sachs 172,238
(2,069) Watsco Inc Goldman Sachs (36,663)(257) Watsco Inc HSBC (3,426)159 Watsco Inc Morgan Stanley 1,609
(3,375) Watsco Inc Morgan Stanley (34,155)(4,460) Watts Water Technologies
Inc ’A’Bank of AmericaMerrill Lynch (39,828)
2,821 Watts Water TechnologiesInc ’A’
Bank of AmericaMerrill Lynch 25,192
(4,152) Watts Water TechnologiesInc ’A’ Barclays Bank (13,536)
4,086 Watts Water TechnologiesInc ’A’ Barclays Bank 13,320
7,472 Watts Water TechnologiesInc ’A’ Goldman Sachs 66,725
(4,058) Watts Water TechnologiesInc ’A’ Goldman Sachs (36,238)
(4,290) Watts Water TechnologiesInc ’A’ HSBC (8,408)
4,084 Watts Water TechnologiesInc ’A’ HSBC 12,872
(1,475) Watts Water TechnologiesInc ’A’ Morgan Stanley (4,809)
23,900 Watts Water TechnologiesInc ’A’ Morgan Stanley 77,914
(23,976) WaVe Life Sciences Ltd Barclays Bank 21,339242 Wayfair Inc ’A’ Bank of America
Merrill Lynch 5,2691,707 Wayfair Inc ’A’ Barclays Bank 16,473
306 Wayfair Inc ’A’ Morgan Stanley 2,953
BlackRock Americas Diversified Equity Absolute Return Fundcontinued
The notes on pages 691 to 711 form an integral part of these financial statements.
BlackRock Strategic Funds[202]

Contracts for difference as at 31 May 2020
Holding Description Counterparty
Netunrealised
appreciation/(depreciation)
USD
United States continued(557) WD-40 Co Bank of America
Merrill Lynch (8,622)(916) WD-40 Co Barclays Bank (2,895)
(1,279) WD-40 Co Goldman Sachs (17,148)(2,903) WD-40 Co HSBC (41,136)
(11,712) WD-40 Co Morgan Stanley (37,010)10,951 Webster Financial Corp Bank of America
Merrill Lynch 67,3495,141 Webster Financial Corp Barclays Bank 17,4286,019 Webster Financial Corp Goldman Sachs 37,017
12,435 Webster Financial Corp HSBC 38,96459,845 Webster Financial Corp Morgan Stanley 202,874
(14,011) WEC Energy Group Inc Bank of AmericaMerrill Lynch (38,333)
(22,028) WEC Energy Group Inc Barclays Bank (74,819)(15,365) WEC Energy Group Inc Goldman Sachs (71,792)(17,289) WEC Energy Group Inc HSBC (67,254)(52,893) WEC Energy Group Inc Morgan Stanley (181,423)37,149 Weingarten Realty Investors
(REIT)Bank of AmericaMerrill Lynch 86,606
22,390 Weingarten Realty Investors(REIT) Barclays Bank 11,419
7,661 Weingarten Realty Investors(REIT) Goldman Sachs 18,923
13,812 Weingarten Realty Investors(REIT) HSBC 5,801
30,231 Weingarten Realty Investors(REIT) Morgan Stanley 15,418
461 Weis Markets Inc Bank of AmericaMerrill Lynch (382)
8,344 Weis Markets Inc Goldman Sachs 5,1732,795 Weis Markets Inc HSBC (204)
22,986 Weis Markets Inc Morgan Stanley (8,045)(75,066) Welbilt Inc Bank of America
Merrill Lynch (90,830)(6,233) Welbilt Inc Barclays Bank (2,244)
(39,292) Welbilt Inc Goldman Sachs (47,543)(10,225) Welbilt Inc HSBC (5,726)(65,367) Welbilt Inc Morgan Stanley (23,532)82,550 Wells Fargo & Co Bank of America
Merrill Lynch 239,395(18,794) Wells Fargo & Co Barclays Bank (39,279)19,525 Wells Fargo & Co Barclays Bank 40,80713,425 Wells Fargo & Co Goldman Sachs 18,186(8,415) Wells Fargo & Co HSBC (6,984)
(12,238) Wells Fargo & Co Morgan Stanley (25,577)76,129 Wells Fargo & Co Morgan Stanley 159,110(7,130) Welltower Inc (REIT) Bank of America
Merrill Lynch (18,001)(3,290) Welltower Inc (REIT) Barclays Bank 6,222(5,173) Welltower Inc (REIT) Goldman Sachs 8,66420,816 Welltower Inc (REIT) Morgan Stanley 34,763(1,147) Wendy’s Co Bank of America
Merrill Lynch (516)27,660 Wendy’s Co Bank of America
Merrill Lynch 13,525(1,730) Wendy’s Co Barclays Bank (779)
(19,793) Wendy’s Co Goldman Sachs (11,000)9,062 Wendy’s Co Goldman Sachs 3,653
(2,102) Wendy’s Co HSBC 273(16,426) Wendy’s Co Morgan Stanley (7,392)(6,748) Werner Enterprises Inc Bank of America
Merrill Lynch (18,954)4,249 Werner Enterprises Inc Barclays Bank 8,923
(8,865) Werner Enterprises Inc Barclays Bank (18,617)(29,588) Werner Enterprises Inc Goldman Sachs (149,715)
4,006 Werner Enterprises Inc Goldman Sachs 20,27010,922 Werner Enterprises Inc HSBC 45,956
Holding Description Counterparty
Netunrealised
appreciation/(depreciation)
USD
United States continued(18,727) Werner Enterprises Inc HSBC (82,399)
4,237 Werner Enterprises Inc Morgan Stanley 8,898(24,933) Werner Enterprises Inc Morgan Stanley (52,359)19,354 WesBanco Inc Bank of America
Merrill Lynch 50,10640,181 WesBanco Inc Barclays Bank 49,82474,577 WesBanco Inc Goldman Sachs 206,39540,193 WesBanco Inc HSBC (28,229)35,630 WesBanco Inc Morgan Stanley 37,92814,030 WESCO International Inc Bank of America
Merrill Lynch 78,9195,854 WESCO International Inc Barclays Bank 21,1042,405 WESCO International Inc Goldman Sachs 13,528
29,914 WESCO International Inc HSBC 108,2922,792 WESCO International Inc Morgan Stanley 10,065
35,636 West BanCorp Inc Bank of AmericaMerrill Lynch 54,448
25,990 West BanCorp Inc Goldman Sachs 42,1044,096 West BanCorp Inc HSBC (527)
41,670 West BanCorp Inc Morgan Stanley 25,419403 West Pharmaceutical
Services IncBank of AmericaMerrill Lynch (1,411)
1,126 West PharmaceuticalServices Inc Barclays Bank (867)
(935) West PharmaceuticalServices Inc Barclays Bank (3,443)
5,195 West PharmaceuticalServices Inc Goldman Sachs (18,183)
2,254 West PharmaceuticalServices Inc HSBC 24,028
(1,281) West PharmaceuticalServices Inc HSBC (13,655)
1,935 West PharmaceuticalServices Inc Morgan Stanley (1,490)
(5,046) West PharmaceuticalServices Inc Morgan Stanley 3,885
(2,473) Westamerica BanCorp Bank of AmericaMerrill Lynch (4,773)
(15,092) Westamerica BanCorp Barclays Bank (3,622)(14,109) Westamerica BanCorp Goldman Sachs (27,230)(7,863) Westamerica BanCorp HSBC 23,510(8,853) Westamerica BanCorp Morgan Stanley (2,125)
(13,824) Western Alliance Bancorp Bank of AmericaMerrill Lynch (93,032)
(11,730) Western Alliance Bancorp Barclays Bank (39,838)(10,413) Western Alliance Bancorp Goldman Sachs (84,166)(23,654) Western Alliance Bancorp HSBC (100,287)(24,013) Western Alliance Bancorp Morgan Stanley (122,706)35,298 Western Asset Mortgage
Capital Corp (REIT) Barclays Bank (7,766)10,451 Western Asset Mortgage
Capital Corp (REIT) Goldman Sachs (314)33,374 Western Asset Mortgage
Capital Corp (REIT) HSBC (7,342)48,973 Western Asset Mortgage
Capital Corp (REIT) Morgan Stanley (10,774)740 Western Digital Corp Bank of America
Merrill Lynch 3,337(2,055) Western Digital Corp Barclays Bank 1,2452,917 Western Digital Corp Goldman Sachs 13,156
(2,703) Western Digital Corp Goldman Sachs 3,6764,267 Western Digital Corp HSBC (2,048)
(15,809) Western Digital Corp HSBC (21,145)7,373 Western Digital Corp Morgan Stanley 9,585
(15,313) Western MidstreamPartners LP Barclays Bank (4,441)
(13,389) Western MidstreamPartners LP HSBC (28,251)
BlackRock Americas Diversified Equity Absolute Return Fundcontinued
The notes on pages 691 to 711 form an integral part of these financial statements.
Annual report and audited financial statements [203]

Contracts for difference as at 31 May 2020
Holding Description Counterparty
Netunrealised
appreciation/(depreciation)
USD
United States continued(95,079) Western New England
Bancorp IncBank of AmericaMerrill Lynch (68,457)
(17,824) Western Union Co Bank of AmericaMerrill Lynch (26,825)
(6,678) Western Union Co Barclays Bank (7,112)(87,568) Western Union Co HSBC (12,697)(21,471) Western Union Co Morgan Stanley (22,867)(10,842) Westinghouse Air Brake
Technologies CorpBank of AmericaMerrill Lynch (85,652)
(3,751) Westinghouse Air BrakeTechnologies Corp Barclays Bank (12,978)
(14,335) Westinghouse Air BrakeTechnologies Corp Goldman Sachs (5,468)
(4,965) Westinghouse Air BrakeTechnologies Corp HSBC (14,597)
(9,550) Westinghouse Air BrakeTechnologies Corp Morgan Stanley (33,043)
5,063 Westlake Chemical Corp Bank of AmericaMerrill Lynch 41,820
23,597 Westlake Chemical Corp Barclays Bank 65,59914,961 Westlake Chemical Corp Goldman Sachs 123,57713,466 Westlake Chemical Corp HSBC 46,61324,895 Westlake Chemical Corp Morgan Stanley 69,2086,555 Westrock Co Bank of America
Merrill Lynch 23,43323,963 Westrock Co Barclays Bank 61,1882,528 Westrock Co Goldman Sachs (2,405)
81,385 Westrock Co Morgan Stanley 220,55412,278 Westwood Holdings Group
IncBank of AmericaMerrill Lynch 9,945
20,946 Westwood Holdings GroupInc Goldman Sachs 16,966
7,655 Westwood Holdings GroupInc Morgan Stanley (1,301)
(1,651) WEX Inc Bank of AmericaMerrill Lynch (43,917)
860 WEX Inc Bank of AmericaMerrill Lynch 22,876
(1,109) WEX Inc Goldman Sachs (29,499)(4,473) WEX Inc HSBC (60,341)(3,610) WEX Inc Morgan Stanley (30,216)
(16,672) Weyco Group Inc Bank of AmericaMerrill Lynch (12,337)
(2,159) Weyco Group Inc Barclays Bank (410)(6,619) Weyco Group Inc Goldman Sachs (4,529)(2,396) Weyco Group Inc HSBC 2,564(1,612) Weyco Group Inc Morgan Stanley (306)(5,021) Weyerhaeuser Co (REIT) Bank of America
Merrill Lynch (15,616)(24,354) Weyerhaeuser Co (REIT) Barclays Bank (23,502)(22,240) Weyerhaeuser Co (REIT) Goldman Sachs (19,013)(83,225) Weyerhaeuser Co (REIT) HSBC (86,382)(94,020) Weyerhaeuser Co (REIT) Morgan Stanley (90,730)
(151) Whirlpool Corp Bank of AmericaMerrill Lynch (1,690)
(1,450) Whirlpool Corp HSBC (10,716)2,670 Whirlpool Corp Morgan Stanley 774
(5,543) Whirlpool Corp Morgan Stanley (1,607)(507) White Mountains Insurance
Group LtdBank of AmericaMerrill Lynch (17,935)
(127) White Mountains InsuranceGroup Ltd Barclays Bank 214
(209) White Mountains InsuranceGroup Ltd Goldman Sachs (7,763)
(200) White Mountains InsuranceGroup Ltd HSBC (2,195)
(917) White Mountains InsuranceGroup Ltd Morgan Stanley 1,545
Holding Description Counterparty
Netunrealised
appreciation/(depreciation)
USD
United States continued23,616 Whitestone REIT (REIT) Bank of America
Merrill Lynch 20,27237,652 Whitestone REIT (REIT) Barclays Bank 7,90743,478 Whitestone REIT (REIT) Goldman Sachs 42,60860,618 Whitestone REIT (REIT) HSBC (6,668)52,920 Whitestone REIT (REIT) Morgan Stanley 11,11364,184 WideOpenWest Inc Bank of America
Merrill Lynch 51,98924,967 WideOpenWest Inc Barclays Bank (749)32,984 WideOpenWest Inc Goldman Sachs 26,7176,877 WideOpenWest Inc HSBC 4,401
13,220 WideOpenWest Inc Morgan Stanley (397)(5,576) Willdan Group Inc Bank of America
Merrill Lynch (26,821)(5,797) Willdan Group Inc Barclays Bank (13,391)
(10,770) Willdan Group Inc HSBC (33,387)(14,989) Willdan Group Inc Morgan Stanley (34,625)
6,907 Williams Cos Inc Bank of AmericaMerrill Lynch 7,114
8,088 Williams Cos Inc Barclays Bank 1,132(167) Williams Cos Inc Goldman Sachs (172)
11,749 Williams Cos Inc HSBC 3,760(26,690) Williams Cos Inc HSBC (15,933)47,350 Williams Cos Inc Morgan Stanley 6,629
(54,986) Williams Cos Inc Morgan Stanley (7,698)2,441 Williams-Sonoma Inc Bank of America
Merrill Lynch 31,1534,354 Williams-Sonoma Inc Barclays Bank 65,3109,704 Williams-Sonoma Inc Goldman Sachs 145,2569,793 Williams-Sonoma Inc HSBC 107,207
15,113 Williams-Sonoma Inc Morgan Stanley 226,695(4,491) Willis Lease Finance Corp Goldman Sachs (36,018)(2,918) Willis Lease Finance Corp HSBC (15,582)(5,722) Willis Lease Finance Corp Morgan Stanley (30,498)
(678) Willis Towers Watson Plc Barclays Bank (4,549)(299) Willis Towers Watson Plc Goldman Sachs (1,417)(710) Willis Towers Watson Plc Morgan Stanley (4,764)
5,916 WillScot Corp Barclays Bank 1,59731,310 WillScot Corp Goldman Sachs 53,85359,217 WillScot Corp HSBC 68,69227,876 WillScot Corp Morgan Stanley 7,5272,277 Wingstop Inc Bank of America
Merrill Lynch (6,761)2,165 Wingstop Inc Barclays Bank (1,841)5,827 Wingstop Inc Goldman Sachs (34,900)
22,709 Wingstop Inc HSBC (157,875)5,014 Wingstop Inc Morgan Stanley (2,667)
(5,327) Winmark Corp Bank of AmericaMerrill Lynch (54,938)
(1,057) Winmark Corp Goldman Sachs (11,151)(2,045) Winmark Corp HSBC 14,233(3,440) Winmark Corp Morgan Stanley (22,394)6,424 Winnebago Industries Inc Bank of America
Merrill Lynch 24,5401,463 Winnebago Industries Inc Barclays Bank (5,267)
(8,245) Winnebago Industries Inc Barclays Bank 29,682(2,228) Winnebago Industries Inc HSBC (5,771)2,651 Winnebago Industries Inc Morgan Stanley (7,782)
(8,951) Winnebago Industries Inc Morgan Stanley 32,22410,625 Wintrust Financial Corp Bank of America
Merrill Lynch 109,1196,378 Wintrust Financial Corp Barclays Bank 29,275
10,202 Wintrust Financial Corp Goldman Sachs 104,77516,440 Wintrust Financial Corp HSBC 88,51321,368 Wintrust Financial Corp Morgan Stanley 98,07926,997 WisdomTree Investments
IncBank of AmericaMerrill Lynch 8,504
BlackRock Americas Diversified Equity Absolute Return Fundcontinued
The notes on pages 691 to 711 form an integral part of these financial statements.
BlackRock Strategic Funds[204]

Contracts for difference as at 31 May 2020
Holding Description Counterparty
Netunrealised
appreciation/(depreciation)
USD
United States continued104,786 WisdomTree Investments
Inc Barclays Bank 14,14638,784 WisdomTree Investments
Inc Goldman Sachs 12,217135,208 WisdomTree Investments
Inc HSBC (16,441)76,053 WisdomTree Investments
Inc Morgan Stanley 9,2363,074 Wix.com Ltd Morgan Stanley (4,442)
13,460 Wolverine World Wide Inc Bank of AmericaMerrill Lynch 41,592
5,517 Wolverine World Wide Inc Barclays Bank 2,37218,392 Wolverine World Wide Inc Goldman Sachs 56,83113,432 Wolverine World Wide Inc HSBC 10,884(8,200) Wolverine World Wide Inc Morgan Stanley (3,526)40,304 Wolverine World Wide Inc Morgan Stanley 17,330
202 Woodward Inc Bank of AmericaMerrill Lynch 2,870
2,764 Woodward Inc Barclays Bank 16,8607,324 Woodward Inc Goldman Sachs 104,0749,730 Woodward Inc HSBC 59,451
18,285 Woodward Inc Morgan Stanley 111,5382,325 Workday Inc ’A’ Bank of America
Merrill Lynch 62,8918,823 Workday Inc ’A’ Goldman Sachs 238,6623,070 Workday Inc ’A’ HSBC 48,5066,601 Workday Inc ’A’ Morgan Stanley 87,133
234 Workiva Inc Bank of AmericaMerrill Lynch 245
4,207 Workiva Inc Barclays Bank 4,2076,128 Workiva Inc Goldman Sachs 16,300
13,191 Workiva Inc HSBC 13,0987,642 Workiva Inc Morgan Stanley 7,1593,903 World Acceptance Corp Bank of America
Merrill Lynch 42,1521,277 World Acceptance Corp Barclays Bank 5,7343,358 World Acceptance Corp Goldman Sachs 36,2663,256 World Acceptance Corp HSBC 7,8802,705 World Acceptance Corp Morgan Stanley 12,1451,351 World Fuel Services Corp Bank of America
Merrill Lynch 5,5669,715 World Fuel Services Corp Goldman Sachs 40,0262,550 World Fuel Services Corp HSBC 2,372
12,357 World Fuel Services Corp Morgan Stanley 17,300(7,812) World Wrestling
Entertainment Inc ’A’Bank of AmericaMerrill Lynch (33,045)
1,769 World WrestlingEntertainment Inc ’A’
Bank of AmericaMerrill Lynch 3,483
(1,603) World WrestlingEntertainment Inc ’A’ Barclays Bank (2,180)
5,442 World WrestlingEntertainment Inc ’A’ Barclays Bank 7,401
(5,073) World WrestlingEntertainment Inc ’A’ HSBC 964
(698) World WrestlingEntertainment Inc ’A’ Morgan Stanley (949)
(8,877) Worthington Industries Inc Bank of AmericaMerrill Lynch (45,095)
(7,774) Worthington Industries Inc Barclays Bank (18,813)(25,942) Worthington Industries Inc Goldman Sachs (131,785)(34,410) Worthington Industries Inc HSBC (93,595)(43,351) Worthington Industries Inc Morgan Stanley (104,909)(38,482) WP Carey Inc (REIT) Bank of America
Merrill Lynch (202,800)(4,480) WP Carey Inc (REIT) Barclays Bank 4,435(3,308) WP Carey Inc (REIT) Goldman Sachs (15,736)(7,205) WP Carey Inc (REIT) HSBC 12,685
(38,430) WP Carey Inc (REIT) Morgan Stanley 38,046
Holding Description Counterparty
Netunrealised
appreciation/(depreciation)
USD
United States continued(30,331) WPX Energy Inc Bank of America
Merrill Lynch (11,526)78,804 WPX Energy Inc Bank of America
Merrill Lynch 29,9469,685 WPX Energy Inc Barclays Bank (872)
(4,094) WPX Energy Inc Goldman Sachs (1,556)(6,992) WPX Energy Inc HSBC 2,028
(42,427) WPX Energy Inc Morgan Stanley 3,81813,738 WR Berkley Corp Bank of America
Merrill Lynch 121,4832,534 WR Berkley Corp Barclays Bank 3,396
15,556 WR Berkley Corp Goldman Sachs 139,44812,526 WR Berkley Corp HSBC 74,24933,317 WR Berkley Corp Morgan Stanley 44,645(1,645) WR Grace & Co Bank of America
Merrill Lynch (7,584)(7,039) WR Grace & Co Barclays Bank 4,223(8,373) WR Grace & Co Goldman Sachs (38,600)
(21,062) WR Grace & Co HSBC 6,126(5,955) WR Grace & Co Morgan Stanley 3,5734,614 Wrap Technologies Inc Bank of America
Merrill Lynch 3,6457,727 Wrap Technologies Inc Barclays Bank 4,8685,182 Wrap Technologies Inc Morgan Stanley 3,265
13,285 WSFS Financial Corp Bank of AmericaMerrill Lynch 47,162
12,788 WSFS Financial Corp Barclays Bank 21,35631,639 WSFS Financial Corp Goldman Sachs 112,31815,050 WSFS Financial Corp HSBC 15,32732,793 WSFS Financial Corp Morgan Stanley 54,764
(877) WW Grainger Inc Bank of AmericaMerrill Lynch (26,328)
3,284 WW Grainger Inc Bank of AmericaMerrill Lynch 98,586
(2,259) WW Grainger Inc Barclays Bank (35,918)1,412 WW Grainger Inc Barclays Bank 22,451
(2,735) WW Grainger Inc Goldman Sachs (82,105)(1,665) WW Grainger Inc Morgan Stanley (26,474)1,902 WW Grainger Inc Morgan Stanley 30,242
(2,208) WW International Inc Bank of AmericaMerrill Lynch 883
16,130 WW International Inc Barclays Bank (23,389)5,070 WW International Inc Goldman Sachs (2,028)
33,636 WW International Inc HSBC (32,041)(3,397) Wyndham Destinations Inc Bank of America
Merrill Lynch (27,940)(9,220) Wyndham Destinations Inc Barclays Bank (29,089)10,238 Wyndham Destinations Inc HSBC 35,02312,998 Wyndham Destinations Inc Morgan Stanley 41,009(2,738) Wyndham Hotels & Resorts
IncBank of AmericaMerrill Lynch (13,608)
(3,218) Wyndham Hotels & ResortsInc Barclays Bank 2,703
(1,543) Wyndham Hotels & ResortsInc Goldman Sachs (7,669)
(636) Wyndham Hotels & ResortsInc HSBC (2,608)
(12,892) Wyndham Hotels & ResortsInc Morgan Stanley 10,829
8,595 Wynn Resorts Ltd Bank of AmericaMerrill Lynch 35,428
(3,494) Wynn Resorts Ltd Barclays Bank (8,788)1,964 Wynn Resorts Ltd Barclays Bank 7,188(313) Wynn Resorts Ltd Goldman Sachs 1,010
(1,652) Wynn Resorts Ltd HSBC 8,3102,543 Wynn Resorts Ltd HSBC 7,567
(7,960) Wynn Resorts Ltd Morgan Stanley (29,134)
BlackRock Americas Diversified Equity Absolute Return Fundcontinued
The notes on pages 691 to 711 form an integral part of these financial statements.
Annual report and audited financial statements [205]

Contracts for difference as at 31 May 2020
Holding Description Counterparty
Netunrealised
appreciation/(depreciation)
USD
United States continued1,292 Wynn Resorts Ltd Morgan Stanley 4,7296,616 X4 Pharmaceuticals Inc Bank of America
Merrill Lynch (1,408)7,804 X4 Pharmaceuticals Inc Barclays Bank (2,029)2,733 X4 Pharmaceuticals Inc Goldman Sachs (847)3,686 X4 Pharmaceuticals Inc HSBC (2,027)2,715 X4 Pharmaceuticals Inc Morgan Stanley (919)
(19,014) XBiotech Inc Barclays Bank 7,986(1,759) XBiotech Inc HSBC 3,11356,748 Xcel Energy Inc Bank of America
Merrill Lynch 348,4322,251 Xcel Energy Inc Barclays Bank 8,239
15,058 Xcel Energy Inc Goldman Sachs 92,45665,602 Xcel Energy Inc HSBC 243,77851,967 Xcel Energy Inc Morgan Stanley 146,5339,010 Xencor Inc Bank of America
Merrill Lynch (11,352)15,948 Xencor Inc Barclays Bank (20,892)10,208 Xencor Inc Goldman Sachs (13,003)11,693 Xencor Inc HSBC (35,313)13,292 Xencor Inc Morgan Stanley (17,412)
(21,833) Xenia Hotels & Resorts Inc(REIT)
Bank of AmericaMerrill Lynch (36,898)
(15,320) Xenia Hotels & Resorts Inc(REIT) Barclays Bank (16,852)
(51,864) Xenia Hotels & Resorts Inc(REIT) Goldman Sachs (87,650)
(35,119) Xenia Hotels & Resorts Inc(REIT) HSBC (351)
(14,836) Xenia Hotels & Resorts Inc(REIT) Morgan Stanley (16,320)
(23,675) Xeris Pharmaceuticals Inc Barclays Bank 16,573(32,699) Xeris Pharmaceuticals Inc Goldman Sachs (43,163)(14,369) Xeris Pharmaceuticals Inc HSBC (26,870)(6,500) Xeris Pharmaceuticals Inc Morgan Stanley 4,550(1,782) Xerox Holdings Corp Bank of America
Merrill Lynch (2,228)4,377 Xerox Holdings Corp Bank of America
Merrill Lynch (7,895)(2,369) Xerox Holdings Corp Barclays Bank 1,990(4,402) Xerox Holdings Corp Goldman Sachs (5,503)42,350 Xerox Holdings Corp Goldman Sachs (43,542)
(17,727) Xerox Holdings Corp HSBC 35,277(17,650) Xerox Holdings Corp Morgan Stanley 14,826(3,728) Xilinx Inc Barclays Bank (13,346)
(21,287) Xilinx Inc Goldman Sachs (147,732)1,827 Xilinx Inc Goldman Sachs 12,679
(2,006) Xilinx Inc HSBC (6,640)(4,921) Xilinx Inc Morgan Stanley (17,617)18,914 Xilinx Inc Morgan Stanley 67,712(9,093) XOMA Corp Goldman Sachs (15,458)(5,535) XOMA Corp Morgan Stanley 1,384
(429) XP Inc ’A’ Bank of AmericaMerrill Lynch (1,437)
(8,254) XP Inc ’A’ Barclays Bank (8,749)(5,228) XP Inc ’A’ Goldman Sachs (17,514)(4,414) XP Inc ’A’ HSBC (20,967)(9,013) XP Inc ’A’ Morgan Stanley (9,554)6,064 XPEL Inc Bank of America
Merrill Lynch 11,6461,720 XPEL Inc Barclays Bank 2,0305,305 XPEL Inc HSBC 10,955
10,831 XPEL Inc Morgan Stanley 12,781(7,847) Xperi Corp Barclays Bank 11,064
(12,918) Xperi Corp HSBC 25,707(8,357) Xperi Corp Morgan Stanley 11,783(1,532) XPO Logistics Inc Bank of America
Merrill Lynch (20,023)
Holding Description Counterparty
Netunrealised
appreciation/(depreciation)
USD
United States continued(835) XPO Logistics Inc Barclays Bank (1,486)
(2,468) XPO Logistics Inc Goldman Sachs (32,257)(3,686) XPO Logistics Inc HSBC (33,137)(8,299) XPO Logistics Inc Morgan Stanley (14,773)9,764 Xylem Inc Bank of America
Merrill Lynch 79,57730,923 Xylem Inc Barclays Bank 117,39911,503 Xylem Inc Goldman Sachs 93,75015,266 Xylem Inc HSBC 50,98930,446 Xylem Inc Morgan Stanley 125,438(8,539) Yandex NV ’A’ Barclays Bank 1,878
(15,162) Yandex NV ’A’ Goldman Sachs (15,920)(12,583) Yandex NV ’A’ HSBC 8,808(12,890) Yandex NV ’A’ Morgan Stanley 2,836
6,346 Yelp Inc Bank of AmericaMerrill Lynch 7,582
26,119 Yelp Inc Barclays Bank 20,37312,156 Yelp Inc Goldman Sachs 18,04014,891 Yelp Inc HSBC (12,343)45,447 Yelp Inc Morgan Stanley 35,44810,053 YETI Holdings Inc Barclays Bank 14,4766,069 YETI Holdings Inc Goldman Sachs 7,953
12,180 YETI Holdings Inc HSBC 28,04519,376 YETI Holdings Inc Morgan Stanley 27,9018,758 Yext Inc Bank of America
Merrill Lynch 14,932(12,633) Yext Inc Barclays Bank (5,748)12,653 Yext Inc Barclays Bank 5,75728,011 Yext Inc Goldman Sachs 47,759(8,626) Yext Inc Goldman Sachs (14,707)(5,907) Yext Inc HSBC (6,232)21,381 Yext Inc HSBC 22,557
(12,453) Yext Inc Morgan Stanley (5,666)47,607 Yext Inc Morgan Stanley 21,6613,314 Y-mAbs Therapeutics Inc Bank of America
Merrill Lynch (2,154)2,592 Y-mAbs Therapeutics Inc Barclays Bank 5701,164 Y-mAbs Therapeutics Inc Goldman Sachs (757)2,755 Y-mAbs Therapeutics Inc HSBC (5,207)6,469 Y-mAbs Therapeutics Inc Morgan Stanley 1,423
16,627 York Water Co Bank of AmericaMerrill Lynch 53,040
6,477 York Water Co Barclays Bank 7,5789,608 York Water Co Goldman Sachs 30,6509,009 York Water Co HSBC 13,075
10,917 York Water Co Morgan Stanley 12,7736,885 YPF SA ADR Goldman Sachs 2,105
45,162 YPF SA ADR HSBC 20,26112,087 YPF SA ADR Morgan Stanley 846
(51,388) YRC Worldwide Inc Bank of AmericaMerrill Lynch (3,083)
(58,785) YRC Worldwide Inc Barclays Bank (6,466)(78,703) YRC Worldwide Inc Goldman Sachs (4,722)(17,727) YRC Worldwide Inc HSBC (177)(3,906) YRC Worldwide Inc Morgan Stanley (430)(3,875) Yum China Holdings Inc Bank of America
Merrill Lynch 9,610(1,481) Yum China Holdings Inc Barclays Bank (2,310)(2,670) Yum China Holdings Inc Goldman Sachs 5,233(5,626) Yum China Holdings Inc HSBC 18,903
(12,339) Yum China Holdings Inc Morgan Stanley (19,249)(1,001) Yum! Brands Inc Bank of America
Merrill Lynch (4,141)(15,428) Yum! Brands Inc Barclays Bank (44,279)(3,783) Yum! Brands Inc Goldman Sachs (16,110)(2,434) Yum! Brands Inc HSBC (9,590)
(10,440) Yum! Brands Inc Morgan Stanley (29,963)
BlackRock Americas Diversified Equity Absolute Return Fundcontinued
The notes on pages 691 to 711 form an integral part of these financial statements.
BlackRock Strategic Funds[206]
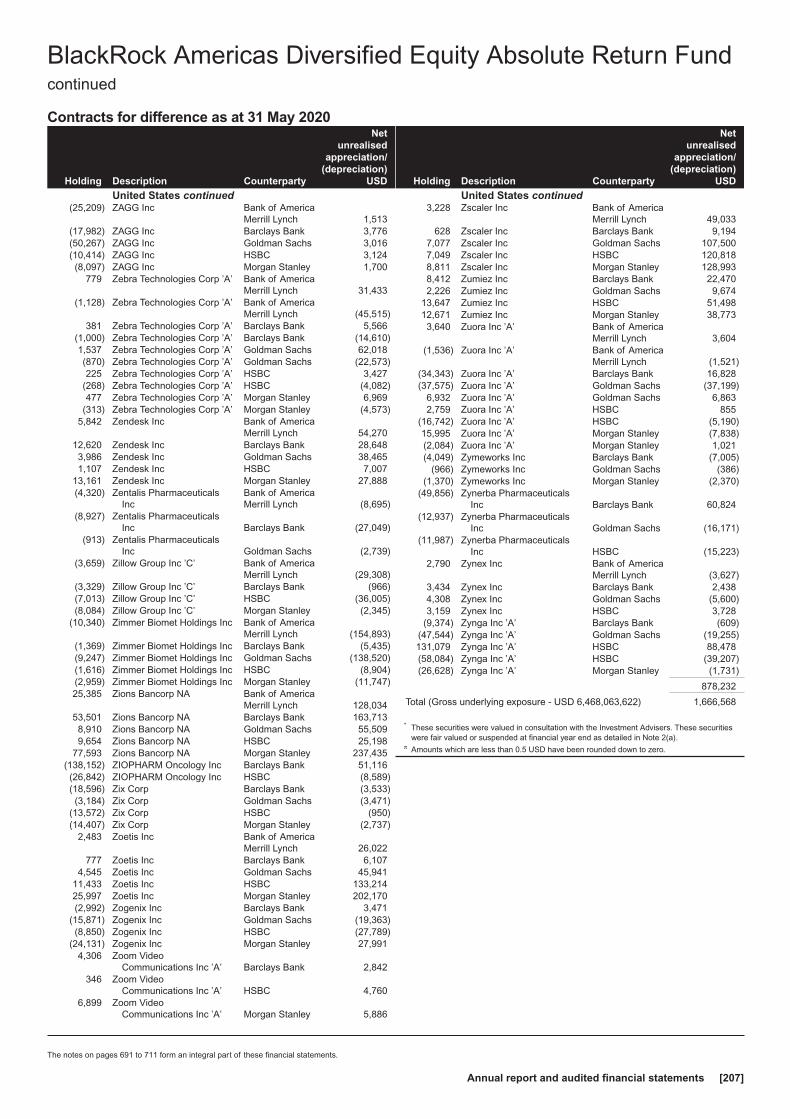
Contracts for difference as at 31 May 2020
Holding Description Counterparty
Netunrealised
appreciation/(depreciation)
USD
United States continued(25,209) ZAGG Inc Bank of America
Merrill Lynch 1,513(17,982) ZAGG Inc Barclays Bank 3,776(50,267) ZAGG Inc Goldman Sachs 3,016(10,414) ZAGG Inc HSBC 3,124(8,097) ZAGG Inc Morgan Stanley 1,700
779 Zebra Technologies Corp ’A’ Bank of AmericaMerrill Lynch 31,433
(1,128) Zebra Technologies Corp ’A’ Bank of AmericaMerrill Lynch (45,515)
381 Zebra Technologies Corp ’A’ Barclays Bank 5,566(1,000) Zebra Technologies Corp ’A’ Barclays Bank (14,610)1,537 Zebra Technologies Corp ’A’ Goldman Sachs 62,018(870) Zebra Technologies Corp ’A’ Goldman Sachs (22,573)225 Zebra Technologies Corp ’A’ HSBC 3,427
(268) Zebra Technologies Corp ’A’ HSBC (4,082)477 Zebra Technologies Corp ’A’ Morgan Stanley 6,969
(313) Zebra Technologies Corp ’A’ Morgan Stanley (4,573)5,842 Zendesk Inc Bank of America
Merrill Lynch 54,27012,620 Zendesk Inc Barclays Bank 28,6483,986 Zendesk Inc Goldman Sachs 38,4651,107 Zendesk Inc HSBC 7,007
13,161 Zendesk Inc Morgan Stanley 27,888(4,320) Zentalis Pharmaceuticals
IncBank of AmericaMerrill Lynch (8,695)
(8,927) Zentalis PharmaceuticalsInc Barclays Bank (27,049)
(913) Zentalis PharmaceuticalsInc Goldman Sachs (2,739)
(3,659) Zillow Group Inc ’C’ Bank of AmericaMerrill Lynch (29,308)
(3,329) Zillow Group Inc ’C’ Barclays Bank (966)(7,013) Zillow Group Inc ’C’ HSBC (36,005)(8,084) Zillow Group Inc ’C’ Morgan Stanley (2,345)
(10,340) Zimmer Biomet Holdings Inc Bank of AmericaMerrill Lynch (154,893)
(1,369) Zimmer Biomet Holdings Inc Barclays Bank (5,435)(9,247) Zimmer Biomet Holdings Inc Goldman Sachs (138,520)(1,616) Zimmer Biomet Holdings Inc HSBC (8,904)(2,959) Zimmer Biomet Holdings Inc Morgan Stanley (11,747)25,385 Zions Bancorp NA Bank of America
Merrill Lynch 128,03453,501 Zions Bancorp NA Barclays Bank 163,7138,910 Zions Bancorp NA Goldman Sachs 55,5099,654 Zions Bancorp NA HSBC 25,198
77,593 Zions Bancorp NA Morgan Stanley 237,435(138,152) ZIOPHARM Oncology Inc Barclays Bank 51,116(26,842) ZIOPHARM Oncology Inc HSBC (8,589)(18,596) Zix Corp Barclays Bank (3,533)(3,184) Zix Corp Goldman Sachs (3,471)
(13,572) Zix Corp HSBC (950)(14,407) Zix Corp Morgan Stanley (2,737)
2,483 Zoetis Inc Bank of AmericaMerrill Lynch 26,022
777 Zoetis Inc Barclays Bank 6,1074,545 Zoetis Inc Goldman Sachs 45,941
11,433 Zoetis Inc HSBC 133,21425,997 Zoetis Inc Morgan Stanley 202,170(2,992) Zogenix Inc Barclays Bank 3,471
(15,871) Zogenix Inc Goldman Sachs (19,363)(8,850) Zogenix Inc HSBC (27,789)
(24,131) Zogenix Inc Morgan Stanley 27,9914,306 Zoom Video
Communications Inc ’A’ Barclays Bank 2,842346 Zoom Video
Communications Inc ’A’ HSBC 4,7606,899 Zoom Video
Communications Inc ’A’ Morgan Stanley 5,886
Holding Description Counterparty
Netunrealised
appreciation/(depreciation)
USD
United States continued3,228 Zscaler Inc Bank of America
Merrill Lynch 49,033628 Zscaler Inc Barclays Bank 9,194
7,077 Zscaler Inc Goldman Sachs 107,5007,049 Zscaler Inc HSBC 120,8188,811 Zscaler Inc Morgan Stanley 128,9938,412 Zumiez Inc Barclays Bank 22,4702,226 Zumiez Inc Goldman Sachs 9,674
13,647 Zumiez Inc HSBC 51,49812,671 Zumiez Inc Morgan Stanley 38,7733,640 Zuora Inc ’A’ Bank of America
Merrill Lynch 3,604(1,536) Zuora Inc ’A’ Bank of America
Merrill Lynch (1,521)(34,343) Zuora Inc ’A’ Barclays Bank 16,828(37,575) Zuora Inc ’A’ Goldman Sachs (37,199)
6,932 Zuora Inc ’A’ Goldman Sachs 6,8632,759 Zuora Inc ’A’ HSBC 855
(16,742) Zuora Inc ’A’ HSBC (5,190)15,995 Zuora Inc ’A’ Morgan Stanley (7,838)(2,084) Zuora Inc ’A’ Morgan Stanley 1,021(4,049) Zymeworks Inc Barclays Bank (7,005)
(966) Zymeworks Inc Goldman Sachs (386)(1,370) Zymeworks Inc Morgan Stanley (2,370)
(49,856) Zynerba PharmaceuticalsInc Barclays Bank 60,824
(12,937) Zynerba PharmaceuticalsInc Goldman Sachs (16,171)
(11,987) Zynerba PharmaceuticalsInc HSBC (15,223)
2,790 Zynex Inc Bank of AmericaMerrill Lynch (3,627)
3,434 Zynex Inc Barclays Bank 2,4384,308 Zynex Inc Goldman Sachs (5,600)3,159 Zynex Inc HSBC 3,728
(9,374) Zynga Inc ’A’ Barclays Bank (609)(47,544) Zynga Inc ’A’ Goldman Sachs (19,255)131,079 Zynga Inc ’A’ HSBC 88,478(58,084) Zynga Inc ’A’ HSBC (39,207)(26,628) Zynga Inc ’A’ Morgan Stanley (1,731)
878,232
Total (Gross underlying exposure - USD 6,468,063,622) 1,666,568
* These securities were valued in consultation with the Investment Advisers. These securitieswere fair valued or suspended at financial year end as detailed in Note 2(a).
π Amounts which are less than 0.5 USD have been rounded down to zero.
BlackRock Americas Diversified Equity Absolute Return Fundcontinued
The notes on pages 691 to 711 form an integral part of these financial statements.
Annual report and audited financial statements [207]
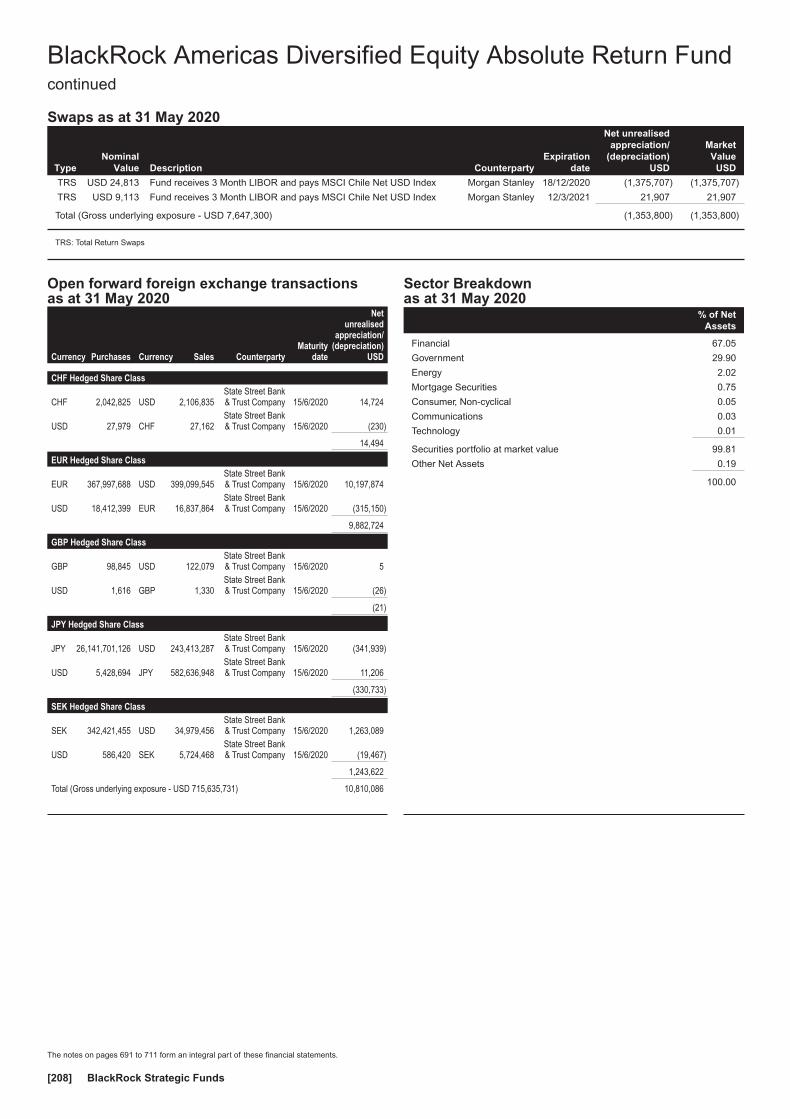
Swaps as at 31 May 2020
TypeNominal
Value Description CounterpartyExpiration
date
Net unrealisedappreciation/
(depreciation)USD
MarketValue
USD
TRS USD 24,813 Fund receives 3 Month LIBOR and pays MSCI Chile Net USD Index Morgan Stanley 18/12/2020 (1,375,707) (1,375,707)
TRS USD 9,113 Fund receives 3 Month LIBOR and pays MSCI Chile Net USD Index Morgan Stanley 12/3/2021 21,907 21,907
Total (Gross underlying exposure - USD 7,647,300) (1,353,800) (1,353,800)
TRS: Total Return Swaps
Open forward foreign exchange transactionsas at 31 May 2020
Currency Purchases Currency Sales CounterpartyMaturity
date
Netunrealised
appreciation/(depreciation)
USD
CHF Hedged Share Class
CHF 2,042,825 USD 2,106,835State Street Bank& Trust Company 15/6/2020 14,724
USD 27,979 CHF 27,162State Street Bank& Trust Company 15/6/2020 (230)
14,494
EUR Hedged Share Class
EUR 367,997,688 USD 399,099,545State Street Bank& Trust Company 15/6/2020 10,197,874
USD 18,412,399 EUR 16,837,864State Street Bank& Trust Company 15/6/2020 (315,150)
9,882,724
GBP Hedged Share Class
GBP 98,845 USD 122,079State Street Bank& Trust Company 15/6/2020 5
USD 1,616 GBP 1,330State Street Bank& Trust Company 15/6/2020 (26)
(21)
JPY Hedged Share Class
JPY 26,141,701,126 USD 243,413,287State Street Bank& Trust Company 15/6/2020 (341,939)
USD 5,428,694 JPY 582,636,948State Street Bank& Trust Company 15/6/2020 11,206
(330,733)
SEK Hedged Share Class
SEK 342,421,455 USD 34,979,456State Street Bank& Trust Company 15/6/2020 1,263,089
USD 586,420 SEK 5,724,468State Street Bank& Trust Company 15/6/2020 (19,467)
1,243,622
Total (Gross underlying exposure - USD 715,635,731) 10,810,086
Sector Breakdownas at 31 May 2020
% of NetAssets
Financial 67.05
Government 29.90
Energy 2.02
Mortgage Securities 0.75
Consumer, Non-cyclical 0.05
Communications 0.03
Technology 0.01
Securities portfolio at market value 99.81
Other Net Assets 0.19
100.00
BlackRock Americas Diversified Equity Absolute Return Fundcontinued
The notes on pages 691 to 711 form an integral part of these financial statements.
BlackRock Strategic Funds[208]

Portfolio of Investments as at 31 May 2020
Holding Description
MarketValue
USD
% ofNet
Assets
Transferable Securities and Money Market Instruments Admittedto an Official Stock Exchange Listing or Dealt in on AnotherRegulated Market
BONDSUnited States
USD 9,300,000 United States CashManagement Bill8/9/2020 (Zero Coupon) 9,295,980 6.68
USD 3,000,000 United States CashManagement Bill3/11/2020 (Zero Coupon) 2,997,728 2.16
USD 5,925,000 United States Treasury Bill9/7/2020 (Zero Coupon) 5,915,075 4.25
USD 5,000,000 United States Treasury Bill6/8/2020 (Zero Coupon) 4,985,635 3.58
USD 1,000,000 United States Treasury Bill13/8/2020 (Zero Coupon) 999,770 0.72
USD 2,500,000 United States Treasury Bill17/9/2020 (Zero Coupon) 2,499,053 1.80
USD 5,000,000 United States Treasury Bill1/10/2020 (Zero Coupon) 4,998,278 3.59
USD 2,000,000 United States Treasury Bill27/11/2020 (Zero Coupon) 1,998,391 1.44
USD 11,000,000 United States Treasury Bill-When Issued 3/9/2020 (ZeroCoupon) 10,966,707 7.88
44,656,617 32.10
Total Bonds 44,656,617 32.10
CERTIFICATE OF DEPOSITSUnited States
USD 2,000,000 KBC Bank NV 0.57%28/7/2020 2,000,000 1.44
USD 2,000,000 KBC Bank NV 0.42%30/7/2020 2,000,237 1.44
USD 2,600,000 MUFG Bank Ltd 1.82%7/7/2020 2,602,921 1.87
USD 2,000,000 National Bank Of America1.82% 1/9/2020 2,000,000 1.44
USD 2,500,000 Oversea-Chinese BankingCorp 1.87% 4/8/2020 2,500,000 1.80
USD 1,500,000 Skandinaviska EnskildaBanken AB 1.83% 8/6/2020 1,500,000 1.08
USD 4,000,000 Skandinaviska EnskildaBanken AB 1.85% 2/7/2020 4,000,072 2.87
USD 4,000,000 Sumitomo Mitsui Banking Corp0.38% 20/11/2020 4,000,000 2.87
USD 2,000,000 Sumitomo Mitsui Trust BankLtd 0.90% 21/7/2020 2,000,433 1.44
22,603,663 16.25
Total Certificate of Deposits 22,603,663 16.25
COMMERCIAL PAPERUnited States
USD 1,000,000 Albion Capital Corp SA27/7/2020 (Zero Coupon) 999,194 0.72
USD 4,000,000 Atlantic Asset SecuritizationLLC 3/6/2020 (Zero Coupon) 3,999,218 2.87
USD 2,500,000 Banque Et Caisse Epargne5/6/2020 (Zero Coupon) 2,499,317 1.80
USD 3,750,000 Barton Capital SA11/6/2020 (Zero Coupon) 3,748,625 2.69
USD 1,300,000 Barton Capital SA15/9/2020 (Zero Coupon) 1,298,830 0.93
USD 1,750,000 Bedford Row Funding Corp18/6/2020 (Zero Coupon) 1,748,494 1.26
USD 1,000,000 BPCE SA 31/7/2020 (ZeroCoupon) 996,659 0.72
USD 250,000 Chariot Funding LLC21/7/2020 (Zero Coupon) 249,408 0.18
Holding Description
MarketValue
USD
% ofNet
Assets
United States continuedUSD 500,000 Credit Suisse 11/6/2020 (Zero
Coupon) 499,817 0.36USD 1,000,000 DBS Bank Ltd 6/8/2020 (Zero
Coupon) 996,864 0.72USD 2,000,000 Erste Abwicklungsanstalt
2/6/2020 (Zero Coupon) 1,999,750 1.44USD 2,000,000 European Investment Bank
2/9/2020 (Zero Coupon) 1,998,575 1.44USD 1,000,000 Federation Des Caisses
Desjardins 16/7/2020 (ZeroCoupon) 997,663 0.72
USD 2,000,000 JP Morgan Securities LLC6/10/2020 (Zero Coupon) 1,987,243 1.43
USD 1,000,000 JP Morgan Securities LLC3/11/2020 (Zero Coupon) 998,473 0.72
USD 6,000,000 Jupiter SecuritizationCompany LLC15/7/2020 (Zero Coupon) 5,991,567 4.31
USD 750,000 LMA Americas LLC5/6/2020 (Zero Coupon) 749,789 0.54
USD 2,000,000 National Security ClearingCorp 9/6/2020 (ZeroCoupon) 1,998,978 1.44
USD 3,000,000 National Security ClearingCorp 10/7/2020 (ZeroCoupon) 2,994,089 2.15
USD 2,500,000 Natixis 9/6/2020 (ZeroCoupon) 2,498,750 1.79
USD 1,500,000 Old Line Funding LLC7/7/2020 (Zero Coupon) 1,498,005 1.08
USD 2,500,000 Old Line Funding LLC13/7/2020 (Zero Coupon) 2,494,592 1.79
USD 1,000,000 Old Line Funding LLC27/7/2020 (Zero Coupon) 997,213 0.72
USD 2,000,000 Oversea-Chinese BankingCorp 8/6/2020 (ZeroCoupon) 1,999,475 1.44
USD 2,000,000 Santander UK Plc1/7/2020 (Zero Coupon) 1,996,995 1.43
USD 2,000,000 Suncorp Metway Ltd26/8/2020 (Zero Coupon) 1,992,080 1.43
USD 3,000,000 Swedbank AB19/10/2020 (Zero Coupon) 2,996,095 2.15
USD 2,500,000 Thunder Bay Funding LLC15/6/2020 (Zero Coupon) 2,498,389 1.79
USD 3,000,000 Total Capital Canada Ltd19/8/2020 (Zero Coupon) 2,997,030 2.15
58,721,177 42.21
Total Commercial Papers 58,721,177 42.21
Total Transferable Securities and Money MarketInstruments Admitted to an Official Stock ExchangeListing or Dealt in on Another Regulated Market 125,981,457 90.56
Securities portfolio at market value 125,981,457 90.56
Other Net Assets 13,136,894 9.44
Total Net Assets (USD) 139,118,351 100.00
BlackRock Asia Extension Fund
The notes on pages 691 to 711 form an integral part of these financial statements.
Annual report and audited financial statements [209]
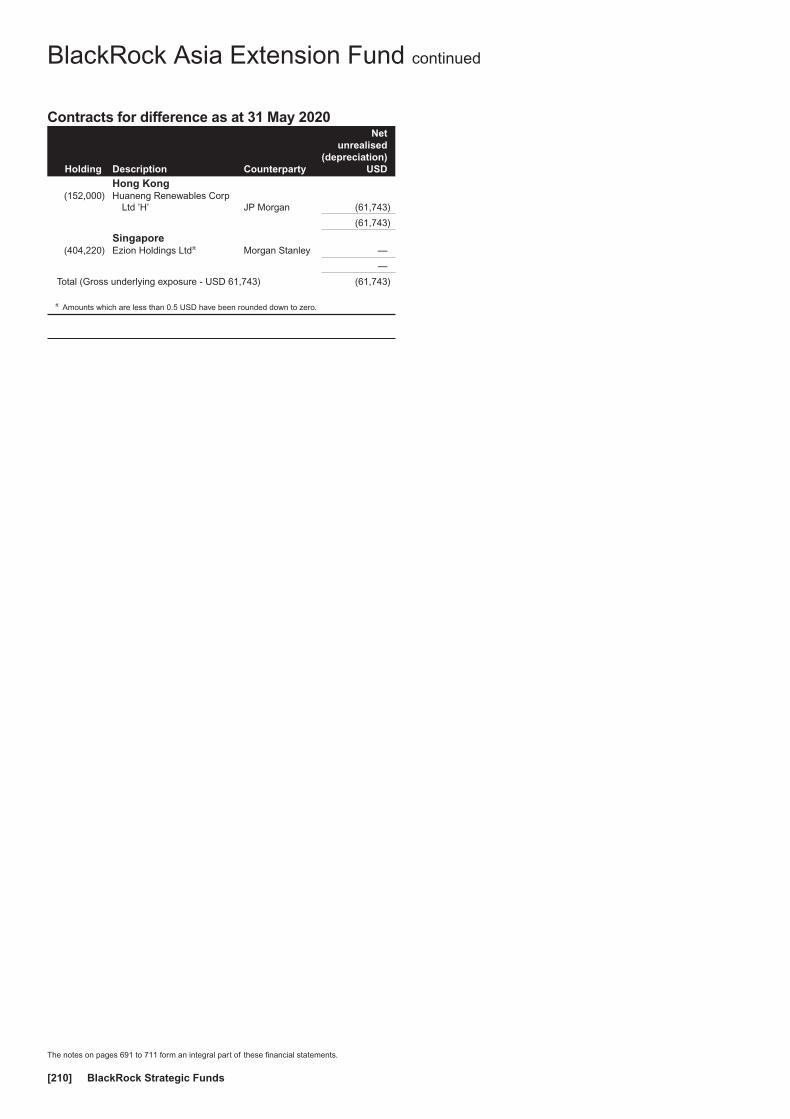
Contracts for difference as at 31 May 2020
Holding Description Counterparty
Netunrealised
(depreciation)USD
Hong Kong(152,000) Huaneng Renewables Corp
Ltd ’H’ JP Morgan (61,743)
(61,743)
Singapore(404,220) Ezion Holdings Ltdπ Morgan Stanley —
—
Total (Gross underlying exposure - USD 61,743) (61,743)
π Amounts which are less than 0.5 USD have been rounded down to zero.
BlackRock Asia Extension Fund continued
The notes on pages 691 to 711 form an integral part of these financial statements.
BlackRock Strategic Funds[210]
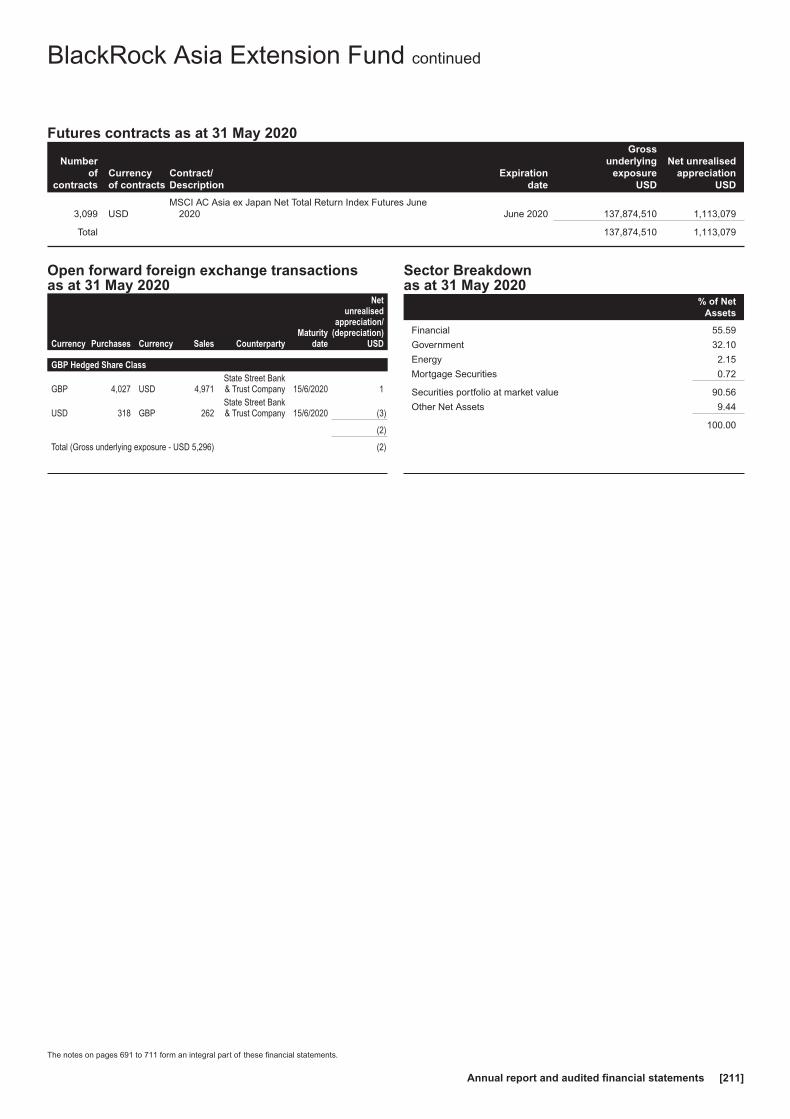
Futures contracts as at 31 May 2020
Numberof
contractsCurrencyof contracts
Contract/Description
Expirationdate
Grossunderlying
exposureUSD
Net unrealisedappreciation
USD
3,099 USDMSCI AC Asia ex Japan Net Total Return Index Futures June
2020 June 2020 137,874,510 1,113,079
Total 137,874,510 1,113,079
Open forward foreign exchange transactionsas at 31 May 2020
Currency Purchases Currency Sales CounterpartyMaturity
date
Netunrealised
appreciation/(depreciation)
USD
GBP Hedged Share Class
GBP 4,027 USD 4,971State Street Bank& Trust Company 15/6/2020 1
USD 318 GBP 262State Street Bank& Trust Company 15/6/2020 (3)
(2)
Total (Gross underlying exposure - USD 5,296) (2)
Sector Breakdownas at 31 May 2020
% of NetAssets
Financial 55.59
Government 32.10
Energy 2.15
Mortgage Securities 0.72
Securities portfolio at market value 90.56
Other Net Assets 9.44
100.00
BlackRock Asia Extension Fund continued
The notes on pages 691 to 711 form an integral part of these financial statements.
Annual report and audited financial statements [211]

Portfolio of Investments as at 31 May 2020
Holding Description
MarketValue
USD
% ofNet
Assets
Transferable Securities and Money Market Instruments Admittedto an Official Stock Exchange Listing or Dealt in on AnotherRegulated Market
COMMON STOCKSAustralia
17,863 Aristocrat Leisure Ltd 304,928 1.0045,694 Coles Group Ltd 465,825 1.53
114,307 Freedom Foods Group Ltd 282,220 0.9366,790 Insurance Australia Group Ltd 270,847 0.89
265,348 NRW Holdings Ltd 341,656 1.12
1,665,476 5.47
Cayman Islands2,286 Alibaba Group Holding Ltd
ADR 452,971 1.49156,000 China Mengniu Dairy Co Ltd 557,233 1.8340,200 ENN Energy Holdings Ltd 468,626 1.5428,270 iQIYI Inc ADR 447,797 1.478,767 JD.com Inc ADR 452,114 1.48
349,000 Jiumaojiu InternationalHoldings Ltd* 549,012 1.80
5,868 New Oriental Education &Technology Group Inc ADR 672,884 2.21
14,592 Silicon Motion TechnologyCorp ADR 658,683 2.16
11,700 Tencent Holdings Ltd 619,192 2.03
4,878,512 16.01
China86,500 Anhui Conch Cement Co Ltd
’H’ 647,516 2.13116,000 China Merchants Bank Co Ltd
’H’^ 542,996 1.7863,200 Glodon Co Ltd ’A’ 505,656 1.66
130,800 Jinyu Bio-Technology Co Ltd’A’ 435,836 1.43
2,800 Kweichow Moutai Co Ltd ’A’ 533,925 1.75101,912 Lepu Medical Technology
Beijing Co Ltd ’A’ 496,712 1.632,224,000 Sinopec Shanghai
Petrochemical Co Ltd ’H’ 547,773 1.80859,623 Zhejiang Huace Film & TV Co
Ltd ’A’ 819,237 2.69183,600 Zoomlion Heavy Industry
Science and Technology CoLtd ’H’ 150,341 0.49
4,679,992 15.36
Hong Kong525,000 CNOOC Ltd 584,255 1.9253,000 Link (REIT) 396,060 1.30
980,315 3.22
India12,550 HDFC Bank Ltd ADR^ 517,813 1.7044,537 Infosys Ltd ADR 401,278 1.32
919,091 3.02
Indonesia245,400 Bank Central Asia Tbk PT 435,875 1.43650,500 Indocement Tunggal Prakarsa
Tbk PT 538,744 1.77
974,619 3.20
Philippines1,635,700 LT Group Inc 254,629 0.84
685,100 Metropolitan Bank & Trust Co 476,403 1.56882,000 SM Prime Holdings Inc 525,332 1.73
1,256,364 4.13
Holding Description
MarketValue
USD
% ofNet
Assets
Singapore123,000 BOC Aviation Ltd 675,689 2.22464,300 ComfortDelGro Corp Ltd^ 472,938 1.5537,478 Flex Ltd 360,538 1.18
1,509,165 4.95
South Korea84,913 Korean Reinsurance Co 506,687 1.66
506,687 1.66
Taiwan4,000 Largan Precision Co Ltd 510,908 1.68
70,000 Novatek Microelectronics Corp 477,935 1.5764,000 Win Semiconductors Corp 547,810 1.8023,000 Wiwynn Corp 613,589 2.01
2,150,242 7.06
Thailand945,900 Thai Beverage PCL 421,530 1.38
421,530 1.38
United States9,294 Yum China Holdings Inc 419,996 1.38
419,996 1.38
Total Common Stocks 20,361,989 66.84
COMMERCIAL PAPERUnited States
USD 1,430,000 Caisse Des Depots EtConsignations6/7/2020 (Zero Coupon) 1,429,706 4.69
USD 1,410,000 Federation Des CaissesDesjardins 29/6/2020 (ZeroCoupon) 1,409,600 4.63
USD 1,456,000 Landesbank HessenThueringen Giroz27/7/2020 (Zero Coupon) 1,455,484 4.78
USD 1,406,000 NederlandseWaterschapsbank NV29/7/2020 (Zero Coupon) 1,405,602 4.61
USD 1,390,000 Oversea-Chinese BankingCorp 25/6/2020 (ZeroCoupon) 1,389,548 4.56
7,089,940 23.27
Total Commercial Papers 7,089,940 23.27
Total Transferable Securities and Money MarketInstruments Admitted to an Official Stock ExchangeListing or Dealt in on Another Regulated Market 27,451,929 90.11
Collective Investment Schemes~
Ireland20,426 Institutional Cash Series Plc -
Institutional Dollar AssetsLiquidity Fund 2,044,586 6.71
2,044,586 6.71
Total Collective Investment Schemes 2,044,586 6.71
Securities portfolio at market value 29,496,515 96.82
Other Net Assets 968,125 3.18
Total Net Assets (USD) 30,464,640 100.00
* These securities were valued in consultation with the Investment Advisers. These securitieswere fair valued or suspended at financial year end as detailed in Note 2(a).
^ All or a portion of this security represents a security on loan.~ Investment in related party fund, see further information in Note 10.
BlackRock Asia Pacific Absolute Return Fund
The notes on pages 691 to 711 form an integral part of these financial statements.
BlackRock Strategic Funds[212]

Contracts for difference as at 31 May 2020
Holding Description Counterparty
Netunrealised
appreciation/(depreciation)
USD
Australia(242,196) Bingo Industries Ltd Bank of America
Merrill Lynch (49,538)(26,896) James Hardie Industries Plc
- CDI Morgan Stanley (50,031)(89,440) Super Retail Group Ltd Bank of America
Merrill Lynch (108,368)(30,444) WiseTech Global Ltd Bank of America
Merrill Lynch (35,921)(57,998) Worley Ltd Bank of America
Merrill Lynch (27,632)
(271,490)
Hong Kong(155,000) 3SBio Inc JP Morgan (13,514)(147,000) Haidilao International
Holding LtdBank of AmericaMerrill Lynch (54,643)
(44,400) Hang Seng Bank Ltd JP Morgan 32,085(340,782) Hong Kong & China Gas Co
Ltd JP Morgan 32,797(129,200) HSBC Holdings Plc Morgan Stanley 3,495(439,000) Nine Dragons Paper
Holdings LtdBank of AmericaMerrill Lynch 13,786
(274,000) Sino Biopharmaceutical Ltd JP Morgan (11,114)(415,500) Sun Art Retail Group Ltd JP Morgan 23,877(33,900) Sunny Optical Technology
Group Co Ltd JP Morgan 58,373(200,000) Tingyi Cayman Islands
Holding Corp JP Morgan 13,575(660,000) Want Want China Holdings
Ltd JP Morgan (23,628)593,800 Zoomlion Heavy Industry
Science and TechnologyCo Ltd ’H’ JP Morgan (11,714)
63,375
Malaysia(285,700) Malayan Banking Bhd Morgan Stanley (6,557)(734,400) Telekom Malaysia Bhd Morgan Stanley (2,866)
(9,423)
Singapore(89,000) Oversea-Chinese Banking
Corp Ltd Morgan Stanley (8,131)
(8,131)
South Korea2,397 Celltrion Inc Bank of America
Merrill Lynch (11,130)(3,460) Celltrion Inc Morgan Stanley 7,716
(15,635) Hana Financial Group Inc Bank of AmericaMerrill Lynch (53,611)
(254,166) Hanwha Life Insurance CoLtd
Bank of AmericaMerrill Lynch 25,638
(7,772) Samsung Life Insurance CoLtd
Bank of AmericaMerrill Lynch (1,421)
(32,808)
Taiwan(473,000) Cathay Financial Holding
Co LtdBank of AmericaMerrill Lynch (12,872)
(248,000) Formosa Chemicals & FibreCorp Morgan Stanley 1,738
(2,229,701) Shin Kong Financial HoldingCo Ltd
Bank of AmericaMerrill Lynch (10,529)
(21,663)
Thailand(22,560) Minor International PCL JP Morgan 180
180
Holding Description Counterparty
Netunrealised
appreciation/(depreciation)
USD
United Kingdom70,156 Prudential Plc Morgan Stanley 44,778
44,778
United States(9,428) Autohome Inc ADR Morgan Stanley (2,640)
(17,178) KB Financial Group IncADR Morgan Stanley (38,994)
(138,096) NIO Inc ADR JP Morgan (6,782)(14,097) Weibo Corp ADR JP Morgan 28,847(20,183) ZTO Express Cayman Inc
ADR JP Morgan (9,660)
(29,229)
Total (Gross underlying exposure - USD 17,256,104) (264,411)
BlackRock Asia Pacific Absolute Return Fund continued
The notes on pages 691 to 711 form an integral part of these financial statements.
Annual report and audited financial statements [213]

Futures contracts as at 31 May 2020
Numberof
contractsCurrencyof contracts
Contract/Description
Expirationdate
Grossunderlying
exposureUSD
Net unrealisedappreciation/
(depreciation)USD
(155) USD FTSE China A50 Futures June 2020 June 2020 2,045,225 (19,648)
(46) HKD Hang Seng Index Futures June 2020 June 2020 1,350,623 (3,760)
(54) USD MSCI Taiwan Index Futures June 2020 June 2020 2,220,480 18,890
(100) USD SGX MSCI Indonesia Index Futures June 2020 June 2020 1,047,000 (41,000)
(29) USD SGX NIFTY 50 Futures June 2020 June 2020 551,812 (27,665)
Total 7,215,140 (73,183)
Open forward foreign exchange transactionsas at 31 May 2020
Currency Purchases Currency Sales CounterpartyMaturity
date
Netunrealised
appreciation/(depreciation)
USD
CHF Hedged Share Class
CHF 1,160,107 USD 1,196,403State Street Bank& Trust Company 15/6/2020 8,416
USD 34,277 CHF 33,264State Street Bank& Trust Company 15/6/2020 (269)
8,147
EUR Hedged Share Class
EUR 46,404 USD 50,312State Street Bank& Trust Company 15/6/2020 1,300
USD 1,636 EUR 1,502State Street Bank& Trust Company 15/6/2020 (34)
1,266
GBP Hedged Share Class
GBP 174,683 USD 215,747State Street Bank& Trust Company 15/6/2020 5
USD 21,051 GBP 17,183State Street Bank& Trust Company 15/6/2020 (172)
(167)
Total (Gross underlying exposure - USD 1,529,622) 9,246
Sector Breakdownas at 31 May 2020
% of NetAssets
Financial 37.54
Consumer, Non-cyclical 13.53
Technology 10.52
Communications 9.16
Industrial 8.80
Collective Investment Schemes 6.71
Consumer, Cyclical 4.18
Basic Materials 2.92
Energy 1.92
Utilities 1.54
Securities portfolio at market value 96.82
Other Net Assets 3.18
100.00
BlackRock Asia Pacific Absolute Return Fund continued
The notes on pages 691 to 711 form an integral part of these financial statements.
BlackRock Strategic Funds[214]

Portfolio of Investments as at 31 May 2020
Holding Description
MarketValue
USD
% ofNet
Assets
Transferable Securities and Money Market Instruments Admittedto an Official Stock Exchange Listing or Dealt in on AnotherRegulated Market
BONDSUnited States
USD 1,200,000 United States CashManagement Bill8/9/2020 (Zero Coupon) 1,199,189 4.54
USD 1,500,000 United States CashManagement Bill6/10/2020 (Zero Coupon) 1,499,272 5.68
USD 750,000 United States Treasury Bill2/6/2020 (Zero Coupon) 749,994 2.84
USD 300,000 United States Treasury Bill9/7/2020 (Zero Coupon) 299,972 1.14
USD 2,500,000 United States Treasury Bill14/7/2020 (Zero Coupon) 2,499,648 9.47
USD 1,000,000 United States Treasury Bill13/8/2020 (Zero Coupon) 999,583 3.78
USD 750,000 United States Treasury Bill17/9/2020 (Zero Coupon) 749,716 2.84
USD 1,000,000 United States Treasury Bill27/11/2020 (Zero Coupon) 999,196 3.78
USD 1,000,000 United States Treasury Bill-When Issued 3/9/2020 (ZeroCoupon) 996,973 3.77
9,993,543 37.84
Total Bonds 9,993,543 37.84
CERTIFICATE OF DEPOSITSUnited States
USD 750,000 KBC Bank NV 0.57%28/7/2020 750,000 2.84
USD 600,000 Oversea-Chinese BankingCorp 1.87% 4/8/2020 600,000 2.27
USD 300,000 Oversea-Chinese BankingCorp 10/8/2020 (ZeroCoupon) 299,997 1.14
USD 250,000 Skandinaviska EnskildaBanken AB 1.83% 8/6/2020 250,000 0.95
1,899,997 7.20
Total Certificate of Deposits 1,899,997 7.20
COMMERCIAL PAPERUnited States
USD 500,000 Atlantic Asset SecuritizationLLC 3/6/2020 (Zero Coupon) 499,902 1.89
USD 700,000 Banque Et Caisse Epargne20/10/2020 (Zero Coupon) 699,027 2.65
USD 300,000 Barton Capital SA1/6/2020 (Zero Coupon) 299,978 1.14
USD 700,000 Barton Capital SA15/9/2020 (Zero Coupon) 699,370 2.65
USD 750,000 Caisse Des Depots EtConsignations (ZeroCoupon) 749,878 2.84
USD 250,000 Chariot Funding LLC21/7/2020 (Zero Coupon) 249,408 0.94
USD 500,000 Charta LLC 3/8/2020 (ZeroCoupon) 499,756 1.89
USD 300,000 Ciesco LLC 9/6/2020 (ZeroCoupon) 299,862 1.14
USD 1,000,000 CRC Funding LLC4/6/2020 (Zero Coupon) 999,769 3.79
USD 1,000,000 DBS Bank Ltd 6/8/2020 (ZeroCoupon) 996,864 3.77
USD 500,000 Erste Abwicklungsanstalt2/6/2020 (Zero Coupon) 499,938 1.89
USD 1,000,000 Exxon Mobil Corp13/7/2020 (Zero Coupon) 998,167 3.78
Holding Description
MarketValue
USD
% ofNet
Assets
United States continuedUSD 250,000 JP Morgan Securities LLC
3/11/2020 (Zero Coupon) 249,618 0.95USD 1,000,000 Jupiter Securitization
Company LLC15/7/2020 (Zero Coupon) 998,594 3.78
USD 450,000 La Fayette Asset SecuritizationLLC (Zero Coupon) 449,027 1.70
USD 500,000 National Security ClearingCorp 10/7/2020 (ZeroCoupon) 499,015 1.89
USD 500,000 Old Line Funding LLC13/7/2020 (Zero Coupon) 498,918 1.89
USD 1,000,000 Santander UK Plc1/7/2020 (Zero Coupon) 998,498 3.78
USD 1,000,000 Suncorp Metway Ltd4/11/2020 (Zero Coupon) 998,245 3.78
USD 500,000 Thunder Bay Funding LLC27/7/2020 (Zero Coupon) 498,631 1.89
USD 1,000,000 Total Capital Canada Ltd19/8/2020 (Zero Coupon) 999,010 3.78
13,681,475 51.81
Total Commercial Papers 13,681,475 51.81
Total Transferable Securities and Money MarketInstruments Admitted to an Official Stock ExchangeListing or Dealt in on Another Regulated Market 25,575,015 96.85
Securities portfolio at market value 25,575,015 96.85
Other Net Assets 831,828 3.15
Total Net Assets (USD) 26,406,843 100.00
BlackRock Asia Pacific Diversified Equity Absolute ReturnFund
The notes on pages 691 to 711 form an integral part of these financial statements.
Annual report and audited financial statements [215]
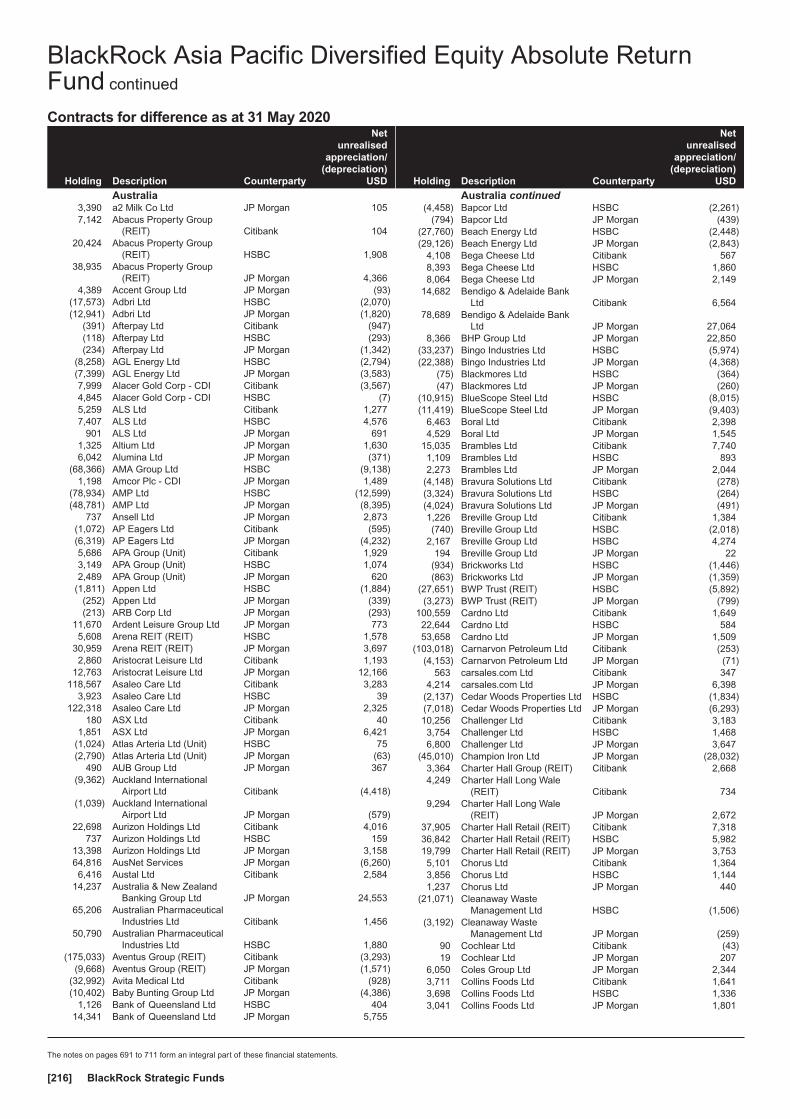
Contracts for difference as at 31 May 2020
Holding Description Counterparty
Netunrealised
appreciation/(depreciation)
USD
Australia3,390 a2 Milk Co Ltd JP Morgan 1057,142 Abacus Property Group
(REIT) Citibank 10420,424 Abacus Property Group
(REIT) HSBC 1,90838,935 Abacus Property Group
(REIT) JP Morgan 4,3664,389 Accent Group Ltd JP Morgan (93)
(17,573) Adbri Ltd HSBC (2,070)(12,941) Adbri Ltd JP Morgan (1,820)
(391) Afterpay Ltd Citibank (947)(118) Afterpay Ltd HSBC (293)(234) Afterpay Ltd JP Morgan (1,342)
(8,258) AGL Energy Ltd HSBC (2,794)(7,399) AGL Energy Ltd JP Morgan (3,583)7,999 Alacer Gold Corp - CDI Citibank (3,567)4,845 Alacer Gold Corp - CDI HSBC (7)5,259 ALS Ltd Citibank 1,2777,407 ALS Ltd HSBC 4,576
901 ALS Ltd JP Morgan 6911,325 Altium Ltd JP Morgan 1,6306,042 Alumina Ltd JP Morgan (371)
(68,366) AMA Group Ltd HSBC (9,138)1,198 Amcor Plc - CDI JP Morgan 1,489
(78,934) AMP Ltd HSBC (12,599)(48,781) AMP Ltd JP Morgan (8,395)
737 Ansell Ltd JP Morgan 2,873(1,072) AP Eagers Ltd Citibank (595)(6,319) AP Eagers Ltd JP Morgan (4,232)5,686 APA Group (Unit) Citibank 1,9293,149 APA Group (Unit) HSBC 1,0742,489 APA Group (Unit) JP Morgan 620
(1,811) Appen Ltd HSBC (1,884)(252) Appen Ltd JP Morgan (339)(213) ARB Corp Ltd JP Morgan (293)
11,670 Ardent Leisure Group Ltd JP Morgan 7735,608 Arena REIT (REIT) HSBC 1,578
30,959 Arena REIT (REIT) JP Morgan 3,6972,860 Aristocrat Leisure Ltd Citibank 1,193
12,763 Aristocrat Leisure Ltd JP Morgan 12,166118,567 Asaleo Care Ltd Citibank 3,283
3,923 Asaleo Care Ltd HSBC 39122,318 Asaleo Care Ltd JP Morgan 2,325
180 ASX Ltd Citibank 401,851 ASX Ltd JP Morgan 6,421
(1,024) Atlas Arteria Ltd (Unit) HSBC 75(2,790) Atlas Arteria Ltd (Unit) JP Morgan (63)
490 AUB Group Ltd JP Morgan 367(9,362) Auckland International
Airport Ltd Citibank (4,418)(1,039) Auckland International
Airport Ltd JP Morgan (579)22,698 Aurizon Holdings Ltd Citibank 4,016
737 Aurizon Holdings Ltd HSBC 15913,398 Aurizon Holdings Ltd JP Morgan 3,15864,816 AusNet Services JP Morgan (6,260)6,416 Austal Ltd Citibank 2,584
14,237 Australia & New ZealandBanking Group Ltd JP Morgan 24,553
65,206 Australian PharmaceuticalIndustries Ltd Citibank 1,456
50,790 Australian PharmaceuticalIndustries Ltd HSBC 1,880
(175,033) Aventus Group (REIT) Citibank (3,293)(9,668) Aventus Group (REIT) JP Morgan (1,571)
(32,992) Avita Medical Ltd Citibank (928)(10,402) Baby Bunting Group Ltd JP Morgan (4,386)
1,126 Bank of Queensland Ltd HSBC 40414,341 Bank of Queensland Ltd JP Morgan 5,755
Holding Description Counterparty
Netunrealised
appreciation/(depreciation)
USD
Australia continued(4,458) Bapcor Ltd HSBC (2,261)
(794) Bapcor Ltd JP Morgan (439)(27,760) Beach Energy Ltd HSBC (2,448)(29,126) Beach Energy Ltd JP Morgan (2,843)
4,108 Bega Cheese Ltd Citibank 5678,393 Bega Cheese Ltd HSBC 1,8608,064 Bega Cheese Ltd JP Morgan 2,149
14,682 Bendigo & Adelaide BankLtd Citibank 6,564
78,689 Bendigo & Adelaide BankLtd JP Morgan 27,064
8,366 BHP Group Ltd JP Morgan 22,850(33,237) Bingo Industries Ltd HSBC (5,974)(22,388) Bingo Industries Ltd JP Morgan (4,368)
(75) Blackmores Ltd HSBC (364)(47) Blackmores Ltd JP Morgan (260)
(10,915) BlueScope Steel Ltd HSBC (8,015)(11,419) BlueScope Steel Ltd JP Morgan (9,403)
6,463 Boral Ltd Citibank 2,3984,529 Boral Ltd JP Morgan 1,545
15,035 Brambles Ltd Citibank 7,7401,109 Brambles Ltd HSBC 8932,273 Brambles Ltd JP Morgan 2,044
(4,148) Bravura Solutions Ltd Citibank (278)(3,324) Bravura Solutions Ltd HSBC (264)(4,024) Bravura Solutions Ltd JP Morgan (491)1,226 Breville Group Ltd Citibank 1,384(740) Breville Group Ltd HSBC (2,018)
2,167 Breville Group Ltd HSBC 4,274194 Breville Group Ltd JP Morgan 22
(934) Brickworks Ltd HSBC (1,446)(863) Brickworks Ltd JP Morgan (1,359)
(27,651) BWP Trust (REIT) HSBC (5,892)(3,273) BWP Trust (REIT) JP Morgan (799)
100,559 Cardno Ltd Citibank 1,64922,644 Cardno Ltd HSBC 58453,658 Cardno Ltd JP Morgan 1,509
(103,018) Carnarvon Petroleum Ltd Citibank (253)(4,153) Carnarvon Petroleum Ltd JP Morgan (71)
563 carsales.com Ltd Citibank 3474,214 carsales.com Ltd JP Morgan 6,398
(2,137) Cedar Woods Properties Ltd HSBC (1,834)(7,018) Cedar Woods Properties Ltd JP Morgan (6,293)10,256 Challenger Ltd Citibank 3,1833,754 Challenger Ltd HSBC 1,4686,800 Challenger Ltd JP Morgan 3,647
(45,010) Champion Iron Ltd JP Morgan (28,032)3,364 Charter Hall Group (REIT) Citibank 2,6684,249 Charter Hall Long Wale
(REIT) Citibank 7349,294 Charter Hall Long Wale
(REIT) JP Morgan 2,67237,905 Charter Hall Retail (REIT) Citibank 7,31836,842 Charter Hall Retail (REIT) HSBC 5,98219,799 Charter Hall Retail (REIT) JP Morgan 3,7535,101 Chorus Ltd Citibank 1,3643,856 Chorus Ltd HSBC 1,1441,237 Chorus Ltd JP Morgan 440
(21,071) Cleanaway WasteManagement Ltd HSBC (1,506)
(3,192) Cleanaway WasteManagement Ltd JP Morgan (259)
90 Cochlear Ltd Citibank (43)19 Cochlear Ltd JP Morgan 207
6,050 Coles Group Ltd JP Morgan 2,3443,711 Collins Foods Ltd Citibank 1,6413,698 Collins Foods Ltd HSBC 1,3363,041 Collins Foods Ltd JP Morgan 1,801
BlackRock Asia Pacific Diversified Equity Absolute ReturnFund continued
The notes on pages 691 to 711 form an integral part of these financial statements.
BlackRock Strategic Funds[216]
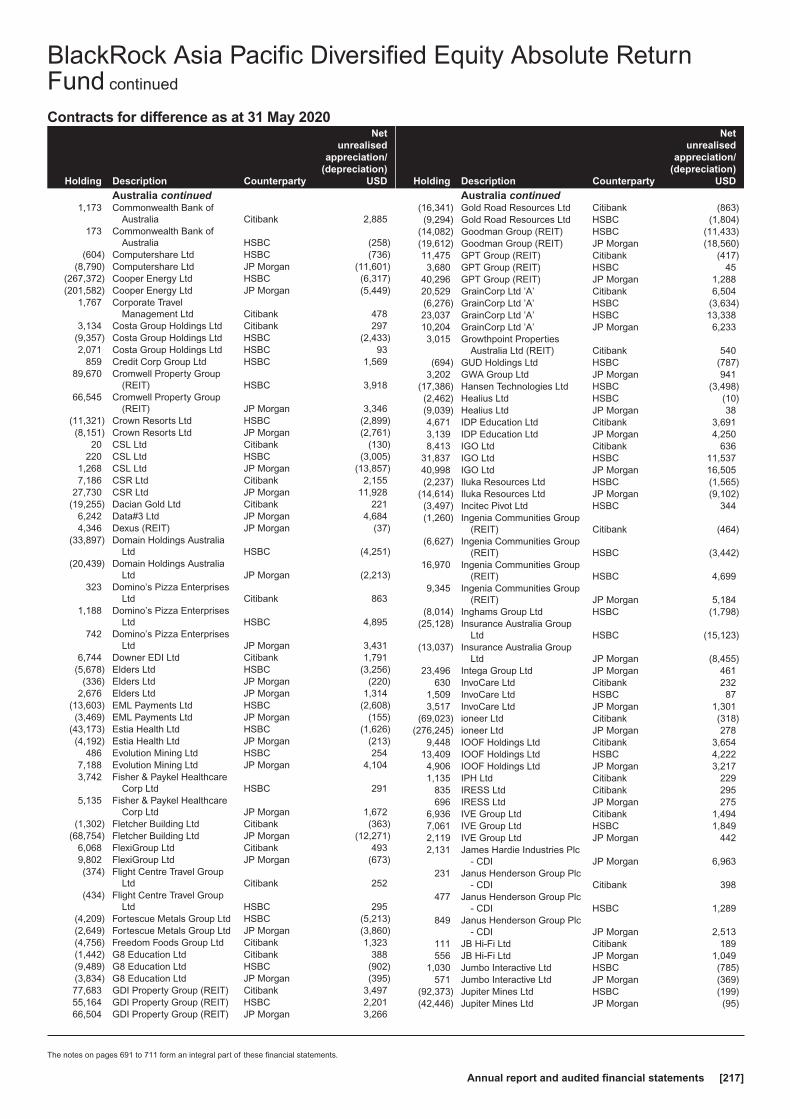
Contracts for difference as at 31 May 2020
Holding Description Counterparty
Netunrealised
appreciation/(depreciation)
USD
Australia continued1,173 Commonwealth Bank of
Australia Citibank 2,885173 Commonwealth Bank of
Australia HSBC (258)(604) Computershare Ltd HSBC (736)
(8,790) Computershare Ltd JP Morgan (11,601)(267,372) Cooper Energy Ltd HSBC (6,317)(201,582) Cooper Energy Ltd JP Morgan (5,449)
1,767 Corporate TravelManagement Ltd Citibank 478
3,134 Costa Group Holdings Ltd Citibank 297(9,357) Costa Group Holdings Ltd HSBC (2,433)2,071 Costa Group Holdings Ltd HSBC 93
859 Credit Corp Group Ltd HSBC 1,56989,670 Cromwell Property Group
(REIT) HSBC 3,91866,545 Cromwell Property Group
(REIT) JP Morgan 3,346(11,321) Crown Resorts Ltd HSBC (2,899)(8,151) Crown Resorts Ltd JP Morgan (2,761)
20 CSL Ltd Citibank (130)220 CSL Ltd HSBC (3,005)
1,268 CSL Ltd JP Morgan (13,857)7,186 CSR Ltd Citibank 2,155
27,730 CSR Ltd JP Morgan 11,928(19,255) Dacian Gold Ltd Citibank 221
6,242 Data#3 Ltd JP Morgan 4,6844,346 Dexus (REIT) JP Morgan (37)
(33,897) Domain Holdings AustraliaLtd HSBC (4,251)
(20,439) Domain Holdings AustraliaLtd JP Morgan (2,213)
323 Domino’s Pizza EnterprisesLtd Citibank 863
1,188 Domino’s Pizza EnterprisesLtd HSBC 4,895
742 Domino’s Pizza EnterprisesLtd JP Morgan 3,431
6,744 Downer EDI Ltd Citibank 1,791(5,678) Elders Ltd HSBC (3,256)
(336) Elders Ltd JP Morgan (220)2,676 Elders Ltd JP Morgan 1,314
(13,603) EML Payments Ltd HSBC (2,608)(3,469) EML Payments Ltd JP Morgan (155)
(43,173) Estia Health Ltd HSBC (1,626)(4,192) Estia Health Ltd JP Morgan (213)
486 Evolution Mining Ltd HSBC 2547,188 Evolution Mining Ltd JP Morgan 4,1043,742 Fisher & Paykel Healthcare
Corp Ltd HSBC 2915,135 Fisher & Paykel Healthcare
Corp Ltd JP Morgan 1,672(1,302) Fletcher Building Ltd Citibank (363)
(68,754) Fletcher Building Ltd JP Morgan (12,271)6,068 FlexiGroup Ltd Citibank 4939,802 FlexiGroup Ltd JP Morgan (673)(374) Flight Centre Travel Group
Ltd Citibank 252(434) Flight Centre Travel Group
Ltd HSBC 295(4,209) Fortescue Metals Group Ltd HSBC (5,213)(2,649) Fortescue Metals Group Ltd JP Morgan (3,860)(4,756) Freedom Foods Group Ltd Citibank 1,323(1,442) G8 Education Ltd Citibank 388(9,489) G8 Education Ltd HSBC (902)(3,834) G8 Education Ltd JP Morgan (395)77,683 GDI Property Group (REIT) Citibank 3,49755,164 GDI Property Group (REIT) HSBC 2,20166,504 GDI Property Group (REIT) JP Morgan 3,266
Holding Description Counterparty
Netunrealised
appreciation/(depreciation)
USD
Australia continued(16,341) Gold Road Resources Ltd Citibank (863)(9,294) Gold Road Resources Ltd HSBC (1,804)
(14,082) Goodman Group (REIT) HSBC (11,433)(19,612) Goodman Group (REIT) JP Morgan (18,560)11,475 GPT Group (REIT) Citibank (417)3,680 GPT Group (REIT) HSBC 45
40,296 GPT Group (REIT) JP Morgan 1,28820,529 GrainCorp Ltd ’A’ Citibank 6,504(6,276) GrainCorp Ltd ’A’ HSBC (3,634)23,037 GrainCorp Ltd ’A’ HSBC 13,33810,204 GrainCorp Ltd ’A’ JP Morgan 6,2333,015 Growthpoint Properties
Australia Ltd (REIT) Citibank 540(694) GUD Holdings Ltd HSBC (787)
3,202 GWA Group Ltd JP Morgan 941(17,386) Hansen Technologies Ltd HSBC (3,498)(2,462) Healius Ltd HSBC (10)(9,039) Healius Ltd JP Morgan 384,671 IDP Education Ltd Citibank 3,6913,139 IDP Education Ltd JP Morgan 4,2508,413 IGO Ltd Citibank 636
31,837 IGO Ltd HSBC 11,53740,998 IGO Ltd JP Morgan 16,505(2,237) Iluka Resources Ltd HSBC (1,565)
(14,614) Iluka Resources Ltd JP Morgan (9,102)(3,497) Incitec Pivot Ltd HSBC 344(1,260) Ingenia Communities Group
(REIT) Citibank (464)(6,627) Ingenia Communities Group
(REIT) HSBC (3,442)16,970 Ingenia Communities Group
(REIT) HSBC 4,6999,345 Ingenia Communities Group
(REIT) JP Morgan 5,184(8,014) Inghams Group Ltd HSBC (1,798)
(25,128) Insurance Australia GroupLtd HSBC (15,123)
(13,037) Insurance Australia GroupLtd JP Morgan (8,455)
23,496 Intega Group Ltd JP Morgan 461630 InvoCare Ltd Citibank 232
1,509 InvoCare Ltd HSBC 873,517 InvoCare Ltd JP Morgan 1,301
(69,023) ioneer Ltd Citibank (318)(276,245) ioneer Ltd JP Morgan 278
9,448 IOOF Holdings Ltd Citibank 3,65413,409 IOOF Holdings Ltd HSBC 4,2224,906 IOOF Holdings Ltd JP Morgan 3,2171,135 IPH Ltd Citibank 229
835 IRESS Ltd Citibank 295696 IRESS Ltd JP Morgan 275
6,936 IVE Group Ltd Citibank 1,4947,061 IVE Group Ltd HSBC 1,8492,119 IVE Group Ltd JP Morgan 4422,131 James Hardie Industries Plc
- CDI JP Morgan 6,963231 Janus Henderson Group Plc
- CDI Citibank 398477 Janus Henderson Group Plc
- CDI HSBC 1,289849 Janus Henderson Group Plc
- CDI JP Morgan 2,513111 JB Hi-Fi Ltd Citibank 189556 JB Hi-Fi Ltd JP Morgan 1,049
1,030 Jumbo Interactive Ltd HSBC (785)571 Jumbo Interactive Ltd JP Morgan (369)
(92,373) Jupiter Mines Ltd HSBC (199)(42,446) Jupiter Mines Ltd JP Morgan (95)
BlackRock Asia Pacific Diversified Equity Absolute ReturnFund continued
The notes on pages 691 to 711 form an integral part of these financial statements.
Annual report and audited financial statements [217]
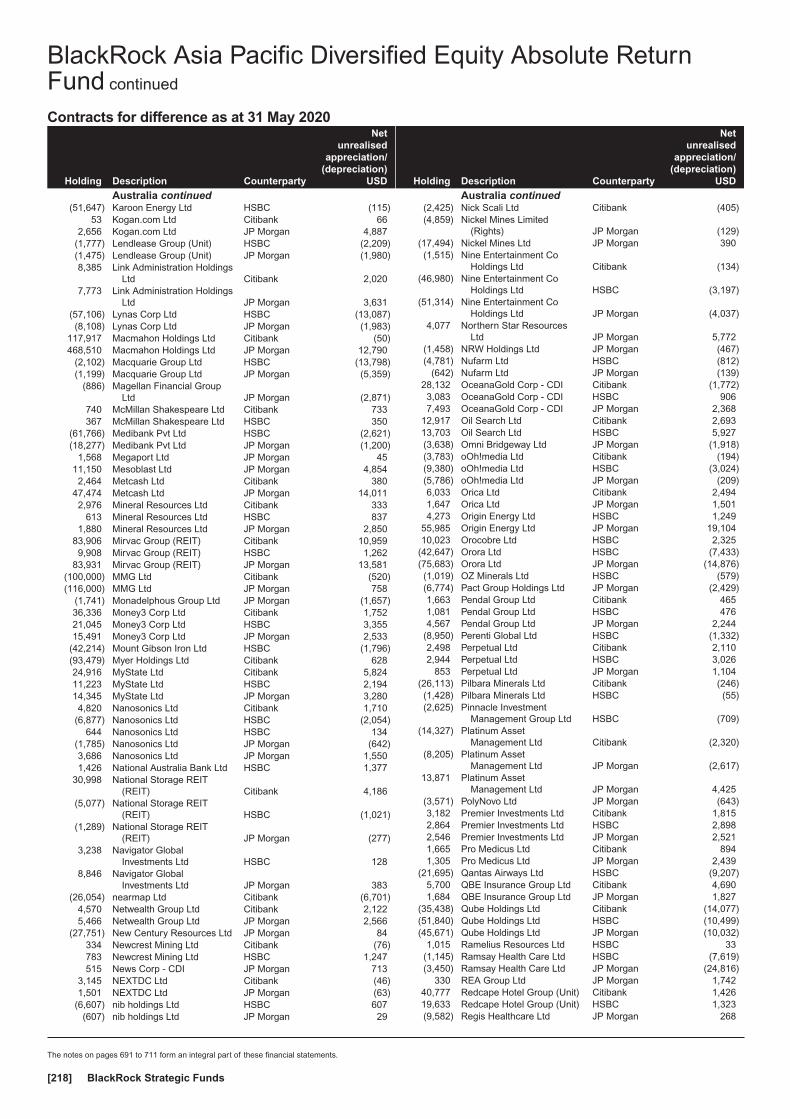
Contracts for difference as at 31 May 2020
Holding Description Counterparty
Netunrealised
appreciation/(depreciation)
USD
Australia continued(51,647) Karoon Energy Ltd HSBC (115)
53 Kogan.com Ltd Citibank 662,656 Kogan.com Ltd JP Morgan 4,887
(1,777) Lendlease Group (Unit) HSBC (2,209)(1,475) Lendlease Group (Unit) JP Morgan (1,980)8,385 Link Administration Holdings
Ltd Citibank 2,0207,773 Link Administration Holdings
Ltd JP Morgan 3,631(57,106) Lynas Corp Ltd HSBC (13,087)(8,108) Lynas Corp Ltd JP Morgan (1,983)
117,917 Macmahon Holdings Ltd Citibank (50)468,510 Macmahon Holdings Ltd JP Morgan 12,790
(2,102) Macquarie Group Ltd HSBC (13,798)(1,199) Macquarie Group Ltd JP Morgan (5,359)
(886) Magellan Financial GroupLtd JP Morgan (2,871)
740 McMillan Shakespeare Ltd Citibank 733367 McMillan Shakespeare Ltd HSBC 350
(61,766) Medibank Pvt Ltd HSBC (2,621)(18,277) Medibank Pvt Ltd JP Morgan (1,200)
1,568 Megaport Ltd JP Morgan 4511,150 Mesoblast Ltd JP Morgan 4,8542,464 Metcash Ltd Citibank 380
47,474 Metcash Ltd JP Morgan 14,0112,976 Mineral Resources Ltd Citibank 333
613 Mineral Resources Ltd HSBC 8371,880 Mineral Resources Ltd JP Morgan 2,850
83,906 Mirvac Group (REIT) Citibank 10,9599,908 Mirvac Group (REIT) HSBC 1,262
83,931 Mirvac Group (REIT) JP Morgan 13,581(100,000) MMG Ltd Citibank (520)(116,000) MMG Ltd JP Morgan 758
(1,741) Monadelphous Group Ltd JP Morgan (1,657)36,336 Money3 Corp Ltd Citibank 1,75221,045 Money3 Corp Ltd HSBC 3,35515,491 Money3 Corp Ltd JP Morgan 2,533
(42,214) Mount Gibson Iron Ltd HSBC (1,796)(93,479) Myer Holdings Ltd Citibank 62824,916 MyState Ltd Citibank 5,82411,223 MyState Ltd HSBC 2,19414,345 MyState Ltd JP Morgan 3,2804,820 Nanosonics Ltd Citibank 1,710
(6,877) Nanosonics Ltd HSBC (2,054)644 Nanosonics Ltd HSBC 134
(1,785) Nanosonics Ltd JP Morgan (642)3,686 Nanosonics Ltd JP Morgan 1,5501,426 National Australia Bank Ltd HSBC 1,377
30,998 National Storage REIT(REIT) Citibank 4,186
(5,077) National Storage REIT(REIT) HSBC (1,021)
(1,289) National Storage REIT(REIT) JP Morgan (277)
3,238 Navigator GlobalInvestments Ltd HSBC 128
8,846 Navigator GlobalInvestments Ltd JP Morgan 383
(26,054) nearmap Ltd Citibank (6,701)4,570 Netwealth Group Ltd Citibank 2,1225,466 Netwealth Group Ltd JP Morgan 2,566
(27,751) New Century Resources Ltd JP Morgan 84334 Newcrest Mining Ltd Citibank (76)783 Newcrest Mining Ltd HSBC 1,247515 News Corp - CDI JP Morgan 713
3,145 NEXTDC Ltd Citibank (46)1,501 NEXTDC Ltd JP Morgan (63)
(6,607) nib holdings Ltd HSBC 607(607) nib holdings Ltd JP Morgan 29
Holding Description Counterparty
Netunrealised
appreciation/(depreciation)
USD
Australia continued(2,425) Nick Scali Ltd Citibank (405)(4,859) Nickel Mines Limited
(Rights) JP Morgan (129)(17,494) Nickel Mines Ltd JP Morgan 390(1,515) Nine Entertainment Co
Holdings Ltd Citibank (134)(46,980) Nine Entertainment Co
Holdings Ltd HSBC (3,197)(51,314) Nine Entertainment Co
Holdings Ltd JP Morgan (4,037)4,077 Northern Star Resources
Ltd JP Morgan 5,772(1,458) NRW Holdings Ltd JP Morgan (467)(4,781) Nufarm Ltd HSBC (812)
(642) Nufarm Ltd JP Morgan (139)28,132 OceanaGold Corp - CDI Citibank (1,772)3,083 OceanaGold Corp - CDI HSBC 9067,493 OceanaGold Corp - CDI JP Morgan 2,368
12,917 Oil Search Ltd Citibank 2,69313,703 Oil Search Ltd HSBC 5,927(3,638) Omni Bridgeway Ltd JP Morgan (1,918)(3,783) oOh!media Ltd Citibank (194)(9,380) oOh!media Ltd HSBC (3,024)(5,786) oOh!media Ltd JP Morgan (209)6,033 Orica Ltd Citibank 2,4941,647 Orica Ltd JP Morgan 1,5014,273 Origin Energy Ltd HSBC 1,249
55,985 Origin Energy Ltd JP Morgan 19,10410,023 Orocobre Ltd HSBC 2,325
(42,647) Orora Ltd HSBC (7,433)(75,683) Orora Ltd JP Morgan (14,876)(1,019) OZ Minerals Ltd HSBC (579)(6,774) Pact Group Holdings Ltd JP Morgan (2,429)1,663 Pendal Group Ltd Citibank 4651,081 Pendal Group Ltd HSBC 4764,567 Pendal Group Ltd JP Morgan 2,244
(8,950) Perenti Global Ltd HSBC (1,332)2,498 Perpetual Ltd Citibank 2,1102,944 Perpetual Ltd HSBC 3,026
853 Perpetual Ltd JP Morgan 1,104(26,113) Pilbara Minerals Ltd Citibank (246)(1,428) Pilbara Minerals Ltd HSBC (55)(2,625) Pinnacle Investment
Management Group Ltd HSBC (709)(14,327) Platinum Asset
Management Ltd Citibank (2,320)(8,205) Platinum Asset
Management Ltd JP Morgan (2,617)13,871 Platinum Asset
Management Ltd JP Morgan 4,425(3,571) PolyNovo Ltd JP Morgan (643)3,182 Premier Investments Ltd Citibank 1,8152,864 Premier Investments Ltd HSBC 2,8982,546 Premier Investments Ltd JP Morgan 2,5211,665 Pro Medicus Ltd Citibank 8941,305 Pro Medicus Ltd JP Morgan 2,439
(21,695) Qantas Airways Ltd HSBC (9,207)5,700 QBE Insurance Group Ltd Citibank 4,6901,684 QBE Insurance Group Ltd JP Morgan 1,827
(35,438) Qube Holdings Ltd Citibank (14,077)(51,840) Qube Holdings Ltd HSBC (10,499)(45,671) Qube Holdings Ltd JP Morgan (10,032)
1,015 Ramelius Resources Ltd HSBC 33(1,145) Ramsay Health Care Ltd HSBC (7,619)(3,450) Ramsay Health Care Ltd JP Morgan (24,816)
330 REA Group Ltd JP Morgan 1,74240,777 Redcape Hotel Group (Unit) Citibank 1,42619,633 Redcape Hotel Group (Unit) HSBC 1,323(9,582) Regis Healthcare Ltd JP Morgan 268
BlackRock Asia Pacific Diversified Equity Absolute ReturnFund continued
The notes on pages 691 to 711 form an integral part of these financial statements.
BlackRock Strategic Funds[218]
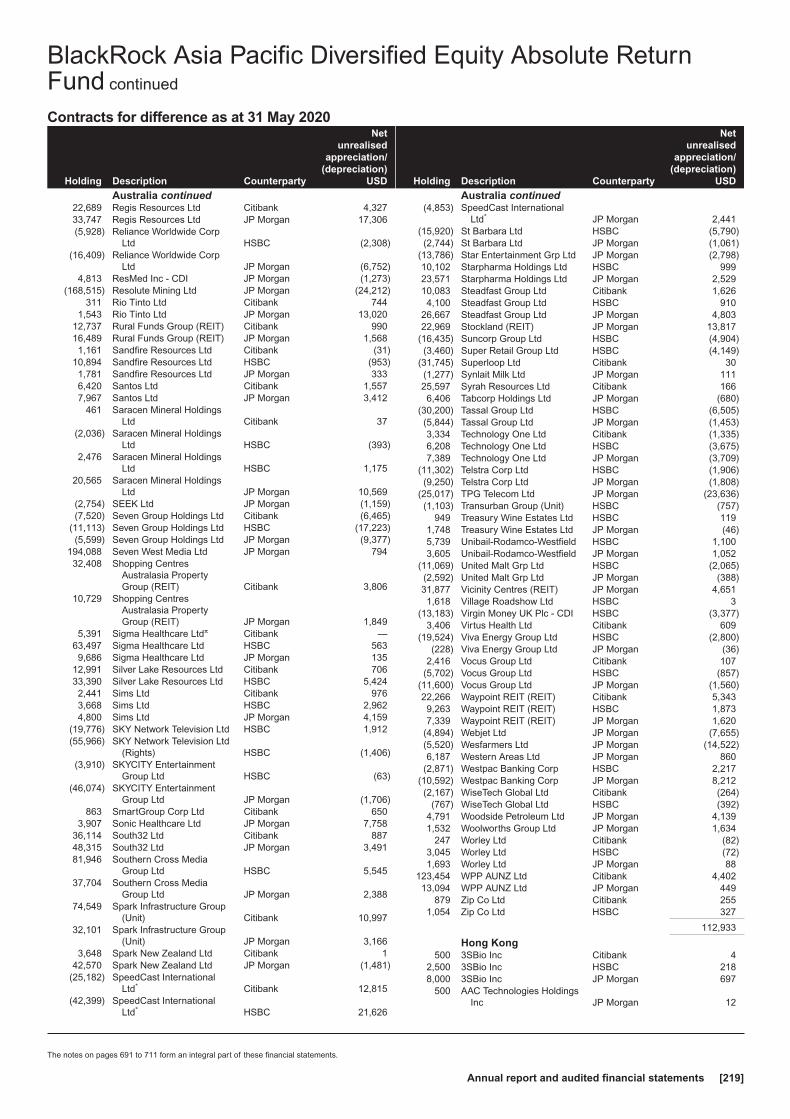
Contracts for difference as at 31 May 2020
Holding Description Counterparty
Netunrealised
appreciation/(depreciation)
USD
Australia continued22,689 Regis Resources Ltd Citibank 4,32733,747 Regis Resources Ltd JP Morgan 17,306(5,928) Reliance Worldwide Corp
Ltd HSBC (2,308)(16,409) Reliance Worldwide Corp
Ltd JP Morgan (6,752)4,813 ResMed Inc - CDI JP Morgan (1,273)
(168,515) Resolute Mining Ltd JP Morgan (24,212)311 Rio Tinto Ltd Citibank 744
1,543 Rio Tinto Ltd JP Morgan 13,02012,737 Rural Funds Group (REIT) Citibank 99016,489 Rural Funds Group (REIT) JP Morgan 1,5681,161 Sandfire Resources Ltd Citibank (31)
10,894 Sandfire Resources Ltd HSBC (953)1,781 Sandfire Resources Ltd JP Morgan 3336,420 Santos Ltd Citibank 1,5577,967 Santos Ltd JP Morgan 3,412
461 Saracen Mineral HoldingsLtd Citibank 37
(2,036) Saracen Mineral HoldingsLtd HSBC (393)
2,476 Saracen Mineral HoldingsLtd HSBC 1,175
20,565 Saracen Mineral HoldingsLtd JP Morgan 10,569
(2,754) SEEK Ltd JP Morgan (1,159)(7,520) Seven Group Holdings Ltd Citibank (6,465)
(11,113) Seven Group Holdings Ltd HSBC (17,223)(5,599) Seven Group Holdings Ltd JP Morgan (9,377)
194,088 Seven West Media Ltd JP Morgan 79432,408 Shopping Centres
Australasia PropertyGroup (REIT) Citibank 3,806
10,729 Shopping CentresAustralasia PropertyGroup (REIT) JP Morgan 1,849
5,391 Sigma Healthcare Ltdπ Citibank —63,497 Sigma Healthcare Ltd HSBC 5639,686 Sigma Healthcare Ltd JP Morgan 135
12,991 Silver Lake Resources Ltd Citibank 70633,390 Silver Lake Resources Ltd HSBC 5,4242,441 Sims Ltd Citibank 9763,668 Sims Ltd HSBC 2,9624,800 Sims Ltd JP Morgan 4,159
(19,776) SKY Network Television Ltd HSBC 1,912(55,966) SKY Network Television Ltd
(Rights) HSBC (1,406)(3,910) SKYCITY Entertainment
Group Ltd HSBC (63)(46,074) SKYCITY Entertainment
Group Ltd JP Morgan (1,706)863 SmartGroup Corp Ltd Citibank 650
3,907 Sonic Healthcare Ltd JP Morgan 7,75836,114 South32 Ltd Citibank 88748,315 South32 Ltd JP Morgan 3,49181,946 Southern Cross Media
Group Ltd HSBC 5,54537,704 Southern Cross Media
Group Ltd JP Morgan 2,38874,549 Spark Infrastructure Group
(Unit) Citibank 10,99732,101 Spark Infrastructure Group
(Unit) JP Morgan 3,1663,648 Spark New Zealand Ltd Citibank 1
42,570 Spark New Zealand Ltd JP Morgan (1,481)(25,182) SpeedCast International
Ltd* Citibank 12,815(42,399) SpeedCast International
Ltd* HSBC 21,626
Holding Description Counterparty
Netunrealised
appreciation/(depreciation)
USD
Australia continued(4,853) SpeedCast International
Ltd* JP Morgan 2,441(15,920) St Barbara Ltd HSBC (5,790)(2,744) St Barbara Ltd JP Morgan (1,061)
(13,786) Star Entertainment Grp Ltd JP Morgan (2,798)10,102 Starpharma Holdings Ltd HSBC 99923,571 Starpharma Holdings Ltd JP Morgan 2,52910,083 Steadfast Group Ltd Citibank 1,6264,100 Steadfast Group Ltd HSBC 910
26,667 Steadfast Group Ltd JP Morgan 4,80322,969 Stockland (REIT) JP Morgan 13,817
(16,435) Suncorp Group Ltd HSBC (4,904)(3,460) Super Retail Group Ltd HSBC (4,149)
(31,745) Superloop Ltd Citibank 30(1,277) Synlait Milk Ltd JP Morgan 11125,597 Syrah Resources Ltd Citibank 1666,406 Tabcorp Holdings Ltd JP Morgan (680)
(30,200) Tassal Group Ltd HSBC (6,505)(5,844) Tassal Group Ltd JP Morgan (1,453)3,334 Technology One Ltd Citibank (1,335)6,208 Technology One Ltd HSBC (3,675)7,389 Technology One Ltd JP Morgan (3,709)
(11,302) Telstra Corp Ltd HSBC (1,906)(9,250) Telstra Corp Ltd JP Morgan (1,808)
(25,017) TPG Telecom Ltd JP Morgan (23,636)(1,103) Transurban Group (Unit) HSBC (757)
949 Treasury Wine Estates Ltd HSBC 1191,748 Treasury Wine Estates Ltd JP Morgan (46)5,739 Unibail-Rodamco-Westfield HSBC 1,1003,605 Unibail-Rodamco-Westfield JP Morgan 1,052
(11,069) United Malt Grp Ltd HSBC (2,065)(2,592) United Malt Grp Ltd JP Morgan (388)31,877 Vicinity Centres (REIT) JP Morgan 4,6511,618 Village Roadshow Ltd HSBC 3
(13,183) Virgin Money UK Plc - CDI HSBC (3,377)3,406 Virtus Health Ltd Citibank 609
(19,524) Viva Energy Group Ltd HSBC (2,800)(228) Viva Energy Group Ltd JP Morgan (36)
2,416 Vocus Group Ltd Citibank 107(5,702) Vocus Group Ltd HSBC (857)
(11,600) Vocus Group Ltd JP Morgan (1,560)22,266 Waypoint REIT (REIT) Citibank 5,3439,263 Waypoint REIT (REIT) HSBC 1,8737,339 Waypoint REIT (REIT) JP Morgan 1,620
(4,894) Webjet Ltd JP Morgan (7,655)(5,520) Wesfarmers Ltd JP Morgan (14,522)6,187 Western Areas Ltd JP Morgan 860
(2,871) Westpac Banking Corp HSBC 2,217(10,592) Westpac Banking Corp JP Morgan 8,212(2,167) WiseTech Global Ltd Citibank (264)
(767) WiseTech Global Ltd HSBC (392)4,791 Woodside Petroleum Ltd JP Morgan 4,1391,532 Woolworths Group Ltd JP Morgan 1,634
247 Worley Ltd Citibank (82)3,045 Worley Ltd HSBC (72)1,693 Worley Ltd JP Morgan 88
123,454 WPP AUNZ Ltd Citibank 4,40213,094 WPP AUNZ Ltd JP Morgan 449
879 Zip Co Ltd Citibank 2551,054 Zip Co Ltd HSBC 327
112,933
Hong Kong500 3SBio Inc Citibank 4
2,500 3SBio Inc HSBC 2188,000 3SBio Inc JP Morgan 697
500 AAC Technologies HoldingsInc JP Morgan 12
BlackRock Asia Pacific Diversified Equity Absolute ReturnFund continued
The notes on pages 691 to 711 form an integral part of these financial statements.
Annual report and audited financial statements [219]

Contracts for difference as at 31 May 2020
Holding Description Counterparty
Netunrealised
appreciation/(depreciation)
USD
Hong Kong continued(4,000) Agile Group Holdings Ltd Citibank (68)
(173,000) Agricultural Bank of ChinaLtd ’H’ HSBC 1,588
7,400 AIA Group Ltd Citibank (1,084)600 AIA Group Ltd HSBC (528)
7,800 AIA Group Ltd JP Morgan (5,730)(100,000) Air China Ltd ’H’ Citibank 115(40,000) Air China Ltd ’H’ HSBC 2,434(6,000) Air China Ltd ’H’ JP Morgan 3656,000 AK Medical Holdings Ltd Citibank 5844,000 AK Medical Holdings Ltd HSBC 9762,000 AK Medical Holdings Ltd JP Morgan 487
(2,000) Alibaba Health InformationTechnology Ltd Citibank 4
(8,000) Alibaba Health InformationTechnology Ltd HSBC 90
(420,000) Alibaba Pictures Group Ltd Citibank 5301,500 A-Living Services Co Ltd ’H’ Citibank 1953,000 A-Living Services Co Ltd ’H’ HSBC (451)6,500 A-Living Services Co Ltd ’H’ JP Morgan (980)
(54,000) Aluminum Corp of ChinaLtd ’H’ Citibank 346
(16,000) Aluminum Corp of ChinaLtd ’H’ HSBC 373
(10,000) Aluminum Corp of ChinaLtd ’H’ JP Morgan 233
5,500 Anhui Conch Cement CoLtd ’H’ Citibank 1,747
2,500 Anhui Conch Cement CoLtd ’H’ HSBC 590
500 Anhui Conch Cement CoLtd ’H’ JP Morgan (98)
36,000 Anhui Expressway Co Ltd’H’ Citibank (1,389)
52,000 Anhui Expressway Co Ltd’H’ HSBC (3,027)
4,000 Anhui Expressway Co Ltd’H’ JP Morgan (233)
3,000 ANTA Sports Products Ltd Citibank 1,5341,000 ANTA Sports Products Ltd HSBC 1517,000 ANTA Sports Products Ltd JP Morgan 1,055
17,000 Ascletis Pharma Inc Citibank (415)17,000 Ascletis Pharma Inc JP Morgan (393)
(14,000) Asia Cement ChinaHoldings Corp Citibank 1,115
(1,500) Asia Cement ChinaHoldings Corp HSBC 22
500 ASM Pacific Technology Ltd Citibank (115)1,500 ASM Pacific Technology Ltd HSBC (732)1,400 ASM Pacific Technology Ltd JP Morgan (1,115)3,000 Ausnutria Dairy Corp Ltd Citibank 56
10,000 Ausnutria Dairy Corp Ltd HSBC 7813,000 Ausnutria Dairy Corp Ltd JP Morgan (23)
(150,000) AviChina Industry &Technology Co Ltd ’H’ Citibank (6,397)
(63,000) AviChina Industry &Technology Co Ltd ’H’ JP Morgan (3,888)
(660,000) Bank of China Ltd ’H’ Citibank 280(18,000) Bank of China Ltd ’H’ HSBC 23(39,000) Bank of Communications
Co Ltd ’H’ Citibank (458)(3,400) Bank of East Asia Ltd Citibank 533
(800) Bank of East Asia Ltd HSBC 226(2,400) Bank of East Asia Ltd JP Morgan 560
(46,000) Beijing Capital InternationalAirport Co Ltd ’H’ Citibank (125)
(13,000) Beijing Enterprises HoldingsLtd Citibank (1,099)
Holding Description Counterparty
Netunrealised
appreciation/(depreciation)
USD
Hong Kong continued(500) Beijing Enterprises Holdings
Ltd JP Morgan 85(16,000) Beijing Enterprises Water
Group Ltd HSBC (18)(8,000) Beijing North Star Co Ltd ’H’ Citibank (124)(7,000) Beijing Tong Ren Tang
Chinese Medicine Co Ltd JP Morgan 1,30417,500 BOC Hong Kong Holdings
Ltd Citibank (1,470)7,500 BOC Hong Kong Holdings
Ltd HSBC (316)54,500 BOC Hong Kong Holdings
Ltd JP Morgan (17,296)14,000 Bosideng International
Holdings Ltd Citibank 1910,000 Bosideng International
Holdings Ltd HSBC (362)80,000 Bosideng International
Holdings Ltd JP Morgan (2,899)(106,000) Brilliance China Automotive
Holdings Ltd Citibank (294)(2,000) Brilliance China Automotive
Holdings Ltd HSBC 189(26,700) Budweiser Brewing Co
APAC Ltd Citibank (5,180)(26,200) Budweiser Brewing Co
APAC Ltd JP Morgan 2,231(13,000) BYD Electronic International
Co Ltd Citibank 732(1,000) C&D International
Investment Group Ltd Citibank 2(3,000) C&D International
Investment Group Ltd HSBC 597(34,000) C&D International
Investment Group Ltd JP Morgan 6,775(4,000) Cafe de Coral Holdings Ltd Citibank 122
(12,000) Cafe de Coral Holdings Ltd HSBC 3,445(1,000) Canvest Environmental
Protection Group Co Ltd Citibank 8(44,000) Canvest Environmental
Protection Group Co Ltd JP Morgan 1,0872,000 Central China Real Estate
Ltd Citibank 414,000 Central China Real Estate
Ltd HSBC (264)61,000 Central China Real Estate
Ltd JP Morgan (4,003)37,000 CGN Power Co Ltd ’H’ Citibank 28858,000 CGN Power Co Ltd ’H’ HSBC (304)48,000 CGN Power Co Ltd ’H’ JP Morgan (253)1,000 China Aoyuan Group Ltd JP Morgan (136)
(406,000) China Cinda AssetManagement Co Ltd ’H’ Citibank 507
(2,000) China Cinda AssetManagement Co Ltd ’H’ JP Morgan 18
(84,000) China CommunicationsConstruction Co Ltd ’H’ Citibank (3,369)
(11,000) China CommunicationsConstruction Co Ltd ’H’ JP Morgan 174
8,000 China CommunicationsServices Corp Ltd ’H’ Citibank (81)
6,500 China Conch VentureHoldings Ltd Citibank (287)
11,500 China Conch VentureHoldings Ltd JP Morgan (24)
(79,000) China Construction BankCorp ’H’ Citibank (284)
BlackRock Asia Pacific Diversified Equity Absolute ReturnFund continued
The notes on pages 691 to 711 form an integral part of these financial statements.
BlackRock Strategic Funds[220]
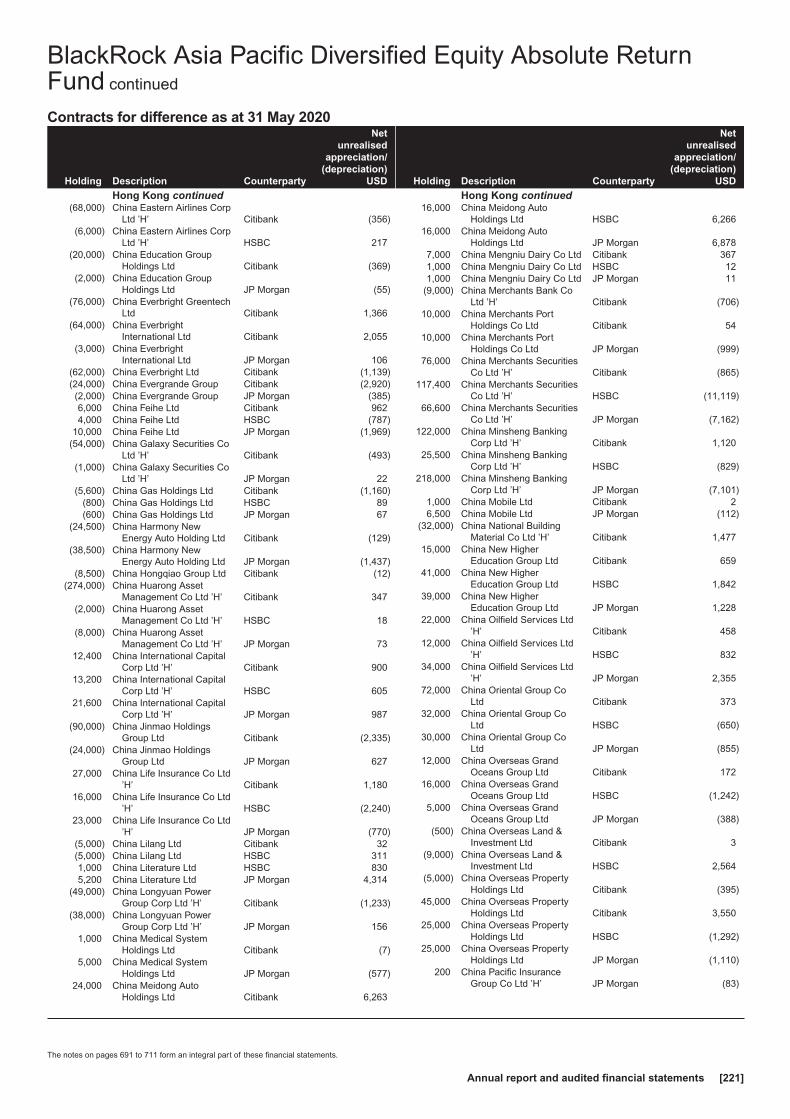
Contracts for difference as at 31 May 2020
Holding Description Counterparty
Netunrealised
appreciation/(depreciation)
USD
Hong Kong continued(68,000) China Eastern Airlines Corp
Ltd ’H’ Citibank (356)(6,000) China Eastern Airlines Corp
Ltd ’H’ HSBC 217(20,000) China Education Group
Holdings Ltd Citibank (369)(2,000) China Education Group
Holdings Ltd JP Morgan (55)(76,000) China Everbright Greentech
Ltd Citibank 1,366(64,000) China Everbright
International Ltd Citibank 2,055(3,000) China Everbright
International Ltd JP Morgan 106(62,000) China Everbright Ltd Citibank (1,139)(24,000) China Evergrande Group Citibank (2,920)(2,000) China Evergrande Group JP Morgan (385)6,000 China Feihe Ltd Citibank 9624,000 China Feihe Ltd HSBC (787)
10,000 China Feihe Ltd JP Morgan (1,969)(54,000) China Galaxy Securities Co
Ltd ’H’ Citibank (493)(1,000) China Galaxy Securities Co
Ltd ’H’ JP Morgan 22(5,600) China Gas Holdings Ltd Citibank (1,160)
(800) China Gas Holdings Ltd HSBC 89(600) China Gas Holdings Ltd JP Morgan 67
(24,500) China Harmony NewEnergy Auto Holding Ltd Citibank (129)
(38,500) China Harmony NewEnergy Auto Holding Ltd JP Morgan (1,437)
(8,500) China Hongqiao Group Ltd Citibank (12)(274,000) China Huarong Asset
Management Co Ltd ’H’ Citibank 347(2,000) China Huarong Asset
Management Co Ltd ’H’ HSBC 18(8,000) China Huarong Asset
Management Co Ltd ’H’ JP Morgan 7312,400 China International Capital
Corp Ltd ’H’ Citibank 90013,200 China International Capital
Corp Ltd ’H’ HSBC 60521,600 China International Capital
Corp Ltd ’H’ JP Morgan 987(90,000) China Jinmao Holdings
Group Ltd Citibank (2,335)(24,000) China Jinmao Holdings
Group Ltd JP Morgan 62727,000 China Life Insurance Co Ltd
’H’ Citibank 1,18016,000 China Life Insurance Co Ltd
’H’ HSBC (2,240)23,000 China Life Insurance Co Ltd
’H’ JP Morgan (770)(5,000) China Lilang Ltd Citibank 32(5,000) China Lilang Ltd HSBC 3111,000 China Literature Ltd HSBC 8305,200 China Literature Ltd JP Morgan 4,314
(49,000) China Longyuan PowerGroup Corp Ltd ’H’ Citibank (1,233)
(38,000) China Longyuan PowerGroup Corp Ltd ’H’ JP Morgan 156
1,000 China Medical SystemHoldings Ltd Citibank (7)
5,000 China Medical SystemHoldings Ltd JP Morgan (577)
24,000 China Meidong AutoHoldings Ltd Citibank 6,263
Holding Description Counterparty
Netunrealised
appreciation/(depreciation)
USD
Hong Kong continued16,000 China Meidong Auto
Holdings Ltd HSBC 6,26616,000 China Meidong Auto
Holdings Ltd JP Morgan 6,8787,000 China Mengniu Dairy Co Ltd Citibank 3671,000 China Mengniu Dairy Co Ltd HSBC 121,000 China Mengniu Dairy Co Ltd JP Morgan 11
(9,000) China Merchants Bank CoLtd ’H’ Citibank (706)
10,000 China Merchants PortHoldings Co Ltd Citibank 54
10,000 China Merchants PortHoldings Co Ltd JP Morgan (999)
76,000 China Merchants SecuritiesCo Ltd ’H’ Citibank (865)
117,400 China Merchants SecuritiesCo Ltd ’H’ HSBC (11,119)
66,600 China Merchants SecuritiesCo Ltd ’H’ JP Morgan (7,162)
122,000 China Minsheng BankingCorp Ltd ’H’ Citibank 1,120
25,500 China Minsheng BankingCorp Ltd ’H’ HSBC (829)
218,000 China Minsheng BankingCorp Ltd ’H’ JP Morgan (7,101)
1,000 China Mobile Ltd Citibank 26,500 China Mobile Ltd JP Morgan (112)
(32,000) China National BuildingMaterial Co Ltd ’H’ Citibank 1,477
15,000 China New HigherEducation Group Ltd Citibank 659
41,000 China New HigherEducation Group Ltd HSBC 1,842
39,000 China New HigherEducation Group Ltd JP Morgan 1,228
22,000 China Oilfield Services Ltd’H’ Citibank 458
12,000 China Oilfield Services Ltd’H’ HSBC 832
34,000 China Oilfield Services Ltd’H’ JP Morgan 2,355
72,000 China Oriental Group CoLtd Citibank 373
32,000 China Oriental Group CoLtd HSBC (650)
30,000 China Oriental Group CoLtd JP Morgan (855)
12,000 China Overseas GrandOceans Group Ltd Citibank 172
16,000 China Overseas GrandOceans Group Ltd HSBC (1,242)
5,000 China Overseas GrandOceans Group Ltd JP Morgan (388)
(500) China Overseas Land &Investment Ltd Citibank 3
(9,000) China Overseas Land &Investment Ltd HSBC 2,564
(5,000) China Overseas PropertyHoldings Ltd Citibank (395)
45,000 China Overseas PropertyHoldings Ltd Citibank 3,550
25,000 China Overseas PropertyHoldings Ltd HSBC (1,292)
25,000 China Overseas PropertyHoldings Ltd JP Morgan (1,110)
200 China Pacific InsuranceGroup Co Ltd ’H’ JP Morgan (83)
BlackRock Asia Pacific Diversified Equity Absolute ReturnFund continued
The notes on pages 691 to 711 form an integral part of these financial statements.
Annual report and audited financial statements [221]
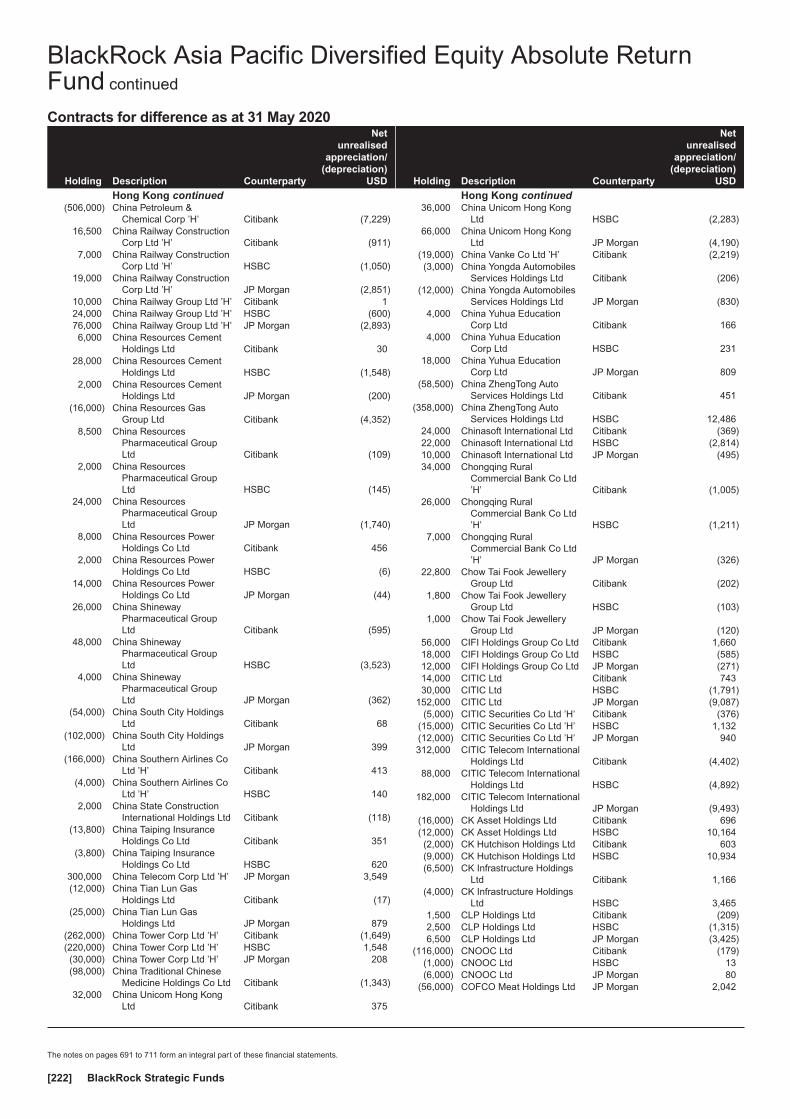
Contracts for difference as at 31 May 2020
Holding Description Counterparty
Netunrealised
appreciation/(depreciation)
USD
Hong Kong continued(506,000) China Petroleum &
Chemical Corp ’H’ Citibank (7,229)16,500 China Railway Construction
Corp Ltd ’H’ Citibank (911)7,000 China Railway Construction
Corp Ltd ’H’ HSBC (1,050)19,000 China Railway Construction
Corp Ltd ’H’ JP Morgan (2,851)10,000 China Railway Group Ltd ’H’ Citibank 124,000 China Railway Group Ltd ’H’ HSBC (600)76,000 China Railway Group Ltd ’H’ JP Morgan (2,893)6,000 China Resources Cement
Holdings Ltd Citibank 3028,000 China Resources Cement
Holdings Ltd HSBC (1,548)2,000 China Resources Cement
Holdings Ltd JP Morgan (200)(16,000) China Resources Gas
Group Ltd Citibank (4,352)8,500 China Resources
Pharmaceutical GroupLtd Citibank (109)
2,000 China ResourcesPharmaceutical GroupLtd HSBC (145)
24,000 China ResourcesPharmaceutical GroupLtd JP Morgan (1,740)
8,000 China Resources PowerHoldings Co Ltd Citibank 456
2,000 China Resources PowerHoldings Co Ltd HSBC (6)
14,000 China Resources PowerHoldings Co Ltd JP Morgan (44)
26,000 China ShinewayPharmaceutical GroupLtd Citibank (595)
48,000 China ShinewayPharmaceutical GroupLtd HSBC (3,523)
4,000 China ShinewayPharmaceutical GroupLtd JP Morgan (362)
(54,000) China South City HoldingsLtd Citibank 68
(102,000) China South City HoldingsLtd JP Morgan 399
(166,000) China Southern Airlines CoLtd ’H’ Citibank 413
(4,000) China Southern Airlines CoLtd ’H’ HSBC 140
2,000 China State ConstructionInternational Holdings Ltd Citibank (118)
(13,800) China Taiping InsuranceHoldings Co Ltd Citibank 351
(3,800) China Taiping InsuranceHoldings Co Ltd HSBC 620
300,000 China Telecom Corp Ltd ’H’ JP Morgan 3,549(12,000) China Tian Lun Gas
Holdings Ltd Citibank (17)(25,000) China Tian Lun Gas
Holdings Ltd JP Morgan 879(262,000) China Tower Corp Ltd ’H’ Citibank (1,649)(220,000) China Tower Corp Ltd ’H’ HSBC 1,548(30,000) China Tower Corp Ltd ’H’ JP Morgan 208(98,000) China Traditional Chinese
Medicine Holdings Co Ltd Citibank (1,343)32,000 China Unicom Hong Kong
Ltd Citibank 375
Holding Description Counterparty
Netunrealised
appreciation/(depreciation)
USD
Hong Kong continued36,000 China Unicom Hong Kong
Ltd HSBC (2,283)66,000 China Unicom Hong Kong
Ltd JP Morgan (4,190)(19,000) China Vanke Co Ltd ’H’ Citibank (2,219)(3,000) China Yongda Automobiles
Services Holdings Ltd Citibank (206)(12,000) China Yongda Automobiles
Services Holdings Ltd JP Morgan (830)4,000 China Yuhua Education
Corp Ltd Citibank 1664,000 China Yuhua Education
Corp Ltd HSBC 23118,000 China Yuhua Education
Corp Ltd JP Morgan 809(58,500) China ZhengTong Auto
Services Holdings Ltd Citibank 451(358,000) China ZhengTong Auto
Services Holdings Ltd HSBC 12,48624,000 Chinasoft International Ltd Citibank (369)22,000 Chinasoft International Ltd HSBC (2,814)10,000 Chinasoft International Ltd JP Morgan (495)34,000 Chongqing Rural
Commercial Bank Co Ltd’H’ Citibank (1,005)
26,000 Chongqing RuralCommercial Bank Co Ltd’H’ HSBC (1,211)
7,000 Chongqing RuralCommercial Bank Co Ltd’H’ JP Morgan (326)
22,800 Chow Tai Fook JewelleryGroup Ltd Citibank (202)
1,800 Chow Tai Fook JewelleryGroup Ltd HSBC (103)
1,000 Chow Tai Fook JewelleryGroup Ltd JP Morgan (120)
56,000 CIFI Holdings Group Co Ltd Citibank 1,66018,000 CIFI Holdings Group Co Ltd HSBC (585)12,000 CIFI Holdings Group Co Ltd JP Morgan (271)14,000 CITIC Ltd Citibank 74330,000 CITIC Ltd HSBC (1,791)
152,000 CITIC Ltd JP Morgan (9,087)(5,000) CITIC Securities Co Ltd ’H’ Citibank (376)
(15,000) CITIC Securities Co Ltd ’H’ HSBC 1,132(12,000) CITIC Securities Co Ltd ’H’ JP Morgan 940312,000 CITIC Telecom International
Holdings Ltd Citibank (4,402)88,000 CITIC Telecom International
Holdings Ltd HSBC (4,892)182,000 CITIC Telecom International
Holdings Ltd JP Morgan (9,493)(16,000) CK Asset Holdings Ltd Citibank 696(12,000) CK Asset Holdings Ltd HSBC 10,164(2,000) CK Hutchison Holdings Ltd Citibank 603(9,000) CK Hutchison Holdings Ltd HSBC 10,934(6,500) CK Infrastructure Holdings
Ltd Citibank 1,166(4,000) CK Infrastructure Holdings
Ltd HSBC 3,4651,500 CLP Holdings Ltd Citibank (209)2,500 CLP Holdings Ltd HSBC (1,315)6,500 CLP Holdings Ltd JP Morgan (3,425)
(116,000) CNOOC Ltd Citibank (179)(1,000) CNOOC Ltd HSBC 13(6,000) CNOOC Ltd JP Morgan 80
(56,000) COFCO Meat Holdings Ltd JP Morgan 2,042
BlackRock Asia Pacific Diversified Equity Absolute ReturnFund continued
The notes on pages 691 to 711 form an integral part of these financial statements.
BlackRock Strategic Funds[222]
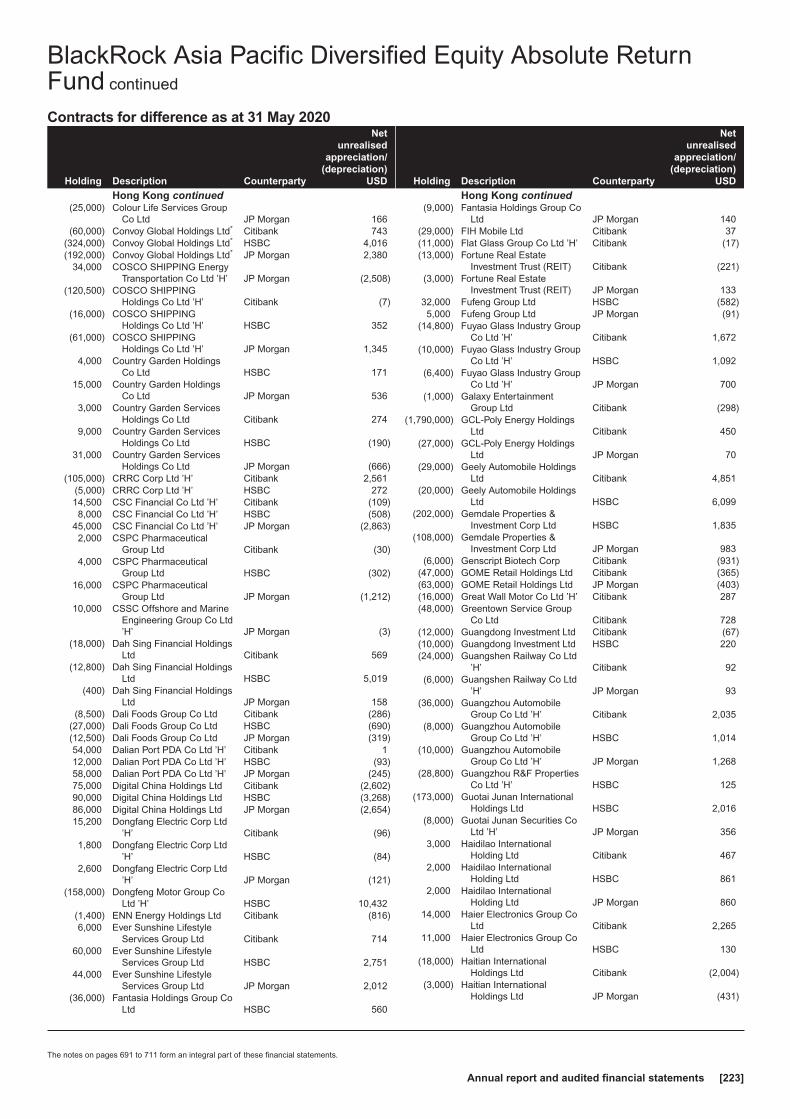
Contracts for difference as at 31 May 2020
Holding Description Counterparty
Netunrealised
appreciation/(depreciation)
USD
Hong Kong continued(25,000) Colour Life Services Group
Co Ltd JP Morgan 166(60,000) Convoy Global Holdings Ltd* Citibank 743
(324,000) Convoy Global Holdings Ltd* HSBC 4,016(192,000) Convoy Global Holdings Ltd* JP Morgan 2,380
34,000 COSCO SHIPPING EnergyTransportation Co Ltd ’H’ JP Morgan (2,508)
(120,500) COSCO SHIPPINGHoldings Co Ltd ’H’ Citibank (7)
(16,000) COSCO SHIPPINGHoldings Co Ltd ’H’ HSBC 352
(61,000) COSCO SHIPPINGHoldings Co Ltd ’H’ JP Morgan 1,345
4,000 Country Garden HoldingsCo Ltd HSBC 171
15,000 Country Garden HoldingsCo Ltd JP Morgan 536
3,000 Country Garden ServicesHoldings Co Ltd Citibank 274
9,000 Country Garden ServicesHoldings Co Ltd HSBC (190)
31,000 Country Garden ServicesHoldings Co Ltd JP Morgan (666)
(105,000) CRRC Corp Ltd ’H’ Citibank 2,561(5,000) CRRC Corp Ltd ’H’ HSBC 27214,500 CSC Financial Co Ltd ’H’ Citibank (109)8,000 CSC Financial Co Ltd ’H’ HSBC (508)
45,000 CSC Financial Co Ltd ’H’ JP Morgan (2,863)2,000 CSPC Pharmaceutical
Group Ltd Citibank (30)4,000 CSPC Pharmaceutical
Group Ltd HSBC (302)16,000 CSPC Pharmaceutical
Group Ltd JP Morgan (1,212)10,000 CSSC Offshore and Marine
Engineering Group Co Ltd’H’ JP Morgan (3)
(18,000) Dah Sing Financial HoldingsLtd Citibank 569
(12,800) Dah Sing Financial HoldingsLtd HSBC 5,019
(400) Dah Sing Financial HoldingsLtd JP Morgan 158
(8,500) Dali Foods Group Co Ltd Citibank (286)(27,000) Dali Foods Group Co Ltd HSBC (690)(12,500) Dali Foods Group Co Ltd JP Morgan (319)54,000 Dalian Port PDA Co Ltd ’H’ Citibank 112,000 Dalian Port PDA Co Ltd ’H’ HSBC (93)58,000 Dalian Port PDA Co Ltd ’H’ JP Morgan (245)75,000 Digital China Holdings Ltd Citibank (2,602)90,000 Digital China Holdings Ltd HSBC (3,268)86,000 Digital China Holdings Ltd JP Morgan (2,654)15,200 Dongfang Electric Corp Ltd
’H’ Citibank (96)1,800 Dongfang Electric Corp Ltd
’H’ HSBC (84)2,600 Dongfang Electric Corp Ltd
’H’ JP Morgan (121)(158,000) Dongfeng Motor Group Co
Ltd ’H’ HSBC 10,432(1,400) ENN Energy Holdings Ltd Citibank (816)6,000 Ever Sunshine Lifestyle
Services Group Ltd Citibank 71460,000 Ever Sunshine Lifestyle
Services Group Ltd HSBC 2,75144,000 Ever Sunshine Lifestyle
Services Group Ltd JP Morgan 2,012(36,000) Fantasia Holdings Group Co
Ltd HSBC 560
Holding Description Counterparty
Netunrealised
appreciation/(depreciation)
USD
Hong Kong continued(9,000) Fantasia Holdings Group Co
Ltd JP Morgan 140(29,000) FIH Mobile Ltd Citibank 37(11,000) Flat Glass Group Co Ltd ’H’ Citibank (17)(13,000) Fortune Real Estate
Investment Trust (REIT) Citibank (221)(3,000) Fortune Real Estate
Investment Trust (REIT) JP Morgan 13332,000 Fufeng Group Ltd HSBC (582)5,000 Fufeng Group Ltd JP Morgan (91)
(14,800) Fuyao Glass Industry GroupCo Ltd ’H’ Citibank 1,672
(10,000) Fuyao Glass Industry GroupCo Ltd ’H’ HSBC 1,092
(6,400) Fuyao Glass Industry GroupCo Ltd ’H’ JP Morgan 700
(1,000) Galaxy EntertainmentGroup Ltd Citibank (298)
(1,790,000) GCL-Poly Energy HoldingsLtd Citibank 450
(27,000) GCL-Poly Energy HoldingsLtd JP Morgan 70
(29,000) Geely Automobile HoldingsLtd Citibank 4,851
(20,000) Geely Automobile HoldingsLtd HSBC 6,099
(202,000) Gemdale Properties &Investment Corp Ltd HSBC 1,835
(108,000) Gemdale Properties &Investment Corp Ltd JP Morgan 983
(6,000) Genscript Biotech Corp Citibank (931)(47,000) GOME Retail Holdings Ltd Citibank (365)(63,000) GOME Retail Holdings Ltd JP Morgan (403)(16,000) Great Wall Motor Co Ltd ’H’ Citibank 287(48,000) Greentown Service Group
Co Ltd Citibank 728(12,000) Guangdong Investment Ltd Citibank (67)(10,000) Guangdong Investment Ltd HSBC 220(24,000) Guangshen Railway Co Ltd
’H’ Citibank 92(6,000) Guangshen Railway Co Ltd
’H’ JP Morgan 93(36,000) Guangzhou Automobile
Group Co Ltd ’H’ Citibank 2,035(8,000) Guangzhou Automobile
Group Co Ltd ’H’ HSBC 1,014(10,000) Guangzhou Automobile
Group Co Ltd ’H’ JP Morgan 1,268(28,800) Guangzhou R&F Properties
Co Ltd ’H’ HSBC 125(173,000) Guotai Junan International
Holdings Ltd HSBC 2,016(8,000) Guotai Junan Securities Co
Ltd ’H’ JP Morgan 3563,000 Haidilao International
Holding Ltd Citibank 4672,000 Haidilao International
Holding Ltd HSBC 8612,000 Haidilao International
Holding Ltd JP Morgan 86014,000 Haier Electronics Group Co
Ltd Citibank 2,26511,000 Haier Electronics Group Co
Ltd HSBC 130(18,000) Haitian International
Holdings Ltd Citibank (2,004)(3,000) Haitian International
Holdings Ltd JP Morgan (431)
BlackRock Asia Pacific Diversified Equity Absolute ReturnFund continued
The notes on pages 691 to 711 form an integral part of these financial statements.
Annual report and audited financial statements [223]
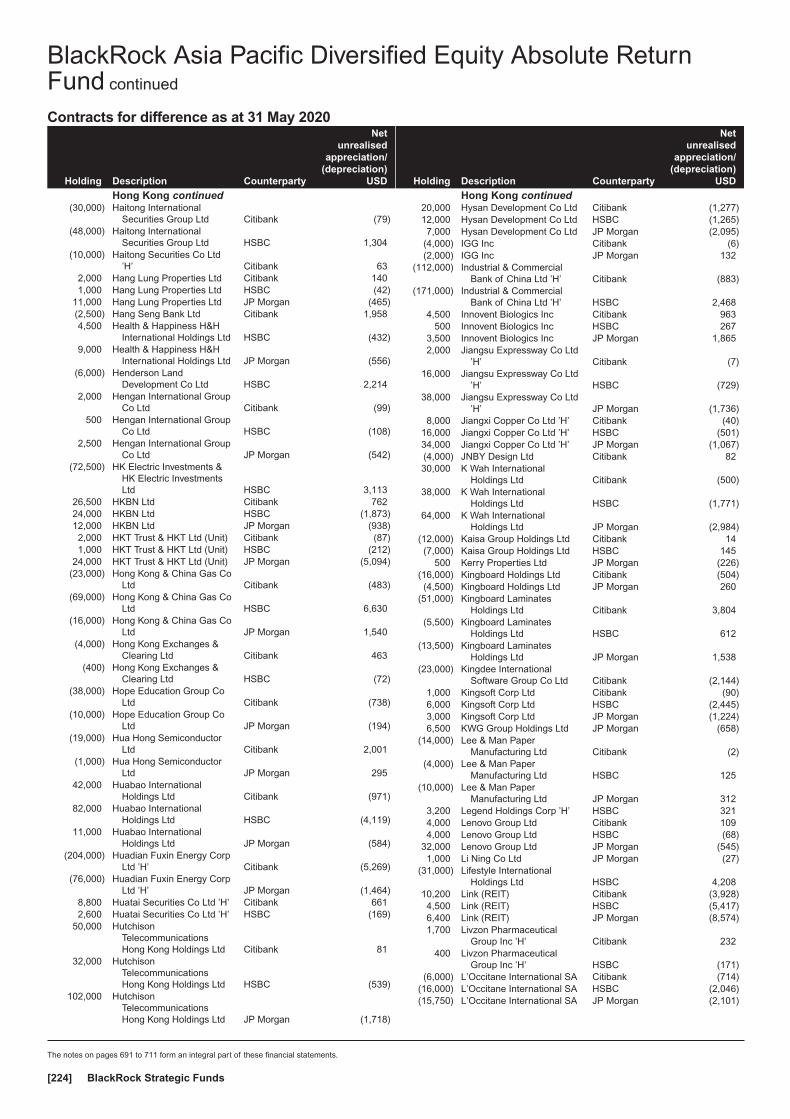
Contracts for difference as at 31 May 2020
Holding Description Counterparty
Netunrealised
appreciation/(depreciation)
USD
Hong Kong continued(30,000) Haitong International
Securities Group Ltd Citibank (79)(48,000) Haitong International
Securities Group Ltd HSBC 1,304(10,000) Haitong Securities Co Ltd
’H’ Citibank 632,000 Hang Lung Properties Ltd Citibank 1401,000 Hang Lung Properties Ltd HSBC (42)
11,000 Hang Lung Properties Ltd JP Morgan (465)(2,500) Hang Seng Bank Ltd Citibank 1,9584,500 Health & Happiness H&H
International Holdings Ltd HSBC (432)9,000 Health & Happiness H&H
International Holdings Ltd JP Morgan (556)(6,000) Henderson Land
Development Co Ltd HSBC 2,2142,000 Hengan International Group
Co Ltd Citibank (99)500 Hengan International Group
Co Ltd HSBC (108)2,500 Hengan International Group
Co Ltd JP Morgan (542)(72,500) HK Electric Investments &
HK Electric InvestmentsLtd HSBC 3,113
26,500 HKBN Ltd Citibank 76224,000 HKBN Ltd HSBC (1,873)12,000 HKBN Ltd JP Morgan (938)2,000 HKT Trust & HKT Ltd (Unit) Citibank (87)1,000 HKT Trust & HKT Ltd (Unit) HSBC (212)
24,000 HKT Trust & HKT Ltd (Unit) JP Morgan (5,094)(23,000) Hong Kong & China Gas Co
Ltd Citibank (483)(69,000) Hong Kong & China Gas Co
Ltd HSBC 6,630(16,000) Hong Kong & China Gas Co
Ltd JP Morgan 1,540(4,000) Hong Kong Exchanges &
Clearing Ltd Citibank 463(400) Hong Kong Exchanges &
Clearing Ltd HSBC (72)(38,000) Hope Education Group Co
Ltd Citibank (738)(10,000) Hope Education Group Co
Ltd JP Morgan (194)(19,000) Hua Hong Semiconductor
Ltd Citibank 2,001(1,000) Hua Hong Semiconductor
Ltd JP Morgan 29542,000 Huabao International
Holdings Ltd Citibank (971)82,000 Huabao International
Holdings Ltd HSBC (4,119)11,000 Huabao International
Holdings Ltd JP Morgan (584)(204,000) Huadian Fuxin Energy Corp
Ltd ’H’ Citibank (5,269)(76,000) Huadian Fuxin Energy Corp
Ltd ’H’ JP Morgan (1,464)8,800 Huatai Securities Co Ltd ’H’ Citibank 6612,600 Huatai Securities Co Ltd ’H’ HSBC (169)
50,000 HutchisonTelecommunicationsHong Kong Holdings Ltd Citibank 81
32,000 HutchisonTelecommunicationsHong Kong Holdings Ltd HSBC (539)
102,000 HutchisonTelecommunicationsHong Kong Holdings Ltd JP Morgan (1,718)
Holding Description Counterparty
Netunrealised
appreciation/(depreciation)
USD
Hong Kong continued20,000 Hysan Development Co Ltd Citibank (1,277)12,000 Hysan Development Co Ltd HSBC (1,265)7,000 Hysan Development Co Ltd JP Morgan (2,095)
(4,000) IGG Inc Citibank (6)(2,000) IGG Inc JP Morgan 132
(112,000) Industrial & CommercialBank of China Ltd ’H’ Citibank (883)
(171,000) Industrial & CommercialBank of China Ltd ’H’ HSBC 2,468
4,500 Innovent Biologics Inc Citibank 963500 Innovent Biologics Inc HSBC 267
3,500 Innovent Biologics Inc JP Morgan 1,8652,000 Jiangsu Expressway Co Ltd
’H’ Citibank (7)16,000 Jiangsu Expressway Co Ltd
’H’ HSBC (729)38,000 Jiangsu Expressway Co Ltd
’H’ JP Morgan (1,736)8,000 Jiangxi Copper Co Ltd ’H’ Citibank (40)
16,000 Jiangxi Copper Co Ltd ’H’ HSBC (501)34,000 Jiangxi Copper Co Ltd ’H’ JP Morgan (1,067)(4,000) JNBY Design Ltd Citibank 8230,000 K Wah International
Holdings Ltd Citibank (500)38,000 K Wah International
Holdings Ltd HSBC (1,771)64,000 K Wah International
Holdings Ltd JP Morgan (2,984)(12,000) Kaisa Group Holdings Ltd Citibank 14(7,000) Kaisa Group Holdings Ltd HSBC 145
500 Kerry Properties Ltd JP Morgan (226)(16,000) Kingboard Holdings Ltd Citibank (504)(4,500) Kingboard Holdings Ltd JP Morgan 260
(51,000) Kingboard LaminatesHoldings Ltd Citibank 3,804
(5,500) Kingboard LaminatesHoldings Ltd HSBC 612
(13,500) Kingboard LaminatesHoldings Ltd JP Morgan 1,538
(23,000) Kingdee InternationalSoftware Group Co Ltd Citibank (2,144)
1,000 Kingsoft Corp Ltd Citibank (90)6,000 Kingsoft Corp Ltd HSBC (2,445)3,000 Kingsoft Corp Ltd JP Morgan (1,224)6,500 KWG Group Holdings Ltd JP Morgan (658)
(14,000) Lee & Man PaperManufacturing Ltd Citibank (2)
(4,000) Lee & Man PaperManufacturing Ltd HSBC 125
(10,000) Lee & Man PaperManufacturing Ltd JP Morgan 312
3,200 Legend Holdings Corp ’H’ HSBC 3214,000 Lenovo Group Ltd Citibank 1094,000 Lenovo Group Ltd HSBC (68)
32,000 Lenovo Group Ltd JP Morgan (545)1,000 Li Ning Co Ltd JP Morgan (27)
(31,000) Lifestyle InternationalHoldings Ltd HSBC 4,208
10,200 Link (REIT) Citibank (3,928)4,500 Link (REIT) HSBC (5,417)6,400 Link (REIT) JP Morgan (8,574)1,700 Livzon Pharmaceutical
Group Inc ’H’ Citibank 232400 Livzon Pharmaceutical
Group Inc ’H’ HSBC (171)(6,000) L’Occitane International SA Citibank (714)
(16,000) L’Occitane International SA HSBC (2,046)(15,750) L’Occitane International SA JP Morgan (2,101)
BlackRock Asia Pacific Diversified Equity Absolute ReturnFund continued
The notes on pages 691 to 711 form an integral part of these financial statements.
BlackRock Strategic Funds[224]
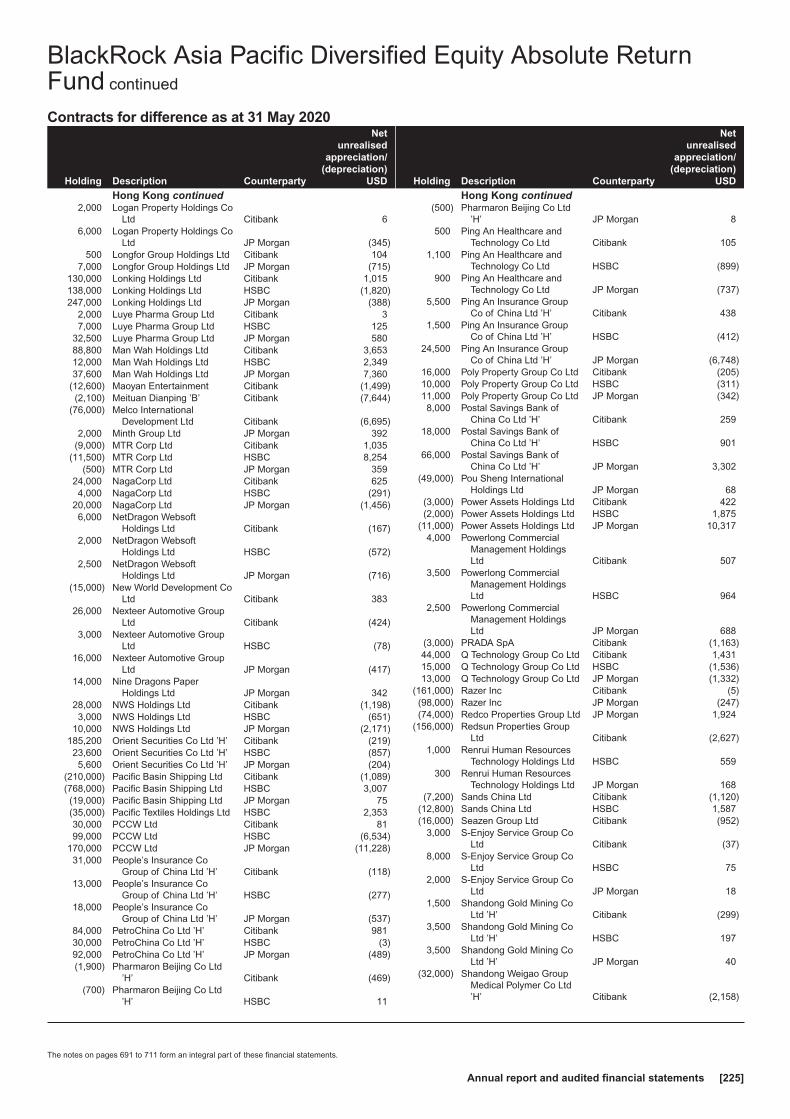
Contracts for difference as at 31 May 2020
Holding Description Counterparty
Netunrealised
appreciation/(depreciation)
USD
Hong Kong continued2,000 Logan Property Holdings Co
Ltd Citibank 66,000 Logan Property Holdings Co
Ltd JP Morgan (345)500 Longfor Group Holdings Ltd Citibank 104
7,000 Longfor Group Holdings Ltd JP Morgan (715)130,000 Lonking Holdings Ltd Citibank 1,015138,000 Lonking Holdings Ltd HSBC (1,820)247,000 Lonking Holdings Ltd JP Morgan (388)
2,000 Luye Pharma Group Ltd Citibank 37,000 Luye Pharma Group Ltd HSBC 125
32,500 Luye Pharma Group Ltd JP Morgan 58088,800 Man Wah Holdings Ltd Citibank 3,65312,000 Man Wah Holdings Ltd HSBC 2,34937,600 Man Wah Holdings Ltd JP Morgan 7,360
(12,600) Maoyan Entertainment Citibank (1,499)(2,100) Meituan Dianping ’B’ Citibank (7,644)
(76,000) Melco InternationalDevelopment Ltd Citibank (6,695)
2,000 Minth Group Ltd JP Morgan 392(9,000) MTR Corp Ltd Citibank 1,035
(11,500) MTR Corp Ltd HSBC 8,254(500) MTR Corp Ltd JP Morgan 359
24,000 NagaCorp Ltd Citibank 6254,000 NagaCorp Ltd HSBC (291)
20,000 NagaCorp Ltd JP Morgan (1,456)6,000 NetDragon Websoft
Holdings Ltd Citibank (167)2,000 NetDragon Websoft
Holdings Ltd HSBC (572)2,500 NetDragon Websoft
Holdings Ltd JP Morgan (716)(15,000) New World Development Co
Ltd Citibank 38326,000 Nexteer Automotive Group
Ltd Citibank (424)3,000 Nexteer Automotive Group
Ltd HSBC (78)16,000 Nexteer Automotive Group
Ltd JP Morgan (417)14,000 Nine Dragons Paper
Holdings Ltd JP Morgan 34228,000 NWS Holdings Ltd Citibank (1,198)3,000 NWS Holdings Ltd HSBC (651)
10,000 NWS Holdings Ltd JP Morgan (2,171)185,200 Orient Securities Co Ltd ’H’ Citibank (219)23,600 Orient Securities Co Ltd ’H’ HSBC (857)5,600 Orient Securities Co Ltd ’H’ JP Morgan (204)
(210,000) Pacific Basin Shipping Ltd Citibank (1,089)(768,000) Pacific Basin Shipping Ltd HSBC 3,007(19,000) Pacific Basin Shipping Ltd JP Morgan 75(35,000) Pacific Textiles Holdings Ltd HSBC 2,35330,000 PCCW Ltd Citibank 8199,000 PCCW Ltd HSBC (6,534)
170,000 PCCW Ltd JP Morgan (11,228)31,000 People’s Insurance Co
Group of China Ltd ’H’ Citibank (118)13,000 People’s Insurance Co
Group of China Ltd ’H’ HSBC (277)18,000 People’s Insurance Co
Group of China Ltd ’H’ JP Morgan (537)84,000 PetroChina Co Ltd ’H’ Citibank 98130,000 PetroChina Co Ltd ’H’ HSBC (3)92,000 PetroChina Co Ltd ’H’ JP Morgan (489)(1,900) Pharmaron Beijing Co Ltd
’H’ Citibank (469)(700) Pharmaron Beijing Co Ltd
’H’ HSBC 11
Holding Description Counterparty
Netunrealised
appreciation/(depreciation)
USD
Hong Kong continued(500) Pharmaron Beijing Co Ltd
’H’ JP Morgan 8500 Ping An Healthcare and
Technology Co Ltd Citibank 1051,100 Ping An Healthcare and
Technology Co Ltd HSBC (899)900 Ping An Healthcare and
Technology Co Ltd JP Morgan (737)5,500 Ping An Insurance Group
Co of China Ltd ’H’ Citibank 4381,500 Ping An Insurance Group
Co of China Ltd ’H’ HSBC (412)24,500 Ping An Insurance Group
Co of China Ltd ’H’ JP Morgan (6,748)16,000 Poly Property Group Co Ltd Citibank (205)10,000 Poly Property Group Co Ltd HSBC (311)11,000 Poly Property Group Co Ltd JP Morgan (342)8,000 Postal Savings Bank of
China Co Ltd ’H’ Citibank 25918,000 Postal Savings Bank of
China Co Ltd ’H’ HSBC 90166,000 Postal Savings Bank of
China Co Ltd ’H’ JP Morgan 3,302(49,000) Pou Sheng International
Holdings Ltd JP Morgan 68(3,000) Power Assets Holdings Ltd Citibank 422(2,000) Power Assets Holdings Ltd HSBC 1,875
(11,000) Power Assets Holdings Ltd JP Morgan 10,3174,000 Powerlong Commercial
Management HoldingsLtd Citibank 507
3,500 Powerlong CommercialManagement HoldingsLtd HSBC 964
2,500 Powerlong CommercialManagement HoldingsLtd JP Morgan 688
(3,000) PRADA SpA Citibank (1,163)44,000 Q Technology Group Co Ltd Citibank 1,43115,000 Q Technology Group Co Ltd HSBC (1,536)13,000 Q Technology Group Co Ltd JP Morgan (1,332)
(161,000) Razer Inc Citibank (5)(98,000) Razer Inc JP Morgan (247)(74,000) Redco Properties Group Ltd JP Morgan 1,924
(156,000) Redsun Properties GroupLtd Citibank (2,627)
1,000 Renrui Human ResourcesTechnology Holdings Ltd HSBC 559
300 Renrui Human ResourcesTechnology Holdings Ltd JP Morgan 168
(7,200) Sands China Ltd Citibank (1,120)(12,800) Sands China Ltd HSBC 1,587(16,000) Seazen Group Ltd Citibank (952)
3,000 S-Enjoy Service Group CoLtd Citibank (37)
8,000 S-Enjoy Service Group CoLtd HSBC 75
2,000 S-Enjoy Service Group CoLtd JP Morgan 18
1,500 Shandong Gold Mining CoLtd ’H’ Citibank (299)
3,500 Shandong Gold Mining CoLtd ’H’ HSBC 197
3,500 Shandong Gold Mining CoLtd ’H’ JP Morgan 40
(32,000) Shandong Weigao GroupMedical Polymer Co Ltd’H’ Citibank (2,158)
BlackRock Asia Pacific Diversified Equity Absolute ReturnFund continued
The notes on pages 691 to 711 form an integral part of these financial statements.
Annual report and audited financial statements [225]
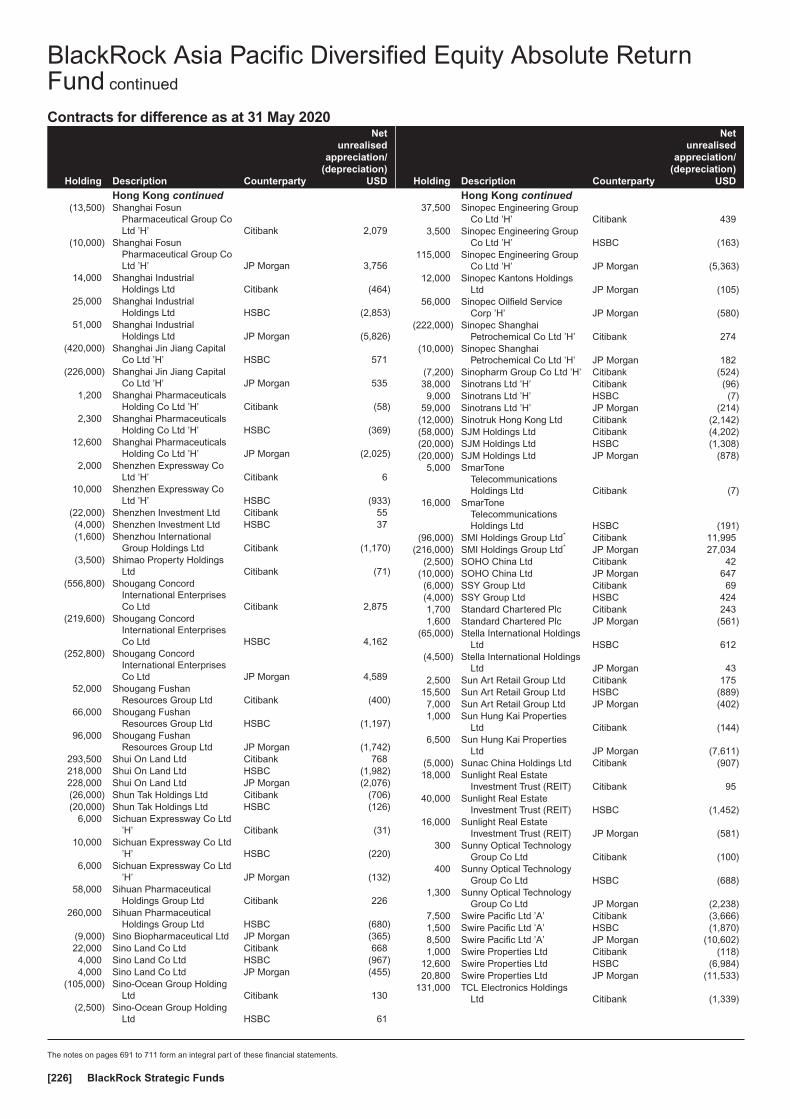
Contracts for difference as at 31 May 2020
Holding Description Counterparty
Netunrealised
appreciation/(depreciation)
USD
Hong Kong continued(13,500) Shanghai Fosun
Pharmaceutical Group CoLtd ’H’ Citibank 2,079
(10,000) Shanghai FosunPharmaceutical Group CoLtd ’H’ JP Morgan 3,756
14,000 Shanghai IndustrialHoldings Ltd Citibank (464)
25,000 Shanghai IndustrialHoldings Ltd HSBC (2,853)
51,000 Shanghai IndustrialHoldings Ltd JP Morgan (5,826)
(420,000) Shanghai Jin Jiang CapitalCo Ltd ’H’ HSBC 571
(226,000) Shanghai Jin Jiang CapitalCo Ltd ’H’ JP Morgan 535
1,200 Shanghai PharmaceuticalsHolding Co Ltd ’H’ Citibank (58)
2,300 Shanghai PharmaceuticalsHolding Co Ltd ’H’ HSBC (369)
12,600 Shanghai PharmaceuticalsHolding Co Ltd ’H’ JP Morgan (2,025)
2,000 Shenzhen Expressway CoLtd ’H’ Citibank 6
10,000 Shenzhen Expressway CoLtd ’H’ HSBC (933)
(22,000) Shenzhen Investment Ltd Citibank 55(4,000) Shenzhen Investment Ltd HSBC 37(1,600) Shenzhou International
Group Holdings Ltd Citibank (1,170)(3,500) Shimao Property Holdings
Ltd Citibank (71)(556,800) Shougang Concord
International EnterprisesCo Ltd Citibank 2,875
(219,600) Shougang ConcordInternational EnterprisesCo Ltd HSBC 4,162
(252,800) Shougang ConcordInternational EnterprisesCo Ltd JP Morgan 4,589
52,000 Shougang FushanResources Group Ltd Citibank (400)
66,000 Shougang FushanResources Group Ltd HSBC (1,197)
96,000 Shougang FushanResources Group Ltd JP Morgan (1,742)
293,500 Shui On Land Ltd Citibank 768218,000 Shui On Land Ltd HSBC (1,982)228,000 Shui On Land Ltd JP Morgan (2,076)(26,000) Shun Tak Holdings Ltd Citibank (706)(20,000) Shun Tak Holdings Ltd HSBC (126)
6,000 Sichuan Expressway Co Ltd’H’ Citibank (31)
10,000 Sichuan Expressway Co Ltd’H’ HSBC (220)
6,000 Sichuan Expressway Co Ltd’H’ JP Morgan (132)
58,000 Sihuan PharmaceuticalHoldings Group Ltd Citibank 226
260,000 Sihuan PharmaceuticalHoldings Group Ltd HSBC (680)
(9,000) Sino Biopharmaceutical Ltd JP Morgan (365)22,000 Sino Land Co Ltd Citibank 6684,000 Sino Land Co Ltd HSBC (967)4,000 Sino Land Co Ltd JP Morgan (455)
(105,000) Sino-Ocean Group HoldingLtd Citibank 130
(2,500) Sino-Ocean Group HoldingLtd HSBC 61
Holding Description Counterparty
Netunrealised
appreciation/(depreciation)
USD
Hong Kong continued37,500 Sinopec Engineering Group
Co Ltd ’H’ Citibank 4393,500 Sinopec Engineering Group
Co Ltd ’H’ HSBC (163)115,000 Sinopec Engineering Group
Co Ltd ’H’ JP Morgan (5,363)12,000 Sinopec Kantons Holdings
Ltd JP Morgan (105)56,000 Sinopec Oilfield Service
Corp ’H’ JP Morgan (580)(222,000) Sinopec Shanghai
Petrochemical Co Ltd ’H’ Citibank 274(10,000) Sinopec Shanghai
Petrochemical Co Ltd ’H’ JP Morgan 182(7,200) Sinopharm Group Co Ltd ’H’ Citibank (524)38,000 Sinotrans Ltd ’H’ Citibank (96)9,000 Sinotrans Ltd ’H’ HSBC (7)
59,000 Sinotrans Ltd ’H’ JP Morgan (214)(12,000) Sinotruk Hong Kong Ltd Citibank (2,142)(58,000) SJM Holdings Ltd Citibank (4,202)(20,000) SJM Holdings Ltd HSBC (1,308)(20,000) SJM Holdings Ltd JP Morgan (878)
5,000 SmarToneTelecommunicationsHoldings Ltd Citibank (7)
16,000 SmarToneTelecommunicationsHoldings Ltd HSBC (191)
(96,000) SMI Holdings Group Ltd* Citibank 11,995(216,000) SMI Holdings Group Ltd* JP Morgan 27,034
(2,500) SOHO China Ltd Citibank 42(10,000) SOHO China Ltd JP Morgan 647(6,000) SSY Group Ltd Citibank 69(4,000) SSY Group Ltd HSBC 4241,700 Standard Chartered Plc Citibank 2431,600 Standard Chartered Plc JP Morgan (561)
(65,000) Stella International HoldingsLtd HSBC 612
(4,500) Stella International HoldingsLtd JP Morgan 43
2,500 Sun Art Retail Group Ltd Citibank 17515,500 Sun Art Retail Group Ltd HSBC (889)7,000 Sun Art Retail Group Ltd JP Morgan (402)1,000 Sun Hung Kai Properties
Ltd Citibank (144)6,500 Sun Hung Kai Properties
Ltd JP Morgan (7,611)(5,000) Sunac China Holdings Ltd Citibank (907)18,000 Sunlight Real Estate
Investment Trust (REIT) Citibank 9540,000 Sunlight Real Estate
Investment Trust (REIT) HSBC (1,452)16,000 Sunlight Real Estate
Investment Trust (REIT) JP Morgan (581)300 Sunny Optical Technology
Group Co Ltd Citibank (100)400 Sunny Optical Technology
Group Co Ltd HSBC (688)1,300 Sunny Optical Technology
Group Co Ltd JP Morgan (2,238)7,500 Swire Pacific Ltd ’A’ Citibank (3,666)1,500 Swire Pacific Ltd ’A’ HSBC (1,870)8,500 Swire Pacific Ltd ’A’ JP Morgan (10,602)1,000 Swire Properties Ltd Citibank (118)
12,600 Swire Properties Ltd HSBC (6,984)20,800 Swire Properties Ltd JP Morgan (11,533)
131,000 TCL Electronics HoldingsLtd Citibank (1,339)
BlackRock Asia Pacific Diversified Equity Absolute ReturnFund continued
The notes on pages 691 to 711 form an integral part of these financial statements.
BlackRock Strategic Funds[226]

Contracts for difference as at 31 May 2020
Holding Description Counterparty
Netunrealised
appreciation/(depreciation)
USD
Hong Kong continued60,000 TCL Electronics Holdings
Ltd HSBC 145143,000 TCL Electronics Holdings
Ltd JP Morgan 189(5,000) Techtronic Industries Co Ltd Citibank (815)(1,000) Techtronic Industries Co Ltd HSBC 715,200 Tencent Holdings Ltd Citibank (1,279)
600 Tencent Holdings Ltd HSBC (616)6,000 Tencent Holdings Ltd JP Morgan (6,679)
(2,000) Tianli EducationInternational Holdings Ltd Citibank (163)
(19,000) Tianli EducationInternational Holdings Ltd JP Morgan (1,879)
68,000 Tianneng PowerInternational Ltd Citibank (13,222)
56,000 Tianneng PowerInternational Ltd HSBC 1,423
32,000 Tianneng PowerInternational Ltd JP Morgan 2,215
(6,000) Times China Holdings Ltd Citibank (203)(3,000) Times China Holdings Ltd HSBC 55912,000 Tingyi Cayman Islands
Holding Corp Citibank 53130,000 Tingyi Cayman Islands
Holding Corp HSBC (2,032)22,000 Tingyi Cayman Islands
Holding Corp JP Morgan (1,493)(1,600) Tongcheng-Elong Holdings
Ltd Citibank (124)(4,000) Tongcheng-Elong Holdings
Ltd HSBC (555)(2,000) Tongcheng-Elong Holdings
Ltd JP Morgan (277)(1,000) Topsports International
Holdings Ltd JP Morgan (212)(9,000) Towngas China Co Ltd Citibank 220
(24,000) Towngas China Co Ltd HSBC 35(68,000) TravelSky Technology Ltd
’H’ Citibank (12,129)(2,000) TravelSky Technology Ltd
’H’ HSBC (473)(1,000) TravelSky Technology Ltd
’H’ JP Morgan (236)2,000 Tsingtao Brewery Co Ltd ’H’ JP Morgan 729
10,000 Uni-President ChinaHoldings Ltd Citibank (165)
9,000 Uni-President ChinaHoldings Ltd HSBC (154)
15,000 Uni-President ChinaHoldings Ltd JP Morgan (259)
48,000 United Co RUSAL Plc JP Morgan 1,38174,000 United Laboratories
International Holdings Ltd Citibank 4,30824,000 United Laboratories
International Holdings Ltd HSBC (287)56,000 United Laboratories
International Holdings Ltd JP Morgan (733)(77,000) Value Partners Group Ltd Citibank (304)(10,000) Value Partners Group Ltd JP Morgan 311
(500) Venus MedTech HangzhouInc ’H’ HSBC 641
(500) Venus MedTech HangzhouInc ’H’ JP Morgan 641
13,000 Vinda International HoldingsLtd Citibank 1,936
21,000 Vinda International HoldingsLtd HSBC 2,821
7,000 Vinda International HoldingsLtd JP Morgan 633
Holding Description Counterparty
Netunrealised
appreciation/(depreciation)
USD
Hong Kong continued6,000 VSTECS Holdings Ltd Citibank (45)6,600 VTech Holdings Ltd Citibank 2461,600 VTech Holdings Ltd HSBC (2,016)
12,000 VTech Holdings Ltd JP Morgan (13,428)135,000 Want Want China Holdings
Ltd Citibank 5,59136,000 Want Want China Holdings
Ltd HSBC 8382,000 Want Want China Holdings
Ltd JP Morgan 1851,000 Weichai Power Co Ltd ’H’ Citibank (38)
356,000 West China Cement Ltd Citibank (4,116)292,000 West China Cement Ltd HSBC (3,410)42,000 West China Cement Ltd JP Morgan (491)1,500 WH Group Ltd Citibank 54
20,500 WH Group Ltd HSBC (1,197)39,000 WH Group Ltd JP Morgan (395)
(19,000) Wharf Holdings Ltd Citibank (2,065)7,000 Wharf Real Estate
Investment Co Ltd Citibank 1,08927,000 Wharf Real Estate
Investment Co Ltd JP Morgan (13,284)(11,000) Wheelock & Co Ltd Citibank (17)(25,000) Wheelock & Co Ltd JP Morgan 16,307
6,000 Wisdom EducationInternational Holdings CoLtd JP Morgan 6
980 WuXi AppTec Co Ltd ’H’ Citibank 120560 WuXi AppTec Co Ltd ’H’ HSBC 240
(4,000) Wuxi Biologics Cayman Inc Citibank 1,894(7,600) Wynn Macau Ltd Citibank 193
(800) XD Inc Citibank 273(15,000) Xiabuxiabu Catering
Management ChinaHoldings Co Ltd Citibank (1,474)
(20,000) Xiabuxiabu CateringManagement ChinaHoldings Co Ltd JP Morgan (3,163)
(25,000) Xiaomi Corp ’B’ Citibank (524)(4,600) Xiaomi Corp ’B’ HSBC (484)12,000 Xinyi Glass Holdings Ltd Citibank (118)32,000 Xinyi Glass Holdings Ltd HSBC (1,252)16,000 Xinyi Glass Holdings Ltd JP Morgan (627)
(30,147) Xinyi Solar Holdings Ltd Citibank (510)(10,000) Xinyi Solar Holdings Ltd HSBC (165)(46,068) Xinyi Solar Holdings Ltd JP Morgan (757)86,000 Yadea Group Holdings Ltd Citibank 1,35922,000 Yadea Group Holdings Ltd HSBC 64926,000 Yadea Group Holdings Ltd JP Morgan (242)1,200 YiChang HEC ChangJiang
Pharmaceutical Co Ltd ’H’ HSBC (420)400 YiChang HEC ChangJiang
Pharmaceutical Co Ltd ’H’ JP Morgan (140)(3,000) Yihai International Holding
Ltd Citibank (1,147)(87,000) Youyuan International
Holdings Ltd* Citibank 583(38,000) Youyuan International
Holdings Ltd* JP Morgan (169)21,000 Yuexiu Real Estate
Investment Trust (REIT) Citibank 297,000 Yuexiu Real Estate
Investment Trust (REIT) HSBC (227)35,000 Yuexiu Real Estate
Investment Trust (REIT) JP Morgan (1,136)16,000 Yuexiu Transport
Infrastructure Ltd Citibank 64
BlackRock Asia Pacific Diversified Equity Absolute ReturnFund continued
The notes on pages 691 to 711 form an integral part of these financial statements.
Annual report and audited financial statements [227]

Contracts for difference as at 31 May 2020
Holding Description Counterparty
Netunrealised
appreciation/(depreciation)
USD
Hong Kong continued8,000 Yuexiu Transport
Infrastructure Ltd HSBC (384)72,000 Yuexiu Transport
Infrastructure Ltd JP Morgan (3,459)(8,000) Yuzhou Properties Co Ltd Citibank 20
(38,000) Yuzhou Properties Co Ltd HSBC 1,182(18,000) Zhaojin Mining Industry Co
Ltd ’H’ Citibank 436(3,500) Zhaojin Mining Industry Co
Ltd ’H’ JP Morgan (88)(3,000) Zhenro Properties Group
Ltd JP Morgan (42)8,000 Zhongliang Holdings Group
Co Ltd HSBC (229)(8,000) Zhongsheng Group
Holdings Ltd Citibank (112)(99,000) Zhou Hei Ya International
Holdings Co Ltd JP Morgan 5,388(13,200) Zhuzhou CRRC Times
Electric Co Ltd ’H’ Citibank 2,970(1,100) Zhuzhou CRRC Times
Electric Co Ltd ’H’ HSBC 63328,000 Zijin Mining Group Co Ltd
’H’ Citibank (286)18,000 Zijin Mining Group Co Ltd
’H’ HSBC (514)34,000 Zijin Mining Group Co Ltd
’H’ JP Morgan (550)23,600 Zoomlion Heavy Industry
Science and TechnologyCo Ltd ’H’ Citibank 522
2,200 Zoomlion Heavy IndustryScience and TechnologyCo Ltd ’H’ HSBC (43)
98,800 Zoomlion Heavy IndustryScience and TechnologyCo Ltd ’H’ JP Morgan (1,949)
(139,017)
Indonesia122,400 Aneka Tambang Tbk Citibank 155137,500 Aneka Tambang Tbk JP Morgan 146
4,500 Bank Central Asia Tbk PT JP Morgan 45029,800 Bank Mandiri Persero Tbk
PT Citibank 872100,200 Bank Negara Indonesia
Persero Tbk PT Citibank 1,745222,400 Bank Negara Indonesia
Persero Tbk PT HSBC 2,32337,500 Bank Negara Indonesia
Persero Tbk PT JP Morgan 665(134,700) Bank Rakyat Indonesia
Persero Tbk PT JP Morgan (4,009)(532,000) Barito Pacific Tbk PT JP Morgan (6,372)(29,100) Charoen Pokphand
Indonesia Tbk PT JP Morgan (3,050)(11,200) Hanjaya Mandala
Sampoerna Tbk PT HSBC (63)(36,300) Indah Kiat Pulp & Paper
Corp Tbk PT JP Morgan (739)89,700 Indosat Tbk PT Citibank 359
259,300 Indosat Tbk PT HSBC 27134,200 Indosat Tbk PT JP Morgan 69
500,600 Japfa Comfeed IndonesiaTbk PT Citibank 380
789,500 Japfa Comfeed IndonesiaTbk PT HSBC 17
889,600 Japfa Comfeed IndonesiaTbk PT JP Morgan 402
(16,700) Jasa Marga Persero Tbk PT JP Morgan (17)
Holding Description Counterparty
Netunrealised
appreciation/(depreciation)
USD
Indonesia continued129,500 Kalbe Farma Tbk PT Citibank 745127,600 Kalbe Farma Tbk PT JP Morgan 48489,000 Matahari Department Store
Tbk PT Citibank 635120,400 Matahari Department Store
Tbk PT HSBC 1,180101,800 Matahari Department Store
Tbk PT JP Morgan 1,645494,300 Media Nusantara Citra Tbk
PT Citibank 271,400 Media Nusantara Citra Tbk
PT HSBC 2313,200 Media Nusantara Citra Tbk
PT JP Morgan 631(43,400) Pabrik Kertas Tjiwi Kimia
Tbk PT JP Morgan 2,111(292,000) Pakuwon Jati Tbk PT JP Morgan (326)
15,000 Perusahaan Gas NegaraTbk PT Citibank 37
42,300 Perusahaan Gas NegaraTbk PT HSBC 55
39,800 Perusahaan PerkebunanLondon SumatraIndonesia Tbk PT Citibank (41)
42,300 Perusahaan PerkebunanLondon SumatraIndonesia Tbk PT HSBC (69)
407,500 Perusahaan PerkebunanLondon SumatraIndonesia Tbk PT JP Morgan (1,100)
127,400 PP Persero Tbk PT JP Morgan 817(20,200) Semen Indonesia Persero
Tbk PT HSBC (1,415)(77,500) Semen Indonesia Persero
Tbk PT JP Morgan (13,608)866,500 Surya Semesta Internusa
Tbk PT Citibank 1,3041,076,600 Surya Semesta Internusa
Tbk PT HSBC 1,517(7,700) Telekomunikasi Indonesia
Persero Tbk PT JP Morgan (28)77,300 Wijaya Karya Persero Tbk
PT JP Morgan 937
(10,856)
Japan(5,400) 77 Bank Ltd JP Morgan (6,946)
(600) ABC-Mart Inc JP Morgan (3,619)400 Achilles Corp Citibank 479600 Achilles Corp HSBC 311
(2,200) Acom Co Ltd JP Morgan 21 Activia Properties Inc
(REIT) HSBC 182,000 ADEKA Corp JP Morgan 1,653
4 Advance ResidenceInvestment Corp (REIT) Citibank 47
800 Advantest Corp Citibank 419100 Advantest Corp JP Morgan (93)
(3,200) Aeon Co Ltd JP Morgan (5,596)500 Aeon Delight Co Ltd Citibank 1,062800 Aeon Delight Co Ltd HSBC (545)900 Aeon Delight Co Ltd JP Morgan 1,184
2,100 AEON Financial Service CoLtd Citibank 2,640
1,700 AEON Financial Service CoLtd HSBC 2,016
3,500 AEON Financial Service CoLtd JP Morgan 4,195
800 Aeon Mall Co Ltd Citibank 260
BlackRock Asia Pacific Diversified Equity Absolute ReturnFund continued
The notes on pages 691 to 711 form an integral part of these financial statements.
BlackRock Strategic Funds[228]
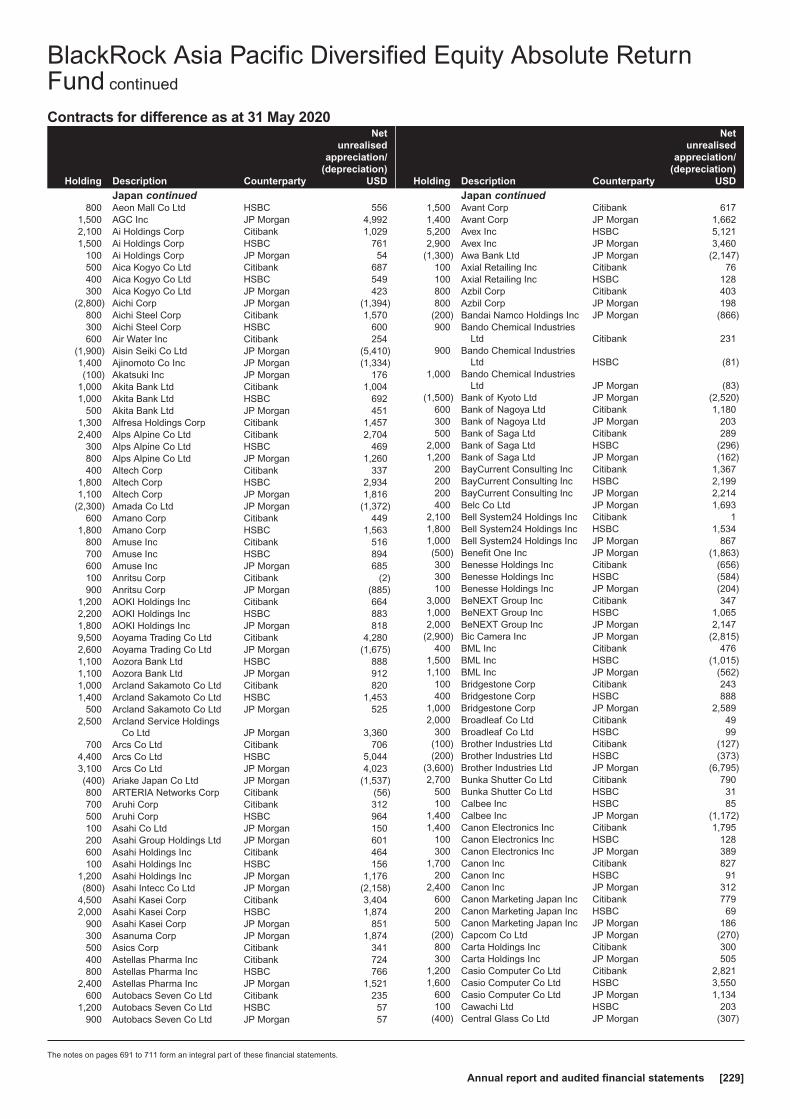
Contracts for difference as at 31 May 2020
Holding Description Counterparty
Netunrealised
appreciation/(depreciation)
USD
Japan continued800 Aeon Mall Co Ltd HSBC 556
1,500 AGC Inc JP Morgan 4,9922,100 Ai Holdings Corp Citibank 1,0291,500 Ai Holdings Corp HSBC 761
100 Ai Holdings Corp JP Morgan 54500 Aica Kogyo Co Ltd Citibank 687400 Aica Kogyo Co Ltd HSBC 549300 Aica Kogyo Co Ltd JP Morgan 423
(2,800) Aichi Corp JP Morgan (1,394)800 Aichi Steel Corp Citibank 1,570300 Aichi Steel Corp HSBC 600600 Air Water Inc Citibank 254
(1,900) Aisin Seiki Co Ltd JP Morgan (5,410)1,400 Ajinomoto Co Inc JP Morgan (1,334)(100) Akatsuki Inc JP Morgan 176
1,000 Akita Bank Ltd Citibank 1,0041,000 Akita Bank Ltd HSBC 692
500 Akita Bank Ltd JP Morgan 4511,300 Alfresa Holdings Corp Citibank 1,4572,400 Alps Alpine Co Ltd Citibank 2,704
300 Alps Alpine Co Ltd HSBC 469800 Alps Alpine Co Ltd JP Morgan 1,260400 Altech Corp Citibank 337
1,800 Altech Corp HSBC 2,9341,100 Altech Corp JP Morgan 1,816
(2,300) Amada Co Ltd JP Morgan (1,372)600 Amano Corp Citibank 449
1,800 Amano Corp HSBC 1,563800 Amuse Inc Citibank 516700 Amuse Inc HSBC 894600 Amuse Inc JP Morgan 685100 Anritsu Corp Citibank (2)900 Anritsu Corp JP Morgan (885)
1,200 AOKI Holdings Inc Citibank 6642,200 AOKI Holdings Inc HSBC 8831,800 AOKI Holdings Inc JP Morgan 8189,500 Aoyama Trading Co Ltd Citibank 4,2802,600 Aoyama Trading Co Ltd JP Morgan (1,675)1,100 Aozora Bank Ltd HSBC 8881,100 Aozora Bank Ltd JP Morgan 9121,000 Arcland Sakamoto Co Ltd Citibank 8201,400 Arcland Sakamoto Co Ltd HSBC 1,453
500 Arcland Sakamoto Co Ltd JP Morgan 5252,500 Arcland Service Holdings
Co Ltd JP Morgan 3,360700 Arcs Co Ltd Citibank 706
4,400 Arcs Co Ltd HSBC 5,0443,100 Arcs Co Ltd JP Morgan 4,023(400) Ariake Japan Co Ltd JP Morgan (1,537)800 ARTERIA Networks Corp Citibank (56)700 Aruhi Corp Citibank 312500 Aruhi Corp HSBC 964100 Asahi Co Ltd JP Morgan 150200 Asahi Group Holdings Ltd JP Morgan 601600 Asahi Holdings Inc Citibank 464100 Asahi Holdings Inc HSBC 156
1,200 Asahi Holdings Inc JP Morgan 1,176(800) Asahi Intecc Co Ltd JP Morgan (2,158)
4,500 Asahi Kasei Corp Citibank 3,4042,000 Asahi Kasei Corp HSBC 1,874
900 Asahi Kasei Corp JP Morgan 851300 Asanuma Corp JP Morgan 1,874500 Asics Corp Citibank 341400 Astellas Pharma Inc Citibank 724800 Astellas Pharma Inc HSBC 766
2,400 Astellas Pharma Inc JP Morgan 1,521600 Autobacs Seven Co Ltd Citibank 235
1,200 Autobacs Seven Co Ltd HSBC 57900 Autobacs Seven Co Ltd JP Morgan 57
Holding Description Counterparty
Netunrealised
appreciation/(depreciation)
USD
Japan continued1,500 Avant Corp Citibank 6171,400 Avant Corp JP Morgan 1,6625,200 Avex Inc HSBC 5,1212,900 Avex Inc JP Morgan 3,460
(1,300) Awa Bank Ltd JP Morgan (2,147)100 Axial Retailing Inc Citibank 76100 Axial Retailing Inc HSBC 128800 Azbil Corp Citibank 403800 Azbil Corp JP Morgan 198
(200) Bandai Namco Holdings Inc JP Morgan (866)900 Bando Chemical Industries
Ltd Citibank 231900 Bando Chemical Industries
Ltd HSBC (81)1,000 Bando Chemical Industries
Ltd JP Morgan (83)(1,500) Bank of Kyoto Ltd JP Morgan (2,520)
600 Bank of Nagoya Ltd Citibank 1,180300 Bank of Nagoya Ltd JP Morgan 203500 Bank of Saga Ltd Citibank 289
2,000 Bank of Saga Ltd HSBC (296)1,200 Bank of Saga Ltd JP Morgan (162)
200 BayCurrent Consulting Inc Citibank 1,367200 BayCurrent Consulting Inc HSBC 2,199200 BayCurrent Consulting Inc JP Morgan 2,214400 Belc Co Ltd JP Morgan 1,693
2,100 Bell System24 Holdings Inc Citibank 11,800 Bell System24 Holdings Inc HSBC 1,5341,000 Bell System24 Holdings Inc JP Morgan 867(500) Benefit One Inc JP Morgan (1,863)300 Benesse Holdings Inc Citibank (656)300 Benesse Holdings Inc HSBC (584)100 Benesse Holdings Inc JP Morgan (204)
3,000 BeNEXT Group Inc Citibank 3471,000 BeNEXT Group Inc HSBC 1,0652,000 BeNEXT Group Inc JP Morgan 2,147
(2,900) Bic Camera Inc JP Morgan (2,815)400 BML Inc Citibank 476
1,500 BML Inc HSBC (1,015)1,100 BML Inc JP Morgan (562)
100 Bridgestone Corp Citibank 243400 Bridgestone Corp HSBC 888
1,000 Bridgestone Corp JP Morgan 2,5892,000 Broadleaf Co Ltd Citibank 49
300 Broadleaf Co Ltd HSBC 99(100) Brother Industries Ltd Citibank (127)(200) Brother Industries Ltd HSBC (373)
(3,600) Brother Industries Ltd JP Morgan (6,795)2,700 Bunka Shutter Co Ltd Citibank 790
500 Bunka Shutter Co Ltd HSBC 31100 Calbee Inc HSBC 85
1,400 Calbee Inc JP Morgan (1,172)1,400 Canon Electronics Inc Citibank 1,795
100 Canon Electronics Inc HSBC 128300 Canon Electronics Inc JP Morgan 389
1,700 Canon Inc Citibank 827200 Canon Inc HSBC 91
2,400 Canon Inc JP Morgan 312600 Canon Marketing Japan Inc Citibank 779200 Canon Marketing Japan Inc HSBC 69500 Canon Marketing Japan Inc JP Morgan 186
(200) Capcom Co Ltd JP Morgan (270)800 Carta Holdings Inc Citibank 300300 Carta Holdings Inc JP Morgan 505
1,200 Casio Computer Co Ltd Citibank 2,8211,600 Casio Computer Co Ltd HSBC 3,550
600 Casio Computer Co Ltd JP Morgan 1,134100 Cawachi Ltd HSBC 203
(400) Central Glass Co Ltd JP Morgan (307)
BlackRock Asia Pacific Diversified Equity Absolute ReturnFund continued
The notes on pages 691 to 711 form an integral part of these financial statements.
Annual report and audited financial statements [229]

Contracts for difference as at 31 May 2020
Holding Description Counterparty
Netunrealised
appreciation/(depreciation)
USD
Japan continued100 Central Japan Railway Co Citibank 942100 Central Japan Railway Co JP Morgan 732
(300) Chiba Bank Ltd Citibank (147)(10,600) Chiba Bank Ltd JP Morgan (1,615)
300 Chiyoda Co Ltd Citibank 902,200 Chiyoda Co Ltd HSBC (90)(100) Chiyoda Corp Citibank (26)
(10,800) Chiyoda Corp JP Morgan (2,989)100 Chiyoda Integre Co Ltd JP Morgan (24)
(400) Chofu Seisakusho Co Ltd JP Morgan 415(7,800) Chubu Electric Power Co
Inc JP Morgan 79200 Chudenko Corp JP Morgan 204400 Chugai Pharmaceutical Co
Ltd Citibank 6,973(6,500) Chugoku Bank Ltd JP Morgan 2,135(4,900) Chugoku Electric Power Co
Inc JP Morgan (471)(300) Chukyo Bank Ltd Citibank (345)
(1,400) Chukyo Bank Ltd JP Morgan (133)3,700 Citizen Watch Co Ltd Citibank 989
500 CKD Corp Citibank 120800 CMIC Holdings Co Ltd Citibank 1,012
2,200 CMIC Holdings Co Ltd HSBC 426500 CMIC Holdings Co Ltd JP Morgan (95)
(1,200) Coca-Cola Bottlers JapanHoldings Inc JP Morgan (1,758)
400 cocokara fine Inc JP Morgan 1,724(700) COLOPL Inc Citibank (347)200 Computer Engineering &
Consulting Ltd Citibank 273300 Computer Engineering &
Consulting Ltd HSBC 470100 Computer Engineering &
Consulting Ltd JP Morgan 171700 COMSYS Holdings Corp Citibank 146600 COMSYS Holdings Corp HSBC (6)400 COMSYS Holdings Corp JP Morgan (107)100 Comture Corp Citibank 194200 Comture Corp HSBC 1,255200 Comture Corp JP Morgan 1,260
(500) Concordia Financial GroupLtd HSBC (114)
(12,900) Concordia Financial GroupLtd JP Morgan (2,993)
1,300 CONEXIO Corp Citibank (968)1,800 CONEXIO Corp JP Morgan (1,246)(600) Cosmo Energy Holdings Co
Ltd JP Morgan (626)(200) Cosmos Pharmaceutical
Corp JP Morgan (1,748)400 Create SD Holdings Co Ltd HSBC 1,030900 Create SD Holdings Co Ltd JP Morgan 2,350800 Credit Saison Co Ltd HSBC 605600 Credit Saison Co Ltd JP Morgan 462
(400) Curves Holdings Co Ltd Citibank (289)(900) Curves Holdings Co Ltd HSBC (473)
(1,500) Curves Holdings Co Ltd JP Morgan (948)(100) CyberAgent Inc JP Morgan (807)
(4,300) CYBERDYNE Inc JP Morgan (3,024)1,200 Cybozu Inc Citibank 3,9751,000 Dai Nippon Printing Co Ltd HSBC 1,946(200) Daicel Corp Citibank (30)
(3,500) Daicel Corp JP Morgan (1,265)(100) Daido Steel Co Ltd JP Morgan (109)(500) Daifuku Co Ltd JP Morgan (3,106)700 Daiho Corp Citibank 301100 Daiho Corp HSBC 164900 Daiho Corp JP Morgan 1,501
Holding Description Counterparty
Netunrealised
appreciation/(depreciation)
USD
Japan continued(400) Dai-ichi Life Holdings Inc Citibank 70(100) Dai-ichi Life Holdings Inc HSBC 25(400) Dai-ichi Life Holdings Inc JP Morgan 77300 Daiichi Sankyo Co Ltd Citibank 4,203100 Daiichi Sankyo Co Ltd HSBC 2,094400 Daiichi Sankyo Co Ltd JP Morgan 8,413900 Daiichikosho Co Ltd Citibank 1,443100 Daiken Corp HSBC 108100 Daikin Industries Ltd HSBC 1,497100 Dainichiseika Color &
Chemicals ManufacturingCo Ltd JP Morgan 152
500 Daio Paper Corp HSBC (129)1,600 Daio Paper Corp JP Morgan (349)
500 Daiseki Co Ltd JP Morgan 1,538(1,800) Daishi Hokuetsu Financial
Group Inc JP Morgan 372500 Daito Pharmaceutical Co
Ltd Citibank 1,823200 Daito Pharmaceutical Co
Ltd HSBC 590600 Daito Pharmaceutical Co
Ltd JP Morgan 1,799(300) Daito Trust Construction Co
Ltd JP Morgan (1,996)300 Daiwa House Industry Co
Ltd Citibank 425200 Daiwa House Industry Co
Ltd JP Morgan (139)2 Daiwa House Investment
Corp (REIT) JP Morgan 4011 Daiwa Office Investment
Corp (REIT) JP Morgan 114(5,400) Daiwa Securities Group Inc JP Morgan (534)
23 Daiwa Securities LivingInvestments Corp (REIT) JP Morgan 579
2,000 DCM Holdings Co Ltd Citibank 3581,500 DCM Holdings Co Ltd HSBC 4393,800 DCM Holdings Co Ltd JP Morgan 814
800 DeNA Co Ltd Citibank 320100 Denka Co Ltd JP Morgan (90)800 Denso Corp Citibank 2,368200 Denso Corp HSBC 692
1,800 Dentsu Group Inc Citibank 10,6001,600 Dentsu Group Inc JP Morgan 9,221(200) Descente Ltd Citibank (376)
(1,000) Descente Ltd HSBC (2,124)200 DIC Corp Citibank 279800 DIC Corp JP Morgan 957
(100) Digital Garage Inc HSBC 32(200) Digital Garage Inc JP Morgan 61200 Digital Hearts Holdings Co
Ltd HSBC 1681,500 Digital Hearts Holdings Co
Ltd JP Morgan 1,868900 Dip Corp Citibank 228
1,000 Dip Corp JP Morgan 1,265(1,400) DMG Mori Co Ltd JP Morgan (2,019)5,300 Doshisha Co Ltd Citibank 6,060
700 Doshisha Co Ltd HSBC 1,0751,300 Doshisha Co Ltd JP Morgan 2,0185,600 Doutor Nichires Holdings Co
Ltd Citibank 5,091500 Doutor Nichires Holdings Co
Ltd JP Morgan 333(700) Dowa Holdings Co Ltd JP Morgan (2,637)900 DTS Corp Citibank 1,075
2,000 DTS Corp HSBC 2,2132,400 DTS Corp JP Morgan 2,718
BlackRock Asia Pacific Diversified Equity Absolute ReturnFund continued
The notes on pages 691 to 711 form an integral part of these financial statements.
BlackRock Strategic Funds[230]

Contracts for difference as at 31 May 2020
Holding Description Counterparty
Netunrealised
appreciation/(depreciation)
USD
Japan continued(400) Duskin Co Ltd JP Morgan (629)100 DyDo Group Holdings Inc Citibank 280200 Earth Corp Citibank 1,312700 Earth Corp JP Morgan 5,537100 East Japan Railway Co Citibank 562400 East Japan Railway Co HSBC 2,066600 East Japan Railway Co JP Morgan 3,015
(800) Ebara Corp JP Morgan (1,148)4,100 EDION Corp Citibank 1,499
400 EDION Corp HSBC 1636,500 EDION Corp JP Morgan 2,727
300 eGuarantee Inc JP Morgan 669(1,800) Ehime Bank Ltd JP Morgan (1,265)
100 Eiken Chemical Co Ltd HSBC 30100 Eisai Co Ltd Citibank 783300 Eisai Co Ltd HSBC 2,269200 Eisai Co Ltd JP Morgan 1,531300 Eizo Corp JP Morgan 1,856400 Elan Corp Citibank 55700 Elan Corp HSBC 591600 Elecom Co Ltd Citibank 2,464500 Elecom Co Ltd JP Morgan 2,677600 Electric Power Development
Co Ltd Citibank 757200 Electric Power Development
Co Ltd JP Morgan 704,500 Elematec Corp Citibank 2,988
800 Elematec Corp HSBC 410700 Elematec Corp JP Morgan 366200 EM Systems Co Ltd JP Morgan 84800 en-japan Inc HSBC 3,149
1,000 en-japan Inc JP Morgan 4,119200 Enplas Corp HSBC (51)100 Enplas Corp JP Morgan (23)
4,400 EPS Holdings Inc Citibank 2,1795,100 EPS Holdings Inc HSBC 1702,600 EPS Holdings Inc JP Morgan (1,056)
(1,400) eRex Co Ltd Citibank (1,107)1,400 ES-Con Japan Ltd Citibank 501
400 ES-Con Japan Ltd JP Morgan 265(400) eSOL Co Ltd JP Morgan (763)400 ESPEC Corp Citibank 215500 ESPEC Corp HSBC 180
1,200 ESPEC Corp JP Morgan 457(600) euglena Co Ltd JP Morgan (400)
(1,400) Ezaki Glico Co Ltd JP Morgan (4,684)700 FamilyMart Co Ltd Citibank 1,332900 FamilyMart Co Ltd HSBC 1,634
1,100 FamilyMart Co Ltd JP Morgan 1,814400 Fancl Corp Citibank (64)
(100) FANUC Corp JP Morgan (1,057)100 Fast Retailing Co Ltd JP Morgan 7,542
3,100 Feed One Co Ltd Citibank 253,600 Feed One Co Ltd JP Morgan 81
(3,600) Ferrotec Holdings Corp Citibank (452)(700) Ferrotec Holdings Corp JP Morgan (265)
1,300 FJ Next Co Ltd HSBC 1,1132,300 FJ Next Co Ltd JP Morgan 1,926
400 Foster Electric Co Ltd Citibank 283700 Foster Electric Co Ltd HSBC 99200 Foster Electric Co Ltd JP Morgan 154
(200) FP Corp JP Morgan 626(300) Freee KK JP Morgan (3,380)
4 Frontier Real EstateInvestment Corp (REIT) Citibank 865
8 Frontier Real EstateInvestment Corp (REIT) HSBC 1,602
12 Frontier Real EstateInvestment Corp (REIT) JP Morgan 2,449
Holding Description Counterparty
Netunrealised
appreciation/(depreciation)
USD
Japan continued1,000 Fudo Tetra Corp Citibank 502
500 Fudo Tetra Corp HSBC 1131,500 Fudo Tetra Corp JP Morgan 364
300 Fuji Co Ltd HSBC 423400 Fuji Co Ltd JP Morgan 572
(500) Fuji Electric Co Ltd JP Morgan (846)3,400 Fuji Media Holdings Inc Citibank 1,874
200 Fuji Oil Holdings Inc Citibank 240300 Fuji Oil Holdings Inc HSBC 309500 Fuji Pharma Co Ltd Citibank 424400 Fuji Pharma Co Ltd HSBC 229800 Fuji Pharma Co Ltd JP Morgan 469600 Fuji Seal International Inc Citibank 1,381100 Fuji Seal International Inc JP Morgan 328200 Fuji Soft Inc HSBC 1,113100 Fuji Soft Inc JP Morgan 270100 FUJIFILM Holdings Corp HSBC (337)200 FUJIFILM Holdings Corp JP Morgan (661)700 Fujikura Ltd JP Morgan 53200 Fujita Kanko Inc Citibank 435300 Fujita Kanko Inc HSBC 267300 Fujita Kanko Inc JP Morgan 218
(100) Fujitsu General Ltd JP Morgan (46)200 Fukui Computer Holdings
Inc Citibank 596600 Fukui Computer Holdings
Inc JP Morgan 1,238(4,200) Fukuoka Financial Group
Inc JP Morgan (6,447)200 Fukushima Galilei Co Ltd JP Morgan (166)700 FULLCAST Holdings Co Ltd HSBC 798
1,700 FULLCAST Holdings Co Ltd JP Morgan 1,967800 Funai Soken Holdings Inc Citibank 1,669700 Funai Soken Holdings Inc JP Morgan 1,093800 Furukawa Co Ltd JP Morgan 132
(1,100) Furukawa Electric Co Ltd JP Morgan (6,292)800 Fuso Chemical Co Ltd Citibank 1,765500 Future Corp Citibank 264200 Future Corp HSBC 269100 Future Corp JP Morgan 136100 Fuyo General Lease Co Ltd Citibank 368800 Fuyo General Lease Co Ltd HSBC 2,141400 Gakken Holdings Co Ltd Citibank 106900 Geo Holdings Corp Citibank (301)600 Glory Ltd Citibank 833
1,300 Glory Ltd HSBC 1,0142,200 Glory Ltd JP Morgan 1,772
5 GLP J-Reit (REIT) Citibank 1447 GLP J-Reit (REIT) JP Morgan 336
(200) GMO Cloud KK JP Morgan (4,207)(600) GMO internet Inc JP Morgan (1,912)(100) GMO Payment Gateway Inc JP Morgan (2,081)100 GNI Group Ltd Citibank (19)100 GNI Group Ltd HSBC 345100 GNI Group Ltd JP Morgan 3
1,500 Goldcrest Co Ltd Citibank 8781,500 Goldcrest Co Ltd HSBC (841)3,500 Goldcrest Co Ltd JP Morgan (1,894)
100 Goldwin Inc HSBC 1,078100 Grace Technology Inc HSBC 316400 Gree Inc Citibank 6
12,000 Gree Inc HSBC 1705,400 Gree Inc JP Morgan 349
(1,300) GS Yuasa Corp JP Morgan (3,656)(1,800) GungHo Online
Entertainment Inc JP Morgan (519)(15,800) Gunma Bank Ltd JP Morgan (129)
100 Gunze Ltd Citibank 721,400 Gurunavi Inc Citibank 854
BlackRock Asia Pacific Diversified Equity Absolute ReturnFund continued
The notes on pages 691 to 711 form an integral part of these financial statements.
Annual report and audited financial statements [231]

Contracts for difference as at 31 May 2020
Holding Description Counterparty
Netunrealised
appreciation/(depreciation)
USD
Japan continued2,000 Gurunavi Inc HSBC 8481,900 Gurunavi Inc JP Morgan 912
400 H2O Retailing Corp HSBC 139(19,200) Hachijuni Bank Ltd JP Morgan (5,639)
200 Hakuhodo DY Holdings Inc Citibank 3653,000 Hakuhodo DY Holdings Inc JP Morgan 5,111
(2,300) Hamamatsu Photonics KK JP Morgan (3,652)(200) Hankyu Hanshin Holdings
Inc JP Morgan 102200 Hanwa Co Ltd HSBC 436
(100) Harmonic Drive Systems Inc Citibank (349)(8,500) Haseko Corp JP Morgan (7,439)3,000 Hazama Ando Corp Citibank 1,2042,900 Hazama Ando Corp HSBC 217
700 Hazama Ando Corp JP Morgan (75)400 Heiwa Corp Citibank 14200 Heiwa Real Estate Co Ltd Citibank 99500 Heiwado Co Ltd Citibank 533600 Heiwado Co Ltd HSBC 573200 Hiday Hidaka Corp HSBC 291200 Hiday Hidaka Corp JP Morgan 295
(300) Hino Motors Ltd HSBC (47)(1,900) Hino Motors Ltd JP Morgan (289)
400 Hinokiya Group Co Ltd Citibank 398300 Hinokiya Group Co Ltd HSBC (145)700 Hinokiya Group Co Ltd JP Morgan (324)
(1,100) Hirata Corp Citibank (3,845)(200) Hirose Electric Co Ltd JP Morgan (1,352)
2,300 Hiroshima Bank Ltd Citibank 1,169200 Hiroshima Bank Ltd HSBC 92
3,600 Hiroshima Bank Ltd JP Morgan 1,820200 Hisaka Works Ltd HSBC 60200 Hisamitsu Pharmaceutical
Co Inc Citibank 868300 Hisamitsu Pharmaceutical
Co Inc JP Morgan 8431,500 Hitachi Capital Corp Citibank 3,341
700 Hitachi Capital Corp HSBC 1,250800 Hitachi Capital Corp JP Morgan 1,448
(100) Hitachi Chemical Co Ltd HSBC 15(200) Hitachi Chemical Co Ltd JP Morgan 71
(3,800) Hitachi ConstructionMachinery Co Ltd JP Morgan (9,474)
(1,200) Hitachi Ltd JP Morgan (2,475)(1,500) Hitachi Metals Ltd JP Morgan (2,751)(1,300) Hitachi Transport System
Ltd JP Morgan (2,843)2,000 Hitachi Zosen Corp JP Morgan (102)
200 Hochiki Corp Citibank 119200 Hochiki Corp HSBC 65500 Hochiki Corp JP Morgan 170
(200) Hodogaya Chemical Co Ltd JP Morgan (1,062)1,100 Hokkaido Electric Power Co
Inc Citibank 994,900 Hokuetsu Corp Citibank 5217,000 Hokuetsu Corp HSBC (939)
(4,600) Hokuhoku Financial GroupInc JP Morgan (1,449)
(5,400) Hokuriku Electric Power Co JP Morgan 535500 Honda Motor Co Ltd Citibank 1,205
2,000 Honda Motor Co Ltd JP Morgan 4,131(300) Horiba Ltd JP Morgan 486500 Hoshizaki Corp HSBC 1,683300 Hoshizaki Corp JP Morgan 1,039700 House Foods Group Inc Citibank 1,025
(400) Hoya Corp JP Morgan (541)400 Hulic Co Ltd HSBC 216
4 Hulic Reit Inc (REIT) Citibank 47710 Hulic Reit Inc (REIT) JP Morgan 652
Holding Description Counterparty
Netunrealised
appreciation/(depreciation)
USD
Japan continued(2,500) Ibiden Co Ltd JP Morgan 2,026(8,200) Ichigo Inc JP Morgan (2,205)
2 Ichigo Office InvestmentCorp (REIT) Citibank 90
15 Ichigo Office InvestmentCorp (REIT) HSBC 479
2,300 Ichiyoshi Securities Co Ltd Citibank 9353,700 Ichiyoshi Securities Co Ltd HSBC 8761,600 Ichiyoshi Securities Co Ltd JP Morgan 150
200 Icom Inc JP Morgan 654(1,400) Idemitsu Kosan Co Ltd JP Morgan 988
600 IDOM Inc Citibank 138700 IDOM Inc JP Morgan 435200 IHI Corp Citibank 387200 IHI Corp HSBC 486
1,200 IHI Corp JP Morgan 2,6611,500 Iida Group Holdings Co Ltd JP Morgan 2,1554,200 Inaba Denki Sangyo Co Ltd Citibank 2,449
300 Inaba Denki Sangyo Co Ltd HSBC 219200 Inaba Denki Sangyo Co Ltd JP Morgan 286
2,100 Ines Corp HSBC (1,930)900 Ines Corp JP Morgan (344)100 Infocom Corp Citibank 119200 Infocom Corp HSBC 399
(1,400) Infomart Corp JP Morgan (674)100 Information Services
International-Dentsu Ltd Citibank 2152,100 Inpex Corp Citibank 558
700 Inpex Corp HSBC 3071,700 Inpex Corp JP Morgan 825
200 Insource Co Ltd HSBC 762500 Insource Co Ltd JP Morgan 1,919400 Internet Initiative Japan Inc HSBC (282)700 Internet Initiative Japan Inc JP Morgan (462)200 Iriso Electronics Co Ltd HSBC 646200 Iriso Electronics Co Ltd JP Morgan 653
(5,000) Isetan Mitsukoshi HoldingsLtd JP Morgan (3,721)
1,700 Ishihara Sangyo Kaisha Ltd Citibank 782600 Ishihara Sangyo Kaisha Ltd HSBC 575900 Ishihara Sangyo Kaisha Ltd JP Morgan 869
1,000 Istyle Inc Citibank (30)(100) Isuzu Motors Ltd JP Morgan (132)300 Itfor Inc HSBC 142
1,900 Itfor Inc JP Morgan 683(1,500) Ito En Ltd JP Morgan (1,303)
500 ITOCHU Corp JP Morgan (126)(1,000) Itochu Techno-Solutions
Corp JP Morgan (1,278)300 Itochu-Shokuhin Co Ltd Citibank 47100 Itochu-Shokuhin Co Ltd HSBC 10400 Itochu-Shokuhin Co Ltd JP Morgan 37700 Itoham Yonekyu Holdings
Inc Citibank 2972,000 Itoham Yonekyu Holdings
Inc HSBC 6943,100 Itoki Corp Citibank 2,5591,700 Itoki Corp JP Morgan 1,200
400 Iwatani Corp HSBC 1031,100 Iwatani Corp JP Morgan 358
(14,500) Iyo Bank Ltd JP Morgan (2,495)500 Izumi Co Ltd Citibank 850
1,300 Izumi Co Ltd JP Morgan 1,9343,500 J Front Retailing Co Ltd Citibank 8592,100 J Front Retailing Co Ltd HSBC 907
800 J Front Retailing Co Ltd JP Morgan 4081,700 JAC Recruitment Co Ltd JP Morgan 3,002
300 Jaccs Co Ltd Citibank 457700 Jaccs Co Ltd HSBC 652
BlackRock Asia Pacific Diversified Equity Absolute ReturnFund continued
The notes on pages 691 to 711 form an integral part of these financial statements.
BlackRock Strategic Funds[232]

Contracts for difference as at 31 May 2020
Holding Description Counterparty
Netunrealised
appreciation/(depreciation)
USD
Japan continued2,100 Jaccs Co Ltd JP Morgan 1,999
400 Jafco Co Ltd Citibank 847100 Jafco Co Ltd JP Morgan 147
1,000 Jamco Corp Citibank 1,000300 Jamco Corp HSBC 498800 Jamco Corp JP Morgan 996800 Japan Airlines Co Ltd JP Morgan 2,292
(400) Japan Airport Terminal CoLtd JP Morgan (2,819)
500 Japan Aviation ElectronicsIndustry Ltd Citibank 460
500 Japan Aviation ElectronicsIndustry Ltd JP Morgan 240
200 Japan Elevator ServiceHoldings Co Ltd Citibank 461
200 Japan Elevator ServiceHoldings Co Ltd HSBC 1,148
500 Japan Elevator ServiceHoldings Co Ltd JP Morgan 2,886
(3,900) Japan Exchange Group Inc JP Morgan (6,421)79 Japan Hotel Investment
Corp (REIT) Citibank 3,50510 Japan Hotel Investment
Corp (REIT) HSBC 5904 Japan Hotel Investment
Corp (REIT) JP Morgan 238100 Japan Material Co Ltd HSBC (27)500 Japan Medical Dynamic
Marketing Inc Citibank (424)100 Japan Medical Dynamic
Marketing Inc JP Morgan 111800 Japan Petroleum
Exploration Co Ltd Citibank 228300 Japan Petroleum
Exploration Co Ltd JP Morgan 344(7,600) Japan Post Bank Co Ltd JP Morgan 9,1488,800 Japan Post Holdings Co Ltd JP Morgan (3,079)
500 Japan Post Insurance CoLtd Citibank 335
900 Japan Post Insurance CoLtd JP Morgan 551
(1) Japan Real EstateInvestment Corp (REIT) JP Morgan 286
(200) Japan Steel Works Ltd HSBC (438)(1,100) Japan Steel Works Ltd JP Morgan (2,428)
300 Japan Tobacco Inc HSBC 4072,500 Japan Tobacco Inc JP Morgan 3,452
300 JCU Corp Citibank 677600 JCU Corp HSBC 2,614100 Jeol Ltd HSBC (155)
2,800 JFE Holdings Inc Citibank 2,3041,600 JFE Holdings Inc HSBC 1,0757,200 JFE Holdings Inc JP Morgan 5,421
900 JGC Holdings Corp Citibank 1,0231,100 JGC Holdings Corp JP Morgan 1,160
300 JINS Holdings Inc Citibank 461500 JINS Holdings Inc HSBC 3,937600 JINS Holdings Inc JP Morgan 4,766200 J-Oil Mills Inc JP Morgan 589100 Joshin Denki Co Ltd HSBC 141300 JSP Corp Citibank 181
1,100 JSP Corp HSBC 9242,800 JSP Corp JP Morgan 2,553
(1,100) JSR Corp JP Morgan (1,511)(200) Juroku Bank Ltd JP Morgan (376)200 Justsystems Corp HSBC 473
3,700 JXTG Holdings Inc JP Morgan 906(600) Kadokawa Corp JP Morgan (600)
Holding Description Counterparty
Netunrealised
appreciation/(depreciation)
USD
Japan continued(700) Kagome Co Ltd JP Morgan (1,549)(400) Kajima Corp JP Morgan (163)(400) Kakaku.com Inc JP Morgan 404(200) Kaken Pharmaceutical Co
Ltd Citibank (327)(600) Kaken Pharmaceutical Co
Ltd JP Morgan (704)100 Kameda Seika Co Ltd Citibank 164300 Kamigumi Co Ltd Citibank 540700 Kamigumi Co Ltd JP Morgan 1,113
1,100 Kanamoto Co Ltd Citibank 577500 Kanamoto Co Ltd HSBC 735800 Kanamoto Co Ltd JP Morgan 1,197
2,200 Kandenko Co Ltd HSBC 1,501(400) Kaneka Corp JP Morgan (361)200 Kanematsu Corp HSBC 295
2,400 Kanematsu Corp JP Morgan 4,112(4,200) Kansai Electric Power Co
Inc JP Morgan (395)(5,400) Kansai Mirai Financial
Group Inc JP Morgan (2,147)200 Kansai Paint Co Ltd HSBC 46800 Kao Corp Citibank 521100 Kao Corp HSBC (57)300 Kao Corp JP Morgan 220600 Kasai Kogyo Co Ltd Citibank 182
4,600 Kasai Kogyo Co Ltd HSBC 1961,000 Kasai Kogyo Co Ltd JP Morgan 3391,500 Katakura Industries Co Ltd Citibank 1,5371,800 Katakura Industries Co Ltd HSBC 2,6081,300 Katakura Industries Co Ltd JP Morgan 1,900
500 Katitas Co Ltd JP Morgan 1,781200 Kato Sangyo Co Ltd Citibank 246500 Kato Sangyo Co Ltd JP Morgan 422
(1,000) Kawasaki Heavy IndustriesLtd JP Morgan (401)
(800) Kawasaki Kisen Kaisha Ltd Citibank (91)(2,100) Kawasaki Kisen Kaisha Ltd JP Morgan (1,531)
500 KDDI Corp Citibank 274200 KDDI Corp HSBC (135)
3,600 KDDI Corp JP Morgan (1,403)(1,300) Keihan Holdings Co Ltd JP Morgan (3,567)(1,100) Keihin Corp JP Morgan 254(3,000) Keikyu Corp JP Morgan (1,387)
(900) Keio Corp JP Morgan (6,169)(600) Keisei Electric Railway Co
Ltd JP Morgan (2,867)(2,400) Keiyo Bank Ltd JP Morgan 24
600 Keiyo Co Ltd JP Morgan 4437,100 Kenedix Inc JP Morgan 6,033
1 Kenedix Office InvestmentCorp (REIT) Citibank 126
4 Kenedix Office InvestmentCorp (REIT) JP Morgan 967
100 Kewpie Corp Citibank 30600 Kewpie Corp HSBC 15
2,100 Kewpie Corp JP Morgan 106(200) Key Coffee Inc Citibank (120)(700) Key Coffee Inc JP Morgan (500)(200) Kikkoman Corp JP Morgan (1,144)200 Kinden Corp Citibank 52500 Kinden Corp JP Morgan 115
(1,100) Kintetsu Group Holdings CoLtd JP Morgan (1,144)
2,200 Kintetsu World Express Inc HSBC 4,003(1,300) Kirin Holdings Co Ltd JP Morgan (1,427)
BlackRock Asia Pacific Diversified Equity Absolute ReturnFund continued
The notes on pages 691 to 711 form an integral part of these financial statements.
Annual report and audited financial statements [233]

Contracts for difference as at 31 May 2020
Holding Description Counterparty
Netunrealised
appreciation/(depreciation)
USD
Japan continued1,800 Kissei Pharmaceutical Co
Ltd Citibank 2,4451,200 Kissei Pharmaceutical Co
Ltd HSBC 690600 Kissei Pharmaceutical Co
Ltd JP Morgan 947(1,200) Kitanotatsujin Corp JP Morgan 100(3,400) Kiyo Bank Ltd JP Morgan (2,739)
(400) KLab Inc Citibank (5)(4,100) KLab Inc JP Morgan (1,722)
400 Koa Corp Citibank 384(300) Kobayashi Pharmaceutical
Co Ltd JP Morgan 1,321300 Kobe Bussan Co Ltd Citibank 1,217
(800) Koei Tecmo Holdings Co Ltd JP Morgan (699)700 Kohnan Shoji Co Ltd JP Morgan 3,092
(300) Koito Manufacturing Co Ltd JP Morgan (1,457)2,100 Kokuyo Co Ltd HSBC 1,552
600 Komeri Co Ltd HSBC 1,2251,100 Komori Corp Citibank 506
900 Komori Corp HSBC 125200 Komori Corp JP Morgan 30100 Konami Holdings Corp HSBC 291800 Konami Holdings Corp JP Morgan 2,363
6,300 Konica Minolta Inc Citibank 1,5665,300 Konica Minolta Inc HSBC 2889,400 Konica Minolta Inc JP Morgan 8421,500 Konoike Transport Co Ltd Citibank 1,0763,900 Konoike Transport Co Ltd HSBC 2,9652,800 Konoike Transport Co Ltd JP Morgan 2,167
300 Kose Corp Citibank 1,704200 Kotobuki Spirits Co Ltd HSBC 1,371300 Kotobuki Spirits Co Ltd JP Morgan 2,073
(500) K’s Holdings Corp JP Morgan (652)1,600 Kubota Corp JP Morgan 1,502
500 Kumagai Gumi Co Ltd Citibank 829900 Kumagai Gumi Co Ltd HSBC 1,067
3,300 Kumagai Gumi Co Ltd JP Morgan 4,011(100) Kura Sushi Inc HSBC (355)(100) Kura Sushi Inc JP Morgan (361)200 Kureha Corp Citibank 543200 Kureha Corp HSBC 995
1,300 Kurita Water Industries Ltd Citibank 1,462300 Kurita Water Industries Ltd HSBC 208200 Kurita Water Industries Ltd JP Morgan 97
(100) Kusuri no Aoki Holdings CoLtd JP Morgan (476)
(900) KYB Corp HSBC (266)400 Kyocera Corp Citibank 952200 Kyocera Corp HSBC 114
1,500 Kyocera Corp JP Morgan 1,2431,200 Kyoei Steel Ltd Citibank 1,295
500 Kyoei Steel Ltd HSBC 258300 Kyoei Steel Ltd JP Morgan 160400 Kyokuto Kaihatsu Kogyo Co
Ltd Citibank 584400 Kyokuto Kaihatsu Kogyo Co
Ltd HSBC 520200 Kyokuto Kaihatsu Kogyo Co
Ltd JP Morgan 263200 KYORIN Holdings Inc Citibank 291
1,200 KYORIN Holdings Inc HSBC 903400 KYORIN Holdings Inc JP Morgan 317
1,100 Kyowa Exeo Corp Citibank 648100 Kyowa Exeo Corp HSBC (225)200 Kyowa Exeo Corp JP Morgan 118400 Kyudenko Corp Citibank 276400 Kyudenko Corp HSBC 122
Holding Description Counterparty
Netunrealised
appreciation/(depreciation)
USD
Japan continued(4,600) Kyushu Electric Power Co
Inc JP Morgan (849)(9,200) Kyushu Financial Group Inc JP Morgan (1,186)
(700) Kyushu Railway Co JP Morgan (551)1,100 LAC Co Ltd HSBC 2,439
200 Lasertec Corp Citibank 900100 Lawson Inc Citibank 322900 Lawson Inc JP Morgan 2,995100 Lintec Corp HSBC 148
1,000 Lintec Corp JP Morgan 1,512100 Litalico Inc Citibank (62)400 Litalico Inc HSBC 1,598
4,000 LIXIL Group Corp HSBC 3,9891,300 LIXIL Group Corp JP Morgan 1,318
300 LIXIL VIVA Corp JP Morgan 1,154400 M3 Inc Citibank 845300 M3 Inc JP Morgan 1,041
1,100 Mabuchi Motor Co Ltd Citibank 3,659300 Mabuchi Motor Co Ltd HSBC 932
1,300 Mabuchi Motor Co Ltd JP Morgan 3,790700 Macnica Fuji Electronics
Holdings Inc Citibank 800700 Macromill Inc Citibank 81300 Macromill Inc HSBC 71
1,500 Maeda Corp Citibank 7311,300 Maeda Corp HSBC (82)1,200 Maeda Corp JP Morgan (276)1,200 Maeda Road Construction
Co Ltd Citibank 476400 Maeda Road Construction
Co Ltd HSBC (140)600 Maeda Road Construction
Co Ltd JP Morgan (195)(600) Makita Corp JP Morgan (1,301)100 Mamezou Holdings Co Ltd Citibank (1)300 Mandom Corp Citibank 169
3,200 Mandom Corp HSBC 3,2401,300 Mandom Corp JP Morgan 1,607
200 Mani Inc Citibank 443100 Mani Inc HSBC 354300 Mani Inc JP Morgan 1,071300 Mars Group Holdings Corp Citibank 142800 Mars Group Holdings Corp HSBC (490)400 Mars Group Holdings Corp JP Morgan (90)
2,400 Marubeni Corp Citibank 1,06826,200 Marubeni Corp JP Morgan 11,564
100 Marudai Food Co Ltd JP Morgan (24)600 Maruha Nichiro Corp Citibank 784600 Maruha Nichiro Corp HSBC 318
1,300 Marui Group Co Ltd JP Morgan 2,415(700) Maruichi Steel Tube Ltd JP Morgan (1,894)500 Maruwa Unyu Kikan Co Ltd Citibank 265200 Maruwa Unyu Kikan Co Ltd JP Morgan (665)300 Maruzen Showa Unyu Co
Ltd Citibank 377500 Maruzen Showa Unyu Co
Ltd HSBC 1,849900 Marvelous Inc Citibank 1,754
5,500 Marvelous Inc HSBC 11,1822,200 Marvelous Inc JP Morgan 4,328
600 Matching Service Japan CoLtd HSBC 758
500 Matching Service Japan CoLtd JP Morgan 636
700 Matsuda Sangyo Co Ltd Citibank 560100 Matsuda Sangyo Co Ltd HSBC 55700 Matsuda Sangyo Co Ltd JP Morgan 398
(7,300) Matsui Securities Co Ltd JP Morgan (5,489)
BlackRock Asia Pacific Diversified Equity Absolute ReturnFund continued
The notes on pages 691 to 711 form an integral part of these financial statements.
BlackRock Strategic Funds[234]
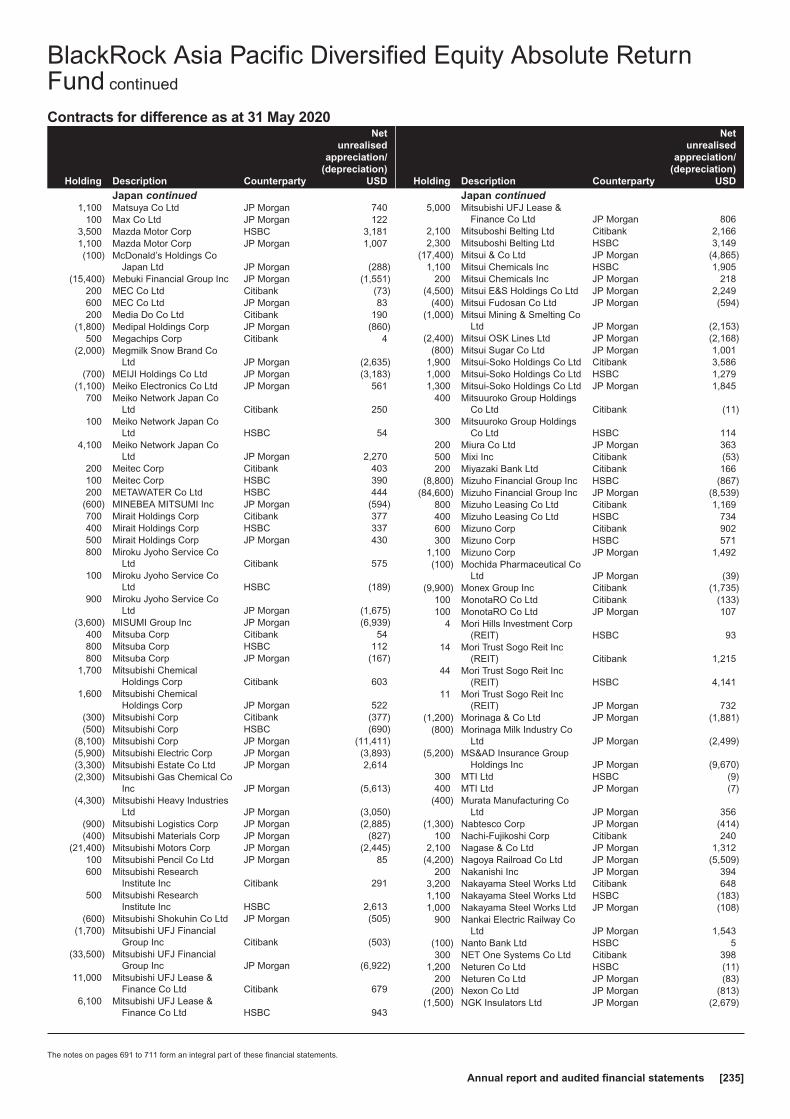
Contracts for difference as at 31 May 2020
Holding Description Counterparty
Netunrealised
appreciation/(depreciation)
USD
Japan continued1,100 Matsuya Co Ltd JP Morgan 740
100 Max Co Ltd JP Morgan 1223,500 Mazda Motor Corp HSBC 3,1811,100 Mazda Motor Corp JP Morgan 1,007(100) McDonald’s Holdings Co
Japan Ltd JP Morgan (288)(15,400) Mebuki Financial Group Inc JP Morgan (1,551)
200 MEC Co Ltd Citibank (73)600 MEC Co Ltd JP Morgan 83200 Media Do Co Ltd Citibank 190
(1,800) Medipal Holdings Corp JP Morgan (860)500 Megachips Corp Citibank 4
(2,000) Megmilk Snow Brand CoLtd JP Morgan (2,635)
(700) MEIJI Holdings Co Ltd JP Morgan (3,183)(1,100) Meiko Electronics Co Ltd JP Morgan 561
700 Meiko Network Japan CoLtd Citibank 250
100 Meiko Network Japan CoLtd HSBC 54
4,100 Meiko Network Japan CoLtd JP Morgan 2,270
200 Meitec Corp Citibank 403100 Meitec Corp HSBC 390200 METAWATER Co Ltd HSBC 444
(600) MINEBEA MITSUMI Inc JP Morgan (594)700 Mirait Holdings Corp Citibank 377400 Mirait Holdings Corp HSBC 337500 Mirait Holdings Corp JP Morgan 430800 Miroku Jyoho Service Co
Ltd Citibank 575100 Miroku Jyoho Service Co
Ltd HSBC (189)900 Miroku Jyoho Service Co
Ltd JP Morgan (1,675)(3,600) MISUMI Group Inc JP Morgan (6,939)
400 Mitsuba Corp Citibank 54800 Mitsuba Corp HSBC 112800 Mitsuba Corp JP Morgan (167)
1,700 Mitsubishi ChemicalHoldings Corp Citibank 603
1,600 Mitsubishi ChemicalHoldings Corp JP Morgan 522
(300) Mitsubishi Corp Citibank (377)(500) Mitsubishi Corp HSBC (690)
(8,100) Mitsubishi Corp JP Morgan (11,411)(5,900) Mitsubishi Electric Corp JP Morgan (3,893)(3,300) Mitsubishi Estate Co Ltd JP Morgan 2,614(2,300) Mitsubishi Gas Chemical Co
Inc JP Morgan (5,613)(4,300) Mitsubishi Heavy Industries
Ltd JP Morgan (3,050)(900) Mitsubishi Logistics Corp JP Morgan (2,885)(400) Mitsubishi Materials Corp JP Morgan (827)
(21,400) Mitsubishi Motors Corp JP Morgan (2,445)100 Mitsubishi Pencil Co Ltd JP Morgan 85600 Mitsubishi Research
Institute Inc Citibank 291500 Mitsubishi Research
Institute Inc HSBC 2,613(600) Mitsubishi Shokuhin Co Ltd JP Morgan (505)
(1,700) Mitsubishi UFJ FinancialGroup Inc Citibank (503)
(33,500) Mitsubishi UFJ FinancialGroup Inc JP Morgan (6,922)
11,000 Mitsubishi UFJ Lease &Finance Co Ltd Citibank 679
6,100 Mitsubishi UFJ Lease &Finance Co Ltd HSBC 943
Holding Description Counterparty
Netunrealised
appreciation/(depreciation)
USD
Japan continued5,000 Mitsubishi UFJ Lease &
Finance Co Ltd JP Morgan 8062,100 Mitsuboshi Belting Ltd Citibank 2,1662,300 Mitsuboshi Belting Ltd HSBC 3,149
(17,400) Mitsui & Co Ltd JP Morgan (4,865)1,100 Mitsui Chemicals Inc HSBC 1,905
200 Mitsui Chemicals Inc JP Morgan 218(4,500) Mitsui E&S Holdings Co Ltd JP Morgan 2,249
(400) Mitsui Fudosan Co Ltd JP Morgan (594)(1,000) Mitsui Mining & Smelting Co
Ltd JP Morgan (2,153)(2,400) Mitsui OSK Lines Ltd JP Morgan (2,168)
(800) Mitsui Sugar Co Ltd JP Morgan 1,0011,900 Mitsui-Soko Holdings Co Ltd Citibank 3,5861,000 Mitsui-Soko Holdings Co Ltd HSBC 1,2791,300 Mitsui-Soko Holdings Co Ltd JP Morgan 1,845
400 Mitsuuroko Group HoldingsCo Ltd Citibank (11)
300 Mitsuuroko Group HoldingsCo Ltd HSBC 114
200 Miura Co Ltd JP Morgan 363500 Mixi Inc Citibank (53)200 Miyazaki Bank Ltd Citibank 166
(8,800) Mizuho Financial Group Inc HSBC (867)(84,600) Mizuho Financial Group Inc JP Morgan (8,539)
800 Mizuho Leasing Co Ltd Citibank 1,169400 Mizuho Leasing Co Ltd HSBC 734600 Mizuno Corp Citibank 902300 Mizuno Corp HSBC 571
1,100 Mizuno Corp JP Morgan 1,492(100) Mochida Pharmaceutical Co
Ltd JP Morgan (39)(9,900) Monex Group Inc Citibank (1,735)
100 MonotaRO Co Ltd Citibank (133)100 MonotaRO Co Ltd JP Morgan 107
4 Mori Hills Investment Corp(REIT) HSBC 93
14 Mori Trust Sogo Reit Inc(REIT) Citibank 1,215
44 Mori Trust Sogo Reit Inc(REIT) HSBC 4,141
11 Mori Trust Sogo Reit Inc(REIT) JP Morgan 732
(1,200) Morinaga & Co Ltd JP Morgan (1,881)(800) Morinaga Milk Industry Co
Ltd JP Morgan (2,499)(5,200) MS&AD Insurance Group
Holdings Inc JP Morgan (9,670)300 MTI Ltd HSBC (9)400 MTI Ltd JP Morgan (7)
(400) Murata Manufacturing CoLtd JP Morgan 356
(1,300) Nabtesco Corp JP Morgan (414)100 Nachi-Fujikoshi Corp Citibank 240
2,100 Nagase & Co Ltd JP Morgan 1,312(4,200) Nagoya Railroad Co Ltd JP Morgan (5,509)
200 Nakanishi Inc JP Morgan 3943,200 Nakayama Steel Works Ltd Citibank 6481,100 Nakayama Steel Works Ltd HSBC (183)1,000 Nakayama Steel Works Ltd JP Morgan (108)
900 Nankai Electric Railway CoLtd JP Morgan 1,543
(100) Nanto Bank Ltd HSBC 5300 NET One Systems Co Ltd Citibank 398
1,200 Neturen Co Ltd HSBC (11)200 Neturen Co Ltd JP Morgan (83)
(200) Nexon Co Ltd JP Morgan (813)(1,500) NGK Insulators Ltd JP Morgan (2,679)
BlackRock Asia Pacific Diversified Equity Absolute ReturnFund continued
The notes on pages 691 to 711 form an integral part of these financial statements.
Annual report and audited financial statements [235]

Contracts for difference as at 31 May 2020
Holding Description Counterparty
Netunrealised
appreciation/(depreciation)
USD
Japan continued300 NGK Spark Plug Co Ltd HSBC 402600 NH Foods Ltd Citibank 1,129400 NH Foods Ltd JP Morgan 180
(7,700) NHK Spring Co Ltd JP Morgan (2,176)(300) Nichiban Co Ltd JP Morgan (180)900 Nichicon Corp JP Morgan 767
1,100 Nichiha Corp Citibank 1,068200 Nichiha Corp HSBC 482
2,900 Nichiha Corp JP Morgan 7,0561,600 NichiiGakkan Co Ltd Citibank 802
500 Nichi-iko Pharmaceutical CoLtd Citibank 126
3,700 Nichi-iko Pharmaceutical CoLtd JP Morgan (4,381)
100 Nichirei Corp JP Morgan 177100 Nidec Corp Citibank 240
1,200 Nidec Corp JP Morgan 4,561400 Nifco Inc Citibank 455500 Nifco Inc JP Morgan 1,375
2,400 Nihon Chouzai Co Ltd Citibank 1,402200 Nihon Chouzai Co Ltd HSBC 58
1,200 Nihon Chouzai Co Ltd JP Morgan 371200 Nihon Kohden Corp HSBC 569300 Nihon Kohden Corp JP Morgan 758300 Nihon M&A Center Inc Citibank 759
1,700 Nihon Nohyaku Co Ltd HSBC 838400 Nihon Nohyaku Co Ltd JP Morgan 197
1,800 Nihon Parkerizing Co Ltd JP Morgan 478600 Nihon Trim Co Ltd Citibank 1,377400 Nihon Trim Co Ltd HSBC 266200 Nihon Trim Co Ltd JP Morgan 141200 Nihon Unisys Ltd Citibank (14)
1,400 Nikkon Holdings Co Ltd HSBC 1,4471,800 Nikkon Holdings Co Ltd JP Morgan 1,904
800 Nikon Corp Citibank 2032,100 Nikon Corp HSBC 1,129(900) Nippo Corp JP Morgan (1,209)
6 Nippon AccommodationsFund Inc (REIT) Citibank 477
3 Nippon Building Fund Inc(REIT) Citibank 1,550
3 Nippon Building Fund Inc(REIT) HSBC (201)
(2) Nippon Building Fund Inc(REIT) JP Morgan 118
(1,400) Nippon Carbon Co Ltd JP Morgan (1,598)400 Nippon Ceramic Co Ltd Citibank 158100 Nippon Ceramic Co Ltd HSBC 24500 Nippon Ceramic Co Ltd JP Morgan 130900 Nippon Densetsu Kogyo Co
Ltd JP Morgan 2,304(1,100) Nippon Express Co Ltd JP Morgan (4,113)3,400 Nippon Flour Mills Co Ltd Citibank 1,4821,200 Nippon Flour Mills Co Ltd HSBC (882)1,000 Nippon Flour Mills Co Ltd JP Morgan (203)
400 Nippon Gas Co Ltd HSBC 1,283200 Nippon Gas Co Ltd JP Morgan 431
1,600 Nippon Kayaku Co Ltd Citibank 7482,800 Nippon Kayaku Co Ltd HSBC 1,2263,400 Nippon Kayaku Co Ltd JP Morgan 1,565
200 Nippon Koei Co Ltd HSBC 41412,200 Nippon Light Metal Holdings
Co Ltd JP Morgan 1,635(100) Nippon Paint Holdings Co
Ltd HSBC (640)(1,200) Nippon Paint Holdings Co
Ltd JP Morgan (11,086)700 Nippon Paper Industries Co
Ltd JP Morgan 290
Holding Description Counterparty
Netunrealised
appreciation/(depreciation)
USD
Japan continued2,200 Nippon Parking
Development Co Ltd Citibank (63)1,900 Nippon Parking
Development Co Ltd HSBC 206100 Nippon Seiki Co Ltd HSBC 34
13,900 Nippon Sheet Glass Co Ltd Citibank 3,5844,000 Nippon Sheet Glass Co Ltd JP Morgan 2,260
400 Nippon Shinyaku Co Ltd Citibank 3,288500 Nippon Shinyaku Co Ltd JP Morgan 9,727300 Nippon Shokubai Co Ltd Citibank 798
1,400 Nippon Steel Corp Citibank 1,0116,400 Nippon Steel Corp JP Morgan 4,980
100 Nippon Steel Trading Corp Citibank 374300 Nippon Steel Trading Corp JP Morgan 1,099
2,900 Nippon Suisan Kaisha Ltd Citibank 854600 Nippon Telegraph &
Telephone Corp Citibank 124400 Nippon Telegraph &
Telephone Corp HSBC (110)8,600 Nippon Telegraph &
Telephone Corp JP Morgan (2,116)(200) Nippon Yakin Kogyo Co Ltd Citibank (169)(700) Nippon Yakin Kogyo Co Ltd JP Morgan (85)
(7,400) Nippon Yusen KK JP Morgan (11,705)(1,700) Nipro Corp JP Morgan (802)2,100 Nishimatsu Construction Co
Ltd Citibank 1,222600 Nishimatsu Construction Co
Ltd HSBC (7)100 Nishimoto Co Ltd Citibank 41700 Nishimoto Co Ltd JP Morgan (299)
(8,500) Nishi-Nippon FinancialHoldings Inc JP Morgan (9,899)
(200) Nishi-Nippon Railroad CoLtd JP Morgan (542)
800 Nishio Rent All Co Ltd Citibank 5461,500 Nishio Rent All Co Ltd HSBC 1,4411,300 Nishio Rent All Co Ltd JP Morgan 1,061
300 Nissan Chemical Corp Citibank 828300 Nissan Chemical Corp JP Morgan 1,776
7,300 Nissan Motor Co Ltd JP Morgan 3,396(3,700) Nissan Shatai Co Ltd JP Morgan (4,013)
(200) Nissei ASB Machine Co Ltd Citibank (200)1,200 Nissha Co Ltd Citibank 1271,700 Nissha Co Ltd HSBC 211
200 Nissha Co Ltd JP Morgan (92)500 Nisshin Seifun Group Inc Citibank 269
2,700 Nisshinbo Holdings Inc Citibank 1,995500 Nisshinbo Holdings Inc JP Morgan 157100 Nissin Corp JP Morgan (12)
(900) Nissin Kogyo Co Ltd JP Morgan 174100 Nitori Holdings Co Ltd HSBC 2,011700 Nitori Holdings Co Ltd JP Morgan 16,805200 Nitta Corp Citibank 213400 Nitta Corp HSBC 74700 Nitta Corp JP Morgan 1,243
1,400 Nitto Denko Corp JP Morgan 4,806500 Nitto Kogyo Corp HSBC 394800 Nitto Kogyo Corp JP Morgan 570200 Nitto Kohki Co Ltd JP Morgan 54
(500) Noevir Holdings Co Ltd JP Morgan 891(200) NOF Corp JP Morgan (487)800 Nohmi Bosai Ltd JP Morgan 1,012100 Nojima Corp Citibank 357200 Nojima Corp HSBC 1,144200 Nojima Corp JP Morgan 1,148
(2,100) NOK Corp JP Morgan (3,157)2,300 Nomura Co Ltd Citibank 1,8261,200 Nomura Co Ltd HSBC 1,462
BlackRock Asia Pacific Diversified Equity Absolute ReturnFund continued
The notes on pages 691 to 711 form an integral part of these financial statements.
BlackRock Strategic Funds[236]

Contracts for difference as at 31 May 2020
Holding Description Counterparty
Netunrealised
appreciation/(depreciation)
USD
Japan continued1,900 Nomura Co Ltd JP Morgan 2,334
(12,200) Nomura Holdings Inc JP Morgan (2,964)400 Nomura Real Estate
Holdings Inc Citibank 601800 Nomura Real Estate
Holdings Inc JP Morgan 1,0391,000 Nomura Research Institute
Ltd Citibank 2,763800 Nomura Research Institute
Ltd HSBC 1,413400 Nomura Research Institute
Ltd JP Morgan 7191,200 Noritz Corp HSBC (161)3,400 Noritz Corp JP Morgan (406)
(1,100) North Pacific Bank Ltd JP Morgan (136)300 NS Solutions Corp HSBC 515800 NS Solutions Corp JP Morgan 1,401
2,000 NSD Co Ltd Citibank 7602,100 NSD Co Ltd HSBC 1,445
700 NSD Co Ltd JP Morgan 495(11,100) NSK Ltd JP Morgan (1,702)
9,600 NTN Corp Citibank 2,308(2,700) NTT Data Corp JP Morgan (299)(1,300) NTT DOCOMO Inc JP Morgan 2,573
100 Obara Group Inc HSBC 9(4,400) Obayashi Corp JP Morgan (2,764)
100 OBIC Business ConsultantsCo Ltd JP Morgan 495
(800) Odakyu Electric Railway CoLtd JP Morgan (2,500)
(2,600) Ohara Inc JP Morgan (1,195)200 Ohsho Food Service Corp Citibank (83)
1,900 Oiles Corp Citibank 1,344300 Oiles Corp HSBC 295600 Oiles Corp JP Morgan 314
(3,600) Oji Holdings Corp JP Morgan 1,1192,900 Okamura Corp Citibank 1,3255,600 Okamura Corp HSBC 3,7162,800 Okamura Corp JP Morgan 2,018
600 Oki Electric Industry Co Ltd HSBC 32(600) OKUMA Corp JP Morgan (753)200 Okumura Corp Citibank 170100 Okumura Corp JP Morgan 166700 Okuwa Co Ltd Citibank 892300 Okuwa Co Ltd HSBC 355700 Okuwa Co Ltd JP Morgan 840
1,100 Olympus Corp Citibank 1,844900 Olympus Corp HSBC 781100 Olympus Corp JP Morgan 162
(900) Omron Corp JP Morgan (3,155)(600) Ono Pharmaceutical Co Ltd JP Morgan (2,418)
2,500 Onward Holdings Co Ltd Citibank 3654,600 Onward Holdings Co Ltd HSBC (13)2,200 Onward Holdings Co Ltd JP Morgan 431
400 OPT Holding Inc Citibank 320300 OPT Holding Inc JP Morgan 78
(100) Optim Corp Citibank (3)(200) Optim Corp JP Morgan (1,038)(700) Oracle Corp Japan JP Morgan (3,896)
(13,400) Orient Corp JP Morgan (731)(200) Oriental Land Co Ltd JP Morgan (2,395)
2,800 ORIX Corp Citibank 2,8923,600 ORIX Corp JP Morgan 5,666
(1,500) Osaka Gas Co Ltd JP Morgan (1,013)100 Osaka Soda Co Ltd Citibank 142300 Osaka Steel Co Ltd Citibank 304700 OSG Corp Citibank 696
3,400 OSG Corp HSBC 3,063700 OSG Corp JP Morgan 642
Holding Description Counterparty
Netunrealised
appreciation/(depreciation)
USD
Japan continued200 Otsuka Corp Citibank 933
1,100 Otsuka Corp JP Morgan 3,439700 Otsuka Holdings Co Ltd Citibank 4,302100 Otsuka Holdings Co Ltd JP Morgan 542
3,300 Oyo Corp Citibank 2,274300 Oyo Corp HSBC 118900 Oyo Corp JP Morgan 368700 PAL GROUP Holdings Co
Ltd Citibank 528900 PAL GROUP Holdings Co
Ltd HSBC 5871,700 PAL GROUP Holdings Co
Ltd JP Morgan 1,391(200) PALTAC Corp JP Morgan 392(400) Pan Pacific International
Holdings Corp JP Morgan (191)4,300 Panasonic Corp Citibank 3,3292,000 Panasonic Corp JP Morgan 2,899
700 Paramount Bed Holdings CoLtd Citibank 46
500 Paramount Bed Holdings CoLtd HSBC (790)
700 Paramount Bed Holdings CoLtd JP Morgan (2,160)
700 Park24 Co Ltd HSBC 2,3941,400 Pasona Group Inc Citibank 1,1611,300 Pasona Group Inc HSBC 1,8992,000 Pasona Group Inc JP Morgan 2,948
400 PCA Corp JP Morgan 1,5801,300 Penta-Ocean Construction
Co Ltd Citibank 1894,800 Penta-Ocean Construction
Co Ltd HSBC 33,200 Penta-Ocean Construction
Co Ltd JP Morgan (28)3,200 Pepper Food Service Co Ltd Citibank 2,5481,000 Pepper Food Service Co Ltd HSBC 1,0711,100 Persol Holdings Co Ltd JP Morgan 2,083
400 Pigeon Corp JP Morgan 454200 Pilot Corp Citibank 128
(600) PKSHA Technology Inc JP Morgan (3,044)400 Pola Orbis Holdings Inc JP Morgan 591300 Poletowin Pitcrew Holdings
Inc Citibank (21)100 Poletowin Pitcrew Holdings
Inc HSBC 491,200 Poletowin Pitcrew Holdings
Inc JP Morgan 5199 Premier Investment Corp
(REIT) Citibank 89712 Premier Investment Corp
(REIT) HSBC 54311 Premier Investment Corp
(REIT) JP Morgan 5123,200 Press Kogyo Co Ltd Citibank 8285,800 Press Kogyo Co Ltd HSBC 6031,000 Press Kogyo Co Ltd JP Morgan 1962,700 Pressance Corp Citibank 1,0571,800 Prestige International Inc HSBC 1,629
200 Prestige International Inc JP Morgan 177300 Prored Partners Co Ltd Citibank 911500 Prored Partners Co Ltd HSBC 3,827200 Prored Partners Co Ltd JP Morgan 699100 Proto Corp Citibank 116200 Qol Holdings Co Ltd Citibank 197
1,200 Qol Holdings Co Ltd HSBC 1,774(2,200) Raiznext Corp JP Morgan (1,629)
(300) Raksul Inc Citibank (67)200 Rakus Co Ltd Citibank (55)
BlackRock Asia Pacific Diversified Equity Absolute ReturnFund continued
The notes on pages 691 to 711 form an integral part of these financial statements.
Annual report and audited financial statements [237]
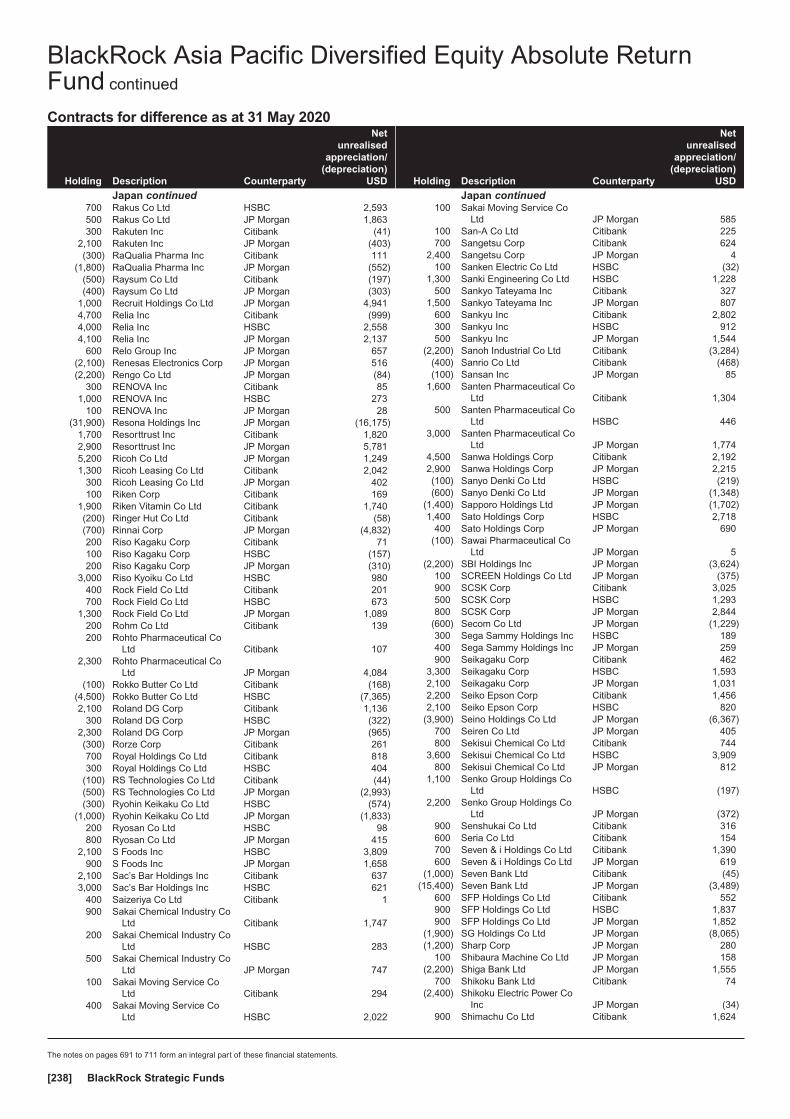
Contracts for difference as at 31 May 2020
Holding Description Counterparty
Netunrealised
appreciation/(depreciation)
USD
Japan continued700 Rakus Co Ltd HSBC 2,593500 Rakus Co Ltd JP Morgan 1,863300 Rakuten Inc Citibank (41)
2,100 Rakuten Inc JP Morgan (403)(300) RaQualia Pharma Inc Citibank 111
(1,800) RaQualia Pharma Inc JP Morgan (552)(500) Raysum Co Ltd Citibank (197)(400) Raysum Co Ltd JP Morgan (303)
1,000 Recruit Holdings Co Ltd JP Morgan 4,9414,700 Relia Inc Citibank (999)4,000 Relia Inc HSBC 2,5584,100 Relia Inc JP Morgan 2,137
600 Relo Group Inc JP Morgan 657(2,100) Renesas Electronics Corp JP Morgan 516(2,200) Rengo Co Ltd JP Morgan (84)
300 RENOVA Inc Citibank 851,000 RENOVA Inc HSBC 273
100 RENOVA Inc JP Morgan 28(31,900) Resona Holdings Inc JP Morgan (16,175)
1,700 Resorttrust Inc Citibank 1,8202,900 Resorttrust Inc JP Morgan 5,7815,200 Ricoh Co Ltd JP Morgan 1,2491,300 Ricoh Leasing Co Ltd Citibank 2,042
300 Ricoh Leasing Co Ltd JP Morgan 402100 Riken Corp Citibank 169
1,900 Riken Vitamin Co Ltd Citibank 1,740(200) Ringer Hut Co Ltd Citibank (58)(700) Rinnai Corp JP Morgan (4,832)200 Riso Kagaku Corp Citibank 71100 Riso Kagaku Corp HSBC (157)200 Riso Kagaku Corp JP Morgan (310)
3,000 Riso Kyoiku Co Ltd HSBC 980400 Rock Field Co Ltd Citibank 201700 Rock Field Co Ltd HSBC 673
1,300 Rock Field Co Ltd JP Morgan 1,089200 Rohm Co Ltd Citibank 139200 Rohto Pharmaceutical Co
Ltd Citibank 1072,300 Rohto Pharmaceutical Co
Ltd JP Morgan 4,084(100) Rokko Butter Co Ltd Citibank (168)
(4,500) Rokko Butter Co Ltd HSBC (7,365)2,100 Roland DG Corp Citibank 1,136
300 Roland DG Corp HSBC (322)2,300 Roland DG Corp JP Morgan (965)(300) Rorze Corp Citibank 261700 Royal Holdings Co Ltd Citibank 818300 Royal Holdings Co Ltd HSBC 404
(100) RS Technologies Co Ltd Citibank (44)(500) RS Technologies Co Ltd JP Morgan (2,993)(300) Ryohin Keikaku Co Ltd HSBC (574)
(1,000) Ryohin Keikaku Co Ltd JP Morgan (1,833)200 Ryosan Co Ltd HSBC 98800 Ryosan Co Ltd JP Morgan 415
2,100 S Foods Inc HSBC 3,809900 S Foods Inc JP Morgan 1,658
2,100 Sac’s Bar Holdings Inc Citibank 6373,000 Sac’s Bar Holdings Inc HSBC 621
400 Saizeriya Co Ltd Citibank 1900 Sakai Chemical Industry Co
Ltd Citibank 1,747200 Sakai Chemical Industry Co
Ltd HSBC 283500 Sakai Chemical Industry Co
Ltd JP Morgan 747100 Sakai Moving Service Co
Ltd Citibank 294400 Sakai Moving Service Co
Ltd HSBC 2,022
Holding Description Counterparty
Netunrealised
appreciation/(depreciation)
USD
Japan continued100 Sakai Moving Service Co
Ltd JP Morgan 585100 San-A Co Ltd Citibank 225700 Sangetsu Corp Citibank 624
2,400 Sangetsu Corp JP Morgan 4100 Sanken Electric Co Ltd HSBC (32)
1,300 Sanki Engineering Co Ltd HSBC 1,228500 Sankyo Tateyama Inc Citibank 327
1,500 Sankyo Tateyama Inc JP Morgan 807600 Sankyu Inc Citibank 2,802300 Sankyu Inc HSBC 912500 Sankyu Inc JP Morgan 1,544
(2,200) Sanoh Industrial Co Ltd Citibank (3,284)(400) Sanrio Co Ltd Citibank (468)(100) Sansan Inc JP Morgan 85
1,600 Santen Pharmaceutical CoLtd Citibank 1,304
500 Santen Pharmaceutical CoLtd HSBC 446
3,000 Santen Pharmaceutical CoLtd JP Morgan 1,774
4,500 Sanwa Holdings Corp Citibank 2,1922,900 Sanwa Holdings Corp JP Morgan 2,215(100) Sanyo Denki Co Ltd HSBC (219)(600) Sanyo Denki Co Ltd JP Morgan (1,348)
(1,400) Sapporo Holdings Ltd JP Morgan (1,702)1,400 Sato Holdings Corp HSBC 2,718
400 Sato Holdings Corp JP Morgan 690(100) Sawai Pharmaceutical Co
Ltd JP Morgan 5(2,200) SBI Holdings Inc JP Morgan (3,624)
100 SCREEN Holdings Co Ltd JP Morgan (375)900 SCSK Corp Citibank 3,025500 SCSK Corp HSBC 1,293800 SCSK Corp JP Morgan 2,844
(600) Secom Co Ltd JP Morgan (1,229)300 Sega Sammy Holdings Inc HSBC 189400 Sega Sammy Holdings Inc JP Morgan 259900 Seikagaku Corp Citibank 462
3,300 Seikagaku Corp HSBC 1,5932,100 Seikagaku Corp JP Morgan 1,0312,200 Seiko Epson Corp Citibank 1,4562,100 Seiko Epson Corp HSBC 820
(3,900) Seino Holdings Co Ltd JP Morgan (6,367)700 Seiren Co Ltd JP Morgan 405800 Sekisui Chemical Co Ltd Citibank 744
3,600 Sekisui Chemical Co Ltd HSBC 3,909800 Sekisui Chemical Co Ltd JP Morgan 812
1,100 Senko Group Holdings CoLtd HSBC (197)
2,200 Senko Group Holdings CoLtd JP Morgan (372)
900 Senshukai Co Ltd Citibank 316600 Seria Co Ltd Citibank 154700 Seven & i Holdings Co Ltd Citibank 1,390600 Seven & i Holdings Co Ltd JP Morgan 619
(1,000) Seven Bank Ltd Citibank (45)(15,400) Seven Bank Ltd JP Morgan (3,489)
600 SFP Holdings Co Ltd Citibank 552900 SFP Holdings Co Ltd HSBC 1,837900 SFP Holdings Co Ltd JP Morgan 1,852
(1,900) SG Holdings Co Ltd JP Morgan (8,065)(1,200) Sharp Corp JP Morgan 280
100 Shibaura Machine Co Ltd JP Morgan 158(2,200) Shiga Bank Ltd JP Morgan 1,555
700 Shikoku Bank Ltd Citibank 74(2,400) Shikoku Electric Power Co
Inc JP Morgan (34)900 Shimachu Co Ltd Citibank 1,624
BlackRock Asia Pacific Diversified Equity Absolute ReturnFund continued
The notes on pages 691 to 711 form an integral part of these financial statements.
BlackRock Strategic Funds[238]
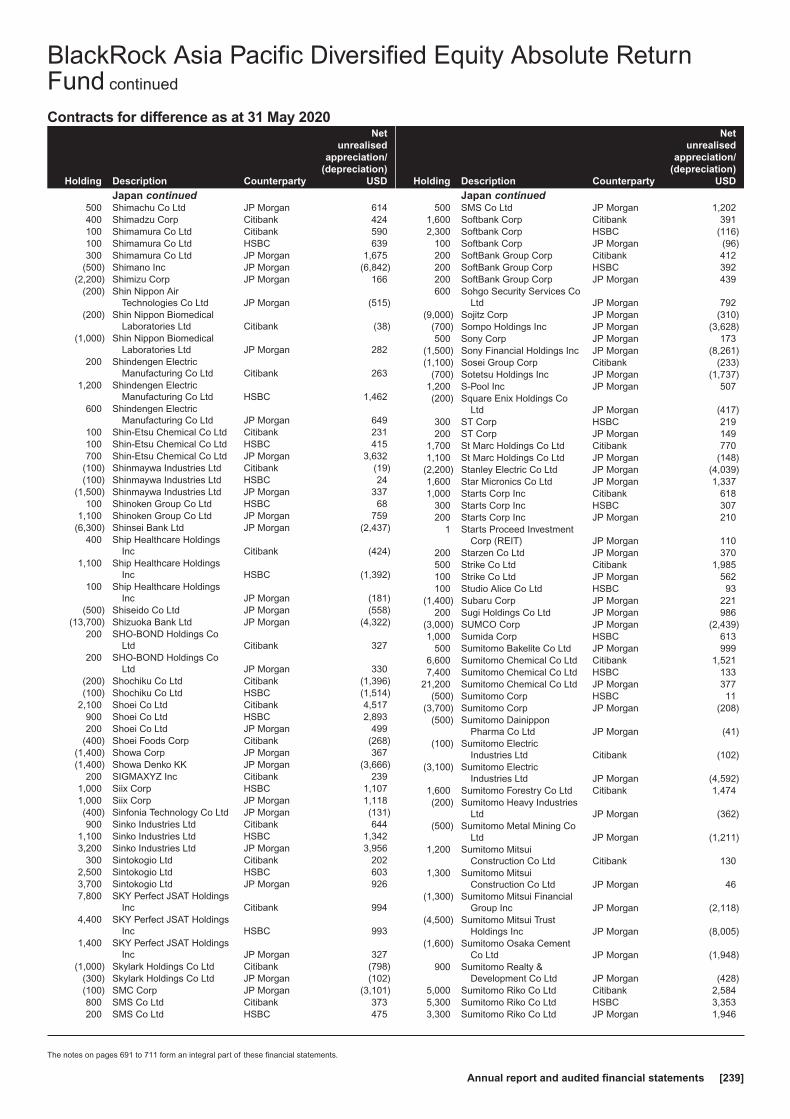
Contracts for difference as at 31 May 2020
Holding Description Counterparty
Netunrealised
appreciation/(depreciation)
USD
Japan continued500 Shimachu Co Ltd JP Morgan 614400 Shimadzu Corp Citibank 424100 Shimamura Co Ltd Citibank 590100 Shimamura Co Ltd HSBC 639300 Shimamura Co Ltd JP Morgan 1,675
(500) Shimano Inc JP Morgan (6,842)(2,200) Shimizu Corp JP Morgan 166
(200) Shin Nippon AirTechnologies Co Ltd JP Morgan (515)
(200) Shin Nippon BiomedicalLaboratories Ltd Citibank (38)
(1,000) Shin Nippon BiomedicalLaboratories Ltd JP Morgan 282
200 Shindengen ElectricManufacturing Co Ltd Citibank 263
1,200 Shindengen ElectricManufacturing Co Ltd HSBC 1,462
600 Shindengen ElectricManufacturing Co Ltd JP Morgan 649
100 Shin-Etsu Chemical Co Ltd Citibank 231100 Shin-Etsu Chemical Co Ltd HSBC 415700 Shin-Etsu Chemical Co Ltd JP Morgan 3,632
(100) Shinmaywa Industries Ltd Citibank (19)(100) Shinmaywa Industries Ltd HSBC 24
(1,500) Shinmaywa Industries Ltd JP Morgan 337100 Shinoken Group Co Ltd HSBC 68
1,100 Shinoken Group Co Ltd JP Morgan 759(6,300) Shinsei Bank Ltd JP Morgan (2,437)
400 Ship Healthcare HoldingsInc Citibank (424)
1,100 Ship Healthcare HoldingsInc HSBC (1,392)
100 Ship Healthcare HoldingsInc JP Morgan (181)
(500) Shiseido Co Ltd JP Morgan (558)(13,700) Shizuoka Bank Ltd JP Morgan (4,322)
200 SHO-BOND Holdings CoLtd Citibank 327
200 SHO-BOND Holdings CoLtd JP Morgan 330
(200) Shochiku Co Ltd Citibank (1,396)(100) Shochiku Co Ltd HSBC (1,514)
2,100 Shoei Co Ltd Citibank 4,517900 Shoei Co Ltd HSBC 2,893200 Shoei Co Ltd JP Morgan 499
(400) Shoei Foods Corp Citibank (268)(1,400) Showa Corp JP Morgan 367(1,400) Showa Denko KK JP Morgan (3,666)
200 SIGMAXYZ Inc Citibank 2391,000 Siix Corp HSBC 1,1071,000 Siix Corp JP Morgan 1,118(400) Sinfonia Technology Co Ltd JP Morgan (131)900 Sinko Industries Ltd Citibank 644
1,100 Sinko Industries Ltd HSBC 1,3423,200 Sinko Industries Ltd JP Morgan 3,956
300 Sintokogio Ltd Citibank 2022,500 Sintokogio Ltd HSBC 6033,700 Sintokogio Ltd JP Morgan 9267,800 SKY Perfect JSAT Holdings
Inc Citibank 9944,400 SKY Perfect JSAT Holdings
Inc HSBC 9931,400 SKY Perfect JSAT Holdings
Inc JP Morgan 327(1,000) Skylark Holdings Co Ltd Citibank (798)
(300) Skylark Holdings Co Ltd JP Morgan (102)(100) SMC Corp JP Morgan (3,101)800 SMS Co Ltd Citibank 373200 SMS Co Ltd HSBC 475
Holding Description Counterparty
Netunrealised
appreciation/(depreciation)
USD
Japan continued500 SMS Co Ltd JP Morgan 1,202
1,600 Softbank Corp Citibank 3912,300 Softbank Corp HSBC (116)
100 Softbank Corp JP Morgan (96)200 SoftBank Group Corp Citibank 412200 SoftBank Group Corp HSBC 392200 SoftBank Group Corp JP Morgan 439600 Sohgo Security Services Co
Ltd JP Morgan 792(9,000) Sojitz Corp JP Morgan (310)
(700) Sompo Holdings Inc JP Morgan (3,628)500 Sony Corp JP Morgan 173
(1,500) Sony Financial Holdings Inc JP Morgan (8,261)(1,100) Sosei Group Corp Citibank (233)
(700) Sotetsu Holdings Inc JP Morgan (1,737)1,200 S-Pool Inc JP Morgan 507(200) Square Enix Holdings Co
Ltd JP Morgan (417)300 ST Corp HSBC 219200 ST Corp JP Morgan 149
1,700 St Marc Holdings Co Ltd Citibank 7701,100 St Marc Holdings Co Ltd JP Morgan (148)
(2,200) Stanley Electric Co Ltd JP Morgan (4,039)1,600 Star Micronics Co Ltd JP Morgan 1,3371,000 Starts Corp Inc Citibank 618
300 Starts Corp Inc HSBC 307200 Starts Corp Inc JP Morgan 210
1 Starts Proceed InvestmentCorp (REIT) JP Morgan 110
200 Starzen Co Ltd JP Morgan 370500 Strike Co Ltd Citibank 1,985100 Strike Co Ltd JP Morgan 562100 Studio Alice Co Ltd HSBC 93
(1,400) Subaru Corp JP Morgan 221200 Sugi Holdings Co Ltd JP Morgan 986
(3,000) SUMCO Corp JP Morgan (2,439)1,000 Sumida Corp HSBC 613
500 Sumitomo Bakelite Co Ltd JP Morgan 9996,600 Sumitomo Chemical Co Ltd Citibank 1,5217,400 Sumitomo Chemical Co Ltd HSBC 133
21,200 Sumitomo Chemical Co Ltd JP Morgan 377(500) Sumitomo Corp HSBC 11
(3,700) Sumitomo Corp JP Morgan (208)(500) Sumitomo Dainippon
Pharma Co Ltd JP Morgan (41)(100) Sumitomo Electric
Industries Ltd Citibank (102)(3,100) Sumitomo Electric
Industries Ltd JP Morgan (4,592)1,600 Sumitomo Forestry Co Ltd Citibank 1,474(200) Sumitomo Heavy Industries
Ltd JP Morgan (362)(500) Sumitomo Metal Mining Co
Ltd JP Morgan (1,211)1,200 Sumitomo Mitsui
Construction Co Ltd Citibank 1301,300 Sumitomo Mitsui
Construction Co Ltd JP Morgan 46(1,300) Sumitomo Mitsui Financial
Group Inc JP Morgan (2,118)(4,500) Sumitomo Mitsui Trust
Holdings Inc JP Morgan (8,005)(1,600) Sumitomo Osaka Cement
Co Ltd JP Morgan (1,948)900 Sumitomo Realty &
Development Co Ltd JP Morgan (428)5,000 Sumitomo Riko Co Ltd Citibank 2,5845,300 Sumitomo Riko Co Ltd HSBC 3,3533,300 Sumitomo Riko Co Ltd JP Morgan 1,946
BlackRock Asia Pacific Diversified Equity Absolute ReturnFund continued
The notes on pages 691 to 711 form an integral part of these financial statements.
Annual report and audited financial statements [239]

Contracts for difference as at 31 May 2020
Holding Description Counterparty
Netunrealised
appreciation/(depreciation)
USD
Japan continued2,700 Sumitomo Rubber
Industries Ltd Citibank 697300 Sumitomo Rubber
Industries Ltd HSBC 2101,100 Sumitomo Rubber
Industries Ltd JP Morgan 7835,200 Sun Frontier Fudousan Co
Ltd Citibank 2,9192,200 Sun Frontier Fudousan Co
Ltd HSBC 1,228800 Sun Frontier Fudousan Co
Ltd JP Morgan 595(300) Sundrug Co Ltd JP Morgan 123
1,800 Suntory Beverage & FoodLtd JP Morgan 6,403
(400) Suruga Bank Ltd Citibank (96)(800) Suruga Bank Ltd HSBC (254)
(2,200) Suruga Bank Ltd JP Morgan (379)(1,400) Sushiro Global Holdings Ltd JP Morgan (2,982)
200 Suzuken Co Ltd JP Morgan 369(600) Suzuki Motor Corp JP Morgan (2,062)(300) Sysmex Corp JP Morgan (1,338)300 Systena Corp HSBC 51
1,300 Systena Corp JP Morgan 1,538400 T Hasegawa Co Ltd HSBC 680
(4,700) T&D Holdings Inc JP Morgan (3,879)(2,100) Tadano Ltd JP Morgan (698)(1,300) Taiheiyo Cement Corp JP Morgan (4,139)
200 Taikisha Ltd Citibank 507300 Taikisha Ltd HSBC 407700 Taiko Pharmaceutical Co
Ltd Citibank 2,444100 Taiko Pharmaceutical Co
Ltd JP Morgan 340300 Taisei Corp Citibank 272500 Taisei Corp HSBC 966200 Taisei Corp JP Morgan 395200 Taisho Pharmaceutical
Holdings Co Ltd JP Morgan 106(800) Taiyo Nippon Sanso Corp JP Morgan (970)200 Taiyo Yuden Co Ltd JP Morgan (146)
2,300 Takamatsu ConstructionGroup Co Ltd Citibank 3,664
700 Takamatsu ConstructionGroup Co Ltd HSBC 1,486
1,700 Takamatsu ConstructionGroup Co Ltd JP Morgan 3,751
(200) Takara Bio Inc JP Morgan (710)2,300 Takara Holdings Inc Citibank 1,6351,100 Takara Holdings Inc HSBC 4123,200 Takara Holdings Inc JP Morgan 1,229
700 Takara Standard Co Ltd Citibank 4811,000 Takara Standard Co Ltd HSBC (288)
200 Takara Standard Co Ltd JP Morgan (54)200 Takasago International Corp Citibank 146
1,000 Takasago ThermalEngineering Co Ltd Citibank 1,477
1,000 Takasago ThermalEngineering Co Ltd HSBC 1,079
1,400 Takasago ThermalEngineering Co Ltd JP Morgan 1,471
(3,100) Takashimaya Co Ltd JP Morgan (2,106)900 Takeda Pharmaceutical Co
Ltd JP Morgan 3,1031,100 Takeuchi Manufacturing Co
Ltd Citibank 499400 Takeuchi Manufacturing Co
Ltd HSBC 474
Holding Description Counterparty
Netunrealised
appreciation/(depreciation)
USD
Japan continued800 Tama Home Co Ltd HSBC (149)400 Tama Home Co Ltd JP Morgan (68)600 Tamron Co Ltd Citibank 751600 Tamron Co Ltd HSBC 1,142600 Tamron Co Ltd JP Morgan 1,155
6,000 Tanseisha Co Ltd Citibank 2,9854,300 Tanseisha Co Ltd HSBC 1,9493,700 Tanseisha Co Ltd JP Morgan 1,805(100) Tayca Corp JP Morgan (15)100 TDK Corp JP Morgan 578
(200) TeamSpirit Inc JP Morgan (171)100 TechnoPro Holdings Inc Citibank 33100 Teijin Ltd JP Morgan 63800 Tenma Corp Citibank 2,171
2,600 Tenma Corp HSBC 7,446600 Terumo Corp Citibank 1,954
1,500 T-Gaia Corp Citibank 5531,900 T-Gaia Corp HSBC 2,128
(1,200) THK Co Ltd JP Morgan (1,914)100 TIS Inc HSBC 106
1,200 TIS Inc JP Morgan 2,140300 TKC Corp Citibank 1,217200 TKC Corp HSBC 865
(300) TKP Corp JP Morgan (379)1,000 Toa Corp Citibank 873
300 Toa Corp HSBC 5431,100 Toagosei Co Ltd Citibank 4621,200 Toagosei Co Ltd HSBC 306
700 Toagosei Co Ltd JP Morgan 191(1,100) Tobu Railway Co Ltd JP Morgan (2,214)6,800 Toda Corp Citibank 2,0804,200 Toda Corp HSBC 1,016
600 Toda Corp JP Morgan 91(6,900) Toho Bank Ltd JP Morgan 272
(800) Toho Co Ltd JP Morgan (2,689)(1,100) Toho Gas Co Ltd JP Morgan 4,2261,100 Toho Holdings Co Ltd Citibank 1,049
(3,700) Tohoku Electric Power CoInc JP Morgan (2,834)
(3,600) Tokai Carbon Co Ltd Citibank (2,623)(2,200) Tokai Carbon Co Ltd JP Morgan (2,868)(3,800) Tokai Rika Co Ltd JP Morgan (4,977)
400 Tokio Marine Holdings Inc HSBC 223(600) Tokushu Tokai Paper Co Ltd JP Morgan (1,350)
(1,300) Tokuyama Corp JP Morgan (3,282)(100) Tokyo Broadcasting System
Holdings Inc Citibank (59)(1,100) Tokyo Broadcasting System
Holdings Inc HSBC (115)(400) Tokyo Broadcasting System
Holdings Inc JP Morgan (50)100 Tokyo Century Corp JP Morgan 991
3,100 Tokyo Dome Corp Citibank 1,049100 Tokyo Dome Corp JP Morgan 83
(34,700) Tokyo Electric Power CoHoldings Inc JP Morgan (177)
300 Tokyo Electron Ltd JP Morgan (3,350)(1,700) Tokyo Gas Co Ltd JP Morgan (879)
(100) Tokyo Ohka Kogyo Co Ltd JP Morgan (398)(800) Tokyo Steel Manufacturing
Co Ltd JP Morgan 558(2,300) Tokyo Tatemono Co Ltd JP Morgan (2,115)
200 Tokyotokeiba Co Ltd JP Morgan (381)2,600 Tokyu Construction Co Ltd Citibank 6923,300 Tokyu Construction Co Ltd HSBC 3356,800 Tokyu Construction Co Ltd JP Morgan 1,2741,300 Tokyu Corp JP Morgan 1,124
BlackRock Asia Pacific Diversified Equity Absolute ReturnFund continued
The notes on pages 691 to 711 form an integral part of these financial statements.
BlackRock Strategic Funds[240]
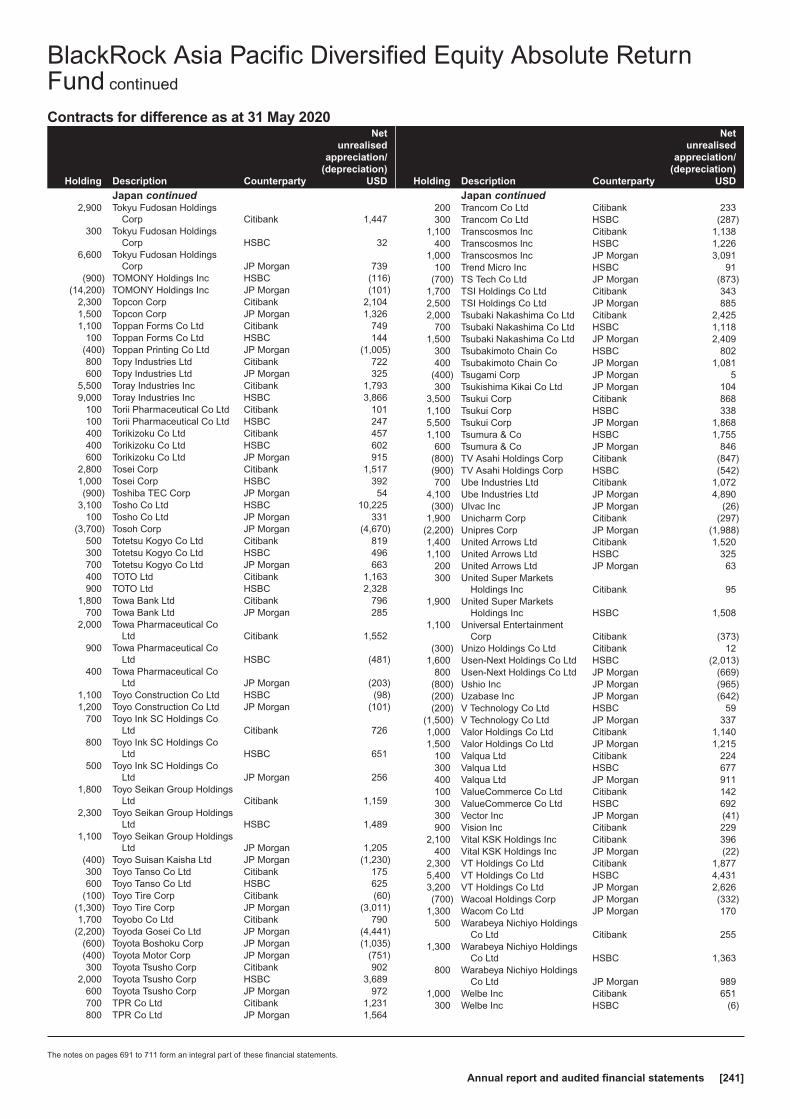
Contracts for difference as at 31 May 2020
Holding Description Counterparty
Netunrealised
appreciation/(depreciation)
USD
Japan continued2,900 Tokyu Fudosan Holdings
Corp Citibank 1,447300 Tokyu Fudosan Holdings
Corp HSBC 326,600 Tokyu Fudosan Holdings
Corp JP Morgan 739(900) TOMONY Holdings Inc HSBC (116)
(14,200) TOMONY Holdings Inc JP Morgan (101)2,300 Topcon Corp Citibank 2,1041,500 Topcon Corp JP Morgan 1,3261,100 Toppan Forms Co Ltd Citibank 749
100 Toppan Forms Co Ltd HSBC 144(400) Toppan Printing Co Ltd JP Morgan (1,005)800 Topy Industries Ltd Citibank 722600 Topy Industries Ltd JP Morgan 325
5,500 Toray Industries Inc Citibank 1,7939,000 Toray Industries Inc HSBC 3,866
100 Torii Pharmaceutical Co Ltd Citibank 101100 Torii Pharmaceutical Co Ltd HSBC 247400 Torikizoku Co Ltd Citibank 457400 Torikizoku Co Ltd HSBC 602600 Torikizoku Co Ltd JP Morgan 915
2,800 Tosei Corp Citibank 1,5171,000 Tosei Corp HSBC 392(900) Toshiba TEC Corp JP Morgan 54
3,100 Tosho Co Ltd HSBC 10,225100 Tosho Co Ltd JP Morgan 331
(3,700) Tosoh Corp JP Morgan (4,670)500 Totetsu Kogyo Co Ltd Citibank 819300 Totetsu Kogyo Co Ltd HSBC 496700 Totetsu Kogyo Co Ltd JP Morgan 663400 TOTO Ltd Citibank 1,163900 TOTO Ltd HSBC 2,328
1,800 Towa Bank Ltd Citibank 796700 Towa Bank Ltd JP Morgan 285
2,000 Towa Pharmaceutical CoLtd Citibank 1,552
900 Towa Pharmaceutical CoLtd HSBC (481)
400 Towa Pharmaceutical CoLtd JP Morgan (203)
1,100 Toyo Construction Co Ltd HSBC (98)1,200 Toyo Construction Co Ltd JP Morgan (101)
700 Toyo Ink SC Holdings CoLtd Citibank 726
800 Toyo Ink SC Holdings CoLtd HSBC 651
500 Toyo Ink SC Holdings CoLtd JP Morgan 256
1,800 Toyo Seikan Group HoldingsLtd Citibank 1,159
2,300 Toyo Seikan Group HoldingsLtd HSBC 1,489
1,100 Toyo Seikan Group HoldingsLtd JP Morgan 1,205
(400) Toyo Suisan Kaisha Ltd JP Morgan (1,230)300 Toyo Tanso Co Ltd Citibank 175600 Toyo Tanso Co Ltd HSBC 625
(100) Toyo Tire Corp Citibank (60)(1,300) Toyo Tire Corp JP Morgan (3,011)1,700 Toyobo Co Ltd Citibank 790
(2,200) Toyoda Gosei Co Ltd JP Morgan (4,441)(600) Toyota Boshoku Corp JP Morgan (1,035)(400) Toyota Motor Corp JP Morgan (751)300 Toyota Tsusho Corp Citibank 902
2,000 Toyota Tsusho Corp HSBC 3,689600 Toyota Tsusho Corp JP Morgan 972700 TPR Co Ltd Citibank 1,231800 TPR Co Ltd JP Morgan 1,564
Holding Description Counterparty
Netunrealised
appreciation/(depreciation)
USD
Japan continued200 Trancom Co Ltd Citibank 233300 Trancom Co Ltd HSBC (287)
1,100 Transcosmos Inc Citibank 1,138400 Transcosmos Inc HSBC 1,226
1,000 Transcosmos Inc JP Morgan 3,091100 Trend Micro Inc HSBC 91
(700) TS Tech Co Ltd JP Morgan (873)1,700 TSI Holdings Co Ltd Citibank 3432,500 TSI Holdings Co Ltd JP Morgan 8852,000 Tsubaki Nakashima Co Ltd Citibank 2,425
700 Tsubaki Nakashima Co Ltd HSBC 1,1181,500 Tsubaki Nakashima Co Ltd JP Morgan 2,409
300 Tsubakimoto Chain Co HSBC 802400 Tsubakimoto Chain Co JP Morgan 1,081
(400) Tsugami Corp JP Morgan 5300 Tsukishima Kikai Co Ltd JP Morgan 104
3,500 Tsukui Corp Citibank 8681,100 Tsukui Corp HSBC 3385,500 Tsukui Corp JP Morgan 1,8681,100 Tsumura & Co HSBC 1,755
600 Tsumura & Co JP Morgan 846(800) TV Asahi Holdings Corp Citibank (847)(900) TV Asahi Holdings Corp HSBC (542)700 Ube Industries Ltd Citibank 1,072
4,100 Ube Industries Ltd JP Morgan 4,890(300) Ulvac Inc JP Morgan (26)
1,900 Unicharm Corp Citibank (297)(2,200) Unipres Corp JP Morgan (1,988)1,400 United Arrows Ltd Citibank 1,5201,100 United Arrows Ltd HSBC 325
200 United Arrows Ltd JP Morgan 63300 United Super Markets
Holdings Inc Citibank 951,900 United Super Markets
Holdings Inc HSBC 1,5081,100 Universal Entertainment
Corp Citibank (373)(300) Unizo Holdings Co Ltd Citibank 12
1,600 Usen-Next Holdings Co Ltd HSBC (2,013)800 Usen-Next Holdings Co Ltd JP Morgan (669)
(800) Ushio Inc JP Morgan (965)(200) Uzabase Inc JP Morgan (642)(200) V Technology Co Ltd HSBC 59
(1,500) V Technology Co Ltd JP Morgan 3371,000 Valor Holdings Co Ltd Citibank 1,1401,500 Valor Holdings Co Ltd JP Morgan 1,215
100 Valqua Ltd Citibank 224300 Valqua Ltd HSBC 677400 Valqua Ltd JP Morgan 911100 ValueCommerce Co Ltd Citibank 142300 ValueCommerce Co Ltd HSBC 692300 Vector Inc JP Morgan (41)900 Vision Inc Citibank 229
2,100 Vital KSK Holdings Inc Citibank 396400 Vital KSK Holdings Inc JP Morgan (22)
2,300 VT Holdings Co Ltd Citibank 1,8775,400 VT Holdings Co Ltd HSBC 4,4313,200 VT Holdings Co Ltd JP Morgan 2,626(700) Wacoal Holdings Corp JP Morgan (332)
1,300 Wacom Co Ltd JP Morgan 170500 Warabeya Nichiyo Holdings
Co Ltd Citibank 2551,300 Warabeya Nichiyo Holdings
Co Ltd HSBC 1,363800 Warabeya Nichiyo Holdings
Co Ltd JP Morgan 9891,000 Welbe Inc Citibank 651
300 Welbe Inc HSBC (6)
BlackRock Asia Pacific Diversified Equity Absolute ReturnFund continued
The notes on pages 691 to 711 form an integral part of these financial statements.
Annual report and audited financial statements [241]
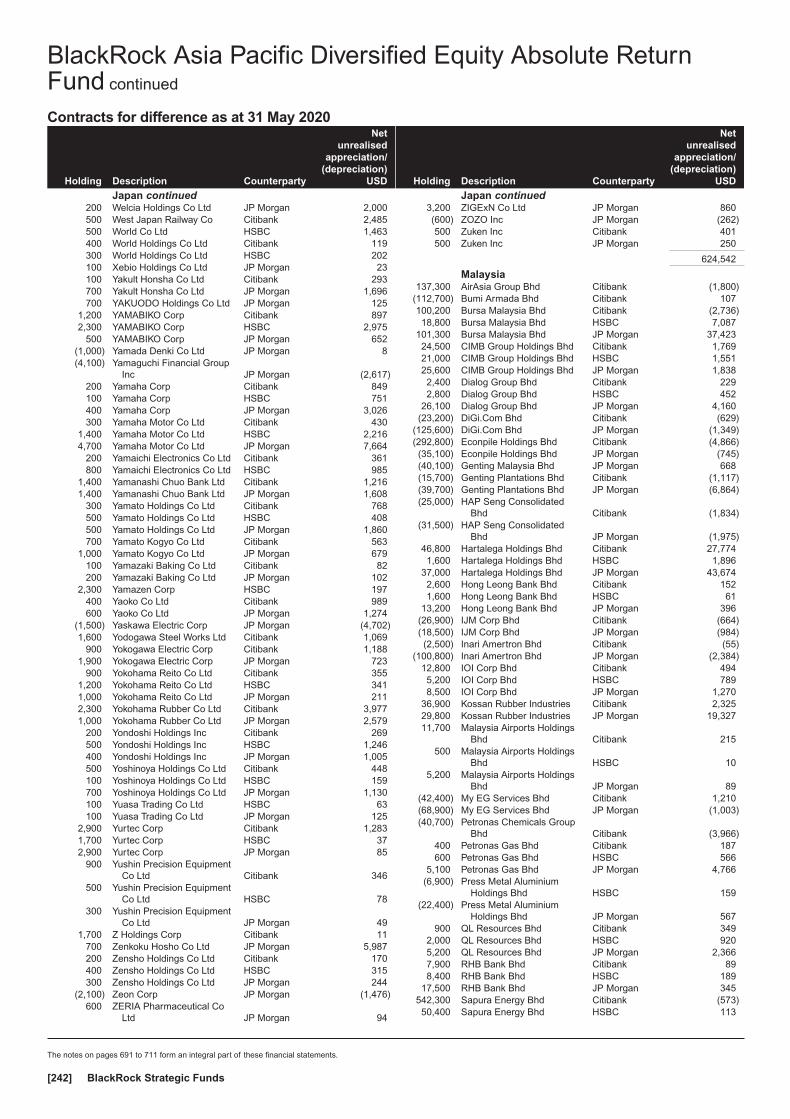
Contracts for difference as at 31 May 2020
Holding Description Counterparty
Netunrealised
appreciation/(depreciation)
USD
Japan continued200 Welcia Holdings Co Ltd JP Morgan 2,000500 West Japan Railway Co Citibank 2,485500 World Co Ltd HSBC 1,463400 World Holdings Co Ltd Citibank 119300 World Holdings Co Ltd HSBC 202100 Xebio Holdings Co Ltd JP Morgan 23100 Yakult Honsha Co Ltd Citibank 293700 Yakult Honsha Co Ltd JP Morgan 1,696700 YAKUODO Holdings Co Ltd JP Morgan 125
1,200 YAMABIKO Corp Citibank 8972,300 YAMABIKO Corp HSBC 2,975
500 YAMABIKO Corp JP Morgan 652(1,000) Yamada Denki Co Ltd JP Morgan 8(4,100) Yamaguchi Financial Group
Inc JP Morgan (2,617)200 Yamaha Corp Citibank 849100 Yamaha Corp HSBC 751400 Yamaha Corp JP Morgan 3,026300 Yamaha Motor Co Ltd Citibank 430
1,400 Yamaha Motor Co Ltd HSBC 2,2164,700 Yamaha Motor Co Ltd JP Morgan 7,664
200 Yamaichi Electronics Co Ltd Citibank 361800 Yamaichi Electronics Co Ltd HSBC 985
1,400 Yamanashi Chuo Bank Ltd Citibank 1,2161,400 Yamanashi Chuo Bank Ltd JP Morgan 1,608
300 Yamato Holdings Co Ltd Citibank 768500 Yamato Holdings Co Ltd HSBC 408500 Yamato Holdings Co Ltd JP Morgan 1,860700 Yamato Kogyo Co Ltd Citibank 563
1,000 Yamato Kogyo Co Ltd JP Morgan 679100 Yamazaki Baking Co Ltd Citibank 82200 Yamazaki Baking Co Ltd JP Morgan 102
2,300 Yamazen Corp HSBC 197400 Yaoko Co Ltd Citibank 989600 Yaoko Co Ltd JP Morgan 1,274
(1,500) Yaskawa Electric Corp JP Morgan (4,702)1,600 Yodogawa Steel Works Ltd Citibank 1,069
900 Yokogawa Electric Corp Citibank 1,1881,900 Yokogawa Electric Corp JP Morgan 723
900 Yokohama Reito Co Ltd Citibank 3551,200 Yokohama Reito Co Ltd HSBC 3411,000 Yokohama Reito Co Ltd JP Morgan 2112,300 Yokohama Rubber Co Ltd Citibank 3,9771,000 Yokohama Rubber Co Ltd JP Morgan 2,579
200 Yondoshi Holdings Inc Citibank 269500 Yondoshi Holdings Inc HSBC 1,246400 Yondoshi Holdings Inc JP Morgan 1,005500 Yoshinoya Holdings Co Ltd Citibank 448100 Yoshinoya Holdings Co Ltd HSBC 159700 Yoshinoya Holdings Co Ltd JP Morgan 1,130100 Yuasa Trading Co Ltd HSBC 63100 Yuasa Trading Co Ltd JP Morgan 125
2,900 Yurtec Corp Citibank 1,2831,700 Yurtec Corp HSBC 372,900 Yurtec Corp JP Morgan 85
900 Yushin Precision EquipmentCo Ltd Citibank 346
500 Yushin Precision EquipmentCo Ltd HSBC 78
300 Yushin Precision EquipmentCo Ltd JP Morgan 49
1,700 Z Holdings Corp Citibank 11700 Zenkoku Hosho Co Ltd JP Morgan 5,987200 Zensho Holdings Co Ltd Citibank 170400 Zensho Holdings Co Ltd HSBC 315300 Zensho Holdings Co Ltd JP Morgan 244
(2,100) Zeon Corp JP Morgan (1,476)600 ZERIA Pharmaceutical Co
Ltd JP Morgan 94
Holding Description Counterparty
Netunrealised
appreciation/(depreciation)
USD
Japan continued3,200 ZIGExN Co Ltd JP Morgan 860(600) ZOZO Inc JP Morgan (262)500 Zuken Inc Citibank 401500 Zuken Inc JP Morgan 250
624,542
Malaysia137,300 AirAsia Group Bhd Citibank (1,800)
(112,700) Bumi Armada Bhd Citibank 107100,200 Bursa Malaysia Bhd Citibank (2,736)18,800 Bursa Malaysia Bhd HSBC 7,087
101,300 Bursa Malaysia Bhd JP Morgan 37,42324,500 CIMB Group Holdings Bhd Citibank 1,76921,000 CIMB Group Holdings Bhd HSBC 1,55125,600 CIMB Group Holdings Bhd JP Morgan 1,8382,400 Dialog Group Bhd Citibank 2292,800 Dialog Group Bhd HSBC 452
26,100 Dialog Group Bhd JP Morgan 4,160(23,200) DiGi.Com Bhd Citibank (629)
(125,600) DiGi.Com Bhd JP Morgan (1,349)(292,800) Econpile Holdings Bhd Citibank (4,866)(35,100) Econpile Holdings Bhd JP Morgan (745)(40,100) Genting Malaysia Bhd JP Morgan 668(15,700) Genting Plantations Bhd Citibank (1,117)(39,700) Genting Plantations Bhd JP Morgan (6,864)(25,000) HAP Seng Consolidated
Bhd Citibank (1,834)(31,500) HAP Seng Consolidated
Bhd JP Morgan (1,975)46,800 Hartalega Holdings Bhd Citibank 27,7741,600 Hartalega Holdings Bhd HSBC 1,896
37,000 Hartalega Holdings Bhd JP Morgan 43,6742,600 Hong Leong Bank Bhd Citibank 1521,600 Hong Leong Bank Bhd HSBC 61
13,200 Hong Leong Bank Bhd JP Morgan 396(26,900) IJM Corp Bhd Citibank (664)(18,500) IJM Corp Bhd JP Morgan (984)(2,500) Inari Amertron Bhd Citibank (55)
(100,800) Inari Amertron Bhd JP Morgan (2,384)12,800 IOI Corp Bhd Citibank 4945,200 IOI Corp Bhd HSBC 7898,500 IOI Corp Bhd JP Morgan 1,270
36,900 Kossan Rubber Industries Citibank 2,32529,800 Kossan Rubber Industries JP Morgan 19,32711,700 Malaysia Airports Holdings
Bhd Citibank 215500 Malaysia Airports Holdings
Bhd HSBC 105,200 Malaysia Airports Holdings
Bhd JP Morgan 89(42,400) My EG Services Bhd Citibank 1,210(68,900) My EG Services Bhd JP Morgan (1,003)(40,700) Petronas Chemicals Group
Bhd Citibank (3,966)400 Petronas Gas Bhd Citibank 187600 Petronas Gas Bhd HSBC 566
5,100 Petronas Gas Bhd JP Morgan 4,766(6,900) Press Metal Aluminium
Holdings Bhd HSBC 159(22,400) Press Metal Aluminium
Holdings Bhd JP Morgan 567900 QL Resources Bhd Citibank 349
2,000 QL Resources Bhd HSBC 9205,200 QL Resources Bhd JP Morgan 2,3667,900 RHB Bank Bhd Citibank 898,400 RHB Bank Bhd HSBC 189
17,500 RHB Bank Bhd JP Morgan 345542,300 Sapura Energy Bhd Citibank (573)50,400 Sapura Energy Bhd HSBC 113
BlackRock Asia Pacific Diversified Equity Absolute ReturnFund continued
The notes on pages 691 to 711 form an integral part of these financial statements.
BlackRock Strategic Funds[242]
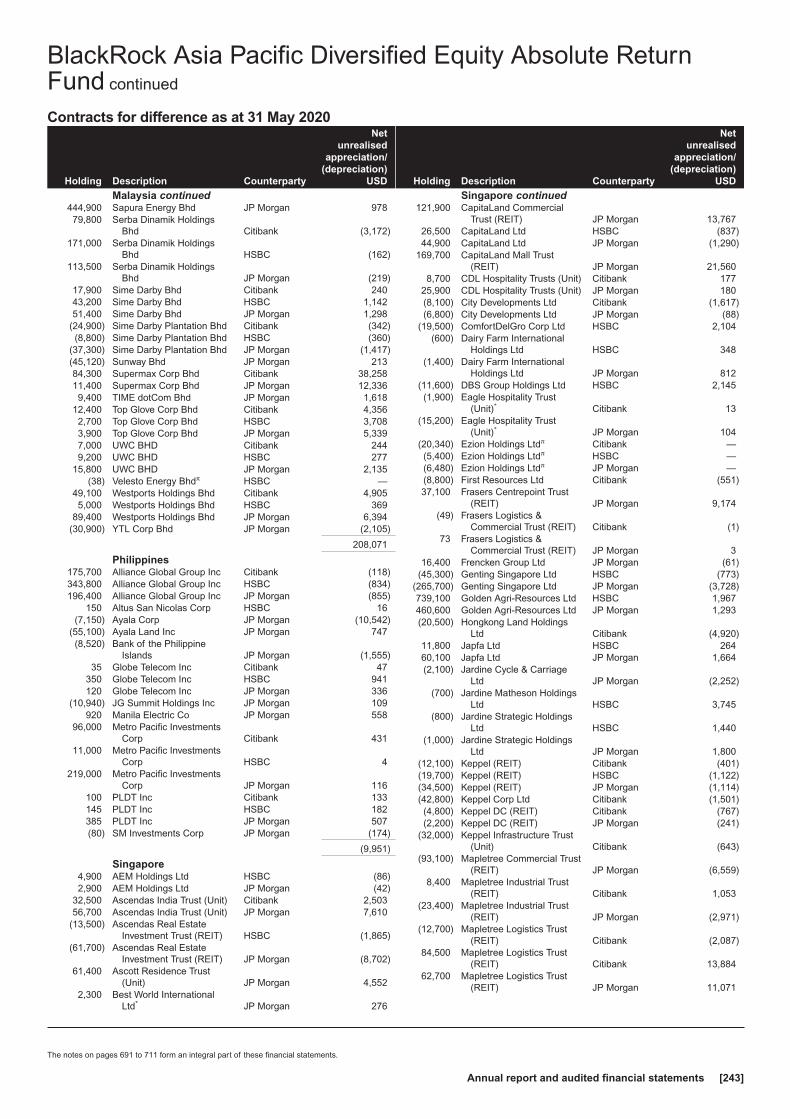
Contracts for difference as at 31 May 2020
Holding Description Counterparty
Netunrealised
appreciation/(depreciation)
USD
Malaysia continued444,900 Sapura Energy Bhd JP Morgan 97879,800 Serba Dinamik Holdings
Bhd Citibank (3,172)171,000 Serba Dinamik Holdings
Bhd HSBC (162)113,500 Serba Dinamik Holdings
Bhd JP Morgan (219)17,900 Sime Darby Bhd Citibank 24043,200 Sime Darby Bhd HSBC 1,14251,400 Sime Darby Bhd JP Morgan 1,298
(24,900) Sime Darby Plantation Bhd Citibank (342)(8,800) Sime Darby Plantation Bhd HSBC (360)
(37,300) Sime Darby Plantation Bhd JP Morgan (1,417)(45,120) Sunway Bhd JP Morgan 21384,300 Supermax Corp Bhd Citibank 38,25811,400 Supermax Corp Bhd JP Morgan 12,3369,400 TIME dotCom Bhd JP Morgan 1,618
12,400 Top Glove Corp Bhd Citibank 4,3562,700 Top Glove Corp Bhd HSBC 3,7083,900 Top Glove Corp Bhd JP Morgan 5,3397,000 UWC BHD Citibank 2449,200 UWC BHD HSBC 277
15,800 UWC BHD JP Morgan 2,135(38) Velesto Energy Bhdπ HSBC —
49,100 Westports Holdings Bhd Citibank 4,9055,000 Westports Holdings Bhd HSBC 369
89,400 Westports Holdings Bhd JP Morgan 6,394(30,900) YTL Corp Bhd JP Morgan (2,105)
208,071
Philippines175,700 Alliance Global Group Inc Citibank (118)343,800 Alliance Global Group Inc HSBC (834)196,400 Alliance Global Group Inc JP Morgan (855)
150 Altus San Nicolas Corp HSBC 16(7,150) Ayala Corp JP Morgan (10,542)
(55,100) Ayala Land Inc JP Morgan 747(8,520) Bank of the Philippine
Islands JP Morgan (1,555)35 Globe Telecom Inc Citibank 47
350 Globe Telecom Inc HSBC 941120 Globe Telecom Inc JP Morgan 336
(10,940) JG Summit Holdings Inc JP Morgan 109920 Manila Electric Co JP Morgan 558
96,000 Metro Pacific InvestmentsCorp Citibank 431
11,000 Metro Pacific InvestmentsCorp HSBC 4
219,000 Metro Pacific InvestmentsCorp JP Morgan 116
100 PLDT Inc Citibank 133145 PLDT Inc HSBC 182385 PLDT Inc JP Morgan 507(80) SM Investments Corp JP Morgan (174)
(9,951)
Singapore4,900 AEM Holdings Ltd HSBC (86)2,900 AEM Holdings Ltd JP Morgan (42)
32,500 Ascendas India Trust (Unit) Citibank 2,50356,700 Ascendas India Trust (Unit) JP Morgan 7,610
(13,500) Ascendas Real EstateInvestment Trust (REIT) HSBC (1,865)
(61,700) Ascendas Real EstateInvestment Trust (REIT) JP Morgan (8,702)
61,400 Ascott Residence Trust(Unit) JP Morgan 4,552
2,300 Best World InternationalLtd* JP Morgan 276
Holding Description Counterparty
Netunrealised
appreciation/(depreciation)
USD
Singapore continued121,900 CapitaLand Commercial
Trust (REIT) JP Morgan 13,76726,500 CapitaLand Ltd HSBC (837)44,900 CapitaLand Ltd JP Morgan (1,290)
169,700 CapitaLand Mall Trust(REIT) JP Morgan 21,560
8,700 CDL Hospitality Trusts (Unit) Citibank 17725,900 CDL Hospitality Trusts (Unit) JP Morgan 180(8,100) City Developments Ltd Citibank (1,617)(6,800) City Developments Ltd JP Morgan (88)
(19,500) ComfortDelGro Corp Ltd HSBC 2,104(600) Dairy Farm International
Holdings Ltd HSBC 348(1,400) Dairy Farm International
Holdings Ltd JP Morgan 812(11,600) DBS Group Holdings Ltd HSBC 2,145(1,900) Eagle Hospitality Trust
(Unit)* Citibank 13(15,200) Eagle Hospitality Trust
(Unit)* JP Morgan 104(20,340) Ezion Holdings Ltdπ Citibank —(5,400) Ezion Holdings Ltdπ HSBC —(6,480) Ezion Holdings Ltdπ JP Morgan —(8,800) First Resources Ltd Citibank (551)37,100 Frasers Centrepoint Trust
(REIT) JP Morgan 9,174(49) Frasers Logistics &
Commercial Trust (REIT) Citibank (1)73 Frasers Logistics &
Commercial Trust (REIT) JP Morgan 316,400 Frencken Group Ltd JP Morgan (61)
(45,300) Genting Singapore Ltd HSBC (773)(265,700) Genting Singapore Ltd JP Morgan (3,728)739,100 Golden Agri-Resources Ltd HSBC 1,967460,600 Golden Agri-Resources Ltd JP Morgan 1,293(20,500) Hongkong Land Holdings
Ltd Citibank (4,920)11,800 Japfa Ltd HSBC 26460,100 Japfa Ltd JP Morgan 1,664(2,100) Jardine Cycle & Carriage
Ltd JP Morgan (2,252)(700) Jardine Matheson Holdings
Ltd HSBC 3,745(800) Jardine Strategic Holdings
Ltd HSBC 1,440(1,000) Jardine Strategic Holdings
Ltd JP Morgan 1,800(12,100) Keppel (REIT) Citibank (401)(19,700) Keppel (REIT) HSBC (1,122)(34,500) Keppel (REIT) JP Morgan (1,114)(42,800) Keppel Corp Ltd Citibank (1,501)(4,800) Keppel DC (REIT) Citibank (767)(2,200) Keppel DC (REIT) JP Morgan (241)
(32,000) Keppel Infrastructure Trust(Unit) Citibank (643)
(93,100) Mapletree Commercial Trust(REIT) JP Morgan (6,559)
8,400 Mapletree Industrial Trust(REIT) Citibank 1,053
(23,400) Mapletree Industrial Trust(REIT) JP Morgan (2,971)
(12,700) Mapletree Logistics Trust(REIT) Citibank (2,087)
84,500 Mapletree Logistics Trust(REIT) Citibank 13,884
62,700 Mapletree Logistics Trust(REIT) JP Morgan 11,071
BlackRock Asia Pacific Diversified Equity Absolute ReturnFund continued
The notes on pages 691 to 711 form an integral part of these financial statements.
Annual report and audited financial statements [243]

Contracts for difference as at 31 May 2020
Holding Description Counterparty
Netunrealised
appreciation/(depreciation)
USD
Singapore continued(45,200) Mapletree North Asia
Commercial Trust (REIT) Citibank (1,450)(61,500) Mapletree North Asia
Commercial Trust (REIT) JP Morgan 2,1832,400 NetLink NBN Trust (Unit) HSBC 74
68,100 NetLink NBN Trust (Unit) JP Morgan 1,15291,900 OUE Commercial Real
Estate Investment Trust(REIT) HSBC (365)
(1,500) Oversea-Chinese BankingCorp Ltd HSBC (102)
(16,200) Oversea-Chinese BankingCorp Ltd JP Morgan 2,054
9,300 Parkway Life Real EstateInvestment Trust (REIT) Citibank 1,721
4,500 Parkway Life Real EstateInvestment Trust (REIT) HSBC 620
14,300 Parkway Life Real EstateInvestment Trust (REIT) JP Morgan 2,016
(10,400) SATS Ltd HSBC 2,315(17,500) SATS Ltd JP Morgan 3,845(24,700) Sembcorp Industries Ltd HSBC 4,238(38,700) Sembcorp Industries Ltd JP Morgan 6,57939,800 Sheng Siong Group Ltd Citibank 576
192,900 Sheng Siong Group Ltd JP Morgan 3,58051,500 Singapore Airlines Ltd JP Morgan (10,534)
(17,800) Singapore Post Ltd Citibank (378)(6,700) Singapore Post Ltd JP Morgan (162)33,600 Singapore Technologies
Engineering Ltd JP Morgan (3,409)500 Singapore
Telecommunications Ltd HSBC (83)40,400 Singapore
Telecommunications Ltd JP Morgan (6,589)91,600 Starhill Global REIT (REIT) Citibank 1,98368,500 Starhill Global REIT (REIT) HSBC 20550,800 Starhill Global REIT (REIT) JP Morgan 17682,600 Suntec Real Estate
Investment Trust (REIT) JP Morgan 6,995(2,300) United Overseas Bank Ltd JP Morgan 625(3,300) UOL Group Ltd HSBC (389)
(400) UOL Group Ltd JP Morgan (42)82,300 Valuetronics Holdings Ltd Citibank 54166,900 Valuetronics Holdings Ltd HSBC (634)8,600 Valuetronics Holdings Ltd JP Morgan 1212,600 Venture Corp Ltd JP Morgan (815)6,200 Wilmar International Ltd HSBC 2,212
30,900 Wilmar International Ltd JP Morgan 11,131(91,600) Yangzijiang Shipbuilding
Holdings Ltd Citibank (1,696)(130,700) Yangzijiang Shipbuilding
Holdings Ltd JP Morgan 2973,600 Yanlord Land Group Ltd Citibank 1452,600 Yanlord Land Group Ltd JP Morgan 127
88,153
South Korea(1,165) Advanced Process Systems
Corp Citibank 1,300(482) Advanced Process Systems
Corp HSBC 1,137(537) Advanced Process Systems
Corp JP Morgan 1,267(1,501) AeroSpace Technology of
Korea Inc Citibank (393)(1,082) AeroSpace Technology of
Korea Inc JP Morgan 41(157) Alteogen Inc Citibank (5,637)(231) Alteogen Inc JP Morgan (17,624)(479) AMOREPACIFIC Group JP Morgan 302
Holding Description Counterparty
Netunrealised
appreciation/(depreciation)
USD
South Korea continued(61) AMOREPACIFIC Group
(Pref) JP Morgan 216(11,765) BGF Co Ltd JP Morgan 1,325
(50) BGF retail Co Ltd Citibank (457)(86) BGF retail Co Ltd JP Morgan (986)(49) BH Co Ltd Citibank 13
(339) BH Co Ltd HSBC 156(606) BH Co Ltd JP Morgan 279
1,733 Binggrae Co Ltd HSBC (6,745)10,581 BNK Financial Group Inc Citibank 3,369
(122) Cafe24 Corp JP Morgan (1,055)(353) Celltrion Healthcare Co Ltd Citibank 31(286) Celltrion Healthcare Co Ltd JP Morgan (337)
7 Celltrion Inc HSBC (1)1,088 Celltrion Pharm Inc JP Morgan 15,1832,934 Chong Kun Dang
Pharmaceutical Corp JP Morgan (15,020)(395) Chunbo Co Ltd Citibank (5,456)(689) Chunbo Co Ltd JP Morgan (14,398)(148) CJ Corp Citibank (382)(118) CJ Corp JP Morgan (1,018)(162) CJ ENM Co Ltd HSBC 175
31 CJ Logistics Corp HSBC 371(49) Com2uSCorp Citibank 13(30) Coway Co Ltd JP Morgan (93)
(2,393) Daea TI Co Ltd Citibank 91(3,370) Daea TI Co Ltd JP Morgan 3,751
(1) Daeduck Co Ltd JP Morgan 13(489) Daeduck Electronics Co Ltd JP Morgan (3,656)
18,249 Daesang Corp Citibank (12,989)(12,750) Daewoo Engineering &
Construction Co Ltd Citibank (3,508)(5,147) Daewoo Engineering &
Construction Co Ltd JP Morgan (854)1,871 Danawa Co Ltd Citibank (2,544)3,415 DGB Financial Group Inc JP Morgan 915
54 Dong-A Socio Holdings CoLtd JP Morgan 95
1,070 Dong-A ST Co Ltd Citibank (437)709 DongKook Pharmaceutical
Co Ltd Citibank (1,844)2,737 Doosan Bobcat Inc JP Morgan 2112,057 Doosan Co Ltd Citibank 1,7541,091 DoubleUGames Co Ltd HSBC 1,0142,254 Duk San Neolux Co Ltd HSBC (2,085)(384) Easy Bio Inc Citibank (93)(724) Easy Bio Inc JP Morgan 38(144) Ecopro BM Co Ltd JP Morgan (5,229)(17) E-MART Inc JP Morgan 38(27) Enzychem
Lifesciences Corp Citibank 120(309) Enzychem
Lifesciences Corp JP Morgan 537(1,155) Eubiologics Co Ltd Citibank 111
(10,038) Foosung Co Ltd Citibank (895)(6,051) Foosung Co Ltd JP Morgan (4,712)
(2) Genexine Co Ltd Citibank (3)(77) Genexine Co Ltd JP Morgan (251)510 Green Cross Corp Citibank (3,163)
3,432 Green Cross Holdings Corp HSBC (1,186)476 GS Engineering &
Construction Corp JP Morgan 1,6951,725 GS Holdings Corp HSBC (1,791)1,483 GS Home Shopping Inc Citibank (5,928)(246) GS Retail Co Ltd Citibank (348)
1,394 Han Kuk Carbon Co Ltd JP Morgan 1,4604,913 Hana Financial Group Inc HSBC 13,277(516) Hana Materials Inc Citibank 676
(1,872) Hana Tour Service Inc JP Morgan 2,393
BlackRock Asia Pacific Diversified Equity Absolute ReturnFund continued
The notes on pages 691 to 711 form an integral part of these financial statements.
BlackRock Strategic Funds[244]

Contracts for difference as at 31 May 2020
Holding Description Counterparty
Netunrealised
appreciation/(depreciation)
USD
South Korea continued(426) Hanall Biopharma Co Ltd Citibank (488)(182) Hanall Biopharma Co Ltd HSBC (373)(421) Hanall Biopharma Co Ltd JP Morgan (862)
2,578 Handsome Co Ltd Citibank 2364,561 Hankook Tire & Technology
Co Ltd Citibank 3,214(95) Hanmi Pharm Co Ltd Citibank 483(74) Hanmi Pharm Co Ltd JP Morgan 2,582768 Hansol Paper Co Ltd JP Morgan (1,364)(86) Hanssem Co Ltd JP Morgan (538)
5,195 Hite Jinro Co Ltd JP Morgan 98(344) HLB Life Science CO LTD Citibank 117
4,214 Huchems Fine ChemicalCorp HSBC (1,568)
(29) Hyosung Corp Citibank (7)(196) Hyosung Corp HSBC 628(36) Hyosung Corp JP Morgan 115
(410) Hyundai Bioscience Co Ltd HSBC 173(30) Hyundai Elevator Co Ltd Citibank (15)(85) Hyundai Elevator Co Ltd JP Morgan 227
2,241 Hyundai Engineering &Construction Co Ltd Citibank 2,733
156 Hyundai Glovis Co Ltd JP Morgan 1,190(18) Hyundai Heavy Industries
Holdings Co Ltd JP Morgan (243)4,996 Hyundai Livart Furniture Co
Ltd HSBC (6,799)321 Hyundai Mipo Dockyard Co
Ltd JP Morgan 1,3184 Hyundai Mobis Co Ltd HSBC 62
748 Hyundai Motor Co JP Morgan 1,5612,418 Hyundai Steel Co JP Morgan 4,008
768 Hyundai Wia Corp JP Morgan 1,724(733) Iljin Materials Co Ltd JP Morgan (3,335)
19,622 Industrial Bank of Korea HSBC 11,032466 i-SENS Inc Citibank 177
3,368 Jahwa Electronics Co Ltd Citibank 4126,149 JB Financial Group Co Ltd JP Morgan 321
19 Kakao Corp HSBC 8342,978 KB Financial Group Inc HSBC 3,038
9 Kia Motors Corp HSBC 24(160) Koh Young Technology Inc Citibank (580)636 Kolmar BNH Co Ltd Citibank 4,808
4,334 Kolon Industries Inc JP Morgan 2,9875,049 Korea Circuit Co Ltd HSBC 1,426(164) Korea Electric Power Corp HSBC 144
1,663 Korea Investment HoldingsCo Ltd Citibank 5,157
(254) Korea Shipbuilding &Offshore Engineering CoLtd Citibank (2,216)
123 Korea Zinc Co Ltd Citibank 3521,697 Korean Reinsurance Co Citibank (1,151)
247 Kumho Petrochemical CoLtd HSBC (459)
3,555 Kumho Tire Co Inc JP Morgan (362)(534) L&F Co Ltd Citibank 444265 LEENO Industrial Inc Citibank (1,782)
2,049 LG Corp Citibank 53636 LG Innotek Co Ltd Citibank 286
1,961 LG International Corp Citibank 2,665(76) Lotte Chemical Corp JP Morgan 643269 Lotte Food Co Ltd HSBC (6,561)328 LOTTE Himart Co Ltd JP Morgan (203)76 Lotte Shopping Co Ltd Citibank 79
344 LS Electric Co Ltd JP Morgan 1,8801,493 Mando Corp JP Morgan 1,614(724) Mcnex Co Ltd JP Morgan 226
2,804 Meritz Financial Group Inc JP Morgan (577)
Holding Description Counterparty
Netunrealised
appreciation/(depreciation)
USD
South Korea continued(936) Meritz Securities Co Ltd Citibank 82(151) Mezzion Pharma Co Ltd JP Morgan 1,127
85 NAVER Corp HSBC 52720 NCSoft Corp HSBC 1,62551 Netmarble Corp JP Morgan (288)
(2,317) NH Investment & SecuritiesCo Ltd JP Morgan (64)
(32) NHN Corp Citibank 602,474 NICE Holdings Co Ltd JP Morgan 1,161(442) NICE Total Cash
Management Co Ltd JP Morgan (35)296 NongShim Co Ltd HSBC (1,959)
1,084 OCI Co Ltd JP Morgan 1,127(830) Pan Ocean Co Ltd Citibank (101)
(11,086) Pan Ocean Co Ltd HSBC (1,739)(122) Paradise Co Ltd JP Morgan 137(144) Pearl Abyss Corp Citibank 355(13) Pearl Abyss Corp JP Morgan 91561 POSCO HSBC (790)
1,665 Posco International Corp JP Morgan 2,572(2,589) RFHIC Corp Citibank 3,859
(30) RFHIC Corp JP Morgan 91(120) Sam Chun Dang Pharm Co
Ltd Citibank (242)(163) Sam Chun Dang Pharm Co
Ltd JP Morgan (658)(24) Samsung Biologics Co Ltd Citibank (63)(5) Samsung Biologics Co Ltd HSBC (101)(1) Samsung Biologics Co Ltd JP Morgan (20)
(63) Samsung C&T Corp JP Morgan 407525 Samsung Card Co Ltd HSBC (449)
3,537 Samsung Electronics Co Ltd JP Morgan 3,3731,838 Samsung Engineering Co
Ltd Citibank 1,241(2,093) Samsung Heavy Industries
Co Ltd HSBC (828)(10,644) Samsung Heavy Industries
Co Ltd JP Morgan (4,212)(79) Sangsangin Co Ltd Citibank 7
(248) Sangsangin Co Ltd JP Morgan 113335 Seegene Inc JP Morgan 6,438
(1,797) Seojin System Co Ltd Citibank (1,260)273 Seoul Semiconductor Co
Ltd Citibank 195(521) SFA Engineering Corp HSBC 782
5,301 Shinhan Financial Group CoLtd Citibank 4,558
(10) Shinsegae International Inc Citibank 42(442) SK Hynix Inc Citibank (36)
1,135 SK Innovation Co Ltd HSBC 19,304(108) SK Materials Co Ltd Citibank 733(22) SK Materials Co Ltd JP Morgan 159
(185) SKC Co Ltd Citibank (648)(286) SKCKOLONPI Inc Citibank 333(79) SKCKOLONPI Inc JP Morgan 225
(388) SM Entertainment Co Ltd Citibank 324(73) SM Entertainment Co Ltd JP Morgan 164
(144) SMCore Inc Citibank 36(125) SMCore Inc JP Morgan 44
(1,303) S-Oil Corp JP Morgan (682)(217) Studio Dragon Corp JP Morgan 559
5 Taekwang Industrial Co Ltd HSBC (58)(1,221) Taeyoung Engineering &
Construction Co Ltd Citibank 216(2,656) Taeyoung Engineering &
Construction Co Ltd JP Morgan (1,997)(16,143) Taihan Fiberoptics Co Ltd Citibank (3,072)(5,256) Telcon RF Pharmaceutical
Inc Citibank 1,871
BlackRock Asia Pacific Diversified Equity Absolute ReturnFund continued
The notes on pages 691 to 711 form an integral part of these financial statements.
Annual report and audited financial statements [245]
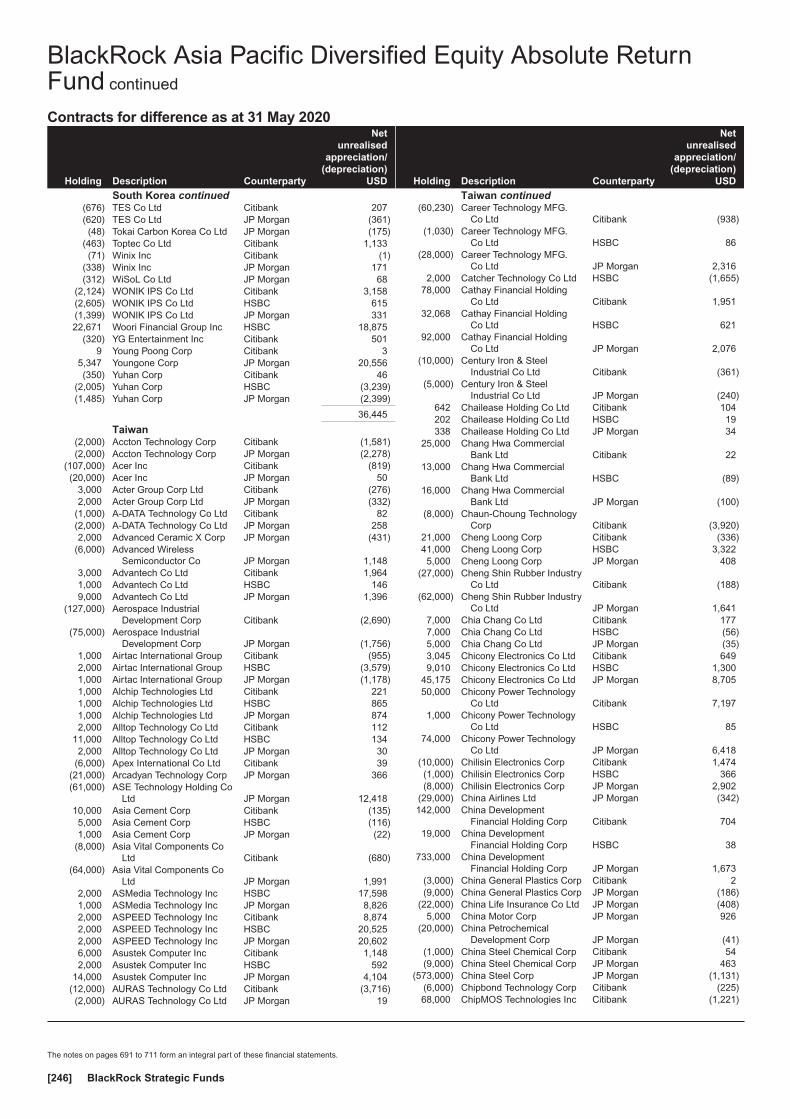
Contracts for difference as at 31 May 2020
Holding Description Counterparty
Netunrealised
appreciation/(depreciation)
USD
South Korea continued(676) TES Co Ltd Citibank 207(620) TES Co Ltd JP Morgan (361)(48) Tokai Carbon Korea Co Ltd JP Morgan (175)
(463) Toptec Co Ltd Citibank 1,133(71) Winix Inc Citibank (1)
(338) Winix Inc JP Morgan 171(312) WiSoL Co Ltd JP Morgan 68
(2,124) WONIK IPS Co Ltd Citibank 3,158(2,605) WONIK IPS Co Ltd HSBC 615(1,399) WONIK IPS Co Ltd JP Morgan 33122,671 Woori Financial Group Inc HSBC 18,875
(320) YG Entertainment Inc Citibank 5019 Young Poong Corp Citibank 3
5,347 Youngone Corp JP Morgan 20,556(350) Yuhan Corp Citibank 46
(2,005) Yuhan Corp HSBC (3,239)(1,485) Yuhan Corp JP Morgan (2,399)
36,445
Taiwan(2,000) Accton Technology Corp Citibank (1,581)(2,000) Accton Technology Corp JP Morgan (2,278)
(107,000) Acer Inc Citibank (819)(20,000) Acer Inc JP Morgan 50
3,000 Acter Group Corp Ltd Citibank (276)2,000 Acter Group Corp Ltd JP Morgan (332)
(1,000) A-DATA Technology Co Ltd Citibank 82(2,000) A-DATA Technology Co Ltd JP Morgan 2582,000 Advanced Ceramic X Corp JP Morgan (431)
(6,000) Advanced WirelessSemiconductor Co JP Morgan 1,148
3,000 Advantech Co Ltd Citibank 1,9641,000 Advantech Co Ltd HSBC 1469,000 Advantech Co Ltd JP Morgan 1,396
(127,000) Aerospace IndustrialDevelopment Corp Citibank (2,690)
(75,000) Aerospace IndustrialDevelopment Corp JP Morgan (1,756)
1,000 Airtac International Group Citibank (955)2,000 Airtac International Group HSBC (3,579)1,000 Airtac International Group JP Morgan (1,178)1,000 Alchip Technologies Ltd Citibank 2211,000 Alchip Technologies Ltd HSBC 8651,000 Alchip Technologies Ltd JP Morgan 8742,000 Alltop Technology Co Ltd Citibank 112
11,000 Alltop Technology Co Ltd HSBC 1342,000 Alltop Technology Co Ltd JP Morgan 30
(6,000) Apex International Co Ltd Citibank 39(21,000) Arcadyan Technology Corp JP Morgan 366(61,000) ASE Technology Holding Co
Ltd JP Morgan 12,41810,000 Asia Cement Corp Citibank (135)5,000 Asia Cement Corp HSBC (116)1,000 Asia Cement Corp JP Morgan (22)
(8,000) Asia Vital Components CoLtd Citibank (680)
(64,000) Asia Vital Components CoLtd JP Morgan 1,991
2,000 ASMedia Technology Inc HSBC 17,5981,000 ASMedia Technology Inc JP Morgan 8,8262,000 ASPEED Technology Inc Citibank 8,8742,000 ASPEED Technology Inc HSBC 20,5252,000 ASPEED Technology Inc JP Morgan 20,6026,000 Asustek Computer Inc Citibank 1,1482,000 Asustek Computer Inc HSBC 592
14,000 Asustek Computer Inc JP Morgan 4,104(12,000) AURAS Technology Co Ltd Citibank (3,716)(2,000) AURAS Technology Co Ltd JP Morgan 19
Holding Description Counterparty
Netunrealised
appreciation/(depreciation)
USD
Taiwan continued(60,230) Career Technology MFG.
Co Ltd Citibank (938)(1,030) Career Technology MFG.
Co Ltd HSBC 86(28,000) Career Technology MFG.
Co Ltd JP Morgan 2,3162,000 Catcher Technology Co Ltd HSBC (1,655)
78,000 Cathay Financial HoldingCo Ltd Citibank 1,951
32,068 Cathay Financial HoldingCo Ltd HSBC 621
92,000 Cathay Financial HoldingCo Ltd JP Morgan 2,076
(10,000) Century Iron & SteelIndustrial Co Ltd Citibank (361)
(5,000) Century Iron & SteelIndustrial Co Ltd JP Morgan (240)
642 Chailease Holding Co Ltd Citibank 104202 Chailease Holding Co Ltd HSBC 19338 Chailease Holding Co Ltd JP Morgan 34
25,000 Chang Hwa CommercialBank Ltd Citibank 22
13,000 Chang Hwa CommercialBank Ltd HSBC (89)
16,000 Chang Hwa CommercialBank Ltd JP Morgan (100)
(8,000) Chaun-Choung TechnologyCorp Citibank (3,920)
21,000 Cheng Loong Corp Citibank (336)41,000 Cheng Loong Corp HSBC 3,3225,000 Cheng Loong Corp JP Morgan 408
(27,000) Cheng Shin Rubber IndustryCo Ltd Citibank (188)
(62,000) Cheng Shin Rubber IndustryCo Ltd JP Morgan 1,641
7,000 Chia Chang Co Ltd Citibank 1777,000 Chia Chang Co Ltd HSBC (56)5,000 Chia Chang Co Ltd JP Morgan (35)3,045 Chicony Electronics Co Ltd Citibank 6499,010 Chicony Electronics Co Ltd HSBC 1,300
45,175 Chicony Electronics Co Ltd JP Morgan 8,70550,000 Chicony Power Technology
Co Ltd Citibank 7,1971,000 Chicony Power Technology
Co Ltd HSBC 8574,000 Chicony Power Technology
Co Ltd JP Morgan 6,418(10,000) Chilisin Electronics Corp Citibank 1,474(1,000) Chilisin Electronics Corp HSBC 366(8,000) Chilisin Electronics Corp JP Morgan 2,902
(29,000) China Airlines Ltd JP Morgan (342)142,000 China Development
Financial Holding Corp Citibank 70419,000 China Development
Financial Holding Corp HSBC 38733,000 China Development
Financial Holding Corp JP Morgan 1,673(3,000) China General Plastics Corp Citibank 2(9,000) China General Plastics Corp JP Morgan (186)
(22,000) China Life Insurance Co Ltd JP Morgan (408)5,000 China Motor Corp JP Morgan 926
(20,000) China PetrochemicalDevelopment Corp JP Morgan (41)
(1,000) China Steel Chemical Corp Citibank 54(9,000) China Steel Chemical Corp JP Morgan 463
(573,000) China Steel Corp JP Morgan (1,131)(6,000) Chipbond Technology Corp Citibank (225)68,000 ChipMOS Technologies Inc Citibank (1,221)
BlackRock Asia Pacific Diversified Equity Absolute ReturnFund continued
The notes on pages 691 to 711 form an integral part of these financial statements.
BlackRock Strategic Funds[246]
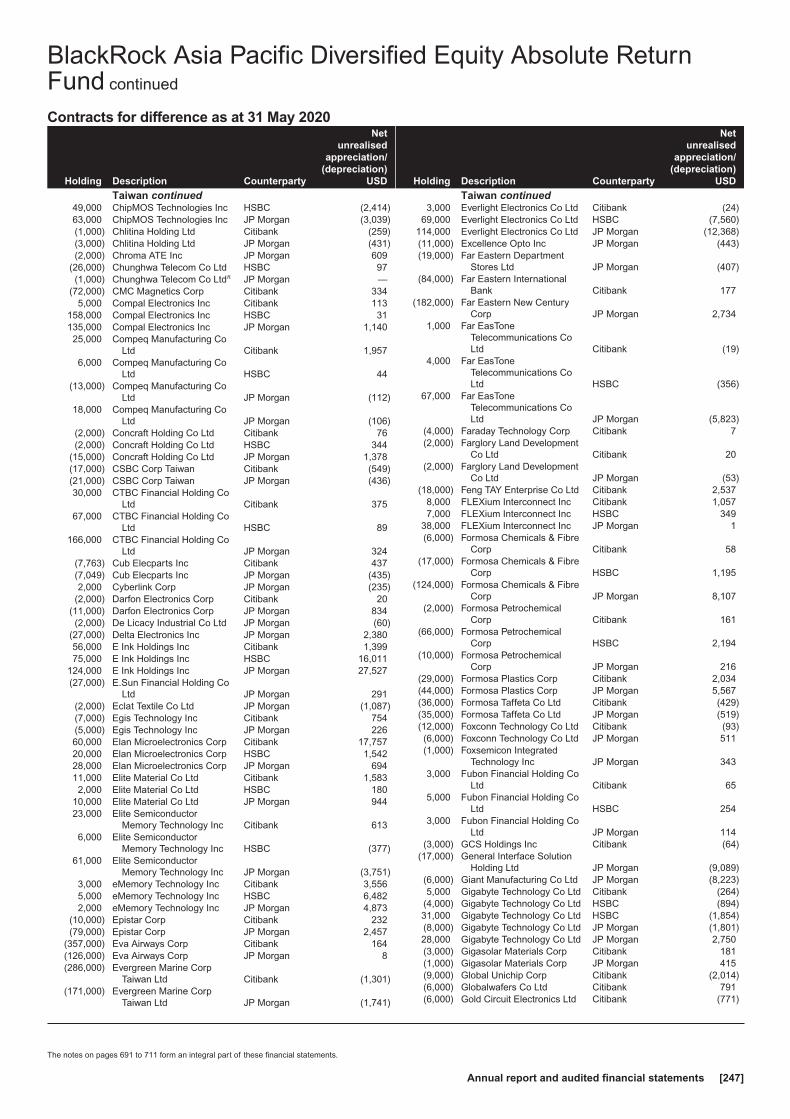
Contracts for difference as at 31 May 2020
Holding Description Counterparty
Netunrealised
appreciation/(depreciation)
USD
Taiwan continued49,000 ChipMOS Technologies Inc HSBC (2,414)63,000 ChipMOS Technologies Inc JP Morgan (3,039)(1,000) Chlitina Holding Ltd Citibank (259)(3,000) Chlitina Holding Ltd JP Morgan (431)(2,000) Chroma ATE Inc JP Morgan 609
(26,000) Chunghwa Telecom Co Ltd HSBC 97(1,000) Chunghwa Telecom Co Ltdπ JP Morgan —
(72,000) CMC Magnetics Corp Citibank 3345,000 Compal Electronics Inc Citibank 113
158,000 Compal Electronics Inc HSBC 31135,000 Compal Electronics Inc JP Morgan 1,14025,000 Compeq Manufacturing Co
Ltd Citibank 1,9576,000 Compeq Manufacturing Co
Ltd HSBC 44(13,000) Compeq Manufacturing Co
Ltd JP Morgan (112)18,000 Compeq Manufacturing Co
Ltd JP Morgan (106)(2,000) Concraft Holding Co Ltd Citibank 76(2,000) Concraft Holding Co Ltd HSBC 344
(15,000) Concraft Holding Co Ltd JP Morgan 1,378(17,000) CSBC Corp Taiwan Citibank (549)(21,000) CSBC Corp Taiwan JP Morgan (436)30,000 CTBC Financial Holding Co
Ltd Citibank 37567,000 CTBC Financial Holding Co
Ltd HSBC 89166,000 CTBC Financial Holding Co
Ltd JP Morgan 324(7,763) Cub Elecparts Inc Citibank 437(7,049) Cub Elecparts Inc JP Morgan (435)2,000 Cyberlink Corp JP Morgan (235)
(2,000) Darfon Electronics Corp Citibank 20(11,000) Darfon Electronics Corp JP Morgan 834(2,000) De Licacy Industrial Co Ltd JP Morgan (60)
(27,000) Delta Electronics Inc JP Morgan 2,38056,000 E Ink Holdings Inc Citibank 1,39975,000 E Ink Holdings Inc HSBC 16,011
124,000 E Ink Holdings Inc JP Morgan 27,527(27,000) E.Sun Financial Holding Co
Ltd JP Morgan 291(2,000) Eclat Textile Co Ltd JP Morgan (1,087)(7,000) Egis Technology Inc Citibank 754(5,000) Egis Technology Inc JP Morgan 22660,000 Elan Microelectronics Corp Citibank 17,75720,000 Elan Microelectronics Corp HSBC 1,54228,000 Elan Microelectronics Corp JP Morgan 69411,000 Elite Material Co Ltd Citibank 1,5832,000 Elite Material Co Ltd HSBC 180
10,000 Elite Material Co Ltd JP Morgan 94423,000 Elite Semiconductor
Memory Technology Inc Citibank 6136,000 Elite Semiconductor
Memory Technology Inc HSBC (377)61,000 Elite Semiconductor
Memory Technology Inc JP Morgan (3,751)3,000 eMemory Technology Inc Citibank 3,5565,000 eMemory Technology Inc HSBC 6,4822,000 eMemory Technology Inc JP Morgan 4,873
(10,000) Epistar Corp Citibank 232(79,000) Epistar Corp JP Morgan 2,457
(357,000) Eva Airways Corp Citibank 164(126,000) Eva Airways Corp JP Morgan 8(286,000) Evergreen Marine Corp
Taiwan Ltd Citibank (1,301)(171,000) Evergreen Marine Corp
Taiwan Ltd JP Morgan (1,741)
Holding Description Counterparty
Netunrealised
appreciation/(depreciation)
USD
Taiwan continued3,000 Everlight Electronics Co Ltd Citibank (24)
69,000 Everlight Electronics Co Ltd HSBC (7,560)114,000 Everlight Electronics Co Ltd JP Morgan (12,368)(11,000) Excellence Opto Inc JP Morgan (443)(19,000) Far Eastern Department
Stores Ltd JP Morgan (407)(84,000) Far Eastern International
Bank Citibank 177(182,000) Far Eastern New Century
Corp JP Morgan 2,7341,000 Far EasTone
Telecommunications CoLtd Citibank (19)
4,000 Far EasToneTelecommunications CoLtd HSBC (356)
67,000 Far EasToneTelecommunications CoLtd JP Morgan (5,823)
(4,000) Faraday Technology Corp Citibank 7(2,000) Farglory Land Development
Co Ltd Citibank 20(2,000) Farglory Land Development
Co Ltd JP Morgan (53)(18,000) Feng TAY Enterprise Co Ltd Citibank 2,537
8,000 FLEXium Interconnect Inc Citibank 1,0577,000 FLEXium Interconnect Inc HSBC 349
38,000 FLEXium Interconnect Inc JP Morgan 1(6,000) Formosa Chemicals & Fibre
Corp Citibank 58(17,000) Formosa Chemicals & Fibre
Corp HSBC 1,195(124,000) Formosa Chemicals & Fibre
Corp JP Morgan 8,107(2,000) Formosa Petrochemical
Corp Citibank 161(66,000) Formosa Petrochemical
Corp HSBC 2,194(10,000) Formosa Petrochemical
Corp JP Morgan 216(29,000) Formosa Plastics Corp Citibank 2,034(44,000) Formosa Plastics Corp JP Morgan 5,567(36,000) Formosa Taffeta Co Ltd Citibank (429)(35,000) Formosa Taffeta Co Ltd JP Morgan (519)(12,000) Foxconn Technology Co Ltd Citibank (93)(6,000) Foxconn Technology Co Ltd JP Morgan 511(1,000) Foxsemicon Integrated
Technology Inc JP Morgan 3433,000 Fubon Financial Holding Co
Ltd Citibank 655,000 Fubon Financial Holding Co
Ltd HSBC 2543,000 Fubon Financial Holding Co
Ltd JP Morgan 114(3,000) GCS Holdings Inc Citibank (64)
(17,000) General Interface SolutionHolding Ltd JP Morgan (9,089)
(6,000) Giant Manufacturing Co Ltd JP Morgan (8,223)5,000 Gigabyte Technology Co Ltd Citibank (264)
(4,000) Gigabyte Technology Co Ltd HSBC (894)31,000 Gigabyte Technology Co Ltd HSBC (1,854)(8,000) Gigabyte Technology Co Ltd JP Morgan (1,801)28,000 Gigabyte Technology Co Ltd JP Morgan 2,750(3,000) Gigasolar Materials Corp Citibank 181(1,000) Gigasolar Materials Corp JP Morgan 415(9,000) Global Unichip Corp Citibank (2,014)(6,000) Globalwafers Co Ltd Citibank 791(6,000) Gold Circuit Electronics Ltd Citibank (771)
BlackRock Asia Pacific Diversified Equity Absolute ReturnFund continued
The notes on pages 691 to 711 form an integral part of these financial statements.
Annual report and audited financial statements [247]
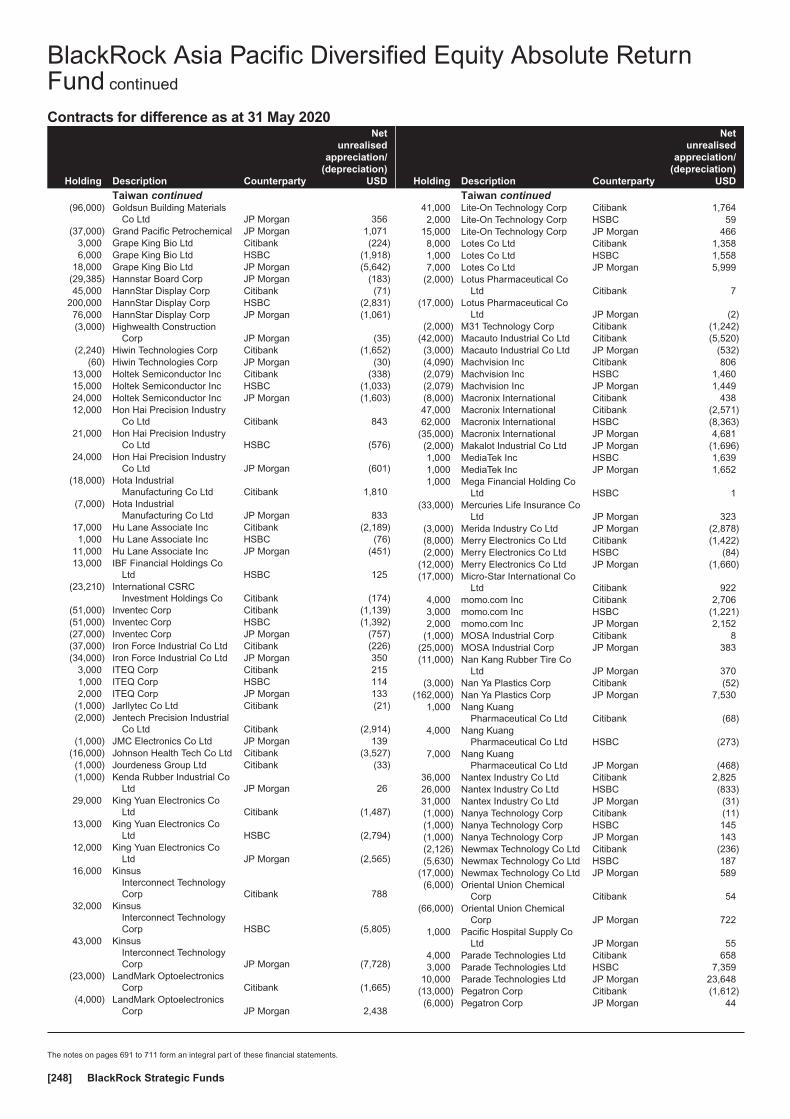
Contracts for difference as at 31 May 2020
Holding Description Counterparty
Netunrealised
appreciation/(depreciation)
USD
Taiwan continued(96,000) Goldsun Building Materials
Co Ltd JP Morgan 356(37,000) Grand Pacific Petrochemical JP Morgan 1,071
3,000 Grape King Bio Ltd Citibank (224)6,000 Grape King Bio Ltd HSBC (1,918)
18,000 Grape King Bio Ltd JP Morgan (5,642)(29,385) Hannstar Board Corp JP Morgan (183)45,000 HannStar Display Corp Citibank (71)
200,000 HannStar Display Corp HSBC (2,831)76,000 HannStar Display Corp JP Morgan (1,061)(3,000) Highwealth Construction
Corp JP Morgan (35)(2,240) Hiwin Technologies Corp Citibank (1,652)
(60) Hiwin Technologies Corp JP Morgan (30)13,000 Holtek Semiconductor Inc Citibank (338)15,000 Holtek Semiconductor Inc HSBC (1,033)24,000 Holtek Semiconductor Inc JP Morgan (1,603)12,000 Hon Hai Precision Industry
Co Ltd Citibank 84321,000 Hon Hai Precision Industry
Co Ltd HSBC (576)24,000 Hon Hai Precision Industry
Co Ltd JP Morgan (601)(18,000) Hota Industrial
Manufacturing Co Ltd Citibank 1,810(7,000) Hota Industrial
Manufacturing Co Ltd JP Morgan 83317,000 Hu Lane Associate Inc Citibank (2,189)1,000 Hu Lane Associate Inc HSBC (76)
11,000 Hu Lane Associate Inc JP Morgan (451)13,000 IBF Financial Holdings Co
Ltd HSBC 125(23,210) International CSRC
Investment Holdings Co Citibank (174)(51,000) Inventec Corp Citibank (1,139)(51,000) Inventec Corp HSBC (1,392)(27,000) Inventec Corp JP Morgan (757)(37,000) Iron Force Industrial Co Ltd Citibank (226)(34,000) Iron Force Industrial Co Ltd JP Morgan 350
3,000 ITEQ Corp Citibank 2151,000 ITEQ Corp HSBC 1142,000 ITEQ Corp JP Morgan 133
(1,000) Jarllytec Co Ltd Citibank (21)(2,000) Jentech Precision Industrial
Co Ltd Citibank (2,914)(1,000) JMC Electronics Co Ltd JP Morgan 139
(16,000) Johnson Health Tech Co Ltd Citibank (3,527)(1,000) Jourdeness Group Ltd Citibank (33)(1,000) Kenda Rubber Industrial Co
Ltd JP Morgan 2629,000 King Yuan Electronics Co
Ltd Citibank (1,487)13,000 King Yuan Electronics Co
Ltd HSBC (2,794)12,000 King Yuan Electronics Co
Ltd JP Morgan (2,565)16,000 Kinsus
Interconnect TechnologyCorp Citibank 788
32,000 KinsusInterconnect TechnologyCorp HSBC (5,805)
43,000 KinsusInterconnect TechnologyCorp JP Morgan (7,728)
(23,000) LandMark OptoelectronicsCorp Citibank (1,665)
(4,000) LandMark OptoelectronicsCorp JP Morgan 2,438
Holding Description Counterparty
Netunrealised
appreciation/(depreciation)
USD
Taiwan continued41,000 Lite-On Technology Corp Citibank 1,7642,000 Lite-On Technology Corp HSBC 59
15,000 Lite-On Technology Corp JP Morgan 4668,000 Lotes Co Ltd Citibank 1,3581,000 Lotes Co Ltd HSBC 1,5587,000 Lotes Co Ltd JP Morgan 5,999
(2,000) Lotus Pharmaceutical CoLtd Citibank 7
(17,000) Lotus Pharmaceutical CoLtd JP Morgan (2)
(2,000) M31 Technology Corp Citibank (1,242)(42,000) Macauto Industrial Co Ltd Citibank (5,520)(3,000) Macauto Industrial Co Ltd JP Morgan (532)(4,090) Machvision Inc Citibank 806(2,079) Machvision Inc HSBC 1,460(2,079) Machvision Inc JP Morgan 1,449(8,000) Macronix International Citibank 43847,000 Macronix International Citibank (2,571)62,000 Macronix International HSBC (8,363)
(35,000) Macronix International JP Morgan 4,681(2,000) Makalot Industrial Co Ltd JP Morgan (1,696)1,000 MediaTek Inc HSBC 1,6391,000 MediaTek Inc JP Morgan 1,6521,000 Mega Financial Holding Co
Ltd HSBC 1(33,000) Mercuries Life Insurance Co
Ltd JP Morgan 323(3,000) Merida Industry Co Ltd JP Morgan (2,878)(8,000) Merry Electronics Co Ltd Citibank (1,422)(2,000) Merry Electronics Co Ltd HSBC (84)
(12,000) Merry Electronics Co Ltd JP Morgan (1,660)(17,000) Micro-Star International Co
Ltd Citibank 9224,000 momo.com Inc Citibank 2,7063,000 momo.com Inc HSBC (1,221)2,000 momo.com Inc JP Morgan 2,152
(1,000) MOSA Industrial Corp Citibank 8(25,000) MOSA Industrial Corp JP Morgan 383(11,000) Nan Kang Rubber Tire Co
Ltd JP Morgan 370(3,000) Nan Ya Plastics Corp Citibank (52)
(162,000) Nan Ya Plastics Corp JP Morgan 7,5301,000 Nang Kuang
Pharmaceutical Co Ltd Citibank (68)4,000 Nang Kuang
Pharmaceutical Co Ltd HSBC (273)7,000 Nang Kuang
Pharmaceutical Co Ltd JP Morgan (468)36,000 Nantex Industry Co Ltd Citibank 2,82526,000 Nantex Industry Co Ltd HSBC (833)31,000 Nantex Industry Co Ltd JP Morgan (31)(1,000) Nanya Technology Corp Citibank (11)(1,000) Nanya Technology Corp HSBC 145(1,000) Nanya Technology Corp JP Morgan 143(2,126) Newmax Technology Co Ltd Citibank (236)(5,630) Newmax Technology Co Ltd HSBC 187
(17,000) Newmax Technology Co Ltd JP Morgan 589(6,000) Oriental Union Chemical
Corp Citibank 54(66,000) Oriental Union Chemical
Corp JP Morgan 7221,000 Pacific Hospital Supply Co
Ltd JP Morgan 554,000 Parade Technologies Ltd Citibank 6583,000 Parade Technologies Ltd HSBC 7,359
10,000 Parade Technologies Ltd JP Morgan 23,648(13,000) Pegatron Corp Citibank (1,612)(6,000) Pegatron Corp JP Morgan 44
BlackRock Asia Pacific Diversified Equity Absolute ReturnFund continued
The notes on pages 691 to 711 form an integral part of these financial statements.
BlackRock Strategic Funds[248]
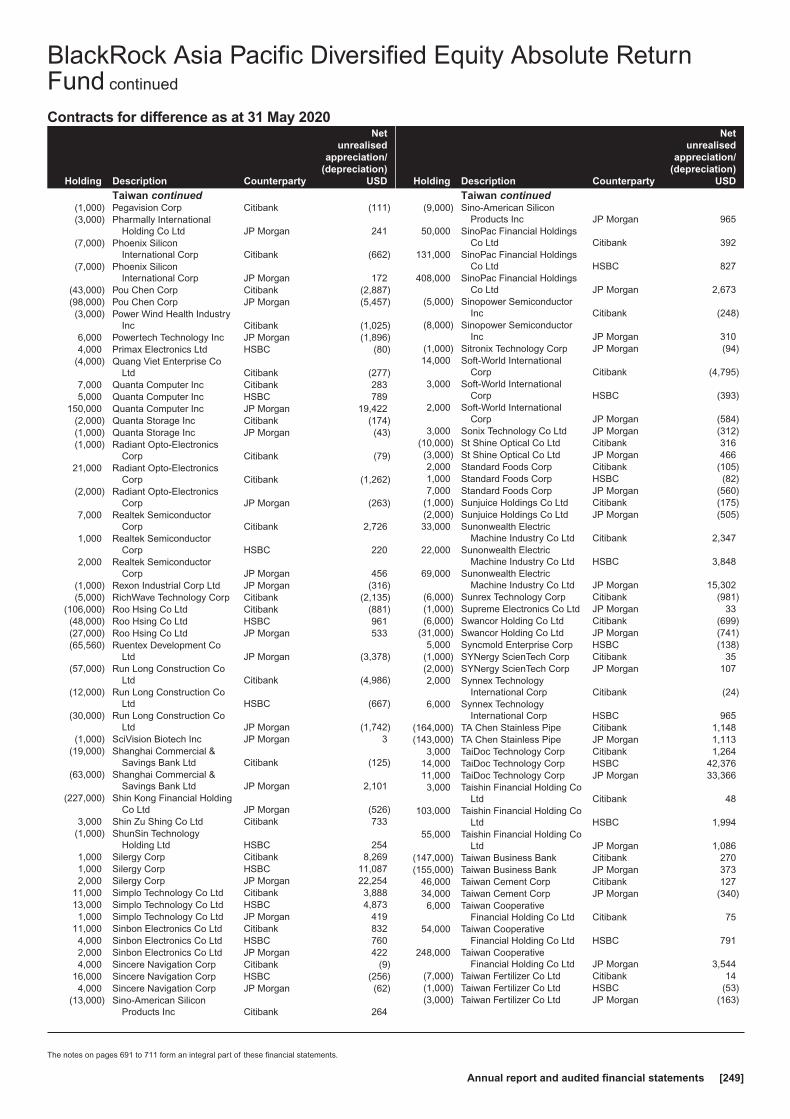
Contracts for difference as at 31 May 2020
Holding Description Counterparty
Netunrealised
appreciation/(depreciation)
USD
Taiwan continued(1,000) Pegavision Corp Citibank (111)(3,000) Pharmally International
Holding Co Ltd JP Morgan 241(7,000) Phoenix Silicon
International Corp Citibank (662)(7,000) Phoenix Silicon
International Corp JP Morgan 172(43,000) Pou Chen Corp Citibank (2,887)(98,000) Pou Chen Corp JP Morgan (5,457)(3,000) Power Wind Health Industry
Inc Citibank (1,025)6,000 Powertech Technology Inc JP Morgan (1,896)4,000 Primax Electronics Ltd HSBC (80)
(4,000) Quang Viet Enterprise CoLtd Citibank (277)
7,000 Quanta Computer Inc Citibank 2835,000 Quanta Computer Inc HSBC 789
150,000 Quanta Computer Inc JP Morgan 19,422(2,000) Quanta Storage Inc Citibank (174)(1,000) Quanta Storage Inc JP Morgan (43)(1,000) Radiant Opto-Electronics
Corp Citibank (79)21,000 Radiant Opto-Electronics
Corp Citibank (1,262)(2,000) Radiant Opto-Electronics
Corp JP Morgan (263)7,000 Realtek Semiconductor
Corp Citibank 2,7261,000 Realtek Semiconductor
Corp HSBC 2202,000 Realtek Semiconductor
Corp JP Morgan 456(1,000) Rexon Industrial Corp Ltd JP Morgan (316)(5,000) RichWave Technology Corp Citibank (2,135)
(106,000) Roo Hsing Co Ltd Citibank (881)(48,000) Roo Hsing Co Ltd HSBC 961(27,000) Roo Hsing Co Ltd JP Morgan 533(65,560) Ruentex Development Co
Ltd JP Morgan (3,378)(57,000) Run Long Construction Co
Ltd Citibank (4,986)(12,000) Run Long Construction Co
Ltd HSBC (667)(30,000) Run Long Construction Co
Ltd JP Morgan (1,742)(1,000) SciVision Biotech Inc JP Morgan 3
(19,000) Shanghai Commercial &Savings Bank Ltd Citibank (125)
(63,000) Shanghai Commercial &Savings Bank Ltd JP Morgan 2,101
(227,000) Shin Kong Financial HoldingCo Ltd JP Morgan (526)
3,000 Shin Zu Shing Co Ltd Citibank 733(1,000) ShunSin Technology
Holding Ltd HSBC 2541,000 Silergy Corp Citibank 8,2691,000 Silergy Corp HSBC 11,0872,000 Silergy Corp JP Morgan 22,254
11,000 Simplo Technology Co Ltd Citibank 3,88813,000 Simplo Technology Co Ltd HSBC 4,8731,000 Simplo Technology Co Ltd JP Morgan 419
11,000 Sinbon Electronics Co Ltd Citibank 8324,000 Sinbon Electronics Co Ltd HSBC 7602,000 Sinbon Electronics Co Ltd JP Morgan 4224,000 Sincere Navigation Corp Citibank (9)
16,000 Sincere Navigation Corp HSBC (256)4,000 Sincere Navigation Corp JP Morgan (62)
(13,000) Sino-American SiliconProducts Inc Citibank 264
Holding Description Counterparty
Netunrealised
appreciation/(depreciation)
USD
Taiwan continued(9,000) Sino-American Silicon
Products Inc JP Morgan 96550,000 SinoPac Financial Holdings
Co Ltd Citibank 392131,000 SinoPac Financial Holdings
Co Ltd HSBC 827408,000 SinoPac Financial Holdings
Co Ltd JP Morgan 2,673(5,000) Sinopower Semiconductor
Inc Citibank (248)(8,000) Sinopower Semiconductor
Inc JP Morgan 310(1,000) Sitronix Technology Corp JP Morgan (94)14,000 Soft-World International
Corp Citibank (4,795)3,000 Soft-World International
Corp HSBC (393)2,000 Soft-World International
Corp JP Morgan (584)3,000 Sonix Technology Co Ltd JP Morgan (312)
(10,000) St Shine Optical Co Ltd Citibank 316(3,000) St Shine Optical Co Ltd JP Morgan 4662,000 Standard Foods Corp Citibank (105)1,000 Standard Foods Corp HSBC (82)7,000 Standard Foods Corp JP Morgan (560)
(1,000) Sunjuice Holdings Co Ltd Citibank (175)(2,000) Sunjuice Holdings Co Ltd JP Morgan (505)33,000 Sunonwealth Electric
Machine Industry Co Ltd Citibank 2,34722,000 Sunonwealth Electric
Machine Industry Co Ltd HSBC 3,84869,000 Sunonwealth Electric
Machine Industry Co Ltd JP Morgan 15,302(6,000) Sunrex Technology Corp Citibank (981)(1,000) Supreme Electronics Co Ltd JP Morgan 33(6,000) Swancor Holding Co Ltd Citibank (699)
(31,000) Swancor Holding Co Ltd JP Morgan (741)5,000 Syncmold Enterprise Corp HSBC (138)
(1,000) SYNergy ScienTech Corp Citibank 35(2,000) SYNergy ScienTech Corp JP Morgan 1072,000 Synnex Technology
International Corp Citibank (24)6,000 Synnex Technology
International Corp HSBC 965(164,000) TA Chen Stainless Pipe Citibank 1,148(143,000) TA Chen Stainless Pipe JP Morgan 1,113
3,000 TaiDoc Technology Corp Citibank 1,26414,000 TaiDoc Technology Corp HSBC 42,37611,000 TaiDoc Technology Corp JP Morgan 33,3663,000 Taishin Financial Holding Co
Ltd Citibank 48103,000 Taishin Financial Holding Co
Ltd HSBC 1,99455,000 Taishin Financial Holding Co
Ltd JP Morgan 1,086(147,000) Taiwan Business Bank Citibank 270(155,000) Taiwan Business Bank JP Morgan 373
46,000 Taiwan Cement Corp Citibank 12734,000 Taiwan Cement Corp JP Morgan (340)6,000 Taiwan Cooperative
Financial Holding Co Ltd Citibank 7554,000 Taiwan Cooperative
Financial Holding Co Ltd HSBC 791248,000 Taiwan Cooperative
Financial Holding Co Ltd JP Morgan 3,544(7,000) Taiwan Fertilizer Co Ltd Citibank 14(1,000) Taiwan Fertilizer Co Ltd HSBC (53)(3,000) Taiwan Fertilizer Co Ltd JP Morgan (163)
BlackRock Asia Pacific Diversified Equity Absolute ReturnFund continued
The notes on pages 691 to 711 form an integral part of these financial statements.
Annual report and audited financial statements [249]

Contracts for difference as at 31 May 2020
Holding Description Counterparty
Netunrealised
appreciation/(depreciation)
USD
Taiwan continued(2,000) Taiwan High Speed Rail
Corp Citibank (147)(19,000) Taiwan High Speed Rail
Corp JP Morgan (2,467)1,000 Taiwan Mobile Co Ltd Citibank 294,000 Taiwan Mobile Co Ltd HSBC (80)
102,000 Taiwan Mobile Co Ltd JP Morgan (1,686)(5,000) Taiwan Paiho Ltd JP Morgan (650)12,000 Taiwan Semiconductor
Manufacturing Co Ltd Citibank (146)1,000 Taiwan Semiconductor
Manufacturing Co Ltd HSBC (238)14,000 Taiwan Semiconductor
Manufacturing Co Ltd JP Morgan (3,205)(11,000) Taiwan Surface Mounting
Technology Corp Citibank 786(2,000) Taiwan Surface Mounting
Technology Corp JP Morgan (902)5,000 Taiwan Union Technology
Corp Citibank 6392,000 Taiwan Union Technology
Corp JP Morgan 413(54,000) Tatung Co Ltd Citibank (584)(12,000) Tatung Co Ltd HSBC 468(16,000) TBI Motion Technology Co
Ltd JP Morgan (3,284)(6,000) TCI Co Ltd Citibank (1,934)(3,000) Teco Electric and Machinery
Co Ltd Citibank (3)21,000 Test Research Inc Citibank (608)10,000 Test Research Inc HSBC 36721,000 Test Research Inc JP Morgan 80714,000 Tong Hsing Electronic
Industries Ltd Citibank (4,980)8,000 Tong Hsing Electronic
Industries Ltd JP Morgan (832)(1,000) TOPBI International
Holdings Ltd JP Morgan 4208,000 Topco Scientific Co Ltd Citibank (168)3,000 Topco Scientific Co Ltd HSBC (8)
17,000 Topco Scientific Co Ltd JP Morgan 1322,000 TPK Holding Co Ltd Citibank (304)50,000 TPK Holding Co Ltd HSBC 529(1,000) TPK Holding Co Ltd JP Morgan (12)8,000 TPK Holding Co Ltd JP Morgan 954,000 Transcend Information Inc Citibank 15
11,000 Transcend Information Inc HSBC (106)17,000 Transcend Information Inc JP Morgan (127)(1,000) TrueLight Corp JP Morgan (70)32,000 TXC Corp Citibank 3,87033,000 TXC Corp HSBC 1,74185,000 TXC Corp JP Morgan 4,63618,000 U-Ming Marine Transport
Corp Citibank 36816,000 U-Ming Marine Transport
Corp JP Morgan 36(21,000) Unimicron Technology Corp JP Morgan 3,362
5,000 Uni-President EnterprisesCorp JP Morgan 262
(52,000) Unitech Printed CircuitBoard Corp Citibank (731)
(153,320) Unitech Printed CircuitBoard Corp JP Morgan 3,062
55,000 United MicroelectronicsCorp Citibank 607
119,000 United MicroelectronicsCorp HSBC (1,137)
22,000 United MicroelectronicsCorp JP Morgan (199)
Holding Description Counterparty
Netunrealised
appreciation/(depreciation)
USD
Taiwan continued(51,000) Universal Microwave
Technology Inc Citibank (3,909)(17,000) Universal Microwave
Technology Inc JP Morgan (721)1,000 Universal Vision
Biotechnology Co Ltd Citibank 272,000 Universal Vision
Biotechnology Co Ltd HSBC 418(24,000) Vanguard International
Semiconductor Corp Citibank (3,128)(7,000) Vanguard International
Semiconductor Corp JP Morgan (535)(1,000) VHQ Media Holdings Ltd JP Morgan 336
(19,000) Visual Photonics Epitaxy CoLtd Citibank (201)
(32,000) Visual Photonics Epitaxy CoLtd JP Morgan 8,640
3,000 Voltronic Power TechnologyCorp Citibank 505
2,200 Voltronic Power TechnologyCorp HSBC 290
2,150 Voltronic Power TechnologyCorp JP Morgan 1,545
(132,000) Wafer Works Corp Citibank (480)(36,000) Wafer Works Corp HSBC 158(57,000) Wafer Works Corp JP Morgan 191(8,000) Walsin Technology Corp Citibank (738)(3,000) Walsin Technology Corp JP Morgan 565(3,000) Wan Hai Lines Ltd JP Morgan (10)
(58,000) Winbond Electronics Corp Citibank (1,901)(1,000) Wisdom Marine Lines Co
Ltd JP Morgan 62132,000 Wistron Corp Citibank 723
1,000 Wistron Corp HSBC 3389,000 Wistron Corp JP Morgan 2,548(3,000) Wistron NeWeb Corp JP Morgan (91)57,000 WPG Holdings Ltd Citibank 1,1424,000 WPG Holdings Ltd HSBC 71
13,000 WPG Holdings Ltd JP Morgan 248(1,000) XinTec Inc Citibank 10
(10,000) XinTec Inc JP Morgan 68369,000 YFY Inc Citibank 7758,000 YFY Inc HSBC 92713,000 YFY Inc JP Morgan 1759,000 Youngtek Electronics Corp Citibank (533)
10,000 Youngtek Electronics Corp HSBC (115)16,000 Youngtek Electronics Corp JP Morgan 146
276,000 Yuanta Financial Holding CoLtd Citibank 734
53,000 Yuanta Financial Holding CoLtd HSBC (426)
184,000 Yuanta Financial Holding CoLtd JP Morgan (1,383)
(11,000) Yulon Motor Co Ltd Citibank 101(10,000) Yulon Motor Co Ltd JP Morgan (1,124)(5,000) Zhen Ding Technology
Holding Ltd Citibank (1,226)(6,000) Zhen Ding Technology
Holding Ltd JP Morgan (392)(12,000) ZongTai Real Estate
Development Co Ltd Citibank (489)(5,000) ZongTai Real Estate
Development Co Ltd JP Morgan (180)
336,832
Thailand(5,800) Advanced Info Service PCL Citibank (691)1,300 AEON Thana Sinsap
Thailand PCL Citibank 56
BlackRock Asia Pacific Diversified Equity Absolute ReturnFund continued
The notes on pages 691 to 711 form an integral part of these financial statements.
BlackRock Strategic Funds[250]

Contracts for difference as at 31 May 2020
Holding Description Counterparty
Netunrealised
appreciation/(depreciation)
USD
Thailand continued1,700 AEON Thana Sinsap
Thailand PCL HSBC 8403,000 AEON Thana Sinsap
Thailand PCL JP Morgan 1,308(70,100) Airports of Thailand PCL Citibank (10,794)
7,300 Amata Corp PCL Citibank 23716,100 Amata Corp PCL HSBC 1,24754,200 Amata Corp PCL JP Morgan 4,297(9,600) AP Thailand PCL Citibank (236)
(21,700) AP Thailand PCL JP Morgan (1,174)900 Bangkok Bank PCL RegS Citibank 375
4,600 Bangkok Bank PCL RegS JP Morgan 1,72518,500 Bangkok Chain Hospital
PCL Citibank 312(169,800) Bangkok Dusit Medical
Services PCL ’F’ Citibank (4,047)(3,300) Bangkok Dusit Medical
Services PCL ’F’ JP Morgan (59)(47,400) Bangkok Expressway &
Metro PCL Citibank (484)(17,700) Bangkok Expressway &
Metro PCL JP Morgan (373)16,300 Bangkok Ranch PCL Citibank 33
900 Berli Jucker PCL Citibank 742,700 Berli Jucker PCL HSBC 530
(81,100) BTS Group Holdings PCL Citibank (1,097)5,000 Central Pattana PCL Citibank 20
12,800 Central Plaza Hotel PCL JP Morgan 2,474(5,066) Central Retail Corp PCL HSBC (436)(1,200) Central Retail Corp PCL JP Morgan (156)34,100 Charoen Pokphand Foods
PCL Citibank 3,56252,200 Charoen Pokphand Foods
PCL HSBC 8,79248,700 Charoen Pokphand Foods
PCL JP Morgan 7,26692,400 CK Power PCL Citibank (141)54,700 CK Power PCL HSBC 81330,100 CK Power PCL JP Morgan 4659,200 CP ALL PCL Citibank 5581,100 CP ALL PCL HSBC (18)
33,600 CP ALL PCL JP Morgan (200)900 Delta Electronics Thailand
PCL Citibank (102)2,600 Delta Electronics Thailand
PCL HSBC 806(352,400) Esso Thailand PCL Citibank 1,642(189,400) Esso Thailand PCL JP Morgan (309)
7,700 GFPT PCL Citibank 10420,400 GFPT PCL HSBC 17169,100 GFPT PCL JP Morgan (3,506)7,500 Gulf Energy Development
PCL Citibank (330)15,500 Gulf Energy Development
PCL HSBC 12825,500 Gulf Energy Development
PCL JP Morgan 3545,300 Hana Microelectronics PCL Citibank 2625,300 Hana Microelectronics PCL HSBC 1507,200 Hana Microelectronics PCL JP Morgan 568
10,300 Home Product Center PCL Citibank 17423,700 Home Product Center PCL HSBC 1,25151,200 Home Product Center PCL JP Morgan 2,488
(36,500) Indorama Ventures PCL Citibank 202(3,900) Jasmine International PCL Citibank (6)3,600 KCE Electronics PCL Citibank 209
19,000 KCE Electronics PCL HSBC 1,62444,100 KCE Electronics PCL JP Morgan 3,204
184,600 Kiatnakin Bank PCL Citibank 7,740
Holding Description Counterparty
Netunrealised
appreciation/(depreciation)
USD
Thailand continued143,000 Kiatnakin Bank PCL JP Morgan 14,820(22,800) Krungthai Card PCL Citibank (784)
(169,700) Land & Houses PCL RegS Citibank (2,761)(15,700) PTT Exploration &
Production PCL Citibank 139(25,600) PTT Global Chemical PCL Citibank (90)
(136,100) PTT PCL Citibank 674(116,800) Quality Houses PCL Citibank (313)
(1,084,600) Quality Houses PCL JP Morgan (6,697)(35,600) Ratch Group PCL Citibank (6,063)241,500 Ratchthani Leasing PCL Citibank 37668,600 Ratchthani Leasing PCL HSBC (346)
192,200 Ratchthani Leasing PCL JP Morgan (431)(14,300) Siam Cement PCL RegS Citibank (1,296)14,400 Siam Commercial Bank
PCL Citibank 2,90967,000 Siam Commercial Bank
PCL JP Morgan 18,1254,100 Siam Makro PCL JP Morgan 107
(9,200) Sino-Thai Engineering &Construction PCL Citibank (63)
(18,300) Sino-Thai Engineering &Construction PCL JP Morgan 155
18,200 Sri Trang Agro-Industry PCL Citibank 2,20825,600 Sri Trang Agro-Industry PCL HSBC 10,45047,300 Sri Trang Agro-Industry PCL JP Morgan 6,315
(56,400) Supalai PCL Citibank (1,483)(60,500) Thai Oil PCL Citibank 3,582
6,900 Thai Union Group PCL ’F’ Citibank 246145,100 Thai Union Group PCL ’F’ HSBC 5,793
3,600 Thai Union Group PCL ’F’ JP Morgan 15010,100 Thai Vegetable Oil PCL HSBC (187)90,500 Thanachart Capital PCL Citibank 3,10661,500 Thanachart Capital PCL HSBC 5,243
111,800 Thanachart Capital PCL JP Morgan 9,60517,600 Tisco Financial Group PCL Citibank 2,86721,900 Tisco Financial Group PCL JP Morgan 4,827
(423,200) TMB Bank PCL Citibank (1,897)36,400 TTW PCL Citibank (188)5,600 TTW PCL JP Morgan 96,800 Workpoint Entertainment
PCL Citibank 704,400 Workpoint Entertainment
PCL HSBC 211
101,290
United States1,327 21Vianet Group Inc ADR Citibank 544
437 21Vianet Group Inc ADR HSBC (1,131)2,340 21Vianet Group Inc ADR JP Morgan (6,318)(366) 360 Finance Inc ADR Citibank (198)
(9,926) 360 Finance Inc ADR HSBC (10,323)109 51job Inc ADR Citibank 686
(838) 58.com Inc ADR HSBC 4,483(122) Aesthetic Medical
International HoldingsGroup Ltd ADR Citibank 13
(394) Aesthetic MedicalInternational HoldingsGroup Ltd ADR HSBC 406
15 Alibaba Group Holding LtdADR Citibank (23)
94 Alibaba Group Holding LtdADR HSBC (286)
20 Alibaba Group Holding LtdADR JP Morgan (56)
(553) Autohome Inc ADR HSBC 3,257316 Baidu Inc ADR Citibank 25996 Baidu Inc ADR JP Morgan 420
BlackRock Asia Pacific Diversified Equity Absolute ReturnFund continued
The notes on pages 691 to 711 form an integral part of these financial statements.
Annual report and audited financial statements [251]

Contracts for difference as at 31 May 2020
Holding Description Counterparty
Netunrealised
appreciation/(depreciation)
USD
United States continued416 Baozun Inc ADR HSBC (1,611)
(1,538) BEST Inc ADR HSBC 408(858) Beyondspring Inc JP Morgan 632140 Bilibili Inc ADR HSBC 210
(15,331) Bitauto Holdings Ltd ADR HSBC (15,868)(212) China Biologic Products
Holdings Inc HSBC (257)(47) China Biologic Products
Holdings Inc JP Morgan (61)334 China Online Education
Group ADR Citibank (267)202 China Online Education
Group ADR HSBC 339184 China Online Education
Group ADR JP Morgan 185,384 China Unicom Hong Kong
Ltd ADR JP Morgan (4,384)(875) Daqo New Energy Corp
ADR HSBC 4,322(543) Daqo New Energy Corp
ADR JP Morgan 2,6821,432 DouYu International
Holdings Ltd ADR Citibank 2,34963 Dr Reddy’s Laboratories Ltd
ADR HSBC 24286 Dr Reddy’s Laboratories Ltd
ADR JP Morgan 1091,523 Futu Holdings Ltd ADR Citibank 1,4562,579 Futu Holdings Ltd ADR HSBC 1,294
743 GDS Holdings Ltd ADR JP Morgan (5,617)(399) Genpact Ltd HSBC (194)151 GSX Techedu Inc ADR JP Morgan (1,732)
5,325 HDFC Bank Ltd ADR Citibank 24,1761,873 HDFC Bank Ltd ADR HSBC 1,2554,258 HDFC Bank Ltd ADR JP Morgan 2,853
254 Himax Technologies IncADR Citibank (13)
(2,230) Hollysys AutomationTechnologies Ltd HSBC 3,363
(98) Huami Corp ADR HSBC 220(33) Huazhu Group Ltd ADR Citibank (84)
(1,313) Huazhu Group Ltd ADR HSBC 538(45) Huazhu Group Ltd ADR JP Morgan 18(65) HUYA Inc ADR Citibank 12
(432) HUYA Inc ADR HSBC 3031,036 Infosys Ltd ADR Citibank (41)
(1,639) Infosys Ltd ADR HSBC (51)18,494 Infosys Ltd ADR HSBC (3,055)
337 iQIYI Inc ADR JP Morgan (570)244 JD.com Inc ADR HSBC 325
(415) JinkoSolar Holding Co LtdADR Citibank (54)
(1,454) JinkoSolar Holding Co LtdADR HSBC 931
(202) JinkoSolar Holding Co LtdADR JP Morgan 129
(88) JOYY Inc ADR HSBC (452)(17) JOYY Inc ADR JP Morgan (87)
(882) LexinFintech Holdings LtdADR JP Morgan (194)
1,074 Melco Resorts &Entertainment Ltd ADR Citibank 1,633
971 Melco Resorts &Entertainment Ltd ADR JP Morgan (884)
(3,699) Momo Inc ADR HSBC 10,9125 NetEase Inc ADR Citibank (30)
(2,578) New Frontier Health Corp Citibank 980(718) New Frontier Health Corp HSBC 93
(4,641) New Frontier Health Corp JP Morgan 678
Holding Description Counterparty
Netunrealised
appreciation/(depreciation)
USD
United States continued(88) New Oriental Education &
Technology Group IncADR HSBC 1,142
929 NIO Inc ADR Citibank 4696,461 NIO Inc ADR HSBC 32
(1,833) Niu Technologies ADR Citibank (752)(960) Niu Technologies ADR HSBC (1,498)
(2,684) Niu Technologies ADR JP Morgan (4,187)(50) Noah Holdings Ltd ADR Citibank 9
(129) Noah Holdings Ltd ADR HSBC 164535 OneConnect Financial
Technology Co Ltd ADR JP Morgan (353)940 OneSmart International
Education Group Ltd ADR HSBC (802)304 Pinduoduo Inc ADR JP Morgan 2,535
1,300 PLDT Inc ADR Citibank 2081,541 PLDT Inc ADR JP Morgan (139)5,194 Qutoutiao Inc ADR Citibank —3,390 Qutoutiao Inc ADR HSBC (169)
12,107 Qutoutiao Inc ADR JP Morgan (605)314 Sea Ltd ADR Citibank (848)831 Sea Ltd ADR JP Morgan 11,476820 Shinhan Financial Group Co
Ltd ADR Citibank 1,050266 Silicon Motion Technology
Corp ADR Citibank (112)622 Silicon Motion Technology
Corp ADR JP Morgan 6531,082 Sogou Inc ADR HSBC (422)5,011 Sohu.com Ltd ADR Citibank (1,453)1,579 Sohu.com Ltd ADR HSBC (1,958)
11,062 Sohu.com Ltd ADR JP Morgan (14,048)365 TAL Education Group ADR HSBC 445
(1,276) Tata Motors Ltd ADR HSBC (77)(3,848) Tencent Music
Entertainment GroupADR HSBC (6,657)
(158) Trip.com Group Ltd ADR Citibank (171)(844) Trip.com Group Ltd ADR HSBC 420(277) Trip.com Group Ltd ADR JP Morgan 65
2,709 Viomi Technology Co LtdADR Citibank (813)
1,656 Viomi Technology Co LtdADR HSBC (1,391)
(688) Vipshop Holdings Ltd ADR HSBC 943(2,229) Weibo Corp ADR HSBC 15,358
(101) Weibo Corp ADR JP Morgan 69682 WNS Holdings Ltd ADR Citibank 515
(4,954) Yiren Digital Ltd ADR HSBC 694(2,518) Yiren Digital Ltd ADR JP Morgan 3531,231 Youdao Inc ADR Citibank (2,432)
327 Youdao Inc ADR HSBC 330599 Youdao Inc ADR JP Morgan 196
(698) Yum China Holdings Inc HSBC 2,345(136) Zai Lab Ltd ADR Citibank (981)(797) ZTO Express Cayman Inc
ADR HSBC (546)
18,173
Total (Gross underlying exposure - USD 103,520,595) 1,366,615
* These securities were valued in consultation with the Investment Advisers. These securitieswere fair valued or suspended at financial year end as detailed in Note 2(a).
π Amounts which are less than 0.5 USD have been rounded down to zero.
BlackRock Asia Pacific Diversified Equity Absolute ReturnFund continued
The notes on pages 691 to 711 form an integral part of these financial statements.
BlackRock Strategic Funds[252]

Swaps as at 31 May 2020
TypeNominal
Value Description CounterpartyExpiration
date
Net unrealisedappreciation/
(depreciation)USD
MarketValue
USD
TRS KRW 2,750,000 Fund receives Fixed 0.000% and pays KOSPI 200 Index Citibank 11/6/2020 (30,490) (30,490)
TRS USD 2,700Fund receives 3 Month LIBOR and pays MSCI AC Asia Pacific
Small Cap Goldman Sachs 4/9/2020 11,059 11,059
TRS USD 745Fund receives 3 Month LIBOR and pays MSCI AC Asia Pacific
Small Cap Goldman Sachs 17/12/2020 (201,197) (201,197)
TRS USD 1,309Fund receives 3 Month LIBOR and pays MSCI AC Asia Pacific
Small Cap Goldman Sachs 8/4/2021 (242,346) (242,346)
TRS USD 2,516Fund receives 3 Month LIBOR and pays MSCI AC Asia Pacific
Small Cap Goldman Sachs 23/4/2021 (331,736) (331,736)
TRS USD 1,356Fund receives 3 Month LIBOR and pays MSCI AC Asia Pacific
Small Cap Index Goldman Sachs 19/11/2020 (69,760) (69,760)
TRS USD 2,147Fund receives 3 Month LIBOR and pays MSCI AC Asia Pacific
Small Cap Index Goldman Sachs 11/5/2021 (119,536) (119,536)
TRS USD 1,560Fund receives 3 Month LIBOR and pays MSCI AC Asia Pacific
Small Cap Index Goldman Sachs 17/5/2021 (119,327) (119,327)
TRS USD 2,538Fund receives 3 Month LIBOR and pays MSCI AC Asia Pacific
Small Cap USD Net Goldman Sachs 16/4/2021 (355,920) (355,920)
Total (Gross underlying exposure - USD 20,570,289) (1,459,253) (1,459,253)
TRS: Total Return Swaps
Open forward foreign exchange transactionsas at 31 May 2020
Currency Purchases Currency Sales CounterpartyMaturity
date
Netunrealised
appreciation/(depreciation)
USD
EUR Hedged Share Class
EUR 553,839 USD 600,690State Street Bank& Trust Company 15/6/2020 15,307
USD 28,487 EUR 26,130State Street Bank& Trust Company 15/6/2020 (577)
14,730
GBP Hedged Share Class
GBP 6,502,058 USD 8,025,331State Street Bank& Trust Company 15/6/2020 5,402
USD 353,180 GBP 289,123State Street Bank& Trust Company 15/6/2020 (3,919)
1,483
Total (Gross underlying exposure - USD 9,032,890) 16,213
Sector Breakdownas at 31 May 2020
% of NetAssets
Financial 51.45
Government 37.84
Energy 7.56
Securities portfolio at market value 96.85
Other Net Assets 3.15
100.00
BlackRock Asia Pacific Diversified Equity Absolute ReturnFund continued
The notes on pages 691 to 711 form an integral part of these financial statements.
Annual report and audited financial statements [253]

Portfolio of Investments as at 31 May 2020
Holding Description
MarketValue
EUR
% ofNet
Assets
Transferable Securities and Money Market Instruments Admittedto an Official Stock Exchange Listing or Dealt in on AnotherRegulated Market
COMMON STOCKSBermuda
21,684 Marvell Technology Group Ltd^ 635,890 0.06
635,890 0.06
Denmark34,154 Novo Nordisk A/S ’B’ 1,999,013 0.19
1,999,013 0.19
Finland24,678 Kone Oyj ’B’ 1,487,590 0.14
1,487,590 0.14
France1,130 Capgemini SE 104,073 0.015,093 L’Oreal SA 1,333,857 0.134,644 LVMH Moet Hennessy Louis
Vuitton SE 1,741,500 0.1723,407 Orange SA 253,849 0.026,072 Pernod Ricard SA 850,687 0.084,007 Ubisoft Entertainment SA 279,128 0.03
13,929 Vivendi SA 284,569 0.034,742 Worldline SA^ 318,283 0.03
5,165,946 0.50
Germany7,474 Deutsche Telekom AG RegS 105,944 0.01
10,344 HelloFresh SE 378,590 0.031,441 Rational AG 695,138 0.077,532 SAP SE 854,882 0.08
14,522 Symrise AG^ 1,428,965 0.142,638 TeamViewer AG^ 120,702 0.01
10,477 United Internet AG RegS 386,392 0.04
3,970,613 0.38
Ireland1,108 Flutter Entertainment Plc 127,752 0.01
431,036 Greencoat Renewables Plc 508,622 0.0519,665 Kingspan Group Plc 1,092,391 0.1111,564 Seagate Technology Plc 551,405 0.052,283 STERIS Plc 340,475 0.03
2,620,645 0.25
Italy14,699 Nexi SpA 217,104 0.02
243,358 Telecom Italia SpA^ 80,795 0.01
297,899 0.03
Japan800 Nintendo Co Ltd 290,657 0.03
5,100 Sony Corp^ 292,537 0.03
583,194 0.06
Luxembourg2,334 Spotify Technology SA^ 379,638 0.04
379,638 0.04
Malta30,739 Kindred Group Plc SDR 150,988 0.01
150,988 0.01
Netherlands346 Adyen NV 409,318 0.04
11,201 ASML Holding NV^ 3,281,333 0.3210,075 Ferrari NV 1,530,392 0.154,208 Prosus NV 313,917 0.03
5,534,960 0.54
Holding Description
MarketValue
EUR
% ofNet
Assets
Poland4,343 CD Projekt SA 393,731 0.04
393,731 0.04
Sweden70,658 Assa Abloy AB ’B’ 1,286,163 0.139,667 Evolution Gaming Group AB 512,854 0.05
25,396 Hexagon AB ’B’ 1,253,741 0.12
3,052,758 0.30
Switzerland2,836 Lonza Group AG RegS 1,251,292 0.12
16,412 Nestle SA RegS 1,595,074 0.16
2,846,366 0.28
United Kingdom1,997 Atlassian Corp Plc ’A’ 332,669 0.03
228,938 Auto Trader Group Plc 1,420,334 0.1434,412 Diageo Plc 1,067,271 0.1059,197 Hargreaves Lansdown Plc 1,206,322 0.1232,382 London Stock Exchange
Group Plc 2,890,027 0.2819,599 Ocado Group Plc 477,264 0.0547,066 Pearson Plc 242,407 0.021,362 Reckitt Benckiser Group Plc 109,355 0.01
17,249 Spirax-Sarco Engineering Plc 1,892,186 0.18
9,637,835 0.93
United States2,173 3M Co 305,609 0.035,126 Activision Blizzard Inc 331,703 0.033,427 Adobe Inc 1,191,063 0.111,046 Akamai Technologies Inc 99,489 0.01
801 Alphabet Inc ’A’ 1,032,274 0.104,166 Altice USA Inc ’A’ 96,327 0.01
463 Amazon.com Inc 1,016,603 0.106,314 Analog Devices Inc 641,135 0.066,536 ANSYS Inc 1,662,866 0.164,238 Apple Inc 1,211,337 0.122,064 Arista Networks Inc 433,192 0.044,536 Aspen Technology Inc 430,785 0.043,224 AT&T Inc 89,444 0.01
449 Becton Dickinson and Co 99,673 0.014,002 BJ’s Wholesale ClubHoldings
Inc 129,520 0.0110,243 Booz Allen Hamilton Holding
Corp 734,465 0.077,122 Box Inc 127,925 0.012,698 Broadcom Inc 706,474 0.07
12,038 Cadence Design Systems Inc 987,953 0.102,263 Campbell Soup Co 103,715 0.01
217 Charter Communications Inc’A’ 106,125 0.01
4,705 Church & Dwight Co Inc 317,530 0.0323,760 Cisco Systems Inc 1,021,444 0.102,147 Citrix Systems Inc 285,894 0.031,709 Clorox Co 316,880 0.03
13,699 Cloudflare Inc ’A’ 358,008 0.034,637 Colgate-Palmolive Co 301,519 0.032,684 Comcast Corp ’A’ 95,551 0.01
17,244 CommScope Holding Co Inc 159,829 0.023,542 Conagra Brands Inc 110,780 0.01
22,988 Conduent Inc 49,392 0.001,012 Costco Wholesale Corp 280,642 0.031,691 CVS Health Corp 99,680 0.012,319 Dell Technologies Inc ’C’ 103,488 0.013,537 DocuSign Inc 444,339 0.04
703 Dollar General Corp 121,033 0.015,213 Dropbox Inc ’A’ 105,774 0.019,812 eBay Inc 401,707 0.04
BlackRock Dynamic Diversified Growth Fund
The notes on pages 691 to 711 form an integral part of these financial statements.
BlackRock Strategic Funds[254]
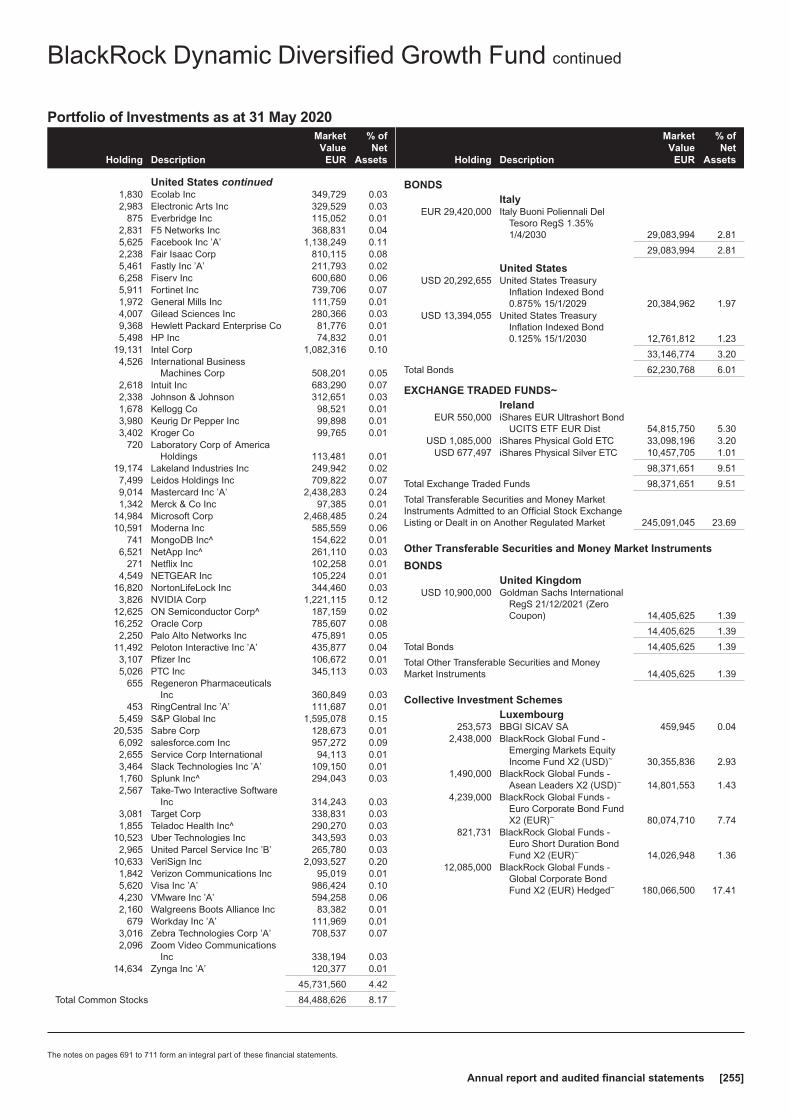
Portfolio of Investments as at 31 May 2020
Holding Description
MarketValue
EUR
% ofNet
Assets
United States continued1,830 Ecolab Inc 349,729 0.032,983 Electronic Arts Inc 329,529 0.03
875 Everbridge Inc 115,052 0.012,831 F5 Networks Inc 368,831 0.045,625 Facebook Inc ’A’ 1,138,249 0.112,238 Fair Isaac Corp 810,115 0.085,461 Fastly Inc ’A’ 211,793 0.026,258 Fiserv Inc 600,680 0.065,911 Fortinet Inc 739,706 0.071,972 General Mills Inc 111,759 0.014,007 Gilead Sciences Inc 280,366 0.039,368 Hewlett Packard Enterprise Co 81,776 0.015,498 HP Inc 74,832 0.01
19,131 Intel Corp 1,082,316 0.104,526 International Business
Machines Corp 508,201 0.052,618 Intuit Inc 683,290 0.072,338 Johnson & Johnson 312,651 0.031,678 Kellogg Co 98,521 0.013,980 Keurig Dr Pepper Inc 99,898 0.013,402 Kroger Co 99,765 0.01
720 Laboratory Corp of AmericaHoldings 113,481 0.01
19,174 Lakeland Industries Inc 249,942 0.027,499 Leidos Holdings Inc 709,822 0.079,014 Mastercard Inc ’A’ 2,438,283 0.241,342 Merck & Co Inc 97,385 0.01
14,984 Microsoft Corp 2,468,485 0.2410,591 Moderna Inc 585,559 0.06
741 MongoDB Inc^ 154,622 0.016,521 NetApp Inc^ 261,110 0.03
271 Netflix Inc 102,258 0.014,549 NETGEAR Inc 105,224 0.01
16,820 NortonLifeLock Inc 344,460 0.033,826 NVIDIA Corp 1,221,115 0.12
12,625 ON Semiconductor Corp^ 187,159 0.0216,252 Oracle Corp 785,607 0.082,250 Palo Alto Networks Inc 475,891 0.05
11,492 Peloton Interactive Inc ’A’ 435,877 0.043,107 Pfizer Inc 106,672 0.015,026 PTC Inc 345,113 0.03
655 Regeneron PharmaceuticalsInc 360,849 0.03
453 RingCentral Inc ’A’ 111,687 0.015,459 S&P Global Inc 1,595,078 0.15
20,535 Sabre Corp 128,673 0.016,092 salesforce.com Inc 957,272 0.092,655 Service Corp International 94,113 0.013,464 Slack Technologies Inc ’A’ 109,150 0.011,760 Splunk Inc^ 294,043 0.032,567 Take-Two Interactive Software
Inc 314,243 0.033,081 Target Corp 338,831 0.031,855 Teladoc Health Inc^ 290,270 0.03
10,523 Uber Technologies Inc 343,593 0.032,965 United Parcel Service Inc ’B’ 265,780 0.03
10,633 VeriSign Inc 2,093,527 0.201,842 Verizon Communications Inc 95,019 0.015,620 Visa Inc ’A’ 986,424 0.104,230 VMware Inc ’A’ 594,258 0.062,160 Walgreens Boots Alliance Inc 83,382 0.01
679 Workday Inc ’A’ 111,969 0.013,016 Zebra Technologies Corp ’A’ 708,537 0.072,096 Zoom Video Communications
Inc 338,194 0.0314,634 Zynga Inc ’A’ 120,377 0.01
45,731,560 4.42
Total Common Stocks 84,488,626 8.17
Holding Description
MarketValue
EUR
% ofNet
Assets
BONDSItaly
EUR 29,420,000 Italy Buoni Poliennali DelTesoro RegS 1.35%1/4/2030 29,083,994 2.81
29,083,994 2.81
United StatesUSD 20,292,655 United States Treasury
Inflation Indexed Bond0.875% 15/1/2029 20,384,962 1.97
USD 13,394,055 United States TreasuryInflation Indexed Bond0.125% 15/1/2030 12,761,812 1.23
33,146,774 3.20
Total Bonds 62,230,768 6.01
EXCHANGE TRADED FUNDS~Ireland
EUR 550,000 iShares EUR Ultrashort BondUCITS ETF EUR Dist 54,815,750 5.30
USD 1,085,000 iShares Physical Gold ETC 33,098,196 3.20USD 677,497 iShares Physical Silver ETC 10,457,705 1.01
98,371,651 9.51
Total Exchange Traded Funds 98,371,651 9.51
Total Transferable Securities and Money MarketInstruments Admitted to an Official Stock ExchangeListing or Dealt in on Another Regulated Market 245,091,045 23.69
Other Transferable Securities and Money Market Instruments
BONDSUnited Kingdom
USD 10,900,000 Goldman Sachs InternationalRegS 21/12/2021 (ZeroCoupon) 14,405,625 1.39
14,405,625 1.39
Total Bonds 14,405,625 1.39
Total Other Transferable Securities and MoneyMarket Instruments 14,405,625 1.39
Collective Investment SchemesLuxembourg
253,573 BBGI SICAV SA 459,945 0.042,438,000 BlackRock Global Fund -
Emerging Markets EquityIncome Fund X2 (USD)~ 30,355,836 2.93
1,490,000 BlackRock Global Funds -Asean Leaders X2 (USD)~ 14,801,553 1.43
4,239,000 BlackRock Global Funds -Euro Corporate Bond FundX2 (EUR)~ 80,074,710 7.74
821,731 BlackRock Global Funds -Euro Short Duration BondFund X2 (EUR)~ 14,026,948 1.36
12,085,000 BlackRock Global Funds -Global Corporate BondFund X2 (EUR) Hedged~ 180,066,500 17.41
BlackRock Dynamic Diversified Growth Fund continued
The notes on pages 691 to 711 form an integral part of these financial statements.
Annual report and audited financial statements [255]
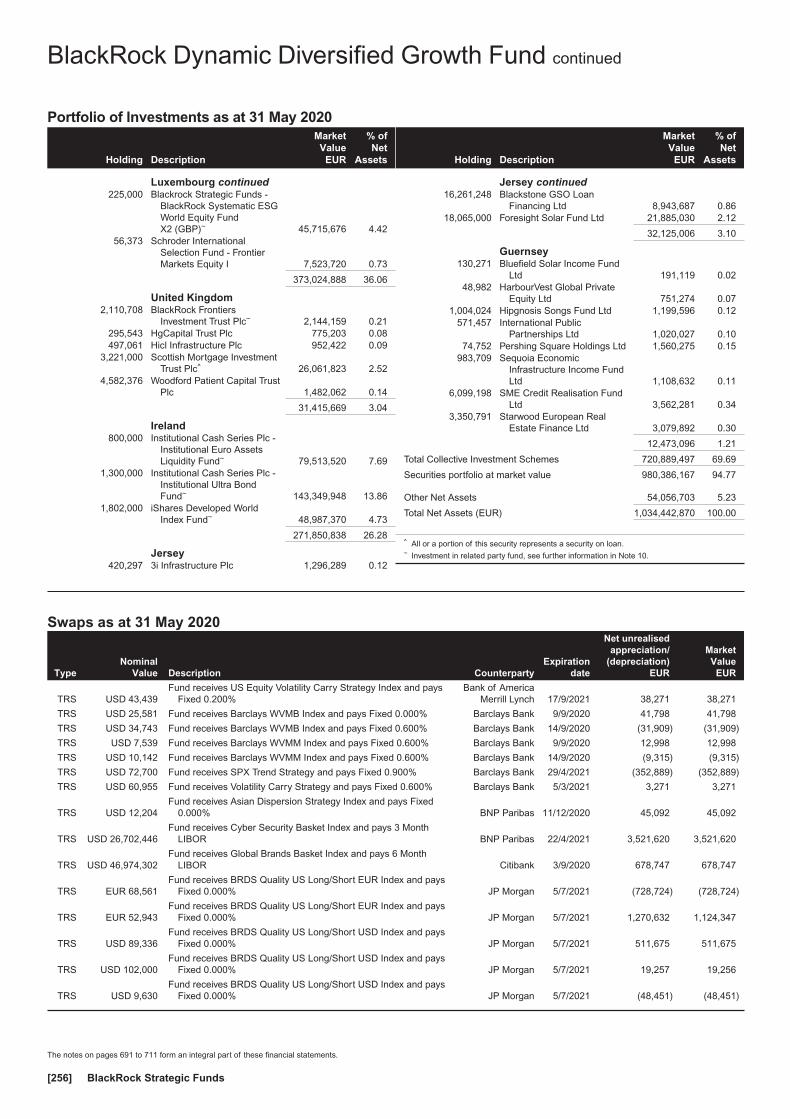
Portfolio of Investments as at 31 May 2020
Holding Description
MarketValue
EUR
% ofNet
Assets
Luxembourg continued225,000 Blackrock Strategic Funds -
BlackRock Systematic ESGWorld Equity FundX2 (GBP)~ 45,715,676 4.42
56,373 Schroder InternationalSelection Fund - FrontierMarkets Equity I 7,523,720 0.73
373,024,888 36.06
United Kingdom2,110,708 BlackRock Frontiers
Investment Trust Plc~ 2,144,159 0.21295,543 HgCapital Trust Plc 775,203 0.08497,061 Hicl Infrastructure Plc 952,422 0.09
3,221,000 Scottish Mortgage InvestmentTrust Plc^ 26,061,823 2.52
4,582,376 Woodford Patient Capital TrustPlc 1,482,062 0.14
31,415,669 3.04
Ireland800,000 Institutional Cash Series Plc -
Institutional Euro AssetsLiquidity Fund~ 79,513,520 7.69
1,300,000 Institutional Cash Series Plc -Institutional Ultra BondFund~ 143,349,948 13.86
1,802,000 iShares Developed WorldIndex Fund~ 48,987,370 4.73
271,850,838 26.28
Jersey420,297 3i Infrastructure Plc 1,296,289 0.12
Holding Description
MarketValue
EUR
% ofNet
Assets
Jersey continued16,261,248 Blackstone GSO Loan
Financing Ltd 8,943,687 0.8618,065,000 Foresight Solar Fund Ltd 21,885,030 2.12
32,125,006 3.10
Guernsey130,271 Bluefield Solar Income Fund
Ltd 191,119 0.0248,982 HarbourVest Global Private
Equity Ltd 751,274 0.071,004,024 Hipgnosis Songs Fund Ltd 1,199,596 0.12
571,457 International PublicPartnerships Ltd 1,020,027 0.10
74,752 Pershing Square Holdings Ltd 1,560,275 0.15983,709 Sequoia Economic
Infrastructure Income FundLtd 1,108,632 0.11
6,099,198 SME Credit Realisation FundLtd 3,562,281 0.34
3,350,791 Starwood European RealEstate Finance Ltd 3,079,892 0.30
12,473,096 1.21
Total Collective Investment Schemes 720,889,497 69.69
Securities portfolio at market value 980,386,167 94.77
Other Net Assets 54,056,703 5.23
Total Net Assets (EUR) 1,034,442,870 100.00
^ All or a portion of this security represents a security on loan.~ Investment in related party fund, see further information in Note 10.
Swaps as at 31 May 2020
TypeNominal
Value Description CounterpartyExpiration
date
Net unrealisedappreciation/
(depreciation)EUR
MarketValue
EUR
TRS USD 43,439Fund receives US Equity Volatility Carry Strategy Index and pays
Fixed 0.200%Bank of America
Merrill Lynch 17/9/2021 38,271 38,271
TRS USD 25,581 Fund receives Barclays WVMB Index and pays Fixed 0.000% Barclays Bank 9/9/2020 41,798 41,798
TRS USD 34,743 Fund receives Barclays WVMB Index and pays Fixed 0.600% Barclays Bank 14/9/2020 (31,909) (31,909)
TRS USD 7,539 Fund receives Barclays WVMM Index and pays Fixed 0.600% Barclays Bank 9/9/2020 12,998 12,998
TRS USD 10,142 Fund receives Barclays WVMM Index and pays Fixed 0.600% Barclays Bank 14/9/2020 (9,315) (9,315)
TRS USD 72,700 Fund receives SPX Trend Strategy and pays Fixed 0.900% Barclays Bank 29/4/2021 (352,889) (352,889)
TRS USD 60,955 Fund receives Volatility Carry Strategy and pays Fixed 0.600% Barclays Bank 5/3/2021 3,271 3,271
TRS USD 12,204Fund receives Asian Dispersion Strategy Index and pays Fixed
0.000% BNP Paribas 11/12/2020 45,092 45,092
TRS USD 26,702,446Fund receives Cyber Security Basket Index and pays 3 Month
LIBOR BNP Paribas 22/4/2021 3,521,620 3,521,620
TRS USD 46,974,302Fund receives Global Brands Basket Index and pays 6 Month
LIBOR Citibank 3/9/2020 678,747 678,747
TRS EUR 68,561Fund receives BRDS Quality US Long/Short EUR Index and pays
Fixed 0.000% JP Morgan 5/7/2021 (728,724) (728,724)
TRS EUR 52,943Fund receives BRDS Quality US Long/Short EUR Index and pays
Fixed 0.000% JP Morgan 5/7/2021 1,270,632 1,124,347
TRS USD 89,336Fund receives BRDS Quality US Long/Short USD Index and pays
Fixed 0.000% JP Morgan 5/7/2021 511,675 511,675
TRS USD 102,000Fund receives BRDS Quality US Long/Short USD Index and pays
Fixed 0.000% JP Morgan 5/7/2021 19,257 19,256
TRS USD 9,630Fund receives BRDS Quality US Long/Short USD Index and pays
Fixed 0.000% JP Morgan 5/7/2021 (48,451) (48,451)
BlackRock Dynamic Diversified Growth Fund continued
The notes on pages 691 to 711 form an integral part of these financial statements.
BlackRock Strategic Funds[256]

Swaps as at 31 May 2020
TypeNominal
Value Description CounterpartyExpiration
date
Net unrealisedappreciation/
(depreciation)EUR
MarketValue
EUR
TRS USD 22,612,964Fund receives MSCI USA Minimum Volatility Index and pays
3 Month LIBOR JP Morgan 4/5/2021 1,350,981 1,350,981
TRS USD 16,999 Fund receives FX Volatility Strategy and pays Fixed 0.200% Morgan Stanley 5/5/2021 (21,690) (21,690)
TRS USD 17,001 Fund receives FX Volatility Strategy and pays Fixed 0.200% Morgan Stanley 5/5/2021 (24,292) (24,292)
TRS EUR 25,611Fund receives European Dispersion Strategy Index and pays Fixed
0.000% Societe Generale 19/6/2020 1,225,371 1,225,371
TRS USD 36,040Fund receives US Dispersion Strategy Index and pays Fixed
0.000% Societe Generale 18/12/2020 (703,402) (703,402)
VAR USD 448,400 Russell 2000 Index strike price USD 20.00 Citibank 18/12/2020 21,966,678 21,966,678
VAR USD 96,888 Russell 2000 Index strike price USD 66.00 Citibank 19/6/2020 708,348 708,348
VAR USD 453,810 S&P 500 Index strike price USD 17.50 Citibank 18/12/2020 (16,545,809) (16,545,809)
VAR USD 96,850 S&P 500 Index strike price USD 65.00 Citibank 19/6/2020 (1,682,758) (1,682,758)
Total (Gross underlying exposure - EUR 479,775,617) 11,245,500 11,099,214
TRS: Total Return SwapsVAR: Variance Swaps
Futures contracts as at 31 May 2020
Numberof
contractsCurrencyof contracts
Contract/Description
Expirationdate
Grossunderlying
exposureEUR
Net unrealisedappreciation/
(depreciation)EUR
50 USD Cboe Volatility Index Futures August 2020 August 2020 1,349,621 (429,738)
42 USD Cboe Volatility Index Futures July 2020 July 2020 1,139,345 (440,417)
(350) USD E-Mini S&P 500 Index Futures June 2020 June 2020 47,858,159 (6,375,537)
(1,031) EUR EURO STOXX 50 Index Futures June 2020 June 2020 31,404,260 (6,322,700)
(331) GBP FTSE 100 Index Futures June 2020 June 2020 22,295,598 (4,158,432)
431 USD US Treasury 10 Year Note Futures September 2020 September 2020 53,882,288 102,921
Total 157,929,271 (17,623,903)
Purchased Options as at 31 May 2020
Numberof
contractsCall/Put Description Counterparty Strike Price
Expirationdate
Netunrealised
appreciation/(depreciation)
EUR
MarketValue
EUR
4,314 Put NASDAQ 100 Index Bank of America Merrill Lynch USD 7,200.00 19/06/2020 (1,393,074) 13,767
394 Put E-Mini S&P 500 Index Exchange Traded USD 2,520.00 17/07/2020 (3,240,650) 550,789
1,636 Call EURO STOXX 50 Index Exchange Traded EUR 4,000.00 18/12/2020 (991,416) 27,812
1,571 Call EURO STOXX 50 Index Exchange Traded EUR 2,900.00 18/12/2020 2,863,933 4,686,293
1,619 Call EURO STOXX 50 Index Exchange Traded EUR 3,550.00 19/06/2020 (879,765) 3,238
Total (Gross underlying exposure - EUR 38,493,154) (3,640,972) 5,281,899
Written Options as at 31 May 2020
Numberof
contractsCall/Put Description Counterparty Strike Price
Expirationdate
Netunrealised
appreciation/(depreciation)
EUR
MarketValue
EUR
(36,488) Call Cboe Spx Volatility Bank of America Merrill Lynch USD 50.00 22/07/2020 46,182 (38,643)
(1,475) Put Cboe Volatility Index Exchange Traded USD 32.50 17/06/2020 (30,642) (702,792)
(1,475) Put Cboe Volatility Index Exchange Traded USD 30.00 17/06/2020 16,840 (477,368)
(2,107) Put Cboe Volatility Index Exchange Traded USD 30.00 22/07/2020 86,574 (805,030)
(2,107) Put Cboe Volatility Index Exchange Traded USD 30.00 19/08/2020 78,328 (943,306)
(394) Put E-Mini S&P 500 Index Exchange Traded USD 2,380.00 17/07/2020 2,366,334 (343,579)
(1,571) Call EURO STOXX 50 Index Exchange Traded EUR 3,050.00 18/12/2020 (2,309,370) (3,204,840)
(810) Put EURO STOXX 50 Index Exchange Traded EUR 2,450.00 19/06/2020 358,020 (38,070)
Total (Gross underlying exposure - EUR 38,532,928) 612,266 (6,553,628)
BlackRock Dynamic Diversified Growth Fund continued
The notes on pages 691 to 711 form an integral part of these financial statements.
Annual report and audited financial statements [257]
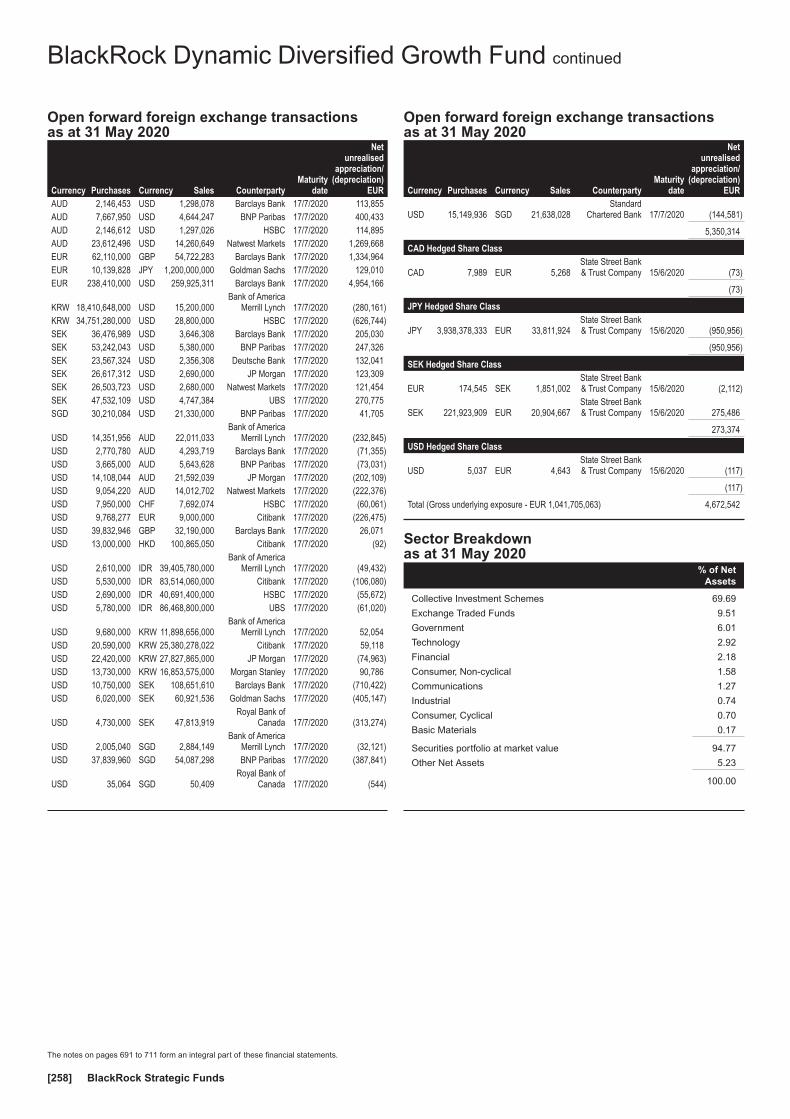
Open forward foreign exchange transactionsas at 31 May 2020
Currency Purchases Currency Sales CounterpartyMaturity
date
Netunrealised
appreciation/(depreciation)
EURAUD 2,146,453 USD 1,298,078 Barclays Bank 17/7/2020 113,855AUD 7,667,950 USD 4,644,247 BNP Paribas 17/7/2020 400,433AUD 2,146,612 USD 1,297,026 HSBC 17/7/2020 114,895AUD 23,612,496 USD 14,260,649 Natwest Markets 17/7/2020 1,269,668EUR 62,110,000 GBP 54,722,283 Barclays Bank 17/7/2020 1,334,964EUR 10,139,828 JPY 1,200,000,000 Goldman Sachs 17/7/2020 129,010EUR 238,410,000 USD 259,925,311 Barclays Bank 17/7/2020 4,954,166
KRW 18,410,648,000 USD 15,200,000Bank of America
Merrill Lynch 17/7/2020 (280,161)KRW 34,751,280,000 USD 28,800,000 HSBC 17/7/2020 (626,744)SEK 36,476,989 USD 3,646,308 Barclays Bank 17/7/2020 205,030SEK 53,242,043 USD 5,380,000 BNP Paribas 17/7/2020 247,326SEK 23,567,324 USD 2,356,308 Deutsche Bank 17/7/2020 132,041SEK 26,617,312 USD 2,690,000 JP Morgan 17/7/2020 123,309SEK 26,503,723 USD 2,680,000 Natwest Markets 17/7/2020 121,454SEK 47,532,109 USD 4,747,384 UBS 17/7/2020 270,775SGD 30,210,084 USD 21,330,000 BNP Paribas 17/7/2020 41,705
USD 14,351,956 AUD 22,011,033Bank of America
Merrill Lynch 17/7/2020 (232,845)USD 2,770,780 AUD 4,293,719 Barclays Bank 17/7/2020 (71,355)USD 3,665,000 AUD 5,643,628 BNP Paribas 17/7/2020 (73,031)USD 14,108,044 AUD 21,592,039 JP Morgan 17/7/2020 (202,109)USD 9,054,220 AUD 14,012,702 Natwest Markets 17/7/2020 (222,376)USD 7,950,000 CHF 7,692,074 HSBC 17/7/2020 (60,061)USD 9,768,277 EUR 9,000,000 Citibank 17/7/2020 (226,475)USD 39,832,946 GBP 32,190,000 Barclays Bank 17/7/2020 26,071USD 13,000,000 HKD 100,865,050 Citibank 17/7/2020 (92)
USD 2,610,000 IDR 39,405,780,000Bank of America
Merrill Lynch 17/7/2020 (49,432)USD 5,530,000 IDR 83,514,060,000 Citibank 17/7/2020 (106,080)USD 2,690,000 IDR 40,691,400,000 HSBC 17/7/2020 (55,672)USD 5,780,000 IDR 86,468,800,000 UBS 17/7/2020 (61,020)
USD 9,680,000 KRW 11,898,656,000Bank of America
Merrill Lynch 17/7/2020 52,054USD 20,590,000 KRW 25,380,278,022 Citibank 17/7/2020 59,118USD 22,420,000 KRW 27,827,865,000 JP Morgan 17/7/2020 (74,963)USD 13,730,000 KRW 16,853,575,000 Morgan Stanley 17/7/2020 90,786USD 10,750,000 SEK 108,651,610 Barclays Bank 17/7/2020 (710,422)USD 6,020,000 SEK 60,921,536 Goldman Sachs 17/7/2020 (405,147)
USD 4,730,000 SEK 47,813,919Royal Bank of
Canada 17/7/2020 (313,274)
USD 2,005,040 SGD 2,884,149Bank of America
Merrill Lynch 17/7/2020 (32,121)USD 37,839,960 SGD 54,087,298 BNP Paribas 17/7/2020 (387,841)
USD 35,064 SGD 50,409Royal Bank of
Canada 17/7/2020 (544)
Open forward foreign exchange transactionsas at 31 May 2020
Currency Purchases Currency Sales CounterpartyMaturity
date
Netunrealised
appreciation/(depreciation)
EUR
USD 15,149,936 SGD 21,638,028Standard
Chartered Bank 17/7/2020 (144,581)
5,350,314
CAD Hedged Share Class
CAD 7,989 EUR 5,268State Street Bank& Trust Company 15/6/2020 (73)
(73)
JPY Hedged Share Class
JPY 3,938,378,333 EUR 33,811,924State Street Bank& Trust Company 15/6/2020 (950,956)
(950,956)
SEK Hedged Share Class
EUR 174,545 SEK 1,851,002State Street Bank& Trust Company 15/6/2020 (2,112)
SEK 221,923,909 EUR 20,904,667State Street Bank& Trust Company 15/6/2020 275,486
273,374
USD Hedged Share Class
USD 5,037 EUR 4,643State Street Bank& Trust Company 15/6/2020 (117)
(117)
Total (Gross underlying exposure - EUR 1,041,705,063) 4,672,542
Sector Breakdownas at 31 May 2020
% of NetAssets
Collective Investment Schemes 69.69
Exchange Traded Funds 9.51
Government 6.01
Technology 2.92
Financial 2.18
Consumer, Non-cyclical 1.58
Communications 1.27
Industrial 0.74
Consumer, Cyclical 0.70
Basic Materials 0.17
Securities portfolio at market value 94.77
Other Net Assets 5.23
100.00
BlackRock Dynamic Diversified Growth Fund continued
The notes on pages 691 to 711 form an integral part of these financial statements.
BlackRock Strategic Funds[258]
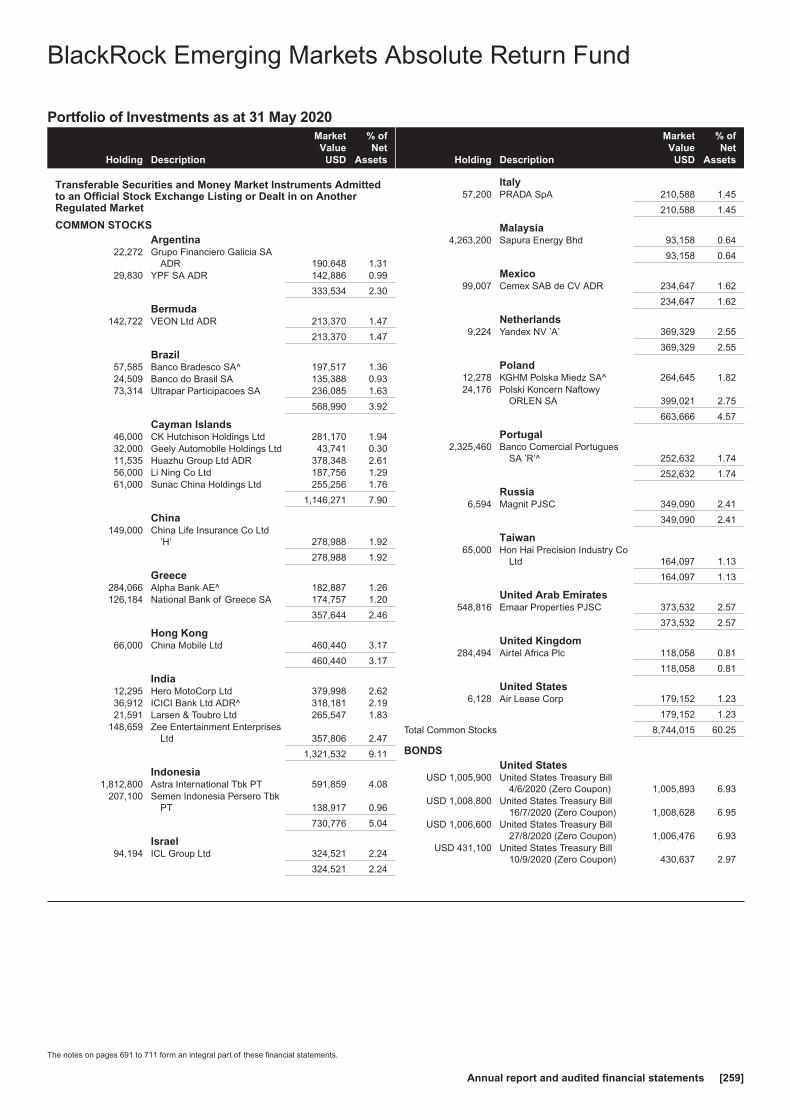
Portfolio of Investments as at 31 May 2020
Holding Description
MarketValue
USD
% ofNet
Assets
Transferable Securities and Money Market Instruments Admittedto an Official Stock Exchange Listing or Dealt in on AnotherRegulated Market
COMMON STOCKSArgentina
22,272 Grupo Financiero Galicia SAADR 190,648 1.31
29,830 YPF SA ADR 142,886 0.99
333,534 2.30
Bermuda142,722 VEON Ltd ADR 213,370 1.47
213,370 1.47
Brazil57,585 Banco Bradesco SA^ 197,517 1.3624,509 Banco do Brasil SA 135,388 0.9373,314 Ultrapar Participacoes SA 236,085 1.63
568,990 3.92
Cayman Islands46,000 CK Hutchison Holdings Ltd 281,170 1.9432,000 Geely Automobile Holdings Ltd 43,741 0.3011,535 Huazhu Group Ltd ADR 378,348 2.6156,000 Li Ning Co Ltd 187,756 1.2961,000 Sunac China Holdings Ltd 255,256 1.76
1,146,271 7.90
China149,000 China Life Insurance Co Ltd
’H’ 278,988 1.92
278,988 1.92
Greece284,066 Alpha Bank AE^ 182,887 1.26126,184 National Bank of Greece SA 174,757 1.20
357,644 2.46
Hong Kong66,000 China Mobile Ltd 460,440 3.17
460,440 3.17
India12,295 Hero MotoCorp Ltd 379,998 2.6236,912 ICICI Bank Ltd ADR^ 318,181 2.1921,591 Larsen & Toubro Ltd 265,547 1.83
148,659 Zee Entertainment EnterprisesLtd 357,806 2.47
1,321,532 9.11
Indonesia1,812,800 Astra International Tbk PT 591,859 4.08
207,100 Semen Indonesia Persero TbkPT 138,917 0.96
730,776 5.04
Israel94,194 ICL Group Ltd 324,521 2.24
324,521 2.24
Holding Description
MarketValue
USD
% ofNet
Assets
Italy57,200 PRADA SpA 210,588 1.45
210,588 1.45
Malaysia4,263,200 Sapura Energy Bhd 93,158 0.64
93,158 0.64
Mexico99,007 Cemex SAB de CV ADR 234,647 1.62
234,647 1.62
Netherlands9,224 Yandex NV ’A’ 369,329 2.55
369,329 2.55
Poland12,278 KGHM Polska Miedz SA^ 264,645 1.8224,176 Polski Koncern Naftowy
ORLEN SA 399,021 2.75
663,666 4.57
Portugal2,325,460 Banco Comercial Portugues
SA ’R’^ 252,632 1.74
252,632 1.74
Russia6,594 Magnit PJSC 349,090 2.41
349,090 2.41
Taiwan65,000 Hon Hai Precision Industry Co
Ltd 164,097 1.13
164,097 1.13
United Arab Emirates548,816 Emaar Properties PJSC 373,532 2.57
373,532 2.57
United Kingdom284,494 Airtel Africa Plc 118,058 0.81
118,058 0.81
United States6,128 Air Lease Corp 179,152 1.23
179,152 1.23
Total Common Stocks 8,744,015 60.25
BONDSUnited States
USD 1,005,900 United States Treasury Bill4/6/2020 (Zero Coupon) 1,005,893 6.93
USD 1,008,800 United States Treasury Bill16/7/2020 (Zero Coupon) 1,008,628 6.95
USD 1,006,600 United States Treasury Bill27/8/2020 (Zero Coupon) 1,006,476 6.93
USD 431,100 United States Treasury Bill10/9/2020 (Zero Coupon) 430,637 2.97
BlackRock Emerging Markets Absolute Return Fund
The notes on pages 691 to 711 form an integral part of these financial statements.
Annual report and audited financial statements [259]
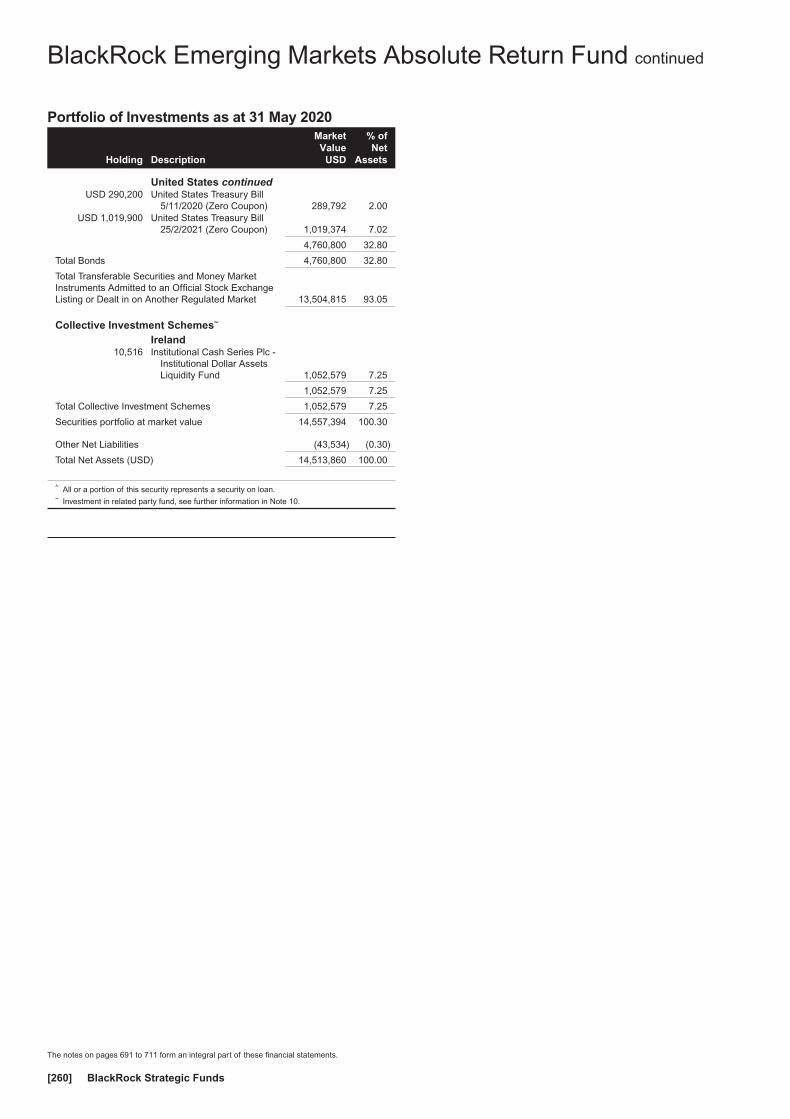
Portfolio of Investments as at 31 May 2020
Holding Description
MarketValue
USD
% ofNet
Assets
United States continuedUSD 290,200 United States Treasury Bill
5/11/2020 (Zero Coupon) 289,792 2.00USD 1,019,900 United States Treasury Bill
25/2/2021 (Zero Coupon) 1,019,374 7.02
4,760,800 32.80
Total Bonds 4,760,800 32.80
Total Transferable Securities and Money MarketInstruments Admitted to an Official Stock ExchangeListing or Dealt in on Another Regulated Market 13,504,815 93.05
Collective Investment Schemes~
Ireland10,516 Institutional Cash Series Plc -
Institutional Dollar AssetsLiquidity Fund 1,052,579 7.25
1,052,579 7.25
Total Collective Investment Schemes 1,052,579 7.25
Securities portfolio at market value 14,557,394 100.30
Other Net Liabilities (43,534) (0.30)
Total Net Assets (USD) 14,513,860 100.00
^ All or a portion of this security represents a security on loan.~ Investment in related party fund, see further information in Note 10.
BlackRock Emerging Markets Absolute Return Fund continued
The notes on pages 691 to 711 form an integral part of these financial statements.
BlackRock Strategic Funds[260]
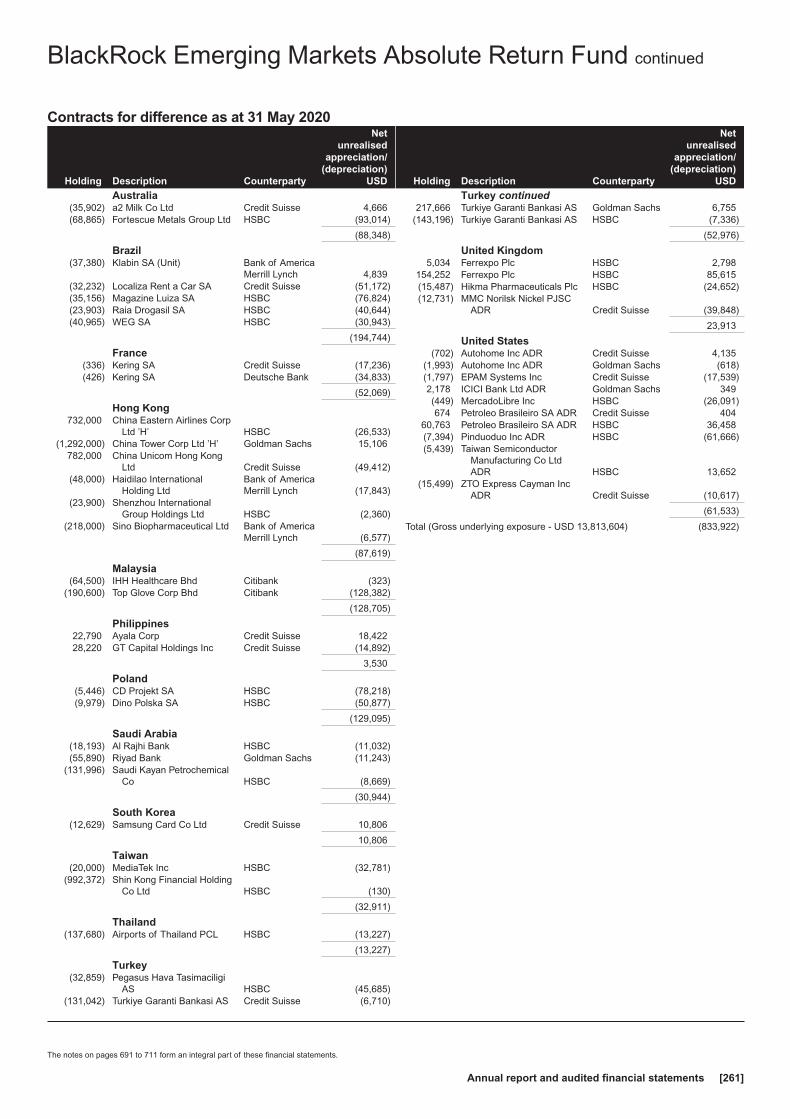
Contracts for difference as at 31 May 2020
Holding Description Counterparty
Netunrealised
appreciation/(depreciation)
USD
Australia(35,902) a2 Milk Co Ltd Credit Suisse 4,666(68,865) Fortescue Metals Group Ltd HSBC (93,014)
(88,348)
Brazil(37,380) Klabin SA (Unit) Bank of America
Merrill Lynch 4,839(32,232) Localiza Rent a Car SA Credit Suisse (51,172)(35,156) Magazine Luiza SA HSBC (76,824)(23,903) Raia Drogasil SA HSBC (40,644)(40,965) WEG SA HSBC (30,943)
(194,744)
France(336) Kering SA Credit Suisse (17,236)(426) Kering SA Deutsche Bank (34,833)
(52,069)
Hong Kong732,000 China Eastern Airlines Corp
Ltd ’H’ HSBC (26,533)(1,292,000) China Tower Corp Ltd ’H’ Goldman Sachs 15,106
782,000 China Unicom Hong KongLtd Credit Suisse (49,412)
(48,000) Haidilao InternationalHolding Ltd
Bank of AmericaMerrill Lynch (17,843)
(23,900) Shenzhou InternationalGroup Holdings Ltd HSBC (2,360)
(218,000) Sino Biopharmaceutical Ltd Bank of AmericaMerrill Lynch (6,577)
(87,619)
Malaysia(64,500) IHH Healthcare Bhd Citibank (323)
(190,600) Top Glove Corp Bhd Citibank (128,382)
(128,705)
Philippines22,790 Ayala Corp Credit Suisse 18,42228,220 GT Capital Holdings Inc Credit Suisse (14,892)
3,530
Poland(5,446) CD Projekt SA HSBC (78,218)(9,979) Dino Polska SA HSBC (50,877)
(129,095)
Saudi Arabia(18,193) Al Rajhi Bank HSBC (11,032)(55,890) Riyad Bank Goldman Sachs (11,243)
(131,996) Saudi Kayan PetrochemicalCo HSBC (8,669)
(30,944)
South Korea(12,629) Samsung Card Co Ltd Credit Suisse 10,806
10,806
Taiwan(20,000) MediaTek Inc HSBC (32,781)
(992,372) Shin Kong Financial HoldingCo Ltd HSBC (130)
(32,911)
Thailand(137,680) Airports of Thailand PCL HSBC (13,227)
(13,227)
Turkey(32,859) Pegasus Hava Tasimaciligi
AS HSBC (45,685)(131,042) Turkiye Garanti Bankasi AS Credit Suisse (6,710)
Holding Description Counterparty
Netunrealised
appreciation/(depreciation)
USD
Turkey continued217,666 Turkiye Garanti Bankasi AS Goldman Sachs 6,755
(143,196) Turkiye Garanti Bankasi AS HSBC (7,336)
(52,976)
United Kingdom5,034 Ferrexpo Plc HSBC 2,798
154,252 Ferrexpo Plc HSBC 85,615(15,487) Hikma Pharmaceuticals Plc HSBC (24,652)(12,731) MMC Norilsk Nickel PJSC
ADR Credit Suisse (39,848)
23,913
United States(702) Autohome Inc ADR Credit Suisse 4,135
(1,993) Autohome Inc ADR Goldman Sachs (618)(1,797) EPAM Systems Inc Credit Suisse (17,539)2,178 ICICI Bank Ltd ADR Goldman Sachs 349(449) MercadoLibre Inc HSBC (26,091)674 Petroleo Brasileiro SA ADR Credit Suisse 404
60,763 Petroleo Brasileiro SA ADR HSBC 36,458(7,394) Pinduoduo Inc ADR HSBC (61,666)(5,439) Taiwan Semiconductor
Manufacturing Co LtdADR HSBC 13,652
(15,499) ZTO Express Cayman IncADR Credit Suisse (10,617)
(61,533)
Total (Gross underlying exposure - USD 13,813,604) (833,922)
BlackRock Emerging Markets Absolute Return Fund continued
The notes on pages 691 to 711 form an integral part of these financial statements.
Annual report and audited financial statements [261]
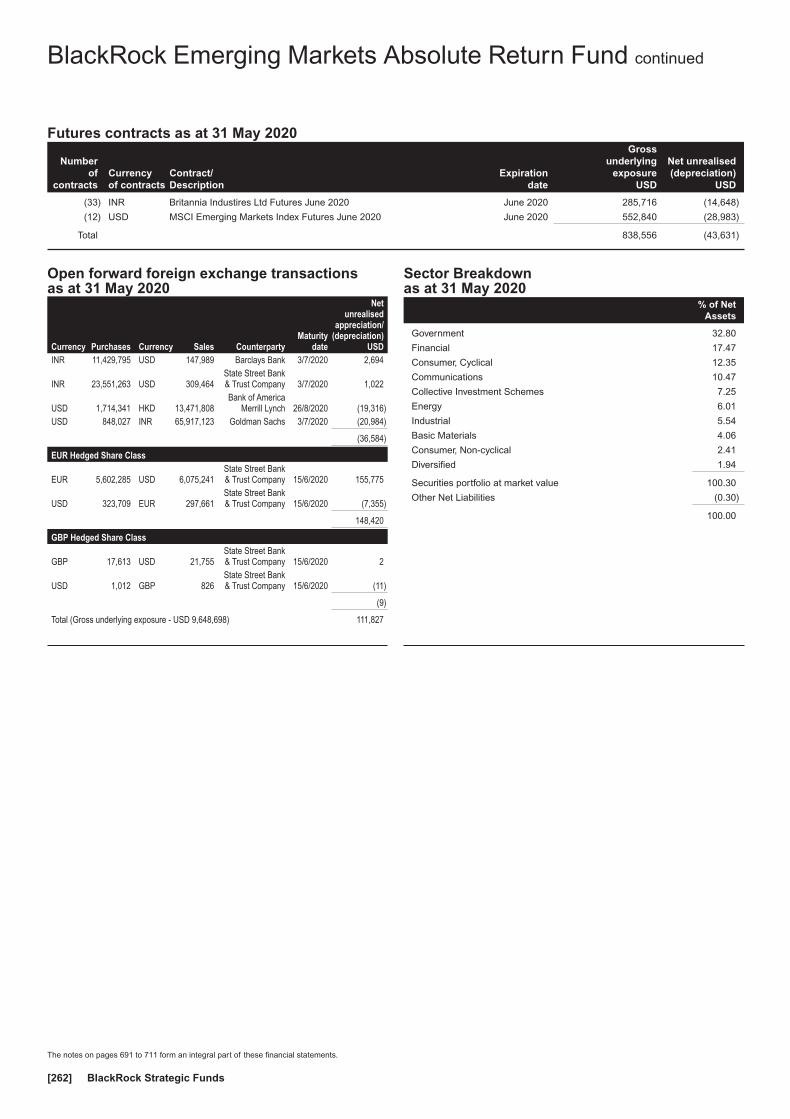
Futures contracts as at 31 May 2020
Numberof
contractsCurrencyof contracts
Contract/Description
Expirationdate
Grossunderlying
exposureUSD
Net unrealised(depreciation)
USD
(33) INR Britannia Industires Ltd Futures June 2020 June 2020 285,716 (14,648)
(12) USD MSCI Emerging Markets Index Futures June 2020 June 2020 552,840 (28,983)
Total 838,556 (43,631)
Open forward foreign exchange transactionsas at 31 May 2020
Currency Purchases Currency Sales CounterpartyMaturity
date
Netunrealised
appreciation/(depreciation)
USDINR 11,429,795 USD 147,989 Barclays Bank 3/7/2020 2,694
INR 23,551,263 USD 309,464State Street Bank& Trust Company 3/7/2020 1,022
USD 1,714,341 HKD 13,471,808Bank of America
Merrill Lynch 26/8/2020 (19,316)USD 848,027 INR 65,917,123 Goldman Sachs 3/7/2020 (20,984)
(36,584)
EUR Hedged Share Class
EUR 5,602,285 USD 6,075,241State Street Bank& Trust Company 15/6/2020 155,775
USD 323,709 EUR 297,661State Street Bank& Trust Company 15/6/2020 (7,355)
148,420
GBP Hedged Share Class
GBP 17,613 USD 21,755State Street Bank& Trust Company 15/6/2020 2
USD 1,012 GBP 826State Street Bank& Trust Company 15/6/2020 (11)
(9)
Total (Gross underlying exposure - USD 9,648,698) 111,827
Sector Breakdownas at 31 May 2020
% of NetAssets
Government 32.80
Financial 17.47
Consumer, Cyclical 12.35
Communications 10.47
Collective Investment Schemes 7.25
Energy 6.01
Industrial 5.54
Basic Materials 4.06
Consumer, Non-cyclical 2.41
Diversified 1.94
Securities portfolio at market value 100.30
Other Net Liabilities (0.30)
100.00
BlackRock Emerging Markets Absolute Return Fund continued
The notes on pages 691 to 711 form an integral part of these financial statements.
BlackRock Strategic Funds[262]
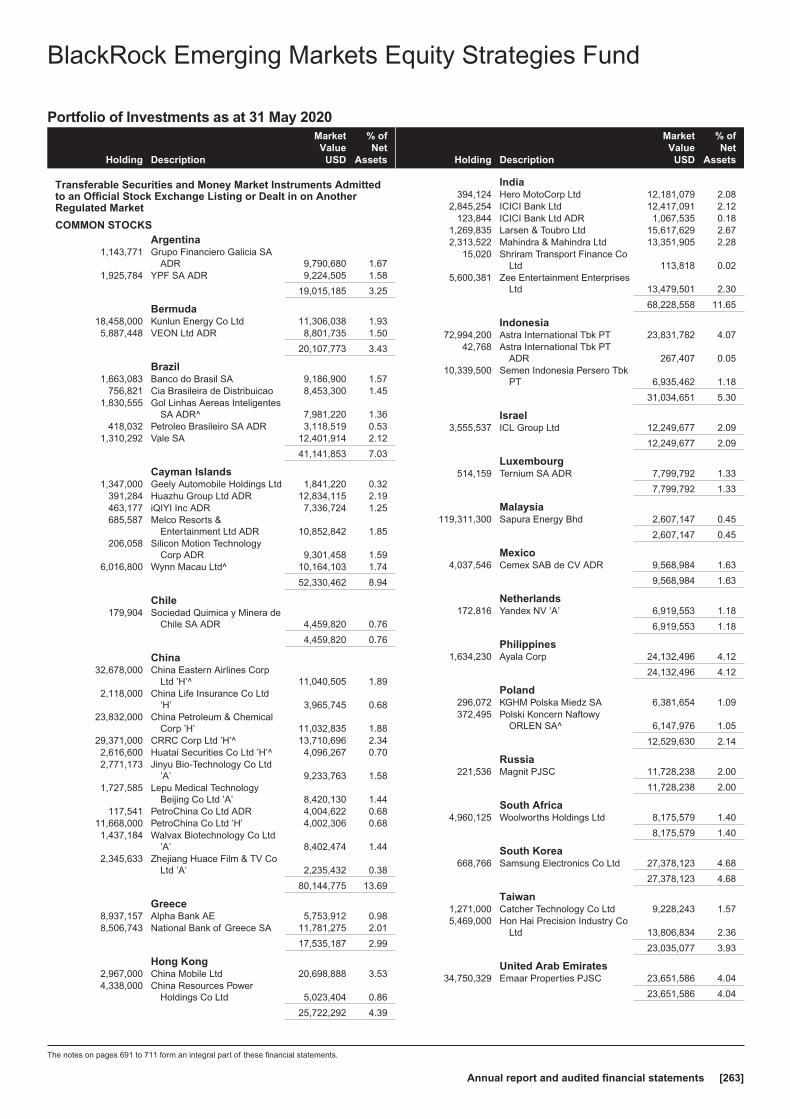
Portfolio of Investments as at 31 May 2020
Holding Description
MarketValue
USD
% ofNet
Assets
Transferable Securities and Money Market Instruments Admittedto an Official Stock Exchange Listing or Dealt in on AnotherRegulated Market
COMMON STOCKSArgentina
1,143,771 Grupo Financiero Galicia SAADR 9,790,680 1.67
1,925,784 YPF SA ADR 9,224,505 1.58
19,015,185 3.25
Bermuda18,458,000 Kunlun Energy Co Ltd 11,306,038 1.935,887,448 VEON Ltd ADR 8,801,735 1.50
20,107,773 3.43
Brazil1,663,083 Banco do Brasil SA 9,186,900 1.57
756,821 Cia Brasileira de Distribuicao 8,453,300 1.451,830,555 Gol Linhas Aereas Inteligentes
SA ADR^ 7,981,220 1.36418,032 Petroleo Brasileiro SA ADR 3,118,519 0.53
1,310,292 Vale SA 12,401,914 2.12
41,141,853 7.03
Cayman Islands1,347,000 Geely Automobile Holdings Ltd 1,841,220 0.32
391,284 Huazhu Group Ltd ADR 12,834,115 2.19463,177 iQIYI Inc ADR 7,336,724 1.25685,587 Melco Resorts &
Entertainment Ltd ADR 10,852,842 1.85206,058 Silicon Motion Technology
Corp ADR 9,301,458 1.596,016,800 Wynn Macau Ltd^ 10,164,103 1.74
52,330,462 8.94
Chile179,904 Sociedad Quimica y Minera de
Chile SA ADR 4,459,820 0.76
4,459,820 0.76
China32,678,000 China Eastern Airlines Corp
Ltd ’H’^ 11,040,505 1.892,118,000 China Life Insurance Co Ltd
’H’ 3,965,745 0.6823,832,000 China Petroleum & Chemical
Corp ’H’ 11,032,835 1.8829,371,000 CRRC Corp Ltd ’H’^ 13,710,696 2.342,616,600 Huatai Securities Co Ltd ’H’^ 4,096,267 0.702,771,173 Jinyu Bio-Technology Co Ltd
’A’ 9,233,763 1.581,727,585 Lepu Medical Technology
Beijing Co Ltd ’A’ 8,420,130 1.44117,541 PetroChina Co Ltd ADR 4,004,622 0.68
11,668,000 PetroChina Co Ltd ’H’ 4,002,306 0.681,437,184 Walvax Biotechnology Co Ltd
’A’ 8,402,474 1.442,345,633 Zhejiang Huace Film & TV Co
Ltd ’A’ 2,235,432 0.38
80,144,775 13.69
Greece8,937,157 Alpha Bank AE 5,753,912 0.988,506,743 National Bank of Greece SA 11,781,275 2.01
17,535,187 2.99
Hong Kong2,967,000 China Mobile Ltd 20,698,888 3.534,338,000 China Resources Power
Holdings Co Ltd 5,023,404 0.86
25,722,292 4.39
Holding Description
MarketValue
USD
% ofNet
Assets
India394,124 Hero MotoCorp Ltd 12,181,079 2.08
2,845,254 ICICI Bank Ltd 12,417,091 2.12123,844 ICICI Bank Ltd ADR 1,067,535 0.18
1,269,835 Larsen & Toubro Ltd 15,617,629 2.672,313,522 Mahindra & Mahindra Ltd 13,351,905 2.28
15,020 Shriram Transport Finance CoLtd 113,818 0.02
5,600,381 Zee Entertainment EnterprisesLtd 13,479,501 2.30
68,228,558 11.65
Indonesia72,994,200 Astra International Tbk PT 23,831,782 4.07
42,768 Astra International Tbk PTADR 267,407 0.05
10,339,500 Semen Indonesia Persero TbkPT 6,935,462 1.18
31,034,651 5.30
Israel3,555,537 ICL Group Ltd 12,249,677 2.09
12,249,677 2.09
Luxembourg514,159 Ternium SA ADR 7,799,792 1.33
7,799,792 1.33
Malaysia119,311,300 Sapura Energy Bhd 2,607,147 0.45
2,607,147 0.45
Mexico4,037,546 Cemex SAB de CV ADR 9,568,984 1.63
9,568,984 1.63
Netherlands172,816 Yandex NV ’A’ 6,919,553 1.18
6,919,553 1.18
Philippines1,634,230 Ayala Corp 24,132,496 4.12
24,132,496 4.12
Poland296,072 KGHM Polska Miedz SA 6,381,654 1.09372,495 Polski Koncern Naftowy
ORLEN SA^ 6,147,976 1.05
12,529,630 2.14
Russia221,536 Magnit PJSC 11,728,238 2.00
11,728,238 2.00
South Africa4,960,125 Woolworths Holdings Ltd 8,175,579 1.40
8,175,579 1.40
South Korea668,766 Samsung Electronics Co Ltd 27,378,123 4.68
27,378,123 4.68
Taiwan1,271,000 Catcher Technology Co Ltd 9,228,243 1.575,469,000 Hon Hai Precision Industry Co
Ltd 13,806,834 2.36
23,035,077 3.93
United Arab Emirates34,750,329 Emaar Properties PJSC 23,651,586 4.04
23,651,586 4.04
BlackRock Emerging Markets Equity Strategies Fund
The notes on pages 691 to 711 form an integral part of these financial statements.
Annual report and audited financial statements [263]

Portfolio of Investments as at 31 May 2020
Holding Description
MarketValue
USD
% ofNet
Assets
United Kingdom14,231,137 Airtel Africa Plc 5,905,590 1.012,833,515 Mediclinic International
Plc (traded in South Africa) 9,487,905 1.62540,997 Mediclinic International
Plc (traded in UnitedKingdom) 1,818,727 0.31
17,212,222 2.94
Total Common Stocks 546,708,660 93.36
Total Transferable Securities and Money MarketInstruments Admitted to an Official Stock ExchangeListing or Dealt in on Another Regulated Market 546,708,660 93.36
Collective Investment Schemes~
Ireland419,514 Institutional Cash Series Plc -
Institutional Dollar AssetsLiquidity Fund 41,991,252 7.17
41,991,252 7.17
Total Collective Investment Schemes 41,991,252 7.17
Securities portfolio at market value 588,699,912 100.53
Other Net Liabilities (3,080,663) (0.53)
Total Net Assets (USD) 585,619,249 100.00
^ All or a portion of this security represents a security on loan.~ Investment in related party fund, see further information in Note 10.
BlackRock Emerging Markets Equity Strategies Fund continued
The notes on pages 691 to 711 form an integral part of these financial statements.
BlackRock Strategic Funds[264]
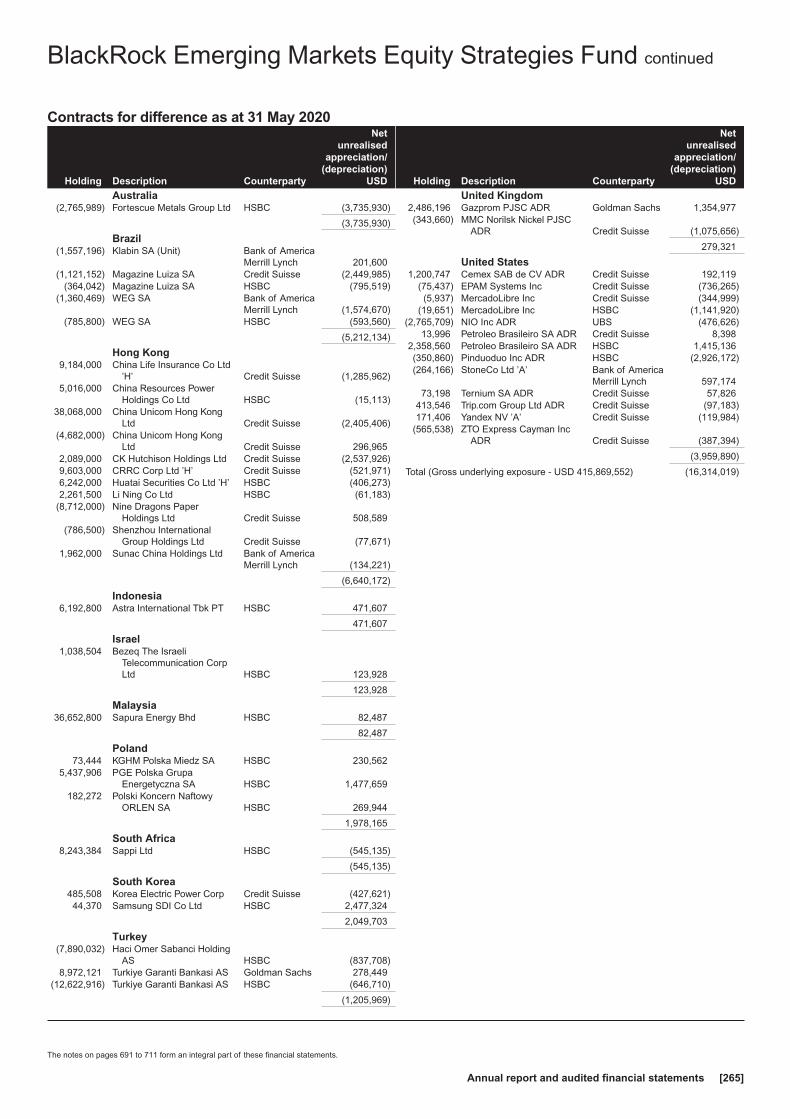
Contracts for difference as at 31 May 2020
Holding Description Counterparty
Netunrealised
appreciation/(depreciation)
USD
Australia(2,765,989) Fortescue Metals Group Ltd HSBC (3,735,930)
(3,735,930)
Brazil(1,557,196) Klabin SA (Unit) Bank of America
Merrill Lynch 201,600(1,121,152) Magazine Luiza SA Credit Suisse (2,449,985)
(364,042) Magazine Luiza SA HSBC (795,519)(1,360,469) WEG SA Bank of America
Merrill Lynch (1,574,670)(785,800) WEG SA HSBC (593,560)
(5,212,134)
Hong Kong9,184,000 China Life Insurance Co Ltd
’H’ Credit Suisse (1,285,962)5,016,000 China Resources Power
Holdings Co Ltd HSBC (15,113)38,068,000 China Unicom Hong Kong
Ltd Credit Suisse (2,405,406)(4,682,000) China Unicom Hong Kong
Ltd Credit Suisse 296,9652,089,000 CK Hutchison Holdings Ltd Credit Suisse (2,537,926)9,603,000 CRRC Corp Ltd ’H’ Credit Suisse (521,971)6,242,000 Huatai Securities Co Ltd ’H’ HSBC (406,273)2,261,500 Li Ning Co Ltd HSBC (61,183)
(8,712,000) Nine Dragons PaperHoldings Ltd Credit Suisse 508,589
(786,500) Shenzhou InternationalGroup Holdings Ltd Credit Suisse (77,671)
1,962,000 Sunac China Holdings Ltd Bank of AmericaMerrill Lynch (134,221)
(6,640,172)
Indonesia6,192,800 Astra International Tbk PT HSBC 471,607
471,607
Israel1,038,504 Bezeq The Israeli
Telecommunication CorpLtd HSBC 123,928
123,928
Malaysia36,652,800 Sapura Energy Bhd HSBC 82,487
82,487
Poland73,444 KGHM Polska Miedz SA HSBC 230,562
5,437,906 PGE Polska GrupaEnergetyczna SA HSBC 1,477,659
182,272 Polski Koncern NaftowyORLEN SA HSBC 269,944
1,978,165
South Africa8,243,384 Sappi Ltd HSBC (545,135)
(545,135)
South Korea485,508 Korea Electric Power Corp Credit Suisse (427,621)44,370 Samsung SDI Co Ltd HSBC 2,477,324
2,049,703
Turkey(7,890,032) Haci Omer Sabanci Holding
AS HSBC (837,708)8,972,121 Turkiye Garanti Bankasi AS Goldman Sachs 278,449
(12,622,916) Turkiye Garanti Bankasi AS HSBC (646,710)
(1,205,969)
Holding Description Counterparty
Netunrealised
appreciation/(depreciation)
USD
United Kingdom2,486,196 Gazprom PJSC ADR Goldman Sachs 1,354,977(343,660) MMC Norilsk Nickel PJSC
ADR Credit Suisse (1,075,656)
279,321
United States1,200,747 Cemex SAB de CV ADR Credit Suisse 192,119
(75,437) EPAM Systems Inc Credit Suisse (736,265)(5,937) MercadoLibre Inc Credit Suisse (344,999)
(19,651) MercadoLibre Inc HSBC (1,141,920)(2,765,709) NIO Inc ADR UBS (476,626)
13,996 Petroleo Brasileiro SA ADR Credit Suisse 8,3982,358,560 Petroleo Brasileiro SA ADR HSBC 1,415,136(350,860) Pinduoduo Inc ADR HSBC (2,926,172)(264,166) StoneCo Ltd ’A’ Bank of America
Merrill Lynch 597,17473,198 Ternium SA ADR Credit Suisse 57,826
413,546 Trip.com Group Ltd ADR Credit Suisse (97,183)171,406 Yandex NV ’A’ Credit Suisse (119,984)
(565,538) ZTO Express Cayman IncADR Credit Suisse (387,394)
(3,959,890)
Total (Gross underlying exposure - USD 415,869,552) (16,314,019)
BlackRock Emerging Markets Equity Strategies Fund continued
The notes on pages 691 to 711 form an integral part of these financial statements.
Annual report and audited financial statements [265]
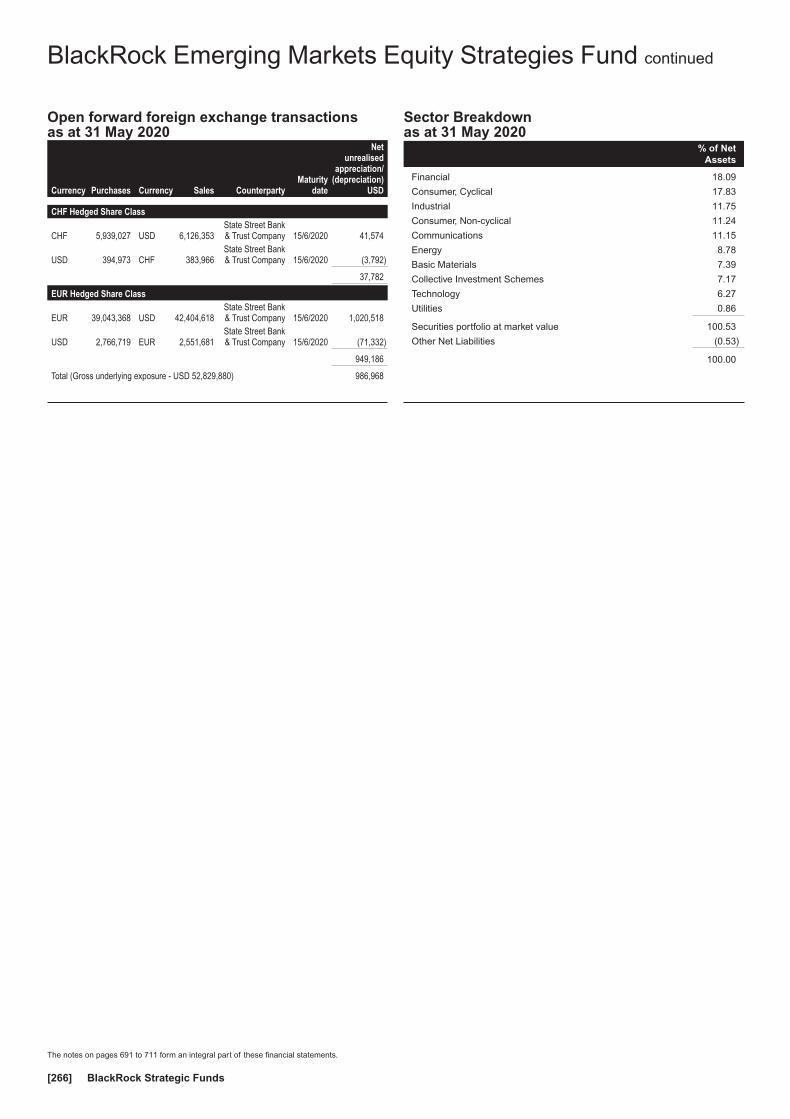
Open forward foreign exchange transactionsas at 31 May 2020
Currency Purchases Currency Sales CounterpartyMaturity
date
Netunrealised
appreciation/(depreciation)
USD
CHF Hedged Share Class
CHF 5,939,027 USD 6,126,353State Street Bank& Trust Company 15/6/2020 41,574
USD 394,973 CHF 383,966State Street Bank& Trust Company 15/6/2020 (3,792)
37,782
EUR Hedged Share Class
EUR 39,043,368 USD 42,404,618State Street Bank& Trust Company 15/6/2020 1,020,518
USD 2,766,719 EUR 2,551,681State Street Bank& Trust Company 15/6/2020 (71,332)
949,186
Total (Gross underlying exposure - USD 52,829,880) 986,968
Sector Breakdownas at 31 May 2020
% of NetAssets
Financial 18.09
Consumer, Cyclical 17.83
Industrial 11.75
Consumer, Non-cyclical 11.24
Communications 11.15
Energy 8.78
Basic Materials 7.39
Collective Investment Schemes 7.17
Technology 6.27
Utilities 0.86
Securities portfolio at market value 100.53
Other Net Liabilities (0.53)
100.00
BlackRock Emerging Markets Equity Strategies Fund continued
The notes on pages 691 to 711 form an integral part of these financial statements.
BlackRock Strategic Funds[266]

Portfolio of Investments as at 31 May 2020
Holding Description
MarketValue
USD
% ofNet
Assets
Transferable Securities and Money Market Instruments Admittedto an Official Stock Exchange Listing or Dealt in on AnotherRegulated Market
BONDSAngola
USD 10,797,000 Angolan GovernmentInternational Bond RegS9.50% 12/11/2025^ 7,353,769 0.46
USD 1,913,000 Angolan GovernmentInternational Bond RegS8.00% 26/11/2029 1,186,825 0.08
8,540,594 0.54
ArgentinaUSD 28,574,000 Argentine Republic
Government InternationalBond 6.875% 22/4/2021 11,786,775 0.75
USD 93,444,000 Argentine RepublicGovernment InternationalBond 5.625% 26/1/2022 37,844,820 2.39
USD 9,478,000 Argentine RepublicGovernment InternationalBond 7.50% 22/4/2026 3,654,954 0.23
USD 63,214,380 Argentine RepublicGovernment InternationalBond 8.28% 31/12/2033 28,476,103 1.80
USD 40,297,118 Argentine RepublicGovernment InternationalBond 8.28% 31/12/2033^ 17,585,914 1.11
USD 47,452,000 Argentine RepublicGovernment InternationalBond 7.625% 22/4/2046^ 18,150,390 1.15
USD 40,535,000 Argentine RepublicGovernment InternationalBond 6.875% 11/1/2048^ 14,459,595 0.91
EUR 37,212,000 Argentine RepublicGovernment InternationalBond RegS 6.25%9/11/2047^ 14,275,370 0.90
USD 7,938,000 Province of Salta ArgentinaRegS 9.125% 7/7/2024 2,986,672 0.19
ARS 103,197,000 Provincia de Buenos AiresFRN 31/5/2022 700,359 0.04
USD 4,865,000 Provincia de Buenos AiresRegS 6.50% 15/2/2023 1,763,562 0.11
USD 17,227,000 Provincia de Buenos AiresRegS 9.125% 16/3/2024^ 6,244,787 0.40
ARS 389,865,000 Provincia de Buenos AiresRegS FRN 12/4/2025 2,285,694 0.15
USD 6,243,000 Provincia de Buenos AiresRegS 9.625% 18/4/2028^ 2,386,972 0.15
USD 5,568,253 Tarjeta Naranja SA RegS FRN11/4/2022^ 483,909 0.03
USD 12,368,000 YPF SA FRN 7/7/2020 2,303,053 0.15
165,388,929 10.46
BeninEUR 6,620,000 Benin Government
International Bond RegS5.75% 26/3/2026 6,583,482 0.42
6,583,482 0.42
CanadaUSD 7,274,000 MEGlobal Canada ULC RegS
5.00% 18/5/2025 7,455,850 0.47USD 8,332,000 MEGlobal Canada ULC RegS
5.875% 18/5/2030 8,883,995 0.56
16,339,845 1.03
Holding Description
MarketValue
USD
% ofNet
Assets
ChileUSD 8,266,000 Empresa de Transporte de
Pasajeros Metro SA RegS3.65% 7/5/2030^ 8,862,640 0.56
USD 16,165,000 Empresa de Transporte dePasajeros Metro SA RegS4.70% 7/5/2050^ 18,468,512 1.17
27,331,152 1.73
ChinaCNY 60,780,000 China Government Bond
3.39% 16/3/2050 8,309,183 0.53
8,309,183 0.53
ColombiaUSD 1,642,000 Colombia Government
International Bond 4.50%15/3/2029 1,814,923 0.11
USD 6,558,000 Ecopetrol SA 6.875%29/4/2030 7,554,816 0.48
9,369,739 0.59
Costa RicaUSD 1,700,000 Costa Rica Government
International Bond RegS6.125% 19/2/2031 1,412,657 0.09
1,412,657 0.09
Dominican RepublicUSD 2,058,000 Dominican Republic
International Bond RegS6.00% 19/7/2028 2,000,119 0.13
2,000,119 0.13
EcuadorUSD 6,053,000 Ecuador Government
International Bond RegS7.95% 20/6/2024 2,599,763 0.17
USD 3,797,000 Ecuador GovernmentInternational Bond RegS8.875% 23/10/2027 1,402,992 0.09
USD 10,918,000 Ecuador GovernmentInternational Bond RegS10.65% 31/1/2029 4,001,447 0.25
USD 5,619,000 Ecuador GovernmentInternational Bond RegS9.50% 27/3/2030^ 2,084,649 0.13
10,088,851 0.64
EgyptEGP 227,723,000 Egypt Government Bond
14.95% 20/3/2021 14,629,785 0.92EGP 225,710,000 Egypt Government Bond
14.85% 10/4/2023 14,690,505 0.93EGP 202,538,000 Egypt Government Bond
16.10% 7/5/2029 13,945,604 0.88USD 2,210,000 Egypt Government
International Bond RegS5.875% 11/6/2025^ 2,222,086 0.14
USD 1,790,000 Egypt GovernmentInternational Bond RegS7.60% 1/3/2029 1,823,283 0.12
EUR 4,103,000 Egypt GovernmentInternational Bond RegS6.375% 11/4/2031^ 4,156,711 0.26
USD 31,295,000 Egypt GovernmentInternational Bond RegS7.625% 29/5/2032 30,832,773 1.95
BlackRock Emerging Markets Flexi Dynamic Bond Fund
The notes on pages 691 to 711 form an integral part of these financial statements.
Annual report and audited financial statements [267]

Portfolio of Investments as at 31 May 2020
Holding Description
MarketValue
USD
% ofNet
Assets
Egypt continuedUSD 19,171,000 Egypt Government
International Bond RegS7.903% 21/2/2048 17,847,003 1.13
USD 8,149,000 Egypt GovernmentInternational Bond RegS8.70% 1/3/2049 8,016,579 0.51
USD 30,985,000 Egypt GovernmentInternational Bond RegS8.875% 29/5/2050 30,692,346 1.94
138,856,675 8.78
GabonUSD 10,120,123 Gabon Government
International Bond RegS6.375% 12/12/2024 9,193,499 0.58
USD 15,801,000 Gabon GovernmentInternational Bond RegS6.95% 16/6/2025 14,062,890 0.89
USD 15,382,000 Gabon GovernmentInternational Bond RegS6.625% 6/2/2031 12,934,955 0.82
36,191,344 2.29
GhanaUSD 5,000,000 Ghana Government
International Bond RegS8.125% 18/1/2026 4,885,156 0.31
USD 7,543,000 Ghana GovernmentInternational Bond RegS7.625% 16/5/2029 6,767,486 0.43
USD 13,163,000 Ghana GovernmentInternational Bond RegS8.627% 16/6/2049 11,501,171 0.73
USD 9,488,000 Ghana GovernmentInternational Bond RegS8.95% 26/3/2051 8,313,860 0.53
USD 9,342,000 Ghana GovernmentInternational Bond RegS8.75% 11/3/2061^ 8,141,740 0.51
GHS 47,907,000 Republic of GhanaGovernment Bond 20.75%16/1/2023 8,464,550 0.53
48,073,963 3.04
GuatemalaUSD 5,118,000 Guatemala Government Bond
5.375% 24/4/2032 5,568,384 0.35USD 11,110,000 Guatemala Government Bond
6.125% 1/6/2050^ 12,574,354 0.80USD 9,202,000 Guatemala Government Bond
RegS 5.375% 24/4/2032^ 9,989,921 0.63USD 10,499,000 Guatemala Government Bond
RegS 6.125% 1/6/2050 11,906,522 0.75
40,039,181 2.53
IndonesiaUSD 4,196,000 Indonesia Government
International Bond 5.35%11/2/2049 5,299,417 0.34
USD 7,253,000 Indonesia GovernmentInternational Bond 4.45%15/4/2070 8,114,294 0.51
IDR120,548,000,000
Indonesia Treasury Bond7.00% 15/9/2030 8,074,406 0.51
IDR151,278,000,000
Indonesia Treasury Bond8.375% 15/3/2034 10,753,060 0.68
IDR 58,740,000,000 Jasa Marga Persero Tbk PTRegS 7.50% 11/12/2020 3,905,506 0.25
IDR123,920,000,000
Wijaya Karya Persero Tbk PTRegS 7.70% 31/1/2021 8,227,236 0.52
44,373,919 2.81
Holding Description
MarketValue
USD
% ofNet
Assets
IsraelUSD 4,573,000 Israel Government
International Bond 3.875%3/7/2050 5,258,950 0.33
USD 9,228,000 Israel GovernmentInternational Bond 4.50%3/4/2120 11,272,371 0.71
USD 11,455,000 State of Israel RegS 3.80%13/5/2060 12,891,343 0.82
29,422,664 1.86
Ivory CoastUSD 1,862,000 Ivory Coast Government
International Bond RegS6.375% 3/3/2028 1,835,816 0.12
USD 15,390,000 Ivory Coast GovernmentInternational Bond RegS5.75% 31/12/2032 14,589,239 0.92
USD 17,705,000 Ivory Coast GovernmentInternational Bond RegS6.125% 15/6/2033 16,750,590 1.06
33,175,645 2.10
KazakhstanKZT 3,805,750,000 Development Bank of
Kazakhstan JSC RegS9.50% 14/12/2020 8,941,456 0.57
KZT 7,045,000,000 Development Bank ofKazakhstan JSC RegS8.95% 4/5/2023 15,066,995 0.95
USD 12,644,000 KazMunayGas National CoJSC RegS 5.75% 19/4/2047 14,277,842 0.90
USD 12,043,000 KazMunayGas National CoJSC RegS 6.375%24/10/2048^ 14,575,793 0.92
52,862,086 3.34
KenyaUSD 21,912,000 Kenya Government
International Bond RegS8.25% 28/2/2048^ 20,628,094 1.30
20,628,094 1.30
LebanonUSD 17,084,000 Lebanon Government
International Bond 6.375%9/3/2021^ 3,382,099 0.21
USD 11,282,000 Lebanon GovernmentInternational Bond RegS5.80% 14/4/2021 2,205,217 0.14
5,587,316 0.35
MacedoniaEUR 2,860,000 North Macedonia Government
International Bond RegS3.675% 3/6/2026 3,231,982 0.20
3,231,982 0.20
MalaysiaUSD 8,765,000 Petronas Capital Ltd RegS
3.50% 21/4/2030 9,630,931 0.61USD 7,625,000 Petronas Capital Ltd RegS
4.55% 21/4/2050 9,336,758 0.59USD 10,790,000 Petronas Capital Ltd RegS
4.80% 21/4/2060^ 14,143,316 0.89
33,111,005 2.09
MexicoUSD 19,427,000 Mexico Government
International Bond 4.75%27/4/2032 21,088,008 1.33
BlackRock Emerging Markets Flexi Dynamic Bond Fundcontinued
The notes on pages 691 to 711 form an integral part of these financial statements.
BlackRock Strategic Funds[268]
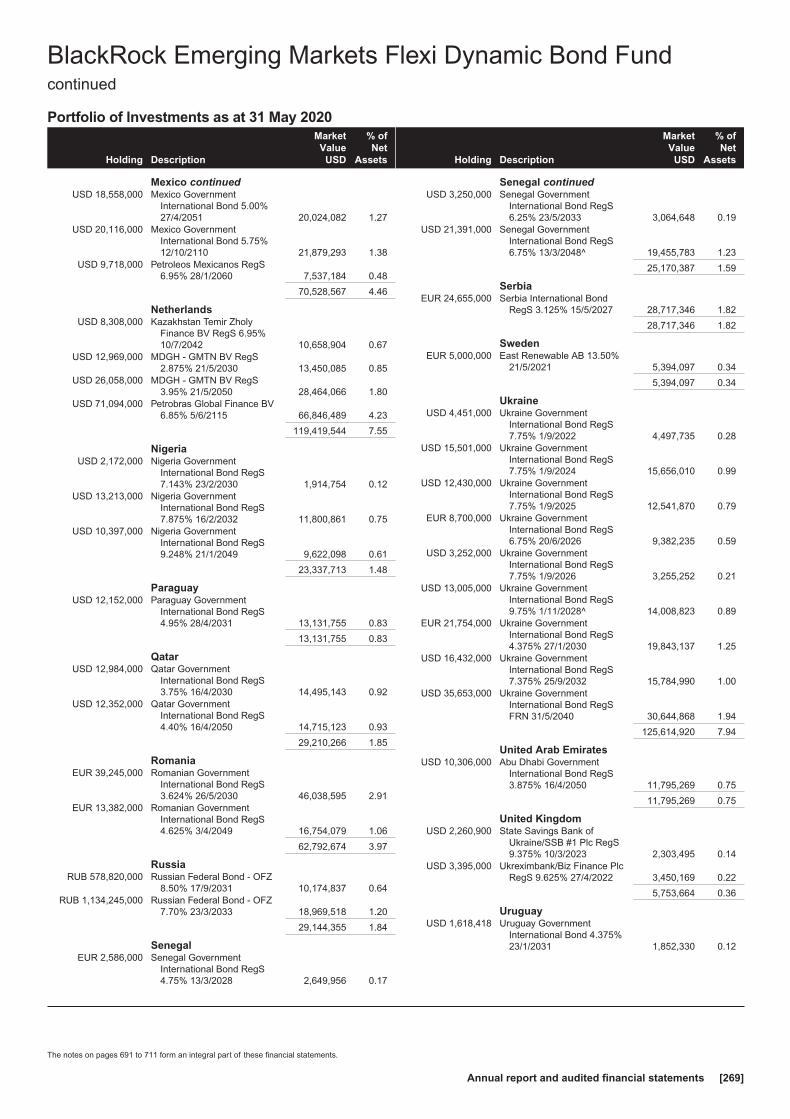
Portfolio of Investments as at 31 May 2020
Holding Description
MarketValue
USD
% ofNet
Assets
Mexico continuedUSD 18,558,000 Mexico Government
International Bond 5.00%27/4/2051 20,024,082 1.27
USD 20,116,000 Mexico GovernmentInternational Bond 5.75%12/10/2110 21,879,293 1.38
USD 9,718,000 Petroleos Mexicanos RegS6.95% 28/1/2060 7,537,184 0.48
70,528,567 4.46
NetherlandsUSD 8,308,000 Kazakhstan Temir Zholy
Finance BV RegS 6.95%10/7/2042 10,658,904 0.67
USD 12,969,000 MDGH - GMTN BV RegS2.875% 21/5/2030 13,450,085 0.85
USD 26,058,000 MDGH - GMTN BV RegS3.95% 21/5/2050 28,464,066 1.80
USD 71,094,000 Petrobras Global Finance BV6.85% 5/6/2115 66,846,489 4.23
119,419,544 7.55
NigeriaUSD 2,172,000 Nigeria Government
International Bond RegS7.143% 23/2/2030 1,914,754 0.12
USD 13,213,000 Nigeria GovernmentInternational Bond RegS7.875% 16/2/2032 11,800,861 0.75
USD 10,397,000 Nigeria GovernmentInternational Bond RegS9.248% 21/1/2049 9,622,098 0.61
23,337,713 1.48
ParaguayUSD 12,152,000 Paraguay Government
International Bond RegS4.95% 28/4/2031 13,131,755 0.83
13,131,755 0.83
QatarUSD 12,984,000 Qatar Government
International Bond RegS3.75% 16/4/2030 14,495,143 0.92
USD 12,352,000 Qatar GovernmentInternational Bond RegS4.40% 16/4/2050 14,715,123 0.93
29,210,266 1.85
RomaniaEUR 39,245,000 Romanian Government
International Bond RegS3.624% 26/5/2030 46,038,595 2.91
EUR 13,382,000 Romanian GovernmentInternational Bond RegS4.625% 3/4/2049 16,754,079 1.06
62,792,674 3.97
RussiaRUB 578,820,000 Russian Federal Bond - OFZ
8.50% 17/9/2031 10,174,837 0.64RUB 1,134,245,000 Russian Federal Bond - OFZ
7.70% 23/3/2033 18,969,518 1.20
29,144,355 1.84
SenegalEUR 2,586,000 Senegal Government
International Bond RegS4.75% 13/3/2028 2,649,956 0.17
Holding Description
MarketValue
USD
% ofNet
Assets
Senegal continuedUSD 3,250,000 Senegal Government
International Bond RegS6.25% 23/5/2033 3,064,648 0.19
USD 21,391,000 Senegal GovernmentInternational Bond RegS6.75% 13/3/2048^ 19,455,783 1.23
25,170,387 1.59
SerbiaEUR 24,655,000 Serbia International Bond
RegS 3.125% 15/5/2027 28,717,346 1.82
28,717,346 1.82
SwedenEUR 5,000,000 East Renewable AB 13.50%
21/5/2021 5,394,097 0.34
5,394,097 0.34
UkraineUSD 4,451,000 Ukraine Government
International Bond RegS7.75% 1/9/2022 4,497,735 0.28
USD 15,501,000 Ukraine GovernmentInternational Bond RegS7.75% 1/9/2024 15,656,010 0.99
USD 12,430,000 Ukraine GovernmentInternational Bond RegS7.75% 1/9/2025 12,541,870 0.79
EUR 8,700,000 Ukraine GovernmentInternational Bond RegS6.75% 20/6/2026 9,382,235 0.59
USD 3,252,000 Ukraine GovernmentInternational Bond RegS7.75% 1/9/2026 3,255,252 0.21
USD 13,005,000 Ukraine GovernmentInternational Bond RegS9.75% 1/11/2028^ 14,008,823 0.89
EUR 21,754,000 Ukraine GovernmentInternational Bond RegS4.375% 27/1/2030 19,843,137 1.25
USD 16,432,000 Ukraine GovernmentInternational Bond RegS7.375% 25/9/2032 15,784,990 1.00
USD 35,653,000 Ukraine GovernmentInternational Bond RegSFRN 31/5/2040 30,644,868 1.94
125,614,920 7.94
United Arab EmiratesUSD 10,306,000 Abu Dhabi Government
International Bond RegS3.875% 16/4/2050 11,795,269 0.75
11,795,269 0.75
United KingdomUSD 2,260,900 State Savings Bank of
Ukraine/SSB #1 Plc RegS9.375% 10/3/2023 2,303,495 0.14
USD 3,395,000 Ukreximbank/Biz Finance PlcRegS 9.625% 27/4/2022 3,450,169 0.22
5,753,664 0.36
UruguayUSD 1,618,418 Uruguay Government
International Bond 4.375%23/1/2031 1,852,330 0.12
BlackRock Emerging Markets Flexi Dynamic Bond Fundcontinued
The notes on pages 691 to 711 form an integral part of these financial statements.
Annual report and audited financial statements [269]
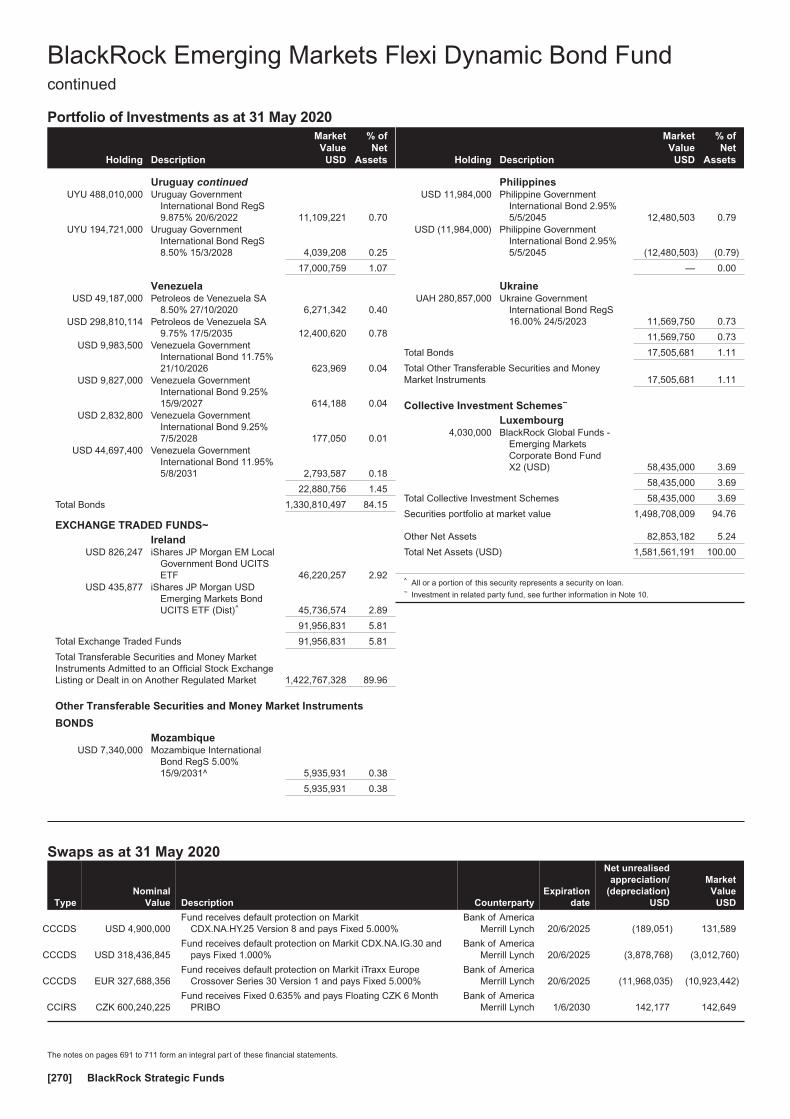
Portfolio of Investments as at 31 May 2020
Holding Description
MarketValue
USD
% ofNet
Assets
Uruguay continuedUYU 488,010,000 Uruguay Government
International Bond RegS9.875% 20/6/2022 11,109,221 0.70
UYU 194,721,000 Uruguay GovernmentInternational Bond RegS8.50% 15/3/2028 4,039,208 0.25
17,000,759 1.07
VenezuelaUSD 49,187,000 Petroleos de Venezuela SA
8.50% 27/10/2020 6,271,342 0.40USD 298,810,114 Petroleos de Venezuela SA
9.75% 17/5/2035 12,400,620 0.78USD 9,983,500 Venezuela Government
International Bond 11.75%21/10/2026 623,969 0.04
USD 9,827,000 Venezuela GovernmentInternational Bond 9.25%15/9/2027 614,188 0.04
USD 2,832,800 Venezuela GovernmentInternational Bond 9.25%7/5/2028 177,050 0.01
USD 44,697,400 Venezuela GovernmentInternational Bond 11.95%5/8/2031 2,793,587 0.18
22,880,756 1.45
Total Bonds 1,330,810,497 84.15
EXCHANGE TRADED FUNDS~Ireland
USD 826,247 iShares JP Morgan EM LocalGovernment Bond UCITSETF 46,220,257 2.92
USD 435,877 iShares JP Morgan USDEmerging Markets BondUCITS ETF (Dist)^ 45,736,574 2.89
91,956,831 5.81
Total Exchange Traded Funds 91,956,831 5.81
Total Transferable Securities and Money MarketInstruments Admitted to an Official Stock ExchangeListing or Dealt in on Another Regulated Market 1,422,767,328 89.96
Other Transferable Securities and Money Market Instruments
BONDSMozambique
USD 7,340,000 Mozambique InternationalBond RegS 5.00%15/9/2031^ 5,935,931 0.38
5,935,931 0.38
Holding Description
MarketValue
USD
% ofNet
Assets
PhilippinesUSD 11,984,000 Philippine Government
International Bond 2.95%5/5/2045 12,480,503 0.79
USD (11,984,000) Philippine GovernmentInternational Bond 2.95%5/5/2045 (12,480,503) (0.79)
— 0.00
UkraineUAH 280,857,000 Ukraine Government
International Bond RegS16.00% 24/5/2023 11,569,750 0.73
11,569,750 0.73
Total Bonds 17,505,681 1.11
Total Other Transferable Securities and MoneyMarket Instruments 17,505,681 1.11
Collective Investment Schemes~
Luxembourg4,030,000 BlackRock Global Funds -
Emerging MarketsCorporate Bond FundX2 (USD) 58,435,000 3.69
58,435,000 3.69
Total Collective Investment Schemes 58,435,000 3.69
Securities portfolio at market value 1,498,708,009 94.76
Other Net Assets 82,853,182 5.24
Total Net Assets (USD) 1,581,561,191 100.00
^ All or a portion of this security represents a security on loan.~ Investment in related party fund, see further information in Note 10.
Swaps as at 31 May 2020
TypeNominal
Value Description CounterpartyExpiration
date
Net unrealisedappreciation/
(depreciation)USD
MarketValue
USD
CCCDS USD 4,900,000Fund receives default protection on Markit
CDX.NA.HY.25 Version 8 and pays Fixed 5.000%Bank of America
Merrill Lynch 20/6/2025 (189,051) 131,589
CCCDS USD 318,436,845Fund receives default protection on Markit CDX.NA.IG.30 and
pays Fixed 1.000%Bank of America
Merrill Lynch 20/6/2025 (3,878,768) (3,012,760)
CCCDS EUR 327,688,356Fund receives default protection on Markit iTraxx Europe
Crossover Series 30 Version 1 and pays Fixed 5.000%Bank of America
Merrill Lynch 20/6/2025 (11,968,035) (10,923,442)
CCIRS CZK 600,240,225Fund receives Fixed 0.635% and pays Floating CZK 6 Month
PRIBOBank of America
Merrill Lynch 1/6/2030 142,177 142,649
BlackRock Emerging Markets Flexi Dynamic Bond Fundcontinued
The notes on pages 691 to 711 form an integral part of these financial statements.
BlackRock Strategic Funds[270]
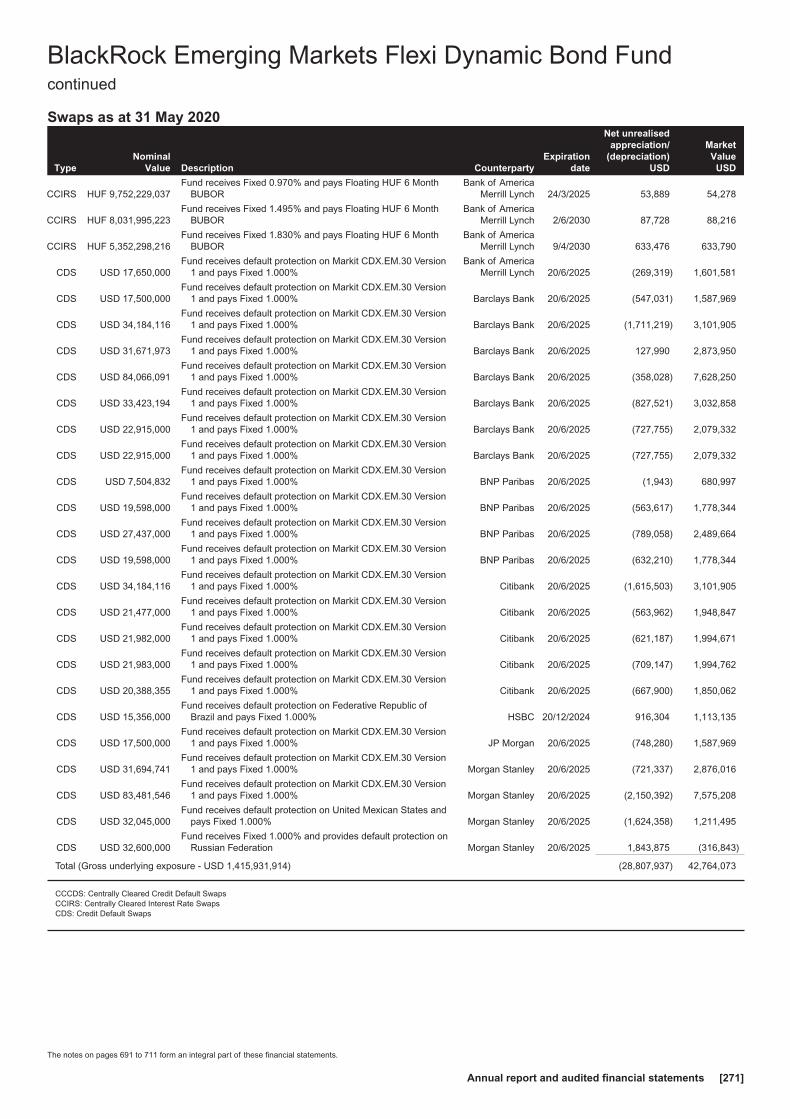
Swaps as at 31 May 2020
TypeNominal
Value Description CounterpartyExpiration
date
Net unrealisedappreciation/
(depreciation)USD
MarketValue
USD
CCIRS HUF 9,752,229,037Fund receives Fixed 0.970% and pays Floating HUF 6 Month
BUBORBank of America
Merrill Lynch 24/3/2025 53,889 54,278
CCIRS HUF 8,031,995,223Fund receives Fixed 1.495% and pays Floating HUF 6 Month
BUBORBank of America
Merrill Lynch 2/6/2030 87,728 88,216
CCIRS HUF 5,352,298,216Fund receives Fixed 1.830% and pays Floating HUF 6 Month
BUBORBank of America
Merrill Lynch 9/4/2030 633,476 633,790
CDS USD 17,650,000Fund receives default protection on Markit CDX.EM.30 Version
1 and pays Fixed 1.000%Bank of America
Merrill Lynch 20/6/2025 (269,319) 1,601,581
CDS USD 17,500,000Fund receives default protection on Markit CDX.EM.30 Version
1 and pays Fixed 1.000% Barclays Bank 20/6/2025 (547,031) 1,587,969
CDS USD 34,184,116Fund receives default protection on Markit CDX.EM.30 Version
1 and pays Fixed 1.000% Barclays Bank 20/6/2025 (1,711,219) 3,101,905
CDS USD 31,671,973Fund receives default protection on Markit CDX.EM.30 Version
1 and pays Fixed 1.000% Barclays Bank 20/6/2025 127,990 2,873,950
CDS USD 84,066,091Fund receives default protection on Markit CDX.EM.30 Version
1 and pays Fixed 1.000% Barclays Bank 20/6/2025 (358,028) 7,628,250
CDS USD 33,423,194Fund receives default protection on Markit CDX.EM.30 Version
1 and pays Fixed 1.000% Barclays Bank 20/6/2025 (827,521) 3,032,858
CDS USD 22,915,000Fund receives default protection on Markit CDX.EM.30 Version
1 and pays Fixed 1.000% Barclays Bank 20/6/2025 (727,755) 2,079,332
CDS USD 22,915,000Fund receives default protection on Markit CDX.EM.30 Version
1 and pays Fixed 1.000% Barclays Bank 20/6/2025 (727,755) 2,079,332
CDS USD 7,504,832Fund receives default protection on Markit CDX.EM.30 Version
1 and pays Fixed 1.000% BNP Paribas 20/6/2025 (1,943) 680,997
CDS USD 19,598,000Fund receives default protection on Markit CDX.EM.30 Version
1 and pays Fixed 1.000% BNP Paribas 20/6/2025 (563,617) 1,778,344
CDS USD 27,437,000Fund receives default protection on Markit CDX.EM.30 Version
1 and pays Fixed 1.000% BNP Paribas 20/6/2025 (789,058) 2,489,664
CDS USD 19,598,000Fund receives default protection on Markit CDX.EM.30 Version
1 and pays Fixed 1.000% BNP Paribas 20/6/2025 (632,210) 1,778,344
CDS USD 34,184,116Fund receives default protection on Markit CDX.EM.30 Version
1 and pays Fixed 1.000% Citibank 20/6/2025 (1,615,503) 3,101,905
CDS USD 21,477,000Fund receives default protection on Markit CDX.EM.30 Version
1 and pays Fixed 1.000% Citibank 20/6/2025 (563,962) 1,948,847
CDS USD 21,982,000Fund receives default protection on Markit CDX.EM.30 Version
1 and pays Fixed 1.000% Citibank 20/6/2025 (621,187) 1,994,671
CDS USD 21,983,000Fund receives default protection on Markit CDX.EM.30 Version
1 and pays Fixed 1.000% Citibank 20/6/2025 (709,147) 1,994,762
CDS USD 20,388,355Fund receives default protection on Markit CDX.EM.30 Version
1 and pays Fixed 1.000% Citibank 20/6/2025 (667,900) 1,850,062
CDS USD 15,356,000Fund receives default protection on Federative Republic of
Brazil and pays Fixed 1.000% HSBC 20/12/2024 916,304 1,113,135
CDS USD 17,500,000Fund receives default protection on Markit CDX.EM.30 Version
1 and pays Fixed 1.000% JP Morgan 20/6/2025 (748,280) 1,587,969
CDS USD 31,694,741Fund receives default protection on Markit CDX.EM.30 Version
1 and pays Fixed 1.000% Morgan Stanley 20/6/2025 (721,337) 2,876,016
CDS USD 83,481,546Fund receives default protection on Markit CDX.EM.30 Version
1 and pays Fixed 1.000% Morgan Stanley 20/6/2025 (2,150,392) 7,575,208
CDS USD 32,045,000Fund receives default protection on United Mexican States and
pays Fixed 1.000% Morgan Stanley 20/6/2025 (1,624,358) 1,211,495
CDS USD 32,600,000Fund receives Fixed 1.000% and provides default protection on
Russian Federation Morgan Stanley 20/6/2025 1,843,875 (316,843)
Total (Gross underlying exposure - USD 1,415,931,914) (28,807,937) 42,764,073
CCCDS: Centrally Cleared Credit Default SwapsCCIRS: Centrally Cleared Interest Rate SwapsCDS: Credit Default Swaps
BlackRock Emerging Markets Flexi Dynamic Bond Fundcontinued
The notes on pages 691 to 711 form an integral part of these financial statements.
Annual report and audited financial statements [271]
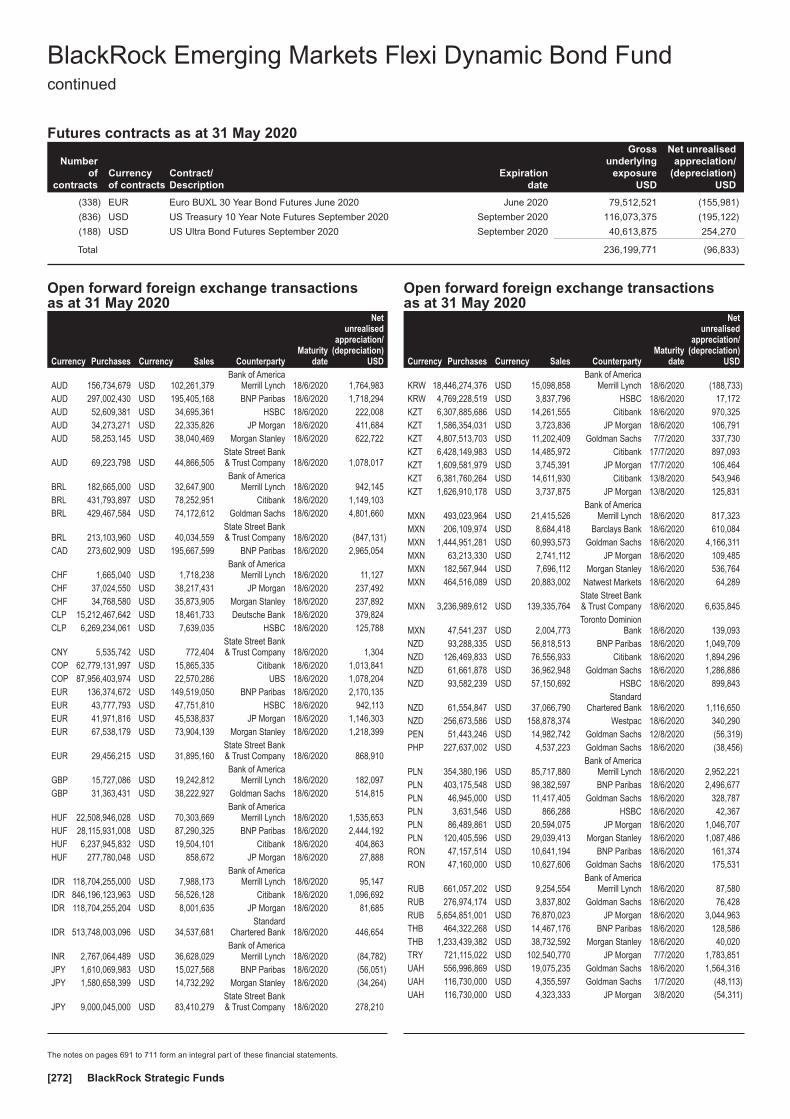
Futures contracts as at 31 May 2020
Numberof
contractsCurrencyof contracts
Contract/Description
Expirationdate
Grossunderlying
exposureUSD
Net unrealisedappreciation/
(depreciation)USD
(338) EUR Euro BUXL 30 Year Bond Futures June 2020 June 2020 79,512,521 (155,981)
(836) USD US Treasury 10 Year Note Futures September 2020 September 2020 116,073,375 (195,122)
(188) USD US Ultra Bond Futures September 2020 September 2020 40,613,875 254,270
Total 236,199,771 (96,833)
Open forward foreign exchange transactionsas at 31 May 2020
Currency Purchases Currency Sales CounterpartyMaturity
date
Netunrealised
appreciation/(depreciation)
USD
AUD 156,734,679 USD 102,261,379Bank of America
Merrill Lynch 18/6/2020 1,764,983AUD 297,002,430 USD 195,405,168 BNP Paribas 18/6/2020 1,718,294AUD 52,609,381 USD 34,695,361 HSBC 18/6/2020 222,008AUD 34,273,271 USD 22,335,826 JP Morgan 18/6/2020 411,684AUD 58,253,145 USD 38,040,469 Morgan Stanley 18/6/2020 622,722
AUD 69,223,798 USD 44,866,505State Street Bank& Trust Company 18/6/2020 1,078,017
BRL 182,665,000 USD 32,647,900Bank of America
Merrill Lynch 18/6/2020 942,145BRL 431,793,897 USD 78,252,951 Citibank 18/6/2020 1,149,103BRL 429,467,584 USD 74,172,612 Goldman Sachs 18/6/2020 4,801,660
BRL 213,103,960 USD 40,034,559State Street Bank& Trust Company 18/6/2020 (847,131)
CAD 273,602,909 USD 195,667,599 BNP Paribas 18/6/2020 2,965,054
CHF 1,665,040 USD 1,718,238Bank of America
Merrill Lynch 18/6/2020 11,127CHF 37,024,550 USD 38,217,431 JP Morgan 18/6/2020 237,492CHF 34,768,580 USD 35,873,905 Morgan Stanley 18/6/2020 237,892CLP 15,212,467,642 USD 18,461,733 Deutsche Bank 18/6/2020 379,824CLP 6,269,234,061 USD 7,639,035 HSBC 18/6/2020 125,788
CNY 5,535,742 USD 772,404State Street Bank& Trust Company 18/6/2020 1,304
COP 62,779,131,997 USD 15,865,335 Citibank 18/6/2020 1,013,841COP 87,956,403,974 USD 22,570,286 UBS 18/6/2020 1,078,204EUR 136,374,672 USD 149,519,050 BNP Paribas 18/6/2020 2,170,135EUR 43,777,793 USD 47,751,810 HSBC 18/6/2020 942,113EUR 41,971,816 USD 45,538,837 JP Morgan 18/6/2020 1,146,303EUR 67,538,179 USD 73,904,139 Morgan Stanley 18/6/2020 1,218,399
EUR 29,456,215 USD 31,895,160State Street Bank& Trust Company 18/6/2020 868,910
GBP 15,727,086 USD 19,242,812Bank of America
Merrill Lynch 18/6/2020 182,097GBP 31,363,431 USD 38,222,927 Goldman Sachs 18/6/2020 514,815
HUF 22,508,946,028 USD 70,303,669Bank of America
Merrill Lynch 18/6/2020 1,535,653HUF 28,115,931,008 USD 87,290,325 BNP Paribas 18/6/2020 2,444,192HUF 6,237,945,832 USD 19,504,101 Citibank 18/6/2020 404,863HUF 277,780,048 USD 858,672 JP Morgan 18/6/2020 27,888
IDR 118,704,255,000 USD 7,988,173Bank of America
Merrill Lynch 18/6/2020 95,147IDR 846,196,123,963 USD 56,526,128 Citibank 18/6/2020 1,096,692IDR 118,704,255,204 USD 8,001,635 JP Morgan 18/6/2020 81,685
IDR 513,748,003,096 USD 34,537,681Standard
Chartered Bank 18/6/2020 446,654
INR 2,767,064,489 USD 36,628,029Bank of America
Merrill Lynch 18/6/2020 (84,782)JPY 1,610,069,983 USD 15,027,568 BNP Paribas 18/6/2020 (56,051)JPY 1,580,658,399 USD 14,732,292 Morgan Stanley 18/6/2020 (34,264)
JPY 9,000,045,000 USD 83,410,279State Street Bank& Trust Company 18/6/2020 278,210
Open forward foreign exchange transactionsas at 31 May 2020
Currency Purchases Currency Sales CounterpartyMaturity
date
Netunrealised
appreciation/(depreciation)
USD
KRW 18,446,274,376 USD 15,098,858Bank of America
Merrill Lynch 18/6/2020 (188,733)KRW 4,769,228,519 USD 3,837,796 HSBC 18/6/2020 17,172KZT 6,307,885,686 USD 14,261,555 Citibank 18/6/2020 970,325KZT 1,586,354,031 USD 3,723,836 JP Morgan 18/6/2020 106,791KZT 4,807,513,703 USD 11,202,409 Goldman Sachs 7/7/2020 337,730KZT 6,428,149,983 USD 14,485,972 Citibank 17/7/2020 897,093KZT 1,609,581,979 USD 3,745,391 JP Morgan 17/7/2020 106,464KZT 6,381,760,264 USD 14,611,930 Citibank 13/8/2020 543,946KZT 1,626,910,178 USD 3,737,875 JP Morgan 13/8/2020 125,831
MXN 493,023,964 USD 21,415,526Bank of America
Merrill Lynch 18/6/2020 817,323MXN 206,109,974 USD 8,684,418 Barclays Bank 18/6/2020 610,084MXN 1,444,951,281 USD 60,993,573 Goldman Sachs 18/6/2020 4,166,311MXN 63,213,330 USD 2,741,112 JP Morgan 18/6/2020 109,485MXN 182,567,944 USD 7,696,112 Morgan Stanley 18/6/2020 536,764MXN 464,516,089 USD 20,883,002 Natwest Markets 18/6/2020 64,289
MXN 3,236,989,612 USD 139,335,764State Street Bank& Trust Company 18/6/2020 6,635,845
MXN 47,541,237 USD 2,004,773Toronto Dominion
Bank 18/6/2020 139,093NZD 93,288,335 USD 56,818,513 BNP Paribas 18/6/2020 1,049,709NZD 126,469,833 USD 76,556,933 Citibank 18/6/2020 1,894,296NZD 61,661,878 USD 36,962,948 Goldman Sachs 18/6/2020 1,286,886NZD 93,582,239 USD 57,150,692 HSBC 18/6/2020 899,843
NZD 61,554,847 USD 37,066,790Standard
Chartered Bank 18/6/2020 1,116,650NZD 256,673,586 USD 158,878,374 Westpac 18/6/2020 340,290PEN 51,443,246 USD 14,982,742 Goldman Sachs 12/8/2020 (56,319)PHP 227,637,002 USD 4,537,223 Goldman Sachs 18/6/2020 (38,456)
PLN 354,380,196 USD 85,717,880Bank of America
Merrill Lynch 18/6/2020 2,952,221PLN 403,175,548 USD 98,382,597 BNP Paribas 18/6/2020 2,496,677PLN 46,945,000 USD 11,417,405 Goldman Sachs 18/6/2020 328,787PLN 3,631,546 USD 866,288 HSBC 18/6/2020 42,367PLN 86,489,861 USD 20,594,075 JP Morgan 18/6/2020 1,046,707PLN 120,405,596 USD 29,039,413 Morgan Stanley 18/6/2020 1,087,486RON 47,157,514 USD 10,641,194 BNP Paribas 18/6/2020 161,374RON 47,160,000 USD 10,627,606 Goldman Sachs 18/6/2020 175,531
RUB 661,057,202 USD 9,254,554Bank of America
Merrill Lynch 18/6/2020 87,580RUB 276,974,174 USD 3,837,802 Goldman Sachs 18/6/2020 76,428RUB 5,654,851,001 USD 76,870,023 JP Morgan 18/6/2020 3,044,963THB 464,322,268 USD 14,467,176 BNP Paribas 18/6/2020 128,586THB 1,233,439,382 USD 38,732,592 Morgan Stanley 18/6/2020 40,020TRY 721,115,022 USD 102,540,770 JP Morgan 7/7/2020 1,783,851UAH 556,996,869 USD 19,075,235 Goldman Sachs 18/6/2020 1,564,316UAH 116,730,000 USD 4,355,597 Goldman Sachs 1/7/2020 (48,113)UAH 116,730,000 USD 4,323,333 JP Morgan 3/8/2020 (54,311)
BlackRock Emerging Markets Flexi Dynamic Bond Fundcontinued
The notes on pages 691 to 711 form an integral part of these financial statements.
BlackRock Strategic Funds[272]

Open forward foreign exchange transactionsas at 31 May 2020
Currency Purchases Currency Sales CounterpartyMaturity
date
Netunrealised
appreciation/(depreciation)
USDUAH 155,640,000 USD 5,862,147 Goldman Sachs 1/9/2020 (218,897)
USD 116,384,024 AUD 177,443,914Bank of America
Merrill Lynch 18/6/2020 (1,387,263)USD 193,622,394 AUD 294,287,674 BNP Paribas 18/6/2020 (1,699,257)USD 38,594,075 AUD 58,571,538 Goldman Sachs 18/6/2020 (280,436)USD 90,808,280 AUD 139,969,866 HSBC 18/6/2020 (2,091,109)USD 75,309,840 AUD 115,486,458 JP Morgan 18/6/2020 (1,339,670)
USD 39,780,468 BRL 215,073,099Bank of America
Merrill Lynch 18/6/2020 230,937USD 46,000,043 BRL 263,192,106 BNP Paribas 18/6/2020 (2,398,034)USD 11,042,077 BRL 65,547,681 Citibank 18/6/2020 (1,011,406)USD 73,244,574 BRL 418,476,245 Goldman Sachs 18/6/2020 (3,708,513)USD 40,108,571 BRL 215,262,699 JP Morgan 18/6/2020 524,175USD 15,610,545 BRL 91,794,686 Morgan Stanley 18/6/2020 (1,269,469)USD 116,781,153 CAD 163,261,220 BNP Paribas 18/6/2020 (1,744,668)USD 79,541,779 CAD 110,430,000 UBS 18/6/2020 (629,167)
USD 75,816,808 CHF 73,469,444Bank of America
Merrill Lynch 18/6/2020 (490,987)USD 33,982,235 CLP 27,682,443,143 JP Morgan 18/6/2020 (304,137)USD 30,769,250 CLP 25,076,938,488 Morgan Stanley 18/6/2020 (290,047)USD 14,217,140 CNH 101,196,807 Goldman Sachs 18/6/2020 111,851USD 38,632,611 COP150,736,723,467 BNP Paribas 18/6/2020 (1,895,375)USD 8,755,674 COP 32,675,123,705 Citibank 18/6/2020 (29,557)USD 15,903,957 COP 60,924,926,550 Deutsche Bank 18/6/2020 (476,686)USD 11,696,397 COP 43,721,130,381 UBS 18/6/2020 (58,731)USD 80,885 CZK 2,048,365 Barclays Bank 18/6/2020 (3,665)
USD 26,862,294 EUR 24,515,470Bank of America
Merrill Lynch 18/6/2020 (406,199)USD 7,690,194 EUR 7,030,977 Barclays Bank 18/6/2020 (130,343)USD 98,223,510 EUR 89,798,383 BNP Paribas 18/6/2020 (1,658,993)USD 41,254,809 EUR 37,956,939 Citibank 18/6/2020 (964,594)USD 4,539,761 EUR 4,131,025 Deutsche Bank 18/6/2020 (55,167)USD 195,762,091 EUR 180,378,910 JP Morgan 18/6/2020 (4,872,892)USD 13,291,784 EUR 12,130,747 Morgan Stanley 18/6/2020 (201,214)
USD 124,840,158 EUR 113,933,139State Street Bank& Trust Company 18/6/2020 (1,887,371)
USD 17,236,228 EUR 15,930,559 UBS 18/6/2020 (483,291)USD 15,410,445 GBP 12,571,232 Barclays Bank 18/6/2020 (116,592)USD 7,493,012 GBP 6,080,756 BNP Paribas 18/6/2020 (17,479)USD 5,992,459 GBP 4,897,873 Deutsche Bank 18/6/2020 (57,024)USD 31,002,534 GBP 25,205,857 Goldman Sachs 18/6/2020 (129,838)USD 84,905,345 GBP 68,932,687 Morgan Stanley 18/6/2020 (235,105)
USD 70,443,257 GBP 57,268,662State Street Bank& Trust Company 18/6/2020 (290,671)
USD 38,332,162 HUF 12,158,195,224Bank of America
Merrill Lynch 18/6/2020 (471,809)USD 99,047,364 HUF 31,843,450,888 BNP Paribas 18/6/2020 (2,583,867)USD 37,144,186 HUF 12,044,336,600 Citibank 18/6/2020 (1,296,395)USD 38,996,368 HUF 12,412,154,049 Goldman Sachs 18/6/2020 (618,135)USD 38,348,709 HUF 12,405,794,297 JP Morgan 18/6/2020 (1,245,497)
USD 105,247 HUF 34,049,289State Street Bank& Trust Company 18/6/2020 (3,425)
USD 247,843 HUF 78,616,686 UBS 18/6/2020 (3,069)USD 28,201,631 IDR 422,178,412,293 Citibank 18/6/2020 (547,155)USD 23,653,259 IDR 353,645,685,093 HSBC 18/6/2020 (428,702)USD 16,131,701 IDR 239,878,399,861 JP Morgan 18/6/2020 (203,129)
USD 9,341,697 IDR 138,500,000,000State Street Bank& Trust Company 18/6/2020 (89,640)
USD 30,855,159 IDR 458,661,941,590 UBS 18/6/2020 (378,019)USD 36,439,909 INR 2,767,064,489 JP Morgan 18/6/2020 (103,339)USD 3,809,251 JPY 410,154,647 BNP Paribas 18/6/2020 (4,643)
Open forward foreign exchange transactionsas at 31 May 2020
Currency Purchases Currency Sales CounterpartyMaturity
date
Netunrealised
appreciation/(depreciation)
USDUSD 172,008,004 JPY 18,479,849,071 Morgan Stanley 18/6/2020 169,901
USD 15,305,443 KRW 18,698,659,771Bank of America
Merrill Lynch 18/6/2020 191,315USD 7,515,855 KRW 9,226,603,660 BNP Paribas 18/6/2020 57,991USD 54,502,744 KRW 67,321,789,493 JP Morgan 18/6/2020 86,538USD 19,226,816 KRW 23,828,562,441 Societe Generale 18/6/2020 (33,812)
USD 50,632,464 MXN 1,153,706,581Bank of America
Merrill Lynch 18/6/2020 (1,393,778)USD 77,807,379 MXN 1,803,479,511 Citibank 18/6/2020 (3,520,285)USD 67,115,687 MXN 1,521,616,535 Goldman Sachs 18/6/2020 (1,501,404)USD 32,190,041 MXN 740,508,542 JP Morgan 18/6/2020 (1,203,092)
USD 22,832,979 MXN 509,484,143Standard
Chartered Bank 18/6/2020 (142,139)
USD 53,099,927 MXN 1,254,309,664State Street Bank& Trust Company 18/6/2020 (3,462,997)
USD 7,685,877 MYR 33,641,084 Barclays Bank 18/6/2020 (53,120)USD 7,452,921 MYR 32,327,046 Morgan Stanley 18/6/2020 16,213
USD 75,984,110 NZD 125,530,623Bank of America
Merrill Lynch 18/6/2020 (1,884,511)USD 75,318,776 NZD 123,219,550 BNP Paribas 18/6/2020 (1,116,251)USD 21,946,357 NZD 36,743,834 Citibank 18/6/2020 (846,421)USD 167,330,375 NZD 275,488,954 HSBC 18/6/2020 (3,559,759)USD 80,436,444 NZD 129,719,906 Morgan Stanley 18/6/2020 (30,854)
USD 22,240,725 NZD 35,859,645Standard
Chartered Bank 18/6/2020 (3,577)USD 57,968,558 NZD 93,445,676 Westpac 18/6/2020 2,734USD 999,425 PEN 3,426,320 Barclays Bank 18/6/2020 3,370USD 21,019,535 PEN 72,395,978 Citibank 12/8/2020 13,609USD 861,054 PHP 43,199,945 Goldman Sachs 18/6/2020 7,298
USD 41,074,132 PLN 165,808,468Bank of America
Merrill Lynch 18/6/2020 (413,100)USD 140,614,859 PLN 589,468,035 HSBC 18/6/2020 (6,876,989)USD 23,742,593 PLN 96,118,589 JP Morgan 18/6/2020 (307,410)USD 38,307,540 PLN 160,364,940 Morgan Stanley 18/6/2020 (1,817,657)
USD 38,957,285 PLN 157,593,903State Street Bank& Trust Company 18/6/2020 (474,567)
USD 489,562 PLN 2,026,282 UBS 18/6/2020 (17,438)USD 21,054,549 RON 94,040,587 BNP Paribas 18/6/2020 (487,719)USD 20,620,626 RUB 1,473,465,392 Barclays Bank 18/6/2020 (202,551)USD 18,095,606 RUB 1,336,541,479 Goldman Sachs 18/6/2020 (792,547)USD 45,741,285 RUB 3,264,558,928 JP Morgan 18/6/2020 (393,827)USD 7,360,500 THB 236,234,374 BNP Paribas 18/6/2020 (65,421)USD 3,865,331 THB 123,362,039 Goldman Sachs 18/6/2020 (12,499)USD 86,358,862 TRY 613,688,344 JP Morgan 7/7/2020 (2,424,208)USD 320,712 TWD 9,534,770 Citibank 18/6/2020 2,931
USD 84,146,622 ZAR 1,496,219,736Bank of America
Merrill Lynch 18/6/2020 (1,103,754)USD 46,925,411 ZAR 823,512,394 BNP Paribas 18/6/2020 4,001USD 49,996,360 ZAR 875,326,263 Citibank 18/6/2020 122,741USD 3,250,233 ZAR 57,550,548 Goldman Sachs 18/6/2020 (28,834)USD 3,983,311 ZAR 70,205,450 Morgan Stanley 18/6/2020 (16,797)
USD 24,162,318 ZAR 426,750,000Standard
Chartered Bank 18/6/2020 (152,692)
ZAR 304,238,206 USD 16,999,030Bank of America
Merrill Lynch 18/6/2020 335,604ZAR 1,088,678,825 USD 59,486,745 Goldman Sachs 18/6/2020 2,543,099ZAR 59,935,809 USD 3,438,372 JP Morgan 18/6/2020 (23,399)ZAR 699,147,928 USD 39,515,738 Morgan Stanley 18/6/2020 319,736
ZAR 652,667,910 USD 37,322,541Standard
Chartered Bank 18/6/2020 (135,367)
BlackRock Emerging Markets Flexi Dynamic Bond Fundcontinued
The notes on pages 691 to 711 form an integral part of these financial statements.
Annual report and audited financial statements [273]
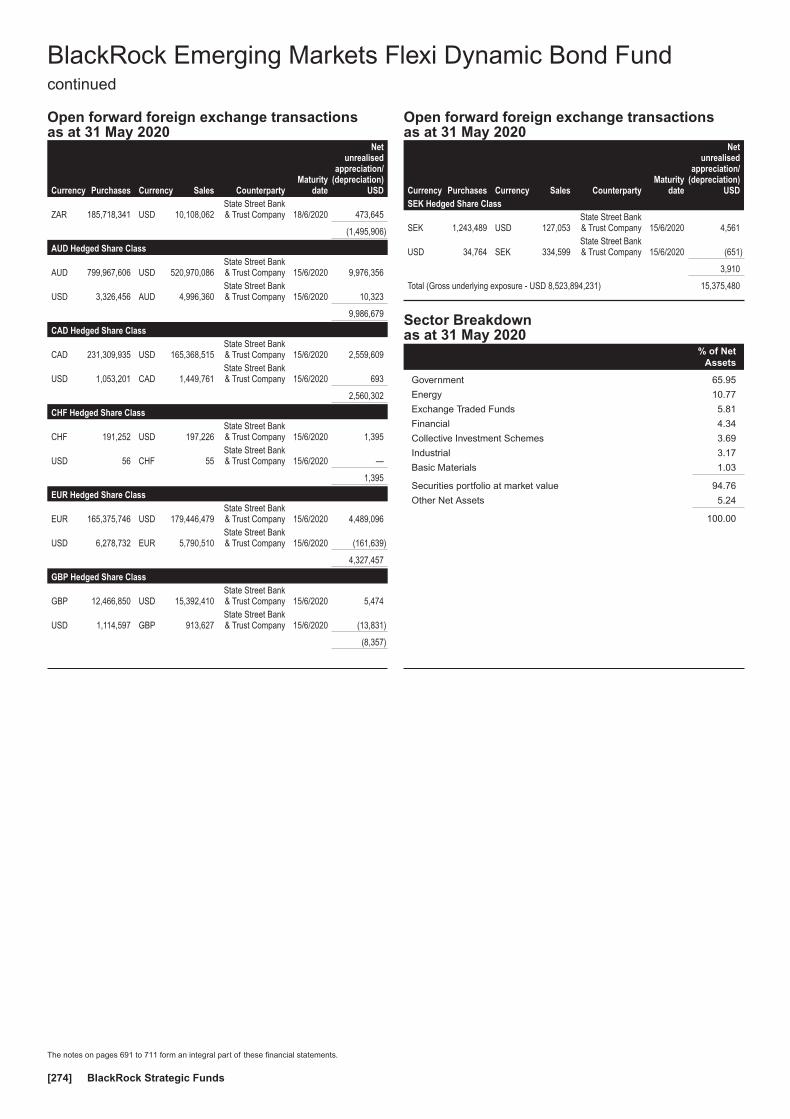
Open forward foreign exchange transactionsas at 31 May 2020
Currency Purchases Currency Sales CounterpartyMaturity
date
Netunrealised
appreciation/(depreciation)
USD
ZAR 185,718,341 USD 10,108,062State Street Bank& Trust Company 18/6/2020 473,645
(1,495,906)
AUD Hedged Share Class
AUD 799,967,606 USD 520,970,086State Street Bank& Trust Company 15/6/2020 9,976,356
USD 3,326,456 AUD 4,996,360State Street Bank& Trust Company 15/6/2020 10,323
9,986,679
CAD Hedged Share Class
CAD 231,309,935 USD 165,368,515State Street Bank& Trust Company 15/6/2020 2,559,609
USD 1,053,201 CAD 1,449,761State Street Bank& Trust Company 15/6/2020 693
2,560,302
CHF Hedged Share Class
CHF 191,252 USD 197,226State Street Bank& Trust Company 15/6/2020 1,395
USD 56 CHF 55State Street Bank& Trust Company 15/6/2020 —
1,395
EUR Hedged Share Class
EUR 165,375,746 USD 179,446,479State Street Bank& Trust Company 15/6/2020 4,489,096
USD 6,278,732 EUR 5,790,510State Street Bank& Trust Company 15/6/2020 (161,639)
4,327,457
GBP Hedged Share Class
GBP 12,466,850 USD 15,392,410State Street Bank& Trust Company 15/6/2020 5,474
USD 1,114,597 GBP 913,627State Street Bank& Trust Company 15/6/2020 (13,831)
(8,357)
Open forward foreign exchange transactionsas at 31 May 2020
Currency Purchases Currency Sales CounterpartyMaturity
date
Netunrealised
appreciation/(depreciation)
USDSEK Hedged Share Class
SEK 1,243,489 USD 127,053State Street Bank& Trust Company 15/6/2020 4,561
USD 34,764 SEK 334,599State Street Bank& Trust Company 15/6/2020 (651)
3,910
Total (Gross underlying exposure - USD 8,523,894,231) 15,375,480
Sector Breakdownas at 31 May 2020
% of NetAssets
Government 65.95
Energy 10.77
Exchange Traded Funds 5.81
Financial 4.34
Collective Investment Schemes 3.69
Industrial 3.17
Basic Materials 1.03
Securities portfolio at market value 94.76
Other Net Assets 5.24
100.00
BlackRock Emerging Markets Flexi Dynamic Bond Fundcontinued
The notes on pages 691 to 711 form an integral part of these financial statements.
BlackRock Strategic Funds[274]
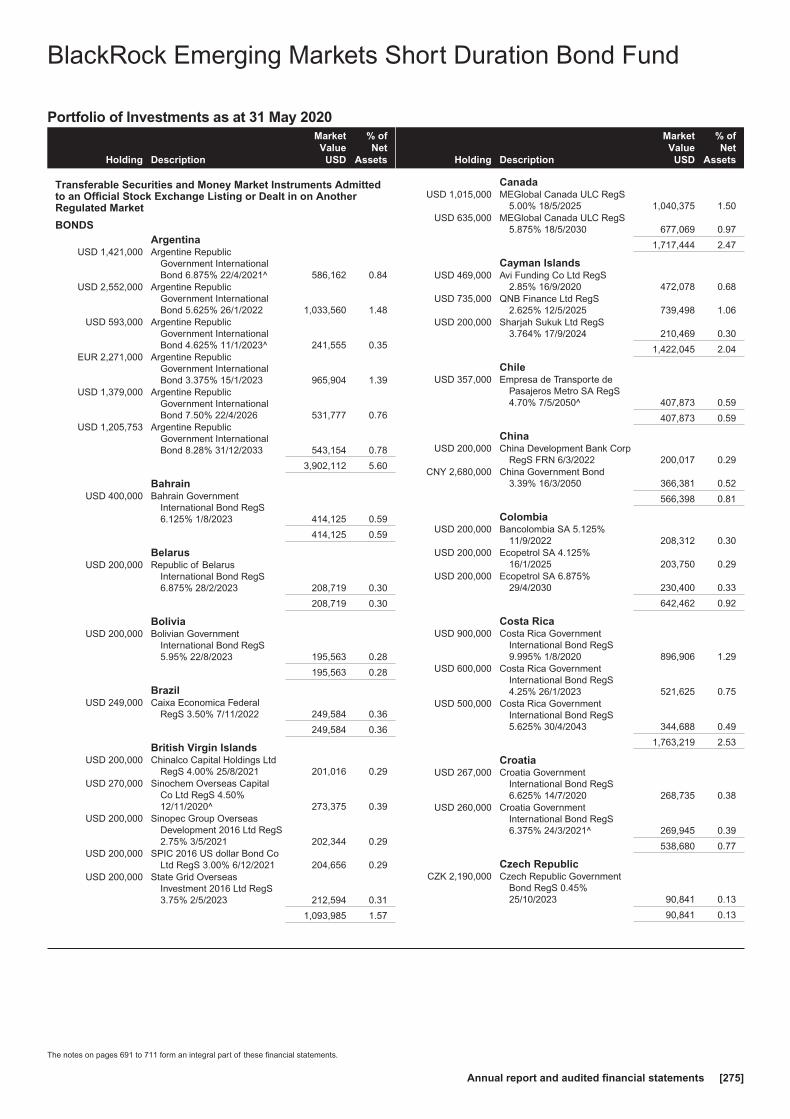
Portfolio of Investments as at 31 May 2020
Holding Description
MarketValue
USD
% ofNet
Assets
Transferable Securities and Money Market Instruments Admittedto an Official Stock Exchange Listing or Dealt in on AnotherRegulated Market
BONDSArgentina
USD 1,421,000 Argentine RepublicGovernment InternationalBond 6.875% 22/4/2021^ 586,162 0.84
USD 2,552,000 Argentine RepublicGovernment InternationalBond 5.625% 26/1/2022 1,033,560 1.48
USD 593,000 Argentine RepublicGovernment InternationalBond 4.625% 11/1/2023^ 241,555 0.35
EUR 2,271,000 Argentine RepublicGovernment InternationalBond 3.375% 15/1/2023 965,904 1.39
USD 1,379,000 Argentine RepublicGovernment InternationalBond 7.50% 22/4/2026 531,777 0.76
USD 1,205,753 Argentine RepublicGovernment InternationalBond 8.28% 31/12/2033 543,154 0.78
3,902,112 5.60
BahrainUSD 400,000 Bahrain Government
International Bond RegS6.125% 1/8/2023 414,125 0.59
414,125 0.59
BelarusUSD 200,000 Republic of Belarus
International Bond RegS6.875% 28/2/2023 208,719 0.30
208,719 0.30
BoliviaUSD 200,000 Bolivian Government
International Bond RegS5.95% 22/8/2023 195,563 0.28
195,563 0.28
BrazilUSD 249,000 Caixa Economica Federal
RegS 3.50% 7/11/2022 249,584 0.36
249,584 0.36
British Virgin IslandsUSD 200,000 Chinalco Capital Holdings Ltd
RegS 4.00% 25/8/2021 201,016 0.29USD 270,000 Sinochem Overseas Capital
Co Ltd RegS 4.50%12/11/2020^ 273,375 0.39
USD 200,000 Sinopec Group OverseasDevelopment 2016 Ltd RegS2.75% 3/5/2021 202,344 0.29
USD 200,000 SPIC 2016 US dollar Bond CoLtd RegS 3.00% 6/12/2021 204,656 0.29
USD 200,000 State Grid OverseasInvestment 2016 Ltd RegS3.75% 2/5/2023 212,594 0.31
1,093,985 1.57
Holding Description
MarketValue
USD
% ofNet
Assets
CanadaUSD 1,015,000 MEGlobal Canada ULC RegS
5.00% 18/5/2025 1,040,375 1.50USD 635,000 MEGlobal Canada ULC RegS
5.875% 18/5/2030 677,069 0.97
1,717,444 2.47
Cayman IslandsUSD 469,000 Avi Funding Co Ltd RegS
2.85% 16/9/2020 472,078 0.68USD 735,000 QNB Finance Ltd RegS
2.625% 12/5/2025 739,498 1.06USD 200,000 Sharjah Sukuk Ltd RegS
3.764% 17/9/2024 210,469 0.30
1,422,045 2.04
ChileUSD 357,000 Empresa de Transporte de
Pasajeros Metro SA RegS4.70% 7/5/2050^ 407,873 0.59
407,873 0.59
ChinaUSD 200,000 China Development Bank Corp
RegS FRN 6/3/2022 200,017 0.29CNY 2,680,000 China Government Bond
3.39% 16/3/2050 366,381 0.52
566,398 0.81
ColombiaUSD 200,000 Bancolombia SA 5.125%
11/9/2022 208,312 0.30USD 200,000 Ecopetrol SA 4.125%
16/1/2025 203,750 0.29USD 200,000 Ecopetrol SA 6.875%
29/4/2030 230,400 0.33
642,462 0.92
Costa RicaUSD 900,000 Costa Rica Government
International Bond RegS9.995% 1/8/2020 896,906 1.29
USD 600,000 Costa Rica GovernmentInternational Bond RegS4.25% 26/1/2023 521,625 0.75
USD 500,000 Costa Rica GovernmentInternational Bond RegS5.625% 30/4/2043 344,688 0.49
1,763,219 2.53
CroatiaUSD 267,000 Croatia Government
International Bond RegS6.625% 14/7/2020 268,735 0.38
USD 260,000 Croatia GovernmentInternational Bond RegS6.375% 24/3/2021^ 269,945 0.39
538,680 0.77
Czech RepublicCZK 2,190,000 Czech Republic Government
Bond RegS 0.45%25/10/2023 90,841 0.13
90,841 0.13
BlackRock Emerging Markets Short Duration Bond Fund
The notes on pages 691 to 711 form an integral part of these financial statements.
Annual report and audited financial statements [275]
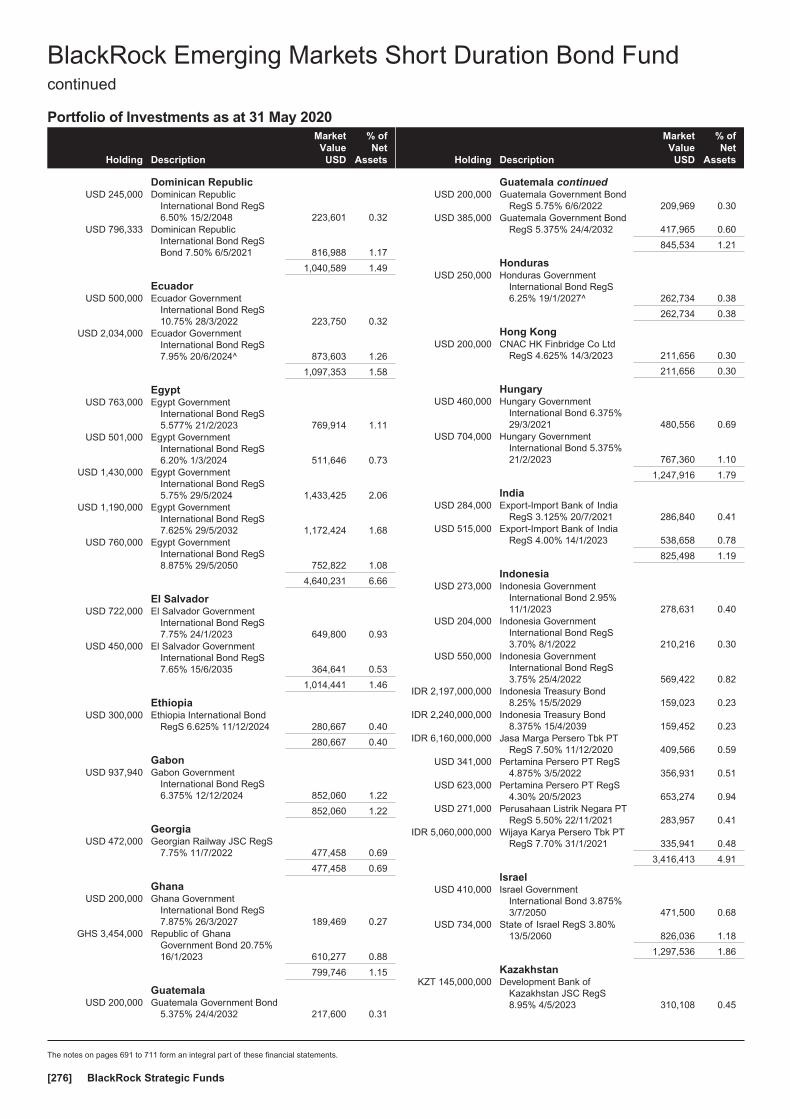
Portfolio of Investments as at 31 May 2020
Holding Description
MarketValue
USD
% ofNet
Assets
Dominican RepublicUSD 245,000 Dominican Republic
International Bond RegS6.50% 15/2/2048 223,601 0.32
USD 796,333 Dominican RepublicInternational Bond RegSBond 7.50% 6/5/2021 816,988 1.17
1,040,589 1.49
EcuadorUSD 500,000 Ecuador Government
International Bond RegS10.75% 28/3/2022 223,750 0.32
USD 2,034,000 Ecuador GovernmentInternational Bond RegS7.95% 20/6/2024^ 873,603 1.26
1,097,353 1.58
EgyptUSD 763,000 Egypt Government
International Bond RegS5.577% 21/2/2023 769,914 1.11
USD 501,000 Egypt GovernmentInternational Bond RegS6.20% 1/3/2024 511,646 0.73
USD 1,430,000 Egypt GovernmentInternational Bond RegS5.75% 29/5/2024 1,433,425 2.06
USD 1,190,000 Egypt GovernmentInternational Bond RegS7.625% 29/5/2032 1,172,424 1.68
USD 760,000 Egypt GovernmentInternational Bond RegS8.875% 29/5/2050 752,822 1.08
4,640,231 6.66
El SalvadorUSD 722,000 El Salvador Government
International Bond RegS7.75% 24/1/2023 649,800 0.93
USD 450,000 El Salvador GovernmentInternational Bond RegS7.65% 15/6/2035 364,641 0.53
1,014,441 1.46
EthiopiaUSD 300,000 Ethiopia International Bond
RegS 6.625% 11/12/2024 280,667 0.40
280,667 0.40
GabonUSD 937,940 Gabon Government
International Bond RegS6.375% 12/12/2024 852,060 1.22
852,060 1.22
GeorgiaUSD 472,000 Georgian Railway JSC RegS
7.75% 11/7/2022 477,458 0.69
477,458 0.69
GhanaUSD 200,000 Ghana Government
International Bond RegS7.875% 26/3/2027 189,469 0.27
GHS 3,454,000 Republic of GhanaGovernment Bond 20.75%16/1/2023 610,277 0.88
799,746 1.15
GuatemalaUSD 200,000 Guatemala Government Bond
5.375% 24/4/2032 217,600 0.31
Holding Description
MarketValue
USD
% ofNet
Assets
Guatemala continuedUSD 200,000 Guatemala Government Bond
RegS 5.75% 6/6/2022 209,969 0.30USD 385,000 Guatemala Government Bond
RegS 5.375% 24/4/2032 417,965 0.60
845,534 1.21
HondurasUSD 250,000 Honduras Government
International Bond RegS6.25% 19/1/2027^ 262,734 0.38
262,734 0.38
Hong KongUSD 200,000 CNAC HK Finbridge Co Ltd
RegS 4.625% 14/3/2023 211,656 0.30
211,656 0.30
HungaryUSD 460,000 Hungary Government
International Bond 6.375%29/3/2021 480,556 0.69
USD 704,000 Hungary GovernmentInternational Bond 5.375%21/2/2023 767,360 1.10
1,247,916 1.79
IndiaUSD 284,000 Export-Import Bank of India
RegS 3.125% 20/7/2021 286,840 0.41USD 515,000 Export-Import Bank of India
RegS 4.00% 14/1/2023 538,658 0.78
825,498 1.19
IndonesiaUSD 273,000 Indonesia Government
International Bond 2.95%11/1/2023 278,631 0.40
USD 204,000 Indonesia GovernmentInternational Bond RegS3.70% 8/1/2022 210,216 0.30
USD 550,000 Indonesia GovernmentInternational Bond RegS3.75% 25/4/2022 569,422 0.82
IDR 2,197,000,000 Indonesia Treasury Bond8.25% 15/5/2029 159,023 0.23
IDR 2,240,000,000 Indonesia Treasury Bond8.375% 15/4/2039 159,452 0.23
IDR 6,160,000,000 Jasa Marga Persero Tbk PTRegS 7.50% 11/12/2020 409,566 0.59
USD 341,000 Pertamina Persero PT RegS4.875% 3/5/2022 356,931 0.51
USD 623,000 Pertamina Persero PT RegS4.30% 20/5/2023 653,274 0.94
USD 271,000 Perusahaan Listrik Negara PTRegS 5.50% 22/11/2021 283,957 0.41
IDR 5,060,000,000 Wijaya Karya Persero Tbk PTRegS 7.70% 31/1/2021 335,941 0.48
3,416,413 4.91
IsraelUSD 410,000 Israel Government
International Bond 3.875%3/7/2050 471,500 0.68
USD 734,000 State of Israel RegS 3.80%13/5/2060 826,036 1.18
1,297,536 1.86
KazakhstanKZT 145,000,000 Development Bank of
Kazakhstan JSC RegS8.95% 4/5/2023 310,108 0.45
BlackRock Emerging Markets Short Duration Bond Fundcontinued
The notes on pages 691 to 711 form an integral part of these financial statements.
BlackRock Strategic Funds[276]
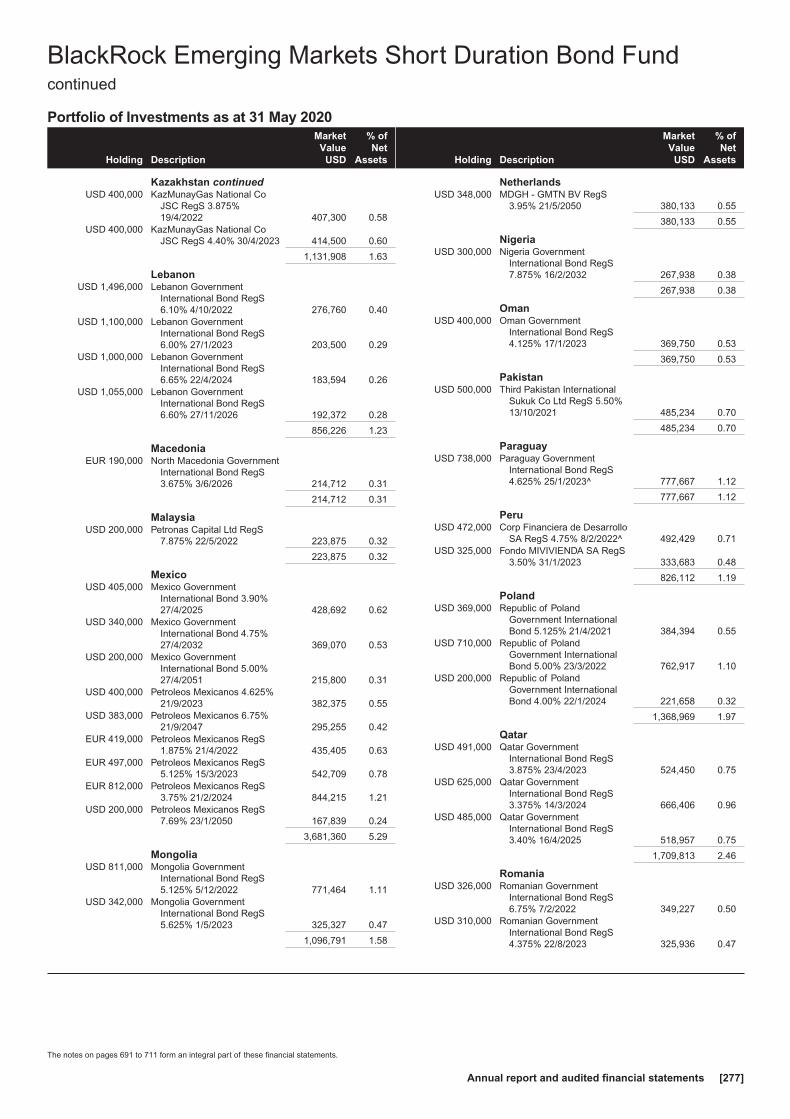
Portfolio of Investments as at 31 May 2020
Holding Description
MarketValue
USD
% ofNet
Assets
Kazakhstan continuedUSD 400,000 KazMunayGas National Co
JSC RegS 3.875%19/4/2022 407,300 0.58
USD 400,000 KazMunayGas National CoJSC RegS 4.40% 30/4/2023 414,500 0.60
1,131,908 1.63
LebanonUSD 1,496,000 Lebanon Government
International Bond RegS6.10% 4/10/2022 276,760 0.40
USD 1,100,000 Lebanon GovernmentInternational Bond RegS6.00% 27/1/2023 203,500 0.29
USD 1,000,000 Lebanon GovernmentInternational Bond RegS6.65% 22/4/2024 183,594 0.26
USD 1,055,000 Lebanon GovernmentInternational Bond RegS6.60% 27/11/2026 192,372 0.28
856,226 1.23
MacedoniaEUR 190,000 North Macedonia Government
International Bond RegS3.675% 3/6/2026 214,712 0.31
214,712 0.31
MalaysiaUSD 200,000 Petronas Capital Ltd RegS
7.875% 22/5/2022 223,875 0.32
223,875 0.32
MexicoUSD 405,000 Mexico Government
International Bond 3.90%27/4/2025 428,692 0.62
USD 340,000 Mexico GovernmentInternational Bond 4.75%27/4/2032 369,070 0.53
USD 200,000 Mexico GovernmentInternational Bond 5.00%27/4/2051 215,800 0.31
USD 400,000 Petroleos Mexicanos 4.625%21/9/2023 382,375 0.55
USD 383,000 Petroleos Mexicanos 6.75%21/9/2047 295,255 0.42
EUR 419,000 Petroleos Mexicanos RegS1.875% 21/4/2022 435,405 0.63
EUR 497,000 Petroleos Mexicanos RegS5.125% 15/3/2023 542,709 0.78
EUR 812,000 Petroleos Mexicanos RegS3.75% 21/2/2024 844,215 1.21
USD 200,000 Petroleos Mexicanos RegS7.69% 23/1/2050 167,839 0.24
3,681,360 5.29
MongoliaUSD 811,000 Mongolia Government
International Bond RegS5.125% 5/12/2022 771,464 1.11
USD 342,000 Mongolia GovernmentInternational Bond RegS5.625% 1/5/2023 325,327 0.47
1,096,791 1.58
Holding Description
MarketValue
USD
% ofNet
Assets
NetherlandsUSD 348,000 MDGH - GMTN BV RegS
3.95% 21/5/2050 380,133 0.55
380,133 0.55
NigeriaUSD 300,000 Nigeria Government
International Bond RegS7.875% 16/2/2032 267,938 0.38
267,938 0.38
OmanUSD 400,000 Oman Government
International Bond RegS4.125% 17/1/2023 369,750 0.53
369,750 0.53
PakistanUSD 500,000 Third Pakistan International
Sukuk Co Ltd RegS 5.50%13/10/2021 485,234 0.70
485,234 0.70
ParaguayUSD 738,000 Paraguay Government
International Bond RegS4.625% 25/1/2023^ 777,667 1.12
777,667 1.12
PeruUSD 472,000 Corp Financiera de Desarrollo
SA RegS 4.75% 8/2/2022^ 492,429 0.71USD 325,000 Fondo MIVIVIENDA SA RegS
3.50% 31/1/2023 333,683 0.48
826,112 1.19
PolandUSD 369,000 Republic of Poland
Government InternationalBond 5.125% 21/4/2021 384,394 0.55
USD 710,000 Republic of PolandGovernment InternationalBond 5.00% 23/3/2022 762,917 1.10
USD 200,000 Republic of PolandGovernment InternationalBond 4.00% 22/1/2024 221,658 0.32
1,368,969 1.97
QatarUSD 491,000 Qatar Government
International Bond RegS3.875% 23/4/2023 524,450 0.75
USD 625,000 Qatar GovernmentInternational Bond RegS3.375% 14/3/2024 666,406 0.96
USD 485,000 Qatar GovernmentInternational Bond RegS3.40% 16/4/2025 518,957 0.75
1,709,813 2.46
RomaniaUSD 326,000 Romanian Government
International Bond RegS6.75% 7/2/2022 349,227 0.50
USD 310,000 Romanian GovernmentInternational Bond RegS4.375% 22/8/2023 325,936 0.47
BlackRock Emerging Markets Short Duration Bond Fundcontinued
The notes on pages 691 to 711 form an integral part of these financial statements.
Annual report and audited financial statements [277]
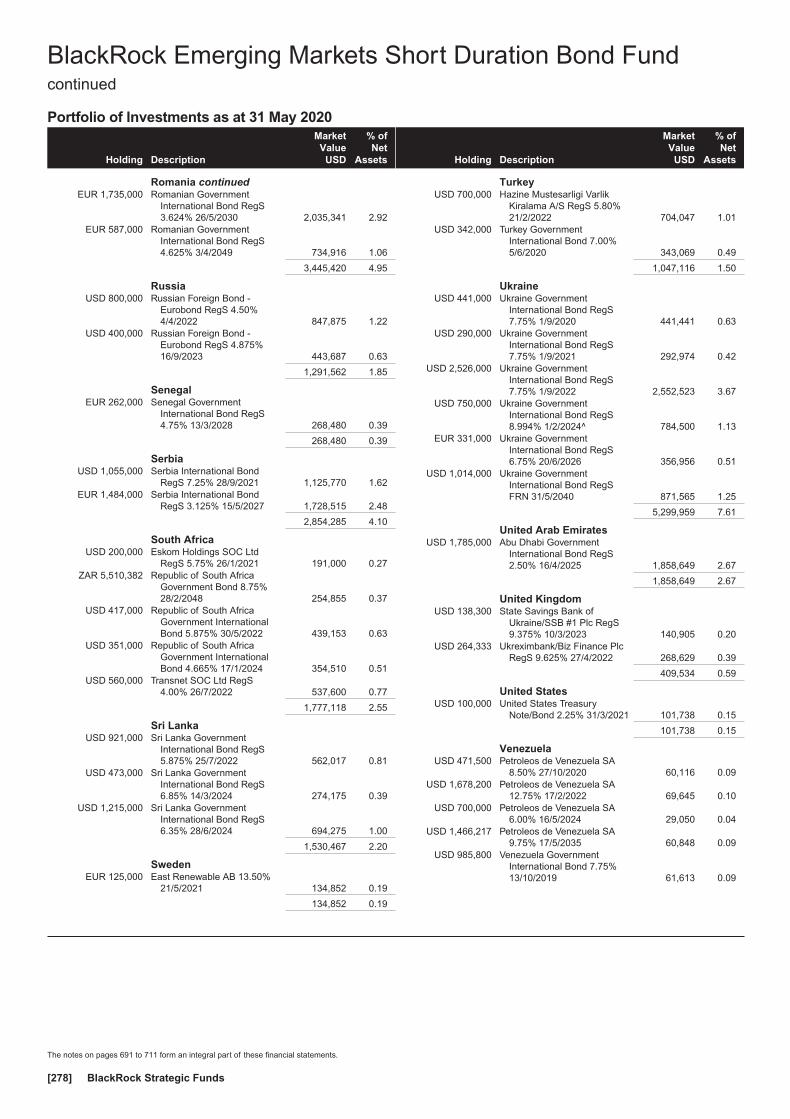
Portfolio of Investments as at 31 May 2020
Holding Description
MarketValue
USD
% ofNet
Assets
Romania continuedEUR 1,735,000 Romanian Government
International Bond RegS3.624% 26/5/2030 2,035,341 2.92
EUR 587,000 Romanian GovernmentInternational Bond RegS4.625% 3/4/2049 734,916 1.06
3,445,420 4.95
RussiaUSD 800,000 Russian Foreign Bond -
Eurobond RegS 4.50%4/4/2022 847,875 1.22
USD 400,000 Russian Foreign Bond -Eurobond RegS 4.875%16/9/2023 443,687 0.63
1,291,562 1.85
SenegalEUR 262,000 Senegal Government
International Bond RegS4.75% 13/3/2028 268,480 0.39
268,480 0.39
SerbiaUSD 1,055,000 Serbia International Bond
RegS 7.25% 28/9/2021 1,125,770 1.62EUR 1,484,000 Serbia International Bond
RegS 3.125% 15/5/2027 1,728,515 2.48
2,854,285 4.10
South AfricaUSD 200,000 Eskom Holdings SOC Ltd
RegS 5.75% 26/1/2021 191,000 0.27ZAR 5,510,382 Republic of South Africa
Government Bond 8.75%28/2/2048 254,855 0.37
USD 417,000 Republic of South AfricaGovernment InternationalBond 5.875% 30/5/2022 439,153 0.63
USD 351,000 Republic of South AfricaGovernment InternationalBond 4.665% 17/1/2024 354,510 0.51
USD 560,000 Transnet SOC Ltd RegS4.00% 26/7/2022 537,600 0.77
1,777,118 2.55
Sri LankaUSD 921,000 Sri Lanka Government
International Bond RegS5.875% 25/7/2022 562,017 0.81
USD 473,000 Sri Lanka GovernmentInternational Bond RegS6.85% 14/3/2024 274,175 0.39
USD 1,215,000 Sri Lanka GovernmentInternational Bond RegS6.35% 28/6/2024 694,275 1.00
1,530,467 2.20
SwedenEUR 125,000 East Renewable AB 13.50%
21/5/2021 134,852 0.19
134,852 0.19
Holding Description
MarketValue
USD
% ofNet
Assets
TurkeyUSD 700,000 Hazine Mustesarligi Varlik
Kiralama A/S RegS 5.80%21/2/2022 704,047 1.01
USD 342,000 Turkey GovernmentInternational Bond 7.00%5/6/2020 343,069 0.49
1,047,116 1.50
UkraineUSD 441,000 Ukraine Government
International Bond RegS7.75% 1/9/2020 441,441 0.63
USD 290,000 Ukraine GovernmentInternational Bond RegS7.75% 1/9/2021 292,974 0.42
USD 2,526,000 Ukraine GovernmentInternational Bond RegS7.75% 1/9/2022 2,552,523 3.67
USD 750,000 Ukraine GovernmentInternational Bond RegS8.994% 1/2/2024^ 784,500 1.13
EUR 331,000 Ukraine GovernmentInternational Bond RegS6.75% 20/6/2026 356,956 0.51
USD 1,014,000 Ukraine GovernmentInternational Bond RegSFRN 31/5/2040 871,565 1.25
5,299,959 7.61
United Arab EmiratesUSD 1,785,000 Abu Dhabi Government
International Bond RegS2.50% 16/4/2025 1,858,649 2.67
1,858,649 2.67
United KingdomUSD 138,300 State Savings Bank of
Ukraine/SSB #1 Plc RegS9.375% 10/3/2023 140,905 0.20
USD 264,333 Ukreximbank/Biz Finance PlcRegS 9.625% 27/4/2022 268,629 0.39
409,534 0.59
United StatesUSD 100,000 United States Treasury
Note/Bond 2.25% 31/3/2021 101,738 0.15
101,738 0.15
VenezuelaUSD 471,500 Petroleos de Venezuela SA
8.50% 27/10/2020 60,116 0.09USD 1,678,200 Petroleos de Venezuela SA
12.75% 17/2/2022 69,645 0.10USD 700,000 Petroleos de Venezuela SA
6.00% 16/5/2024 29,050 0.04USD 1,466,217 Petroleos de Venezuela SA
9.75% 17/5/2035 60,848 0.09USD 985,800 Venezuela Government
International Bond 7.75%13/10/2019 61,613 0.09
BlackRock Emerging Markets Short Duration Bond Fundcontinued
The notes on pages 691 to 711 form an integral part of these financial statements.
BlackRock Strategic Funds[278]

Portfolio of Investments as at 31 May 2020
Holding Description
MarketValue
USD
% ofNet
Assets
Venezuela continuedUSD 602,900 Venezuela Government
International Bond 12.75%23/8/2022 37,681 0.05
USD 1,473,500 Venezuela GovernmentInternational Bond 9.00%7/5/2023 92,094 0.13
411,047 0.59
ZambiaUSD 736,000 Zambia Government
International Bond RegS5.375% 20/9/2022 337,985 0.49
USD 379,000 Zambia GovernmentInternational Bond RegS8.50% 14/4/2024^ 175,288 0.25
513,273 0.74
Total Bonds 65,856,870 94.59
Total Transferable Securities and Money MarketInstruments Admitted to an Official Stock ExchangeListing or Dealt in on Another Regulated Market 65,856,870 94.59
Securities portfolio at market value 65,856,870 94.59
Other Net Assets 3,766,797 5.41
Total Net Assets (USD) 69,623,667 100.00
^ All or a portion of this security represents a security on loan.
Swaps as at 31 May 2020
TypeNominal
Value Description CounterpartyExpiration
date
Net unrealised(depreciation)
USD
MarketValue
USD
CCCDS USD 1,445,500Fund receives default protection on Markit CDX.NA.HY.25 Version
8 and pays Fixed 5.000% Morgan Stanley 20/6/2025 (30,403) 38,819
CCCDS USD 3,300,000Fund receives default protection on Markit CDX.NA.IG.30 and pays
Fixed 1.000% Morgan Stanley 20/6/2025 (15,400) (31,222)
CDS USD 3,900,000Fund receives default protection on Markit CDX.EM.30 Version
1 and pays Fixed 1.000%Bank of America
Merrill Lynch 20/6/2025 (59,510) 353,890
CDS USD 3,200,000Fund receives default protection on Markit CDX.EM.30 Version
1 and pays Fixed 1.000% Barclays Bank 20/6/2025 (141,628) 290,372
Total (Gross underlying exposure - USD 11,193,641) (246,941) 651,859
CCCDS: Centrally Cleared Credit Default SwapsCDS: Credit Default Swaps
Futures contracts as at 31 May 2020
Numberof
contractsCurrencyof contracts
Contract/Description
Expirationdate
Grossunderlying
exposureUSD
Net unrealisedappreciation/
(depreciation)USD
(24) EUR Euro BOBL Futures June 2020 June 2020 3,604,586 9,074
(5) EUR Euro Bund Futures June 2020 June 2020 958,167 12,454
(34) EUR Euro Schatz Futures June 2020 June 2020 4,235,440 12,476
(3) JPY Japan 10 Year Bond Futures June 2020 June 2020 4,244,875 3,347
(20) GBP UK Long Gilt Bond Futures September 2020 September 2020 3,391,199 (247)
(51) USD US Treasury 2 Year Note Futures September 2020 September 2020 11,259,844 146
(29) USD US Treasury 5 Year Note Futures September 2020 September 2020 3,639,727 (4,789)
Total 31,333,838 32,461
BlackRock Emerging Markets Short Duration Bond Fundcontinued
The notes on pages 691 to 711 form an integral part of these financial statements.
Annual report and audited financial statements [279]

Open forward foreign exchange transactionsas at 31 May 2020
Currency Purchases Currency Sales CounterpartyMaturity
date
Netunrealised
appreciation/(depreciation)
USDAUD 538,394 USD 351,151 JP Morgan 18/6/2020 6,187BRL 1,605,747 USD 277,326 Goldman Sachs 18/6/2020 17,953CAD 5,248,757 USD 3,754,449 BNP Paribas 18/6/2020 56,090
CHF 184,743 USD 190,646Bank of America
Merrill Lynch 18/6/2020 1,235CLP 274,260,277 USD 334,304 BNP Paribas 18/6/2020 5,384CNH 460,000 USD 64,306 Goldman Sachs 18/6/2020 (189)COP 39,172,965 USD 10,040 BNP Paribas 18/6/2020 493CZK 4,290,000 USD 175,215 UBS 18/6/2020 1,862EUR 1,821,737 USD 1,976,559 JP Morgan 18/6/2020 49,754EUR 20,000 USD 22,043 Natwest Markets 18/6/2020 203EUR 410,000 USD 451,285 UBS 18/6/2020 4,757
GBP 690,808 USD 845,224Bank of America
Merrill Lynch 18/6/2020 8,010
HUF 207,540,975 USD 641,512State Street Bank& Trust Company 18/6/2020 20,873
INR 39,465,431 USD 522,410Bank of America
Merrill Lynch 18/6/2020 (1,209)JPY 71,059,110 USD 663,229 BNP Paribas 18/6/2020 (2,474)
JPY 428,024,019 USD 3,976,721State Street Bank& Trust Company 18/6/2020 3,335
KRW 419,330,304 USD 337,435 HSBC 18/6/2020 1,510MXN 73,789,295 USD 3,080,792 Goldman Sachs 18/6/2020 246,726MXN 8,020,487 USD 338,102 Morgan Stanley 18/6/2020 23,581
MXN 8,029,822 USD 336,295State Street Bank& Trust Company 18/6/2020 25,808
NZD 909,864 USD 556,160 BNP Paribas 18/6/2020 8,243PLN 5,703,185 USD 1,360,468 HSBC 18/6/2020 66,536
RUB 12,181,506 USD 168,801Bank of America
Merrill Lynch 18/6/2020 3,350RUB 12,181,506 USD 168,789 Goldman Sachs 18/6/2020 3,361RUB 40,221,349 USD 546,754 JP Morgan 18/6/2020 21,658UAH 3,129,887 USD 107,188 Goldman Sachs 18/6/2020 8,790USD 660,580 AUD 1,019,289 HSBC 18/6/2020 (15,933)USD 830,554 AUD 1,273,642 JP Morgan 18/6/2020 (14,775)USD 228,788 BRL 1,346,126 BNP Paribas 18/6/2020 (18,749)USD 408,856 BRL 2,392,972 Goldman Sachs 18/6/2020 (31,184)USD 3,774,818 CAD 5,260,000 Morgan Stanley 18/6/2020 (43,884)
USD 190,646 CHF 184,743Bank of America
Merrill Lynch 18/6/2020 (1,235)USD 771,685 CLP 623,948,070 JP Morgan 18/6/2020 (1,113)USD 305,058 CNH 2,176,111 Goldman Sachs 18/6/2020 1,741USD 332,744 COP 1,312,341,962 Deutsche Bank 18/6/2020 (20,100)USD 223,801 CZK 5,667,645 Barclays Bank 18/6/2020 (10,140)
USD 1,380,779 EUR 1,260,114Bank of America
Merrill Lynch 18/6/2020 (20,843)USD 337,916 EUR 308,949 Barclays Bank 18/6/2020 (5,727)USD 690,427 EUR 626,050 BNP Paribas 18/6/2020 (5,927)USD 1,897,775 EUR 1,740,000 HSBC 18/6/2020 (37,623)USD 5,088,437 EUR 4,687,698 JP Morgan 18/6/2020 (125,677)USD 2,029,599 EUR 1,880,000 Morgan Stanley 18/6/2020 (61,520)USD 196,997 EUR 180,000 UBS 18/6/2020 (3,216)
USD 24,373 GBP 20,000Bank of America
Merrill Lynch 18/6/2020 (330)USD 668,402 GBP 544,156 Barclays Bank 18/6/2020 (3,697)
Open forward foreign exchange transactionsas at 31 May 2020
Currency Purchases Currency Sales CounterpartyMaturity
date
Netunrealised
appreciation/(depreciation)
USDUSD 330,233 GBP 267,992 BNP Paribas 18/6/2020 (770)USD 824,513 GBP 667,020 Morgan Stanley 18/6/2020 661
USD 641,541 HUF 207,550,116State Street Bank& Trust Company 18/6/2020 (20,874)
USD 1,025,125 IDR 15,346,120,209 Citibank 18/6/2020 (19,889)
USD 331,475 IDR 4,968,530,393State Street Bank& Trust Company 18/6/2020 (6,863)
USD 331,265 JPY 35,668,422 BNP Paribas 18/6/2020 (404)USD 2,968,247 JPY 318,469,430 Morgan Stanley 18/6/2020 6,903
USD 1,034,530 KRW 1,263,884,919Bank of America
Merrill Lynch 18/6/2020 12,931USD 331,434 KRW 406,837,618 BNP Paribas 18/6/2020 2,587
USD 343,806 MXN 7,927,257Bank of America
Merrill Lynch 18/6/2020 (13,672)USD 163,767 MXN 3,967,630 Barclays Bank 18/6/2020 (15,152)USD 2,220,658 MXN 53,187,889 Goldman Sachs 18/6/2020 (177,842)USD 337,887 MYR 1,478,932 Barclays Bank 18/6/2020 (2,335)USD 345,099 MYR 1,496,866 Morgan Stanley 18/6/2020 751USD 904,258 NZD 1,479,343 BNP Paribas 18/6/2020 (13,401)USD 994,644 PEN 3,426,456 Citibank 12/8/2020 445USD 169,624 PHP 8,510,217 Goldman Sachs 18/6/2020 1,438USD 1,369,376 PLN 5,740,529 HSBC 18/6/2020 (66,972)USD 233,243 TRY 1,657,542 JP Morgan 7/7/2020 (6,557)USD 760,040 ZAR 13,814,170 Goldman Sachs 18/6/2020 (27,053)USD 175,743 ZAR 3,097,450 Morgan Stanley 18/6/2020 (741)
ZAR 6,216,987 USD 337,222Bank of America
Merrill Lynch 18/6/2020 17,005ZAR 17,737,148 USD 969,179 Goldman Sachs 18/6/2020 41,433
(126,476)
EUR Hedged Share Class
EUR 36,558,484 USD 39,648,559State Street Bank& Trust Company 15/6/2020 1,012,820
USD 482,693 EUR 443,133State Street Bank& Trust Company 15/6/2020 (10,173)
1,002,647
Total (Gross underlying exposure - USD 101,003,596) 876,171
Sector Breakdownas at 31 May 2020
% of NetAssets
Government 74.14
Energy 8.20
Financial 4.79
Industrial 3.12
Basic Materials 3.06
Utilities 1.28
Securities portfolio at market value 94.59
Other Net Assets 5.41
100.00
BlackRock Emerging Markets Short Duration Bond Fundcontinued
The notes on pages 691 to 711 form an integral part of these financial statements.
BlackRock Strategic Funds[280]

Portfolio of Investments as at 31 May 2020
Holding Description
MarketValue
EUR
% ofNet
Assets
Transferable Securities and Money Market Instruments Admittedto an Official Stock Exchange Listing or Dealt in on AnotherRegulated Market
BONDSAustralia
EUR 325,000 APT Pipelines Ltd RegS2.00% 15/7/2030 332,241 0.08
EUR 425,000 Telstra Corp Ltd RegS 1.00%23/4/2030 431,171 0.10
763,412 0.18
AustriaEUR 300,000 Erste Group Bank AG RegS
0.01% 11/9/2029 301,138 0.07EUR 1,400,000 Erste Group Bank AG RegS
0.10% 15/1/2030 1,415,932 0.33EUR 400,000 Raiffeisen Bank International
RegS 0.25% 5/7/2021 398,794 0.09EUR 930,000 Republic of Austria
Government Bond RegS3.65% 20/4/2022 1,004,544 0.24
EUR 2,205,000 Republic of AustriaGovernment Bond RegS1.65% 21/10/2024 2,415,269 0.57
EUR 255,000 Republic of AustriaGovernment Bond RegS0.75% 20/10/2026 273,118 0.06
EUR 1,410,000 Republic of AustriaGovernment Bond RegS0.50% 20/4/2027 1,491,075 0.35
EUR 150,000 Republic of AustriaGovernment Bond RegS0.75% 20/2/2028 161,664 0.04
EUR 456,000 Republic of AustriaGovernment Bond RegS0.50% 20/2/2029 483,415 0.11
EUR 125,000 Republic of AustriaGovernment Bond RegS20/2/2030 (Zero Coupon) 126,661 0.03
EUR 110,000 Republic of AustriaGovernment Bond RegS2.40% 23/5/2034 146,377 0.04
EUR 85,000 Republic of AustriaGovernment Bond RegS4.15% 15/3/2037 (traded inAustria) 142,114 0.03
EUR 460,000 Republic of AustriaGovernment Bond RegS4.15% 15/3/2037 (traded inGermany) 769,090 0.18
EUR 290,000 Republic of AustriaGovernment Bond RegS3.15% 20/6/2044 489,798 0.12
EUR 904,000 Republic of AustriaGovernment Bond RegS1.50% 20/2/2047 1,186,328 0.28
EUR 155,000 Republic of AustriaGovernment Bond RegS0.75% 20/3/2051 173,436 0.04
EUR 158,000 Republic of AustriaGovernment Bond RegS3.80% 26/1/2062 362,356 0.09
EUR 236,000 Republic of AustriaGovernment Bond RegS2.10% 20/9/2117 461,536 0.11
EUR 100,000 UniCredit Bank Austria RegS0.625% 20/3/2029 105,850 0.03
11,908,495 2.81
Holding Description
MarketValue
EUR
% ofNet
Assets
BelgiumEUR 20,000 Anheuser-Busch InBev SA
RegS 1.50% 17/3/2025 20,828 0.00EUR 200,000 Anheuser-Busch InBev SA
RegS 1.125% 1/7/2027 201,300 0.05EUR 220,000 Anheuser-Busch InBev SA
RegS 2.75% 17/3/2036 233,307 0.06EUR 375,000 Anheuser-Busch InBev SA
RegS 3.70% 2/4/2040 438,981 0.10GBP 325,000 Anheuser-Busch InBev SA/NV
RegS 1.75% 7/3/2025 367,957 0.09EUR 124,000 Anheuser-Busch InBev SA/NV
RegS 2.00% 17/3/2028 132,458 0.03EUR 100,000 Belfius Bank SA RegS 1.00%
12/6/2028 108,993 0.03EUR 300,000 BNP Paribas Fortis SA RegS
24/10/2023 (Zero Coupon) 302,237 0.07EUR 600,000 ING Belgium SA RegS 0.75%
28/9/2026 634,833 0.15EUR 1,000,000 KBC Bank NV RegS 0.75%
24/10/2027 1,064,665 0.25EUR 1,460,000 Kingdom of Belgium
Government Bond RegS4.25% 28/9/2021 1,552,586 0.37
EUR 590,000 Kingdom of BelgiumGovernment Bond RegS4.25% 28/9/2022 656,525 0.15
EUR 2,814,029 Kingdom of BelgiumGovernment Bond RegS0.50% 22/10/2024 2,930,671 0.69
EUR 315,000 Kingdom of BelgiumGovernment Bond RegS4.50% 28/3/2026 404,469 0.10
EUR 165,000 Kingdom of BelgiumGovernment Bond RegS22/10/2027 (Zero Coupon) 167,237 0.04
EUR 1,400,000 Kingdom of BelgiumGovernment Bond RegS0.80% 22/6/2028 1,509,655 0.36
EUR 1,207,000 Kingdom of BelgiumGovernment Bond RegS0.90% 22/6/2029 1,316,016 0.31
EUR 425,000 Kingdom of BelgiumGovernment Bond RegS0.10% 22/6/2030 430,457 0.10
EUR 340,000 Kingdom of BelgiumGovernment Bond RegS1.00% 22/6/2031 375,855 0.09
EUR 1,490,000 Kingdom of BelgiumGovernment Bond RegS1.25% 22/4/2033^ 1,705,342 0.40
EUR 113,000 Kingdom of BelgiumGovernment Bond RegS1.45% 22/6/2037 133,028 0.03
EUR 1,072,397 Kingdom of BelgiumGovernment Bond RegS1.90% 22/6/2038 1,349,456 0.32
EUR 260,000 Kingdom of BelgiumGovernment Bond RegS0.40% 22/6/2040 254,322 0.06
EUR 305,000 Kingdom of BelgiumGovernment Bond RegS4.25% 28/3/2041 528,217 0.12
EUR 95,000 Kingdom of BelgiumGovernment Bond RegS3.75% 22/6/2045 164,791 0.04
BlackRock ESG Euro Bond Fund
The notes on pages 691 to 711 form an integral part of these financial statements.
Annual report and audited financial statements [281]

Portfolio of Investments as at 31 May 2020
Holding Description
MarketValue
EUR
% ofNet
Assets
Belgium continuedEUR 205,477 Kingdom of Belgium
Government Bond RegS1.60% 22/6/2047 254,457 0.06
EUR 622,957 Kingdom of BelgiumGovernment Bond RegS1.70% 22/6/2050 796,310 0.19
18,034,953 4.26
CanadaEUR 495,000 Canadian Imperial Bank of
Commerce RegS 0.25%24/1/2023 499,849 0.12
EUR 722,000 CPPIB Capital Inc RegS0.875% 6/2/2029 762,724 0.18
EUR 2,463,000 Royal Bank of Canada RegS0.01% 21/1/2027 2,473,295 0.58
3,735,868 0.88
CyprusEUR 41,000 Cyprus Government
International Bond RegS3.875% 6/5/2022 43,892 0.01
EUR 84,000 Cyprus GovernmentInternational Bond RegS3.75% 26/7/2023 92,777 0.02
EUR 195,000 Cyprus GovernmentInternational Bond RegS1.50% 16/4/2027 201,101 0.05
EUR 145,000 Cyprus GovernmentInternational Bond RegS2.25% 16/4/2050 153,934 0.04
491,704 0.12
DenmarkDKK 5,151,861 Nordea Kredit
Realkreditaktieselskab0.50% 1/10/2050 656,513 0.16
DKK 9,390,191 Nykredit Realkredit A/S RegS0.50% 1/10/2050 1,196,041 0.28
DKK 11,911,683 Nykredit Realkredit A/S RegS1.00% 1/10/2050 1,574,959 0.37
EUR 350,000 Orsted A/S RegS FRN24/11/3017 357,000 0.08
EUR 250,000 Orsted A/S RegS FRN9/12/3019 247,809 0.06
4,032,322 0.95
FinlandEUR 246,000 Finland Government Bond
RegS 15/4/2022 (ZeroCoupon) 248,743 0.06
EUR 740,000 Finland Government BondRegS 15/9/2024 (ZeroCoupon) 756,102 0.18
EUR 373,000 Finland Government BondRegS 0.50% 15/9/2027 394,895 0.09
EUR 475,000 Finland Government BondRegS 0.50% 15/9/2029 505,125 0.12
EUR 310,000 Finland Government BondRegS 0.75% 15/4/2031 338,940 0.08
EUR 140,000 Finland Government BondRegS 1.125% 15/4/2034 160,852 0.04
EUR 65,000 Finland Government BondRegS 2.625% 4/7/2042 99,779 0.02
EUR 891,000 Finland Government BondRegS 1.375% 15/4/2047 1,153,636 0.27
Holding Description
MarketValue
EUR
% ofNet
Assets
Finland continuedEUR 1,125,000 OP Corporate Bank Plc 0.60%
18/1/2027 1,095,997 0.26EUR 850,000 OP Corporate Bank Plc RegS
0.50% 12/8/2025 852,329 0.20EUR 260,000 OP Mortgage Bank RegS
0.625% 15/2/2029 276,041 0.07
5,882,439 1.39
FranceEUR 100,000 Agence Francaise de
Developpement RegS0.375% 30/4/2024 102,353 0.02
EUR 300,000 Agence Francaise deDeveloppement RegS1.00% 31/1/2028 320,763 0.08
EUR 600,000 AXA Bank Europe SCF RegS0.125% 14/3/2022 603,990 0.14
EUR 1,000,000 Banque Federative du CreditMutuel RegS 0.75%15/6/2023 1,014,725 0.24
EUR 200,000 Banque Federative du CreditMutuel RegS 0.75%8/6/2026 203,101 0.05
EUR 300,000 Banque Federative du CreditMutuel SA RegS FRN3/6/2020 300,003 0.07
EUR 300,000 Banque Federative du CreditMutuel SA RegS 0.125%5/2/2024 297,962 0.07
EUR 100,000 BNP Paribas SA RegS 1.00%17/4/2024 101,013 0.02
EUR 435,000 BNP Paribas SA RegS 2.375%20/5/2024 472,377 0.11
EUR 200,000 BNP Paribas SA RegS FRN15/7/2025 196,624 0.05
EUR 430,000 BNP Paribas SA RegS 1.625%23/2/2026 464,391 0.11
EUR 300,000 BNP Paribas SA RegS FRN23/1/2027 319,298 0.08
EUR 200,000 BNP Paribas SA RegS FRN17/4/2029 201,157 0.05
EUR 200,000 BNP Paribas SA RegS 1.625%2/7/2031 196,030 0.05
EUR 1,100,000 BNP Paribas SA RegS FRN15/1/2032 1,047,057 0.25
EUR 700,000 BPCE SA RegS 0.625%26/9/2023 707,115 0.17
EUR 400,000 BPCE SA RegS 0.375%5/10/2023 401,070 0.09
EUR 500,000 BPCE SA RegS 1.00%15/7/2024 513,207 0.12
EUR 700,000 BPCE SA RegS 0.125%4/12/2024 692,146 0.16
EUR 200,000 BPCE SA RegS 1.00%1/4/2025 200,594 0.05
EUR 1,000,000 BPCE SFH SA RegS 0.01%23/3/2028 1,010,440 0.24
EUR 200,000 BPCE SFH SA RegS 0.01%27/5/2030 200,577 0.05
EUR 400,000 Bpifrance Financement SARegS 0.125% 25/11/2023 405,366 0.10
EUR 600,000 Caisse Centrale du CreditImmobilier de France RegS0.125% 26/10/2022 605,592 0.14
BlackRock ESG Euro Bond Fund continued
The notes on pages 691 to 711 form an integral part of these financial statements.
BlackRock Strategic Funds[282]

Portfolio of Investments as at 31 May 2020
Holding Description
MarketValue
EUR
% ofNet
Assets
France continuedEUR 500,000 Caisse Centrale du Credit
Immobilier de France SARegS 0.375% 31/7/2020 500,613 0.12
EUR 300,000 Caisse de Refinancement del’Habitat SA RegS 0.25%7/2/2035 305,390 0.07
EUR 300,000 Caisse Francaise deFinancement Local RegS0.625% 26/1/2023 306,981 0.07
EUR 600,000 Caisse Francaise deFinancement Local RegS0.375% 11/5/2024 614,817 0.14
EUR 300,000 Capgemini SE RegS 2.00%15/4/2029 316,670 0.07
EUR 900,000 Capgemini SE RegS 2.375%15/4/2032 975,667 0.23
EUR 600,000 Cie de Financement FoncierSA RegS 0.25% 11/4/2023^ 607,767 0.14
EUR 100,000 Cie de Financement FoncierSA RegS 0.75% 29/5/2026 105,425 0.02
EUR 500,000 Cie de Saint-Gobain RegS0.875% 21/9/2023 501,010 0.12
EUR 200,000 Cie de Saint-Gobain RegS0.625% 15/3/2024 (traded inSupranational) 198,717 0.05
EUR 400,000 Cie de Saint-Gobain RegS0.625% 15/3/2024 (traded inUnited Kingdom) 397,434 0.09
EUR 200,000 Cie de Saint-Gobain RegS2.375% 4/10/2027 213,920 0.05
EUR 2,800,000 Coentreprise de Transportd’Electricite SA RegS0.875% 29/9/2024 2,859,150 0.67
EUR 400,000 Coentreprise de Transportd’Electricite SA RegS2.125% 29/7/2032 446,178 0.10
EUR 200,000 Credit Agricole Assurances SARegS FRN 27/9/2048 233,673 0.05
EUR 1,900,000 Credit Agricole Home LoanSFH SA RegS 0.05%6/12/2029 1,920,282 0.45
EUR 200,000 Credit Agricole Public SectorSCF SA 0.01% 13/9/2028 201,029 0.05
EUR 300,000 Credit Agricole SA RegS0.875% 19/1/2022 303,903 0.07
EUR 700,000 Credit Agricole SA RegS0.75% 5/12/2023 713,247 0.17
EUR 200,000 Credit Agricole SA RegS1.375% 13/3/2025 205,594 0.05
EUR 700,000 Credit Agricole SA RegS FRN22/4/2026 703,402 0.17
EUR 400,000 Credit Agricole SA RegS1.75% 5/3/2029 424,016 0.10
EUR 400,000 Credit Mutuel - CIC HomeLoan SFH RegS 0.25%30/4/2024 407,668 0.10
EUR 100,000 Credit Mutuel Arkea RegS1.375% 17/1/2025 103,879 0.02
EUR 200,000 Danone SA RegS 0.424%3/11/2022 201,090 0.05
EUR 600,000 Dexia Credit Local RegS0.625% 17/1/2026 622,674 0.15
EUR 600,000 Engie SA RegS 4/3/2027 (ZeroCoupon) 580,776 0.14
EUR 300,000 Engie SA RegS 1.75%27/3/2028 323,757 0.08
EUR 200,000 Engie SA RegS 1.375%22/6/2028 210,167 0.05
Holding Description
MarketValue
EUR
% ofNet
Assets
France continuedEUR 400,000 Engie SA RegS 1.25%
24/10/2041 392,862 0.09EUR 100,000 Engie SA RegS FRN
(Perpetual) 98,006 0.02EUR 1,595,000 France Government Bond OAT
RegS 25/2/2023 (ZeroCoupon) 1,618,813 0.38
EUR 3,000,000 France Government Bond OATRegS 4.25% 25/10/2023 3,496,245 0.83
EUR 6,230,000 France Government Bond OATRegS 1.75% 25/11/2024 6,860,196 1.62
EUR 5,870,000 France Government Bond OATRegS 25/3/2025 (ZeroCoupon) 5,995,207 1.41
EUR 415,000 France Government Bond OATRegS 1.00% 25/11/2025 447,036 0.11
EUR 2,760,000 France Government Bond OATRegS 0.50% 25/5/2026 2,902,775 0.68
EUR 1,326,769 France Government Bond OATRegS 0.10% 1/3/2028 1,402,155 0.33
EUR 230,000 France Government Bond OATRegS 25/11/2029 (ZeroCoupon) (traded in France) 231,808 0.05
EUR 1,060,000 France Government Bond OATRegS 25/11/2029 (ZeroCoupon) (traded inGermany) 1,068,332 0.25
EUR 1,090,000 France Government Bond OATRegS 1.50% 25/5/2031 1,270,428 0.30
EUR 691,196 France Government Bond OATRegS 5.75% 25/10/2032 1,177,083 0.28
EUR 3,755,000 France Government Bond OATRegS 0.50% 25/5/2040 3,793,151 0.90
EUR 420,000 France Government Bond OATRegS 4.50% 25/4/2041 760,864 0.18
EUR 1,181,808 French Republic GovernmentBond OAT RegS 0.25%25/11/2020 1,186,252 0.28
EUR 1,534,286 French Republic GovernmentBond OAT RegS 3.00%25/4/2022 1,638,318 0.39
EUR 276,000 French Republic GovernmentBond OAT RegS25/5/2022 (Zero Coupon) 279,048 0.07
EUR 41,877 French Republic GovernmentBond OAT RegS 2.25%25/10/2022 44,725 0.01
EUR 77,445 French Republic GovernmentBond OAT RegS25/3/2023 (Zero Coupon) 78,651 0.02
EUR 490,000 French Republic GovernmentBond OAT RegS 0.50%25/5/2025 513,236 0.12
EUR 258,000 French Republic GovernmentBond OAT RegS 2.75%25/10/2027 316,036 0.07
EUR 235,554 French Republic GovernmentBond OAT RegS 2.50%25/5/2030 296,182 0.07
EUR 1,293,013 French Republic GovernmentBond OAT RegS 1.25%25/5/2034 1,484,463 0.35
EUR 5,047,573 French Republic GovernmentBond OAT RegS 1.75%25/6/2039 6,315,978 1.49
EUR 1,285,000 French Republic GovernmentBond OAT RegS 3.25%25/5/2045 2,091,074 0.49
BlackRock ESG Euro Bond Fund continued
The notes on pages 691 to 711 form an integral part of these financial statements.
Annual report and audited financial statements [283]
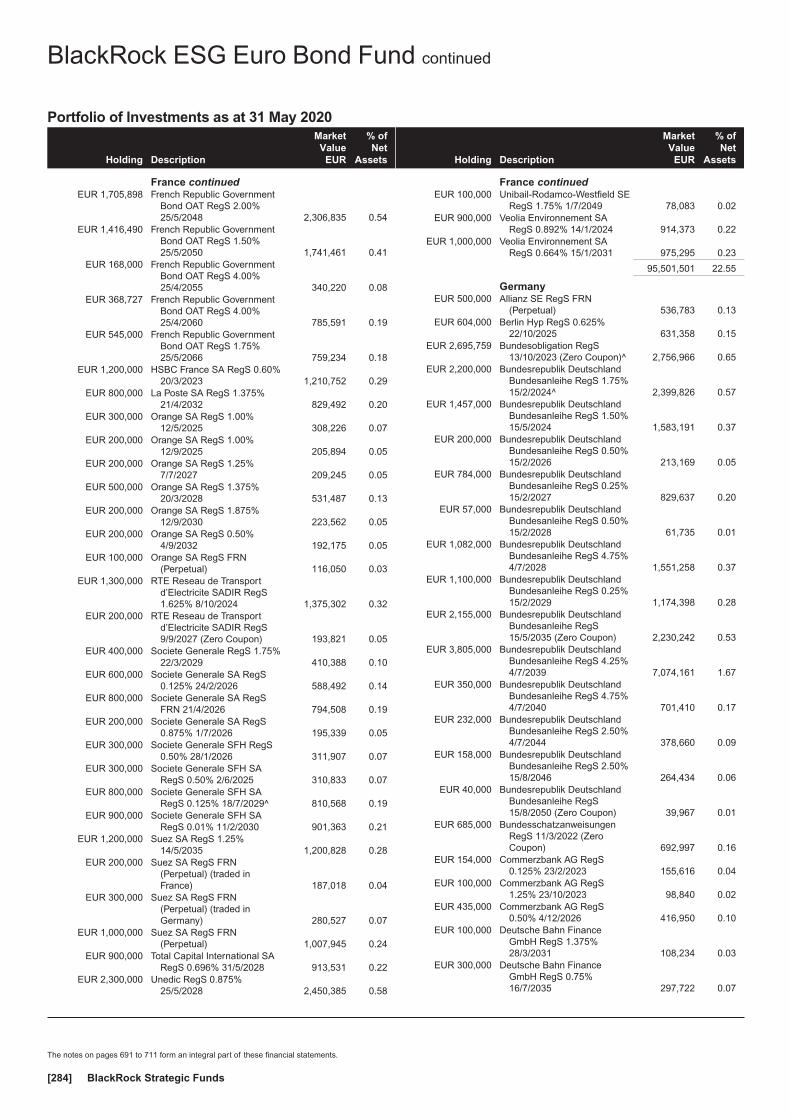
Portfolio of Investments as at 31 May 2020
Holding Description
MarketValue
EUR
% ofNet
Assets
France continuedEUR 1,705,898 French Republic Government
Bond OAT RegS 2.00%25/5/2048 2,306,835 0.54
EUR 1,416,490 French Republic GovernmentBond OAT RegS 1.50%25/5/2050 1,741,461 0.41
EUR 168,000 French Republic GovernmentBond OAT RegS 4.00%25/4/2055 340,220 0.08
EUR 368,727 French Republic GovernmentBond OAT RegS 4.00%25/4/2060 785,591 0.19
EUR 545,000 French Republic GovernmentBond OAT RegS 1.75%25/5/2066 759,234 0.18
EUR 1,200,000 HSBC France SA RegS 0.60%20/3/2023 1,210,752 0.29
EUR 800,000 La Poste SA RegS 1.375%21/4/2032 829,492 0.20
EUR 300,000 Orange SA RegS 1.00%12/5/2025 308,226 0.07
EUR 200,000 Orange SA RegS 1.00%12/9/2025 205,894 0.05
EUR 200,000 Orange SA RegS 1.25%7/7/2027 209,245 0.05
EUR 500,000 Orange SA RegS 1.375%20/3/2028 531,487 0.13
EUR 200,000 Orange SA RegS 1.875%12/9/2030 223,562 0.05
EUR 200,000 Orange SA RegS 0.50%4/9/2032 192,175 0.05
EUR 100,000 Orange SA RegS FRN(Perpetual) 116,050 0.03
EUR 1,300,000 RTE Reseau de Transportd’Electricite SADIR RegS1.625% 8/10/2024 1,375,302 0.32
EUR 200,000 RTE Reseau de Transportd’Electricite SADIR RegS9/9/2027 (Zero Coupon) 193,821 0.05
EUR 400,000 Societe Generale RegS 1.75%22/3/2029 410,388 0.10
EUR 600,000 Societe Generale SA RegS0.125% 24/2/2026 588,492 0.14
EUR 800,000 Societe Generale SA RegSFRN 21/4/2026 794,508 0.19
EUR 200,000 Societe Generale SA RegS0.875% 1/7/2026 195,339 0.05
EUR 300,000 Societe Generale SFH RegS0.50% 28/1/2026 311,907 0.07
EUR 300,000 Societe Generale SFH SARegS 0.50% 2/6/2025 310,833 0.07
EUR 800,000 Societe Generale SFH SARegS 0.125% 18/7/2029^ 810,568 0.19
EUR 900,000 Societe Generale SFH SARegS 0.01% 11/2/2030 901,363 0.21
EUR 1,200,000 Suez SA RegS 1.25%14/5/2035 1,200,828 0.28
EUR 200,000 Suez SA RegS FRN(Perpetual) (traded inFrance) 187,018 0.04
EUR 300,000 Suez SA RegS FRN(Perpetual) (traded inGermany) 280,527 0.07
EUR 1,000,000 Suez SA RegS FRN(Perpetual) 1,007,945 0.24
EUR 900,000 Total Capital International SARegS 0.696% 31/5/2028 913,531 0.22
EUR 2,300,000 Unedic RegS 0.875%25/5/2028 2,450,385 0.58
Holding Description
MarketValue
EUR
% ofNet
Assets
France continuedEUR 100,000 Unibail-Rodamco-Westfield SE
RegS 1.75% 1/7/2049 78,083 0.02EUR 900,000 Veolia Environnement SA
RegS 0.892% 14/1/2024 914,373 0.22EUR 1,000,000 Veolia Environnement SA
RegS 0.664% 15/1/2031 975,295 0.23
95,501,501 22.55
GermanyEUR 500,000 Allianz SE RegS FRN
(Perpetual) 536,783 0.13EUR 604,000 Berlin Hyp RegS 0.625%
22/10/2025 631,358 0.15EUR 2,695,759 Bundesobligation RegS
13/10/2023 (Zero Coupon)^ 2,756,966 0.65EUR 2,200,000 Bundesrepublik Deutschland
Bundesanleihe RegS 1.75%15/2/2024^ 2,399,826 0.57
EUR 1,457,000 Bundesrepublik DeutschlandBundesanleihe RegS 1.50%15/5/2024 1,583,191 0.37
EUR 200,000 Bundesrepublik DeutschlandBundesanleihe RegS 0.50%15/2/2026 213,169 0.05
EUR 784,000 Bundesrepublik DeutschlandBundesanleihe RegS 0.25%15/2/2027 829,637 0.20
EUR 57,000 Bundesrepublik DeutschlandBundesanleihe RegS 0.50%15/2/2028 61,735 0.01
EUR 1,082,000 Bundesrepublik DeutschlandBundesanleihe RegS 4.75%4/7/2028 1,551,258 0.37
EUR 1,100,000 Bundesrepublik DeutschlandBundesanleihe RegS 0.25%15/2/2029 1,174,398 0.28
EUR 2,155,000 Bundesrepublik DeutschlandBundesanleihe RegS15/5/2035 (Zero Coupon) 2,230,242 0.53
EUR 3,805,000 Bundesrepublik DeutschlandBundesanleihe RegS 4.25%4/7/2039 7,074,161 1.67
EUR 350,000 Bundesrepublik DeutschlandBundesanleihe RegS 4.75%4/7/2040 701,410 0.17
EUR 232,000 Bundesrepublik DeutschlandBundesanleihe RegS 2.50%4/7/2044 378,660 0.09
EUR 158,000 Bundesrepublik DeutschlandBundesanleihe RegS 2.50%15/8/2046 264,434 0.06
EUR 40,000 Bundesrepublik DeutschlandBundesanleihe RegS15/8/2050 (Zero Coupon) 39,967 0.01
EUR 685,000 BundesschatzanweisungenRegS 11/3/2022 (ZeroCoupon) 692,997 0.16
EUR 154,000 Commerzbank AG RegS0.125% 23/2/2023 155,616 0.04
EUR 100,000 Commerzbank AG RegS1.25% 23/10/2023 98,840 0.02
EUR 435,000 Commerzbank AG RegS0.50% 4/12/2026 416,950 0.10
EUR 100,000 Deutsche Bahn FinanceGmbH RegS 1.375%28/3/2031 108,234 0.03
EUR 300,000 Deutsche Bahn FinanceGmbH RegS 0.75%16/7/2035 297,722 0.07
BlackRock ESG Euro Bond Fund continued
The notes on pages 691 to 711 form an integral part of these financial statements.
BlackRock Strategic Funds[284]

Portfolio of Investments as at 31 May 2020
Holding Description
MarketValue
EUR
% ofNet
Assets
Germany continuedEUR 175,000 Deutsche Bahn Finance
GmbH RegS 1.375%16/4/2040 188,003 0.04
EUR 1,100,000 Deutsche Pfandbriefbank AG0.10% 21/1/2028 1,119,442 0.26
EUR 300,000 Deutsche Pfandbriefbank AGRegS 0.75% 7/2/2023 297,263 0.07
EUR 500,000 Deutsche Pfandbriefbank AGRegS 0.125% 5/9/2024 479,198 0.11
EUR 80,000 Deutsche Telekom AG RegS1.75% 25/3/2031 86,298 0.02
EUR 543,000 DZ HYP AG RegS 0.50%30/9/2026 566,718 0.13
EUR 720,000 DZ HYP AG RegS 0.01%15/1/2027 729,454 0.17
EUR 154,000 DZ HYP AG RegS 0.875%30/1/2029 167,065 0.04
EUR 100,000 DZ HYP AG RegS 0.875%17/4/2034 110,755 0.03
EUR 300,000 Erste AbwicklungsanstaltRegS 12/6/2020 (ZeroCoupon) 300,029 0.07
EUR 600,000 Eurogrid GmbH RegS 1.625%3/11/2023 624,843 0.15
EUR 300,000 Eurogrid GmbH RegS 1.113%15/5/2032 309,660 0.07
EUR 400,000 FMS Wertmanagement RegS0.375% 29/4/2030 418,654 0.10
EUR 12,000 Kreditanstalt fuerWiederaufbau 0.05%30/5/2024 12,226 0.00
EUR 1,013,000 Kreditanstalt fuerWiederaufbau 0.25%30/6/2025 1,048,014 0.25
EUR 60,000 Kreditanstalt fuerWiederaufbau 0.50%15/9/2027 63,589 0.02
EUR 754,000 Kreditanstalt fuerWiederaufbau RegS30/9/2026 (Zero Coupon) 771,331 0.18
EUR 5,709,000 Kreditanstalt fuerWiederaufbau RegS 0.01%5/5/2027^ 5,842,077 1.38
EUR 1,286,000 Land Berlin RegS 0.125%4/6/2035 1,271,815 0.30
EUR 218,000 Land Berlin RegS 0.625%15/7/2039 232,187 0.06
EUR 303,000 LandesbankBaden-Wuerttemberg RegS0.05% 11/11/2021 304,407 0.07
EUR 600,000 LandesbankBaden-Wuerttemberg RegS0.125% 27/6/2023^ 607,659 0.14
EUR 176,000 LandesbankBaden-Wuerttemberg RegS0.01% 18/9/2028 177,746 0.04
EUR 100,000 LandesbankBaden-Wuerttemberg RegS2.20% 9/5/2029 89,866 0.02
EUR 100,000 LandesbankHessen-ThueringenGirozentrale 0.01%26/9/2029 100,880 0.02
EUR 300,000 LandesbankHessen-ThueringenGirozentrale RegS12/1/2022 (Zero Coupon) 301,380 0.07
EUR 304,000 LandwirtschaftlicheRentenbank RegS 0.05%12/6/2023 307,578 0.07
Holding Description
MarketValue
EUR
% ofNet
Assets
Germany continuedEUR 980,000 Landwirtschaftliche
Rentenbank RegS27/11/2029 (Zero Coupon) 991,113 0.23
EUR 300,000 Merck Financial ServicesGmbH RegS 0.125%16/7/2025 297,756 0.07
EUR 700,000 Merck Financial ServicesGmbH RegS 0.375%5/7/2027 700,577 0.17
EUR 300,000 Merck Financial ServicesGmbH RegS 0.875%5/7/2031 307,337 0.07
EUR 400,000 Muenchener HypothekenbankeG RegS 2.50% 4/7/2028 485,732 0.11
EUR 1,000,000 NRW Bank 15/10/2029 (ZeroCoupon) 1,004,875 0.24
EUR 316,000 NRW Bank RegS 0.875%10/11/2025 334,584 0.08
EUR 248,000 NRW Bank RegS 0.625%2/2/2029 262,571 0.06
EUR 164,000 NRW Bank RegS 0.375%16/5/2029 170,149 0.04
EUR 200,000 Santander Consumer Bank AGRegS 0.05% 14/2/2030 201,233 0.05
EUR 300,000 Santander Consumer BankRegS 0.25% 5/12/2024 305,894 0.07
EUR 1,128,000 State of Hesse RegS25/4/2025 (Zero Coupon) 1,138,722 0.27
EUR 637,000 State of Lower Saxony0.125% 8/4/2027 648,953 0.15
EUR 776,000 State of Lower Saxony RegS0.125% 7/3/2025 788,835 0.19
EUR 840,000 State of NorthRhine-Westphalia GermanyRegS 0.50% 16/2/2027 877,233 0.21
49,241,255 11.62
HungaryEUR 335,000 Hungary Government
International Bond RegS1.625% 28/4/2032 336,675 0.08
336,675 0.08
IcelandEUR 325,000 Iceland Government
International Bond RegS0.10% 20/6/2024 326,433 0.08
326,433 0.08
IrelandEUR 400,000 Abbott Ireland Financing DAC
RegS 0.10% 19/11/2024 395,400 0.09EUR 575,000 CRH SMW Finance DAC
RegS 1.25% 5/11/2026 582,208 0.14EUR 200,000 Eaton Capital Unlimited Co
RegS 0.021% 14/5/2021 199,027 0.05EUR 675,000 Ireland Government Bond
5.40% 13/3/2025 858,138 0.20EUR 300,000 Ireland Government Bond
RegS 3.40% 18/3/2024 342,757 0.08EUR 773,000 Ireland Government Bond
RegS 0.20% 15/5/2027 787,424 0.19EUR 946,000 Ireland Government Bond
RegS 1.35% 18/3/2031 1,061,842 0.25EUR 318,195 Ireland Government Bond
RegS 1.30% 15/5/2033 357,818 0.09EUR 190,000 Ireland Government Bond
RegS 1.70% 15/5/2037 226,832 0.05
BlackRock ESG Euro Bond Fund continued
The notes on pages 691 to 711 form an integral part of these financial statements.
Annual report and audited financial statements [285]

Portfolio of Investments as at 31 May 2020
Holding Description
MarketValue
EUR
% ofNet
Assets
Ireland continuedEUR 65,000 Ireland Government Bond
RegS 2.00% 18/2/2045 85,440 0.02EUR 360,000 Ireland Government Bond
RegS 1.50% 15/5/2050 428,888 0.10
5,325,774 1.26
ItalyEUR 600,000 Cassa Depositi e Prestiti SpA
RegS 0.75% 21/11/2022 600,825 0.14EUR 100,000 Credit Agricole Italia SpA
RegS 1.00% 25/3/2027 107,140 0.03EUR 450,000 Credito Emiliano SpA RegS
1.125% 17/1/2024 466,875 0.11EUR 300,000 Intesa Sanpaolo SpA RegS
0.50% 5/3/2024 306,258 0.07EUR 175,000 Intesa Sanpaolo SpA RegS
0.75% 4/12/2024 168,235 0.04EUR 476,000 Intesa Sanpaolo SpA RegS
1.75% 4/7/2029 460,775 0.11EUR 1,182,000 Italy Buoni Poliennali Del
Tesoro 0.05% 15/4/2021 1,181,421 0.28EUR 207,000 Italy Buoni Poliennali Del
Tesoro 0.35% 1/11/2021 207,318 0.05EUR 4,410,000 Italy Buoni Poliennali Del
Tesoro 2.15% 15/12/2021 4,537,692 1.07EUR 1,900,000 Italy Buoni Poliennali Del
Tesoro 1.35% 15/4/2022 1,935,178 0.46EUR 1,179,000 Italy Buoni Poliennali Del
Tesoro 1.45% 15/9/2022 1,207,443 0.29EUR 131,000 Italy Buoni Poliennali Del
Tesoro 0.95% 1/3/2023 132,658 0.03EUR 768,000 Italy Buoni Poliennali Del
Tesoro 0.65% 15/10/2023 770,177 0.18EUR 1,865,000 Italy Buoni Poliennali Del
Tesoro 2.50% 1/12/2024 1,999,578 0.47EUR 137,000 Italy Buoni Poliennali Del
Tesoro 2.05% 1/8/2027 144,501 0.03EUR 1,259,000 Italy Buoni Poliennali Del
Tesoro RegS 3.75%1/5/2021 1,300,320 0.31
EUR 1,740,383 Italy Buoni Poliennali DelTesoro RegS 0.45%22/5/2023 1,724,719 0.41
EUR 1,407,394 Italy Buoni Poliennali DelTesoro RegS 0.25%20/11/2023 1,379,366 0.33
EUR 575,000 Italy Buoni Poliennali DelTesoro RegS 1.75%1/7/2024 597,566 0.14
EUR 4,072,000 Italy Buoni Poliennali DelTesoro RegS 1.45%15/11/2024 4,182,942 0.99
EUR 825,000 Italy Buoni Poliennali DelTesoro RegS 0.35%1/2/2025 805,769 0.19
EUR 1,239,000 Italy Buoni Poliennali DelTesoro RegS 1.45%15/5/2025 (traded inGermany) 1,269,579 0.30
EUR 1,013,000 Italy Buoni Poliennali DelTesoro RegS 1.45%15/5/2025 (traded in Italy) 1,038,001 0.24
EUR 1,675,000 Italy Buoni Poliennali DelTesoro RegS 4.50%1/3/2026 1,995,829 0.47
EUR 600,000 Italy Buoni Poliennali DelTesoro RegS 2.00%1/2/2028 631,233 0.15
Holding Description
MarketValue
EUR
% ofNet
Assets
Italy continuedEUR 4,594,675 Italy Buoni Poliennali Del
Tesoro RegS 1.30%15/5/2028 4,650,960 1.10
EUR 3,788,000 Italy Buoni Poliennali DelTesoro RegS 4.75%1/9/2028 4,788,240 1.13
EUR 1,505,000 Italy Buoni Poliennali DelTesoro RegS 3.00%1/8/2029^ 1,709,560 0.40
EUR 1,075,000 Italy Buoni Poliennali DelTesoro RegS 3.50%1/3/2030 1,271,386 0.30
EUR 350,000 Italy Buoni Poliennali DelTesoro RegS 1.35%1/4/2030 346,801 0.08
EUR 1,980,000 Italy Buoni Poliennali DelTesoro RegS 1.65%1/3/2032 1,993,276 0.47
EUR 1,875,000 Italy Buoni Poliennali DelTesoro RegS 2.45%1/9/2033 2,032,566 0.48
EUR 845,000 Italy Buoni Poliennali DelTesoro RegS 3.35%1/3/2035 1,005,474 0.24
EUR 248,000 Italy Buoni Poliennali DelTesoro RegS 2.25%1/9/2036 259,962 0.06
EUR 1,559,000 Italy Buoni Poliennali DelTesoro RegS 2.95%1/9/2038 1,770,369 0.42
EUR 1,040,000 Italy Buoni Poliennali DelTesoro RegS 5.00%1/8/2039 1,512,098 0.36
EUR 1,295,000 Italy Buoni Poliennali DelTesoro RegS 3.10%1/3/2040 1,496,774 0.35
EUR 240,000 Italy Buoni Poliennali DelTesoro RegS 5.00%1/9/2040 350,147 0.08
EUR 425,000 Italy Buoni Poliennali DelTesoro RegS 4.75%1/9/2044 615,532 0.15
EUR 1,024,000 Italy Buoni Poliennali DelTesoro RegS 3.25%1/9/2046 1,207,977 0.29
EUR 214,000 Italy Buoni Poliennali DelTesoro RegS 2.70%1/3/2047 230,982 0.05
EUR 1,080,000 Italy Buoni Poliennali DelTesoro RegS 3.45%1/3/2048 1,318,928 0.31
EUR 957,000 Italy Buoni Poliennali DelTesoro RegS 3.85%1/9/2049 1,249,426 0.29
EUR 305,000 Italy Buoni Poliennali DelTesoro RegS 2.45%1/9/2050 310,912 0.07
EUR 58,000 Italy Buoni Poliennali DelTesoro RegS 2.80%1/3/2067 62,332 0.01
EUR 200,000 UniCredit SpA RegS FRN25/6/2025 195,836 0.05
EUR 485,000 UniCredit SpA RegS FRN23/9/2029 432,989 0.10
57,963,925 13.68
BlackRock ESG Euro Bond Fund continued
The notes on pages 691 to 711 form an integral part of these financial statements.
BlackRock Strategic Funds[286]
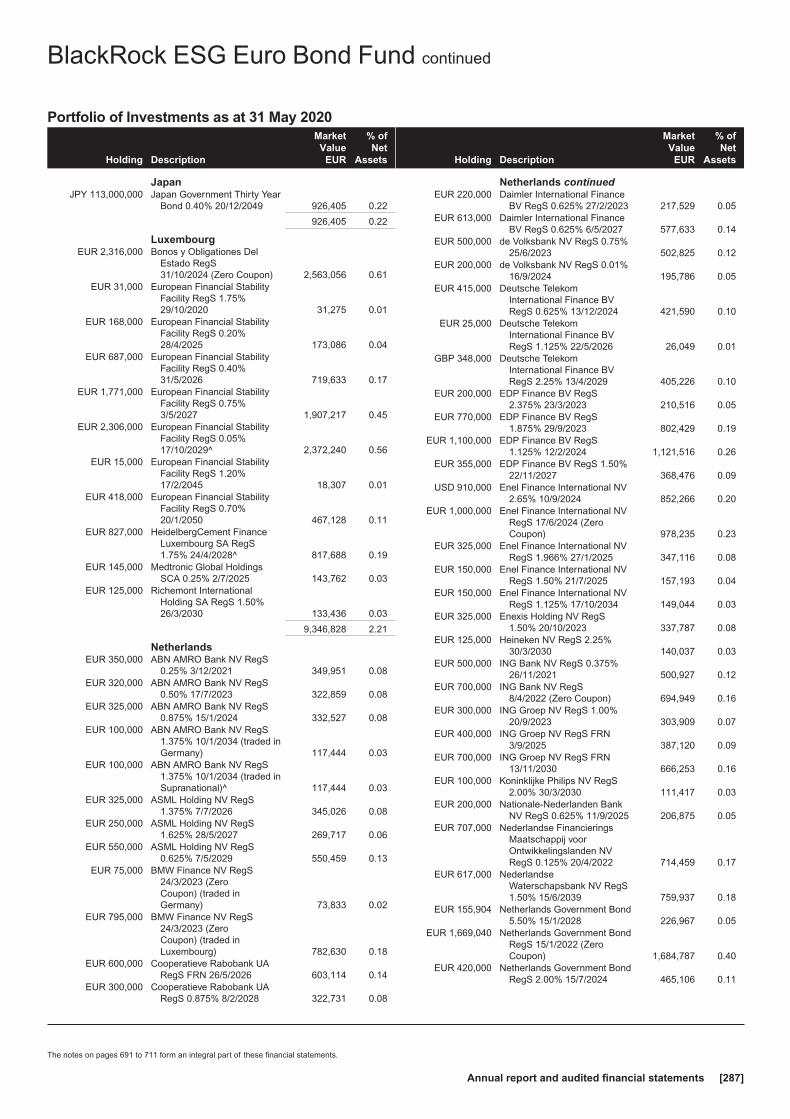
Portfolio of Investments as at 31 May 2020
Holding Description
MarketValue
EUR
% ofNet
Assets
JapanJPY 113,000,000 Japan Government Thirty Year
Bond 0.40% 20/12/2049 926,405 0.22
926,405 0.22
LuxembourgEUR 2,316,000 Bonos y Obligationes Del
Estado RegS31/10/2024 (Zero Coupon) 2,563,056 0.61
EUR 31,000 European Financial StabilityFacility RegS 1.75%29/10/2020 31,275 0.01
EUR 168,000 European Financial StabilityFacility RegS 0.20%28/4/2025 173,086 0.04
EUR 687,000 European Financial StabilityFacility RegS 0.40%31/5/2026 719,633 0.17
EUR 1,771,000 European Financial StabilityFacility RegS 0.75%3/5/2027 1,907,217 0.45
EUR 2,306,000 European Financial StabilityFacility RegS 0.05%17/10/2029^ 2,372,240 0.56
EUR 15,000 European Financial StabilityFacility RegS 1.20%17/2/2045 18,307 0.01
EUR 418,000 European Financial StabilityFacility RegS 0.70%20/1/2050 467,128 0.11
EUR 827,000 HeidelbergCement FinanceLuxembourg SA RegS1.75% 24/4/2028^ 817,688 0.19
EUR 145,000 Medtronic Global HoldingsSCA 0.25% 2/7/2025 143,762 0.03
EUR 125,000 Richemont InternationalHolding SA RegS 1.50%26/3/2030 133,436 0.03
9,346,828 2.21
NetherlandsEUR 350,000 ABN AMRO Bank NV RegS
0.25% 3/12/2021 349,951 0.08EUR 320,000 ABN AMRO Bank NV RegS
0.50% 17/7/2023 322,859 0.08EUR 325,000 ABN AMRO Bank NV RegS
0.875% 15/1/2024 332,527 0.08EUR 100,000 ABN AMRO Bank NV RegS
1.375% 10/1/2034 (traded inGermany) 117,444 0.03
EUR 100,000 ABN AMRO Bank NV RegS1.375% 10/1/2034 (traded inSupranational)^ 117,444 0.03
EUR 325,000 ASML Holding NV RegS1.375% 7/7/2026 345,026 0.08
EUR 250,000 ASML Holding NV RegS1.625% 28/5/2027 269,717 0.06
EUR 550,000 ASML Holding NV RegS0.625% 7/5/2029 550,459 0.13
EUR 75,000 BMW Finance NV RegS24/3/2023 (ZeroCoupon) (traded inGermany) 73,833 0.02
EUR 795,000 BMW Finance NV RegS24/3/2023 (ZeroCoupon) (traded inLuxembourg) 782,630 0.18
EUR 600,000 Cooperatieve Rabobank UARegS FRN 26/5/2026 603,114 0.14
EUR 300,000 Cooperatieve Rabobank UARegS 0.875% 8/2/2028 322,731 0.08
Holding Description
MarketValue
EUR
% ofNet
Assets
Netherlands continuedEUR 220,000 Daimler International Finance
BV RegS 0.625% 27/2/2023 217,529 0.05EUR 613,000 Daimler International Finance
BV RegS 0.625% 6/5/2027 577,633 0.14EUR 500,000 de Volksbank NV RegS 0.75%
25/6/2023 502,825 0.12EUR 200,000 de Volksbank NV RegS 0.01%
16/9/2024 195,786 0.05EUR 415,000 Deutsche Telekom
International Finance BVRegS 0.625% 13/12/2024 421,590 0.10
EUR 25,000 Deutsche TelekomInternational Finance BVRegS 1.125% 22/5/2026 26,049 0.01
GBP 348,000 Deutsche TelekomInternational Finance BVRegS 2.25% 13/4/2029 405,226 0.10
EUR 200,000 EDP Finance BV RegS2.375% 23/3/2023 210,516 0.05
EUR 770,000 EDP Finance BV RegS1.875% 29/9/2023 802,429 0.19
EUR 1,100,000 EDP Finance BV RegS1.125% 12/2/2024 1,121,516 0.26
EUR 355,000 EDP Finance BV RegS 1.50%22/11/2027 368,476 0.09
USD 910,000 Enel Finance International NV2.65% 10/9/2024 852,266 0.20
EUR 1,000,000 Enel Finance International NVRegS 17/6/2024 (ZeroCoupon) 978,235 0.23
EUR 325,000 Enel Finance International NVRegS 1.966% 27/1/2025 347,116 0.08
EUR 150,000 Enel Finance International NVRegS 1.50% 21/7/2025 157,193 0.04
EUR 150,000 Enel Finance International NVRegS 1.125% 17/10/2034 149,044 0.03
EUR 325,000 Enexis Holding NV RegS1.50% 20/10/2023 337,787 0.08
EUR 125,000 Heineken NV RegS 2.25%30/3/2030 140,037 0.03
EUR 500,000 ING Bank NV RegS 0.375%26/11/2021 500,927 0.12
EUR 700,000 ING Bank NV RegS8/4/2022 (Zero Coupon) 694,949 0.16
EUR 300,000 ING Groep NV RegS 1.00%20/9/2023 303,909 0.07
EUR 400,000 ING Groep NV RegS FRN3/9/2025 387,120 0.09
EUR 700,000 ING Groep NV RegS FRN13/11/2030 666,253 0.16
EUR 100,000 Koninklijke Philips NV RegS2.00% 30/3/2030 111,417 0.03
EUR 200,000 Nationale-Nederlanden BankNV RegS 0.625% 11/9/2025 206,875 0.05
EUR 707,000 Nederlandse FinancieringsMaatschappij voorOntwikkelingslanden NVRegS 0.125% 20/4/2022 714,459 0.17
EUR 617,000 NederlandseWaterschapsbank NV RegS1.50% 15/6/2039 759,937 0.18
EUR 155,904 Netherlands Government Bond5.50% 15/1/2028 226,967 0.05
EUR 1,669,040 Netherlands Government BondRegS 15/1/2022 (ZeroCoupon) 1,684,787 0.40
EUR 420,000 Netherlands Government BondRegS 2.00% 15/7/2024 465,106 0.11
BlackRock ESG Euro Bond Fund continued
The notes on pages 691 to 711 form an integral part of these financial statements.
Annual report and audited financial statements [287]

Portfolio of Investments as at 31 May 2020
Holding Description
MarketValue
EUR
% ofNet
Assets
Netherlands continuedEUR 356,422 Netherlands Government Bond
RegS 0.25% 15/7/2025 370,850 0.09EUR 1,205,845 Netherlands Government Bond
RegS 0.50% 15/7/2026 1,278,166 0.30EUR 184,050 Netherlands Government Bond
RegS 0.75% 15/7/2027 199,625 0.05EUR 835,000 Netherlands Government Bond
RegS 0.25% 15/7/2029 877,990 0.21EUR 1,070,000 Netherlands Government Bond
RegS 15/7/2030 (ZeroCoupon) 1,096,991 0.26
EUR 525,000 Netherlands Government BondRegS 2.50% 15/1/2033 703,907 0.17
EUR 1,197,000 Netherlands Government BondRegS 0.50% 15/1/2040 1,316,323 0.31
EUR 150,000 Netherlands Government BondRegS 3.75% 15/1/2042 271,673 0.06
EUR 692,000 Netherlands Government BondRegS 2.75% 15/1/2047 1,186,271 0.28
EUR 100,000 NN Group NV RegS FRN8/4/2044 109,151 0.03
EUR 600,000 SiemensFinancieringsmaatschappijNV RegS 20/2/2023 (ZeroCoupon) 598,503 0.14
EUR 400,000 SiemensFinancieringsmaatschappijNV RegS 0.375% 5/6/2026 400,922 0.09
EUR 227,000 SiemensFinancieringsmaatschappijNV RegS 0.90% 28/2/2028 235,073 0.05
EUR 100,000 Telefonica Europe BV RegSFRN (Perpetual) 97,804 0.02
EUR 100,000 TenneT Holding BV RegS0.875% 3/6/2030 103,142 0.02
EUR 600,000 Vonovia Finance BV RegS1.80% 29/6/2025 626,370 0.15
EUR 100,000 Vonovia Finance BV RegS2.25% 7/4/2030 108,860 0.03
EUR 200,000 Vonovia Finance BV RegS1.125% 14/9/2034 187,143 0.04
28,490,458 6.73
New ZealandEUR 495,000 ANZ New Zealand
International Ltd RegS0.125% 22/9/2023 497,641 0.12
EUR 807,000 Chorus Ltd RegS 1.125%18/10/2023 819,480 0.19
EUR 600,000 Chorus Ltd RegS 0.875%5/12/2026 591,375 0.14
1,908,496 0.45
NorwayEUR 1,400,000 DNB Bank ASA RegS 0.05%
14/11/2023 1,386,959 0.33EUR 375,000 DNB Bank ASA RegS 0.25%
9/4/2024 374,237 0.09EUR 1,452,000 DNB Boligkreditt AS RegS
0.625% 19/6/2025 1,511,278 0.36EUR 873,000 SpareBank 1 Boligkreditt RegS
0.50% 30/1/2025 900,124 0.21EUR 150,000 Telenor ASA RegS
25/9/2023 (Zero Coupon) 148,782 0.03EUR 330,000 Telenor ASA RegS 2.50%
22/5/2025 363,911 0.09
4,685,291 1.11
Holding Description
MarketValue
EUR
% ofNet
Assets
PolandEUR 300,000 mBank Hipoteczny SA RegS
1.073% 5/3/2025 313,356 0.07EUR 633,000 Republic of Poland
Government InternationalBond RegS 0.50%20/12/2021 639,033 0.15
EUR 98,000 Republic of PolandGovernment InternationalBond RegS 1.00%25/10/2028 103,053 0.03
1,055,442 0.25
PortugalEUR 300,000 Banco Santander Totta SA
RegS 1.25% 26/9/2027 327,992 0.08EUR 200,000 EDP - Energias de Portugal
SA RegS 1.625% 15/4/2027 209,404 0.05EUR 300,000 EDP - Energias de Portugal
SA RegS FRN 30/4/2079 316,037 0.07EUR 300,000 EDP - Energias de Portugal
SA RegS FRN 20/7/2080 276,063 0.06EUR 435,000 Portugal Obrigacoes do
Tesouro OT RegS 4.95%25/10/2023 513,256 0.12
EUR 885,000 Portugal Obrigacoes doTesouro OT RegS 5.65%15/2/2024 1,080,744 0.25
EUR 285,000 Portugal Obrigacoes doTesouro OT RegS 2.875%15/10/2025 329,423 0.08
EUR 329,737 Portugal Obrigacoes doTesouro OT RegS 4.125%14/4/2027 418,888 0.10
EUR 557,064 Portugal Obrigacoes doTesouro OT RegS 0.70%15/10/2027 575,706 0.14
EUR 172,000 Portugal Obrigacoes doTesouro OT RegS 2.125%17/10/2028 197,542 0.05
EUR 671,000 Portugal Obrigacoes doTesouro OT RegS 1.95%15/6/2029 763,393 0.18
EUR 646,000 Portugal Obrigacoes doTesouro OT RegS 0.475%18/10/2030 644,963 0.15
EUR 445,000 Portugal Obrigacoes doTesouro OT RegS 4.10%15/4/2037 664,040 0.16
EUR 147,400 Portugal Obrigacoes doTesouro OT RegS 4.10%15/2/2045^ 234,782 0.06
6,552,233 1.55
RomaniaEUR 275,000 Romanian Government
International Bond RegS3.624% 26/5/2030 290,125 0.07
EUR 500,000 Romanian GovernmentInternational Bond RegS2.00% 28/1/2032 452,758 0.10
742,883 0.17
SingaporeEUR 516,000 Oversea-Chinese Banking
Corp Ltd RegS 0.625%18/4/2025 532,448 0.12
532,448 0.12
BlackRock ESG Euro Bond Fund continued
The notes on pages 691 to 711 form an integral part of these financial statements.
BlackRock Strategic Funds[288]
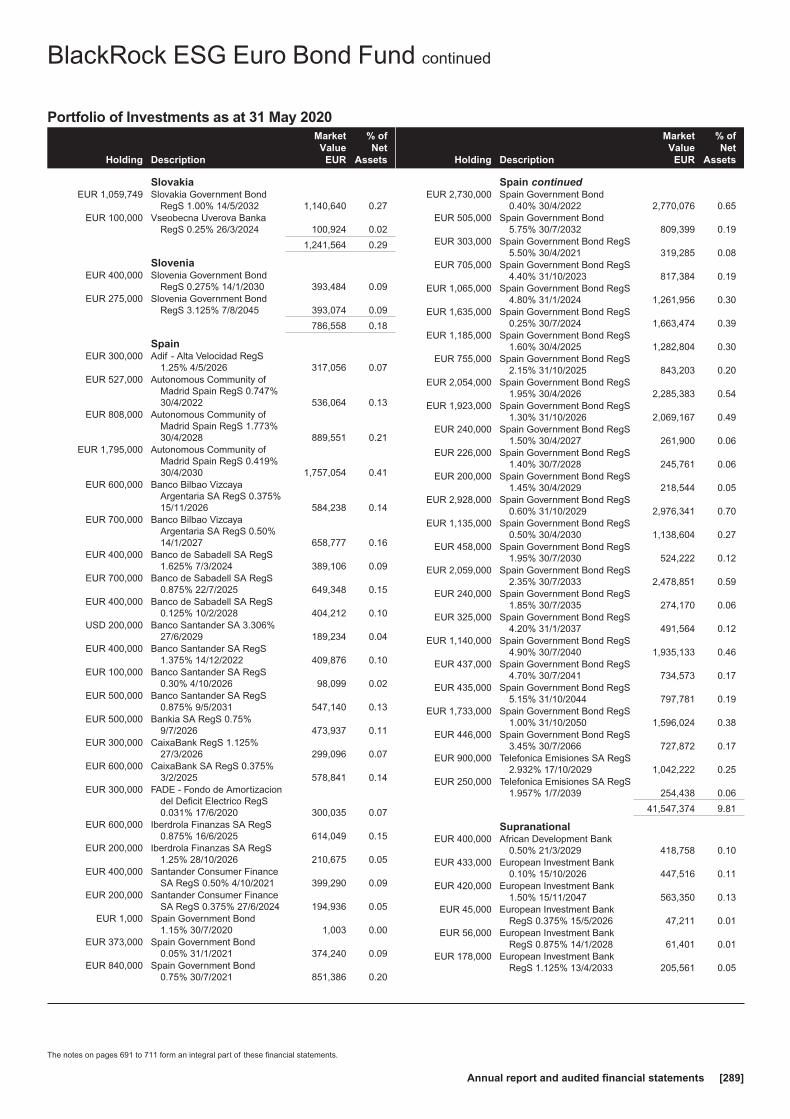
Portfolio of Investments as at 31 May 2020
Holding Description
MarketValue
EUR
% ofNet
Assets
SlovakiaEUR 1,059,749 Slovakia Government Bond
RegS 1.00% 14/5/2032 1,140,640 0.27EUR 100,000 Vseobecna Uverova Banka
RegS 0.25% 26/3/2024 100,924 0.02
1,241,564 0.29
SloveniaEUR 400,000 Slovenia Government Bond
RegS 0.275% 14/1/2030 393,484 0.09EUR 275,000 Slovenia Government Bond
RegS 3.125% 7/8/2045 393,074 0.09
786,558 0.18
SpainEUR 300,000 Adif - Alta Velocidad RegS
1.25% 4/5/2026 317,056 0.07EUR 527,000 Autonomous Community of
Madrid Spain RegS 0.747%30/4/2022 536,064 0.13
EUR 808,000 Autonomous Community ofMadrid Spain RegS 1.773%30/4/2028 889,551 0.21
EUR 1,795,000 Autonomous Community ofMadrid Spain RegS 0.419%30/4/2030 1,757,054 0.41
EUR 600,000 Banco Bilbao VizcayaArgentaria SA RegS 0.375%15/11/2026 584,238 0.14
EUR 700,000 Banco Bilbao VizcayaArgentaria SA RegS 0.50%14/1/2027 658,777 0.16
EUR 400,000 Banco de Sabadell SA RegS1.625% 7/3/2024 389,106 0.09
EUR 700,000 Banco de Sabadell SA RegS0.875% 22/7/2025 649,348 0.15
EUR 400,000 Banco de Sabadell SA RegS0.125% 10/2/2028 404,212 0.10
USD 200,000 Banco Santander SA 3.306%27/6/2029 189,234 0.04
EUR 400,000 Banco Santander SA RegS1.375% 14/12/2022 409,876 0.10
EUR 100,000 Banco Santander SA RegS0.30% 4/10/2026 98,099 0.02
EUR 500,000 Banco Santander SA RegS0.875% 9/5/2031 547,140 0.13
EUR 500,000 Bankia SA RegS 0.75%9/7/2026 473,937 0.11
EUR 300,000 CaixaBank RegS 1.125%27/3/2026 299,096 0.07
EUR 600,000 CaixaBank SA RegS 0.375%3/2/2025 578,841 0.14
EUR 300,000 FADE - Fondo de Amortizaciondel Deficit Electrico RegS0.031% 17/6/2020 300,035 0.07
EUR 600,000 Iberdrola Finanzas SA RegS0.875% 16/6/2025 614,049 0.15
EUR 200,000 Iberdrola Finanzas SA RegS1.25% 28/10/2026 210,675 0.05
EUR 400,000 Santander Consumer FinanceSA RegS 0.50% 4/10/2021 399,290 0.09
EUR 200,000 Santander Consumer FinanceSA RegS 0.375% 27/6/2024 194,936 0.05
EUR 1,000 Spain Government Bond1.15% 30/7/2020 1,003 0.00
EUR 373,000 Spain Government Bond0.05% 31/1/2021 374,240 0.09
EUR 840,000 Spain Government Bond0.75% 30/7/2021 851,386 0.20
Holding Description
MarketValue
EUR
% ofNet
Assets
Spain continuedEUR 2,730,000 Spain Government Bond
0.40% 30/4/2022 2,770,076 0.65EUR 505,000 Spain Government Bond
5.75% 30/7/2032 809,399 0.19EUR 303,000 Spain Government Bond RegS
5.50% 30/4/2021 319,285 0.08EUR 705,000 Spain Government Bond RegS
4.40% 31/10/2023 817,384 0.19EUR 1,065,000 Spain Government Bond RegS
4.80% 31/1/2024 1,261,956 0.30EUR 1,635,000 Spain Government Bond RegS
0.25% 30/7/2024 1,663,474 0.39EUR 1,185,000 Spain Government Bond RegS
1.60% 30/4/2025 1,282,804 0.30EUR 755,000 Spain Government Bond RegS
2.15% 31/10/2025 843,203 0.20EUR 2,054,000 Spain Government Bond RegS
1.95% 30/4/2026 2,285,383 0.54EUR 1,923,000 Spain Government Bond RegS
1.30% 31/10/2026 2,069,167 0.49EUR 240,000 Spain Government Bond RegS
1.50% 30/4/2027 261,900 0.06EUR 226,000 Spain Government Bond RegS
1.40% 30/7/2028 245,761 0.06EUR 200,000 Spain Government Bond RegS
1.45% 30/4/2029 218,544 0.05EUR 2,928,000 Spain Government Bond RegS
0.60% 31/10/2029 2,976,341 0.70EUR 1,135,000 Spain Government Bond RegS
0.50% 30/4/2030 1,138,604 0.27EUR 458,000 Spain Government Bond RegS
1.95% 30/7/2030 524,222 0.12EUR 2,059,000 Spain Government Bond RegS
2.35% 30/7/2033 2,478,851 0.59EUR 240,000 Spain Government Bond RegS
1.85% 30/7/2035 274,170 0.06EUR 325,000 Spain Government Bond RegS
4.20% 31/1/2037 491,564 0.12EUR 1,140,000 Spain Government Bond RegS
4.90% 30/7/2040 1,935,133 0.46EUR 437,000 Spain Government Bond RegS
4.70% 30/7/2041 734,573 0.17EUR 435,000 Spain Government Bond RegS
5.15% 31/10/2044 797,781 0.19EUR 1,733,000 Spain Government Bond RegS
1.00% 31/10/2050 1,596,024 0.38EUR 446,000 Spain Government Bond RegS
3.45% 30/7/2066 727,872 0.17EUR 900,000 Telefonica Emisiones SA RegS
2.932% 17/10/2029 1,042,222 0.25EUR 250,000 Telefonica Emisiones SA RegS
1.957% 1/7/2039 254,438 0.06
41,547,374 9.81
SupranationalEUR 400,000 African Development Bank
0.50% 21/3/2029 418,758 0.10EUR 433,000 European Investment Bank
0.10% 15/10/2026 447,516 0.11EUR 420,000 European Investment Bank
1.50% 15/11/2047 563,350 0.13EUR 45,000 European Investment Bank
RegS 0.375% 15/5/2026 47,211 0.01EUR 56,000 European Investment Bank
RegS 0.875% 14/1/2028 61,401 0.01EUR 178,000 European Investment Bank
RegS 1.125% 13/4/2033 205,561 0.05
BlackRock ESG Euro Bond Fund continued
The notes on pages 691 to 711 form an integral part of these financial statements.
Annual report and audited financial statements [289]

Portfolio of Investments as at 31 May 2020
Holding Description
MarketValue
EUR
% ofNet
Assets
Supranational continuedEUR 655,000 European Investment Bank
RegS 1.00% 14/11/2042 785,892 0.19EUR 343,000 European Stability Mechanism
RegS 17/1/2022 (ZeroCoupon) 345,399 0.08
EUR 222,000 European Stability MechanismRegS 0.10% 31/7/2023 225,705 0.05
EUR 5,200,000 European Stability MechanismRegS 14/3/2025 (ZeroCoupon) 5,298,514 1.25
EUR 114,000 European Stability MechanismRegS 0.75% 15/3/2027 122,194 0.03
EUR 86,000 European Union RegS 0.50%4/4/2025 89,459 0.02
EUR 27,000 European Union RegS 1.375%4/10/2029 30,813 0.01
EUR 29,000 European Union RegS 0.75%4/4/2031 31,515 0.01
EUR 93,000 European Union RegS 1.25%4/4/2033 107,536 0.03
EUR 500,000 International Bank forReconstruction &Development 0.625%22/11/2027^ 528,244 0.12
9,309,068 2.20
SwedenEUR 100,000 Lansforsakringar Hypotek AB
RegS 0.625% 29/1/2026 104,130 0.02EUR 520,000 Skandinaviska Enskilda
Banken AB RegS 0.05%1/7/2024 (traded inGermany) 515,174 0.12
EUR 425,000 Skandinaviska EnskildaBanken AB RegS 0.05%1/7/2024 (traded inSupranational) 421,056 0.10
EUR 325,000 Svenska Handelsbanken ABRegS 0.375% 3/7/2023 327,468 0.08
EUR 200,000 Svenska Handelsbanken ABRegS 0.125%18/6/2024 (traded inGermany) 199,514 0.05
EUR 645,000 Svenska Handelsbanken ABRegS 0.125%18/6/2024 (traded inSupranational) 643,433 0.15
2,210,775 0.52
SwitzerlandEUR 160,000 Credit Suisse AG RegS
1.375% 31/1/2022 163,008 0.04EUR 630,000 Credit Suisse AG RegS 1.00%
7/6/2023 643,013 0.15EUR 460,000 Credit Suisse AG RegS FRN
18/9/2025 465,784 0.11EUR 230,000 Credit Suisse Group AG RegS
FRN 17/7/2025 230,682 0.05EUR 1,100,000 Credit Suisse Group AG RegS
FRN 24/6/2027 1,079,056 0.25EUR 600,000 Credit Suisse Group AG RegS
FRN 14/1/2028 572,196 0.14EUR 325,000 UBS AG RegS FRN 12/2/2026 332,202 0.08EUR 227,000 UBS AG/London RegS 0.25%
10/1/2022 227,052 0.05EUR 300,000 UBS AG/London RegS 0.625%
23/1/2023 302,739 0.07EUR 200,000 UBS Group AG RegS FRN
29/1/2026 194,090 0.05
4,209,822 0.99
Holding Description
MarketValue
EUR
% ofNet
Assets
United KingdomEUR 700,000 Barclays Plc RegS FRN
24/1/2026 697,861 0.16EUR 200,000 BP Capital Markets Plc RegS
0.90% 3/7/2024 200,127 0.05EUR 100,000 BP Capital Markets Plc RegS
1.573% 16/2/2027 102,202 0.02EUR 150,000 BP Capital Markets Plc RegS
1.231% 8/5/2031 145,911 0.03EUR 795,000 British Telecommunications Plc
RegS 1.00% 21/11/2024 799,281 0.19EUR 325,000 Centrica Plc RegS FRN
10/4/2076 316,852 0.07GBP 648,000 Crh Finance UK Plc RegS
4.125% 2/12/2029 825,672 0.19EUR 800,000 Diageo Finance Plc RegS
0.125% 12/10/2023 792,580 0.19EUR 575,000 Diageo Finance Plc RegS
2.50% 27/3/2032 670,637 0.16EUR 250,000 GlaxoSmithKline Capital Plc
RegS 23/9/2023 (ZeroCoupon) 248,529 0.06
EUR 206,000 GlaxoSmithKline Capital PlcRegS 1.375% 2/12/2024 216,585 0.05
EUR 625,000 GlaxoSmithKline Capital PlcRegS 1.25% 21/5/2026 658,738 0.16
EUR 125,000 Lloyds Bank Plc RegS 0.25%25/3/2024 126,959 0.03
EUR 400,000 Lloyds Bank Plc RegS 0.625%26/3/2025 414,712 0.10
EUR 900,000 Mondi Finance Plc RegS1.625% 27/4/2026 912,739 0.22
EUR 253,000 Nationwide Building SocietyRegS 2.25% 25/6/2029 301,348 0.07
EUR 125,000 Santander UK Plc 0.10%12/5/2024 125,853 0.03
EUR 625,000 Santander UK Plc RegS0.05% 12/1/2027 626,553 0.15
EUR 325,000 Sky Ltd RegS 1.50%15/9/2021 329,578 0.08
EUR 452,000 Sky Ltd RegS 1.875%24/11/2023 473,768 0.11
EUR 327,000 Sky Ltd RegS 2.25%17/11/2025 356,402 0.08
EUR 100,000 Sky Ltd RegS 2.50%15/9/2026 111,584 0.03
EUR 200,000 Swiss Re Finance UK PlcRegS FRN 4/6/2052 204,443 0.05
9,658,914 2.28
United StatesEUR 275,000 Air Products and Chemicals
Inc 0.80% 5/5/2032 275,041 0.06EUR 325,000 AT&T Inc 2.60% 19/5/2038 338,015 0.08EUR 200,000 Bank of America Corp RegS
FRN 9/5/2030 204,449 0.05EUR 190,000 Chubb INA Holdings Inc 1.40%
15/6/2031 191,838 0.05EUR 600,000 Citigroup Inc RegS FRN
6/7/2026 606,792 0.14EUR 300,000 Coca-Cola Co 0.75%
22/9/2026 307,857 0.07EUR 225,000 Comcast Corp 0.75%
20/2/2032 218,129 0.05EUR 100,000 Danaher Corp 2.50%
30/3/2030 113,260 0.03EUR 200,000 Eli Lilly and Co 1.70%
1/11/2049 204,986 0.05EUR 1,420,000 Fiserv Inc 0.375% 1/7/2023 1,407,488 0.33EUR 1,139,000 Fiserv Inc 1.125% 1/7/2027 1,144,387 0.27
BlackRock ESG Euro Bond Fund continued
The notes on pages 691 to 711 form an integral part of these financial statements.
BlackRock Strategic Funds[290]
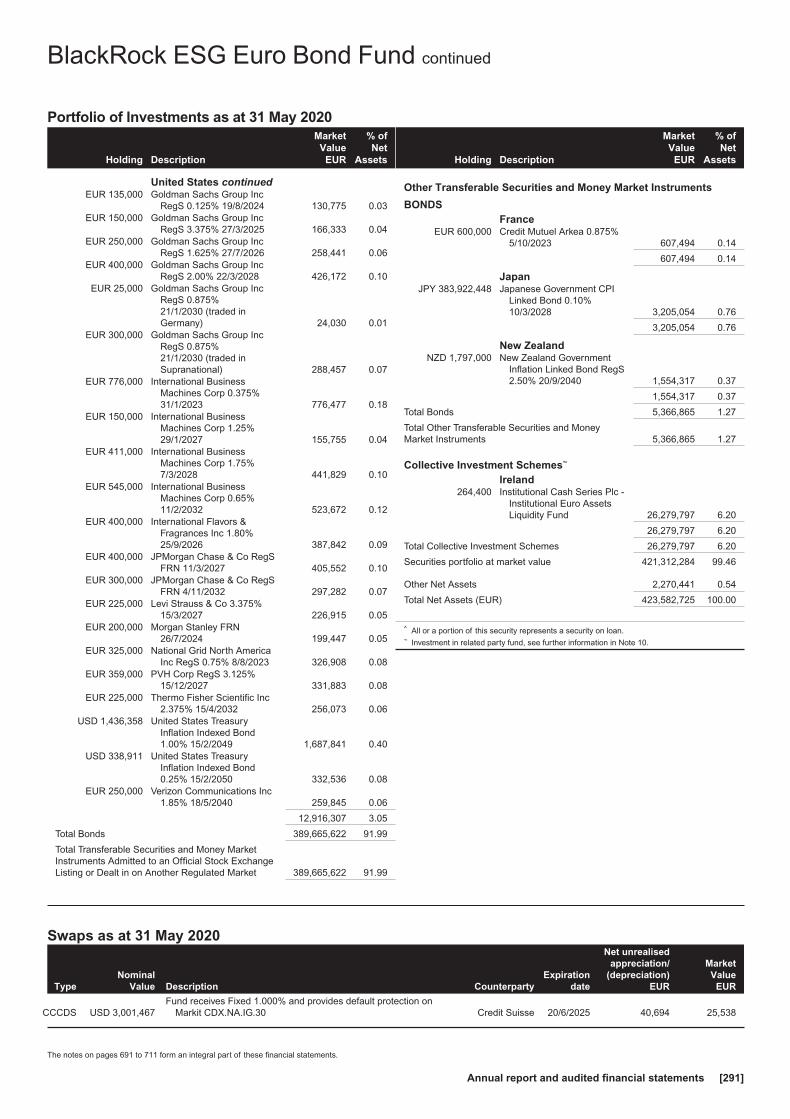
Portfolio of Investments as at 31 May 2020
Holding Description
MarketValue
EUR
% ofNet
Assets
United States continuedEUR 135,000 Goldman Sachs Group Inc
RegS 0.125% 19/8/2024 130,775 0.03EUR 150,000 Goldman Sachs Group Inc
RegS 3.375% 27/3/2025 166,333 0.04EUR 250,000 Goldman Sachs Group Inc
RegS 1.625% 27/7/2026 258,441 0.06EUR 400,000 Goldman Sachs Group Inc
RegS 2.00% 22/3/2028 426,172 0.10EUR 25,000 Goldman Sachs Group Inc
RegS 0.875%21/1/2030 (traded inGermany) 24,030 0.01
EUR 300,000 Goldman Sachs Group IncRegS 0.875%21/1/2030 (traded inSupranational) 288,457 0.07
EUR 776,000 International BusinessMachines Corp 0.375%31/1/2023 776,477 0.18
EUR 150,000 International BusinessMachines Corp 1.25%29/1/2027 155,755 0.04
EUR 411,000 International BusinessMachines Corp 1.75%7/3/2028 441,829 0.10
EUR 545,000 International BusinessMachines Corp 0.65%11/2/2032 523,672 0.12
EUR 400,000 International Flavors &Fragrances Inc 1.80%25/9/2026 387,842 0.09
EUR 400,000 JPMorgan Chase & Co RegSFRN 11/3/2027 405,552 0.10
EUR 300,000 JPMorgan Chase & Co RegSFRN 4/11/2032 297,282 0.07
EUR 225,000 Levi Strauss & Co 3.375%15/3/2027 226,915 0.05
EUR 200,000 Morgan Stanley FRN26/7/2024 199,447 0.05
EUR 325,000 National Grid North AmericaInc RegS 0.75% 8/8/2023 326,908 0.08
EUR 359,000 PVH Corp RegS 3.125%15/12/2027 331,883 0.08
EUR 225,000 Thermo Fisher Scientific Inc2.375% 15/4/2032 256,073 0.06
USD 1,436,358 United States TreasuryInflation Indexed Bond1.00% 15/2/2049 1,687,841 0.40
USD 338,911 United States TreasuryInflation Indexed Bond0.25% 15/2/2050 332,536 0.08
EUR 250,000 Verizon Communications Inc1.85% 18/5/2040 259,845 0.06
12,916,307 3.05
Total Bonds 389,665,622 91.99
Total Transferable Securities and Money MarketInstruments Admitted to an Official Stock ExchangeListing or Dealt in on Another Regulated Market 389,665,622 91.99
Holding Description
MarketValue
EUR
% ofNet
Assets
Other Transferable Securities and Money Market Instruments
BONDSFrance
EUR 600,000 Credit Mutuel Arkea 0.875%5/10/2023 607,494 0.14
607,494 0.14
JapanJPY 383,922,448 Japanese Government CPI
Linked Bond 0.10%10/3/2028 3,205,054 0.76
3,205,054 0.76
New ZealandNZD 1,797,000 New Zealand Government
Inflation Linked Bond RegS2.50% 20/9/2040 1,554,317 0.37
1,554,317 0.37
Total Bonds 5,366,865 1.27
Total Other Transferable Securities and MoneyMarket Instruments 5,366,865 1.27
Collective Investment Schemes~
Ireland264,400 Institutional Cash Series Plc -
Institutional Euro AssetsLiquidity Fund 26,279,797 6.20
26,279,797 6.20
Total Collective Investment Schemes 26,279,797 6.20
Securities portfolio at market value 421,312,284 99.46
Other Net Assets 2,270,441 0.54
Total Net Assets (EUR) 423,582,725 100.00
^ All or a portion of this security represents a security on loan.~ Investment in related party fund, see further information in Note 10.
Swaps as at 31 May 2020
TypeNominal
Value Description CounterpartyExpiration
date
Net unrealisedappreciation/
(depreciation)EUR
MarketValue
EUR
CCCDS USD 3,001,467Fund receives Fixed 1.000% and provides default protection on
Markit CDX.NA.IG.30 Credit Suisse 20/6/2025 40,694 25,538
BlackRock ESG Euro Bond Fund continued
The notes on pages 691 to 711 form an integral part of these financial statements.
Annual report and audited financial statements [291]
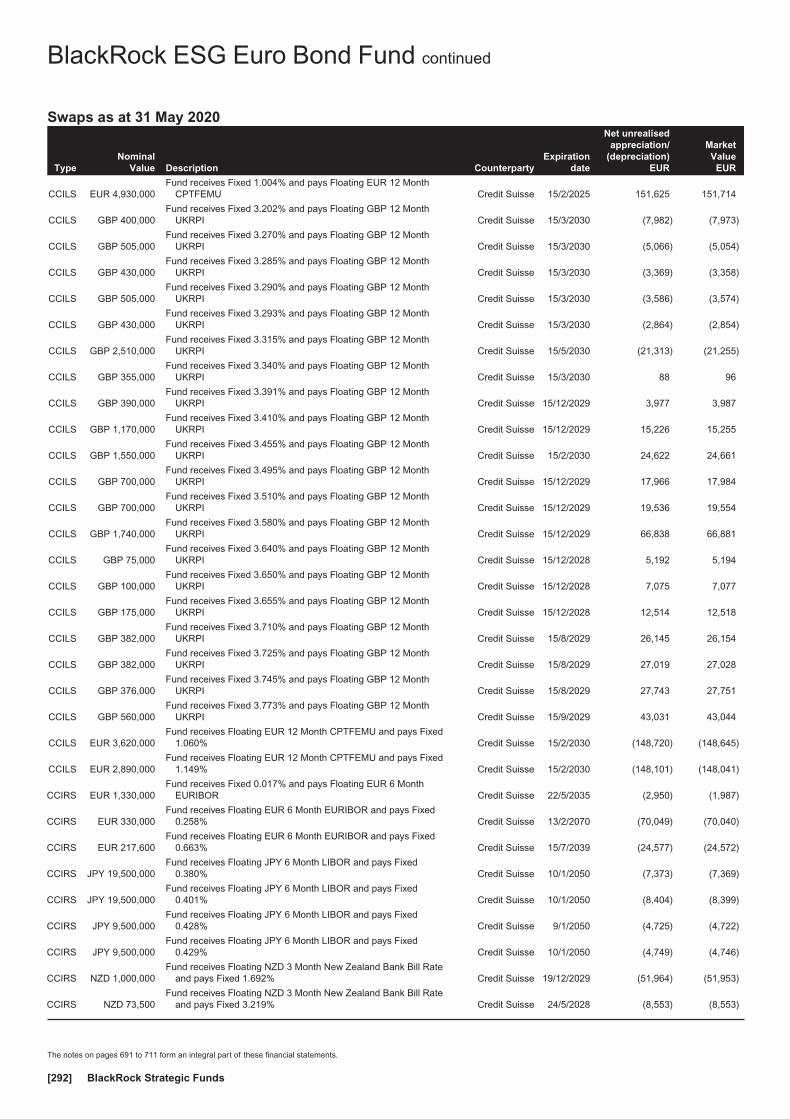
Swaps as at 31 May 2020
TypeNominal
Value Description CounterpartyExpiration
date
Net unrealisedappreciation/
(depreciation)EUR
MarketValue
EUR
CCILS EUR 4,930,000Fund receives Fixed 1.004% and pays Floating EUR 12 Month
CPTFEMU Credit Suisse 15/2/2025 151,625 151,714
CCILS GBP 400,000Fund receives Fixed 3.202% and pays Floating GBP 12 Month
UKRPI Credit Suisse 15/3/2030 (7,982) (7,973)
CCILS GBP 505,000Fund receives Fixed 3.270% and pays Floating GBP 12 Month
UKRPI Credit Suisse 15/3/2030 (5,066) (5,054)
CCILS GBP 430,000Fund receives Fixed 3.285% and pays Floating GBP 12 Month
UKRPI Credit Suisse 15/3/2030 (3,369) (3,358)
CCILS GBP 505,000Fund receives Fixed 3.290% and pays Floating GBP 12 Month
UKRPI Credit Suisse 15/3/2030 (3,586) (3,574)
CCILS GBP 430,000Fund receives Fixed 3.293% and pays Floating GBP 12 Month
UKRPI Credit Suisse 15/3/2030 (2,864) (2,854)
CCILS GBP 2,510,000Fund receives Fixed 3.315% and pays Floating GBP 12 Month
UKRPI Credit Suisse 15/5/2030 (21,313) (21,255)
CCILS GBP 355,000Fund receives Fixed 3.340% and pays Floating GBP 12 Month
UKRPI Credit Suisse 15/3/2030 88 96
CCILS GBP 390,000Fund receives Fixed 3.391% and pays Floating GBP 12 Month
UKRPI Credit Suisse 15/12/2029 3,977 3,987
CCILS GBP 1,170,000Fund receives Fixed 3.410% and pays Floating GBP 12 Month
UKRPI Credit Suisse 15/12/2029 15,226 15,255
CCILS GBP 1,550,000Fund receives Fixed 3.455% and pays Floating GBP 12 Month
UKRPI Credit Suisse 15/2/2030 24,622 24,661
CCILS GBP 700,000Fund receives Fixed 3.495% and pays Floating GBP 12 Month
UKRPI Credit Suisse 15/12/2029 17,966 17,984
CCILS GBP 700,000Fund receives Fixed 3.510% and pays Floating GBP 12 Month
UKRPI Credit Suisse 15/12/2029 19,536 19,554
CCILS GBP 1,740,000Fund receives Fixed 3.580% and pays Floating GBP 12 Month
UKRPI Credit Suisse 15/12/2029 66,838 66,881
CCILS GBP 75,000Fund receives Fixed 3.640% and pays Floating GBP 12 Month
UKRPI Credit Suisse 15/12/2028 5,192 5,194
CCILS GBP 100,000Fund receives Fixed 3.650% and pays Floating GBP 12 Month
UKRPI Credit Suisse 15/12/2028 7,075 7,077
CCILS GBP 175,000Fund receives Fixed 3.655% and pays Floating GBP 12 Month
UKRPI Credit Suisse 15/12/2028 12,514 12,518
CCILS GBP 382,000Fund receives Fixed 3.710% and pays Floating GBP 12 Month
UKRPI Credit Suisse 15/8/2029 26,145 26,154
CCILS GBP 382,000Fund receives Fixed 3.725% and pays Floating GBP 12 Month
UKRPI Credit Suisse 15/8/2029 27,019 27,028
CCILS GBP 376,000Fund receives Fixed 3.745% and pays Floating GBP 12 Month
UKRPI Credit Suisse 15/8/2029 27,743 27,751
CCILS GBP 560,000Fund receives Fixed 3.773% and pays Floating GBP 12 Month
UKRPI Credit Suisse 15/9/2029 43,031 43,044
CCILS EUR 3,620,000Fund receives Floating EUR 12 Month CPTFEMU and pays Fixed
1.060% Credit Suisse 15/2/2030 (148,720) (148,645)
CCILS EUR 2,890,000Fund receives Floating EUR 12 Month CPTFEMU and pays Fixed
1.149% Credit Suisse 15/2/2030 (148,101) (148,041)
CCIRS EUR 1,330,000Fund receives Fixed 0.017% and pays Floating EUR 6 Month
EURIBOR Credit Suisse 22/5/2035 (2,950) (1,987)
CCIRS EUR 330,000Fund receives Floating EUR 6 Month EURIBOR and pays Fixed
0.258% Credit Suisse 13/2/2070 (70,049) (70,040)
CCIRS EUR 217,600Fund receives Floating EUR 6 Month EURIBOR and pays Fixed
0.663% Credit Suisse 15/7/2039 (24,577) (24,572)
CCIRS JPY 19,500,000Fund receives Floating JPY 6 Month LIBOR and pays Fixed
0.380% Credit Suisse 10/1/2050 (7,373) (7,369)
CCIRS JPY 19,500,000Fund receives Floating JPY 6 Month LIBOR and pays Fixed
0.401% Credit Suisse 10/1/2050 (8,404) (8,399)
CCIRS JPY 9,500,000Fund receives Floating JPY 6 Month LIBOR and pays Fixed
0.428% Credit Suisse 9/1/2050 (4,725) (4,722)
CCIRS JPY 9,500,000Fund receives Floating JPY 6 Month LIBOR and pays Fixed
0.429% Credit Suisse 10/1/2050 (4,749) (4,746)
CCIRS NZD 1,000,000Fund receives Floating NZD 3 Month New Zealand Bank Bill Rate
and pays Fixed 1.692% Credit Suisse 19/12/2029 (51,964) (51,953)
CCIRS NZD 73,500Fund receives Floating NZD 3 Month New Zealand Bank Bill Rate
and pays Fixed 3.219% Credit Suisse 24/5/2028 (8,553) (8,553)
BlackRock ESG Euro Bond Fund continued
The notes on pages 691 to 711 form an integral part of these financial statements.
BlackRock Strategic Funds[292]
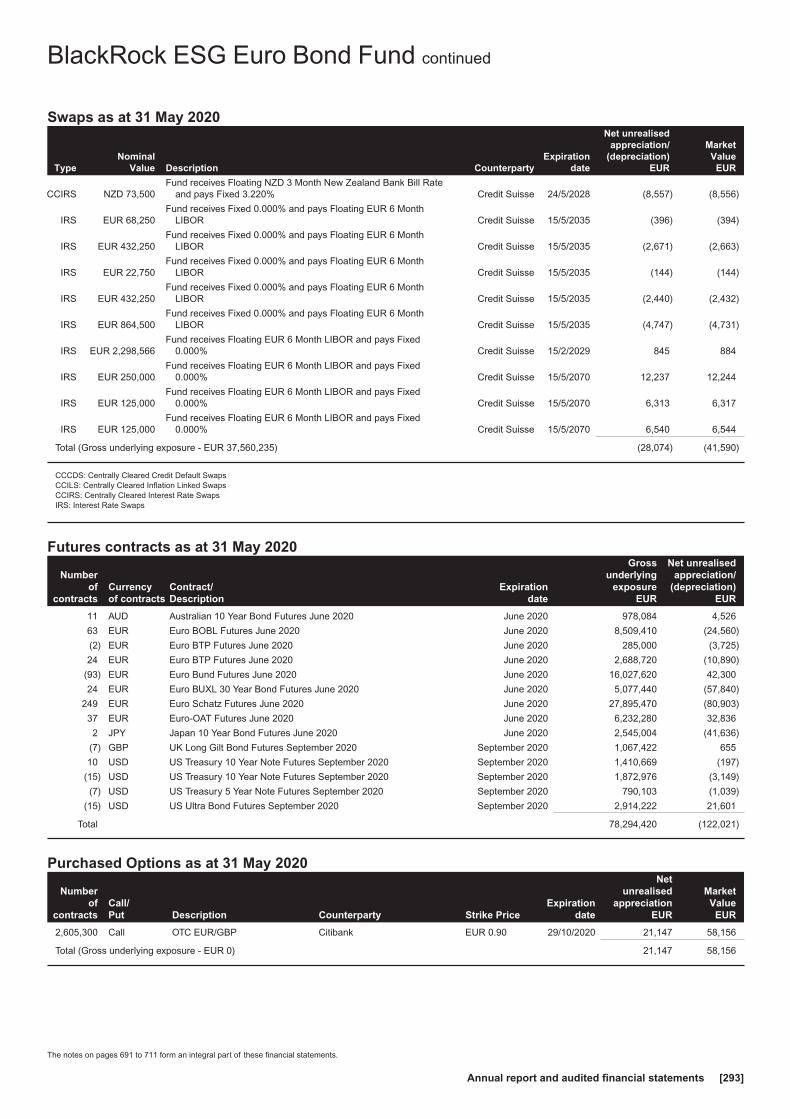
Swaps as at 31 May 2020
TypeNominal
Value Description CounterpartyExpiration
date
Net unrealisedappreciation/
(depreciation)EUR
MarketValue
EUR
CCIRS NZD 73,500Fund receives Floating NZD 3 Month New Zealand Bank Bill Rate
and pays Fixed 3.220% Credit Suisse 24/5/2028 (8,557) (8,556)
IRS EUR 68,250Fund receives Fixed 0.000% and pays Floating EUR 6 Month
LIBOR Credit Suisse 15/5/2035 (396) (394)
IRS EUR 432,250Fund receives Fixed 0.000% and pays Floating EUR 6 Month
LIBOR Credit Suisse 15/5/2035 (2,671) (2,663)
IRS EUR 22,750Fund receives Fixed 0.000% and pays Floating EUR 6 Month
LIBOR Credit Suisse 15/5/2035 (144) (144)
IRS EUR 432,250Fund receives Fixed 0.000% and pays Floating EUR 6 Month
LIBOR Credit Suisse 15/5/2035 (2,440) (2,432)
IRS EUR 864,500Fund receives Fixed 0.000% and pays Floating EUR 6 Month
LIBOR Credit Suisse 15/5/2035 (4,747) (4,731)
IRS EUR 2,298,566Fund receives Floating EUR 6 Month LIBOR and pays Fixed
0.000% Credit Suisse 15/2/2029 845 884
IRS EUR 250,000Fund receives Floating EUR 6 Month LIBOR and pays Fixed
0.000% Credit Suisse 15/5/2070 12,237 12,244
IRS EUR 125,000Fund receives Floating EUR 6 Month LIBOR and pays Fixed
0.000% Credit Suisse 15/5/2070 6,313 6,317
IRS EUR 125,000Fund receives Floating EUR 6 Month LIBOR and pays Fixed
0.000% Credit Suisse 15/5/2070 6,540 6,544
Total (Gross underlying exposure - EUR 37,560,235) (28,074) (41,590)
CCCDS: Centrally Cleared Credit Default SwapsCCILS: Centrally Cleared Inflation Linked SwapsCCIRS: Centrally Cleared Interest Rate SwapsIRS: Interest Rate Swaps
Futures contracts as at 31 May 2020
Numberof
contractsCurrencyof contracts
Contract/Description
Expirationdate
Grossunderlying
exposureEUR
Net unrealisedappreciation/
(depreciation)EUR
11 AUD Australian 10 Year Bond Futures June 2020 June 2020 978,084 4,526
63 EUR Euro BOBL Futures June 2020 June 2020 8,509,410 (24,560)
(2) EUR Euro BTP Futures June 2020 June 2020 285,000 (3,725)
24 EUR Euro BTP Futures June 2020 June 2020 2,688,720 (10,890)
(93) EUR Euro Bund Futures June 2020 June 2020 16,027,620 42,300
24 EUR Euro BUXL 30 Year Bond Futures June 2020 June 2020 5,077,440 (57,840)
249 EUR Euro Schatz Futures June 2020 June 2020 27,895,470 (80,903)
37 EUR Euro-OAT Futures June 2020 June 2020 6,232,280 32,836
2 JPY Japan 10 Year Bond Futures June 2020 June 2020 2,545,004 (41,636)
(7) GBP UK Long Gilt Bond Futures September 2020 September 2020 1,067,422 655
10 USD US Treasury 10 Year Note Futures September 2020 September 2020 1,410,669 (197)
(15) USD US Treasury 10 Year Note Futures September 2020 September 2020 1,872,976 (3,149)
(7) USD US Treasury 5 Year Note Futures September 2020 September 2020 790,103 (1,039)
(15) USD US Ultra Bond Futures September 2020 September 2020 2,914,222 21,601
Total 78,294,420 (122,021)
Purchased Options as at 31 May 2020
Numberof
contractsCall/Put Description Counterparty Strike Price
Expirationdate
Netunrealised
appreciationEUR
MarketValue
EUR
2,605,300 Call OTC EUR/GBP Citibank EUR 0.90 29/10/2020 21,147 58,156
Total (Gross underlying exposure - EUR 0) 21,147 58,156
BlackRock ESG Euro Bond Fund continued
The notes on pages 691 to 711 form an integral part of these financial statements.
Annual report and audited financial statements [293]

Written Swaptions as at 31 May 2020
NominalValue
Call/Put Description Counterparty Strike Price
Expirationdate
Netunrealised
appreciationEUR
MarketValue
EUR
(3,491,669) Put
Fund writes an option to enter into an InterestRate Swap. If exercised Fund receives0.11% Fixed annually from 22/7/2020; andpays Floating EUR EURIBOR 6 Monthsemi-annually from 22/1/2021 Barclays Bank EUR 0.11 20/07/2020 13,558 (1,194)
(2,733,000) Put
Fund writes an option to enter into an InterestRate Swap. If exercised Fund receives0.635% Fixed semi-annually from5/8/2020; and pays Floating GBP LIBOR6 Month BBA semi-annually from 5/2/2021 Barclays Bank GBP 0.64 05/08/2020 6,554 (14)
Total (Gross underlying exposure - EUR 328,014) 20,112 (1,208)
Open forward foreign exchange transactionsas at 31 May 2020
Currency Purchases Currency Sales CounterpartyMaturity
date
Netunrealised
appreciation/(depreciation)
EURAUD 510,000 EUR 305,111 Barclays Bank 17/6/2020 (787)AUD 500,000 EUR 293,745 JP Morgan 17/6/2020 4,612
AUD 470,000 USD 312,787Bank of America
Merrill Lynch 17/6/2020 (758)AUD 1,880,000 USD 1,186,896 BNP Paribas 17/6/2020 54,733AUD 570,000 USD 350,448 Citibank 17/6/2020 25,054AUD 3,370,000 USD 2,161,054 HSBC 17/6/2020 68,012AUD 520,000 USD 342,260 JP Morgan 17/6/2020 2,580
AUD 2,230,000 USD 1,438,756Toronto Dominion
Bank 17/6/2020 37,147AUD 480,000 USD 312,444 Westpac 17/6/2020 5,517CAD 700,000 EUR 457,772 UBS 14/7/2020 (1,130)
CAD 820,000 USD 574,196Bank of America
Merrill Lynch 17/6/2020 18,983CAD 2,620,000 USD 1,868,972 JP Morgan 17/6/2020 29,773CAD 420,000 USD 299,555 Morgan Stanley 17/6/2020 4,819CHF 440,000 USD 449,475 UBS 17/6/2020 6,761
EUR 303,403 AUD 510,000Bank of America
Merrill Lynch 17/6/2020 (921)EUR 623,498 AUD 1,040,000 Citibank 17/6/2020 2,915
EUR 299,520 AUD 500,000Toronto Dominion
Bank 17/6/2020 1,162
EUR 529,328 CAD 810,000Royal Bank of
Canada 14/7/2020 929
EUR 3,264,860 DKK 24,360,000The Bank of New
York Mellon 14/7/2020 (3,209)EUR 1,146,725 GBP 1,000,000 Barclays Bank 17/6/2020 36,281EUR 2,344,972 GBP 2,180,000 Citibank 17/6/2020 (75,796)EUR 830,382 GBP 730,000 HSBC 17/6/2020 19,758
EUR 1,622,425 GBP 1,425,000Toronto Dominion
Bank 14/7/2020 40,755EUR 4,165,272 JPY 491,950,000 Citibank 14/7/2020 53,209EUR 106,395 NOK 1,200,000 Barclays Bank 17/6/2020 (4,639)EUR 366,083 NOK 4,300,000 JP Morgan 17/6/2020 (31,790)EUR 166,871 NOK 1,900,000 Natwest Markets 17/6/2020 (8,933)
EUR 147,298 NOK 1,700,000Royal Bank of
Canada 17/6/2020 (10,001)EUR 206,017 NOK 2,400,000 UBS 17/6/2020 (16,051)EUR 1,489,665 NZD 2,700,000 Morgan Stanley 14/7/2020 (15,066)EUR 293,756 NZD 520,000 UBS 14/7/2020 3,956EUR 905,387 SEK 9,600,000 JP Morgan 17/6/2020 (8,149)EUR 1,110,395 SEK 12,000,000 Natwest Markets 17/6/2020 (31,525)
EUR 1,120,000 USD 1,220,064Bank of America
Merrill Lynch 17/6/2020 23,091
Open forward foreign exchange transactionsas at 31 May 2020
Currency Purchases Currency Sales CounterpartyMaturity
date
Netunrealised
appreciation/(depreciation)
EUREUR 550,000 USD 630,360 BNP Paribas 17/6/2020 (16,731)EUR 160,000 USD 176,185 Citibank 17/6/2020 1,600EUR 1,050,000 USD 1,162,505 Morgan Stanley 17/6/2020 4,840
EUR 7,579,264 USD 8,260,000Bank of America
Merrill Lynch 14/7/2020 157,272EUR 36,743 USD 40,000 Barclays Bank 14/7/2020 801EUR 752,023 USD 820,000 JP Morgan 14/7/2020 15,215EUR 137,836 USD 150,000 Natwest Markets 14/7/2020 3,053EUR 36,857 USD 40,000 UBS 14/7/2020 916GBP 520,000 EUR 594,215 Barclays Bank 17/6/2020 (16,785)GBP 2,440,000 EUR 2,677,319 BNP Paribas 17/6/2020 32,164GBP 720,000 EUR 814,793 Citibank 17/6/2020 (15,273)
GBP 230,000 EUR 260,391The Bank of New
York Mellon 17/6/2020 (4,989)GBP 780,000 USD 966,886 JP Morgan 17/6/2020 (3,141)GBP 520,000 USD 650,390 Westpac 17/6/2020 (7,308)JPY 30,000,000 USD 279,945 Barclays Bank 17/6/2020 (889)JPY 95,000,000 USD 858,535 JP Morgan 17/6/2020 22,319
JPY 35,000,000 USD 327,304Royal Bank of
Canada 17/6/2020 (1,668)
JPY 64,000,000 USD 606,555Toronto Dominion
Bank 17/6/2020 (10,293)JPY 35,000,000 USD 325,150 UBS 17/6/2020 268NOK 11,500,000 EUR 1,020,068 Natwest Markets 17/6/2020 44,012NOK 4,200,000 USD 418,598 Natwest Markets 17/6/2020 12,276NZD 350,000 EUR 195,727 HSBC 14/7/2020 (670)NZD 490,000 USD 296,653 BNP Paribas 17/6/2020 6,571NZD 1,230,000 USD 690,276 Citibank 17/6/2020 65,390NZD 2,361,502 USD 1,393,055 Morgan Stanley 17/6/2020 64,606
NZD 530,000 USD 318,562Standard
Chartered Bank 17/6/2020 9,183NZD 488,498 USD 294,765 Westpac 17/6/2020 7,432SEK 2,900,000 EUR 265,224 Barclays Bank 17/6/2020 10,740SEK 2,400,000 EUR 216,410 BNP Paribas 17/6/2020 11,973SEK 7,955,000 EUR 742,712 JP Morgan 17/6/2020 14,285SEK 1,745,000 EUR 159,026 UBS 17/6/2020 7,028SEK 3,200,000 USD 323,904 JP Morgan 17/6/2020 13,303
USD 394,118 AUD 610,000Bank of America
Merrill Lynch 17/6/2020 (9,660)USD 612,826 AUD 960,000 Barclays Bank 17/6/2020 (21,878)USD 2,369,700 AUD 3,700,000 BNP Paribas 17/6/2020 (77,344)USD 692,646 AUD 1,220,000 Citibank 17/6/2020 (105,262)USD 1,175,924 AUD 1,780,000 JP Morgan 17/6/2020 (4,927)
BlackRock ESG Euro Bond Fund continued
The notes on pages 691 to 711 form an integral part of these financial statements.
BlackRock Strategic Funds[294]

Open forward foreign exchange transactionsas at 31 May 2020
Currency Purchases Currency Sales CounterpartyMaturity
date
Netunrealised
appreciation/(depreciation)
EURUSD 1,722,287 AUD 2,750,000 Morgan Stanley 17/6/2020 (92,527)
USD 895,471 AUD 1,430,000Toronto Dominion
Bank 17/6/2020 (48,220)USD 304,930 AUD 470,000 UBS 17/6/2020 (6,305)USD 881,024 CAD 1,240,000 JP Morgan 17/6/2020 (17,263)USD 631,381 CAD 870,000 Societe Generale 17/6/2020 (206)
USD 372,795 CAD 515,726Toronto Dominion
Bank 17/6/2020 (1,452)USD 574,897 CAD 784,274 UBS 17/6/2020 4,966USD 319,471 CAD 450,000 Westpac 17/6/2020 (6,495)USD 467,784 CHF 440,000 Morgan Stanley 17/6/2020 9,700
USD 823,310 EUR 750,000Bank of America
Merrill Lynch 17/6/2020 (9,796)USD 1,002,146 EUR 910,000 BNP Paribas 17/6/2020 (9,012)USD 178,192 EUR 160,000 Morgan Stanley 17/6/2020 205USD 881,723 EUR 800,000 Societe Generale 17/6/2020 (7,279)USD 284,394 EUR 260,000 UBS 17/6/2020 (4,313)
USD 2,940,000 EUR 2,695,099Bank of America
Merrill Lynch 14/7/2020 (53,372)
USD 1,900,000 EUR 1,729,805Royal Bank of
Canada 14/7/2020 (22,567)
USD 653,403 GBP 520,000Bank of America
Merrill Lynch 17/6/2020 10,016USD 648,607 GBP 520,000 Barclays Bank 17/6/2020 5,705USD 324,225 GBP 260,000 BNP Paribas 17/6/2020 2,782
USD 330,313 JPY 35,000,000Bank of America
Merrill Lynch 17/6/2020 4,374USD 589,943 JPY 64,000,000 Citibank 17/6/2020 (4,641)USD 866,120 JPY 94,000,000 HSBC 17/6/2020 (7,140)USD 325,868 JPY 35,000,000 JP Morgan 17/6/2020 377USD 285,278 JPY 31,000,000 Morgan Stanley 17/6/2020 (2,675)USD 191,105 NOK 2,000,000 Natwest Markets 17/6/2020 (13,243)USD 211,707 NOK 2,200,000 Societe Generale 17/6/2020 (13,226)
Open forward foreign exchange transactionsas at 31 May 2020
Currency Purchases Currency Sales CounterpartyMaturity
date
Netunrealised
appreciation/(depreciation)
EURUSD 325,220 NZD 540,000 BNP Paribas 17/6/2020 (8,774)USD 605,435 NZD 1,000,000 Citibank 17/6/2020 (13,393)USD 1,211,715 NZD 1,970,000 HSBC 17/6/2020 (9,295)USD 289,012 NZD 490,000 JP Morgan 17/6/2020 (13,441)USD 335,494 NZD 540,000 Morgan Stanley 17/6/2020 463USD 368,575 SEK 3,500,000 BNP Paribas 17/6/2020 (1,689)USD 326,493 SEK 3,200,000 JP Morgan 17/6/2020 (10,975)USD 324,644 SEK 3,200,000 Natwest Markets 17/6/2020 (12,638)
Total (Gross underlying exposure - EUR 113,330,908) 88,372
Sector Breakdownas at 31 May 2020
% of NetAssets
Government 58.59
Financial 21.49
Collective Investment Schemes 6.20
Utilities 4.84
Communications 2.22
Consumer, Non-cyclical 1.77
Technology 1.61
Industrial 1.50
Consumer, Cyclical 0.55
Basic Materials 0.37
Energy 0.32
Securities portfolio at market value 99.46
Other Net Assets 0.54
100.00
BlackRock ESG Euro Bond Fund continued
The notes on pages 691 to 711 form an integral part of these financial statements.
Annual report and audited financial statements [295]

Portfolio of Investments as at 31 May 2020
Holding Description
MarketValue
EUR
% ofNet
Assets
Transferable Securities and Money Market Instruments Admittedto an Official Stock Exchange Listing or Dealt in on AnotherRegulated Market
BONDSAustralia
EUR 350,000 APT Pipelines Ltd RegS2.00% 15/7/2030 357,798 0.19
EUR 136,000 Telstra Corp Ltd RegS 1.375%26/3/2029 143,511 0.08
EUR 425,000 Telstra Corp Ltd RegS 1.00%23/4/2030 431,171 0.24
EUR 274,000 Westpac Banking Corp RegS0.75% 17/10/2023 278,232 0.15
1,210,712 0.66
AustriaEUR 200,000 BAWAG Group RegS FRN
26/3/2029 193,678 0.11EUR 400,000 Erste Group Bank AG RegS
0.875% 13/5/2027 406,070 0.22EUR 400,000 Raiffeisen Bank International
AG RegS 0.25% 22/1/2025 391,838 0.21
991,586 0.54
BelgiumEUR 200,000 Ageas SA RegS FRN
(Perpetual) 183,505 0.10EUR 215,000 Anheuser-Busch InBev SA
RegS 1.50% 17/3/2025 223,899 0.12EUR 120,000 Anheuser-Busch InBev SA
RegS 1.125% 1/7/2027 120,780 0.07EUR 401,000 Anheuser-Busch InBev SA
RegS 2.75% 17/3/2036 425,254 0.23EUR 100,000 Anheuser-Busch InBev SA
RegS 3.70% 2/4/2040 117,062 0.06GBP 230,000 Anheuser-Busch InBev SA/NV
RegS 1.75% 7/3/2025 260,400 0.14EUR 70,000 Anheuser-Busch InBev SA/NV
RegS 2.00% 17/3/2028 74,775 0.04EUR 200,000 Belfius Bank SA RegS
28/8/2026 (Zero Coupon) 191,654 0.11EUR 100,000 Elia Transmission Belgium SA
RegS 1.375% 14/1/2026 104,765 0.06EUR 200,000 Elia Transmission Belgium SA
RegS 1.375% 7/4/2027 210,158 0.12EUR 200,000 Groupe Bruxelles Lambert SA
RegS 1.375% 23/5/2024 198,176 0.11EUR 100,000 KBC Group NV RegS FRN
24/11/2022 98,474 0.05EUR 300,000 KBC Group NV RegS 0.75%
18/10/2023 301,447 0.17
2,510,349 1.38
CanadaEUR 500,000 Total Capital Canada Ltd RegS
2.125% 18/9/2029 570,946 0.31
570,946 0.31
DenmarkDKK 590,040 Nordea Kredit
Realkreditaktieselskab0.50% 1/10/2050 75,190 0.04
EUR 880,000 Orsted A/S RegS FRN24/11/3017 897,600 0.49
972,790 0.53
FinlandEUR 725,000 Nordea Bank Abp RegS 0.50%
14/5/2027 728,857 0.40EUR 950,000 OP Corporate Bank Plc 0.60%
18/1/2027 925,509 0.51
Holding Description
MarketValue
EUR
% ofNet
Assets
Finland continuedEUR 857,000 OP Corporate Bank Plc RegS
0.375% 29/8/2023 863,098 0.47EUR 750,000 OP Corporate Bank Plc RegS
0.50% 12/8/2025 752,055 0.41
3,269,519 1.79
FranceEUR 100,000 Air Liquide Finance SA RegS
1.375% 2/4/2030 108,502 0.06EUR 100,000 Arkema SA RegS FRN
(Perpetual) 101,217 0.06EUR 400,000 AXA SA RegS FRN 6/7/2047 440,154 0.24EUR 550,000 AXA SA RegS FRN 28/5/2049 603,696 0.33EUR 448,000 AXA SA RegS FRN
(Perpetual) 487,050 0.27EUR 700,000 Banque Federative du Credit
Mutuel RegS 0.75%15/6/2023 710,307 0.39
EUR 200,000 Banque Federative du CreditMutuel RegS 1.625%19/1/2026 213,288 0.12
EUR 400,000 Banque Federative du CreditMutuel RegS 0.75%8/6/2026 406,202 0.22
EUR 1,000,000 Banque Federative du CreditMutuel SA RegS 0.125%5/2/2024 993,205 0.54
EUR 200,000 Banque Federative du CreditMutuel SA RegS 2.625%18/3/2024 217,265 0.12
EUR 200,000 Banque Federative du CreditMutuel SA RegS 0.75%17/7/2025 203,603 0.11
GBP 600,000 Banque Federative du CreditMutuel SA RegS 1.25%5/12/2025 665,871 0.36
EUR 300,000 BNP Paribas Cardif SA RegSFRN (Perpetual) 319,736 0.18
EUR 900,000 BNP Paribas SA RegS FRN15/7/2025 884,808 0.48
EUR 235,000 BNP Paribas SA RegS FRN20/3/2026 236,967 0.13
EUR 400,000 BNP Paribas SA RegS FRN19/2/2028 386,242 0.21
EUR 1,000,000 BNP Paribas SA RegS 1.625%2/7/2031 980,150 0.54
EUR 1,200,000 BNP Paribas SA RegS FRN15/1/2032 1,142,244 0.63
EUR 900,000 BPCE SA RegS 0.625%26/9/2023 909,148 0.50
EUR 200,000 BPCE SA RegS 0.375%5/10/2023 200,535 0.11
EUR 800,000 BPCE SA RegS 1.00%15/7/2024 821,132 0.45
EUR 1,000,000 BPCE SA RegS 0.125%4/12/2024 988,780 0.54
EUR 700,000 BPCE SA RegS 0.25%15/1/2026 688,068 0.38
EUR 900,000 Capgemini SE RegS 2.50%1/7/2023 946,377 0.52
EUR 800,000 Capgemini SE RegS 1.00%18/10/2024 805,148 0.44
EUR 300,000 Capgemini SE RegS 2.00%15/4/2029 316,670 0.17
EUR 400,000 Capgemini SE RegS 2.375%15/4/2032 433,630 0.24
EUR 136,000 Carrefour SA RegS 1.75%15/7/2022 138,963 0.08
EUR 1,100,000 Cie de Saint-Gobain RegS0.625% 15/3/2024 1,092,943 0.60
BlackRock ESG Euro Corporate Bond Fund
The notes on pages 691 to 711 form an integral part of these financial statements.
BlackRock Strategic Funds[296]

Portfolio of Investments as at 31 May 2020
Holding Description
MarketValue
EUR
% ofNet
Assets
France continuedEUR 500,000 Cie de Saint-Gobain RegS
1.125% 23/3/2026 503,000 0.28EUR 400,000 Cie de Saint-Gobain RegS
2.375% 4/10/2027 427,840 0.23EUR 300,000 CNP Assurances RegS FRN
27/7/2050 288,740 0.16EUR 1,800,000 Coentreprise de Transport
d’Electricite SA RegS0.875% 29/9/2024 1,838,025 1.01
EUR 100,000 Credit Agricole Assurances SARegS FRN 29/1/2048 100,525 0.06
EUR 300,000 Credit Agricole Assurances SARegS FRN 27/9/2048 350,510 0.19
EUR 1,100,000 Credit Agricole SA RegS0.75% 5/12/2023 1,120,817 0.61
EUR 100,000 Credit Agricole SA RegS2.375% 20/5/2024 108,744 0.06
EUR 400,000 Credit Agricole SA RegS FRN22/4/2026 401,944 0.22
EUR 500,000 Credit Agricole SA RegS1.75% 5/3/2029 530,020 0.29
EUR 300,000 Credit Mutuel Arkea RegS1.375% 17/1/2025 311,636 0.17
EUR 300,000 Credit Mutuel Arkea SA RegS0.875% 7/5/2027 302,865 0.17
EUR 50,000 Electricite de France SA RegS4.50% 12/11/2040 71,112 0.04
EUR 400,000 Electricite de France SA RegS2.00% 9/12/2049 389,430 0.21
EUR 400,000 Elis SA RegS 1.75%11/4/2024 387,350 0.21
EUR 200,000 Engie SA RegS 0.875%27/3/2024 204,443 0.11
EUR 800,000 Engie SA RegS 4/3/2027 (ZeroCoupon) 774,368 0.42
EUR 300,000 Engie SA RegS 1.75%27/3/2028 323,757 0.18
EUR 200,000 Engie SA RegS 1.375%21/6/2039 202,775 0.11
EUR 300,000 Engie SA RegS 1.25%24/10/2041 294,647 0.16
EUR 400,000 HSBC France SA RegS 0.60%20/3/2023 403,584 0.22
EUR 200,000 HSBC France SA RegS 0.25%17/5/2024 199,419 0.11
EUR 300,000 La Banque Postale SA RegSFRN 23/4/2026 302,208 0.17
EUR 900,000 La Banque Postale SA RegS0.25% 12/7/2026 882,198 0.48
EUR 500,000 La Poste SA RegS 1.375%21/4/2032 518,432 0.28
EUR 152,000 LVMH Moet Hennessy LouisVuitton SE RegS 0.375%26/5/2022 152,451 0.08
EUR 700,000 Orange SA RegS 1.00%12/5/2025 719,194 0.39
EUR 800,000 Orange SA RegS 1.00%12/9/2025 823,576 0.45
EUR 200,000 Orange SA RegS 1.25%7/7/2027 209,245 0.11
EUR 900,000 Orange SA RegS 2.00%15/1/2029 1,005,651 0.55
EUR 1,100,000 Orange SA RegS 1.875%12/9/2030 1,229,591 0.67
EUR 200,000 Orange SA RegS 0.50%4/9/2032 192,175 0.11
EUR 210,000 Orange SA RegS FRN(Perpetual) 243,705 0.13
Holding Description
MarketValue
EUR
% ofNet
Assets
France continuedEUR 800,000 Peugeot SA RegS 2.00%
20/3/2025 789,612 0.43EUR 50,000 RTE Reseau de Transport
d’Electricite SADIR RegS3.875% 28/6/2022 53,802 0.03
EUR 700,000 RTE Reseau de Transportd’Electricite SADIR RegS1.625% 8/10/2024 740,547 0.41
EUR 200,000 RTE Reseau de Transportd’Electricite SADIR RegS1.00% 19/10/2026 207,996 0.11
EUR 800,000 Societe Generale SA RegS0.125% 24/2/2026 784,656 0.43
EUR 1,000,000 Societe Generale SA RegS0.875% 1/7/2026 976,695 0.54
EUR 600,000 Societe Generale SA RegS0.75% 25/1/2027 576,804 0.32
EUR 100,000 Societe Generale SA RegS0.875% 24/9/2029 94,860 0.05
EUR 600,000 Suez SA RegS 2.75%9/10/2023 649,242 0.36
EUR 500,000 Suez SA RegS 1.25%14/5/2035 500,345 0.27
EUR 900,000 Suez SA RegS FRN(Perpetual) 902,169 0.49
EUR 200,000 Suez SA RegS FRN(Perpetual) 187,018 0.10
EUR 700,000 Suez SA RegS FRN(Perpetual) 705,561 0.39
EUR 500,000 Total Capital International SARegS 0.696% 31/5/2028 507,517 0.28
EUR 518,000 TOTAL SA RegS FRN(Perpetual) 533,410 0.29
EUR 197,000 TOTAL SA RegS FRN(Perpetual) 212,995 0.12
EUR 800,000 Unibail-Rodamco-Westfield SERegS 1.75% 1/7/2049 624,664 0.34
EUR 300,000 Veolia Environnement SARegS 0.672% 30/3/2022 301,002 0.17
EUR 100,000 Veolia Environnement SARegS 0.892% 14/1/2024 101,597 0.06
EUR 500,000 Veolia Environnement SARegS 0.664% 15/1/2031 487,648 0.27
EUR 900,000 Vinci SA RegS 1.625%18/1/2029 961,101 0.53
43,155,119 23.65
GermanyEUR 1,000,000 Allianz SE RegS FRN
25/9/2049 963,045 0.53EUR 500,000 Allianz SE RegS FRN
8/7/2050 511,265 0.28EUR 300,000 Allianz SE RegS FRN
(Perpetual) 322,070 0.18EUR 900,000 Bertelsmann SE & Co KGaA
RegS FRN 23/4/2075 881,743 0.48EUR 660,000 Commerzbank AG RegS
0.50% 4/12/2026 632,613 0.35EUR 800,000 Commerzbank AG RegS
0.875% 22/1/2027 732,300 0.40EUR 416,000 Daimler AG RegS 0.75%
8/2/2030 383,731 0.21EUR 156,000 Deutsche Bahn Finance
GmbH RegS 1.375%28/3/2031 168,845 0.09
EUR 350,000 Deutsche Bahn FinanceGmbH RegS 0.75%16/7/2035 347,342 0.19
BlackRock ESG Euro Corporate Bond Fund continued
The notes on pages 691 to 711 form an integral part of these financial statements.
Annual report and audited financial statements [297]

Portfolio of Investments as at 31 May 2020
Holding Description
MarketValue
EUR
% ofNet
Assets
Germany continuedEUR 175,000 Deutsche Bahn Finance
GmbH RegS 1.375%16/4/2040 188,003 0.10
EUR 700,000 Deutsche Pfandbriefbank AGRegS 0.75% 7/2/2023 693,612 0.38
EUR 500,000 Deutsche Pfandbriefbank AGRegS 0.125% 5/9/2024 479,197 0.26
EUR 132,000 Deutsche Telekom AG RegS1.75% 25/3/2031 (traded inGermany) 142,392 0.08
EUR 341,000 Deutsche Telekom AG RegS1.75% 25/3/2031 (traded inLuxembourg) 367,847 0.20
EUR 326,000 E.ON SE RegS 0.375%23/8/2021 326,334 0.18
EUR 150,000 E.ON SE RegS 1.00%7/10/2025 154,436 0.08
EUR 800,000 Eurogrid GmbH RegS 1.625%3/11/2023 833,124 0.46
EUR 300,000 Eurogrid GmbH RegS 1.875%10/6/2025 321,381 0.18
EUR 300,000 Eurogrid GmbH RegS 1.113%15/5/2032 309,660 0.17
EUR 500,000 Evonik Industries AG RegS0.625% 18/9/2025 501,377 0.27
EUR 267,000 HeidelbergCement AG RegS2.25% 3/6/2024 275,527 0.15
EUR 357,000 HeidelbergCement AG RegS1.50% 7/2/2025 356,870 0.20
EUR 100,000 LandesbankBaden-Wuerttemberg RegS2.20% 9/5/2029 89,866 0.05
EUR 400,000 Merck Financial ServicesGmbH RegS 0.125%16/7/2025 397,008 0.22
EUR 500,000 Merck Financial ServicesGmbH RegS 0.875%5/7/2031 512,227 0.28
EUR 200,000 Merck KGaA RegS FRN25/6/2079 210,667 0.12
EUR 200,000 MuenchenerRueckversicherungs-GesellschaftAG in Muenchen RegS FRN26/5/2042 220,185 0.12
EUR 400,000 MuenchenerRueckversicherungs-GesellschaftAG in Muenchen RegS FRN26/5/2049 456,812 0.25
11,779,479 6.46
GreeceEUR 100,000 Alpha Bank AE RegS 2.50%
5/2/2023 104,318 0.06
104,318 0.06
IrelandEUR 274,000 Abbott Ireland Financing DAC
RegS 0.875% 27/9/2023 279,007 0.15EUR 639,000 Abbott Ireland Financing DAC
RegS 0.10% 19/11/2024 631,652 0.35EUR 300,000 AIB Group Plc RegS 1.25%
28/5/2024 293,075 0.16EUR 748,000 Bank of Ireland Group Plc
RegS 1.375% 29/8/2023 735,314 0.40EUR 400,000 Bank of Ireland Group Plc
RegS FRN 25/11/2025 381,904 0.21
Holding Description
MarketValue
EUR
% ofNet
Assets
Ireland continuedEUR 525,000 CRH SMW Finance DAC
RegS 1.25% 5/11/2026 531,581 0.29EUR 669,000 Smurfit Kappa
Acquisitions ULC RegS2.375% 1/2/2024 685,678 0.38
EUR 400,000 Smurfit Kappa Treasury ULCRegS 1.50% 15/9/2027 383,452 0.21
3,921,663 2.15
ItalyEUR 200,000 Assicurazioni Generali SpA
RegS 2.124% 1/10/2030 189,313 0.10EUR 200,000 Assicurazioni Generali SpA
RegS FRN (Perpetual) 208,221 0.11EUR 121,000 ASTM SpA RegS 1.625%
8/2/2028 111,002 0.06EUR 300,000 Enel SpA RegS FRN
24/11/2081 310,158 0.17EUR 150,000 FCA Bank SpA RegS 0.25%
12/10/2020 149,442 0.08EUR 200,000 Intesa Sanpaolo SpA RegS
0.75% 4/12/2024 192,268 0.11EUR 805,000 Intesa Sanpaolo SpA RegS
1.00% 19/11/2026 767,954 0.42EUR 639,000 Intesa Sanpaolo SpA RegS
1.75% 4/7/2029 618,562 0.34EUR 717,000 UniCredit SpA RegS FRN
25/6/2025 702,072 0.39EUR 1,494,000 UniCredit SpA RegS FRN
23/9/2029 1,333,783 0.73EUR 300,000 UniCredit SpA RegS FRN
15/1/2032 265,599 0.15
4,848,374 2.66
LuxembourgEUR 1,374,000 GELF Bond Issuer I SA RegS
1.125% 18/7/2029 1,279,022 0.70EUR 325,000 HeidelbergCement Finance
Luxembourg SA RegS2.50% 9/10/2024 338,590 0.19
EUR 195,000 HeidelbergCement FinanceLuxembourg SA RegS1.625% 7/4/2026 194,938 0.11
EUR 83,000 HeidelbergCement FinanceLuxembourg SA RegS1.50% 14/6/2027 81,591 0.04
EUR 195,000 HeidelbergCement FinanceLuxembourg SA RegS1.125% 1/12/2027 185,873 0.10
EUR 824,000 HeidelbergCement FinanceLuxembourg SA RegS1.75% 24/4/2028 814,722 0.45
EUR 251,000 Medtronic Global HoldingsSCA 1.125% 7/3/2027 261,166 0.14
EUR 300,000 Medtronic Global HoldingsSCA 2.25% 7/3/2039 339,225 0.19
EUR 100,000 Medtronic Global HoldingsSCA 1.75% 2/7/2049 98,390 0.05
EUR 550,000 Richemont InternationalHolding SA RegS 1.00%26/3/2026 569,288 0.31
EUR 183,000 Richemont InternationalHolding SA RegS 1.50%26/3/2030 195,351 0.11
EUR 182,000 SES SA RegS 1.625%22/3/2026 178,436 0.10
BlackRock ESG Euro Corporate Bond Fund continued
The notes on pages 691 to 711 form an integral part of these financial statements.
BlackRock Strategic Funds[298]
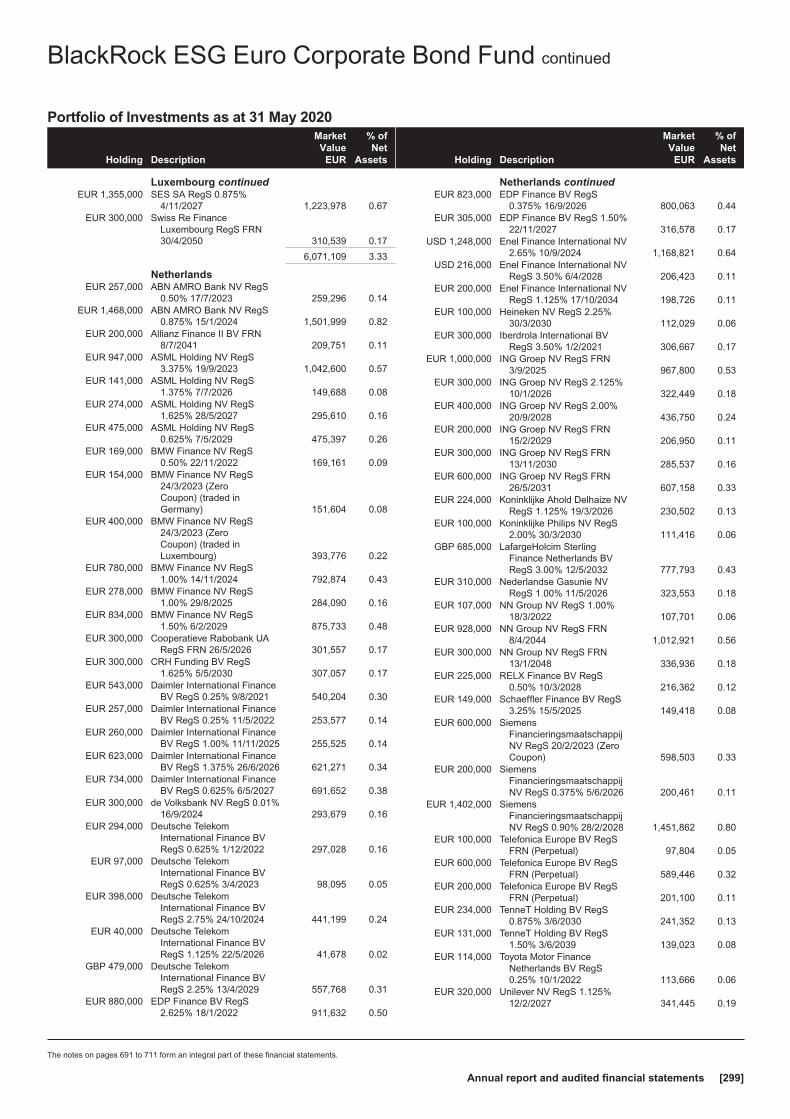
Portfolio of Investments as at 31 May 2020
Holding Description
MarketValue
EUR
% ofNet
Assets
Luxembourg continuedEUR 1,355,000 SES SA RegS 0.875%
4/11/2027 1,223,978 0.67EUR 300,000 Swiss Re Finance
Luxembourg RegS FRN30/4/2050 310,539 0.17
6,071,109 3.33
NetherlandsEUR 257,000 ABN AMRO Bank NV RegS
0.50% 17/7/2023 259,296 0.14EUR 1,468,000 ABN AMRO Bank NV RegS
0.875% 15/1/2024 1,501,999 0.82EUR 200,000 Allianz Finance II BV FRN
8/7/2041 209,751 0.11EUR 947,000 ASML Holding NV RegS
3.375% 19/9/2023 1,042,600 0.57EUR 141,000 ASML Holding NV RegS
1.375% 7/7/2026 149,688 0.08EUR 274,000 ASML Holding NV RegS
1.625% 28/5/2027 295,610 0.16EUR 475,000 ASML Holding NV RegS
0.625% 7/5/2029 475,397 0.26EUR 169,000 BMW Finance NV RegS
0.50% 22/11/2022 169,161 0.09EUR 154,000 BMW Finance NV RegS
24/3/2023 (ZeroCoupon) (traded inGermany) 151,604 0.08
EUR 400,000 BMW Finance NV RegS24/3/2023 (ZeroCoupon) (traded inLuxembourg) 393,776 0.22
EUR 780,000 BMW Finance NV RegS1.00% 14/11/2024 792,874 0.43
EUR 278,000 BMW Finance NV RegS1.00% 29/8/2025 284,090 0.16
EUR 834,000 BMW Finance NV RegS1.50% 6/2/2029 875,733 0.48
EUR 300,000 Cooperatieve Rabobank UARegS FRN 26/5/2026 301,557 0.17
EUR 300,000 CRH Funding BV RegS1.625% 5/5/2030 307,057 0.17
EUR 543,000 Daimler International FinanceBV RegS 0.25% 9/8/2021 540,204 0.30
EUR 257,000 Daimler International FinanceBV RegS 0.25% 11/5/2022 253,577 0.14
EUR 260,000 Daimler International FinanceBV RegS 1.00% 11/11/2025 255,525 0.14
EUR 623,000 Daimler International FinanceBV RegS 1.375% 26/6/2026 621,271 0.34
EUR 734,000 Daimler International FinanceBV RegS 0.625% 6/5/2027 691,652 0.38
EUR 300,000 de Volksbank NV RegS 0.01%16/9/2024 293,679 0.16
EUR 294,000 Deutsche TelekomInternational Finance BVRegS 0.625% 1/12/2022 297,028 0.16
EUR 97,000 Deutsche TelekomInternational Finance BVRegS 0.625% 3/4/2023 98,095 0.05
EUR 398,000 Deutsche TelekomInternational Finance BVRegS 2.75% 24/10/2024 441,199 0.24
EUR 40,000 Deutsche TelekomInternational Finance BVRegS 1.125% 22/5/2026 41,678 0.02
GBP 479,000 Deutsche TelekomInternational Finance BVRegS 2.25% 13/4/2029 557,768 0.31
EUR 880,000 EDP Finance BV RegS2.625% 18/1/2022 911,632 0.50
Holding Description
MarketValue
EUR
% ofNet
Assets
Netherlands continuedEUR 823,000 EDP Finance BV RegS
0.375% 16/9/2026 800,063 0.44EUR 305,000 EDP Finance BV RegS 1.50%
22/11/2027 316,578 0.17USD 1,248,000 Enel Finance International NV
2.65% 10/9/2024 1,168,821 0.64USD 216,000 Enel Finance International NV
RegS 3.50% 6/4/2028 206,423 0.11EUR 200,000 Enel Finance International NV
RegS 1.125% 17/10/2034 198,726 0.11EUR 100,000 Heineken NV RegS 2.25%
30/3/2030 112,029 0.06EUR 300,000 Iberdrola International BV
RegS 3.50% 1/2/2021 306,667 0.17EUR 1,000,000 ING Groep NV RegS FRN
3/9/2025 967,800 0.53EUR 300,000 ING Groep NV RegS 2.125%
10/1/2026 322,449 0.18EUR 400,000 ING Groep NV RegS 2.00%
20/9/2028 436,750 0.24EUR 200,000 ING Groep NV RegS FRN
15/2/2029 206,950 0.11EUR 300,000 ING Groep NV RegS FRN
13/11/2030 285,537 0.16EUR 600,000 ING Groep NV RegS FRN
26/5/2031 607,158 0.33EUR 224,000 Koninklijke Ahold Delhaize NV
RegS 1.125% 19/3/2026 230,502 0.13EUR 100,000 Koninklijke Philips NV RegS
2.00% 30/3/2030 111,416 0.06GBP 685,000 LafargeHolcim Sterling
Finance Netherlands BVRegS 3.00% 12/5/2032 777,793 0.43
EUR 310,000 Nederlandse Gasunie NVRegS 1.00% 11/5/2026 323,553 0.18
EUR 107,000 NN Group NV RegS 1.00%18/3/2022 107,701 0.06
EUR 928,000 NN Group NV RegS FRN8/4/2044 1,012,921 0.56
EUR 300,000 NN Group NV RegS FRN13/1/2048 336,936 0.18
EUR 225,000 RELX Finance BV RegS0.50% 10/3/2028 216,362 0.12
EUR 149,000 Schaeffler Finance BV RegS3.25% 15/5/2025 149,418 0.08
EUR 600,000 SiemensFinancieringsmaatschappijNV RegS 20/2/2023 (ZeroCoupon) 598,503 0.33
EUR 200,000 SiemensFinancieringsmaatschappijNV RegS 0.375% 5/6/2026 200,461 0.11
EUR 1,402,000 SiemensFinancieringsmaatschappijNV RegS 0.90% 28/2/2028 1,451,862 0.80
EUR 100,000 Telefonica Europe BV RegSFRN (Perpetual) 97,804 0.05
EUR 600,000 Telefonica Europe BV RegSFRN (Perpetual) 589,446 0.32
EUR 200,000 Telefonica Europe BV RegSFRN (Perpetual) 201,100 0.11
EUR 234,000 TenneT Holding BV RegS0.875% 3/6/2030 241,352 0.13
EUR 131,000 TenneT Holding BV RegS1.50% 3/6/2039 139,023 0.08
EUR 114,000 Toyota Motor FinanceNetherlands BV RegS0.25% 10/1/2022 113,666 0.06
EUR 320,000 Unilever NV RegS 1.125%12/2/2027 341,445 0.19
BlackRock ESG Euro Corporate Bond Fund continued
The notes on pages 691 to 711 form an integral part of these financial statements.
Annual report and audited financial statements [299]

Portfolio of Investments as at 31 May 2020
Holding Description
MarketValue
EUR
% ofNet
Assets
Netherlands continuedEUR 200,000 Unilever NV RegS 1.625%
12/2/2033 226,513 0.12EUR 100,000 Vonovia Finance BV RegS
2.25% 7/4/2030 108,860 0.06EUR 400,000 Vonovia Finance BV RegS
1.125% 14/9/2034 374,286 0.21
26,100,375 14.30
New ZealandEUR 1,614,000 Chorus Ltd RegS 1.125%
18/10/2023 1,638,961 0.90EUR 300,000 Chorus Ltd RegS 0.875%
5/12/2026 295,687 0.16
1,934,648 1.06
NorwayEUR 873,000 DNB Bank ASA RegS 0.25%
9/4/2024 871,224 0.48EUR 250,000 Telenor ASA RegS
25/9/2023 (Zero Coupon) 247,971 0.13
1,119,195 0.61
PolandEUR 150,000 Santander Bank Polska SA
RegS 0.75% 20/9/2021 149,437 0.08
149,437 0.08
PortugalEUR 100,000 EDP - Energias de Portugal
SA RegS 1.625% 15/4/2027 104,702 0.06EUR 500,000 EDP - Energias de Portugal
SA RegS FRN 20/7/2080 460,105 0.25
564,807 0.31
SpainEUR 300,000 Amadeus IT Group SA RegS
0.875% 18/9/2023 291,440 0.16EUR 100,000 Banco Bilbao Vizcaya
Argentaria SA RegS 0.625%17/1/2022 100,332 0.05
EUR 500,000 Banco Bilbao VizcayaArgentaria SA RegS 0.375%15/11/2026 486,865 0.27
EUR 1,000,000 Banco Bilbao VizcayaArgentaria SA RegS 0.50%14/1/2027 941,110 0.52
EUR 200,000 Banco Bilbao VizcayaArgentaria SA RegS 3.50%10/2/2027 218,131 0.12
EUR 200,000 Banco de Sabadell SA RegS1.625% 7/3/2024 194,553 0.11
EUR 1,100,000 Banco de Sabadell SA RegS0.875% 22/7/2025 1,020,404 0.56
USD 200,000 Banco Santander SA 3.306%27/6/2029 189,234 0.10
EUR 300,000 Banco Santander SA RegS1.375% 14/12/2022 307,407 0.17
EUR 800,000 Banco Santander SA RegS3.25% 4/4/2026 858,264 0.47
EUR 300,000 Banco Santander SA RegS0.30% 4/10/2026 294,297 0.16
EUR 1,100,000 Bankia SA RegS 0.75%9/7/2026 1,042,662 0.57
EUR 300,000 Bankia SA RegS 1.125%12/11/2026 269,600 0.15
EUR 600,000 Bankia SA RegS FRN15/2/2029 581,100 0.32
EUR 300,000 CaixaBank RegS 1.125%27/3/2026 299,095 0.16
EUR 200,000 CaixaBank SA RegS 1.125%17/5/2024 200,228 0.11
Holding Description
MarketValue
EUR
% ofNet
Assets
Spain continuedEUR 300,000 CaixaBank SA RegS 0.375%
3/2/2025 289,421 0.16EUR 500,000 Iberdrola Finanzas SA RegS
0.875% 16/6/2025 511,707 0.28EUR 300,000 Santander Consumer Finance
SA RegS 1.50% 12/11/2020 301,776 0.17EUR 200,000 Santander Consumer Finance
SA RegS 0.50% 4/10/2021 199,645 0.11EUR 600,000 Santander Consumer Finance
SA RegS 1.00% 27/2/2024 600,264 0.33EUR 100,000 Santander Consumer Finance
SA RegS 0.375%27/6/2024 (traded in Ireland) 97,468 0.05
EUR 300,000 Santander Consumer FinanceSA RegS 0.375%27/6/2024 (traded inSupranational) 292,404 0.16
EUR 600,000 Telefonica Emisiones SA RegS1.477% 14/9/2021 609,009 0.33
EUR 823,000 Telefonica Emisiones SA RegS1.957% 1/7/2039 837,608 0.46
11,034,024 6.05
SwedenEUR 994,000 Skandinaviska Enskilda
Banken AB RegS 0.05%1/7/2024 984,776 0.54
EUR 185,000 Skandinaviska EnskildaBanken AB RegS FRN28/5/2026 185,821 0.10
EUR 722,000 Svenska Handelsbanken ABRegS 0.05% 3/9/2026 695,578 0.38
EUR 200,000 Svenska Handelsbanken ABRegS 0.50% 18/2/2030 193,095 0.11
2,059,270 1.13
SwitzerlandEUR 200,000 Credit Suisse AG RegS 1.00%
7/6/2023 204,131 0.11EUR 155,000 Credit Suisse AG RegS FRN
18/9/2025 156,949 0.09EUR 100,000 Credit Suisse Group AG RegS
FRN 2/4/2026 109,196 0.06EUR 953,000 Credit Suisse Group AG RegS
FRN 24/6/2027 934,855 0.51EUR 925,000 Credit Suisse Group AG RegS
FRN 14/1/2028 882,135 0.48EUR 597,000 UBS AG RegS FRN 12/2/2026 610,230 0.34EUR 200,000 UBS Group AG RegS FRN
20/9/2022 198,904 0.11EUR 502,000 UBS Group AG RegS FRN
17/4/2025 510,273 0.28EUR 500,000 UBS Group AG RegS FRN
29/1/2026 485,225 0.27USD 261,000 UBS Group AG RegS FRN
(Perpetual) 244,418 0.13
4,336,316 2.38
United KingdomEUR 235,000 Barclays Plc RegS FRN
11/11/2025 234,141 0.13EUR 500,000 Barclays Plc RegS FRN
24/1/2026 498,472 0.27GBP 149,000 Barclays Plc RegS 3.00%
8/5/2026 170,185 0.09EUR 100,000 BP Capital Markets Plc RegS
1.117% 25/1/2024 101,266 0.06EUR 136,000 BP Capital Markets Plc RegS
0.90% 3/7/2024 136,086 0.07
BlackRock ESG Euro Corporate Bond Fund continued
The notes on pages 691 to 711 form an integral part of these financial statements.
BlackRock Strategic Funds[300]
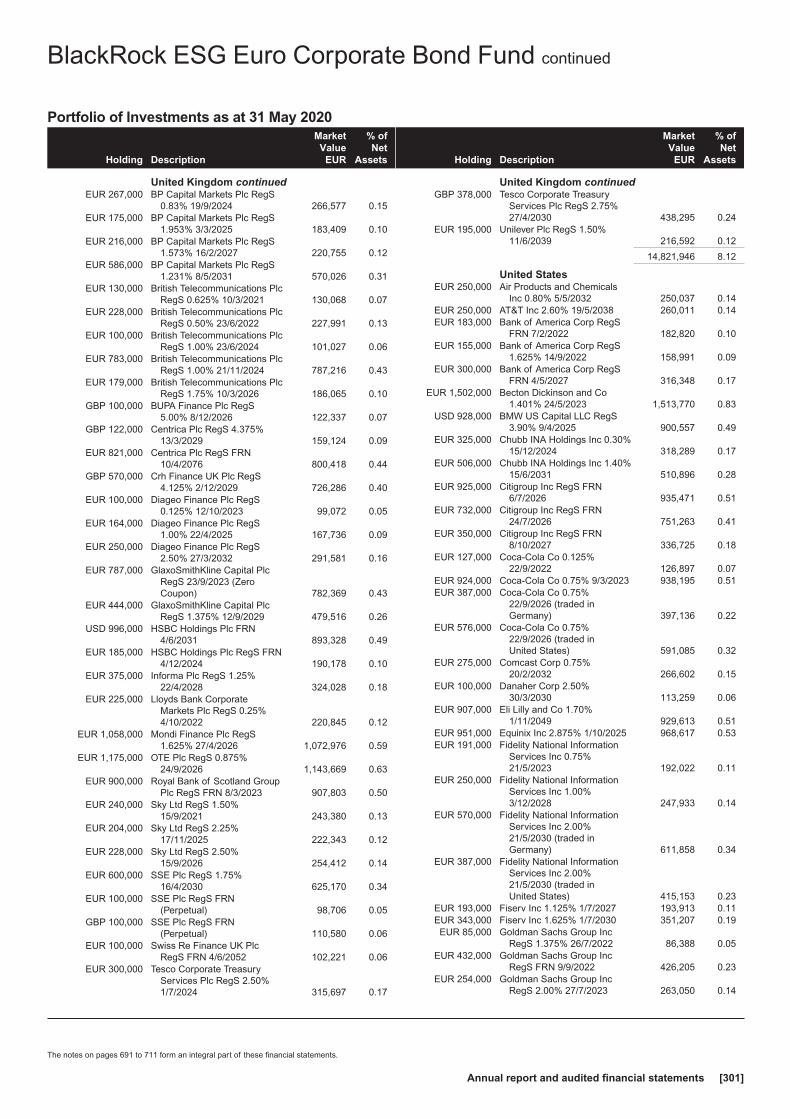
Portfolio of Investments as at 31 May 2020
Holding Description
MarketValue
EUR
% ofNet
Assets
United Kingdom continuedEUR 267,000 BP Capital Markets Plc RegS
0.83% 19/9/2024 266,577 0.15EUR 175,000 BP Capital Markets Plc RegS
1.953% 3/3/2025 183,409 0.10EUR 216,000 BP Capital Markets Plc RegS
1.573% 16/2/2027 220,755 0.12EUR 586,000 BP Capital Markets Plc RegS
1.231% 8/5/2031 570,026 0.31EUR 130,000 British Telecommunications Plc
RegS 0.625% 10/3/2021 130,068 0.07EUR 228,000 British Telecommunications Plc
RegS 0.50% 23/6/2022 227,991 0.13EUR 100,000 British Telecommunications Plc
RegS 1.00% 23/6/2024 101,027 0.06EUR 783,000 British Telecommunications Plc
RegS 1.00% 21/11/2024 787,216 0.43EUR 179,000 British Telecommunications Plc
RegS 1.75% 10/3/2026 186,065 0.10GBP 100,000 BUPA Finance Plc RegS
5.00% 8/12/2026 122,337 0.07GBP 122,000 Centrica Plc RegS 4.375%
13/3/2029 159,124 0.09EUR 821,000 Centrica Plc RegS FRN
10/4/2076 800,418 0.44GBP 570,000 Crh Finance UK Plc RegS
4.125% 2/12/2029 726,286 0.40EUR 100,000 Diageo Finance Plc RegS
0.125% 12/10/2023 99,072 0.05EUR 164,000 Diageo Finance Plc RegS
1.00% 22/4/2025 167,736 0.09EUR 250,000 Diageo Finance Plc RegS
2.50% 27/3/2032 291,581 0.16EUR 787,000 GlaxoSmithKline Capital Plc
RegS 23/9/2023 (ZeroCoupon) 782,369 0.43
EUR 444,000 GlaxoSmithKline Capital PlcRegS 1.375% 12/9/2029 479,516 0.26
USD 996,000 HSBC Holdings Plc FRN4/6/2031 893,328 0.49
EUR 185,000 HSBC Holdings Plc RegS FRN4/12/2024 190,178 0.10
EUR 375,000 Informa Plc RegS 1.25%22/4/2028 324,028 0.18
EUR 225,000 Lloyds Bank CorporateMarkets Plc RegS 0.25%4/10/2022 220,845 0.12
EUR 1,058,000 Mondi Finance Plc RegS1.625% 27/4/2026 1,072,976 0.59
EUR 1,175,000 OTE Plc RegS 0.875%24/9/2026 1,143,669 0.63
EUR 900,000 Royal Bank of Scotland GroupPlc RegS FRN 8/3/2023 907,803 0.50
EUR 240,000 Sky Ltd RegS 1.50%15/9/2021 243,380 0.13
EUR 204,000 Sky Ltd RegS 2.25%17/11/2025 222,343 0.12
EUR 228,000 Sky Ltd RegS 2.50%15/9/2026 254,412 0.14
EUR 600,000 SSE Plc RegS 1.75%16/4/2030 625,170 0.34
EUR 100,000 SSE Plc RegS FRN(Perpetual) 98,706 0.05
GBP 100,000 SSE Plc RegS FRN(Perpetual) 110,580 0.06
EUR 100,000 Swiss Re Finance UK PlcRegS FRN 4/6/2052 102,221 0.06
EUR 300,000 Tesco Corporate TreasuryServices Plc RegS 2.50%1/7/2024 315,697 0.17
Holding Description
MarketValue
EUR
% ofNet
Assets
United Kingdom continuedGBP 378,000 Tesco Corporate Treasury
Services Plc RegS 2.75%27/4/2030 438,295 0.24
EUR 195,000 Unilever Plc RegS 1.50%11/6/2039 216,592 0.12
14,821,946 8.12
United StatesEUR 250,000 Air Products and Chemicals
Inc 0.80% 5/5/2032 250,037 0.14EUR 250,000 AT&T Inc 2.60% 19/5/2038 260,011 0.14EUR 183,000 Bank of America Corp RegS
FRN 7/2/2022 182,820 0.10EUR 155,000 Bank of America Corp RegS
1.625% 14/9/2022 158,991 0.09EUR 300,000 Bank of America Corp RegS
FRN 4/5/2027 316,348 0.17EUR 1,502,000 Becton Dickinson and Co
1.401% 24/5/2023 1,513,770 0.83USD 928,000 BMW US Capital LLC RegS
3.90% 9/4/2025 900,557 0.49EUR 325,000 Chubb INA Holdings Inc 0.30%
15/12/2024 318,289 0.17EUR 506,000 Chubb INA Holdings Inc 1.40%
15/6/2031 510,896 0.28EUR 925,000 Citigroup Inc RegS FRN
6/7/2026 935,471 0.51EUR 732,000 Citigroup Inc RegS FRN
24/7/2026 751,263 0.41EUR 350,000 Citigroup Inc RegS FRN
8/10/2027 336,725 0.18EUR 127,000 Coca-Cola Co 0.125%
22/9/2022 126,897 0.07EUR 924,000 Coca-Cola Co 0.75% 9/3/2023 938,195 0.51EUR 387,000 Coca-Cola Co 0.75%
22/9/2026 (traded inGermany) 397,136 0.22
EUR 576,000 Coca-Cola Co 0.75%22/9/2026 (traded inUnited States) 591,085 0.32
EUR 275,000 Comcast Corp 0.75%20/2/2032 266,602 0.15
EUR 100,000 Danaher Corp 2.50%30/3/2030 113,259 0.06
EUR 907,000 Eli Lilly and Co 1.70%1/11/2049 929,613 0.51
EUR 951,000 Equinix Inc 2.875% 1/10/2025 968,617 0.53EUR 191,000 Fidelity National Information
Services Inc 0.75%21/5/2023 192,022 0.11
EUR 250,000 Fidelity National InformationServices Inc 1.00%3/12/2028 247,933 0.14
EUR 570,000 Fidelity National InformationServices Inc 2.00%21/5/2030 (traded inGermany) 611,858 0.34
EUR 387,000 Fidelity National InformationServices Inc 2.00%21/5/2030 (traded inUnited States) 415,153 0.23
EUR 193,000 Fiserv Inc 1.125% 1/7/2027 193,913 0.11EUR 343,000 Fiserv Inc 1.625% 1/7/2030 351,207 0.19EUR 85,000 Goldman Sachs Group Inc
RegS 1.375% 26/7/2022 86,388 0.05EUR 432,000 Goldman Sachs Group Inc
RegS FRN 9/9/2022 426,205 0.23EUR 254,000 Goldman Sachs Group Inc
RegS 2.00% 27/7/2023 263,050 0.14
BlackRock ESG Euro Corporate Bond Fund continued
The notes on pages 691 to 711 form an integral part of these financial statements.
Annual report and audited financial statements [301]

Portfolio of Investments as at 31 May 2020
Holding Description
MarketValue
EUR
% ofNet
Assets
United States continuedEUR 290,000 Goldman Sachs Group Inc
RegS 1.375% 15/5/2024 294,424 0.16EUR 125,000 Goldman Sachs Group Inc
RegS 0.125% 19/8/2024 121,088 0.07EUR 3,000 Goldman Sachs Group Inc
RegS 2.125%30/9/2024 (traded inGermany) 3,154 0.00
EUR 16,000 Goldman Sachs Group IncRegS 2.125%30/9/2024 (traded inSupranational) 16,774 0.01
EUR 200,000 Goldman Sachs Group IncRegS 3.375% 27/3/2025 221,777 0.12
EUR 116,000 Goldman Sachs Group IncRegS 1.625% 27/7/2026 119,917 0.07
EUR 350,000 Goldman Sachs Group IncRegS 0.875% 21/1/2030 336,533 0.18
EUR 100,000 International BusinessMachines Corp 0.375%31/1/2023 100,057 0.05
EUR 852,000 International BusinessMachines Corp 0.95%23/5/2025 872,254 0.48
EUR 816,000 International BusinessMachines Corp 1.25%29/1/2027 847,310 0.46
EUR 570,000 International BusinessMachines Corp 0.65%11/2/2032 547,694 0.30
EUR 207,000 International Flavors &Fragrances Inc 0.50%25/9/2021 205,805 0.11
EUR 1,163,000 International Flavors &Fragrances Inc 1.80%25/9/2026 1,127,651 0.62
EUR 183,000 JPMorgan Chase & Co RegS1.50% 26/10/2022 187,672 0.10
EUR 200,000 JPMorgan Chase & Co RegSFRN 4/11/2032 198,188 0.11
EUR 863,000 Levi Strauss & Co 3.375%15/3/2027 870,344 0.48
EUR 300,000 Marsh & McLennan Cos Inc1.979% 21/3/2030 315,710 0.17
USD 375,000 McDonald’s Corp 4.45%1/9/2048 412,367 0.23
EUR 700,000 MMS USA Investments IncRegS 1.25% 13/6/2028 648,315 0.36
EUR 700,000 MMS USA Investments IncRegS 1.75% 13/6/2031 647,797 0.36
EUR 174,000 Morgan Stanley 1.00%2/12/2022 175,768 0.10
EUR 625,000 Morgan Stanley 1.75%11/3/2024 651,969 0.36
EUR 1,088,000 Morgan Stanley FRN26/7/2024 1,084,992 0.59
EUR 329,000 National Grid North AmericaInc RegS 0.75% 8/8/2023 330,931 0.18
EUR 200,000 Prologis Euro Finance LLC1.875% 5/1/2029 210,675 0.12
Holding Description
MarketValue
EUR
% ofNet
Assets
United States continuedEUR 200,000 Prologis Euro Finance LLC
1.50% 10/9/2049 180,757 0.10EUR 1,027,000 PVH Corp RegS 3.125%
15/12/2027 949,426 0.52EUR 751,000 RELX Capital Inc 1.30%
12/5/2025 771,862 0.42EUR 125,000 Thermo Fisher Scientific Inc
0.125% 1/3/2025 122,364 0.07EUR 200,000 Thermo Fisher Scientific Inc
2.375% 15/4/2032 227,621 0.12USD 70,000 Union Pacific Corp 3.875%
1/2/2055 71,927 0.04EUR 192,000 Verizon Communications Inc
0.875% 2/4/2025 196,259 0.11GBP 237,000 Verizon Communications Inc
2.50% 8/4/2031 283,577 0.16EUR 775,000 Verizon Communications Inc
1.30% 18/5/2033 796,708 0.44EUR 775,000 Verizon Communications Inc
1.85% 18/5/2040 805,519 0.44
28,509,497 15.63
Total Bonds 170,035,479 93.19
Total Transferable Securities and Money MarketInstruments Admitted to an Official Stock ExchangeListing or Dealt in on Another Regulated Market 170,035,479 93.19
Other Transferable Securities and Money Market Instruments
BONDSFrance
EUR 1,100,000 Credit Mutuel Arkea 0.875%5/10/2023 1,113,739 0.61
1,113,739 0.61
New ZealandNZD 292,000 New Zealand Government
Inflation Linked Bond RegS2.50% 20/9/2040 252,566 0.14
252,566 0.14
Total Bonds 1,366,305 0.75
Total Other Transferable Securities and MoneyMarket Instruments 1,366,305 0.75
Collective Investment Schemes~
Ireland101,566 Institutional Cash Series Plc -
Institutional Euro AssetsLiquidity Fund 10,095,087 5.53
10,095,087 5.53
Total Collective Investment Schemes 10,095,087 5.53
Securities portfolio at market value 181,496,871 99.47
Other Net Assets 978,017 0.53
Total Net Assets (EUR) 182,474,888 100.00
~ Investment in related party fund, see further information in Note 10.
Swaps as at 31 May 2020
TypeNominal
Value Description CounterpartyExpiration
date
Net unrealisedappreciation/
(depreciation)EUR
MarketValue
EUR
CCCDS USD 3,294,916Fund receives Fixed 1.000% and provides default protection on
Markit CDX.NA.IG.30Bank of America
Merrill Lynch 20/6/2025 40,193 28,035
BlackRock ESG Euro Corporate Bond Fund continued
The notes on pages 691 to 711 form an integral part of these financial statements.
BlackRock Strategic Funds[302]
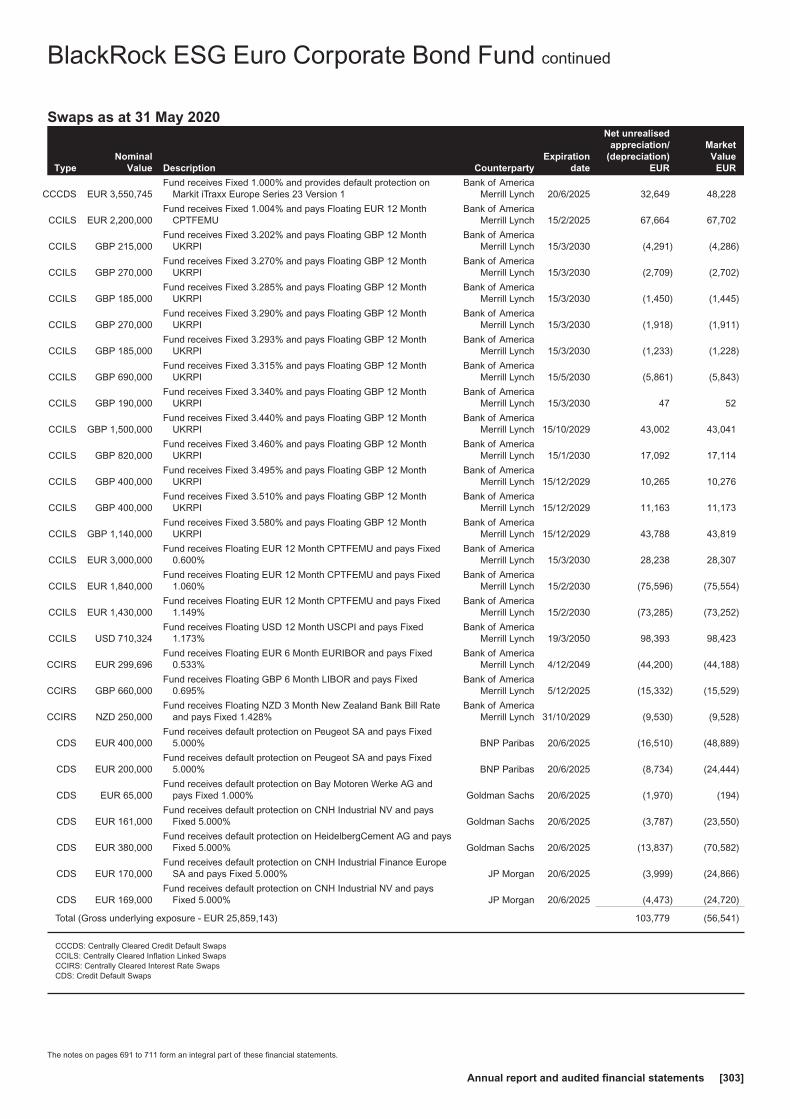
Swaps as at 31 May 2020
TypeNominal
Value Description CounterpartyExpiration
date
Net unrealisedappreciation/
(depreciation)EUR
MarketValue
EUR
CCCDS EUR 3,550,745Fund receives Fixed 1.000% and provides default protection on
Markit iTraxx Europe Series 23 Version 1Bank of America
Merrill Lynch 20/6/2025 32,649 48,228
CCILS EUR 2,200,000Fund receives Fixed 1.004% and pays Floating EUR 12 Month
CPTFEMUBank of America
Merrill Lynch 15/2/2025 67,664 67,702
CCILS GBP 215,000Fund receives Fixed 3.202% and pays Floating GBP 12 Month
UKRPIBank of America
Merrill Lynch 15/3/2030 (4,291) (4,286)
CCILS GBP 270,000Fund receives Fixed 3.270% and pays Floating GBP 12 Month
UKRPIBank of America
Merrill Lynch 15/3/2030 (2,709) (2,702)
CCILS GBP 185,000Fund receives Fixed 3.285% and pays Floating GBP 12 Month
UKRPIBank of America
Merrill Lynch 15/3/2030 (1,450) (1,445)
CCILS GBP 270,000Fund receives Fixed 3.290% and pays Floating GBP 12 Month
UKRPIBank of America
Merrill Lynch 15/3/2030 (1,918) (1,911)
CCILS GBP 185,000Fund receives Fixed 3.293% and pays Floating GBP 12 Month
UKRPIBank of America
Merrill Lynch 15/3/2030 (1,233) (1,228)
CCILS GBP 690,000Fund receives Fixed 3.315% and pays Floating GBP 12 Month
UKRPIBank of America
Merrill Lynch 15/5/2030 (5,861) (5,843)
CCILS GBP 190,000Fund receives Fixed 3.340% and pays Floating GBP 12 Month
UKRPIBank of America
Merrill Lynch 15/3/2030 47 52
CCILS GBP 1,500,000Fund receives Fixed 3.440% and pays Floating GBP 12 Month
UKRPIBank of America
Merrill Lynch 15/10/2029 43,002 43,041
CCILS GBP 820,000Fund receives Fixed 3.460% and pays Floating GBP 12 Month
UKRPIBank of America
Merrill Lynch 15/1/2030 17,092 17,114
CCILS GBP 400,000Fund receives Fixed 3.495% and pays Floating GBP 12 Month
UKRPIBank of America
Merrill Lynch 15/12/2029 10,265 10,276
CCILS GBP 400,000Fund receives Fixed 3.510% and pays Floating GBP 12 Month
UKRPIBank of America
Merrill Lynch 15/12/2029 11,163 11,173
CCILS GBP 1,140,000Fund receives Fixed 3.580% and pays Floating GBP 12 Month
UKRPIBank of America
Merrill Lynch 15/12/2029 43,788 43,819
CCILS EUR 3,000,000Fund receives Floating EUR 12 Month CPTFEMU and pays Fixed
0.600%Bank of America
Merrill Lynch 15/3/2030 28,238 28,307
CCILS EUR 1,840,000Fund receives Floating EUR 12 Month CPTFEMU and pays Fixed
1.060%Bank of America
Merrill Lynch 15/2/2030 (75,596) (75,554)
CCILS EUR 1,430,000Fund receives Floating EUR 12 Month CPTFEMU and pays Fixed
1.149%Bank of America
Merrill Lynch 15/2/2030 (73,285) (73,252)
CCILS USD 710,324Fund receives Floating USD 12 Month USCPI and pays Fixed
1.173%Bank of America
Merrill Lynch 19/3/2050 98,393 98,423
CCIRS EUR 299,696Fund receives Floating EUR 6 Month EURIBOR and pays Fixed
0.533%Bank of America
Merrill Lynch 4/12/2049 (44,200) (44,188)
CCIRS GBP 660,000Fund receives Floating GBP 6 Month LIBOR and pays Fixed
0.695%Bank of America
Merrill Lynch 5/12/2025 (15,332) (15,529)
CCIRS NZD 250,000Fund receives Floating NZD 3 Month New Zealand Bank Bill Rate
and pays Fixed 1.428%Bank of America
Merrill Lynch 31/10/2029 (9,530) (9,528)
CDS EUR 400,000Fund receives default protection on Peugeot SA and pays Fixed
5.000% BNP Paribas 20/6/2025 (16,510) (48,889)
CDS EUR 200,000Fund receives default protection on Peugeot SA and pays Fixed
5.000% BNP Paribas 20/6/2025 (8,734) (24,444)
CDS EUR 65,000Fund receives default protection on Bay Motoren Werke AG and
pays Fixed 1.000% Goldman Sachs 20/6/2025 (1,970) (194)
CDS EUR 161,000Fund receives default protection on CNH Industrial NV and pays
Fixed 5.000% Goldman Sachs 20/6/2025 (3,787) (23,550)
CDS EUR 380,000Fund receives default protection on HeidelbergCement AG and pays
Fixed 5.000% Goldman Sachs 20/6/2025 (13,837) (70,582)
CDS EUR 170,000Fund receives default protection on CNH Industrial Finance Europe
SA and pays Fixed 5.000% JP Morgan 20/6/2025 (3,999) (24,866)
CDS EUR 169,000Fund receives default protection on CNH Industrial NV and pays
Fixed 5.000% JP Morgan 20/6/2025 (4,473) (24,720)
Total (Gross underlying exposure - EUR 25,859,143) 103,779 (56,541)
CCCDS: Centrally Cleared Credit Default SwapsCCILS: Centrally Cleared Inflation Linked SwapsCCIRS: Centrally Cleared Interest Rate SwapsCDS: Credit Default Swaps
BlackRock ESG Euro Corporate Bond Fund continued
The notes on pages 691 to 711 form an integral part of these financial statements.
Annual report and audited financial statements [303]
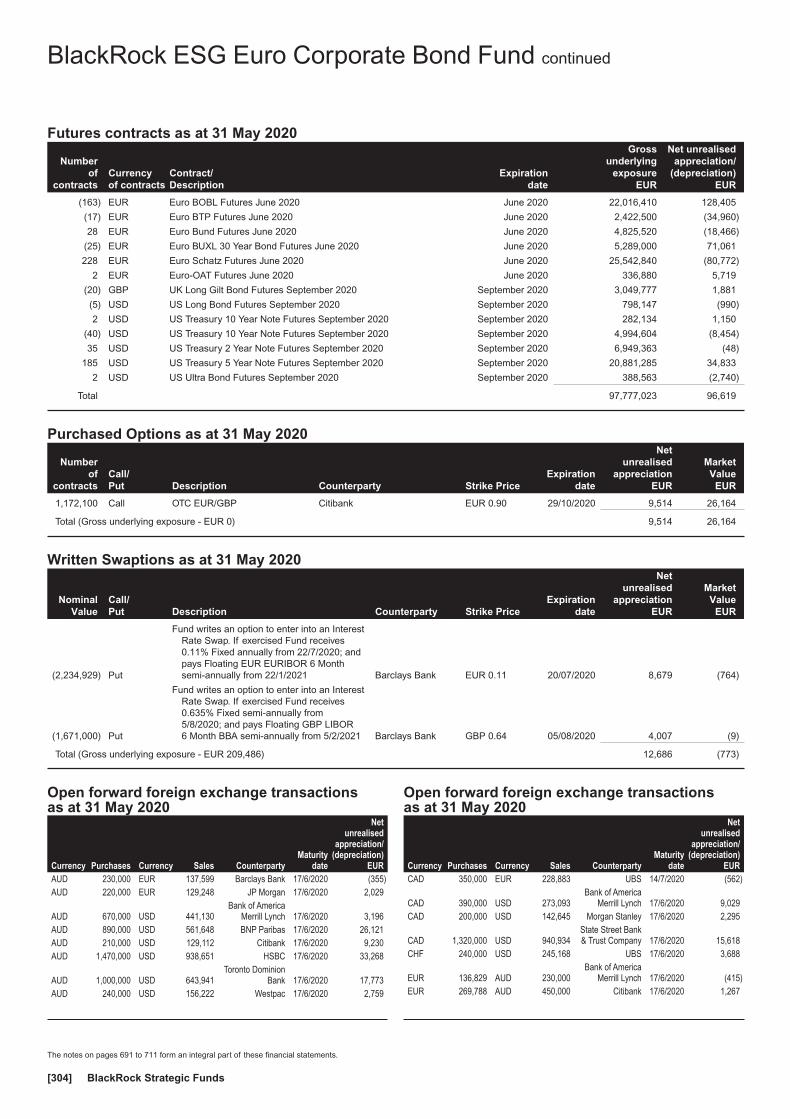
Futures contracts as at 31 May 2020
Numberof
contractsCurrencyof contracts
Contract/Description
Expirationdate
Grossunderlying
exposureEUR
Net unrealisedappreciation/
(depreciation)EUR
(163) EUR Euro BOBL Futures June 2020 June 2020 22,016,410 128,405
(17) EUR Euro BTP Futures June 2020 June 2020 2,422,500 (34,960)
28 EUR Euro Bund Futures June 2020 June 2020 4,825,520 (18,466)
(25) EUR Euro BUXL 30 Year Bond Futures June 2020 June 2020 5,289,000 71,061
228 EUR Euro Schatz Futures June 2020 June 2020 25,542,840 (80,772)
2 EUR Euro-OAT Futures June 2020 June 2020 336,880 5,719
(20) GBP UK Long Gilt Bond Futures September 2020 September 2020 3,049,777 1,881
(5) USD US Long Bond Futures September 2020 September 2020 798,147 (990)
2 USD US Treasury 10 Year Note Futures September 2020 September 2020 282,134 1,150
(40) USD US Treasury 10 Year Note Futures September 2020 September 2020 4,994,604 (8,454)
35 USD US Treasury 2 Year Note Futures September 2020 September 2020 6,949,363 (48)
185 USD US Treasury 5 Year Note Futures September 2020 September 2020 20,881,285 34,833
2 USD US Ultra Bond Futures September 2020 September 2020 388,563 (2,740)
Total 97,777,023 96,619
Purchased Options as at 31 May 2020
Numberof
contractsCall/Put Description Counterparty Strike Price
Expirationdate
Netunrealised
appreciationEUR
MarketValue
EUR
1,172,100 Call OTC EUR/GBP Citibank EUR 0.90 29/10/2020 9,514 26,164
Total (Gross underlying exposure - EUR 0) 9,514 26,164
Written Swaptions as at 31 May 2020
NominalValue
Call/Put Description Counterparty Strike Price
Expirationdate
Netunrealised
appreciationEUR
MarketValue
EUR
(2,234,929) Put
Fund writes an option to enter into an InterestRate Swap. If exercised Fund receives0.11% Fixed annually from 22/7/2020; andpays Floating EUR EURIBOR 6 Monthsemi-annually from 22/1/2021 Barclays Bank EUR 0.11 20/07/2020 8,679 (764)
(1,671,000) Put
Fund writes an option to enter into an InterestRate Swap. If exercised Fund receives0.635% Fixed semi-annually from5/8/2020; and pays Floating GBP LIBOR6 Month BBA semi-annually from 5/2/2021 Barclays Bank GBP 0.64 05/08/2020 4,007 (9)
Total (Gross underlying exposure - EUR 209,486) 12,686 (773)
Open forward foreign exchange transactionsas at 31 May 2020
Currency Purchases Currency Sales CounterpartyMaturity
date
Netunrealised
appreciation/(depreciation)
EURAUD 230,000 EUR 137,599 Barclays Bank 17/6/2020 (355)AUD 220,000 EUR 129,248 JP Morgan 17/6/2020 2,029
AUD 670,000 USD 441,130Bank of America
Merrill Lynch 17/6/2020 3,196AUD 890,000 USD 561,648 BNP Paribas 17/6/2020 26,121AUD 210,000 USD 129,112 Citibank 17/6/2020 9,230AUD 1,470,000 USD 938,651 HSBC 17/6/2020 33,268
AUD 1,000,000 USD 643,941Toronto Dominion
Bank 17/6/2020 17,773AUD 240,000 USD 156,222 Westpac 17/6/2020 2,759
Open forward foreign exchange transactionsas at 31 May 2020
Currency Purchases Currency Sales CounterpartyMaturity
date
Netunrealised
appreciation/(depreciation)
EURCAD 350,000 EUR 228,883 UBS 14/7/2020 (562)
CAD 390,000 USD 273,093Bank of America
Merrill Lynch 17/6/2020 9,029CAD 200,000 USD 142,645 Morgan Stanley 17/6/2020 2,295
CAD 1,320,000 USD 940,934State Street Bank& Trust Company 17/6/2020 15,618
CHF 240,000 USD 245,168 UBS 17/6/2020 3,688
EUR 136,829 AUD 230,000Bank of America
Merrill Lynch 17/6/2020 (415)EUR 269,788 AUD 450,000 Citibank 17/6/2020 1,267
BlackRock ESG Euro Corporate Bond Fund continued
The notes on pages 691 to 711 form an integral part of these financial statements.
BlackRock Strategic Funds[304]

Open forward foreign exchange transactionsas at 31 May 2020
Currency Purchases Currency Sales CounterpartyMaturity
date
Netunrealised
appreciation/(depreciation)
EUR
EUR 131,789 AUD 220,000Toronto Dominion
Bank 17/6/2020 511
EUR 241,792 CAD 370,000Royal Bank of
Canada 14/7/2020 424EUR 87,114 DKK 650,000 Goldman Sachs 14/7/2020 (88)EUR 538,930 GBP 470,000 Barclays Bank 17/6/2020 17,023EUR 1,216,300 GBP 1,130,000 Citibank 17/6/2020 (38,503)EUR 398,399 GBP 350,000 Deutsche Bank 17/6/2020 9,743EUR 690,000 GBP 616,327 Morgan Stanley 17/6/2020 5,603EUR 178,931 GBP 160,000 Citibank 14/7/2020 1,340EUR 212,399 GBP 190,000 Morgan Stanley 14/7/2020 1,510
EUR 4,389,086 GBP 3,855,000Toronto Dominion
Bank 14/7/2020 110,253EUR 22,303 GBP 20,000 UBS 14/7/2020 104EUR 65,806 NOK 802,183 BNP Paribas 17/6/2020 (8,419)EUR 24,453 NOK 297,817 Deutsche Bank 17/6/2020 (3,104)EUR 53,182 NOK 600,000 Goldman Sachs 17/6/2020 (2,335)EUR 29,007 NOK 340,000 JP Morgan 17/6/2020 (2,453)EUR 59,273 NOK 673,164 Morgan Stanley 17/6/2020 (3,014)
EUR 69,317 NOK 800,000Royal Bank of
Canada 17/6/2020 (4,706)EUR 95,362 NOK 1,086,836 Societe Generale 17/6/2020 (5,201)EUR 145,929 NOK 1,700,000 UBS 17/6/2020 (11,370)EUR 215,174 NZD 390,000 Morgan Stanley 14/7/2020 (2,176)EUR 273,336 SEK 2,900,000 HSBC 17/6/2020 (2,628)EUR 263,939 SEK 2,800,000 JP Morgan 17/6/2020 (2,509)EUR 441,345 SEK 4,800,000 Natwest Markets 17/6/2020 (15,423)
EUR 515,000 USD 560,895Bank of America
Merrill Lynch 17/6/2020 10,722EUR 300,000 USD 343,833 BNP Paribas 17/6/2020 (9,126)EUR 70,000 USD 77,081 Citibank 17/6/2020 700EUR 500,000 USD 553,580 Morgan Stanley 17/6/2020 2,299
EUR 4,669,532 USD 5,090,000Bank of America
Merrill Lynch 14/7/2020 95,932EUR 301,439 USD 330,000 HSBC 14/7/2020 4,919EUR 181,725 USD 200,000 Morgan Stanley 14/7/2020 2,015GBP 1,250,000 EUR 1,371,415 BNP Paribas 17/6/2020 16,641GBP 340,000 EUR 384,772 Citibank 17/6/2020 (7,221)GBP 120,000 EUR 135,846 Societe Generale 17/6/2020 (2,593)GBP 240,000 EUR 274,342 Westpac 17/6/2020 (7,836)GBP 380,000 EUR 435,957 Deutsche Bank 14/7/2020 (14,179)GBP 230,000 USD 285,737 Deutsche Bank 17/6/2020 (1,492)
GBP 120,000 USD 148,223State Street Bank& Trust Company 17/6/2020 (8)
GBP 230,000 USD 287,673 Westpac 17/6/2020 (3,232)
JPY 34,000,000 USD 322,452Bank of America
Merrill Lynch 17/6/2020 (5,666)JPY 13,000,000 USD 121,309 Barclays Bank 17/6/2020 (385)JPY 15,000,000 USD 135,223 Citibank 17/6/2020 3,825JPY 30,000,000 USD 271,517 JP Morgan 17/6/2020 6,688
JPY 16,000,000 USD 149,625Royal Bank of
Canada 17/6/2020 (763)JPY 16,000,000 USD 148,640 UBS 17/6/2020 123NOK 6,300,000 EUR 558,820 Natwest Markets 17/6/2020 24,111NOK 2,300,000 USD 229,232 Natwest Markets 17/6/2020 6,723NZD 240,000 USD 145,300 BNP Paribas 17/6/2020 3,219NZD 610,000 USD 342,332 Citibank 17/6/2020 32,429NZD 512,890 USD 304,890 Morgan Stanley 17/6/2020 11,932
Open forward foreign exchange transactionsas at 31 May 2020
Currency Purchases Currency Sales CounterpartyMaturity
date
Netunrealised
appreciation/(depreciation)
EURNZD 165,316 USD 96,742 Societe Generale 17/6/2020 5,223
NZD 240,000 USD 144,254Standard
Chartered Bank 17/6/2020 4,158NZD 474,684 USD 277,749 UBS 17/6/2020 15,025NZD 217,110 USD 131,007 Westpac 17/6/2020 3,303SEK 811,612 EUR 73,192 BNP Paribas 17/6/2020 4,041SEK 2,066,053 EUR 188,797 Deutsche Bank 17/6/2020 7,809SEK 163,947 EUR 14,945 Goldman Sachs 17/6/2020 657SEK 3,770,000 EUR 351,551 JP Morgan 17/6/2020 7,202SEK 788,388 EUR 71,085 UBS 17/6/2020 3,938SEK 1,500,000 USD 151,830 JP Morgan 17/6/2020 6,236
USD 148,602 AUD 230,000Bank of America
Merrill Lynch 17/6/2020 (3,642)USD 293,513 AUD 460,000 Barclays Bank 17/6/2020 (10,604)USD 1,074,206 AUD 1,680,000 BNP Paribas 17/6/2020 (36,704)USD 346,323 AUD 610,000 Citibank 17/6/2020 (52,631)USD 187,102 AUD 315,393 Deutsche Bank 17/6/2020 (19,984)USD 515,134 AUD 780,000 JP Morgan 17/6/2020 (2,301)USD 443,227 AUD 680,000 Morgan Stanley 17/6/2020 (7,279)
USD 431,730 AUD 690,000Toronto Dominion
Bank 17/6/2020 (23,582)USD 310,494 AUD 504,607 UBS 17/6/2020 (21,954)USD 141,583 CAD 200,000 BNP Paribas 17/6/2020 (3,250)USD 277,408 CAD 390,000 Goldman Sachs 17/6/2020 (5,149)USD 326,577 CAD 450,000 Societe Generale 17/6/2020 (106)
USD 22,374 CAD 30,517Toronto Dominion
Bank 17/6/2020 197USD 314,824 CAD 429,483 UBS 17/6/2020 2,719USD 293,437 CAD 410,000 Westpac 17/6/2020 (3,792)USD 255,155 CHF 240,000 Morgan Stanley 17/6/2020 5,291
USD 367,745 EUR 335,000Bank of America
Merrill Lynch 17/6/2020 (4,375)USD 495,570 EUR 450,000 BNP Paribas 17/6/2020 (4,453)USD 77,959 EUR 70,000 Morgan Stanley 17/6/2020 90
USD 440,988 EUR 400,000State Street Bank& Trust Company 17/6/2020 (3,526)
USD 142,197 EUR 130,000 UBS 17/6/2020 (2,157)USD 1,700,000 EUR 1,566,404 BNP Paribas 14/7/2020 (38,876)
USD 144,723 GBP 115,000Bank of America
Merrill Lynch 17/6/2020 2,413USD 286,884 GBP 230,000 Barclays Bank 17/6/2020 2,523USD 293,891 GBP 235,000 Deutsche Bank 17/6/2020 3,271
USD 151,000 JPY 16,000,000Bank of America
Merrill Lynch 17/6/2020 1,999USD 425,497 JPY 46,000,000 Citibank 17/6/2020 (2,009)USD 138,038 JPY 15,000,000 Morgan Stanley 17/6/2020 (1,295)USD 432,920 JPY 47,000,000 Westpac 17/6/2020 (3,695)USD 38,148 NOK 396,978 Barclays Bank 17/6/2020 (2,434)USD 182,031 NOK 1,903,022 Morgan Stanley 17/6/2020 (12,428)USD 144,542 NZD 240,000 BNP Paribas 17/6/2020 (3,899)USD 266,209 NZD 440,000 Citibank 17/6/2020 (6,058)USD 141,497 NZD 240,000 Goldman Sachs 17/6/2020 (6,638)USD 645,838 NZD 1,050,000 HSBC 17/6/2020 (4,954)USD 155,321 NZD 250,000 Morgan Stanley 17/6/2020 214USD 157,961 SEK 1,500,000 BNP Paribas 17/6/2020 (724)
BlackRock ESG Euro Corporate Bond Fund continued
The notes on pages 691 to 711 form an integral part of these financial statements.
Annual report and audited financial statements [305]

Open forward foreign exchange transactionsas at 31 May 2020
Currency Purchases Currency Sales CounterpartyMaturity
date
Netunrealised
appreciation/(depreciation)
EURUSD 142,029 SEK 1,400,000 Goldman Sachs 17/6/2020 (5,532)USD 153,044 SEK 1,500,000 JP Morgan 17/6/2020 (5,145)
Total (Gross underlying exposure - EUR 55,733,024) 116,433
Sector Breakdownas at 31 May 2020
% of NetAssets
Financial 41.83
Communications 11.77
Utilities 11.28
Consumer, Non-cyclical 7.95
Industrial 6.32
Consumer, Cyclical 5.76
Collective Investment Schemes 5.53
Technology 4.85
Basic Materials 2.23
Energy 1.81
Government 0.14
Securities portfolio at market value 99.47
Other Net Assets 0.53
100.00
BlackRock ESG Euro Corporate Bond Fund continued
The notes on pages 691 to 711 form an integral part of these financial statements.
BlackRock Strategic Funds[306]
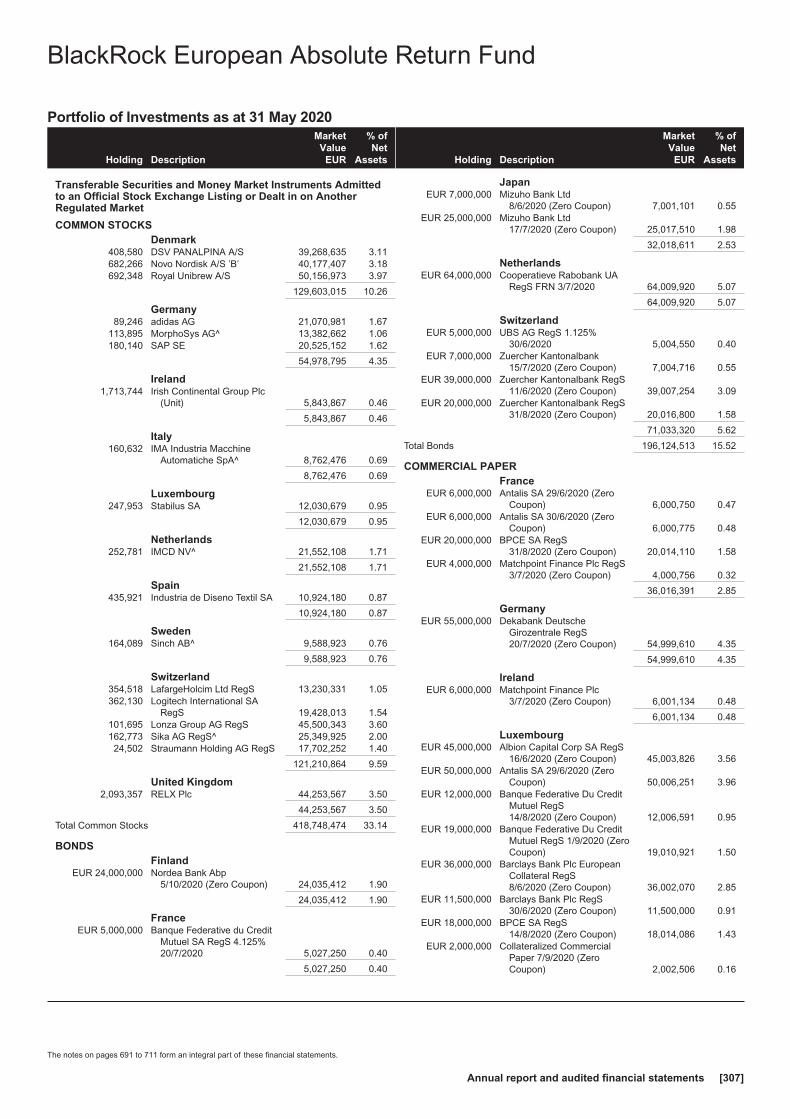
Portfolio of Investments as at 31 May 2020
Holding Description
MarketValue
EUR
% ofNet
Assets
Transferable Securities and Money Market Instruments Admittedto an Official Stock Exchange Listing or Dealt in on AnotherRegulated Market
COMMON STOCKSDenmark
408,580 DSV PANALPINA A/S 39,268,635 3.11682,266 Novo Nordisk A/S ’B’ 40,177,407 3.18692,348 Royal Unibrew A/S 50,156,973 3.97
129,603,015 10.26
Germany89,246 adidas AG 21,070,981 1.67
113,895 MorphoSys AG^ 13,382,662 1.06180,140 SAP SE 20,525,152 1.62
54,978,795 4.35
Ireland1,713,744 Irish Continental Group Plc
(Unit) 5,843,867 0.46
5,843,867 0.46
Italy160,632 IMA Industria Macchine
Automatiche SpA^ 8,762,476 0.69
8,762,476 0.69
Luxembourg247,953 Stabilus SA 12,030,679 0.95
12,030,679 0.95
Netherlands252,781 IMCD NV^ 21,552,108 1.71
21,552,108 1.71
Spain435,921 Industria de Diseno Textil SA 10,924,180 0.87
10,924,180 0.87
Sweden164,089 Sinch AB^ 9,588,923 0.76
9,588,923 0.76
Switzerland354,518 LafargeHolcim Ltd RegS 13,230,331 1.05362,130 Logitech International SA
RegS 19,428,013 1.54101,695 Lonza Group AG RegS 45,500,343 3.60162,773 Sika AG RegS^ 25,349,925 2.0024,502 Straumann Holding AG RegS 17,702,252 1.40
121,210,864 9.59
United Kingdom2,093,357 RELX Plc 44,253,567 3.50
44,253,567 3.50
Total Common Stocks 418,748,474 33.14
BONDSFinland
EUR 24,000,000 Nordea Bank Abp5/10/2020 (Zero Coupon) 24,035,412 1.90
24,035,412 1.90
FranceEUR 5,000,000 Banque Federative du Credit
Mutuel SA RegS 4.125%20/7/2020 5,027,250 0.40
5,027,250 0.40
Holding Description
MarketValue
EUR
% ofNet
Assets
JapanEUR 7,000,000 Mizuho Bank Ltd
8/6/2020 (Zero Coupon) 7,001,101 0.55EUR 25,000,000 Mizuho Bank Ltd
17/7/2020 (Zero Coupon) 25,017,510 1.98
32,018,611 2.53
NetherlandsEUR 64,000,000 Cooperatieve Rabobank UA
RegS FRN 3/7/2020 64,009,920 5.07
64,009,920 5.07
SwitzerlandEUR 5,000,000 UBS AG RegS 1.125%
30/6/2020 5,004,550 0.40EUR 7,000,000 Zuercher Kantonalbank
15/7/2020 (Zero Coupon) 7,004,716 0.55EUR 39,000,000 Zuercher Kantonalbank RegS
11/6/2020 (Zero Coupon) 39,007,254 3.09EUR 20,000,000 Zuercher Kantonalbank RegS
31/8/2020 (Zero Coupon) 20,016,800 1.58
71,033,320 5.62
Total Bonds 196,124,513 15.52
COMMERCIAL PAPERFrance
EUR 6,000,000 Antalis SA 29/6/2020 (ZeroCoupon) 6,000,750 0.47
EUR 6,000,000 Antalis SA 30/6/2020 (ZeroCoupon) 6,000,775 0.48
EUR 20,000,000 BPCE SA RegS31/8/2020 (Zero Coupon) 20,014,110 1.58
EUR 4,000,000 Matchpoint Finance Plc RegS3/7/2020 (Zero Coupon) 4,000,756 0.32
36,016,391 2.85
GermanyEUR 55,000,000 Dekabank Deutsche
Girozentrale RegS20/7/2020 (Zero Coupon) 54,999,610 4.35
54,999,610 4.35
IrelandEUR 6,000,000 Matchpoint Finance Plc
3/7/2020 (Zero Coupon) 6,001,134 0.48
6,001,134 0.48
LuxembourgEUR 45,000,000 Albion Capital Corp SA RegS
16/6/2020 (Zero Coupon) 45,003,826 3.56EUR 50,000,000 Antalis SA 29/6/2020 (Zero
Coupon) 50,006,251 3.96EUR 12,000,000 Banque Federative Du Credit
Mutuel RegS14/8/2020 (Zero Coupon) 12,006,591 0.95
EUR 19,000,000 Banque Federative Du CreditMutuel RegS 1/9/2020 (ZeroCoupon) 19,010,921 1.50
EUR 36,000,000 Barclays Bank Plc EuropeanCollateral RegS8/6/2020 (Zero Coupon) 36,002,070 2.85
EUR 11,500,000 Barclays Bank Plc RegS30/6/2020 (Zero Coupon) 11,500,000 0.91
EUR 18,000,000 BPCE SA RegS14/8/2020 (Zero Coupon) 18,014,086 1.43
EUR 2,000,000 Collateralized CommercialPaper 7/9/2020 (ZeroCoupon) 2,002,506 0.16
BlackRock European Absolute Return Fund
The notes on pages 691 to 711 form an integral part of these financial statements.
Annual report and audited financial statements [307]

Portfolio of Investments as at 31 May 2020
Holding Description
MarketValue
EUR
% ofNet
Assets
Luxembourg continuedEUR 13,000,000 Collateralized Commercial
Paper RegS14/8/2020 (Zero Coupon) 13,010,174 1.03
EUR 7,500,000 Deutsche Bahn AG RegS11/8/2020 (Zero Coupon) 7,502,358 0.59
EUR 44,000,000 Landesbank Hessen GZFrankfurt 10/6/2020 (ZeroCoupon) 44,005,119 3.48
EUR 10,000,000 Landesbank Hessen GZFrankfurt 10/6/2020 (ZeroCoupon) 10,001,163 0.79
EUR 16,000,000 Landesbank HessenThueringen Giroz RegS31/7/2020 (Zero Coupon) 16,006,617 1.27
EUR 45,500,000 Matchpoint Finance Plc RegS18/6/2020 (Zero Coupon) 45,504,323 3.60
EUR 26,000,000 Oesterreichische KontrollbankAG 12/6/2020 (ZeroCoupon) 26,004,465 2.06
EUR 28,500,000 Procter & Gamble Co RegS13/8/2020 (Zero Coupon) 28,503,563 2.26
EUR 27,500,000 Svenska Handelsbanken ABRegS 15/9/2020 (ZeroCoupon) 27,522,295 2.18
411,606,328 32.58
Total Commercial Papers 508,623,463 40.26
Total Transferable Securities and Money MarketInstruments Admitted to an Official Stock ExchangeListing or Dealt in on Another Regulated Market 1,123,496,450 88.92
Other Transferable Securities and Money Market Instruments
BONDSFrance
EUR 12,000,000 Credit Agricole SA13/7/2020 (Zero Coupon) 12,006,719 0.95
EUR 50,000,000 Credit Agricole SA12/8/2020 (Zero Coupon) 50,042,785 3.96
62,049,504 4.91
Total Bonds 62,049,504 4.91
Total Other Transferable Securities and MoneyMarket Instruments 62,049,504 4.91
Collective Investment Schemes~
Ireland819,067 Institutional Cash Series Plc -
Institutional Euro AssetsLiquidity Fund 81,410,452 6.45
81,410,452 6.45
Total Collective Investment Schemes 81,410,452 6.45
Securities portfolio at market value 1,266,956,406 100.28
Other Net Liabilities (3,511,292) (0.28)
Total Net Assets (EUR) 1,263,445,114 100.00
^ All or a portion of this security represents a security on loan.~ Investment in related party fund, see further information in Note 10.
BlackRock European Absolute Return Fund continued
The notes on pages 691 to 711 form an integral part of these financial statements.
BlackRock Strategic Funds[308]

Contracts for difference as at 31 May 2020
Holding Description Counterparty
Netunrealised
appreciation/(depreciation)
EUR
Austria(69,178) Lenzing AG Citibank (51,884)
(51,884)
Belgium(115,262) Solvay SA Citibank (368,839)
(368,839)
Denmark(564,088) Demant A/S JP Morgan (1,392,444)(314,550) ISS A/S Citibank (251,085)(139,558) Novozymes A/S ’B’ Citibank (207,812)
(1,851,341)
Finland(443,289) Nokian Renkaat Oyj Bank of America
Merrill Lynch (1,644,602)
(1,644,602)
France(253,236) Alstom SA Bank of America
Merrill Lynch 81,358236,954 Alten SA Bank of America
Merrill Lynch 853,034(168,402) Casino Guichard Perrachon
SABank of AmericaMerrill Lynch (149,878)
(606,761) Elior Group SA JP Morgan 145,623(20,745) Eurofins Scientific SE Citibank (697,032)(24,341) Imerys SA Citibank (73,510)41,945 Kering SA JP Morgan 1,160,753
(426,354) Klepierre SA (REIT) Citibank (1,387,782)35,764 LVMH Moet Hennessy Louis
Vuitton SE JP Morgan 953,111(496,135) Orange SA Bank of America
Merrill Lynch (396,908)97,609 Pernod Ricard SA JP Morgan 370,914
283,773 Safran SA JP Morgan 1,543,725(156,687) Societe BIC SA Bank of America
Merrill Lynch (545,271)(682,558) Suez SA JP Morgan (6,825)
30,511 Teleperformance Citibank (131,197)(206,792) Valeo SA JP Morgan (229,539)(67,797) Vallourec SA JP Morgan 577,622
2,068,198
Germany(243,186) BASF SE JP Morgan (632,284)(360,653) Bilfinger SE Citibank (248,851)(900,492) CECONOMY AG Citibank (334,983)(182,305) CECONOMY AG JP Morgan (48,858)(110,180) Continental AG JP Morgan (1,073,153)(136,315) Covestro AG Citibank (314,888)
(1,296,782) Deutsche Bank AG Bank of AmericaMerrill Lynch (2,192,858)
(200,869) Deutsche EuroShop AG JP Morgan (6,026)(1,136,184) Deutsche Lufthansa AG
RegSBank of AmericaMerrill Lynch (1,940,602)
(476,189) Evonik Industries AG JP Morgan (9,524)(19,372) GRENKE AG Bank of America
Merrill Lynch (232,464)(114,005) GRENKE AG JP Morgan (684,030)(787,424) K+S AG RegS Bank of America
Merrill Lynch (431,508)(81,953) Knorr-Bremse AG Bank of America
Merrill Lynch (638,572)(4,118) Rational AG Citibank (160,602)
(317,345) RIB Software SE Bank of AmericaMerrill Lynch —
(175,608) Siemens Healthineers AG Bank of AmericaMerrill Lynch (928,088)
(178,853) SLM Solutions Group AG Bank of AmericaMerrill Lynch (398,842)
Holding Description Counterparty
Netunrealised
appreciation/(depreciation)
EUR
Germany continued(212,322) Software AG Bank of America
Merrill Lynch (450,123)(31,321) Wirecard AG Citibank (271,866)
(10,998,122)
Italy(89,602) Tod’s SpA Citibank (62,721)
(62,721)
Netherlands(40,499) Galapagos NV Citibank (12,150)
(223,589) Signify NV Citibank (441,588)(1,161,591) SNS REAAL NV* Deutsche Bank 11
(99,739) Unibail-Rodamco-Westfield(REIT)
Bank of AmericaMerrill Lynch (528,617)
(982,344)
Norway(4,354,361) REC Silicon ASA Bank of America
Merrill Lynch (22,566)
(22,566)
Portugal(2,910,461) CTT-Correios de Portugal
SA Citibank 14,552
14,552
Spain(620,230) Siemens Gamesa
Renewable Energy SABank of AmericaMerrill Lynch (859,018)
(1,626,005) Telefonica SA Citibank (243,901)
(1,102,919)
Sweden612,552 AddTech AB ’B’ Bank of America
Merrill Lynch 2,390,280114,752 Atlas Copco AB ’A’ Bank of America
Merrill Lynch 370,239437,363 Atlas Copco AB ’B’ JP Morgan 894,957
(1,189,789) Elekta AB ’B’ JP Morgan (908,168)270,728 Hexagon AB ’B’ Deutsche Bank 1,592,369239,168 Thule Group AB Deutsche Bank 726,132
(487,819) Veoneer Inc SDR JP Morgan (306,425)1,608,077 Volvo AB ’B’ Citibank 1,186,125
5,945,509
Switzerland(316,691) ABB Ltd RegS JP Morgan (391,787)(28,120) Bucher Industries AG RegS Bank of America
Merrill Lynch (651,126)(16,460) Dufry AG RegS Deutsche Bank (73,615)
(136,096) Dufry AG RegS JP Morgan (72,430)(56,247) Flughafen Zurich AG RegS Citibank (798,254)(75,663) Kuehne + Nagel
International AG RegS Citibank (84,774)55,275 Medartis Holding AG JP Morgan 7,741
(72,209) Sonova Holding AG RegS JP Morgan (1,645,051)(47,878) Swatch Group AG Bank of America
Merrill Lynch (871,704)(86,833) Swiss Prime Site AG JP Morgan 385,103
(143,497) Swiss Re AG Bank of AmericaMerrill Lynch (769,047)
(69,004) Temenos AG RegS JP Morgan (988,965)
(5,953,909)
United Kingdom(1,317,371) Aggreko Plc Citibank 40,9702,986,283 AJ Bell Plc Bank of America
Merrill Lynch (918,359)734,566 Associated British Foods Plc Bank of America
Merrill Lynch 1,758,236
BlackRock European Absolute Return Fund continued
The notes on pages 691 to 711 form an integral part of these financial statements.
Annual report and audited financial statements [309]

Contracts for difference as at 31 May 2020
Holding Description Counterparty
Netunrealised
appreciation/(depreciation)
EUR
United Kingdom continued3,264,046 Auto Trader Group Plc Bank of America
Merrill Lynch 2,131,733856,258 British American Tobacco
Plc Citibank 589,652(596,571) Carnival Plc Citibank (473,107)
(14,994,630) Centrica Plc JP Morgan 6,662(5,162,681) Cineworld Group Plc Bank of America
Merrill Lynch (1,755,819)(254,235) Croda International Plc Citibank (184,451)907,140 Experian Plc Citibank 1,602,030
(553,775) Fevertree Drinks Plc Citibank (1,479,271)(2,310,691) HSBC Holdings Plc Bank of America
Merrill Lynch 680,122(3,256,675) IQE Plc JP Morgan (42,394)(4,657,794) J Sainsbury Plc Bank of America
Merrill Lynch (307,820)(402,158) Johnson Matthey Plc Bank of America
Merrill Lynch (427,786)(2,237,204) Jupiter Fund Management
PlcBank of AmericaMerrill Lynch (646,068)
(2,390,565) Kingfisher Plc Bank of AmericaMerrill Lynch (646,545)
201,392 London Stock ExchangeGroup Plc JP Morgan 317,636
(7,943,623) Marks & Spencer Group Plc Citibank (266,456)(961,387) Pearson Plc Citibank (57,662)(663,302) Petrofac Ltd Citibank (12,524)
(3,065,040) Rolls-Royce Holdings Plc JP Morgan 3,404(6,438,930) Royal Mail Plc JP Morgan (479,168)
(366,050) Schroders Plc Citibank (601,729)(412,443) Smith & Nephew Plc JP Morgan (288,605)157,793 Spirax-Sarco Engineering
Plc Citibank 311,966(973,382) St James’s Place Plc JP Morgan (912,483)
(3,292,456) Standard Life Aberdeen Plc Citibank (947,150)(1,039,988) TUI AG Bank of America
Merrill Lynch (1,778,886)(483,805) Victrex Plc JP Morgan (564,233)
(5,348,105)
Total (Gross underlying exposure - EUR 877,892,091) (20,359,093)
* These securities were valued in consultation with the Investment Advisers. These securitieswere fair valued or suspended at financial year end as detailed in Note 2(a).
BlackRock European Absolute Return Fund continued
The notes on pages 691 to 711 form an integral part of these financial statements.
BlackRock Strategic Funds[310]
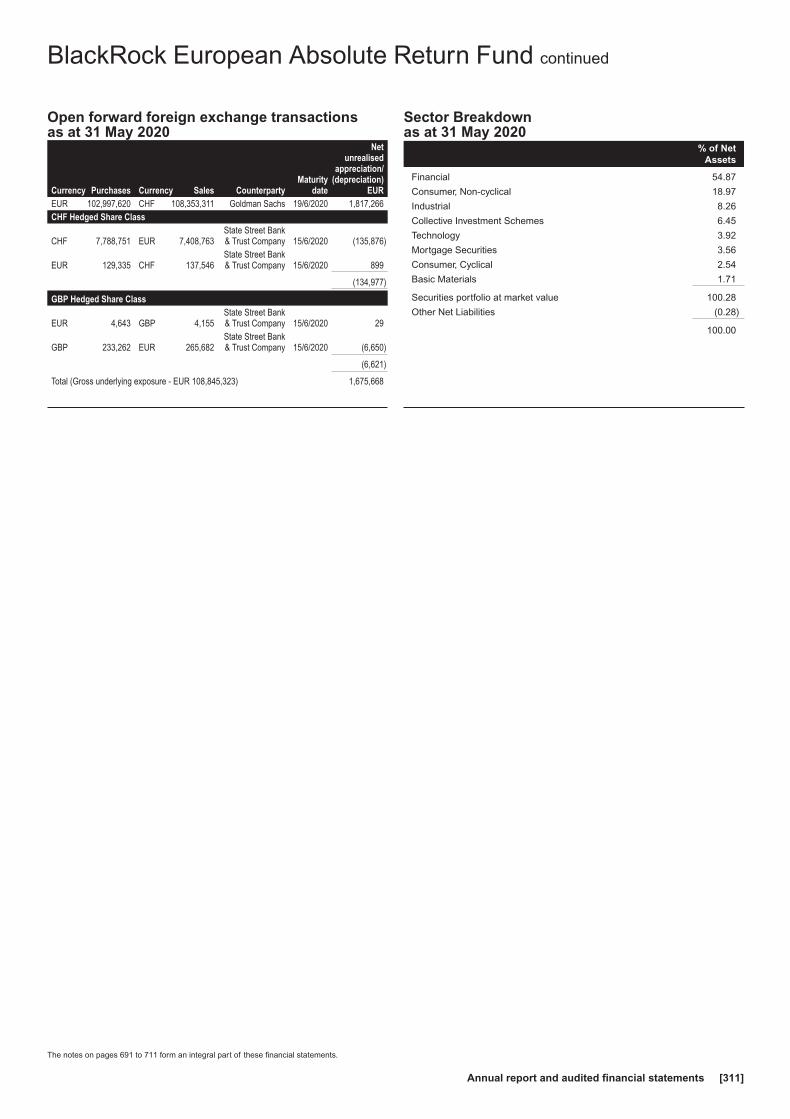
Open forward foreign exchange transactionsas at 31 May 2020
Currency Purchases Currency Sales CounterpartyMaturity
date
Netunrealised
appreciation/(depreciation)
EUREUR 102,997,620 CHF 108,353,311 Goldman Sachs 19/6/2020 1,817,266CHF Hedged Share Class
CHF 7,788,751 EUR 7,408,763State Street Bank& Trust Company 15/6/2020 (135,876)
EUR 129,335 CHF 137,546State Street Bank& Trust Company 15/6/2020 899
(134,977)
GBP Hedged Share Class
EUR 4,643 GBP 4,155State Street Bank& Trust Company 15/6/2020 29
GBP 233,262 EUR 265,682State Street Bank& Trust Company 15/6/2020 (6,650)
(6,621)
Total (Gross underlying exposure - EUR 108,845,323) 1,675,668
Sector Breakdownas at 31 May 2020
% of NetAssets
Financial 54.87
Consumer, Non-cyclical 18.97
Industrial 8.26
Collective Investment Schemes 6.45
Technology 3.92
Mortgage Securities 3.56
Consumer, Cyclical 2.54
Basic Materials 1.71
Securities portfolio at market value 100.28
Other Net Liabilities (0.28)
100.00
BlackRock European Absolute Return Fund continued
The notes on pages 691 to 711 form an integral part of these financial statements.
Annual report and audited financial statements [311]
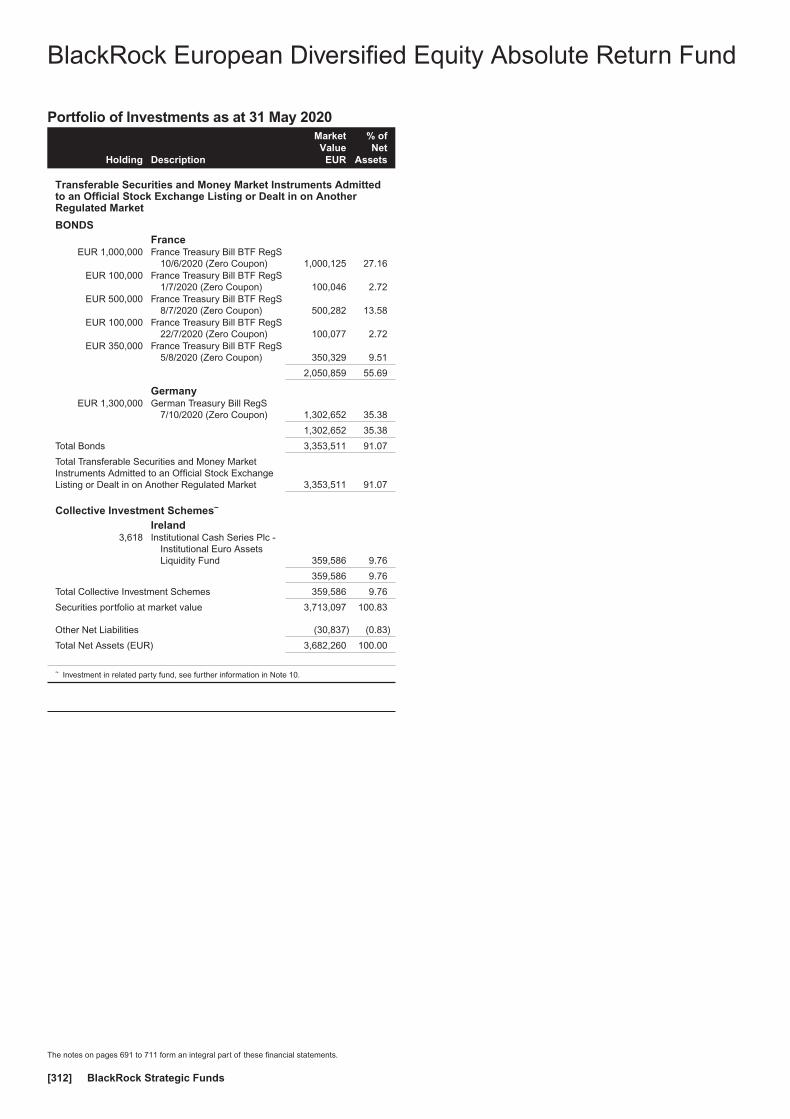
Portfolio of Investments as at 31 May 2020
Holding Description
MarketValue
EUR
% ofNet
Assets
Transferable Securities and Money Market Instruments Admittedto an Official Stock Exchange Listing or Dealt in on AnotherRegulated Market
BONDSFrance
EUR 1,000,000 France Treasury Bill BTF RegS10/6/2020 (Zero Coupon) 1,000,125 27.16
EUR 100,000 France Treasury Bill BTF RegS1/7/2020 (Zero Coupon) 100,046 2.72
EUR 500,000 France Treasury Bill BTF RegS8/7/2020 (Zero Coupon) 500,282 13.58
EUR 100,000 France Treasury Bill BTF RegS22/7/2020 (Zero Coupon) 100,077 2.72
EUR 350,000 France Treasury Bill BTF RegS5/8/2020 (Zero Coupon) 350,329 9.51
2,050,859 55.69
GermanyEUR 1,300,000 German Treasury Bill RegS
7/10/2020 (Zero Coupon) 1,302,652 35.38
1,302,652 35.38
Total Bonds 3,353,511 91.07
Total Transferable Securities and Money MarketInstruments Admitted to an Official Stock ExchangeListing or Dealt in on Another Regulated Market 3,353,511 91.07
Collective Investment Schemes~
Ireland3,618 Institutional Cash Series Plc -
Institutional Euro AssetsLiquidity Fund 359,586 9.76
359,586 9.76
Total Collective Investment Schemes 359,586 9.76
Securities portfolio at market value 3,713,097 100.83
Other Net Liabilities (30,837) (0.83)
Total Net Assets (EUR) 3,682,260 100.00
~ Investment in related party fund, see further information in Note 10.
BlackRock European Diversified Equity Absolute Return Fund
The notes on pages 691 to 711 form an integral part of these financial statements.
BlackRock Strategic Funds[312]

Contracts for difference as at 31 May 2020
Holding Description Counterparty
Netunrealised
appreciation/(depreciation)
EUR
Belgium(1) Warehouses De Pauw CVA
(REIT) Goldman Sachs (24)
(24)
Finland681 Kesko Oyj ’B’ Barclays Bank 477
477
Ireland(144) Flutter Entertainment Plc Goldman Sachs (353)
(353)
Italy(796) Davide Camparimilano Spa
(Rights) Goldman Sachs —(574) Davide Camparimilano Spa
(Rights) HSBC —
—
Jersey4,716 IWG Plc Goldman Sachs 4,347
4,347
United Kingdom25 Flutter Entertainment Plc Barclays Bank (21)
(155) LondonMetric Property Plc(REIT) Barclays Bank (26)
106 NMC Health Plc*,π Citibank —1,270 NMC Health Plc*,π Goldman Sachs —
671 NMC Health Plc* HSBC (6,994)140 NMC Health Plc* JP Morgan (1,459)
(8,500)
Total (Gross underlying exposure - EUR 45,732) (4,053)
* These securities were valued in consultation with the Investment Advisers. These securitieswere fair valued or suspended at financial year end as detailed in Note 2(a).
π Amounts which are less than 0.5 USD have been rounded down to zero.
BlackRock European Diversified Equity Absolute Return Fundcontinued
The notes on pages 691 to 711 form an integral part of these financial statements.
Annual report and audited financial statements [313]

Open forward foreign exchange transactionsas at 31 May 2020
Currency Purchases Currency Sales CounterpartyMaturity
date
Netunrealised
appreciation/(depreciation)
EUR
CHF Hedged Share Class
CHF 7,111 EUR 6,763State Street Bank& Trust Company 15/6/2020 (124)
EUR 443 CHF 470State Street Bank& Trust Company 15/6/2020 5
(119)
GBP Hedged Share Class
EUR 12,616 GBP 11,247State Street Bank& Trust Company 15/6/2020 126
GBP 99,578 EUR 113,386State Street Bank& Trust Company 15/6/2020 (2,807)
(2,681)
SEK Hedged Share Class
EUR 831,908 SEK 8,801,352State Street Bank& Trust Company 15/6/2020 (5,647)
SEK 17,607,675 EUR 1,658,359State Street Bank& Trust Company 15/6/2020 17,224
11,577
USD Hedged Share Class
EUR 2,052 USD 2,245State Street Bank& Trust Company 15/6/2020 34
USD 33,961 EUR 31,323State Street Bank& Trust Company 15/6/2020 (789)
(755)
Total (Gross underlying exposure - EUR 2,675,836) 8,022
Sector Breakdownas at 31 May 2020
% of NetAssets
Government 91.07
Collective Investment Schemes 9.76
Securities portfolio at market value 100.83
Other Net Liabilities (0.83)
100.00
BlackRock European Diversified Equity Absolute Return Fundcontinued
The notes on pages 691 to 711 form an integral part of these financial statements.
BlackRock Strategic Funds[314]
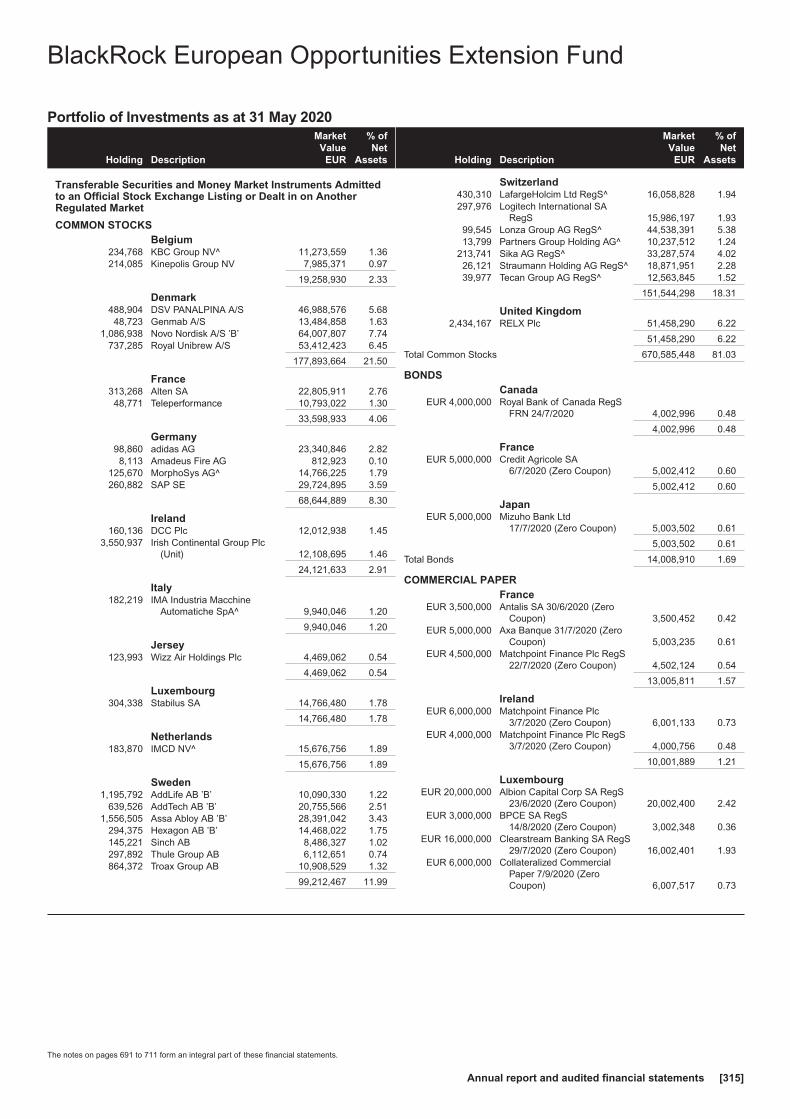
Portfolio of Investments as at 31 May 2020
Holding Description
MarketValue
EUR
% ofNet
Assets
Transferable Securities and Money Market Instruments Admittedto an Official Stock Exchange Listing or Dealt in on AnotherRegulated Market
COMMON STOCKSBelgium
234,768 KBC Group NV^ 11,273,559 1.36214,085 Kinepolis Group NV 7,985,371 0.97
19,258,930 2.33
Denmark488,904 DSV PANALPINA A/S 46,988,576 5.6848,723 Genmab A/S 13,484,858 1.63
1,086,938 Novo Nordisk A/S ’B’ 64,007,807 7.74737,285 Royal Unibrew A/S 53,412,423 6.45
177,893,664 21.50
France313,268 Alten SA 22,805,911 2.7648,771 Teleperformance 10,793,022 1.30
33,598,933 4.06
Germany98,860 adidas AG 23,340,846 2.828,113 Amadeus Fire AG 812,923 0.10
125,670 MorphoSys AG^ 14,766,225 1.79260,882 SAP SE 29,724,895 3.59
68,644,889 8.30
Ireland160,136 DCC Plc 12,012,938 1.45
3,550,937 Irish Continental Group Plc(Unit) 12,108,695 1.46
24,121,633 2.91
Italy182,219 IMA Industria Macchine
Automatiche SpA^ 9,940,046 1.20
9,940,046 1.20
Jersey123,993 Wizz Air Holdings Plc 4,469,062 0.54
4,469,062 0.54
Luxembourg304,338 Stabilus SA 14,766,480 1.78
14,766,480 1.78
Netherlands183,870 IMCD NV^ 15,676,756 1.89
15,676,756 1.89
Sweden1,195,792 AddLife AB ’B’ 10,090,330 1.22
639,526 AddTech AB ’B’ 20,755,566 2.511,556,505 Assa Abloy AB ’B’ 28,391,042 3.43
294,375 Hexagon AB ’B’ 14,468,022 1.75145,221 Sinch AB 8,486,327 1.02297,892 Thule Group AB 6,112,651 0.74864,372 Troax Group AB 10,908,529 1.32
99,212,467 11.99
Holding Description
MarketValue
EUR
% ofNet
Assets
Switzerland430,310 LafargeHolcim Ltd RegS^ 16,058,828 1.94297,976 Logitech International SA
RegS 15,986,197 1.9399,545 Lonza Group AG RegS^ 44,538,391 5.3813,799 Partners Group Holding AG^ 10,237,512 1.24
213,741 Sika AG RegS^ 33,287,574 4.0226,121 Straumann Holding AG RegS^ 18,871,951 2.2839,977 Tecan Group AG RegS^ 12,563,845 1.52
151,544,298 18.31
United Kingdom2,434,167 RELX Plc 51,458,290 6.22
51,458,290 6.22
Total Common Stocks 670,585,448 81.03
BONDSCanada
EUR 4,000,000 Royal Bank of Canada RegSFRN 24/7/2020 4,002,996 0.48
4,002,996 0.48
FranceEUR 5,000,000 Credit Agricole SA
6/7/2020 (Zero Coupon) 5,002,412 0.60
5,002,412 0.60
JapanEUR 5,000,000 Mizuho Bank Ltd
17/7/2020 (Zero Coupon) 5,003,502 0.61
5,003,502 0.61
Total Bonds 14,008,910 1.69
COMMERCIAL PAPERFrance
EUR 3,500,000 Antalis SA 30/6/2020 (ZeroCoupon) 3,500,452 0.42
EUR 5,000,000 Axa Banque 31/7/2020 (ZeroCoupon) 5,003,235 0.61
EUR 4,500,000 Matchpoint Finance Plc RegS22/7/2020 (Zero Coupon) 4,502,124 0.54
13,005,811 1.57
IrelandEUR 6,000,000 Matchpoint Finance Plc
3/7/2020 (Zero Coupon) 6,001,133 0.73EUR 4,000,000 Matchpoint Finance Plc RegS
3/7/2020 (Zero Coupon) 4,000,756 0.48
10,001,889 1.21
LuxembourgEUR 20,000,000 Albion Capital Corp SA RegS
23/6/2020 (Zero Coupon) 20,002,400 2.42EUR 3,000,000 BPCE SA RegS
14/8/2020 (Zero Coupon) 3,002,348 0.36EUR 16,000,000 Clearstream Banking SA RegS
29/7/2020 (Zero Coupon) 16,002,401 1.93EUR 6,000,000 Collateralized Commercial
Paper 7/9/2020 (ZeroCoupon) 6,007,517 0.73
BlackRock European Opportunities Extension Fund
The notes on pages 691 to 711 form an integral part of these financial statements.
Annual report and audited financial statements [315]

Portfolio of Investments as at 31 May 2020
Holding Description
MarketValue
EUR
% ofNet
Assets
Luxembourg continuedEUR 1,000,000 Landesbank Hessen GZ
Frankfurt 10/6/2020 (ZeroCoupon) 1,000,116 0.12
EUR 8,000,000 Procter & Gamble Co RegS4/6/2020 (Zero Coupon) 8,000,478 0.97
EUR 3,000,000 Svenska Handelsbanken ABRegS 13/10/2020 (ZeroCoupon) 3,005,114 0.36
EUR 4,000,000 Svenska Handelsbanken ABRegS 20/8/2021 (ZeroCoupon) 4,006,470 0.49
61,026,844 7.38
Total Commercial Papers 84,034,544 10.16
Total Transferable Securities and Money MarketInstruments Admitted to an Official Stock ExchangeListing or Dealt in on Another Regulated Market 768,628,902 92.88
Collective Investment Schemes~
Ireland759,803 Institutional Cash Series Plc -
Institutional Euro AssetsLiquidity Fund 75,519,889 9.13
75,519,889 9.13
Total Collective Investment Schemes 75,519,889 9.13
Securities portfolio at market value 844,148,791 102.01
Other Net Liabilities (16,600,451) (2.01)
Total Net Assets (EUR) 827,548,340 100.00
^ All or a portion of this security represents a security on loan.~ Investment in related party fund, see further information in Note 10.
BlackRock European Opportunities Extension Fund continued
The notes on pages 691 to 711 form an integral part of these financial statements.
BlackRock Strategic Funds[316]
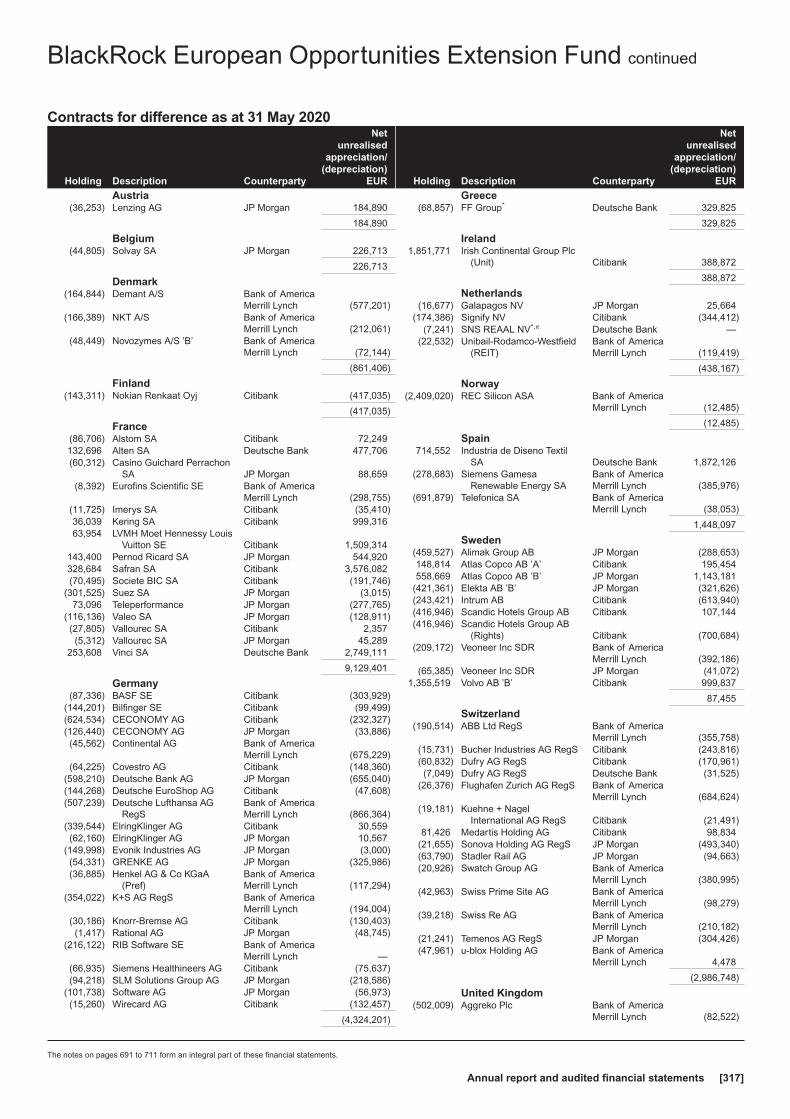
Contracts for difference as at 31 May 2020
Holding Description Counterparty
Netunrealised
appreciation/(depreciation)
EUR
Austria(36,253) Lenzing AG JP Morgan 184,890
184,890
Belgium(44,805) Solvay SA JP Morgan 226,713
226,713
Denmark(164,844) Demant A/S Bank of America
Merrill Lynch (577,201)(166,389) NKT A/S Bank of America
Merrill Lynch (212,061)(48,449) Novozymes A/S ’B’ Bank of America
Merrill Lynch (72,144)
(861,406)
Finland(143,311) Nokian Renkaat Oyj Citibank (417,035)
(417,035)
France(86,706) Alstom SA Citibank 72,249132,696 Alten SA Deutsche Bank 477,706(60,312) Casino Guichard Perrachon
SA JP Morgan 88,659(8,392) Eurofins Scientific SE Bank of America
Merrill Lynch (298,755)(11,725) Imerys SA Citibank (35,410)36,039 Kering SA Citibank 999,31663,954 LVMH Moet Hennessy Louis
Vuitton SE Citibank 1,509,314143,400 Pernod Ricard SA JP Morgan 544,920328,684 Safran SA Citibank 3,576,082(70,495) Societe BIC SA Citibank (191,746)
(301,525) Suez SA JP Morgan (3,015)73,096 Teleperformance JP Morgan (277,765)
(116,136) Valeo SA JP Morgan (128,911)(27,805) Vallourec SA Citibank 2,357(5,312) Vallourec SA JP Morgan 45,289
253,608 Vinci SA Deutsche Bank 2,749,111
9,129,401
Germany(87,336) BASF SE Citibank (303,929)
(144,201) Bilfinger SE Citibank (99,499)(624,534) CECONOMY AG Citibank (232,327)(126,440) CECONOMY AG JP Morgan (33,886)(45,562) Continental AG Bank of America
Merrill Lynch (675,229)(64,225) Covestro AG Citibank (148,360)
(598,210) Deutsche Bank AG JP Morgan (655,040)(144,268) Deutsche EuroShop AG Citibank (47,608)(507,239) Deutsche Lufthansa AG
RegSBank of AmericaMerrill Lynch (866,364)
(339,544) ElringKlinger AG Citibank 30,559(62,160) ElringKlinger AG JP Morgan 10,567
(149,998) Evonik Industries AG JP Morgan (3,000)(54,331) GRENKE AG JP Morgan (325,986)(36,885) Henkel AG & Co KGaA
(Pref)Bank of AmericaMerrill Lynch (117,294)
(354,022) K+S AG RegS Bank of AmericaMerrill Lynch (194,004)
(30,186) Knorr-Bremse AG Citibank (130,403)(1,417) Rational AG JP Morgan (48,745)
(216,122) RIB Software SE Bank of AmericaMerrill Lynch —
(66,935) Siemens Healthineers AG Citibank (75,637)(94,218) SLM Solutions Group AG JP Morgan (218,586)
(101,738) Software AG JP Morgan (56,973)(15,260) Wirecard AG Citibank (132,457)
(4,324,201)
Holding Description Counterparty
Netunrealised
appreciation/(depreciation)
EUR
Greece(68,857) FF Group* Deutsche Bank 329,825
329,825
Ireland1,851,771 Irish Continental Group Plc
(Unit) Citibank 388,872
388,872
Netherlands(16,677) Galapagos NV JP Morgan 25,664
(174,386) Signify NV Citibank (344,412)(7,241) SNS REAAL NV*,π Deutsche Bank —
(22,532) Unibail-Rodamco-Westfield(REIT)
Bank of AmericaMerrill Lynch (119,419)
(438,167)
Norway(2,409,020) REC Silicon ASA Bank of America
Merrill Lynch (12,485)
(12,485)
Spain714,552 Industria de Diseno Textil
SA Deutsche Bank 1,872,126(278,683) Siemens Gamesa
Renewable Energy SABank of AmericaMerrill Lynch (385,976)
(691,879) Telefonica SA Bank of AmericaMerrill Lynch (38,053)
1,448,097
Sweden(459,527) Alimak Group AB JP Morgan (288,653)148,814 Atlas Copco AB ’A’ Citibank 195,454558,669 Atlas Copco AB ’B’ JP Morgan 1,143,181
(421,361) Elekta AB ’B’ JP Morgan (321,626)(243,421) Intrum AB Citibank (613,940)(416,946) Scandic Hotels Group AB Citibank 107,144(416,946) Scandic Hotels Group AB
(Rights) Citibank (700,684)(209,172) Veoneer Inc SDR Bank of America
Merrill Lynch (392,186)(65,385) Veoneer Inc SDR JP Morgan (41,072)
1,355,519 Volvo AB ’B’ Citibank 999,837
87,455
Switzerland(190,514) ABB Ltd RegS Bank of America
Merrill Lynch (355,758)(15,731) Bucher Industries AG RegS Citibank (243,816)(60,832) Dufry AG RegS Citibank (170,961)(7,049) Dufry AG RegS Deutsche Bank (31,525)
(26,376) Flughafen Zurich AG RegS Bank of AmericaMerrill Lynch (684,624)
(19,181) Kuehne + NagelInternational AG RegS Citibank (21,491)
81,426 Medartis Holding AG Citibank 98,834(21,655) Sonova Holding AG RegS JP Morgan (493,340)(63,790) Stadler Rail AG JP Morgan (94,663)(20,926) Swatch Group AG Bank of America
Merrill Lynch (380,995)(42,963) Swiss Prime Site AG Bank of America
Merrill Lynch (98,279)(39,218) Swiss Re AG Bank of America
Merrill Lynch (210,182)(21,241) Temenos AG RegS JP Morgan (304,426)(47,961) u-blox Holding AG Bank of America
Merrill Lynch 4,478
(2,986,748)
United Kingdom(502,009) Aggreko Plc Bank of America
Merrill Lynch (82,522)
BlackRock European Opportunities Extension Fund continued
The notes on pages 691 to 711 form an integral part of these financial statements.
Annual report and audited financial statements [317]

Contracts for difference as at 31 May 2020
Holding Description Counterparty
Netunrealised
appreciation/(depreciation)
EUR
United Kingdom continued3,182,567 AJ Bell Plc JP Morgan (1,378,610)1,484,910 Associated British Foods Plc Bank of America
Merrill Lynch 3,554,2393,593,187 Auto Trader Group Plc Bank of America
Merrill Lynch 2,346,693860,016 British American Tobacco
Plc JP Morgan 1,466,271(195,101) Carnival Plc JP Morgan (207,165)
(5,262,803) Centrica Plc JP Morgan 2,338(2,020,266) Cineworld Group Plc JP Morgan (504,434)
(111,196) Croda International Plc Citibank (80,674)102,902 DCC Plc JP Morgan 962,355
1,078,093 Experian Plc Bank of AmericaMerrill Lynch 5,196,909
(236,862) Fevertree Drinks Plc Bank of AmericaMerrill Lynch (1,072,068)
(2,197,444) J Sainsbury Plc JP Morgan (58,577)(147,531) Johnson Matthey Plc Citibank (150,960)
(1,020,005) Jupiter Fund ManagementPlc Citibank (194,863)
(1,291,543) Kingfisher Plc Bank of AmericaMerrill Lynch (349,307)
343,162 London Stock ExchangeGroup Plc JP Morgan 541,236
(2,987,547) Marks & Spencer Group Plc JP Morgan (332,492)4,946,255 Melrose Industries Plc Deutsche Bank 1,552,723
(1,456,222) Mitie Group Plc JP Morgan 33,966(2,917,709) N Brown Group Plc Bank of America
Merrill Lynch (136,888)(1,683,661) N Brown Group Plc Deutsche Bank (78,991)
(395,425) Pearson Plc Deutsche Bank (156,795)(1,750,833) PZ Cussons Plc Bank of America
Merrill Lynch 66,118(1,067,227) Rolls-Royce Holdings Plc Citibank (22,522)(2,541,039) Royal Mail Plc JP Morgan (189,097)
384,761 Ryanair Holdings Plc Deutsche Bank 1,067,712(134,303) Schroders Plc JP Morgan (290,884)(173,071) Smith & Nephew Plc JP Morgan (121,106)193,451 Spirax-Sarco Engineering
PlcBank of AmericaMerrill Lynch 1,680,262
(363,844) St James’s Place Plc Citibank (391,321)(1,055,494) Standard Life Aberdeen Plc Citibank (303,637)
(490,334) TUI AG Citibank (618,685)(176,493) Victrex Plc Citibank (90,175)
11,659,049
Total (Gross underlying exposure - EUR 647,853,631) 14,414,260
* These securities were valued in consultation with the Investment Advisers. These securitieswere fair valued or suspended at financial year end as detailed in Note 2(a).
π Amounts which are less than 0.5 USD have been rounded down to zero.
BlackRock European Opportunities Extension Fund continued
The notes on pages 691 to 711 form an integral part of these financial statements.
BlackRock Strategic Funds[318]
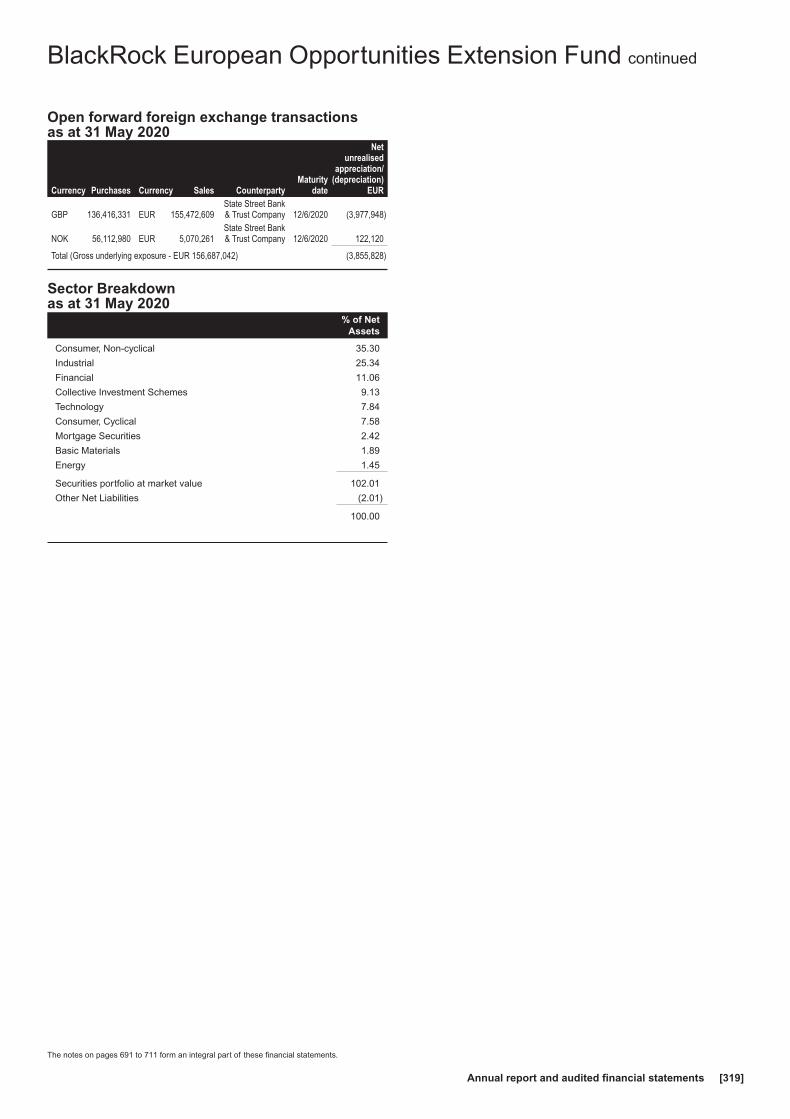
Open forward foreign exchange transactionsas at 31 May 2020
Currency Purchases Currency Sales CounterpartyMaturity
date
Netunrealised
appreciation/(depreciation)
EUR
GBP 136,416,331 EUR 155,472,609State Street Bank& Trust Company 12/6/2020 (3,977,948)
NOK 56,112,980 EUR 5,070,261State Street Bank& Trust Company 12/6/2020 122,120
Total (Gross underlying exposure - EUR 156,687,042) (3,855,828)
Sector Breakdownas at 31 May 2020
% of NetAssets
Consumer, Non-cyclical 35.30
Industrial 25.34
Financial 11.06
Collective Investment Schemes 9.13
Technology 7.84
Consumer, Cyclical 7.58
Mortgage Securities 2.42
Basic Materials 1.89
Energy 1.45
Securities portfolio at market value 102.01
Other Net Liabilities (2.01)
100.00
BlackRock European Opportunities Extension Fund continued
The notes on pages 691 to 711 form an integral part of these financial statements.
Annual report and audited financial statements [319]

Portfolio of Investments as at 31 May 2020
Holding Description
MarketValue
EUR
% ofNet
Assets
Transferable Securities and Money Market Instruments Admittedto an Official Stock Exchange Listing or Dealt in on AnotherRegulated Market
COMMON STOCKSBelgium
13,000 Solvay SA 893,100 0.17
893,100 0.17
Denmark31,255 DSV PANALPINA A/S 3,003,919 0.5797,816 Novo Nordisk A/S ’B’^ 5,760,207 1.10
8,764,126 1.67
Finland49,924 Kone Oyj ’B’ 3,008,420 0.57
140,320 Sampo Oyj ’A’ 4,570,223 0.87
7,578,643 1.44
France187,003 Bouygues SA 5,232,344 1.0088,787 Engie SA 946,913 0.186,838 Kering SA 3,239,503 0.627,917 LVMH Moet Hennessy Louis
Vuitton SE 2,999,751 0.5710,645 Pernod Ricard SA 1,495,623 0.2832,021 Safran SA 2,771,738 0.5362,694 Sanofi 5,549,046 1.0635,128 Schneider Electric SE 3,159,412 0.60
182,419 SCOR SE 4,067,944 0.7858,372 Vinci SA 4,893,908 0.93
34,356,182 6.55
Germany34,706 Allianz SE RegS 5,684,149 1.08
308,590 E.ON SE 2,921,730 0.5520,766 Hannover Rueck SE 2,979,921 0.5732,462 LEG Immobilien AG 3,663,012 0.7011,216 Muenchener
Rueckversicherungs-GesellschaftAG in Muenchen RegS 2,297,037 0.44
17,545,849 3.34
Italy924,640 Enel SpA 6,370,770 1.21267,285 FinecoBank Banca Fineco
SpA^ 2,802,483 0.54
9,173,253 1.75
Netherlands12,544 ASML Holding NV 3,694,835 0.70
3,694,835 0.70
Portugal1,309,535 EDP - Energias de Portugal
SA 5,527,547 1.05
5,527,547 1.05
Spain617,251 Iberdrola SA 6,024,370 1.15
6,024,370 1.15
Sweden87,143 Atlas Copco AB ’A’^ 3,064,565 0.59
473,169 Tele2 AB ’B’ 5,672,003 1.08357,133 Volvo AB ’B’ 4,529,176 0.86
13,265,744 2.53
Switzerland17,340 Cembra Money Bank AG^ 1,528,338 0.29
Holding Description
MarketValue
EUR
% ofNet
Assets
Switzerland continued4,699 Lonza Group AG RegS 2,102,425 0.40
54,235 Nestle SA RegS 5,239,024 1.0016,119 Roche Holding AG 5,080,126 0.9717,930 Sika AG RegS^ 2,792,380 0.539,723 Zurich Insurance Group AG^ 2,808,787 0.54
19,551,080 3.73
United Kingdom483,695 Auto Trader Group Plc 3,012,859 0.57196,013 Barratt Developments Plc 1,094,660 0.21162,873 British American Tobacco Plc 5,797,070 1.11119,131 Persimmon Plc^ 3,048,642 0.58432,112 Phoenix Group Holdings Plc 3,014,083 0.57149,909 RELX Plc^ 3,168,587 0.60946,346 Taylor Wimpey Plc 1,527,792 0.29
3,156,937 Vodafone Group Plc 4,707,732 0.90
25,371,425 4.83
Total Common Stocks 151,746,154 28.91
BONDSAustralia
EUR 550,000 APT Pipelines Ltd RegS2.00% 15/7/2030 562,254 0.11
EUR 200,000 Telstra Corp Ltd RegS 1.00%23/4/2030 202,904 0.04
765,158 0.15
AustriaEUR 400,000 Erste Group Bank AG RegS
0.01% 11/9/2029 401,518 0.08EUR 700,000 Erste Group Bank AG RegS
0.10% 15/1/2030 707,966 0.13EUR 100,000 Erste Group Bank AG RegS
0.875% 15/5/2034 110,329 0.02EUR 500,000 Raiffeisen Bank International
RegS 0.25% 5/7/2021 498,492 0.09EUR 1,300,000 Republic of Austria
Government Bond RegS1.20% 20/10/2025^ 1,414,627 0.27
EUR 1,240,000 Republic of AustriaGovernment Bond RegS0.50% 20/4/2027 1,311,300 0.25
EUR 262,000 Republic of AustriaGovernment Bond RegS4.15% 15/3/2037 438,047 0.08
EUR 309,000 Republic of AustriaGovernment Bond RegS1.50% 20/2/2047 405,504 0.08
EUR 86,000 Republic of AustriaGovernment Bond RegS3.80% 26/1/2062 197,232 0.04
EUR 318,000 Republic of AustriaGovernment Bond RegS2.10% 20/9/2117 621,900 0.12
EUR 300,000 UniCredit Bank Austria RegS0.625% 20/3/2029^ 317,550 0.06
6,424,465 1.22
BelgiumEUR 600,000 Ageas SA RegS FRN
(Perpetual) 550,515 0.10EUR 280,000 Anheuser-Busch InBev SA
RegS 1.50% 17/3/2025 291,589 0.06EUR 180,000 Anheuser-Busch InBev SA
RegS 2.75% 17/3/2036 190,887 0.04EUR 750,000 Anheuser-Busch InBev SA
RegS 3.70% 2/4/2040 877,961 0.17
BlackRock European Select Strategies Fund
The notes on pages 691 to 711 form an integral part of these financial statements.
BlackRock Strategic Funds[320]

Portfolio of Investments as at 31 May 2020
Holding Description
MarketValue
EUR
% ofNet
Assets
Belgium continuedGBP 295,000 Anheuser-Busch InBev SA/NV
RegS 1.75% 7/3/2025 333,992 0.06EUR 800,000 Argenta Spaarbank NV RegS
1.00% 6/2/2024 805,144 0.15EUR 200,000 Belfius Bank SA RegS 1.00%
12/6/2028 217,986 0.04EUR 300,000 BNP Paribas Fortis SA RegS
24/10/2023 (Zero Coupon) 302,237 0.06EUR 200,000 Fluxys Belgium RegS 1.75%
5/10/2027^ 198,008 0.04EUR 445,000 Kingdom of Belgium
Government Bond RegS0.50% 22/10/2024 463,445 0.09
EUR 2,400,000 Kingdom of BelgiumGovernment Bond RegS0.80% 22/6/2028 2,587,980 0.49
EUR 641,778 Kingdom of BelgiumGovernment Bond RegS0.90% 22/6/2029 699,744 0.13
EUR 190,000 Kingdom of BelgiumGovernment Bond RegS3.00% 22/6/2034 263,715 0.05
EUR 341,000 Kingdom of BelgiumGovernment Bond RegS1.45% 22/6/2037 401,437 0.08
EUR 174,000 Kingdom of BelgiumGovernment Bond RegS1.90% 22/6/2038 218,954 0.04
EUR 26,264 Kingdom of BelgiumGovernment Bond RegS1.60% 22/6/2047 32,525 0.01
EUR 360,000 Kingdom of BelgiumGovernment Bond RegS1.70% 22/6/2050 460,179 0.09
8,896,298 1.70
CanadaEUR 1,000,000 Canadian Imperial Bank of
Commerce RegS 0.25%24/1/2023^ 1,009,795 0.19
EUR 514,000 CPPIB Capital Inc RegS0.375% 20/6/2024 521,787 0.10
EUR 680,000 CPPIB Capital Inc RegS0.875% 6/2/2029 718,355 0.14
EUR 1,530,000 Royal Bank of Canada RegS0.01% 21/1/2027 1,536,396 0.29
3,786,333 0.72
ChinaEUR 1,400,000 China Government
International Bond RegS0.50% 12/11/2031 1,335,250 0.25
1,335,250 0.25
CyprusEUR 118,000 Cyprus Government
International Bond RegS3.875% 6/5/2022 126,324 0.02
EUR 541,000 Cyprus GovernmentInternational Bond RegS3.75% 26/7/2023 597,526 0.11
EUR 325,000 Cyprus GovernmentInternational Bond RegS2.75% 27/6/2024 354,136 0.07
EUR 325,000 Cyprus GovernmentInternational Bond RegS0.625% 3/12/2024 326,633 0.06
EUR 270,000 Cyprus GovernmentInternational Bond RegS1.50% 16/4/2027 278,447 0.05
Holding Description
MarketValue
EUR
% ofNet
Assets
Cyprus continuedEUR 55,000 Cyprus Government
International Bond RegS2.375% 25/9/2028 60,430 0.01
EUR 334,000 Cyprus GovernmentInternational Bond RegS0.625% 21/1/2030 316,032 0.06
EUR 165,000 Cyprus GovernmentInternational Bond RegS2.75% 26/2/2034 189,396 0.04
EUR 150,000 Cyprus GovernmentInternational Bond RegS1.25% 21/1/2040 140,941 0.03
EUR 139,000 Cyprus GovernmentInternational Bond RegS2.75% 3/5/2049 164,715 0.03
EUR 320,000 Cyprus GovernmentInternational Bond RegS2.25% 16/4/2050 339,717 0.07
2,894,297 0.55
DenmarkEUR 800,000 Danske Bank A/S RegS
1.375% 24/5/2022 803,836 0.15USD 397,000 Danske Bank A/S RegS FRN
12/9/2023 344,600 0.07EUR 350,000 Danske Bank RegS 0.25%
28/11/2022 349,139 0.07DKK 3,594,000 Denmark Government Bond
1.75% 15/11/2025 541,044 0.10DKK 3,292,000 Denmark Government Bond
4.50% 15/11/2039 829,645 0.16EUR 100,000 Kommunekredit RegS 0.875%
3/11/2036 110,169 0.02DKK 8,163,684 Nordea Kredit
Realkreditaktieselskab0.50% 1/10/2050 1,040,317 0.20
DKK 428,407 Nordea KreditRealkreditaktieselskab RegS1.00% 1/10/2050 56,680 0.01
DKK 22,832,989 Nykredit Realkredit A/S RegS0.50% 1/10/2050 2,908,267 0.55
DKK 5,906,210 Nykredit Realkredit A/S RegS1.00% 1/10/2050 780,917 0.15
DKK 4,256,310 Realkredit Danmark A/S RegS0.50% 1/10/2050 542,132 0.10
DKK 5,510,911 Realkredit Danmark A/S RegS1.00% 1/10/2050 728,455 0.14
9,035,201 1.72
EstoniaEUR 150,000 Elering AS RegS 0.875%
3/5/2023 150,846 0.03
150,846 0.03
FinlandEUR 400,000 Aktia Bank Oyj RegS 0.375%
5/3/2026 411,750 0.08EUR 805,000 Finland Government Bond
RegS 0.50% 15/9/2027 852,253 0.16EUR 691,000 Finland Government Bond
RegS 0.50% 15/9/2029 734,823 0.14EUR 847,000 Finland Government Bond
RegS 1.375% 15/4/2047 1,096,666 0.21EUR 400,000 Nordea Bank AB RegS 3.25%
5/7/2022 425,722 0.08EUR 800,000 OP Corporate Bank Plc 0.60%
18/1/2027 779,376 0.15
BlackRock European Select Strategies Fund continued
The notes on pages 691 to 711 form an integral part of these financial statements.
Annual report and audited financial statements [321]

Portfolio of Investments as at 31 May 2020
Holding Description
MarketValue
EUR
% ofNet
Assets
Finland continuedEUR 550,000 OP Corporate Bank Plc RegS
0.375% 29/8/2023 553,913 0.11EUR 325,000 OP Corporate Bank Plc RegS
0.50% 12/8/2025 325,891 0.06
5,180,394 0.99
FranceEUR 1,100,000 Agence Francaise de
Developpement RegS1.00% 31/1/2028 1,176,131 0.22
EUR 200,000 Arkema SA RegS FRN(Perpetual) 202,433 0.04
EUR 700,000 AXA Home Loan SFH SARegS 0.01% 16/10/2029 702,859 0.13
EUR 200,000 AXA SA RegS FRN(Perpetual) 217,433 0.04
EUR 700,000 Banque Federative du CreditMutuel RegS 0.75%15/6/2023 710,307 0.14
EUR 600,000 Banque Federative du CreditMutuel SA RegS 0.125%5/2/2024 595,923 0.11
EUR 700,000 Banque Federative du CreditMutuel SA RegS 0.75%17/7/2025 712,610 0.14
GBP 500,000 Banque Federative du CreditMutuel SA RegS 1.25%5/12/2025 554,892 0.11
EUR 200,000 BNP Paribas Cardif SA RegSFRN (Perpetual) 213,157 0.04
EUR 1,100,000 BNP Paribas SA RegS FRN15/7/2025^ 1,081,432 0.21
EUR 400,000 BNP Paribas SA RegS 1.625%2/7/2031 392,060 0.07
EUR 1,000,000 BNP Paribas SA RegS FRN15/1/2032 951,870 0.18
GBP 200,000 Bouygues SA RegS 5.50%6/10/2026 276,396 0.05
EUR 100,000 BPCE SA RegS 0.625%26/9/2023 101,017 0.02
EUR 500,000 BPCE SA RegS 0.375%5/10/2023 501,337 0.10
EUR 700,000 BPCE SA RegS 1.00%15/7/2024 718,490 0.14
EUR 300,000 BPCE SA RegS 0.125%4/12/2024 296,634 0.06
EUR 200,000 BPCE SA RegS 1.00%1/4/2025 200,594 0.04
EUR 300,000 BPCE SFH SA RegS 0.01%27/5/2030 300,866 0.06
EUR 200,000 Caisse Francaise deFinancement Local RegS1.125% 9/9/2025^ 213,903 0.04
EUR 400,000 Capgemini SE RegS 2.00%15/4/2029 422,226 0.08
EUR 400,000 Capgemini SE RegS 2.375%15/4/2032 433,630 0.08
EUR 9,348 Cars Alliance Auto LoansFrance V ’2016-1A’ RegSFRN 18/5/2027 9,353 0.00
EUR 100,000 Cars Alliance Auto LoansFrance V ’2018-1 B’ RegSFRN 21/10/2029 98,075 0.02
EUR 123,262 Cars Alliance Auto LoansFrance V ’2018-1A’ RegSFRN 21/10/2029 123,217 0.02
EUR 300,000 Cie de Financement FoncierSA RegS 0.75% 29/5/2026 316,273 0.06
Holding Description
MarketValue
EUR
% ofNet
Assets
France continuedEUR 100,000 Cie de Saint-Gobain RegS
0.875% 21/9/2023 100,202 0.02EUR 200,000 Cie de Saint-Gobain RegS
0.625% 15/3/2024 198,717 0.04EUR 600,000 Cie de Saint-Gobain RegS
1.125% 23/3/2026 603,600 0.11EUR 200,000 Cie de Saint-Gobain RegS
2.375% 4/10/2027 213,920 0.04EUR 600,000 Coentreprise de Transport
d’Electricite SA RegS0.875% 29/9/2024 612,675 0.12
EUR 100,000 Credit Agricole Assurances SARegS FRN 27/9/2048 116,837 0.02
EUR 130,000 Credit Agricole Home LoanSFH RegS 0.625%11/9/2023 133,723 0.03
EUR 100,000 Credit Agricole Home LoanSFH RegS 0.25% 23/2/2024 101,809 0.02
EUR 400,000 Credit Agricole Public SectorSCF SA 0.01% 13/9/2028 402,058 0.08
EUR 100,000 Credit Agricole SA RegS0.875% 19/1/2022 101,301 0.02
EUR 200,000 Credit Agricole SA RegS0.75% 1/12/2022 203,380 0.04
EUR 200,000 Credit Agricole SA RegS1.375% 13/3/2025 205,594 0.04
EUR 700,000 Credit Mutuel - CIC HomeLoan SFH RegS 0.25%30/4/2024 713,419 0.14
EUR 200,000 Credit Mutuel Arkea RegS1.375% 17/1/2025 207,757 0.04
EUR 100,000 Credit Mutuel Arkea SA RegS0.875% 7/5/2027 100,955 0.02
EUR 400,000 Crown European Holdings SARegS 2.875% 1/2/2026 405,008 0.08
GBP 1,900,000 Dexia Credit Local SA RegS1.125% 15/6/2022 2,139,792 0.41
GBP 2,900,000 Dexia Credit Local SA RegS1.625% 8/12/2023^ 3,348,682 0.64
GBP 200,000 Electricite de France SA RegSFRN (Perpetual) 228,250 0.04
EUR 300,000 Electricite de France SA RegS2.00% 9/12/2049 292,073 0.06
EUR 100,000 Engie SA RegS 0.875%27/3/2024 102,222 0.02
EUR 500,000 Engie SA RegS 4/3/2027 (ZeroCoupon) 483,980 0.09
EUR 300,000 Engie SA RegS 1.75%27/3/2028 323,757 0.06
EUR 200,000 Engie SA RegS 2.00%28/9/2037 221,940 0.04
EUR 500,000 Engie SA RegS 1.25%24/10/2041 491,077 0.09
EUR 100,000 Engie SA RegS FRN(Perpetual) 107,386 0.02
EUR 100,000 Engie SA RegS FRN(Perpetual) 98,006 0.02
EUR 1,489,760 France Government Bond OATRegS 0.10% 1/3/2028 1,574,408 0.30
EUR 3,610,000 France Government Bond OATRegS 0.50% 25/5/2040 3,646,678 0.69
EUR 105,000 France Government Bond OATRegS 0.75% 25/5/2052 106,970 0.02
EUR 386,178 French Republic GovernmentBond OAT RegS 1.25%25/5/2034 443,357 0.08
BlackRock European Select Strategies Fund continued
The notes on pages 691 to 711 form an integral part of these financial statements.
BlackRock Strategic Funds[322]

Portfolio of Investments as at 31 May 2020
Holding Description
MarketValue
EUR
% ofNet
Assets
France continuedEUR 3,125,400 French Republic Government
Bond OAT RegS 1.75%25/6/2039 3,910,782 0.75
EUR 338,967 French Republic GovernmentBond OAT RegS 3.25%25/5/2045 551,599 0.11
EUR 900,000 French Republic GovernmentBond OAT RegS 2.00%25/5/2048 1,217,043 0.23
EUR 295,000 French Republic GovernmentBond OAT RegS 1.50%25/5/2050 362,679 0.07
EUR 217,000 French Republic GovernmentBond OAT RegS 4.00%25/4/2055 439,451 0.08
EUR 217,000 French Republic GovernmentBond OAT RegS 4.00%25/4/2060 462,329 0.09
EUR 630,000 French Republic GovernmentBond OAT RegS 1.75%25/5/2066 877,647 0.17
EUR 400,000 HSBC France SA RegS 0.20%4/9/2021 399,914 0.08
EUR 900,000 La Poste SA RegS 1.375%21/4/2032 933,178 0.18
EUR 200,000 Orange SA RegS 1.25%7/7/2027 209,245 0.04
EUR 200,000 Orange SA RegS 1.375%20/3/2028 212,595 0.04
EUR 300,000 Orange SA RegS 1.875%12/9/2030 335,343 0.06
EUR 400,000 Orange SA RegS 0.50%4/9/2032 384,350 0.07
EUR 400,000 RTE Reseau de Transportd’Electricite SADIR RegS9/9/2027 (Zero Coupon)^ 387,642 0.07
EUR 700,000 Societe Generale SA RegS0.125% 24/2/2026 686,574 0.13
EUR 400,000 Societe Generale SA RegS0.875% 1/7/2026 390,678 0.07
EUR 800,000 Societe Generale SFH SARegS 0.50% 2/6/2025 828,888 0.16
EUR 300,000 Suez SA RegS FRN(Perpetual) 280,527 0.05
EUR 800,000 Total Capital International SARegS 0.696% 31/5/2028 812,028 0.15
EUR 2,000,000 Unedic RegS 0.875%25/5/2028 2,130,770 0.41
EUR 300,000 Unibail-Rodamco-Westfield SERegS 1.75% 1/7/2049 234,249 0.04
45,600,162 8.69
GermanyEUR 300,000 Allianz SE RegS FRN
8/7/2050 306,759 0.06EUR 100,000 Bertelsmann SE & Co KGaA
RegS FRN 23/4/2075 97,972 0.02EUR 2,200,000 Bundesrepublik Deutschland
Bundesanleihe RegS15/5/2035 (Zero Coupon) 2,276,813 0.43
EUR 335,682 Bundesrepublik DeutschlandBundesanleihe RegS 4.00%4/1/2037 575,644 0.11
EUR 2,800,000 Bundesrepublik DeutschlandBundesanleihe RegS 4.25%4/7/2039‡ 5,205,690 0.99
EUR 271,000 Bundesrepublik DeutschlandBundesanleihe RegS 4.75%4/7/2040 543,092 0.10
Holding Description
MarketValue
EUR
% ofNet
Assets
Germany continuedEUR 95,000 Commerzbank 0.50% 9/6/2026 98,871 0.02
EUR 300,000 Deutsche Bahn FinanceGmbH RegS 1.375%28/3/2031^ 324,702 0.06
EUR 300,000 Deutsche Bahn FinanceGmbH RegS 0.75%16/7/2035 297,722 0.06
EUR 225,000 Deutsche Bahn FinanceGmbH RegS 1.375%16/4/2040 241,718 0.05
EUR 1,200,000 Deutsche Pfandbriefbank AG0.10% 21/1/2028 1,221,210 0.23
EUR 700,000 Deutsche Pfandbriefbank AGRegS 0.125% 5/9/2024 670,876 0.13
EUR 425,000 Deutsche Telekom AG RegS1.75% 25/3/2031 458,460 0.09
EUR 175,000 DZ HYP AG RegS 0.01%15/1/2027 177,298 0.03
EUR 350,000 DZ HYP AG RegS 0.875%30/1/2029 379,694 0.07
EUR 275,000 DZ HYP AG RegS 0.875%17/4/2034 304,576 0.06
EUR 300,000 Eurogrid GmbH RegS 1.625%3/11/2023 312,422 0.06
EUR 300,000 Eurogrid GmbH RegS 1.113%15/5/2032 309,660 0.06
EUR 1,500,000 FMS Wertmanagement RegS0.375% 29/4/2030 1,569,952 0.30
EUR 700,000 Fresenius SE & Co KGaARegS 2.875% 15/7/2020 702,408 0.13
EUR 765,000 Gemeinsame DeutscheBundeslaender RegS0.625% 13/2/2029^ 811,217 0.16
EUR 200,000 ING-DiBa AG RegS 0.25%16/11/2026 205,905 0.04
EUR 113,000 Kreditanstalt fuerWiederaufbau 0.125%4/10/2024 115,804 0.02
EUR 114,000 Kreditanstalt fuerWiederaufbau 0.50%15/9/2027 120,818 0.02
EUR 74,000 Kreditanstalt fuerWiederaufbau RegS30/9/2026 (Zero Coupon) 75,701 0.01
EUR 900,000 Land Berlin RegS 0.125%4/6/2035 890,073 0.17
EUR 430,000 Land Berlin RegS 0.625%15/7/2039 457,984 0.09
EUR 429,000 LandesbankBaden-Wuerttemberg RegS0.01% 18/9/2028 433,256 0.08
EUR 300,000 LandesbankHessen-ThueringenGirozentrale 0.01%26/9/2029 302,639 0.06
EUR 1,360,000 LandwirtschaftlicheRentenbank RegS27/11/2029 (Zero Coupon) 1,375,422 0.26
EUR 200,000 Merck Financial ServicesGmbH RegS 0.005%15/12/2023 198,695 0.04
EUR 300,000 Merck Financial ServicesGmbH RegS 0.125%16/7/2025 297,756 0.06
EUR 100,000 Merck Financial ServicesGmbH RegS 0.875%5/7/2031 102,446 0.02
EUR 640,000 NRW Bank RegS 0.625%2/2/2029 677,603 0.13
BlackRock European Select Strategies Fund continued
The notes on pages 691 to 711 form an integral part of these financial statements.
Annual report and audited financial statements [323]

Portfolio of Investments as at 31 May 2020
Holding Description
MarketValue
EUR
% ofNet
Assets
Germany continuedEUR 371,000 NRW Bank RegS 0.375%
16/5/2029 384,911 0.07EUR 34,969 Red & Black Auto Germany
5 UG haftungsbeschrankt ’A’RegS FRN 15/1/2027 35,054 0.01
EUR 200,000 Santander Consumer Bank AGRegS 0.05% 14/2/2030 201,233 0.04
EUR 400,000 Santander Consumer BankRegS 0.25% 5/12/2024 407,858 0.08
EUR 1,495,000 State of Hesse RegS25/4/2025 (Zero Coupon) 1,509,210 0.29
EUR 1,553,000 State of Lower Saxony0.125% 8/4/2027 1,582,142 0.30
EUR 10,000 State of NorthRhine-Westphalia GermanyRegS 1.625% 24/10/2030 11,666 0.00
EUR 320,000 State of Saxony-Anhalt RegS0.125% 21/6/2029 326,235 0.06
EUR 266,000 State of Schleswig-HolsteinGermany RegS 0.125%12/6/2029 270,136 0.05
EUR 200,000 Volkswagen Bank GmbH RegS1.25% 10/6/2024 199,071 0.04
EUR 375,000 Volkswagen Financial ServicesAG RegS 0.875% 12/4/2023 369,812 0.07
EUR 125,000 Volkswagen Financial ServicesAG RegS 1.375%16/10/2023 125,016 0.02
EUR 425,000 Volkswagen Financial ServicesRegS 1.50% 1/10/2024 428,408 0.08
EUR 200,000 Volkswagen Leasing GmbHRegS 1.375% 20/1/2025 198,837 0.04
EUR 325,000 Volkswagen Leasing GmbHRegS 1.625% 15/8/2025 326,398 0.06
28,516,845 5.43
GreeceEUR 400,000 Alpha Bank AE RegS 2.50%
5/2/2023 417,270 0.08EUR 596,000 Hellenic Republic Government
Bond RegS 3.45% 2/4/2024 654,110 0.12EUR 931,000 Hellenic Republic Government
Bond RegS 3.375%15/2/2025 1,032,246 0.20
EUR 742,000 Hellenic Republic GovernmentBond RegS 1.875%23/7/2026 772,571 0.15
EUR 140,000 Hellenic Republic GovernmentBond RegS 3.75%30/1/2028 163,940 0.03
3,040,137 0.58
HungaryEUR 120,000 Hungary Government
International Bond RegS1.125% 28/4/2026 120,900 0.02
EUR 365,000 Hungary GovernmentInternational Bond RegS1.625% 28/4/2032 366,825 0.07
487,725 0.09
IcelandEUR 700,000 Islandsbanki HF RegS FRN
19/1/2024 669,263 0.13EUR 100,000 Landsbankinn HF RegS 0.50%
20/5/2024 93,016 0.02
762,279 0.15
Holding Description
MarketValue
EUR
% ofNet
Assets
IndonesiaIDR 11,754,000,000 Indonesia Treasury Bond
7.00% 15/9/2030 708,029 0.14
708,029 0.14
IrelandEUR 575,000 Abbott Ireland Financing DAC
RegS 0.10% 19/11/2024 568,388 0.11GBP 100,000 BAMS CMBS 2018-1 DAC ’C’
RegS FRN 17/5/2028 103,762 0.02EUR 700,000 Bank of Ireland Mortgage
Bank RegS 0.625%14/3/2025 727,489 0.14
SEK 1,990,000 Bluestep Mortgage SecuritiesNo 4 DAC ’B’ RegS FRN10/8/2066 188,745 0.03
EUR 850,000 CRH SMW Finance DACRegS 1.25% 5/11/2026 860,655 0.16
EUR 159,878 Ireland Government Bond5.40% 13/3/2025 203,255 0.04
EUR 270,000 Ireland Government BondRegS 3.40% 18/3/2024 308,482 0.06
EUR 291,000 Ireland Government BondRegS 0.20% 15/5/2027 296,430 0.06
EUR 195,000 Ireland Government BondRegS 1.10% 15/5/2029 212,874 0.04
EUR 524,293 Ireland Government BondRegS 1.35% 18/3/2031 588,495 0.11
EUR 315,000 Ireland Government BondRegS 1.50% 15/5/2050 375,277 0.07
EUR 99,750 River Green Finance’2020 DAC A’ RegS FRN22/1/2032 97,575 0.02
4,531,427 0.86
ItalyEUR 300,000 ACEA SpA RegS 1.50%
8/6/2027 308,087 0.06EUR 200,000 Banca Monte dei Paschi di
Siena SpA RegS 1.25%20/1/2022 202,501 0.04
EUR 1,010,000 Banca Monte dei Paschi diSiena SpA RegS 0.875%8/10/2026 995,703 0.19
EUR 200,000 Credit Agricole Italia SpARegS 1.00% 25/3/2027 214,279 0.04
EUR 675,000 Credito Emiliano SpA RegS1.125% 17/1/2024 700,313 0.13
EUR 26,393 Driver Italia One SRL ’A’ RegSFRN 21/4/2029 26,369 0.01
EUR 224,000 Enel SpA RegS FRN24/5/2080 234,111 0.04
EUR 100,000 Enel SpA RegS FRN24/11/2081 103,386 0.02
EUR 200,000 Intesa Sanpaolo SpA RegS2.00% 18/6/2021 202,071 0.04
EUR 600,000 Intesa Sanpaolo SpA RegS1.125% 4/3/2022 597,348 0.11
EUR 500,000 Intesa Sanpaolo SpA RegS0.50% 5/3/2024^ 510,430 0.10
EUR 350,000 Intesa Sanpaolo SpA RegS0.75% 4/12/2024 336,469 0.06
EUR 300,000 Intesa Sanpaolo SpA RegS1.75% 4/7/2029 290,405 0.06
EUR 850,000 Italy Buoni Poliennali DelTesoro 4.50% 1/5/2023 947,716 0.18
EUR 128,000 Italy Buoni Poliennali DelTesoro 3.75% 1/9/2024 143,585 0.03
BlackRock European Select Strategies Fund continued
The notes on pages 691 to 711 form an integral part of these financial statements.
BlackRock Strategic Funds[324]

Portfolio of Investments as at 31 May 2020
Holding Description
MarketValue
EUR
% ofNet
Assets
Italy continuedEUR 190,000 Italy Buoni Poliennali Del
Tesoro 2.05% 1/8/2027 200,403 0.04EUR 196,121 Italy Buoni Poliennali Del
Tesoro RegS 1.25%27/10/2020 196,946 0.04
EUR 1,472,324 Italy Buoni Poliennali DelTesoro RegS 0.45%22/5/2023 1,459,073 0.28
EUR 674,189 Italy Buoni Poliennali DelTesoro RegS 0.25%20/11/2023 660,762 0.13
EUR 2,911,000 Italy Buoni Poliennali DelTesoro RegS 1.45%15/11/2024 2,990,310 0.57
EUR 750,000 Italy Buoni Poliennali DelTesoro RegS 0.35%1/2/2025 732,518 0.14
EUR 945,000 Italy Buoni Poliennali DelTesoro RegS 1.45%15/5/2025 968,323 0.18
EUR 490,044 Italy Buoni Poliennali DelTesoro RegS 1.40%26/5/2025 494,734 0.09
EUR 300,000 Italy Buoni Poliennali DelTesoro RegS 4.50%1/3/2026 357,462 0.07
EUR 5,337,840 Italy Buoni Poliennali DelTesoro RegS 1.30%15/5/2028 5,403,228 1.03
EUR 1,663,000 Italy Buoni Poliennali DelTesoro RegS 1.65%1/3/2032 1,674,150 0.32
EUR 65,000 Italy Buoni Poliennali DelTesoro RegS 2.45%1/9/2033 70,462 0.01
EUR 1,500,000 Italy Buoni Poliennali DelTesoro RegS 3.35%1/3/2035 1,784,865 0.34
EUR 660,000 Italy Buoni Poliennali DelTesoro RegS 2.25%1/9/2036 691,835 0.13
EUR 139,000 Italy Buoni Poliennali DelTesoro RegS 2.95%1/9/2038 157,846 0.03
EUR 195,000 Italy Buoni Poliennali DelTesoro RegS 5.00%1/8/2039 283,518 0.05
EUR 80,000 Italy Buoni Poliennali DelTesoro RegS 3.10%1/3/2040 92,465 0.02
EUR 962,000 Italy Buoni Poliennali DelTesoro RegS 3.25%1/9/2046 1,134,838 0.22
EUR 150,000 Italy Buoni Poliennali DelTesoro RegS 2.70%1/3/2047 161,903 0.03
EUR 1,034,000 Italy Buoni Poliennali DelTesoro RegS 3.45%1/3/2048 1,262,752 0.24
EUR 183,000 Italy Buoni Poliennali DelTesoro RegS 3.85%1/9/2049 238,918 0.05
EUR 414,000 Italy Buoni Poliennali DelTesoro RegS 2.45%1/9/2050 422,025 0.08
EUR 65,000 Italy Buoni Poliennali DelTesoro RegS 2.80%1/3/2067 69,855 0.01
EUR 500,000 Mediobanca Banca di CreditoFinanziario SpA RegS1.125% 15/7/2025 476,755 0.09
Holding Description
MarketValue
EUR
% ofNet
Assets
Italy continuedEUR 350,000 Mediobanca Banca di Credito
Finanziario SpA RegS0.50% 1/10/2026 356,872 0.07
EUR 300,000 Mediobanca Banca di CreditoFinanziario SpA RegS0.75% 15/7/2027 267,909 0.05
EUR 104,411 Sunrise SPV 40 Srl ’2018-1 A’RegS FRN 27/7/2042 104,292 0.02
EUR 100,000 Sunrise SPV Z70 Srl’2019-1 A’ RegS FRN27/5/2044 99,826 0.02
EUR 750,000 UniCredit SpA RegS FRN25/6/2025 734,385 0.14
EUR 1,075,000 UniCredit SpA RegS FRN23/9/2029 959,717 0.18
EUR 200,000 UniCredit SpA RegS FRN15/1/2032 177,066 0.03
30,498,786 5.81
JapanJPY 51,000,000 Japan Government Thirty Year
Bond 0.40% 20/6/2049 418,234 0.08JPY 118,000,000 Japan Government Thirty Year
Bond 0.40% 20/12/2049 967,396 0.18
1,385,630 0.26
JerseyEUR 500,000 Glencore Finance Europe Ltd
RegS 1.25% 17/3/2021 497,628 0.09GBP 475,000 Glencore Finance Europe Ltd
RegS 3.125% 26/3/2026 517,561 0.10GBP 200,000 Heathrow Funding Ltd RegS
2.75% 9/8/2049 206,869 0.04GBP 200,000 HSBC Bank Capital Funding
Sterling 1 LP RegS FRN(Perpetual) 294,506 0.06
1,516,564 0.29
LatviaEUR 175,000 Latvia Government
International Bond RegS0.375% 7/10/2026 178,478 0.03
178,478 0.03
LuxembourgEUR 1,822,000 Bonos y Obligationes Del
Estado RegS31/10/2024 (Zero Coupon) 2,016,360 0.38
GBP 16,282 Compartment Driver UK Four’A’ RegS FRN 25/3/2025 18,076 0.00
GBP 33,292 Compartment Driver UK Four’B’ RegS FRN 25/3/2025 36,970 0.01
GBP 33,181 Compartment Driver UK Six ’A’RegS FRN 25/2/2026 36,686 0.01
EUR 240,000 European Financial StabilityFacility RegS 0.20%28/4/2025^ 247,266 0.05
EUR 1,618,000 European Financial StabilityFacility RegS 0.40%31/5/2026 1,694,855 0.32
EUR 1,643,000 European Financial StabilityFacility RegS 0.75%3/5/2027 1,769,371 0.34
EUR 400,000 European Financial StabilityFacility RegS 0.95%14/2/2028 439,042 0.08
EUR 500,000 European Financial StabilityFacility RegS 1.75%17/7/2053 713,467 0.13
EUR 59,339 FACT Master ’2018-1 A’ RegSFRN 20/11/2025 59,097 0.01
BlackRock European Select Strategies Fund continued
The notes on pages 691 to 711 form an integral part of these financial statements.
Annual report and audited financial statements [325]
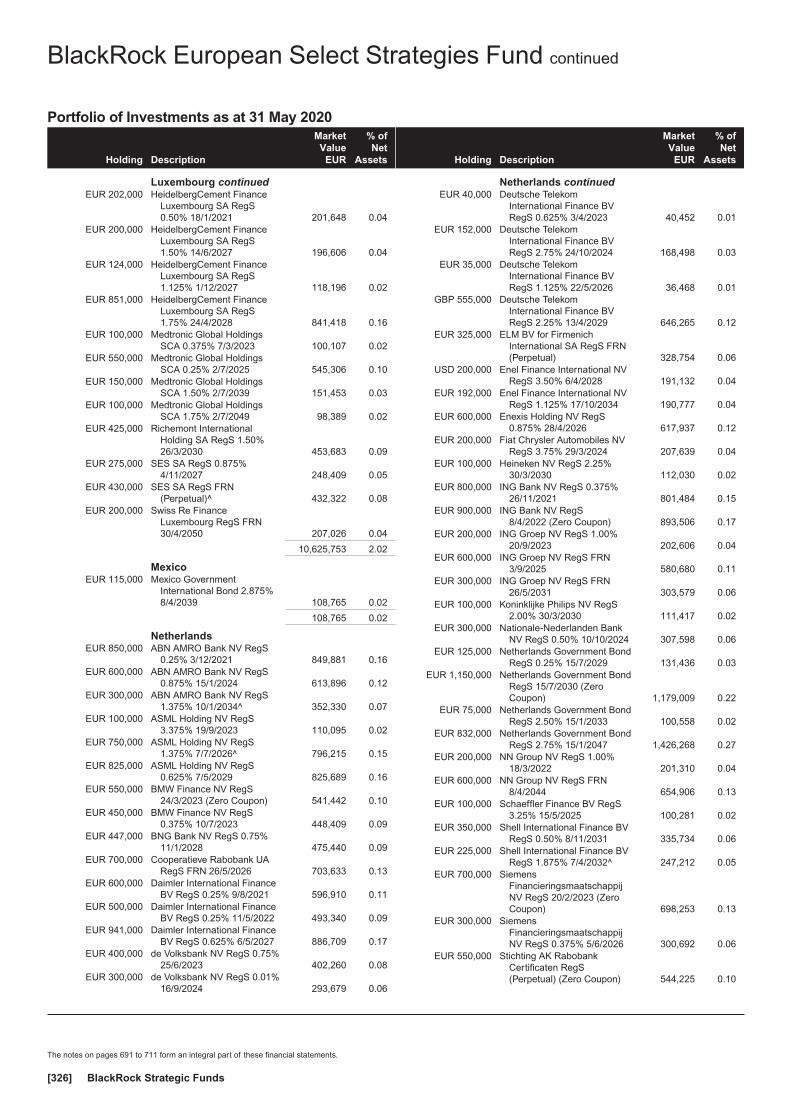
Portfolio of Investments as at 31 May 2020
Holding Description
MarketValue
EUR
% ofNet
Assets
Luxembourg continuedEUR 202,000 HeidelbergCement Finance
Luxembourg SA RegS0.50% 18/1/2021 201,648 0.04
EUR 200,000 HeidelbergCement FinanceLuxembourg SA RegS1.50% 14/6/2027 196,606 0.04
EUR 124,000 HeidelbergCement FinanceLuxembourg SA RegS1.125% 1/12/2027 118,196 0.02
EUR 851,000 HeidelbergCement FinanceLuxembourg SA RegS1.75% 24/4/2028 841,418 0.16
EUR 100,000 Medtronic Global HoldingsSCA 0.375% 7/3/2023 100,107 0.02
EUR 550,000 Medtronic Global HoldingsSCA 0.25% 2/7/2025 545,306 0.10
EUR 150,000 Medtronic Global HoldingsSCA 1.50% 2/7/2039 151,453 0.03
EUR 100,000 Medtronic Global HoldingsSCA 1.75% 2/7/2049 98,389 0.02
EUR 425,000 Richemont InternationalHolding SA RegS 1.50%26/3/2030 453,683 0.09
EUR 275,000 SES SA RegS 0.875%4/11/2027 248,409 0.05
EUR 430,000 SES SA RegS FRN(Perpetual)^ 432,322 0.08
EUR 200,000 Swiss Re FinanceLuxembourg RegS FRN30/4/2050 207,026 0.04
10,625,753 2.02
MexicoEUR 115,000 Mexico Government
International Bond 2.875%8/4/2039 108,765 0.02
108,765 0.02
NetherlandsEUR 850,000 ABN AMRO Bank NV RegS
0.25% 3/12/2021 849,881 0.16EUR 600,000 ABN AMRO Bank NV RegS
0.875% 15/1/2024 613,896 0.12EUR 300,000 ABN AMRO Bank NV RegS
1.375% 10/1/2034^ 352,330 0.07EUR 100,000 ASML Holding NV RegS
3.375% 19/9/2023 110,095 0.02EUR 750,000 ASML Holding NV RegS
1.375% 7/7/2026^ 796,215 0.15EUR 825,000 ASML Holding NV RegS
0.625% 7/5/2029 825,689 0.16EUR 550,000 BMW Finance NV RegS
24/3/2023 (Zero Coupon) 541,442 0.10EUR 450,000 BMW Finance NV RegS
0.375% 10/7/2023 448,409 0.09EUR 447,000 BNG Bank NV RegS 0.75%
11/1/2028 475,440 0.09EUR 700,000 Cooperatieve Rabobank UA
RegS FRN 26/5/2026 703,633 0.13EUR 600,000 Daimler International Finance
BV RegS 0.25% 9/8/2021 596,910 0.11EUR 500,000 Daimler International Finance
BV RegS 0.25% 11/5/2022 493,340 0.09EUR 941,000 Daimler International Finance
BV RegS 0.625% 6/5/2027 886,709 0.17EUR 400,000 de Volksbank NV RegS 0.75%
25/6/2023 402,260 0.08EUR 300,000 de Volksbank NV RegS 0.01%
16/9/2024 293,679 0.06
Holding Description
MarketValue
EUR
% ofNet
Assets
Netherlands continuedEUR 40,000 Deutsche Telekom
International Finance BVRegS 0.625% 3/4/2023 40,452 0.01
EUR 152,000 Deutsche TelekomInternational Finance BVRegS 2.75% 24/10/2024 168,498 0.03
EUR 35,000 Deutsche TelekomInternational Finance BVRegS 1.125% 22/5/2026 36,468 0.01
GBP 555,000 Deutsche TelekomInternational Finance BVRegS 2.25% 13/4/2029 646,265 0.12
EUR 325,000 ELM BV for FirmenichInternational SA RegS FRN(Perpetual) 328,754 0.06
USD 200,000 Enel Finance International NVRegS 3.50% 6/4/2028 191,132 0.04
EUR 192,000 Enel Finance International NVRegS 1.125% 17/10/2034 190,777 0.04
EUR 600,000 Enexis Holding NV RegS0.875% 28/4/2026 617,937 0.12
EUR 200,000 Fiat Chrysler Automobiles NVRegS 3.75% 29/3/2024 207,639 0.04
EUR 100,000 Heineken NV RegS 2.25%30/3/2030 112,030 0.02
EUR 800,000 ING Bank NV RegS 0.375%26/11/2021 801,484 0.15
EUR 900,000 ING Bank NV RegS8/4/2022 (Zero Coupon) 893,506 0.17
EUR 200,000 ING Groep NV RegS 1.00%20/9/2023 202,606 0.04
EUR 600,000 ING Groep NV RegS FRN3/9/2025 580,680 0.11
EUR 300,000 ING Groep NV RegS FRN26/5/2031 303,579 0.06
EUR 100,000 Koninklijke Philips NV RegS2.00% 30/3/2030 111,417 0.02
EUR 300,000 Nationale-Nederlanden BankNV RegS 0.50% 10/10/2024 307,598 0.06
EUR 125,000 Netherlands Government BondRegS 0.25% 15/7/2029 131,436 0.03
EUR 1,150,000 Netherlands Government BondRegS 15/7/2030 (ZeroCoupon) 1,179,009 0.22
EUR 75,000 Netherlands Government BondRegS 2.50% 15/1/2033 100,558 0.02
EUR 832,000 Netherlands Government BondRegS 2.75% 15/1/2047 1,426,268 0.27
EUR 200,000 NN Group NV RegS 1.00%18/3/2022 201,310 0.04
EUR 600,000 NN Group NV RegS FRN8/4/2044 654,906 0.13
EUR 100,000 Schaeffler Finance BV RegS3.25% 15/5/2025 100,281 0.02
EUR 350,000 Shell International Finance BVRegS 0.50% 8/11/2031 335,734 0.06
EUR 225,000 Shell International Finance BVRegS 1.875% 7/4/2032^ 247,212 0.05
EUR 700,000 SiemensFinancieringsmaatschappijNV RegS 20/2/2023 (ZeroCoupon) 698,253 0.13
EUR 300,000 SiemensFinancieringsmaatschappijNV RegS 0.375% 5/6/2026 300,692 0.06
EUR 550,000 Stichting AK RabobankCertificaten RegS(Perpetual) (Zero Coupon) 544,225 0.10
BlackRock European Select Strategies Fund continued
The notes on pages 691 to 711 form an integral part of these financial statements.
BlackRock Strategic Funds[326]
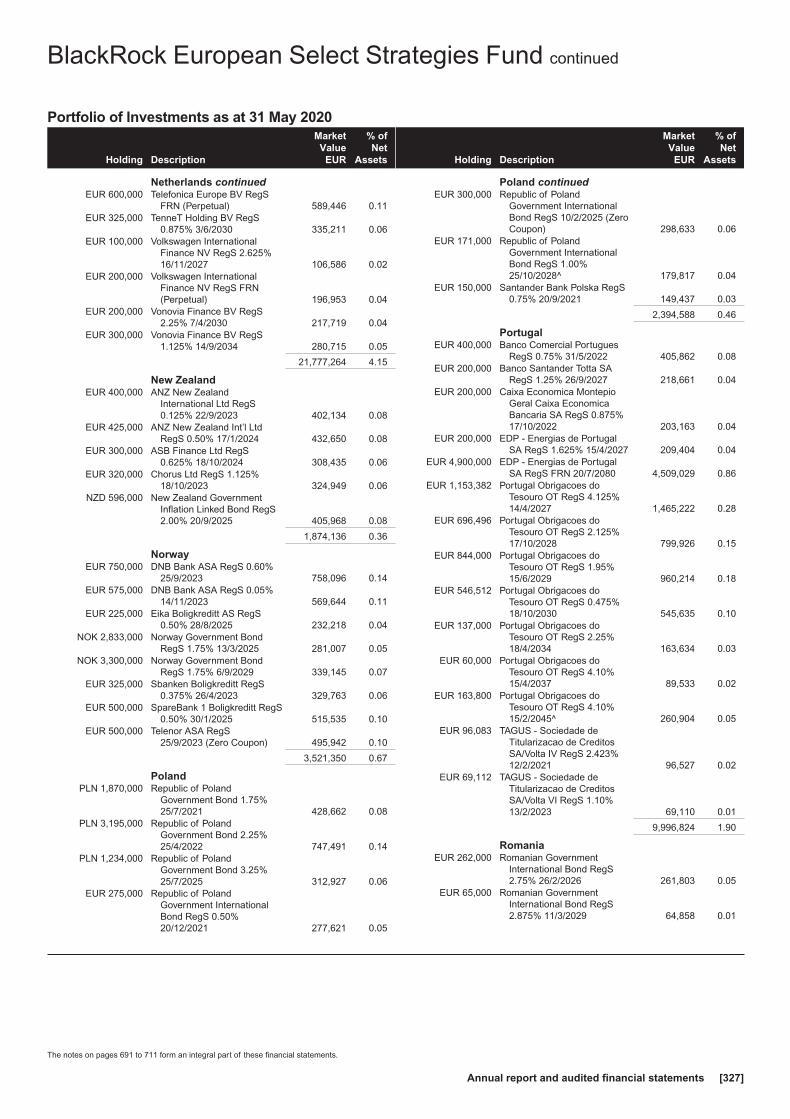
Portfolio of Investments as at 31 May 2020
Holding Description
MarketValue
EUR
% ofNet
Assets
Netherlands continuedEUR 600,000 Telefonica Europe BV RegS
FRN (Perpetual) 589,446 0.11EUR 325,000 TenneT Holding BV RegS
0.875% 3/6/2030 335,211 0.06EUR 100,000 Volkswagen International
Finance NV RegS 2.625%16/11/2027 106,586 0.02
EUR 200,000 Volkswagen InternationalFinance NV RegS FRN(Perpetual) 196,953 0.04
EUR 200,000 Vonovia Finance BV RegS2.25% 7/4/2030 217,719 0.04
EUR 300,000 Vonovia Finance BV RegS1.125% 14/9/2034 280,715 0.05
21,777,264 4.15
New ZealandEUR 400,000 ANZ New Zealand
International Ltd RegS0.125% 22/9/2023 402,134 0.08
EUR 425,000 ANZ New Zealand Int’l LtdRegS 0.50% 17/1/2024 432,650 0.08
EUR 300,000 ASB Finance Ltd RegS0.625% 18/10/2024 308,435 0.06
EUR 320,000 Chorus Ltd RegS 1.125%18/10/2023 324,949 0.06
NZD 596,000 New Zealand GovernmentInflation Linked Bond RegS2.00% 20/9/2025 405,968 0.08
1,874,136 0.36
NorwayEUR 750,000 DNB Bank ASA RegS 0.60%
25/9/2023 758,096 0.14EUR 575,000 DNB Bank ASA RegS 0.05%
14/11/2023 569,644 0.11EUR 225,000 Eika Boligkreditt AS RegS
0.50% 28/8/2025 232,218 0.04NOK 2,833,000 Norway Government Bond
RegS 1.75% 13/3/2025 281,007 0.05NOK 3,300,000 Norway Government Bond
RegS 1.75% 6/9/2029 339,145 0.07EUR 325,000 Sbanken Boligkreditt RegS
0.375% 26/4/2023 329,763 0.06EUR 500,000 SpareBank 1 Boligkreditt RegS
0.50% 30/1/2025 515,535 0.10EUR 500,000 Telenor ASA RegS
25/9/2023 (Zero Coupon) 495,942 0.10
3,521,350 0.67
PolandPLN 1,870,000 Republic of Poland
Government Bond 1.75%25/7/2021 428,662 0.08
PLN 3,195,000 Republic of PolandGovernment Bond 2.25%25/4/2022 747,491 0.14
PLN 1,234,000 Republic of PolandGovernment Bond 3.25%25/7/2025 312,927 0.06
EUR 275,000 Republic of PolandGovernment InternationalBond RegS 0.50%20/12/2021 277,621 0.05
Holding Description
MarketValue
EUR
% ofNet
Assets
Poland continuedEUR 300,000 Republic of Poland
Government InternationalBond RegS 10/2/2025 (ZeroCoupon) 298,633 0.06
EUR 171,000 Republic of PolandGovernment InternationalBond RegS 1.00%25/10/2028^ 179,817 0.04
EUR 150,000 Santander Bank Polska RegS0.75% 20/9/2021 149,437 0.03
2,394,588 0.46
PortugalEUR 400,000 Banco Comercial Portugues
RegS 0.75% 31/5/2022 405,862 0.08EUR 200,000 Banco Santander Totta SA
RegS 1.25% 26/9/2027 218,661 0.04EUR 200,000 Caixa Economica Montepio
Geral Caixa EconomicaBancaria SA RegS 0.875%17/10/2022 203,163 0.04
EUR 200,000 EDP - Energias de PortugalSA RegS 1.625% 15/4/2027 209,404 0.04
EUR 4,900,000 EDP - Energias de PortugalSA RegS FRN 20/7/2080 4,509,029 0.86
EUR 1,153,382 Portugal Obrigacoes doTesouro OT RegS 4.125%14/4/2027 1,465,222 0.28
EUR 696,496 Portugal Obrigacoes doTesouro OT RegS 2.125%17/10/2028 799,926 0.15
EUR 844,000 Portugal Obrigacoes doTesouro OT RegS 1.95%15/6/2029 960,214 0.18
EUR 546,512 Portugal Obrigacoes doTesouro OT RegS 0.475%18/10/2030 545,635 0.10
EUR 137,000 Portugal Obrigacoes doTesouro OT RegS 2.25%18/4/2034 163,634 0.03
EUR 60,000 Portugal Obrigacoes doTesouro OT RegS 4.10%15/4/2037 89,533 0.02
EUR 163,800 Portugal Obrigacoes doTesouro OT RegS 4.10%15/2/2045^ 260,904 0.05
EUR 96,083 TAGUS - Sociedade deTitularizacao de CreditosSA/Volta IV RegS 2.423%12/2/2021 96,527 0.02
EUR 69,112 TAGUS - Sociedade deTitularizacao de CreditosSA/Volta VI RegS 1.10%13/2/2023 69,110 0.01
9,996,824 1.90
RomaniaEUR 262,000 Romanian Government
International Bond RegS2.75% 26/2/2026 261,803 0.05
EUR 65,000 Romanian GovernmentInternational Bond RegS2.875% 11/3/2029 64,858 0.01
BlackRock European Select Strategies Fund continued
The notes on pages 691 to 711 form an integral part of these financial statements.
Annual report and audited financial statements [327]
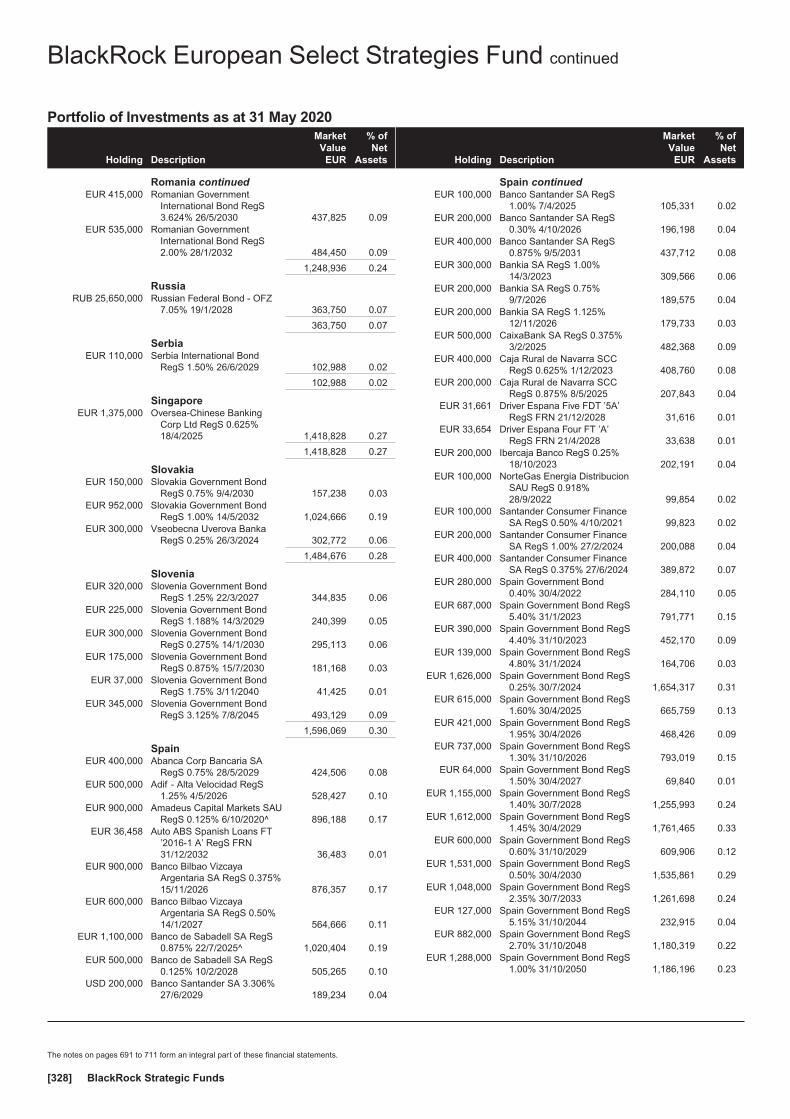
Portfolio of Investments as at 31 May 2020
Holding Description
MarketValue
EUR
% ofNet
Assets
Romania continuedEUR 415,000 Romanian Government
International Bond RegS3.624% 26/5/2030 437,825 0.09
EUR 535,000 Romanian GovernmentInternational Bond RegS2.00% 28/1/2032 484,450 0.09
1,248,936 0.24
RussiaRUB 25,650,000 Russian Federal Bond - OFZ
7.05% 19/1/2028 363,750 0.07
363,750 0.07
SerbiaEUR 110,000 Serbia International Bond
RegS 1.50% 26/6/2029 102,988 0.02
102,988 0.02
SingaporeEUR 1,375,000 Oversea-Chinese Banking
Corp Ltd RegS 0.625%18/4/2025 1,418,828 0.27
1,418,828 0.27
SlovakiaEUR 150,000 Slovakia Government Bond
RegS 0.75% 9/4/2030 157,238 0.03EUR 952,000 Slovakia Government Bond
RegS 1.00% 14/5/2032 1,024,666 0.19EUR 300,000 Vseobecna Uverova Banka
RegS 0.25% 26/3/2024 302,772 0.06
1,484,676 0.28
SloveniaEUR 320,000 Slovenia Government Bond
RegS 1.25% 22/3/2027 344,835 0.06EUR 225,000 Slovenia Government Bond
RegS 1.188% 14/3/2029 240,399 0.05EUR 300,000 Slovenia Government Bond
RegS 0.275% 14/1/2030 295,113 0.06EUR 175,000 Slovenia Government Bond
RegS 0.875% 15/7/2030 181,168 0.03EUR 37,000 Slovenia Government Bond
RegS 1.75% 3/11/2040 41,425 0.01EUR 345,000 Slovenia Government Bond
RegS 3.125% 7/8/2045 493,129 0.09
1,596,069 0.30
SpainEUR 400,000 Abanca Corp Bancaria SA
RegS 0.75% 28/5/2029 424,506 0.08EUR 500,000 Adif - Alta Velocidad RegS
1.25% 4/5/2026 528,427 0.10EUR 900,000 Amadeus Capital Markets SAU
RegS 0.125% 6/10/2020^ 896,188 0.17EUR 36,458 Auto ABS Spanish Loans FT
’2016-1 A’ RegS FRN31/12/2032 36,483 0.01
EUR 900,000 Banco Bilbao VizcayaArgentaria SA RegS 0.375%15/11/2026 876,357 0.17
EUR 600,000 Banco Bilbao VizcayaArgentaria SA RegS 0.50%14/1/2027 564,666 0.11
EUR 1,100,000 Banco de Sabadell SA RegS0.875% 22/7/2025^ 1,020,404 0.19
EUR 500,000 Banco de Sabadell SA RegS0.125% 10/2/2028 505,265 0.10
USD 200,000 Banco Santander SA 3.306%27/6/2029 189,234 0.04
Holding Description
MarketValue
EUR
% ofNet
Assets
Spain continuedEUR 100,000 Banco Santander SA RegS
1.00% 7/4/2025 105,331 0.02EUR 200,000 Banco Santander SA RegS
0.30% 4/10/2026 196,198 0.04EUR 400,000 Banco Santander SA RegS
0.875% 9/5/2031 437,712 0.08EUR 300,000 Bankia SA RegS 1.00%
14/3/2023 309,566 0.06EUR 200,000 Bankia SA RegS 0.75%
9/7/2026 189,575 0.04EUR 200,000 Bankia SA RegS 1.125%
12/11/2026 179,733 0.03EUR 500,000 CaixaBank SA RegS 0.375%
3/2/2025 482,368 0.09EUR 400,000 Caja Rural de Navarra SCC
RegS 0.625% 1/12/2023 408,760 0.08EUR 200,000 Caja Rural de Navarra SCC
RegS 0.875% 8/5/2025 207,843 0.04EUR 31,661 Driver Espana Five FDT ’5A’
RegS FRN 21/12/2028 31,616 0.01EUR 33,654 Driver Espana Four FT ’A’
RegS FRN 21/4/2028 33,638 0.01EUR 200,000 Ibercaja Banco RegS 0.25%
18/10/2023 202,191 0.04EUR 100,000 NorteGas Energia Distribucion
SAU RegS 0.918%28/9/2022 99,854 0.02
EUR 100,000 Santander Consumer FinanceSA RegS 0.50% 4/10/2021 99,823 0.02
EUR 200,000 Santander Consumer FinanceSA RegS 1.00% 27/2/2024 200,088 0.04
EUR 400,000 Santander Consumer FinanceSA RegS 0.375% 27/6/2024 389,872 0.07
EUR 280,000 Spain Government Bond0.40% 30/4/2022 284,110 0.05
EUR 687,000 Spain Government Bond RegS5.40% 31/1/2023 791,771 0.15
EUR 390,000 Spain Government Bond RegS4.40% 31/10/2023 452,170 0.09
EUR 139,000 Spain Government Bond RegS4.80% 31/1/2024 164,706 0.03
EUR 1,626,000 Spain Government Bond RegS0.25% 30/7/2024 1,654,317 0.31
EUR 615,000 Spain Government Bond RegS1.60% 30/4/2025 665,759 0.13
EUR 421,000 Spain Government Bond RegS1.95% 30/4/2026 468,426 0.09
EUR 737,000 Spain Government Bond RegS1.30% 31/10/2026 793,019 0.15
EUR 64,000 Spain Government Bond RegS1.50% 30/4/2027 69,840 0.01
EUR 1,155,000 Spain Government Bond RegS1.40% 30/7/2028 1,255,993 0.24
EUR 1,612,000 Spain Government Bond RegS1.45% 30/4/2029 1,761,465 0.33
EUR 600,000 Spain Government Bond RegS0.60% 31/10/2029 609,906 0.12
EUR 1,531,000 Spain Government Bond RegS0.50% 30/4/2030 1,535,861 0.29
EUR 1,048,000 Spain Government Bond RegS2.35% 30/7/2033 1,261,698 0.24
EUR 127,000 Spain Government Bond RegS5.15% 31/10/2044 232,915 0.04
EUR 882,000 Spain Government Bond RegS2.70% 31/10/2048 1,180,319 0.22
EUR 1,288,000 Spain Government Bond RegS1.00% 31/10/2050 1,186,196 0.23
BlackRock European Select Strategies Fund continued
The notes on pages 691 to 711 form an integral part of these financial statements.
BlackRock Strategic Funds[328]

Portfolio of Investments as at 31 May 2020
Holding Description
MarketValue
EUR
% ofNet
Assets
Spain continuedEUR 144,000 Spain Government Bond RegS
3.45% 30/7/2066 235,008 0.04GBP 300,000 Telefonica Emisiones SAU
RegS 5.375% 2/2/2026 399,184 0.08
23,618,361 4.50
SupranationalEUR 500,000 African Development Bank
0.50% 21/3/2029 523,447 0.10EUR 59,000 European Investment Bank
0.10% 15/10/2026 60,978 0.01EUR 44,000 European Investment Bank
2.625% 15/3/2035 61,181 0.01EUR 128,000 European Investment Bank
RegS 0.375% 15/5/2026 134,289 0.03EUR 99,000 European Investment Bank
RegS 0.875% 14/1/2028 108,549 0.02EUR 92,000 European Investment Bank
RegS 1.125% 13/4/2033 106,245 0.02GBP 21,000 European Investment Bank
RegS 3.875% 8/6/2037 34,815 0.01EUR 390,336 European Stability Mechanism
RegS 0.75% 15/3/2027 418,391 0.08EUR 44,000 European Union RegS 0.50%
4/4/2025 45,770 0.01EUR 66,000 European Union RegS 0.75%
4/4/2031 71,723 0.01EUR 48,000 European Union RegS 1.25%
4/4/2033 55,502 0.01GBP 700,000 International Bank for
Reconstruction &Development 0.75%7/12/2021^ 783,547 0.15
GBP 125,000 International Bank forReconstruction &Development 0.75%15/12/2026 141,942 0.03
GBP 70,000 International DevelopmentAssociation RegS 0.75%12/12/2024 79,195 0.01
2,625,574 0.50
SwedenSEK 4,700,000 Kommuninvest I Sverige AB
RegS 1.00% 12/5/2025 462,866 0.09SEK 6,000,000 Landshypotek Bank AB RegS
0.75% 25/5/2023 579,763 0.11EUR 225,000 Lansforsakringar Hypotek AB
RegS 0.625% 29/1/2026 234,291 0.04SEK 5,000,000 Skandinaviska Enskilda
Banken AB RegS 1.50%21/12/2022 492,706 0.09
EUR 145,000 Skandinaviska EnskildaBanken AB RegS 0.625%30/1/2023 148,139 0.03
EUR 950,000 Skandinaviska EnskildaBanken AB RegS 0.05%1/7/2024 941,184 0.18
SEK 15,000,000 Stadshypotek AB RegS 1.50%1/6/2023 1,485,055 0.28
EUR 100,000 Svenska Handelsbanken ABRegS 1.125% 14/12/2022 102,485 0.02
EUR 150,000 Svenska Handelsbanken ABRegS 0.125% 18/6/2024 149,635 0.03
SEK 2,000,000 Sveriges SakerstalldaObligationer AB RegS1.00% 21/6/2023 195,257 0.04
EUR 800,000 Swedbank AB RegS 0.30%6/9/2022 799,164 0.15
Holding Description
MarketValue
EUR
% ofNet
Assets
Sweden continuedSEK 1,800,000 Sweden Government Bond
3.50% 30/3/2039 (traded inGermany) 268,244 0.05
SEK 575,000 Sweden Government Bond3.50% 30/3/2039 (traded inSweden) 85,689 0.02
5,944,478 1.13
SwitzerlandEUR 100,000 Credit Suisse AG RegS FRN
18/9/2025 101,258 0.02EUR 1,225,000 Credit Suisse Group AG RegS
FRN 24/6/2027 1,201,676 0.23EUR 850,000 Credit Suisse Group AG RegS
FRN 14/1/2028 810,611 0.16CHF 2,332,000 Swiss Confederation
Government Bond RegS1.50% 24/7/2025^ 2,422,239 0.46
CHF 293,000 Swiss ConfederationGovernment Bond RegS1.25% 28/5/2026 304,891 0.06
CHF 999,000 Swiss ConfederationGovernment Bond RegS4.00% 8/4/2028 1,275,135 0.24
CHF 721,000 Swiss ConfederationGovernment Bond RegS1.50% 30/4/2042 948,034 0.18
EUR 1,200,000 UBS AG RegS FRN 12/2/2026 1,226,592 0.23GBP 1,575,000 UBS AG/London RegS 1.25%
10/12/2020^ 1,752,782 0.33EUR 625,000 UBS AG/London RegS 0.625%
23/1/2023 630,706 0.12EUR 200,000 UBS Group AG RegS FRN
29/1/2026 194,090 0.04
10,868,014 2.07
TurkeyUSD 200,000 Turkey Government
International Bond 5.25%13/3/2030 154,917 0.03
154,917 0.03
United KingdomGBP 100,000 Azure Finance Plc ’C’ RegS
FRN 30/6/2027 109,069 0.02GBP 100,000 Barclays Bank Plc RegS
10.00% 21/5/2021 118,696 0.02GBP 675,000 Barclays Plc RegS FRN
6/10/2023 753,599 0.14EUR 475,000 Barclays Plc RegS FRN
11/11/2025 473,264 0.09EUR 700,000 BAT International Finance Plc
RegS 3.625% 9/11/2021 726,176 0.14GBP 164,000 BAT International Finance Plc
RegS 4.00% 4/9/2026 200,295 0.04EUR 405,000 BAT International Finance Plc
RegS 2.25% 16/1/2030 410,836 0.08EUR 400,000 BP Capital Markets Plc RegS
1.117% 25/1/2024 405,064 0.08EUR 100,000 BP Capital Markets Plc RegS
0.83% 19/9/2024 99,842 0.02EUR 100,000 BP Capital Markets Plc RegS
1.573% 16/2/2027 102,202 0.02EUR 375,000 BP Capital Markets Plc RegS
1.231% 8/5/2031 364,777 0.07EUR 175,000 BP Capital Markets Plc RegS
1.104% 15/11/2034 159,970 0.03GBP 100,980 Brass No 7 Plc ’A’ RegS FRN
16/10/2059 111,789 0.02
BlackRock European Select Strategies Fund continued
The notes on pages 691 to 711 form an integral part of these financial statements.
Annual report and audited financial statements [329]
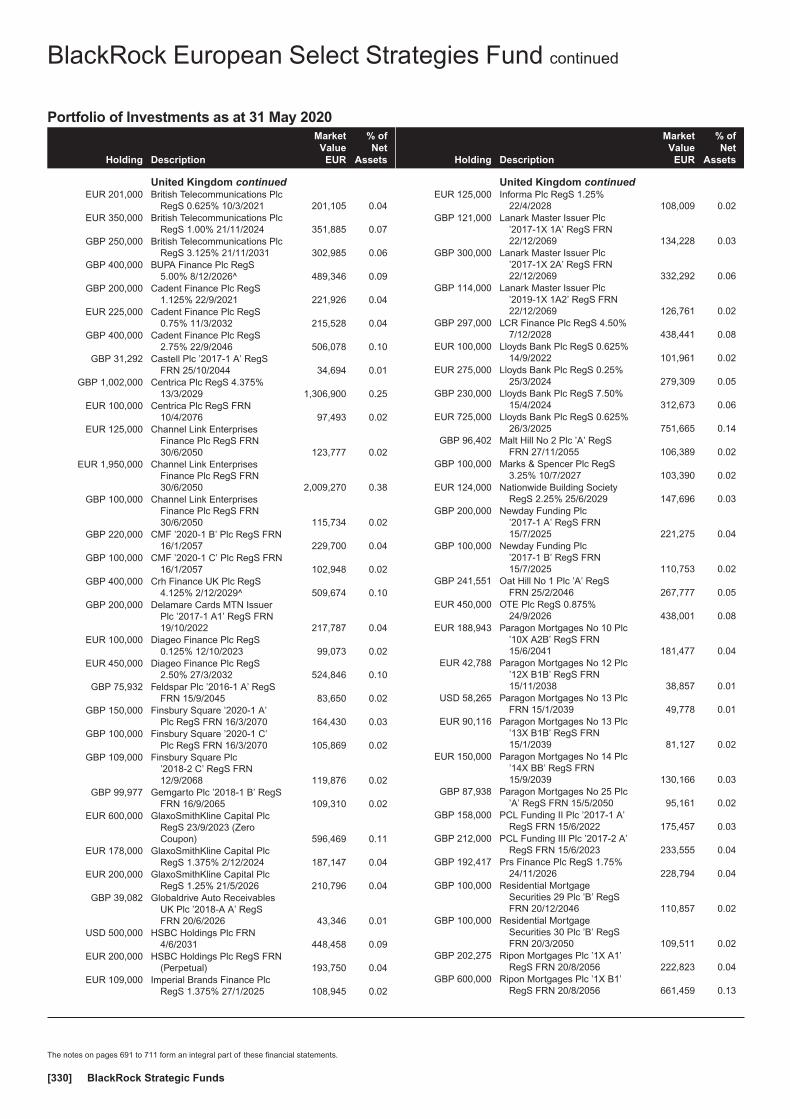
Portfolio of Investments as at 31 May 2020
Holding Description
MarketValue
EUR
% ofNet
Assets
United Kingdom continuedEUR 201,000 British Telecommunications Plc
RegS 0.625% 10/3/2021 201,105 0.04EUR 350,000 British Telecommunications Plc
RegS 1.00% 21/11/2024 351,885 0.07GBP 250,000 British Telecommunications Plc
RegS 3.125% 21/11/2031 302,985 0.06GBP 400,000 BUPA Finance Plc RegS
5.00% 8/12/2026^ 489,346 0.09GBP 200,000 Cadent Finance Plc RegS
1.125% 22/9/2021 221,926 0.04EUR 225,000 Cadent Finance Plc RegS
0.75% 11/3/2032 215,528 0.04GBP 400,000 Cadent Finance Plc RegS
2.75% 22/9/2046 506,078 0.10GBP 31,292 Castell Plc ’2017-1 A’ RegS
FRN 25/10/2044 34,694 0.01GBP 1,002,000 Centrica Plc RegS 4.375%
13/3/2029 1,306,900 0.25EUR 100,000 Centrica Plc RegS FRN
10/4/2076 97,493 0.02EUR 125,000 Channel Link Enterprises
Finance Plc RegS FRN30/6/2050 123,777 0.02
EUR 1,950,000 Channel Link EnterprisesFinance Plc RegS FRN30/6/2050 2,009,270 0.38
GBP 100,000 Channel Link EnterprisesFinance Plc RegS FRN30/6/2050 115,734 0.02
GBP 220,000 CMF ’2020-1 B’ Plc RegS FRN16/1/2057 229,700 0.04
GBP 100,000 CMF ’2020-1 C’ Plc RegS FRN16/1/2057 102,948 0.02
GBP 400,000 Crh Finance UK Plc RegS4.125% 2/12/2029^ 509,674 0.10
GBP 200,000 Delamare Cards MTN IssuerPlc ’2017-1 A1’ RegS FRN19/10/2022 217,787 0.04
EUR 100,000 Diageo Finance Plc RegS0.125% 12/10/2023 99,073 0.02
EUR 450,000 Diageo Finance Plc RegS2.50% 27/3/2032 524,846 0.10
GBP 75,932 Feldspar Plc ’2016-1 A’ RegSFRN 15/9/2045 83,650 0.02
GBP 150,000 Finsbury Square ’2020-1 A’Plc RegS FRN 16/3/2070 164,430 0.03
GBP 100,000 Finsbury Square ’2020-1 C’Plc RegS FRN 16/3/2070 105,869 0.02
GBP 109,000 Finsbury Square Plc’2018-2 C’ RegS FRN12/9/2068 119,876 0.02
GBP 99,977 Gemgarto Plc ’2018-1 B’ RegSFRN 16/9/2065 109,310 0.02
EUR 600,000 GlaxoSmithKline Capital PlcRegS 23/9/2023 (ZeroCoupon) 596,469 0.11
EUR 178,000 GlaxoSmithKline Capital PlcRegS 1.375% 2/12/2024 187,147 0.04
EUR 200,000 GlaxoSmithKline Capital PlcRegS 1.25% 21/5/2026 210,796 0.04
GBP 39,082 Globaldrive Auto ReceivablesUK Plc ’2018-A A’ RegSFRN 20/6/2026 43,346 0.01
USD 500,000 HSBC Holdings Plc FRN4/6/2031 448,458 0.09
EUR 200,000 HSBC Holdings Plc RegS FRN(Perpetual) 193,750 0.04
EUR 109,000 Imperial Brands Finance PlcRegS 1.375% 27/1/2025 108,945 0.02
Holding Description
MarketValue
EUR
% ofNet
Assets
United Kingdom continuedEUR 125,000 Informa Plc RegS 1.25%
22/4/2028 108,009 0.02GBP 121,000 Lanark Master Issuer Plc
’2017-1X 1A’ RegS FRN22/12/2069 134,228 0.03
GBP 300,000 Lanark Master Issuer Plc’2017-1X 2A’ RegS FRN22/12/2069 332,292 0.06
GBP 114,000 Lanark Master Issuer Plc’2019-1X 1A2’ RegS FRN22/12/2069 126,761 0.02
GBP 297,000 LCR Finance Plc RegS 4.50%7/12/2028 438,441 0.08
EUR 100,000 Lloyds Bank Plc RegS 0.625%14/9/2022 101,961 0.02
EUR 275,000 Lloyds Bank Plc RegS 0.25%25/3/2024 279,309 0.05
GBP 230,000 Lloyds Bank Plc RegS 7.50%15/4/2024 312,673 0.06
EUR 725,000 Lloyds Bank Plc RegS 0.625%26/3/2025 751,665 0.14
GBP 96,402 Malt Hill No 2 Plc ’A’ RegSFRN 27/11/2055 106,389 0.02
GBP 100,000 Marks & Spencer Plc RegS3.25% 10/7/2027 103,390 0.02
EUR 124,000 Nationwide Building SocietyRegS 2.25% 25/6/2029 147,696 0.03
GBP 200,000 Newday Funding Plc’2017-1 A’ RegS FRN15/7/2025 221,275 0.04
GBP 100,000 Newday Funding Plc’2017-1 B’ RegS FRN15/7/2025 110,753 0.02
GBP 241,551 Oat Hill No 1 Plc ’A’ RegSFRN 25/2/2046 267,777 0.05
EUR 450,000 OTE Plc RegS 0.875%24/9/2026 438,001 0.08
EUR 188,943 Paragon Mortgages No 10 Plc’10X A2B’ RegS FRN15/6/2041 181,477 0.04
EUR 42,788 Paragon Mortgages No 12 Plc’12X B1B’ RegS FRN15/11/2038 38,857 0.01
USD 58,265 Paragon Mortgages No 13 PlcFRN 15/1/2039 49,778 0.01
EUR 90,116 Paragon Mortgages No 13 Plc’13X B1B’ RegS FRN15/1/2039 81,127 0.02
EUR 150,000 Paragon Mortgages No 14 Plc’14X BB’ RegS FRN15/9/2039 130,166 0.03
GBP 87,938 Paragon Mortgages No 25 Plc’A’ RegS FRN 15/5/2050 95,161 0.02
GBP 158,000 PCL Funding II Plc ’2017-1 A’RegS FRN 15/6/2022 175,457 0.03
GBP 212,000 PCL Funding III Plc ’2017-2 A’RegS FRN 15/6/2023 233,555 0.04
GBP 192,417 Prs Finance Plc RegS 1.75%24/11/2026 228,794 0.04
GBP 100,000 Residential MortgageSecurities 29 Plc ’B’ RegSFRN 20/12/2046 110,857 0.02
GBP 100,000 Residential MortgageSecurities 30 Plc ’B’ RegSFRN 20/3/2050 109,511 0.02
GBP 202,275 Ripon Mortgages Plc ’1X A1’RegS FRN 20/8/2056 222,823 0.04
GBP 600,000 Ripon Mortgages Plc ’1X B1’RegS FRN 20/8/2056 661,459 0.13
BlackRock European Select Strategies Fund continued
The notes on pages 691 to 711 form an integral part of these financial statements.
BlackRock Strategic Funds[330]
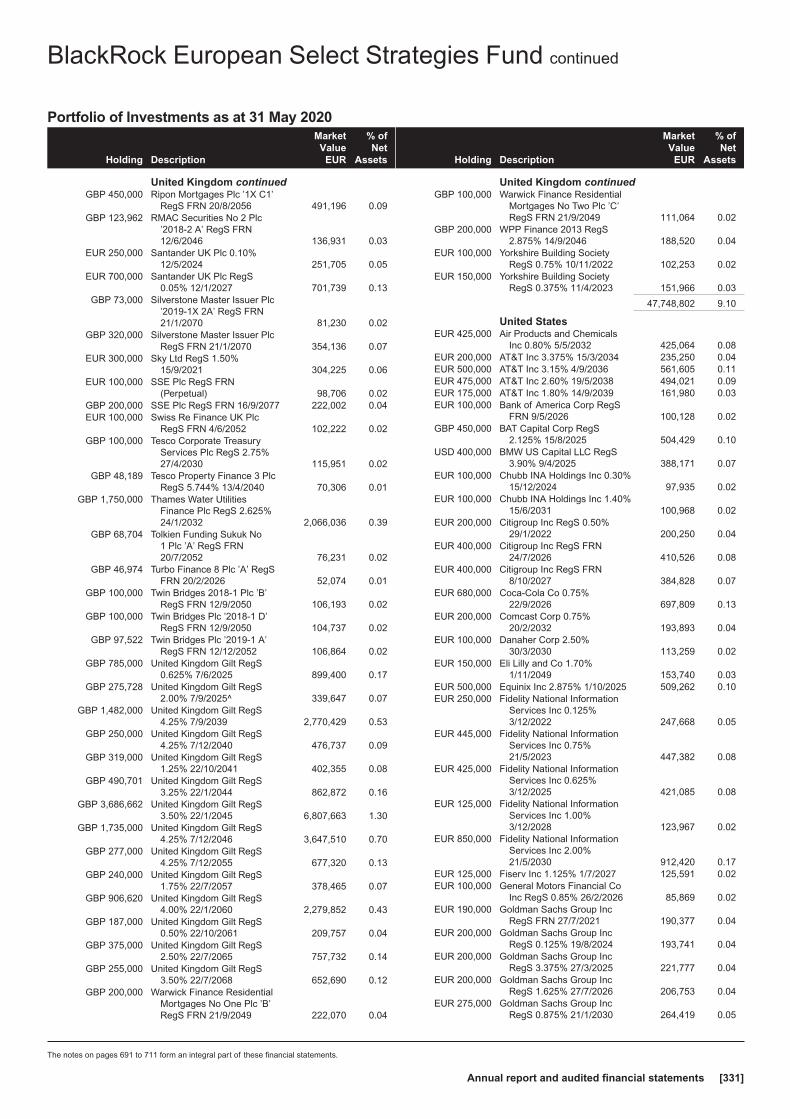
Portfolio of Investments as at 31 May 2020
Holding Description
MarketValue
EUR
% ofNet
Assets
United Kingdom continuedGBP 450,000 Ripon Mortgages Plc ’1X C1’
RegS FRN 20/8/2056 491,196 0.09GBP 123,962 RMAC Securities No 2 Plc
’2018-2 A’ RegS FRN12/6/2046 136,931 0.03
EUR 250,000 Santander UK Plc 0.10%12/5/2024 251,705 0.05
EUR 700,000 Santander UK Plc RegS0.05% 12/1/2027 701,739 0.13
GBP 73,000 Silverstone Master Issuer Plc’2019-1X 2A’ RegS FRN21/1/2070 81,230 0.02
GBP 320,000 Silverstone Master Issuer PlcRegS FRN 21/1/2070 354,136 0.07
EUR 300,000 Sky Ltd RegS 1.50%15/9/2021 304,225 0.06
EUR 100,000 SSE Plc RegS FRN(Perpetual) 98,706 0.02
GBP 200,000 SSE Plc RegS FRN 16/9/2077 222,002 0.04EUR 100,000 Swiss Re Finance UK Plc
RegS FRN 4/6/2052 102,222 0.02GBP 100,000 Tesco Corporate Treasury
Services Plc RegS 2.75%27/4/2030 115,951 0.02
GBP 48,189 Tesco Property Finance 3 PlcRegS 5.744% 13/4/2040 70,306 0.01
GBP 1,750,000 Thames Water UtilitiesFinance Plc RegS 2.625%24/1/2032 2,066,036 0.39
GBP 68,704 Tolkien Funding Sukuk No1 Plc ’A’ RegS FRN20/7/2052 76,231 0.02
GBP 46,974 Turbo Finance 8 Plc ’A’ RegSFRN 20/2/2026 52,074 0.01
GBP 100,000 Twin Bridges 2018-1 Plc ’B’RegS FRN 12/9/2050 106,193 0.02
GBP 100,000 Twin Bridges Plc ’2018-1 D’RegS FRN 12/9/2050 104,737 0.02
GBP 97,522 Twin Bridges Plc ’2019-1 A’RegS FRN 12/12/2052 106,864 0.02
GBP 785,000 United Kingdom Gilt RegS0.625% 7/6/2025 899,400 0.17
GBP 275,728 United Kingdom Gilt RegS2.00% 7/9/2025^ 339,647 0.07
GBP 1,482,000 United Kingdom Gilt RegS4.25% 7/9/2039 2,770,429 0.53
GBP 250,000 United Kingdom Gilt RegS4.25% 7/12/2040 476,737 0.09
GBP 319,000 United Kingdom Gilt RegS1.25% 22/10/2041 402,355 0.08
GBP 490,701 United Kingdom Gilt RegS3.25% 22/1/2044 862,872 0.16
GBP 3,686,662 United Kingdom Gilt RegS3.50% 22/1/2045 6,807,663 1.30
GBP 1,735,000 United Kingdom Gilt RegS4.25% 7/12/2046 3,647,510 0.70
GBP 277,000 United Kingdom Gilt RegS4.25% 7/12/2055 677,320 0.13
GBP 240,000 United Kingdom Gilt RegS1.75% 22/7/2057 378,465 0.07
GBP 906,620 United Kingdom Gilt RegS4.00% 22/1/2060 2,279,852 0.43
GBP 187,000 United Kingdom Gilt RegS0.50% 22/10/2061 209,757 0.04
GBP 375,000 United Kingdom Gilt RegS2.50% 22/7/2065 757,732 0.14
GBP 255,000 United Kingdom Gilt RegS3.50% 22/7/2068 652,690 0.12
GBP 200,000 Warwick Finance ResidentialMortgages No One Plc ’B’RegS FRN 21/9/2049 222,070 0.04
Holding Description
MarketValue
EUR
% ofNet
Assets
United Kingdom continuedGBP 100,000 Warwick Finance Residential
Mortgages No Two Plc ’C’RegS FRN 21/9/2049 111,064 0.02
GBP 200,000 WPP Finance 2013 RegS2.875% 14/9/2046 188,520 0.04
EUR 100,000 Yorkshire Building SocietyRegS 0.75% 10/11/2022 102,253 0.02
EUR 150,000 Yorkshire Building SocietyRegS 0.375% 11/4/2023 151,966 0.03
47,748,802 9.10
United StatesEUR 425,000 Air Products and Chemicals
Inc 0.80% 5/5/2032 425,064 0.08EUR 200,000 AT&T Inc 3.375% 15/3/2034 235,250 0.04EUR 500,000 AT&T Inc 3.15% 4/9/2036 561,605 0.11EUR 475,000 AT&T Inc 2.60% 19/5/2038 494,021 0.09EUR 175,000 AT&T Inc 1.80% 14/9/2039 161,980 0.03EUR 100,000 Bank of America Corp RegS
FRN 9/5/2026 100,128 0.02GBP 450,000 BAT Capital Corp RegS
2.125% 15/8/2025 504,429 0.10USD 400,000 BMW US Capital LLC RegS
3.90% 9/4/2025 388,171 0.07EUR 100,000 Chubb INA Holdings Inc 0.30%
15/12/2024 97,935 0.02EUR 100,000 Chubb INA Holdings Inc 1.40%
15/6/2031 100,968 0.02EUR 200,000 Citigroup Inc RegS 0.50%
29/1/2022 200,250 0.04EUR 400,000 Citigroup Inc RegS FRN
24/7/2026 410,526 0.08EUR 400,000 Citigroup Inc RegS FRN
8/10/2027 384,828 0.07EUR 680,000 Coca-Cola Co 0.75%
22/9/2026 697,809 0.13EUR 200,000 Comcast Corp 0.75%
20/2/2032 193,893 0.04EUR 100,000 Danaher Corp 2.50%
30/3/2030 113,259 0.02EUR 150,000 Eli Lilly and Co 1.70%
1/11/2049 153,740 0.03EUR 500,000 Equinix Inc 2.875% 1/10/2025 509,262 0.10EUR 250,000 Fidelity National Information
Services Inc 0.125%3/12/2022 247,668 0.05
EUR 445,000 Fidelity National InformationServices Inc 0.75%21/5/2023 447,382 0.08
EUR 425,000 Fidelity National InformationServices Inc 0.625%3/12/2025 421,085 0.08
EUR 125,000 Fidelity National InformationServices Inc 1.00%3/12/2028 123,967 0.02
EUR 850,000 Fidelity National InformationServices Inc 2.00%21/5/2030 912,420 0.17
EUR 125,000 Fiserv Inc 1.125% 1/7/2027 125,591 0.02EUR 100,000 General Motors Financial Co
Inc RegS 0.85% 26/2/2026 85,869 0.02EUR 190,000 Goldman Sachs Group Inc
RegS FRN 27/7/2021 190,377 0.04EUR 200,000 Goldman Sachs Group Inc
RegS 0.125% 19/8/2024 193,741 0.04EUR 200,000 Goldman Sachs Group Inc
RegS 3.375% 27/3/2025 221,777 0.04EUR 200,000 Goldman Sachs Group Inc
RegS 1.625% 27/7/2026 206,753 0.04EUR 275,000 Goldman Sachs Group Inc
RegS 0.875% 21/1/2030 264,419 0.05
BlackRock European Select Strategies Fund continued
The notes on pages 691 to 711 form an integral part of these financial statements.
Annual report and audited financial statements [331]

Portfolio of Investments as at 31 May 2020
Holding Description
MarketValue
EUR
% ofNet
Assets
United States continuedEUR 475,000 International Business
Machines Corp 1.25%29/1/2027 493,226 0.09
EUR 700,000 International BusinessMachines Corp 0.65%11/2/2032 672,606 0.13
EUR 100,000 International Flavors &Fragrances Inc 1.80%25/9/2026 (traded inGermany) 96,961 0.02
EUR 525,000 International Flavors &Fragrances Inc 1.80%25/9/2026 (traded inSupranational) 509,043 0.10
EUR 200,000 JPMorgan Chase & Co RegS0.625% 25/1/2024 200,861 0.04
EUR 300,000 JPMorgan Chase & Co RegSFRN 11/3/2027 304,164 0.06
EUR 450,000 Levi Strauss & Co 3.375%15/3/2027 453,829 0.09
USD 180,000 McDonald’s Corp 4.45%1/9/2048 197,936 0.04
GBP 400,000 McDonald’s Corp RegS 2.95%15/3/2034 498,063 0.09
EUR 600,000 MMS USA Investments IncRegS 1.25% 13/6/2028 555,699 0.11
EUR 200,000 MMS USA Investments IncRegS 1.75% 13/6/2031 185,085 0.03
EUR 300,000 Morgan Stanley FRN9/11/2021 298,224 0.06
EUR 700,000 Morgan Stanley FRN26/7/2024 698,064 0.13
EUR 625,000 National Grid North AmericaInc RegS 0.75% 8/8/2023 628,669 0.12
EUR 625,000 PVH Corp RegS 3.125%15/12/2027 577,791 0.11
EUR 600,000 Silgan Holdings Inc RegS2.25% 1/6/2028 588,711 0.11
EUR 250,000 Thermo Fisher Scientific Inc0.125% 1/3/2025 244,728 0.05
EUR 175,000 Thermo Fisher Scientific Inc2.375% 15/4/2032 199,168 0.04
USD 32,000 Union Pacific Corp 3.875%1/2/2055 32,881 0.01
USD 480,942 United States TreasuryInflation Indexed Bond0.375% 15/1/2027 458,297 0.09
USD 433,010 United States TreasuryInflation Indexed Bond1.00% 15/2/2048 503,199 0.09
USD 1,374,800 United States TreasuryInflation Indexed Bond1.00% 15/2/2049 1,615,504 0.31
USD 421,454 United States TreasuryInflation Indexed Bond0.25% 15/2/2050 413,527 0.08
EUR 115,000 US Bancorp 0.85% 7/6/2024 115,481 0.02GBP 300,000 Verizon Communications Inc
1.875% 19/9/2030 338,185 0.06EUR 300,000 Verizon Communications Inc
0.875% 19/3/2032 296,295 0.06EUR 160,000 Verizon Communications Inc
2.875% 15/1/2038 194,399 0.04
Holding Description
MarketValue
EUR
% ofNet
Assets
United States continuedEUR 350,000 Verizon Communications Inc
1.85% 18/5/2040 363,783 0.07GBP 325,000 Wells Fargo & Co RegS 2.50%
2/5/2029 376,859 0.07
21,285,405 4.06
Total Bonds 324,453,782 61.81
EXCHANGE TRADED FUNDS~Ireland
EUR 3,000 iShares Core EUR Corp BondUCITS ETF 391,440 0.07
EUR 8,241 iShares EUR High Yield CorpBond UCITS ETF 787,263 0.15
EUR 297,237 iShares Euro Dividend UCITSETF 4,494,223 0.86
USD 5,000 iShares JP Morgan EM LocalGovernment Bond UCITSETF 251,540 0.05
USD 3,408 iShares USD Corp BondUCITS ETF ’D’ 386,452 0.07
USD 2,262 iShares USD High Yield CorpBond UCITS ETF 195,554 0.04
6,506,472 1.24
Total Exchange Traded Funds 6,506,472 1.24
Total Transferable Securities and Money MarketInstruments Admitted to an Official Stock ExchangeListing or Dealt in on Another Regulated Market 482,706,408 91.96
Other Transferable Securities and Money Market Instruments
BONDSFrance
EUR 100,000 FCT Autonoria ’2019 B’ RegSFRN 25/9/2035 97,501 0.02
97,501 0.02
IrelandGBP 100,000 Taurus ’2019-2 B’ UK DAC
RegS FRN 17/11/2029 102,255 0.02GBP 100,000 Taurus ’2019-2 C’ UK DAC
RegS FRN 17/11/2029 97,035 0.02GBP 180,000 Taurus 2019-2 UK DAC ’A’
RegS FRN 17/11/2029 194,129 0.03
393,419 0.07
ItalyEUR 134,000 AutoFlorence 1 Srl ’A’ RegS
FRN 25/12/2042 134,399 0.02EUR 100,000 AutoFlorence 1 Srl ’B’ RegS
FRN 25/12/2042 98,607 0.02
233,006 0.04
JapanJPY 503,227,816 Japanese Government CPI
Linked Bond 0.10%10/3/2028 4,201,037 0.80
JPY 29,544,942 Japanese Government CPILinked Bond 0.10%10/3/2029 246,251 0.05
4,447,288 0.85
BlackRock European Select Strategies Fund continued
The notes on pages 691 to 711 form an integral part of these financial statements.
BlackRock Strategic Funds[332]

Portfolio of Investments as at 31 May 2020
Holding Description
MarketValue
EUR
% ofNet
Assets
LuxembourgEUR 100,000 Silver Arrow S.A.
Compartment 10 ’D’ RegSFRN 15/3/2027 95,120 0.02
95,120 0.02
New ZealandNZD 1,924,000 New Zealand Government
Inflation Linked Bond RegS2.50% 20/9/2040 1,664,167 0.32
1,664,167 0.32
PortugalEUR 246,215 TAGUS - Sociedade de
Titularizacao de CreditosSA/Volta VII RegS 0.70%12/2/2024 243,637 0.04
EUR 87,447 TAGUS-Sociedade deTitularizacao de CreditosSA/Volta V RegS 0.85%12/2/2022 87,291 0.02
330,928 0.06
SpainEUR 100,000 Wizink Master Credit Cards FT
’A’ RegS FRN 28/3/2033 100,075 0.02
100,075 0.02
United KingdomGBP 8,337 Bavarian Sky UK 1 Plc ’A’
RegS FRN 20/11/2025 9,259 0.00GBP 197,238 CMF ’2020-1 A’ Plc RegS FRN
16/1/2057 217,083 0.04GBP 120,000 Finsbury Square ’2018-2B’ Plc
RegS FRN 12/9/2068 131,285 0.03GBP 131,513 Gemgarto Plc ’2018-1A’ RegS
FRN 16/9/2065 143,848 0.03GBP 96,951 Globaldrive Auto Receivables
UK ’2019-A A’ Plc RegSFRN 20/9/2026 107,052 0.02
GBP 131,000 Globaldrive Auto Receivables’UK 2019-A B’ Plc RegSFRN 20/9/2026 142,121 0.03
GBP 200,000 Gosforth Funding Plc ’2017-1XA2’ RegS FRN 19/12/2059 221,122 0.04
USD 112,000 Lanark Master Issuer Plc’2018-2X 1A’ RegS FRN22/12/2069 100,332 0.02
GBP 100,000 Motor Plc ’2016-1 C’ RegS3.75% 25/11/2025 111,744 0.02
GBP 98,857 Silk Road Finance Number SixPlc ’A’ RegS FRN 21/9/2067 109,126 0.02
1,292,972 0.25
Total Bonds 8,654,476 1.65
Total Other Transferable Securities and MoneyMarket Instruments 8,654,476 1.65
Holding Description
MarketValue
EUR
% ofNet
Assets
Collective Investment Schemes~
Ireland178,783 Institutional Cash Series Plc -
Institutional Euro AssetsLiquidity Fund 17,769,970 3.38
17,769,970 3.38
Total Collective Investment Schemes 17,769,970 3.38
Securities portfolio at market value 509,130,854 96.99
Other Net Assets 15,779,388 3.01
Total Net Assets (EUR) 524,910,242 100.00
^ All or a portion of this security represents a security on loan.‡ A portion of these securities were pledged or given in guarantee, see Supplementary
Information for further details.~ Investment in related party fund, see further information in Note 10.
BlackRock European Select Strategies Fund continued
The notes on pages 691 to 711 form an integral part of these financial statements.
Annual report and audited financial statements [333]
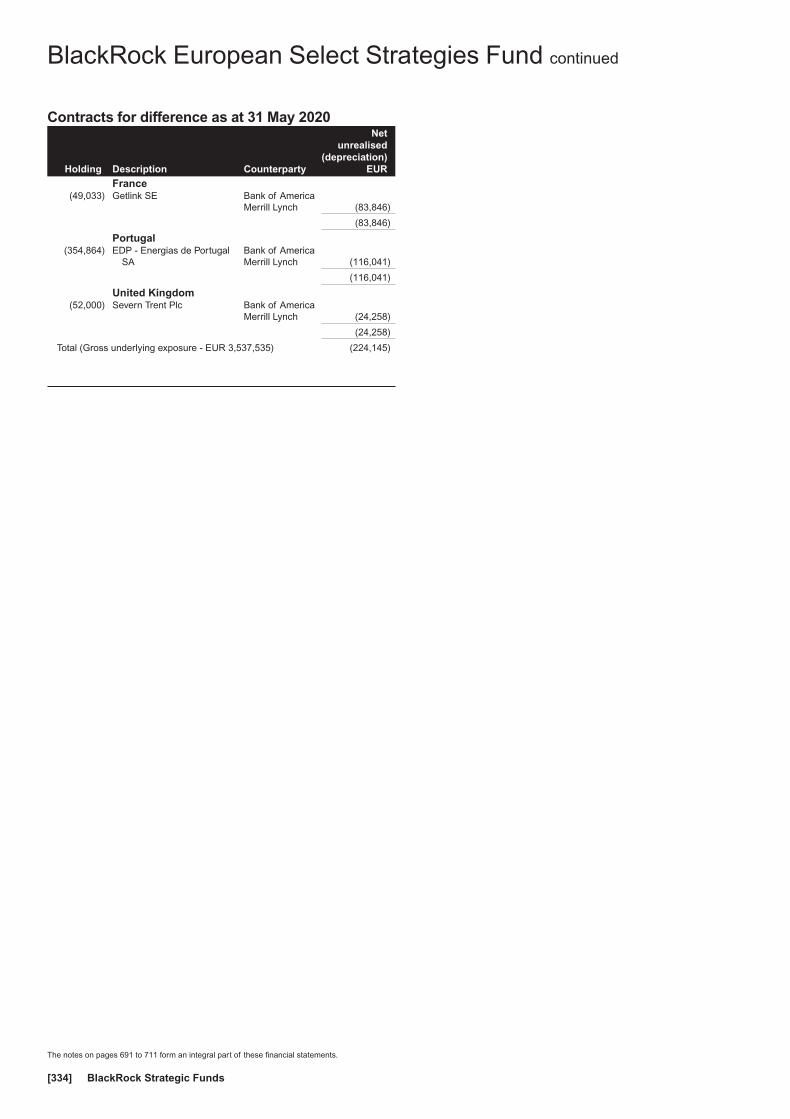
Contracts for difference as at 31 May 2020
Holding Description Counterparty
Netunrealised
(depreciation)EUR
France(49,033) Getlink SE Bank of America
Merrill Lynch (83,846)
(83,846)
Portugal(354,864) EDP - Energias de Portugal
SABank of AmericaMerrill Lynch (116,041)
(116,041)
United Kingdom(52,000) Severn Trent Plc Bank of America
Merrill Lynch (24,258)
(24,258)
Total (Gross underlying exposure - EUR 3,537,535) (224,145)
BlackRock European Select Strategies Fund continued
The notes on pages 691 to 711 form an integral part of these financial statements.
BlackRock Strategic Funds[334]
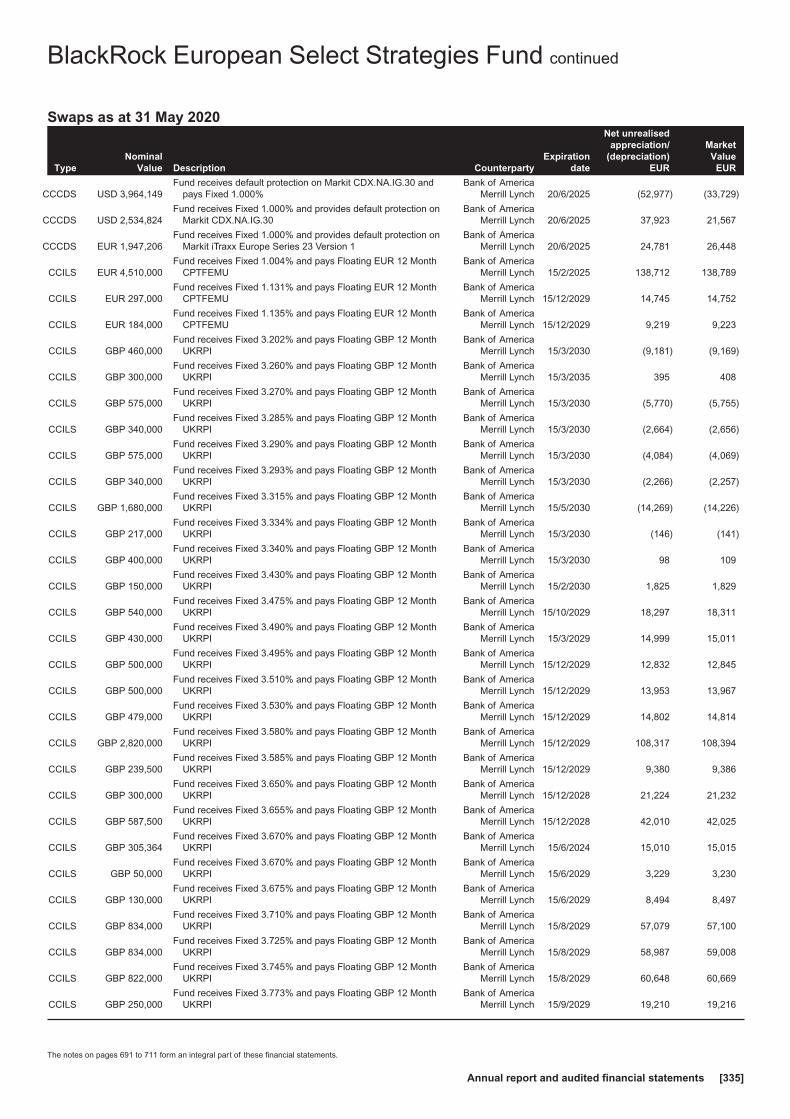
Swaps as at 31 May 2020
TypeNominal
Value Description CounterpartyExpiration
date
Net unrealisedappreciation/
(depreciation)EUR
MarketValue
EUR
CCCDS USD 3,964,149Fund receives default protection on Markit CDX.NA.IG.30 and
pays Fixed 1.000%Bank of America
Merrill Lynch 20/6/2025 (52,977) (33,729)
CCCDS USD 2,534,824Fund receives Fixed 1.000% and provides default protection on
Markit CDX.NA.IG.30Bank of America
Merrill Lynch 20/6/2025 37,923 21,567
CCCDS EUR 1,947,206Fund receives Fixed 1.000% and provides default protection on
Markit iTraxx Europe Series 23 Version 1Bank of America
Merrill Lynch 20/6/2025 24,781 26,448
CCILS EUR 4,510,000Fund receives Fixed 1.004% and pays Floating EUR 12 Month
CPTFEMUBank of America
Merrill Lynch 15/2/2025 138,712 138,789
CCILS EUR 297,000Fund receives Fixed 1.131% and pays Floating EUR 12 Month
CPTFEMUBank of America
Merrill Lynch 15/12/2029 14,745 14,752
CCILS EUR 184,000Fund receives Fixed 1.135% and pays Floating EUR 12 Month
CPTFEMUBank of America
Merrill Lynch 15/12/2029 9,219 9,223
CCILS GBP 460,000Fund receives Fixed 3.202% and pays Floating GBP 12 Month
UKRPIBank of America
Merrill Lynch 15/3/2030 (9,181) (9,169)
CCILS GBP 300,000Fund receives Fixed 3.260% and pays Floating GBP 12 Month
UKRPIBank of America
Merrill Lynch 15/3/2035 395 408
CCILS GBP 575,000Fund receives Fixed 3.270% and pays Floating GBP 12 Month
UKRPIBank of America
Merrill Lynch 15/3/2030 (5,770) (5,755)
CCILS GBP 340,000Fund receives Fixed 3.285% and pays Floating GBP 12 Month
UKRPIBank of America
Merrill Lynch 15/3/2030 (2,664) (2,656)
CCILS GBP 575,000Fund receives Fixed 3.290% and pays Floating GBP 12 Month
UKRPIBank of America
Merrill Lynch 15/3/2030 (4,084) (4,069)
CCILS GBP 340,000Fund receives Fixed 3.293% and pays Floating GBP 12 Month
UKRPIBank of America
Merrill Lynch 15/3/2030 (2,266) (2,257)
CCILS GBP 1,680,000Fund receives Fixed 3.315% and pays Floating GBP 12 Month
UKRPIBank of America
Merrill Lynch 15/5/2030 (14,269) (14,226)
CCILS GBP 217,000Fund receives Fixed 3.334% and pays Floating GBP 12 Month
UKRPIBank of America
Merrill Lynch 15/3/2030 (146) (141)
CCILS GBP 400,000Fund receives Fixed 3.340% and pays Floating GBP 12 Month
UKRPIBank of America
Merrill Lynch 15/3/2030 98 109
CCILS GBP 150,000Fund receives Fixed 3.430% and pays Floating GBP 12 Month
UKRPIBank of America
Merrill Lynch 15/2/2030 1,825 1,829
CCILS GBP 540,000Fund receives Fixed 3.475% and pays Floating GBP 12 Month
UKRPIBank of America
Merrill Lynch 15/10/2029 18,297 18,311
CCILS GBP 430,000Fund receives Fixed 3.490% and pays Floating GBP 12 Month
UKRPIBank of America
Merrill Lynch 15/3/2029 14,999 15,011
CCILS GBP 500,000Fund receives Fixed 3.495% and pays Floating GBP 12 Month
UKRPIBank of America
Merrill Lynch 15/12/2029 12,832 12,845
CCILS GBP 500,000Fund receives Fixed 3.510% and pays Floating GBP 12 Month
UKRPIBank of America
Merrill Lynch 15/12/2029 13,953 13,967
CCILS GBP 479,000Fund receives Fixed 3.530% and pays Floating GBP 12 Month
UKRPIBank of America
Merrill Lynch 15/12/2029 14,802 14,814
CCILS GBP 2,820,000Fund receives Fixed 3.580% and pays Floating GBP 12 Month
UKRPIBank of America
Merrill Lynch 15/12/2029 108,317 108,394
CCILS GBP 239,500Fund receives Fixed 3.585% and pays Floating GBP 12 Month
UKRPIBank of America
Merrill Lynch 15/12/2029 9,380 9,386
CCILS GBP 300,000Fund receives Fixed 3.650% and pays Floating GBP 12 Month
UKRPIBank of America
Merrill Lynch 15/12/2028 21,224 21,232
CCILS GBP 587,500Fund receives Fixed 3.655% and pays Floating GBP 12 Month
UKRPIBank of America
Merrill Lynch 15/12/2028 42,010 42,025
CCILS GBP 305,364Fund receives Fixed 3.670% and pays Floating GBP 12 Month
UKRPIBank of America
Merrill Lynch 15/6/2024 15,010 15,015
CCILS GBP 50,000Fund receives Fixed 3.670% and pays Floating GBP 12 Month
UKRPIBank of America
Merrill Lynch 15/6/2029 3,229 3,230
CCILS GBP 130,000Fund receives Fixed 3.675% and pays Floating GBP 12 Month
UKRPIBank of America
Merrill Lynch 15/6/2029 8,494 8,497
CCILS GBP 834,000Fund receives Fixed 3.710% and pays Floating GBP 12 Month
UKRPIBank of America
Merrill Lynch 15/8/2029 57,079 57,100
CCILS GBP 834,000Fund receives Fixed 3.725% and pays Floating GBP 12 Month
UKRPIBank of America
Merrill Lynch 15/8/2029 58,987 59,008
CCILS GBP 822,000Fund receives Fixed 3.745% and pays Floating GBP 12 Month
UKRPIBank of America
Merrill Lynch 15/8/2029 60,648 60,669
CCILS GBP 250,000Fund receives Fixed 3.773% and pays Floating GBP 12 Month
UKRPIBank of America
Merrill Lynch 15/9/2029 19,210 19,216
BlackRock European Select Strategies Fund continued
The notes on pages 691 to 711 form an integral part of these financial statements.
Annual report and audited financial statements [335]
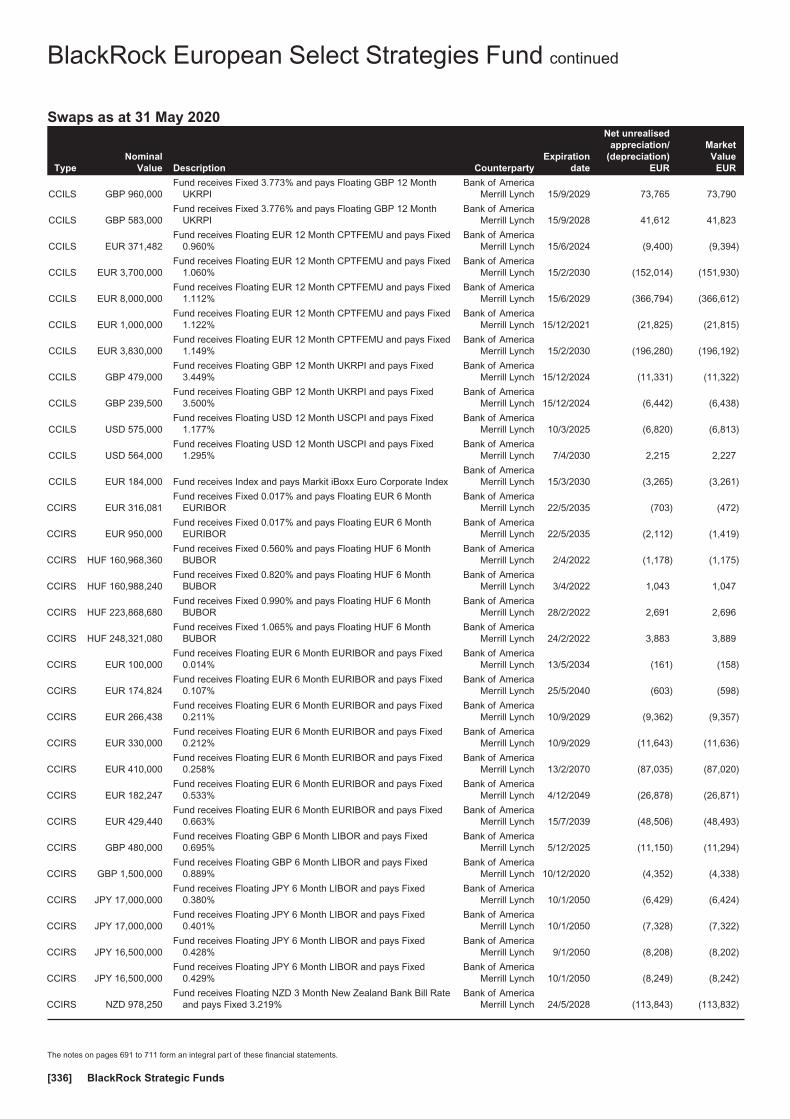
Swaps as at 31 May 2020
TypeNominal
Value Description CounterpartyExpiration
date
Net unrealisedappreciation/
(depreciation)EUR
MarketValue
EUR
CCILS GBP 960,000Fund receives Fixed 3.773% and pays Floating GBP 12 Month
UKRPIBank of America
Merrill Lynch 15/9/2029 73,765 73,790
CCILS GBP 583,000Fund receives Fixed 3.776% and pays Floating GBP 12 Month
UKRPIBank of America
Merrill Lynch 15/9/2028 41,612 41,823
CCILS EUR 371,482Fund receives Floating EUR 12 Month CPTFEMU and pays Fixed
0.960%Bank of America
Merrill Lynch 15/6/2024 (9,400) (9,394)
CCILS EUR 3,700,000Fund receives Floating EUR 12 Month CPTFEMU and pays Fixed
1.060%Bank of America
Merrill Lynch 15/2/2030 (152,014) (151,930)
CCILS EUR 8,000,000Fund receives Floating EUR 12 Month CPTFEMU and pays Fixed
1.112%Bank of America
Merrill Lynch 15/6/2029 (366,794) (366,612)
CCILS EUR 1,000,000Fund receives Floating EUR 12 Month CPTFEMU and pays Fixed
1.122%Bank of America
Merrill Lynch 15/12/2021 (21,825) (21,815)
CCILS EUR 3,830,000Fund receives Floating EUR 12 Month CPTFEMU and pays Fixed
1.149%Bank of America
Merrill Lynch 15/2/2030 (196,280) (196,192)
CCILS GBP 479,000Fund receives Floating GBP 12 Month UKRPI and pays Fixed
3.449%Bank of America
Merrill Lynch 15/12/2024 (11,331) (11,322)
CCILS GBP 239,500Fund receives Floating GBP 12 Month UKRPI and pays Fixed
3.500%Bank of America
Merrill Lynch 15/12/2024 (6,442) (6,438)
CCILS USD 575,000Fund receives Floating USD 12 Month USCPI and pays Fixed
1.177%Bank of America
Merrill Lynch 10/3/2025 (6,820) (6,813)
CCILS USD 564,000Fund receives Floating USD 12 Month USCPI and pays Fixed
1.295%Bank of America
Merrill Lynch 7/4/2030 2,215 2,227
CCILS EUR 184,000 Fund receives Index and pays Markit iBoxx Euro Corporate IndexBank of America
Merrill Lynch 15/3/2030 (3,265) (3,261)
CCIRS EUR 316,081Fund receives Fixed 0.017% and pays Floating EUR 6 Month
EURIBORBank of America
Merrill Lynch 22/5/2035 (703) (472)
CCIRS EUR 950,000Fund receives Fixed 0.017% and pays Floating EUR 6 Month
EURIBORBank of America
Merrill Lynch 22/5/2035 (2,112) (1,419)
CCIRS HUF 160,968,360Fund receives Fixed 0.560% and pays Floating HUF 6 Month
BUBORBank of America
Merrill Lynch 2/4/2022 (1,178) (1,175)
CCIRS HUF 160,988,240Fund receives Fixed 0.820% and pays Floating HUF 6 Month
BUBORBank of America
Merrill Lynch 3/4/2022 1,043 1,047
CCIRS HUF 223,868,680Fund receives Fixed 0.990% and pays Floating HUF 6 Month
BUBORBank of America
Merrill Lynch 28/2/2022 2,691 2,696
CCIRS HUF 248,321,080Fund receives Fixed 1.065% and pays Floating HUF 6 Month
BUBORBank of America
Merrill Lynch 24/2/2022 3,883 3,889
CCIRS EUR 100,000Fund receives Floating EUR 6 Month EURIBOR and pays Fixed
0.014%Bank of America
Merrill Lynch 13/5/2034 (161) (158)
CCIRS EUR 174,824Fund receives Floating EUR 6 Month EURIBOR and pays Fixed
0.107%Bank of America
Merrill Lynch 25/5/2040 (603) (598)
CCIRS EUR 266,438Fund receives Floating EUR 6 Month EURIBOR and pays Fixed
0.211%Bank of America
Merrill Lynch 10/9/2029 (9,362) (9,357)
CCIRS EUR 330,000Fund receives Floating EUR 6 Month EURIBOR and pays Fixed
0.212%Bank of America
Merrill Lynch 10/9/2029 (11,643) (11,636)
CCIRS EUR 410,000Fund receives Floating EUR 6 Month EURIBOR and pays Fixed
0.258%Bank of America
Merrill Lynch 13/2/2070 (87,035) (87,020)
CCIRS EUR 182,247Fund receives Floating EUR 6 Month EURIBOR and pays Fixed
0.533%Bank of America
Merrill Lynch 4/12/2049 (26,878) (26,871)
CCIRS EUR 429,440Fund receives Floating EUR 6 Month EURIBOR and pays Fixed
0.663%Bank of America
Merrill Lynch 15/7/2039 (48,506) (48,493)
CCIRS GBP 480,000Fund receives Floating GBP 6 Month LIBOR and pays Fixed
0.695%Bank of America
Merrill Lynch 5/12/2025 (11,150) (11,294)
CCIRS GBP 1,500,000Fund receives Floating GBP 6 Month LIBOR and pays Fixed
0.889%Bank of America
Merrill Lynch 10/12/2020 (4,352) (4,338)
CCIRS JPY 17,000,000Fund receives Floating JPY 6 Month LIBOR and pays Fixed
0.380%Bank of America
Merrill Lynch 10/1/2050 (6,429) (6,424)
CCIRS JPY 17,000,000Fund receives Floating JPY 6 Month LIBOR and pays Fixed
0.401%Bank of America
Merrill Lynch 10/1/2050 (7,328) (7,322)
CCIRS JPY 16,500,000Fund receives Floating JPY 6 Month LIBOR and pays Fixed
0.428%Bank of America
Merrill Lynch 9/1/2050 (8,208) (8,202)
CCIRS JPY 16,500,000Fund receives Floating JPY 6 Month LIBOR and pays Fixed
0.429%Bank of America
Merrill Lynch 10/1/2050 (8,249) (8,242)
CCIRS NZD 978,250Fund receives Floating NZD 3 Month New Zealand Bank Bill Rate
and pays Fixed 3.219%Bank of America
Merrill Lynch 24/5/2028 (113,843) (113,832)
BlackRock European Select Strategies Fund continued
The notes on pages 691 to 711 form an integral part of these financial statements.
BlackRock Strategic Funds[336]
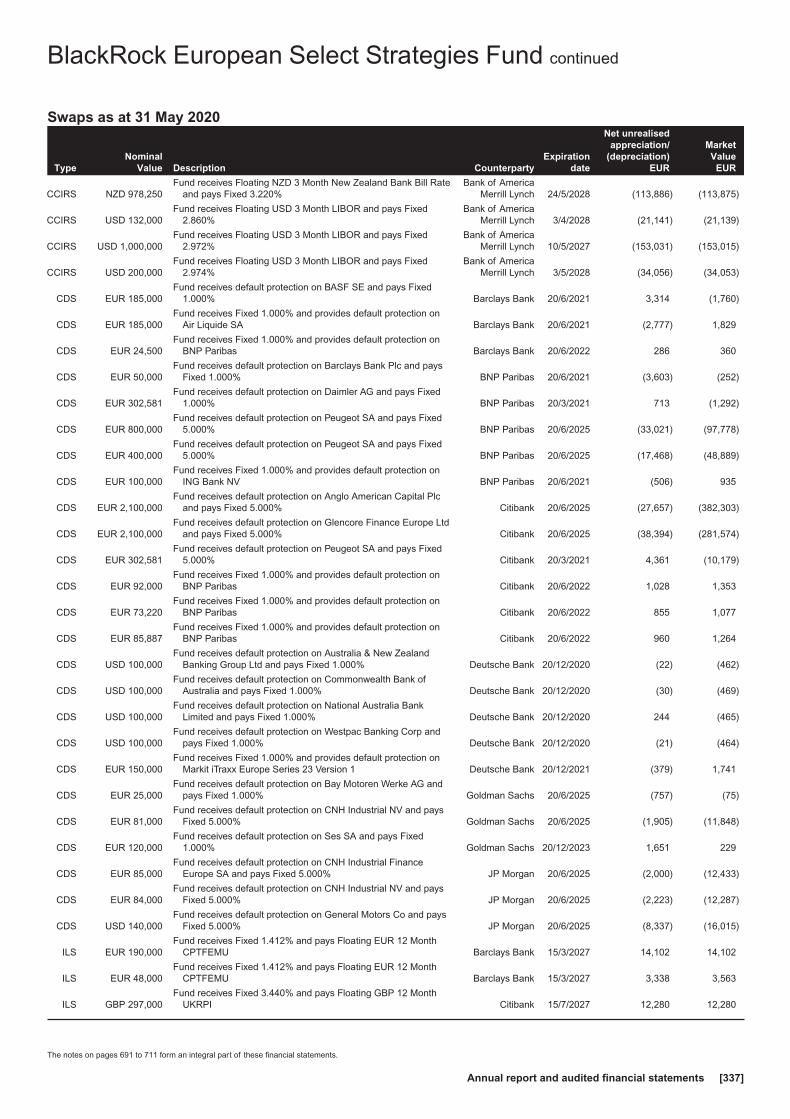
Swaps as at 31 May 2020
TypeNominal
Value Description CounterpartyExpiration
date
Net unrealisedappreciation/
(depreciation)EUR
MarketValue
EUR
CCIRS NZD 978,250Fund receives Floating NZD 3 Month New Zealand Bank Bill Rate
and pays Fixed 3.220%Bank of America
Merrill Lynch 24/5/2028 (113,886) (113,875)
CCIRS USD 132,000Fund receives Floating USD 3 Month LIBOR and pays Fixed
2.860%Bank of America
Merrill Lynch 3/4/2028 (21,141) (21,139)
CCIRS USD 1,000,000Fund receives Floating USD 3 Month LIBOR and pays Fixed
2.972%Bank of America
Merrill Lynch 10/5/2027 (153,031) (153,015)
CCIRS USD 200,000Fund receives Floating USD 3 Month LIBOR and pays Fixed
2.974%Bank of America
Merrill Lynch 3/5/2028 (34,056) (34,053)
CDS EUR 185,000Fund receives default protection on BASF SE and pays Fixed
1.000% Barclays Bank 20/6/2021 3,314 (1,760)
CDS EUR 185,000Fund receives Fixed 1.000% and provides default protection on
Air Liquide SA Barclays Bank 20/6/2021 (2,777) 1,829
CDS EUR 24,500Fund receives Fixed 1.000% and provides default protection on
BNP Paribas Barclays Bank 20/6/2022 286 360
CDS EUR 50,000Fund receives default protection on Barclays Bank Plc and pays
Fixed 1.000% BNP Paribas 20/6/2021 (3,603) (252)
CDS EUR 302,581Fund receives default protection on Daimler AG and pays Fixed
1.000% BNP Paribas 20/3/2021 713 (1,292)
CDS EUR 800,000Fund receives default protection on Peugeot SA and pays Fixed
5.000% BNP Paribas 20/6/2025 (33,021) (97,778)
CDS EUR 400,000Fund receives default protection on Peugeot SA and pays Fixed
5.000% BNP Paribas 20/6/2025 (17,468) (48,889)
CDS EUR 100,000Fund receives Fixed 1.000% and provides default protection on
ING Bank NV BNP Paribas 20/6/2021 (506) 935
CDS EUR 2,100,000Fund receives default protection on Anglo American Capital Plc
and pays Fixed 5.000% Citibank 20/6/2025 (27,657) (382,303)
CDS EUR 2,100,000Fund receives default protection on Glencore Finance Europe Ltd
and pays Fixed 5.000% Citibank 20/6/2025 (38,394) (281,574)
CDS EUR 302,581Fund receives default protection on Peugeot SA and pays Fixed
5.000% Citibank 20/3/2021 4,361 (10,179)
CDS EUR 92,000Fund receives Fixed 1.000% and provides default protection on
BNP Paribas Citibank 20/6/2022 1,028 1,353
CDS EUR 73,220Fund receives Fixed 1.000% and provides default protection on
BNP Paribas Citibank 20/6/2022 855 1,077
CDS EUR 85,887Fund receives Fixed 1.000% and provides default protection on
BNP Paribas Citibank 20/6/2022 960 1,264
CDS USD 100,000Fund receives default protection on Australia & New Zealand
Banking Group Ltd and pays Fixed 1.000% Deutsche Bank 20/12/2020 (22) (462)
CDS USD 100,000Fund receives default protection on Commonwealth Bank of
Australia and pays Fixed 1.000% Deutsche Bank 20/12/2020 (30) (469)
CDS USD 100,000Fund receives default protection on National Australia Bank
Limited and pays Fixed 1.000% Deutsche Bank 20/12/2020 244 (465)
CDS USD 100,000Fund receives default protection on Westpac Banking Corp and
pays Fixed 1.000% Deutsche Bank 20/12/2020 (21) (464)
CDS EUR 150,000Fund receives Fixed 1.000% and provides default protection on
Markit iTraxx Europe Series 23 Version 1 Deutsche Bank 20/12/2021 (379) 1,741
CDS EUR 25,000Fund receives default protection on Bay Motoren Werke AG and
pays Fixed 1.000% Goldman Sachs 20/6/2025 (757) (75)
CDS EUR 81,000Fund receives default protection on CNH Industrial NV and pays
Fixed 5.000% Goldman Sachs 20/6/2025 (1,905) (11,848)
CDS EUR 120,000Fund receives default protection on Ses SA and pays Fixed
1.000% Goldman Sachs 20/12/2023 1,651 229
CDS EUR 85,000Fund receives default protection on CNH Industrial Finance
Europe SA and pays Fixed 5.000% JP Morgan 20/6/2025 (2,000) (12,433)
CDS EUR 84,000Fund receives default protection on CNH Industrial NV and pays
Fixed 5.000% JP Morgan 20/6/2025 (2,223) (12,287)
CDS USD 140,000Fund receives default protection on General Motors Co and pays
Fixed 5.000% JP Morgan 20/6/2025 (8,337) (16,015)
ILS EUR 190,000Fund receives Fixed 1.412% and pays Floating EUR 12 Month
CPTFEMU Barclays Bank 15/3/2027 14,102 14,102
ILS EUR 48,000Fund receives Fixed 1.412% and pays Floating EUR 12 Month
CPTFEMU Barclays Bank 15/3/2027 3,338 3,563
ILS GBP 297,000Fund receives Fixed 3.440% and pays Floating GBP 12 Month
UKRPI Citibank 15/7/2027 12,280 12,280
BlackRock European Select Strategies Fund continued
The notes on pages 691 to 711 form an integral part of these financial statements.
Annual report and audited financial statements [337]

Swaps as at 31 May 2020
TypeNominal
Value Description CounterpartyExpiration
date
Net unrealisedappreciation/
(depreciation)EUR
MarketValue
EUR
ILS GBP 28,000Fund receives Floating GBP 12 Month UKRPI and pays Fixed
3.475% Citibank 15/7/2047 (11,076) (11,076)
ILS GBP 85,000Fund receives Floating GBP 12 Month UKRPI and pays Fixed
3.489% Goldman Sachs 15/8/2047 (34,768) (34,768)
ILS GBP 101,000Fund receives Floating GBP 12 Month UKRPI and pays Fixed
3.504% Goldman Sachs 15/11/2047 (43,876) (43,876)
ILS USD 518,000Fund receives Floating USD 12 Month USCPI and pays Fixed
2.152% Goldman Sachs 30/11/2027 (40,381) (40,381)
IRS EUR 78,188Fund receives Fixed 0.000% and pays Floating EUR 6 Month
LIBORBank of America
Merrill Lynch 15/5/2035 (454) (452)
IRS EUR 495,187Fund receives Fixed 0.000% and pays Floating EUR 6 Month
LIBORBank of America
Merrill Lynch 15/5/2035 (3,063) (3,051)
IRS EUR 26,062Fund receives Fixed 0.000% and pays Floating EUR 6 Month
LIBORBank of America
Merrill Lynch 15/5/2035 (165) (165)
IRS EUR 495,188Fund receives Fixed 0.000% and pays Floating EUR 6 Month
LIBORBank of America
Merrill Lynch 15/5/2035 (2,797) (2,786)
IRS EUR 990,375Fund receives Fixed 0.000% and pays Floating EUR 6 Month
LIBORBank of America
Merrill Lynch 15/5/2035 (5,443) (5,420)
IRS GBP 642,000Fund receives Fixed 0.343% and pays Floating GBP 12 Month
SONIOBank of America
Merrill Lynch 7/12/2030 14,369 14,384
IRS MYR 3,232,211Fund receives Fixed 2.716% and pays Floating MYR 3 Month
KLIBOBank of America
Merrill Lynch 17/6/2022 8,796 8,796
IRS EUR 60,000Fund receives Floating EUR 6 Month LIBOR and pays Fixed
0.000%Bank of America
Merrill Lynch 23/1/2024 (233) (232)
IRS EUR 170,000Fund receives Floating EUR 6 Month LIBOR and pays Fixed
0.000%Bank of America
Merrill Lynch 15/1/2027 134 138
IRS EUR 2,085,935Fund receives Floating EUR 6 Month LIBOR and pays Fixed
0.000%Bank of America
Merrill Lynch 15/2/2029 762 802
IRS EUR 270,000Fund receives Floating EUR 6 Month LIBOR and pays Fixed
0.000%Bank of America
Merrill Lynch 23/9/2029 (1,577) (1,572)
IRS EUR 287,500Fund receives Floating EUR 6 Month LIBOR and pays Fixed
0.000%Bank of America
Merrill Lynch 15/5/2070 14,070 14,081
IRS EUR 143,750Fund receives Floating EUR 6 Month LIBOR and pays Fixed
0.000%Bank of America
Merrill Lynch 15/5/2070 7,259 7,264
IRS EUR 143,750Fund receives Floating EUR 6 Month LIBOR and pays Fixed
0.000%Bank of America
Merrill Lynch 15/5/2070 7,520 7,525
IRS GBP 220,000Fund receives Floating GBP 12 Month CPTFEMU and pays Fixed
0.440%Bank of America
Merrill Lynch 15/6/2022 (2,266) (2,266)
IRS GBP 97,000Fund receives Floating GBP 12 Month SONIO and pays Fixed
0.240%Bank of America
Merrill Lynch 15/6/2022 (559) (558)
IRS GBP 191,000Fund receives Floating GBP 12 Month SONIO and pays Fixed
0.346%Bank of America
Merrill Lynch 17/6/2022 (1,266) (1,565)
IRS GBP 96,000Fund receives Floating GBP 12 Month SONIO and pays Fixed
0.347%Bank of America
Merrill Lynch 15/6/2022 (786) (785)
IRS GBP 317,000Fund receives Floating GBP 12 Month SONIO and pays Fixed
0.371%Bank of America
Merrill Lynch 22/10/2041 (14,378) (14,365)
IRS GBP 97,000Fund receives Floating GBP 12 Month SONIO and pays Fixed
0.386%Bank of America
Merrill Lynch 8/12/2023 (1,460) (1,459)
IRS GBP 143,000Fund receives Floating GBP 12 Month SONIO and pays Fixed
0.476%Bank of America
Merrill Lynch 15/12/2026 (4,186) (4,183)
IRS GBP 1,665,623Fund receives Floating GBP 6 Month LIBOR and pays Fixed
0.949%Bank of America
Merrill Lynch 6/7/2022 (25,938) (25,938)
IRS NZD 169,500Fund receives Floating NZD 3 Month LIBOR and pays Fixed
3.215%Bank of America
Merrill Lynch 18/5/2028 (19,668) (19,666)
IRS MYR 3,849,615Fund receives Fixed 2.050% and pays Floating MYR 3 Month
KLIBO BNP Paribas 17/6/2022 123 123
BlackRock European Select Strategies Fund continued
The notes on pages 691 to 711 form an integral part of these financial statements.
BlackRock Strategic Funds[338]
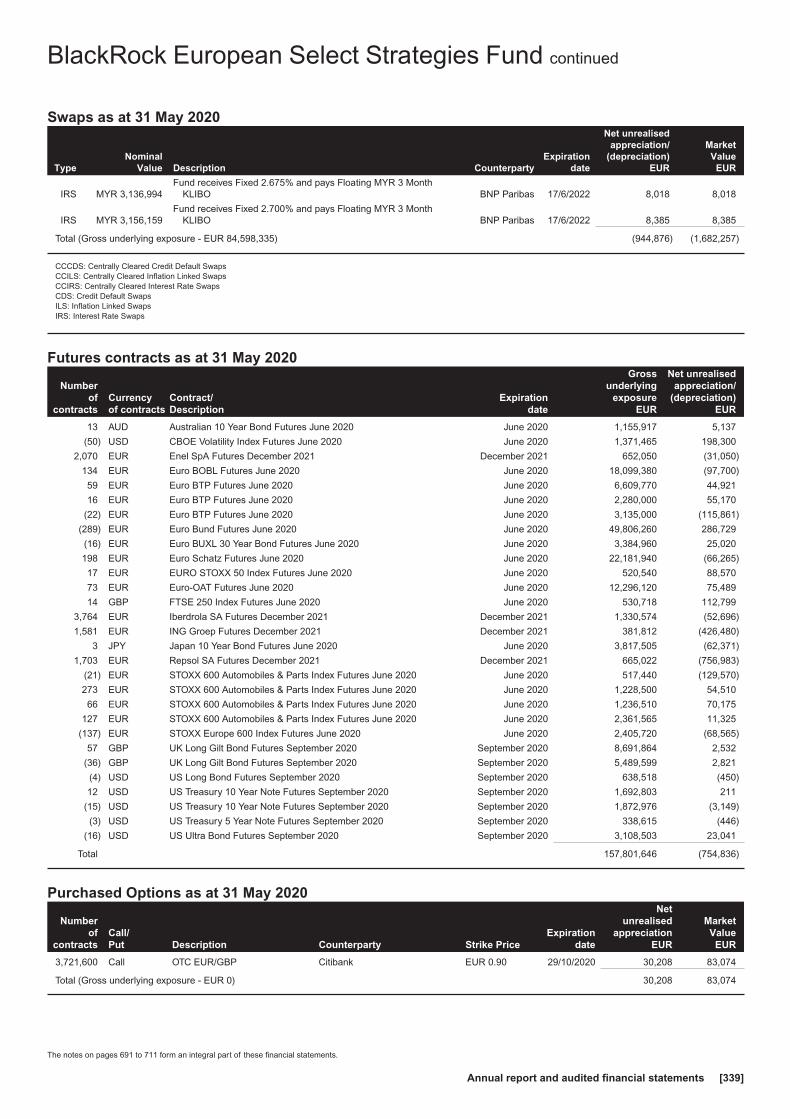
Swaps as at 31 May 2020
TypeNominal
Value Description CounterpartyExpiration
date
Net unrealisedappreciation/
(depreciation)EUR
MarketValue
EUR
IRS MYR 3,136,994Fund receives Fixed 2.675% and pays Floating MYR 3 Month
KLIBO BNP Paribas 17/6/2022 8,018 8,018
IRS MYR 3,156,159Fund receives Fixed 2.700% and pays Floating MYR 3 Month
KLIBO BNP Paribas 17/6/2022 8,385 8,385
Total (Gross underlying exposure - EUR 84,598,335) (944,876) (1,682,257)
CCCDS: Centrally Cleared Credit Default SwapsCCILS: Centrally Cleared Inflation Linked SwapsCCIRS: Centrally Cleared Interest Rate SwapsCDS: Credit Default SwapsILS: Inflation Linked SwapsIRS: Interest Rate Swaps
Futures contracts as at 31 May 2020
Numberof
contractsCurrencyof contracts
Contract/Description
Expirationdate
Grossunderlying
exposureEUR
Net unrealisedappreciation/
(depreciation)EUR
13 AUD Australian 10 Year Bond Futures June 2020 June 2020 1,155,917 5,137
(50) USD CBOE Volatility Index Futures June 2020 June 2020 1,371,465 198,300
2,070 EUR Enel SpA Futures December 2021 December 2021 652,050 (31,050)
134 EUR Euro BOBL Futures June 2020 June 2020 18,099,380 (97,700)
59 EUR Euro BTP Futures June 2020 June 2020 6,609,770 44,921
16 EUR Euro BTP Futures June 2020 June 2020 2,280,000 55,170
(22) EUR Euro BTP Futures June 2020 June 2020 3,135,000 (115,861)
(289) EUR Euro Bund Futures June 2020 June 2020 49,806,260 286,729
(16) EUR Euro BUXL 30 Year Bond Futures June 2020 June 2020 3,384,960 25,020
198 EUR Euro Schatz Futures June 2020 June 2020 22,181,940 (66,265)
17 EUR EURO STOXX 50 Index Futures June 2020 June 2020 520,540 88,570
73 EUR Euro-OAT Futures June 2020 June 2020 12,296,120 75,489
14 GBP FTSE 250 Index Futures June 2020 June 2020 530,718 112,799
3,764 EUR Iberdrola SA Futures December 2021 December 2021 1,330,574 (52,696)
1,581 EUR ING Groep Futures December 2021 December 2021 381,812 (426,480)
3 JPY Japan 10 Year Bond Futures June 2020 June 2020 3,817,505 (62,371)
1,703 EUR Repsol SA Futures December 2021 December 2021 665,022 (756,983)
(21) EUR STOXX 600 Automobiles & Parts Index Futures June 2020 June 2020 517,440 (129,570)
273 EUR STOXX 600 Automobiles & Parts Index Futures June 2020 June 2020 1,228,500 54,510
66 EUR STOXX 600 Automobiles & Parts Index Futures June 2020 June 2020 1,236,510 70,175
127 EUR STOXX 600 Automobiles & Parts Index Futures June 2020 June 2020 2,361,565 11,325
(137) EUR STOXX Europe 600 Index Futures June 2020 June 2020 2,405,720 (68,565)
57 GBP UK Long Gilt Bond Futures September 2020 September 2020 8,691,864 2,532
(36) GBP UK Long Gilt Bond Futures September 2020 September 2020 5,489,599 2,821
(4) USD US Long Bond Futures September 2020 September 2020 638,518 (450)
12 USD US Treasury 10 Year Note Futures September 2020 September 2020 1,692,803 211
(15) USD US Treasury 10 Year Note Futures September 2020 September 2020 1,872,976 (3,149)
(3) USD US Treasury 5 Year Note Futures September 2020 September 2020 338,615 (446)
(16) USD US Ultra Bond Futures September 2020 September 2020 3,108,503 23,041
Total 157,801,646 (754,836)
Purchased Options as at 31 May 2020
Numberof
contractsCall/Put Description Counterparty Strike Price
Expirationdate
Netunrealised
appreciationEUR
MarketValue
EUR
3,721,600 Call OTC EUR/GBP Citibank EUR 0.90 29/10/2020 30,208 83,074
Total (Gross underlying exposure - EUR 0) 30,208 83,074
BlackRock European Select Strategies Fund continued
The notes on pages 691 to 711 form an integral part of these financial statements.
Annual report and audited financial statements [339]

Written Swaptions as at 31 May 2020
NominalValue
Call/Put Description Counterparty Strike Price
Expirationdate
Netunrealised
appreciationEUR
MarketValue
EUR
(7,165,524) Put
Fund writes an option to enter into an InterestRate Swap. If exercised Fund receives0.11% Fixed annually from 22/7/2020; andpays Floating EUR EURIBOR 6 Monthsemi-annually from 22/1/2021 Barclays Bank EUR 0.11 20/07/2020 27,824 (2,450)
(3,986,000) Put
Fund writes an option to enter into an InterestRate Swap. If exercised Fund receives0.635% Fixed semi-annually from5/8/2020; and pays Floating GBP LIBOR6 Month BBA semi-annually from 5/2/2021 Barclays Bank GBP 0.64 05/08/2020 9,559 (20)
Total (Gross underlying exposure - EUR 862,605) 37,383 (2,470)
Open forward foreign exchange transactionsas at 31 May 2020
Currency Purchases Currency Sales CounterpartyMaturity
date
Netunrealised
appreciation/(depreciation)
EURAUD 740,000 EUR 442,711 Barclays Bank 17/6/2020 (1,142)AUD 710,000 EUR 417,118 JP Morgan 17/6/2020 6,549AUD 40,000 EUR 22,798 JP Morgan 14/7/2020 1,057
AUD 2,210,000 USD 1,455,212Bank of America
Merrill Lynch 17/6/2020 10,418AUD 2,900,000 USD 1,829,651 BNP Paribas 17/6/2020 85,508AUD 880,000 USD 541,042 Citibank 17/6/2020 38,680AUD 4,550,000 USD 2,906,793 HSBC 17/6/2020 101,671
AUD 3,230,000 USD 2,080,234Toronto Dominion
Bank 17/6/2020 57,134AUD 760,000 USD 494,703 Westpac 17/6/2020 8,736CAD 480,000 EUR 315,844 Deutsche Bank 14/7/2020 (2,718)CAD 550,000 EUR 359,671 UBS 14/7/2020 (881)
CAD 1,340,000 USD 938,320Bank of America
Merrill Lynch 17/6/2020 31,022CAD 660,000 USD 470,729 Morgan Stanley 17/6/2020 7,573
CAD 4,125,000 USD 2,940,960State Street Bank& Trust Company 17/6/2020 48,316
CHF 31,580,000 EUR 29,593,673 Barclays Bank 2/6/2020 (108,044)CHF 140,000 EUR 133,057 BNP Paribas 14/7/2020 (2,300)CHF 165,000 EUR 156,229 Citibank 14/7/2020 (2,122)CHF 750,000 USD 766,150 UBS 17/6/2020 11,524CZK 23,716,000 EUR 879,182 BNP Paribas 2/6/2020 1,112CZK 28,920,000 EUR 1,060,395 Citibank 14/7/2020 12,427DKK 50,510,000 EUR 6,775,000 JP Morgan 2/6/2020 1,266DKK 1,100,000 EUR 147,548 Morgan Stanley 14/7/2020 25
EUR 440,233 AUD 740,000Bank of America
Merrill Lynch 17/6/2020 (1,336)EUR 869,151 AUD 1,450,000 Citibank 17/6/2020 3,916
EUR 425,318 AUD 710,000Toronto Dominion
Bank 17/6/2020 1,651EUR 23,023 AUD 40,000 JP Morgan 14/7/2020 (832)EUR 22,900 CAD 35,000 Goldman Sachs 14/7/2020 68EUR 71,664 CAD 110,000 HSBC 14/7/2020 (94)EUR 71,249 CAD 110,000 Morgan Stanley 14/7/2020 (509)
EUR 594,678 CAD 910,000Royal Bank of
Canada 14/7/2020 1,043EUR 29,914,654 CHF 31,580,000 JP Morgan 2/6/2020 429,026EUR 29,600,735 CHF 31,580,000 Barclays Bank 2/7/2020 108,009EUR 147,019 CHF 155,000 JP Morgan 14/7/2020 2,252EUR 873,868 CZK 23,716,000 Barclays Bank 2/6/2020 (6,427)EUR 878,795 CZK 23,716,000 BNP Paribas 2/7/2020 (1,116)EUR 6,772,637 DKK 50,510,000 JP Morgan 2/6/2020 (3,629)EUR 6,775,039 DKK 50,510,000 JP Morgan 2/7/2020 (1,249)EUR 22,804 DKK 170,000 Barclays Bank 14/7/2020 (3)
Open forward foreign exchange transactionsas at 31 May 2020
Currency Purchases Currency Sales CounterpartyMaturity
date
Netunrealised
appreciation/(depreciation)
EUREUR 5,273,739 DKK 39,350,000 Goldman Sachs 14/7/2020 (5,345)EUR 79,049,451 GBP 69,041,000 Goldman Sachs 2/6/2020 2,365,187
EUR 4,197,733 GBP 3,650,000The Bank of New
York Mellon 2/6/2020 143,655EUR 1,719,935 GBP 1,500,000 Barclays Bank 17/6/2020 54,269EUR 3,818,868 GBP 3,550,000 Citibank 17/6/2020 (123,208)EUR 1,263,403 GBP 1,110,000 Deutsche Bank 17/6/2020 30,811EUR 79,781,485 GBP 71,751,000 Goldman Sachs 2/7/2020 124,880
EUR 45,590 GBP 40,000Bank of America
Merrill Lynch 14/7/2020 1,192EUR 34,323 GBP 30,000 Deutsche Bank 14/7/2020 1,024EUR 239,243 GBP 210,000 HSBC 14/7/2020 6,155EUR 1,180,195 GBP 1,040,000 JP Morgan 14/7/2020 25,854EUR 22,545 GBP 20,000 Morgan Stanley 14/7/2020 346EUR 68,703 GBP 60,000 Societe Generale 14/7/2020 2,107
EUR 194,367 GBP 170,000The Bank of New
York Mellon 14/7/2020 5,676
EUR 7,463,154 GBP 6,555,000Toronto Dominion
Bank 14/7/2020 187,473EUR 693,116 HUF 246,305,000 Barclays Bank 2/6/2020 (13,945)EUR 703,988 HUF 246,305,000 Barclays Bank 2/7/2020 (2,512)EUR 516,865 IDR 8,603,330,000 HSBC 17/6/2020 (9,963)EUR 6,004,824 JPY 709,215,000 Citibank 14/7/2020 76,709
EUR 2,324,985 NOK 26,149,000Bank of America
Merrill Lynch 2/6/2020 (94,940)EUR 185,453 NOK 2,260,697 BNP Paribas 17/6/2020 (23,726)EUR 68,913 NOK 839,303 Deutsche Bank 17/6/2020 (8,746)EUR 177,274 NOK 2,000,000 Goldman Sachs 17/6/2020 (7,783)EUR 89,154 NOK 1,045,000 JP Morgan 17/6/2020 (7,538)EUR 196,771 NOK 2,234,749 Morgan Stanley 17/6/2020 (10,007)
EUR 233,944 NOK 2,700,000Royal Bank of
Canada 17/6/2020 (15,884)EUR 335,194 NOK 3,820,251 Societe Generale 17/6/2020 (18,289)EUR 360,531 NOK 4,200,000 UBS 17/6/2020 (28,090)
EUR 2,401,694 NOK 26,149,000Bank of America
Merrill Lynch 2/7/2020 (17,393)
EUR 32,935 NZD 60,000Bank of America
Merrill Lynch 14/7/2020 (504)EUR 5,534 NZD 10,000 BNP Paribas 14/7/2020 (39)EUR 5,598 NZD 10,000 JP Morgan 14/7/2020 25EUR 1,980,703 NZD 3,590,000 Morgan Stanley 14/7/2020 (20,032)
EUR 55,617 NZD 100,000Standard
Chartered Bank 14/7/2020 (114)EUR 2,122,192 PLN 9,661,000 Goldman Sachs 2/6/2020 (51,850)EUR 2,185,611 PLN 9,661,000 Barclays Bank 2/7/2020 13,057
BlackRock European Select Strategies Fund continued
The notes on pages 691 to 711 form an integral part of these financial statements.
BlackRock Strategic Funds[340]

Open forward foreign exchange transactionsas at 31 May 2020
Currency Purchases Currency Sales CounterpartyMaturity
date
Netunrealised
appreciation/(depreciation)
EUR
EUR 10,508,924 SEK 112,723,000Bank of America
Merrill Lynch 2/6/2020 (219,465)EUR 867,174 SEK 9,200,000 HSBC 17/6/2020 (8,298)EUR 867,200 SEK 9,200,000 JP Morgan 17/6/2020 (8,271)EUR 1,342,425 SEK 14,600,000 Natwest Markets 17/6/2020 (46,910)EUR 10,665,797 SEK 112,723,000 Citibank 2/7/2020 (59,140)
EUR 865,377 USD 940,000State Street Bank& Trust Company 2/6/2020 20,015
EUR 1,695,000 USD 1,845,847Bank of America
Merrill Lynch 17/6/2020 35,475EUR 920,000 USD 1,054,421 BNP Paribas 17/6/2020 (27,987)EUR 240,000 USD 264,277 Citibank 17/6/2020 2,399EUR 1,526,283 USD 1,689,360 Morgan Stanley 17/6/2020 7,449
EUR 772,659 USD 850,421State Street Bank& Trust Company 17/6/2020 8,081
EUR 853,222 USD 940,000 Barclays Bank 2/7/2020 8,369
EUR 14,465,947 USD 15,766,955Bank of America
Merrill Lynch 14/7/2020 298,609EUR 45,928 USD 50,000 Barclays Bank 14/7/2020 1,001EUR 439,805 USD 480,000 BNP Paribas 14/7/2020 8,502EUR 250,879 USD 273,045 Citibank 14/7/2020 5,534EUR 448,669 USD 490,000 Goldman Sachs 14/7/2020 8,381EUR 219,232 USD 240,000 HSBC 14/7/2020 3,581EUR 420,375 USD 455,000 JP Morgan 14/7/2020 11,536EUR 264,712 USD 290,000 Morgan Stanley 14/7/2020 4,134EUR 55,052 USD 60,000 Natwest Markets 14/7/2020 1,139
EUR 120,157 USD 130,000Standard
Chartered Bank 14/7/2020 3,346
EUR 138,387 USD 150,000State Street Bank& Trust Company 14/7/2020 3,606
EUR 343,078 ZAR 5,990,000 Goldman Sachs 17/6/2020 36,204GBP 71,751,000 EUR 79,820,004 Goldman Sachs 2/6/2020 (125,727)
GBP 940,000 EUR 1,072,827The Bank of New
York Mellon 2/6/2020 (28,763)GBP 3,930,000 EUR 4,310,956 BNP Paribas 17/6/2020 53,088GBP 1,100,000 EUR 1,245,001 Citibank 17/6/2020 (23,513)GBP 370,000 EUR 418,860 Societe Generale 17/6/2020 (7,996)GBP 760,000 EUR 868,750 Westpac 17/6/2020 (24,813)GBP 860,000 EUR 978,313 Citibank 14/7/2020 (23,762)GBP 1,400,000 EUR 1,598,502 Deutsche Bank 14/7/2020 (44,580)GBP 100,000 EUR 114,375 HSBC 14/7/2020 (3,381)GBP 450,000 EUR 502,406 Societe Generale 14/7/2020 (2,931)
GBP 500,000 EUR 572,913Standard
Chartered Bank 14/7/2020 (17,941)GBP 750,000 USD 931,751 Deutsche Bank 17/6/2020 (4,866)
GBP 380,000 USD 469,372State Street Bank& Trust Company 17/6/2020 (24)
GBP 740,000 USD 925,555 Westpac 17/6/2020 (10,400)HUF 246,305,000 EUR 704,530 Barclays Bank 2/6/2020 2,532
HUF 19,910,000 EUR 56,458State Street Bank& Trust Company 14/7/2020 630
HUF 214,990,000 EUR 597,467 UBS 14/7/2020 18,984
IDR 4,670,500,000 USD 313,878Bank of America
Merrill Lynch 17/6/2020 3,805IDR 2,506,330,000 USD 159,199 Citibank 17/6/2020 10,347
JPY 6,650,000 EUR 56,642State Street Bank& Trust Company 14/7/2020 (1,057)
JPY 104,000,000 USD 986,324Bank of America
Merrill Lynch 17/6/2020 (17,332)JPY 49,000,000 USD 457,243 Barclays Bank 17/6/2020 (1,452)JPY 52,000,000 USD 468,773 Citibank 17/6/2020 13,262JPY 102,000,000 USD 923,156 JP Morgan 17/6/2020 22,740
JPY 50,000,000 USD 467,577Royal Bank of
Canada 17/6/2020 (2,383)JPY 51,000,000 USD 473,790 UBS 17/6/2020 391
Open forward foreign exchange transactionsas at 31 May 2020
Currency Purchases Currency Sales CounterpartyMaturity
date
Netunrealised
appreciation/(depreciation)
EUR
NOK 26,149,000 EUR 2,402,581Bank of America
Merrill Lynch 2/6/2020 17,343NOK 19,100,000 EUR 1,694,200 Natwest Markets 17/6/2020 73,099NOK 4,940,000 EUR 441,830 JP Morgan 14/7/2020 15,094NOK 7,200,000 USD 717,597 Natwest Markets 17/6/2020 21,045
NZD 590,000 EUR 329,880State Street Bank& Trust Company 14/7/2020 (1,068)
NZD 780,000 USD 472,224 BNP Paribas 17/6/2020 10,461NZD 1,990,000 USD 1,116,788 Citibank 17/6/2020 105,794NZD 1,694,391 USD 1,007,242 Morgan Stanley 17/6/2020 39,418NZD 532,112 USD 311,387 Societe Generale 17/6/2020 16,811
NZD 770,000 USD 462,816Standard
Chartered Bank 17/6/2020 13,341NZD 1,527,888 USD 894,005 UBS 17/6/2020 48,362NZD 705,609 USD 425,771 Westpac 17/6/2020 10,735PLN 9,661,000 EUR 2,187,506 Barclays Bank 2/6/2020 (13,464)PLN 2,600,000 EUR 571,599 BNP Paribas 14/7/2020 12,931RUB 5,988,000 USD 79,823 Barclays Bank 17/6/2020 4,325RUB 3,870,000 USD 51,678 Deutsche Bank 17/6/2020 2,715RUB 14,070,000 USD 188,270 Goldman Sachs 17/6/2020 9,524RUB 2,500,000 USD 35,241 Morgan Stanley 17/6/2020 84SEK 112,723,000 EUR 10,669,355 Citibank 2/6/2020 59,035SEK 2,079,756 EUR 187,556 BNP Paribas 17/6/2020 10,354SEK 7,194,764 EUR 657,512 Deutsche Bank 17/6/2020 27,141SEK 540,236 EUR 49,245 Goldman Sachs 17/6/2020 2,164SEK 11,965,000 EUR 1,116,768 JP Morgan 17/6/2020 21,819SEK 2,020,244 EUR 182,155 UBS 17/6/2020 10,092SEK 5,475,000 EUR 501,153 JP Morgan 14/7/2020 19,683SEK 4,700,000 USD 475,733 JP Morgan 17/6/2020 19,539
USD 465,188 AUD 720,000Bank of America
Merrill Lynch 17/6/2020 (11,403)USD 925,271 AUD 1,450,000 Barclays Bank 17/6/2020 (33,362)USD 3,535,618 AUD 5,530,000 BNP Paribas 17/6/2020 (121,100)USD 1,124,130 AUD 1,980,000 Citibank 17/6/2020 (170,835)USD 603,556 AUD 1,017,397 Deutsche Bank 17/6/2020 (64,463)USD 1,657,969 AUD 2,510,000 JP Morgan 17/6/2020 (7,142)USD 1,433,878 AUD 2,200,000 Morgan Stanley 17/6/2020 (23,631)
USD 1,369,866 AUD 2,190,000Toronto Dominion
Bank 17/6/2020 (75,213)USD 1,017,706 AUD 1,652,602 UBS 17/6/2020 (71,154)USD 474,303 CAD 670,000 BNP Paribas 17/6/2020 (10,887)USD 946,033 CAD 1,330,000 Goldman Sachs 17/6/2020 (17,559)USD 1,030,530 CAD 1,420,000 Societe Generale 17/6/2020 (336)
USD 68,337 CAD 93,208Toronto Dominion
Bank 17/6/2020 601USD 961,583 CAD 1,311,792 UBS 17/6/2020 8,305USD 930,119 CAD 1,300,000 Westpac 17/6/2020 (12,285)USD 797,359 CHF 750,000 Morgan Stanley 17/6/2020 16,535USD 940,000 EUR 853,738 Barclays Bank 2/6/2020 (8,377)
USD 1,346,056 EUR 1,227,840Bank of America
Merrill Lynch 17/6/2020 (17,656)USD 1,607,842 EUR 1,460,000 BNP Paribas 17/6/2020 (14,456)USD 289,562 EUR 260,000 Morgan Stanley 17/6/2020 333
USD 1,433,211 EUR 1,300,000State Street Bank& Trust Company 17/6/2020 (11,459)
USD 470,343 EUR 430,000 UBS 17/6/2020 (7,134)
USD 3,720,000 EUR 3,413,582Bank of America
Merrill Lynch 14/7/2020 (70,989)USD 3,300,000 EUR 3,040,667 BNP Paribas 14/7/2020 (75,464)USD 210,000 EUR 191,633 Deutsche Bank 14/7/2020 (2,939)USD 1,030,000 EUR 947,483 JP Morgan 14/7/2020 (21,980)USD 300,000 EUR 276,460 Morgan Stanley 14/7/2020 (6,896)
USD 2,370,000 EUR 2,157,703Royal Bank of
Canada 14/7/2020 (28,149)
BlackRock European Select Strategies Fund continued
The notes on pages 691 to 711 form an integral part of these financial statements.
Annual report and audited financial statements [341]

Open forward foreign exchange transactionsas at 31 May 2020
Currency Purchases Currency Sales CounterpartyMaturity
date
Netunrealised
appreciation/(depreciation)
EURUSD 100,000 EUR 92,135 Societe Generale 14/7/2020 (2,280)
USD 100,000 EUR 91,170State Street Bank& Trust Company 14/7/2020 (1,315)
USD 465,630 GBP 370,000Bank of America
Merrill Lynch 17/6/2020 7,765USD 935,491 GBP 750,000 Barclays Bank 17/6/2020 8,228USD 937,974 GBP 750,000 Deutsche Bank 17/6/2020 10,461USD 347,900 IDR 5,227,200,000 Barclays Bank 17/6/2020 (7,307)USD 99,434 IDR 1,556,910,000 Citibank 17/6/2020 (5,941)USD 147,955 IDR 2,335,130,000 HSBC 17/6/2020 (9,973)USD 51,509 IDR 778,460,000 UBS 17/6/2020 (1,359)
USD 471,876 JPY 50,000,000Bank of America
Merrill Lynch 17/6/2020 6,248USD 1,424,174 JPY 154,000,000 Citibank 17/6/2020 (7,010)USD 469,329 JPY 51,000,000 Morgan Stanley 17/6/2020 (4,402)USD 1,409,294 JPY 153,000,000 Westpac 17/6/2020 (12,030)USD 133,519 NOK 1,389,423 Barclays Bank 17/6/2020 (8,520)USD 556,021 NOK 5,810,577 Morgan Stanley 17/6/2020 (37,749)USD 469,763 NZD 780,000 BNP Paribas 17/6/2020 (12,673)USD 962,485 NZD 1,590,000 Citibank 17/6/2020 (21,435)USD 459,865 NZD 780,000 Goldman Sachs 17/6/2020 (21,572)USD 2,005,173 NZD 3,260,000 HSBC 17/6/2020 (15,382)USD 503,241 NZD 810,000 Morgan Stanley 17/6/2020 694USD 16,232 RUB 1,259,536 Deutsche Bank 17/6/2020 (1,412)USD 33,643 RUB 2,610,464 Goldman Sachs 17/6/2020 (2,925)USD 418,227 RUB 27,695,021 HSBC 17/6/2020 24,085USD 248,675 RUB 16,660,000 JP Morgan 17/6/2020 11,872USD 494,944 SEK 4,700,000 BNP Paribas 17/6/2020 (2,268)USD 466,666 SEK 4,600,000 Goldman Sachs 17/6/2020 (18,175)USD 479,537 SEK 4,700,000 JP Morgan 17/6/2020 (16,120)USD 38,684 ZAR 730,000 Goldman Sachs 19/6/2020 (2,612)
ZAR 2,180,000 EUR 105,218Bank of America
Merrill Lynch 17/6/2020 6,466ZAR 2,280,000 EUR 117,861 Deutsche Bank 17/6/2020 (1,054)ZAR 1,080,000 EUR 52,388 JP Morgan 17/6/2020 2,942ZAR 450,000 EUR 23,272 UBS 17/6/2020 (218)ZAR 370,000 USD 19,495 HSBC 19/6/2020 1,425ZAR 360,000 USD 19,447 Natwest Markets 19/6/2020 956
2,861,933
Open forward foreign exchange transactionsas at 31 May 2020
Currency Purchases Currency Sales CounterpartyMaturity
date
Netunrealised
appreciation/(depreciation)
EURCZK Hedged Share Class
CZK 45,327,928 EUR 1,646,475State Street Bank& Trust Company 15/6/2020 35,686
EUR 42,684 CZK 1,177,554State Street Bank& Trust Company 15/6/2020 (1,017)
34,669
USD Hedged Share Class
EUR 8,789 USD 9,481State Street Bank& Trust Company 15/6/2020 264
USD 579,593 EUR 534,372State Street Bank& Trust Company 15/6/2020 (13,262)
(12,998)
Total (Gross underlying exposure - EUR 606,788,031) 2,883,604
Sector Breakdownas at 31 May 2020
% of NetAssets
Government 29.60
Financial 25.02
Consumer, Non-cyclical 9.01
Utilities 7.44
Industrial 6.88
Consumer, Cyclical 4.65
Communications 4.61
Collective Investment Schemes 3.38
Technology 2.00
Mortgage Securities 1.39
Exchange Traded Funds 1.24
Basic Materials 0.66
Asset Backed Securities 0.63
Energy 0.48
Securities portfolio at market value 96.99
Other Net Assets 3.01
100.00
BlackRock European Select Strategies Fund continued
The notes on pages 691 to 711 form an integral part of these financial statements.
BlackRock Strategic Funds[342]
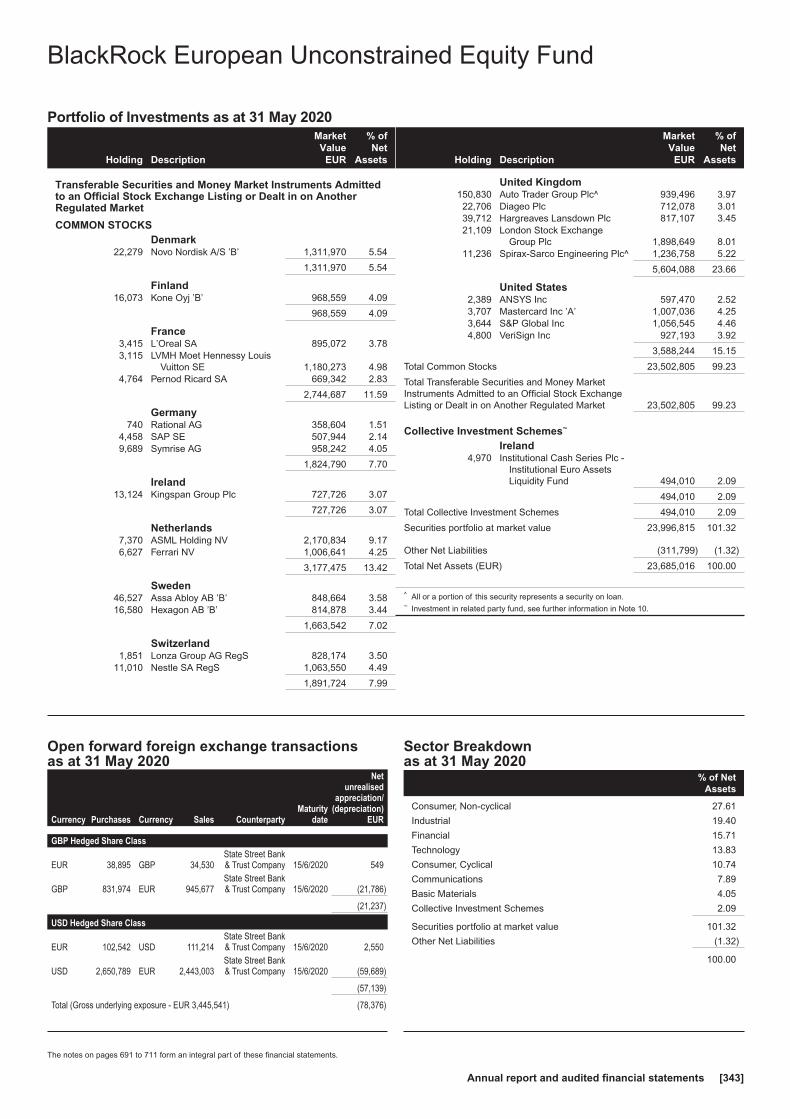
Portfolio of Investments as at 31 May 2020
Holding Description
MarketValue
EUR
% ofNet
Assets
Transferable Securities and Money Market Instruments Admittedto an Official Stock Exchange Listing or Dealt in on AnotherRegulated Market
COMMON STOCKSDenmark
22,279 Novo Nordisk A/S ’B’ 1,311,970 5.54
1,311,970 5.54
Finland16,073 Kone Oyj ’B’ 968,559 4.09
968,559 4.09
France3,415 L’Oreal SA 895,072 3.783,115 LVMH Moet Hennessy Louis
Vuitton SE 1,180,273 4.984,764 Pernod Ricard SA 669,342 2.83
2,744,687 11.59
Germany740 Rational AG 358,604 1.51
4,458 SAP SE 507,944 2.149,689 Symrise AG 958,242 4.05
1,824,790 7.70
Ireland13,124 Kingspan Group Plc 727,726 3.07
727,726 3.07
Netherlands7,370 ASML Holding NV 2,170,834 9.176,627 Ferrari NV 1,006,641 4.25
3,177,475 13.42
Sweden46,527 Assa Abloy AB ’B’ 848,664 3.5816,580 Hexagon AB ’B’ 814,878 3.44
1,663,542 7.02
Switzerland1,851 Lonza Group AG RegS 828,174 3.50
11,010 Nestle SA RegS 1,063,550 4.49
1,891,724 7.99
Holding Description
MarketValue
EUR
% ofNet
Assets
United Kingdom150,830 Auto Trader Group Plc^ 939,496 3.9722,706 Diageo Plc 712,078 3.0139,712 Hargreaves Lansdown Plc 817,107 3.4521,109 London Stock Exchange
Group Plc 1,898,649 8.0111,236 Spirax-Sarco Engineering Plc^ 1,236,758 5.22
5,604,088 23.66
United States2,389 ANSYS Inc 597,470 2.523,707 Mastercard Inc ’A’ 1,007,036 4.253,644 S&P Global Inc 1,056,545 4.464,800 VeriSign Inc 927,193 3.92
3,588,244 15.15
Total Common Stocks 23,502,805 99.23
Total Transferable Securities and Money MarketInstruments Admitted to an Official Stock ExchangeListing or Dealt in on Another Regulated Market 23,502,805 99.23
Collective Investment Schemes~
Ireland4,970 Institutional Cash Series Plc -
Institutional Euro AssetsLiquidity Fund 494,010 2.09
494,010 2.09
Total Collective Investment Schemes 494,010 2.09
Securities portfolio at market value 23,996,815 101.32
Other Net Liabilities (311,799) (1.32)
Total Net Assets (EUR) 23,685,016 100.00
^ All or a portion of this security represents a security on loan.~ Investment in related party fund, see further information in Note 10.
Open forward foreign exchange transactionsas at 31 May 2020
Currency Purchases Currency Sales CounterpartyMaturity
date
Netunrealised
appreciation/(depreciation)
EUR
GBP Hedged Share Class
EUR 38,895 GBP 34,530State Street Bank& Trust Company 15/6/2020 549
GBP 831,974 EUR 945,677State Street Bank& Trust Company 15/6/2020 (21,786)
(21,237)
USD Hedged Share Class
EUR 102,542 USD 111,214State Street Bank& Trust Company 15/6/2020 2,550
USD 2,650,789 EUR 2,443,003State Street Bank& Trust Company 15/6/2020 (59,689)
(57,139)
Total (Gross underlying exposure - EUR 3,445,541) (78,376)
Sector Breakdownas at 31 May 2020
% of NetAssets
Consumer, Non-cyclical 27.61
Industrial 19.40
Financial 15.71
Technology 13.83
Consumer, Cyclical 10.74
Communications 7.89
Basic Materials 4.05
Collective Investment Schemes 2.09
Securities portfolio at market value 101.32
Other Net Liabilities (1.32)
100.00
BlackRock European Unconstrained Equity Fund
The notes on pages 691 to 711 form an integral part of these financial statements.
Annual report and audited financial statements [343]
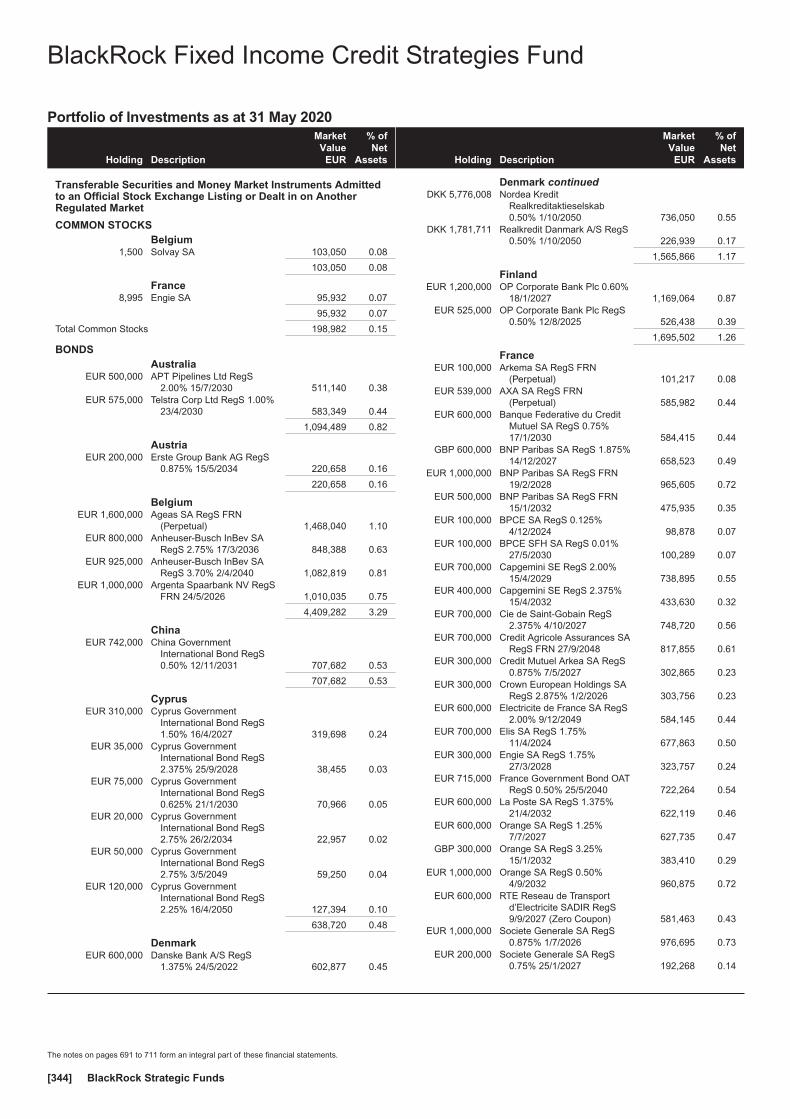
Portfolio of Investments as at 31 May 2020
Holding Description
MarketValue
EUR
% ofNet
Assets
Transferable Securities and Money Market Instruments Admittedto an Official Stock Exchange Listing or Dealt in on AnotherRegulated Market
COMMON STOCKSBelgium
1,500 Solvay SA 103,050 0.08
103,050 0.08
France8,995 Engie SA 95,932 0.07
95,932 0.07
Total Common Stocks 198,982 0.15
BONDSAustralia
EUR 500,000 APT Pipelines Ltd RegS2.00% 15/7/2030 511,140 0.38
EUR 575,000 Telstra Corp Ltd RegS 1.00%23/4/2030 583,349 0.44
1,094,489 0.82
AustriaEUR 200,000 Erste Group Bank AG RegS
0.875% 15/5/2034 220,658 0.16
220,658 0.16
BelgiumEUR 1,600,000 Ageas SA RegS FRN
(Perpetual) 1,468,040 1.10EUR 800,000 Anheuser-Busch InBev SA
RegS 2.75% 17/3/2036 848,388 0.63EUR 925,000 Anheuser-Busch InBev SA
RegS 3.70% 2/4/2040 1,082,819 0.81EUR 1,000,000 Argenta Spaarbank NV RegS
FRN 24/5/2026 1,010,035 0.75
4,409,282 3.29
ChinaEUR 742,000 China Government
International Bond RegS0.50% 12/11/2031 707,682 0.53
707,682 0.53
CyprusEUR 310,000 Cyprus Government
International Bond RegS1.50% 16/4/2027 319,698 0.24
EUR 35,000 Cyprus GovernmentInternational Bond RegS2.375% 25/9/2028 38,455 0.03
EUR 75,000 Cyprus GovernmentInternational Bond RegS0.625% 21/1/2030 70,966 0.05
EUR 20,000 Cyprus GovernmentInternational Bond RegS2.75% 26/2/2034 22,957 0.02
EUR 50,000 Cyprus GovernmentInternational Bond RegS2.75% 3/5/2049 59,250 0.04
EUR 120,000 Cyprus GovernmentInternational Bond RegS2.25% 16/4/2050 127,394 0.10
638,720 0.48
DenmarkEUR 600,000 Danske Bank A/S RegS
1.375% 24/5/2022 602,877 0.45
Holding Description
MarketValue
EUR
% ofNet
Assets
Denmark continuedDKK 5,776,008 Nordea Kredit
Realkreditaktieselskab0.50% 1/10/2050 736,050 0.55
DKK 1,781,711 Realkredit Danmark A/S RegS0.50% 1/10/2050 226,939 0.17
1,565,866 1.17
FinlandEUR 1,200,000 OP Corporate Bank Plc 0.60%
18/1/2027 1,169,064 0.87EUR 525,000 OP Corporate Bank Plc RegS
0.50% 12/8/2025 526,438 0.39
1,695,502 1.26
FranceEUR 100,000 Arkema SA RegS FRN
(Perpetual) 101,217 0.08EUR 539,000 AXA SA RegS FRN
(Perpetual) 585,982 0.44EUR 600,000 Banque Federative du Credit
Mutuel SA RegS 0.75%17/1/2030 584,415 0.44
GBP 600,000 BNP Paribas SA RegS 1.875%14/12/2027 658,523 0.49
EUR 1,000,000 BNP Paribas SA RegS FRN19/2/2028 965,605 0.72
EUR 500,000 BNP Paribas SA RegS FRN15/1/2032 475,935 0.35
EUR 100,000 BPCE SA RegS 0.125%4/12/2024 98,878 0.07
EUR 100,000 BPCE SFH SA RegS 0.01%27/5/2030 100,289 0.07
EUR 700,000 Capgemini SE RegS 2.00%15/4/2029 738,895 0.55
EUR 400,000 Capgemini SE RegS 2.375%15/4/2032 433,630 0.32
EUR 700,000 Cie de Saint-Gobain RegS2.375% 4/10/2027 748,720 0.56
EUR 700,000 Credit Agricole Assurances SARegS FRN 27/9/2048 817,855 0.61
EUR 300,000 Credit Mutuel Arkea SA RegS0.875% 7/5/2027 302,865 0.23
EUR 300,000 Crown European Holdings SARegS 2.875% 1/2/2026 303,756 0.23
EUR 600,000 Electricite de France SA RegS2.00% 9/12/2049 584,145 0.44
EUR 700,000 Elis SA RegS 1.75%11/4/2024 677,863 0.50
EUR 300,000 Engie SA RegS 1.75%27/3/2028 323,757 0.24
EUR 715,000 France Government Bond OATRegS 0.50% 25/5/2040 722,264 0.54
EUR 600,000 La Poste SA RegS 1.375%21/4/2032 622,119 0.46
EUR 600,000 Orange SA RegS 1.25%7/7/2027 627,735 0.47
GBP 300,000 Orange SA RegS 3.25%15/1/2032 383,410 0.29
EUR 1,000,000 Orange SA RegS 0.50%4/9/2032 960,875 0.72
EUR 600,000 RTE Reseau de Transportd’Electricite SADIR RegS9/9/2027 (Zero Coupon) 581,463 0.43
EUR 1,000,000 Societe Generale SA RegS0.875% 1/7/2026 976,695 0.73
EUR 200,000 Societe Generale SA RegS0.75% 25/1/2027 192,268 0.14
BlackRock Fixed Income Credit Strategies Fund
The notes on pages 691 to 711 form an integral part of these financial statements.
BlackRock Strategic Funds[344]

Portfolio of Investments as at 31 May 2020
Holding Description
MarketValue
EUR
% ofNet
Assets
France continuedEUR 500,000 Societe Generale SA RegS
0.875% 24/9/2029 474,298 0.35EUR 600,000 Suez SA RegS 1.25%
14/5/2035 600,414 0.45EUR 500,000 Unibail-Rodamco-Westfield SE
RegS 1.75% 1/7/2049 390,415 0.29EUR 200,000 Veolia Environnement SA
RegS 0.672% 30/3/2022 200,668 0.15
15,234,954 11.36
GermanyEUR 400,000 Allianz SE RegS FRN
8/7/2050 409,012 0.31EUR 1,085,560 Bundesrepublik Deutschland
Bundesanleihe RegS 0.50%15/2/2025 1,145,407 0.85
EUR 1,125,000 Bundesrepublik DeutschlandBundesanleihe RegS15/5/2035 (Zero Coupon) 1,164,279 0.87
EUR 250,000 Deutsche Bahn FinanceGmbH RegS 1.375%16/4/2040 268,575 0.20
GBP 100,000 Deutsche Bank AG RegS2.625% 16/12/2024 108,357 0.08
EUR 125,000 DZ HYP AG RegS 0.01%15/1/2027 126,641 0.09
EUR 500,000 Eurogrid GmbH RegS 1.113%15/5/2032 516,100 0.38
EUR 700,000 Evonik Industries AG RegS0.625% 18/9/2025 701,929 0.52
EUR 1,500,000 German Treasury Bill RegS8/7/2020 (Zero Coupon) 1,500,832 1.12
EUR 100,000 LandesbankBaden-Wuerttemberg RegS2.20% 9/5/2029 89,866 0.07
EUR 200,000 LandesbankHessen-ThueringenGirozentrale 0.01%26/9/2029 201,759 0.15
EUR 200,000 Merck Financial ServicesGmbH RegS 0.005%15/12/2023 198,695 0.15
EUR 200,000 Merck Financial ServicesGmbH RegS 0.125%16/7/2025 198,504 0.15
EUR 800,000 Merck KGaA RegS FRN25/6/2079 842,668 0.63
EUR 900,000 Volkswagen Financial ServicesAG RegS 3.375% 6/4/2028 993,231 0.74
8,465,855 6.31
GreeceEUR 84,000 Hellenic Republic Government
Bond RegS 3.375%15/2/2025 93,135 0.07
EUR 54,000 Hellenic Republic GovernmentBond RegS 1.875%23/7/2026 56,225 0.04
149,360 0.11
HungaryEUR 60,000 Hungary Government
International Bond RegS1.625% 28/4/2032 60,300 0.04
60,300 0.04
Holding Description
MarketValue
EUR
% ofNet
Assets
IcelandEUR 300,000 Islandsbanki HF RegS FRN
19/1/2024 286,827 0.21EUR 125,000 Landsbankinn HF RegS 0.50%
20/5/2024 116,269 0.09
403,096 0.30
IrelandEUR 800,000 Abbott Ireland Financing DAC
RegS 0.10% 19/11/2024 790,801 0.59EUR 1,500,000 Bank of Ireland Group Plc
RegS FRN 25/11/2025 1,432,140 1.07EUR 725,000 CRH SMW Finance DAC
RegS 1.25% 5/11/2026 734,088 0.55EUR 251,000 GAS Networks Ireland RegS
0.125% 4/12/2024 245,539 0.18EUR 1,000,000 Smurfit Kappa Treasury ULC
RegS 1.50% 15/9/2027 958,630 0.71
4,161,198 3.10
ItalyEUR 430,000 ASTM SpA RegS 1.625%
8/2/2028 394,469 0.29EUR 300,000 Enel SpA RegS FRN
24/11/2081 310,158 0.23EUR 100,000 Intesa Sanpaolo SpA RegS
0.75% 4/12/2024 96,134 0.07EUR 700,000 Intesa Sanpaolo SpA RegS
1.75% 4/7/2029 677,610 0.51EUR 504,141 Italy Buoni Poliennali Del
Tesoro RegS 1.30%15/5/2028 510,317 0.38
EUR 1,000,000 Leonardo SpA RegS 1.50%7/6/2024 979,800 0.73
EUR 1,125,000 Mediobanca Banca di CreditoFinanziario SpA RegS0.75% 15/7/2027 1,004,659 0.75
EUR 200,000 UniCredit SpA RegS FRN25/6/2025 195,836 0.15
EUR 800,000 UniCredit SpA RegS FRN23/9/2029 714,208 0.53
4,883,191 3.64
JerseyGBP 500,000 Glencore Finance Europe Ltd
RegS 3.125% 26/3/2026 544,801 0.41EUR 1,100,000 Heathrow Funding Ltd RegS
1.50% 11/2/2030^ 1,077,786 0.80
1,622,587 1.21
LuxembourgEUR 425,000 HeidelbergCement Finance
Luxembourg SA RegS2.50% 9/10/2024 442,771 0.33
EUR 1,000,000 HeidelbergCement FinanceLuxembourg SA RegS1.75% 24/4/2028 988,740 0.74
EUR 150,000 Medtronic Global HoldingsSCA 7/3/2021 (ZeroCoupon) 149,810 0.11
EUR 800,000 Medtronic Global HoldingsSCA 0.25% 2/7/2025 793,172 0.59
BlackRock Fixed Income Credit Strategies Fund continued
The notes on pages 691 to 711 form an integral part of these financial statements.
Annual report and audited financial statements [345]

Portfolio of Investments as at 31 May 2020
Holding Description
MarketValue
EUR
% ofNet
Assets
Luxembourg continuedEUR 180,000 Medtronic Global Holdings
SCA 1.75% 2/7/2049 177,101 0.13EUR 400,000 SES SA RegS 0.875%
4/11/2027 361,322 0.27
2,912,916 2.17
MexicoEUR 185,000 Mexico Government
International Bond 1.125%17/1/2030 163,853 0.12
163,853 0.12
NetherlandsEUR 1,200,000 Aegon NV RegS FRN
25/4/2044 1,259,970 0.94EUR 700,000 ASML Holding NV RegS
0.625% 7/5/2029 700,584 0.52EUR 600,000 BMW Finance NV RegS
0.625% 6/10/2023 603,378 0.45EUR 500,000 Cooperatieve Rabobank UA
RegS FRN 26/5/2026 502,595 0.38EUR 500,000 Daimler International Finance
BV RegS 0.625% 6/5/2027 471,152 0.35EUR 300,000 Deutsche Telekom
International Finance BVRegS 0.625% 1/12/2022 303,090 0.23
EUR 300,000 EDP Finance BV RegS2.625% 18/1/2022 310,783 0.23
EUR 325,000 ELM BV for FirmenichInternational SA RegS FRN(Perpetual) 328,754 0.25
EUR 100,000 Enel Finance International NVRegS 1.125% 17/10/2034 99,363 0.07
EUR 1,600,000 Fiat Chrysler Automobiles NVRegS 3.75% 29/3/2024 1,661,112 1.24
EUR 100,000 Heineken NV RegS 2.25%30/3/2030 112,030 0.08
EUR 1,000,000 ING Groep NV RegS FRN3/9/2025 967,800 0.72
EUR 500,000 ING Groep NV RegS FRN26/5/2031 505,965 0.38
GBP 210,000 innogy Finance BV RegS6.25% 3/6/2030 327,465 0.24
EUR 100,000 Koninklijke Philips NV RegS2.00% 30/3/2030 111,417 0.08
EUR 1,200,000 NN Group NV RegS FRN(Perpetual) 1,299,756 0.97
EUR 400,000 Redexis Gas Finance BVRegS 1.875% 28/5/2025 402,512 0.30
EUR 250,000 RELX Finance BV RegS0.50% 10/3/2028 240,403 0.18
EUR 300,000 SiemensFinancieringsmaatschappijNV RegS 20/2/2023 (ZeroCoupon) 299,252 0.22
EUR 200,000 SiemensFinancieringsmaatschappijNV RegS 0.375% 5/6/2026 200,461 0.15
EUR 700,000 SiemensFinancieringsmaatschappijNV RegS 1.75% 28/2/2039 769,268 0.57
EUR 200,000 Stichting AK RabobankCertificaten RegS(Perpetual) (Zero Coupon) 197,900 0.15
EUR 200,000 Telefonica Europe BV RegSFRN (Perpetual) 195,607 0.15
EUR 700,000 Telefonica Europe BV RegSFRN (Perpetual) 687,687 0.51
Holding Description
MarketValue
EUR
% ofNet
Assets
Netherlands continuedEUR 100,000 TenneT Holding BV RegS
1.50% 3/6/2039 106,125 0.08GBP 300,000 Volkswagen Financial Services
NV RegS 4.25% 9/10/2025 360,215 0.27EUR 200,000 Volkswagen International
Finance NV RegS 1.875%30/3/2027 204,344 0.15
EUR 1,000,000 Volkswagen InternationalFinance NV RegS FRN(Perpetual) 984,765 0.74
EUR 100,000 Vonovia Finance BV RegS2.25% 7/4/2030 108,860 0.08
EUR 200,000 Vonovia Finance BV RegS1.125% 14/9/2034 187,143 0.14
14,509,756 10.82
New ZealandEUR 225,000 Chorus Ltd RegS 0.875%
5/12/2026 221,766 0.16
221,766 0.16
NorwayEUR 350,000 DNB Bank ASA RegS 0.05%
14/11/2023 346,740 0.26EUR 200,000 Telenor ASA RegS
25/9/2023 (Zero Coupon) 198,377 0.15
545,117 0.41
PortugalEUR 200,000 EDP - Energias de Portugal
SA RegS 1.625% 15/4/2027 209,404 0.16EUR 500,000 EDP - Energias de Portugal
SA RegS FRN 20/7/2080 460,105 0.34EUR 151,066 Portugal Obrigacoes do
Tesouro OT RegS 4.125%14/4/2027 191,909 0.14
EUR 223,352 Portugal Obrigacoes doTesouro OT RegS 2.125%17/10/2028 256,520 0.19
1,117,938 0.83
SlovakiaEUR 275,000 Slovakia Government Bond
RegS 1.00% 14/5/2032 295,991 0.22
295,991 0.22
SloveniaEUR 250,000 Slovenia Government Bond
RegS 0.875% 15/7/2030^ 258,811 0.19EUR 25,000 Slovenia Government Bond
RegS 3.125% 7/8/2045 35,734 0.03
294,545 0.22
SpainEUR 100,000 Banco Bilbao Vizcaya
Argentaria SA RegS 0.625%17/1/2022 100,332 0.07
EUR 200,000 Banco Bilbao VizcayaArgentaria SA RegS 0.375%15/11/2026 194,746 0.15
USD 200,000 Banco Santander SA 3.306%27/6/2029 189,234 0.14
EUR 500,000 Banco Santander SA RegS3.25% 4/4/2026 536,415 0.40
EUR 200,000 Banco Santander SA RegSFRN (Perpetual) 175,905 0.13
BlackRock Fixed Income Credit Strategies Fund continued
The notes on pages 691 to 711 form an integral part of these financial statements.
BlackRock Strategic Funds[346]
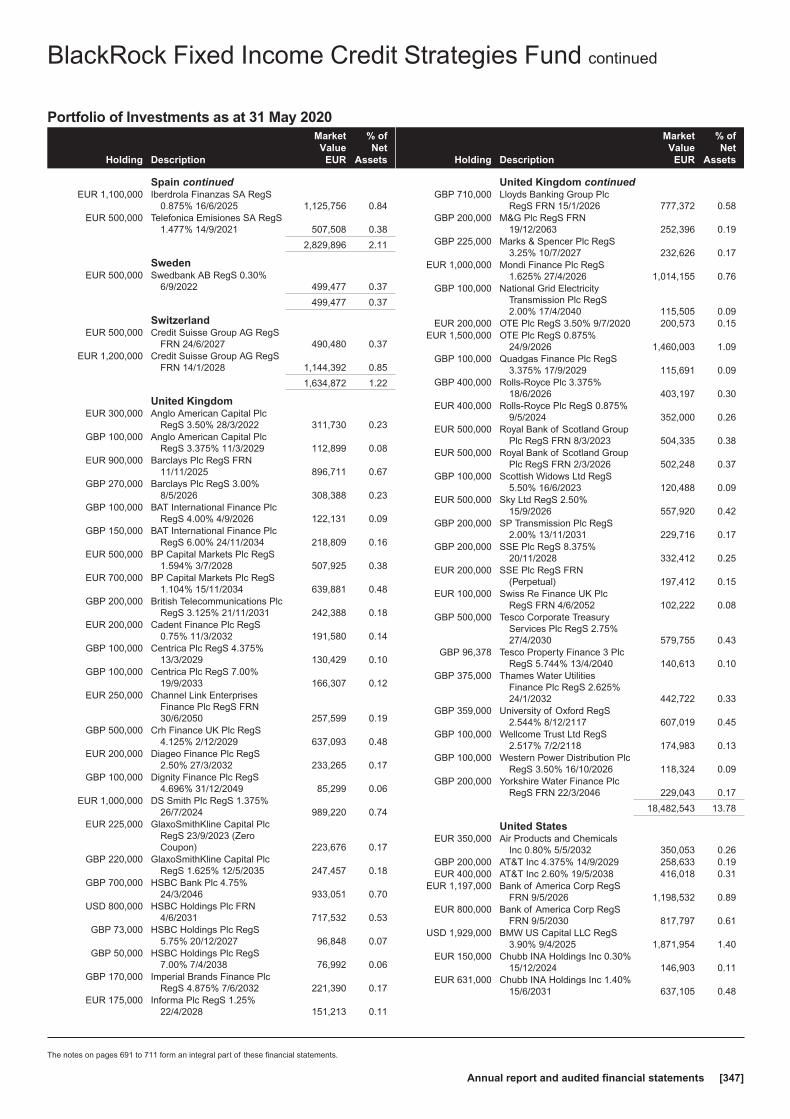
Portfolio of Investments as at 31 May 2020
Holding Description
MarketValue
EUR
% ofNet
Assets
Spain continuedEUR 1,100,000 Iberdrola Finanzas SA RegS
0.875% 16/6/2025 1,125,756 0.84EUR 500,000 Telefonica Emisiones SA RegS
1.477% 14/9/2021 507,508 0.38
2,829,896 2.11
SwedenEUR 500,000 Swedbank AB RegS 0.30%
6/9/2022 499,477 0.37
499,477 0.37
SwitzerlandEUR 500,000 Credit Suisse Group AG RegS
FRN 24/6/2027 490,480 0.37EUR 1,200,000 Credit Suisse Group AG RegS
FRN 14/1/2028 1,144,392 0.85
1,634,872 1.22
United KingdomEUR 300,000 Anglo American Capital Plc
RegS 3.50% 28/3/2022 311,730 0.23GBP 100,000 Anglo American Capital Plc
RegS 3.375% 11/3/2029 112,899 0.08EUR 900,000 Barclays Plc RegS FRN
11/11/2025 896,711 0.67GBP 270,000 Barclays Plc RegS 3.00%
8/5/2026 308,388 0.23GBP 100,000 BAT International Finance Plc
RegS 4.00% 4/9/2026 122,131 0.09GBP 150,000 BAT International Finance Plc
RegS 6.00% 24/11/2034 218,809 0.16EUR 500,000 BP Capital Markets Plc RegS
1.594% 3/7/2028 507,925 0.38EUR 700,000 BP Capital Markets Plc RegS
1.104% 15/11/2034 639,881 0.48GBP 200,000 British Telecommunications Plc
RegS 3.125% 21/11/2031 242,388 0.18EUR 200,000 Cadent Finance Plc RegS
0.75% 11/3/2032 191,580 0.14GBP 100,000 Centrica Plc RegS 4.375%
13/3/2029 130,429 0.10GBP 100,000 Centrica Plc RegS 7.00%
19/9/2033 166,307 0.12EUR 250,000 Channel Link Enterprises
Finance Plc RegS FRN30/6/2050 257,599 0.19
GBP 500,000 Crh Finance UK Plc RegS4.125% 2/12/2029 637,093 0.48
EUR 200,000 Diageo Finance Plc RegS2.50% 27/3/2032 233,265 0.17
GBP 100,000 Dignity Finance Plc RegS4.696% 31/12/2049 85,299 0.06
EUR 1,000,000 DS Smith Plc RegS 1.375%26/7/2024 989,220 0.74
EUR 225,000 GlaxoSmithKline Capital PlcRegS 23/9/2023 (ZeroCoupon) 223,676 0.17
GBP 220,000 GlaxoSmithKline Capital PlcRegS 1.625% 12/5/2035 247,457 0.18
GBP 700,000 HSBC Bank Plc 4.75%24/3/2046 933,051 0.70
USD 800,000 HSBC Holdings Plc FRN4/6/2031 717,532 0.53
GBP 73,000 HSBC Holdings Plc RegS5.75% 20/12/2027 96,848 0.07
GBP 50,000 HSBC Holdings Plc RegS7.00% 7/4/2038 76,992 0.06
GBP 170,000 Imperial Brands Finance PlcRegS 4.875% 7/6/2032 221,390 0.17
EUR 175,000 Informa Plc RegS 1.25%22/4/2028 151,213 0.11
Holding Description
MarketValue
EUR
% ofNet
Assets
United Kingdom continuedGBP 710,000 Lloyds Banking Group Plc
RegS FRN 15/1/2026 777,372 0.58GBP 200,000 M&G Plc RegS FRN
19/12/2063 252,396 0.19GBP 225,000 Marks & Spencer Plc RegS
3.25% 10/7/2027 232,626 0.17EUR 1,000,000 Mondi Finance Plc RegS
1.625% 27/4/2026 1,014,155 0.76GBP 100,000 National Grid Electricity
Transmission Plc RegS2.00% 17/4/2040 115,505 0.09
EUR 200,000 OTE Plc RegS 3.50% 9/7/2020 200,573 0.15EUR 1,500,000 OTE Plc RegS 0.875%
24/9/2026 1,460,003 1.09GBP 100,000 Quadgas Finance Plc RegS
3.375% 17/9/2029 115,691 0.09GBP 400,000 Rolls-Royce Plc 3.375%
18/6/2026 403,197 0.30EUR 400,000 Rolls-Royce Plc RegS 0.875%
9/5/2024 352,000 0.26EUR 500,000 Royal Bank of Scotland Group
Plc RegS FRN 8/3/2023 504,335 0.38EUR 500,000 Royal Bank of Scotland Group
Plc RegS FRN 2/3/2026 502,248 0.37GBP 100,000 Scottish Widows Ltd RegS
5.50% 16/6/2023 120,488 0.09EUR 500,000 Sky Ltd RegS 2.50%
15/9/2026 557,920 0.42GBP 200,000 SP Transmission Plc RegS
2.00% 13/11/2031 229,716 0.17GBP 200,000 SSE Plc RegS 8.375%
20/11/2028 332,412 0.25EUR 200,000 SSE Plc RegS FRN
(Perpetual) 197,412 0.15EUR 100,000 Swiss Re Finance UK Plc
RegS FRN 4/6/2052 102,222 0.08GBP 500,000 Tesco Corporate Treasury
Services Plc RegS 2.75%27/4/2030 579,755 0.43
GBP 96,378 Tesco Property Finance 3 PlcRegS 5.744% 13/4/2040 140,613 0.10
GBP 375,000 Thames Water UtilitiesFinance Plc RegS 2.625%24/1/2032 442,722 0.33
GBP 359,000 University of Oxford RegS2.544% 8/12/2117 607,019 0.45
GBP 100,000 Wellcome Trust Ltd RegS2.517% 7/2/2118 174,983 0.13
GBP 100,000 Western Power Distribution PlcRegS 3.50% 16/10/2026 118,324 0.09
GBP 200,000 Yorkshire Water Finance PlcRegS FRN 22/3/2046 229,043 0.17
18,482,543 13.78
United StatesEUR 350,000 Air Products and Chemicals
Inc 0.80% 5/5/2032 350,053 0.26GBP 200,000 AT&T Inc 4.375% 14/9/2029 258,633 0.19EUR 400,000 AT&T Inc 2.60% 19/5/2038 416,018 0.31
EUR 1,197,000 Bank of America Corp RegSFRN 9/5/2026 1,198,532 0.89
EUR 800,000 Bank of America Corp RegSFRN 9/5/2030 817,797 0.61
USD 1,929,000 BMW US Capital LLC RegS3.90% 9/4/2025 1,871,954 1.40
EUR 150,000 Chubb INA Holdings Inc 0.30%15/12/2024 146,903 0.11
EUR 631,000 Chubb INA Holdings Inc 1.40%15/6/2031 637,105 0.48
BlackRock Fixed Income Credit Strategies Fund continued
The notes on pages 691 to 711 form an integral part of these financial statements.
Annual report and audited financial statements [347]
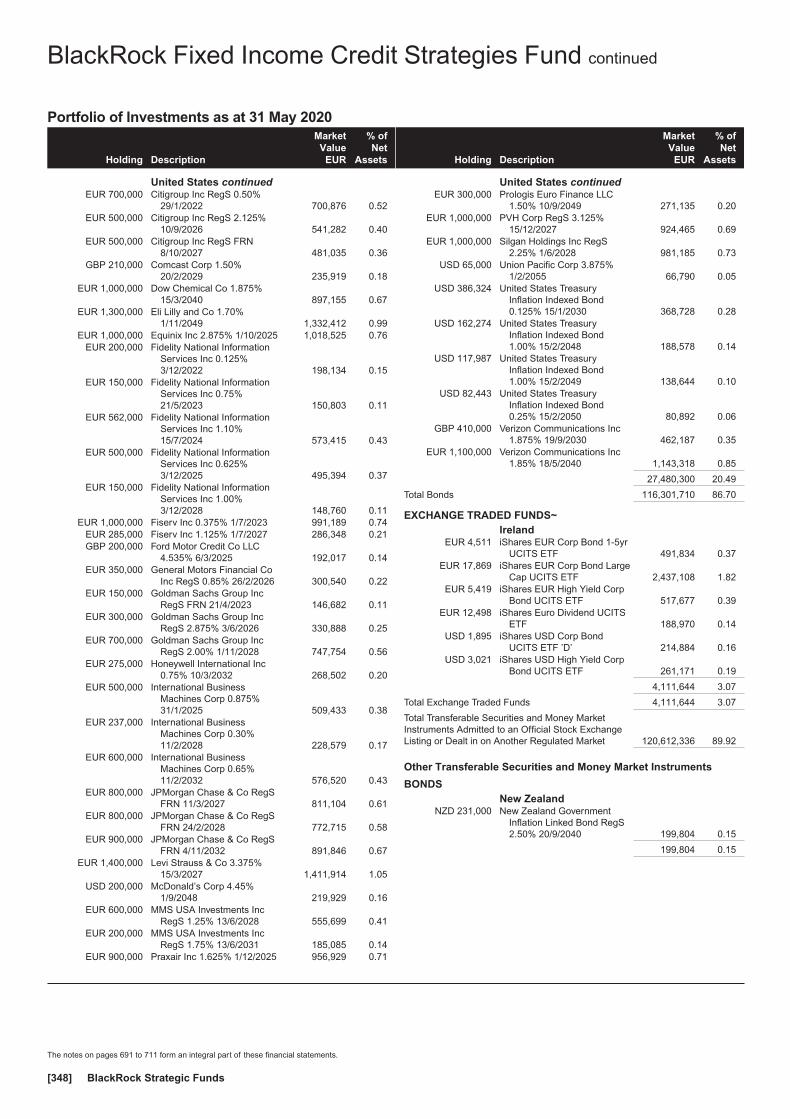
Portfolio of Investments as at 31 May 2020
Holding Description
MarketValue
EUR
% ofNet
Assets
United States continuedEUR 700,000 Citigroup Inc RegS 0.50%
29/1/2022 700,876 0.52EUR 500,000 Citigroup Inc RegS 2.125%
10/9/2026 541,282 0.40EUR 500,000 Citigroup Inc RegS FRN
8/10/2027 481,035 0.36GBP 210,000 Comcast Corp 1.50%
20/2/2029 235,919 0.18EUR 1,000,000 Dow Chemical Co 1.875%
15/3/2040 897,155 0.67EUR 1,300,000 Eli Lilly and Co 1.70%
1/11/2049 1,332,412 0.99EUR 1,000,000 Equinix Inc 2.875% 1/10/2025 1,018,525 0.76
EUR 200,000 Fidelity National InformationServices Inc 0.125%3/12/2022 198,134 0.15
EUR 150,000 Fidelity National InformationServices Inc 0.75%21/5/2023 150,803 0.11
EUR 562,000 Fidelity National InformationServices Inc 1.10%15/7/2024 573,415 0.43
EUR 500,000 Fidelity National InformationServices Inc 0.625%3/12/2025 495,394 0.37
EUR 150,000 Fidelity National InformationServices Inc 1.00%3/12/2028 148,760 0.11
EUR 1,000,000 Fiserv Inc 0.375% 1/7/2023 991,189 0.74EUR 285,000 Fiserv Inc 1.125% 1/7/2027 286,348 0.21GBP 200,000 Ford Motor Credit Co LLC
4.535% 6/3/2025 192,017 0.14EUR 350,000 General Motors Financial Co
Inc RegS 0.85% 26/2/2026 300,540 0.22EUR 150,000 Goldman Sachs Group Inc
RegS FRN 21/4/2023 146,682 0.11EUR 300,000 Goldman Sachs Group Inc
RegS 2.875% 3/6/2026 330,888 0.25EUR 700,000 Goldman Sachs Group Inc
RegS 2.00% 1/11/2028 747,754 0.56EUR 275,000 Honeywell International Inc
0.75% 10/3/2032 268,502 0.20EUR 500,000 International Business
Machines Corp 0.875%31/1/2025 509,433 0.38
EUR 237,000 International BusinessMachines Corp 0.30%11/2/2028 228,579 0.17
EUR 600,000 International BusinessMachines Corp 0.65%11/2/2032 576,520 0.43
EUR 800,000 JPMorgan Chase & Co RegSFRN 11/3/2027 811,104 0.61
EUR 800,000 JPMorgan Chase & Co RegSFRN 24/2/2028 772,715 0.58
EUR 900,000 JPMorgan Chase & Co RegSFRN 4/11/2032 891,846 0.67
EUR 1,400,000 Levi Strauss & Co 3.375%15/3/2027 1,411,914 1.05
USD 200,000 McDonald’s Corp 4.45%1/9/2048 219,929 0.16
EUR 600,000 MMS USA Investments IncRegS 1.25% 13/6/2028 555,699 0.41
EUR 200,000 MMS USA Investments IncRegS 1.75% 13/6/2031 185,085 0.14
EUR 900,000 Praxair Inc 1.625% 1/12/2025 956,929 0.71
Holding Description
MarketValue
EUR
% ofNet
Assets
United States continuedEUR 300,000 Prologis Euro Finance LLC
1.50% 10/9/2049 271,135 0.20EUR 1,000,000 PVH Corp RegS 3.125%
15/12/2027 924,465 0.69EUR 1,000,000 Silgan Holdings Inc RegS
2.25% 1/6/2028 981,185 0.73USD 65,000 Union Pacific Corp 3.875%
1/2/2055 66,790 0.05USD 386,324 United States Treasury
Inflation Indexed Bond0.125% 15/1/2030 368,728 0.28
USD 162,274 United States TreasuryInflation Indexed Bond1.00% 15/2/2048 188,578 0.14
USD 117,987 United States TreasuryInflation Indexed Bond1.00% 15/2/2049 138,644 0.10
USD 82,443 United States TreasuryInflation Indexed Bond0.25% 15/2/2050 80,892 0.06
GBP 410,000 Verizon Communications Inc1.875% 19/9/2030 462,187 0.35
EUR 1,100,000 Verizon Communications Inc1.85% 18/5/2040 1,143,318 0.85
27,480,300 20.49
Total Bonds 116,301,710 86.70
EXCHANGE TRADED FUNDS~Ireland
EUR 4,511 iShares EUR Corp Bond 1-5yrUCITS ETF 491,834 0.37
EUR 17,869 iShares EUR Corp Bond LargeCap UCITS ETF 2,437,108 1.82
EUR 5,419 iShares EUR High Yield CorpBond UCITS ETF 517,677 0.39
EUR 12,498 iShares Euro Dividend UCITSETF 188,970 0.14
USD 1,895 iShares USD Corp BondUCITS ETF ’D’ 214,884 0.16
USD 3,021 iShares USD High Yield CorpBond UCITS ETF 261,171 0.19
4,111,644 3.07
Total Exchange Traded Funds 4,111,644 3.07
Total Transferable Securities and Money MarketInstruments Admitted to an Official Stock ExchangeListing or Dealt in on Another Regulated Market 120,612,336 89.92
Other Transferable Securities and Money Market Instruments
BONDSNew Zealand
NZD 231,000 New Zealand GovernmentInflation Linked Bond RegS2.50% 20/9/2040 199,804 0.15
199,804 0.15
BlackRock Fixed Income Credit Strategies Fund continued
The notes on pages 691 to 711 form an integral part of these financial statements.
BlackRock Strategic Funds[348]
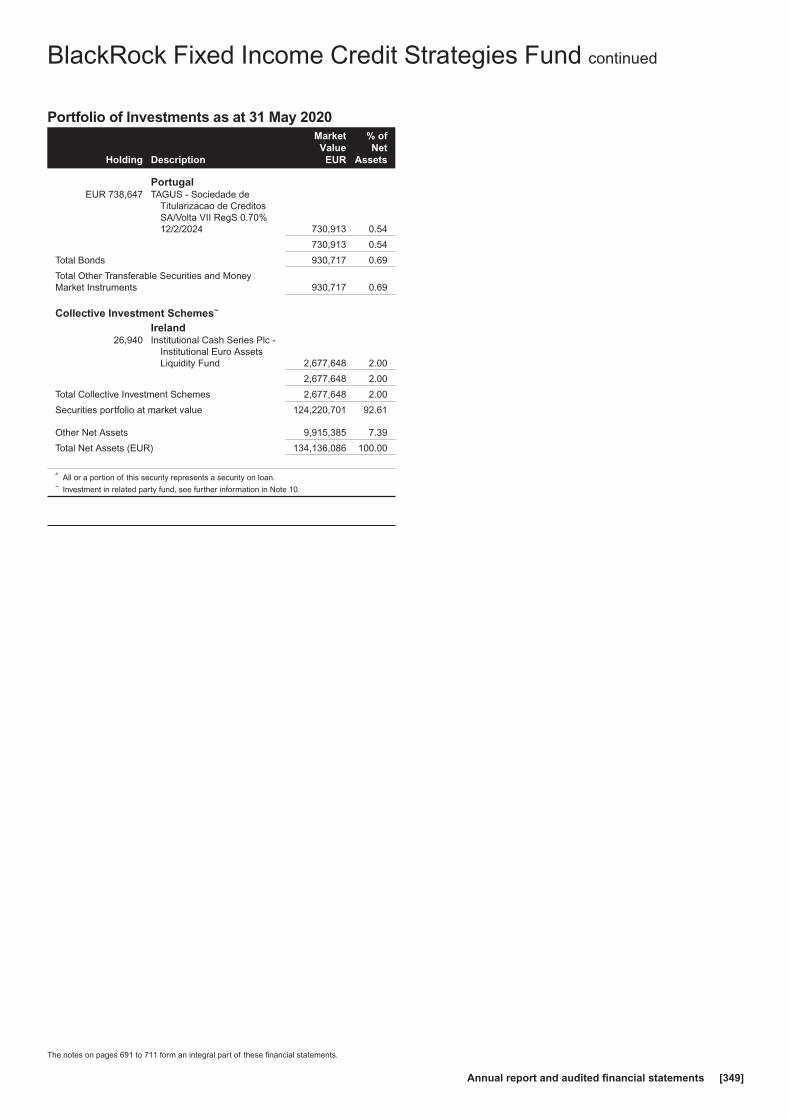
Portfolio of Investments as at 31 May 2020
Holding Description
MarketValue
EUR
% ofNet
Assets
PortugalEUR 738,647 TAGUS - Sociedade de
Titularizacao de CreditosSA/Volta VII RegS 0.70%12/2/2024 730,913 0.54
730,913 0.54
Total Bonds 930,717 0.69
Total Other Transferable Securities and MoneyMarket Instruments 930,717 0.69
Collective Investment Schemes~
Ireland26,940 Institutional Cash Series Plc -
Institutional Euro AssetsLiquidity Fund 2,677,648 2.00
2,677,648 2.00
Total Collective Investment Schemes 2,677,648 2.00
Securities portfolio at market value 124,220,701 92.61
Other Net Assets 9,915,385 7.39
Total Net Assets (EUR) 134,136,086 100.00
^ All or a portion of this security represents a security on loan.~ Investment in related party fund, see further information in Note 10.
BlackRock Fixed Income Credit Strategies Fund continued
The notes on pages 691 to 711 form an integral part of these financial statements.
Annual report and audited financial statements [349]

Contracts for difference as at 31 May 2020
Holding Description Counterparty
Netunrealised
(depreciation)EUR
Portugal(35,949) EDP - Energias de Portugal
SABank of AmericaMerrill Lynch (11,755)
(11,755)
United Kingdom(7,420) Severn Trent Plc Bank of America
Merrill Lynch (3,462)
(3,462)
Total (Gross underlying exposure - EUR 352,667) (15,217)
BlackRock Fixed Income Credit Strategies Fund continued
The notes on pages 691 to 711 form an integral part of these financial statements.
BlackRock Strategic Funds[350]

Swaps as at 31 May 2020
TypeNominal
Value Description CounterpartyExpiration
date
Net unrealisedappreciation/
(depreciation)EUR
MarketValue
EUR
CCCDS USD 3,394,149Fund receives default protection on Markit CDX.NA.IG.30 and pays
Fixed 1.000% Credit Suisse 20/6/2024 30,611 (30,621)
CCCDS EUR 2,597,413Fund receives Fixed 1.000% and provides default protection on
Markit iTraxx Europe Series 23 Version 1 Credit Suisse 20/6/2025 39,816 35,279
CCILS EUR 520,000Fund receives Fixed 0.785% and pays Floating EUR 12 Month
CPTFEMU Credit Suisse 15/3/2025 10,384 10,393
CCILS GBP 70,000Fund receives Fixed 3.202% and pays Floating GBP 12 Month
UKRPI Credit Suisse 15/3/2030 (1,397) (1,395)
CCILS GBP 87,500Fund receives Fixed 3.270% and pays Floating GBP 12 Month
UKRPI Credit Suisse 15/3/2030 (878) (876)
CCILS GBP 40,000Fund receives Fixed 3.285% and pays Floating GBP 12 Month
UKRPI Credit Suisse 15/3/2030 (313) (312)
CCILS GBP 87,500Fund receives Fixed 3.290% and pays Floating GBP 12 Month
UKRPI Credit Suisse 15/3/2030 (621) (619)
CCILS GBP 40,000Fund receives Fixed 3.293% and pays Floating GBP 12 Month
UKRPI Credit Suisse 15/3/2030 (266) (265)
CCILS GBP 450,000Fund receives Fixed 3.315% and pays Floating GBP 12 Month
UKRPI Credit Suisse 15/5/2030 (3,821) (3,811)
CCILS GBP 60,000Fund receives Fixed 3.340% and pays Floating GBP 12 Month
UKRPI Credit Suisse 15/3/2030 15 16
CCILS GBP 540,000Fund receives Fixed 3.372% and pays Floating GBP 12 Month
UKRPI Credit Suisse 15/3/2030 2,722 2,735
CCILS GBP 321,000Fund receives Fixed 3.530% and pays Floating GBP 12 Month
UKRPI Credit Suisse 15/12/2029 9,920 9,928
CCILS GBP 190,000Fund receives Fixed 3.580% and pays Floating GBP 12 Month
UKRPI Credit Suisse 15/12/2029 7,298 7,303
CCILS GBP 160,500Fund receives Fixed 3.585% and pays Floating GBP 12 Month
UKRPI Credit Suisse 15/12/2029 6,286 6,290
CCILS GBP 50,000Fund receives Fixed 3.690% and pays Floating GBP 12 Month
UKRPI Credit Suisse 15/6/2029 3,381 3,382
CCILS GBP 54,000Fund receives Fixed 3.710% and pays Floating GBP 12 Month
UKRPI Credit Suisse 15/8/2029 3,696 3,697
CCILS GBP 53,000Fund receives Fixed 3.725% and pays Floating GBP 12 Month
UKRPI Credit Suisse 15/8/2029 3,749 3,750
CCILS GBP 53,000Fund receives Fixed 3.745% and pays Floating GBP 12 Month
UKRPI Credit Suisse 15/8/2029 3,910 3,912
CCILS GBP 50,000Fund receives Fixed 3.773% and pays Floating GBP 12 Month
UKRPI Credit Suisse 15/9/2029 3,842 3,843
CCILS EUR 450,000Fund receives Floating EUR 12 Month CPTFEMU and pays Fixed
0.948% Credit Suisse 15/3/2030 (13,036) (13,026)
CCILS EUR 170,000Fund receives Floating EUR 12 Month CPTFEMU and pays Fixed
1.060% Credit Suisse 15/2/2030 (6,984) (6,981)
CCILS EUR 250,000Fund receives Floating EUR 12 Month CPTFEMU and pays Fixed
1.149% Credit Suisse 15/2/2030 (12,812) (12,806)
CCILS GBP 321,000Fund receives Floating GBP 12 Month UKRPI and pays Fixed
3.449% Credit Suisse 15/12/2024 (7,594) (7,588)
CCILS GBP 160,500Fund receives Floating GBP 12 Month UKRPI and pays Fixed
3.500% Credit Suisse 15/12/2024 (4,317) (4,314)
CCIRS EUR 85,749Fund receives Fixed 0.017% and pays Floating EUR 6 Month
EURIBOR Credit Suisse 22/5/2035 (190) (128)
CCIRS EUR 200,000Fund receives Floating EUR 6 Month EURIBOR and pays Fixed
0.014% Credit Suisse 13/5/2034 (320) (317)
CCIRS EUR 295,014Fund receives Floating EUR 6 Month EURIBOR and pays Fixed
0.107% Credit Suisse 25/5/2040 (1,016) (1,009)
CCIRS EUR 2,630,000Fund receives Floating EUR 6 Month EURIBOR and pays Fixed
0.214% Credit Suisse 15/8/2028 (89,641) (89,596)
CCIRS EUR 2,500,000Fund receives Floating EUR 6 Month EURIBOR and pays Fixed
0.246% Credit Suisse 18/6/2029 (94,077) (94,034)
CCIRS EUR 25,000Fund receives Floating EUR 6 Month EURIBOR and pays Fixed
0.258% Credit Suisse 13/2/2070 (5,307) (5,306)
CCIRS EUR 421,194Fund receives Floating EUR 6 Month EURIBOR and pays Fixed
0.533% Credit Suisse 4/12/2049 (62,114) (62,102)
CDS EUR 433,906Fund receives default protection on Daimler AG and pays Fixed
1.000% BNP Paribas 20/3/2021 1,023 (1,853)
BlackRock Fixed Income Credit Strategies Fund continued
The notes on pages 691 to 711 form an integral part of these financial statements.
Annual report and audited financial statements [351]
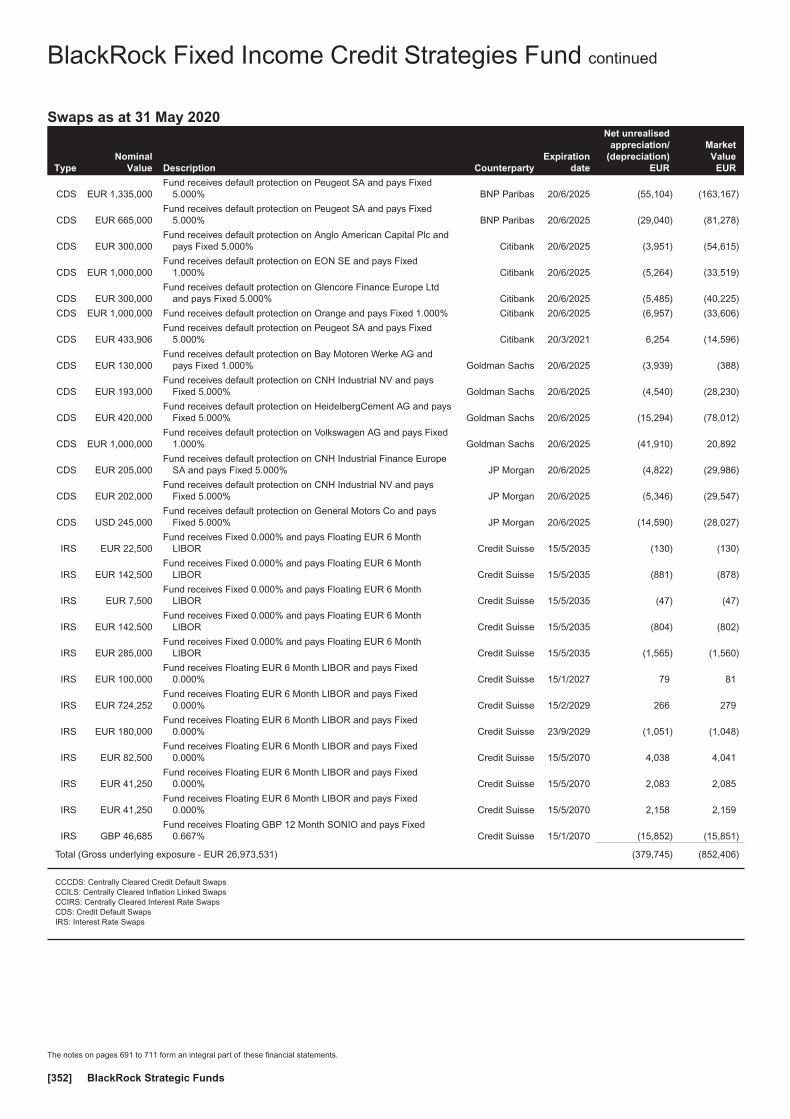
Swaps as at 31 May 2020
TypeNominal
Value Description CounterpartyExpiration
date
Net unrealisedappreciation/
(depreciation)EUR
MarketValue
EUR
CDS EUR 1,335,000Fund receives default protection on Peugeot SA and pays Fixed
5.000% BNP Paribas 20/6/2025 (55,104) (163,167)
CDS EUR 665,000Fund receives default protection on Peugeot SA and pays Fixed
5.000% BNP Paribas 20/6/2025 (29,040) (81,278)
CDS EUR 300,000Fund receives default protection on Anglo American Capital Plc and
pays Fixed 5.000% Citibank 20/6/2025 (3,951) (54,615)
CDS EUR 1,000,000Fund receives default protection on EON SE and pays Fixed
1.000% Citibank 20/6/2025 (5,264) (33,519)
CDS EUR 300,000Fund receives default protection on Glencore Finance Europe Ltd
and pays Fixed 5.000% Citibank 20/6/2025 (5,485) (40,225)
CDS EUR 1,000,000 Fund receives default protection on Orange and pays Fixed 1.000% Citibank 20/6/2025 (6,957) (33,606)
CDS EUR 433,906Fund receives default protection on Peugeot SA and pays Fixed
5.000% Citibank 20/3/2021 6,254 (14,596)
CDS EUR 130,000Fund receives default protection on Bay Motoren Werke AG and
pays Fixed 1.000% Goldman Sachs 20/6/2025 (3,939) (388)
CDS EUR 193,000Fund receives default protection on CNH Industrial NV and pays
Fixed 5.000% Goldman Sachs 20/6/2025 (4,540) (28,230)
CDS EUR 420,000Fund receives default protection on HeidelbergCement AG and pays
Fixed 5.000% Goldman Sachs 20/6/2025 (15,294) (78,012)
CDS EUR 1,000,000Fund receives default protection on Volkswagen AG and pays Fixed
1.000% Goldman Sachs 20/6/2025 (41,910) 20,892
CDS EUR 205,000Fund receives default protection on CNH Industrial Finance Europe
SA and pays Fixed 5.000% JP Morgan 20/6/2025 (4,822) (29,986)
CDS EUR 202,000Fund receives default protection on CNH Industrial NV and pays
Fixed 5.000% JP Morgan 20/6/2025 (5,346) (29,547)
CDS USD 245,000Fund receives default protection on General Motors Co and pays
Fixed 5.000% JP Morgan 20/6/2025 (14,590) (28,027)
IRS EUR 22,500Fund receives Fixed 0.000% and pays Floating EUR 6 Month
LIBOR Credit Suisse 15/5/2035 (130) (130)
IRS EUR 142,500Fund receives Fixed 0.000% and pays Floating EUR 6 Month
LIBOR Credit Suisse 15/5/2035 (881) (878)
IRS EUR 7,500Fund receives Fixed 0.000% and pays Floating EUR 6 Month
LIBOR Credit Suisse 15/5/2035 (47) (47)
IRS EUR 142,500Fund receives Fixed 0.000% and pays Floating EUR 6 Month
LIBOR Credit Suisse 15/5/2035 (804) (802)
IRS EUR 285,000Fund receives Fixed 0.000% and pays Floating EUR 6 Month
LIBOR Credit Suisse 15/5/2035 (1,565) (1,560)
IRS EUR 100,000Fund receives Floating EUR 6 Month LIBOR and pays Fixed
0.000% Credit Suisse 15/1/2027 79 81
IRS EUR 724,252Fund receives Floating EUR 6 Month LIBOR and pays Fixed
0.000% Credit Suisse 15/2/2029 266 279
IRS EUR 180,000Fund receives Floating EUR 6 Month LIBOR and pays Fixed
0.000% Credit Suisse 23/9/2029 (1,051) (1,048)
IRS EUR 82,500Fund receives Floating EUR 6 Month LIBOR and pays Fixed
0.000% Credit Suisse 15/5/2070 4,038 4,041
IRS EUR 41,250Fund receives Floating EUR 6 Month LIBOR and pays Fixed
0.000% Credit Suisse 15/5/2070 2,083 2,085
IRS EUR 41,250Fund receives Floating EUR 6 Month LIBOR and pays Fixed
0.000% Credit Suisse 15/5/2070 2,158 2,159
IRS GBP 46,685Fund receives Floating GBP 12 Month SONIO and pays Fixed
0.667% Credit Suisse 15/1/2070 (15,852) (15,851)
Total (Gross underlying exposure - EUR 26,973,531) (379,745) (852,406)
CCCDS: Centrally Cleared Credit Default SwapsCCILS: Centrally Cleared Inflation Linked SwapsCCIRS: Centrally Cleared Interest Rate SwapsCDS: Credit Default SwapsIRS: Interest Rate Swaps
BlackRock Fixed Income Credit Strategies Fund continued
The notes on pages 691 to 711 form an integral part of these financial statements.
BlackRock Strategic Funds[352]
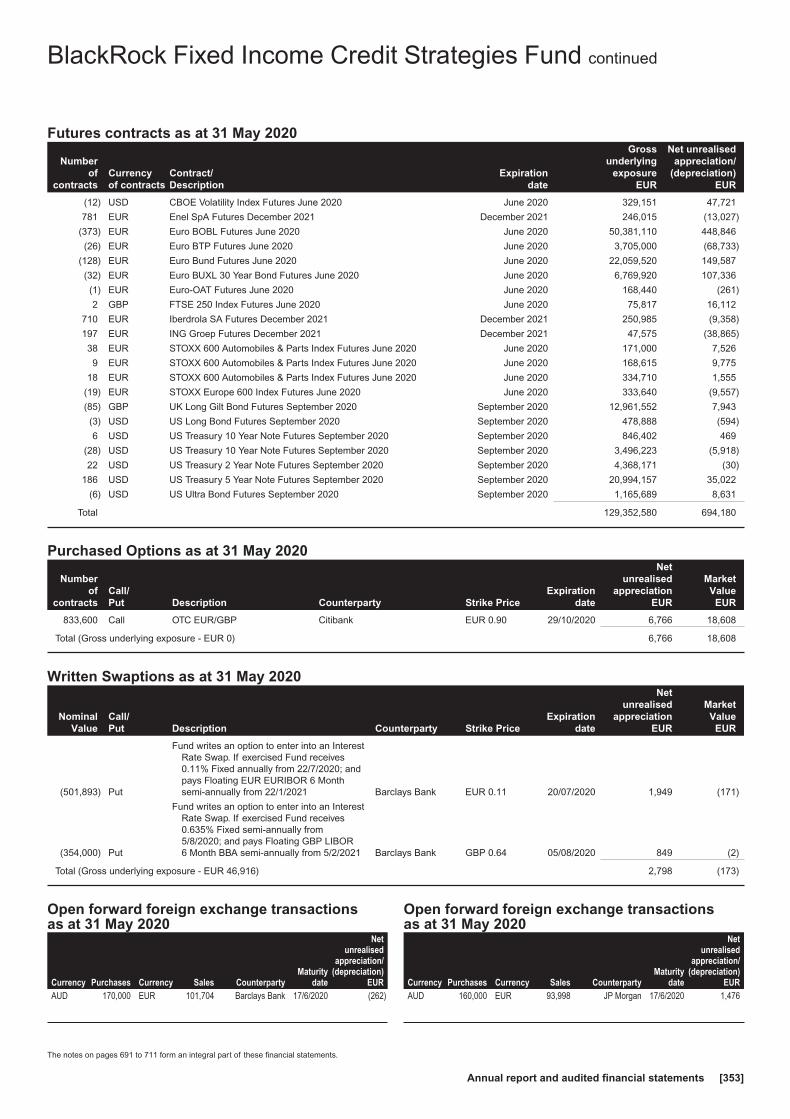
Futures contracts as at 31 May 2020
Numberof
contractsCurrencyof contracts
Contract/Description
Expirationdate
Grossunderlying
exposureEUR
Net unrealisedappreciation/
(depreciation)EUR
(12) USD CBOE Volatility Index Futures June 2020 June 2020 329,151 47,721
781 EUR Enel SpA Futures December 2021 December 2021 246,015 (13,027)
(373) EUR Euro BOBL Futures June 2020 June 2020 50,381,110 448,846
(26) EUR Euro BTP Futures June 2020 June 2020 3,705,000 (68,733)
(128) EUR Euro Bund Futures June 2020 June 2020 22,059,520 149,587
(32) EUR Euro BUXL 30 Year Bond Futures June 2020 June 2020 6,769,920 107,336
(1) EUR Euro-OAT Futures June 2020 June 2020 168,440 (261)
2 GBP FTSE 250 Index Futures June 2020 June 2020 75,817 16,112
710 EUR Iberdrola SA Futures December 2021 December 2021 250,985 (9,358)
197 EUR ING Groep Futures December 2021 December 2021 47,575 (38,865)
38 EUR STOXX 600 Automobiles & Parts Index Futures June 2020 June 2020 171,000 7,526
9 EUR STOXX 600 Automobiles & Parts Index Futures June 2020 June 2020 168,615 9,775
18 EUR STOXX 600 Automobiles & Parts Index Futures June 2020 June 2020 334,710 1,555
(19) EUR STOXX Europe 600 Index Futures June 2020 June 2020 333,640 (9,557)
(85) GBP UK Long Gilt Bond Futures September 2020 September 2020 12,961,552 7,943
(3) USD US Long Bond Futures September 2020 September 2020 478,888 (594)
6 USD US Treasury 10 Year Note Futures September 2020 September 2020 846,402 469
(28) USD US Treasury 10 Year Note Futures September 2020 September 2020 3,496,223 (5,918)
22 USD US Treasury 2 Year Note Futures September 2020 September 2020 4,368,171 (30)
186 USD US Treasury 5 Year Note Futures September 2020 September 2020 20,994,157 35,022
(6) USD US Ultra Bond Futures September 2020 September 2020 1,165,689 8,631
Total 129,352,580 694,180
Purchased Options as at 31 May 2020
Numberof
contractsCall/Put Description Counterparty Strike Price
Expirationdate
Netunrealised
appreciationEUR
MarketValue
EUR
833,600 Call OTC EUR/GBP Citibank EUR 0.90 29/10/2020 6,766 18,608
Total (Gross underlying exposure - EUR 0) 6,766 18,608
Written Swaptions as at 31 May 2020
NominalValue
Call/Put Description Counterparty Strike Price
Expirationdate
Netunrealised
appreciationEUR
MarketValue
EUR
(501,893) Put
Fund writes an option to enter into an InterestRate Swap. If exercised Fund receives0.11% Fixed annually from 22/7/2020; andpays Floating EUR EURIBOR 6 Monthsemi-annually from 22/1/2021 Barclays Bank EUR 0.11 20/07/2020 1,949 (171)
(354,000) Put
Fund writes an option to enter into an InterestRate Swap. If exercised Fund receives0.635% Fixed semi-annually from5/8/2020; and pays Floating GBP LIBOR6 Month BBA semi-annually from 5/2/2021 Barclays Bank GBP 0.64 05/08/2020 849 (2)
Total (Gross underlying exposure - EUR 46,916) 2,798 (173)
Open forward foreign exchange transactionsas at 31 May 2020
Currency Purchases Currency Sales CounterpartyMaturity
date
Netunrealised
appreciation/(depreciation)
EURAUD 170,000 EUR 101,704 Barclays Bank 17/6/2020 (262)
Open forward foreign exchange transactionsas at 31 May 2020
Currency Purchases Currency Sales CounterpartyMaturity
date
Netunrealised
appreciation/(depreciation)
EURAUD 160,000 EUR 93,998 JP Morgan 17/6/2020 1,476
BlackRock Fixed Income Credit Strategies Fund continued
The notes on pages 691 to 711 form an integral part of these financial statements.
Annual report and audited financial statements [353]
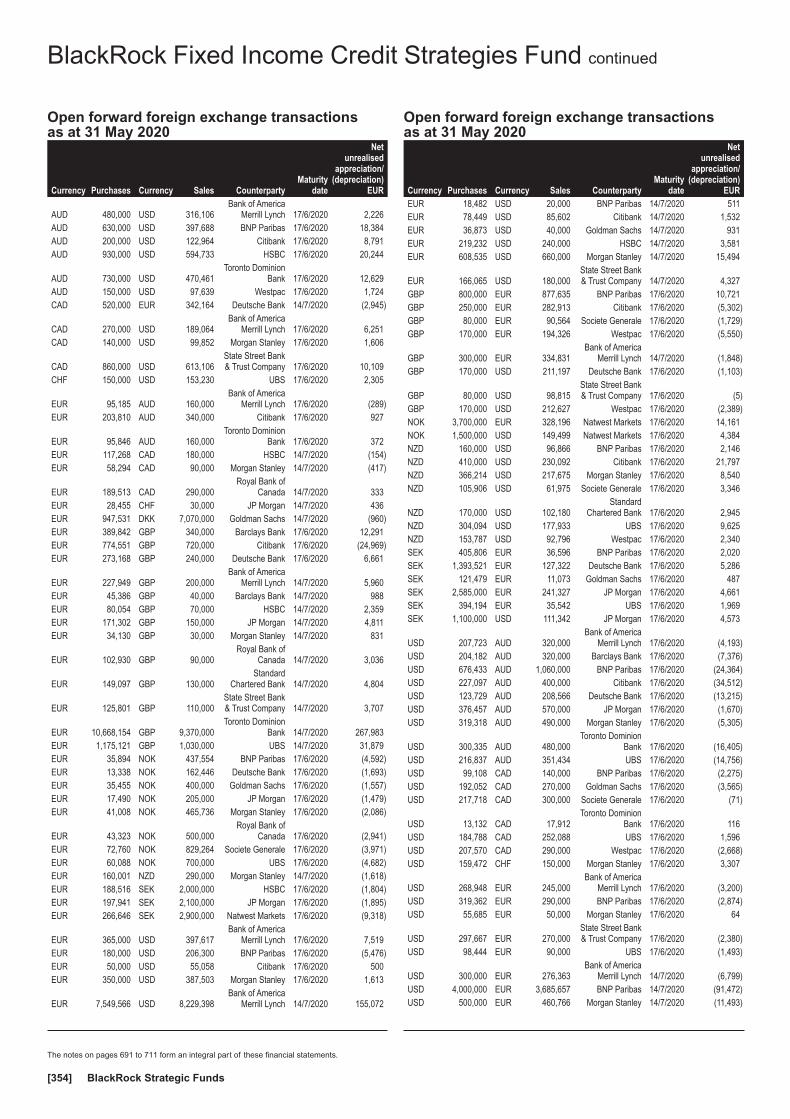
Open forward foreign exchange transactionsas at 31 May 2020
Currency Purchases Currency Sales CounterpartyMaturity
date
Netunrealised
appreciation/(depreciation)
EUR
AUD 480,000 USD 316,106Bank of America
Merrill Lynch 17/6/2020 2,226AUD 630,000 USD 397,688 BNP Paribas 17/6/2020 18,384AUD 200,000 USD 122,964 Citibank 17/6/2020 8,791AUD 930,000 USD 594,733 HSBC 17/6/2020 20,244
AUD 730,000 USD 470,461Toronto Dominion
Bank 17/6/2020 12,629AUD 150,000 USD 97,639 Westpac 17/6/2020 1,724CAD 520,000 EUR 342,164 Deutsche Bank 14/7/2020 (2,945)
CAD 270,000 USD 189,064Bank of America
Merrill Lynch 17/6/2020 6,251CAD 140,000 USD 99,852 Morgan Stanley 17/6/2020 1,606
CAD 860,000 USD 613,106State Street Bank& Trust Company 17/6/2020 10,109
CHF 150,000 USD 153,230 UBS 17/6/2020 2,305
EUR 95,185 AUD 160,000Bank of America
Merrill Lynch 17/6/2020 (289)EUR 203,810 AUD 340,000 Citibank 17/6/2020 927
EUR 95,846 AUD 160,000Toronto Dominion
Bank 17/6/2020 372EUR 117,268 CAD 180,000 HSBC 14/7/2020 (154)EUR 58,294 CAD 90,000 Morgan Stanley 14/7/2020 (417)
EUR 189,513 CAD 290,000Royal Bank of
Canada 14/7/2020 333EUR 28,455 CHF 30,000 JP Morgan 14/7/2020 436EUR 947,531 DKK 7,070,000 Goldman Sachs 14/7/2020 (960)EUR 389,842 GBP 340,000 Barclays Bank 17/6/2020 12,291EUR 774,551 GBP 720,000 Citibank 17/6/2020 (24,969)EUR 273,168 GBP 240,000 Deutsche Bank 17/6/2020 6,661
EUR 227,949 GBP 200,000Bank of America
Merrill Lynch 14/7/2020 5,960EUR 45,386 GBP 40,000 Barclays Bank 14/7/2020 988EUR 80,054 GBP 70,000 HSBC 14/7/2020 2,359EUR 171,302 GBP 150,000 JP Morgan 14/7/2020 4,811EUR 34,130 GBP 30,000 Morgan Stanley 14/7/2020 831
EUR 102,930 GBP 90,000Royal Bank of
Canada 14/7/2020 3,036
EUR 149,097 GBP 130,000Standard
Chartered Bank 14/7/2020 4,804
EUR 125,801 GBP 110,000State Street Bank& Trust Company 14/7/2020 3,707
EUR 10,668,154 GBP 9,370,000Toronto Dominion
Bank 14/7/2020 267,983EUR 1,175,121 GBP 1,030,000 UBS 14/7/2020 31,879EUR 35,894 NOK 437,554 BNP Paribas 17/6/2020 (4,592)EUR 13,338 NOK 162,446 Deutsche Bank 17/6/2020 (1,693)EUR 35,455 NOK 400,000 Goldman Sachs 17/6/2020 (1,557)EUR 17,490 NOK 205,000 JP Morgan 17/6/2020 (1,479)EUR 41,008 NOK 465,736 Morgan Stanley 17/6/2020 (2,086)
EUR 43,323 NOK 500,000Royal Bank of
Canada 17/6/2020 (2,941)EUR 72,760 NOK 829,264 Societe Generale 17/6/2020 (3,971)EUR 60,088 NOK 700,000 UBS 17/6/2020 (4,682)EUR 160,001 NZD 290,000 Morgan Stanley 14/7/2020 (1,618)EUR 188,516 SEK 2,000,000 HSBC 17/6/2020 (1,804)EUR 197,941 SEK 2,100,000 JP Morgan 17/6/2020 (1,895)EUR 266,646 SEK 2,900,000 Natwest Markets 17/6/2020 (9,318)
EUR 365,000 USD 397,617Bank of America
Merrill Lynch 17/6/2020 7,519EUR 180,000 USD 206,300 BNP Paribas 17/6/2020 (5,476)EUR 50,000 USD 55,058 Citibank 17/6/2020 500EUR 350,000 USD 387,503 Morgan Stanley 17/6/2020 1,613
EUR 7,549,566 USD 8,229,398Bank of America
Merrill Lynch 14/7/2020 155,072
Open forward foreign exchange transactionsas at 31 May 2020
Currency Purchases Currency Sales CounterpartyMaturity
date
Netunrealised
appreciation/(depreciation)
EUREUR 18,482 USD 20,000 BNP Paribas 14/7/2020 511EUR 78,449 USD 85,602 Citibank 14/7/2020 1,532EUR 36,873 USD 40,000 Goldman Sachs 14/7/2020 931EUR 219,232 USD 240,000 HSBC 14/7/2020 3,581EUR 608,535 USD 660,000 Morgan Stanley 14/7/2020 15,494
EUR 166,065 USD 180,000State Street Bank& Trust Company 14/7/2020 4,327
GBP 800,000 EUR 877,635 BNP Paribas 17/6/2020 10,721GBP 250,000 EUR 282,913 Citibank 17/6/2020 (5,302)GBP 80,000 EUR 90,564 Societe Generale 17/6/2020 (1,729)GBP 170,000 EUR 194,326 Westpac 17/6/2020 (5,550)
GBP 300,000 EUR 334,831Bank of America
Merrill Lynch 14/7/2020 (1,848)GBP 170,000 USD 211,197 Deutsche Bank 17/6/2020 (1,103)
GBP 80,000 USD 98,815State Street Bank& Trust Company 17/6/2020 (5)
GBP 170,000 USD 212,627 Westpac 17/6/2020 (2,389)NOK 3,700,000 EUR 328,196 Natwest Markets 17/6/2020 14,161NOK 1,500,000 USD 149,499 Natwest Markets 17/6/2020 4,384NZD 160,000 USD 96,866 BNP Paribas 17/6/2020 2,146NZD 410,000 USD 230,092 Citibank 17/6/2020 21,797NZD 366,214 USD 217,675 Morgan Stanley 17/6/2020 8,540NZD 105,906 USD 61,975 Societe Generale 17/6/2020 3,346
NZD 170,000 USD 102,180Standard
Chartered Bank 17/6/2020 2,945NZD 304,094 USD 177,933 UBS 17/6/2020 9,625NZD 153,787 USD 92,796 Westpac 17/6/2020 2,340SEK 405,806 EUR 36,596 BNP Paribas 17/6/2020 2,020SEK 1,393,521 EUR 127,322 Deutsche Bank 17/6/2020 5,286SEK 121,479 EUR 11,073 Goldman Sachs 17/6/2020 487SEK 2,585,000 EUR 241,327 JP Morgan 17/6/2020 4,661SEK 394,194 EUR 35,542 UBS 17/6/2020 1,969SEK 1,100,000 USD 111,342 JP Morgan 17/6/2020 4,573
USD 207,723 AUD 320,000Bank of America
Merrill Lynch 17/6/2020 (4,193)USD 204,182 AUD 320,000 Barclays Bank 17/6/2020 (7,376)USD 676,433 AUD 1,060,000 BNP Paribas 17/6/2020 (24,364)USD 227,097 AUD 400,000 Citibank 17/6/2020 (34,512)USD 123,729 AUD 208,566 Deutsche Bank 17/6/2020 (13,215)USD 376,457 AUD 570,000 JP Morgan 17/6/2020 (1,670)USD 319,318 AUD 490,000 Morgan Stanley 17/6/2020 (5,305)
USD 300,335 AUD 480,000Toronto Dominion
Bank 17/6/2020 (16,405)USD 216,837 AUD 351,434 UBS 17/6/2020 (14,756)USD 99,108 CAD 140,000 BNP Paribas 17/6/2020 (2,275)USD 192,052 CAD 270,000 Goldman Sachs 17/6/2020 (3,565)USD 217,718 CAD 300,000 Societe Generale 17/6/2020 (71)
USD 13,132 CAD 17,912Toronto Dominion
Bank 17/6/2020 116USD 184,788 CAD 252,088 UBS 17/6/2020 1,596USD 207,570 CAD 290,000 Westpac 17/6/2020 (2,668)USD 159,472 CHF 150,000 Morgan Stanley 17/6/2020 3,307
USD 268,948 EUR 245,000Bank of America
Merrill Lynch 17/6/2020 (3,200)USD 319,362 EUR 290,000 BNP Paribas 17/6/2020 (2,874)USD 55,685 EUR 50,000 Morgan Stanley 17/6/2020 64
USD 297,667 EUR 270,000State Street Bank& Trust Company 17/6/2020 (2,380)
USD 98,444 EUR 90,000 UBS 17/6/2020 (1,493)
USD 300,000 EUR 276,363Bank of America
Merrill Lynch 14/7/2020 (6,799)USD 4,000,000 EUR 3,685,657 BNP Paribas 14/7/2020 (91,472)USD 500,000 EUR 460,766 Morgan Stanley 14/7/2020 (11,493)
BlackRock Fixed Income Credit Strategies Fund continued
The notes on pages 691 to 711 form an integral part of these financial statements.
BlackRock Strategic Funds[354]
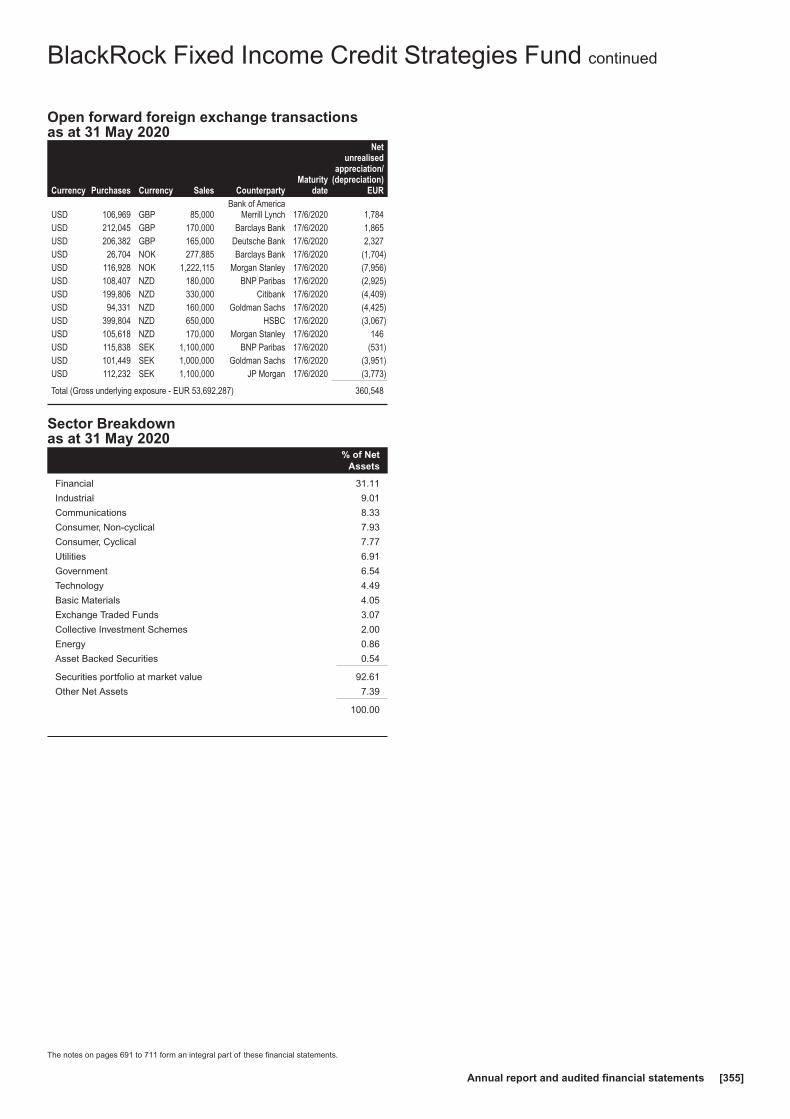
Open forward foreign exchange transactionsas at 31 May 2020
Currency Purchases Currency Sales CounterpartyMaturity
date
Netunrealised
appreciation/(depreciation)
EUR
USD 106,969 GBP 85,000Bank of America
Merrill Lynch 17/6/2020 1,784USD 212,045 GBP 170,000 Barclays Bank 17/6/2020 1,865USD 206,382 GBP 165,000 Deutsche Bank 17/6/2020 2,327USD 26,704 NOK 277,885 Barclays Bank 17/6/2020 (1,704)USD 116,928 NOK 1,222,115 Morgan Stanley 17/6/2020 (7,956)USD 108,407 NZD 180,000 BNP Paribas 17/6/2020 (2,925)USD 199,806 NZD 330,000 Citibank 17/6/2020 (4,409)USD 94,331 NZD 160,000 Goldman Sachs 17/6/2020 (4,425)USD 399,804 NZD 650,000 HSBC 17/6/2020 (3,067)USD 105,618 NZD 170,000 Morgan Stanley 17/6/2020 146USD 115,838 SEK 1,100,000 BNP Paribas 17/6/2020 (531)USD 101,449 SEK 1,000,000 Goldman Sachs 17/6/2020 (3,951)USD 112,232 SEK 1,100,000 JP Morgan 17/6/2020 (3,773)
Total (Gross underlying exposure - EUR 53,692,287) 360,548
Sector Breakdownas at 31 May 2020
% of NetAssets
Financial 31.11
Industrial 9.01
Communications 8.33
Consumer, Non-cyclical 7.93
Consumer, Cyclical 7.77
Utilities 6.91
Government 6.54
Technology 4.49
Basic Materials 4.05
Exchange Traded Funds 3.07
Collective Investment Schemes 2.00
Energy 0.86
Asset Backed Securities 0.54
Securities portfolio at market value 92.61
Other Net Assets 7.39
100.00
BlackRock Fixed Income Credit Strategies Fund continued
The notes on pages 691 to 711 form an integral part of these financial statements.
Annual report and audited financial statements [355]
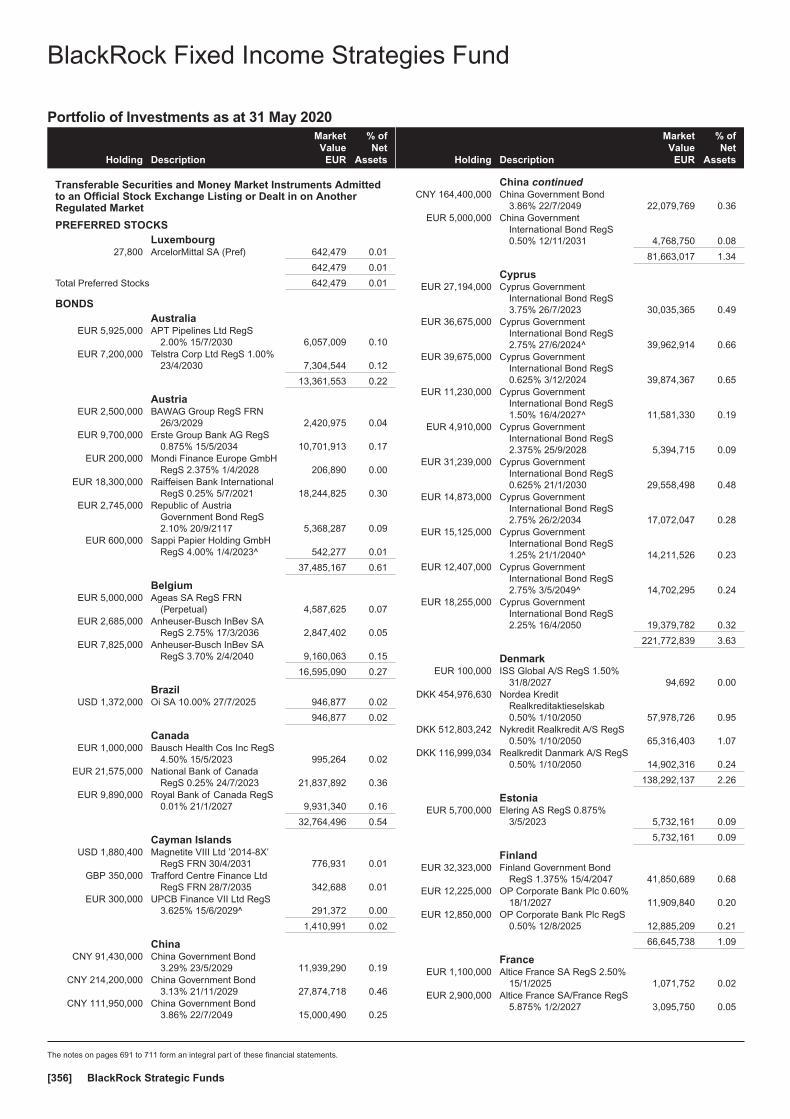
Portfolio of Investments as at 31 May 2020
Holding Description
MarketValue
EUR
% ofNet
Assets
Transferable Securities and Money Market Instruments Admittedto an Official Stock Exchange Listing or Dealt in on AnotherRegulated Market
PREFERRED STOCKSLuxembourg
27,800 ArcelorMittal SA (Pref) 642,479 0.01
642,479 0.01
Total Preferred Stocks 642,479 0.01
BONDSAustralia
EUR 5,925,000 APT Pipelines Ltd RegS2.00% 15/7/2030 6,057,009 0.10
EUR 7,200,000 Telstra Corp Ltd RegS 1.00%23/4/2030 7,304,544 0.12
13,361,553 0.22
AustriaEUR 2,500,000 BAWAG Group RegS FRN
26/3/2029 2,420,975 0.04EUR 9,700,000 Erste Group Bank AG RegS
0.875% 15/5/2034 10,701,913 0.17EUR 200,000 Mondi Finance Europe GmbH
RegS 2.375% 1/4/2028 206,890 0.00EUR 18,300,000 Raiffeisen Bank International
RegS 0.25% 5/7/2021 18,244,825 0.30EUR 2,745,000 Republic of Austria
Government Bond RegS2.10% 20/9/2117 5,368,287 0.09
EUR 600,000 Sappi Papier Holding GmbHRegS 4.00% 1/4/2023^ 542,277 0.01
37,485,167 0.61
BelgiumEUR 5,000,000 Ageas SA RegS FRN
(Perpetual) 4,587,625 0.07EUR 2,685,000 Anheuser-Busch InBev SA
RegS 2.75% 17/3/2036 2,847,402 0.05EUR 7,825,000 Anheuser-Busch InBev SA
RegS 3.70% 2/4/2040 9,160,063 0.15
16,595,090 0.27
BrazilUSD 1,372,000 Oi SA 10.00% 27/7/2025 946,877 0.02
946,877 0.02
CanadaEUR 1,000,000 Bausch Health Cos Inc RegS
4.50% 15/5/2023 995,264 0.02EUR 21,575,000 National Bank of Canada
RegS 0.25% 24/7/2023 21,837,892 0.36EUR 9,890,000 Royal Bank of Canada RegS
0.01% 21/1/2027 9,931,340 0.16
32,764,496 0.54
Cayman IslandsUSD 1,880,400 Magnetite VIII Ltd ’2014-8X’
RegS FRN 30/4/2031 776,931 0.01GBP 350,000 Trafford Centre Finance Ltd
RegS FRN 28/7/2035 342,688 0.01EUR 300,000 UPCB Finance VII Ltd RegS
3.625% 15/6/2029^ 291,372 0.00
1,410,991 0.02
ChinaCNY 91,430,000 China Government Bond
3.29% 23/5/2029 11,939,290 0.19CNY 214,200,000 China Government Bond
3.13% 21/11/2029 27,874,718 0.46CNY 111,950,000 China Government Bond
3.86% 22/7/2049 15,000,490 0.25
Holding Description
MarketValue
EUR
% ofNet
Assets
China continuedCNY 164,400,000 China Government Bond
3.86% 22/7/2049 22,079,769 0.36EUR 5,000,000 China Government
International Bond RegS0.50% 12/11/2031 4,768,750 0.08
81,663,017 1.34
CyprusEUR 27,194,000 Cyprus Government
International Bond RegS3.75% 26/7/2023 30,035,365 0.49
EUR 36,675,000 Cyprus GovernmentInternational Bond RegS2.75% 27/6/2024^ 39,962,914 0.66
EUR 39,675,000 Cyprus GovernmentInternational Bond RegS0.625% 3/12/2024 39,874,367 0.65
EUR 11,230,000 Cyprus GovernmentInternational Bond RegS1.50% 16/4/2027^ 11,581,330 0.19
EUR 4,910,000 Cyprus GovernmentInternational Bond RegS2.375% 25/9/2028 5,394,715 0.09
EUR 31,239,000 Cyprus GovernmentInternational Bond RegS0.625% 21/1/2030 29,558,498 0.48
EUR 14,873,000 Cyprus GovernmentInternational Bond RegS2.75% 26/2/2034 17,072,047 0.28
EUR 15,125,000 Cyprus GovernmentInternational Bond RegS1.25% 21/1/2040^ 14,211,526 0.23
EUR 12,407,000 Cyprus GovernmentInternational Bond RegS2.75% 3/5/2049^ 14,702,295 0.24
EUR 18,255,000 Cyprus GovernmentInternational Bond RegS2.25% 16/4/2050 19,379,782 0.32
221,772,839 3.63
DenmarkEUR 100,000 ISS Global A/S RegS 1.50%
31/8/2027 94,692 0.00DKK 454,976,630 Nordea Kredit
Realkreditaktieselskab0.50% 1/10/2050 57,978,726 0.95
DKK 512,803,242 Nykredit Realkredit A/S RegS0.50% 1/10/2050 65,316,403 1.07
DKK 116,999,034 Realkredit Danmark A/S RegS0.50% 1/10/2050 14,902,316 0.24
138,292,137 2.26
EstoniaEUR 5,700,000 Elering AS RegS 0.875%
3/5/2023 5,732,161 0.09
5,732,161 0.09
FinlandEUR 32,323,000 Finland Government Bond
RegS 1.375% 15/4/2047 41,850,689 0.68EUR 12,225,000 OP Corporate Bank Plc 0.60%
18/1/2027 11,909,840 0.20EUR 12,850,000 OP Corporate Bank Plc RegS
0.50% 12/8/2025 12,885,209 0.21
66,645,738 1.09
FranceEUR 1,100,000 Altice France SA RegS 2.50%
15/1/2025 1,071,752 0.02EUR 2,900,000 Altice France SA/France RegS
5.875% 1/2/2027 3,095,750 0.05
BlackRock Fixed Income Strategies Fund
The notes on pages 691 to 711 form an integral part of these financial statements.
BlackRock Strategic Funds[356]

Portfolio of Investments as at 31 May 2020
Holding Description
MarketValue
EUR
% ofNet
Assets
France continuedEUR 100,000 Arkema SA RegS FRN
(Perpetual) 101,217 0.00EUR 15,300,000 Banque Federative du Credit
Mutuel RegS 0.75%15/6/2023 15,525,292 0.25
EUR 8,900,000 BNP Paribas SA RegS FRN15/7/2025 8,749,768 0.14
GBP 7,900,000 BNP Paribas SA RegS 1.875%14/12/2027 8,670,556 0.14
EUR 8,000,000 BNP Paribas SA RegS FRN19/2/2028 7,724,840 0.13
EUR 12,100,000 BNP Paribas SA RegS FRN15/1/2032 11,517,627 0.19
EUR 1,200,000 BPCE SA RegS 0.625%26/9/2023 1,212,198 0.02
EUR 4,200,000 BPCE SA RegS 0.125%4/12/2024 4,152,876 0.07
EUR 3,700,000 BPCE SFH SA RegS 0.01%27/5/2030 3,710,674 0.06
EUR 5,600,000 Capgemini SE RegS 2.00%15/4/2029 5,911,164 0.10
EUR 5,800,000 Capgemini SE RegS 2.375%15/4/2032 6,287,635 0.10
EUR 5,800,000 Cars Alliance Auto LoansFrance V ’2018-1 B’ RegSFRN 21/10/2029 5,688,345 0.09
EUR 100,000 Casino Guichard PerrachonSA RegS 4.498% 7/3/2024 87,789 0.00
EUR 100,000 Casino Guichard PerrachonSA RegS FRN (Perpetual) 44,453 0.00
EUR 1,100,000 Cie de Saint-Gobain RegS0.875% 21/9/2023 1,102,222 0.02
EUR 3,600,000 Cie de Saint-Gobain RegS0.625% 15/3/2024 3,576,906 0.06
EUR 14,600,000 Cie de Saint-Gobain RegS2.375% 4/10/2027 15,616,160 0.26
USD 200,000 Credit Agricole SA FRN(Perpetual) 185,160 0.00
EUR 1,700,000 Credit Mutuel Arkea RegS1.375% 17/1/2025 1,765,934 0.03
EUR 10,100,000 Credit Mutuel Arkea SA RegS0.875% 7/5/2027 10,196,455 0.17
EUR 9,700,000 Crown European Holdings SARegS 2.875% 1/2/2026 9,821,444 0.16
GBP 12,900,000 Dexia Credit Local SA RegS1.625% 8/12/2023 14,895,861 0.24
GBP 2,100,000 Electricite de France SA RegSFRN (Perpetual) 2,396,626 0.04
EUR 21,300,000 Electricite de France SA RegS2.00% 9/12/2049 20,737,147 0.34
GBP 400,000 Electricite de France SA RegSFRN (Perpetual) 465,386 0.01
EUR 600,000 Electricite de France SA RegSFRN (Perpetual) 579,066 0.01
GBP 3,000,000 Electricite de France SA RegS6.00% 23/1/2114 5,646,758 0.09
EUR 4,700,000 Engie SA RegS 4/3/2027 (ZeroCoupon) 4,549,412 0.07
EUR 300,000 EssilorLuxottica SA RegS0.50% 5/6/2028 298,350 0.01
EUR 300,000 FCT Autonoria ’2019 D’ RegSFRN 25/9/2035 290,069 0.00
EUR 885,492 FCT Noria ’2018-1 E’ RegSFRN 25/6/2038 834,853 0.01
EUR 75,785,000 France Government Bond OATRegS 0.50% 25/5/2040 76,554,976 1.25
EUR 6,557,000 French Republic GovernmentBond OAT RegS 1.50%25/5/2050‡ 8,061,307 0.13
Holding Description
MarketValue
EUR
% ofNet
Assets
France continuedEUR 200,000 JCDecaux SA RegS 2.625%
24/4/2028 192,439 0.00EUR 300,000 Kering SA RegS
30/9/2022 (Zero Coupon) 307,635 0.01EUR 100,000 Kering SA RegS 0.75%
13/5/2028 100,652 0.00EUR 15,200,000 La Poste SA RegS 1.375%
21/4/2032 15,760,348 0.26EUR 300,000 Peugeot SA RegS 2.75%
15/5/2026 301,966 0.01EUR 300,000 Picard Groupe SAS RegS
FRN 30/11/2023 286,077 0.00EUR 2,825,000 PSA Banque France RegS
0.50% 12/4/2022 2,762,257 0.05EUR 5,825,000 RCI Banque SA RegS FRN
8/7/2020 5,818,301 0.10USD 200,000 Societe Generale SA FRN
(Perpetual) 178,227 0.00EUR 9,900,000 Societe Generale SA RegS
0.75% 25/1/2027 9,517,266 0.16USD 200,000 Societe Generale SA RegS
FRN (Perpetual) 181,163 0.00EUR 295,000 TOTAL SA RegS FRN
(Perpetual) 304,173 0.01USD 200,000 Valeo SA RegS
16/6/2021 (Zero Coupon) 174,049 0.00
297,010,581 4.86
GermanyEUR 1,500,000 ADLER Real Estate AG RegS
1.50% 6/12/2021 1,482,840 0.02EUR 500,000 ADLER Real Estate AG RegS
3.00% 27/4/2026 490,158 0.01EUR 8,800,000 Allianz SE RegS FRN
8/7/2050 8,998,264 0.15EUR 600,000 Bayer AG RegS FRN
12/11/2079 588,000 0.01EUR 500,000 Bayer AG RegS FRN
12/11/2079 499,275 0.01EUR 54,100,000 Bundesrepublik Deutschland
Bundesanleihe RegS15/5/2035 (Zero Coupon)‡ 55,988,901 0.92
EUR 300,000 CeramTec BondCo GmbHRegS 5.25% 15/12/2025 275,961 0.00
EUR 200,000 Commerzbank AG RegS FRN5/12/2030 199,000 0.00
EUR 100,000 Consus Real Estate AG RegS4.00% 29/11/2022 91,166 0.00
EUR 700,000 Consus Real Estate AG RegS9.625% 15/5/2024 715,236 0.01
EUR 300,000 Continental AG 2.50%27/8/2026 311,697 0.00
EUR 3,150,000 Deutsche Bahn FinanceGmbH RegS 1.375%16/4/2040 3,384,045 0.06
GBP 9,000,000 Deutsche Bank AG RegS2.625% 16/12/2024 9,752,094 0.16
EUR 6,900,000 Deutsche Pfandbriefbank AG0.10% 21/1/2028^ 7,021,957 0.11
EUR 1,000,000 Deutsche Pfandbriefbank AGRegS FRN (Perpetual) 860,970 0.01
GBP 3,325,000 Deutsche Telekom RegS3.125% 6/2/2034 4,219,697 0.07
EUR 5,025,000 DZ HYP AG RegS 0.01%29/1/2024 5,075,250 0.08
EUR 15,425,000 DZ HYP AG RegS 0.01%15/1/2027 15,627,530 0.26
EUR 3,400,000 Eurogrid GmbH RegS 1.113%15/5/2032 3,509,480 0.06
BlackRock Fixed Income Strategies Fund continued
The notes on pages 691 to 711 form an integral part of these financial statements.
Annual report and audited financial statements [357]
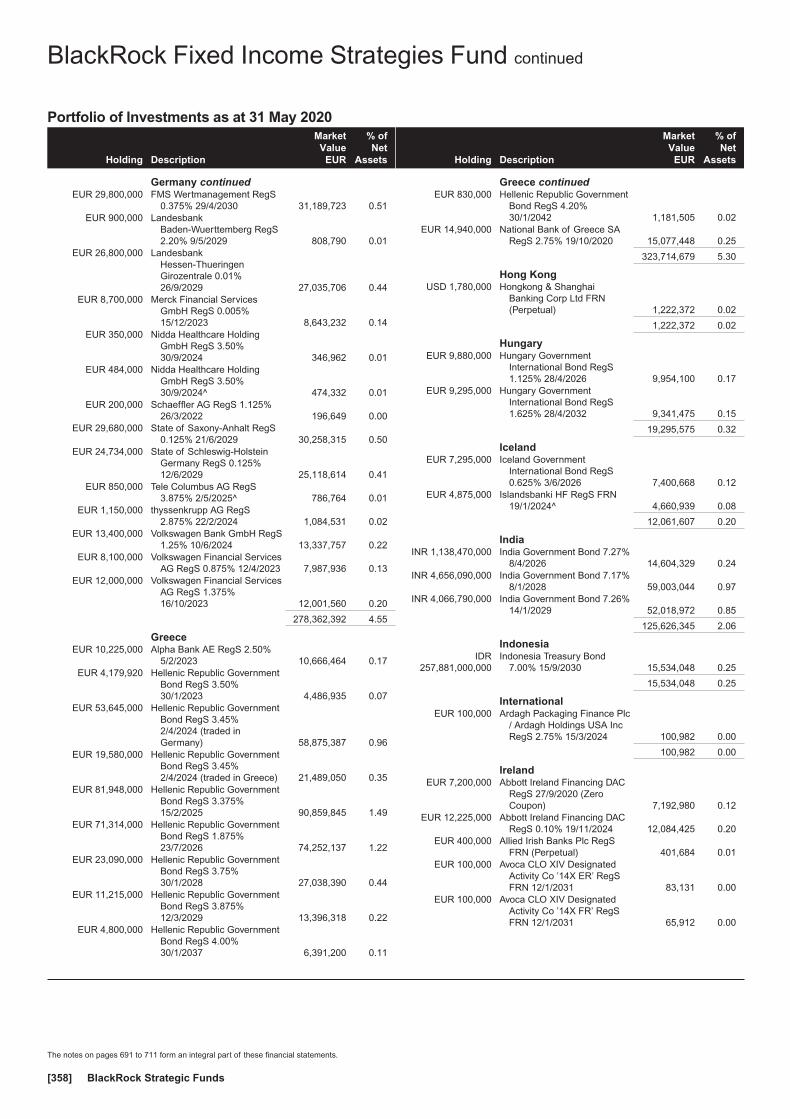
Portfolio of Investments as at 31 May 2020
Holding Description
MarketValue
EUR
% ofNet
Assets
Germany continuedEUR 29,800,000 FMS Wertmanagement RegS
0.375% 29/4/2030 31,189,723 0.51EUR 900,000 Landesbank
Baden-Wuerttemberg RegS2.20% 9/5/2029 808,790 0.01
EUR 26,800,000 LandesbankHessen-ThueringenGirozentrale 0.01%26/9/2029 27,035,706 0.44
EUR 8,700,000 Merck Financial ServicesGmbH RegS 0.005%15/12/2023 8,643,232 0.14
EUR 350,000 Nidda Healthcare HoldingGmbH RegS 3.50%30/9/2024 346,962 0.01
EUR 484,000 Nidda Healthcare HoldingGmbH RegS 3.50%30/9/2024^ 474,332 0.01
EUR 200,000 Schaeffler AG RegS 1.125%26/3/2022 196,649 0.00
EUR 29,680,000 State of Saxony-Anhalt RegS0.125% 21/6/2029 30,258,315 0.50
EUR 24,734,000 State of Schleswig-HolsteinGermany RegS 0.125%12/6/2029 25,118,614 0.41
EUR 850,000 Tele Columbus AG RegS3.875% 2/5/2025^ 786,764 0.01
EUR 1,150,000 thyssenkrupp AG RegS2.875% 22/2/2024 1,084,531 0.02
EUR 13,400,000 Volkswagen Bank GmbH RegS1.25% 10/6/2024 13,337,757 0.22
EUR 8,100,000 Volkswagen Financial ServicesAG RegS 0.875% 12/4/2023 7,987,936 0.13
EUR 12,000,000 Volkswagen Financial ServicesAG RegS 1.375%16/10/2023 12,001,560 0.20
278,362,392 4.55
GreeceEUR 10,225,000 Alpha Bank AE RegS 2.50%
5/2/2023 10,666,464 0.17EUR 4,179,920 Hellenic Republic Government
Bond RegS 3.50%30/1/2023 4,486,935 0.07
EUR 53,645,000 Hellenic Republic GovernmentBond RegS 3.45%2/4/2024 (traded inGermany) 58,875,387 0.96
EUR 19,580,000 Hellenic Republic GovernmentBond RegS 3.45%2/4/2024 (traded in Greece) 21,489,050 0.35
EUR 81,948,000 Hellenic Republic GovernmentBond RegS 3.375%15/2/2025 90,859,845 1.49
EUR 71,314,000 Hellenic Republic GovernmentBond RegS 1.875%23/7/2026 74,252,137 1.22
EUR 23,090,000 Hellenic Republic GovernmentBond RegS 3.75%30/1/2028 27,038,390 0.44
EUR 11,215,000 Hellenic Republic GovernmentBond RegS 3.875%12/3/2029 13,396,318 0.22
EUR 4,800,000 Hellenic Republic GovernmentBond RegS 4.00%30/1/2037 6,391,200 0.11
Holding Description
MarketValue
EUR
% ofNet
Assets
Greece continuedEUR 830,000 Hellenic Republic Government
Bond RegS 4.20%30/1/2042 1,181,505 0.02
EUR 14,940,000 National Bank of Greece SARegS 2.75% 19/10/2020 15,077,448 0.25
323,714,679 5.30
Hong KongUSD 1,780,000 Hongkong & Shanghai
Banking Corp Ltd FRN(Perpetual) 1,222,372 0.02
1,222,372 0.02
HungaryEUR 9,880,000 Hungary Government
International Bond RegS1.125% 28/4/2026 9,954,100 0.17
EUR 9,295,000 Hungary GovernmentInternational Bond RegS1.625% 28/4/2032 9,341,475 0.15
19,295,575 0.32
IcelandEUR 7,295,000 Iceland Government
International Bond RegS0.625% 3/6/2026 7,400,668 0.12
EUR 4,875,000 Islandsbanki HF RegS FRN19/1/2024^ 4,660,939 0.08
12,061,607 0.20
IndiaINR 1,138,470,000 India Government Bond 7.27%
8/4/2026 14,604,329 0.24INR 4,656,090,000 India Government Bond 7.17%
8/1/2028 59,003,044 0.97INR 4,066,790,000 India Government Bond 7.26%
14/1/2029 52,018,972 0.85
125,626,345 2.06
IndonesiaIDR
257,881,000,000Indonesia Treasury Bond
7.00% 15/9/2030 15,534,048 0.25
15,534,048 0.25
InternationalEUR 100,000 Ardagh Packaging Finance Plc
/ Ardagh Holdings USA IncRegS 2.75% 15/3/2024 100,982 0.00
100,982 0.00
IrelandEUR 7,200,000 Abbott Ireland Financing DAC
RegS 27/9/2020 (ZeroCoupon) 7,192,980 0.12
EUR 12,225,000 Abbott Ireland Financing DACRegS 0.10% 19/11/2024 12,084,425 0.20
EUR 400,000 Allied Irish Banks Plc RegSFRN (Perpetual) 401,684 0.01
EUR 100,000 Avoca CLO XIV DesignatedActivity Co ’14X ER’ RegSFRN 12/1/2031 83,131 0.00
EUR 100,000 Avoca CLO XIV DesignatedActivity Co ’14X FR’ RegSFRN 12/1/2031 65,912 0.00
BlackRock Fixed Income Strategies Fund continued
The notes on pages 691 to 711 form an integral part of these financial statements.
BlackRock Strategic Funds[358]

Portfolio of Investments as at 31 May 2020
Holding Description
MarketValue
EUR
% ofNet
Assets
Ireland continuedEUR 275,000 Avoca Clo XIV Designated
Activity Co ’14X SUB’ RegSFRN 12/1/2031 125,042 0.00
EUR 500,000 Avoca CLO XV DAC ’15X FR’RegS FRN 15/4/2031 290,899 0.00
GBP 8,540,000 BAMS CMBS 2018-1 DAC ’A’RegS FRN 17/5/2028 9,277,858 0.15
GBP 2,985,000 BAMS CMBS 2018-1 DAC ’B’RegS FRN 17/5/2028 3,144,964 0.05
GBP 1,775,000 BAMS CMBS 2018-1 DAC ’C’RegS FRN 17/5/2028 1,841,778 0.03
USD 1,600,000 Bank of Ireland Group PlcRegS FRN 19/9/2027 1,382,645 0.02
SEK 65,580,000 Bluestep Mortgage SecuritiesNo 4 DAC ’B’ RegS FRN10/8/2066 6,220,044 0.10
EUR 4,400,000 CRH SMW Finance DACRegS 1.25% 5/11/2026 4,455,154 0.07
EUR 7,175,000 Eaton Capital Unlimited CoRegS 0.021% 14/5/2021 7,140,094 0.12
EUR 200,000 Harvest CLO XVIII DAC ’D’RegS FRN 15/10/2030 173,687 0.00
EUR 553,613 River Green Finance ’2020 B’DAC RegS FRN 22/1/2032 516,963 0.01
EUR 329,175 River Green Finance ’2020 C’DAC RegS FRN 22/1/2032 304,158 0.00
EUR 4,379,025 River Green Finance’2020 DAC A’ RegS FRN22/1/2032 4,283,562 0.07
EUR 1,000,000 Ryanair DAC RegS 1.125%15/8/2023 928,755 0.02
EUR 405,731 Taurus ’2019-1 FR B’ DACRegS FRN 2/2/2031 380,363 0.01
EUR 378,423 Taurus ’2019-1 FR C’ DACRegS FRN 2/2/2031 350,788 0.01
EUR 1,747,766 Taurus ’2019-1 FR’ DAC RegSFRN 2/2/2031 1,725,395 0.03
GBP 600,000 Virgin Media ReceivablesFinancing Notes II DACRegS 5.75% 15/4/2023 677,293 0.01
63,047,574 1.03
Isle of ManEUR 400,000 Playtech Plc RegS 3.75%
12/10/2023 397,000 0.01EUR 200,000 Playtech Plc RegS 4.25%
7/3/2026 196,029 0.00
593,029 0.01
ItalyEUR 320,000 Asset-Backed European
Securitisation TransactionSeventeen Srl ’C’ RegS FRN15/4/2032 305,927 0.01
EUR 900,000 Banca Monte dei Paschi diSiena SpA RegS 2.875%16/4/2021 920,677 0.02
EUR 225,000 Brignole Co ’2019 1 C’ FRN24/7/2034 211,948 0.00
EUR 17,955,000 Buzzi Unicem SpA RegS2.125% 28/4/2023 18,262,569 0.30
EUR 2,190,596 Driver Italia One SRL ’A’ RegSFRN 21/4/2029 2,188,598 0.04
EUR 1,133,683 Driver Italia One SRL ’B’ RegSFRN 21/4/2029 1,124,750 0.02
EUR 3,500,000 Enel SpA RegS FRN24/11/2081^ 3,618,510 0.06
EUR 300,000 Gamenet Group SpA RegSFRN 27/4/2023 274,895 0.00
EUR 275,334 Gamenet Group SpA RegSFRN 27/4/2023 261,790 0.00
Holding Description
MarketValue
EUR
% ofNet
Assets
Italy continuedEUR 3,290,000 Intesa Sanpaolo SpA RegS
0.875% 27/6/2022 3,257,610 0.05EUR 5,050,000 Intesa Sanpaolo SpA RegS
0.75% 4/12/2024 4,854,767 0.08EUR 14,000,000 Intesa Sanpaolo SpA RegS
1.75% 4/7/2029 13,552,210 0.22EUR 200,000 Intesa Sanpaolo SpA RegS
FRN (Perpetual) 200,333 0.00EUR 200,000 Intesa Sanpaolo SpA RegS
FRN (Perpetual) 211,255 0.00EUR 250,000 Intesa Sanpaolo SpA RegS
FRN (Perpetual) 193,726 0.00EUR 37,728,395 Italy Buoni Poliennali Del
Tesoro RegS 1.40%26/5/2025 38,089,456 0.62
EUR 191,696,711 Italy Buoni Poliennali DelTesoro RegS 1.30%15/5/2028 194,044,995 3.18
EUR 3,095,000 Italy Buoni Poliennali DelTesoro RegS 3.45%1/3/2048 (traded inGermany) 3,779,707 0.06
EUR 8,330,000 Italy Buoni Poliennali DelTesoro RegS 3.45%1/3/2048 (traded in Italy) 10,172,846 0.17
EUR 2,557,000 Italy Buoni Poliennali DelTesoro RegS 3.85%1/9/2049 3,338,330 0.05
EUR 1,945,000 Italy Buoni Poliennali DelTesoro RegS 2.45%1/9/2050 (traded inGermany) 1,982,704 0.03
EUR 51,862,000 Italy Buoni Poliennali DelTesoro RegS 2.45%1/9/2050 (traded in Italy) 52,867,345 0.87
EUR 5,525,000 Mediobanca Banca di CreditoFinanziario SpA RegS0.75% 15/7/2027 4,933,991 0.08
EUR 500,000 Nexi SpA RegS 1.75%24/4/2027 548,300 0.01
EUR 206,250 Sisal Group SpA RegS 7.00%31/7/2023 192,844 0.00
EUR 8,405,106 Sunrise SPV 40 Srl ’2018-1 A’RegS FRN 27/7/2042 8,395,496 0.14
EUR 3,705,000 Sunrise SPV Z70 Srl’2019-1 A’ RegS FRN27/5/2044 3,698,541 0.06
EUR 472,987 Taurus ’2018-IT1 A’ SRL FRN18/5/2030 454,068 0.01
GBP 8,000,000 Telecom Italia SpA 5.875%19/5/2023 9,548,919 0.16
EUR 1,300,000 Telecom Italia SpA RegS1.125% 26/3/2022 1,254,467 0.02
EUR 1,116,000 Telecom Italia SpA/MilanoRegS 2.75% 15/4/2025 1,118,851 0.02
EUR 10,100,000 UniCredit SpA RegS 6.95%31/10/2022 10,977,892 0.18
EUR 14,150,000 UniCredit SpA RegS FRN25/6/2025 13,855,397 0.23
EUR 20,265,000 UniCredit SpA RegS FRN28/10/2025 20,394,595 0.33
EUR 5,775,000 UniCredit SpA RegS FRN3/1/2027^ 5,850,912 0.10
EUR 1,920,000 UniCredit SpA RegS FRN20/2/2029^ 1,947,101 0.03
EUR 12,495,000 UniCredit SpA RegS FRN23/9/2029 11,155,036 0.18
EUR 4,150,000 UniCredit SpA RegS FRN15/1/2032 3,674,119 0.06
BlackRock Fixed Income Strategies Fund continued
The notes on pages 691 to 711 form an integral part of these financial statements.
Annual report and audited financial statements [359]

Portfolio of Investments as at 31 May 2020
Holding Description
MarketValue
EUR
% ofNet
Assets
Italy continuedUSD 800,000 UniCredit SpA RegS FRN
(Perpetual) 683,357 0.01EUR 575,000 UniCredit SpA RegS FRN
(Perpetual) 628,855 0.01EUR 300,000 UniCredit SpA RegS FRN
(Perpetual) 223,209 0.00EUR 500,000 UniCredit SpA RegS FRN
(Perpetual) 477,435 0.01
453,728,333 7.42
JapanJPY 1,225,500,000 Japan Government Thirty Year
Bond 0.40% 20/6/2049 10,049,903 0.17JPY 2,601,000,000 Japan Government Thirty Year
Bond 0.40% 20/12/2049 21,323,707 0.35EUR 200,000 SoftBank Group Corp RegS
4.00% 30/7/2022 207,241 0.00USD 200,000 SoftBank Group Corp RegS
5.375% 30/7/2022 186,395 0.00USD 200,000 SoftBank Group Corp RegS
6.00% 30/7/2025 188,493 0.00EUR 500,000 SoftBank Group Corp RegS
3.125% 19/9/2025 491,545 0.01EUR 800,000 SoftBank Group Corp RegS
5.00% 15/4/2028 840,648 0.01EUR 850,000 SoftBank Group Corp RegS
4.00% 19/9/2029 856,346 0.02USD 800,000 SoftBank Group Corp RegS
FRN (Perpetual) 676,290 0.01
34,820,568 0.57
JerseyGBP 4,515,000 CPUK Finance Ltd RegS
4.25% 28/8/2022^ 4,581,882 0.08GBP 200,000 CPUK Finance Ltd RegS
3.69% 28/8/2028 219,715 0.00EUR 10,653,000 Glencore Finance Europe Ltd
RegS 1.25% 17/3/2021 10,602,452 0.17GBP 8,950,000 Glencore Finance Europe Ltd
RegS 3.125% 26/3/2026 9,751,945 0.16USD 1,400,000 HBOS Capital Funding LP
RegS 6.85% (Perpetual) 1,273,736 0.02GBP 1,100,000 Intu Jersey 2 Ltd RegS
(Contingent ConvertibleBond) 2.875% 1/11/2022 199,565 0.00
USD 600,000 Tullow Oil Jersey Ltd RegS(Contingent ConvertibleBond) 6.625% 12/7/2021 432,292 0.01
27,061,587 0.44
LatviaEUR 13,025,000 Latvia Government
International Bond RegS0.375% 7/10/2026 13,283,872 0.22
13,283,872 0.22
LuxembourgEUR 964,000 Altice Financing SA RegS
2.25% 15/1/2025 923,575 0.02EUR 500,000 Altice Finco SA RegS 4.75%
15/1/2028 448,803 0.01EUR 700,000 Aramark International Finance
Sarl RegS 3.125% 1/4/2025 668,713 0.01EUR 100,000 Aroundtown SA RegS 1.875%
19/1/2026 99,262 0.00EUR 100,000 Aroundtown SA RegS 2.00%
2/11/2026 99,866 0.00EUR 9,000,000 Bank of China Luxembourg
SA RegS 0.125% 16/1/2023 8,838,585 0.14
Holding Description
MarketValue
EUR
% ofNet
Assets
Luxembourg continuedEUR 100,000 Blackstone Property Partners
Europe Holdings Sarl RegS2.20% 24/7/2025 101,066 0.00
EUR 100,000 Cirsa Finance InternationalSarl RegS 6.25%20/12/2023 91,890 0.00
EUR 470,000 Cirsa Finance InternationalSarl RegS 4.75% 22/5/2025 418,704 0.01
EUR 600,000 Codere Finance 2 LuxembourgSA RegS 6.75% 1/11/2021 291,153 0.01
GBP 966,466 Compartment Driver UK Five’B’ RegS FRN 25/7/2025 1,071,044 0.02
GBP 1,082,002 Compartment Driver UK Four’B’ RegS FRN 25/3/2025 1,201,510 0.02
GBP 4,346,706 Compartment Driver UK Six ’A’RegS FRN 25/2/2026 4,805,843 0.08
EUR 1,509,485 Compartment VCL ’26A’ RegSFRN 21/2/2024 1,510,536 0.03
EUR 5,573,036 Compartment VCL ’26B’ RegSFRN 21/2/2024 5,558,563 0.09
EUR 1,100,000 European TopSoho Sarl RegS(Contingent ConvertibleBond) 4.00% 21/9/2021 618,882 0.01
EUR 4,984,427 FACT Master ’2018-1 A’ RegSFRN 20/11/2025 4,964,189 0.08
GBP 200,000 Garfunkelux Holdco 2 RegS11.00% 1/11/2023 188,096 0.00
EUR 18,373,000 HeidelbergCement FinanceLuxembourg SA RegS0.50% 18/1/2021 18,340,939 0.30
EUR 6,100,000 HeidelbergCement FinanceLuxembourg SA RegS1.50% 14/6/2027 5,996,483 0.10
EUR 6,020,000 HeidelbergCement FinanceLuxembourg SA RegS1.125% 1/12/2027 5,738,234 0.09
EUR 4,855,000 HeidelbergCement FinanceLuxembourg SA RegS1.75% 24/4/2028^ 4,800,333 0.08
EUR 630,000 LHMC Finco 2 Sarl RegS7.25% 2/10/2025 345,253 0.01
EUR 10,675,000 Medtronic Global HoldingsSCA 2/12/2022 (ZeroCoupon) 10,583,035 0.17
EUR 5,100,000 Medtronic Global HoldingsSCA 0.25% 2/7/2025 5,056,471 0.08
EUR 730,000 Medtronic Global HoldingsSCA 1.125% 7/3/2027 759,565 0.01
EUR 1,100,000 Medtronic Global HoldingsSCA 1.625% 7/3/2031 1,190,596 0.02
EUR 910,000 Medtronic Global HoldingsSCA 2.25% 7/3/2039 1,028,982 0.02
EUR 885,000 Medtronic Global HoldingsSCA 1.75% 2/7/2049 870,747 0.01
EUR 100,000 Rossini Sarl RegS 6.75%30/10/2025 107,675 0.00
USD 321,000 SES SA 5.30% 4/4/2043 264,657 0.00EUR 9,240,000 SES SA RegS 0.875%
4/11/2027^ 8,346,538 0.14EUR 15,521,000 SES SA RegS FRN
(Perpetual)^ 15,604,813 0.26EUR 100,000 SES SA RegS FRN
(Perpetual) 100,949 0.00EUR 450,526 Summer BC Holdco A Sarl
RegS 9.25% 31/10/2027 335,349 0.01EUR 900,000 Summer BC Holdco B Sarl
RegS 5.75% 31/10/2026 847,390 0.01
BlackRock Fixed Income Strategies Fund continued
The notes on pages 691 to 711 form an integral part of these financial statements.
BlackRock Strategic Funds[360]
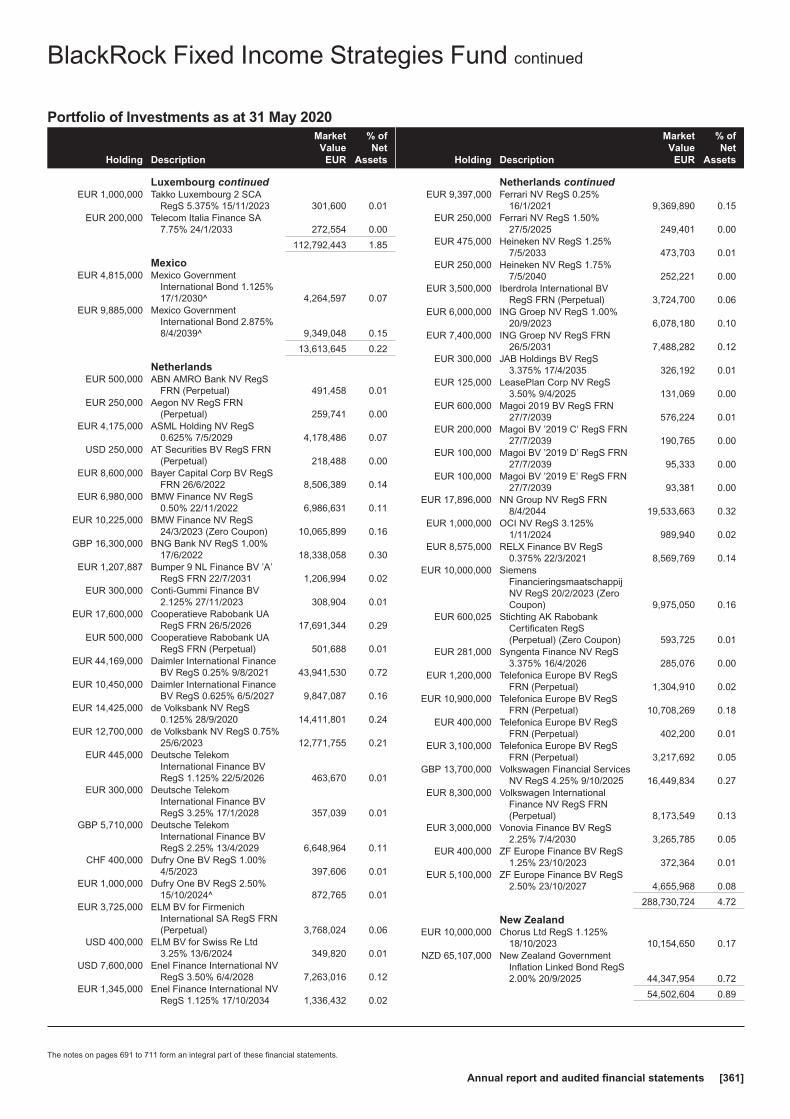
Portfolio of Investments as at 31 May 2020
Holding Description
MarketValue
EUR
% ofNet
Assets
Luxembourg continuedEUR 1,000,000 Takko Luxembourg 2 SCA
RegS 5.375% 15/11/2023 301,600 0.01EUR 200,000 Telecom Italia Finance SA
7.75% 24/1/2033 272,554 0.00
112,792,443 1.85
MexicoEUR 4,815,000 Mexico Government
International Bond 1.125%17/1/2030^ 4,264,597 0.07
EUR 9,885,000 Mexico GovernmentInternational Bond 2.875%8/4/2039^ 9,349,048 0.15
13,613,645 0.22
NetherlandsEUR 500,000 ABN AMRO Bank NV RegS
FRN (Perpetual) 491,458 0.01EUR 250,000 Aegon NV RegS FRN
(Perpetual) 259,741 0.00EUR 4,175,000 ASML Holding NV RegS
0.625% 7/5/2029 4,178,486 0.07USD 250,000 AT Securities BV RegS FRN
(Perpetual) 218,488 0.00EUR 8,600,000 Bayer Capital Corp BV RegS
FRN 26/6/2022 8,506,389 0.14EUR 6,980,000 BMW Finance NV RegS
0.50% 22/11/2022 6,986,631 0.11EUR 10,225,000 BMW Finance NV RegS
24/3/2023 (Zero Coupon) 10,065,899 0.16GBP 16,300,000 BNG Bank NV RegS 1.00%
17/6/2022 18,338,058 0.30EUR 1,207,887 Bumper 9 NL Finance BV ’A’
RegS FRN 22/7/2031 1,206,994 0.02EUR 300,000 Conti-Gummi Finance BV
2.125% 27/11/2023 308,904 0.01EUR 17,600,000 Cooperatieve Rabobank UA
RegS FRN 26/5/2026 17,691,344 0.29EUR 500,000 Cooperatieve Rabobank UA
RegS FRN (Perpetual) 501,688 0.01EUR 44,169,000 Daimler International Finance
BV RegS 0.25% 9/8/2021 43,941,530 0.72EUR 10,450,000 Daimler International Finance
BV RegS 0.625% 6/5/2027 9,847,087 0.16EUR 14,425,000 de Volksbank NV RegS
0.125% 28/9/2020 14,411,801 0.24EUR 12,700,000 de Volksbank NV RegS 0.75%
25/6/2023 12,771,755 0.21EUR 445,000 Deutsche Telekom
International Finance BVRegS 1.125% 22/5/2026 463,670 0.01
EUR 300,000 Deutsche TelekomInternational Finance BVRegS 3.25% 17/1/2028 357,039 0.01
GBP 5,710,000 Deutsche TelekomInternational Finance BVRegS 2.25% 13/4/2029 6,648,964 0.11
CHF 400,000 Dufry One BV RegS 1.00%4/5/2023 397,606 0.01
EUR 1,000,000 Dufry One BV RegS 2.50%15/10/2024^ 872,765 0.01
EUR 3,725,000 ELM BV for FirmenichInternational SA RegS FRN(Perpetual) 3,768,024 0.06
USD 400,000 ELM BV for Swiss Re Ltd3.25% 13/6/2024 349,820 0.01
USD 7,600,000 Enel Finance International NVRegS 3.50% 6/4/2028 7,263,016 0.12
EUR 1,345,000 Enel Finance International NVRegS 1.125% 17/10/2034 1,336,432 0.02
Holding Description
MarketValue
EUR
% ofNet
Assets
Netherlands continuedEUR 9,397,000 Ferrari NV RegS 0.25%
16/1/2021 9,369,890 0.15EUR 250,000 Ferrari NV RegS 1.50%
27/5/2025 249,401 0.00EUR 475,000 Heineken NV RegS 1.25%
7/5/2033 473,703 0.01EUR 250,000 Heineken NV RegS 1.75%
7/5/2040 252,221 0.00EUR 3,500,000 Iberdrola International BV
RegS FRN (Perpetual) 3,724,700 0.06EUR 6,000,000 ING Groep NV RegS 1.00%
20/9/2023 6,078,180 0.10EUR 7,400,000 ING Groep NV RegS FRN
26/5/2031 7,488,282 0.12EUR 300,000 JAB Holdings BV RegS
3.375% 17/4/2035 326,192 0.01EUR 125,000 LeasePlan Corp NV RegS
3.50% 9/4/2025 131,069 0.00EUR 600,000 Magoi 2019 BV RegS FRN
27/7/2039 576,224 0.01EUR 200,000 Magoi BV ’2019 C’ RegS FRN
27/7/2039 190,765 0.00EUR 100,000 Magoi BV ’2019 D’ RegS FRN
27/7/2039 95,333 0.00EUR 100,000 Magoi BV ’2019 E’ RegS FRN
27/7/2039 93,381 0.00EUR 17,896,000 NN Group NV RegS FRN
8/4/2044 19,533,663 0.32EUR 1,000,000 OCI NV RegS 3.125%
1/11/2024 989,940 0.02EUR 8,575,000 RELX Finance BV RegS
0.375% 22/3/2021 8,569,769 0.14EUR 10,000,000 Siemens
FinancieringsmaatschappijNV RegS 20/2/2023 (ZeroCoupon) 9,975,050 0.16
EUR 600,025 Stichting AK RabobankCertificaten RegS(Perpetual) (Zero Coupon) 593,725 0.01
EUR 281,000 Syngenta Finance NV RegS3.375% 16/4/2026 285,076 0.00
EUR 1,200,000 Telefonica Europe BV RegSFRN (Perpetual) 1,304,910 0.02
EUR 10,900,000 Telefonica Europe BV RegSFRN (Perpetual) 10,708,269 0.18
EUR 400,000 Telefonica Europe BV RegSFRN (Perpetual) 402,200 0.01
EUR 3,100,000 Telefonica Europe BV RegSFRN (Perpetual) 3,217,692 0.05
GBP 13,700,000 Volkswagen Financial ServicesNV RegS 4.25% 9/10/2025 16,449,834 0.27
EUR 8,300,000 Volkswagen InternationalFinance NV RegS FRN(Perpetual) 8,173,549 0.13
EUR 3,000,000 Vonovia Finance BV RegS2.25% 7/4/2030 3,265,785 0.05
EUR 400,000 ZF Europe Finance BV RegS1.25% 23/10/2023 372,364 0.01
EUR 5,100,000 ZF Europe Finance BV RegS2.50% 23/10/2027 4,655,968 0.08
288,730,724 4.72
New ZealandEUR 10,000,000 Chorus Ltd RegS 1.125%
18/10/2023 10,154,650 0.17NZD 65,107,000 New Zealand Government
Inflation Linked Bond RegS2.00% 20/9/2025 44,347,954 0.72
54,502,604 0.89
BlackRock Fixed Income Strategies Fund continued
The notes on pages 691 to 711 form an integral part of these financial statements.
Annual report and audited financial statements [361]

Portfolio of Investments as at 31 May 2020
Holding Description
MarketValue
EUR
% ofNet
Assets
NorwayEUR 15,100,000 DNB Bank ASA RegS 0.05%
14/11/2023 14,959,343 0.24GBP 6,049,000 Kommunalbanken AS RegS
1.125% 30/11/2022 6,846,551 0.11USD 3,205,000 Norske Skogindustrier ASA
(Defaulted) 7.125%15/10/2033 6,745 0.00
EUR 7,200,000 Telenor ASA RegS25/9/2023 (Zero Coupon) 7,141,572 0.12
28,954,211 0.47
OmanUSD 11,690,000 Oman Government
International Bond RegS3.625% 15/6/2021 10,297,873 0.17
10,297,873 0.17
PanamaEUR 100,000 Carnival Corp 1.875%
7/11/2022 76,910 0.00USD 1,400,000 Carnival Corp 11.50%
1/4/2023 1,343,996 0.02
1,420,906 0.02
PolandEUR 6,550,000 Santander Bank Polska RegS
0.75% 20/9/2021 6,525,437 0.11
6,525,437 0.11
PortugalEUR 6,500,000 Caixa Economica Montepio
Geral Caixa EconomicaBancaria SA RegS 0.875%17/10/2022 6,602,797 0.11
EUR 2,700,000 EDP - Energias de PortugalSA RegS 1.625% 15/4/2027 2,826,954 0.05
EUR 64,531,867 Portugal Obrigacoes doTesouro OT RegS 4.125%14/4/2027 81,979,348 1.34
EUR 54,771,485 Portugal Obrigacoes doTesouro OT RegS 2.125%17/10/2028 62,905,051 1.03
EUR 48,343,529 Portugal Obrigacoes doTesouro OT RegS 0.475%18/10/2030 48,265,938 0.79
EUR 500,000 SAGRES Socidade deTitularizacao de CreditosSA/ Ulisses Finance No.1 ’B’ RegS FRN 20/3/2033 494,737 0.01
EUR 656,909 SAGRES Socidade deTitularizacao de CreditosSA/Ulisses Finance No. 1 ’A’RegS FRN 20/3/2033 659,872 0.01
EUR 800,000 SAGRES Socidade deTitularizacao de CreditosSA/Ulisses Finance No. 1 ’C’RegS FRN 20/3/2033 797,616 0.01
EUR 4,208,433 TAGUS - Sociedade deTitularizacao de CreditosSA/Volta IV RegS 2.423%12/2/2021 4,227,876 0.07
EUR 7,395,015 TAGUS - Sociedade deTitularizacao de CreditosSA/Volta VI RegS 1.10%13/2/2023 7,394,760 0.12
216,154,949 3.54
RomaniaEUR 19,520,000 Romanian Government
International Bond RegS2.75% 26/2/2026^ 19,505,320 0.32
Holding Description
MarketValue
EUR
% ofNet
Assets
Romania continuedEUR 4,935,000 Romanian Government
International Bond RegS2.875% 11/3/2029 4,924,205 0.08
EUR 22,905,000 Romanian GovernmentInternational Bond RegS3.624% 26/5/2030 24,164,775 0.40
EUR 8,340,000 Romanian GovernmentInternational Bond RegS2.00% 28/1/2032 7,551,995 0.12
EUR 3,000,000 Romanian GovernmentInternational Bond RegS3.375% 28/1/2050 2,879,235 0.05
59,025,530 0.97
RussiaRUB 586,210,000 Russian Federal Bond - OFZ
7.05% 19/1/2028 8,313,202 0.14
8,313,202 0.14
SerbiaEUR 9,890,000 Serbia International Bond
RegS 1.50% 26/6/2029^ 9,259,512 0.15
9,259,512 0.15
SlovakiaEUR 15,450,000 Slovakia Government Bond
RegS 0.25% 14/5/2025 15,770,047 0.26EUR 13,125,000 Slovakia Government Bond
RegS 1.00% 14/5/2032 14,126,831 0.23EUR 4,940,000 Slovakia Government Bond
RegS 2.00% 17/10/2047 6,239,269 0.10
36,136,147 0.59
SloveniaEUR 29,680,000 Slovenia Government Bond
RegS 1.25% 22/3/2027 31,983,465 0.52EUR 18,275,000 Slovenia Government Bond
RegS 1.188% 14/3/2029^ 19,525,741 0.32EUR 30,790,000 Slovenia Government Bond
RegS 0.875% 15/7/2030^ 31,875,194 0.52EUR 2,963,000 Slovenia Government Bond
RegS 1.75% 3/11/2040^ 3,317,315 0.06EUR 6,505,000 Slovenia Government Bond
RegS 3.125% 7/8/2045 9,297,987 0.15
95,999,702 1.57
SpainEUR 2,700,000 Amadeus Capital Markets SAU
RegS 0.125% 6/10/2020 2,688,566 0.04EUR 984,360 Auto ABS Spanish Loans FT
’2016-1 A’ RegS FRN31/12/2032 985,048 0.02
EUR 500,000 Autonoria Spain ’2019 C’RegS FRN 25/12/2035 480,847 0.01
EUR 300,000 Autonoria Spain ’2019 D’RegS FRN 25/12/2035 288,353 0.00
EUR 300,000 Autonoria Spain ’2019 E’ RegSFRN 25/12/2035 274,855 0.00
EUR 200,000 Autonoria Spain ’2019 F’ RegSFRN 25/12/2035 176,109 0.00
EUR 11,400,000 Banco Bilbao VizcayaArgentaria SA RegS 0.375%15/11/2026 11,100,522 0.18
EUR 2,800,000 Banco de Sabadell SA RegS0.875% 22/7/2025 2,597,392 0.04
EUR 3,800,000 Banco de Sabadell SA RegS0.125% 10/2/2028^ 3,840,014 0.06
USD 4,200,000 Banco Santander SA 3.306%27/6/2029 3,973,915 0.07
BlackRock Fixed Income Strategies Fund continued
The notes on pages 691 to 711 form an integral part of these financial statements.
BlackRock Strategic Funds[362]

Portfolio of Investments as at 31 May 2020
Holding Description
MarketValue
EUR
% ofNet
Assets
Spain continuedEUR 4,000,000 Banco Santander SA RegS
FRN (Perpetual)^ 3,518,100 0.06EUR 400,000 Banco Santander SA RegS
FRN (Perpetual) 353,684 0.01EUR 8,100,000 Bankia SA RegS 1.125%
12/11/2026 7,279,186 0.12EUR 300,000 Distribuidora Internacional de
Alimentacion SA RegS1.00% 28/4/2021 224,888 0.00
EUR 600,000 Distribuidora Internacional deAlimentacion SA RegS0.875% 6/4/2023 274,305 0.00
EUR 2,627,835 Driver Espana Five FDT ’5A’RegS FRN 21/12/2028 2,624,142 0.04
EUR 1,601,466 Driver Espana Five FDT ’5B’RegS FRN 21/12/2028 1,582,996 0.03
EUR 2,254,862 Driver Espana Four FT ’A’RegS FRN 21/4/2028 2,253,731 0.04
EUR 283,720 Driver Espana Four FT ’B’RegS FRN 21/4/2028 282,703 0.00
EUR 100,000 Grifols SA RegS 1.625%15/2/2025 98,500 0.00
EUR 200,000 International ConsolidatedAirlines Group SA RegS0.50% 4/7/2023 165,445 0.00
EUR 300,000 International ConsolidatedAirlines Group SA RegS1.50% 4/7/2027^ 233,610 0.00
EUR 4,625,000 NorteGas Energia DistribucionSAU RegS 0.918%28/9/2022 4,618,247 0.08
EUR 4,900,000 Santander Consumer FinanceSA RegS 0.50% 4/10/2021 4,891,302 0.08
EUR 5,300,000 Santander Consumer FinanceSA RegS 1.00% 27/2/2024 5,302,332 0.09
EUR 64,636,000 Spain Government Bond RegS0.50% 30/4/2030 64,841,219 1.06
EUR 35,900,000 Spain Government Bond RegS2.70% 31/10/2048 48,042,457 0.79
EUR 18,220,000 Spain Government Bond RegS1.00% 31/10/2050 16,779,891 0.27
EUR 4,500,000 Telefonica Emisiones SA RegS1.477% 14/9/2021 4,567,567 0.08
GBP 3,500,000 Telefonica Emisiones SAURegS 5.375% 2/2/2026 4,657,152 0.08
EUR 500,000 Tendam Brands SAU RegS5.00% 15/9/2024^ 354,195 0.01
EUR 4,300,000 Wizink Master Credit Cards FT2017-3 ’A’ RegS FRN26/12/2031 4,284,569 0.07
203,635,842 3.33
SupranationalGBP 30,499,000 Council Of Europe
Development Bank RegS0.625% 15/6/2022 34,078,849 0.56
GBP 11,705,000 International Bank forReconstruction &Development 0.75%15/12/2026 13,291,493 0.21
47,370,342 0.77
SwedenEUR 200,000 Intrum AB RegS 2.75%
15/7/2022 187,885 0.00EUR 648,000 Verisure Holding AB RegS
FRN 15/4/2025 658,054 0.01EUR 300,000 Verisure Midholding AB RegS
5.75% 1/12/2023 301,590 0.01
1,147,529 0.02
Holding Description
MarketValue
EUR
% ofNet
Assets
SwitzerlandUSD 200,000 Credit Suisse Group AG FRN
(Perpetual) 184,036 0.00EUR 3,325,000 Credit Suisse Group AG RegS
FRN 2/4/2026 3,630,767 0.06EUR 12,375,000 Credit Suisse Group AG RegS
FRN 24/6/2027 12,139,380 0.20EUR 21,675,000 Credit Suisse Group AG RegS
FRN 14/1/2028 20,670,581 0.34USD 1,570,000 Credit Suisse Group AG RegS
FRN (Perpetual) 1,310,451 0.02EUR 21,863,000 UBS AG RegS FRN 12/2/2026 22,347,484 0.37EUR 8,354,000 UBS AG/London RegS 0.25%
10/1/2022 8,355,921 0.14USD 200,000 UBS Group AG FRN
(Perpetual) 187,294 0.00EUR 12,250,000 UBS Group AG RegS FRN
20/9/2022 12,182,870 0.20
81,008,784 1.33
TurkeyUSD 7,510,000 Turkey Government
International Bond 5.125%25/3/2022^ 6,745,458 0.11
USD 7,310,000 Turkey GovernmentInternational Bond 6.25%26/9/2022 6,655,185 0.11
USD 14,800,000 Turkey GovernmentInternational Bond 5.25%13/3/2030 11,463,861 0.19
24,864,504 0.41
United Arab EmiratesUSD 7,984,000 Abu Dhabi Government
International Bond RegS3.125% 30/9/2049 7,254,224 0.12
7,254,224 0.12
United KingdomGBP 1,235,939 Albion No 4 Plc ’A’ RegS FRN
17/8/2062 1,369,313 0.02GBP 3,750,000 Anglo American Capital Plc
RegS 3.375% 11/3/2029 4,233,706 0.07GBP 2,455,000 Aviva Plc RegS FRN 3/6/2055 2,751,447 0.04
GBP 984,155 Azure Finance No 1 Plc ’A’RegS FRN 30/6/2027 1,093,441 0.02
GBP 9,330,000 Azure Finance Plc ’B’ RegSFRN 30/6/2027 10,366,493 0.17
GBP 4,355,000 Azure Finance Plc ’C’ RegSFRN 30/6/2027 4,749,955 0.08
EUR 250,000 Barclays Plc FRN (Perpetual) 251,912 0.00USD 600,000 Barclays Plc FRN (Perpetual) 551,434 0.01
EUR 6,865,000 Barclays Plc RegS FRN11/11/2025 6,839,908 0.11
GBP 2,683,982 Barley Hill No 1 Plc ’A’ RegSFRN 28/8/2059 2,954,599 0.05
GBP 3,574,000 BAT International Finance PlcRegS 4.00% 4/9/2026 4,364,963 0.07
EUR 11,457,000 BAT International Finance PlcRegS 2.25% 16/1/2030 11,622,095 0.19
GBP 9,348,000 BAT International Finance PlcRegS 6.00% 24/11/2034 13,636,201 0.22
GBP 100,000 BP Capital Markets Plc RegS1.00% 28/4/2023 115,085 0.00
EUR 5,450,000 BP Capital Markets Plc RegS1.117% 25/1/2024 5,518,997 0.09
EUR 9,075,000 BP Capital Markets Plc RegS1.104% 15/11/2034 8,295,594 0.14
GBP 2,637,000 Brass No 6 Plc ’A’ RegS FRN16/12/2060 2,909,426 0.05
BlackRock Fixed Income Strategies Fund continued
The notes on pages 691 to 711 form an integral part of these financial statements.
Annual report and audited financial statements [363]

Portfolio of Investments as at 31 May 2020
Holding Description
MarketValue
EUR
% ofNet
Assets
United Kingdom continuedGBP 3,603,600 Brass No 7 Plc ’A’ RegS FRN
16/10/2059 3,989,334 0.07EUR 20,091,000 British Telecommunications Plc
RegS 0.625% 10/3/2021 20,101,447 0.33GBP 7,035,000 British Telecommunications Plc
RegS 3.125% 21/11/2031 8,526,008 0.14GBP 1,470,236 Bumper 8 UK Finance Plc ’B’
RegS FRN 20/11/2027 1,632,428 0.03EUR 2,875,000 Cadent Finance Plc RegS
0.75% 11/3/2032 2,753,962 0.04GBP 300,000 Canary Wharf Finance II Plc
’C2’ RegS FRN 22/10/2037 253,754 0.00GBP 2,051,000 Canary Wharf Finance II Plc
’D2’ RegS FRN 22/10/2037 1,693,716 0.03GBP 860,535 Castell Plc ’2017-1 A’ RegS
FRN 25/10/2044 954,081 0.02GBP 10,975,000 Centrica Plc RegS 4.375%
13/3/2029 14,314,595 0.23GBP 4,695,000 Centrica Plc RegS 7.00%
19/9/2033 7,808,120 0.13EUR 3,200,000 Centrica Plc RegS FRN
10/4/2076 3,119,776 0.05EUR 3,450,000 Channel Link Enterprises
Finance Plc RegS FRN30/6/2050 3,416,242 0.06
EUR 5,125,000 Channel Link EnterprisesFinance Plc RegS FRN30/6/2050 5,280,774 0.09
GBP 1,625,000 Channel Link EnterprisesFinance Plc RegS FRN30/6/2050 1,880,676 0.03
GBP 1,467,246 Charter Mortgage Funding Plc’2017-1 A’ RegS FRN12/6/2054 1,623,742 0.03
GBP 220,000 CMF ’2020-1 B’ Plc RegS FRN16/1/2057 229,700 0.00
GBP 100,000 CMF ’2020-1 C’ Plc RegS FRN16/1/2057 102,948 0.00
GBP 3,764,000 Crh Finance UK Plc RegS4.125% 2/12/2029 4,796,034 0.08
GBP 9,568,000 Delamare Cards MTN IssuerPlc ’2017-1 A1’ RegS FRN19/10/2022 10,418,943 0.17
GBP 7,447,921 Dignity Finance Plc RegS3.546% 31/12/2034 8,805,652 0.14
GBP 3,404,000 Dignity Finance Plc RegS4.696% 31/12/2049 2,903,593 0.05
GBP 859,739 DLL UK Equipment Finance2019-1 Plc ’A’ RegS FRN25/3/2028 947,814 0.02
EUR 500,000 DS Smith Plc RegS 0.875%12/9/2026 463,760 0.01
GBP 500,000 DS Smith Plc RegS 2.875%26/7/2029 545,426 0.01
GBP 216,856 Duncan Funding Plc ’2016-1XA1B’ RegS FRN 17/4/2063 240,840 0.00
EUR 200,000 easyJet Plc RegS 1.75%9/2/2023 176,320 0.00
EUR 200,000 easyJet Plc RegS 0.875%11/6/2025 164,788 0.00
GBP 5,063,429 E-Carat 8 Plc ’B’ RegS FRN8/3/2024 5,622,399 0.09
EUR 400,000 eG Global Finance Plc RegS6.25% 30/10/2025 (traded inGermany) 400,480 0.01
EUR 900,000 eG Global Finance Plc RegS6.25% 30/10/2025 (traded inSupranational) 901,080 0.01
GBP 7,221,675 Elvet Mortgages Plc ’2018-1 A’RegS FRN 22/10/2058 7,993,584 0.13
Holding Description
MarketValue
EUR
% ofNet
Assets
United Kingdom continuedUSD 536,667 EnQuest Plc RegS 7.00%
15/4/2022 263,493 0.00GBP 103,500 EnQuest Plc RegS 7.00%
15/4/2022^ 65,766 0.00GBP 398,934 Eurosail Plc ’2006-1X A2C’
RegS FRN 10/6/2044 441,797 0.01EUR 1,000,000 FCE Bank Plc RegS 1.615%
11/5/2023 941,185 0.02GBP 2,393,100 Feldspar Plc ’2016-1 A’ RegS
FRN 15/9/2045 2,636,346 0.04GBP 2,281,249 Finsbury Square ’2019-3 A’
Plc RegS FRN 16/12/2069 2,508,168 0.04GBP 3,460,000 Finsbury Square ’2020-1 A’
Plc RegS FRN 16/3/2070 3,792,862 0.06GBP 215,000 Finsbury Square ’2020-1 C’
Plc RegS FRN 16/3/2070 227,618 0.00GBP 2,811,139 Finsbury Square Plc
’2018-1 A’ RegS FRN12/9/2065 3,101,453 0.05
GBP 658,986 Finsbury Square Plc’2018-1 D’ RegS FRN12/9/2065 699,002 0.01
GBP 1,029,978 Finsbury Square Plc ’2018-1B’RegS FRN 12/9/2065 1,131,109 0.02
GBP 9,907,699 Finsbury Square Plc’2018-2 A’ RegS FRN12/9/2068 10,919,941 0.18
GBP 5,985,000 Finsbury Square Plc’2018-2 C’ RegS FRN12/9/2068 6,582,201 0.11
GBP 950,000 Finsbury Square Plc’2018-2 D’ RegS FRN12/9/2068 1,031,707 0.02
GBP 1,865,421 Finsbury Square Plc’2019-1 A’ RegS FRN16/6/2069 2,056,609 0.03
GBP 485,000 Finsbury Square Plc’2019-1 B’ RegS FRN16/6/2069 532,003 0.01
GBP 1,793,793 Friary No 4 Plc ’A’ RegS FRN21/1/2050 1,983,054 0.03
GBP 654,847 Gemgarto 2018-1 Plc ’C’ RegSFRN 16/9/2065 714,414 0.01
GBP 1,585,629 Gemgarto Plc ’2018-1 B’ RegSFRN 16/9/2065 1,733,650 0.03
GBP 234,945 Gemgarto Plc ’2018-1 D’ RegSFRN 16/9/2065 255,479 0.00
EUR 11,050,000 GlaxoSmithKline Capital PlcRegS 23/9/2023 (ZeroCoupon) 10,984,971 0.18
EUR 300,000 GlaxoSmithKline Capital PlcRegS 1.75% 21/5/2030 333,040 0.01
GBP 9,820,000 GlaxoSmithKline Capital PlcRegS 1.625% 12/5/2035 11,045,600 0.18
GBP 4,201,340 Globaldrive Auto ReceivablesUK Plc ’2018-A A’ RegSFRN 20/6/2026 4,659,671 0.08
GBP 3,470,000 Globaldrive Auto ReceivablesUK Plc ’2018-A B’ RegSFRN 20/6/2026 3,802,235 0.06
EUR 3,228,680 Gosforth Funding Plc ’2016-1XA2A’ RegS FRN 15/2/2058 3,218,348 0.05
GBP 1,000,000 Greene King Finance Plc2.287% 15/12/2034 1,047,007 0.02
GBP 2,895,987 Greene King Finance PlcRegS FRN 15/12/2033 2,849,176 0.05
GBP 1,700,000 Greene King Finance PlcRegS 3.593% 15/3/2035 1,964,673 0.03
GBP 959,870 Greene King Finance PlcRegS 4.064% 15/3/2035 1,138,764 0.02
BlackRock Fixed Income Strategies Fund continued
The notes on pages 691 to 711 form an integral part of these financial statements.
BlackRock Strategic Funds[364]
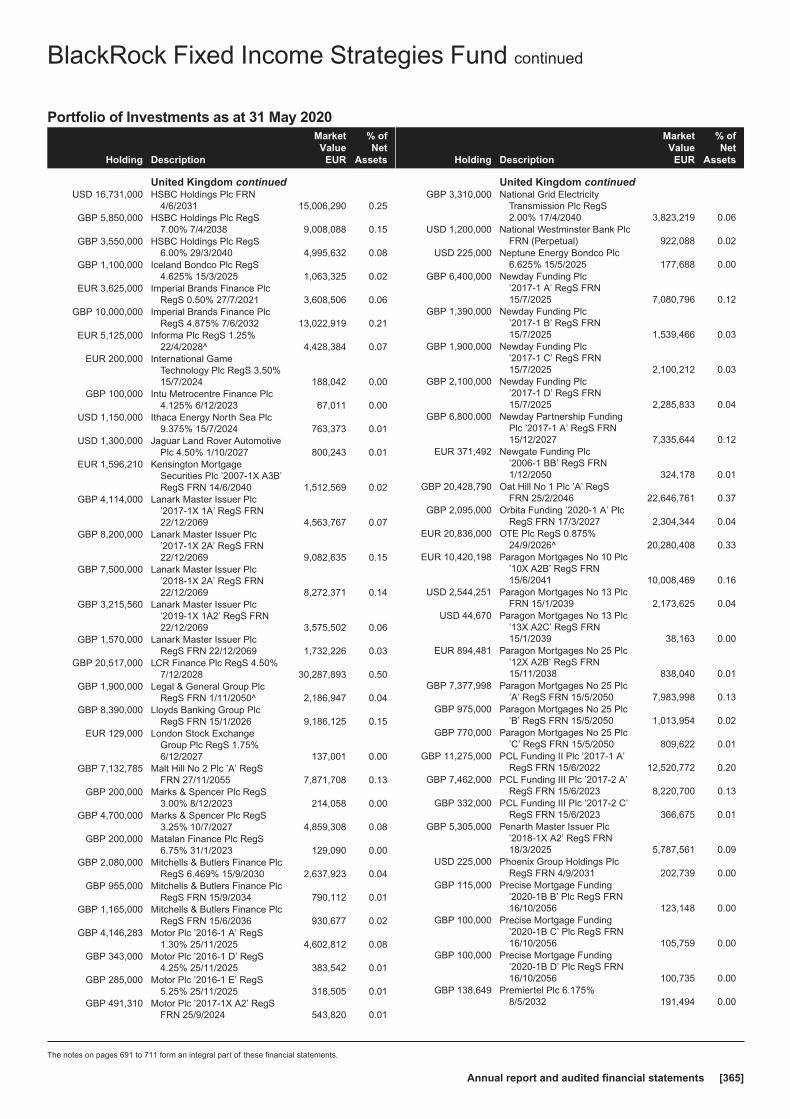
Portfolio of Investments as at 31 May 2020
Holding Description
MarketValue
EUR
% ofNet
Assets
United Kingdom continuedUSD 16,731,000 HSBC Holdings Plc FRN
4/6/2031 15,006,290 0.25GBP 5,850,000 HSBC Holdings Plc RegS
7.00% 7/4/2038 9,008,088 0.15GBP 3,550,000 HSBC Holdings Plc RegS
6.00% 29/3/2040 4,995,632 0.08GBP 1,100,000 Iceland Bondco Plc RegS
4.625% 15/3/2025 1,063,325 0.02EUR 3,625,000 Imperial Brands Finance Plc
RegS 0.50% 27/7/2021 3,608,506 0.06GBP 10,000,000 Imperial Brands Finance Plc
RegS 4.875% 7/6/2032 13,022,919 0.21EUR 5,125,000 Informa Plc RegS 1.25%
22/4/2028^ 4,428,384 0.07EUR 200,000 International Game
Technology Plc RegS 3.50%15/7/2024 188,042 0.00
GBP 100,000 Intu Metrocentre Finance Plc4.125% 6/12/2023 67,011 0.00
USD 1,150,000 Ithaca Energy North Sea Plc9.375% 15/7/2024 763,373 0.01
USD 1,300,000 Jaguar Land Rover AutomotivePlc 4.50% 1/10/2027 800,243 0.01
EUR 1,596,210 Kensington MortgageSecurities Plc ’2007-1X A3B’RegS FRN 14/6/2040 1,512,569 0.02
GBP 4,114,000 Lanark Master Issuer Plc’2017-1X 1A’ RegS FRN22/12/2069 4,563,767 0.07
GBP 8,200,000 Lanark Master Issuer Plc’2017-1X 2A’ RegS FRN22/12/2069 9,082,635 0.15
GBP 7,500,000 Lanark Master Issuer Plc’2018-1X 2A’ RegS FRN22/12/2069 8,272,371 0.14
GBP 3,215,560 Lanark Master Issuer Plc’2019-1X 1A2’ RegS FRN22/12/2069 3,575,502 0.06
GBP 1,570,000 Lanark Master Issuer PlcRegS FRN 22/12/2069 1,732,226 0.03
GBP 20,517,000 LCR Finance Plc RegS 4.50%7/12/2028 30,287,893 0.50
GBP 1,900,000 Legal & General Group PlcRegS FRN 1/11/2050^ 2,186,947 0.04
GBP 8,390,000 Lloyds Banking Group PlcRegS FRN 15/1/2026 9,186,125 0.15
EUR 129,000 London Stock ExchangeGroup Plc RegS 1.75%6/12/2027 137,001 0.00
GBP 7,132,785 Malt Hill No 2 Plc ’A’ RegSFRN 27/11/2055 7,871,708 0.13
GBP 200,000 Marks & Spencer Plc RegS3.00% 8/12/2023 214,058 0.00
GBP 4,700,000 Marks & Spencer Plc RegS3.25% 10/7/2027 4,859,308 0.08
GBP 200,000 Matalan Finance Plc RegS6.75% 31/1/2023 129,090 0.00
GBP 2,080,000 Mitchells & Butlers Finance PlcRegS 6.469% 15/9/2030 2,637,923 0.04
GBP 955,000 Mitchells & Butlers Finance PlcRegS FRN 15/9/2034 790,112 0.01
GBP 1,165,000 Mitchells & Butlers Finance PlcRegS FRN 15/6/2036 930,677 0.02
GBP 4,146,283 Motor Plc ’2016-1 A’ RegS1.30% 25/11/2025 4,602,812 0.08
GBP 343,000 Motor Plc ’2016-1 D’ RegS4.25% 25/11/2025 383,542 0.01
GBP 285,000 Motor Plc ’2016-1 E’ RegS5.25% 25/11/2025 318,505 0.01
GBP 491,310 Motor Plc ’2017-1X A2’ RegSFRN 25/9/2024 543,820 0.01
Holding Description
MarketValue
EUR
% ofNet
Assets
United Kingdom continuedGBP 3,310,000 National Grid Electricity
Transmission Plc RegS2.00% 17/4/2040 3,823,219 0.06
USD 1,200,000 National Westminster Bank PlcFRN (Perpetual) 922,088 0.02
USD 225,000 Neptune Energy Bondco Plc6.625% 15/5/2025 177,688 0.00
GBP 6,400,000 Newday Funding Plc’2017-1 A’ RegS FRN15/7/2025 7,080,796 0.12
GBP 1,390,000 Newday Funding Plc’2017-1 B’ RegS FRN15/7/2025 1,539,466 0.03
GBP 1,900,000 Newday Funding Plc’2017-1 C’ RegS FRN15/7/2025 2,100,212 0.03
GBP 2,100,000 Newday Funding Plc’2017-1 D’ RegS FRN15/7/2025 2,285,833 0.04
GBP 6,800,000 Newday Partnership FundingPlc ’2017-1 A’ RegS FRN15/12/2027 7,335,644 0.12
EUR 371,492 Newgate Funding Plc’2006-1 BB’ RegS FRN1/12/2050 324,178 0.01
GBP 20,428,790 Oat Hill No 1 Plc ’A’ RegSFRN 25/2/2046 22,646,761 0.37
GBP 2,095,000 Orbita Funding ’2020-1 A’ PlcRegS FRN 17/3/2027 2,304,344 0.04
EUR 20,836,000 OTE Plc RegS 0.875%24/9/2026^ 20,280,408 0.33
EUR 10,420,198 Paragon Mortgages No 10 Plc’10X A2B’ RegS FRN15/6/2041 10,008,469 0.16
USD 2,544,251 Paragon Mortgages No 13 PlcFRN 15/1/2039 2,173,625 0.04
USD 44,670 Paragon Mortgages No 13 Plc’13X A2C’ RegS FRN15/1/2039 38,163 0.00
EUR 894,481 Paragon Mortgages No 25 Plc’12X A2B’ RegS FRN15/11/2038 838,040 0.01
GBP 7,377,998 Paragon Mortgages No 25 Plc’A’ RegS FRN 15/5/2050 7,983,998 0.13
GBP 975,000 Paragon Mortgages No 25 Plc’B’ RegS FRN 15/5/2050 1,013,954 0.02
GBP 770,000 Paragon Mortgages No 25 Plc’C’ RegS FRN 15/5/2050 809,622 0.01
GBP 11,275,000 PCL Funding II Plc ’2017-1 A’RegS FRN 15/6/2022 12,520,772 0.20
GBP 7,462,000 PCL Funding III Plc ’2017-2 A’RegS FRN 15/6/2023 8,220,700 0.13
GBP 332,000 PCL Funding III Plc ’2017-2 C’RegS FRN 15/6/2023 366,675 0.01
GBP 5,305,000 Penarth Master Issuer Plc’2018-1X A2’ RegS FRN18/3/2025 5,787,561 0.09
USD 225,000 Phoenix Group Holdings PlcRegS FRN 4/9/2031 202,739 0.00
GBP 115,000 Precise Mortgage Funding’2020-1B B’ Plc RegS FRN16/10/2056 123,148 0.00
GBP 100,000 Precise Mortgage Funding’2020-1B C’ Plc RegS FRN16/10/2056 105,759 0.00
GBP 100,000 Precise Mortgage Funding’2020-1B D’ Plc RegS FRN16/10/2056 100,735 0.00
GBP 138,649 Premiertel Plc 6.175%8/5/2032 191,494 0.00
BlackRock Fixed Income Strategies Fund continued
The notes on pages 691 to 711 form an integral part of these financial statements.
Annual report and audited financial statements [365]

Portfolio of Investments as at 31 May 2020
Holding Description
MarketValue
EUR
% ofNet
Assets
United Kingdom continuedGBP 7,759,207 Prs Finance Plc RegS 1.75%
24/11/2026 9,226,127 0.15GBP 5,200,000 Prs Finance Plc RegS 2.00%
23/1/2029 6,322,079 0.10GBP 860,000 Quadgas Finance Plc RegS
3.375% 17/9/2029 (traded inGermany) 994,944 0.02
GBP 4,705,000 Quadgas Finance Plc RegS3.375% 17/9/2029 (traded inUnited Kingdom) 5,443,269 0.09
GBP 2,585,722 Residential MortgageSecurities 29 Plc ’A’ RegSFRN 20/12/2046 2,870,562 0.05
GBP 2,570,000 Residential MortgageSecurities 29 Plc ’B’ RegSFRN 20/12/2046 2,849,020 0.05
GBP 695,000 Residential MortgageSecurities 29 Plc ’C’ RegSFRN 20/12/2046 769,961 0.01
GBP 3,218,840 Residential MortgageSecurities 30 Plc ’A’ RegSFRN 20/3/2050 3,555,631 0.06
GBP 2,350,000 Residential MortgageSecurities 30 Plc ’B’ RegSFRN 20/3/2050 2,573,513 0.04
GBP 460,000 Residential MortgageSecurities 30 Plc ’C’ RegSFRN 20/3/2050 509,614 0.01
GBP 7,737,888 Ripon Mortgages Plc ’1X A1’RegS FRN 20/8/2056 8,523,929 0.14
GBP 22,810,000 Ripon Mortgages Plc ’1X B1’RegS FRN 20/8/2056 25,146,460 0.41
GBP 485,000 Ripon Mortgages Plc ’1X B2’RegS FRN 20/8/2056 525,768 0.01
GBP 11,250,000 Ripon Mortgages Plc ’1X C1’RegS FRN 20/8/2056 12,279,898 0.20
EUR 2,538,883 RMAC Securities No 1 Plc’2006-NS1X M1C’ RegSFRN 12/6/2044 2,297,647 0.04
GBP 5,280,755 RMAC Securities No 2 Plc’2018-2 A’ RegS FRN12/6/2046 5,833,276 0.10
GBP 410,000 RMAC Securities No 2 Plc’2018-2 B’ RegS FRN12/6/2046 435,984 0.01
GBP 420,000 RMAC Securities No 2 Plc’2018-2 C’ RegS FRN12/6/2046 445,443 0.01
EUR 4,800,000 Santander UK Plc RegS0.05% 12/1/2027 4,811,928 0.08
GBP 7,000,000 Scottish Widows Ltd RegS5.50% 16/6/2023 8,434,142 0.14
GBP 1,956,400 Silverstone Master Issuer Plc’2019-1X 2A’ RegS FRN21/1/2070 2,176,956 0.04
GBP 9,640,000 Silverstone Master Issuer PlcRegS FRN 21/1/2070 10,668,347 0.17
EUR 951,000 Sky Ltd RegS 2.25%17/11/2025 1,036,509 0.02
GBP 5,780,000 SSE Plc RegS 8.375%20/11/2028 9,606,711 0.16
EUR 2,925,000 SSE Plc RegS FRN(Perpetual) 2,887,150 0.05
GBP 683,000 SSE Plc RegS FRN(Perpetual) 755,263 0.01
GBP 612,641 Stanlington No 1 Plc’2017-1 A’ RegS FRN12/6/2046 678,004 0.01
GBP 180,000 Stanlington No 1 Plc ’2017-1E’RegS FRN 12/6/2046 197,654 0.00
Holding Description
MarketValue
EUR
% ofNet
Assets
United Kingdom continuedEUR 3,000,000 Swiss Re Finance UK Plc
RegS FRN 4/6/2052 3,066,645 0.05EUR 1,371,000 Synlab Bondco Plc RegS FRN
1/7/2025 1,375,504 0.02GBP 250,000 Telereal Securitisation Plc FRN
10/12/2031 232,626 0.00GBP 7,795,000 Tesco Corporate Treasury
Services Plc RegS 2.75%27/4/2030 9,038,385 0.15
GBP 522,712 Tesco Property Finance 1 PlcRegS 7.623% 13/7/2039 859,736 0.01
GBP 11,796,662 Tesco Property Finance 3 PlcRegS 5.744%13/4/2040 (traded in Ireland) 17,211,019 0.28
GBP 1,002,331 Tesco Property Finance 3 PlcRegS 5.744%13/4/2040 (traded in UnitedKingdom) 1,462,374 0.02
GBP 1,361,899 Tesco Property Finance 4 PlcRegS 5.801% 13/10/2040 2,019,225 0.03
GBP 11,200,000 Thames Water UtilitiesFinance Plc RegS 4.375%3/7/2034 15,863,185 0.26
GBP 5,183,716 Tolkien Funding Sukuk No1 Plc ’A’ RegS FRN20/7/2052 5,751,640 0.09
GBP 200,000 Trinity Square Plc ’2015-1X B’RegS FRN 15/7/2051 219,920 0.00
USD 400,000 Tullow Oil Plc RegS 6.25%15/4/2022 236,635 0.00
GBP 3,120,206 Turbo Finance 8 Plc ’A’ RegSFRN 20/2/2026 3,458,938 0.06
GBP 1,190,000 Turbo Finance 8 Plc ’C’ RegSFRN 20/2/2026 1,305,708 0.02
GBP 1,685,000 Twin Bridges 2018-1 Plc ’B’RegS FRN 12/9/2050 1,789,360 0.03
GBP 565,000 Twin Bridges ’2019-2 C’ PlcRegS FRN 12/6/2053 608,645 0.01
GBP 3,483,000 Twin Bridges Plc ’2018-1 C’RegS FRN 12/9/2050 3,689,281 0.06
GBP 2,040,000 Twin Bridges Plc ’2018-1 D’RegS FRN 12/9/2050 2,136,634 0.03
GBP 2,350,277 Twin Bridges Plc ’2019-1 A’RegS FRN 12/12/2052 2,575,431 0.04
GBP 385,000 Twin Bridges Plc ’2019-1B’RegS FRN 12/12/2052 418,475 0.01
GBP 550,000 Twin Bridges Plc ’2019-1C’RegS FRN 12/12/2052 594,043 0.01
GBP 272,000 Unique Pub Finance Co PlcRegS 7.395% 28/3/2024 323,713 0.01
GBP 1,100,390 Unique Pub Finance Co PlcRegS 5.659% 30/6/2027 1,223,744 0.02
GBP 471,000 Unique Pub Finance Co PlcRegS 6.464% 30/3/2032 592,551 0.01
GBP 26,081,000 United Kingdom Gilt RegS1.25% 22/10/2041 32,895,998 0.54
GBP 15,039,000 United Kingdom Gilt RegS0.50% 22/10/2061 16,869,195 0.28
GBP 170,000 University of Oxford RegS2.544% 8/12/2117 287,446 0.00
USD 400,000 Virgin Media Secured FinancePlc 5.50% 15/5/2029 379,447 0.01
GBP 400,000 Virgin Media Secured FinancePlc RegS 4.875% 15/1/2027 449,643 0.01
GBP 100,000 Virgin Media Secured FinancePlc RegS 5.25% 15/5/2029 114,297 0.00
GBP 1,400,000 Virgin Media Secured FinancePlc RegS 4.25% 15/1/2030^ 1,551,451 0.03
BlackRock Fixed Income Strategies Fund continued
The notes on pages 691 to 711 form an integral part of these financial statements.
BlackRock Strategic Funds[366]
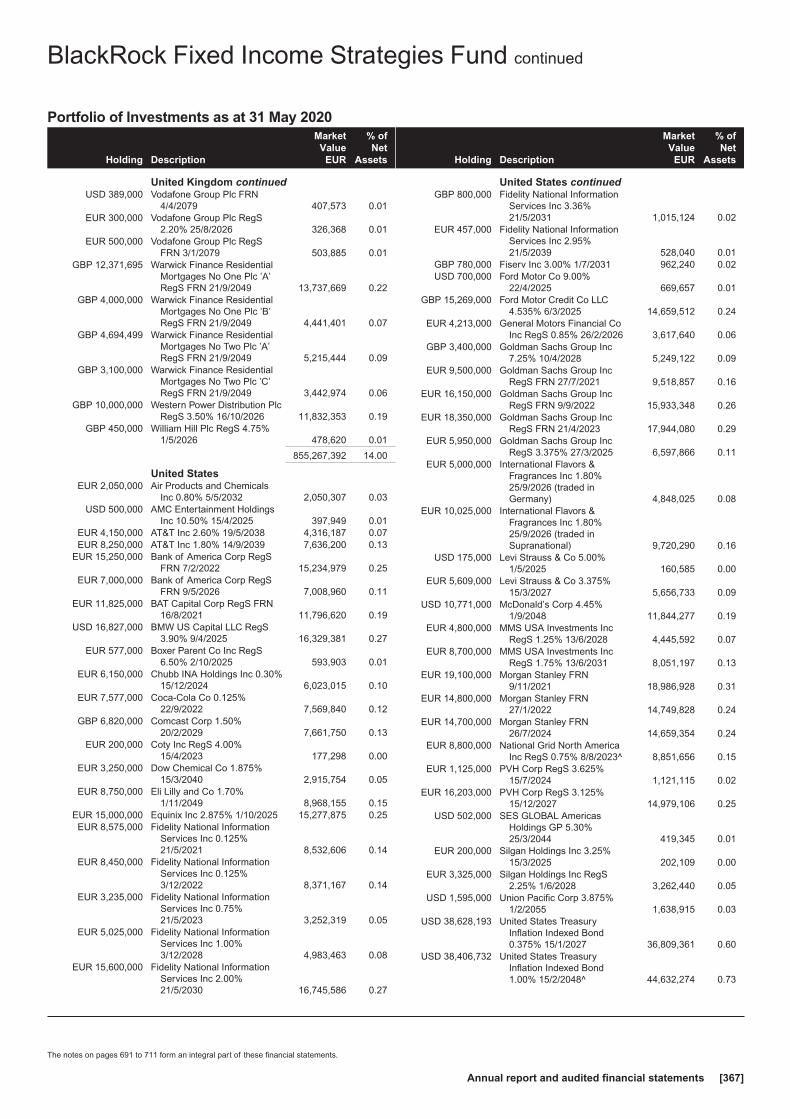
Portfolio of Investments as at 31 May 2020
Holding Description
MarketValue
EUR
% ofNet
Assets
United Kingdom continuedUSD 389,000 Vodafone Group Plc FRN
4/4/2079 407,573 0.01EUR 300,000 Vodafone Group Plc RegS
2.20% 25/8/2026 326,368 0.01EUR 500,000 Vodafone Group Plc RegS
FRN 3/1/2079 503,885 0.01GBP 12,371,695 Warwick Finance Residential
Mortgages No One Plc ’A’RegS FRN 21/9/2049 13,737,669 0.22
GBP 4,000,000 Warwick Finance ResidentialMortgages No One Plc ’B’RegS FRN 21/9/2049 4,441,401 0.07
GBP 4,694,499 Warwick Finance ResidentialMortgages No Two Plc ’A’RegS FRN 21/9/2049 5,215,444 0.09
GBP 3,100,000 Warwick Finance ResidentialMortgages No Two Plc ’C’RegS FRN 21/9/2049 3,442,974 0.06
GBP 10,000,000 Western Power Distribution PlcRegS 3.50% 16/10/2026 11,832,353 0.19
GBP 450,000 William Hill Plc RegS 4.75%1/5/2026 478,620 0.01
855,267,392 14.00
United StatesEUR 2,050,000 Air Products and Chemicals
Inc 0.80% 5/5/2032 2,050,307 0.03USD 500,000 AMC Entertainment Holdings
Inc 10.50% 15/4/2025 397,949 0.01EUR 4,150,000 AT&T Inc 2.60% 19/5/2038 4,316,187 0.07EUR 8,250,000 AT&T Inc 1.80% 14/9/2039 7,636,200 0.13
EUR 15,250,000 Bank of America Corp RegSFRN 7/2/2022 15,234,979 0.25
EUR 7,000,000 Bank of America Corp RegSFRN 9/5/2026 7,008,960 0.11
EUR 11,825,000 BAT Capital Corp RegS FRN16/8/2021 11,796,620 0.19
USD 16,827,000 BMW US Capital LLC RegS3.90% 9/4/2025 16,329,381 0.27
EUR 577,000 Boxer Parent Co Inc RegS6.50% 2/10/2025 593,903 0.01
EUR 6,150,000 Chubb INA Holdings Inc 0.30%15/12/2024 6,023,015 0.10
EUR 7,577,000 Coca-Cola Co 0.125%22/9/2022 7,569,840 0.12
GBP 6,820,000 Comcast Corp 1.50%20/2/2029 7,661,750 0.13
EUR 200,000 Coty Inc RegS 4.00%15/4/2023 177,298 0.00
EUR 3,250,000 Dow Chemical Co 1.875%15/3/2040 2,915,754 0.05
EUR 8,750,000 Eli Lilly and Co 1.70%1/11/2049 8,968,155 0.15
EUR 15,000,000 Equinix Inc 2.875% 1/10/2025 15,277,875 0.25EUR 8,575,000 Fidelity National Information
Services Inc 0.125%21/5/2021 8,532,606 0.14
EUR 8,450,000 Fidelity National InformationServices Inc 0.125%3/12/2022 8,371,167 0.14
EUR 3,235,000 Fidelity National InformationServices Inc 0.75%21/5/2023 3,252,319 0.05
EUR 5,025,000 Fidelity National InformationServices Inc 1.00%3/12/2028 4,983,463 0.08
EUR 15,600,000 Fidelity National InformationServices Inc 2.00%21/5/2030 16,745,586 0.27
Holding Description
MarketValue
EUR
% ofNet
Assets
United States continuedGBP 800,000 Fidelity National Information
Services Inc 3.36%21/5/2031 1,015,124 0.02
EUR 457,000 Fidelity National InformationServices Inc 2.95%21/5/2039 528,040 0.01
GBP 780,000 Fiserv Inc 3.00% 1/7/2031 962,240 0.02USD 700,000 Ford Motor Co 9.00%
22/4/2025 669,657 0.01GBP 15,269,000 Ford Motor Credit Co LLC
4.535% 6/3/2025 14,659,512 0.24EUR 4,213,000 General Motors Financial Co
Inc RegS 0.85% 26/2/2026 3,617,640 0.06GBP 3,400,000 Goldman Sachs Group Inc
7.25% 10/4/2028 5,249,122 0.09EUR 9,500,000 Goldman Sachs Group Inc
RegS FRN 27/7/2021 9,518,857 0.16EUR 16,150,000 Goldman Sachs Group Inc
RegS FRN 9/9/2022 15,933,348 0.26EUR 18,350,000 Goldman Sachs Group Inc
RegS FRN 21/4/2023 17,944,080 0.29EUR 5,950,000 Goldman Sachs Group Inc
RegS 3.375% 27/3/2025 6,597,866 0.11EUR 5,000,000 International Flavors &
Fragrances Inc 1.80%25/9/2026 (traded inGermany) 4,848,025 0.08
EUR 10,025,000 International Flavors &Fragrances Inc 1.80%25/9/2026 (traded inSupranational) 9,720,290 0.16
USD 175,000 Levi Strauss & Co 5.00%1/5/2025 160,585 0.00
EUR 5,609,000 Levi Strauss & Co 3.375%15/3/2027 5,656,733 0.09
USD 10,771,000 McDonald’s Corp 4.45%1/9/2048 11,844,277 0.19
EUR 4,800,000 MMS USA Investments IncRegS 1.25% 13/6/2028 4,445,592 0.07
EUR 8,700,000 MMS USA Investments IncRegS 1.75% 13/6/2031 8,051,197 0.13
EUR 19,100,000 Morgan Stanley FRN9/11/2021 18,986,928 0.31
EUR 14,800,000 Morgan Stanley FRN27/1/2022 14,749,828 0.24
EUR 14,700,000 Morgan Stanley FRN26/7/2024 14,659,354 0.24
EUR 8,800,000 National Grid North AmericaInc RegS 0.75% 8/8/2023^ 8,851,656 0.15
EUR 1,125,000 PVH Corp RegS 3.625%15/7/2024 1,121,115 0.02
EUR 16,203,000 PVH Corp RegS 3.125%15/12/2027 14,979,106 0.25
USD 502,000 SES GLOBAL AmericasHoldings GP 5.30%25/3/2044 419,345 0.01
EUR 200,000 Silgan Holdings Inc 3.25%15/3/2025 202,109 0.00
EUR 3,325,000 Silgan Holdings Inc RegS2.25% 1/6/2028 3,262,440 0.05
USD 1,595,000 Union Pacific Corp 3.875%1/2/2055 1,638,915 0.03
USD 38,628,193 United States TreasuryInflation Indexed Bond0.375% 15/1/2027 36,809,361 0.60
USD 38,406,732 United States TreasuryInflation Indexed Bond1.00% 15/2/2048^ 44,632,274 0.73
BlackRock Fixed Income Strategies Fund continued
The notes on pages 691 to 711 form an integral part of these financial statements.
Annual report and audited financial statements [367]

Portfolio of Investments as at 31 May 2020
Holding Description
MarketValue
EUR
% ofNet
Assets
United States continuedUSD 24,412,956 United States Treasury
Inflation Indexed Bond1.00% 15/2/2049 28,687,261 0.47
USD 12,744,550 United States TreasuryInflation Indexed Bond0.25% 15/2/2050 12,504,836 0.20
GBP 5,500,000 Verizon Communications Inc1.875% 19/9/2030 6,200,364 0.10
484,970,391 7.94
Total Bonds 4,929,379,503 80.67
EXCHANGE TRADED FUNDS~Ireland
EUR 133,413 iShares EUR Corp Bond 1-5yrUCITS ETF^ 14,546,019 0.24
USD 290,000 iShares JP Morgan EM LocalGovernment Bond UCITSETF 14,589,325 0.24
29,135,344 0.48
Total Exchange Traded Funds 29,135,344 0.48
Total Transferable Securities and Money MarketInstruments Admitted to an Official Stock ExchangeListing or Dealt in on Another Regulated Market 4,959,157,326 81.16
Other Transferable Securities and Money Market Instruments
BONDSFrance
EUR 800,000 E-Carat SA ’B’ RegS FRN20/12/2028 781,081 0.01
EUR 200,000 E-Carat SA ’C’ RegS FRN20/12/2028 193,758 0.00
EUR 200,000 E-Carat SA ’D’ RegS FRN20/12/2028 194,247 0.00
EUR 300,000 E-Carat SA ’E’ RegS FRN20/12/2028 291,186 0.01
EUR 5,300,000 FCT Autonoria ’2019 B’ RegSFRN 25/9/2035 5,167,557 0.08
EUR 400,000 FCT Autonoria ’2019 C’ RegSFRN 25/9/2035 384,198 0.01
EUR 400,000 FCT Autonoria ’2019 E’ RegSFRN 25/9/2035 373,813 0.01
EUR 400,000 FCT Autonoria ’2019 F’ RegSFRN 25/9/2035 361,541 0.01
EUR 2,007,116 Noria ’2018-1B’ RegS FRN25/6/2038 1,963,019 0.03
EUR 1,770,985 Noria ’2018-1C’ RegS FRN25/6/2038 1,707,920 0.03
EUR 826,459 Noria ’2018-1D’ RegS FRN25/6/2038 793,969 0.01
12,212,289 0.20
GermanyEUR 200,000 Red & Black Auto Germany
6 UG ’C’ RegS FRN15/10/2028 198,388 0.00
EUR 200,000 Red & Black Auto Germany6 UG ’D’ RegS FRN15/10/2028 203,579 0.01
401,967 0.01
InternationalEUR 600,000 Panther BF Aggregator
2 LP/Panther Finance CoInc RegS 4.375% 15/5/2026 585,036 0.01
585,036 0.01
Holding Description
MarketValue
EUR
% ofNet
Assets
IrelandEUR 300,000 Invesco Euro Clo III DAC ’F’
RegS FRN 15/7/2032 217,478 0.00EUR 500,000 Sound Point Euro CLO II
Funding DAC ’X’ RegS FRN26/10/2032 499,295 0.01
GBP 3,495,000 Taurus ’2019-2 B’ UK DACRegS FRN 17/11/2029 3,573,818 0.06
GBP 2,185,000 Taurus ’2019-2 C’ UK DACRegS FRN 17/11/2029 2,120,209 0.04
GBP 9,860,000 Taurus 2019-2 UK DAC ’A’RegS FRN 17/11/2029 10,633,967 0.17
17,044,767 0.28
ItalyEUR 650,000 Asset-Backed European
Securitisation TransactionSeventeen Srl ’B’ RegS FRN15/4/2032 625,014 0.01
EUR 300,000 Asset-Backed EuropeanSecuritisation TransactionSeventeen Srl ’D’ RegS FRN15/4/2032 274,031 0.00
EUR 100,000 Asset-Backed EuropeanSecuritisation TransactionSeventeen Srl ’E’ RegS FRN15/4/2032 89,272 0.00
EUR 8,945,000 AutoFlorence 1 Srl ’A’ RegSFRN 25/12/2042 8,971,660 0.15
EUR 1,355,000 AutoFlorence 1 Srl ’B’ RegSFRN 25/12/2042 1,336,125 0.02
EUR 4,785,000 Brignole Co ’2019 1 A’ FRN24/7/2034 4,764,425 0.08
EUR 330,000 Brignole Co ’2019 1 B’ FRN24/7/2034 318,735 0.01
16,379,262 0.27
JapanJPY 17,971,699,202 Japanese Government CPI
Linked Bond 0.10%10/3/2028 150,030,986 2.46
JPY 2,799,935,966 Japanese Government CPILinked Bond 0.10%10/3/2029 23,336,915 0.38
173,367,901 2.84
LuxembourgEUR 4,300,000 BL Consumer Issuance
Platform SA CompartmentBL Cards ’2018-1A’ RegSFRN 25/3/2034 4,293,320 0.07
EUR 3,100,000 Silver Arrow S.A.Compartment 10 ’B’ RegSFRN 15/3/2027 2,939,684 0.05
EUR 300,000 Silver Arrow S.A.Compartment 10 ’D’ RegSFRN 15/3/2027 285,360 0.01
EUR 300,000 Silver Arrow S.A.Compartment 10 RegS FRN15/3/2027 282,491 0.00
7,800,855 0.13
New ZealandNZD 39,263,000 New Zealand Government
Inflation Linked Bond RegS2.50% 20/9/2040 33,960,587 0.55
33,960,587 0.55
BlackRock Fixed Income Strategies Fund continued
The notes on pages 691 to 711 form an integral part of these financial statements.
BlackRock Strategic Funds[368]
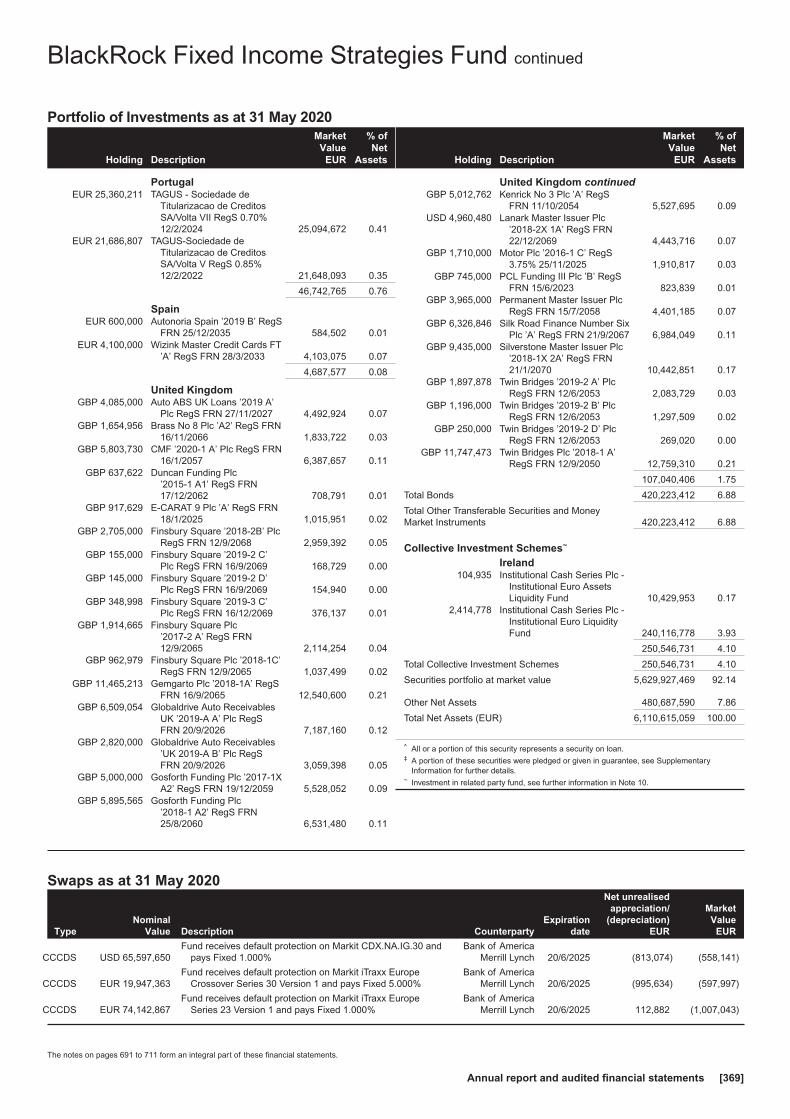
Portfolio of Investments as at 31 May 2020
Holding Description
MarketValue
EUR
% ofNet
Assets
PortugalEUR 25,360,211 TAGUS - Sociedade de
Titularizacao de CreditosSA/Volta VII RegS 0.70%12/2/2024 25,094,672 0.41
EUR 21,686,807 TAGUS-Sociedade deTitularizacao de CreditosSA/Volta V RegS 0.85%12/2/2022 21,648,093 0.35
46,742,765 0.76
SpainEUR 600,000 Autonoria Spain ’2019 B’ RegS
FRN 25/12/2035 584,502 0.01EUR 4,100,000 Wizink Master Credit Cards FT
’A’ RegS FRN 28/3/2033 4,103,075 0.07
4,687,577 0.08
United KingdomGBP 4,085,000 Auto ABS UK Loans ’2019 A’
Plc RegS FRN 27/11/2027 4,492,924 0.07GBP 1,654,956 Brass No 8 Plc ’A2’ RegS FRN
16/11/2066 1,833,722 0.03GBP 5,803,730 CMF ’2020-1 A’ Plc RegS FRN
16/1/2057 6,387,657 0.11GBP 637,622 Duncan Funding Plc
’2015-1 A1’ RegS FRN17/12/2062 708,791 0.01
GBP 917,629 E-CARAT 9 Plc ’A’ RegS FRN18/1/2025 1,015,951 0.02
GBP 2,705,000 Finsbury Square ’2018-2B’ PlcRegS FRN 12/9/2068 2,959,392 0.05
GBP 155,000 Finsbury Square ’2019-2 C’Plc RegS FRN 16/9/2069 168,729 0.00
GBP 145,000 Finsbury Square ’2019-2 D’Plc RegS FRN 16/9/2069 154,940 0.00
GBP 348,998 Finsbury Square ’2019-3 C’Plc RegS FRN 16/12/2069 376,137 0.01
GBP 1,914,665 Finsbury Square Plc’2017-2 A’ RegS FRN12/9/2065 2,114,254 0.04
GBP 962,979 Finsbury Square Plc ’2018-1C’RegS FRN 12/9/2065 1,037,499 0.02
GBP 11,465,213 Gemgarto Plc ’2018-1A’ RegSFRN 16/9/2065 12,540,600 0.21
GBP 6,509,054 Globaldrive Auto ReceivablesUK ’2019-A A’ Plc RegSFRN 20/9/2026 7,187,160 0.12
GBP 2,820,000 Globaldrive Auto Receivables’UK 2019-A B’ Plc RegSFRN 20/9/2026 3,059,398 0.05
GBP 5,000,000 Gosforth Funding Plc ’2017-1XA2’ RegS FRN 19/12/2059 5,528,052 0.09
GBP 5,895,565 Gosforth Funding Plc’2018-1 A2’ RegS FRN25/8/2060 6,531,480 0.11
Holding Description
MarketValue
EUR
% ofNet
Assets
United Kingdom continuedGBP 5,012,762 Kenrick No 3 Plc ’A’ RegS
FRN 11/10/2054 5,527,695 0.09USD 4,960,480 Lanark Master Issuer Plc
’2018-2X 1A’ RegS FRN22/12/2069 4,443,716 0.07
GBP 1,710,000 Motor Plc ’2016-1 C’ RegS3.75% 25/11/2025 1,910,817 0.03
GBP 745,000 PCL Funding III Plc ’B’ RegSFRN 15/6/2023 823,839 0.01
GBP 3,965,000 Permanent Master Issuer PlcRegS FRN 15/7/2058 4,401,185 0.07
GBP 6,326,846 Silk Road Finance Number SixPlc ’A’ RegS FRN 21/9/2067 6,984,049 0.11
GBP 9,435,000 Silverstone Master Issuer Plc’2018-1X 2A’ RegS FRN21/1/2070 10,442,851 0.17
GBP 1,897,878 Twin Bridges ’2019-2 A’ PlcRegS FRN 12/6/2053 2,083,729 0.03
GBP 1,196,000 Twin Bridges ’2019-2 B’ PlcRegS FRN 12/6/2053 1,297,509 0.02
GBP 250,000 Twin Bridges ’2019-2 D’ PlcRegS FRN 12/6/2053 269,020 0.00
GBP 11,747,473 Twin Bridges Plc ’2018-1 A’RegS FRN 12/9/2050 12,759,310 0.21
107,040,406 1.75
Total Bonds 420,223,412 6.88
Total Other Transferable Securities and MoneyMarket Instruments 420,223,412 6.88
Collective Investment Schemes~
Ireland104,935 Institutional Cash Series Plc -
Institutional Euro AssetsLiquidity Fund 10,429,953 0.17
2,414,778 Institutional Cash Series Plc -Institutional Euro LiquidityFund 240,116,778 3.93
250,546,731 4.10
Total Collective Investment Schemes 250,546,731 4.10
Securities portfolio at market value 5,629,927,469 92.14
Other Net Assets 480,687,590 7.86
Total Net Assets (EUR) 6,110,615,059 100.00
^ All or a portion of this security represents a security on loan.‡ A portion of these securities were pledged or given in guarantee, see Supplementary
Information for further details.~ Investment in related party fund, see further information in Note 10.
Swaps as at 31 May 2020
TypeNominal
Value Description CounterpartyExpiration
date
Net unrealisedappreciation/
(depreciation)EUR
MarketValue
EUR
CCCDS USD 65,597,650Fund receives default protection on Markit CDX.NA.IG.30 and
pays Fixed 1.000%Bank of America
Merrill Lynch 20/6/2025 (813,074) (558,141)
CCCDS EUR 19,947,363Fund receives default protection on Markit iTraxx Europe
Crossover Series 30 Version 1 and pays Fixed 5.000%Bank of America
Merrill Lynch 20/6/2025 (995,634) (597,997)
CCCDS EUR 74,142,867Fund receives default protection on Markit iTraxx Europe
Series 23 Version 1 and pays Fixed 1.000%Bank of America
Merrill Lynch 20/6/2025 112,882 (1,007,043)
BlackRock Fixed Income Strategies Fund continued
The notes on pages 691 to 711 form an integral part of these financial statements.
Annual report and audited financial statements [369]

Swaps as at 31 May 2020
TypeNominal
Value Description CounterpartyExpiration
date
Net unrealisedappreciation/
(depreciation)EUR
MarketValue
EUR
CCCDS EUR 3,230,000Fund receives default protection on Markit iTraxx Europe Sub
Financials Series 29 Version 1 and pays Fixed 1.000%Bank of America
Merrill Lynch 20/6/2025 (154,648) 124,739
CCILS EUR 72,550,000Fund receives Fixed 1.004% and pays Floating EUR 12 Month
CPTFEMUBank of America
Merrill Lynch 15/2/2025 2,231,383 2,232,624
CCILS EUR 26,903,000Fund receives Fixed 1.131% and pays Floating EUR 12 Month
CPTFEMUBank of America
Merrill Lynch 15/12/2029 1,335,656 1,336,270
CCILS EUR 17,066,000Fund receives Fixed 1.135% and pays Floating EUR 12 Month
CPTFEMUBank of America
Merrill Lynch 15/12/2029 855,064 855,453
CCILS GBP 10,695,000Fund receives Fixed 3.202% and pays Floating GBP 12 Month
UKRPIBank of America
Merrill Lynch 15/3/2030 (213,456) (213,189)
CCILS GBP 31,800,000Fund receives Fixed 3.260% and pays Floating GBP 12 Month
UKRPIBank of America
Merrill Lynch 15/3/2035 41,916 43,209
CCILS GBP 13,367,500Fund receives Fixed 3.270% and pays Floating GBP 12 Month
UKRPIBank of America
Merrill Lynch 15/3/2030 (134,127) (133,778)
CCILS GBP 5,445,000Fund receives Fixed 3.285% and pays Floating GBP 12 Month
UKRPIBank of America
Merrill Lynch 15/3/2030 (42,669) (42,527)
CCILS GBP 13,367,500Fund receives Fixed 3.290% and pays Floating GBP 12 Month
UKRPIBank of America
Merrill Lynch 15/3/2030 (94,953) (94,604)
CCILS GBP 5,445,000Fund receives Fixed 3.293% and pays Floating GBP 12 Month
UKRPIBank of America
Merrill Lynch 15/3/2030 (36,281) (36,139)
CCILS GBP 25,780,000Fund receives Fixed 3.315% and pays Floating GBP 12 Month
UKRPIBank of America
Merrill Lynch 15/5/2030 (218,967) (218,307)
CCILS GBP 9,360,000Fund receives Fixed 3.340% and pays Floating GBP 12 Month
UKRPIBank of America
Merrill Lynch 15/3/2030 2,298 2,542
CCILS GBP 49,460,000Fund receives Fixed 3.475% and pays Floating GBP 12 Month
UKRPIBank of America
Merrill Lynch 15/10/2029 1,675,844 1,677,145
CCILS GBP 44,200,000Fund receives Fixed 3.530% and pays Floating GBP 12 Month
UKRPIBank of America
Merrill Lynch 15/12/2029 1,365,825 1,367,023
CCILS GBP 76,530,000Fund receives Fixed 3.580% and pays Floating GBP 12 Month
UKRPIBank of America
Merrill Lynch 15/12/2029 2,939,546 2,941,619
CCILS GBP 22,100,000Fund receives Fixed 3.585% and pays Floating GBP 12 Month
UKRPIBank of America
Merrill Lynch 15/12/2029 865,504 866,103
CCILS GBP 28,392,550Fund receives Fixed 3.670% and pays Floating GBP 12 Month
UKRPIBank of America
Merrill Lynch 15/6/2024 1,395,591 1,396,072
CCILS GBP 1,300,000Fund receives Fixed 3.675% and pays Floating GBP 12 Month
UKRPIBank of America
Merrill Lynch 15/6/2029 84,938 84,971
CCILS GBP 24,495,000Fund receives Fixed 3.710% and pays Floating GBP 12 Month
UKRPIBank of America
Merrill Lynch 15/8/2029 1,676,440 1,677,058
CCILS GBP 24,495,000Fund receives Fixed 3.725% and pays Floating GBP 12 Month
UKRPIBank of America
Merrill Lynch 15/8/2029 1,732,466 1,733,083
CCILS GBP 24,130,000Fund receives Fixed 3.745% and pays Floating GBP 12 Month
UKRPIBank of America
Merrill Lynch 15/8/2029 1,780,348 1,780,956
CCILS GBP 24,140,000Fund receives Fixed 3.773% and pays Floating GBP 12 Month
UKRPIBank of America
Merrill Lynch 15/9/2029 1,854,895 1,855,512
CCILS GBP 55,113,000Fund receives Fixed 3.776% and pays Floating GBP 12 Month
UKRPIBank of America
Merrill Lynch 15/9/2028 3,933,978 3,953,665
CCILS EUR 34,221,395Fund receives Floating EUR 12 Month CPTFEMU and pays
Fixed 0.960%Bank of America
Merrill Lynch 15/6/2024 (865,940) (865,425)
CCILS EUR 63,220,000Fund receives Floating EUR 12 Month CPTFEMU and pays
Fixed 1.060%Bank of America
Merrill Lynch 15/2/2030 (2,597,385) (2,595,944)
CCILS EUR 100,000,000Fund receives Floating EUR 12 Month CPTFEMU and pays
Fixed 1.122%Bank of America
Merrill Lynch 15/12/2021 (2,182,476) (2,181,539)
CCILS EUR 80,350,000Fund receives Floating EUR 12 Month CPTFEMU and pays
Fixed 1.149%Bank of America
Merrill Lynch 15/2/2030 (4,117,771) (4,115,939)
CCILS GBP 44,200,000Fund receives Floating GBP 12 Month UKRPI and pays Fixed
3.449%Bank of America
Merrill Lynch 15/12/2024 (1,045,574) (1,044,782)
CCILS GBP 22,100,000Fund receives Floating GBP 12 Month UKRPI and pays Fixed
3.500%Bank of America
Merrill Lynch 15/12/2024 (594,455) (594,062)
CCILS USD 49,425,000Fund receives Floating USD 12 Month USCPI and pays Fixed
1.177%Bank of America
Merrill Lynch 10/3/2025 (586,232) (585,575)
CCILS USD 46,555,000Fund receives Floating USD 12 Month USCPI and pays Fixed
1.295%Bank of America
Merrill Lynch 7/4/2030 182,824 183,808
CCILS EUR 15,519,000Fund receives Index and pays Markit iBoxx Euro Corporate
IndexBank of America
Merrill Lynch 15/3/2030 (275,408) (275,054)
BlackRock Fixed Income Strategies Fund continued
The notes on pages 691 to 711 form an integral part of these financial statements.
BlackRock Strategic Funds[370]
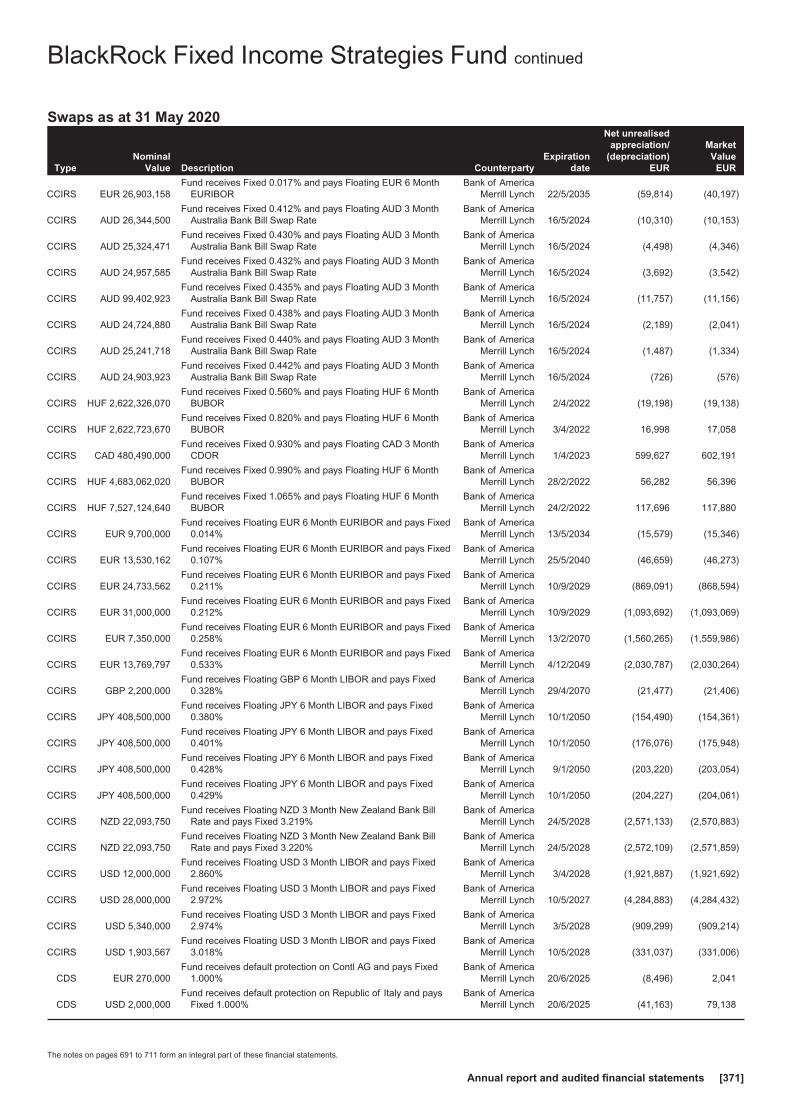
Swaps as at 31 May 2020
TypeNominal
Value Description CounterpartyExpiration
date
Net unrealisedappreciation/
(depreciation)EUR
MarketValue
EUR
CCIRS EUR 26,903,158Fund receives Fixed 0.017% and pays Floating EUR 6 Month
EURIBORBank of America
Merrill Lynch 22/5/2035 (59,814) (40,197)
CCIRS AUD 26,344,500Fund receives Fixed 0.412% and pays Floating AUD 3 Month
Australia Bank Bill Swap RateBank of America
Merrill Lynch 16/5/2024 (10,310) (10,153)
CCIRS AUD 25,324,471Fund receives Fixed 0.430% and pays Floating AUD 3 Month
Australia Bank Bill Swap RateBank of America
Merrill Lynch 16/5/2024 (4,498) (4,346)
CCIRS AUD 24,957,585Fund receives Fixed 0.432% and pays Floating AUD 3 Month
Australia Bank Bill Swap RateBank of America
Merrill Lynch 16/5/2024 (3,692) (3,542)
CCIRS AUD 99,402,923Fund receives Fixed 0.435% and pays Floating AUD 3 Month
Australia Bank Bill Swap RateBank of America
Merrill Lynch 16/5/2024 (11,757) (11,156)
CCIRS AUD 24,724,880Fund receives Fixed 0.438% and pays Floating AUD 3 Month
Australia Bank Bill Swap RateBank of America
Merrill Lynch 16/5/2024 (2,189) (2,041)
CCIRS AUD 25,241,718Fund receives Fixed 0.440% and pays Floating AUD 3 Month
Australia Bank Bill Swap RateBank of America
Merrill Lynch 16/5/2024 (1,487) (1,334)
CCIRS AUD 24,903,923Fund receives Fixed 0.442% and pays Floating AUD 3 Month
Australia Bank Bill Swap RateBank of America
Merrill Lynch 16/5/2024 (726) (576)
CCIRS HUF 2,622,326,070Fund receives Fixed 0.560% and pays Floating HUF 6 Month
BUBORBank of America
Merrill Lynch 2/4/2022 (19,198) (19,138)
CCIRS HUF 2,622,723,670Fund receives Fixed 0.820% and pays Floating HUF 6 Month
BUBORBank of America
Merrill Lynch 3/4/2022 16,998 17,058
CCIRS CAD 480,490,000Fund receives Fixed 0.930% and pays Floating CAD 3 Month
CDORBank of America
Merrill Lynch 1/4/2023 599,627 602,191
CCIRS HUF 4,683,062,020Fund receives Fixed 0.990% and pays Floating HUF 6 Month
BUBORBank of America
Merrill Lynch 28/2/2022 56,282 56,396
CCIRS HUF 7,527,124,640Fund receives Fixed 1.065% and pays Floating HUF 6 Month
BUBORBank of America
Merrill Lynch 24/2/2022 117,696 117,880
CCIRS EUR 9,700,000Fund receives Floating EUR 6 Month EURIBOR and pays Fixed
0.014%Bank of America
Merrill Lynch 13/5/2034 (15,579) (15,346)
CCIRS EUR 13,530,162Fund receives Floating EUR 6 Month EURIBOR and pays Fixed
0.107%Bank of America
Merrill Lynch 25/5/2040 (46,659) (46,273)
CCIRS EUR 24,733,562Fund receives Floating EUR 6 Month EURIBOR and pays Fixed
0.211%Bank of America
Merrill Lynch 10/9/2029 (869,091) (868,594)
CCIRS EUR 31,000,000Fund receives Floating EUR 6 Month EURIBOR and pays Fixed
0.212%Bank of America
Merrill Lynch 10/9/2029 (1,093,692) (1,093,069)
CCIRS EUR 7,350,000Fund receives Floating EUR 6 Month EURIBOR and pays Fixed
0.258%Bank of America
Merrill Lynch 13/2/2070 (1,560,265) (1,559,986)
CCIRS EUR 13,769,797Fund receives Floating EUR 6 Month EURIBOR and pays Fixed
0.533%Bank of America
Merrill Lynch 4/12/2049 (2,030,787) (2,030,264)
CCIRS GBP 2,200,000Fund receives Floating GBP 6 Month LIBOR and pays Fixed
0.328%Bank of America
Merrill Lynch 29/4/2070 (21,477) (21,406)
CCIRS JPY 408,500,000Fund receives Floating JPY 6 Month LIBOR and pays Fixed
0.380%Bank of America
Merrill Lynch 10/1/2050 (154,490) (154,361)
CCIRS JPY 408,500,000Fund receives Floating JPY 6 Month LIBOR and pays Fixed
0.401%Bank of America
Merrill Lynch 10/1/2050 (176,076) (175,948)
CCIRS JPY 408,500,000Fund receives Floating JPY 6 Month LIBOR and pays Fixed
0.428%Bank of America
Merrill Lynch 9/1/2050 (203,220) (203,054)
CCIRS JPY 408,500,000Fund receives Floating JPY 6 Month LIBOR and pays Fixed
0.429%Bank of America
Merrill Lynch 10/1/2050 (204,227) (204,061)
CCIRS NZD 22,093,750Fund receives Floating NZD 3 Month New Zealand Bank Bill
Rate and pays Fixed 3.219%Bank of America
Merrill Lynch 24/5/2028 (2,571,133) (2,570,883)
CCIRS NZD 22,093,750Fund receives Floating NZD 3 Month New Zealand Bank Bill
Rate and pays Fixed 3.220%Bank of America
Merrill Lynch 24/5/2028 (2,572,109) (2,571,859)
CCIRS USD 12,000,000Fund receives Floating USD 3 Month LIBOR and pays Fixed
2.860%Bank of America
Merrill Lynch 3/4/2028 (1,921,887) (1,921,692)
CCIRS USD 28,000,000Fund receives Floating USD 3 Month LIBOR and pays Fixed
2.972%Bank of America
Merrill Lynch 10/5/2027 (4,284,883) (4,284,432)
CCIRS USD 5,340,000Fund receives Floating USD 3 Month LIBOR and pays Fixed
2.974%Bank of America
Merrill Lynch 3/5/2028 (909,299) (909,214)
CCIRS USD 1,903,567Fund receives Floating USD 3 Month LIBOR and pays Fixed
3.018%Bank of America
Merrill Lynch 10/5/2028 (331,037) (331,006)
CDS EUR 270,000Fund receives default protection on Contl AG and pays Fixed
1.000%Bank of America
Merrill Lynch 20/6/2025 (8,496) 2,041
CDS USD 2,000,000Fund receives default protection on Republic of Italy and pays
Fixed 1.000%Bank of America
Merrill Lynch 20/6/2025 (41,163) 79,138
BlackRock Fixed Income Strategies Fund continued
The notes on pages 691 to 711 form an integral part of these financial statements.
Annual report and audited financial statements [371]

Swaps as at 31 May 2020
TypeNominal
Value Description CounterpartyExpiration
date
Net unrealisedappreciation/
(depreciation)EUR
MarketValue
EUR
CDS EUR 200,000Fund receives default protection on Sudzucker International
Finance BV and pays Fixed 1.000%Bank of America
Merrill Lynch 20/12/2024 3,550 1,641
CDS USD 2,000,000Fund receives Fixed 1.000% and provides default protection on
Republic of ItalyBank of America
Merrill Lynch 20/6/2025 (10,335) (79,138)
CDS EUR 615,000Fund receives default protection on Accor SA and pays Fixed
1.000% Barclays Bank 20/12/2024 38,977 33,105
CDS EUR 51,400Fund receives default protection on Altice Finco SA and pays
Fixed 5.000% Barclays Bank 20/12/2024 1,561 (3,403)
CDS EUR 51,000Fund receives default protection on Altice Finco SA and pays
Fixed 5.000% Barclays Bank 20/12/2024 2,064 (3,376)
CDS EUR 9,240,000Fund receives default protection on BASF SE and pays Fixed
1.000% Barclays Bank 20/6/2021 165,525 (87,883)
CDS USD 430,000Fund receives default protection on Brazilian Government
International Bond and pays Fixed 1.000% Barclays Bank 20/6/2025 (17,249) 33,069
CDS USD 220,000Fund receives default protection on Brazilian Government
International Bond and pays Fixed 1.000% Barclays Bank 20/6/2025 (7,398) 16,919
CDS EUR 300,000Fund receives default protection on Casino Guichard Perrachon
SA and pays Fixed 5.000% Barclays Bank 20/6/2021 (5,342) 2,158
CDS EUR 420,000Fund receives default protection on Contl AG and pays Fixed
1.000% Barclays Bank 20/6/2025 (12,873) 3,174
CDS EUR 100,000Fund receives default protection on Marks & Spencer Plc and
pays Fixed 1.000% Barclays Bank 20/6/2022 (137) 3,366
CDS EUR 100,000Fund receives default protection on Monitchem HoldCo 3 SA
and pays Fixed 5.000% Barclays Bank 20/6/2025 131 (8,990)
CDS USD 82,773Fund receives default protection on Netflix Inc and pays Fixed
5.000% Barclays Bank 20/12/2024 1,657 (13,321)
CDS EUR 770,000Fund receives default protection on Next Plc and pays Fixed
1.000% Barclays Bank 20/12/2024 31,967 39,744
CDS EUR 300,000Fund receives default protection on Suedzucker and pays Fixed
1.000% Barclays Bank 20/6/2024 (4,760) 774
CDS EUR 750,000Fund receives default protection on Sunrise Communications
Holdings SA and pays Fixed 5.000% Barclays Bank 20/12/2024 13,390 (144,609)
CDS EUR 9,240,000Fund receives Fixed 1.000% and provides default protection on
Air Liquide SA Barclays Bank 20/6/2021 (162,057) 91,352
CDS EUR 500,000Fund receives Fixed 5.000% and provides default protection on
Garfunkelux Holdco 2 SA Barclays Bank 20/6/2023 (72,920) (82,920)
CDS EUR 107,820Fund receives default protection on Altice Finco SA and pays
Fixed 5.000% BNP Paribas 20/12/2024 5,659 (7,138)
CDS EUR 230,000Fund receives default protection on Ardagh Packaging Ltd Co
and pays Fixed 5.000% BNP Paribas 20/12/2024 (10,080) (24,737)
CDS EUR 2,750,000Fund receives default protection on Barclays Bank Plc and pays
Fixed 1.000% BNP Paribas 20/6/2021 (198,163) (13,874)
CDS EUR 66,084Fund receives default protection on Cable Wireless Ltd and
pays Fixed 5.000% BNP Paribas 20/12/2023 2,649 (9,354)
CDS EUR 108,000Fund receives default protection on Jaguar Land Rover
Automotive Plc and pays Fixed 5.000% BNP Paribas 20/6/2024 15,495 19,545
CDS EUR 200,000Fund receives default protection on Suedzucker and pays Fixed
1.000% BNP Paribas 20/12/2024 3,549 1,641
CDS EUR 160,000Fund receives Fixed 1.000% and provides default protection on
Casino Guichard Perrachon SA BNP Paribas 20/6/2023 (9,326) (23,221)
CDS EUR 160,000Fund receives Fixed 1.000% and provides default protection on
Casino Guichard Perrachon SA BNP Paribas 20/6/2023 (9,326) (23,221)
CDS EUR 128,226Fund receives Fixed 1.000% and provides default protection on
Ladbrokers Coral Group Ltd BNP Paribas 20/6/2025 5,348 (10,502)
CDS EUR 70,000Fund receives Fixed 5.000% and provides default protection on
Garfunkelux Holdco 2 SA BNP Paribas 20/6/2024 (7,388) (12,638)
CDS EUR 80,000Fund receives Fixed 5.000% and provides default protection on
Garfunkelux Holdco 2 SA BNP Paribas 20/12/2024 (16,559) (14,940)
CDS EUR 40,000Fund receives Fixed 5.000% and provides default protection on
Garfunkelux Holdco 2 SA BNP Paribas 20/12/2024 (8,314) (7,470)
CDS EUR 247,765Fund receives default protection on Ardagh Packaging Ltd Co
and pays Fixed 5.000% Citibank 20/12/2024 12,730 (26,647)
CDS EUR 215,000Fund receives default protection on Banco Bilbao Vizcaya
Argentaria SA and pays Fixed 1.000% Citibank 20/6/2025 (18,503) 12,880
BlackRock Fixed Income Strategies Fund continued
The notes on pages 691 to 711 form an integral part of these financial statements.
BlackRock Strategic Funds[372]
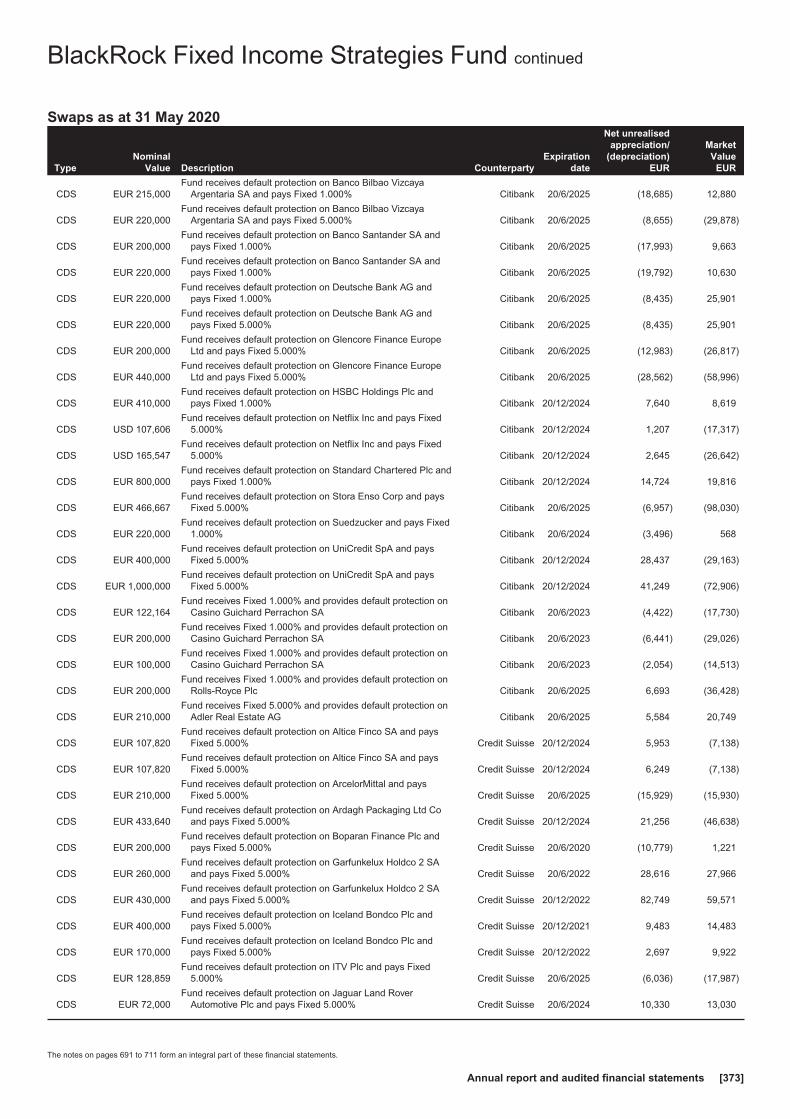
Swaps as at 31 May 2020
TypeNominal
Value Description CounterpartyExpiration
date
Net unrealisedappreciation/
(depreciation)EUR
MarketValue
EUR
CDS EUR 215,000Fund receives default protection on Banco Bilbao Vizcaya
Argentaria SA and pays Fixed 1.000% Citibank 20/6/2025 (18,685) 12,880
CDS EUR 220,000Fund receives default protection on Banco Bilbao Vizcaya
Argentaria SA and pays Fixed 5.000% Citibank 20/6/2025 (8,655) (29,878)
CDS EUR 200,000Fund receives default protection on Banco Santander SA and
pays Fixed 1.000% Citibank 20/6/2025 (17,993) 9,663
CDS EUR 220,000Fund receives default protection on Banco Santander SA and
pays Fixed 1.000% Citibank 20/6/2025 (19,792) 10,630
CDS EUR 220,000Fund receives default protection on Deutsche Bank AG and
pays Fixed 1.000% Citibank 20/6/2025 (8,435) 25,901
CDS EUR 220,000Fund receives default protection on Deutsche Bank AG and
pays Fixed 5.000% Citibank 20/6/2025 (8,435) 25,901
CDS EUR 200,000Fund receives default protection on Glencore Finance Europe
Ltd and pays Fixed 5.000% Citibank 20/6/2025 (12,983) (26,817)
CDS EUR 440,000Fund receives default protection on Glencore Finance Europe
Ltd and pays Fixed 5.000% Citibank 20/6/2025 (28,562) (58,996)
CDS EUR 410,000Fund receives default protection on HSBC Holdings Plc and
pays Fixed 1.000% Citibank 20/12/2024 7,640 8,619
CDS USD 107,606Fund receives default protection on Netflix Inc and pays Fixed
5.000% Citibank 20/12/2024 1,207 (17,317)
CDS USD 165,547Fund receives default protection on Netflix Inc and pays Fixed
5.000% Citibank 20/12/2024 2,645 (26,642)
CDS EUR 800,000Fund receives default protection on Standard Chartered Plc and
pays Fixed 1.000% Citibank 20/12/2024 14,724 19,816
CDS EUR 466,667Fund receives default protection on Stora Enso Corp and pays
Fixed 5.000% Citibank 20/6/2025 (6,957) (98,030)
CDS EUR 220,000Fund receives default protection on Suedzucker and pays Fixed
1.000% Citibank 20/6/2024 (3,496) 568
CDS EUR 400,000Fund receives default protection on UniCredit SpA and pays
Fixed 5.000% Citibank 20/12/2024 28,437 (29,163)
CDS EUR 1,000,000Fund receives default protection on UniCredit SpA and pays
Fixed 5.000% Citibank 20/12/2024 41,249 (72,906)
CDS EUR 122,164Fund receives Fixed 1.000% and provides default protection on
Casino Guichard Perrachon SA Citibank 20/6/2023 (4,422) (17,730)
CDS EUR 200,000Fund receives Fixed 1.000% and provides default protection on
Casino Guichard Perrachon SA Citibank 20/6/2023 (6,441) (29,026)
CDS EUR 100,000Fund receives Fixed 1.000% and provides default protection on
Casino Guichard Perrachon SA Citibank 20/6/2023 (2,054) (14,513)
CDS EUR 200,000Fund receives Fixed 1.000% and provides default protection on
Rolls-Royce Plc Citibank 20/6/2025 6,693 (36,428)
CDS EUR 210,000Fund receives Fixed 5.000% and provides default protection on
Adler Real Estate AG Citibank 20/6/2025 5,584 20,749
CDS EUR 107,820Fund receives default protection on Altice Finco SA and pays
Fixed 5.000% Credit Suisse 20/12/2024 5,953 (7,138)
CDS EUR 107,820Fund receives default protection on Altice Finco SA and pays
Fixed 5.000% Credit Suisse 20/12/2024 6,249 (7,138)
CDS EUR 210,000Fund receives default protection on ArcelorMittal and pays
Fixed 5.000% Credit Suisse 20/6/2025 (15,929) (15,930)
CDS EUR 433,640Fund receives default protection on Ardagh Packaging Ltd Co
and pays Fixed 5.000% Credit Suisse 20/12/2024 21,256 (46,638)
CDS EUR 200,000Fund receives default protection on Boparan Finance Plc and
pays Fixed 5.000% Credit Suisse 20/6/2020 (10,779) 1,221
CDS EUR 260,000Fund receives default protection on Garfunkelux Holdco 2 SA
and pays Fixed 5.000% Credit Suisse 20/6/2022 28,616 27,966
CDS EUR 430,000Fund receives default protection on Garfunkelux Holdco 2 SA
and pays Fixed 5.000% Credit Suisse 20/12/2022 82,749 59,571
CDS EUR 400,000Fund receives default protection on Iceland Bondco Plc and
pays Fixed 5.000% Credit Suisse 20/12/2021 9,483 14,483
CDS EUR 170,000Fund receives default protection on Iceland Bondco Plc and
pays Fixed 5.000% Credit Suisse 20/12/2022 2,697 9,922
CDS EUR 128,859Fund receives default protection on ITV Plc and pays Fixed
5.000% Credit Suisse 20/6/2025 (6,036) (17,987)
CDS EUR 72,000Fund receives default protection on Jaguar Land Rover
Automotive Plc and pays Fixed 5.000% Credit Suisse 20/6/2024 10,330 13,030
BlackRock Fixed Income Strategies Fund continued
The notes on pages 691 to 711 form an integral part of these financial statements.
Annual report and audited financial statements [373]
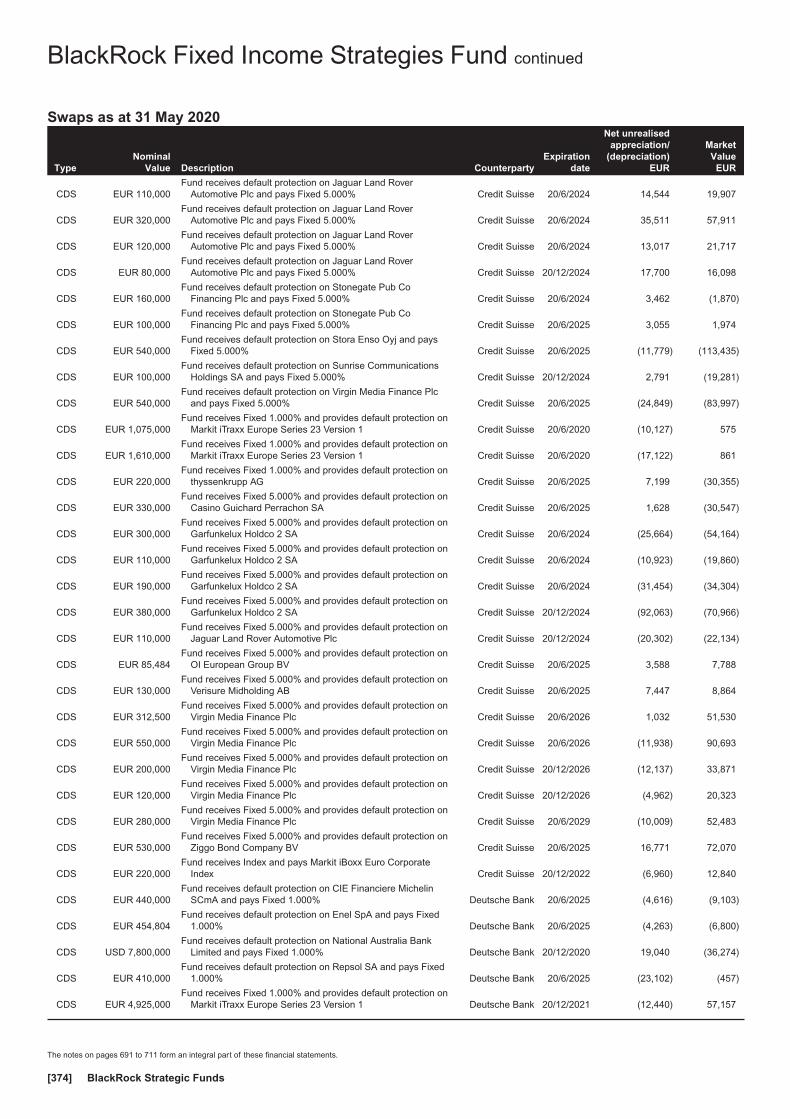
Swaps as at 31 May 2020
TypeNominal
Value Description CounterpartyExpiration
date
Net unrealisedappreciation/
(depreciation)EUR
MarketValue
EUR
CDS EUR 110,000Fund receives default protection on Jaguar Land Rover
Automotive Plc and pays Fixed 5.000% Credit Suisse 20/6/2024 14,544 19,907
CDS EUR 320,000Fund receives default protection on Jaguar Land Rover
Automotive Plc and pays Fixed 5.000% Credit Suisse 20/6/2024 35,511 57,911
CDS EUR 120,000Fund receives default protection on Jaguar Land Rover
Automotive Plc and pays Fixed 5.000% Credit Suisse 20/6/2024 13,017 21,717
CDS EUR 80,000Fund receives default protection on Jaguar Land Rover
Automotive Plc and pays Fixed 5.000% Credit Suisse 20/12/2024 17,700 16,098
CDS EUR 160,000Fund receives default protection on Stonegate Pub Co
Financing Plc and pays Fixed 5.000% Credit Suisse 20/6/2024 3,462 (1,870)
CDS EUR 100,000Fund receives default protection on Stonegate Pub Co
Financing Plc and pays Fixed 5.000% Credit Suisse 20/6/2025 3,055 1,974
CDS EUR 540,000Fund receives default protection on Stora Enso Oyj and pays
Fixed 5.000% Credit Suisse 20/6/2025 (11,779) (113,435)
CDS EUR 100,000Fund receives default protection on Sunrise Communications
Holdings SA and pays Fixed 5.000% Credit Suisse 20/12/2024 2,791 (19,281)
CDS EUR 540,000Fund receives default protection on Virgin Media Finance Plc
and pays Fixed 5.000% Credit Suisse 20/6/2025 (24,849) (83,997)
CDS EUR 1,075,000Fund receives Fixed 1.000% and provides default protection on
Markit iTraxx Europe Series 23 Version 1 Credit Suisse 20/6/2020 (10,127) 575
CDS EUR 1,610,000Fund receives Fixed 1.000% and provides default protection on
Markit iTraxx Europe Series 23 Version 1 Credit Suisse 20/6/2020 (17,122) 861
CDS EUR 220,000Fund receives Fixed 1.000% and provides default protection on
thyssenkrupp AG Credit Suisse 20/6/2025 7,199 (30,355)
CDS EUR 330,000Fund receives Fixed 5.000% and provides default protection on
Casino Guichard Perrachon SA Credit Suisse 20/6/2025 1,628 (30,547)
CDS EUR 300,000Fund receives Fixed 5.000% and provides default protection on
Garfunkelux Holdco 2 SA Credit Suisse 20/6/2024 (25,664) (54,164)
CDS EUR 110,000Fund receives Fixed 5.000% and provides default protection on
Garfunkelux Holdco 2 SA Credit Suisse 20/6/2024 (10,923) (19,860)
CDS EUR 190,000Fund receives Fixed 5.000% and provides default protection on
Garfunkelux Holdco 2 SA Credit Suisse 20/6/2024 (31,454) (34,304)
CDS EUR 380,000Fund receives Fixed 5.000% and provides default protection on
Garfunkelux Holdco 2 SA Credit Suisse 20/12/2024 (92,063) (70,966)
CDS EUR 110,000Fund receives Fixed 5.000% and provides default protection on
Jaguar Land Rover Automotive Plc Credit Suisse 20/12/2024 (20,302) (22,134)
CDS EUR 85,484Fund receives Fixed 5.000% and provides default protection on
OI European Group BV Credit Suisse 20/6/2025 3,588 7,788
CDS EUR 130,000Fund receives Fixed 5.000% and provides default protection on
Verisure Midholding AB Credit Suisse 20/6/2025 7,447 8,864
CDS EUR 312,500Fund receives Fixed 5.000% and provides default protection on
Virgin Media Finance Plc Credit Suisse 20/6/2026 1,032 51,530
CDS EUR 550,000Fund receives Fixed 5.000% and provides default protection on
Virgin Media Finance Plc Credit Suisse 20/6/2026 (11,938) 90,693
CDS EUR 200,000Fund receives Fixed 5.000% and provides default protection on
Virgin Media Finance Plc Credit Suisse 20/12/2026 (12,137) 33,871
CDS EUR 120,000Fund receives Fixed 5.000% and provides default protection on
Virgin Media Finance Plc Credit Suisse 20/12/2026 (4,962) 20,323
CDS EUR 280,000Fund receives Fixed 5.000% and provides default protection on
Virgin Media Finance Plc Credit Suisse 20/6/2029 (10,009) 52,483
CDS EUR 530,000Fund receives Fixed 5.000% and provides default protection on
Ziggo Bond Company BV Credit Suisse 20/6/2025 16,771 72,070
CDS EUR 220,000Fund receives Index and pays Markit iBoxx Euro Corporate
Index Credit Suisse 20/12/2022 (6,960) 12,840
CDS EUR 440,000Fund receives default protection on CIE Financiere Michelin
SCmA and pays Fixed 1.000% Deutsche Bank 20/6/2025 (4,616) (9,103)
CDS EUR 454,804Fund receives default protection on Enel SpA and pays Fixed
1.000% Deutsche Bank 20/6/2025 (4,263) (6,800)
CDS USD 7,800,000Fund receives default protection on National Australia Bank
Limited and pays Fixed 1.000% Deutsche Bank 20/12/2020 19,040 (36,274)
CDS EUR 410,000Fund receives default protection on Repsol SA and pays Fixed
1.000% Deutsche Bank 20/6/2025 (23,102) (457)
CDS EUR 4,925,000Fund receives Fixed 1.000% and provides default protection on
Markit iTraxx Europe Series 23 Version 1 Deutsche Bank 20/12/2021 (12,440) 57,157
BlackRock Fixed Income Strategies Fund continued
The notes on pages 691 to 711 form an integral part of these financial statements.
BlackRock Strategic Funds[374]

Swaps as at 31 May 2020
TypeNominal
Value Description CounterpartyExpiration
date
Net unrealisedappreciation/
(depreciation)EUR
MarketValue
EUR
CDS EUR 205,000Fund receives default protection on Accor SA and pays Fixed
1.000% Goldman Sachs 20/12/2024 12,500 11,035
CDS USD 220,000Fund receives default protection on Ally Finl Inc and pays Fixed
5.000% Goldman Sachs 20/6/2023 (1,559) (19,544)
CDS EUR 51,400Fund receives default protection on Altice Finco SA and pays
Fixed 5.000% Goldman Sachs 20/12/2024 1,432 (3,403)
CDS EUR 115,849Fund receives default protection on Altice Finco SA and pays
Fixed 5.000% Goldman Sachs 20/12/2024 8,197 (7,669)
CDS USD 7,077,915Fund receives default protection on Australia & New Zealand
Banking Group Ltd and pays Fixed 1.000% Goldman Sachs 20/12/2020 4,757 (32,677)
CDS EUR 1,150,000Fund receives default protection on Bay Motoren Werke AG and
pays Fixed 1.000% Goldman Sachs 20/6/2025 (34,848) (3,432)
CDS EUR 92,518Fund receives default protection on Cable Wireless Ltd and
pays Fixed 5.000% Goldman Sachs 20/12/2023 4,281 (13,095)
CDS EUR 76,250Fund receives default protection on Cable Wireless Ltd and
pays Fixed 5.000% Goldman Sachs 20/12/2023 2,844 (10,793)
CDS EUR 1,629,000Fund receives default protection on CNH Industrial NV and pays
Fixed 5.000% Goldman Sachs 20/6/2025 (38,321) (238,276)
CDS USD 210,000Fund receives default protection on Ford Motor Co and pays
Fixed 5.000% Goldman Sachs 20/6/2021 (6,570) (771)
CDS USD 130,000Fund receives default protection on Ford Motor Co and pays
Fixed 5.000% Goldman Sachs 20/6/2022 (6,757) 1,021
CDS EUR 450,000Fund receives default protection on ITV Plc and pays Fixed
5.000% Goldman Sachs 20/12/2024 25,120 (59,483)
CDS USD 82,774Fund receives default protection on Netflix Inc and pays Fixed
5.000% Goldman Sachs 20/12/2024 1,657 (13,321)
CDS EUR 320,000Fund receives default protection on Next Plc and pays Fixed
1.000% Goldman Sachs 20/6/2025 (8,701) 19,612
CDS EUR 440,000Fund receives default protection on Nokia Oyj and pays Fixed
5.000% Goldman Sachs 20/6/2025 1,831 (75,713)
CDS EUR 210,000Fund receives default protection on Peugeot SA and pays Fixed
5.000% Goldman Sachs 20/6/2025 940 (25,667)
CDS EUR 420,000Fund receives default protection on Renault and pays Fixed
1.000% Goldman Sachs 20/6/2025 (13,677) 31,569
CDS EUR 200,000Fund receives default protection on Repsol SA and pays Fixed
1.000% Goldman Sachs 20/6/2025 (10,757) (223)
CDS EUR 230,000Fund receives default protection on Repsol SA and pays Fixed
1.000% Goldman Sachs 20/6/2025 (10,096) (257)
CDS EUR 4,800,000Fund receives default protection on Ses SA and pays Fixed
1.000% Goldman Sachs 20/12/2023 66,049 9,173
CDS EUR 230,000Fund receives default protection on Ses SA and pays Fixed
1.000% Goldman Sachs 20/6/2025 (2,157) 4,349
CDS EUR 200,000Fund receives default protection on Ses SA and pays Fixed
1.000% Goldman Sachs 20/6/2025 (689) 3,782
CDS JPY 18,499,157Fund receives default protection on SoftBank Group Corp and
pays Fixed 1.000% Goldman Sachs 20/12/2024 121 8,476
CDS JPY 18,499,157Fund receives default protection on SoftBank Group Corp and
pays Fixed 1.000% Goldman Sachs 20/12/2024 321 8,476
CDS JPY 36,998,314Fund receives default protection on SoftBank Group Corp and
pays Fixed 1.000% Goldman Sachs 20/12/2024 178 16,952
CDS EUR 200,000Fund receives default protection on Standard Chartered Plc and
pays Fixed 1.000% Goldman Sachs 20/6/2024 (1,510) 3,435
CDS EUR 620,000Fund receives default protection on Standard Chartered Plc and
pays Fixed 1.000% Goldman Sachs 20/12/2024 18,379 15,357
CDS EUR 200,000Fund receives default protection on Stora Enso Corp and pays
Fixed 5.000% Goldman Sachs 20/6/2025 (1,221) (42,013)
CDS EUR 369,892Fund receives default protection on Suedzucker and pays Fixed
1.000% Goldman Sachs 20/6/2025 (6,207) 5,067
CDS EUR 200,000Fund receives default protection on Valeo SA and pays Fixed
1.000% Goldman Sachs 20/6/2025 (7,555) 14,296
CDS EUR 200,000Fund receives default protection on Valeo SA and pays Fixed
1.000% Goldman Sachs 20/6/2025 (7,141) 14,296
CDS EUR 100,000Fund receives default protection on Valeo SA and pays Fixed
1.000% Goldman Sachs 20/6/2025 (2,857) 7,148
BlackRock Fixed Income Strategies Fund continued
The notes on pages 691 to 711 form an integral part of these financial statements.
Annual report and audited financial statements [375]

Swaps as at 31 May 2020
TypeNominal
Value Description CounterpartyExpiration
date
Net unrealisedappreciation/
(depreciation)EUR
MarketValue
EUR
CDS EUR 40,000Fund receives default protection on Valeo SA and pays Fixed
1.000% Goldman Sachs 20/6/2025 (806) 2,859
CDS EUR 170,000Fund receives Fixed 1.000% and provides default protection on
Casino Guichard Perrachon SA Goldman Sachs 20/6/2023 (9,755) (24,672)
CDS EUR 80,000Fund receives Fixed 5.000% and provides default protection on
Casino Guichard Perrachon SA Goldman Sachs 20/12/2024 573 (6,627)
CDS EUR 400,000Fund receives Fixed 5.000% and provides default protection on
Garfunkelux Holdco 2 SA Goldman Sachs 20/6/2023 (53,336) (66,336)
CDS EUR 200,000Fund receives Fixed 5.000% and provides default protection on
Garfunkelux Holdco 2 SA Goldman Sachs 20/6/2024 (26,360) (36,110)
CDS EUR 220,000Fund receives Fixed 5.000% and provides default protection on
Intrum AB Goldman Sachs 20/6/2025 8,500 (32,200)
CDS EUR 220,000Fund receives default protection on Repsol SA and pays Fixed
1.000% HSBC 20/6/2025 (11,525) (245)
CDS EUR 190,000Fund receives default protection on Altice Luxembourg SA and
pays Fixed 5.000% JP Morgan 20/6/2021 3,231 (7,676)
CDS EUR 180,000Fund receives default protection on Altice Luxembourg SA and
pays Fixed 5.000% JP Morgan 20/6/2022 (4,912) (9,953)
CDS USD 722,085Fund receives default protection on Australia & New Zealand
Banking Group Ltd and pays Fixed 1.000% JP Morgan 20/12/2020 (1,437) (3,334)
CDS EUR 1,000,000Fund receives default protection on Casino Guichard Perrachon
SA and pays Fixed 5.000% JP Morgan 20/6/2020 (4,489) (739)
CDS EUR 1,685,000Fund receives default protection on CNH Industrial Finance
Europe SA and pays Fixed 5.000% JP Morgan 20/6/2025 (39,639) (246,467)
CDS EUR 1,686,000Fund receives default protection on CNH Industrial NV and pays
Fixed 5.000% JP Morgan 20/6/2025 (44,622) (246,614)
CDS USD 7,700,000Fund receives default protection on Commonwealth Bank of
Australia and pays Fixed 1.000% JP Morgan 20/12/2020 (15,923) (36,153)
CDS USD 4,354,000Fund receives default protection on General Motors Co and
pays Fixed 5.000% JP Morgan 20/6/2025 (259,277) (498,078)
CDS EUR 820,000Fund receives default protection on HSBC Holdings Plc and
pays Fixed 1.000% JP Morgan 20/6/2025 1,409 23,215
CDS EUR 110,000Fund receives default protection on Iceland Bondco Plc and
pays Fixed 5.000% JP Morgan 20/12/2021 3,433 3,983
CDS EUR 170,000Fund receives default protection on Jaguar Land Rover
Automotive Plc and pays Fixed 5.000% JP Morgan 20/6/2024 23,753 30,765
CDS USD 4,020,000Fund receives default protection on Republic of Italy and pays
Fixed 1.000% JP Morgan 20/12/2024 62,189 136,069
CDS EUR 200,000Fund receives default protection on Standard Chartered Plc and
pays Fixed 1.000% JP Morgan 20/6/2024 (1,229) 3,435
CDS EUR 430,108Fund receives default protection on Suedzucker and pays Fixed
1.000% JP Morgan 20/6/2025 (6,805) 5,891
CDS EUR 400,000Fund receives default protection on Telefonica SA and pays
Fixed 1.000% JP Morgan 20/6/2025 (11,940) (1,307)
CDS EUR 300,000Fund receives default protection on UniCredit SpA and pays
Fixed 1.000% JP Morgan 20/12/2024 16,232 29,493
CDS USD 7,700,000Fund receives default protection on Westpac Banking Corp and
pays Fixed 1.000% JP Morgan 20/12/2020 (8,856) (35,756)
CDS EUR 100,000Fund receives Fixed 1.000% and provides default protection on
Casino Guichard Perrachon SA JP Morgan 20/6/2023 (2,721) (14,513)
CDS USD 4,020,000Fund receives Fixed 1.000% and provides default protection on
Republic of Italy JP Morgan 20/12/2024 (139,491) (136,069)
CDS EUR 220,000Fund receives Fixed 5.000% and provides default protection on
Adler Real Estate AG JP Morgan 20/6/2025 24,090 21,737
CDS EUR 130,000Fund receives Fixed 5.000% and provides default protection on
Adler Real Estate AG JP Morgan 20/6/2025 9,689 12,845
CDS EUR 65,201Fund receives default protection on Ardagh Packaging Ltd Co
and pays Fixed 5.000% Morgan Stanley 20/12/2024 2,153 (7,012)
CDS EUR 65,201Fund receives default protection on Ardagh Packaging Ltd Co
and pays Fixed 5.000% Morgan Stanley 20/12/2024 2,153 (7,012)
CDS EUR 750,000Fund receives default protection on Auchan Holding and pays
Fixed 1.000% Morgan Stanley 20/12/2024 (367) 30,355
CDS EUR 400,000Fund receives default protection on Casino Guichard Perrachon
SA and pays Fixed 5.000% Morgan Stanley 20/12/2021 8,116 6,210
BlackRock Fixed Income Strategies Fund continued
The notes on pages 691 to 711 form an integral part of these financial statements.
BlackRock Strategic Funds[376]

Swaps as at 31 May 2020
TypeNominal
Value Description CounterpartyExpiration
date
Net unrealisedappreciation/
(depreciation)EUR
MarketValue
EUR
CDS EUR 220,000Fund receives default protection on Deutsche Bank AG and
pays Fixed 1.000% Morgan Stanley 20/12/2021 (9,709) 5,516
CDS EUR 1,180,000Fund receives Fixed 1.000% and provides default protection on
Tesco Plc Morgan Stanley 20/12/2028 60,840 (42,091)
CDS EUR 140,000Fund receives Fixed 5.000% and provides default protection on
Garfunkelux Holdco 2 SA Morgan Stanley 20/12/2024 (20,451) (26,146)
CDS EUR 100,000Fund receives Fixed 5.000% and provides default protection on
Intrum AB Morgan Stanley 20/6/2025 (636) (14,636)
ILS EUR 42,995,000Fund receives Fixed 1.412% and pays Floating EUR 12 Month
CPTFEMU Barclays Bank 15/3/2027 3,191,229 3,191,229
ILS GBP 32,096,000Fund receives Fixed 3.440% and pays Floating GBP 12 Month
UKRPI Citibank 15/7/2027 1,327,074 1,327,074
ILS GBP 4,548,000Fund receives Floating GBP 12 Month UKRPI and pays Fixed
3.475% Citibank 15/7/2047 (1,799,083) (1,799,083)
ILS GBP 12,233,000Fund receives Floating GBP 12 Month UKRPI and pays Fixed
3.489% Goldman Sachs 15/8/2047 (5,003,662) (5,003,662)
ILS GBP 1,275,000Fund receives Floating GBP 12 Month UKRPI and pays Fixed
3.504% Goldman Sachs 15/11/2047 (553,886) (553,886)
ILS USD 39,606,000Fund receives Floating USD 12 Month USCPI and pays Fixed
2.152% Goldman Sachs 30/11/2027 (3,087,546) (3,087,546)
IRS CHF 305,918,000Fund receives Fixed 0.000% and pays Floating CHF 6 Month
LIBORBank of America
Merrill Lynch 8/1/2022 176,778 179,104
IRS CHF 31,184,000Fund receives Fixed 0.000% and pays Floating CHF 6 Month
LIBORBank of America
Merrill Lynch 9/5/2023 (9,865) (9,620)
IRS CHF 42,940,368Fund receives Fixed 0.000% and pays Floating CHF 6 Month
LIBORBank of America
Merrill Lynch 18/5/2023 (23,513) (23,176)
IRS EUR 43,980,000Fund receives Fixed 0.000% and pays Floating EUR 1 Month
Euro Overnight Index AverageBank of America
Merrill Lynch 8/2/2023 (27,446) (26,842)
IRS EUR 53,800,000Fund receives Fixed 0.000% and pays Floating EUR 1 Month
Euro Overnight Index AverageBank of America
Merrill Lynch 25/2/2023 16,007 16,450
IRS EUR 89,750,000Fund receives Fixed 0.000% and pays Floating EUR 1 Month
Euro Overnight Index AverageBank of America
Merrill Lynch 2/3/2023 (29,694) (28,295)
IRS EUR 152,975,000Fund receives Fixed 0.000% and pays Floating EUR 1 Month
Euro Overnight Index AverageBank of America
Merrill Lynch 22/3/2023 170,454 171,716
IRS EUR 76,487,500Fund receives Fixed 0.000% and pays Floating EUR 1 Month
Euro Overnight Index AverageBank of America
Merrill Lynch 22/3/2023 92,309 92,940
IRS EUR 23,597,600Fund receives Fixed 0.000% and pays Floating EUR 1 Month
Euro Overnight Index AverageBank of America
Merrill Lynch 10/5/2023 (9,817) (18,319)
IRS EUR 117,420,000Fund receives Fixed 0.000% and pays Floating EUR 1 Month
Euro Overnight Index AverageBank of America
Merrill Lynch 24/5/2023 (3,956) 1,452
IRS EUR 2,258,812Fund receives Fixed 0.000% and pays Floating EUR 6 Month
LIBORBank of America
Merrill Lynch 15/5/2035 (13,106) (13,052)
IRS EUR 14,305,813Fund receives Fixed 0.000% and pays Floating EUR 6 Month
LIBORBank of America
Merrill Lynch 15/5/2035 (88,481) (88,137)
IRS EUR 752,938Fund receives Fixed 0.000% and pays Floating EUR 6 Month
LIBORBank of America
Merrill Lynch 15/5/2035 (4,772) (4,754)
IRS EUR 14,305,812Fund receives Fixed 0.000% and pays Floating EUR 6 Month
LIBORBank of America
Merrill Lynch 15/5/2035 (80,818) (80,475)
IRS EUR 28,611,625Fund receives Fixed 0.000% and pays Floating EUR 6 Month
LIBORBank of America
Merrill Lynch 15/5/2035 (157,258) (156,571)
IRS GBP 52,390,000Fund receives Fixed 0.343% and pays Floating GBP 12 Month
SONIOBank of America
Merrill Lynch 7/12/2030 1,172,568 1,173,761
IRS CHF 48,904,308Fund receives Fixed 0.680% and pays Floating CHF 6 Month
LIBORBank of America
Merrill Lynch 23/5/2023 (27,040) (26,660)
IRS CHF 42,098,400Fund receives Fixed 0.685% and pays Floating CHF 6 Month
LIBORBank of America
Merrill Lynch 16/5/2023 (24,852) (24,522)
IRS MYR 75,057,340Fund receives Fixed 2.716% and pays Floating MYR 3 Month
KLIBOBank of America
Merrill Lynch 17/6/2022 204,263 204,263
IRS EUR 4,940,000Fund receives Floating EUR 6 Month LIBOR and pays Fixed
0.000%Bank of America
Merrill Lynch 23/1/2024 (19,194) (19,129)
IRS EUR 15,460,000Fund receives Floating EUR 6 Month LIBOR and pays Fixed
0.000%Bank of America
Merrill Lynch 15/1/2027 12,216 12,513
IRS EUR 33,670,858Fund receives Floating EUR 6 Month LIBOR and pays Fixed
0.000%Bank of America
Merrill Lynch 15/2/2029 12,306 12,953
BlackRock Fixed Income Strategies Fund continued
The notes on pages 691 to 711 form an integral part of these financial statements.
Annual report and audited financial statements [377]

Swaps as at 31 May 2020
TypeNominal
Value Description CounterpartyExpiration
date
Net unrealisedappreciation/
(depreciation)EUR
MarketValue
EUR
IRS EUR 26,840,000Fund receives Floating EUR 6 Month LIBOR and pays Fixed
0.000%Bank of America
Merrill Lynch 23/9/2029 (156,761) (156,245)
IRS EUR 8,392,500Fund receives Floating EUR 6 Month LIBOR and pays Fixed
0.000%Bank of America
Merrill Lynch 15/5/2070 410,708 411,027
IRS EUR 4,196,250Fund receives Floating EUR 6 Month LIBOR and pays Fixed
0.000%Bank of America
Merrill Lynch 15/5/2070 211,886 212,045
IRS EUR 4,196,250Fund receives Floating EUR 6 Month LIBOR and pays Fixed
0.000%Bank of America
Merrill Lynch 15/5/2070 219,507 219,666
IRS GBP 31,628,000Fund receives Floating GBP 12 Month CPTFEMU and pays
Fixed 0.440%Bank of America
Merrill Lynch 15/6/2022 (326,047) (325,736)
IRS GBP 14,295,000Fund receives Floating GBP 12 Month SONIO and pays Fixed
0.346%Bank of America
Merrill Lynch 17/6/2022 (94,719) (117,165)
IRS GBP 25,894,000Fund receives Floating GBP 12 Month SONIO and pays Fixed
0.371%Bank of America
Merrill Lynch 22/10/2041 (1,174,489) (1,173,427)
IRS GBP 13,071,000Fund receives Floating GBP 12 Month SONIO and pays Fixed
0.386%Bank of America
Merrill Lynch 8/12/2023 (196,750) (196,551)
IRS GBP 11,190,000Fund receives Floating GBP 12 Month SONIO and pays Fixed
0.476%Bank of America
Merrill Lynch 15/12/2026 (327,525) (327,335)
IRS INR 1,096,176,171Fund receives Floating INR 6 Month India National Stock
Exchange NSE Interbank Offer Rate and pays Fixed 4.770%Bank of America
Merrill Lynch 18/3/2022 (238,916) (238,916)
IRS NZD 18,937,500Fund receives Floating NZD 3 Month LIBOR and pays Fixed
3.215%Bank of America
Merrill Lynch 18/5/2028 (2,197,384) (2,197,171)
IRS MYR 69,453,054Fund receives Fixed 2.050% and pays Floating MYR 3 Month
KLIBO BNP Paribas 17/6/2022 2,215 2,215
IRS MYR 72,846,235Fund receives Fixed 2.675% and pays Floating MYR 3 Month
KLIBO BNP Paribas 17/6/2022 186,185 186,185
IRS MYR 73,291,285Fund receives Fixed 2.700% and pays Floating MYR 3 Month
KLIBO BNP Paribas 17/6/2022 194,721 194,721
IRS INR 257,808,020Fund receives Floating INR 6 Month India National Stock
Exchange NSE Interbank Offer Rate and pays Fixed 5.065% Citibank 18/3/2025 (134,651) (134,650)
IRS INR 483,390,039Fund receives Floating INR 6 Month India National Stock
Exchange NSE Interbank Offer Rate and pays Fixed 5.120% Citibank 18/3/2025 (266,205) (266,205)
IRS INR 1,010,302,600Fund receives Floating INR 6 Month India National Stock
Exchange NSE Interbank Offer Rate and pays Fixed 4.652% Goldman Sachs 18/3/2022 (195,602) (195,602)
IRS INR 601,552,049Fund receives Floating INR 6 Month India National Stock
Exchange NSE Interbank Offer Rate and pays Fixed 4.985% JP Morgan 18/3/2025 (289,322) (289,322)
IRS INR 290,645,350Fund receives Floating INR 6 Month India National Stock
Exchange NSE Interbank Offer Rate and pays Fixed 5.348% JP Morgan 18/3/2025 (194,295) (194,295)
IRS INR 603,264,542Fund receives Floating INR 6 Month India National Stock
Exchange NSE Interbank Offer Rate and pays Fixed 5.310% Morgan Stanley 18/3/2025 (391,437) (391,437)
TRS EUR 700,000Fund receives Markit iBoxx Euro Corporate Index and pays
3 Month EURIBOR Barclays Bank 20/6/2020 (26,473) (26,474)
TRS EUR 1,100,000Fund receives Markit iBoxx Euro Corporate Index and pays
3 Month EURIBOR Barclays Bank 20/6/2020 (777) (453)
TRS EUR 1,100,000Fund receives Markit iBoxx Euro Corporate Index and pays
3 Month EURIBOR Citibank 20/6/2020 37,556 37,631
TRS EUR 900,000 Fund receives 1 Month LIBOR and pays ARD Finance SA Credit Suisse 22/11/2021 11,950 11,950
TRS EUR 800,000 Fund receives 1 Month LIBOR and pays Eircom Finance Dac Credit Suisse 16/10/2021 14,607 14,607
TRS EUR 200,000 Fund receives 1 Month LIBOR and pays Eircom Finance Dac Credit Suisse 16/10/2021 3,502 3,502
TRS EUR 700,000 Fund receives 1 Month LIBOR and pays FCE Bank Plc Credit Suisse 9/5/2022 (15,363) (15,363)
TRS EUR 300,000Fund receives 1 Month LIBOR and pays Gestamp Funding
Luxembourg SA Credit Suisse 29/4/2022 (8,884) (8,884)
TRS GBP 190,000Fund receives 1 Month LIBOR and pays TALKTALK Telecom
Group Plc Credit Suisse 7/3/2022 (2,388) (2,388)
TRS GBP 20,000Fund receives 1 Month LIBOR and pays TALKTALK Telecom
Group Plc Credit Suisse 7/3/2022 (307) (307)
TRS EUR 1,000,000Fund receives 3 Month EURIBOR and pays iBoxx EUR Liquid
High Yield Index Goldman Sachs 20/6/2020 23,802 24,505
TRS EUR 2,000,000Fund receives iBoxx EUR Liquid High Yield Index and pays
3 Month EURIBOR Goldman Sachs 20/6/2020 34,405 35,311
TRS EUR 550,000Fund receives Markit iBoxx EUR Contingent Conver and pays
3 Month EURIBOR Goldman Sachs 20/6/2020 (9,359) (8,929)
TRS EUR 1,070,000Fund receives MarkitiBoxx Euro Corporate Index and pays
3 Month EURIBOR Goldman Sachs 20/6/2020 1,914 2,338
BlackRock Fixed Income Strategies Fund continued
The notes on pages 691 to 711 form an integral part of these financial statements.
BlackRock Strategic Funds[378]

Swaps as at 31 May 2020
TypeNominal
Value Description CounterpartyExpiration
date
Net unrealisedappreciation/
(depreciation)EUR
MarketValue
EUR
TRS EUR 100,000Fund receives Fixed 0.000% and pays Banco Bilbao Vizcaya
Argentaria SA JP Morgan 16/6/2020 424 424
TRS EUR 100,000 Fund receives Fixed 0.000% and pays Ineos Finance Plc JP Morgan 16/6/2020 121 121
TRS EUR 250,000 Fund receives Fixed 0.000% and pays Ineos Finance Plc JP Morgan 11/8/2020 6,087 6,087
TRS EUR 200,000 Fund receives Fixed 0.000% and pays Loxam SAS JP Morgan 7/6/2021 (284) (284)
TRS EUR 500,000 Fund receives Fixed 0.000% and pays Orange SA JP Morgan 11/8/2020 12,174 12,174
TRS EUR 300,000 Fund receives Fixed -1.350% and pays ARD Finance SA JP Morgan 4/1/2021 8,188 8,188
TRS EUR 300,000Fund receives Fixed -1.350% and pays Ardagh Packaging
Finanace Plc JP Morgan 21/5/2021 3,434 3,434
TRS EUR 700,000Fund receives Fixed -1.350% and pays Ardagh Packaging
Finanace Plc JP Morgan 21/5/2021 8,013 8,013
TRS EUR 300,000Fund receives Fixed -1.350% and pays Banco Bilbao Vizcaya
Argentaria SA JP Morgan 6/7/2020 2,568 2,568
TRS EUR 100,000 Fund receives Fixed -1.350% and pays BNP Paribas SA JP Morgan 28/9/2020 5,406 5,406
TRS EUR 500,000Fund receives Fixed -1.350% and pays National Bank of
Greece SA JP Morgan 9/2/2021 57,026 57,026
TRS EUR 200,000 Fund receives Fixed -1.800% and pays Tasty Bondco 1 SA JP Morgan 3/5/2021 (24,405) (24,405)
TRS EUR 500,000 Fund receives Fixed -1.950% and pays Eircom Finance Dac JP Morgan 30/11/2020 3,775 3,775
TRS EUR 300,000 Fund receives Fixed -2.350% and pays Eircom Finance Dac JP Morgan 8/12/2020 3,427 3,427
TRS EUR 1,020,000Fund receives Markit iBoxx Euro Corporate Index and pays
3 Month EURIBOR JP Morgan 20/6/2020 34,825 34,895
TRS EUR 350,000Fund receives Markit iBoxx Euro Corporate Index and pays
3 Month EURIBOR Morgan Stanley 20/6/2020 (11,477) (11,478)
Total (Gross underlying exposure - EUR 3,787,851,331) (19,432,955) (20,805,397)
CCCDS: Centrally Cleared Credit Default SwapsCCILS: Centrally Cleared Inflation Linked SwapsCCIRS: Centrally Cleared Interest Rate SwapsCDS: Credit Default SwapsILS: Inflation Linked SwapsIRS: Interest Rate SwapsTRS: Total Return Swaps
Futures contracts as at 31 May 2020
Numberof
contractsCurrencyof contracts
Contract/Description
Expirationdate
Grossunderlying
exposureEUR
Net unrealisedappreciation/
(depreciation)EUR
1,024 USD 90 Day Euro Futures December 2020 December 2020 229,512,475 4,532,994
(1,024) USD 90 Day Euro Futures March 21 March 2021 229,696,656 (6,929,852)
277 AUD Australian 10 Year Bond Futures June 2020 June 2020 24,629,931 112,843
(1,825) EUR Euro BOBL Futures June 2020 June 2020 246,502,750 (147,360)
1,614 EUR Euro BTP Futures June 2020 June 2020 180,816,420 489,103
(1,578) EUR Euro BTP Futures June 2020 June 2020 224,865,000 (5,754,107)
(6,591) EUR Euro Bund Futures June 2020 June 2020 1,135,892,940 7,289,328
(906) EUR Euro BUXL 30 Year Bond Futures June 2020 June 2020 191,673,360 1,020,081
1,262 EUR Euro Schatz Futures June 2020 June 2020 141,381,860 (528,763)
943 EUR Euro-OAT Futures June 2020 June 2020 158,838,920 679,510
(6) EUR Euro-OAT Futures June 2020 June 2020 1,010,640 (4,020)
6 JPY Japan 10 Year Bond Futures June 2020 June 2020 7,635,011 (124,240)
(2,827) GBP UK Long Gilt Bond Futures September 2020 September 2020 431,085,972 221,219
(80) USD US Long Bond Futures September 2020 September 2020 12,770,358 (15,738)
161 USD US Treasury 10 Year Note Futures September 2020 September 2020 22,711,776 (4,061)
(185) USD US Treasury 10 Year Note Futures September 2020 September 2020 23,100,044 (38,761)
(216) USD US Treasury 5 Year Note Futures September 2020 September 2020 24,380,311 (31,819)
(517) USD US Ultra Bond Futures September 2020 September 2020 100,443,504 744,514
Total 3,386,947,928 1,510,871
BlackRock Fixed Income Strategies Fund continued
The notes on pages 691 to 711 form an integral part of these financial statements.
Annual report and audited financial statements [379]

Purchased Options as at 31 May 2020
Numberof
contractsCall/Put Description Counterparty Strike Price
Expirationdate
Netunrealised
appreciation/(depreciation)
EUR
MarketValue
EUR
41,740,000 Call OTC EUR/USD Bank of America Merrill Lynch EUR 1.09 24/08/2020 506,723 1,098,179
53,088,800 Call OTC EUR/GBP Citibank EUR 0.90 29/10/2020 430,922 1,185,048
650 CalliShares USD High Yield Corp
Bond UCITS ETF Exchange Traded USD 100.00 19/06/2020 (19,583) 10,522
386 PutiShares USD High Yield Corp
Bond UCITS ETF Exchange Traded USD 91.00 19/06/2020 (63,992) 11,109
650 CalliShares USD High Yield Corp
Bond UCITS ETF Exchange Traded USD 95.50 19/06/2020 37,080 113,989
Total (Gross underlying exposure - EUR 4,299,387) 891,150 2,418,847
Written Options as at 31 May 2020
Numberof
contractsCall/Put Description Counterparty Strike Price
Expirationdate
Netunrealised
appreciation/(depreciation)
EUR
MarketValue
EUR
(41,740,000) Call OTC EUR/USD Bank of America Merrill Lynch EUR 1.14 24/08/2020 (104,934) (187,162)
(386) PutiShares USD High Yield Corp
Bond UCITS ETF Exchange Traded USD 87.00 19/06/2020 31,103 (3,471)
(650) CalliShares USD High Yield Corp
Bond UCITS ETF Exchange Traded USD 97.50 19/06/2020 (22,495) (47,934)
Total (Gross underlying exposure - EUR 2,132,135) (96,326) (238,567)
Purchased Swaptions as at 31 May 2020
NominalValue
Call/Put Description Counterparty Strike Price
Expirationdate
Netnrealised
appreciation/(depreciation)
EUR
MarketValue
EUR
4,400,000 Put
Fund purchases an option to enter into aCredit Default Swap. If exercised Fundreceives default protection on Markit iTraxxEurope Series 33 Version 1 from17/6/2020; and provides 5% Fixedsemi-annually from 20/6/2020
Bank of AmericaMerrill Lynch EUR 550.00 17/06/2020 (116,111) 9,289
8,500,000 Call
Fund purchases an option to enter into aCredit Default Swap. If exercised Fundreceives 1% Fixed annually from20/6/2020; and provides default protectionon Markit iTraxx Europe Series 33 Version1 from 17/6/2020 Barclays Bank EUR 65.00 17/06/2020 (10,110) 4,680
11,100,000 Put
Fund purchases an option to enter into aCredit Default Swap. If exercised Fundreceives default protection on Markit iTraxxEurope Series 33 Version 1 from17/6/2020; and provides 1% Fixed annuallyfrom 20/6/2020 Barclays Bank EUR 90.00 17/06/2020 (48,653) 6,181
4,400,000 Put
Fund purchases an option to enter into aCredit Default Swap. If exercised Fundreceives default protection on Markit iTraxxEurope Series 33 Version 1 from17/6/2020; and provides 5% Fixedsemi-annually from 20/6/2020 Barclays Bank EUR 700.00 17/06/2020 (78,624) 3,216
2,200,000 Put
Fund purchases an option to enter into aCredit Default Swap. If exercised Fundreceives default protection on Markit iTraxxEurope Series 33 Version 1 from17/6/2020; and provides 5% Fixedsemi-annually from 20/6/2020 Barclays Bank EUR 550.00 17/06/2020 (52,776) 4,644
BlackRock Fixed Income Strategies Fund continued
The notes on pages 691 to 711 form an integral part of these financial statements.
BlackRock Strategic Funds[380]
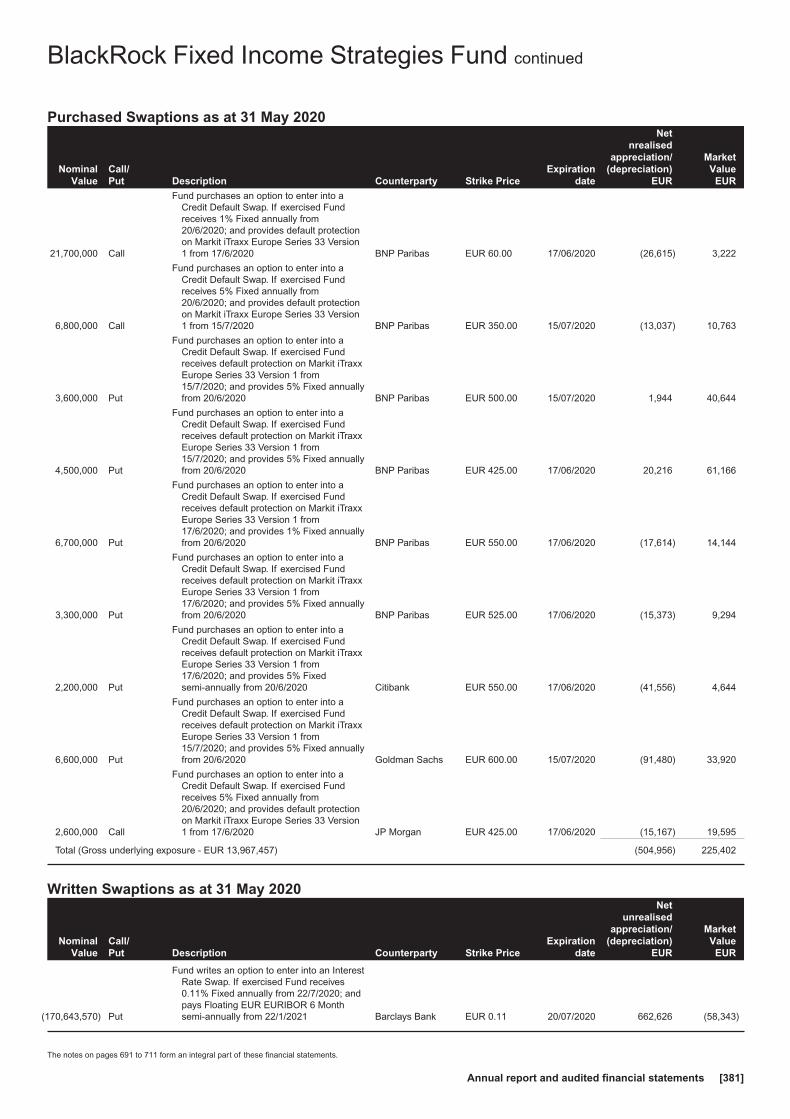
Purchased Swaptions as at 31 May 2020
NominalValue
Call/Put Description Counterparty Strike Price
Expirationdate
Netnrealised
appreciation/(depreciation)
EUR
MarketValue
EUR
21,700,000 Call
Fund purchases an option to enter into aCredit Default Swap. If exercised Fundreceives 1% Fixed annually from20/6/2020; and provides default protectionon Markit iTraxx Europe Series 33 Version1 from 17/6/2020 BNP Paribas EUR 60.00 17/06/2020 (26,615) 3,222
6,800,000 Call
Fund purchases an option to enter into aCredit Default Swap. If exercised Fundreceives 5% Fixed annually from20/6/2020; and provides default protectionon Markit iTraxx Europe Series 33 Version1 from 15/7/2020 BNP Paribas EUR 350.00 15/07/2020 (13,037) 10,763
3,600,000 Put
Fund purchases an option to enter into aCredit Default Swap. If exercised Fundreceives default protection on Markit iTraxxEurope Series 33 Version 1 from15/7/2020; and provides 5% Fixed annuallyfrom 20/6/2020 BNP Paribas EUR 500.00 15/07/2020 1,944 40,644
4,500,000 Put
Fund purchases an option to enter into aCredit Default Swap. If exercised Fundreceives default protection on Markit iTraxxEurope Series 33 Version 1 from15/7/2020; and provides 5% Fixed annuallyfrom 20/6/2020 BNP Paribas EUR 425.00 17/06/2020 20,216 61,166
6,700,000 Put
Fund purchases an option to enter into aCredit Default Swap. If exercised Fundreceives default protection on Markit iTraxxEurope Series 33 Version 1 from17/6/2020; and provides 1% Fixed annuallyfrom 20/6/2020 BNP Paribas EUR 550.00 17/06/2020 (17,614) 14,144
3,300,000 Put
Fund purchases an option to enter into aCredit Default Swap. If exercised Fundreceives default protection on Markit iTraxxEurope Series 33 Version 1 from17/6/2020; and provides 5% Fixed annuallyfrom 20/6/2020 BNP Paribas EUR 525.00 17/06/2020 (15,373) 9,294
2,200,000 Put
Fund purchases an option to enter into aCredit Default Swap. If exercised Fundreceives default protection on Markit iTraxxEurope Series 33 Version 1 from17/6/2020; and provides 5% Fixedsemi-annually from 20/6/2020 Citibank EUR 550.00 17/06/2020 (41,556) 4,644
6,600,000 Put
Fund purchases an option to enter into aCredit Default Swap. If exercised Fundreceives default protection on Markit iTraxxEurope Series 33 Version 1 from15/7/2020; and provides 5% Fixed annuallyfrom 20/6/2020 Goldman Sachs EUR 600.00 15/07/2020 (91,480) 33,920
2,600,000 Call
Fund purchases an option to enter into aCredit Default Swap. If exercised Fundreceives 5% Fixed annually from20/6/2020; and provides default protectionon Markit iTraxx Europe Series 33 Version1 from 17/6/2020 JP Morgan EUR 425.00 17/06/2020 (15,167) 19,595
Total (Gross underlying exposure - EUR 13,967,457) (504,956) 225,402
Written Swaptions as at 31 May 2020
NominalValue
Call/Put Description Counterparty Strike Price
Expirationdate
Netunrealised
appreciation/(depreciation)
EUR
MarketValue
EUR
(170,643,570) Put
Fund writes an option to enter into an InterestRate Swap. If exercised Fund receives0.11% Fixed annually from 22/7/2020; andpays Floating EUR EURIBOR 6 Monthsemi-annually from 22/1/2021 Barclays Bank EUR 0.11 20/07/2020 662,626 (58,343)
BlackRock Fixed Income Strategies Fund continued
The notes on pages 691 to 711 form an integral part of these financial statements.
Annual report and audited financial statements [381]
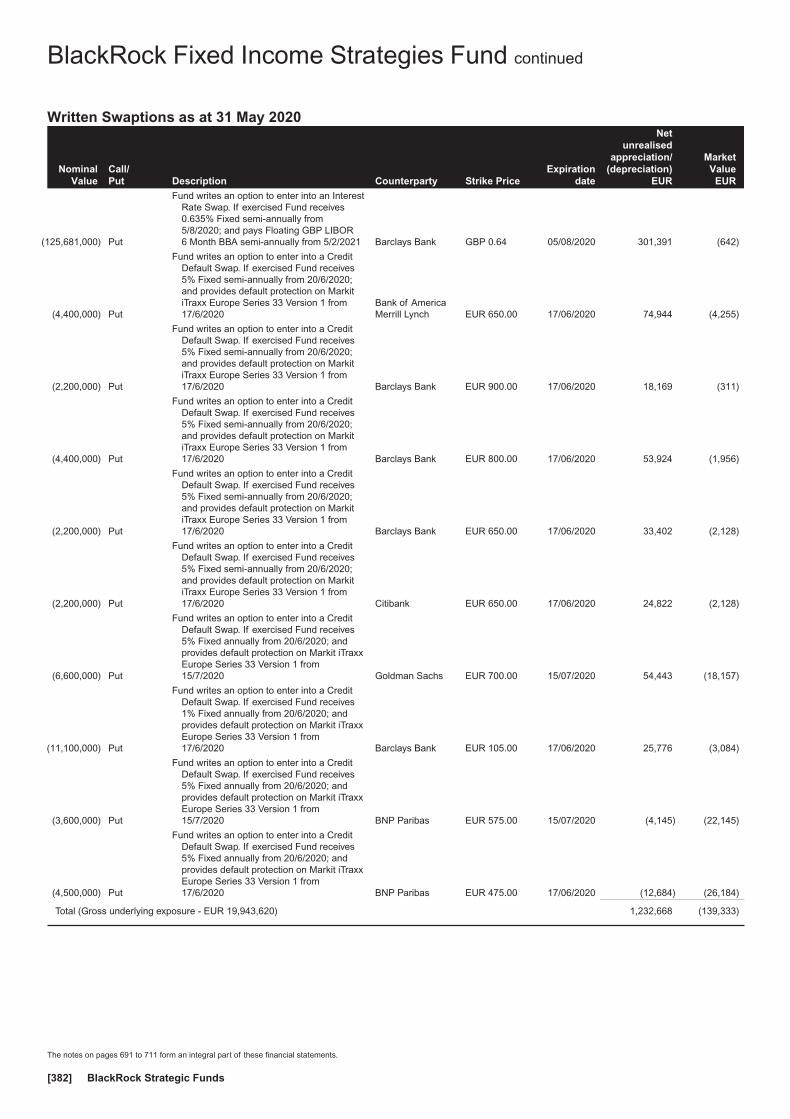
Written Swaptions as at 31 May 2020
NominalValue
Call/Put Description Counterparty Strike Price
Expirationdate
Netunrealised
appreciation/(depreciation)
EUR
MarketValue
EUR
(125,681,000) Put
Fund writes an option to enter into an InterestRate Swap. If exercised Fund receives0.635% Fixed semi-annually from5/8/2020; and pays Floating GBP LIBOR6 Month BBA semi-annually from 5/2/2021 Barclays Bank GBP 0.64 05/08/2020 301,391 (642)
(4,400,000) Put
Fund writes an option to enter into a CreditDefault Swap. If exercised Fund receives5% Fixed semi-annually from 20/6/2020;and provides default protection on MarkitiTraxx Europe Series 33 Version 1 from17/6/2020
Bank of AmericaMerrill Lynch EUR 650.00 17/06/2020 74,944 (4,255)
(2,200,000) Put
Fund writes an option to enter into a CreditDefault Swap. If exercised Fund receives5% Fixed semi-annually from 20/6/2020;and provides default protection on MarkitiTraxx Europe Series 33 Version 1 from17/6/2020 Barclays Bank EUR 900.00 17/06/2020 18,169 (311)
(4,400,000) Put
Fund writes an option to enter into a CreditDefault Swap. If exercised Fund receives5% Fixed semi-annually from 20/6/2020;and provides default protection on MarkitiTraxx Europe Series 33 Version 1 from17/6/2020 Barclays Bank EUR 800.00 17/06/2020 53,924 (1,956)
(2,200,000) Put
Fund writes an option to enter into a CreditDefault Swap. If exercised Fund receives5% Fixed semi-annually from 20/6/2020;and provides default protection on MarkitiTraxx Europe Series 33 Version 1 from17/6/2020 Barclays Bank EUR 650.00 17/06/2020 33,402 (2,128)
(2,200,000) Put
Fund writes an option to enter into a CreditDefault Swap. If exercised Fund receives5% Fixed semi-annually from 20/6/2020;and provides default protection on MarkitiTraxx Europe Series 33 Version 1 from17/6/2020 Citibank EUR 650.00 17/06/2020 24,822 (2,128)
(6,600,000) Put
Fund writes an option to enter into a CreditDefault Swap. If exercised Fund receives5% Fixed annually from 20/6/2020; andprovides default protection on Markit iTraxxEurope Series 33 Version 1 from15/7/2020 Goldman Sachs EUR 700.00 15/07/2020 54,443 (18,157)
(11,100,000) Put
Fund writes an option to enter into a CreditDefault Swap. If exercised Fund receives1% Fixed annually from 20/6/2020; andprovides default protection on Markit iTraxxEurope Series 33 Version 1 from17/6/2020 Barclays Bank EUR 105.00 17/06/2020 25,776 (3,084)
(3,600,000) Put
Fund writes an option to enter into a CreditDefault Swap. If exercised Fund receives5% Fixed annually from 20/6/2020; andprovides default protection on Markit iTraxxEurope Series 33 Version 1 from15/7/2020 BNP Paribas EUR 575.00 15/07/2020 (4,145) (22,145)
(4,500,000) Put
Fund writes an option to enter into a CreditDefault Swap. If exercised Fund receives5% Fixed annually from 20/6/2020; andprovides default protection on Markit iTraxxEurope Series 33 Version 1 from17/6/2020 BNP Paribas EUR 475.00 17/06/2020 (12,684) (26,184)
Total (Gross underlying exposure - EUR 19,943,620) 1,232,668 (139,333)
BlackRock Fixed Income Strategies Fund continued
The notes on pages 691 to 711 form an integral part of these financial statements.
BlackRock Strategic Funds[382]
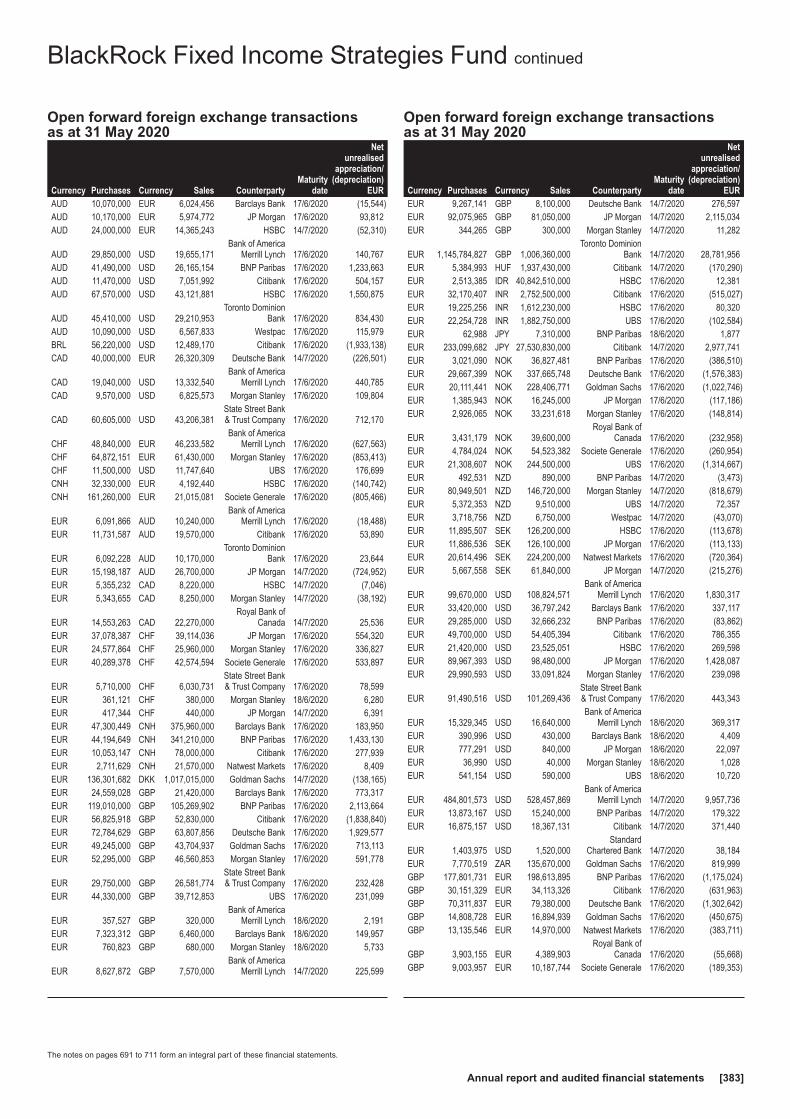
Open forward foreign exchange transactionsas at 31 May 2020
Currency Purchases Currency Sales CounterpartyMaturity
date
Netunrealised
appreciation/(depreciation)
EURAUD 10,070,000 EUR 6,024,456 Barclays Bank 17/6/2020 (15,544)AUD 10,170,000 EUR 5,974,772 JP Morgan 17/6/2020 93,812AUD 24,000,000 EUR 14,365,243 HSBC 14/7/2020 (52,310)
AUD 29,850,000 USD 19,655,171Bank of America
Merrill Lynch 17/6/2020 140,767AUD 41,490,000 USD 26,165,154 BNP Paribas 17/6/2020 1,233,663AUD 11,470,000 USD 7,051,992 Citibank 17/6/2020 504,157AUD 67,570,000 USD 43,121,881 HSBC 17/6/2020 1,550,875
AUD 45,410,000 USD 29,210,953Toronto Dominion
Bank 17/6/2020 834,430AUD 10,090,000 USD 6,567,833 Westpac 17/6/2020 115,979BRL 56,220,000 USD 12,489,170 Citibank 17/6/2020 (1,933,138)CAD 40,000,000 EUR 26,320,309 Deutsche Bank 14/7/2020 (226,501)
CAD 19,040,000 USD 13,332,540Bank of America
Merrill Lynch 17/6/2020 440,785CAD 9,570,000 USD 6,825,573 Morgan Stanley 17/6/2020 109,804
CAD 60,605,000 USD 43,206,381State Street Bank& Trust Company 17/6/2020 712,170
CHF 48,840,000 EUR 46,233,582Bank of America
Merrill Lynch 17/6/2020 (627,563)CHF 64,872,151 EUR 61,430,000 Morgan Stanley 17/6/2020 (853,413)CHF 11,500,000 USD 11,747,640 UBS 17/6/2020 176,699CNH 32,330,000 EUR 4,192,440 HSBC 17/6/2020 (140,742)CNH 161,260,000 EUR 21,015,081 Societe Generale 17/6/2020 (805,466)
EUR 6,091,866 AUD 10,240,000Bank of America
Merrill Lynch 17/6/2020 (18,488)EUR 11,731,587 AUD 19,570,000 Citibank 17/6/2020 53,890
EUR 6,092,228 AUD 10,170,000Toronto Dominion
Bank 17/6/2020 23,644EUR 15,198,187 AUD 26,700,000 JP Morgan 14/7/2020 (724,952)EUR 5,355,232 CAD 8,220,000 HSBC 14/7/2020 (7,046)EUR 5,343,655 CAD 8,250,000 Morgan Stanley 14/7/2020 (38,192)
EUR 14,553,263 CAD 22,270,000Royal Bank of
Canada 14/7/2020 25,536EUR 37,078,387 CHF 39,114,036 JP Morgan 17/6/2020 554,320EUR 24,577,864 CHF 25,960,000 Morgan Stanley 17/6/2020 336,827EUR 40,289,378 CHF 42,574,594 Societe Generale 17/6/2020 533,897
EUR 5,710,000 CHF 6,030,731State Street Bank& Trust Company 17/6/2020 78,599
EUR 361,121 CHF 380,000 Morgan Stanley 18/6/2020 6,280EUR 417,344 CHF 440,000 JP Morgan 14/7/2020 6,391EUR 47,300,449 CNH 375,960,000 Barclays Bank 17/6/2020 183,950EUR 44,194,649 CNH 341,210,000 BNP Paribas 17/6/2020 1,433,130EUR 10,053,147 CNH 78,000,000 Citibank 17/6/2020 277,939EUR 2,711,629 CNH 21,570,000 Natwest Markets 17/6/2020 8,409EUR 136,301,682 DKK 1,017,015,000 Goldman Sachs 14/7/2020 (138,165)EUR 24,559,028 GBP 21,420,000 Barclays Bank 17/6/2020 773,317EUR 119,010,000 GBP 105,269,902 BNP Paribas 17/6/2020 2,113,664EUR 56,825,918 GBP 52,830,000 Citibank 17/6/2020 (1,838,840)EUR 72,784,629 GBP 63,807,856 Deutsche Bank 17/6/2020 1,929,577EUR 49,245,000 GBP 43,704,937 Goldman Sachs 17/6/2020 713,113EUR 52,295,000 GBP 46,560,853 Morgan Stanley 17/6/2020 591,778
EUR 29,750,000 GBP 26,581,774State Street Bank& Trust Company 17/6/2020 232,428
EUR 44,330,000 GBP 39,712,853 UBS 17/6/2020 231,099
EUR 357,527 GBP 320,000Bank of America
Merrill Lynch 18/6/2020 2,191EUR 7,323,312 GBP 6,460,000 Barclays Bank 18/6/2020 149,957EUR 760,823 GBP 680,000 Morgan Stanley 18/6/2020 5,733
EUR 8,627,872 GBP 7,570,000Bank of America
Merrill Lynch 14/7/2020 225,599
Open forward foreign exchange transactionsas at 31 May 2020
Currency Purchases Currency Sales CounterpartyMaturity
date
Netunrealised
appreciation/(depreciation)
EUREUR 9,267,141 GBP 8,100,000 Deutsche Bank 14/7/2020 276,597EUR 92,075,965 GBP 81,050,000 JP Morgan 14/7/2020 2,115,034EUR 344,265 GBP 300,000 Morgan Stanley 14/7/2020 11,282
EUR 1,145,784,827 GBP 1,006,360,000Toronto Dominion
Bank 14/7/2020 28,781,956EUR 5,384,993 HUF 1,937,430,000 Citibank 14/7/2020 (170,290)EUR 2,513,385 IDR 40,842,510,000 HSBC 17/6/2020 12,381EUR 32,170,407 INR 2,752,500,000 Citibank 17/6/2020 (515,027)EUR 19,225,256 INR 1,612,230,000 HSBC 17/6/2020 80,320EUR 22,254,728 INR 1,882,750,000 UBS 17/6/2020 (102,584)EUR 62,988 JPY 7,310,000 BNP Paribas 18/6/2020 1,877EUR 233,099,682 JPY 27,530,830,000 Citibank 14/7/2020 2,977,741EUR 3,021,090 NOK 36,827,481 BNP Paribas 17/6/2020 (386,510)EUR 29,667,399 NOK 337,665,748 Deutsche Bank 17/6/2020 (1,576,383)EUR 20,111,441 NOK 228,406,771 Goldman Sachs 17/6/2020 (1,022,746)EUR 1,385,943 NOK 16,245,000 JP Morgan 17/6/2020 (117,186)EUR 2,926,065 NOK 33,231,618 Morgan Stanley 17/6/2020 (148,814)
EUR 3,431,179 NOK 39,600,000Royal Bank of
Canada 17/6/2020 (232,958)EUR 4,784,024 NOK 54,523,382 Societe Generale 17/6/2020 (260,954)EUR 21,308,607 NOK 244,500,000 UBS 17/6/2020 (1,314,667)EUR 492,531 NZD 890,000 BNP Paribas 14/7/2020 (3,473)EUR 80,949,501 NZD 146,720,000 Morgan Stanley 14/7/2020 (818,679)EUR 5,372,353 NZD 9,510,000 UBS 14/7/2020 72,357EUR 3,718,756 NZD 6,750,000 Westpac 14/7/2020 (43,070)EUR 11,895,507 SEK 126,200,000 HSBC 17/6/2020 (113,678)EUR 11,886,536 SEK 126,100,000 JP Morgan 17/6/2020 (113,133)EUR 20,614,496 SEK 224,200,000 Natwest Markets 17/6/2020 (720,364)EUR 5,667,558 SEK 61,840,000 JP Morgan 14/7/2020 (215,276)
EUR 99,670,000 USD 108,824,571Bank of America
Merrill Lynch 17/6/2020 1,830,317EUR 33,420,000 USD 36,797,242 Barclays Bank 17/6/2020 337,117EUR 29,285,000 USD 32,666,232 BNP Paribas 17/6/2020 (83,862)EUR 49,700,000 USD 54,405,394 Citibank 17/6/2020 786,355EUR 21,420,000 USD 23,525,051 HSBC 17/6/2020 269,598EUR 89,967,393 USD 98,480,000 JP Morgan 17/6/2020 1,428,087EUR 29,990,593 USD 33,091,824 Morgan Stanley 17/6/2020 239,098
EUR 91,490,516 USD 101,269,436State Street Bank& Trust Company 17/6/2020 443,343
EUR 15,329,345 USD 16,640,000Bank of America
Merrill Lynch 18/6/2020 369,317EUR 390,996 USD 430,000 Barclays Bank 18/6/2020 4,409EUR 777,291 USD 840,000 JP Morgan 18/6/2020 22,097EUR 36,990 USD 40,000 Morgan Stanley 18/6/2020 1,028EUR 541,154 USD 590,000 UBS 18/6/2020 10,720
EUR 484,801,573 USD 528,457,869Bank of America
Merrill Lynch 14/7/2020 9,957,736EUR 13,873,167 USD 15,240,000 BNP Paribas 14/7/2020 179,322EUR 16,875,157 USD 18,367,131 Citibank 14/7/2020 371,440
EUR 1,403,975 USD 1,520,000Standard
Chartered Bank 14/7/2020 38,184EUR 7,770,519 ZAR 135,670,000 Goldman Sachs 17/6/2020 819,999GBP 177,801,731 EUR 198,613,895 BNP Paribas 17/6/2020 (1,175,024)GBP 30,151,329 EUR 34,113,326 Citibank 17/6/2020 (631,963)GBP 70,311,837 EUR 79,380,000 Deutsche Bank 17/6/2020 (1,302,642)GBP 14,808,728 EUR 16,894,939 Goldman Sachs 17/6/2020 (450,675)GBP 13,135,546 EUR 14,970,000 Natwest Markets 17/6/2020 (383,711)
GBP 3,903,155 EUR 4,389,903Royal Bank of
Canada 17/6/2020 (55,668)GBP 9,003,957 EUR 10,187,744 Societe Generale 17/6/2020 (189,353)
BlackRock Fixed Income Strategies Fund continued
The notes on pages 691 to 711 form an integral part of these financial statements.
Annual report and audited financial statements [383]

Open forward foreign exchange transactionsas at 31 May 2020
Currency Purchases Currency Sales CounterpartyMaturity
date
Netunrealised
appreciation/(depreciation)
EUR
GBP 27,417,564 EUR 30,880,097State Street Bank& Trust Company 17/6/2020 (434,427)
GBP 8,036,923 EUR 8,960,000 UBS 17/6/2020 (35,447)GBP 10,610,000 EUR 12,128,209 Westpac 17/6/2020 (346,398)
GBP 19,000,000 EUR 21,205,972Bank of America
Merrill Lynch 14/7/2020 (117,044)GBP 58,000,000 EUR 65,034,654 Citibank 14/7/2020 (657,923)GBP 48,000,000 EUR 55,068,290 Deutsche Bank 14/7/2020 (1,790,996)GBP 32,000,000 EUR 36,677,294 JP Morgan 14/7/2020 (1,159,098)GBP 13,260,000 USD 16,474,091 Barclays Bank 17/6/2020 (86,688)GBP 10,710,000 USD 13,175,335 BNP Paribas 17/6/2020 47,455GBP 13,410,000 USD 16,818,965 Citibank 17/6/2020 (230,184)GBP 23,890,000 USD 29,672,544 Deutsche Bank 17/6/2020 (148,852)GBP 69,680,000 USD 86,418,093 Goldman Sachs 17/6/2020 (319,202)GBP 10,690,000 USD 13,169,585 HSBC 17/6/2020 30,415GBP 10,700,000 USD 13,187,151 JP Morgan 17/6/2020 25,728GBP 62,838,824 USD 77,101,666 Natwest Markets 17/6/2020 460,070GBP 12,380,000 USD 15,406,353 Societe Generale 17/6/2020 (103,919)
GBP 13,090,000 USD 16,157,511Standard
Chartered Bank 17/6/2020 9,161
GBP 76,751,176 USD 94,120,213State Street Bank& Trust Company 17/6/2020 608,284
GBP 64,210,000 USD 80,024,409 Westpac 17/6/2020 (645,034)HUF 1,995,920,000 EUR 5,611,973 Deutsche Bank 14/7/2020 111,021IDR 42,889,990,000 EUR 2,554,496 Goldman Sachs 17/6/2020 71,886
IDR 107,917,000,000 USD 7,252,487Bank of America
Merrill Lynch 17/6/2020 87,920IDR 64,072,370,000 USD 4,069,792 Citibank 17/6/2020 264,510INR 1,684,300,000 USD 21,879,709 Deutsche Bank 17/6/2020 329,611INR 1,864,500,000 USD 24,304,798 HSBC 17/6/2020 289,155INR 1,258,750,000 USD 16,063,812 JP Morgan 17/6/2020 505,115INR 1,684,300,000 USD 21,874,026 UBS 17/6/2020 334,720JPY 2,700,000,000 EUR 23,195,793 Morgan Stanley 14/7/2020 (627,303)
JPY 1,563,000,000 USD 14,823,315Bank of America
Merrill Lynch 17/6/2020 (260,477)JPY 720,000,000 USD 6,718,674 Barclays Bank 17/6/2020 (21,341)JPY 735,000,000 USD 6,625,920 Citibank 17/6/2020 187,450JPY 1,471,000,000 USD 13,313,362 JP Morgan 17/6/2020 327,947
JPY 700,000,000 USD 6,546,137Royal Bank of
Canada 17/6/2020 (33,418)JPY 693,000,000 USD 6,437,966 UBS 17/6/2020 5,315
MXN 522,150,000 USD 21,634,056Bank of America
Merrill Lynch 17/6/2020 1,722,472MXN 48,375,000 USD 2,036,559 Citibank 17/6/2020 130,581MXN 574,600,000 USD 23,931,824 Goldman Sachs 17/6/2020 1,783,449MXN 143,095,000 USD 5,844,682 JP Morgan 17/6/2020 547,674NOK 160,816,588 EUR 14,265,693 Barclays Bank 17/6/2020 614,461NOK 533,683,412 EUR 47,130,593 Goldman Sachs 17/6/2020 2,250,455NOK 296,500,000 EUR 26,300,012 Natwest Markets 17/6/2020 1,134,756NOK 109,900,000 USD 10,953,315 Natwest Markets 17/6/2020 321,233
NZD 18,000,000 EUR 10,063,883State Street Bank& Trust Company 14/7/2020 (32,345)
NZD 11,350,000 USD 6,871,460 BNP Paribas 17/6/2020 152,214NZD 29,850,000 USD 16,751,820 Citibank 17/6/2020 1,586,910NZD 23,204,311 USD 13,794,802 Morgan Stanley 17/6/2020 539,044NZD 7,888,695 USD 4,616,393 Societe Generale 17/6/2020 249,231
NZD 10,560,000 USD 6,347,194Standard
Chartered Bank 17/6/2020 182,966NZD 22,651,305 USD 13,253,845 UBS 17/6/2020 716,978NZD 9,715,689 USD 5,862,544 Westpac 17/6/2020 147,810RUB 136,823,000 USD 1,823,925 Barclays Bank 17/6/2020 98,820RUB 85,020,000 USD 1,135,315 Deutsche Bank 17/6/2020 59,650RUB 318,150,000 USD 4,257,298 Goldman Sachs 17/6/2020 215,232RUB 48,800,000 USD 687,911 Morgan Stanley 17/6/2020 1,638
Open forward foreign exchange transactionsas at 31 May 2020
Currency Purchases Currency Sales CounterpartyMaturity
date
Netunrealised
appreciation/(depreciation)
EURSEK 35,964,569 EUR 3,243,339 BNP Paribas 17/6/2020 179,048SEK 102,959,114 EUR 9,408,872 Deutsche Bank 17/6/2020 388,711SEK 7,915,886 EUR 721,571 Goldman Sachs 17/6/2020 31,704SEK 168,825,000 EUR 15,745,906 JP Morgan 17/6/2020 319,474SEK 34,935,431 EUR 3,149,944 UBS 17/6/2020 174,510SEK 64,000,000 USD 6,478,073 JP Morgan 17/6/2020 266,068
USD 6,034,527 AUD 9,340,000Bank of America
Merrill Lynch 17/6/2020 (147,916)USD 13,242,561 AUD 20,760,000 Barclays Bank 17/6/2020 (481,947)USD 48,585,491 AUD 76,110,000 BNP Paribas 17/6/2020 (1,734,708)USD 16,822,207 AUD 29,630,000 Citibank 17/6/2020 (2,556,490)USD 8,956,768 AUD 15,098,179 Deutsche Bank 17/6/2020 (956,637)USD 22,915,323 AUD 34,700,000 JP Morgan 17/6/2020 (103,762)USD 19,148,034 AUD 29,370,000 Morgan Stanley 17/6/2020 (310,289)
USD 19,714,270 AUD 31,540,000Toronto Dominion
Bank 17/6/2020 (1,096,080)USD 14,607,866 AUD 23,761,821 UBS 17/6/2020 (1,045,687)
USD 12,926,694 BRL 56,220,000State Street Bank& Trust Company 17/6/2020 2,326,497
USD 6,753,504 CAD 9,540,000 BNP Paribas 17/6/2020 (155,018)USD 13,564,554 CAD 19,070,000 Goldman Sachs 17/6/2020 (251,771)USD 15,095,091 CAD 20,800,000 Societe Generale 17/6/2020 (4,910)
USD 1,036,240 CAD 1,413,381Toronto Dominion
Bank 17/6/2020 9,118USD 14,581,160 CAD 19,891,619 UBS 17/6/2020 125,942USD 13,238,707 CAD 18,500,000 Westpac 17/6/2020 (172,684)USD 12,226,172 CHF 11,500,000 Morgan Stanley 17/6/2020 253,529USD 430,000 EUR 391,119 Barclays Bank 1/6/2020 (4,411)
USD 127,848,044 EUR 116,852,956Bank of America
Merrill Lynch 17/6/2020 (1,910,054)USD 100,191,900 EUR 91,590,000 BNP Paribas 17/6/2020 (1,511,596)USD 60,941,436 EUR 54,980,000 Citibank 17/6/2020 (190,069)USD 22,800,000 EUR 21,165,200 HSBC 17/6/2020 (666,660)USD 44,200,000 EUR 40,574,092 JP Morgan 17/6/2020 (835,695)USD 4,065,008 EUR 3,650,000 Morgan Stanley 17/6/2020 4,681
USD 3,243,589 EUR 2,918,655Royal Bank of
Canada 17/6/2020 (2,478)
USD 21,409,967 EUR 19,420,000State Street Bank& Trust Company 17/6/2020 (171,181)
USD 7,027,806 EUR 6,425,000 UBS 17/6/2020 (106,589)USD 700,000 EUR 645,678 JP Morgan 18/6/2020 (16,350)
USD 60,000,000 EUR 55,272,540Bank of America
Merrill Lynch 14/7/2020 (1,359,765)USD 160,000,000 EUR 147,426,278 BNP Paribas 14/7/2020 (3,658,878)USD 20,000,000 EUR 18,393,265 JP Morgan 14/7/2020 (422,340)
USD 60,000,000 EUR 54,625,406Royal Bank of
Canada 14/7/2020 (712,631)USD 12,060,000 EUR 11,111,480 Societe Generale 14/7/2020 (275,012)
USD 6,650,961 GBP 5,285,000Bank of America
Merrill Lynch 17/6/2020 110,908USD 33,073,557 GBP 26,512,539 Barclays Bank 17/6/2020 294,379USD 87,965,157 GBP 70,796,787 Deutsche Bank 17/6/2020 469,974USD 148,613,002 GBP 119,190,000 Goldman Sachs 17/6/2020 1,257,996USD 16,505,739 GBP 13,430,000 Natwest Markets 17/6/2020 (73,635)
USD 37,171,826 GBP 30,467,461Standard
Chartered Bank 17/6/2020 (412,755)
USD 96,624,297 GBP 78,248,213State Street Bank& Trust Company 17/6/2020 (19,340)
USD 20,016,276 GBP 16,050,000Toronto Dominion
Bank 17/6/2020 173,181USD 26,664,404 GBP 21,630,000 Westpac 17/6/2020 (46,039)USD 20,937,916 IDR 314,592,190,000 Barclays Bank 17/6/2020 (439,736)USD 2,297,528 IDR 35,974,130,000 Citibank 17/6/2020 (137,275)USD 3,418,658 IDR 53,955,800,000 HSBC 17/6/2020 (230,427)
BlackRock Fixed Income Strategies Fund continued
The notes on pages 691 to 711 form an integral part of these financial statements.
BlackRock Strategic Funds[384]

Open forward foreign exchange transactionsas at 31 May 2020
Currency Purchases Currency Sales CounterpartyMaturity
date
Netunrealised
appreciation/(depreciation)
EURUSD 1,190,172 IDR 17,987,070,000 UBS 17/6/2020 (31,409)USD 49,705,045 INR 3,753,725,000 Goldman Sachs 17/6/2020 112,958USD 49,517,595 INR 3,743,035,000 HSBC 17/6/2020 71,371USD 42,352,583 INR 3,197,620,000 Morgan Stanley 17/6/2020 106,307
USD 6,606,267 JPY 700,000,000Bank of America
Merrill Lynch 17/6/2020 87,478USD 19,974,879 JPY 2,160,000,000 Citibank 17/6/2020 (98,836)USD 6,800,668 JPY 739,000,000 Morgan Stanley 17/6/2020 (63,780)USD 21,028,877 JPY 2,283,000,000 Westpac 17/6/2020 (179,501)USD 29,853,264 MXN 731,412,000 Citibank 17/6/2020 (2,818,326)USD 22,852,083 MXN 556,808,000 Credit Suisse 17/6/2020 (2,032,748)USD 1,930,309 NOK 20,087,085 Barclays Bank 17/6/2020 (123,171)USD 8,592,594 NOK 89,812,915 Morgan Stanley 17/6/2020 (585,029)USD 6,341,798 NZD 10,530,000 BNP Paribas 17/6/2020 (171,086)USD 14,039,981 NZD 23,190,000 Citibank 17/6/2020 (310,633)USD 6,691,620 NZD 11,350,000 Goldman Sachs 17/6/2020 (313,901)USD 29,874,610 NZD 48,570,000 HSBC 17/6/2020 (229,167)USD 6,790,645 NZD 10,930,000 Morgan Stanley 17/6/2020 9,369USD 356,640 RUB 27,673,980 Deutsche Bank 17/6/2020 (31,019)USD 739,182 RUB 57,356,020 Goldman Sachs 17/6/2020 (64,266)USD 9,556,128 RUB 632,806,796 HSBC 17/6/2020 550,324USD 5,682,663 RUB 380,710,000 JP Morgan 17/6/2020 271,293USD 6,687,010 SEK 63,500,000 BNP Paribas 17/6/2020 (30,641)USD 6,462,314 SEK 63,700,000 Goldman Sachs 17/6/2020 (251,689)USD 6,499,254 SEK 63,700,000 JP Morgan 17/6/2020 (218,478)USD 841,513 ZAR 15,880,000 Goldman Sachs 19/6/2020 (56,810)
ZAR 49,550,000 EUR 2,391,539Bank of America
Merrill Lynch 17/6/2020 146,961ZAR 51,450,000 EUR 2,659,624 Deutsche Bank 17/6/2020 (23,785)ZAR 33,600,000 EUR 1,629,836 JP Morgan 17/6/2020 91,528ZAR 1,070,000 EUR 55,337 UBS 17/6/2020 (519)ZAR 7,940,000 USD 418,343 HSBC 19/6/2020 30,575ZAR 7,940,000 USD 428,904 Natwest Markets 19/6/2020 21,080
35,403,667
CHF Hedged Share Class
CHF 149,280,340 EUR 141,983,012State Street Bank& Trust Company 15/6/2020 (2,589,803)
EUR 3,435,997 CHF 3,635,760State Street Bank& Trust Company 15/6/2020 41,041
(2,548,762)
GBP Hedged Share Class
EUR 128,473 GBP 114,587State Street Bank& Trust Company 15/6/2020 1,226
GBP 10,645,674 EUR 12,124,161State Street Bank& Trust Company 15/6/2020 (302,363)
(301,137)
Open forward foreign exchange transactionsas at 31 May 2020
Currency Purchases Currency Sales CounterpartyMaturity
date
Netunrealised
appreciation/(depreciation)
EURJPY Hedged Share Class
JPY 48,512,528 EUR 416,561State Street Bank& Trust Company 15/6/2020 (10,996)
(10,996)
USD Hedged Share Class
EUR 6,754,990 USD 7,338,858State Street Bank& Trust Company 15/6/2020 156,653
USD 275,366,658 EUR 253,935,844State Street Bank& Trust Company 15/6/2020 (6,354,783)
(6,198,130)
Total (Gross underlying exposure - EUR 9,400,174,862) 26,344,642
Sector Breakdownas at 31 May 2020
% of NetAssets
Government 40.74
Financial 17.33
Mortgage Securities 6.72
Asset Backed Securities 4.64
Collective Investment Schemes 4.10
Consumer, Cyclical 4.04
Communications 3.59
Consumer, Non-cyclical 3.48
Utilities 2.64
Industrial 2.22
Technology 1.06
Basic Materials 0.84
Exchange Traded Funds 0.48
Energy 0.26
Diversified 0.00
Securities portfolio at market value 92.14
Other Net Assets 7.86
100.00
BlackRock Fixed Income Strategies Fund continued
The notes on pages 691 to 711 form an integral part of these financial statements.
Annual report and audited financial statements [385]
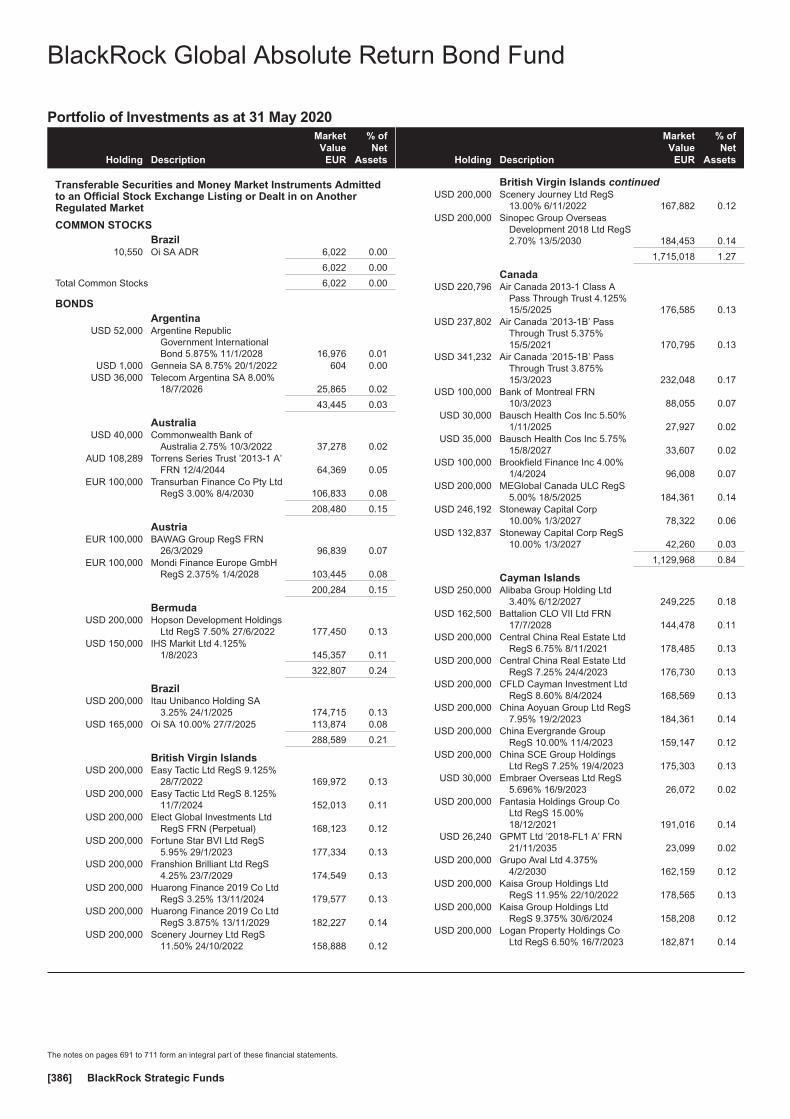
Portfolio of Investments as at 31 May 2020
Holding Description
MarketValue
EUR
% ofNet
Assets
Transferable Securities and Money Market Instruments Admittedto an Official Stock Exchange Listing or Dealt in on AnotherRegulated Market
COMMON STOCKSBrazil
10,550 Oi SA ADR 6,022 0.00
6,022 0.00
Total Common Stocks 6,022 0.00
BONDSArgentina
USD 52,000 Argentine RepublicGovernment InternationalBond 5.875% 11/1/2028 16,976 0.01
USD 1,000 Genneia SA 8.75% 20/1/2022 604 0.00USD 36,000 Telecom Argentina SA 8.00%
18/7/2026 25,865 0.02
43,445 0.03
AustraliaUSD 40,000 Commonwealth Bank of
Australia 2.75% 10/3/2022 37,278 0.02AUD 108,289 Torrens Series Trust ’2013-1 A’
FRN 12/4/2044 64,369 0.05EUR 100,000 Transurban Finance Co Pty Ltd
RegS 3.00% 8/4/2030 106,833 0.08
208,480 0.15
AustriaEUR 100,000 BAWAG Group RegS FRN
26/3/2029 96,839 0.07EUR 100,000 Mondi Finance Europe GmbH
RegS 2.375% 1/4/2028 103,445 0.08
200,284 0.15
BermudaUSD 200,000 Hopson Development Holdings
Ltd RegS 7.50% 27/6/2022 177,450 0.13USD 150,000 IHS Markit Ltd 4.125%
1/8/2023 145,357 0.11
322,807 0.24
BrazilUSD 200,000 Itau Unibanco Holding SA
3.25% 24/1/2025 174,715 0.13USD 165,000 Oi SA 10.00% 27/7/2025 113,874 0.08
288,589 0.21
British Virgin IslandsUSD 200,000 Easy Tactic Ltd RegS 9.125%
28/7/2022 169,972 0.13USD 200,000 Easy Tactic Ltd RegS 8.125%
11/7/2024 152,013 0.11USD 200,000 Elect Global Investments Ltd
RegS FRN (Perpetual) 168,123 0.12USD 200,000 Fortune Star BVI Ltd RegS
5.95% 29/1/2023 177,334 0.13USD 200,000 Franshion Brilliant Ltd RegS
4.25% 23/7/2029 174,549 0.13USD 200,000 Huarong Finance 2019 Co Ltd
RegS 3.25% 13/11/2024 179,577 0.13USD 200,000 Huarong Finance 2019 Co Ltd
RegS 3.875% 13/11/2029 182,227 0.14USD 200,000 Scenery Journey Ltd RegS
11.50% 24/10/2022 158,888 0.12
Holding Description
MarketValue
EUR
% ofNet
Assets
British Virgin Islands continuedUSD 200,000 Scenery Journey Ltd RegS
13.00% 6/11/2022 167,882 0.12USD 200,000 Sinopec Group Overseas
Development 2018 Ltd RegS2.70% 13/5/2030 184,453 0.14
1,715,018 1.27
CanadaUSD 220,796 Air Canada 2013-1 Class A
Pass Through Trust 4.125%15/5/2025 176,585 0.13
USD 237,802 Air Canada ’2013-1B’ PassThrough Trust 5.375%15/5/2021 170,795 0.13
USD 341,232 Air Canada ’2015-1B’ PassThrough Trust 3.875%15/3/2023 232,048 0.17
USD 100,000 Bank of Montreal FRN10/3/2023 88,055 0.07
USD 30,000 Bausch Health Cos Inc 5.50%1/11/2025 27,927 0.02
USD 35,000 Bausch Health Cos Inc 5.75%15/8/2027 33,607 0.02
USD 100,000 Brookfield Finance Inc 4.00%1/4/2024 96,008 0.07
USD 200,000 MEGlobal Canada ULC RegS5.00% 18/5/2025 184,361 0.14
USD 246,192 Stoneway Capital Corp10.00% 1/3/2027 78,322 0.06
USD 132,837 Stoneway Capital Corp RegS10.00% 1/3/2027 42,260 0.03
1,129,968 0.84
Cayman IslandsUSD 250,000 Alibaba Group Holding Ltd
3.40% 6/12/2027 249,225 0.18USD 162,500 Battalion CLO VII Ltd FRN
17/7/2028 144,478 0.11USD 200,000 Central China Real Estate Ltd
RegS 6.75% 8/11/2021 178,485 0.13USD 200,000 Central China Real Estate Ltd
RegS 7.25% 24/4/2023 176,730 0.13USD 200,000 CFLD Cayman Investment Ltd
RegS 8.60% 8/4/2024 168,569 0.13USD 200,000 China Aoyuan Group Ltd RegS
7.95% 19/2/2023 184,361 0.14USD 200,000 China Evergrande Group
RegS 10.00% 11/4/2023 159,147 0.12USD 200,000 China SCE Group Holdings
Ltd RegS 7.25% 19/4/2023 175,303 0.13USD 30,000 Embraer Overseas Ltd RegS
5.696% 16/9/2023 26,072 0.02USD 200,000 Fantasia Holdings Group Co
Ltd RegS 15.00%18/12/2021 191,016 0.14
USD 26,240 GPMT Ltd ’2018-FL1 A’ FRN21/11/2035 23,099 0.02
USD 200,000 Grupo Aval Ltd 4.375%4/2/2030 162,159 0.12
USD 200,000 Kaisa Group Holdings LtdRegS 11.95% 22/10/2022 178,565 0.13
USD 200,000 Kaisa Group Holdings LtdRegS 9.375% 30/6/2024 158,208 0.12
USD 200,000 Logan Property Holdings CoLtd RegS 6.50% 16/7/2023 182,871 0.14
BlackRock Global Absolute Return Bond Fund
The notes on pages 691 to 711 form an integral part of these financial statements.
BlackRock Strategic Funds[386]
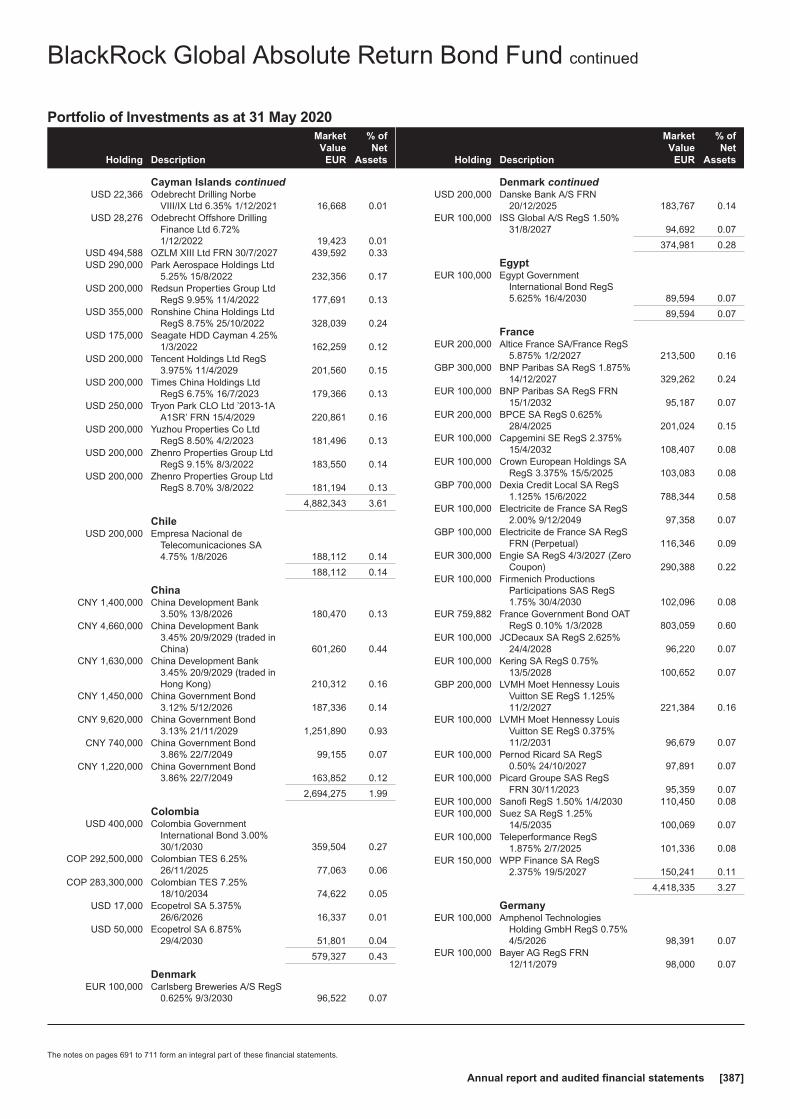
Portfolio of Investments as at 31 May 2020
Holding Description
MarketValue
EUR
% ofNet
Assets
Cayman Islands continuedUSD 22,366 Odebrecht Drilling Norbe
VIII/IX Ltd 6.35% 1/12/2021 16,668 0.01USD 28,276 Odebrecht Offshore Drilling
Finance Ltd 6.72%1/12/2022 19,423 0.01
USD 494,588 OZLM XIII Ltd FRN 30/7/2027 439,592 0.33USD 290,000 Park Aerospace Holdings Ltd
5.25% 15/8/2022 232,356 0.17USD 200,000 Redsun Properties Group Ltd
RegS 9.95% 11/4/2022 177,691 0.13USD 355,000 Ronshine China Holdings Ltd
RegS 8.75% 25/10/2022 328,039 0.24USD 175,000 Seagate HDD Cayman 4.25%
1/3/2022 162,259 0.12USD 200,000 Tencent Holdings Ltd RegS
3.975% 11/4/2029 201,560 0.15USD 200,000 Times China Holdings Ltd
RegS 6.75% 16/7/2023 179,366 0.13USD 250,000 Tryon Park CLO Ltd ’2013-1A
A1SR’ FRN 15/4/2029 220,861 0.16USD 200,000 Yuzhou Properties Co Ltd
RegS 8.50% 4/2/2023 181,496 0.13USD 200,000 Zhenro Properties Group Ltd
RegS 9.15% 8/3/2022 183,550 0.14USD 200,000 Zhenro Properties Group Ltd
RegS 8.70% 3/8/2022 181,194 0.13
4,882,343 3.61
ChileUSD 200,000 Empresa Nacional de
Telecomunicaciones SA4.75% 1/8/2026 188,112 0.14
188,112 0.14
ChinaCNY 1,400,000 China Development Bank
3.50% 13/8/2026 180,470 0.13CNY 4,660,000 China Development Bank
3.45% 20/9/2029 (traded inChina) 601,260 0.44
CNY 1,630,000 China Development Bank3.45% 20/9/2029 (traded inHong Kong) 210,312 0.16
CNY 1,450,000 China Government Bond3.12% 5/12/2026 187,336 0.14
CNY 9,620,000 China Government Bond3.13% 21/11/2029 1,251,890 0.93
CNY 740,000 China Government Bond3.86% 22/7/2049 99,155 0.07
CNY 1,220,000 China Government Bond3.86% 22/7/2049 163,852 0.12
2,694,275 1.99
ColombiaUSD 400,000 Colombia Government
International Bond 3.00%30/1/2030 359,504 0.27
COP 292,500,000 Colombian TES 6.25%26/11/2025 77,063 0.06
COP 283,300,000 Colombian TES 7.25%18/10/2034 74,622 0.05
USD 17,000 Ecopetrol SA 5.375%26/6/2026 16,337 0.01
USD 50,000 Ecopetrol SA 6.875%29/4/2030 51,801 0.04
579,327 0.43
DenmarkEUR 100,000 Carlsberg Breweries A/S RegS
0.625% 9/3/2030 96,522 0.07
Holding Description
MarketValue
EUR
% ofNet
Assets
Denmark continuedUSD 200,000 Danske Bank A/S FRN
20/12/2025 183,767 0.14EUR 100,000 ISS Global A/S RegS 1.50%
31/8/2027 94,692 0.07
374,981 0.28
EgyptEUR 100,000 Egypt Government
International Bond RegS5.625% 16/4/2030 89,594 0.07
89,594 0.07
FranceEUR 200,000 Altice France SA/France RegS
5.875% 1/2/2027 213,500 0.16GBP 300,000 BNP Paribas SA RegS 1.875%
14/12/2027 329,262 0.24EUR 100,000 BNP Paribas SA RegS FRN
15/1/2032 95,187 0.07EUR 200,000 BPCE SA RegS 0.625%
28/4/2025 201,024 0.15EUR 100,000 Capgemini SE RegS 2.375%
15/4/2032 108,407 0.08EUR 100,000 Crown European Holdings SA
RegS 3.375% 15/5/2025 103,083 0.08GBP 700,000 Dexia Credit Local SA RegS
1.125% 15/6/2022 788,344 0.58EUR 100,000 Electricite de France SA RegS
2.00% 9/12/2049 97,358 0.07GBP 100,000 Electricite de France SA RegS
FRN (Perpetual) 116,346 0.09EUR 300,000 Engie SA RegS 4/3/2027 (Zero
Coupon) 290,388 0.22EUR 100,000 Firmenich Productions
Participations SAS RegS1.75% 30/4/2030 102,096 0.08
EUR 759,882 France Government Bond OATRegS 0.10% 1/3/2028 803,059 0.60
EUR 100,000 JCDecaux SA RegS 2.625%24/4/2028 96,220 0.07
EUR 100,000 Kering SA RegS 0.75%13/5/2028 100,652 0.07
GBP 200,000 LVMH Moet Hennessy LouisVuitton SE RegS 1.125%11/2/2027 221,384 0.16
EUR 100,000 LVMH Moet Hennessy LouisVuitton SE RegS 0.375%11/2/2031 96,679 0.07
EUR 100,000 Pernod Ricard SA RegS0.50% 24/10/2027 97,891 0.07
EUR 100,000 Picard Groupe SAS RegSFRN 30/11/2023 95,359 0.07
EUR 100,000 Sanofi RegS 1.50% 1/4/2030 110,450 0.08EUR 100,000 Suez SA RegS 1.25%
14/5/2035 100,069 0.07EUR 100,000 Teleperformance RegS
1.875% 2/7/2025 101,336 0.08EUR 150,000 WPP Finance SA RegS
2.375% 19/5/2027 150,241 0.11
4,418,335 3.27
GermanyEUR 100,000 Amphenol Technologies
Holding GmbH RegS 0.75%4/5/2026 98,391 0.07
EUR 100,000 Bayer AG RegS FRN12/11/2079 98,000 0.07
BlackRock Global Absolute Return Bond Fund continued
The notes on pages 691 to 711 form an integral part of these financial statements.
Annual report and audited financial statements [387]
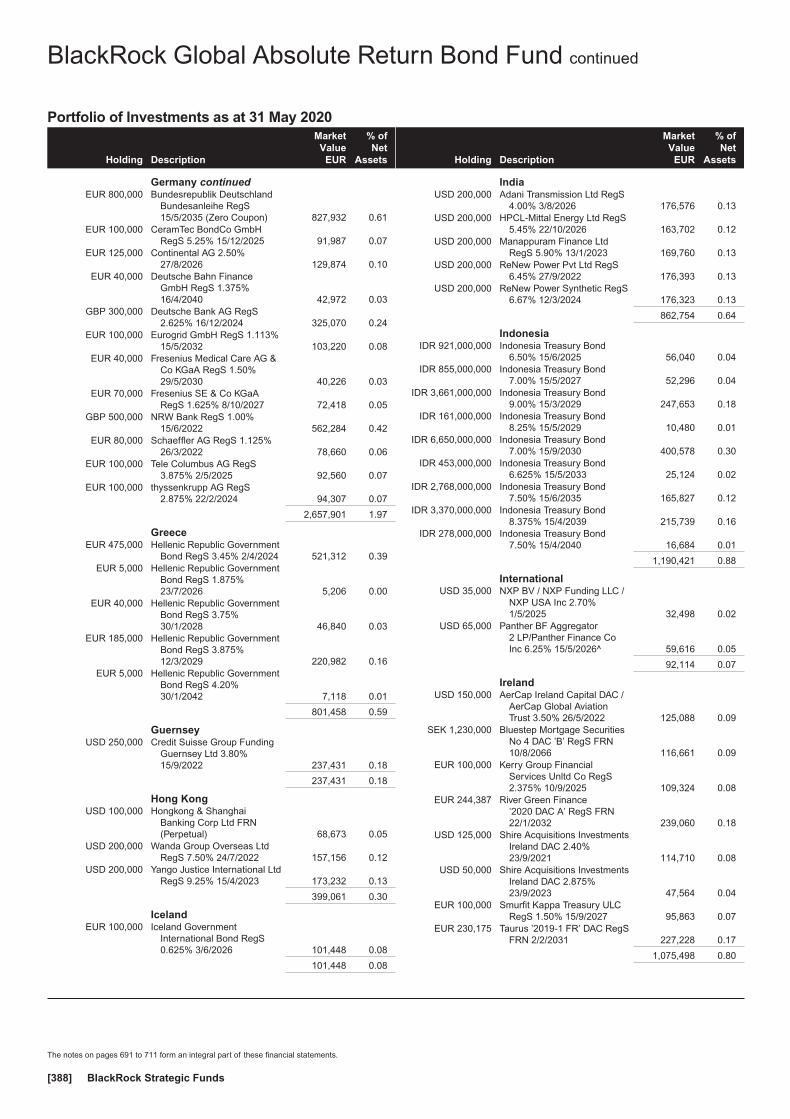
Portfolio of Investments as at 31 May 2020
Holding Description
MarketValue
EUR
% ofNet
Assets
Germany continuedEUR 800,000 Bundesrepublik Deutschland
Bundesanleihe RegS15/5/2035 (Zero Coupon) 827,932 0.61
EUR 100,000 CeramTec BondCo GmbHRegS 5.25% 15/12/2025 91,987 0.07
EUR 125,000 Continental AG 2.50%27/8/2026 129,874 0.10
EUR 40,000 Deutsche Bahn FinanceGmbH RegS 1.375%16/4/2040 42,972 0.03
GBP 300,000 Deutsche Bank AG RegS2.625% 16/12/2024 325,070 0.24
EUR 100,000 Eurogrid GmbH RegS 1.113%15/5/2032 103,220 0.08
EUR 40,000 Fresenius Medical Care AG &Co KGaA RegS 1.50%29/5/2030 40,226 0.03
EUR 70,000 Fresenius SE & Co KGaARegS 1.625% 8/10/2027 72,418 0.05
GBP 500,000 NRW Bank RegS 1.00%15/6/2022 562,284 0.42
EUR 80,000 Schaeffler AG RegS 1.125%26/3/2022 78,660 0.06
EUR 100,000 Tele Columbus AG RegS3.875% 2/5/2025 92,560 0.07
EUR 100,000 thyssenkrupp AG RegS2.875% 22/2/2024 94,307 0.07
2,657,901 1.97
GreeceEUR 475,000 Hellenic Republic Government
Bond RegS 3.45% 2/4/2024 521,312 0.39EUR 5,000 Hellenic Republic Government
Bond RegS 1.875%23/7/2026 5,206 0.00
EUR 40,000 Hellenic Republic GovernmentBond RegS 3.75%30/1/2028 46,840 0.03
EUR 185,000 Hellenic Republic GovernmentBond RegS 3.875%12/3/2029 220,982 0.16
EUR 5,000 Hellenic Republic GovernmentBond RegS 4.20%30/1/2042 7,118 0.01
801,458 0.59
GuernseyUSD 250,000 Credit Suisse Group Funding
Guernsey Ltd 3.80%15/9/2022 237,431 0.18
237,431 0.18
Hong KongUSD 100,000 Hongkong & Shanghai
Banking Corp Ltd FRN(Perpetual) 68,673 0.05
USD 200,000 Wanda Group Overseas LtdRegS 7.50% 24/7/2022 157,156 0.12
USD 200,000 Yango Justice International LtdRegS 9.25% 15/4/2023 173,232 0.13
399,061 0.30
IcelandEUR 100,000 Iceland Government
International Bond RegS0.625% 3/6/2026 101,448 0.08
101,448 0.08
Holding Description
MarketValue
EUR
% ofNet
Assets
IndiaUSD 200,000 Adani Transmission Ltd RegS
4.00% 3/8/2026 176,576 0.13USD 200,000 HPCL-Mittal Energy Ltd RegS
5.45% 22/10/2026 163,702 0.12USD 200,000 Manappuram Finance Ltd
RegS 5.90% 13/1/2023 169,760 0.13USD 200,000 ReNew Power Pvt Ltd RegS
6.45% 27/9/2022 176,393 0.13USD 200,000 ReNew Power Synthetic RegS
6.67% 12/3/2024 176,323 0.13
862,754 0.64
IndonesiaIDR 921,000,000 Indonesia Treasury Bond
6.50% 15/6/2025 56,040 0.04IDR 855,000,000 Indonesia Treasury Bond
7.00% 15/5/2027 52,296 0.04IDR 3,661,000,000 Indonesia Treasury Bond
9.00% 15/3/2029 247,653 0.18IDR 161,000,000 Indonesia Treasury Bond
8.25% 15/5/2029 10,480 0.01IDR 6,650,000,000 Indonesia Treasury Bond
7.00% 15/9/2030 400,578 0.30IDR 453,000,000 Indonesia Treasury Bond
6.625% 15/5/2033 25,124 0.02IDR 2,768,000,000 Indonesia Treasury Bond
7.50% 15/6/2035 165,827 0.12IDR 3,370,000,000 Indonesia Treasury Bond
8.375% 15/4/2039 215,739 0.16IDR 278,000,000 Indonesia Treasury Bond
7.50% 15/4/2040 16,684 0.01
1,190,421 0.88
InternationalUSD 35,000 NXP BV / NXP Funding LLC /
NXP USA Inc 2.70%1/5/2025 32,498 0.02
USD 65,000 Panther BF Aggregator2 LP/Panther Finance CoInc 6.25% 15/5/2026^ 59,616 0.05
92,114 0.07
IrelandUSD 150,000 AerCap Ireland Capital DAC /
AerCap Global AviationTrust 3.50% 26/5/2022 125,088 0.09
SEK 1,230,000 Bluestep Mortgage SecuritiesNo 4 DAC ’B’ RegS FRN10/8/2066 116,661 0.09
EUR 100,000 Kerry Group FinancialServices Unltd Co RegS2.375% 10/9/2025 109,324 0.08
EUR 244,387 River Green Finance’2020 DAC A’ RegS FRN22/1/2032 239,060 0.18
USD 125,000 Shire Acquisitions InvestmentsIreland DAC 2.40%23/9/2021 114,710 0.08
USD 50,000 Shire Acquisitions InvestmentsIreland DAC 2.875%23/9/2023 47,564 0.04
EUR 100,000 Smurfit Kappa Treasury ULCRegS 1.50% 15/9/2027 95,863 0.07
EUR 230,175 Taurus ’2019-1 FR’ DAC RegSFRN 2/2/2031 227,228 0.17
1,075,498 0.80
BlackRock Global Absolute Return Bond Fund continued
The notes on pages 691 to 711 form an integral part of these financial statements.
BlackRock Strategic Funds[388]

Portfolio of Investments as at 31 May 2020
Holding Description
MarketValue
EUR
% ofNet
Assets
Isle of ManEUR 100,000 Playtech Plc RegS 4.25%
7/3/2026 98,014 0.07
98,014 0.07
ItalyUSD 665,000 Eni SpA 4.00% 12/9/2023 630,460 0.47
EUR 1,779,628 Italy Buoni Poliennali DelTesoro RegS 1.30%15/5/2028 1,801,428 1.33
EUR 550,000 Italy Buoni Poliennali DelTesoro RegS 1.45%1/3/2036 520,000 0.39
EUR 185,000 Italy Buoni Poliennali DelTesoro RegS 2.70%1/3/2047 199,681 0.15
EUR 120,000 Italy Buoni Poliennali DelTesoro RegS 3.45%1/3/2048 (traded inGermany) 146,548 0.11
EUR 160,000 Italy Buoni Poliennali DelTesoro RegS 3.45%1/3/2048 (traded in Italy) 195,397 0.14
EUR 34,000 Italy Buoni Poliennali DelTesoro RegS 3.85%1/9/2049 44,389 0.03
EUR 75,000 Italy Buoni Poliennali DelTesoro RegS 2.45%1/9/2050 (traded inGermany) 76,454 0.06
EUR 660,000 Italy Buoni Poliennali DelTesoro RegS 2.45%1/9/2050 (traded in Italy) 672,794 0.50
EUR 60,000 Italy Buoni Poliennali DelTesoro RegS 2.80%1/3/2067 64,481 0.05
EUR 261,028 Sunrise SPV 40 Srl ’2018-1 A’RegS FRN 27/7/2042 260,730 0.19
EUR 100,000 Telecom Italia SpA RegS1.125% 26/3/2022 96,497 0.07
EUR 200,000 UniCredit SpA RegS FRN(Perpetual) 190,974 0.14
4,899,833 3.63
JapanJPY 18,800,000 Japan Government Thirty Year
Bond 0.40% 20/6/2049 154,172 0.11JPY 80,000,000 Japan Government Thirty Year
Bond 0.40% 20/12/2049 655,862 0.49EUR 130,000 SoftBank Group Corp RegS
4.00% 30/7/2022 134,707 0.10USD 200,000 SoftBank Group Corp RegS
5.375% 30/7/2022 186,395 0.14EUR 345,000 SoftBank Group Corp RegS
4.00% 20/4/2023 354,988 0.26EUR 100,000 SoftBank Group Corp RegS
4.00% 19/9/2029 100,746 0.07
1,586,870 1.17
JerseyGBP 155,000 Glencore Finance Europe Ltd
RegS 3.125% 26/3/2026 168,889 0.12USD 200,000 Tullow Oil Jersey Ltd RegS
(Contingent ConvertibleBond) 6.625% 12/7/2021 144,097 0.11
312,986 0.23
LuxembourgEUR 200,000 Altice Finco SA RegS 4.75%
15/1/2028 179,521 0.13EUR 100,000 Aroundtown SA RegS 1.875%
19/1/2026 99,262 0.07
Holding Description
MarketValue
EUR
% ofNet
Assets
Luxembourg continuedEUR 100,000 Blackstone Property Partners
Europe Holdings Sarl RegS2.20% 24/7/2025 101,065 0.08
USD 29,000 Gol Finance Inc 7.00%31/1/2025 12,258 0.01
EUR 100,000 LHMC Finco 2 Sarl RegS7.25% 2/10/2025 54,802 0.04
EUR 110,000 Medtronic Global HoldingsSCA 2.25% 7/3/2039 124,382 0.09
USD 200,000 Rumo Luxembourg Sarl5.875% 18/1/2025 182,358 0.14
USD 2,000 SES SA 5.30% 4/4/2043 1,649 0.00EUR 300,000 SES SA RegS 4.75%
11/3/2021 306,837 0.23EUR 100,000 SES SA RegS FRN
(Perpetual) 100,949 0.07EUR 90,105 Summer BC Holdco A Sarl
RegS 9.25% 31/10/2027 67,070 0.05USD 100,000 Telecom Italia Capital SA
7.721% 4/6/2038 107,777 0.08
1,337,930 0.99
MalaysiaUSD 200,000 Petronas Capital Ltd 3.50%
21/4/2030 197,634 0.15
197,634 0.15
MauritiusUSD 200,000 Network i2i Ltd RegS FRN
(Perpetual) 177,616 0.13
177,616 0.13
MexicoUSD 200,000 Grupo KUO SAB de CV 5.75%
7/7/2027 148,782 0.11USD 200,000 Industrias Penoles SAB de CV
4.15% 12/9/2029 179,605 0.13USD 10,000 Petroleos Mexicanos 5.50%
21/1/2021 9,016 0.01USD 10,000 Petroleos Mexicanos FRN
11/3/2022 8,585 0.01USD 39,000 Petroleos Mexicanos 4.25%
15/1/2025 31,219 0.02USD 80,000 Petroleos Mexicanos 4.50%
23/1/2026 61,837 0.05USD 42,000 Petroleos Mexicanos 6.75%
21/9/2047 29,118 0.02
468,162 0.35
NetherlandsGBP 741,000 BNG Bank NV RegS 1.00%
17/6/2022 833,650 0.62EUR 100,000 Conti-Gummi Finance BV
2.125% 27/11/2023 102,968 0.08EUR 100,000 Deutsche Telekom
International Finance BVRegS 3.25% 17/1/2028 119,013 0.09
EUR 100,000 Digital Dutch Finco BV RegS1.50% 15/3/2030 99,737 0.07
EUR 200,000 Dufry One BV RegS 2.50%15/10/2024 174,553 0.13
USD 14,000 Embraer Netherlands FinanceBV 5.40% 1/2/2027 11,414 0.01
EUR 100,000 Ferrovial Netherlands BVRegS FRN (Perpetual) 91,559 0.07
EUR 205,000 Givaudan Finance Europe BVRegS 1.625% 22/4/2032 217,330 0.16
EUR 150,000 Heineken NV RegS 1.25%7/5/2033 149,590 0.11
BlackRock Global Absolute Return Bond Fund continued
The notes on pages 691 to 711 form an integral part of these financial statements.
Annual report and audited financial statements [389]
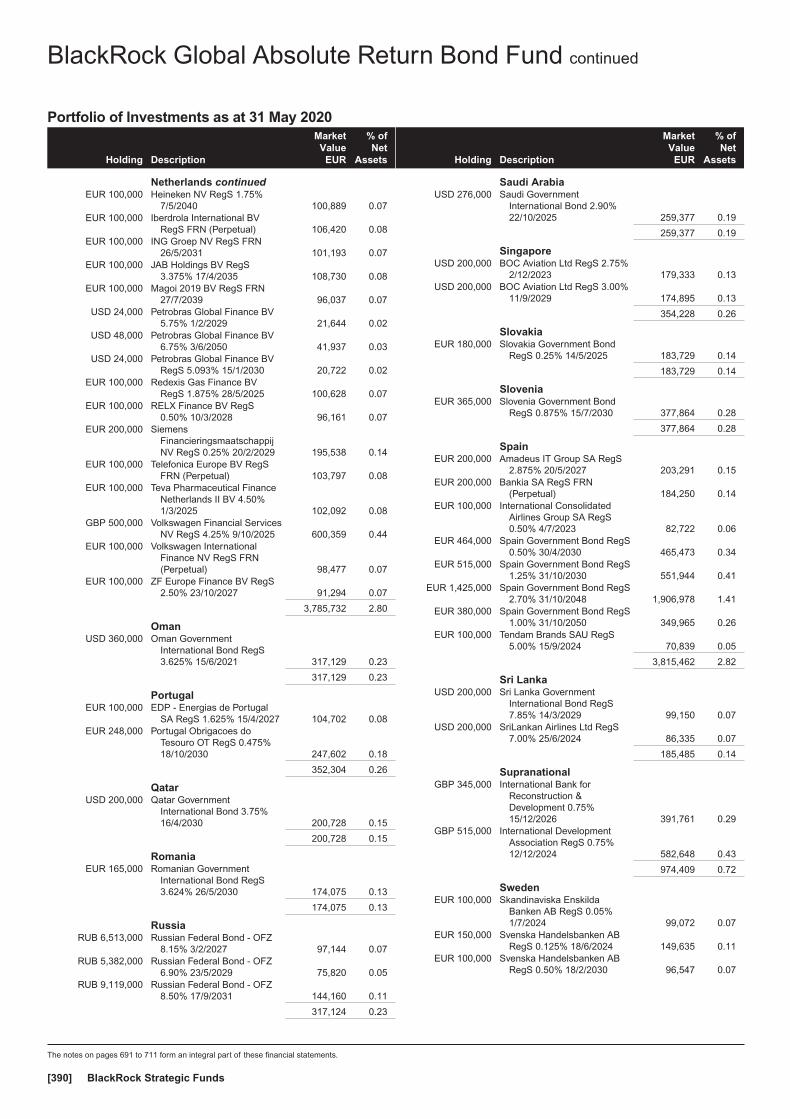
Portfolio of Investments as at 31 May 2020
Holding Description
MarketValue
EUR
% ofNet
Assets
Netherlands continuedEUR 100,000 Heineken NV RegS 1.75%
7/5/2040 100,889 0.07EUR 100,000 Iberdrola International BV
RegS FRN (Perpetual) 106,420 0.08EUR 100,000 ING Groep NV RegS FRN
26/5/2031 101,193 0.07EUR 100,000 JAB Holdings BV RegS
3.375% 17/4/2035 108,730 0.08EUR 100,000 Magoi 2019 BV RegS FRN
27/7/2039 96,037 0.07USD 24,000 Petrobras Global Finance BV
5.75% 1/2/2029 21,644 0.02USD 48,000 Petrobras Global Finance BV
6.75% 3/6/2050 41,937 0.03USD 24,000 Petrobras Global Finance BV
RegS 5.093% 15/1/2030 20,722 0.02EUR 100,000 Redexis Gas Finance BV
RegS 1.875% 28/5/2025 100,628 0.07EUR 100,000 RELX Finance BV RegS
0.50% 10/3/2028 96,161 0.07EUR 200,000 Siemens
FinancieringsmaatschappijNV RegS 0.25% 20/2/2029 195,538 0.14
EUR 100,000 Telefonica Europe BV RegSFRN (Perpetual) 103,797 0.08
EUR 100,000 Teva Pharmaceutical FinanceNetherlands II BV 4.50%1/3/2025 102,092 0.08
GBP 500,000 Volkswagen Financial ServicesNV RegS 4.25% 9/10/2025 600,359 0.44
EUR 100,000 Volkswagen InternationalFinance NV RegS FRN(Perpetual) 98,477 0.07
EUR 100,000 ZF Europe Finance BV RegS2.50% 23/10/2027 91,294 0.07
3,785,732 2.80
OmanUSD 360,000 Oman Government
International Bond RegS3.625% 15/6/2021 317,129 0.23
317,129 0.23
PortugalEUR 100,000 EDP - Energias de Portugal
SA RegS 1.625% 15/4/2027 104,702 0.08EUR 248,000 Portugal Obrigacoes do
Tesouro OT RegS 0.475%18/10/2030 247,602 0.18
352,304 0.26
QatarUSD 200,000 Qatar Government
International Bond 3.75%16/4/2030 200,728 0.15
200,728 0.15
RomaniaEUR 165,000 Romanian Government
International Bond RegS3.624% 26/5/2030 174,075 0.13
174,075 0.13
RussiaRUB 6,513,000 Russian Federal Bond - OFZ
8.15% 3/2/2027 97,144 0.07RUB 5,382,000 Russian Federal Bond - OFZ
6.90% 23/5/2029 75,820 0.05RUB 9,119,000 Russian Federal Bond - OFZ
8.50% 17/9/2031 144,160 0.11
317,124 0.23
Holding Description
MarketValue
EUR
% ofNet
Assets
Saudi ArabiaUSD 276,000 Saudi Government
International Bond 2.90%22/10/2025 259,377 0.19
259,377 0.19
SingaporeUSD 200,000 BOC Aviation Ltd RegS 2.75%
2/12/2023 179,333 0.13USD 200,000 BOC Aviation Ltd RegS 3.00%
11/9/2029 174,895 0.13
354,228 0.26
SlovakiaEUR 180,000 Slovakia Government Bond
RegS 0.25% 14/5/2025 183,729 0.14
183,729 0.14
SloveniaEUR 365,000 Slovenia Government Bond
RegS 0.875% 15/7/2030 377,864 0.28
377,864 0.28
SpainEUR 200,000 Amadeus IT Group SA RegS
2.875% 20/5/2027 203,291 0.15EUR 200,000 Bankia SA RegS FRN
(Perpetual) 184,250 0.14EUR 100,000 International Consolidated
Airlines Group SA RegS0.50% 4/7/2023 82,722 0.06
EUR 464,000 Spain Government Bond RegS0.50% 30/4/2030 465,473 0.34
EUR 515,000 Spain Government Bond RegS1.25% 31/10/2030 551,944 0.41
EUR 1,425,000 Spain Government Bond RegS2.70% 31/10/2048 1,906,978 1.41
EUR 380,000 Spain Government Bond RegS1.00% 31/10/2050 349,965 0.26
EUR 100,000 Tendam Brands SAU RegS5.00% 15/9/2024 70,839 0.05
3,815,462 2.82
Sri LankaUSD 200,000 Sri Lanka Government
International Bond RegS7.85% 14/3/2029 99,150 0.07
USD 200,000 SriLankan Airlines Ltd RegS7.00% 25/6/2024 86,335 0.07
185,485 0.14
SupranationalGBP 345,000 International Bank for
Reconstruction &Development 0.75%15/12/2026 391,761 0.29
GBP 515,000 International DevelopmentAssociation RegS 0.75%12/12/2024 582,648 0.43
974,409 0.72
SwedenEUR 100,000 Skandinaviska Enskilda
Banken AB RegS 0.05%1/7/2024 99,072 0.07
EUR 150,000 Svenska Handelsbanken ABRegS 0.125% 18/6/2024 149,635 0.11
EUR 100,000 Svenska Handelsbanken ABRegS 0.50% 18/2/2030 96,547 0.07
BlackRock Global Absolute Return Bond Fund continued
The notes on pages 691 to 711 form an integral part of these financial statements.
BlackRock Strategic Funds[390]
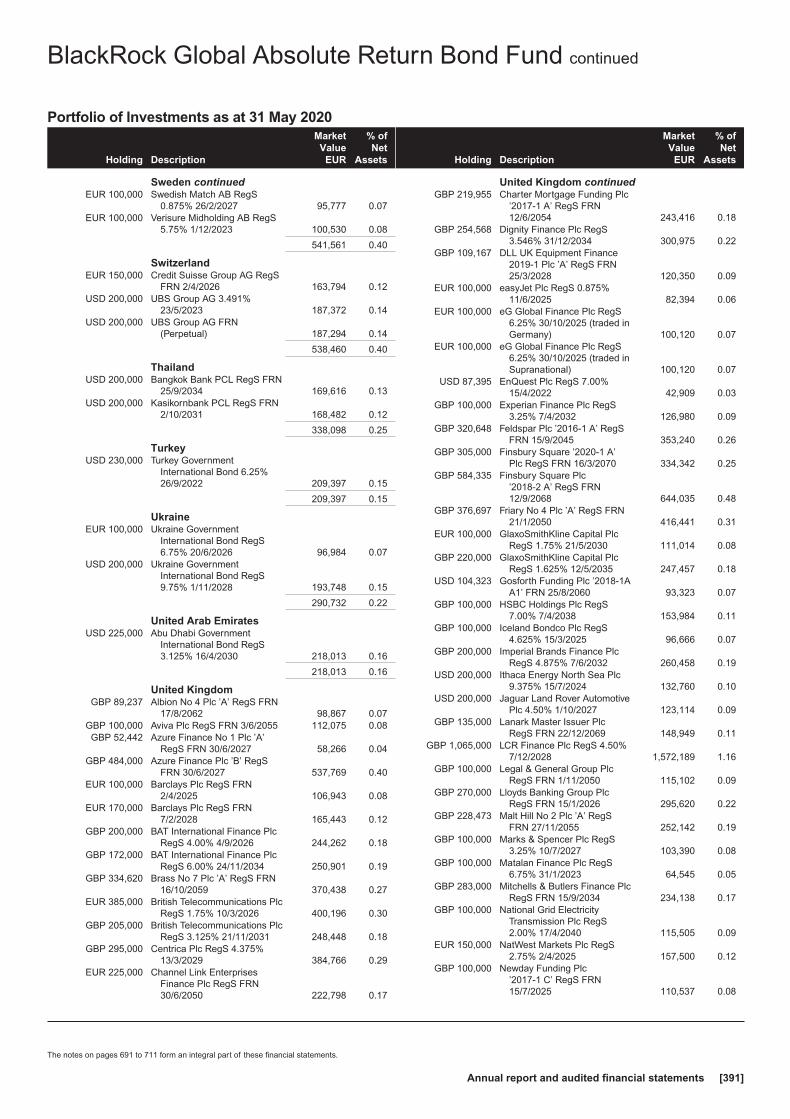
Portfolio of Investments as at 31 May 2020
Holding Description
MarketValue
EUR
% ofNet
Assets
Sweden continuedEUR 100,000 Swedish Match AB RegS
0.875% 26/2/2027 95,777 0.07EUR 100,000 Verisure Midholding AB RegS
5.75% 1/12/2023 100,530 0.08
541,561 0.40
SwitzerlandEUR 150,000 Credit Suisse Group AG RegS
FRN 2/4/2026 163,794 0.12USD 200,000 UBS Group AG 3.491%
23/5/2023 187,372 0.14USD 200,000 UBS Group AG FRN
(Perpetual) 187,294 0.14
538,460 0.40
ThailandUSD 200,000 Bangkok Bank PCL RegS FRN
25/9/2034 169,616 0.13USD 200,000 Kasikornbank PCL RegS FRN
2/10/2031 168,482 0.12
338,098 0.25
TurkeyUSD 230,000 Turkey Government
International Bond 6.25%26/9/2022 209,397 0.15
209,397 0.15
UkraineEUR 100,000 Ukraine Government
International Bond RegS6.75% 20/6/2026 96,984 0.07
USD 200,000 Ukraine GovernmentInternational Bond RegS9.75% 1/11/2028 193,748 0.15
290,732 0.22
United Arab EmiratesUSD 225,000 Abu Dhabi Government
International Bond RegS3.125% 16/4/2030 218,013 0.16
218,013 0.16
United KingdomGBP 89,237 Albion No 4 Plc ’A’ RegS FRN
17/8/2062 98,867 0.07GBP 100,000 Aviva Plc RegS FRN 3/6/2055 112,075 0.08GBP 52,442 Azure Finance No 1 Plc ’A’
RegS FRN 30/6/2027 58,266 0.04GBP 484,000 Azure Finance Plc ’B’ RegS
FRN 30/6/2027 537,769 0.40EUR 100,000 Barclays Plc RegS FRN
2/4/2025 106,943 0.08EUR 170,000 Barclays Plc RegS FRN
7/2/2028 165,443 0.12GBP 200,000 BAT International Finance Plc
RegS 4.00% 4/9/2026 244,262 0.18GBP 172,000 BAT International Finance Plc
RegS 6.00% 24/11/2034 250,901 0.19GBP 334,620 Brass No 7 Plc ’A’ RegS FRN
16/10/2059 370,438 0.27EUR 385,000 British Telecommunications Plc
RegS 1.75% 10/3/2026 400,196 0.30GBP 205,000 British Telecommunications Plc
RegS 3.125% 21/11/2031 248,448 0.18GBP 295,000 Centrica Plc RegS 4.375%
13/3/2029 384,766 0.29EUR 225,000 Channel Link Enterprises
Finance Plc RegS FRN30/6/2050 222,798 0.17
Holding Description
MarketValue
EUR
% ofNet
Assets
United Kingdom continuedGBP 219,955 Charter Mortgage Funding Plc
’2017-1 A’ RegS FRN12/6/2054 243,416 0.18
GBP 254,568 Dignity Finance Plc RegS3.546% 31/12/2034 300,975 0.22
GBP 109,167 DLL UK Equipment Finance2019-1 Plc ’A’ RegS FRN25/3/2028 120,350 0.09
EUR 100,000 easyJet Plc RegS 0.875%11/6/2025 82,394 0.06
EUR 100,000 eG Global Finance Plc RegS6.25% 30/10/2025 (traded inGermany) 100,120 0.07
EUR 100,000 eG Global Finance Plc RegS6.25% 30/10/2025 (traded inSupranational) 100,120 0.07
USD 87,395 EnQuest Plc RegS 7.00%15/4/2022 42,909 0.03
GBP 100,000 Experian Finance Plc RegS3.25% 7/4/2032 126,980 0.09
GBP 320,648 Feldspar Plc ’2016-1 A’ RegSFRN 15/9/2045 353,240 0.26
GBP 305,000 Finsbury Square ’2020-1 A’Plc RegS FRN 16/3/2070 334,342 0.25
GBP 584,335 Finsbury Square Plc’2018-2 A’ RegS FRN12/9/2068 644,035 0.48
GBP 376,697 Friary No 4 Plc ’A’ RegS FRN21/1/2050 416,441 0.31
EUR 100,000 GlaxoSmithKline Capital PlcRegS 1.75% 21/5/2030 111,014 0.08
GBP 220,000 GlaxoSmithKline Capital PlcRegS 1.625% 12/5/2035 247,457 0.18
USD 104,323 Gosforth Funding Plc ’2018-1AA1’ FRN 25/8/2060 93,323 0.07
GBP 100,000 HSBC Holdings Plc RegS7.00% 7/4/2038 153,984 0.11
GBP 100,000 Iceland Bondco Plc RegS4.625% 15/3/2025 96,666 0.07
GBP 200,000 Imperial Brands Finance PlcRegS 4.875% 7/6/2032 260,458 0.19
USD 200,000 Ithaca Energy North Sea Plc9.375% 15/7/2024 132,760 0.10
USD 200,000 Jaguar Land Rover AutomotivePlc 4.50% 1/10/2027 123,114 0.09
GBP 135,000 Lanark Master Issuer PlcRegS FRN 22/12/2069 148,949 0.11
GBP 1,065,000 LCR Finance Plc RegS 4.50%7/12/2028 1,572,189 1.16
GBP 100,000 Legal & General Group PlcRegS FRN 1/11/2050 115,102 0.09
GBP 270,000 Lloyds Banking Group PlcRegS FRN 15/1/2026 295,620 0.22
GBP 228,473 Malt Hill No 2 Plc ’A’ RegSFRN 27/11/2055 252,142 0.19
GBP 100,000 Marks & Spencer Plc RegS3.25% 10/7/2027 103,390 0.08
GBP 100,000 Matalan Finance Plc RegS6.75% 31/1/2023 64,545 0.05
GBP 283,000 Mitchells & Butlers Finance PlcRegS FRN 15/9/2034 234,138 0.17
GBP 100,000 National Grid ElectricityTransmission Plc RegS2.00% 17/4/2040 115,505 0.09
EUR 150,000 NatWest Markets Plc RegS2.75% 2/4/2025 157,500 0.12
GBP 100,000 Newday Funding Plc’2017-1 C’ RegS FRN15/7/2025 110,537 0.08
BlackRock Global Absolute Return Bond Fund continued
The notes on pages 691 to 711 form an integral part of these financial statements.
Annual report and audited financial statements [391]
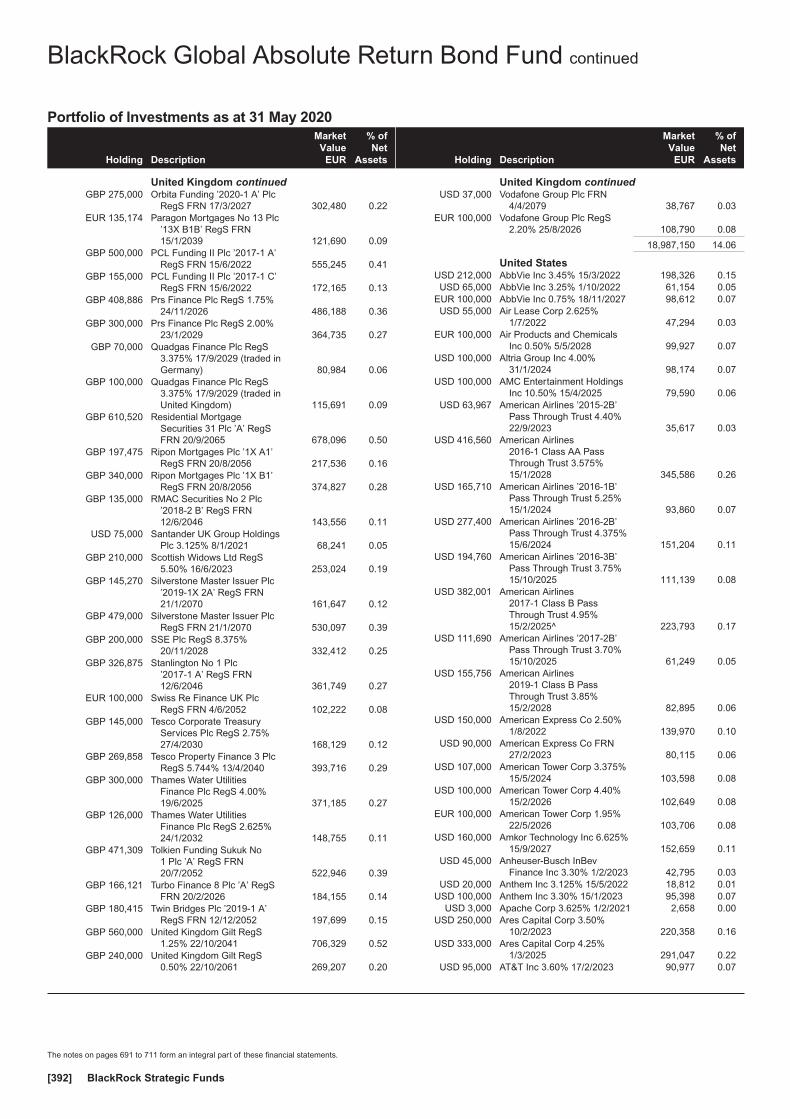
Portfolio of Investments as at 31 May 2020
Holding Description
MarketValue
EUR
% ofNet
Assets
United Kingdom continuedGBP 275,000 Orbita Funding ’2020-1 A’ Plc
RegS FRN 17/3/2027 302,480 0.22EUR 135,174 Paragon Mortgages No 13 Plc
’13X B1B’ RegS FRN15/1/2039 121,690 0.09
GBP 500,000 PCL Funding II Plc ’2017-1 A’RegS FRN 15/6/2022 555,245 0.41
GBP 155,000 PCL Funding II Plc ’2017-1 C’RegS FRN 15/6/2022 172,165 0.13
GBP 408,886 Prs Finance Plc RegS 1.75%24/11/2026 486,188 0.36
GBP 300,000 Prs Finance Plc RegS 2.00%23/1/2029 364,735 0.27
GBP 70,000 Quadgas Finance Plc RegS3.375% 17/9/2029 (traded inGermany) 80,984 0.06
GBP 100,000 Quadgas Finance Plc RegS3.375% 17/9/2029 (traded inUnited Kingdom) 115,691 0.09
GBP 610,520 Residential MortgageSecurities 31 Plc ’A’ RegSFRN 20/9/2065 678,096 0.50
GBP 197,475 Ripon Mortgages Plc ’1X A1’RegS FRN 20/8/2056 217,536 0.16
GBP 340,000 Ripon Mortgages Plc ’1X B1’RegS FRN 20/8/2056 374,827 0.28
GBP 135,000 RMAC Securities No 2 Plc’2018-2 B’ RegS FRN12/6/2046 143,556 0.11
USD 75,000 Santander UK Group HoldingsPlc 3.125% 8/1/2021 68,241 0.05
GBP 210,000 Scottish Widows Ltd RegS5.50% 16/6/2023 253,024 0.19
GBP 145,270 Silverstone Master Issuer Plc’2019-1X 2A’ RegS FRN21/1/2070 161,647 0.12
GBP 479,000 Silverstone Master Issuer PlcRegS FRN 21/1/2070 530,097 0.39
GBP 200,000 SSE Plc RegS 8.375%20/11/2028 332,412 0.25
GBP 326,875 Stanlington No 1 Plc’2017-1 A’ RegS FRN12/6/2046 361,749 0.27
EUR 100,000 Swiss Re Finance UK PlcRegS FRN 4/6/2052 102,222 0.08
GBP 145,000 Tesco Corporate TreasuryServices Plc RegS 2.75%27/4/2030 168,129 0.12
GBP 269,858 Tesco Property Finance 3 PlcRegS 5.744% 13/4/2040 393,716 0.29
GBP 300,000 Thames Water UtilitiesFinance Plc RegS 4.00%19/6/2025 371,185 0.27
GBP 126,000 Thames Water UtilitiesFinance Plc RegS 2.625%24/1/2032 148,755 0.11
GBP 471,309 Tolkien Funding Sukuk No1 Plc ’A’ RegS FRN20/7/2052 522,946 0.39
GBP 166,121 Turbo Finance 8 Plc ’A’ RegSFRN 20/2/2026 184,155 0.14
GBP 180,415 Twin Bridges Plc ’2019-1 A’RegS FRN 12/12/2052 197,699 0.15
GBP 560,000 United Kingdom Gilt RegS1.25% 22/10/2041 706,329 0.52
GBP 240,000 United Kingdom Gilt RegS0.50% 22/10/2061 269,207 0.20
Holding Description
MarketValue
EUR
% ofNet
Assets
United Kingdom continuedUSD 37,000 Vodafone Group Plc FRN
4/4/2079 38,767 0.03EUR 100,000 Vodafone Group Plc RegS
2.20% 25/8/2026 108,790 0.08
18,987,150 14.06
United StatesUSD 212,000 AbbVie Inc 3.45% 15/3/2022 198,326 0.15USD 65,000 AbbVie Inc 3.25% 1/10/2022 61,154 0.05
EUR 100,000 AbbVie Inc 0.75% 18/11/2027 98,612 0.07USD 55,000 Air Lease Corp 2.625%
1/7/2022 47,294 0.03EUR 100,000 Air Products and Chemicals
Inc 0.50% 5/5/2028 99,927 0.07USD 100,000 Altria Group Inc 4.00%
31/1/2024 98,174 0.07USD 100,000 AMC Entertainment Holdings
Inc 10.50% 15/4/2025 79,590 0.06USD 63,967 American Airlines ’2015-2B’
Pass Through Trust 4.40%22/9/2023 35,617 0.03
USD 416,560 American Airlines2016-1 Class AA PassThrough Trust 3.575%15/1/2028 345,586 0.26
USD 165,710 American Airlines ’2016-1B’Pass Through Trust 5.25%15/1/2024 93,860 0.07
USD 277,400 American Airlines ’2016-2B’Pass Through Trust 4.375%15/6/2024 151,204 0.11
USD 194,760 American Airlines ’2016-3B’Pass Through Trust 3.75%15/10/2025 111,139 0.08
USD 382,001 American Airlines2017-1 Class B PassThrough Trust 4.95%15/2/2025^ 223,793 0.17
USD 111,690 American Airlines ’2017-2B’Pass Through Trust 3.70%15/10/2025 61,249 0.05
USD 155,756 American Airlines2019-1 Class B PassThrough Trust 3.85%15/2/2028 82,895 0.06
USD 150,000 American Express Co 2.50%1/8/2022 139,970 0.10
USD 90,000 American Express Co FRN27/2/2023 80,115 0.06
USD 107,000 American Tower Corp 3.375%15/5/2024 103,598 0.08
USD 100,000 American Tower Corp 4.40%15/2/2026 102,649 0.08
EUR 100,000 American Tower Corp 1.95%22/5/2026 103,706 0.08
USD 160,000 Amkor Technology Inc 6.625%15/9/2027 152,659 0.11
USD 45,000 Anheuser-Busch InBevFinance Inc 3.30% 1/2/2023 42,795 0.03
USD 20,000 Anthem Inc 3.125% 15/5/2022 18,812 0.01USD 100,000 Anthem Inc 3.30% 15/1/2023 95,398 0.07
USD 3,000 Apache Corp 3.625% 1/2/2021 2,658 0.00USD 250,000 Ares Capital Corp 3.50%
10/2/2023 220,358 0.16USD 333,000 Ares Capital Corp 4.25%
1/3/2025 291,047 0.22USD 95,000 AT&T Inc 3.60% 17/2/2023 90,977 0.07
BlackRock Global Absolute Return Bond Fund continued
The notes on pages 691 to 711 form an integral part of these financial statements.
BlackRock Strategic Funds[392]

Portfolio of Investments as at 31 May 2020
Holding Description
MarketValue
EUR
% ofNet
Assets
United States continuedEUR 100,000 AT&T Inc 1.60% 19/5/2028 101,894 0.08USD 100,000 AT&T Inc 4.30% 15/2/2030 101,890 0.08USD 300,000 AutoZone Inc 3.625%
15/4/2025 295,518 0.22USD 50,000 Baker Hughes a GE Co
LLC/Baker HughesCo-Obligor Inc 2.773%15/12/2022 46,590 0.03
USD 100,000 Bank of America Corp FRN23/1/2022 90,892 0.07
USD 260,000 Bank of America Corp 2.503%21/10/2022 239,247 0.18
USD 70,000 Bank of America Corp 3.30%11/1/2023 66,716 0.05
USD 40,000 Bank of America Corp 3.95%21/4/2025 39,338 0.03
USD 90,000 BAT Capital Corp 2.764%15/8/2022 83,476 0.06
USD 200,000 BAT Capital Corp 4.70%2/4/2027 201,303 0.15
USD 70,000 Baxter International Inc 2.60%15/8/2026 67,617 0.05
USD 15,000 Bay Area Toll Authority ’S1’7.043% 1/4/2050 22,723 0.02
USD 200,000 BMW US Capital LLC 3.90%9/4/2025 194,085 0.14
USD 100,000 Booking Holdings Inc 4.10%13/4/2025 98,142 0.07
USD 15,000 BP Capital Markets AmericaInc 3.79% 6/2/2024 14,658 0.01
USD 6,133 British Airways ’2013-1B’ PassThrough Trust 5.625%20/6/2020 5,447 0.00
USD 100,000 British Airways 2019-1 Class APass Through Trust ’A’3.35% 15/6/2029 69,244 0.05
USD 35,000 Broadcom Inc 3.125%15/4/2021 31,717 0.02
USD 365,000 Broadcom Inc 4.70%15/4/2025 360,500 0.27
USD 200,000 Broadcom Inc 4.25%15/4/2026 192,602 0.14
USD 210,000 Broadcom Inc 4.11%15/9/2028 197,565 0.15
USD 53,487 BX Commercial MortgageTrust ’2018-IND A’ FRN15/11/2035 47,133 0.03
USD 45,000 California Health FacilitiesFinancing Authority ’A’5.00% 15/8/2033 47,580 0.04
USD 350,000 California Pollution ControlFinancing Authority 5.00%21/11/2045 322,748 0.24
USD 145,000 Capital One Financial Corp3.05% 9/3/2022 134,501 0.10
USD 60,000 Capital One Financial Corp3.20% 30/1/2023 55,807 0.04
USD 240,000 Cargo Aircraft ManagementInc 4.75% 1/2/2028 216,272 0.16
USD 100,000 Caterpillar Financial ServicesCorp 0.95% 13/5/2022 90,725 0.07
USD 50,000 CD 2018-CD7 Mortgage Trust’A4’ 4.279% 15/8/2051 51,883 0.04
USD 100,000 Central Puget Sound RegionalTransit Authority ’S1’ 5.00%1/11/2041 107,722 0.08
USD 5,876,735 CFCRE Commercial MortgageTrust ’2016-C4 XA’ FRN10/5/2058 372,798 0.28
Holding Description
MarketValue
EUR
% ofNet
Assets
United States continuedUSD 91,354 CGDBB Commercial Mortgage
Trust ’2017-BIOC A’ FRN15/7/2032 80,781 0.06
USD 100,000 Charter CommunicationsOperating LLC / CharterCommunications OperatingCapital 4.464% 23/7/2022 95,785 0.07
USD 400,000 Charter CommunicationsOperating LLC / CharterCommunications OperatingCapital 4.908% 23/7/2025 411,411 0.30
USD 50,000 Charter CommunicationsOperating LLC / CharterCommunications OperatingCapital 3.75% 15/2/2028 48,676 0.04
USD 340,000 Cheniere Energy Partners LP5.25% 1/10/2025 312,835 0.23
USD 25,000 Chesapeake Bay Bridge &Tunnel District 5.00%1/7/2051 24,044 0.02
USD 30,000 Chevron Corp 1.141%11/5/2023 27,486 0.02
USD 43,000 Citgo Holding Inc 9.25%1/8/2024 37,245 0.03
USD 100,000 Citibank Credit Card IssuanceTrust ’2018-A3 A3’ 3.29%23/5/2025 96,419 0.07
USD 75,072 Citigroup CommercialMortgage Trust’2014-GC19 AAB’ 3.552%10/3/2047 70,127 0.05
EUR 100,000 Citigroup Inc RegS 1.25%10/4/2029 102,460 0.08
USD 10,000 City of Riverside CA ElectricRevenue 7.605% 1/10/2040 14,495 0.01
USD 1,000,000 CityLine Commercial MortgageTrust ’2016-CLNE A’ FRN10/11/2031 902,966 0.67
USD 82,000 Claremont Mckenna College3.378% 1/1/2050 72,593 0.05
USD 128,321 CNH Equipment Trust ’2017-CA3’ 2.08% 15/2/2023 116,015 0.09
USD 6,718 CNH Equipment Trust ’2018-BA2’ 2.93% 15/12/2021 6,047 0.00
EUR 100,000 Coca-Cola Co 0.75%22/9/2026 102,619 0.08
USD 260,000 Colorado Health FacilitiesAuthority 5.00% 1/8/2044 261,538 0.19
GBP 285,000 Comcast Corp 1.50%20/2/2029 320,176 0.24
USD 95,000 COMM Mortgage Trust’2015-CR22 X3’ 3.207%10/3/2048 87,455 0.06
USD 579,089 COMM Mortgage Trust’2015-CR23 XA’ FRN10/5/2048 17,391 0.01
USD 5,000 Commonwealth FinancingAuthority PennsylvaniaRevenue 4.144% 1/6/2038 4,958 0.00
USD 75,000 Commonwealth ofMassachusetts 2.90%1/9/2049 71,118 0.05
USD 170,000 Connecticut State Health &Educational FacilityAuthority 5.00% 1/7/2045 168,109 0.12
USD 170,000 Connecticut State Health &Educational FacilityAuthority ’L’ 5.00% 1/7/2045 165,552 0.12
BlackRock Global Absolute Return Bond Fund continued
The notes on pages 691 to 711 form an integral part of these financial statements.
Annual report and audited financial statements [393]
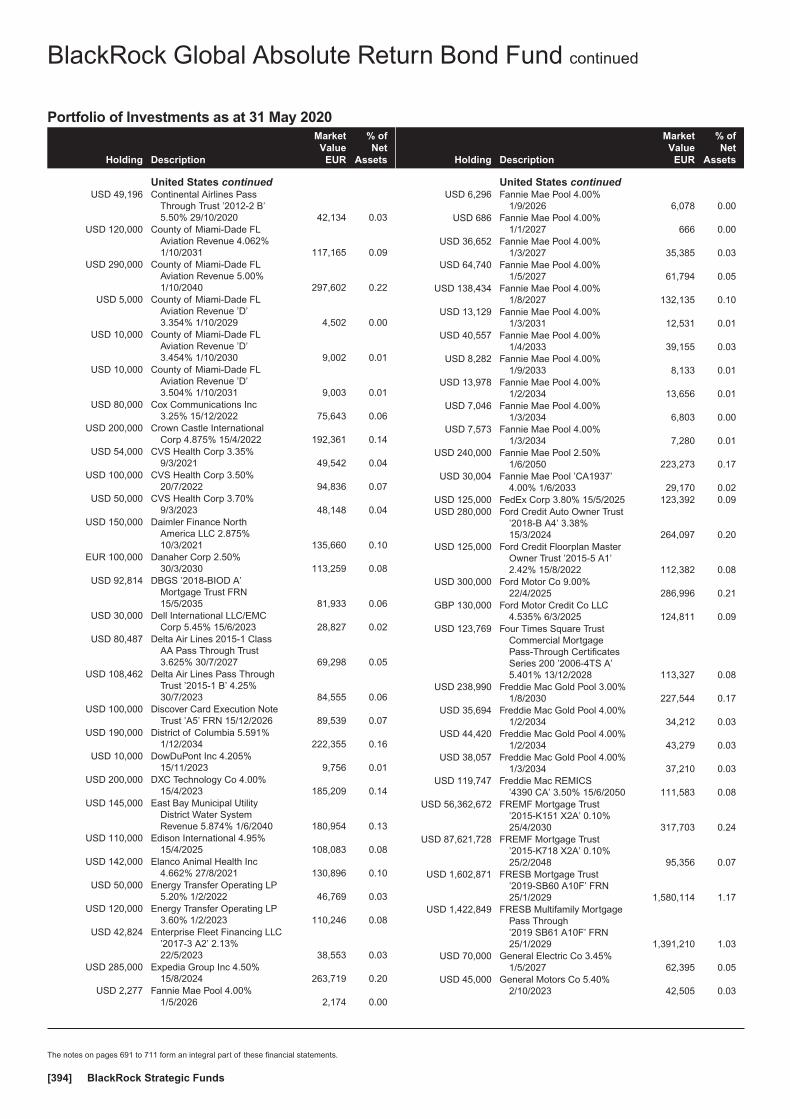
Portfolio of Investments as at 31 May 2020
Holding Description
MarketValue
EUR
% ofNet
Assets
United States continuedUSD 49,196 Continental Airlines Pass
Through Trust ’2012-2 B’5.50% 29/10/2020 42,134 0.03
USD 120,000 County of Miami-Dade FLAviation Revenue 4.062%1/10/2031 117,165 0.09
USD 290,000 County of Miami-Dade FLAviation Revenue 5.00%1/10/2040 297,602 0.22
USD 5,000 County of Miami-Dade FLAviation Revenue ’D’3.354% 1/10/2029 4,502 0.00
USD 10,000 County of Miami-Dade FLAviation Revenue ’D’3.454% 1/10/2030 9,002 0.01
USD 10,000 County of Miami-Dade FLAviation Revenue ’D’3.504% 1/10/2031 9,003 0.01
USD 80,000 Cox Communications Inc3.25% 15/12/2022 75,643 0.06
USD 200,000 Crown Castle InternationalCorp 4.875% 15/4/2022 192,361 0.14
USD 54,000 CVS Health Corp 3.35%9/3/2021 49,542 0.04
USD 100,000 CVS Health Corp 3.50%20/7/2022 94,836 0.07
USD 50,000 CVS Health Corp 3.70%9/3/2023 48,148 0.04
USD 150,000 Daimler Finance NorthAmerica LLC 2.875%10/3/2021 135,660 0.10
EUR 100,000 Danaher Corp 2.50%30/3/2030 113,259 0.08
USD 92,814 DBGS ’2018-BIOD A’Mortgage Trust FRN15/5/2035 81,933 0.06
USD 30,000 Dell International LLC/EMCCorp 5.45% 15/6/2023 28,827 0.02
USD 80,487 Delta Air Lines 2015-1 ClassAA Pass Through Trust3.625% 30/7/2027 69,298 0.05
USD 108,462 Delta Air Lines Pass ThroughTrust ’2015-1 B’ 4.25%30/7/2023 84,555 0.06
USD 100,000 Discover Card Execution NoteTrust ’A5’ FRN 15/12/2026 89,539 0.07
USD 190,000 District of Columbia 5.591%1/12/2034 222,355 0.16
USD 10,000 DowDuPont Inc 4.205%15/11/2023 9,756 0.01
USD 200,000 DXC Technology Co 4.00%15/4/2023 185,209 0.14
USD 145,000 East Bay Municipal UtilityDistrict Water SystemRevenue 5.874% 1/6/2040 180,954 0.13
USD 110,000 Edison International 4.95%15/4/2025 108,083 0.08
USD 142,000 Elanco Animal Health Inc4.662% 27/8/2021 130,896 0.10
USD 50,000 Energy Transfer Operating LP5.20% 1/2/2022 46,769 0.03
USD 120,000 Energy Transfer Operating LP3.60% 1/2/2023 110,246 0.08
USD 42,824 Enterprise Fleet Financing LLC’2017-3 A2’ 2.13%22/5/2023 38,553 0.03
USD 285,000 Expedia Group Inc 4.50%15/8/2024 263,719 0.20
USD 2,277 Fannie Mae Pool 4.00%1/5/2026 2,174 0.00
Holding Description
MarketValue
EUR
% ofNet
Assets
United States continuedUSD 6,296 Fannie Mae Pool 4.00%
1/9/2026 6,078 0.00USD 686 Fannie Mae Pool 4.00%
1/1/2027 666 0.00USD 36,652 Fannie Mae Pool 4.00%
1/3/2027 35,385 0.03USD 64,740 Fannie Mae Pool 4.00%
1/5/2027 61,794 0.05USD 138,434 Fannie Mae Pool 4.00%
1/8/2027 132,135 0.10USD 13,129 Fannie Mae Pool 4.00%
1/3/2031 12,531 0.01USD 40,557 Fannie Mae Pool 4.00%
1/4/2033 39,155 0.03USD 8,282 Fannie Mae Pool 4.00%
1/9/2033 8,133 0.01USD 13,978 Fannie Mae Pool 4.00%
1/2/2034 13,656 0.01USD 7,046 Fannie Mae Pool 4.00%
1/3/2034 6,803 0.00USD 7,573 Fannie Mae Pool 4.00%
1/3/2034 7,280 0.01USD 240,000 Fannie Mae Pool 2.50%
1/6/2050 223,273 0.17USD 30,004 Fannie Mae Pool ’CA1937’
4.00% 1/6/2033 29,170 0.02USD 125,000 FedEx Corp 3.80% 15/5/2025 123,392 0.09USD 280,000 Ford Credit Auto Owner Trust
’2018-B A4’ 3.38%15/3/2024 264,097 0.20
USD 125,000 Ford Credit Floorplan MasterOwner Trust ’2015-5 A1’2.42% 15/8/2022 112,382 0.08
USD 300,000 Ford Motor Co 9.00%22/4/2025 286,996 0.21
GBP 130,000 Ford Motor Credit Co LLC4.535% 6/3/2025 124,811 0.09
USD 123,769 Four Times Square TrustCommercial MortgagePass-Through CertificatesSeries 200 ’2006-4TS A’5.401% 13/12/2028 113,327 0.08
USD 238,990 Freddie Mac Gold Pool 3.00%1/8/2030 227,544 0.17
USD 35,694 Freddie Mac Gold Pool 4.00%1/2/2034 34,212 0.03
USD 44,420 Freddie Mac Gold Pool 4.00%1/2/2034 43,279 0.03
USD 38,057 Freddie Mac Gold Pool 4.00%1/3/2034 37,210 0.03
USD 119,747 Freddie Mac REMICS’4390 CA’ 3.50% 15/6/2050 111,583 0.08
USD 56,362,672 FREMF Mortgage Trust’2015-K151 X2A’ 0.10%25/4/2030 317,703 0.24
USD 87,621,728 FREMF Mortgage Trust’2015-K718 X2A’ 0.10%25/2/2048 95,356 0.07
USD 1,602,871 FRESB Mortgage Trust’2019-SB60 A10F’ FRN25/1/2029 1,580,114 1.17
USD 1,422,849 FRESB Multifamily MortgagePass Through’2019 SB61 A10F’ FRN25/1/2029 1,391,210 1.03
USD 70,000 General Electric Co 3.45%1/5/2027 62,395 0.05
USD 45,000 General Motors Co 5.40%2/10/2023 42,505 0.03
BlackRock Global Absolute Return Bond Fund continued
The notes on pages 691 to 711 form an integral part of these financial statements.
BlackRock Strategic Funds[394]
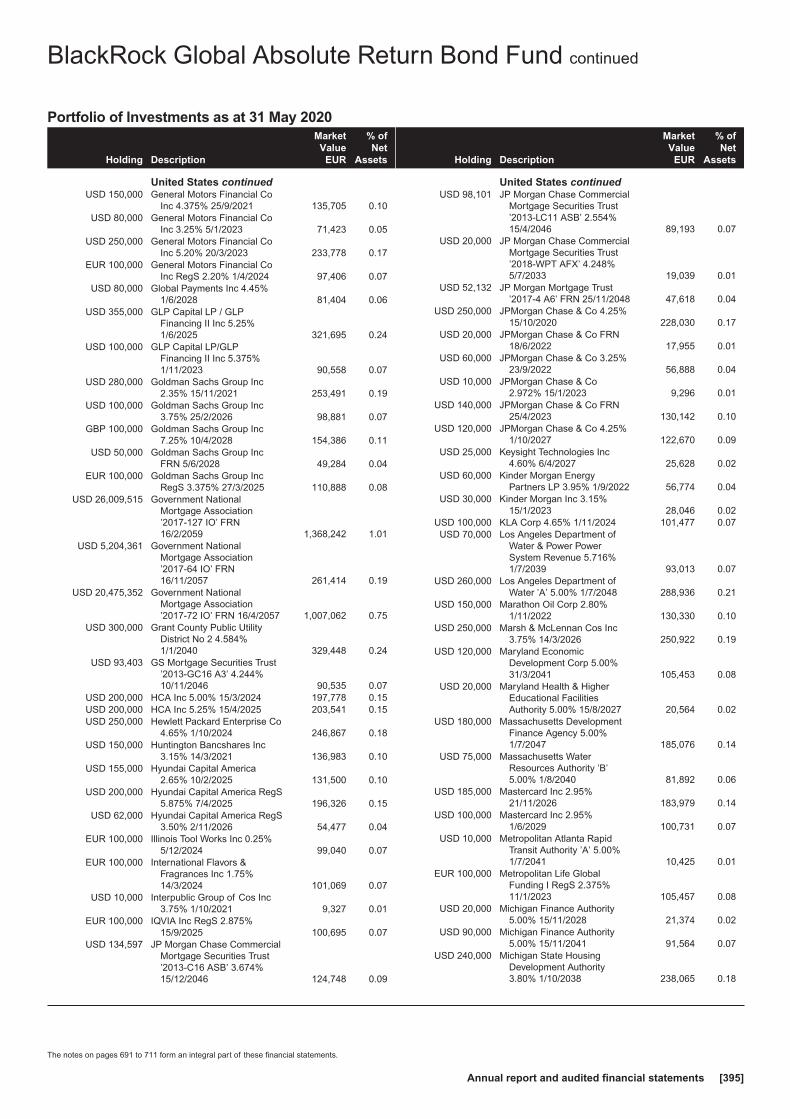
Portfolio of Investments as at 31 May 2020
Holding Description
MarketValue
EUR
% ofNet
Assets
United States continuedUSD 150,000 General Motors Financial Co
Inc 4.375% 25/9/2021 135,705 0.10USD 80,000 General Motors Financial Co
Inc 3.25% 5/1/2023 71,423 0.05USD 250,000 General Motors Financial Co
Inc 5.20% 20/3/2023 233,778 0.17EUR 100,000 General Motors Financial Co
Inc RegS 2.20% 1/4/2024 97,406 0.07USD 80,000 Global Payments Inc 4.45%
1/6/2028 81,404 0.06USD 355,000 GLP Capital LP / GLP
Financing II Inc 5.25%1/6/2025 321,695 0.24
USD 100,000 GLP Capital LP/GLPFinancing II Inc 5.375%1/11/2023 90,558 0.07
USD 280,000 Goldman Sachs Group Inc2.35% 15/11/2021 253,491 0.19
USD 100,000 Goldman Sachs Group Inc3.75% 25/2/2026 98,881 0.07
GBP 100,000 Goldman Sachs Group Inc7.25% 10/4/2028 154,386 0.11
USD 50,000 Goldman Sachs Group IncFRN 5/6/2028 49,284 0.04
EUR 100,000 Goldman Sachs Group IncRegS 3.375% 27/3/2025 110,888 0.08
USD 26,009,515 Government NationalMortgage Association’2017-127 IO’ FRN16/2/2059 1,368,242 1.01
USD 5,204,361 Government NationalMortgage Association’2017-64 IO’ FRN16/11/2057 261,414 0.19
USD 20,475,352 Government NationalMortgage Association’2017-72 IO’ FRN 16/4/2057 1,007,062 0.75
USD 300,000 Grant County Public UtilityDistrict No 2 4.584%1/1/2040 329,448 0.24
USD 93,403 GS Mortgage Securities Trust’2013-GC16 A3’ 4.244%10/11/2046 90,535 0.07
USD 200,000 HCA Inc 5.00% 15/3/2024 197,778 0.15USD 200,000 HCA Inc 5.25% 15/4/2025 203,541 0.15USD 250,000 Hewlett Packard Enterprise Co
4.65% 1/10/2024 246,867 0.18USD 150,000 Huntington Bancshares Inc
3.15% 14/3/2021 136,983 0.10USD 155,000 Hyundai Capital America
2.65% 10/2/2025 131,500 0.10USD 200,000 Hyundai Capital America RegS
5.875% 7/4/2025 196,326 0.15USD 62,000 Hyundai Capital America RegS
3.50% 2/11/2026 54,477 0.04EUR 100,000 Illinois Tool Works Inc 0.25%
5/12/2024 99,040 0.07EUR 100,000 International Flavors &
Fragrances Inc 1.75%14/3/2024 101,069 0.07
USD 10,000 Interpublic Group of Cos Inc3.75% 1/10/2021 9,327 0.01
EUR 100,000 IQVIA Inc RegS 2.875%15/9/2025 100,695 0.07
USD 134,597 JP Morgan Chase CommercialMortgage Securities Trust’2013-C16 ASB’ 3.674%15/12/2046 124,748 0.09
Holding Description
MarketValue
EUR
% ofNet
Assets
United States continuedUSD 98,101 JP Morgan Chase Commercial
Mortgage Securities Trust’2013-LC11 ASB’ 2.554%15/4/2046 89,193 0.07
USD 20,000 JP Morgan Chase CommercialMortgage Securities Trust’2018-WPT AFX’ 4.248%5/7/2033 19,039 0.01
USD 52,132 JP Morgan Mortgage Trust’2017-4 A6’ FRN 25/11/2048 47,618 0.04
USD 250,000 JPMorgan Chase & Co 4.25%15/10/2020 228,030 0.17
USD 20,000 JPMorgan Chase & Co FRN18/6/2022 17,955 0.01
USD 60,000 JPMorgan Chase & Co 3.25%23/9/2022 56,888 0.04
USD 10,000 JPMorgan Chase & Co2.972% 15/1/2023 9,296 0.01
USD 140,000 JPMorgan Chase & Co FRN25/4/2023 130,142 0.10
USD 120,000 JPMorgan Chase & Co 4.25%1/10/2027 122,670 0.09
USD 25,000 Keysight Technologies Inc4.60% 6/4/2027 25,628 0.02
USD 60,000 Kinder Morgan EnergyPartners LP 3.95% 1/9/2022 56,774 0.04
USD 30,000 Kinder Morgan Inc 3.15%15/1/2023 28,046 0.02
USD 100,000 KLA Corp 4.65% 1/11/2024 101,477 0.07USD 70,000 Los Angeles Department of
Water & Power PowerSystem Revenue 5.716%1/7/2039 93,013 0.07
USD 260,000 Los Angeles Department ofWater ’A’ 5.00% 1/7/2048 288,936 0.21
USD 150,000 Marathon Oil Corp 2.80%1/11/2022 130,330 0.10
USD 250,000 Marsh & McLennan Cos Inc3.75% 14/3/2026 250,922 0.19
USD 120,000 Maryland EconomicDevelopment Corp 5.00%31/3/2041 105,453 0.08
USD 20,000 Maryland Health & HigherEducational FacilitiesAuthority 5.00% 15/8/2027 20,564 0.02
USD 180,000 Massachusetts DevelopmentFinance Agency 5.00%1/7/2047 185,076 0.14
USD 75,000 Massachusetts WaterResources Authority ’B’5.00% 1/8/2040 81,892 0.06
USD 185,000 Mastercard Inc 2.95%21/11/2026 183,979 0.14
USD 100,000 Mastercard Inc 2.95%1/6/2029 100,731 0.07
USD 10,000 Metropolitan Atlanta RapidTransit Authority ’A’ 5.00%1/7/2041 10,425 0.01
EUR 100,000 Metropolitan Life GlobalFunding I RegS 2.375%11/1/2023 105,457 0.08
USD 20,000 Michigan Finance Authority5.00% 15/11/2028 21,374 0.02
USD 90,000 Michigan Finance Authority5.00% 15/11/2041 91,564 0.07
USD 240,000 Michigan State HousingDevelopment Authority3.80% 1/10/2038 238,065 0.18
BlackRock Global Absolute Return Bond Fund continued
The notes on pages 691 to 711 form an integral part of these financial statements.
Annual report and audited financial statements [395]

Portfolio of Investments as at 31 May 2020
Holding Description
MarketValue
EUR
% ofNet
Assets
United States continuedUSD 70,000 Micron Technology Inc 5.327%
6/2/2029 72,501 0.05USD 350,000 Mississippi Hospital Equipment
& Facilities Authority 5.00%1/9/2046 343,031 0.25
USD 100,000 Morgan Stanley 3.125%27/7/2026 97,769 0.07
EUR 100,000 Morgan Stanley 1.875%27/4/2027 107,916 0.08
USD 122,073 Morgan Stanley Bank ofAmerica Merrill Lynch Trust’2013-C10 A3FL’ FRN15/7/2046 109,262 0.08
USD 150,000 Morgan Stanley Bank ofAmerica Merrill Lynch Trust’2013-C10 A4’ FRN15/7/2046 143,107 0.11
USD 500,000 Morgan Stanley Capital I Trust’2014-150E A’ 3.912%9/9/2032 471,187 0.35
USD 105,000 Morgan Stanley Capital I Trust’2014-CPT A’ 3.35%13/7/2029 96,266 0.07
USD 20,000 Morgan Stanley Capital I Trust’2018-BOP A’ FRN15/8/2033 17,027 0.01
USD 250,000 Morgan Stanley Capital I Trust’2018-H4 A4’ 4.31%15/12/2051 259,259 0.19
USD 26,000 MPLX LP 6.25% 15/10/2022 23,389 0.02USD 30,000 MPLX LP 3.50% 1/12/2022 27,206 0.02USD 20,000 MPLX LP 3.375% 15/3/2023 18,538 0.01USD 50,000 Navient Corp 6.125%
25/3/2024 42,296 0.03USD 3,663 Navient Private Education
Loan Trust ’2018-BA A1’FRN 15/12/2059 3,292 0.00
USD 30,602 Navient Private Education RefiLoan Trust ’2018-D A1’ FRN15/12/2059 27,464 0.02
EUR 100,000 Netflix Inc 3.625% 15/5/2027 106,832 0.08USD 120,000 New Jersey Economic
Development Authority3.72% 15/6/2030 99,081 0.07
USD 250,000 New York City HousingDevelopment Corp 4.125%1/5/2058 239,979 0.18
USD 95,000 New York City TransitionalFinance Authority Future TaxSecured Revenue 2.90%1/11/2032 88,042 0.07
USD 55,000 New York City Water & SewerSystem 5.724% 15/6/2042 76,723 0.06
USD 45,000 New York City Water & SewerSystem 5.44% 15/6/2043 60,963 0.05
USD 170,000 New York Convention CenterDevelopment Corp 5.00%15/11/2040 164,192 0.12
USD 15,000 New York Life Global Funding1.10% 5/5/2023 13,637 0.01
USD 15,000 New York State DormitoryAuthority 3.19% 15/2/2043 13,831 0.01
USD 70,000 New York State DormitoryAuthority ’B’ 2.626%1/7/2028 63,539 0.05
USD 80,000 New York State DormitoryAuthority ’B’ 3.142%1/7/2043 71,135 0.05
USD 20,000 New York State UrbanDevelopment Corp ’B’3.12% 15/3/2025 18,982 0.01
Holding Description
MarketValue
EUR
% ofNet
Assets
United States continuedUSD 170,000 New York Transportation
Development Corp ’A’5.00% 1/7/2046 158,464 0.12
USD 10,000 New York TransportationDevelopment Corp ’A’5.25% 1/1/2050 9,388 0.01
USD 90,000 NextEra Energy CapitalHoldings Inc 2.403%1/9/2021 82,847 0.06
USD 585,000 NGPL PipeCo LLC 4.375%15/8/2022 536,108 0.40
USD 140,000 Nissan Master Owner TrustReceivables ’2017-C A’ FRN17/10/2022 125,220 0.09
USD 175,000 Occidental Petroleum CorpFRN 13/8/2021 150,153 0.11
USD 1,330,000 Occidental Petroleum Corp10/10/2036 (Zero Coupon) 508,341 0.38
USD 84,000 Ochsner Clinic Foundation5.897% 15/5/2045 93,706 0.07
USD 25,000 Omega Healthcare InvestorsInc 4.75% 15/1/2028 22,113 0.02
USD 45,000 Omnicom Group Inc 4.20%1/6/2030 43,593 0.03
USD 100,000 OneMain Direct AutoReceivables Trust ’2018-1AA’ 3.43% 16/12/2024 91,634 0.07
USD 50,000 ONEOK Inc 4.35% 15/3/2029 45,497 0.03USD 150,000 ONEOK Partners LP 4.90%
15/3/2025 141,260 0.10USD 100,000 Oracle Corp 2.625%
15/2/2023 94,837 0.07USD 25,000 Oregon School Boards
Association ’B’ 5.55%30/6/2028 26,682 0.02
USD 20,000 Oregon School BoardsAssociation ’B’ 5.68%30/6/2028 21,755 0.02
USD 50,000 Par Pharmaceutical Inc 7.50%1/4/2027 46,007 0.03
USD 35,000 PayPal Holdings Inc 1.35%1/6/2023 31,999 0.02
USD 120,000 PayPal Holdings Inc 2.85%1/10/2029 117,246 0.09
USD 80,000 Penske Truck Leasing Co LP /PTL Finance Corp 3.30%1/4/2021 72,919 0.05
USD 300,000 Penske Truck Leasing Co LP /PTL Finance Corp 4.00%15/7/2025 288,842 0.21
USD 135,000 PFS Financing Corp ’2018-FA’ 3.52% 15/10/2023 122,289 0.09
USD 20,000 Philip Morris International Inc1.125% 1/5/2023 18,153 0.01
USD 300,000 Philip Morris International Inc3.375% 11/8/2025 297,764 0.22
USD 55,000 Port Authority of New York &New Jersey 5.647%1/11/2040 70,480 0.05
USD 70,000 Port Authority of New York &New Jersey 4.926%1/10/2051 84,634 0.06
USD 300,000 Port of Seattle WA ’C’ 5.25%1/5/2042 310,301 0.23
EUR 100,000 Procter & Gamble Co 1.20%30/10/2028 108,586 0.08
USD 60,000 Reynolds American Inc 4.00%12/6/2022 56,682 0.04
USD 260,000 Reynolds American Inc 4.45%12/6/2025 258,004 0.19
BlackRock Global Absolute Return Bond Fund continued
The notes on pages 691 to 711 form an integral part of these financial statements.
BlackRock Strategic Funds[396]

Portfolio of Investments as at 31 May 2020
Holding Description
MarketValue
EUR
% ofNet
Assets
United States continuedUSD 170,000 Royal Oak Hospital Finance
Authority ’D’ 5.00% 1/9/2039 165,903 0.12USD 50,000 Rutgers The State University
of New Jersey 2.888%1/5/2032 45,437 0.03
USD 60,000 Rutgers The State Universityof New Jersey 3.27%1/5/2043 53,780 0.04
USD 70,000 Sabine Pass Liquefaction LLC5.625% 1/3/2025 70,242 0.05
USD 30,000 Sacramento County SanitationDistricts Financing Authority’B’ FRN 1/12/2035 25,384 0.02
USD 80,000 Sacramento Municipal UtilityDistrict ’W’ 6.156%15/5/2036 96,718 0.07
USD 40,000 Salt River Project AgriculturalImprovement & PowerDistrict 4.839% 1/1/2041 47,858 0.04
USD 60,000 Santander Holdings USA Inc4.45% 3/12/2021 56,291 0.04
USD 33,612 Sequoia Mortgage Trust’2017-CH2 A10’ FRN25/12/2047 30,563 0.02
USD 3,000 Sherwin-Williams Co 2.75%1/6/2022 2,751 0.00
USD 14,968 SLM Private Credit StudentLoan Trust ’2005-A A3’ FRN15/6/2023 13,421 0.01
USD 130,000 SLM Private Credit StudentLoan Trust ’2005-A A4’ FRN15/12/2038 105,263 0.08
USD 66,577 SLM Private Credit StudentLoan Trust ’2006-A A5’ FRN15/6/2039 55,104 0.04
USD 51,177 SLM Student Loan Trust’2013-4 A’ FRN 25/6/2043 43,849 0.03
USD 71,482 SMB Private Education LoanTrust ’2015-A A2A’ 2.49%15/6/2027 64,636 0.05
USD 60,969 SMB Private Education LoanTrust ’2016-B A2B’ FRN17/2/2032 53,957 0.04
USD 362 SMB Private Education LoanTrust ’2018-A A1’ FRN16/3/2026 326 0.00
USD 161 SMB Private Education LoanTrust ’2018-C A1’ FRN15/9/2025 145 0.00
USD 46,446 SoFi Professional LoanProgram LLC ’2016-C A2B’2.36% 27/12/2032 42,126 0.03
USD 100,000 Sofi Professional LoanProgram LLC ’2018-A A2B’2.95% 25/2/2042 92,209 0.07
USD 44,777 SoFi Professional LoanProgram LLC ’2018-D A1FX’3.12% 25/2/2048 40,528 0.03
USD 7,000 South Carolina Public ServiceAuthority ’D’ 2.388%1/12/2023 6,392 0.00
USD 277,143 Southern California Edison Co1.845% 1/2/2022 247,604 0.18
USD 175,000 Southern California Edison Co3.70% 1/8/2025 173,319 0.13
USD 10,000 Spectra Energy Partners LP4.75% 15/3/2024 9,963 0.01
Holding Description
MarketValue
EUR
% ofNet
Assets
United States continuedUSD 115,000 Spirit AeroSystems Inc 7.50%
15/4/2025 103,763 0.08USD 322,500 Sprint Spectrum Co LLC /
Sprint Spectrum Co II LLC /Sprint Spectrum Co III LLC3.36% 20/9/2021 291,851 0.22
USD 15,000 Starbucks Corp 1.30%7/5/2022 13,664 0.01
USD 135,000 State of California 7.55%1/4/2039 209,209 0.15
USD 80,000 State of Washington 5.00%1/8/2040 88,847 0.07
USD 170,000 Steel Dynamics Inc 2.80%15/12/2024 154,580 0.11
EUR 100,000 Stryker Corp 1.00% 3/12/2031 97,441 0.07USD 115,000 Teleflex Inc 4.625%
15/11/2027 108,095 0.08USD 520,000 Texas Eastern Transmission
LP 4.125% 1/12/2020 468,302 0.35USD 725,000 Texas Eastern Transmission
LP 2.80% 15/10/2022 659,889 0.49USD 135,000 Texas Municipal Gas
Acquisition & Supply Corp I’D’ 6.25% 15/12/2026 139,584 0.10
USD 100,000 Texas Private Activity BondSurface Transportation Corp5.00% 31/12/2055 90,756 0.07
EUR 100,000 Thermo Fisher Scientific Inc1.75% 15/4/2027 106,460 0.08
USD 5,000 Total System Services Inc3.75% 1/6/2023 4,783 0.00
USD 20,000 Total System Services Inc4.00% 1/6/2023 19,444 0.01
USD 92,380 Towd Point Mortgage Trust’2016-3 A1’ FRN 25/4/2056 83,345 0.06
USD 45,000 Transcontinental Gas PipeLine Co LLC 7.85% 1/2/2026 51,223 0.04
USD 250,000 Truist Bank 1.25% 9/3/2023 226,565 0.17USD 50,000 Union Pacific Corp 3.15%
1/3/2024 48,407 0.04USD 165,000 United Airlines 2019-2 Class A
Pass Through Trust ’A’2.90% 1/5/2028 107,583 0.08
USD 219,000 United Airlines 2019-2 Class BPass Through Trust ’B’3.50% 1/5/2028 123,334 0.09
USD 817,601 United States TreasuryInflation Indexed Bond0.375% 15/1/2027 779,104 0.58
USD 310,822 United States TreasuryInflation Indexed Bond0.875% 15/1/2029 312,889 0.23
USD 1,877,279 United States TreasuryInflation Indexed Bond0.25% 15/7/2029 1,812,488 1.34
USD 467,842 United States TreasuryInflation Indexed Bond1.00% 15/2/2049 549,754 0.41
USD 164,987 United States TreasuryInflation Indexed Bond0.25% 15/2/2050 161,884 0.12
USD 5,000 University of California 5.77%15/5/2043 6,347 0.00
USD 23,597 US Airways Pass ThroughTrust ’2012-2B’ 6.75%3/6/2021 16,510 0.01
BlackRock Global Absolute Return Bond Fund continued
The notes on pages 691 to 711 form an integral part of these financial statements.
Annual report and audited financial statements [397]

Portfolio of Investments as at 31 May 2020
Holding Description
MarketValue
EUR
% ofNet
Assets
United States continuedUSD 633,228 US Airways Pass Through
Trust ’2013-1B’ 5.375%15/11/2021 425,694 0.32
USD 65,000 VeriSign Inc 4.75% 15/7/2027 61,222 0.05USD 120,000 Verizon Communications Inc
2.946% 15/3/2022 112,730 0.08USD 280,000 Verizon Communications Inc
FRN 15/5/2025 250,961 0.19USD 125,000 VICI Properties LP / VICI Note
Co Inc 3.75% 15/2/2027 108,744 0.08USD 25,000 Virginia Electric & Power Co
3.45% 1/9/2022 23,593 0.02USD 200,000 Vistra Operations Co LLC
3.55% 15/7/2024 183,906 0.14USD 18,000 VMware Inc 3.90% 21/8/2027 17,001 0.01
EUR 100,000 Walmart Inc 2.55% 8/4/2026 112,932 0.08USD 90,000 Wells Fargo & Co 2.625%
22/7/2022 83,596 0.06USD 80,000 Wells Fargo & Co 3.069%
24/1/2023 74,158 0.05USD 30,000 Wells Fargo & Co 3.75%
24/1/2024 29,100 0.02EUR 190,000 Wells Fargo & Co RegS FRN
4/5/2030 195,601 0.14USD 9,338,241 Wells Fargo Commercial
Mortgage Trust’2017-C41 XA’ FRN15/11/2050 574,909 0.43
USD 139,312 Wells Fargo CommercialMortgage Trust ’2018-BXI E’FRN 15/12/2036 108,141 0.08
USD 135,000 WFRBS Commercial MortgageTrust ’2013-UBS1 A4’ FRN15/3/2046 130,295 0.10
USD 25,000 Williams Cos Inc 4.00%15/11/2021 23,303 0.02
USD 25,000 WRKCo Inc 3.75% 15/3/2025 24,423 0.02USD 45,000 Xerox Corp 3.50% 20/8/2020 40,464 0.03
46,276,775 34.26
Total Bonds 112,330,521 83.16
EXCHANGE TRADED FUNDS~Ireland
EUR 30,800 iShares EUR Corp Bond 1-5yrUCITS ETF 3,358,124 2.49
3,358,124 2.49
Total Exchange Traded Funds 3,358,124 2.49
Total Transferable Securities and Money MarketInstruments Admitted to an Official Stock ExchangeListing or Dealt in on Another Regulated Market 115,694,667 85.65
Other Transferable Securities and Money Market Instruments
BONDSCayman Islands
USD 250,000 Madison Park Funding XIII LtdFRN 19/4/2030 218,521 0.16
USD 245,210 Neuberger Berman CLO XVI-SLtd ’A’ FRN 15/1/2028 217,079 0.16
USD 250,000 Treman Park CLO Ltd FRN20/10/2028 221,714 0.17
657,314 0.49
Holding Description
MarketValue
EUR
% ofNet
Assets
FranceEUR 100,000 FCT Autonoria ’2019 B’ RegS
FRN 25/9/2035 97,501 0.07EUR 118,066 Noria ’2018-1C’ RegS FRN
25/6/2038 113,861 0.09
211,362 0.16
InternationalEUR 100,000 Panther BF Aggregator
2 LP/Panther Finance CoInc RegS 4.375% 15/5/2026 97,506 0.07
97,506 0.07
IrelandGBP 200,000 Taurus ’2019-2 C’ UK DAC
RegS FRN 17/11/2029 194,069 0.15EUR 100,000 Voya Euro CLO I DAC ’A’
RegS FRN 15/10/2030 98,375 0.07
292,444 0.22
JapanJPY 46,548,319 Japanese Government CPI
Linked Bond 0.10%10/3/2028 388,594 0.28
JPY 51,552,909 Japanese Government CPILinked Bond 0.10%10/3/2029 429,683 0.32
818,277 0.60
LuxembourgEUR 100,000 Silver Arrow S.A.
Compartment 10 ’B’ RegSFRN 15/3/2027 94,829 0.07
94,829 0.07
SpainEUR 200,000 Wizink Master Credit Cards FT
’A’ RegS FRN 28/3/2033 200,150 0.15
200,150 0.15
United KingdomGBP 96,006 Brass No 8 Plc ’A2’ RegS FRN
16/11/2066 106,376 0.08GBP 279,092 CMF ’2020-1 A’ Plc RegS FRN
16/1/2057 307,172 0.23GBP 554,000 Finsbury Square ’2018-2B’ Plc
RegS FRN 12/9/2068 606,101 0.45GBP 638,518 Gemgarto Plc ’2018-1A’ RegS
FRN 16/9/2065 698,409 0.52GBP 540,427 Gosforth Funding Plc
’2018-1 A2’ RegS FRN25/8/2060 598,719 0.44
GBP 491,031 Kenrick No 3 Plc ’A’ RegSFRN 11/10/2054 541,472 0.40
GBP 288,000 Motor Plc ’2016-1 C’ RegS3.75% 25/11/2025 321,822 0.24
GBP 375,656 Silk Road Finance Number SixPlc ’A’ RegS FRN 21/9/2067 414,678 0.30
GBP 514,678 Twin Bridges Plc ’2018-1 A’RegS FRN 12/9/2050 559,008 0.41
4,153,757 3.07
United StatesUSD 100,000 225 Liberty Street Trust
’2016-225L E’ FRN10/2/2036 91,377 0.07
BlackRock Global Absolute Return Bond Fund continued
The notes on pages 691 to 711 form an integral part of these financial statements.
BlackRock Strategic Funds[398]
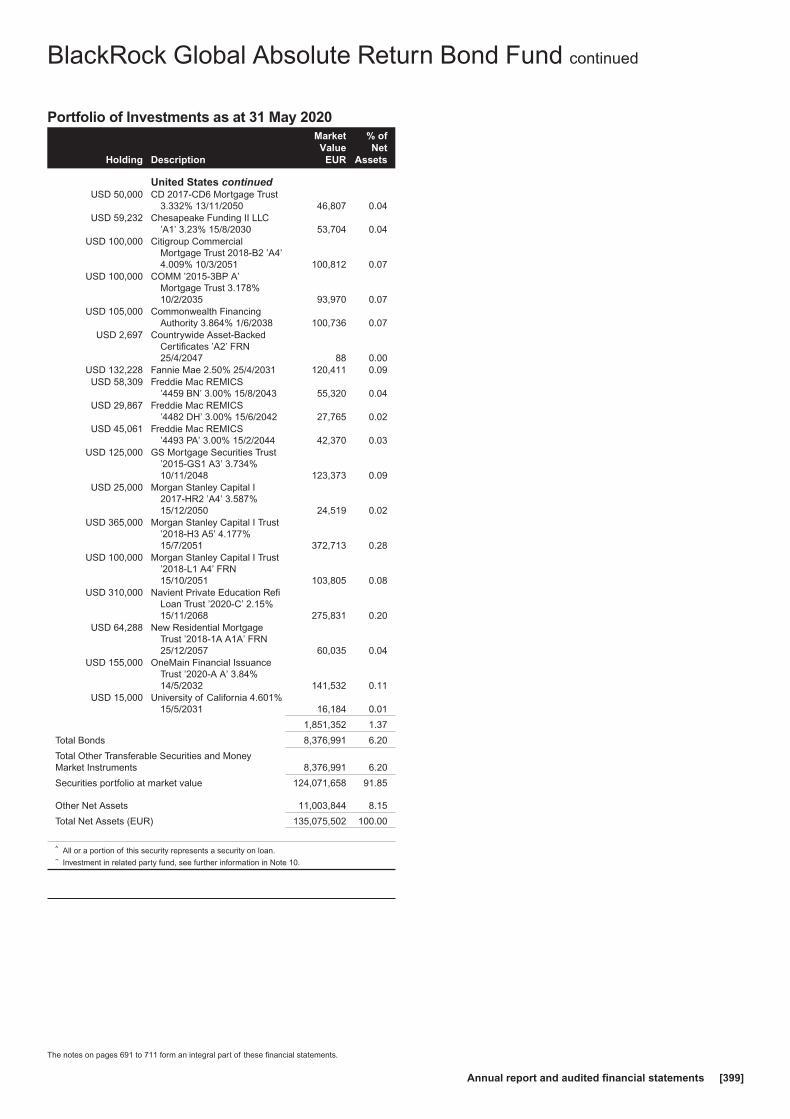
Portfolio of Investments as at 31 May 2020
Holding Description
MarketValue
EUR
% ofNet
Assets
United States continuedUSD 50,000 CD 2017-CD6 Mortgage Trust
3.332% 13/11/2050 46,807 0.04USD 59,232 Chesapeake Funding II LLC
’A1’ 3.23% 15/8/2030 53,704 0.04USD 100,000 Citigroup Commercial
Mortgage Trust 2018-B2 ’A4’4.009% 10/3/2051 100,812 0.07
USD 100,000 COMM ’2015-3BP A’Mortgage Trust 3.178%10/2/2035 93,970 0.07
USD 105,000 Commonwealth FinancingAuthority 3.864% 1/6/2038 100,736 0.07
USD 2,697 Countrywide Asset-BackedCertificates ’A2’ FRN25/4/2047 88 0.00
USD 132,228 Fannie Mae 2.50% 25/4/2031 120,411 0.09USD 58,309 Freddie Mac REMICS
’4459 BN’ 3.00% 15/8/2043 55,320 0.04USD 29,867 Freddie Mac REMICS
’4482 DH’ 3.00% 15/6/2042 27,765 0.02USD 45,061 Freddie Mac REMICS
’4493 PA’ 3.00% 15/2/2044 42,370 0.03USD 125,000 GS Mortgage Securities Trust
’2015-GS1 A3’ 3.734%10/11/2048 123,373 0.09
USD 25,000 Morgan Stanley Capital I2017-HR2 ’A4’ 3.587%15/12/2050 24,519 0.02
USD 365,000 Morgan Stanley Capital I Trust’2018-H3 A5’ 4.177%15/7/2051 372,713 0.28
USD 100,000 Morgan Stanley Capital I Trust’2018-L1 A4’ FRN15/10/2051 103,805 0.08
USD 310,000 Navient Private Education RefiLoan Trust ’2020-C’ 2.15%15/11/2068 275,831 0.20
USD 64,288 New Residential MortgageTrust ’2018-1A A1A’ FRN25/12/2057 60,035 0.04
USD 155,000 OneMain Financial IssuanceTrust ’2020-A A’ 3.84%14/5/2032 141,532 0.11
USD 15,000 University of California 4.601%15/5/2031 16,184 0.01
1,851,352 1.37
Total Bonds 8,376,991 6.20
Total Other Transferable Securities and MoneyMarket Instruments 8,376,991 6.20
Securities portfolio at market value 124,071,658 91.85
Other Net Assets 11,003,844 8.15
Total Net Assets (EUR) 135,075,502 100.00
^ All or a portion of this security represents a security on loan.~ Investment in related party fund, see further information in Note 10.
BlackRock Global Absolute Return Bond Fund continued
The notes on pages 691 to 711 form an integral part of these financial statements.
Annual report and audited financial statements [399]

Contracts for difference as at 31 May 2020
Holding Description Counterparty
Netunrealised
appreciation/(depreciation)
EUR
Germany1,416 Aroundtown SA HSBC (135)6,248 Tele Columbus AG HSBC 1,937
1,802
Italy71,812 Telecom Italia SpA - RSP HSBC 29
29
Japan357 SoftBank Group Corp HSBC 490
490
Netherlands6,094 Altice Europe NV HSBC (463)
(463)
United Kingdom8,439 Arrow Global Group Plc HSBC (1,753)
(1,753)
United States682 Bausch Health Cos Inc HSBC 945187 Liberty Global Plc ’A’ HSBC (71)
5,275 Oi SA ADR HSBC 449
1,323
Total (Gross underlying exposure - EUR 110,779) 1,428
BlackRock Global Absolute Return Bond Fund continued
The notes on pages 691 to 711 form an integral part of these financial statements.
BlackRock Strategic Funds[400]

Swaps as at 31 May 2020
TypeNominal
Value Description CounterpartyExpiration
date
Net unrealisedappreciation/
(depreciation)EUR
MarketValue
EUR
CCCDS USD 1,102,696Fund receives default protection on Markit
CDX.NA.HY.25 Version 8 and pays Fixed 5.000%Bank of America
Merrill Lynch 20/6/2025 (37,590) 26,631
CCCDS USD 1,887,000Fund receives default protection on Markit CDX.NA.IG.30 and
pays Fixed 1.000%Bank of America
Merrill Lynch 20/6/2025 (44,252) (16,056)
CCCDS EUR 2,511,200Fund receives default protection on Markit iTraxx Europe
Crossover Series 30 Version 1 and pays Fixed 5.000%Bank of America
Merrill Lynch 20/6/2025 (137,137) (75,282)
CCCDS EUR 2,700,000Fund receives default protection on Markit iTraxx Europe
Series 23 Version 1 and pays Fixed 1.000%Bank of America
Merrill Lynch 20/6/2025 4,111 (36,673)
CCCDS EUR 200,000Fund receives default protection on Markit iTraxx Europe Sub
Financials Series 29 Version 1 and pays Fixed 1.000%Bank of America
Merrill Lynch 20/12/2024 (9,225) 5,802
CCCDS EUR 395,000Fund receives Fixed 1.000% and provides default protection on
Markit iTraxx Europe Series 23 Version 1Bank of America
Merrill Lynch 20/6/2025 1,394 5,365
CCILS EUR 1,639,895Fund receives Fixed 1.004% and pays Floating EUR 12 Month
CPTFEMUBank of America
Merrill Lynch 15/2/2025 50,437 50,466
CCILS GBP 245,000Fund receives Fixed 3.202% and pays Floating GBP 12 Month
UKRPIBank of America
Merrill Lynch 15/3/2030 (4,890) (4,884)
CCILS GBP 410,000Fund receives Fixed 3.268% and pays Floating GBP 12 Month
UKRPIBank of America
Merrill Lynch 15/3/2030 (4,264) (4,253)
CCILS GBP 310,000Fund receives Fixed 3.270% and pays Floating GBP 12 Month
UKRPIBank of America
Merrill Lynch 15/3/2030 (3,111) (3,102)
CCILS GBP 265,000Fund receives Fixed 3.285% and pays Floating GBP 12 Month
UKRPIBank of America
Merrill Lynch 15/3/2030 (2,077) (2,070)
CCILS GBP 310,000Fund receives Fixed 3.290% and pays Floating GBP 12 Month
UKRPIBank of America
Merrill Lynch 15/3/2030 (2,202) (2,194)
CCILS GBP 265,000Fund receives Fixed 3.293% and pays Floating GBP 12 Month
UKRPIBank of America
Merrill Lynch 15/3/2030 (1,766) (1,759)
CCILS GBP 290,000Fund receives Fixed 3.315% and pays Floating GBP 12 Month
UKRPIBank of America
Merrill Lynch 15/5/2030 (2,463) (2,456)
CCILS GBP 190,000Fund receives Fixed 3.334% and pays Floating GBP 12 Month
UKRPIBank of America
Merrill Lynch 15/5/2030 (1,083) (1,078)
CCILS GBP 220,000Fund receives Fixed 3.340% and pays Floating GBP 12 Month
UKRPIBank of America
Merrill Lynch 15/3/2030 54 60
CCILS GBP 640,000Fund receives Fixed 3.410% and pays Floating GBP 12 Month
UKRPIBank of America
Merrill Lynch 15/2/2030 5,888 5,905
CCILS GBP 320,000Fund receives Fixed 3.480% and pays Floating GBP 12 Month
UKRPIBank of America
Merrill Lynch 15/1/2030 7,648 7,656
CCILS GBP 304,572Fund receives Fixed 3.490% and pays Floating GBP 12 Month
UKRPIBank of America
Merrill Lynch 15/3/2029 10,624 10,632
CCILS GBP 300,000Fund receives Fixed 3.495% and pays Floating GBP 12 Month
UKRPIBank of America
Merrill Lynch 15/12/2029 7,699 7,707
CCILS GBP 400,000Fund receives Fixed 3.510% and pays Floating GBP 12 Month
UKRPIBank of America
Merrill Lynch 15/12/2029 11,163 11,173
CCILS GBP 903,445Fund receives Fixed 3.580% and pays Floating GBP 12 Month
UKRPIBank of America
Merrill Lynch 15/12/2029 34,702 34,726
CCILS GBP 640,000Fund receives Fixed 3.580% and pays Floating GBP 12 Month
UKRPIBank of America
Merrill Lynch 15/12/2029 24,583 24,600
CCILS GBP 490,625Fund receives Fixed 3.710% and pays Floating GBP 12 Month
UKRPIBank of America
Merrill Lynch 15/8/2029 33,578 33,591
CCILS GBP 651,000Fund receives Fixed 3.745% and pays Floating GBP 12 Month
UKRPIBank of America
Merrill Lynch 15/8/2029 48,032 48,048
CCILS GBP 1,646,000Fund receives Fixed 3.776% and pays Floating GBP 12 Month
UKRPIBank of America
Merrill Lynch 15/9/2028 117,483 118,080
CCILS EUR 1,244,044Fund receives Floating EUR 12 Month CPTFEMU and pays
Fixed 1.060%Bank of America
Merrill Lynch 15/2/2030 (51,111) (51,083)
CCILS EUR 1,440,000Fund receives Floating EUR 12 Month CPTFEMU and pays
Fixed 1.149%Bank of America
Merrill Lynch 15/2/2030 (73,797) (73,764)
CCILS EUR 692,039Fund receives Floating EUR 12 Month CPTFEMU and pays
Fixed 1.157%Bank of America
Merrill Lynch 15/7/2029 (37,559) (37,543)
CCILS GBP 640,000Fund receives Floating GBP 12 Month UKRPI and pays Fixed
3.298%Bank of America
Merrill Lynch 15/2/2025 (6,754) (6,743)
CCILS GBP 320,000Fund receives Floating GBP 12 Month UKRPI and pays Fixed
3.345%Bank of America
Merrill Lynch 15/1/2025 (5,537) (5,532)
CCILS GBP 640,000Fund receives Floating GBP 12 Month UKRPI and pays Fixed
3.505%Bank of America
Merrill Lynch 15/12/2024 (17,419) (17,407)
BlackRock Global Absolute Return Bond Fund continued
The notes on pages 691 to 711 form an integral part of these financial statements.
Annual report and audited financial statements [401]
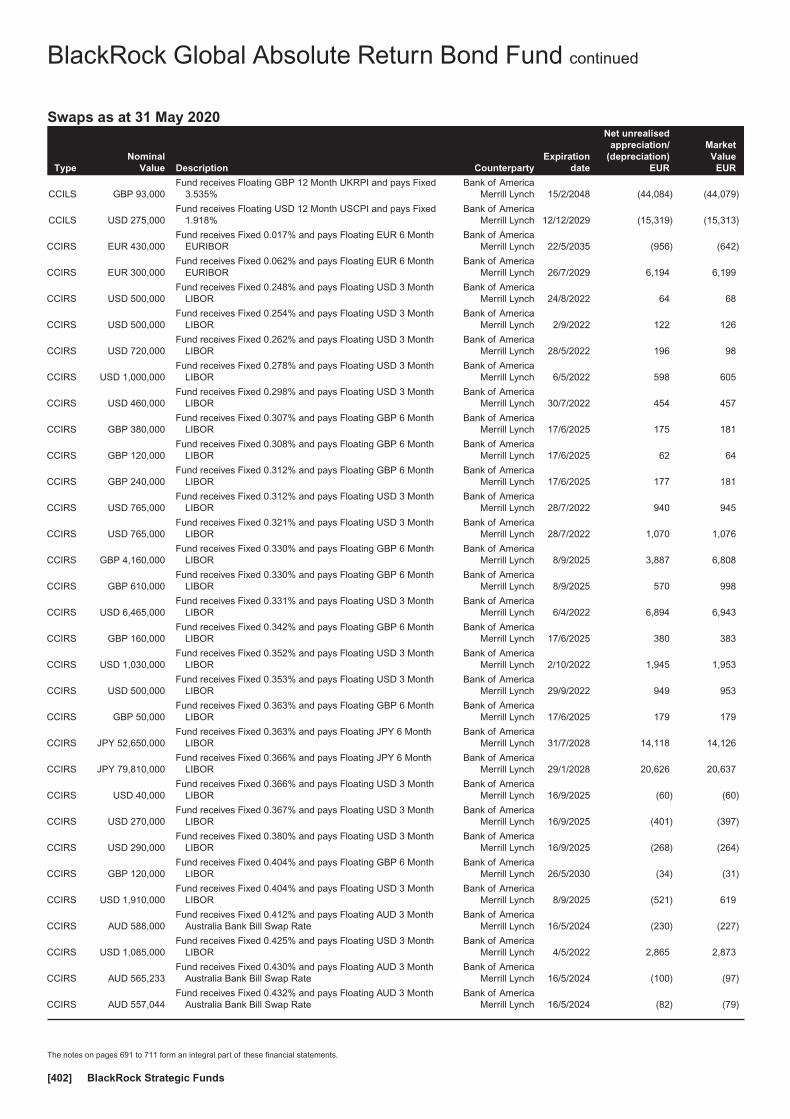
Swaps as at 31 May 2020
TypeNominal
Value Description CounterpartyExpiration
date
Net unrealisedappreciation/
(depreciation)EUR
MarketValue
EUR
CCILS GBP 93,000Fund receives Floating GBP 12 Month UKRPI and pays Fixed
3.535%Bank of America
Merrill Lynch 15/2/2048 (44,084) (44,079)
CCILS USD 275,000Fund receives Floating USD 12 Month USCPI and pays Fixed
1.918%Bank of America
Merrill Lynch 12/12/2029 (15,319) (15,313)
CCIRS EUR 430,000Fund receives Fixed 0.017% and pays Floating EUR 6 Month
EURIBORBank of America
Merrill Lynch 22/5/2035 (956) (642)
CCIRS EUR 300,000Fund receives Fixed 0.062% and pays Floating EUR 6 Month
EURIBORBank of America
Merrill Lynch 26/7/2029 6,194 6,199
CCIRS USD 500,000Fund receives Fixed 0.248% and pays Floating USD 3 Month
LIBORBank of America
Merrill Lynch 24/8/2022 64 68
CCIRS USD 500,000Fund receives Fixed 0.254% and pays Floating USD 3 Month
LIBORBank of America
Merrill Lynch 2/9/2022 122 126
CCIRS USD 720,000Fund receives Fixed 0.262% and pays Floating USD 3 Month
LIBORBank of America
Merrill Lynch 28/5/2022 196 98
CCIRS USD 1,000,000Fund receives Fixed 0.278% and pays Floating USD 3 Month
LIBORBank of America
Merrill Lynch 6/5/2022 598 605
CCIRS USD 460,000Fund receives Fixed 0.298% and pays Floating USD 3 Month
LIBORBank of America
Merrill Lynch 30/7/2022 454 457
CCIRS GBP 380,000Fund receives Fixed 0.307% and pays Floating GBP 6 Month
LIBORBank of America
Merrill Lynch 17/6/2025 175 181
CCIRS GBP 120,000Fund receives Fixed 0.308% and pays Floating GBP 6 Month
LIBORBank of America
Merrill Lynch 17/6/2025 62 64
CCIRS GBP 240,000Fund receives Fixed 0.312% and pays Floating GBP 6 Month
LIBORBank of America
Merrill Lynch 17/6/2025 177 181
CCIRS USD 765,000Fund receives Fixed 0.312% and pays Floating USD 3 Month
LIBORBank of America
Merrill Lynch 28/7/2022 940 945
CCIRS USD 765,000Fund receives Fixed 0.321% and pays Floating USD 3 Month
LIBORBank of America
Merrill Lynch 28/7/2022 1,070 1,076
CCIRS GBP 4,160,000Fund receives Fixed 0.330% and pays Floating GBP 6 Month
LIBORBank of America
Merrill Lynch 8/9/2025 3,887 6,808
CCIRS GBP 610,000Fund receives Fixed 0.330% and pays Floating GBP 6 Month
LIBORBank of America
Merrill Lynch 8/9/2025 570 998
CCIRS USD 6,465,000Fund receives Fixed 0.331% and pays Floating USD 3 Month
LIBORBank of America
Merrill Lynch 6/4/2022 6,894 6,943
CCIRS GBP 160,000Fund receives Fixed 0.342% and pays Floating GBP 6 Month
LIBORBank of America
Merrill Lynch 17/6/2025 380 383
CCIRS USD 1,030,000Fund receives Fixed 0.352% and pays Floating USD 3 Month
LIBORBank of America
Merrill Lynch 2/10/2022 1,945 1,953
CCIRS USD 500,000Fund receives Fixed 0.353% and pays Floating USD 3 Month
LIBORBank of America
Merrill Lynch 29/9/2022 949 953
CCIRS GBP 50,000Fund receives Fixed 0.363% and pays Floating GBP 6 Month
LIBORBank of America
Merrill Lynch 17/6/2025 179 179
CCIRS JPY 52,650,000Fund receives Fixed 0.363% and pays Floating JPY 6 Month
LIBORBank of America
Merrill Lynch 31/7/2028 14,118 14,126
CCIRS JPY 79,810,000Fund receives Fixed 0.366% and pays Floating JPY 6 Month
LIBORBank of America
Merrill Lynch 29/1/2028 20,626 20,637
CCIRS USD 40,000Fund receives Fixed 0.366% and pays Floating USD 3 Month
LIBORBank of America
Merrill Lynch 16/9/2025 (60) (60)
CCIRS USD 270,000Fund receives Fixed 0.367% and pays Floating USD 3 Month
LIBORBank of America
Merrill Lynch 16/9/2025 (401) (397)
CCIRS USD 290,000Fund receives Fixed 0.380% and pays Floating USD 3 Month
LIBORBank of America
Merrill Lynch 16/9/2025 (268) (264)
CCIRS GBP 120,000Fund receives Fixed 0.404% and pays Floating GBP 6 Month
LIBORBank of America
Merrill Lynch 26/5/2030 (34) (31)
CCIRS USD 1,910,000Fund receives Fixed 0.404% and pays Floating USD 3 Month
LIBORBank of America
Merrill Lynch 8/9/2025 (521) 619
CCIRS AUD 588,000Fund receives Fixed 0.412% and pays Floating AUD 3 Month
Australia Bank Bill Swap RateBank of America
Merrill Lynch 16/5/2024 (230) (227)
CCIRS USD 1,085,000Fund receives Fixed 0.425% and pays Floating USD 3 Month
LIBORBank of America
Merrill Lynch 4/5/2022 2,865 2,873
CCIRS AUD 565,233Fund receives Fixed 0.430% and pays Floating AUD 3 Month
Australia Bank Bill Swap RateBank of America
Merrill Lynch 16/5/2024 (100) (97)
CCIRS AUD 557,044Fund receives Fixed 0.432% and pays Floating AUD 3 Month
Australia Bank Bill Swap RateBank of America
Merrill Lynch 16/5/2024 (82) (79)
BlackRock Global Absolute Return Bond Fund continued
The notes on pages 691 to 711 form an integral part of these financial statements.
BlackRock Strategic Funds[402]
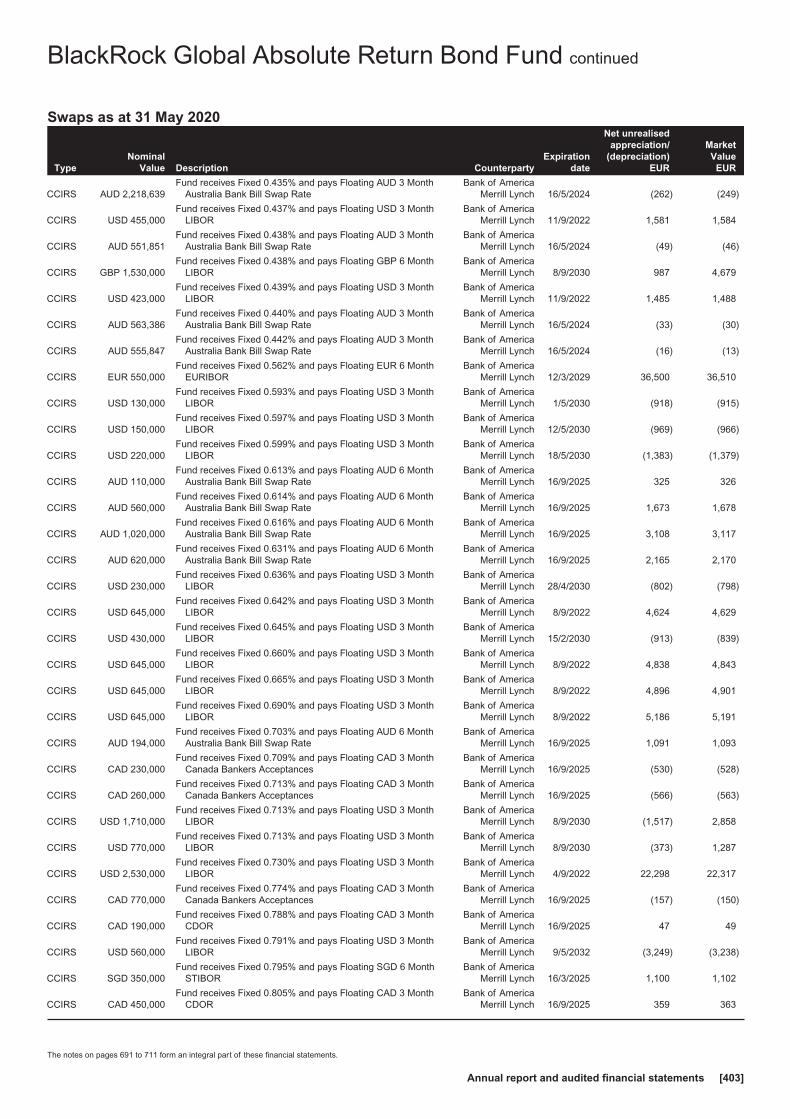
Swaps as at 31 May 2020
TypeNominal
Value Description CounterpartyExpiration
date
Net unrealisedappreciation/
(depreciation)EUR
MarketValue
EUR
CCIRS AUD 2,218,639Fund receives Fixed 0.435% and pays Floating AUD 3 Month
Australia Bank Bill Swap RateBank of America
Merrill Lynch 16/5/2024 (262) (249)
CCIRS USD 455,000Fund receives Fixed 0.437% and pays Floating USD 3 Month
LIBORBank of America
Merrill Lynch 11/9/2022 1,581 1,584
CCIRS AUD 551,851Fund receives Fixed 0.438% and pays Floating AUD 3 Month
Australia Bank Bill Swap RateBank of America
Merrill Lynch 16/5/2024 (49) (46)
CCIRS GBP 1,530,000Fund receives Fixed 0.438% and pays Floating GBP 6 Month
LIBORBank of America
Merrill Lynch 8/9/2030 987 4,679
CCIRS USD 423,000Fund receives Fixed 0.439% and pays Floating USD 3 Month
LIBORBank of America
Merrill Lynch 11/9/2022 1,485 1,488
CCIRS AUD 563,386Fund receives Fixed 0.440% and pays Floating AUD 3 Month
Australia Bank Bill Swap RateBank of America
Merrill Lynch 16/5/2024 (33) (30)
CCIRS AUD 555,847Fund receives Fixed 0.442% and pays Floating AUD 3 Month
Australia Bank Bill Swap RateBank of America
Merrill Lynch 16/5/2024 (16) (13)
CCIRS EUR 550,000Fund receives Fixed 0.562% and pays Floating EUR 6 Month
EURIBORBank of America
Merrill Lynch 12/3/2029 36,500 36,510
CCIRS USD 130,000Fund receives Fixed 0.593% and pays Floating USD 3 Month
LIBORBank of America
Merrill Lynch 1/5/2030 (918) (915)
CCIRS USD 150,000Fund receives Fixed 0.597% and pays Floating USD 3 Month
LIBORBank of America
Merrill Lynch 12/5/2030 (969) (966)
CCIRS USD 220,000Fund receives Fixed 0.599% and pays Floating USD 3 Month
LIBORBank of America
Merrill Lynch 18/5/2030 (1,383) (1,379)
CCIRS AUD 110,000Fund receives Fixed 0.613% and pays Floating AUD 6 Month
Australia Bank Bill Swap RateBank of America
Merrill Lynch 16/9/2025 325 326
CCIRS AUD 560,000Fund receives Fixed 0.614% and pays Floating AUD 6 Month
Australia Bank Bill Swap RateBank of America
Merrill Lynch 16/9/2025 1,673 1,678
CCIRS AUD 1,020,000Fund receives Fixed 0.616% and pays Floating AUD 6 Month
Australia Bank Bill Swap RateBank of America
Merrill Lynch 16/9/2025 3,108 3,117
CCIRS AUD 620,000Fund receives Fixed 0.631% and pays Floating AUD 6 Month
Australia Bank Bill Swap RateBank of America
Merrill Lynch 16/9/2025 2,165 2,170
CCIRS USD 230,000Fund receives Fixed 0.636% and pays Floating USD 3 Month
LIBORBank of America
Merrill Lynch 28/4/2030 (802) (798)
CCIRS USD 645,000Fund receives Fixed 0.642% and pays Floating USD 3 Month
LIBORBank of America
Merrill Lynch 8/9/2022 4,624 4,629
CCIRS USD 430,000Fund receives Fixed 0.645% and pays Floating USD 3 Month
LIBORBank of America
Merrill Lynch 15/2/2030 (913) (839)
CCIRS USD 645,000Fund receives Fixed 0.660% and pays Floating USD 3 Month
LIBORBank of America
Merrill Lynch 8/9/2022 4,838 4,843
CCIRS USD 645,000Fund receives Fixed 0.665% and pays Floating USD 3 Month
LIBORBank of America
Merrill Lynch 8/9/2022 4,896 4,901
CCIRS USD 645,000Fund receives Fixed 0.690% and pays Floating USD 3 Month
LIBORBank of America
Merrill Lynch 8/9/2022 5,186 5,191
CCIRS AUD 194,000Fund receives Fixed 0.703% and pays Floating AUD 6 Month
Australia Bank Bill Swap RateBank of America
Merrill Lynch 16/9/2025 1,091 1,093
CCIRS CAD 230,000Fund receives Fixed 0.709% and pays Floating CAD 3 Month
Canada Bankers AcceptancesBank of America
Merrill Lynch 16/9/2025 (530) (528)
CCIRS CAD 260,000Fund receives Fixed 0.713% and pays Floating CAD 3 Month
Canada Bankers AcceptancesBank of America
Merrill Lynch 16/9/2025 (566) (563)
CCIRS USD 1,710,000Fund receives Fixed 0.713% and pays Floating USD 3 Month
LIBORBank of America
Merrill Lynch 8/9/2030 (1,517) 2,858
CCIRS USD 770,000Fund receives Fixed 0.713% and pays Floating USD 3 Month
LIBORBank of America
Merrill Lynch 8/9/2030 (373) 1,287
CCIRS USD 2,530,000Fund receives Fixed 0.730% and pays Floating USD 3 Month
LIBORBank of America
Merrill Lynch 4/9/2022 22,298 22,317
CCIRS CAD 770,000Fund receives Fixed 0.774% and pays Floating CAD 3 Month
Canada Bankers AcceptancesBank of America
Merrill Lynch 16/9/2025 (157) (150)
CCIRS CAD 190,000Fund receives Fixed 0.788% and pays Floating CAD 3 Month
CDORBank of America
Merrill Lynch 16/9/2025 47 49
CCIRS USD 560,000Fund receives Fixed 0.791% and pays Floating USD 3 Month
LIBORBank of America
Merrill Lynch 9/5/2032 (3,249) (3,238)
CCIRS SGD 350,000Fund receives Fixed 0.795% and pays Floating SGD 6 Month
STIBORBank of America
Merrill Lynch 16/3/2025 1,100 1,102
CCIRS CAD 450,000Fund receives Fixed 0.805% and pays Floating CAD 3 Month
CDORBank of America
Merrill Lynch 16/9/2025 359 363
BlackRock Global Absolute Return Bond Fund continued
The notes on pages 691 to 711 form an integral part of these financial statements.
Annual report and audited financial statements [403]

Swaps as at 31 May 2020
TypeNominal
Value Description CounterpartyExpiration
date
Net unrealisedappreciation/
(depreciation)EUR
MarketValue
EUR
CCIRS CAD 420,000Fund receives Fixed 0.820% and pays Floating CAD 3 Month
CDORBank of America
Merrill Lynch 16/9/2025 586 543
CCIRS CAD 370,000Fund receives Fixed 0.827% and pays Floating CAD 3 Month
CDORBank of America
Merrill Lynch 16/9/2025 558 562
CCIRS CAD 1,030,000Fund receives Fixed 0.864% and pays Floating CAD 3 Month
CDORBank of America
Merrill Lynch 16/9/2025 2,786 2,796
CCIRS USD 645,000Fund receives Fixed 0.872% and pays Floating USD 3 Month
LIBORBank of America
Merrill Lynch 2/3/2023 7,089 7,094
CCIRS USD 2,570,000Fund receives Fixed 0.876% and pays Floating USD 3 Month
LIBORBank of America
Merrill Lynch 2/3/2023 28,408 28,428
CCIRS USD 645,000Fund receives Fixed 0.903% and pays Floating USD 3 Month
LIBORBank of America
Merrill Lynch 2/3/2023 7,443 7,448
CCIRS CAD 14,700,000Fund receives Fixed 0.930% and pays Floating CAD 3 Month
CDORBank of America
Merrill Lynch 1/4/2023 18,345 18,423
CCIRS USD 635,000Fund receives Fixed 0.978% and pays Floating USD 3 Month
LIBORBank of America
Merrill Lynch 2/3/2023 8,178 8,183
CCIRS USD 635,000Fund receives Fixed 0.986% and pays Floating USD 3 Month
LIBORBank of America
Merrill Lynch 2/3/2023 8,269 8,274
CCIRS USD 355,000Fund receives Fixed 1.015% and pays Floating USD 3 Month
LIBORBank of America
Merrill Lynch 8/9/2030 10,086 10,093
CCIRS USD 630,000Fund receives Fixed 1.048% and pays Floating USD 3 Month
LIBORBank of America
Merrill Lynch 1/3/2023 8,913 8,918
CCIRS USD 630,000Fund receives Fixed 1.052% and pays Floating USD 3 Month
LIBORBank of America
Merrill Lynch 1/3/2023 8,964 8,969
CCIRS USD 630,000Fund receives Fixed 1.063% and pays Floating USD 3 Month
LIBORBank of America
Merrill Lynch 1/3/2023 9,083 9,088
CCIRS USD 2,500,000Fund receives Fixed 1.088% and pays Floating USD 3 Month
LIBORBank of America
Merrill Lynch 1/3/2023 37,168 37,187
CCIRS USD 154,000Fund receives Fixed 1.147% and pays Floating USD 3 Month
LIBORBank of America
Merrill Lynch 17/6/2025 5,308 5,310
CCIRS USD 660,000Fund receives Fixed 1.206% and pays Floating USD 3 Month
LIBORBank of America
Merrill Lynch 6/10/2022 11,372 11,377
CCIRS USD 260,000Fund receives Fixed 1.232% and pays Floating USD 3 Month
LIBORBank of America
Merrill Lynch 2/3/2030 12,875 12,880
CCIRS USD 83,000Fund receives Fixed 1.242% and pays Floating USD 3 Month
LIBORBank of America
Merrill Lynch 8/9/2050 5,015 5,018
CCIRS USD 1,665,000Fund receives Fixed 1.247% and pays Floating USD 3 Month
LIBORBank of America
Merrill Lynch 6/10/2022 29,915 29,928
CCIRS USD 260,000Fund receives Fixed 1.310% and pays Floating USD 3 Month
LIBORBank of America
Merrill Lynch 26/2/2030 14,644 14,649
CCIRS USD 260,000Fund receives Fixed 1.419% and pays Floating USD 3 Month
LIBORBank of America
Merrill Lynch 25/2/2030 17,094 17,099
CCIRS USD 3,480,000Fund receives Fixed 1.444% and pays Floating USD 3 Month
LIBORBank of America
Merrill Lynch 13/2/2022 62,829 62,855
CCIRS USD 2,520,000Fund receives Fixed 1.528% and pays Floating USD 3 Month
LIBORBank of America
Merrill Lynch 22/11/2020 13,275 13,293
CCIRS USD 280,000Fund receives Fixed 1.557% and pays Floating USD 3 Month
LIBORBank of America
Merrill Lynch 29/4/2030 21,752 21,758
CCIRS USD 150,000Fund receives Fixed 1.748% and pays Floating USD 3 Month
LIBORBank of America
Merrill Lynch 11/1/2031 13,561 13,564
CCIRS HKD 2,218,000Fund receives Fixed 1.852% and pays Floating HKD 3 Month
HIBORBank of America
Merrill Lynch 18/3/2025 9,554 9,558
CCIRS USD 6,200,000Fund receives Fixed 1.864% and pays Floating USD 3 Month
LIBORBank of America
Merrill Lynch 3/9/2021 110,786 110,962
CCIRS HKD 2,810,000Fund receives Fixed 1.866% and pays Floating HKD 3 Month
HIBORBank of America
Merrill Lynch 18/3/2025 12,312 12,317
CCIRS HKD 1,318,000Fund receives Fixed 1.870% and pays Floating HKD 3 Month
HIBORBank of America
Merrill Lynch 18/3/2025 5,804 5,806
CCIRS USD 20,000Fund receives Fixed 1.912% and pays Floating USD 3 Month
LIBORBank of America
Merrill Lynch 1/12/2056 3,829 3,830
CCIRS USD 250,000Fund receives Fixed 2.420% and pays Floating USD 3 Month
LIBORBank of America
Merrill Lynch 18/5/2031 36,704 36,708
CCIRS MXN 6,962,000Fund receives Fixed 4.764% and pays Floating MXN 1 Month
Mexican Interbank RateBank of America
Merrill Lynch 5/5/2023 (1,042) (1,040)
BlackRock Global Absolute Return Bond Fund continued
The notes on pages 691 to 711 form an integral part of these financial statements.
BlackRock Strategic Funds[404]
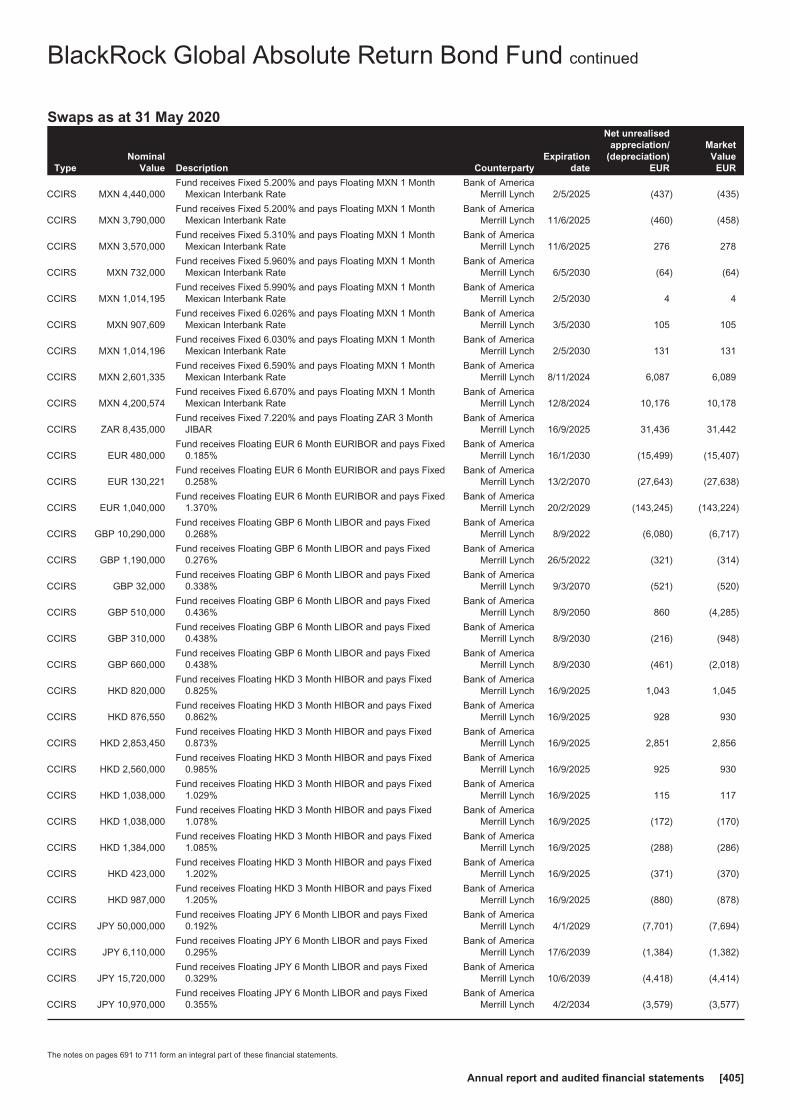
Swaps as at 31 May 2020
TypeNominal
Value Description CounterpartyExpiration
date
Net unrealisedappreciation/
(depreciation)EUR
MarketValue
EUR
CCIRS MXN 4,440,000Fund receives Fixed 5.200% and pays Floating MXN 1 Month
Mexican Interbank RateBank of America
Merrill Lynch 2/5/2025 (437) (435)
CCIRS MXN 3,790,000Fund receives Fixed 5.200% and pays Floating MXN 1 Month
Mexican Interbank RateBank of America
Merrill Lynch 11/6/2025 (460) (458)
CCIRS MXN 3,570,000Fund receives Fixed 5.310% and pays Floating MXN 1 Month
Mexican Interbank RateBank of America
Merrill Lynch 11/6/2025 276 278
CCIRS MXN 732,000Fund receives Fixed 5.960% and pays Floating MXN 1 Month
Mexican Interbank RateBank of America
Merrill Lynch 6/5/2030 (64) (64)
CCIRS MXN 1,014,195Fund receives Fixed 5.990% and pays Floating MXN 1 Month
Mexican Interbank RateBank of America
Merrill Lynch 2/5/2030 4 4
CCIRS MXN 907,609Fund receives Fixed 6.026% and pays Floating MXN 1 Month
Mexican Interbank RateBank of America
Merrill Lynch 3/5/2030 105 105
CCIRS MXN 1,014,196Fund receives Fixed 6.030% and pays Floating MXN 1 Month
Mexican Interbank RateBank of America
Merrill Lynch 2/5/2030 131 131
CCIRS MXN 2,601,335Fund receives Fixed 6.590% and pays Floating MXN 1 Month
Mexican Interbank RateBank of America
Merrill Lynch 8/11/2024 6,087 6,089
CCIRS MXN 4,200,574Fund receives Fixed 6.670% and pays Floating MXN 1 Month
Mexican Interbank RateBank of America
Merrill Lynch 12/8/2024 10,176 10,178
CCIRS ZAR 8,435,000Fund receives Fixed 7.220% and pays Floating ZAR 3 Month
JIBARBank of America
Merrill Lynch 16/9/2025 31,436 31,442
CCIRS EUR 480,000Fund receives Floating EUR 6 Month EURIBOR and pays Fixed
0.185%Bank of America
Merrill Lynch 16/1/2030 (15,499) (15,407)
CCIRS EUR 130,221Fund receives Floating EUR 6 Month EURIBOR and pays Fixed
0.258%Bank of America
Merrill Lynch 13/2/2070 (27,643) (27,638)
CCIRS EUR 1,040,000Fund receives Floating EUR 6 Month EURIBOR and pays Fixed
1.370%Bank of America
Merrill Lynch 20/2/2029 (143,245) (143,224)
CCIRS GBP 10,290,000Fund receives Floating GBP 6 Month LIBOR and pays Fixed
0.268%Bank of America
Merrill Lynch 8/9/2022 (6,080) (6,717)
CCIRS GBP 1,190,000Fund receives Floating GBP 6 Month LIBOR and pays Fixed
0.276%Bank of America
Merrill Lynch 26/5/2022 (321) (314)
CCIRS GBP 32,000Fund receives Floating GBP 6 Month LIBOR and pays Fixed
0.338%Bank of America
Merrill Lynch 9/3/2070 (521) (520)
CCIRS GBP 510,000Fund receives Floating GBP 6 Month LIBOR and pays Fixed
0.436%Bank of America
Merrill Lynch 8/9/2050 860 (4,285)
CCIRS GBP 310,000Fund receives Floating GBP 6 Month LIBOR and pays Fixed
0.438%Bank of America
Merrill Lynch 8/9/2030 (216) (948)
CCIRS GBP 660,000Fund receives Floating GBP 6 Month LIBOR and pays Fixed
0.438%Bank of America
Merrill Lynch 8/9/2030 (461) (2,018)
CCIRS HKD 820,000Fund receives Floating HKD 3 Month HIBOR and pays Fixed
0.825%Bank of America
Merrill Lynch 16/9/2025 1,043 1,045
CCIRS HKD 876,550Fund receives Floating HKD 3 Month HIBOR and pays Fixed
0.862%Bank of America
Merrill Lynch 16/9/2025 928 930
CCIRS HKD 2,853,450Fund receives Floating HKD 3 Month HIBOR and pays Fixed
0.873%Bank of America
Merrill Lynch 16/9/2025 2,851 2,856
CCIRS HKD 2,560,000Fund receives Floating HKD 3 Month HIBOR and pays Fixed
0.985%Bank of America
Merrill Lynch 16/9/2025 925 930
CCIRS HKD 1,038,000Fund receives Floating HKD 3 Month HIBOR and pays Fixed
1.029%Bank of America
Merrill Lynch 16/9/2025 115 117
CCIRS HKD 1,038,000Fund receives Floating HKD 3 Month HIBOR and pays Fixed
1.078%Bank of America
Merrill Lynch 16/9/2025 (172) (170)
CCIRS HKD 1,384,000Fund receives Floating HKD 3 Month HIBOR and pays Fixed
1.085%Bank of America
Merrill Lynch 16/9/2025 (288) (286)
CCIRS HKD 423,000Fund receives Floating HKD 3 Month HIBOR and pays Fixed
1.202%Bank of America
Merrill Lynch 16/9/2025 (371) (370)
CCIRS HKD 987,000Fund receives Floating HKD 3 Month HIBOR and pays Fixed
1.205%Bank of America
Merrill Lynch 16/9/2025 (880) (878)
CCIRS JPY 50,000,000Fund receives Floating JPY 6 Month LIBOR and pays Fixed
0.192%Bank of America
Merrill Lynch 4/1/2029 (7,701) (7,694)
CCIRS JPY 6,110,000Fund receives Floating JPY 6 Month LIBOR and pays Fixed
0.295%Bank of America
Merrill Lynch 17/6/2039 (1,384) (1,382)
CCIRS JPY 15,720,000Fund receives Floating JPY 6 Month LIBOR and pays Fixed
0.329%Bank of America
Merrill Lynch 10/6/2039 (4,418) (4,414)
CCIRS JPY 10,970,000Fund receives Floating JPY 6 Month LIBOR and pays Fixed
0.355%Bank of America
Merrill Lynch 4/2/2034 (3,579) (3,577)
BlackRock Global Absolute Return Bond Fund continued
The notes on pages 691 to 711 form an integral part of these financial statements.
Annual report and audited financial statements [405]

Swaps as at 31 May 2020
TypeNominal
Value Description CounterpartyExpiration
date
Net unrealisedappreciation/
(depreciation)EUR
MarketValue
EUR
CCIRS JPY 23,500,000Fund receives Floating JPY 6 Month LIBOR and pays Fixed
0.380%Bank of America
Merrill Lynch 10/1/2050 (8,887) (8,880)
CCIRS JPY 23,500,000Fund receives Floating JPY 6 Month LIBOR and pays Fixed
0.401%Bank of America
Merrill Lynch 10/1/2050 (10,129) (10,122)
CCIRS JPY 12,850,000Fund receives Floating JPY 6 Month LIBOR and pays Fixed
0.409%Bank of America
Merrill Lynch 3/4/2039 (5,245) (5,242)
CCIRS JPY 30,000,000Fund receives Floating JPY 6 Month LIBOR and pays Fixed
0.522%Bank of America
Merrill Lynch 30/11/2031 (12,230) (12,225)
CCIRS JPY 2,000,000Fund receives Floating JPY 6 Month LIBOR and pays Fixed
0.616%Bank of America
Merrill Lynch 14/12/2038 (1,460) (1,459)
CCIRS JPY 10,522,000Fund receives Floating JPY 6 Month LIBOR and pays Fixed
0.657%Bank of America
Merrill Lynch 6/12/2038 (8,339) (8,336)
CCIRS JPY 8,200,000Fund receives Floating JPY 6 Month LIBOR and pays Fixed
0.715%Bank of America
Merrill Lynch 21/3/2044 (6,492) (6,490)
CCIRS PLN 1,800,000Fund receives Floating PLN 6 Month WIBOR and pays Fixed
0.570%Bank of America
Merrill Lynch 16/9/2025 (1,685) (1,679)
CCIRS PLN 1,110,000Fund receives Floating PLN 6 Month WIBOR and pays Fixed
0.588%Bank of America
Merrill Lynch 16/9/2025 (1,257) (1,254)
CCIRS PLN 1,180,000Fund receives Floating PLN 6 Month WIBOR and pays Fixed
0.730%Bank of America
Merrill Lynch 16/9/2025 (3,228) (3,224)
CCIRS PLN 730,000Fund receives Floating PLN 6 Month WIBOR and pays Fixed
0.795%Bank of America
Merrill Lynch 16/9/2025 (2,530) (2,528)
CCIRS PLN 2,860,000Fund receives Floating PLN 6 Month WIBOR and pays Fixed
0.855%Bank of America
Merrill Lynch 16/9/2025 (11,843) (11,834)
CCIRS SEK 1,710,000Fund receives Floating SEK 3 Month STIBOR and pays Fixed
0.144%Bank of America
Merrill Lynch 16/9/2025 287 289
CCIRS SEK 820,000Fund receives Floating SEK 3 Month STIBOR and pays Fixed
0.150%Bank of America
Merrill Lynch 16/9/2025 122 115
CCIRS SEK 1,300,000Fund receives Floating SEK 3 Month STIBOR and pays Fixed
0.152%Bank of America
Merrill Lynch 16/9/2025 165 167
CCIRS SEK 620,000Fund receives Floating SEK 3 Month STIBOR and pays Fixed
0.160%Bank of America
Merrill Lynch 16/9/2025 39 57
CCIRS SEK 2,840,000Fund receives Floating SEK 3 Month STIBOR and pays Fixed
0.260%Bank of America
Merrill Lynch 16/9/2025 (811) (1,104)
CCIRS SEK 3,430,000Fund receives Floating SEK 3 Month STIBOR and pays Fixed
0.263%Bank of America
Merrill Lynch 16/9/2025 (2,347) (1,371)
CCIRS SEK 3,830,000Fund receives Floating SEK 3 Month STIBOR and pays Fixed
0.312%Bank of America
Merrill Lynch 16/9/2025 (1,305) (2,438)
CCIRS SGD 160,000Fund receives Floating SGD 6 Month SORF6 and pays Fixed
0.840%Bank of America
Merrill Lynch 16/9/2025 (1,417) (1,416)
CCIRS SGD 550,000Fund receives Floating SGD 6 Month STIBOR and pays Fixed
0.850%Bank of America
Merrill Lynch 16/9/2025 (5,047) (5,042)
CCIRS SGD 115,000Fund receives Floating SGD 6 Month STIBOR and pays Fixed
0.863%Bank of America
Merrill Lynch 16/9/2025 (1,103) (1,102)
CCIRS SGD 115,000Fund receives Floating SGD 6 Month STIBOR and pays Fixed
0.870%Bank of America
Merrill Lynch 16/9/2025 (1,129) (1,128)
CCIRS USD 4,670,000Fund receives Floating USD 3 Month LIBOR and pays Fixed
0.254%Bank of America
Merrill Lynch 8/9/2022 (161) (942)
CCIRS USD 3,120,000Fund receives Floating USD 3 Month LIBOR and pays Fixed
0.404%Bank of America
Merrill Lynch 8/9/2025 812 (1,012)
CCIRS USD 780,000Fund receives Floating USD 3 Month LIBOR and pays Fixed
0.404%Bank of America
Merrill Lynch 8/9/2025 203 (253)
CCIRS USD 70,000Fund receives Floating USD 3 Month LIBOR and pays Fixed
0.650%Bank of America
Merrill Lynch 20/4/2027 (156) (155)
CCIRS USD 150,000Fund receives Floating USD 3 Month LIBOR and pays Fixed
0.656%Bank of America
Merrill Lynch 28/5/2030 (234) 190
CCIRS USD 90,000Fund receives Floating USD 3 Month LIBOR and pays Fixed
0.681%Bank of America
Merrill Lynch 20/5/2030 (93) (91)
CCIRS USD 590,000Fund receives Floating USD 3 Month LIBOR and pays Fixed
0.698%Bank of America
Merrill Lynch 22/7/2030 (822) (811)
CCIRS USD 390,000Fund receives Floating USD 3 Month LIBOR and pays Fixed
0.713%Bank of America
Merrill Lynch 8/9/2030 291 (652)
CCIRS USD 770,000Fund receives Floating USD 3 Month LIBOR and pays Fixed
0.765%Bank of America
Merrill Lynch 4/5/2032 6,098 6,112
BlackRock Global Absolute Return Bond Fund continued
The notes on pages 691 to 711 form an integral part of these financial statements.
BlackRock Strategic Funds[406]
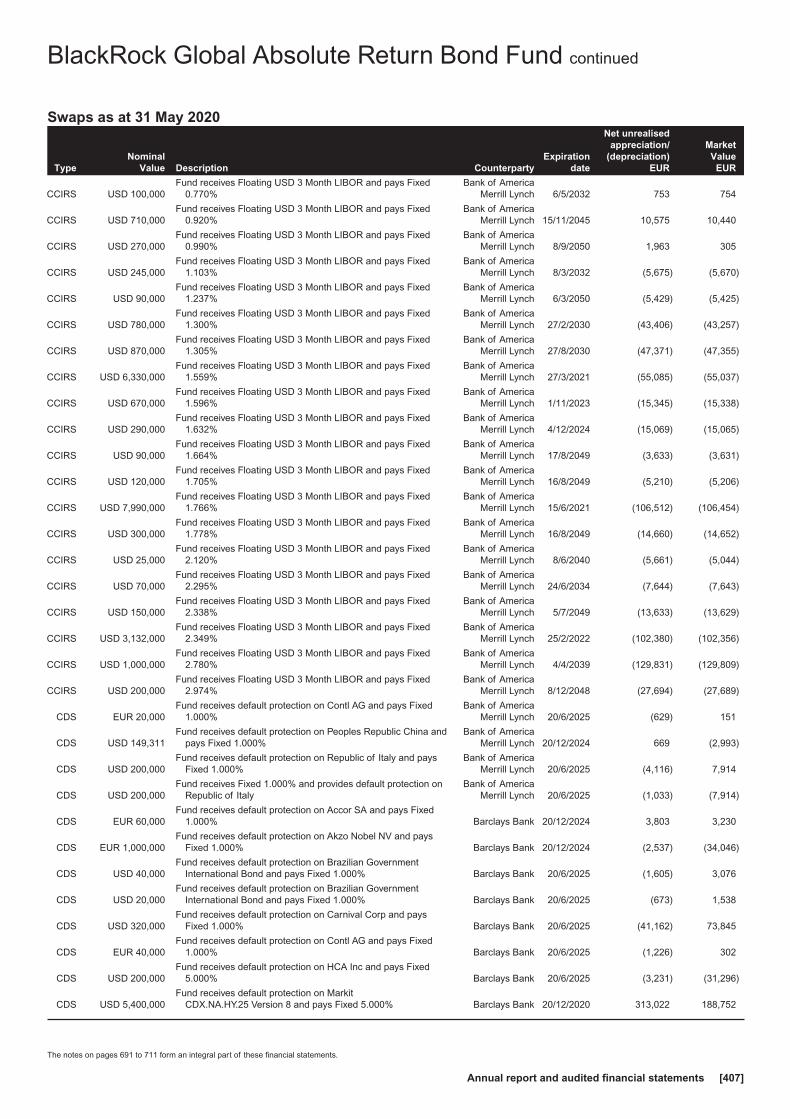
Swaps as at 31 May 2020
TypeNominal
Value Description CounterpartyExpiration
date
Net unrealisedappreciation/
(depreciation)EUR
MarketValue
EUR
CCIRS USD 100,000Fund receives Floating USD 3 Month LIBOR and pays Fixed
0.770%Bank of America
Merrill Lynch 6/5/2032 753 754
CCIRS USD 710,000Fund receives Floating USD 3 Month LIBOR and pays Fixed
0.920%Bank of America
Merrill Lynch 15/11/2045 10,575 10,440
CCIRS USD 270,000Fund receives Floating USD 3 Month LIBOR and pays Fixed
0.990%Bank of America
Merrill Lynch 8/9/2050 1,963 305
CCIRS USD 245,000Fund receives Floating USD 3 Month LIBOR and pays Fixed
1.103%Bank of America
Merrill Lynch 8/3/2032 (5,675) (5,670)
CCIRS USD 90,000Fund receives Floating USD 3 Month LIBOR and pays Fixed
1.237%Bank of America
Merrill Lynch 6/3/2050 (5,429) (5,425)
CCIRS USD 780,000Fund receives Floating USD 3 Month LIBOR and pays Fixed
1.300%Bank of America
Merrill Lynch 27/2/2030 (43,406) (43,257)
CCIRS USD 870,000Fund receives Floating USD 3 Month LIBOR and pays Fixed
1.305%Bank of America
Merrill Lynch 27/8/2030 (47,371) (47,355)
CCIRS USD 6,330,000Fund receives Floating USD 3 Month LIBOR and pays Fixed
1.559%Bank of America
Merrill Lynch 27/3/2021 (55,085) (55,037)
CCIRS USD 670,000Fund receives Floating USD 3 Month LIBOR and pays Fixed
1.596%Bank of America
Merrill Lynch 1/11/2023 (15,345) (15,338)
CCIRS USD 290,000Fund receives Floating USD 3 Month LIBOR and pays Fixed
1.632%Bank of America
Merrill Lynch 4/12/2024 (15,069) (15,065)
CCIRS USD 90,000Fund receives Floating USD 3 Month LIBOR and pays Fixed
1.664%Bank of America
Merrill Lynch 17/8/2049 (3,633) (3,631)
CCIRS USD 120,000Fund receives Floating USD 3 Month LIBOR and pays Fixed
1.705%Bank of America
Merrill Lynch 16/8/2049 (5,210) (5,206)
CCIRS USD 7,990,000Fund receives Floating USD 3 Month LIBOR and pays Fixed
1.766%Bank of America
Merrill Lynch 15/6/2021 (106,512) (106,454)
CCIRS USD 300,000Fund receives Floating USD 3 Month LIBOR and pays Fixed
1.778%Bank of America
Merrill Lynch 16/8/2049 (14,660) (14,652)
CCIRS USD 25,000Fund receives Floating USD 3 Month LIBOR and pays Fixed
2.120%Bank of America
Merrill Lynch 8/6/2040 (5,661) (5,044)
CCIRS USD 70,000Fund receives Floating USD 3 Month LIBOR and pays Fixed
2.295%Bank of America
Merrill Lynch 24/6/2034 (7,644) (7,643)
CCIRS USD 150,000Fund receives Floating USD 3 Month LIBOR and pays Fixed
2.338%Bank of America
Merrill Lynch 5/7/2049 (13,633) (13,629)
CCIRS USD 3,132,000Fund receives Floating USD 3 Month LIBOR and pays Fixed
2.349%Bank of America
Merrill Lynch 25/2/2022 (102,380) (102,356)
CCIRS USD 1,000,000Fund receives Floating USD 3 Month LIBOR and pays Fixed
2.780%Bank of America
Merrill Lynch 4/4/2039 (129,831) (129,809)
CCIRS USD 200,000Fund receives Floating USD 3 Month LIBOR and pays Fixed
2.974%Bank of America
Merrill Lynch 8/12/2048 (27,694) (27,689)
CDS EUR 20,000Fund receives default protection on Contl AG and pays Fixed
1.000%Bank of America
Merrill Lynch 20/6/2025 (629) 151
CDS USD 149,311Fund receives default protection on Peoples Republic China and
pays Fixed 1.000%Bank of America
Merrill Lynch 20/12/2024 669 (2,993)
CDS USD 200,000Fund receives default protection on Republic of Italy and pays
Fixed 1.000%Bank of America
Merrill Lynch 20/6/2025 (4,116) 7,914
CDS USD 200,000Fund receives Fixed 1.000% and provides default protection on
Republic of ItalyBank of America
Merrill Lynch 20/6/2025 (1,033) (7,914)
CDS EUR 60,000Fund receives default protection on Accor SA and pays Fixed
1.000% Barclays Bank 20/12/2024 3,803 3,230
CDS EUR 1,000,000Fund receives default protection on Akzo Nobel NV and pays
Fixed 1.000% Barclays Bank 20/12/2024 (2,537) (34,046)
CDS USD 40,000Fund receives default protection on Brazilian Government
International Bond and pays Fixed 1.000% Barclays Bank 20/6/2025 (1,605) 3,076
CDS USD 20,000Fund receives default protection on Brazilian Government
International Bond and pays Fixed 1.000% Barclays Bank 20/6/2025 (673) 1,538
CDS USD 320,000Fund receives default protection on Carnival Corp and pays
Fixed 1.000% Barclays Bank 20/6/2025 (41,162) 73,845
CDS EUR 40,000Fund receives default protection on Contl AG and pays Fixed
1.000% Barclays Bank 20/6/2025 (1,226) 302
CDS USD 200,000Fund receives default protection on HCA Inc and pays Fixed
5.000% Barclays Bank 20/6/2025 (3,231) (31,296)
CDS USD 5,400,000Fund receives default protection on Markit
CDX.NA.HY.25 Version 8 and pays Fixed 5.000% Barclays Bank 20/12/2020 313,022 188,752
BlackRock Global Absolute Return Bond Fund continued
The notes on pages 691 to 711 form an integral part of these financial statements.
Annual report and audited financial statements [407]

Swaps as at 31 May 2020
TypeNominal
Value Description CounterpartyExpiration
date
Net unrealisedappreciation/
(depreciation)EUR
MarketValue
EUR
CDS EUR 600,000Fund receives default protection on PostNL NV and pays Fixed
1.000% Barclays Bank 20/12/2023 (2,556) (11,387)
CDS EUR 20,000Fund receives default protection on Repsol SA and pays Fixed
1.000% Barclays Bank 20/6/2025 (989) (22)
CDS USD 5,400,000Fund receives Fixed 5.000% and provides default protection on
Markit CDX.NA.HY.25 Version 8 Barclays Bank 20/12/2020 (254,777) (188,752)
CDS EUR 10,269Fund receives default protection on Altice Finco SA and pays
Fixed 5.000% BNP Paribas 20/12/2024 539 (680)
CDS EUR 40,000Fund receives default protection on Ardagh Packaging Ltd Co
and pays Fixed 5.000% BNP Paribas 20/12/2024 (1,753) (4,302)
CDS USD 530,000Fund receives default protection on Hess Corp and pays Fixed
1.000% BNP Paribas 20/6/2025 (103,470) 3,603
CDS USD 290,000Fund receives default protection on Tyson Foods Inc and pays
Fixed 1.000% BNP Paribas 20/12/2023 (4,303) (6,888)
CDS EUR 12,097Fund receives Fixed 1.000% and provides default protection on
Ladbrokers Coral Group Ltd BNP Paribas 20/6/2025 505 (991)
CDS USD 625,000Fund receives Fixed 1.000% and provides default protection on
Rio Tinto Ltd BNP Paribas 20/12/2023 291 9,364
CDS EUR 310,000Fund receives Fixed 1.000% and provides default protection on
Telefonaktiebolaget LM Ericsson BNP Paribas 20/6/2022 7,930 4,151
CDS EUR 13,333Fund receives Fixed 5.000% and provides default protection on
Garfunkelux Holdco 2 SA BNP Paribas 20/12/2024 (2,760) (2,490)
CDS EUR 6,667Fund receives Fixed 5.000% and provides default protection on
Garfunkelux Holdco 2 SA BNP Paribas 20/12/2024 (1,386) (1,245)
CDS USD 560,000Fund receives default protection on Aramark Service In and pays
Fixed 5.000% Citibank 20/12/2024 32,627 (63,173)
CDS EUR 26,081Fund receives default protection on Ardagh Packaging Ltd Co
and pays Fixed 5.000% Citibank 20/12/2024 1,340 (2,805)
CDS EUR 20,000Fund receives default protection on Banco Bilbao Vizcaya
Argentaria SA and pays Fixed 1.000% Citibank 20/6/2025 (1,721) 1,198
CDS EUR 20,000Fund receives default protection on Banco Bilbao Vizcaya
Argentaria SA and pays Fixed 1.000% Citibank 20/6/2025 (1,738) 1,198
CDS EUR 20,000Fund receives default protection on Banco Bilbao Vizcaya
Argentaria SA and pays Fixed 5.000% Citibank 20/6/2025 (787) (2,716)
CDS EUR 27,000Fund receives default protection on Banco Santander SA and
pays Fixed 1.000% Citibank 20/6/2025 (2,429) 1,305
CDS USD 79,000Fund receives default protection on Chile Government
International Bond and pays Fixed 1.000% Citibank 20/6/2025 (2,556) (154)
CDS EUR 20,000Fund receives default protection on Deutsche Bank AG and pays
Fixed 1.000% Citibank 20/6/2025 (767) 2,355
CDS EUR 20,000Fund receives default protection on Deutsche Bank AG and pays
Fixed 5.000% Citibank 20/6/2025 (767) 2,355
CDS EUR 40,000Fund receives default protection on HSBC Holdings Plc and pays
Fixed 1.000% Citibank 20/12/2024 745 841
CDS EUR 50,000Fund receives default protection on ITV Plc and pays Fixed
5.000% Citibank 20/12/2024 2,894 (6,609)
CDS USD 114,495Fund receives default protection on Mexico Government
International Bond and pays Fixed 1.000% Citibank 20/6/2025 (7,046) 3,893
CDS USD 57,941Fund receives default protection on Netflix Inc and pays Fixed
5.000% Citibank 20/12/2024 650 (9,325)
CDS EUR 60,000Fund receives default protection on Next Group Plc and pays
Fixed 1.000% Citibank 20/12/2024 3,248 3,097
CDS USD 312,981Fund receives default protection on Philippine Government
International Bond and pays Fixed 1.000% Citibank 20/6/2025 (13,790) (3,528)
CDS EUR 1,100,000Fund receives default protection on Sanofi and pays Fixed
1.000% Citibank 20/12/2023 5,498 (35,801)
CDS EUR 80,000Fund receives default protection on Standard Chartered Plc and
pays Fixed 1.000% Citibank 20/12/2024 2,388 1,982
CDS EUR 66,666Fund receives default protection on Stora Enso Corp and pays
Fixed 5.000% Citibank 20/6/2025 (994) (14,004)
CDS EUR 425,000Fund receives default protection on TVN Finance Corp III AB and
pays Fixed 5.000% Citibank 20/12/2020 80,740 (11,910)
CDS EUR 20,000Fund receives Fixed 5.000% and provides default protection on
Adler Real Estate AG Citibank 20/6/2025 532 1,976
BlackRock Global Absolute Return Bond Fund continued
The notes on pages 691 to 711 form an integral part of these financial statements.
BlackRock Strategic Funds[408]
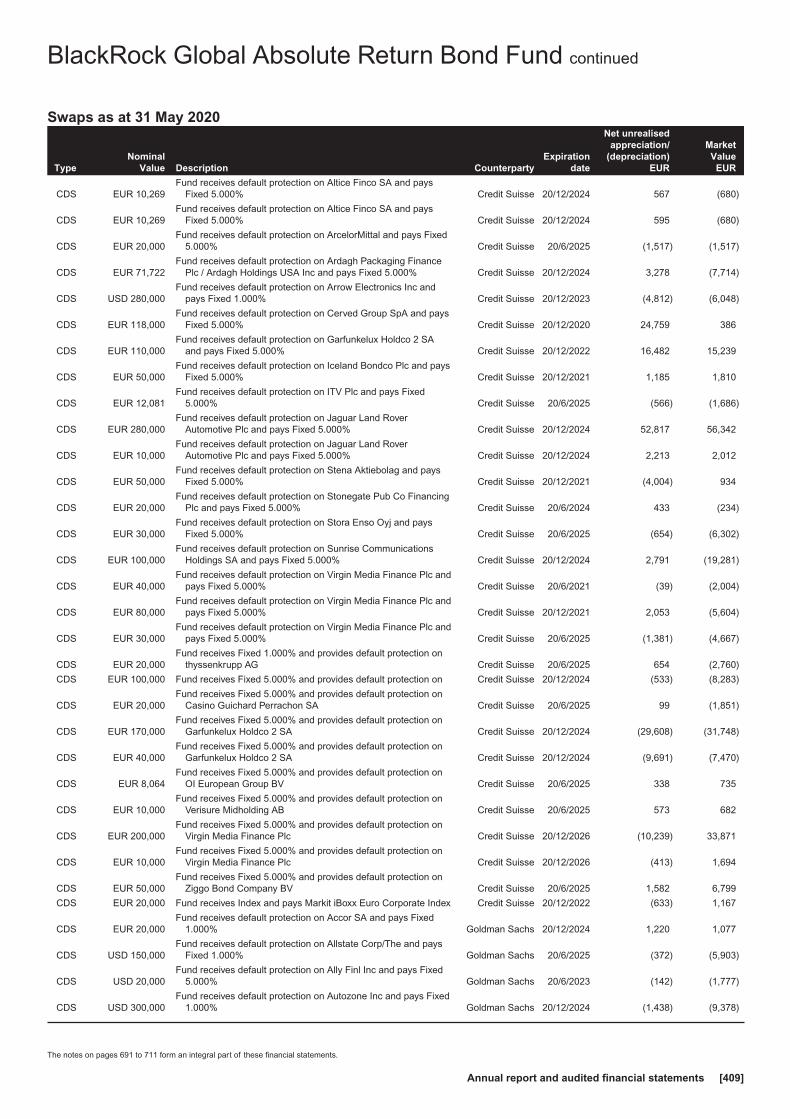
Swaps as at 31 May 2020
TypeNominal
Value Description CounterpartyExpiration
date
Net unrealisedappreciation/
(depreciation)EUR
MarketValue
EUR
CDS EUR 10,269Fund receives default protection on Altice Finco SA and pays
Fixed 5.000% Credit Suisse 20/12/2024 567 (680)
CDS EUR 10,269Fund receives default protection on Altice Finco SA and pays
Fixed 5.000% Credit Suisse 20/12/2024 595 (680)
CDS EUR 20,000Fund receives default protection on ArcelorMittal and pays Fixed
5.000% Credit Suisse 20/6/2025 (1,517) (1,517)
CDS EUR 71,722Fund receives default protection on Ardagh Packaging Finance
Plc / Ardagh Holdings USA Inc and pays Fixed 5.000% Credit Suisse 20/12/2024 3,278 (7,714)
CDS USD 280,000Fund receives default protection on Arrow Electronics Inc and
pays Fixed 1.000% Credit Suisse 20/12/2023 (4,812) (6,048)
CDS EUR 118,000Fund receives default protection on Cerved Group SpA and pays
Fixed 5.000% Credit Suisse 20/12/2020 24,759 386
CDS EUR 110,000Fund receives default protection on Garfunkelux Holdco 2 SA
and pays Fixed 5.000% Credit Suisse 20/12/2022 16,482 15,239
CDS EUR 50,000Fund receives default protection on Iceland Bondco Plc and pays
Fixed 5.000% Credit Suisse 20/12/2021 1,185 1,810
CDS EUR 12,081Fund receives default protection on ITV Plc and pays Fixed
5.000% Credit Suisse 20/6/2025 (566) (1,686)
CDS EUR 280,000Fund receives default protection on Jaguar Land Rover
Automotive Plc and pays Fixed 5.000% Credit Suisse 20/12/2024 52,817 56,342
CDS EUR 10,000Fund receives default protection on Jaguar Land Rover
Automotive Plc and pays Fixed 5.000% Credit Suisse 20/12/2024 2,213 2,012
CDS EUR 50,000Fund receives default protection on Stena Aktiebolag and pays
Fixed 5.000% Credit Suisse 20/12/2021 (4,004) 934
CDS EUR 20,000Fund receives default protection on Stonegate Pub Co Financing
Plc and pays Fixed 5.000% Credit Suisse 20/6/2024 433 (234)
CDS EUR 30,000Fund receives default protection on Stora Enso Oyj and pays
Fixed 5.000% Credit Suisse 20/6/2025 (654) (6,302)
CDS EUR 100,000Fund receives default protection on Sunrise Communications
Holdings SA and pays Fixed 5.000% Credit Suisse 20/12/2024 2,791 (19,281)
CDS EUR 40,000Fund receives default protection on Virgin Media Finance Plc and
pays Fixed 5.000% Credit Suisse 20/6/2021 (39) (2,004)
CDS EUR 80,000Fund receives default protection on Virgin Media Finance Plc and
pays Fixed 5.000% Credit Suisse 20/12/2021 2,053 (5,604)
CDS EUR 30,000Fund receives default protection on Virgin Media Finance Plc and
pays Fixed 5.000% Credit Suisse 20/6/2025 (1,381) (4,667)
CDS EUR 20,000Fund receives Fixed 1.000% and provides default protection on
thyssenkrupp AG Credit Suisse 20/6/2025 654 (2,760)
CDS EUR 100,000 Fund receives Fixed 5.000% and provides default protection on Credit Suisse 20/12/2024 (533) (8,283)
CDS EUR 20,000Fund receives Fixed 5.000% and provides default protection on
Casino Guichard Perrachon SA Credit Suisse 20/6/2025 99 (1,851)
CDS EUR 170,000Fund receives Fixed 5.000% and provides default protection on
Garfunkelux Holdco 2 SA Credit Suisse 20/12/2024 (29,608) (31,748)
CDS EUR 40,000Fund receives Fixed 5.000% and provides default protection on
Garfunkelux Holdco 2 SA Credit Suisse 20/12/2024 (9,691) (7,470)
CDS EUR 8,064Fund receives Fixed 5.000% and provides default protection on
OI European Group BV Credit Suisse 20/6/2025 338 735
CDS EUR 10,000Fund receives Fixed 5.000% and provides default protection on
Verisure Midholding AB Credit Suisse 20/6/2025 573 682
CDS EUR 200,000Fund receives Fixed 5.000% and provides default protection on
Virgin Media Finance Plc Credit Suisse 20/12/2026 (10,239) 33,871
CDS EUR 10,000Fund receives Fixed 5.000% and provides default protection on
Virgin Media Finance Plc Credit Suisse 20/12/2026 (413) 1,694
CDS EUR 50,000Fund receives Fixed 5.000% and provides default protection on
Ziggo Bond Company BV Credit Suisse 20/6/2025 1,582 6,799
CDS EUR 20,000 Fund receives Index and pays Markit iBoxx Euro Corporate Index Credit Suisse 20/12/2022 (633) 1,167
CDS EUR 20,000Fund receives default protection on Accor SA and pays Fixed
1.000% Goldman Sachs 20/12/2024 1,220 1,077
CDS USD 150,000Fund receives default protection on Allstate Corp/The and pays
Fixed 1.000% Goldman Sachs 20/6/2025 (372) (5,903)
CDS USD 20,000Fund receives default protection on Ally Finl Inc and pays Fixed
5.000% Goldman Sachs 20/6/2023 (142) (1,777)
CDS USD 300,000Fund receives default protection on Autozone Inc and pays Fixed
1.000% Goldman Sachs 20/12/2024 (1,438) (9,378)
BlackRock Global Absolute Return Bond Fund continued
The notes on pages 691 to 711 form an integral part of these financial statements.
Annual report and audited financial statements [409]

Swaps as at 31 May 2020
TypeNominal
Value Description CounterpartyExpiration
date
Net unrealisedappreciation/
(depreciation)EUR
MarketValue
EUR
CDS USD 150,000Fund receives default protection on Barrick Gold Corp and pays
Fixed 1.000% Goldman Sachs 20/6/2025 (744) (5,304)
CDS USD 300,000Fund receives default protection on Bristol Myers Squibb Co and
pays Fixed 1.000% Goldman Sachs 20/12/2024 (163) (10,013)
CDS USD 150,000Fund receives default protection on Campbell Soup Co and pays
Fixed 1.000% Goldman Sachs 20/6/2025 398 (5,032)
CDS USD 150,000Fund receives default protection on Cardinal Health Inc and pays
Fixed 1.000% Goldman Sachs 20/6/2025 321 (4,094)
CDS EUR 50,000Fund receives default protection on Casino Guichard Perrachon
SA and pays Fixed 5.000% Goldman Sachs 20/12/2022 (268) 1,732
CDS USD 150,000Fund receives default protection on Caterpillar Inc and pays
Fixed 1.000% Goldman Sachs 20/6/2025 (440) (4,712)
CDS EUR 211,000Fund receives default protection on Cerved Group SpA and pays
Fixed 5.000% Goldman Sachs 20/12/2020 44,506 690
CDS EUR 211,000Fund receives default protection on Cerved Group SpA and pays
Fixed 5.000% Goldman Sachs 20/12/2020 44,056 690
CDS EUR 97,000Fund receives default protection on Cerved Group SpA and pays
Fixed 5.000% Goldman Sachs 20/12/2020 20,519 317
CDS EUR 113,000Fund receives default protection on Cerved Group SpA and pays
Fixed 5.000% Goldman Sachs 20/12/2020 23,894 370
CDS EUR 131,000Fund receives default protection on Cerved Group SpA and pays
Fixed 5.000% Goldman Sachs 20/12/2020 28,009 429
CDS EUR 84,000Fund receives default protection on Cerved Group SpA and pays
Fixed 5.000% Goldman Sachs 20/12/2020 18,623 275
CDS EUR 201,000Fund receives default protection on Cerved Group SpA and pays
Fixed 5.000% Goldman Sachs 20/12/2020 44,193 658
CDS USD 150,000Fund receives default protection on CSX Corp and pays Fixed
1.000% Goldman Sachs 20/6/2025 259 (5,682)
CDS USD 300,000Fund receives default protection on Dominion Energy Inc and
pays Fixed 1.000% Goldman Sachs 20/12/2024 855 (8,858)
CDS USD 150,000Fund receives default protection on Exelon Corp and pays Fixed
1.000% Goldman Sachs 20/6/2025 (977) (5,644)
CDS USD 150,000Fund receives default protection on FirstEnergy Corp and pays
Fixed 1.000% Goldman Sachs 20/6/2025 (466) (5,491)
CDS USD 20,000Fund receives default protection on Ford Motor Co and pays
Fixed 5.000% Goldman Sachs 20/6/2021 (626) (73)
CDS USD 10,000Fund receives default protection on Ford Motor Co and pays
Fixed 5.000% Goldman Sachs 20/6/2022 (520) 78
CDS USD 300,000Fund receives default protection on Home Depot Inc and pays
Fixed 1.000% Goldman Sachs 20/12/2024 237 (10,300)
CDS USD 150,000Fund receives default protection on International Paper Co and
pays Fixed 1.000% Goldman Sachs 20/6/2025 382 (4,902)
CDS USD 300,000Fund receives default protection on Lowes Cos Inc and pays
Fixed 1.000% Goldman Sachs 20/12/2024 935 (8,640)
CDS USD 150,000Fund receives default protection on McKesson Corp and pays
Fixed 1.000% Goldman Sachs 20/6/2025 636 (4,141)
CDS USD 150,000Fund receives default protection on Mondelez International Inc
and pays Fixed 1.000% Goldman Sachs 20/6/2025 404 (4,807)
CDS USD 150,000Fund receives default protection on Motorola Solutions Inc and
pays Fixed 1.000% Goldman Sachs 20/6/2025 (98) (4,298)
CDS USD 150,000Fund receives default protection on Newmont Corp and pays
Fixed 1.000% Goldman Sachs 20/6/2025 (1,400) (5,744)
CDS EUR 30,000Fund receives default protection on Next Plc and pays Fixed
1.000% Goldman Sachs 20/6/2025 (816) 1,839
CDS EUR 40,000Fund receives default protection on Nokia Oyj and pays Fixed
5.000% Goldman Sachs 20/6/2025 166 (6,883)
CDS USD 150,000Fund receives default protection on Norfolk Southern Corp and
pays Fixed 1.000% Goldman Sachs 20/6/2025 84 (5,638)
CDS EUR 20,000Fund receives default protection on Peugeot SA and pays Fixed
5.000% Goldman Sachs 20/6/2025 90 (2,444)
CDS USD 300,000Fund receives default protection on Quest Diagnostics Inc and
pays Fixed 1.000% Goldman Sachs 20/12/2024 (817) (9,846)
CDS EUR 40,000Fund receives default protection on Renault and pays Fixed
1.000% Goldman Sachs 20/6/2025 (1,303) 3,007
BlackRock Global Absolute Return Bond Fund continued
The notes on pages 691 to 711 form an integral part of these financial statements.
BlackRock Strategic Funds[410]
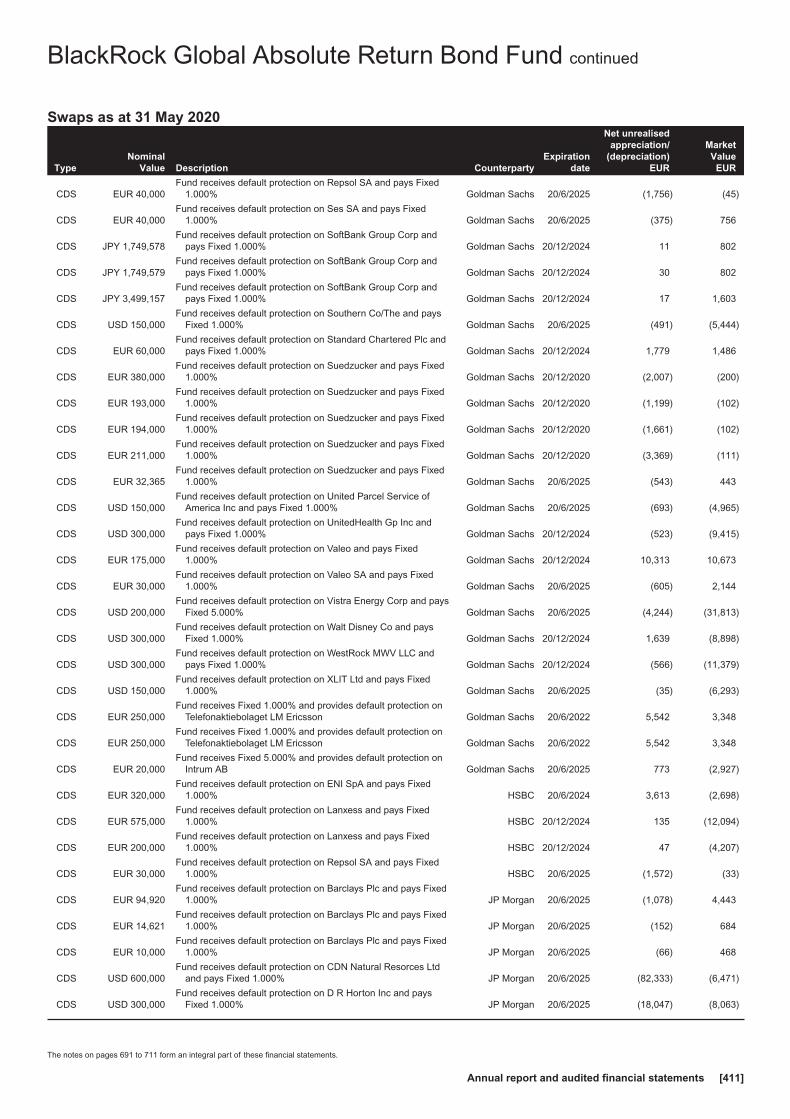
Swaps as at 31 May 2020
TypeNominal
Value Description CounterpartyExpiration
date
Net unrealisedappreciation/
(depreciation)EUR
MarketValue
EUR
CDS EUR 40,000Fund receives default protection on Repsol SA and pays Fixed
1.000% Goldman Sachs 20/6/2025 (1,756) (45)
CDS EUR 40,000Fund receives default protection on Ses SA and pays Fixed
1.000% Goldman Sachs 20/6/2025 (375) 756
CDS JPY 1,749,578Fund receives default protection on SoftBank Group Corp and
pays Fixed 1.000% Goldman Sachs 20/12/2024 11 802
CDS JPY 1,749,579Fund receives default protection on SoftBank Group Corp and
pays Fixed 1.000% Goldman Sachs 20/12/2024 30 802
CDS JPY 3,499,157Fund receives default protection on SoftBank Group Corp and
pays Fixed 1.000% Goldman Sachs 20/12/2024 17 1,603
CDS USD 150,000Fund receives default protection on Southern Co/The and pays
Fixed 1.000% Goldman Sachs 20/6/2025 (491) (5,444)
CDS EUR 60,000Fund receives default protection on Standard Chartered Plc and
pays Fixed 1.000% Goldman Sachs 20/12/2024 1,779 1,486
CDS EUR 380,000Fund receives default protection on Suedzucker and pays Fixed
1.000% Goldman Sachs 20/12/2020 (2,007) (200)
CDS EUR 193,000Fund receives default protection on Suedzucker and pays Fixed
1.000% Goldman Sachs 20/12/2020 (1,199) (102)
CDS EUR 194,000Fund receives default protection on Suedzucker and pays Fixed
1.000% Goldman Sachs 20/12/2020 (1,661) (102)
CDS EUR 211,000Fund receives default protection on Suedzucker and pays Fixed
1.000% Goldman Sachs 20/12/2020 (3,369) (111)
CDS EUR 32,365Fund receives default protection on Suedzucker and pays Fixed
1.000% Goldman Sachs 20/6/2025 (543) 443
CDS USD 150,000Fund receives default protection on United Parcel Service of
America Inc and pays Fixed 1.000% Goldman Sachs 20/6/2025 (693) (4,965)
CDS USD 300,000Fund receives default protection on UnitedHealth Gp Inc and
pays Fixed 1.000% Goldman Sachs 20/12/2024 (523) (9,415)
CDS EUR 175,000Fund receives default protection on Valeo and pays Fixed
1.000% Goldman Sachs 20/12/2024 10,313 10,673
CDS EUR 30,000Fund receives default protection on Valeo SA and pays Fixed
1.000% Goldman Sachs 20/6/2025 (605) 2,144
CDS USD 200,000Fund receives default protection on Vistra Energy Corp and pays
Fixed 5.000% Goldman Sachs 20/6/2025 (4,244) (31,813)
CDS USD 300,000Fund receives default protection on Walt Disney Co and pays
Fixed 1.000% Goldman Sachs 20/12/2024 1,639 (8,898)
CDS USD 300,000Fund receives default protection on WestRock MWV LLC and
pays Fixed 1.000% Goldman Sachs 20/12/2024 (566) (11,379)
CDS USD 150,000Fund receives default protection on XLIT Ltd and pays Fixed
1.000% Goldman Sachs 20/6/2025 (35) (6,293)
CDS EUR 250,000Fund receives Fixed 1.000% and provides default protection on
Telefonaktiebolaget LM Ericsson Goldman Sachs 20/6/2022 5,542 3,348
CDS EUR 250,000Fund receives Fixed 1.000% and provides default protection on
Telefonaktiebolaget LM Ericsson Goldman Sachs 20/6/2022 5,542 3,348
CDS EUR 20,000Fund receives Fixed 5.000% and provides default protection on
Intrum AB Goldman Sachs 20/6/2025 773 (2,927)
CDS EUR 320,000Fund receives default protection on ENI SpA and pays Fixed
1.000% HSBC 20/6/2024 3,613 (2,698)
CDS EUR 575,000Fund receives default protection on Lanxess and pays Fixed
1.000% HSBC 20/12/2024 135 (12,094)
CDS EUR 200,000Fund receives default protection on Lanxess and pays Fixed
1.000% HSBC 20/12/2024 47 (4,207)
CDS EUR 30,000Fund receives default protection on Repsol SA and pays Fixed
1.000% HSBC 20/6/2025 (1,572) (33)
CDS EUR 94,920Fund receives default protection on Barclays Plc and pays Fixed
1.000% JP Morgan 20/6/2025 (1,078) 4,443
CDS EUR 14,621Fund receives default protection on Barclays Plc and pays Fixed
1.000% JP Morgan 20/6/2025 (152) 684
CDS EUR 10,000Fund receives default protection on Barclays Plc and pays Fixed
1.000% JP Morgan 20/6/2025 (66) 468
CDS USD 600,000Fund receives default protection on CDN Natural Resorces Ltd
and pays Fixed 1.000% JP Morgan 20/6/2025 (82,333) (6,471)
CDS USD 300,000Fund receives default protection on D R Horton Inc and pays
Fixed 1.000% JP Morgan 20/6/2025 (18,047) (8,063)
BlackRock Global Absolute Return Bond Fund continued
The notes on pages 691 to 711 form an integral part of these financial statements.
Annual report and audited financial statements [411]

Swaps as at 31 May 2020
TypeNominal
Value Description CounterpartyExpiration
date
Net unrealisedappreciation/
(depreciation)EUR
MarketValue
EUR
CDS USD 350,000Fund receives default protection on General Milis Inc and pays
Fixed 1.000% JP Morgan 20/12/2023 (6,455) (9,758)
CDS EUR 50,000Fund receives default protection on HSBC Holdings Plc and pays
Fixed 1.000% JP Morgan 20/6/2025 86 1,416
CDS EUR 10,000Fund receives default protection on Iceland Bondco Plc and pays
Fixed 5.000% JP Morgan 20/12/2021 312 362
CDS USD 380,000Fund receives default protection on Republic of Italy and pays
Fixed 1.000% JP Morgan 20/12/2024 5,879 12,862
CDS EUR 50,000Fund receives default protection on Sudzucker International
Finance BV and pays Fixed 1.000% JP Morgan 20/12/2024 211 410
CDS EUR 37,635Fund receives default protection on Suedzucker and pays Fixed
1.000% JP Morgan 20/6/2025 (595) 516
CDS USD 380,000Fund receives Fixed 1.000% and provides default protection on
Republic of Italy JP Morgan 20/12/2024 (13,186) (12,862)
CDS EUR 360,000Fund receives Fixed 1.000% and provides default protection on
Telefonaktiebolaget LM Ericsson JP Morgan 20/6/2022 7,429 4,821
CDS EUR 110,000Fund receives Fixed 1.000% and provides default protection on
Tesco Plc JP Morgan 20/12/2029 2,062 (5,283)
CDS EUR 20,000Fund receives Fixed 5.000% and provides default protection on
Adler Real Estate AG JP Morgan 20/6/2025 2,190 1,976
CDS EUR 10,000Fund receives Fixed 5.000% and provides default protection on
Adler Real Estate AG JP Morgan 20/6/2025 745 988
CDS USD 55,003Fund receives default protection on Brazilian Government
International Bond and pays Fixed 1.000% Morgan Stanley 20/6/2025 (2,521) 4,230
CDS USD 113,000Fund receives default protection on Brazilian Government
International Bond and pays Fixed 1.000% Morgan Stanley 20/6/2025 (6,762) 8,690
CDS EUR 20,000Fund receives default protection on Deutsche Bank AG and pays
Fixed 1.000% Morgan Stanley 20/12/2021 (883) 501
CDS USD 95,000Fund receives default protection on Republic of South Africa
Government International Bond and pays Fixed 1.000% Morgan Stanley 20/6/2025 (2,772) 9,616
IRS CHF 4,936,000Fund receives Fixed 0.000% and pays Floating CHF 6 Month
LIBORBank of America
Merrill Lynch 8/1/2022 2,852 2,890
IRS CHF 1,957,000Fund receives Fixed 0.000% and pays Floating CHF 6 Month
LIBORBank of America
Merrill Lynch 15/1/2022 1,543 1,558
IRS CHF 801,000Fund receives Fixed 0.000% and pays Floating CHF 6 Month
LIBORBank of America
Merrill Lynch 9/5/2023 (253) (247)
IRS CHF 1,102,977Fund receives Fixed 0.000% and pays Floating CHF 6 Month
LIBORBank of America
Merrill Lynch 18/5/2023 (604) (595)
IRS EUR 6,040,000Fund receives Fixed 0.000% and pays Floating EUR 1 Month
Euro Overnight Index AverageBank of America
Merrill Lynch 22/3/2023 6,730 6,780
IRS EUR 3,135,000Fund receives Fixed 0.000% and pays Floating EUR 1 Month
Euro Overnight Index AverageBank of America
Merrill Lynch 22/3/2023 3,784 3,809
IRS EUR 260,000Fund receives Fixed 0.000% and pays Floating EUR 1 Month
Euro Overnight Index AverageBank of America
Merrill Lynch 10/5/2023 (108) (202)
IRS EUR 2,350,000Fund receives Fixed 0.000% and pays Floating EUR 6 Month
LIBORBank of America
Merrill Lynch 16/1/2022 (98) (46)
IRS EUR 1,140,000Fund receives Fixed 0.000% and pays Floating EUR 6 Month
LIBORBank of America
Merrill Lynch 5/3/2022 (3,019) (3,009)
IRS EUR 1,390,000Fund receives Fixed 0.000% and pays Floating EUR 6 Month
LIBORBank of America
Merrill Lynch 6/3/2022 (3,769) (3,757)
IRS EUR 890,000Fund receives Fixed 0.000% and pays Floating EUR 6 Month
LIBORBank of America
Merrill Lynch 9/3/2022 (2,579) (2,571)
IRS EUR 1,300,000Fund receives Fixed 0.000% and pays Floating EUR 6 Month
LIBORBank of America
Merrill Lynch 6/5/2022 (689) (678)
IRS EUR 182,000Fund receives Fixed 0.000% and pays Floating EUR 6 Month
LIBORBank of America
Merrill Lynch 25/6/2022 42 44
IRS EUR 183,000Fund receives Fixed 0.000% and pays Floating EUR 6 Month
LIBORBank of America
Merrill Lynch 26/6/2022 80 81
IRS EUR 182,000Fund receives Fixed 0.000% and pays Floating EUR 6 Month
LIBORBank of America
Merrill Lynch 30/6/2022 101 103
IRS EUR 350,000Fund receives Fixed 0.000% and pays Floating EUR 6 Month
LIBORBank of America
Merrill Lynch 16/7/2022 80 83
IRS EUR 785,000Fund receives Fixed 0.000% and pays Floating EUR 6 Month
LIBORBank of America
Merrill Lynch 16/7/2022 (242) (45)
BlackRock Global Absolute Return Bond Fund continued
The notes on pages 691 to 711 form an integral part of these financial statements.
BlackRock Strategic Funds[412]

Swaps as at 31 May 2020
TypeNominal
Value Description CounterpartyExpiration
date
Net unrealisedappreciation/
(depreciation)EUR
MarketValue
EUR
IRS EUR 785,000Fund receives Fixed 0.000% and pays Floating EUR 6 Month
LIBORBank of America
Merrill Lynch 16/7/2022 (130) (123)
IRS EUR 810,000Fund receives Fixed 0.000% and pays Floating EUR 6 Month
LIBORBank of America
Merrill Lynch 20/7/2022 118 124
IRS EUR 1,050,000Fund receives Fixed 0.000% and pays Floating EUR 6 Month
LIBORBank of America
Merrill Lynch 2/10/2022 (30) (21)
IRS EUR 360,000Fund receives Fixed 0.000% and pays Floating EUR 6 Month
LIBORBank of America
Merrill Lynch 2/11/2022 (59) (56)
IRS EUR 920,000Fund receives Fixed 0.000% and pays Floating EUR 6 Month
LIBORBank of America
Merrill Lynch 30/3/2023 916 924
IRS EUR 360,000Fund receives Fixed 0.000% and pays Floating EUR 6 Month
LIBORBank of America
Merrill Lynch 3/5/2023 24 27
IRS EUR 1,310,000Fund receives Fixed 0.000% and pays Floating EUR 6 Month
LIBORBank of America
Merrill Lynch 2/12/2024 3,922 3,941
IRS EUR 397,447Fund receives Fixed 0.000% and pays Floating EUR 6 Month
LIBORBank of America
Merrill Lynch 8/6/2025 (1,697) (2,893)
IRS EUR 972,281Fund receives Fixed 0.000% and pays Floating EUR 6 Month
LIBORBank of America
Merrill Lynch 8/6/2025 9,506 8,152
IRS EUR 70,000Fund receives Fixed 0.000% and pays Floating EUR 6 Month
LIBORBank of America
Merrill Lynch 17/4/2030 546 676
IRS EUR 180,000Fund receives Fixed 0.000% and pays Floating EUR 6 Month
LIBORBank of America
Merrill Lynch 20/4/2030 779 1,003
IRS EUR 180,000Fund receives Fixed 0.000% and pays Floating EUR 6 Month
LIBORBank of America
Merrill Lynch 21/4/2030 986 926
IRS EUR 180,000Fund receives Fixed 0.000% and pays Floating EUR 6 Month
LIBORBank of America
Merrill Lynch 22/4/2030 1,040 863
IRS EUR 180,000Fund receives Fixed 0.000% and pays Floating EUR 6 Month
LIBORBank of America
Merrill Lynch 23/4/2030 1,274 1,461
IRS EUR 180,000Fund receives Fixed 0.000% and pays Floating EUR 6 Month
LIBORBank of America
Merrill Lynch 28/4/2030 1,397 2,306
IRS EUR 210,000Fund receives Fixed 0.000% and pays Floating EUR 6 Month
LIBORBank of America
Merrill Lynch 14/5/2030 383 (44)
IRS EUR 327,500Fund receives Fixed 0.000% and pays Floating EUR 6 Month
LIBORBank of America
Merrill Lynch 8/6/2030 235 542
IRS EUR 22,875Fund receives Fixed 0.000% and pays Floating EUR 6 Month
LIBORBank of America
Merrill Lynch 15/5/2035 (133) (132)
IRS EUR 144,875Fund receives Fixed 0.000% and pays Floating EUR 6 Month
LIBORBank of America
Merrill Lynch 15/5/2035 (896) (893)
IRS EUR 34,625Fund receives Fixed 0.000% and pays Floating EUR 6 Month
LIBORBank of America
Merrill Lynch 15/5/2035 (219) (219)
IRS EUR 144,875Fund receives Fixed 0.000% and pays Floating EUR 6 Month
LIBORBank of America
Merrill Lynch 15/5/2035 (818) (815)
IRS EUR 802,750Fund receives Fixed 0.000% and pays Floating EUR 6 Month
LIBORBank of America
Merrill Lynch 15/5/2035 (4,412) (4,393)
IRS EUR 27,000Fund receives Fixed 0.000% and pays Floating EUR 6 Month
LIBORBank of America
Merrill Lynch 15/5/2035 (146) (146)
IRS EUR 513,000Fund receives Fixed 0.000% and pays Floating EUR 6 Month
LIBORBank of America
Merrill Lynch 15/5/2035 (3,055) (3,043)
IRS GBP 1,112,000Fund receives Fixed 0.343% and pays Floating GBP 12 Month
SONIOBank of America
Merrill Lynch 7/12/2030 24,888 24,914
IRS EUR 2,650,000Fund receives Fixed 0.507% and pays Floating EUR 6 Month
EURIBORBank of America
Merrill Lynch 24/5/2023 (90) 33
IRS THB 7,990,000Fund receives Fixed 0.662% and pays Floating THB 6 Month
Thailand Fixing RateBank of America
Merrill Lynch 16/9/2025 (1,490) (1,490)
IRS CHF 1,256,168Fund receives Fixed 0.680% and pays Floating CHF 6 Month
LIBORBank of America
Merrill Lynch 23/5/2023 (695) (685)
IRS CHF 1,081,350Fund receives Fixed 0.685% and pays Floating CHF 6 Month
LIBORBank of America
Merrill Lynch 16/5/2023 (638) (630)
IRS KRW 227,130,000Fund receives Fixed 0.758% and pays Floating KRW 3 Month
KSDABank of America
Merrill Lynch 16/9/2025 (416) (416)
IRS KRW 398,980,000Fund receives Fixed 0.830% and pays Floating KRW 3 Month
KSDABank of America
Merrill Lynch 16/9/2025 297 297
IRS MYR 2,328,943Fund receives Fixed 2.716% and pays Floating MYR 3 Month
KLIBOBank of America
Merrill Lynch 17/6/2022 6,338 6,338
BlackRock Global Absolute Return Bond Fund continued
The notes on pages 691 to 711 form an integral part of these financial statements.
Annual report and audited financial statements [413]
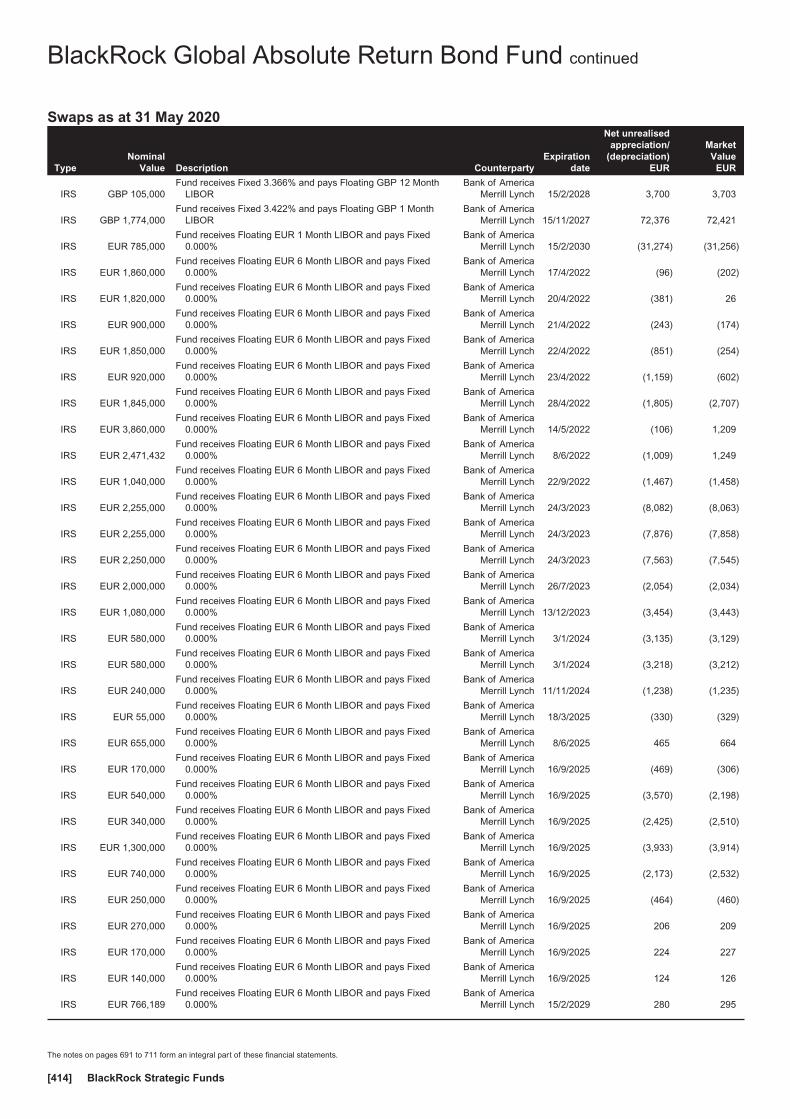
Swaps as at 31 May 2020
TypeNominal
Value Description CounterpartyExpiration
date
Net unrealisedappreciation/
(depreciation)EUR
MarketValue
EUR
IRS GBP 105,000Fund receives Fixed 3.366% and pays Floating GBP 12 Month
LIBORBank of America
Merrill Lynch 15/2/2028 3,700 3,703
IRS GBP 1,774,000Fund receives Fixed 3.422% and pays Floating GBP 1 Month
LIBORBank of America
Merrill Lynch 15/11/2027 72,376 72,421
IRS EUR 785,000Fund receives Floating EUR 1 Month LIBOR and pays Fixed
0.000%Bank of America
Merrill Lynch 15/2/2030 (31,274) (31,256)
IRS EUR 1,860,000Fund receives Floating EUR 6 Month LIBOR and pays Fixed
0.000%Bank of America
Merrill Lynch 17/4/2022 (96) (202)
IRS EUR 1,820,000Fund receives Floating EUR 6 Month LIBOR and pays Fixed
0.000%Bank of America
Merrill Lynch 20/4/2022 (381) 26
IRS EUR 900,000Fund receives Floating EUR 6 Month LIBOR and pays Fixed
0.000%Bank of America
Merrill Lynch 21/4/2022 (243) (174)
IRS EUR 1,850,000Fund receives Floating EUR 6 Month LIBOR and pays Fixed
0.000%Bank of America
Merrill Lynch 22/4/2022 (851) (254)
IRS EUR 920,000Fund receives Floating EUR 6 Month LIBOR and pays Fixed
0.000%Bank of America
Merrill Lynch 23/4/2022 (1,159) (602)
IRS EUR 1,845,000Fund receives Floating EUR 6 Month LIBOR and pays Fixed
0.000%Bank of America
Merrill Lynch 28/4/2022 (1,805) (2,707)
IRS EUR 3,860,000Fund receives Floating EUR 6 Month LIBOR and pays Fixed
0.000%Bank of America
Merrill Lynch 14/5/2022 (106) 1,209
IRS EUR 2,471,432Fund receives Floating EUR 6 Month LIBOR and pays Fixed
0.000%Bank of America
Merrill Lynch 8/6/2022 (1,009) 1,249
IRS EUR 1,040,000Fund receives Floating EUR 6 Month LIBOR and pays Fixed
0.000%Bank of America
Merrill Lynch 22/9/2022 (1,467) (1,458)
IRS EUR 2,255,000Fund receives Floating EUR 6 Month LIBOR and pays Fixed
0.000%Bank of America
Merrill Lynch 24/3/2023 (8,082) (8,063)
IRS EUR 2,255,000Fund receives Floating EUR 6 Month LIBOR and pays Fixed
0.000%Bank of America
Merrill Lynch 24/3/2023 (7,876) (7,858)
IRS EUR 2,250,000Fund receives Floating EUR 6 Month LIBOR and pays Fixed
0.000%Bank of America
Merrill Lynch 24/3/2023 (7,563) (7,545)
IRS EUR 2,000,000Fund receives Floating EUR 6 Month LIBOR and pays Fixed
0.000%Bank of America
Merrill Lynch 26/7/2023 (2,054) (2,034)
IRS EUR 1,080,000Fund receives Floating EUR 6 Month LIBOR and pays Fixed
0.000%Bank of America
Merrill Lynch 13/12/2023 (3,454) (3,443)
IRS EUR 580,000Fund receives Floating EUR 6 Month LIBOR and pays Fixed
0.000%Bank of America
Merrill Lynch 3/1/2024 (3,135) (3,129)
IRS EUR 580,000Fund receives Floating EUR 6 Month LIBOR and pays Fixed
0.000%Bank of America
Merrill Lynch 3/1/2024 (3,218) (3,212)
IRS EUR 240,000Fund receives Floating EUR 6 Month LIBOR and pays Fixed
0.000%Bank of America
Merrill Lynch 11/11/2024 (1,238) (1,235)
IRS EUR 55,000Fund receives Floating EUR 6 Month LIBOR and pays Fixed
0.000%Bank of America
Merrill Lynch 18/3/2025 (330) (329)
IRS EUR 655,000Fund receives Floating EUR 6 Month LIBOR and pays Fixed
0.000%Bank of America
Merrill Lynch 8/6/2025 465 664
IRS EUR 170,000Fund receives Floating EUR 6 Month LIBOR and pays Fixed
0.000%Bank of America
Merrill Lynch 16/9/2025 (469) (306)
IRS EUR 540,000Fund receives Floating EUR 6 Month LIBOR and pays Fixed
0.000%Bank of America
Merrill Lynch 16/9/2025 (3,570) (2,198)
IRS EUR 340,000Fund receives Floating EUR 6 Month LIBOR and pays Fixed
0.000%Bank of America
Merrill Lynch 16/9/2025 (2,425) (2,510)
IRS EUR 1,300,000Fund receives Floating EUR 6 Month LIBOR and pays Fixed
0.000%Bank of America
Merrill Lynch 16/9/2025 (3,933) (3,914)
IRS EUR 740,000Fund receives Floating EUR 6 Month LIBOR and pays Fixed
0.000%Bank of America
Merrill Lynch 16/9/2025 (2,173) (2,532)
IRS EUR 250,000Fund receives Floating EUR 6 Month LIBOR and pays Fixed
0.000%Bank of America
Merrill Lynch 16/9/2025 (464) (460)
IRS EUR 270,000Fund receives Floating EUR 6 Month LIBOR and pays Fixed
0.000%Bank of America
Merrill Lynch 16/9/2025 206 209
IRS EUR 170,000Fund receives Floating EUR 6 Month LIBOR and pays Fixed
0.000%Bank of America
Merrill Lynch 16/9/2025 224 227
IRS EUR 140,000Fund receives Floating EUR 6 Month LIBOR and pays Fixed
0.000%Bank of America
Merrill Lynch 16/9/2025 124 126
IRS EUR 766,189Fund receives Floating EUR 6 Month LIBOR and pays Fixed
0.000%Bank of America
Merrill Lynch 15/2/2029 280 295
BlackRock Global Absolute Return Bond Fund continued
The notes on pages 691 to 711 form an integral part of these financial statements.
BlackRock Strategic Funds[414]

Swaps as at 31 May 2020
TypeNominal
Value Description CounterpartyExpiration
date
Net unrealisedappreciation/
(depreciation)EUR
MarketValue
EUR
IRS EUR 196,255Fund receives Floating EUR 6 Month LIBOR and pays Fixed
0.000%Bank of America
Merrill Lynch 8/6/2030 735 1,554
IRS EUR 85,000Fund receives Floating EUR 6 Month LIBOR and pays Fixed
0.000%Bank of America
Merrill Lynch 15/5/2070 4,160 4,163
IRS EUR 42,500Fund receives Floating EUR 6 Month LIBOR and pays Fixed
0.000%Bank of America
Merrill Lynch 15/5/2070 2,146 2,148
IRS EUR 42,500Fund receives Floating EUR 6 Month LIBOR and pays Fixed
0.000%Bank of America
Merrill Lynch 15/5/2070 2,223 2,225
IRS EUR 150,000Fund receives Floating EUR 6 Month LIBOR and pays Fixed
0.000%Bank of America
Merrill Lynch 15/5/2070 7,730 7,735
IRS EUR 150,000Fund receives Floating EUR 6 Month LIBOR and pays Fixed
0.000%Bank of America
Merrill Lynch 15/5/2070 7,496 7,502
IRS GBP 254,000Fund receives Floating GBP 12 Month LIBOR and pays Fixed
3.422%Bank of America
Merrill Lynch 15/3/2048 (94,654) (94,640)
IRS GBP 751,000Fund receives Floating GBP 12 Month SONIO and pays Fixed
0.346%Bank of America
Merrill Lynch 17/6/2022 (4,976) (6,155)
IRS GBP 558,000Fund receives Floating GBP 12 Month SONIO and pays Fixed
0.347%Bank of America
Merrill Lynch 15/6/2022 (3,688) (4,562)
IRS GBP 553,000Fund receives Floating GBP 12 Month SONIO and pays Fixed
0.371%Bank of America
Merrill Lynch 22/10/2041 (25,083) (25,060)
IRS GBP 706,000Fund receives Floating GBP 12 Month SONIO and pays Fixed
0.398%Bank of America
Merrill Lynch 15/6/2022 (6,601) (6,594)
IRS GBP 328,000Fund receives Floating GBP 12 Month SONIO and pays Fixed
0.476%Bank of America
Merrill Lynch 15/12/2026 (9,600) (9,595)
IRS MYR 2,260,335Fund receives Fixed 2.675% and pays Floating MYR 3 Month
KLIBO BNP Paribas 17/6/2022 5,777 5,777
IRS MYR 2,274,144Fund receives Fixed 2.700% and pays Floating MYR 3 Month
KLIBO BNP Paribas 17/6/2022 6,042 6,042
IRS MYR 512,415Fund receives Floating MYR 3 Month KLIBO and pays Fixed
2.720% BNP Paribas 17/6/2025 (3,086) (3,086)
IRS KRW 190,540,000Fund receives Fixed 0.800% and pays Floating KRW 3 Month
KSDA Citibank 16/9/2025 (61) (61)
IRS BRL 2,024,835Fund receives Fixed 5.660% and pays Floating BRL 3 Month
BRCDI Citibank 2/1/2024 5,135 5,135
IRS MYR 1,357,078Fund receives Floating MYR 3 Month KLIBO and pays Fixed
2.609% Citibank 17/6/2025 (6,698) (6,698)
IRS MXN 421,000Fund receives Fixed 7.790% and pays Floating MXN 1 Month
Mexican Interbank Rate Deutsche Bank 31/12/2025 2,032 2,032
IRS KRW 57,389,320Fund receives Fixed 1.010% and pays Floating KRW 3 Month
KSDA HSBC 16/9/2025 410 409
IRS KRW 569,400,680Fund receives Fixed 1.010% and pays Floating KRW 3 Month
KSDA JP Morgan 16/9/2025 4,064 4,064
IRS KRW 523,710,000Fund receives Fixed 1.010% and pays Floating KRW 3 Month
KSDA JP Morgan 16/9/2025 3,738 3,737
IRS BRL 727,806Fund receives Fixed 5.130% and pays Floating BRL 3 Month
BRCDI JP Morgan 2/1/2023 2,675 2,675
TRS EUR 65,000Fund receives Markit iBoxx Euro Corporate Index and pays
3 Month EURIBOR Barclays Bank 20/6/2020 (2,458) (2,458)
TRS EUR 100,000Fund receives Markit iBoxx Euro Corporate Index and pays
3 Month EURIBOR Barclays Bank 20/6/2020 (70) (40)
TRS EUR 100,000Fund receives Markit iBoxx Euro Corporate Index and pays
3 Month EURIBOR Citibank 20/6/2020 3,415 3,422
TRS EUR 30,000Fund receives Markit iBoxx EUR Contingent Conver and pays
3 Month EURIBOR Goldman Sachs 20/6/2020 (511) (488)
TRS EUR 90,000Fund receives MarkitiBoxx Euro Corporate Index and pays
3 Month EURIBOR Goldman Sachs 20/6/2020 161 197
BlackRock Global Absolute Return Bond Fund continued
The notes on pages 691 to 711 form an integral part of these financial statements.
Annual report and audited financial statements [415]
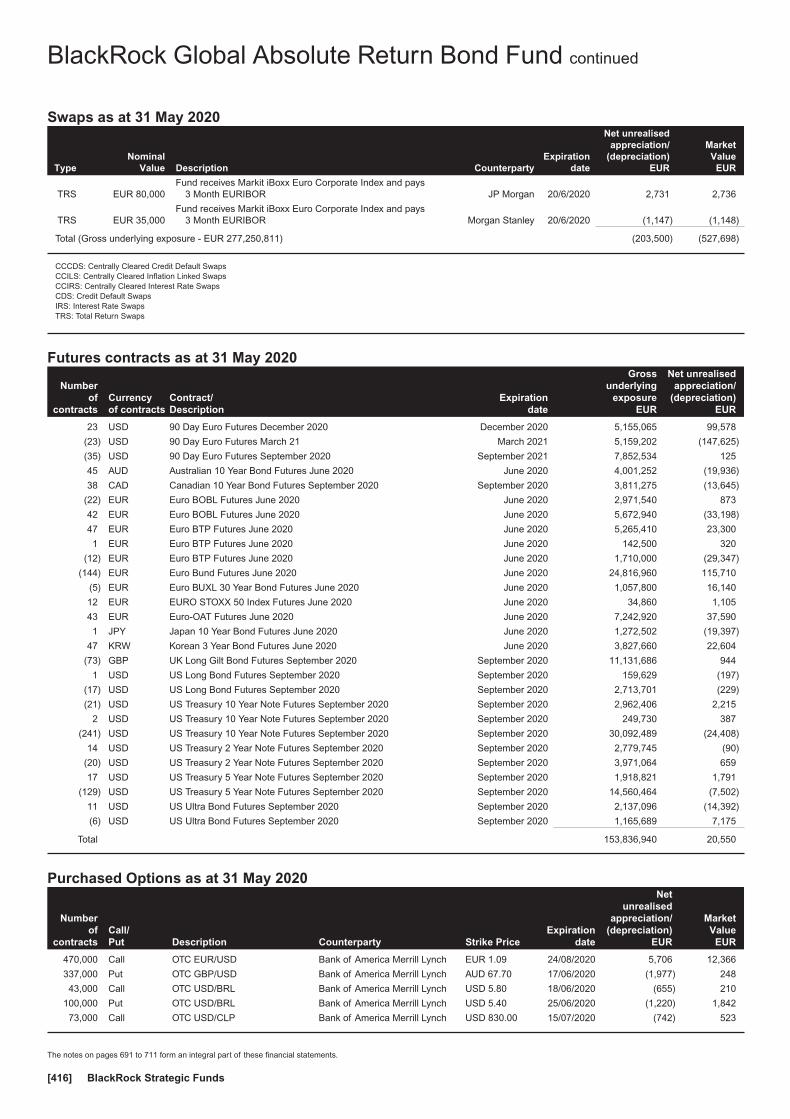
Swaps as at 31 May 2020
TypeNominal
Value Description CounterpartyExpiration
date
Net unrealisedappreciation/
(depreciation)EUR
MarketValue
EUR
TRS EUR 80,000Fund receives Markit iBoxx Euro Corporate Index and pays
3 Month EURIBOR JP Morgan 20/6/2020 2,731 2,736
TRS EUR 35,000Fund receives Markit iBoxx Euro Corporate Index and pays
3 Month EURIBOR Morgan Stanley 20/6/2020 (1,147) (1,148)
Total (Gross underlying exposure - EUR 277,250,811) (203,500) (527,698)
CCCDS: Centrally Cleared Credit Default SwapsCCILS: Centrally Cleared Inflation Linked SwapsCCIRS: Centrally Cleared Interest Rate SwapsCDS: Credit Default SwapsIRS: Interest Rate SwapsTRS: Total Return Swaps
Futures contracts as at 31 May 2020
Numberof
contractsCurrencyof contracts
Contract/Description
Expirationdate
Grossunderlying
exposureEUR
Net unrealisedappreciation/
(depreciation)EUR
23 USD 90 Day Euro Futures December 2020 December 2020 5,155,065 99,578
(23) USD 90 Day Euro Futures March 21 March 2021 5,159,202 (147,625)
(35) USD 90 Day Euro Futures September 2020 September 2021 7,852,534 125
45 AUD Australian 10 Year Bond Futures June 2020 June 2020 4,001,252 (19,936)
38 CAD Canadian 10 Year Bond Futures September 2020 September 2020 3,811,275 (13,645)
(22) EUR Euro BOBL Futures June 2020 June 2020 2,971,540 873
42 EUR Euro BOBL Futures June 2020 June 2020 5,672,940 (33,198)
47 EUR Euro BTP Futures June 2020 June 2020 5,265,410 23,300
1 EUR Euro BTP Futures June 2020 June 2020 142,500 320
(12) EUR Euro BTP Futures June 2020 June 2020 1,710,000 (29,347)
(144) EUR Euro Bund Futures June 2020 June 2020 24,816,960 115,710
(5) EUR Euro BUXL 30 Year Bond Futures June 2020 June 2020 1,057,800 16,140
12 EUR EURO STOXX 50 Index Futures June 2020 June 2020 34,860 1,105
43 EUR Euro-OAT Futures June 2020 June 2020 7,242,920 37,590
1 JPY Japan 10 Year Bond Futures June 2020 June 2020 1,272,502 (19,397)
47 KRW Korean 3 Year Bond Futures June 2020 June 2020 3,827,660 22,604
(73) GBP UK Long Gilt Bond Futures September 2020 September 2020 11,131,686 944
1 USD US Long Bond Futures September 2020 September 2020 159,629 (197)
(17) USD US Long Bond Futures September 2020 September 2020 2,713,701 (229)
(21) USD US Treasury 10 Year Note Futures September 2020 September 2020 2,962,406 2,215
2 USD US Treasury 10 Year Note Futures September 2020 September 2020 249,730 387
(241) USD US Treasury 10 Year Note Futures September 2020 September 2020 30,092,489 (24,408)
14 USD US Treasury 2 Year Note Futures September 2020 September 2020 2,779,745 (90)
(20) USD US Treasury 2 Year Note Futures September 2020 September 2020 3,971,064 659
17 USD US Treasury 5 Year Note Futures September 2020 September 2020 1,918,821 1,791
(129) USD US Treasury 5 Year Note Futures September 2020 September 2020 14,560,464 (7,502)
11 USD US Ultra Bond Futures September 2020 September 2020 2,137,096 (14,392)
(6) USD US Ultra Bond Futures September 2020 September 2020 1,165,689 7,175
Total 153,836,940 20,550
Purchased Options as at 31 May 2020
Numberof
contractsCall/Put Description Counterparty Strike Price
Expirationdate
Netunrealised
appreciation/(depreciation)
EUR
MarketValue
EUR
470,000 Call OTC EUR/USD Bank of America Merrill Lynch EUR 1.09 24/08/2020 5,706 12,366
337,000 Put OTC GBP/USD Bank of America Merrill Lynch AUD 67.70 17/06/2020 (1,977) 248
43,000 Call OTC USD/BRL Bank of America Merrill Lynch USD 5.80 18/06/2020 (655) 210
100,000 Put OTC USD/BRL Bank of America Merrill Lynch USD 5.40 25/06/2020 (1,220) 1,842
73,000 Call OTC USD/CLP Bank of America Merrill Lynch USD 830.00 15/07/2020 (742) 523
BlackRock Global Absolute Return Bond Fund continued
The notes on pages 691 to 711 form an integral part of these financial statements.
BlackRock Strategic Funds[416]
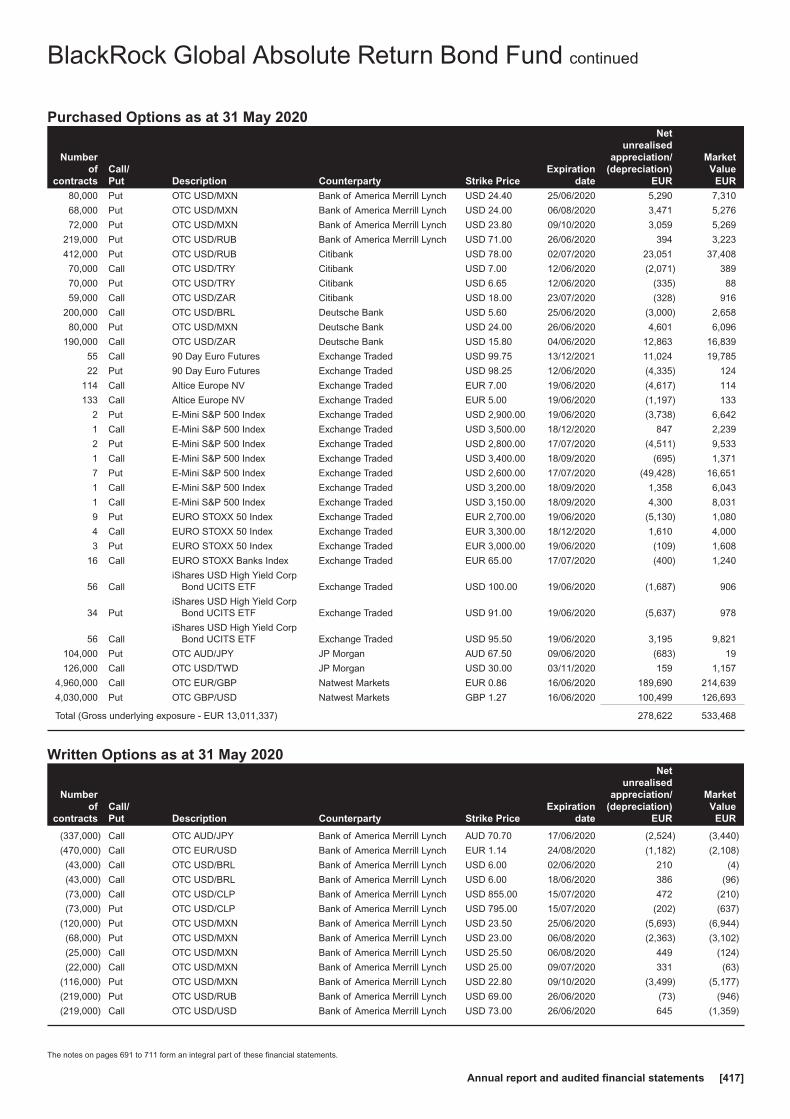
Purchased Options as at 31 May 2020
Numberof
contractsCall/Put Description Counterparty Strike Price
Expirationdate
Netunrealised
appreciation/(depreciation)
EUR
MarketValue
EUR
80,000 Put OTC USD/MXN Bank of America Merrill Lynch USD 24.40 25/06/2020 5,290 7,310
68,000 Put OTC USD/MXN Bank of America Merrill Lynch USD 24.00 06/08/2020 3,471 5,276
72,000 Put OTC USD/MXN Bank of America Merrill Lynch USD 23.80 09/10/2020 3,059 5,269
219,000 Put OTC USD/RUB Bank of America Merrill Lynch USD 71.00 26/06/2020 394 3,223
412,000 Put OTC USD/RUB Citibank USD 78.00 02/07/2020 23,051 37,408
70,000 Call OTC USD/TRY Citibank USD 7.00 12/06/2020 (2,071) 389
70,000 Put OTC USD/TRY Citibank USD 6.65 12/06/2020 (335) 88
59,000 Call OTC USD/ZAR Citibank USD 18.00 23/07/2020 (328) 916
200,000 Call OTC USD/BRL Deutsche Bank USD 5.60 25/06/2020 (3,000) 2,658
80,000 Put OTC USD/MXN Deutsche Bank USD 24.00 26/06/2020 4,601 6,096
190,000 Call OTC USD/ZAR Deutsche Bank USD 15.80 04/06/2020 12,863 16,839
55 Call 90 Day Euro Futures Exchange Traded USD 99.75 13/12/2021 11,024 19,785
22 Put 90 Day Euro Futures Exchange Traded USD 98.25 12/06/2020 (4,335) 124
114 Call Altice Europe NV Exchange Traded EUR 7.00 19/06/2020 (4,617) 114
133 Call Altice Europe NV Exchange Traded EUR 5.00 19/06/2020 (1,197) 133
2 Put E-Mini S&P 500 Index Exchange Traded USD 2,900.00 19/06/2020 (3,738) 6,642
1 Call E-Mini S&P 500 Index Exchange Traded USD 3,500.00 18/12/2020 847 2,239
2 Put E-Mini S&P 500 Index Exchange Traded USD 2,800.00 17/07/2020 (4,511) 9,533
1 Call E-Mini S&P 500 Index Exchange Traded USD 3,400.00 18/09/2020 (695) 1,371
7 Put E-Mini S&P 500 Index Exchange Traded USD 2,600.00 17/07/2020 (49,428) 16,651
1 Call E-Mini S&P 500 Index Exchange Traded USD 3,200.00 18/09/2020 1,358 6,043
1 Call E-Mini S&P 500 Index Exchange Traded USD 3,150.00 18/09/2020 4,300 8,031
9 Put EURO STOXX 50 Index Exchange Traded EUR 2,700.00 19/06/2020 (5,130) 1,080
4 Call EURO STOXX 50 Index Exchange Traded EUR 3,300.00 18/12/2020 1,610 4,000
3 Put EURO STOXX 50 Index Exchange Traded EUR 3,000.00 19/06/2020 (109) 1,608
16 Call EURO STOXX Banks Index Exchange Traded EUR 65.00 17/07/2020 (400) 1,240
56 CalliShares USD High Yield Corp
Bond UCITS ETF Exchange Traded USD 100.00 19/06/2020 (1,687) 906
34 PutiShares USD High Yield Corp
Bond UCITS ETF Exchange Traded USD 91.00 19/06/2020 (5,637) 978
56 CalliShares USD High Yield Corp
Bond UCITS ETF Exchange Traded USD 95.50 19/06/2020 3,195 9,821
104,000 Put OTC AUD/JPY JP Morgan AUD 67.50 09/06/2020 (683) 19
126,000 Call OTC USD/TWD JP Morgan USD 30.00 03/11/2020 159 1,157
4,960,000 Call OTC EUR/GBP Natwest Markets EUR 0.86 16/06/2020 189,690 214,639
4,030,000 Put OTC GBP/USD Natwest Markets GBP 1.27 16/06/2020 100,499 126,693
Total (Gross underlying exposure - EUR 13,011,337) 278,622 533,468
Written Options as at 31 May 2020
Numberof
contractsCall/Put Description Counterparty Strike Price
Expirationdate
Netunrealised
appreciation/(depreciation)
EUR
MarketValue
EUR
(337,000) Call OTC AUD/JPY Bank of America Merrill Lynch AUD 70.70 17/06/2020 (2,524) (3,440)
(470,000) Call OTC EUR/USD Bank of America Merrill Lynch EUR 1.14 24/08/2020 (1,182) (2,108)
(43,000) Call OTC USD/BRL Bank of America Merrill Lynch USD 6.00 02/06/2020 210 (4)
(43,000) Call OTC USD/BRL Bank of America Merrill Lynch USD 6.00 18/06/2020 386 (96)
(73,000) Call OTC USD/CLP Bank of America Merrill Lynch USD 855.00 15/07/2020 472 (210)
(73,000) Put OTC USD/CLP Bank of America Merrill Lynch USD 795.00 15/07/2020 (202) (637)
(120,000) Put OTC USD/MXN Bank of America Merrill Lynch USD 23.50 25/06/2020 (5,693) (6,944)
(68,000) Put OTC USD/MXN Bank of America Merrill Lynch USD 23.00 06/08/2020 (2,363) (3,102)
(25,000) Call OTC USD/MXN Bank of America Merrill Lynch USD 25.50 06/08/2020 449 (124)
(22,000) Call OTC USD/MXN Bank of America Merrill Lynch USD 25.00 09/07/2020 331 (63)
(116,000) Put OTC USD/MXN Bank of America Merrill Lynch USD 22.80 09/10/2020 (3,499) (5,177)
(219,000) Put OTC USD/RUB Bank of America Merrill Lynch USD 69.00 26/06/2020 (73) (946)
(219,000) Call OTC USD/USD Bank of America Merrill Lynch USD 73.00 26/06/2020 645 (1,359)
BlackRock Global Absolute Return Bond Fund continued
The notes on pages 691 to 711 form an integral part of these financial statements.
Annual report and audited financial statements [417]

Written Options as at 31 May 2020
Numberof
contractsCall/Put Description Counterparty Strike Price
Expirationdate
Netunrealised
appreciation/(depreciation)
EUR
MarketValue
EUR
(3,290,000) Call OTC EUR/GBP Citibank EUR 0.86 16/06/2020 94,180 (142,372)
(1,360,000) Put OTC GBP/USD Citibank GBP 1.27 16/06/2020 75,655 (42,755)
(412,000) Put OTC USD/RUB Citibank USD 75.00 02/07/2020 (15,759) (22,755)
(70,000) Put OTC USD/TRY Citibank USD 6.65 12/06/2020 674 (88)
(59,000) Put OTC USD/ZAR Citibank USD 17.00 23/07/2020 (21) (538)
(59,000) Call OTC USD/ZAR Citibank USD 19.00 23/07/2020 179 (348)
(100,000) Put OTC USD/BRL Deutsche Bank USD 5.40 25/06/2020 399 (1,842)
(200,000) Call OTC USD/BRL Deutsche Bank USD 6.00 25/06/2020 1,838 (696)
(100,000) Put OTC USD/MXN Deutsche Bank USD 23.00 26/06/2020 (3,489) (4,108)
(279,000) Call OTC USD/ZAR Deutsche Bank USD 17.00 04/06/2020 (5,884) (7,664)
(28) Call 90 Day Euro Futures Exchange Traded USD 99.38 13/12/2021 (16,549) (27,699)
(114) Call Altice Europe NV Exchange Traded EUR 9.00 19/06/2020 1,042 (114)
(133) Call Altice Europe NV Exchange Traded EUR 6.00 19/06/2020 66 (133)
(2) Put E-Mini S&P 500 Index Exchange Traded USD 2,800.00 19/06/2020 2,487 (3,957)
(1) Call E-Mini S&P 500 Index Exchange Traded USD 3,600.00 18/12/2020 (442) (1,196)
(2) Call E-Mini S&P 500 Index Exchange Traded USD 3,500.00 18/09/2020 769 (1,318)
(8) Put E-Mini S&P 500 Index Exchange Traded USD 2,200.00 17/07/2020 17,771 (5,324)
(1) Put E-Mini S&P 500 Index Exchange Traded USD 2,400.00 17/07/2020 3,044 (1,223)
(1) Call E-Mini S&P 500 Index Exchange Traded USD 3,300.00 18/09/2020 (1,572) (3,096)
(4) Call EURO STOXX 50 Index Exchange Traded EUR 3,550.00 18/12/2020 (503) (1,312)
(3) Put EURO STOXX 50 Index Exchange Traded EUR 2,900.00 19/06/2020 (11) (990)
(9) Put EURO STOXX 50 Index Exchange Traded EUR 2,500.00 19/06/2020 2,754 (450)
(16) Call EURO STOXX Banks Index Exchange Traded EUR 75.00 17/07/2020 60 (260)
(34) PutiShares USD High Yield Corp
Bond UCITS ETF Exchange Traded USD 87.00 19/06/2020 2,740 (306)
(56) CalliShares USD High Yield Corp
Bond UCITS ETF Exchange Traded USD 97.50 19/06/2020 (1,938) (4,130)
(52,000) Call OTC AUD/JPY JP Morgan AUD 71.00 09/07/2020 (342) (585)
(67,000) Put OTC USD/TWD JP Morgan USD 29.25 07/08/2020 281 (145)
(290,000) Call OTC USD/TWD JP Morgan USD 30.25 24/08/2020 (61) (1,412)
Total (Gross underlying exposure - EUR 8,100,934) 144,325 (301,026)
Purchased Swaptions as at 31 May 2020
NominalValue
Call/Put Description Counterparty Strike Price
Expirationdate
Netnrealised
appreciation/(depreciation)
EUR
MarketValue
EUR
400,000 Put
Fund purchases an option to enter into aCredit Default Swap. If exercised Fundreceives default protection on Markit iTraxxEurope Series 33 Version 1 from17/6/2020; and provides 5% Fixedsemi-annually from 20/6/2020
Bank of AmericaMerrill Lynch EUR 550.00 17/06/2020 (10,556) 844
1,630,000 Call
Fund purchases an option to enter into anInterest Rate Swap. If exercised Fundreceives 0.39% Fixed semi-annually from24/5/2023; and pays Floating USD LIBOR3 Month BBA quarterly from 24/8/2023
Bank of AmericaMerrill Lynch USD 0.39 22/05/2023 (192) 4,336
5,830,000 Call
Fund purchases an option to enter into anInterest Rate Swap. If exercised Fundreceives 1.25% Fixed semi-annually from12/8/2020; and pays Floating USD LIBOR3 Month BBA quarterly from 12/11/2020
Bank of AmericaMerrill Lynch USD 1.25 10/08/2020 78,314 104,349
2,105,000 Put
Fund purchases an option to enter into anInterest Rate Swap. If exercised Fundreceives Floating EUR EURIBOR 6 Monthsemi-annually from 26/12/2020; and pays0% Fixed annually from 26/6/2020
Bank of AmericaMerrill Lynch EUR 0.00 24/06/2020 (892) 2
BlackRock Global Absolute Return Bond Fund continued
The notes on pages 691 to 711 form an integral part of these financial statements.
BlackRock Strategic Funds[418]
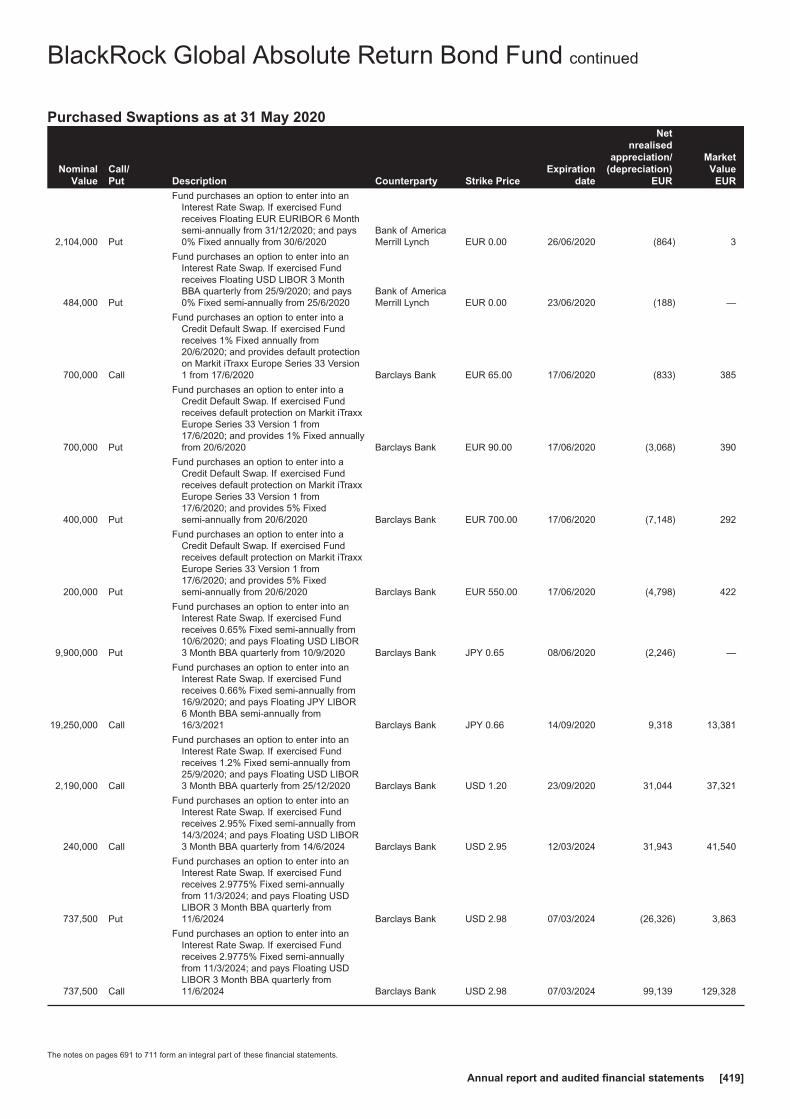
Purchased Swaptions as at 31 May 2020
NominalValue
Call/Put Description Counterparty Strike Price
Expirationdate
Netnrealised
appreciation/(depreciation)
EUR
MarketValue
EUR
2,104,000 Put
Fund purchases an option to enter into anInterest Rate Swap. If exercised Fundreceives Floating EUR EURIBOR 6 Monthsemi-annually from 31/12/2020; and pays0% Fixed annually from 30/6/2020
Bank of AmericaMerrill Lynch EUR 0.00 26/06/2020 (864) 3
484,000 Put
Fund purchases an option to enter into anInterest Rate Swap. If exercised Fundreceives Floating USD LIBOR 3 MonthBBA quarterly from 25/9/2020; and pays0% Fixed semi-annually from 25/6/2020
Bank of AmericaMerrill Lynch EUR 0.00 23/06/2020 (188) —
700,000 Call
Fund purchases an option to enter into aCredit Default Swap. If exercised Fundreceives 1% Fixed annually from20/6/2020; and provides default protectionon Markit iTraxx Europe Series 33 Version1 from 17/6/2020 Barclays Bank EUR 65.00 17/06/2020 (833) 385
700,000 Put
Fund purchases an option to enter into aCredit Default Swap. If exercised Fundreceives default protection on Markit iTraxxEurope Series 33 Version 1 from17/6/2020; and provides 1% Fixed annuallyfrom 20/6/2020 Barclays Bank EUR 90.00 17/06/2020 (3,068) 390
400,000 Put
Fund purchases an option to enter into aCredit Default Swap. If exercised Fundreceives default protection on Markit iTraxxEurope Series 33 Version 1 from17/6/2020; and provides 5% Fixedsemi-annually from 20/6/2020 Barclays Bank EUR 700.00 17/06/2020 (7,148) 292
200,000 Put
Fund purchases an option to enter into aCredit Default Swap. If exercised Fundreceives default protection on Markit iTraxxEurope Series 33 Version 1 from17/6/2020; and provides 5% Fixedsemi-annually from 20/6/2020 Barclays Bank EUR 550.00 17/06/2020 (4,798) 422
9,900,000 Put
Fund purchases an option to enter into anInterest Rate Swap. If exercised Fundreceives 0.65% Fixed semi-annually from10/6/2020; and pays Floating USD LIBOR3 Month BBA quarterly from 10/9/2020 Barclays Bank JPY 0.65 08/06/2020 (2,246) —
19,250,000 Call
Fund purchases an option to enter into anInterest Rate Swap. If exercised Fundreceives 0.66% Fixed semi-annually from16/9/2020; and pays Floating JPY LIBOR6 Month BBA semi-annually from16/3/2021 Barclays Bank JPY 0.66 14/09/2020 9,318 13,381
2,190,000 Call
Fund purchases an option to enter into anInterest Rate Swap. If exercised Fundreceives 1.2% Fixed semi-annually from25/9/2020; and pays Floating USD LIBOR3 Month BBA quarterly from 25/12/2020 Barclays Bank USD 1.20 23/09/2020 31,044 37,321
240,000 Call
Fund purchases an option to enter into anInterest Rate Swap. If exercised Fundreceives 2.95% Fixed semi-annually from14/3/2024; and pays Floating USD LIBOR3 Month BBA quarterly from 14/6/2024 Barclays Bank USD 2.95 12/03/2024 31,943 41,540
737,500 Put
Fund purchases an option to enter into anInterest Rate Swap. If exercised Fundreceives 2.9775% Fixed semi-annuallyfrom 11/3/2024; and pays Floating USDLIBOR 3 Month BBA quarterly from11/6/2024 Barclays Bank USD 2.98 07/03/2024 (26,326) 3,863
737,500 Call
Fund purchases an option to enter into anInterest Rate Swap. If exercised Fundreceives 2.9775% Fixed semi-annuallyfrom 11/3/2024; and pays Floating USDLIBOR 3 Month BBA quarterly from11/6/2024 Barclays Bank USD 2.98 07/03/2024 99,139 129,328
BlackRock Global Absolute Return Bond Fund continued
The notes on pages 691 to 711 form an integral part of these financial statements.
Annual report and audited financial statements [419]
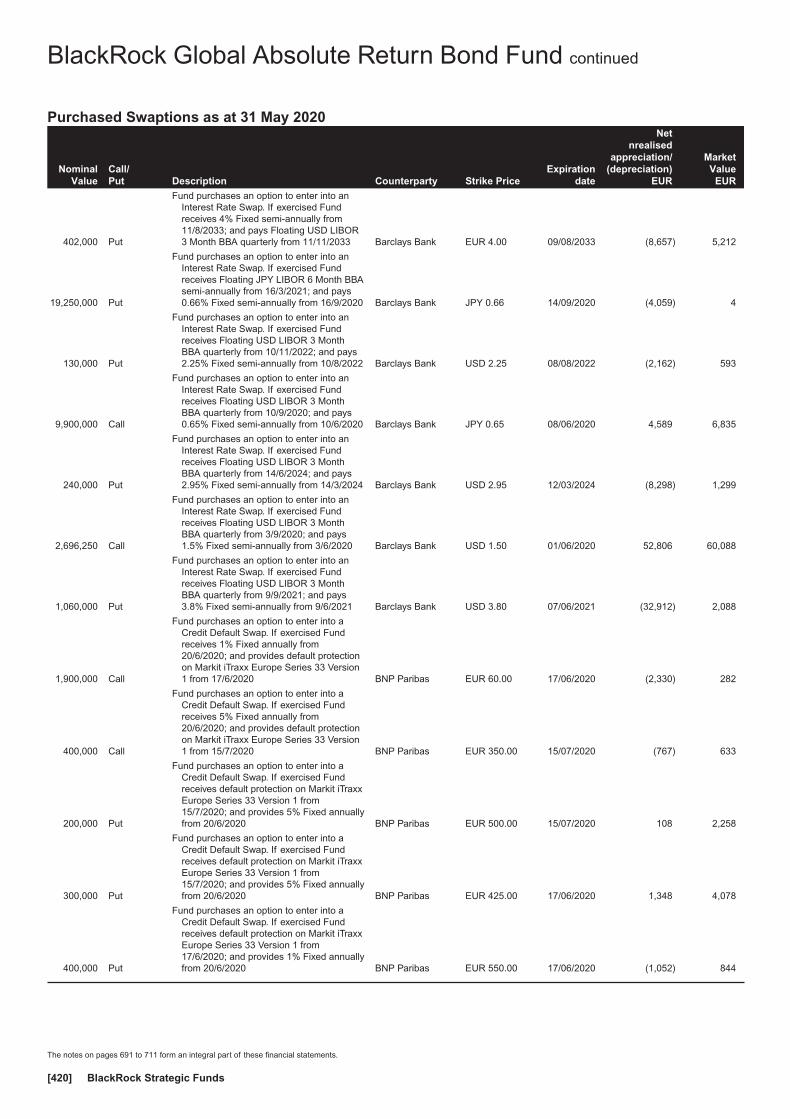
Purchased Swaptions as at 31 May 2020
NominalValue
Call/Put Description Counterparty Strike Price
Expirationdate
Netnrealised
appreciation/(depreciation)
EUR
MarketValue
EUR
402,000 Put
Fund purchases an option to enter into anInterest Rate Swap. If exercised Fundreceives 4% Fixed semi-annually from11/8/2033; and pays Floating USD LIBOR3 Month BBA quarterly from 11/11/2033 Barclays Bank EUR 4.00 09/08/2033 (8,657) 5,212
19,250,000 Put
Fund purchases an option to enter into anInterest Rate Swap. If exercised Fundreceives Floating JPY LIBOR 6 Month BBAsemi-annually from 16/3/2021; and pays0.66% Fixed semi-annually from 16/9/2020 Barclays Bank JPY 0.66 14/09/2020 (4,059) 4
130,000 Put
Fund purchases an option to enter into anInterest Rate Swap. If exercised Fundreceives Floating USD LIBOR 3 MonthBBA quarterly from 10/11/2022; and pays2.25% Fixed semi-annually from 10/8/2022 Barclays Bank USD 2.25 08/08/2022 (2,162) 593
9,900,000 Call
Fund purchases an option to enter into anInterest Rate Swap. If exercised Fundreceives Floating USD LIBOR 3 MonthBBA quarterly from 10/9/2020; and pays0.65% Fixed semi-annually from 10/6/2020 Barclays Bank JPY 0.65 08/06/2020 4,589 6,835
240,000 Put
Fund purchases an option to enter into anInterest Rate Swap. If exercised Fundreceives Floating USD LIBOR 3 MonthBBA quarterly from 14/6/2024; and pays2.95% Fixed semi-annually from 14/3/2024 Barclays Bank USD 2.95 12/03/2024 (8,298) 1,299
2,696,250 Call
Fund purchases an option to enter into anInterest Rate Swap. If exercised Fundreceives Floating USD LIBOR 3 MonthBBA quarterly from 3/9/2020; and pays1.5% Fixed semi-annually from 3/6/2020 Barclays Bank USD 1.50 01/06/2020 52,806 60,088
1,060,000 Put
Fund purchases an option to enter into anInterest Rate Swap. If exercised Fundreceives Floating USD LIBOR 3 MonthBBA quarterly from 9/9/2021; and pays3.8% Fixed semi-annually from 9/6/2021 Barclays Bank USD 3.80 07/06/2021 (32,912) 2,088
1,900,000 Call
Fund purchases an option to enter into aCredit Default Swap. If exercised Fundreceives 1% Fixed annually from20/6/2020; and provides default protectionon Markit iTraxx Europe Series 33 Version1 from 17/6/2020 BNP Paribas EUR 60.00 17/06/2020 (2,330) 282
400,000 Call
Fund purchases an option to enter into aCredit Default Swap. If exercised Fundreceives 5% Fixed annually from20/6/2020; and provides default protectionon Markit iTraxx Europe Series 33 Version1 from 15/7/2020 BNP Paribas EUR 350.00 15/07/2020 (767) 633
200,000 Put
Fund purchases an option to enter into aCredit Default Swap. If exercised Fundreceives default protection on Markit iTraxxEurope Series 33 Version 1 from15/7/2020; and provides 5% Fixed annuallyfrom 20/6/2020 BNP Paribas EUR 500.00 15/07/2020 108 2,258
300,000 Put
Fund purchases an option to enter into aCredit Default Swap. If exercised Fundreceives default protection on Markit iTraxxEurope Series 33 Version 1 from15/7/2020; and provides 5% Fixed annuallyfrom 20/6/2020 BNP Paribas EUR 425.00 17/06/2020 1,348 4,078
400,000 Put
Fund purchases an option to enter into aCredit Default Swap. If exercised Fundreceives default protection on Markit iTraxxEurope Series 33 Version 1 from17/6/2020; and provides 1% Fixed annuallyfrom 20/6/2020 BNP Paribas EUR 550.00 17/06/2020 (1,052) 844
BlackRock Global Absolute Return Bond Fund continued
The notes on pages 691 to 711 form an integral part of these financial statements.
BlackRock Strategic Funds[420]

Purchased Swaptions as at 31 May 2020
NominalValue
Call/Put Description Counterparty Strike Price
Expirationdate
Netnrealised
appreciation/(depreciation)
EUR
MarketValue
EUR
200,000 Put
Fund purchases an option to enter into aCredit Default Swap. If exercised Fundreceives default protection on Markit iTraxxEurope Series 33 Version 1 from17/6/2020; and provides 5% Fixed annuallyfrom 20/6/2020 BNP Paribas EUR 525.00 17/06/2020 (932) 563
200,000 Put
Fund purchases an option to enter into aCredit Default Swap. If exercised Fundreceives default protection on Markit iTraxxEurope Series 33 Version 1 from17/6/2020; and provides 5% Fixedsemi-annually from 20/6/2020 Citibank EUR 550.00 17/06/2020 (3,778) 422
8,900,000 Call
Fund purchases an option to enter into anInterest Rate Cap. If exercised Fundreceives Max USD 0 - 5 Year ConstantMaturity Swap - 0.3% annually from14/2/2022; and pays 0.3% on 14/2/2022 Citibank USD 0.30 14/02/2022 16,892 31,320
270,000 Call
Fund purchases an option to enter into anInterest Rate Swap. If exercised Fundreceives 1.492% Fixed semi-annually from27/2/2025; and pays Floating USD LIBOR3 Month BBA quarterly from 27/5/2025 Citibank USD 1.49 25/02/2025 5,448 18,535
1,715,000 Put
Fund purchases an option to enter into anInterest Rate Swap. If exercised Fundreceives Floating USD LIBOR 3 MonthBBA quarterly from 15/10/2020; and pays2.35% Fixed semi-annually from 15/7/2020 Citibank USD 2.35 13/07/2020 (5,838) 1
270,000 Put
Fund purchases an option to enter into anInterest Rate Swap. If exercised Fundreceives Floating USD LIBOR 3 MonthBBA quarterly from 27/5/2027; and pays1.492% Fixed semi-annually from27/2/2025 Citibank USD 1.49 25/02/2025 (4,725) 8,362
103,180,000 Put
Fund purchases an option to enter into anInterest Rate Swap. If exercised Fundreceives 1.25% Fixed semi-annually from13/1/2022; and pays Floating USD LIBOR3 Month BBA quarterly from 13/4/2022 Credit Suisse JPY 1.25 11/01/2022 (11,957) 32
140,000 Call
Fund purchases an option to enter into anInterest Rate Swap. If exercised Fundreceives 0.828% Fixed semi-annually from25/11/2020; and pays Floating USD LIBOR3 Month BBA quarterly from 25/2/2021 Deutsche Bank USD 0.83 23/11/2020 (4,460) 4,468
190,000 Call
Fund purchases an option to enter into anInterest Rate Swap. If exercised Fundreceives 0.89% Fixed semi-annually from2/5/2025; and pays Floating USD LIBOR3 Month BBA quarterly from 2/8/2025 Deutsche Bank USD 0.89 30/04/2025 (2,132) 7,307
190,000 Put
Fund purchases an option to enter into anInterest Rate Swap. If exercised Fundreceives Floating USD LIBOR 3 MonthBBA quarterly from 2/8/2025; and pays0.89% Fixed semi-annually from 2/5/2025 Deutsche Bank USD 0.89 30/04/2025 1,156 10,595
140,000 Put
Fund purchases an option to enter into anInterest Rate Swap. If exercised Fundreceives Floating USD LIBOR 3 MonthBBA quarterly from 25/2/2021; and pays0.828% Fixed semi-annually from25/11/2020 Deutsche Bank USD 0.83 23/11/2020 1,359 10,287
1,170,000 Call
Fund purchases an option to enter into anInterest Rate Swap. If exercised Fundreceives Floating USD LIBOR 3 MonthBBA quarterly from 29/08/2028; and pays3.05% Fixed semi-annually from29/06/2038 Deutsche Bank USD 3.05 27/06/2028 167,214 1,175,183
BlackRock Global Absolute Return Bond Fund continued
The notes on pages 691 to 711 form an integral part of these financial statements.
Annual report and audited financial statements [421]
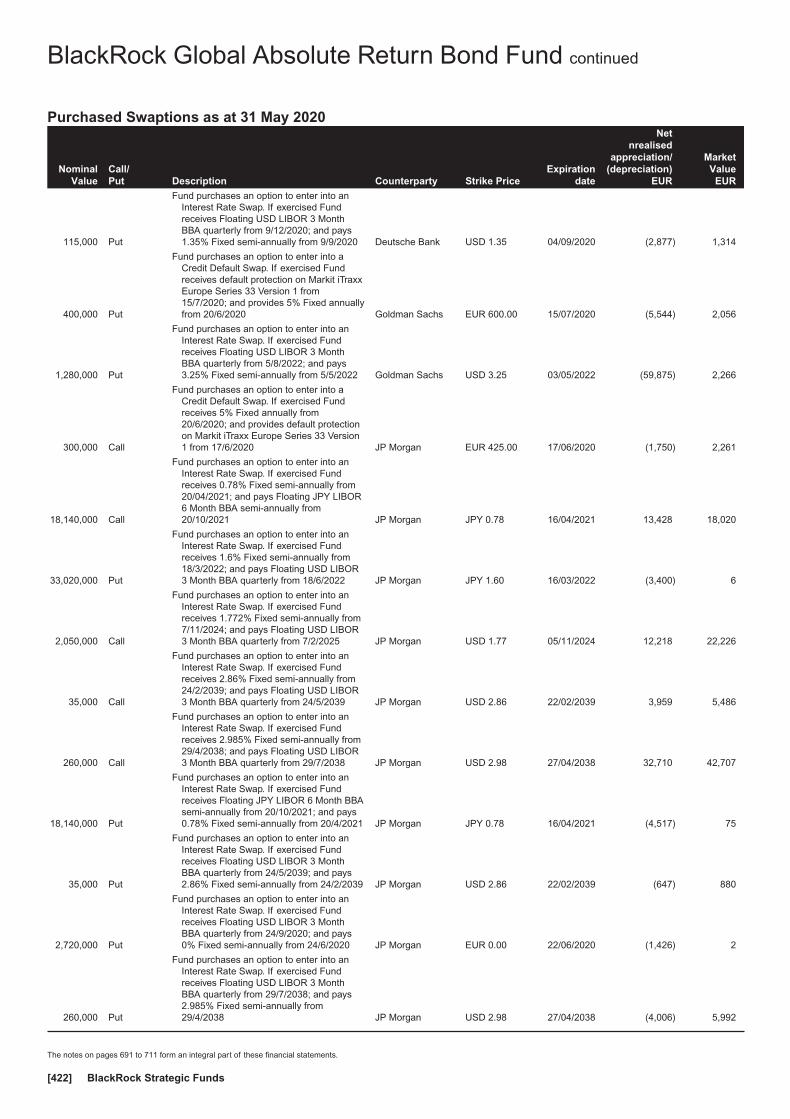
Purchased Swaptions as at 31 May 2020
NominalValue
Call/Put Description Counterparty Strike Price
Expirationdate
Netnrealised
appreciation/(depreciation)
EUR
MarketValue
EUR
115,000 Put
Fund purchases an option to enter into anInterest Rate Swap. If exercised Fundreceives Floating USD LIBOR 3 MonthBBA quarterly from 9/12/2020; and pays1.35% Fixed semi-annually from 9/9/2020 Deutsche Bank USD 1.35 04/09/2020 (2,877) 1,314
400,000 Put
Fund purchases an option to enter into aCredit Default Swap. If exercised Fundreceives default protection on Markit iTraxxEurope Series 33 Version 1 from15/7/2020; and provides 5% Fixed annuallyfrom 20/6/2020 Goldman Sachs EUR 600.00 15/07/2020 (5,544) 2,056
1,280,000 Put
Fund purchases an option to enter into anInterest Rate Swap. If exercised Fundreceives Floating USD LIBOR 3 MonthBBA quarterly from 5/8/2022; and pays3.25% Fixed semi-annually from 5/5/2022 Goldman Sachs USD 3.25 03/05/2022 (59,875) 2,266
300,000 Call
Fund purchases an option to enter into aCredit Default Swap. If exercised Fundreceives 5% Fixed annually from20/6/2020; and provides default protectionon Markit iTraxx Europe Series 33 Version1 from 17/6/2020 JP Morgan EUR 425.00 17/06/2020 (1,750) 2,261
18,140,000 Call
Fund purchases an option to enter into anInterest Rate Swap. If exercised Fundreceives 0.78% Fixed semi-annually from20/04/2021; and pays Floating JPY LIBOR6 Month BBA semi-annually from20/10/2021 JP Morgan JPY 0.78 16/04/2021 13,428 18,020
33,020,000 Put
Fund purchases an option to enter into anInterest Rate Swap. If exercised Fundreceives 1.6% Fixed semi-annually from18/3/2022; and pays Floating USD LIBOR3 Month BBA quarterly from 18/6/2022 JP Morgan JPY 1.60 16/03/2022 (3,400) 6
2,050,000 Call
Fund purchases an option to enter into anInterest Rate Swap. If exercised Fundreceives 1.772% Fixed semi-annually from7/11/2024; and pays Floating USD LIBOR3 Month BBA quarterly from 7/2/2025 JP Morgan USD 1.77 05/11/2024 12,218 22,226
35,000 Call
Fund purchases an option to enter into anInterest Rate Swap. If exercised Fundreceives 2.86% Fixed semi-annually from24/2/2039; and pays Floating USD LIBOR3 Month BBA quarterly from 24/5/2039 JP Morgan USD 2.86 22/02/2039 3,959 5,486
260,000 Call
Fund purchases an option to enter into anInterest Rate Swap. If exercised Fundreceives 2.985% Fixed semi-annually from29/4/2038; and pays Floating USD LIBOR3 Month BBA quarterly from 29/7/2038 JP Morgan USD 2.98 27/04/2038 32,710 42,707
18,140,000 Put
Fund purchases an option to enter into anInterest Rate Swap. If exercised Fundreceives Floating JPY LIBOR 6 Month BBAsemi-annually from 20/10/2021; and pays0.78% Fixed semi-annually from 20/4/2021 JP Morgan JPY 0.78 16/04/2021 (4,517) 75
35,000 Put
Fund purchases an option to enter into anInterest Rate Swap. If exercised Fundreceives Floating USD LIBOR 3 MonthBBA quarterly from 24/5/2039; and pays2.86% Fixed semi-annually from 24/2/2039 JP Morgan USD 2.86 22/02/2039 (647) 880
2,720,000 Put
Fund purchases an option to enter into anInterest Rate Swap. If exercised Fundreceives Floating USD LIBOR 3 MonthBBA quarterly from 24/9/2020; and pays0% Fixed semi-annually from 24/6/2020 JP Morgan EUR 0.00 22/06/2020 (1,426) 2
260,000 Put
Fund purchases an option to enter into anInterest Rate Swap. If exercised Fundreceives Floating USD LIBOR 3 MonthBBA quarterly from 29/7/2038; and pays2.985% Fixed semi-annually from29/4/2038 JP Morgan USD 2.98 27/04/2038 (4,006) 5,992
BlackRock Global Absolute Return Bond Fund continued
The notes on pages 691 to 711 form an integral part of these financial statements.
BlackRock Strategic Funds[422]
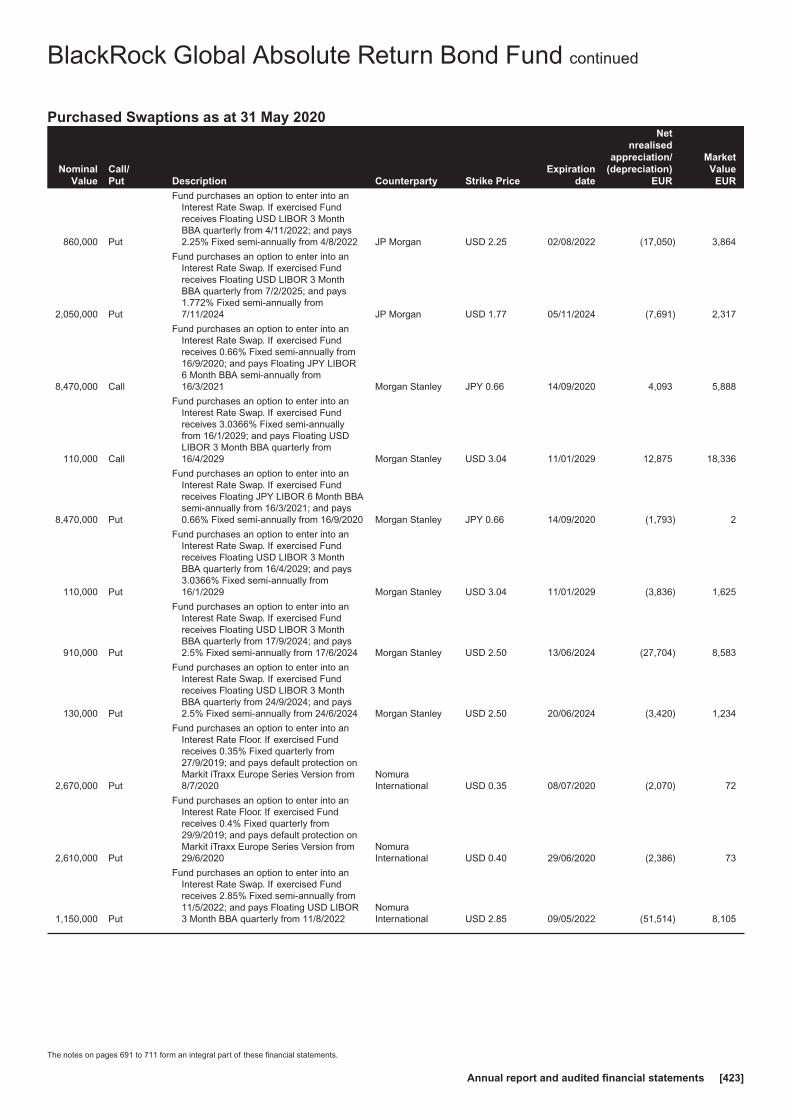
Purchased Swaptions as at 31 May 2020
NominalValue
Call/Put Description Counterparty Strike Price
Expirationdate
Netnrealised
appreciation/(depreciation)
EUR
MarketValue
EUR
860,000 Put
Fund purchases an option to enter into anInterest Rate Swap. If exercised Fundreceives Floating USD LIBOR 3 MonthBBA quarterly from 4/11/2022; and pays2.25% Fixed semi-annually from 4/8/2022 JP Morgan USD 2.25 02/08/2022 (17,050) 3,864
2,050,000 Put
Fund purchases an option to enter into anInterest Rate Swap. If exercised Fundreceives Floating USD LIBOR 3 MonthBBA quarterly from 7/2/2025; and pays1.772% Fixed semi-annually from7/11/2024 JP Morgan USD 1.77 05/11/2024 (7,691) 2,317
8,470,000 Call
Fund purchases an option to enter into anInterest Rate Swap. If exercised Fundreceives 0.66% Fixed semi-annually from16/9/2020; and pays Floating JPY LIBOR6 Month BBA semi-annually from16/3/2021 Morgan Stanley JPY 0.66 14/09/2020 4,093 5,888
110,000 Call
Fund purchases an option to enter into anInterest Rate Swap. If exercised Fundreceives 3.0366% Fixed semi-annuallyfrom 16/1/2029; and pays Floating USDLIBOR 3 Month BBA quarterly from16/4/2029 Morgan Stanley USD 3.04 11/01/2029 12,875 18,336
8,470,000 Put
Fund purchases an option to enter into anInterest Rate Swap. If exercised Fundreceives Floating JPY LIBOR 6 Month BBAsemi-annually from 16/3/2021; and pays0.66% Fixed semi-annually from 16/9/2020 Morgan Stanley JPY 0.66 14/09/2020 (1,793) 2
110,000 Put
Fund purchases an option to enter into anInterest Rate Swap. If exercised Fundreceives Floating USD LIBOR 3 MonthBBA quarterly from 16/4/2029; and pays3.0366% Fixed semi-annually from16/1/2029 Morgan Stanley USD 3.04 11/01/2029 (3,836) 1,625
910,000 Put
Fund purchases an option to enter into anInterest Rate Swap. If exercised Fundreceives Floating USD LIBOR 3 MonthBBA quarterly from 17/9/2024; and pays2.5% Fixed semi-annually from 17/6/2024 Morgan Stanley USD 2.50 13/06/2024 (27,704) 8,583
130,000 Put
Fund purchases an option to enter into anInterest Rate Swap. If exercised Fundreceives Floating USD LIBOR 3 MonthBBA quarterly from 24/9/2024; and pays2.5% Fixed semi-annually from 24/6/2024 Morgan Stanley USD 2.50 20/06/2024 (3,420) 1,234
2,670,000 Put
Fund purchases an option to enter into anInterest Rate Floor. If exercised Fundreceives 0.35% Fixed quarterly from27/9/2019; and pays default protection onMarkit iTraxx Europe Series Version from8/7/2020
NomuraInternational USD 0.35 08/07/2020 (2,070) 72
2,610,000 Put
Fund purchases an option to enter into anInterest Rate Floor. If exercised Fundreceives 0.4% Fixed quarterly from29/9/2019; and pays default protection onMarkit iTraxx Europe Series Version from29/6/2020
NomuraInternational USD 0.40 29/06/2020 (2,386) 73
1,150,000 Put
Fund purchases an option to enter into anInterest Rate Swap. If exercised Fundreceives 2.85% Fixed semi-annually from11/5/2022; and pays Floating USD LIBOR3 Month BBA quarterly from 11/8/2022
NomuraInternational USD 2.85 09/05/2022 (51,514) 8,105
BlackRock Global Absolute Return Bond Fund continued
The notes on pages 691 to 711 form an integral part of these financial statements.
Annual report and audited financial statements [423]

Purchased Swaptions as at 31 May 2020
NominalValue
Call/Put Description Counterparty Strike Price
Expirationdate
Netnrealised
appreciation/(depreciation)
EUR
MarketValue
EUR
330,000 Call
Fund purchases an option to enter into anInterest Rate Swap. If exercised Fundreceives 3.04% Fixed semi-annually from12/1/2029; and pays Floating USD LIBOR3 Month BBA quarterly from 12/4/2029
NomuraInternational USD 3.04 10/01/2029 38,811 55,096
330,000 Put
Fund purchases an option to enter into anInterest Rate Swap. If exercised Fundreceives Floating USD LIBOR 3 MonthBBA quarterly from 12/4/2029; and pays3.04% Fixed semi-annually from 12/1/2029
NomuraInternational USD 3.04 10/01/2029 (11,425) 4,860
Total (Gross underlying exposure - EUR 29,760,643) 254,671 1,901,091
Written Swaptions as at 31 May 2020
NominalValue
Call/Put Description Counterparty Strike Price
Expirationdate
Netunrealised
appreciation/(depreciation)
EUR
MarketValue
EUR
(3,200,000) Put
Fund writes an option to enter into an InterestRate Swap. If exercised Fund receives3.25% Fixed semi-annually from 5/5/2022;and pays Floating USD LIBOR 3 MonthBBA quarterly from 5/8/2022 Goldman Sachs USD 3.25 03/05/2022 60,853 (505)
(750,000) Put
Fund writes an option to enter into an InterestRate Swap. If exercised Fund receives2.15% Fixed annually from 21/4/2021; andpays Floating EUR EURIBOR 6 Monthsemi-annually from 21/10/2021 JP Morgan EUR 2.15 19/04/2021 12,839 (137)
(470,000) Put
Fund writes an option to enter into an InterestRate Swap. If exercised Fund receives 2%Fixed annually from 6/5/2021; and paysFloating EUR EURIBOR 6 Monthsemi-annually from 6/11/2021 Barclays Bank EUR 2.00 04/05/2021 9,672 (114)
(4,470,000) Put
Fund writes an option to enter into an InterestRate Swap. If exercised Fund receives2.9% Fixed semi-annually from 2/6/2020;and pays Floating USD LIBOR 3 MonthBBA quarterly from 2/9/2020 Deutsche Bank USD 2.90 29/05/2020 28,285 —
(2,240,000) Put
Fund writes an option to enter into an InterestRate Swap. If exercised Fund receives3.87% Fixed semi-annually from 9/6/2021;and pays Floating USD LIBOR 3 MonthBBA quarterly from 9/9/2021 Barclays Bank USD 3.87 07/06/2021 36,955 (187)
(6,240,000) Put
Fund writes an option to enter into an InterestRate Swap. If exercised Fund receives3.45% Fixed semi-annually from10/6/2020; and pays Floating USD LIBOR3 Month BBA quarterly from 10/9/2020 Goldman Sachs USD 3.45 08/06/2020 21,970 —
(4,611,000) Put
Fund writes an option to enter into an InterestRate Swap. If exercised Fund receives3.5% Fixed semi-annually from 26/8/2020;and pays Floating USD LIBOR 3 MonthBBA quarterly from 26/11/2020 Barclays Bank USD 3.50 24/08/2020 13,416 —
(4,280,000) Put
Fund writes an option to enter into an InterestRate Swap. If exercised Fund receives3.05% Fixed semi-annually from23/12/2020; and pays Floating USD LIBOR3 Month BBA quarterly from 23/3/2021
NomuraInternational USD 3.05 21/12/2020 18,145 (2)
(1,930,000) Put
Fund writes an option to enter into an InterestRate Swap. If exercised Fund receives3.25% Fixed semi-annually from31/12/2020; and pays Floating USD LIBOR3 Month BBA quarterly from 31/3/2021 Citibank USD 3.25 29/12/2020 6,149 (1)
BlackRock Global Absolute Return Bond Fund continued
The notes on pages 691 to 711 form an integral part of these financial statements.
BlackRock Strategic Funds[424]

Written Swaptions as at 31 May 2020
NominalValue
Call/Put Description Counterparty Strike Price
Expirationdate
Netunrealised
appreciation/(depreciation)
EUR
MarketValue
EUR
(720,000) Put
Fund writes an option to enter into an InterestRate Swap. If exercised Fund receives0.3% Fixed annually from 10/3/2021; andpays Floating EUR EURIBOR 6 Monthsemi-annually from 10/9/2021 JP Morgan EUR 0.30 08/03/2021 1,640 (106)
(731,500) Put
Fund writes an option to enter into an InterestRate Swap. If exercised Fund receives2.7875% Fixed semi-annually from10/3/2021; and pays Floating USD LIBOR3 Month BBA quarterly from 10/6/2021 Barclays Bank USD 2.79 08/03/2021 19,236 (180)
(731,500) Call
Fund writes an option to enter into an InterestRate Swap. If exercised Fund receivesFloating USD LIBOR 3 Month BBAquarterly from 10/6/2021; and pays2.7875% Fixed semi-annually from10/3/2021 Barclays Bank USD 2.79 08/03/2021 (113,224) (132,641)
(400,000) Put
Fund writes an option to enter into an InterestRate Swap. If exercised Fund receives3.05% Fixed semi-annually from14/3/2029; and pays Floating USD LIBOR3 Month BBA quarterly from 14/6/2029 Barclays Bank USD 3.05 12/03/2029 12,870 (5,956)
(400,000) Call
Fund writes an option to enter into an InterestRate Swap. If exercised Fund receivesFloating USD LIBOR 3 Month BBAquarterly from 14/6/2029; and pays 3.05%Fixed semi-annually from 14/3/2029 Barclays Bank USD 3.05 12/03/2029 (48,179) (67,005)
(7,710,000) Put
Fund writes an option to enter into an InterestRate Swap. If exercised Fund receives0.1% Fixed annually from 31/3/2021; andpays Floating EUR EURIBOR 6 Monthsemi-annually from 30/9/2021 Barclays Bank EUR 0.10 29/03/2021 21,613 (2,288)
(5,870,000) Put
Fund writes an option to enter into an InterestRate Swap. If exercised Fund receives0.1% Fixed annually from 14/4/2021; andpays Floating EUR EURIBOR 6 Monthsemi-annually from 14/10/2021 Citibank EUR 0.10 12/04/2021 15,547 (1,843)
(5,870,000) Put
Fund writes an option to enter into an InterestRate Swap. If exercised Fund receives0.16% Fixed annually from 14/4/2021; andpays Floating EUR EURIBOR 6 Monthsemi-annually from 14/10/2021 Goldman Sachs EUR 0.16 12/04/2021 15,964 (1,529)
(1,170,000) Put
Fund writes an option to enter into an InterestRate Swap. If exercised Fund receives0.15% Fixed annually from 21/4/2021; andpays Floating EUR EURIBOR 6 Monthsemi-annually from 21/10/2021 Morgan Stanley EUR 0.15 19/04/2021 3,422 (322)
(2,510,000) Put
Fund writes an option to enter into an InterestRate Swap. If exercised Fund receivesFloating USD LIBOR 3 Month BBAquarterly from 11/8/2022; and pays 2.75%Fixed semi-annually from 11/5/2022
NomuraInternational USD 2.75 09/05/2022 60,368 (4,544)
(10,710,000) Put
Fund writes an option to enter into an InterestRate Swap. If exercised Fund receivesFloating USD LIBOR 3 Month BBAquarterly from 19/8/2021; and pays 2.35%Fixed semi-annually from 19/5/2021 Citibank USD 2.35 17/05/2021 18,777 (207)
(3,884,800) Put
Fund writes an option to enter into an InterestRate Swap. If exercised Fund receives0.11% Fixed annually from 19/5/2021; andpays Floating EUR EURIBOR 6 Monthsemi-annually from 19/11/2021 Barclays Bank EUR 0.11 17/05/2021 10,161 (1,338)
(14,550,000) Put
Fund writes an option to enter into an InterestRate Swap. If exercised Fund receives2.15% Fixed semi-annually from 1/6/2021;and pays Floating USD LIBOR 3 MonthBBA quarterly from 1/9/2021 Barclays Bank USD 2.15 27/05/2021 36,153 (316)
BlackRock Global Absolute Return Bond Fund continued
The notes on pages 691 to 711 form an integral part of these financial statements.
Annual report and audited financial statements [425]

Written Swaptions as at 31 May 2020
NominalValue
Call/Put Description Counterparty Strike Price
Expirationdate
Netunrealised
appreciation/(depreciation)
EUR
MarketValue
EUR
(18,000,000) Put
Fund writes an option to enter into an InterestRate Swap. If exercised Fund receives2.4% Fixed semi-annually from 3/6/2021;and pays Floating USD LIBOR 3 MonthBBA quarterly from 3/9/2021 Morgan Stanley USD 2.40 01/06/2021 28,913 (325)
(5,398,750) Call
Fund writes an option to enter into an InterestRate Swap. If exercised Fund receivesFloating USD LIBOR 3 Month BBAquarterly from 3/9/2020; and pays 1%Fixed semi-annually from 3/6/2020 Barclays Bank USD 1.00 01/06/2020 (65,130) (71,777)
(820,000) Call
Fund writes an option to enter into an InterestRate Swap. If exercised Fund receivesFloating USD LIBOR 3 Month BBAquarterly from 15/9/2020; and pays 2.16%Fixed semi-annually from 15/6/2020 Citibank USD 2.16 11/06/2020 (91,960) (107,903)
(820,000) Put
Fund writes an option to enter into an InterestRate Swap. If exercised Fund receives2.16% Fixed semi-annually from15/6/2020; and pays Floating USD LIBOR3 Month BBA quarterly from 15/9/2020 Citibank USD 2.16 11/06/2020 15,943 —
(910,000) Put
Fund writes an option to enter into an InterestRate Swap. If exercised Fund receives3.5% Fixed semi-annually from 17/6/2024;and pays Floating USD LIBOR 3 MonthBBA quarterly from 17/9/2024 Morgan Stanley USD 3.50 13/06/2024 10,323 (3,186)
(910,000) Put
Fund writes an option to enter into an InterestRate Swap. If exercised Fund receives2.3% Fixed semi-annually from 17/6/2020;and pays Floating USD LIBOR 3 MonthBBA quarterly from 17/9/2020 Citibank USD 2.30 15/06/2020 12,285 —
(910,000) Put
Fund writes an option to enter into an InterestRate Swap. If exercised Fund receives 3%Fixed semi-annually from 17/6/2024; andpays Floating USD LIBOR 3 Month BBAquarterly from 17/9/2024 Morgan Stanley USD 3.00 13/06/2024 17,003 (5,162)
(130,000) Put
Fund writes an option to enter into an InterestRate Swap. If exercised Fund receives 3%Fixed semi-annually from 24/6/2024; andpays Floating USD LIBOR 3 Month BBAquarterly from 24/9/2024 Morgan Stanley USD 3.00 20/06/2024 2,069 (742)
(130,000) Put
Fund writes an option to enter into an InterestRate Swap. If exercised Fund receives3.5% Fixed semi-annually from 24/6/2024;and pays Floating USD LIBOR 3 MonthBBA quarterly from 24/9/2024 Morgan Stanley USD 3.50 20/06/2024 1,229 (458)
(5,210,000) Put
Fund writes an option to enter into an InterestRate Floor. If exercised Fund receivesdefault protection on Markit iTraxx EuropeSeries Version from 29/6/2020; and pays0.3% Fixed quarterly from 29/9/2019
NomuraInternational USD 0.30 29/06/2020 2,999 (19)
(1,230,000) Put
Fund writes an option to enter into an InterestRate Swap. If exercised Fund receives 0%Fixed annually from 5/7/2021; and paysFloating EUR EURIBOR 6 Monthsemi-annually from 5/1/2022 Barclays Bank EUR 0.00 01/07/2021 1,457 (794)
(5,350,000) Put
Fund writes an option to enter into an InterestRate Floor. If exercised Fund receivesdefault protection on Markit iTraxx EuropeSeries Version from 8/7/2020; and pays0.25% Fixed quarterly from 27/9/2019
NomuraInternational USD 0.25 08/07/2020 2,360 (24)
(670,000) Put
Fund writes an option to enter into an InterestRate Swap. If exercised Fund receives2.35% Fixed semi-annually from14/7/2020; and pays Floating USD LIBOR3 Month BBA quarterly from 14/10/2020
NomuraInternational USD 2.35 10/07/2020 6,026 —
BlackRock Global Absolute Return Bond Fund continued
The notes on pages 691 to 711 form an integral part of these financial statements.
BlackRock Strategic Funds[426]
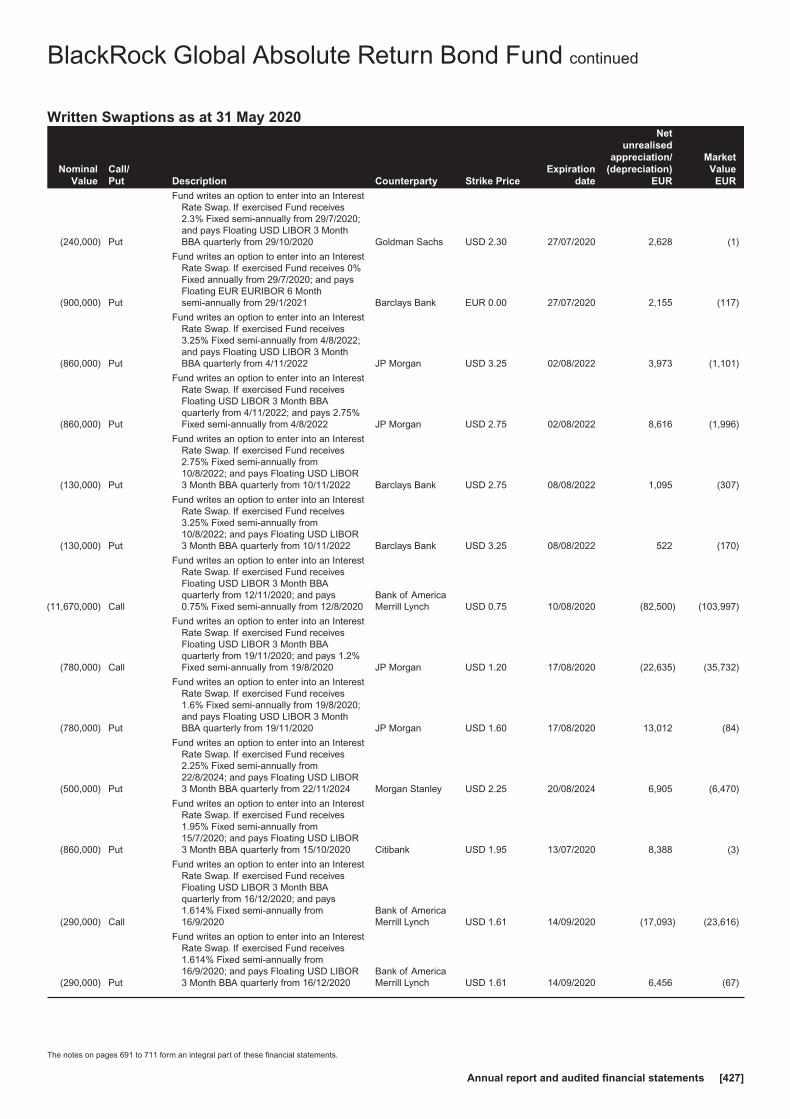
Written Swaptions as at 31 May 2020
NominalValue
Call/Put Description Counterparty Strike Price
Expirationdate
Netunrealised
appreciation/(depreciation)
EUR
MarketValue
EUR
(240,000) Put
Fund writes an option to enter into an InterestRate Swap. If exercised Fund receives2.3% Fixed semi-annually from 29/7/2020;and pays Floating USD LIBOR 3 MonthBBA quarterly from 29/10/2020 Goldman Sachs USD 2.30 27/07/2020 2,628 (1)
(900,000) Put
Fund writes an option to enter into an InterestRate Swap. If exercised Fund receives 0%Fixed annually from 29/7/2020; and paysFloating EUR EURIBOR 6 Monthsemi-annually from 29/1/2021 Barclays Bank EUR 0.00 27/07/2020 2,155 (117)
(860,000) Put
Fund writes an option to enter into an InterestRate Swap. If exercised Fund receives3.25% Fixed semi-annually from 4/8/2022;and pays Floating USD LIBOR 3 MonthBBA quarterly from 4/11/2022 JP Morgan USD 3.25 02/08/2022 3,973 (1,101)
(860,000) Put
Fund writes an option to enter into an InterestRate Swap. If exercised Fund receivesFloating USD LIBOR 3 Month BBAquarterly from 4/11/2022; and pays 2.75%Fixed semi-annually from 4/8/2022 JP Morgan USD 2.75 02/08/2022 8,616 (1,996)
(130,000) Put
Fund writes an option to enter into an InterestRate Swap. If exercised Fund receives2.75% Fixed semi-annually from10/8/2022; and pays Floating USD LIBOR3 Month BBA quarterly from 10/11/2022 Barclays Bank USD 2.75 08/08/2022 1,095 (307)
(130,000) Put
Fund writes an option to enter into an InterestRate Swap. If exercised Fund receives3.25% Fixed semi-annually from10/8/2022; and pays Floating USD LIBOR3 Month BBA quarterly from 10/11/2022 Barclays Bank USD 3.25 08/08/2022 522 (170)
(11,670,000) Call
Fund writes an option to enter into an InterestRate Swap. If exercised Fund receivesFloating USD LIBOR 3 Month BBAquarterly from 12/11/2020; and pays0.75% Fixed semi-annually from 12/8/2020
Bank of AmericaMerrill Lynch USD 0.75 10/08/2020 (82,500) (103,997)
(780,000) Call
Fund writes an option to enter into an InterestRate Swap. If exercised Fund receivesFloating USD LIBOR 3 Month BBAquarterly from 19/11/2020; and pays 1.2%Fixed semi-annually from 19/8/2020 JP Morgan USD 1.20 17/08/2020 (22,635) (35,732)
(780,000) Put
Fund writes an option to enter into an InterestRate Swap. If exercised Fund receives1.6% Fixed semi-annually from 19/8/2020;and pays Floating USD LIBOR 3 MonthBBA quarterly from 19/11/2020 JP Morgan USD 1.60 17/08/2020 13,012 (84)
(500,000) Put
Fund writes an option to enter into an InterestRate Swap. If exercised Fund receives2.25% Fixed semi-annually from22/8/2024; and pays Floating USD LIBOR3 Month BBA quarterly from 22/11/2024 Morgan Stanley USD 2.25 20/08/2024 6,905 (6,470)
(860,000) Put
Fund writes an option to enter into an InterestRate Swap. If exercised Fund receives1.95% Fixed semi-annually from15/7/2020; and pays Floating USD LIBOR3 Month BBA quarterly from 15/10/2020 Citibank USD 1.95 13/07/2020 8,388 (3)
(290,000) Call
Fund writes an option to enter into an InterestRate Swap. If exercised Fund receivesFloating USD LIBOR 3 Month BBAquarterly from 16/12/2020; and pays1.614% Fixed semi-annually from16/9/2020
Bank of AmericaMerrill Lynch USD 1.61 14/09/2020 (17,093) (23,616)
(290,000) Put
Fund writes an option to enter into an InterestRate Swap. If exercised Fund receives1.614% Fixed semi-annually from16/9/2020; and pays Floating USD LIBOR3 Month BBA quarterly from 16/12/2020
Bank of AmericaMerrill Lynch USD 1.61 14/09/2020 6,456 (67)
BlackRock Global Absolute Return Bond Fund continued
The notes on pages 691 to 711 form an integral part of these financial statements.
Annual report and audited financial statements [427]
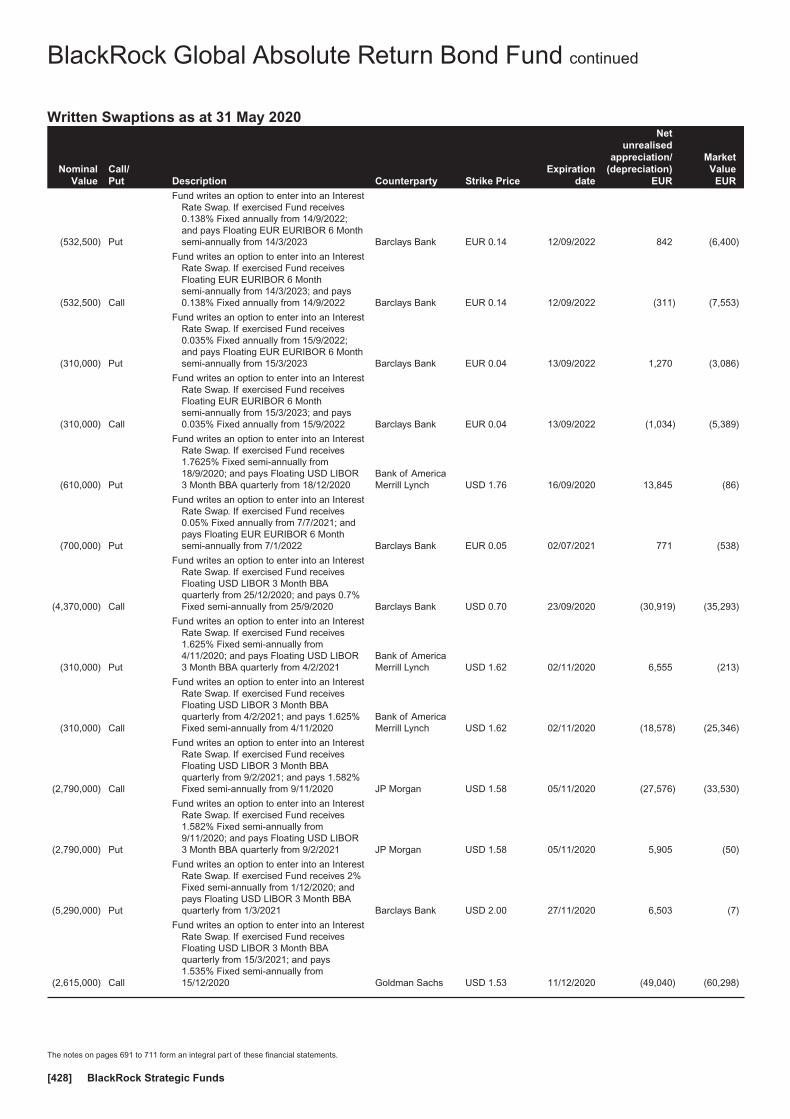
Written Swaptions as at 31 May 2020
NominalValue
Call/Put Description Counterparty Strike Price
Expirationdate
Netunrealised
appreciation/(depreciation)
EUR
MarketValue
EUR
(532,500) Put
Fund writes an option to enter into an InterestRate Swap. If exercised Fund receives0.138% Fixed annually from 14/9/2022;and pays Floating EUR EURIBOR 6 Monthsemi-annually from 14/3/2023 Barclays Bank EUR 0.14 12/09/2022 842 (6,400)
(532,500) Call
Fund writes an option to enter into an InterestRate Swap. If exercised Fund receivesFloating EUR EURIBOR 6 Monthsemi-annually from 14/3/2023; and pays0.138% Fixed annually from 14/9/2022 Barclays Bank EUR 0.14 12/09/2022 (311) (7,553)
(310,000) Put
Fund writes an option to enter into an InterestRate Swap. If exercised Fund receives0.035% Fixed annually from 15/9/2022;and pays Floating EUR EURIBOR 6 Monthsemi-annually from 15/3/2023 Barclays Bank EUR 0.04 13/09/2022 1,270 (3,086)
(310,000) Call
Fund writes an option to enter into an InterestRate Swap. If exercised Fund receivesFloating EUR EURIBOR 6 Monthsemi-annually from 15/3/2023; and pays0.035% Fixed annually from 15/9/2022 Barclays Bank EUR 0.04 13/09/2022 (1,034) (5,389)
(610,000) Put
Fund writes an option to enter into an InterestRate Swap. If exercised Fund receives1.7625% Fixed semi-annually from18/9/2020; and pays Floating USD LIBOR3 Month BBA quarterly from 18/12/2020
Bank of AmericaMerrill Lynch USD 1.76 16/09/2020 13,845 (86)
(700,000) Put
Fund writes an option to enter into an InterestRate Swap. If exercised Fund receives0.05% Fixed annually from 7/7/2021; andpays Floating EUR EURIBOR 6 Monthsemi-annually from 7/1/2022 Barclays Bank EUR 0.05 02/07/2021 771 (538)
(4,370,000) Call
Fund writes an option to enter into an InterestRate Swap. If exercised Fund receivesFloating USD LIBOR 3 Month BBAquarterly from 25/12/2020; and pays 0.7%Fixed semi-annually from 25/9/2020 Barclays Bank USD 0.70 23/09/2020 (30,919) (35,293)
(310,000) Put
Fund writes an option to enter into an InterestRate Swap. If exercised Fund receives1.625% Fixed semi-annually from4/11/2020; and pays Floating USD LIBOR3 Month BBA quarterly from 4/2/2021
Bank of AmericaMerrill Lynch USD 1.62 02/11/2020 6,555 (213)
(310,000) Call
Fund writes an option to enter into an InterestRate Swap. If exercised Fund receivesFloating USD LIBOR 3 Month BBAquarterly from 4/2/2021; and pays 1.625%Fixed semi-annually from 4/11/2020
Bank of AmericaMerrill Lynch USD 1.62 02/11/2020 (18,578) (25,346)
(2,790,000) Call
Fund writes an option to enter into an InterestRate Swap. If exercised Fund receivesFloating USD LIBOR 3 Month BBAquarterly from 9/2/2021; and pays 1.582%Fixed semi-annually from 9/11/2020 JP Morgan USD 1.58 05/11/2020 (27,576) (33,530)
(2,790,000) Put
Fund writes an option to enter into an InterestRate Swap. If exercised Fund receives1.582% Fixed semi-annually from9/11/2020; and pays Floating USD LIBOR3 Month BBA quarterly from 9/2/2021 JP Morgan USD 1.58 05/11/2020 5,905 (50)
(5,290,000) Put
Fund writes an option to enter into an InterestRate Swap. If exercised Fund receives 2%Fixed semi-annually from 1/12/2020; andpays Floating USD LIBOR 3 Month BBAquarterly from 1/3/2021 Barclays Bank USD 2.00 27/11/2020 6,503 (7)
(2,615,000) Call
Fund writes an option to enter into an InterestRate Swap. If exercised Fund receivesFloating USD LIBOR 3 Month BBAquarterly from 15/3/2021; and pays1.535% Fixed semi-annually from15/12/2020 Goldman Sachs USD 1.53 11/12/2020 (49,040) (60,298)
BlackRock Global Absolute Return Bond Fund continued
The notes on pages 691 to 711 form an integral part of these financial statements.
BlackRock Strategic Funds[428]

Written Swaptions as at 31 May 2020
NominalValue
Call/Put Description Counterparty Strike Price
Expirationdate
Netunrealised
appreciation/(depreciation)
EUR
MarketValue
EUR
(2,615,000) Put
Fund writes an option to enter into an InterestRate Swap. If exercised Fund receives1.535% Fixed semi-annually from15/12/2020; and pays Floating USD LIBOR3 Month BBA quarterly from 15/3/2021 Goldman Sachs USD 1.53 11/12/2020 11,243 (15)
(365,000) Put
Fund writes an option to enter into an InterestRate Swap. If exercised Fund receives1.53% Fixed semi-annually from16/12/2020; and pays Floating USD LIBOR3 Month BBA quarterly from 16/3/2021 Citibank USD 1.53 14/12/2020 1,573 (2)
(365,000) Call
Fund writes an option to enter into an InterestRate Swap. If exercised Fund receivesFloating USD LIBOR 3 Month BBAquarterly from 16/3/2021; and pays 1.53%Fixed semi-annually from 16/12/2020 Citibank USD 1.53 14/12/2020 (6,809) (8,384)
(810,000) Put
Fund writes an option to enter into an InterestRate Swap. If exercised Fund receives2.1% Fixed semi-annually from 10/1/2022;and pays Floating USD LIBOR 3 MonthBBA quarterly from 10/4/2022 Barclays Bank USD 2.10 06/01/2022 13,926 (2,687)
(840,000) Put
Fund writes an option to enter into an InterestRate Swap. If exercised Fund receives2.15% Fixed semi-annually from12/1/2022; and pays Floating USD LIBOR3 Month BBA quarterly from 12/4/2022
Bank of AmericaMerrill Lynch USD 2.15 10/01/2022 15,008 (2,604)
(470,000) Put
Fund writes an option to enter into an InterestRate Swap. If exercised Fund receives1.95% Fixed semi-annually from 1/2/2022;and pays Floating USD LIBOR 3 MonthBBA quarterly from 1/5/2022 Morgan Stanley USD 1.95 28/01/2022 7,881 (2,104)
(240,000) Put
Fund writes an option to enter into an InterestRate Swap. If exercised Fund receives1.85% Fixed semi-annually from24/2/2022; and pays Floating USD LIBOR3 Month BBA quarterly from 24/5/2022
Bank of AmericaMerrill Lynch USD 1.85 22/02/2022 2,557 (1,337)
(240,000) Put
Fund writes an option to enter into an InterestRate Swap. If exercised Fund receives1.85% Fixed semi-annually from24/2/2022; and pays Floating USD LIBOR3 Month BBA quarterly from 24/5/2022
Bank of AmericaMerrill Lynch USD 1.85 22/02/2022 2,446 (1,337)
(540,000) Put
Fund writes an option to enter into an InterestRate Swap. If exercised Fund receives1.6% Fixed semi-annually from 2/3/2022;and pays Floating USD LIBOR 3 MonthBBA quarterly from 2/6/2022 Deutsche Bank USD 1.60 28/02/2022 4,245 (4,610)
(2,280,000) Put
Fund writes an option to enter into an InterestRate Swap. If exercised Fund receives1.05% Fixed semi-annually from6/10/2020; and pays Floating USD LIBOR3 Month BBA quarterly from 6/1/2021 Goldman Sachs USD 1.05 02/10/2020 3,595 (11)
(360,000) Put
Fund writes an option to enter into an InterestRate Swap. If exercised Fund receives1.6% Fixed semi-annually from 7/3/2022;and pays Floating USD LIBOR 3 MonthBBA quarterly from 7/6/2022 Deutsche Bank USD 1.60 03/03/2022 2,643 (3,096)
(4,455,000) Call
Fund writes an option to enter into an InterestRate Cap. If exercised Fund receives MaxUSD 0 - 5 Year Constant Maturity Swap -0.55% annually from 14/2/2/2022; andpays 0.55% on 14/2/2022 Citibank USD 0.55 14/02/2022 (5,992) (9,383)
(2,280,000) Put
Fund writes an option to enter into an InterestRate Swap. If exercised Fund receives1.05% Fixed semi-annually from6/10/2020; and pays Floating USD LIBOR3 Month BBA quarterly from 6/1/2021 Goldman Sachs USD 1.05 02/10/2020 2,389 (11)
BlackRock Global Absolute Return Bond Fund continued
The notes on pages 691 to 711 form an integral part of these financial statements.
Annual report and audited financial statements [429]
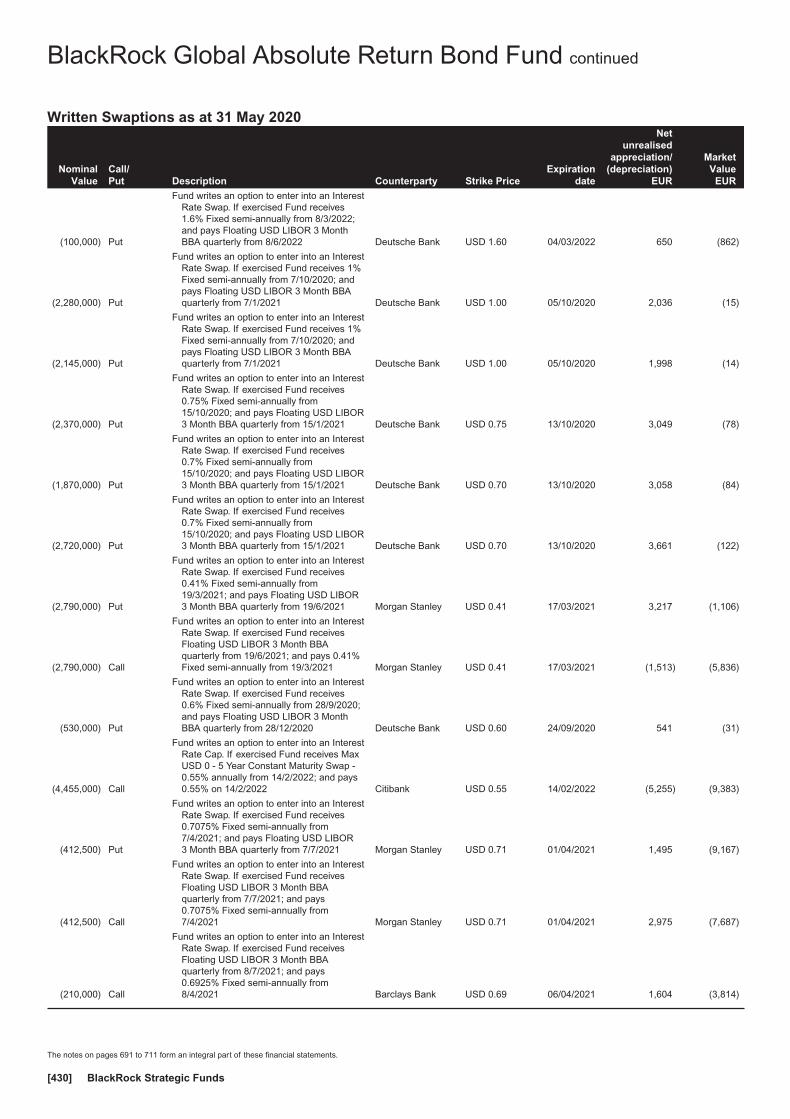
Written Swaptions as at 31 May 2020
NominalValue
Call/Put Description Counterparty Strike Price
Expirationdate
Netunrealised
appreciation/(depreciation)
EUR
MarketValue
EUR
(100,000) Put
Fund writes an option to enter into an InterestRate Swap. If exercised Fund receives1.6% Fixed semi-annually from 8/3/2022;and pays Floating USD LIBOR 3 MonthBBA quarterly from 8/6/2022 Deutsche Bank USD 1.60 04/03/2022 650 (862)
(2,280,000) Put
Fund writes an option to enter into an InterestRate Swap. If exercised Fund receives 1%Fixed semi-annually from 7/10/2020; andpays Floating USD LIBOR 3 Month BBAquarterly from 7/1/2021 Deutsche Bank USD 1.00 05/10/2020 2,036 (15)
(2,145,000) Put
Fund writes an option to enter into an InterestRate Swap. If exercised Fund receives 1%Fixed semi-annually from 7/10/2020; andpays Floating USD LIBOR 3 Month BBAquarterly from 7/1/2021 Deutsche Bank USD 1.00 05/10/2020 1,998 (14)
(2,370,000) Put
Fund writes an option to enter into an InterestRate Swap. If exercised Fund receives0.75% Fixed semi-annually from15/10/2020; and pays Floating USD LIBOR3 Month BBA quarterly from 15/1/2021 Deutsche Bank USD 0.75 13/10/2020 3,049 (78)
(1,870,000) Put
Fund writes an option to enter into an InterestRate Swap. If exercised Fund receives0.7% Fixed semi-annually from15/10/2020; and pays Floating USD LIBOR3 Month BBA quarterly from 15/1/2021 Deutsche Bank USD 0.70 13/10/2020 3,058 (84)
(2,720,000) Put
Fund writes an option to enter into an InterestRate Swap. If exercised Fund receives0.7% Fixed semi-annually from15/10/2020; and pays Floating USD LIBOR3 Month BBA quarterly from 15/1/2021 Deutsche Bank USD 0.70 13/10/2020 3,661 (122)
(2,790,000) Put
Fund writes an option to enter into an InterestRate Swap. If exercised Fund receives0.41% Fixed semi-annually from19/3/2021; and pays Floating USD LIBOR3 Month BBA quarterly from 19/6/2021 Morgan Stanley USD 0.41 17/03/2021 3,217 (1,106)
(2,790,000) Call
Fund writes an option to enter into an InterestRate Swap. If exercised Fund receivesFloating USD LIBOR 3 Month BBAquarterly from 19/6/2021; and pays 0.41%Fixed semi-annually from 19/3/2021 Morgan Stanley USD 0.41 17/03/2021 (1,513) (5,836)
(530,000) Put
Fund writes an option to enter into an InterestRate Swap. If exercised Fund receives0.6% Fixed semi-annually from 28/9/2020;and pays Floating USD LIBOR 3 MonthBBA quarterly from 28/12/2020 Deutsche Bank USD 0.60 24/09/2020 541 (31)
(4,455,000) Call
Fund writes an option to enter into an InterestRate Cap. If exercised Fund receives MaxUSD 0 - 5 Year Constant Maturity Swap -0.55% annually from 14/2/2022; and pays0.55% on 14/2/2022 Citibank USD 0.55 14/02/2022 (5,255) (9,383)
(412,500) Put
Fund writes an option to enter into an InterestRate Swap. If exercised Fund receives0.7075% Fixed semi-annually from7/4/2021; and pays Floating USD LIBOR3 Month BBA quarterly from 7/7/2021 Morgan Stanley USD 0.71 01/04/2021 1,495 (9,167)
(412,500) Call
Fund writes an option to enter into an InterestRate Swap. If exercised Fund receivesFloating USD LIBOR 3 Month BBAquarterly from 7/7/2021; and pays0.7075% Fixed semi-annually from7/4/2021 Morgan Stanley USD 0.71 01/04/2021 2,975 (7,687)
(210,000) Call
Fund writes an option to enter into an InterestRate Swap. If exercised Fund receivesFloating USD LIBOR 3 Month BBAquarterly from 8/7/2021; and pays0.6925% Fixed semi-annually from8/4/2021 Barclays Bank USD 0.69 06/04/2021 1,604 (3,814)
BlackRock Global Absolute Return Bond Fund continued
The notes on pages 691 to 711 form an integral part of these financial statements.
BlackRock Strategic Funds[430]

Written Swaptions as at 31 May 2020
NominalValue
Call/Put Description Counterparty Strike Price
Expirationdate
Netunrealised
appreciation/(depreciation)
EUR
MarketValue
EUR
(210,000) Put
Fund writes an option to enter into an InterestRate Swap. If exercised Fund receives0.6925% Fixed semi-annually from8/4/2021; and pays Floating USD LIBOR3 Month BBA quarterly from 8/7/2021 Barclays Bank USD 0.69 06/04/2021 568 (4,851)
(410,000) Put
Fund writes an option to enter into an InterestRate Swap. If exercised Fund receives0.7125% Fixed semi-annually from8/4/2021; and pays Floating USD LIBOR3 Month BBA quarterly from 8/7/2021 Barclays Bank USD 0.71 06/04/2021 1,491 (9,088)
(410,000) Call
Fund writes an option to enter into an InterestRate Swap. If exercised Fund receivesFloating USD LIBOR 3 Month BBAquarterly from 8/7/2021; and pays0.7125% Fixed semi-annually from8/4/2021 Barclays Bank USD 0.71 06/04/2021 2,790 (7,789)
(860,000) Call
Fund writes an option to enter into an InterestRate Swap. If exercised Fund receivesFloating EUR EURIBOR 6 Monthsemi-annually from 6/10/2022; and pays0.115% Fixed annually from 6/4/2022 Barclays Bank EUR 0.12 04/04/2022 (1,987) (12,049)
(860,000) Put
Fund writes an option to enter into an InterestRate Swap. If exercised Fund receives0.115% Fixed annually from 6/4/2022; andpays Floating EUR EURIBOR 6 Monthquarterly from 6/10/2022 Barclays Bank EUR 0.12 04/04/2022 2,252 (7,810)
(210,000) Call
Fund writes an option to enter into an InterestRate Swap. If exercised Fund receivesFloating USD LIBOR 3 Month BBAquarterly from 8/7/2021; and pays 0.688%Fixed semi-annually from 8/4/2021 Deutsche Bank USD 0.69 06/04/2021 1,514 (3,775)
(210,000) Put
Fund writes an option to enter into an InterestRate Swap. If exercised Fund receives0.688% Fixed semi-annually from8/4/2021; and pays Floating USD LIBOR3 Month BBA quarterly from 8/7/2021 Deutsche Bank USD 0.69 06/04/2021 394 (4,896)
(240,000) Put
Fund writes an option to enter into an InterestRate Swap. If exercised Fund receives0.73% Fixed semi-annually from 8/4/2021;and pays Floating USD LIBOR 3 MonthBBA quarterly from 8/7/2021 Morgan Stanley USD 0.73 06/04/2021 693 (5,130)
(240,000) Call
Fund writes an option to enter into an InterestRate Swap. If exercised Fund receivesFloating USD LIBOR 3 Month BBAquarterly from 8/7/2021; and pays 0.73%Fixed semi-annually from 8/4/2021 Morgan Stanley USD 0.73 06/04/2021 1,082 (4,740)
(350,000) Put
Fund writes an option to enter into an InterestRate Swap. If exercised Fund receives0.61% Fixed semi-annually from12/4/2023; and pays Floating USD LIBOR3 Month BBA quarterly from 12/7/2023
Bank of AmericaMerrill Lynch USD 0.61 06/04/2023 514 (685)
(350,000) Call
Fund writes an option to enter into an InterestRate Swap. If exercised Fund receivesFloating USD LIBOR 3 Month BBAquarterly from 12/7/2023; and pays 0.61%Fixed semi-annually from 12/4/2023
Bank of AmericaMerrill Lynch USD 0.61 06/04/2023 (82) (1,281)
(167,500) Call
Fund writes an option to enter into an InterestRate Swap. If exercised Fund receivesFloating USD LIBOR 3 Month BBAquarterly from 9/7/2021; and pays 0.85%Fixed semi-annually from 9/4/2021 Morgan Stanley USD 0.85 07/04/2021 (266) (4,272)
(230,000) Call
Fund writes an option to enter into an InterestRate Swap. If exercised Fund receivesFloating EUR EURIBOR 6 Monthsemi-annually from 11/10/2022; and pays0.02% Fixed annually from 11/4/2022 Barclays Bank EUR 0.02 07/04/2022 (1,254) (3,957)
BlackRock Global Absolute Return Bond Fund continued
The notes on pages 691 to 711 form an integral part of these financial statements.
Annual report and audited financial statements [431]

Written Swaptions as at 31 May 2020
NominalValue
Call/Put Description Counterparty Strike Price
Expirationdate
Netunrealised
appreciation/(depreciation)
EUR
MarketValue
EUR
(230,000) Put
Fund writes an option to enter into an InterestRate Swap. If exercised Fund receives0.02% Fixed annually from 11/4/2022; andpays Floating EUR EURIBOR 6 Monthsemi-annually from 11/10/2022 Barclays Bank EUR 0.02 07/04/2022 986 (1,717)
(167,500) Put
Fund writes an option to enter into an InterestRate Swap. If exercised Fund receives0.85% Fixed semi-annually from 9/4/2021;and pays Floating USD LIBOR 3 MonthBBA quarterly from 9/7/2021 Morgan Stanley USD 0.85 07/04/2021 1,236 (2,770)
(1,630,000) Put
Fund writes an option to enter into an InterestRate Swap. If exercised Fund receives0.685% Fixed semi-annually from13/4/2023; and pays Floating USD LIBOR3 Month BBA quarterly from 13/7/2023 Deutsche Bank USD 0.68 11/04/2023 2,939 (2,810)
(1,630,000) Call
Fund writes an option to enter into an InterestRate Swap. If exercised Fund receivesFloating USD LIBOR 3 Month BBAquarterly from 13/7/2023; and pays0.685% Fixed semi-annually from13/4/2023 Deutsche Bank USD 0.69 11/04/2023 (931) (6,680)
(400,000) Put
Fund writes an option to enter into an InterestRate Swap. If exercised Fund receives0.87% Fixed semi-annually from13/4/2021; and pays Floating USD LIBOR3 Month BBA quarterly from 13/7/2021 Morgan Stanley USD 0.87 09/04/2021 3,550 (6,368)
(400,000) Call
Fund writes an option to enter into an InterestRate Swap. If exercised Fund receivesFloating USD LIBOR 3 Month BBAquarterly from 13/7/2021; and pays 0.87%Fixed semi-annually from 13/4/2021 Morgan Stanley USD 0.87 09/04/2021 (706) (10,624)
(200,000) Call
Fund writes an option to enter into an InterestRate Swap. If exercised Fund receivesFloating USD LIBOR 3 Month BBAquarterly from 16/7/2021; and pays0.877% Fixed semi-annually from16/4/2021 Barclays Bank USD 0.88 14/04/2021 (465) (5,409)
(200,000) Put
Fund writes an option to enter into an InterestRate Swap. If exercised Fund receives0.877% Fixed semi-annually from16/4/2021; and pays Floating USD LIBOR3 Month BBA quarterly from 16/7/2021 Barclays Bank USD 0.88 14/04/2021 1,773 (3,172)
(220,000) Call
Fund writes an option to enter into an InterestRate Swap. If exercised Fund receivesFloating USD LIBOR 3 Month BBAquarterly from 19/7/2021; and pays 0.79%Fixed semi-annually from 19/4/2021 Citibank USD 0.79 15/04/2021 493 (4,981)
(9,000,000) Put
Fund writes an option to enter into a CreditDefault Swap. If exercised Fund receives1% Fixed semi-annually from 20/6/2020;and provides default protection on MarkitiTraxx Europe Series 33 Version 1 from17/6/2020
Bank of AmericaMerrill Lynch EUR 135.00 17/06/2020 18,368 (1,252)
(400,000) Put
Fund writes an option to enter into a CreditDefault Swap. If exercised Fund receives5% Fixed semi-annually from 20/6/2020;and provides default protection on MarkitiTraxx Europe Series 33 Version 1 from17/6/2020
Bank of AmericaMerrill Lynch EUR 650.00 17/06/2020 6,813 (387)
(220,000) Put
Fund writes an option to enter into an InterestRate Swap. If exercised Fund receives0.79% Fixed semi-annually from19/4/2021; and pays Floating USD LIBOR3 Month BBA quarterly from 19/7/2021 Citibank USD 0.79 15/04/2021 1,247 (4,228)
(2,350,000) Put
Fund writes an option to enter into an InterestRate Swap. If exercised Fund receives0.55% Fixed semi-annually from25/4/2022; and pays Floating USD LIBOR3 Month BBA quarterly from 25/7/2022 Deutsche Bank USD 0.55 21/04/2022 1,501 (2,294)
BlackRock Global Absolute Return Bond Fund continued
The notes on pages 691 to 711 form an integral part of these financial statements.
BlackRock Strategic Funds[432]
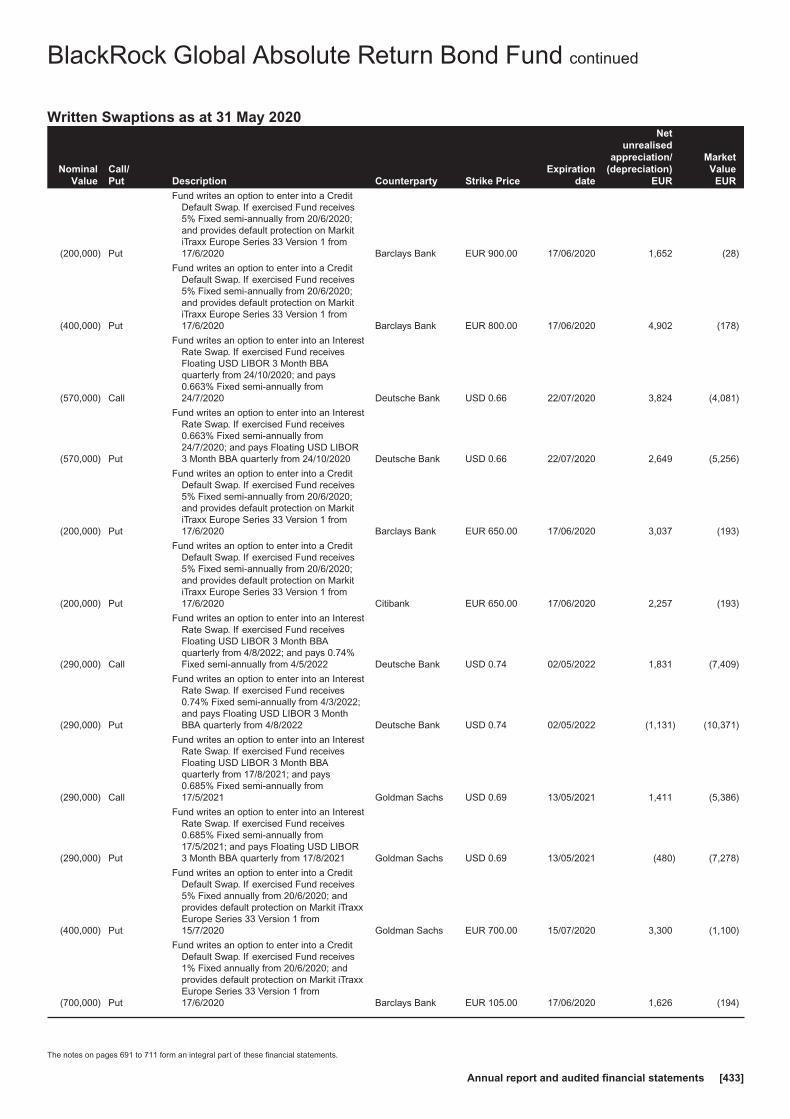
Written Swaptions as at 31 May 2020
NominalValue
Call/Put Description Counterparty Strike Price
Expirationdate
Netunrealised
appreciation/(depreciation)
EUR
MarketValue
EUR
(200,000) Put
Fund writes an option to enter into a CreditDefault Swap. If exercised Fund receives5% Fixed semi-annually from 20/6/2020;and provides default protection on MarkitiTraxx Europe Series 33 Version 1 from17/6/2020 Barclays Bank EUR 900.00 17/06/2020 1,652 (28)
(400,000) Put
Fund writes an option to enter into a CreditDefault Swap. If exercised Fund receives5% Fixed semi-annually from 20/6/2020;and provides default protection on MarkitiTraxx Europe Series 33 Version 1 from17/6/2020 Barclays Bank EUR 800.00 17/06/2020 4,902 (178)
(570,000) Call
Fund writes an option to enter into an InterestRate Swap. If exercised Fund receivesFloating USD LIBOR 3 Month BBAquarterly from 24/10/2020; and pays0.663% Fixed semi-annually from24/7/2020 Deutsche Bank USD 0.66 22/07/2020 3,824 (4,081)
(570,000) Put
Fund writes an option to enter into an InterestRate Swap. If exercised Fund receives0.663% Fixed semi-annually from24/7/2020; and pays Floating USD LIBOR3 Month BBA quarterly from 24/10/2020 Deutsche Bank USD 0.66 22/07/2020 2,649 (5,256)
(200,000) Put
Fund writes an option to enter into a CreditDefault Swap. If exercised Fund receives5% Fixed semi-annually from 20/6/2020;and provides default protection on MarkitiTraxx Europe Series 33 Version 1 from17/6/2020 Barclays Bank EUR 650.00 17/06/2020 3,037 (193)
(200,000) Put
Fund writes an option to enter into a CreditDefault Swap. If exercised Fund receives5% Fixed semi-annually from 20/6/2020;and provides default protection on MarkitiTraxx Europe Series 33 Version 1 from17/6/2020 Citibank EUR 650.00 17/06/2020 2,257 (193)
(290,000) Call
Fund writes an option to enter into an InterestRate Swap. If exercised Fund receivesFloating USD LIBOR 3 Month BBAquarterly from 4/8/2022; and pays 0.74%Fixed semi-annually from 4/5/2022 Deutsche Bank USD 0.74 02/05/2022 1,831 (7,409)
(290,000) Put
Fund writes an option to enter into an InterestRate Swap. If exercised Fund receives0.74% Fixed semi-annually from 4/3/2022;and pays Floating USD LIBOR 3 MonthBBA quarterly from 4/8/2022 Deutsche Bank USD 0.74 02/05/2022 (1,131) (10,371)
(290,000) Call
Fund writes an option to enter into an InterestRate Swap. If exercised Fund receivesFloating USD LIBOR 3 Month BBAquarterly from 17/8/2021; and pays0.685% Fixed semi-annually from17/5/2021 Goldman Sachs USD 0.69 13/05/2021 1,411 (5,386)
(290,000) Put
Fund writes an option to enter into an InterestRate Swap. If exercised Fund receives0.685% Fixed semi-annually from17/5/2021; and pays Floating USD LIBOR3 Month BBA quarterly from 17/8/2021 Goldman Sachs USD 0.69 13/05/2021 (480) (7,278)
(400,000) Put
Fund writes an option to enter into a CreditDefault Swap. If exercised Fund receives5% Fixed annually from 20/6/2020; andprovides default protection on Markit iTraxxEurope Series 33 Version 1 from15/7/2020 Goldman Sachs EUR 700.00 15/07/2020 3,300 (1,100)
(700,000) Put
Fund writes an option to enter into a CreditDefault Swap. If exercised Fund receives1% Fixed annually from 20/6/2020; andprovides default protection on Markit iTraxxEurope Series 33 Version 1 from17/6/2020 Barclays Bank EUR 105.00 17/06/2020 1,626 (194)
BlackRock Global Absolute Return Bond Fund continued
The notes on pages 691 to 711 form an integral part of these financial statements.
Annual report and audited financial statements [433]
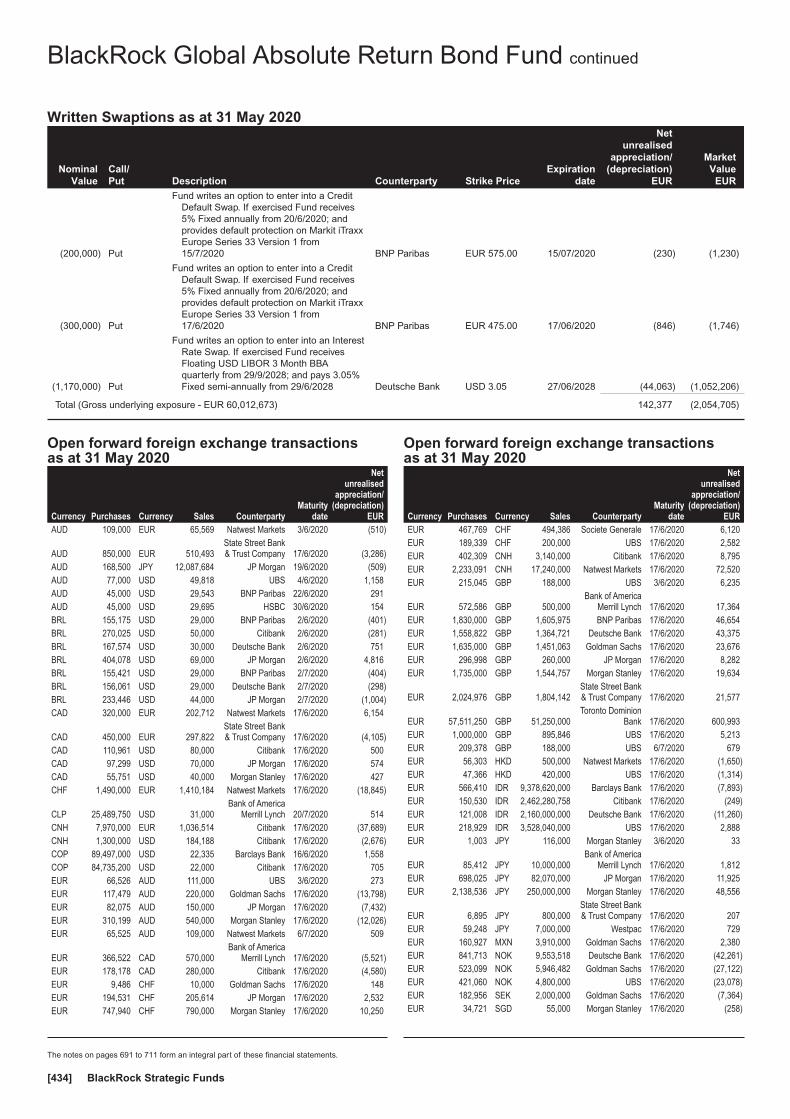
Written Swaptions as at 31 May 2020
NominalValue
Call/Put Description Counterparty Strike Price
Expirationdate
Netunrealised
appreciation/(depreciation)
EUR
MarketValue
EUR
(200,000) Put
Fund writes an option to enter into a CreditDefault Swap. If exercised Fund receives5% Fixed annually from 20/6/2020; andprovides default protection on Markit iTraxxEurope Series 33 Version 1 from15/7/2020 BNP Paribas EUR 575.00 15/07/2020 (230) (1,230)
(300,000) Put
Fund writes an option to enter into a CreditDefault Swap. If exercised Fund receives5% Fixed annually from 20/6/2020; andprovides default protection on Markit iTraxxEurope Series 33 Version 1 from17/6/2020 BNP Paribas EUR 475.00 17/06/2020 (846) (1,746)
(1,170,000) Put
Fund writes an option to enter into an InterestRate Swap. If exercised Fund receivesFloating USD LIBOR 3 Month BBAquarterly from 29/9/2028; and pays 3.05%Fixed semi-annually from 29/6/2028 Deutsche Bank USD 3.05 27/06/2028 (44,063) (1,052,206)
Total (Gross underlying exposure - EUR 60,012,673) 142,377 (2,054,705)
Open forward foreign exchange transactionsas at 31 May 2020
Currency Purchases Currency Sales CounterpartyMaturity
date
Netunrealised
appreciation/(depreciation)
EURAUD 109,000 EUR 65,569 Natwest Markets 3/6/2020 (510)
AUD 850,000 EUR 510,493State Street Bank& Trust Company 17/6/2020 (3,286)
AUD 168,500 JPY 12,087,684 JP Morgan 19/6/2020 (509)AUD 77,000 USD 49,818 UBS 4/6/2020 1,158AUD 45,000 USD 29,543 BNP Paribas 22/6/2020 291AUD 45,000 USD 29,695 HSBC 30/6/2020 154BRL 155,175 USD 29,000 BNP Paribas 2/6/2020 (401)BRL 270,025 USD 50,000 Citibank 2/6/2020 (281)BRL 167,574 USD 30,000 Deutsche Bank 2/6/2020 751BRL 404,078 USD 69,000 JP Morgan 2/6/2020 4,816BRL 155,421 USD 29,000 BNP Paribas 2/7/2020 (404)BRL 156,061 USD 29,000 Deutsche Bank 2/7/2020 (298)BRL 233,446 USD 44,000 JP Morgan 2/7/2020 (1,004)CAD 320,000 EUR 202,712 Natwest Markets 17/6/2020 6,154
CAD 450,000 EUR 297,822State Street Bank& Trust Company 17/6/2020 (4,105)
CAD 110,961 USD 80,000 Citibank 17/6/2020 500CAD 97,299 USD 70,000 JP Morgan 17/6/2020 574CAD 55,751 USD 40,000 Morgan Stanley 17/6/2020 427CHF 1,490,000 EUR 1,410,184 Natwest Markets 17/6/2020 (18,845)
CLP 25,489,750 USD 31,000Bank of America
Merrill Lynch 20/7/2020 514CNH 7,970,000 EUR 1,036,514 Citibank 17/6/2020 (37,689)CNH 1,300,000 USD 184,188 Citibank 17/6/2020 (2,676)COP 89,497,000 USD 22,335 Barclays Bank 16/6/2020 1,558COP 84,735,200 USD 22,000 Citibank 17/6/2020 705EUR 66,526 AUD 111,000 UBS 3/6/2020 273EUR 117,479 AUD 220,000 Goldman Sachs 17/6/2020 (13,798)EUR 82,075 AUD 150,000 JP Morgan 17/6/2020 (7,432)EUR 310,199 AUD 540,000 Morgan Stanley 17/6/2020 (12,026)EUR 65,525 AUD 109,000 Natwest Markets 6/7/2020 509
EUR 366,522 CAD 570,000Bank of America
Merrill Lynch 17/6/2020 (5,521)EUR 178,178 CAD 280,000 Citibank 17/6/2020 (4,580)EUR 9,486 CHF 10,000 Goldman Sachs 17/6/2020 148EUR 194,531 CHF 205,614 JP Morgan 17/6/2020 2,532EUR 747,940 CHF 790,000 Morgan Stanley 17/6/2020 10,250
Open forward foreign exchange transactionsas at 31 May 2020
Currency Purchases Currency Sales CounterpartyMaturity
date
Netunrealised
appreciation/(depreciation)
EUREUR 467,769 CHF 494,386 Societe Generale 17/6/2020 6,120EUR 189,339 CHF 200,000 UBS 17/6/2020 2,582EUR 402,309 CNH 3,140,000 Citibank 17/6/2020 8,795EUR 2,233,091 CNH 17,240,000 Natwest Markets 17/6/2020 72,520EUR 215,045 GBP 188,000 UBS 3/6/2020 6,235
EUR 572,586 GBP 500,000Bank of America
Merrill Lynch 17/6/2020 17,364EUR 1,830,000 GBP 1,605,975 BNP Paribas 17/6/2020 46,654EUR 1,558,822 GBP 1,364,721 Deutsche Bank 17/6/2020 43,375EUR 1,635,000 GBP 1,451,063 Goldman Sachs 17/6/2020 23,676EUR 296,998 GBP 260,000 JP Morgan 17/6/2020 8,282EUR 1,735,000 GBP 1,544,757 Morgan Stanley 17/6/2020 19,634
EUR 2,024,976 GBP 1,804,142State Street Bank& Trust Company 17/6/2020 21,577
EUR 57,511,250 GBP 51,250,000Toronto Dominion
Bank 17/6/2020 600,993EUR 1,000,000 GBP 895,846 UBS 17/6/2020 5,213EUR 209,378 GBP 188,000 UBS 6/7/2020 679EUR 56,303 HKD 500,000 Natwest Markets 17/6/2020 (1,650)EUR 47,366 HKD 420,000 UBS 17/6/2020 (1,314)EUR 566,410 IDR 9,378,620,000 Barclays Bank 17/6/2020 (7,893)EUR 150,530 IDR 2,462,280,758 Citibank 17/6/2020 (249)EUR 121,008 IDR 2,160,000,000 Deutsche Bank 17/6/2020 (11,260)EUR 218,929 IDR 3,528,040,000 UBS 17/6/2020 2,888EUR 1,003 JPY 116,000 Morgan Stanley 3/6/2020 33
EUR 85,412 JPY 10,000,000Bank of America
Merrill Lynch 17/6/2020 1,812EUR 698,025 JPY 82,070,000 JP Morgan 17/6/2020 11,925EUR 2,138,536 JPY 250,000,000 Morgan Stanley 17/6/2020 48,556
EUR 6,895 JPY 800,000State Street Bank& Trust Company 17/6/2020 207
EUR 59,248 JPY 7,000,000 Westpac 17/6/2020 729EUR 160,927 MXN 3,910,000 Goldman Sachs 17/6/2020 2,380EUR 841,713 NOK 9,553,518 Deutsche Bank 17/6/2020 (42,261)EUR 523,099 NOK 5,946,482 Goldman Sachs 17/6/2020 (27,122)EUR 421,060 NOK 4,800,000 UBS 17/6/2020 (23,078)EUR 182,956 SEK 2,000,000 Goldman Sachs 17/6/2020 (7,364)EUR 34,721 SGD 55,000 Morgan Stanley 17/6/2020 (258)
BlackRock Global Absolute Return Bond Fund continued
The notes on pages 691 to 711 form an integral part of these financial statements.
BlackRock Strategic Funds[434]
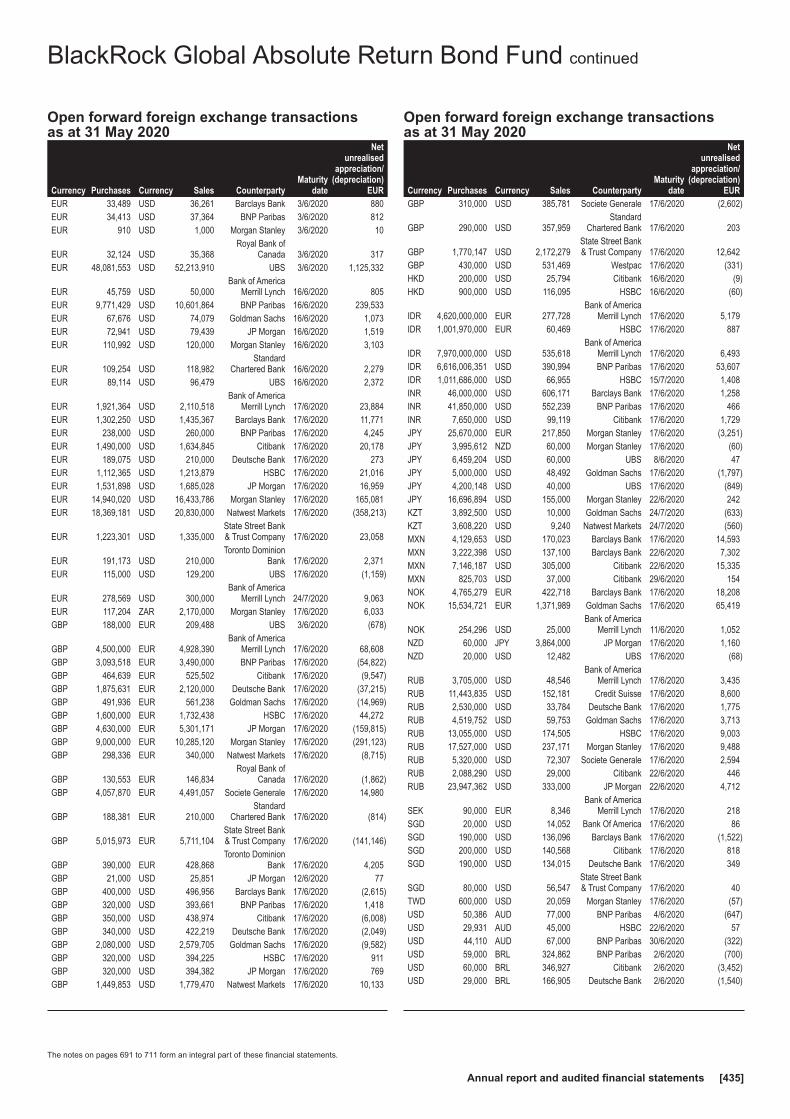
Open forward foreign exchange transactionsas at 31 May 2020
Currency Purchases Currency Sales CounterpartyMaturity
date
Netunrealised
appreciation/(depreciation)
EUREUR 33,489 USD 36,261 Barclays Bank 3/6/2020 880EUR 34,413 USD 37,364 BNP Paribas 3/6/2020 812EUR 910 USD 1,000 Morgan Stanley 3/6/2020 10
EUR 32,124 USD 35,368Royal Bank of
Canada 3/6/2020 317EUR 48,081,553 USD 52,213,910 UBS 3/6/2020 1,125,332
EUR 45,759 USD 50,000Bank of America
Merrill Lynch 16/6/2020 805EUR 9,771,429 USD 10,601,864 BNP Paribas 16/6/2020 239,533EUR 67,676 USD 74,079 Goldman Sachs 16/6/2020 1,073EUR 72,941 USD 79,439 JP Morgan 16/6/2020 1,519EUR 110,992 USD 120,000 Morgan Stanley 16/6/2020 3,103
EUR 109,254 USD 118,982Standard
Chartered Bank 16/6/2020 2,279EUR 89,114 USD 96,479 UBS 16/6/2020 2,372
EUR 1,921,364 USD 2,110,518Bank of America
Merrill Lynch 17/6/2020 23,884EUR 1,302,250 USD 1,435,367 Barclays Bank 17/6/2020 11,771EUR 238,000 USD 260,000 BNP Paribas 17/6/2020 4,245EUR 1,490,000 USD 1,634,845 Citibank 17/6/2020 20,178EUR 189,075 USD 210,000 Deutsche Bank 17/6/2020 273EUR 1,112,365 USD 1,213,879 HSBC 17/6/2020 21,016EUR 1,531,898 USD 1,685,028 JP Morgan 17/6/2020 16,959EUR 14,940,020 USD 16,433,786 Morgan Stanley 17/6/2020 165,081EUR 18,369,181 USD 20,830,000 Natwest Markets 17/6/2020 (358,213)
EUR 1,223,301 USD 1,335,000State Street Bank& Trust Company 17/6/2020 23,058
EUR 191,173 USD 210,000Toronto Dominion
Bank 17/6/2020 2,371EUR 115,000 USD 129,200 UBS 17/6/2020 (1,159)
EUR 278,569 USD 300,000Bank of America
Merrill Lynch 24/7/2020 9,063EUR 117,204 ZAR 2,170,000 Morgan Stanley 17/6/2020 6,033GBP 188,000 EUR 209,488 UBS 3/6/2020 (678)
GBP 4,500,000 EUR 4,928,390Bank of America
Merrill Lynch 17/6/2020 68,608GBP 3,093,518 EUR 3,490,000 BNP Paribas 17/6/2020 (54,822)GBP 464,639 EUR 525,502 Citibank 17/6/2020 (9,547)GBP 1,875,631 EUR 2,120,000 Deutsche Bank 17/6/2020 (37,215)GBP 491,936 EUR 561,238 Goldman Sachs 17/6/2020 (14,969)GBP 1,600,000 EUR 1,732,438 HSBC 17/6/2020 44,272GBP 4,630,000 EUR 5,301,171 JP Morgan 17/6/2020 (159,815)GBP 9,000,000 EUR 10,285,120 Morgan Stanley 17/6/2020 (291,123)GBP 298,336 EUR 340,000 Natwest Markets 17/6/2020 (8,715)
GBP 130,553 EUR 146,834Royal Bank of
Canada 17/6/2020 (1,862)GBP 4,057,870 EUR 4,491,057 Societe Generale 17/6/2020 14,980
GBP 188,381 EUR 210,000Standard
Chartered Bank 17/6/2020 (814)
GBP 5,015,973 EUR 5,711,104State Street Bank& Trust Company 17/6/2020 (141,146)
GBP 390,000 EUR 428,868Toronto Dominion
Bank 17/6/2020 4,205GBP 21,000 USD 25,851 JP Morgan 12/6/2020 77GBP 400,000 USD 496,956 Barclays Bank 17/6/2020 (2,615)GBP 320,000 USD 393,661 BNP Paribas 17/6/2020 1,418GBP 350,000 USD 438,974 Citibank 17/6/2020 (6,008)GBP 340,000 USD 422,219 Deutsche Bank 17/6/2020 (2,049)GBP 2,080,000 USD 2,579,705 Goldman Sachs 17/6/2020 (9,582)GBP 320,000 USD 394,225 HSBC 17/6/2020 911GBP 320,000 USD 394,382 JP Morgan 17/6/2020 769GBP 1,449,853 USD 1,779,470 Natwest Markets 17/6/2020 10,133
Open forward foreign exchange transactionsas at 31 May 2020
Currency Purchases Currency Sales CounterpartyMaturity
date
Netunrealised
appreciation/(depreciation)
EURGBP 310,000 USD 385,781 Societe Generale 17/6/2020 (2,602)
GBP 290,000 USD 357,959Standard
Chartered Bank 17/6/2020 203
GBP 1,770,147 USD 2,172,279State Street Bank& Trust Company 17/6/2020 12,642
GBP 430,000 USD 531,469 Westpac 17/6/2020 (331)HKD 200,000 USD 25,794 Citibank 16/6/2020 (9)HKD 900,000 USD 116,095 HSBC 16/6/2020 (60)
IDR 4,620,000,000 EUR 277,728Bank of America
Merrill Lynch 17/6/2020 5,179IDR 1,001,970,000 EUR 60,469 HSBC 17/6/2020 887
IDR 7,970,000,000 USD 535,618Bank of America
Merrill Lynch 17/6/2020 6,493IDR 6,616,006,351 USD 390,994 BNP Paribas 17/6/2020 53,607IDR 1,011,686,000 USD 66,955 HSBC 15/7/2020 1,408INR 46,000,000 USD 606,171 Barclays Bank 17/6/2020 1,258INR 41,850,000 USD 552,239 BNP Paribas 17/6/2020 466INR 7,650,000 USD 99,119 Citibank 17/6/2020 1,729JPY 25,670,000 EUR 217,850 Morgan Stanley 17/6/2020 (3,251)JPY 3,995,612 NZD 60,000 Morgan Stanley 17/6/2020 (60)JPY 6,459,204 USD 60,000 UBS 8/6/2020 47JPY 5,000,000 USD 48,492 Goldman Sachs 17/6/2020 (1,797)JPY 4,200,148 USD 40,000 UBS 17/6/2020 (849)JPY 16,696,894 USD 155,000 Morgan Stanley 22/6/2020 242KZT 3,892,500 USD 10,000 Goldman Sachs 24/7/2020 (633)KZT 3,608,220 USD 9,240 Natwest Markets 24/7/2020 (560)MXN 4,129,653 USD 170,023 Barclays Bank 17/6/2020 14,593MXN 3,222,398 USD 137,100 Barclays Bank 22/6/2020 7,302MXN 7,146,187 USD 305,000 Citibank 22/6/2020 15,335MXN 825,703 USD 37,000 Citibank 29/6/2020 154NOK 4,765,279 EUR 422,718 Barclays Bank 17/6/2020 18,208NOK 15,534,721 EUR 1,371,989 Goldman Sachs 17/6/2020 65,419
NOK 254,296 USD 25,000Bank of America
Merrill Lynch 11/6/2020 1,052NZD 60,000 JPY 3,864,000 JP Morgan 17/6/2020 1,160NZD 20,000 USD 12,482 UBS 17/6/2020 (68)
RUB 3,705,000 USD 48,546Bank of America
Merrill Lynch 17/6/2020 3,435RUB 11,443,835 USD 152,181 Credit Suisse 17/6/2020 8,600RUB 2,530,000 USD 33,784 Deutsche Bank 17/6/2020 1,775RUB 4,519,752 USD 59,753 Goldman Sachs 17/6/2020 3,713RUB 13,055,000 USD 174,505 HSBC 17/6/2020 9,003RUB 17,527,000 USD 237,171 Morgan Stanley 17/6/2020 9,488RUB 5,320,000 USD 72,307 Societe Generale 17/6/2020 2,594RUB 2,088,290 USD 29,000 Citibank 22/6/2020 446RUB 23,947,362 USD 333,000 JP Morgan 22/6/2020 4,712
SEK 90,000 EUR 8,346Bank of America
Merrill Lynch 17/6/2020 218SGD 20,000 USD 14,052 Bank Of America 17/6/2020 86SGD 190,000 USD 136,096 Barclays Bank 17/6/2020 (1,522)SGD 200,000 USD 140,568 Citibank 17/6/2020 818SGD 190,000 USD 134,015 Deutsche Bank 17/6/2020 349
SGD 80,000 USD 56,547State Street Bank& Trust Company 17/6/2020 40
TWD 600,000 USD 20,059 Morgan Stanley 17/6/2020 (57)USD 50,386 AUD 77,000 BNP Paribas 4/6/2020 (647)USD 29,931 AUD 45,000 HSBC 22/6/2020 57USD 44,110 AUD 67,000 BNP Paribas 30/6/2020 (322)USD 59,000 BRL 324,862 BNP Paribas 2/6/2020 (700)USD 60,000 BRL 346,927 Citibank 2/6/2020 (3,452)USD 29,000 BRL 166,905 Deutsche Bank 2/6/2020 (1,540)
BlackRock Global Absolute Return Bond Fund continued
The notes on pages 691 to 711 form an integral part of these financial statements.
Annual report and audited financial statements [435]

Open forward foreign exchange transactionsas at 31 May 2020
Currency Purchases Currency Sales CounterpartyMaturity
date
Netunrealised
appreciation/(depreciation)
EURUSD 30,000 BRL 170,390 JP Morgan 2/6/2020 (1,217)
USD 48,000 BRL 255,101Bank of America
Merrill Lynch 2/7/2020 1,023USD 29,000 BRL 155,421 BNP Paribas 2/7/2020 404USD 5,000 BRL 26,657 Citibank 2/7/2020 93USD 20,000 BRL 106,255 JP Morgan 2/7/2020 432
USD 80,000 CAD 111,376Bank of America
Merrill Lynch 17/6/2020 (771)USD 40,000 CAD 55,418 HSBC 17/6/2020 (209)USD 30,000 CAD 42,583 Morgan Stanley 17/6/2020 (822)
USD 40,000 CAD 55,494State Street Bank& Trust Company 17/6/2020 (259)
USD 29,000 CLP 23,620,500 Deutsche Bank 30/6/2020 (228)USD 31,000 CLP 25,489,750 Citibank 20/7/2020 (514)USD 220,205 CNH 1,564,338 Citibank 16/6/2020 1,917USD 1,095,413 CNH 7,815,000 HSBC 16/6/2020 5,376USD 44,816 CNH 320,000 Goldman Sachs 19/6/2020 194USD 22,504 COP 89,497,000 BNP Paribas 16/6/2020 (1,406)USD 65,397 COP 251,382,000 Barclays Bank 17/6/2020 (1,976)USD 29,660 COP 116,810,000 BNP Paribas 17/6/2020 (1,573)USD 27,539 COP 104,119,000 Citibank 17/6/2020 (412)USD 10,583 COP 40,634,000 Goldman Sachs 17/6/2020 (308)USD 44,000 COP 165,238,480 HSBC 17/6/2020 (388)USD 21,000 COP 83,286,000 Natwest Markets 17/6/2020 (1,254)USD 45,000 COP 178,092,000 UBS 17/6/2020 (2,596)USD 23,454 COP 87,854,000 Goldman Sachs 27/7/2020 (81)USD 247,128 EUR 217,708 JP Morgan 12/6/2020 4,498USD 43,842 EUR 40,248 ANZ 16/6/2020 (830)USD 430,000 EUR 389,696 Bank Of America 17/6/2020 (3,101)
USD 8,463,144 EUR 7,771,300Bank of America
Merrill Lynch 17/6/2020 (162,437)USD 490,000 EUR 436,954 Barclays Bank 17/6/2020 3,585USD 2,215,675 EUR 2,030,000 BNP Paribas 17/6/2020 (37,979)USD 1,436,044 EUR 1,300,000 Citibank 17/6/2020 (8,911)USD 2,449,870 EUR 2,227,447 Morgan Stanley 17/6/2020 (24,871)USD 7,470,000 EUR 6,829,234 Natwest Markets 17/6/2020 (113,265)
USD 99,366 EUR 89,412Royal Bank of
Canada 17/6/2020 (76)
USD 7,130,000 EUR 6,584,746State Street Bank& Trust Company 17/6/2020 (174,457)
USD 2,000,000 EUR 1,841,680 UBS 17/6/2020 (43,562)
USD 25,886 GBP 21,000Bank of America
Merrill Lynch 12/6/2020 (46)USD 488,919 GBP 391,723 Barclays Bank 17/6/2020 4,580USD 2,097,087 GBP 1,688,983 Deutsche Bank 17/6/2020 9,884USD 4,061,111 GBP 3,260,000 Goldman Sachs 17/6/2020 31,131USD 801,359 GBP 650,000 Morgan Stanley 17/6/2020 (1,319)USD 368,706 GBP 300,000 Natwest Markets 17/6/2020 (1,645)
USD 827,532 GBP 678,277Standard
Chartered Bank 17/6/2020 (9,189)
USD 1,145,172 GBP 931,017State Street Bank& Trust Company 17/6/2020 (4,264)
USD 598,618 GBP 480,000Toronto Dominion
Bank 17/6/2020 5,179
USD 157,865 HKD 1,224,014Bank of America
Merrill Lynch 16/6/2020 57USD 165,861 IDR 2,516,115,397 Barclays Bank 16/6/2020 (4,988)USD 151,339 IDR 2,600,000,000 Citibank 16/6/2020 (23,183)USD 126,474 IDR 1,889,000,000 Barclays Bank 17/6/2020 (1,966)USD 44,966 IDR 690,000,000 Goldman Sachs 17/6/2020 (1,825)USD 197,721 IDR 2,950,000,000 HSBC 17/6/2020 (2,881)USD 481,392 IDR 6,944,317,605 JP Morgan 17/6/2020 7,562
Open forward foreign exchange transactionsas at 31 May 2020
Currency Purchases Currency Sales CounterpartyMaturity
date
Netunrealised
appreciation/(depreciation)
EUR
USD 80,451 IDR 1,212,000,000State Street Bank& Trust Company 17/6/2020 (1,887)
USD 475,231 IDR 6,944,317,605 JP Morgan 15/7/2020 4,392
USD 67,820 INR 5,195,000Bank of America
Merrill Lynch 17/6/2020 (716)USD 329,518 INR 24,900,000 Barclays Bank 17/6/2020 573USD 248,327 INR 18,800,000 BNP Paribas 17/6/2020 14USD 71,447 INR 5,480,000 Citibank 17/6/2020 (839)USD 117,079 INR 8,900,000 Goldman Sachs 17/6/2020 (425)USD 57,948 INR 4,400,000 HSBC 17/6/2020 (150)USD 175,741 INR 13,335,000 JP Morgan 17/6/2020 (350)USD 86,882 INR 6,600,000 Morgan Stanley 17/6/2020 (262)USD 67,755 INR 5,190,000 Natwest Markets 17/6/2020 (715)
USD 60,000 JPY 6,361,308Bank of America
Merrill Lynch 8/6/2020 771USD 58,624 JPY 6,188,972 JP Morgan 17/6/2020 967USD 544,369 KRW 663,460,777 Goldman Sachs 16/6/2020 7,286
USD 114,085 MXN 2,797,000Bank of America
Merrill Lynch 17/6/2020 (10,846)USD 45,799 MXN 1,139,000 Deutsche Bank 17/6/2020 (5,010)USD 40,962 MXN 986,000 HSBC 17/6/2020 (3,155)USD 25,000 NOK 255,613 BNP Paribas 11/6/2020 (1,174)USD 11,695 NZD 20,000 Morgan Stanley 17/6/2020 (640)USD 11,187 RUB 833,406 Barclays Bank 17/6/2020 (532)USD 927,539 RUB 62,752,675 Citibank 17/6/2020 36,502USD 10,653 RUB 826,672 Deutsche Bank 17/6/2020 (927)USD 22,081 RUB 1,713,328 Goldman Sachs 17/6/2020 (1,920)USD 122,201 RUB 9,302,026 HSBC 17/6/2020 (8,337)USD 42,157 RUB 3,156,295 JP Morgan 17/6/2020 (2,206)
USD 196,546 SGD 280,000Bank of America
Merrill Lynch 17/6/2020 (1,368)USD 343,405 SGD 480,000 Natwest Markets 17/6/2020 3,470USD 148,000 TRY 1,014,614 JP Morgan 22/6/2020 378USD 35,000 TWD 1,039,675 Morgan Stanley 26/8/2020 146USD 25,436 ZAR 480,000 Goldman Sachs 19/6/2020 (1,717)
USD 41,877 ZAR 772,240Bank of America
Merrill Lynch 22/6/2020 (1,892)USD 445,171 ZAR 7,792,160 BNP Paribas 22/6/2020 1,240USD 37,000 ZAR 650,910 Deutsche Bank 22/6/2020 (65)USD 30,123 ZAR 555,866 Morgan Stanley 22/6/2020 (1,381)ZAR 240,000 USD 12,645 HSBC 19/6/2020 924ZAR 240,000 USD 12,964 Natwest Markets 19/6/2020 637
1,160,887
CHF Hedged Share Class
CHF 145 EUR 138State Street Bank& Trust Company 15/6/2020 (2)
(2)
GBP Hedged Share Class
GBP 3,015,538 EUR 3,434,175State Street Bank& Trust Company 15/6/2020 (85,482)
(85,482)
SEK Hedged Share Class
SEK 32,838,772 EUR 3,092,948State Street Bank& Trust Company 15/6/2020 32,056
32,056
BlackRock Global Absolute Return Bond Fund continued
The notes on pages 691 to 711 form an integral part of these financial statements.
BlackRock Strategic Funds[436]
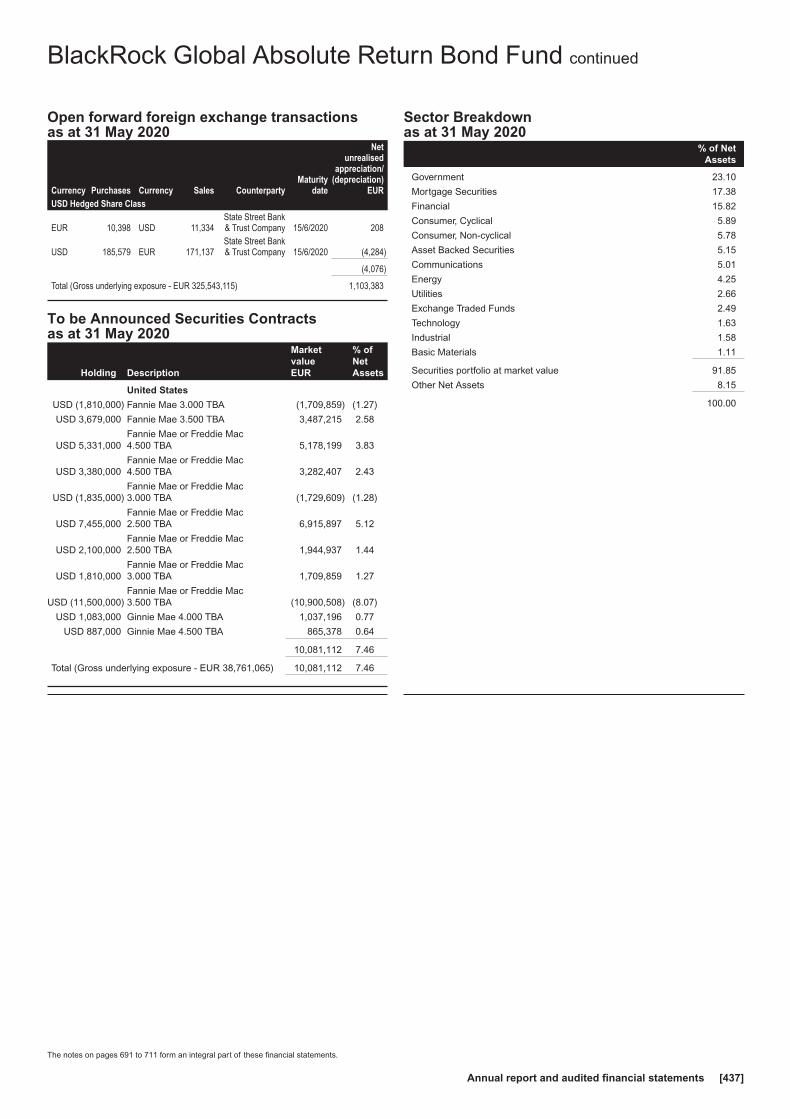
Open forward foreign exchange transactionsas at 31 May 2020
Currency Purchases Currency Sales CounterpartyMaturity
date
Netunrealised
appreciation/(depreciation)
EURUSD Hedged Share Class
EUR 10,398 USD 11,334State Street Bank& Trust Company 15/6/2020 208
USD 185,579 EUR 171,137State Street Bank& Trust Company 15/6/2020 (4,284)
(4,076)
Total (Gross underlying exposure - EUR 325,543,115) 1,103,383
To be Announced Securities Contractsas at 31 May 2020
Holding Description
MarketvalueEUR
% ofNetAssets
United States
USD (1,810,000) Fannie Mae 3.000 TBA (1,709,859) (1.27)
USD 3,679,000 Fannie Mae 3.500 TBA 3,487,215 2.58
USD 5,331,000Fannie Mae or Freddie Mac4.500 TBA 5,178,199 3.83
USD 3,380,000Fannie Mae or Freddie Mac4.500 TBA 3,282,407 2.43
USD (1,835,000)Fannie Mae or Freddie Mac3.000 TBA (1,729,609) (1.28)
USD 7,455,000Fannie Mae or Freddie Mac2.500 TBA 6,915,897 5.12
USD 2,100,000Fannie Mae or Freddie Mac2.500 TBA 1,944,937 1.44
USD 1,810,000Fannie Mae or Freddie Mac3.000 TBA 1,709,859 1.27
USD (11,500,000)Fannie Mae or Freddie Mac3.500 TBA (10,900,508) (8.07)
USD 1,083,000 Ginnie Mae 4.000 TBA 1,037,196 0.77
USD 887,000 Ginnie Mae 4.500 TBA 865,378 0.64
10,081,112 7.46
Total (Gross underlying exposure - EUR 38,761,065) 10,081,112 7.46
Sector Breakdownas at 31 May 2020
% of NetAssets
Government 23.10
Mortgage Securities 17.38
Financial 15.82
Consumer, Cyclical 5.89
Consumer, Non-cyclical 5.78
Asset Backed Securities 5.15
Communications 5.01
Energy 4.25
Utilities 2.66
Exchange Traded Funds 2.49
Technology 1.63
Industrial 1.58
Basic Materials 1.11
Securities portfolio at market value 91.85
Other Net Assets 8.15
100.00
BlackRock Global Absolute Return Bond Fund continued
The notes on pages 691 to 711 form an integral part of these financial statements.
Annual report and audited financial statements [437]
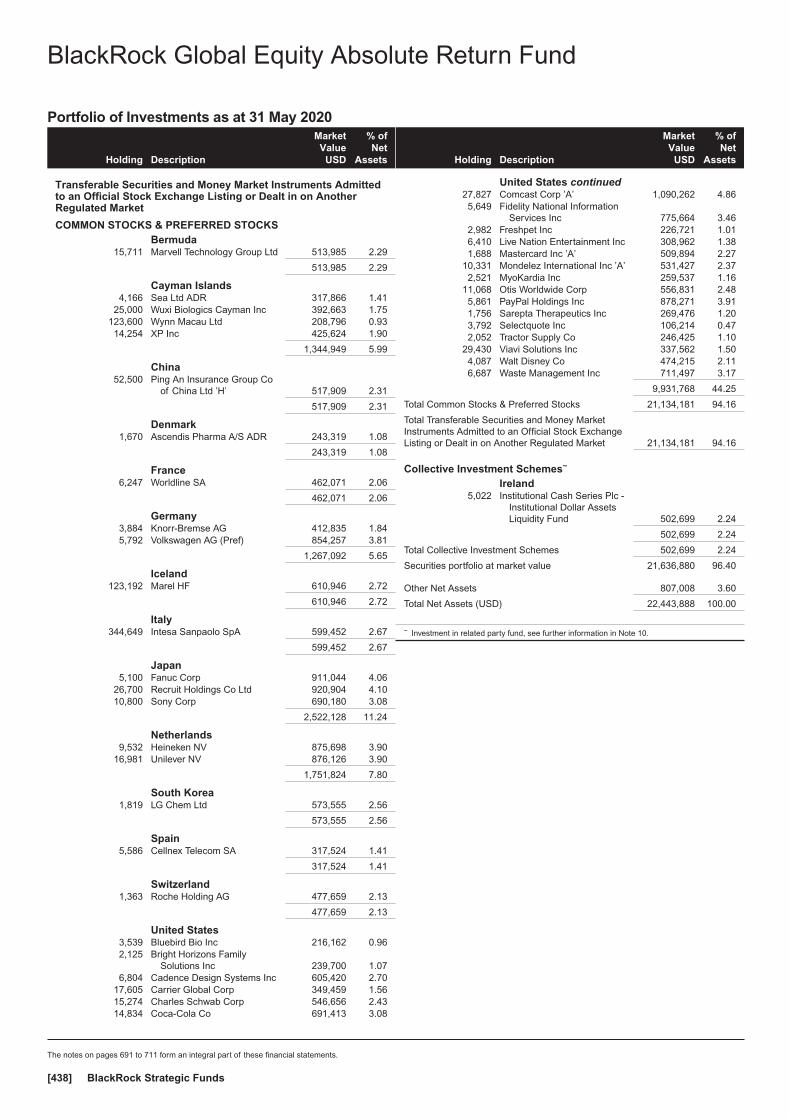
Portfolio of Investments as at 31 May 2020
Holding Description
MarketValue
USD
% ofNet
Assets
Transferable Securities and Money Market Instruments Admittedto an Official Stock Exchange Listing or Dealt in on AnotherRegulated Market
COMMON STOCKS & PREFERRED STOCKSBermuda
15,711 Marvell Technology Group Ltd 513,985 2.29
513,985 2.29
Cayman Islands4,166 Sea Ltd ADR 317,866 1.41
25,000 Wuxi Biologics Cayman Inc 392,663 1.75123,600 Wynn Macau Ltd 208,796 0.9314,254 XP Inc 425,624 1.90
1,344,949 5.99
China52,500 Ping An Insurance Group Co
of China Ltd ’H’ 517,909 2.31
517,909 2.31
Denmark1,670 Ascendis Pharma A/S ADR 243,319 1.08
243,319 1.08
France6,247 Worldline SA 462,071 2.06
462,071 2.06
Germany3,884 Knorr-Bremse AG 412,835 1.845,792 Volkswagen AG (Pref) 854,257 3.81
1,267,092 5.65
Iceland123,192 Marel HF 610,946 2.72
610,946 2.72
Italy344,649 Intesa Sanpaolo SpA 599,452 2.67
599,452 2.67
Japan5,100 Fanuc Corp 911,044 4.06
26,700 Recruit Holdings Co Ltd 920,904 4.1010,800 Sony Corp 690,180 3.08
2,522,128 11.24
Netherlands9,532 Heineken NV 875,698 3.90
16,981 Unilever NV 876,126 3.90
1,751,824 7.80
South Korea1,819 LG Chem Ltd 573,555 2.56
573,555 2.56
Spain5,586 Cellnex Telecom SA 317,524 1.41
317,524 1.41
Switzerland1,363 Roche Holding AG 477,659 2.13
477,659 2.13
United States3,539 Bluebird Bio Inc 216,162 0.962,125 Bright Horizons Family
Solutions Inc 239,700 1.076,804 Cadence Design Systems Inc 605,420 2.70
17,605 Carrier Global Corp 349,459 1.5615,274 Charles Schwab Corp 546,656 2.4314,834 Coca-Cola Co 691,413 3.08
Holding Description
MarketValue
USD
% ofNet
Assets
United States continued27,827 Comcast Corp ’A’ 1,090,262 4.865,649 Fidelity National Information
Services Inc 775,664 3.462,982 Freshpet Inc 226,721 1.016,410 Live Nation Entertainment Inc 308,962 1.381,688 Mastercard Inc ’A’ 509,894 2.27
10,331 Mondelez International Inc ’A’ 531,427 2.372,521 MyoKardia Inc 259,537 1.16
11,068 Otis Worldwide Corp 556,831 2.485,861 PayPal Holdings Inc 878,271 3.911,756 Sarepta Therapeutics Inc 269,476 1.203,792 Selectquote Inc 106,214 0.472,052 Tractor Supply Co 246,425 1.10
29,430 Viavi Solutions Inc 337,562 1.504,087 Walt Disney Co 474,215 2.116,687 Waste Management Inc 711,497 3.17
9,931,768 44.25
Total Common Stocks & Preferred Stocks 21,134,181 94.16
Total Transferable Securities and Money MarketInstruments Admitted to an Official Stock ExchangeListing or Dealt in on Another Regulated Market 21,134,181 94.16
Collective Investment Schemes~
Ireland5,022 Institutional Cash Series Plc -
Institutional Dollar AssetsLiquidity Fund 502,699 2.24
502,699 2.24
Total Collective Investment Schemes 502,699 2.24
Securities portfolio at market value 21,636,880 96.40
Other Net Assets 807,008 3.60
Total Net Assets (USD) 22,443,888 100.00
~ Investment in related party fund, see further information in Note 10.
BlackRock Global Equity Absolute Return Fund
The notes on pages 691 to 711 form an integral part of these financial statements.
BlackRock Strategic Funds[438]

Contracts for difference as at 31 May 2020
Holding Description Counterparty
Netunrealised
appreciation/(depreciation)
USD
Australia(12,499) Afterpay Ltd JP Morgan (62,466)(8,264) Commonwealth Bank of
Australia JP Morgan (22,762)
(85,228)
Brazil41,984 Banco do Brasil SA JP Morgan 33,700
105,496 Locaweb Servicos deInternet SA JP Morgan 45,963
(10,041) Notre Dame IntermedicaParticipacoes SA JP Morgan (4,762)
35,487 Notre Dame IntermedicaParticipacoes SA JP Morgan 58,576
133,477
Canada(6,678) Toronto-Dominion Bank UBS (22,931)
(22,931)
France(5,259) Alstom SA UBS (10)4,805 Schneider Electric SE UBS 63,0463,868 Ubisoft Entertainment SA Goldman Sachs 5,419
68,455
Germany(18,664) Freenet AG UBS 8,820(3,650) Stroeer SE & Co KGaA UBS (31,860)
(23,040)
Hong Kong(32,500) Hengan International Group
Co Ltd Goldman Sachs 7,544(148,000) Tingyi Cayman Islands
Holding Corp JP Morgan 9,924
17,468
Indonesia(120,100) Bank Central Asia Tbk PT JP Morgan (3,973)
(3,973)
Japan(4,800) Secom Co Ltd Goldman Sachs (16,957)
(185,800) Seven Bank Ltd UBS (38,001)(23,400) Softbank Corp JP Morgan 19,470
(35,488)
Netherlands(18,359) Signify NV UBS (47,055)
(47,055)
Spain28,540 Masmovil Ibercom SA Goldman Sachs 40,303
40,303
Sweden(38,234) Telefonaktiebolaget LM
Ericsson ’B’ Goldman Sachs (15,700)25,433 Volvo AB ’B’ Goldman Sachs 17,380
1,680
United Kingdom(8,974) Bunzl Plc Goldman Sachs (21,502)48,571 Burberry Group Plc Goldman Sachs 120,87511,912 Fevertree Drinks Plc UBS 59,951
(10,867) Hargreaves Lansdown Plc JP Morgan (35,902)(47,974) Sage Group Plc JP Morgan (28,440)31,058 Sberbank of Russia PJSC
ADR UBS 41,525384,208 Vodafone Group Plc JP Morgan 100,882
237,389
Holding Description Counterparty
Netunrealised
appreciation/(depreciation)
USD
United States(20,129) AT&T Inc Goldman Sachs (43,277)(2,371) Brink’s Co UBS (5,382)(8,401) Campbell Soup Co Goldman Sachs 33,436(7,544) Discovery Inc ’A’ Goldman Sachs (8,449)(1,880) Electronic Arts Inc UBS (5,377)(5,704) Fastenal Co Goldman Sachs (8,670)(3,174) First Republic Bank UBS (40,913)
(16,041) GFL Environmental Inc UBS (21,174)(4,482) Intel Corp JP Morgan (13,401)(1,716) International Flavors &
Fragrances Inc UBS (7,207)(13,615) Interpublic Group of Cos Inc Goldman Sachs (19,742)(7,417) Liberty Global Plc ’A’ Goldman Sachs 3,783
(21,926) Lions Gate EntertainmentCorp ’A’ Goldman Sachs (11,621)
(3,985) Omnicom Group Inc UBS (12,234)(6,329) Palomar Holdings Inc UBS (108,352)(2,406) Roku Inc Goldman Sachs 6,159(8,990) Seagate Technology Plc Goldman Sachs (36,949)(1,049) Ulta Beauty Inc UBS (25,897)(1,079) Wayfair Inc ’A’ UBS (14,731)
(339,998)
Total (Gross underlying exposure - USD 15,931,668) (58,941)
BlackRock Global Equity Absolute Return Fund continued
The notes on pages 691 to 711 form an integral part of these financial statements.
Annual report and audited financial statements [439]

Futures contracts as at 31 May 2020
Numberof
contractsCurrencyof contracts
Contract/Description
Expirationdate
Grossunderlying
exposureUSD
Net unrealised(depreciation)
USD
(25) EUR CAC 40 Index Futures June 2020 June 2020 1,312,101 (91,035)
(15) USD E-Mini S&P 500 Index Futures June 2020 June 2020 2,266,725 (348,242)
(39) JPY Mini-Topix Index Futures June 2020 June 2020 565,249 (71,155)
(6) USD NASDAQ 100 E-Mini Stock Index Futures June 2020 June 2020 1,134,720 (247,590)
(204) EUR STOXX Europe 600 Index Futures June 2020 June 2020 3,983,272 (710,505)
Total 9,262,067 (1,468,527)
Open forward foreign exchange transactionsas at 31 May 2020
Currency Purchases Currency Sales CounterpartyMaturity
date
Netunrealised
appreciation/(depreciation)
USD
IDR 4,354,285,000 USD 293,863Royal Bank of
Canada 30/6/2020 1,906USD 518,348 CAD 712,670 JP Morgan 30/6/2020 953USD 576,345 CHF 558,555 Morgan Stanley 30/6/2020 (3,993)USD 4,563,611 EUR 4,146,590 BNP Paribas 30/6/2020 (49,777)
USD 2,406,557 JPY 259,504,819State Street Bank& Trust Company 30/6/2020 (6,963)
USD 471,065 SEK 4,519,233 JP Morgan 30/6/2020 (7,329)
(65,203)
CHF Hedged Share Class
CHF 5,007 USD 5,165State Street Bank& Trust Company 15/6/2020 36
USD 29 CHF 28State Street Bank& Trust Company 15/6/2020 —
36
EUR Hedged Share Class
EUR 8,914 USD 9,670State Street Bank& Trust Company 15/6/2020 244
USD 89 EUR 81State Street Bank& Trust Company 15/6/2020 (1)
243
GBP Hedged Share Class
GBP 649,819 USD 802,302State Street Bank& Trust Company 15/6/2020 293
USD 4,563 GBP 3,722State Street Bank& Trust Company 15/6/2020 (34)
259
Total (Gross underlying exposure - USD 9,721,230) (64,665)
Sector Breakdownas at 31 May 2020
% of NetAssets
Consumer, Non-cyclical 32.67
Industrial 17.24
Financial 12.05
Consumer, Cyclical 11.31
Technology 9.86
Communications 8.47
Basic Materials 2.56
Collective Investment Schemes 2.24
Securities portfolio at market value 96.40
Other Net Assets 3.60
100.00
BlackRock Global Equity Absolute Return Fund continued
The notes on pages 691 to 711 form an integral part of these financial statements.
BlackRock Strategic Funds[440]
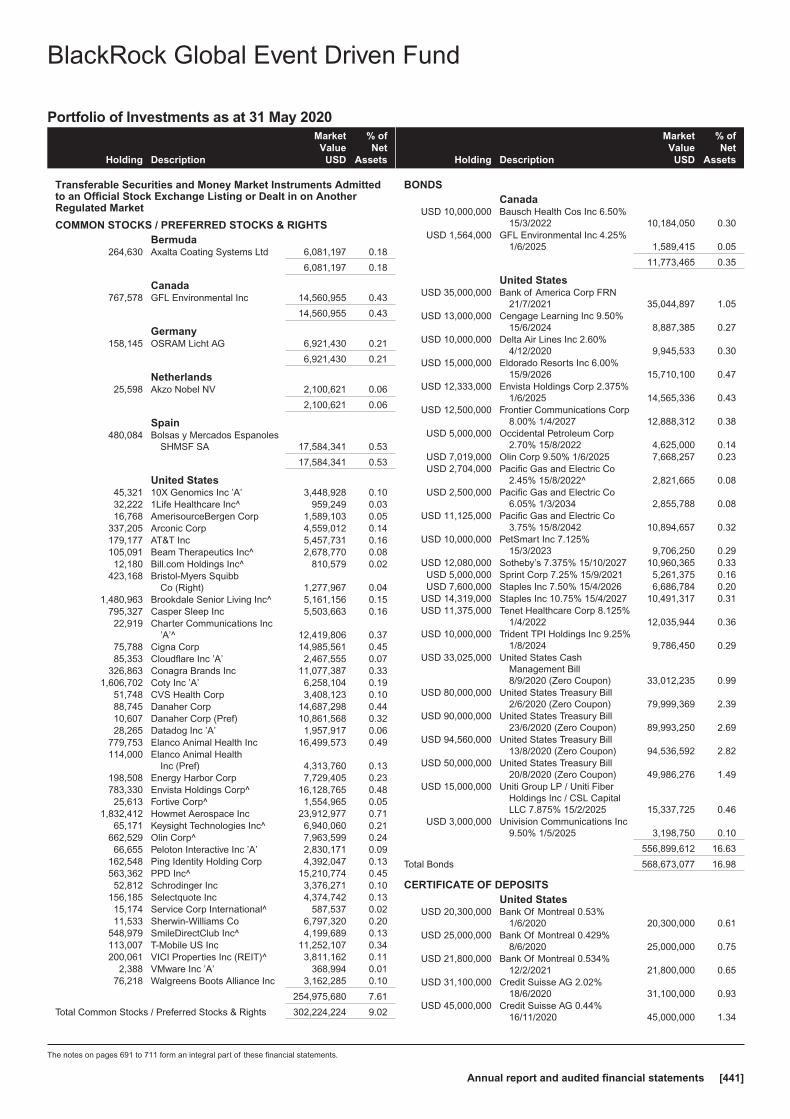
Portfolio of Investments as at 31 May 2020
Holding Description
MarketValue
USD
% ofNet
Assets
Transferable Securities and Money Market Instruments Admittedto an Official Stock Exchange Listing or Dealt in on AnotherRegulated Market
COMMON STOCKS / PREFERRED STOCKS & RIGHTSBermuda
264,630 Axalta Coating Systems Ltd 6,081,197 0.18
6,081,197 0.18
Canada767,578 GFL Environmental Inc 14,560,955 0.43
14,560,955 0.43
Germany158,145 OSRAM Licht AG 6,921,430 0.21
6,921,430 0.21
Netherlands25,598 Akzo Nobel NV 2,100,621 0.06
2,100,621 0.06
Spain480,084 Bolsas y Mercados Espanoles
SHMSF SA 17,584,341 0.53
17,584,341 0.53
United States45,321 10X Genomics Inc ’A’ 3,448,928 0.1032,222 1Life Healthcare Inc^ 959,249 0.0316,768 AmerisourceBergen Corp 1,589,103 0.05
337,205 Arconic Corp 4,559,012 0.14179,177 AT&T Inc 5,457,731 0.16105,091 Beam Therapeutics Inc^ 2,678,770 0.0812,180 Bill.com Holdings Inc^ 810,579 0.02
423,168 Bristol-Myers SquibbCo (Right) 1,277,967 0.04
1,480,963 Brookdale Senior Living Inc^ 5,161,156 0.15795,327 Casper Sleep Inc 5,503,663 0.1622,919 Charter Communications Inc
’A’^ 12,419,806 0.3775,788 Cigna Corp 14,985,561 0.4585,353 Cloudflare Inc ’A’ 2,467,555 0.07
326,863 Conagra Brands Inc 11,077,387 0.331,606,702 Coty Inc ’A’ 6,258,104 0.19
51,748 CVS Health Corp 3,408,123 0.1088,745 Danaher Corp 14,687,298 0.4410,607 Danaher Corp (Pref) 10,861,568 0.3228,265 Datadog Inc ’A’ 1,957,917 0.06
779,753 Elanco Animal Health Inc 16,499,573 0.49114,000 Elanco Animal Health
Inc (Pref) 4,313,760 0.13198,508 Energy Harbor Corp 7,729,405 0.23783,330 Envista Holdings Corp^ 16,128,765 0.4825,613 Fortive Corp^ 1,554,965 0.05
1,832,412 Howmet Aerospace Inc 23,912,977 0.7165,171 Keysight Technologies Inc^ 6,940,060 0.21
662,529 Olin Corp^ 7,963,599 0.2466,655 Peloton Interactive Inc ’A’ 2,830,171 0.09
162,548 Ping Identity Holding Corp 4,392,047 0.13563,362 PPD Inc^ 15,210,774 0.4552,812 Schrodinger Inc 3,376,271 0.10
156,185 Selectquote Inc 4,374,742 0.1315,174 Service Corp International^ 587,537 0.0211,533 Sherwin-Williams Co 6,797,320 0.20
548,979 SmileDirectClub Inc^ 4,199,689 0.13113,007 T-Mobile US Inc 11,252,107 0.34200,061 VICI Properties Inc (REIT)^ 3,811,162 0.11
2,388 VMware Inc ’A’ 368,994 0.0176,218 Walgreens Boots Alliance Inc 3,162,285 0.10
254,975,680 7.61
Total Common Stocks / Preferred Stocks & Rights 302,224,224 9.02
Holding Description
MarketValue
USD
% ofNet
Assets
BONDSCanada
USD 10,000,000 Bausch Health Cos Inc 6.50%15/3/2022 10,184,050 0.30
USD 1,564,000 GFL Environmental Inc 4.25%1/6/2025 1,589,415 0.05
11,773,465 0.35
United StatesUSD 35,000,000 Bank of America Corp FRN
21/7/2021 35,044,897 1.05USD 13,000,000 Cengage Learning Inc 9.50%
15/6/2024 8,887,385 0.27USD 10,000,000 Delta Air Lines Inc 2.60%
4/12/2020 9,945,533 0.30USD 15,000,000 Eldorado Resorts Inc 6.00%
15/9/2026 15,710,100 0.47USD 12,333,000 Envista Holdings Corp 2.375%
1/6/2025 14,565,336 0.43USD 12,500,000 Frontier Communications Corp
8.00% 1/4/2027 12,888,312 0.38USD 5,000,000 Occidental Petroleum Corp
2.70% 15/8/2022 4,625,000 0.14USD 7,019,000 Olin Corp 9.50% 1/6/2025 7,668,257 0.23USD 2,704,000 Pacific Gas and Electric Co
2.45% 15/8/2022^ 2,821,665 0.08USD 2,500,000 Pacific Gas and Electric Co
6.05% 1/3/2034 2,855,788 0.08USD 11,125,000 Pacific Gas and Electric Co
3.75% 15/8/2042 10,894,657 0.32USD 10,000,000 PetSmart Inc 7.125%
15/3/2023 9,706,250 0.29USD 12,080,000 Sotheby’s 7.375% 15/10/2027 10,960,365 0.33USD 5,000,000 Sprint Corp 7.25% 15/9/2021 5,261,375 0.16USD 7,600,000 Staples Inc 7.50% 15/4/2026 6,686,784 0.20
USD 14,319,000 Staples Inc 10.75% 15/4/2027 10,491,317 0.31USD 11,375,000 Tenet Healthcare Corp 8.125%
1/4/2022 12,035,944 0.36USD 10,000,000 Trident TPI Holdings Inc 9.25%
1/8/2024 9,786,450 0.29USD 33,025,000 United States Cash
Management Bill8/9/2020 (Zero Coupon) 33,012,235 0.99
USD 80,000,000 United States Treasury Bill2/6/2020 (Zero Coupon) 79,999,369 2.39
USD 90,000,000 United States Treasury Bill23/6/2020 (Zero Coupon) 89,993,250 2.69
USD 94,560,000 United States Treasury Bill13/8/2020 (Zero Coupon) 94,536,592 2.82
USD 50,000,000 United States Treasury Bill20/8/2020 (Zero Coupon) 49,986,276 1.49
USD 15,000,000 Uniti Group LP / Uniti FiberHoldings Inc / CSL CapitalLLC 7.875% 15/2/2025 15,337,725 0.46
USD 3,000,000 Univision Communications Inc9.50% 1/5/2025 3,198,750 0.10
556,899,612 16.63
Total Bonds 568,673,077 16.98
CERTIFICATE OF DEPOSITSUnited States
USD 20,300,000 Bank Of Montreal 0.53%1/6/2020 20,300,000 0.61
USD 25,000,000 Bank Of Montreal 0.429%8/6/2020 25,000,000 0.75
USD 21,800,000 Bank Of Montreal 0.534%12/2/2021 21,800,000 0.65
USD 31,100,000 Credit Suisse AG 2.02%18/6/2020 31,100,000 0.93
USD 45,000,000 Credit Suisse AG 0.44%16/11/2020 45,000,000 1.34
BlackRock Global Event Driven Fund
The notes on pages 691 to 711 form an integral part of these financial statements.
Annual report and audited financial statements [441]

Portfolio of Investments as at 31 May 2020
Holding Description
MarketValue
USD
% ofNet
Assets
United States continuedUSD 29,500,000 KBC Bank NV 0.42%
30/7/2020 29,503,496 0.88USD 19,650,000 National Bank Of America
1.95% 4/8/2020 19,650,000 0.59USD 24,100,000 National Bank Of America
1.82% 1/9/2020 24,100,000 0.72USD 25,000,000 National Bank Of America
0.429% 3/11/2020 25,000,000 0.75USD 12,950,000 Nordea Bank ABP 1.85%
8/7/2020 12,950,000 0.39USD 18,950,000 Nordea Bank ABP 0.451%
9/7/2020 18,950,000 0.56USD 19,900,000 Nordea Bank ABP 1.75%
20/10/2020 19,900,000 0.59USD 25,100,000 Oversea-Chinese Banking
Corp 1.87% 4/8/2020 25,100,000 0.75USD 48,300,000 Oversea-Chinese Banking
Corp 0.25% 20/8/2020 48,304,397 1.44USD 10,100,000 Royal Bank Of Canada 0.39%
9/10/2020 10,100,000 0.30USD 13,625,000 Skandinaviska Enskilda
Banken AB 1.81%9/11/2020 13,625,000 0.41
USD 57,200,000 Sumitomo Mitsui Trust BankLtd 0.218% 26/6/2020 57,200,000 1.71
USD 20,000,000 Sumitomo Mitsui Trust BankLtd 1.161% 27/7/2020 20,000,000 0.60
USD 15,400,000 Sumitomo Mitsui Trust BankLtd 0.45% 9/11/2020 15,400,000 0.46
USD 14,900,000 Sumitomo Mitsui Trust BankLtd 0.43% 12/11/2020 14,900,000 0.44
497,882,893 14.87
Total Certificate of Deposits 497,882,893 14.87
COMMERCIAL PAPERJapan
USD 37,600,000 Mitsubishi UFJ Trust AndBanking 21/8/2020 (ZeroCoupon) 37,576,594 1.12
37,576,594 1.12
United StatesUSD 23,850,000 ABN Amro Funding USA LLC
10/8/2020 (Zero Coupon) 23,761,278 0.71USD 15,050,000 ABN Amro Funding USA LLC
9/11/2020 (Zero Coupon) 14,934,838 0.45USD 32,475,000 American Electric Power
Company Incorporated8/7/2020 (Zero Coupon) 32,459,168 0.97
USD 17,000,000 AT&T Inc 21/7/2020 (ZeroCoupon) 16,959,483 0.51
USD 15,900,000 AT&T Inc 1/10/2020 (ZeroCoupon) 15,839,757 0.47
USD 15,600,000 Barton Capital SA5/8/2020 (Zero Coupon) 15,591,000 0.47
USD 49,700,000 BASF SE 6/7/2020 (ZeroCoupon) 49,618,782 1.48
USD 28,850,000 Bayerische Landesbk Giro7/8/2020 (Zero Coupon) 28,758,762 0.86
USD 50,500,000 BP Capital Markets Plc1/6/2020 (Zero Coupon) 50,495,202 1.51
USD 16,000,000 Cafco LLC 6/7/2020 (ZeroCoupon) 15,981,911 0.48
USD 39,500,000 Cafco LLC 8/7/2020 (ZeroCoupon) 39,446,510 1.18
USD 51,800,000 Caisse Des Depots etConsignations3/8/2020 (Zero Coupon) 51,781,294 1.55
Holding Description
MarketValue
USD
% ofNet
Assets
United States continuedUSD 35,650,000 Caisse Des Depots et
Consignations8/9/2020 (Zero Coupon) 35,622,995 1.06
USD 34,890,000 Cancara Asset Secur LLC4/6/2020 (Zero Coupon) 34,883,943 1.04
USD 10,785,000 Cargill Inc 9/6/2020 (ZeroCoupon) 10,781,555 0.32
USD 24,850,000 Chariot Funding LLC7/7/2020 (Zero Coupon) 24,817,212 0.74
USD 18,100,000 Chariot Funding LLC8/9/2020 (Zero Coupon) 18,083,750 0.54
USD 25,000,000 Charta LLC 10/7/2020 (ZeroCoupon) 24,994,306 0.75
USD 18,850,000 Ciesco LLC 17/8/2020 (ZeroCoupon) 18,840,486 0.56
USD 15,000,000 Citigroup Global Markets Inc5/6/2020 (Zero Coupon) 14,995,225 0.45
USD 41,500,000 Collat CP Flex Co LLC12/11/2020 (Zero Coupon) 41,431,110 1.24
USD 10,400,000 Compass Group Plc31/7/2020 (Zero Coupon) 10,367,760 0.31
USD 1,600,000 Crown Point Capital LLC8/9/2020 (Zero Coupon) 1,591,875 0.05
USD 49,250,000 DBS Bank Ltd 1/9/2020 (ZeroCoupon) 49,223,569 1.47
USD 1,425,000 Eli Lilly And Company4/8/2020 (Zero Coupon) 1,420,820 0.04
USD 50,000,000 Exxon Mobil Corp27/7/2020 (Zero Coupon) 49,936,361 1.49
USD 18,500,000 Federation Des CaissesDesjardins 29/6/2020 (ZeroCoupon) 18,494,758 0.55
USD 48,200,000 Hitachi America Capital Ltd5/6/2020 (Zero Coupon) 48,197,992 1.44
USD 39,500,000 Jupiter SecuritizationCompany LLC1/6/2020 (Zero Coupon) 39,497,586 1.18
USD 17,400,000 Jupiter SecuritizationCompany LLC8/6/2020 (Zero Coupon) 17,399,348 0.52
USD 7,000,000 Jupiter SecuritizationCompany LLC15/7/2020 (Zero Coupon) 6,990,161 0.21
USD 5,000,000 Kells Funding LLC16/6/2020 (Zero Coupon) 4,996,128 0.15
USD 19,250,000 Koch Industries Inc22/9/2020 (Zero Coupon) 19,231,552 0.57
USD 15,500,000 Koch Industries Inc23/9/2020 (Zero Coupon) 15,485,017 0.46
USD 22,000,000 Liberty Street Funding LLC2/6/2020 (Zero Coupon) 21,997,708 0.66
USD 20,000,000 Lma Americas LLC14/9/2020 (Zero Coupon) 19,983,356 0.60
USD 47,000,000 Manhattan Asset Funding CoLLC 5/6/2020 (Zero Coupon) 46,990,365 1.40
USD 22,600,000 Manhattan Asset Funding CoLLC 13/7/2020 (ZeroCoupon) 22,591,713 0.67
USD 13,300,000 Manhattan Asset Funding CoLLC 16/7/2020 (ZeroCoupon) 13,292,186 0.40
USD 5,000,000 Manhattan Asset Funding CoLLC 28/7/2020 (ZeroCoupon) 4,998,033 0.15
USD 21,500,000 Matchpoint Finance Plc21/9/2020 (Zero Coupon) 21,479,575 0.64
USD 35,100,000 Metlife Short Term Fund5/6/2020 (Zero Coupon) 35,089,704 1.05
BlackRock Global Event Driven Fund continued
The notes on pages 691 to 711 form an integral part of these financial statements.
BlackRock Strategic Funds[442]
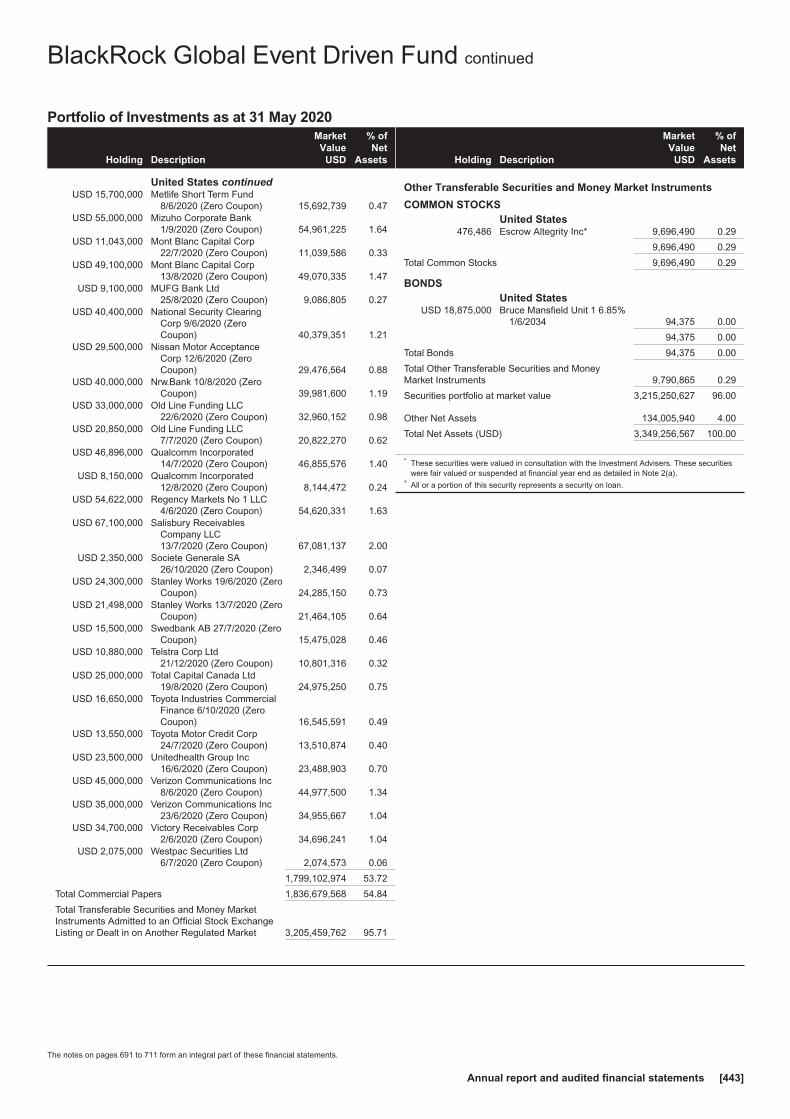
Portfolio of Investments as at 31 May 2020
Holding Description
MarketValue
USD
% ofNet
Assets
United States continuedUSD 15,700,000 Metlife Short Term Fund
8/6/2020 (Zero Coupon) 15,692,739 0.47USD 55,000,000 Mizuho Corporate Bank
1/9/2020 (Zero Coupon) 54,961,225 1.64USD 11,043,000 Mont Blanc Capital Corp
22/7/2020 (Zero Coupon) 11,039,586 0.33USD 49,100,000 Mont Blanc Capital Corp
13/8/2020 (Zero Coupon) 49,070,335 1.47USD 9,100,000 MUFG Bank Ltd
25/8/2020 (Zero Coupon) 9,086,805 0.27USD 40,400,000 National Security Clearing
Corp 9/6/2020 (ZeroCoupon) 40,379,351 1.21
USD 29,500,000 Nissan Motor AcceptanceCorp 12/6/2020 (ZeroCoupon) 29,476,564 0.88
USD 40,000,000 Nrw.Bank 10/8/2020 (ZeroCoupon) 39,981,600 1.19
USD 33,000,000 Old Line Funding LLC22/6/2020 (Zero Coupon) 32,960,152 0.98
USD 20,850,000 Old Line Funding LLC7/7/2020 (Zero Coupon) 20,822,270 0.62
USD 46,896,000 Qualcomm Incorporated14/7/2020 (Zero Coupon) 46,855,576 1.40
USD 8,150,000 Qualcomm Incorporated12/8/2020 (Zero Coupon) 8,144,472 0.24
USD 54,622,000 Regency Markets No 1 LLC4/6/2020 (Zero Coupon) 54,620,331 1.63
USD 67,100,000 Salisbury ReceivablesCompany LLC13/7/2020 (Zero Coupon) 67,081,137 2.00
USD 2,350,000 Societe Generale SA26/10/2020 (Zero Coupon) 2,346,499 0.07
USD 24,300,000 Stanley Works 19/6/2020 (ZeroCoupon) 24,285,150 0.73
USD 21,498,000 Stanley Works 13/7/2020 (ZeroCoupon) 21,464,105 0.64
USD 15,500,000 Swedbank AB 27/7/2020 (ZeroCoupon) 15,475,028 0.46
USD 10,880,000 Telstra Corp Ltd21/12/2020 (Zero Coupon) 10,801,316 0.32
USD 25,000,000 Total Capital Canada Ltd19/8/2020 (Zero Coupon) 24,975,250 0.75
USD 16,650,000 Toyota Industries CommercialFinance 6/10/2020 (ZeroCoupon) 16,545,591 0.49
USD 13,550,000 Toyota Motor Credit Corp24/7/2020 (Zero Coupon) 13,510,874 0.40
USD 23,500,000 Unitedhealth Group Inc16/6/2020 (Zero Coupon) 23,488,903 0.70
USD 45,000,000 Verizon Communications Inc8/6/2020 (Zero Coupon) 44,977,500 1.34
USD 35,000,000 Verizon Communications Inc23/6/2020 (Zero Coupon) 34,955,667 1.04
USD 34,700,000 Victory Receivables Corp2/6/2020 (Zero Coupon) 34,696,241 1.04
USD 2,075,000 Westpac Securities Ltd6/7/2020 (Zero Coupon) 2,074,573 0.06
1,799,102,974 53.72
Total Commercial Papers 1,836,679,568 54.84
Total Transferable Securities and Money MarketInstruments Admitted to an Official Stock ExchangeListing or Dealt in on Another Regulated Market 3,205,459,762 95.71
Holding Description
MarketValue
USD
% ofNet
Assets
Other Transferable Securities and Money Market Instruments
COMMON STOCKSUnited States
476,486 Escrow Altegrity Inc* 9,696,490 0.29
9,696,490 0.29
Total Common Stocks 9,696,490 0.29
BONDSUnited States
USD 18,875,000 Bruce Mansfield Unit 1 6.85%1/6/2034 94,375 0.00
94,375 0.00
Total Bonds 94,375 0.00
Total Other Transferable Securities and MoneyMarket Instruments 9,790,865 0.29
Securities portfolio at market value 3,215,250,627 96.00
Other Net Assets 134,005,940 4.00
Total Net Assets (USD) 3,349,256,567 100.00
* These securities were valued in consultation with the Investment Advisers. These securitieswere fair valued or suspended at financial year end as detailed in Note 2(a).
^ All or a portion of this security represents a security on loan.
BlackRock Global Event Driven Fund continued
The notes on pages 691 to 711 form an integral part of these financial statements.
Annual report and audited financial statements [443]
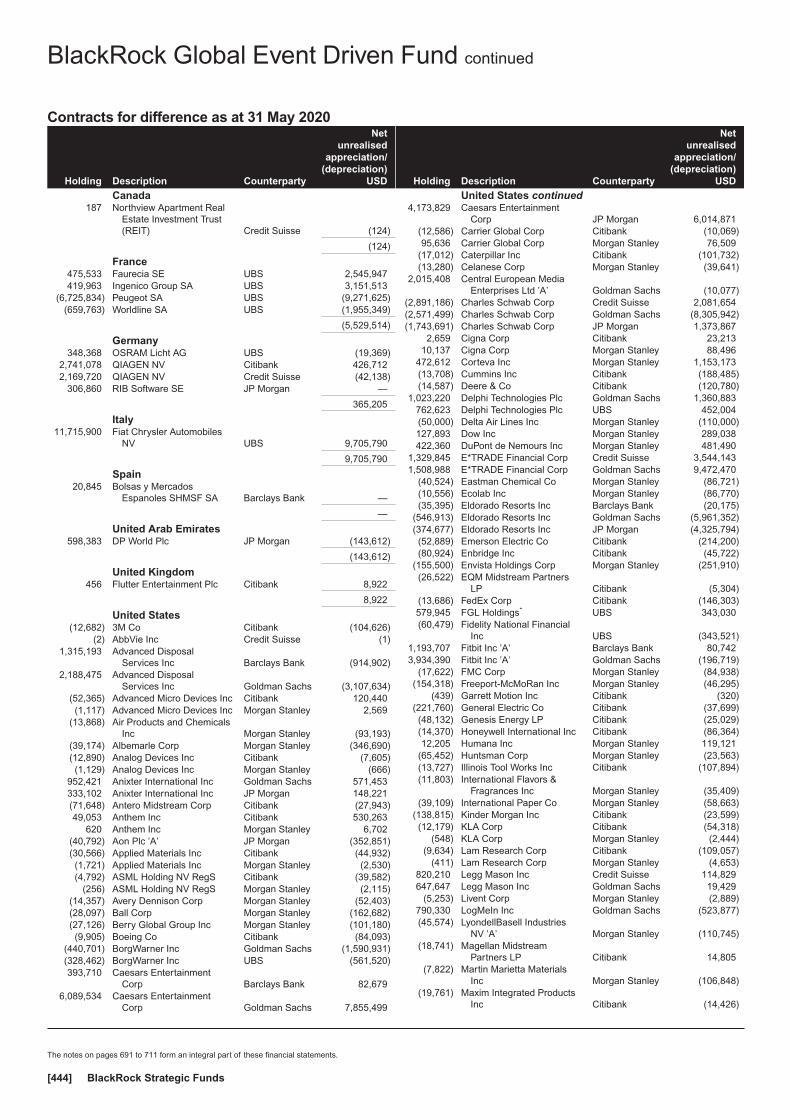
Contracts for difference as at 31 May 2020
Holding Description Counterparty
Netunrealised
appreciation/(depreciation)
USD
Canada187 Northview Apartment Real
Estate Investment Trust(REIT) Credit Suisse (124)
(124)
France475,533 Faurecia SE UBS 2,545,947419,963 Ingenico Group SA UBS 3,151,513
(6,725,834) Peugeot SA UBS (9,271,625)(659,763) Worldline SA UBS (1,955,349)
(5,529,514)
Germany348,368 OSRAM Licht AG UBS (19,369)
2,741,078 QIAGEN NV Citibank 426,7122,169,720 QIAGEN NV Credit Suisse (42,138)
306,860 RIB Software SE JP Morgan —
365,205
Italy11,715,900 Fiat Chrysler Automobiles
NV UBS 9,705,790
9,705,790
Spain20,845 Bolsas y Mercados
Espanoles SHMSF SA Barclays Bank —
—
United Arab Emirates598,383 DP World Plc JP Morgan (143,612)
(143,612)
United Kingdom456 Flutter Entertainment Plc Citibank 8,922
8,922
United States(12,682) 3M Co Citibank (104,626)
(2) AbbVie Inc Credit Suisse (1)1,315,193 Advanced Disposal
Services Inc Barclays Bank (914,902)2,188,475 Advanced Disposal
Services Inc Goldman Sachs (3,107,634)(52,365) Advanced Micro Devices Inc Citibank 120,440(1,117) Advanced Micro Devices Inc Morgan Stanley 2,569
(13,868) Air Products and ChemicalsInc Morgan Stanley (93,193)
(39,174) Albemarle Corp Morgan Stanley (346,690)(12,890) Analog Devices Inc Citibank (7,605)(1,129) Analog Devices Inc Morgan Stanley (666)
952,421 Anixter International Inc Goldman Sachs 571,453333,102 Anixter International Inc JP Morgan 148,221(71,648) Antero Midstream Corp Citibank (27,943)49,053 Anthem Inc Citibank 530,263
620 Anthem Inc Morgan Stanley 6,702(40,792) Aon Plc ’A’ JP Morgan (352,851)(30,566) Applied Materials Inc Citibank (44,932)(1,721) Applied Materials Inc Morgan Stanley (2,530)(4,792) ASML Holding NV RegS Citibank (39,582)
(256) ASML Holding NV RegS Morgan Stanley (2,115)(14,357) Avery Dennison Corp Morgan Stanley (52,403)(28,097) Ball Corp Morgan Stanley (162,682)(27,126) Berry Global Group Inc Morgan Stanley (101,180)(9,905) Boeing Co Citibank (84,093)
(440,701) BorgWarner Inc Goldman Sachs (1,590,931)(328,462) BorgWarner Inc UBS (561,520)393,710 Caesars Entertainment
Corp Barclays Bank 82,6796,089,534 Caesars Entertainment
Corp Goldman Sachs 7,855,499
Holding Description Counterparty
Netunrealised
appreciation/(depreciation)
USD
United States continued4,173,829 Caesars Entertainment
Corp JP Morgan 6,014,871(12,586) Carrier Global Corp Citibank (10,069)95,636 Carrier Global Corp Morgan Stanley 76,509
(17,012) Caterpillar Inc Citibank (101,732)(13,280) Celanese Corp Morgan Stanley (39,641)
2,015,408 Central European MediaEnterprises Ltd ’A’ Goldman Sachs (10,077)
(2,891,186) Charles Schwab Corp Credit Suisse 2,081,654(2,571,499) Charles Schwab Corp Goldman Sachs (8,305,942)(1,743,691) Charles Schwab Corp JP Morgan 1,373,867
2,659 Cigna Corp Citibank 23,21310,137 Cigna Corp Morgan Stanley 88,496
472,612 Corteva Inc Morgan Stanley 1,153,173(13,708) Cummins Inc Citibank (188,485)(14,587) Deere & Co Citibank (120,780)
1,023,220 Delphi Technologies Plc Goldman Sachs 1,360,883762,623 Delphi Technologies Plc UBS 452,004(50,000) Delta Air Lines Inc Morgan Stanley (110,000)127,893 Dow Inc Morgan Stanley 289,038422,360 DuPont de Nemours Inc Morgan Stanley 481,490
1,329,845 E*TRADE Financial Corp Credit Suisse 3,544,1431,508,988 E*TRADE Financial Corp Goldman Sachs 9,472,470
(40,524) Eastman Chemical Co Morgan Stanley (86,721)(10,556) Ecolab Inc Morgan Stanley (86,770)(35,395) Eldorado Resorts Inc Barclays Bank (20,175)
(546,913) Eldorado Resorts Inc Goldman Sachs (5,961,352)(374,677) Eldorado Resorts Inc JP Morgan (4,325,794)(52,889) Emerson Electric Co Citibank (214,200)(80,924) Enbridge Inc Citibank (45,722)
(155,500) Envista Holdings Corp Morgan Stanley (251,910)(26,522) EQM Midstream Partners
LP Citibank (5,304)(13,686) FedEx Corp Citibank (146,303)579,945 FGL Holdings* UBS 343,030(60,479) Fidelity National Financial
Inc UBS (343,521)1,193,707 Fitbit Inc ’A’ Barclays Bank 80,7423,934,390 Fitbit Inc ’A’ Goldman Sachs (196,719)
(17,622) FMC Corp Morgan Stanley (84,938)(154,318) Freeport-McMoRan Inc Morgan Stanley (46,295)
(439) Garrett Motion Inc Citibank (320)(221,760) General Electric Co Citibank (37,699)(48,132) Genesis Energy LP Citibank (25,029)(14,370) Honeywell International Inc Citibank (86,364)12,205 Humana Inc Morgan Stanley 119,121
(65,452) Huntsman Corp Morgan Stanley (23,563)(13,727) Illinois Tool Works Inc Citibank (107,894)(11,803) International Flavors &
Fragrances Inc Morgan Stanley (35,409)(39,109) International Paper Co Morgan Stanley (58,663)
(138,815) Kinder Morgan Inc Citibank (23,599)(12,179) KLA Corp Citibank (54,318)
(548) KLA Corp Morgan Stanley (2,444)(9,634) Lam Research Corp Citibank (109,057)
(411) Lam Research Corp Morgan Stanley (4,653)820,210 Legg Mason Inc Credit Suisse 114,829647,647 Legg Mason Inc Goldman Sachs 19,429
(5,253) Livent Corp Morgan Stanley (2,889)790,330 LogMeIn Inc Goldman Sachs (523,877)(45,574) LyondellBasell Industries
NV ’A’ Morgan Stanley (110,745)(18,741) Magellan Midstream
Partners LP Citibank 14,805(7,822) Martin Marietta Materials
Inc Morgan Stanley (106,848)(19,761) Maxim Integrated Products
Inc Citibank (14,426)
BlackRock Global Event Driven Fund continued
The notes on pages 691 to 711 form an integral part of these financial statements.
BlackRock Strategic Funds[444]

Contracts for difference as at 31 May 2020
Holding Description Counterparty
Netunrealised
appreciation/(depreciation)
USD
United States continued(2,267) Maxim Integrated Products
Inc Morgan Stanley (1,655)(3,573) Mettler-Toledo International
Inc Citibank (151,225)(13,058) Microchip Technology Inc Citibank (113,605)(1,395) Microchip Technology Inc Morgan Stanley (12,136)
(23,359) Micron Technology Inc Citibank (53,258)(2,332) Micron Technology Inc Morgan Stanley (5,317)(4,403) MKS Instruments Inc Citibank (23,380)
(458) MKS Instruments Inc Morgan Stanley (2,432)(1,989) Monolithic Power Systems
Inc Citibank (13,426)(215) Monolithic Power Systems
Inc Morgan Stanley (1,451)(1,387,295) Morgan Stanley Credit Suisse (3,579,747)(1,574,215) Morgan Stanley Goldman Sachs (9,583,643)
(103,260) Mosaic Co Morgan Stanley (45,434)(37,180) MPLX LP Citibank 44,616(33,404) Newmont Corp Morgan Stanley 126,935(39,156) Nucor Corp Morgan Stanley (76,354)(68,566) NXP Semiconductors NV Citibank (86,393)281,494 NXP Semiconductors NV JP Morgan (1,477,843)(18,392) ON Semiconductor Corp Citibank (10,116)(2,983) ON Semiconductor Corp Morgan Stanley (1,641)(6,293) Otis Worldwide Corp Citibank 8,81065,111 Otis Worldwide Corp Morgan Stanley (91,155)
(18,865) Phillips 66 Partners LP Citibank 2,830687,857 Portola Pharmaceuticals Inc Goldman Sachs (449)(30,073) PPG Industries Inc Morgan Stanley (155,778)(8,232) Qorvo Inc Citibank (9,796)
(449) Qorvo Inc Morgan Stanley (534)(24,367) Republic Services Inc Morgan Stanley (89,427)
(757) Resideo Technologies Inc Citibank (394)(10,350) Rockwell Automation Inc Citibank (116,955)(45,719) Sealed Air Corp Morgan Stanley (76,808)(9,868) Skyworks Solutions Inc Citibank 5,822
(837) Skyworks Solutions Inc Morgan Stanley 494(6,413) Spy US Equity Morgan Stanley (43,288)
(13,077) Stanley Black & Decker Inc Citibank (36,223)(32,253) Taiwan Semiconductor
Manufacturing Co LtdADR Citibank (19,352)
(1,785) Taiwan SemiconductorManufacturing Co LtdADR Morgan Stanley (1,071)
1,267,701 Taubman Centers Inc(REIT) Goldman Sachs 1,774,103
2,667,457 TD Ameritrade Holding Corp Credit Suisse (1,173,681)2,372,887 TD Ameritrade Holding Corp Goldman Sachs 9,159,3441,609,015 TD Ameritrade Holding Corp JP Morgan (946,115)
(15,352) Teradyne Inc Citibank (50,048)(737) Teradyne Inc Morgan Stanley (2,403)
(11,182) Texas Instruments Inc Citibank (44,952)(1,085) Texas Instruments Inc Morgan Stanley (4,362)
868,791 Tiffany & Co Goldman Sachs 556,026104,123 Tiffany & Co Morgan Stanley 268,637(14,553) Union Pacific Corp Citibank (62,869)(20,074) United Parcel Service Inc ’B’ Citibank (45,066)(22,677) UnitedHealth Group Inc Citibank (311,128)(12,983) UnitedHealth Group Inc Morgan Stanley (178,127)53,773 ViacomCBS Inc ’B’ Citibank 53,773
(13,619) Vulcan Materials Co Morgan Stanley (120,392)(19,677) Waste Management Inc Morgan Stanley (147,184)(13,386) Waters Corp Citibank (162,287)
(174,138) WESCO International Inc Goldman Sachs (979,526)(79,841) WESCO International Inc JP Morgan (345,122)(28,903) Western Midstream
Partners LP Citibank (8,382)
Holding Description Counterparty
Netunrealised
appreciation/(depreciation)
USD
United States continued(193) Westinghouse Air Brake
Technologies Corp Citibank (668)(43,756) Westrock Co Morgan Stanley (118,579)848,624 Williams Cos Inc Citibank 118,80737,804 Willis Towers Watson Plc JP Morgan 297,518
860,899 Wright Medical Group NV Barclays Bank 228,364587,979 Wright Medical Group NV Credit Suisse (53,942)
3,106,661 Wright Medical Group NV Goldman Sachs 217,466(14,231) Xilinx Inc Citibank (50,947)(1,086) Xilinx Inc Morgan Stanley (3,888)
(1,033,142)
Total (Gross underlying exposure - USD 2,560,014,301) 3,373,525
* These securities were valued in consultation with the Investment Advisers. These securitieswere fair valued or suspended at financial year end as detailed in Note 2(a).
BlackRock Global Event Driven Fund continued
The notes on pages 691 to 711 form an integral part of these financial statements.
Annual report and audited financial statements [445]

Swaps as at 31 May 2020
TypeNominal
Value Description CounterpartyExpiration
date
Net unrealisedappreciation
USD
MarketValue
USD
CCCDS USD 257,740,000Fund receives Fixed 5.000% and provides default protection on
Markit CDX.NA.HY.25 Version 8 Morgan Stanley 20/6/2025 7,305,889 (6,921,556)
Total (Gross underlying exposure - USD 250,818,444) 7,305,889 (6,921,556)
CCCDS: Centrally Cleared Credit Default Swaps
Futures contracts as at 31 May 2020
Numberof
contractsCurrencyof contracts
Contract/Description
Expirationdate
Grossunderlying
exposureUSD
Net unrealisedappreciation
USD
213 USD E-Mini S&P 500 Index Futures June 2020 June 2020 32,187,495 4,554,363
Total 32,187,495 4,554,363
Open forward foreign exchange transactionsas at 31 May 2020
Currency Purchases Currency Sales CounterpartyMaturity
date
Netunrealised
appreciation/(depreciation)
USD
BRL Hedged Share Class
BRL 17,033,602 USD 3,100,337State Street Bank& Trust Company 2/7/2020 28,712
28,712
CHF Hedged Share Class
CHF 56,682,250 USD 58,457,865State Street Bank& Trust Company 15/6/2020 409,010
USD 1,118,790 CHF 1,084,610State Street Bank& Trust Company 15/6/2020 (7,621)
401,389
EUR Hedged Share Class
EUR 1,687,441,579 USD 1,830,519,146State Street Bank& Trust Company 15/6/2020 46,301,011
USD 33,865,135 EUR 31,244,786State Street Bank& Trust Company 15/6/2020 (886,199)
45,414,812
GBP Hedged Share Class
GBP 585,515,343 USD 721,709,748State Street Bank& Trust Company 15/6/2020 1,463,909
USD 4,734,046 GBP 3,878,387State Street Bank& Trust Company 15/6/2020 (56,176)
1,407,733
HKD Hedged Share Class
HKD 39,147 USD 5,049State Street Bank& Trust Company 15/6/2020 (2)
USD 38 HKD 294State Street Bank& Trust Company 15/6/2020 —
(2)
JPY Hedged Share Class
JPY 16,069,314,691 USD 149,626,410State Street Bank& Trust Company 15/6/2020 (210,350)
USD 968,800 JPY 103,850,231State Street Bank& Trust Company 15/6/2020 3,178
(207,172)
Open forward foreign exchange transactionsas at 31 May 2020
Currency Purchases Currency Sales CounterpartyMaturity
date
Netunrealised
appreciation/(depreciation)
USD
SGD Hedged Share Class
SGD 7,026 USD 4,963State Street Bank& Trust Company 15/6/2020 7
USD 37 SGD 53State Street Bank& Trust Company 15/6/2020 —
7
Total (Gross underlying exposure - USD 2,853,049,480) 47,045,479
Sector Breakdownas at 31 May 2020
% of NetAssets
Financial 54.44
Government 11.57
Consumer, Cyclical 5.69
Communications 5.46
Consumer, Non-cyclical 5.41
Energy 4.92
Basic Materials 2.53
Technology 2.35
Industrial 1.95
Utilities 1.68
Securities portfolio at market value 96.00
Other Net Assets 4.00
100.00
BlackRock Global Event Driven Fund continued
The notes on pages 691 to 711 form an integral part of these financial statements.
BlackRock Strategic Funds[446]

Portfolio of Investments as at 31 May 2020
Holding Description
MarketValue
USD
% ofNet
Assets
Transferable Securities and Money Market Instruments Admittedto an Official Stock Exchange Listing or Dealt in on AnotherRegulated Market
BONDSUnited States
USD 6,900,000 United States CashManagement Bill13/10/2020 (Zero Coupon) 6,896,468 9.55
USD 5,050,000 United States Treasury Bill4/6/2020 (Zero Coupon) 5,048,944 6.99
USD 5,800,000 United States Treasury Bill11/6/2020 (Zero Coupon) 5,797,120 8.03
USD 750,000 United States Treasury Bill16/6/2020 (Zero Coupon) 749,976 1.04
USD 3,650,000 United States Treasury Bill18/6/2020 (Zero Coupon) 3,647,092 5.05
USD 550,000 United States Treasury Bill25/6/2020 (Zero Coupon) 549,927 0.76
USD 2,750,000 United States Treasury Bill9/7/2020 (Zero Coupon) 2,745,385 3.80
USD 4,400,000 United States Treasury Bill16/7/2020 (Zero Coupon) 4,397,738 6.09
USD 9,300,000 United States Treasury Bill23/7/2020 (Zero Coupon) 9,297,238 12.88
USD 1,600,000 United States Treasury Bill30/7/2020 (Zero Coupon) 1,599,728 2.22
USD 1,200,000 United States Treasury Bill27/8/2020 (Zero Coupon) 1,199,659 1.66
USD 2,600,000 United States Treasury Bill10/9/2020 (Zero Coupon) 2,599,089 3.60
USD 5,000,000 United States Treasury Bill17/9/2020 (Zero Coupon) 4,999,503 6.93
USD 5,900,000 United States Treasury Bill24/9/2020 (Zero Coupon) 5,899,904 8.17
USD 3,600,000 United States Treasury Bill1/10/2020 (Zero Coupon) 3,598,574 4.98
59,026,345 81.75
Total Bonds 59,026,345 81.75
Total Transferable Securities and Money MarketInstruments Admitted to an Official Stock ExchangeListing or Dealt in on Another Regulated Market 59,026,345 81.75
Securities portfolio at market value 59,026,345 81.75
Other Net Assets 13,174,051 18.25
Total Net Assets (USD) 72,200,396 100.00
BlackRock Global Long/Short Equity Fund
The notes on pages 691 to 711 form an integral part of these financial statements.
Annual report and audited financial statements [447]

Contracts for difference as at 31 May 2020
Holding Description Counterparty
Netunrealised
appreciation/(depreciation)
USD
Australia2,093 Abacus Property Group
(REIT)Bank of AmericaMerrill Lynch (127)
(6,379) Adbri Ltd Goldman Sachs (1,355)977 Afterpay Ltd Bank of America
Merrill Lynch 3,001481 ALS Ltd Bank of America
Merrill Lynch 2784,102 ALS Ltd Goldman Sachs 3543,546 ALS Ltd Morgan Stanley 5881,662 Altium Ltd Bank of America
Merrill Lynch 415529 Altium Ltd Morgan Stanley (6)
(549) Appen Ltd Goldman Sachs 64(741) ARB Corp Ltd Bank of America
Merrill Lynch (821)(1,735) ARB Corp Ltd Goldman Sachs (1,923)4,183 Aristocrat Leisure Ltd Bank of America
Merrill Lynch 25511,952 Aristocrat Leisure Ltd Goldman Sachs 3,9665,071 Atlas Arteria Ltd (Unit) Bank of America
Merrill Lynch 2,3563,194 Atlas Arteria Ltd (Unit) Goldman Sachs 1,4845,275 Atlas Arteria Ltd (Unit) Morgan Stanley 5253,606 Aurizon Holdings Ltd Bank of America
Merrill Lynch 3051,514 Aurizon Holdings Ltdπ Goldman Sachs —
(5,824) Bank of Queensland Ltd Bank of AmericaMerrill Lynch (2,242)
(29,421) Beach Energy Ltd Bank of AmericaMerrill Lynch (381)
(33,282) Beach Energy Ltd Goldman Sachs (1,389)(5,863) Bega Cheese Ltd Bank of America
Merrill Lynch (810)10,422 Bendigo & Adelaide Bank
LtdBank of AmericaMerrill Lynch 851
4,413 Bendigo & Adelaide BankLtd Goldman Sachs 1,318
21,247 Bendigo & Adelaide BankLtd Morgan Stanley (5,571)
1,484 Bingo Industries Ltd Bank of AmericaMerrill Lynch (75)
253 Blackmores Ltd Goldman Sachs 932(1,071) Boral Ltd Bank of America
Merrill Lynch (42)(2,811) Boral Ltd Morgan Stanley 5711,183 Brambles Ltd Bank of America
Merrill Lynch 4,01612,920 Brambles Ltd Goldman Sachs 4,8888,254 Brambles Ltd Morgan Stanley 3,232
(1,345) Bravura Solutions Ltd Bank of AmericaMerrill Lynch (196)
(6,338) Bravura Solutions Ltd Goldman Sachs (925)(647) Breville Group Ltd Bank of America
Merrill Lynch (746)(1,449) BWX Ltd Goldman Sachs (279)3,167 carsales.com Ltd Goldman Sachs 351
947 Cedar Woods Properties Ltd Bank of AmericaMerrill Lynch 660
854 Cedar Woods Properties Ltd Goldman Sachs 5952,836 Centuria Industrial (REIT) Bank of America
Merrill Lynch 6965,716 Centuria Industrial (REIT) Goldman Sachs 1,4049,572 Centuria Office (REIT) Goldman Sachs 1,302(906) Charter Hall Group (REIT) Morgan Stanley (129)
1,231 Charter Hall Retail (REIT) Bank of AmericaMerrill Lynch (59)
15,680 Charter Hall Retail (REIT) Goldman Sachs 2,116(5,872) Coca-Cola Amatil Ltd Morgan Stanley (935)
Holding Description Counterparty
Netunrealised
appreciation/(depreciation)
USD
Australia continued(7,584) Coles Group Ltd Bank of America
Merrill Lynch (857)(5,593) Coles Group Ltd Goldman Sachs (520)
(22,906) Coles Group Ltd Morgan Stanley (4,713)(5,860) Crown Resorts Ltd Morgan Stanley (1,128)
15 CSL Ltd Bank of AmericaMerrill Lynch (133)
1,010 CSL Ltd Morgan Stanley (9,861)(6,114) CSR Ltd Goldman Sachs (1,212)
510 Dicker Data Ltd Bank of AmericaMerrill Lynch 291
8,473 Downer EDI Ltd Bank of AmericaMerrill Lynch 3,093
1,469 Downer EDI Ltd Goldman Sachs 5365,044 Downer EDI Ltd Morgan Stanley 1,105(419) Elders Ltd Bank of America
Merrill Lynch (108)(6,939) EML Payments Ltd Bank of America
Merrill Lynch (2,257)(10,395) EML Payments Ltd Goldman Sachs (3,151)(1,332) Evolution Mining Ltd Morgan Stanley (291)(1,127) Flight Centre Travel Group
LtdBank of AmericaMerrill Lynch (1,792)
(9,680) Flight Centre Travel GroupLtd Morgan Stanley (11,500)
24,162 Fortescue Metals Group Ltd Morgan Stanley 5,132507 G8 Education Ltd Bank of America
Merrill Lynch 55(468) G8 Education Ltd Bank of America
Merrill Lynch (20)1,493 G8 Education Ltd Goldman Sachs (11)2,732 GrainCorp Ltd ’A’ Goldman Sachs 888
(15,794) Harvey Norman HoldingsLtd
Bank of AmericaMerrill Lynch (3,132)
18,886 IGO Ltd Bank of AmericaMerrill Lynch 3,657
34,141 IGO Ltd Goldman Sachs 2,7118,273 IGO Ltd Morgan Stanley 165
(1,838) Iluka Resources Ltd Goldman Sachs (708)1,957 Inghams Group Ltd Bank of America
Merrill Lynch 3464,707 Insurance Australia Group
LtdBank of AmericaMerrill Lynch 2,091
33,883 Insurance Australia GroupLtd Goldman Sachs 15,494
11,072 Insurance Australia GroupLtd Morgan Stanley 4,262
(1,709) Integrated Research Ltd Goldman Sachs (227)4,046 IOOF Holdings Ltd Goldman Sachs 2,175(567) IRESS Ltd Goldman Sachs (233)
(2,658) James Hardie Industries Plc- CDI
Bank of AmericaMerrill Lynch (529)
(1,461) James Hardie Industries Plc- CDI Goldman Sachs (307)
486 JB Hi-Fi Ltd Goldman Sachs 913380 Jumbo Interactive Ltd Bank of America
Merrill Lynch (13)2,451 Jumbo Interactive Ltd Goldman Sachs (348)5,987 Lendlease Group (Unit) Bank of America
Merrill Lynch 7,1131,606 Lendlease Group (Unit) Goldman Sachs 1,908
(1,798) Magellan Financial GroupLtd Goldman Sachs (4,809)
(1,401) Magellan Financial GroupLtd Morgan Stanley (2,232)
(7,009) McMillan Shakespeare Ltd Bank of AmericaMerrill Lynch (7,035)
(2,881) McMillan Shakespeare Ltd Goldman Sachs (2,808)
BlackRock Global Long/Short Equity Fund continued
The notes on pages 691 to 711 form an integral part of these financial statements.
BlackRock Strategic Funds[448]

Contracts for difference as at 31 May 2020
Holding Description Counterparty
Netunrealised
appreciation/(depreciation)
USD
Australia continued(41,360) Medibank Pvt Ltd Bank of America
Merrill Lynch (158)(13,699) Medibank Pvt Ltd Morgan Stanley (546)
1,258 Mineral Resources Ltd Goldman Sachs 1,0103,150 Mineral Resources Ltd Morgan Stanley (314)
14,803 Mirvac Group (REIT) Morgan Stanley 1,5723,201 National Australia Bank Ltd Bank of America
Merrill Lynch (93)690 NEXTDC Ltd Bank of America
Merrill Lynch (77)1,024 Nufarm Ltd Morgan Stanley (114)9,690 Oil Search Ltd Morgan Stanley 1,672
(1,412) Omni Bridgeway Ltd Bank of AmericaMerrill Lynch (797)
(38,522) Orora Ltd Bank of AmericaMerrill Lynch (2,045)
(35,615) Orora Ltd Goldman Sachs (1,891)1,570 OZ Minerals Ltd Goldman Sachs 792
221 Perpetual Ltd Bank of AmericaMerrill Lynch 333
418 Perpetual Ltd Goldman Sachs 630(8,654) Qube Holdings Ltd Bank of America
Merrill Lynch (2,179)692 Qube Holdings Ltd Goldman Sachs 108
(10,582) Qube Holdings Ltd Goldman Sachs (2,684)(4,917) Qube Holdings Ltd Morgan Stanley (2,480)(1,445) Qube Holdings Ltd (Rights) Goldman Sachs (729)
153 Regis Resources Ltd Bank of AmericaMerrill Lynch 12
4,106 Regis Resources Ltd Goldman Sachs 46866 Rio Tinto Ltd Bank of America
Merrill Lynch 3521,067 Rio Tinto Ltd Goldman Sachs 5,694
335 Rio Tinto Ltd Morgan Stanley 4606,618 Sandfire Resources Ltd Bank of America
Merrill Lynch 4393,042 Sandfire Resources Ltd Goldman Sachs (368)
(23,302) Scentre Group (REIT) Morgan Stanley 155(148) SEEK Ltd Bank of America
Merrill Lynch 202,054 Service Stream Ltd Bank of America
Merrill Lynch (150)8,289 Service Stream Ltd Goldman Sachs (605)
(28,390) Seven Group Holdings Ltd Bank of AmericaMerrill Lynch (42,935)
(554) Seven Group Holdings Ltd Goldman Sachs (860)(319) Seven Group Holdings Ltd Morgan Stanley (220)
2,677 Sims Ltd Bank of AmericaMerrill Lynch 1,952
5,896 Sims Ltd Goldman Sachs 4,5502,411 Sims Ltd Morgan Stanley 768
22,280 South32 Ltd Bank of AmericaMerrill Lynch 628
106,968 South32 Ltd Goldman Sachs 2,95854,874 South32 Ltd Morgan Stanley 18226,445 Spark Infrastructure Group
(Unit) Morgan Stanley 3,335(1,360) Star Entertainment Grp Ltd Bank of America
Merrill Lynch 94(1,279) Star Entertainment Grp Ltd Morgan Stanley 85
718 Steadfast Group Ltd Bank of AmericaMerrill Lynch 195
14,825 Steadfast Group Ltd Goldman Sachs 4,034(8,393) Sydney Airport (Unit) Morgan Stanley (836)
(10,156) Tabcorp Holdings Ltd Morgan Stanley (135)2,534 Tassal Group Ltd Bank of America
Merrill Lynch 370
Holding Description Counterparty
Netunrealised
appreciation/(depreciation)
USD
Australia continued2,000 Technology One Ltd Bank of America
Merrill Lynch (1,236)7,766 Technology One Ltd Goldman Sachs (2,399)(581) TPG Telecom Ltd Bank of America
Merrill Lynch (451)(7,646) TPG Telecom Ltd Goldman Sachs (5,937)(6,349) TPG Telecom Ltd Morgan Stanley (2,950)
(29,182) Vicinity Centres (REIT) Bank of AmericaMerrill Lynch 1,245
(4,980) Vocus Group Ltd Goldman Sachs (814)(4,877) Waypoint REIT (REIT) Bank of America
Merrill Lynch (496)(179) Webjet Ltd Bank of America
Merrill Lynch (122)(5,558) Webjet Ltd Goldman Sachs (6,674)6,865 Woodside Petroleum Ltd Goldman Sachs (2,648)4,083 Worley Ltd Morgan Stanley (1,761)
(41,593)
Austria(1,508) AT&S Austria Technologie &
Systemtechnik AG Goldman Sachs (2,482)(672) BAWAG Group AG Goldman Sachs (1,925)
(4,491) Erste Group Bank AG Goldman Sachs (7,005)(790) FACC AG Bank of America
Merrill Lynch (35)(440) FACC AG Goldman Sachs (20)(631) Kapsch TrafficCom AG Bank of America
Merrill Lynch (35)(312) Kapsch TrafficCom AG Goldman Sachs (17)137 Lenzing AG Bank of America
Merrill Lynch (145)42 Lenzing AG Goldman Sachs (44)99 Oesterreichische Post AG Bank of America
Merrill Lynch (23)1,048 Oesterreichische Post AG Goldman Sachs (1,155)
187 Porr Ag Bank of AmericaMerrill Lynch 101
248 Porr Ag Goldman Sachs 108553 Raiffeisen Bank
International AG Goldman Sachs (72)(316) Semperit AG Holding Bank of America
Merrill Lynch (316)(290) Semperit AG Holding Goldman Sachs (290)
1,440 Telekom Austria AG Goldman Sachs 384(407) Wienerberger AG Bank of America
Merrill Lynch (133)(968) Wienerberger AG Goldman Sachs (315)
(1,545) Wienerberger AG Morgan Stanley 584
(12,835)
Belgium(109) Aedifica SA (REIT) Goldman Sachs (618)(812) Ageas SA Goldman Sachs (866)(231) Ageas SA Morgan Stanley (270)
(7,973) AGFA-Gevaert NV Goldman Sachs (443)102 Argenx SE Bank of America
Merrill Lynch 5,762(303) Bekaert SA Goldman Sachs (404)464 bpost SA Bank of America
Merrill Lynch (28)598 bpost SA Goldman Sachs (37)
(3) Cie d’Entreprises CFE Bank of AmericaMerrill Lynch (9)
(387) Cie d’Entreprises CFE Goldman Sachs (1,119)(790) Colruyt SA Goldman Sachs (1,406)(364) Colruyt SA Morgan Stanley (478)
BlackRock Global Long/Short Equity Fund continued
The notes on pages 691 to 711 form an integral part of these financial statements.
Annual report and audited financial statements [449]
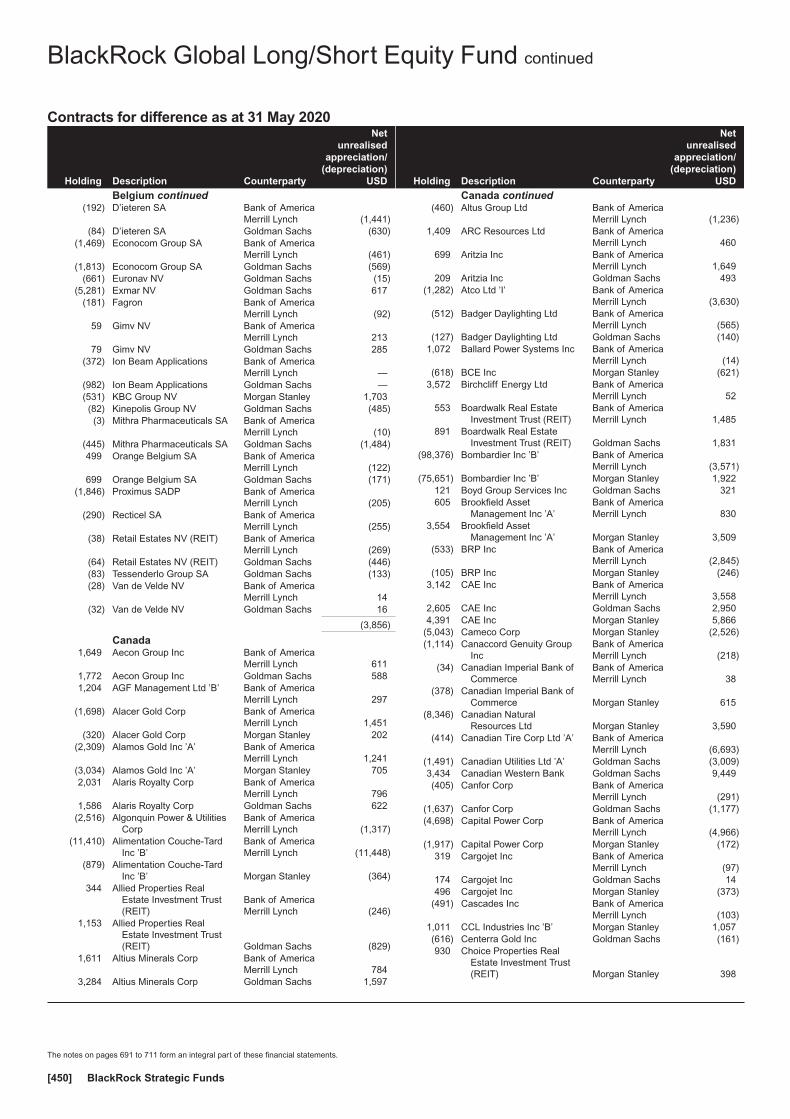
Contracts for difference as at 31 May 2020
Holding Description Counterparty
Netunrealised
appreciation/(depreciation)
USD
Belgium continued(192) D’ieteren SA Bank of America
Merrill Lynch (1,441)(84) D’ieteren SA Goldman Sachs (630)
(1,469) Econocom Group SA Bank of AmericaMerrill Lynch (461)
(1,813) Econocom Group SA Goldman Sachs (569)(661) Euronav NV Goldman Sachs (15)
(5,281) Exmar NV Goldman Sachs 617(181) Fagron Bank of America
Merrill Lynch (92)59 Gimv NV Bank of America
Merrill Lynch 21379 Gimv NV Goldman Sachs 285
(372) Ion Beam Applications Bank of AmericaMerrill Lynch —
(982) Ion Beam Applications Goldman Sachs —(531) KBC Group NV Morgan Stanley 1,703(82) Kinepolis Group NV Goldman Sachs (485)(3) Mithra Pharmaceuticals SA Bank of America
Merrill Lynch (10)(445) Mithra Pharmaceuticals SA Goldman Sachs (1,484)499 Orange Belgium SA Bank of America
Merrill Lynch (122)699 Orange Belgium SA Goldman Sachs (171)
(1,846) Proximus SADP Bank of AmericaMerrill Lynch (205)
(290) Recticel SA Bank of AmericaMerrill Lynch (255)
(38) Retail Estates NV (REIT) Bank of AmericaMerrill Lynch (269)
(64) Retail Estates NV (REIT) Goldman Sachs (446)(83) Tessenderlo Group SA Goldman Sachs (133)(28) Van de Velde NV Bank of America
Merrill Lynch 14(32) Van de Velde NV Goldman Sachs 16
(3,856)
Canada1,649 Aecon Group Inc Bank of America
Merrill Lynch 6111,772 Aecon Group Inc Goldman Sachs 5881,204 AGF Management Ltd ’B’ Bank of America
Merrill Lynch 297(1,698) Alacer Gold Corp Bank of America
Merrill Lynch 1,451(320) Alacer Gold Corp Morgan Stanley 202
(2,309) Alamos Gold Inc ’A’ Bank of AmericaMerrill Lynch 1,241
(3,034) Alamos Gold Inc ’A’ Morgan Stanley 7052,031 Alaris Royalty Corp Bank of America
Merrill Lynch 7961,586 Alaris Royalty Corp Goldman Sachs 622
(2,516) Algonquin Power & UtilitiesCorp
Bank of AmericaMerrill Lynch (1,317)
(11,410) Alimentation Couche-TardInc ’B’
Bank of AmericaMerrill Lynch (11,448)
(879) Alimentation Couche-TardInc ’B’ Morgan Stanley (364)
344 Allied Properties RealEstate Investment Trust(REIT)
Bank of AmericaMerrill Lynch (246)
1,153 Allied Properties RealEstate Investment Trust(REIT) Goldman Sachs (829)
1,611 Altius Minerals Corp Bank of AmericaMerrill Lynch 784
3,284 Altius Minerals Corp Goldman Sachs 1,597
Holding Description Counterparty
Netunrealised
appreciation/(depreciation)
USD
Canada continued(460) Altus Group Ltd Bank of America
Merrill Lynch (1,236)1,409 ARC Resources Ltd Bank of America
Merrill Lynch 460699 Aritzia Inc Bank of America
Merrill Lynch 1,649209 Aritzia Inc Goldman Sachs 493
(1,282) Atco Ltd ’I’ Bank of AmericaMerrill Lynch (3,630)
(512) Badger Daylighting Ltd Bank of AmericaMerrill Lynch (565)
(127) Badger Daylighting Ltd Goldman Sachs (140)1,072 Ballard Power Systems Inc Bank of America
Merrill Lynch (14)(618) BCE Inc Morgan Stanley (621)
3,572 Birchcliff Energy Ltd Bank of AmericaMerrill Lynch 52
553 Boardwalk Real EstateInvestment Trust (REIT)
Bank of AmericaMerrill Lynch 1,485
891 Boardwalk Real EstateInvestment Trust (REIT) Goldman Sachs 1,831
(98,376) Bombardier Inc ’B’ Bank of AmericaMerrill Lynch (3,571)
(75,651) Bombardier Inc ’B’ Morgan Stanley 1,922121 Boyd Group Services Inc Goldman Sachs 321605 Brookfield Asset
Management Inc ’A’Bank of AmericaMerrill Lynch 830
3,554 Brookfield AssetManagement Inc ’A’ Morgan Stanley 3,509
(533) BRP Inc Bank of AmericaMerrill Lynch (2,845)
(105) BRP Inc Morgan Stanley (246)3,142 CAE Inc Bank of America
Merrill Lynch 3,5582,605 CAE Inc Goldman Sachs 2,9504,391 CAE Inc Morgan Stanley 5,866
(5,043) Cameco Corp Morgan Stanley (2,526)(1,114) Canaccord Genuity Group
IncBank of AmericaMerrill Lynch (218)
(34) Canadian Imperial Bank ofCommerce
Bank of AmericaMerrill Lynch 38
(378) Canadian Imperial Bank ofCommerce Morgan Stanley 615
(8,346) Canadian NaturalResources Ltd Morgan Stanley 3,590
(414) Canadian Tire Corp Ltd ’A’ Bank of AmericaMerrill Lynch (6,693)
(1,491) Canadian Utilities Ltd ’A’ Goldman Sachs (3,009)3,434 Canadian Western Bank Goldman Sachs 9,449(405) Canfor Corp Bank of America
Merrill Lynch (291)(1,637) Canfor Corp Goldman Sachs (1,177)(4,698) Capital Power Corp Bank of America
Merrill Lynch (4,966)(1,917) Capital Power Corp Morgan Stanley (172)
319 Cargojet Inc Bank of AmericaMerrill Lynch (97)
174 Cargojet Inc Goldman Sachs 14496 Cargojet Inc Morgan Stanley (373)
(491) Cascades Inc Bank of AmericaMerrill Lynch (103)
1,011 CCL Industries Inc ’B’ Morgan Stanley 1,057(616) Centerra Gold Inc Goldman Sachs (161)930 Choice Properties Real
Estate Investment Trust(REIT) Morgan Stanley 398
BlackRock Global Long/Short Equity Fund continued
The notes on pages 691 to 711 form an integral part of these financial statements.
BlackRock Strategic Funds[450]

Contracts for difference as at 31 May 2020
Holding Description Counterparty
Netunrealised
appreciation/(depreciation)
USD
Canada continued(1,001) Cineplex Inc Bank of America
Merrill Lynch 632(78) Cogeco Inc Goldman Sachs (105)
1,008 Colliers International GroupInc
Bank of AmericaMerrill Lynch 3,163
1,202 Colliers International GroupInc Goldman Sachs 3,672
331 Colliers International GroupInc Morgan Stanley 661
2,186 Computer Modelling GroupLtd
Bank of AmericaMerrill Lynch 428
(221) Constellation Software Inc Morgan Stanley 4,1191,941 Corus Entertainment Inc Bank of America
Merrill Lynch 4931,494 Corus Entertainment Inc Goldman Sachs 380
(1,097) Descartes Systems GroupInc
Bank of AmericaMerrill Lynch (1,290)
1,258 Dollarama Inc Bank of AmericaMerrill Lynch 1,367
2,078 Dollarama Inc Goldman Sachs 1,0262,675 Dollarama Inc Morgan Stanley 4,011
911 Dream Office Real EstateInvestment Trust (REIT)
Bank of AmericaMerrill Lynch 575
192 Dream Office Real EstateInvestment Trust (REIT) Goldman Sachs 121
(5,920) DREAM Unlimited Corp Bank of AmericaMerrill Lynch (988)
(1,200) ECN Capital Corp Bank of AmericaMerrill Lynch (72)
(935) Eldorado Gold Corp Bank of AmericaMerrill Lynch 1,005
(809) Eldorado Gold Corp Goldman Sachs 869(1,488) Eldorado Gold Corp Morgan Stanley 951
(685) Element Fleet ManagementCorp
Bank of AmericaMerrill Lynch (746)
(1,651) Element Fleet ManagementCorp Goldman Sachs (1,798)
(327) Emera Inc Morgan Stanley (379)(404) Empire Co Ltd ’A’ Morgan Stanley (303)(324) Endeavour Mining Corp Bank of America
Merrill Lynch 133553 Enerflex Ltd Bank of America
Merrill Lynch 128927 Enerflex Ltd Goldman Sachs 215
(909) Enghouse Systems Ltd Bank of AmericaMerrill Lynch (1,538)
334 Equitable Group Inc Bank of AmericaMerrill Lynch 2,736
272 Equitable Group Inc Goldman Sachs 2,472(181) Fairfax Financial Holdings
LtdBank of AmericaMerrill Lynch (1,255)
556 Fiera Capital Corp Bank of AmericaMerrill Lynch 412
4,085 Fiera Capital Corp Goldman Sachs 3,025(506) Finning International Inc Bank of America
Merrill Lynch (569)(986) Finning International Inc Goldman Sachs (1,109)717 First Majestic Silver Corp Bank of America
Merrill Lynch 536135 First National Financial
CorpBank of AmericaMerrill Lynch 315
3,289 First Quantum Minerals Ltd Goldman Sachs 1,1461,423 First Quantum Minerals Ltd Morgan Stanley 1861,276 Fortuna Silver Mines Inc Bank of America
Merrill Lynch 3983,439 Freehold Royalties Ltd Bank of America
Merrill Lynch 2001,126 Freehold Royalties Ltd Goldman Sachs 65
Holding Description Counterparty
Netunrealised
appreciation/(depreciation)
USD
Canada continued1,701 Gildan Activewear Inc Bank of America
Merrill Lynch 1,7352,334 Gildan Activewear Inc Goldman Sachs 2,3813,225 Gildan Activewear Inc Morgan Stanley 1,253
(2,148) Great-West Lifeco Inc Morgan Stanley (2,713)(4,511) H&R Real Estate
Investment Trust (REIT)Bank of AmericaMerrill Lynch (4,225)
2,419 Hudbay Minerals Inc Bank of AmericaMerrill Lynch 1,159
3,639 Husky Energy Inc Goldman Sachs 898460 Innergex Renewable Energy
IncBank of AmericaMerrill Lynch 257
1,898 Innergex Renewable EnergyInc Goldman Sachs 1,061
1,429 Innergex Renewable EnergyInc Morgan Stanley 633
(978) Interfor Corp Bank of AmericaMerrill Lynch (1,108)
(405) Interfor Corp Goldman Sachs (459)1,410 Ivanhoe Mines Ltd ’A’ Goldman Sachs 369(133) Jamieson Wellness Inc Bank of America
Merrill Lynch 64173 Killam Apartment Real
Estate Investment Trust(REIT) Goldman Sachs 41
(15,837) Kinross Gold Corp Bank of AmericaMerrill Lynch 14,487
240 Kirkland Lake Gold Ltd Goldman Sachs 2841,455 Kirkland Lake Gold Ltd Morgan Stanley 367
425 Knight Therapeutics Incπ Bank of AmericaMerrill Lynch —
2,068 Knight Therapeutics Inc Goldman Sachs (75)(1,002) Labrador Iron Ore Royalty
CorpBank of AmericaMerrill Lynch (2,095)
(431) Labrador Iron Ore RoyaltyCorp Goldman Sachs (901)
(82) Lassonde Industries Inc ’A’ Bank of AmericaMerrill Lynch (119)
1,324 Laurentian Bank of Canada Bank of AmericaMerrill Lynch (360)
5,726 Laurentian Bank of Canada Goldman Sachs (5,352)(864) Linamar Corp Bank of America
Merrill Lynch (1,723)1,427 Lundin Mining Corp Morgan Stanley 13(243) MAG Silver Corp Goldman Sachs 166592 Magellan Aerospace Corp Bank of America
Merrill Lynch 344219 Magellan Aerospace Corp Goldman Sachs 127
3,693 Magna International Inc Bank of AmericaMerrill Lynch 13,994
912 Magna International Inc Goldman Sachs 2,0013,117 Major Drilling Group
International IncBank of AmericaMerrill Lynch 747
4,689 Major Drilling GroupInternational Inc Goldman Sachs 1,123
(1,011) Manulife Financial Corp Bank of AmericaMerrill Lynch 510
(2,106) Manulife Financial Corp Morgan Stanley 4292,079 Methanex Corp Goldman Sachs 3,803
234 Methanex Corp Morgan Stanley (121)180 Morguard North American
Residential Real EstateInvestment Trust (REIT)
Bank of AmericaMerrill Lynch 148
2,039 Morguard North AmericanResidential Real EstateInvestment Trust (REIT) Goldman Sachs 1,673
1,859 Morguard Real EstateInvestment Trust (REIT)
Bank of AmericaMerrill Lynch 756
BlackRock Global Long/Short Equity Fund continued
The notes on pages 691 to 711 form an integral part of these financial statements.
Annual report and audited financial statements [451]
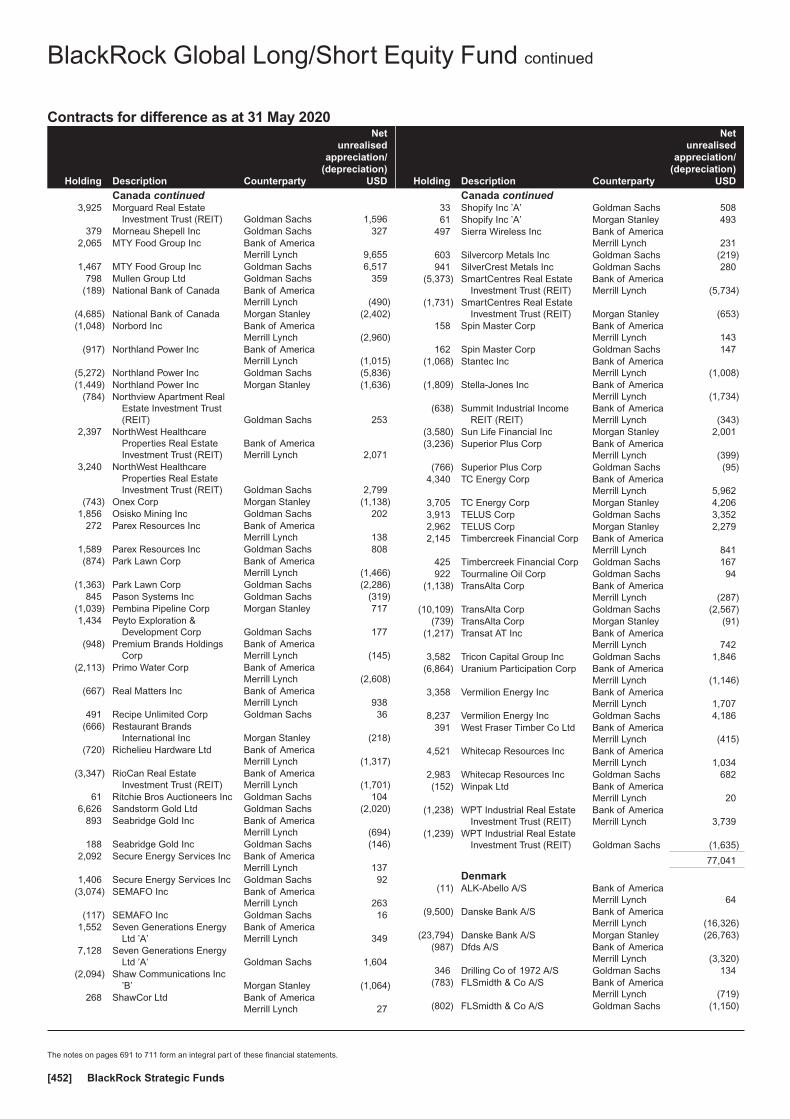
Contracts for difference as at 31 May 2020
Holding Description Counterparty
Netunrealised
appreciation/(depreciation)
USD
Canada continued3,925 Morguard Real Estate
Investment Trust (REIT) Goldman Sachs 1,596379 Morneau Shepell Inc Goldman Sachs 327
2,065 MTY Food Group Inc Bank of AmericaMerrill Lynch 9,655
1,467 MTY Food Group Inc Goldman Sachs 6,517798 Mullen Group Ltd Goldman Sachs 359
(189) National Bank of Canada Bank of AmericaMerrill Lynch (490)
(4,685) National Bank of Canada Morgan Stanley (2,402)(1,048) Norbord Inc Bank of America
Merrill Lynch (2,960)(917) Northland Power Inc Bank of America
Merrill Lynch (1,015)(5,272) Northland Power Inc Goldman Sachs (5,836)(1,449) Northland Power Inc Morgan Stanley (1,636)
(784) Northview Apartment RealEstate Investment Trust(REIT) Goldman Sachs 253
2,397 NorthWest HealthcareProperties Real EstateInvestment Trust (REIT)
Bank of AmericaMerrill Lynch 2,071
3,240 NorthWest HealthcareProperties Real EstateInvestment Trust (REIT) Goldman Sachs 2,799
(743) Onex Corp Morgan Stanley (1,138)1,856 Osisko Mining Inc Goldman Sachs 202
272 Parex Resources Inc Bank of AmericaMerrill Lynch 138
1,589 Parex Resources Inc Goldman Sachs 808(874) Park Lawn Corp Bank of America
Merrill Lynch (1,466)(1,363) Park Lawn Corp Goldman Sachs (2,286)
845 Pason Systems Inc Goldman Sachs (319)(1,039) Pembina Pipeline Corp Morgan Stanley 7171,434 Peyto Exploration &
Development Corp Goldman Sachs 177(948) Premium Brands Holdings
CorpBank of AmericaMerrill Lynch (145)
(2,113) Primo Water Corp Bank of AmericaMerrill Lynch (2,608)
(667) Real Matters Inc Bank of AmericaMerrill Lynch 938
491 Recipe Unlimited Corp Goldman Sachs 36(666) Restaurant Brands
International Inc Morgan Stanley (218)(720) Richelieu Hardware Ltd Bank of America
Merrill Lynch (1,317)(3,347) RioCan Real Estate
Investment Trust (REIT)Bank of AmericaMerrill Lynch (1,701)
61 Ritchie Bros Auctioneers Inc Goldman Sachs 1046,626 Sandstorm Gold Ltd Goldman Sachs (2,020)
893 Seabridge Gold Inc Bank of AmericaMerrill Lynch (694)
188 Seabridge Gold Inc Goldman Sachs (146)2,092 Secure Energy Services Inc Bank of America
Merrill Lynch 1371,406 Secure Energy Services Inc Goldman Sachs 92
(3,074) SEMAFO Inc Bank of AmericaMerrill Lynch 263
(117) SEMAFO Inc Goldman Sachs 161,552 Seven Generations Energy
Ltd ’A’Bank of AmericaMerrill Lynch 349
7,128 Seven Generations EnergyLtd ’A’ Goldman Sachs 1,604
(2,094) Shaw Communications Inc’B’ Morgan Stanley (1,064)
268 ShawCor Ltd Bank of AmericaMerrill Lynch 27
Holding Description Counterparty
Netunrealised
appreciation/(depreciation)
USD
Canada continued33 Shopify Inc ’A’ Goldman Sachs 50861 Shopify Inc ’A’ Morgan Stanley 493
497 Sierra Wireless Inc Bank of AmericaMerrill Lynch 231
603 Silvercorp Metals Inc Goldman Sachs (219)941 SilverCrest Metals Inc Goldman Sachs 280
(5,373) SmartCentres Real EstateInvestment Trust (REIT)
Bank of AmericaMerrill Lynch (5,734)
(1,731) SmartCentres Real EstateInvestment Trust (REIT) Morgan Stanley (653)
158 Spin Master Corp Bank of AmericaMerrill Lynch 143
162 Spin Master Corp Goldman Sachs 147(1,068) Stantec Inc Bank of America
Merrill Lynch (1,008)(1,809) Stella-Jones Inc Bank of America
Merrill Lynch (1,734)(638) Summit Industrial Income
REIT (REIT)Bank of AmericaMerrill Lynch (343)
(3,580) Sun Life Financial Inc Morgan Stanley 2,001(3,236) Superior Plus Corp Bank of America
Merrill Lynch (399)(766) Superior Plus Corp Goldman Sachs (95)
4,340 TC Energy Corp Bank of AmericaMerrill Lynch 5,962
3,705 TC Energy Corp Morgan Stanley 4,2063,913 TELUS Corp Goldman Sachs 3,3522,962 TELUS Corp Morgan Stanley 2,2792,145 Timbercreek Financial Corp Bank of America
Merrill Lynch 841425 Timbercreek Financial Corp Goldman Sachs 167922 Tourmaline Oil Corp Goldman Sachs 94
(1,138) TransAlta Corp Bank of AmericaMerrill Lynch (287)
(10,109) TransAlta Corp Goldman Sachs (2,567)(739) TransAlta Corp Morgan Stanley (91)
(1,217) Transat AT Inc Bank of AmericaMerrill Lynch 742
3,582 Tricon Capital Group Inc Goldman Sachs 1,846(6,864) Uranium Participation Corp Bank of America
Merrill Lynch (1,146)3,358 Vermilion Energy Inc Bank of America
Merrill Lynch 1,7078,237 Vermilion Energy Inc Goldman Sachs 4,186
391 West Fraser Timber Co Ltd Bank of AmericaMerrill Lynch (415)
4,521 Whitecap Resources Inc Bank of AmericaMerrill Lynch 1,034
2,983 Whitecap Resources Inc Goldman Sachs 682(152) Winpak Ltd Bank of America
Merrill Lynch 20(1,238) WPT Industrial Real Estate
Investment Trust (REIT)Bank of AmericaMerrill Lynch 3,739
(1,239) WPT Industrial Real EstateInvestment Trust (REIT) Goldman Sachs (1,635)
77,041
Denmark(11) ALK-Abello A/S Bank of America
Merrill Lynch 64(9,500) Danske Bank A/S Bank of America
Merrill Lynch (16,326)(23,794) Danske Bank A/S Morgan Stanley (26,763)
(987) Dfds A/S Bank of AmericaMerrill Lynch (3,320)
346 Drilling Co of 1972 A/S Goldman Sachs 134(783) FLSmidth & Co A/S Bank of America
Merrill Lynch (719)(802) FLSmidth & Co A/S Goldman Sachs (1,150)
BlackRock Global Long/Short Equity Fund continued
The notes on pages 691 to 711 form an integral part of these financial statements.
BlackRock Strategic Funds[452]
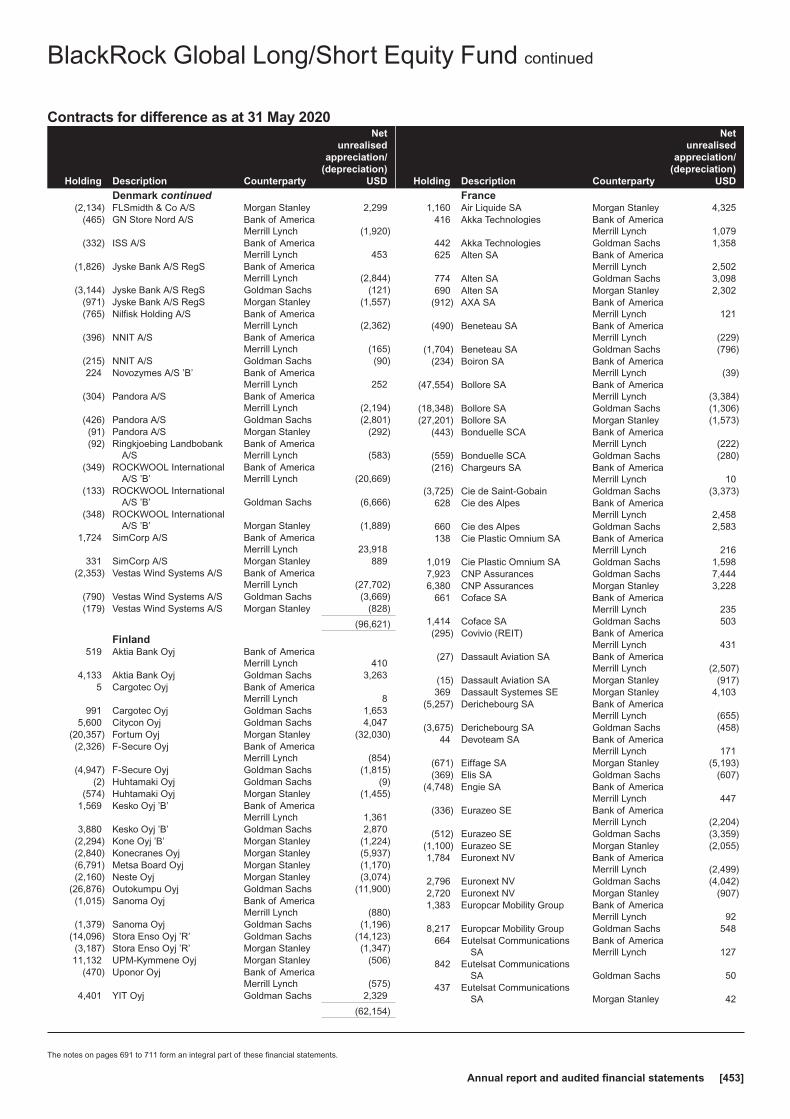
Contracts for difference as at 31 May 2020
Holding Description Counterparty
Netunrealised
appreciation/(depreciation)
USD
Denmark continued(2,134) FLSmidth & Co A/S Morgan Stanley 2,299
(465) GN Store Nord A/S Bank of AmericaMerrill Lynch (1,920)
(332) ISS A/S Bank of AmericaMerrill Lynch 453
(1,826) Jyske Bank A/S RegS Bank of AmericaMerrill Lynch (2,844)
(3,144) Jyske Bank A/S RegS Goldman Sachs (121)(971) Jyske Bank A/S RegS Morgan Stanley (1,557)(765) Nilfisk Holding A/S Bank of America
Merrill Lynch (2,362)(396) NNIT A/S Bank of America
Merrill Lynch (165)(215) NNIT A/S Goldman Sachs (90)224 Novozymes A/S ’B’ Bank of America
Merrill Lynch 252(304) Pandora A/S Bank of America
Merrill Lynch (2,194)(426) Pandora A/S Goldman Sachs (2,801)(91) Pandora A/S Morgan Stanley (292)(92) Ringkjoebing Landbobank
A/SBank of AmericaMerrill Lynch (583)
(349) ROCKWOOL InternationalA/S ’B’
Bank of AmericaMerrill Lynch (20,669)
(133) ROCKWOOL InternationalA/S ’B’ Goldman Sachs (6,666)
(348) ROCKWOOL InternationalA/S ’B’ Morgan Stanley (1,889)
1,724 SimCorp A/S Bank of AmericaMerrill Lynch 23,918
331 SimCorp A/S Morgan Stanley 889(2,353) Vestas Wind Systems A/S Bank of America
Merrill Lynch (27,702)(790) Vestas Wind Systems A/S Goldman Sachs (3,669)(179) Vestas Wind Systems A/S Morgan Stanley (828)
(96,621)
Finland519 Aktia Bank Oyj Bank of America
Merrill Lynch 4104,133 Aktia Bank Oyj Goldman Sachs 3,263
5 Cargotec Oyj Bank of AmericaMerrill Lynch 8
991 Cargotec Oyj Goldman Sachs 1,6535,600 Citycon Oyj Goldman Sachs 4,047
(20,357) Fortum Oyj Morgan Stanley (32,030)(2,326) F-Secure Oyj Bank of America
Merrill Lynch (854)(4,947) F-Secure Oyj Goldman Sachs (1,815)
(2) Huhtamaki Oyj Goldman Sachs (9)(574) Huhtamaki Oyj Morgan Stanley (1,455)
1,569 Kesko Oyj ’B’ Bank of AmericaMerrill Lynch 1,361
3,880 Kesko Oyj ’B’ Goldman Sachs 2,870(2,294) Kone Oyj ’B’ Morgan Stanley (1,224)(2,840) Konecranes Oyj Morgan Stanley (5,937)(6,791) Metsa Board Oyj Morgan Stanley (1,170)(2,160) Neste Oyj Morgan Stanley (3,074)
(26,876) Outokumpu Oyj Goldman Sachs (11,900)(1,015) Sanoma Oyj Bank of America
Merrill Lynch (880)(1,379) Sanoma Oyj Goldman Sachs (1,196)
(14,096) Stora Enso Oyj ’R’ Goldman Sachs (14,123)(3,187) Stora Enso Oyj ’R’ Morgan Stanley (1,347)11,132 UPM-Kymmene Oyj Morgan Stanley (506)
(470) Uponor Oyj Bank of AmericaMerrill Lynch (575)
4,401 YIT Oyj Goldman Sachs 2,329
(62,154)
Holding Description Counterparty
Netunrealised
appreciation/(depreciation)
USD
France1,160 Air Liquide SA Morgan Stanley 4,325
416 Akka Technologies Bank of AmericaMerrill Lynch 1,079
442 Akka Technologies Goldman Sachs 1,358625 Alten SA Bank of America
Merrill Lynch 2,502774 Alten SA Goldman Sachs 3,098690 Alten SA Morgan Stanley 2,302
(912) AXA SA Bank of AmericaMerrill Lynch 121
(490) Beneteau SA Bank of AmericaMerrill Lynch (229)
(1,704) Beneteau SA Goldman Sachs (796)(234) Boiron SA Bank of America
Merrill Lynch (39)(47,554) Bollore SA Bank of America
Merrill Lynch (3,384)(18,348) Bollore SA Goldman Sachs (1,306)(27,201) Bollore SA Morgan Stanley (1,573)
(443) Bonduelle SCA Bank of AmericaMerrill Lynch (222)
(559) Bonduelle SCA Goldman Sachs (280)(216) Chargeurs SA Bank of America
Merrill Lynch 10(3,725) Cie de Saint-Gobain Goldman Sachs (3,373)
628 Cie des Alpes Bank of AmericaMerrill Lynch 2,458
660 Cie des Alpes Goldman Sachs 2,583138 Cie Plastic Omnium SA Bank of America
Merrill Lynch 2161,019 Cie Plastic Omnium SA Goldman Sachs 1,5987,923 CNP Assurances Goldman Sachs 7,4446,380 CNP Assurances Morgan Stanley 3,228
661 Coface SA Bank of AmericaMerrill Lynch 235
1,414 Coface SA Goldman Sachs 503(295) Covivio (REIT) Bank of America
Merrill Lynch 431(27) Dassault Aviation SA Bank of America
Merrill Lynch (2,507)(15) Dassault Aviation SA Morgan Stanley (917)369 Dassault Systemes SE Morgan Stanley 4,103
(5,257) Derichebourg SA Bank of AmericaMerrill Lynch (655)
(3,675) Derichebourg SA Goldman Sachs (458)44 Devoteam SA Bank of America
Merrill Lynch 171(671) Eiffage SA Morgan Stanley (5,193)(369) Elis SA Goldman Sachs (607)
(4,748) Engie SA Bank of AmericaMerrill Lynch 447
(336) Eurazeo SE Bank of AmericaMerrill Lynch (2,204)
(512) Eurazeo SE Goldman Sachs (3,359)(1,100) Eurazeo SE Morgan Stanley (2,055)1,784 Euronext NV Bank of America
Merrill Lynch (2,499)2,796 Euronext NV Goldman Sachs (4,042)2,720 Euronext NV Morgan Stanley (907)1,383 Europcar Mobility Group Bank of America
Merrill Lynch 928,217 Europcar Mobility Group Goldman Sachs 548
664 Eutelsat CommunicationsSA
Bank of AmericaMerrill Lynch 127
842 Eutelsat CommunicationsSA Goldman Sachs 50
437 Eutelsat CommunicationsSA Morgan Stanley 42
BlackRock Global Long/Short Equity Fund continued
The notes on pages 691 to 711 form an integral part of these financial statements.
Annual report and audited financial statements [453]
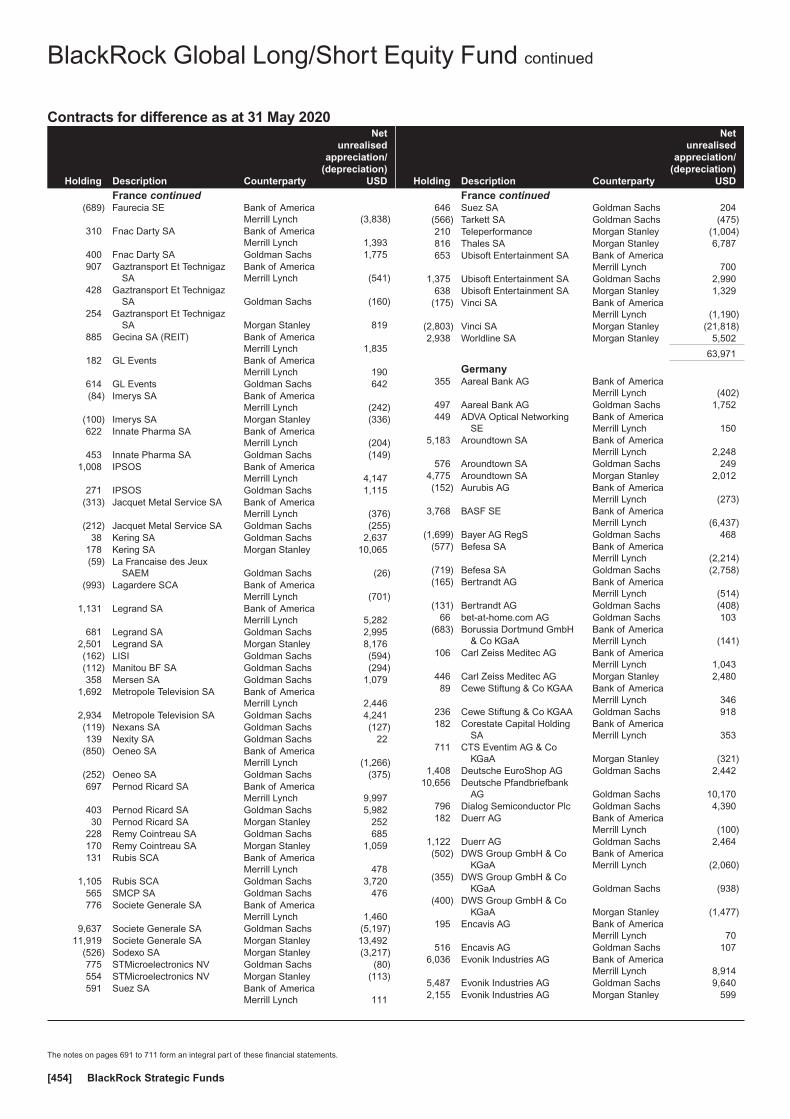
Contracts for difference as at 31 May 2020
Holding Description Counterparty
Netunrealised
appreciation/(depreciation)
USD
France continued(689) Faurecia SE Bank of America
Merrill Lynch (3,838)310 Fnac Darty SA Bank of America
Merrill Lynch 1,393400 Fnac Darty SA Goldman Sachs 1,775907 Gaztransport Et Technigaz
SABank of AmericaMerrill Lynch (541)
428 Gaztransport Et TechnigazSA Goldman Sachs (160)
254 Gaztransport Et TechnigazSA Morgan Stanley 819
885 Gecina SA (REIT) Bank of AmericaMerrill Lynch 1,835
182 GL Events Bank of AmericaMerrill Lynch 190
614 GL Events Goldman Sachs 642(84) Imerys SA Bank of America
Merrill Lynch (242)(100) Imerys SA Morgan Stanley (336)622 Innate Pharma SA Bank of America
Merrill Lynch (204)453 Innate Pharma SA Goldman Sachs (149)
1,008 IPSOS Bank of AmericaMerrill Lynch 4,147
271 IPSOS Goldman Sachs 1,115(313) Jacquet Metal Service SA Bank of America
Merrill Lynch (376)(212) Jacquet Metal Service SA Goldman Sachs (255)
38 Kering SA Goldman Sachs 2,637178 Kering SA Morgan Stanley 10,065(59) La Francaise des Jeux
SAEM Goldman Sachs (26)(993) Lagardere SCA Bank of America
Merrill Lynch (701)1,131 Legrand SA Bank of America
Merrill Lynch 5,282681 Legrand SA Goldman Sachs 2,995
2,501 Legrand SA Morgan Stanley 8,176(162) LISI Goldman Sachs (594)(112) Manitou BF SA Goldman Sachs (294)358 Mersen SA Goldman Sachs 1,079
1,692 Metropole Television SA Bank of AmericaMerrill Lynch 2,446
2,934 Metropole Television SA Goldman Sachs 4,241(119) Nexans SA Goldman Sachs (127)139 Nexity SA Goldman Sachs 22
(850) Oeneo SA Bank of AmericaMerrill Lynch (1,266)
(252) Oeneo SA Goldman Sachs (375)697 Pernod Ricard SA Bank of America
Merrill Lynch 9,997403 Pernod Ricard SA Goldman Sachs 5,98230 Pernod Ricard SA Morgan Stanley 252
228 Remy Cointreau SA Goldman Sachs 685170 Remy Cointreau SA Morgan Stanley 1,059131 Rubis SCA Bank of America
Merrill Lynch 4781,105 Rubis SCA Goldman Sachs 3,720
565 SMCP SA Goldman Sachs 476776 Societe Generale SA Bank of America
Merrill Lynch 1,4609,637 Societe Generale SA Goldman Sachs (5,197)
11,919 Societe Generale SA Morgan Stanley 13,492(526) Sodexo SA Morgan Stanley (3,217)775 STMicroelectronics NV Goldman Sachs (80)554 STMicroelectronics NV Morgan Stanley (113)591 Suez SA Bank of America
Merrill Lynch 111
Holding Description Counterparty
Netunrealised
appreciation/(depreciation)
USD
France continued646 Suez SA Goldman Sachs 204
(566) Tarkett SA Goldman Sachs (475)210 Teleperformance Morgan Stanley (1,004)816 Thales SA Morgan Stanley 6,787653 Ubisoft Entertainment SA Bank of America
Merrill Lynch 7001,375 Ubisoft Entertainment SA Goldman Sachs 2,990
638 Ubisoft Entertainment SA Morgan Stanley 1,329(175) Vinci SA Bank of America
Merrill Lynch (1,190)(2,803) Vinci SA Morgan Stanley (21,818)2,938 Worldline SA Morgan Stanley 5,502
63,971
Germany355 Aareal Bank AG Bank of America
Merrill Lynch (402)497 Aareal Bank AG Goldman Sachs 1,752449 ADVA Optical Networking
SEBank of AmericaMerrill Lynch 150
5,183 Aroundtown SA Bank of AmericaMerrill Lynch 2,248
576 Aroundtown SA Goldman Sachs 2494,775 Aroundtown SA Morgan Stanley 2,012(152) Aurubis AG Bank of America
Merrill Lynch (273)3,768 BASF SE Bank of America
Merrill Lynch (6,437)(1,699) Bayer AG RegS Goldman Sachs 468
(577) Befesa SA Bank of AmericaMerrill Lynch (2,214)
(719) Befesa SA Goldman Sachs (2,758)(165) Bertrandt AG Bank of America
Merrill Lynch (514)(131) Bertrandt AG Goldman Sachs (408)
66 bet-at-home.com AG Goldman Sachs 103(683) Borussia Dortmund GmbH
& Co KGaABank of AmericaMerrill Lynch (141)
106 Carl Zeiss Meditec AG Bank of AmericaMerrill Lynch 1,043
446 Carl Zeiss Meditec AG Morgan Stanley 2,48089 Cewe Stiftung & Co KGAA Bank of America
Merrill Lynch 346236 Cewe Stiftung & Co KGAA Goldman Sachs 918182 Corestate Capital Holding
SABank of AmericaMerrill Lynch 353
711 CTS Eventim AG & CoKGaA Morgan Stanley (321)
1,408 Deutsche EuroShop AG Goldman Sachs 2,44210,656 Deutsche Pfandbriefbank
AG Goldman Sachs 10,170796 Dialog Semiconductor Plc Goldman Sachs 4,390182 Duerr AG Bank of America
Merrill Lynch (100)1,122 Duerr AG Goldman Sachs 2,464(502) DWS Group GmbH & Co
KGaABank of AmericaMerrill Lynch (2,060)
(355) DWS Group GmbH & CoKGaA Goldman Sachs (938)
(400) DWS Group GmbH & CoKGaA Morgan Stanley (1,477)
195 Encavis AG Bank of AmericaMerrill Lynch 70
516 Encavis AG Goldman Sachs 1076,036 Evonik Industries AG Bank of America
Merrill Lynch 8,9145,487 Evonik Industries AG Goldman Sachs 9,6402,155 Evonik Industries AG Morgan Stanley 599
BlackRock Global Long/Short Equity Fund continued
The notes on pages 691 to 711 form an integral part of these financial statements.
BlackRock Strategic Funds[454]
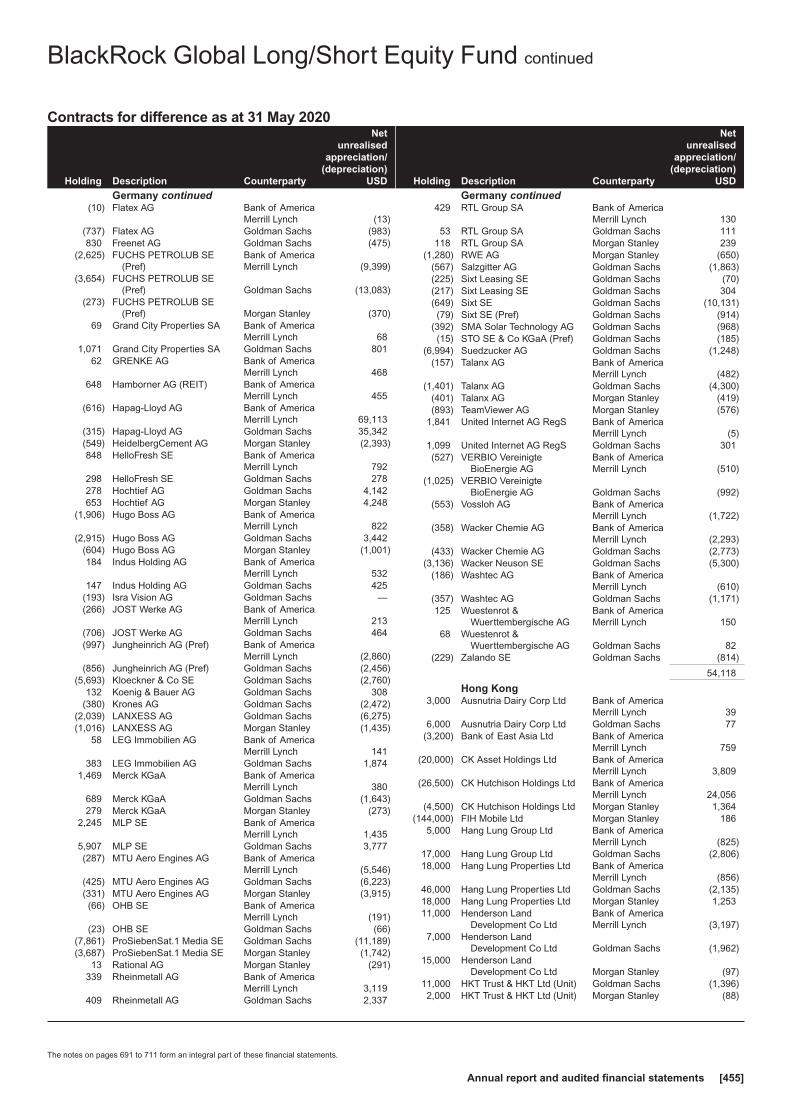
Contracts for difference as at 31 May 2020
Holding Description Counterparty
Netunrealised
appreciation/(depreciation)
USD
Germany continued(10) Flatex AG Bank of America
Merrill Lynch (13)(737) Flatex AG Goldman Sachs (983)830 Freenet AG Goldman Sachs (475)
(2,625) FUCHS PETROLUB SE(Pref)
Bank of AmericaMerrill Lynch (9,399)
(3,654) FUCHS PETROLUB SE(Pref) Goldman Sachs (13,083)
(273) FUCHS PETROLUB SE(Pref) Morgan Stanley (370)
69 Grand City Properties SA Bank of AmericaMerrill Lynch 68
1,071 Grand City Properties SA Goldman Sachs 80162 GRENKE AG Bank of America
Merrill Lynch 468648 Hamborner AG (REIT) Bank of America
Merrill Lynch 455(616) Hapag-Lloyd AG Bank of America
Merrill Lynch 69,113(315) Hapag-Lloyd AG Goldman Sachs 35,342(549) HeidelbergCement AG Morgan Stanley (2,393)848 HelloFresh SE Bank of America
Merrill Lynch 792298 HelloFresh SE Goldman Sachs 278278 Hochtief AG Goldman Sachs 4,142653 Hochtief AG Morgan Stanley 4,248
(1,906) Hugo Boss AG Bank of AmericaMerrill Lynch 822
(2,915) Hugo Boss AG Goldman Sachs 3,442(604) Hugo Boss AG Morgan Stanley (1,001)184 Indus Holding AG Bank of America
Merrill Lynch 532147 Indus Holding AG Goldman Sachs 425
(193) Isra Vision AG Goldman Sachs —(266) JOST Werke AG Bank of America
Merrill Lynch 213(706) JOST Werke AG Goldman Sachs 464(997) Jungheinrich AG (Pref) Bank of America
Merrill Lynch (2,860)(856) Jungheinrich AG (Pref) Goldman Sachs (2,456)
(5,693) Kloeckner & Co SE Goldman Sachs (2,760)132 Koenig & Bauer AG Goldman Sachs 308
(380) Krones AG Goldman Sachs (2,472)(2,039) LANXESS AG Goldman Sachs (6,275)(1,016) LANXESS AG Morgan Stanley (1,435)
58 LEG Immobilien AG Bank of AmericaMerrill Lynch 141
383 LEG Immobilien AG Goldman Sachs 1,8741,469 Merck KGaA Bank of America
Merrill Lynch 380689 Merck KGaA Goldman Sachs (1,643)279 Merck KGaA Morgan Stanley (273)
2,245 MLP SE Bank of AmericaMerrill Lynch 1,435
5,907 MLP SE Goldman Sachs 3,777(287) MTU Aero Engines AG Bank of America
Merrill Lynch (5,546)(425) MTU Aero Engines AG Goldman Sachs (6,223)(331) MTU Aero Engines AG Morgan Stanley (3,915)(66) OHB SE Bank of America
Merrill Lynch (191)(23) OHB SE Goldman Sachs (66)
(7,861) ProSiebenSat.1 Media SE Goldman Sachs (11,189)(3,687) ProSiebenSat.1 Media SE Morgan Stanley (1,742)
13 Rational AG Morgan Stanley (291)339 Rheinmetall AG Bank of America
Merrill Lynch 3,119409 Rheinmetall AG Goldman Sachs 2,337
Holding Description Counterparty
Netunrealised
appreciation/(depreciation)
USD
Germany continued429 RTL Group SA Bank of America
Merrill Lynch 13053 RTL Group SA Goldman Sachs 111
118 RTL Group SA Morgan Stanley 239(1,280) RWE AG Morgan Stanley (650)
(567) Salzgitter AG Goldman Sachs (1,863)(225) Sixt Leasing SE Goldman Sachs (70)(217) Sixt Leasing SE Goldman Sachs 304(649) Sixt SE Goldman Sachs (10,131)(79) Sixt SE (Pref) Goldman Sachs (914)
(392) SMA Solar Technology AG Goldman Sachs (968)(15) STO SE & Co KGaA (Pref) Goldman Sachs (185)
(6,994) Suedzucker AG Goldman Sachs (1,248)(157) Talanx AG Bank of America
Merrill Lynch (482)(1,401) Talanx AG Goldman Sachs (4,300)
(401) Talanx AG Morgan Stanley (419)(893) TeamViewer AG Morgan Stanley (576)
1,841 United Internet AG RegS Bank of AmericaMerrill Lynch (5)
1,099 United Internet AG RegS Goldman Sachs 301(527) VERBIO Vereinigte
BioEnergie AGBank of AmericaMerrill Lynch (510)
(1,025) VERBIO VereinigteBioEnergie AG Goldman Sachs (992)
(553) Vossloh AG Bank of AmericaMerrill Lynch (1,722)
(358) Wacker Chemie AG Bank of AmericaMerrill Lynch (2,293)
(433) Wacker Chemie AG Goldman Sachs (2,773)(3,136) Wacker Neuson SE Goldman Sachs (5,300)
(186) Washtec AG Bank of AmericaMerrill Lynch (610)
(357) Washtec AG Goldman Sachs (1,171)125 Wuestenrot &
Wuerttembergische AGBank of AmericaMerrill Lynch 150
68 Wuestenrot &Wuerttembergische AG Goldman Sachs 82
(229) Zalando SE Goldman Sachs (814)
54,118
Hong Kong3,000 Ausnutria Dairy Corp Ltd Bank of America
Merrill Lynch 396,000 Ausnutria Dairy Corp Ltd Goldman Sachs 77
(3,200) Bank of East Asia Ltd Bank of AmericaMerrill Lynch 759
(20,000) CK Asset Holdings Ltd Bank of AmericaMerrill Lynch 3,809
(26,500) CK Hutchison Holdings Ltd Bank of AmericaMerrill Lynch 24,056
(4,500) CK Hutchison Holdings Ltd Morgan Stanley 1,364(144,000) FIH Mobile Ltd Morgan Stanley 186
5,000 Hang Lung Group Ltd Bank of AmericaMerrill Lynch (825)
17,000 Hang Lung Group Ltd Goldman Sachs (2,806)18,000 Hang Lung Properties Ltd Bank of America
Merrill Lynch (856)46,000 Hang Lung Properties Ltd Goldman Sachs (2,135)18,000 Hang Lung Properties Ltd Morgan Stanley 1,25311,000 Henderson Land
Development Co LtdBank of AmericaMerrill Lynch (3,197)
7,000 Henderson LandDevelopment Co Ltd Goldman Sachs (1,962)
15,000 Henderson LandDevelopment Co Ltd Morgan Stanley (97)
11,000 HKT Trust & HKT Ltd (Unit) Goldman Sachs (1,396)2,000 HKT Trust & HKT Ltd (Unit) Morgan Stanley (88)
BlackRock Global Long/Short Equity Fund continued
The notes on pages 691 to 711 form an integral part of these financial statements.
Annual report and audited financial statements [455]
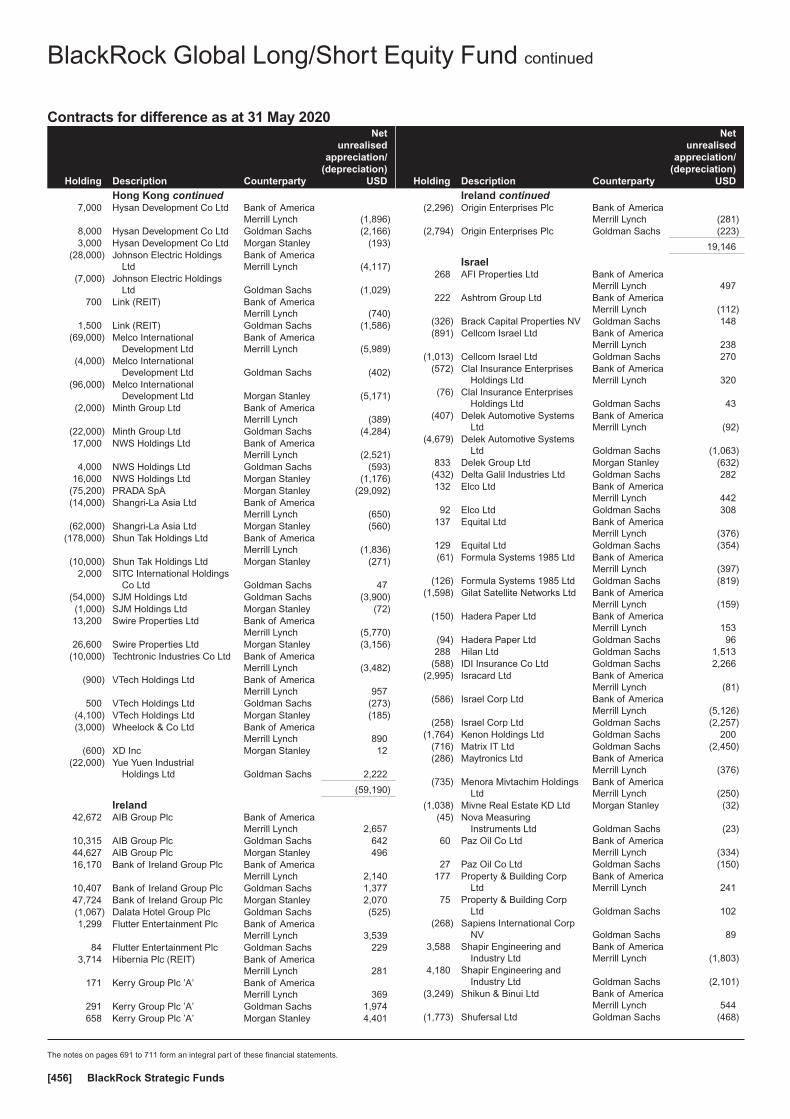
Contracts for difference as at 31 May 2020
Holding Description Counterparty
Netunrealised
appreciation/(depreciation)
USD
Hong Kong continued7,000 Hysan Development Co Ltd Bank of America
Merrill Lynch (1,896)8,000 Hysan Development Co Ltd Goldman Sachs (2,166)3,000 Hysan Development Co Ltd Morgan Stanley (193)
(28,000) Johnson Electric HoldingsLtd
Bank of AmericaMerrill Lynch (4,117)
(7,000) Johnson Electric HoldingsLtd Goldman Sachs (1,029)
700 Link (REIT) Bank of AmericaMerrill Lynch (740)
1,500 Link (REIT) Goldman Sachs (1,586)(69,000) Melco International
Development LtdBank of AmericaMerrill Lynch (5,989)
(4,000) Melco InternationalDevelopment Ltd Goldman Sachs (402)
(96,000) Melco InternationalDevelopment Ltd Morgan Stanley (5,171)
(2,000) Minth Group Ltd Bank of AmericaMerrill Lynch (389)
(22,000) Minth Group Ltd Goldman Sachs (4,284)17,000 NWS Holdings Ltd Bank of America
Merrill Lynch (2,521)4,000 NWS Holdings Ltd Goldman Sachs (593)
16,000 NWS Holdings Ltd Morgan Stanley (1,176)(75,200) PRADA SpA Morgan Stanley (29,092)(14,000) Shangri-La Asia Ltd Bank of America
Merrill Lynch (650)(62,000) Shangri-La Asia Ltd Morgan Stanley (560)
(178,000) Shun Tak Holdings Ltd Bank of AmericaMerrill Lynch (1,836)
(10,000) Shun Tak Holdings Ltd Morgan Stanley (271)2,000 SITC International Holdings
Co Ltd Goldman Sachs 47(54,000) SJM Holdings Ltd Goldman Sachs (3,900)(1,000) SJM Holdings Ltd Morgan Stanley (72)13,200 Swire Properties Ltd Bank of America
Merrill Lynch (5,770)26,600 Swire Properties Ltd Morgan Stanley (3,156)
(10,000) Techtronic Industries Co Ltd Bank of AmericaMerrill Lynch (3,482)
(900) VTech Holdings Ltd Bank of AmericaMerrill Lynch 957
500 VTech Holdings Ltd Goldman Sachs (273)(4,100) VTech Holdings Ltd Morgan Stanley (185)(3,000) Wheelock & Co Ltd Bank of America
Merrill Lynch 890(600) XD Inc Morgan Stanley 12
(22,000) Yue Yuen IndustrialHoldings Ltd Goldman Sachs 2,222
(59,190)
Ireland42,672 AIB Group Plc Bank of America
Merrill Lynch 2,65710,315 AIB Group Plc Goldman Sachs 64244,627 AIB Group Plc Morgan Stanley 49616,170 Bank of Ireland Group Plc Bank of America
Merrill Lynch 2,14010,407 Bank of Ireland Group Plc Goldman Sachs 1,37747,724 Bank of Ireland Group Plc Morgan Stanley 2,070(1,067) Dalata Hotel Group Plc Goldman Sachs (525)1,299 Flutter Entertainment Plc Bank of America
Merrill Lynch 3,53984 Flutter Entertainment Plc Goldman Sachs 229
3,714 Hibernia Plc (REIT) Bank of AmericaMerrill Lynch 281
171 Kerry Group Plc ’A’ Bank of AmericaMerrill Lynch 369
291 Kerry Group Plc ’A’ Goldman Sachs 1,974658 Kerry Group Plc ’A’ Morgan Stanley 4,401
Holding Description Counterparty
Netunrealised
appreciation/(depreciation)
USD
Ireland continued(2,296) Origin Enterprises Plc Bank of America
Merrill Lynch (281)(2,794) Origin Enterprises Plc Goldman Sachs (223)
19,146
Israel268 AFI Properties Ltd Bank of America
Merrill Lynch 497222 Ashtrom Group Ltd Bank of America
Merrill Lynch (112)(326) Brack Capital Properties NV Goldman Sachs 148(891) Cellcom Israel Ltd Bank of America
Merrill Lynch 238(1,013) Cellcom Israel Ltd Goldman Sachs 270
(572) Clal Insurance EnterprisesHoldings Ltd
Bank of AmericaMerrill Lynch 320
(76) Clal Insurance EnterprisesHoldings Ltd Goldman Sachs 43
(407) Delek Automotive SystemsLtd
Bank of AmericaMerrill Lynch (92)
(4,679) Delek Automotive SystemsLtd Goldman Sachs (1,063)
833 Delek Group Ltd Morgan Stanley (632)(432) Delta Galil Industries Ltd Goldman Sachs 282132 Elco Ltd Bank of America
Merrill Lynch 44292 Elco Ltd Goldman Sachs 308
137 Equital Ltd Bank of AmericaMerrill Lynch (376)
129 Equital Ltd Goldman Sachs (354)(61) Formula Systems 1985 Ltd Bank of America
Merrill Lynch (397)(126) Formula Systems 1985 Ltd Goldman Sachs (819)
(1,598) Gilat Satellite Networks Ltd Bank of AmericaMerrill Lynch (159)
(150) Hadera Paper Ltd Bank of AmericaMerrill Lynch 153
(94) Hadera Paper Ltd Goldman Sachs 96288 Hilan Ltd Goldman Sachs 1,513
(588) IDI Insurance Co Ltd Goldman Sachs 2,266(2,995) Isracard Ltd Bank of America
Merrill Lynch (81)(586) Israel Corp Ltd Bank of America
Merrill Lynch (5,126)(258) Israel Corp Ltd Goldman Sachs (2,257)
(1,764) Kenon Holdings Ltd Goldman Sachs 200(716) Matrix IT Ltd Goldman Sachs (2,450)(286) Maytronics Ltd Bank of America
Merrill Lynch (376)(735) Menora Mivtachim Holdings
LtdBank of AmericaMerrill Lynch (250)
(1,038) Mivne Real Estate KD Ltd Morgan Stanley (32)(45) Nova Measuring
Instruments Ltd Goldman Sachs (23)60 Paz Oil Co Ltd Bank of America
Merrill Lynch (334)27 Paz Oil Co Ltd Goldman Sachs (150)
177 Property & Building CorpLtd
Bank of AmericaMerrill Lynch 241
75 Property & Building CorpLtd Goldman Sachs 102
(268) Sapiens International CorpNV Goldman Sachs 89
3,588 Shapir Engineering andIndustry Ltd
Bank of AmericaMerrill Lynch (1,803)
4,180 Shapir Engineering andIndustry Ltd Goldman Sachs (2,101)
(3,249) Shikun & Binui Ltd Bank of AmericaMerrill Lynch 544
(1,773) Shufersal Ltd Goldman Sachs (468)
BlackRock Global Long/Short Equity Fund continued
The notes on pages 691 to 711 form an integral part of these financial statements.
BlackRock Strategic Funds[456]
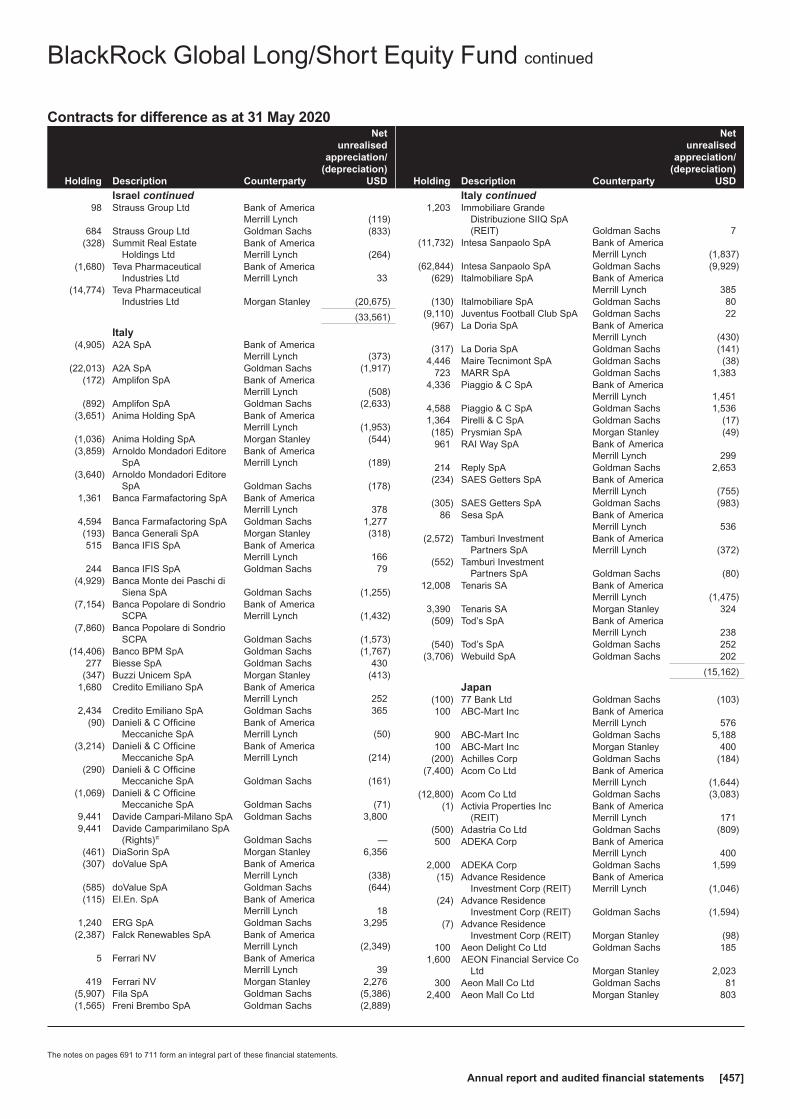
Contracts for difference as at 31 May 2020
Holding Description Counterparty
Netunrealised
appreciation/(depreciation)
USD
Israel continued98 Strauss Group Ltd Bank of America
Merrill Lynch (119)684 Strauss Group Ltd Goldman Sachs (833)
(328) Summit Real EstateHoldings Ltd
Bank of AmericaMerrill Lynch (264)
(1,680) Teva PharmaceuticalIndustries Ltd
Bank of AmericaMerrill Lynch 33
(14,774) Teva PharmaceuticalIndustries Ltd Morgan Stanley (20,675)
(33,561)
Italy(4,905) A2A SpA Bank of America
Merrill Lynch (373)(22,013) A2A SpA Goldman Sachs (1,917)
(172) Amplifon SpA Bank of AmericaMerrill Lynch (508)
(892) Amplifon SpA Goldman Sachs (2,633)(3,651) Anima Holding SpA Bank of America
Merrill Lynch (1,953)(1,036) Anima Holding SpA Morgan Stanley (544)(3,859) Arnoldo Mondadori Editore
SpABank of AmericaMerrill Lynch (189)
(3,640) Arnoldo Mondadori EditoreSpA Goldman Sachs (178)
1,361 Banca Farmafactoring SpA Bank of AmericaMerrill Lynch 378
4,594 Banca Farmafactoring SpA Goldman Sachs 1,277(193) Banca Generali SpA Morgan Stanley (318)515 Banca IFIS SpA Bank of America
Merrill Lynch 166244 Banca IFIS SpA Goldman Sachs 79
(4,929) Banca Monte dei Paschi diSiena SpA Goldman Sachs (1,255)
(7,154) Banca Popolare di SondrioSCPA
Bank of AmericaMerrill Lynch (1,432)
(7,860) Banca Popolare di SondrioSCPA Goldman Sachs (1,573)
(14,406) Banco BPM SpA Goldman Sachs (1,767)277 Biesse SpA Goldman Sachs 430
(347) Buzzi Unicem SpA Morgan Stanley (413)1,680 Credito Emiliano SpA Bank of America
Merrill Lynch 2522,434 Credito Emiliano SpA Goldman Sachs 365
(90) Danieli & C OfficineMeccaniche SpA
Bank of AmericaMerrill Lynch (50)
(3,214) Danieli & C OfficineMeccaniche SpA
Bank of AmericaMerrill Lynch (214)
(290) Danieli & C OfficineMeccaniche SpA Goldman Sachs (161)
(1,069) Danieli & C OfficineMeccaniche SpA Goldman Sachs (71)
9,441 Davide Campari-Milano SpA Goldman Sachs 3,8009,441 Davide Camparimilano SpA
(Rights)π Goldman Sachs —(461) DiaSorin SpA Morgan Stanley 6,356(307) doValue SpA Bank of America
Merrill Lynch (338)(585) doValue SpA Goldman Sachs (644)(115) El.En. SpA Bank of America
Merrill Lynch 181,240 ERG SpA Goldman Sachs 3,295
(2,387) Falck Renewables SpA Bank of AmericaMerrill Lynch (2,349)
5 Ferrari NV Bank of AmericaMerrill Lynch 39
419 Ferrari NV Morgan Stanley 2,276(5,907) Fila SpA Goldman Sachs (5,386)(1,565) Freni Brembo SpA Goldman Sachs (2,889)
Holding Description Counterparty
Netunrealised
appreciation/(depreciation)
USD
Italy continued1,203 Immobiliare Grande
Distribuzione SIIQ SpA(REIT) Goldman Sachs 7
(11,732) Intesa Sanpaolo SpA Bank of AmericaMerrill Lynch (1,837)
(62,844) Intesa Sanpaolo SpA Goldman Sachs (9,929)(629) Italmobiliare SpA Bank of America
Merrill Lynch 385(130) Italmobiliare SpA Goldman Sachs 80
(9,110) Juventus Football Club SpA Goldman Sachs 22(967) La Doria SpA Bank of America
Merrill Lynch (430)(317) La Doria SpA Goldman Sachs (141)
4,446 Maire Tecnimont SpA Goldman Sachs (38)723 MARR SpA Goldman Sachs 1,383
4,336 Piaggio & C SpA Bank of AmericaMerrill Lynch 1,451
4,588 Piaggio & C SpA Goldman Sachs 1,5361,364 Pirelli & C SpA Goldman Sachs (17)(185) Prysmian SpA Morgan Stanley (49)961 RAI Way SpA Bank of America
Merrill Lynch 299214 Reply SpA Goldman Sachs 2,653
(234) SAES Getters SpA Bank of AmericaMerrill Lynch (755)
(305) SAES Getters SpA Goldman Sachs (983)86 Sesa SpA Bank of America
Merrill Lynch 536(2,572) Tamburi Investment
Partners SpABank of AmericaMerrill Lynch (372)
(552) Tamburi InvestmentPartners SpA Goldman Sachs (80)
12,008 Tenaris SA Bank of AmericaMerrill Lynch (1,475)
3,390 Tenaris SA Morgan Stanley 324(509) Tod’s SpA Bank of America
Merrill Lynch 238(540) Tod’s SpA Goldman Sachs 252
(3,706) Webuild SpA Goldman Sachs 202
(15,162)
Japan(100) 77 Bank Ltd Goldman Sachs (103)100 ABC-Mart Inc Bank of America
Merrill Lynch 576900 ABC-Mart Inc Goldman Sachs 5,188100 ABC-Mart Inc Morgan Stanley 400
(200) Achilles Corp Goldman Sachs (184)(7,400) Acom Co Ltd Bank of America
Merrill Lynch (1,644)(12,800) Acom Co Ltd Goldman Sachs (3,083)
(1) Activia Properties Inc(REIT)
Bank of AmericaMerrill Lynch 171
(500) Adastria Co Ltd Goldman Sachs (809)500 ADEKA Corp Bank of America
Merrill Lynch 4002,000 ADEKA Corp Goldman Sachs 1,599
(15) Advance ResidenceInvestment Corp (REIT)
Bank of AmericaMerrill Lynch (1,046)
(24) Advance ResidenceInvestment Corp (REIT) Goldman Sachs (1,594)
(7) Advance ResidenceInvestment Corp (REIT) Morgan Stanley (98)
100 Aeon Delight Co Ltd Goldman Sachs 1851,600 AEON Financial Service Co
Ltd Morgan Stanley 2,023300 Aeon Mall Co Ltd Goldman Sachs 81
2,400 Aeon Mall Co Ltd Morgan Stanley 803
BlackRock Global Long/Short Equity Fund continued
The notes on pages 691 to 711 form an integral part of these financial statements.
Annual report and audited financial statements [457]
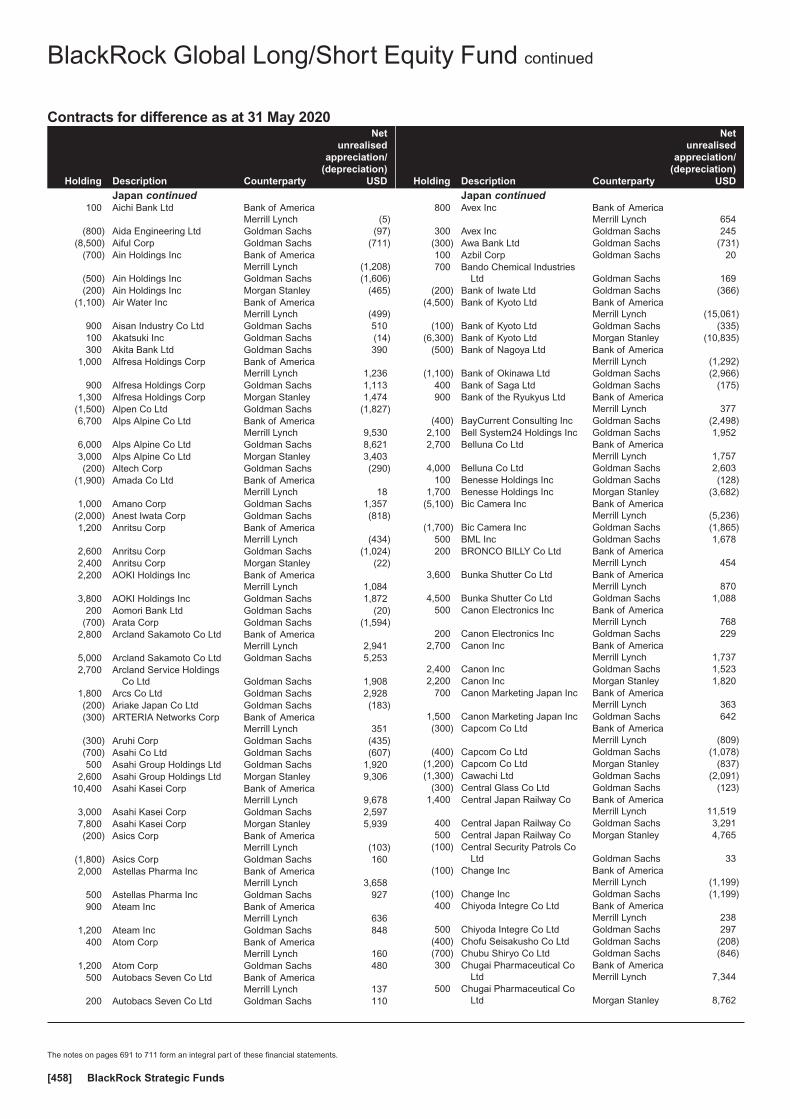
Contracts for difference as at 31 May 2020
Holding Description Counterparty
Netunrealised
appreciation/(depreciation)
USD
Japan continued100 Aichi Bank Ltd Bank of America
Merrill Lynch (5)(800) Aida Engineering Ltd Goldman Sachs (97)
(8,500) Aiful Corp Goldman Sachs (711)(700) Ain Holdings Inc Bank of America
Merrill Lynch (1,208)(500) Ain Holdings Inc Goldman Sachs (1,606)(200) Ain Holdings Inc Morgan Stanley (465)
(1,100) Air Water Inc Bank of AmericaMerrill Lynch (499)
900 Aisan Industry Co Ltd Goldman Sachs 510100 Akatsuki Inc Goldman Sachs (14)300 Akita Bank Ltd Goldman Sachs 390
1,000 Alfresa Holdings Corp Bank of AmericaMerrill Lynch 1,236
900 Alfresa Holdings Corp Goldman Sachs 1,1131,300 Alfresa Holdings Corp Morgan Stanley 1,474
(1,500) Alpen Co Ltd Goldman Sachs (1,827)6,700 Alps Alpine Co Ltd Bank of America
Merrill Lynch 9,5306,000 Alps Alpine Co Ltd Goldman Sachs 8,6213,000 Alps Alpine Co Ltd Morgan Stanley 3,403(200) Altech Corp Goldman Sachs (290)
(1,900) Amada Co Ltd Bank of AmericaMerrill Lynch 18
1,000 Amano Corp Goldman Sachs 1,357(2,000) Anest Iwata Corp Goldman Sachs (818)1,200 Anritsu Corp Bank of America
Merrill Lynch (434)2,600 Anritsu Corp Goldman Sachs (1,024)2,400 Anritsu Corp Morgan Stanley (22)2,200 AOKI Holdings Inc Bank of America
Merrill Lynch 1,0843,800 AOKI Holdings Inc Goldman Sachs 1,872
200 Aomori Bank Ltd Goldman Sachs (20)(700) Arata Corp Goldman Sachs (1,594)
2,800 Arcland Sakamoto Co Ltd Bank of AmericaMerrill Lynch 2,941
5,000 Arcland Sakamoto Co Ltd Goldman Sachs 5,2532,700 Arcland Service Holdings
Co Ltd Goldman Sachs 1,9081,800 Arcs Co Ltd Goldman Sachs 2,928(200) Ariake Japan Co Ltd Goldman Sachs (183)(300) ARTERIA Networks Corp Bank of America
Merrill Lynch 351(300) Aruhi Corp Goldman Sachs (435)(700) Asahi Co Ltd Goldman Sachs (607)500 Asahi Group Holdings Ltd Goldman Sachs 1,920
2,600 Asahi Group Holdings Ltd Morgan Stanley 9,30610,400 Asahi Kasei Corp Bank of America
Merrill Lynch 9,6783,000 Asahi Kasei Corp Goldman Sachs 2,5977,800 Asahi Kasei Corp Morgan Stanley 5,939(200) Asics Corp Bank of America
Merrill Lynch (103)(1,800) Asics Corp Goldman Sachs 1602,000 Astellas Pharma Inc Bank of America
Merrill Lynch 3,658500 Astellas Pharma Inc Goldman Sachs 927900 Ateam Inc Bank of America
Merrill Lynch 6361,200 Ateam Inc Goldman Sachs 848
400 Atom Corp Bank of AmericaMerrill Lynch 160
1,200 Atom Corp Goldman Sachs 480500 Autobacs Seven Co Ltd Bank of America
Merrill Lynch 137200 Autobacs Seven Co Ltd Goldman Sachs 110
Holding Description Counterparty
Netunrealised
appreciation/(depreciation)
USD
Japan continued800 Avex Inc Bank of America
Merrill Lynch 654300 Avex Inc Goldman Sachs 245
(300) Awa Bank Ltd Goldman Sachs (731)100 Azbil Corp Goldman Sachs 20700 Bando Chemical Industries
Ltd Goldman Sachs 169(200) Bank of Iwate Ltd Goldman Sachs (366)
(4,500) Bank of Kyoto Ltd Bank of AmericaMerrill Lynch (15,061)
(100) Bank of Kyoto Ltd Goldman Sachs (335)(6,300) Bank of Kyoto Ltd Morgan Stanley (10,835)
(500) Bank of Nagoya Ltd Bank of AmericaMerrill Lynch (1,292)
(1,100) Bank of Okinawa Ltd Goldman Sachs (2,966)400 Bank of Saga Ltd Goldman Sachs (175)900 Bank of the Ryukyus Ltd Bank of America
Merrill Lynch 377(400) BayCurrent Consulting Inc Goldman Sachs (2,498)
2,100 Bell System24 Holdings Inc Goldman Sachs 1,9522,700 Belluna Co Ltd Bank of America
Merrill Lynch 1,7574,000 Belluna Co Ltd Goldman Sachs 2,603
100 Benesse Holdings Inc Goldman Sachs (128)1,700 Benesse Holdings Inc Morgan Stanley (3,682)
(5,100) Bic Camera Inc Bank of AmericaMerrill Lynch (5,236)
(1,700) Bic Camera Inc Goldman Sachs (1,865)500 BML Inc Goldman Sachs 1,678200 BRONCO BILLY Co Ltd Bank of America
Merrill Lynch 4543,600 Bunka Shutter Co Ltd Bank of America
Merrill Lynch 8704,500 Bunka Shutter Co Ltd Goldman Sachs 1,088
500 Canon Electronics Inc Bank of AmericaMerrill Lynch 768
200 Canon Electronics Inc Goldman Sachs 2292,700 Canon Inc Bank of America
Merrill Lynch 1,7372,400 Canon Inc Goldman Sachs 1,5232,200 Canon Inc Morgan Stanley 1,820
700 Canon Marketing Japan Inc Bank of AmericaMerrill Lynch 363
1,500 Canon Marketing Japan Inc Goldman Sachs 642(300) Capcom Co Ltd Bank of America
Merrill Lynch (809)(400) Capcom Co Ltd Goldman Sachs (1,078)
(1,200) Capcom Co Ltd Morgan Stanley (837)(1,300) Cawachi Ltd Goldman Sachs (2,091)
(300) Central Glass Co Ltd Goldman Sachs (123)1,400 Central Japan Railway Co Bank of America
Merrill Lynch 11,519400 Central Japan Railway Co Goldman Sachs 3,291500 Central Japan Railway Co Morgan Stanley 4,765
(100) Central Security Patrols CoLtd Goldman Sachs 33
(100) Change Inc Bank of AmericaMerrill Lynch (1,199)
(100) Change Inc Goldman Sachs (1,199)400 Chiyoda Integre Co Ltd Bank of America
Merrill Lynch 238500 Chiyoda Integre Co Ltd Goldman Sachs 297
(400) Chofu Seisakusho Co Ltd Goldman Sachs (208)(700) Chubu Shiryo Co Ltd Goldman Sachs (846)300 Chugai Pharmaceutical Co
LtdBank of AmericaMerrill Lynch 7,344
500 Chugai Pharmaceutical CoLtd Morgan Stanley 8,762
BlackRock Global Long/Short Equity Fund continued
The notes on pages 691 to 711 form an integral part of these financial statements.
BlackRock Strategic Funds[458]

Contracts for difference as at 31 May 2020
Holding Description Counterparty
Netunrealised
appreciation/(depreciation)
USD
Japan continued(6,400) Chugoku Bank Ltd Bank of America
Merrill Lynch (3,213)(2,000) Chugoku Bank Ltd Goldman Sachs (1,004)
(27,700) Chugoku Bank Ltd Morgan Stanley (9,786)(900) Chukyo Bank Ltd Goldman Sachs (1,222)
1,700 CI Takiron Corp Bank of AmericaMerrill Lynch 1,754
(5,500) Citizen Watch Co Ltd Goldman Sachs (1,991)(800) CKD Corp Goldman Sachs (82)200 CMIC Holdings Co Ltd Bank of America
Merrill Lynch 126500 CMIC Holdings Co Ltd Goldman Sachs 316100 COMSYS Holdings Corp Bank of America
Merrill Lynch (107)2,300 COMSYS Holdings Corp Goldman Sachs (693)
500 COMSYS Holdings Corp Morgan Stanley 90100 Comture Corp Bank of America
Merrill Lynch 7191,000 CONEXIO Corp Bank of America
Merrill Lynch (493)700 CONEXIO Corp Goldman Sachs (345)700 COOKPAD Inc Bank of America
Merrill Lynch 2282,600 COOKPAD Inc Goldman Sachs 846(100) Cosmo Energy Holdings Co
LtdBank of AmericaMerrill Lynch 83
(1,800) Create RestaurantsHoldings Inc Goldman Sachs (623)
(1,100) Create SD Holdings Co Ltd Goldman Sachs (3,221)(1,500) Curves Holdings Co Ltd Goldman Sachs (1,171)
700 Dai Nippon Printing Co Ltd Morgan Stanley 888(1,400) Daibiru Corp Goldman Sachs (742)
200 Daiho Corp Goldman Sachs 175200 Daiichi Jitsugyo Co Ltd Goldman Sachs 344
(100) Daiichikosho Co Ltd Goldman Sachs 70(200) Daiichikosho Co Ltd Morgan Stanley 200600 Daikin Industries Ltd Bank of America
Merrill Lynch 7,949800 Daikin Industries Ltd Goldman Sachs 10,598700 Daikin Industries Ltd Morgan Stanley 6,833300 Daio Paper Corp Bank of America
Merrill Lynch 453,800 Daio Paper Corp Goldman Sachs 454(700) Daishi Hokuetsu Financial
Group Inc Goldman Sachs (625)(2) Daiwa Office Investment
Corp (REIT) Goldman Sachs (651)(3) Daiwa Office Investment
Corp (REIT) Morgan Stanley 84(8) Daiwa Securities Living
Investments Corp (REIT) Goldman Sachs (662)(200) Daiwabo Holdings Co Ltd Goldman Sachs (297)
5,700 DCM Holdings Co Ltd Goldman Sachs 1,355200 Denso Corp Bank of America
Merrill Lynch 753900 Denso Corp Goldman Sachs 3,389600 Denso Corp Morgan Stanley 1,791500 Dentsu Group Inc Bank of America
Merrill Lynch 2,9521,800 Dentsu Group Inc Goldman Sachs 10,626
11,400 Dentsu Group Inc Morgan Stanley 67,299(1,100) Descente Ltd Bank of America
Merrill Lynch (1,923)700 DIC Corp Goldman Sachs 1,445
1,800 DIC Corp Morgan Stanley 2,544100 Dip Corp Goldman Sachs 10
(200) Disco Corp Bank of AmericaMerrill Lynch 1,878
Holding Description Counterparty
Netunrealised
appreciation/(depreciation)
USD
Japan continued(4,500) DMG Mori Co Ltd Bank of America
Merrill Lynch (6,069)(11,300) DMG Mori Co Ltd Goldman Sachs (15,523)(3,400) DMG Mori Co Ltd Morgan Stanley (3,652)2,700 Doshisha Co Ltd Bank of America
Merrill Lynch 1,4814,100 Doshisha Co Ltd Goldman Sachs 2,2493,700 Doutor Nichires Holdings Co
Ltd Goldman Sachs 3,715(6,000) Dowa Holdings Co Ltd Morgan Stanley (18,686)
100 Duskin Co Ltd Bank of AmericaMerrill Lynch 103
300 Duskin Co Ltd Goldman Sachs 310500 Eagle Industry Co Ltd Bank of America
Merrill Lynch 2002,300 Eagle Industry Co Ltd Goldman Sachs 919(400) Earth Corp Goldman Sachs (2,975)
3,600 East Japan Railway Co Bank of AmericaMerrill Lynch 19,847
1,600 East Japan Railway Co Morgan Stanley 9,0743,200 EDION Corp Bank of America
Merrill Lynch 1,8156,600 EDION Corp Goldman Sachs 3,743
300 eGuarantee Inc Goldman Sachs 156(500) Eiken Chemical Co Ltd Goldman Sachs (456)(600) Eizo Corp Goldman Sachs (2,178)200 Elan Corp Goldman Sachs 164100 Elecom Co Ltd Goldman Sachs 445500 Electric Power Development
Co LtdBank of AmericaMerrill Lynch 548
200 Electric Power DevelopmentCo Ltd Morgan Stanley 255
400 Enigmo Inc Goldman Sachs 227500 en-japan Inc Bank of America
Merrill Lynch 1,692900 en-japan Inc Goldman Sachs 3,046
(300) Enplas Corp Goldman Sachs (195)700 EPS Holdings Inc Bank of America
Merrill Lynch 1042,100 EPS Holdings Inc Goldman Sachs 312
(1,500) ES-Con Japan Ltd Goldman Sachs (865)(400) Exedy Corp Goldman Sachs (636)(400) Ezaki Glico Co Ltd Goldman Sachs (278)600 FAN Communications Inc Goldman Sachs 139100 Fast Retailing Co Ltd Goldman Sachs 8,813200 Fast Retailing Co Ltd Morgan Stanley 14,001
(400) Ferrotec Holdings Corp Bank of AmericaMerrill Lynch (108)
(900) Ferrotec Holdings Corp Goldman Sachs (243)300 Fixstars Corp Goldman Sachs 257400 Foster Electric Co Ltd Goldman Sachs 327
(200) FP Corp Bank of AmericaMerrill Lynch (260)
(600) FP Corp Morgan Stanley (223)300 France Bed Holdings Co Ltd Goldman Sachs (84)
(2,500) Freee KK Bank of AmericaMerrill Lynch (27,890)
2 Frontier Real EstateInvestment Corp (REIT)
Bank of AmericaMerrill Lynch 669
3 Frontier Real EstateInvestment Corp (REIT) Goldman Sachs 1,004
800 Fuji Co Ltd Goldman Sachs 640(2,000) Fuji Corp/Aichi Goldman Sachs (3,737)
(200) Fuji Kyuko Co Ltd Bank of AmericaMerrill Lynch (865)
9,200 Fuji Media Holdings Inc Morgan Stanley 5,132(1,200) Fuji Seal International Inc Goldman Sachs (1,606)
(700) Fujibo Holdings Inc Goldman Sachs (748)
BlackRock Global Long/Short Equity Fund continued
The notes on pages 691 to 711 form an integral part of these financial statements.
Annual report and audited financial statements [459]
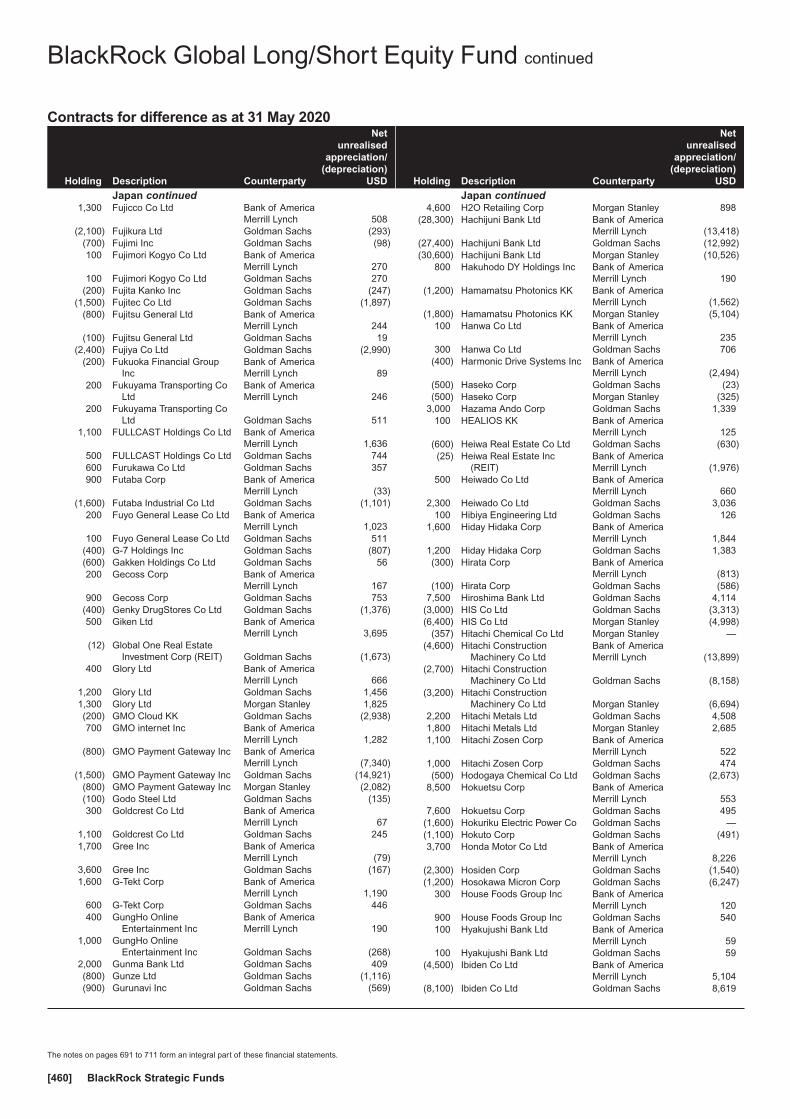
Contracts for difference as at 31 May 2020
Holding Description Counterparty
Netunrealised
appreciation/(depreciation)
USD
Japan continued1,300 Fujicco Co Ltd Bank of America
Merrill Lynch 508(2,100) Fujikura Ltd Goldman Sachs (293)
(700) Fujimi Inc Goldman Sachs (98)100 Fujimori Kogyo Co Ltd Bank of America
Merrill Lynch 270100 Fujimori Kogyo Co Ltd Goldman Sachs 270
(200) Fujita Kanko Inc Goldman Sachs (247)(1,500) Fujitec Co Ltd Goldman Sachs (1,897)
(800) Fujitsu General Ltd Bank of AmericaMerrill Lynch 244
(100) Fujitsu General Ltd Goldman Sachs 19(2,400) Fujiya Co Ltd Goldman Sachs (2,990)
(200) Fukuoka Financial GroupInc
Bank of AmericaMerrill Lynch 89
200 Fukuyama Transporting CoLtd
Bank of AmericaMerrill Lynch 246
200 Fukuyama Transporting CoLtd Goldman Sachs 511
1,100 FULLCAST Holdings Co Ltd Bank of AmericaMerrill Lynch 1,636
500 FULLCAST Holdings Co Ltd Goldman Sachs 744600 Furukawa Co Ltd Goldman Sachs 357900 Futaba Corp Bank of America
Merrill Lynch (33)(1,600) Futaba Industrial Co Ltd Goldman Sachs (1,101)
200 Fuyo General Lease Co Ltd Bank of AmericaMerrill Lynch 1,023
100 Fuyo General Lease Co Ltd Goldman Sachs 511(400) G-7 Holdings Inc Goldman Sachs (807)(600) Gakken Holdings Co Ltd Goldman Sachs 56200 Gecoss Corp Bank of America
Merrill Lynch 167900 Gecoss Corp Goldman Sachs 753
(400) Genky DrugStores Co Ltd Goldman Sachs (1,376)500 Giken Ltd Bank of America
Merrill Lynch 3,695(12) Global One Real Estate
Investment Corp (REIT) Goldman Sachs (1,673)400 Glory Ltd Bank of America
Merrill Lynch 6661,200 Glory Ltd Goldman Sachs 1,4561,300 Glory Ltd Morgan Stanley 1,825(200) GMO Cloud KK Goldman Sachs (2,938)700 GMO internet Inc Bank of America
Merrill Lynch 1,282(800) GMO Payment Gateway Inc Bank of America
Merrill Lynch (7,340)(1,500) GMO Payment Gateway Inc Goldman Sachs (14,921)
(800) GMO Payment Gateway Inc Morgan Stanley (2,082)(100) Godo Steel Ltd Goldman Sachs (135)300 Goldcrest Co Ltd Bank of America
Merrill Lynch 671,100 Goldcrest Co Ltd Goldman Sachs 2451,700 Gree Inc Bank of America
Merrill Lynch (79)3,600 Gree Inc Goldman Sachs (167)1,600 G-Tekt Corp Bank of America
Merrill Lynch 1,190600 G-Tekt Corp Goldman Sachs 446400 GungHo Online
Entertainment IncBank of AmericaMerrill Lynch 190
1,000 GungHo OnlineEntertainment Inc Goldman Sachs (268)
2,000 Gunma Bank Ltd Goldman Sachs 409(800) Gunze Ltd Goldman Sachs (1,116)(900) Gurunavi Inc Goldman Sachs (569)
Holding Description Counterparty
Netunrealised
appreciation/(depreciation)
USD
Japan continued4,600 H2O Retailing Corp Morgan Stanley 898
(28,300) Hachijuni Bank Ltd Bank of AmericaMerrill Lynch (13,418)
(27,400) Hachijuni Bank Ltd Goldman Sachs (12,992)(30,600) Hachijuni Bank Ltd Morgan Stanley (10,526)
800 Hakuhodo DY Holdings Inc Bank of AmericaMerrill Lynch 190
(1,200) Hamamatsu Photonics KK Bank of AmericaMerrill Lynch (1,562)
(1,800) Hamamatsu Photonics KK Morgan Stanley (5,104)100 Hanwa Co Ltd Bank of America
Merrill Lynch 235300 Hanwa Co Ltd Goldman Sachs 706
(400) Harmonic Drive Systems Inc Bank of AmericaMerrill Lynch (2,494)
(500) Haseko Corp Goldman Sachs (23)(500) Haseko Corp Morgan Stanley (325)
3,000 Hazama Ando Corp Goldman Sachs 1,339100 HEALIOS KK Bank of America
Merrill Lynch 125(600) Heiwa Real Estate Co Ltd Goldman Sachs (630)(25) Heiwa Real Estate Inc
(REIT)Bank of AmericaMerrill Lynch (1,976)
500 Heiwado Co Ltd Bank of AmericaMerrill Lynch 660
2,300 Heiwado Co Ltd Goldman Sachs 3,036100 Hibiya Engineering Ltd Goldman Sachs 126
1,600 Hiday Hidaka Corp Bank of AmericaMerrill Lynch 1,844
1,200 Hiday Hidaka Corp Goldman Sachs 1,383(300) Hirata Corp Bank of America
Merrill Lynch (813)(100) Hirata Corp Goldman Sachs (586)
7,500 Hiroshima Bank Ltd Goldman Sachs 4,114(3,000) HIS Co Ltd Goldman Sachs (3,313)(6,400) HIS Co Ltd Morgan Stanley (4,998)
(357) Hitachi Chemical Co Ltd Morgan Stanley —(4,600) Hitachi Construction
Machinery Co LtdBank of AmericaMerrill Lynch (13,899)
(2,700) Hitachi ConstructionMachinery Co Ltd Goldman Sachs (8,158)
(3,200) Hitachi ConstructionMachinery Co Ltd Morgan Stanley (6,694)
2,200 Hitachi Metals Ltd Goldman Sachs 4,5081,800 Hitachi Metals Ltd Morgan Stanley 2,6851,100 Hitachi Zosen Corp Bank of America
Merrill Lynch 5221,000 Hitachi Zosen Corp Goldman Sachs 474(500) Hodogaya Chemical Co Ltd Goldman Sachs (2,673)
8,500 Hokuetsu Corp Bank of AmericaMerrill Lynch 553
7,600 Hokuetsu Corp Goldman Sachs 495(1,600) Hokuriku Electric Power Co Goldman Sachs —(1,100) Hokuto Corp Goldman Sachs (491)3,700 Honda Motor Co Ltd Bank of America
Merrill Lynch 8,226(2,300) Hosiden Corp Goldman Sachs (1,540)(1,200) Hosokawa Micron Corp Goldman Sachs (6,247)
300 House Foods Group Inc Bank of AmericaMerrill Lynch 120
900 House Foods Group Inc Goldman Sachs 540100 Hyakujushi Bank Ltd Bank of America
Merrill Lynch 59100 Hyakujushi Bank Ltd Goldman Sachs 59
(4,500) Ibiden Co Ltd Bank of AmericaMerrill Lynch 5,104
(8,100) Ibiden Co Ltd Goldman Sachs 8,619
BlackRock Global Long/Short Equity Fund continued
The notes on pages 691 to 711 form an integral part of these financial statements.
BlackRock Strategic Funds[460]
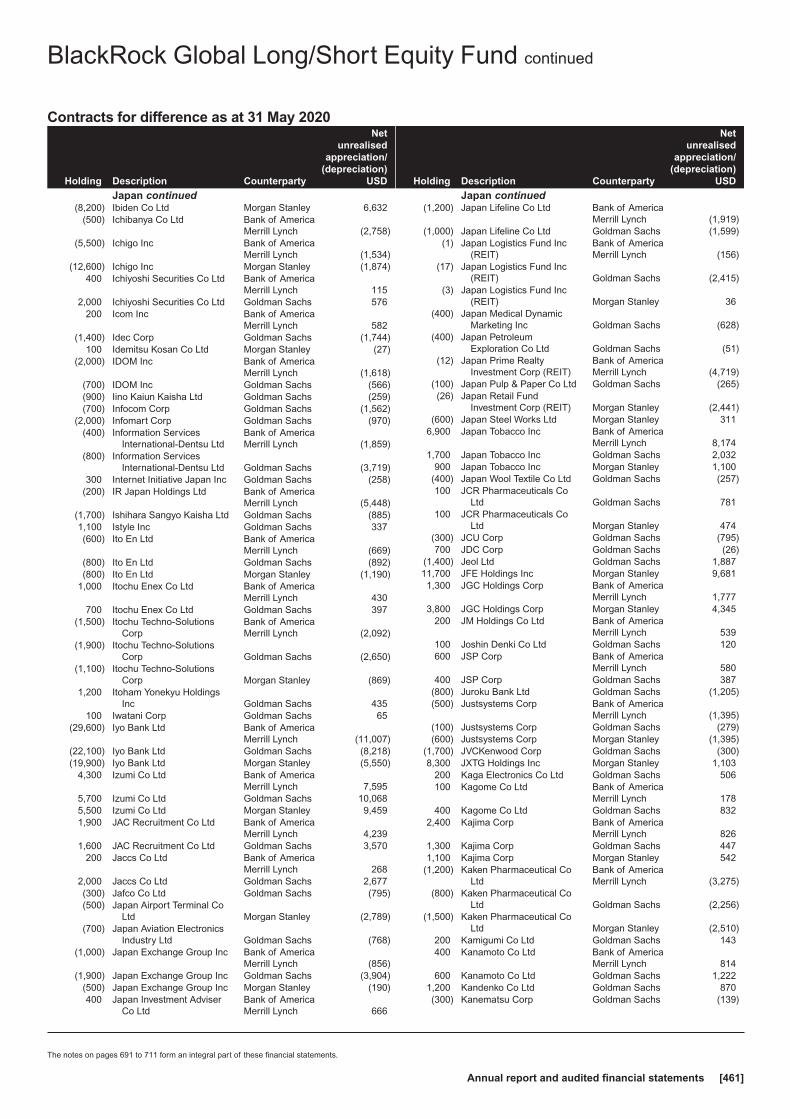
Contracts for difference as at 31 May 2020
Holding Description Counterparty
Netunrealised
appreciation/(depreciation)
USD
Japan continued(8,200) Ibiden Co Ltd Morgan Stanley 6,632
(500) Ichibanya Co Ltd Bank of AmericaMerrill Lynch (2,758)
(5,500) Ichigo Inc Bank of AmericaMerrill Lynch (1,534)
(12,600) Ichigo Inc Morgan Stanley (1,874)400 Ichiyoshi Securities Co Ltd Bank of America
Merrill Lynch 1152,000 Ichiyoshi Securities Co Ltd Goldman Sachs 576
200 Icom Inc Bank of AmericaMerrill Lynch 582
(1,400) Idec Corp Goldman Sachs (1,744)100 Idemitsu Kosan Co Ltd Morgan Stanley (27)
(2,000) IDOM Inc Bank of AmericaMerrill Lynch (1,618)
(700) IDOM Inc Goldman Sachs (566)(900) Iino Kaiun Kaisha Ltd Goldman Sachs (259)(700) Infocom Corp Goldman Sachs (1,562)
(2,000) Infomart Corp Goldman Sachs (970)(400) Information Services
International-Dentsu LtdBank of AmericaMerrill Lynch (1,859)
(800) Information ServicesInternational-Dentsu Ltd Goldman Sachs (3,719)
300 Internet Initiative Japan Inc Goldman Sachs (258)(200) IR Japan Holdings Ltd Bank of America
Merrill Lynch (5,448)(1,700) Ishihara Sangyo Kaisha Ltd Goldman Sachs (885)1,100 Istyle Inc Goldman Sachs 337(600) Ito En Ltd Bank of America
Merrill Lynch (669)(800) Ito En Ltd Goldman Sachs (892)(800) Ito En Ltd Morgan Stanley (1,190)
1,000 Itochu Enex Co Ltd Bank of AmericaMerrill Lynch 430
700 Itochu Enex Co Ltd Goldman Sachs 397(1,500) Itochu Techno-Solutions
CorpBank of AmericaMerrill Lynch (2,092)
(1,900) Itochu Techno-SolutionsCorp Goldman Sachs (2,650)
(1,100) Itochu Techno-SolutionsCorp Morgan Stanley (869)
1,200 Itoham Yonekyu HoldingsInc Goldman Sachs 435
100 Iwatani Corp Goldman Sachs 65(29,600) Iyo Bank Ltd Bank of America
Merrill Lynch (11,007)(22,100) Iyo Bank Ltd Goldman Sachs (8,218)(19,900) Iyo Bank Ltd Morgan Stanley (5,550)
4,300 Izumi Co Ltd Bank of AmericaMerrill Lynch 7,595
5,700 Izumi Co Ltd Goldman Sachs 10,0685,500 Izumi Co Ltd Morgan Stanley 9,4591,900 JAC Recruitment Co Ltd Bank of America
Merrill Lynch 4,2391,600 JAC Recruitment Co Ltd Goldman Sachs 3,570
200 Jaccs Co Ltd Bank of AmericaMerrill Lynch 268
2,000 Jaccs Co Ltd Goldman Sachs 2,677(300) Jafco Co Ltd Goldman Sachs (795)(500) Japan Airport Terminal Co
Ltd Morgan Stanley (2,789)(700) Japan Aviation Electronics
Industry Ltd Goldman Sachs (768)(1,000) Japan Exchange Group Inc Bank of America
Merrill Lynch (856)(1,900) Japan Exchange Group Inc Goldman Sachs (3,904)
(500) Japan Exchange Group Inc Morgan Stanley (190)400 Japan Investment Adviser
Co LtdBank of AmericaMerrill Lynch 666
Holding Description Counterparty
Netunrealised
appreciation/(depreciation)
USD
Japan continued(1,200) Japan Lifeline Co Ltd Bank of America
Merrill Lynch (1,919)(1,000) Japan Lifeline Co Ltd Goldman Sachs (1,599)
(1) Japan Logistics Fund Inc(REIT)
Bank of AmericaMerrill Lynch (156)
(17) Japan Logistics Fund Inc(REIT) Goldman Sachs (2,415)
(3) Japan Logistics Fund Inc(REIT) Morgan Stanley 36
(400) Japan Medical DynamicMarketing Inc Goldman Sachs (628)
(400) Japan PetroleumExploration Co Ltd Goldman Sachs (51)
(12) Japan Prime RealtyInvestment Corp (REIT)
Bank of AmericaMerrill Lynch (4,719)
(100) Japan Pulp & Paper Co Ltd Goldman Sachs (265)(26) Japan Retail Fund
Investment Corp (REIT) Morgan Stanley (2,441)(600) Japan Steel Works Ltd Morgan Stanley 311
6,900 Japan Tobacco Inc Bank of AmericaMerrill Lynch 8,174
1,700 Japan Tobacco Inc Goldman Sachs 2,032900 Japan Tobacco Inc Morgan Stanley 1,100
(400) Japan Wool Textile Co Ltd Goldman Sachs (257)100 JCR Pharmaceuticals Co
Ltd Goldman Sachs 781100 JCR Pharmaceuticals Co
Ltd Morgan Stanley 474(300) JCU Corp Goldman Sachs (795)700 JDC Corp Goldman Sachs (26)
(1,400) Jeol Ltd Goldman Sachs 1,88711,700 JFE Holdings Inc Morgan Stanley 9,6811,300 JGC Holdings Corp Bank of America
Merrill Lynch 1,7773,800 JGC Holdings Corp Morgan Stanley 4,345
200 JM Holdings Co Ltd Bank of AmericaMerrill Lynch 539
100 Joshin Denki Co Ltd Goldman Sachs 120600 JSP Corp Bank of America
Merrill Lynch 580400 JSP Corp Goldman Sachs 387
(800) Juroku Bank Ltd Goldman Sachs (1,205)(500) Justsystems Corp Bank of America
Merrill Lynch (1,395)(100) Justsystems Corp Goldman Sachs (279)(600) Justsystems Corp Morgan Stanley (1,395)
(1,700) JVCKenwood Corp Goldman Sachs (300)8,300 JXTG Holdings Inc Morgan Stanley 1,103
200 Kaga Electronics Co Ltd Goldman Sachs 506100 Kagome Co Ltd Bank of America
Merrill Lynch 178400 Kagome Co Ltd Goldman Sachs 832
2,400 Kajima Corp Bank of AmericaMerrill Lynch 826
1,300 Kajima Corp Goldman Sachs 4471,100 Kajima Corp Morgan Stanley 542
(1,200) Kaken Pharmaceutical CoLtd
Bank of AmericaMerrill Lynch (3,275)
(800) Kaken Pharmaceutical CoLtd Goldman Sachs (2,256)
(1,500) Kaken Pharmaceutical CoLtd Morgan Stanley (2,510)
200 Kamigumi Co Ltd Goldman Sachs 143400 Kanamoto Co Ltd Bank of America
Merrill Lynch 814600 Kanamoto Co Ltd Goldman Sachs 1,222
1,200 Kandenko Co Ltd Goldman Sachs 870(300) Kanematsu Corp Goldman Sachs (139)
BlackRock Global Long/Short Equity Fund continued
The notes on pages 691 to 711 form an integral part of these financial statements.
Annual report and audited financial statements [461]

Contracts for difference as at 31 May 2020
Holding Description Counterparty
Netunrealised
appreciation/(depreciation)
USD
Japan continued300 Kanematsu Electronics Ltd Bank of America
Merrill Lynch 516100 Kanematsu Electronics Ltd Goldman Sachs 172
(11,100) Kansai Mirai FinancialGroup Inc
Bank of AmericaMerrill Lynch (5,676)
(9,900) Kansai Mirai FinancialGroup Inc Goldman Sachs (5,062)
(8,700) Kansai Mirai FinancialGroup Inc Morgan Stanley (3,882)
(3,100) Kanto Denka Kogyo Co Ltd Bank of AmericaMerrill Lynch 922
(700) Kappa Create Co Ltd Bank of AmericaMerrill Lynch (527)
500 Kasai Kogyo Co Ltd Bank of AmericaMerrill Lynch 163
(1,200) Katitas Co Ltd Goldman Sachs 555(100) Kato Sangyo Co Ltd Goldman Sachs (228)
(5,400) Kawasaki Kisen Kaisha Ltd Bank of AmericaMerrill Lynch (4,770)
(5,200) Kawasaki Kisen Kaisha Ltd Goldman Sachs (4,593)(1,100) Kawasaki Kisen Kaisha Ltd Morgan Stanley (133)5,600 KDDI Corp Morgan Stanley 1,548
(1,000) Keihan Holdings Co Ltd Morgan Stanley (1,255)(200) Keihanshin Building Co Ltd Goldman Sachs (128)(600) Keihin Corp Goldman Sachs 22
(2,700) Keikyu Corp Bank of AmericaMerrill Lynch (2,962)
(1,000) Keikyu Corp Goldman Sachs (1,097)(2,600) Keikyu Corp Morgan Stanley (1,474)(2,500) Keio Corp Morgan Stanley (7,902)
(600) Keisei Electric Railway CoLtd Morgan Stanley 66
(4,200) Keiyo Bank Ltd Goldman Sachs (1,562)(700) Keiyo Co Ltd Bank of America
Merrill Lynch (508)(500) Keiyo Co Ltd Goldman Sachs (363)
(4,800) Kenedix Inc Goldman Sachs (1,835)(18) Kenedix Residential Next
Investment Corp (REIT) Goldman Sachs (3,113)(200) Kenko Mayonnaise Co Ltd Bank of America
Merrill Lynch (223)(100) Kenko Mayonnaise Co Ltd Goldman Sachs (112)600 Kewpie Corp Goldman Sachs (12)400 Kewpie Corp Morgan Stanley 11200 Keyence Corp Bank of America
Merrill Lynch 10,370(700) Kintetsu Department Store
Co Ltd Goldman Sachs (2,928)(100) Kintetsu Group Holdings Co
LtdBank of AmericaMerrill Lynch (158)
(400) Kintetsu Group Holdings CoLtd Goldman Sachs (632)
(2,300) Kintetsu Group Holdings CoLtd Morgan Stanley (2,352)
(2,900) Kintetsu World Express Inc Goldman Sachs (5,500)100 Kissei Pharmaceutical Co
LtdBank of AmericaMerrill Lynch 254
100 Kissei Pharmaceutical CoLtd Morgan Stanley 174
2,500 Kitanotatsujin Corp Bank of AmericaMerrill Lynch (127)
2,400 Kitanotatsujin Corp Goldman Sachs 76(2,900) Kitz Corp Goldman Sachs (500)(1,700) Kiyo Bank Ltd Goldman Sachs (2,292)
(500) KNT-CT Holdings Co Ltd Goldman Sachs (794)600 Koa Corp Bank of America
Merrill Lynch 563200 Kobe Bussan Co Ltd Bank of America
Merrill Lynch 1,114
Holding Description Counterparty
Netunrealised
appreciation/(depreciation)
USD
Japan continued(14,600) Kobe Steel Ltd Goldman Sachs (3,556)(4,100) Koei Tecmo Holdings Co Ltd Bank of America
Merrill Lynch (1,144)(4,700) Koei Tecmo Holdings Co Ltd Goldman Sachs (1,311)
200 Koei Tecmo Holdings Co Ltd Goldman Sachs 56(2,100) Koei Tecmo Holdings Co Ltd Morgan Stanley (98)
400 Kohnan Shoji Co Ltd Bank of AmericaMerrill Lynch 1,621
300 Kohnan Shoji Co Ltd Goldman Sachs 1,216200 Kokuyo Co Ltd Goldman Sachs 231
(400) Komeri Co Ltd Goldman Sachs (953)(400) Komori Corp Goldman Sachs (167)
1,000 Konami Holdings Corp Bank of AmericaMerrill Lynch 3,518
600 Konami Holdings Corp Morgan Stanley 1,36725,700 Konica Minolta Inc Bank of America
Merrill Lynch 7,31430,200 Konica Minolta Inc Goldman Sachs 8,70415,000 Konica Minolta Inc Morgan Stanley 3,7651,800 Konoike Transport Co Ltd Bank of America
Merrill Lynch 1,6401,900 Konoike Transport Co Ltd Goldman Sachs 1,731
400 Kose Corp Goldman Sachs (993)200 Kose Corp Morgan Stanley (730)
(100) Kotobuki Spirits Co Ltd Goldman Sachs 290(300) Krosaki Harima Corp Goldman Sachs (572)(700) K’s Holdings Corp Bank of America
Merrill Lynch (813)(800) K’s Holdings Corp Goldman Sachs (930)(800) K’s Holdings Corp Morgan Stanley (446)100 Kumagai Gumi Co Ltd Bank of America
Merrill Lynch 205800 Kumagai Gumi Co Ltd Goldman Sachs 1,636
(3,700) Kumiai Chemical IndustryCo Ltd Goldman Sachs (757)
(400) Kurabo Industries Ltd Goldman Sachs (130)(5,400) Kurita Water Industries Ltd Bank of America
Merrill Lynch 398(2,700) Kurita Water Industries Ltd Goldman Sachs 193(2,500) Kurita Water Industries Ltd Morgan Stanley (2,859)1,100 Kyocera Corp Bank of America
Merrill Lynch 1,3401,200 Kyocera Corp Goldman Sachs 1,2813,000 Kyocera Corp Morgan Stanley 7,550
(1,700) KYORIN Holdings Inc Goldman Sachs (2,734)(500) Kyoritsu Maintenance Co
LtdBank of AmericaMerrill Lynch (716)
(2,000) Kyoritsu Maintenance CoLtd Morgan Stanley (1,707)
1,000 Kyowa Exeo Corp Goldman Sachs (87)(200) Kyowa Kirin Co Ltd Bank of America
Merrill Lynch (114)(500) Kyowa Kirin Co Ltd Morgan Stanley (505)
(5,900) Kyushu Financial Group Inc Bank of AmericaMerrill Lynch (2,084)
(4,000) Kyushu Financial Group Inc Goldman Sachs (1,413)(2,300) Kyushu Financial Group Inc Morgan Stanley (449)
(15) LaSalle Logiport REIT(REIT) Goldman Sachs (1,408)
(600) Lasertec Corp Bank of AmericaMerrill Lynch (6,694)
(1,600) Lasertec Corp Goldman Sachs (17,934)(1,500) Lasertec Corp Morgan Stanley (6,427)
(400) Lawson Inc Morgan Stanley (1,302)(1,000) LEC Inc Goldman Sachs (1,776)(1,800) Leopalace21 Corp Bank of America
Merrill Lynch (402)
BlackRock Global Long/Short Equity Fund continued
The notes on pages 691 to 711 form an integral part of these financial statements.
BlackRock Strategic Funds[462]

Contracts for difference as at 31 May 2020
Holding Description Counterparty
Netunrealised
appreciation/(depreciation)
USD
Japan continued2,100 LIFULL Co Ltd Bank of America
Merrill Lynch 20700 LIFULL Co Ltd Goldman Sachs 7800 LINE Corp Goldman Sachs 266
1,000 Link And Motivation Inc Goldman Sachs 920100 Lintec Corp Bank of America
Merrill Lynch 145300 Lintec Corp Goldman Sachs 435
4,800 Lintec Corp Morgan Stanley 5,578(2,400) Lion Corp Bank of America
Merrill Lynch (7)(1,100) Lion Corp Morgan Stanley (153)(1,700) LIXIL VIVA Corp Goldman Sachs (6,575)
100 M&A Capital Partners CoLtd
Bank of AmericaMerrill Lynch 623
100 M&A Capital Partners CoLtd Goldman Sachs 623
100 Mabuchi Motor Co Ltd Bank of AmericaMerrill Lynch 353
1,000 Mabuchi Motor Co Ltd Morgan Stanley 3,347(800) Macnica Fuji Electronics
Holdings Inc Goldman Sachs (1,300)(200) Maeda Kosen Co Ltd Bank of America
Merrill Lynch (495)100 Mandom Corp Goldman Sachs 92700 Mars Group Holdings Corp Bank of America
Merrill Lynch 46200 Mars Group Holdings Corp Goldman Sachs 13
42,400 Marubeni Corp Goldman Sachs 21,94229,700 Marubeni Corp Morgan Stanley 13,309
200 Marudai Food Co Ltd Goldman Sachs (104)7,600 Maruha Nichiro Corp Bank of America
Merrill Lynch 11,0387,500 Maruha Nichiro Corp Goldman Sachs 10,4931,800 Maruha Nichiro Corp Morgan Stanley 2,376(400) Maruwa Co Ltd Goldman Sachs (558)400 Maruwa Unyu Kikan Co Ltd Goldman Sachs 677
3,400 Marvelous Inc Bank of AmericaMerrill Lynch 6,954
1,600 Marvelous Inc Goldman Sachs 3,272600 Matsuda Sangyo Co Ltd Bank of America
Merrill Lynch 379200 Matsui Securities Co Ltd Bank of America
Merrill Lynch (11)200 Matsui Securities Co Ltd Goldman Sachs 45300 Matsumotokiyoshi Holdings
Co LtdBank of AmericaMerrill Lynch 586
2,500 Matsumotokiyoshi HoldingsCo Ltd Goldman Sachs 4,620
700 Matsumotokiyoshi HoldingsCo Ltd Morgan Stanley 488
500 McDonald’s Holdings CoJapan Ltd Goldman Sachs 111
(2,000) MCJ Co Ltd Bank of AmericaMerrill Lynch (186)
100 Media Do Co Ltd Bank of AmericaMerrill Lynch 209
(200) Meidensha Corp Goldman Sachs (335)100 MEIJI Holdings Co Ltd Bank of America
Merrill Lynch 2311,500 Meiko Network Japan Co
LtdBank of AmericaMerrill Lynch 711
600 Meiko Network Japan CoLtd Goldman Sachs 284
(1,500) Meisei Industrial Co Ltd Goldman Sachs (321)800 Meitec Corp Goldman Sachs 1,413200 Mercari Inc Goldman Sachs 354
(400) Micronics Japan Co Ltd Bank of AmericaMerrill Lynch (617)
Holding Description Counterparty
Netunrealised
appreciation/(depreciation)
USD
Japan continued(600) Mimasu Semiconductor
Industry Co Ltd Goldman Sachs (324)300 Ministop Co Ltd Goldman Sachs 159
(600) Miraca Holdings Inc Bank of AmericaMerrill Lynch 123
(2,500) Miraca Holdings Inc Goldman Sachs 511600 Miroku Jyoho Service Co
LtdBank of AmericaMerrill Lynch 1,339
500 Miroku Jyoho Service CoLtd Goldman Sachs 1,116
(800) MISUMI Group Inc Morgan Stanley (997)7,200 Mitsubishi Chemical
Holdings Corp Morgan Stanley 2,932(5) Mitsubishi Estate Logistics
Investment Corp (REIT)Bank of AmericaMerrill Lynch (1,484)
(400) Mitsubishi Heavy IndustriesLtd Goldman Sachs (887)
(6,500) Mitsubishi Heavy IndustriesLtd Morgan Stanley (12,086)
(1,400) Mitsubishi Logisnext Co Ltd Goldman Sachs (1,588)(1,600) Mitsubishi Logistics Corp Bank of America
Merrill Lynch (5,310)(2,600) Mitsubishi Logistics Corp Goldman Sachs (8,629)(2,000) Mitsubishi Logistics Corp Morgan Stanley (5,225)6,600 Mitsubishi Motors Corp Goldman Sachs (1,714)
400 Mitsubishi Pencil Co Ltd Bank of AmericaMerrill Lynch 297
400 Mitsubishi Pencil Co Ltd Goldman Sachs 2971 Mitsui Fudosan Logistics
Park Inc (REIT) Goldman Sachs (19)(7) Mitsui Fudosan Logistics
Park Inc (REIT) Goldman Sachs (2,050)(300) Mitsui High-Tec Inc Bank of America
Merrill Lynch (318)(1,300) Mitsui Mining & Smelting Co
Ltd Goldman Sachs (3,577)(1,600) Mitsui OSK Lines Ltd Bank of America
Merrill Lynch (2,425)(6,100) Mitsui OSK Lines Ltd Morgan Stanley (6,805)
100 Mitsui Sugar Co Ltd Bank of AmericaMerrill Lynch (103)
(200) Mitsui-Soko Holdings Co Ltd Goldman Sachs (381)(1,100) Miura Co Ltd Bank of America
Merrill Lynch (2,894)(1,100) Miura Co Ltd Goldman Sachs (2,863)
(300) Miura Co Ltd Morgan Stanley (153)(300) Mizuho Leasing Co Ltd Goldman Sachs (689)
1,600 Mizuno Corp Goldman Sachs 3,8971,300 Modec Inc Bank of America
Merrill Lynch 2,8831,100 Modec Inc Goldman Sachs 2,108(100) Money Forward Inc Bank of America
Merrill Lynch (1,487)(100) Monogatari Corp Bank of America
Merrill Lynch (298)(8) Mori Hills Investment Corp
(REIT) Goldman Sachs (959)100 Morinaga & Co Ltd Bank of America
Merrill Lynch 321100 Morinaga & Co Ltd Goldman Sachs 321800 MOS Food Services Inc Bank of America
Merrill Lynch 803100 MOS Food Services Inc Goldman Sachs 100100 MTI Ltd Bank of America
Merrill Lynch (8)1,600 Murata Manufacturing Co
LtdBank of AmericaMerrill Lynch (301)
300 Murata Manufacturing CoLtd Morgan Stanley 139
BlackRock Global Long/Short Equity Fund continued
The notes on pages 691 to 711 form an integral part of these financial statements.
Annual report and audited financial statements [463]
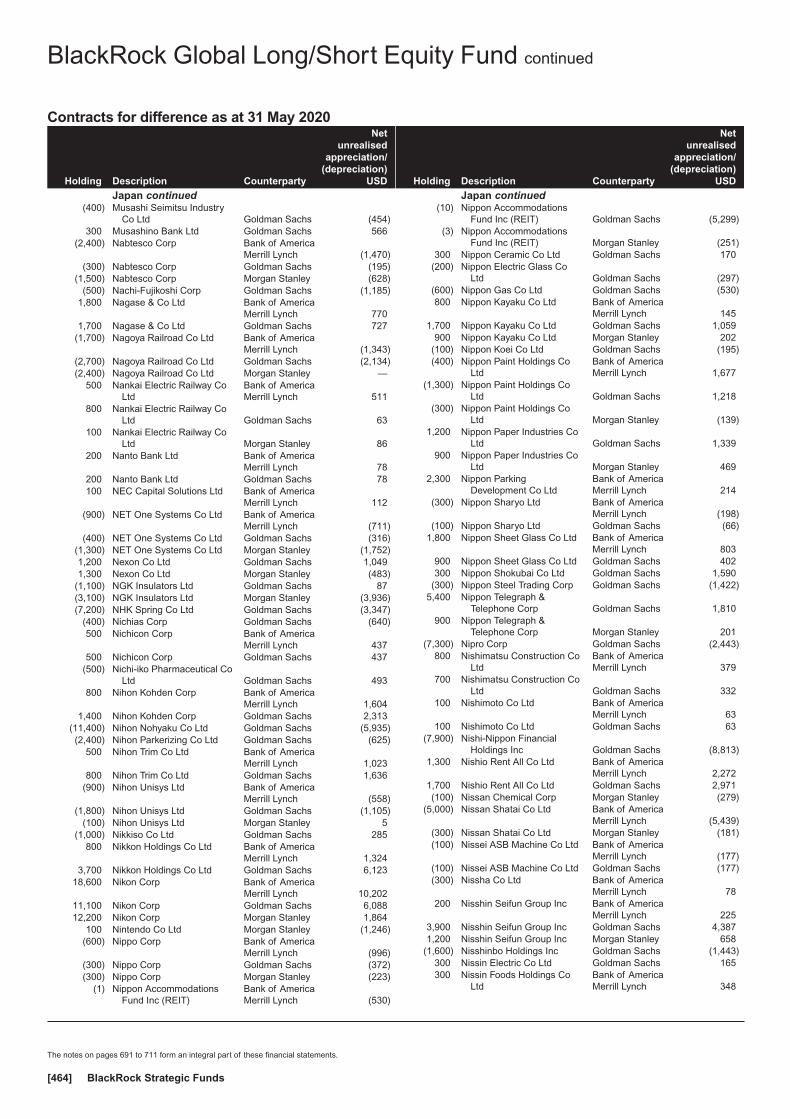
Contracts for difference as at 31 May 2020
Holding Description Counterparty
Netunrealised
appreciation/(depreciation)
USD
Japan continued(400) Musashi Seimitsu Industry
Co Ltd Goldman Sachs (454)300 Musashino Bank Ltd Goldman Sachs 566
(2,400) Nabtesco Corp Bank of AmericaMerrill Lynch (1,470)
(300) Nabtesco Corp Goldman Sachs (195)(1,500) Nabtesco Corp Morgan Stanley (628)
(500) Nachi-Fujikoshi Corp Goldman Sachs (1,185)1,800 Nagase & Co Ltd Bank of America
Merrill Lynch 7701,700 Nagase & Co Ltd Goldman Sachs 727
(1,700) Nagoya Railroad Co Ltd Bank of AmericaMerrill Lynch (1,343)
(2,700) Nagoya Railroad Co Ltd Goldman Sachs (2,134)(2,400) Nagoya Railroad Co Ltd Morgan Stanley —
500 Nankai Electric Railway CoLtd
Bank of AmericaMerrill Lynch 511
800 Nankai Electric Railway CoLtd Goldman Sachs 63
100 Nankai Electric Railway CoLtd Morgan Stanley 86
200 Nanto Bank Ltd Bank of AmericaMerrill Lynch 78
200 Nanto Bank Ltd Goldman Sachs 78100 NEC Capital Solutions Ltd Bank of America
Merrill Lynch 112(900) NET One Systems Co Ltd Bank of America
Merrill Lynch (711)(400) NET One Systems Co Ltd Goldman Sachs (316)
(1,300) NET One Systems Co Ltd Morgan Stanley (1,752)1,200 Nexon Co Ltd Goldman Sachs 1,0491,300 Nexon Co Ltd Morgan Stanley (483)
(1,100) NGK Insulators Ltd Goldman Sachs 87(3,100) NGK Insulators Ltd Morgan Stanley (3,936)(7,200) NHK Spring Co Ltd Goldman Sachs (3,347)
(400) Nichias Corp Goldman Sachs (640)500 Nichicon Corp Bank of America
Merrill Lynch 437500 Nichicon Corp Goldman Sachs 437
(500) Nichi-iko Pharmaceutical CoLtd Goldman Sachs 493
800 Nihon Kohden Corp Bank of AmericaMerrill Lynch 1,604
1,400 Nihon Kohden Corp Goldman Sachs 2,313(11,400) Nihon Nohyaku Co Ltd Goldman Sachs (5,935)(2,400) Nihon Parkerizing Co Ltd Goldman Sachs (625)
500 Nihon Trim Co Ltd Bank of AmericaMerrill Lynch 1,023
800 Nihon Trim Co Ltd Goldman Sachs 1,636(900) Nihon Unisys Ltd Bank of America
Merrill Lynch (558)(1,800) Nihon Unisys Ltd Goldman Sachs (1,105)
(100) Nihon Unisys Ltd Morgan Stanley 5(1,000) Nikkiso Co Ltd Goldman Sachs 285
800 Nikkon Holdings Co Ltd Bank of AmericaMerrill Lynch 1,324
3,700 Nikkon Holdings Co Ltd Goldman Sachs 6,12318,600 Nikon Corp Bank of America
Merrill Lynch 10,20211,100 Nikon Corp Goldman Sachs 6,08812,200 Nikon Corp Morgan Stanley 1,864
100 Nintendo Co Ltd Morgan Stanley (1,246)(600) Nippo Corp Bank of America
Merrill Lynch (996)(300) Nippo Corp Goldman Sachs (372)(300) Nippo Corp Morgan Stanley (223)
(1) Nippon AccommodationsFund Inc (REIT)
Bank of AmericaMerrill Lynch (530)
Holding Description Counterparty
Netunrealised
appreciation/(depreciation)
USD
Japan continued(10) Nippon Accommodations
Fund Inc (REIT) Goldman Sachs (5,299)(3) Nippon Accommodations
Fund Inc (REIT) Morgan Stanley (251)300 Nippon Ceramic Co Ltd Goldman Sachs 170
(200) Nippon Electric Glass CoLtd Goldman Sachs (297)
(600) Nippon Gas Co Ltd Goldman Sachs (530)800 Nippon Kayaku Co Ltd Bank of America
Merrill Lynch 1451,700 Nippon Kayaku Co Ltd Goldman Sachs 1,059
900 Nippon Kayaku Co Ltd Morgan Stanley 202(100) Nippon Koei Co Ltd Goldman Sachs (195)(400) Nippon Paint Holdings Co
LtdBank of AmericaMerrill Lynch 1,677
(1,300) Nippon Paint Holdings CoLtd Goldman Sachs 1,218
(300) Nippon Paint Holdings CoLtd Morgan Stanley (139)
1,200 Nippon Paper Industries CoLtd Goldman Sachs 1,339
900 Nippon Paper Industries CoLtd Morgan Stanley 469
2,300 Nippon ParkingDevelopment Co Ltd
Bank of AmericaMerrill Lynch 214
(300) Nippon Sharyo Ltd Bank of AmericaMerrill Lynch (198)
(100) Nippon Sharyo Ltd Goldman Sachs (66)1,800 Nippon Sheet Glass Co Ltd Bank of America
Merrill Lynch 803900 Nippon Sheet Glass Co Ltd Goldman Sachs 402300 Nippon Shokubai Co Ltd Goldman Sachs 1,590
(300) Nippon Steel Trading Corp Goldman Sachs (1,422)5,400 Nippon Telegraph &
Telephone Corp Goldman Sachs 1,810900 Nippon Telegraph &
Telephone Corp Morgan Stanley 201(7,300) Nipro Corp Goldman Sachs (2,443)
800 Nishimatsu Construction CoLtd
Bank of AmericaMerrill Lynch 379
700 Nishimatsu Construction CoLtd Goldman Sachs 332
100 Nishimoto Co Ltd Bank of AmericaMerrill Lynch 63
100 Nishimoto Co Ltd Goldman Sachs 63(7,900) Nishi-Nippon Financial
Holdings Inc Goldman Sachs (8,813)1,300 Nishio Rent All Co Ltd Bank of America
Merrill Lynch 2,2721,700 Nishio Rent All Co Ltd Goldman Sachs 2,971(100) Nissan Chemical Corp Morgan Stanley (279)
(5,000) Nissan Shatai Co Ltd Bank of AmericaMerrill Lynch (5,439)
(300) Nissan Shatai Co Ltd Morgan Stanley (181)(100) Nissei ASB Machine Co Ltd Bank of America
Merrill Lynch (177)(100) Nissei ASB Machine Co Ltd Goldman Sachs (177)(300) Nissha Co Ltd Bank of America
Merrill Lynch 78200 Nisshin Seifun Group Inc Bank of America
Merrill Lynch 2253,900 Nisshin Seifun Group Inc Goldman Sachs 4,3871,200 Nisshin Seifun Group Inc Morgan Stanley 658
(1,600) Nisshinbo Holdings Inc Goldman Sachs (1,443)300 Nissin Electric Co Ltd Goldman Sachs 165300 Nissin Foods Holdings Co
LtdBank of AmericaMerrill Lynch 348
BlackRock Global Long/Short Equity Fund continued
The notes on pages 691 to 711 form an integral part of these financial statements.
BlackRock Strategic Funds[464]
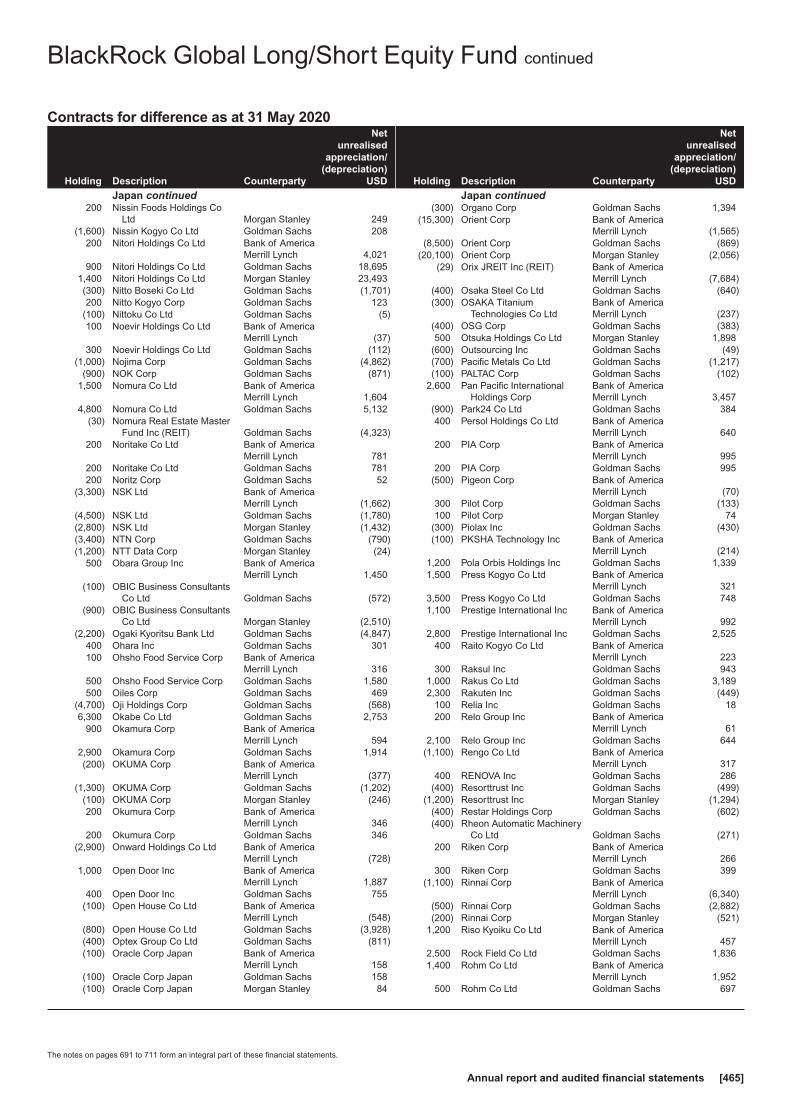
Contracts for difference as at 31 May 2020
Holding Description Counterparty
Netunrealised
appreciation/(depreciation)
USD
Japan continued200 Nissin Foods Holdings Co
Ltd Morgan Stanley 249(1,600) Nissin Kogyo Co Ltd Goldman Sachs 208
200 Nitori Holdings Co Ltd Bank of AmericaMerrill Lynch 4,021
900 Nitori Holdings Co Ltd Goldman Sachs 18,6951,400 Nitori Holdings Co Ltd Morgan Stanley 23,493(300) Nitto Boseki Co Ltd Goldman Sachs (1,701)200 Nitto Kogyo Corp Goldman Sachs 123
(100) Nittoku Co Ltd Goldman Sachs (5)100 Noevir Holdings Co Ltd Bank of America
Merrill Lynch (37)300 Noevir Holdings Co Ltd Goldman Sachs (112)
(1,000) Nojima Corp Goldman Sachs (4,862)(900) NOK Corp Goldman Sachs (871)
1,500 Nomura Co Ltd Bank of AmericaMerrill Lynch 1,604
4,800 Nomura Co Ltd Goldman Sachs 5,132(30) Nomura Real Estate Master
Fund Inc (REIT) Goldman Sachs (4,323)200 Noritake Co Ltd Bank of America
Merrill Lynch 781200 Noritake Co Ltd Goldman Sachs 781200 Noritz Corp Goldman Sachs 52
(3,300) NSK Ltd Bank of AmericaMerrill Lynch (1,662)
(4,500) NSK Ltd Goldman Sachs (1,780)(2,800) NSK Ltd Morgan Stanley (1,432)(3,400) NTN Corp Goldman Sachs (790)(1,200) NTT Data Corp Morgan Stanley (24)
500 Obara Group Inc Bank of AmericaMerrill Lynch 1,450
(100) OBIC Business ConsultantsCo Ltd Goldman Sachs (572)
(900) OBIC Business ConsultantsCo Ltd Morgan Stanley (2,510)
(2,200) Ogaki Kyoritsu Bank Ltd Goldman Sachs (4,847)400 Ohara Inc Goldman Sachs 301100 Ohsho Food Service Corp Bank of America
Merrill Lynch 316500 Ohsho Food Service Corp Goldman Sachs 1,580500 Oiles Corp Goldman Sachs 469
(4,700) Oji Holdings Corp Goldman Sachs (568)6,300 Okabe Co Ltd Goldman Sachs 2,753
900 Okamura Corp Bank of AmericaMerrill Lynch 594
2,900 Okamura Corp Goldman Sachs 1,914(200) OKUMA Corp Bank of America
Merrill Lynch (377)(1,300) OKUMA Corp Goldman Sachs (1,202)
(100) OKUMA Corp Morgan Stanley (246)200 Okumura Corp Bank of America
Merrill Lynch 346200 Okumura Corp Goldman Sachs 346
(2,900) Onward Holdings Co Ltd Bank of AmericaMerrill Lynch (728)
1,000 Open Door Inc Bank of AmericaMerrill Lynch 1,887
400 Open Door Inc Goldman Sachs 755(100) Open House Co Ltd Bank of America
Merrill Lynch (548)(800) Open House Co Ltd Goldman Sachs (3,928)(400) Optex Group Co Ltd Goldman Sachs (811)(100) Oracle Corp Japan Bank of America
Merrill Lynch 158(100) Oracle Corp Japan Goldman Sachs 158(100) Oracle Corp Japan Morgan Stanley 84
Holding Description Counterparty
Netunrealised
appreciation/(depreciation)
USD
Japan continued(300) Organo Corp Goldman Sachs 1,394
(15,300) Orient Corp Bank of AmericaMerrill Lynch (1,565)
(8,500) Orient Corp Goldman Sachs (869)(20,100) Orient Corp Morgan Stanley (2,056)
(29) Orix JREIT Inc (REIT) Bank of AmericaMerrill Lynch (7,684)
(400) Osaka Steel Co Ltd Goldman Sachs (640)(300) OSAKA Titanium
Technologies Co LtdBank of AmericaMerrill Lynch (237)
(400) OSG Corp Goldman Sachs (383)500 Otsuka Holdings Co Ltd Morgan Stanley 1,898
(600) Outsourcing Inc Goldman Sachs (49)(700) Pacific Metals Co Ltd Goldman Sachs (1,217)(100) PALTAC Corp Goldman Sachs (102)
2,600 Pan Pacific InternationalHoldings Corp
Bank of AmericaMerrill Lynch 3,457
(900) Park24 Co Ltd Goldman Sachs 384400 Persol Holdings Co Ltd Bank of America
Merrill Lynch 640200 PIA Corp Bank of America
Merrill Lynch 995200 PIA Corp Goldman Sachs 995
(500) Pigeon Corp Bank of AmericaMerrill Lynch (70)
300 Pilot Corp Goldman Sachs (133)100 Pilot Corp Morgan Stanley 74
(300) Piolax Inc Goldman Sachs (430)(100) PKSHA Technology Inc Bank of America
Merrill Lynch (214)1,200 Pola Orbis Holdings Inc Goldman Sachs 1,3391,500 Press Kogyo Co Ltd Bank of America
Merrill Lynch 3213,500 Press Kogyo Co Ltd Goldman Sachs 7481,100 Prestige International Inc Bank of America
Merrill Lynch 9922,800 Prestige International Inc Goldman Sachs 2,525
400 Raito Kogyo Co Ltd Bank of AmericaMerrill Lynch 223
300 Raksul Inc Goldman Sachs 9431,000 Rakus Co Ltd Goldman Sachs 3,1892,300 Rakuten Inc Goldman Sachs (449)
100 Relia Inc Goldman Sachs 18200 Relo Group Inc Bank of America
Merrill Lynch 612,100 Relo Group Inc Goldman Sachs 644
(1,100) Rengo Co Ltd Bank of AmericaMerrill Lynch 317
400 RENOVA Inc Goldman Sachs 286(400) Resorttrust Inc Goldman Sachs (499)
(1,200) Resorttrust Inc Morgan Stanley (1,294)(400) Restar Holdings Corp Goldman Sachs (602)(400) Rheon Automatic Machinery
Co Ltd Goldman Sachs (271)200 Riken Corp Bank of America
Merrill Lynch 266300 Riken Corp Goldman Sachs 399
(1,100) Rinnai Corp Bank of AmericaMerrill Lynch (6,340)
(500) Rinnai Corp Goldman Sachs (2,882)(200) Rinnai Corp Morgan Stanley (521)
1,200 Riso Kyoiku Co Ltd Bank of AmericaMerrill Lynch 457
2,500 Rock Field Co Ltd Goldman Sachs 1,8361,400 Rohm Co Ltd Bank of America
Merrill Lynch 1,952500 Rohm Co Ltd Goldman Sachs 697
BlackRock Global Long/Short Equity Fund continued
The notes on pages 691 to 711 form an integral part of these financial statements.
Annual report and audited financial statements [465]
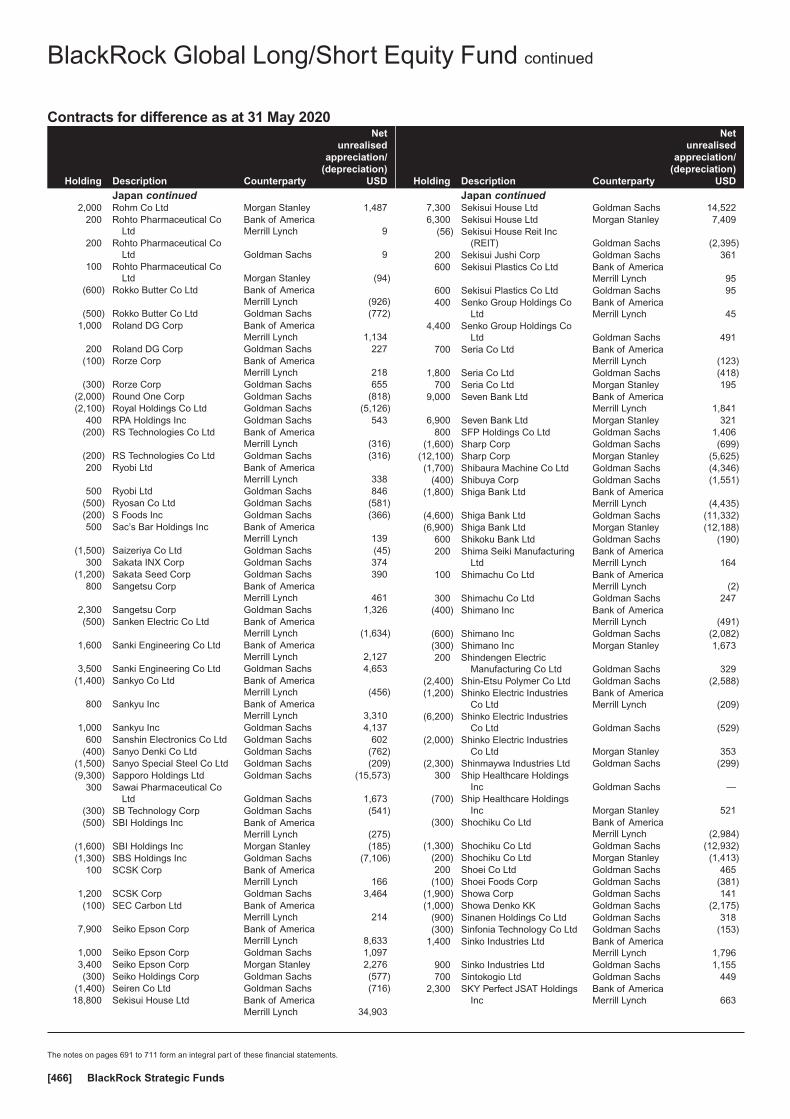
Contracts for difference as at 31 May 2020
Holding Description Counterparty
Netunrealised
appreciation/(depreciation)
USD
Japan continued2,000 Rohm Co Ltd Morgan Stanley 1,487
200 Rohto Pharmaceutical CoLtd
Bank of AmericaMerrill Lynch 9
200 Rohto Pharmaceutical CoLtd Goldman Sachs 9
100 Rohto Pharmaceutical CoLtd Morgan Stanley (94)
(600) Rokko Butter Co Ltd Bank of AmericaMerrill Lynch (926)
(500) Rokko Butter Co Ltd Goldman Sachs (772)1,000 Roland DG Corp Bank of America
Merrill Lynch 1,134200 Roland DG Corp Goldman Sachs 227
(100) Rorze Corp Bank of AmericaMerrill Lynch 218
(300) Rorze Corp Goldman Sachs 655(2,000) Round One Corp Goldman Sachs (818)(2,100) Royal Holdings Co Ltd Goldman Sachs (5,126)
400 RPA Holdings Inc Goldman Sachs 543(200) RS Technologies Co Ltd Bank of America
Merrill Lynch (316)(200) RS Technologies Co Ltd Goldman Sachs (316)200 Ryobi Ltd Bank of America
Merrill Lynch 338500 Ryobi Ltd Goldman Sachs 846
(500) Ryosan Co Ltd Goldman Sachs (581)(200) S Foods Inc Goldman Sachs (366)500 Sac’s Bar Holdings Inc Bank of America
Merrill Lynch 139(1,500) Saizeriya Co Ltd Goldman Sachs (45)
300 Sakata INX Corp Goldman Sachs 374(1,200) Sakata Seed Corp Goldman Sachs 390
800 Sangetsu Corp Bank of AmericaMerrill Lynch 461
2,300 Sangetsu Corp Goldman Sachs 1,326(500) Sanken Electric Co Ltd Bank of America
Merrill Lynch (1,634)1,600 Sanki Engineering Co Ltd Bank of America
Merrill Lynch 2,1273,500 Sanki Engineering Co Ltd Goldman Sachs 4,653
(1,400) Sankyo Co Ltd Bank of AmericaMerrill Lynch (456)
800 Sankyu Inc Bank of AmericaMerrill Lynch 3,310
1,000 Sankyu Inc Goldman Sachs 4,137600 Sanshin Electronics Co Ltd Goldman Sachs 602
(400) Sanyo Denki Co Ltd Goldman Sachs (762)(1,500) Sanyo Special Steel Co Ltd Goldman Sachs (209)(9,300) Sapporo Holdings Ltd Goldman Sachs (15,573)
300 Sawai Pharmaceutical CoLtd Goldman Sachs 1,673
(300) SB Technology Corp Goldman Sachs (541)(500) SBI Holdings Inc Bank of America
Merrill Lynch (275)(1,600) SBI Holdings Inc Morgan Stanley (185)(1,300) SBS Holdings Inc Goldman Sachs (7,106)
100 SCSK Corp Bank of AmericaMerrill Lynch 166
1,200 SCSK Corp Goldman Sachs 3,464(100) SEC Carbon Ltd Bank of America
Merrill Lynch 2147,900 Seiko Epson Corp Bank of America
Merrill Lynch 8,6331,000 Seiko Epson Corp Goldman Sachs 1,0973,400 Seiko Epson Corp Morgan Stanley 2,276(300) Seiko Holdings Corp Goldman Sachs (577)
(1,400) Seiren Co Ltd Goldman Sachs (716)18,800 Sekisui House Ltd Bank of America
Merrill Lynch 34,903
Holding Description Counterparty
Netunrealised
appreciation/(depreciation)
USD
Japan continued7,300 Sekisui House Ltd Goldman Sachs 14,5226,300 Sekisui House Ltd Morgan Stanley 7,409
(56) Sekisui House Reit Inc(REIT) Goldman Sachs (2,395)
200 Sekisui Jushi Corp Goldman Sachs 361600 Sekisui Plastics Co Ltd Bank of America
Merrill Lynch 95600 Sekisui Plastics Co Ltd Goldman Sachs 95400 Senko Group Holdings Co
LtdBank of AmericaMerrill Lynch 45
4,400 Senko Group Holdings CoLtd Goldman Sachs 491
700 Seria Co Ltd Bank of AmericaMerrill Lynch (123)
1,800 Seria Co Ltd Goldman Sachs (418)700 Seria Co Ltd Morgan Stanley 195
9,000 Seven Bank Ltd Bank of AmericaMerrill Lynch 1,841
6,900 Seven Bank Ltd Morgan Stanley 321800 SFP Holdings Co Ltd Goldman Sachs 1,406
(1,600) Sharp Corp Goldman Sachs (699)(12,100) Sharp Corp Morgan Stanley (5,625)(1,700) Shibaura Machine Co Ltd Goldman Sachs (4,346)
(400) Shibuya Corp Goldman Sachs (1,551)(1,800) Shiga Bank Ltd Bank of America
Merrill Lynch (4,435)(4,600) Shiga Bank Ltd Goldman Sachs (11,332)(6,900) Shiga Bank Ltd Morgan Stanley (12,188)
600 Shikoku Bank Ltd Goldman Sachs (190)200 Shima Seiki Manufacturing
LtdBank of AmericaMerrill Lynch 164
100 Shimachu Co Ltd Bank of AmericaMerrill Lynch (2)
300 Shimachu Co Ltd Goldman Sachs 247(400) Shimano Inc Bank of America
Merrill Lynch (491)(600) Shimano Inc Goldman Sachs (2,082)(300) Shimano Inc Morgan Stanley 1,673200 Shindengen Electric
Manufacturing Co Ltd Goldman Sachs 329(2,400) Shin-Etsu Polymer Co Ltd Goldman Sachs (2,588)(1,200) Shinko Electric Industries
Co LtdBank of AmericaMerrill Lynch (209)
(6,200) Shinko Electric IndustriesCo Ltd Goldman Sachs (529)
(2,000) Shinko Electric IndustriesCo Ltd Morgan Stanley 353
(2,300) Shinmaywa Industries Ltd Goldman Sachs (299)300 Ship Healthcare Holdings
Inc Goldman Sachs —(700) Ship Healthcare Holdings
Inc Morgan Stanley 521(300) Shochiku Co Ltd Bank of America
Merrill Lynch (2,984)(1,300) Shochiku Co Ltd Goldman Sachs (12,932)
(200) Shochiku Co Ltd Morgan Stanley (1,413)200 Shoei Co Ltd Goldman Sachs 465
(100) Shoei Foods Corp Goldman Sachs (381)(1,900) Showa Corp Goldman Sachs 141(1,000) Showa Denko KK Goldman Sachs (2,175)
(900) Sinanen Holdings Co Ltd Goldman Sachs 318(300) Sinfonia Technology Co Ltd Goldman Sachs (153)
1,400 Sinko Industries Ltd Bank of AmericaMerrill Lynch 1,796
900 Sinko Industries Ltd Goldman Sachs 1,155700 Sintokogio Ltd Goldman Sachs 449
2,300 SKY Perfect JSAT HoldingsInc
Bank of AmericaMerrill Lynch 663
BlackRock Global Long/Short Equity Fund continued
The notes on pages 691 to 711 form an integral part of these financial statements.
BlackRock Strategic Funds[466]

Contracts for difference as at 31 May 2020
Holding Description Counterparty
Netunrealised
appreciation/(depreciation)
USD
Japan continued3,800 SKY Perfect JSAT Holdings
Inc Goldman Sachs 1,095(1,300) Skylark Holdings Co Ltd Goldman Sachs (744)
(10,000) Skylark Holdings Co Ltd Morgan Stanley (8,088)(100) SMC Corp Goldman Sachs (1,924)500 SMS Co Ltd Bank of America
Merrill Lynch 697700 SMS Co Ltd Goldman Sachs 976500 SMS Co Ltd Morgan Stanley 242
(1,400) Sodick Co Ltd Goldman Sachs (299)5,900 Softbank Corp Bank of America
Merrill Lynch 2671,300 Sojitz Corp Bank of America
Merrill Lynch 21813,100 Sojitz Corp Goldman Sachs 2,192(2,800) Sony Financial Holdings Inc Bank of America
Merrill Lynch (15,410)(5,000) Sony Financial Holdings Inc Goldman Sachs (27,518)(4,200) Sony Financial Holdings Inc Morgan Stanley (39)
200 Sosei Group Corp Goldman Sachs 244100 Sotetsu Holdings Inc Goldman Sachs 28
1,000 Sourcenext Corp Bank of AmericaMerrill Lynch 102
6,500 Sourcenext Corp Goldman Sachs 5071,900 St Marc Holdings Co Ltd Goldman Sachs 1,5541,300 Starts Corp Inc Bank of America
Merrill Lynch 2,5141,600 Starts Corp Inc Goldman Sachs 3,094(100) Starzen Co Ltd Goldman Sachs (274)(500) Stella Chemifa Corp Bank of America
Merrill Lynch 158(100) Strike Co Ltd Goldman Sachs (572)400 Studio Alice Co Ltd Bank of America
Merrill Lynch 480200 Studio Alice Co Ltd Goldman Sachs 240300 Subaru Corp Bank of America
Merrill Lynch 4231,700 Subaru Corp Goldman Sachs 4,0621,800 Subaru Corp Morgan Stanley 3,271(300) Sugi Holdings Co Ltd Bank of America
Merrill Lynch (725)(100) Sugi Holdings Co Ltd Goldman Sachs (69)(100) Sugi Holdings Co Ltd Morgan Stanley (9)
(6,200) SUMCO Corp Bank of AmericaMerrill Lynch (331)
(1,700) SUMCO Corp Goldman Sachs (219)(10,100) SUMCO Corp Morgan Stanley (2,160)
(200) Sumitomo Bakelite Co Ltd Bank of AmericaMerrill Lynch (166)
(100) Sumitomo Bakelite Co Ltd Morgan Stanley (43)48,800 Sumitomo Chemical Co Ltd Morgan Stanley 11,342
900 Sumitomo DainipponPharma Co Ltd
Bank of AmericaMerrill Lynch 1,498
600 Sumitomo DainipponPharma Co Ltd Goldman Sachs 998
300 Sumitomo DainipponPharma Co Ltd Morgan Stanley 388
(2,100) Sumitomo Densetsu Co Ltd Goldman Sachs (1,132)(1,600) Sumitomo Heavy Industries
LtdBank of AmericaMerrill Lynch (3,183)
(300) Sumitomo Heavy IndustriesLtd Morgan Stanley (446)
600 Sumitomo MitsuiConstruction Co Ltd
Bank of AmericaMerrill Lynch 156
3,000 Sumitomo MitsuiConstruction Co Ltd Goldman Sachs 781
7,800 Sumitomo Mitsui FinancialGroup Inc
Bank of AmericaMerrill Lynch 29,695
Holding Description Counterparty
Netunrealised
appreciation/(depreciation)
USD
Japan continued10,100 Sumitomo Mitsui Financial
Group Inc Morgan Stanley 26,4323,200 Sumitomo Mitsui Trust
Holdings IncBank of AmericaMerrill Lynch 5,236
4,700 Sumitomo Mitsui TrustHoldings Inc Goldman Sachs 5,916
3,200 Sumitomo Mitsui TrustHoldings Inc Morgan Stanley 9,416
100 Sumitomo Seika ChemicalsCo Ltd
Bank of AmericaMerrill Lynch 19
100 Sumitomo Seika ChemicalsCo Ltd Goldman Sachs 19
400 Suntory Beverage & FoodLtd
Bank of AmericaMerrill Lynch 1,190
1,100 Suntory Beverage & FoodLtd Goldman Sachs 3,272
(3,400) Suruga Bank Ltd Goldman Sachs (937)(5,300) Sushiro Global Holdings Ltd Bank of America
Merrill Lynch (14,317)(5,900) Sushiro Global Holdings Ltd Goldman Sachs (15,484)(4,700) Sushiro Global Holdings Ltd Morgan Stanley 524
100 Suzuken Co Ltd Goldman Sachs 71(1,700) Suzuki Motor Corp Bank of America
Merrill Lynch (3,793)(700) Suzuki Motor Corp Goldman Sachs (1,562)
(2,200) Suzuki Motor Corp Morgan Stanley (5,318)1,400 Sysmex Corp Bank of America
Merrill Lynch 8,2391,100 Sysmex Corp Goldman Sachs 6,473
700 Sysmex Corp Morgan Stanley 2,597200 T Hasegawa Co Ltd Goldman Sachs 264
(4,000) Tadano Ltd Goldman Sachs (2,640)(100) Taihei Dengyo Kaisha Ltd Goldman Sachs (11)
1,300 Taisho PharmaceuticalHoldings Co Ltd
Bank of AmericaMerrill Lynch 8,823
300 Taisho PharmaceuticalHoldings Co Ltd Goldman Sachs 2,036
2,100 Taisho PharmaceuticalHoldings Co Ltd Morgan Stanley 9,176
(400) Taiyo Yuden Co Ltd Bank of AmericaMerrill Lynch 316
1,700 Takamatsu ConstructionGroup Co Ltd
Bank of AmericaMerrill Lynch 5,410
400 Takamatsu ConstructionGroup Co Ltd Goldman Sachs 1,208
1,200 Takara Holdings Inc Bank of AmericaMerrill Lynch 1,183
4,100 Takara Holdings Inc Goldman Sachs 4,0412,100 Takara Holdings Inc Morgan Stanley 1,503
(8) Takara Leben Real EstateInvestment Corp (REIT)
Bank of AmericaMerrill Lynch (744)
(15) Takara Leben Real EstateInvestment Corp (REIT) Goldman Sachs (1,395)
200 Takara Standard Co Ltd Bank of AmericaMerrill Lynch 78
500 Takasago ThermalEngineering Co Ltd
Bank of AmericaMerrill Lynch 800
800 Takasago ThermalEngineering Co Ltd Goldman Sachs 1,279
1,600 Takashimaya Co Ltd Goldman Sachs (328)(900) Takeuchi Manufacturing Co
Ltd Goldman Sachs (1,104)900 Takuma Co Ltd Bank of America
Merrill Lynch 1,632600 Takuma Co Ltd Goldman Sachs 1,088
(300) Tamron Co Ltd Goldman Sachs (789)(600) Tanaka Chemical Corp Bank of America
Merrill Lynch (675)
BlackRock Global Long/Short Equity Fund continued
The notes on pages 691 to 711 form an integral part of these financial statements.
Annual report and audited financial statements [467]
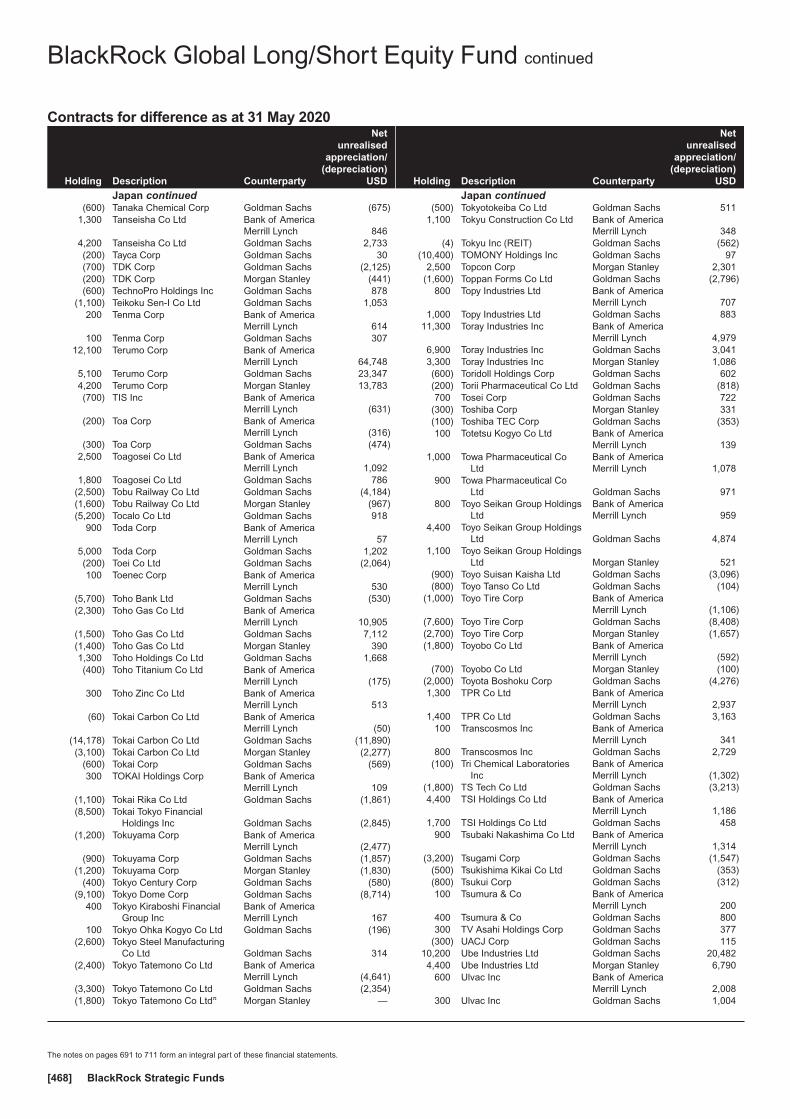
Contracts for difference as at 31 May 2020
Holding Description Counterparty
Netunrealised
appreciation/(depreciation)
USD
Japan continued(600) Tanaka Chemical Corp Goldman Sachs (675)
1,300 Tanseisha Co Ltd Bank of AmericaMerrill Lynch 846
4,200 Tanseisha Co Ltd Goldman Sachs 2,733(200) Tayca Corp Goldman Sachs 30(700) TDK Corp Goldman Sachs (2,125)(200) TDK Corp Morgan Stanley (441)(600) TechnoPro Holdings Inc Goldman Sachs 878
(1,100) Teikoku Sen-I Co Ltd Goldman Sachs 1,053200 Tenma Corp Bank of America
Merrill Lynch 614100 Tenma Corp Goldman Sachs 307
12,100 Terumo Corp Bank of AmericaMerrill Lynch 64,748
5,100 Terumo Corp Goldman Sachs 23,3474,200 Terumo Corp Morgan Stanley 13,783(700) TIS Inc Bank of America
Merrill Lynch (631)(200) Toa Corp Bank of America
Merrill Lynch (316)(300) Toa Corp Goldman Sachs (474)
2,500 Toagosei Co Ltd Bank of AmericaMerrill Lynch 1,092
1,800 Toagosei Co Ltd Goldman Sachs 786(2,500) Tobu Railway Co Ltd Goldman Sachs (4,184)(1,600) Tobu Railway Co Ltd Morgan Stanley (967)(5,200) Tocalo Co Ltd Goldman Sachs 918
900 Toda Corp Bank of AmericaMerrill Lynch 57
5,000 Toda Corp Goldman Sachs 1,202(200) Toei Co Ltd Goldman Sachs (2,064)100 Toenec Corp Bank of America
Merrill Lynch 530(5,700) Toho Bank Ltd Goldman Sachs (530)(2,300) Toho Gas Co Ltd Bank of America
Merrill Lynch 10,905(1,500) Toho Gas Co Ltd Goldman Sachs 7,112(1,400) Toho Gas Co Ltd Morgan Stanley 3901,300 Toho Holdings Co Ltd Goldman Sachs 1,668(400) Toho Titanium Co Ltd Bank of America
Merrill Lynch (175)300 Toho Zinc Co Ltd Bank of America
Merrill Lynch 513(60) Tokai Carbon Co Ltd Bank of America
Merrill Lynch (50)(14,178) Tokai Carbon Co Ltd Goldman Sachs (11,890)(3,100) Tokai Carbon Co Ltd Morgan Stanley (2,277)
(600) Tokai Corp Goldman Sachs (569)300 TOKAI Holdings Corp Bank of America
Merrill Lynch 109(1,100) Tokai Rika Co Ltd Goldman Sachs (1,861)(8,500) Tokai Tokyo Financial
Holdings Inc Goldman Sachs (2,845)(1,200) Tokuyama Corp Bank of America
Merrill Lynch (2,477)(900) Tokuyama Corp Goldman Sachs (1,857)
(1,200) Tokuyama Corp Morgan Stanley (1,830)(400) Tokyo Century Corp Goldman Sachs (580)
(9,100) Tokyo Dome Corp Goldman Sachs (8,714)400 Tokyo Kiraboshi Financial
Group IncBank of AmericaMerrill Lynch 167
100 Tokyo Ohka Kogyo Co Ltd Goldman Sachs (196)(2,600) Tokyo Steel Manufacturing
Co Ltd Goldman Sachs 314(2,400) Tokyo Tatemono Co Ltd Bank of America
Merrill Lynch (4,641)(3,300) Tokyo Tatemono Co Ltd Goldman Sachs (2,354)(1,800) Tokyo Tatemono Co Ltdπ Morgan Stanley —
Holding Description Counterparty
Netunrealised
appreciation/(depreciation)
USD
Japan continued(500) Tokyotokeiba Co Ltd Goldman Sachs 511
1,100 Tokyu Construction Co Ltd Bank of AmericaMerrill Lynch 348
(4) Tokyu Inc (REIT) Goldman Sachs (562)(10,400) TOMONY Holdings Inc Goldman Sachs 97
2,500 Topcon Corp Morgan Stanley 2,301(1,600) Toppan Forms Co Ltd Goldman Sachs (2,796)
800 Topy Industries Ltd Bank of AmericaMerrill Lynch 707
1,000 Topy Industries Ltd Goldman Sachs 88311,300 Toray Industries Inc Bank of America
Merrill Lynch 4,9796,900 Toray Industries Inc Goldman Sachs 3,0413,300 Toray Industries Inc Morgan Stanley 1,086(600) Toridoll Holdings Corp Goldman Sachs 602(200) Torii Pharmaceutical Co Ltd Goldman Sachs (818)700 Tosei Corp Goldman Sachs 722
(300) Toshiba Corp Morgan Stanley 331(100) Toshiba TEC Corp Goldman Sachs (353)100 Totetsu Kogyo Co Ltd Bank of America
Merrill Lynch 1391,000 Towa Pharmaceutical Co
LtdBank of AmericaMerrill Lynch 1,078
900 Towa Pharmaceutical CoLtd Goldman Sachs 971
800 Toyo Seikan Group HoldingsLtd
Bank of AmericaMerrill Lynch 959
4,400 Toyo Seikan Group HoldingsLtd Goldman Sachs 4,874
1,100 Toyo Seikan Group HoldingsLtd Morgan Stanley 521
(900) Toyo Suisan Kaisha Ltd Goldman Sachs (3,096)(800) Toyo Tanso Co Ltd Goldman Sachs (104)
(1,000) Toyo Tire Corp Bank of AmericaMerrill Lynch (1,106)
(7,600) Toyo Tire Corp Goldman Sachs (8,408)(2,700) Toyo Tire Corp Morgan Stanley (1,657)(1,800) Toyobo Co Ltd Bank of America
Merrill Lynch (592)(700) Toyobo Co Ltd Morgan Stanley (100)
(2,000) Toyota Boshoku Corp Goldman Sachs (4,276)1,300 TPR Co Ltd Bank of America
Merrill Lynch 2,9371,400 TPR Co Ltd Goldman Sachs 3,163
100 Transcosmos Inc Bank of AmericaMerrill Lynch 341
800 Transcosmos Inc Goldman Sachs 2,729(100) Tri Chemical Laboratories
IncBank of AmericaMerrill Lynch (1,302)
(1,800) TS Tech Co Ltd Goldman Sachs (3,213)4,400 TSI Holdings Co Ltd Bank of America
Merrill Lynch 1,1861,700 TSI Holdings Co Ltd Goldman Sachs 458
900 Tsubaki Nakashima Co Ltd Bank of AmericaMerrill Lynch 1,314
(3,200) Tsugami Corp Goldman Sachs (1,547)(500) Tsukishima Kikai Co Ltd Goldman Sachs (353)(800) Tsukui Corp Goldman Sachs (312)100 Tsumura & Co Bank of America
Merrill Lynch 200400 Tsumura & Co Goldman Sachs 800300 TV Asahi Holdings Corp Goldman Sachs 377
(300) UACJ Corp Goldman Sachs 11510,200 Ube Industries Ltd Goldman Sachs 20,4824,400 Ube Industries Ltd Morgan Stanley 6,790
600 Ulvac Inc Bank of AmericaMerrill Lynch 2,008
300 Ulvac Inc Goldman Sachs 1,004
BlackRock Global Long/Short Equity Fund continued
The notes on pages 691 to 711 form an integral part of these financial statements.
BlackRock Strategic Funds[468]
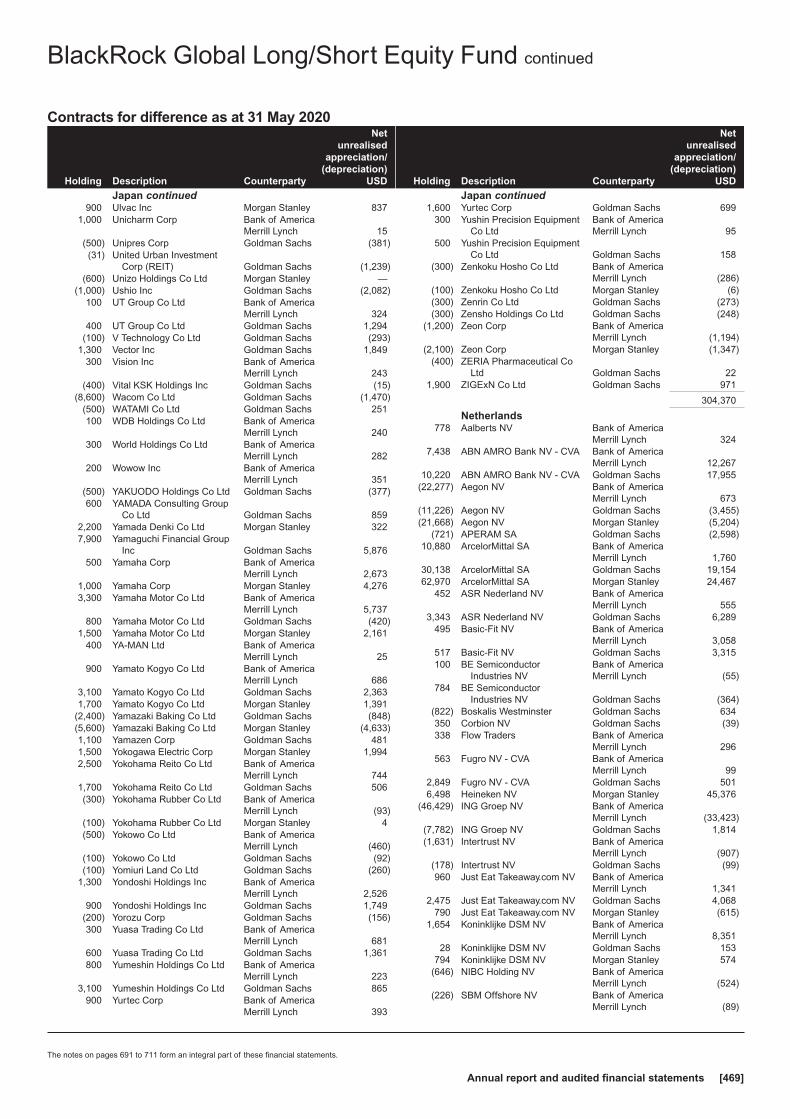
Contracts for difference as at 31 May 2020
Holding Description Counterparty
Netunrealised
appreciation/(depreciation)
USD
Japan continued900 Ulvac Inc Morgan Stanley 837
1,000 Unicharm Corp Bank of AmericaMerrill Lynch 15
(500) Unipres Corp Goldman Sachs (381)(31) United Urban Investment
Corp (REIT) Goldman Sachs (1,239)(600) Unizo Holdings Co Ltd Morgan Stanley —
(1,000) Ushio Inc Goldman Sachs (2,082)100 UT Group Co Ltd Bank of America
Merrill Lynch 324400 UT Group Co Ltd Goldman Sachs 1,294
(100) V Technology Co Ltd Goldman Sachs (293)1,300 Vector Inc Goldman Sachs 1,849
300 Vision Inc Bank of AmericaMerrill Lynch 243
(400) Vital KSK Holdings Inc Goldman Sachs (15)(8,600) Wacom Co Ltd Goldman Sachs (1,470)
(500) WATAMI Co Ltd Goldman Sachs 251100 WDB Holdings Co Ltd Bank of America
Merrill Lynch 240300 World Holdings Co Ltd Bank of America
Merrill Lynch 282200 Wowow Inc Bank of America
Merrill Lynch 351(500) YAKUODO Holdings Co Ltd Goldman Sachs (377)600 YAMADA Consulting Group
Co Ltd Goldman Sachs 8592,200 Yamada Denki Co Ltd Morgan Stanley 3227,900 Yamaguchi Financial Group
Inc Goldman Sachs 5,876500 Yamaha Corp Bank of America
Merrill Lynch 2,6731,000 Yamaha Corp Morgan Stanley 4,2763,300 Yamaha Motor Co Ltd Bank of America
Merrill Lynch 5,737800 Yamaha Motor Co Ltd Goldman Sachs (420)
1,500 Yamaha Motor Co Ltd Morgan Stanley 2,161400 YA-MAN Ltd Bank of America
Merrill Lynch 25900 Yamato Kogyo Co Ltd Bank of America
Merrill Lynch 6863,100 Yamato Kogyo Co Ltd Goldman Sachs 2,3631,700 Yamato Kogyo Co Ltd Morgan Stanley 1,391
(2,400) Yamazaki Baking Co Ltd Goldman Sachs (848)(5,600) Yamazaki Baking Co Ltd Morgan Stanley (4,633)1,100 Yamazen Corp Goldman Sachs 4811,500 Yokogawa Electric Corp Morgan Stanley 1,9942,500 Yokohama Reito Co Ltd Bank of America
Merrill Lynch 7441,700 Yokohama Reito Co Ltd Goldman Sachs 506(300) Yokohama Rubber Co Ltd Bank of America
Merrill Lynch (93)(100) Yokohama Rubber Co Ltd Morgan Stanley 4(500) Yokowo Co Ltd Bank of America
Merrill Lynch (460)(100) Yokowo Co Ltd Goldman Sachs (92)(100) Yomiuri Land Co Ltd Goldman Sachs (260)
1,300 Yondoshi Holdings Inc Bank of AmericaMerrill Lynch 2,526
900 Yondoshi Holdings Inc Goldman Sachs 1,749(200) Yorozu Corp Goldman Sachs (156)300 Yuasa Trading Co Ltd Bank of America
Merrill Lynch 681600 Yuasa Trading Co Ltd Goldman Sachs 1,361800 Yumeshin Holdings Co Ltd Bank of America
Merrill Lynch 2233,100 Yumeshin Holdings Co Ltd Goldman Sachs 865
900 Yurtec Corp Bank of AmericaMerrill Lynch 393
Holding Description Counterparty
Netunrealised
appreciation/(depreciation)
USD
Japan continued1,600 Yurtec Corp Goldman Sachs 699
300 Yushin Precision EquipmentCo Ltd
Bank of AmericaMerrill Lynch 95
500 Yushin Precision EquipmentCo Ltd Goldman Sachs 158
(300) Zenkoku Hosho Co Ltd Bank of AmericaMerrill Lynch (286)
(100) Zenkoku Hosho Co Ltd Morgan Stanley (6)(300) Zenrin Co Ltd Goldman Sachs (273)(300) Zensho Holdings Co Ltd Goldman Sachs (248)
(1,200) Zeon Corp Bank of AmericaMerrill Lynch (1,194)
(2,100) Zeon Corp Morgan Stanley (1,347)(400) ZERIA Pharmaceutical Co
Ltd Goldman Sachs 221,900 ZIGExN Co Ltd Goldman Sachs 971
304,370
Netherlands778 Aalberts NV Bank of America
Merrill Lynch 3247,438 ABN AMRO Bank NV - CVA Bank of America
Merrill Lynch 12,26710,220 ABN AMRO Bank NV - CVA Goldman Sachs 17,955
(22,277) Aegon NV Bank of AmericaMerrill Lynch 673
(11,226) Aegon NV Goldman Sachs (3,455)(21,668) Aegon NV Morgan Stanley (5,204)
(721) APERAM SA Goldman Sachs (2,598)10,880 ArcelorMittal SA Bank of America
Merrill Lynch 1,76030,138 ArcelorMittal SA Goldman Sachs 19,15462,970 ArcelorMittal SA Morgan Stanley 24,467
452 ASR Nederland NV Bank of AmericaMerrill Lynch 555
3,343 ASR Nederland NV Goldman Sachs 6,289495 Basic-Fit NV Bank of America
Merrill Lynch 3,058517 Basic-Fit NV Goldman Sachs 3,315100 BE Semiconductor
Industries NVBank of AmericaMerrill Lynch (55)
784 BE SemiconductorIndustries NV Goldman Sachs (364)
(822) Boskalis Westminster Goldman Sachs 634350 Corbion NV Goldman Sachs (39)338 Flow Traders Bank of America
Merrill Lynch 296563 Fugro NV - CVA Bank of America
Merrill Lynch 992,849 Fugro NV - CVA Goldman Sachs 5016,498 Heineken NV Morgan Stanley 45,376
(46,429) ING Groep NV Bank of AmericaMerrill Lynch (33,423)
(7,782) ING Groep NV Goldman Sachs 1,814(1,631) Intertrust NV Bank of America
Merrill Lynch (907)(178) Intertrust NV Goldman Sachs (99)960 Just Eat Takeaway.com NV Bank of America
Merrill Lynch 1,3412,475 Just Eat Takeaway.com NV Goldman Sachs 4,068
790 Just Eat Takeaway.com NV Morgan Stanley (615)1,654 Koninklijke DSM NV Bank of America
Merrill Lynch 8,35128 Koninklijke DSM NV Goldman Sachs 153
794 Koninklijke DSM NV Morgan Stanley 574(646) NIBC Holding NV Bank of America
Merrill Lynch (524)(226) SBM Offshore NV Bank of America
Merrill Lynch (89)
BlackRock Global Long/Short Equity Fund continued
The notes on pages 691 to 711 form an integral part of these financial statements.
Annual report and audited financial statements [469]
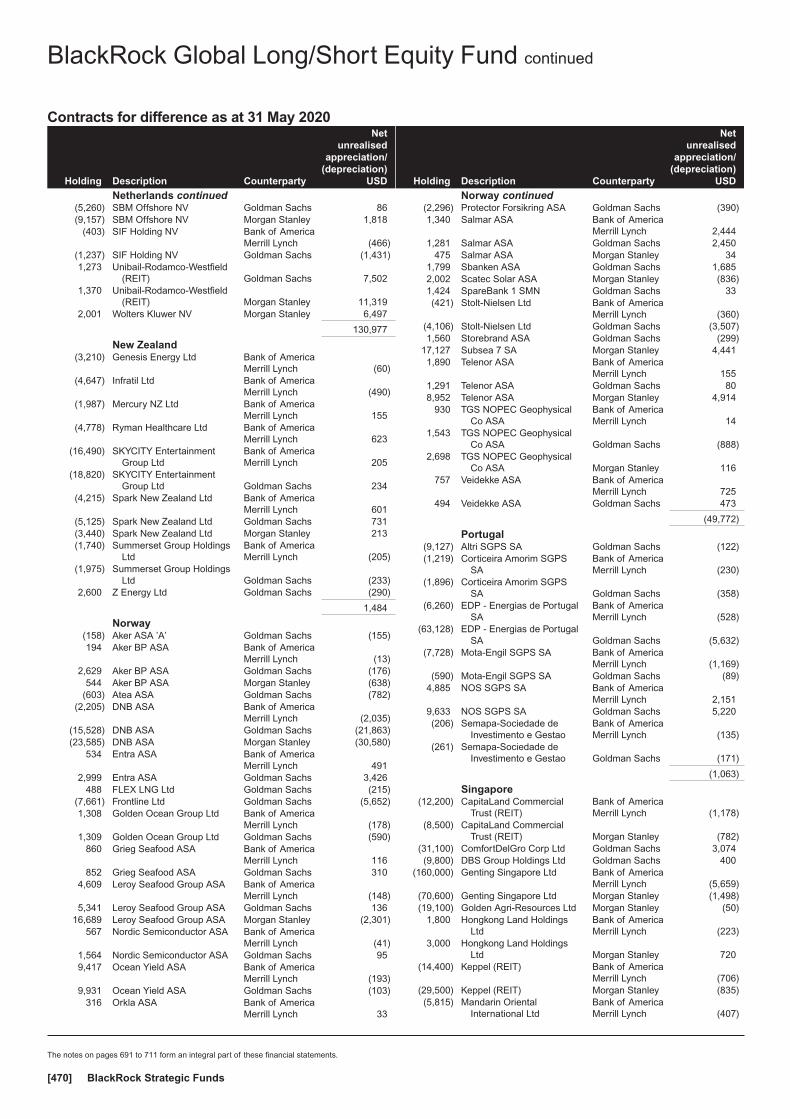
Contracts for difference as at 31 May 2020
Holding Description Counterparty
Netunrealised
appreciation/(depreciation)
USD
Netherlands continued(5,260) SBM Offshore NV Goldman Sachs 86(9,157) SBM Offshore NV Morgan Stanley 1,818
(403) SIF Holding NV Bank of AmericaMerrill Lynch (466)
(1,237) SIF Holding NV Goldman Sachs (1,431)1,273 Unibail-Rodamco-Westfield
(REIT) Goldman Sachs 7,5021,370 Unibail-Rodamco-Westfield
(REIT) Morgan Stanley 11,3192,001 Wolters Kluwer NV Morgan Stanley 6,497
130,977
New Zealand(3,210) Genesis Energy Ltd Bank of America
Merrill Lynch (60)(4,647) Infratil Ltd Bank of America
Merrill Lynch (490)(1,987) Mercury NZ Ltd Bank of America
Merrill Lynch 155(4,778) Ryman Healthcare Ltd Bank of America
Merrill Lynch 623(16,490) SKYCITY Entertainment
Group LtdBank of AmericaMerrill Lynch 205
(18,820) SKYCITY EntertainmentGroup Ltd Goldman Sachs 234
(4,215) Spark New Zealand Ltd Bank of AmericaMerrill Lynch 601
(5,125) Spark New Zealand Ltd Goldman Sachs 731(3,440) Spark New Zealand Ltd Morgan Stanley 213(1,740) Summerset Group Holdings
LtdBank of AmericaMerrill Lynch (205)
(1,975) Summerset Group HoldingsLtd Goldman Sachs (233)
2,600 Z Energy Ltd Goldman Sachs (290)
1,484
Norway(158) Aker ASA ’A’ Goldman Sachs (155)194 Aker BP ASA Bank of America
Merrill Lynch (13)2,629 Aker BP ASA Goldman Sachs (176)
544 Aker BP ASA Morgan Stanley (638)(603) Atea ASA Goldman Sachs (782)
(2,205) DNB ASA Bank of AmericaMerrill Lynch (2,035)
(15,528) DNB ASA Goldman Sachs (21,863)(23,585) DNB ASA Morgan Stanley (30,580)
534 Entra ASA Bank of AmericaMerrill Lynch 491
2,999 Entra ASA Goldman Sachs 3,426488 FLEX LNG Ltd Goldman Sachs (215)
(7,661) Frontline Ltd Goldman Sachs (5,652)1,308 Golden Ocean Group Ltd Bank of America
Merrill Lynch (178)1,309 Golden Ocean Group Ltd Goldman Sachs (590)
860 Grieg Seafood ASA Bank of AmericaMerrill Lynch 116
852 Grieg Seafood ASA Goldman Sachs 3104,609 Leroy Seafood Group ASA Bank of America
Merrill Lynch (148)5,341 Leroy Seafood Group ASA Goldman Sachs 136
16,689 Leroy Seafood Group ASA Morgan Stanley (2,301)567 Nordic Semiconductor ASA Bank of America
Merrill Lynch (41)1,564 Nordic Semiconductor ASA Goldman Sachs 959,417 Ocean Yield ASA Bank of America
Merrill Lynch (193)9,931 Ocean Yield ASA Goldman Sachs (103)
316 Orkla ASA Bank of AmericaMerrill Lynch 33
Holding Description Counterparty
Netunrealised
appreciation/(depreciation)
USD
Norway continued(2,296) Protector Forsikring ASA Goldman Sachs (390)1,340 Salmar ASA Bank of America
Merrill Lynch 2,4441,281 Salmar ASA Goldman Sachs 2,450
475 Salmar ASA Morgan Stanley 341,799 Sbanken ASA Goldman Sachs 1,6852,002 Scatec Solar ASA Morgan Stanley (836)1,424 SpareBank 1 SMN Goldman Sachs 33(421) Stolt-Nielsen Ltd Bank of America
Merrill Lynch (360)(4,106) Stolt-Nielsen Ltd Goldman Sachs (3,507)1,560 Storebrand ASA Goldman Sachs (299)
17,127 Subsea 7 SA Morgan Stanley 4,4411,890 Telenor ASA Bank of America
Merrill Lynch 1551,291 Telenor ASA Goldman Sachs 808,952 Telenor ASA Morgan Stanley 4,914
930 TGS NOPEC GeophysicalCo ASA
Bank of AmericaMerrill Lynch 14
1,543 TGS NOPEC GeophysicalCo ASA Goldman Sachs (888)
2,698 TGS NOPEC GeophysicalCo ASA Morgan Stanley 116
757 Veidekke ASA Bank of AmericaMerrill Lynch 725
494 Veidekke ASA Goldman Sachs 473
(49,772)
Portugal(9,127) Altri SGPS SA Goldman Sachs (122)(1,219) Corticeira Amorim SGPS
SABank of AmericaMerrill Lynch (230)
(1,896) Corticeira Amorim SGPSSA Goldman Sachs (358)
(6,260) EDP - Energias de PortugalSA
Bank of AmericaMerrill Lynch (528)
(63,128) EDP - Energias de PortugalSA Goldman Sachs (5,632)
(7,728) Mota-Engil SGPS SA Bank of AmericaMerrill Lynch (1,169)
(590) Mota-Engil SGPS SA Goldman Sachs (89)4,885 NOS SGPS SA Bank of America
Merrill Lynch 2,1519,633 NOS SGPS SA Goldman Sachs 5,220(206) Semapa-Sociedade de
Investimento e GestaoBank of AmericaMerrill Lynch (135)
(261) Semapa-Sociedade deInvestimento e Gestao Goldman Sachs (171)
(1,063)
Singapore(12,200) CapitaLand Commercial
Trust (REIT)Bank of AmericaMerrill Lynch (1,178)
(8,500) CapitaLand CommercialTrust (REIT) Morgan Stanley (782)
(31,100) ComfortDelGro Corp Ltd Goldman Sachs 3,074(9,800) DBS Group Holdings Ltd Goldman Sachs 400
(160,000) Genting Singapore Ltd Bank of AmericaMerrill Lynch (5,659)
(70,600) Genting Singapore Ltd Morgan Stanley (1,498)(19,100) Golden Agri-Resources Ltd Morgan Stanley (50)
1,800 Hongkong Land HoldingsLtd
Bank of AmericaMerrill Lynch (223)
3,000 Hongkong Land HoldingsLtd Morgan Stanley 720
(14,400) Keppel (REIT) Bank of AmericaMerrill Lynch (706)
(29,500) Keppel (REIT) Morgan Stanley (835)(5,815) Mandarin Oriental
International LtdBank of AmericaMerrill Lynch (407)
BlackRock Global Long/Short Equity Fund continued
The notes on pages 691 to 711 form an integral part of these financial statements.
BlackRock Strategic Funds[470]

Contracts for difference as at 31 May 2020
Holding Description Counterparty
Netunrealised
appreciation/(depreciation)
USD
Singapore continued(4,400) Mapletree Commercial Trust
(REIT) Morgan Stanley (138)(3,900) Mapletree Industrial Trust
(REIT)Bank of AmericaMerrill Lynch (745)
(17,300) Mapletree Industrial Trust(REIT) Goldman Sachs (3,304)
(22,800) Mapletree Industrial Trust(REIT) Morgan Stanley (2,580)
(69,200) Mapletree Logistics Trust(REIT) Goldman Sachs (9,198)
(35,800) Mapletree Logistics Trust(REIT) Morgan Stanley (4,451)
(3,500) Mapletree North AsiaCommercial Trust (REIT) Morgan Stanley (99)
1,800 Olam International Ltd Goldman Sachs (27)(17,200) SATS Ltd Goldman Sachs 379
(151,600) Sembcorp Marine Ltd Morgan Stanley 2,145(300) Singapore Exchange Ltd Morgan Stanley 97
13,600 Singapore TechnologiesEngineering Ltd
Bank of AmericaMerrill Lynch (770)
5,000 Singapore TechnologiesEngineering Ltd Morgan Stanley 354
2,800 StarHub Ltd Goldman Sachs (48)(141,500) Suntec Real Estate
Investment Trust (REIT) Morgan Stanley (9,863)900 Venture Corp Ltd Bank of America
Merrill Lynch (83)5,700 Venture Corp Ltd Goldman Sachs (875)1,900 Venture Corp Ltd Morgan Stanley —
(6,000) Wilmar International Ltd Goldman Sachs (368)(12,100) Wilmar International Ltd Morgan Stanley (384)(8,100) Yangzijiang Shipbuilding
Holdings LtdBank of AmericaMerrill Lynch (143)
(23,200) Yangzijiang ShipbuildingHoldings Ltd Goldman Sachs (410)
(6,600) Yangzijiang ShipbuildingHoldings Ltd Morgan Stanley (93)
(37,748)
Spain(976) ACS Actividades de
Construccion y ServiciosSA Morgan Stanley 690
(2,079) Aedas Homes SA Goldman Sachs (2,127)(300) Aena SME SA Goldman Sachs (5,028)(349) Aena SME SA Morgan Stanley (5,200)(406) Almirall SA Goldman Sachs (330)
(1,233) Amadeus IT Group SA Morgan Stanley 1,44726,401 Banco Bilbao Vizcaya
Argentaria SA Morgan Stanley (3,023)(126,967) Banco Santander SA Morgan Stanley 10,077
521 Cellnex Telecom SA Bank of AmericaMerrill Lynch 754
(218) CIE Automotive SA Goldman Sachs (364)236 Ebro Foods SA Bank of America
Merrill Lynch 94532 Ebro Foods SA Goldman Sachs 213
1,404 Euskaltel SA Bank of AmericaMerrill Lynch 78
1,298 Euskaltel SA Goldman Sachs 722,857 Faes Farma SA Goldman Sachs 492
(1,288) Ferrovial SA Goldman Sachs (472)(1,069) Fomento de Construcciones
y Contratas SA Goldman Sachs (36)(1,856) Grupo Empresarial San
Jose SA Goldman Sachs (1,507)3,486 Industria de Diseno Textil
SA Morgan Stanley 7,404(179) Masmovil Ibercom SA Bank of America
Merrill Lynch (203)
Holding Description Counterparty
Netunrealised
appreciation/(depreciation)
USD
Spain continued(351) Masmovil Ibercom SA Goldman Sachs (443)
(1,066) Melia Hotels InternationalSA
Bank of AmericaMerrill Lynch 513
(897) Melia Hotels InternationalSA Goldman Sachs 381
(1,347) Metrovacesa SA Bank of AmericaMerrill Lynch (1,033)
(3,025) Metrovacesa SA Goldman Sachs (2,321)(602) Neinor Homes SA Bank of America
Merrill Lynch 80(1,376) Neinor Homes SA Goldman Sachs 1844,057 Repsol SA Bank of America
Merrill Lynch (2,246)(5,803) Sacyr SA Goldman Sachs (1,155)
(658) Solaria Energia y MedioAmbiente SA Goldman Sachs (273)
(254) Tecnicas Reunidas SA Goldman Sachs (290)(74) Viscofan SA Bank of America
Merrill Lynch (81)(162) Viscofan SA Goldman Sachs (295)454 Zardoya Otis SA Bank of America
Merrill Lynch 1672,091 Zardoya Otis SA Goldman Sachs 767
(3,014)
Sweden398 AcadeMedia AB Goldman Sachs (93)
(1,127) Adapteo Oyj Goldman Sachs (1,634)(179) AF Poyry AB Bank of America
Merrill Lynch (19)(302) Alimak Group AB Goldman Sachs (342)319 Ambea AB Bank of America
Merrill Lynch 280462 Ambea AB Goldman Sachs 406
(907) Arjo AB ’B’ Bank of AmericaMerrill Lynch (701)
(2,941) Arjo AB ’B’ Goldman Sachs (2,272)671 Atrium Ljungberg AB ’B’ Bank of America
Merrill Lynch 9521,088 Atrium Ljungberg AB ’B’ Goldman Sachs 1,543
(2,143) Attendo AB Goldman Sachs (816)(2,063) Avanza Bank Holding AB Bank of America
Merrill Lynch (1,266)(1,817) Avanza Bank Holding AB Goldman Sachs (820)2,193 Axfood AB Goldman Sachs 1,207
916 Axfood AB Morgan Stanley 407(925) Betsson AB Bank of America
Merrill Lynch (617)(811) Betsson AB Goldman Sachs (541)
(1,306) Bilia AB ’A’ Bank of AmericaMerrill Lynch (1,541)
(888) Bilia AB ’A’ Goldman Sachs (1,048)(398) Biotage AB Bank of America
Merrill Lynch (644)1,081 Bonava AB ’B’ Goldman Sachs 437
(1,056) Boozt AB Bank of AmericaMerrill Lynch (615)
(241) Bravida Holding AB Bank of AmericaMerrill Lynch (66)
813 Bufab AB Bank of AmericaMerrill Lynch 628
(300) Bure Equity AB Goldman Sachs (759)(676) Camurus AB Bank of America
Merrill Lynch (129)(574) Camurus AB Goldman Sachs (109)707 Castellum AB Bank of America
Merrill Lynch 5992,172 Castellum AB Goldman Sachs 1,8392,685 Clas Ohlson AB ’B’ Goldman Sachs 930
BlackRock Global Long/Short Equity Fund continued
The notes on pages 691 to 711 form an integral part of these financial statements.
Annual report and audited financial statements [471]
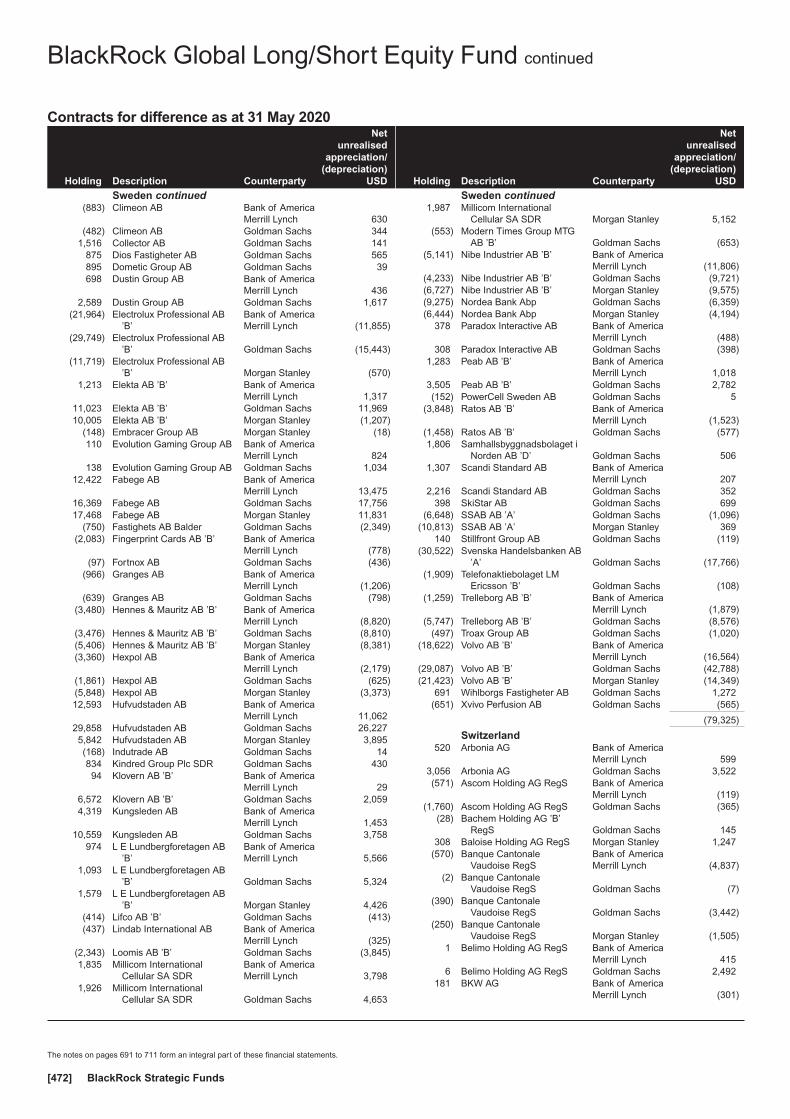
Contracts for difference as at 31 May 2020
Holding Description Counterparty
Netunrealised
appreciation/(depreciation)
USD
Sweden continued(883) Climeon AB Bank of America
Merrill Lynch 630(482) Climeon AB Goldman Sachs 344
1,516 Collector AB Goldman Sachs 141875 Dios Fastigheter AB Goldman Sachs 565895 Dometic Group AB Goldman Sachs 39698 Dustin Group AB Bank of America
Merrill Lynch 4362,589 Dustin Group AB Goldman Sachs 1,617
(21,964) Electrolux Professional AB’B’
Bank of AmericaMerrill Lynch (11,855)
(29,749) Electrolux Professional AB’B’ Goldman Sachs (15,443)
(11,719) Electrolux Professional AB’B’ Morgan Stanley (570)
1,213 Elekta AB ’B’ Bank of AmericaMerrill Lynch 1,317
11,023 Elekta AB ’B’ Goldman Sachs 11,96910,005 Elekta AB ’B’ Morgan Stanley (1,207)
(148) Embracer Group AB Morgan Stanley (18)110 Evolution Gaming Group AB Bank of America
Merrill Lynch 824138 Evolution Gaming Group AB Goldman Sachs 1,034
12,422 Fabege AB Bank of AmericaMerrill Lynch 13,475
16,369 Fabege AB Goldman Sachs 17,75617,468 Fabege AB Morgan Stanley 11,831
(750) Fastighets AB Balder Goldman Sachs (2,349)(2,083) Fingerprint Cards AB ’B’ Bank of America
Merrill Lynch (778)(97) Fortnox AB Goldman Sachs (436)
(966) Granges AB Bank of AmericaMerrill Lynch (1,206)
(639) Granges AB Goldman Sachs (798)(3,480) Hennes & Mauritz AB ’B’ Bank of America
Merrill Lynch (8,820)(3,476) Hennes & Mauritz AB ’B’ Goldman Sachs (8,810)(5,406) Hennes & Mauritz AB ’B’ Morgan Stanley (8,381)(3,360) Hexpol AB Bank of America
Merrill Lynch (2,179)(1,861) Hexpol AB Goldman Sachs (625)(5,848) Hexpol AB Morgan Stanley (3,373)12,593 Hufvudstaden AB Bank of America
Merrill Lynch 11,06229,858 Hufvudstaden AB Goldman Sachs 26,2275,842 Hufvudstaden AB Morgan Stanley 3,895(168) Indutrade AB Goldman Sachs 14834 Kindred Group Plc SDR Goldman Sachs 43094 Klovern AB ’B’ Bank of America
Merrill Lynch 296,572 Klovern AB ’B’ Goldman Sachs 2,0594,319 Kungsleden AB Bank of America
Merrill Lynch 1,45310,559 Kungsleden AB Goldman Sachs 3,758
974 L E Lundbergforetagen AB’B’
Bank of AmericaMerrill Lynch 5,566
1,093 L E Lundbergforetagen AB’B’ Goldman Sachs 5,324
1,579 L E Lundbergforetagen AB’B’ Morgan Stanley 4,426
(414) Lifco AB ’B’ Goldman Sachs (413)(437) Lindab International AB Bank of America
Merrill Lynch (325)(2,343) Loomis AB ’B’ Goldman Sachs (3,845)1,835 Millicom International
Cellular SA SDRBank of AmericaMerrill Lynch 3,798
1,926 Millicom InternationalCellular SA SDR Goldman Sachs 4,653
Holding Description Counterparty
Netunrealised
appreciation/(depreciation)
USD
Sweden continued1,987 Millicom International
Cellular SA SDR Morgan Stanley 5,152(553) Modern Times Group MTG
AB ’B’ Goldman Sachs (653)(5,141) Nibe Industrier AB ’B’ Bank of America
Merrill Lynch (11,806)(4,233) Nibe Industrier AB ’B’ Goldman Sachs (9,721)(6,727) Nibe Industrier AB ’B’ Morgan Stanley (9,575)(9,275) Nordea Bank Abp Goldman Sachs (6,359)(6,444) Nordea Bank Abp Morgan Stanley (4,194)
378 Paradox Interactive AB Bank of AmericaMerrill Lynch (488)
308 Paradox Interactive AB Goldman Sachs (398)1,283 Peab AB ’B’ Bank of America
Merrill Lynch 1,0183,505 Peab AB ’B’ Goldman Sachs 2,782(152) PowerCell Sweden AB Goldman Sachs 5
(3,848) Ratos AB ’B’ Bank of AmericaMerrill Lynch (1,523)
(1,458) Ratos AB ’B’ Goldman Sachs (577)1,806 Samhallsbyggnadsbolaget i
Norden AB ’D’ Goldman Sachs 5061,307 Scandi Standard AB Bank of America
Merrill Lynch 2072,216 Scandi Standard AB Goldman Sachs 352
398 SkiStar AB Goldman Sachs 699(6,648) SSAB AB ’A’ Goldman Sachs (1,096)
(10,813) SSAB AB ’A’ Morgan Stanley 369140 Stillfront Group AB Goldman Sachs (119)
(30,522) Svenska Handelsbanken AB’A’ Goldman Sachs (17,766)
(1,909) Telefonaktiebolaget LMEricsson ’B’ Goldman Sachs (108)
(1,259) Trelleborg AB ’B’ Bank of AmericaMerrill Lynch (1,879)
(5,747) Trelleborg AB ’B’ Goldman Sachs (8,576)(497) Troax Group AB Goldman Sachs (1,020)
(18,622) Volvo AB ’B’ Bank of AmericaMerrill Lynch (16,564)
(29,087) Volvo AB ’B’ Goldman Sachs (42,788)(21,423) Volvo AB ’B’ Morgan Stanley (14,349)
691 Wihlborgs Fastigheter AB Goldman Sachs 1,272(651) Xvivo Perfusion AB Goldman Sachs (565)
(79,325)
Switzerland520 Arbonia AG Bank of America
Merrill Lynch 5993,056 Arbonia AG Goldman Sachs 3,522(571) Ascom Holding AG RegS Bank of America
Merrill Lynch (119)(1,760) Ascom Holding AG RegS Goldman Sachs (365)
(28) Bachem Holding AG ’B’RegS Goldman Sachs 145
308 Baloise Holding AG RegS Morgan Stanley 1,247(570) Banque Cantonale
Vaudoise RegSBank of AmericaMerrill Lynch (4,837)
(2) Banque CantonaleVaudoise RegS Goldman Sachs (7)
(390) Banque CantonaleVaudoise RegS Goldman Sachs (3,442)
(250) Banque CantonaleVaudoise RegS Morgan Stanley (1,505)
1 Belimo Holding AG RegS Bank of AmericaMerrill Lynch 415
6 Belimo Holding AG RegS Goldman Sachs 2,492181 BKW AG Bank of America
Merrill Lynch (301)
BlackRock Global Long/Short Equity Fund continued
The notes on pages 691 to 711 form an integral part of these financial statements.
BlackRock Strategic Funds[472]
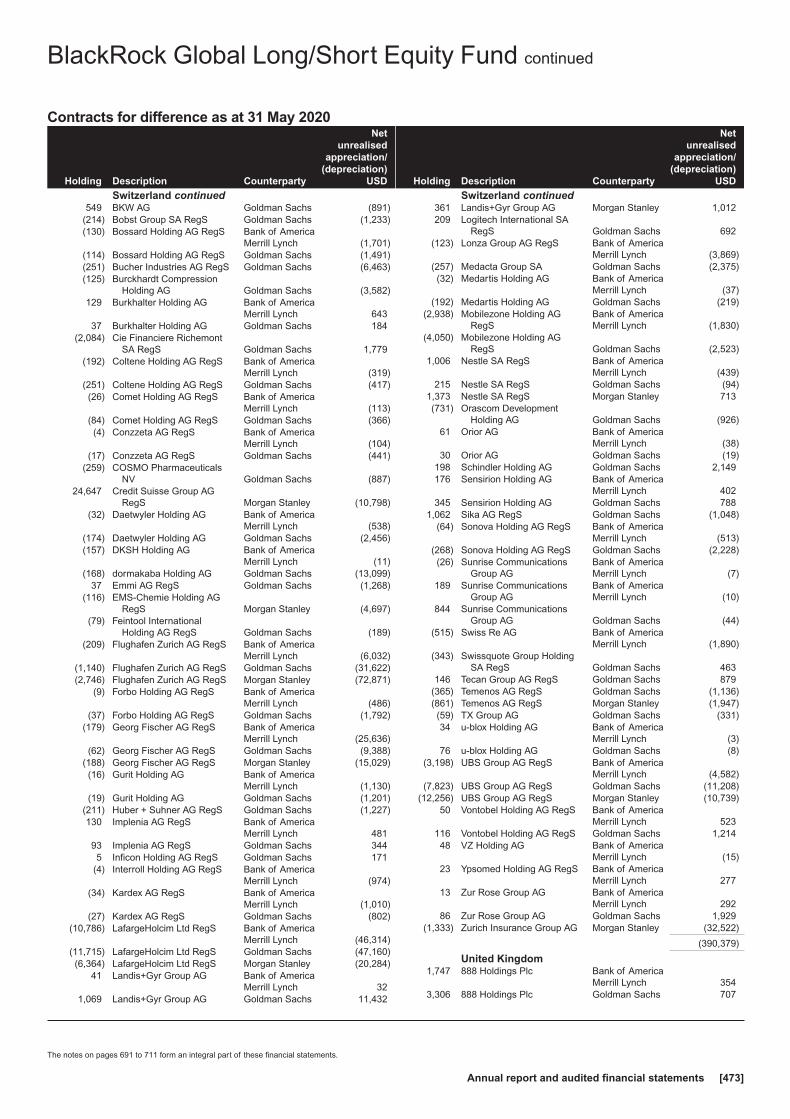
Contracts for difference as at 31 May 2020
Holding Description Counterparty
Netunrealised
appreciation/(depreciation)
USD
Switzerland continued549 BKW AG Goldman Sachs (891)
(214) Bobst Group SA RegS Goldman Sachs (1,233)(130) Bossard Holding AG RegS Bank of America
Merrill Lynch (1,701)(114) Bossard Holding AG RegS Goldman Sachs (1,491)(251) Bucher Industries AG RegS Goldman Sachs (6,463)(125) Burckhardt Compression
Holding AG Goldman Sachs (3,582)129 Burkhalter Holding AG Bank of America
Merrill Lynch 64337 Burkhalter Holding AG Goldman Sachs 184
(2,084) Cie Financiere RichemontSA RegS Goldman Sachs 1,779
(192) Coltene Holding AG RegS Bank of AmericaMerrill Lynch (319)
(251) Coltene Holding AG RegS Goldman Sachs (417)(26) Comet Holding AG RegS Bank of America
Merrill Lynch (113)(84) Comet Holding AG RegS Goldman Sachs (366)(4) Conzzeta AG RegS Bank of America
Merrill Lynch (104)(17) Conzzeta AG RegS Goldman Sachs (441)
(259) COSMO PharmaceuticalsNV Goldman Sachs (887)
24,647 Credit Suisse Group AGRegS Morgan Stanley (10,798)
(32) Daetwyler Holding AG Bank of AmericaMerrill Lynch (538)
(174) Daetwyler Holding AG Goldman Sachs (2,456)(157) DKSH Holding AG Bank of America
Merrill Lynch (11)(168) dormakaba Holding AG Goldman Sachs (13,099)
37 Emmi AG RegS Goldman Sachs (1,268)(116) EMS-Chemie Holding AG
RegS Morgan Stanley (4,697)(79) Feintool International
Holding AG RegS Goldman Sachs (189)(209) Flughafen Zurich AG RegS Bank of America
Merrill Lynch (6,032)(1,140) Flughafen Zurich AG RegS Goldman Sachs (31,622)(2,746) Flughafen Zurich AG RegS Morgan Stanley (72,871)
(9) Forbo Holding AG RegS Bank of AmericaMerrill Lynch (486)
(37) Forbo Holding AG RegS Goldman Sachs (1,792)(179) Georg Fischer AG RegS Bank of America
Merrill Lynch (25,636)(62) Georg Fischer AG RegS Goldman Sachs (9,388)
(188) Georg Fischer AG RegS Morgan Stanley (15,029)(16) Gurit Holding AG Bank of America
Merrill Lynch (1,130)(19) Gurit Holding AG Goldman Sachs (1,201)
(211) Huber + Suhner AG RegS Goldman Sachs (1,227)130 Implenia AG RegS Bank of America
Merrill Lynch 48193 Implenia AG RegS Goldman Sachs 3445 Inficon Holding AG RegS Goldman Sachs 171
(4) Interroll Holding AG RegS Bank of AmericaMerrill Lynch (974)
(34) Kardex AG RegS Bank of AmericaMerrill Lynch (1,010)
(27) Kardex AG RegS Goldman Sachs (802)(10,786) LafargeHolcim Ltd RegS Bank of America
Merrill Lynch (46,314)(11,715) LafargeHolcim Ltd RegS Goldman Sachs (47,160)(6,364) LafargeHolcim Ltd RegS Morgan Stanley (20,284)
41 Landis+Gyr Group AG Bank of AmericaMerrill Lynch 32
1,069 Landis+Gyr Group AG Goldman Sachs 11,432
Holding Description Counterparty
Netunrealised
appreciation/(depreciation)
USD
Switzerland continued361 Landis+Gyr Group AG Morgan Stanley 1,012209 Logitech International SA
RegS Goldman Sachs 692(123) Lonza Group AG RegS Bank of America
Merrill Lynch (3,869)(257) Medacta Group SA Goldman Sachs (2,375)(32) Medartis Holding AG Bank of America
Merrill Lynch (37)(192) Medartis Holding AG Goldman Sachs (219)
(2,938) Mobilezone Holding AGRegS
Bank of AmericaMerrill Lynch (1,830)
(4,050) Mobilezone Holding AGRegS Goldman Sachs (2,523)
1,006 Nestle SA RegS Bank of AmericaMerrill Lynch (439)
215 Nestle SA RegS Goldman Sachs (94)1,373 Nestle SA RegS Morgan Stanley 713(731) Orascom Development
Holding AG Goldman Sachs (926)61 Orior AG Bank of America
Merrill Lynch (38)30 Orior AG Goldman Sachs (19)
198 Schindler Holding AG Goldman Sachs 2,149176 Sensirion Holding AG Bank of America
Merrill Lynch 402345 Sensirion Holding AG Goldman Sachs 788
1,062 Sika AG RegS Goldman Sachs (1,048)(64) Sonova Holding AG RegS Bank of America
Merrill Lynch (513)(268) Sonova Holding AG RegS Goldman Sachs (2,228)(26) Sunrise Communications
Group AGBank of AmericaMerrill Lynch (7)
189 Sunrise CommunicationsGroup AG
Bank of AmericaMerrill Lynch (10)
844 Sunrise CommunicationsGroup AG Goldman Sachs (44)
(515) Swiss Re AG Bank of AmericaMerrill Lynch (1,890)
(343) Swissquote Group HoldingSA RegS Goldman Sachs 463
146 Tecan Group AG RegS Goldman Sachs 879(365) Temenos AG RegS Goldman Sachs (1,136)(861) Temenos AG RegS Morgan Stanley (1,947)(59) TX Group AG Goldman Sachs (331)34 u-blox Holding AG Bank of America
Merrill Lynch (3)76 u-blox Holding AG Goldman Sachs (8)
(3,198) UBS Group AG RegS Bank of AmericaMerrill Lynch (4,582)
(7,823) UBS Group AG RegS Goldman Sachs (11,208)(12,256) UBS Group AG RegS Morgan Stanley (10,739)
50 Vontobel Holding AG RegS Bank of AmericaMerrill Lynch 523
116 Vontobel Holding AG RegS Goldman Sachs 1,21448 VZ Holding AG Bank of America
Merrill Lynch (15)23 Ypsomed Holding AG RegS Bank of America
Merrill Lynch 27713 Zur Rose Group AG Bank of America
Merrill Lynch 29286 Zur Rose Group AG Goldman Sachs 1,929
(1,333) Zurich Insurance Group AG Morgan Stanley (32,522)
(390,379)
United Kingdom1,747 888 Holdings Plc Bank of America
Merrill Lynch 3543,306 888 Holdings Plc Goldman Sachs 707
BlackRock Global Long/Short Equity Fund continued
The notes on pages 691 to 711 form an integral part of these financial statements.
Annual report and audited financial statements [473]
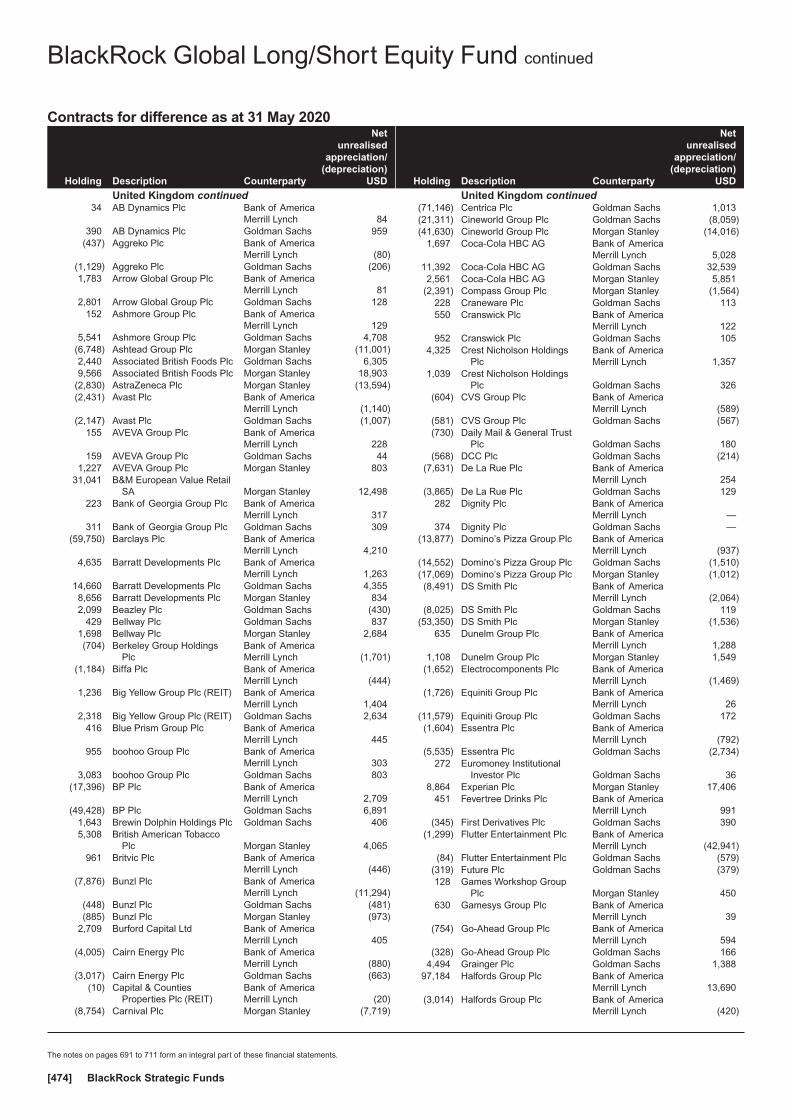
Contracts for difference as at 31 May 2020
Holding Description Counterparty
Netunrealised
appreciation/(depreciation)
USD
United Kingdom continued34 AB Dynamics Plc Bank of America
Merrill Lynch 84390 AB Dynamics Plc Goldman Sachs 959
(437) Aggreko Plc Bank of AmericaMerrill Lynch (80)
(1,129) Aggreko Plc Goldman Sachs (206)1,783 Arrow Global Group Plc Bank of America
Merrill Lynch 812,801 Arrow Global Group Plc Goldman Sachs 128
152 Ashmore Group Plc Bank of AmericaMerrill Lynch 129
5,541 Ashmore Group Plc Goldman Sachs 4,708(6,748) Ashtead Group Plc Morgan Stanley (11,001)2,440 Associated British Foods Plc Goldman Sachs 6,3059,566 Associated British Foods Plc Morgan Stanley 18,903
(2,830) AstraZeneca Plc Morgan Stanley (13,594)(2,431) Avast Plc Bank of America
Merrill Lynch (1,140)(2,147) Avast Plc Goldman Sachs (1,007)
155 AVEVA Group Plc Bank of AmericaMerrill Lynch 228
159 AVEVA Group Plc Goldman Sachs 441,227 AVEVA Group Plc Morgan Stanley 803
31,041 B&M European Value RetailSA Morgan Stanley 12,498
223 Bank of Georgia Group Plc Bank of AmericaMerrill Lynch 317
311 Bank of Georgia Group Plc Goldman Sachs 309(59,750) Barclays Plc Bank of America
Merrill Lynch 4,2104,635 Barratt Developments Plc Bank of America
Merrill Lynch 1,26314,660 Barratt Developments Plc Goldman Sachs 4,3558,656 Barratt Developments Plc Morgan Stanley 8342,099 Beazley Plc Goldman Sachs (430)
429 Bellway Plc Goldman Sachs 8371,698 Bellway Plc Morgan Stanley 2,684(704) Berkeley Group Holdings
PlcBank of AmericaMerrill Lynch (1,701)
(1,184) Biffa Plc Bank of AmericaMerrill Lynch (444)
1,236 Big Yellow Group Plc (REIT) Bank of AmericaMerrill Lynch 1,404
2,318 Big Yellow Group Plc (REIT) Goldman Sachs 2,634416 Blue Prism Group Plc Bank of America
Merrill Lynch 445955 boohoo Group Plc Bank of America
Merrill Lynch 3033,083 boohoo Group Plc Goldman Sachs 803
(17,396) BP Plc Bank of AmericaMerrill Lynch 2,709
(49,428) BP Plc Goldman Sachs 6,8911,643 Brewin Dolphin Holdings Plc Goldman Sachs 4065,308 British American Tobacco
Plc Morgan Stanley 4,065961 Britvic Plc Bank of America
Merrill Lynch (446)(7,876) Bunzl Plc Bank of America
Merrill Lynch (11,294)(448) Bunzl Plc Goldman Sachs (481)(885) Bunzl Plc Morgan Stanley (973)
2,709 Burford Capital Ltd Bank of AmericaMerrill Lynch 405
(4,005) Cairn Energy Plc Bank of AmericaMerrill Lynch (880)
(3,017) Cairn Energy Plc Goldman Sachs (663)(10) Capital & Counties
Properties Plc (REIT)Bank of AmericaMerrill Lynch (20)
(8,754) Carnival Plc Morgan Stanley (7,719)
Holding Description Counterparty
Netunrealised
appreciation/(depreciation)
USD
United Kingdom continued(71,146) Centrica Plc Goldman Sachs 1,013(21,311) Cineworld Group Plc Goldman Sachs (8,059)(41,630) Cineworld Group Plc Morgan Stanley (14,016)
1,697 Coca-Cola HBC AG Bank of AmericaMerrill Lynch 5,028
11,392 Coca-Cola HBC AG Goldman Sachs 32,5392,561 Coca-Cola HBC AG Morgan Stanley 5,851
(2,391) Compass Group Plc Morgan Stanley (1,564)228 Craneware Plc Goldman Sachs 113550 Cranswick Plc Bank of America
Merrill Lynch 122952 Cranswick Plc Goldman Sachs 105
4,325 Crest Nicholson HoldingsPlc
Bank of AmericaMerrill Lynch 1,357
1,039 Crest Nicholson HoldingsPlc Goldman Sachs 326
(604) CVS Group Plc Bank of AmericaMerrill Lynch (589)
(581) CVS Group Plc Goldman Sachs (567)(730) Daily Mail & General Trust
Plc Goldman Sachs 180(568) DCC Plc Goldman Sachs (214)
(7,631) De La Rue Plc Bank of AmericaMerrill Lynch 254
(3,865) De La Rue Plc Goldman Sachs 129282 Dignity Plc Bank of America
Merrill Lynch —374 Dignity Plc Goldman Sachs —
(13,877) Domino’s Pizza Group Plc Bank of AmericaMerrill Lynch (937)
(14,552) Domino’s Pizza Group Plc Goldman Sachs (1,510)(17,069) Domino’s Pizza Group Plc Morgan Stanley (1,012)(8,491) DS Smith Plc Bank of America
Merrill Lynch (2,064)(8,025) DS Smith Plc Goldman Sachs 119
(53,350) DS Smith Plc Morgan Stanley (1,536)635 Dunelm Group Plc Bank of America
Merrill Lynch 1,2881,108 Dunelm Group Plc Morgan Stanley 1,549
(1,652) Electrocomponents Plc Bank of AmericaMerrill Lynch (1,469)
(1,726) Equiniti Group Plc Bank of AmericaMerrill Lynch 26
(11,579) Equiniti Group Plc Goldman Sachs 172(1,604) Essentra Plc Bank of America
Merrill Lynch (792)(5,535) Essentra Plc Goldman Sachs (2,734)
272 Euromoney InstitutionalInvestor Plc Goldman Sachs 36
8,864 Experian Plc Morgan Stanley 17,406451 Fevertree Drinks Plc Bank of America
Merrill Lynch 991(345) First Derivatives Plc Goldman Sachs 390
(1,299) Flutter Entertainment Plc Bank of AmericaMerrill Lynch (42,941)
(84) Flutter Entertainment Plc Goldman Sachs (579)(319) Future Plc Goldman Sachs (379)128 Games Workshop Group
Plc Morgan Stanley 450630 Gamesys Group Plc Bank of America
Merrill Lynch 39(754) Go-Ahead Group Plc Bank of America
Merrill Lynch 594(328) Go-Ahead Group Plc Goldman Sachs 166
4,494 Grainger Plc Goldman Sachs 1,38897,184 Halfords Group Plc Bank of America
Merrill Lynch 13,690(3,014) Halfords Group Plc Bank of America
Merrill Lynch (420)
BlackRock Global Long/Short Equity Fund continued
The notes on pages 691 to 711 form an integral part of these financial statements.
BlackRock Strategic Funds[474]

Contracts for difference as at 31 May 2020
Holding Description Counterparty
Netunrealised
appreciation/(depreciation)
USD
United Kingdom continued3,944 Halfords Group Plc Goldman Sachs 554
(1,888) Halfords Group Plc Goldman Sachs (263)3,000 Halfords Group Plc Morgan Stanley 418(578) Hargreaves Lansdown Plc Bank of America
Merrill Lynch (1,300)(4,043) Hargreaves Lansdown Plc Goldman Sachs (9,721)
651 Helical Plc Goldman Sachs 374(3,808) Hikma Pharmaceuticals Plc Bank of America
Merrill Lynch (8,466)(8,636) Hikma Pharmaceuticals Plc Goldman Sachs (19,198)
(486) Hill & Smith Holdings Plc Bank of AmericaMerrill Lynch (828)
(392) Hill & Smith Holdings Plc Goldman Sachs (668)(1,255) Hochschild Mining Plc Bank of America
Merrill Lynch 153513 HomeServe Plc Bank of America
Merrill Lynch 1,13620,962 HomeServe Plc Goldman Sachs 45,5673,383 HomeServe Plc Morgan Stanley 2,4791,763 Hotel Chocolat Group Plc Bank of America
Merrill Lynch 56627,084 Howden Joinery Group Plc Goldman Sachs 23,750
(22,582) HSBC Holdings Plc Goldman Sachs 5,997(1,024) IG Design Group Plc Bank of America
Merrill Lynch (272)(1,524) IG Design Group Plc Goldman Sachs (405)1,147 IG Group Holdings Plc Goldman Sachs (21)
(2,107) Inchcape Plc Bank of AmericaMerrill Lynch (786)
(23,200) Inchcape Plc Morgan Stanley (11,862)19,148 Informa Plc Goldman Sachs 11,58856,280 Informa Plc Morgan Stanley 20,366
(358) InterContinental HotelsGroup Plc
Bank of AmericaMerrill Lynch (1,329)
(2,029) InterContinental HotelsGroup Plc Morgan Stanley (4,925)
(1,422) Investec Plc Goldman Sachs 5(840) J D Wetherspoon Plc Goldman Sachs (2,957)
2,315 John Wood Group Plc Goldman Sachs 629(6,918) John Wood Group Plc Morgan Stanley (333)
409 Kainos Group Plc Bank of AmericaMerrill Lynch 101
621 Kainos Group Plc Goldman Sachs 153(681) KAZ Minerals Plc Morgan Stanley (37)
60,395 Kingfisher Plc Morgan Stanley 14,955(1,091) Lancashire Holdings Ltd Bank of America
Merrill Lynch (337)7,228 Land Securities Group Plc
(REIT)Bank of AmericaMerrill Lynch 7,356
3,336 Land Securities Group Plc(REIT) Goldman Sachs 2,251
6,874 Land Securities Group Plc(REIT) Morgan Stanley 4,196
(23,310) Learning TechnologiesGroup Plc Goldman Sachs (1,008)
3,890 LondonMetric Property Plc(REIT) Goldman Sachs 1,110
(2,478) LXI Plc (REIT) Bank of AmericaMerrill Lynch (563)
(41,283) Marks & Spencer Group Plc Bank of AmericaMerrill Lynch 1,112
5,124 Mediclinic International Plc Goldman Sachs 4452,681 Meggitt Plc Bank of America
Merrill Lynch (663)4,615 Meggitt Plc Morgan Stanley 1,009
13,356 Melrose Industries Plc Bank of AmericaMerrill Lynch (1,549)
7,532 Melrose Industries Plc Goldman Sachs (252)
Holding Description Counterparty
Netunrealised
appreciation/(depreciation)
USD
United Kingdom continued5,479 Micro Focus International
PlcBank of AmericaMerrill Lynch (1,497)
1,371 Micro Focus InternationalPlc Goldman Sachs (30)
1,792 Micro Focus InternationalPlc Morgan Stanley (319)
(653) Mondi Plc Bank of AmericaMerrill Lynch (1,075)
(9,776) Mondi Plc Morgan Stanley (12,678)3,143 Moneysupermarket.com
Group PlcBank of AmericaMerrill Lynch 215
816 Moneysupermarket.comGroup Plc Goldman Sachs 54
1,243 Morgan Sindall Group Plc Bank of AmericaMerrill Lynch 1,105
785 Morgan Sindall Group Plc Goldman Sachs 698(4,317) NCC Group Plc Bank of America
Merrill Lynch (608)(1,775) NCC Group Plc Goldman Sachs (250)2,042 NewRiver Plc (REIT) Goldman Sachs 30(378) Numis Corp Plc Bank of America
Merrill Lynch (63)(715) Numis Corp Plc Goldman Sachs (119)
(3,032) Paragon Banking Group Plc Goldman Sachs (1,281)(1,084) Persimmon Plc Bank of America
Merrill Lynch (2,745)(542) Persimmon Plc Goldman Sachs (1,372)
(2,541) Persimmon Plc Morgan Stanley (3,186)1,228 Pets at Home Group Plc Goldman Sachs 82
606 Polypipe Group Plc Bank of AmericaMerrill Lynch 228
2,195 Polypipe Group Plc Goldman Sachs 8271,249 Provident Financial Plc Bank of America
Merrill Lynch 7191,620 QinetiQ Group Plc Goldman Sachs (36)
(1,656) Quilter Plc Bank of AmericaMerrill Lynch (238)
(17,379) Quilter Plc Goldman Sachs (2,501)(18,397) Quilter Plc Morgan Stanley (1,454)(2,488) Redde Northgate Plc Goldman Sachs (664)(6,433) Rentokil Initial Plc Morgan Stanley (1,041)(5,013) Restaurant Group Plc Goldman Sachs (1,467)(2,948) Restore Plc Bank of America
Merrill Lynch (540)(1,588) Restore Plc Goldman Sachs (333)
122 Rhi Magnesita NV Bank of AmericaMerrill Lynch 262
81 Rhi Magnesita NV Goldman Sachs 174(5,759) Rightmove Plc Goldman Sachs (4,776)(2,499) Rolls-Royce Holdings Plc Morgan Stanley 1,1473,092 Rotork Plc Bank of America
Merrill Lynch (447)(1,390) Rotork Plc Goldman Sachs (395)74,390 Royal Bank of Scotland
Group PlcBank of AmericaMerrill Lynch 6,437
5,149 Royal Bank of ScotlandGroup Plc Goldman Sachs 448
213,269 Royal Bank of ScotlandGroup Plc Morgan Stanley 16,692
(2,120) Royal Dutch Shell Plc ’A’ Morgan Stanley 749(7,070) Royal Mail Plc Bank of America
Merrill Lynch 57(11,308) Royal Mail Plc Goldman Sachs 19(6,449) Royal Mail Plc Morgan Stanley 841,334 Safestore Holdings Plc
(REIT)Bank of AmericaMerrill Lynch 568
1,168 Safestore Holdings Plc(REIT) Goldman Sachs 498
BlackRock Global Long/Short Equity Fund continued
The notes on pages 691 to 711 form an integral part of these financial statements.
Annual report and audited financial statements [475]
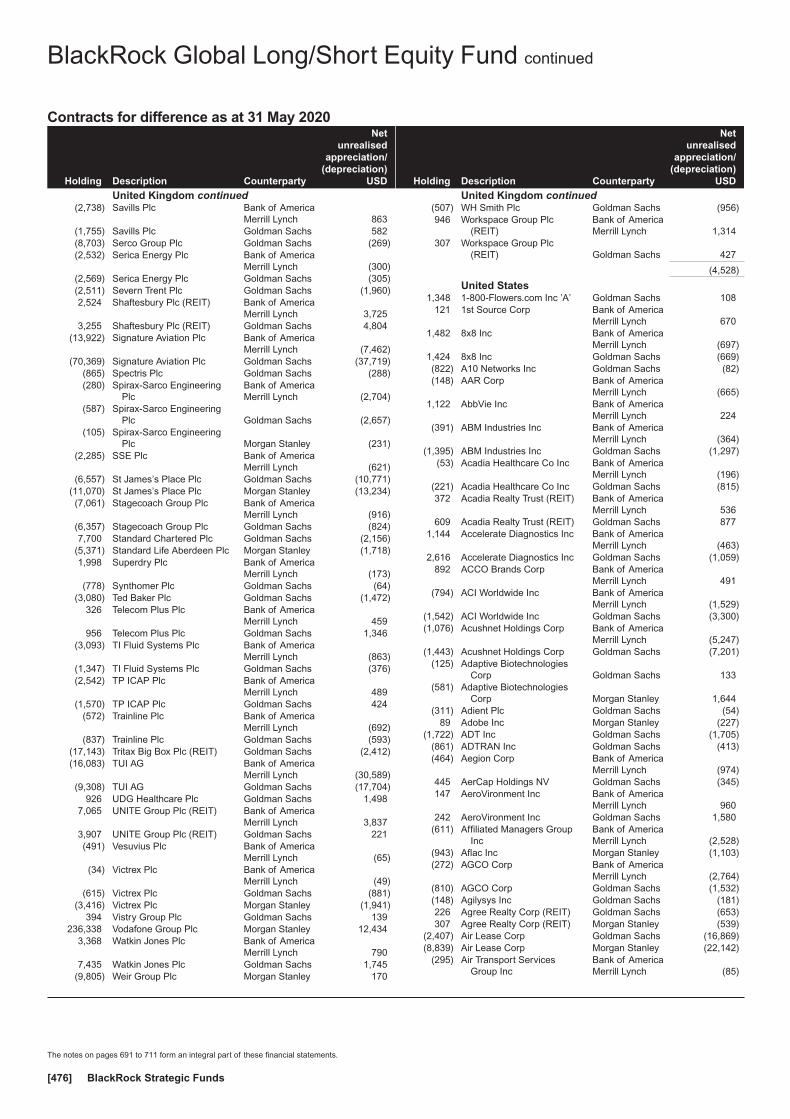
Contracts for difference as at 31 May 2020
Holding Description Counterparty
Netunrealised
appreciation/(depreciation)
USD
United Kingdom continued(2,738) Savills Plc Bank of America
Merrill Lynch 863(1,755) Savills Plc Goldman Sachs 582(8,703) Serco Group Plc Goldman Sachs (269)(2,532) Serica Energy Plc Bank of America
Merrill Lynch (300)(2,569) Serica Energy Plc Goldman Sachs (305)(2,511) Severn Trent Plc Goldman Sachs (1,960)2,524 Shaftesbury Plc (REIT) Bank of America
Merrill Lynch 3,7253,255 Shaftesbury Plc (REIT) Goldman Sachs 4,804
(13,922) Signature Aviation Plc Bank of AmericaMerrill Lynch (7,462)
(70,369) Signature Aviation Plc Goldman Sachs (37,719)(865) Spectris Plc Goldman Sachs (288)(280) Spirax-Sarco Engineering
PlcBank of AmericaMerrill Lynch (2,704)
(587) Spirax-Sarco EngineeringPlc Goldman Sachs (2,657)
(105) Spirax-Sarco EngineeringPlc Morgan Stanley (231)
(2,285) SSE Plc Bank of AmericaMerrill Lynch (621)
(6,557) St James’s Place Plc Goldman Sachs (10,771)(11,070) St James’s Place Plc Morgan Stanley (13,234)(7,061) Stagecoach Group Plc Bank of America
Merrill Lynch (916)(6,357) Stagecoach Group Plc Goldman Sachs (824)7,700 Standard Chartered Plc Goldman Sachs (2,156)
(5,371) Standard Life Aberdeen Plc Morgan Stanley (1,718)1,998 Superdry Plc Bank of America
Merrill Lynch (173)(778) Synthomer Plc Goldman Sachs (64)
(3,080) Ted Baker Plc Goldman Sachs (1,472)326 Telecom Plus Plc Bank of America
Merrill Lynch 459956 Telecom Plus Plc Goldman Sachs 1,346
(3,093) TI Fluid Systems Plc Bank of AmericaMerrill Lynch (863)
(1,347) TI Fluid Systems Plc Goldman Sachs (376)(2,542) TP ICAP Plc Bank of America
Merrill Lynch 489(1,570) TP ICAP Plc Goldman Sachs 424
(572) Trainline Plc Bank of AmericaMerrill Lynch (692)
(837) Trainline Plc Goldman Sachs (593)(17,143) Tritax Big Box Plc (REIT) Goldman Sachs (2,412)(16,083) TUI AG Bank of America
Merrill Lynch (30,589)(9,308) TUI AG Goldman Sachs (17,704)
926 UDG Healthcare Plc Goldman Sachs 1,4987,065 UNITE Group Plc (REIT) Bank of America
Merrill Lynch 3,8373,907 UNITE Group Plc (REIT) Goldman Sachs 221(491) Vesuvius Plc Bank of America
Merrill Lynch (65)(34) Victrex Plc Bank of America
Merrill Lynch (49)(615) Victrex Plc Goldman Sachs (881)
(3,416) Victrex Plc Morgan Stanley (1,941)394 Vistry Group Plc Goldman Sachs 139
236,338 Vodafone Group Plc Morgan Stanley 12,4343,368 Watkin Jones Plc Bank of America
Merrill Lynch 7907,435 Watkin Jones Plc Goldman Sachs 1,745
(9,805) Weir Group Plc Morgan Stanley 170
Holding Description Counterparty
Netunrealised
appreciation/(depreciation)
USD
United Kingdom continued(507) WH Smith Plc Goldman Sachs (956)946 Workspace Group Plc
(REIT)Bank of AmericaMerrill Lynch 1,314
307 Workspace Group Plc(REIT) Goldman Sachs 427
(4,528)
United States1,348 1-800-Flowers.com Inc ’A’ Goldman Sachs 108
121 1st Source Corp Bank of AmericaMerrill Lynch 670
1,482 8x8 Inc Bank of AmericaMerrill Lynch (697)
1,424 8x8 Inc Goldman Sachs (669)(822) A10 Networks Inc Goldman Sachs (82)(148) AAR Corp Bank of America
Merrill Lynch (665)1,122 AbbVie Inc Bank of America
Merrill Lynch 224(391) ABM Industries Inc Bank of America
Merrill Lynch (364)(1,395) ABM Industries Inc Goldman Sachs (1,297)
(53) Acadia Healthcare Co Inc Bank of AmericaMerrill Lynch (196)
(221) Acadia Healthcare Co Inc Goldman Sachs (815)372 Acadia Realty Trust (REIT) Bank of America
Merrill Lynch 536609 Acadia Realty Trust (REIT) Goldman Sachs 877
1,144 Accelerate Diagnostics Inc Bank of AmericaMerrill Lynch (463)
2,616 Accelerate Diagnostics Inc Goldman Sachs (1,059)892 ACCO Brands Corp Bank of America
Merrill Lynch 491(794) ACI Worldwide Inc Bank of America
Merrill Lynch (1,529)(1,542) ACI Worldwide Inc Goldman Sachs (3,300)(1,076) Acushnet Holdings Corp Bank of America
Merrill Lynch (5,247)(1,443) Acushnet Holdings Corp Goldman Sachs (7,201)
(125) Adaptive BiotechnologiesCorp Goldman Sachs 133
(581) Adaptive BiotechnologiesCorp Morgan Stanley 1,644
(311) Adient Plc Goldman Sachs (54)89 Adobe Inc Morgan Stanley (227)
(1,722) ADT Inc Goldman Sachs (1,705)(861) ADTRAN Inc Goldman Sachs (413)(464) Aegion Corp Bank of America
Merrill Lynch (974)445 AerCap Holdings NV Goldman Sachs (345)147 AeroVironment Inc Bank of America
Merrill Lynch 960242 AeroVironment Inc Goldman Sachs 1,580
(611) Affiliated Managers GroupInc
Bank of AmericaMerrill Lynch (2,528)
(943) Aflac Inc Morgan Stanley (1,103)(272) AGCO Corp Bank of America
Merrill Lynch (2,764)(810) AGCO Corp Goldman Sachs (1,532)(148) Agilysys Inc Goldman Sachs (181)226 Agree Realty Corp (REIT) Goldman Sachs (653)307 Agree Realty Corp (REIT) Morgan Stanley (539)
(2,407) Air Lease Corp Goldman Sachs (16,869)(8,839) Air Lease Corp Morgan Stanley (22,142)
(295) Air Transport ServicesGroup Inc
Bank of AmericaMerrill Lynch (85)
BlackRock Global Long/Short Equity Fund continued
The notes on pages 691 to 711 form an integral part of these financial statements.
BlackRock Strategic Funds[476]

Contracts for difference as at 31 May 2020
Holding Description Counterparty
Netunrealised
appreciation/(depreciation)
USD
United States continued(853) Air Transport Services
Group Inc Goldman Sachs (346)343 Akamai Technologies Inc Morgan Stanley 1,283358 Alarm.com Holdings Inc Goldman Sachs 57
(240) Albany International Corp’A’
Bank of AmericaMerrill Lynch (2,306)
(227) Albany International Corp’A’ Goldman Sachs (1,200)
(65) Albemarle Corp Morgan Stanley 1(147) Alexander’s Inc (REIT) Goldman Sachs (5,320)286 Allegion Plc Bank of America
Merrill Lynch 4311,909 Allegion Plc Goldman Sachs 3,9383,013 Allegion Plc Morgan Stanley (1,592)(987) Allison Transmission
Holdings Inc Morgan Stanley (1,392)171 Allogene Therapeutics Inc Goldman Sachs (393)
6,127 Allscripts HealthcareSolutions Inc
Bank of AmericaMerrill Lynch 2,757
4,516 Allscripts HealthcareSolutions Inc Goldman Sachs 2,032
(3,327) Allstate Corp Bank of AmericaMerrill Lynch (5,007)
(3,334) Allstate Corp Morgan Stanley (6,885)1,318 Ally Financial Inc Morgan Stanley 1,857
(1,079) Alpha & OmegaSemiconductor Ltd Goldman Sachs (1,036)
399 Alphabet Inc ’A’ Morgan Stanley 6,52876 Altair Engineering Inc ’A’ Bank of America
Merrill Lynch 189444 Altair Engineering Inc ’A’ Goldman Sachs 2,000781 Altice USA Inc ’A’ Bank of America
Merrill Lynch 316,353 Altice USA Inc ’A’ Morgan Stanley 6,234(178) Altisource Portfolio
Solutions SABank of AmericaMerrill Lynch 9
1,441 Altria Group Inc Bank of AmericaMerrill Lynch 1,332
5,256 Altria Group Inc Goldman Sachs 8,4039,434 Altria Group Inc Morgan Stanley 4,906
559 Amalgamated Bank ’A’ Bank of AmericaMerrill Lynch 1,090
1,335 Amalgamated Bank ’A’ Goldman Sachs 2,603158 Amazon.com Inc Bank of America
Merrill Lynch (631)28 Amazon.com Inc Goldman Sachs 29
352 Amazon.com Inc Morgan Stanley (7,397)(923) Ambac Financial Group Inc Bank of America
Merrill Lynch (1,237)(629) Ambac Financial Group Inc Goldman Sachs (843)443 Ambarella Inc Bank of America
Merrill Lynch 1,524426 AMC Networks Inc ’A’ Bank of America
Merrill Lynch 175972 AMC Networks Inc ’A’ Goldman Sachs 399
(100) Amedisys Inc Goldman Sachs 76450 Ameresco Inc ’A’ Bank of America
Merrill Lynch 1,183690 Ameresco Inc ’A’ Goldman Sachs 1,815
(1,180) American Assets Trust Inc(REIT) Goldman Sachs (2,254)
(1,169) American CampusCommunities Inc (REIT)
Bank of AmericaMerrill Lynch (4,424)
(345) American CampusCommunities Inc (REIT) Goldman Sachs (1,411)
(1,032) American CampusCommunities Inc (REIT) Morgan Stanley (945)
Holding Description Counterparty
Netunrealised
appreciation/(depreciation)
USD
United States continued7,051 American Eagle Outfitters
Inc Goldman Sachs 9,131(841) American Electric Power Co
Inc Goldman Sachs (3,024)402 American Finance Trust Inc
(REIT) Goldman Sachs 398(524) American Financial Group
Inc Goldman Sachs (3,427)1,327 American Homes 4 Rent ’A’
(REIT)Bank of AmericaMerrill Lynch 1,627
1,798 American Homes 4 Rent ’A’(REIT) Goldman Sachs 1,794
(1,112) American InternationalGroup Inc Goldman Sachs (4,404)
31 American NationalInsurance Co
Bank of AmericaMerrill Lynch 184
40 American NationalInsurance Co Goldman Sachs 237
(95) American Public EducationInc Goldman Sachs 109
374 American Software Inc ’A’ Bank of AmericaMerrill Lynch 905
228 American Tower Corp(REIT) Goldman Sachs 6,537
(597) American Vanguard Corp Goldman Sachs (555)152 American Woodmark Corp Bank of America
Merrill Lynch 1,857176 American Woodmark Corp Goldman Sachs 2,151
(141) America’s Car-Mart Inc Bank of AmericaMerrill Lynch (1,422)
(51) America’s Car-Mart Inc Goldman Sachs (624)(1,210) Ameriprise Financial Inc Bank of America
Merrill Lynch (12,423)(1,103) Ameriprise Financial Inc Goldman Sachs (11,056)
(381) Ameriprise Financial Inc Morgan Stanley (2,484)(281) AMERISAFE Inc Goldman Sachs (1,793)(962) AmerisourceBergen Corp Bank of America
Merrill Lynch (8,677)(272) AmerisourceBergen Corp Goldman Sachs (996)
(1,648) AmerisourceBergen Corp Morgan Stanley (1,644)(1,114) Amkor Technology Inc Bank of America
Merrill Lynch (503)(60) AMN Healthcare Services
Inc Goldman Sachs 129(560) Amneal Pharmaceuticals
IncBank of AmericaMerrill Lynch (208)
1,144 Amyris Inc Bank of AmericaMerrill Lynch (217)
(1,223) Anaplan Inc Bank of AmericaMerrill Lynch (1,430)
(2,545) Anaplan Inc Goldman Sachs 1,694(300) Andersons Inc Bank of America
Merrill Lynch (423)(309) Andersons Inc Goldman Sachs (436)
(1,825) ANGI Homeservices Inc ’A’ Goldman Sachs (1,834)(997) AngioDynamics Inc Goldman Sachs (299)837 ANSYS Inc Bank of America
Merrill Lynch 20,2221,071 ANSYS Inc Goldman Sachs 20,1901,786 ANSYS Inc Morgan Stanley 14,648
(1,085) Antero Resources Corp Bank of AmericaMerrill Lynch (770)
3,980 Apache Corp Bank of AmericaMerrill Lynch (6,268)
(843) Apartment Investment andManagement Co ’A’(REIT)
Bank of AmericaMerrill Lynch (2,462)
BlackRock Global Long/Short Equity Fund continued
The notes on pages 691 to 711 form an integral part of these financial statements.
Annual report and audited financial statements [477]
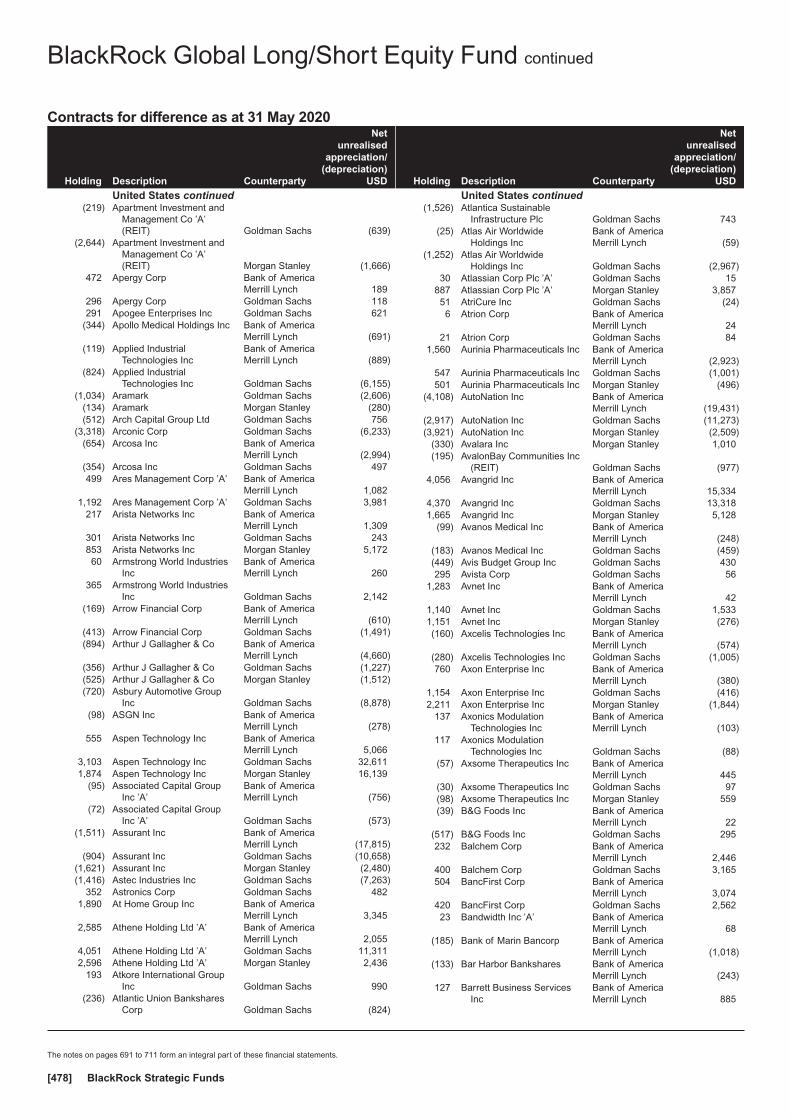
Contracts for difference as at 31 May 2020
Holding Description Counterparty
Netunrealised
appreciation/(depreciation)
USD
United States continued(219) Apartment Investment and
Management Co ’A’(REIT) Goldman Sachs (639)
(2,644) Apartment Investment andManagement Co ’A’(REIT) Morgan Stanley (1,666)
472 Apergy Corp Bank of AmericaMerrill Lynch 189
296 Apergy Corp Goldman Sachs 118291 Apogee Enterprises Inc Goldman Sachs 621
(344) Apollo Medical Holdings Inc Bank of AmericaMerrill Lynch (691)
(119) Applied IndustrialTechnologies Inc
Bank of AmericaMerrill Lynch (889)
(824) Applied IndustrialTechnologies Inc Goldman Sachs (6,155)
(1,034) Aramark Goldman Sachs (2,606)(134) Aramark Morgan Stanley (280)(512) Arch Capital Group Ltd Goldman Sachs 756
(3,318) Arconic Corp Goldman Sachs (6,233)(654) Arcosa Inc Bank of America
Merrill Lynch (2,994)(354) Arcosa Inc Goldman Sachs 497499 Ares Management Corp ’A’ Bank of America
Merrill Lynch 1,0821,192 Ares Management Corp ’A’ Goldman Sachs 3,981
217 Arista Networks Inc Bank of AmericaMerrill Lynch 1,309
301 Arista Networks Inc Goldman Sachs 243853 Arista Networks Inc Morgan Stanley 5,17260 Armstrong World Industries
IncBank of AmericaMerrill Lynch 260
365 Armstrong World IndustriesInc Goldman Sachs 2,142
(169) Arrow Financial Corp Bank of AmericaMerrill Lynch (610)
(413) Arrow Financial Corp Goldman Sachs (1,491)(894) Arthur J Gallagher & Co Bank of America
Merrill Lynch (4,660)(356) Arthur J Gallagher & Co Goldman Sachs (1,227)(525) Arthur J Gallagher & Co Morgan Stanley (1,512)(720) Asbury Automotive Group
Inc Goldman Sachs (8,878)(98) ASGN Inc Bank of America
Merrill Lynch (278)555 Aspen Technology Inc Bank of America
Merrill Lynch 5,0663,103 Aspen Technology Inc Goldman Sachs 32,6111,874 Aspen Technology Inc Morgan Stanley 16,139
(95) Associated Capital GroupInc ’A’
Bank of AmericaMerrill Lynch (756)
(72) Associated Capital GroupInc ’A’ Goldman Sachs (573)
(1,511) Assurant Inc Bank of AmericaMerrill Lynch (17,815)
(904) Assurant Inc Goldman Sachs (10,658)(1,621) Assurant Inc Morgan Stanley (2,480)(1,416) Astec Industries Inc Goldman Sachs (7,263)
352 Astronics Corp Goldman Sachs 4821,890 At Home Group Inc Bank of America
Merrill Lynch 3,3452,585 Athene Holding Ltd ’A’ Bank of America
Merrill Lynch 2,0554,051 Athene Holding Ltd ’A’ Goldman Sachs 11,3112,596 Athene Holding Ltd ’A’ Morgan Stanley 2,436
193 Atkore International GroupInc Goldman Sachs 990
(236) Atlantic Union BanksharesCorp Goldman Sachs (824)
Holding Description Counterparty
Netunrealised
appreciation/(depreciation)
USD
United States continued(1,526) Atlantica Sustainable
Infrastructure Plc Goldman Sachs 743(25) Atlas Air Worldwide
Holdings IncBank of AmericaMerrill Lynch (59)
(1,252) Atlas Air WorldwideHoldings Inc Goldman Sachs (2,967)
30 Atlassian Corp Plc ’A’ Goldman Sachs 15887 Atlassian Corp Plc ’A’ Morgan Stanley 3,85751 AtriCure Inc Goldman Sachs (24)6 Atrion Corp Bank of America
Merrill Lynch 2421 Atrion Corp Goldman Sachs 84
1,560 Aurinia Pharmaceuticals Inc Bank of AmericaMerrill Lynch (2,923)
547 Aurinia Pharmaceuticals Inc Goldman Sachs (1,001)501 Aurinia Pharmaceuticals Inc Morgan Stanley (496)
(4,108) AutoNation Inc Bank of AmericaMerrill Lynch (19,431)
(2,917) AutoNation Inc Goldman Sachs (11,273)(3,921) AutoNation Inc Morgan Stanley (2,509)
(330) Avalara Inc Morgan Stanley 1,010(195) AvalonBay Communities Inc
(REIT) Goldman Sachs (977)4,056 Avangrid Inc Bank of America
Merrill Lynch 15,3344,370 Avangrid Inc Goldman Sachs 13,3181,665 Avangrid Inc Morgan Stanley 5,128
(99) Avanos Medical Inc Bank of AmericaMerrill Lynch (248)
(183) Avanos Medical Inc Goldman Sachs (459)(449) Avis Budget Group Inc Goldman Sachs 430295 Avista Corp Goldman Sachs 56
1,283 Avnet Inc Bank of AmericaMerrill Lynch 42
1,140 Avnet Inc Goldman Sachs 1,5331,151 Avnet Inc Morgan Stanley (276)(160) Axcelis Technologies Inc Bank of America
Merrill Lynch (574)(280) Axcelis Technologies Inc Goldman Sachs (1,005)760 Axon Enterprise Inc Bank of America
Merrill Lynch (380)1,154 Axon Enterprise Inc Goldman Sachs (416)2,211 Axon Enterprise Inc Morgan Stanley (1,844)
137 Axonics ModulationTechnologies Inc
Bank of AmericaMerrill Lynch (103)
117 Axonics ModulationTechnologies Inc Goldman Sachs (88)
(57) Axsome Therapeutics Inc Bank of AmericaMerrill Lynch 445
(30) Axsome Therapeutics Inc Goldman Sachs 97(98) Axsome Therapeutics Inc Morgan Stanley 559(39) B&G Foods Inc Bank of America
Merrill Lynch 22(517) B&G Foods Inc Goldman Sachs 295232 Balchem Corp Bank of America
Merrill Lynch 2,446400 Balchem Corp Goldman Sachs 3,165504 BancFirst Corp Bank of America
Merrill Lynch 3,074420 BancFirst Corp Goldman Sachs 2,56223 Bandwidth Inc ’A’ Bank of America
Merrill Lynch 68(185) Bank of Marin Bancorp Bank of America
Merrill Lynch (1,018)(133) Bar Harbor Bankshares Bank of America
Merrill Lynch (243)127 Barrett Business Services
IncBank of AmericaMerrill Lynch 885
BlackRock Global Long/Short Equity Fund continued
The notes on pages 691 to 711 form an integral part of these financial statements.
BlackRock Strategic Funds[478]
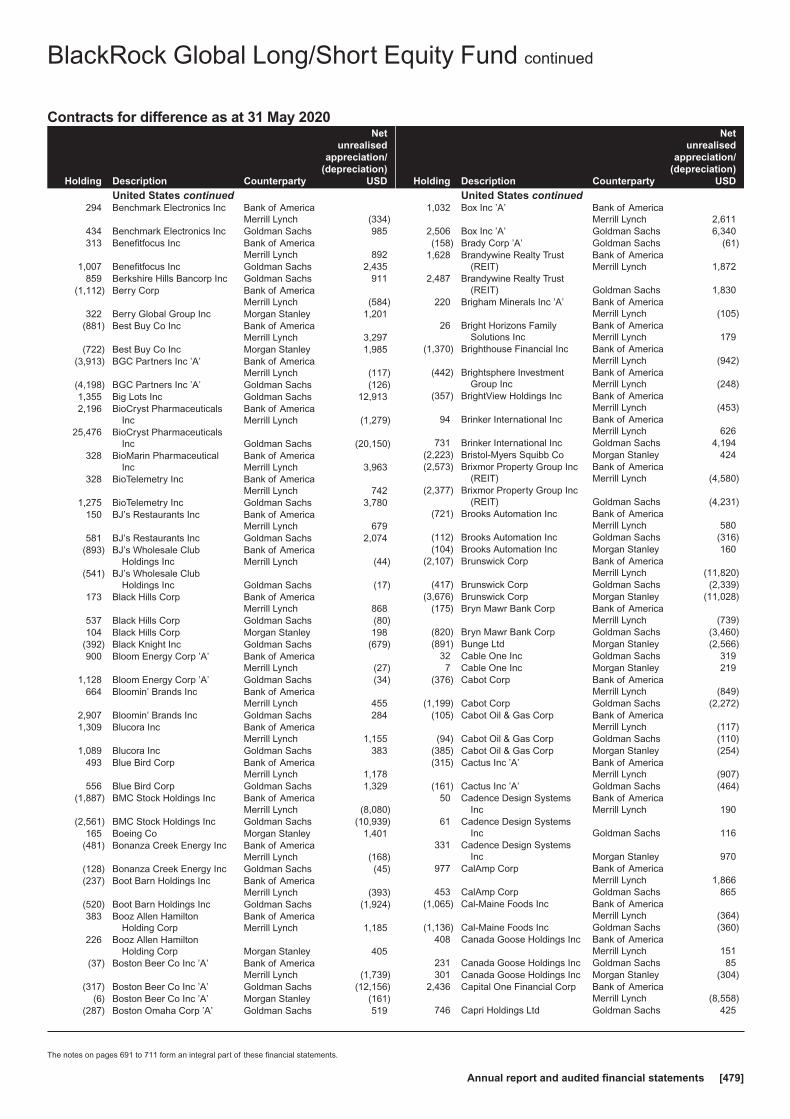
Contracts for difference as at 31 May 2020
Holding Description Counterparty
Netunrealised
appreciation/(depreciation)
USD
United States continued294 Benchmark Electronics Inc Bank of America
Merrill Lynch (334)434 Benchmark Electronics Inc Goldman Sachs 985313 Benefitfocus Inc Bank of America
Merrill Lynch 8921,007 Benefitfocus Inc Goldman Sachs 2,435
859 Berkshire Hills Bancorp Inc Goldman Sachs 911(1,112) Berry Corp Bank of America
Merrill Lynch (584)322 Berry Global Group Inc Morgan Stanley 1,201
(881) Best Buy Co Inc Bank of AmericaMerrill Lynch 3,297
(722) Best Buy Co Inc Morgan Stanley 1,985(3,913) BGC Partners Inc ’A’ Bank of America
Merrill Lynch (117)(4,198) BGC Partners Inc ’A’ Goldman Sachs (126)1,355 Big Lots Inc Goldman Sachs 12,9132,196 BioCryst Pharmaceuticals
IncBank of AmericaMerrill Lynch (1,279)
25,476 BioCryst PharmaceuticalsInc Goldman Sachs (20,150)
328 BioMarin PharmaceuticalInc
Bank of AmericaMerrill Lynch 3,963
328 BioTelemetry Inc Bank of AmericaMerrill Lynch 742
1,275 BioTelemetry Inc Goldman Sachs 3,780150 BJ’s Restaurants Inc Bank of America
Merrill Lynch 679581 BJ’s Restaurants Inc Goldman Sachs 2,074
(893) BJ’s Wholesale ClubHoldings Inc
Bank of AmericaMerrill Lynch (44)
(541) BJ’s Wholesale ClubHoldings Inc Goldman Sachs (17)
173 Black Hills Corp Bank of AmericaMerrill Lynch 868
537 Black Hills Corp Goldman Sachs (80)104 Black Hills Corp Morgan Stanley 198
(392) Black Knight Inc Goldman Sachs (679)900 Bloom Energy Corp ’A’ Bank of America
Merrill Lynch (27)1,128 Bloom Energy Corp ’A’ Goldman Sachs (34)
664 Bloomin’ Brands Inc Bank of AmericaMerrill Lynch 455
2,907 Bloomin’ Brands Inc Goldman Sachs 2841,309 Blucora Inc Bank of America
Merrill Lynch 1,1551,089 Blucora Inc Goldman Sachs 383
493 Blue Bird Corp Bank of AmericaMerrill Lynch 1,178
556 Blue Bird Corp Goldman Sachs 1,329(1,887) BMC Stock Holdings Inc Bank of America
Merrill Lynch (8,080)(2,561) BMC Stock Holdings Inc Goldman Sachs (10,939)
165 Boeing Co Morgan Stanley 1,401(481) Bonanza Creek Energy Inc Bank of America
Merrill Lynch (168)(128) Bonanza Creek Energy Inc Goldman Sachs (45)(237) Boot Barn Holdings Inc Bank of America
Merrill Lynch (393)(520) Boot Barn Holdings Inc Goldman Sachs (1,924)383 Booz Allen Hamilton
Holding CorpBank of AmericaMerrill Lynch 1,185
226 Booz Allen HamiltonHolding Corp Morgan Stanley 405
(37) Boston Beer Co Inc ’A’ Bank of AmericaMerrill Lynch (1,739)
(317) Boston Beer Co Inc ’A’ Goldman Sachs (12,156)(6) Boston Beer Co Inc ’A’ Morgan Stanley (161)
(287) Boston Omaha Corp ’A’ Goldman Sachs 519
Holding Description Counterparty
Netunrealised
appreciation/(depreciation)
USD
United States continued1,032 Box Inc ’A’ Bank of America
Merrill Lynch 2,6112,506 Box Inc ’A’ Goldman Sachs 6,340(158) Brady Corp ’A’ Goldman Sachs (61)
1,628 Brandywine Realty Trust(REIT)
Bank of AmericaMerrill Lynch 1,872
2,487 Brandywine Realty Trust(REIT) Goldman Sachs 1,830
220 Brigham Minerals Inc ’A’ Bank of AmericaMerrill Lynch (105)
26 Bright Horizons FamilySolutions Inc
Bank of AmericaMerrill Lynch 179
(1,370) Brighthouse Financial Inc Bank of AmericaMerrill Lynch (942)
(442) Brightsphere InvestmentGroup Inc
Bank of AmericaMerrill Lynch (248)
(357) BrightView Holdings Inc Bank of AmericaMerrill Lynch (453)
94 Brinker International Inc Bank of AmericaMerrill Lynch 626
731 Brinker International Inc Goldman Sachs 4,194(2,223) Bristol-Myers Squibb Co Morgan Stanley 424(2,573) Brixmor Property Group Inc
(REIT)Bank of AmericaMerrill Lynch (4,580)
(2,377) Brixmor Property Group Inc(REIT) Goldman Sachs (4,231)
(721) Brooks Automation Inc Bank of AmericaMerrill Lynch 580
(112) Brooks Automation Inc Goldman Sachs (316)(104) Brooks Automation Inc Morgan Stanley 160
(2,107) Brunswick Corp Bank of AmericaMerrill Lynch (11,820)
(417) Brunswick Corp Goldman Sachs (2,339)(3,676) Brunswick Corp Morgan Stanley (11,028)
(175) Bryn Mawr Bank Corp Bank of AmericaMerrill Lynch (739)
(820) Bryn Mawr Bank Corp Goldman Sachs (3,460)(891) Bunge Ltd Morgan Stanley (2,566)
32 Cable One Inc Goldman Sachs 3197 Cable One Inc Morgan Stanley 219
(376) Cabot Corp Bank of AmericaMerrill Lynch (849)
(1,199) Cabot Corp Goldman Sachs (2,272)(105) Cabot Oil & Gas Corp Bank of America
Merrill Lynch (117)(94) Cabot Oil & Gas Corp Goldman Sachs (110)
(385) Cabot Oil & Gas Corp Morgan Stanley (254)(315) Cactus Inc ’A’ Bank of America
Merrill Lynch (907)(161) Cactus Inc ’A’ Goldman Sachs (464)
50 Cadence Design SystemsInc
Bank of AmericaMerrill Lynch 190
61 Cadence Design SystemsInc Goldman Sachs 116
331 Cadence Design SystemsInc Morgan Stanley 970
977 CalAmp Corp Bank of AmericaMerrill Lynch 1,866
453 CalAmp Corp Goldman Sachs 865(1,065) Cal-Maine Foods Inc Bank of America
Merrill Lynch (364)(1,136) Cal-Maine Foods Inc Goldman Sachs (360)
408 Canada Goose Holdings Inc Bank of AmericaMerrill Lynch 151
231 Canada Goose Holdings Inc Goldman Sachs 85301 Canada Goose Holdings Inc Morgan Stanley (304)
2,436 Capital One Financial Corp Bank of AmericaMerrill Lynch (8,558)
746 Capri Holdings Ltd Goldman Sachs 425
BlackRock Global Long/Short Equity Fund continued
The notes on pages 691 to 711 form an integral part of these financial statements.
Annual report and audited financial statements [479]
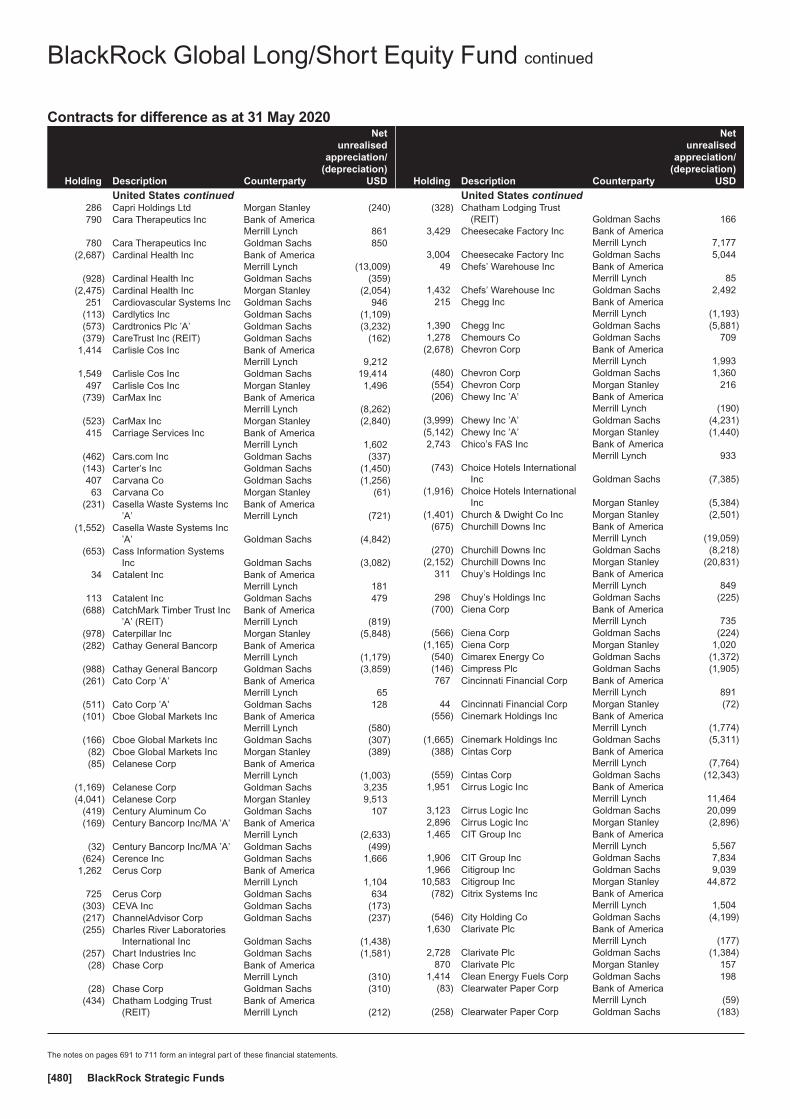
Contracts for difference as at 31 May 2020
Holding Description Counterparty
Netunrealised
appreciation/(depreciation)
USD
United States continued286 Capri Holdings Ltd Morgan Stanley (240)790 Cara Therapeutics Inc Bank of America
Merrill Lynch 861780 Cara Therapeutics Inc Goldman Sachs 850
(2,687) Cardinal Health Inc Bank of AmericaMerrill Lynch (13,009)
(928) Cardinal Health Inc Goldman Sachs (359)(2,475) Cardinal Health Inc Morgan Stanley (2,054)
251 Cardiovascular Systems Inc Goldman Sachs 946(113) Cardlytics Inc Goldman Sachs (1,109)(573) Cardtronics Plc ’A’ Goldman Sachs (3,232)(379) CareTrust Inc (REIT) Goldman Sachs (162)
1,414 Carlisle Cos Inc Bank of AmericaMerrill Lynch 9,212
1,549 Carlisle Cos Inc Goldman Sachs 19,414497 Carlisle Cos Inc Morgan Stanley 1,496
(739) CarMax Inc Bank of AmericaMerrill Lynch (8,262)
(523) CarMax Inc Morgan Stanley (2,840)415 Carriage Services Inc Bank of America
Merrill Lynch 1,602(462) Cars.com Inc Goldman Sachs (337)(143) Carter’s Inc Goldman Sachs (1,450)407 Carvana Co Goldman Sachs (1,256)63 Carvana Co Morgan Stanley (61)
(231) Casella Waste Systems Inc’A’
Bank of AmericaMerrill Lynch (721)
(1,552) Casella Waste Systems Inc’A’ Goldman Sachs (4,842)
(653) Cass Information SystemsInc Goldman Sachs (3,082)
34 Catalent Inc Bank of AmericaMerrill Lynch 181
113 Catalent Inc Goldman Sachs 479(688) CatchMark Timber Trust Inc
’A’ (REIT)Bank of AmericaMerrill Lynch (819)
(978) Caterpillar Inc Morgan Stanley (5,848)(282) Cathay General Bancorp Bank of America
Merrill Lynch (1,179)(988) Cathay General Bancorp Goldman Sachs (3,859)(261) Cato Corp ’A’ Bank of America
Merrill Lynch 65(511) Cato Corp ’A’ Goldman Sachs 128(101) Cboe Global Markets Inc Bank of America
Merrill Lynch (580)(166) Cboe Global Markets Inc Goldman Sachs (307)(82) Cboe Global Markets Inc Morgan Stanley (389)(85) Celanese Corp Bank of America
Merrill Lynch (1,003)(1,169) Celanese Corp Goldman Sachs 3,235(4,041) Celanese Corp Morgan Stanley 9,513
(419) Century Aluminum Co Goldman Sachs 107(169) Century Bancorp Inc/MA ’A’ Bank of America
Merrill Lynch (2,633)(32) Century Bancorp Inc/MA ’A’ Goldman Sachs (499)
(624) Cerence Inc Goldman Sachs 1,6661,262 Cerus Corp Bank of America
Merrill Lynch 1,104725 Cerus Corp Goldman Sachs 634
(303) CEVA Inc Goldman Sachs (173)(217) ChannelAdvisor Corp Goldman Sachs (237)(255) Charles River Laboratories
International Inc Goldman Sachs (1,438)(257) Chart Industries Inc Goldman Sachs (1,581)(28) Chase Corp Bank of America
Merrill Lynch (310)(28) Chase Corp Goldman Sachs (310)
(434) Chatham Lodging Trust(REIT)
Bank of AmericaMerrill Lynch (212)
Holding Description Counterparty
Netunrealised
appreciation/(depreciation)
USD
United States continued(328) Chatham Lodging Trust
(REIT) Goldman Sachs 1663,429 Cheesecake Factory Inc Bank of America
Merrill Lynch 7,1773,004 Cheesecake Factory Inc Goldman Sachs 5,044
49 Chefs’ Warehouse Inc Bank of AmericaMerrill Lynch 85
1,432 Chefs’ Warehouse Inc Goldman Sachs 2,492215 Chegg Inc Bank of America
Merrill Lynch (1,193)1,390 Chegg Inc Goldman Sachs (5,881)1,278 Chemours Co Goldman Sachs 709
(2,678) Chevron Corp Bank of AmericaMerrill Lynch 1,993
(480) Chevron Corp Goldman Sachs 1,360(554) Chevron Corp Morgan Stanley 216(206) Chewy Inc ’A’ Bank of America
Merrill Lynch (190)(3,999) Chewy Inc ’A’ Goldman Sachs (4,231)(5,142) Chewy Inc ’A’ Morgan Stanley (1,440)2,743 Chico’s FAS Inc Bank of America
Merrill Lynch 933(743) Choice Hotels International
Inc Goldman Sachs (7,385)(1,916) Choice Hotels International
Inc Morgan Stanley (5,384)(1,401) Church & Dwight Co Inc Morgan Stanley (2,501)
(675) Churchill Downs Inc Bank of AmericaMerrill Lynch (19,059)
(270) Churchill Downs Inc Goldman Sachs (8,218)(2,152) Churchill Downs Inc Morgan Stanley (20,831)
311 Chuy’s Holdings Inc Bank of AmericaMerrill Lynch 849
298 Chuy’s Holdings Inc Goldman Sachs (225)(700) Ciena Corp Bank of America
Merrill Lynch 735(566) Ciena Corp Goldman Sachs (224)
(1,165) Ciena Corp Morgan Stanley 1,020(540) Cimarex Energy Co Goldman Sachs (1,372)(146) Cimpress Plc Goldman Sachs (1,905)767 Cincinnati Financial Corp Bank of America
Merrill Lynch 89144 Cincinnati Financial Corp Morgan Stanley (72)
(556) Cinemark Holdings Inc Bank of AmericaMerrill Lynch (1,774)
(1,665) Cinemark Holdings Inc Goldman Sachs (5,311)(388) Cintas Corp Bank of America
Merrill Lynch (7,764)(559) Cintas Corp Goldman Sachs (12,343)
1,951 Cirrus Logic Inc Bank of AmericaMerrill Lynch 11,464
3,123 Cirrus Logic Inc Goldman Sachs 20,0992,896 Cirrus Logic Inc Morgan Stanley (2,896)1,465 CIT Group Inc Bank of America
Merrill Lynch 5,5671,906 CIT Group Inc Goldman Sachs 7,8341,966 Citigroup Inc Goldman Sachs 9,039
10,583 Citigroup Inc Morgan Stanley 44,872(782) Citrix Systems Inc Bank of America
Merrill Lynch 1,504(546) City Holding Co Goldman Sachs (4,199)
1,630 Clarivate Plc Bank of AmericaMerrill Lynch (177)
2,728 Clarivate Plc Goldman Sachs (1,384)870 Clarivate Plc Morgan Stanley 157
1,414 Clean Energy Fuels Corp Goldman Sachs 198(83) Clearwater Paper Corp Bank of America
Merrill Lynch (59)(258) Clearwater Paper Corp Goldman Sachs (183)
BlackRock Global Long/Short Equity Fund continued
The notes on pages 691 to 711 form an integral part of these financial statements.
BlackRock Strategic Funds[480]
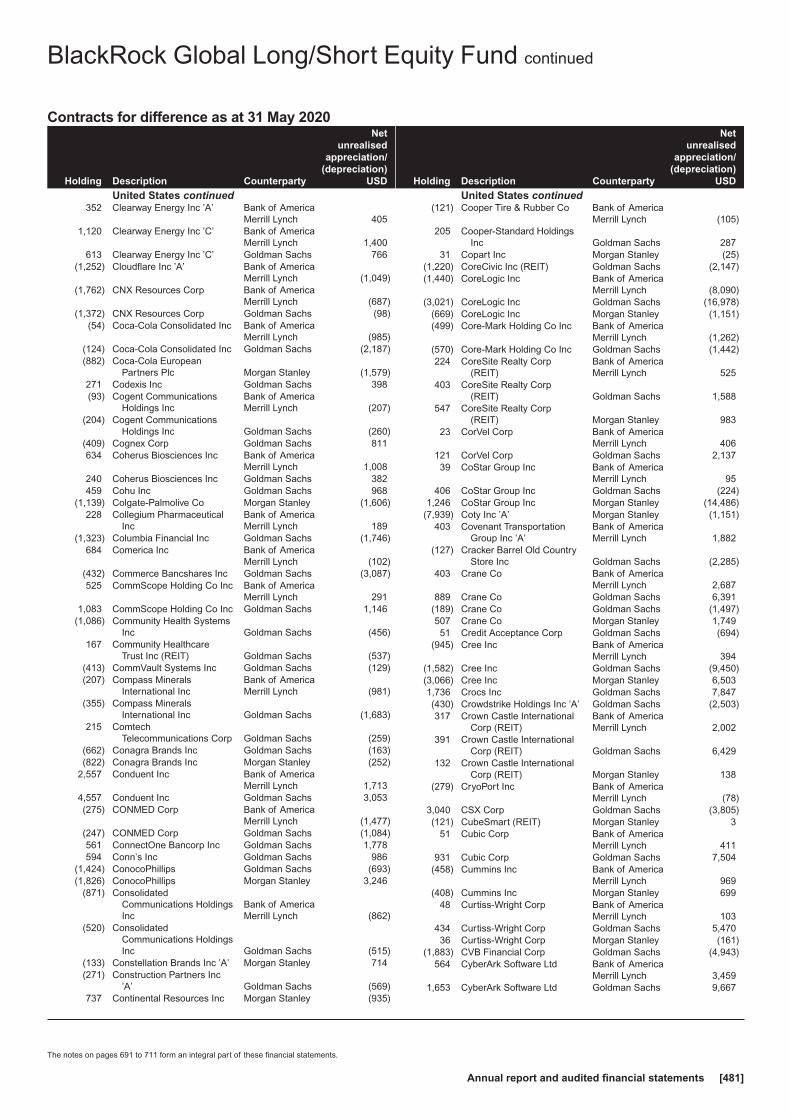
Contracts for difference as at 31 May 2020
Holding Description Counterparty
Netunrealised
appreciation/(depreciation)
USD
United States continued352 Clearway Energy Inc ’A’ Bank of America
Merrill Lynch 4051,120 Clearway Energy Inc ’C’ Bank of America
Merrill Lynch 1,400613 Clearway Energy Inc ’C’ Goldman Sachs 766
(1,252) Cloudflare Inc ’A’ Bank of AmericaMerrill Lynch (1,049)
(1,762) CNX Resources Corp Bank of AmericaMerrill Lynch (687)
(1,372) CNX Resources Corp Goldman Sachs (98)(54) Coca-Cola Consolidated Inc Bank of America
Merrill Lynch (985)(124) Coca-Cola Consolidated Inc Goldman Sachs (2,187)(882) Coca-Cola European
Partners Plc Morgan Stanley (1,579)271 Codexis Inc Goldman Sachs 398(93) Cogent Communications
Holdings IncBank of AmericaMerrill Lynch (207)
(204) Cogent CommunicationsHoldings Inc Goldman Sachs (260)
(409) Cognex Corp Goldman Sachs 811634 Coherus Biosciences Inc Bank of America
Merrill Lynch 1,008240 Coherus Biosciences Inc Goldman Sachs 382459 Cohu Inc Goldman Sachs 968
(1,139) Colgate-Palmolive Co Morgan Stanley (1,606)228 Collegium Pharmaceutical
IncBank of AmericaMerrill Lynch 189
(1,323) Columbia Financial Inc Goldman Sachs (1,746)684 Comerica Inc Bank of America
Merrill Lynch (102)(432) Commerce Bancshares Inc Goldman Sachs (3,087)525 CommScope Holding Co Inc Bank of America
Merrill Lynch 2911,083 CommScope Holding Co Inc Goldman Sachs 1,146
(1,086) Community Health SystemsInc Goldman Sachs (456)
167 Community HealthcareTrust Inc (REIT) Goldman Sachs (537)
(413) CommVault Systems Inc Goldman Sachs (129)(207) Compass Minerals
International IncBank of AmericaMerrill Lynch (981)
(355) Compass MineralsInternational Inc Goldman Sachs (1,683)
215 ComtechTelecommunications Corp Goldman Sachs (259)
(662) Conagra Brands Inc Goldman Sachs (163)(822) Conagra Brands Inc Morgan Stanley (252)
2,557 Conduent Inc Bank of AmericaMerrill Lynch 1,713
4,557 Conduent Inc Goldman Sachs 3,053(275) CONMED Corp Bank of America
Merrill Lynch (1,477)(247) CONMED Corp Goldman Sachs (1,084)561 ConnectOne Bancorp Inc Goldman Sachs 1,778594 Conn’s Inc Goldman Sachs 986
(1,424) ConocoPhillips Goldman Sachs (693)(1,826) ConocoPhillips Morgan Stanley 3,246
(871) ConsolidatedCommunications HoldingsInc
Bank of AmericaMerrill Lynch (862)
(520) ConsolidatedCommunications HoldingsInc Goldman Sachs (515)
(133) Constellation Brands Inc ’A’ Morgan Stanley 714(271) Construction Partners Inc
’A’ Goldman Sachs (569)737 Continental Resources Inc Morgan Stanley (935)
Holding Description Counterparty
Netunrealised
appreciation/(depreciation)
USD
United States continued(121) Cooper Tire & Rubber Co Bank of America
Merrill Lynch (105)205 Cooper-Standard Holdings
Inc Goldman Sachs 28731 Copart Inc Morgan Stanley (25)
(1,220) CoreCivic Inc (REIT) Goldman Sachs (2,147)(1,440) CoreLogic Inc Bank of America
Merrill Lynch (8,090)(3,021) CoreLogic Inc Goldman Sachs (16,978)
(669) CoreLogic Inc Morgan Stanley (1,151)(499) Core-Mark Holding Co Inc Bank of America
Merrill Lynch (1,262)(570) Core-Mark Holding Co Inc Goldman Sachs (1,442)224 CoreSite Realty Corp
(REIT)Bank of AmericaMerrill Lynch 525
403 CoreSite Realty Corp(REIT) Goldman Sachs 1,588
547 CoreSite Realty Corp(REIT) Morgan Stanley 983
23 CorVel Corp Bank of AmericaMerrill Lynch 406
121 CorVel Corp Goldman Sachs 2,13739 CoStar Group Inc Bank of America
Merrill Lynch 95406 CoStar Group Inc Goldman Sachs (224)
1,246 CoStar Group Inc Morgan Stanley (14,486)(7,939) Coty Inc ’A’ Morgan Stanley (1,151)
403 Covenant TransportationGroup Inc ’A’
Bank of AmericaMerrill Lynch 1,882
(127) Cracker Barrel Old CountryStore Inc Goldman Sachs (2,285)
403 Crane Co Bank of AmericaMerrill Lynch 2,687
889 Crane Co Goldman Sachs 6,391(189) Crane Co Goldman Sachs (1,497)507 Crane Co Morgan Stanley 1,74951 Credit Acceptance Corp Goldman Sachs (694)
(945) Cree Inc Bank of AmericaMerrill Lynch 394
(1,582) Cree Inc Goldman Sachs (9,450)(3,066) Cree Inc Morgan Stanley 6,5031,736 Crocs Inc Goldman Sachs 7,847(430) Crowdstrike Holdings Inc ’A’ Goldman Sachs (2,503)317 Crown Castle International
Corp (REIT)Bank of AmericaMerrill Lynch 2,002
391 Crown Castle InternationalCorp (REIT) Goldman Sachs 6,429
132 Crown Castle InternationalCorp (REIT) Morgan Stanley 138
(279) CryoPort Inc Bank of AmericaMerrill Lynch (78)
3,040 CSX Corp Goldman Sachs (3,805)(121) CubeSmart (REIT) Morgan Stanley 3
51 Cubic Corp Bank of AmericaMerrill Lynch 411
931 Cubic Corp Goldman Sachs 7,504(458) Cummins Inc Bank of America
Merrill Lynch 969(408) Cummins Inc Morgan Stanley 699
48 Curtiss-Wright Corp Bank of AmericaMerrill Lynch 103
434 Curtiss-Wright Corp Goldman Sachs 5,47036 Curtiss-Wright Corp Morgan Stanley (161)
(1,883) CVB Financial Corp Goldman Sachs (4,943)564 CyberArk Software Ltd Bank of America
Merrill Lynch 3,4591,653 CyberArk Software Ltd Goldman Sachs 9,667
BlackRock Global Long/Short Equity Fund continued
The notes on pages 691 to 711 form an integral part of these financial statements.
Annual report and audited financial statements [481]

Contracts for difference as at 31 May 2020
Holding Description Counterparty
Netunrealised
appreciation/(depreciation)
USD
United States continued596 CyberArk Software Ltd Morgan Stanley 989607 Dana Inc Bank of America
Merrill Lynch 1,8091,230 Danaher Corp Goldman Sachs 4,2382,955 Danaher Corp Morgan Stanley 21,394(430) Darden Restaurants Inc Goldman Sachs (3,685)
(3,693) Darling Ingredients Inc Bank of AmericaMerrill Lynch (10,008)
(2,250) Darling Ingredients Inc Goldman Sachs (6,098)(2,746) Darling Ingredients Inc Morgan Stanley (2,993)
(524) Datadog Inc ’A’ Morgan Stanley 1,707(526) Dave & Buster’s
Entertainment Inc Goldman Sachs (1,783)(864) DaVita Inc Goldman Sachs 115
42 Deckers Outdoor Corp Goldman Sachs 1,853137 Deluxe Corp Bank of America
Merrill Lynch 359157 Deluxe Corp Goldman Sachs 533546 Denny’s Corp Goldman Sachs 1,032
(1,044) Dentsply Sirona Inc Morgan Stanley 1,190295 Digimarc Corp Goldman Sachs 404
(1,198) Digital Turbine Inc Bank of AmericaMerrill Lynch (707)
(678) Dillard’s Inc ’A’ Goldman Sachs (1,724)125 Dine Brands Global Inc Bank of America
Merrill Lynch 1,251530 Dine Brands Global Inc Goldman Sachs 2,079(93) Diodes Inc Bank of America
Merrill Lynch (461)(270) Diodes Inc Goldman Sachs (1,339)
5,953 Discover Financial Services Bank of AmericaMerrill Lynch 60,046
3,041 Discover Financial Services Goldman Sachs 11,4454,371 Discover Financial Services Morgan Stanley 36,367(733) DISH Network Corp ’A’ Bank of America
Merrill Lynch 112(190) DocuSign Inc Bank of America
Merrill Lynch (2,035)105 Dolby Laboratories Inc ’A’ Bank of America
Merrill Lynch 7131,373 Dolby Laboratories Inc ’A’ Goldman Sachs 8,176
189 Dolby Laboratories Inc ’A’ Morgan Stanley 318(1,016) Dominion Energy Inc Bank of America
Merrill Lynch (5,161)(864) Dominion Energy Inc Goldman Sachs (4,221)
(12,458) Dominion Energy Inc Morgan Stanley (34,758)507 Domo Inc ’B’ Bank of America
Merrill Lynch 1,034130 Domtar Corp Bank of America
Merrill Lynch 85(362) Donaldson Co Inc Morgan Stanley (561)309 Douglas Dynamics Inc Bank of America
Merrill Lynch 1,795(4,153) DR Horton Inc Bank of America
Merrill Lynch (37,626)(7,315) DR Horton Inc Morgan Stanley (16,166)
(74) Dril-Quip Inc Bank of AmericaMerrill Lynch (289)
(171) Dril-Quip Inc Goldman Sachs (667)(330) DTE Energy Co Goldman Sachs (1,059)
(2,695) Duke Energy Corp Morgan Stanley (4,851)1,876 Duluth Holdings Inc ’B’ Bank of America
Merrill Lynch 2,1101,181 Duluth Holdings Inc ’B’ Goldman Sachs 1,329
213 DXP Enterprises Inc Goldman Sachs 803(103) Eagle Bancorp Inc Goldman Sachs (431)(338) Eagle Materials Inc Bank of America
Merrill Lynch (2,562)(689) Eagle Materials Inc Goldman Sachs 933
Holding Description Counterparty
Netunrealised
appreciation/(depreciation)
USD
United States continued(747) Eastman Chemical Co Bank of America
Merrill Lynch (4,141)(1,317) Eastman Chemical Co Goldman Sachs (10,049)(1,536) Eastman Chemical Co Morgan Stanley (21)(1,036) Eaton Vance Corp Goldman Sachs (2,859)(1,959) Eaton Vance Corp Morgan Stanley (1,293)2,224 eBay Inc Bank of America
Merrill Lynch 3,4892,564 eBay Inc Goldman Sachs 9762,417 eBay Inc Morgan Stanley 2,244(820) Ecolab Inc Goldman Sachs (6,001)
(1,054) Ecolab Inc Morgan Stanley (8,664)1,484 Edison International Bank of America
Merrill Lynch 1,2652,537 Edison International Goldman Sachs 2,198
853 Edison International Morgan Stanley 1,152193 Edwards Lifesciences Corp Goldman Sachs 1,263
1,675 Edwards Lifesciences Corp Morgan Stanley 7,470796 eHealth Inc Bank of America
Merrill Lynch 8,660307 eHealth Inc Goldman Sachs 3,34049 eHealth Inc Morgan Stanley (246)
714 Elanco Animal Health Inc Bank of AmericaMerrill Lynch 1,163
47 Elastic NV Bank of AmericaMerrill Lynch 564
(83) Eldorado Resorts Inc Goldman Sachs 109(4,730) Element Solutions Inc Bank of America
Merrill Lynch (5,159)(5,747) Element Solutions Inc Goldman Sachs (5,063)(1,096) Element Solutions Inc Morgan Stanley (88)
(557) Eli Lilly and Co Bank of AmericaMerrill Lynch 4,010
29 Emergent BioSolutions Inc Bank of AmericaMerrill Lynch (1)
(239) Encompass Health Corp Goldman Sachs (1,883)(146) Encore Capital Group Inc Goldman Sachs (13)(271) Encore Wire Corp Goldman Sachs (1,203)
2,182 Endo International Plc Bank of AmericaMerrill Lynch 240
1,006 Endurance InternationalGroup Holdings Inc
Bank of AmericaMerrill Lynch 936
(70) Energizer Holdings Inc Goldman Sachs (153)504 Energy Recovery Inc Goldman Sachs 222
(161) Enerpac Tool Group Corp Bank of AmericaMerrill Lynch (539)
(725) Enerpac Tool Group Corp Goldman Sachs (2,429)(256) Ennis Inc Bank of America
Merrill Lynch (448)(1,011) Enphase Energy Inc Bank of America
Merrill Lynch 10,095(144) Ensign Group Inc Goldman Sachs 46(636) Entegris Inc Bank of America
Merrill Lynch (38)(1,168) Entegris Inc Goldman Sachs 321
415 Enterprise FinancialServices Corp
Bank of AmericaMerrill Lynch 1,838
276 Enterprise FinancialServices Corp Goldman Sachs 1,223
816 EPAM Systems Inc Bank of AmericaMerrill Lynch 13,045
122 EPAM Systems Inc Goldman Sachs 1,494985 EPAM Systems Inc Morgan Stanley 9,46639 ePlus Inc Bank of America
Merrill Lynch 19256 ePlus Inc Goldman Sachs 276
(1,844) EQT Corp Goldman Sachs 1,076(2,704) EQT Corp Morgan Stanley 3,985
407 Equifax Inc Goldman Sachs 1,076
BlackRock Global Long/Short Equity Fund continued
The notes on pages 691 to 711 form an integral part of these financial statements.
BlackRock Strategic Funds[482]
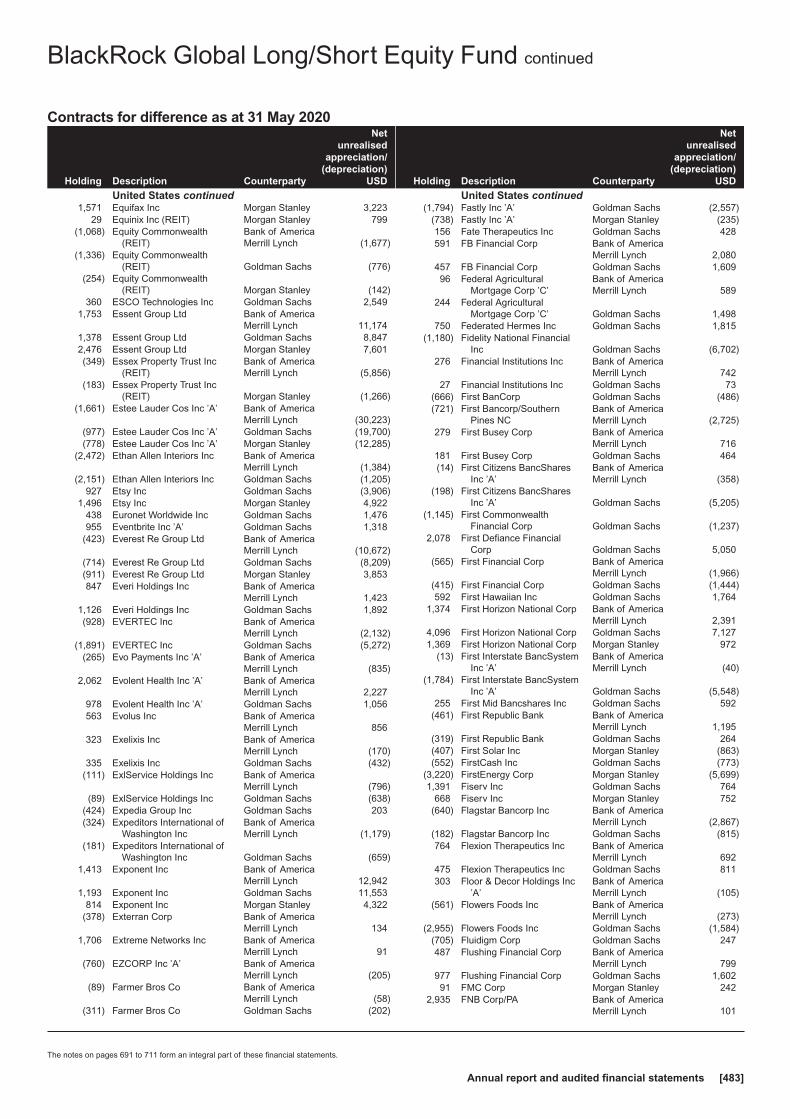
Contracts for difference as at 31 May 2020
Holding Description Counterparty
Netunrealised
appreciation/(depreciation)
USD
United States continued1,571 Equifax Inc Morgan Stanley 3,223
29 Equinix Inc (REIT) Morgan Stanley 799(1,068) Equity Commonwealth
(REIT)Bank of AmericaMerrill Lynch (1,677)
(1,336) Equity Commonwealth(REIT) Goldman Sachs (776)
(254) Equity Commonwealth(REIT) Morgan Stanley (142)
360 ESCO Technologies Inc Goldman Sachs 2,5491,753 Essent Group Ltd Bank of America
Merrill Lynch 11,1741,378 Essent Group Ltd Goldman Sachs 8,8472,476 Essent Group Ltd Morgan Stanley 7,601(349) Essex Property Trust Inc
(REIT)Bank of AmericaMerrill Lynch (5,856)
(183) Essex Property Trust Inc(REIT) Morgan Stanley (1,266)
(1,661) Estee Lauder Cos Inc ’A’ Bank of AmericaMerrill Lynch (30,223)
(977) Estee Lauder Cos Inc ’A’ Goldman Sachs (19,700)(778) Estee Lauder Cos Inc ’A’ Morgan Stanley (12,285)
(2,472) Ethan Allen Interiors Inc Bank of AmericaMerrill Lynch (1,384)
(2,151) Ethan Allen Interiors Inc Goldman Sachs (1,205)927 Etsy Inc Goldman Sachs (3,906)
1,496 Etsy Inc Morgan Stanley 4,922438 Euronet Worldwide Inc Goldman Sachs 1,476955 Eventbrite Inc ’A’ Goldman Sachs 1,318
(423) Everest Re Group Ltd Bank of AmericaMerrill Lynch (10,672)
(714) Everest Re Group Ltd Goldman Sachs (8,209)(911) Everest Re Group Ltd Morgan Stanley 3,853847 Everi Holdings Inc Bank of America
Merrill Lynch 1,4231,126 Everi Holdings Inc Goldman Sachs 1,892(928) EVERTEC Inc Bank of America
Merrill Lynch (2,132)(1,891) EVERTEC Inc Goldman Sachs (5,272)
(265) Evo Payments Inc ’A’ Bank of AmericaMerrill Lynch (835)
2,062 Evolent Health Inc ’A’ Bank of AmericaMerrill Lynch 2,227
978 Evolent Health Inc ’A’ Goldman Sachs 1,056563 Evolus Inc Bank of America
Merrill Lynch 856323 Exelixis Inc Bank of America
Merrill Lynch (170)335 Exelixis Inc Goldman Sachs (432)
(111) ExlService Holdings Inc Bank of AmericaMerrill Lynch (796)
(89) ExlService Holdings Inc Goldman Sachs (638)(424) Expedia Group Inc Goldman Sachs 203(324) Expeditors International of
Washington IncBank of AmericaMerrill Lynch (1,179)
(181) Expeditors International ofWashington Inc Goldman Sachs (659)
1,413 Exponent Inc Bank of AmericaMerrill Lynch 12,942
1,193 Exponent Inc Goldman Sachs 11,553814 Exponent Inc Morgan Stanley 4,322
(378) Exterran Corp Bank of AmericaMerrill Lynch 134
1,706 Extreme Networks Inc Bank of AmericaMerrill Lynch 91
(760) EZCORP Inc ’A’ Bank of AmericaMerrill Lynch (205)
(89) Farmer Bros Co Bank of AmericaMerrill Lynch (58)
(311) Farmer Bros Co Goldman Sachs (202)
Holding Description Counterparty
Netunrealised
appreciation/(depreciation)
USD
United States continued(1,794) Fastly Inc ’A’ Goldman Sachs (2,557)
(738) Fastly Inc ’A’ Morgan Stanley (235)156 Fate Therapeutics Inc Goldman Sachs 428591 FB Financial Corp Bank of America
Merrill Lynch 2,080457 FB Financial Corp Goldman Sachs 1,60996 Federal Agricultural
Mortgage Corp ’C’Bank of AmericaMerrill Lynch 589
244 Federal AgriculturalMortgage Corp ’C’ Goldman Sachs 1,498
750 Federated Hermes Inc Goldman Sachs 1,815(1,180) Fidelity National Financial
Inc Goldman Sachs (6,702)276 Financial Institutions Inc Bank of America
Merrill Lynch 74227 Financial Institutions Inc Goldman Sachs 73
(666) First BanCorp Goldman Sachs (486)(721) First Bancorp/Southern
Pines NCBank of AmericaMerrill Lynch (2,725)
279 First Busey Corp Bank of AmericaMerrill Lynch 716
181 First Busey Corp Goldman Sachs 464(14) First Citizens BancShares
Inc ’A’Bank of AmericaMerrill Lynch (358)
(198) First Citizens BancSharesInc ’A’ Goldman Sachs (5,205)
(1,145) First CommonwealthFinancial Corp Goldman Sachs (1,237)
2,078 First Defiance FinancialCorp Goldman Sachs 5,050
(565) First Financial Corp Bank of AmericaMerrill Lynch (1,966)
(415) First Financial Corp Goldman Sachs (1,444)592 First Hawaiian Inc Goldman Sachs 1,764
1,374 First Horizon National Corp Bank of AmericaMerrill Lynch 2,391
4,096 First Horizon National Corp Goldman Sachs 7,1271,369 First Horizon National Corp Morgan Stanley 972
(13) First Interstate BancSystemInc ’A’
Bank of AmericaMerrill Lynch (40)
(1,784) First Interstate BancSystemInc ’A’ Goldman Sachs (5,548)
255 First Mid Bancshares Inc Goldman Sachs 592(461) First Republic Bank Bank of America
Merrill Lynch 1,195(319) First Republic Bank Goldman Sachs 264(407) First Solar Inc Morgan Stanley (863)(552) FirstCash Inc Goldman Sachs (773)
(3,220) FirstEnergy Corp Morgan Stanley (5,699)1,391 Fiserv Inc Goldman Sachs 764
668 Fiserv Inc Morgan Stanley 752(640) Flagstar Bancorp Inc Bank of America
Merrill Lynch (2,867)(182) Flagstar Bancorp Inc Goldman Sachs (815)764 Flexion Therapeutics Inc Bank of America
Merrill Lynch 692475 Flexion Therapeutics Inc Goldman Sachs 811303 Floor & Decor Holdings Inc
’A’Bank of AmericaMerrill Lynch (105)
(561) Flowers Foods Inc Bank of AmericaMerrill Lynch (273)
(2,955) Flowers Foods Inc Goldman Sachs (1,584)(705) Fluidigm Corp Goldman Sachs 247487 Flushing Financial Corp Bank of America
Merrill Lynch 799977 Flushing Financial Corp Goldman Sachs 1,60291 FMC Corp Morgan Stanley 242
2,935 FNB Corp/PA Bank of AmericaMerrill Lynch 101
BlackRock Global Long/Short Equity Fund continued
The notes on pages 691 to 711 form an integral part of these financial statements.
Annual report and audited financial statements [483]

Contracts for difference as at 31 May 2020
Holding Description Counterparty
Netunrealised
appreciation/(depreciation)
USD
United States continued6,999 FNB Corp/PA Goldman Sachs 4,7975,173 FNB Corp/PA Morgan Stanley 1,429
(1,181) Foot Locker Inc Bank of AmericaMerrill Lynch 2,295
(2,160) Forestar Group Inc Bank of AmericaMerrill Lynch (4,838)
(535) Forestar Group Inc Goldman Sachs (1,198)216 Forrester Research Inc Bank of America
Merrill Lynch 177257 Forrester Research Inc Goldman Sachs 211
(474) Forterra Inc Bank of AmericaMerrill Lynch (393)
216 Fortinet Inc Bank of AmericaMerrill Lynch 405
217 Fortinet Inc Morgan Stanley (1,163)33 Fortive Corp Bank of America
Merrill Lynch (87)766 Fortive Corp Goldman Sachs (540)97 Forward Air Corp Bank of America
Merrill Lynch 14657 Forward Air Corp Goldman Sachs (46)
271 Four Corners Property TrustInc (REIT)
Bank of AmericaMerrill Lynch (372)
(478) Fresh Del Monte ProduceInc
Bank of AmericaMerrill Lynch (1,123)
1,258 Freshpet Inc Bank of AmericaMerrill Lynch 3,944
1,778 Freshpet Inc Goldman Sachs 6,0791,117 Freshpet Inc Morgan Stanley 5,360
940 frontdoor Inc Morgan Stanley 1,730137 FRP Holdings Inc Bank of America
Merrill Lynch (66)249 FRP Holdings Inc Goldman Sachs (3)
(115) FTI Consulting Inc Goldman Sachs (90)330 Fulton Financial Corp Bank of America
Merrill Lynch 1421,896 GameStop Corp ’A’ Goldman Sachs 360
9 Gaming and LeisureProperties Inc (REIT)
Bank of AmericaMerrill Lynch 22
(101) Gaming and LeisureProperties Inc (REIT)
Bank of AmericaMerrill Lynch (675)
(3,962) Gaming and LeisureProperties Inc (REIT) Goldman Sachs (26,466)
12 Gaming and LeisureProperties Inc (REIT) Goldman Sachs (21)
2,383 Gannett Co Inc Bank of AmericaMerrill Lynch 844
2,422 Gap Inc Bank of AmericaMerrill Lynch 3,398
1,651 Gap Inc Goldman Sachs 1,469(2,532) Garrett Motion Inc Bank of America
Merrill Lynch (1,139)(690) Garrett Motion Inc Goldman Sachs (311)(504) GCP Applied Technologies
IncBank of AmericaMerrill Lynch (1,507)
(442) GCP Applied TechnologiesInc Goldman Sachs (1,322)
(1,609) Genco Shipping & TradingLtd Goldman Sachs (8)
487 Generac Holdings Inc Goldman Sachs 5,7474,804 General Electric Co Morgan Stanley 817(141) Genesco Inc Goldman Sachs 236146 Gentex Corp Goldman Sachs (55)
(1,179) Genuine Parts Co Bank of AmericaMerrill Lynch (11,389)
(74) Genuine Parts Co Goldman Sachs (715)(1,279) Genuine Parts Co Morgan Stanley (7,111)
(553) Getty Realty Corp (REIT) Bank of AmericaMerrill Lynch (1,991)
Holding Description Counterparty
Netunrealised
appreciation/(depreciation)
USD
United States continued1,306 Gilead Sciences Inc Goldman Sachs (1,437)
97 Gilead Sciences Inc Morgan Stanley 177(160) Glacier Bancorp Inc Bank of America
Merrill Lynch (249)856 Gladstone Commercial Corp
(REIT)Bank of AmericaMerrill Lynch 2,089
554 Gladstone Commercial Corp(REIT) Goldman Sachs 1,352
336 Glaukos Corp Bank of AmericaMerrill Lynch 1,509
472 Glaukos Corp Goldman Sachs 1,830(568) Global Indemnity Ltd Goldman Sachs (227)199 Global Medical Inc (REIT) Bank of America
Merrill Lynch 277385 Global Medical Inc (REIT) Goldman Sachs 535243 GMS Inc Bank of America
Merrill Lynch 537366 Golden Entertainment Inc Bank of America
Merrill Lynch 1,292151 Graco Inc Bank of America
Merrill Lynch 26333 Grand Canyon Education
IncBank of AmericaMerrill Lynch 26
403 Grand Canyon EducationInc Goldman Sachs 323
572 Grand Canyon EducationInc Morgan Stanley 738
(195) Graphic Packaging HoldingCo Goldman Sachs (324)
(2,422) Graphic Packaging HoldingCo Morgan Stanley (2,519)
843 Green Brick Partners Inc Bank of AmericaMerrill Lynch 969
225 Green Brick Partners Inc Goldman Sachs 259(289) Green Plains Inc Goldman Sachs 193(687) Greenbrier Cos Inc Goldman Sachs (1,891)
78 Greif Inc ’A’ Bank of AmericaMerrill Lynch 419
434 Greif Inc ’A’ Goldman Sachs 1,943(419) Group 1 Automotive Inc Bank of America
Merrill Lynch (8,028)(746) Guess? Inc Bank of America
Merrill Lynch (547)(3,730) Gulfport Energy Corp Bank of America
Merrill Lynch 522(2,241) Gulfport Energy Corp Goldman Sachs 314
(473) H&E Equipment ServicesInc
Bank of AmericaMerrill Lynch (1,428)
(153) H&E Equipment ServicesInc Goldman Sachs (462)
4,527 H&R Block Inc Bank of AmericaMerrill Lynch 5,885
5,209 H&R Block Inc Goldman Sachs 6,7725,890 H&R Block Inc Morgan Stanley (59)
174 Haemonetics Corp Goldman Sachs 1,777(6,423) Hain Celestial Group Inc Bank of America
Merrill Lynch (6,998)(4,033) Hain Celestial Group Inc Goldman Sachs (4,027)(1,205) Hain Celestial Group Inc Morgan Stanley (1,904)
70 Hamilton Lane Inc ’A’ Bank of AmericaMerrill Lynch 514
650 Hancock Whitney Corp Bank of AmericaMerrill Lynch 2,135
2,063 Hancock Whitney Corp Goldman Sachs 9,466(12,792) Hanesbrands Inc Bank of America
Merrill Lynch (15,862)(7,364) Hanesbrands Inc Goldman Sachs (9,131)(5,612) Hanesbrands Inc Morgan Stanley (954)
BlackRock Global Long/Short Equity Fund continued
The notes on pages 691 to 711 form an integral part of these financial statements.
BlackRock Strategic Funds[484]

Contracts for difference as at 31 May 2020
Holding Description Counterparty
Netunrealised
appreciation/(depreciation)
USD
United States continued(189) Hanger Inc Bank of America
Merrill Lynch (518)(143) Hanger Inc Goldman Sachs (392)237 Hannon Armstrong
Sustainable InfrastructureCapital Inc (REIT)
Bank of AmericaMerrill Lynch (2)
127 Hanover Insurance GroupInc Goldman Sachs 1,836
287 Harsco Corp Bank of AmericaMerrill Lynch 763
681 Harsco Corp Goldman Sachs 1,81149 Hasbro Inc Bank of America
Merrill Lynch 17834 Hasbro Inc Morgan Stanley 902
(262) Haverty Furniture Cos Inc Goldman Sachs 177(590) Haynes International Inc Bank of America
Merrill Lynch (646)395 HCA Healthcare Inc Morgan Stanley (1,355)217 HCI Group Inc Bank of America
Merrill Lynch 571122 HCI Group Inc Goldman Sachs 321116 HD Supply Holdings Inc Goldman Sachs (129)128 Health Catalyst Inc Goldman Sachs (234)
(1,503) Healthcare Realty Trust Inc(REIT)
Bank of AmericaMerrill Lynch (1,561)
(2,813) Healthcare Realty Trust Inc(REIT) Goldman Sachs (4,335)
(1,605) Healthcare Realty Trust Inc(REIT) Morgan Stanley (465)
521 HealthEquity Inc Goldman Sachs 4,413(57) HealthEquity Inc Goldman Sachs 102
1,629 HealthEquity Inc Morgan Stanley 6,695(1,403) Healthpeak Properties Inc
(REIT) Goldman Sachs (3,718)1,597 Heartland Express Inc Bank of America
Merrill Lynch 3,9653,914 Heartland Express Inc Goldman Sachs 6,967(195) Heartland Financial USA Inc Goldman Sachs (975)
(2,074) Hecla Mining Co Bank of AmericaMerrill Lynch (257)
(5,684) Hecla Mining Co Goldman Sachs (1,035)98 Helen of Troy Ltd Morgan Stanley (512)
(348) Helios Technologies Inc Goldman Sachs (2,081)(1,026) Helmerich & Payne Inc Goldman Sachs (2,360)
(58) Henry Schein Inc Bank of AmericaMerrill Lynch 54
1,436 Heritage Commerce Corp Goldman Sachs 1,623(183) Heritage Insurance Holdings
Inc Goldman Sachs (66)(683) Hersha Hospitality Trust
(REIT)Bank of AmericaMerrill Lynch (209)
(1,044) Hess Corp Bank of AmericaMerrill Lynch (177)
(1,023) Hess Corp Goldman Sachs 1,37510,594 Hewlett Packard Enterprise
Co Goldman Sachs 3,54913,935 Hewlett Packard Enterprise
Co Morgan Stanley (325)303 Hillenbrand Inc Goldman Sachs 1,239
(553) Hilltop Holdings Inc Goldman Sachs (2,129)2,655 Hilton Worldwide Holdings
IncBank of AmericaMerrill Lynch (6,984)
790 Hilton Worldwide HoldingsInc Goldman Sachs (1,340)
122 HMS Holdings Corp Bank of AmericaMerrill Lynch 470
945 HMS Holdings Corp Goldman Sachs 3,638(369) HNI Corp Bank of America
Merrill Lynch (1,775)
Holding Description Counterparty
Netunrealised
appreciation/(depreciation)
USD
United States continued(380) HNI Corp Goldman Sachs (1,828)(342) HomeTrust Bancshares Inc Bank of America
Merrill Lynch (845)(280) HomeTrust Bancshares Inc Goldman Sachs (692)784 Horizon Bancorp Inc Bank of America
Merrill Lynch 1,1841,405 Horizon Bancorp Inc Goldman Sachs 2,122
(4,635) Horizon Therapeutics Plc Goldman Sachs (8,131)(5,764) Horizon Therapeutics Plc Morgan Stanley (3,093)
(530) Host Hotels & Resorts Inc(REIT) Goldman Sachs (898)
(10,660) Host Hotels & Resorts Inc(REIT) Morgan Stanley (5,597)
2,161 Houghton Mifflin HarcourtCo Goldman Sachs 1,091
(1,290) Houlihan Lokey Inc Bank of AmericaMerrill Lynch 3,456
(408) Houlihan Lokey Inc Goldman Sachs 1,152(739) Houlihan Lokey Inc Morgan Stanley 429398 Howard Hughes Corp Bank of America
Merrill Lynch 3,227549 Howard Hughes Corp Goldman Sachs 3,101586 Howard Hughes Corp Morgan Stanley 2,022
(4,036) Howmet Aerospace Inc Morgan Stanley (2,744)197 Hubbell Inc Goldman Sachs 1,423526 HubSpot Inc Bank of America
Merrill Lynch 4,473891 HubSpot Inc Goldman Sachs 7,588391 HubSpot Inc Morgan Stanley (657)686 Hudson Pacific Properties
Inc (REIT)Bank of AmericaMerrill Lynch 2,752
1,103 Hudson Pacific PropertiesInc (REIT) Goldman Sachs 3,337
(241) Humana Inc Bank of AmericaMerrill Lynch (1,357)
2,656 Huntington Bancshares Inc Morgan Stanley 2,085(282) Huntsman Corp Bank of America
Merrill Lynch (823)(1,000) Huntsman Corp Goldman Sachs (2,920)
84 Huron Consulting Group Inc Bank of AmericaMerrill Lynch 570
96 Huron Consulting Group Inc Goldman Sachs 652647 IAA Inc Bank of America
Merrill Lynch 3,0801,338 IAA Inc Goldman Sachs 6,369
717 IAA Inc Morgan Stanley 2,459181 ICF International Inc Bank of America
Merrill Lynch 1,412702 ICF International Inc Goldman Sachs 5,086332 ICU Medical Inc Bank of America
Merrill Lynch 568383 ICU Medical Inc Goldman Sachs 1,881231 ICU Medical Inc Morgan Stanley 1,31713 IDACORP Inc Goldman Sachs 84
187 IDACORP Inc Morgan Stanley 613508 IHS Markit Ltd Goldman Sachs 1,361570 IHS Markit Ltd Morgan Stanley 457238 Illumina Inc Goldman Sachs 8,758
(454) IMAX Corp Goldman Sachs 433347 Incyte Corp Goldman Sachs 880
(613) Independent Bank Corp Bank of AmericaMerrill Lynch (8,276)
1,156 Independent Bank Corp Bank of AmericaMerrill Lynch 2,439
3,184 Independent Bank Corp Goldman Sachs 6,718(81) Independent Bank Group
IncBank of AmericaMerrill Lynch (427)
BlackRock Global Long/Short Equity Fund continued
The notes on pages 691 to 711 form an integral part of these financial statements.
Annual report and audited financial statements [485]

Contracts for difference as at 31 May 2020
Holding Description Counterparty
Netunrealised
appreciation/(depreciation)
USD
United States continued41 Infinera Corp Bank of America
Merrill Lynch 26(58) Ingredion Inc Bank of America
Merrill Lynch 58(376) Ingredion Inc Morgan Stanley 1,107(275) Innoviva Inc Bank of America
Merrill Lynch 45270 Inogen Inc Bank of America
Merrill Lynch (49)160 Inogen Inc Goldman Sachs (29)253 Inovalon Holdings Inc ’A’ Bank of America
Merrill Lynch 751220 Inovalon Holdings Inc ’A’ Goldman Sachs (93)281 Inovio Pharmaceuticals Inc Bank of America
Merrill Lynch 277,340 Inovio Pharmaceuticals Inc Goldman Sachs (95)
403 Inovio Pharmaceuticals Inc Morgan Stanley 143552 Insight Enterprises Inc Bank of America
Merrill Lynch 2,1561,597 Insight Enterprises Inc Goldman Sachs 7,5681,376 Insperity Inc Goldman Sachs 8,339
121 Inspire Medical Systems Inc Goldman Sachs 560(422) Insteel Industries Inc Bank of America
Merrill Lynch (928)(287) Insteel Industries Inc Goldman Sachs (631)280 Insulet Corp Bank of America
Merrill Lynch (4,290)237 Insulet Corp Goldman Sachs (3,639)158 Insulet Corp Morgan Stanley (815)(31) Integer Holdings Corp Bank of America
Merrill Lynch 140(147) Integer Holdings Corp Goldman Sachs 449(598) Integra
LifeSciences HoldingsCorp Goldman Sachs (3,044)
(3,999) Intel Corp Bank of AmericaMerrill Lynch (106)
(1,184) Intel Corp Goldman Sachs (4,819)(5,527) Intel Corp Morgan Stanley (2,238)1,483 Interactive Brokers Group
Inc ’A’Bank of AmericaMerrill Lynch 1,551
4,386 Interactive Brokers GroupInc ’A’ Goldman Sachs 15,860
496 Interactive Brokers GroupInc ’A’ Morgan Stanley 1,805
30 Intercept PharmaceuticalsInc
Bank of AmericaMerrill Lynch (31)
107 Intercept PharmaceuticalsInc Goldman Sachs (1,092)
409 Intercontinental ExchangeInc
Bank of AmericaMerrill Lynch 56
2,965 Intercontinental ExchangeInc Goldman Sachs 4,833
3,689 Intercontinental ExchangeInc Morgan Stanley 4,404
(946) Interface Inc Bank of AmericaMerrill Lynch (1,244)
(1,013) Interface Inc Goldman Sachs (1,332)(671) International Bancshares
CorpBank of AmericaMerrill Lynch (2,630)
(1,642) International BancsharesCorp Goldman Sachs (7,586)
(4,512) International BusinessMachines Corp Morgan Stanley (19,311)
(626) International MoneyExpress Inc
Bank of AmericaMerrill Lynch (662)
(235) International Seaways Inc Goldman Sachs 187262 INTL. FCStone Inc Bank of America
Merrill Lynch 3,144
Holding Description Counterparty
Netunrealised
appreciation/(depreciation)
USD
United States continued457 INTL. FCStone Inc Goldman Sachs 5,484179 Intra-Cellular Therapies Inc Bank of America
Merrill Lynch (272)8,421 Invesco Ltd Bank of America
Merrill Lynch 9,7143,747 Invesco Ltd Goldman Sachs 3,8305,791 Invesco Ltd Morgan Stanley 3,504
(2,902) Investors Bancorp Inc Goldman Sachs (3,308)(71) Investors Real Estate Trust
(REIT)Bank of AmericaMerrill Lynch (510)
(442) Investors Real Estate Trust(REIT) Goldman Sachs (1,911)
843 Invitae Corp Bank of AmericaMerrill Lynch 294
913 Invitae Corp Goldman Sachs 420(1,334) Invitation Homes Inc (REIT) Morgan Stanley (640)
(331) iRhythm Technologies Inc Bank of AmericaMerrill Lynch 638
(205) iRhythm Technologies Inc Goldman Sachs 822(299) iRhythm Technologies Inc Morgan Stanley 571
87 iRobot Corp Bank of AmericaMerrill Lynch (47)
240 iRobot Corp Goldman Sachs (77)(348) iStar Inc (REIT) Bank of America
Merrill Lynch (550)(219) iStar Inc (REIT) Goldman Sachs (346)357 ITT Inc Goldman Sachs 3,013258 Ituran Location and Control
LtdBank of AmericaMerrill Lynch 676
309 J&J Snack Foods Corp Bank of AmericaMerrill Lynch 1,486
513 J&J Snack Foods Corp Goldman Sachs 2,147348 J2 Global Inc Goldman Sachs 978
(5,489) Jabil Inc Bank of AmericaMerrill Lynch (10,319)
(5,410) Jabil Inc Goldman Sachs (10,171)(5,877) Jabil Inc Morgan Stanley (4,702)
(851) Janus Henderson Group Plc Goldman Sachs (3,447)(687) JELD-WEN Holding Inc Bank of America
Merrill Lynch 448(15) John B Sanfilippo & Son Inc Bank of America
Merrill Lynch (51)(186) John B Sanfilippo & Son Inc Goldman Sachs (634)
(7,298) Johnson & Johnson Morgan Stanley (20,905)260 Johnson Outdoors Inc ’A’ Bank of America
Merrill Lynch 2,493446 Johnson Outdoors Inc ’A’ Goldman Sachs 3,825
3,982 JPMorgan Chase & Co Morgan Stanley 34,619(198) K12 Inc Goldman Sachs (59)(168) Kadant Inc Bank of America
Merrill Lynch (667)(315) Kadant Inc Goldman Sachs (1,306)
(3,236) Kearny Financial Corp Bank of AmericaMerrill Lynch (2,851)
(276) Kearny Financial Corp Goldman Sachs 86(6) Kennametal Inc Bank of America
Merrill Lynch (29)(4,406) Kennametal Inc Goldman Sachs (21,589)4,231 KeyCorp Bank of America
Merrill Lynch 5,913340 Keysight Technologies Inc Morgan Stanley 1,506485 Kimball International Inc ’B’ Goldman Sachs 509
(1,057) Kimberly-Clark Corp Bank of AmericaMerrill Lynch (2,653)
(1,490) Kimberly-Clark Corp Goldman Sachs (4,301)(2,501) Kimberly-Clark Corp Morgan Stanley (3,526)1,026 Kinder Morgan Inc Goldman Sachs 206
BlackRock Global Long/Short Equity Fund continued
The notes on pages 691 to 711 form an integral part of these financial statements.
BlackRock Strategic Funds[486]
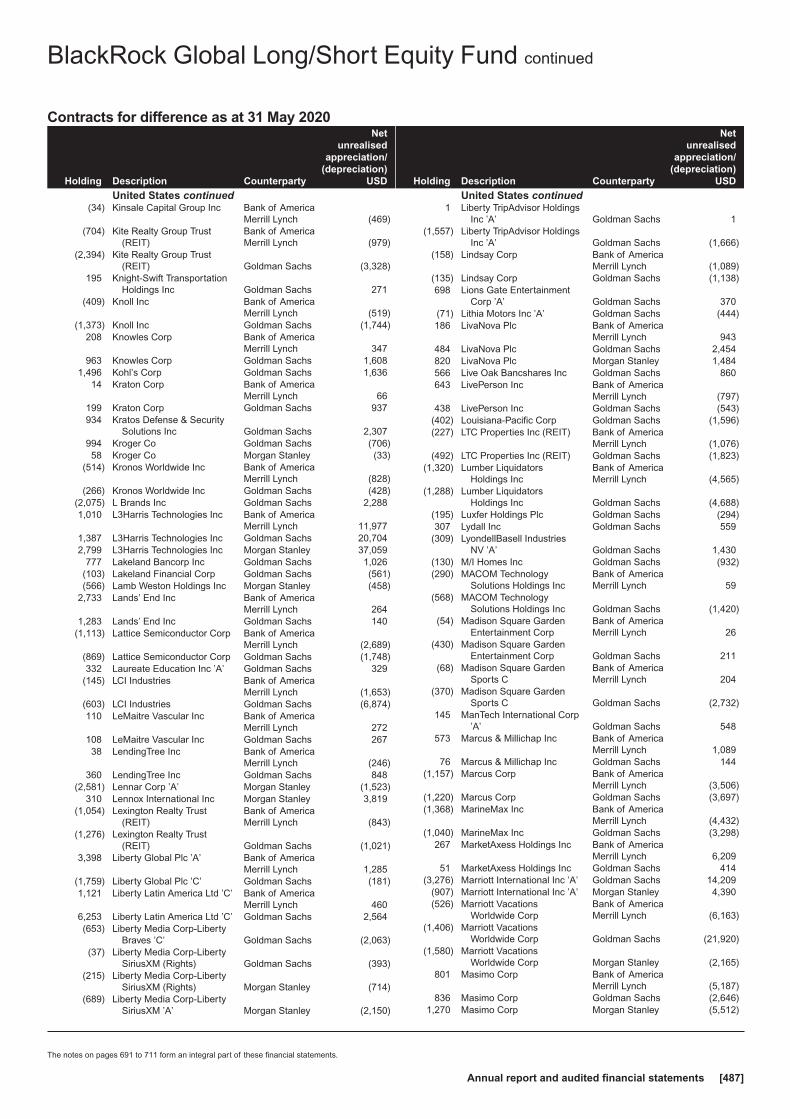
Contracts for difference as at 31 May 2020
Holding Description Counterparty
Netunrealised
appreciation/(depreciation)
USD
United States continued(34) Kinsale Capital Group Inc Bank of America
Merrill Lynch (469)(704) Kite Realty Group Trust
(REIT)Bank of AmericaMerrill Lynch (979)
(2,394) Kite Realty Group Trust(REIT) Goldman Sachs (3,328)
195 Knight-Swift TransportationHoldings Inc Goldman Sachs 271
(409) Knoll Inc Bank of AmericaMerrill Lynch (519)
(1,373) Knoll Inc Goldman Sachs (1,744)208 Knowles Corp Bank of America
Merrill Lynch 347963 Knowles Corp Goldman Sachs 1,608
1,496 Kohl’s Corp Goldman Sachs 1,63614 Kraton Corp Bank of America
Merrill Lynch 66199 Kraton Corp Goldman Sachs 937934 Kratos Defense & Security
Solutions Inc Goldman Sachs 2,307994 Kroger Co Goldman Sachs (706)58 Kroger Co Morgan Stanley (33)
(514) Kronos Worldwide Inc Bank of AmericaMerrill Lynch (828)
(266) Kronos Worldwide Inc Goldman Sachs (428)(2,075) L Brands Inc Goldman Sachs 2,2881,010 L3Harris Technologies Inc Bank of America
Merrill Lynch 11,9771,387 L3Harris Technologies Inc Goldman Sachs 20,7042,799 L3Harris Technologies Inc Morgan Stanley 37,059
777 Lakeland Bancorp Inc Goldman Sachs 1,026(103) Lakeland Financial Corp Goldman Sachs (561)(566) Lamb Weston Holdings Inc Morgan Stanley (458)
2,733 Lands’ End Inc Bank of AmericaMerrill Lynch 264
1,283 Lands’ End Inc Goldman Sachs 140(1,113) Lattice Semiconductor Corp Bank of America
Merrill Lynch (2,689)(869) Lattice Semiconductor Corp Goldman Sachs (1,748)332 Laureate Education Inc ’A’ Goldman Sachs 329
(145) LCI Industries Bank of AmericaMerrill Lynch (1,653)
(603) LCI Industries Goldman Sachs (6,874)110 LeMaitre Vascular Inc Bank of America
Merrill Lynch 272108 LeMaitre Vascular Inc Goldman Sachs 26738 LendingTree Inc Bank of America
Merrill Lynch (246)360 LendingTree Inc Goldman Sachs 848
(2,581) Lennar Corp ’A’ Morgan Stanley (1,523)310 Lennox International Inc Morgan Stanley 3,819
(1,054) Lexington Realty Trust(REIT)
Bank of AmericaMerrill Lynch (843)
(1,276) Lexington Realty Trust(REIT) Goldman Sachs (1,021)
3,398 Liberty Global Plc ’A’ Bank of AmericaMerrill Lynch 1,285
(1,759) Liberty Global Plc ’C’ Goldman Sachs (181)1,121 Liberty Latin America Ltd ’C’ Bank of America
Merrill Lynch 4606,253 Liberty Latin America Ltd ’C’ Goldman Sachs 2,564(653) Liberty Media Corp-Liberty
Braves ’C’ Goldman Sachs (2,063)(37) Liberty Media Corp-Liberty
SiriusXM (Rights) Goldman Sachs (393)(215) Liberty Media Corp-Liberty
SiriusXM (Rights) Morgan Stanley (714)(689) Liberty Media Corp-Liberty
SiriusXM ’A’ Morgan Stanley (2,150)
Holding Description Counterparty
Netunrealised
appreciation/(depreciation)
USD
United States continued1 Liberty TripAdvisor Holdings
Inc ’A’ Goldman Sachs 1(1,557) Liberty TripAdvisor Holdings
Inc ’A’ Goldman Sachs (1,666)(158) Lindsay Corp Bank of America
Merrill Lynch (1,089)(135) Lindsay Corp Goldman Sachs (1,138)698 Lions Gate Entertainment
Corp ’A’ Goldman Sachs 370(71) Lithia Motors Inc ’A’ Goldman Sachs (444)186 LivaNova Plc Bank of America
Merrill Lynch 943484 LivaNova Plc Goldman Sachs 2,454820 LivaNova Plc Morgan Stanley 1,484566 Live Oak Bancshares Inc Goldman Sachs 860643 LivePerson Inc Bank of America
Merrill Lynch (797)438 LivePerson Inc Goldman Sachs (543)
(402) Louisiana-Pacific Corp Goldman Sachs (1,596)(227) LTC Properties Inc (REIT) Bank of America
Merrill Lynch (1,076)(492) LTC Properties Inc (REIT) Goldman Sachs (1,823)
(1,320) Lumber LiquidatorsHoldings Inc
Bank of AmericaMerrill Lynch (4,565)
(1,288) Lumber LiquidatorsHoldings Inc Goldman Sachs (4,688)
(195) Luxfer Holdings Plc Goldman Sachs (294)307 Lydall Inc Goldman Sachs 559
(309) LyondellBasell IndustriesNV ’A’ Goldman Sachs 1,430
(130) M/I Homes Inc Goldman Sachs (932)(290) MACOM Technology
Solutions Holdings IncBank of AmericaMerrill Lynch 59
(568) MACOM TechnologySolutions Holdings Inc Goldman Sachs (1,420)
(54) Madison Square GardenEntertainment Corp
Bank of AmericaMerrill Lynch 26
(430) Madison Square GardenEntertainment Corp Goldman Sachs 211
(68) Madison Square GardenSports C
Bank of AmericaMerrill Lynch 204
(370) Madison Square GardenSports C Goldman Sachs (2,732)
145 ManTech International Corp’A’ Goldman Sachs 548
573 Marcus & Millichap Inc Bank of AmericaMerrill Lynch 1,089
76 Marcus & Millichap Inc Goldman Sachs 144(1,157) Marcus Corp Bank of America
Merrill Lynch (3,506)(1,220) Marcus Corp Goldman Sachs (3,697)(1,368) MarineMax Inc Bank of America
Merrill Lynch (4,432)(1,040) MarineMax Inc Goldman Sachs (3,298)
267 MarketAxess Holdings Inc Bank of AmericaMerrill Lynch 6,209
51 MarketAxess Holdings Inc Goldman Sachs 414(3,276) Marriott International Inc ’A’ Goldman Sachs 14,209
(907) Marriott International Inc ’A’ Morgan Stanley 4,390(526) Marriott Vacations
Worldwide CorpBank of AmericaMerrill Lynch (6,163)
(1,406) Marriott VacationsWorldwide Corp Goldman Sachs (21,920)
(1,580) Marriott VacationsWorldwide Corp Morgan Stanley (2,165)
801 Masimo Corp Bank of AmericaMerrill Lynch (5,187)
836 Masimo Corp Goldman Sachs (2,646)1,270 Masimo Corp Morgan Stanley (5,512)
BlackRock Global Long/Short Equity Fund continued
The notes on pages 691 to 711 form an integral part of these financial statements.
Annual report and audited financial statements [487]

Contracts for difference as at 31 May 2020
Holding Description Counterparty
Netunrealised
appreciation/(depreciation)
USD
United States continued(243) Masonite International Corp Bank of America
Merrill Lynch (1,965)(116) Masonite International Corp Goldman Sachs (820)221 MasTec Inc Bank of America
Merrill Lynch 900547 MasTec Inc Goldman Sachs 2,624342 Matrix Service Co Bank of America
Merrill Lynch 9611,592 Mattel Inc Bank of America
Merrill Lynch 1,9421,987 Mattel Inc Morgan Stanley 1,490(224) MAXIMUS Inc Bank of America
Merrill Lynch (1,427)(2,423) MAXIMUS Inc Goldman Sachs (15,435)
(384) MAXIMUS Inc Morgan Stanley 648568 MaxLinear Inc Bank of America
Merrill Lynch 914739 MaxLinear Inc Goldman Sachs 1,190
(350) MBIA Inc Goldman Sachs (378)(346) McCormick & Co Inc Bank of America
Merrill Lynch (364)(427) McCormick & Co Inc Goldman Sachs 1,773
(1,073) McCormick & Co Inc Morgan Stanley (1,112)927 McDonald’s Corp Bank of America
Merrill Lynch 13,108872 McDonald’s Corp Goldman Sachs 636
1,905 McDonald’s Corp Morgan Stanley 3,418(489) McKesson Corp Bank of America
Merrill Lynch (7,277)(363) McKesson Corp Goldman Sachs 222(559) McKesson Corp Morgan Stanley (842)
1,102 MDC Holdings Inc Goldman Sachs 7,499827 MDU Resources Group Inc Bank of America
Merrill Lynch (528)686 Media Gen Inc CVR* Bank of America
Merrill Lynch (206)45 Medifast Inc Goldman Sachs 106
267 MEDNAX Inc Bank of AmericaMerrill Lynch 451
644 MEDNAX Inc Goldman Sachs 759(385) Medpace Holdings Inc Bank of America
Merrill Lynch (3,326)(662) Medpace Holdings Inc Goldman Sachs (5,465)(137) Medpace Holdings Inc Morgan Stanley (112)898 Medtronic Plc Goldman Sachs 2,438
1,023 Mercantile Bank Corp Bank of AmericaMerrill Lynch 3,028
1,006 Mercantile Bank Corp Goldman Sachs 2,978(986) Mercer International Inc Bank of America
Merrill Lynch (256)(830) Mercury General Corp Bank of America
Merrill Lynch (1,751)(1,364) Mercury General Corp Goldman Sachs (2,357)
250 Mercury Systems Inc Bank of AmericaMerrill Lynch 86
743 Mercury Systems Inc Goldman Sachs 2,499(57) Meritage Homes Corp Bank of America
Merrill Lynch (246)(346) Meritage Homes Corp Goldman Sachs (2,661)(894) Meritor Inc Bank of America
Merrill Lynch (1,527)(347) Meritor Inc Goldman Sachs (888)(802) Methode Electronics Inc Bank of America
Merrill Lynch (2,999)(79) Methode Electronics Inc Goldman Sachs (295)
11,551 MGIC Investment Corp Bank of AmericaMerrill Lynch 18,597
4,593 MGIC Investment Corp Goldman Sachs 6,770
Holding Description Counterparty
Netunrealised
appreciation/(depreciation)
USD
United States continued12,923 MGIC Investment Corp Morgan Stanley 9,0462,262 MGM Resorts International Goldman Sachs 76
864 Midland States Bancorp Inc Bank of AmericaMerrill Lynch 1,236
1,564 Midland States Bancorp Inc Goldman Sachs 2,237242 MidWestOne Financial
Group IncBank of AmericaMerrill Lynch 622
174 MidWestOne FinancialGroup Inc Goldman Sachs 447
585 MobileIron Inc Bank of AmericaMerrill Lynch (59)
1,685 MobileIron Inc Goldman Sachs (169)311 Model N Inc Goldman Sachs (504)188 Moderna Inc Goldman Sachs 322
1,826 Moderna Inc Morgan Stanley (14,892)696 Modine Manufacturing Co Bank of America
Merrill Lynch 1,2182,352 Modine Manufacturing Co Goldman Sachs 4,116(130) Molina Healthcare Inc Goldman Sachs (1,235)(335) Monarch Casino & Resort
Inc Goldman Sachs (3,136)(63) MongoDB Inc Bank of America
Merrill Lynch (299)(14) MongoDB Inc Goldman Sachs (65)350 Monmouth Real Estate
Investment Corp (REIT)Bank of AmericaMerrill Lynch 455
(270) Monro Inc Bank of AmericaMerrill Lynch (1,269)
(869) Monro Inc Goldman Sachs (4,084)826 Moog Inc ’A’ Goldman Sachs 9,554
(3,179) Morgan Stanley Goldman Sachs 1,774207 Morningstar Inc Bank of America
Merrill Lynch 1,033709 Morningstar Inc Goldman Sachs 3,738505 Mosaic Co Bank of America
Merrill Lynch 4395,037 Mosaic Co Goldman Sachs 9,671
761 Mosaic Co Morgan Stanley (325)237 Motorcar Parts of America
IncBank of AmericaMerrill Lynch 412
67 Motorola Solutions Inc Bank of AmericaMerrill Lynch 18
462 Motorola Solutions Inc Goldman Sachs (1,285)1,876 Motorola Solutions Inc Morgan Stanley 807
303 Movado Group Inc Goldman Sachs 100(601) Mr Cooper Group Inc Bank of America
Merrill Lynch (1,142)(556) Mr Cooper Group Inc Goldman Sachs (1,056)
45 MSA Safety Inc Bank of AmericaMerrill Lynch (196)
550 MSA Safety Inc Goldman Sachs (490)46 MSCI Inc Bank of America
Merrill Lynch 261194 MSCI Inc Goldman Sachs 3,064
(362) MSG Networks Inc ’A’ Bank of AmericaMerrill Lynch (214)
(203) MSG Networks Inc ’A’ Goldman Sachs (120)536 MTS Systems Corp Bank of America
Merrill Lynch 1,597579 MTS Systems Corp Goldman Sachs 1,811
(1,990) Mueller Industries Inc Bank of AmericaMerrill Lynch (8,060)
(2,137) Mueller Industries Inc Goldman Sachs (8,655)(1,467) Murphy USA Inc Morgan Stanley 5,487
439 MYR Group Inc Bank of AmericaMerrill Lynch 1,594
348 MYR Group Inc Goldman Sachs 1,263
BlackRock Global Long/Short Equity Fund continued
The notes on pages 691 to 711 form an integral part of these financial statements.
BlackRock Strategic Funds[488]

Contracts for difference as at 31 May 2020
Holding Description Counterparty
Netunrealised
appreciation/(depreciation)
USD
United States continued97 NanoString Technologies
IncBank of AmericaMerrill Lynch (127)
149 NanoString TechnologiesInc Goldman Sachs (195)
9,005 NanoViricides Inc Bank of AmericaMerrill Lynch (16,429)
2,013 NanoViricides Inc Goldman Sachs (2,098)3,011 NanoViricides Inc Morgan Stanley (391)
725 National CineMedia Inc Goldman Sachs 65458 National Research Corp Bank of America
Merrill Lynch 1,850587 National Research Corp Goldman Sachs 2,371
(2,171) National Retail PropertiesInc (REIT)
Bank of AmericaMerrill Lynch (6,839)
(131) National Retail PropertiesInc (REIT) Goldman Sachs (144)
(1,956) National Retail PropertiesInc (REIT) Morgan Stanley (724)
(27) National Western Life GroupInc ’A’
Bank of AmericaMerrill Lynch (657)
(16) National Western Life GroupInc ’A’ Goldman Sachs (389)
(309) Natus Medical Inc Bank of AmericaMerrill Lynch (28)
(264) Natus Medical Inc Goldman Sachs (24)775 Navient Corp Goldman Sachs 597340 Neenah Inc Bank of America
Merrill Lynch 2,132497 Neenah Inc Goldman Sachs 2,827107 Nektar Therapeutics Bank of America
Merrill Lynch (117)4,170 NeoGenomics Inc Goldman Sachs (3,832)3,846 NeoGenomics Inc Morgan Stanley (2,923)
358 NetApp Inc Bank of AmericaMerrill Lynch 180
65 NetApp Inc Goldman Sachs 9993 NetApp Inc Morgan Stanley (42)
147 NETGEAR Inc Bank of AmericaMerrill Lynch 194
86 Nevro Corp Bank of AmericaMerrill Lynch 648
995 Nevro Corp Morgan Stanley (1,781)2,968 New Relic Inc Bank of America
Merrill Lynch 3,3976,229 New Relic Inc Goldman Sachs 7,4181,186 New Relic Inc Morgan Stanley 1,304(780) New York Community
Bancorp IncBank of AmericaMerrill Lynch (889)
(1,233) New York CommunityBancorp Inc Goldman Sachs (1,406)
(2,478) New York CommunityBancorp Inc Morgan Stanley (2,404)
1,670 New York Times Co ’A’ Bank of AmericaMerrill Lynch 3,722
972 New York Times Co ’A’ Goldman Sachs 2,381754 New York Times Co ’A’ Morgan Stanley 442
(1,049) Newmark Group Inc ’A’ Goldman Sachs (965)(15) NewMarket Corp Bank of America
Merrill Lynch (174)(38) NewMarket Corp Goldman Sachs (695)
(416) NewMarket Corp Morgan Stanley (1,785)(5,144) News Corp ’A’ Goldman Sachs (5,012)
(14,652) News Corp ’A’ Morgan Stanley (4,982)(80) NexPoint Residential Trust
Inc (REIT)Bank of AmericaMerrill Lynch (270)
1,676 Nexstar Media Group Inc ’A’ Goldman Sachs 13,8612,731 Nexstar Media Group Inc ’A’ Morgan Stanley 3,277
363 NextGen Healthcare Inc Bank of AmericaMerrill Lynch 358
Holding Description Counterparty
Netunrealised
appreciation/(depreciation)
USD
United States continued73 Nicolet Bankshares Inc Bank of America
Merrill Lynch 433309 Nicolet Bankshares Inc Goldman Sachs 1,832454 Nielsen Holdings Plc Bank of America
Merrill Lynch 6952,243 Nielsen Holdings Plc Goldman Sachs 2,5206,674 Nielsen Holdings Plc Morgan Stanley 4,338
859 NN Inc Goldman Sachs 9234,737 Noble Energy Inc Goldman Sachs (5,232)1,511 Norfolk Southern Corp Bank of America
Merrill Lynch 20,3581,453 Norfolk Southern Corp Goldman Sachs 11,116
131 Norfolk Southern Corp Morgan Stanley 857(2,585) Northern Oil and Gas Inc Bank of America
Merrill Lynch 192(2,698) Northern Oil and Gas Inc Goldman Sachs 2015,119 Norwegian Cruise Line
Holdings LtdBank of AmericaMerrill Lynch (868)
(60) Novanta Inc Goldman Sachs (166)253 Novavax Inc Bank of America
Merrill Lynch (856)2,058 Novavax Inc Morgan Stanley (2,131)
640 Novocure Ltd Bank of AmericaMerrill Lynch 1,459
621 Novocure Ltd Goldman Sachs 1,416(2,918) NRG Energy Inc Bank of America
Merrill Lynch (9,338)(4,554) NRG Energy Inc Goldman Sachs (7,151)(2,375) NRG Energy Inc Morgan Stanley 94
120 Nu Skin Enterprises Inc ’A’ Goldman Sachs (208)(806) Nuance Communications
IncBank of AmericaMerrill Lynch (1,948)
(230) Nuance CommunicationsInc Goldman Sachs (26)
2,399 Nucor Corp Goldman Sachs 6,3638 Nutanix Inc ’A’ Bank of America
Merrill Lynch 281,066 Nutanix Inc ’A’ Goldman Sachs 3,683(550) NuVasive Inc Bank of America
Merrill Lynch (1,650)(957) NuVasive Inc Morgan Stanley 2,813204 NV5 Global Inc Bank of America
Merrill Lynch 1,448123 NV5 Global Inc Goldman Sachs 140(59) NVE Corp Bank of America
Merrill Lynch (239)(356) NVE Corp Goldman Sachs (1,442)217 nVent Electric Plc Goldman Sachs (144)(11) NVR Inc Goldman Sachs (4,784)
(2,322) Occidental Petroleum Corp Morgan Stanley 2,4153,830 Oceaneering International
IncBank of AmericaMerrill Lynch 4,902
2,621 Oceaneering InternationalInc Goldman Sachs 3,355
2,112 OceanFirst Financial Corp Bank of AmericaMerrill Lynch 6,146
(234) Odonate Therapeutics Inc Bank of AmericaMerrill Lynch (1,135)
(408) Odonate Therapeutics Inc Goldman Sachs (1,979)(235) OFG Bancorp Bank of America
Merrill Lynch (411)(3,711) Old Republic International
Corp Goldman Sachs (5,010)(323) Ollie’s Bargain Outlet
Holdings IncBank of AmericaMerrill Lynch (6,304)
(536) Omega HealthcareInvestors Inc (REIT)
Bank of AmericaMerrill Lynch (2,326)
(2,890) Omega HealthcareInvestors Inc (REIT) Morgan Stanley (3,121)
BlackRock Global Long/Short Equity Fund continued
The notes on pages 691 to 711 form an integral part of these financial statements.
Annual report and audited financial statements [489]

Contracts for difference as at 31 May 2020
Holding Description Counterparty
Netunrealised
appreciation/(depreciation)
USD
United States continued491 Omeros Corp Bank of America
Merrill Lynch 211821 Omeros Corp Goldman Sachs 550102 Omnicell Inc Bank of America
Merrill Lynch 209470 Omnicell Inc Goldman Sachs 1,927
(347) One Liberty Properties Inc(REIT)
Bank of AmericaMerrill Lynch (743)
(194) One Liberty Properties Inc(REIT) Goldman Sachs (415)
(934) ONEOK Inc Bank of AmericaMerrill Lynch (37)
(324) OneSpan Inc Goldman Sachs 6(1,146) OneSpaWorld Holdings Ltd Goldman Sachs (1,650)
672 Onto Innovation Inc Bank of AmericaMerrill Lynch 236
438 Onto Innovation Inc Goldman Sachs 399(5,590) Oracle Corp Bank of America
Merrill Lynch (5,154)(1,751) Oracle Corp Goldman Sachs (1,106)
(13,952) Oracle Corp Morgan Stanley (10,758)530 OraSure Technologies Inc Bank of America
Merrill Lynch (518)1,083 OraSure Technologies Inc Goldman Sachs (1,386)
493 Oshkosh Corp Bank of AmericaMerrill Lynch 3,630
344 Oshkosh Corp Goldman Sachs 2,664(199) Otter Tail Corp Goldman Sachs (728)(710) Owens & Minor Inc Bank of America
Merrill Lynch (646)(1,406) Owens & Minor Inc Goldman Sachs (1,279)(1,246) Owens Corning Bank of America
Merrill Lynch 2,865237 Oxford Industries Inc Goldman Sachs 1,446
(2,305) PACCAR Inc Morgan Stanley (10,326)4,772 Pacific Biosciences of
California IncBank of AmericaMerrill Lynch 262
(584) Pacira BioSciences Inc Bank of AmericaMerrill Lynch 213
(225) Pacira BioSciences Inc Goldman Sachs 35536 PagerDuty Inc Goldman Sachs 139(39) Palomar Holdings Inc Bank of America
Merrill Lynch (506)534 Par Pacific Holdings Inc Goldman Sachs 961
(537) Park Aerospace Corp Bank of AmericaMerrill Lynch (97)
(552) Park Aerospace Corp Goldman Sachs (99)(562) Parker-Hannifin Corp Bank of America
Merrill Lynch (13,287)(938) Parker-Hannifin Corp Morgan Stanley (10,205)402 Parsley Energy Inc ’A’ Bank of America
Merrill Lynch 801,728 Parsley Energy Inc ’A’ Goldman Sachs (52)(110) Patrick Industries Inc Goldman Sachs (142)
(6,092) Paychex Inc Morgan Stanley (23,028)506 Paylocity Holding Corp Goldman Sachs 4,030
1,134 Paylocity Holding Corp Morgan Stanley 9,5261,019 PayPal Holdings Inc Bank of America
Merrill Lynch 4,163804 PayPal Holdings Inc Goldman Sachs 162
3,758 PayPal Holdings Inc Morgan Stanley 10,730563 Paysign Inc Bank of America
Merrill Lynch (138)(620) PDC Energy Inc Bank of America
Merrill Lynch (570)(1,073) PDC Energy Inc Goldman Sachs (987)
168 Peapack-GladstoneFinancial Corp Goldman Sachs 521
Holding Description Counterparty
Netunrealised
appreciation/(depreciation)
USD
United States continued(778) Pebblebrook Hotel Trust
(REIT)Bank of AmericaMerrill Lynch (198)
(1,359) Pebblebrook Hotel Trust(REIT) Goldman Sachs 625
(1,530) Peloton Interactive Inc ’A’ Bank of AmericaMerrill Lynch 9,119
(498) Peloton Interactive Inc ’A’ Goldman Sachs 1,241(2,102) Penn National Gaming Inc Bank of America
Merrill Lynch (4,208)(352) Penn Virginia Corp Goldman Sachs (483)(155) Penske Automotive Group
Inc Goldman Sachs (818)(5,715) Pentair Plc Goldman Sachs (32,404)(4,429) Pentair Plc Morgan Stanley (11,870)
237 Penumbra Inc Bank of AmericaMerrill Lynch 592
72 Penumbra Inc Goldman Sachs 173(146) Peoples Bancorp Inc Bank of America
Merrill Lynch (457)(787) Peoples Bancorp Inc Goldman Sachs (2,463)(464) Perdoceo Education Corp Goldman Sachs (457)562 Perficient Inc Goldman Sachs 1,810
(412) Perrigo Co Plc Goldman Sachs 361(1,644) Perrigo Co Plc Morgan Stanley 1,158
(222) PetMed Express Inc Bank of AmericaMerrill Lynch (410)
(241) PetMed Express Inc Goldman Sachs (378)(12,949) Pfizer Inc Bank of America
Merrill Lynch (7,069)1,173 PGT Innovations Inc Bank of America
Merrill Lynch 3,073746 PGT Innovations Inc Goldman Sachs 1,955
(720) PH Glatfelter Co Bank of AmericaMerrill Lynch (1,274)
(941) PH Glatfelter Co Goldman Sachs (1,666)(186) Phibro Animal Health Corp
’A’Bank of AmericaMerrill Lynch (760)
(320) Phibro Animal Health Corp’A’ Goldman Sachs (1,307)
474 Philip Morris InternationalInc
Bank of AmericaMerrill Lynch 1,697
(344) Phillips 66 Goldman Sachs 37790 Phreesia Inc Bank of America
Merrill Lynch (53)7,069 Pinnacle Financial Partners
IncBank of AmericaMerrill Lynch 34,618
5,630 Pinnacle Financial PartnersInc Goldman Sachs 26,601
1,309 Pinnacle Financial PartnersInc Morgan Stanley 4,176
(527) Pioneer Natural ResourcesCo
Bank of AmericaMerrill Lynch 1,600
(92) Piper Sandler Cos Bank of AmericaMerrill Lynch (650)
(230) Piper Sandler Cos Goldman Sachs (1,624)2,590 Planet Fitness Inc ’A’ Bank of America
Merrill Lynch 21,524794 Planet Fitness Inc ’A’ Goldman Sachs 6,685666 Planet Fitness Inc ’A’ Morgan Stanley 1,244262 Plantronics Inc Bank of America
Merrill Lynch (242)(1,443) Playa Hotels & Resorts NV Goldman Sachs (209)1,111 PlayAGS Inc Goldman Sachs 1,811
(59) Plexus Corp Goldman Sachs (59)867 Plug Power Inc Bank of America
Merrill Lynch 742,874 Plug Power Inc Goldman Sachs 193(603) Polaris Inc Morgan Stanley (2,394)
BlackRock Global Long/Short Equity Fund continued
The notes on pages 691 to 711 form an integral part of these financial statements.
BlackRock Strategic Funds[490]
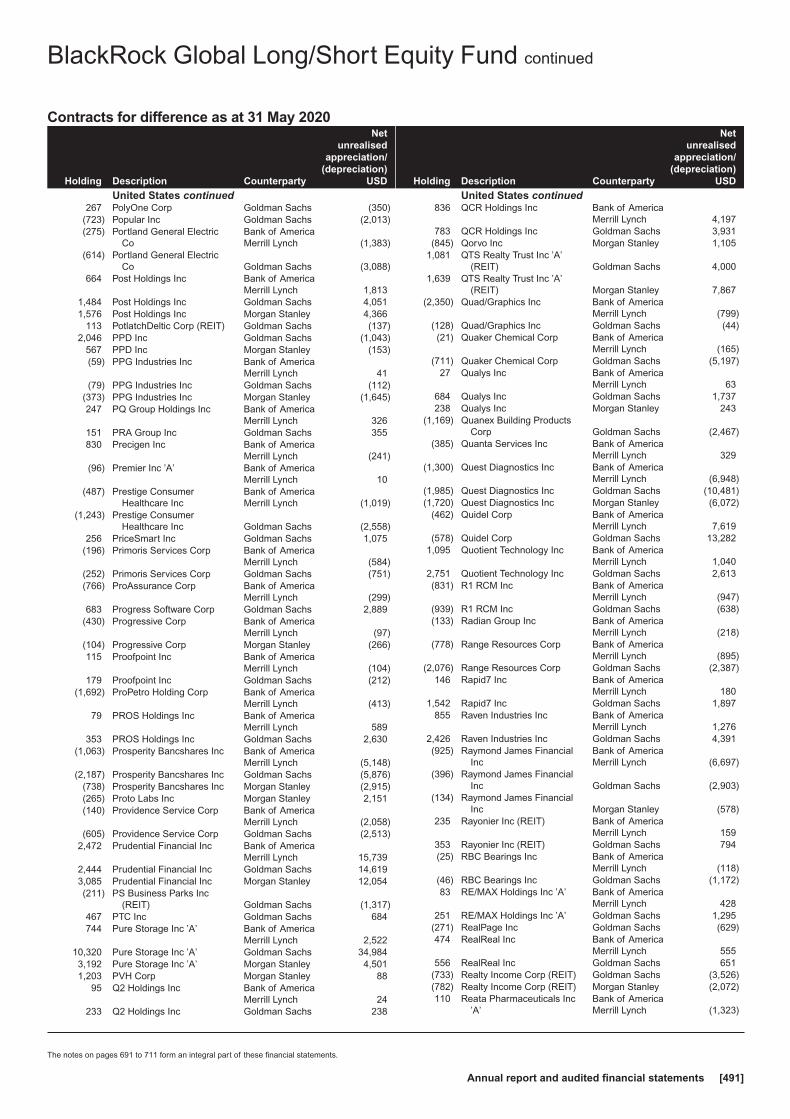
Contracts for difference as at 31 May 2020
Holding Description Counterparty
Netunrealised
appreciation/(depreciation)
USD
United States continued267 PolyOne Corp Goldman Sachs (350)
(723) Popular Inc Goldman Sachs (2,013)(275) Portland General Electric
CoBank of AmericaMerrill Lynch (1,383)
(614) Portland General ElectricCo Goldman Sachs (3,088)
664 Post Holdings Inc Bank of AmericaMerrill Lynch 1,813
1,484 Post Holdings Inc Goldman Sachs 4,0511,576 Post Holdings Inc Morgan Stanley 4,366
113 PotlatchDeltic Corp (REIT) Goldman Sachs (137)2,046 PPD Inc Goldman Sachs (1,043)
567 PPD Inc Morgan Stanley (153)(59) PPG Industries Inc Bank of America
Merrill Lynch 41(79) PPG Industries Inc Goldman Sachs (112)
(373) PPG Industries Inc Morgan Stanley (1,645)247 PQ Group Holdings Inc Bank of America
Merrill Lynch 326151 PRA Group Inc Goldman Sachs 355830 Precigen Inc Bank of America
Merrill Lynch (241)(96) Premier Inc ’A’ Bank of America
Merrill Lynch 10(487) Prestige Consumer
Healthcare IncBank of AmericaMerrill Lynch (1,019)
(1,243) Prestige ConsumerHealthcare Inc Goldman Sachs (2,558)
256 PriceSmart Inc Goldman Sachs 1,075(196) Primoris Services Corp Bank of America
Merrill Lynch (584)(252) Primoris Services Corp Goldman Sachs (751)(766) ProAssurance Corp Bank of America
Merrill Lynch (299)683 Progress Software Corp Goldman Sachs 2,889
(430) Progressive Corp Bank of AmericaMerrill Lynch (97)
(104) Progressive Corp Morgan Stanley (266)115 Proofpoint Inc Bank of America
Merrill Lynch (104)179 Proofpoint Inc Goldman Sachs (212)
(1,692) ProPetro Holding Corp Bank of AmericaMerrill Lynch (413)
79 PROS Holdings Inc Bank of AmericaMerrill Lynch 589
353 PROS Holdings Inc Goldman Sachs 2,630(1,063) Prosperity Bancshares Inc Bank of America
Merrill Lynch (5,148)(2,187) Prosperity Bancshares Inc Goldman Sachs (5,876)
(738) Prosperity Bancshares Inc Morgan Stanley (2,915)(265) Proto Labs Inc Morgan Stanley 2,151(140) Providence Service Corp Bank of America
Merrill Lynch (2,058)(605) Providence Service Corp Goldman Sachs (2,513)
2,472 Prudential Financial Inc Bank of AmericaMerrill Lynch 15,739
2,444 Prudential Financial Inc Goldman Sachs 14,6193,085 Prudential Financial Inc Morgan Stanley 12,054(211) PS Business Parks Inc
(REIT) Goldman Sachs (1,317)467 PTC Inc Goldman Sachs 684744 Pure Storage Inc ’A’ Bank of America
Merrill Lynch 2,52210,320 Pure Storage Inc ’A’ Goldman Sachs 34,9843,192 Pure Storage Inc ’A’ Morgan Stanley 4,5011,203 PVH Corp Morgan Stanley 88
95 Q2 Holdings Inc Bank of AmericaMerrill Lynch 24
233 Q2 Holdings Inc Goldman Sachs 238
Holding Description Counterparty
Netunrealised
appreciation/(depreciation)
USD
United States continued836 QCR Holdings Inc Bank of America
Merrill Lynch 4,197783 QCR Holdings Inc Goldman Sachs 3,931
(845) Qorvo Inc Morgan Stanley 1,1051,081 QTS Realty Trust Inc ’A’
(REIT) Goldman Sachs 4,0001,639 QTS Realty Trust Inc ’A’
(REIT) Morgan Stanley 7,867(2,350) Quad/Graphics Inc Bank of America
Merrill Lynch (799)(128) Quad/Graphics Inc Goldman Sachs (44)(21) Quaker Chemical Corp Bank of America
Merrill Lynch (165)(711) Quaker Chemical Corp Goldman Sachs (5,197)
27 Qualys Inc Bank of AmericaMerrill Lynch 63
684 Qualys Inc Goldman Sachs 1,737238 Qualys Inc Morgan Stanley 243
(1,169) Quanex Building ProductsCorp Goldman Sachs (2,467)
(385) Quanta Services Inc Bank of AmericaMerrill Lynch 329
(1,300) Quest Diagnostics Inc Bank of AmericaMerrill Lynch (6,948)
(1,985) Quest Diagnostics Inc Goldman Sachs (10,481)(1,720) Quest Diagnostics Inc Morgan Stanley (6,072)
(462) Quidel Corp Bank of AmericaMerrill Lynch 7,619
(578) Quidel Corp Goldman Sachs 13,2821,095 Quotient Technology Inc Bank of America
Merrill Lynch 1,0402,751 Quotient Technology Inc Goldman Sachs 2,613(831) R1 RCM Inc Bank of America
Merrill Lynch (947)(939) R1 RCM Inc Goldman Sachs (638)(133) Radian Group Inc Bank of America
Merrill Lynch (218)(778) Range Resources Corp Bank of America
Merrill Lynch (895)(2,076) Range Resources Corp Goldman Sachs (2,387)
146 Rapid7 Inc Bank of AmericaMerrill Lynch 180
1,542 Rapid7 Inc Goldman Sachs 1,897855 Raven Industries Inc Bank of America
Merrill Lynch 1,2762,426 Raven Industries Inc Goldman Sachs 4,391(925) Raymond James Financial
IncBank of AmericaMerrill Lynch (6,697)
(396) Raymond James FinancialInc Goldman Sachs (2,903)
(134) Raymond James FinancialInc Morgan Stanley (578)
235 Rayonier Inc (REIT) Bank of AmericaMerrill Lynch 159
353 Rayonier Inc (REIT) Goldman Sachs 794(25) RBC Bearings Inc Bank of America
Merrill Lynch (118)(46) RBC Bearings Inc Goldman Sachs (1,172)83 RE/MAX Holdings Inc ’A’ Bank of America
Merrill Lynch 428251 RE/MAX Holdings Inc ’A’ Goldman Sachs 1,295
(271) RealPage Inc Goldman Sachs (629)474 RealReal Inc Bank of America
Merrill Lynch 555556 RealReal Inc Goldman Sachs 651
(733) Realty Income Corp (REIT) Goldman Sachs (3,526)(782) Realty Income Corp (REIT) Morgan Stanley (2,072)110 Reata Pharmaceuticals Inc
’A’Bank of AmericaMerrill Lynch (1,323)
BlackRock Global Long/Short Equity Fund continued
The notes on pages 691 to 711 form an integral part of these financial statements.
Annual report and audited financial statements [491]
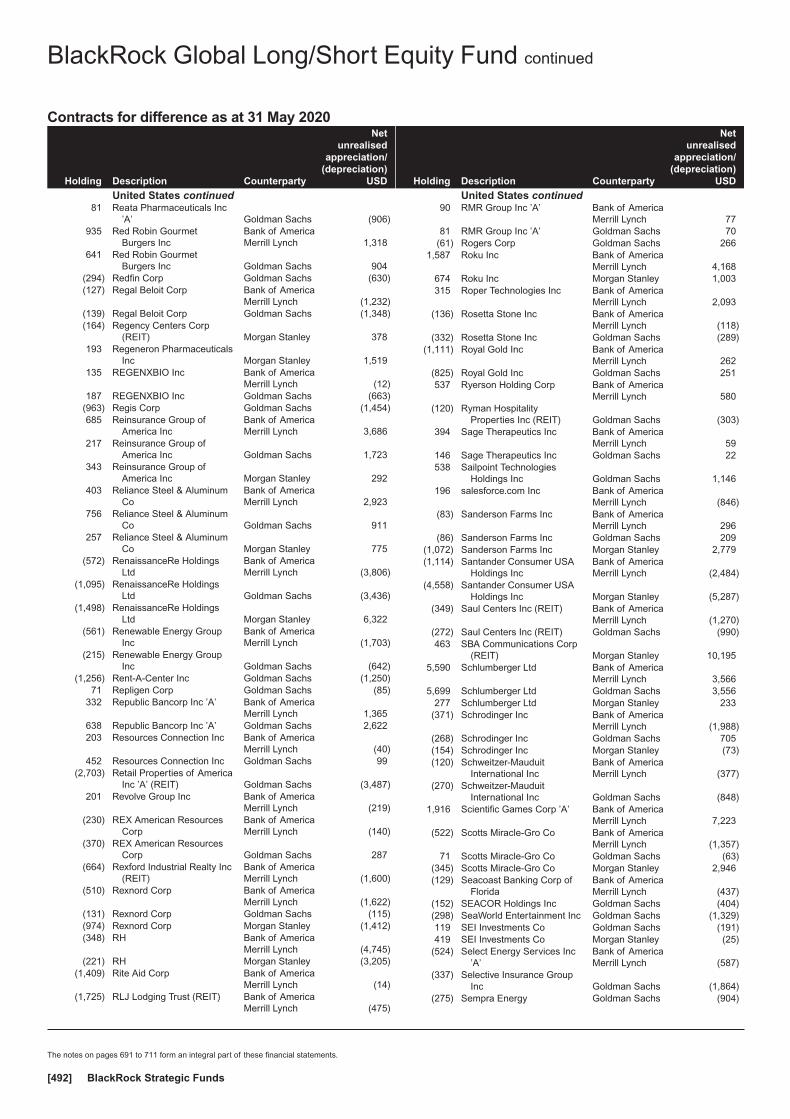
Contracts for difference as at 31 May 2020
Holding Description Counterparty
Netunrealised
appreciation/(depreciation)
USD
United States continued81 Reata Pharmaceuticals Inc
’A’ Goldman Sachs (906)935 Red Robin Gourmet
Burgers IncBank of AmericaMerrill Lynch 1,318
641 Red Robin GourmetBurgers Inc Goldman Sachs 904
(294) Redfin Corp Goldman Sachs (630)(127) Regal Beloit Corp Bank of America
Merrill Lynch (1,232)(139) Regal Beloit Corp Goldman Sachs (1,348)(164) Regency Centers Corp
(REIT) Morgan Stanley 378193 Regeneron Pharmaceuticals
Inc Morgan Stanley 1,519135 REGENXBIO Inc Bank of America
Merrill Lynch (12)187 REGENXBIO Inc Goldman Sachs (663)
(963) Regis Corp Goldman Sachs (1,454)685 Reinsurance Group of
America IncBank of AmericaMerrill Lynch 3,686
217 Reinsurance Group ofAmerica Inc Goldman Sachs 1,723
343 Reinsurance Group ofAmerica Inc Morgan Stanley 292
403 Reliance Steel & AluminumCo
Bank of AmericaMerrill Lynch 2,923
756 Reliance Steel & AluminumCo Goldman Sachs 911
257 Reliance Steel & AluminumCo Morgan Stanley 775
(572) RenaissanceRe HoldingsLtd
Bank of AmericaMerrill Lynch (3,806)
(1,095) RenaissanceRe HoldingsLtd Goldman Sachs (3,436)
(1,498) RenaissanceRe HoldingsLtd Morgan Stanley 6,322
(561) Renewable Energy GroupInc
Bank of AmericaMerrill Lynch (1,703)
(215) Renewable Energy GroupInc Goldman Sachs (642)
(1,256) Rent-A-Center Inc Goldman Sachs (1,250)71 Repligen Corp Goldman Sachs (85)
332 Republic Bancorp Inc ’A’ Bank of AmericaMerrill Lynch 1,365
638 Republic Bancorp Inc ’A’ Goldman Sachs 2,622203 Resources Connection Inc Bank of America
Merrill Lynch (40)452 Resources Connection Inc Goldman Sachs 99
(2,703) Retail Properties of AmericaInc ’A’ (REIT) Goldman Sachs (3,487)
201 Revolve Group Inc Bank of AmericaMerrill Lynch (219)
(230) REX American ResourcesCorp
Bank of AmericaMerrill Lynch (140)
(370) REX American ResourcesCorp Goldman Sachs 287
(664) Rexford Industrial Realty Inc(REIT)
Bank of AmericaMerrill Lynch (1,600)
(510) Rexnord Corp Bank of AmericaMerrill Lynch (1,622)
(131) Rexnord Corp Goldman Sachs (115)(974) Rexnord Corp Morgan Stanley (1,412)(348) RH Bank of America
Merrill Lynch (4,745)(221) RH Morgan Stanley (3,205)
(1,409) Rite Aid Corp Bank of AmericaMerrill Lynch (14)
(1,725) RLJ Lodging Trust (REIT) Bank of AmericaMerrill Lynch (475)
Holding Description Counterparty
Netunrealised
appreciation/(depreciation)
USD
United States continued90 RMR Group Inc ’A’ Bank of America
Merrill Lynch 7781 RMR Group Inc ’A’ Goldman Sachs 70
(61) Rogers Corp Goldman Sachs 2661,587 Roku Inc Bank of America
Merrill Lynch 4,168674 Roku Inc Morgan Stanley 1,003315 Roper Technologies Inc Bank of America
Merrill Lynch 2,093(136) Rosetta Stone Inc Bank of America
Merrill Lynch (118)(332) Rosetta Stone Inc Goldman Sachs (289)
(1,111) Royal Gold Inc Bank of AmericaMerrill Lynch 262
(825) Royal Gold Inc Goldman Sachs 251537 Ryerson Holding Corp Bank of America
Merrill Lynch 580(120) Ryman Hospitality
Properties Inc (REIT) Goldman Sachs (303)394 Sage Therapeutics Inc Bank of America
Merrill Lynch 59146 Sage Therapeutics Inc Goldman Sachs 22538 Sailpoint Technologies
Holdings Inc Goldman Sachs 1,146196 salesforce.com Inc Bank of America
Merrill Lynch (846)(83) Sanderson Farms Inc Bank of America
Merrill Lynch 296(86) Sanderson Farms Inc Goldman Sachs 209
(1,072) Sanderson Farms Inc Morgan Stanley 2,779(1,114) Santander Consumer USA
Holdings IncBank of AmericaMerrill Lynch (2,484)
(4,558) Santander Consumer USAHoldings Inc Morgan Stanley (5,287)
(349) Saul Centers Inc (REIT) Bank of AmericaMerrill Lynch (1,270)
(272) Saul Centers Inc (REIT) Goldman Sachs (990)463 SBA Communications Corp
(REIT) Morgan Stanley 10,1955,590 Schlumberger Ltd Bank of America
Merrill Lynch 3,5665,699 Schlumberger Ltd Goldman Sachs 3,556
277 Schlumberger Ltd Morgan Stanley 233(371) Schrodinger Inc Bank of America
Merrill Lynch (1,988)(268) Schrodinger Inc Goldman Sachs 705(154) Schrodinger Inc Morgan Stanley (73)(120) Schweitzer-Mauduit
International IncBank of AmericaMerrill Lynch (377)
(270) Schweitzer-MauduitInternational Inc Goldman Sachs (848)
1,916 Scientific Games Corp ’A’ Bank of AmericaMerrill Lynch 7,223
(522) Scotts Miracle-Gro Co Bank of AmericaMerrill Lynch (1,357)
71 Scotts Miracle-Gro Co Goldman Sachs (63)(345) Scotts Miracle-Gro Co Morgan Stanley 2,946(129) Seacoast Banking Corp of
FloridaBank of AmericaMerrill Lynch (437)
(152) SEACOR Holdings Inc Goldman Sachs (404)(298) SeaWorld Entertainment Inc Goldman Sachs (1,329)119 SEI Investments Co Goldman Sachs (191)419 SEI Investments Co Morgan Stanley (25)
(524) Select Energy Services Inc’A’
Bank of AmericaMerrill Lynch (587)
(337) Selective Insurance GroupInc Goldman Sachs (1,864)
(275) Sempra Energy Goldman Sachs (904)
BlackRock Global Long/Short Equity Fund continued
The notes on pages 691 to 711 form an integral part of these financial statements.
BlackRock Strategic Funds[492]

Contracts for difference as at 31 May 2020
Holding Description Counterparty
Netunrealised
appreciation/(depreciation)
USD
United States continued(119) Semtech Corp Goldman Sachs (710)
1,003 Seritage Growth Properties(REIT)
Bank of AmericaMerrill Lynch 1,163
100 Service Corp International Goldman Sachs (3)(1,102) Service Properties Trust
(REIT)Bank of AmericaMerrill Lynch (8)
(1,855) Service Properties Trust(REIT) Goldman Sachs (247)
886 ServiceNow Inc Bank of AmericaMerrill Lynch 11,388
531 ServiceNow Inc Morgan Stanley 815(182) ServisFirst Bancshares Inc Bank of America
Merrill Lynch (768)(52) Shake Shack Inc ’A’ Goldman Sachs (332)266 Shockwave Medical Inc Bank of America
Merrill Lynch 359373 Shockwave Medical Inc Goldman Sachs 504361 Shoe Carnival Inc Goldman Sachs 678
1,312 Shutterstock Inc Bank of AmericaMerrill Lynch (302)
380 Shutterstock Inc Goldman Sachs (87)(903) SIGA Technologies Inc Bank of America
Merrill Lynch (352)(510) SIGA Technologies Inc Goldman Sachs (199)198 Signature Bank Bank of America
Merrill Lynch 487(418) Signet Jewelers Ltd Bank of America
Merrill Lynch (686)(1,201) Signet Jewelers Ltd Goldman Sachs (1,702)1,095 Silicon Laboratories Inc Bank of America
Merrill Lynch 533,025 Silicon Laboratories Inc Goldman Sachs 1,474
953 Silicon Laboratories Inc Morgan Stanley (2,585)188 Simply Good Foods Co Bank of America
Merrill Lynch (62)280 Simply Good Foods Co Goldman Sachs (139)
(890) Simpson Manufacturing CoInc
Bank of AmericaMerrill Lynch (8,756)
(743) Simpson Manufacturing CoInc Goldman Sachs (7,683)
(261) Simpson Manufacturing CoInc Morgan Stanley (1,054)
222 Simulations Plus Inc Bank of AmericaMerrill Lynch 2,005
694 Simulations Plus Inc Goldman Sachs 6,787(238) Sinclair Broadcast Group
Inc ’A’Bank of AmericaMerrill Lynch (613)
5,410 Sirius XM Holdings Inc Bank of AmericaMerrill Lynch 1,069
4,286 Sirius XM Holdings Inc Goldman Sachs 1,56885,324 Sirius XM Holdings Inc Morgan Stanley 32,850
247 SiteOne Landscape SupplyInc Goldman Sachs 1,419
1,668 Skechers USA Inc ’A’ Goldman Sachs 9,208(1,165) Skyline Champion Corp Goldman Sachs (3,342)
(867) Skyworks Solutions Inc Bank of AmericaMerrill Lynch 1,599
(1,021) Skyworks Solutions Inc Goldman Sachs 1,821(194) Skyworks Solutions Inc Morgan Stanley 114
(1,086) Slack Technologies Inc ’A’ Bank of AmericaMerrill Lynch (1,328)
(740) Sleep Number Corp Bank of AmericaMerrill Lynch (1,199)
(417) Sleep Number Corp Goldman Sachs (676)(825) SLM Corp Bank of America
Merrill Lynch (83)(1,675) SM Energy Co Goldman Sachs (988)
(326) SMART Global Holdings Inc Goldman Sachs (365)
Holding Description Counterparty
Netunrealised
appreciation/(depreciation)
USD
United States continued(288) Snap-on Inc Morgan Stanley (357)(361) SolarEdge Technologies Inc Goldman Sachs (3,680)(28) SolarEdge Technologies Inc Morgan Stanley (215)
1,185 Solaris Oilfield InfrastructureInc ’A’ Goldman Sachs 1,066
(848) Sonic Automotive Inc ’A’ Goldman Sachs (3,112)(2,223) Southwestern Energy Co Goldman Sachs (290)
(321) Spartan Motors Inc Goldman Sachs (324)(146) Spectrum Brands Holdings
Inc Goldman Sachs (1,183)436 Spire Inc Bank of America
Merrill Lynch (268)(1,632) Spirit Realty Capital Inc
(REIT)Bank of AmericaMerrill Lynch (4,015)
(1,824) Spirit Realty Capital Inc(REIT) Goldman Sachs (4,487)
(1,632) Spirit Realty Capital Inc(REIT) Morgan Stanley (228)
(212) Spotify Technology SA Goldman Sachs 1,225(84) Spotify Technology SA Morgan Stanley (159)
(2,720) Sprouts Farmers Market Inc Goldman Sachs 959(63) SPS Commerce Inc Goldman Sachs (597)
(338) SPX Corp Bank of AmericaMerrill Lynch (2,062)
(439) SPX Corp Goldman Sachs (2,678)(290) SPX FLOW Inc Bank of America
Merrill Lynch (1,720)(133) SPX FLOW Inc Goldman Sachs (789)
(1,785) SS&C TechnologiesHoldings Inc
Bank of AmericaMerrill Lynch (4,695)
(556) SS&C TechnologiesHoldings Inc Goldman Sachs (1,462)
(4,795) SS&C TechnologiesHoldings Inc Morgan Stanley (6,617)
(11) STAAR Surgical Co Bank of AmericaMerrill Lynch (17)
(326) STAAR Surgical Co Goldman Sachs (518)31 Stamps.com Inc Goldman Sachs 5114 Standard Motor Products
IncBank of AmericaMerrill Lynch 62
115 Standard Motor ProductsInc Goldman Sachs 506
1,552 Steel Dynamics Inc Goldman Sachs 2,4841,072 Steel Dynamics Inc Morgan Stanley 1,812(503) Stericycle Inc Goldman Sachs (3,164)(96) STERIS Plc Goldman Sachs (227)(66) STERIS Plc Morgan Stanley (328)
10,326 Sterling Bancorp Bank of AmericaMerrill Lynch 27,622
594 Sterling Construction Co Inc Goldman Sachs 606(566) Steven Madden Ltd Bank of America
Merrill Lynch (1,964)(436) Steven Madden Ltd Goldman Sachs (1,159)
(1,126) Stewart InformationServices Corp
Bank of AmericaMerrill Lynch (1,727)
(960) Stewart InformationServices Corp Goldman Sachs (1,396)
(802) Stifel Financial Corp Bank of AmericaMerrill Lynch (4,628)
(294) Stifel Financial Corp Goldman Sachs (1,696)(631) Stifel Financial Corp Morgan Stanley (1,716)408 Stitch Fix Inc ’A’ Goldman Sachs 869
(224) Stoneridge Inc Bank of AmericaMerrill Lynch (775)
1,962 STORE Capital Corp (REIT) Goldman Sachs 2,6512,574 STORE Capital Corp (REIT) Morgan Stanley 2,136
576 Sunrun Inc Goldman Sachs 1,400
BlackRock Global Long/Short Equity Fund continued
The notes on pages 691 to 711 form an integral part of these financial statements.
Annual report and audited financial statements [493]
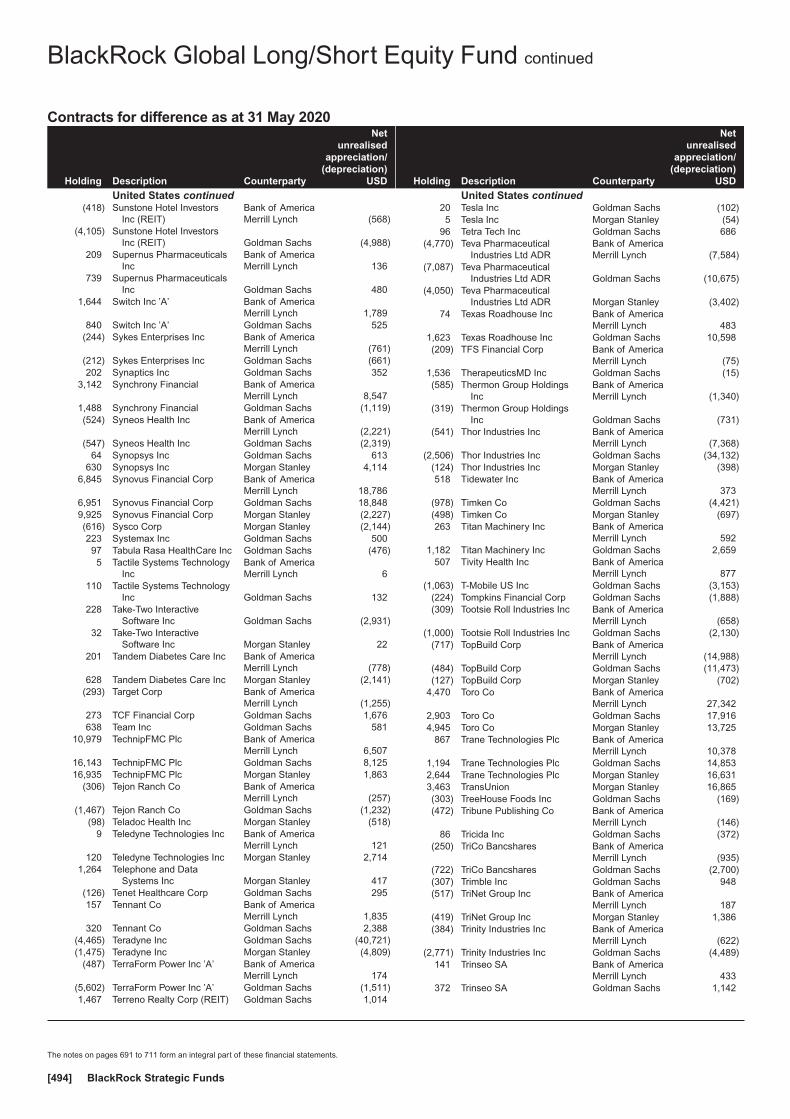
Contracts for difference as at 31 May 2020
Holding Description Counterparty
Netunrealised
appreciation/(depreciation)
USD
United States continued(418) Sunstone Hotel Investors
Inc (REIT)Bank of AmericaMerrill Lynch (568)
(4,105) Sunstone Hotel InvestorsInc (REIT) Goldman Sachs (4,988)
209 Supernus PharmaceuticalsInc
Bank of AmericaMerrill Lynch 136
739 Supernus PharmaceuticalsInc Goldman Sachs 480
1,644 Switch Inc ’A’ Bank of AmericaMerrill Lynch 1,789
840 Switch Inc ’A’ Goldman Sachs 525(244) Sykes Enterprises Inc Bank of America
Merrill Lynch (761)(212) Sykes Enterprises Inc Goldman Sachs (661)202 Synaptics Inc Goldman Sachs 352
3,142 Synchrony Financial Bank of AmericaMerrill Lynch 8,547
1,488 Synchrony Financial Goldman Sachs (1,119)(524) Syneos Health Inc Bank of America
Merrill Lynch (2,221)(547) Syneos Health Inc Goldman Sachs (2,319)
64 Synopsys Inc Goldman Sachs 613630 Synopsys Inc Morgan Stanley 4,114
6,845 Synovus Financial Corp Bank of AmericaMerrill Lynch 18,786
6,951 Synovus Financial Corp Goldman Sachs 18,8489,925 Synovus Financial Corp Morgan Stanley (2,227)(616) Sysco Corp Morgan Stanley (2,144)223 Systemax Inc Goldman Sachs 50097 Tabula Rasa HealthCare Inc Goldman Sachs (476)5 Tactile Systems Technology
IncBank of AmericaMerrill Lynch 6
110 Tactile Systems TechnologyInc Goldman Sachs 132
228 Take-Two InteractiveSoftware Inc Goldman Sachs (2,931)
32 Take-Two InteractiveSoftware Inc Morgan Stanley 22
201 Tandem Diabetes Care Inc Bank of AmericaMerrill Lynch (778)
628 Tandem Diabetes Care Inc Morgan Stanley (2,141)(293) Target Corp Bank of America
Merrill Lynch (1,255)273 TCF Financial Corp Goldman Sachs 1,676638 Team Inc Goldman Sachs 581
10,979 TechnipFMC Plc Bank of AmericaMerrill Lynch 6,507
16,143 TechnipFMC Plc Goldman Sachs 8,12516,935 TechnipFMC Plc Morgan Stanley 1,863
(306) Tejon Ranch Co Bank of AmericaMerrill Lynch (257)
(1,467) Tejon Ranch Co Goldman Sachs (1,232)(98) Teladoc Health Inc Morgan Stanley (518)
9 Teledyne Technologies Inc Bank of AmericaMerrill Lynch 121
120 Teledyne Technologies Inc Morgan Stanley 2,7141,264 Telephone and Data
Systems Inc Morgan Stanley 417(126) Tenet Healthcare Corp Goldman Sachs 295157 Tennant Co Bank of America
Merrill Lynch 1,835320 Tennant Co Goldman Sachs 2,388
(4,465) Teradyne Inc Goldman Sachs (40,721)(1,475) Teradyne Inc Morgan Stanley (4,809)
(487) TerraForm Power Inc ’A’ Bank of AmericaMerrill Lynch 174
(5,602) TerraForm Power Inc ’A’ Goldman Sachs (1,511)1,467 Terreno Realty Corp (REIT) Goldman Sachs 1,014
Holding Description Counterparty
Netunrealised
appreciation/(depreciation)
USD
United States continued20 Tesla Inc Goldman Sachs (102)5 Tesla Inc Morgan Stanley (54)
96 Tetra Tech Inc Goldman Sachs 686(4,770) Teva Pharmaceutical
Industries Ltd ADRBank of AmericaMerrill Lynch (7,584)
(7,087) Teva PharmaceuticalIndustries Ltd ADR Goldman Sachs (10,675)
(4,050) Teva PharmaceuticalIndustries Ltd ADR Morgan Stanley (3,402)
74 Texas Roadhouse Inc Bank of AmericaMerrill Lynch 483
1,623 Texas Roadhouse Inc Goldman Sachs 10,598(209) TFS Financial Corp Bank of America
Merrill Lynch (75)1,536 TherapeuticsMD Inc Goldman Sachs (15)(585) Thermon Group Holdings
IncBank of AmericaMerrill Lynch (1,340)
(319) Thermon Group HoldingsInc Goldman Sachs (731)
(541) Thor Industries Inc Bank of AmericaMerrill Lynch (7,368)
(2,506) Thor Industries Inc Goldman Sachs (34,132)(124) Thor Industries Inc Morgan Stanley (398)518 Tidewater Inc Bank of America
Merrill Lynch 373(978) Timken Co Goldman Sachs (4,421)(498) Timken Co Morgan Stanley (697)263 Titan Machinery Inc Bank of America
Merrill Lynch 5921,182 Titan Machinery Inc Goldman Sachs 2,659
507 Tivity Health Inc Bank of AmericaMerrill Lynch 877
(1,063) T-Mobile US Inc Goldman Sachs (3,153)(224) Tompkins Financial Corp Goldman Sachs (1,888)(309) Tootsie Roll Industries Inc Bank of America
Merrill Lynch (658)(1,000) Tootsie Roll Industries Inc Goldman Sachs (2,130)
(717) TopBuild Corp Bank of AmericaMerrill Lynch (14,988)
(484) TopBuild Corp Goldman Sachs (11,473)(127) TopBuild Corp Morgan Stanley (702)
4,470 Toro Co Bank of AmericaMerrill Lynch 27,342
2,903 Toro Co Goldman Sachs 17,9164,945 Toro Co Morgan Stanley 13,725
867 Trane Technologies Plc Bank of AmericaMerrill Lynch 10,378
1,194 Trane Technologies Plc Goldman Sachs 14,8532,644 Trane Technologies Plc Morgan Stanley 16,6313,463 TransUnion Morgan Stanley 16,865(303) TreeHouse Foods Inc Goldman Sachs (169)(472) Tribune Publishing Co Bank of America
Merrill Lynch (146)86 Tricida Inc Goldman Sachs (372)
(250) TriCo Bancshares Bank of AmericaMerrill Lynch (935)
(722) TriCo Bancshares Goldman Sachs (2,700)(307) Trimble Inc Goldman Sachs 948(517) TriNet Group Inc Bank of America
Merrill Lynch 187(419) TriNet Group Inc Morgan Stanley 1,386(384) Trinity Industries Inc Bank of America
Merrill Lynch (622)(2,771) Trinity Industries Inc Goldman Sachs (4,489)
141 Trinseo SA Bank of AmericaMerrill Lynch 433
372 Trinseo SA Goldman Sachs 1,142
BlackRock Global Long/Short Equity Fund continued
The notes on pages 691 to 711 form an integral part of these financial statements.
BlackRock Strategic Funds[494]

Contracts for difference as at 31 May 2020
Holding Description Counterparty
Netunrealised
appreciation/(depreciation)
USD
United States continued(397) TripAdvisor Inc Bank of America
Merrill Lynch 290(236) Triple-S Management Corp
’B’Bank of AmericaMerrill Lynch (261)
(669) Triple-S Management Corp’B’ Goldman Sachs (728)
2,036 TriState Capital Holdings Inc Goldman Sachs 5,986(165) TrueBlue Inc Bank of America
Merrill Lynch (267)(861) TrueBlue Inc Goldman Sachs (1,395)
(1,072) TrueCar Inc Bank of AmericaMerrill Lynch (311)
124 Trupanion Inc Bank of AmericaMerrill Lynch 480
1,343 Trupanion Inc Goldman Sachs 5,204(637) TrustCo Bank Corp NY Bank of America
Merrill Lynch (688)(165) Tucows Inc ’A’ Bank of America
Merrill Lynch (493)(239) Tucows Inc ’A’ Goldman Sachs (844)
1,413 Tupperware Brands Corp Goldman Sachs 1,116(478) Tutor Perini Corp Bank of America
Merrill Lynch 298(465) Tutor Perini Corp Goldman Sachs (704)(155) Twin River Worldwide
Holdings Inc Goldman Sachs (358)267 Uber Technologies Inc Bank of America
Merrill Lynch 1731,608 Uber Technologies Inc Goldman Sachs 2,1271,645 Uber Technologies Inc Morgan Stanley 247
286 Ubiquiti Inc Bank of AmericaMerrill Lynch 174
107 Ubiquiti Inc Morgan Stanley 2702,528 UDR Inc (REIT) Bank of America
Merrill Lynch 3,834697 UDR Inc (REIT) Goldman Sachs 1,322613 UDR Inc (REIT) Morgan Stanley 834
(970) Ultra Clean Holdings Inc Bank of AmericaMerrill Lynch (1,780)
(200) Ultra Clean Holdings Inc Goldman Sachs (145)(387) UMH Properties Inc (REIT) Goldman Sachs (569)236 Unifi Inc Bank of America
Merrill Lynch 503187 Union Pacific Corp Goldman Sachs (189)
(332) Unisys Corp Goldman Sachs (315)512 United Fire Group Inc Bank of America
Merrill Lynch 1,649(847) United Natural Foods Inc Goldman Sachs 23(158) United Rentals Inc Morgan Stanley (939)(19) United States Lime &
Minerals IncBank of AmericaMerrill Lynch (139)
(152) United States Lime &Minerals Inc Goldman Sachs (1,114)
(1,450) United States Steel Corp Bank of AmericaMerrill Lynch (1,320)
(101) Univar Solutions Inc Bank of AmericaMerrill Lynch (266)
(262) Univar Solutions Inc Goldman Sachs (689)(57) Universal Electronics Inc Bank of America
Merrill Lynch (324)(155) Universal Electronics Inc Goldman Sachs (882)(87) Universal Health Realty
Income Trust (REIT)Bank of AmericaMerrill Lynch (1,009)
(49) Universal Health RealtyIncome Trust (REIT) Goldman Sachs (568)
(1,334) Universal Health ServicesInc ’B’
Bank of AmericaMerrill Lynch (12,186)
Holding Description Counterparty
Netunrealised
appreciation/(depreciation)
USD
United States continued(2,757) Universal Health Services
Inc ’B’ Goldman Sachs (32,909)(1,704) Universal Health Services
Inc ’B’ Morgan Stanley (116)(496) Universal Logistics Holdings
IncBank of AmericaMerrill Lynch (1,533)
(162) Universal Logistics HoldingsInc Goldman Sachs (501)
131 Univest Financial Corp Bank of AmericaMerrill Lynch 244
1,159 Univest Financial Corp Goldman Sachs 2,156274 Upwork Inc Goldman Sachs (425)
(1,072) Urban Edge Properties(REIT)
Bank of AmericaMerrill Lynch (1,479)
(1,889) Urban Edge Properties(REIT) Goldman Sachs (2,607)
746 Urban Outfitters Inc Bank of AmericaMerrill Lynch 265
647 Urban Outfitters Inc Goldman Sachs (324)(156) Urstadt Biddle Properties
Inc ’A’ (REIT)Bank of AmericaMerrill Lynch (170)
(302) Urstadt Biddle PropertiesInc ’A’ (REIT) Goldman Sachs (329)
640 US Concrete Inc Bank of AmericaMerrill Lynch 2,266
(155) US Ecology Inc Bank of AmericaMerrill Lynch (781)
(315) US Ecology Inc Goldman Sachs (1,203)(867) US Foods Holding Corp Goldman Sachs (1,561)
1,804 US Silica Holdings Inc Bank of AmericaMerrill Lynch 2,183
52 USANA Health Sciences Inc Bank of AmericaMerrill Lynch 110
78 USANA Health Sciences Inc Goldman Sachs 165(109) Vail Resorts Inc Bank of America
Merrill Lynch (901)(1,691) Vail Resorts Inc Goldman Sachs (38,205)
(832) Vail Resorts Inc Morgan Stanley (2,183)(622) Valero Energy Corp Bank of America
Merrill Lynch (4,802)(908) Valero Energy Corp Morgan Stanley (745)
(1,063) Valley National Bancorp Bank of AmericaMerrill Lynch (1,254)
1,139 Varian Medical Systems Inc Bank of AmericaMerrill Lynch 3,327
746 Varian Medical Systems Inc Morgan Stanley 5,498125 Vectrus Inc Bank of America
Merrill Lynch 1,302267 Vectrus Inc Goldman Sachs 2,782789 Veeco Instruments Inc Goldman Sachs 109
1,392 Veeva Systems Inc ’A’ Bank of AmericaMerrill Lynch 15,173
2,031 Veeva Systems Inc ’A’ Goldman Sachs 23,0421,416 Veeva Systems Inc ’A’ Morgan Stanley 11,852(938) Ventas Inc (REIT) Morgan Stanley (1,323)219 Veracyte Inc Bank of America
Merrill Lynch (133)538 Veracyte Inc Goldman Sachs 113
(6,752) VEREIT Inc (REIT) Bank of AmericaMerrill Lynch (6,414)
(4,700) VEREIT Inc (REIT) Morgan Stanley (47)(1,064) Verint Systems Inc Bank of America
Merrill Lynch (2,511)(1,067) Verint Systems Inc Goldman Sachs (2,518)
545 VeriSign Inc Bank of AmericaMerrill Lynch 294
115 VeriSign Inc Morgan Stanley 123
BlackRock Global Long/Short Equity Fund continued
The notes on pages 691 to 711 form an integral part of these financial statements.
Annual report and audited financial statements [495]

Contracts for difference as at 31 May 2020
Holding Description Counterparty
Netunrealised
appreciation/(depreciation)
USD
United States continued2,183 Verisk Analytics Inc Bank of America
Merrill Lynch 19,217870 Verisk Analytics Inc Goldman Sachs 7,718
(247) Verra Mobility Corp Bank of AmericaMerrill Lynch (262)
(2,830) Verra Mobility Corp Goldman Sachs (3,000)(1,018) Verso Corp ’A’ Bank of America
Merrill Lynch (490)(472) Verso Corp ’A’ Goldman Sachs (260)
5 Vertex Pharmaceuticals Inc Bank of AmericaMerrill Lynch 24
121 Vertex Pharmaceuticals Inc Morgan Stanley (369)226 Viad Corp Bank of America
Merrill Lynch 723512 ViaSat Inc Bank of America
Merrill Lynch 3,4511,364 ViaSat Inc Goldman Sachs 5,589
402 ViaSat Inc Morgan Stanley (125)(10,627) Viavi Solutions Inc Bank of America
Merrill Lynch (7,970)290 Vicor Corp Bank of America
Merrill Lynch 1,839261 Vicor Corp Goldman Sachs 1,123195 Vir Biotechnology Inc Bank of America
Merrill Lynch 772,433 Vir Biotechnology Inc Goldman Sachs 3,990
635 Vir Biotechnology Inc Morgan Stanley (923)239 Virtus Investment Partners
Inc Goldman Sachs 2,763267 Virtusa Corp Goldman Sachs 446
(2,041) Vishay Intertechnology Inc Bank of AmericaMerrill Lynch (3,806)
(1,156) Vishay Intertechnology Inc Goldman Sachs (2,156)(2,311) Vishay Intertechnology Inc Morgan Stanley (682)
31 Visteon Corp Bank of AmericaMerrill Lynch 69
270 Visteon Corp Goldman Sachs 597(404) Vistra Energy Corp Bank of America
Merrill Lynch (237)(2,664) Vistra Energy Corp Goldman Sachs (5,308)(1,455) Vistra Energy Corp Morgan Stanley (798)2,709 Vivint Solar Inc Bank of America
Merrill Lynch 3,9283,740 Vivint Solar Inc Goldman Sachs 5,4231,129 VMware Inc ’A’ Bank of America
Merrill Lynch 19,8442,222 VMware Inc ’A’ Goldman Sachs 44,5292,165 VMware Inc ’A’ Morgan Stanley 43,1272,282 Vonage Holdings Corp Bank of America
Merrill Lynch 4392,471 Vonage Holdings Corp Goldman Sachs 500
(1,963) Waddell & Reed FinancialInc ’A’
Bank of AmericaMerrill Lynch (412)
(2,453) Waddell & Reed FinancialInc ’A’ Goldman Sachs (515)
(382) Walker & Dunlop Inc Bank of AmericaMerrill Lynch (1,539)
(379) Walker & Dunlop Inc Goldman Sachs (1,861)(3,776) Walmart Inc Goldman Sachs 204(1,456) Walmart Inc Morgan Stanley (2,117)
(73) Warrior Met Coal Inc Bank of AmericaMerrill Lynch (52)
(500) Warrior Met Coal Inc Goldman Sachs (355)(198) Washington Federal Inc Bank of America
Merrill Lynch (513)(788) Washington Federal Inc Goldman Sachs (2,041)103 Washington Trust Bancorp
IncBank of AmericaMerrill Lynch 406
Holding Description Counterparty
Netunrealised
appreciation/(depreciation)
USD
United States continued48 Washington Trust Bancorp
Inc Goldman Sachs 86(2,745) Waste Management Inc Morgan Stanley (20,232)
(231) Waterstone Financial Inc Bank of AmericaMerrill Lynch (381)
(135) Watford Holdings Ltd Goldman Sachs 44263 WaVe Life Sciences Ltd Goldman Sachs (50)106 Wayfair Inc ’A’ Bank of America
Merrill Lynch 2,26018 Wayfair Inc ’A’ Goldman Sachs 202
318 Webster Financial Corp Goldman Sachs 1,9563,243 Webster Financial Corp Morgan Stanley 10,994(349) Weingarten Realty Investors
(REIT)Bank of AmericaMerrill Lynch (862)
(994) Weingarten Realty Investors(REIT) Goldman Sachs (2,455)
377 Weis Markets Inc Goldman Sachs 1161,461 Welbilt Inc Bank of America
Merrill Lynch 1,768790 Welbilt Inc Goldman Sachs 956
(676) Welltower Inc (REIT) Goldman Sachs (5,976)735 Wendy’s Co Bank of America
Merrill Lynch 482433 Wendy’s Co Goldman Sachs 21875 Werner Enterprises Inc Bank of America
Merrill Lynch 51241 Werner Enterprises Inc Goldman Sachs 494
1,218 WesBanco Inc Goldman Sachs 3,071208 WESCO International Inc Bank of America
Merrill Lynch 1,170541 WESCO International Inc Goldman Sachs 3,043(15) Westamerica BanCorp Bank of America
Merrill Lynch (29)(622) Westamerica BanCorp Goldman Sachs (1,200)(340) Western Alliance Bancorp Goldman Sachs (104)975 Western Digital Corp Bank of America
Merrill Lynch 4,397136 Western Digital Corp Goldman Sachs 613796 Western Digital Corp Morgan Stanley 1,035293 Westrock Co Goldman Sachs (273)
2,454 Westrock Co Morgan Stanley 2,218(508) Westwood Holdings Group
IncBank of AmericaMerrill Lynch (411)
(498) Westwood Holdings GroupInc Goldman Sachs (403)
(1,124) Whirlpool Corp Bank of AmericaMerrill Lynch (12,578)
(2,275) Whirlpool Corp Goldman Sachs (25,457)(2,064) Whirlpool Corp Morgan Stanley (599)
538 WideOpenWest Inc Bank of AmericaMerrill Lynch 436
(6,654) Williams Cos Inc Bank of AmericaMerrill Lynch (6,854)
(4,907) Williams Cos Inc Goldman Sachs (5,054)(5,585) Williams Cos Inc Morgan Stanley (782)
(371) Williams-Sonoma Inc Bank of AmericaMerrill Lynch (3,106)
393 Williams-Sonoma Inc Goldman Sachs 5,883140 Wingstop Inc Goldman Sachs (930)
(200) Winnebago Industries Inc Bank of AmericaMerrill Lynch (764)
749 Wintrust Financial Corp Bank of AmericaMerrill Lynch 7,692
1,640 Wintrust Financial Corp Goldman Sachs 16,26997 WisdomTree Investments
IncBank of AmericaMerrill Lynch 31
1,373 WisdomTree InvestmentsInc Goldman Sachs 432
BlackRock Global Long/Short Equity Fund continued
The notes on pages 691 to 711 form an integral part of these financial statements.
BlackRock Strategic Funds[496]
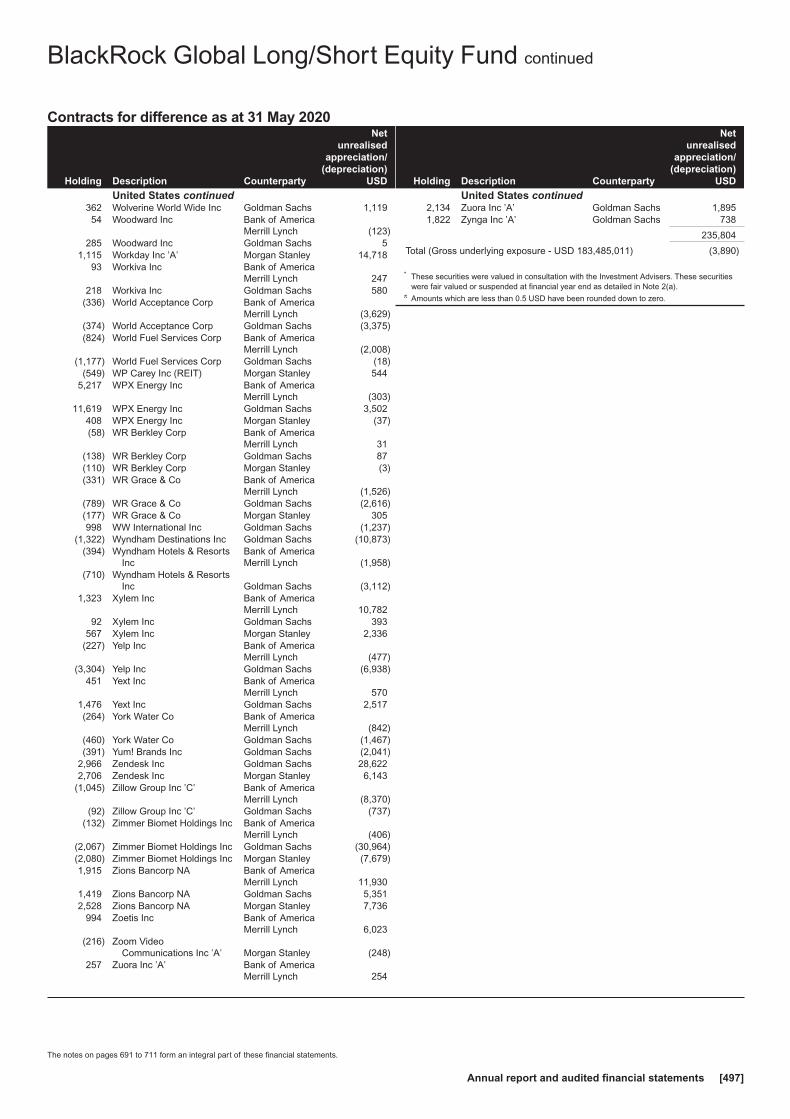
Contracts for difference as at 31 May 2020
Holding Description Counterparty
Netunrealised
appreciation/(depreciation)
USD
United States continued362 Wolverine World Wide Inc Goldman Sachs 1,11954 Woodward Inc Bank of America
Merrill Lynch (123)285 Woodward Inc Goldman Sachs 5
1,115 Workday Inc ’A’ Morgan Stanley 14,71893 Workiva Inc Bank of America
Merrill Lynch 247218 Workiva Inc Goldman Sachs 580
(336) World Acceptance Corp Bank of AmericaMerrill Lynch (3,629)
(374) World Acceptance Corp Goldman Sachs (3,375)(824) World Fuel Services Corp Bank of America
Merrill Lynch (2,008)(1,177) World Fuel Services Corp Goldman Sachs (18)
(549) WP Carey Inc (REIT) Morgan Stanley 5445,217 WPX Energy Inc Bank of America
Merrill Lynch (303)11,619 WPX Energy Inc Goldman Sachs 3,502
408 WPX Energy Inc Morgan Stanley (37)(58) WR Berkley Corp Bank of America
Merrill Lynch 31(138) WR Berkley Corp Goldman Sachs 87(110) WR Berkley Corp Morgan Stanley (3)(331) WR Grace & Co Bank of America
Merrill Lynch (1,526)(789) WR Grace & Co Goldman Sachs (2,616)(177) WR Grace & Co Morgan Stanley 305998 WW International Inc Goldman Sachs (1,237)
(1,322) Wyndham Destinations Inc Goldman Sachs (10,873)(394) Wyndham Hotels & Resorts
IncBank of AmericaMerrill Lynch (1,958)
(710) Wyndham Hotels & ResortsInc Goldman Sachs (3,112)
1,323 Xylem Inc Bank of AmericaMerrill Lynch 10,782
92 Xylem Inc Goldman Sachs 393567 Xylem Inc Morgan Stanley 2,336
(227) Yelp Inc Bank of AmericaMerrill Lynch (477)
(3,304) Yelp Inc Goldman Sachs (6,938)451 Yext Inc Bank of America
Merrill Lynch 5701,476 Yext Inc Goldman Sachs 2,517(264) York Water Co Bank of America
Merrill Lynch (842)(460) York Water Co Goldman Sachs (1,467)(391) Yum! Brands Inc Goldman Sachs (2,041)
2,966 Zendesk Inc Goldman Sachs 28,6222,706 Zendesk Inc Morgan Stanley 6,143
(1,045) Zillow Group Inc ’C’ Bank of AmericaMerrill Lynch (8,370)
(92) Zillow Group Inc ’C’ Goldman Sachs (737)(132) Zimmer Biomet Holdings Inc Bank of America
Merrill Lynch (406)(2,067) Zimmer Biomet Holdings Inc Goldman Sachs (30,964)(2,080) Zimmer Biomet Holdings Inc Morgan Stanley (7,679)1,915 Zions Bancorp NA Bank of America
Merrill Lynch 11,9301,419 Zions Bancorp NA Goldman Sachs 5,3512,528 Zions Bancorp NA Morgan Stanley 7,736
994 Zoetis Inc Bank of AmericaMerrill Lynch 6,023
(216) Zoom VideoCommunications Inc ’A’ Morgan Stanley (248)
257 Zuora Inc ’A’ Bank of AmericaMerrill Lynch 254
Holding Description Counterparty
Netunrealised
appreciation/(depreciation)
USD
United States continued2,134 Zuora Inc ’A’ Goldman Sachs 1,8951,822 Zynga Inc ’A’ Goldman Sachs 738
235,804
Total (Gross underlying exposure - USD 183,485,011) (3,890)
* These securities were valued in consultation with the Investment Advisers. These securitieswere fair valued or suspended at financial year end as detailed in Note 2(a).
π Amounts which are less than 0.5 USD have been rounded down to zero.
BlackRock Global Long/Short Equity Fund continued
The notes on pages 691 to 711 form an integral part of these financial statements.
Annual report and audited financial statements [497]

Futures contracts as at 31 May 2020
Numberof
contractsCurrencyof contracts
Contract/Description
Expirationdate
Grossunderlying
exposureUSD
Net unrealisedappreciation/
(depreciation)USD
11 EUR Amsterdam Index Futures June 2020 June 2020 1,304,607 46,652
52 EUR CAC 40 Index Futures June 2020 June 2020 2,729,170 155,694
(9) EUR DAX Index Futures June 2020 June 2020 2,912,197 (175,229)
4 USD E-Mini S&P 500 Index Futures June 2020 June 2020 604,460 7,231
11 GBP FTSE 100 Index Futures June 2020 June 2020 830,485 (3,705)
1 EUR FTSE MIB Index Futures June 2020 June 2020 101,326 1,918
18 HKD Hang Seng Index Futures June 2020 June 2020 2,642,522 (29,801)
35 EUR IBEX 35 Index Futures June 2020 June 2020 2,763,974 171,307
(14) SGD MSCI Singapore Index Futures June 2020 June 2020 285,209 2,429
(272) SEK OMX Stockholm 30 Index Futures June 2020 June 2020 4,703,577 (163,508)
(25) CAD S&P/TSX 60 Index Futures June 2020 June 2020 3,329,340 (318,935)
15 AUD SPI 200 Index Futures June 2020 June 2020 1,430,854 100,144
(3) CHF Swiss Market Index Futures June 2020 June 2020 307,818 (7,579)
(7) JPY Topix Index Futures June 2020 June 2020 1,014,549 (63,032)
Total 24,960,088 (276,414)
Purchased Options as at 31 May 2020
Numberof
contractsCall/Put Description Counterparty Strike Price
Expirationdate
Netunrealised
(depreciation)USD
MarketValue
USD
39 Put E-Mini S&P 500 Index Exchange Traded USD 2,520.00 19/06/2020 (189,952) 22,230
Total (Gross underlying exposure - USD 351,527) (189,952) 22,230
Written Options as at 31 May 2020
Numberof
contractsCall/Put Description Counterparty Strike Price
Expirationdate
Netunrealised
appreciationUSD
MarketValue
USD
(39) Put E-Mini S&P 500 Index Exchange Traded USD 2,470.00 19/06/2020 159,951 (17,940)
Total (Gross underlying exposure - USD 277,536) 159,951 (17,940)
Open forward foreign exchange transactionsas at 31 May 2020
Currency Purchases Currency Sales CounterpartyMaturity
date
Netunrealised
appreciation/(depreciation)
USDAUD 2,862,000 USD 1,869,921 Citibank 15/6/2020 29,617AUD 937,000 USD 623,999 JP Morgan 15/6/2020 (2,103)AUD 422,000 USD 277,770 Morgan Stanley 15/6/2020 2,316CAD 1,380,000 USD 991,577 Citibank 15/6/2020 10,286CAD 2,736,000 USD 1,991,729 Deutsche Bank 15/6/2020 (5,427)CAD 814,000 USD 589,776 Goldman Sachs 15/6/2020 1,178CAD 4,138,000 USD 2,983,109 JP Morgan 15/6/2020 21,028CHF 1,012,000 EUR 956,193 Deutsche Bank 15/6/2020 (12,500)CHF 6,015,000 EUR 5,704,457 JP Morgan 15/6/2020 (97,830)CHF 700,000 EUR 658,011 Morgan Stanley 15/6/2020 (4,879)EUR 457,046 CHF 481,000 BNP Paribas 15/6/2020 8,801EUR 837,045 CHF 891,000 Goldman Sachs 15/6/2020 5,643EUR 558,884 NOK 6,166,000 Goldman Sachs 15/6/2020 (12,958)EUR 1,702,076 NOK 18,894,000 JP Morgan 15/6/2020 (51,351)EUR 51,392 SEK 547,000 Barclays Bank 15/6/2020 (736)EUR 423,087 SEK 4,499,000 JP Morgan 15/6/2020 (5,614)EUR 1,163,000 USD 1,277,582 BNP Paribas 15/6/2020 15,939EUR 2,192,000 USD 2,399,361 Citibank 15/6/2020 38,644
Open forward foreign exchange transactionsas at 31 May 2020
Currency Purchases Currency Sales CounterpartyMaturity
date
Netunrealised
appreciation/(depreciation)
USDEUR 2,559,000 USD 2,829,860 JP Morgan 15/6/2020 16,332
EUR 1,195,000 USD 1,299,337State Street Bank& Trust Company 15/6/2020 29,776
GBP 97,000 USD 118,544 BNP Paribas 15/6/2020 1,261GBP 923,000 USD 1,140,053 Deutsche Bank 15/6/2020 (50)GBP 218,000 USD 268,588 JP Morgan 15/6/2020 665
JPY 15,594,000 USD 144,852Bank of America
Merrill Lynch 15/6/2020 145JPY 53,647,000 USD 497,840 Citibank 15/6/2020 982JPY 48,378,000 USD 453,550 Deutsche Bank 15/6/2020 (3,721)JPY 55,861,000 USD 519,807 HSBC 15/6/2020 (399)JPY 180,025,000 USD 1,679,713 JP Morgan 15/6/2020 (5,799)NOK 1,110,000 EUR 101,991 Goldman Sachs 15/6/2020 797NOK 15,918,000 EUR 1,427,921 JP Morgan 15/6/2020 50,003NZD 328,000 USD 202,134 Citibank 15/6/2020 1,332NZD 1,451,000 USD 876,743 Goldman Sachs 15/6/2020 23,348NZD 1,499,000 USD 920,579 JP Morgan 15/6/2020 9,288SEK 24,084,000 EUR 2,279,631 Goldman Sachs 15/6/2020 13,626
BlackRock Global Long/Short Equity Fund continued
The notes on pages 691 to 711 form an integral part of these financial statements.
BlackRock Strategic Funds[498]

Open forward foreign exchange transactionsas at 31 May 2020
Currency Purchases Currency Sales CounterpartyMaturity
date
Netunrealised
appreciation/(depreciation)
USDSEK 10,509,000 EUR 991,881 JP Morgan 15/6/2020 9,095SEK 18,350,000 EUR 1,712,210 Morgan Stanley 15/6/2020 37,831SGD 140,000 USD 98,988 JP Morgan 15/6/2020 46USD 270,252 AUD 419,000 Citibank 15/6/2020 (7,843)USD 269,653 AUD 404,000 Goldman Sachs 15/6/2020 1,514USD 1,414,050 AUD 2,199,000 JP Morgan 15/6/2020 (45,448)
USD 606,811 CAD 852,000Bank of America
Merrill Lynch 15/6/2020 (11,731)USD 1,527,491 CAD 2,140,000 BNP Paribas 15/6/2020 (26,122)USD 2,269,906 CAD 3,197,000 JP Morgan 15/6/2020 (51,076)USD 1,049,371 EUR 969,000 JP Morgan 15/6/2020 (28,378)USD 422,766 EUR 387,468 Morgan Stanley 15/6/2020 (8,186)USD 857,998 GBP 695,000 BNP Paribas 15/6/2020 (401)USD 2,773,401 GBP 2,251,043 Deutsche Bank 15/6/2020 (6,877)USD 1,564,952 GBP 1,258,000 JP Morgan 15/6/2020 11,188USD 1,560,122 JPY 166,549,000 BNP Paribas 15/6/2020 11,512USD 2,059,730 JPY 221,822,000 Citibank 15/6/2020 (2,820)USD 742,354 NZD 1,213,578 Citibank 15/6/2020 (10,458)USD 190,491 NZD 306,000 Deutsche Bank 15/6/2020 672USD 291,990 NZD 477,422 Morgan Stanley 15/6/2020 (4,167)USD 266,925 SGD 378,000 BNP Paribas 15/6/2020 (466)
(54,475)
EUR Hedged Share Class
EUR 51,341,835 USD 55,679,030State Street Bank& Trust Company 15/6/2020 1,424,805
USD 2,096,928 EUR 1,919,726State Street Bank& Trust Company 15/6/2020 (38,243)
1,386,562
Open forward foreign exchange transactionsas at 31 May 2020
Currency Purchases Currency Sales CounterpartyMaturity
date
Netunrealised
appreciation/(depreciation)
USDGBP Hedged Share Class
GBP 486,432 USD 600,700State Street Bank& Trust Company 15/6/2020 95
USD 22,707 GBP 18,582State Street Bank& Trust Company 15/6/2020 (243)
(148)
SEK Hedged Share Class
SEK 565,633 USD 57,775State Street Bank& Trust Company 15/6/2020 2,094
USD 1,364 SEK 13,195State Street Bank& Trust Company 15/6/2020 (33)
2,061
Total (Gross underlying exposure - USD 142,266,667) 1,334,000
Sector Breakdownas at 31 May 2020
% of NetAssets
Government 81.75
Securities portfolio at market value 81.75
Other Net Assets 18.25
100.00
BlackRock Global Long/Short Equity Fund continued
The notes on pages 691 to 711 form an integral part of these financial statements.
Annual report and audited financial statements [499]
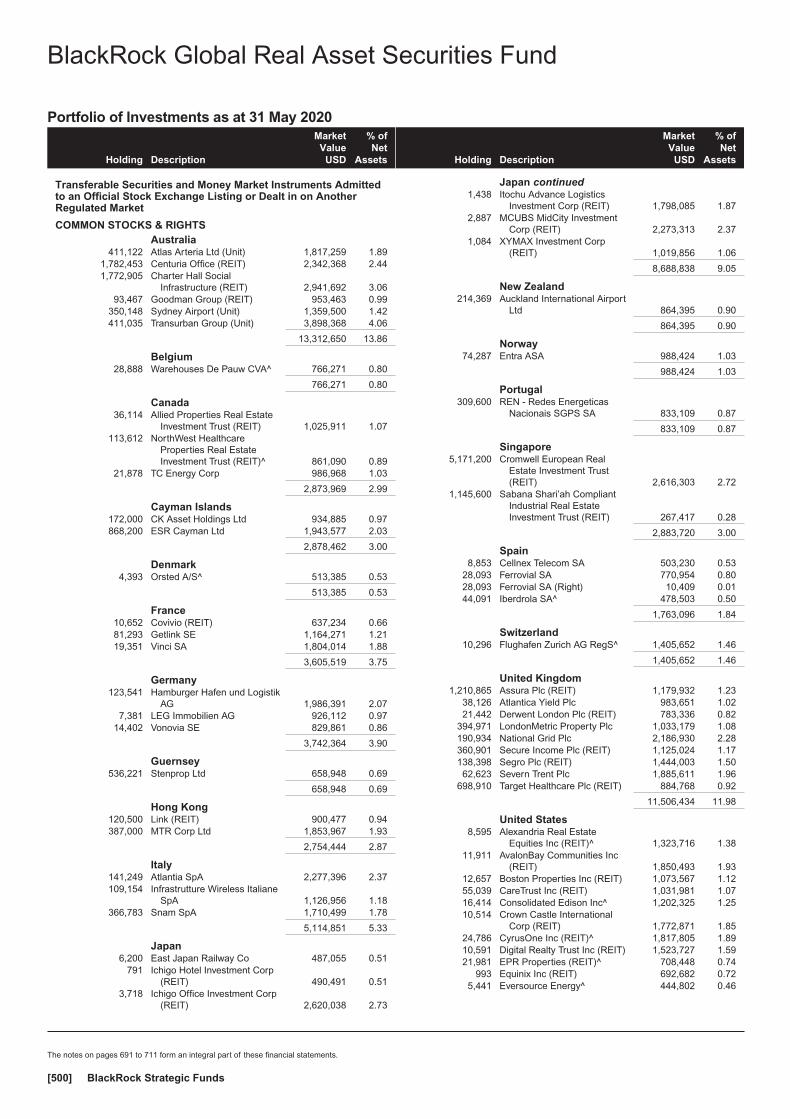
Portfolio of Investments as at 31 May 2020
Holding Description
MarketValue
USD
% ofNet
Assets
Transferable Securities and Money Market Instruments Admittedto an Official Stock Exchange Listing or Dealt in on AnotherRegulated Market
COMMON STOCKS & RIGHTSAustralia
411,122 Atlas Arteria Ltd (Unit) 1,817,259 1.891,782,453 Centuria Office (REIT) 2,342,368 2.441,772,905 Charter Hall Social
Infrastructure (REIT) 2,941,692 3.0693,467 Goodman Group (REIT) 953,463 0.99
350,148 Sydney Airport (Unit) 1,359,500 1.42411,035 Transurban Group (Unit) 3,898,368 4.06
13,312,650 13.86
Belgium28,888 Warehouses De Pauw CVA^ 766,271 0.80
766,271 0.80
Canada36,114 Allied Properties Real Estate
Investment Trust (REIT) 1,025,911 1.07113,612 NorthWest Healthcare
Properties Real EstateInvestment Trust (REIT)^ 861,090 0.89
21,878 TC Energy Corp 986,968 1.03
2,873,969 2.99
Cayman Islands172,000 CK Asset Holdings Ltd 934,885 0.97868,200 ESR Cayman Ltd 1,943,577 2.03
2,878,462 3.00
Denmark4,393 Orsted A/S^ 513,385 0.53
513,385 0.53
France10,652 Covivio (REIT) 637,234 0.6681,293 Getlink SE 1,164,271 1.2119,351 Vinci SA 1,804,014 1.88
3,605,519 3.75
Germany123,541 Hamburger Hafen und Logistik
AG 1,986,391 2.077,381 LEG Immobilien AG 926,112 0.97
14,402 Vonovia SE 829,861 0.86
3,742,364 3.90
Guernsey536,221 Stenprop Ltd 658,948 0.69
658,948 0.69
Hong Kong120,500 Link (REIT) 900,477 0.94387,000 MTR Corp Ltd 1,853,967 1.93
2,754,444 2.87
Italy141,249 Atlantia SpA 2,277,396 2.37109,154 Infrastrutture Wireless Italiane
SpA 1,126,956 1.18366,783 Snam SpA 1,710,499 1.78
5,114,851 5.33
Japan6,200 East Japan Railway Co 487,055 0.51
791 Ichigo Hotel Investment Corp(REIT) 490,491 0.51
3,718 Ichigo Office Investment Corp(REIT) 2,620,038 2.73
Holding Description
MarketValue
USD
% ofNet
Assets
Japan continued1,438 Itochu Advance Logistics
Investment Corp (REIT) 1,798,085 1.872,887 MCUBS MidCity Investment
Corp (REIT) 2,273,313 2.371,084 XYMAX Investment Corp
(REIT) 1,019,856 1.06
8,688,838 9.05
New Zealand214,369 Auckland International Airport
Ltd 864,395 0.90
864,395 0.90
Norway74,287 Entra ASA 988,424 1.03
988,424 1.03
Portugal309,600 REN - Redes Energeticas
Nacionais SGPS SA 833,109 0.87
833,109 0.87
Singapore5,171,200 Cromwell European Real
Estate Investment Trust(REIT) 2,616,303 2.72
1,145,600 Sabana Shari’ah CompliantIndustrial Real EstateInvestment Trust (REIT) 267,417 0.28
2,883,720 3.00
Spain8,853 Cellnex Telecom SA 503,230 0.53
28,093 Ferrovial SA 770,954 0.8028,093 Ferrovial SA (Right) 10,409 0.0144,091 Iberdrola SA^ 478,503 0.50
1,763,096 1.84
Switzerland10,296 Flughafen Zurich AG RegS^ 1,405,652 1.46
1,405,652 1.46
United Kingdom1,210,865 Assura Plc (REIT) 1,179,932 1.23
38,126 Atlantica Yield Plc 983,651 1.0221,442 Derwent London Plc (REIT) 783,336 0.82
394,971 LondonMetric Property Plc 1,033,179 1.08190,934 National Grid Plc 2,186,930 2.28360,901 Secure Income Plc (REIT) 1,125,024 1.17138,398 Segro Plc (REIT) 1,444,003 1.5062,623 Severn Trent Plc 1,885,611 1.96
698,910 Target Healthcare Plc (REIT) 884,768 0.92
11,506,434 11.98
United States8,595 Alexandria Real Estate
Equities Inc (REIT)^ 1,323,716 1.3811,911 AvalonBay Communities Inc
(REIT) 1,850,493 1.9312,657 Boston Properties Inc (REIT) 1,073,567 1.1255,039 CareTrust Inc (REIT) 1,031,981 1.0716,414 Consolidated Edison Inc^ 1,202,325 1.2510,514 Crown Castle International
Corp (REIT) 1,772,871 1.8524,786 CyrusOne Inc (REIT)^ 1,817,805 1.8910,591 Digital Realty Trust Inc (REIT) 1,523,727 1.5921,981 EPR Properties (REIT)^ 708,448 0.74
993 Equinix Inc (REIT) 692,682 0.725,441 Eversource Energy^ 444,802 0.46
BlackRock Global Real Asset Securities Fund
The notes on pages 691 to 711 form an integral part of these financial statements.
BlackRock Strategic Funds[500]

Portfolio of Investments as at 31 May 2020
Holding Description
MarketValue
USD
% ofNet
Assets
United States continued12,679 Extra Space Storage Inc
(REIT) 1,210,718 1.2653,875 Kinder Morgan Inc^ 839,373 0.876,108 NextEra Energy Inc^ 1,544,835 1.61
20,095 Prologis Inc (REIT) 1,853,362 1.936,452 Sempra Energy 814,113 0.85
19,023 Spirit Realty Capital Inc(REIT)^ 544,058 0.57
67,007 STAG Industrial Inc (REIT) 1,784,396 1.8632,737 Welltower Inc (REIT) 1,620,154 1.6958,594 Williams Cos Inc^ 1,159,575 1.2124,388 Xcel Energy Inc^ 1,561,564 1.62
26,374,565 27.47
Total Common Stocks & Rights 91,529,096 95.32
Total Transferable Securities and Money MarketInstruments Admitted to an Official Stock ExchangeListing or Dealt in on Another Regulated Market 91,529,096 95.32
Securities portfolio at market value 91,529,096 95.32
Other Net Assets 4,500,379 4.68
Total Net Assets (USD) 96,029,475 100.00
^ All or a portion of this security represents a security on loan.
Written Options as at 31 May 2020
Numberof
contractsCall/Put Description Counterparty Strike Price
Expirationdate
Netunrealised
appreciation/(depreciation)
USD
MarketValue
USD
(66,000) Call CK Asset Holdings Ltd Citibank HKD 48.70 24/06/2020 7,647 (1,253)
(28,300) Call Atlantia SpA Credit Suisse EUR 14.41 24/06/2020 (9,092) (22,357)
(10,700) Call Derwent London Plc Credit Suisse GBP 35.74 02/06/2020 10,491 (17)
(33,400) Call Entra ASA Credit Suisse NOK 126.30 07/07/2020 (35,127) (42,039)
(14,100) Call Ferrovial SA Credit Suisse EUR 23.43 16/06/2020 (18,309) (25,111)
(3,400) Call LEG Immobilien AG Credit Suisse EUR 107.76 08/07/2020 (13,236) (18,913)
(32,700) Call National Grid Plc Credit Suisse GBP 9.85 16/06/2020 3,817 (1,875)
(53,200) Call National Grid Plc Credit Suisse GBP 9.77 07/07/2020 3,082 (4,840)
(148,500) CallRedes Energeticas Nacionais
SGPS SA Credit Suisse EUR 2.36 17/06/2020 (18,834) (24,170)
(36,300) Call Segro Plc Credit Suisse GBP 8.74 14/07/2020 (19,113) (23,694)
(108,100) Call Snam SpA Credit Suisse EUR 3.86 08/06/2020 (21,381) (40,954)
(44,000) Call Stenprop Ltd Credit Suisse GBP 0.98 11/06/2020 (1,810) (2,732)
(105,000) Call Target Healthcare REIT Plc Credit Suisse GBP 1.15 11/06/2020 (2,153) (3,172)
(6,500) Call Vonovia SE Credit Suisse EUR 49.11 25/06/2020 (14,868) (21,957)
(38) CallAlexandria Real Estate
Equitiejan Exchange Traded USD 150.00 19/06/2020 (11,405) (25,080)
(162) CallAllied Properties Real Estate
Investment Trust Exchange Traded CAD 44.00 19/06/2020 3,966 (2,940)
(171) CallAtlantica Sustainable
Infrastructure Plc Exchange Traded USD 28.00 30/06/2020 (1,666) (8,506)
(53) Call Avalonbay Communities Inc Exchange Traded USD 160.00 19/06/2020 4,864 (18,762)
(56) Call Boston Properties Inc Exchange Traded USD 80.00 17/07/2020 (29,234) (48,160)
(46) Call Caretrust REIT Inc Exchange Traded USD 20.00 17/07/2020 315 (3,910)
(201) Call Caretrust REIT Inc Exchange Traded USD 17.50 19/06/2020 (18,228) (31,155)
(73) Call Consolidated Edison Inc Exchange Traded USD 73.00 26/06/2020 1,643 (16,608)
(47) Call Crown Castle International Exchange Traded USD 160.00 19/06/2020 (28,313) (40,420)
(49) Call CyrusOne Inc Exchange Traded USD 75.00 19/06/2020 5,672 (7,350)
BlackRock Global Real Asset Securities Fund continued
The notes on pages 691 to 711 form an integral part of these financial statements.
Annual report and audited financial statements [501]

Written Options as at 31 May 2020
Numberof
contractsCall/Put Description Counterparty Strike Price
Expirationdate
Netunrealised
appreciation/(depreciation)
USD
MarketValue
USD
(40) Call Digital Realty Trust Inc Exchange Traded USD 145.00 17/07/2020 (9,498) (22,000)
(116) Call EPR Properties Exchange Traded USD 26.49 19/06/2020 (57,719) (76,047)
(5) Call Equinix Inc Exchange Traded USD 700.00 19/06/2020 (3,805) (8,700)
(24) Call Eversource Energy Exchange Traded USD 80.00 17/07/2020 (7,649) (11,520)
(53) Call Extra Space Storage Inc Exchange Traded USD 100.00 19/06/2020 11,685 (3,445)
(10) Call Extra Space Storage Inc Exchange Traded USD 105.00 17/07/2020 (121) (950)
(59) Call Kinder Morgan Inc Exchange Traded USD 16.00 26/06/2020 (472) (2,714)
(58) Call Kinder Morgan Inc Exchange Traded USD 16.00 17/07/2020 (696) (3,770)
(42) Call Kinder Morgan Inc Exchange Traded USD 16.00 02/07/2020 (756) (2,268)
(41) Call Kinder Morgan Inc Exchange Traded USD 15.50 19/06/2020 (677) (2,563)
(42) Call Kinder Morgan Inc Exchange Traded USD 15.50 12/06/2020 (630) (2,226)
(2) Call NextEra Energy Inc Exchange Traded USD 250.00 19/06/2020 68 (1,458)
(25) Call NextEra Energy Inc Exchange Traded USD 238.00 17/07/2020 (27,308) (43,783)
(510) CallNorthwest Healthcare
Properties Exchange Traded CAD 11.00 17/07/2020 (194) (3,888)
(95) Call Prologis Inc Exchange Traded USD 90.00 19/06/2020 19,956 (38,950)
(29) Call Sempra Energy Exchange Traded USD 125.00 19/06/2020 (4,785) (12,325)
(95) Call Spirit Realty Capital Inc Exchange Traded USD 28.00 17/07/2020 (12,113) (24,463)
(190) Call Stag Industrial Inc Exchange Traded USD 30.00 19/06/2020 17,775 (950)
(152) Call Stag Industrial Inc Exchange Traded USD 25.00 19/06/2020 (19,239) (30,780)
(44) Call TC Energy Corp Exchange Traded CAD 68.00 19/06/2020 7,432 (367)
(39) Call TC Energy Corp Exchange Traded CAD 66.50 05/06/2020 3,054 (538)
(15) Call TC Energy Corp Exchange Traded CAD 62.50 26/06/2020 (93) (1,889)
(98) Call Welltower Inc Exchange Traded USD 42.50 19/06/2020 (63,671) (75,460)
(49) Call Welltower Inc Exchange Traded USD 55.00 19/06/2020 1,568 (3,087)
(34) Call Williams Cos Inc Exchange Traded USD 18.00 19/06/2020 (3,058) (6,613)
(29) Call Williams Cos Inc Exchange Traded USD 20.00 17/07/2020 548 (2,610)
(77) Call Williams Cos Inc Exchange Traded USD 21.00 26/06/2020 2,292 (1,694)
(77) Call Williams Cos Inc Exchange Traded USD 20.50 12/06/2020 1,617 (2,310)
(12) Call Williams Cos Inc Exchange Traded USD 20.00 26/06/2020 54 (846)
(12) Call Williams Cos Inc Exchange Traded USD 20.00 19/06/2020 90 (678)
(22) Call Williams Cos Inc Exchange Traded USD 20.50 02/07/2020 649 (1,331)
(3) Call Xcel Energy Inc Exchange Traded USD 65.00 19/06/2020 939 (255)
(118) Call Xcel Energy Inc Exchange Traded USD 60.00 19/06/2020 (37,878) (50,150)
(378,500) Call Assura Group Ltd Goldman Sachs GBP 0.80 24/06/2020 (10,677) (19,364)
(121,900) Call Assura Group Ltd Goldman Sachs GBP 0.81 17/06/2020 (1,731) (4,667)
(43,400) Call Getlink SE Goldman Sachs EUR 11.55 03/06/2020 (36,332) (60,813)
(46,200) CallHamburger Hafen und Logistik
AG Goldman Sachs EUR 13.89 07/07/2020 (14,760) (34,229)
(7,000) CallHamburger Hafen und Logistik
AG Goldman Sachs EUR 15.67 07/07/2020 2,408 (517)
(84,000) Call MTR Corp Ltd Goldman Sachs HKD 43.85 03/06/2020 2,503 —
(42,800) Call Secure Income REIT Plc Goldman Sachs GBP 2.92 08/06/2020 3,299 (4,134)
(56,600) Call Secure Income REIT Plc Goldman Sachs GBP 2.50 09/07/2020 (20,055) (27,886)
(15,400) Call Severn Trent Plc Goldman Sachs GBP 24.89 17/06/2020 3,703 (2,930)
(163,600) Call Sydney Airport Goldman Sachs AUD 6.49 08/07/2020 7,346 (8,616)
(47,000) Call Goodman Group JP Morgan AUD 14.23 02/06/2020 (19,644) (36,110)
(2,040) Call Ichigo Office REIT Investment JP Morgan JPY 67,865.58 11/06/2020 (156,602) (193,392)
(600) CallItochu Advance Logistics
Investment JP MorganJPY132,199.89 30/06/2020 (19,704) (28,655)
(185,000) Call Transurban Group JP Morgan AUD 15.15 14/07/2020 8,306 (22,494)
(17,500) Call Iberdrola SA Morgan Stanley EUR 9.06 07/07/2020 (12,327) (15,454)
(4,500) Call Iberdrola SA Morgan Stanley EUR 9.29 25/06/2020 (2,130) (2,889)
(51,400) CallInfrastrutture Wireless Italiane
SpA Morgan Stanley EUR 9.58 14/07/2020 (3,457) (12,116)
(47,700) Call Link REIT Morgan Stanley HKD 70.16 08/06/2020 6,986 (10)
(177,700) Call LondonMetric Property Plc Morgan Stanley GBP 1.92 23/06/2020 (44,382) (59,776)
(63,000) Call Secure Income REIT Plc Morgan Stanley GBP 2.87 17/06/2020 (6,615) (12,203)
BlackRock Global Real Asset Securities Fund continued
The notes on pages 691 to 711 form an integral part of these financial statements.
BlackRock Strategic Funds[502]
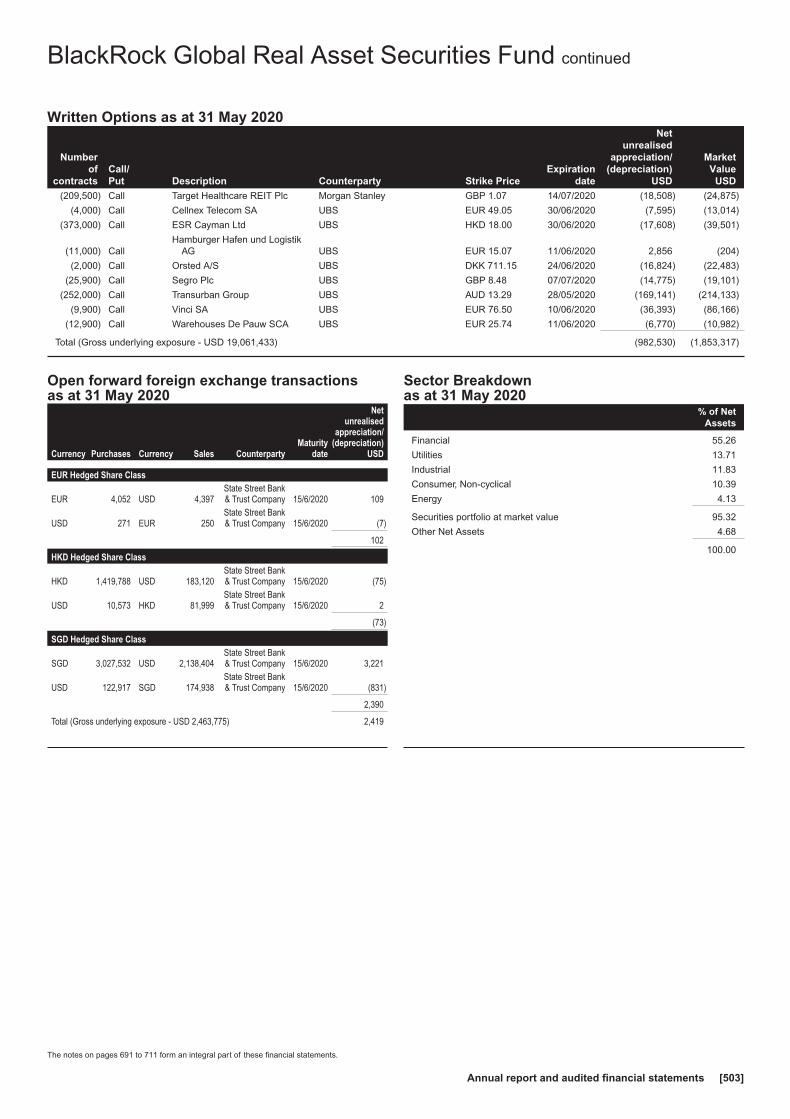
Written Options as at 31 May 2020
Numberof
contractsCall/Put Description Counterparty Strike Price
Expirationdate
Netunrealised
appreciation/(depreciation)
USD
MarketValue
USD
(209,500) Call Target Healthcare REIT Plc Morgan Stanley GBP 1.07 14/07/2020 (18,508) (24,875)
(4,000) Call Cellnex Telecom SA UBS EUR 49.05 30/06/2020 (7,595) (13,014)
(373,000) Call ESR Cayman Ltd UBS HKD 18.00 30/06/2020 (17,608) (39,501)
(11,000) CallHamburger Hafen und Logistik
AG UBS EUR 15.07 11/06/2020 2,856 (204)
(2,000) Call Orsted A/S UBS DKK 711.15 24/06/2020 (16,824) (22,483)
(25,900) Call Segro Plc UBS GBP 8.48 07/07/2020 (14,775) (19,101)
(252,000) Call Transurban Group UBS AUD 13.29 28/05/2020 (169,141) (214,133)
(9,900) Call Vinci SA UBS EUR 76.50 10/06/2020 (36,393) (86,166)
(12,900) Call Warehouses De Pauw SCA UBS EUR 25.74 11/06/2020 (6,770) (10,982)
Total (Gross underlying exposure - USD 19,061,433) (982,530) (1,853,317)
Open forward foreign exchange transactionsas at 31 May 2020
Currency Purchases Currency Sales CounterpartyMaturity
date
Netunrealised
appreciation/(depreciation)
USD
EUR Hedged Share Class
EUR 4,052 USD 4,397State Street Bank& Trust Company 15/6/2020 109
USD 271 EUR 250State Street Bank& Trust Company 15/6/2020 (7)
102
HKD Hedged Share Class
HKD 1,419,788 USD 183,120State Street Bank& Trust Company 15/6/2020 (75)
USD 10,573 HKD 81,999State Street Bank& Trust Company 15/6/2020 2
(73)
SGD Hedged Share Class
SGD 3,027,532 USD 2,138,404State Street Bank& Trust Company 15/6/2020 3,221
USD 122,917 SGD 174,938State Street Bank& Trust Company 15/6/2020 (831)
2,390
Total (Gross underlying exposure - USD 2,463,775) 2,419
Sector Breakdownas at 31 May 2020
% of NetAssets
Financial 55.26
Utilities 13.71
Industrial 11.83
Consumer, Non-cyclical 10.39
Energy 4.13
Securities portfolio at market value 95.32
Other Net Assets 4.68
100.00
BlackRock Global Real Asset Securities Fund continued
The notes on pages 691 to 711 form an integral part of these financial statements.
Annual report and audited financial statements [503]

Portfolio of Investments as at 31 May 2020
Holding Description
MarketValue
USD
% ofNet
Assets
Transferable Securities and Money Market Instruments Admittedto an Official Stock Exchange Listing or Dealt in on AnotherRegulated Market
BONDSArgentina
USD 320,000 Argentine RepublicGovernment InternationalBond 4.625% 11/1/2023^ 130,350 0.34
130,350 0.34
CyprusEUR 840,000 Cyprus Government
International Bond RegS0.625% 21/1/2030 883,791 2.32
EUR 273,000 Cyprus GovernmentInternational Bond RegS1.25% 21/1/2040 285,229 0.75
1,169,020 3.07
FranceEUR 566,000 France Government Bond OAT
RegS 0.50% 25/5/2040 635,758 1.67
635,758 1.67
GermanyEUR 180,000 Bundesrepublik Deutschland
Bundesanleihe RegS15/8/2050 (Zero Coupon) 199,987 0.53
EUR 1,700,000 German Treasury Bill RegS10/6/2020 (Zero Coupon) 1,890,542 4.96
2,090,529 5.49
GreeceEUR 1,789,000 Hellenic Republic Government
Bond RegS 1.875%23/7/2026 2,071,237 5.44
2,071,237 5.44
IndonesiaUSD 590,000 Indonesia Government
International Bond 4.10%24/4/2028 653,056 1.71
653,056 1.71
ItalyEUR 3,909,000 Italy Buoni Poliennali Del
Tesoro 1.45% 15/9/2022 4,451,475 11.69
4,451,475 11.69
PortugalEUR 1,393,000 Portugal Obrigacoes do
Tesouro OT RegS 5.65%15/2/2024 1,891,542 4.97
EUR 328,493 Portugal Obrigacoes doTesouro OT RegS 2.875%21/7/2026 428,059 1.12
2,319,601 6.09
RussiaRUB 76,365,000 Russian Federal Bond - OFZ
7.40% 17/7/2024 1,182,164 3.10
1,182,164 3.10
SpainEUR 5,565,000 Spain Government Bond
0.35% 30/7/2023 6,305,574 16.56
6,305,574 16.56
Holding Description
MarketValue
USD
% ofNet
Assets
United StatesUSD 34,192 Banc of America Commercial
Mortgage Trust’2016-UBS10’ 1.559%15/7/2049 34,197 0.09
USD 1,085 Citigroup CommercialMortgage Trust ’2016-GC36’1.613% 10/2/2049 1,086 0.00
USD 88,752 COMM ’2016-DC2’ MortgageTrust 1.82% 10/2/2049 88,879 0.23
USD 9,380 COMM Mortgage Trust’2012-CR2 ASB’ 2.752%15/8/2045 9,462 0.03
USD 26,255 Commercial Mortgage PassThrough Certificates 1.77%10/2/2049 26,282 0.07
USD 30,206 GS Mortgage Securities Trust’2012-GC6’ 3.314%10/1/2045 30,562 0.08
USD 8,220 Springleaf Funding Trust’2016-A’ 2.90% 15/11/2029 8,208 0.02
USD 3,000,000 United States Treasury Bill23/6/2020 (Zero Coupon) 2,999,796 7.88
USD 3,000,000 United States Treasury Bill21/7/2020 (Zero Coupon) 2,999,428 7.87
USD 2,500,000 United States Treasury Bill24/9/2020 (Zero Coupon) 2,499,647 6.56
8,697,547 22.83
Total Bonds 29,706,311 77.99
Total Transferable Securities and Money MarketInstruments Admitted to an Official Stock ExchangeListing or Dealt in on Another Regulated Market 29,706,311 77.99
Other Transferable Securities and Money Market Instruments
BONDSUnited States
USD 73,752 COMM ’2014-CCRE15’Mortgage Trust 2.928%10/2/2047 73,979 0.19
73,979 0.19
Total Bonds 73,979 0.19
Total Other Transferable Securities and MoneyMarket Instruments 73,979 0.19
Collective Investment Schemes~
Ireland3,595,000 Institutional Cash Series Plc -
Institutional US DollarLiquidity Fund 3,595,000 9.44
3,595,000 9.44
Total Collective Investment Schemes 3,595,000 9.44
Securities portfolio at market value 33,375,290 87.62
Other Net Assets 4,713,785 12.38
Total Net Assets (USD) 38,089,075 100.00
^ All or a portion of this security represents a security on loan.~ Investment in related party fund, see further information in Note 10.
BlackRock Macro Opportunities Fund
The notes on pages 691 to 711 form an integral part of these financial statements.
BlackRock Strategic Funds[504]
Swaps as at 31 May 2020
TypeNominal
Value Description CounterpartyExpiration
date
Net unrealisedappreciation/
(depreciation)USD
MarketValue
USD
CCCDS USD 1,568,000Fund receives default protection on Markit CDX.NA.HY.25 Version
8 and pays Fixed 5.000%Bank of America
Merrill Lynch 20/6/2025 (24,474) 42,109
CCCDS USD 10,200,000Fund receives Fixed 1.000% and provides default protection on
Markit CDX.NA.IG.30Bank of America
Merrill Lynch 20/6/2025 120,325 96,503
CCILS GBP 4,502,000Fund receives Fixed 3.440% and pays Floating GBP 12 Month
UKRPIBank of America
Merrill Lynch 15/2/2030 68,348 68,480
CCILS EUR 900,000Fund receives Floating EUR 12 Month CPTFEMU and pays Fixed
0.560%Bank of America
Merrill Lynch 15/3/2030 13,766 13,788
CCILS GBP 4,502,000Fund receives Floating GBP 12 Month UKRPI and pays Fixed
3.340%Bank of America
Merrill Lynch 15/2/2025 (66,275) (66,187)
CCILS USD 8,750,000Fund receives Floating USD 12 Month USCPI and pays Fixed
1.810%Bank of America
Merrill Lynch 13/1/2025 (395,029) (394,897)
CCIRS USD 2,710,000Fund receives Fixed 0.645% and pays Floating USD 3 Month
LIBORBank of America
Merrill Lynch 15/2/2030 (6,388) (5,879)
CCIRS AUD 1,900,000Fund receives Fixed 0.780% and pays Floating AUD 3 Month
Australia Bank Bill Swap RateBank of America
Merrill Lynch 15/6/2025 8,189 8,203
CCIRS USD 2,250,000Fund receives Fixed 1.572% and pays Floating USD 3 Month
LIBORBank of America
Merrill Lynch 18/2/2030 197,440 197,483
CCIRS EUR 522,000Fund receives Floating EUR 6 Month EURIBOR and pays Fixed
0.180%Bank of America
Merrill Lynch 16/1/2030 (18,735) (18,345)
CCIRS USD 2,840,000Fund receives Floating USD 3 Month LIBOR and pays Fixed
0.920%Bank of America
Merrill Lynch 15/11/2045 47,021 46,436
IRS EUR 3,166,000Fund receives Floating EUR 6 Month LIBOR and pays Fixed
0.000%Bank of America
Merrill Lynch 2/4/2023 (1,778) (1,844)
IRS THB 24,200,000Fund receives Fixed 1.000% and pays Floating THB 6 Month
Thailand Fixing Rate JP Morgan 16/9/2025 7,578 7,578
IRS CNY 4,000,000Fund receives Fixed 1.910% and pays Floating CNY 3 Month 7D
China Fixing Repo Rates Nomura 16/9/2025 (2,294) (2,295)
IRS CNY 12,100,000Fund receives Fixed 2.285% and pays Floating CNY 12 Month 7D
China Fixing Repo Rates Nomura 17/6/2025 26,019 26,019
Total (Gross underlying exposure - USD 49,583,346) (26,287) 17,152
CCCDS: Centrally Cleared Credit Default SwapsCCILS: Centrally Cleared Inflation Linked SwapsCCIRS: Centrally Cleared Interest Rate SwapsIRS: Interest Rate Swaps
Futures contracts as at 31 May 2020
Numberof
contractsCurrencyof contracts
Contract/Description
Expirationdate
Grossunderlying
exposureUSD
Net unrealisedappreciation/
(depreciation)USD
50 EUR 3 Month Euribor Futures September 2020 September 2020 13,952,888 1,029
(22) USD 90 Day Euro Futures September 2020 September 2022 5,484,050 (1,650)
3 USD E-Mini S&P 500 Index Futures June 2020 June 2020 453,345 43,545
(14) EUR Euro BOBL Futures June 2020 June 2020 2,102,675 11,064
79 EUR Euro BTP Futures June 2020 June 2020 9,841,169 50,194
(14) EUR Euro BTP Futures June 2020 June 2020 2,218,340 (71,643)
(1) EUR Euro Bund Futures June 2020 June 2020 191,633 1,690
2 EUR Euro BUXL 30 Year Bond Futures June 2020 June 2020 470,488 1,446
(22) EUR Euro Schatz Futures June 2020 June 2020 2,740,579 4,742
(8) EUR EURO STOXX 50 Index Futures June 2020 June 2020 272,383 (13,343)
6 EUR Euro-OAT Futures June 2020 June 2020 1,123,781 8,531
23 USD FTSE China A50 Futures June 2020 June 2020 303,485 2,070
(2) HKD Hang Seng Index Futures June 2020 June 2020 293,614 4,913
3 USD Japanese Yen Futures June 2020 June 2020 348,788 410
(3) USD US Dollar Index Futures June 2020 June 2020 294,570 5,765
(18) USD US Treasury 10 Year Note Futures September 2020 September 2020 2,823,469 2,599
(1) USD US Treasury 10 Year Note Futures September 2020 September 2020 138,844 (141)
BlackRock Macro Opportunities Fund continued
The notes on pages 691 to 711 form an integral part of these financial statements.
Annual report and audited financial statements [505]

Futures contracts as at 31 May 2020
Numberof
contractsCurrencyof contracts
Contract/Description
Expirationdate
Grossunderlying
exposureUSD
Net unrealisedappreciation/
(depreciation)USD
15 USD US Treasury 5 Year Note Futures September 2020 September 2020 1,882,617 1,992
16 USD US Ultra Bond Futures September 2020 September 2020 3,456,500 (18,344)
Total 48,393,218 34,869
Purchased Options as at 31 May 2020
Numberof
contractsCall/Put Description Counterparty Strike Price
Expirationdate
Netunrealised
appreciation/(depreciation)
USD
MarketValue
USD
4,600,000 Call OTC USD/JPY Bank of America Merrill Lynch USD 111.00 19/03/2024 38,787 112,065
1,000,000 Call OTC USD/CNH Barclays Bank USD 7.15 13/08/2020 4,172 14,452
1,000,000 Call OTC USD/CNH Barclays Bank USD 7.15 13/08/2020 4,012 14,452
1,600,000 Put OTC AUD/USD Citibank AUD 0.64 17/08/2020 (9,679) 9,740
10,000,000 Put OTC USD/MXN Deutsche Bank USD 19.25 29/05/2020 (99,980) 10
0 Put Cboe Volatility Index Exchange Traded 0.00 20/05/2020 — —
0 Put Cboe Volatility Index Exchange Traded 0.00 20/05/2020 — —
80 Put Cboe Volatility Index Exchange Traded USD 30.00 17/06/2020 (727) 23,200
4 Put E-Mini S&P 500 Index Exchange Traded USD 2,800.00 17/07/2020 (44,300) 21,200
2 Put E-Mini S&P 500 Index Exchange Traded USD 2,500.00 17/07/2020 (12,320) 3,640
8 Put E-Mini S&P 500 Index Exchange Traded USD 2,800.00 31/07/2020 (49,618) 53,440
4 Put E-Mini S&P 500 Index Exchange Traded USD 2,500.00 31/07/2020 (13,677) 10,680
32 Call EURO STOXX 50 Index Exchange Traded EUR 3,050.00 19/06/2020 22,812 31,989
4 Put Russell 2000 Index Exchange Traded USD 1,250.00 31/07/2020 (5,140) 16,260
1,600,000 Put OTC AUD/USD JP Morgan AUD 0.64 17/08/2020 (12,270) 9,740
2,250,000 Call OTC EUR/GBP JP Morgan EUR 0.88 15/07/2020 30,838 64,153
1,750,000 Call OTC USD/JPY JP Morgan USD 100.00 25/09/2028 44,520 120,050
5,000,000 Put OTC USD/MXN JP Morgan USD 18.65 29/05/2020 (1,745) 5
1,080,000 Put OTC USD/RUB JP Morgan USD 72.50 05/08/2020 20,318 38,619
650,000 Put OTC EUR/USD Morgan Stanley EUR 1.25 25/09/2028 48,612 86,862
Total (Gross underlying exposure - USD 4,579,678) (35,385) 630,557
Written Options as at 31 May 2020
Numberof
contractsCall/Put Description Counterparty Strike Price
Expirationdate
Netunrealised
appreciation/(depreciation)
USD
MarketValue
USD
(1,110,000) Call OTC USD/KRW Bank of America Merrill Lynch USD 1,280.00 02/11/2020 2,132 (15,779)
(2,000,000) Call OTC USD/CNH Barclays Bank USD 7.40 13/08/2020 (1,312) (9,292)
(2,000,000) Call OTC USD/CNH Barclays Bank USD 7.40 13/08/2020 (1,472) (9,292)
(1,090,000) Call OTC USD/IDR Barclays Bank USD 15,500.00 04/06/2020 14,384 (113)
(1,090,000) Put OTC USD/IDR Barclays Bank USD 15,000.00 04/06/2020 (12,922) (27,092)
(1,600,000) Put OTC AUD/USD Citibank AUD 0.60 17/08/2020 3,797 (2,532)
(5,000,000) Put OTC USD/MXN Deutsche Bank USD 18.65 29/05/2020 12,205 (5)
(160) Put Cboe Volatility Index Exchange Traded USD 26.00 17/06/2020 4,490 (17,120)
(6) Put E-Mini S&P 500 Index Exchange Traded USD 2,650.00 17/07/2020 49,992 (19,380)
(12) Put E-Mini S&P 500 Index Exchange Traded USD 2,650.00 31/07/2020 55,195 (52,260)
(4) Put Russell 2000 Index Exchange Traded USD 1,100.00 31/07/2020 2,782 (6,400)
(1,600,000) Put OTC AUD/USD JP Morgan AUD 0.60 17/08/2020 4,902 (2,532)
(2,250,000) Call OTC EUR/GBP JP Morgan EUR 0.91 15/07/2020 (4,109) (18,711)
(1,080,000) Put OTC USD/RUB JP Morgan USD 68.00 05/08/2020 (2,549) (7,047)
Total (Gross underlying exposure - USD 1,900,597) 127,515 (187,555)
BlackRock Macro Opportunities Fund continued
The notes on pages 691 to 711 form an integral part of these financial statements.
BlackRock Strategic Funds[506]
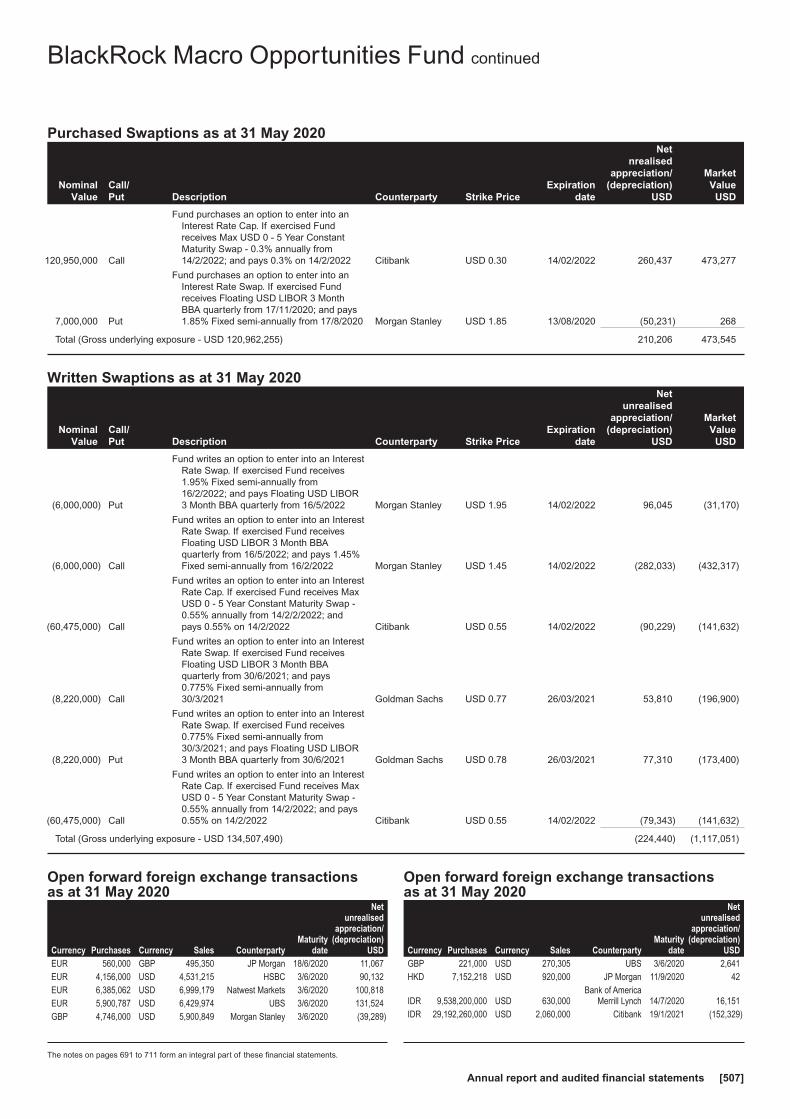
Purchased Swaptions as at 31 May 2020
NominalValue
Call/Put Description Counterparty Strike Price
Expirationdate
Netnrealised
appreciation/(depreciation)
USD
MarketValue
USD
120,950,000 Call
Fund purchases an option to enter into anInterest Rate Cap. If exercised Fundreceives Max USD 0 - 5 Year ConstantMaturity Swap - 0.3% annually from14/2/2022; and pays 0.3% on 14/2/2022 Citibank USD 0.30 14/02/2022 260,437 473,277
7,000,000 Put
Fund purchases an option to enter into anInterest Rate Swap. If exercised Fundreceives Floating USD LIBOR 3 MonthBBA quarterly from 17/11/2020; and pays1.85% Fixed semi-annually from 17/8/2020 Morgan Stanley USD 1.85 13/08/2020 (50,231) 268
Total (Gross underlying exposure - USD 120,962,255) 210,206 473,545
Written Swaptions as at 31 May 2020
NominalValue
Call/Put Description Counterparty Strike Price
Expirationdate
Netunrealised
appreciation/(depreciation)
USD
MarketValue
USD
(6,000,000) Put
Fund writes an option to enter into an InterestRate Swap. If exercised Fund receives1.95% Fixed semi-annually from16/2/2022; and pays Floating USD LIBOR3 Month BBA quarterly from 16/5/2022 Morgan Stanley USD 1.95 14/02/2022 96,045 (31,170)
(6,000,000) Call
Fund writes an option to enter into an InterestRate Swap. If exercised Fund receivesFloating USD LIBOR 3 Month BBAquarterly from 16/5/2022; and pays 1.45%Fixed semi-annually from 16/2/2022 Morgan Stanley USD 1.45 14/02/2022 (282,033) (432,317)
(60,475,000) Call
Fund writes an option to enter into an InterestRate Cap. If exercised Fund receives MaxUSD 0 - 5 Year Constant Maturity Swap -0.55% annually from 14/2/2/2022; andpays 0.55% on 14/2/2022 Citibank USD 0.55 14/02/2022 (90,229) (141,632)
(8,220,000) Call
Fund writes an option to enter into an InterestRate Swap. If exercised Fund receivesFloating USD LIBOR 3 Month BBAquarterly from 30/6/2021; and pays0.775% Fixed semi-annually from30/3/2021 Goldman Sachs USD 0.77 26/03/2021 53,810 (196,900)
(8,220,000) Put
Fund writes an option to enter into an InterestRate Swap. If exercised Fund receives0.775% Fixed semi-annually from30/3/2021; and pays Floating USD LIBOR3 Month BBA quarterly from 30/6/2021 Goldman Sachs USD 0.78 26/03/2021 77,310 (173,400)
(60,475,000) Call
Fund writes an option to enter into an InterestRate Cap. If exercised Fund receives MaxUSD 0 - 5 Year Constant Maturity Swap -0.55% annually from 14/2/2022; and pays0.55% on 14/2/2022 Citibank USD 0.55 14/02/2022 (79,343) (141,632)
Total (Gross underlying exposure - USD 134,507,490) (224,440) (1,117,051)
Open forward foreign exchange transactionsas at 31 May 2020
Currency Purchases Currency Sales CounterpartyMaturity
date
Netunrealised
appreciation/(depreciation)
USDEUR 560,000 GBP 495,350 JP Morgan 18/6/2020 11,067EUR 4,156,000 USD 4,531,215 HSBC 3/6/2020 90,132EUR 6,385,062 USD 6,999,179 Natwest Markets 3/6/2020 100,818EUR 5,900,787 USD 6,429,974 UBS 3/6/2020 131,524GBP 4,746,000 USD 5,900,849 Morgan Stanley 3/6/2020 (39,289)
Open forward foreign exchange transactionsas at 31 May 2020
Currency Purchases Currency Sales CounterpartyMaturity
date
Netunrealised
appreciation/(depreciation)
USDGBP 221,000 USD 270,305 UBS 3/6/2020 2,641HKD 7,152,218 USD 920,000 JP Morgan 11/9/2020 42
IDR 9,538,200,000 USD 630,000Bank of America
Merrill Lynch 14/7/2020 16,151IDR 29,192,260,000 USD 2,060,000 Citibank 19/1/2021 (152,329)
BlackRock Macro Opportunities Fund continued
The notes on pages 691 to 711 form an integral part of these financial statements.
Annual report and audited financial statements [507]

Open forward foreign exchange transactionsas at 31 May 2020
Currency Purchases Currency Sales CounterpartyMaturity
date
Netunrealised
appreciation/(depreciation)
USDIDR 8,946,000,000 USD 630,000 JP Morgan 19/1/2021 (45,392)INR 23,049,000 USD 300,000 Deutsche Bank 17/6/2020 4,433INR 97,410,600 USD 1,260,000 JP Morgan 17/6/2020 26,605JPY 28,293,570 NZD 430,000 Citibank 24/8/2020 (3,255)JPY 28,261,246 NZD 430,000 JP Morgan 24/8/2020 (3,556)JPY 80,314,600 USD 730,000 Citibank 30/6/2020 16,965JPY 53,772,890 USD 500,000 JP Morgan 30/6/2020 114JPY 236,935,205 USD 2,210,000 JP Morgan 20/8/2020 (4,658)KRW 181,905,000 USD 150,000 BNP Paribas 17/6/2020 (2,968)KRW 1,458,413,000 USD 1,210,000 Deutsche Bank 27/7/2020 (30,922)KRW 222,548,400 USD 180,000 Citibank 4/11/2020 47MXN 44,021,250 USD 2,250,000 Citibank 5/6/2020 (260,889)NZD 860,000 JPY 57,602,800 Citibank 4/8/2020 (2,702)NZD 230,000 JPY 15,155,873 Goldman Sachs 24/8/2020 1,535RUB 105,132,005 USD 1,465,020 Deutsche Bank 17/6/2020 20,918RUB 66,108,420 USD 882,000 JP Morgan 7/8/2020 46,213SGD 1,328,480 USD 920,000 Citibank 16/6/2020 19,747TWD 7,173,087 USD 240,000 UBS 14/7/2020 (464)TWD 17,260,425 USD 585,000 JP Morgan 31/7/2020 (7,812)
USD 19,395 AUD 30,000Bank of America
Merrill Lynch 3/6/2020 (516)USD 31,362 EUR 29,000 BNP Paribas 3/6/2020 (885)USD 444,118 EUR 405,000 Deutsche Bank 3/6/2020 (6,229)USD 178,195 EUR 165,000 HSBC 3/6/2020 (5,280)USD 5,615,554 EUR 5,190,000 JP Morgan 3/6/2020 (155,570)USD 5,672,409 EUR 5,223,000 Morgan Stanley 3/6/2020 (135,411)
USD 24,979,264 EUR 22,885,000State Street Bank& Trust Company 3/6/2020 (468,170)
USD 66,159 EUR 60,000 JP Morgan 6/7/2020 (604)USD 306,533 GBP 250,000 Deutsche Bank 3/6/2020 (2,230)
USD 5,883,161 GBP 4,711,000State Street Bank& Trust Company 3/6/2020 64,828
USD 50,041 HKD 388,000State Street Bank& Trust Company 3/6/2020 8
USD 920,000 HKD 7,143,708 JP Morgan 11/9/2020 1,053USD 240,000 IDR 3,586,800,000 HSBC 14/7/2020 (2,982)USD 2,690,000 IDR 38,814,010,000 Citibank 19/1/2021 153,562
USD 300,000 INR 22,870,500Bank of America
Merrill Lynch 17/6/2020 (2,075)USD 630,000 INR 47,801,250 Citibank 17/6/2020 (1,362)USD 630,000 INR 48,925,800 JP Morgan 17/6/2020 (16,215)USD 120,000 JPY 12,937,960 HSBC 30/6/2020 (329)USD 370,000 JPY 39,773,338 JP Morgan 30/6/2020 89USD 1,100,000 JPY 118,103,711 JP Morgan 20/8/2020 716USD 584,577 KRW 703,333,781 HSBC 17/6/2020 16,078USD 600,000 KRW 737,574,000 HSBC 27/7/2020 3,696USD 610,000 KRW 750,849,000 JP Morgan 27/7/2020 2,964
USD 1,109,999 KRW 1,354,110,391Bank of America
Merrill Lynch 4/11/2020 14,493
USD 337,000 MXN 7,188,035State Street Bank& Trust Company 5/6/2020 12,207
USD 1,469,454 MXN 36,833,215 UBS 5/6/2020 (194,864)USD 3,258,647 RUB 246,735,000 JP Morgan 17/6/2020 (228,712)
Open forward foreign exchange transactionsas at 31 May 2020
Currency Purchases Currency Sales CounterpartyMaturity
date
Netunrealised
appreciation/(depreciation)
USD
USD 205,000 RUB 14,577,120Standard
Chartered Bank 17/6/2020 (1,033)USD 81,000 RUB 5,845,794 Goldman Sachs 7/8/2020 (1,080)USD 920,000 SGD 1,289,376 JP Morgan 16/6/2020 7,915
USD 70,000 THB 2,264,500Bank of America
Merrill Lynch 4/6/2020 (1,188)USD 630,000 TWD 18,666,900 JP Morgan 14/7/2020 6,643USD 585,000 TWD 17,564,625 Citibank 31/7/2020 (2,361)
(1,008,128)
BRL Hedged Share Class
BRL 27,094,392 USD 4,701,438State Street Bank& Trust Company 2/6/2020 284,235
BRL 29,902,416 USD 5,600,563State Street Bank& Trust Company 2/7/2020 (107,532)
USD 5,087,953 BRL 27,094,392State Street Bank& Trust Company 2/6/2020 102,281
278,984
CHF Hedged Share Class
CHF 4,572 USD 4,715State Street Bank& Trust Company 15/6/2020 33
USD 1 CHF 1State Street Bank& Trust Company 15/6/2020 —
33
EUR Hedged Share Class
EUR 19,341,171 USD 20,973,732State Street Bank& Trust Company 15/6/2020 538,064
USD 83,122 EUR 76,371State Street Bank& Trust Company 15/6/2020 (1,819)
536,245
GBP Hedged Share Class
GBP 3,364,209 USD 4,154,409State Street Bank& Trust Company 15/6/2020 744
USD 2,228,813 GBP 1,829,515State Street Bank& Trust Company 15/6/2020 (30,831)
(30,087)
Total (Gross underlying exposure - USD 149,962,959) (222,953)
Sector Breakdownas at 31 May 2020
% of NetAssets
Government 77.47
Collective Investment Schemes 9.44
Mortgage Securities 0.69
Asset Backed Securities 0.02
Securities portfolio at market value 87.62
Other Net Assets 12.38
100.00
BlackRock Macro Opportunities Fund continued
The notes on pages 691 to 711 form an integral part of these financial statements.
BlackRock Strategic Funds[508]

Portfolio of Investments as at 31 May 2020
Holding Description
MarketValue
EUR
% ofNet
Assets
Transferable Securities and Money Market Instruments Admittedto an Official Stock Exchange Listing or Dealt in on AnotherRegulated Market
EXCHANGE TRADED FUNDS~Germany
EUR 36,553 iShares SLI UCITS ETF (DE)(Dist)^ 3,482,770 2.24
3,482,770 2.24
IrelandGBP 5,500 iShares Core GBP Corporate
Bond UCITS ETF (Dist) 937,775 0.60EUR 19,130 iShares Core MSCI EMU
UCITS ETF (Acc) 2,015,537 1.29EUR 17,313 iShares Core MSCI Pacific
ex-Japan UCITS ETF 1,957,754 1.26USD 44,377 iShares Edge MSCI World
Minimum Volatility UCITSETF (Acc) 1,946,370 1.25
USD 8,818 iShares Edge MSCI WorldMomentum Factor UCITSETF (Acc) 359,873 0.23
USD 55,477 iShares Edge MSCI WorldQuality Factor UCITS ETFUSD (Acc) 1,917,834 1.23
USD 54,468 iShares Edge MSCI WorldSize Factor UCITS ETF(Acc)^ 1,523,899 0.98
EUR 68,636 iShares Edge MSCI WorldValue Factor UCITS ETF(Acc) 1,636,969 1.05
EUR 11,889 iShares EUR Bond 10-15yrUCITS ETF (Dist) 2,279,002 1.46
EUR 8,978 iShares EUR Covered BondUCITS ETF (Dist) 1,421,352 0.91
EUR 71,589 iShares EUR Goverment Bond0-1yr UCITS ETF 7,018,586 4.51
EUR 500,702 iShares EUR Goverment Bond20yr Target Duration UCITSETF 3,114,367 2.00
EUR 9,434 iShares EUR GovernmentBond 15-30yr UCITS ETFEUR (Dist) 2,535,010 1.63
EUR 43,745 iShares Euro Corporate BondInterest Rate Hedged UCITSETF (Dist) 4,086,658 2.62
EUR 4,125 iShares Euro GovernmentBond 7-10yr UCITS ETF(Dist) 928,125 0.59
EUR 57,223 iShares France Bond UCITSETF (Acc) 9,132,791 5.86
EUR 781,369 iShares MSCI China A UCITSETF 2,937,557 1.89
Holding Description
MarketValue
EUR
% ofNet
Assets
Ireland continuedEUR 502,476 iShares MSCI Japan ESG
Enhanced UCITS ETF ’A’ 2,364,150 1.52EUR 3,930,027 iShares MSCI USA ESG
Enhanced UCITS ETF ’A’ 19,119,581 12.28USD 110,512 iShares Physical Gold ETC 3,358,245 2.16
GBP 1,772,708 iShares US Mortgage BackedSecurities UCITS ETF 8,092,416 5.20
EUR 181,882 iShares USD Corporate BondInterest Rate Hedged UCITSETF (Dist) 15,046,734 9.66
EUR 140,040 iShares USD Corporate BondUCITS ETF (Dist) 15,881,936 10.20
EUR 39,580 iShares USD High YieldCorporate Bond UCITS ETF(Dist) 3,425,253 2.20
EUR 25,842 iShares USD TIPS UCITS ETF(Acc) 5,372,810 3.45
EUR 213,385 iShares USD Treasury Bond1-3 UCITS ETF (Dist) 25,919,876 16.64
EUR 183,297 iShares USD Treasury Bond20+yr UCITS ETF (Dist) 1,007,950 0.65
EUR 3,671 iShares USD Treasury Bond3-7yr UCITS ETF (Acc) 466,364 0.30
EUR 3,907 iShares USD Treasury Bond7-10yr UCITS ETF (Dist) 782,650 0.50
146,587,424 94.12
Total Exchange Traded Funds 150,070,194 96.36
Total Transferable Securities and Money MarketInstruments Admitted to an Official Stock ExchangeListing or Dealt in on Another Regulated Market 150,070,194 96.36
Collective Investment Schemes~
Luxembourg31,663 BlackRock Global Index Funds
- iShares Emerging MarketsGovernment Bond IndexFund (LU) X2 (USD) 3,792,105 2.43
8,325 BlackRock Global Index Funds- iShares Euro GovernmentBond Index Fund(LU) X2 (EUR) 1,132,777 0.73
4,924,882 3.16
Total Collective Investment Schemes 4,924,882 3.16
Securities portfolio at market value 154,995,076 99.52
Other Net Assets 743,821 0.48
Total Net Assets (EUR) 155,738,897 100.00
~ Investment in related party fund, see further information in Note 10.^ All or a portion of this security represents a security on loan.
Open forward foreign exchange transactionsas at 31 May 2020
Currency Purchases Currency Sales CounterpartyMaturity
date
Netunrealised
appreciation/(depreciation)
EUREUR 1,077,411 AUD 1,806,341 BNP Paribas 3/6/2020 (739)EUR 106,320 AUD 177,951 Citibank 3/6/2020 106EUR 186,058 CAD 283,189 Citibank 3/6/2020 1,170
Open forward foreign exchange transactionsas at 31 May 2020
Currency Purchases Currency Sales CounterpartyMaturity
date
Netunrealised
appreciation/(depreciation)
EUREUR 862,531 GBP 749,316 Goldman Sachs 3/6/2020 30,274EUR 76,516,776 USD 83,856,266 Citibank 3/6/2020 1,104,433EUR 6,304,894 USD 6,884,209 Morgan Stanley 3/6/2020 113,891
BlackRock Managed Index Portfolios - Conservative
The notes on pages 691 to 711 form an integral part of these financial statements.
Annual report and audited financial statements [509]

Open forward foreign exchange transactionsas at 31 May 2020
Currency Purchases Currency Sales CounterpartyMaturity
date
Netunrealised
appreciation/(depreciation)
EUREUR 946,512 USD 1,040,101 Societe Generale 3/6/2020 11,145
EUR 17,967,075 USD 19,469,212State Street Bank& Trust Company 3/6/2020 458,318
EUR 1,176,447 USD 1,276,683 UBS 3/6/2020 28,320
USD 1,387,061 EUR 1,278,859State Street Bank& Trust Company 3/6/2020 (31,469)
USD 1,284,629 EUR 1,181,399The Bank of New
York Mellon 3/6/2020 (26,125)
1,689,324
GBP Hedged Share Class
EUR 11,333 GBP 10,031State Street Bank& Trust Company 15/6/2020 195
GBP 761,660 EUR 867,202State Street Bank& Trust Company 15/6/2020 (21,397)
(21,202)
USD Hedged Share Class
EUR 409,168 USD 442,474State Street Bank& Trust Company 15/6/2020 11,342
USD 32,129,529 EUR 29,628,546State Street Bank& Trust Company 15/6/2020 (741,015)
(729,673)
Total (Gross underlying exposure - EUR 135,942,074) 938,449
Sector Breakdownas at 31 May 2020
% of NetAssets
Exchange Traded Funds 96.36
Collective Investment Schemes 3.16
Securities portfolio at market value 99.52
Other Net Assets 0.48
100.00
BlackRock Managed Index Portfolios - Conservative continued
The notes on pages 691 to 711 form an integral part of these financial statements.
BlackRock Strategic Funds[510]
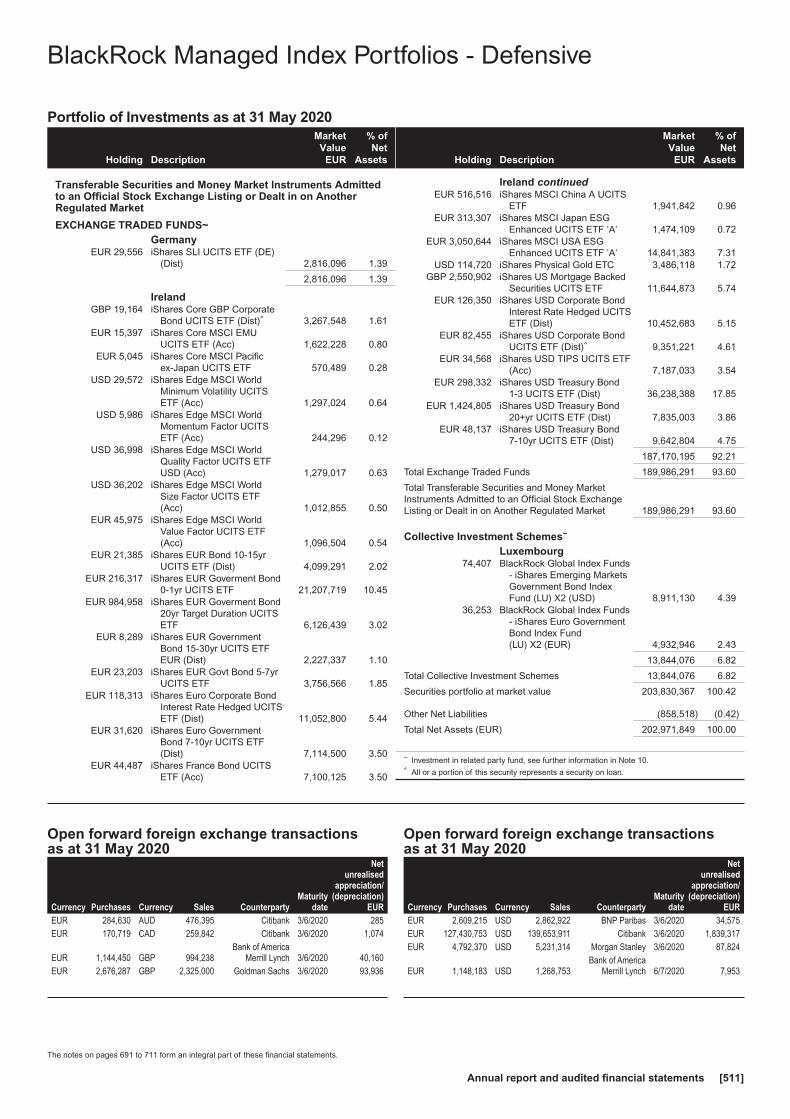
Portfolio of Investments as at 31 May 2020
Holding Description
MarketValue
EUR
% ofNet
Assets
Transferable Securities and Money Market Instruments Admittedto an Official Stock Exchange Listing or Dealt in on AnotherRegulated Market
EXCHANGE TRADED FUNDS~Germany
EUR 29,556 iShares SLI UCITS ETF (DE)(Dist) 2,816,096 1.39
2,816,096 1.39
IrelandGBP 19,164 iShares Core GBP Corporate
Bond UCITS ETF (Dist)^ 3,267,548 1.61EUR 15,397 iShares Core MSCI EMU
UCITS ETF (Acc) 1,622,228 0.80EUR 5,045 iShares Core MSCI Pacific
ex-Japan UCITS ETF 570,489 0.28USD 29,572 iShares Edge MSCI World
Minimum Volatility UCITSETF (Acc) 1,297,024 0.64
USD 5,986 iShares Edge MSCI WorldMomentum Factor UCITSETF (Acc) 244,296 0.12
USD 36,998 iShares Edge MSCI WorldQuality Factor UCITS ETFUSD (Acc) 1,279,017 0.63
USD 36,202 iShares Edge MSCI WorldSize Factor UCITS ETF(Acc) 1,012,855 0.50
EUR 45,975 iShares Edge MSCI WorldValue Factor UCITS ETF(Acc) 1,096,504 0.54
EUR 21,385 iShares EUR Bond 10-15yrUCITS ETF (Dist) 4,099,291 2.02
EUR 216,317 iShares EUR Goverment Bond0-1yr UCITS ETF 21,207,719 10.45
EUR 984,958 iShares EUR Goverment Bond20yr Target Duration UCITSETF 6,126,439 3.02
EUR 8,289 iShares EUR GovernmentBond 15-30yr UCITS ETFEUR (Dist) 2,227,337 1.10
EUR 23,203 iShares EUR Govt Bond 5-7yrUCITS ETF 3,756,566 1.85
EUR 118,313 iShares Euro Corporate BondInterest Rate Hedged UCITSETF (Dist) 11,052,800 5.44
EUR 31,620 iShares Euro GovernmentBond 7-10yr UCITS ETF(Dist) 7,114,500 3.50
EUR 44,487 iShares France Bond UCITSETF (Acc) 7,100,125 3.50
Holding Description
MarketValue
EUR
% ofNet
Assets
Ireland continuedEUR 516,516 iShares MSCI China A UCITS
ETF 1,941,842 0.96EUR 313,307 iShares MSCI Japan ESG
Enhanced UCITS ETF ’A’ 1,474,109 0.72EUR 3,050,644 iShares MSCI USA ESG
Enhanced UCITS ETF ’A’ 14,841,383 7.31USD 114,720 iShares Physical Gold ETC 3,486,118 1.72
GBP 2,550,902 iShares US Mortgage BackedSecurities UCITS ETF 11,644,873 5.74
EUR 126,350 iShares USD Corporate BondInterest Rate Hedged UCITSETF (Dist) 10,452,683 5.15
EUR 82,455 iShares USD Corporate BondUCITS ETF (Dist)^ 9,351,221 4.61
EUR 34,568 iShares USD TIPS UCITS ETF(Acc) 7,187,033 3.54
EUR 298,332 iShares USD Treasury Bond1-3 UCITS ETF (Dist) 36,238,388 17.85
EUR 1,424,805 iShares USD Treasury Bond20+yr UCITS ETF (Dist) 7,835,003 3.86
EUR 48,137 iShares USD Treasury Bond7-10yr UCITS ETF (Dist) 9,642,804 4.75
187,170,195 92.21
Total Exchange Traded Funds 189,986,291 93.60
Total Transferable Securities and Money MarketInstruments Admitted to an Official Stock ExchangeListing or Dealt in on Another Regulated Market 189,986,291 93.60
Collective Investment Schemes~
Luxembourg74,407 BlackRock Global Index Funds
- iShares Emerging MarketsGovernment Bond IndexFund (LU) X2 (USD) 8,911,130 4.39
36,253 BlackRock Global Index Funds- iShares Euro GovernmentBond Index Fund(LU) X2 (EUR) 4,932,946 2.43
13,844,076 6.82
Total Collective Investment Schemes 13,844,076 6.82
Securities portfolio at market value 203,830,367 100.42
Other Net Liabilities (858,518) (0.42)
Total Net Assets (EUR) 202,971,849 100.00
~ Investment in related party fund, see further information in Note 10.^ All or a portion of this security represents a security on loan.
Open forward foreign exchange transactionsas at 31 May 2020
Currency Purchases Currency Sales CounterpartyMaturity
date
Netunrealised
appreciation/(depreciation)
EUREUR 284,630 AUD 476,395 Citibank 3/6/2020 285EUR 170,719 CAD 259,842 Citibank 3/6/2020 1,074
EUR 1,144,450 GBP 994,238Bank of America
Merrill Lynch 3/6/2020 40,160EUR 2,676,287 GBP 2,325,000 Goldman Sachs 3/6/2020 93,936
Open forward foreign exchange transactionsas at 31 May 2020
Currency Purchases Currency Sales CounterpartyMaturity
date
Netunrealised
appreciation/(depreciation)
EUREUR 2,609,215 USD 2,862,922 BNP Paribas 3/6/2020 34,575EUR 127,430,753 USD 139,653,911 Citibank 3/6/2020 1,839,317EUR 4,792,370 USD 5,231,314 Morgan Stanley 3/6/2020 87,824
EUR 1,148,183 USD 1,268,753Bank of America
Merrill Lynch 6/7/2020 7,953
BlackRock Managed Index Portfolios - Defensive
The notes on pages 691 to 711 form an integral part of these financial statements.
Annual report and audited financial statements [511]
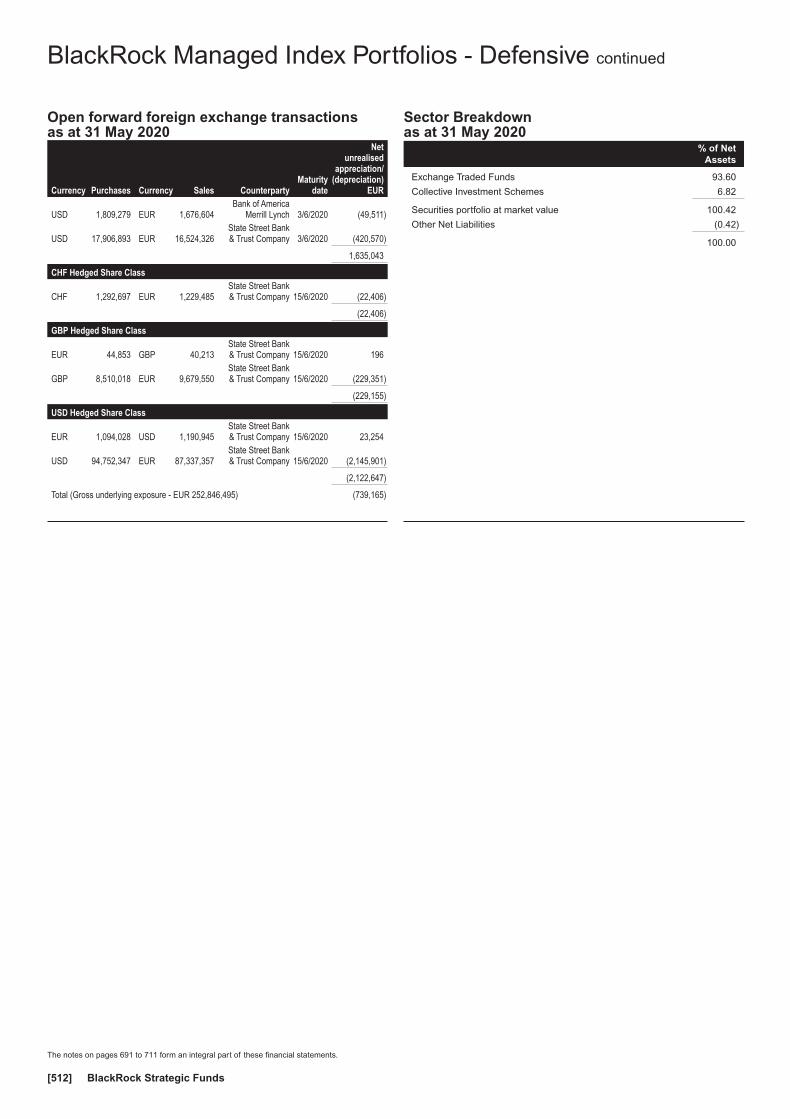
Open forward foreign exchange transactionsas at 31 May 2020
Currency Purchases Currency Sales CounterpartyMaturity
date
Netunrealised
appreciation/(depreciation)
EUR
USD 1,809,279 EUR 1,676,604Bank of America
Merrill Lynch 3/6/2020 (49,511)
USD 17,906,893 EUR 16,524,326State Street Bank& Trust Company 3/6/2020 (420,570)
1,635,043
CHF Hedged Share Class
CHF 1,292,697 EUR 1,229,485State Street Bank& Trust Company 15/6/2020 (22,406)
(22,406)
GBP Hedged Share Class
EUR 44,853 GBP 40,213State Street Bank& Trust Company 15/6/2020 196
GBP 8,510,018 EUR 9,679,550State Street Bank& Trust Company 15/6/2020 (229,351)
(229,155)
USD Hedged Share Class
EUR 1,094,028 USD 1,190,945State Street Bank& Trust Company 15/6/2020 23,254
USD 94,752,347 EUR 87,337,357State Street Bank& Trust Company 15/6/2020 (2,145,901)
(2,122,647)
Total (Gross underlying exposure - EUR 252,846,495) (739,165)
Sector Breakdownas at 31 May 2020
% of NetAssets
Exchange Traded Funds 93.60
Collective Investment Schemes 6.82
Securities portfolio at market value 100.42
Other Net Liabilities (0.42)
100.00
BlackRock Managed Index Portfolios - Defensive continued
The notes on pages 691 to 711 form an integral part of these financial statements.
BlackRock Strategic Funds[512]
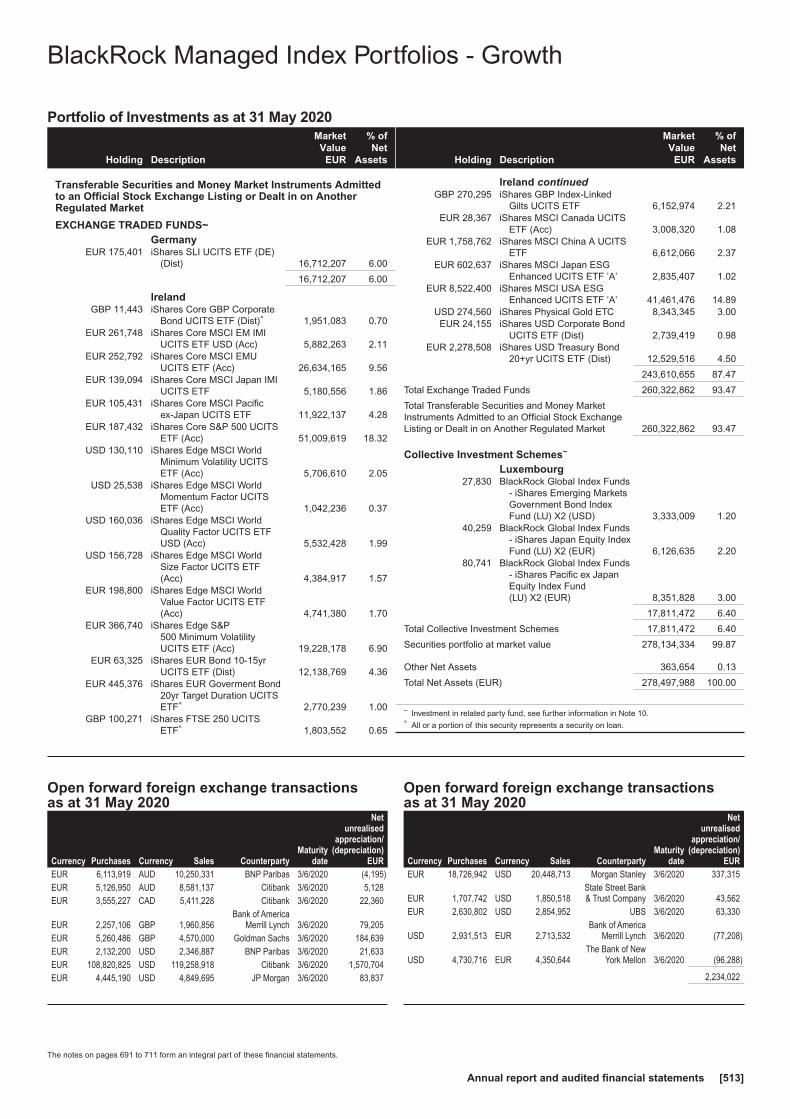
Portfolio of Investments as at 31 May 2020
Holding Description
MarketValue
EUR
% ofNet
Assets
Transferable Securities and Money Market Instruments Admittedto an Official Stock Exchange Listing or Dealt in on AnotherRegulated Market
EXCHANGE TRADED FUNDS~Germany
EUR 175,401 iShares SLI UCITS ETF (DE)(Dist) 16,712,207 6.00
16,712,207 6.00
IrelandGBP 11,443 iShares Core GBP Corporate
Bond UCITS ETF (Dist)^ 1,951,083 0.70EUR 261,748 iShares Core MSCI EM IMI
UCITS ETF USD (Acc) 5,882,263 2.11EUR 252,792 iShares Core MSCI EMU
UCITS ETF (Acc) 26,634,165 9.56EUR 139,094 iShares Core MSCI Japan IMI
UCITS ETF 5,180,556 1.86EUR 105,431 iShares Core MSCI Pacific
ex-Japan UCITS ETF 11,922,137 4.28EUR 187,432 iShares Core S&P 500 UCITS
ETF (Acc) 51,009,619 18.32USD 130,110 iShares Edge MSCI World
Minimum Volatility UCITSETF (Acc) 5,706,610 2.05
USD 25,538 iShares Edge MSCI WorldMomentum Factor UCITSETF (Acc) 1,042,236 0.37
USD 160,036 iShares Edge MSCI WorldQuality Factor UCITS ETFUSD (Acc) 5,532,428 1.99
USD 156,728 iShares Edge MSCI WorldSize Factor UCITS ETF(Acc) 4,384,917 1.57
EUR 198,800 iShares Edge MSCI WorldValue Factor UCITS ETF(Acc) 4,741,380 1.70
EUR 366,740 iShares Edge S&P500 Minimum VolatilityUCITS ETF (Acc) 19,228,178 6.90
EUR 63,325 iShares EUR Bond 10-15yrUCITS ETF (Dist) 12,138,769 4.36
EUR 445,376 iShares EUR Goverment Bond20yr Target Duration UCITSETF^ 2,770,239 1.00
GBP 100,271 iShares FTSE 250 UCITSETF^ 1,803,552 0.65
Holding Description
MarketValue
EUR
% ofNet
Assets
Ireland continuedGBP 270,295 iShares GBP Index-Linked
Gilts UCITS ETF 6,152,974 2.21EUR 28,367 iShares MSCI Canada UCITS
ETF (Acc) 3,008,320 1.08EUR 1,758,762 iShares MSCI China A UCITS
ETF 6,612,066 2.37EUR 602,637 iShares MSCI Japan ESG
Enhanced UCITS ETF ’A’ 2,835,407 1.02EUR 8,522,400 iShares MSCI USA ESG
Enhanced UCITS ETF ’A’ 41,461,476 14.89USD 274,560 iShares Physical Gold ETC 8,343,345 3.00EUR 24,155 iShares USD Corporate Bond
UCITS ETF (Dist) 2,739,419 0.98EUR 2,278,508 iShares USD Treasury Bond
20+yr UCITS ETF (Dist) 12,529,516 4.50
243,610,655 87.47
Total Exchange Traded Funds 260,322,862 93.47
Total Transferable Securities and Money MarketInstruments Admitted to an Official Stock ExchangeListing or Dealt in on Another Regulated Market 260,322,862 93.47
Collective Investment Schemes~
Luxembourg27,830 BlackRock Global Index Funds
- iShares Emerging MarketsGovernment Bond IndexFund (LU) X2 (USD) 3,333,009 1.20
40,259 BlackRock Global Index Funds- iShares Japan Equity IndexFund (LU) X2 (EUR) 6,126,635 2.20
80,741 BlackRock Global Index Funds- iShares Pacific ex JapanEquity Index Fund(LU) X2 (EUR) 8,351,828 3.00
17,811,472 6.40
Total Collective Investment Schemes 17,811,472 6.40
Securities portfolio at market value 278,134,334 99.87
Other Net Assets 363,654 0.13
Total Net Assets (EUR) 278,497,988 100.00
~ Investment in related party fund, see further information in Note 10.^ All or a portion of this security represents a security on loan.
Open forward foreign exchange transactionsas at 31 May 2020
Currency Purchases Currency Sales CounterpartyMaturity
date
Netunrealised
appreciation/(depreciation)
EUREUR 6,113,919 AUD 10,250,331 BNP Paribas 3/6/2020 (4,195)EUR 5,126,950 AUD 8,581,137 Citibank 3/6/2020 5,128EUR 3,555,227 CAD 5,411,228 Citibank 3/6/2020 22,360
EUR 2,257,106 GBP 1,960,856Bank of America
Merrill Lynch 3/6/2020 79,205EUR 5,260,486 GBP 4,570,000 Goldman Sachs 3/6/2020 184,639EUR 2,132,200 USD 2,346,887 BNP Paribas 3/6/2020 21,633EUR 108,820,825 USD 119,258,918 Citibank 3/6/2020 1,570,704EUR 4,445,190 USD 4,849,695 JP Morgan 3/6/2020 83,837
Open forward foreign exchange transactionsas at 31 May 2020
Currency Purchases Currency Sales CounterpartyMaturity
date
Netunrealised
appreciation/(depreciation)
EUREUR 18,726,942 USD 20,448,713 Morgan Stanley 3/6/2020 337,315
EUR 1,707,742 USD 1,850,518State Street Bank& Trust Company 3/6/2020 43,562
EUR 2,630,802 USD 2,854,952 UBS 3/6/2020 63,330
USD 2,931,513 EUR 2,713,532Bank of America
Merrill Lynch 3/6/2020 (77,208)
USD 4,730,716 EUR 4,350,644The Bank of New
York Mellon 3/6/2020 (96,288)
2,234,022
BlackRock Managed Index Portfolios - Growth
The notes on pages 691 to 711 form an integral part of these financial statements.
Annual report and audited financial statements [513]
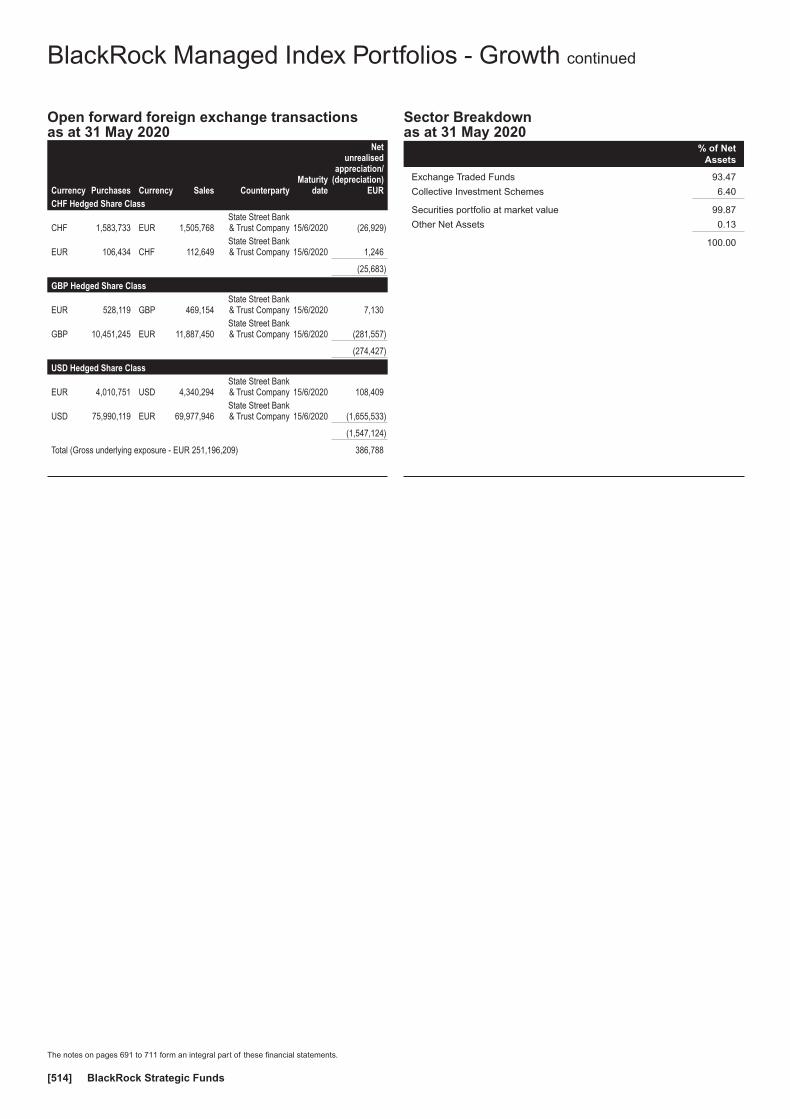
Open forward foreign exchange transactionsas at 31 May 2020
Currency Purchases Currency Sales CounterpartyMaturity
date
Netunrealised
appreciation/(depreciation)
EURCHF Hedged Share Class
CHF 1,583,733 EUR 1,505,768State Street Bank& Trust Company 15/6/2020 (26,929)
EUR 106,434 CHF 112,649State Street Bank& Trust Company 15/6/2020 1,246
(25,683)
GBP Hedged Share Class
EUR 528,119 GBP 469,154State Street Bank& Trust Company 15/6/2020 7,130
GBP 10,451,245 EUR 11,887,450State Street Bank& Trust Company 15/6/2020 (281,557)
(274,427)
USD Hedged Share Class
EUR 4,010,751 USD 4,340,294State Street Bank& Trust Company 15/6/2020 108,409
USD 75,990,119 EUR 69,977,946State Street Bank& Trust Company 15/6/2020 (1,655,533)
(1,547,124)
Total (Gross underlying exposure - EUR 251,196,209) 386,788
Sector Breakdownas at 31 May 2020
% of NetAssets
Exchange Traded Funds 93.47
Collective Investment Schemes 6.40
Securities portfolio at market value 99.87
Other Net Assets 0.13
100.00
BlackRock Managed Index Portfolios - Growth continued
The notes on pages 691 to 711 form an integral part of these financial statements.
BlackRock Strategic Funds[514]
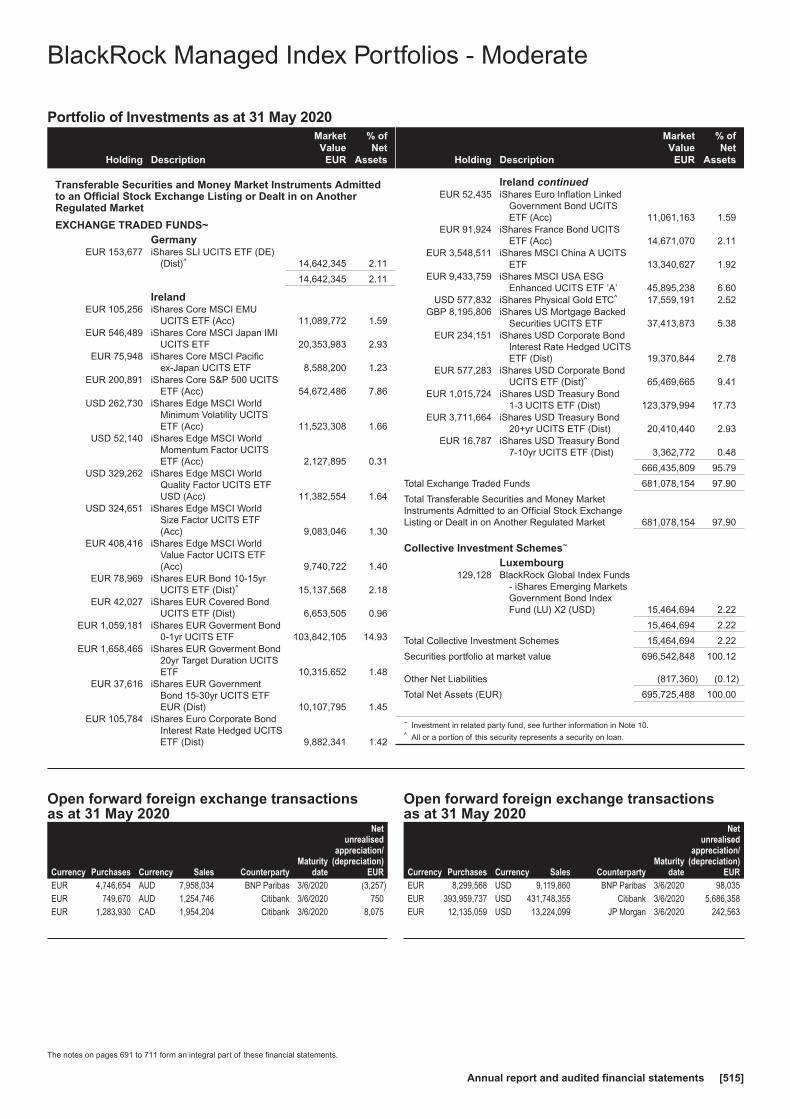
Portfolio of Investments as at 31 May 2020
Holding Description
MarketValue
EUR
% ofNet
Assets
Transferable Securities and Money Market Instruments Admittedto an Official Stock Exchange Listing or Dealt in on AnotherRegulated Market
EXCHANGE TRADED FUNDS~Germany
EUR 153,677 iShares SLI UCITS ETF (DE)(Dist)^ 14,642,345 2.11
14,642,345 2.11
IrelandEUR 105,256 iShares Core MSCI EMU
UCITS ETF (Acc) 11,089,772 1.59EUR 546,489 iShares Core MSCI Japan IMI
UCITS ETF 20,353,983 2.93EUR 75,948 iShares Core MSCI Pacific
ex-Japan UCITS ETF 8,588,200 1.23EUR 200,891 iShares Core S&P 500 UCITS
ETF (Acc) 54,672,486 7.86USD 262,730 iShares Edge MSCI World
Minimum Volatility UCITSETF (Acc) 11,523,308 1.66
USD 52,140 iShares Edge MSCI WorldMomentum Factor UCITSETF (Acc) 2,127,895 0.31
USD 329,262 iShares Edge MSCI WorldQuality Factor UCITS ETFUSD (Acc) 11,382,554 1.64
USD 324,651 iShares Edge MSCI WorldSize Factor UCITS ETF(Acc) 9,083,046 1.30
EUR 408,416 iShares Edge MSCI WorldValue Factor UCITS ETF(Acc) 9,740,722 1.40
EUR 78,969 iShares EUR Bond 10-15yrUCITS ETF (Dist)^ 15,137,568 2.18
EUR 42,027 iShares EUR Covered BondUCITS ETF (Dist) 6,653,505 0.96
EUR 1,059,181 iShares EUR Goverment Bond0-1yr UCITS ETF 103,842,105 14.93
EUR 1,658,465 iShares EUR Goverment Bond20yr Target Duration UCITSETF 10,315,652 1.48
EUR 37,616 iShares EUR GovernmentBond 15-30yr UCITS ETFEUR (Dist) 10,107,795 1.45
EUR 105,784 iShares Euro Corporate BondInterest Rate Hedged UCITSETF (Dist) 9,882,341 1.42
Holding Description
MarketValue
EUR
% ofNet
Assets
Ireland continuedEUR 52,435 iShares Euro Inflation Linked
Government Bond UCITSETF (Acc) 11,061,163 1.59
EUR 91,924 iShares France Bond UCITSETF (Acc) 14,671,070 2.11
EUR 3,548,511 iShares MSCI China A UCITSETF 13,340,627 1.92
EUR 9,433,759 iShares MSCI USA ESGEnhanced UCITS ETF ’A’ 45,895,238 6.60
USD 577,832 iShares Physical Gold ETC^ 17,559,191 2.52GBP 8,195,806 iShares US Mortgage Backed
Securities UCITS ETF 37,413,873 5.38EUR 234,151 iShares USD Corporate Bond
Interest Rate Hedged UCITSETF (Dist) 19,370,844 2.78
EUR 577,283 iShares USD Corporate BondUCITS ETF (Dist)^ 65,469,665 9.41
EUR 1,015,724 iShares USD Treasury Bond1-3 UCITS ETF (Dist) 123,379,994 17.73
EUR 3,711,664 iShares USD Treasury Bond20+yr UCITS ETF (Dist) 20,410,440 2.93
EUR 16,787 iShares USD Treasury Bond7-10yr UCITS ETF (Dist) 3,362,772 0.48
666,435,809 95.79
Total Exchange Traded Funds 681,078,154 97.90
Total Transferable Securities and Money MarketInstruments Admitted to an Official Stock ExchangeListing or Dealt in on Another Regulated Market 681,078,154 97.90
Collective Investment Schemes~
Luxembourg129,128 BlackRock Global Index Funds
- iShares Emerging MarketsGovernment Bond IndexFund (LU) X2 (USD) 15,464,694 2.22
15,464,694 2.22
Total Collective Investment Schemes 15,464,694 2.22
Securities portfolio at market value 696,542,848 100.12
Other Net Liabilities (817,360) (0.12)
Total Net Assets (EUR) 695,725,488 100.00
~ Investment in related party fund, see further information in Note 10.^ All or a portion of this security represents a security on loan.
Open forward foreign exchange transactionsas at 31 May 2020
Currency Purchases Currency Sales CounterpartyMaturity
date
Netunrealised
appreciation/(depreciation)
EUREUR 4,746,654 AUD 7,958,034 BNP Paribas 3/6/2020 (3,257)EUR 749,670 AUD 1,254,746 Citibank 3/6/2020 750EUR 1,283,930 CAD 1,954,204 Citibank 3/6/2020 8,075
Open forward foreign exchange transactionsas at 31 May 2020
Currency Purchases Currency Sales CounterpartyMaturity
date
Netunrealised
appreciation/(depreciation)
EUREUR 8,299,568 USD 9,119,860 BNP Paribas 3/6/2020 98,035EUR 393,959,737 USD 431,748,355 Citibank 3/6/2020 5,686,358EUR 12,135,059 USD 13,224,099 JP Morgan 3/6/2020 242,563
BlackRock Managed Index Portfolios - Moderate
The notes on pages 691 to 711 form an integral part of these financial statements.
Annual report and audited financial statements [515]
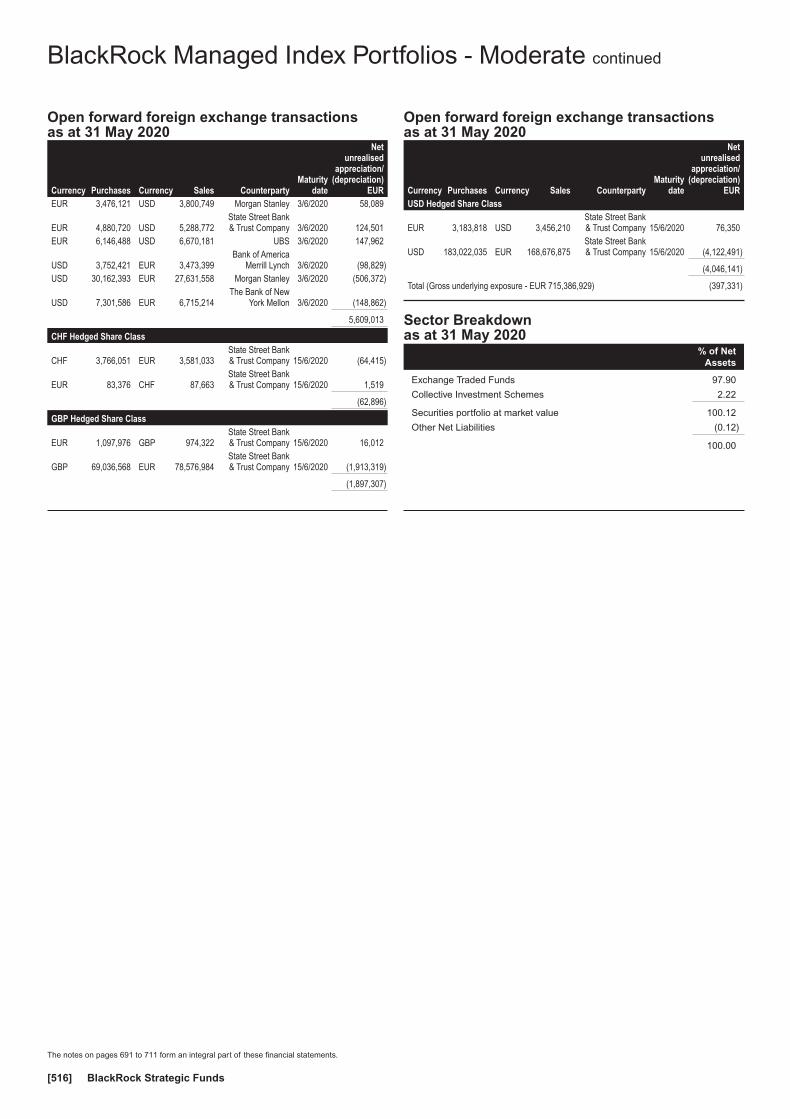
Open forward foreign exchange transactionsas at 31 May 2020
Currency Purchases Currency Sales CounterpartyMaturity
date
Netunrealised
appreciation/(depreciation)
EUREUR 3,476,121 USD 3,800,749 Morgan Stanley 3/6/2020 58,089
EUR 4,880,720 USD 5,288,772State Street Bank& Trust Company 3/6/2020 124,501
EUR 6,146,488 USD 6,670,181 UBS 3/6/2020 147,962
USD 3,752,421 EUR 3,473,399Bank of America
Merrill Lynch 3/6/2020 (98,829)USD 30,162,393 EUR 27,631,558 Morgan Stanley 3/6/2020 (506,372)
USD 7,301,586 EUR 6,715,214The Bank of New
York Mellon 3/6/2020 (148,862)
5,609,013
CHF Hedged Share Class
CHF 3,766,051 EUR 3,581,033State Street Bank& Trust Company 15/6/2020 (64,415)
EUR 83,376 CHF 87,663State Street Bank& Trust Company 15/6/2020 1,519
(62,896)
GBP Hedged Share Class
EUR 1,097,976 GBP 974,322State Street Bank& Trust Company 15/6/2020 16,012
GBP 69,036,568 EUR 78,576,984State Street Bank& Trust Company 15/6/2020 (1,913,319)
(1,897,307)
Open forward foreign exchange transactionsas at 31 May 2020
Currency Purchases Currency Sales CounterpartyMaturity
date
Netunrealised
appreciation/(depreciation)
EURUSD Hedged Share Class
EUR 3,183,818 USD 3,456,210State Street Bank& Trust Company 15/6/2020 76,350
USD 183,022,035 EUR 168,676,875State Street Bank& Trust Company 15/6/2020 (4,122,491)
(4,046,141)
Total (Gross underlying exposure - EUR 715,386,929) (397,331)
Sector Breakdownas at 31 May 2020
% of NetAssets
Exchange Traded Funds 97.90
Collective Investment Schemes 2.22
Securities portfolio at market value 100.12
Other Net Liabilities (0.12)
100.00
BlackRock Managed Index Portfolios - Moderate continued
The notes on pages 691 to 711 form an integral part of these financial statements.
BlackRock Strategic Funds[516]
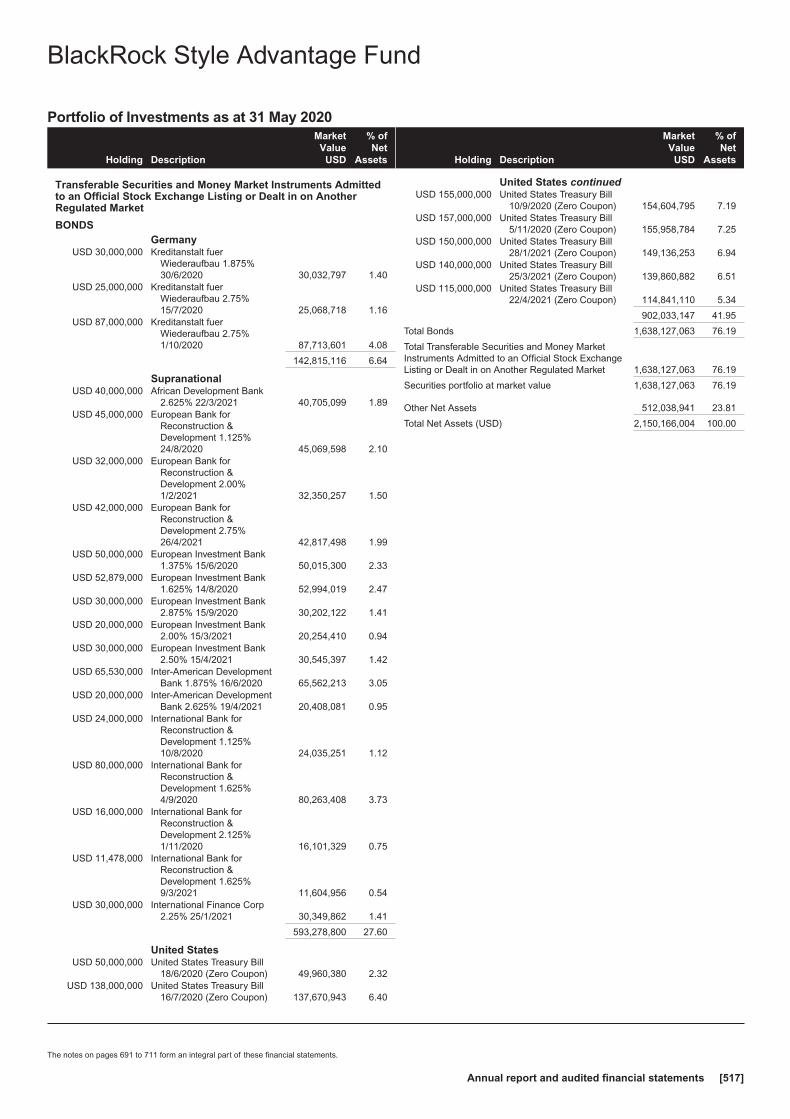
Portfolio of Investments as at 31 May 2020
Holding Description
MarketValue
USD
% ofNet
Assets
Transferable Securities and Money Market Instruments Admittedto an Official Stock Exchange Listing or Dealt in on AnotherRegulated Market
BONDSGermany
USD 30,000,000 Kreditanstalt fuerWiederaufbau 1.875%30/6/2020 30,032,797 1.40
USD 25,000,000 Kreditanstalt fuerWiederaufbau 2.75%15/7/2020 25,068,718 1.16
USD 87,000,000 Kreditanstalt fuerWiederaufbau 2.75%1/10/2020 87,713,601 4.08
142,815,116 6.64
SupranationalUSD 40,000,000 African Development Bank
2.625% 22/3/2021 40,705,099 1.89USD 45,000,000 European Bank for
Reconstruction &Development 1.125%24/8/2020 45,069,598 2.10
USD 32,000,000 European Bank forReconstruction &Development 2.00%1/2/2021 32,350,257 1.50
USD 42,000,000 European Bank forReconstruction &Development 2.75%26/4/2021 42,817,498 1.99
USD 50,000,000 European Investment Bank1.375% 15/6/2020 50,015,300 2.33
USD 52,879,000 European Investment Bank1.625% 14/8/2020 52,994,019 2.47
USD 30,000,000 European Investment Bank2.875% 15/9/2020 30,202,122 1.41
USD 20,000,000 European Investment Bank2.00% 15/3/2021 20,254,410 0.94
USD 30,000,000 European Investment Bank2.50% 15/4/2021 30,545,397 1.42
USD 65,530,000 Inter-American DevelopmentBank 1.875% 16/6/2020 65,562,213 3.05
USD 20,000,000 Inter-American DevelopmentBank 2.625% 19/4/2021 20,408,081 0.95
USD 24,000,000 International Bank forReconstruction &Development 1.125%10/8/2020 24,035,251 1.12
USD 80,000,000 International Bank forReconstruction &Development 1.625%4/9/2020 80,263,408 3.73
USD 16,000,000 International Bank forReconstruction &Development 2.125%1/11/2020 16,101,329 0.75
USD 11,478,000 International Bank forReconstruction &Development 1.625%9/3/2021 11,604,956 0.54
USD 30,000,000 International Finance Corp2.25% 25/1/2021 30,349,862 1.41
593,278,800 27.60
United StatesUSD 50,000,000 United States Treasury Bill
18/6/2020 (Zero Coupon) 49,960,380 2.32USD 138,000,000 United States Treasury Bill
16/7/2020 (Zero Coupon) 137,670,943 6.40
Holding Description
MarketValue
USD
% ofNet
Assets
United States continuedUSD 155,000,000 United States Treasury Bill
10/9/2020 (Zero Coupon) 154,604,795 7.19USD 157,000,000 United States Treasury Bill
5/11/2020 (Zero Coupon) 155,958,784 7.25USD 150,000,000 United States Treasury Bill
28/1/2021 (Zero Coupon) 149,136,253 6.94USD 140,000,000 United States Treasury Bill
25/3/2021 (Zero Coupon) 139,860,882 6.51USD 115,000,000 United States Treasury Bill
22/4/2021 (Zero Coupon) 114,841,110 5.34
902,033,147 41.95
Total Bonds 1,638,127,063 76.19
Total Transferable Securities and Money MarketInstruments Admitted to an Official Stock ExchangeListing or Dealt in on Another Regulated Market 1,638,127,063 76.19
Securities portfolio at market value 1,638,127,063 76.19
Other Net Assets 512,038,941 23.81
Total Net Assets (USD) 2,150,166,004 100.00
BlackRock Style Advantage Fund
The notes on pages 691 to 711 form an integral part of these financial statements.
Annual report and audited financial statements [517]
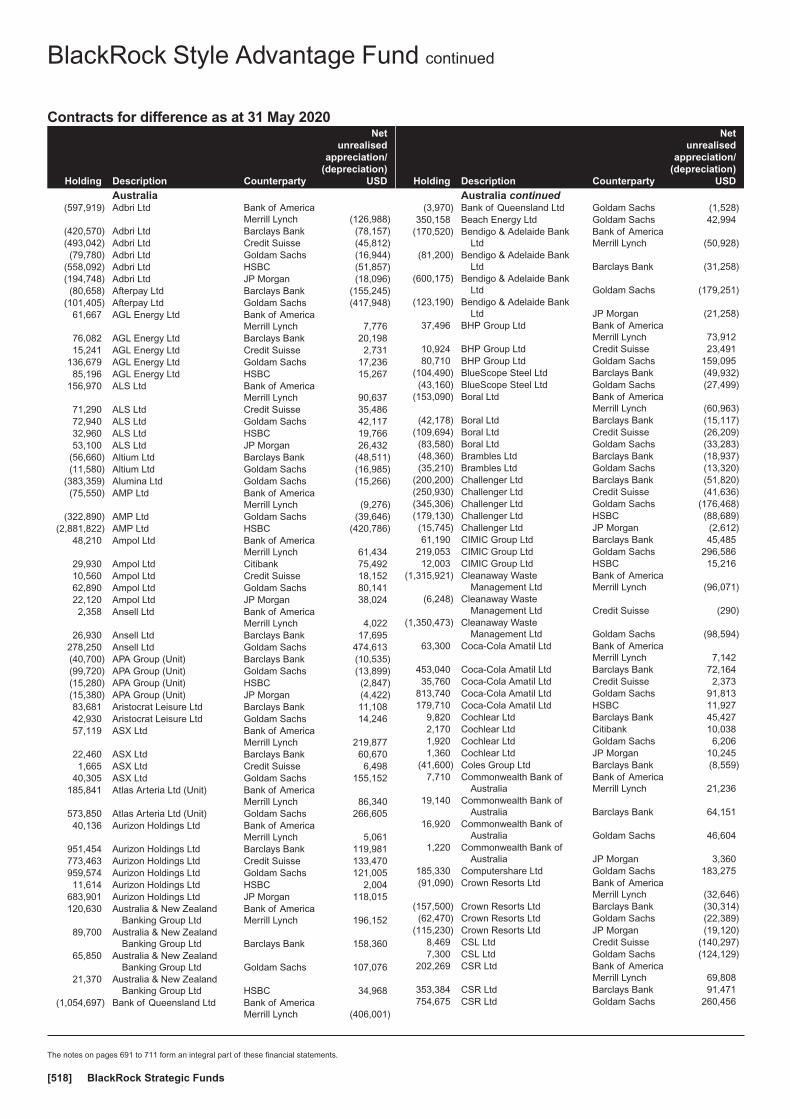
Contracts for difference as at 31 May 2020
Holding Description Counterparty
Netunrealised
appreciation/(depreciation)
USD
Australia(597,919) Adbri Ltd Bank of America
Merrill Lynch (126,988)(420,570) Adbri Ltd Barclays Bank (78,157)(493,042) Adbri Ltd Credit Suisse (45,812)(79,780) Adbri Ltd Goldam Sachs (16,944)
(558,092) Adbri Ltd HSBC (51,857)(194,748) Adbri Ltd JP Morgan (18,096)(80,658) Afterpay Ltd Barclays Bank (155,245)
(101,405) Afterpay Ltd Goldam Sachs (417,948)61,667 AGL Energy Ltd Bank of America
Merrill Lynch 7,77676,082 AGL Energy Ltd Barclays Bank 20,19815,241 AGL Energy Ltd Credit Suisse 2,731
136,679 AGL Energy Ltd Goldam Sachs 17,23685,196 AGL Energy Ltd HSBC 15,267
156,970 ALS Ltd Bank of AmericaMerrill Lynch 90,637
71,290 ALS Ltd Credit Suisse 35,48672,940 ALS Ltd Goldam Sachs 42,11732,960 ALS Ltd HSBC 19,76653,100 ALS Ltd JP Morgan 26,432
(56,660) Altium Ltd Barclays Bank (48,511)(11,580) Altium Ltd Goldam Sachs (16,985)
(383,359) Alumina Ltd Goldam Sachs (15,266)(75,550) AMP Ltd Bank of America
Merrill Lynch (9,276)(322,890) AMP Ltd Goldam Sachs (39,646)
(2,881,822) AMP Ltd HSBC (420,786)48,210 Ampol Ltd Bank of America
Merrill Lynch 61,43429,930 Ampol Ltd Citibank 75,49210,560 Ampol Ltd Credit Suisse 18,15262,890 Ampol Ltd Goldam Sachs 80,14122,120 Ampol Ltd JP Morgan 38,0242,358 Ansell Ltd Bank of America
Merrill Lynch 4,02226,930 Ansell Ltd Barclays Bank 17,695
278,250 Ansell Ltd Goldam Sachs 474,613(40,700) APA Group (Unit) Barclays Bank (10,535)(99,720) APA Group (Unit) Goldam Sachs (13,899)(15,280) APA Group (Unit) HSBC (2,847)(15,380) APA Group (Unit) JP Morgan (4,422)83,681 Aristocrat Leisure Ltd Barclays Bank 11,10842,930 Aristocrat Leisure Ltd Goldam Sachs 14,24657,119 ASX Ltd Bank of America
Merrill Lynch 219,87722,460 ASX Ltd Barclays Bank 60,6701,665 ASX Ltd Credit Suisse 6,498
40,305 ASX Ltd Goldam Sachs 155,152185,841 Atlas Arteria Ltd (Unit) Bank of America
Merrill Lynch 86,340573,850 Atlas Arteria Ltd (Unit) Goldam Sachs 266,60540,136 Aurizon Holdings Ltd Bank of America
Merrill Lynch 5,061951,454 Aurizon Holdings Ltd Barclays Bank 119,981773,463 Aurizon Holdings Ltd Credit Suisse 133,470959,574 Aurizon Holdings Ltd Goldam Sachs 121,00511,614 Aurizon Holdings Ltd HSBC 2,004
683,901 Aurizon Holdings Ltd JP Morgan 118,015120,630 Australia & New Zealand
Banking Group LtdBank of AmericaMerrill Lynch 196,152
89,700 Australia & New ZealandBanking Group Ltd Barclays Bank 158,360
65,850 Australia & New ZealandBanking Group Ltd Goldam Sachs 107,076
21,370 Australia & New ZealandBanking Group Ltd HSBC 34,968
(1,054,697) Bank of Queensland Ltd Bank of AmericaMerrill Lynch (406,001)
Holding Description Counterparty
Netunrealised
appreciation/(depreciation)
USD
Australia continued(3,970) Bank of Queensland Ltd Goldam Sachs (1,528)
350,158 Beach Energy Ltd Goldam Sachs 42,994(170,520) Bendigo & Adelaide Bank
LtdBank of AmericaMerrill Lynch (50,928)
(81,200) Bendigo & Adelaide BankLtd Barclays Bank (31,258)
(600,175) Bendigo & Adelaide BankLtd Goldam Sachs (179,251)
(123,190) Bendigo & Adelaide BankLtd JP Morgan (21,258)
37,496 BHP Group Ltd Bank of AmericaMerrill Lynch 73,912
10,924 BHP Group Ltd Credit Suisse 23,49180,710 BHP Group Ltd Goldam Sachs 159,095
(104,490) BlueScope Steel Ltd Barclays Bank (49,932)(43,160) BlueScope Steel Ltd Goldam Sachs (27,499)
(153,090) Boral Ltd Bank of AmericaMerrill Lynch (60,963)
(42,178) Boral Ltd Barclays Bank (15,117)(109,694) Boral Ltd Credit Suisse (26,209)(83,580) Boral Ltd Goldam Sachs (33,283)(48,360) Brambles Ltd Barclays Bank (18,937)(35,210) Brambles Ltd Goldam Sachs (13,320)
(200,200) Challenger Ltd Barclays Bank (51,820)(250,930) Challenger Ltd Credit Suisse (41,636)(345,306) Challenger Ltd Goldam Sachs (176,468)(179,130) Challenger Ltd HSBC (88,689)(15,745) Challenger Ltd JP Morgan (2,612)61,190 CIMIC Group Ltd Barclays Bank 45,485
219,053 CIMIC Group Ltd Goldam Sachs 296,58612,003 CIMIC Group Ltd HSBC 15,216
(1,315,921) Cleanaway WasteManagement Ltd
Bank of AmericaMerrill Lynch (96,071)
(6,248) Cleanaway WasteManagement Ltd Credit Suisse (290)
(1,350,473) Cleanaway WasteManagement Ltd Goldam Sachs (98,594)
63,300 Coca-Cola Amatil Ltd Bank of AmericaMerrill Lynch 7,142
453,040 Coca-Cola Amatil Ltd Barclays Bank 72,16435,760 Coca-Cola Amatil Ltd Credit Suisse 2,373
813,740 Coca-Cola Amatil Ltd Goldam Sachs 91,813179,710 Coca-Cola Amatil Ltd HSBC 11,927
9,820 Cochlear Ltd Barclays Bank 45,4272,170 Cochlear Ltd Citibank 10,0381,920 Cochlear Ltd Goldam Sachs 6,2061,360 Cochlear Ltd JP Morgan 10,245
(41,600) Coles Group Ltd Barclays Bank (8,559)7,710 Commonwealth Bank of
AustraliaBank of AmericaMerrill Lynch 21,236
19,140 Commonwealth Bank ofAustralia Barclays Bank 64,151
16,920 Commonwealth Bank ofAustralia Goldam Sachs 46,604
1,220 Commonwealth Bank ofAustralia JP Morgan 3,360
185,330 Computershare Ltd Goldam Sachs 183,275(91,090) Crown Resorts Ltd Bank of America
Merrill Lynch (32,646)(157,500) Crown Resorts Ltd Barclays Bank (30,314)(62,470) Crown Resorts Ltd Goldam Sachs (22,389)
(115,230) Crown Resorts Ltd JP Morgan (19,120)8,469 CSL Ltd Credit Suisse (140,297)7,300 CSL Ltd Goldam Sachs (124,129)
202,269 CSR Ltd Bank of AmericaMerrill Lynch 69,808
353,384 CSR Ltd Barclays Bank 91,471754,675 CSR Ltd Goldam Sachs 260,456
BlackRock Style Advantage Fund continued
The notes on pages 691 to 711 form an integral part of these financial statements.
BlackRock Strategic Funds[518]

Contracts for difference as at 31 May 2020
Holding Description Counterparty
Netunrealised
appreciation/(depreciation)
USD
Australia continued(477,789) Domain Holdings Australia
LtdBank of AmericaMerrill Lynch (104,646)
(327,811) Domain Holdings AustraliaLtd Barclays Bank 2,176
(192,651) Domain Holdings AustraliaLtd Goldam Sachs (42,195)
(60,274) Domain Holdings AustraliaLtd JP Morgan (4,000)
(19,402) Domino’s Pizza EnterprisesLtd HSBC (69,279)
(210,450) Downer EDI Ltd Bank of AmericaMerrill Lynch (76,822)
(248,290) Downer EDI Ltd Barclays Bank (54,381)(1,569,940) Downer EDI Ltd Goldam Sachs (573,083)
(234,719) Downer EDI Ltd HSBC (70,102)43,160 Evolution Mining Ltd Bank of America
Merrill Lynch 10,599216,170 Evolution Mining Ltd Barclays Bank 30,129129,570 Evolution Mining Ltd Goldam Sachs 31,818
(307,326) Flight Centre Travel GroupLtd Credit Suisse (485,090)
(91,236) Fortescue Metals Group Ltd Barclays Bank (19,377)(1,902,004) Harvey Norman Holdings
LtdBank of AmericaMerrill Lynch (542,815)
14,450 IDP Education Ltd Barclays Bank 8,82319,040 IDP Education Ltd Goldam Sachs 34,4999,930 IDP Education Ltd JP Morgan 10,611
(1) Iluka Resources Ltdπ Bank of AmericaMerrill Lynch —
374,454 Iluka Resources Ltd Barclays Bank 27,33876,663 Iluka Resources Ltd Credit Suisse 42,304
139,401 Iluka Resources Ltd Goldam Sachs 53,66248,774 Iluka Resources Ltd HSBC 20,526
(284,884) Incitec Pivot Ltd Bank of AmericaMerrill Lynch (5,672)
(473,510) Incitec Pivot Ltd Barclays Bank (34,570)(256,010) Incitec Pivot Ltd Credit Suisse (4,587)(636,463) Incitec Pivot Ltd Goldam Sachs (12,673)(885,734) Insurance Australia Group
Ltd Barclays Bank (340,960)(293,692) IOOF Holdings Ltd Bank of America
Merrill Lynch (157,888)(205,841) IOOF Holdings Ltd Barclays Bank (69,674)(319,551) IOOF Holdings Ltd HSBC (86,955)
1,110 James Hardie Industries Plc- CDI Barclays Bank 1,768
62,080 James Hardie Industries Plc- CDI Goldam Sachs 181,703
(15,720) JB Hi-Fi Ltd Credit Suisse (19,239)(319,499) Lendlease Group (Unit) Goldam Sachs (379,572)
61,520 Macquarie Group Ltd Barclays Bank 300,10712,150 Macquarie Group Ltd Goldam Sachs 39,43311,890 Macquarie Group Ltd HSBC 37,721
(17,104) Magellan Financial GroupLtd
Bank of AmericaMerrill Lynch (45,748)
(69,470) Magellan Financial GroupLtd Barclays Bank (110,657)
(22,273) Magellan Financial GroupLtd Goldam Sachs (59,574)
(648,346) Medibank Pvt Ltd Bank of AmericaMerrill Lynch 4,303
(584,200) Medibank Pvt Ltd Barclays Bank (23,264)(936,790) Medibank Pvt Ltd Goldam Sachs 6,217
(1,160,655) Metcash Ltd Barclays Bank (146,362)(2,567,547) Metcash Ltd Goldam Sachs (477,143)
(85,420) National Australia Bank Ltd Bank of AmericaMerrill Lynch (133,229)
(250,832) National Australia Bank Ltd Barclays Bank (411,199)(43,950) National Australia Bank Ltd Citibank (72,049)
Holding Description Counterparty
Netunrealised
appreciation/(depreciation)
USD
Australia continued13,080 Newcrest Mining Ltd Bank of America
Merrill Lynch 3,038183,110 Newcrest Mining Ltd Goldam Sachs 42,536
6,210 Newcrest Mining Ltd HSBC 6,68929,080 Northern Star Resources
LtdBank of AmericaMerrill Lynch 14,668
29,510 Northern Star ResourcesLtd Barclays Bank 6,463
16,240 Northern Star ResourcesLtd Citibank 3,557
18,840 Northern Star ResourcesLtd Credit Suisse 21,861
(1,467,348) Nufarm Ltd Bank of AmericaMerrill Lynch (301,902)
109,540 Oil Search Ltd Barclays Bank 18,902255,660 Oil Search Ltd Credit Suisse 103,506208,840 Oil Search Ltd Goldam Sachs 88,709127,425 Orica Ltd Bank of America
Merrill Lynch 82,88117,640 Orica Ltd Barclays Bank 3,981
138,800 Orica Ltd Citibank 31,321104,282 Orica Ltd Credit Suisse 65,238342,646 Orica Ltd Goldam Sachs 222,86618,230 Orica Ltd JP Morgan 20,196
842,184 Orora Ltd Goldam Sachs 44,717348,140 OZ Minerals Ltd Bank of America
Merrill Lynch 175,60627,770 OZ Minerals Ltd Barclays Bank (369)68,560 OZ Minerals Ltd Citibank (910)
184,500 OZ Minerals Ltd Goldam Sachs 93,06437,360 OZ Minerals Ltd HSBC 18,01836,500 OZ Minerals Ltd JP Morgan 17,684
(24,543) Perpetual Ltd Bank of AmericaMerrill Lynch (36,976)
(29,584) Perpetual Ltd Credit Suisse (21,795)(40,068) Perpetual Ltd Goldam Sachs (60,366)(20,221) Perpetual Ltd HSBC (14,897)(82,402) Platinum Asset
Management LtdBank of AmericaMerrill Lynch (19,142)
(499,197) Platinum AssetManagement Ltd Barclays Bank (59,637)
(264,515) Platinum AssetManagement Ltd Credit Suisse (66,712)
(82,510) Platinum AssetManagement Ltd JP Morgan (20,810)
(89,060) Qantas Airways Ltd Citibank (23,053)(49,000) Qantas Airways Ltd JP Morgan (15,288)106,120 QBE Insurance Group Ltd Bank of America
Merrill Lynch 85,223148,440 QBE Insurance Group Ltd Barclays Bank 109,35752,040 QBE Insurance Group Ltd Citibank 38,338
108,350 QBE Insurance Group Ltd Credit Suisse 91,328100,710 QBE Insurance Group Ltd Goldam Sachs 80,878302,340 QBE Insurance Group Ltd HSBC 259,880
(832,930) Qube Holdings Ltd Bank of AmericaMerrill Lynch (121,619)
(429,230) Qube Holdings Ltd Barclays Bank (11,395)(128,190) Qube Holdings Ltd Credit Suisse (19,798)
(3,700) Ramsay Health Care Ltd Bank of AmericaMerrill Lynch (14,538)
(55,610) Ramsay Health Care Ltd Barclays Bank (123,643)8,430 REA Group Ltd Bank of America
Merrill Lynch 56,45332,900 REA Group Ltd Barclays Bank 69,00125,860 REA Group Ltd Goldam Sachs 173,17845,630 Rio Tinto Ltd Bank of America
Merrill Lynch 243,48836,677 Rio Tinto Ltd Barclays Bank 50,389
BlackRock Style Advantage Fund continued
The notes on pages 691 to 711 form an integral part of these financial statements.
Annual report and audited financial statements [519]
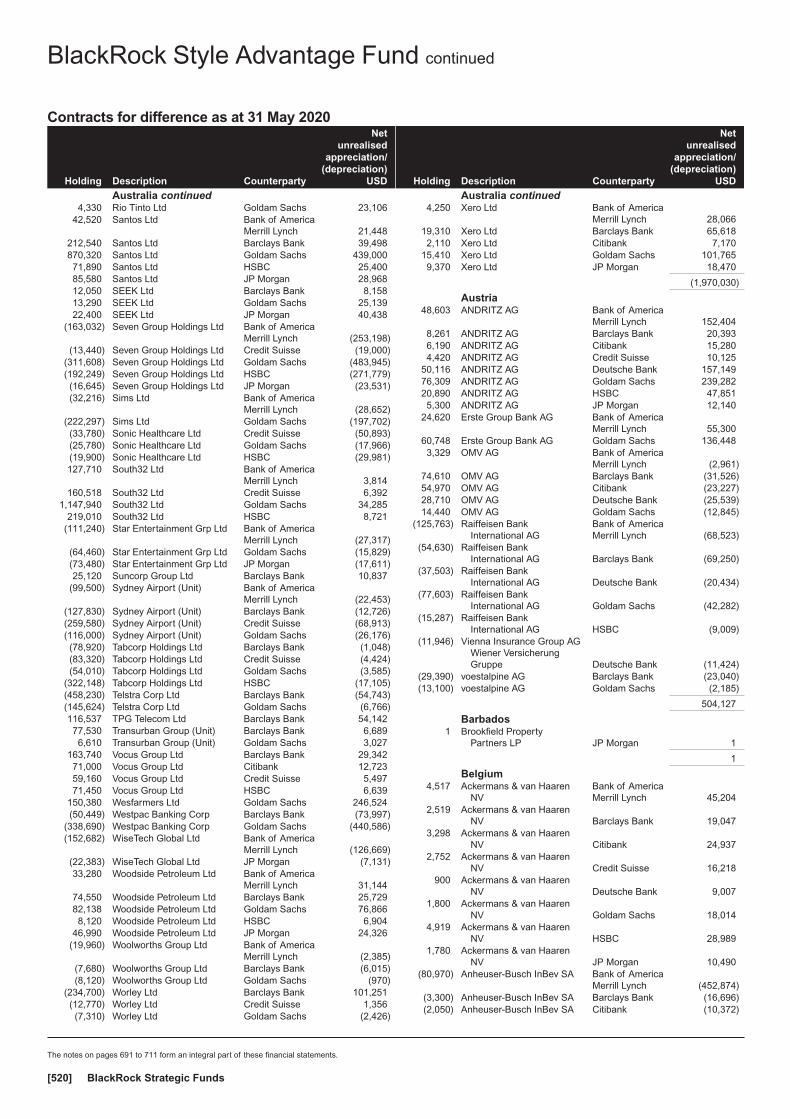
Contracts for difference as at 31 May 2020
Holding Description Counterparty
Netunrealised
appreciation/(depreciation)
USD
Australia continued4,330 Rio Tinto Ltd Goldam Sachs 23,106
42,520 Santos Ltd Bank of AmericaMerrill Lynch 21,448
212,540 Santos Ltd Barclays Bank 39,498870,320 Santos Ltd Goldam Sachs 439,00071,890 Santos Ltd HSBC 25,40085,580 Santos Ltd JP Morgan 28,96812,050 SEEK Ltd Barclays Bank 8,15813,290 SEEK Ltd Goldam Sachs 25,13922,400 SEEK Ltd JP Morgan 40,438
(163,032) Seven Group Holdings Ltd Bank of AmericaMerrill Lynch (253,198)
(13,440) Seven Group Holdings Ltd Credit Suisse (19,000)(311,608) Seven Group Holdings Ltd Goldam Sachs (483,945)(192,249) Seven Group Holdings Ltd HSBC (271,779)(16,645) Seven Group Holdings Ltd JP Morgan (23,531)(32,216) Sims Ltd Bank of America
Merrill Lynch (28,652)(222,297) Sims Ltd Goldam Sachs (197,702)(33,780) Sonic Healthcare Ltd Credit Suisse (50,893)(25,780) Sonic Healthcare Ltd Goldam Sachs (17,966)(19,900) Sonic Healthcare Ltd HSBC (29,981)127,710 South32 Ltd Bank of America
Merrill Lynch 3,814160,518 South32 Ltd Credit Suisse 6,392
1,147,940 South32 Ltd Goldam Sachs 34,285219,010 South32 Ltd HSBC 8,721
(111,240) Star Entertainment Grp Ltd Bank of AmericaMerrill Lynch (27,317)
(64,460) Star Entertainment Grp Ltd Goldam Sachs (15,829)(73,480) Star Entertainment Grp Ltd JP Morgan (17,611)25,120 Suncorp Group Ltd Barclays Bank 10,837
(99,500) Sydney Airport (Unit) Bank of AmericaMerrill Lynch (22,453)
(127,830) Sydney Airport (Unit) Barclays Bank (12,726)(259,580) Sydney Airport (Unit) Credit Suisse (68,913)(116,000) Sydney Airport (Unit) Goldam Sachs (26,176)(78,920) Tabcorp Holdings Ltd Barclays Bank (1,048)(83,320) Tabcorp Holdings Ltd Credit Suisse (4,424)(54,010) Tabcorp Holdings Ltd Goldam Sachs (3,585)
(322,148) Tabcorp Holdings Ltd HSBC (17,105)(458,230) Telstra Corp Ltd Barclays Bank (54,743)(145,624) Telstra Corp Ltd Goldam Sachs (6,766)116,537 TPG Telecom Ltd Barclays Bank 54,14277,530 Transurban Group (Unit) Barclays Bank 6,6896,610 Transurban Group (Unit) Goldam Sachs 3,027
163,740 Vocus Group Ltd Barclays Bank 29,34271,000 Vocus Group Ltd Citibank 12,72359,160 Vocus Group Ltd Credit Suisse 5,49771,450 Vocus Group Ltd HSBC 6,639
150,380 Wesfarmers Ltd Goldam Sachs 246,524(50,449) Westpac Banking Corp Barclays Bank (73,997)
(338,690) Westpac Banking Corp Goldam Sachs (440,586)(152,682) WiseTech Global Ltd Bank of America
Merrill Lynch (126,669)(22,383) WiseTech Global Ltd JP Morgan (7,131)33,280 Woodside Petroleum Ltd Bank of America
Merrill Lynch 31,14474,550 Woodside Petroleum Ltd Barclays Bank 25,72982,138 Woodside Petroleum Ltd Goldam Sachs 76,8668,120 Woodside Petroleum Ltd HSBC 6,904
46,990 Woodside Petroleum Ltd JP Morgan 24,326(19,960) Woolworths Group Ltd Bank of America
Merrill Lynch (2,385)(7,680) Woolworths Group Ltd Barclays Bank (6,015)(8,120) Woolworths Group Ltd Goldam Sachs (970)
(234,700) Worley Ltd Barclays Bank 101,251(12,770) Worley Ltd Credit Suisse 1,356(7,310) Worley Ltd Goldam Sachs (2,426)
Holding Description Counterparty
Netunrealised
appreciation/(depreciation)
USD
Australia continued4,250 Xero Ltd Bank of America
Merrill Lynch 28,06619,310 Xero Ltd Barclays Bank 65,6182,110 Xero Ltd Citibank 7,170
15,410 Xero Ltd Goldam Sachs 101,7659,370 Xero Ltd JP Morgan 18,470
(1,970,030)
Austria48,603 ANDRITZ AG Bank of America
Merrill Lynch 152,4048,261 ANDRITZ AG Barclays Bank 20,3936,190 ANDRITZ AG Citibank 15,2804,420 ANDRITZ AG Credit Suisse 10,125
50,116 ANDRITZ AG Deutsche Bank 157,14976,309 ANDRITZ AG Goldam Sachs 239,28220,890 ANDRITZ AG HSBC 47,8515,300 ANDRITZ AG JP Morgan 12,140
24,620 Erste Group Bank AG Bank of AmericaMerrill Lynch 55,300
60,748 Erste Group Bank AG Goldam Sachs 136,4483,329 OMV AG Bank of America
Merrill Lynch (2,961)74,610 OMV AG Barclays Bank (31,526)54,970 OMV AG Citibank (23,227)28,710 OMV AG Deutsche Bank (25,539)14,440 OMV AG Goldam Sachs (12,845)
(125,763) Raiffeisen BankInternational AG
Bank of AmericaMerrill Lynch (68,523)
(54,630) Raiffeisen BankInternational AG Barclays Bank (69,250)
(37,503) Raiffeisen BankInternational AG Deutsche Bank (20,434)
(77,603) Raiffeisen BankInternational AG Goldam Sachs (42,282)
(15,287) Raiffeisen BankInternational AG HSBC (9,009)
(11,946) Vienna Insurance Group AGWiener VersicherungGruppe Deutsche Bank (11,424)
(29,390) voestalpine AG Barclays Bank (23,040)(13,100) voestalpine AG Goldam Sachs (2,185)
504,127
Barbados1 Brookfield Property
Partners LP JP Morgan 1
1
Belgium4,517 Ackermans & van Haaren
NVBank of AmericaMerrill Lynch 45,204
2,519 Ackermans & van HaarenNV Barclays Bank 19,047
3,298 Ackermans & van HaarenNV Citibank 24,937
2,752 Ackermans & van HaarenNV Credit Suisse 16,218
900 Ackermans & van HaarenNV Deutsche Bank 9,007
1,800 Ackermans & van HaarenNV Goldam Sachs 18,014
4,919 Ackermans & van HaarenNV HSBC 28,989
1,780 Ackermans & van HaarenNV JP Morgan 10,490
(80,970) Anheuser-Busch InBev SA Bank of AmericaMerrill Lynch (452,874)
(3,300) Anheuser-Busch InBev SA Barclays Bank (16,696)(2,050) Anheuser-Busch InBev SA Citibank (10,372)
BlackRock Style Advantage Fund continued
The notes on pages 691 to 711 form an integral part of these financial statements.
BlackRock Strategic Funds[520]
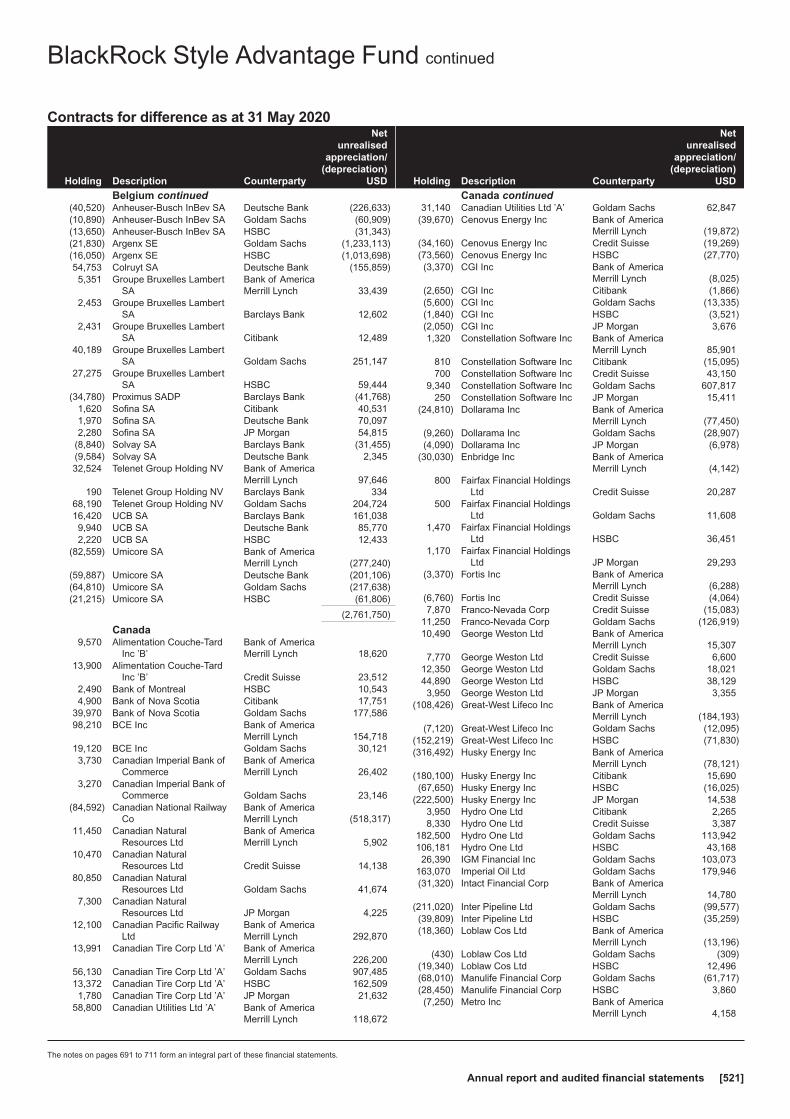
Contracts for difference as at 31 May 2020
Holding Description Counterparty
Netunrealised
appreciation/(depreciation)
USD
Belgium continued(40,520) Anheuser-Busch InBev SA Deutsche Bank (226,633)(10,890) Anheuser-Busch InBev SA Goldam Sachs (60,909)(13,650) Anheuser-Busch InBev SA HSBC (31,343)(21,830) Argenx SE Goldam Sachs (1,233,113)(16,050) Argenx SE HSBC (1,013,698)54,753 Colruyt SA Deutsche Bank (155,859)5,351 Groupe Bruxelles Lambert
SABank of AmericaMerrill Lynch 33,439
2,453 Groupe Bruxelles LambertSA Barclays Bank 12,602
2,431 Groupe Bruxelles LambertSA Citibank 12,489
40,189 Groupe Bruxelles LambertSA Goldam Sachs 251,147
27,275 Groupe Bruxelles LambertSA HSBC 59,444
(34,780) Proximus SADP Barclays Bank (41,768)1,620 Sofina SA Citibank 40,5311,970 Sofina SA Deutsche Bank 70,0972,280 Sofina SA JP Morgan 54,815
(8,840) Solvay SA Barclays Bank (31,455)(9,584) Solvay SA Deutsche Bank 2,34532,524 Telenet Group Holding NV Bank of America
Merrill Lynch 97,646190 Telenet Group Holding NV Barclays Bank 334
68,190 Telenet Group Holding NV Goldam Sachs 204,72416,420 UCB SA Barclays Bank 161,0389,940 UCB SA Deutsche Bank 85,7702,220 UCB SA HSBC 12,433
(82,559) Umicore SA Bank of AmericaMerrill Lynch (277,240)
(59,887) Umicore SA Deutsche Bank (201,106)(64,810) Umicore SA Goldam Sachs (217,638)(21,215) Umicore SA HSBC (61,806)
(2,761,750)
Canada9,570 Alimentation Couche-Tard
Inc ’B’Bank of AmericaMerrill Lynch 18,620
13,900 Alimentation Couche-TardInc ’B’ Credit Suisse 23,512
2,490 Bank of Montreal HSBC 10,5434,900 Bank of Nova Scotia Citibank 17,751
39,970 Bank of Nova Scotia Goldam Sachs 177,58698,210 BCE Inc Bank of America
Merrill Lynch 154,71819,120 BCE Inc Goldam Sachs 30,1213,730 Canadian Imperial Bank of
CommerceBank of AmericaMerrill Lynch 26,402
3,270 Canadian Imperial Bank ofCommerce Goldam Sachs 23,146
(84,592) Canadian National RailwayCo
Bank of AmericaMerrill Lynch (518,317)
11,450 Canadian NaturalResources Ltd
Bank of AmericaMerrill Lynch 5,902
10,470 Canadian NaturalResources Ltd Credit Suisse 14,138
80,850 Canadian NaturalResources Ltd Goldam Sachs 41,674
7,300 Canadian NaturalResources Ltd JP Morgan 4,225
12,100 Canadian Pacific RailwayLtd
Bank of AmericaMerrill Lynch 292,870
13,991 Canadian Tire Corp Ltd ’A’ Bank of AmericaMerrill Lynch 226,200
56,130 Canadian Tire Corp Ltd ’A’ Goldam Sachs 907,48513,372 Canadian Tire Corp Ltd ’A’ HSBC 162,5091,780 Canadian Tire Corp Ltd ’A’ JP Morgan 21,632
58,800 Canadian Utilities Ltd ’A’ Bank of AmericaMerrill Lynch 118,672
Holding Description Counterparty
Netunrealised
appreciation/(depreciation)
USD
Canada continued31,140 Canadian Utilities Ltd ’A’ Goldam Sachs 62,847
(39,670) Cenovus Energy Inc Bank of AmericaMerrill Lynch (19,872)
(34,160) Cenovus Energy Inc Credit Suisse (19,269)(73,560) Cenovus Energy Inc HSBC (27,770)(3,370) CGI Inc Bank of America
Merrill Lynch (8,025)(2,650) CGI Inc Citibank (1,866)(5,600) CGI Inc Goldam Sachs (13,335)(1,840) CGI Inc HSBC (3,521)(2,050) CGI Inc JP Morgan 3,6761,320 Constellation Software Inc Bank of America
Merrill Lynch 85,901810 Constellation Software Inc Citibank (15,095)700 Constellation Software Inc Credit Suisse 43,150
9,340 Constellation Software Inc Goldam Sachs 607,817250 Constellation Software Inc JP Morgan 15,411
(24,810) Dollarama Inc Bank of AmericaMerrill Lynch (77,450)
(9,260) Dollarama Inc Goldam Sachs (28,907)(4,090) Dollarama Inc JP Morgan (6,978)
(30,030) Enbridge Inc Bank of AmericaMerrill Lynch (4,142)
800 Fairfax Financial HoldingsLtd Credit Suisse 20,287
500 Fairfax Financial HoldingsLtd Goldam Sachs 11,608
1,470 Fairfax Financial HoldingsLtd HSBC 36,451
1,170 Fairfax Financial HoldingsLtd JP Morgan 29,293
(3,370) Fortis Inc Bank of AmericaMerrill Lynch (6,288)
(6,760) Fortis Inc Credit Suisse (4,064)7,870 Franco-Nevada Corp Credit Suisse (15,083)
11,250 Franco-Nevada Corp Goldam Sachs (126,919)10,490 George Weston Ltd Bank of America
Merrill Lynch 15,3077,770 George Weston Ltd Credit Suisse 6,600
12,350 George Weston Ltd Goldam Sachs 18,02144,890 George Weston Ltd HSBC 38,1293,950 George Weston Ltd JP Morgan 3,355
(108,426) Great-West Lifeco Inc Bank of AmericaMerrill Lynch (184,193)
(7,120) Great-West Lifeco Inc Goldam Sachs (12,095)(152,219) Great-West Lifeco Inc HSBC (71,830)(316,492) Husky Energy Inc Bank of America
Merrill Lynch (78,121)(180,100) Husky Energy Inc Citibank 15,690(67,650) Husky Energy Inc HSBC (16,025)
(222,500) Husky Energy Inc JP Morgan 14,5383,950 Hydro One Ltd Citibank 2,2658,330 Hydro One Ltd Credit Suisse 3,387
182,500 Hydro One Ltd Goldam Sachs 113,942106,181 Hydro One Ltd HSBC 43,16826,390 IGM Financial Inc Goldam Sachs 103,073
163,070 Imperial Oil Ltd Goldam Sachs 179,946(31,320) Intact Financial Corp Bank of America
Merrill Lynch 14,780(211,020) Inter Pipeline Ltd Goldam Sachs (99,577)(39,809) Inter Pipeline Ltd HSBC (35,259)(18,360) Loblaw Cos Ltd Bank of America
Merrill Lynch (13,196)(430) Loblaw Cos Ltd Goldam Sachs (309)
(19,340) Loblaw Cos Ltd HSBC 12,496(68,010) Manulife Financial Corp Goldam Sachs (61,717)(28,450) Manulife Financial Corp HSBC 3,860(7,250) Metro Inc Bank of America
Merrill Lynch 4,158
BlackRock Style Advantage Fund continued
The notes on pages 691 to 711 form an integral part of these financial statements.
Annual report and audited financial statements [521]

Contracts for difference as at 31 May 2020
Holding Description Counterparty
Netunrealised
appreciation/(depreciation)
USD
Canada continued(145,740) Metro Inc Goldam Sachs 83,585
79,671 National Bank of Canada Bank of AmericaMerrill Lynch 529,810
66,198 National Bank of Canada HSBC 242,2145,650 Pembina Pipeline Corp Bank of America
Merrill Lynch 4,9226,710 Pembina Pipeline Corp Citibank (4,628)6,300 Pembina Pipeline Corp Credit Suisse 10,4288,380 Pembina Pipeline Corp Goldam Sachs 7,3008,070 Pembina Pipeline Corp HSBC 13,358
32,470 Pembina Pipeline Corp JP Morgan 53,745(75,550) Power Corp of Canada Bank of America
Merrill Lynch (170,576)(23,530) Power Corp of Canada Credit Suisse (27,161)(51,230) Power Corp of Canada HSBC (59,135)(47,420) Power Corp of Canada JP Morgan (66,185)(23,130) Rogers Communications Inc
’B’Bank of AmericaMerrill Lynch (39,461)
(10,780) Rogers Communications Inc’B’ Citibank (21,365)
(4,710) Rogers Communications Inc’B’ Goldam Sachs (8,035)
(3,350) Rogers Communications Inc’B’ HSBC (6,186)
86,120 Royal Bank of Canada Bank of AmericaMerrill Lynch 482,665
32,940 Royal Bank of Canada Goldam Sachs 184,614(71,580) Saputo Inc Goldam Sachs 7,275(62,850) Shaw Communications Inc
’B’Bank of AmericaMerrill Lynch (31,483)
(2,330) Shaw Communications Inc’B’ Citibank (1,184)
(2,830) Shaw Communications Inc’B’ Credit Suisse (185)
(75,310) Shaw Communications Inc’B’ Goldam Sachs (37,725)
(1,100) Shopify Inc ’A’ Bank of AmericaMerrill Lynch 26,744
(2,500) Shopify Inc ’A’ Citibank 190,35237,000 Sun Life Financial Inc Goldam Sachs 54,52859,610 Suncor Energy Inc Bank of America
Merrill Lynch 29,427119,090 Suncor Energy Inc Goldam Sachs 58,79115,990 TC Energy Corp Bank of America
Merrill Lynch (6,617)8,120 TC Energy Corp Citibank 19,100
(137,900) Teck Resources Ltd ’B’ Bank of AmericaMerrill Lynch (65,073)
(27,880) TELUS Corp Bank of AmericaMerrill Lynch (23,884)
(59,370) TELUS Corp Citibank (45,687)6,060 Toronto-Dominion Bank Goldam Sachs 20,809
22,470 Toronto-Dominion Bank HSBC 42,413(13,450) Wheaton Precious Metals
CorpBank of AmericaMerrill Lynch 40,620
3,805,769
Denmark(97,361) Ambu A/S ’B’ Citibank (162,668)(8,893) Ambu A/S ’B’ Credit Suisse (26,002)
(22,910) Ambu A/S ’B’ Goldam Sachs (86,808)(20,030) Ambu A/S ’B’ HSBC (58,565)
635 AP Moller - Maersk A/S ’A’ Barclays Bank (33,154)588 AP Moller - Maersk A/S ’A’ Deutsche Bank 11,403483 AP Moller - Maersk A/S ’A’ Goldam Sachs 9,367240 AP Moller - Maersk A/S ’A’ JP Morgan 13,212
17,940 Carlsberg A/S ’B’ Citibank 82,9634,040 Carlsberg A/S ’B’ Credit Suisse 21,335
20,850 Carlsberg A/S ’B’ HSBC 110,10519,669 Carlsberg A/S ’B’ JP Morgan 103,868
Holding Description Counterparty
Netunrealised
appreciation/(depreciation)
USD
Denmark continued(21,611) Chr Hansen Holding A/S Bank of America
Merrill Lynch (61,253)(14,118) Chr Hansen Holding A/S Barclays Bank (421)(14,395) Chr Hansen Holding A/S Credit Suisse (49,390)
1,550 Coloplast A/S ’B’ Bank of AmericaMerrill Lynch 21,966
840 Coloplast A/S ’B’ Barclays Bank (627)2,530 Coloplast A/S ’B’ Credit Suisse 33,779
35,230 Coloplast A/S ’B’ Deutsche Bank 499,269(55,990) Danske Bank A/S Bank of America
Merrill Lynch (96,219)(76,140) Danske Bank A/S Barclays Bank (85,641)(21,350) Danske Bank A/S Citibank (21,275)
(285,160) Danske Bank A/S Deutsche Bank (490,049)(36,090) Danske Bank A/S HSBC (41,132)(69,989) Demant A/S Deutsche Bank (272,501)(54,760) DSV PANALPINA A/S Bank of America
Merrill Lynch (249,967)(3,663) DSV PANALPINA A/S Deutsche Bank (16,721)9,640 Genmab A/S Deutsche Bank 153,8722,040 Genmab A/S Goldam Sachs 32,562
34,755 GN Store Nord A/S Bank of AmericaMerrill Lynch 240,047
8 GN Store Nord A/S Barclays Bank 1115,450 GN Store Nord A/S Deutsche Bank 106,711
(65,520) H Lundbeck A/S Deutsche Bank (138,791)(15,830) ISS A/S Bank of America
Merrill Lynch (37,287)(40,800) ISS A/S Barclays Bank (14,607)
(102,510) ISS A/S Deutsche Bank (241,461)(14,700) ISS A/S JP Morgan (32,433)
8,733 Novo Nordisk A/S ’B’ Citibank (11,139)30,830 Novo Nordisk A/S ’B’ Deutsche Bank (2,530)54,440 Novo Nordisk A/S ’B’ Goldam Sachs (4,467)15,065 Novo Nordisk A/S ’B’ JP Morgan (112)7,130 Novozymes A/S ’B’ Credit Suisse 17,337
20,288 Novozymes A/S ’B’ Deutsche Bank 55,99013,060 Novozymes A/S ’B’ HSBC 31,756
(10,080) Orsted A/S Barclays Bank (28,570)(5,146) Orsted A/S Credit Suisse (65,251)
(34,770) Orsted A/S Deutsche Bank (405,611)(13,690) Orsted A/S HSBC (173,588)75,920 Pandora A/S Barclays Bank 362,4146,947 ROCKWOOL International
A/S ’B’Bank of AmericaMerrill Lynch 411,421
810 ROCKWOOL InternationalA/S ’B’ Credit Suisse 55,372
7,684 ROCKWOOL InternationalA/S ’B’ Deutsche Bank 455,068
3,843 ROCKWOOL InternationalA/S ’B’ Goldam Sachs 227,593
33,098 Tryg A/S Barclays Bank 10,86262,910 Tryg A/S Deutsche Bank 113,5541,750 Vestas Wind Systems A/S Deutsche Bank 20,937
294,534
Finland(1,860) Elisa Oyj Citibank (2,399)20,200 Fortum Oyj Bank of America
Merrill Lynch 51,21264,480 Fortum Oyj Barclays Bank 101,4532,090 Fortum Oyj Citibank 3,2886,770 Fortum Oyj Credit Suisse 12,120
29,550 Fortum Oyj Deutsche Bank 74,91758,875 Fortum Oyj Goldam Sachs 149,26323,100 Fortum Oyj HSBC 41,35533,900 Fortum Oyj JP Morgan 55,43512,880 Huhtamaki Oyj Deutsche Bank 60,15218,560 Huhtamaki Oyj HSBC 57,373
BlackRock Style Advantage Fund continued
The notes on pages 691 to 711 form an integral part of these financial statements.
BlackRock Strategic Funds[522]
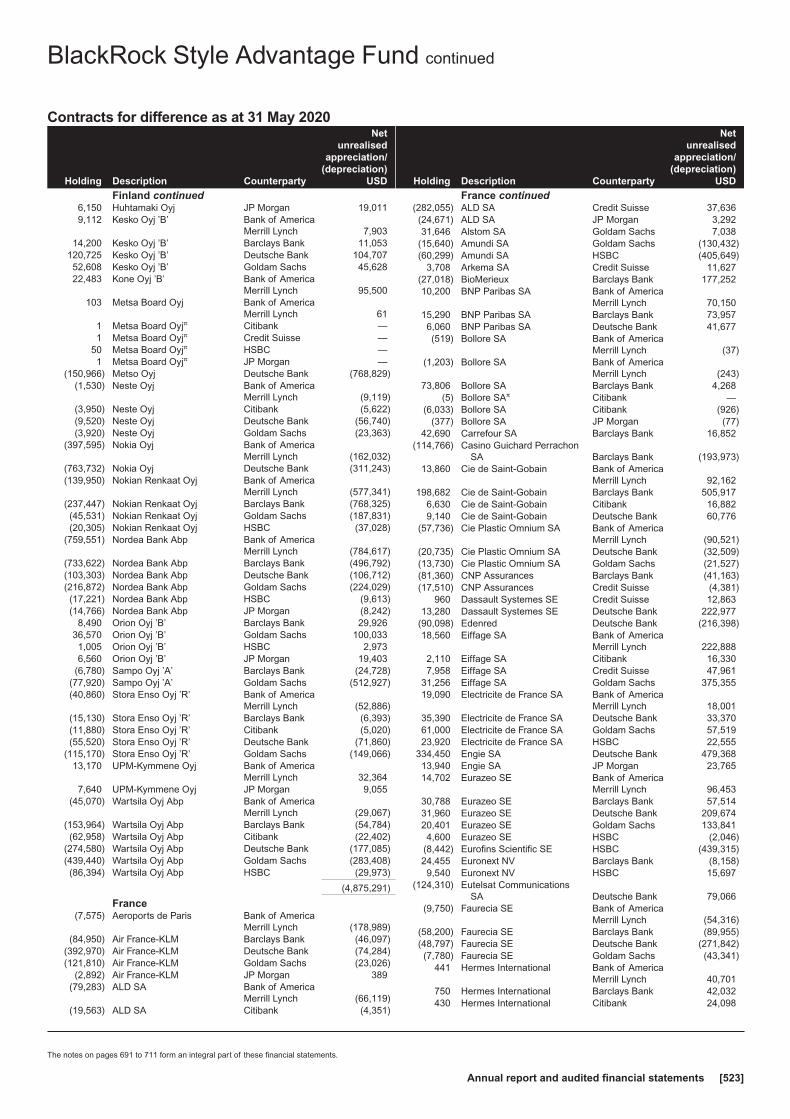
Contracts for difference as at 31 May 2020
Holding Description Counterparty
Netunrealised
appreciation/(depreciation)
USD
Finland continued6,150 Huhtamaki Oyj JP Morgan 19,0119,112 Kesko Oyj ’B’ Bank of America
Merrill Lynch 7,90314,200 Kesko Oyj ’B’ Barclays Bank 11,053
120,725 Kesko Oyj ’B’ Deutsche Bank 104,70752,608 Kesko Oyj ’B’ Goldam Sachs 45,62822,483 Kone Oyj ’B’ Bank of America
Merrill Lynch 95,500103 Metsa Board Oyj Bank of America
Merrill Lynch 611 Metsa Board Oyjπ Citibank —1 Metsa Board Oyjπ Credit Suisse —
50 Metsa Board Oyjπ HSBC —1 Metsa Board Oyjπ JP Morgan —
(150,966) Metso Oyj Deutsche Bank (768,829)(1,530) Neste Oyj Bank of America
Merrill Lynch (9,119)(3,950) Neste Oyj Citibank (5,622)(9,520) Neste Oyj Deutsche Bank (56,740)(3,920) Neste Oyj Goldam Sachs (23,363)
(397,595) Nokia Oyj Bank of AmericaMerrill Lynch (162,032)
(763,732) Nokia Oyj Deutsche Bank (311,243)(139,950) Nokian Renkaat Oyj Bank of America
Merrill Lynch (577,341)(237,447) Nokian Renkaat Oyj Barclays Bank (768,325)(45,531) Nokian Renkaat Oyj Goldam Sachs (187,831)(20,305) Nokian Renkaat Oyj HSBC (37,028)
(759,551) Nordea Bank Abp Bank of AmericaMerrill Lynch (784,617)
(733,622) Nordea Bank Abp Barclays Bank (496,792)(103,303) Nordea Bank Abp Deutsche Bank (106,712)(216,872) Nordea Bank Abp Goldam Sachs (224,029)(17,221) Nordea Bank Abp HSBC (9,613)(14,766) Nordea Bank Abp JP Morgan (8,242)
8,490 Orion Oyj ’B’ Barclays Bank 29,92636,570 Orion Oyj ’B’ Goldam Sachs 100,0331,005 Orion Oyj ’B’ HSBC 2,9736,560 Orion Oyj ’B’ JP Morgan 19,403
(6,780) Sampo Oyj ’A’ Barclays Bank (24,728)(77,920) Sampo Oyj ’A’ Goldam Sachs (512,927)(40,860) Stora Enso Oyj ’R’ Bank of America
Merrill Lynch (52,886)(15,130) Stora Enso Oyj ’R’ Barclays Bank (6,393)(11,880) Stora Enso Oyj ’R’ Citibank (5,020)(55,520) Stora Enso Oyj ’R’ Deutsche Bank (71,860)
(115,170) Stora Enso Oyj ’R’ Goldam Sachs (149,066)13,170 UPM-Kymmene Oyj Bank of America
Merrill Lynch 32,3647,640 UPM-Kymmene Oyj JP Morgan 9,055
(45,070) Wartsila Oyj Abp Bank of AmericaMerrill Lynch (29,067)
(153,964) Wartsila Oyj Abp Barclays Bank (54,784)(62,958) Wartsila Oyj Abp Citibank (22,402)
(274,580) Wartsila Oyj Abp Deutsche Bank (177,085)(439,440) Wartsila Oyj Abp Goldam Sachs (283,408)(86,394) Wartsila Oyj Abp HSBC (29,973)
(4,875,291)
France(7,575) Aeroports de Paris Bank of America
Merrill Lynch (178,989)(84,950) Air France-KLM Barclays Bank (46,097)
(392,970) Air France-KLM Deutsche Bank (74,284)(121,810) Air France-KLM Goldam Sachs (23,026)
(2,892) Air France-KLM JP Morgan 389(79,283) ALD SA Bank of America
Merrill Lynch (66,119)(19,563) ALD SA Citibank (4,351)
Holding Description Counterparty
Netunrealised
appreciation/(depreciation)
USD
France continued(282,055) ALD SA Credit Suisse 37,636(24,671) ALD SA JP Morgan 3,29231,646 Alstom SA Goldam Sachs 7,038
(15,640) Amundi SA Goldam Sachs (130,432)(60,299) Amundi SA HSBC (405,649)
3,708 Arkema SA Credit Suisse 11,627(27,018) BioMerieux Barclays Bank 177,25210,200 BNP Paribas SA Bank of America
Merrill Lynch 70,15015,290 BNP Paribas SA Barclays Bank 73,9576,060 BNP Paribas SA Deutsche Bank 41,677(519) Bollore SA Bank of America
Merrill Lynch (37)(1,203) Bollore SA Bank of America
Merrill Lynch (243)73,806 Bollore SA Barclays Bank 4,268
(5) Bollore SAπ Citibank —(6,033) Bollore SA Citibank (926)
(377) Bollore SA JP Morgan (77)42,690 Carrefour SA Barclays Bank 16,852
(114,766) Casino Guichard PerrachonSA Barclays Bank (193,973)
13,860 Cie de Saint-Gobain Bank of AmericaMerrill Lynch 92,162
198,682 Cie de Saint-Gobain Barclays Bank 505,9176,630 Cie de Saint-Gobain Citibank 16,8829,140 Cie de Saint-Gobain Deutsche Bank 60,776
(57,736) Cie Plastic Omnium SA Bank of AmericaMerrill Lynch (90,521)
(20,735) Cie Plastic Omnium SA Deutsche Bank (32,509)(13,730) Cie Plastic Omnium SA Goldam Sachs (21,527)(81,360) CNP Assurances Barclays Bank (41,163)(17,510) CNP Assurances Credit Suisse (4,381)
960 Dassault Systemes SE Credit Suisse 12,86313,280 Dassault Systemes SE Deutsche Bank 222,977
(90,098) Edenred Deutsche Bank (216,398)18,560 Eiffage SA Bank of America
Merrill Lynch 222,8882,110 Eiffage SA Citibank 16,3307,958 Eiffage SA Credit Suisse 47,961
31,256 Eiffage SA Goldam Sachs 375,35519,090 Electricite de France SA Bank of America
Merrill Lynch 18,00135,390 Electricite de France SA Deutsche Bank 33,37061,000 Electricite de France SA Goldam Sachs 57,51923,920 Electricite de France SA HSBC 22,555
334,450 Engie SA Deutsche Bank 479,36813,940 Engie SA JP Morgan 23,76514,702 Eurazeo SE Bank of America
Merrill Lynch 96,45330,788 Eurazeo SE Barclays Bank 57,51431,960 Eurazeo SE Deutsche Bank 209,67420,401 Eurazeo SE Goldam Sachs 133,8414,600 Eurazeo SE HSBC (2,046)
(8,442) Eurofins Scientific SE HSBC (439,315)24,455 Euronext NV Barclays Bank (8,158)9,540 Euronext NV HSBC 15,697
(124,310) Eutelsat CommunicationsSA Deutsche Bank 79,066
(9,750) Faurecia SE Bank of AmericaMerrill Lynch (54,316)
(58,200) Faurecia SE Barclays Bank (89,955)(48,797) Faurecia SE Deutsche Bank (271,842)(7,780) Faurecia SE Goldam Sachs (43,341)
441 Hermes International Bank of AmericaMerrill Lynch 40,701
750 Hermes International Barclays Bank 42,032430 Hermes International Citibank 24,098
BlackRock Style Advantage Fund continued
The notes on pages 691 to 711 form an integral part of these financial statements.
Annual report and audited financial statements [523]
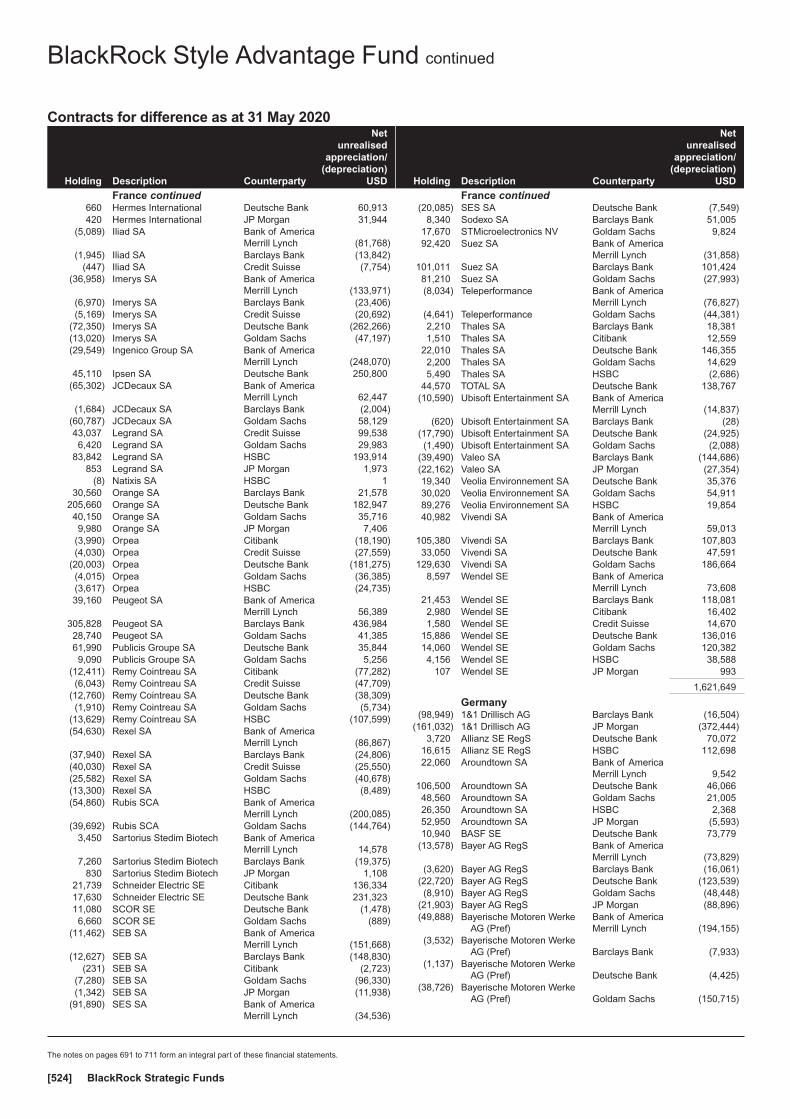
Contracts for difference as at 31 May 2020
Holding Description Counterparty
Netunrealised
appreciation/(depreciation)
USD
France continued660 Hermes International Deutsche Bank 60,913420 Hermes International JP Morgan 31,944
(5,089) Iliad SA Bank of AmericaMerrill Lynch (81,768)
(1,945) Iliad SA Barclays Bank (13,842)(447) Iliad SA Credit Suisse (7,754)
(36,958) Imerys SA Bank of AmericaMerrill Lynch (133,971)
(6,970) Imerys SA Barclays Bank (23,406)(5,169) Imerys SA Credit Suisse (20,692)
(72,350) Imerys SA Deutsche Bank (262,266)(13,020) Imerys SA Goldam Sachs (47,197)(29,549) Ingenico Group SA Bank of America
Merrill Lynch (248,070)45,110 Ipsen SA Deutsche Bank 250,800
(65,302) JCDecaux SA Bank of AmericaMerrill Lynch 62,447
(1,684) JCDecaux SA Barclays Bank (2,004)(60,787) JCDecaux SA Goldam Sachs 58,12943,037 Legrand SA Credit Suisse 99,5386,420 Legrand SA Goldam Sachs 29,983
83,842 Legrand SA HSBC 193,914853 Legrand SA JP Morgan 1,973
(8) Natixis SA HSBC 130,560 Orange SA Barclays Bank 21,578
205,660 Orange SA Deutsche Bank 182,94740,150 Orange SA Goldam Sachs 35,7169,980 Orange SA JP Morgan 7,406
(3,990) Orpea Citibank (18,190)(4,030) Orpea Credit Suisse (27,559)
(20,003) Orpea Deutsche Bank (181,275)(4,015) Orpea Goldam Sachs (36,385)(3,617) Orpea HSBC (24,735)39,160 Peugeot SA Bank of America
Merrill Lynch 56,389305,828 Peugeot SA Barclays Bank 436,98428,740 Peugeot SA Goldam Sachs 41,38561,990 Publicis Groupe SA Deutsche Bank 35,8449,090 Publicis Groupe SA Goldam Sachs 5,256
(12,411) Remy Cointreau SA Citibank (77,282)(6,043) Remy Cointreau SA Credit Suisse (47,709)
(12,760) Remy Cointreau SA Deutsche Bank (38,309)(1,910) Remy Cointreau SA Goldam Sachs (5,734)
(13,629) Remy Cointreau SA HSBC (107,599)(54,630) Rexel SA Bank of America
Merrill Lynch (86,867)(37,940) Rexel SA Barclays Bank (24,806)(40,030) Rexel SA Credit Suisse (25,550)(25,582) Rexel SA Goldam Sachs (40,678)(13,300) Rexel SA HSBC (8,489)(54,860) Rubis SCA Bank of America
Merrill Lynch (200,085)(39,692) Rubis SCA Goldam Sachs (144,764)
3,450 Sartorius Stedim Biotech Bank of AmericaMerrill Lynch 14,578
7,260 Sartorius Stedim Biotech Barclays Bank (19,375)830 Sartorius Stedim Biotech JP Morgan 1,108
21,739 Schneider Electric SE Citibank 136,33417,630 Schneider Electric SE Deutsche Bank 231,32311,080 SCOR SE Deutsche Bank (1,478)6,660 SCOR SE Goldam Sachs (889)
(11,462) SEB SA Bank of AmericaMerrill Lynch (151,668)
(12,627) SEB SA Barclays Bank (148,830)(231) SEB SA Citibank (2,723)
(7,280) SEB SA Goldam Sachs (96,330)(1,342) SEB SA JP Morgan (11,938)
(91,890) SES SA Bank of AmericaMerrill Lynch (34,536)
Holding Description Counterparty
Netunrealised
appreciation/(depreciation)
USD
France continued(20,085) SES SA Deutsche Bank (7,549)
8,340 Sodexo SA Barclays Bank 51,00517,670 STMicroelectronics NV Goldam Sachs 9,82492,420 Suez SA Bank of America
Merrill Lynch (31,858)101,011 Suez SA Barclays Bank 101,42481,210 Suez SA Goldam Sachs (27,993)(8,034) Teleperformance Bank of America
Merrill Lynch (76,827)(4,641) Teleperformance Goldam Sachs (44,381)2,210 Thales SA Barclays Bank 18,3811,510 Thales SA Citibank 12,559
22,010 Thales SA Deutsche Bank 146,3552,200 Thales SA Goldam Sachs 14,6295,490 Thales SA HSBC (2,686)
44,570 TOTAL SA Deutsche Bank 138,767(10,590) Ubisoft Entertainment SA Bank of America
Merrill Lynch (14,837)(620) Ubisoft Entertainment SA Barclays Bank (28)
(17,790) Ubisoft Entertainment SA Deutsche Bank (24,925)(1,490) Ubisoft Entertainment SA Goldam Sachs (2,088)
(39,490) Valeo SA Barclays Bank (144,686)(22,162) Valeo SA JP Morgan (27,354)19,340 Veolia Environnement SA Deutsche Bank 35,37630,020 Veolia Environnement SA Goldam Sachs 54,91189,276 Veolia Environnement SA HSBC 19,85440,982 Vivendi SA Bank of America
Merrill Lynch 59,013105,380 Vivendi SA Barclays Bank 107,80333,050 Vivendi SA Deutsche Bank 47,591
129,630 Vivendi SA Goldam Sachs 186,6648,597 Wendel SE Bank of America
Merrill Lynch 73,60821,453 Wendel SE Barclays Bank 118,0812,980 Wendel SE Citibank 16,4021,580 Wendel SE Credit Suisse 14,670
15,886 Wendel SE Deutsche Bank 136,01614,060 Wendel SE Goldam Sachs 120,3824,156 Wendel SE HSBC 38,588
107 Wendel SE JP Morgan 993
1,621,649
Germany(98,949) 1&1 Drillisch AG Barclays Bank (16,504)
(161,032) 1&1 Drillisch AG JP Morgan (372,444)3,720 Allianz SE RegS Deutsche Bank 70,072
16,615 Allianz SE RegS HSBC 112,69822,060 Aroundtown SA Bank of America
Merrill Lynch 9,542106,500 Aroundtown SA Deutsche Bank 46,06648,560 Aroundtown SA Goldam Sachs 21,00526,350 Aroundtown SA HSBC 2,36852,950 Aroundtown SA JP Morgan (5,593)10,940 BASF SE Deutsche Bank 73,779
(13,578) Bayer AG RegS Bank of AmericaMerrill Lynch (73,829)
(3,620) Bayer AG RegS Barclays Bank (16,061)(22,720) Bayer AG RegS Deutsche Bank (123,539)(8,910) Bayer AG RegS Goldam Sachs (48,448)
(21,903) Bayer AG RegS JP Morgan (88,896)(49,888) Bayerische Motoren Werke
AG (Pref)Bank of AmericaMerrill Lynch (194,155)
(3,532) Bayerische Motoren WerkeAG (Pref) Barclays Bank (7,933)
(1,137) Bayerische Motoren WerkeAG (Pref) Deutsche Bank (4,425)
(38,726) Bayerische Motoren WerkeAG (Pref) Goldam Sachs (150,715)
BlackRock Style Advantage Fund continued
The notes on pages 691 to 711 form an integral part of these financial statements.
BlackRock Strategic Funds[524]

Contracts for difference as at 31 May 2020
Holding Description Counterparty
Netunrealised
appreciation/(depreciation)
USD
Germany continued(466) Bayerische Motoren Werke
AG (Pref) JP Morgan 497(5,990) Bechtle AG Bank of America
Merrill Lynch (80,593)(3,450) Bechtle AG Barclays Bank (15,729)(1,390) Bechtle AG Credit Suisse (7,126)(3,260) Bechtle AG Goldam Sachs (43,862)2,640 Beiersdorf AG Bank of America
Merrill Lynch 6,92823,790 Beiersdorf AG Deutsche Bank 62,4303,237 Beiersdorf AG Goldam Sachs 8,495
24,060 Brenntag AG Bank of AmericaMerrill Lynch 132,965
11,640 Brenntag AG Goldam Sachs 64,3275,798 Carl Zeiss Meditec AG Barclays Bank 32,2358,980 Carl Zeiss Meditec AG Deutsche Bank 88,3701,770 Carl Zeiss Meditec AG Goldam Sachs 17,418
(100,350) Commerzbank AG Barclays Bank (28,900)(1,292,770) Commerzbank AG Deutsche Bank (977,497)
(361,280) Commerzbank AG Goldam Sachs (273,173)(155,946) Commerzbank AG HSBC (55,316)(13,530) Continental AG Deutsche Bank (222,962)(15,430) Covestro AG Barclays Bank (39,634)(2,108) Covestro AG Deutsche Bank (10,595)3,390 CTS Eventim AG & Co
KGaA JP Morgan 14,444(130,800) Daimler AG Barclays Bank (346,882)
(3,850) Daimler AG Goldam Sachs (24,487)(18,391) Delivery Hero SE Barclays Bank 79,755(26,270) Delivery Hero SE Deutsche Bank (97,564)(2,650) Delivery Hero SE Goldam Sachs (9,842)
(41,360) Deutsche Bank AG Bank of AmericaMerrill Lynch (77,770)
(238,779) Deutsche Bank AG Citibank (249,845)(60,220) Deutsche Bank AG Credit Suisse (107,863)
(688,041) Deutsche Bank AG HSBC (837,749)3,200 Deutsche Boerse AG Bank of America
Merrill Lynch 6,04915,880 Deutsche Boerse AG Deutsche Bank 30,0186,660 Deutsche Boerse AG Goldam Sachs 12,590
6 Deutsche EuroShop AGπ HSBC —(336,622) Deutsche Lufthansa AG
RegS Deutsche Bank (639,316)193,474 Deutsche Post AG RegS Bank of America
Merrill Lynch 342,06252,040 Deutsche Post AG RegS Barclays Bank 54,39459,460 Deutsche Post AG RegS Deutsche Bank 105,12537,380 Deutsche Post AG RegS HSBC 71,076
195,040 Deutsche Telekom AG RegS Credit Suisse 119,281282,370 Deutsche Telekom AG RegS Deutsche Bank 178,96921,240 Deutsche Telekom AG RegS Goldam Sachs 13,462
(12,280) Deutsche Wohnen SE Barclays Bank (8,876)(9,870) Deutsche Wohnen SE Goldam Sachs (27,767)3,591 DWS Group GmbH & Co
KGaA Credit Suisse 17,9605,870 DWS Group GmbH & Co
KGaA Goldam Sachs 25,5544,760 DWS Group GmbH & Co
KGaA JP Morgan 20,434(96,210) E.ON SE Barclays Bank 8,34551,300 Evonik Industries AG Bank of America
Merrill Lynch 90,12865,565 Evonik Industries AG HSBC 1,45811,380 Fielmann AG Bank of America
Merrill Lynch 37,9626,970 Fielmann AG Barclays Bank 18,6011,857 Fielmann AG Credit Suisse 5,8858,777 Fielmann AG Goldam Sachs 29,279
Holding Description Counterparty
Netunrealised
appreciation/(depreciation)
USD
Germany continued55 Fielmann AG HSBC 174
25,624 Fraport AG Frankfurt AirportServices Worldwide
Bank of AmericaMerrill Lynch 237,628
47,354 Fraport AG Frankfurt AirportServices Worldwide Barclays Bank 284,339
12,320 Fraport AG Frankfurt AirportServices Worldwide Citibank 73,976
16,691 Fraport AG Frankfurt AirportServices Worldwide Credit Suisse 120,682
10,140 Fraport AG Frankfurt AirportServices Worldwide Deutsche Bank 94,035
23,828 Fraport AG Frankfurt AirportServices Worldwide Goldam Sachs 220,973
(8,230) Fresenius Medical Care AG& Co KGaA
Bank of AmericaMerrill Lynch (30,932)
(3,440) Fresenius Medical Care AG& Co KGaA Barclays Bank (2,678)
(49,706) Fresenius Medical Care AG& Co KGaA Deutsche Bank (186,815)
(7,840) Fresenius Medical Care AG& Co KGaA Goldam Sachs (29,466)
(16,340) Fresenius SE & Co KGaA Bank of AmericaMerrill Lynch (86,122)
(11,980) Fresenius SE & Co KGaA Barclays Bank (1,465)(6,940) Fresenius SE & Co KGaA Goldam Sachs (36,578)(9,200) Fresenius SE & Co KGaA JP Morgan (30,792)9,087 FUCHS PETROLUB SE Goldam Sachs 17,6835,094 FUCHS PETROLUB SE HSBC —4,240 FUCHS PETROLUB SE
(Pref) Citibank 5,75214,995 FUCHS PETROLUB SE
(Pref) Deutsche Bank 53,6898,010 FUCHS PETROLUB SE
(Pref) HSBC 6,76916,680 FUCHS PETROLUB SE
(Pref) JP Morgan 14,09655,880 GEA Group AG Bank of America
Merrill Lynch 218,09743,360 GEA Group AG Barclays Bank 103,66014,092 GEA Group AG Credit Suisse 75,21497,030 GEA Group AG Deutsche Bank 378,703
112,810 GEA Group AG Goldam Sachs 440,2915,020 GEA Group AG HSBC 26,794
11,370 GEA Group AG JP Morgan 60,686(16,043) GRENKE AG HSBC (107,034)
(79) GRENKE AG JP Morgan (527)(35,148) Hapag-Lloyd AG Bank of America
Merrill Lynch 3,943,456(151) Hapag-Lloyd AG Barclays Bank 10,494
(6,180) Hapag-Lloyd AG JP Morgan 489,9636,410 HeidelbergCement AG Bank of America
Merrill Lynch 39,84365,635 HeidelbergCement AG Barclays Bank 286,0931,170 HeidelbergCement AG Deutsche Bank 7,273
30,930 HeidelbergCement AG Goldam Sachs 192,255524 Hella GmbH & Co KGaA Bank of America
Merrill Lynch 2,13321,496 Hella GmbH & Co KGaA Barclays Bank 38,7224,030 Hella GmbH & Co KGaA Goldam Sachs 16,401
8 Hella GmbH & Co KGaA HSBC 1232,650 Henkel AG & Co KGaA
(Pref) Barclays Bank 113,9985,306 HOCHTIEF AG Bank of America
Merrill Lynch 79,06067,839 HOCHTIEF AG Barclays Bank 441,28622,348 HOCHTIEF AG Citibank 145,3724,130 HOCHTIEF AG Credit Suisse 37,657
18,350 HOCHTIEF AG Goldam Sachs 273,417
BlackRock Style Advantage Fund continued
The notes on pages 691 to 711 form an integral part of these financial statements.
Annual report and audited financial statements [525]

Contracts for difference as at 31 May 2020
Holding Description Counterparty
Netunrealised
appreciation/(depreciation)
USD
Germany continued15,068 HOCHTIEF AG HSBC 137,3905,210 HUGO BOSS AG Bank of America
Merrill Lynch 10,83358,410 HUGO BOSS AG Barclays Bank 96,7748,350 HUGO BOSS AG Credit Suisse 325
140,200 HUGO BOSS AG Deutsche Bank 291,52423,070 HUGO BOSS AG Goldam Sachs 47,97162,210 HUGO BOSS AG HSBC 86,4687,010 HUGO BOSS AG JP Morgan 9,743
(83,140) Infineon Technologies AG Barclays Bank (22,372)(65,750) Infineon Technologies AG Deutsche Bank (179,852)(61,140) Infineon Technologies AG Goldam Sachs (167,242)(16,440) KION Group AG Barclays Bank (103,285)(15,022) KION Group AG Citibank (94,376)(17,148) KION Group AG Credit Suisse (90,000)(15,870) KION Group AG Deutsche Bank (120,350)(9,020) KION Group AG Goldam Sachs (68,403)
(22,123) KION Group AG HSBC (116,110)(8) Knorr-Bremse AG Bank of America
Merrill Lynch (102)(1,215) Knorr-Bremse AG Barclays Bank (5,836)
(16,124) LANXESS AG Barclays Bank (22,770)(10,210) LANXESS AG Citibank (14,418)(14,480) LANXESS AG Deutsche Bank (57,642)(5,790) LANXESS AG Goldam Sachs (23,049)(2,830) LANXESS AG HSBC (7,718)25,383 Merck KGaA Bank of America
Merrill Lynch 25,4026,700 Merck KGaA Barclays Bank 745
14,900 Merck KGaA Goldam Sachs 14,911(104,770) METRO AG Bank of America
Merrill Lynch (52,658)(57,100) METRO AG Deutsche Bank (28,699)(14,930) METRO AG Goldam Sachs (7,504)(67,900) METRO AG JP Morgan (54,059)(5,870) MTU Aero Engines AG Bank of America
Merrill Lynch (193,530)(3,130) MTU Aero Engines AG Barclays Bank (51,162)
(180) MTU Aero Engines AG Credit Suisse (4,403)(623) MTU Aero Engines AG Deutsche Bank (20,540)
3,230 MuenchenerRueckversicherungs-Gesellschaft AG inMuenchen RegS
Bank of AmericaMerrill Lynch 91,406
2,240 MuenchenerRueckversicherungs-Gesellschaft AG inMuenchen RegS Barclays Bank 29,391
3,030 MuenchenerRueckversicherungs-Gesellschaft AG inMuenchen RegS Citibank 39,757
1,060 MuenchenerRueckversicherungs-Gesellschaft AG inMuenchen RegS Credit Suisse 30,022
7,200 MuenchenerRueckversicherungs-Gesellschaft AG inMuenchen RegS Deutsche Bank 203,754
11,170 MuenchenerRueckversicherungs-Gesellschaft AG inMuenchen RegS Goldam Sachs 316,101
11,855 MuenchenerRueckversicherungs-Gesellschaft AG inMuenchen RegS HSBC 181,255
Holding Description Counterparty
Netunrealised
appreciation/(depreciation)
USD
Germany continued2,379 Muenchener
Rueckversicherungs-Gesellschaft AG inMuenchen RegS JP Morgan 36,373
2,510 Nemetschek SE Bank of AmericaMerrill Lynch 27,910
(11,472) OSRAM Licht AG JP Morgan 2,551(9,670) Porsche Automobil Holding
SE (Pref)Bank of AmericaMerrill Lynch (70,644)
(48,880) Porsche Automobil HoldingSE (Pref) Barclays Bank (134,793)
(124,779) ProSiebenSat.1 Media SE Bank of AmericaMerrill Lynch (177,597)
(1,662) ProSiebenSat.1 Media SE Credit Suisse (3,546)(128,370) ProSiebenSat.1 Media SE Deutsche Bank (182,708)
30,350 Puma SE Deutsche Bank 178,863(7,760) QIAGEN NV Barclays Bank (1,208)(2,860) QIAGEN NV Deutsche Bank (1,145)
(31,070) QIAGEN NV Goldam Sachs (12,437)1,727 Rational AG Bank of America
Merrill Lynch 115,220310 Rational AG Barclays Bank 13,443
4,960 Rational AG Deutsche Bank 330,916710 Rational AG Goldam Sachs 47,369960 Rational AG HSBC 36,721
1,018 Rational AG JP Morgan 38,94035,660 Rheinmetall AG Barclays Bank 203,812
170 Rheinmetall AG Citibank 97219,280 Rheinmetall AG Deutsche Bank 185,2289,630 Rheinmetall AG Goldam Sachs 92,518
46 RTL Group SA Barclays Bank 931,655 RTL Group SA Deutsche Bank 5,300
54,103 RTL Group SA Goldam Sachs 173,2605,218 RTL Group SA HSBC 5,338
(8,680) SAP SE Goldam Sachs (98,448)(670) Sartorius AG (Pref) Bank of America
Merrill Lynch (23,393)(1,150) Sartorius AG (Pref) Barclays Bank (7,928)(1,747) Sartorius AG (Pref) Credit Suisse (80,423)(4,986) Sartorius AG (Pref) Deutsche Bank (174,087)
(820) Sartorius AG (Pref) Goldam Sachs (28,630)7,700 Scout24 AG Bank of America
Merrill Lynch 32,53611,190 Scout24 AG Goldam Sachs 47,28216,100 Siemens AG RegS Deutsche Bank 227,3604,870 Siemens Healthineers AG Bank of America
Merrill Lynch 28,6199,190 Siemens Healthineers AG Credit Suisse 62,5906,560 Siemens Healthineers AG Deutsche Bank 38,5514,600 Siemens Healthineers AG Goldam Sachs 27,033
(95,080) Suedzucker AG Barclays Bank 1,057(1,943) Suedzucker AG HSBC (1,167)
(46,362) Suedzucker AG JP Morgan (27,838)4,620 Symrise AG Barclays Bank 10,7881,870 Symrise AG Credit Suisse 7,902
11,820 Symrise AG Deutsche Bank 55,7274,060 Symrise AG Goldam Sachs 19,1424,330 Symrise AG JP Morgan 18,296
(15) Talanx AG Bank of AmericaMerrill Lynch (46)
(908) Talanx AG Barclays Bank (949)(1) Talanx AG Goldam Sachs (3)
(45,570) TeamViewer AG Bank of AmericaMerrill Lynch (144,667)
(1,110) TeamViewer AG Credit Suisse (3,234)584,616 Telefonica Deutschland
Holding AG Barclays Bank 94,259
BlackRock Style Advantage Fund continued
The notes on pages 691 to 711 form an integral part of these financial statements.
BlackRock Strategic Funds[526]

Contracts for difference as at 31 May 2020
Holding Description Counterparty
Netunrealised
appreciation/(depreciation)
USD
Germany continued(76,314) thyssenkrupp AG Bank of America
Merrill Lynch (140,269)(19,500) thyssenkrupp AG Barclays Bank (15,525)(54,174) thyssenkrupp AG Goldam Sachs (99,575)
(284,124) thyssenkrupp AG JP Morgan (244,531)(1,007) Traton SE Credit Suisse (1,299)
(46,623) Traton SE Goldam Sachs (108,040)(28,040) Uniper SE Bank of America
Merrill Lynch (110,997)(51,004) Uniper SE Barclays Bank (165,605)(12,630) Uniper SE Deutsche Bank (49,996)(49,232) Uniper SE Goldam Sachs (194,887)(5,195) United Internet AG RegS Bank of America
Merrill Lynch (13,633)(6,555) United Internet AG RegS Citibank (5,977)
(11,126) United Internet AG RegS Deutsche Bank (29,197)(6,700) United Internet AG RegS Goldam Sachs (17,582)
(35,736) United Internet AG RegS HSBC (214,975)(34,014) United Internet AG RegS JP Morgan (204,616)
(470) Volkswagen AG Barclays Bank (1,463)(4,933) Volkswagen AG Credit Suisse (20,295)
(26,216) Volkswagen AG Deutsche Bank (358,556)(13,658) Volkswagen AG HSBC (56,192)(4,500) Vonovia SE Bank of America
Merrill Lynch (22,417)(6,430) Vonovia SE Citibank (16,159)(2,870) Vonovia SE Deutsche Bank (14,297)3,400 Wacker Chemie AG Barclays Bank 1,5124,920 Wacker Chemie AG Citibank 2,1886,660 Wacker Chemie AG Credit Suisse 19,551
26,448 Wacker Chemie AG Deutsche Bank 169,39515,510 Wacker Chemie AG HSBC 45,5303,360 Wacker Chemie AG JP Morgan 14,962
(5,710) Wirecard AG HSBC (49,524)(10,330) Wirecard AG JP Morgan (89,594)(2,840) Zalando SE Barclays Bank (14,400)
(34,899) Zalando SE Goldam Sachs (352,358)
3,524,352
Hong Kong70,400 AIA Group Ltd Bank of America
Merrill Lynch (49,023)40,400 AIA Group Ltd Barclays Bank (5,991)25,200 AIA Group Ltd Citibank (3,737)6,400 AIA Group Ltd HSBC (5,612)
(34,863) Bank of East Asia Ltd Bank of AmericaMerrill Lynch 8,272
(658,600) Bank of East Asia Ltd Barclays Bank 103,613(653,000) Bank of East Asia Ltd Citibank 102,732(468,425) Bank of East Asia Ltd Goldam Sachs 111,145(235,600) Bank of East Asia Ltd HSBC 66,231(92,199) Bank of East Asia Ltd JP Morgan 25,919191,500 BOC Hong Kong Holdings
LtdBank of AmericaMerrill Lynch (58,032)
241,500 BOC Hong Kong HoldingsLtd Barclays Bank (26,471)
357,000 BOC Hong Kong HoldingsLtd Credit Suisse (112,789)
16,000 BOC Hong Kong HoldingsLtd Goldam Sachs (4,849)
322,500 BOC Hong Kong HoldingsLtd HSBC (101,889)
(86,000) Cafe de Coral Holdings Ltd Bank of AmericaMerrill Lynch 19,740
(76,000) Cafe de Coral Holdings Ltd Barclays Bank 2,352(66,000) Cafe de Coral Holdings Ltd HSBC 15,875(66,000) Cafe de Coral Holdings Ltd JP Morgan 18,894
(132,000) Cathay Pacific Airways Ltd Barclays Bank 4,255
Holding Description Counterparty
Netunrealised
appreciation/(depreciation)
USD
Hong Kong continued(163,000) Cathay Pacific Airways Ltd Citibank 5,255(745,000) Cathay Pacific Airways Ltd Goldam Sachs 95,109
816 Cathay Pacific Airways Ltd JP Morgan (133)(866) China Everbright Bank Co
Ltd ’H’ Citibank (10)171,500 CK Asset Holdings Ltd HSBC (144,856)189,000 CK Hutchison Holdings Ltd Bank of America
Merrill Lynch (197,414)253,500 CK Hutchison Holdings Ltd Barclays Bank (76,821)22,000 CK Hutchison Holdings Ltd Credit Suisse (26,668)
728,500 CK Hutchison Holdings Ltd Goldam Sachs (760,934)230,500 CK Hutchison Holdings Ltd HSBC (279,403)80,000 CK Hutchison Holdings Ltd JP Morgan (96,973)
113,500 CK Infrastructure HoldingsLtd
Bank of AmericaMerrill Lynch (122,212)
61,000 CK Infrastructure HoldingsLtd Credit Suisse (52,703)
110,000 CLP Holdings Ltd Barclays Bank (15,603)21,500 CLP Holdings Ltd Citibank (3,050)11,500 CLP Holdings Ltd Credit Suisse (5,225)74,500 CLP Holdings Ltd Goldam Sachs (27,860)28,800 Dah Sing Financial Holdings
Ltd Goldam Sachs (8,542)(1,578,000) FIH Mobile Ltd Barclays Bank 2,035(7,287,000) FIH Mobile Ltd Citibank 9,397
(687,000) FIH Mobile Ltd Credit Suisse (886)(17,640,000) FIH Mobile Ltd Goldam Sachs (45,495)(2,370,000) FIH Mobile Ltd HSBC (3,056)
(3,173) FIH Mobile Ltd JP Morgan (4)(157,000) Galaxy Entertainment
Group LtdBank of AmericaMerrill Lynch (5,061)
(188,000) Galaxy EntertainmentGroup Ltd Barclays Bank (55,759)
(7,000) Galaxy EntertainmentGroup Ltd Citibank (2,076)
(497) GOME Retail Holdings Ltd JP Morgan (3)(457,000) Guotai Junan International
Holdings Ltd Citibank 1,768(2,726,000) Guotai Junan International
Holdings Ltd Credit Suisse 31,63770,000 Hang Lung Group Ltd Bank of America
Merrill Lynch (11,554)181,000 Hang Lung Group Ltd Barclays Bank (2,801)149,000 Hang Lung Group Ltd Credit Suisse (34,201)184,000 Hang Lung Group Ltd Goldam Sachs (30,371)66,000 Hang Lung Group Ltd JP Morgan (15,149)
(287,000) Hang Lung Properties Ltd Bank of AmericaMerrill Lynch 13,323
(68,000) Hang Lung Properties Ltd Barclays Bank (4,735)(114,000) Hang Lung Properties Ltd Citibank (7,938)(431,000) Hang Lung Properties Ltd Goldam Sachs 20,008(148,000) Hang Lung Properties Ltd JP Morgan 6,107193,500 Hang Seng Bank Ltd Bank of America
Merrill Lynch (336,858)344,800 Hang Seng Bank Ltd Barclays Bank (271,225)59,400 Hang Seng Bank Ltd Credit Suisse (132,515)
(45,500) Health & Happiness H&HInternational Holdings Ltd Barclays Bank (14,082)
(490,000) Health & Happiness H&HInternational Holdings Ltd Citibank (151,649)
(181,500) Health & Happiness H&HInternational Holdings Ltd Credit Suisse (4,681)
(7,000) Health & Happiness H&HInternational Holdings Ltd HSBC (181)
(44,000) Health & Happiness H&HInternational Holdings Ltd JP Morgan (1,135)
BlackRock Style Advantage Fund continued
The notes on pages 691 to 711 form an integral part of these financial statements.
Annual report and audited financial statements [527]
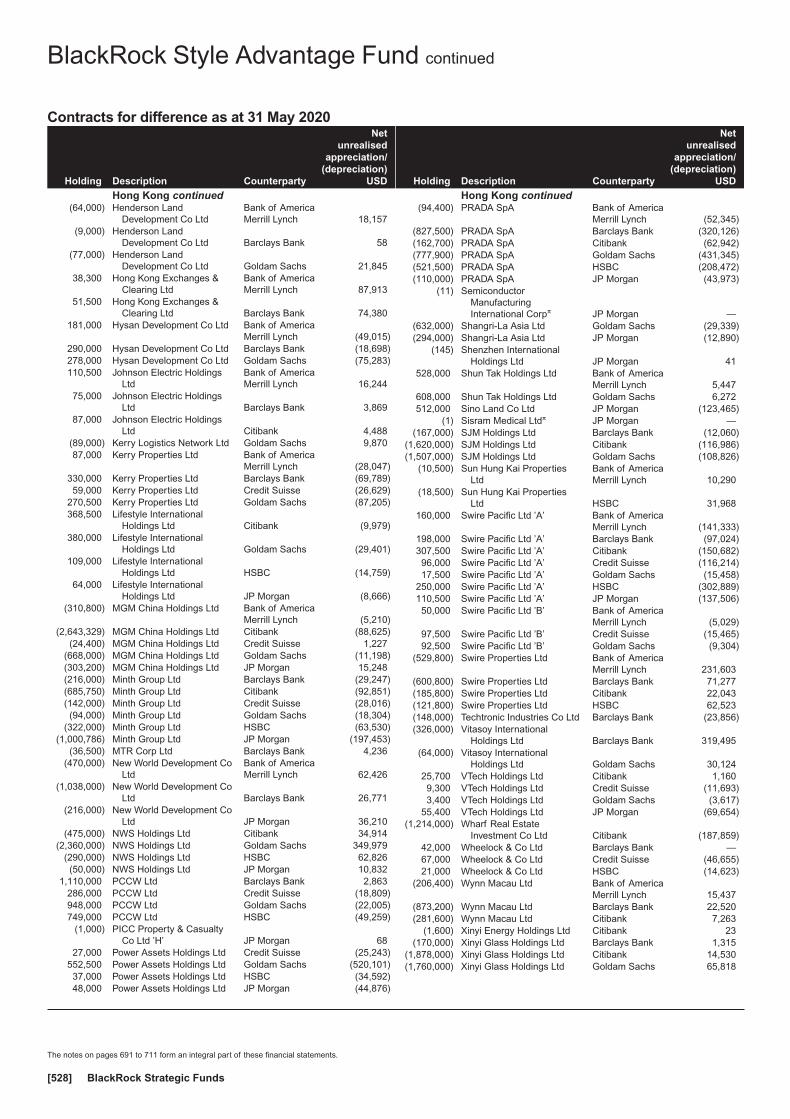
Contracts for difference as at 31 May 2020
Holding Description Counterparty
Netunrealised
appreciation/(depreciation)
USD
Hong Kong continued(64,000) Henderson Land
Development Co LtdBank of AmericaMerrill Lynch 18,157
(9,000) Henderson LandDevelopment Co Ltd Barclays Bank 58
(77,000) Henderson LandDevelopment Co Ltd Goldam Sachs 21,845
38,300 Hong Kong Exchanges &Clearing Ltd
Bank of AmericaMerrill Lynch 87,913
51,500 Hong Kong Exchanges &Clearing Ltd Barclays Bank 74,380
181,000 Hysan Development Co Ltd Bank of AmericaMerrill Lynch (49,015)
290,000 Hysan Development Co Ltd Barclays Bank (18,698)278,000 Hysan Development Co Ltd Goldam Sachs (75,283)110,500 Johnson Electric Holdings
LtdBank of AmericaMerrill Lynch 16,244
75,000 Johnson Electric HoldingsLtd Barclays Bank 3,869
87,000 Johnson Electric HoldingsLtd Citibank 4,488
(89,000) Kerry Logistics Network Ltd Goldam Sachs 9,87087,000 Kerry Properties Ltd Bank of America
Merrill Lynch (28,047)330,000 Kerry Properties Ltd Barclays Bank (69,789)59,000 Kerry Properties Ltd Credit Suisse (26,629)
270,500 Kerry Properties Ltd Goldam Sachs (87,205)368,500 Lifestyle International
Holdings Ltd Citibank (9,979)380,000 Lifestyle International
Holdings Ltd Goldam Sachs (29,401)109,000 Lifestyle International
Holdings Ltd HSBC (14,759)64,000 Lifestyle International
Holdings Ltd JP Morgan (8,666)(310,800) MGM China Holdings Ltd Bank of America
Merrill Lynch (5,210)(2,643,329) MGM China Holdings Ltd Citibank (88,625)
(24,400) MGM China Holdings Ltd Credit Suisse 1,227(668,000) MGM China Holdings Ltd Goldam Sachs (11,198)(303,200) MGM China Holdings Ltd JP Morgan 15,248(216,000) Minth Group Ltd Barclays Bank (29,247)(685,750) Minth Group Ltd Citibank (92,851)(142,000) Minth Group Ltd Credit Suisse (28,016)(94,000) Minth Group Ltd Goldam Sachs (18,304)
(322,000) Minth Group Ltd HSBC (63,530)(1,000,786) Minth Group Ltd JP Morgan (197,453)
(36,500) MTR Corp Ltd Barclays Bank 4,236(470,000) New World Development Co
LtdBank of AmericaMerrill Lynch 62,426
(1,038,000) New World Development CoLtd Barclays Bank 26,771
(216,000) New World Development CoLtd JP Morgan 36,210
(475,000) NWS Holdings Ltd Citibank 34,914(2,360,000) NWS Holdings Ltd Goldam Sachs 349,979
(290,000) NWS Holdings Ltd HSBC 62,826(50,000) NWS Holdings Ltd JP Morgan 10,832
1,110,000 PCCW Ltd Barclays Bank 2,863286,000 PCCW Ltd Credit Suisse (18,809)948,000 PCCW Ltd Goldam Sachs (22,005)749,000 PCCW Ltd HSBC (49,259)
(1,000) PICC Property & CasualtyCo Ltd ’H’ JP Morgan 68
27,000 Power Assets Holdings Ltd Credit Suisse (25,243)552,500 Power Assets Holdings Ltd Goldam Sachs (520,101)37,000 Power Assets Holdings Ltd HSBC (34,592)48,000 Power Assets Holdings Ltd JP Morgan (44,876)
Holding Description Counterparty
Netunrealised
appreciation/(depreciation)
USD
Hong Kong continued(94,400) PRADA SpA Bank of America
Merrill Lynch (52,345)(827,500) PRADA SpA Barclays Bank (320,126)(162,700) PRADA SpA Citibank (62,942)(777,900) PRADA SpA Goldam Sachs (431,345)(521,500) PRADA SpA HSBC (208,472)(110,000) PRADA SpA JP Morgan (43,973)
(11) SemiconductorManufacturingInternational Corpπ JP Morgan —
(632,000) Shangri-La Asia Ltd Goldam Sachs (29,339)(294,000) Shangri-La Asia Ltd JP Morgan (12,890)
(145) Shenzhen InternationalHoldings Ltd JP Morgan 41
528,000 Shun Tak Holdings Ltd Bank of AmericaMerrill Lynch 5,447
608,000 Shun Tak Holdings Ltd Goldam Sachs 6,272512,000 Sino Land Co Ltd JP Morgan (123,465)
(1) Sisram Medical Ltdπ JP Morgan —(167,000) SJM Holdings Ltd Barclays Bank (12,060)
(1,620,000) SJM Holdings Ltd Citibank (116,986)(1,507,000) SJM Holdings Ltd Goldam Sachs (108,826)
(10,500) Sun Hung Kai PropertiesLtd
Bank of AmericaMerrill Lynch 10,290
(18,500) Sun Hung Kai PropertiesLtd HSBC 31,968
160,000 Swire Pacific Ltd ’A’ Bank of AmericaMerrill Lynch (141,333)
198,000 Swire Pacific Ltd ’A’ Barclays Bank (97,024)307,500 Swire Pacific Ltd ’A’ Citibank (150,682)96,000 Swire Pacific Ltd ’A’ Credit Suisse (116,214)17,500 Swire Pacific Ltd ’A’ Goldam Sachs (15,458)
250,000 Swire Pacific Ltd ’A’ HSBC (302,889)110,500 Swire Pacific Ltd ’A’ JP Morgan (137,506)50,000 Swire Pacific Ltd ’B’ Bank of America
Merrill Lynch (5,029)97,500 Swire Pacific Ltd ’B’ Credit Suisse (15,465)92,500 Swire Pacific Ltd ’B’ Goldam Sachs (9,304)
(529,800) Swire Properties Ltd Bank of AmericaMerrill Lynch 231,603
(600,800) Swire Properties Ltd Barclays Bank 71,277(185,800) Swire Properties Ltd Citibank 22,043(121,800) Swire Properties Ltd HSBC 62,523(148,000) Techtronic Industries Co Ltd Barclays Bank (23,856)(326,000) Vitasoy International
Holdings Ltd Barclays Bank 319,495(64,000) Vitasoy International
Holdings Ltd Goldam Sachs 30,12425,700 VTech Holdings Ltd Citibank 1,1609,300 VTech Holdings Ltd Credit Suisse (11,693)3,400 VTech Holdings Ltd Goldam Sachs (3,617)
55,400 VTech Holdings Ltd JP Morgan (69,654)(1,214,000) Wharf Real Estate
Investment Co Ltd Citibank (187,859)42,000 Wheelock & Co Ltd Barclays Bank —67,000 Wheelock & Co Ltd Credit Suisse (46,655)21,000 Wheelock & Co Ltd HSBC (14,623)
(206,400) Wynn Macau Ltd Bank of AmericaMerrill Lynch 15,437
(873,200) Wynn Macau Ltd Barclays Bank 22,520(281,600) Wynn Macau Ltd Citibank 7,263
(1,600) Xinyi Energy Holdings Ltd Citibank 23(170,000) Xinyi Glass Holdings Ltd Barclays Bank 1,315
(1,878,000) Xinyi Glass Holdings Ltd Citibank 14,530(1,760,000) Xinyi Glass Holdings Ltd Goldam Sachs 65,818
BlackRock Style Advantage Fund continued
The notes on pages 691 to 711 form an integral part of these financial statements.
BlackRock Strategic Funds[528]
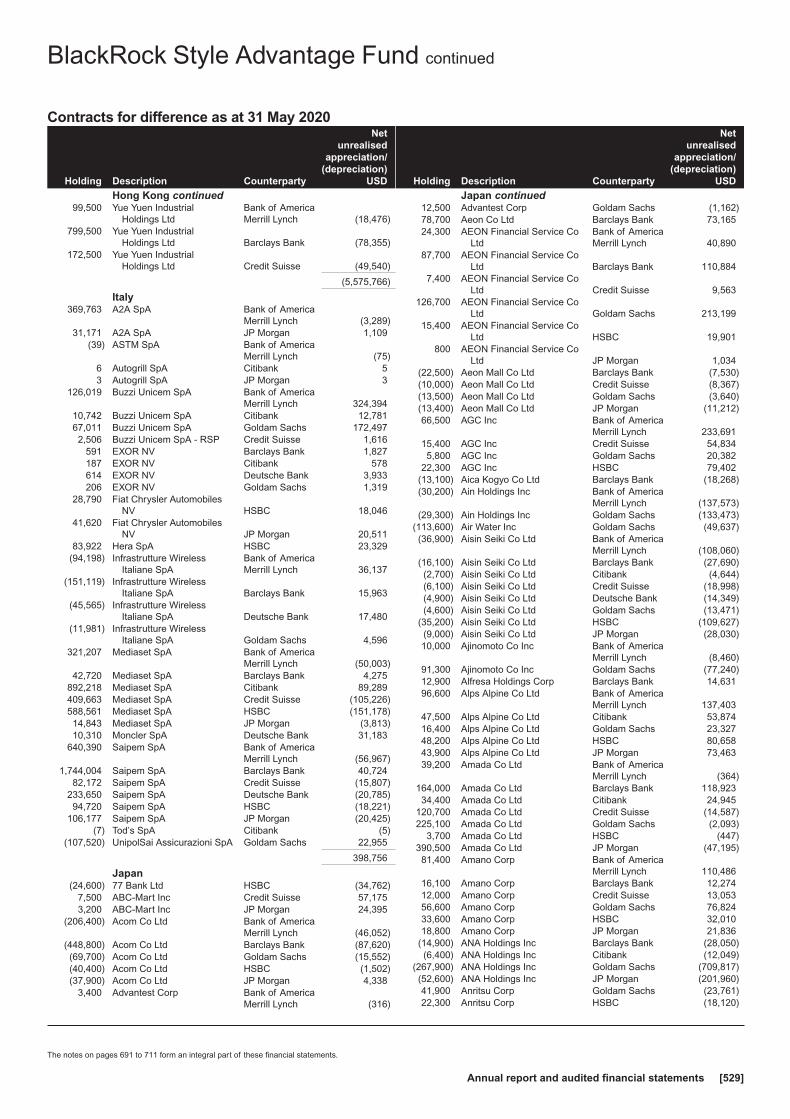
Contracts for difference as at 31 May 2020
Holding Description Counterparty
Netunrealised
appreciation/(depreciation)
USD
Hong Kong continued99,500 Yue Yuen Industrial
Holdings LtdBank of AmericaMerrill Lynch (18,476)
799,500 Yue Yuen IndustrialHoldings Ltd Barclays Bank (78,355)
172,500 Yue Yuen IndustrialHoldings Ltd Credit Suisse (49,540)
(5,575,766)
Italy369,763 A2A SpA Bank of America
Merrill Lynch (3,289)31,171 A2A SpA JP Morgan 1,109
(39) ASTM SpA Bank of AmericaMerrill Lynch (75)
6 Autogrill SpA Citibank 53 Autogrill SpA JP Morgan 3
126,019 Buzzi Unicem SpA Bank of AmericaMerrill Lynch 324,394
10,742 Buzzi Unicem SpA Citibank 12,78167,011 Buzzi Unicem SpA Goldam Sachs 172,4972,506 Buzzi Unicem SpA - RSP Credit Suisse 1,616
591 EXOR NV Barclays Bank 1,827187 EXOR NV Citibank 578614 EXOR NV Deutsche Bank 3,933206 EXOR NV Goldam Sachs 1,319
28,790 Fiat Chrysler AutomobilesNV HSBC 18,046
41,620 Fiat Chrysler AutomobilesNV JP Morgan 20,511
83,922 Hera SpA HSBC 23,329(94,198) Infrastrutture Wireless
Italiane SpABank of AmericaMerrill Lynch 36,137
(151,119) Infrastrutture WirelessItaliane SpA Barclays Bank 15,963
(45,565) Infrastrutture WirelessItaliane SpA Deutsche Bank 17,480
(11,981) Infrastrutture WirelessItaliane SpA Goldam Sachs 4,596
321,207 Mediaset SpA Bank of AmericaMerrill Lynch (50,003)
42,720 Mediaset SpA Barclays Bank 4,275892,218 Mediaset SpA Citibank 89,289409,663 Mediaset SpA Credit Suisse (105,226)588,561 Mediaset SpA HSBC (151,178)14,843 Mediaset SpA JP Morgan (3,813)10,310 Moncler SpA Deutsche Bank 31,183
640,390 Saipem SpA Bank of AmericaMerrill Lynch (56,967)
1,744,004 Saipem SpA Barclays Bank 40,72482,172 Saipem SpA Credit Suisse (15,807)
233,650 Saipem SpA Deutsche Bank (20,785)94,720 Saipem SpA HSBC (18,221)
106,177 Saipem SpA JP Morgan (20,425)(7) Tod’s SpA Citibank (5)
(107,520) UnipolSai Assicurazioni SpA Goldam Sachs 22,955
398,756
Japan(24,600) 77 Bank Ltd HSBC (34,762)
7,500 ABC-Mart Inc Credit Suisse 57,1753,200 ABC-Mart Inc JP Morgan 24,395
(206,400) Acom Co Ltd Bank of AmericaMerrill Lynch (46,052)
(448,800) Acom Co Ltd Barclays Bank (87,620)(69,700) Acom Co Ltd Goldam Sachs (15,552)(40,400) Acom Co Ltd HSBC (1,502)(37,900) Acom Co Ltd JP Morgan 4,338
3,400 Advantest Corp Bank of AmericaMerrill Lynch (316)
Holding Description Counterparty
Netunrealised
appreciation/(depreciation)
USD
Japan continued12,500 Advantest Corp Goldam Sachs (1,162)78,700 Aeon Co Ltd Barclays Bank 73,16524,300 AEON Financial Service Co
LtdBank of AmericaMerrill Lynch 40,890
87,700 AEON Financial Service CoLtd Barclays Bank 110,884
7,400 AEON Financial Service CoLtd Credit Suisse 9,563
126,700 AEON Financial Service CoLtd Goldam Sachs 213,199
15,400 AEON Financial Service CoLtd HSBC 19,901
800 AEON Financial Service CoLtd JP Morgan 1,034
(22,500) Aeon Mall Co Ltd Barclays Bank (7,530)(10,000) Aeon Mall Co Ltd Credit Suisse (8,367)(13,500) Aeon Mall Co Ltd Goldam Sachs (3,640)(13,400) Aeon Mall Co Ltd JP Morgan (11,212)66,500 AGC Inc Bank of America
Merrill Lynch 233,69115,400 AGC Inc Credit Suisse 54,8345,800 AGC Inc Goldam Sachs 20,382
22,300 AGC Inc HSBC 79,402(13,100) Aica Kogyo Co Ltd Barclays Bank (18,268)(30,200) Ain Holdings Inc Bank of America
Merrill Lynch (137,573)(29,300) Ain Holdings Inc Goldam Sachs (133,473)
(113,600) Air Water Inc Goldam Sachs (49,637)(36,900) Aisin Seiki Co Ltd Bank of America
Merrill Lynch (108,060)(16,100) Aisin Seiki Co Ltd Barclays Bank (27,690)(2,700) Aisin Seiki Co Ltd Citibank (4,644)(6,100) Aisin Seiki Co Ltd Credit Suisse (18,998)(4,900) Aisin Seiki Co Ltd Deutsche Bank (14,349)(4,600) Aisin Seiki Co Ltd Goldam Sachs (13,471)
(35,200) Aisin Seiki Co Ltd HSBC (109,627)(9,000) Aisin Seiki Co Ltd JP Morgan (28,030)10,000 Ajinomoto Co Inc Bank of America
Merrill Lynch (8,460)91,300 Ajinomoto Co Inc Goldam Sachs (77,240)12,900 Alfresa Holdings Corp Barclays Bank 14,63196,600 Alps Alpine Co Ltd Bank of America
Merrill Lynch 137,40347,500 Alps Alpine Co Ltd Citibank 53,87416,400 Alps Alpine Co Ltd Goldam Sachs 23,32748,200 Alps Alpine Co Ltd HSBC 80,65843,900 Alps Alpine Co Ltd JP Morgan 73,46339,200 Amada Co Ltd Bank of America
Merrill Lynch (364)164,000 Amada Co Ltd Barclays Bank 118,92334,400 Amada Co Ltd Citibank 24,945
120,700 Amada Co Ltd Credit Suisse (14,587)225,100 Amada Co Ltd Goldam Sachs (2,093)
3,700 Amada Co Ltd HSBC (447)390,500 Amada Co Ltd JP Morgan (47,195)81,400 Amano Corp Bank of America
Merrill Lynch 110,48616,100 Amano Corp Barclays Bank 12,27412,000 Amano Corp Credit Suisse 13,05356,600 Amano Corp Goldam Sachs 76,82433,600 Amano Corp HSBC 32,01018,800 Amano Corp JP Morgan 21,836
(14,900) ANA Holdings Inc Barclays Bank (28,050)(6,400) ANA Holdings Inc Citibank (12,049)
(267,900) ANA Holdings Inc Goldam Sachs (709,817)(52,600) ANA Holdings Inc JP Morgan (201,960)41,900 Anritsu Corp Goldam Sachs (23,761)22,300 Anritsu Corp HSBC (18,120)
BlackRock Style Advantage Fund continued
The notes on pages 691 to 711 form an integral part of these financial statements.
Annual report and audited financial statements [529]
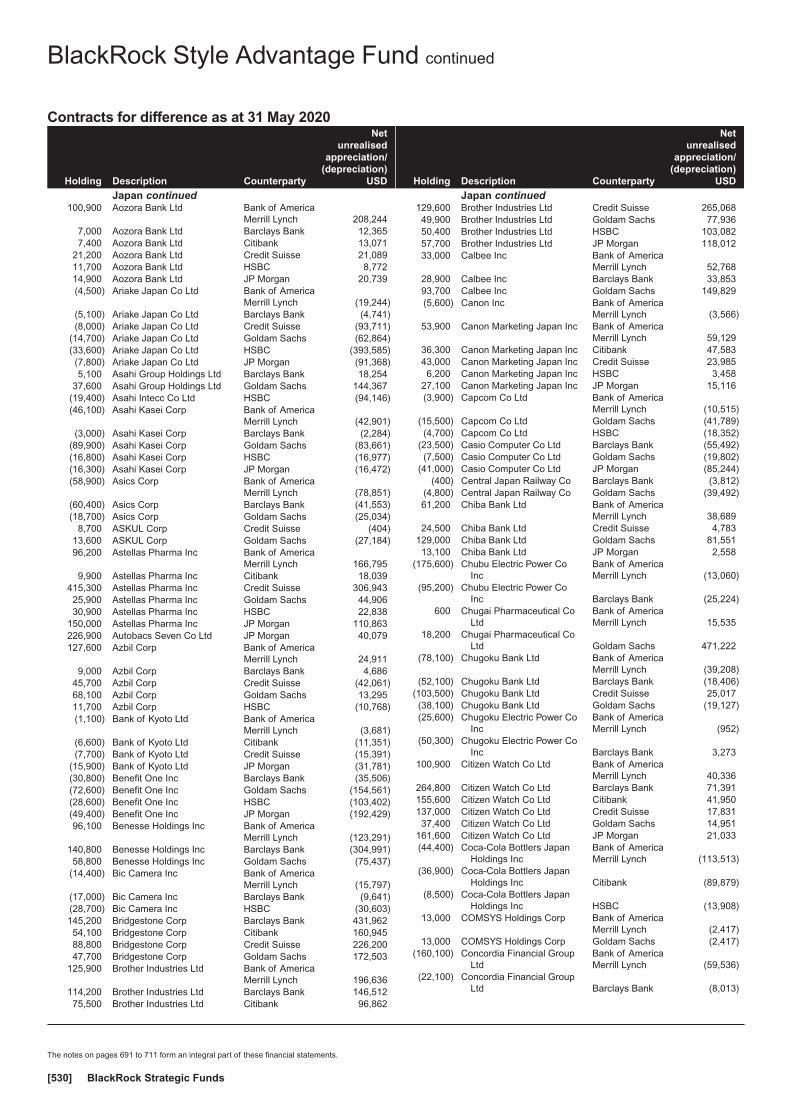
Contracts for difference as at 31 May 2020
Holding Description Counterparty
Netunrealised
appreciation/(depreciation)
USD
Japan continued100,900 Aozora Bank Ltd Bank of America
Merrill Lynch 208,2447,000 Aozora Bank Ltd Barclays Bank 12,3657,400 Aozora Bank Ltd Citibank 13,071
21,200 Aozora Bank Ltd Credit Suisse 21,08911,700 Aozora Bank Ltd HSBC 8,77214,900 Aozora Bank Ltd JP Morgan 20,739(4,500) Ariake Japan Co Ltd Bank of America
Merrill Lynch (19,244)(5,100) Ariake Japan Co Ltd Barclays Bank (4,741)(8,000) Ariake Japan Co Ltd Credit Suisse (93,711)
(14,700) Ariake Japan Co Ltd Goldam Sachs (62,864)(33,600) Ariake Japan Co Ltd HSBC (393,585)(7,800) Ariake Japan Co Ltd JP Morgan (91,368)5,100 Asahi Group Holdings Ltd Barclays Bank 18,254
37,600 Asahi Group Holdings Ltd Goldam Sachs 144,367(19,400) Asahi Intecc Co Ltd HSBC (94,146)(46,100) Asahi Kasei Corp Bank of America
Merrill Lynch (42,901)(3,000) Asahi Kasei Corp Barclays Bank (2,284)
(89,900) Asahi Kasei Corp Goldam Sachs (83,661)(16,800) Asahi Kasei Corp HSBC (16,977)(16,300) Asahi Kasei Corp JP Morgan (16,472)(58,900) Asics Corp Bank of America
Merrill Lynch (78,851)(60,400) Asics Corp Barclays Bank (41,553)(18,700) Asics Corp Goldam Sachs (25,034)
8,700 ASKUL Corp Credit Suisse (404)13,600 ASKUL Corp Goldam Sachs (27,184)96,200 Astellas Pharma Inc Bank of America
Merrill Lynch 166,7959,900 Astellas Pharma Inc Citibank 18,039
415,300 Astellas Pharma Inc Credit Suisse 306,94325,900 Astellas Pharma Inc Goldam Sachs 44,90630,900 Astellas Pharma Inc HSBC 22,838
150,000 Astellas Pharma Inc JP Morgan 110,863226,900 Autobacs Seven Co Ltd JP Morgan 40,079127,600 Azbil Corp Bank of America
Merrill Lynch 24,9119,000 Azbil Corp Barclays Bank 4,686
45,700 Azbil Corp Credit Suisse (42,061)68,100 Azbil Corp Goldam Sachs 13,29511,700 Azbil Corp HSBC (10,768)(1,100) Bank of Kyoto Ltd Bank of America
Merrill Lynch (3,681)(6,600) Bank of Kyoto Ltd Citibank (11,351)(7,700) Bank of Kyoto Ltd Credit Suisse (15,391)
(15,900) Bank of Kyoto Ltd JP Morgan (31,781)(30,800) Benefit One Inc Barclays Bank (35,506)(72,600) Benefit One Inc Goldam Sachs (154,561)(28,600) Benefit One Inc HSBC (103,402)(49,400) Benefit One Inc JP Morgan (192,429)96,100 Benesse Holdings Inc Bank of America
Merrill Lynch (123,291)140,800 Benesse Holdings Inc Barclays Bank (304,991)58,800 Benesse Holdings Inc Goldam Sachs (75,437)
(14,400) Bic Camera Inc Bank of AmericaMerrill Lynch (15,797)
(17,000) Bic Camera Inc Barclays Bank (9,641)(28,700) Bic Camera Inc HSBC (30,603)145,200 Bridgestone Corp Barclays Bank 431,96254,100 Bridgestone Corp Citibank 160,94588,800 Bridgestone Corp Credit Suisse 226,20047,700 Bridgestone Corp Goldam Sachs 172,503
125,900 Brother Industries Ltd Bank of AmericaMerrill Lynch 196,636
114,200 Brother Industries Ltd Barclays Bank 146,51275,500 Brother Industries Ltd Citibank 96,862
Holding Description Counterparty
Netunrealised
appreciation/(depreciation)
USD
Japan continued129,600 Brother Industries Ltd Credit Suisse 265,06849,900 Brother Industries Ltd Goldam Sachs 77,93650,400 Brother Industries Ltd HSBC 103,08257,700 Brother Industries Ltd JP Morgan 118,01233,000 Calbee Inc Bank of America
Merrill Lynch 52,76828,900 Calbee Inc Barclays Bank 33,85393,700 Calbee Inc Goldam Sachs 149,829(5,600) Canon Inc Bank of America
Merrill Lynch (3,566)53,900 Canon Marketing Japan Inc Bank of America
Merrill Lynch 59,12936,300 Canon Marketing Japan Inc Citibank 47,58343,000 Canon Marketing Japan Inc Credit Suisse 23,9856,200 Canon Marketing Japan Inc HSBC 3,458
27,100 Canon Marketing Japan Inc JP Morgan 15,116(3,900) Capcom Co Ltd Bank of America
Merrill Lynch (10,515)(15,500) Capcom Co Ltd Goldam Sachs (41,789)(4,700) Capcom Co Ltd HSBC (18,352)
(23,500) Casio Computer Co Ltd Barclays Bank (55,492)(7,500) Casio Computer Co Ltd Goldam Sachs (19,802)
(41,000) Casio Computer Co Ltd JP Morgan (85,244)(400) Central Japan Railway Co Barclays Bank (3,812)
(4,800) Central Japan Railway Co Goldam Sachs (39,492)61,200 Chiba Bank Ltd Bank of America
Merrill Lynch 38,68924,500 Chiba Bank Ltd Credit Suisse 4,783
129,000 Chiba Bank Ltd Goldam Sachs 81,55113,100 Chiba Bank Ltd JP Morgan 2,558
(175,600) Chubu Electric Power CoInc
Bank of AmericaMerrill Lynch (13,060)
(95,200) Chubu Electric Power CoInc Barclays Bank (25,224)
600 Chugai Pharmaceutical CoLtd
Bank of AmericaMerrill Lynch 15,535
18,200 Chugai Pharmaceutical CoLtd Goldam Sachs 471,222
(78,100) Chugoku Bank Ltd Bank of AmericaMerrill Lynch (39,208)
(52,100) Chugoku Bank Ltd Barclays Bank (18,406)(103,500) Chugoku Bank Ltd Credit Suisse 25,017(38,100) Chugoku Bank Ltd Goldam Sachs (19,127)(25,600) Chugoku Electric Power Co
IncBank of AmericaMerrill Lynch (952)
(50,300) Chugoku Electric Power CoInc Barclays Bank 3,273
100,900 Citizen Watch Co Ltd Bank of AmericaMerrill Lynch 40,336
264,800 Citizen Watch Co Ltd Barclays Bank 71,391155,600 Citizen Watch Co Ltd Citibank 41,950137,000 Citizen Watch Co Ltd Credit Suisse 17,83137,400 Citizen Watch Co Ltd Goldam Sachs 14,951
161,600 Citizen Watch Co Ltd JP Morgan 21,033(44,400) Coca-Cola Bottlers Japan
Holdings IncBank of AmericaMerrill Lynch (113,513)
(36,900) Coca-Cola Bottlers JapanHoldings Inc Citibank (89,879)
(8,500) Coca-Cola Bottlers JapanHoldings Inc HSBC (13,908)
13,000 COMSYS Holdings Corp Bank of AmericaMerrill Lynch (2,417)
13,000 COMSYS Holdings Corp Goldam Sachs (2,417)(160,100) Concordia Financial Group
LtdBank of AmericaMerrill Lynch (59,536)
(22,100) Concordia Financial GroupLtd Barclays Bank (8,013)
BlackRock Style Advantage Fund continued
The notes on pages 691 to 711 form an integral part of these financial statements.
BlackRock Strategic Funds[530]

Contracts for difference as at 31 May 2020
Holding Description Counterparty
Netunrealised
appreciation/(depreciation)
USD
Japan continued(49,600) Concordia Financial Group
Ltd Credit Suisse (12,911)(117,000) Concordia Financial Group
Ltd Goldam Sachs (43,509)3,800 Cosmos Pharmaceutical
CorpBank of AmericaMerrill Lynch 41,333
15,800 Cosmos PharmaceuticalCorp Barclays Bank 69,037
1,000 Cosmos PharmaceuticalCorp Citibank 4,369
4,800 Cosmos PharmaceuticalCorp Goldam Sachs 52,210
(138,300) Credit Saison Co Ltd Barclays Bank (191,574)(13,500) Credit Saison Co Ltd JP Morgan (10,500)(27,100) CyberAgent Inc Bank of America
Merrill Lynch (137,308)(67,300) CyberAgent Inc Barclays Bank (100,107)(15,200) CyberAgent Inc Goldam Sachs (77,014)21,200 Dai Nippon Printing Co Ltd Bank of America
Merrill Lynch 72,92344,200 Dai Nippon Printing Co Ltd Goldam Sachs 152,03832,100 Daicel Corp Bank of America
Merrill Lynch 15,51853,500 Daicel Corp Credit Suisse 23,37723,700 Daicel Corp Goldam Sachs 11,457
(12,800) Daido Steel Co Ltd Bank of AmericaMerrill Lynch (25,585)
(13,600) Daido Steel Co Ltd Barclays Bank (54,999)(8,900) Daido Steel Co Ltd Citibank (35,992)
(20,300) Daido Steel Co Ltd Credit Suisse (28,308)(8,600) Daido Steel Co Ltd Deutsche Bank (17,190)(5,200) Daido Steel Co Ltd JP Morgan (7,251)
(16,600) Daifuku Co Ltd Bank of AmericaMerrill Lynch (72,533)
(35,400) Daifuku Co Ltd Citibank (36,201)(48,400) Daifuku Co Ltd Credit Suisse (409,464)(2,100) Daifuku Co Ltd HSBC (17,766)
(377,200) Dai-ichi Life Holdings Inc Goldam Sachs (398,012)(36,200) Dai-ichi Life Holdings Inc HSBC (35,842)(3,300) Daiichi Sankyo Co Ltd Bank of America
Merrill Lynch (50,713)(9,500) Daiichi Sankyo Co Ltd Barclays Bank (133,626)(3,700) Daiichi Sankyo Co Ltd Goldam Sachs (56,860)45,700 Daiichikosho Co Ltd Bank of America
Merrill Lynch 165,6956,400 Daiichikosho Co Ltd Barclays Bank 10,412
34,100 Daiichikosho Co Ltd Credit Suisse 131,5628,900 Daiichikosho Co Ltd Goldam Sachs 32,269
21,500 Daiichikosho Co Ltd HSBC 82,95029,200 Daiichikosho Co Ltd JP Morgan 108,2781,600 Daikin Industries Ltd Citibank 15,618
(3,300) Daishi Hokuetsu FinancialGroup Inc
Bank of AmericaMerrill Lynch (2,945)
(20,600) Daishi Hokuetsu FinancialGroup Inc Barclays Bank (30,450)
(12,900) Daishi Hokuetsu FinancialGroup Inc Goldam Sachs (11,513)
(11,800) Daishi Hokuetsu FinancialGroup Inc HSBC (2,848)
(2,600) Daito Trust Construction CoLtd Barclays Bank (18,612)
(5,000) Daito Trust Construction CoLtd Credit Suisse (37,884)
(2,200) Daito Trust Construction CoLtd Goldam Sachs (20,044)
(41,100) Daiwa House Industry CoLtd
Bank of AmericaMerrill Lynch (108,706)
(63,700) Daiwa House Industry CoLtd Barclays Bank (91,199)
Holding Description Counterparty
Netunrealised
appreciation/(depreciation)
USD
Japan continued(11,300) Daiwa House Industry Co
Ltd Citibank (16,178)(5,800) Daiwa House Industry Co
Ltd Credit Suisse 2,642(34,600) Daiwa House Industry Co
Ltd Goldam Sachs (91,514)(12,300) Daiwa House Industry Co
Ltd HSBC 5,603(4,800) Daiwa House Industry Co
Ltd JP Morgan 2,187(101,800) Daiwa Securities Group Inc Barclays Bank (29,812)(28,600) Daiwa Securities Group Inc Credit Suisse (7,745)(99,600) Daiwa Securities Group Inc JP Morgan (13,611)129,700 DeNA Co Ltd Bank of America
Merrill Lynch 94,05153,300 DeNA Co Ltd Barclays Bank 21,8039,400 DeNA Co Ltd Citibank 3,845
120,100 DeNA Co Ltd Credit Suisse 193,16079,500 DeNA Co Ltd Goldam Sachs 57,64932,100 DeNA Co Ltd HSBC 51,62727,400 Denka Co Ltd Bank of America
Merrill Lynch (9,934)10,400 Denka Co Ltd Barclays Bank 5,51133,600 Denka Co Ltd Citibank 17,80518,100 Denka Co Ltd Credit Suisse (978)17,700 Denka Co Ltd JP Morgan (471)33,300 Denso Corp Bank of America
Merrill Lynch 125,380100,200 Denso Corp Barclays Bank 299,02145,100 Denso Corp Goldam Sachs 169,80923,300 Dentsu Group Inc Barclays Bank 137,54932,800 Dentsu Group Inc Citibank 193,63222,100 Dentsu Group Inc HSBC 131,6987,000 Dentsu Group Inc JP Morgan 38,8492,500 DIC Corp HSBC 9,554
(5,800) Disco Corp Bank of AmericaMerrill Lynch 54,460
(4,300) Disco Corp Goldam Sachs 40,37688,700 DMG Mori Co Ltd Bank of America
Merrill Lynch 124,517119,000 DMG Mori Co Ltd Barclays Bank 140,50113,900 DMG Mori Co Ltd Citibank 16,41186,300 DMG Mori Co Ltd Credit Suisse 143,613
445,000 DMG Mori Co Ltd Goldam Sachs 624,69250,100 DMG Mori Co Ltd HSBC 83,37276,300 DMG Mori Co Ltd JP Morgan 126,97232,100 East Japan Railway Co Barclays Bank 182,0394,100 East Japan Railway Co Citibank 23,251
29,300 East Japan Railway Co Goldam Sachs 161,5297,900 East Japan Railway Co HSBC 38,5697,800 Ebara Corp Bank of America
Merrill Lynch 21,60919,100 Ebara Corp Barclays Bank 43,32673,600 Ebara Corp Goldam Sachs 203,9035,300 Ebara Corp HSBC 14,743
(9,400) Eisai Co Ltd Bank of AmericaMerrill Lynch (85,991)
(5,200) Eisai Co Ltd Goldam Sachs (47,569)(87,500) Electric Power Development
Co LtdBank of AmericaMerrill Lynch (95,988)
(22,300) Electric Power DevelopmentCo Ltd Barclays Bank (28,402)
(22,500) Electric Power DevelopmentCo Ltd Credit Suisse (11,714)
(47,500) Electric Power DevelopmentCo Ltd Goldam Sachs (52,108)
21,600 Ezaki Glico Co Ltd Bank of AmericaMerrill Lynch 22,089
BlackRock Style Advantage Fund continued
The notes on pages 691 to 711 form an integral part of these financial statements.
Annual report and audited financial statements [531]

Contracts for difference as at 31 May 2020
Holding Description Counterparty
Netunrealised
appreciation/(depreciation)
USD
Japan continued10,700 Ezaki Glico Co Ltd Barclays Bank 20,89023,800 Ezaki Glico Co Ltd Credit Suisse 89,61123,100 Ezaki Glico Co Ltd Goldam Sachs 23,6231,000 Ezaki Glico Co Ltd HSBC 3,765
(33,600) FamilyMart Co Ltd Bank of AmericaMerrill Lynch (69,971)
(21,100) FamilyMart Co Ltd Barclays Bank (40,409)(44,000) FamilyMart Co Ltd Goldam Sachs (91,628)13,200 Fancl Corp Barclays Bank (1,841)10,100 Fancl Corp JP Morgan 2,112
(11,000) FANUC Corp Bank of AmericaMerrill Lynch (183,563)
(6,700) FANUC Corp Credit Suisse (81,286)(1,300) FANUC Corp HSBC (15,772)
(700) FANUC Corp JP Morgan (9,515)(900) Fast Retailing Co Ltd Barclays Bank (63,004)
(4,400) Fast Retailing Co Ltd Citibank (308,018)(1,600) Fast Retailing Co Ltd Credit Suisse (127,923)(1,800) Fast Retailing Co Ltd Goldam Sachs (158,639)3,800 FP Corp Goldam Sachs 4,9462,700 FP Corp HSBC (6,526)
(7,300) Fuji Electric Co Ltd Bank of AmericaMerrill Lynch (12,759)
(800) Fuji Electric Co Ltd Barclays Bank (1,130)(3,000) Fuji Electric Co Ltd Credit Suisse (5,773)
(35,000) Fuji Electric Co Ltd Goldam Sachs (61,172)310,800 Fuji Media Holdings Inc Bank of America
Merrill Lynch 288,942218,900 Fuji Media Holdings Inc Barclays Bank 122,103131,300 Fuji Media Holdings Inc Credit Suisse (1,221)105,300 Fuji Media Holdings Inc Goldam Sachs 97,89468,600 Fuji Media Holdings Inc HSBC (638)28,600 Fuji Media Holdings Inc JP Morgan (266)
(48,500) Fuji Oil Holdings Inc Bank of AmericaMerrill Lynch (85,669)
(10,000) Fuji Oil Holdings Inc Barclays Bank (17,292)(18,300) Fuji Oil Holdings Inc Citibank (31,644)(51,100) Fuji Oil Holdings Inc Credit Suisse (176,248)(7,000) Fuji Oil Holdings Inc HSBC (24,144)
(36,100) Fuji Oil Holdings Inc JP Morgan (124,512)8,800 Fuji Seal International Inc Barclays Bank 20,3719,500 Fuji Seal International Inc Credit Suisse 32,678
43,700 Fuji Seal International Inc Goldam Sachs 58,502(6,300) FUJIFILM Holdings Corp Bank of America
Merrill Lynch 8,610(5,200) FUJIFILM Holdings Corp Barclays Bank (1,740)
(10,600) FUJIFILM Holdings Corp Goldam Sachs 14,486258,400 Fujikura Ltd Bank of America
Merrill Lynch 36,034178,100 Fujikura Ltd Barclays Bank (3,311)487,300 Fujikura Ltd Credit Suisse 49,833198,100 Fujikura Ltd Goldam Sachs 27,625(98,900) Fujitsu General Ltd Bank of America
Merrill Lynch (163,661)(26,500) Fujitsu General Ltd Credit Suisse (77,112)
(164,700) Fujitsu General Ltd Goldam Sachs (272,548)(80,200) Fujitsu General Ltd HSBC (233,371)(4,100) Fujitsu General Ltd JP Morgan (11,930)13,700 Fujitsu Ltd Bank of America
Merrill Lynch 86,608300 Fujitsu Ltd Barclays Bank 1,604
45,700 Fujitsu Ltd Goldam Sachs 288,904(59,500) Fukuoka Financial Group
IncBank of AmericaMerrill Lynch (114,503)
(78,500) Fukuoka Financial GroupInc Barclays Bank (102,901)
(17,500) Fukuoka Financial GroupInc Credit Suisse (29,122)
Holding Description Counterparty
Netunrealised
appreciation/(depreciation)
USD
Japan continued(43,100) Fukuoka Financial Group
Inc Goldam Sachs (82,942)(17,100) Fukuoka Financial Group
Inc HSBC (28,456)(27,800) Fukuyama Transporting Co
LtdBank of AmericaMerrill Lynch (71,073)
(3,800) Fukuyama Transporting CoLtd Citibank (8,832)
(17,900) Fukuyama Transporting CoLtd Credit Suisse 26,626
53,700 Furukawa Electric Co Ltd Bank of AmericaMerrill Lynch 310,523
2,900 Furukawa Electric Co Ltd Barclays Bank 4,63734,100 Furukawa Electric Co Ltd Goldam Sachs 197,1857,300 Fuyo General Lease Co Ltd Bank of America
Merrill Lynch 37,326300 Fuyo General Lease Co Ltd Barclays Bank 1,116
9,800 Fuyo General Lease Co Ltd Goldam Sachs 50,10983,700 Glory Ltd Bank of America
Merrill Lynch 139,28610,700 Glory Ltd Barclays Bank 15,02152,900 Glory Ltd Citibank 74,26153,700 Glory Ltd Credit Suisse 54,91615,700 Glory Ltd HSBC 16,05540,300 Glory Ltd JP Morgan 41,212
(25,300) GMO internet Inc Bank of AmericaMerrill Lynch (46,336)
(5,100) GMO internet Inc JP Morgan (4,898)(20,200) GMO Payment Gateway Inc Bank of America
Merrill Lynch (200,939)(23,300) GMO Payment Gateway Inc Barclays Bank (60,652)(5,900) GMO Payment Gateway Inc Goldam Sachs (58,690)(9,400) GMO Payment Gateway Inc JP Morgan (203,616)(4,600) Goldwin Inc Credit Suisse (52,057)(2,200) Goldwin Inc JP Morgan (24,952)33,300 GS Yuasa Corp Bank of America
Merrill Lynch 89,469310,000 GS Yuasa Corp Credit Suisse 1,083,62438,500 GS Yuasa Corp Goldam Sachs 103,44010,600 GungHo Online
Entertainment IncBank of AmericaMerrill Lynch 5,026
29,900 GungHo OnlineEntertainment Inc Barclays Bank 2,502
8,900 GungHo OnlineEntertainment Inc Citibank 745
33,600 GungHo OnlineEntertainment Inc Goldam Sachs 15,931
(130,200) Gunma Bank Ltd Barclays Bank (48,417)(68,400) Gunma Bank Ltd Credit Suisse (2,544)47,700 H2O Retailing Corp Goldam Sachs 19,95520,300 H2O Retailing Corp JP Morgan 8,681
(53,100) Hachijuni Bank Ltd Credit Suisse (17,278)(76,100) Hachijuni Bank Ltd Deutsche Bank (36,081)(59,300) Hachijuni Bank Ltd JP Morgan (19,295)48,900 Hakuhodo DY Holdings Inc Bank of America
Merrill Lynch 103,19654,100 Hakuhodo DY Holdings Inc Barclays Bank 99,08131,300 Hakuhodo DY Holdings Inc Citibank 57,32414,900 Hakuhodo DY Holdings Inc Credit Suisse 24,65725,600 Hakuhodo DY Holdings Inc Goldam Sachs 54,02514,300 Hakuhodo DY Holdings Inc HSBC 23,66412,700 Hakuhodo DY Holdings Inc JP Morgan 21,016(3,300) Hamamatsu Photonics KK Barclays Bank (9,357)(2,600) Hamamatsu Photonics KK HSBC (2,319)62,100 Hankyu Hanshin Holdings
IncBank of AmericaMerrill Lynch 158,764
80,200 Hankyu Hanshin HoldingsInc Barclays Bank 130,479
BlackRock Style Advantage Fund continued
The notes on pages 691 to 711 form an integral part of these financial statements.
BlackRock Strategic Funds[532]
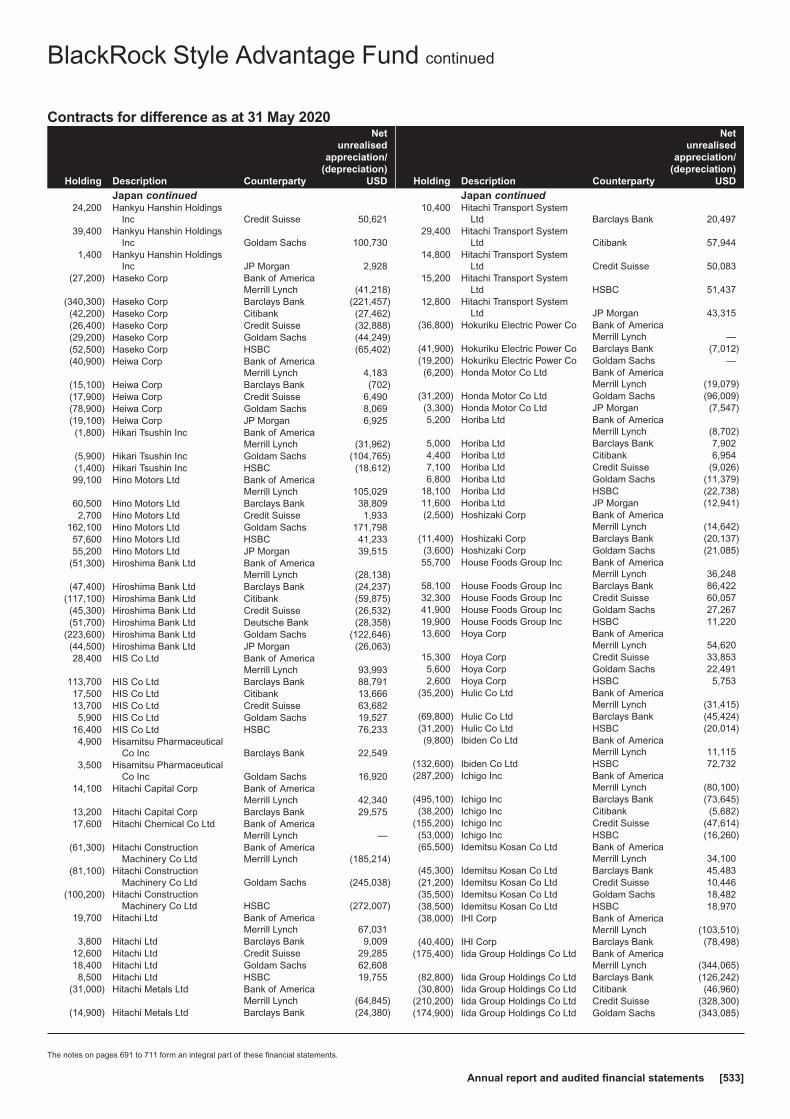
Contracts for difference as at 31 May 2020
Holding Description Counterparty
Netunrealised
appreciation/(depreciation)
USD
Japan continued24,200 Hankyu Hanshin Holdings
Inc Credit Suisse 50,62139,400 Hankyu Hanshin Holdings
Inc Goldam Sachs 100,7301,400 Hankyu Hanshin Holdings
Inc JP Morgan 2,928(27,200) Haseko Corp Bank of America
Merrill Lynch (41,218)(340,300) Haseko Corp Barclays Bank (221,457)(42,200) Haseko Corp Citibank (27,462)(26,400) Haseko Corp Credit Suisse (32,888)(29,200) Haseko Corp Goldam Sachs (44,249)(52,500) Haseko Corp HSBC (65,402)(40,900) Heiwa Corp Bank of America
Merrill Lynch 4,183(15,100) Heiwa Corp Barclays Bank (702)(17,900) Heiwa Corp Credit Suisse 6,490(78,900) Heiwa Corp Goldam Sachs 8,069(19,100) Heiwa Corp JP Morgan 6,925(1,800) Hikari Tsushin Inc Bank of America
Merrill Lynch (31,962)(5,900) Hikari Tsushin Inc Goldam Sachs (104,765)(1,400) Hikari Tsushin Inc HSBC (18,612)99,100 Hino Motors Ltd Bank of America
Merrill Lynch 105,02960,500 Hino Motors Ltd Barclays Bank 38,8092,700 Hino Motors Ltd Credit Suisse 1,933
162,100 Hino Motors Ltd Goldam Sachs 171,79857,600 Hino Motors Ltd HSBC 41,23355,200 Hino Motors Ltd JP Morgan 39,515
(51,300) Hiroshima Bank Ltd Bank of AmericaMerrill Lynch (28,138)
(47,400) Hiroshima Bank Ltd Barclays Bank (24,237)(117,100) Hiroshima Bank Ltd Citibank (59,875)(45,300) Hiroshima Bank Ltd Credit Suisse (26,532)(51,700) Hiroshima Bank Ltd Deutsche Bank (28,358)
(223,600) Hiroshima Bank Ltd Goldam Sachs (122,646)(44,500) Hiroshima Bank Ltd JP Morgan (26,063)28,400 HIS Co Ltd Bank of America
Merrill Lynch 93,993113,700 HIS Co Ltd Barclays Bank 88,79117,500 HIS Co Ltd Citibank 13,66613,700 HIS Co Ltd Credit Suisse 63,6825,900 HIS Co Ltd Goldam Sachs 19,527
16,400 HIS Co Ltd HSBC 76,2334,900 Hisamitsu Pharmaceutical
Co Inc Barclays Bank 22,5493,500 Hisamitsu Pharmaceutical
Co Inc Goldam Sachs 16,92014,100 Hitachi Capital Corp Bank of America
Merrill Lynch 42,34013,200 Hitachi Capital Corp Barclays Bank 29,57517,600 Hitachi Chemical Co Ltd Bank of America
Merrill Lynch —(61,300) Hitachi Construction
Machinery Co LtdBank of AmericaMerrill Lynch (185,214)
(81,100) Hitachi ConstructionMachinery Co Ltd Goldam Sachs (245,038)
(100,200) Hitachi ConstructionMachinery Co Ltd HSBC (272,007)
19,700 Hitachi Ltd Bank of AmericaMerrill Lynch 67,031
3,800 Hitachi Ltd Barclays Bank 9,00912,600 Hitachi Ltd Credit Suisse 29,28518,400 Hitachi Ltd Goldam Sachs 62,6088,500 Hitachi Ltd HSBC 19,755
(31,000) Hitachi Metals Ltd Bank of AmericaMerrill Lynch (64,845)
(14,900) Hitachi Metals Ltd Barclays Bank (24,380)
Holding Description Counterparty
Netunrealised
appreciation/(depreciation)
USD
Japan continued10,400 Hitachi Transport System
Ltd Barclays Bank 20,49729,400 Hitachi Transport System
Ltd Citibank 57,94414,800 Hitachi Transport System
Ltd Credit Suisse 50,08315,200 Hitachi Transport System
Ltd HSBC 51,43712,800 Hitachi Transport System
Ltd JP Morgan 43,315(36,800) Hokuriku Electric Power Co Bank of America
Merrill Lynch —(41,900) Hokuriku Electric Power Co Barclays Bank (7,012)(19,200) Hokuriku Electric Power Co Goldam Sachs —(6,200) Honda Motor Co Ltd Bank of America
Merrill Lynch (19,079)(31,200) Honda Motor Co Ltd Goldam Sachs (96,009)(3,300) Honda Motor Co Ltd JP Morgan (7,547)5,200 Horiba Ltd Bank of America
Merrill Lynch (8,702)5,000 Horiba Ltd Barclays Bank 7,9024,400 Horiba Ltd Citibank 6,9547,100 Horiba Ltd Credit Suisse (9,026)6,800 Horiba Ltd Goldam Sachs (11,379)
18,100 Horiba Ltd HSBC (22,738)11,600 Horiba Ltd JP Morgan (12,941)(2,500) Hoshizaki Corp Bank of America
Merrill Lynch (14,642)(11,400) Hoshizaki Corp Barclays Bank (20,137)(3,600) Hoshizaki Corp Goldam Sachs (21,085)55,700 House Foods Group Inc Bank of America
Merrill Lynch 36,24858,100 House Foods Group Inc Barclays Bank 86,42232,300 House Foods Group Inc Credit Suisse 60,05741,900 House Foods Group Inc Goldam Sachs 27,26719,900 House Foods Group Inc HSBC 11,22013,600 Hoya Corp Bank of America
Merrill Lynch 54,62015,300 Hoya Corp Credit Suisse 33,8535,600 Hoya Corp Goldam Sachs 22,4912,600 Hoya Corp HSBC 5,753
(35,200) Hulic Co Ltd Bank of AmericaMerrill Lynch (31,415)
(69,800) Hulic Co Ltd Barclays Bank (45,424)(31,200) Hulic Co Ltd HSBC (20,014)(9,800) Ibiden Co Ltd Bank of America
Merrill Lynch 11,115(132,600) Ibiden Co Ltd HSBC 72,732(287,200) Ichigo Inc Bank of America
Merrill Lynch (80,100)(495,100) Ichigo Inc Barclays Bank (73,645)(38,200) Ichigo Inc Citibank (5,682)
(155,200) Ichigo Inc Credit Suisse (47,614)(53,000) Ichigo Inc HSBC (16,260)(65,500) Idemitsu Kosan Co Ltd Bank of America
Merrill Lynch 34,100(45,300) Idemitsu Kosan Co Ltd Barclays Bank 45,483(21,200) Idemitsu Kosan Co Ltd Credit Suisse 10,446(35,500) Idemitsu Kosan Co Ltd Goldam Sachs 18,482(38,500) Idemitsu Kosan Co Ltd HSBC 18,970(38,000) IHI Corp Bank of America
Merrill Lynch (103,510)(40,400) IHI Corp Barclays Bank (78,498)
(175,400) Iida Group Holdings Co Ltd Bank of AmericaMerrill Lynch (344,065)
(82,800) Iida Group Holdings Co Ltd Barclays Bank (126,242)(30,800) Iida Group Holdings Co Ltd Citibank (46,960)
(210,200) Iida Group Holdings Co Ltd Credit Suisse (328,300)(174,900) Iida Group Holdings Co Ltd Goldam Sachs (343,085)
BlackRock Style Advantage Fund continued
The notes on pages 691 to 711 form an integral part of these financial statements.
Annual report and audited financial statements [533]

Contracts for difference as at 31 May 2020
Holding Description Counterparty
Netunrealised
appreciation/(depreciation)
USD
Japan continued(71,100) Iida Group Holdings Co Ltd JP Morgan (111,047)83,900 Inpex Corp Bank of America
Merrill Lynch 53,742114,600 Inpex Corp Barclays Bank 31,00336,300 Inpex Corp Citibank 9,82023,000 Inpex Corp Credit Suisse 17,94676,400 Inpex Corp Goldam Sachs 48,93769,000 Inpex Corp HSBC 37,654
(31,400) Isetan Mitsukoshi HoldingsLtd
Bank of AmericaMerrill Lynch (21,018)
(357,500) Isetan Mitsukoshi HoldingsLtd Barclays Bank (169,502)
(73,100) Isetan Mitsukoshi HoldingsLtd Credit Suisse (62,594)
(89,100) Isetan Mitsukoshi HoldingsLtd Goldam Sachs (59,640)
(277,900) Isetan Mitsukoshi HoldingsLtd JP Morgan (222,186)
(179,900) Isuzu Motors Ltd Bank of AmericaMerrill Lynch (252,042)
(136,200) Isuzu Motors Ltd Barclays Bank (162,835)(98,000) Isuzu Motors Ltd Goldam Sachs (137,299)53,700 Ito En Ltd Bank of America
Merrill Lynch 59,908300 Ito En Ltd Barclays Bank 446
45,500 Ito En Ltd Citibank 67,68026,000 Ito En Ltd Credit Suisse 36,2575,800 Ito En Ltd JP Morgan 8,088
(15,700) ITOCHU Corp Bank of AmericaMerrill Lynch (18,975)
(70,700) ITOCHU Corp Citibank (69,014)(20,500) ITOCHU Corp Goldam Sachs (24,776)(24,600) Itochu Techno-Solutions
Corp Barclays Bank (19,439)(12,100) Itoham Yonekyu Holdings
IncBank of AmericaMerrill Lynch (4,387)
(54,600) Itoham Yonekyu HoldingsInc JP Morgan (22,334)
(203,500) Iyo Bank Ltd Bank of AmericaMerrill Lynch (75,675)
(72,500) Iyo Bank Ltd Barclays Bank (20,220)(1,400) Iyo Bank Ltd Citibank (390)
(106,200) Iyo Bank Ltd Credit Suisse (23,695)(120,400) Iyo Bank Ltd Goldam Sachs (44,773)(27,000) Iyo Bank Ltd JP Morgan (6,024)10,200 Izumi Co Ltd Bank of America
Merrill Lynch 18,01752,600 Izumi Co Ltd Barclays Bank 90,4669,400 Izumi Co Ltd Citibank 16,167
14,500 Izumi Co Ltd Credit Suisse 25,61251,000 Izumi Co Ltd Goldam Sachs 90,0855,700 Izumi Co Ltd HSBC 10,068
(80,800) J Front Retailing Co Ltd Bank of AmericaMerrill Lynch (41,315)
(40,500) J Front Retailing Co Ltd Barclays Bank (25,227)(156,400) Japan Airlines Co Ltd Bank of America
Merrill Lynch (451,468)(79,500) Japan Airlines Co Ltd Barclays Bank (170,360)(39,800) Japan Airlines Co Ltd Citibank (85,287)
(312,000) Japan Airlines Co Ltd Credit Suisse (942,686)(56,800) Japan Airlines Co Ltd Goldam Sachs (163,960)(13,900) Japan Airport Terminal Co
LtdBank of AmericaMerrill Lynch (93,041)
(30,800) Japan Airport Terminal CoLtd Barclays Bank (171,803)
(32,600) Japan Airport Terminal CoLtd Goldam Sachs (218,212)
(23,600) Japan Airport Terminal CoLtd HSBC (174,425)
Holding Description Counterparty
Netunrealised
appreciation/(depreciation)
USD
Japan continued(26,400) Japan Airport Terminal Co
Ltd JP Morgan (189,904)10,800 Japan Aviation Electronics
Industry LtdBank of AmericaMerrill Lynch 11,848
48,200 Japan Aviation ElectronicsIndustry Ltd Barclays Bank 44,810
12,900 Japan Aviation ElectronicsIndustry Ltd Citibank 11,993
23,000 Japan Aviation ElectronicsIndustry Ltd Credit Suisse 13,360
26,400 Japan Aviation ElectronicsIndustry Ltd HSBC 15,953
29,200 Japan Exchange Group Inc Credit Suisse 53,47812,200 Japan Exchange Group Inc JP Morgan 22,34499,300 Japan Petroleum
Exploration Co LtdBank of AmericaMerrill Lynch 89,547
42,400 Japan PetroleumExploration Co Ltd Credit Suisse 55,579
148,600 Japan PetroleumExploration Co Ltd Goldam Sachs 134,005
5,100 Japan PetroleumExploration Co Ltd HSBC 6,685
(180,800) Japan Post Bank Co Ltd Bank of AmericaMerrill Lynch 258,850
(34,400) Japan Post Bank Co Ltd Barclays Bank (5,437)(31,800) Japan Post Bank Co Ltd Citibank (5,026)(52,900) Japan Post Bank Co Ltd Credit Suisse 59,015(93,100) Japan Post Bank Co Ltd Goldam Sachs 133,291(71,600) Japan Post Bank Co Ltd HSBC 79,877(72,900) Japan Post Holdings Co Ltd Barclays Bank (26,499)
(315,100) Japan Post Holdings Co Ltd Goldam Sachs 154,379(47,600) Japan Post Holdings Co Ltd HSBC 13,276(15,300) Japan Post Insurance Co
LtdBank of AmericaMerrill Lynch (12,090)
(58,400) Japan Post Insurance CoLtd Barclays Bank (39,634)
(23,300) Japan Post Insurance CoLtd JP Morgan (13,931)
(31,800) Japan Steel Works Ltd Bank of AmericaMerrill Lynch (80,117)
(32,700) Japan Steel Works Ltd Barclays Bank (78,433)(11,800) Japan Steel Works Ltd Citibank (28,303)(54,200) Japan Steel Works Ltd Credit Suisse (125,970)(41,600) Japan Steel Works Ltd Goldam Sachs (104,807)(45,000) Japan Steel Works Ltd HSBC (104,588)(67,000) Japan Tobacco Inc Bank of America
Merrill Lynch (79,729)(36,700) Japan Tobacco Inc Barclays Bank (44,866)(6,100) JCR Pharmaceuticals Co
Ltd Barclays Bank (28,922)(41,600) JCR Pharmaceuticals Co
Ltd Goldam Sachs (324,864)(249,700) JFE Holdings Inc Bank of America
Merrill Lynch (222,853)(207,500) JFE Holdings Inc Barclays Bank (171,687)(26,400) JFE Holdings Inc Credit Suisse (20,862)(19,200) JFE Holdings Inc Goldam Sachs (17,136)(33,300) JFE Holdings Inc HSBC (26,314)(12,600) JFE Holdings Inc JP Morgan (9,957)15,700 JGC Holdings Corp Bank of America
Merrill Lynch 21,456105,800 JGC Holdings Corp Goldam Sachs 144,588
8,100 JSR Corp HSBC 10,911121,600 JTEKT Corp Bank of America
Merrill Lynch 123,22217,900 JTEKT Corp Barclays Bank 17,14073,000 JTEKT Corp Citibank 69,90252,000 JTEKT Corp Credit Suisse 53,17721,300 JTEKT Corp Deutsche Bank 21,584
BlackRock Style Advantage Fund continued
The notes on pages 691 to 711 form an integral part of these financial statements.
BlackRock Strategic Funds[534]

Contracts for difference as at 31 May 2020
Holding Description Counterparty
Netunrealised
appreciation/(depreciation)
USD
Japan continued14,100 JTEKT Corp Goldam Sachs 14,28816,400 JTEKT Corp HSBC 16,77148,500 JTEKT Corp JP Morgan 49,598(1,200) Justsystems Corp Barclays Bank (2,789)(9,000) Justsystems Corp HSBC (27,611)
658,000 JXTG Holdings Inc Barclays Bank 87,47648,400 JXTG Holdings Inc Citibank 6,434
252,900 JXTG Holdings Inc Goldam Sachs 86,28779,900 JXTG Holdings Inc JP Morgan 21,1187,800 Kagome Co Ltd Bank of America
Merrill Lynch 18,201700 Kagome Co Ltd Barclays Bank 1,028
39,900 Kagome Co Ltd Goldam Sachs 93,106(49,800) Kajima Corp Bank of America
Merrill Lynch (17,130)(203,900) Kajima Corp Barclays Bank (100,467)(436,300) Kajima Corp Credit Suisse (287,987)(400,000) Kajima Corp Goldam Sachs (137,591)
9,700 Kakaku.com Inc Credit Suisse 10,5877,200 Kakaku.com Inc Goldam Sachs 12,718
40,100 Kaken Pharmaceutical CoLtd
Bank of AmericaMerrill Lynch 123,023
23,200 Kaken Pharmaceutical CoLtd Citibank 38,823
7,400 Kaken Pharmaceutical CoLtd Credit Suisse 12,383
12,400 Kaken Pharmaceutical CoLtd JP Morgan 20,750
83,200 Kamigumi Co Ltd Bank of AmericaMerrill Lynch 123,758
21,000 Kamigumi Co Ltd Barclays Bank 38,0705,400 Kamigumi Co Ltd Citibank 9,7899,100 Kamigumi Co Ltd Credit Suisse 15,989
147,600 Kamigumi Co Ltd Goldam Sachs 219,55134,700 Kamigumi Co Ltd HSBC 60,97124,200 Kamigumi Co Ltd JP Morgan 42,521
208,600 Kandenko Co Ltd Bank of AmericaMerrill Lynch 151,265
92,000 Kandenko Co Ltd Barclays Bank 23,948147,000 Kandenko Co Ltd Goldam Sachs 106,596169,800 Kaneka Corp Citibank 228,894
(105,400) Kansai Electric Power CoInc
Bank of AmericaMerrill Lynch (68,591)
(305,200) Kansai Electric Power CoInc Barclays Bank (103,563)
(9,200) Kansai Electric Power CoInc Credit Suisse (1,711)
(57,500) Kansai Electric Power CoInc Goldam Sachs (37,419)
(19,600) Kansai Electric Power CoInc HSBC (3,644)
(68,200) Kansai Mirai FinancialGroup Inc
Bank of AmericaMerrill Lynch (34,872)
(92,500) Kansai Mirai FinancialGroup Inc Barclays Bank (41,277)
(39,700) Kansai Mirai FinancialGroup Inc HSBC (16,978)
(79,800) Kansai Mirai FinancialGroup Inc JP Morgan (34,126)
(33,000) Kansai Paint Co Ltd Credit Suisse (56,756)(21,800) Kansai Paint Co Ltd JP Morgan (37,494)
4,900 Kao Corp Barclays Bank 3,46213,600 Kao Corp Goldam Sachs (11,632)
(111,500) Kawasaki Heavy IndustriesLtd
Bank of AmericaMerrill Lynch (204,207)
(159,500) Kawasaki Heavy IndustriesLtd Barclays Bank (209,078)
(10,400) Kawasaki Heavy IndustriesLtd Credit Suisse (10,345)
Holding Description Counterparty
Netunrealised
appreciation/(depreciation)
USD
Japan continued(89,800) Kawasaki Heavy Industries
Ltd Goldam Sachs (164,464)(7,700) Kawasaki Heavy Industries
Ltd HSBC (11,394)(321,201) Kawasaki Kisen Kaisha Ltd Credit Suisse (262,778)(112,200) Kawasaki Kisen Kaisha Ltd JP Morgan (91,792)
10,100 KDDI Corp Bank of AmericaMerrill Lynch (2,723)
13,500 KDDI Corp Barclays Bank 7,6568,400 KDDI Corp Credit Suisse (2,263)6,700 KDDI Corp HSBC (2,429)8,400 KDDI Corp JP Morgan (3,046)
(5,500) Keihan Holdings Co Ltd Citibank (6,903)(32,900) Keihan Holdings Co Ltd Credit Suisse (103,993)51,700 Keikyu Corp Bank of America
Merrill Lynch 56,71510,200 Keikyu Corp Barclays Bank 5,78440,200 Keikyu Corp Goldam Sachs 44,100(3,900) Keio Corp Bank of America
Merrill Lynch (17,766)(3,200) Keio Corp Barclays Bank (10,115)(8,300) Keio Corp Citibank (26,235)
(23,500) Keio Corp Credit Suisse (172,593)(3,000) Keio Corp Goldam Sachs (13,666)
(31,000) Keio Corp JP Morgan (227,676)(26,700) Keisei Electric Railway Co
LtdBank of AmericaMerrill Lynch (84,395)
85,200 Kewpie Corp Bank of AmericaMerrill Lynch 30,891
34,100 Kewpie Corp Barclays Bank 14,58323,600 Kewpie Corp Citibank 10,09321,700 Kewpie Corp Credit Suisse 5,043
100,100 Kewpie Corp Goldam Sachs 36,29339,000 Kewpie Corp HSBC 9,064(1,600) Keyence Corp Bank of America
Merrill Lynch (81,514)(2,300) Keyence Corp Citibank (90,875)(7,900) Keyence Corp HSBC (356,938)
(400) Keyence Corp JP Morgan (18,073)(15,700) Kikkoman Corp Bank of America
Merrill Lynch (80,277)(23,600) Kikkoman Corp Barclays Bank (78,985)(12,100) Kikkoman Corp Goldam Sachs (61,870)73,500 Kinden Corp Bank of America
Merrill Lynch 57,39837,100 Kinden Corp Barclays Bank 10,00211,100 Kinden Corp Citibank 2,99376,000 Kinden Corp Credit Suisse 16,95753,600 Kinden Corp Goldam Sachs 41,857
109,200 Kinden Corp JP Morgan 24,365(27,600) Kirin Holdings Co Ltd Bank of America
Merrill Lynch (53,755)(1,400) Kirin Holdings Co Ltd Barclays Bank (2,252)
(122,800) Kirin Holdings Co Ltd Goldam Sachs (239,173)9,600 Kissei Pharmaceutical Co
LtdBank of AmericaMerrill Lynch 24,365
5,700 Kissei Pharmaceutical CoLtd Barclays Bank 12,294
9,600 Kissei Pharmaceutical CoLtd Citibank 20,706
4,400 Kissei Pharmaceutical CoLtd Credit Suisse 3,681
1,800 Kissei Pharmaceutical CoLtd Deutsche Bank 4,568
19,100 Kissei Pharmaceutical CoLtd JP Morgan 15,981
(3,900) Kobayashi PharmaceuticalCo Ltd
Bank of AmericaMerrill Lynch 7,251
BlackRock Style Advantage Fund continued
The notes on pages 691 to 711 form an integral part of these financial statements.
Annual report and audited financial statements [535]
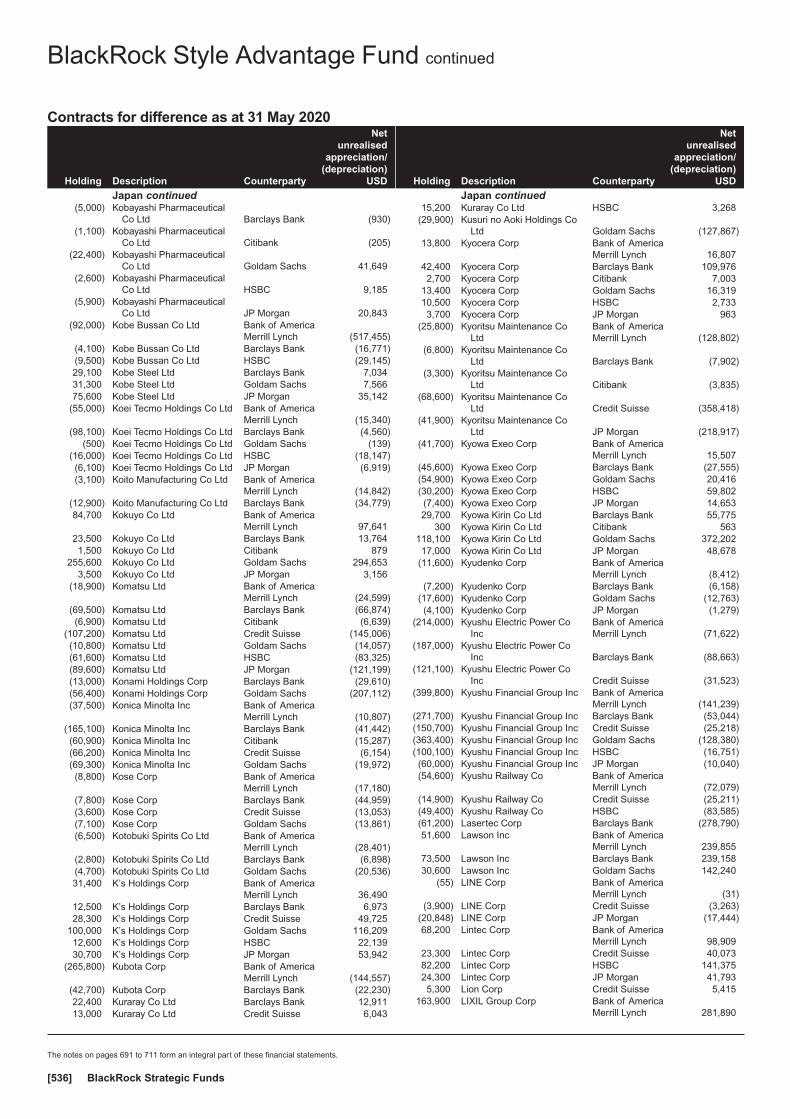
Contracts for difference as at 31 May 2020
Holding Description Counterparty
Netunrealised
appreciation/(depreciation)
USD
Japan continued(5,000) Kobayashi Pharmaceutical
Co Ltd Barclays Bank (930)(1,100) Kobayashi Pharmaceutical
Co Ltd Citibank (205)(22,400) Kobayashi Pharmaceutical
Co Ltd Goldam Sachs 41,649(2,600) Kobayashi Pharmaceutical
Co Ltd HSBC 9,185(5,900) Kobayashi Pharmaceutical
Co Ltd JP Morgan 20,843(92,000) Kobe Bussan Co Ltd Bank of America
Merrill Lynch (517,455)(4,100) Kobe Bussan Co Ltd Barclays Bank (16,771)(9,500) Kobe Bussan Co Ltd HSBC (29,145)29,100 Kobe Steel Ltd Barclays Bank 7,03431,300 Kobe Steel Ltd Goldam Sachs 7,56675,600 Kobe Steel Ltd JP Morgan 35,142
(55,000) Koei Tecmo Holdings Co Ltd Bank of AmericaMerrill Lynch (15,340)
(98,100) Koei Tecmo Holdings Co Ltd Barclays Bank (4,560)(500) Koei Tecmo Holdings Co Ltd Goldam Sachs (139)
(16,000) Koei Tecmo Holdings Co Ltd HSBC (18,147)(6,100) Koei Tecmo Holdings Co Ltd JP Morgan (6,919)(3,100) Koito Manufacturing Co Ltd Bank of America
Merrill Lynch (14,842)(12,900) Koito Manufacturing Co Ltd Barclays Bank (34,779)84,700 Kokuyo Co Ltd Bank of America
Merrill Lynch 97,64123,500 Kokuyo Co Ltd Barclays Bank 13,7641,500 Kokuyo Co Ltd Citibank 879
255,600 Kokuyo Co Ltd Goldam Sachs 294,6533,500 Kokuyo Co Ltd JP Morgan 3,156
(18,900) Komatsu Ltd Bank of AmericaMerrill Lynch (24,599)
(69,500) Komatsu Ltd Barclays Bank (66,874)(6,900) Komatsu Ltd Citibank (6,639)
(107,200) Komatsu Ltd Credit Suisse (145,006)(10,800) Komatsu Ltd Goldam Sachs (14,057)(61,600) Komatsu Ltd HSBC (83,325)(89,600) Komatsu Ltd JP Morgan (121,199)(13,000) Konami Holdings Corp Barclays Bank (29,610)(56,400) Konami Holdings Corp Goldam Sachs (207,112)(37,500) Konica Minolta Inc Bank of America
Merrill Lynch (10,807)(165,100) Konica Minolta Inc Barclays Bank (41,442)(60,900) Konica Minolta Inc Citibank (15,287)(66,200) Konica Minolta Inc Credit Suisse (6,154)(69,300) Konica Minolta Inc Goldam Sachs (19,972)(8,800) Kose Corp Bank of America
Merrill Lynch (17,180)(7,800) Kose Corp Barclays Bank (44,959)(3,600) Kose Corp Credit Suisse (13,053)(7,100) Kose Corp Goldam Sachs (13,861)(6,500) Kotobuki Spirits Co Ltd Bank of America
Merrill Lynch (28,401)(2,800) Kotobuki Spirits Co Ltd Barclays Bank (6,898)(4,700) Kotobuki Spirits Co Ltd Goldam Sachs (20,536)31,400 K’s Holdings Corp Bank of America
Merrill Lynch 36,49012,500 K’s Holdings Corp Barclays Bank 6,97328,300 K’s Holdings Corp Credit Suisse 49,725
100,000 K’s Holdings Corp Goldam Sachs 116,20912,600 K’s Holdings Corp HSBC 22,13930,700 K’s Holdings Corp JP Morgan 53,942
(265,800) Kubota Corp Bank of AmericaMerrill Lynch (144,557)
(42,700) Kubota Corp Barclays Bank (22,230)22,400 Kuraray Co Ltd Barclays Bank 12,91113,000 Kuraray Co Ltd Credit Suisse 6,043
Holding Description Counterparty
Netunrealised
appreciation/(depreciation)
USD
Japan continued15,200 Kuraray Co Ltd HSBC 3,268
(29,900) Kusuri no Aoki Holdings CoLtd Goldam Sachs (127,867)
13,800 Kyocera Corp Bank of AmericaMerrill Lynch 16,807
42,400 Kyocera Corp Barclays Bank 109,9762,700 Kyocera Corp Citibank 7,003
13,400 Kyocera Corp Goldam Sachs 16,31910,500 Kyocera Corp HSBC 2,7333,700 Kyocera Corp JP Morgan 963
(25,800) Kyoritsu Maintenance CoLtd
Bank of AmericaMerrill Lynch (128,802)
(6,800) Kyoritsu Maintenance CoLtd Barclays Bank (7,902)
(3,300) Kyoritsu Maintenance CoLtd Citibank (3,835)
(68,600) Kyoritsu Maintenance CoLtd Credit Suisse (358,418)
(41,900) Kyoritsu Maintenance CoLtd JP Morgan (218,917)
(41,700) Kyowa Exeo Corp Bank of AmericaMerrill Lynch 15,507
(45,600) Kyowa Exeo Corp Barclays Bank (27,555)(54,900) Kyowa Exeo Corp Goldam Sachs 20,416(30,200) Kyowa Exeo Corp HSBC 59,802(7,400) Kyowa Exeo Corp JP Morgan 14,65329,700 Kyowa Kirin Co Ltd Barclays Bank 55,775
300 Kyowa Kirin Co Ltd Citibank 563118,100 Kyowa Kirin Co Ltd Goldam Sachs 372,20217,000 Kyowa Kirin Co Ltd JP Morgan 48,678
(11,600) Kyudenko Corp Bank of AmericaMerrill Lynch (8,412)
(7,200) Kyudenko Corp Barclays Bank (6,158)(17,600) Kyudenko Corp Goldam Sachs (12,763)(4,100) Kyudenko Corp JP Morgan (1,279)
(214,000) Kyushu Electric Power CoInc
Bank of AmericaMerrill Lynch (71,622)
(187,000) Kyushu Electric Power CoInc Barclays Bank (88,663)
(121,100) Kyushu Electric Power CoInc Credit Suisse (31,523)
(399,800) Kyushu Financial Group Inc Bank of AmericaMerrill Lynch (141,239)
(271,700) Kyushu Financial Group Inc Barclays Bank (53,044)(150,700) Kyushu Financial Group Inc Credit Suisse (25,218)(363,400) Kyushu Financial Group Inc Goldam Sachs (128,380)(100,100) Kyushu Financial Group Inc HSBC (16,751)(60,000) Kyushu Financial Group Inc JP Morgan (10,040)(54,600) Kyushu Railway Co Bank of America
Merrill Lynch (72,079)(14,900) Kyushu Railway Co Credit Suisse (25,211)(49,400) Kyushu Railway Co HSBC (83,585)(61,200) Lasertec Corp Barclays Bank (278,790)51,600 Lawson Inc Bank of America
Merrill Lynch 239,85573,500 Lawson Inc Barclays Bank 239,15830,600 Lawson Inc Goldam Sachs 142,240
(55) LINE Corp Bank of AmericaMerrill Lynch (31)
(3,900) LINE Corp Credit Suisse (3,263)(20,848) LINE Corp JP Morgan (17,444)68,200 Lintec Corp Bank of America
Merrill Lynch 98,90923,300 Lintec Corp Credit Suisse 40,07382,200 Lintec Corp HSBC 141,37524,300 Lintec Corp JP Morgan 41,7935,300 Lion Corp Credit Suisse 5,415
163,900 LIXIL Group Corp Bank of AmericaMerrill Lynch 281,890
BlackRock Style Advantage Fund continued
The notes on pages 691 to 711 form an integral part of these financial statements.
BlackRock Strategic Funds[536]
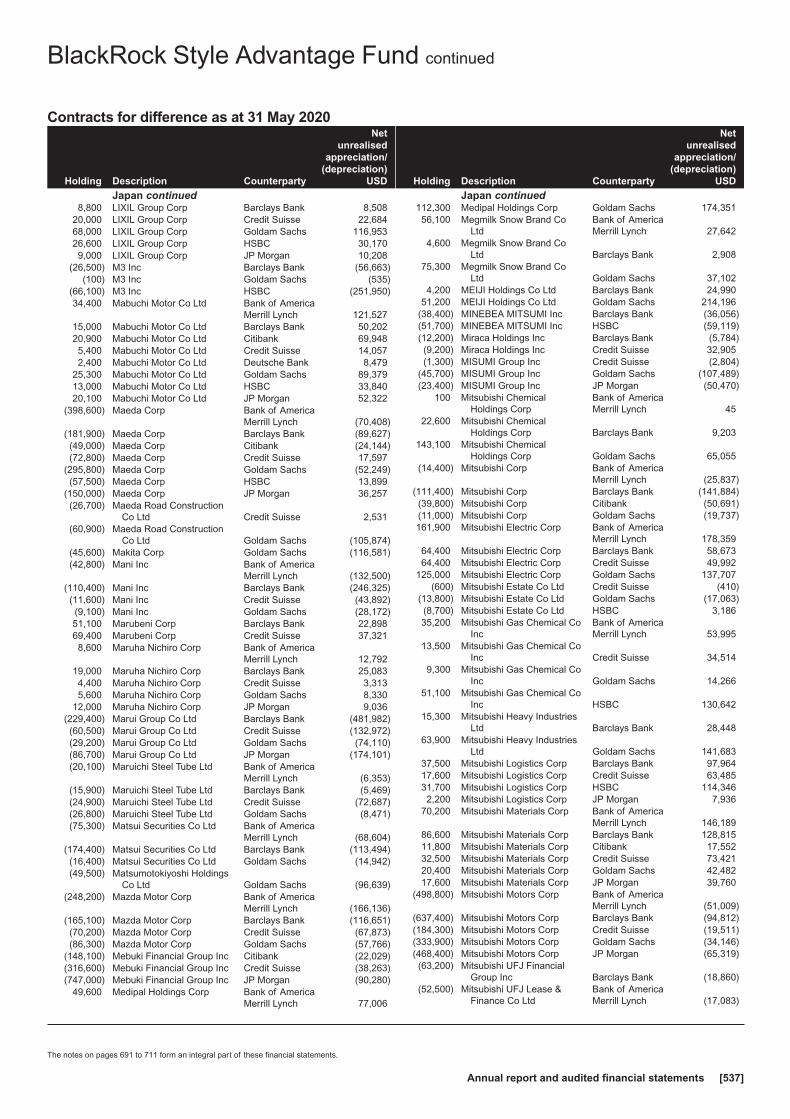
Contracts for difference as at 31 May 2020
Holding Description Counterparty
Netunrealised
appreciation/(depreciation)
USD
Japan continued8,800 LIXIL Group Corp Barclays Bank 8,508
20,000 LIXIL Group Corp Credit Suisse 22,68468,000 LIXIL Group Corp Goldam Sachs 116,95326,600 LIXIL Group Corp HSBC 30,1709,000 LIXIL Group Corp JP Morgan 10,208
(26,500) M3 Inc Barclays Bank (56,663)(100) M3 Inc Goldam Sachs (535)
(66,100) M3 Inc HSBC (251,950)34,400 Mabuchi Motor Co Ltd Bank of America
Merrill Lynch 121,52715,000 Mabuchi Motor Co Ltd Barclays Bank 50,20220,900 Mabuchi Motor Co Ltd Citibank 69,9485,400 Mabuchi Motor Co Ltd Credit Suisse 14,0572,400 Mabuchi Motor Co Ltd Deutsche Bank 8,479
25,300 Mabuchi Motor Co Ltd Goldam Sachs 89,37913,000 Mabuchi Motor Co Ltd HSBC 33,84020,100 Mabuchi Motor Co Ltd JP Morgan 52,322
(398,600) Maeda Corp Bank of AmericaMerrill Lynch (70,408)
(181,900) Maeda Corp Barclays Bank (89,627)(49,000) Maeda Corp Citibank (24,144)(72,800) Maeda Corp Credit Suisse 17,597
(295,800) Maeda Corp Goldam Sachs (52,249)(57,500) Maeda Corp HSBC 13,899
(150,000) Maeda Corp JP Morgan 36,257(26,700) Maeda Road Construction
Co Ltd Credit Suisse 2,531(60,900) Maeda Road Construction
Co Ltd Goldam Sachs (105,874)(45,600) Makita Corp Goldam Sachs (116,581)(42,800) Mani Inc Bank of America
Merrill Lynch (132,500)(110,400) Mani Inc Barclays Bank (246,325)(11,600) Mani Inc Credit Suisse (43,892)(9,100) Mani Inc Goldam Sachs (28,172)51,100 Marubeni Corp Barclays Bank 22,89869,400 Marubeni Corp Credit Suisse 37,3218,600 Maruha Nichiro Corp Bank of America
Merrill Lynch 12,79219,000 Maruha Nichiro Corp Barclays Bank 25,0834,400 Maruha Nichiro Corp Credit Suisse 3,3135,600 Maruha Nichiro Corp Goldam Sachs 8,330
12,000 Maruha Nichiro Corp JP Morgan 9,036(229,400) Marui Group Co Ltd Barclays Bank (481,982)(60,500) Marui Group Co Ltd Credit Suisse (132,972)(29,200) Marui Group Co Ltd Goldam Sachs (74,110)(86,700) Marui Group Co Ltd JP Morgan (174,101)(20,100) Maruichi Steel Tube Ltd Bank of America
Merrill Lynch (6,353)(15,900) Maruichi Steel Tube Ltd Barclays Bank (5,469)(24,900) Maruichi Steel Tube Ltd Credit Suisse (72,687)(26,800) Maruichi Steel Tube Ltd Goldam Sachs (8,471)(75,300) Matsui Securities Co Ltd Bank of America
Merrill Lynch (68,604)(174,400) Matsui Securities Co Ltd Barclays Bank (113,494)(16,400) Matsui Securities Co Ltd Goldam Sachs (14,942)(49,500) Matsumotokiyoshi Holdings
Co Ltd Goldam Sachs (96,639)(248,200) Mazda Motor Corp Bank of America
Merrill Lynch (166,136)(165,100) Mazda Motor Corp Barclays Bank (116,651)(70,200) Mazda Motor Corp Credit Suisse (67,873)(86,300) Mazda Motor Corp Goldam Sachs (57,766)
(148,100) Mebuki Financial Group Inc Citibank (22,029)(316,600) Mebuki Financial Group Inc Credit Suisse (38,263)(747,000) Mebuki Financial Group Inc JP Morgan (90,280)
49,600 Medipal Holdings Corp Bank of AmericaMerrill Lynch 77,006
Holding Description Counterparty
Netunrealised
appreciation/(depreciation)
USD
Japan continued112,300 Medipal Holdings Corp Goldam Sachs 174,35156,100 Megmilk Snow Brand Co
LtdBank of AmericaMerrill Lynch 27,642
4,600 Megmilk Snow Brand CoLtd Barclays Bank 2,908
75,300 Megmilk Snow Brand CoLtd Goldam Sachs 37,102
4,200 MEIJI Holdings Co Ltd Barclays Bank 24,99051,200 MEIJI Holdings Co Ltd Goldam Sachs 214,196
(38,400) MINEBEA MITSUMI Inc Barclays Bank (36,056)(51,700) MINEBEA MITSUMI Inc HSBC (59,119)(12,200) Miraca Holdings Inc Barclays Bank (5,784)(9,200) Miraca Holdings Inc Credit Suisse 32,905(1,300) MISUMI Group Inc Credit Suisse (2,804)
(45,700) MISUMI Group Inc Goldam Sachs (107,489)(23,400) MISUMI Group Inc JP Morgan (50,470)
100 Mitsubishi ChemicalHoldings Corp
Bank of AmericaMerrill Lynch 45
22,600 Mitsubishi ChemicalHoldings Corp Barclays Bank 9,203
143,100 Mitsubishi ChemicalHoldings Corp Goldam Sachs 65,055
(14,400) Mitsubishi Corp Bank of AmericaMerrill Lynch (25,837)
(111,400) Mitsubishi Corp Barclays Bank (141,884)(39,800) Mitsubishi Corp Citibank (50,691)(11,000) Mitsubishi Corp Goldam Sachs (19,737)161,900 Mitsubishi Electric Corp Bank of America
Merrill Lynch 178,35964,400 Mitsubishi Electric Corp Barclays Bank 58,67364,400 Mitsubishi Electric Corp Credit Suisse 49,992
125,000 Mitsubishi Electric Corp Goldam Sachs 137,707(600) Mitsubishi Estate Co Ltd Credit Suisse (410)
(13,800) Mitsubishi Estate Co Ltd Goldam Sachs (17,063)(8,700) Mitsubishi Estate Co Ltd HSBC 3,18635,200 Mitsubishi Gas Chemical Co
IncBank of AmericaMerrill Lynch 53,995
13,500 Mitsubishi Gas Chemical CoInc Credit Suisse 34,514
9,300 Mitsubishi Gas Chemical CoInc Goldam Sachs 14,266
51,100 Mitsubishi Gas Chemical CoInc HSBC 130,642
15,300 Mitsubishi Heavy IndustriesLtd Barclays Bank 28,448
63,900 Mitsubishi Heavy IndustriesLtd Goldam Sachs 141,683
37,500 Mitsubishi Logistics Corp Barclays Bank 97,96417,600 Mitsubishi Logistics Corp Credit Suisse 63,48531,700 Mitsubishi Logistics Corp HSBC 114,3462,200 Mitsubishi Logistics Corp JP Morgan 7,936
70,200 Mitsubishi Materials Corp Bank of AmericaMerrill Lynch 146,189
86,600 Mitsubishi Materials Corp Barclays Bank 128,81511,800 Mitsubishi Materials Corp Citibank 17,55232,500 Mitsubishi Materials Corp Credit Suisse 73,42120,400 Mitsubishi Materials Corp Goldam Sachs 42,48217,600 Mitsubishi Materials Corp JP Morgan 39,760
(498,800) Mitsubishi Motors Corp Bank of AmericaMerrill Lynch (51,009)
(637,400) Mitsubishi Motors Corp Barclays Bank (94,812)(184,300) Mitsubishi Motors Corp Credit Suisse (19,511)(333,900) Mitsubishi Motors Corp Goldam Sachs (34,146)(468,400) Mitsubishi Motors Corp JP Morgan (65,319)(63,200) Mitsubishi UFJ Financial
Group Inc Barclays Bank (18,860)(52,500) Mitsubishi UFJ Lease &
Finance Co LtdBank of AmericaMerrill Lynch (17,083)
BlackRock Style Advantage Fund continued
The notes on pages 691 to 711 form an integral part of these financial statements.
Annual report and audited financial statements [537]

Contracts for difference as at 31 May 2020
Holding Description Counterparty
Netunrealised
appreciation/(depreciation)
USD
Japan continued(156,500) Mitsubishi UFJ Lease &
Finance Co Ltd Credit Suisse (32,009)(310,800) Mitsubishi UFJ Lease &
Finance Co Ltd HSBC (63,567)74,500 Mitsui Chemicals Inc Bank of America
Merrill Lynch 244,48913,500 Mitsui Chemicals Inc Citibank 37,27528,800 Mitsui Chemicals Inc Credit Suisse 55,69128,700 Mitsui Chemicals Inc Goldam Sachs 94,18613,000 Mitsui Chemicals Inc HSBC 25,138
(19,000) Mitsui Fudosan Co Ltd Bank of AmericaMerrill Lynch (29,498)
(36,300) Mitsui Fudosan Co Ltd HSBC (59,901)(8,200) Mitsui Fudosan Co Ltd JP Morgan (13,531)(7,100) Mitsui Mining & Smelting Co
LtdBank of AmericaMerrill Lynch (19,538)
(96,200) Mitsui Mining & Smelting CoLtd Barclays Bank (171,714)
(16,300) Mitsui Mining & Smelting CoLtd Goldam Sachs (44,855)
(7,100) Mitsui Mining & Smelting CoLtd HSBC (16,568)
41,200 Mitsui OSK Lines Ltd Bank of AmericaMerrill Lynch 62,433
9,900 Mitsui OSK Lines Ltd Barclays Bank 11,04447,100 Mitsui OSK Lines Ltd Goldam Sachs 71,3743,800 Mitsui OSK Lines Ltd HSBC 4,027
(1,400) Miura Co Ltd Goldam Sachs (3,644)(23,700) Miura Co Ltd HSBC (17,627)344,900 Mizuho Financial Group Inc Bank of America
Merrill Lynch 45,852564,500 Mizuho Financial Group Inc Goldam Sachs 75,046359,100 Mizuho Financial Group Inc HSBC 39,728131,400 Mizuho Financial Group Inc JP Morgan 16,497
6,600 Mochida Pharmaceutical CoLtd
Bank of AmericaMerrill Lynch 9,511
8,400 Mochida Pharmaceutical CoLtd Barclays Bank 25,380
6,400 Mochida Pharmaceutical CoLtd Credit Suisse 4,760
3,300 Mochida Pharmaceutical CoLtd Goldam Sachs 4,755
19,400 Mochida Pharmaceutical CoLtd JP Morgan 14,428
(125,400) MonotaRO Co Ltd Barclays Bank 163,213(47,500) MonotaRO Co Ltd Citibank 61,82332,900 Morinaga & Co Ltd Bank of America
Merrill Lynch 105,5225,800 Morinaga & Co Ltd Barclays Bank 14,828
33,700 Morinaga & Co Ltd Credit Suisse 65,793102,200 Morinaga & Co Ltd Goldam Sachs 327,79223,100 Morinaga & Co Ltd HSBC 45,0984,800 Morinaga Milk Industry Co
LtdBank of AmericaMerrill Lynch 446
4,100 Morinaga Milk Industry CoLtd Barclays Bank 6,861
7,500 Morinaga Milk Industry CoLtd Citibank 12,551
5,300 Morinaga Milk Industry CoLtd Goldam Sachs 493
18,600 Morinaga Milk Industry CoLtd HSBC 64,845
13,200 Morinaga Milk Industry CoLtd JP Morgan 46,019
11,600 MS&AD Insurance GroupHoldings Inc Citibank 25,882
119,500 MS&AD Insurance GroupHoldings Inc HSBC 224,413
Holding Description Counterparty
Netunrealised
appreciation/(depreciation)
USD
Japan continued(14,500) Murata Manufacturing Co
LtdBank of AmericaMerrill Lynch 14,424
(1,600) Murata Manufacturing CoLtd Barclays Bank (744)
(23,500) Murata Manufacturing CoLtd JP Morgan 8,520
29,300 Nagase & Co Ltd Bank of AmericaMerrill Lynch 12,530
19,000 Nagase & Co Ltd Citibank 8,83210,200 Nagase & Co Ltd Credit Suisse 7,4918,500 Nagase & Co Ltd Goldam Sachs 3,635
20,600 Nagase & Co Ltd JP Morgan 15,12943,500 Nankai Electric Railway Co
LtdBank of AmericaMerrill Lynch 44,485
14,700 Nankai Electric Railway CoLtd Barclays Bank 12,573
14,800 Nankai Electric Railway CoLtd Credit Suisse 26,274
16,000 Nankai Electric Railway CoLtd Goldam Sachs 16,362
17,100 Nankai Electric Railway CoLtd JP Morgan 32,908
151,800 NEC Corp Bank of AmericaMerrill Lynch 49,393
22,300 NEC Corp HSBC 152,37837,700 NET One Systems Co Ltd Goldam Sachs 29,791
(11,800) Nexon Co Ltd Bank of AmericaMerrill Lynch (10,312)
(213,500) Nexon Co Ltd Barclays Bank 79,394(6,200) Nexon Co Ltd Credit Suisse (26,168)(6,600) Nexon Co Ltd Goldam Sachs (5,768)8,600 NGK Insulators Ltd Bank of America
Merrill Lynch 16,71028,300 NGK Insulators Ltd Barclays Bank 43,14834,300 NGK Insulators Ltd Credit Suisse 64,19429,400 NGK Insulators Ltd HSBC 56,031
(73,400) NGK Spark Plug Co Ltd Bank of AmericaMerrill Lynch (109,181)
(8,700) NGK Spark Plug Co Ltd Barclays Bank (9,140)(3,300) NGK Spark Plug Co Ltd Citibank (3,467)
(49,700) NGK Spark Plug Co Ltd Credit Suisse (74,389)(66,700) NGK Spark Plug Co Ltd Goldam Sachs (99,214)(30,200) NGK Spark Plug Co Ltd HSBC (45,202)(3,000) NGK Spark Plug Co Ltd JP Morgan (4,490)2,500 NH Foods Ltd Barclays Bank 4,765
23,600 NH Foods Ltd Goldam Sachs 69,112(22,200) NHK Spring Co Ltd Bank of America
Merrill Lynch (10,319)(2,000) Nichirei Corp Bank of America
Merrill Lynch (1,283)(10,300) Nichirei Corp Barclays Bank (14,555)(23,600) Nichirei Corp Goldam Sachs (15,139)(1,800) Nichirei Corp HSBC (5,171)
(55,500) Nidec Corp Bank of AmericaMerrill Lynch (305,453)
(600) Nidec Corp Barclays Bank (1,467)(24,500) Nidec Corp JP Morgan (103,179)24,000 Nifco Inc Bank of America
Merrill Lynch 56,67319,000 Nifco Inc Barclays Bank 21,90320,000 Nifco Inc Citibank 23,05643,000 Nifco Inc Credit Suisse 125,92412,900 Nifco Inc Goldam Sachs 30,46230,600 Nifco Inc HSBC 89,61118,600 Nifco Inc JP Morgan 54,46920,500 Nihon Kohden Corp Barclays Bank 64,7988,100 Nihon Kohden Corp Credit Suisse (20,211)
BlackRock Style Advantage Fund continued
The notes on pages 691 to 711 form an integral part of these financial statements.
BlackRock Strategic Funds[538]

Contracts for difference as at 31 May 2020
Holding Description Counterparty
Netunrealised
appreciation/(depreciation)
USD
Japan continued3,900 Nihon Kohden Corp Goldam Sachs 8,3393,700 Nihon Kohden Corp HSBC 1,734
(5,400) Nihon M&A Center Inc Barclays Bank (13,806)(39,900) Nihon M&A Center Inc HSBC (250,383)
1,800 Nihon Unisys Ltd Bank of AmericaMerrill Lynch 2,008
2,700 Nihon Unisys Ltd Goldam Sachs 3,01263,900 Nihon Unisys Ltd HSBC 121,782
(300,500) Nikon Corp Barclays Bank (78,222)(63,200) Nikon Corp Goldam Sachs (34,666)(25,700) Nikon Corp HSBC (1,434)(43,200) Nikon Corp JP Morgan (2,410)(24,600) Nippo Corp Bank of America
Merrill Lynch (47,798)(34,000) Nippo Corp Barclays Bank (25,287)(6,200) Nippo Corp Credit Suisse (9,683)(5,800) Nippo Corp JP Morgan (13,426)59,200 Nippon Electric Glass Co
LtdBank of AmericaMerrill Lynch 82,004
1,300 Nippon Electric Glass CoLtd Credit Suisse 1,511
29,700 Nippon Electric Glass CoLtd Goldam Sachs 41,141
(10,900) Nippon Express Co Ltd Bank of AmericaMerrill Lynch (67,894)
(9,100) Nippon Express Co Ltd Barclays Bank (51,606)(13,800) Nippon Express Co Ltd Credit Suisse (57,733)(12,100) Nippon Express Co Ltd Goldam Sachs (75,368)154,800 Nippon Kayaku Co Ltd Bank of America
Merrill Lynch 96,42274,700 Nippon Kayaku Co Ltd Citibank 35,41845,400 Nippon Kayaku Co Ltd Credit Suisse 24,48067,100 Nippon Kayaku Co Ltd Goldam Sachs 41,79539,200 Nippon Kayaku Co Ltd JP Morgan 21,137
(88,300) Nippon Paint Holdings CoLtd
Bank of AmericaMerrill Lynch (591,047)
(24,600) Nippon Paint Holdings CoLtd Goldam Sachs (164,663)
17,600 Nippon Paper Industries CoLtd
Bank of AmericaMerrill Lynch 19,635
12,800 Nippon Paper Industries CoLtd Barclays Bank 6,664
140,400 Nippon Paper Industries CoLtd Goldam Sachs 156,631
(5,800) Nippon Shinyaku Co Ltd Barclays Bank (47,990)(3,600) Nippon Shinyaku Co Ltd Credit Suisse (62,914)(1,900) Nippon Shinyaku Co Ltd JP Morgan (29,293)18,000 Nippon Shokubai Co Ltd Barclays Bank 48,529
146,800 Nippon Steel Corp Bank of AmericaMerrill Lynch 142,481
139,700 Nippon Steel Corp Barclays Bank 101,69285,000 Nippon Steel Corp Goldam Sachs 82,49922,500 Nippon Steel Corp HSBC 20,081
(53,500) Nippon Telegraph &Telephone Corp
Bank of AmericaMerrill Lynch (43,520)
(88,100) Nippon Telegraph &Telephone Corp Barclays Bank (19,657)
70,700 Nippon Television HoldingsInc
Bank of AmericaMerrill Lynch 88,075
259,300 Nippon Television HoldingsInc Goldam Sachs 323,025
165,600 Nippon Yusen KK Bank of AmericaMerrill Lynch 249,405
31,700 Nippon Yusen KK Credit Suisse 53,931157,400 Nippon Yusen KK Goldam Sachs 237,05538,800 Nipro Corp Bank of America
Merrill Lynch 12,98693,600 Nipro Corp Barclays Bank 22,62434,800 Nipro Corp Citibank 8,412
Holding Description Counterparty
Netunrealised
appreciation/(depreciation)
USD
Japan continued44,700 Nipro Corp Credit Suisse 23,99582,500 Nipro Corp Goldam Sachs 27,61135,700 Nipro Corp HSBC 20,57780,800 Nipro Corp JP Morgan 46,5731,200 Nishi-Nippon Financial
Holdings IncBank of AmericaMerrill Lynch 1,339
(15,800) Nishi-Nippon Railroad CoLtd
Bank of AmericaMerrill Lynch (32,462)
(30,100) Nishi-Nippon Railroad CoLtd Barclays Bank (50,649)
(12,700) Nishi-Nippon Railroad CoLtd Citibank (21,370)
(55,700) Nishi-Nippon Railroad CoLtd Credit Suisse (163,633)
(16,600) Nishi-Nippon Railroad CoLtd Deutsche Bank (34,106)
(7,900) Nishi-Nippon Railroad CoLtd HSBC (23,208)
(24,900) Nishi-Nippon Railroad CoLtd JP Morgan (73,150)
(21,200) Nissan Chemical Corp Bank of AmericaMerrill Lynch (131,065)
(8,400) Nissan Chemical Corp Barclays Bank (23,428)(22,300) Nissan Chemical Corp Goldam Sachs (137,865)(37,400) Nissan Chemical Corp HSBC (234,695)(14,600) Nissan Motor Co Ltd Bank of America
Merrill Lynch (4,262)(82,800) Nissan Motor Co Ltd Barclays Bank (21,477)
(103,500) Nissan Motor Co Ltd Citibank (26,846)(728,100) Nissan Motor Co Ltd Goldam Sachs (212,544)(24,000) Nisshin Seifun Group Inc Bank of America
Merrill Lynch (26,998)(15,600) Nisshin Seifun Group Inc Barclays Bank (8,557)(22,700) Nisshin Seifun Group Inc Goldam Sachs (25,535)47,100 Nisshinbo Holdings Inc Barclays Bank 35,03025,900 Nisshinbo Holdings Inc JP Morgan 22,8152,300 Nissin Foods Holdings Co
Ltd Citibank (1,069)6,700 Nissin Foods Holdings Co
Ltd Credit Suisse (1,246)3,800 Nissin Foods Holdings Co
Ltd JP Morgan (835)4,100 Nitori Holdings Co Ltd Bank of America
Merrill Lynch 85,5724,200 Nitori Holdings Co Ltd Barclays Bank 70,478
10,600 Nitori Holdings Co Ltd Citibank 177,8742,600 Nitori Holdings Co Ltd Credit Suisse 66,2309,800 Nitori Holdings Co Ltd Goldam Sachs 204,537
56,700 Nitto Denko Corp Bank of AmericaMerrill Lynch 258,290
16,900 Nitto Denko Corp Barclays Bank 67,55913,200 Nitto Denko Corp Credit Suisse 51,54141,500 Nitto Denko Corp Goldam Sachs 189,0484,100 Nitto Denko Corp HSBC 16,009
19,100 Nitto Denko Corp JP Morgan 76,247(10,500) Noevir Holdings Co Ltd Barclays Bank (16,107)(5,500) Noevir Holdings Co Ltd Credit Suisse 7,414(5,000) NOF Corp Citibank (2,324)(3,700) NOF Corp Credit Suisse (8,457)(4,100) NOF Corp Goldam Sachs (2,859)55,500 NOK Corp Bank of America
Merrill Lynch 81,5239,900 NOK Corp Citibank 7,823
12,200 NOK Corp Credit Suisse 14,81747,300 NOK Corp Goldam Sachs 69,47810,700 NOK Corp HSBC 14,99613,100 NOK Corp JP Morgan 21,069
(46,700) Nomura Holdings Inc Bank of AmericaMerrill Lynch (24,921)
BlackRock Style Advantage Fund continued
The notes on pages 691 to 711 form an integral part of these financial statements.
Annual report and audited financial statements [539]

Contracts for difference as at 31 May 2020
Holding Description Counterparty
Netunrealised
appreciation/(depreciation)
USD
Japan continued(94,000) Nomura Holdings Inc Barclays Bank (41,073)
(114,300) Nomura Holdings Inc Citibank (49,943)(136,400) Nomura Holdings Inc Goldam Sachs (72,787)(49,900) Nomura Holdings Inc HSBC (10,113)(27,000) Nomura Real Estate
Holdings Inc Barclays Bank (40,915)(17,000) Nomura Real Estate
Holdings Inc Goldam Sachs (40,143)(4,700) Nomura Research Institute
LtdBank of AmericaMerrill Lynch (12,890)
(10,600) Nomura Research InstituteLtd Barclays Bank (29,465)
(6,300) Nomura Research InstituteLtd HSBC (17,486)
(5,600) NS Solutions Corp Goldam Sachs (13,848)(49,200) NSK Ltd Barclays Bank (25,157)(28,200) NSK Ltd Goldam Sachs (14,944)379,000 NTN Corp Bank of America
Merrill Lynch 88,08629,200 NTN Corp Barclays Bank 7,058
421,900 NTN Corp Goldam Sachs 98,057136,900 NTT Data Corp Bank of America
Merrill Lynch 162,90839,300 NTT Data Corp Barclays Bank 13,51859,800 NTT DOCOMO Inc Bank of America
Merrill Lynch (56,428)8,000 NTT DOCOMO Inc Barclays Bank (1,450)
26,100 NTT DOCOMO Inc Citibank (4,732)18,400 NTT DOCOMO Inc HSBC (31,389)14,600 NTT DOCOMO Inc JP Morgan (24,907)
(31,000) Obayashi Corp JP Morgan (24,934)(9,300) OBIC Business Consultants
Co Ltd Barclays Bank (25,938)(20,300) OBIC Business Consultants
Co Ltd Goldam Sachs (116,065)(13,900) OBIC Business Consultants
Co Ltd HSBC (74,950)(4,000) OBIC Business Consultants
Co Ltd JP Morgan (21,568)(16,600) Obic Co Ltd Bank of America
Merrill Lynch (226,858)(12,900) Obic Co Ltd HSBC (188,286)(33,000) Odakyu Electric Railway Co
Ltd Barclays Bank (50,621)(11,900) Odakyu Electric Railway Co
Ltd Citibank (18,254)(19,600) Odakyu Electric Railway Co
Ltd Credit Suisse (65,233)(16,300) Odakyu Electric Railway Co
Ltd Goldam Sachs (39,096)(5,100) Odakyu Electric Railway Co
Ltd JP Morgan (16,974)(104,600) Oji Holdings Corp Bank of America
Merrill Lynch (12,642)(234,300) Oji Holdings Corp Barclays Bank 17,426(247,700) Oji Holdings Corp Goldam Sachs (29,936)(53,500) OKUMA Corp Bank of America
Merrill Lynch (126,830)(3,100) OKUMA Corp Credit Suisse (5,764)
(62,400) OKUMA Corp Goldam Sachs (147,929)(10,100) OKUMA Corp HSBC (18,779)42,300 Olympus Corp Bank of America
Merrill Lynch 95,75760,900 Olympus Corp Barclays Bank 102,7608,200 Olympus Corp Citibank 13,836
48,200 Olympus Corp Goldam Sachs 109,11311,400 Omron Corp Goldam Sachs 49,81230,600 Ono Pharmaceutical Co Ltd Bank of America
Merrill Lynch 102,555
Holding Description Counterparty
Netunrealised
appreciation/(depreciation)
USD
Japan continued137,000 Ono Pharmaceutical Co Ltd Barclays Bank 291,029(14,400) Open House Co Ltd Bank of America
Merrill Lynch (78,851)(76,000) Open House Co Ltd Barclays Bank (207,019)(55,800) Open House Co Ltd HSBC (300,879)(3,700) Open House Co Ltd JP Morgan (19,951)
(10,900) Oracle Corp Japan Goldam Sachs 17,227(185,300) Orient Corp Bank of America
Merrill Lynch (18,949)(133,500) Orient Corp Barclays Bank (13,652)(216,800) Orient Corp Citibank (22,171)(928,200) Orient Corp Credit Suisse (53,972)(102,300) Orient Corp Goldam Sachs (10,462)(22,400) Oriental Land Co Ltd Bank of America
Merrill Lynch (283,215)(900) Oriental Land Co Ltd Barclays Bank (3,472)
(9,300) Oriental Land Co Ltd Credit Suisse (162,976)(13,500) Oriental Land Co Ltd HSBC (236,578)98,000 ORIX Corp HSBC 164,90514,600 Osaka Gas Co Ltd Bank of America
Merrill Lynch 8,41512,600 Osaka Gas Co Ltd Barclays Bank 12,76813,500 OSG Corp Bank of America
Merrill Lynch 12,9279,700 OSG Corp Citibank 9,739
46,700 OSG Corp Credit Suisse 48,62588,600 OSG Corp HSBC 92,25325,000 OSG Corp JP Morgan 26,031
(25,400) Otsuka Corp Bank of AmericaMerrill Lynch (88,551)
(3,200) Otsuka Corp Citibank (15,023)(13,200) Otsuka Corp Credit Suisse (27,935)(12,200) Otsuka Corp Goldam Sachs (42,532)46,400 Otsuka Holdings Co Ltd Bank of America
Merrill Lynch 263,99763,700 Otsuka Holdings Co Ltd Barclays Bank 393,221
(24,400) PALTAC Corp Barclays Bank (38,563)(5,000) PALTAC Corp Citibank (7,902)
(18,000) PALTAC Corp Credit Suisse 26,775(13,100) PALTAC Corp Goldam Sachs (13,397)(3,400) PALTAC Corp HSBC 5,057
(60,100) Pan Pacific InternationalHoldings Corp Barclays Bank (38,553)
(40,000) Pan Pacific InternationalHoldings Corp Goldam Sachs (56,152)
191,300 Panasonic Corp Barclays Bank 149,213(24,700) Park24 Co Ltd Bank of America
Merrill Lynch (45,237)(47,700) Park24 Co Ltd Citibank (33,702)
(165,000) Penta-Ocean ConstructionCo Ltd
Bank of AmericaMerrill Lynch (35,281)
(153,500) Penta-Ocean ConstructionCo Ltd Barclays Bank (22,833)
(228,200) Penta-Ocean ConstructionCo Ltd Citibank (33,944)
(287,200) Penta-Ocean ConstructionCo Ltd Credit Suisse (16,020)
(987,100) Penta-Ocean ConstructionCo Ltd Goldam Sachs (211,066)
(29,100) Penta-Ocean ConstructionCo Ltd JP Morgan (1,623)
(59,000) PeptiDream Inc Bank of AmericaMerrill Lynch (257,798)
(49,200) PeptiDream Inc Barclays Bank (130,358)(29,600) PeptiDream Inc Credit Suisse (158,230)(9,800) PeptiDream Inc Goldam Sachs (42,821)
(11,000) Persol Holdings Co Ltd Bank of AmericaMerrill Lynch (17,589)
BlackRock Style Advantage Fund continued
The notes on pages 691 to 711 form an integral part of these financial statements.
BlackRock Strategic Funds[540]
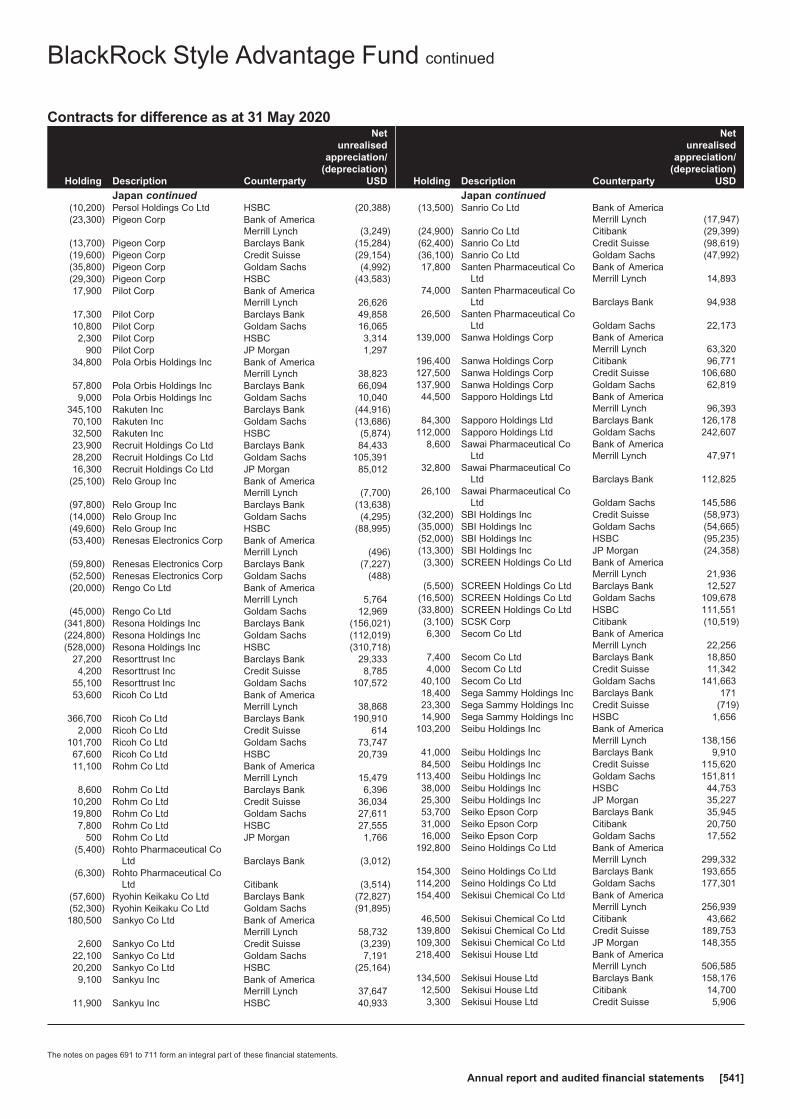
Contracts for difference as at 31 May 2020
Holding Description Counterparty
Netunrealised
appreciation/(depreciation)
USD
Japan continued(10,200) Persol Holdings Co Ltd HSBC (20,388)(23,300) Pigeon Corp Bank of America
Merrill Lynch (3,249)(13,700) Pigeon Corp Barclays Bank (15,284)(19,600) Pigeon Corp Credit Suisse (29,154)(35,800) Pigeon Corp Goldam Sachs (4,992)(29,300) Pigeon Corp HSBC (43,583)17,900 Pilot Corp Bank of America
Merrill Lynch 26,62617,300 Pilot Corp Barclays Bank 49,85810,800 Pilot Corp Goldam Sachs 16,0652,300 Pilot Corp HSBC 3,314
900 Pilot Corp JP Morgan 1,29734,800 Pola Orbis Holdings Inc Bank of America
Merrill Lynch 38,82357,800 Pola Orbis Holdings Inc Barclays Bank 66,0949,000 Pola Orbis Holdings Inc Goldam Sachs 10,040
345,100 Rakuten Inc Barclays Bank (44,916)70,100 Rakuten Inc Goldam Sachs (13,686)32,500 Rakuten Inc HSBC (5,874)23,900 Recruit Holdings Co Ltd Barclays Bank 84,43328,200 Recruit Holdings Co Ltd Goldam Sachs 105,39116,300 Recruit Holdings Co Ltd JP Morgan 85,012
(25,100) Relo Group Inc Bank of AmericaMerrill Lynch (7,700)
(97,800) Relo Group Inc Barclays Bank (13,638)(14,000) Relo Group Inc Goldam Sachs (4,295)(49,600) Relo Group Inc HSBC (88,995)(53,400) Renesas Electronics Corp Bank of America
Merrill Lynch (496)(59,800) Renesas Electronics Corp Barclays Bank (7,227)(52,500) Renesas Electronics Corp Goldam Sachs (488)(20,000) Rengo Co Ltd Bank of America
Merrill Lynch 5,764(45,000) Rengo Co Ltd Goldam Sachs 12,969
(341,800) Resona Holdings Inc Barclays Bank (156,021)(224,800) Resona Holdings Inc Goldam Sachs (112,019)(528,000) Resona Holdings Inc HSBC (310,718)
27,200 Resorttrust Inc Barclays Bank 29,3334,200 Resorttrust Inc Credit Suisse 8,785
55,100 Resorttrust Inc Goldam Sachs 107,57253,600 Ricoh Co Ltd Bank of America
Merrill Lynch 38,868366,700 Ricoh Co Ltd Barclays Bank 190,910
2,000 Ricoh Co Ltd Credit Suisse 614101,700 Ricoh Co Ltd Goldam Sachs 73,74767,600 Ricoh Co Ltd HSBC 20,73911,100 Rohm Co Ltd Bank of America
Merrill Lynch 15,4798,600 Rohm Co Ltd Barclays Bank 6,396
10,200 Rohm Co Ltd Credit Suisse 36,03419,800 Rohm Co Ltd Goldam Sachs 27,6117,800 Rohm Co Ltd HSBC 27,555
500 Rohm Co Ltd JP Morgan 1,766(5,400) Rohto Pharmaceutical Co
Ltd Barclays Bank (3,012)(6,300) Rohto Pharmaceutical Co
Ltd Citibank (3,514)(57,600) Ryohin Keikaku Co Ltd Barclays Bank (72,827)(52,300) Ryohin Keikaku Co Ltd Goldam Sachs (91,895)180,500 Sankyo Co Ltd Bank of America
Merrill Lynch 58,7322,600 Sankyo Co Ltd Credit Suisse (3,239)
22,100 Sankyo Co Ltd Goldam Sachs 7,19120,200 Sankyo Co Ltd HSBC (25,164)9,100 Sankyu Inc Bank of America
Merrill Lynch 37,64711,900 Sankyu Inc HSBC 40,933
Holding Description Counterparty
Netunrealised
appreciation/(depreciation)
USD
Japan continued(13,500) Sanrio Co Ltd Bank of America
Merrill Lynch (17,947)(24,900) Sanrio Co Ltd Citibank (29,399)(62,400) Sanrio Co Ltd Credit Suisse (98,619)(36,100) Sanrio Co Ltd Goldam Sachs (47,992)17,800 Santen Pharmaceutical Co
LtdBank of AmericaMerrill Lynch 14,893
74,000 Santen Pharmaceutical CoLtd Barclays Bank 94,938
26,500 Santen Pharmaceutical CoLtd Goldam Sachs 22,173
139,000 Sanwa Holdings Corp Bank of AmericaMerrill Lynch 63,320
196,400 Sanwa Holdings Corp Citibank 96,771127,500 Sanwa Holdings Corp Credit Suisse 106,680137,900 Sanwa Holdings Corp Goldam Sachs 62,81944,500 Sapporo Holdings Ltd Bank of America
Merrill Lynch 96,39384,300 Sapporo Holdings Ltd Barclays Bank 126,178
112,000 Sapporo Holdings Ltd Goldam Sachs 242,6078,600 Sawai Pharmaceutical Co
LtdBank of AmericaMerrill Lynch 47,971
32,800 Sawai Pharmaceutical CoLtd Barclays Bank 112,825
26,100 Sawai Pharmaceutical CoLtd Goldam Sachs 145,586
(32,200) SBI Holdings Inc Credit Suisse (58,973)(35,000) SBI Holdings Inc Goldam Sachs (54,665)(52,000) SBI Holdings Inc HSBC (95,235)(13,300) SBI Holdings Inc JP Morgan (24,358)(3,300) SCREEN Holdings Co Ltd Bank of America
Merrill Lynch 21,936(5,500) SCREEN Holdings Co Ltd Barclays Bank 12,527
(16,500) SCREEN Holdings Co Ltd Goldam Sachs 109,678(33,800) SCREEN Holdings Co Ltd HSBC 111,551(3,100) SCSK Corp Citibank (10,519)6,300 Secom Co Ltd Bank of America
Merrill Lynch 22,2567,400 Secom Co Ltd Barclays Bank 18,8504,000 Secom Co Ltd Credit Suisse 11,342
40,100 Secom Co Ltd Goldam Sachs 141,66318,400 Sega Sammy Holdings Inc Barclays Bank 17123,300 Sega Sammy Holdings Inc Credit Suisse (719)14,900 Sega Sammy Holdings Inc HSBC 1,656
103,200 Seibu Holdings Inc Bank of AmericaMerrill Lynch 138,156
41,000 Seibu Holdings Inc Barclays Bank 9,91084,500 Seibu Holdings Inc Credit Suisse 115,620
113,400 Seibu Holdings Inc Goldam Sachs 151,81138,000 Seibu Holdings Inc HSBC 44,75325,300 Seibu Holdings Inc JP Morgan 35,22753,700 Seiko Epson Corp Barclays Bank 35,94531,000 Seiko Epson Corp Citibank 20,75016,000 Seiko Epson Corp Goldam Sachs 17,552
192,800 Seino Holdings Co Ltd Bank of AmericaMerrill Lynch 299,332
154,300 Seino Holdings Co Ltd Barclays Bank 193,655114,200 Seino Holdings Co Ltd Goldam Sachs 177,301154,400 Sekisui Chemical Co Ltd Bank of America
Merrill Lynch 256,93946,500 Sekisui Chemical Co Ltd Citibank 43,662
139,800 Sekisui Chemical Co Ltd Credit Suisse 189,753109,300 Sekisui Chemical Co Ltd JP Morgan 148,355218,400 Sekisui House Ltd Bank of America
Merrill Lynch 506,585134,500 Sekisui House Ltd Barclays Bank 158,17612,500 Sekisui House Ltd Citibank 14,7003,300 Sekisui House Ltd Credit Suisse 5,906
BlackRock Style Advantage Fund continued
The notes on pages 691 to 711 form an integral part of these financial statements.
Annual report and audited financial statements [541]
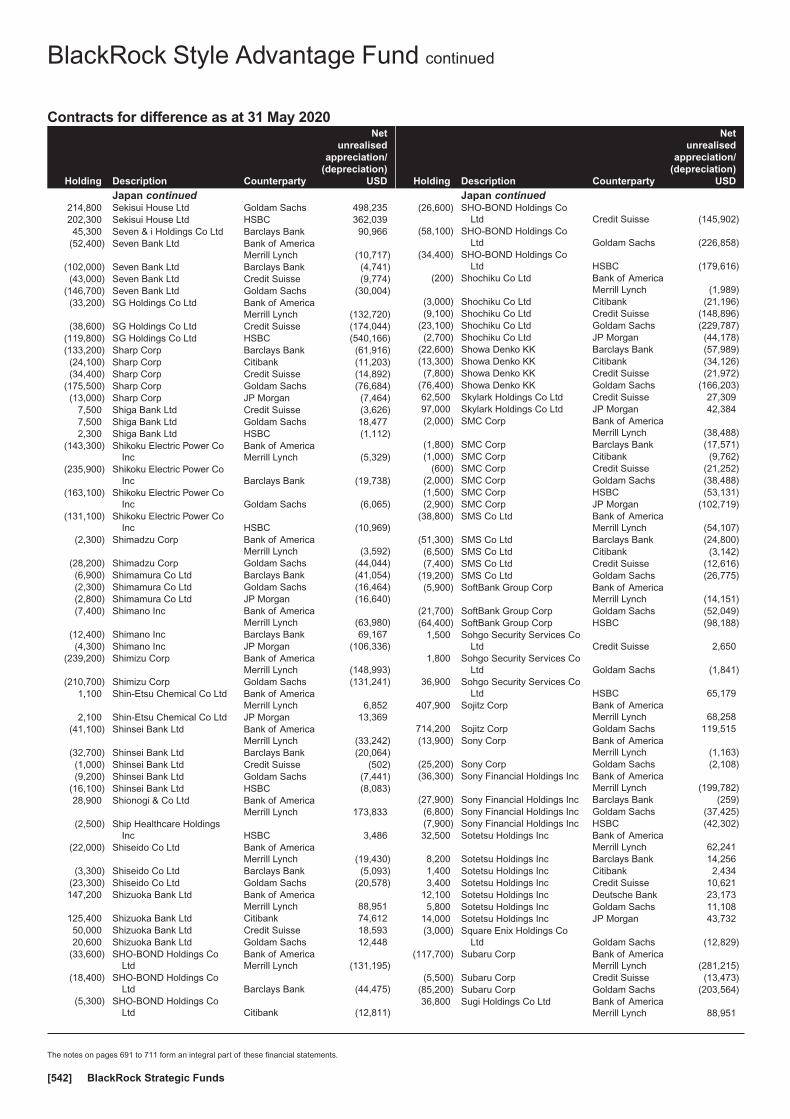
Contracts for difference as at 31 May 2020
Holding Description Counterparty
Netunrealised
appreciation/(depreciation)
USD
Japan continued214,800 Sekisui House Ltd Goldam Sachs 498,235202,300 Sekisui House Ltd HSBC 362,03945,300 Seven & i Holdings Co Ltd Barclays Bank 90,966
(52,400) Seven Bank Ltd Bank of AmericaMerrill Lynch (10,717)
(102,000) Seven Bank Ltd Barclays Bank (4,741)(43,000) Seven Bank Ltd Credit Suisse (9,774)
(146,700) Seven Bank Ltd Goldam Sachs (30,004)(33,200) SG Holdings Co Ltd Bank of America
Merrill Lynch (132,720)(38,600) SG Holdings Co Ltd Credit Suisse (174,044)
(119,800) SG Holdings Co Ltd HSBC (540,166)(133,200) Sharp Corp Barclays Bank (61,916)(24,100) Sharp Corp Citibank (11,203)(34,400) Sharp Corp Credit Suisse (14,892)
(175,500) Sharp Corp Goldam Sachs (76,684)(13,000) Sharp Corp JP Morgan (7,464)
7,500 Shiga Bank Ltd Credit Suisse (3,626)7,500 Shiga Bank Ltd Goldam Sachs 18,4772,300 Shiga Bank Ltd HSBC (1,112)
(143,300) Shikoku Electric Power CoInc
Bank of AmericaMerrill Lynch (5,329)
(235,900) Shikoku Electric Power CoInc Barclays Bank (19,738)
(163,100) Shikoku Electric Power CoInc Goldam Sachs (6,065)
(131,100) Shikoku Electric Power CoInc HSBC (10,969)
(2,300) Shimadzu Corp Bank of AmericaMerrill Lynch (3,592)
(28,200) Shimadzu Corp Goldam Sachs (44,044)(6,900) Shimamura Co Ltd Barclays Bank (41,054)(2,300) Shimamura Co Ltd Goldam Sachs (16,464)(2,800) Shimamura Co Ltd JP Morgan (16,640)(7,400) Shimano Inc Bank of America
Merrill Lynch (63,980)(12,400) Shimano Inc Barclays Bank 69,167(4,300) Shimano Inc JP Morgan (106,336)
(239,200) Shimizu Corp Bank of AmericaMerrill Lynch (148,993)
(210,700) Shimizu Corp Goldam Sachs (131,241)1,100 Shin-Etsu Chemical Co Ltd Bank of America
Merrill Lynch 6,8522,100 Shin-Etsu Chemical Co Ltd JP Morgan 13,369
(41,100) Shinsei Bank Ltd Bank of AmericaMerrill Lynch (33,242)
(32,700) Shinsei Bank Ltd Barclays Bank (20,064)(1,000) Shinsei Bank Ltd Credit Suisse (502)(9,200) Shinsei Bank Ltd Goldam Sachs (7,441)
(16,100) Shinsei Bank Ltd HSBC (8,083)28,900 Shionogi & Co Ltd Bank of America
Merrill Lynch 173,833(2,500) Ship Healthcare Holdings
Inc HSBC 3,486(22,000) Shiseido Co Ltd Bank of America
Merrill Lynch (19,430)(3,300) Shiseido Co Ltd Barclays Bank (5,093)
(23,300) Shiseido Co Ltd Goldam Sachs (20,578)147,200 Shizuoka Bank Ltd Bank of America
Merrill Lynch 88,951125,400 Shizuoka Bank Ltd Citibank 74,61250,000 Shizuoka Bank Ltd Credit Suisse 18,59320,600 Shizuoka Bank Ltd Goldam Sachs 12,448
(33,600) SHO-BOND Holdings CoLtd
Bank of AmericaMerrill Lynch (131,195)
(18,400) SHO-BOND Holdings CoLtd Barclays Bank (44,475)
(5,300) SHO-BOND Holdings CoLtd Citibank (12,811)
Holding Description Counterparty
Netunrealised
appreciation/(depreciation)
USD
Japan continued(26,600) SHO-BOND Holdings Co
Ltd Credit Suisse (145,902)(58,100) SHO-BOND Holdings Co
Ltd Goldam Sachs (226,858)(34,400) SHO-BOND Holdings Co
Ltd HSBC (179,616)(200) Shochiku Co Ltd Bank of America
Merrill Lynch (1,989)(3,000) Shochiku Co Ltd Citibank (21,196)(9,100) Shochiku Co Ltd Credit Suisse (148,896)
(23,100) Shochiku Co Ltd Goldam Sachs (229,787)(2,700) Shochiku Co Ltd JP Morgan (44,178)
(22,600) Showa Denko KK Barclays Bank (57,989)(13,300) Showa Denko KK Citibank (34,126)(7,800) Showa Denko KK Credit Suisse (21,972)
(76,400) Showa Denko KK Goldam Sachs (166,203)62,500 Skylark Holdings Co Ltd Credit Suisse 27,30997,000 Skylark Holdings Co Ltd JP Morgan 42,384(2,000) SMC Corp Bank of America
Merrill Lynch (38,488)(1,800) SMC Corp Barclays Bank (17,571)(1,000) SMC Corp Citibank (9,762)
(600) SMC Corp Credit Suisse (21,252)(2,000) SMC Corp Goldam Sachs (38,488)(1,500) SMC Corp HSBC (53,131)(2,900) SMC Corp JP Morgan (102,719)
(38,800) SMS Co Ltd Bank of AmericaMerrill Lynch (54,107)
(51,300) SMS Co Ltd Barclays Bank (24,800)(6,500) SMS Co Ltd Citibank (3,142)(7,400) SMS Co Ltd Credit Suisse (12,616)
(19,200) SMS Co Ltd Goldam Sachs (26,775)(5,900) SoftBank Group Corp Bank of America
Merrill Lynch (14,151)(21,700) SoftBank Group Corp Goldam Sachs (52,049)(64,400) SoftBank Group Corp HSBC (98,188)
1,500 Sohgo Security Services CoLtd Credit Suisse 2,650
1,800 Sohgo Security Services CoLtd Goldam Sachs (1,841)
36,900 Sohgo Security Services CoLtd HSBC 65,179
407,900 Sojitz Corp Bank of AmericaMerrill Lynch 68,258
714,200 Sojitz Corp Goldam Sachs 119,515(13,900) Sony Corp Bank of America
Merrill Lynch (1,163)(25,200) Sony Corp Goldam Sachs (2,108)(36,300) Sony Financial Holdings Inc Bank of America
Merrill Lynch (199,782)(27,900) Sony Financial Holdings Inc Barclays Bank (259)(6,800) Sony Financial Holdings Inc Goldam Sachs (37,425)(7,900) Sony Financial Holdings Inc HSBC (42,302)32,500 Sotetsu Holdings Inc Bank of America
Merrill Lynch 62,2418,200 Sotetsu Holdings Inc Barclays Bank 14,2561,400 Sotetsu Holdings Inc Citibank 2,4343,400 Sotetsu Holdings Inc Credit Suisse 10,621
12,100 Sotetsu Holdings Inc Deutsche Bank 23,1735,800 Sotetsu Holdings Inc Goldam Sachs 11,108
14,000 Sotetsu Holdings Inc JP Morgan 43,732(3,000) Square Enix Holdings Co
Ltd Goldam Sachs (12,829)(117,700) Subaru Corp Bank of America
Merrill Lynch (281,215)(5,500) Subaru Corp Credit Suisse (13,473)
(85,200) Subaru Corp Goldam Sachs (203,564)36,800 Sugi Holdings Co Ltd Bank of America
Merrill Lynch 88,951
BlackRock Style Advantage Fund continued
The notes on pages 691 to 711 form an integral part of these financial statements.
BlackRock Strategic Funds[542]
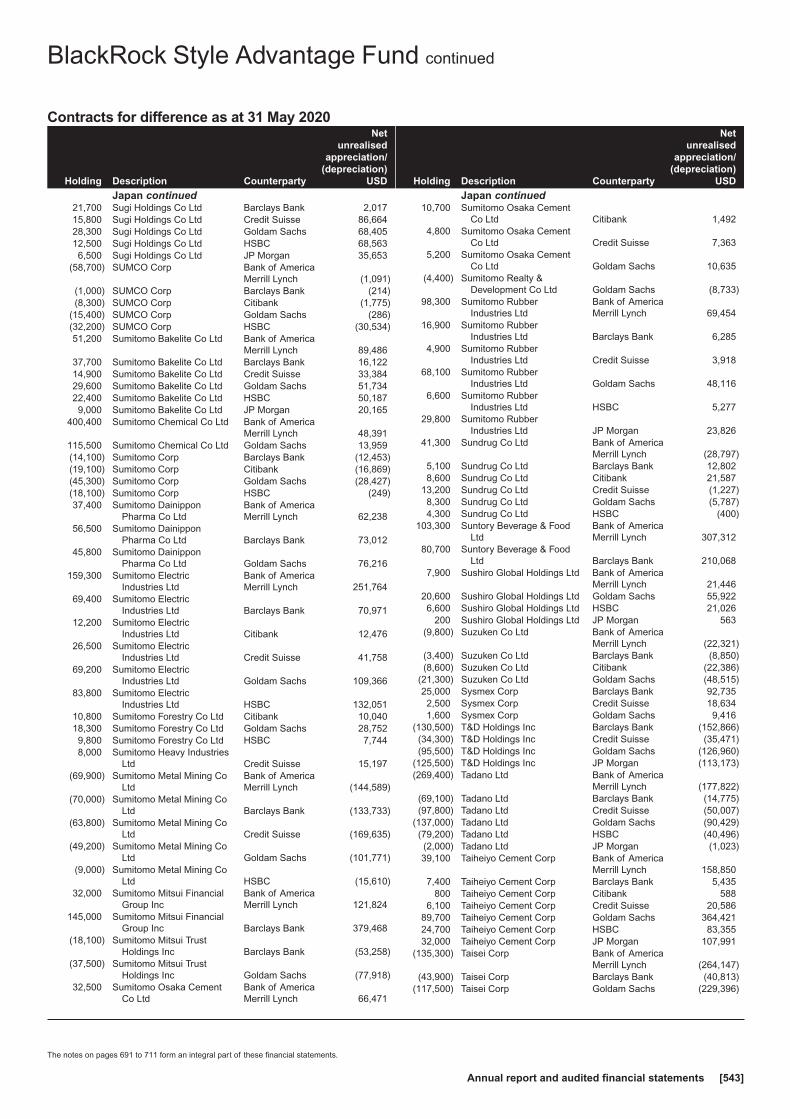
Contracts for difference as at 31 May 2020
Holding Description Counterparty
Netunrealised
appreciation/(depreciation)
USD
Japan continued21,700 Sugi Holdings Co Ltd Barclays Bank 2,01715,800 Sugi Holdings Co Ltd Credit Suisse 86,66428,300 Sugi Holdings Co Ltd Goldam Sachs 68,40512,500 Sugi Holdings Co Ltd HSBC 68,5636,500 Sugi Holdings Co Ltd JP Morgan 35,653
(58,700) SUMCO Corp Bank of AmericaMerrill Lynch (1,091)
(1,000) SUMCO Corp Barclays Bank (214)(8,300) SUMCO Corp Citibank (1,775)
(15,400) SUMCO Corp Goldam Sachs (286)(32,200) SUMCO Corp HSBC (30,534)51,200 Sumitomo Bakelite Co Ltd Bank of America
Merrill Lynch 89,48637,700 Sumitomo Bakelite Co Ltd Barclays Bank 16,12214,900 Sumitomo Bakelite Co Ltd Credit Suisse 33,38429,600 Sumitomo Bakelite Co Ltd Goldam Sachs 51,73422,400 Sumitomo Bakelite Co Ltd HSBC 50,1879,000 Sumitomo Bakelite Co Ltd JP Morgan 20,165
400,400 Sumitomo Chemical Co Ltd Bank of AmericaMerrill Lynch 48,391
115,500 Sumitomo Chemical Co Ltd Goldam Sachs 13,959(14,100) Sumitomo Corp Barclays Bank (12,453)(19,100) Sumitomo Corp Citibank (16,869)(45,300) Sumitomo Corp Goldam Sachs (28,427)(18,100) Sumitomo Corp HSBC (249)37,400 Sumitomo Dainippon
Pharma Co LtdBank of AmericaMerrill Lynch 62,238
56,500 Sumitomo DainipponPharma Co Ltd Barclays Bank 73,012
45,800 Sumitomo DainipponPharma Co Ltd Goldam Sachs 76,216
159,300 Sumitomo ElectricIndustries Ltd
Bank of AmericaMerrill Lynch 251,764
69,400 Sumitomo ElectricIndustries Ltd Barclays Bank 70,971
12,200 Sumitomo ElectricIndustries Ltd Citibank 12,476
26,500 Sumitomo ElectricIndustries Ltd Credit Suisse 41,758
69,200 Sumitomo ElectricIndustries Ltd Goldam Sachs 109,366
83,800 Sumitomo ElectricIndustries Ltd HSBC 132,051
10,800 Sumitomo Forestry Co Ltd Citibank 10,04018,300 Sumitomo Forestry Co Ltd Goldam Sachs 28,7529,800 Sumitomo Forestry Co Ltd HSBC 7,7448,000 Sumitomo Heavy Industries
Ltd Credit Suisse 15,197(69,900) Sumitomo Metal Mining Co
LtdBank of AmericaMerrill Lynch (144,589)
(70,000) Sumitomo Metal Mining CoLtd Barclays Bank (133,733)
(63,800) Sumitomo Metal Mining CoLtd Credit Suisse (169,635)
(49,200) Sumitomo Metal Mining CoLtd Goldam Sachs (101,771)
(9,000) Sumitomo Metal Mining CoLtd HSBC (15,610)
32,000 Sumitomo Mitsui FinancialGroup Inc
Bank of AmericaMerrill Lynch 121,824
145,000 Sumitomo Mitsui FinancialGroup Inc Barclays Bank 379,468
(18,100) Sumitomo Mitsui TrustHoldings Inc Barclays Bank (53,258)
(37,500) Sumitomo Mitsui TrustHoldings Inc Goldam Sachs (77,918)
32,500 Sumitomo Osaka CementCo Ltd
Bank of AmericaMerrill Lynch 66,471
Holding Description Counterparty
Netunrealised
appreciation/(depreciation)
USD
Japan continued10,700 Sumitomo Osaka Cement
Co Ltd Citibank 1,4924,800 Sumitomo Osaka Cement
Co Ltd Credit Suisse 7,3635,200 Sumitomo Osaka Cement
Co Ltd Goldam Sachs 10,635(4,400) Sumitomo Realty &
Development Co Ltd Goldam Sachs (8,733)98,300 Sumitomo Rubber
Industries LtdBank of AmericaMerrill Lynch 69,454
16,900 Sumitomo RubberIndustries Ltd Barclays Bank 6,285
4,900 Sumitomo RubberIndustries Ltd Credit Suisse 3,918
68,100 Sumitomo RubberIndustries Ltd Goldam Sachs 48,116
6,600 Sumitomo RubberIndustries Ltd HSBC 5,277
29,800 Sumitomo RubberIndustries Ltd JP Morgan 23,826
41,300 Sundrug Co Ltd Bank of AmericaMerrill Lynch (28,797)
5,100 Sundrug Co Ltd Barclays Bank 12,8028,600 Sundrug Co Ltd Citibank 21,587
13,200 Sundrug Co Ltd Credit Suisse (1,227)8,300 Sundrug Co Ltd Goldam Sachs (5,787)4,300 Sundrug Co Ltd HSBC (400)
103,300 Suntory Beverage & FoodLtd
Bank of AmericaMerrill Lynch 307,312
80,700 Suntory Beverage & FoodLtd Barclays Bank 210,068
7,900 Sushiro Global Holdings Ltd Bank of AmericaMerrill Lynch 21,446
20,600 Sushiro Global Holdings Ltd Goldam Sachs 55,9226,600 Sushiro Global Holdings Ltd HSBC 21,026
200 Sushiro Global Holdings Ltd JP Morgan 563(9,800) Suzuken Co Ltd Bank of America
Merrill Lynch (22,321)(3,400) Suzuken Co Ltd Barclays Bank (8,850)(8,600) Suzuken Co Ltd Citibank (22,386)
(21,300) Suzuken Co Ltd Goldam Sachs (48,515)25,000 Sysmex Corp Barclays Bank 92,7352,500 Sysmex Corp Credit Suisse 18,6341,600 Sysmex Corp Goldam Sachs 9,416
(130,500) T&D Holdings Inc Barclays Bank (152,866)(34,300) T&D Holdings Inc Credit Suisse (35,471)(95,500) T&D Holdings Inc Goldam Sachs (126,960)
(125,500) T&D Holdings Inc JP Morgan (113,173)(269,400) Tadano Ltd Bank of America
Merrill Lynch (177,822)(69,100) Tadano Ltd Barclays Bank (14,775)(97,800) Tadano Ltd Credit Suisse (50,007)
(137,000) Tadano Ltd Goldam Sachs (90,429)(79,200) Tadano Ltd HSBC (40,496)(2,000) Tadano Ltd JP Morgan (1,023)39,100 Taiheiyo Cement Corp Bank of America
Merrill Lynch 158,8507,400 Taiheiyo Cement Corp Barclays Bank 5,435
800 Taiheiyo Cement Corp Citibank 5886,100 Taiheiyo Cement Corp Credit Suisse 20,586
89,700 Taiheiyo Cement Corp Goldam Sachs 364,42124,700 Taiheiyo Cement Corp HSBC 83,35532,000 Taiheiyo Cement Corp JP Morgan 107,991
(135,300) Taisei Corp Bank of AmericaMerrill Lynch (264,147)
(43,900) Taisei Corp Barclays Bank (40,813)(117,500) Taisei Corp Goldam Sachs (229,396)
BlackRock Style Advantage Fund continued
The notes on pages 691 to 711 form an integral part of these financial statements.
Annual report and audited financial statements [543]
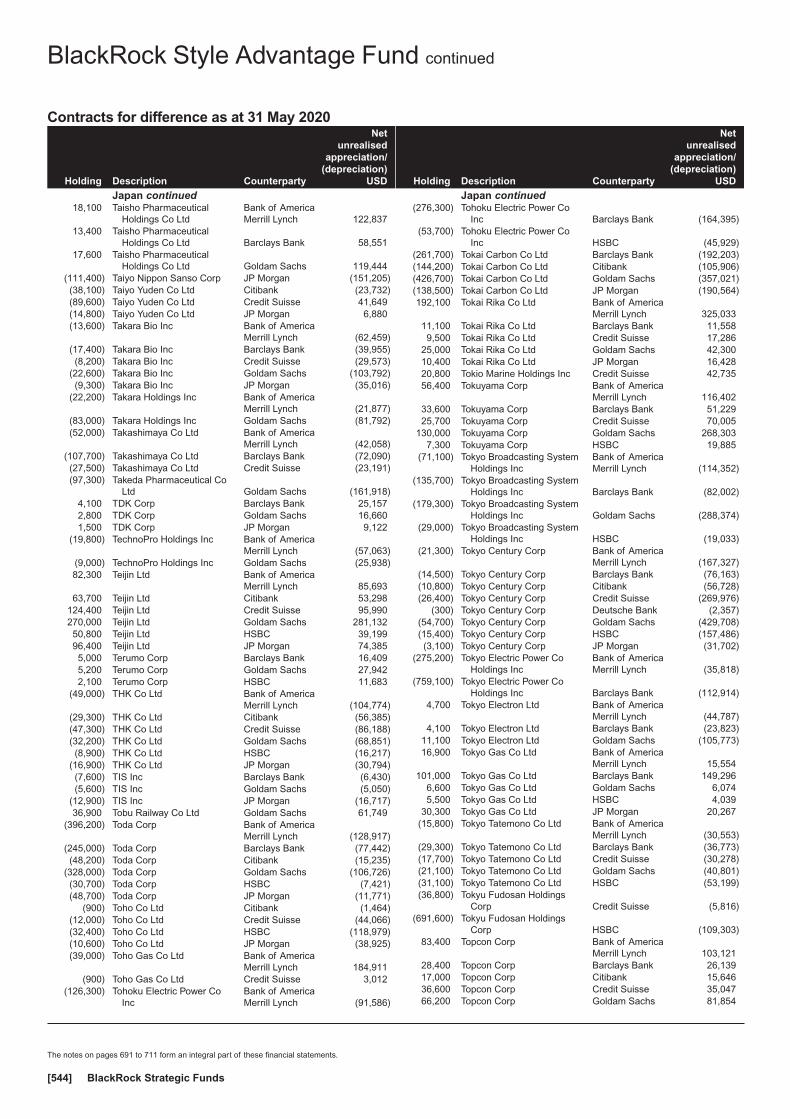
Contracts for difference as at 31 May 2020
Holding Description Counterparty
Netunrealised
appreciation/(depreciation)
USD
Japan continued18,100 Taisho Pharmaceutical
Holdings Co LtdBank of AmericaMerrill Lynch 122,837
13,400 Taisho PharmaceuticalHoldings Co Ltd Barclays Bank 58,551
17,600 Taisho PharmaceuticalHoldings Co Ltd Goldam Sachs 119,444
(111,400) Taiyo Nippon Sanso Corp JP Morgan (151,205)(38,100) Taiyo Yuden Co Ltd Citibank (23,732)(89,600) Taiyo Yuden Co Ltd Credit Suisse 41,649(14,800) Taiyo Yuden Co Ltd JP Morgan 6,880(13,600) Takara Bio Inc Bank of America
Merrill Lynch (62,459)(17,400) Takara Bio Inc Barclays Bank (39,955)(8,200) Takara Bio Inc Credit Suisse (29,573)
(22,600) Takara Bio Inc Goldam Sachs (103,792)(9,300) Takara Bio Inc JP Morgan (35,016)
(22,200) Takara Holdings Inc Bank of AmericaMerrill Lynch (21,877)
(83,000) Takara Holdings Inc Goldam Sachs (81,792)(52,000) Takashimaya Co Ltd Bank of America
Merrill Lynch (42,058)(107,700) Takashimaya Co Ltd Barclays Bank (72,090)(27,500) Takashimaya Co Ltd Credit Suisse (23,191)(97,300) Takeda Pharmaceutical Co
Ltd Goldam Sachs (161,918)4,100 TDK Corp Barclays Bank 25,1572,800 TDK Corp Goldam Sachs 16,6601,500 TDK Corp JP Morgan 9,122
(19,800) TechnoPro Holdings Inc Bank of AmericaMerrill Lynch (57,063)
(9,000) TechnoPro Holdings Inc Goldam Sachs (25,938)82,300 Teijin Ltd Bank of America
Merrill Lynch 85,69363,700 Teijin Ltd Citibank 53,298
124,400 Teijin Ltd Credit Suisse 95,990270,000 Teijin Ltd Goldam Sachs 281,13250,800 Teijin Ltd HSBC 39,19996,400 Teijin Ltd JP Morgan 74,3855,000 Terumo Corp Barclays Bank 16,4095,200 Terumo Corp Goldam Sachs 27,9422,100 Terumo Corp HSBC 11,683
(49,000) THK Co Ltd Bank of AmericaMerrill Lynch (104,774)
(29,300) THK Co Ltd Citibank (56,385)(47,300) THK Co Ltd Credit Suisse (86,188)(32,200) THK Co Ltd Goldam Sachs (68,851)(8,900) THK Co Ltd HSBC (16,217)
(16,900) THK Co Ltd JP Morgan (30,794)(7,600) TIS Inc Barclays Bank (6,430)(5,600) TIS Inc Goldam Sachs (5,050)
(12,900) TIS Inc JP Morgan (16,717)36,900 Tobu Railway Co Ltd Goldam Sachs 61,749
(396,200) Toda Corp Bank of AmericaMerrill Lynch (128,917)
(245,000) Toda Corp Barclays Bank (77,442)(48,200) Toda Corp Citibank (15,235)
(328,000) Toda Corp Goldam Sachs (106,726)(30,700) Toda Corp HSBC (7,421)(48,700) Toda Corp JP Morgan (11,771)
(900) Toho Co Ltd Citibank (1,464)(12,000) Toho Co Ltd Credit Suisse (44,066)(32,400) Toho Co Ltd HSBC (118,979)(10,600) Toho Co Ltd JP Morgan (38,925)(39,000) Toho Gas Co Ltd Bank of America
Merrill Lynch 184,911(900) Toho Gas Co Ltd Credit Suisse 3,012
(126,300) Tohoku Electric Power CoInc
Bank of AmericaMerrill Lynch (91,586)
Holding Description Counterparty
Netunrealised
appreciation/(depreciation)
USD
Japan continued(276,300) Tohoku Electric Power Co
Inc Barclays Bank (164,395)(53,700) Tohoku Electric Power Co
Inc HSBC (45,929)(261,700) Tokai Carbon Co Ltd Barclays Bank (192,203)(144,200) Tokai Carbon Co Ltd Citibank (105,906)(426,700) Tokai Carbon Co Ltd Goldam Sachs (357,021)(138,500) Tokai Carbon Co Ltd JP Morgan (190,564)192,100 Tokai Rika Co Ltd Bank of America
Merrill Lynch 325,03311,100 Tokai Rika Co Ltd Barclays Bank 11,5589,500 Tokai Rika Co Ltd Credit Suisse 17,286
25,000 Tokai Rika Co Ltd Goldam Sachs 42,30010,400 Tokai Rika Co Ltd JP Morgan 16,42820,800 Tokio Marine Holdings Inc Credit Suisse 42,73556,400 Tokuyama Corp Bank of America
Merrill Lynch 116,40233,600 Tokuyama Corp Barclays Bank 51,22925,700 Tokuyama Corp Credit Suisse 70,005
130,000 Tokuyama Corp Goldam Sachs 268,3037,300 Tokuyama Corp HSBC 19,885
(71,100) Tokyo Broadcasting SystemHoldings Inc
Bank of AmericaMerrill Lynch (114,352)
(135,700) Tokyo Broadcasting SystemHoldings Inc Barclays Bank (82,002)
(179,300) Tokyo Broadcasting SystemHoldings Inc Goldam Sachs (288,374)
(29,000) Tokyo Broadcasting SystemHoldings Inc HSBC (19,033)
(21,300) Tokyo Century Corp Bank of AmericaMerrill Lynch (167,327)
(14,500) Tokyo Century Corp Barclays Bank (76,163)(10,800) Tokyo Century Corp Citibank (56,728)(26,400) Tokyo Century Corp Credit Suisse (269,976)
(300) Tokyo Century Corp Deutsche Bank (2,357)(54,700) Tokyo Century Corp Goldam Sachs (429,708)(15,400) Tokyo Century Corp HSBC (157,486)(3,100) Tokyo Century Corp JP Morgan (31,702)
(275,200) Tokyo Electric Power CoHoldings Inc
Bank of AmericaMerrill Lynch (35,818)
(759,100) Tokyo Electric Power CoHoldings Inc Barclays Bank (112,914)
4,700 Tokyo Electron Ltd Bank of AmericaMerrill Lynch (44,787)
4,100 Tokyo Electron Ltd Barclays Bank (23,823)11,100 Tokyo Electron Ltd Goldam Sachs (105,773)16,900 Tokyo Gas Co Ltd Bank of America
Merrill Lynch 15,554101,000 Tokyo Gas Co Ltd Barclays Bank 149,296
6,600 Tokyo Gas Co Ltd Goldam Sachs 6,0745,500 Tokyo Gas Co Ltd HSBC 4,039
30,300 Tokyo Gas Co Ltd JP Morgan 20,267(15,800) Tokyo Tatemono Co Ltd Bank of America
Merrill Lynch (30,553)(29,300) Tokyo Tatemono Co Ltd Barclays Bank (36,773)(17,700) Tokyo Tatemono Co Ltd Credit Suisse (30,278)(21,100) Tokyo Tatemono Co Ltd Goldam Sachs (40,801)(31,100) Tokyo Tatemono Co Ltd HSBC (53,199)(36,800) Tokyu Fudosan Holdings
Corp Credit Suisse (5,816)(691,600) Tokyu Fudosan Holdings
Corp HSBC (109,303)83,400 Topcon Corp Bank of America
Merrill Lynch 103,12128,400 Topcon Corp Barclays Bank 26,13917,000 Topcon Corp Citibank 15,64636,600 Topcon Corp Credit Suisse 35,04766,200 Topcon Corp Goldam Sachs 81,854
BlackRock Style Advantage Fund continued
The notes on pages 691 to 711 form an integral part of these financial statements.
BlackRock Strategic Funds[544]
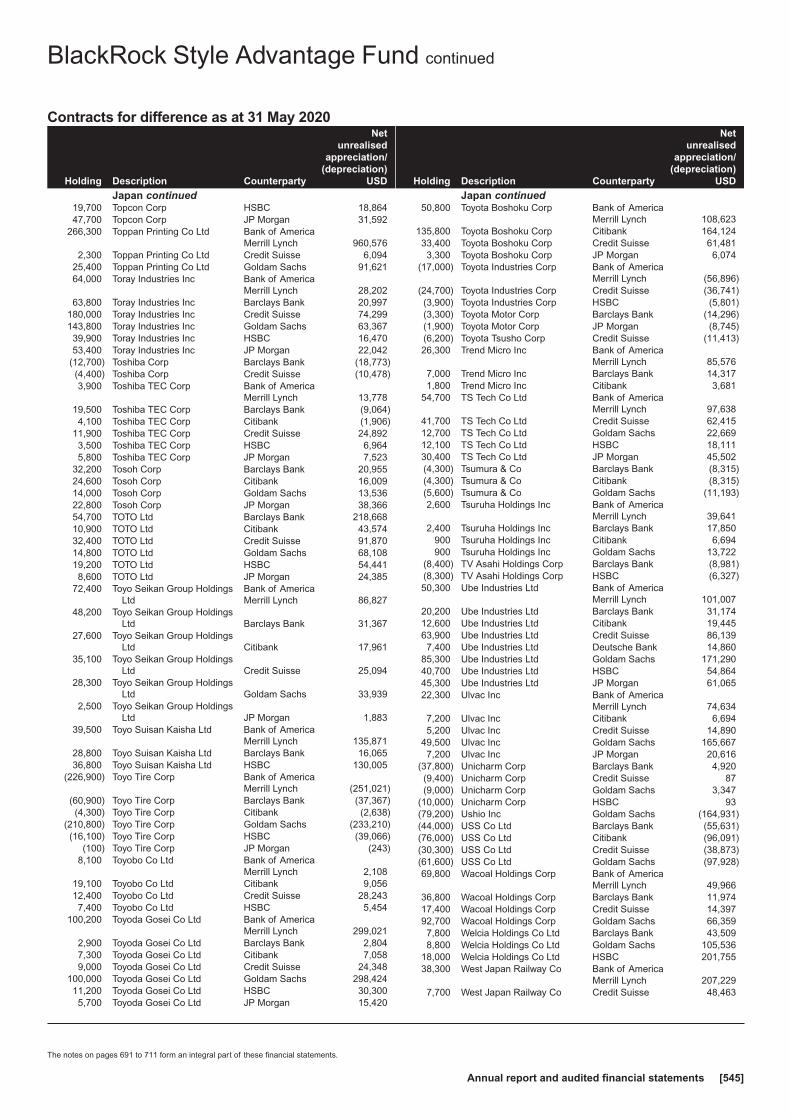
Contracts for difference as at 31 May 2020
Holding Description Counterparty
Netunrealised
appreciation/(depreciation)
USD
Japan continued19,700 Topcon Corp HSBC 18,86447,700 Topcon Corp JP Morgan 31,592
266,300 Toppan Printing Co Ltd Bank of AmericaMerrill Lynch 960,576
2,300 Toppan Printing Co Ltd Credit Suisse 6,09425,400 Toppan Printing Co Ltd Goldam Sachs 91,62164,000 Toray Industries Inc Bank of America
Merrill Lynch 28,20263,800 Toray Industries Inc Barclays Bank 20,997
180,000 Toray Industries Inc Credit Suisse 74,299143,800 Toray Industries Inc Goldam Sachs 63,36739,900 Toray Industries Inc HSBC 16,47053,400 Toray Industries Inc JP Morgan 22,042
(12,700) Toshiba Corp Barclays Bank (18,773)(4,400) Toshiba Corp Credit Suisse (10,478)3,900 Toshiba TEC Corp Bank of America
Merrill Lynch 13,77819,500 Toshiba TEC Corp Barclays Bank (9,064)4,100 Toshiba TEC Corp Citibank (1,906)
11,900 Toshiba TEC Corp Credit Suisse 24,8923,500 Toshiba TEC Corp HSBC 6,9645,800 Toshiba TEC Corp JP Morgan 7,523
32,200 Tosoh Corp Barclays Bank 20,95524,600 Tosoh Corp Citibank 16,00914,000 Tosoh Corp Goldam Sachs 13,53622,800 Tosoh Corp JP Morgan 38,36654,700 TOTO Ltd Barclays Bank 218,66810,900 TOTO Ltd Citibank 43,57432,400 TOTO Ltd Credit Suisse 91,87014,800 TOTO Ltd Goldam Sachs 68,10819,200 TOTO Ltd HSBC 54,4418,600 TOTO Ltd JP Morgan 24,385
72,400 Toyo Seikan Group HoldingsLtd
Bank of AmericaMerrill Lynch 86,827
48,200 Toyo Seikan Group HoldingsLtd Barclays Bank 31,367
27,600 Toyo Seikan Group HoldingsLtd Citibank 17,961
35,100 Toyo Seikan Group HoldingsLtd Credit Suisse 25,094
28,300 Toyo Seikan Group HoldingsLtd Goldam Sachs 33,939
2,500 Toyo Seikan Group HoldingsLtd JP Morgan 1,883
39,500 Toyo Suisan Kaisha Ltd Bank of AmericaMerrill Lynch 135,871
28,800 Toyo Suisan Kaisha Ltd Barclays Bank 16,06536,800 Toyo Suisan Kaisha Ltd HSBC 130,005
(226,900) Toyo Tire Corp Bank of AmericaMerrill Lynch (251,021)
(60,900) Toyo Tire Corp Barclays Bank (37,367)(4,300) Toyo Tire Corp Citibank (2,638)
(210,800) Toyo Tire Corp Goldam Sachs (233,210)(16,100) Toyo Tire Corp HSBC (39,066)
(100) Toyo Tire Corp JP Morgan (243)8,100 Toyobo Co Ltd Bank of America
Merrill Lynch 2,10819,100 Toyobo Co Ltd Citibank 9,05612,400 Toyobo Co Ltd Credit Suisse 28,2437,400 Toyobo Co Ltd HSBC 5,454
100,200 Toyoda Gosei Co Ltd Bank of AmericaMerrill Lynch 299,021
2,900 Toyoda Gosei Co Ltd Barclays Bank 2,8047,300 Toyoda Gosei Co Ltd Citibank 7,0589,000 Toyoda Gosei Co Ltd Credit Suisse 24,348
100,000 Toyoda Gosei Co Ltd Goldam Sachs 298,42411,200 Toyoda Gosei Co Ltd HSBC 30,3005,700 Toyoda Gosei Co Ltd JP Morgan 15,420
Holding Description Counterparty
Netunrealised
appreciation/(depreciation)
USD
Japan continued50,800 Toyota Boshoku Corp Bank of America
Merrill Lynch 108,623135,800 Toyota Boshoku Corp Citibank 164,12433,400 Toyota Boshoku Corp Credit Suisse 61,4813,300 Toyota Boshoku Corp JP Morgan 6,074
(17,000) Toyota Industries Corp Bank of AmericaMerrill Lynch (56,896)
(24,700) Toyota Industries Corp Credit Suisse (36,741)(3,900) Toyota Industries Corp HSBC (5,801)(3,300) Toyota Motor Corp Barclays Bank (14,296)(1,900) Toyota Motor Corp JP Morgan (8,745)(6,200) Toyota Tsusho Corp Credit Suisse (11,413)26,300 Trend Micro Inc Bank of America
Merrill Lynch 85,5767,000 Trend Micro Inc Barclays Bank 14,3171,800 Trend Micro Inc Citibank 3,681
54,700 TS Tech Co Ltd Bank of AmericaMerrill Lynch 97,638
41,700 TS Tech Co Ltd Credit Suisse 62,41512,700 TS Tech Co Ltd Goldam Sachs 22,66912,100 TS Tech Co Ltd HSBC 18,11130,400 TS Tech Co Ltd JP Morgan 45,502(4,300) Tsumura & Co Barclays Bank (8,315)(4,300) Tsumura & Co Citibank (8,315)(5,600) Tsumura & Co Goldam Sachs (11,193)2,600 Tsuruha Holdings Inc Bank of America
Merrill Lynch 39,6412,400 Tsuruha Holdings Inc Barclays Bank 17,850
900 Tsuruha Holdings Inc Citibank 6,694900 Tsuruha Holdings Inc Goldam Sachs 13,722
(8,400) TV Asahi Holdings Corp Barclays Bank (8,981)(8,300) TV Asahi Holdings Corp HSBC (6,327)50,300 Ube Industries Ltd Bank of America
Merrill Lynch 101,00720,200 Ube Industries Ltd Barclays Bank 31,17412,600 Ube Industries Ltd Citibank 19,44563,900 Ube Industries Ltd Credit Suisse 86,1397,400 Ube Industries Ltd Deutsche Bank 14,860
85,300 Ube Industries Ltd Goldam Sachs 171,29040,700 Ube Industries Ltd HSBC 54,86445,300 Ube Industries Ltd JP Morgan 61,06522,300 Ulvac Inc Bank of America
Merrill Lynch 74,6347,200 Ulvac Inc Citibank 6,6945,200 Ulvac Inc Credit Suisse 14,890
49,500 Ulvac Inc Goldam Sachs 165,6677,200 Ulvac Inc JP Morgan 20,616
(37,800) Unicharm Corp Barclays Bank 4,920(9,400) Unicharm Corp Credit Suisse 87(9,000) Unicharm Corp Goldam Sachs 3,347
(10,000) Unicharm Corp HSBC 93(79,200) Ushio Inc Goldam Sachs (164,931)(44,000) USS Co Ltd Barclays Bank (55,631)(76,000) USS Co Ltd Citibank (96,091)(30,300) USS Co Ltd Credit Suisse (38,873)(61,600) USS Co Ltd Goldam Sachs (97,928)69,800 Wacoal Holdings Corp Bank of America
Merrill Lynch 49,96636,800 Wacoal Holdings Corp Barclays Bank 11,97417,400 Wacoal Holdings Corp Credit Suisse 14,39792,700 Wacoal Holdings Corp Goldam Sachs 66,3597,800 Welcia Holdings Co Ltd Barclays Bank 43,5098,800 Welcia Holdings Co Ltd Goldam Sachs 105,536
18,000 Welcia Holdings Co Ltd HSBC 201,75538,300 West Japan Railway Co Bank of America
Merrill Lynch 207,2297,700 West Japan Railway Co Credit Suisse 48,463
BlackRock Style Advantage Fund continued
The notes on pages 691 to 711 form an integral part of these financial statements.
Annual report and audited financial statements [545]
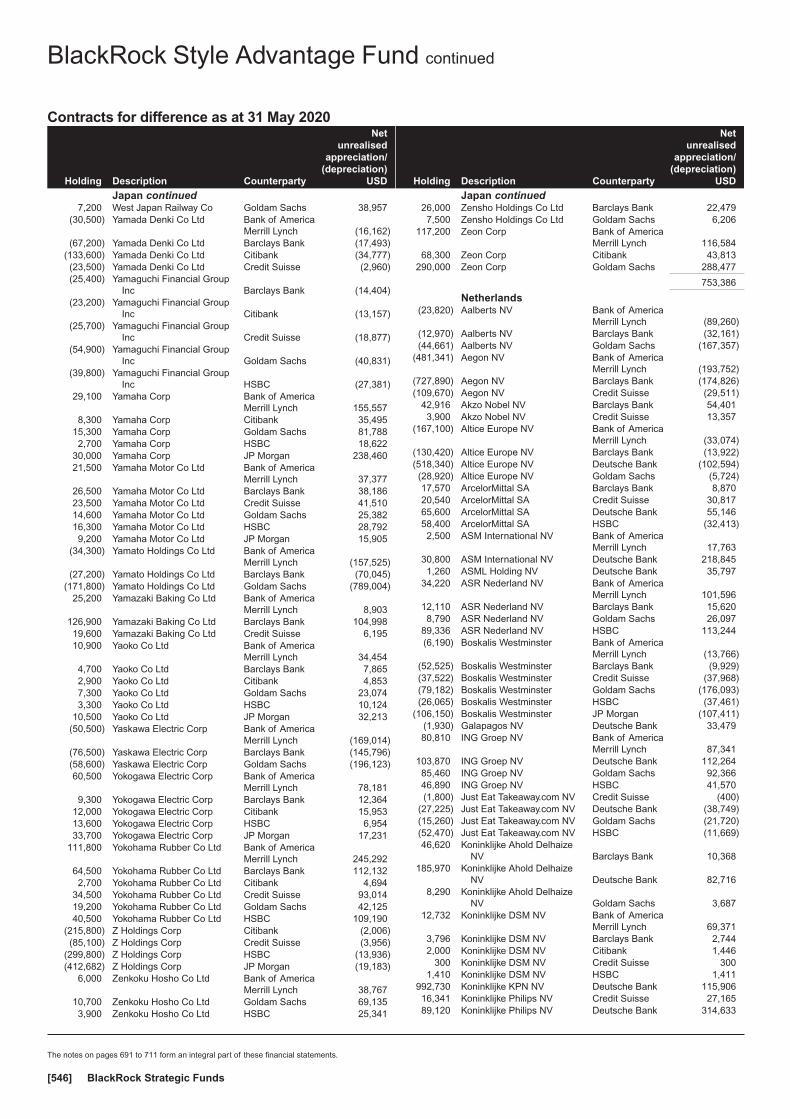
Contracts for difference as at 31 May 2020
Holding Description Counterparty
Netunrealised
appreciation/(depreciation)
USD
Japan continued7,200 West Japan Railway Co Goldam Sachs 38,957
(30,500) Yamada Denki Co Ltd Bank of AmericaMerrill Lynch (16,162)
(67,200) Yamada Denki Co Ltd Barclays Bank (17,493)(133,600) Yamada Denki Co Ltd Citibank (34,777)(23,500) Yamada Denki Co Ltd Credit Suisse (2,960)(25,400) Yamaguchi Financial Group
Inc Barclays Bank (14,404)(23,200) Yamaguchi Financial Group
Inc Citibank (13,157)(25,700) Yamaguchi Financial Group
Inc Credit Suisse (18,877)(54,900) Yamaguchi Financial Group
Inc Goldam Sachs (40,831)(39,800) Yamaguchi Financial Group
Inc HSBC (27,381)29,100 Yamaha Corp Bank of America
Merrill Lynch 155,5578,300 Yamaha Corp Citibank 35,495
15,300 Yamaha Corp Goldam Sachs 81,7882,700 Yamaha Corp HSBC 18,622
30,000 Yamaha Corp JP Morgan 238,46021,500 Yamaha Motor Co Ltd Bank of America
Merrill Lynch 37,37726,500 Yamaha Motor Co Ltd Barclays Bank 38,18623,500 Yamaha Motor Co Ltd Credit Suisse 41,51014,600 Yamaha Motor Co Ltd Goldam Sachs 25,38216,300 Yamaha Motor Co Ltd HSBC 28,7929,200 Yamaha Motor Co Ltd JP Morgan 15,905
(34,300) Yamato Holdings Co Ltd Bank of AmericaMerrill Lynch (157,525)
(27,200) Yamato Holdings Co Ltd Barclays Bank (70,045)(171,800) Yamato Holdings Co Ltd Goldam Sachs (789,004)
25,200 Yamazaki Baking Co Ltd Bank of AmericaMerrill Lynch 8,903
126,900 Yamazaki Baking Co Ltd Barclays Bank 104,99819,600 Yamazaki Baking Co Ltd Credit Suisse 6,19510,900 Yaoko Co Ltd Bank of America
Merrill Lynch 34,4544,700 Yaoko Co Ltd Barclays Bank 7,8652,900 Yaoko Co Ltd Citibank 4,8537,300 Yaoko Co Ltd Goldam Sachs 23,0743,300 Yaoko Co Ltd HSBC 10,124
10,500 Yaoko Co Ltd JP Morgan 32,213(50,500) Yaskawa Electric Corp Bank of America
Merrill Lynch (169,014)(76,500) Yaskawa Electric Corp Barclays Bank (145,796)(58,600) Yaskawa Electric Corp Goldam Sachs (196,123)60,500 Yokogawa Electric Corp Bank of America
Merrill Lynch 78,1819,300 Yokogawa Electric Corp Barclays Bank 12,364
12,000 Yokogawa Electric Corp Citibank 15,95313,600 Yokogawa Electric Corp HSBC 6,95433,700 Yokogawa Electric Corp JP Morgan 17,231
111,800 Yokohama Rubber Co Ltd Bank of AmericaMerrill Lynch 245,292
64,500 Yokohama Rubber Co Ltd Barclays Bank 112,1322,700 Yokohama Rubber Co Ltd Citibank 4,694
34,500 Yokohama Rubber Co Ltd Credit Suisse 93,01419,200 Yokohama Rubber Co Ltd Goldam Sachs 42,12540,500 Yokohama Rubber Co Ltd HSBC 109,190
(215,800) Z Holdings Corp Citibank (2,006)(85,100) Z Holdings Corp Credit Suisse (3,956)
(299,800) Z Holdings Corp HSBC (13,936)(412,682) Z Holdings Corp JP Morgan (19,183)
6,000 Zenkoku Hosho Co Ltd Bank of AmericaMerrill Lynch 38,767
10,700 Zenkoku Hosho Co Ltd Goldam Sachs 69,1353,900 Zenkoku Hosho Co Ltd HSBC 25,341
Holding Description Counterparty
Netunrealised
appreciation/(depreciation)
USD
Japan continued26,000 Zensho Holdings Co Ltd Barclays Bank 22,4797,500 Zensho Holdings Co Ltd Goldam Sachs 6,206
117,200 Zeon Corp Bank of AmericaMerrill Lynch 116,584
68,300 Zeon Corp Citibank 43,813290,000 Zeon Corp Goldam Sachs 288,477
753,386
Netherlands(23,820) Aalberts NV Bank of America
Merrill Lynch (89,260)(12,970) Aalberts NV Barclays Bank (32,161)(44,661) Aalberts NV Goldam Sachs (167,357)
(481,341) Aegon NV Bank of AmericaMerrill Lynch (193,752)
(727,890) Aegon NV Barclays Bank (174,826)(109,670) Aegon NV Credit Suisse (29,511)
42,916 Akzo Nobel NV Barclays Bank 54,4013,900 Akzo Nobel NV Credit Suisse 13,357
(167,100) Altice Europe NV Bank of AmericaMerrill Lynch (33,074)
(130,420) Altice Europe NV Barclays Bank (13,922)(518,340) Altice Europe NV Deutsche Bank (102,594)(28,920) Altice Europe NV Goldam Sachs (5,724)17,570 ArcelorMittal SA Barclays Bank 8,87020,540 ArcelorMittal SA Credit Suisse 30,81765,600 ArcelorMittal SA Deutsche Bank 55,14658,400 ArcelorMittal SA HSBC (32,413)2,500 ASM International NV Bank of America
Merrill Lynch 17,76330,800 ASM International NV Deutsche Bank 218,8451,260 ASML Holding NV Deutsche Bank 35,797
34,220 ASR Nederland NV Bank of AmericaMerrill Lynch 101,596
12,110 ASR Nederland NV Barclays Bank 15,6208,790 ASR Nederland NV Goldam Sachs 26,097
89,336 ASR Nederland NV HSBC 113,244(6,190) Boskalis Westminster Bank of America
Merrill Lynch (13,766)(52,525) Boskalis Westminster Barclays Bank (9,929)(37,522) Boskalis Westminster Credit Suisse (37,968)(79,182) Boskalis Westminster Goldam Sachs (176,093)(26,065) Boskalis Westminster HSBC (37,461)
(106,150) Boskalis Westminster JP Morgan (107,411)(1,930) Galapagos NV Deutsche Bank 33,47980,810 ING Groep NV Bank of America
Merrill Lynch 87,341103,870 ING Groep NV Deutsche Bank 112,26485,460 ING Groep NV Goldam Sachs 92,36646,890 ING Groep NV HSBC 41,570(1,800) Just Eat Takeaway.com NV Credit Suisse (400)
(27,225) Just Eat Takeaway.com NV Deutsche Bank (38,749)(15,260) Just Eat Takeaway.com NV Goldam Sachs (21,720)(52,470) Just Eat Takeaway.com NV HSBC (11,669)46,620 Koninklijke Ahold Delhaize
NV Barclays Bank 10,368185,970 Koninklijke Ahold Delhaize
NV Deutsche Bank 82,7168,290 Koninklijke Ahold Delhaize
NV Goldam Sachs 3,68712,732 Koninklijke DSM NV Bank of America
Merrill Lynch 69,3713,796 Koninklijke DSM NV Barclays Bank 2,7442,000 Koninklijke DSM NV Citibank 1,446
300 Koninklijke DSM NV Credit Suisse 3001,410 Koninklijke DSM NV HSBC 1,411
992,730 Koninklijke KPN NV Deutsche Bank 115,90616,341 Koninklijke Philips NV Credit Suisse 27,16589,120 Koninklijke Philips NV Deutsche Bank 314,633
BlackRock Style Advantage Fund continued
The notes on pages 691 to 711 form an integral part of these financial statements.
BlackRock Strategic Funds[546]
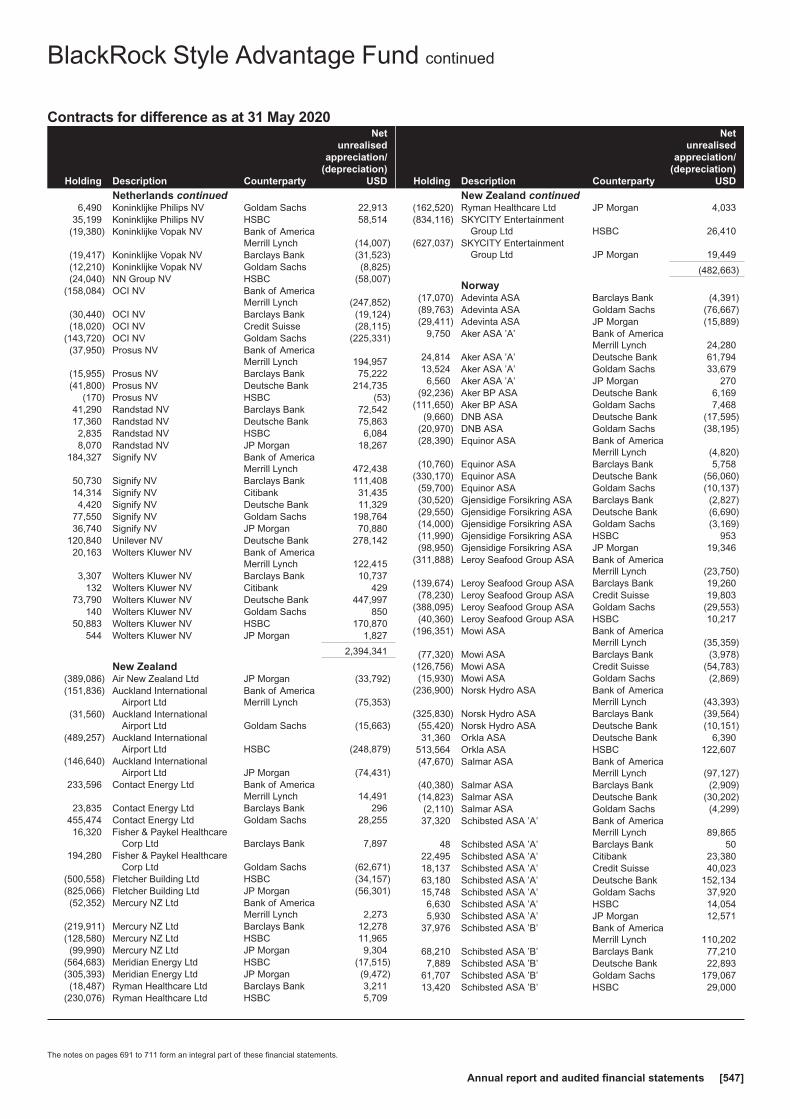
Contracts for difference as at 31 May 2020
Holding Description Counterparty
Netunrealised
appreciation/(depreciation)
USD
Netherlands continued6,490 Koninklijke Philips NV Goldam Sachs 22,913
35,199 Koninklijke Philips NV HSBC 58,514(19,380) Koninklijke Vopak NV Bank of America
Merrill Lynch (14,007)(19,417) Koninklijke Vopak NV Barclays Bank (31,523)(12,210) Koninklijke Vopak NV Goldam Sachs (8,825)(24,040) NN Group NV HSBC (58,007)
(158,084) OCI NV Bank of AmericaMerrill Lynch (247,852)
(30,440) OCI NV Barclays Bank (19,124)(18,020) OCI NV Credit Suisse (28,115)
(143,720) OCI NV Goldam Sachs (225,331)(37,950) Prosus NV Bank of America
Merrill Lynch 194,957(15,955) Prosus NV Barclays Bank 75,222(41,800) Prosus NV Deutsche Bank 214,735
(170) Prosus NV HSBC (53)41,290 Randstad NV Barclays Bank 72,54217,360 Randstad NV Deutsche Bank 75,8632,835 Randstad NV HSBC 6,0848,070 Randstad NV JP Morgan 18,267
184,327 Signify NV Bank of AmericaMerrill Lynch 472,438
50,730 Signify NV Barclays Bank 111,40814,314 Signify NV Citibank 31,4354,420 Signify NV Deutsche Bank 11,329
77,550 Signify NV Goldam Sachs 198,76436,740 Signify NV JP Morgan 70,880
120,840 Unilever NV Deutsche Bank 278,14220,163 Wolters Kluwer NV Bank of America
Merrill Lynch 122,4153,307 Wolters Kluwer NV Barclays Bank 10,737
132 Wolters Kluwer NV Citibank 42973,790 Wolters Kluwer NV Deutsche Bank 447,997
140 Wolters Kluwer NV Goldam Sachs 85050,883 Wolters Kluwer NV HSBC 170,870
544 Wolters Kluwer NV JP Morgan 1,827
2,394,341
New Zealand(389,086) Air New Zealand Ltd JP Morgan (33,792)(151,836) Auckland International
Airport LtdBank of AmericaMerrill Lynch (75,353)
(31,560) Auckland InternationalAirport Ltd Goldam Sachs (15,663)
(489,257) Auckland InternationalAirport Ltd HSBC (248,879)
(146,640) Auckland InternationalAirport Ltd JP Morgan (74,431)
233,596 Contact Energy Ltd Bank of AmericaMerrill Lynch 14,491
23,835 Contact Energy Ltd Barclays Bank 296455,474 Contact Energy Ltd Goldam Sachs 28,25516,320 Fisher & Paykel Healthcare
Corp Ltd Barclays Bank 7,897194,280 Fisher & Paykel Healthcare
Corp Ltd Goldam Sachs (62,671)(500,558) Fletcher Building Ltd HSBC (34,157)(825,066) Fletcher Building Ltd JP Morgan (56,301)(52,352) Mercury NZ Ltd Bank of America
Merrill Lynch 2,273(219,911) Mercury NZ Ltd Barclays Bank 12,278(128,580) Mercury NZ Ltd HSBC 11,965(99,990) Mercury NZ Ltd JP Morgan 9,304
(564,683) Meridian Energy Ltd HSBC (17,515)(305,393) Meridian Energy Ltd JP Morgan (9,472)(18,487) Ryman Healthcare Ltd Barclays Bank 3,211
(230,076) Ryman Healthcare Ltd HSBC 5,709
Holding Description Counterparty
Netunrealised
appreciation/(depreciation)
USD
New Zealand continued(162,520) Ryman Healthcare Ltd JP Morgan 4,033(834,116) SKYCITY Entertainment
Group Ltd HSBC 26,410(627,037) SKYCITY Entertainment
Group Ltd JP Morgan 19,449
(482,663)
Norway(17,070) Adevinta ASA Barclays Bank (4,391)(89,763) Adevinta ASA Goldam Sachs (76,667)(29,411) Adevinta ASA JP Morgan (15,889)
9,750 Aker ASA ’A’ Bank of AmericaMerrill Lynch 24,280
24,814 Aker ASA ’A’ Deutsche Bank 61,79413,524 Aker ASA ’A’ Goldam Sachs 33,6796,560 Aker ASA ’A’ JP Morgan 270
(92,236) Aker BP ASA Deutsche Bank 6,169(111,650) Aker BP ASA Goldam Sachs 7,468
(9,660) DNB ASA Deutsche Bank (17,595)(20,970) DNB ASA Goldam Sachs (38,195)(28,390) Equinor ASA Bank of America
Merrill Lynch (4,820)(10,760) Equinor ASA Barclays Bank 5,758
(330,170) Equinor ASA Deutsche Bank (56,060)(59,700) Equinor ASA Goldam Sachs (10,137)(30,520) Gjensidige Forsikring ASA Barclays Bank (2,827)(29,550) Gjensidige Forsikring ASA Deutsche Bank (6,690)(14,000) Gjensidige Forsikring ASA Goldam Sachs (3,169)(11,990) Gjensidige Forsikring ASA HSBC 953(98,950) Gjensidige Forsikring ASA JP Morgan 19,346
(311,888) Leroy Seafood Group ASA Bank of AmericaMerrill Lynch (23,750)
(139,674) Leroy Seafood Group ASA Barclays Bank 19,260(78,230) Leroy Seafood Group ASA Credit Suisse 19,803
(388,095) Leroy Seafood Group ASA Goldam Sachs (29,553)(40,360) Leroy Seafood Group ASA HSBC 10,217
(196,351) Mowi ASA Bank of AmericaMerrill Lynch (35,359)
(77,320) Mowi ASA Barclays Bank (3,978)(126,756) Mowi ASA Credit Suisse (54,783)(15,930) Mowi ASA Goldam Sachs (2,869)
(236,900) Norsk Hydro ASA Bank of AmericaMerrill Lynch (43,393)
(325,830) Norsk Hydro ASA Barclays Bank (39,564)(55,420) Norsk Hydro ASA Deutsche Bank (10,151)31,360 Orkla ASA Deutsche Bank 6,390
513,564 Orkla ASA HSBC 122,607(47,670) Salmar ASA Bank of America
Merrill Lynch (97,127)(40,380) Salmar ASA Barclays Bank (2,909)(14,823) Salmar ASA Deutsche Bank (30,202)(2,110) Salmar ASA Goldam Sachs (4,299)37,320 Schibsted ASA ’A’ Bank of America
Merrill Lynch 89,86548 Schibsted ASA ’A’ Barclays Bank 50
22,495 Schibsted ASA ’A’ Citibank 23,38018,137 Schibsted ASA ’A’ Credit Suisse 40,02363,180 Schibsted ASA ’A’ Deutsche Bank 152,13415,748 Schibsted ASA ’A’ Goldam Sachs 37,9206,630 Schibsted ASA ’A’ HSBC 14,0545,930 Schibsted ASA ’A’ JP Morgan 12,571
37,976 Schibsted ASA ’B’ Bank of AmericaMerrill Lynch 110,202
68,210 Schibsted ASA ’B’ Barclays Bank 77,2107,889 Schibsted ASA ’B’ Deutsche Bank 22,893
61,707 Schibsted ASA ’B’ Goldam Sachs 179,06713,420 Schibsted ASA ’B’ HSBC 29,000
BlackRock Style Advantage Fund continued
The notes on pages 691 to 711 form an integral part of these financial statements.
Annual report and audited financial statements [547]
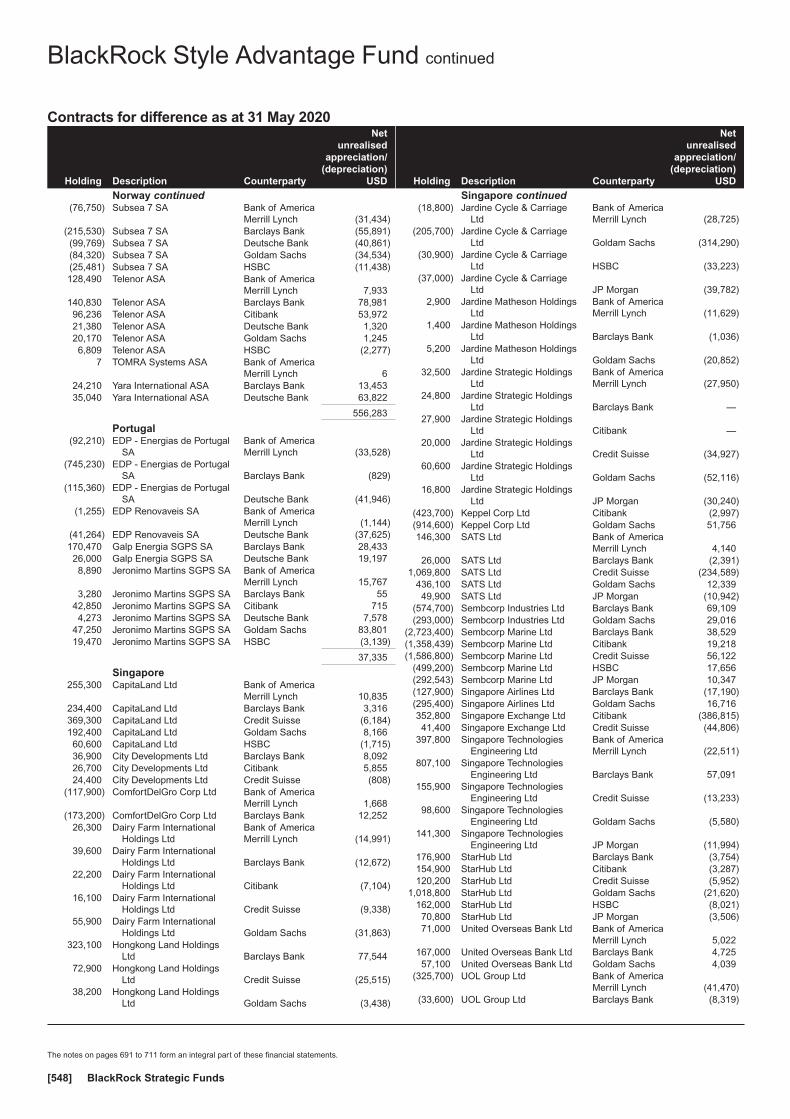
Contracts for difference as at 31 May 2020
Holding Description Counterparty
Netunrealised
appreciation/(depreciation)
USD
Norway continued(76,750) Subsea 7 SA Bank of America
Merrill Lynch (31,434)(215,530) Subsea 7 SA Barclays Bank (55,891)(99,769) Subsea 7 SA Deutsche Bank (40,861)(84,320) Subsea 7 SA Goldam Sachs (34,534)(25,481) Subsea 7 SA HSBC (11,438)128,490 Telenor ASA Bank of America
Merrill Lynch 7,933140,830 Telenor ASA Barclays Bank 78,98196,236 Telenor ASA Citibank 53,97221,380 Telenor ASA Deutsche Bank 1,32020,170 Telenor ASA Goldam Sachs 1,2456,809 Telenor ASA HSBC (2,277)
7 TOMRA Systems ASA Bank of AmericaMerrill Lynch 6
24,210 Yara International ASA Barclays Bank 13,45335,040 Yara International ASA Deutsche Bank 63,822
556,283
Portugal(92,210) EDP - Energias de Portugal
SABank of AmericaMerrill Lynch (33,528)
(745,230) EDP - Energias de PortugalSA Barclays Bank (829)
(115,360) EDP - Energias de PortugalSA Deutsche Bank (41,946)
(1,255) EDP Renovaveis SA Bank of AmericaMerrill Lynch (1,144)
(41,264) EDP Renovaveis SA Deutsche Bank (37,625)170,470 Galp Energia SGPS SA Barclays Bank 28,43326,000 Galp Energia SGPS SA Deutsche Bank 19,1978,890 Jeronimo Martins SGPS SA Bank of America
Merrill Lynch 15,7673,280 Jeronimo Martins SGPS SA Barclays Bank 55
42,850 Jeronimo Martins SGPS SA Citibank 7154,273 Jeronimo Martins SGPS SA Deutsche Bank 7,578
47,250 Jeronimo Martins SGPS SA Goldam Sachs 83,80119,470 Jeronimo Martins SGPS SA HSBC (3,139)
37,335
Singapore255,300 CapitaLand Ltd Bank of America
Merrill Lynch 10,835234,400 CapitaLand Ltd Barclays Bank 3,316369,300 CapitaLand Ltd Credit Suisse (6,184)192,400 CapitaLand Ltd Goldam Sachs 8,16660,600 CapitaLand Ltd HSBC (1,715)36,900 City Developments Ltd Barclays Bank 8,09226,700 City Developments Ltd Citibank 5,85524,400 City Developments Ltd Credit Suisse (808)
(117,900) ComfortDelGro Corp Ltd Bank of AmericaMerrill Lynch 1,668
(173,200) ComfortDelGro Corp Ltd Barclays Bank 12,25226,300 Dairy Farm International
Holdings LtdBank of AmericaMerrill Lynch (14,991)
39,600 Dairy Farm InternationalHoldings Ltd Barclays Bank (12,672)
22,200 Dairy Farm InternationalHoldings Ltd Citibank (7,104)
16,100 Dairy Farm InternationalHoldings Ltd Credit Suisse (9,338)
55,900 Dairy Farm InternationalHoldings Ltd Goldam Sachs (31,863)
323,100 Hongkong Land HoldingsLtd Barclays Bank 77,544
72,900 Hongkong Land HoldingsLtd Credit Suisse (25,515)
38,200 Hongkong Land HoldingsLtd Goldam Sachs (3,438)
Holding Description Counterparty
Netunrealised
appreciation/(depreciation)
USD
Singapore continued(18,800) Jardine Cycle & Carriage
LtdBank of AmericaMerrill Lynch (28,725)
(205,700) Jardine Cycle & CarriageLtd Goldam Sachs (314,290)
(30,900) Jardine Cycle & CarriageLtd HSBC (33,223)
(37,000) Jardine Cycle & CarriageLtd JP Morgan (39,782)
2,900 Jardine Matheson HoldingsLtd
Bank of AmericaMerrill Lynch (11,629)
1,400 Jardine Matheson HoldingsLtd Barclays Bank (1,036)
5,200 Jardine Matheson HoldingsLtd Goldam Sachs (20,852)
32,500 Jardine Strategic HoldingsLtd
Bank of AmericaMerrill Lynch (27,950)
24,800 Jardine Strategic HoldingsLtd Barclays Bank —
27,900 Jardine Strategic HoldingsLtd Citibank —
20,000 Jardine Strategic HoldingsLtd Credit Suisse (34,927)
60,600 Jardine Strategic HoldingsLtd Goldam Sachs (52,116)
16,800 Jardine Strategic HoldingsLtd JP Morgan (30,240)
(423,700) Keppel Corp Ltd Citibank (2,997)(914,600) Keppel Corp Ltd Goldam Sachs 51,756146,300 SATS Ltd Bank of America
Merrill Lynch 4,14026,000 SATS Ltd Barclays Bank (2,391)
1,069,800 SATS Ltd Credit Suisse (234,589)436,100 SATS Ltd Goldam Sachs 12,33949,900 SATS Ltd JP Morgan (10,942)
(574,700) Sembcorp Industries Ltd Barclays Bank 69,109(293,000) Sembcorp Industries Ltd Goldam Sachs 29,016
(2,723,400) Sembcorp Marine Ltd Barclays Bank 38,529(1,358,439) Sembcorp Marine Ltd Citibank 19,218(1,586,800) Sembcorp Marine Ltd Credit Suisse 56,122
(499,200) Sembcorp Marine Ltd HSBC 17,656(292,543) Sembcorp Marine Ltd JP Morgan 10,347(127,900) Singapore Airlines Ltd Barclays Bank (17,190)(295,400) Singapore Airlines Ltd Goldam Sachs 16,716352,800 Singapore Exchange Ltd Citibank (386,815)41,400 Singapore Exchange Ltd Credit Suisse (44,806)
397,800 Singapore TechnologiesEngineering Ltd
Bank of AmericaMerrill Lynch (22,511)
807,100 Singapore TechnologiesEngineering Ltd Barclays Bank 57,091
155,900 Singapore TechnologiesEngineering Ltd Credit Suisse (13,233)
98,600 Singapore TechnologiesEngineering Ltd Goldam Sachs (5,580)
141,300 Singapore TechnologiesEngineering Ltd JP Morgan (11,994)
176,900 StarHub Ltd Barclays Bank (3,754)154,900 StarHub Ltd Citibank (3,287)120,200 StarHub Ltd Credit Suisse (5,952)
1,018,800 StarHub Ltd Goldam Sachs (21,620)162,000 StarHub Ltd HSBC (8,021)70,800 StarHub Ltd JP Morgan (3,506)71,000 United Overseas Bank Ltd Bank of America
Merrill Lynch 5,022167,000 United Overseas Bank Ltd Barclays Bank 4,72557,100 United Overseas Bank Ltd Goldam Sachs 4,039
(325,700) UOL Group Ltd Bank of AmericaMerrill Lynch (41,470)
(33,600) UOL Group Ltd Barclays Bank (8,319)
BlackRock Style Advantage Fund continued
The notes on pages 691 to 711 form an integral part of these financial statements.
BlackRock Strategic Funds[548]

Contracts for difference as at 31 May 2020
Holding Description Counterparty
Netunrealised
appreciation/(depreciation)
USD
Singapore continued(214,300) UOL Group Ltd Goldam Sachs (27,286)(69,200) Venture Corp Ltd Bank of America
Merrill Lynch 6,364(136,700) Venture Corp Ltd Barclays Bank —(143,000) Venture Corp Ltd Goldam Sachs 13,150(18,000) Venture Corp Ltd JP Morgan 3,998(95,000) Wilmar International Ltd Bank of America
Merrill Lynch (10,080)(88,200) Wilmar International Ltd Barclays Bank (12,478)(43,800) Wilmar International Ltd Goldam Sachs (4,647)(65,500) Wilmar International Ltd HSBC (23,629)181,800 Yanlord Land Group Ltd Citibank 6,430
1,231,600 Yanlord Land Group Ltd Credit Suisse 43,560363,300 Yanlord Land Group Ltd JP Morgan 12,849
(1,025,591)
South Korea2,230 Amorepacific Corp Barclays Bank (12,976)
15,730 AMOREPACIFIC Group Barclays Bank 29,6305,529 AMOREPACIFIC Group Citibank 10,4154,850 AMOREPACIFIC Group Goldam Sachs 9,662
10,910 AMOREPACIFIC Group JP Morgan (6,870)(1,310) AMOREPACIFIC Group
(Pref) Barclays Bank 891(47) AMOREPACIFIC Group
(Pref) Credit Suisse 166(252) AMOREPACIFIC Group
(Pref) JP Morgan 892(4,879) BGF retail Co Ltd JP Morgan (55,963)77,100 BNK Financial Group Inc Barclays Bank 24,54978,470 BNK Financial Group Inc Citibank 24,985
393,922 BNK Financial Group Inc Credit Suisse 44,792241,025 BNK Financial Group Inc Goldam Sachs 104,64161,882 BNK Financial Group Inc HSBC 7,03650,676 BNK Financial Group Inc JP Morgan 5,762(6,474) Celltrion Healthcare Co Ltd Barclays Bank 576
(64,996) Celltrion Healthcare Co Ltd Citibank 5,779(66,936) Celltrion Healthcare Co Ltd Credit Suisse (78,813)(7,224) Celltrion Healthcare Co Ltd HSBC (8,506)
(13,795) Celltrion Inc Credit Suisse 2,33572,120 Cheil Worldwide Inc Barclays Bank (24,494)
106,182 Cheil Worldwide Inc Credit Suisse (117,451)117,070 Cheil Worldwide Inc Goldam Sachs (42,782)
7,882 Cheil Worldwide Inc HSBC (8,719)8,571 CJ CheilJedang Corp Barclays Bank (33,674)
490 CJ CheilJedang Corp Goldam Sachs (5,289)1,680 CJ CheilJedang Corp HSBC 21,4012,349 CJ Corp Bank of America
Merrill Lynch 21,65316,100 CJ Corp Barclays Bank 41,5043,388 CJ Corp Citibank 8,7344,979 CJ Corp Credit Suisse 42,9387,007 CJ Corp Goldam Sachs 64,589
32,630 CJ Corp JP Morgan 281,39516,296 CJ ENM Co Ltd Barclays Bank 37,592(4,344) CJ Logistics Corp Citibank (18,630)
(14,210) CJ Logistics Corp JP Morgan (169,865)6,100 Coway Co Ltd Barclays Bank 11,4384,930 Coway Co Ltd Credit Suisse 15,357
13,100 Coway Co Ltd Goldam Sachs 46,81720,036 Coway Co Ltd JP Morgan 62,41139,882 Daelim Industrial Co Ltd Credit Suisse 314,31429,055 Daelim Industrial Co Ltd HSBC 228,986
(37,767) Daewoo Engineering &Construction Co Ltd Barclays Bank (10,392)
(667) Daewoo Engineering &Construction Co Ltd Goldam Sachs (177)
(136,542) Daewoo Engineering &Construction Co Ltd JP Morgan (22,664)
Holding Description Counterparty
Netunrealised
appreciation/(depreciation)
USD
South Korea continued83,694 Daewoo Shipbuilding &
Marine Engineering CoLtd Barclays Bank 322,989
7,533 Daewoo Shipbuilding &Marine Engineering CoLtd Citibank 29,071
6,282 Daewoo Shipbuilding &Marine Engineering CoLtd Credit Suisse 21,746
71,094 Daewoo Shipbuilding &Marine Engineering CoLtd Goldam Sachs 298,517
57,630 Daewoo Shipbuilding &Marine Engineering CoLtd HSBC 199,490
37,176 Daewoo Shipbuilding &Marine Engineering CoLtd JP Morgan 128,687
(14,770) DB Insurance Co Ltd Barclays Bank 31,076(33,144) DB Insurance Co Ltd Goldam Sachs 208,963(2,873) DB Insurance Co Ltd HSBC 5,65786,970 DGB Financial Group Inc Barclays Bank 19,590
115,587 DGB Financial Group Inc Credit Suisse 4,833290,340 DGB Financial Group Inc Goldam Sachs 99,852155,620 DGB Financial Group Inc HSBC 6,50610,769 DGB Financial Group Inc JP Morgan 450(3,406) Dongsuh Cos Inc Bank of America
Merrill Lynch 1,523(42,249) Dongsuh Cos Inc Citibank 17,769(26,801) Dongsuh Cos Inc Credit Suisse 19,792(10,792) Dongsuh Cos Inc JP Morgan 7,969164,305 Doosan Bobcat Inc HSBC 12,66911,980 Doosan Bobcat Inc JP Morgan 9246,490 Doosan Co Ltd Barclays Bank 5,533
1 Doosan Co Ltd Citibank 111,929 Doosan Co Ltd Credit Suisse (25,687)17,317 Doosan Co Ltd Goldam Sachs 22,843
(40,327) Doosan Heavy Industries &Construction Co Ltd Citibank (10,590)
194,470 Doosan Infracore Co Ltd Barclays Bank (45,011)336,974 Doosan Infracore Co Ltd Goldam Sachs (66,048)(39,881) Doosan Solus Co Ltd Citibank (162,816)(8,110) Doosan Solus Co Ltd JP Morgan (52,382)(7,770) E-MART Inc Barclays Bank (24,263)
(15,806) E-MART Inc Citibank (49,356)(18,456) E-MART Inc Credit Suisse 40,920(6,574) E-MART Inc JP Morgan 14,57681,670 GS Engineering &
Construction Corp Barclays Bank 291,5294,216 GS Engineering &
Construction Corp Credit Suisse 10,61584,743 GS Engineering &
Construction Corp Goldam Sachs 315,171280 GS Engineering &
Construction Corp HSBC 7055,040 GS Holdings Corp Barclays Bank (797)8,352 GS Holdings Corp Citibank (1,321)
30,143 GS Holdings Corp Credit Suisse (20,154)74,992 GS Holdings Corp Goldam Sachs 31,87466,625 GS Holdings Corp HSBC (69,157)41,801 GS Holdings Corp JP Morgan (43,390)11,671 GS Retail Co Ltd Barclays Bank 16,49718,690 GS Retail Co Ltd Goldam Sachs (2,373)18,203 GS Retail Co Ltd HSBC 51,66911,740 GS Retail Co Ltd JP Morgan 38,9306,817 Hana Financial Group Inc Citibank 24,602
33,860 Hana Financial Group Inc Credit Suisse 68,094101,160 Hana Financial Group Inc Goldam Sachs 346,87288,057 Hana Financial Group Inc HSBC 177,088
BlackRock Style Advantage Fund continued
The notes on pages 691 to 711 form an integral part of these financial statements.
Annual report and audited financial statements [549]
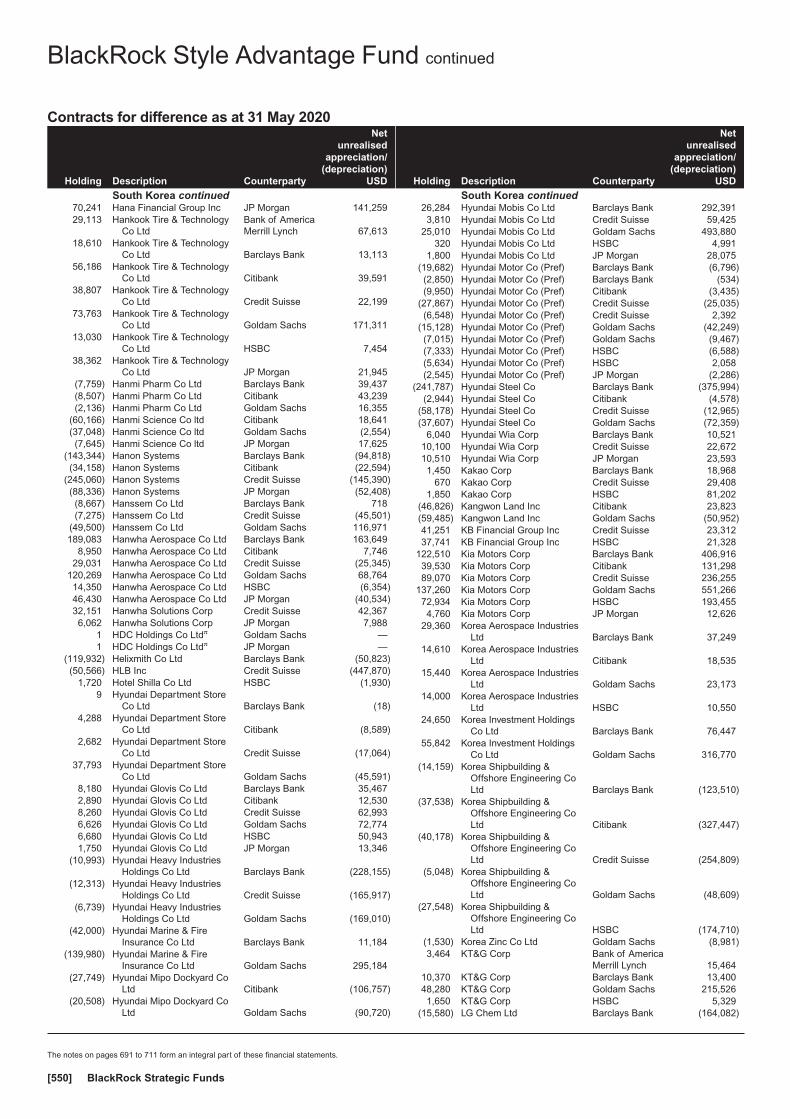
Contracts for difference as at 31 May 2020
Holding Description Counterparty
Netunrealised
appreciation/(depreciation)
USD
South Korea continued70,241 Hana Financial Group Inc JP Morgan 141,25929,113 Hankook Tire & Technology
Co LtdBank of AmericaMerrill Lynch 67,613
18,610 Hankook Tire & TechnologyCo Ltd Barclays Bank 13,113
56,186 Hankook Tire & TechnologyCo Ltd Citibank 39,591
38,807 Hankook Tire & TechnologyCo Ltd Credit Suisse 22,199
73,763 Hankook Tire & TechnologyCo Ltd Goldam Sachs 171,311
13,030 Hankook Tire & TechnologyCo Ltd HSBC 7,454
38,362 Hankook Tire & TechnologyCo Ltd JP Morgan 21,945
(7,759) Hanmi Pharm Co Ltd Barclays Bank 39,437(8,507) Hanmi Pharm Co Ltd Citibank 43,239(2,136) Hanmi Pharm Co Ltd Goldam Sachs 16,355
(60,166) Hanmi Science Co ltd Citibank 18,641(37,048) Hanmi Science Co ltd Goldam Sachs (2,554)(7,645) Hanmi Science Co ltd JP Morgan 17,625
(143,344) Hanon Systems Barclays Bank (94,818)(34,158) Hanon Systems Citibank (22,594)
(245,060) Hanon Systems Credit Suisse (145,390)(88,336) Hanon Systems JP Morgan (52,408)(8,667) Hanssem Co Ltd Barclays Bank 718(7,275) Hanssem Co Ltd Credit Suisse (45,501)
(49,500) Hanssem Co Ltd Goldam Sachs 116,971189,083 Hanwha Aerospace Co Ltd Barclays Bank 163,649
8,950 Hanwha Aerospace Co Ltd Citibank 7,74629,031 Hanwha Aerospace Co Ltd Credit Suisse (25,345)
120,269 Hanwha Aerospace Co Ltd Goldam Sachs 68,76414,350 Hanwha Aerospace Co Ltd HSBC (6,354)46,430 Hanwha Aerospace Co Ltd JP Morgan (40,534)32,151 Hanwha Solutions Corp Credit Suisse 42,3676,062 Hanwha Solutions Corp JP Morgan 7,988
1 HDC Holdings Co Ltdπ Goldam Sachs —1 HDC Holdings Co Ltdπ JP Morgan —
(119,932) Helixmith Co Ltd Barclays Bank (50,823)(50,566) HLB Inc Credit Suisse (447,870)
1,720 Hotel Shilla Co Ltd HSBC (1,930)9 Hyundai Department Store
Co Ltd Barclays Bank (18)4,288 Hyundai Department Store
Co Ltd Citibank (8,589)2,682 Hyundai Department Store
Co Ltd Credit Suisse (17,064)37,793 Hyundai Department Store
Co Ltd Goldam Sachs (45,591)8,180 Hyundai Glovis Co Ltd Barclays Bank 35,4672,890 Hyundai Glovis Co Ltd Citibank 12,5308,260 Hyundai Glovis Co Ltd Credit Suisse 62,9936,626 Hyundai Glovis Co Ltd Goldam Sachs 72,7746,680 Hyundai Glovis Co Ltd HSBC 50,9431,750 Hyundai Glovis Co Ltd JP Morgan 13,346
(10,993) Hyundai Heavy IndustriesHoldings Co Ltd Barclays Bank (228,155)
(12,313) Hyundai Heavy IndustriesHoldings Co Ltd Credit Suisse (165,917)
(6,739) Hyundai Heavy IndustriesHoldings Co Ltd Goldam Sachs (169,010)
(42,000) Hyundai Marine & FireInsurance Co Ltd Barclays Bank 11,184
(139,980) Hyundai Marine & FireInsurance Co Ltd Goldam Sachs 295,184
(27,749) Hyundai Mipo Dockyard CoLtd Citibank (106,757)
(20,508) Hyundai Mipo Dockyard CoLtd Goldam Sachs (90,720)
Holding Description Counterparty
Netunrealised
appreciation/(depreciation)
USD
South Korea continued26,284 Hyundai Mobis Co Ltd Barclays Bank 292,3913,810 Hyundai Mobis Co Ltd Credit Suisse 59,425
25,010 Hyundai Mobis Co Ltd Goldam Sachs 493,880320 Hyundai Mobis Co Ltd HSBC 4,991
1,800 Hyundai Mobis Co Ltd JP Morgan 28,075(19,682) Hyundai Motor Co (Pref) Barclays Bank (6,796)(2,850) Hyundai Motor Co (Pref) Barclays Bank (534)(9,950) Hyundai Motor Co (Pref) Citibank (3,435)
(27,867) Hyundai Motor Co (Pref) Credit Suisse (25,035)(6,548) Hyundai Motor Co (Pref) Credit Suisse 2,392
(15,128) Hyundai Motor Co (Pref) Goldam Sachs (42,249)(7,015) Hyundai Motor Co (Pref) Goldam Sachs (9,467)(7,333) Hyundai Motor Co (Pref) HSBC (6,588)(5,634) Hyundai Motor Co (Pref) HSBC 2,058(2,545) Hyundai Motor Co (Pref) JP Morgan (2,286)
(241,787) Hyundai Steel Co Barclays Bank (375,994)(2,944) Hyundai Steel Co Citibank (4,578)
(58,178) Hyundai Steel Co Credit Suisse (12,965)(37,607) Hyundai Steel Co Goldam Sachs (72,359)
6,040 Hyundai Wia Corp Barclays Bank 10,52110,100 Hyundai Wia Corp Credit Suisse 22,67210,510 Hyundai Wia Corp JP Morgan 23,5931,450 Kakao Corp Barclays Bank 18,968
670 Kakao Corp Credit Suisse 29,4081,850 Kakao Corp HSBC 81,202
(46,826) Kangwon Land Inc Citibank 23,823(59,485) Kangwon Land Inc Goldam Sachs (50,952)41,251 KB Financial Group Inc Credit Suisse 23,31237,741 KB Financial Group Inc HSBC 21,328
122,510 Kia Motors Corp Barclays Bank 406,91639,530 Kia Motors Corp Citibank 131,29889,070 Kia Motors Corp Credit Suisse 236,255
137,260 Kia Motors Corp Goldam Sachs 551,26672,934 Kia Motors Corp HSBC 193,4554,760 Kia Motors Corp JP Morgan 12,626
29,360 Korea Aerospace IndustriesLtd Barclays Bank 37,249
14,610 Korea Aerospace IndustriesLtd Citibank 18,535
15,440 Korea Aerospace IndustriesLtd Goldam Sachs 23,173
14,000 Korea Aerospace IndustriesLtd HSBC 10,550
24,650 Korea Investment HoldingsCo Ltd Barclays Bank 76,447
55,842 Korea Investment HoldingsCo Ltd Goldam Sachs 316,770
(14,159) Korea Shipbuilding &Offshore Engineering CoLtd Barclays Bank (123,510)
(37,538) Korea Shipbuilding &Offshore Engineering CoLtd Citibank (327,447)
(40,178) Korea Shipbuilding &Offshore Engineering CoLtd Credit Suisse (254,809)
(5,048) Korea Shipbuilding &Offshore Engineering CoLtd Goldam Sachs (48,609)
(27,548) Korea Shipbuilding &Offshore Engineering CoLtd HSBC (174,710)
(1,530) Korea Zinc Co Ltd Goldam Sachs (8,981)3,464 KT&G Corp Bank of America
Merrill Lynch 15,46410,370 KT&G Corp Barclays Bank 13,40048,280 KT&G Corp Goldam Sachs 215,5261,650 KT&G Corp HSBC 5,329
(15,580) LG Chem Ltd Barclays Bank (164,082)
BlackRock Style Advantage Fund continued
The notes on pages 691 to 711 form an integral part of these financial statements.
BlackRock Strategic Funds[550]
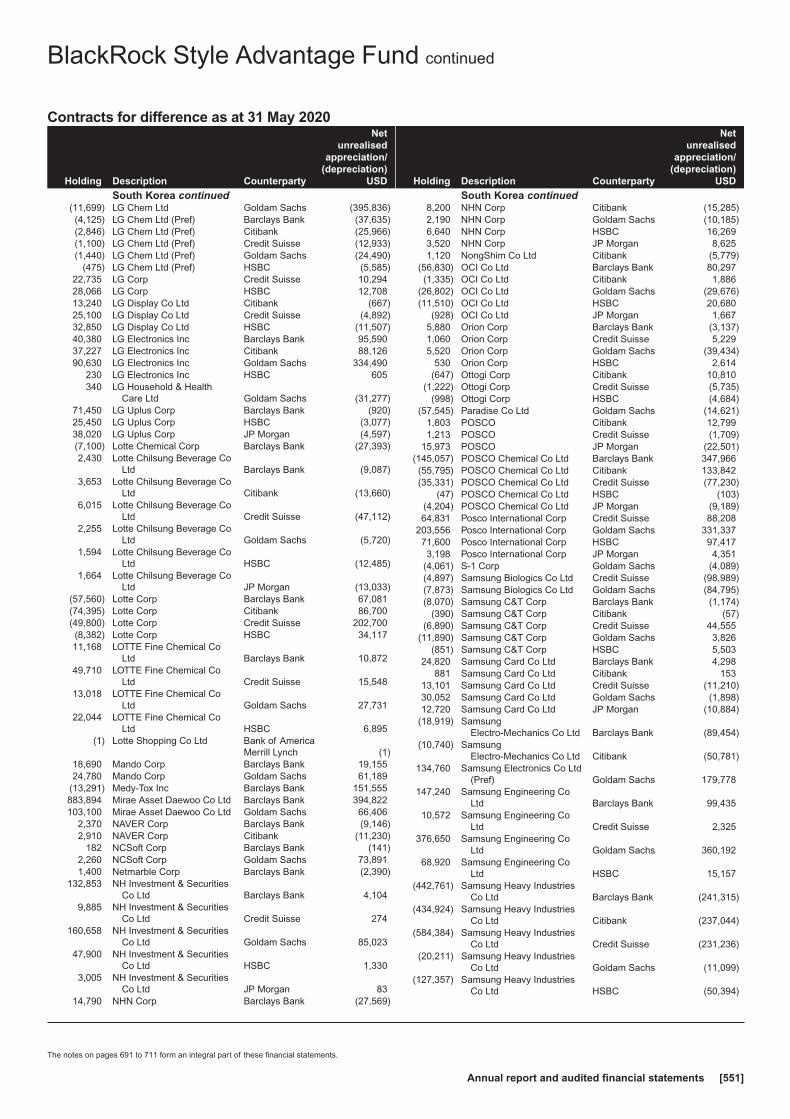
Contracts for difference as at 31 May 2020
Holding Description Counterparty
Netunrealised
appreciation/(depreciation)
USD
South Korea continued(11,699) LG Chem Ltd Goldam Sachs (395,836)(4,125) LG Chem Ltd (Pref) Barclays Bank (37,635)(2,846) LG Chem Ltd (Pref) Citibank (25,966)(1,100) LG Chem Ltd (Pref) Credit Suisse (12,933)(1,440) LG Chem Ltd (Pref) Goldam Sachs (24,490)
(475) LG Chem Ltd (Pref) HSBC (5,585)22,735 LG Corp Credit Suisse 10,29428,066 LG Corp HSBC 12,70813,240 LG Display Co Ltd Citibank (667)25,100 LG Display Co Ltd Credit Suisse (4,892)32,850 LG Display Co Ltd HSBC (11,507)40,380 LG Electronics Inc Barclays Bank 95,59037,227 LG Electronics Inc Citibank 88,12690,630 LG Electronics Inc Goldam Sachs 334,490
230 LG Electronics Inc HSBC 605340 LG Household & Health
Care Ltd Goldam Sachs (31,277)71,450 LG Uplus Corp Barclays Bank (920)25,450 LG Uplus Corp HSBC (3,077)38,020 LG Uplus Corp JP Morgan (4,597)(7,100) Lotte Chemical Corp Barclays Bank (27,393)2,430 Lotte Chilsung Beverage Co
Ltd Barclays Bank (9,087)3,653 Lotte Chilsung Beverage Co
Ltd Citibank (13,660)6,015 Lotte Chilsung Beverage Co
Ltd Credit Suisse (47,112)2,255 Lotte Chilsung Beverage Co
Ltd Goldam Sachs (5,720)1,594 Lotte Chilsung Beverage Co
Ltd HSBC (12,485)1,664 Lotte Chilsung Beverage Co
Ltd JP Morgan (13,033)(57,560) Lotte Corp Barclays Bank 67,081(74,395) Lotte Corp Citibank 86,700(49,800) Lotte Corp Credit Suisse 202,700(8,382) Lotte Corp HSBC 34,11711,168 LOTTE Fine Chemical Co
Ltd Barclays Bank 10,87249,710 LOTTE Fine Chemical Co
Ltd Credit Suisse 15,54813,018 LOTTE Fine Chemical Co
Ltd Goldam Sachs 27,73122,044 LOTTE Fine Chemical Co
Ltd HSBC 6,895(1) Lotte Shopping Co Ltd Bank of America
Merrill Lynch (1)18,690 Mando Corp Barclays Bank 19,15524,780 Mando Corp Goldam Sachs 61,189
(13,291) Medy-Tox Inc Barclays Bank 151,555883,894 Mirae Asset Daewoo Co Ltd Barclays Bank 394,822103,100 Mirae Asset Daewoo Co Ltd Goldam Sachs 66,406
2,370 NAVER Corp Barclays Bank (9,146)2,910 NAVER Corp Citibank (11,230)
182 NCSoft Corp Barclays Bank (141)2,260 NCSoft Corp Goldam Sachs 73,8911,400 Netmarble Corp Barclays Bank (2,390)
132,853 NH Investment & SecuritiesCo Ltd Barclays Bank 4,104
9,885 NH Investment & SecuritiesCo Ltd Credit Suisse 274
160,658 NH Investment & SecuritiesCo Ltd Goldam Sachs 85,023
47,900 NH Investment & SecuritiesCo Ltd HSBC 1,330
3,005 NH Investment & SecuritiesCo Ltd JP Morgan 83
14,790 NHN Corp Barclays Bank (27,569)
Holding Description Counterparty
Netunrealised
appreciation/(depreciation)
USD
South Korea continued8,200 NHN Corp Citibank (15,285)2,190 NHN Corp Goldam Sachs (10,185)6,640 NHN Corp HSBC 16,2693,520 NHN Corp JP Morgan 8,6251,120 NongShim Co Ltd Citibank (5,779)
(56,830) OCI Co Ltd Barclays Bank 80,297(1,335) OCI Co Ltd Citibank 1,886
(26,802) OCI Co Ltd Goldam Sachs (29,676)(11,510) OCI Co Ltd HSBC 20,680
(928) OCI Co Ltd JP Morgan 1,6675,880 Orion Corp Barclays Bank (3,137)1,060 Orion Corp Credit Suisse 5,2295,520 Orion Corp Goldam Sachs (39,434)
530 Orion Corp HSBC 2,614(647) Ottogi Corp Citibank 10,810
(1,222) Ottogi Corp Credit Suisse (5,735)(998) Ottogi Corp HSBC (4,684)
(57,545) Paradise Co Ltd Goldam Sachs (14,621)1,803 POSCO Citibank 12,7991,213 POSCO Credit Suisse (1,709)
15,973 POSCO JP Morgan (22,501)(145,057) POSCO Chemical Co Ltd Barclays Bank 347,966(55,795) POSCO Chemical Co Ltd Citibank 133,842(35,331) POSCO Chemical Co Ltd Credit Suisse (77,230)
(47) POSCO Chemical Co Ltd HSBC (103)(4,204) POSCO Chemical Co Ltd JP Morgan (9,189)64,831 Posco International Corp Credit Suisse 88,208
203,556 Posco International Corp Goldam Sachs 331,33771,600 Posco International Corp HSBC 97,4173,198 Posco International Corp JP Morgan 4,351
(4,061) S-1 Corp Goldam Sachs (4,089)(4,897) Samsung Biologics Co Ltd Credit Suisse (98,989)(7,873) Samsung Biologics Co Ltd Goldam Sachs (84,795)(8,070) Samsung C&T Corp Barclays Bank (1,174)
(390) Samsung C&T Corp Citibank (57)(6,890) Samsung C&T Corp Credit Suisse 44,555
(11,890) Samsung C&T Corp Goldam Sachs 3,826(851) Samsung C&T Corp HSBC 5,503
24,820 Samsung Card Co Ltd Barclays Bank 4,298881 Samsung Card Co Ltd Citibank 153
13,101 Samsung Card Co Ltd Credit Suisse (11,210)30,052 Samsung Card Co Ltd Goldam Sachs (1,898)12,720 Samsung Card Co Ltd JP Morgan (10,884)
(18,919) SamsungElectro-Mechanics Co Ltd Barclays Bank (89,454)
(10,740) SamsungElectro-Mechanics Co Ltd Citibank (50,781)
134,760 Samsung Electronics Co Ltd(Pref) Goldam Sachs 179,778
147,240 Samsung Engineering CoLtd Barclays Bank 99,435
10,572 Samsung Engineering CoLtd Credit Suisse 2,325
376,650 Samsung Engineering CoLtd Goldam Sachs 360,192
68,920 Samsung Engineering CoLtd HSBC 15,157
(442,761) Samsung Heavy IndustriesCo Ltd Barclays Bank (241,315)
(434,924) Samsung Heavy IndustriesCo Ltd Citibank (237,044)
(584,384) Samsung Heavy IndustriesCo Ltd Credit Suisse (231,236)
(20,211) Samsung Heavy IndustriesCo Ltd Goldam Sachs (11,099)
(127,357) Samsung Heavy IndustriesCo Ltd HSBC (50,394)
BlackRock Style Advantage Fund continued
The notes on pages 691 to 711 form an integral part of these financial statements.
Annual report and audited financial statements [551]
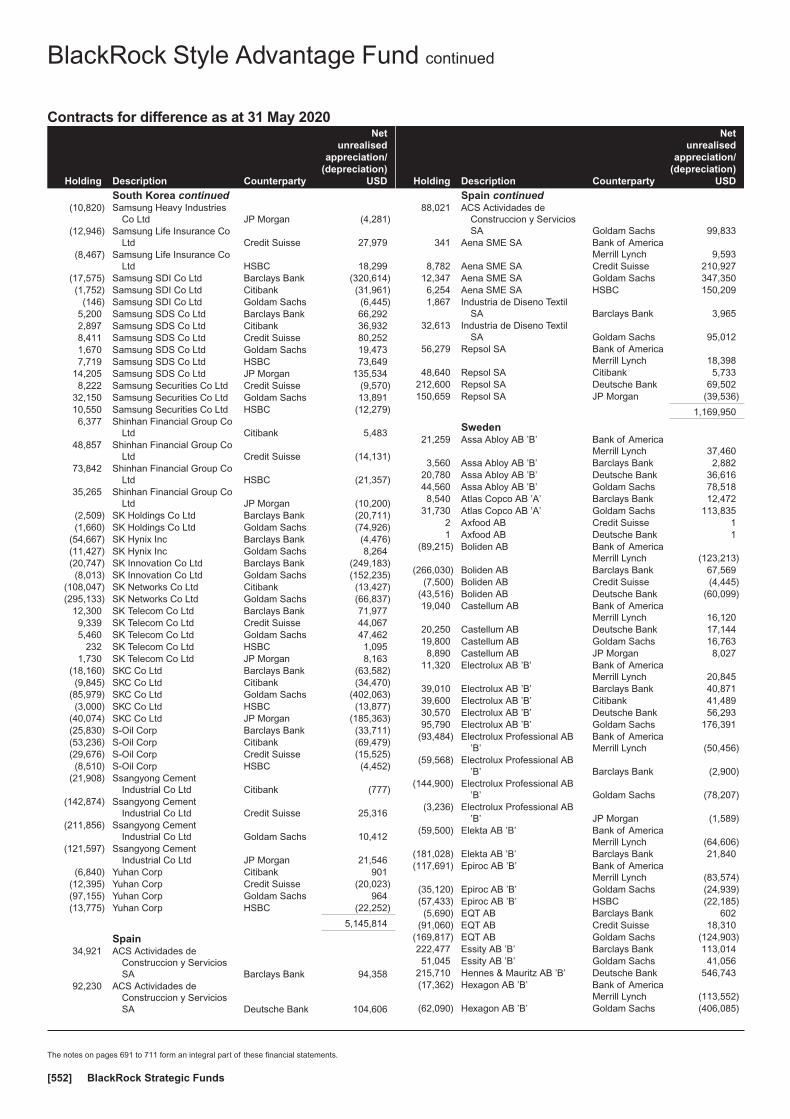
Contracts for difference as at 31 May 2020
Holding Description Counterparty
Netunrealised
appreciation/(depreciation)
USD
South Korea continued(10,820) Samsung Heavy Industries
Co Ltd JP Morgan (4,281)(12,946) Samsung Life Insurance Co
Ltd Credit Suisse 27,979(8,467) Samsung Life Insurance Co
Ltd HSBC 18,299(17,575) Samsung SDI Co Ltd Barclays Bank (320,614)(1,752) Samsung SDI Co Ltd Citibank (31,961)
(146) Samsung SDI Co Ltd Goldam Sachs (6,445)5,200 Samsung SDS Co Ltd Barclays Bank 66,2922,897 Samsung SDS Co Ltd Citibank 36,9328,411 Samsung SDS Co Ltd Credit Suisse 80,2521,670 Samsung SDS Co Ltd Goldam Sachs 19,4737,719 Samsung SDS Co Ltd HSBC 73,649
14,205 Samsung SDS Co Ltd JP Morgan 135,5348,222 Samsung Securities Co Ltd Credit Suisse (9,570)
32,150 Samsung Securities Co Ltd Goldam Sachs 13,89110,550 Samsung Securities Co Ltd HSBC (12,279)6,377 Shinhan Financial Group Co
Ltd Citibank 5,48348,857 Shinhan Financial Group Co
Ltd Credit Suisse (14,131)73,842 Shinhan Financial Group Co
Ltd HSBC (21,357)35,265 Shinhan Financial Group Co
Ltd JP Morgan (10,200)(2,509) SK Holdings Co Ltd Barclays Bank (20,711)(1,660) SK Holdings Co Ltd Goldam Sachs (74,926)
(54,667) SK Hynix Inc Barclays Bank (4,476)(11,427) SK Hynix Inc Goldam Sachs 8,264(20,747) SK Innovation Co Ltd Barclays Bank (249,183)(8,013) SK Innovation Co Ltd Goldam Sachs (152,235)
(108,047) SK Networks Co Ltd Citibank (13,427)(295,133) SK Networks Co Ltd Goldam Sachs (66,837)
12,300 SK Telecom Co Ltd Barclays Bank 71,9779,339 SK Telecom Co Ltd Credit Suisse 44,0675,460 SK Telecom Co Ltd Goldam Sachs 47,462
232 SK Telecom Co Ltd HSBC 1,0951,730 SK Telecom Co Ltd JP Morgan 8,163
(18,160) SKC Co Ltd Barclays Bank (63,582)(9,845) SKC Co Ltd Citibank (34,470)
(85,979) SKC Co Ltd Goldam Sachs (402,063)(3,000) SKC Co Ltd HSBC (13,877)
(40,074) SKC Co Ltd JP Morgan (185,363)(25,830) S-Oil Corp Barclays Bank (33,711)(53,236) S-Oil Corp Citibank (69,479)(29,676) S-Oil Corp Credit Suisse (15,525)(8,510) S-Oil Corp HSBC (4,452)
(21,908) Ssangyong CementIndustrial Co Ltd Citibank (777)
(142,874) Ssangyong CementIndustrial Co Ltd Credit Suisse 25,316
(211,856) Ssangyong CementIndustrial Co Ltd Goldam Sachs 10,412
(121,597) Ssangyong CementIndustrial Co Ltd JP Morgan 21,546
(6,840) Yuhan Corp Citibank 901(12,395) Yuhan Corp Credit Suisse (20,023)(97,155) Yuhan Corp Goldam Sachs 964(13,775) Yuhan Corp HSBC (22,252)
5,145,814
Spain34,921 ACS Actividades de
Construccion y ServiciosSA Barclays Bank 94,358
92,230 ACS Actividades deConstruccion y ServiciosSA Deutsche Bank 104,606
Holding Description Counterparty
Netunrealised
appreciation/(depreciation)
USD
Spain continued88,021 ACS Actividades de
Construccion y ServiciosSA Goldam Sachs 99,833
341 Aena SME SA Bank of AmericaMerrill Lynch 9,593
8,782 Aena SME SA Credit Suisse 210,92712,347 Aena SME SA Goldam Sachs 347,3506,254 Aena SME SA HSBC 150,2091,867 Industria de Diseno Textil
SA Barclays Bank 3,96532,613 Industria de Diseno Textil
SA Goldam Sachs 95,01256,279 Repsol SA Bank of America
Merrill Lynch 18,39848,640 Repsol SA Citibank 5,733
212,600 Repsol SA Deutsche Bank 69,502150,659 Repsol SA JP Morgan (39,536)
1,169,950
Sweden21,259 Assa Abloy AB ’B’ Bank of America
Merrill Lynch 37,4603,560 Assa Abloy AB ’B’ Barclays Bank 2,882
20,780 Assa Abloy AB ’B’ Deutsche Bank 36,61644,560 Assa Abloy AB ’B’ Goldam Sachs 78,5188,540 Atlas Copco AB ’A’ Barclays Bank 12,472
31,730 Atlas Copco AB ’A’ Goldam Sachs 113,8352 Axfood AB Credit Suisse 11 Axfood AB Deutsche Bank 1
(89,215) Boliden AB Bank of AmericaMerrill Lynch (123,213)
(266,030) Boliden AB Barclays Bank 67,569(7,500) Boliden AB Credit Suisse (4,445)
(43,516) Boliden AB Deutsche Bank (60,099)19,040 Castellum AB Bank of America
Merrill Lynch 16,12020,250 Castellum AB Deutsche Bank 17,14419,800 Castellum AB Goldam Sachs 16,7638,890 Castellum AB JP Morgan 8,027
11,320 Electrolux AB ’B’ Bank of AmericaMerrill Lynch 20,845
39,010 Electrolux AB ’B’ Barclays Bank 40,87139,600 Electrolux AB ’B’ Citibank 41,48930,570 Electrolux AB ’B’ Deutsche Bank 56,29395,790 Electrolux AB ’B’ Goldam Sachs 176,391
(93,484) Electrolux Professional AB’B’
Bank of AmericaMerrill Lynch (50,456)
(59,568) Electrolux Professional AB’B’ Barclays Bank (2,900)
(144,900) Electrolux Professional AB’B’ Goldam Sachs (78,207)
(3,236) Electrolux Professional AB’B’ JP Morgan (1,589)
(59,500) Elekta AB ’B’ Bank of AmericaMerrill Lynch (64,606)
(181,028) Elekta AB ’B’ Barclays Bank 21,840(117,691) Epiroc AB ’B’ Bank of America
Merrill Lynch (83,574)(35,120) Epiroc AB ’B’ Goldam Sachs (24,939)(57,433) Epiroc AB ’B’ HSBC (22,185)(5,690) EQT AB Barclays Bank 602
(91,060) EQT AB Credit Suisse 18,310(169,817) EQT AB Goldam Sachs (124,903)222,477 Essity AB ’B’ Barclays Bank 113,01451,045 Essity AB ’B’ Goldam Sachs 41,056
215,710 Hennes & Mauritz AB ’B’ Deutsche Bank 546,743(17,362) Hexagon AB ’B’ Bank of America
Merrill Lynch (113,552)(62,090) Hexagon AB ’B’ Goldam Sachs (406,085)
BlackRock Style Advantage Fund continued
The notes on pages 691 to 711 form an integral part of these financial statements.
BlackRock Strategic Funds[552]

Contracts for difference as at 31 May 2020
Holding Description Counterparty
Netunrealised
appreciation/(depreciation)
USD
Sweden continued32,199 Hufvudstaden AB Bank of America
Merrill Lynch 28,28388,447 Hufvudstaden AB Barclays Bank 58,97048,691 Hufvudstaden AB Citibank 32,464
109,410 Hufvudstaden AB Deutsche Bank 96,10419,403 Hufvudstaden AB HSBC (13,142)
(30,040) Husqvarna AB ’B’ Citibank (11,699)(3,890) ICA Gruppen AB Bank of America
Merrill Lynch (5,969)(50,398) ICA Gruppen AB Barclays Bank (87,471)(9,008) ICA Gruppen AB Goldam Sachs (13,823)
266,497 Industrivarden AB ’A’ Barclays Bank 358,18233,894 Industrivarden AB ’A’ Goldam Sachs 82,85985,910 Industrivarden AB ’C’ Bank of America
Merrill Lynch 201,838248,394 Industrivarden AB ’C’ Barclays Bank 337,794
(3) Intrum AB JP Morgan (7)(23,790) Investment AB Latour ’B’ Credit Suisse (47,836)
(389,288) Investment AB Latour ’B’ Goldam Sachs (255,429)(84,683) Investment AB Latour ’B’ HSBC (170,277)(90,240) Investment AB Latour ’B’ JP Morgan (181,451)
8,469 Investor AB ’B’ Bank of AmericaMerrill Lynch 41,497
39,099 Investor AB ’B’ Citibank 107,99754,172 Investor AB ’B’ HSBC 122,68642,402 Investor AB ’B’ JP Morgan 96,030
(38,480) Kinnevik AB ’B’ Deutsche Bank (95,700)(10,340) L E Lundbergforetagen AB
’B’Bank of AmericaMerrill Lynch (59,091)
(5,430) L E Lundbergforetagen AB’B’ Barclays Bank (21,147)
82,310 Lundin Energy AB Barclays Bank (49,652)9,530 Lundin Energy AB Citibank (5,749)
75,230 Lundin Energy AB Deutsche Bank 55,73122,440 Lundin Energy AB JP Morgan 1,662
(5) Modern Times Group MTGAB ’B’ Citibank (1)
(2) NCC AB ’B’π Credit Suisse —(710) Nibe Industrier AB ’B’ Bank of America
Merrill Lynch (1,631)(38,695) Nibe Industrier AB ’B’ Credit Suisse (111,591)
(101,009) Nibe Industrier AB ’B’ Goldam Sachs (231,967)(57,555) Saab AB ’B’ Goldam Sachs (163,239)(96,474) Saab AB ’B’ JP Morgan (160,294)154,669 Sandvik AB Credit Suisse 107,21414,150 Sandvik AB Goldam Sachs 23,81059,646 Sandvik AB HSBC 41,34654,198 Securitas AB ’B’ Barclays Bank 46,460
117,430 Securitas AB ’B’ Goldam Sachs 192,627(50,060) Skandinaviska Enskilda
Banken AB ’A’ Barclays Bank (39,098)(47,050) Skandinaviska Enskilda
Banken AB ’A’ Deutsche Bank (53,378)43,060 Skanska AB ’B’ Bank of America
Merrill Lynch 86,3569,580 Skanska AB ’B’ Barclays Bank 13,8908,950 Skanska AB ’B’ Deutsche Bank 17,949
31,710 Skanska AB ’B’ Goldam Sachs 63,594(9,840) SKF AB ’B’ Bank of America
Merrill Lynch (26,294)(9,810) SKF AB ’B’ Credit Suisse (16,611)
(79,960) SKF AB ’B’ Goldam Sachs (213,669)(13,410) Svenska Cellulosa AB SCA
’B’Bank of AmericaMerrill Lynch (25,190)
(67,660) Svenska Cellulosa AB SCA’B’ Deutsche Bank (127,098)
(436,861) Svenska Handelsbanken AB’A’ Deutsche Bank (254,281)
Holding Description Counterparty
Netunrealised
appreciation/(depreciation)
USD
Sweden continued(44,370) Swedbank AB ’A’ Bank of America
Merrill Lynch (86,588)(149,230) Swedbank AB ’A’ Barclays Bank (215,732)(48,000) Swedbank AB ’A’ Deutsche Bank (93,672)(79,670) Swedbank AB ’A’ Goldam Sachs (155,476)83,259 Swedish Match AB Bank of America
Merrill Lynch 287,24711,410 Swedish Match AB Citibank 19,32024,894 Swedish Match AB Goldam Sachs 85,88535,310 Swedish Match AB JP Morgan 152,463
(43,320) Swedish Orphan BiovitrumAB Deutsche Bank (50,888)
16,900 Tele2 AB ’B’ Credit Suisse (1,699)190,630 Tele2 AB ’B’ Deutsche Bank 87,75812,830 Tele2 AB ’B’ HSBC 61825,570 Telefonaktiebolaget LM
Ericsson ’B’ Barclays Bank 1,89437,440 Telefonaktiebolaget LM
Ericsson ’B’ Citibank 2,77428,590 Telefonaktiebolaget LM
Ericsson ’B’ Credit Suisse 3,872(123,200) Telia Co AB HSBC 3,651
19,490 Trelleborg AB ’B’ Citibank 16,19256,470 Trelleborg AB ’B’ Deutsche Bank 84,26428,160 Trelleborg AB ’B’ Goldam Sachs 42,02029,490 Trelleborg AB ’B’ JP Morgan 16,697
182,520 Volvo AB ’B’ Bank of AmericaMerrill Lynch 268,493
185,190 Volvo AB ’B’ Barclays Bank 151,88944,706 Volvo AB ’B’ Citibank 36,667
754,316
Switzerland(245,680) ABB Ltd RegS Barclays Bank (215,531)(203,310) ABB Ltd RegS Goldam Sachs (422,155)
5 Allreal Holding AG RegS Credit Suisse 171 Allreal Holding AG RegS HSBC 3
(3,720) Baloise Holding AG RegS Barclays Bank (15,062)27,370 Banque Cantonale
Vaudoise RegSBank of AmericaMerrill Lynch 241,533
9,500 Banque CantonaleVaudoise RegS Barclays Bank 57,205
3,800 Banque CantonaleVaudoise RegS Citibank 22,882
1,730 Banque CantonaleVaudoise RegS Credit Suisse 11,675
230 Banque CantonaleVaudoise RegS Deutsche Bank 2,030
2,890 Banque CantonaleVaudoise RegS HSBC 19,503
8,530 Banque CantonaleVaudoise RegS JP Morgan 57,009
(70) Barry Callebaut AG RegS Bank of AmericaMerrill Lynch (6,541)
(770) Barry Callebaut AG RegS Barclays Bank (64,753)(770) Barry Callebaut AG RegS Goldam Sachs (71,948)
1 Cembra Money Bank AG JP Morgan 6(242) Chocoladefabriken Lindt &
Spruengli AG Goldam Sachs (62,811)(70) Chocoladefabriken Lindt &
Spruengli AG JP Morgan (11,628)(140,130) Cie Financiere Richemont
SA RegSBank of AmericaMerrill Lynch (657,587)
(10,740) Cie Financiere RichemontSA RegS Credit Suisse (669)
(78,600) Cie Financiere RichemontSA RegS Goldam Sachs (368,845)
BlackRock Style Advantage Fund continued
The notes on pages 691 to 711 form an integral part of these financial statements.
Annual report and audited financial statements [553]
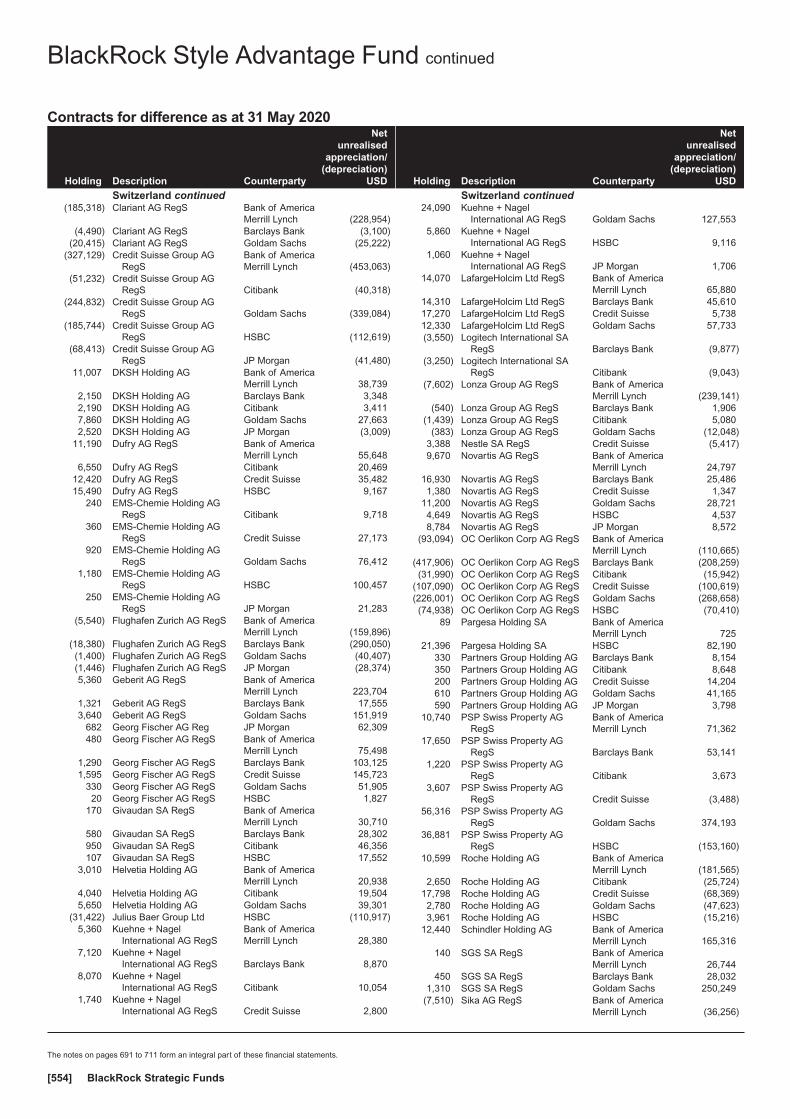
Contracts for difference as at 31 May 2020
Holding Description Counterparty
Netunrealised
appreciation/(depreciation)
USD
Switzerland continued(185,318) Clariant AG RegS Bank of America
Merrill Lynch (228,954)(4,490) Clariant AG RegS Barclays Bank (3,100)
(20,415) Clariant AG RegS Goldam Sachs (25,222)(327,129) Credit Suisse Group AG
RegSBank of AmericaMerrill Lynch (453,063)
(51,232) Credit Suisse Group AGRegS Citibank (40,318)
(244,832) Credit Suisse Group AGRegS Goldam Sachs (339,084)
(185,744) Credit Suisse Group AGRegS HSBC (112,619)
(68,413) Credit Suisse Group AGRegS JP Morgan (41,480)
11,007 DKSH Holding AG Bank of AmericaMerrill Lynch 38,739
2,150 DKSH Holding AG Barclays Bank 3,3482,190 DKSH Holding AG Citibank 3,4117,860 DKSH Holding AG Goldam Sachs 27,6632,520 DKSH Holding AG JP Morgan (3,009)
11,190 Dufry AG RegS Bank of AmericaMerrill Lynch 55,648
6,550 Dufry AG RegS Citibank 20,46912,420 Dufry AG RegS Credit Suisse 35,48215,490 Dufry AG RegS HSBC 9,167
240 EMS-Chemie Holding AGRegS Citibank 9,718
360 EMS-Chemie Holding AGRegS Credit Suisse 27,173
920 EMS-Chemie Holding AGRegS Goldam Sachs 76,412
1,180 EMS-Chemie Holding AGRegS HSBC 100,457
250 EMS-Chemie Holding AGRegS JP Morgan 21,283
(5,540) Flughafen Zurich AG RegS Bank of AmericaMerrill Lynch (159,896)
(18,380) Flughafen Zurich AG RegS Barclays Bank (290,050)(1,400) Flughafen Zurich AG RegS Goldam Sachs (40,407)(1,446) Flughafen Zurich AG RegS JP Morgan (28,374)5,360 Geberit AG RegS Bank of America
Merrill Lynch 223,7041,321 Geberit AG RegS Barclays Bank 17,5553,640 Geberit AG RegS Goldam Sachs 151,919
682 Georg Fischer AG Reg JP Morgan 62,309480 Georg Fischer AG RegS Bank of America
Merrill Lynch 75,4981,290 Georg Fischer AG RegS Barclays Bank 103,1251,595 Georg Fischer AG RegS Credit Suisse 145,723
330 Georg Fischer AG RegS Goldam Sachs 51,90520 Georg Fischer AG RegS HSBC 1,827
170 Givaudan SA RegS Bank of AmericaMerrill Lynch 30,710
580 Givaudan SA RegS Barclays Bank 28,302950 Givaudan SA RegS Citibank 46,356107 Givaudan SA RegS HSBC 17,552
3,010 Helvetia Holding AG Bank of AmericaMerrill Lynch 20,938
4,040 Helvetia Holding AG Citibank 19,5045,650 Helvetia Holding AG Goldam Sachs 39,301
(31,422) Julius Baer Group Ltd HSBC (110,917)5,360 Kuehne + Nagel
International AG RegSBank of AmericaMerrill Lynch 28,380
7,120 Kuehne + NagelInternational AG RegS Barclays Bank 8,870
8,070 Kuehne + NagelInternational AG RegS Citibank 10,054
1,740 Kuehne + NagelInternational AG RegS Credit Suisse 2,800
Holding Description Counterparty
Netunrealised
appreciation/(depreciation)
USD
Switzerland continued24,090 Kuehne + Nagel
International AG RegS Goldam Sachs 127,5535,860 Kuehne + Nagel
International AG RegS HSBC 9,1161,060 Kuehne + Nagel
International AG RegS JP Morgan 1,70614,070 LafargeHolcim Ltd RegS Bank of America
Merrill Lynch 65,88014,310 LafargeHolcim Ltd RegS Barclays Bank 45,61017,270 LafargeHolcim Ltd RegS Credit Suisse 5,73812,330 LafargeHolcim Ltd RegS Goldam Sachs 57,733(3,550) Logitech International SA
RegS Barclays Bank (9,877)(3,250) Logitech International SA
RegS Citibank (9,043)(7,602) Lonza Group AG RegS Bank of America
Merrill Lynch (239,141)(540) Lonza Group AG RegS Barclays Bank 1,906
(1,439) Lonza Group AG RegS Citibank 5,080(383) Lonza Group AG RegS Goldam Sachs (12,048)
3,388 Nestle SA RegS Credit Suisse (5,417)9,670 Novartis AG RegS Bank of America
Merrill Lynch 24,79716,930 Novartis AG RegS Barclays Bank 25,4861,380 Novartis AG RegS Credit Suisse 1,347
11,200 Novartis AG RegS Goldam Sachs 28,7214,649 Novartis AG RegS HSBC 4,5378,784 Novartis AG RegS JP Morgan 8,572
(93,094) OC Oerlikon Corp AG RegS Bank of AmericaMerrill Lynch (110,665)
(417,906) OC Oerlikon Corp AG RegS Barclays Bank (208,259)(31,990) OC Oerlikon Corp AG RegS Citibank (15,942)
(107,090) OC Oerlikon Corp AG RegS Credit Suisse (100,619)(226,001) OC Oerlikon Corp AG RegS Goldam Sachs (268,658)(74,938) OC Oerlikon Corp AG RegS HSBC (70,410)
89 Pargesa Holding SA Bank of AmericaMerrill Lynch 725
21,396 Pargesa Holding SA HSBC 82,190330 Partners Group Holding AG Barclays Bank 8,154350 Partners Group Holding AG Citibank 8,648200 Partners Group Holding AG Credit Suisse 14,204610 Partners Group Holding AG Goldam Sachs 41,165590 Partners Group Holding AG JP Morgan 3,798
10,740 PSP Swiss Property AGRegS
Bank of AmericaMerrill Lynch 71,362
17,650 PSP Swiss Property AGRegS Barclays Bank 53,141
1,220 PSP Swiss Property AGRegS Citibank 3,673
3,607 PSP Swiss Property AGRegS Credit Suisse (3,488)
56,316 PSP Swiss Property AGRegS Goldam Sachs 374,193
36,881 PSP Swiss Property AGRegS HSBC (153,160)
10,599 Roche Holding AG Bank of AmericaMerrill Lynch (181,565)
2,650 Roche Holding AG Citibank (25,724)17,798 Roche Holding AG Credit Suisse (68,369)2,780 Roche Holding AG Goldam Sachs (47,623)3,961 Roche Holding AG HSBC (15,216)
12,440 Schindler Holding AG Bank of AmericaMerrill Lynch 165,316
140 SGS SA RegS Bank of AmericaMerrill Lynch 26,744
450 SGS SA RegS Barclays Bank 28,0321,310 SGS SA RegS Goldam Sachs 250,249
(7,510) Sika AG RegS Bank of AmericaMerrill Lynch (36,256)
BlackRock Style Advantage Fund continued
The notes on pages 691 to 711 form an integral part of these financial statements.
BlackRock Strategic Funds[554]
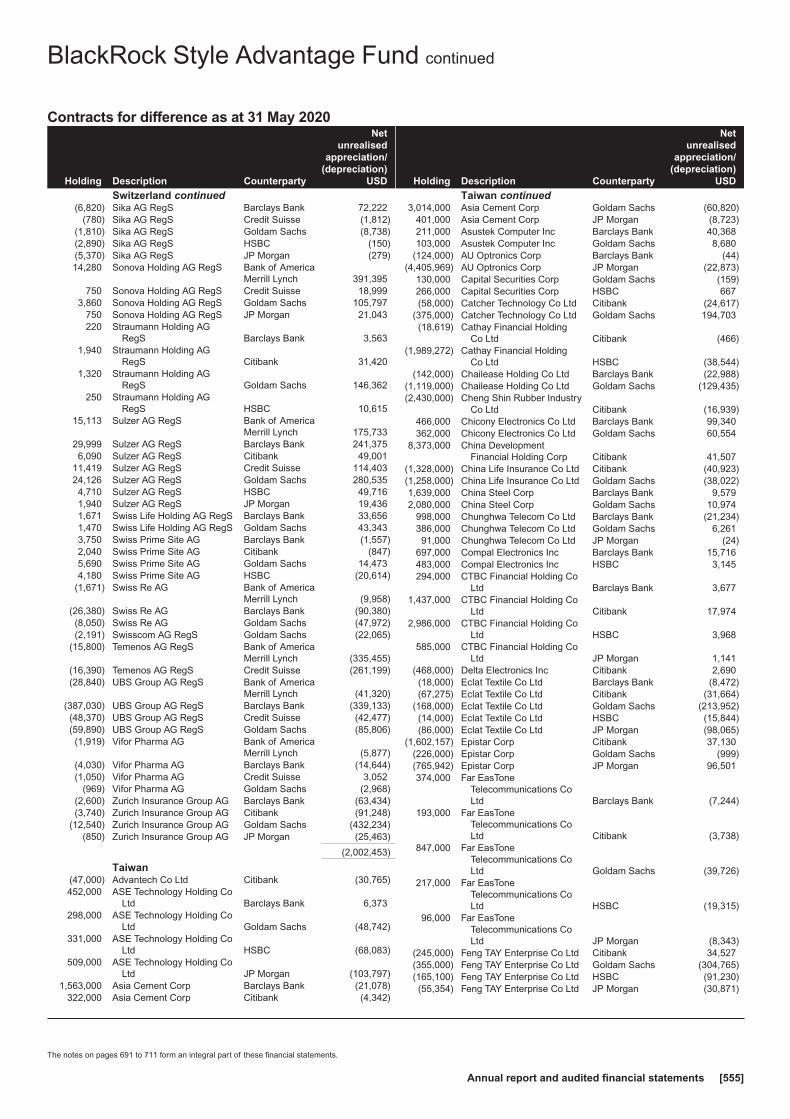
Contracts for difference as at 31 May 2020
Holding Description Counterparty
Netunrealised
appreciation/(depreciation)
USD
Switzerland continued(6,820) Sika AG RegS Barclays Bank 72,222
(780) Sika AG RegS Credit Suisse (1,812)(1,810) Sika AG RegS Goldam Sachs (8,738)(2,890) Sika AG RegS HSBC (150)(5,370) Sika AG RegS JP Morgan (279)14,280 Sonova Holding AG RegS Bank of America
Merrill Lynch 391,395750 Sonova Holding AG RegS Credit Suisse 18,999
3,860 Sonova Holding AG RegS Goldam Sachs 105,797750 Sonova Holding AG RegS JP Morgan 21,043220 Straumann Holding AG
RegS Barclays Bank 3,5631,940 Straumann Holding AG
RegS Citibank 31,4201,320 Straumann Holding AG
RegS Goldam Sachs 146,362250 Straumann Holding AG
RegS HSBC 10,61515,113 Sulzer AG RegS Bank of America
Merrill Lynch 175,73329,999 Sulzer AG RegS Barclays Bank 241,3756,090 Sulzer AG RegS Citibank 49,001
11,419 Sulzer AG RegS Credit Suisse 114,40324,126 Sulzer AG RegS Goldam Sachs 280,5354,710 Sulzer AG RegS HSBC 49,7161,940 Sulzer AG RegS JP Morgan 19,4361,671 Swiss Life Holding AG RegS Barclays Bank 33,6561,470 Swiss Life Holding AG RegS Goldam Sachs 43,3433,750 Swiss Prime Site AG Barclays Bank (1,557)2,040 Swiss Prime Site AG Citibank (847)5,690 Swiss Prime Site AG Goldam Sachs 14,4734,180 Swiss Prime Site AG HSBC (20,614)
(1,671) Swiss Re AG Bank of AmericaMerrill Lynch (9,958)
(26,380) Swiss Re AG Barclays Bank (90,380)(8,050) Swiss Re AG Goldam Sachs (47,972)(2,191) Swisscom AG RegS Goldam Sachs (22,065)
(15,800) Temenos AG RegS Bank of AmericaMerrill Lynch (335,455)
(16,390) Temenos AG RegS Credit Suisse (261,199)(28,840) UBS Group AG RegS Bank of America
Merrill Lynch (41,320)(387,030) UBS Group AG RegS Barclays Bank (339,133)(48,370) UBS Group AG RegS Credit Suisse (42,477)(59,890) UBS Group AG RegS Goldam Sachs (85,806)(1,919) Vifor Pharma AG Bank of America
Merrill Lynch (5,877)(4,030) Vifor Pharma AG Barclays Bank (14,644)(1,050) Vifor Pharma AG Credit Suisse 3,052
(969) Vifor Pharma AG Goldam Sachs (2,968)(2,600) Zurich Insurance Group AG Barclays Bank (63,434)(3,740) Zurich Insurance Group AG Citibank (91,248)
(12,540) Zurich Insurance Group AG Goldam Sachs (432,234)(850) Zurich Insurance Group AG JP Morgan (25,463)
(2,002,453)
Taiwan(47,000) Advantech Co Ltd Citibank (30,765)452,000 ASE Technology Holding Co
Ltd Barclays Bank 6,373298,000 ASE Technology Holding Co
Ltd Goldam Sachs (48,742)331,000 ASE Technology Holding Co
Ltd HSBC (68,083)509,000 ASE Technology Holding Co
Ltd JP Morgan (103,797)1,563,000 Asia Cement Corp Barclays Bank (21,078)
322,000 Asia Cement Corp Citibank (4,342)
Holding Description Counterparty
Netunrealised
appreciation/(depreciation)
USD
Taiwan continued3,014,000 Asia Cement Corp Goldam Sachs (60,820)
401,000 Asia Cement Corp JP Morgan (8,723)211,000 Asustek Computer Inc Barclays Bank 40,368103,000 Asustek Computer Inc Goldam Sachs 8,680
(124,000) AU Optronics Corp Barclays Bank (44)(4,405,969) AU Optronics Corp JP Morgan (22,873)
130,000 Capital Securities Corp Goldam Sachs (159)266,000 Capital Securities Corp HSBC 667(58,000) Catcher Technology Co Ltd Citibank (24,617)
(375,000) Catcher Technology Co Ltd Goldam Sachs 194,703(18,619) Cathay Financial Holding
Co Ltd Citibank (466)(1,989,272) Cathay Financial Holding
Co Ltd HSBC (38,544)(142,000) Chailease Holding Co Ltd Barclays Bank (22,988)
(1,119,000) Chailease Holding Co Ltd Goldam Sachs (129,435)(2,430,000) Cheng Shin Rubber Industry
Co Ltd Citibank (16,939)466,000 Chicony Electronics Co Ltd Barclays Bank 99,340362,000 Chicony Electronics Co Ltd Goldam Sachs 60,554
8,373,000 China DevelopmentFinancial Holding Corp Citibank 41,507
(1,328,000) China Life Insurance Co Ltd Citibank (40,923)(1,258,000) China Life Insurance Co Ltd Goldam Sachs (38,022)1,639,000 China Steel Corp Barclays Bank 9,5792,080,000 China Steel Corp Goldam Sachs 10,974
998,000 Chunghwa Telecom Co Ltd Barclays Bank (21,234)386,000 Chunghwa Telecom Co Ltd Goldam Sachs 6,26191,000 Chunghwa Telecom Co Ltd JP Morgan (24)
697,000 Compal Electronics Inc Barclays Bank 15,716483,000 Compal Electronics Inc HSBC 3,145294,000 CTBC Financial Holding Co
Ltd Barclays Bank 3,6771,437,000 CTBC Financial Holding Co
Ltd Citibank 17,9742,986,000 CTBC Financial Holding Co
Ltd HSBC 3,968585,000 CTBC Financial Holding Co
Ltd JP Morgan 1,141(468,000) Delta Electronics Inc Citibank 2,690(18,000) Eclat Textile Co Ltd Barclays Bank (8,472)(67,275) Eclat Textile Co Ltd Citibank (31,664)
(168,000) Eclat Textile Co Ltd Goldam Sachs (213,952)(14,000) Eclat Textile Co Ltd HSBC (15,844)(86,000) Eclat Textile Co Ltd JP Morgan (98,065)
(1,602,157) Epistar Corp Citibank 37,130(226,000) Epistar Corp Goldam Sachs (999)(765,942) Epistar Corp JP Morgan 96,501374,000 Far EasTone
Telecommunications CoLtd Barclays Bank (7,244)
193,000 Far EasToneTelecommunications CoLtd Citibank (3,738)
847,000 Far EasToneTelecommunications CoLtd Goldam Sachs (39,726)
217,000 Far EasToneTelecommunications CoLtd HSBC (19,315)
96,000 Far EasToneTelecommunications CoLtd JP Morgan (8,343)
(245,000) Feng TAY Enterprise Co Ltd Citibank 34,527(355,000) Feng TAY Enterprise Co Ltd Goldam Sachs (304,765)(165,100) Feng TAY Enterprise Co Ltd HSBC (91,230)(55,354) Feng TAY Enterprise Co Ltd JP Morgan (30,871)
BlackRock Style Advantage Fund continued
The notes on pages 691 to 711 form an integral part of these financial statements.
Annual report and audited financial statements [555]

Contracts for difference as at 31 May 2020
Holding Description Counterparty
Netunrealised
appreciation/(depreciation)
USD
Taiwan continued1,757,000 First Financial Holding Co
Ltd Barclays Bank 51,0591,842,170 First Financial Holding Co
Ltd Citibank 53,5341,872,000 First Financial Holding Co
Ltd Goldam Sachs 59,0972,870,430 First Financial Holding Co
Ltd HSBC 93,5991,243,310 First Financial Holding Co
Ltd JP Morgan 41,391(102,000) Formosa Petrochemical
CorpBank of AmericaMerrill Lynch (3,041)
(686,000) Formosa PetrochemicalCorp Barclays Bank 55,121
(482,000) Formosa PetrochemicalCorp Citibank 38,729
(823,000) Formosa PetrochemicalCorp Goldam Sachs (24,539)
(243,000) Formosa PetrochemicalCorp HSBC 8,829
(34,000) Formosa PetrochemicalCorp JP Morgan 1,141
117,000 Foxconn Technology Co Ltd Barclays Bank 908176,000 Foxconn Technology Co Ltd Goldam Sachs (6,780)
1,094,000 Foxconn Technology Co Ltd HSBC (95,188)(705,000) Fubon Financial Holding Co
Ltd Citibank (15,212)(29,000) Giant Manufacturing Co Ltd Citibank 1,251
(232,000) Giant Manufacturing Co Ltd Goldam Sachs (270,965)(217,000) Giant Manufacturing Co Ltd HSBC (332,130)(641,791) Giant Manufacturing Co Ltd JP Morgan (986,080)(200,000) Hon Hai Precision Industry
Co Ltd Goldam Sachs 11,065(29,000) Hotai Motor Co Ltd Bank of America
Merrill Lynch (23,775)(119,000) Hotai Motor Co Ltd Citibank (92,583)(179,000) Hotai Motor Co Ltd HSBC (90,142)(163,510) Hotai Motor Co Ltd JP Morgan (84,999)
3,791,375 Hua Nan Financial HoldingsCo Ltd
Bank of AmericaMerrill Lynch 45,586
590,520 Hua Nan Financial HoldingsCo Ltd Goldam Sachs 7,100
2,241,055 Hua Nan Financial HoldingsCo Ltd JP Morgan 23,292
(1,332,000) Inventec Corp Barclays Bank (29,739)(4,069,000) Inventec Corp Goldam Sachs (93,432)
(372,000) Inventec Corp HSBC (10,155)(92,000) Inventec Corp JP Morgan (2,579)(3,000) Largan Precision Co Ltd Barclays Bank 979
(14,000) Largan Precision Co Ltd Citibank 4,570(27,000) Largan Precision Co Ltd Goldam Sachs 223,952(3,000) Largan Precision Co Ltd HSBC 41,314
648,000 Lite-On Technology Corp Barclays Bank 27,874378,000 Lite-On Technology Corp Goldam Sachs 22,460192,000 MediaTek Inc Goldam Sachs 320,21123,000 MediaTek Inc HSBC 37,698
(2,422,000) Mega Financial Holding CoLtd Goldam Sachs (28,904)
(333,000) Mega Financial Holding CoLtd HSBC (6,469)
(698,000) Nan Ya Plastics Corp Goldam Sachs 2,178(51,000) Nanya Technology Corp Barclays Bank (553)
(1,047,000) Nanya Technology Corp Goldam Sachs 20,278(332,000) Nanya Technology Corp JP Morgan 47,487618,000 Pegatron Corp Barclays Bank 76,653
1,045,000 Pegatron Corp Goldam Sachs 55,92245,000 Pegatron Corp HSBC (3,250)
2,656,000 Pou Chen Corp Citibank 178,301
Holding Description Counterparty
Netunrealised
appreciation/(depreciation)
USD
Taiwan continued1,350,000 Pou Chen Corp JP Morgan 75,172
46,000 President Chain Store Corp Barclays Bank (6,702)31,000 President Chain Store Corp HSBC (11,559)
(1,011,000) Quanta Computer Inc Citibank (40,881)(526,687) Quanta Computer Inc JP Morgan (84,206)462,000 Realtek Semiconductor
Corp Barclays Bank 179,903258,000 Realtek Semiconductor
Corp Goldam Sachs 101,825(513,000) Shanghai Commercial &
Savings Bank Ltd Barclays Bank (3,362)(390,000) Shanghai Commercial &
Savings Bank Ltd Citibank (2,556)(2,236,000) Shanghai Commercial &
Savings Bank Ltd Goldam Sachs (26,219)(887,000) Shanghai Commercial &
Savings Bank Ltd HSBC 30,794(635,000) Shanghai Commercial &
Savings Bank Ltd JP Morgan 21,177(9,462,136) Shin Kong Financial Holding
Co LtdBank of AmericaMerrill Lynch (44,683)
(2,103,133) Shin Kong Financial HoldingCo Ltd Barclays Bank (16,103)
(7,027,888) Shin Kong Financial HoldingCo Ltd Citibank (53,809)
(3,927,223) Shin Kong Financial HoldingCo Ltd Goldam Sachs (19,712)
(355,483) Shin Kong Financial HoldingCo Ltd JP Morgan (5,528)
(415) Shin Kong Financial HoldingCo Ltd (Pref)
Bank of AmericaMerrill Lynch 3
1,298,000 SinoPac Financial HoldingsCo Ltd Barclays Bank 10,183
2,143,700 SinoPac Financial HoldingsCo Ltd Citibank 16,818
4,133,000 SinoPac Financial HoldingsCo Ltd Goldam Sachs 13,135
2,986,740 SinoPac Financial HoldingsCo Ltd JP Morgan 19,564
1,423,000 Synnex TechnologyInternational Corp Barclays Bank (16,867)
704,000 Synnex TechnologyInternational Corp Goldam Sachs 42,237
40,000 Synnex TechnologyInternational Corp JP Morgan 6,486
3,420,000 Taishin Financial Holding CoLtd Barclays Bank 55,174
8,580,812 Taishin Financial Holding CoLtd Goldam Sachs 169,231
438,249 Taishin Financial Holding CoLtd HSBC 8,485
(262,000) Taiwan Cement Corp Barclays Bank 1,338(193,000) Taiwan Cement Corp HSBC 4,429161,000 Taiwan Cooperative
Financial Holding Co Ltd Barclays Bank 2,0116,000 Taiwan Cooperative
Financial Holding Co Ltd Citibank 752,555,120 Taiwan Cooperative
Financial Holding Co Ltd Goldam Sachs 30,3426,657,077 Taiwan Cooperative
Financial Holding Co Ltd JP Morgan 101,624464,000 Taiwan Fertilizer Co Ltd Barclays Bank (945)366,000 Taiwan Fertilizer Co Ltd Citibank (745)160,000 Taiwan Fertilizer Co Ltd Goldam Sachs (1,488)331,000 Taiwan Fertilizer Co Ltd HSBC (3,103)240,000 Taiwan Fertilizer Co Ltd JP Morgan 13,05121,000 Taiwan Semiconductor
Manufacturing Co Ltd Barclays Bank (255)
BlackRock Style Advantage Fund continued
The notes on pages 691 to 711 form an integral part of these financial statements.
BlackRock Strategic Funds[556]
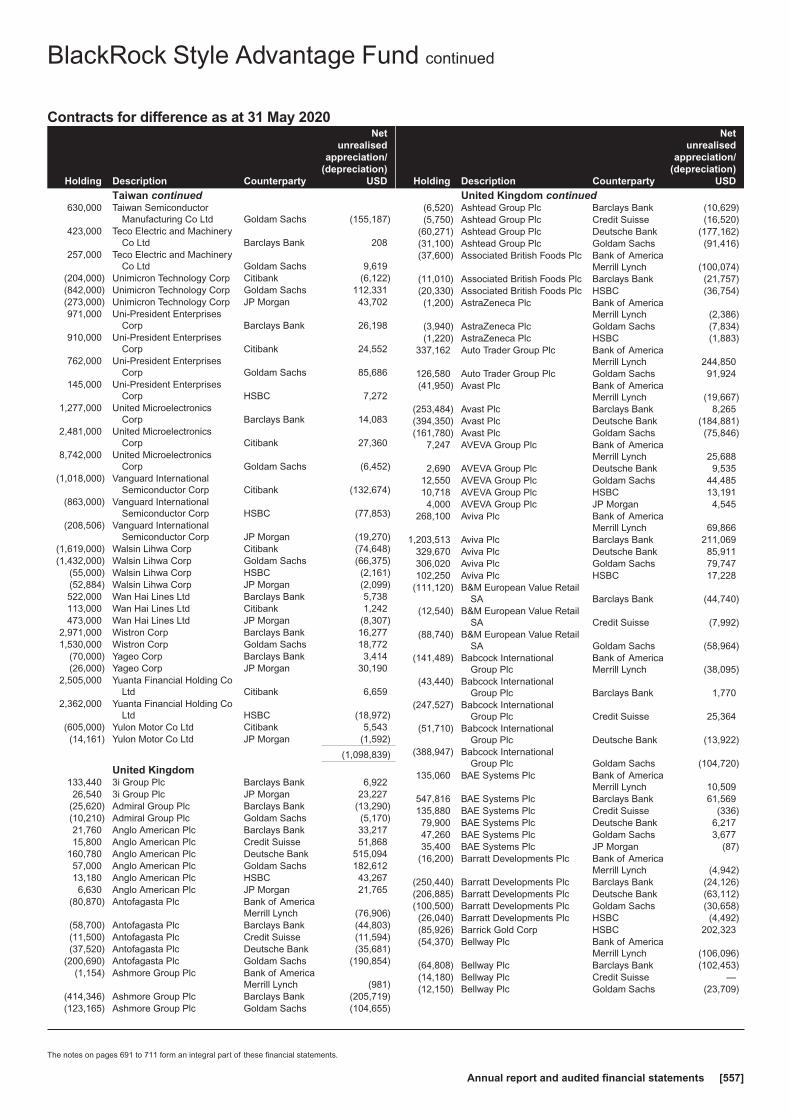
Contracts for difference as at 31 May 2020
Holding Description Counterparty
Netunrealised
appreciation/(depreciation)
USD
Taiwan continued630,000 Taiwan Semiconductor
Manufacturing Co Ltd Goldam Sachs (155,187)423,000 Teco Electric and Machinery
Co Ltd Barclays Bank 208257,000 Teco Electric and Machinery
Co Ltd Goldam Sachs 9,619(204,000) Unimicron Technology Corp Citibank (6,122)(842,000) Unimicron Technology Corp Goldam Sachs 112,331(273,000) Unimicron Technology Corp JP Morgan 43,702971,000 Uni-President Enterprises
Corp Barclays Bank 26,198910,000 Uni-President Enterprises
Corp Citibank 24,552762,000 Uni-President Enterprises
Corp Goldam Sachs 85,686145,000 Uni-President Enterprises
Corp HSBC 7,2721,277,000 United Microelectronics
Corp Barclays Bank 14,0832,481,000 United Microelectronics
Corp Citibank 27,3608,742,000 United Microelectronics
Corp Goldam Sachs (6,452)(1,018,000) Vanguard International
Semiconductor Corp Citibank (132,674)(863,000) Vanguard International
Semiconductor Corp HSBC (77,853)(208,506) Vanguard International
Semiconductor Corp JP Morgan (19,270)(1,619,000) Walsin Lihwa Corp Citibank (74,648)(1,432,000) Walsin Lihwa Corp Goldam Sachs (66,375)
(55,000) Walsin Lihwa Corp HSBC (2,161)(52,884) Walsin Lihwa Corp JP Morgan (2,099)522,000 Wan Hai Lines Ltd Barclays Bank 5,738113,000 Wan Hai Lines Ltd Citibank 1,242473,000 Wan Hai Lines Ltd JP Morgan (8,307)
2,971,000 Wistron Corp Barclays Bank 16,2771,530,000 Wistron Corp Goldam Sachs 18,772
(70,000) Yageo Corp Barclays Bank 3,414(26,000) Yageo Corp JP Morgan 30,190
2,505,000 Yuanta Financial Holding CoLtd Citibank 6,659
2,362,000 Yuanta Financial Holding CoLtd HSBC (18,972)
(605,000) Yulon Motor Co Ltd Citibank 5,543(14,161) Yulon Motor Co Ltd JP Morgan (1,592)
(1,098,839)
United Kingdom133,440 3i Group Plc Barclays Bank 6,92226,540 3i Group Plc JP Morgan 23,227
(25,620) Admiral Group Plc Barclays Bank (13,290)(10,210) Admiral Group Plc Goldam Sachs (5,170)21,760 Anglo American Plc Barclays Bank 33,21715,800 Anglo American Plc Credit Suisse 51,868
160,780 Anglo American Plc Deutsche Bank 515,09457,000 Anglo American Plc Goldam Sachs 182,61213,180 Anglo American Plc HSBC 43,2676,630 Anglo American Plc JP Morgan 21,765
(80,870) Antofagasta Plc Bank of AmericaMerrill Lynch (76,906)
(58,700) Antofagasta Plc Barclays Bank (44,803)(11,500) Antofagasta Plc Credit Suisse (11,594)(37,520) Antofagasta Plc Deutsche Bank (35,681)
(200,690) Antofagasta Plc Goldam Sachs (190,854)(1,154) Ashmore Group Plc Bank of America
Merrill Lynch (981)(414,346) Ashmore Group Plc Barclays Bank (205,719)(123,165) Ashmore Group Plc Goldam Sachs (104,655)
Holding Description Counterparty
Netunrealised
appreciation/(depreciation)
USD
United Kingdom continued(6,520) Ashtead Group Plc Barclays Bank (10,629)(5,750) Ashtead Group Plc Credit Suisse (16,520)
(60,271) Ashtead Group Plc Deutsche Bank (177,162)(31,100) Ashtead Group Plc Goldam Sachs (91,416)(37,600) Associated British Foods Plc Bank of America
Merrill Lynch (100,074)(11,010) Associated British Foods Plc Barclays Bank (21,757)(20,330) Associated British Foods Plc HSBC (36,754)(1,200) AstraZeneca Plc Bank of America
Merrill Lynch (2,386)(3,940) AstraZeneca Plc Goldam Sachs (7,834)(1,220) AstraZeneca Plc HSBC (1,883)
337,162 Auto Trader Group Plc Bank of AmericaMerrill Lynch 244,850
126,580 Auto Trader Group Plc Goldam Sachs 91,924(41,950) Avast Plc Bank of America
Merrill Lynch (19,667)(253,484) Avast Plc Barclays Bank 8,265(394,350) Avast Plc Deutsche Bank (184,881)(161,780) Avast Plc Goldam Sachs (75,846)
7,247 AVEVA Group Plc Bank of AmericaMerrill Lynch 25,688
2,690 AVEVA Group Plc Deutsche Bank 9,53512,550 AVEVA Group Plc Goldam Sachs 44,48510,718 AVEVA Group Plc HSBC 13,1914,000 AVEVA Group Plc JP Morgan 4,545
268,100 Aviva Plc Bank of AmericaMerrill Lynch 69,866
1,203,513 Aviva Plc Barclays Bank 211,069329,670 Aviva Plc Deutsche Bank 85,911306,020 Aviva Plc Goldam Sachs 79,747102,250 Aviva Plc HSBC 17,228
(111,120) B&M European Value RetailSA Barclays Bank (44,740)
(12,540) B&M European Value RetailSA Credit Suisse (7,992)
(88,740) B&M European Value RetailSA Goldam Sachs (58,964)
(141,489) Babcock InternationalGroup Plc
Bank of AmericaMerrill Lynch (38,095)
(43,440) Babcock InternationalGroup Plc Barclays Bank 1,770
(247,527) Babcock InternationalGroup Plc Credit Suisse 25,364
(51,710) Babcock InternationalGroup Plc Deutsche Bank (13,922)
(388,947) Babcock InternationalGroup Plc Goldam Sachs (104,720)
135,060 BAE Systems Plc Bank of AmericaMerrill Lynch 10,509
547,816 BAE Systems Plc Barclays Bank 61,569135,880 BAE Systems Plc Credit Suisse (336)79,900 BAE Systems Plc Deutsche Bank 6,21747,260 BAE Systems Plc Goldam Sachs 3,67735,400 BAE Systems Plc JP Morgan (87)
(16,200) Barratt Developments Plc Bank of AmericaMerrill Lynch (4,942)
(250,440) Barratt Developments Plc Barclays Bank (24,126)(206,885) Barratt Developments Plc Deutsche Bank (63,112)(100,500) Barratt Developments Plc Goldam Sachs (30,658)(26,040) Barratt Developments Plc HSBC (4,492)(85,926) Barrick Gold Corp HSBC 202,323(54,370) Bellway Plc Bank of America
Merrill Lynch (106,096)(64,808) Bellway Plc Barclays Bank (102,453)(14,180) Bellway Plc Credit Suisse —(12,150) Bellway Plc Goldam Sachs (23,709)
BlackRock Style Advantage Fund continued
The notes on pages 691 to 711 form an integral part of these financial statements.
Annual report and audited financial statements [557]

Contracts for difference as at 31 May 2020
Holding Description Counterparty
Netunrealised
appreciation/(depreciation)
USD
United Kingdom continued2,570 Berkeley Group Holdings
PlcBank of AmericaMerrill Lynch 4,729
8,075 Berkeley Group HoldingsPlc Barclays Bank 19,647
46,040 Berkeley Group HoldingsPlc Deutsche Bank 84,724
4,900 Berkeley Group HoldingsPlc HSBC 507
114,461 BHP Group Plc Bank of AmericaMerrill Lynch 241,451
72,030 BHP Group Plc Barclays Bank 30,24753,717 BHP Group Plc Deutsche Bank 113,314
635,390 BP Plc Deutsche Bank 58,071(7,150) British American Tobacco
PlcBank of AmericaMerrill Lynch (13,687)
(171,873) British American TobaccoPlc Deutsche Bank (329,021)
(22,170) British American TobaccoPlc Goldam Sachs (42,441)
(254,870) BT Group Plc Bank of AmericaMerrill Lynch (31,950)
(521,468) BT Group Plc Deutsche Bank (65,370)165,317 Bunzl Plc Bank of America
Merrill Lynch 396,09985,880 Bunzl Plc Goldam Sachs 205,76836,756 Burberry Group Plc Bank of America
Merrill Lynch 91,4725,620 Burberry Group Plc Barclays Bank 6,976
94,851 Burberry Group Plc Goldam Sachs 236,04951,821 Carnival Plc Barclays Bank 45,697
108,071 Carnival Plc Deutsche Bank 223,167396,350 Centrica Plc Bank of America
Merrill Lynch 1,517601,460 Centrica Plc Barclays Bank 7,874180,200 Centrica Plc Credit Suisse (89)361,500 Centrica Plc Goldam Sachs 1,384144,720 Centrica Plc HSBC (72)41,795 Coca-Cola HBC AG Bank of America
Merrill Lynch 126,98287,740 Coca-Cola HBC AG Barclays Bank 200,4729,810 Coca-Cola HBC AG Citibank 22,414
155,046 Coca-Cola HBC AG Goldam Sachs 471,06440,850 Compass Group Plc Bank of America
Merrill Lynch 56,732184,150 Compass Group Plc Barclays Bank 120,42218,229 Compass Group Plc Credit Suisse (15,208)
102,530 Compass Group Plc Deutsche Bank 142,392112,850 Compass Group Plc Goldam Sachs 156,72526,630 Compass Group Plc HSBC (2,188)10,530 Compass Group Plc JP Morgan (8,785)44,580 ConvaTec Group Plc Bank of America
Merrill Lynch 1,65278,190 ConvaTec Group Plc Citibank (4,442)
104,170 ConvaTec Group Plc Deutsche Bank 3,860(3,870) Croda International Plc Barclays Bank (3,122)(3,540) Croda International Plc Deutsche Bank (11,207)
(13,630) Croda International Plc Goldam Sachs (43,148)(7,859) DCC Plc Bank of America
Merrill Lynch (102,886)(7,570) DCC Plc Barclays Bank (5,610)
(68,182) DCC Plc Goldam Sachs (892,607)44,040 Direct Line Insurance Group
PlcBank of AmericaMerrill Lynch 870
(811,993) DS Smith Plc Bank of AmericaMerrill Lynch (478,360)
(522,314) DS Smith Plc Barclays Bank (107,084)(5,003) DS Smith Plc Credit Suisse (1,668)
(309,468) easyJet Plc Deutsche Bank (735,904)
Holding Description Counterparty
Netunrealised
appreciation/(depreciation)
USD
United Kingdom continued(75,240) easyJet Plc Goldam Sachs (178,918)65,580 Evraz Plc Bank of America
Merrill Lynch 29,401168,070 Evraz Plc Credit Suisse 67,669137,570 Evraz Plc Deutsche Bank 61,67614,570 Experian Plc Bank of America
Merrill Lynch 78,09719,710 Experian Plc Deutsche Bank 105,648
(11,380) Ferguson Plc Bank of AmericaMerrill Lynch (105,412)
(2,260) Ferguson Plc Barclays Bank (5,806)(4,330) Ferguson Plc Credit Suisse (17,846)
(11,170) Ferguson Plc Deutsche Bank (103,466)(1,640) Ferguson Plc JP Morgan (14,369)
(66,460) Fresnillo Plc Barclays Bank 4,432(287,933) Fresnillo Plc Deutsche Bank (181,362)(138,770) Fresnillo Plc Goldam Sachs (87,408)
(4,085) Fresnillo Plc JP Morgan (5,146)(118,690) G4S Plc Deutsche Bank (2,170)
37,940 GlaxoSmithKline Plc Bank of AmericaMerrill Lynch 8,153
75,800 GlaxoSmithKline Plc Barclays Bank 1,8728,266 GlaxoSmithKline Plc Credit Suisse (1,286)
144,740 GlaxoSmithKline Plc Goldam Sachs 31,104(63,651) Glencore Plc Bank of America
Merrill Lynch (6,792)(1,252,470) Glencore Plc Deutsche Bank (133,649)
(464,210) Glencore Plc Goldam Sachs (49,535)(35,530) GVC Holdings Plc Credit Suisse (10,684)(14,890) GVC Holdings Plc Deutsche Bank (11,328)(27,700) GVC Holdings Plc JP Morgan (10,126)94,432 Halma Plc Barclays Bank 138,321
(61,380) Hargreaves Lansdown Plc Bank of AmericaMerrill Lynch (166,397)
(8,850) Hargreaves Lansdown Plc Barclays Bank (13,936)(41,778) Hargreaves Lansdown Plc Deutsche Bank (113,257)
(172,941) Hargreaves Lansdown Plc HSBC (571,355)(27,690) Hikma Pharmaceuticals Plc Barclays Bank (24,965)(30,685) Hikma Pharmaceuticals Plc Goldam Sachs (68,216)(3,700) Hikma Pharmaceuticals Plc JP Morgan (4,373)
(89,037) Hiscox Ltd Barclays Bank (27,931)(12,990) HomeServe Plc Goldam Sachs (28,772)235,890 Howden Joinery Group Plc Barclays Bank 180,62892,750 Howden Joinery Group Plc Citibank 71,022
280,868 Howden Joinery Group Plc Deutsche Bank 246,289200,990 Howden Joinery Group Plc Goldam Sachs 176,24516,820 Howden Joinery Group Plc JP Morgan 13,586
(648,909) HSBC Holdings Plc Deutsche Bank 212,380119,707 IMI Plc Bank of America
Merrill Lynch 118,275487,301 IMI Plc Barclays Bank 204,62647,846 IMI Plc Credit Suisse 32,205
158,328 IMI Plc Deutsche Bank 156,43426,604 IMI Plc Goldam Sachs 26,286
(11,150) Imperial Brands Plc Bank of AmericaMerrill Lynch 22,584
(17,310) Imperial Brands Plc Barclays Bank 10,155830,359 Inchcape Plc Barclays Bank 424,571436,474 Inchcape Plc Deutsche Bank 162,79846,477 Inchcape Plc Goldam Sachs 17,335
228,800 Informa Plc Deutsche Bank 138,464159,940 Informa Plc Goldam Sachs 96,79252,030 Informa Plc HSBC 20,627(4,930) InterContinental Hotels
Group Plc Barclays Bank (13,456)(3,150) InterContinental Hotels
Group Plc Goldam Sachs (24,548)
BlackRock Style Advantage Fund continued
The notes on pages 691 to 711 form an integral part of these financial statements.
BlackRock Strategic Funds[558]

Contracts for difference as at 31 May 2020
Holding Description Counterparty
Netunrealised
appreciation/(depreciation)
USD
United Kingdom continued87,530 Intermediate Capital Group
PlcBank of AmericaMerrill Lynch 219,451
65,140 Intermediate Capital GroupPlc Barclays Bank 111,827
86,166 Intermediate Capital GroupPlc Deutsche Bank 216,031
33,000 Intermediate Capital GroupPlc Goldam Sachs 82,736
20,420 Intermediate Capital GroupPlc HSBC 37,577
24,580 Intermediate Capital GroupPlc JP Morgan 45,233
5,350 Intertek Group Plc Deutsche Bank 76,38380,530 Investec Plc Bank of America
Merrill Lynch (4,476)187,472 Investec Plc Barclays Bank 3,47335,930 Investec Plc Citibank 66633,770 Investec Plc Credit Suisse (2,065)
341,000 Investec Plc Deutsche Bank (18,952)228,889 Investec Plc Goldam Sachs (12,721)275,313 Investec Plc HSBC (16,831)
(1,103,480) J Sainsbury Plc Bank of AmericaMerrill Lynch (81,090)
(325,866) J Sainsbury Plc Barclays Bank (40,447)(80,550) J Sainsbury Plc Credit Suisse 1,523
(110,870) J Sainsbury Plc Deutsche Bank (8,147)(700,240) J Sainsbury Plc Goldam Sachs (51,457)
15,040 JD Sports Fashion Plc Bank of AmericaMerrill Lynch 23,572
71,710 JD Sports Fashion Plc Barclays Bank 72,71225,580 JD Sports Fashion Plc Deutsche Bank 40,09172,370 JD Sports Fashion Plc HSBC 96,263
107,130 John Wood Group Plc Bank of AmericaMerrill Lynch 29,108
77,480 John Wood Group Plc Deutsche Bank 21,052(23,260) Johnson Matthey Plc Bank of America
Merrill Lynch (61,907)(48,940) Johnson Matthey Plc Barclays Bank (64,070)(19,040) Johnson Matthey Plc Credit Suisse (40,211)(31,370) Johnson Matthey Plc Goldam Sachs (83,492)(45,273) Just Eat Takeaway.com NV Barclays Bank 12,301
(108,698) KAZ Minerals Plc Bank of AmericaMerrill Lynch (88,335)
(134,076) KAZ Minerals Plc Barclays Bank (51,167)(86,232) KAZ Minerals Plc Credit Suisse (71,782)
(266,602) KAZ Minerals Plc Deutsche Bank (216,658)(319,293) KAZ Minerals Plc Goldam Sachs (259,478)(145,840) KAZ Minerals Plc HSBC (121,401)
(5,390) Kingfisher Plc Bank of AmericaMerrill Lynch (1,621)
(149,060) Kingfisher Plc Barclays Bank (36,911)(80,380) Kingfisher Plc Deutsche Bank (24,173)(97,000) Kingfisher Plc Goldam Sachs (29,171)
(106,560) Legal & General Group Plc Barclays Bank (14,674)(786,870) Legal & General Group Plc Deutsche Bank (155,006)(559,970) Legal & General Group Plc Goldam Sachs (110,309)(155,340) Legal & General Group Plc HSBC (12,065)
(6,060) London Stock ExchangeGroup Plc Barclays Bank 24,998
(905,250) M&G Plc Barclays Bank (181,680)(535,270) Marks & Spencer Group Plc Bank of America
Merrill Lynch (82,900)(203,230) Marks & Spencer Group Plc Barclays Bank (7,580)(327,835) Marks & Spencer Group Plc Credit Suisse (40,570)
(2,099,565) Marks & Spencer Group Plc Deutsche Bank (325,171)414,460 Meggitt Plc Bank of America
Merrill Lynch 126,434655,097 Meggitt Plc Barclays Bank 143,207219,890 Meggitt Plc Deutsche Bank 67,079
Holding Description Counterparty
Netunrealised
appreciation/(depreciation)
USD
United Kingdom continued99,960 Meggitt Plc Goldam Sachs 30,494
(710,420) Melrose Industries Plc Barclays Bank (201,303)(1,554,020) Melrose Industries Plc Deutsche Bank (542,450)
(413,170) Melrose Industries Plc Goldam Sachs (144,222)57,460 Micro Focus International
Plc Credit Suisse (37,443)87,440 Micro Focus International
Plc Deutsche Bank (1,944)(21,010) Mondi Plc Bank of America
Merrill Lynch (55,789)(12,940) Mondi Plc Deutsche Bank (34,360)(27,370) Mondi Plc Goldam Sachs (72,677)
7 National Express GroupPlcπ
Bank of AmericaMerrill Lynch —
37 National Express Group Plc Credit Suisse (3)2 National Express Group
Plcπ JP Morgan —(36,134) National Grid Plc Bank of America
Merrill Lynch (4,731)(87,778) National Grid Plc Barclays Bank (50,736)(31,679) National Grid Plc Credit Suisse (704)
(119,209) National Grid Plc Deutsche Bank (15,606)(217,036) National Grid Plc Goldam Sachs (28,413)
7,530 Next Plc Barclays Bank 34,968(155,976) Ocado Group Plc Bank of America
Merrill Lynch (467,147)(87,582) Ocado Group Plc Barclays Bank (123,312)(5,880) Ocado Group Plc Goldam Sachs (17,611)30,980 Pearson Plc Bank of America
Merrill Lynch 13,65971,733 Pearson Plc Barclays Bank 4,784
173,410 Pearson Plc Deutsche Bank 76,45937,840 Pearson Plc Goldam Sachs 16,684
122,780 Pearson Plc HSBC 7,477(33,740) Pennon Group Plc Bank of America
Merrill Lynch (11,459)(5,370) Pennon Group Plc Barclays Bank (1,923)
(35,350) Pennon Group Plc Goldam Sachs (12,006)(13,110) Persimmon Plc Bank of America
Merrill Lynch (33,193)(48,881) Persimmon Plc Barclays Bank (84,519)
(189,628) Persimmon Plc Deutsche Bank (480,110)(15,850) Phoenix Group Holdings Plc Bank of America
Merrill Lynch (10,297)(23,810) Prudential Plc Barclays Bank (11,322)(58,915) Prudential Plc Credit Suisse 29,891
(321,940) Prudential Plc Deutsche Bank —(175,930) Prudential Plc Goldam Sachs —(180,870) Prudential Plc JP Morgan 159,719(826,416) Quilter Plc Bank of America
Merrill Lynch (118,907)(12,213) Quilter Plc Barclays Bank (965)(65,954) Reckitt Benckiser Group Plc Bank of America
Merrill Lynch (73,311)(3,090) Reckitt Benckiser Group Plc Deutsche Bank (3,435)
(19,597) Reckitt Benckiser Group Plc HSBC (67,285)11,808 RELX Plc Bank of America
Merrill Lynch 17,50036,660 RELX Plc Barclays Bank 9,28247,450 RELX Plc Deutsche Bank 70,3249,210 RELX Plc Goldam Sachs 13,650
(100,248) Renishaw Plc Barclays Bank 118,85925,851 Rentokil Initial Plc Barclays Bank 1,85248,340 Rentokil Initial Plc Deutsche Bank 20,120
163,662 Rentokil Initial Plc Goldam Sachs 68,118132,297 Rightmove Plc Citibank 90,520350,860 Rightmove Plc Deutsche Bank 365,730
5,955 Rightmove Plc Goldam Sachs 6,207
BlackRock Style Advantage Fund continued
The notes on pages 691 to 711 form an integral part of these financial statements.
Annual report and audited financial statements [559]

Contracts for difference as at 31 May 2020
Holding Description Counterparty
Netunrealised
appreciation/(depreciation)
USD
United Kingdom continued102,409 Rightmove Plc HSBC 80,947107,264 Rightmove Plc JP Morgan 84,78553,550 Rio Tinto Plc Barclays Bank 31,08435,030 Rolls-Royce Holdings Plc Bank of America
Merrill Lynch 14,19169,540 Rolls-Royce Holdings Plc Barclays Bank 1,632
1,817,165 Rolls-Royce Holdings Plc Deutsche Bank 736,127346,210 Rolls-Royce Holdings Plc Goldam Sachs 140,248
(698,310) Royal Bank of ScotlandGroup Plc
Bank of AmericaMerrill Lynch (60,803)
(101,050) Royal Bank of ScotlandGroup Plc Barclays Bank (9,111)
(292,360) Royal Bank of ScotlandGroup Plc Goldam Sachs (25,456)
(644,294) Royal Bank of ScotlandGroup Plc HSBC (7,957)
136,391 Royal Dutch Shell Plc ’A’ Bank of AmericaMerrill Lynch 60,642
163,420 Royal Dutch Shell Plc ’A’ Deutsche Bank 72,659609,224 RSA Insurance Group Plc Bank of America
Merrill Lynch 272,37796,920 RSA Insurance Group Plc Barclays Bank 26,81333,680 RSA Insurance Group Plc Citibank 9,318
507,520 RSA Insurance Group Plc Deutsche Bank 226,906406,110 RSA Insurance Group Plc Goldam Sachs 181,56772,440 RSA Insurance Group Plc HSBC 13,241
300,440 Sage Group Plc Bank of AmericaMerrill Lynch 190,724
393,650 Sage Group Plc Barclays Bank 52,50738,166 Sage Group Plc Credit Suisse 22,62685,510 Sage Group Plc Deutsche Bank 54,283
124,680 Sage Group Plc Goldam Sachs 79,149(10,370) Schroders Plc Bank of America
Merrill Lynch (31,891)(28,590) Schroders Plc Barclays Bank (52,259)(24,810) Schroders Plc Deutsche Bank (76,298)(50,327) Schroders Plc Goldam Sachs (154,769)(25,310) Schroders Plc HSBC (60,955)11,340 Severn Trent Plc Bank of America
Merrill Lynch 5,8825,610 Severn Trent Plc Barclays Bank 4,6424,210 Severn Trent Plc Citibank 3,484
12,230 Severn Trent Plc Deutsche Bank 6,344(68) Signature Aviation Plc Bank of America
Merrill Lynch (36)(2) Signature Aviation Plc HSBC (1)
(224) Signature Aviation Plc JP Morgan (133)172,191 Smith & Nephew Plc Bank of America
Merrill Lynch 306,23711,360 Smith & Nephew Plc Barclays Bank 1,26319,757 Smith & Nephew Plc Citibank 2,1967,050 Smith & Nephew Plc Credit Suisse 12,452
29,460 Smith & Nephew Plc Deutsche Bank 52,394131,420 Smith & Nephew Plc Goldam Sachs 233,727
(150,993) Smiths Group Plc Bank of AmericaMerrill Lynch (185,551)
(37,801) Smiths Group Plc Barclays Bank (21,709)(172,537) Smiths Group Plc HSBC (107,611)(49,772) Spirax-Sarco Engineering
Plc Barclays Bank (109,418)(16,360) SSE Plc Bank of America
Merrill Lynch (4,445)(42,285) SSE Plc Barclays Bank (32,379)
(811) SSE Plc Credit Suisse (40)(33,900) SSE Plc Deutsche Bank (9,211)(43,240) SSE Plc Goldam Sachs (11,749)
(230,542) St James’s Place Plc Barclays Bank (275,619)391,518 Standard Chartered Plc Deutsche Bank (57,542)
(653,200) Standard Life Aberdeen Plc Deutsche Bank (392,880)
Holding Description Counterparty
Netunrealised
appreciation/(depreciation)
USD
United Kingdom continued694,509 Tate & Lyle Plc Bank of America
Merrill Lynch 372,265599,137 Tate & Lyle Plc Barclays Bank 331,504117,201 Tate & Lyle Plc Citibank 64,84852,590 Tate & Lyle Plc Deutsche Bank 28,189
321,715 Tate & Lyle Plc Goldam Sachs 172,443(51,680) Taylor Wimpey Plc Bank of America
Merrill Lynch (3,159)(139,208) Taylor Wimpey Plc Barclays Bank (7,651)
(1,785,560) Taylor Wimpey Plc Deutsche Bank (109,160)(577,955) Taylor Wimpey Plc HSBC 37,832(674,810) Tesco Plc Bank of America
Merrill Lynch 78,434(1,109,800) Tesco Plc Barclays Bank (45,081)
(58,090) Tesco Plc Credit Suisse 5,389(632,293) Tesco Plc Deutsche Bank 73,492(151,060) Tesco Plc Goldam Sachs 17,558(165,840) Tesco Plc HSBC 24,293(13,791) Travis Perkins Plc Bank of America
Merrill Lynch (10,134)(943) Travis Perkins Plc Barclays Bank (547)
(10,554) Travis Perkins Plc Credit Suisse (6,811)(138,191) Travis Perkins Plc Deutsche Bank (101,550)(21,684) Travis Perkins Plc Goldam Sachs (15,935)
(192,720) TUI AG Bank of AmericaMerrill Lynch (366,549)
(226,984) TUI AG Barclays Bank (318,462)(64,596) TUI AG Credit Suisse (118,951)
(104,920) TUI AG Deutsche Bank (199,555)(115,660) TUI AG Goldam Sachs (219,983)(29,010) TUI AG JP Morgan (53,421)58,340 Unilever Plc Barclays Bank 163,560
(70,640) United Utilities Group Plc Bank of AmericaMerrill Lynch (23,730)
270,120 Vodafone Group Plc Barclays Bank 14,212321,380 Vodafone Group Plc Credit Suisse 84,385192,040 Vodafone Group Plc Deutsche Bank 31,497676,656 Vodafone Group Plc Goldam Sachs 110,981
(302,304) Weir Group Plc Barclays Bank 5,227(9,530) Whitbread Plc Bank of America
Merrill Lynch 22,010(84,854) Whitbread Plc Barclays Bank 123,663(9,340) Whitbread Plc Goldam Sachs 21,571
(69,709) Whitbread Plc HSBC 281,932(4,765) Whitbread Plc (Rights) Bank of America
Merrill Lynch (57,661)(42,427) Whitbread Plc (Rights) Barclays Bank (513,410)(4,670) Whitbread Plc (Rights) Goldam Sachs (56,512)
(34,854) Whitbread Plc (Rights) HSBC (421,769)756,691 Wm Morrison Supermarkets
Plc HSBC (6,542)25,860 WPP Plc Bank of America
Merrill Lynch 16,80094,570 WPP Plc Barclays Bank 16,58522,360 WPP Plc Credit Suisse 14,10820,360 WPP Plc Deutsche Bank 13,22715,370 WPP Plc Goldam Sachs 9,985
(560,252)
United States(125,695) 2U Inc Barclays Bank 280,300
(9,017) 3M Co Bank of AmericaMerrill Lynch (144,272)
(17,350) 3M Co Barclays Bank (143,138)(15,840) 3M Co Citibank (130,680)(5,260) 3M Co Goldam Sachs (84,160)(7,300) Abbott Laboratories Bank of America
Merrill Lynch (20,805)(7,360) Abbott Laboratories Barclays Bank (9,347)
BlackRock Style Advantage Fund continued
The notes on pages 691 to 711 form an integral part of these financial statements.
BlackRock Strategic Funds[560]
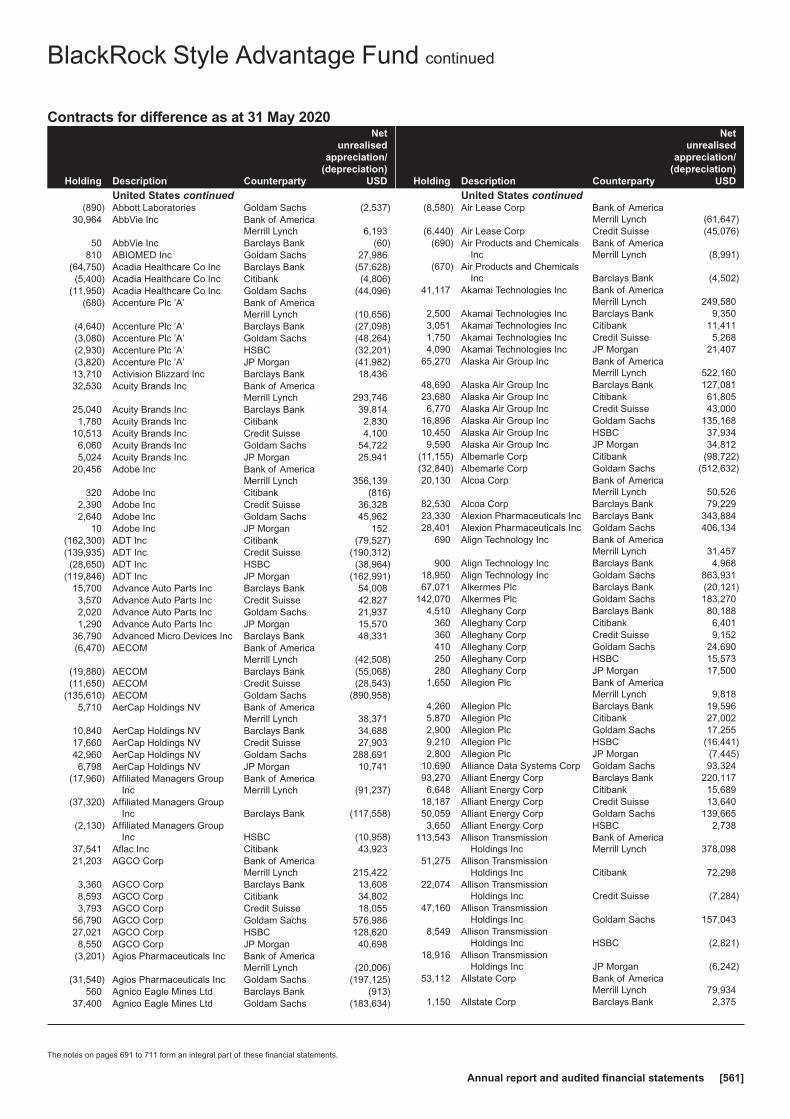
Contracts for difference as at 31 May 2020
Holding Description Counterparty
Netunrealised
appreciation/(depreciation)
USD
United States continued(890) Abbott Laboratories Goldam Sachs (2,537)
30,964 AbbVie Inc Bank of AmericaMerrill Lynch 6,193
50 AbbVie Inc Barclays Bank (60)810 ABIOMED Inc Goldam Sachs 27,986
(64,750) Acadia Healthcare Co Inc Barclays Bank (57,628)(5,400) Acadia Healthcare Co Inc Citibank (4,806)
(11,950) Acadia Healthcare Co Inc Goldam Sachs (44,096)(680) Accenture Plc ’A’ Bank of America
Merrill Lynch (10,656)(4,640) Accenture Plc ’A’ Barclays Bank (27,098)(3,080) Accenture Plc ’A’ Goldam Sachs (48,264)(2,930) Accenture Plc ’A’ HSBC (32,201)(3,820) Accenture Plc ’A’ JP Morgan (41,982)13,710 Activision Blizzard Inc Barclays Bank 18,43632,530 Acuity Brands Inc Bank of America
Merrill Lynch 293,74625,040 Acuity Brands Inc Barclays Bank 39,8141,780 Acuity Brands Inc Citibank 2,830
10,513 Acuity Brands Inc Credit Suisse 4,1006,060 Acuity Brands Inc Goldam Sachs 54,7225,024 Acuity Brands Inc JP Morgan 25,941
20,456 Adobe Inc Bank of AmericaMerrill Lynch 356,139
320 Adobe Inc Citibank (816)2,390 Adobe Inc Credit Suisse 36,3282,640 Adobe Inc Goldam Sachs 45,962
10 Adobe Inc JP Morgan 152(162,300) ADT Inc Citibank (79,527)(139,935) ADT Inc Credit Suisse (190,312)(28,650) ADT Inc HSBC (38,964)
(119,846) ADT Inc JP Morgan (162,991)15,700 Advance Auto Parts Inc Barclays Bank 54,0083,570 Advance Auto Parts Inc Credit Suisse 42,8272,020 Advance Auto Parts Inc Goldam Sachs 21,9371,290 Advance Auto Parts Inc JP Morgan 15,570
36,790 Advanced Micro Devices Inc Barclays Bank 48,331(6,470) AECOM Bank of America
Merrill Lynch (42,508)(19,880) AECOM Barclays Bank (55,068)(11,650) AECOM Credit Suisse (28,543)
(135,610) AECOM Goldam Sachs (890,958)5,710 AerCap Holdings NV Bank of America
Merrill Lynch 38,37110,840 AerCap Holdings NV Barclays Bank 34,68817,660 AerCap Holdings NV Credit Suisse 27,90342,960 AerCap Holdings NV Goldam Sachs 288,6916,798 AerCap Holdings NV JP Morgan 10,741
(17,960) Affiliated Managers GroupInc
Bank of AmericaMerrill Lynch (91,237)
(37,320) Affiliated Managers GroupInc Barclays Bank (117,558)
(2,130) Affiliated Managers GroupInc HSBC (10,958)
37,541 Aflac Inc Citibank 43,92321,203 AGCO Corp Bank of America
Merrill Lynch 215,4223,360 AGCO Corp Barclays Bank 13,6088,593 AGCO Corp Citibank 34,8023,793 AGCO Corp Credit Suisse 18,055
56,790 AGCO Corp Goldam Sachs 576,98627,021 AGCO Corp HSBC 128,6208,550 AGCO Corp JP Morgan 40,698
(3,201) Agios Pharmaceuticals Inc Bank of AmericaMerrill Lynch (20,006)
(31,540) Agios Pharmaceuticals Inc Goldam Sachs (197,125)560 Agnico Eagle Mines Ltd Barclays Bank (913)
37,400 Agnico Eagle Mines Ltd Goldam Sachs (183,634)
Holding Description Counterparty
Netunrealised
appreciation/(depreciation)
USD
United States continued(8,580) Air Lease Corp Bank of America
Merrill Lynch (61,647)(6,440) Air Lease Corp Credit Suisse (45,076)
(690) Air Products and ChemicalsInc
Bank of AmericaMerrill Lynch (8,991)
(670) Air Products and ChemicalsInc Barclays Bank (4,502)
41,117 Akamai Technologies Inc Bank of AmericaMerrill Lynch 249,580
2,500 Akamai Technologies Inc Barclays Bank 9,3503,051 Akamai Technologies Inc Citibank 11,4111,750 Akamai Technologies Inc Credit Suisse 5,2684,090 Akamai Technologies Inc JP Morgan 21,407
65,270 Alaska Air Group Inc Bank of AmericaMerrill Lynch 522,160
48,690 Alaska Air Group Inc Barclays Bank 127,08123,680 Alaska Air Group Inc Citibank 61,8056,770 Alaska Air Group Inc Credit Suisse 43,000
16,896 Alaska Air Group Inc Goldam Sachs 135,16810,450 Alaska Air Group Inc HSBC 37,9349,590 Alaska Air Group Inc JP Morgan 34,812
(11,155) Albemarle Corp Citibank (98,722)(32,840) Albemarle Corp Goldam Sachs (512,632)20,130 Alcoa Corp Bank of America
Merrill Lynch 50,52682,530 Alcoa Corp Barclays Bank 79,22923,330 Alexion Pharmaceuticals Inc Barclays Bank 343,88428,401 Alexion Pharmaceuticals Inc Goldam Sachs 406,134
690 Align Technology Inc Bank of AmericaMerrill Lynch 31,457
900 Align Technology Inc Barclays Bank 4,96818,950 Align Technology Inc Goldam Sachs 863,93167,071 Alkermes Plc Barclays Bank (20,121)
142,070 Alkermes Plc Goldam Sachs 183,2704,510 Alleghany Corp Barclays Bank 80,188
360 Alleghany Corp Citibank 6,401360 Alleghany Corp Credit Suisse 9,152410 Alleghany Corp Goldam Sachs 24,690250 Alleghany Corp HSBC 15,573280 Alleghany Corp JP Morgan 17,500
1,650 Allegion Plc Bank of AmericaMerrill Lynch 9,818
4,260 Allegion Plc Barclays Bank 19,5965,870 Allegion Plc Citibank 27,0022,900 Allegion Plc Goldam Sachs 17,2559,210 Allegion Plc HSBC (16,441)2,800 Allegion Plc JP Morgan (7,445)
10,690 Alliance Data Systems Corp Goldam Sachs 93,32493,270 Alliant Energy Corp Barclays Bank 220,1176,648 Alliant Energy Corp Citibank 15,689
18,187 Alliant Energy Corp Credit Suisse 13,64050,059 Alliant Energy Corp Goldam Sachs 139,6653,650 Alliant Energy Corp HSBC 2,738
113,543 Allison TransmissionHoldings Inc
Bank of AmericaMerrill Lynch 378,098
51,275 Allison TransmissionHoldings Inc Citibank 72,298
22,074 Allison TransmissionHoldings Inc Credit Suisse (7,284)
47,160 Allison TransmissionHoldings Inc Goldam Sachs 157,043
8,549 Allison TransmissionHoldings Inc HSBC (2,821)
18,916 Allison TransmissionHoldings Inc JP Morgan (6,242)
53,112 Allstate Corp Bank of AmericaMerrill Lynch 79,934
1,150 Allstate Corp Barclays Bank 2,375
BlackRock Style Advantage Fund continued
The notes on pages 691 to 711 form an integral part of these financial statements.
Annual report and audited financial statements [561]

Contracts for difference as at 31 May 2020
Holding Description Counterparty
Netunrealised
appreciation/(depreciation)
USD
United States continued2,720 Allstate Corp Goldam Sachs 4,094
15,346 Allstate Corp JP Morgan (59,926)375,177 Ally Financial Inc Bank of America
Merrill Lynch 913,55642,128 Ally Financial Inc Credit Suisse 79,833(9,861) Alnylam Pharmaceuticals
Inc Credit Suisse 31,2591,330 Alphabet Inc ’A’ Barclays Bank 21,7591,510 Alphabet Inc ’A’ Goldam Sachs 85,375
100 Alphabet Inc ’C’ Barclays Bank 1,7992,530 Alphabet Inc ’C’ Goldam Sachs 139,707
(17,300) Alteryx Inc ’A’ Goldam Sachs (193,587)(19,750) Altice USA Inc ’A’ Bank of America
Merrill Lynch (43,450)(20,310) Altice USA Inc ’A’ Credit Suisse (37,574)(31,070) Altria Group Inc Goldam Sachs (51,576)
280 Amazon.com Inc Credit Suisse 8,828(4,180) AMC Networks Inc ’A’ Barclays Bank 4,891(5,250) AMC Networks Inc ’A’ Goldam Sachs (2,153)25,170 Amdocs Ltd Bank of America
Merrill Lynch 41,02710,236 Amdocs Ltd Goldam Sachs 16,68528,718 Amdocs Ltd HSBC (39,918)
(15,779) AMERCO Bank of AmericaMerrill Lynch (509,188)
(3,010) AMERCO Goldam Sachs (97,133)8,492 Ameren Corp Bank of America
Merrill Lynch 43,13916,910 Ameren Corp Barclays Bank 67,9782,739 Ameren Corp Credit Suisse 8,162
13,950 Ameren Corp Goldam Sachs 70,8667,540 Ameren Corp HSBC 22,4699,717 Ameren Corp JP Morgan 28,957
14,683 American Electric Power CoInc
Bank of AmericaMerrill Lynch 94,118
4,816 American Electric Power CoInc Barclays Bank 29,185
5,986 American Electric Power CoInc Credit Suisse 29,810
12,730 American Electric Power CoInc Goldam Sachs 81,599
6,019 American Electric Power CoInc HSBC 29,975
21,966 American Express Co Credit Suisse 147,3925,730 American Financial Group
IncBank of AmericaMerrill Lynch 37,474
4,319 American Financial GroupInc Barclays Bank 5,053
1,091 American Financial GroupInc Citibank 1,276
(17,340) American InternationalGroup Inc Barclays Bank (26,704)
(33,710) American InternationalGroup Inc JP Morgan (93,714)
1,330 American NationalInsurance Co Goldam Sachs 7,887
16,040 American Water Works CoInc Barclays Bank 54,055
2,130 American Water Works CoInc Credit Suisse 12,887
8,775 American Water Works CoInc Goldam Sachs 55,458
7,140 American Water Works CoInc HSBC 50,204
10,300 American Water Works CoInc JP Morgan 62,315
4,940 Ameriprise Financial Inc Barclays Bank 38,878(19,050) AmerisourceBergen Corp Barclays Bank (31,052)(4,770) AmerisourceBergen Corp Citibank (7,775)
Holding Description Counterparty
Netunrealised
appreciation/(depreciation)
USD
United States continued22,810 AMETEK Inc Barclays Bank 111,9972,150 Amgen Inc Bank of America
Merrill Lynch (34,314)5,850 Amgen Inc Goldam Sachs (93,366)
510 Amgen Inc HSBC (8,676)9,394 Amgen Inc JP Morgan (99,389)
(84) Amneal PharmaceuticalsInc
Bank of AmericaMerrill Lynch (52)
(55,940) Amphenol Corp ’A’ Barclays Bank (227,676)(9,500) Amphenol Corp ’A’ Goldam Sachs (119,320)
(33,570) Analog Devices Inc Bank of AmericaMerrill Lynch (330,664)
(10,120) Analog Devices Inc Barclays Bank (5,971)(2,370) Analog Devices Inc Credit Suisse (7,371)(6,130) Analog Devices Inc Goldam Sachs (60,381)36,440 Anaplan Inc Barclays Bank (185,480)1,400 ANSYS Inc Bank of America
Merrill Lynch 33,824560 ANSYS Inc JP Morgan 16,497
(7,723) Antero Midstream Corp Bank of AmericaMerrill Lynch (8,341)
(185,070) Antero Midstream Corp JP Morgan (94,386)(91,909) Antero Resources Corp Bank of America
Merrill Lynch (65,255)(1,022,110) Antero Resources Corp Barclays Bank 10,221
(178,916) Antero Resources Corp HSBC (128,059)(1,260) Anthem Inc Bank of America
Merrill Lynch (12,386)(620) Anthem Inc Barclays Bank (6,702)
(3,080) Anthem Inc Goldam Sachs (30,276)(660) Anthem Inc JP Morgan (8,969)
20,370 AO Smith Corp Barclays Bank 95,332(16,350) Aon Plc ’A’ Barclays Bank (105,294)(70,731) Apache Corp Bank of America
Merrill Lynch (44,561)1 Apartment Investment and
Management Co ’A’(REIT)
Bank of AmericaMerrill Lynch 3
(142,930) Apergy Corp Bank of AmericaMerrill Lynch (57,172)
(15,000) Apergy Corp Citibank (3,000)(24,610) Apergy Corp Goldam Sachs (9,844)(10,930) Apergy Corp HSBC 10,930(21,205) Apergy Corp JP Morgan 21,205(4,130) Apple Inc Bank of America
Merrill Lynch (43,943)(5,780) Apple Inc Barclays Bank 3,121(1,000) Apple Inc Credit Suisse (1,765)31,441 Applied Materials Inc Bank of America
Merrill Lynch 120,10584,510 Applied Materials Inc Barclays Bank 124,2302,620 Applied Materials Inc Goldam Sachs 10,0084,400 Applied Materials Inc HSBC 10,7301,670 AptarGroup Inc Bank of America
Merrill Lynch 15,1641,560 AptarGroup Inc Credit Suisse 4,7588,710 AptarGroup Inc Goldam Sachs 79,0873,330 AptarGroup Inc JP Morgan 10,157
(14,550) Aptiv Plc Barclays Bank (23,426)(55,280) Aptiv Plc Goldam Sachs (521,290)(10,694) Aptiv Plc HSBC (57,213)50,310 Arch Capital Group Ltd Bank of America
Merrill Lynch 270,66826,510 Arch Capital Group Ltd Barclays Bank 1,5917,440 Arch Capital Group Ltd Citibank 446
16,410 Arch Capital Group Ltd Credit Suisse 56,05850,230 Arch Capital Group Ltd Goldam Sachs 270,2378,960 Arch Capital Group Ltd HSBC 21,594
BlackRock Style Advantage Fund continued
The notes on pages 691 to 711 form an integral part of these financial statements.
BlackRock Strategic Funds[562]
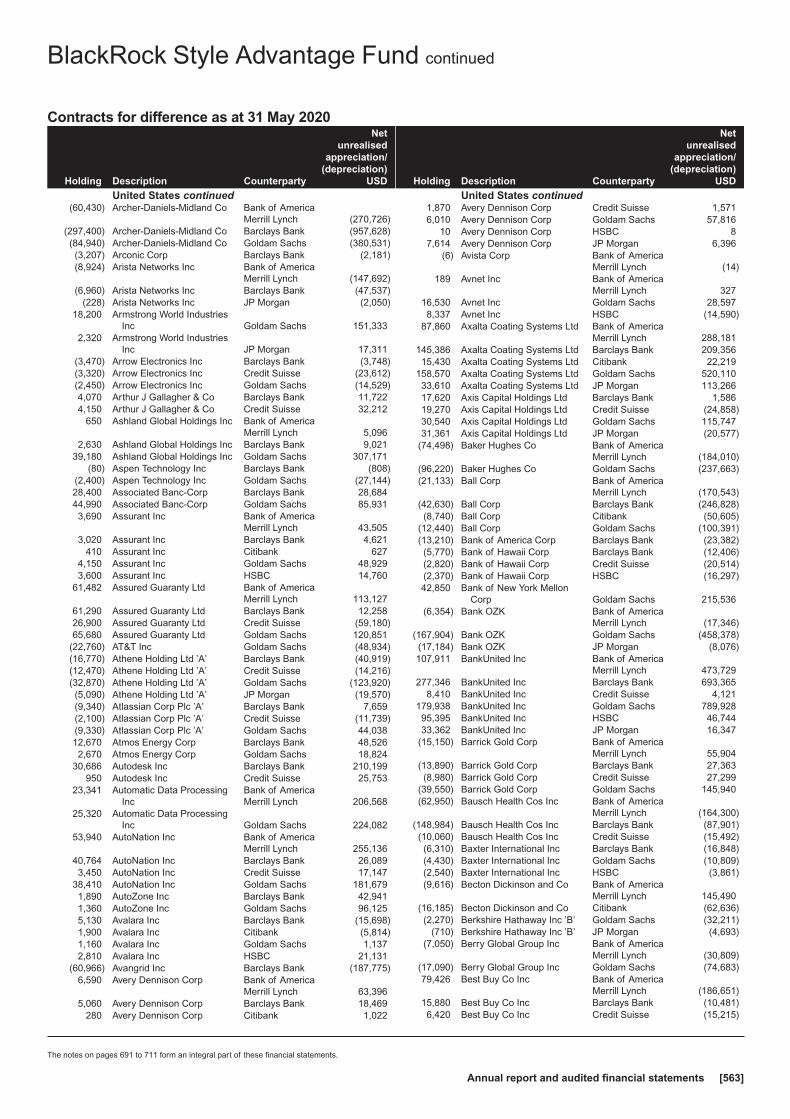
Contracts for difference as at 31 May 2020
Holding Description Counterparty
Netunrealised
appreciation/(depreciation)
USD
United States continued(60,430) Archer-Daniels-Midland Co Bank of America
Merrill Lynch (270,726)(297,400) Archer-Daniels-Midland Co Barclays Bank (957,628)(84,940) Archer-Daniels-Midland Co Goldam Sachs (380,531)(3,207) Arconic Corp Barclays Bank (2,181)(8,924) Arista Networks Inc Bank of America
Merrill Lynch (147,692)(6,960) Arista Networks Inc Barclays Bank (47,537)
(228) Arista Networks Inc JP Morgan (2,050)18,200 Armstrong World Industries
Inc Goldam Sachs 151,3332,320 Armstrong World Industries
Inc JP Morgan 17,311(3,470) Arrow Electronics Inc Barclays Bank (3,748)(3,320) Arrow Electronics Inc Credit Suisse (23,612)(2,450) Arrow Electronics Inc Goldam Sachs (14,529)4,070 Arthur J Gallagher & Co Barclays Bank 11,7224,150 Arthur J Gallagher & Co Credit Suisse 32,212
650 Ashland Global Holdings Inc Bank of AmericaMerrill Lynch 5,096
2,630 Ashland Global Holdings Inc Barclays Bank 9,02139,180 Ashland Global Holdings Inc Goldam Sachs 307,171
(80) Aspen Technology Inc Barclays Bank (808)(2,400) Aspen Technology Inc Goldam Sachs (27,144)28,400 Associated Banc-Corp Barclays Bank 28,68444,990 Associated Banc-Corp Goldam Sachs 85,9313,690 Assurant Inc Bank of America
Merrill Lynch 43,5053,020 Assurant Inc Barclays Bank 4,621
410 Assurant Inc Citibank 6274,150 Assurant Inc Goldam Sachs 48,9293,600 Assurant Inc HSBC 14,760
61,482 Assured Guaranty Ltd Bank of AmericaMerrill Lynch 113,127
61,290 Assured Guaranty Ltd Barclays Bank 12,25826,900 Assured Guaranty Ltd Credit Suisse (59,180)65,680 Assured Guaranty Ltd Goldam Sachs 120,851
(22,760) AT&T Inc Goldam Sachs (48,934)(16,770) Athene Holding Ltd ’A’ Barclays Bank (40,919)(12,470) Athene Holding Ltd ’A’ Credit Suisse (14,216)(32,870) Athene Holding Ltd ’A’ Goldam Sachs (123,920)(5,090) Athene Holding Ltd ’A’ JP Morgan (19,570)(9,340) Atlassian Corp Plc ’A’ Barclays Bank 7,659(2,100) Atlassian Corp Plc ’A’ Credit Suisse (11,739)(9,330) Atlassian Corp Plc ’A’ Goldam Sachs 44,03812,670 Atmos Energy Corp Barclays Bank 48,5262,670 Atmos Energy Corp Goldam Sachs 18,824
30,686 Autodesk Inc Barclays Bank 210,199950 Autodesk Inc Credit Suisse 25,753
23,341 Automatic Data ProcessingInc
Bank of AmericaMerrill Lynch 206,568
25,320 Automatic Data ProcessingInc Goldam Sachs 224,082
53,940 AutoNation Inc Bank of AmericaMerrill Lynch 255,136
40,764 AutoNation Inc Barclays Bank 26,0893,450 AutoNation Inc Credit Suisse 17,147
38,410 AutoNation Inc Goldam Sachs 181,6791,890 AutoZone Inc Barclays Bank 42,9411,360 AutoZone Inc Goldam Sachs 96,1255,130 Avalara Inc Barclays Bank (15,698)1,900 Avalara Inc Citibank (5,814)1,160 Avalara Inc Goldam Sachs 1,1372,810 Avalara Inc HSBC 21,131
(60,966) Avangrid Inc Barclays Bank (187,775)6,590 Avery Dennison Corp Bank of America
Merrill Lynch 63,3965,060 Avery Dennison Corp Barclays Bank 18,469
280 Avery Dennison Corp Citibank 1,022
Holding Description Counterparty
Netunrealised
appreciation/(depreciation)
USD
United States continued1,870 Avery Dennison Corp Credit Suisse 1,5716,010 Avery Dennison Corp Goldam Sachs 57,816
10 Avery Dennison Corp HSBC 87,614 Avery Dennison Corp JP Morgan 6,396
(6) Avista Corp Bank of AmericaMerrill Lynch (14)
189 Avnet Inc Bank of AmericaMerrill Lynch 327
16,530 Avnet Inc Goldam Sachs 28,5978,337 Avnet Inc HSBC (14,590)
87,860 Axalta Coating Systems Ltd Bank of AmericaMerrill Lynch 288,181
145,386 Axalta Coating Systems Ltd Barclays Bank 209,35615,430 Axalta Coating Systems Ltd Citibank 22,219
158,570 Axalta Coating Systems Ltd Goldam Sachs 520,11033,610 Axalta Coating Systems Ltd JP Morgan 113,26617,620 Axis Capital Holdings Ltd Barclays Bank 1,58619,270 Axis Capital Holdings Ltd Credit Suisse (24,858)30,540 Axis Capital Holdings Ltd Goldam Sachs 115,74731,361 Axis Capital Holdings Ltd JP Morgan (20,577)
(74,498) Baker Hughes Co Bank of AmericaMerrill Lynch (184,010)
(96,220) Baker Hughes Co Goldam Sachs (237,663)(21,133) Ball Corp Bank of America
Merrill Lynch (170,543)(42,630) Ball Corp Barclays Bank (246,828)(8,740) Ball Corp Citibank (50,605)
(12,440) Ball Corp Goldam Sachs (100,391)(13,210) Bank of America Corp Barclays Bank (23,382)(5,770) Bank of Hawaii Corp Barclays Bank (12,406)(2,820) Bank of Hawaii Corp Credit Suisse (20,514)(2,370) Bank of Hawaii Corp HSBC (16,297)42,850 Bank of New York Mellon
Corp Goldam Sachs 215,536(6,354) Bank OZK Bank of America
Merrill Lynch (17,346)(167,904) Bank OZK Goldam Sachs (458,378)(17,184) Bank OZK JP Morgan (8,076)107,911 BankUnited Inc Bank of America
Merrill Lynch 473,729277,346 BankUnited Inc Barclays Bank 693,365
8,410 BankUnited Inc Credit Suisse 4,121179,938 BankUnited Inc Goldam Sachs 789,92895,395 BankUnited Inc HSBC 46,74433,362 BankUnited Inc JP Morgan 16,347
(15,150) Barrick Gold Corp Bank of AmericaMerrill Lynch 55,904
(13,890) Barrick Gold Corp Barclays Bank 27,363(8,980) Barrick Gold Corp Credit Suisse 27,299
(39,550) Barrick Gold Corp Goldam Sachs 145,940(62,950) Bausch Health Cos Inc Bank of America
Merrill Lynch (164,300)(148,984) Bausch Health Cos Inc Barclays Bank (87,901)(10,060) Bausch Health Cos Inc Credit Suisse (15,492)(6,310) Baxter International Inc Barclays Bank (16,848)(4,430) Baxter International Inc Goldam Sachs (10,809)(2,540) Baxter International Inc HSBC (3,861)(9,616) Becton Dickinson and Co Bank of America
Merrill Lynch 145,490(16,185) Becton Dickinson and Co Citibank (62,636)(2,270) Berkshire Hathaway Inc ’B’ Goldam Sachs (32,211)
(710) Berkshire Hathaway Inc ’B’ JP Morgan (4,693)(7,050) Berry Global Group Inc Bank of America
Merrill Lynch (30,809)(17,090) Berry Global Group Inc Goldam Sachs (74,683)79,426 Best Buy Co Inc Bank of America
Merrill Lynch (186,651)15,880 Best Buy Co Inc Barclays Bank (10,481)6,420 Best Buy Co Inc Credit Suisse (15,215)
BlackRock Style Advantage Fund continued
The notes on pages 691 to 711 form an integral part of these financial statements.
Annual report and audited financial statements [563]

Contracts for difference as at 31 May 2020
Holding Description Counterparty
Netunrealised
appreciation/(depreciation)
USD
United States continued9,630 Best Buy Co Inc HSBC (22,823)4,100 Best Buy Co Inc JP Morgan (9,717)
632,623 BGC Partners Inc ’A’ Barclays Bank 12,652144,421 BGC Partners Inc ’A’ Credit Suisse (40,438)329,588 BGC Partners Inc ’A’ Goldam Sachs 9,888129,843 BGC Partners Inc ’A’ HSBC 18,022
2,844 Biogen Inc Bank of AmericaMerrill Lynch (45,618)
13,917 Biogen Inc Citibank (55,250)16,320 Biogen Inc HSBC (219,667)(1,400) BioMarin Pharmaceutical
IncBank of AmericaMerrill Lynch (16,842)
(1,890) BioMarin PharmaceuticalInc Barclays Bank (15,611)
(9,390) BioMarin PharmaceuticalInc Goldam Sachs (112,962)
10,040 Bio-Rad Laboratories Inc ’A’ Barclays Bank 72,3883,400 Bio-Rad Laboratories Inc ’A’ Goldam Sachs 43,996
(12,074) Bio-Techne Corp Bank of AmericaMerrill Lynch 86,088
(26,300) Black Knight Inc Barclays Bank (61,805)(28,800) Black Knight Inc Goldam Sachs (95,040)
(84) BlackBerry Ltd Bank of AmericaMerrill Lynch (16)
(32,982) Bluebird Bio Inc Barclays Bank 187,997(7,590) Bluebird Bio Inc Credit Suisse (13,662)(1,410) Bluebird Bio Inc Goldam Sachs (6,232)
(15,760) Boeing Co Barclays Bank (133,802)(6,161) Boeing Co Goldam Sachs (160,309)(5,450) Boeing Co HSBC (68,561)
(16,132) BOK Financial Corp Bank of AmericaMerrill Lynch (154,545)
(105) BOK Financial Corp Credit Suisse (203)750 Booking Holdings Inc Barclays Bank 4,860660 Booking Holdings Inc Goldam Sachs 167,290
63,197 Booz Allen HamiltonHolding Corp
Bank of AmericaMerrill Lynch 431,004
8,400 Booz Allen HamiltonHolding Corp Barclays Bank 15,036
32,810 Booz Allen HamiltonHolding Corp Goldam Sachs 223,764
12,452 Booz Allen HamiltonHolding Corp JP Morgan 57,528
(8,740) BorgWarner Inc Bank of AmericaMerrill Lynch (31,551)
(7,730) BorgWarner Inc Barclays Bank (11,904)(4,360) BorgWarner Inc Credit Suisse (16,341)
(16,490) BorgWarner Inc Goldam Sachs (59,529)(4,800) BorgWarner Inc JP Morgan (22,924)
(14,569) Boston Scientific Corp Bank of AmericaMerrill Lynch (38,316)
(29,300) Boston Scientific Corp Barclays Bank (45,415)(6,350) Boston Scientific Corp Goldam Sachs (16,701)23,680 Bright Horizons Family
Solutions IncBank of AmericaMerrill Lynch 323,706
2,150 Bright Horizons FamilySolutions Inc Barclays Bank 14,534
5,370 Bright Horizons FamilySolutions Inc Citibank 36,301
3,120 Bright Horizons FamilySolutions Inc Credit Suisse 1,373
13,420 Bright Horizons FamilySolutions Inc Goldam Sachs 183,451
6,290 Bright Horizons FamilySolutions Inc HSBC 2,768
1,360 Bright Horizons FamilySolutions Inc JP Morgan 598
(19,830) Brighthouse Financial Inc Bank of AmericaMerrill Lynch (65,836)
Holding Description Counterparty
Netunrealised
appreciation/(depreciation)
USD
United States continued(13,090) Brighthouse Financial Inc Barclays Bank (15,054)(31,050) Brighthouse Financial Inc Goldam Sachs (103,086)
15 Brinker International Inc Bank of AmericaMerrill Lynch 100
6,617 Bristol-Myers Squibb Co Barclays Bank (3,772)44,302 Bristol-Myers Squibb Co
CVR (Rights)Bank of AmericaMerrill Lynch 3,101
54,930 Bristol-Myers Squibb CoCVR (Rights) Barclays Bank 5,493
25,852 Bristol-Myers Squibb CoCVR (Rights) Credit Suisse (19,389)
1,600 Bristol-Myers Squibb CoCVR (Rights) Goldam Sachs 112
19,640 Bristol-Myers Squibb CoCVR (Rights) HSBC (14,730)
5,425 Bristol-Myers Squibb CoCVR (Rights) JP Morgan (4,069)
(1,810) Broadcom Inc Bank of AmericaMerrill Lynch (44,055)
(1,130) Broadcom Inc Barclays Bank (9,153)(740) Broadcom Inc Citibank (5,994)
(9,600) Broadcom Inc Goldam Sachs (233,664)(2,640) Broadcom Inc JP Morgan (25,661)
(16,230) Broadridge FinancialSolutions Inc
Bank of AmericaMerrill Lynch (55,994)
(1,360) Broadridge FinancialSolutions Inc Barclays Bank (2,978)
(13,760) Broadridge FinancialSolutions Inc Goldam Sachs (47,472)
(2,600) Broadridge FinancialSolutions Inc HSBC 286
(53,625) Brookfield AssetManagement Inc ’A’
Bank of AmericaMerrill Lynch (97,598)
(76,005) Brookfield AssetManagement Inc ’A’ Barclays Bank (111,727)
(15,935) Brookfield AssetManagement Inc ’A’ Goldam Sachs (29,002)
32,230 Brown & Brown Inc Barclays Bank 55,1137,490 Brown & Brown Inc Credit Suisse 25,875
30,657 Brown & Brown Inc Goldam Sachs 95,956(11,237) Brown-Forman Corp ’B’ Bank of America
Merrill Lynch 5,281(44,129) Brown-Forman Corp ’B’ Barclays Bank (47,218)(10,880) Brown-Forman Corp ’B’ Goldam Sachs 5,114
9,920 Bruker Corp JP Morgan 46,5915,360 Brunswick Corp Bank of America
Merrill Lynch 30,07010,830 Brunswick Corp HSBC 66,60520,640 Brunswick Corp JP Morgan 132,083
(18,900) Bunge Ltd Bank of AmericaMerrill Lynch (74,277)
(27,583) Bunge Ltd Barclays Bank (79,439)(91,580) Bunge Ltd Goldam Sachs (359,909)(7,480) Bunge Ltd HSBC (21,831)4,686 Burlington Stores Inc Bank of America
Merrill Lynch 202,06017,850 Burlington Stores Inc Barclays Bank 152,6183,210 Burlington Stores Inc Citibank 27,4462,060 Burlington Stores Inc Credit Suisse 94,445
13,230 Burlington Stores Inc Goldam Sachs 570,4783,370 Burlington Stores Inc HSBC 107,267
120 Burlington Stores Inc JP Morgan 3,820(1,518) BWX Technologies Inc Bank of America
Merrill Lynch (11,172)(18,950) BWX Technologies Inc Goldam Sachs (139,472)
(828) Cable One Inc Barclays Bank (47,858)(1,660) Cable One Inc Goldam Sachs 2,39012,365 Cabot Corp Bank of America
Merrill Lynch 86,926
BlackRock Style Advantage Fund continued
The notes on pages 691 to 711 form an integral part of these financial statements.
BlackRock Strategic Funds[564]

Contracts for difference as at 31 May 2020
Holding Description Counterparty
Netunrealised
appreciation/(depreciation)
USD
United States continued8,470 Cabot Corp Barclays Bank 15,8398,690 Cabot Corp Citibank 16,2503,900 Cabot Corp Credit Suisse 29,585
21,100 Cabot Corp Goldam Sachs 148,33312,600 Cabot Corp HSBC 59,06614,120 Cabot Corp JP Morgan 51,3975,990 Cabot Oil & Gas Corp Citibank 3,953
24,490 Cabot Oil & Gas Corp HSBC (23,266)22,049 CACI International Inc ’A’ Barclays Bank 147,50814,224 Cadence Design Systems
IncBank of AmericaMerrill Lynch 98,288
52,916 Cadence Design SystemsInc Citibank 155,044
29,753 Cadence Design SystemsInc Credit Suisse 193,990
(158,879) Caesars EntertainmentCorp
Bank of AmericaMerrill Lynch (204,954)
(90,909) Caesars EntertainmentCorp JP Morgan (147,273)
2,860 Campbell Soup Co Goldam Sachs (11,383)2,190 Campbell Soup Co HSBC (6,789)
(2,558) Cantel Medical Corp Bank of AmericaMerrill Lynch (20,643)
(13,129) Cantel Medical Corp Barclays Bank (82,713)(74,760) Cantel Medical Corp Goldam Sachs (603,313)30,600 Capital One Financial Corp Bank of America
Merrill Lynch 276,93011,805 Capital One Financial Corp Barclays Bank 81,10021,089 Capital One Financial Corp Citibank 144,8814,080 Capital One Financial Corp HSBC 19,910
12,639 Capital One Financial Corp JP Morgan 61,678(53,530) Capri Holdings Ltd Barclays Bank (60,489)
(104,360) Capri Holdings Ltd Goldam Sachs (288,034)(5,160) Cardinal Health Inc Bank of America
Merrill Lynch (28,225)(6,690) Cardinal Health Inc Barclays Bank (5,553)
(10,490) Cardinal Health Inc Goldam Sachs (57,380)10,585 Carlisle Cos Inc Goldam Sachs 157,399
(18,290) CarMax Inc Bank of AmericaMerrill Lynch (204,482)
(4,600) CarMax Inc Barclays Bank (24,978)(7,960) CarMax Inc Credit Suisse (81,908)
(25,950) CarMax Inc Goldam Sachs (290,121)(86,760) Carnival Corp Barclays Bank (69,408)(12,530) Carnival Corp JP Morgan (31,317)16,406 Carter’s Inc Bank of America
Merrill Lynch 166,3573,780 Carter’s Inc Barclays Bank 15,196
16,410 Carter’s Inc Goldam Sachs 166,397(25,080) Carvana Co Bank of America
Merrill Lynch (9,280)(16,760) Carvana Co Barclays Bank 57,319(9,270) Carvana Co Goldam Sachs (3,430)(8,170) Carvana Co HSBC 4,2627,560 Casey’s General Stores Inc Bank of America
Merrill Lynch 77,4901,820 Casey’s General Stores Inc Barclays Bank 7,972
600 Casey’s General Stores Inc Citibank 2,6281,860 Casey’s General Stores Inc Credit Suisse 7,459
880 Casey’s General Stores Inc HSBC 3,529490 Casey’s General Stores Inc JP Morgan 1,965
(96,993) Catalent Inc Bank of AmericaMerrill Lynch (516,003)
(1,158) Catalent Inc Credit Suisse (7,932)(8,442) Catalent Inc Goldam Sachs (44,911)
(37,959) Catalent Inc JP Morgan (260,019)(83) Caterpillar Inc Bank of America
Merrill Lynch (874)(2,860) Caterpillar Inc Barclays Bank (17,103)
Holding Description Counterparty
Netunrealised
appreciation/(depreciation)
USD
United States continued(16,380) Caterpillar Inc Citibank (97,952)(40,860) Caterpillar Inc Goldam Sachs (430,256)18,400 Cboe Global Markets Inc Bank of America
Merrill Lynch 76,7281,820 Cboe Global Markets Inc Barclays Bank 8,6274,020 Cboe Global Markets Inc Credit Suisse 15,557
23,710 Cboe Global Markets Inc Goldam Sachs 98,871(14,850) CBRE Group Inc ’A’ Bank of America
Merrill Lynch (111,227)(37,550) CBRE Group Inc ’A’ Barclays Bank (119,409)(10,430) CBRE Group Inc ’A’ HSBC (32,618)13,140 CDK Global Inc Barclays Bank 1,97112,150 CDK Global Inc Citibank 1,8235,650 CDK Global Inc Credit Suisse (9,266)5,740 CDK Global Inc Goldam Sachs 16,1293,730 CDK Global Inc JP Morgan (6,117)5,726 CDW Corp Bank of America
Merrill Lynch 65,6773,100 CDW Corp Barclays Bank 10,974
26,160 CDW Corp Goldam Sachs 300,055(1,280) Celanese Corp Barclays Bank (3,821)(4,430) Celanese Corp Goldam Sachs (52,252)(5,447) Centene Corp Bank of America
Merrill Lynch 13,454(15,171) Centene Corp Barclays Bank (21,088)(2,540) Centene Corp Credit Suisse (889)
(16,903) Centene Corp Goldam Sachs 41,7503,582 Centene Corp JP Morgan 1,254
(240,919) Centennial ResourceDevelopment Inc ’A’
Bank of AmericaMerrill Lynch (42,619)
(883,840) Centennial ResourceDevelopment Inc ’A’ Barclays Bank (8,838)
(502,779) Centennial ResourceDevelopment Inc ’A’ Citibank (5,028)
(542,472) Centennial ResourceDevelopment Inc ’A’ Goldam Sachs (95,963)
(107,550) Centennial ResourceDevelopment Inc ’A’ HSBC (21,521)
(92,604) Centennial ResourceDevelopment Inc ’A’ JP Morgan (18,530)
12,460 CenturyLink Inc Citibank (2,118)25,510 CenturyLink Inc Goldam Sachs 9,69491,320 CenturyLink Inc JP Morgan (24,468)12,237 Cerence Inc Barclays Bank (66,936)
(99,857) Ceridian HCM Holding Inc Credit Suisse (347,502)71,570 Cerner Corp Bank of America
Merrill Lynch 381,46854,300 Cerner Corp Barclays Bank 171,5884,520 Cerner Corp Citibank 14,283
11,410 Cerner Corp Credit Suisse 19,28380,330 Cerner Corp Goldam Sachs 428,1594,290 Cerner Corp JP Morgan 7,2509,520 CF Industries Holdings Inc Bank of America
Merrill Lynch 39,6037,320 CF Industries Holdings Inc Goldam Sachs 30,4518,310 CF Industries Holdings Inc HSBC 18,8897,790 CF Industries Holdings Inc JP Morgan (390)5,270 CH Robinson Worldwide Inc Goldam Sachs 47,535
15,150 Change Healthcare Inc Bank of AmericaMerrill Lynch 20,301
(1,490) Charles River LaboratoriesInternational Inc
Bank of AmericaMerrill Lynch (8,404)
(8,750) Charles River LaboratoriesInternational Inc Goldam Sachs (49,350)
(5,770) Charles River LaboratoriesInternational Inc HSBC (91,685)
(19,315) Charles Schwab Corp Bank of AmericaMerrill Lynch (62,387)
(22,460) Charles Schwab Corp Barclays Bank (66,482)
BlackRock Style Advantage Fund continued
The notes on pages 691 to 711 form an integral part of these financial statements.
Annual report and audited financial statements [565]

Contracts for difference as at 31 May 2020
Holding Description Counterparty
Netunrealised
appreciation/(depreciation)
USD
United States continued(44,830) Charles Schwab Corp Credit Suisse 32,278(32,340) Charles Schwab Corp Goldam Sachs (104,458)(3,240) Charles Schwab Corp JP Morgan (8,616)(1,930) Charter Communications
Inc ’A’ Barclays Bank (55,970)(1,430) Charter Communications
Inc ’A’ Goldam Sachs (55,069)(2,100) Charter Communications
Inc ’A’ JP Morgan (55,902)25 Cheesecake Factory Inc Bank of America
Merrill Lynch 653,230 Chemed Corp Goldam Sachs 72,772
(99,655) Chemours Co Bank of AmericaMerrill Lynch (228,210)
(108,136) Chemours Co Barclays Bank (100,566)(11,080) Cheniere Energy Inc Bank of America
Merrill Lynch (24,376)(30,330) Cheniere Energy Inc Barclays Bank 72,489(5,000) Cheniere Energy Inc Credit Suisse (8,501)
(21,150) Cheniere Energy Inc Goldam Sachs (46,530)(1,760) Chevron Corp Credit Suisse 462(1,290) Chevron Corp HSBC 3,5741,680 Chipotle Mexican Grill Inc Barclays Bank (100,430)
210 Chipotle Mexican Grill Inc Goldam Sachs 5,076(9,530) Choice Hotels International
IncBank of AmericaMerrill Lynch (94,728)
(5,220) Choice Hotels InternationalInc Barclays Bank (14,668)
(4,430) Choice Hotels InternationalInc Credit Suisse (32,295)
(42,364) Choice Hotels InternationalInc Goldam Sachs (421,098)
(16,740) Church & Dwight Co Inc Barclays Bank (29,881)(5,360) Church & Dwight Co Inc Goldam Sachs (616)6,327 Ciena Corp Bank of America
Merrill Lynch 30,05356,810 Ciena Corp Barclays Bank 90,32869,590 Ciena Corp Goldam Sachs 330,553(4,050) Cigna Corp Bank of America
Merrill Lynch (30,699)(9,330) Cigna Corp Barclays Bank (81,451)(3,890) Cigna Corp Goldam Sachs (29,486)(5,280) Cigna Corp HSBC (44,669)2,580 Cincinnati Financial Corp Citibank 3,3802,210 Cincinnati Financial Corp JP Morgan 21,136
31,770 Cinemark Holdings Inc Bank of AmericaMerrill Lynch 101,346
24,490 Cinemark Holdings Inc Barclays Bank 25,2259,670 Cinemark Holdings Inc Credit Suisse 9,090
74,320 Cinemark Holdings Inc Goldam Sachs 237,08118,520 Cinemark Holdings Inc HSBC 17,40944,630 Cinemark Holdings Inc JP Morgan 41,9522,030 Cintas Corp Goldam Sachs 44,822
(57,120) Cisco Systems Inc Goldam Sachs (89,107)(8,970) Cisco Systems Inc JP Morgan (25,475)54,850 CIT Group Inc Bank of America
Merrill Lynch 225,434114,750 CIT Group Inc Barclays Bank 269,663
3,934 CIT Group Inc Citibank 9,2455,230 CIT Group Inc Goldam Sachs 21,495
60,423 CIT Group Inc HSBC 112,3871,000 CIT Group Inc JP Morgan 1,860
17,010 Citigroup Inc Barclays Bank 72,1224,230 Citigroup Inc Credit Suisse 32,266
47,280 Citigroup Inc Goldam Sachs 303,5383,800 Citigroup Inc JP Morgan 24,602
46,194 Citizens Financial Group Inc Bank of AmericaMerrill Lynch 181,542
97,694 Citizens Financial Group Inc Barclays Bank 251,074
Holding Description Counterparty
Netunrealised
appreciation/(depreciation)
USD
United States continued79,650 Citizens Financial Group Inc Goldam Sachs 313,02525,822 Citrix Systems Inc Citibank 190,3082,548 Citrix Systems Inc Credit Suisse (16,740)4,818 Citrix Systems Inc HSBC (31,654)6,809 Citrix Systems Inc JP Morgan (44,735)
42,900 Clean Harbors Inc Barclays Bank 97,812(2,460) Clorox Co Goldam Sachs 13,1128,590 CME Group Inc Bank of America
Merrill Lynch (6,786)10,210 CME Group Inc Goldam Sachs (8,066)
870 CME Group Inc HSBC 1,5692,150 CME Group Inc JP Morgan (2,688)
450 CMS Energy Corp Bank of AmericaMerrill Lynch 1,877
3,500 CMS Energy Corp Citibank 7,91040,450 CMS Energy Corp Goldam Sachs 168,67720,927 CNA Financial Corp Bank of America
Merrill Lynch 93,3347,180 CNA Financial Corp Barclays Bank 5,8162,625 CNA Financial Corp Goldam Sachs 11,708
(48,460) Coca-Cola Co Barclays Bank (76,567)(4,290) Coca-Cola European
Partners Plc Credit Suisse (13,112)(21,680) Coca-Cola European
Partners Plc Goldam Sachs (71,978)(66,940) Cognex Corp Barclays Bank 161,995(24,350) Cognex Corp Goldam Sachs (49,431)11,460 Cognizant Technology
Solutions Corp ’A’Bank of AmericaMerrill Lynch 31,973
9,140 Cognizant TechnologySolutions Corp ’A’ Goldam Sachs 25,501
10,910 Cognizant TechnologySolutions Corp ’A’ JP Morgan (45,713)
(26,886) Coherent Inc Bank of AmericaMerrill Lynch (262,945)
(17,968) Coherent Inc Goldam Sachs (175,727)(19,634) Colfax Corp Bank of America
Merrill Lynch (50,067)(11,564) Colfax Corp Goldam Sachs (29,488)
5,420 Colgate-Palmolive Co Bank of AmericaMerrill Lynch 17,398
3,570 Colgate-Palmolive Co Barclays Bank 5,03413,620 Colgate-Palmolive Co Citibank 19,20425,460 Colgate-Palmolive Co Goldam Sachs 81,72710,540 Colgate-Palmolive Co HSBC 29,4072,380 Colgate-Palmolive Co JP Morgan 6,640
11,751 Columbia Sportswear Co Barclays Bank 42,6562,640 Columbia Sportswear Co Goldam Sachs 26,585
(40,590) Comcast Corp ’A’ Barclays Bank (17,860)(47,240) Comcast Corp ’A’ Goldam Sachs (154,002)(6,220) Comcast Corp ’A’ JP Morgan (16,452)6,732 Comerica Inc Bank of America
Merrill Lynch 44,63352,310 Comerica Inc Barclays Bank 210,28619,480 Comerica Inc Goldam Sachs 129,152(4,530) Commerce Bancshares Inc Bank of America
Merrill Lynch (39,547)(10,370) Commerce Bancshares Inc Barclays Bank (35,673)(21,640) Commerce Bancshares Inc Credit Suisse (88,724)(49,870) Commerce Bancshares Inc Goldam Sachs (435,365)(1,970) Commerce Bancshares Inc HSBC (19,507)
(216,791) CommScope Holding Co Inc Barclays Bank (197,280)(21,410) Conagra Brands Inc Bank of America
Merrill Lynch 5,995(138,923) Conagra Brands Inc JP Morgan (51,402)(41,621) Concho Resources Inc Bank of America
Merrill Lynch 39,540(3,640) Concho Resources Inc Barclays Bank 9,173
(29,390) Concho Resources Inc Goldam Sachs 27,921
BlackRock Style Advantage Fund continued
The notes on pages 691 to 711 form an integral part of these financial statements.
BlackRock Strategic Funds[566]
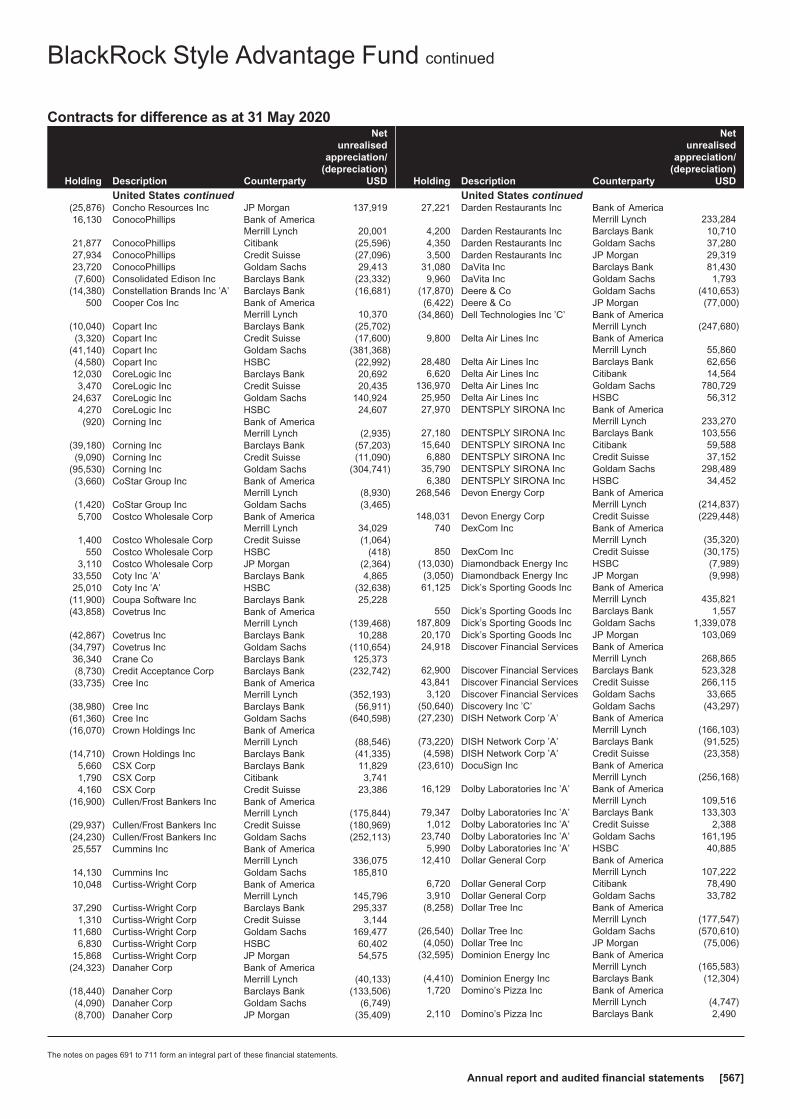
Contracts for difference as at 31 May 2020
Holding Description Counterparty
Netunrealised
appreciation/(depreciation)
USD
United States continued(25,876) Concho Resources Inc JP Morgan 137,91916,130 ConocoPhillips Bank of America
Merrill Lynch 20,00121,877 ConocoPhillips Citibank (25,596)27,934 ConocoPhillips Credit Suisse (27,096)23,720 ConocoPhillips Goldam Sachs 29,413(7,600) Consolidated Edison Inc Barclays Bank (23,332)
(14,380) Constellation Brands Inc ’A’ Barclays Bank (16,681)500 Cooper Cos Inc Bank of America
Merrill Lynch 10,370(10,040) Copart Inc Barclays Bank (25,702)(3,320) Copart Inc Credit Suisse (17,600)
(41,140) Copart Inc Goldam Sachs (381,368)(4,580) Copart Inc HSBC (22,992)12,030 CoreLogic Inc Barclays Bank 20,6923,470 CoreLogic Inc Credit Suisse 20,435
24,637 CoreLogic Inc Goldam Sachs 140,9244,270 CoreLogic Inc HSBC 24,607(920) Corning Inc Bank of America
Merrill Lynch (2,935)(39,180) Corning Inc Barclays Bank (57,203)(9,090) Corning Inc Credit Suisse (11,090)
(95,530) Corning Inc Goldam Sachs (304,741)(3,660) CoStar Group Inc Bank of America
Merrill Lynch (8,930)(1,420) CoStar Group Inc Goldam Sachs (3,465)5,700 Costco Wholesale Corp Bank of America
Merrill Lynch 34,0291,400 Costco Wholesale Corp Credit Suisse (1,064)
550 Costco Wholesale Corp HSBC (418)3,110 Costco Wholesale Corp JP Morgan (2,364)
33,550 Coty Inc ’A’ Barclays Bank 4,86525,010 Coty Inc ’A’ HSBC (32,638)
(11,900) Coupa Software Inc Barclays Bank 25,228(43,858) Covetrus Inc Bank of America
Merrill Lynch (139,468)(42,867) Covetrus Inc Barclays Bank 10,288(34,797) Covetrus Inc Goldam Sachs (110,654)36,340 Crane Co Barclays Bank 125,373(8,730) Credit Acceptance Corp Barclays Bank (232,742)
(33,735) Cree Inc Bank of AmericaMerrill Lynch (352,193)
(38,980) Cree Inc Barclays Bank (56,911)(61,360) Cree Inc Goldam Sachs (640,598)(16,070) Crown Holdings Inc Bank of America
Merrill Lynch (88,546)(14,710) Crown Holdings Inc Barclays Bank (41,335)
5,660 CSX Corp Barclays Bank 11,8291,790 CSX Corp Citibank 3,7414,160 CSX Corp Credit Suisse 23,386
(16,900) Cullen/Frost Bankers Inc Bank of AmericaMerrill Lynch (175,844)
(29,937) Cullen/Frost Bankers Inc Credit Suisse (180,969)(24,230) Cullen/Frost Bankers Inc Goldam Sachs (252,113)25,557 Cummins Inc Bank of America
Merrill Lynch 336,07514,130 Cummins Inc Goldam Sachs 185,81010,048 Curtiss-Wright Corp Bank of America
Merrill Lynch 145,79637,290 Curtiss-Wright Corp Barclays Bank 295,3371,310 Curtiss-Wright Corp Credit Suisse 3,144
11,680 Curtiss-Wright Corp Goldam Sachs 169,4776,830 Curtiss-Wright Corp HSBC 60,402
15,868 Curtiss-Wright Corp JP Morgan 54,575(24,323) Danaher Corp Bank of America
Merrill Lynch (40,133)(18,440) Danaher Corp Barclays Bank (133,506)(4,090) Danaher Corp Goldam Sachs (6,749)(8,700) Danaher Corp JP Morgan (35,409)
Holding Description Counterparty
Netunrealised
appreciation/(depreciation)
USD
United States continued27,221 Darden Restaurants Inc Bank of America
Merrill Lynch 233,2844,200 Darden Restaurants Inc Barclays Bank 10,7104,350 Darden Restaurants Inc Goldam Sachs 37,2803,500 Darden Restaurants Inc JP Morgan 29,319
31,080 DaVita Inc Barclays Bank 81,4309,960 DaVita Inc Goldam Sachs 1,793
(17,870) Deere & Co Goldam Sachs (410,653)(6,422) Deere & Co JP Morgan (77,000)
(34,860) Dell Technologies Inc ’C’ Bank of AmericaMerrill Lynch (247,680)
9,800 Delta Air Lines Inc Bank of AmericaMerrill Lynch 55,860
28,480 Delta Air Lines Inc Barclays Bank 62,6566,620 Delta Air Lines Inc Citibank 14,564
136,970 Delta Air Lines Inc Goldam Sachs 780,72925,950 Delta Air Lines Inc HSBC 56,31227,970 DENTSPLY SIRONA Inc Bank of America
Merrill Lynch 233,27027,180 DENTSPLY SIRONA Inc Barclays Bank 103,55615,640 DENTSPLY SIRONA Inc Citibank 59,5886,880 DENTSPLY SIRONA Inc Credit Suisse 37,152
35,790 DENTSPLY SIRONA Inc Goldam Sachs 298,4896,380 DENTSPLY SIRONA Inc HSBC 34,452
268,546 Devon Energy Corp Bank of AmericaMerrill Lynch (214,837)
148,031 Devon Energy Corp Credit Suisse (229,448)740 DexCom Inc Bank of America
Merrill Lynch (35,320)850 DexCom Inc Credit Suisse (30,175)
(13,030) Diamondback Energy Inc HSBC (7,989)(3,050) Diamondback Energy Inc JP Morgan (9,998)61,125 Dick’s Sporting Goods Inc Bank of America
Merrill Lynch 435,821550 Dick’s Sporting Goods Inc Barclays Bank 1,557
187,809 Dick’s Sporting Goods Inc Goldam Sachs 1,339,07820,170 Dick’s Sporting Goods Inc JP Morgan 103,06924,918 Discover Financial Services Bank of America
Merrill Lynch 268,86562,900 Discover Financial Services Barclays Bank 523,32843,841 Discover Financial Services Credit Suisse 266,1153,120 Discover Financial Services Goldam Sachs 33,665
(50,640) Discovery Inc ’C’ Goldam Sachs (43,297)(27,230) DISH Network Corp ’A’ Bank of America
Merrill Lynch (166,103)(73,220) DISH Network Corp ’A’ Barclays Bank (91,525)(4,598) DISH Network Corp ’A’ Credit Suisse (23,358)
(23,610) DocuSign Inc Bank of AmericaMerrill Lynch (256,168)
16,129 Dolby Laboratories Inc ’A’ Bank of AmericaMerrill Lynch 109,516
79,347 Dolby Laboratories Inc ’A’ Barclays Bank 133,3031,012 Dolby Laboratories Inc ’A’ Credit Suisse 2,388
23,740 Dolby Laboratories Inc ’A’ Goldam Sachs 161,1955,990 Dolby Laboratories Inc ’A’ HSBC 40,885
12,410 Dollar General Corp Bank of AmericaMerrill Lynch 107,222
6,720 Dollar General Corp Citibank 78,4903,910 Dollar General Corp Goldam Sachs 33,782
(8,258) Dollar Tree Inc Bank of AmericaMerrill Lynch (177,547)
(26,540) Dollar Tree Inc Goldam Sachs (570,610)(4,050) Dollar Tree Inc JP Morgan (75,006)
(32,595) Dominion Energy Inc Bank of AmericaMerrill Lynch (165,583)
(4,410) Dominion Energy Inc Barclays Bank (12,304)1,720 Domino’s Pizza Inc Bank of America
Merrill Lynch (4,747)2,110 Domino’s Pizza Inc Barclays Bank 2,490
BlackRock Style Advantage Fund continued
The notes on pages 691 to 711 form an integral part of these financial statements.
Annual report and audited financial statements [567]

Contracts for difference as at 31 May 2020
Holding Description Counterparty
Netunrealised
appreciation/(depreciation)
USD
United States continued1,240 Domino’s Pizza Inc Citibank 1,463
420 Domino’s Pizza Inc HSBC 1,75139,998 Domtar Corp Bank of America
Merrill Lynch 33,99813,700 Domtar Corp Barclays Bank 6,71310,348 Donaldson Co Inc Bank of America
Merrill Lynch 52,25738,014 Donaldson Co Inc Barclays Bank 78,3098,810 Donaldson Co Inc Credit Suisse 45,6687,920 Donaldson Co Inc Goldam Sachs 39,996
47,784 Dover Corp Bank of AmericaMerrill Lynch 559,551
2,557 Dover Corp Credit Suisse 11,30226,510 Dover Corp Goldam Sachs 310,432
(22,580) Dow Inc Barclays Bank (51,031)(89,110) Dow Inc Goldam Sachs (429,510)(12,420) Dow Inc HSBC (54,303)(89,430) Dow Inc JP Morgan (362,191)(4,281) DR Horton Inc Bank of America
Merrill Lynch (38,786)(22,770) DR Horton Inc Goldam Sachs (206,296)67,580 Dropbox Inc ’A’ Bank of America
Merrill Lynch (6,082)49,695 Dropbox Inc ’A’ Barclays Bank 30,5625,320 Dropbox Inc ’A’ Citibank 3,272
67,900 Dropbox Inc ’A’ Goldam Sachs (6,111)34,525 DTE Energy Co Bank of America
Merrill Lynch 307,273755 DTE Energy Co Credit Suisse 3,767
13,270 Duke Energy Corp Goldam Sachs 50,9571,600 Duke Energy Corp HSBC 5,922
75,100 Dunkin’ Brands Group Inc Bank of AmericaMerrill Lynch 129,172
9,980 Dunkin’ Brands Group Inc Barclays Bank 3,49324,354 Dunkin’ Brands Group Inc Credit Suisse (26,302)69,913 Dunkin’ Brands Group Inc Goldam Sachs 120,250
(10,500) DuPont de Nemours Inc Bank of AmericaMerrill Lynch (45,990)
(54,680) DuPont de Nemours Inc Barclays Bank (62,335)(7,130) DuPont de Nemours Inc Citibank (8,128)
(52,200) DuPont de Nemours Inc Goldam Sachs (228,636)(13,410) DuPont de Nemours Inc HSBC (38,889)
8,680 DXC Technology Co Barclays Bank (7,291)12,070 DXC Technology Co Citibank (10,139)8,140 DXC Technology Co Credit Suisse (24,501)
(6,230) E*TRADE Financial Corp Barclays Bank (26,104)(3,000) E*TRADE Financial Corp HSBC (20,969)15,460 Eagle Materials Inc Bank of America
Merrill Lynch 202,06212,267 Eagle Materials Inc Citibank 7,3602,210 Eagle Materials Inc Credit Suisse 16,133
16,590 Eagle Materials Inc Goldam Sachs 216,8315,430 Eagle Materials Inc JP Morgan 39,639
(17,790) East West Bancorp Inc Bank of AmericaMerrill Lynch (59,597)
(34,280) East West Bancorp Inc Barclays Bank (51,763)(11,540) East West Bancorp Inc Credit Suisse (1,039)(21,190) East West Bancorp Inc Goldam Sachs (70,987)(29,130) Eastman Chemical Co Bank of America
Merrill Lynch (222,262)(28,340) Eastman Chemical Co Barclays Bank (60,648)(2,620) Eastman Chemical Co Citibank (5,607)
(56,830) Eastman Chemical Co Goldam Sachs (433,613)(5,010) Eastman Chemical Co JP Morgan (25,401)(3,650) Eaton Corp Plc Barclays Bank (16,936)
(31,780) Eaton Corp Plc Goldam Sachs (305,088)(5,060) Eaton Corp Plc HSBC (5,364)(1,860) Eaton Corp Plc JP Morgan (1,972)
Holding Description Counterparty
Netunrealised
appreciation/(depreciation)
USD
United States continued17,046 eBay Inc Bank of America
Merrill Lynch 39,54788,790 eBay Inc Barclays Bank 87,01451,408 eBay Inc Credit Suisse 117,21026,750 eBay Inc Goldam Sachs 62,06013,586 eBay Inc HSBC 30,976(4,670) EchoStar Corp ’A’ Bank of America
Merrill Lynch (18,026)(46,930) EchoStar Corp ’A’ Barclays Bank (51,623)(5,330) EchoStar Corp ’A’ Credit Suisse (20,757)
(99,691) EchoStar Corp ’A’ Goldam Sachs (384,807)1,630 Ecolab Inc Bank of America
Merrill Lynch 22,7712,520 Ecolab Inc Citibank 20,7141,640 Ecolab Inc Credit Suisse 17,974
820 Ecolab Inc Goldam Sachs 11,4551,700 Ecolab Inc HSBC 20,477
(24,152) Edison International Barclays Bank (32,605)(56,660) Edison International Goldam Sachs (103,688)(14,450) Edison International JP Morgan (10,549)
3,110 Edwards Lifesciences Corp Bank of AmericaMerrill Lynch 32,064
25,330 Edwards Lifesciences Corp Goldam Sachs 261,152(40,230) Elanco Animal Health Inc Bank of America
Merrill Lynch (82,069)(112,850) Elanco Animal Health Inc Barclays Bank (250,527)(28,040) Elanco Animal Health Inc Credit Suisse (37,013)
(119,680) Elanco Animal Health Inc Goldam Sachs (244,147)(47,821) Elanco Animal Health Inc HSBC (66,767)(27,520) Elanco Animal Health Inc JP Morgan (36,326)(7,010) Elastic NV Barclays Bank 5,748
(14,924) Elastic NV Credit Suisse (163,119)(23,990) Elastic NV Goldam Sachs (287,880)
7,280 Electronic Arts Inc Barclays Bank 8,51826,610 Electronic Arts Inc Credit Suisse 126,95018,070 Electronic Arts Inc Goldam Sachs 51,680
(127,050) Element Solutions Inc Bank of AmericaMerrill Lynch (152,460)
(660) Element Solutions Inc Barclays Bank (53)(400,878) Element Solutions Inc Goldam Sachs (481,054)(33,104) Element Solutions Inc JP Morgan (21,187)20,510 Eli Lilly and Co Barclays Bank 17,8441,150 Eli Lilly and Co Goldam Sachs (8,280)
(2,140) Emerson Electric Co Bank of AmericaMerrill Lynch (14,937)
(5,360) Emerson Electric Co Barclays Bank (21,708)1,790 Encompass Health Corp Bank of America
Merrill Lynch 14,105(46,705) Energizer Holdings Inc Bank of America
Merrill Lynch (101,817)(4,901) Energizer Holdings Inc Barclays Bank 2,549
(109,471) Energizer Holdings Inc Goldam Sachs (238,647)(21,480) Entegris Inc Barclays Bank (16,969)(12,780) Entegris Inc Credit Suisse (34,313)(6,410) Entegris Inc Goldam Sachs (24,166)25,910 Entergy Corp Bank of America
Merrill Lynch 176,1887,430 Entergy Corp Barclays Bank 28,383
25,421 Entergy Corp Credit Suisse 172,1002,220 Entergy Corp Goldam Sachs 15,096
(2,270) EOG Resources Inc Goldam Sachs (5,698)(8,083) EPAM Systems Inc Bank of America
Merrill Lynch (130,055)(5,150) EPAM Systems Inc Barclays Bank (49,492)
(60,150) EQT Corp Bank of AmericaMerrill Lynch (36,692)
(13,170) EQT Corp Barclays Bank 5,136(87,743) EQT Corp Credit Suisse 56,156
BlackRock Style Advantage Fund continued
The notes on pages 691 to 711 form an integral part of these financial statements.
BlackRock Strategic Funds[568]
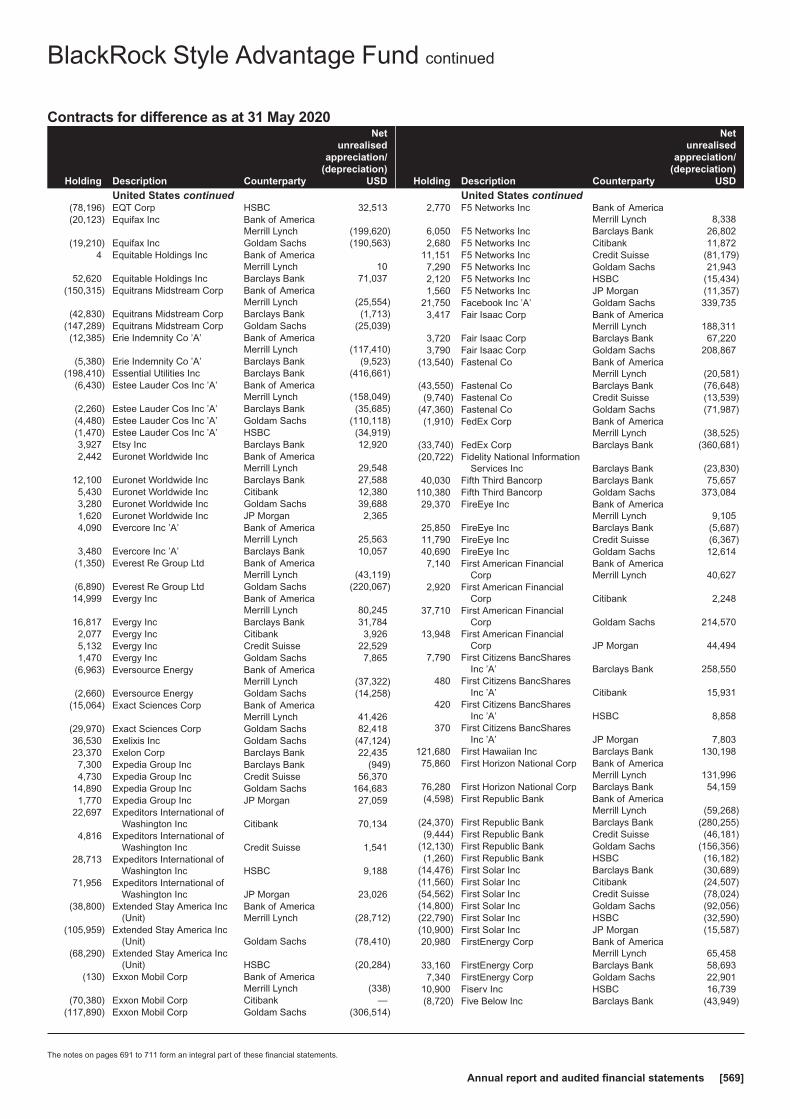
Contracts for difference as at 31 May 2020
Holding Description Counterparty
Netunrealised
appreciation/(depreciation)
USD
United States continued(78,196) EQT Corp HSBC 32,513(20,123) Equifax Inc Bank of America
Merrill Lynch (199,620)(19,210) Equifax Inc Goldam Sachs (190,563)
4 Equitable Holdings Inc Bank of AmericaMerrill Lynch 10
52,620 Equitable Holdings Inc Barclays Bank 71,037(150,315) Equitrans Midstream Corp Bank of America
Merrill Lynch (25,554)(42,830) Equitrans Midstream Corp Barclays Bank (1,713)
(147,289) Equitrans Midstream Corp Goldam Sachs (25,039)(12,385) Erie Indemnity Co ’A’ Bank of America
Merrill Lynch (117,410)(5,380) Erie Indemnity Co ’A’ Barclays Bank (9,523)
(198,410) Essential Utilities Inc Barclays Bank (416,661)(6,430) Estee Lauder Cos Inc ’A’ Bank of America
Merrill Lynch (158,049)(2,260) Estee Lauder Cos Inc ’A’ Barclays Bank (35,685)(4,480) Estee Lauder Cos Inc ’A’ Goldam Sachs (110,118)(1,470) Estee Lauder Cos Inc ’A’ HSBC (34,919)3,927 Etsy Inc Barclays Bank 12,9202,442 Euronet Worldwide Inc Bank of America
Merrill Lynch 29,54812,100 Euronet Worldwide Inc Barclays Bank 27,5885,430 Euronet Worldwide Inc Citibank 12,3803,280 Euronet Worldwide Inc Goldam Sachs 39,6881,620 Euronet Worldwide Inc JP Morgan 2,3654,090 Evercore Inc ’A’ Bank of America
Merrill Lynch 25,5633,480 Evercore Inc ’A’ Barclays Bank 10,057
(1,350) Everest Re Group Ltd Bank of AmericaMerrill Lynch (43,119)
(6,890) Everest Re Group Ltd Goldam Sachs (220,067)14,999 Evergy Inc Bank of America
Merrill Lynch 80,24516,817 Evergy Inc Barclays Bank 31,7842,077 Evergy Inc Citibank 3,9265,132 Evergy Inc Credit Suisse 22,5291,470 Evergy Inc Goldam Sachs 7,865
(6,963) Eversource Energy Bank of AmericaMerrill Lynch (37,322)
(2,660) Eversource Energy Goldam Sachs (14,258)(15,064) Exact Sciences Corp Bank of America
Merrill Lynch 41,426(29,970) Exact Sciences Corp Goldam Sachs 82,41836,530 Exelixis Inc Goldam Sachs (47,124)23,370 Exelon Corp Barclays Bank 22,4357,300 Expedia Group Inc Barclays Bank (949)4,730 Expedia Group Inc Credit Suisse 56,370
14,890 Expedia Group Inc Goldam Sachs 164,6831,770 Expedia Group Inc JP Morgan 27,059
22,697 Expeditors International ofWashington Inc Citibank 70,134
4,816 Expeditors International ofWashington Inc Credit Suisse 1,541
28,713 Expeditors International ofWashington Inc HSBC 9,188
71,956 Expeditors International ofWashington Inc JP Morgan 23,026
(38,800) Extended Stay America Inc(Unit)
Bank of AmericaMerrill Lynch (28,712)
(105,959) Extended Stay America Inc(Unit) Goldam Sachs (78,410)
(68,290) Extended Stay America Inc(Unit) HSBC (20,284)
(130) Exxon Mobil Corp Bank of AmericaMerrill Lynch (338)
(70,380) Exxon Mobil Corp Citibank —(117,890) Exxon Mobil Corp Goldam Sachs (306,514)
Holding Description Counterparty
Netunrealised
appreciation/(depreciation)
USD
United States continued2,770 F5 Networks Inc Bank of America
Merrill Lynch 8,3386,050 F5 Networks Inc Barclays Bank 26,8022,680 F5 Networks Inc Citibank 11,872
11,151 F5 Networks Inc Credit Suisse (81,179)7,290 F5 Networks Inc Goldam Sachs 21,9432,120 F5 Networks Inc HSBC (15,434)1,560 F5 Networks Inc JP Morgan (11,357)
21,750 Facebook Inc ’A’ Goldam Sachs 339,7353,417 Fair Isaac Corp Bank of America
Merrill Lynch 188,3113,720 Fair Isaac Corp Barclays Bank 67,2203,790 Fair Isaac Corp Goldam Sachs 208,867
(13,540) Fastenal Co Bank of AmericaMerrill Lynch (20,581)
(43,550) Fastenal Co Barclays Bank (76,648)(9,740) Fastenal Co Credit Suisse (13,539)
(47,360) Fastenal Co Goldam Sachs (71,987)(1,910) FedEx Corp Bank of America
Merrill Lynch (38,525)(33,740) FedEx Corp Barclays Bank (360,681)(20,722) Fidelity National Information
Services Inc Barclays Bank (23,830)40,030 Fifth Third Bancorp Barclays Bank 75,657
110,380 Fifth Third Bancorp Goldam Sachs 373,08429,370 FireEye Inc Bank of America
Merrill Lynch 9,10525,850 FireEye Inc Barclays Bank (5,687)11,790 FireEye Inc Credit Suisse (6,367)40,690 FireEye Inc Goldam Sachs 12,6147,140 First American Financial
CorpBank of AmericaMerrill Lynch 40,627
2,920 First American FinancialCorp Citibank 2,248
37,710 First American FinancialCorp Goldam Sachs 214,570
13,948 First American FinancialCorp JP Morgan 44,494
7,790 First Citizens BancSharesInc ’A’ Barclays Bank 258,550
480 First Citizens BancSharesInc ’A’ Citibank 15,931
420 First Citizens BancSharesInc ’A’ HSBC 8,858
370 First Citizens BancSharesInc ’A’ JP Morgan 7,803
121,680 First Hawaiian Inc Barclays Bank 130,19875,860 First Horizon National Corp Bank of America
Merrill Lynch 131,99676,280 First Horizon National Corp Barclays Bank 54,159(4,598) First Republic Bank Bank of America
Merrill Lynch (59,268)(24,370) First Republic Bank Barclays Bank (280,255)(9,444) First Republic Bank Credit Suisse (46,181)
(12,130) First Republic Bank Goldam Sachs (156,356)(1,260) First Republic Bank HSBC (16,182)
(14,476) First Solar Inc Barclays Bank (30,689)(11,560) First Solar Inc Citibank (24,507)(54,562) First Solar Inc Credit Suisse (78,024)(14,800) First Solar Inc Goldam Sachs (92,056)(22,790) First Solar Inc HSBC (32,590)(10,900) First Solar Inc JP Morgan (15,587)20,980 FirstEnergy Corp Bank of America
Merrill Lynch 65,45833,160 FirstEnergy Corp Barclays Bank 58,6937,340 FirstEnergy Corp Goldam Sachs 22,901
10,900 Fiserv Inc HSBC 16,739(8,720) Five Below Inc Barclays Bank (43,949)
BlackRock Style Advantage Fund continued
The notes on pages 691 to 711 form an integral part of these financial statements.
Annual report and audited financial statements [569]
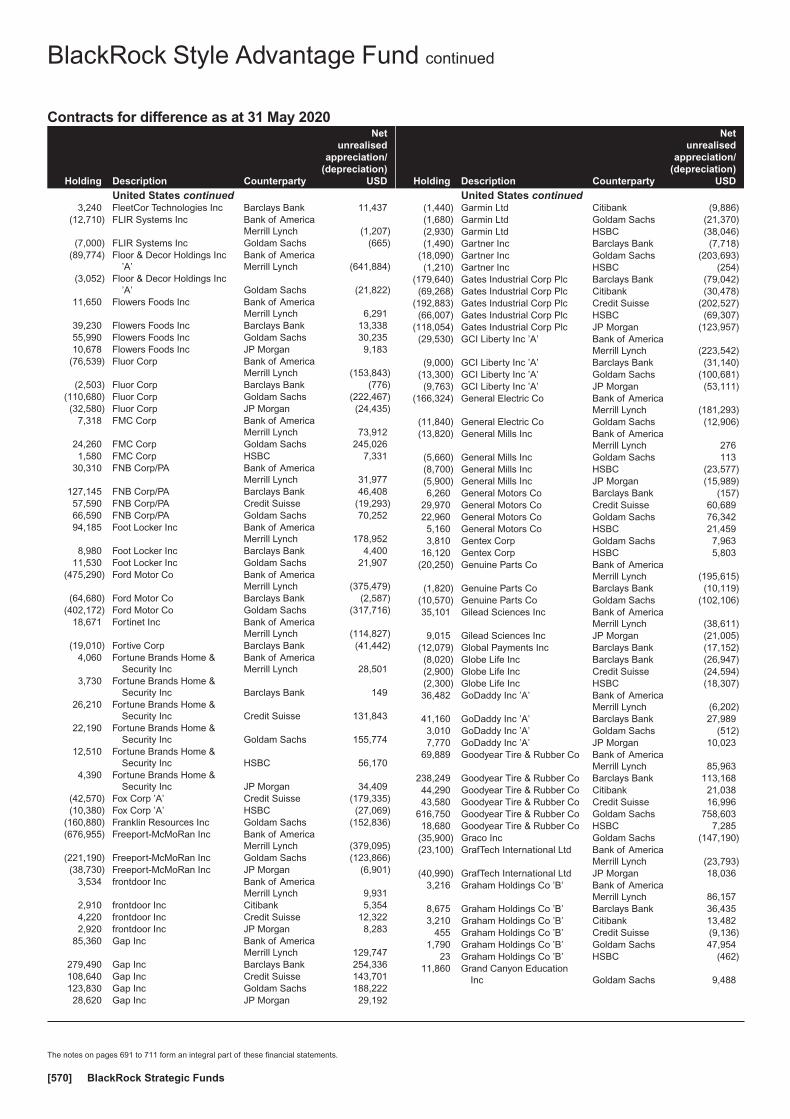
Contracts for difference as at 31 May 2020
Holding Description Counterparty
Netunrealised
appreciation/(depreciation)
USD
United States continued3,240 FleetCor Technologies Inc Barclays Bank 11,437
(12,710) FLIR Systems Inc Bank of AmericaMerrill Lynch (1,207)
(7,000) FLIR Systems Inc Goldam Sachs (665)(89,774) Floor & Decor Holdings Inc
’A’Bank of AmericaMerrill Lynch (641,884)
(3,052) Floor & Decor Holdings Inc’A’ Goldam Sachs (21,822)
11,650 Flowers Foods Inc Bank of AmericaMerrill Lynch 6,291
39,230 Flowers Foods Inc Barclays Bank 13,33855,990 Flowers Foods Inc Goldam Sachs 30,23510,678 Flowers Foods Inc JP Morgan 9,183
(76,539) Fluor Corp Bank of AmericaMerrill Lynch (153,843)
(2,503) Fluor Corp Barclays Bank (776)(110,680) Fluor Corp Goldam Sachs (222,467)(32,580) Fluor Corp JP Morgan (24,435)
7,318 FMC Corp Bank of AmericaMerrill Lynch 73,912
24,260 FMC Corp Goldam Sachs 245,0261,580 FMC Corp HSBC 7,331
30,310 FNB Corp/PA Bank of AmericaMerrill Lynch 31,977
127,145 FNB Corp/PA Barclays Bank 46,40857,590 FNB Corp/PA Credit Suisse (19,293)66,590 FNB Corp/PA Goldam Sachs 70,25294,185 Foot Locker Inc Bank of America
Merrill Lynch 178,9528,980 Foot Locker Inc Barclays Bank 4,400
11,530 Foot Locker Inc Goldam Sachs 21,907(475,290) Ford Motor Co Bank of America
Merrill Lynch (375,479)(64,680) Ford Motor Co Barclays Bank (2,587)
(402,172) Ford Motor Co Goldam Sachs (317,716)18,671 Fortinet Inc Bank of America
Merrill Lynch (114,827)(19,010) Fortive Corp Barclays Bank (41,442)
4,060 Fortune Brands Home &Security Inc
Bank of AmericaMerrill Lynch 28,501
3,730 Fortune Brands Home &Security Inc Barclays Bank 149
26,210 Fortune Brands Home &Security Inc Credit Suisse 131,843
22,190 Fortune Brands Home &Security Inc Goldam Sachs 155,774
12,510 Fortune Brands Home &Security Inc HSBC 56,170
4,390 Fortune Brands Home &Security Inc JP Morgan 34,409
(42,570) Fox Corp ’A’ Credit Suisse (179,335)(10,380) Fox Corp ’A’ HSBC (27,069)
(160,880) Franklin Resources Inc Goldam Sachs (152,836)(676,955) Freeport-McMoRan Inc Bank of America
Merrill Lynch (379,095)(221,190) Freeport-McMoRan Inc Goldam Sachs (123,866)(38,730) Freeport-McMoRan Inc JP Morgan (6,901)
3,534 frontdoor Inc Bank of AmericaMerrill Lynch 9,931
2,910 frontdoor Inc Citibank 5,3544,220 frontdoor Inc Credit Suisse 12,3222,920 frontdoor Inc JP Morgan 8,283
85,360 Gap Inc Bank of AmericaMerrill Lynch 129,747
279,490 Gap Inc Barclays Bank 254,336108,640 Gap Inc Credit Suisse 143,701123,830 Gap Inc Goldam Sachs 188,22228,620 Gap Inc JP Morgan 29,192
Holding Description Counterparty
Netunrealised
appreciation/(depreciation)
USD
United States continued(1,440) Garmin Ltd Citibank (9,886)(1,680) Garmin Ltd Goldam Sachs (21,370)(2,930) Garmin Ltd HSBC (38,046)(1,490) Gartner Inc Barclays Bank (7,718)
(18,090) Gartner Inc Goldam Sachs (203,693)(1,210) Gartner Inc HSBC (254)
(179,640) Gates Industrial Corp Plc Barclays Bank (79,042)(69,268) Gates Industrial Corp Plc Citibank (30,478)
(192,883) Gates Industrial Corp Plc Credit Suisse (202,527)(66,007) Gates Industrial Corp Plc HSBC (69,307)
(118,054) Gates Industrial Corp Plc JP Morgan (123,957)(29,530) GCI Liberty Inc ’A’ Bank of America
Merrill Lynch (223,542)(9,000) GCI Liberty Inc ’A’ Barclays Bank (31,140)
(13,300) GCI Liberty Inc ’A’ Goldam Sachs (100,681)(9,763) GCI Liberty Inc ’A’ JP Morgan (53,111)
(166,324) General Electric Co Bank of AmericaMerrill Lynch (181,293)
(11,840) General Electric Co Goldam Sachs (12,906)(13,820) General Mills Inc Bank of America
Merrill Lynch 276(5,660) General Mills Inc Goldam Sachs 113(8,700) General Mills Inc HSBC (23,577)(5,900) General Mills Inc JP Morgan (15,989)6,260 General Motors Co Barclays Bank (157)
29,970 General Motors Co Credit Suisse 60,68922,960 General Motors Co Goldam Sachs 76,3425,160 General Motors Co HSBC 21,4593,810 Gentex Corp Goldam Sachs 7,963
16,120 Gentex Corp HSBC 5,803(20,250) Genuine Parts Co Bank of America
Merrill Lynch (195,615)(1,820) Genuine Parts Co Barclays Bank (10,119)
(10,570) Genuine Parts Co Goldam Sachs (102,106)35,101 Gilead Sciences Inc Bank of America
Merrill Lynch (38,611)9,015 Gilead Sciences Inc JP Morgan (21,005)
(12,079) Global Payments Inc Barclays Bank (17,152)(8,020) Globe Life Inc Barclays Bank (26,947)(2,900) Globe Life Inc Credit Suisse (24,594)(2,300) Globe Life Inc HSBC (18,307)36,482 GoDaddy Inc ’A’ Bank of America
Merrill Lynch (6,202)41,160 GoDaddy Inc ’A’ Barclays Bank 27,9893,010 GoDaddy Inc ’A’ Goldam Sachs (512)7,770 GoDaddy Inc ’A’ JP Morgan 10,023
69,889 Goodyear Tire & Rubber Co Bank of AmericaMerrill Lynch 85,963
238,249 Goodyear Tire & Rubber Co Barclays Bank 113,16844,290 Goodyear Tire & Rubber Co Citibank 21,03843,580 Goodyear Tire & Rubber Co Credit Suisse 16,996
616,750 Goodyear Tire & Rubber Co Goldam Sachs 758,60318,680 Goodyear Tire & Rubber Co HSBC 7,285
(35,900) Graco Inc Goldam Sachs (147,190)(23,100) GrafTech International Ltd Bank of America
Merrill Lynch (23,793)(40,990) GrafTech International Ltd JP Morgan 18,036
3,216 Graham Holdings Co ’B’ Bank of AmericaMerrill Lynch 86,157
8,675 Graham Holdings Co ’B’ Barclays Bank 36,4353,210 Graham Holdings Co ’B’ Citibank 13,482
455 Graham Holdings Co ’B’ Credit Suisse (9,136)1,790 Graham Holdings Co ’B’ Goldam Sachs 47,954
23 Graham Holdings Co ’B’ HSBC (462)11,860 Grand Canyon Education
Inc Goldam Sachs 9,488
BlackRock Style Advantage Fund continued
The notes on pages 691 to 711 form an integral part of these financial statements.
BlackRock Strategic Funds[570]
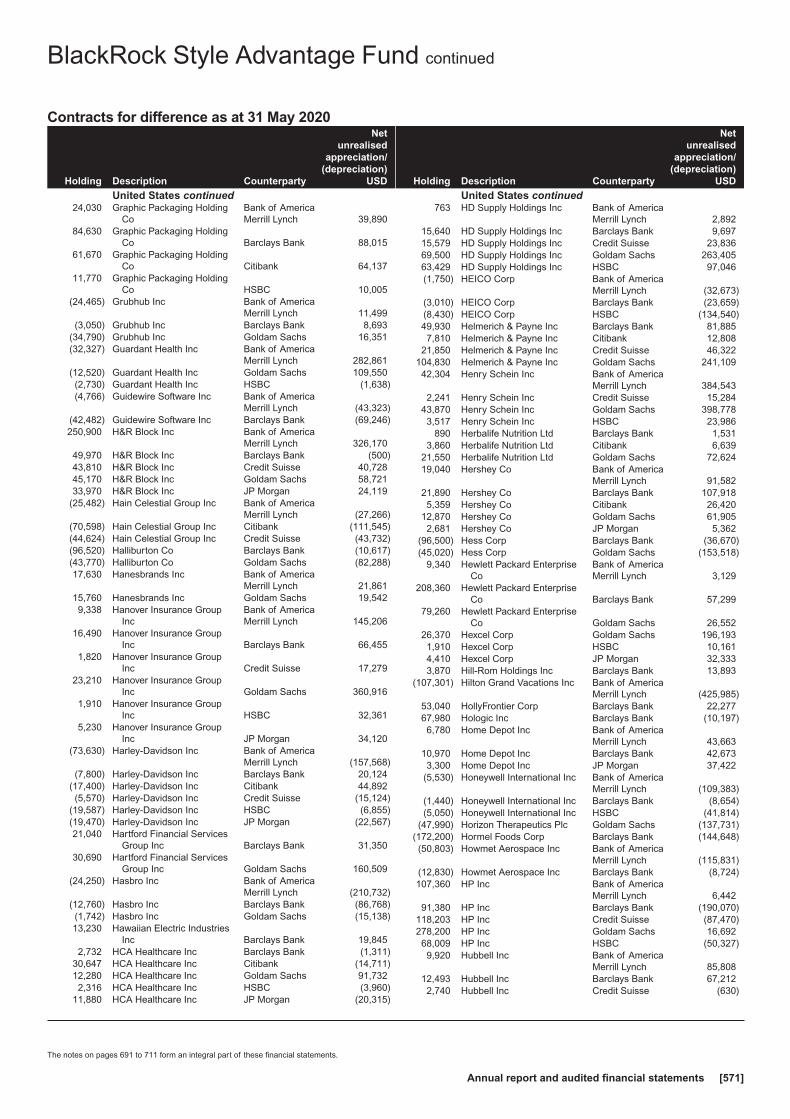
Contracts for difference as at 31 May 2020
Holding Description Counterparty
Netunrealised
appreciation/(depreciation)
USD
United States continued24,030 Graphic Packaging Holding
CoBank of AmericaMerrill Lynch 39,890
84,630 Graphic Packaging HoldingCo Barclays Bank 88,015
61,670 Graphic Packaging HoldingCo Citibank 64,137
11,770 Graphic Packaging HoldingCo HSBC 10,005
(24,465) Grubhub Inc Bank of AmericaMerrill Lynch 11,499
(3,050) Grubhub Inc Barclays Bank 8,693(34,790) Grubhub Inc Goldam Sachs 16,351(32,327) Guardant Health Inc Bank of America
Merrill Lynch 282,861(12,520) Guardant Health Inc Goldam Sachs 109,550(2,730) Guardant Health Inc HSBC (1,638)(4,766) Guidewire Software Inc Bank of America
Merrill Lynch (43,323)(42,482) Guidewire Software Inc Barclays Bank (69,246)250,900 H&R Block Inc Bank of America
Merrill Lynch 326,17049,970 H&R Block Inc Barclays Bank (500)43,810 H&R Block Inc Credit Suisse 40,72845,170 H&R Block Inc Goldam Sachs 58,72133,970 H&R Block Inc JP Morgan 24,119
(25,482) Hain Celestial Group Inc Bank of AmericaMerrill Lynch (27,266)
(70,598) Hain Celestial Group Inc Citibank (111,545)(44,624) Hain Celestial Group Inc Credit Suisse (43,732)(96,520) Halliburton Co Barclays Bank (10,617)(43,770) Halliburton Co Goldam Sachs (82,288)17,630 Hanesbrands Inc Bank of America
Merrill Lynch 21,86115,760 Hanesbrands Inc Goldam Sachs 19,5429,338 Hanover Insurance Group
IncBank of AmericaMerrill Lynch 145,206
16,490 Hanover Insurance GroupInc Barclays Bank 66,455
1,820 Hanover Insurance GroupInc Credit Suisse 17,279
23,210 Hanover Insurance GroupInc Goldam Sachs 360,916
1,910 Hanover Insurance GroupInc HSBC 32,361
5,230 Hanover Insurance GroupInc JP Morgan 34,120
(73,630) Harley-Davidson Inc Bank of AmericaMerrill Lynch (157,568)
(7,800) Harley-Davidson Inc Barclays Bank 20,124(17,400) Harley-Davidson Inc Citibank 44,892(5,570) Harley-Davidson Inc Credit Suisse (15,124)
(19,587) Harley-Davidson Inc HSBC (6,855)(19,470) Harley-Davidson Inc JP Morgan (22,567)21,040 Hartford Financial Services
Group Inc Barclays Bank 31,35030,690 Hartford Financial Services
Group Inc Goldam Sachs 160,509(24,250) Hasbro Inc Bank of America
Merrill Lynch (210,732)(12,760) Hasbro Inc Barclays Bank (86,768)(1,742) Hasbro Inc Goldam Sachs (15,138)13,230 Hawaiian Electric Industries
Inc Barclays Bank 19,8452,732 HCA Healthcare Inc Barclays Bank (1,311)
30,647 HCA Healthcare Inc Citibank (14,711)12,280 HCA Healthcare Inc Goldam Sachs 91,7322,316 HCA Healthcare Inc HSBC (3,960)
11,880 HCA Healthcare Inc JP Morgan (20,315)
Holding Description Counterparty
Netunrealised
appreciation/(depreciation)
USD
United States continued763 HD Supply Holdings Inc Bank of America
Merrill Lynch 2,89215,640 HD Supply Holdings Inc Barclays Bank 9,69715,579 HD Supply Holdings Inc Credit Suisse 23,83669,500 HD Supply Holdings Inc Goldam Sachs 263,40563,429 HD Supply Holdings Inc HSBC 97,046(1,750) HEICO Corp Bank of America
Merrill Lynch (32,673)(3,010) HEICO Corp Barclays Bank (23,659)(8,430) HEICO Corp HSBC (134,540)49,930 Helmerich & Payne Inc Barclays Bank 81,8857,810 Helmerich & Payne Inc Citibank 12,808
21,850 Helmerich & Payne Inc Credit Suisse 46,322104,830 Helmerich & Payne Inc Goldam Sachs 241,10942,304 Henry Schein Inc Bank of America
Merrill Lynch 384,5432,241 Henry Schein Inc Credit Suisse 15,284
43,870 Henry Schein Inc Goldam Sachs 398,7783,517 Henry Schein Inc HSBC 23,986
890 Herbalife Nutrition Ltd Barclays Bank 1,5313,860 Herbalife Nutrition Ltd Citibank 6,639
21,550 Herbalife Nutrition Ltd Goldam Sachs 72,62419,040 Hershey Co Bank of America
Merrill Lynch 91,58221,890 Hershey Co Barclays Bank 107,9185,359 Hershey Co Citibank 26,420
12,870 Hershey Co Goldam Sachs 61,9052,681 Hershey Co JP Morgan 5,362
(96,500) Hess Corp Barclays Bank (36,670)(45,020) Hess Corp Goldam Sachs (153,518)
9,340 Hewlett Packard EnterpriseCo
Bank of AmericaMerrill Lynch 3,129
208,360 Hewlett Packard EnterpriseCo Barclays Bank 57,299
79,260 Hewlett Packard EnterpriseCo Goldam Sachs 26,552
26,370 Hexcel Corp Goldam Sachs 196,1931,910 Hexcel Corp HSBC 10,1614,410 Hexcel Corp JP Morgan 32,3333,870 Hill-Rom Holdings Inc Barclays Bank 13,893
(107,301) Hilton Grand Vacations Inc Bank of AmericaMerrill Lynch (425,985)
53,040 HollyFrontier Corp Barclays Bank 22,27767,980 Hologic Inc Barclays Bank (10,197)6,780 Home Depot Inc Bank of America
Merrill Lynch 43,66310,970 Home Depot Inc Barclays Bank 42,6733,300 Home Depot Inc JP Morgan 37,422
(5,530) Honeywell International Inc Bank of AmericaMerrill Lynch (109,383)
(1,440) Honeywell International Inc Barclays Bank (8,654)(5,050) Honeywell International Inc HSBC (41,814)
(47,990) Horizon Therapeutics Plc Goldam Sachs (137,731)(172,200) Hormel Foods Corp Barclays Bank (144,648)(50,803) Howmet Aerospace Inc Bank of America
Merrill Lynch (115,831)(12,830) Howmet Aerospace Inc Barclays Bank (8,724)107,360 HP Inc Bank of America
Merrill Lynch 6,44291,380 HP Inc Barclays Bank (190,070)
118,203 HP Inc Credit Suisse (87,470)278,200 HP Inc Goldam Sachs 16,69268,009 HP Inc HSBC (50,327)9,920 Hubbell Inc Bank of America
Merrill Lynch 85,80812,493 Hubbell Inc Barclays Bank 67,2122,740 Hubbell Inc Credit Suisse (630)
BlackRock Style Advantage Fund continued
The notes on pages 691 to 711 form an integral part of these financial statements.
Annual report and audited financial statements [571]

Contracts for difference as at 31 May 2020
Holding Description Counterparty
Netunrealised
appreciation/(depreciation)
USD
United States continued18,330 Hubbell Inc Goldam Sachs 158,5554,340 Hubbell Inc HSBC (998)
(3,530) HubSpot Inc Goldam Sachs (31,735)500 Humana Inc Barclays Bank 4,880
1,620 Humana Inc Credit Suisse 43,2382,410 Humana Inc Goldam Sachs 14,388
440 Humana Inc HSBC 11,744(61,150) Huntington Bancshares Inc Bank of America
Merrill Lynch (84,081)(260,980) Huntington Bancshares Inc Barclays Bank (204,869)
(9,958) Huntington Bancshares Inc Citibank (7,817)(78,730) Huntington Bancshares Inc JP Morgan (18,108)(7,990) Huntington Ingalls Industries
Inc Barclays Bank (116,255)(124,995) Huntsman Corp Bank of America
Merrill Lynch (364,985)(187,632) Huntsman Corp Barclays Bank (67,548)(11,193) Huntsman Corp Credit Suisse (22,946)(62,680) Huntsman Corp Goldam Sachs (183,026)(25,080) Huntsman Corp HSBC (51,414)(12,610) Huntsman Corp JP Morgan (36,120)(3,080) Hyatt Hotels Corp ’A’ Citibank (5,082)(3,620) Hyatt Hotels Corp ’A’ Credit Suisse (4,706)4,400 IAC/interactivecorp Bank of America
Merrill Lynch 141,6364,020 IAC/interactivecorp Barclays Bank 45,426
732 IAC/interactivecorp Credit Suisse 27,2741,370 IAC/interactivecorp HSBC 51,046
930 IAC/interactivecorp JP Morgan 34,652(809) ICU Medical Inc Bank of America
Merrill Lynch (8,713)(1,010) ICU Medical Inc Barclays Bank (5,757)
(16,730) ICU Medical Inc Goldam Sachs (180,182)93,306 IDACORP Inc Barclays Bank 306,044(1,010) IDEX Corp Bank of America
Merrill Lynch (9,029)(1,110) IDEX Corp Barclays Bank (7,670)
(850) IDEX Corp Credit Suisse (9,551)(2,320) IDEX Corp Goldam Sachs (20,741)8,683 IDEXX Laboratories Inc Bank of America
Merrill Lynch 103,5887,300 IDEXX Laboratories Inc Goldam Sachs 87,089
840 IDEXX Laboratories Inc HSBC 15,464(12,130) IHS Markit Ltd Barclays Bank (27,050)
5,880 Illinois Tool Works Inc Bank of AmericaMerrill Lynch 93,668
2,460 Illinois Tool Works Inc Citibank 19,3368,120 Illinois Tool Works Inc Credit Suisse 86,0722,500 Illinois Tool Works Inc JP Morgan 26,5001,850 Illumina Inc Goldam Sachs 68,080
940 Illumina Inc JP Morgan 58,2149,970 Incyte Corp Bank of America
Merrill Lynch 44,26755,230 Incyte Corp Goldam Sachs 245,221
(95,083) Ingersoll Rand Inc Bank of AmericaMerrill Lynch (160,690)
(88,231) Ingersoll Rand Inc Barclays Bank 37,9393,402 Ingersoll Rand Inc Citibank (1,463)
(43,976) Ingersoll Rand Inc Credit Suisse 46,615(61,379) Ingersoll Rand Inc Goldam Sachs (103,731)(19,075) Ingersoll Rand Inc HSBC 20,220(7,644) Ingersoll Rand Inc JP Morgan 8,103(3,090) Ingredion Inc Bank of America
Merrill Lynch (15,728)(30,070) Ingredion Inc Barclays Bank (110,658)(3,160) Ingredion Inc Goldam Sachs (16,084)1,060 Insulet Corp Citibank (5,470)
Holding Description Counterparty
Netunrealised
appreciation/(depreciation)
USD
United States continued510 Insulet Corp JP Morgan (19,732)
(23,271) IntegraLifeSciences HoldingsCorp Goldam Sachs (118,449)
15,640 Intel Corp Bank of AmericaMerrill Lynch 68,503
12,160 Intel Corp Barclays Bank 4,92522,050 Intel Corp Credit Suisse 66,81459,020 Intel Corp Goldam Sachs 258,50848,990 Intel Corp HSBC (12,233)
(35,738) Interactive Brokers GroupInc ’A’
Bank of AmericaMerrill Lynch (186,552)
(35,522) Interactive Brokers GroupInc ’A’ Credit Suisse (47,244)
(68,320) Interactive Brokers GroupInc ’A’ Goldam Sachs (356,630)
23,980 Intercontinental ExchangeInc
Bank of AmericaMerrill Lynch 39,087
30,260 Intercontinental ExchangeInc Barclays Bank 40,246
5,960 Intercontinental ExchangeInc Credit Suisse 9,417
10,940 Intercontinental ExchangeInc HSBC 17,285
5,480 Intercontinental ExchangeInc JP Morgan 8,658
(9,830) International BusinessMachines Corp
Bank of AmericaMerrill Lynch (55,933)
(2,700) International BusinessMachines Corp Barclays Bank (11,556)
(2,340) International BusinessMachines Corp Citibank (10,015)
(5,780) International BusinessMachines Corp Credit Suisse 1,850
(1,420) International BusinessMachines Corp Goldam Sachs (8,080)
(1,640) International BusinessMachines Corp JP Morgan 525
(27,883) International Flavors &Fragrances Inc Credit Suisse 57,160
(32,011) International Flavors &Fragrances Inc HSBC 65,623
(1,010) International Flavors &Fragrances Inc JP Morgan (4,461)
(105,950) International GameTechnology Plc Barclays Bank (51,916)
(23,830) International GameTechnology Plc Citibank (11,677)
(9,590) International Paper Co Barclays Bank (14,385)85,270 Interpublic Group of Cos Inc Barclays Bank 28,99275,200 Interpublic Group of Cos Inc Goldam Sachs 109,0408,420 Intuit Inc Bank of America
Merrill Lynch 7,57821,670 Intuit Inc Barclays Bank (50,274)4,050 Intuit Inc Citibank (9,396)5,070 Intuit Inc Goldam Sachs 4,563
(1,805) Intuitive Surgical Inc Bank of AmericaMerrill Lynch (98,517)
(54,310) Invesco Ltd Credit Suisse 5,703(36,070) Invesco Ltd HSBC 3,787
6,490 Ionis Pharmaceuticals Inc Bank of AmericaMerrill Lynch 21,936
12,430 Ionis Pharmaceuticals Inc Barclays Bank 24,61110,800 Ionis Pharmaceuticals Inc Citibank 21,3848,020 Ionis Pharmaceuticals Inc Credit Suisse 16,4415,140 Ionis Pharmaceuticals Inc Goldam Sachs 17,373
11,150 Ionis Pharmaceuticals Inc HSBC 22,858
BlackRock Style Advantage Fund continued
The notes on pages 691 to 711 form an integral part of these financial statements.
BlackRock Strategic Funds[572]
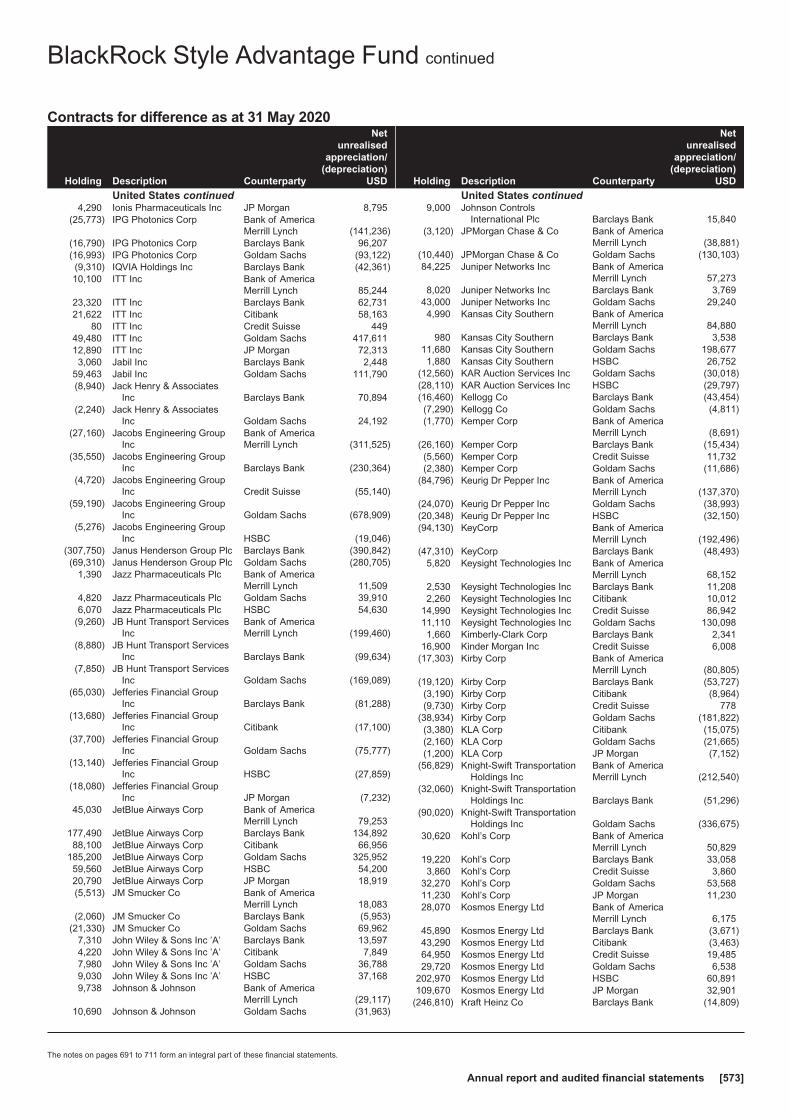
Contracts for difference as at 31 May 2020
Holding Description Counterparty
Netunrealised
appreciation/(depreciation)
USD
United States continued4,290 Ionis Pharmaceuticals Inc JP Morgan 8,795
(25,773) IPG Photonics Corp Bank of AmericaMerrill Lynch (141,236)
(16,790) IPG Photonics Corp Barclays Bank 96,207(16,993) IPG Photonics Corp Goldam Sachs (93,122)(9,310) IQVIA Holdings Inc Barclays Bank (42,361)10,100 ITT Inc Bank of America
Merrill Lynch 85,24423,320 ITT Inc Barclays Bank 62,73121,622 ITT Inc Citibank 58,163
80 ITT Inc Credit Suisse 44949,480 ITT Inc Goldam Sachs 417,61112,890 ITT Inc JP Morgan 72,3133,060 Jabil Inc Barclays Bank 2,448
59,463 Jabil Inc Goldam Sachs 111,790(8,940) Jack Henry & Associates
Inc Barclays Bank 70,894(2,240) Jack Henry & Associates
Inc Goldam Sachs 24,192(27,160) Jacobs Engineering Group
IncBank of AmericaMerrill Lynch (311,525)
(35,550) Jacobs Engineering GroupInc Barclays Bank (230,364)
(4,720) Jacobs Engineering GroupInc Credit Suisse (55,140)
(59,190) Jacobs Engineering GroupInc Goldam Sachs (678,909)
(5,276) Jacobs Engineering GroupInc HSBC (19,046)
(307,750) Janus Henderson Group Plc Barclays Bank (390,842)(69,310) Janus Henderson Group Plc Goldam Sachs (280,705)
1,390 Jazz Pharmaceuticals Plc Bank of AmericaMerrill Lynch 11,509
4,820 Jazz Pharmaceuticals Plc Goldam Sachs 39,9106,070 Jazz Pharmaceuticals Plc HSBC 54,630
(9,260) JB Hunt Transport ServicesInc
Bank of AmericaMerrill Lynch (199,460)
(8,880) JB Hunt Transport ServicesInc Barclays Bank (99,634)
(7,850) JB Hunt Transport ServicesInc Goldam Sachs (169,089)
(65,030) Jefferies Financial GroupInc Barclays Bank (81,288)
(13,680) Jefferies Financial GroupInc Citibank (17,100)
(37,700) Jefferies Financial GroupInc Goldam Sachs (75,777)
(13,140) Jefferies Financial GroupInc HSBC (27,859)
(18,080) Jefferies Financial GroupInc JP Morgan (7,232)
45,030 JetBlue Airways Corp Bank of AmericaMerrill Lynch 79,253
177,490 JetBlue Airways Corp Barclays Bank 134,89288,100 JetBlue Airways Corp Citibank 66,956
185,200 JetBlue Airways Corp Goldam Sachs 325,95259,560 JetBlue Airways Corp HSBC 54,20020,790 JetBlue Airways Corp JP Morgan 18,919(5,513) JM Smucker Co Bank of America
Merrill Lynch 18,083(2,060) JM Smucker Co Barclays Bank (5,953)
(21,330) JM Smucker Co Goldam Sachs 69,9627,310 John Wiley & Sons Inc ’A’ Barclays Bank 13,5974,220 John Wiley & Sons Inc ’A’ Citibank 7,8497,980 John Wiley & Sons Inc ’A’ Goldam Sachs 36,7889,030 John Wiley & Sons Inc ’A’ HSBC 37,1689,738 Johnson & Johnson Bank of America
Merrill Lynch (29,117)10,690 Johnson & Johnson Goldam Sachs (31,963)
Holding Description Counterparty
Netunrealised
appreciation/(depreciation)
USD
United States continued9,000 Johnson Controls
International Plc Barclays Bank 15,840(3,120) JPMorgan Chase & Co Bank of America
Merrill Lynch (38,881)(10,440) JPMorgan Chase & Co Goldam Sachs (130,103)84,225 Juniper Networks Inc Bank of America
Merrill Lynch 57,2738,020 Juniper Networks Inc Barclays Bank 3,769
43,000 Juniper Networks Inc Goldam Sachs 29,2404,990 Kansas City Southern Bank of America
Merrill Lynch 84,880980 Kansas City Southern Barclays Bank 3,538
11,680 Kansas City Southern Goldam Sachs 198,6771,880 Kansas City Southern HSBC 26,752
(12,560) KAR Auction Services Inc Goldam Sachs (30,018)(28,110) KAR Auction Services Inc HSBC (29,797)(16,460) Kellogg Co Barclays Bank (43,454)(7,290) Kellogg Co Goldam Sachs (4,811)(1,770) Kemper Corp Bank of America
Merrill Lynch (8,691)(26,160) Kemper Corp Barclays Bank (15,434)(5,560) Kemper Corp Credit Suisse 11,732(2,380) Kemper Corp Goldam Sachs (11,686)
(84,796) Keurig Dr Pepper Inc Bank of AmericaMerrill Lynch (137,370)
(24,070) Keurig Dr Pepper Inc Goldam Sachs (38,993)(20,348) Keurig Dr Pepper Inc HSBC (32,150)(94,130) KeyCorp Bank of America
Merrill Lynch (192,496)(47,310) KeyCorp Barclays Bank (48,493)
5,820 Keysight Technologies Inc Bank of AmericaMerrill Lynch 68,152
2,530 Keysight Technologies Inc Barclays Bank 11,2082,260 Keysight Technologies Inc Citibank 10,012
14,990 Keysight Technologies Inc Credit Suisse 86,94211,110 Keysight Technologies Inc Goldam Sachs 130,0981,660 Kimberly-Clark Corp Barclays Bank 2,341
16,900 Kinder Morgan Inc Credit Suisse 6,008(17,303) Kirby Corp Bank of America
Merrill Lynch (80,805)(19,120) Kirby Corp Barclays Bank (53,727)(3,190) Kirby Corp Citibank (8,964)(9,730) Kirby Corp Credit Suisse 778
(38,934) Kirby Corp Goldam Sachs (181,822)(3,380) KLA Corp Citibank (15,075)(2,160) KLA Corp Goldam Sachs (21,665)(1,200) KLA Corp JP Morgan (7,152)
(56,829) Knight-Swift TransportationHoldings Inc
Bank of AmericaMerrill Lynch (212,540)
(32,060) Knight-Swift TransportationHoldings Inc Barclays Bank (51,296)
(90,020) Knight-Swift TransportationHoldings Inc Goldam Sachs (336,675)
30,620 Kohl’s Corp Bank of AmericaMerrill Lynch 50,829
19,220 Kohl’s Corp Barclays Bank 33,0583,860 Kohl’s Corp Credit Suisse 3,860
32,270 Kohl’s Corp Goldam Sachs 53,56811,230 Kohl’s Corp JP Morgan 11,23028,070 Kosmos Energy Ltd Bank of America
Merrill Lynch 6,17545,890 Kosmos Energy Ltd Barclays Bank (3,671)43,290 Kosmos Energy Ltd Citibank (3,463)64,950 Kosmos Energy Ltd Credit Suisse 19,48529,720 Kosmos Energy Ltd Goldam Sachs 6,538
202,970 Kosmos Energy Ltd HSBC 60,891109,670 Kosmos Energy Ltd JP Morgan 32,901
(246,810) Kraft Heinz Co Barclays Bank (14,809)
BlackRock Style Advantage Fund continued
The notes on pages 691 to 711 form an integral part of these financial statements.
Annual report and audited financial statements [573]

Contracts for difference as at 31 May 2020
Holding Description Counterparty
Netunrealised
appreciation/(depreciation)
USD
United States continued(23,780) Kraft Heinz Co Goldam Sachs (19,262)
3,510 Kroger Co Goldam Sachs (2,492)10,040 L Brands Inc Bank of America
Merrill Lynch 51,10412,010 L Brands Inc Barclays Bank 10,449(6,250) L3Harris Technologies Inc Bank of America
Merrill Lynch (109,813)(10,270) L3Harris Technologies Inc Barclays Bank (142,753)(10,900) L3Harris Technologies Inc Goldam Sachs (191,513)(7,000) Laboratory Corp of America
Holdings Barclays Bank (31,150)(1,750) Laboratory Corp of America
Holdings Credit Suisse (12,863)(1,300) Laboratory Corp of America
Holdings Goldam Sachs (9,334)(6,000) Laboratory Corp of America
Holdings HSBC (44,100)12,430 Lam Research Corp Barclays Bank 140,7089,910 Lamb Weston Holdings Inc Goldam Sachs 58,8655,090 Lamb Weston Holdings Inc HSBC (17,866)
(1,320) Landstar System Inc Goldam Sachs (16,196)(32,080) Las Vegas Sands Corp Bank of America
Merrill Lynch (95,278)(55,570) Las Vegas Sands Corp Barclays Bank (46,123)(3,680) Las Vegas Sands Corp Goldam Sachs (10,930)(6,890) Lear Corp Bank of America
Merrill Lynch (61,872)(5,520) Lear Corp Barclays Bank 5,299(3,910) Lear Corp Goldam Sachs (35,112)(3,210) Lear Corp JP Morgan (9,855)(5,810) Legg Mason Inc Barclays Bank (523)
(11,370) Legg Mason Inc Credit Suisse (1,592)(5,270) Leidos Holdings Inc Bank of America
Merrill Lynch (35,678)(5,200) Leidos Holdings Inc Barclays Bank (13,676)(1,000) Leidos Holdings Inc Goldam Sachs (6,770)(1,690) Leidos Holdings Inc HSBC (1,504)(6,153) LendingTree Inc Barclays Bank (68,298)(4,180) Lennar Corp ’A’ Bank of America
Merrill Lynch (41,967)(4,530) Lennar Corp ’A’ Goldam Sachs (45,481)(3,720) Lennar Corp ’B’ Bank of America
Merrill Lynch (25,222)(24,228) Lennar Corp ’B’ Barclays Bank (1,454)(6,239) Lennar Corp ’B’ Citibank (374)(8,870) Lennar Corp ’B’ Credit Suisse (38,939)(7,134) Lennar Corp ’B’ Goldam Sachs (48,369)(7,628) Lennar Corp ’B’ HSBC (33,487)(1,240) Lennox International Inc Bank of America
Merrill Lynch (36,989)(2,130) Lennox International Inc Barclays Bank (26,242)
(80) Lennox International Inc Goldam Sachs (2,386)2,300 Liberty Broadband Corp Bank of America
Merrill Lynch 27,278(47,188) Liberty Media Corp-Liberty
Formula One ’A’ Barclays Bank (117,970)(5,670) Liberty Media Corp-Liberty
Formula One ’A’ Credit Suisse (23,814)(5,590) Liberty Media Corp-Liberty
Formula One ’A’ Goldam Sachs (26,888)(4,670) Liberty Media Corp-Liberty
Formula One ’A’ JP Morgan (19,614)4,947 Liberty Media Corp-Liberty
SiriusXM (Rights)Bank of AmericaMerrill Lynch 52,537
16,212 Liberty Media Corp-LibertySiriusXM (Rights) Barclays Bank 53,824
7,235 Liberty Media Corp-LibertySiriusXM (Rights) Goldam Sachs 76,836
Holding Description Counterparty
Netunrealised
appreciation/(depreciation)
USD
United States continued52,684 Liberty Media Corp-Liberty
SiriusXM ’C’Bank of AmericaMerrill Lynch 221,273
172,659 Liberty Media Corp-LibertySiriusXM ’C’ Barclays Bank 521,430
77,060 Liberty Media Corp-LibertySiriusXM ’C’ Goldam Sachs 323,652
(3,530) Lincoln Electric Holdings Inc HSBC (30,040)(84,043) Lincoln National Corp Bank of America
Merrill Lynch (440,385)(2,250) Lincoln National Corp Barclays Bank (6,728)
(33,010) Lincoln National Corp Goldam Sachs (172,972)(15,610) Lincoln National Corp JP Morgan (20,917)
2,670 Linde Plc Credit Suisse 34,0162,250 Linde Plc Goldam Sachs 41,7602,310 Linde Plc JP Morgan 29,429
(25,885) Littelfuse Inc Bank of AmericaMerrill Lynch (565,328)
(6,050) Littelfuse Inc Barclays Bank (32,791)(9,792) Littelfuse Inc Credit Suisse (144,628)
(20,313) Littelfuse Inc Goldam Sachs (443,636)(21,430) Live Nation Entertainment
IncBank of AmericaMerrill Lynch (174,440)
(32,710) Live Nation EntertainmentInc Barclays Bank (55,934)
26,050 LKQ Corp Bank of AmericaMerrill Lynch 94,041
25,830 LKQ Corp Barclays Bank 48,43115,480 LKQ Corp Goldam Sachs 55,883
410 LKQ Corp JP Morgan 381(28,410) Loews Corp Barclays Bank (36,081)52,881 LogMeIn Inc Barclays Bank 29,6131,040 Lowe’s Cos Inc Credit Suisse 16,6231,020 Lowe’s Cos Inc HSBC 21,007
33,362 LPL Financial Holdings Inc Bank of AmericaMerrill Lynch 305,596
7,990 LPL Financial Holdings Inc Barclays Bank 32,75941,920 LPL Financial Holdings Inc Goldam Sachs 383,987
490 Lululemon Athletica Inc Bank of AmericaMerrill Lynch 20,600
2,800 Lululemon Athletica Inc Barclays Bank 34,7202,080 Lululemon Athletica Inc Goldam Sachs 87,443
(35,540) Lyft Inc ’A’ Bank of AmericaMerrill Lynch (116,571)
(85,170) Lyft Inc ’A’ Barclays Bank (14,479)(6,460) Lyft Inc ’A’ Goldam Sachs (21,189)(1,130) LyondellBasell Industries
NV ’A’ Credit Suisse (7,232)(12,282) LyondellBasell Industries
NV ’A’ HSBC (78,605)(3,810) M&T Bank Corp Bank of America
Merrill Lynch (62,713)(1,350) M&T Bank Corp Barclays Bank (10,193)(1,080) M&T Bank Corp Credit Suisse (767)(3,640) M&T Bank Corp Goldam Sachs (59,914)
(8) Mack-Cali Realty Corp(REIT) Citibank (6)
(33,495) Macquarie InfrastructureCorp
Bank of AmericaMerrill Lynch (30,815)
290,600 Macy’s Inc Barclays Bank 390,85793,000 Macy’s Inc Goldam Sachs 115,785
(15,600) Madison Square GardenEntertainment Corp Barclays Bank (39,624)
910 Madison Square GardenSports C HSBC 10,626
55,800 Magna International Inc Bank of AmericaMerrill Lynch 273,420
77,800 Magna International Inc Barclays Bank 164,93694,700 Magna International Inc Goldam Sachs 464,030
BlackRock Style Advantage Fund continued
The notes on pages 691 to 711 form an integral part of these financial statements.
BlackRock Strategic Funds[574]
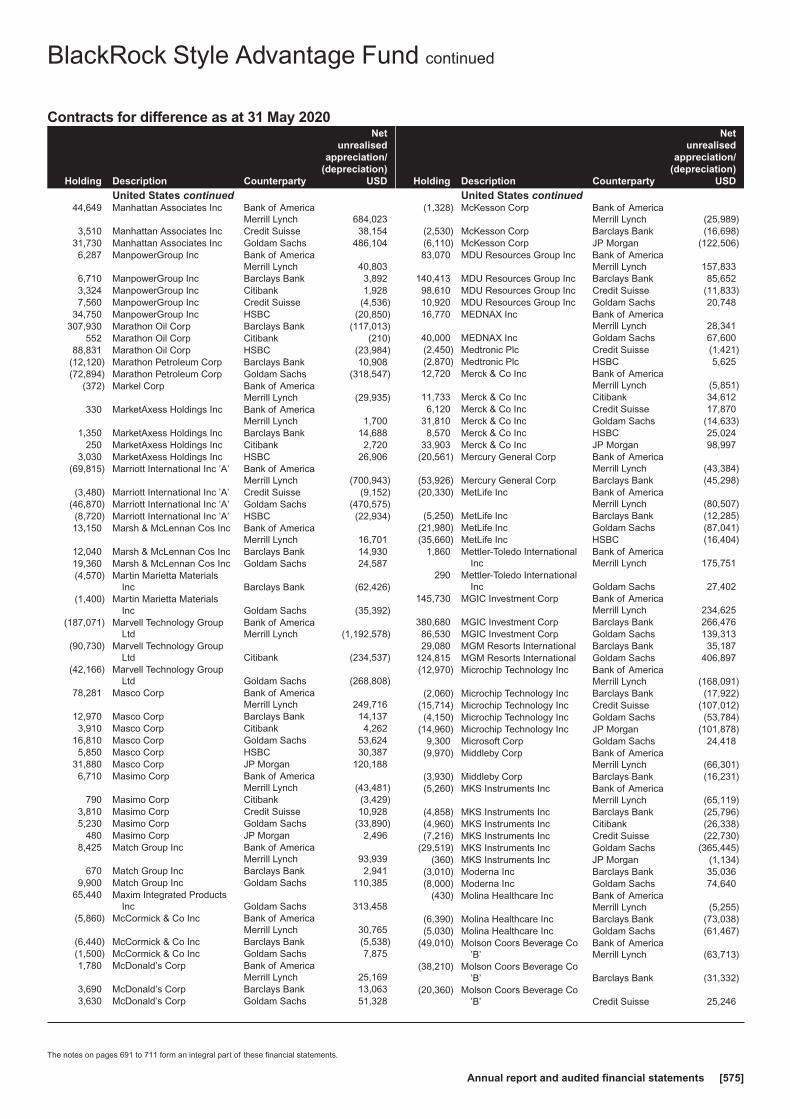
Contracts for difference as at 31 May 2020
Holding Description Counterparty
Netunrealised
appreciation/(depreciation)
USD
United States continued44,649 Manhattan Associates Inc Bank of America
Merrill Lynch 684,0233,510 Manhattan Associates Inc Credit Suisse 38,154
31,730 Manhattan Associates Inc Goldam Sachs 486,1046,287 ManpowerGroup Inc Bank of America
Merrill Lynch 40,8036,710 ManpowerGroup Inc Barclays Bank 3,8923,324 ManpowerGroup Inc Citibank 1,9287,560 ManpowerGroup Inc Credit Suisse (4,536)
34,750 ManpowerGroup Inc HSBC (20,850)307,930 Marathon Oil Corp Barclays Bank (117,013)
552 Marathon Oil Corp Citibank (210)88,831 Marathon Oil Corp HSBC (23,984)
(12,120) Marathon Petroleum Corp Barclays Bank 10,908(72,894) Marathon Petroleum Corp Goldam Sachs (318,547)
(372) Markel Corp Bank of AmericaMerrill Lynch (29,935)
330 MarketAxess Holdings Inc Bank of AmericaMerrill Lynch 1,700
1,350 MarketAxess Holdings Inc Barclays Bank 14,688250 MarketAxess Holdings Inc Citibank 2,720
3,030 MarketAxess Holdings Inc HSBC 26,906(69,815) Marriott International Inc ’A’ Bank of America
Merrill Lynch (700,943)(3,480) Marriott International Inc ’A’ Credit Suisse (9,152)
(46,870) Marriott International Inc ’A’ Goldam Sachs (470,575)(8,720) Marriott International Inc ’A’ HSBC (22,934)13,150 Marsh & McLennan Cos Inc Bank of America
Merrill Lynch 16,70112,040 Marsh & McLennan Cos Inc Barclays Bank 14,93019,360 Marsh & McLennan Cos Inc Goldam Sachs 24,587(4,570) Martin Marietta Materials
Inc Barclays Bank (62,426)(1,400) Martin Marietta Materials
Inc Goldam Sachs (35,392)(187,071) Marvell Technology Group
LtdBank of AmericaMerrill Lynch (1,192,578)
(90,730) Marvell Technology GroupLtd Citibank (234,537)
(42,166) Marvell Technology GroupLtd Goldam Sachs (268,808)
78,281 Masco Corp Bank of AmericaMerrill Lynch 249,716
12,970 Masco Corp Barclays Bank 14,1373,910 Masco Corp Citibank 4,262
16,810 Masco Corp Goldam Sachs 53,6245,850 Masco Corp HSBC 30,387
31,880 Masco Corp JP Morgan 120,1886,710 Masimo Corp Bank of America
Merrill Lynch (43,481)790 Masimo Corp Citibank (3,429)
3,810 Masimo Corp Credit Suisse 10,9285,230 Masimo Corp Goldam Sachs (33,890)
480 Masimo Corp JP Morgan 2,4968,425 Match Group Inc Bank of America
Merrill Lynch 93,939670 Match Group Inc Barclays Bank 2,941
9,900 Match Group Inc Goldam Sachs 110,38565,440 Maxim Integrated Products
Inc Goldam Sachs 313,458(5,860) McCormick & Co Inc Bank of America
Merrill Lynch 30,765(6,440) McCormick & Co Inc Barclays Bank (5,538)(1,500) McCormick & Co Inc Goldam Sachs 7,8751,780 McDonald’s Corp Bank of America
Merrill Lynch 25,1693,690 McDonald’s Corp Barclays Bank 13,0633,630 McDonald’s Corp Goldam Sachs 51,328
Holding Description Counterparty
Netunrealised
appreciation/(depreciation)
USD
United States continued(1,328) McKesson Corp Bank of America
Merrill Lynch (25,989)(2,530) McKesson Corp Barclays Bank (16,698)(6,110) McKesson Corp JP Morgan (122,506)83,070 MDU Resources Group Inc Bank of America
Merrill Lynch 157,833140,413 MDU Resources Group Inc Barclays Bank 85,65298,610 MDU Resources Group Inc Credit Suisse (11,833)10,920 MDU Resources Group Inc Goldam Sachs 20,74816,770 MEDNAX Inc Bank of America
Merrill Lynch 28,34140,000 MEDNAX Inc Goldam Sachs 67,600(2,450) Medtronic Plc Credit Suisse (1,421)(2,870) Medtronic Plc HSBC 5,62512,720 Merck & Co Inc Bank of America
Merrill Lynch (5,851)11,733 Merck & Co Inc Citibank 34,6126,120 Merck & Co Inc Credit Suisse 17,870
31,810 Merck & Co Inc Goldam Sachs (14,633)8,570 Merck & Co Inc HSBC 25,024
33,903 Merck & Co Inc JP Morgan 98,997(20,561) Mercury General Corp Bank of America
Merrill Lynch (43,384)(53,926) Mercury General Corp Barclays Bank (45,298)(20,330) MetLife Inc Bank of America
Merrill Lynch (80,507)(5,250) MetLife Inc Barclays Bank (12,285)
(21,980) MetLife Inc Goldam Sachs (87,041)(35,660) MetLife Inc HSBC (16,404)
1,860 Mettler-Toledo InternationalInc
Bank of AmericaMerrill Lynch 175,751
290 Mettler-Toledo InternationalInc Goldam Sachs 27,402
145,730 MGIC Investment Corp Bank of AmericaMerrill Lynch 234,625
380,680 MGIC Investment Corp Barclays Bank 266,47686,530 MGIC Investment Corp Goldam Sachs 139,31329,080 MGM Resorts International Barclays Bank 35,187
124,815 MGM Resorts International Goldam Sachs 406,897(12,970) Microchip Technology Inc Bank of America
Merrill Lynch (168,091)(2,060) Microchip Technology Inc Barclays Bank (17,922)
(15,714) Microchip Technology Inc Credit Suisse (107,012)(4,150) Microchip Technology Inc Goldam Sachs (53,784)
(14,960) Microchip Technology Inc JP Morgan (101,878)9,300 Microsoft Corp Goldam Sachs 24,418
(9,970) Middleby Corp Bank of AmericaMerrill Lynch (66,301)
(3,930) Middleby Corp Barclays Bank (16,231)(5,260) MKS Instruments Inc Bank of America
Merrill Lynch (65,119)(4,858) MKS Instruments Inc Barclays Bank (25,796)(4,960) MKS Instruments Inc Citibank (26,338)(7,216) MKS Instruments Inc Credit Suisse (22,730)
(29,519) MKS Instruments Inc Goldam Sachs (365,445)(360) MKS Instruments Inc JP Morgan (1,134)
(3,010) Moderna Inc Barclays Bank 35,036(8,000) Moderna Inc Goldam Sachs 74,640
(430) Molina Healthcare Inc Bank of AmericaMerrill Lynch (5,255)
(6,390) Molina Healthcare Inc Barclays Bank (73,038)(5,030) Molina Healthcare Inc Goldam Sachs (61,467)
(49,010) Molson Coors Beverage Co’B’
Bank of AmericaMerrill Lynch (63,713)
(38,210) Molson Coors Beverage Co’B’ Barclays Bank (31,332)
(20,360) Molson Coors Beverage Co’B’ Credit Suisse 25,246
BlackRock Style Advantage Fund continued
The notes on pages 691 to 711 form an integral part of these financial statements.
Annual report and audited financial statements [575]
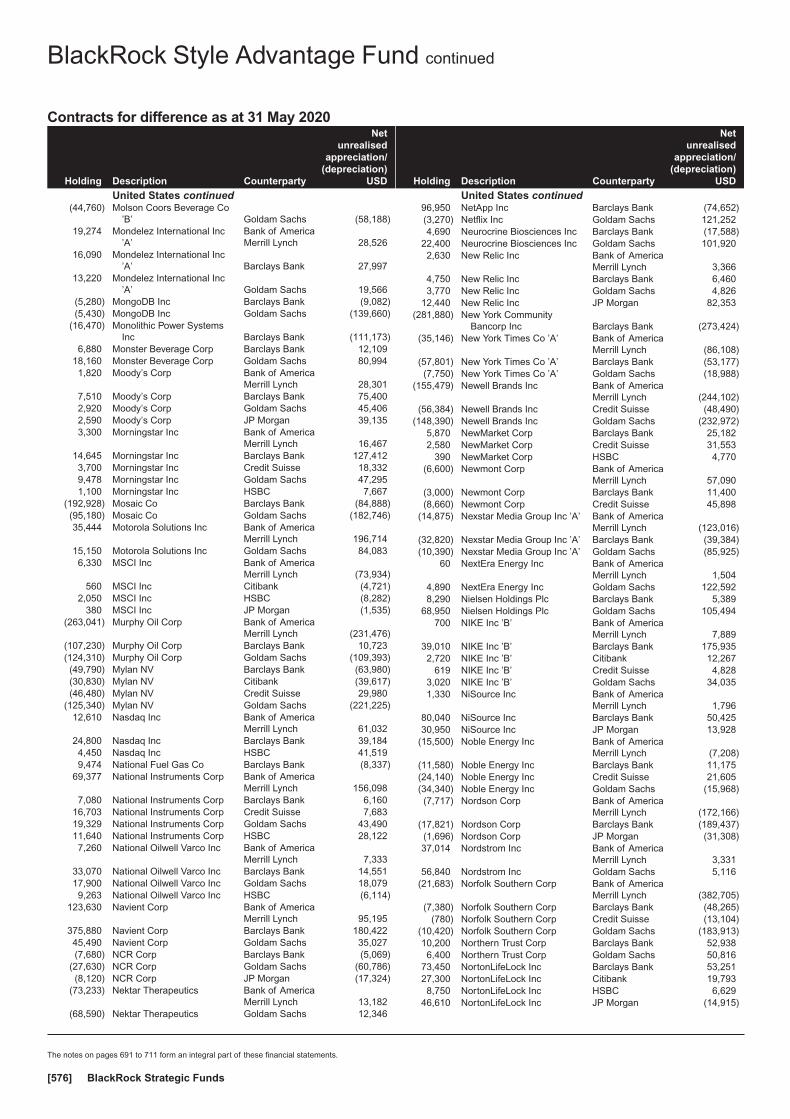
Contracts for difference as at 31 May 2020
Holding Description Counterparty
Netunrealised
appreciation/(depreciation)
USD
United States continued(44,760) Molson Coors Beverage Co
’B’ Goldam Sachs (58,188)19,274 Mondelez International Inc
’A’Bank of AmericaMerrill Lynch 28,526
16,090 Mondelez International Inc’A’ Barclays Bank 27,997
13,220 Mondelez International Inc’A’ Goldam Sachs 19,566
(5,280) MongoDB Inc Barclays Bank (9,082)(5,430) MongoDB Inc Goldam Sachs (139,660)
(16,470) Monolithic Power SystemsInc Barclays Bank (111,173)
6,880 Monster Beverage Corp Barclays Bank 12,10918,160 Monster Beverage Corp Goldam Sachs 80,9941,820 Moody’s Corp Bank of America
Merrill Lynch 28,3017,510 Moody’s Corp Barclays Bank 75,4002,920 Moody’s Corp Goldam Sachs 45,4062,590 Moody’s Corp JP Morgan 39,1353,300 Morningstar Inc Bank of America
Merrill Lynch 16,46714,645 Morningstar Inc Barclays Bank 127,4123,700 Morningstar Inc Credit Suisse 18,3329,478 Morningstar Inc Goldam Sachs 47,2951,100 Morningstar Inc HSBC 7,667
(192,928) Mosaic Co Barclays Bank (84,888)(95,180) Mosaic Co Goldam Sachs (182,746)35,444 Motorola Solutions Inc Bank of America
Merrill Lynch 196,71415,150 Motorola Solutions Inc Goldam Sachs 84,0836,330 MSCI Inc Bank of America
Merrill Lynch (73,934)560 MSCI Inc Citibank (4,721)
2,050 MSCI Inc HSBC (8,282)380 MSCI Inc JP Morgan (1,535)
(263,041) Murphy Oil Corp Bank of AmericaMerrill Lynch (231,476)
(107,230) Murphy Oil Corp Barclays Bank 10,723(124,310) Murphy Oil Corp Goldam Sachs (109,393)(49,790) Mylan NV Barclays Bank (63,980)(30,830) Mylan NV Citibank (39,617)(46,480) Mylan NV Credit Suisse 29,980
(125,340) Mylan NV Goldam Sachs (221,225)12,610 Nasdaq Inc Bank of America
Merrill Lynch 61,03224,800 Nasdaq Inc Barclays Bank 39,1844,450 Nasdaq Inc HSBC 41,5199,474 National Fuel Gas Co Barclays Bank (8,337)
69,377 National Instruments Corp Bank of AmericaMerrill Lynch 156,098
7,080 National Instruments Corp Barclays Bank 6,16016,703 National Instruments Corp Credit Suisse 7,68319,329 National Instruments Corp Goldam Sachs 43,49011,640 National Instruments Corp HSBC 28,1227,260 National Oilwell Varco Inc Bank of America
Merrill Lynch 7,33333,070 National Oilwell Varco Inc Barclays Bank 14,55117,900 National Oilwell Varco Inc Goldam Sachs 18,0799,263 National Oilwell Varco Inc HSBC (6,114)
123,630 Navient Corp Bank of AmericaMerrill Lynch 95,195
375,880 Navient Corp Barclays Bank 180,42245,490 Navient Corp Goldam Sachs 35,027(7,680) NCR Corp Barclays Bank (5,069)
(27,630) NCR Corp Goldam Sachs (60,786)(8,120) NCR Corp JP Morgan (17,324)
(73,233) Nektar Therapeutics Bank of AmericaMerrill Lynch 13,182
(68,590) Nektar Therapeutics Goldam Sachs 12,346
Holding Description Counterparty
Netunrealised
appreciation/(depreciation)
USD
United States continued96,950 NetApp Inc Barclays Bank (74,652)(3,270) Netflix Inc Goldam Sachs 121,2524,690 Neurocrine Biosciences Inc Barclays Bank (17,588)
22,400 Neurocrine Biosciences Inc Goldam Sachs 101,9202,630 New Relic Inc Bank of America
Merrill Lynch 3,3664,750 New Relic Inc Barclays Bank 6,4603,770 New Relic Inc Goldam Sachs 4,826
12,440 New Relic Inc JP Morgan 82,353(281,880) New York Community
Bancorp Inc Barclays Bank (273,424)(35,146) New York Times Co ’A’ Bank of America
Merrill Lynch (86,108)(57,801) New York Times Co ’A’ Barclays Bank (53,177)(7,750) New York Times Co ’A’ Goldam Sachs (18,988)
(155,479) Newell Brands Inc Bank of AmericaMerrill Lynch (244,102)
(56,384) Newell Brands Inc Credit Suisse (48,490)(148,390) Newell Brands Inc Goldam Sachs (232,972)
5,870 NewMarket Corp Barclays Bank 25,1822,580 NewMarket Corp Credit Suisse 31,553
390 NewMarket Corp HSBC 4,770(6,600) Newmont Corp Bank of America
Merrill Lynch 57,090(3,000) Newmont Corp Barclays Bank 11,400(8,660) Newmont Corp Credit Suisse 45,898
(14,875) Nexstar Media Group Inc ’A’ Bank of AmericaMerrill Lynch (123,016)
(32,820) Nexstar Media Group Inc ’A’ Barclays Bank (39,384)(10,390) Nexstar Media Group Inc ’A’ Goldam Sachs (85,925)
60 NextEra Energy Inc Bank of AmericaMerrill Lynch 1,504
4,890 NextEra Energy Inc Goldam Sachs 122,5928,290 Nielsen Holdings Plc Barclays Bank 5,389
68,950 Nielsen Holdings Plc Goldam Sachs 105,494700 NIKE Inc ’B’ Bank of America
Merrill Lynch 7,88939,010 NIKE Inc ’B’ Barclays Bank 175,9352,720 NIKE Inc ’B’ Citibank 12,267
619 NIKE Inc ’B’ Credit Suisse 4,8283,020 NIKE Inc ’B’ Goldam Sachs 34,0351,330 NiSource Inc Bank of America
Merrill Lynch 1,79680,040 NiSource Inc Barclays Bank 50,42530,950 NiSource Inc JP Morgan 13,928
(15,500) Noble Energy Inc Bank of AmericaMerrill Lynch (7,208)
(11,580) Noble Energy Inc Barclays Bank 11,175(24,140) Noble Energy Inc Credit Suisse 21,605(34,340) Noble Energy Inc Goldam Sachs (15,968)(7,717) Nordson Corp Bank of America
Merrill Lynch (172,166)(17,821) Nordson Corp Barclays Bank (189,437)(1,696) Nordson Corp JP Morgan (31,308)37,014 Nordstrom Inc Bank of America
Merrill Lynch 3,33156,840 Nordstrom Inc Goldam Sachs 5,116
(21,683) Norfolk Southern Corp Bank of AmericaMerrill Lynch (382,705)
(7,380) Norfolk Southern Corp Barclays Bank (48,265)(780) Norfolk Southern Corp Credit Suisse (13,104)
(10,420) Norfolk Southern Corp Goldam Sachs (183,913)10,200 Northern Trust Corp Barclays Bank 52,9386,400 Northern Trust Corp Goldam Sachs 50,816
73,450 NortonLifeLock Inc Barclays Bank 53,25127,300 NortonLifeLock Inc Citibank 19,7938,750 NortonLifeLock Inc HSBC 6,629
46,610 NortonLifeLock Inc JP Morgan (14,915)
BlackRock Style Advantage Fund continued
The notes on pages 691 to 711 form an integral part of these financial statements.
BlackRock Strategic Funds[576]
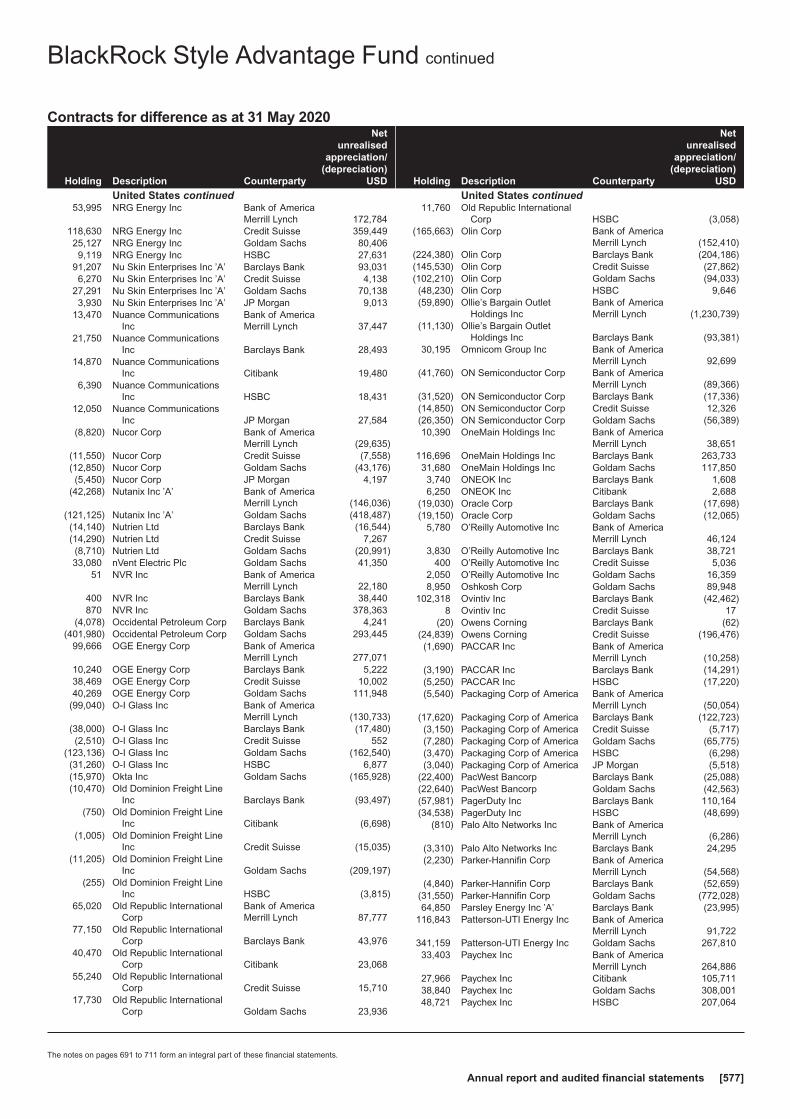
Contracts for difference as at 31 May 2020
Holding Description Counterparty
Netunrealised
appreciation/(depreciation)
USD
United States continued53,995 NRG Energy Inc Bank of America
Merrill Lynch 172,784118,630 NRG Energy Inc Credit Suisse 359,44925,127 NRG Energy Inc Goldam Sachs 80,4069,119 NRG Energy Inc HSBC 27,631
91,207 Nu Skin Enterprises Inc ’A’ Barclays Bank 93,0316,270 Nu Skin Enterprises Inc ’A’ Credit Suisse 4,138
27,291 Nu Skin Enterprises Inc ’A’ Goldam Sachs 70,1383,930 Nu Skin Enterprises Inc ’A’ JP Morgan 9,013
13,470 Nuance CommunicationsInc
Bank of AmericaMerrill Lynch 37,447
21,750 Nuance CommunicationsInc Barclays Bank 28,493
14,870 Nuance CommunicationsInc Citibank 19,480
6,390 Nuance CommunicationsInc HSBC 18,431
12,050 Nuance CommunicationsInc JP Morgan 27,584
(8,820) Nucor Corp Bank of AmericaMerrill Lynch (29,635)
(11,550) Nucor Corp Credit Suisse (7,558)(12,850) Nucor Corp Goldam Sachs (43,176)(5,450) Nucor Corp JP Morgan 4,197
(42,268) Nutanix Inc ’A’ Bank of AmericaMerrill Lynch (146,036)
(121,125) Nutanix Inc ’A’ Goldam Sachs (418,487)(14,140) Nutrien Ltd Barclays Bank (16,544)(14,290) Nutrien Ltd Credit Suisse 7,267(8,710) Nutrien Ltd Goldam Sachs (20,991)33,080 nVent Electric Plc Goldam Sachs 41,350
51 NVR Inc Bank of AmericaMerrill Lynch 22,180
400 NVR Inc Barclays Bank 38,440870 NVR Inc Goldam Sachs 378,363
(4,078) Occidental Petroleum Corp Barclays Bank 4,241(401,980) Occidental Petroleum Corp Goldam Sachs 293,445
99,666 OGE Energy Corp Bank of AmericaMerrill Lynch 277,071
10,240 OGE Energy Corp Barclays Bank 5,22238,469 OGE Energy Corp Credit Suisse 10,00240,269 OGE Energy Corp Goldam Sachs 111,948
(99,040) O-I Glass Inc Bank of AmericaMerrill Lynch (130,733)
(38,000) O-I Glass Inc Barclays Bank (17,480)(2,510) O-I Glass Inc Credit Suisse 552
(123,136) O-I Glass Inc Goldam Sachs (162,540)(31,260) O-I Glass Inc HSBC 6,877(15,970) Okta Inc Goldam Sachs (165,928)(10,470) Old Dominion Freight Line
Inc Barclays Bank (93,497)(750) Old Dominion Freight Line
Inc Citibank (6,698)(1,005) Old Dominion Freight Line
Inc Credit Suisse (15,035)(11,205) Old Dominion Freight Line
Inc Goldam Sachs (209,197)(255) Old Dominion Freight Line
Inc HSBC (3,815)65,020 Old Republic International
CorpBank of AmericaMerrill Lynch 87,777
77,150 Old Republic InternationalCorp Barclays Bank 43,976
40,470 Old Republic InternationalCorp Citibank 23,068
55,240 Old Republic InternationalCorp Credit Suisse 15,710
17,730 Old Republic InternationalCorp Goldam Sachs 23,936
Holding Description Counterparty
Netunrealised
appreciation/(depreciation)
USD
United States continued11,760 Old Republic International
Corp HSBC (3,058)(165,663) Olin Corp Bank of America
Merrill Lynch (152,410)(224,380) Olin Corp Barclays Bank (204,186)(145,530) Olin Corp Credit Suisse (27,862)(102,210) Olin Corp Goldam Sachs (94,033)(48,230) Olin Corp HSBC 9,646(59,890) Ollie’s Bargain Outlet
Holdings IncBank of AmericaMerrill Lynch (1,230,739)
(11,130) Ollie’s Bargain OutletHoldings Inc Barclays Bank (93,381)
30,195 Omnicom Group Inc Bank of AmericaMerrill Lynch 92,699
(41,760) ON Semiconductor Corp Bank of AmericaMerrill Lynch (89,366)
(31,520) ON Semiconductor Corp Barclays Bank (17,336)(14,850) ON Semiconductor Corp Credit Suisse 12,326(26,350) ON Semiconductor Corp Goldam Sachs (56,389)10,390 OneMain Holdings Inc Bank of America
Merrill Lynch 38,651116,696 OneMain Holdings Inc Barclays Bank 263,73331,680 OneMain Holdings Inc Goldam Sachs 117,8503,740 ONEOK Inc Barclays Bank 1,6086,250 ONEOK Inc Citibank 2,688
(19,030) Oracle Corp Barclays Bank (17,698)(19,150) Oracle Corp Goldam Sachs (12,065)
5,780 O’Reilly Automotive Inc Bank of AmericaMerrill Lynch 46,124
3,830 O’Reilly Automotive Inc Barclays Bank 38,721400 O’Reilly Automotive Inc Credit Suisse 5,036
2,050 O’Reilly Automotive Inc Goldam Sachs 16,3598,950 Oshkosh Corp Goldam Sachs 89,948
102,318 Ovintiv Inc Barclays Bank (42,462)8 Ovintiv Inc Credit Suisse 17
(20) Owens Corning Barclays Bank (62)(24,839) Owens Corning Credit Suisse (196,476)(1,690) PACCAR Inc Bank of America
Merrill Lynch (10,258)(3,190) PACCAR Inc Barclays Bank (14,291)(5,250) PACCAR Inc HSBC (17,220)(5,540) Packaging Corp of America Bank of America
Merrill Lynch (50,054)(17,620) Packaging Corp of America Barclays Bank (122,723)(3,150) Packaging Corp of America Credit Suisse (5,717)(7,280) Packaging Corp of America Goldam Sachs (65,775)(3,470) Packaging Corp of America HSBC (6,298)(3,040) Packaging Corp of America JP Morgan (5,518)
(22,400) PacWest Bancorp Barclays Bank (25,088)(22,640) PacWest Bancorp Goldam Sachs (42,563)(57,981) PagerDuty Inc Barclays Bank 110,164(34,538) PagerDuty Inc HSBC (48,699)
(810) Palo Alto Networks Inc Bank of AmericaMerrill Lynch (6,286)
(3,310) Palo Alto Networks Inc Barclays Bank 24,295(2,230) Parker-Hannifin Corp Bank of America
Merrill Lynch (54,568)(4,840) Parker-Hannifin Corp Barclays Bank (52,659)
(31,550) Parker-Hannifin Corp Goldam Sachs (772,028)64,850 Parsley Energy Inc ’A’ Barclays Bank (23,995)
116,843 Patterson-UTI Energy Inc Bank of AmericaMerrill Lynch 91,722
341,159 Patterson-UTI Energy Inc Goldam Sachs 267,81033,403 Paychex Inc Bank of America
Merrill Lynch 264,88627,966 Paychex Inc Citibank 105,71138,840 Paychex Inc Goldam Sachs 308,00148,721 Paychex Inc HSBC 207,064
BlackRock Style Advantage Fund continued
The notes on pages 691 to 711 form an integral part of these financial statements.
Annual report and audited financial statements [577]
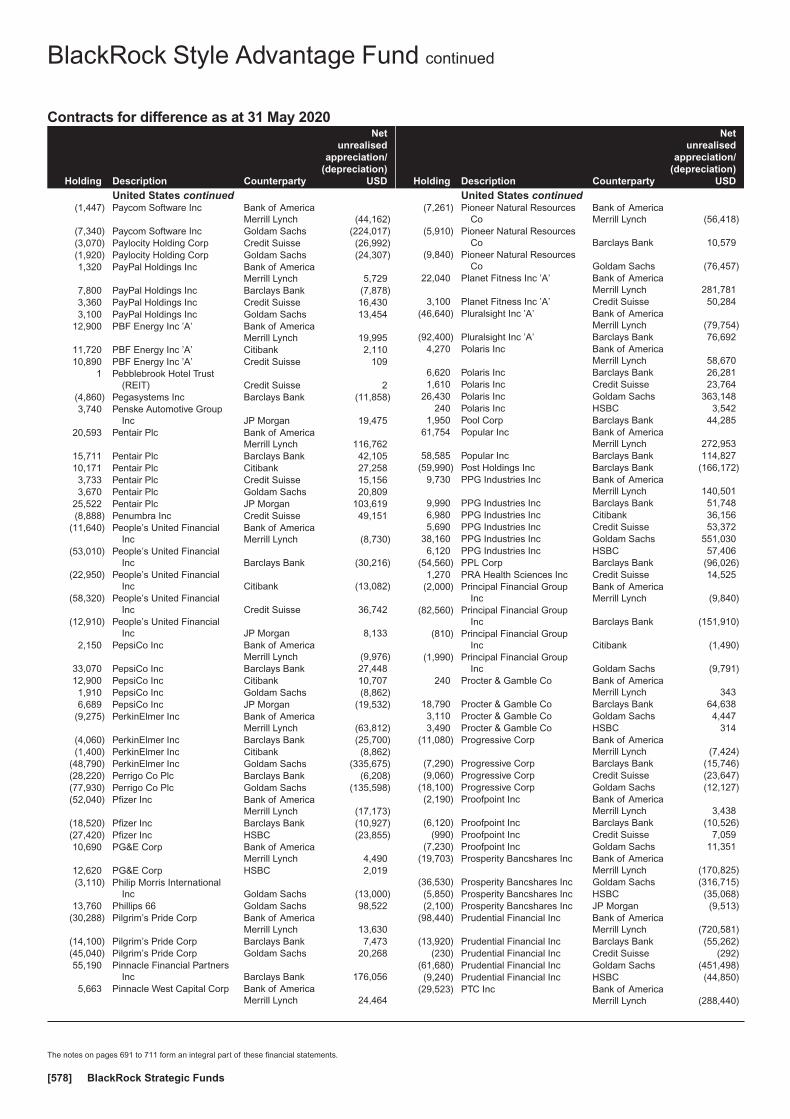
Contracts for difference as at 31 May 2020
Holding Description Counterparty
Netunrealised
appreciation/(depreciation)
USD
United States continued(1,447) Paycom Software Inc Bank of America
Merrill Lynch (44,162)(7,340) Paycom Software Inc Goldam Sachs (224,017)(3,070) Paylocity Holding Corp Credit Suisse (26,992)(1,920) Paylocity Holding Corp Goldam Sachs (24,307)1,320 PayPal Holdings Inc Bank of America
Merrill Lynch 5,7297,800 PayPal Holdings Inc Barclays Bank (7,878)3,360 PayPal Holdings Inc Credit Suisse 16,4303,100 PayPal Holdings Inc Goldam Sachs 13,454
12,900 PBF Energy Inc ’A’ Bank of AmericaMerrill Lynch 19,995
11,720 PBF Energy Inc ’A’ Citibank 2,11010,890 PBF Energy Inc ’A’ Credit Suisse 109
1 Pebblebrook Hotel Trust(REIT) Credit Suisse 2
(4,860) Pegasystems Inc Barclays Bank (11,858)3,740 Penske Automotive Group
Inc JP Morgan 19,47520,593 Pentair Plc Bank of America
Merrill Lynch 116,76215,711 Pentair Plc Barclays Bank 42,10510,171 Pentair Plc Citibank 27,2583,733 Pentair Plc Credit Suisse 15,1563,670 Pentair Plc Goldam Sachs 20,809
25,522 Pentair Plc JP Morgan 103,619(8,888) Penumbra Inc Credit Suisse 49,151
(11,640) People’s United FinancialInc
Bank of AmericaMerrill Lynch (8,730)
(53,010) People’s United FinancialInc Barclays Bank (30,216)
(22,950) People’s United FinancialInc Citibank (13,082)
(58,320) People’s United FinancialInc Credit Suisse 36,742
(12,910) People’s United FinancialInc JP Morgan 8,133
2,150 PepsiCo Inc Bank of AmericaMerrill Lynch (9,976)
33,070 PepsiCo Inc Barclays Bank 27,44812,900 PepsiCo Inc Citibank 10,7071,910 PepsiCo Inc Goldam Sachs (8,862)6,689 PepsiCo Inc JP Morgan (19,532)
(9,275) PerkinElmer Inc Bank of AmericaMerrill Lynch (63,812)
(4,060) PerkinElmer Inc Barclays Bank (25,700)(1,400) PerkinElmer Inc Citibank (8,862)
(48,790) PerkinElmer Inc Goldam Sachs (335,675)(28,220) Perrigo Co Plc Barclays Bank (6,208)(77,930) Perrigo Co Plc Goldam Sachs (135,598)(52,040) Pfizer Inc Bank of America
Merrill Lynch (17,173)(18,520) Pfizer Inc Barclays Bank (10,927)(27,420) Pfizer Inc HSBC (23,855)10,690 PG&E Corp Bank of America
Merrill Lynch 4,49012,620 PG&E Corp HSBC 2,019(3,110) Philip Morris International
Inc Goldam Sachs (13,000)13,760 Phillips 66 Goldam Sachs 98,522
(30,288) Pilgrim’s Pride Corp Bank of AmericaMerrill Lynch 13,630
(14,100) Pilgrim’s Pride Corp Barclays Bank 7,473(45,040) Pilgrim’s Pride Corp Goldam Sachs 20,26855,190 Pinnacle Financial Partners
Inc Barclays Bank 176,0565,663 Pinnacle West Capital Corp Bank of America
Merrill Lynch 24,464
Holding Description Counterparty
Netunrealised
appreciation/(depreciation)
USD
United States continued(7,261) Pioneer Natural Resources
CoBank of AmericaMerrill Lynch (56,418)
(5,910) Pioneer Natural ResourcesCo Barclays Bank 10,579
(9,840) Pioneer Natural ResourcesCo Goldam Sachs (76,457)
22,040 Planet Fitness Inc ’A’ Bank of AmericaMerrill Lynch 281,781
3,100 Planet Fitness Inc ’A’ Credit Suisse 50,284(46,640) Pluralsight Inc ’A’ Bank of America
Merrill Lynch (79,754)(92,400) Pluralsight Inc ’A’ Barclays Bank 76,692
4,270 Polaris Inc Bank of AmericaMerrill Lynch 58,670
6,620 Polaris Inc Barclays Bank 26,2811,610 Polaris Inc Credit Suisse 23,764
26,430 Polaris Inc Goldam Sachs 363,148240 Polaris Inc HSBC 3,542
1,950 Pool Corp Barclays Bank 44,28561,754 Popular Inc Bank of America
Merrill Lynch 272,95358,585 Popular Inc Barclays Bank 114,827
(59,990) Post Holdings Inc Barclays Bank (166,172)9,730 PPG Industries Inc Bank of America
Merrill Lynch 140,5019,990 PPG Industries Inc Barclays Bank 51,7486,980 PPG Industries Inc Citibank 36,1565,690 PPG Industries Inc Credit Suisse 53,372
38,160 PPG Industries Inc Goldam Sachs 551,0306,120 PPG Industries Inc HSBC 57,406
(54,560) PPL Corp Barclays Bank (96,026)1,270 PRA Health Sciences Inc Credit Suisse 14,525
(2,000) Principal Financial GroupInc
Bank of AmericaMerrill Lynch (9,840)
(82,560) Principal Financial GroupInc Barclays Bank (151,910)
(810) Principal Financial GroupInc Citibank (1,490)
(1,990) Principal Financial GroupInc Goldam Sachs (9,791)
240 Procter & Gamble Co Bank of AmericaMerrill Lynch 343
18,790 Procter & Gamble Co Barclays Bank 64,6383,110 Procter & Gamble Co Goldam Sachs 4,4473,490 Procter & Gamble Co HSBC 314
(11,080) Progressive Corp Bank of AmericaMerrill Lynch (7,424)
(7,290) Progressive Corp Barclays Bank (15,746)(9,060) Progressive Corp Credit Suisse (23,647)
(18,100) Progressive Corp Goldam Sachs (12,127)(2,190) Proofpoint Inc Bank of America
Merrill Lynch 3,438(6,120) Proofpoint Inc Barclays Bank (10,526)
(990) Proofpoint Inc Credit Suisse 7,059(7,230) Proofpoint Inc Goldam Sachs 11,351
(19,703) Prosperity Bancshares Inc Bank of AmericaMerrill Lynch (170,825)
(36,530) Prosperity Bancshares Inc Goldam Sachs (316,715)(5,850) Prosperity Bancshares Inc HSBC (35,068)(2,100) Prosperity Bancshares Inc JP Morgan (9,513)
(98,440) Prudential Financial Inc Bank of AmericaMerrill Lynch (720,581)
(13,920) Prudential Financial Inc Barclays Bank (55,262)(230) Prudential Financial Inc Credit Suisse (292)
(61,680) Prudential Financial Inc Goldam Sachs (451,498)(9,240) Prudential Financial Inc HSBC (44,850)
(29,523) PTC Inc Bank of AmericaMerrill Lynch (288,440)
BlackRock Style Advantage Fund continued
The notes on pages 691 to 711 form an integral part of these financial statements.
BlackRock Strategic Funds[578]

Contracts for difference as at 31 May 2020
Holding Description Counterparty
Netunrealised
appreciation/(depreciation)
USD
United States continued(26,223) PTC Inc Credit Suisse (84,438)(8,580) PTC Inc Goldam Sachs (83,827)27,250 PulteGroup Inc Bank of America
Merrill Lynch 180,39515,460 PulteGroup Inc Barclays Bank 15,92432,060 PulteGroup Inc Goldam Sachs 212,23743,276 Pure Storage Inc ’A’ Bank of America
Merrill Lynch 146,70623,640 Pure Storage Inc ’A’ Barclays Bank 33,3329,820 Pure Storage Inc ’A’ Citibank 13,846
39,030 Pure Storage Inc ’A’ Goldam Sachs 132,31215,850 Pure Storage Inc ’A’ HSBC 34,39512,970 PVH Corp Bank of America
Merrill Lynch 88,19613,150 PVH Corp Barclays Bank 37,60913,700 PVH Corp Goldam Sachs 93,1607,240 PVH Corp HSBC 7,168
(44,069) QIAGEN NV Goldam Sachs (77,121)19,781 Qorvo Inc Goldam Sachs 158,64412,220 QUALCOMM Inc Citibank 24410,690 QUALCOMM Inc Credit Suisse (19,670)31,300 QUALCOMM Inc Goldam Sachs 92,33532,091 Quanta Services Inc Goldam Sachs 148,902(8,170) Quest Diagnostics Inc Citibank (28,840)(1,820) Quest Diagnostics Inc Goldam Sachs (9,610)(4,540) Quest Diagnostics Inc HSBC (18,796)(2,560) Quest Diagnostics Inc JP Morgan (10,598)98,917 Qurate Retail Inc ’A’ Barclays Bank 35,61050,275 Ralph Lauren Corp Bank of America
Merrill Lynch 627,93532,740 Ralph Lauren Corp Barclays Bank 164,6823,060 Ralph Lauren Corp Citibank 15,3926,309 Ralph Lauren Corp Credit Suisse 36,529
33,500 Ralph Lauren Corp Goldam Sachs 418,415(144,681) Range Resources Corp Barclays Bank (7,234)(26,380) Range Resources Corp Credit Suisse 3,166(52,320) Range Resources Corp Goldam Sachs (60,168)
(120,950) Range Resources Corp HSBC 14,514(1,710) Raymond James Financial
Inc Citibank (7,370)(2,830) Raymond James Financial
Inc Credit Suisse (7,613)(10,510) Raymond James Financial
Inc Goldam Sachs (89,125)(2,240) Regal Beloit Corp Credit Suisse (8,131)(4,480) Regal Beloit Corp Goldam Sachs (43,456)
310 Regeneron PharmaceuticalsInc
Bank of AmericaMerrill Lynch 37
410 Regeneron PharmaceuticalsInc HSBC 5,510
(99,990) Regions Financial Corp Barclays Bank (117,988)(42,040) Regions Financial Corp Goldam Sachs (81,558)(7,190) Reinsurance Group of
America IncBank of AmericaMerrill Lynch (57,089)
(8,490) Reinsurance Group ofAmerica Inc Barclays Bank (7,217)
50,582 Reliance Steel & AluminumCo
Bank of AmericaMerrill Lynch 392,011
69,731 Reliance Steel & AluminumCo Barclays Bank 267,767
21,720 Reliance Steel & AluminumCo Goldam Sachs 168,330
9,230 RenaissanceRe HoldingsLtd
Bank of AmericaMerrill Lynch 65,810
3,120 RenaissanceRe HoldingsLtd Goldam Sachs 22,246
20,940 Republic Services Inc Bank of AmericaMerrill Lynch 111,401
Holding Description Counterparty
Netunrealised
appreciation/(depreciation)
USD
United States continued25,060 Republic Services Inc Barclays Bank 91,9701,540 Republic Services Inc Credit Suisse 5,359
15,950 Republic Services Inc Goldam Sachs 84,8541,680 Republic Services Inc HSBC 9,446
(11,387) Resideo Technologies Inc Bank of AmericaMerrill Lynch (10,248)
(168,571) Resideo Technologies Inc Goldam Sachs (151,714)(7,740) ResMed Inc Goldam Sachs 34,75318,235 Restaurant Brands
International IncBank of AmericaMerrill Lynch 51,787
1,270 Restaurant BrandsInternational Inc Barclays Bank 1,575
6,960 Restaurant BrandsInternational Inc Goldam Sachs 19,766
(19,770) Reynolds ConsumerProducts Inc
Bank of AmericaMerrill Lynch 16,211
(29,500) Reynolds ConsumerProducts Inc Barclays Bank (590)
(12,740) Reynolds ConsumerProducts Inc Credit Suisse (1,019)
(37,640) Reynolds ConsumerProducts Inc Goldam Sachs 30,865
14,400 RingCentral Inc ’A’ Barclays Bank 301,941(2) RLI Corp Bank of America
Merrill Lynch (18)35,217 Robert Half International
IncBank of AmericaMerrill Lynch 198,624
87,160 Robert Half InternationalInc Barclays Bank 293,729
(14,370) Roku Inc Bank of AmericaMerrill Lynch 36,787
(1,490) Roku Inc Barclays Bank (2,771)(6,570) Roku Inc Credit Suisse 107,025
(11,100) Roku Inc Goldam Sachs 28,416(11,455) Rollins Inc Bank of America
Merrill Lynch (4,467)(3,157) Roper Technologies Inc Bank of America
Merrill Lynch (75,610)(1,660) Roper Technologies Inc Barclays Bank (30,527)(3,560) Roper Technologies Inc Credit Suisse (96,291)(3,050) Roper Technologies Inc Goldam Sachs (73,048)
(10,030) Roper Technologies Inc JP Morgan (271,713)(35,670) Royal Caribbean Cruises
Ltd Barclays Bank (275,016)(17,630) Royal Caribbean Cruises
Ltd Goldam Sachs (236,242)18,350 Royal Gold Inc Bank of America
Merrill Lynch (7,707)4,210 Royal Gold Inc Barclays Bank (14,230)1,960 Royal Gold Inc Goldam Sachs (823)6,690 RPM International Inc Bank of America
Merrill Lynch 49,90713,830 RPM International Inc Barclays Bank 60,7142,600 RPM International Inc Citibank 11,4149,660 RPM International Inc Credit Suisse 51,584
17,600 RPM International Inc Goldam Sachs 131,2962,660 RPM International Inc HSBC 14,204
14,370 RPM International Inc JP Morgan 76,736(24,010) Ryder System Inc Bank of America
Merrill Lynch (100,362)(21,730) Ryder System Inc Barclays Bank (64,755)(19,717) Ryder System Inc Goldam Sachs (82,417)
2,270 S&P Global Inc Bank of AmericaMerrill Lynch 43,720
16,040 S&P Global Inc Barclays Bank 169,062440 S&P Global Inc Citibank 4,638910 S&P Global Inc Credit Suisse 22,523
10,540 S&P Global Inc Goldam Sachs 203,000
BlackRock Style Advantage Fund continued
The notes on pages 691 to 711 form an integral part of these financial statements.
Annual report and audited financial statements [579]

Contracts for difference as at 31 May 2020
Holding Description Counterparty
Netunrealised
appreciation/(depreciation)
USD
United States continued478 S&P Global Inc JP Morgan 11,831
34,200 Sabre Corp Bank of AmericaMerrill Lynch 58,824
48,940 Sabre Corp Goldam Sachs 84,177(3,617) Sage Therapeutics Inc Bank of America
Merrill Lynch (543)(19,450) Sage Therapeutics Inc Barclays Bank 35,983(6,828) Sage Therapeutics Inc Credit Suisse 14,407
(43,590) Sage Therapeutics Inc Goldam Sachs (6,539)15,540 salesforce.com Inc Bank of America
Merrill Lynch 19,7362,520 salesforce.com Inc Barclays Bank (13,230)
22,580 salesforce.com Inc Goldam Sachs 28,67714,020 Santander Consumer USA
Holdings IncBank of AmericaMerrill Lynch 31,265
14,300 Santander Consumer USAHoldings Inc Citibank 16,588
39,830 Santander Consumer USAHoldings Inc Credit Suisse 33,457
35,790 Santander Consumer USAHoldings Inc HSBC 30,064
(780) Sarepta Therapeutics Inc Barclays Bank (2,231)(28,740) Sarepta Therapeutics Inc Goldam Sachs (350,915)206,021 Schneider National Inc ’B’ Goldam Sachs 580,979(14,597) Scotts Miracle-Gro Co Goldam Sachs (37,952)
(389) Seaboard Corp Bank of AmericaMerrill Lynch 29,241
(341) Seaboard Corp Barclays Bank 8,184(50) Seaboard Corp Credit Suisse 12,101
(720) Seaboard Corp Goldam Sachs 54,122(26) Seaboard Corp HSBC 6,292(83) Seaboard Corp JP Morgan 20,087
32,659 Sealed Air Corp Bank of AmericaMerrill Lynch 88,832
9,039 Sealed Air Corp Barclays Bank 15,18614,945 Sealed Air Corp Credit Suisse 27,49967,130 Sealed Air Corp Goldam Sachs 182,59436,311 Sealed Air Corp JP Morgan 67,352
(13,538) Seattle Genetics Inc Credit Suisse 48,331(10,850) Seattle Genetics Inc Goldam Sachs 67,59614,390 SEI Investments Co Bank of America
Merrill Lynch 37,41458,760 SEI Investments Co Goldam Sachs 152,77616,128 SEI Investments Co HSBC 23,708(9,530) Sempra Energy Bank of America
Merrill Lynch (66,519)(4,090) Sempra Energy Credit Suisse (11,593)(1,220) Sempra Energy Goldam Sachs (8,516)(4,350) Sensata Technologies
Holding Plc Barclays Bank (4,176)(40,691) Sensata Technologies
Holding Plc Credit Suisse 32,553(38,740) Sensata Technologies
Holding Plc Goldam Sachs (101,886)(25,050) Service Corp International Barclays Bank (10,020)(66,486) ServiceMaster Global
Holdings IncBank of AmericaMerrill Lynch (317,138)
(15,650) ServiceMaster GlobalHoldings Inc Barclays Bank (39,908)
(4,420) ServiceMaster GlobalHoldings Inc Credit Suisse (8,707)
(61,720) ServiceMaster GlobalHoldings Inc Goldam Sachs (294,404)
13,940 ServiceNow Inc Barclays Bank 106,3701,620 Sherwin-Williams Co Bank of America
Merrill Lynch 34,0201,350 Sherwin-Williams Co Barclays Bank 16,308
860 Sherwin-Williams Co Citibank 10,389830 Sherwin-Williams Co Credit Suisse 32,951
Holding Description Counterparty
Netunrealised
appreciation/(depreciation)
USD
United States continued690 Sherwin-Williams Co Goldam Sachs 14,490
5,730 Signature Bank Barclays Bank 48,934270 Signature Bank HSBC 419450 Signature Bank JP Morgan 698
34,724 Silgan Holdings Inc Bank of AmericaMerrill Lynch 9,375
22,363 Silgan Holdings Inc Credit Suisse (15,207)41,410 Silgan Holdings Inc Goldam Sachs 11,1812,761 Silgan Holdings Inc JP Morgan (1,877)
(119,450) Sinclair Broadcast GroupInc ’A’
Bank of AmericaMerrill Lynch (307,584)
(125,012) Sinclair Broadcast GroupInc ’A’ Barclays Bank (20,002)
(35,730) Sinclair Broadcast GroupInc ’A’ Citibank (5,717)
(11,720) Sinclair Broadcast GroupInc ’A’ Credit Suisse (20,041)
(45,760) Sinclair Broadcast GroupInc ’A’ Goldam Sachs (117,832)
(15,440) Sinclair Broadcast GroupInc ’A’ JP Morgan (36,979)
129,560 Sirius XM Holdings Inc Bank of AmericaMerrill Lynch 45,346
107,990 Sirius XM Holdings Inc Barclays Bank 41,57668,070 Sirius XM Holdings Inc Goldam Sachs 23,8256,660 Six Flags Entertainment
CorpBank of AmericaMerrill Lynch 30,103
4,570 Six Flags EntertainmentCorp Barclays Bank 411
48,260 Six Flags EntertainmentCorp Credit Suisse 128,832
8,940 Six Flags EntertainmentCorp HSBC 21,814
30,080 Six Flags EntertainmentCorp JP Morgan 93,785
67,710 Skechers USA Inc ’A’ Barclays Bank 129,3265,530 Skyworks Solutions Inc Goldam Sachs 56,461
(99,660) SLM Corp Bank of AmericaMerrill Lynch (9,966)
(60,180) SLM Corp Barclays Bank (13,240)(107,630) SLM Corp Citibank (23,679)(49,450) Smartsheet Inc ’A’ Barclays Bank 18,297
1,690 Snap-on Inc Bank of AmericaMerrill Lynch 12,117
2,960 Snap-on Inc Barclays Bank 3,6708,780 Snap-on Inc Credit Suisse 37,2974,700 Snap-on Inc HSBC 13,113
(72,717) SolarWinds Corp Bank of AmericaMerrill Lynch (109,076)
(12,240) SolarWinds Corp Barclays Bank (490)(116,221) SolarWinds Corp Goldam Sachs (174,331)(65,120) SolarWinds Corp HSBC (70,330)(9,210) Sonoco Products Co Bank of America
Merrill Lynch (56,273)(5,460) Sonoco Products Co Barclays Bank (12,558)
(18,680) Sonoco Products Co Goldam Sachs (114,135)16,700 Southern Co Barclays Bank 39,91311,120 Southern Co Goldam Sachs 49,26225,030 Southwest Airlines Co Goldam Sachs 198,989(8,014) Spectrum Brands Holdings
Inc Barclays Bank (20,195)(38,622) Spectrum Brands Holdings
Inc JP Morgan (120,501)39,260 Spirit AeroSystems
Holdings Inc ’A’Bank of AmericaMerrill Lynch 145,655
11,730 Spirit AeroSystemsHoldings Inc ’A’ Barclays Bank 12,434
24,180 Spirit AeroSystemsHoldings Inc ’A’ Citibank 25,631
BlackRock Style Advantage Fund continued
The notes on pages 691 to 711 form an integral part of these financial statements.
BlackRock Strategic Funds[580]
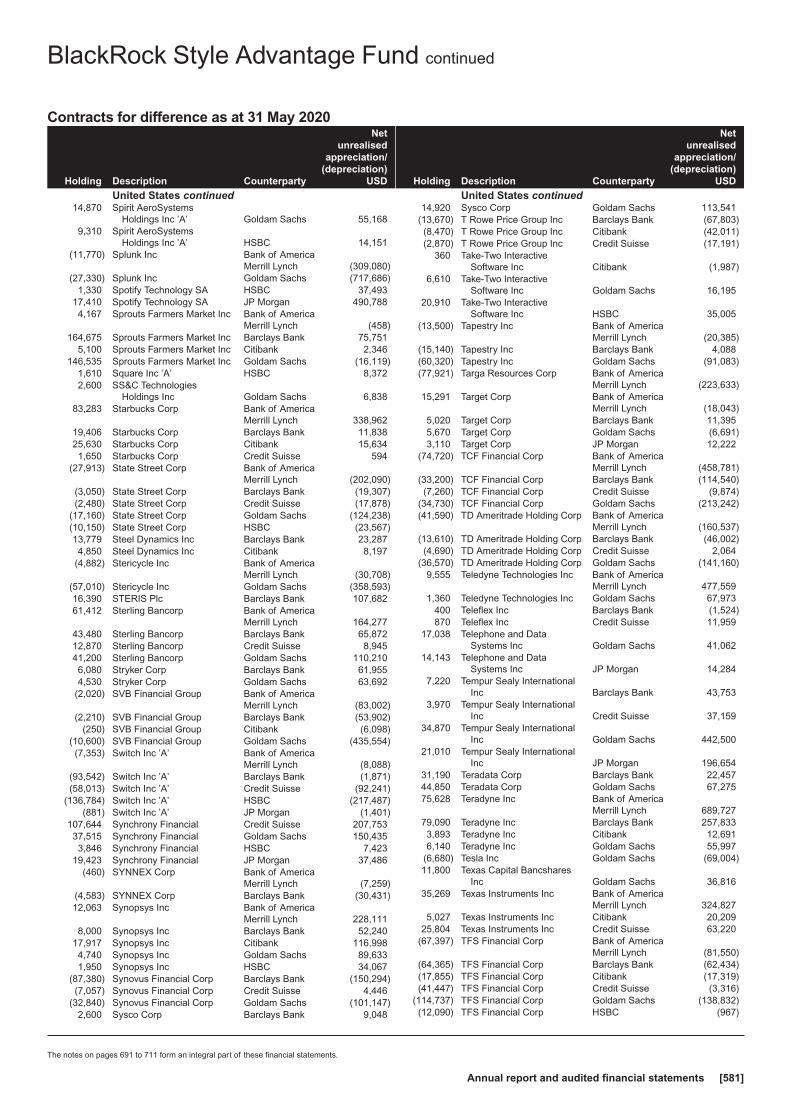
Contracts for difference as at 31 May 2020
Holding Description Counterparty
Netunrealised
appreciation/(depreciation)
USD
United States continued14,870 Spirit AeroSystems
Holdings Inc ’A’ Goldam Sachs 55,1689,310 Spirit AeroSystems
Holdings Inc ’A’ HSBC 14,151(11,770) Splunk Inc Bank of America
Merrill Lynch (309,080)(27,330) Splunk Inc Goldam Sachs (717,686)
1,330 Spotify Technology SA HSBC 37,49317,410 Spotify Technology SA JP Morgan 490,7884,167 Sprouts Farmers Market Inc Bank of America
Merrill Lynch (458)164,675 Sprouts Farmers Market Inc Barclays Bank 75,751
5,100 Sprouts Farmers Market Inc Citibank 2,346146,535 Sprouts Farmers Market Inc Goldam Sachs (16,119)
1,610 Square Inc ’A’ HSBC 8,3722,600 SS&C Technologies
Holdings Inc Goldam Sachs 6,83883,283 Starbucks Corp Bank of America
Merrill Lynch 338,96219,406 Starbucks Corp Barclays Bank 11,83825,630 Starbucks Corp Citibank 15,6341,650 Starbucks Corp Credit Suisse 594
(27,913) State Street Corp Bank of AmericaMerrill Lynch (202,090)
(3,050) State Street Corp Barclays Bank (19,307)(2,480) State Street Corp Credit Suisse (17,878)
(17,160) State Street Corp Goldam Sachs (124,238)(10,150) State Street Corp HSBC (23,567)13,779 Steel Dynamics Inc Barclays Bank 23,2874,850 Steel Dynamics Inc Citibank 8,197
(4,882) Stericycle Inc Bank of AmericaMerrill Lynch (30,708)
(57,010) Stericycle Inc Goldam Sachs (358,593)16,390 STERIS Plc Barclays Bank 107,68261,412 Sterling Bancorp Bank of America
Merrill Lynch 164,27743,480 Sterling Bancorp Barclays Bank 65,87212,870 Sterling Bancorp Credit Suisse 8,94541,200 Sterling Bancorp Goldam Sachs 110,2106,080 Stryker Corp Barclays Bank 61,9554,530 Stryker Corp Goldam Sachs 63,692
(2,020) SVB Financial Group Bank of AmericaMerrill Lynch (83,002)
(2,210) SVB Financial Group Barclays Bank (53,902)(250) SVB Financial Group Citibank (6,098)
(10,600) SVB Financial Group Goldam Sachs (435,554)(7,353) Switch Inc ’A’ Bank of America
Merrill Lynch (8,088)(93,542) Switch Inc ’A’ Barclays Bank (1,871)(58,013) Switch Inc ’A’ Credit Suisse (92,241)
(136,784) Switch Inc ’A’ HSBC (217,487)(881) Switch Inc ’A’ JP Morgan (1,401)
107,644 Synchrony Financial Credit Suisse 207,75337,515 Synchrony Financial Goldam Sachs 150,4353,846 Synchrony Financial HSBC 7,423
19,423 Synchrony Financial JP Morgan 37,486(460) SYNNEX Corp Bank of America
Merrill Lynch (7,259)(4,583) SYNNEX Corp Barclays Bank (30,431)12,063 Synopsys Inc Bank of America
Merrill Lynch 228,1118,000 Synopsys Inc Barclays Bank 52,240
17,917 Synopsys Inc Citibank 116,9984,740 Synopsys Inc Goldam Sachs 89,6331,950 Synopsys Inc HSBC 34,067
(87,380) Synovus Financial Corp Barclays Bank (150,294)(7,057) Synovus Financial Corp Credit Suisse 4,446
(32,840) Synovus Financial Corp Goldam Sachs (101,147)2,600 Sysco Corp Barclays Bank 9,048
Holding Description Counterparty
Netunrealised
appreciation/(depreciation)
USD
United States continued14,920 Sysco Corp Goldam Sachs 113,541
(13,670) T Rowe Price Group Inc Barclays Bank (67,803)(8,470) T Rowe Price Group Inc Citibank (42,011)(2,870) T Rowe Price Group Inc Credit Suisse (17,191)
360 Take-Two InteractiveSoftware Inc Citibank (1,987)
6,610 Take-Two InteractiveSoftware Inc Goldam Sachs 16,195
20,910 Take-Two InteractiveSoftware Inc HSBC 35,005
(13,500) Tapestry Inc Bank of AmericaMerrill Lynch (20,385)
(15,140) Tapestry Inc Barclays Bank 4,088(60,320) Tapestry Inc Goldam Sachs (91,083)(77,921) Targa Resources Corp Bank of America
Merrill Lynch (223,633)15,291 Target Corp Bank of America
Merrill Lynch (18,043)5,020 Target Corp Barclays Bank 11,3955,670 Target Corp Goldam Sachs (6,691)3,110 Target Corp JP Morgan 12,222
(74,720) TCF Financial Corp Bank of AmericaMerrill Lynch (458,781)
(33,200) TCF Financial Corp Barclays Bank (114,540)(7,260) TCF Financial Corp Credit Suisse (9,874)
(34,730) TCF Financial Corp Goldam Sachs (213,242)(41,590) TD Ameritrade Holding Corp Bank of America
Merrill Lynch (160,537)(13,610) TD Ameritrade Holding Corp Barclays Bank (46,002)(4,690) TD Ameritrade Holding Corp Credit Suisse 2,064
(36,570) TD Ameritrade Holding Corp Goldam Sachs (141,160)9,555 Teledyne Technologies Inc Bank of America
Merrill Lynch 477,5591,360 Teledyne Technologies Inc Goldam Sachs 67,973
400 Teleflex Inc Barclays Bank (1,524)870 Teleflex Inc Credit Suisse 11,959
17,038 Telephone and DataSystems Inc Goldam Sachs 41,062
14,143 Telephone and DataSystems Inc JP Morgan 14,284
7,220 Tempur Sealy InternationalInc Barclays Bank 43,753
3,970 Tempur Sealy InternationalInc Credit Suisse 37,159
34,870 Tempur Sealy InternationalInc Goldam Sachs 442,500
21,010 Tempur Sealy InternationalInc JP Morgan 196,654
31,190 Teradata Corp Barclays Bank 22,45744,850 Teradata Corp Goldam Sachs 67,27575,628 Teradyne Inc Bank of America
Merrill Lynch 689,72779,090 Teradyne Inc Barclays Bank 257,8333,893 Teradyne Inc Citibank 12,6916,140 Teradyne Inc Goldam Sachs 55,997
(6,680) Tesla Inc Goldam Sachs (69,004)11,800 Texas Capital Bancshares
Inc Goldam Sachs 36,81635,269 Texas Instruments Inc Bank of America
Merrill Lynch 324,8275,027 Texas Instruments Inc Citibank 20,209
25,804 Texas Instruments Inc Credit Suisse 63,220(67,397) TFS Financial Corp Bank of America
Merrill Lynch (81,550)(64,365) TFS Financial Corp Barclays Bank (62,434)(17,855) TFS Financial Corp Citibank (17,319)(41,447) TFS Financial Corp Credit Suisse (3,316)
(114,737) TFS Financial Corp Goldam Sachs (138,832)(12,090) TFS Financial Corp HSBC (967)
BlackRock Style Advantage Fund continued
The notes on pages 691 to 711 form an integral part of these financial statements.
Annual report and audited financial statements [581]
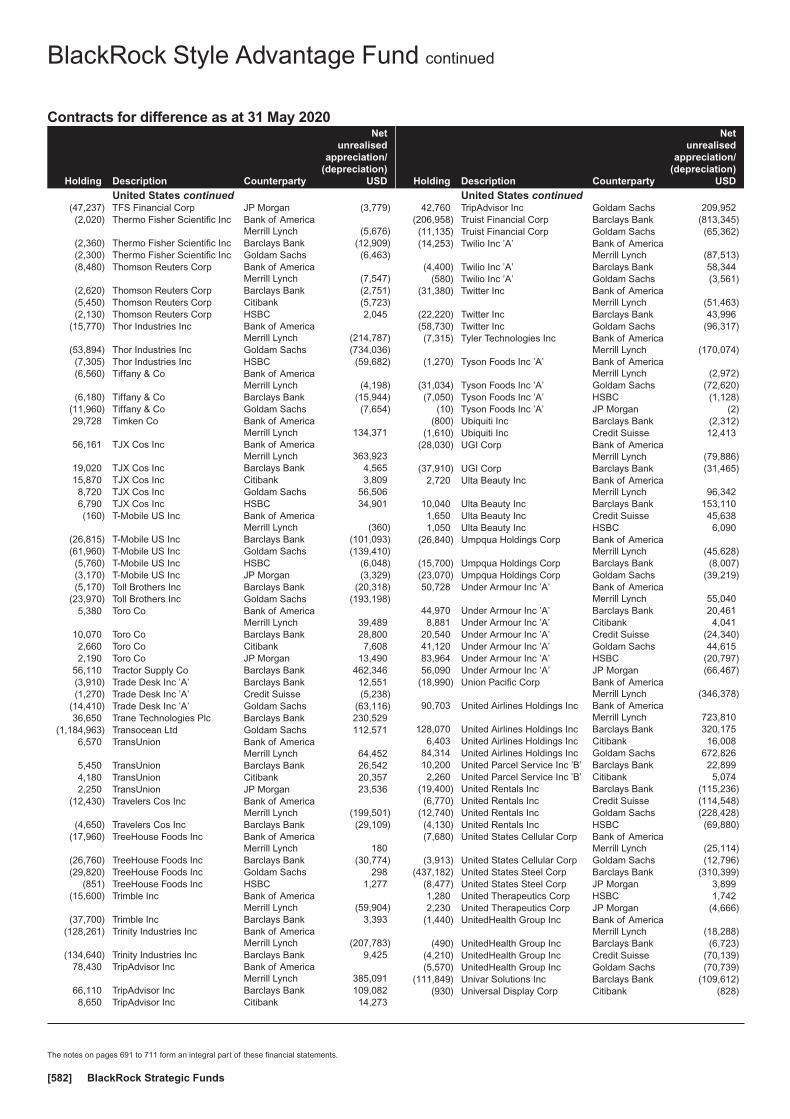
Contracts for difference as at 31 May 2020
Holding Description Counterparty
Netunrealised
appreciation/(depreciation)
USD
United States continued(47,237) TFS Financial Corp JP Morgan (3,779)(2,020) Thermo Fisher Scientific Inc Bank of America
Merrill Lynch (5,676)(2,360) Thermo Fisher Scientific Inc Barclays Bank (12,909)(2,300) Thermo Fisher Scientific Inc Goldam Sachs (6,463)(8,480) Thomson Reuters Corp Bank of America
Merrill Lynch (7,547)(2,620) Thomson Reuters Corp Barclays Bank (2,751)(5,450) Thomson Reuters Corp Citibank (5,723)(2,130) Thomson Reuters Corp HSBC 2,045
(15,770) Thor Industries Inc Bank of AmericaMerrill Lynch (214,787)
(53,894) Thor Industries Inc Goldam Sachs (734,036)(7,305) Thor Industries Inc HSBC (59,682)(6,560) Tiffany & Co Bank of America
Merrill Lynch (4,198)(6,180) Tiffany & Co Barclays Bank (15,944)
(11,960) Tiffany & Co Goldam Sachs (7,654)29,728 Timken Co Bank of America
Merrill Lynch 134,37156,161 TJX Cos Inc Bank of America
Merrill Lynch 363,92319,020 TJX Cos Inc Barclays Bank 4,56515,870 TJX Cos Inc Citibank 3,8098,720 TJX Cos Inc Goldam Sachs 56,5066,790 TJX Cos Inc HSBC 34,901(160) T-Mobile US Inc Bank of America
Merrill Lynch (360)(26,815) T-Mobile US Inc Barclays Bank (101,093)(61,960) T-Mobile US Inc Goldam Sachs (139,410)(5,760) T-Mobile US Inc HSBC (6,048)(3,170) T-Mobile US Inc JP Morgan (3,329)(5,170) Toll Brothers Inc Barclays Bank (20,318)
(23,970) Toll Brothers Inc Goldam Sachs (193,198)5,380 Toro Co Bank of America
Merrill Lynch 39,48910,070 Toro Co Barclays Bank 28,8002,660 Toro Co Citibank 7,6082,190 Toro Co JP Morgan 13,490
56,110 Tractor Supply Co Barclays Bank 462,346(3,910) Trade Desk Inc ’A’ Barclays Bank 12,551(1,270) Trade Desk Inc ’A’ Credit Suisse (5,238)
(14,410) Trade Desk Inc ’A’ Goldam Sachs (63,116)36,650 Trane Technologies Plc Barclays Bank 230,529
(1,184,963) Transocean Ltd Goldam Sachs 112,5716,570 TransUnion Bank of America
Merrill Lynch 64,4525,450 TransUnion Barclays Bank 26,5424,180 TransUnion Citibank 20,3572,250 TransUnion JP Morgan 23,536
(12,430) Travelers Cos Inc Bank of AmericaMerrill Lynch (199,501)
(4,650) Travelers Cos Inc Barclays Bank (29,109)(17,960) TreeHouse Foods Inc Bank of America
Merrill Lynch 180(26,760) TreeHouse Foods Inc Barclays Bank (30,774)(29,820) TreeHouse Foods Inc Goldam Sachs 298
(851) TreeHouse Foods Inc HSBC 1,277(15,600) Trimble Inc Bank of America
Merrill Lynch (59,904)(37,700) Trimble Inc Barclays Bank 3,393
(128,261) Trinity Industries Inc Bank of AmericaMerrill Lynch (207,783)
(134,640) Trinity Industries Inc Barclays Bank 9,42578,430 TripAdvisor Inc Bank of America
Merrill Lynch 385,09166,110 TripAdvisor Inc Barclays Bank 109,0828,650 TripAdvisor Inc Citibank 14,273
Holding Description Counterparty
Netunrealised
appreciation/(depreciation)
USD
United States continued42,760 TripAdvisor Inc Goldam Sachs 209,952
(206,958) Truist Financial Corp Barclays Bank (813,345)(11,135) Truist Financial Corp Goldam Sachs (65,362)(14,253) Twilio Inc ’A’ Bank of America
Merrill Lynch (87,513)(4,400) Twilio Inc ’A’ Barclays Bank 58,344
(580) Twilio Inc ’A’ Goldam Sachs (3,561)(31,380) Twitter Inc Bank of America
Merrill Lynch (51,463)(22,220) Twitter Inc Barclays Bank 43,996(58,730) Twitter Inc Goldam Sachs (96,317)(7,315) Tyler Technologies Inc Bank of America
Merrill Lynch (170,074)(1,270) Tyson Foods Inc ’A’ Bank of America
Merrill Lynch (2,972)(31,034) Tyson Foods Inc ’A’ Goldam Sachs (72,620)(7,050) Tyson Foods Inc ’A’ HSBC (1,128)
(10) Tyson Foods Inc ’A’ JP Morgan (2)(800) Ubiquiti Inc Barclays Bank (2,312)
(1,610) Ubiquiti Inc Credit Suisse 12,413(28,030) UGI Corp Bank of America
Merrill Lynch (79,886)(37,910) UGI Corp Barclays Bank (31,465)
2,720 Ulta Beauty Inc Bank of AmericaMerrill Lynch 96,342
10,040 Ulta Beauty Inc Barclays Bank 153,1101,650 Ulta Beauty Inc Credit Suisse 45,6381,050 Ulta Beauty Inc HSBC 6,090
(26,840) Umpqua Holdings Corp Bank of AmericaMerrill Lynch (45,628)
(15,700) Umpqua Holdings Corp Barclays Bank (8,007)(23,070) Umpqua Holdings Corp Goldam Sachs (39,219)50,728 Under Armour Inc ’A’ Bank of America
Merrill Lynch 55,04044,970 Under Armour Inc ’A’ Barclays Bank 20,4618,881 Under Armour Inc ’A’ Citibank 4,041
20,540 Under Armour Inc ’A’ Credit Suisse (24,340)41,120 Under Armour Inc ’A’ Goldam Sachs 44,61583,964 Under Armour Inc ’A’ HSBC (20,797)56,090 Under Armour Inc ’A’ JP Morgan (66,467)
(18,990) Union Pacific Corp Bank of AmericaMerrill Lynch (346,378)
90,703 United Airlines Holdings Inc Bank of AmericaMerrill Lynch 723,810
128,070 United Airlines Holdings Inc Barclays Bank 320,1756,403 United Airlines Holdings Inc Citibank 16,008
84,314 United Airlines Holdings Inc Goldam Sachs 672,82610,200 United Parcel Service Inc ’B’ Barclays Bank 22,8992,260 United Parcel Service Inc ’B’ Citibank 5,074
(19,400) United Rentals Inc Barclays Bank (115,236)(6,770) United Rentals Inc Credit Suisse (114,548)
(12,740) United Rentals Inc Goldam Sachs (228,428)(4,130) United Rentals Inc HSBC (69,880)(7,680) United States Cellular Corp Bank of America
Merrill Lynch (25,114)(3,913) United States Cellular Corp Goldam Sachs (12,796)
(437,182) United States Steel Corp Barclays Bank (310,399)(8,477) United States Steel Corp JP Morgan 3,8991,280 United Therapeutics Corp HSBC 1,7422,230 United Therapeutics Corp JP Morgan (4,666)
(1,440) UnitedHealth Group Inc Bank of AmericaMerrill Lynch (18,288)
(490) UnitedHealth Group Inc Barclays Bank (6,723)(4,210) UnitedHealth Group Inc Credit Suisse (70,139)(5,570) UnitedHealth Group Inc Goldam Sachs (70,739)
(111,849) Univar Solutions Inc Barclays Bank (109,612)(930) Universal Display Corp Citibank (828)
BlackRock Style Advantage Fund continued
The notes on pages 691 to 711 form an integral part of these financial statements.
BlackRock Strategic Funds[582]
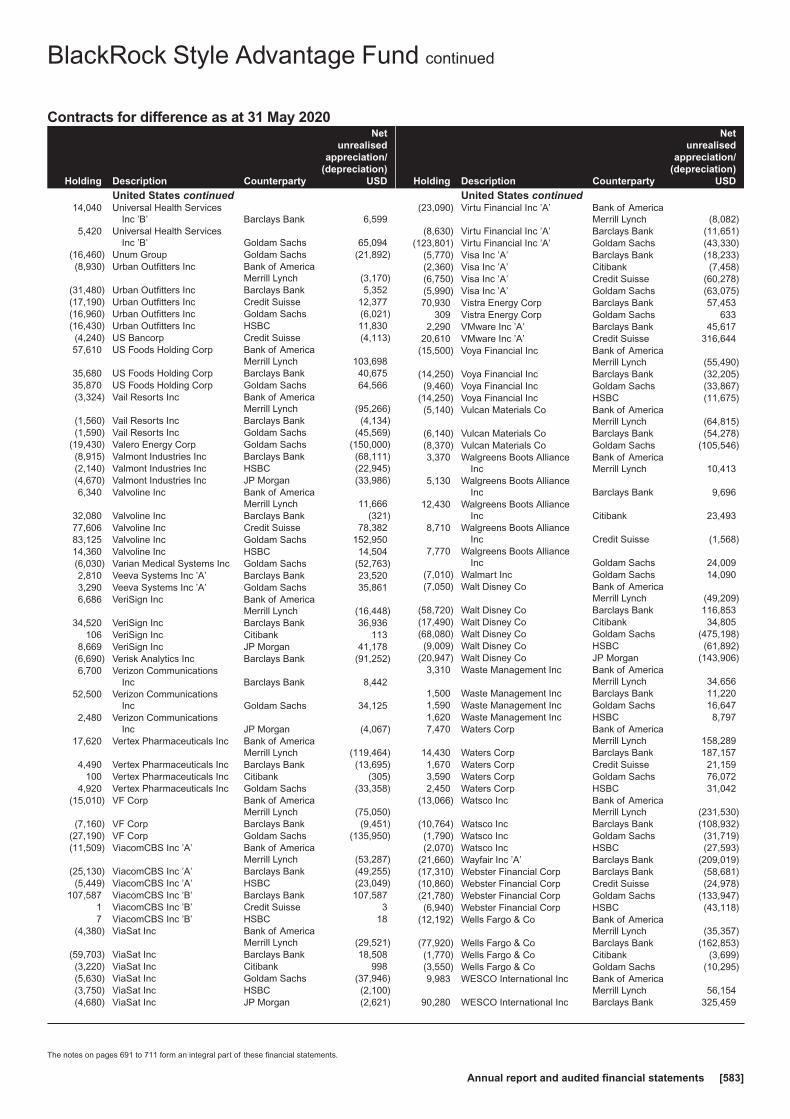
Contracts for difference as at 31 May 2020
Holding Description Counterparty
Netunrealised
appreciation/(depreciation)
USD
United States continued14,040 Universal Health Services
Inc ’B’ Barclays Bank 6,5995,420 Universal Health Services
Inc ’B’ Goldam Sachs 65,094(16,460) Unum Group Goldam Sachs (21,892)(8,930) Urban Outfitters Inc Bank of America
Merrill Lynch (3,170)(31,480) Urban Outfitters Inc Barclays Bank 5,352(17,190) Urban Outfitters Inc Credit Suisse 12,377(16,960) Urban Outfitters Inc Goldam Sachs (6,021)(16,430) Urban Outfitters Inc HSBC 11,830(4,240) US Bancorp Credit Suisse (4,113)57,610 US Foods Holding Corp Bank of America
Merrill Lynch 103,69835,680 US Foods Holding Corp Barclays Bank 40,67535,870 US Foods Holding Corp Goldam Sachs 64,566(3,324) Vail Resorts Inc Bank of America
Merrill Lynch (95,266)(1,560) Vail Resorts Inc Barclays Bank (4,134)(1,590) Vail Resorts Inc Goldam Sachs (45,569)
(19,430) Valero Energy Corp Goldam Sachs (150,000)(8,915) Valmont Industries Inc Barclays Bank (68,111)(2,140) Valmont Industries Inc HSBC (22,945)(4,670) Valmont Industries Inc JP Morgan (33,986)6,340 Valvoline Inc Bank of America
Merrill Lynch 11,66632,080 Valvoline Inc Barclays Bank (321)77,606 Valvoline Inc Credit Suisse 78,38283,125 Valvoline Inc Goldam Sachs 152,95014,360 Valvoline Inc HSBC 14,504(6,030) Varian Medical Systems Inc Goldam Sachs (52,763)2,810 Veeva Systems Inc ’A’ Barclays Bank 23,5203,290 Veeva Systems Inc ’A’ Goldam Sachs 35,8616,686 VeriSign Inc Bank of America
Merrill Lynch (16,448)34,520 VeriSign Inc Barclays Bank 36,936
106 VeriSign Inc Citibank 1138,669 VeriSign Inc JP Morgan 41,178
(6,690) Verisk Analytics Inc Barclays Bank (91,252)6,700 Verizon Communications
Inc Barclays Bank 8,44252,500 Verizon Communications
Inc Goldam Sachs 34,1252,480 Verizon Communications
Inc JP Morgan (4,067)17,620 Vertex Pharmaceuticals Inc Bank of America
Merrill Lynch (119,464)4,490 Vertex Pharmaceuticals Inc Barclays Bank (13,695)
100 Vertex Pharmaceuticals Inc Citibank (305)4,920 Vertex Pharmaceuticals Inc Goldam Sachs (33,358)
(15,010) VF Corp Bank of AmericaMerrill Lynch (75,050)
(7,160) VF Corp Barclays Bank (9,451)(27,190) VF Corp Goldam Sachs (135,950)(11,509) ViacomCBS Inc ’A’ Bank of America
Merrill Lynch (53,287)(25,130) ViacomCBS Inc ’A’ Barclays Bank (49,255)(5,449) ViacomCBS Inc ’A’ HSBC (23,049)
107,587 ViacomCBS Inc ’B’ Barclays Bank 107,5871 ViacomCBS Inc ’B’ Credit Suisse 37 ViacomCBS Inc ’B’ HSBC 18
(4,380) ViaSat Inc Bank of AmericaMerrill Lynch (29,521)
(59,703) ViaSat Inc Barclays Bank 18,508(3,220) ViaSat Inc Citibank 998(5,630) ViaSat Inc Goldam Sachs (37,946)(3,750) ViaSat Inc HSBC (2,100)(4,680) ViaSat Inc JP Morgan (2,621)
Holding Description Counterparty
Netunrealised
appreciation/(depreciation)
USD
United States continued(23,090) Virtu Financial Inc ’A’ Bank of America
Merrill Lynch (8,082)(8,630) Virtu Financial Inc ’A’ Barclays Bank (11,651)
(123,801) Virtu Financial Inc ’A’ Goldam Sachs (43,330)(5,770) Visa Inc ’A’ Barclays Bank (18,233)(2,360) Visa Inc ’A’ Citibank (7,458)(6,750) Visa Inc ’A’ Credit Suisse (60,278)(5,990) Visa Inc ’A’ Goldam Sachs (63,075)70,930 Vistra Energy Corp Barclays Bank 57,453
309 Vistra Energy Corp Goldam Sachs 6332,290 VMware Inc ’A’ Barclays Bank 45,617
20,610 VMware Inc ’A’ Credit Suisse 316,644(15,500) Voya Financial Inc Bank of America
Merrill Lynch (55,490)(14,250) Voya Financial Inc Barclays Bank (32,205)(9,460) Voya Financial Inc Goldam Sachs (33,867)
(14,250) Voya Financial Inc HSBC (11,675)(5,140) Vulcan Materials Co Bank of America
Merrill Lynch (64,815)(6,140) Vulcan Materials Co Barclays Bank (54,278)(8,370) Vulcan Materials Co Goldam Sachs (105,546)3,370 Walgreens Boots Alliance
IncBank of AmericaMerrill Lynch 10,413
5,130 Walgreens Boots AllianceInc Barclays Bank 9,696
12,430 Walgreens Boots AllianceInc Citibank 23,493
8,710 Walgreens Boots AllianceInc Credit Suisse (1,568)
7,770 Walgreens Boots AllianceInc Goldam Sachs 24,009
(7,010) Walmart Inc Goldam Sachs 14,090(7,050) Walt Disney Co Bank of America
Merrill Lynch (49,209)(58,720) Walt Disney Co Barclays Bank 116,853(17,490) Walt Disney Co Citibank 34,805(68,080) Walt Disney Co Goldam Sachs (475,198)(9,009) Walt Disney Co HSBC (61,892)
(20,947) Walt Disney Co JP Morgan (143,906)3,310 Waste Management Inc Bank of America
Merrill Lynch 34,6561,500 Waste Management Inc Barclays Bank 11,2201,590 Waste Management Inc Goldam Sachs 16,6471,620 Waste Management Inc HSBC 8,7977,470 Waters Corp Bank of America
Merrill Lynch 158,28914,430 Waters Corp Barclays Bank 187,1571,670 Waters Corp Credit Suisse 21,1593,590 Waters Corp Goldam Sachs 76,0722,450 Waters Corp HSBC 31,042
(13,066) Watsco Inc Bank of AmericaMerrill Lynch (231,530)
(10,764) Watsco Inc Barclays Bank (108,932)(1,790) Watsco Inc Goldam Sachs (31,719)(2,070) Watsco Inc HSBC (27,593)
(21,660) Wayfair Inc ’A’ Barclays Bank (209,019)(17,310) Webster Financial Corp Barclays Bank (58,681)(10,860) Webster Financial Corp Credit Suisse (24,978)(21,780) Webster Financial Corp Goldam Sachs (133,947)(6,940) Webster Financial Corp HSBC (43,118)
(12,192) Wells Fargo & Co Bank of AmericaMerrill Lynch (35,357)
(77,920) Wells Fargo & Co Barclays Bank (162,853)(1,770) Wells Fargo & Co Citibank (3,699)(3,550) Wells Fargo & Co Goldam Sachs (10,295)9,983 WESCO International Inc Bank of America
Merrill Lynch 56,15490,280 WESCO International Inc Barclays Bank 325,459
BlackRock Style Advantage Fund continued
The notes on pages 691 to 711 form an integral part of these financial statements.
Annual report and audited financial statements [583]

Contracts for difference as at 31 May 2020
Holding Description Counterparty
Netunrealised
appreciation/(depreciation)
USD
United States continued31,694 WESCO International Inc Credit Suisse 113,62336,880 WESCO International Inc Goldam Sachs 207,45041,380 WESCO International Inc HSBC 148,34716,876 West Pharmaceutical
Services IncBank of AmericaMerrill Lynch (59,066)
1,160 West PharmaceuticalServices Inc Barclays Bank (893)
17,080 West PharmaceuticalServices Inc Goldam Sachs (59,780)
9,480 Western Alliance Bancorp Goldam Sachs 81,054(47,646) Western Digital Corp Bank of America
Merrill Lynch (214,883)(16,020) Western Digital Corp Barclays Bank (20,826)(6,260) Western Digital Corp Credit Suisse 3,005(7,490) Western Digital Corp Goldam Sachs (33,780)(3,810) Western Digital Corp HSBC 1,829
(42,316) Western Digital Corp JP Morgan 20,31231,150 Western Union Co Goldam Sachs 46,8812,080 Westinghouse Air Brake
Technologies Corp Goldam Sachs 16,432(95,880) Westlake Chemical Corp Barclays Bank (266,546)(40,030) Westlake Chemical Corp Goldam Sachs (330,648)
(640) Westlake Chemical Corp HSBC (2,093)(17,121) Westlake Chemical Corp JP Morgan (55,986)(5,050) Westrock Co Bank of America
Merrill Lynch (19,443)(82,370) Westrock Co Barclays Bank (223,223)(11,490) Westrock Co Credit Suisse (12,179)(43,230) Westrock Co Goldam Sachs (166,436)(7,660) Westrock Co JP Morgan (8,120)(8,835) WEX Inc Bank of America
Merrill Lynch (235,011)(9,180) WEX Inc Barclays Bank (76,837)(2,650) WEX Inc Credit Suisse (35,749)
(420) WEX Inc Goldam Sachs (11,172)2,600 Whirlpool Corp Barclays Bank 754
31,590 Whirlpool Corp Goldam Sachs 353,4924,147 White Mountains Insurance
Group Ltd Barclays Bank (6,988)593 White Mountains Insurance
Group Ltd Goldam Sachs 22,027127 White Mountains Insurance
Group Ltd JP Morgan 1,394(15,650) Williams Cos Inc Bank of America
Merrill Lynch (16,120)(6,200) Williams Cos Inc Goldam Sachs (6,386)39,170 Williams-Sonoma Inc Bank of America
Merrill Lynch 586,3757,720 Williams-Sonoma Inc Barclays Bank 115,8005,817 Williams-Sonoma Inc Credit Suisse 76,668
24,520 Williams-Sonoma Inc Goldam Sachs 367,06416,075 Williams-Sonoma Inc HSBC 211,86923,980 Willis Towers Watson Plc Barclays Bank 160,906
880 Willis Towers Watson Plc Citibank 5,9053,620 Willis Towers Watson Plc HSBC 28,4893,630 Willis Towers Watson Plc JP Morgan 28,568
15,010 Wintrust Financial Corp Bank of AmericaMerrill Lynch 154,153
8,630 Wintrust Financial Corp Barclays Bank 39,6124,830 Wintrust Financial Corp Goldam Sachs 49,6042,670 Woodward Inc Bank of America
Merrill Lynch 37,94113,330 Woodward Inc Barclays Bank 81,3131,960 Woodward Inc Goldam Sachs 27,8521,950 Workday Inc ’A’ Bank of America
Merrill Lynch 52,74816,820 Workday Inc ’A’ Barclays Bank 222,0243,190 Workday Inc ’A’ Citibank 42,1081,010 Workday Inc ’A’ Credit Suisse 18,587
Holding Description Counterparty
Netunrealised
appreciation/(depreciation)
USD
United States continued900 Workday Inc ’A’ Goldam Sachs 24,345
2,130 Workday Inc ’A’ HSBC 47,313(97,146) World Wrestling
Entertainment Inc ’A’ Barclays Bank (132,119)(20,456) WPX Energy Inc Goldam Sachs (7,773)(19,240) WPX Energy Inc HSBC 2,99031,067 WR Berkley Corp Barclays Bank 41,6303,870 WR Grace & Co Bank of America
Merrill Lynch 17,84113,950 WR Grace & Co Barclays Bank (8,370)9,310 WR Grace & Co Goldam Sachs 42,9199,350 WR Grace & Co JP Morgan (6,826)
24,880 Wyndham Destinations Inc Bank of AmericaMerrill Lynch 204,638
3,150 Wyndham Destinations Inc Barclays Bank 9,93830,824 Wyndham Destinations Inc Credit Suisse 190,030
125,335 Wyndham Destinations Inc Goldam Sachs 1,030,88021,958 Wyndham Destinations Inc HSBC 135,371
(36,733) Wyndham Hotels & ResortsInc
Bank of AmericaMerrill Lynch (182,563)
(51,998) Wyndham Hotels & ResortsInc Barclays Bank 43,678
(14,186) Wyndham Hotels & ResortsInc Credit Suisse (37,309)
(18,240) Wyndham Hotels & ResortsInc Goldam Sachs (90,653)
(4,940) Wyndham Hotels & ResortsInc JP Morgan (25,541)
(36,791) Wynn Resorts Ltd Bank of AmericaMerrill Lynch (154,890)
(1,840) Wynn Resorts Ltd Barclays Bank (6,734)(35,100) Wynn Resorts Ltd Goldam Sachs (147,771)(2,290) Xcel Energy Inc Barclays Bank (8,381)70,659 Xerox Holdings Corp Bank of America
Merrill Lynch 88,324110,390 Xerox Holdings Corp Barclays Bank (92,728)12,310 Xerox Holdings Corp Citibank (10,340)33,110 Xerox Holdings Corp Credit Suisse (16,060)
146,780 Xerox Holdings Corp Goldam Sachs 183,47520,417 Xerox Holdings Corp JP Morgan (40,630)(2,320) XPO Logistics Inc Credit Suisse (30,018)
(23,940) XPO Logistics Inc Goldam Sachs (312,896)(93,557) Xylem Inc Bank of America
Merrill Lynch (762,490)(24,540) Xylem Inc Goldam Sachs (200,001)
600 Yum! Brands Inc Bank of AmericaMerrill Lynch 3,132
37,507 Yum! Brands Inc Barclays Bank 107,6452,201 Yum! Brands Inc Credit Suisse 8,672
16,940 Yum! Brands Inc Goldam Sachs 88,42710,752 Yum! Brands Inc HSBC 42,3634,220 Zebra Technologies Corp ’A’ Barclays Bank 61,6541,500 Zendesk Inc Bank of America
Merrill Lynch 14,4751,930 Zendesk Inc Barclays Bank 4,3811,870 Zendesk Inc Citibank 4,2452,900 Zendesk Inc HSBC 18,3571,810 Zendesk Inc JP Morgan 11,457
(6,250) Zillow Group Inc ’C’ Barclays Bank (1,813)(29,458) Zillow Group Inc ’C’ Credit Suisse (112,530)(73,460) Zillow Group Inc ’C’ Goldam Sachs (588,415)(3,910) Zimmer Biomet Holdings Inc Goldam Sachs (58,572)(2,600) Zimmer Biomet Holdings Inc JP Morgan (14,326)47,400 Zions Bancorp NA Barclays Bank 145,04485,957 Zions Bancorp NA Credit Suisse 217,4716,720 Zions Bancorp NA HSBC 17,002
(4,080) Zoetis Inc Barclays Bank (32,069)(20,180) Zoetis Inc Goldam Sachs (211,486)
BlackRock Style Advantage Fund continued
The notes on pages 691 to 711 form an integral part of these financial statements.
BlackRock Strategic Funds[584]
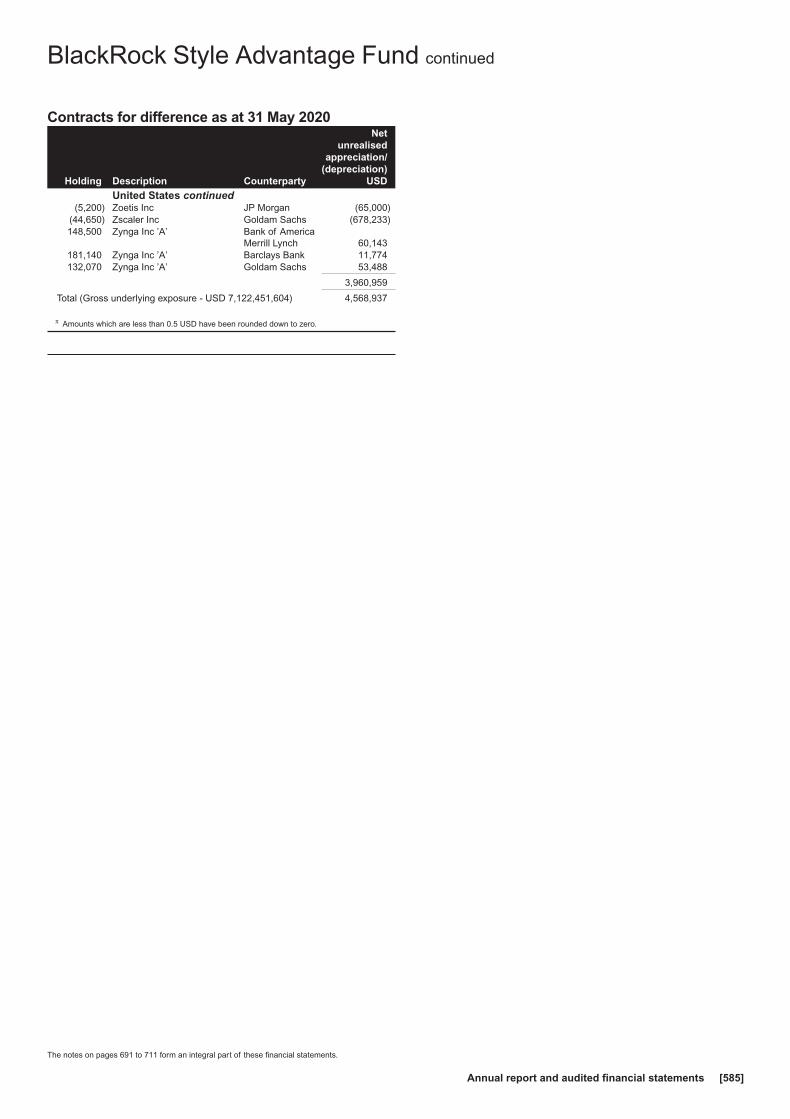
Contracts for difference as at 31 May 2020
Holding Description Counterparty
Netunrealised
appreciation/(depreciation)
USD
United States continued(5,200) Zoetis Inc JP Morgan (65,000)
(44,650) Zscaler Inc Goldam Sachs (678,233)148,500 Zynga Inc ’A’ Bank of America
Merrill Lynch 60,143181,140 Zynga Inc ’A’ Barclays Bank 11,774132,070 Zynga Inc ’A’ Goldam Sachs 53,488
3,960,959
Total (Gross underlying exposure - USD 7,122,451,604) 4,568,937
π Amounts which are less than 0.5 USD have been rounded down to zero.
BlackRock Style Advantage Fund continued
The notes on pages 691 to 711 form an integral part of these financial statements.
Annual report and audited financial statements [585]

Swaps as at 31 May 2020
TypeNominal
Value Description CounterpartyExpiration
date
Net unrealisedappreciation/
(depreciation)USD
MarketValue
USD
CCIRS SEK 191,648,000Fund receives Fixed 0.450% and pays Floating SEK 3 Month
STIBORBank of America
Merrill Lynch 16/9/2030 97,244 108,111
CCIRS GBP 322,107,000Fund receives Fixed 0.516% and pays Floating GBP 6 Month
LIBORBank of America
Merrill Lynch 16/9/2025 4,216,255 4,285,178
CCIRS USD 16,432,000Fund receives Fixed 0.610% and pays Floating USD 3 Month
LIBORBank of America
Merrill Lynch 16/9/2030 (121,197) (140,414)
CCIRS USD 20,135,000Fund receives Fixed 0.640% and pays Floating USD 3 Month
LIBORBank of America
Merrill Lynch 16/9/2030 (115,466) (112,526)
CCIRS USD 6,752,500Fund receives Fixed 0.675% and pays Floating USD 3 Month
LIBORBank of America
Merrill Lynch 16/9/2030 (16,566) (14,445)
CCIRS USD 13,337,000Fund receives Fixed 0.680% and pays Floating USD 3 Month
LIBORBank of America
Merrill Lynch 16/9/2030 (8,451) (21,959)
CCIRS AUD 27,866,000Fund receives Fixed 0.879% and pays Floating AUD 6 Month
Australia Bank Bill Swap RateBank of America
Merrill Lynch 16/9/2030 (91,344) (90,971)
CCIRS CAD 33,958,000Fund receives Fixed 0.985% and pays Floating CAD 3 Month
Canada Bankers AcceptancesBank of America
Merrill Lynch 16/9/2030 (112,496) (104,245)
CCIRS USD 26,457,000Fund receives Fixed 0.985% and pays Floating USD 3 Month
LIBORBank of America
Merrill Lynch 16/9/2030 729,477 751,693
CCIRS AUD 154,567,400Fund receives Fixed 1.032% and pays Floating AUD 6 Month
Australia Bank Bill Swap RateBank of America
Merrill Lynch 16/9/2030 1,024,040 1,025,942
CCIRS CAD 46,910,000Fund receives Fixed 1.079% and pays Floating CAD 3 Month
CDORBank of America
Merrill Lynch 16/9/2030 165,564 166,228
CCIRS ZAR 1,068,584,224Fund receives Fixed 6.700% and pays Floating ZAR 3 Month
JIBARBank of America
Merrill Lynch 16/9/2025 3,044,476 3,045,433
CCIRS AUD 220,136,284Fund receives Floating AUD 6 Month Australia Bank Bill Swap
Rate and pays Fixed 0.652%Bank of America
Merrill Lynch 16/9/2025 (1,011,221) (1,009,117)
CCIRS AUD 59,383,804Fund receives Floating AUD 6 Month Australia Bank Bill Swap
Rate and pays Fixed 0.685%Bank of America
Merrill Lynch 16/9/2025 (337,379) (336,809)
CCIRS AUD 299,818,943Fund receives Floating AUD 6 Month Australia Bank Bill Swap
Rate and pays Fixed 0.800%Bank of America
Merrill Lynch 16/9/2025 (2,839,567) (2,836,924)
CCIRS CAD 39,087,000Fund receives Floating CAD 3 Month Canada Bankers
Acceptances and pays Fixed 0.760%Bank of America
Merrill Lynch 16/9/2025 24,621 28,111
CCIRS CAD 142,073,000Fund receives Floating CAD 3 Month Canada Bankers
Acceptances and pays Fixed 0.840%Bank of America
Merrill Lynch 16/9/2025 (307,838) (306,396)
CCIRS EUR 15,263,500Fund receives Floating EUR 6 Month EURIBOR and pays
Fixed 0.080%Bank of America
Merrill Lynch 16/9/2030 (349,415) (337,014)
CCIRS EUR 35,892,000Fund receives Floating EUR 6 Month EURIBOR and pays
Fixed 0.160%Bank of America
Merrill Lynch 16/9/2030 (1,147,301) (1,119,175)
CCIRS GBP 163,660,500Fund receives Floating GBP 6 Month LIBOR and pays Fixed
0.607%Bank of America
Merrill Lynch 16/9/2030 (3,875,264) (3,946,869)
CCIRS HKD 617,768,538Fund receives Floating HKD 3 Month HIBOR and pays Fixed
1.003%Bank of America
Merrill Lynch 16/9/2025 177,878 179,023
CCIRS HKD 152,667,271Fund receives Floating HKD 3 Month HIBOR and pays Fixed
1.205%Bank of America
Merrill Lynch 16/9/2025 (151,321) (151,038)
CCIRS MXN 52,022,000Fund receives Floating MXN 1 Month Mexican Interbank Rate
and pays Fixed 5.355%Bank of America
Merrill Lynch 11/9/2025 (3,917) (3,883)
CCIRS PLN 102,856,000Fund receives Floating PLN 6 Month WIBOR and pays Fixed
0.590%Bank of America
Merrill Lynch 16/9/2025 (132,755) (132,400)
CCIRS PLN 348,672,196Fund receives Floating PLN 6 Month WIBOR and pays Fixed
1.232%Bank of America
Merrill Lynch 16/9/2025 (3,249,419) (3,248,092)
CCIRS SEK 377,849,000Fund receives Floating SEK 3 Month STIBOR and pays Fixed
0.250%Bank of America
Merrill Lynch 16/9/2025 (156,413) (142,471)
CCIRS SGD 21,165,600Fund receives Floating SGD 6 Month STIBOR and pays Fixed
0.890%Bank of America
Merrill Lynch 16/9/2025 (246,001) (245,787)
CCIRS SGD 31,748,400Fund receives Floating SGD 6 Month STIBOR and pays Fixed
0.930%Bank of America
Merrill Lynch 16/9/2025 (414,038) (413,718)
CCIRS USD 32,158,000Fund receives Floating USD 3 Month LIBOR and pays Fixed
0.375%Bank of America
Merrill Lynch 16/9/2025 33,393 39,767
CCIRS USD 72,785,000Fund receives Floating USD 3 Month LIBOR and pays Fixed
0.530%Bank of America
Merrill Lynch 16/9/2025 (542,215) (472,789)
CCIRS USD 46,800,000Fund receives Floating USD 3 Month LIBOR and pays Fixed
0.545%Bank of America
Merrill Lynch 16/9/2025 (339,692) (339,018)
IRS EUR 40,630,000Fund receives Fixed 0.000% and pays Floating EUR 6 Month
LIBORBank of America
Merrill Lynch 16/9/2025 354,945 367,927
BlackRock Style Advantage Fund continued
The notes on pages 691 to 711 form an integral part of these financial statements.
BlackRock Strategic Funds[586]
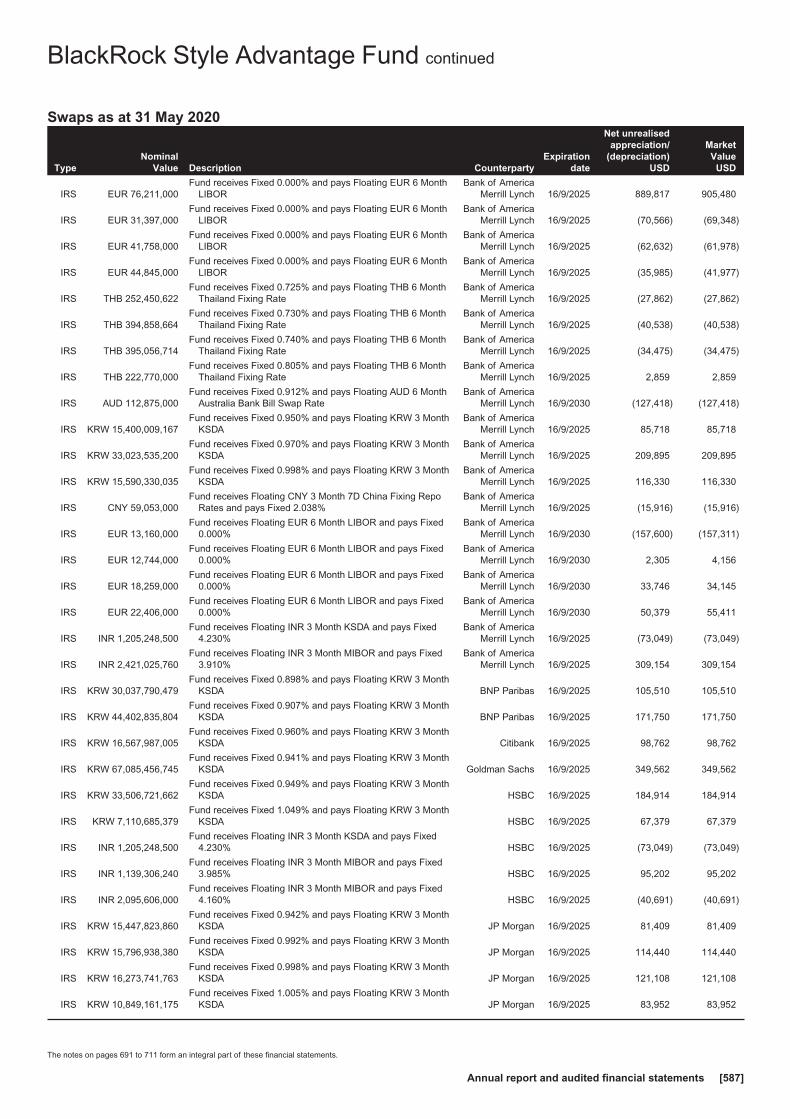
Swaps as at 31 May 2020
TypeNominal
Value Description CounterpartyExpiration
date
Net unrealisedappreciation/
(depreciation)USD
MarketValue
USD
IRS EUR 76,211,000Fund receives Fixed 0.000% and pays Floating EUR 6 Month
LIBORBank of America
Merrill Lynch 16/9/2025 889,817 905,480
IRS EUR 31,397,000Fund receives Fixed 0.000% and pays Floating EUR 6 Month
LIBORBank of America
Merrill Lynch 16/9/2025 (70,566) (69,348)
IRS EUR 41,758,000Fund receives Fixed 0.000% and pays Floating EUR 6 Month
LIBORBank of America
Merrill Lynch 16/9/2025 (62,632) (61,978)
IRS EUR 44,845,000Fund receives Fixed 0.000% and pays Floating EUR 6 Month
LIBORBank of America
Merrill Lynch 16/9/2025 (35,985) (41,977)
IRS THB 252,450,622Fund receives Fixed 0.725% and pays Floating THB 6 Month
Thailand Fixing RateBank of America
Merrill Lynch 16/9/2025 (27,862) (27,862)
IRS THB 394,858,664Fund receives Fixed 0.730% and pays Floating THB 6 Month
Thailand Fixing RateBank of America
Merrill Lynch 16/9/2025 (40,538) (40,538)
IRS THB 395,056,714Fund receives Fixed 0.740% and pays Floating THB 6 Month
Thailand Fixing RateBank of America
Merrill Lynch 16/9/2025 (34,475) (34,475)
IRS THB 222,770,000Fund receives Fixed 0.805% and pays Floating THB 6 Month
Thailand Fixing RateBank of America
Merrill Lynch 16/9/2025 2,859 2,859
IRS AUD 112,875,000Fund receives Fixed 0.912% and pays Floating AUD 6 Month
Australia Bank Bill Swap RateBank of America
Merrill Lynch 16/9/2030 (127,418) (127,418)
IRS KRW 15,400,009,167Fund receives Fixed 0.950% and pays Floating KRW 3 Month
KSDABank of America
Merrill Lynch 16/9/2025 85,718 85,718
IRS KRW 33,023,535,200Fund receives Fixed 0.970% and pays Floating KRW 3 Month
KSDABank of America
Merrill Lynch 16/9/2025 209,895 209,895
IRS KRW 15,590,330,035Fund receives Fixed 0.998% and pays Floating KRW 3 Month
KSDABank of America
Merrill Lynch 16/9/2025 116,330 116,330
IRS CNY 59,053,000Fund receives Floating CNY 3 Month 7D China Fixing Repo
Rates and pays Fixed 2.038%Bank of America
Merrill Lynch 16/9/2025 (15,916) (15,916)
IRS EUR 13,160,000Fund receives Floating EUR 6 Month LIBOR and pays Fixed
0.000%Bank of America
Merrill Lynch 16/9/2030 (157,600) (157,311)
IRS EUR 12,744,000Fund receives Floating EUR 6 Month LIBOR and pays Fixed
0.000%Bank of America
Merrill Lynch 16/9/2030 2,305 4,156
IRS EUR 18,259,000Fund receives Floating EUR 6 Month LIBOR and pays Fixed
0.000%Bank of America
Merrill Lynch 16/9/2030 33,746 34,145
IRS EUR 22,406,000Fund receives Floating EUR 6 Month LIBOR and pays Fixed
0.000%Bank of America
Merrill Lynch 16/9/2030 50,379 55,411
IRS INR 1,205,248,500Fund receives Floating INR 3 Month KSDA and pays Fixed
4.230%Bank of America
Merrill Lynch 16/9/2025 (73,049) (73,049)
IRS INR 2,421,025,760Fund receives Floating INR 3 Month MIBOR and pays Fixed
3.910%Bank of America
Merrill Lynch 16/9/2025 309,154 309,154
IRS KRW 30,037,790,479Fund receives Fixed 0.898% and pays Floating KRW 3 Month
KSDA BNP Paribas 16/9/2025 105,510 105,510
IRS KRW 44,402,835,804Fund receives Fixed 0.907% and pays Floating KRW 3 Month
KSDA BNP Paribas 16/9/2025 171,750 171,750
IRS KRW 16,567,987,005Fund receives Fixed 0.960% and pays Floating KRW 3 Month
KSDA Citibank 16/9/2025 98,762 98,762
IRS KRW 67,085,456,745Fund receives Fixed 0.941% and pays Floating KRW 3 Month
KSDA Goldman Sachs 16/9/2025 349,562 349,562
IRS KRW 33,506,721,662Fund receives Fixed 0.949% and pays Floating KRW 3 Month
KSDA HSBC 16/9/2025 184,914 184,914
IRS KRW 7,110,685,379Fund receives Fixed 1.049% and pays Floating KRW 3 Month
KSDA HSBC 16/9/2025 67,379 67,379
IRS INR 1,205,248,500Fund receives Floating INR 3 Month KSDA and pays Fixed
4.230% HSBC 16/9/2025 (73,049) (73,049)
IRS INR 1,139,306,240Fund receives Floating INR 3 Month MIBOR and pays Fixed
3.985% HSBC 16/9/2025 95,202 95,202
IRS INR 2,095,606,000Fund receives Floating INR 3 Month MIBOR and pays Fixed
4.160% HSBC 16/9/2025 (40,691) (40,691)
IRS KRW 15,447,823,860Fund receives Fixed 0.942% and pays Floating KRW 3 Month
KSDA JP Morgan 16/9/2025 81,409 81,409
IRS KRW 15,796,938,380Fund receives Fixed 0.992% and pays Floating KRW 3 Month
KSDA JP Morgan 16/9/2025 114,440 114,440
IRS KRW 16,273,741,763Fund receives Fixed 0.998% and pays Floating KRW 3 Month
KSDA JP Morgan 16/9/2025 121,108 121,108
IRS KRW 10,849,161,175Fund receives Fixed 1.005% and pays Floating KRW 3 Month
KSDA JP Morgan 16/9/2025 83,952 83,952
BlackRock Style Advantage Fund continued
The notes on pages 691 to 711 form an integral part of these financial statements.
Annual report and audited financial statements [587]

Swaps as at 31 May 2020
TypeNominal
Value Description CounterpartyExpiration
date
Net unrealisedappreciation/
(depreciation)USD
MarketValue
USD
TRS BRL 59 Fund receives Fixed 0.000% and pays Ibovespa IndexBank of America
Merrill Lynch 17/6/2020 (87,855) (87,855)
TRS BRL 221 Fund receives Fixed 0.000% and pays Ibovespa IndexBank of America
Merrill Lynch 17/6/2020 (220,339) (220,339)
TRS KRW 324,250,000 Fund receives Fixed 0.000% and pays KOSPI 200 IndexBank of America
Merrill Lynch 11/6/2020 (827,899) (827,899)
TRS KRW 64,250,000 Fund receives Fixed 0.000% and pays KOSPI 200 IndexBank of America
Merrill Lynch 11/6/2020 (806,371) (806,371)
TRS TWD 544,800 Fund receives TAIEX Index and pays Fixed 0.000%Bank of America
Merrill Lynch 17/6/2020 3,905,948 3,905,948
TRS TWD 13,800 Fund receives TAIEX Index and pays Fixed 0.000%Bank of America
Merrill Lynch 17/6/2020 (22,654) (22,654)
TRS THB 246,200 Fund receives Fixed 0.000% and pays SET50 Futures Index Credit Suisse 29/6/2020 (285,986) (285,986)
TRS THB 404,200 Fund receives Fixed 0.000% and pays SET50 Futures Index Credit Suisse 29/6/2020 (351,674) (351,674)
TRS THB 82,200 Fund receives Fixed 0.000% and pays SET50 Futures Index Credit Suisse 29/6/2020 (14,980) (14,980)
TRS PLN 38,640 Fund receives Fixed 0.000% and pays WIG20 Index JP Morgan 19/6/2020 (2,986,360) (2,986,360)
Total (Gross underlying exposure - USD 3,139,746,671) (4,985,143) (4,793,293)
CCIRS: Centrally Cleared Interest Rate SwapsIRS: Interest Rate SwapsTRS: Total Return Swaps
Futures contracts as at 31 May 2020
Numberof
contractsCurrencyof contracts
Contract/Description
Expirationdate
Grossunderlying
exposureUSD
Net unrealisedappreciation/
(depreciation)USD
205 EUR Amsterdam Index Futures June 2020 June 2020 24,313,121 885,339
243 AUD Australian 10 Year Bond Futures June 2020 June 2020 24,025,640 124,573
2,032 EUR CAC 40 Index Futures June 2020 June 2020 106,647,571 7,399,676
7,338 CAD Canadian 10 Year Bond Futures September 2020 September 2020 818,369,857 434,053
(95) EUR DAX Index Futures June 2020 June 2020 30,739,858 (2,063,559)
(579) USD E-Mini S&P 500 Index Futures June 2020 June 2020 87,495,585 (13,223,918)
(963) EUR Euro Bund Futures June 2020 June 2020 184,543,028 340,129
(1,852) GBP FTSE 100 Index Futures June 2020 June 2020 139,823,388 (5,848,482)
175 EUR FTSE MIB Index Futures June 2020 June 2020 17,732,128 863,086
(5,228) ZAR FTSE/JSE Top 40 Index Futures June 2020 June 2020 139,532,684 (15,087,364)
1,270 HKD Hang Seng China Enterprises Futures June 2020 June 2020 77,758,277 627,158
452 HKD Hang Seng Index Futures June 2020 June 2020 66,356,672 (122,460)
2,106 EUR IBEX 35 Index Futures June 2020 June 2020 166,312,273 8,840,703
134 JPY Japan 10 Year Bond Futures June 2020 June 2020 189,604,425 (317,575)
220 SGD MSCI Singapore Index Futures June 2020 June 2020 4,481,856 (47,315)
(10,346) SEK OMX Stockholm 30 Index Futures June 2020 June 2020 178,908,833 (11,140,673)
(390) CAD S&P/TSX 60 Index Futures June 2020 June 2020 51,937,711 (2,120,567)
(1,142) USD SGX NIFTY 50 Futures June 2020 June 2020 21,729,976 (1,096,708)
(1,195) AUD SPI 200 Index Futures June 2020 June 2020 113,991,375 (5,713,650)
1,053 CHF Swiss Market Index Futures June 2020 June 2020 108,044,010 10,131,502
180 JPY Topix Index Futures June 2020 June 2020 26,088,412 1,063,979
(1,217) GBP UK Long Gilt Bond Futures September 2020 September 2020 206,354,491 538,592
(2,524) USD US Treasury 10 Year Note Futures September 2020 September 2020 350,441,625 165,592
Total 3,135,232,796 (25,367,889)
BlackRock Style Advantage Fund continued
The notes on pages 691 to 711 form an integral part of these financial statements.
BlackRock Strategic Funds[588]

Open forward foreign exchange transactionsas at 31 May 2020
Currency Purchases Currency Sales CounterpartyMaturity
date
Netunrealised
appreciation/(depreciation)
USD
AUD 11,892,000 USD 7,690,460Bank of America
Merrill Lynch 17/6/2020 202,378AUD 18,586,572 USD 11,863,490 Barclays Bank 17/6/2020 472,601AUD 1,834,000 USD 1,204,747 BNP Paribas 17/6/2020 12,497AUD 11,594,000 USD 7,623,063 Citibank 17/6/2020 71,990AUD 30,779,230 USD 18,722,698 Deutsche Bank 17/6/2020 1,705,783AUD 46,525,000 USD 27,902,345 Goldman Sachs 17/6/2020 2,976,759AUD 117,369,034 USD 72,556,892 JP Morgan 17/6/2020 5,342,101AUD 40,677,663 USD 24,974,773 Morgan Stanley 17/6/2020 2,023,396
AUD 11,887,000 USD 7,687,666Bank of America
Merrill Lynch 15/7/2020 201,760AUD 18,580,605 USD 11,859,933 Barclays Bank 15/7/2020 472,051AUD 1,831,000 USD 1,202,819 BNP Paribas 15/7/2020 12,420AUD 11,592,000 USD 7,622,000 Citibank 15/7/2020 71,634AUD 53,886,395 USD 34,157,735 JP Morgan 15/7/2020 1,606,776AUD 9,806,000 USD 6,464,507 Morgan Stanley 15/7/2020 43,755
AUD 7,612,000 USD 4,898,893Bank of America
Merrill Lynch 19/8/2020 153,036AUD 1,831,000 USD 1,202,846 BNP Paribas 19/8/2020 12,351AUD 11,592,000 USD 7,622,164 Citibank 19/8/2020 71,210AUD 9,806,000 USD 6,464,558 Morgan Stanley 19/8/2020 43,484
BRL 44,439,000 USD 8,661,770Bank of America
Merrill Lynch 17/6/2020 (489,331)BRL 16,035,000 USD 3,416,427 Barclays Bank 17/6/2020 (467,552)BRL 48,395,000 USD 9,599,961 Citibank 17/6/2020 (700,006)BRL 46,542,000 USD 8,579,171 Deutsche Bank 17/6/2020 (19,986)BRL 45,002,000 USD 9,364,385 Goldman Sachs 17/6/2020 (1,088,410)BRL 161,635,000 USD 30,424,815 HSBC 17/6/2020 (699,753)BRL 105,307,000 USD 19,203,253 JP Morgan 17/6/2020 162,956BRL 162,592,000 USD 32,660,909 Morgan Stanley 17/6/2020 (2,759,852)BRL 46,603,000 USD 8,577,766 Deutsche Bank 15/7/2020 (21,362)BRL 131,741,000 USD 24,468,329 HSBC 15/7/2020 (280,419)BRL 81,936,000 USD 14,691,067 JP Morgan 15/7/2020 352,545BRL 30,873,000 USD 5,656,675 Morgan Stanley 15/7/2020 11,669BRL 32,242,000 USD 5,431,604 HSBC 19/8/2020 479,670
CAD 24,495,606 USD 17,395,107Bank of America
Merrill Lynch 17/6/2020 388,418CAD 77,200,699 USD 55,633,008 BNP Paribas 17/6/2020 413,803CAD 40,852,797 USD 29,071,711 Goldman Sachs 17/6/2020 586,944CAD 400,849,947 USD 292,546,295 JP Morgan 17/6/2020 (1,533,888)CAD 142,840,000 USD 101,877,110 Morgan Stanley 17/6/2020 1,823,070CAD 11,543,301 USD 8,336,680 Societe Generale 17/6/2020 43,622CAD 43,843,000 USD 31,436,748 UBS 17/6/2020 392,761
CAD 17,469,683 USD 12,450,678Bank of America
Merrill Lynch 15/7/2020 232,224CAD 42,993,000 USD 30,718,233 BNP Paribas 15/7/2020 494,469CAD 138,754,253 USD 98,120,957 Goldman Sachs 15/7/2020 2,613,934CAD 34,231,274 USD 24,398,401 JP Morgan 15/7/2020 453,332CAD 143,736,030 USD 102,471,474 Citibank 19/8/2020 1,880,161CHF 8,155,000 EUR 7,703,607 Deutsche Bank 17/6/2020 (98,720)CHF 4,832,000 EUR 4,576,096 JP Morgan 17/6/2020 (71,346)CHF 20,934,000 USD 21,827,564 Barclays Bank 17/6/2020 (85,457)CHF 8,462,000 USD 8,755,294 JP Morgan 17/6/2020 33,362
CLP 1,950,454,000 USD 2,360,182Bank of America
Merrill Lynch 17/6/2020 55,586CLP 5,094,948,000 USD 6,309,768 Barclays Bank 17/6/2020 666CLP 8,062,562,000 USD 9,575,257 Citibank 17/6/2020 410,764CLP 16,439,145,000 USD 19,891,073 Credit Suisse 17/6/2020 469,906CLP 9,420,276,000 USD 11,337,887 Deutsche Bank 17/6/2020 329,754CLP 2,345,807,000 USD 2,754,911 Goldman Sachs 17/6/2020 150,527CLP 3,808,795,000 USD 4,446,929 HSBC 17/6/2020 270,518CLP 23,250,719,000 USD 27,519,599 JP Morgan 17/6/2020 1,277,970
Open forward foreign exchange transactionsas at 31 May 2020
Currency Purchases Currency Sales CounterpartyMaturity
date
Netunrealised
appreciation/(depreciation)
USDCLP 8,703,770,000 USD 10,149,431 Morgan Stanley 17/6/2020 630,770
CLP 1,948,735,000 USD 2,359,300Bank of America
Merrill Lynch 15/7/2020 54,368CLP 5,092,626,000 USD 6,309,783 Barclays Bank 15/7/2020 (2,148)CLP 3,261,834,000 USD 3,985,234 Citibank 15/7/2020 54,815CLP 9,439,805,000 USD 11,493,186 Credit Suisse 15/7/2020 198,786CLP 3,424,377,000 USD 4,157,614 Deutsche Bank 15/7/2020 83,758CLP 2,072,414,000 USD 2,459,839 Morgan Stanley 15/7/2020 107,016CLP 5,088,753,000 USD 6,309,675 Barclays Bank 19/8/2020 (5,750)CLP 4,890,500,000 USD 5,997,449 Credit Suisse 19/8/2020 60,881CLP 3,422,901,000 USD 4,157,437 Deutsche Bank 19/8/2020 82,838CLP 3,260,334,000 USD 3,985,982 Goldman Sachs 19/8/2020 52,905EUR 2,784,821 CHF 2,942,164 Deutsche Bank 17/6/2020 41,746EUR 11,593,442 CHF 12,209,500 Morgan Stanley 17/6/2020 214,270EUR 13,194,119 CHF 13,934,836 UBS 17/6/2020 202,722
EUR 15,623,479 USD 16,960,360Bank of America
Merrill Lynch 17/6/2020 417,234EUR 196,636,752 USD 218,610,077 Barclays Bank 17/6/2020 103,930EUR 30,676,000 USD 33,410,142 BNP Paribas 17/6/2020 709,985EUR 7,596,521 USD 8,229,060 Deutsche Bank 17/6/2020 220,355EUR 28,358,000 USD 31,294,726 JP Morgan 17/6/2020 247,149
EUR 15,607,784 USD 16,955,869Bank of America
Merrill Lynch 15/7/2020 414,545EUR 20,019,000 USD 21,751,244 BNP Paribas 15/7/2020 528,556EUR 25,000,000 USD 27,487,860 Citibank 15/7/2020 335,457EUR 7,589,216 USD 8,226,187 Deutsche Bank 15/7/2020 220,100EUR 39,095,069 USD 42,340,972 JP Morgan 15/7/2020 1,169,208EUR 50,659,896 USD 54,869,592 Barclays Bank 19/8/2020 1,553,808
GBP 44,339,080 USD 56,898,346Bank of America
Merrill Lynch 17/6/2020 (2,134,331)GBP 13,000,000 USD 16,179,131 Barclays Bank 17/6/2020 (122,591)GBP 4,692,000 USD 5,844,881 BNP Paribas 17/6/2020 (49,705)GBP 38,208,433 USD 47,081,762 Deutsche Bank 17/6/2020 110,177GBP 3,242,420 USD 3,958,213 Goldman Sachs 17/6/2020 46,559GBP 3,292,630 USD 4,258,852 HSBC 17/6/2020 (192,064)GBP 5,559,067 USD 6,829,926 JP Morgan 17/6/2020 36,180GBP 14,217,000 USD 17,377,483 Morgan Stanley 17/6/2020 182,196
GBP 1,354,000 USD 1,665,955Bank of America
Merrill Lynch 15/7/2020 6,602GBP 4,690,000 USD 5,843,187 BNP Paribas 15/7/2020 (49,767)GBP 20,919,329 USD 26,056,341 Deutsche Bank 15/7/2020 (215,307)GBP 1,673,671 USD 2,068,362 JP Morgan 15/7/2020 (926)GBP 14,211,000 USD 17,372,415 Morgan Stanley 15/7/2020 182,016GBP 22,814,270 USD 28,134,186 JP Morgan 19/8/2020 51,348GBP 14,209,000 USD 17,372,287 Morgan Stanley 19/8/2020 182,001
HKD 28,499,943 USD 3,674,263Bank of America
Merrill Lynch 17/6/2020 (115)HKD 32,344,057 USD 4,169,983 Deutsche Bank 17/6/2020 (261)HKD 49,324,000 USD 6,359,426 HSBC 17/6/2020 (688)
HUF 4,170,105,591 USD 12,761,428Bank of America
Merrill Lynch 17/6/2020 547,905HUF 622,442,000 USD 1,898,521 Barclays Bank 17/6/2020 88,069HUF 15,224,543,464 USD 48,900,444 BNP Paribas 17/6/2020 (309,703)HUF 6,546,994,422 USD 20,447,081 Credit Suisse 17/6/2020 448,346HUF 495,949,000 USD 1,610,625 JP Morgan 17/6/2020 (27,751)HUF 8,093,560,522 USD 24,764,162 Societe Generale 17/6/2020 1,067,293
HUF 2,060,132,039 USD 6,296,311Bank of America
Merrill Lynch 15/7/2020 277,618HUF 622,454,000 USD 1,897,987 Barclays Bank 15/7/2020 88,279HUF 1,820,396,223 USD 5,510,923 BNP Paribas 15/7/2020 298,004HUF 4,663,978,000 USD 14,561,915 Credit Suisse 15/7/2020 320,948HUF 4,423,277,738 USD 13,335,236 Societe Generale 15/7/2020 779,547
BlackRock Style Advantage Fund continued
The notes on pages 691 to 711 form an integral part of these financial statements.
Annual report and audited financial statements [589]

Open forward foreign exchange transactionsas at 31 May 2020
Currency Purchases Currency Sales CounterpartyMaturity
date
Netunrealised
appreciation/(depreciation)
USDHUF 1,079,325,000 USD 3,401,958 Credit Suisse 19/8/2020 41,052
INR 4,274,571,350 USD 56,820,037Bank of America
Merrill Lynch 17/6/2020 (361,248)INR 11,691,925,000 USD 155,483,817 HSBC 17/6/2020 (1,056,187)INR 1,378,221,000 USD 17,678,566 JP Morgan 17/6/2020 525,058INR 6,855,532,570 USD 87,443,017 Barclays Bank 15/7/2020 2,822,354INR 148,441,000 USD 1,908,882 Goldman Sachs 15/7/2020 45,610INR 4,403,800,740 USD 57,423,403 Morgan Stanley 19/8/2020 346,193
JPY 4,045,591,042 USD 38,104,517Bank of America
Merrill Lynch 17/6/2020 (486,490)JPY 1,074,547,000 USD 9,984,538 BNP Paribas 17/6/2020 7,163JPY 1,918,067,000 USD 17,910,661 Citibank 17/6/2020 (75,470)JPY 1,225,469,870 USD 11,755,309 Goldman Sachs 17/6/2020 (360,249)JPY 1,465,202,605 USD 13,767,695 JP Morgan 17/6/2020 (143,474)JPY 2,132,368,353 USD 19,872,759 Morgan Stanley 17/6/2020 (44,880)
JPY 2,442,679,957 USD 22,746,286Bank of America
Merrill Lynch 15/7/2020 (22,988)JPY 1,073,509,000 USD 9,981,348 BNP Paribas 15/7/2020 5,087JPY 1,022,062,000 USD 9,534,479 Citibank 15/7/2020 (26,635)JPY 675,010,596 USD 6,322,767 JP Morgan 15/7/2020 (43,407)JPY 1,375,486,447 USD 12,798,888 Morgan Stanley 15/7/2020 (3,274)
JPY 1,605,464,105 USD 14,916,553Bank of America
Merrill Lynch 19/8/2020 26,525JPY 1,021,416,000 USD 9,534,128 Citibank 19/8/2020 (27,157)JPY 1,077,648,895 USD 10,016,236 Morgan Stanley 19/8/2020 14,130
KRW 67,593,142,000 USD 55,020,080Bank of America
Merrill Lynch 17/6/2020 (385,059)KRW 7,797,970,260 USD 6,292,456 Citibank 17/6/2020 10,583KRW 39,925,858,740 USD 32,564,769 HSBC 17/6/2020 (293,001)KRW 8,203,640,000 USD 6,751,967 JP Morgan 17/6/2020 (121,027)KRW 28,429,043,000 USD 23,194,544 Morgan Stanley 17/6/2020 (215,565)KRW 11,208,683,000 USD 9,206,139 UBS 17/6/2020 (146,246)
KRW 14,543,946,000 USD 11,980,882Bank of America
Merrill Lynch 15/7/2020 (223,004)KRW 2,109,608,000 USD 1,738,115 Citibank 15/7/2020 (32,628)KRW 20,691,916,000 USD 16,972,863 HSBC 15/7/2020 (244,732)KRW 1,267,057,000 USD 1,039,764 Morgan Stanley 15/7/2020 (15,428)
MXN 113,305,552 USD 4,667,984Bank of America
Merrill Lynch 17/6/2020 442,305MXN 947,055,000 USD 47,177,016 HSBC 17/6/2020 (4,463,091)MXN 814,116,688 USD 38,455,808 JP Morgan 17/6/2020 (1,737,646)MXN 173,994,000 USD 7,888,143 UBS 17/6/2020 (40,693)
MXN 113,709,000 USD 4,665,682Bank of America
Merrill Lynch 15/7/2020 441,128MXN 2,439,200 USD 97,384 Citibank 15/7/2020 12,163MXN 39,405,000 USD 1,740,668 JP Morgan 15/7/2020 29,057
MXN 88,306,900 USD 3,601,174Bank of America
Merrill Lynch 19/8/2020 345,079MXN 39,596,100 USD 1,740,483 JP Morgan 19/8/2020 28,984
NOK 26,873,836 USD 2,582,357Bank of America
Merrill Lynch 17/6/2020 183,370NOK 704,387,404 USD 67,587,002 Credit Suisse 17/6/2020 4,905,166NOK 932,610,977 USD 86,741,166 Deutsche Bank 17/6/2020 9,238,677NOK 730,463,000 USD 72,757,163 JP Morgan 17/6/2020 2,418,581NOK 106,066,283 USD 10,089,514 Morgan Stanley 17/6/2020 826,319
NOK 26,861,913 USD 2,581,657Bank of America
Merrill Lynch 15/7/2020 183,440NOK 253,848,770 USD 24,381,103 Barclays Bank 15/7/2020 1,749,445NOK 145,190,000 USD 13,763,005 Credit Suisse 15/7/2020 1,182,485NOK 208,525,573 USD 20,007,203 Deutsche Bank 15/7/2020 1,457,890NOK 86,786,514 USD 8,336,406 Morgan Stanley 15/7/2020 597,178
NZD 19,984,057 USD 11,979,610Bank of America
Merrill Lynch 17/6/2020 416,876NZD 664,902 USD 401,687 Barclays Bank 17/6/2020 10,764
Open forward foreign exchange transactionsas at 31 May 2020
Currency Purchases Currency Sales CounterpartyMaturity
date
Netunrealised
appreciation/(depreciation)
USDNZD 60,454,832 USD 36,191,820 BNP Paribas 17/6/2020 1,309,449NZD 8,632,733 USD 5,161,571 Citibank 17/6/2020 193,475NZD 14,968,000 USD 9,456,922 Credit Suisse 17/6/2020 (171,991)NZD 48,790,040 USD 30,678,861 Deutsche Bank 17/6/2020 (413,483)NZD 11,692,143 USD 7,034,384 Goldman Sachs 17/6/2020 218,471NZD 14,662,831 USD 8,707,156 HSBC 17/6/2020 388,474NZD 49,679,404 USD 29,251,678 JP Morgan 17/6/2020 1,565,389NZD 7,803,098 USD 4,709,248 Morgan Stanley 17/6/2020 131,161
NZD 14,418,301 USD 8,671,442Bank of America
Merrill Lynch 15/7/2020 271,074NZD 35,205,941 USD 21,200,754 BNP Paribas 15/7/2020 634,666NZD 8,631,622 USD 5,160,113 Citibank 15/7/2020 193,389NZD 11,691,388 USD 7,032,267 Goldman Sachs 15/7/2020 218,963NZD 103,570,588 USD 60,809,270 JP Morgan 15/7/2020 3,427,255NZD 19,486,897 USD 11,727,348 BNP Paribas 19/8/2020 355,950NZD 8,633,103 USD 5,159,980 Citibank 19/8/2020 193,174NZD 126,294,600 USD 76,726,495 Morgan Stanley 19/8/2020 1,585,374
PLN 36,925,885 USD 8,817,907Bank of America
Merrill Lynch 17/6/2020 421,404PLN 8,309,000 USD 1,972,824 Citibank 17/6/2020 106,190PLN 57,019,000 USD 13,620,765 Credit Suisse 17/6/2020 646,090PLN 14,077,737 USD 3,333,113 Deutsche Bank 17/6/2020 189,310PLN 248,971,220 USD 64,735,107 HSBC 17/6/2020 (2,439,445)PLN 4,933,378 USD 1,178,768 Societe Generale 17/6/2020 55,624
PLN 29,025,277 USD 6,899,140Bank of America
Merrill Lynch 15/7/2020 363,071PLN 105,058,440 USD 24,756,516 Citibank 15/7/2020 1,529,422PLN 41,607,000 USD 9,948,385 Credit Suisse 15/7/2020 461,812PLN 14,073,390 USD 3,331,942 Deutsche Bank 15/7/2020 189,263PLN 4,932,333 USD 1,178,433 Societe Generale 15/7/2020 55,651
PLN 15,068,127 USD 3,567,079Bank of America
Merrill Lynch 19/8/2020 203,059PLN 115,578,310 USD 27,393,100 Citibank 19/8/2020 1,525,301PLN 14,073,873 USD 3,331,993 Deutsche Bank 19/8/2020 189,376
RUB 5,244,809,000 USD 71,594,558Bank of America
Merrill Lynch 17/6/2020 2,535,708RUB 4,881,188,600 USD 66,775,891 Goldman Sachs 17/6/2020 2,214,955RUB 464,986,000 USD 6,304,895 HSBC 17/6/2020 267,229RUB 232,490,000 USD 3,149,418 JP Morgan 17/6/2020 136,602
RUB 233,425,000 USD 3,149,497Bank of America
Merrill Lynch 15/7/2020 137,505RUB 2,487,201,490 USD 31,965,207 Goldman Sachs 15/7/2020 3,058,618RUB 466,855,000 USD 6,307,036 HSBC 15/7/2020 267,038RUB 233,425,000 USD 3,150,518 JP Morgan 15/7/2020 136,484RUB 2,519,544,600 USD 33,856,201 JP Morgan 19/8/2020 1,472,802
SEK 27,912,000 USD 2,897,895Bank of America
Merrill Lynch 17/6/2020 56,422SEK 420,335,921 USD 41,771,179 Barclays Bank 17/6/2020 2,718,843SEK 11,717,000 USD 1,219,132 Citibank 17/6/2020 21,042SEK 955,307,500 USD 96,451,875 Credit Suisse 17/6/2020 4,661,661SEK 149,311,530 USD 14,989,442 Deutsche Bank 17/6/2020 814,284SEK 159,864,000 USD 16,885,779 Goldman Sachs 17/6/2020 34,861SEK 399,247,000 USD 40,998,670 HSBC 17/6/2020 1,259,217SEK 208,812,000 USD 21,911,312 JP Morgan 17/6/2020 190,178SEK 117,376,549 USD 11,679,229 Morgan Stanley 17/6/2020 744,370
SEK 27,895,000 USD 2,896,942Bank of America
Merrill Lynch 15/7/2020 56,354SEK 24,975,786 USD 2,492,176 Barclays Bank 15/7/2020 152,058SEK 11,710,000 USD 1,218,719 Citibank 15/7/2020 21,041SEK 676,878,000 USD 68,440,793 Credit Suisse 15/7/2020 3,221,552SEK 65,547,000 USD 6,643,625 Deutsche Bank 15/7/2020 295,959SEK 11,455,000 USD 1,169,282 Goldman Sachs 15/7/2020 43,480SEK 65,095,000 USD 6,775,067 JP Morgan 15/7/2020 116,663
BlackRock Style Advantage Fund continued
The notes on pages 691 to 711 form an integral part of these financial statements.
BlackRock Strategic Funds[590]

Open forward foreign exchange transactionsas at 31 May 2020
Currency Purchases Currency Sales CounterpartyMaturity
date
Netunrealised
appreciation/(depreciation)
USDSEK 33,434,214 USD 3,334,766 Morgan Stanley 15/7/2020 204,977
SEK 27,890,000 USD 2,897,295Bank of America
Merrill Lynch 19/8/2020 56,408SEK 11,706,000 USD 1,218,691 Citibank 19/8/2020 21,038SEK 210,709,000 USD 21,752,484 Credit Suisse 19/8/2020 562,746SEK 65,070,000 USD 6,774,566 JP Morgan 19/8/2020 116,701SGD 61,840,000 USD 44,889,500 Barclays Bank 17/6/2020 (1,144,638)SGD 2,929,000 USD 2,021,659 BNP Paribas 17/6/2020 50,280SGD 2,728,500 USD 1,920,592 Goldman Sachs 17/6/2020 9,515SGD 144,285,200 USD 103,874,790 JP Morgan 17/6/2020 (1,809,199)SGD 22,553,990 USD 15,730,873 Societe Generale 15/7/2020 224,904
THB 10,769,243 USD 330,598Bank of America
Merrill Lynch 17/6/2020 7,929THB 451,275,000 USD 13,822,379 BNP Paribas 17/6/2020 363,292THB 91,785,757 USD 2,818,800 Deutsche Bank 17/6/2020 66,453THB 1,146,461,000 USD 35,346,436 HSBC 17/6/2020 692,161THB 219,157,000 USD 6,842,491 JP Morgan 17/6/2020 46,631THB 1,503,708,500 USD 47,087,830 Morgan Stanley 17/6/2020 180,717
THB 2,541,588,000 USD 78,876,815Standard
Chartered Bank 17/6/2020 1,017,106THB 351,580,000 USD 10,752,442 BNP Paribas 15/7/2020 298,363THB 565,698,000 USD 17,662,164 HSBC 15/7/2020 118,762THB 342,900,000 USD 10,481,903 Morgan Stanley 15/7/2020 296,073
THB 2,416,954,000 USD 75,036,682Standard
Chartered Bank 15/7/2020 932,616THB 1,263,444,070 USD 39,341,857 BNP Paribas 19/8/2020 366,569THB 179,565,000 USD 5,642,262 HSBC 19/8/2020 1,235
THB 921,005,000 USD 28,815,297Standard
Chartered Bank 19/8/2020 130,708TWD 2,749,258,000 USD 92,560,587 Credit Suisse 17/6/2020 (937,907)TWD 237,070,000 USD 7,970,079 HSBC 17/6/2020 (69,406)TWD 1,182,738,000 USD 39,757,656 JP Morgan 17/6/2020 (341,339)
TWD 384,770,000 USD 12,920,416Standard
Chartered Bank 17/6/2020 (97,444)TWD 935,578,000 USD 31,492,892 Credit Suisse 15/7/2020 (247,919)TWD 37,668,170 USD 1,262,127 Goldman Sachs 15/7/2020 (4,144)TWD 231,046,000 USD 7,806,927 JP Morgan 15/7/2020 (90,813)TWD 165,187,000 USD 5,567,100 Credit Suisse 19/8/2020 (35,038)TWD 291,081,340 USD 9,879,555 HSBC 19/8/2020 (131,331)
USD 71,120,785 AUD 112,676,499Bank of America
Merrill Lynch 17/6/2020 (3,663,726)USD 45,568,815 AUD 69,700,000 Barclays Bank 17/6/2020 (691,767)USD 30,509,152 AUD 48,976,974 BNP Paribas 17/6/2020 (1,997,351)USD 45,022,534 AUD 71,431,148 Deutsche Bank 17/6/2020 (2,387,027)USD 57,956,085 AUD 89,799,727 Goldman Sachs 17/6/2020 (1,644,885)USD 37,617,246 AUD 58,810,602 JP Morgan 17/6/2020 (1,415,937)
USD 47,283,908 AUD 73,975,706Bank of America
Merrill Lynch 15/7/2020 (1,813,920)USD 13,968,535 AUD 21,873,000 BNP Paribas 15/7/2020 (548,620)USD 4,793,943 AUD 7,548,043 Goldman Sachs 15/7/2020 (215,708)USD 19,013,614 AUD 29,964,251 JP Morgan 15/7/2020 (873,721)USD 80,634,488 AUD 134,648,620 Morgan Stanley 15/7/2020 (8,732,077)
USD 113,186,216 AUD 174,841,150Bank of America
Merrill Lynch 19/8/2020 (2,852,286)
USD 109,538,046 BRL 515,507,950Bank of America
Merrill Lynch 17/6/2020 14,734,904USD 7,006,855 BRL 37,604,000 Citibank 17/6/2020 91,390USD 19,536,132 BRL 90,970,000 Goldman Sachs 17/6/2020 2,806,532USD 5,713,936 BRL 30,385,000 Citibank 15/7/2020 135,190USD 1,289,846 BRL 7,258,000 Goldman Sachs 15/7/2020 (42,737)USD 53,564,145 BRL 284,693,430 HSBC 15/7/2020 1,293,865
USD 3,171,892 BRL 18,433,450Bank of America
Merrill Lynch 19/8/2020 (207,712)USD 1,000,000 BRL 5,626,880 BNP Paribas 19/8/2020 (31,637)
Open forward foreign exchange transactionsas at 31 May 2020
Currency Purchases Currency Sales CounterpartyMaturity
date
Netunrealised
appreciation/(depreciation)
USDUSD 5,714,044 BRL 30,433,000 Citibank 19/8/2020 134,434USD 292,351 BRL 1,645,120 Morgan Stanley 19/8/2020 (9,266)
USD 1,090,741 CAD 1,517,409Bank of America
Merrill Lynch 17/6/2020 (10,880)USD 4,100,854 CAD 5,703,591 BNP Paribas 17/6/2020 (39,887)USD 96,605,448 CAD 137,804,605 Citibank 17/6/2020 (3,439,095)USD 36,266,122 CAD 50,338,264 Deutsche Bank 17/6/2020 (278,873)USD 89,089,281 CAD 125,456,611 Goldman Sachs 17/6/2020 (1,990,760)USD 120,164,755 CAD 170,830,519 JP Morgan 17/6/2020 (3,856,220)USD 84,454,177 CAD 118,084,000 Morgan Stanley 17/6/2020 (1,273,436)
USD 1,090,327 CAD 1,516,779Bank of America
Merrill Lynch 15/7/2020 (10,847)USD 4,099,283 CAD 5,701,221 BNP Paribas 15/7/2020 (39,775)USD 13,632,837 CAD 19,139,705 Deutsche Bank 15/7/2020 (262,493)USD 27,206,283 CAD 38,007,318 Goldman Sachs 15/7/2020 (386,839)USD 16,428,655 CAD 23,056,977 JP Morgan 15/7/2020 (310,594)USD 8,053,135 CAD 11,203,000 Morgan Stanley 15/7/2020 (80,187)
USD 1,090,353 CAD 1,516,779Bank of America
Merrill Lynch 19/8/2020 (10,820)USD 4,099,548 CAD 5,701,221 BNP Paribas 19/8/2020 (39,510)USD 4,842,687 CAD 6,677,000 Goldman Sachs 19/8/2020 (4,781)USD 8,053,530 CAD 11,203,000 Morgan Stanley 19/8/2020 (79,792)USD 15,839,153 CHF 14,693,000 Citibank 17/6/2020 578,965USD 6,812,946 CHF 6,456,000 JP Morgan 17/6/2020 107,727
USD 59,208,755 CLP 49,359,379,000Bank of America
Merrill Lynch 17/6/2020 (1,926,133)USD 4,360,622 CLP 3,770,630,000 Barclays Bank 17/6/2020 (309,555)USD 53,403,205 CLP 43,875,005,000 Citibank 17/6/2020 (938,920)USD 37,228,744 CLP 30,947,786,000 Credit Suisse 17/6/2020 (1,102,158)USD 2,373,458 CLP 1,969,970,000 JP Morgan 17/6/2020 (66,482)USD 8,134,902 CLP 6,874,582,000 Credit Suisse 15/7/2020 (379,832)USD 80,426,627 CLP 69,200,678,500 Goldman Sachs 15/7/2020 (5,284,092)USD 82,331,871 CLP 67,523,660,500 Goldman Sachs 19/8/2020 (1,316,143)
USD 22,981,581 EUR 21,176,405Bank of America
Merrill Lynch 17/6/2020 (572,390)USD 30,543,260 EUR 27,707,000 Barclays Bank 17/6/2020 (274,523)USD 65,391,821 EUR 59,950,916 BNP Paribas 17/6/2020 (1,290,041)USD 31,557,861 EUR 28,592,000 Citibank 17/6/2020 (244,286)USD 49,374,094 EUR 44,269,500 Deutsche Bank 17/6/2020 134,267USD 101,685,847 EUR 91,448,000 Goldman Sachs 17/6/2020 (29,413)USD 18,077,876 EUR 16,648,595 HSBC 17/6/2020 (439,928)USD 23,350,394 EUR 20,841,084 JP Morgan 17/6/2020 169,391USD 6,003,344 EUR 5,450,000 Morgan Stanley 17/6/2020 (58,551)USD 3,245,433 EUR 2,940,000 UBS 17/6/2020 (24,653)
USD 19,382,703 EUR 17,848,000Bank of America
Merrill Lynch 15/7/2020 (480,921)USD 65,373,751 EUR 59,895,905 BNP Paribas 15/7/2020 (1,286,362)USD 1,076,713 EUR 991,095 JP Morgan 15/7/2020 (26,309)USD 1,545,802 EUR 1,403,000 UBS 15/7/2020 (15,643)USD 34,924,672 EUR 31,815,000 BNP Paribas 19/8/2020 (509,875)USD 1,545,856 EUR 1,402,000 UBS 19/8/2020 (15,647)
USD 16,633,473 GBP 14,224,412Bank of America
Merrill Lynch 17/6/2020 (935,361)USD 31,489,129 GBP 24,384,000 Barclays Bank 17/6/2020 1,372,002USD 12,909,233 GBP 10,384,000 BNP Paribas 17/6/2020 83,763USD 7,237,259 GBP 5,819,000 Deutsche Bank 17/6/2020 50,105USD 18,639,410 GBP 15,059,000 Goldman Sachs 17/6/2020 39,762USD 32,574,272 GBP 27,039,588 JP Morgan 17/6/2020 (822,822)USD 9,954,252 GBP 8,123,000 Morgan Stanley 17/6/2020 (78,614)USD 7,234,959 GBP 5,816,000 Deutsche Bank 15/7/2020 50,624USD 11,523,361 GBP 9,375,950 JP Morgan 15/7/2020 (58,475)USD 9,950,684 GBP 8,119,000 Morgan Stanley 15/7/2020 (78,478)USD 9,950,707 GBP 8,118,000 Morgan Stanley 19/8/2020 (78,549)
BlackRock Style Advantage Fund continued
The notes on pages 691 to 711 form an integral part of these financial statements.
Annual report and audited financial statements [591]

Open forward foreign exchange transactionsas at 31 May 2020
Currency Purchases Currency Sales CounterpartyMaturity
date
Netunrealised
appreciation/(depreciation)
USDUSD 9,925,860 HKD 77,115,000 Citibank 17/6/2020 (15,631)USD 8,696,834 HKD 67,549,000 JP Morgan 17/6/2020 (11,430)USD 1,469,730 HUF 468,491,000 BNP Paribas 17/6/2020 (25,509)USD 19,549,654 HUF 6,375,686,000 Credit Suisse 17/6/2020 (799,024)USD 124,004,179 HUF 37,196,516,650 Deutsche Bank 17/6/2020 5,287,557USD 1,601,787 HUF 483,679,000 HSBC 17/6/2020 58,074USD 1,469,275 HUF 468,427,000 BNP Paribas 15/7/2020 (25,486)USD 19,543,363 HUF 6,375,892,000 Credit Suisse 15/7/2020 (802,257)USD 47,097,741 HUF 15,901,874,000 Deutsche Bank 15/7/2020 (3,645,511)USD 1,469,335 HUF 468,571,000 BNP Paribas 19/8/2020 (25,390)USD 18,992,632 HUF 6,163,359,790 Citibank 19/8/2020 (668,276)USD 10,901,959 HUF 3,575,074,000 Credit Suisse 19/8/2020 (502,405)
USD 23,218,512 INR 1,793,137,953Bank of America
Merrill Lynch 17/6/2020 (465,360)USD 20,776,986 INR 1,608,383,000 Citibank 17/6/2020 (466,630)USD 12,544,661 INR 960,605,000 Deutsche Bank 17/6/2020 (143,065)USD 14,370,936 INR 1,110,984,048 HSBC 17/6/2020 (303,008)USD 66,449,120 INR 5,055,784,000 JP Morgan 17/6/2020 (327,973)USD 9,302,071 INR 725,378,000 Morgan Stanley 17/6/2020 (278,764)USD 1,437,464 INR 109,299,000 Societe Generale 17/6/2020 (6,164)USD 28,804,193 INR 2,209,725,000 UBS 17/6/2020 (381,983)
USD 9,902,330 INR 765,580,000Bank of America
Merrill Lynch 15/7/2020 (177,902)USD 3,026,033 INR 233,386,000 BNP Paribas 15/7/2020 (46,912)USD 7,471,790 INR 572,694,000 Citibank 15/7/2020 (68,753)USD 11,685,807 INR 900,213,200 HSBC 15/7/2020 (167,114)USD 257,090 INR 19,773,800 JP Morgan 15/7/2020 (3,268)
USD 728,118 INR 55,476,000Standard
Chartered Bank 15/7/2020 (2,323)USD 8,381,631 INR 653,725,000 UBS 15/7/2020 (225,830)USD 4,777,424 INR 365,664,000 HSBC 19/8/2020 (19,401)
USD 728,080 INR 55,732,000Standard
Chartered Bank 19/8/2020 (3,019)
USD 24,932,521 JPY 2,692,679,000Bank of America
Merrill Lynch 17/6/2020 (105,420)USD 24,347,280 JPY 2,580,952,000 BNP Paribas 17/6/2020 348,237USD 8,366,705 JPY 891,485,000 Deutsche Bank 17/6/2020 77,211USD 17,181,459 JPY 1,855,978,000 Goldman Sachs 17/6/2020 (76,397)USD 25,642,672 JPY 2,769,462,000 JP Morgan 17/6/2020 (109,236)USD 26,201,128 JPY 2,753,027,000 Morgan Stanley 17/6/2020 602,041
USD 24,924,913 JPY 2,689,815,000Bank of America
Merrill Lynch 15/7/2020 (97,386)USD 3,639,884 JPY 391,155,000 BNP Paribas 15/7/2020 1,121USD 3,636,987 JPY 391,155,000 Deutsche Bank 15/7/2020 (1,776)USD 20,509,216 JPY 2,212,757,150 JP Morgan 15/7/2020 (75,200)USD 46,742,498 JPY 5,020,409,350 JP Morgan 19/8/2020 14,347
USD 11,279,559 KRW 13,789,533,000Bank of America
Merrill Lynch 17/6/2020 133,584USD 48,265,633 KRW 57,256,554,680 Deutsche Bank 17/6/2020 1,985,596USD 132,243,367 KRW157,865,868,000 HSBC 17/6/2020 4,641,589USD 7,437,689 KRW 9,110,425,000 UBS 17/6/2020 73,802
USD 75,140,855 KRW 92,517,515,540Bank of America
Merrill Lynch 15/7/2020 346,182USD 5,078,363 KRW 6,239,048,000 HSBC 15/7/2020 34,479USD 7,432,869 KRW 9,100,805,000 UBS 15/7/2020 75,433
USD 6,779,276 KRW 8,344,272,000Bank of America
Merrill Lynch 19/8/2020 32,685USD 53,858,199 KRW 65,942,306,230 HSBC 19/8/2020 541,888
USD 6,154,761 MXN 148,883,870Bank of America
Merrill Lynch 17/6/2020 (560,176)USD 10,362,336 MXN 229,186,912 Barclays Bank 17/6/2020 25,585USD 1,277,834 MXN 30,566,805 Citibank 17/6/2020 (100,786)USD 34,332,683 MXN 764,049,205 Credit Suisse 17/6/2020 (127,345)USD 2,425,398 MXN 58,604,454 Deutsche Bank 17/6/2020 (217,771)
Open forward foreign exchange transactionsas at 31 May 2020
Currency Purchases Currency Sales CounterpartyMaturity
date
Netunrealised
appreciation/(depreciation)
USDUSD 5,185,544 MXN 120,523,695 Goldman Sachs 17/6/2020 (250,297)USD 8,834,456 MXN 210,868,262 JP Morgan 17/6/2020 (676,091)USD 4,725,884 MXN 110,215,797 Morgan Stanley 17/6/2020 (245,052)USD 1,233,112 MXN 28,223,500 UBS 17/6/2020 (39,820)
USD 1,639,232 MXN 39,561,766Bank of America
Merrill Lynch 15/7/2020 (137,534)USD 1,277,661 MXN 30,689,805 Citibank 15/7/2020 (100,655)USD 4,968,071 MXN 119,012,883 JP Morgan 15/7/2020 (376,942)USD 188,544 MXN 4,556,546 Morgan Stanley 15/7/2020 (16,096)USD 20,093,210 MXN 486,484,360 Barclays Bank 19/8/2020 (1,646,770)
USD 8,337,592 NOK 85,361,348Bank of America
Merrill Lynch 17/6/2020 (447,388)USD 146,177,917 NOK 1,518,047,773 Credit Suisse 17/6/2020 (10,052,271)USD 38,346,384 NOK 394,713,281 Deutsche Bank 17/6/2020 (2,275,612)USD 134,711,412 NOK 1,256,469,280 JP Morgan 17/6/2020 5,401,628USD 5,116,296 NOK 52,297,275 Morgan Stanley 17/6/2020 (265,888)USD 1,125,481 NOK 11,687,823 UBS 17/6/2020 (77,374)
USD 8,334,716 NOK 85,309,878Bank of America
Merrill Lynch 15/7/2020 (446,866)USD 100,841,413 NOK 1,041,064,347 Credit Suisse 15/7/2020 (6,323,107)USD 26,675,226 NOK 272,209,699 Deutsche Bank 15/7/2020 (1,345,349)USD 6,968,461 NOK 69,104,000 JP Morgan 15/7/2020 (144,930)USD 5,114,573 NOK 52,267,076 Morgan Stanley 15/7/2020 (265,667)USD 8,654,953 NOK 86,005,710 Credit Suisse 19/8/2020 (200,295)USD 18,340,021 NOK 186,934,442 Deutsche Bank 19/8/2020 (906,968)USD 6,968,349 NOK 69,086,000 JP Morgan 19/8/2020 (144,826)USD 44,396,716 NOK 457,079,738 Morgan Stanley 19/8/2020 (2,664,748)USD 16,806,740 NZD 28,232,224 Barclays Bank 17/6/2020 (706,239)USD 6,089,848 NZD 9,867,000 BNP Paribas 17/6/2020 (30,837)USD 10,113,745 NZD 16,780,000 Citibank 17/6/2020 (295,205)USD 3,888,275 NZD 6,552,977 Deutsche Bank 17/6/2020 (176,660)USD 19,982,616 NZD 33,066,621 Goldman Sachs 17/6/2020 (529,229)USD 2,156,989 NZD 3,535,178 JP Morgan 17/6/2020 (35,948)USD 6,088,764 NZD 9,870,000 Morgan Stanley 17/6/2020 (33,783)USD 6,090,061 NZD 9,869,000 BNP Paribas 15/7/2020 (30,888)USD 3,210,073 NZD 5,249,000 Citibank 15/7/2020 (45,460)USD 11,715,007 NZD 19,274,000 Goldman Sachs 15/7/2020 (239,109)USD 6,084,771 NZD 9,865,000 Morgan Stanley 15/7/2020 (33,696)USD 6,088,581 NZD 9,869,000 BNP Paribas 19/8/2020 (30,919)USD 3,209,924 NZD 5,250,000 Citibank 19/8/2020 (45,460)USD 6,086,375 NZD 9,870,000 Morgan Stanley 19/8/2020 (33,745)
USD 12,746,990 PLN 51,731,000Bank of America
Merrill Lynch 17/6/2020 (196,743)USD 1,815,743 PLN 7,092,109 BNP Paribas 17/6/2020 41,210USD 8,919,482 PLN 38,088,000 Citibank 17/6/2020 (610,604)USD 17,089,469 PLN 70,818,000 Credit Suisse 17/6/2020 (630,066)USD 1,974,496 PLN 8,164,000 Goldman Sachs 17/6/2020 (68,238)USD 7,664,415 PLN 29,116,000 HSBC 17/6/2020 379,233USD 7,011,616 PLN 28,570,891 JP Morgan 17/6/2020 (137,172)
USD 12,742,729 PLN 51,723,000Bank of America
Merrill Lynch 15/7/2020 (198,522)USD 7,363,025 PLN 30,807,000 Credit Suisse 15/7/2020 (344,980)USD 1,973,817 PLN 8,162,000 Goldman Sachs 15/7/2020 (68,340)
USD 12,742,500 PLN 51,727,000Bank of America
Merrill Lynch 19/8/2020 (199,913)
USD 34,661,167 RUB 2,623,363,000Bank of America
Merrill Lynch 17/6/2020 (2,417,514)USD 1,523,866 RUB 116,210,000 Barclays Bank 17/6/2020 (118,649)USD 8,464,380 RUB 621,052,000 Citibank 17/6/2020 (313,586)USD 7,384,453 RUB 536,385,000 Credit Suisse 17/6/2020 (196,826)USD 14,401,249 RUB 1,071,758,000 Goldman Sachs 17/6/2020 (747,006)USD 6,895,711 RUB 504,835,000 HSBC 17/6/2020 (239,640)USD 26,823,485 RUB 2,014,625,000 JP Morgan 17/6/2020 (1,651,277)
BlackRock Style Advantage Fund continued
The notes on pages 691 to 711 form an integral part of these financial statements.
BlackRock Strategic Funds[592]
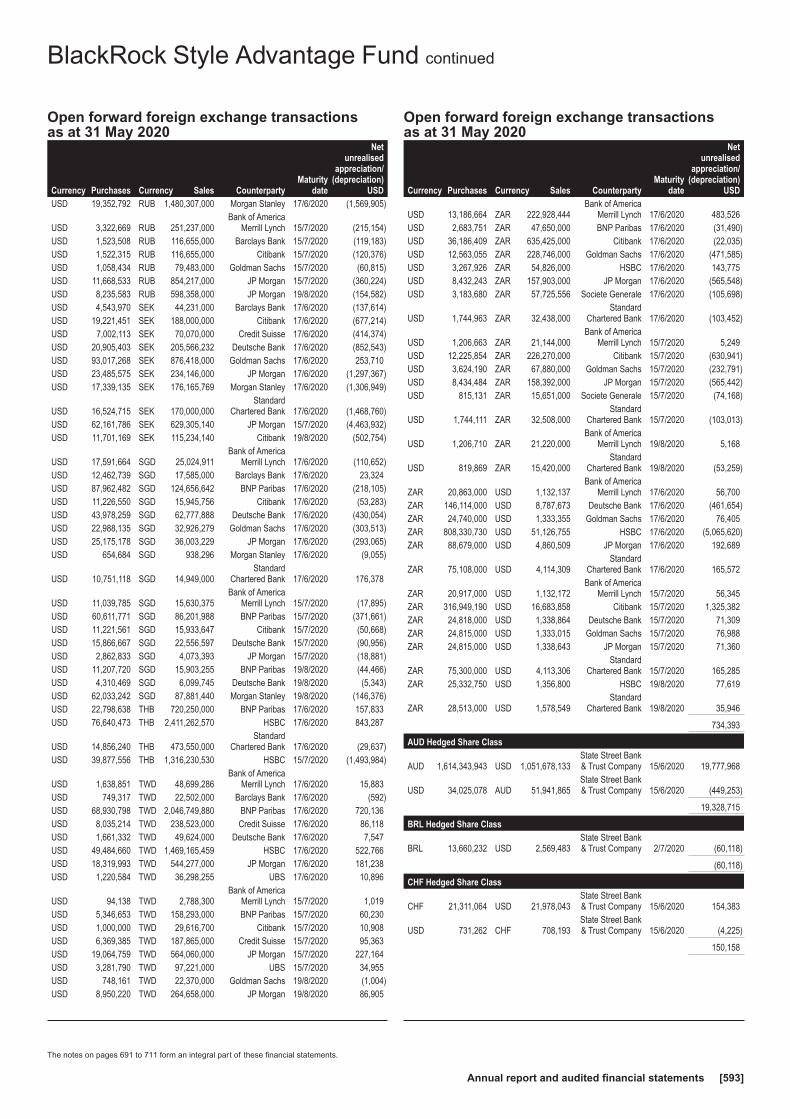
Open forward foreign exchange transactionsas at 31 May 2020
Currency Purchases Currency Sales CounterpartyMaturity
date
Netunrealised
appreciation/(depreciation)
USDUSD 19,352,792 RUB 1,480,307,000 Morgan Stanley 17/6/2020 (1,569,905)
USD 3,322,669 RUB 251,237,000Bank of America
Merrill Lynch 15/7/2020 (215,154)USD 1,523,508 RUB 116,655,000 Barclays Bank 15/7/2020 (119,183)USD 1,522,315 RUB 116,655,000 Citibank 15/7/2020 (120,376)USD 1,058,434 RUB 79,483,000 Goldman Sachs 15/7/2020 (60,815)USD 11,668,533 RUB 854,217,000 JP Morgan 15/7/2020 (360,224)USD 8,235,583 RUB 598,358,000 JP Morgan 19/8/2020 (154,582)USD 4,543,970 SEK 44,231,000 Barclays Bank 17/6/2020 (137,614)USD 19,221,451 SEK 188,000,000 Citibank 17/6/2020 (677,214)USD 7,002,113 SEK 70,070,000 Credit Suisse 17/6/2020 (414,374)USD 20,905,403 SEK 205,566,232 Deutsche Bank 17/6/2020 (852,543)USD 93,017,268 SEK 876,418,000 Goldman Sachs 17/6/2020 253,710USD 23,485,575 SEK 234,146,000 JP Morgan 17/6/2020 (1,297,367)USD 17,339,135 SEK 176,165,769 Morgan Stanley 17/6/2020 (1,306,949)
USD 16,524,715 SEK 170,000,000Standard
Chartered Bank 17/6/2020 (1,468,760)USD 62,161,786 SEK 629,305,140 JP Morgan 15/7/2020 (4,463,932)USD 11,701,169 SEK 115,234,140 Citibank 19/8/2020 (502,754)
USD 17,591,664 SGD 25,024,911Bank of America
Merrill Lynch 17/6/2020 (110,652)USD 12,462,739 SGD 17,585,000 Barclays Bank 17/6/2020 23,324USD 87,962,482 SGD 124,656,642 BNP Paribas 17/6/2020 (218,105)USD 11,226,550 SGD 15,945,756 Citibank 17/6/2020 (53,283)USD 43,978,259 SGD 62,777,888 Deutsche Bank 17/6/2020 (430,054)USD 22,988,135 SGD 32,926,279 Goldman Sachs 17/6/2020 (303,513)USD 25,175,178 SGD 36,003,229 JP Morgan 17/6/2020 (293,065)USD 654,684 SGD 938,296 Morgan Stanley 17/6/2020 (9,055)
USD 10,751,118 SGD 14,949,000Standard
Chartered Bank 17/6/2020 176,378
USD 11,039,785 SGD 15,630,375Bank of America
Merrill Lynch 15/7/2020 (17,895)USD 60,611,771 SGD 86,201,988 BNP Paribas 15/7/2020 (371,661)USD 11,221,561 SGD 15,933,647 Citibank 15/7/2020 (50,668)USD 15,866,667 SGD 22,556,597 Deutsche Bank 15/7/2020 (90,956)USD 2,862,833 SGD 4,073,393 JP Morgan 15/7/2020 (18,881)USD 11,207,720 SGD 15,903,255 BNP Paribas 19/8/2020 (44,466)USD 4,310,469 SGD 6,099,745 Deutsche Bank 19/8/2020 (5,343)USD 62,033,242 SGD 87,881,440 Morgan Stanley 19/8/2020 (146,376)USD 22,798,638 THB 720,250,000 BNP Paribas 17/6/2020 157,833USD 76,640,473 THB 2,411,262,570 HSBC 17/6/2020 843,287
USD 14,856,240 THB 473,550,000Standard
Chartered Bank 17/6/2020 (29,637)USD 39,877,556 THB 1,316,230,530 HSBC 15/7/2020 (1,493,984)
USD 1,638,851 TWD 48,699,286Bank of America
Merrill Lynch 17/6/2020 15,883USD 749,317 TWD 22,502,000 Barclays Bank 17/6/2020 (592)USD 68,930,798 TWD 2,046,749,880 BNP Paribas 17/6/2020 720,136USD 8,035,214 TWD 238,523,000 Credit Suisse 17/6/2020 86,118USD 1,661,332 TWD 49,624,000 Deutsche Bank 17/6/2020 7,547USD 49,484,660 TWD 1,469,165,459 HSBC 17/6/2020 522,766USD 18,319,993 TWD 544,277,000 JP Morgan 17/6/2020 181,238USD 1,220,584 TWD 36,298,255 UBS 17/6/2020 10,896
USD 94,138 TWD 2,788,300Bank of America
Merrill Lynch 15/7/2020 1,019USD 5,346,653 TWD 158,293,000 BNP Paribas 15/7/2020 60,230USD 1,000,000 TWD 29,616,700 Citibank 15/7/2020 10,908USD 6,369,385 TWD 187,865,000 Credit Suisse 15/7/2020 95,363USD 19,064,759 TWD 564,060,000 JP Morgan 15/7/2020 227,164USD 3,281,790 TWD 97,221,000 UBS 15/7/2020 34,955USD 748,161 TWD 22,370,000 Goldman Sachs 19/8/2020 (1,004)USD 8,950,220 TWD 264,658,000 JP Morgan 19/8/2020 86,905
Open forward foreign exchange transactionsas at 31 May 2020
Currency Purchases Currency Sales CounterpartyMaturity
date
Netunrealised
appreciation/(depreciation)
USD
USD 13,186,664 ZAR 222,928,444Bank of America
Merrill Lynch 17/6/2020 483,526USD 2,683,751 ZAR 47,650,000 BNP Paribas 17/6/2020 (31,490)USD 36,186,409 ZAR 635,425,000 Citibank 17/6/2020 (22,035)USD 12,563,055 ZAR 228,746,000 Goldman Sachs 17/6/2020 (471,585)USD 3,267,926 ZAR 54,826,000 HSBC 17/6/2020 143,775USD 8,432,243 ZAR 157,903,000 JP Morgan 17/6/2020 (565,548)USD 3,183,680 ZAR 57,725,556 Societe Generale 17/6/2020 (105,698)
USD 1,744,963 ZAR 32,438,000Standard
Chartered Bank 17/6/2020 (103,452)
USD 1,206,663 ZAR 21,144,000Bank of America
Merrill Lynch 15/7/2020 5,249USD 12,225,854 ZAR 226,270,000 Citibank 15/7/2020 (630,941)USD 3,624,190 ZAR 67,880,000 Goldman Sachs 15/7/2020 (232,791)USD 8,434,484 ZAR 158,392,000 JP Morgan 15/7/2020 (565,442)USD 815,131 ZAR 15,651,000 Societe Generale 15/7/2020 (74,168)
USD 1,744,111 ZAR 32,508,000Standard
Chartered Bank 15/7/2020 (103,013)
USD 1,206,710 ZAR 21,220,000Bank of America
Merrill Lynch 19/8/2020 5,168
USD 819,869 ZAR 15,420,000Standard
Chartered Bank 19/8/2020 (53,259)
ZAR 20,863,000 USD 1,132,137Bank of America
Merrill Lynch 17/6/2020 56,700ZAR 146,114,000 USD 8,787,673 Deutsche Bank 17/6/2020 (461,654)ZAR 24,740,000 USD 1,333,355 Goldman Sachs 17/6/2020 76,405ZAR 808,330,730 USD 51,126,755 HSBC 17/6/2020 (5,065,620)ZAR 88,679,000 USD 4,860,509 JP Morgan 17/6/2020 192,689
ZAR 75,108,000 USD 4,114,309Standard
Chartered Bank 17/6/2020 165,572
ZAR 20,917,000 USD 1,132,172Bank of America
Merrill Lynch 15/7/2020 56,345ZAR 316,949,190 USD 16,683,858 Citibank 15/7/2020 1,325,382ZAR 24,818,000 USD 1,338,864 Deutsche Bank 15/7/2020 71,309ZAR 24,815,000 USD 1,333,015 Goldman Sachs 15/7/2020 76,988ZAR 24,815,000 USD 1,338,643 JP Morgan 15/7/2020 71,360
ZAR 75,300,000 USD 4,113,306Standard
Chartered Bank 15/7/2020 165,285ZAR 25,332,750 USD 1,356,800 HSBC 19/8/2020 77,619
ZAR 28,513,000 USD 1,578,549Standard
Chartered Bank 19/8/2020 35,946
734,393
AUD Hedged Share Class
AUD 1,614,343,943 USD 1,051,678,133State Street Bank& Trust Company 15/6/2020 19,777,968
USD 34,025,078 AUD 51,941,865State Street Bank& Trust Company 15/6/2020 (449,253)
19,328,715
BRL Hedged Share Class
BRL 13,660,232 USD 2,569,483State Street Bank& Trust Company 2/7/2020 (60,118)
(60,118)
CHF Hedged Share Class
CHF 21,311,064 USD 21,978,043State Street Bank& Trust Company 15/6/2020 154,383
USD 731,262 CHF 708,193State Street Bank& Trust Company 15/6/2020 (4,225)
150,158
BlackRock Style Advantage Fund continued
The notes on pages 691 to 711 form an integral part of these financial statements.
Annual report and audited financial statements [593]
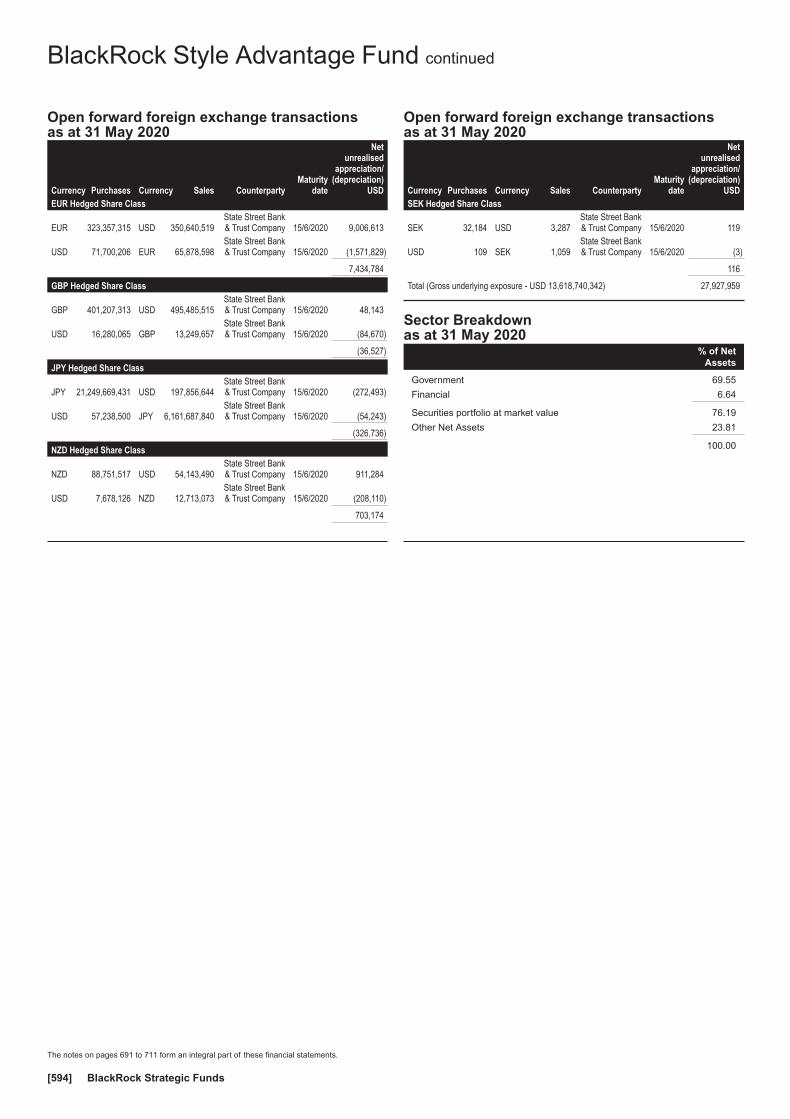
Open forward foreign exchange transactionsas at 31 May 2020
Currency Purchases Currency Sales CounterpartyMaturity
date
Netunrealised
appreciation/(depreciation)
USDEUR Hedged Share Class
EUR 323,357,315 USD 350,640,519State Street Bank& Trust Company 15/6/2020 9,006,613
USD 71,700,206 EUR 65,878,598State Street Bank& Trust Company 15/6/2020 (1,571,829)
7,434,784
GBP Hedged Share Class
GBP 401,207,313 USD 495,485,515State Street Bank& Trust Company 15/6/2020 48,143
USD 16,280,065 GBP 13,249,657State Street Bank& Trust Company 15/6/2020 (84,670)
(36,527)
JPY Hedged Share Class
JPY 21,249,669,431 USD 197,856,644State Street Bank& Trust Company 15/6/2020 (272,493)
USD 57,238,500 JPY 6,161,687,840State Street Bank& Trust Company 15/6/2020 (54,243)
(326,736)
NZD Hedged Share Class
NZD 88,751,517 USD 54,143,490State Street Bank& Trust Company 15/6/2020 911,284
USD 7,678,126 NZD 12,713,073State Street Bank& Trust Company 15/6/2020 (208,110)
703,174
Open forward foreign exchange transactionsas at 31 May 2020
Currency Purchases Currency Sales CounterpartyMaturity
date
Netunrealised
appreciation/(depreciation)
USDSEK Hedged Share Class
SEK 32,184 USD 3,287State Street Bank& Trust Company 15/6/2020 119
USD 109 SEK 1,059State Street Bank& Trust Company 15/6/2020 (3)
116
Total (Gross underlying exposure - USD 13,618,740,342) 27,927,959
Sector Breakdownas at 31 May 2020
% of NetAssets
Government 69.55
Financial 6.64
Securities portfolio at market value 76.19
Other Net Assets 23.81
100.00
BlackRock Style Advantage Fund continued
The notes on pages 691 to 711 form an integral part of these financial statements.
BlackRock Strategic Funds[594]
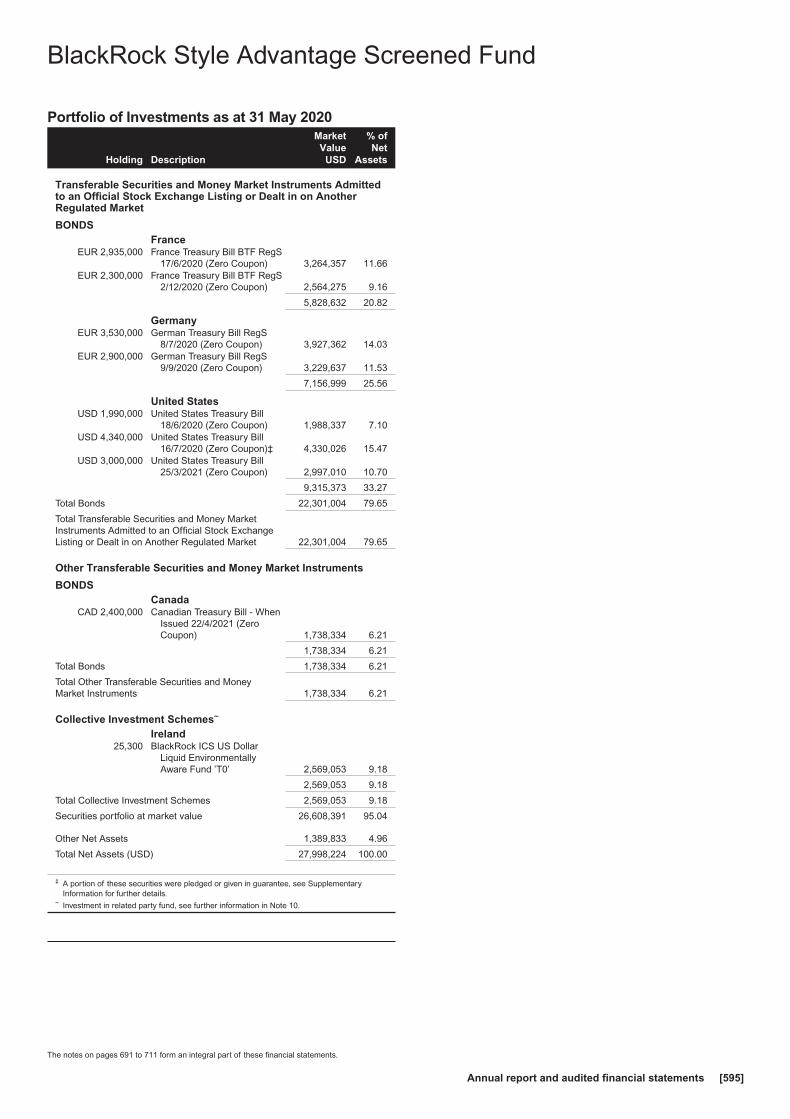
Portfolio of Investments as at 31 May 2020
Holding Description
MarketValue
USD
% ofNet
Assets
Transferable Securities and Money Market Instruments Admittedto an Official Stock Exchange Listing or Dealt in on AnotherRegulated Market
BONDSFrance
EUR 2,935,000 France Treasury Bill BTF RegS17/6/2020 (Zero Coupon) 3,264,357 11.66
EUR 2,300,000 France Treasury Bill BTF RegS2/12/2020 (Zero Coupon) 2,564,275 9.16
5,828,632 20.82
GermanyEUR 3,530,000 German Treasury Bill RegS
8/7/2020 (Zero Coupon) 3,927,362 14.03EUR 2,900,000 German Treasury Bill RegS
9/9/2020 (Zero Coupon) 3,229,637 11.53
7,156,999 25.56
United StatesUSD 1,990,000 United States Treasury Bill
18/6/2020 (Zero Coupon) 1,988,337 7.10USD 4,340,000 United States Treasury Bill
16/7/2020 (Zero Coupon)‡ 4,330,026 15.47USD 3,000,000 United States Treasury Bill
25/3/2021 (Zero Coupon) 2,997,010 10.70
9,315,373 33.27
Total Bonds 22,301,004 79.65
Total Transferable Securities and Money MarketInstruments Admitted to an Official Stock ExchangeListing or Dealt in on Another Regulated Market 22,301,004 79.65
Other Transferable Securities and Money Market Instruments
BONDSCanada
CAD 2,400,000 Canadian Treasury Bill - WhenIssued 22/4/2021 (ZeroCoupon) 1,738,334 6.21
1,738,334 6.21
Total Bonds 1,738,334 6.21
Total Other Transferable Securities and MoneyMarket Instruments 1,738,334 6.21
Collective Investment Schemes~
Ireland25,300 BlackRock ICS US Dollar
Liquid EnvironmentallyAware Fund ’T0’ 2,569,053 9.18
2,569,053 9.18
Total Collective Investment Schemes 2,569,053 9.18
Securities portfolio at market value 26,608,391 95.04
Other Net Assets 1,389,833 4.96
Total Net Assets (USD) 27,998,224 100.00
‡ A portion of these securities were pledged or given in guarantee, see SupplementaryInformation for further details.
~ Investment in related party fund, see further information in Note 10.
BlackRock Style Advantage Screened Fund
The notes on pages 691 to 711 form an integral part of these financial statements.
Annual report and audited financial statements [595]
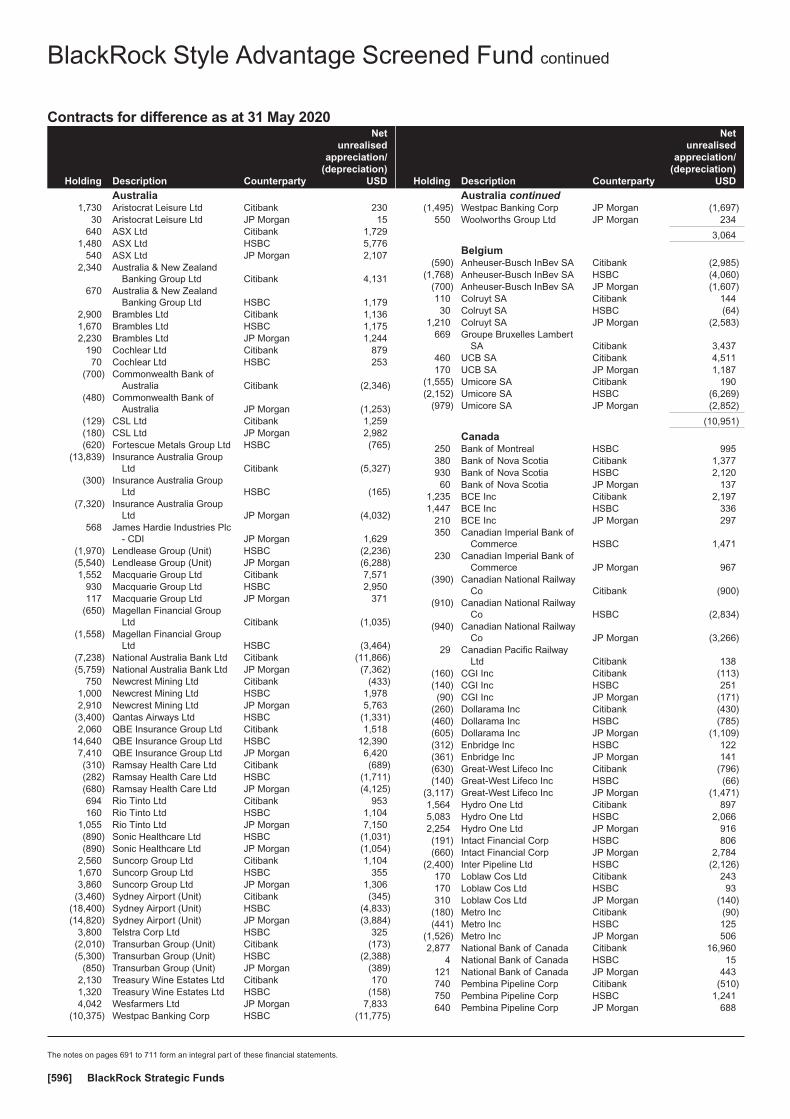
Contracts for difference as at 31 May 2020
Holding Description Counterparty
Netunrealised
appreciation/(depreciation)
USD
Australia1,730 Aristocrat Leisure Ltd Citibank 230
30 Aristocrat Leisure Ltd JP Morgan 15640 ASX Ltd Citibank 1,729
1,480 ASX Ltd HSBC 5,776540 ASX Ltd JP Morgan 2,107
2,340 Australia & New ZealandBanking Group Ltd Citibank 4,131
670 Australia & New ZealandBanking Group Ltd HSBC 1,179
2,900 Brambles Ltd Citibank 1,1361,670 Brambles Ltd HSBC 1,1752,230 Brambles Ltd JP Morgan 1,244
190 Cochlear Ltd Citibank 87970 Cochlear Ltd HSBC 253
(700) Commonwealth Bank ofAustralia Citibank (2,346)
(480) Commonwealth Bank ofAustralia JP Morgan (1,253)
(129) CSL Ltd Citibank 1,259(180) CSL Ltd JP Morgan 2,982(620) Fortescue Metals Group Ltd HSBC (765)
(13,839) Insurance Australia GroupLtd Citibank (5,327)
(300) Insurance Australia GroupLtd HSBC (165)
(7,320) Insurance Australia GroupLtd JP Morgan (4,032)
568 James Hardie Industries Plc- CDI JP Morgan 1,629
(1,970) Lendlease Group (Unit) HSBC (2,236)(5,540) Lendlease Group (Unit) JP Morgan (6,288)1,552 Macquarie Group Ltd Citibank 7,571
930 Macquarie Group Ltd HSBC 2,950117 Macquarie Group Ltd JP Morgan 371
(650) Magellan Financial GroupLtd Citibank (1,035)
(1,558) Magellan Financial GroupLtd HSBC (3,464)
(7,238) National Australia Bank Ltd Citibank (11,866)(5,759) National Australia Bank Ltd JP Morgan (7,362)
750 Newcrest Mining Ltd Citibank (433)1,000 Newcrest Mining Ltd HSBC 1,9782,910 Newcrest Mining Ltd JP Morgan 5,763
(3,400) Qantas Airways Ltd HSBC (1,331)2,060 QBE Insurance Group Ltd Citibank 1,518
14,640 QBE Insurance Group Ltd HSBC 12,3907,410 QBE Insurance Group Ltd JP Morgan 6,420(310) Ramsay Health Care Ltd Citibank (689)(282) Ramsay Health Care Ltd HSBC (1,711)(680) Ramsay Health Care Ltd JP Morgan (4,125)694 Rio Tinto Ltd Citibank 953160 Rio Tinto Ltd HSBC 1,104
1,055 Rio Tinto Ltd JP Morgan 7,150(890) Sonic Healthcare Ltd HSBC (1,031)(890) Sonic Healthcare Ltd JP Morgan (1,054)
2,560 Suncorp Group Ltd Citibank 1,1041,670 Suncorp Group Ltd HSBC 3553,860 Suncorp Group Ltd JP Morgan 1,306
(3,460) Sydney Airport (Unit) Citibank (345)(18,400) Sydney Airport (Unit) HSBC (4,833)(14,820) Sydney Airport (Unit) JP Morgan (3,884)
3,800 Telstra Corp Ltd HSBC 325(2,010) Transurban Group (Unit) Citibank (173)(5,300) Transurban Group (Unit) HSBC (2,388)
(850) Transurban Group (Unit) JP Morgan (389)2,130 Treasury Wine Estates Ltd Citibank 1701,320 Treasury Wine Estates Ltd HSBC (158)4,042 Wesfarmers Ltd JP Morgan 7,833
(10,375) Westpac Banking Corp HSBC (11,775)
Holding Description Counterparty
Netunrealised
appreciation/(depreciation)
USD
Australia continued(1,495) Westpac Banking Corp JP Morgan (1,697)
550 Woolworths Group Ltd JP Morgan 234
3,064
Belgium(590) Anheuser-Busch InBev SA Citibank (2,985)
(1,768) Anheuser-Busch InBev SA HSBC (4,060)(700) Anheuser-Busch InBev SA JP Morgan (1,607)110 Colruyt SA Citibank 14430 Colruyt SA HSBC (64)
1,210 Colruyt SA JP Morgan (2,583)669 Groupe Bruxelles Lambert
SA Citibank 3,437460 UCB SA Citibank 4,511170 UCB SA JP Morgan 1,187
(1,555) Umicore SA Citibank 190(2,152) Umicore SA HSBC (6,269)
(979) Umicore SA JP Morgan (2,852)
(10,951)
Canada250 Bank of Montreal HSBC 995380 Bank of Nova Scotia Citibank 1,377930 Bank of Nova Scotia HSBC 2,12060 Bank of Nova Scotia JP Morgan 137
1,235 BCE Inc Citibank 2,1971,447 BCE Inc HSBC 336
210 BCE Inc JP Morgan 297350 Canadian Imperial Bank of
Commerce HSBC 1,471230 Canadian Imperial Bank of
Commerce JP Morgan 967(390) Canadian National Railway
Co Citibank (900)(910) Canadian National Railway
Co HSBC (2,834)(940) Canadian National Railway
Co JP Morgan (3,266)29 Canadian Pacific Railway
Ltd Citibank 138(160) CGI Inc Citibank (113)(140) CGI Inc HSBC 251(90) CGI Inc JP Morgan (171)
(260) Dollarama Inc Citibank (430)(460) Dollarama Inc HSBC (785)(605) Dollarama Inc JP Morgan (1,109)(312) Enbridge Inc HSBC 122(361) Enbridge Inc JP Morgan 141(630) Great-West Lifeco Inc Citibank (796)(140) Great-West Lifeco Inc HSBC (66)
(3,117) Great-West Lifeco Inc JP Morgan (1,471)1,564 Hydro One Ltd Citibank 8975,083 Hydro One Ltd HSBC 2,0662,254 Hydro One Ltd JP Morgan 916(191) Intact Financial Corp HSBC 806(660) Intact Financial Corp JP Morgan 2,784
(2,400) Inter Pipeline Ltd HSBC (2,126)170 Loblaw Cos Ltd Citibank 243170 Loblaw Cos Ltd HSBC 93310 Loblaw Cos Ltd JP Morgan (140)
(180) Metro Inc Citibank (90)(441) Metro Inc HSBC 125
(1,526) Metro Inc JP Morgan 5062,877 National Bank of Canada Citibank 16,960
4 National Bank of Canada HSBC 15121 National Bank of Canada JP Morgan 443740 Pembina Pipeline Corp Citibank (510)750 Pembina Pipeline Corp HSBC 1,241640 Pembina Pipeline Corp JP Morgan 688
BlackRock Style Advantage Screened Fund continued
The notes on pages 691 to 711 form an integral part of these financial statements.
BlackRock Strategic Funds[596]

Contracts for difference as at 31 May 2020
Holding Description Counterparty
Netunrealised
appreciation/(depreciation)
USD
Canada continued(2,530) Power Corp of Canada Citibank (2,406)
(530) Power Corp of Canada HSBC (1,220)(1,410) Power Corp of Canada JP Morgan (1,628)1,200 Royal Bank of Canada Citibank 7,048
330 Royal Bank of Canada HSBC 1,203780 Royal Bank of Canada JP Morgan 2,843
(140) Shopify Inc ’A’ HSBC (6,137)620 Sun Life Financial Inc Citibank 392645 Sun Life Financial Inc HSBC (440)310 TC Energy Corp Citibank 729190 TC Energy Corp HSBC 99600 TELUS Corp Citibank 462590 TELUS Corp JP Morgan 57299 Toronto-Dominion Bank Citibank 295
(260) Wheaton Precious MetalsCorp Citibank 451
25,788
Denmark(40) AP Moller - Maersk A/S ’B’ Citibank 2,041(20) AP Moller - Maersk A/S ’B’ JP Morgan (268)
1,690 Carlsberg A/S ’B’ HSBC 8,925(665) Chr Hansen Holding A/S Citibank (1,270)(390) Chr Hansen Holding A/S HSBC (1,338)210 Coloplast A/S ’B’ HSBC 2,726669 Coloplast A/S ’B’ JP Morgan 8,932
(395) Demant A/S Citibank (775)(683) Demant A/S HSBC (1,875)(150) DSV PANALPINA A/S Citibank 524
(1,450) DSV PANALPINA A/S HSBC (1,168)708 GN Store Nord A/S Citibank 2,281
(180) H Lundbeck A/S Citibank (145)(190) H Lundbeck A/S HSBC (340)(500) H Lundbeck A/S JP Morgan (895)
65 Novo Nordisk A/S ’B’ Citibank (83)940 Novo Nordisk A/S ’B’ HSBC (7)
1,170 Novo Nordisk A/S ’B’ JP Morgan (9)400 Novozymes A/S ’B’ Citibank 818140 Novozymes A/S ’B’ HSBC 398440 Novozymes A/S ’B’ JP Morgan 1,070
(1,310) Orsted A/S Citibank (8,169)(60) Orsted A/S HSBC (761)
(160) Orsted A/S JP Morgan (2,029)(90) Vestas Wind Systems A/S Citibank (765)(10) Vestas Wind Systems A/S HSBC (120)
7,698
Finland(1,050) Elisa Oyj HSBC (384)2,330 Fortum Oyj Citibank 3,6663,100 Fortum Oyj HSBC 5,5501,270 Fortum Oyj JP Morgan 2,274
393 Kone Oyj ’B’ JP Morgan 1,687(800) Neste Oyj Citibank (1,139)
(1,050) Neste Oyj HSBC (5,593)(16,808) Nokia Oyj Citibank (1,009)(13,507) Nokia Oyj HSBC (3,890)(4,446) Nordea Bank Abp Citibank (3,011)
(20,159) Nordea Bank Abp HSBC (11,253)(14,163) Nordea Bank Abp JP Morgan (7,906)(1,440) Sampo Oyj ’A’ Citibank (5,252)
(680) Stora Enso Oyj ’R’ Citibank (287)(180) Stora Enso Oyj ’R’ HSBC (70)
(1,880) Stora Enso Oyj ’R’ JP Morgan (732)220 UPM-Kymmene Oyj Citibank 191770 UPM-Kymmene Oyj HSBC 1,141350 UPM-Kymmene Oyj JP Morgan 245
Holding Description Counterparty
Netunrealised
appreciation/(depreciation)
USD
Finland continued(204) Wartsila Oyj Abp Citibank (73)
(7,168) Wartsila Oyj Abp HSBC (2,487)(10,920) Wartsila Oyj Abp JP Morgan (3,788)
(32,120)
France(331) Aeroports de Paris Citibank (5,024)(90) Aeroports de Paris HSBC (1,181)200 BNP Paribas SA Citibank 967460 BNP Paribas SA JP Morgan 2,506
1,460 Carrefour SA HSBC 5651,347 Carrefour SA JP Morgan 397
390 Cie de Saint-Gobain Citibank 9931,640 Cie de Saint-Gobain HSBC 6,7473,673 Cie de Saint-Gobain JP Morgan 15,877
54 Danone SA Citibank 5520 Dassault Systemes SE HSBC 26860 Dassault Systemes SE JP Morgan 991
(273) Edenred HSBC 395(1,300) Edenred JP Morgan 1,879
628 Eiffage SA Citibank 4,860(690) Faurecia SE Citibank (1,066)(270) Faurecia SE HSBC (483)
(1,234) Faurecia SE JP Morgan (2,209)(2,265) Getlink SE HSBC (3,727)
21 Hermes International JP Morgan 1,597(199) Iliad SA HSBC (3,452)(149) Iliad SA JP Morgan (2,585)(70) Ingenico Group SA Citibank (253)(70) Ingenico Group SA HSBC (160)
(607) Ingenico Group SA JP Morgan (1,384)322 Ipsen SA Citibank 985520 Ipsen SA HSBC 2,179136 Ipsen SA JP Morgan 514
1,897 Legrand SA Citibank 6,202330 Legrand SA HSBC 763620 Legrand SA JP Morgan 1,434
(6) Natixis SA JP Morgan 11,210 Orange SA HSBC 4433,630 Orange SA JP Morgan 1,698(154) Orpea Citibank (702)(290) Orpea HSBC (1,983)(70) Orpea JP Morgan (479)
5,740 Peugeot SA Citibank 8,2021,640 Peugeot SA HSBC (505)
520 Peugeot SA JP Morgan 788490 Publicis Groupe SA HSBC (251)300 Publicis Groupe SA JP Morgan (153)410 Schneider Electric SE Citibank 2,571140 Schneider Electric SE HSBC 1,387304 Schneider Electric SE JP Morgan 3,218
(700) SCOR SE HSBC 1,4793,775 Suez SA Citibank 3,7901,320 Suez SA HSBC 384,410 Suez SA JP Morgan 49(290) Teleperformance Citibank 1,387(10) Teleperformance HSBC 42(70) Teleperformance JP Morgan 296
(393) Ubisoft Entertainment SA Citibank (17)(80) Ubisoft Entertainment SA HSBC 317
(260) Ubisoft Entertainment SA JP Morgan 1,029(148) Valeo SA Citibank (542)(596) Valeo SA HSBC (736)
(1,351) Valeo SA JP Morgan (1,667)2,017 Vivendi SA Citibank 2,063
BlackRock Style Advantage Screened Fund continued
The notes on pages 691 to 711 form an integral part of these financial statements.
Annual report and audited financial statements [597]

Contracts for difference as at 31 May 2020
Holding Description Counterparty
Netunrealised
appreciation/(depreciation)
USD
France continued1,030 Vivendi SA HSBC 1,1614,596 Vivendi SA JP Morgan 2,964
54,538
Germany(30) adidas AG Citibank (611)54 Allianz SE RegS Citibank 497
510 Allianz SE RegS JP Morgan 4,1573,630 Aroundtown SA HSBC 3464,520 Aroundtown SA JP Morgan 99
(1,140) Bayerische Motoren WerkeAG HSBC (1,863)
(170) Bayerische Motoren WerkeAG JP Morgan (278)
610 Beiersdorf AG Citibank 1,940680 Brenntag AG Citibank 1,905259 Brenntag AG HSBC 875510 Brenntag AG JP Morgan 1,72460 Carl Zeiss Meditec AG JP Morgan 460
(10,323) Commerzbank AG Citibank (2,973)(13,493) Commerzbank AG HSBC (4,786)(19,420) Commerzbank AG JP Morgan (6,889)
(120) Continental AG Citibank (971)(70) Continental AG JP Morgan (758)380 Covestro AG Citibank 976410 Covestro AG HSBC 1,866630 Covestro AG JP Morgan 1,758
(1,062) Daimler AG HSBC (2,444)(1,970) Daimler AG JP Morgan (4,534)
(628) Delivery Hero SE JP Morgan 405(11,789) Deutsche Bank AG Citibank (12,335)(13,060) Deutsche Bank AG HSBC (15,902)(2,210) Deutsche Bank AG JP Morgan (3,274)
140 Deutsche Boerse AG Citibank (288)360 Deutsche Boerse AG HSBC (5)40 Deutsche Boerse AG JP Morgan 96
(190) Deutsche Lufthansa AGRegS Citibank (245)
(3,820) Deutsche Lufthansa AGRegS HSBC (6,023)
(1,240) Deutsche Lufthansa AGRegS JP Morgan (1,955)
630 Deutsche Post AG RegS Citibank 6583,528 Deutsche Post AG RegS HSBC 6,9073,462 Deutsche Post AG RegS JP Morgan 6,5835,244 Deutsche Telekom AG RegS Citibank 3,3531,520 Deutsche Telekom AG RegS HSBC 9301,770 Deutsche Telekom AG RegS JP Morgan 1,082(150) Deutsche Wohnen SE Citibank (108)(280) Deutsche Wohnen SE HSBC (568)
1,714 Fraport AG Frankfurt AirportServices Worldwide JP Morgan 12,045
(470) Fresenius Medical Care AG& Co KGaA Citibank (366)
(600) Fresenius Medical Care AG& Co KGaA HSBC (2,438)
(300) Fresenius Medical Care AG& Co KGaA JP Morgan (1,191)
(430) Fresenius SE & Co KGaA Citibank (53)(130) Fresenius SE & Co KGaA HSBC (435)(190) Fresenius SE & Co KGaA JP Morgan (636)
1,486 HeidelbergCement AG Citibank 6,4771,421 HeidelbergCement AG HSBC 1,928
11 HeidelbergCement AG JP Morgan 15430 Henkel AG & Co KGaA
(Pref) Citibank 1,501410 Henkel AG & Co KGaA
(Pref) HSBC 629441 HOCHTIEF AG Citibank 2,869
Holding Description Counterparty
Netunrealised
appreciation/(depreciation)
USD
Germany continued482 HOCHTIEF AG HSBC 4,864
1,193 HOCHTIEF AG JP Morgan 11,586(3,470) Infineon Technologies AG HSBC (4,167)
(910) Infineon Technologies AG JP Morgan (2,010)(1,269) KION Group AG Citibank (7,973)
(177) KION Group AG HSBC (929)(230) KION Group AG JP Morgan (1,207)160 LEG Immobilien AG HSBC 815120 LEG Immobilien AG JP Morgan 611680 Merck KGaA Citibank 76313 Merck KGaA JP Morgan (766)
(145) MTU Aero Engines AG HSBC (3,547)(104) MTU Aero Engines AG JP Morgan (2,544)180 Muenchener
Rueckversicherungs-GesellschaftAG in Muenchen RegS Citibank 2,362
581 MuenchenerRueckversicherungs-GesellschaftAG in Muenchen RegS HSBC 9,404
128 MuenchenerRueckversicherungs-GesellschaftAG in Muenchen RegS JP Morgan 2,697
(370) Nemetschek SE Citibank (2,222)(10) Nemetschek SE JP Morgan (86)500 Puma SE Citibank 2,424370 Puma SE HSBC 2,029100 Puma SE JP Morgan 656
(1,586) QIAGEN NV JP Morgan 71(210) SAP SE Citibank (1,765)(140) SAP SE JP Morgan (1,068)(109) Sartorius AG (Pref) HSBC (5,018)(230) Sartorius AG (Pref) JP Morgan (10,588)840 Siemens AG RegS Citibank 4,894130 Siemens AG RegS HSBC 1,841460 Siemens AG RegS JP Morgan 5,376150 Siemens Healthineers AG Citibank 188170 Siemens Healthineers AG JP Morgan 823260 Symrise AG Citibank 607140 Symrise AG HSBC 592110 Symrise AG JP Morgan 465
1,530 Telefonica DeutschlandHolding AG Citibank 247
2,299 Telefonica DeutschlandHolding AG HSBC 161
800 Telefonica DeutschlandHolding AG JP Morgan 56
(1,150) thyssenkrupp AG HSBC (2,256)(18,073) thyssenkrupp AG JP Morgan (18,785)
(600) Uniper SE Citibank (1,948)(2,020) Uniper SE HSBC (6,840)
(220) Uniper SE JP Morgan (724)(240) Vonovia SE Citibank (603)(130) Vonovia SE JP Morgan (494)(150) Wirecard AG HSBC (1,301)(383) Wirecard AG JP Morgan (3,322)(494) Zalando SE JP Morgan (4,449)
(41,615)
Hong Kong(5,400) AIA Group Ltd Citibank 801(1,400) AIA Group Ltd HSBC 1,0447,000 BOC Hong Kong Holdings
Ltd Citibank (767)25,500 BOC Hong Kong Holdings
Ltd HSBC (8,056)1,500 CK Asset Holdings Ltd Citibank (87)2,000 CK Asset Holdings Ltd HSBC (1,689)
(12,000) Galaxy EntertainmentGroup Ltd Citibank (3,559)
BlackRock Style Advantage Screened Fund continued
The notes on pages 691 to 711 form an integral part of these financial statements.
BlackRock Strategic Funds[598]
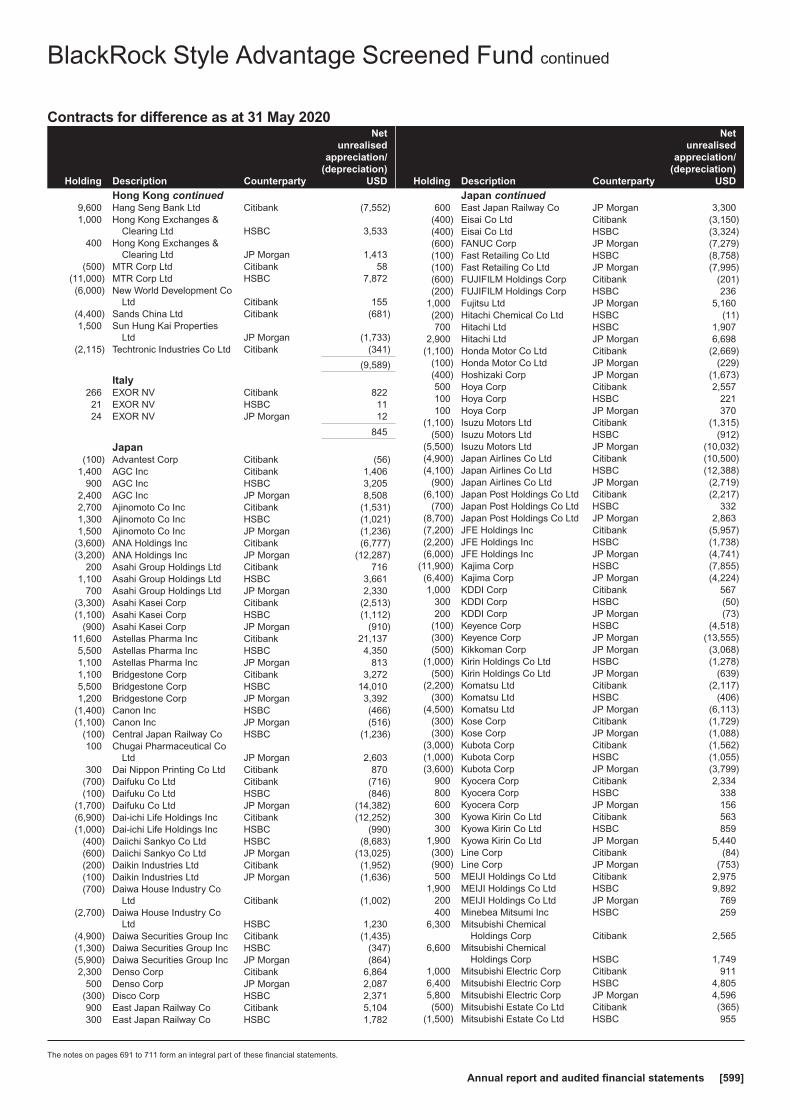
Contracts for difference as at 31 May 2020
Holding Description Counterparty
Netunrealised
appreciation/(depreciation)
USD
Hong Kong continued9,600 Hang Seng Bank Ltd Citibank (7,552)1,000 Hong Kong Exchanges &
Clearing Ltd HSBC 3,533400 Hong Kong Exchanges &
Clearing Ltd JP Morgan 1,413(500) MTR Corp Ltd Citibank 58
(11,000) MTR Corp Ltd HSBC 7,872(6,000) New World Development Co
Ltd Citibank 155(4,400) Sands China Ltd Citibank (681)1,500 Sun Hung Kai Properties
Ltd JP Morgan (1,733)(2,115) Techtronic Industries Co Ltd Citibank (341)
(9,589)
Italy266 EXOR NV Citibank 82221 EXOR NV HSBC 1124 EXOR NV JP Morgan 12
845
Japan(100) Advantest Corp Citibank (56)
1,400 AGC Inc Citibank 1,406900 AGC Inc HSBC 3,205
2,400 AGC Inc JP Morgan 8,5082,700 Ajinomoto Co Inc Citibank (1,531)1,300 Ajinomoto Co Inc HSBC (1,021)1,500 Ajinomoto Co Inc JP Morgan (1,236)
(3,600) ANA Holdings Inc Citibank (6,777)(3,200) ANA Holdings Inc JP Morgan (12,287)
200 Asahi Group Holdings Ltd Citibank 7161,100 Asahi Group Holdings Ltd HSBC 3,661
700 Asahi Group Holdings Ltd JP Morgan 2,330(3,300) Asahi Kasei Corp Citibank (2,513)(1,100) Asahi Kasei Corp HSBC (1,112)
(900) Asahi Kasei Corp JP Morgan (910)11,600 Astellas Pharma Inc Citibank 21,1375,500 Astellas Pharma Inc HSBC 4,3501,100 Astellas Pharma Inc JP Morgan 8131,100 Bridgestone Corp Citibank 3,2725,500 Bridgestone Corp HSBC 14,0101,200 Bridgestone Corp JP Morgan 3,392
(1,400) Canon Inc HSBC (466)(1,100) Canon Inc JP Morgan (516)
(100) Central Japan Railway Co HSBC (1,236)100 Chugai Pharmaceutical Co
Ltd JP Morgan 2,603300 Dai Nippon Printing Co Ltd Citibank 870
(700) Daifuku Co Ltd Citibank (716)(100) Daifuku Co Ltd HSBC (846)
(1,700) Daifuku Co Ltd JP Morgan (14,382)(6,900) Dai-ichi Life Holdings Inc Citibank (12,252)(1,000) Dai-ichi Life Holdings Inc HSBC (990)
(400) Daiichi Sankyo Co Ltd HSBC (8,683)(600) Daiichi Sankyo Co Ltd JP Morgan (13,025)(200) Daikin Industries Ltd Citibank (1,952)(100) Daikin Industries Ltd JP Morgan (1,636)(700) Daiwa House Industry Co
Ltd Citibank (1,002)(2,700) Daiwa House Industry Co
Ltd HSBC 1,230(4,900) Daiwa Securities Group Inc Citibank (1,435)(1,300) Daiwa Securities Group Inc HSBC (347)(5,900) Daiwa Securities Group Inc JP Morgan (864)2,300 Denso Corp Citibank 6,864
500 Denso Corp JP Morgan 2,087(300) Disco Corp HSBC 2,371900 East Japan Railway Co Citibank 5,104300 East Japan Railway Co HSBC 1,782
Holding Description Counterparty
Netunrealised
appreciation/(depreciation)
USD
Japan continued600 East Japan Railway Co JP Morgan 3,300
(400) Eisai Co Ltd Citibank (3,150)(400) Eisai Co Ltd HSBC (3,324)(600) FANUC Corp JP Morgan (7,279)(100) Fast Retailing Co Ltd HSBC (8,758)(100) Fast Retailing Co Ltd JP Morgan (7,995)(600) FUJIFILM Holdings Corp Citibank (201)(200) FUJIFILM Holdings Corp HSBC 236
1,000 Fujitsu Ltd JP Morgan 5,160(200) Hitachi Chemical Co Ltd HSBC (11)700 Hitachi Ltd HSBC 1,907
2,900 Hitachi Ltd JP Morgan 6,698(1,100) Honda Motor Co Ltd Citibank (2,669)
(100) Honda Motor Co Ltd JP Morgan (229)(400) Hoshizaki Corp JP Morgan (1,673)500 Hoya Corp Citibank 2,557100 Hoya Corp HSBC 221100 Hoya Corp JP Morgan 370
(1,100) Isuzu Motors Ltd Citibank (1,315)(500) Isuzu Motors Ltd HSBC (912)
(5,500) Isuzu Motors Ltd JP Morgan (10,032)(4,900) Japan Airlines Co Ltd Citibank (10,500)(4,100) Japan Airlines Co Ltd HSBC (12,388)
(900) Japan Airlines Co Ltd JP Morgan (2,719)(6,100) Japan Post Holdings Co Ltd Citibank (2,217)
(700) Japan Post Holdings Co Ltd HSBC 332(8,700) Japan Post Holdings Co Ltd JP Morgan 2,863(7,200) JFE Holdings Inc Citibank (5,957)(2,200) JFE Holdings Inc HSBC (1,738)(6,000) JFE Holdings Inc JP Morgan (4,741)
(11,900) Kajima Corp HSBC (7,855)(6,400) Kajima Corp JP Morgan (4,224)1,000 KDDI Corp Citibank 567
300 KDDI Corp HSBC (50)200 KDDI Corp JP Morgan (73)
(100) Keyence Corp HSBC (4,518)(300) Keyence Corp JP Morgan (13,555)(500) Kikkoman Corp JP Morgan (3,068)
(1,000) Kirin Holdings Co Ltd HSBC (1,278)(500) Kirin Holdings Co Ltd JP Morgan (639)
(2,200) Komatsu Ltd Citibank (2,117)(300) Komatsu Ltd HSBC (406)
(4,500) Komatsu Ltd JP Morgan (6,113)(300) Kose Corp Citibank (1,729)(300) Kose Corp JP Morgan (1,088)
(3,000) Kubota Corp Citibank (1,562)(1,000) Kubota Corp HSBC (1,055)(3,600) Kubota Corp JP Morgan (3,799)
900 Kyocera Corp Citibank 2,334800 Kyocera Corp HSBC 338600 Kyocera Corp JP Morgan 156300 Kyowa Kirin Co Ltd Citibank 563300 Kyowa Kirin Co Ltd HSBC 859
1,900 Kyowa Kirin Co Ltd JP Morgan 5,440(300) Line Corp Citibank (84)(900) Line Corp JP Morgan (753)500 MEIJI Holdings Co Ltd Citibank 2,975
1,900 MEIJI Holdings Co Ltd HSBC 9,892200 MEIJI Holdings Co Ltd JP Morgan 769400 Minebea Mitsumi Inc HSBC 259
6,300 Mitsubishi ChemicalHoldings Corp Citibank 2,565
6,600 Mitsubishi ChemicalHoldings Corp HSBC 1,749
1,000 Mitsubishi Electric Corp Citibank 9116,400 Mitsubishi Electric Corp HSBC 4,8055,800 Mitsubishi Electric Corp JP Morgan 4,596(500) Mitsubishi Estate Co Ltd Citibank (365)
(1,500) Mitsubishi Estate Co Ltd HSBC 955
BlackRock Style Advantage Screened Fund continued
The notes on pages 691 to 711 form an integral part of these financial statements.
Annual report and audited financial statements [599]
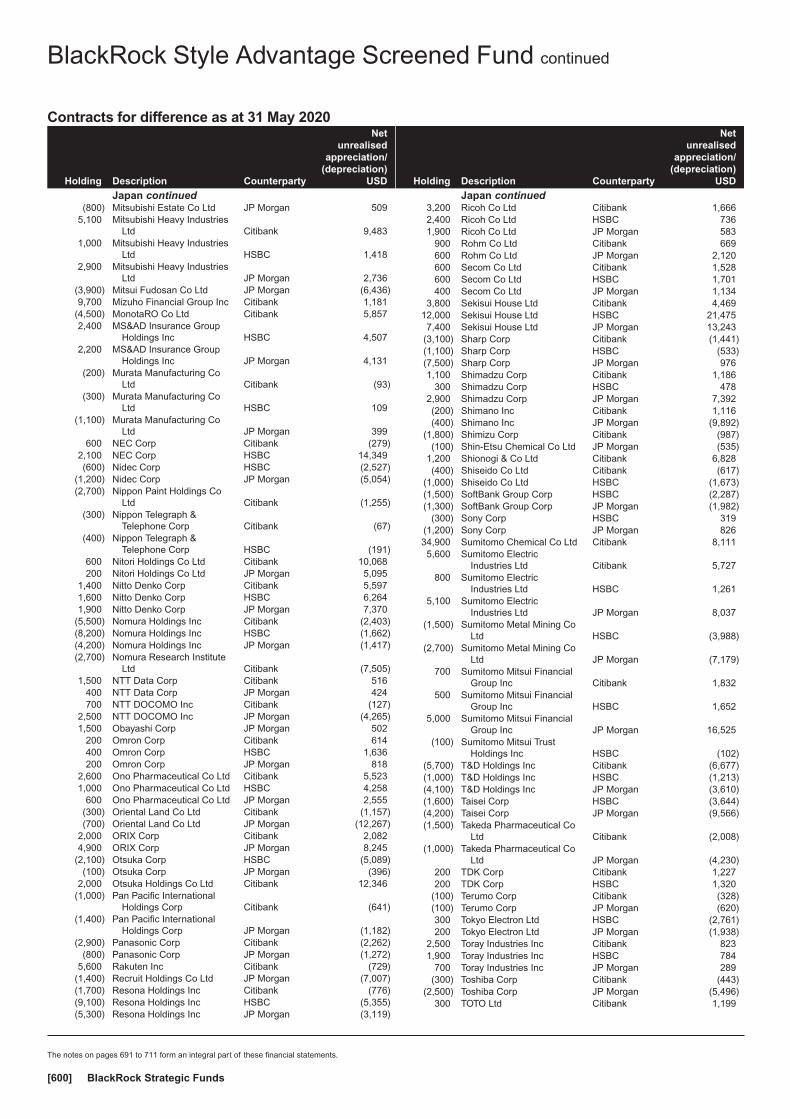
Contracts for difference as at 31 May 2020
Holding Description Counterparty
Netunrealised
appreciation/(depreciation)
USD
Japan continued(800) Mitsubishi Estate Co Ltd JP Morgan 509
5,100 Mitsubishi Heavy IndustriesLtd Citibank 9,483
1,000 Mitsubishi Heavy IndustriesLtd HSBC 1,418
2,900 Mitsubishi Heavy IndustriesLtd JP Morgan 2,736
(3,900) Mitsui Fudosan Co Ltd JP Morgan (6,436)9,700 Mizuho Financial Group Inc Citibank 1,181
(4,500) MonotaRO Co Ltd Citibank 5,8572,400 MS&AD Insurance Group
Holdings Inc HSBC 4,5072,200 MS&AD Insurance Group
Holdings Inc JP Morgan 4,131(200) Murata Manufacturing Co
Ltd Citibank (93)(300) Murata Manufacturing Co
Ltd HSBC 109(1,100) Murata Manufacturing Co
Ltd JP Morgan 399600 NEC Corp Citibank (279)
2,100 NEC Corp HSBC 14,349(600) Nidec Corp HSBC (2,527)
(1,200) Nidec Corp JP Morgan (5,054)(2,700) Nippon Paint Holdings Co
Ltd Citibank (1,255)(300) Nippon Telegraph &
Telephone Corp Citibank (67)(400) Nippon Telegraph &
Telephone Corp HSBC (191)600 Nitori Holdings Co Ltd Citibank 10,068200 Nitori Holdings Co Ltd JP Morgan 5,095
1,400 Nitto Denko Corp Citibank 5,5971,600 Nitto Denko Corp HSBC 6,2641,900 Nitto Denko Corp JP Morgan 7,370
(5,500) Nomura Holdings Inc Citibank (2,403)(8,200) Nomura Holdings Inc HSBC (1,662)(4,200) Nomura Holdings Inc JP Morgan (1,417)(2,700) Nomura Research Institute
Ltd Citibank (7,505)1,500 NTT Data Corp Citibank 516
400 NTT Data Corp JP Morgan 424700 NTT DOCOMO Inc Citibank (127)
2,500 NTT DOCOMO Inc JP Morgan (4,265)1,500 Obayashi Corp JP Morgan 502
200 Omron Corp Citibank 614400 Omron Corp HSBC 1,636200 Omron Corp JP Morgan 818
2,600 Ono Pharmaceutical Co Ltd Citibank 5,5231,000 Ono Pharmaceutical Co Ltd HSBC 4,258
600 Ono Pharmaceutical Co Ltd JP Morgan 2,555(300) Oriental Land Co Ltd Citibank (1,157)(700) Oriental Land Co Ltd JP Morgan (12,267)
2,000 ORIX Corp Citibank 2,0824,900 ORIX Corp JP Morgan 8,245
(2,100) Otsuka Corp HSBC (5,089)(100) Otsuka Corp JP Morgan (396)
2,000 Otsuka Holdings Co Ltd Citibank 12,346(1,000) Pan Pacific International
Holdings Corp Citibank (641)(1,400) Pan Pacific International
Holdings Corp JP Morgan (1,182)(2,900) Panasonic Corp Citibank (2,262)
(800) Panasonic Corp JP Morgan (1,272)5,600 Rakuten Inc Citibank (729)
(1,400) Recruit Holdings Co Ltd JP Morgan (7,007)(1,700) Resona Holdings Inc Citibank (776)(9,100) Resona Holdings Inc HSBC (5,355)(5,300) Resona Holdings Inc JP Morgan (3,119)
Holding Description Counterparty
Netunrealised
appreciation/(depreciation)
USD
Japan continued3,200 Ricoh Co Ltd Citibank 1,6662,400 Ricoh Co Ltd HSBC 7361,900 Ricoh Co Ltd JP Morgan 583
900 Rohm Co Ltd Citibank 669600 Rohm Co Ltd JP Morgan 2,120600 Secom Co Ltd Citibank 1,528600 Secom Co Ltd HSBC 1,701400 Secom Co Ltd JP Morgan 1,134
3,800 Sekisui House Ltd Citibank 4,46912,000 Sekisui House Ltd HSBC 21,4757,400 Sekisui House Ltd JP Morgan 13,243
(3,100) Sharp Corp Citibank (1,441)(1,100) Sharp Corp HSBC (533)(7,500) Sharp Corp JP Morgan 9761,100 Shimadzu Corp Citibank 1,186
300 Shimadzu Corp HSBC 4782,900 Shimadzu Corp JP Morgan 7,392(200) Shimano Inc Citibank 1,116(400) Shimano Inc JP Morgan (9,892)
(1,800) Shimizu Corp Citibank (987)(100) Shin-Etsu Chemical Co Ltd JP Morgan (535)
1,200 Shionogi & Co Ltd Citibank 6,828(400) Shiseido Co Ltd Citibank (617)
(1,000) Shiseido Co Ltd HSBC (1,673)(1,500) SoftBank Group Corp HSBC (2,287)(1,300) SoftBank Group Corp JP Morgan (1,982)
(300) Sony Corp HSBC 319(1,200) Sony Corp JP Morgan 82634,900 Sumitomo Chemical Co Ltd Citibank 8,1115,600 Sumitomo Electric
Industries Ltd Citibank 5,727800 Sumitomo Electric
Industries Ltd HSBC 1,2615,100 Sumitomo Electric
Industries Ltd JP Morgan 8,037(1,500) Sumitomo Metal Mining Co
Ltd HSBC (3,988)(2,700) Sumitomo Metal Mining Co
Ltd JP Morgan (7,179)700 Sumitomo Mitsui Financial
Group Inc Citibank 1,832500 Sumitomo Mitsui Financial
Group Inc HSBC 1,6525,000 Sumitomo Mitsui Financial
Group Inc JP Morgan 16,525(100) Sumitomo Mitsui Trust
Holdings Inc HSBC (102)(5,700) T&D Holdings Inc Citibank (6,677)(1,000) T&D Holdings Inc HSBC (1,213)(4,100) T&D Holdings Inc JP Morgan (3,610)(1,600) Taisei Corp HSBC (3,644)(4,200) Taisei Corp JP Morgan (9,566)(1,500) Takeda Pharmaceutical Co
Ltd Citibank (2,008)(1,000) Takeda Pharmaceutical Co
Ltd JP Morgan (4,230)200 TDK Corp Citibank 1,227200 TDK Corp HSBC 1,320
(100) Terumo Corp Citibank (328)(100) Terumo Corp JP Morgan (620)300 Tokyo Electron Ltd HSBC (2,761)200 Tokyo Electron Ltd JP Morgan (1,938)
2,500 Toray Industries Inc Citibank 8231,900 Toray Industries Inc HSBC 784
700 Toray Industries Inc JP Morgan 289(300) Toshiba Corp Citibank (443)
(2,500) Toshiba Corp JP Morgan (5,496)300 TOTO Ltd Citibank 1,199
BlackRock Style Advantage Screened Fund continued
The notes on pages 691 to 711 form an integral part of these financial statements.
BlackRock Strategic Funds[600]
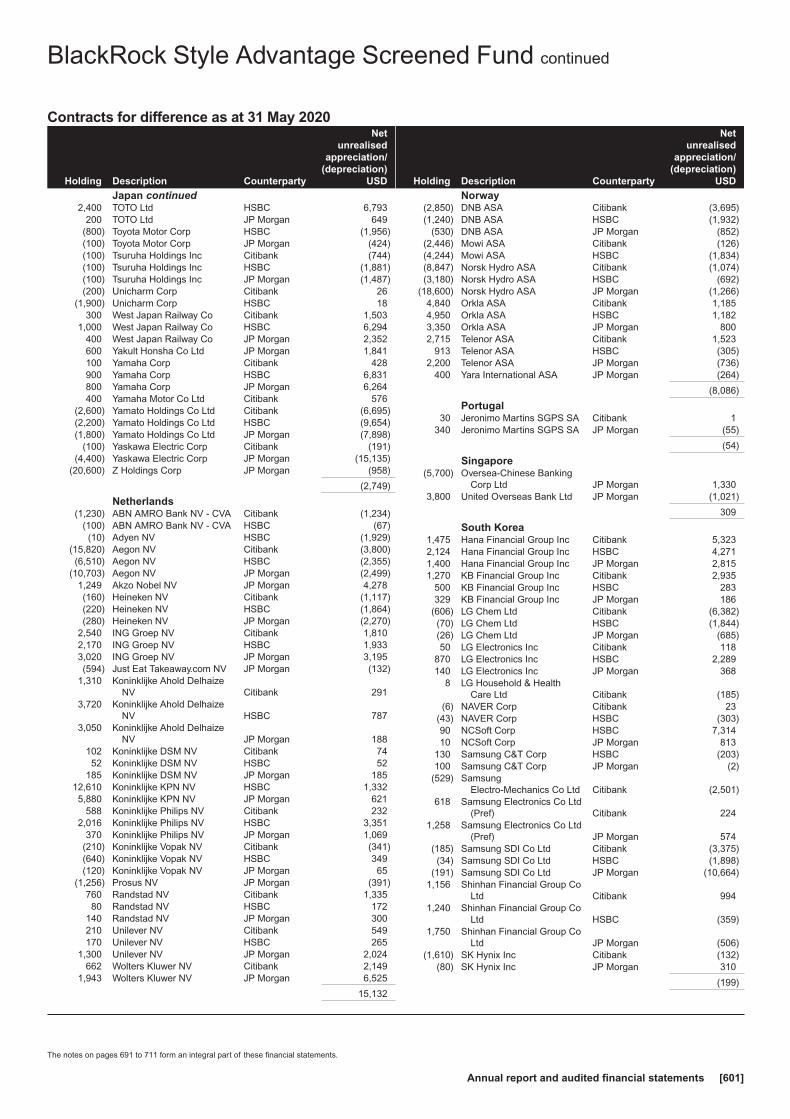
Contracts for difference as at 31 May 2020
Holding Description Counterparty
Netunrealised
appreciation/(depreciation)
USD
Japan continued2,400 TOTO Ltd HSBC 6,793
200 TOTO Ltd JP Morgan 649(800) Toyota Motor Corp HSBC (1,956)(100) Toyota Motor Corp JP Morgan (424)(100) Tsuruha Holdings Inc Citibank (744)(100) Tsuruha Holdings Inc HSBC (1,881)(100) Tsuruha Holdings Inc JP Morgan (1,487)(200) Unicharm Corp Citibank 26
(1,900) Unicharm Corp HSBC 18300 West Japan Railway Co Citibank 1,503
1,000 West Japan Railway Co HSBC 6,294400 West Japan Railway Co JP Morgan 2,352600 Yakult Honsha Co Ltd JP Morgan 1,841100 Yamaha Corp Citibank 428900 Yamaha Corp HSBC 6,831800 Yamaha Corp JP Morgan 6,264400 Yamaha Motor Co Ltd Citibank 576
(2,600) Yamato Holdings Co Ltd Citibank (6,695)(2,200) Yamato Holdings Co Ltd HSBC (9,654)(1,800) Yamato Holdings Co Ltd JP Morgan (7,898)
(100) Yaskawa Electric Corp Citibank (191)(4,400) Yaskawa Electric Corp JP Morgan (15,135)
(20,600) Z Holdings Corp JP Morgan (958)
(2,749)
Netherlands(1,230) ABN AMRO Bank NV - CVA Citibank (1,234)
(100) ABN AMRO Bank NV - CVA HSBC (67)(10) Adyen NV HSBC (1,929)
(15,820) Aegon NV Citibank (3,800)(6,510) Aegon NV HSBC (2,355)
(10,703) Aegon NV JP Morgan (2,499)1,249 Akzo Nobel NV JP Morgan 4,278(160) Heineken NV Citibank (1,117)(220) Heineken NV HSBC (1,864)(280) Heineken NV JP Morgan (2,270)
2,540 ING Groep NV Citibank 1,8102,170 ING Groep NV HSBC 1,9333,020 ING Groep NV JP Morgan 3,195(594) Just Eat Takeaway.com NV JP Morgan (132)
1,310 Koninklijke Ahold DelhaizeNV Citibank 291
3,720 Koninklijke Ahold DelhaizeNV HSBC 787
3,050 Koninklijke Ahold DelhaizeNV JP Morgan 188
102 Koninklijke DSM NV Citibank 7452 Koninklijke DSM NV HSBC 52
185 Koninklijke DSM NV JP Morgan 18512,610 Koninklijke KPN NV HSBC 1,3325,880 Koninklijke KPN NV JP Morgan 621
588 Koninklijke Philips NV Citibank 2322,016 Koninklijke Philips NV HSBC 3,351
370 Koninklijke Philips NV JP Morgan 1,069(210) Koninklijke Vopak NV Citibank (341)(640) Koninklijke Vopak NV HSBC 349(120) Koninklijke Vopak NV JP Morgan 65
(1,256) Prosus NV JP Morgan (391)760 Randstad NV Citibank 1,33580 Randstad NV HSBC 172
140 Randstad NV JP Morgan 300210 Unilever NV Citibank 549170 Unilever NV HSBC 265
1,300 Unilever NV JP Morgan 2,024662 Wolters Kluwer NV Citibank 2,149
1,943 Wolters Kluwer NV JP Morgan 6,525
15,132
Holding Description Counterparty
Netunrealised
appreciation/(depreciation)
USD
Norway(2,850) DNB ASA Citibank (3,695)(1,240) DNB ASA HSBC (1,932)
(530) DNB ASA JP Morgan (852)(2,446) Mowi ASA Citibank (126)(4,244) Mowi ASA HSBC (1,834)(8,847) Norsk Hydro ASA Citibank (1,074)(3,180) Norsk Hydro ASA HSBC (692)
(18,600) Norsk Hydro ASA JP Morgan (1,266)4,840 Orkla ASA Citibank 1,1854,950 Orkla ASA HSBC 1,1823,350 Orkla ASA JP Morgan 8002,715 Telenor ASA Citibank 1,523
913 Telenor ASA HSBC (305)2,200 Telenor ASA JP Morgan (736)
400 Yara International ASA JP Morgan (264)
(8,086)
Portugal30 Jeronimo Martins SGPS SA Citibank 1
340 Jeronimo Martins SGPS SA JP Morgan (55)
(54)
Singapore(5,700) Oversea-Chinese Banking
Corp Ltd JP Morgan 1,3303,800 United Overseas Bank Ltd JP Morgan (1,021)
309
South Korea1,475 Hana Financial Group Inc Citibank 5,3232,124 Hana Financial Group Inc HSBC 4,2711,400 Hana Financial Group Inc JP Morgan 2,8151,270 KB Financial Group Inc Citibank 2,935
500 KB Financial Group Inc HSBC 283329 KB Financial Group Inc JP Morgan 186
(606) LG Chem Ltd Citibank (6,382)(70) LG Chem Ltd HSBC (1,844)(26) LG Chem Ltd JP Morgan (685)50 LG Electronics Inc Citibank 118
870 LG Electronics Inc HSBC 2,289140 LG Electronics Inc JP Morgan 368
8 LG Household & HealthCare Ltd Citibank (185)
(6) NAVER Corp Citibank 23(43) NAVER Corp HSBC (303)90 NCSoft Corp HSBC 7,31410 NCSoft Corp JP Morgan 813
130 Samsung C&T Corp HSBC (203)100 Samsung C&T Corp JP Morgan (2)
(529) SamsungElectro-Mechanics Co Ltd Citibank (2,501)
618 Samsung Electronics Co Ltd(Pref) Citibank 224
1,258 Samsung Electronics Co Ltd(Pref) JP Morgan 574
(185) Samsung SDI Co Ltd Citibank (3,375)(34) Samsung SDI Co Ltd HSBC (1,898)
(191) Samsung SDI Co Ltd JP Morgan (10,664)1,156 Shinhan Financial Group Co
Ltd Citibank 9941,240 Shinhan Financial Group Co
Ltd HSBC (359)1,750 Shinhan Financial Group Co
Ltd JP Morgan (506)(1,610) SK Hynix Inc Citibank (132)
(80) SK Hynix Inc JP Morgan 310
(199)
BlackRock Style Advantage Screened Fund continued
The notes on pages 691 to 711 form an integral part of these financial statements.
Annual report and audited financial statements [601]

Contracts for difference as at 31 May 2020
Holding Description Counterparty
Netunrealised
appreciation/(depreciation)
USD
Spain3,423 ACS Actividades de
Construccion y ServiciosSA HSBC (2,741)
816 ACS Actividades deConstruccion y ServiciosSA JP Morgan (653)
1,387 Industria de Diseno TextilSA Citibank 2,946
1,150 Industria de Diseno TextilSA HSBC 2,499
321 Industria de Diseno TextilSA JP Morgan 692
2,743
Sweden420 Alfa Laval AB Citibank 496
1,080 Alfa Laval AB JP Morgan 724110 Atlas Copco AB ’A’ HSBC 290
(2,560) Boliden AB Citibank 650(1,392) Boliden AB HSBC (825)(1,866) Boliden AB JP Morgan (1,106)
470 Electrolux AB ’B’ Citibank 492(1,610) Epiroc AB ’A’ Citibank (707)(1,270) Epiroc AB ’A’ HSBC (893)(5,162) Epiroc AB ’A’ JP Morgan (1,437)5,820 Essity AB ’B’ HSBC (924)
896 Hennes & Mauritz AB ’B’ Citibank 1,3892,520 Hennes & Mauritz AB ’B’ HSBC 3,0544,374 Hennes & Mauritz AB ’B’ JP Morgan 6,062
(1,538) Hexagon AB ’B’ Citibank (6,006)(795) ICA Gruppen AB HSBC (2,112)(120) ICA Gruppen AB JP Morgan (207)
2,417 Investor AB ’B’ Citibank 6,6761,017 Investor AB ’B’ HSBC 2,3031,110 Sandvik AB Citibank 1,6804,621 Sandvik AB HSBC 3,2281,200 Sandvik AB JP Morgan 1,745
(2,460) Skandinaviska EnskildaBanken AB ’A’ Citibank (1,921)
(2,220) Skandinaviska EnskildaBanken AB ’A’ HSBC (1,541)
440 SKF AB ’B’ HSBC 1,0461,170 SKF AB ’B’ JP Morgan 2,428
(3,458) Svenska Cellulosa AB SCA’B’ Citibank (3,074)
(3,840) Svenska Handelsbanken AB’A’ Citibank (1,073)
(7,490) Svenska Handelsbanken AB’A’ HSBC (1,633)
(430) Svenska Handelsbanken AB’A’ JP Morgan (94)
(4,940) Swedbank AB ’A’ Citibank (7,141)(1,550) Swedbank AB ’A’ HSBC (2,740)(2,090) Swedbank AB ’A’ JP Morgan (2,839)
970 Tele2 AB ’B’ Citibank 467660 Tele2 AB ’B’ HSBC 150550 Tele2 AB ’B’ JP Morgan (55)
(1,460) Telefonaktiebolaget LMEricsson ’B’ HSBC (358)
2,960 Telia Co AB JP Morgan 1245,611 Volvo AB ’B’ Citibank 4,6021,433 Volvo AB ’B’ HSBC 1,5454,220 Volvo AB ’B’ JP Morgan 3,267
5,732
Switzerland(1,450) ABB Ltd RegS Citibank (1,272)(3,624) ABB Ltd RegS HSBC (4,985)
(758) ABB Ltd RegS JP Morgan (1,043)
Holding Description Counterparty
Netunrealised
appreciation/(depreciation)
USD
Switzerland continued270 Adecco Group AG RegS HSBC 1,197100 Adecco Group AG RegS JP Morgan 443
(3,253) Clariant AG RegS Citibank (2,246)(230) Clariant AG RegS JP Morgan 36
(4,160) Credit Suisse Group AGRegS Citibank (3,274)
(3,130) Credit Suisse Group AGRegS HSBC (1,898)
(1,910) Credit Suisse Group AGRegS JP Morgan (1,158)
101 Geberit AG RegS JP Morgan 3,89014 Givaudan SA RegS Citibank 68320 Givaudan SA RegS JP Morgan 3,281
(461) Julius Baer Group Ltd Citibank (1,579)330 Kuehne + Nagel
International AG RegS Citibank 411480 Kuehne + Nagel
International AG RegS HSBC 773620 Kuehne + Nagel
International AG RegS JP Morgan 1,4191,360 LafargeHolcim Ltd RegS Citibank 4,3351,493 LafargeHolcim Ltd RegS HSBC 1,077
610 LafargeHolcim Ltd RegS JP Morgan 1,091(530) Logitech International SA
RegS Citibank (1,475)(180) Logitech International SA
RegS JP Morgan (1,564)(28) Lonza Group AG RegS Citibank 99
(135) Lonza Group AG RegS HSBC (4,681)(133) Lonza Group AG RegS JP Morgan (4,612)245 Nestle SA RegS JP Morgan (392)10 Partners Group Holding AG Citibank 24710 Partners Group Holding AG HSBC 373
827 Roche Holding AG HSBC (3,177)144 Schindler Holding AG Citibank 1,002246 Schindler Holding AG HSBC 2,73320 SGS SA RegS Citibank 1,24610 SGS SA RegS JP Morgan 841
(383) Sika AG RegS Citibank 4,056(220) Sika AG RegS HSBC (104)(50) Sika AG RegS JP Morgan (3)30 Sonova Holding AG RegS Citibank 224
360 Sonova Holding AG RegS HSBC 9,20610 Straumann Holding AG
RegS Citibank 16220 Straumann Holding AG
RegS HSBC 73430 Straumann Holding AG
RegS JP Morgan 1,793115 Swatch Group AG Citibank 1,51066 Swiss Life Holding AG RegS Citibank 1,32925 Swiss Life Holding AG RegS JP Morgan 55
220 Swiss Prime Site AG Citibank (91)660 Swiss Prime Site AG JP Morgan (3,255)
(260) Swiss Re AG Citibank (891)(700) Swiss Re AG JP Morgan 872(70) Swisscom AG RegS Citibank (516)(40) Swisscom AG RegS HSBC 143
(200) Temenos AG RegS Citibank (1,952)(240) Temenos AG RegS HSBC (3,825)(360) Temenos AG RegS JP Morgan (5,737)
(4,120) UBS Group AG RegS Citibank (3,610)(5,650) UBS Group AG RegS HSBC (5,174)(2,660) UBS Group AG RegS JP Morgan (2,021)
(40) Vifor Pharma AG Citibank (145)(60) Vifor Pharma AG HSBC 174(50) Vifor Pharma AG JP Morgan (107)
(250) Zurich Insurance Group AG Citibank (6,099)
BlackRock Style Advantage Screened Fund continued
The notes on pages 691 to 711 form an integral part of these financial statements.
BlackRock Strategic Funds[602]

Contracts for difference as at 31 May 2020
Holding Description Counterparty
Netunrealised
appreciation/(depreciation)
USD
Switzerland continued(40) Zurich Insurance Group AG HSBC (752)(70) Zurich Insurance Group AG JP Morgan (1,872)
(24,075)
Taiwan21,000 Chunghwa Telecom Co Ltd HSBC (78)15,000 Chunghwa Telecom Co Ltd JP Morgan (4)(4,069) Delta Electronics Inc JP Morgan 3593,000 MediaTek Inc JP Morgan 4,956
(28,000) Nanya Technology Corp JP Morgan 4,00510,000 Taiwan Semiconductor
Manufacturing Co Ltd HSBC (2,226)3,000 Taiwan Semiconductor
Manufacturing Co Ltd JP Morgan (687)
6,325
United Kingdom2,130 3i Group Plc Citibank 1104,210 3i Group Plc JP Morgan 3,753(230) Admiral Group Plc Citibank (119)(420) Admiral Group Plc HSBC 498
(1,240) Admiral Group Plc JP Morgan 1,470(570) Antofagasta Plc HSBC (611)
(3,691) Antofagasta Plc JP Morgan (3,957)(580) Ashtead Group Plc HSBC (1,282)(800) Ashtead Group Plc JP Morgan (2,292)
2,396 Associated British Foods Plc JP Morgan 3,388(111) AstraZeneca Plc HSBC (43)(260) AstraZeneca Plc JP Morgan (238)
2,130 Auto Trader Group Plc Citibank 1,0474,180 Auto Trader Group Plc HSBC 3,2994,210 Auto Trader Group Plc JP Morgan 3,323
246 AVEVA Group Plc Citibank 161290 AVEVA Group Plc JP Morgan 330
5,470 Aviva Plc Citibank 95924,882 Aviva Plc HSBC 3,22640,270 Aviva Plc JP Morgan 4,029
(11,510) Barclays Plc HSBC (1,996)(9,430) Barratt Developments Plc HSBC 57(4,180) Barratt Developments Plc JP Morgan 182
290 Berkeley Group HoldingsPlc Citibank 706
840 Berkeley Group HoldingsPlc HSBC (72)
(980) BT Group Plc HSBC (134)(1,401) BT Group Plc JP Morgan (192)5,301 Bunzl Plc Citibank 5,827
810 Bunzl Plc HSBC 1,611490 Bunzl Plc JP Morgan 974
1,390 Burberry Group Plc Citibank 1,725640 Burberry Group Plc JP Morgan 1,455
2,804 Coca-Cola HBC AG Citibank 6,4074,291 Coca-Cola HBC AG JP Morgan 11,0632,190 Compass Group Plc Citibank 1,432
900 Compass Group Plc HSBC (517)5,299 Compass Group Plc JP Morgan (1,791)(110) Croda International Plc JP Morgan (378)(954) DCC Plc HSBC (9,921)410 Diageo Plc Citibank (53)640 Diageo Plc HSBC (59)650 Diageo Plc JP Morgan (431)
(30,847) DS Smith Plc JP Morgan (10,286)(7,951) easyJet Plc Citibank (13,202)
(1) easyJet Plc JP Morgan (1)(100) Experian Plc HSBC (345)(90) Experian Plc JP Morgan (310)
(490) Ferguson Plc HSBC (2,693)(9,050) Fresnillo Plc Citibank 604(3,649) Fresnillo Plc JP Morgan (4,604)
Holding Description Counterparty
Netunrealised
appreciation/(depreciation)
USD
United Kingdom continued2,580 GlaxoSmithKline Plc Citibank 642,764 GlaxoSmithKline Plc HSBC (430)
303 GlaxoSmithKline Plc JP Morgan (47)1,770 Halma Plc HSBC 2,921
(3,390) Hargreaves Lansdown Plc HSBC (11,200)(3,993) Hargreaves Lansdown Plc JP Morgan (13,192)
(538) Hikma Pharmaceuticals Plc HSBC (864)(1,160) Hikma Pharmaceuticals Plc JP Morgan (1,926)
(17,410) HSBC Holdings Plc Citibank 1,247(1,591) HSBC Holdings Plc JP Morgan 743
(180) InterContinental HotelsGroup Plc JP Morgan (1,749)
130 Intertek Group Plc HSBC 1,823(12,850) J Sainsbury Plc HSBC (531)(19,670) J Sainsbury Plc JP Morgan (583)
820 JD Sports Fashion Plc Citibank 8311,570 JD Sports Fashion Plc HSBC 2,088(690) Johnson Matthey Plc HSBC (1,457)
(25,440) Legal & General Group Plc HSBC (1,341)(5,070) Legal & General Group Plc JP Morgan (394)(9,030) Lloyds Banking Group Plc HSBC 21
(80) London Stock ExchangeGroup Plc JP Morgan (140)
(4,181) National Grid Plc HSBC (93)(100) Next Plc HSBC (497)(550) Next Plc JP Morgan (1,397)(515) NMC Health Plc* HSBC 5,969
(2,420) NMC Health Plc* JP Morgan 28,047(2,895) Ocado Group Plc Citibank (4,076)
(360) Ocado Group Plc JP Morgan (1,134)798 Pearson Plc Citibank 53272 Pearson Plc JP Morgan 19
(2,007) Persimmon Plc HSBC (2,132)(2,000) Persimmon Plc JP Morgan (2,124)(9,150) Prudential Plc HSBC 7,354(5,991) Prudential Plc JP Morgan 4,548
(984) Reckitt Benckiser Group Plc HSBC (3,379)(1,165) Reckitt Benckiser Group Plc JP Morgan (4,000)
340 RELX Plc Citibank 86941 RELX Plc HSBC 494
6,670 Rentokil Initial Plc Citibank 478393 Rentokil Initial Plc HSBC 120305 Rightmove Plc Citibank 209
10,811 Rightmove Plc HSBC 8,545477 Rightmove Plc JP Morgan 377
1,080 Rio Tinto Plc Citibank 627667 Rio Tinto Plc HSBC 5,235480 Rio Tinto Plc JP Morgan 3,695
(23,170) Royal Bank of ScotlandGroup Plc HSBC (286)
(6,790) Royal Bank of ScotlandGroup Plc JP Morgan (84)
34,622 RSA Insurance Group Plc Citibank 9,5783,450 RSA Insurance Group Plc JP Morgan 631
830 Sage Group Plc Citibank 1116,701 Sage Group Plc HSBC 3,972
21,391 Sage Group Plc JP Morgan 12,774340 Severn Trent Plc Citibank 281290 Severn Trent Plc JP Morgan (124)
5,107 Smith & Nephew Plc Citibank 568360 Smith & Nephew Plc HSBC 636
2,500 Smith & Nephew Plc JP Morgan 2,166(2,583) Smiths Group Plc HSBC (1,611)
(664) Spirax-Sarco EngineeringPlc HSBC (5,216)
(360) Spirax-Sarco EngineeringPlc JP Morgan (2,828)
(2,471) St James’s Place Plc HSBC (2,576)
BlackRock Style Advantage Screened Fund continued
The notes on pages 691 to 711 form an integral part of these financial statements.
Annual report and audited financial statements [603]

Contracts for difference as at 31 May 2020
Holding Description Counterparty
Netunrealised
appreciation/(depreciation)
USD
United Kingdom continued4,610 Standard Chartered Plc Citibank (393)
800 Standard Chartered Plc HSBC (293)1,390 Standard Chartered Plc JP Morgan (354)
(6,130) Standard Life Aberdeen Plc HSBC (3,316)(5,980) Standard Life Aberdeen Plc JP Morgan (3,235)
(51,180) Taylor Wimpey Plc HSBC 3,3501,710 Unilever Plc Citibank 4,794
14 Unilever Plc JP Morgan 29(460) United Utilities Group Plc HSBC (22)
(1,090) United Utilities Group Plc JP Morgan (165)5,680 Vodafone Group Plc Citibank 2993,470 Vodafone Group Plc JP Morgan 638
(2,050) Whitbread Plc Citibank 2,988(2,043) Whitbread Plc HSBC 7,617
(500) Whitbread Plc JP Morgan 1,002(1,025) Whitbread Plc (Rights) Citibank (12,404)(1,021) Whitbread Plc (Rights) HSBC (12,355)
(250) Whitbread Plc (Rights) JP Morgan (3,025)1,740 WPP Plc JP Morgan 438
28,602
United States(182) 3M Co HSBC (1,125)(451) 3M Co JP Morgan (2,787)(10) Abbott Laboratories Citibank (13)(70) Abbott Laboratories HSBC (211)
(452) Abbott Laboratories JP Morgan 434130 AbbVie Inc Citibank (155)92 AbbVie Inc HSBC 639
(109) ABIOMED Inc HSBC (3,532)(2) ABIOMED Inc JP Morgan (65)
(340) Accenture Plc ’A’ Citibank (1,986)(130) Accenture Plc ’A’ HSBC (1,429)(80) Accenture Plc ’A’ JP Morgan (864)279 Adobe Inc Citibank (711)90 Adobe Inc HSBC 1,964
215 Adobe Inc JP Morgan 3,2094 Advance Auto Parts Inc HSBC 48
100 Advance Auto Parts Inc JP Morgan 1,207(358) Advanced Micro Devices Inc Citibank 823(298) Advanced Micro Devices Inc JP Morgan 95570 AerCap Holdings NV Citibank 1,824410 AerCap Holdings NV HSBC 648440 AerCap Holdings NV JP Morgan 695902 Aflac Inc HSBC (352)394 Aflac Inc JP Morgan (154)540 Agnico Eagle Mines Ltd Citibank (880)400 Agnico Eagle Mines Ltd HSBC (748)80 Air Products and Chemicals
Inc Citibank 53890 Air Products and Chemicals
Inc HSBC 90870 Air Products and Chemicals
Inc JP Morgan 855161 Akamai Technologies Inc Citibank 602220 Akamai Technologies Inc HSBC 987793 Akamai Technologies Inc JP Morgan 2,387
2,080 Alaska Air Group Inc Citibank 5,429420 Alaska Air Group Inc HSBC 3,537
2,370 Alaska Air Group Inc JP Morgan 9,233(298) Albemarle Corp HSBC (3,788)(662) Albemarle Corp JP Morgan (8,414)
24 Align Technology Inc Citibank 132370 Align Technology Inc HSBC 14,663140 Allegion Plc Citibank 644120 Allegion Plc HSBC (406)
1,470 Allstate Corp Citibank 3,036378 Allstate Corp JP Morgan (393)
Holding Description Counterparty
Netunrealised
appreciation/(depreciation)
USD
United States continued8,796 Ally Financial Inc Citibank 15,701
30 Alphabet Inc ’A’ JP Morgan 1,35880 Alphabet Inc ’C’ JP Morgan 3,203
1,330 Amdocs Ltd HSBC (1,849)49 American Express Co JP Morgan 329
115 American Financial GroupInc Citibank 135
468 American Financial GroupInc HSBC (2,228)
70 American Financial GroupInc JP Morgan (333)
(1,313) American InternationalGroup Inc HSBC (3,650)
780 American Water Works CoInc Citibank 2,629
570 American Water Works CoInc HSBC 3,799
376 Ameriprise Financial Inc JP Morgan 5,535(520) AmerisourceBergen Corp Citibank (848)(50) AmerisourceBergen Corp HSBC (334)
(110) AmerisourceBergen Corp JP Morgan (735)96 Amgen Inc HSBC (1,016)
(1,470) Amphenol Corp ’A’ Citibank (5,983)(190) Amphenol Corp ’A’ HSBC (1,009)(120) Amphenol Corp ’A’ JP Morgan (1,571)(660) Analog Devices Inc Citibank (389)(340) Analog Devices Inc HSBC (934)(90) Analog Devices Inc JP Morgan (607)30 ANSYS Inc JP Morgan 884
(70) Anthem Inc HSBC (1,067)(90) Anthem Inc JP Morgan (1,223)150 Aon Plc ’A’ Citibank 96680 Aon Plc ’A’ HSBC 63270 Aon Plc ’A’ JP Morgan 437
(140) Apple Inc Citibank 76(230) Apple Inc HSBC (2,107)(90) Apple Inc JP Morgan (740)850 Applied Materials Inc Citibank 1,250
1,580 Applied Materials Inc HSBC 3,7111,170 Applied Materials Inc JP Morgan 2,707
170 AptarGroup Inc Citibank 932450 AptarGroup Inc HSBC 1,793590 AptarGroup Inc JP Morgan 2,294
(1,468) Aptiv Plc Citibank (2,363)(1,146) Aptiv Plc JP Morgan (8,956)(1,050) Aramark Citibank (2,194)
(340) Aramark JP Morgan (194)790 Arch Capital Group Ltd Citibank 47
1,300 Arch Capital Group Ltd HSBC 3,1331,500 Arch Capital Group Ltd JP Morgan 4,940
(4,853) Archer-Daniels-Midland Co Citibank (15,627)(450) Archer-Daniels-Midland Co HSBC (2,157)
(1,674) Archer-Daniels-Midland Co JP Morgan (3,700)(273) Arista Networks Inc Citibank (1,865)(299) Arista Networks Inc HSBC (2,688)(280) Arrow Electronics Inc Citibank (302)(150) Arrow Electronics Inc HSBC (1,051)
70 Arthur J Gallagher & Co JP Morgan 57270 Assurant Inc HSBC 287
100 Assurant Inc JP Morgan 410(58) Atlassian Corp Plc ’A’ Citibank 48
(125) Atlassian Corp Plc ’A’ HSBC (726)(362) Atlassian Corp Plc ’A’ JP Morgan (2,024)540 Atmos Energy Corp Citibank 2,068210 Atmos Energy Corp HSBC 1,014260 Atmos Energy Corp JP Morgan 1,25670 Autodesk Inc Citibank 480
BlackRock Style Advantage Screened Fund continued
The notes on pages 691 to 711 form an integral part of these financial statements.
BlackRock Strategic Funds[604]
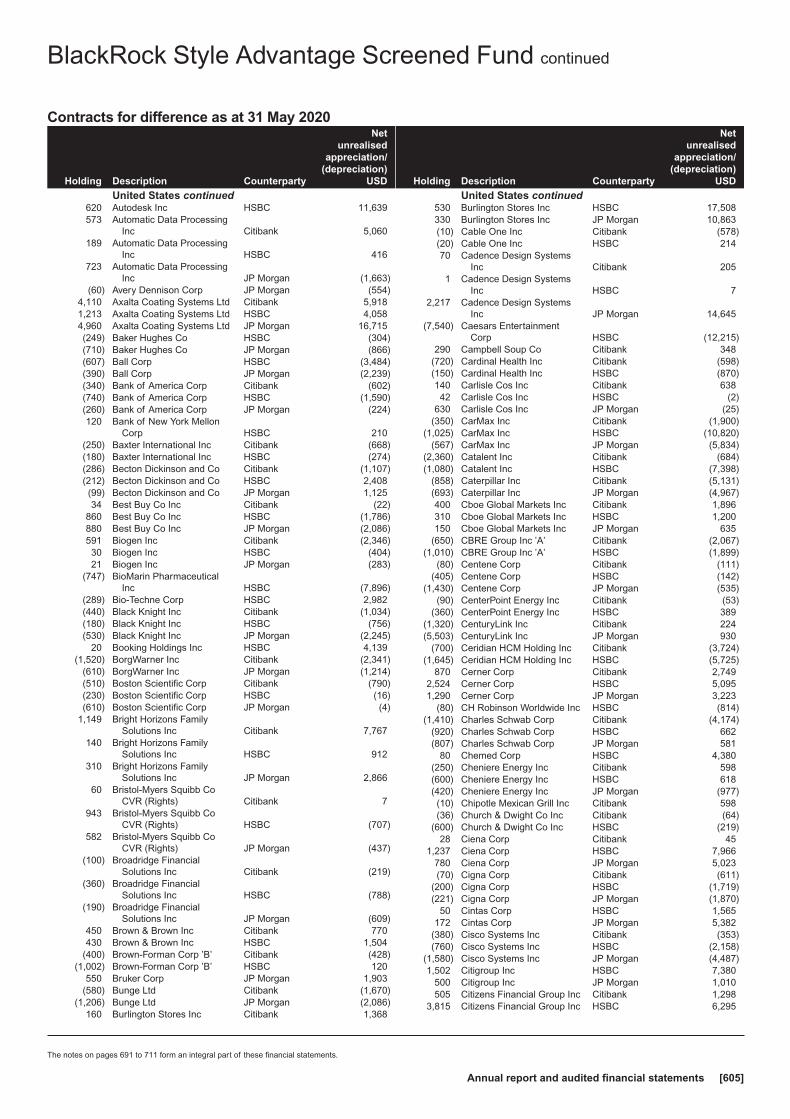
Contracts for difference as at 31 May 2020
Holding Description Counterparty
Netunrealised
appreciation/(depreciation)
USD
United States continued620 Autodesk Inc HSBC 11,639573 Automatic Data Processing
Inc Citibank 5,060189 Automatic Data Processing
Inc HSBC 416723 Automatic Data Processing
Inc JP Morgan (1,663)(60) Avery Dennison Corp JP Morgan (554)
4,110 Axalta Coating Systems Ltd Citibank 5,9181,213 Axalta Coating Systems Ltd HSBC 4,0584,960 Axalta Coating Systems Ltd JP Morgan 16,715(249) Baker Hughes Co HSBC (304)(710) Baker Hughes Co JP Morgan (866)(607) Ball Corp HSBC (3,484)(390) Ball Corp JP Morgan (2,239)(340) Bank of America Corp Citibank (602)(740) Bank of America Corp HSBC (1,590)(260) Bank of America Corp JP Morgan (224)120 Bank of New York Mellon
Corp HSBC 210(250) Baxter International Inc Citibank (668)(180) Baxter International Inc HSBC (274)(286) Becton Dickinson and Co Citibank (1,107)(212) Becton Dickinson and Co HSBC 2,408(99) Becton Dickinson and Co JP Morgan 1,12534 Best Buy Co Inc Citibank (22)
860 Best Buy Co Inc HSBC (1,786)880 Best Buy Co Inc JP Morgan (2,086)591 Biogen Inc Citibank (2,346)30 Biogen Inc HSBC (404)21 Biogen Inc JP Morgan (283)
(747) BioMarin PharmaceuticalInc HSBC (7,896)
(289) Bio-Techne Corp HSBC 2,982(440) Black Knight Inc Citibank (1,034)(180) Black Knight Inc HSBC (756)(530) Black Knight Inc JP Morgan (2,245)
20 Booking Holdings Inc HSBC 4,139(1,520) BorgWarner Inc Citibank (2,341)
(610) BorgWarner Inc JP Morgan (1,214)(510) Boston Scientific Corp Citibank (790)(230) Boston Scientific Corp HSBC (16)(610) Boston Scientific Corp JP Morgan (4)
1,149 Bright Horizons FamilySolutions Inc Citibank 7,767
140 Bright Horizons FamilySolutions Inc HSBC 912
310 Bright Horizons FamilySolutions Inc JP Morgan 2,866
60 Bristol-Myers Squibb CoCVR (Rights) Citibank 7
943 Bristol-Myers Squibb CoCVR (Rights) HSBC (707)
582 Bristol-Myers Squibb CoCVR (Rights) JP Morgan (437)
(100) Broadridge FinancialSolutions Inc Citibank (219)
(360) Broadridge FinancialSolutions Inc HSBC (788)
(190) Broadridge FinancialSolutions Inc JP Morgan (609)
450 Brown & Brown Inc Citibank 770430 Brown & Brown Inc HSBC 1,504
(400) Brown-Forman Corp ’B’ Citibank (428)(1,002) Brown-Forman Corp ’B’ HSBC 120
550 Bruker Corp JP Morgan 1,903(580) Bunge Ltd Citibank (1,670)
(1,206) Bunge Ltd JP Morgan (2,086)160 Burlington Stores Inc Citibank 1,368
Holding Description Counterparty
Netunrealised
appreciation/(depreciation)
USD
United States continued530 Burlington Stores Inc HSBC 17,508330 Burlington Stores Inc JP Morgan 10,863(10) Cable One Inc Citibank (578)(20) Cable One Inc HSBC 21470 Cadence Design Systems
Inc Citibank 2051 Cadence Design Systems
Inc HSBC 72,217 Cadence Design Systems
Inc JP Morgan 14,645(7,540) Caesars Entertainment
Corp HSBC (12,215)290 Campbell Soup Co Citibank 348
(720) Cardinal Health Inc Citibank (598)(150) Cardinal Health Inc HSBC (870)140 Carlisle Cos Inc Citibank 63842 Carlisle Cos Inc HSBC (2)
630 Carlisle Cos Inc JP Morgan (25)(350) CarMax Inc Citibank (1,900)
(1,025) CarMax Inc HSBC (10,820)(567) CarMax Inc JP Morgan (5,834)
(2,360) Catalent Inc Citibank (684)(1,080) Catalent Inc HSBC (7,398)
(858) Caterpillar Inc Citibank (5,131)(693) Caterpillar Inc JP Morgan (4,967)400 Cboe Global Markets Inc Citibank 1,896310 Cboe Global Markets Inc HSBC 1,200150 Cboe Global Markets Inc JP Morgan 635
(650) CBRE Group Inc ’A’ Citibank (2,067)(1,010) CBRE Group Inc ’A’ HSBC (1,899)
(80) Centene Corp Citibank (111)(405) Centene Corp HSBC (142)
(1,430) Centene Corp JP Morgan (535)(90) CenterPoint Energy Inc Citibank (53)
(360) CenterPoint Energy Inc HSBC 389(1,320) CenturyLink Inc Citibank 224(5,503) CenturyLink Inc JP Morgan 930
(700) Ceridian HCM Holding Inc Citibank (3,724)(1,645) Ceridian HCM Holding Inc HSBC (5,725)
870 Cerner Corp Citibank 2,7492,524 Cerner Corp HSBC 5,0951,290 Cerner Corp JP Morgan 3,223
(80) CH Robinson Worldwide Inc HSBC (814)(1,410) Charles Schwab Corp Citibank (4,174)
(920) Charles Schwab Corp HSBC 662(807) Charles Schwab Corp JP Morgan 581
80 Chemed Corp HSBC 4,380(250) Cheniere Energy Inc Citibank 598(600) Cheniere Energy Inc HSBC 618(420) Cheniere Energy Inc JP Morgan (977)(10) Chipotle Mexican Grill Inc Citibank 598(36) Church & Dwight Co Inc Citibank (64)
(600) Church & Dwight Co Inc HSBC (219)28 Ciena Corp Citibank 45
1,237 Ciena Corp HSBC 7,966780 Ciena Corp JP Morgan 5,023(70) Cigna Corp Citibank (611)
(200) Cigna Corp HSBC (1,719)(221) Cigna Corp JP Morgan (1,870)
50 Cintas Corp HSBC 1,565172 Cintas Corp JP Morgan 5,382
(380) Cisco Systems Inc Citibank (353)(760) Cisco Systems Inc HSBC (2,158)
(1,580) Cisco Systems Inc JP Morgan (4,487)1,502 Citigroup Inc HSBC 7,380
500 Citigroup Inc JP Morgan 1,010505 Citizens Financial Group Inc Citibank 1,298
3,815 Citizens Financial Group Inc HSBC 6,295
BlackRock Style Advantage Screened Fund continued
The notes on pages 691 to 711 form an integral part of these financial statements.
Annual report and audited financial statements [605]

Contracts for difference as at 31 May 2020
Holding Description Counterparty
Netunrealised
appreciation/(depreciation)
USD
United States continued1,577 Citizens Financial Group Inc JP Morgan 2,602
140 Citrix Systems Inc Citibank 1,03250 Citrix Systems Inc HSBC (48)
665 Citrix Systems Inc JP Morgan (4,369)(155) Clorox Co Citibank (916)140 CME Group Inc HSBC (175)180 CME Group Incπ JP Morgan —
(290) Coca-Cola Co Citibank (458)(145) Coca-Cola Co HSBC (73)(150) Coca-Cola European
Partners Plc Citibank (269)(216) Coca-Cola European
Partners Plc HSBC 207(130) Coca-Cola European
Partners Plc JP Morgan 125(1,095) Cognex Corp Citibank 2,650
(460) Cognex Corp HSBC (796)(420) Cognex Corp JP Morgan (727)290 Cognizant Technology
Solutions Corp ’A’ Citibank 441351 Cognizant Technology
Solutions Corp ’A’ JP Morgan (1,471)350 Colgate-Palmolive Co Citibank 494100 Colgate-Palmolive Co HSBC 279310 Colgate-Palmolive Co JP Morgan 1,113290 Columbia Sportswear Co Citibank 1,053100 Columbia Sportswear Co HSBC 1,256340 Columbia Sportswear Co JP Morgan 2,530150 Comcast Corp ’A’ JP Morgan 577340 Comerica Inc Citibank 1,367
1,429 Comerica Inc HSBC 3,973(1,360) Commerce Bancshares Inc Citibank (4,678)
(350) Commerce Bancshares Inc HSBC (2,018)(415) Commerce Bancshares Inc JP Morgan (1,946)
(3,105) Conagra Brands Inc Citibank (3,757)(80) Consolidated Edison Inc Citibank (246)
(130) Consolidated Edison Inc HSBC (328)60 Cooper Cos Inc HSBC 1,265
(270) Copart Inc Citibank (691)(580) Copart Inc JP Morgan (2,912)(800) Corning Inc Citibank (1,168)
(1,040) Corning Inc HSBC (1,269)(1,465) Corning Inc JP Morgan (1,787)
60 Costco Wholesale Corp Citibank 16530 Costco Wholesale Corp HSBC (23)
110 Costco Wholesale Corp JP Morgan (132)(160) Coupa Software Inc Citibank 339(231) Coupa Software Inc JP Morgan (7,271)470 Crown Holdings Inc Citibank 1,321250 Crown Holdings Inc JP Morgan 937
(430) CSX Corp Citibank (899)(180) CSX Corp JP Morgan (812)539 Cummins Inc HSBC 4,329330 Cummins Inc JP Morgan 2,475(90) CVS Health Corp JP Morgan (384)
(810) Danaher Corp Citibank (5,864)(499) Danaher Corp HSBC (2,031)(10) Danaher Corp JP Morgan (41)80 Darden Restaurants Inc Citibank 204
388 Darden Restaurants Inc HSBC 2,08080 Darden Restaurants Inc JP Morgan 1,000
470 DaVita Inc Citibank 1,231410 DaVita Inc JP Morgan (545)(20) Deere & Co Citibank (166)
(838) Deere & Co HSBC (10,048)(90) Deere & Co JP Morgan (2,029)
(560) Dell Technologies Inc ’C’ Citibank (3,430)(620) Dell Technologies Inc ’C’ HSBC (3,438)
(1,180) Dell Technologies Inc ’C’ JP Morgan (6,867)
Holding Description Counterparty
Netunrealised
appreciation/(depreciation)
USD
United States continued990 Delta Air Lines Inc Citibank 2,178760 Delta Air Lines Inc HSBC 2,013
3,400 Delta Air Lines Inc JP Morgan 9,7721,070 DENTSPLY SIRONA Inc Citibank 4,077
500 DENTSPLY SIRONA Inc HSBC 2,7001,620 DENTSPLY SIRONA Inc JP Morgan 10,773
(49) DexCom Inc HSBC 1,740792 Discover Financial Services Citibank 6,589
1,698 Discover Financial Services HSBC 11,171567 Discover Financial Services JP Morgan 3,442
(658) DocuSign Inc Citibank (2,454)20 Domino’s Pizza Inc HSBC 8310 Domino’s Pizza Inc JP Morgan 42
1,275 Dover Corp Citibank 8,772691 Dover Corp HSBC 3,054
(1,190) DR Horton Inc JP Morgan (7,949)1,190 Dunkin’ Brands Group Inc Citibank 4171,320 Dunkin’ Brands Group Inc HSBC (1,011)
660 Dunkin’ Brands Group Inc JP Morgan (713)(1,120) DuPont de Nemours Inc Citibank (1,277)(1,102) DuPont de Nemours Inc HSBC (3,196)
(530) DuPont de Nemours Inc JP Morgan (2,285)(850) DXC Technology Co HSBC 2,559(900) East West Bancorp Inc HSBC (723)(900) East West Bancorp Inc JP Morgan (743)(240) Eaton Corp Plc JP Morgan (254)
1,648 eBay Inc Citibank 1,6151,448 eBay Inc HSBC 3,301
506 eBay Inc JP Morgan 1,15430 Ecolab Inc Citibank 247
120 Ecolab Inc JP Morgan 1,486(1,009) Edison International Citibank (1,362)
(312) Edison International HSBC (228)(630) Edison International JP Morgan (460)820 Edwards Lifesciences Corp Citibank 3,65780 Edwards Lifesciences Corp JP Morgan 434
(4,580) Elanco Animal Health Inc Citibank (10,168)(1,770) Elanco Animal Health Inc HSBC (2,336)(3,204) Elanco Animal Health Inc JP Morgan (4,572)1,088 Electronic Arts Inc HSBC 4,907
283 Eli Lilly and Co HSBC (419)400 Emerson Electric Co HSBC 2,415691 Emerson Electric Co JP Morgan 2,841
(540) Entegris Inc Citibank (427)(158) Entegris Inc JP Morgan (409)(190) EPAM Systems Inc Citibank (1,826)(140) EPAM Systems Inc HSBC (1,286)(40) EPAM Systems Inc JP Morgan (1,070)
(1,090) Equifax Inc HSBC (5,406)1,343 Equitable Holdings Inc Citibank 1,813
(70) Essential Utilities Inc Citibank (147)(2,950) Essential Utilities Inc HSBC (8,348)
(40) Estee Lauder Cos Inc ’A’ Citibank (632)(260) Estee Lauder Cos Inc ’A’ HSBC (5,880)(120) Estee Lauder Cos Inc ’A’ JP Morgan (2,707)260 Eversource Energy HSBC 1,030100 Eversource Energy JP Morgan 396
1,769 Exelon Corp Citibank 1,698170 Exelon Corp JP Morgan 386380 Expedia Group Inc HSBC 3,249
1,009 Expeditors International ofWashington Inc Citibank 3,118
1,960 Expeditors International ofWashington Inc HSBC 627
220 F5 Networks Inc Citibank 975310 F5 Networks Inc HSBC (2,257)120 F5 Networks Inc JP Morgan (874)50 Facebook Inc ’A’ Citibank (421)
BlackRock Style Advantage Screened Fund continued
The notes on pages 691 to 711 form an integral part of these financial statements.
BlackRock Strategic Funds[606]
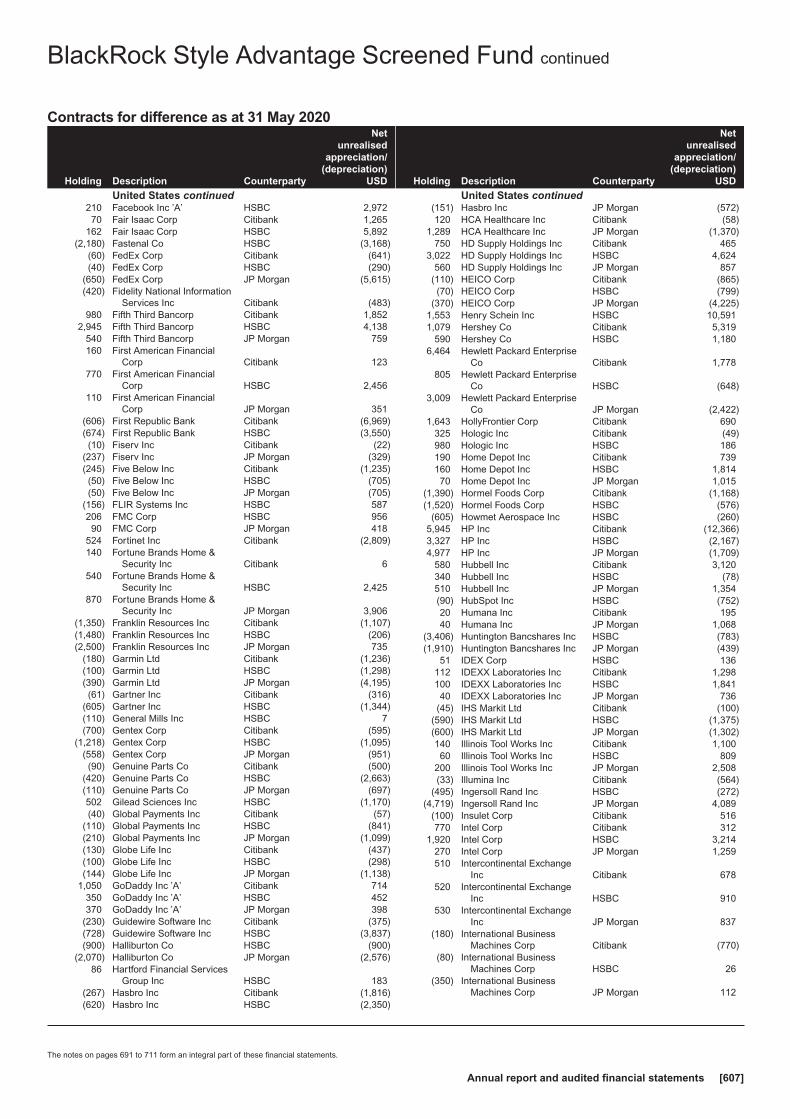
Contracts for difference as at 31 May 2020
Holding Description Counterparty
Netunrealised
appreciation/(depreciation)
USD
United States continued210 Facebook Inc ’A’ HSBC 2,97270 Fair Isaac Corp Citibank 1,265
162 Fair Isaac Corp HSBC 5,892(2,180) Fastenal Co HSBC (3,168)
(60) FedEx Corp Citibank (641)(40) FedEx Corp HSBC (290)
(650) FedEx Corp JP Morgan (5,615)(420) Fidelity National Information
Services Inc Citibank (483)980 Fifth Third Bancorp Citibank 1,852
2,945 Fifth Third Bancorp HSBC 4,138540 Fifth Third Bancorp JP Morgan 759160 First American Financial
Corp Citibank 123770 First American Financial
Corp HSBC 2,456110 First American Financial
Corp JP Morgan 351(606) First Republic Bank Citibank (6,969)(674) First Republic Bank HSBC (3,550)(10) Fiserv Inc Citibank (22)
(237) Fiserv Inc JP Morgan (329)(245) Five Below Inc Citibank (1,235)(50) Five Below Inc HSBC (705)(50) Five Below Inc JP Morgan (705)
(156) FLIR Systems Inc HSBC 587206 FMC Corp HSBC 95690 FMC Corp JP Morgan 418
524 Fortinet Inc Citibank (2,809)140 Fortune Brands Home &
Security Inc Citibank 6540 Fortune Brands Home &
Security Inc HSBC 2,425870 Fortune Brands Home &
Security Inc JP Morgan 3,906(1,350) Franklin Resources Inc Citibank (1,107)(1,480) Franklin Resources Inc HSBC (206)(2,500) Franklin Resources Inc JP Morgan 735
(180) Garmin Ltd Citibank (1,236)(100) Garmin Ltd HSBC (1,298)(390) Garmin Ltd JP Morgan (4,195)(61) Gartner Inc Citibank (316)
(605) Gartner Inc HSBC (1,344)(110) General Mills Inc HSBC 7(700) Gentex Corp Citibank (595)
(1,218) Gentex Corp HSBC (1,095)(558) Gentex Corp JP Morgan (951)(90) Genuine Parts Co Citibank (500)
(420) Genuine Parts Co HSBC (2,663)(110) Genuine Parts Co JP Morgan (697)502 Gilead Sciences Inc HSBC (1,170)(40) Global Payments Inc Citibank (57)
(110) Global Payments Inc HSBC (841)(210) Global Payments Inc JP Morgan (1,099)(130) Globe Life Inc Citibank (437)(100) Globe Life Inc HSBC (298)(144) Globe Life Inc JP Morgan (1,138)
1,050 GoDaddy Inc ’A’ Citibank 714350 GoDaddy Inc ’A’ HSBC 452370 GoDaddy Inc ’A’ JP Morgan 398
(230) Guidewire Software Inc Citibank (375)(728) Guidewire Software Inc HSBC (3,837)(900) Halliburton Co HSBC (900)
(2,070) Halliburton Co JP Morgan (2,576)86 Hartford Financial Services
Group Inc HSBC 183(267) Hasbro Inc Citibank (1,816)(620) Hasbro Inc HSBC (2,350)
Holding Description Counterparty
Netunrealised
appreciation/(depreciation)
USD
United States continued(151) Hasbro Inc JP Morgan (572)120 HCA Healthcare Inc Citibank (58)
1,289 HCA Healthcare Inc JP Morgan (1,370)750 HD Supply Holdings Inc Citibank 465
3,022 HD Supply Holdings Inc HSBC 4,624560 HD Supply Holdings Inc JP Morgan 857
(110) HEICO Corp Citibank (865)(70) HEICO Corp HSBC (799)
(370) HEICO Corp JP Morgan (4,225)1,553 Henry Schein Inc HSBC 10,5911,079 Hershey Co Citibank 5,319
590 Hershey Co HSBC 1,1806,464 Hewlett Packard Enterprise
Co Citibank 1,778805 Hewlett Packard Enterprise
Co HSBC (648)3,009 Hewlett Packard Enterprise
Co JP Morgan (2,422)1,643 HollyFrontier Corp Citibank 690
325 Hologic Inc Citibank (49)980 Hologic Inc HSBC 186190 Home Depot Inc Citibank 739160 Home Depot Inc HSBC 1,81470 Home Depot Inc JP Morgan 1,015
(1,390) Hormel Foods Corp Citibank (1,168)(1,520) Hormel Foods Corp HSBC (576)
(605) Howmet Aerospace Inc HSBC (260)5,945 HP Inc Citibank (12,366)3,327 HP Inc HSBC (2,167)4,977 HP Inc JP Morgan (1,709)
580 Hubbell Inc Citibank 3,120340 Hubbell Inc HSBC (78)510 Hubbell Inc JP Morgan 1,354(90) HubSpot Inc HSBC (752)20 Humana Inc Citibank 19540 Humana Inc JP Morgan 1,068
(3,406) Huntington Bancshares Inc HSBC (783)(1,910) Huntington Bancshares Inc JP Morgan (439)
51 IDEX Corp HSBC 136112 IDEXX Laboratories Inc Citibank 1,298100 IDEXX Laboratories Inc HSBC 1,84140 IDEXX Laboratories Inc JP Morgan 736
(45) IHS Markit Ltd Citibank (100)(590) IHS Markit Ltd HSBC (1,375)(600) IHS Markit Ltd JP Morgan (1,302)140 Illinois Tool Works Inc Citibank 1,10060 Illinois Tool Works Inc HSBC 809
200 Illinois Tool Works Inc JP Morgan 2,508(33) Illumina Inc Citibank (564)
(495) Ingersoll Rand Inc HSBC (272)(4,719) Ingersoll Rand Inc JP Morgan 4,089
(100) Insulet Corp Citibank 516770 Intel Corp Citibank 312
1,920 Intel Corp HSBC 3,214270 Intel Corp JP Morgan 1,259510 Intercontinental Exchange
Inc Citibank 678520 Intercontinental Exchange
Inc HSBC 910530 Intercontinental Exchange
Inc JP Morgan 837(180) International Business
Machines Corp Citibank (770)(80) International Business
Machines Corp HSBC 26(350) International Business
Machines Corp JP Morgan 112
BlackRock Style Advantage Screened Fund continued
The notes on pages 691 to 711 form an integral part of these financial statements.
Annual report and audited financial statements [607]

Contracts for difference as at 31 May 2020
Holding Description Counterparty
Netunrealised
appreciation/(depreciation)
USD
United States continued(120) International Flavors &
Fragrances Inc Citibank (360)(1,334) International Flavors &
Fragrances Inc HSBC 2,058(199) International Flavors &
Fragrances Inc JP Morgan 85(420) International Paper Co Citibank (630)(240) International Paper Co HSBC 50(160) International Paper Co JP Morgan (227)696 Interpublic Group of Cos Inc JP Morgan (348)369 Intuit Inc Citibank (856)410 Intuit Inc HSBC 2,06980 Intuit Inc JP Morgan 394
(690) Invesco Ltd Citibank (417)(3,885) Invesco Ltd HSBC (854)
(650) Invesco Ltd JP Morgan (286)130 Ionis Pharmaceuticals Inc Citibank 257280 Ionis Pharmaceuticals Inc HSBC 574150 Ionis Pharmaceuticals Inc JP Morgan 308
(336) IQVIA Holdings Inc Citibank (1,529)(80) Jack Henry & Associates
Inc Citibank 634(120) Jack Henry & Associates
Inc HSBC 507200 Jazz Pharmaceuticals Plc Citibank 1,970130 Jazz Pharmaceuticals Plc HSBC 1,170124 Jazz Pharmaceuticals Plc JP Morgan 866
(190) JM Smucker Co JP Morgan 880140 Johnson & Johnson HSBC (175)192 Johnson & Johnson JP Morgan (240)
(320) Johnson ControlsInternational Plc Citibank (563)
(60) Jones Lang LaSalle Inc HSBC 175710 Juniper Networks Inc Citibank 334910 Juniper Networks Inc HSBC (46)688 Juniper Networks Inc JP Morgan (34)130 Kansas City Southern Citibank 469
(1,400) Keurig Dr Pepper Inc HSBC (2,212)(470) Keurig Dr Pepper Inc JP Morgan (743)
(2,210) KeyCorp HSBC (1,072)340 Keysight Technologies Inc Citibank 1,506210 Keysight Technologies Inc HSBC 1,218220 Keysight Technologies Inc JP Morgan 1,276
(178) Kimberly-Clark Corp HSBC (470)(33) Kimberly-Clark Corp JP Morgan (87)(20) KLA Corp HSBC (119)530 Kohl’s Corp Citibank 912470 Kohl’s Corp HSBC 470
(645) Kraft Heinz Co Citibank (39)(1,370) Kraft Heinz Co HSBC (617)(3,098) Kraft Heinz Co JP Morgan (1,394)
190 Kroger Co HSBC (411)(190) Laboratory Corp of America
Holdings Citibank (845)(110) Laboratory Corp of America
Holdings HSBC (810)(160) Laboratory Corp of America
Holdings JP Morgan (1,176)148 Lam Research Corp Citibank 1,675138 Lam Research Corp HSBC 974280 Lamb Weston Holdings Inc Citibank 22790 Lamb Weston Holdings Inc JP Morgan (316)
(2,190) Las Vegas Sands Corp Citibank (1,818)(330) Las Vegas Sands Corp HSBC 1,059
(1,775) Lennar Corp ’A’ HSBC (13,337)(70) Lennar Corp ’A’ JP Morgan (467)(50) Lennox International Inc Citibank (616)(20) Lennox International Inc HSBC (385)
Holding Description Counterparty
Netunrealised
appreciation/(depreciation)
USD
United States continued(150) Lennox International Inc JP Morgan (2,890)110 Liberty Broadband Corp Citibank 961160 Liberty Broadband Corp HSBC 1,566
(1,880) Lincoln National Corp Citibank (5,621)(390) Lincoln National Corp JP Morgan (523)160 Linde Plc Citibank 1,645210 Linde Plc HSBC 2,675190 Linde Plc JP Morgan 3,444
(1,051) Live Nation EntertainmentInc HSBC (6,558)
270 LKQ Corp Citibank 506831 LKQ Corp HSBC 773
(460) Loews Corp Citibank (584)(520) Loews Corp JP Morgan (1,441)
70 LPL Financial Holdings Inc Citibank 287110 LPL Financial Holdings Inc HSBC 635
1,560 LPL Financial Holdings Inc JP Morgan 9,00180 Lululemon Athletica Inc Citibank 992
(540) LyondellBasell IndustriesNV ’A’ Citibank (1,312)
(130) LyondellBasell IndustriesNV ’A’ JP Morgan (1,324)
70 M&T Bank Corp Citibank 5291,962 Magna International Inc Citibank 4,159
785 Magna International Inc HSBC 1,5152,400 Magna International Inc JP Morgan 6,136(670) Marathon Petroleum Corp HSBC (1,099)(530) Marathon Petroleum Corp JP Morgan (869)(30) Markel Corp Citibank (1,295)30 MarketAxess Holdings Inc Citibank 32630 MarketAxess Holdings Inc HSBC 266
150 Marsh & McLennan Cos Inc Citibank 186370 Marsh & McLennan Cos Inc HSBC 588180 Marsh & McLennan Cos Inc JP Morgan 184(30) Martin Marietta Materials
Inc Citibank (410)(50) Martin Marietta Materials
Inc HSBC (838)(130) Martin Marietta Materials
Inc JP Morgan (2,707)(5,263) Marvell Technology Group
Ltd Citibank (13,605)(1,064) Marvell Technology Group
Ltd HSBC (6,240)(1,090) Marvell Technology Group
Ltd JP Morgan (7,185)130 Masco Corp Citibank 142581 Masco Corp HSBC 2,190
1,626 Masco Corp JP Morgan 6,512840 Maxim Integrated Products
Inc Citibank 613680 Maxim Integrated Products
Inc HSBC 1,856(80) McCormick & Co Inc Citibank (69)(54) McCormick & Co Inc HSBC (470)(40) McCormick & Co Inc JP Morgan (156)(50) McDonald’s Corp HSBC (793)(62) McDonald’s Corp JP Morgan (417)(40) McKesson Corp HSBC (1,104)(40) McKesson Corp JP Morgan (716)
(220) Medtronic Plc Citibank (517)(17) Medtronic Plc HSBC 33(20) Medtronic Plc JP Morgan 39
2,240 Merck & Co Inc JP Morgan 6,541(160) MetLife Inc HSBC (747)(230) MetLife Inc JP Morgan (1,041)
28 Mettler-Toledo InternationalInc Citibank 1,257
BlackRock Style Advantage Screened Fund continued
The notes on pages 691 to 711 form an integral part of these financial statements.
BlackRock Strategic Funds[608]
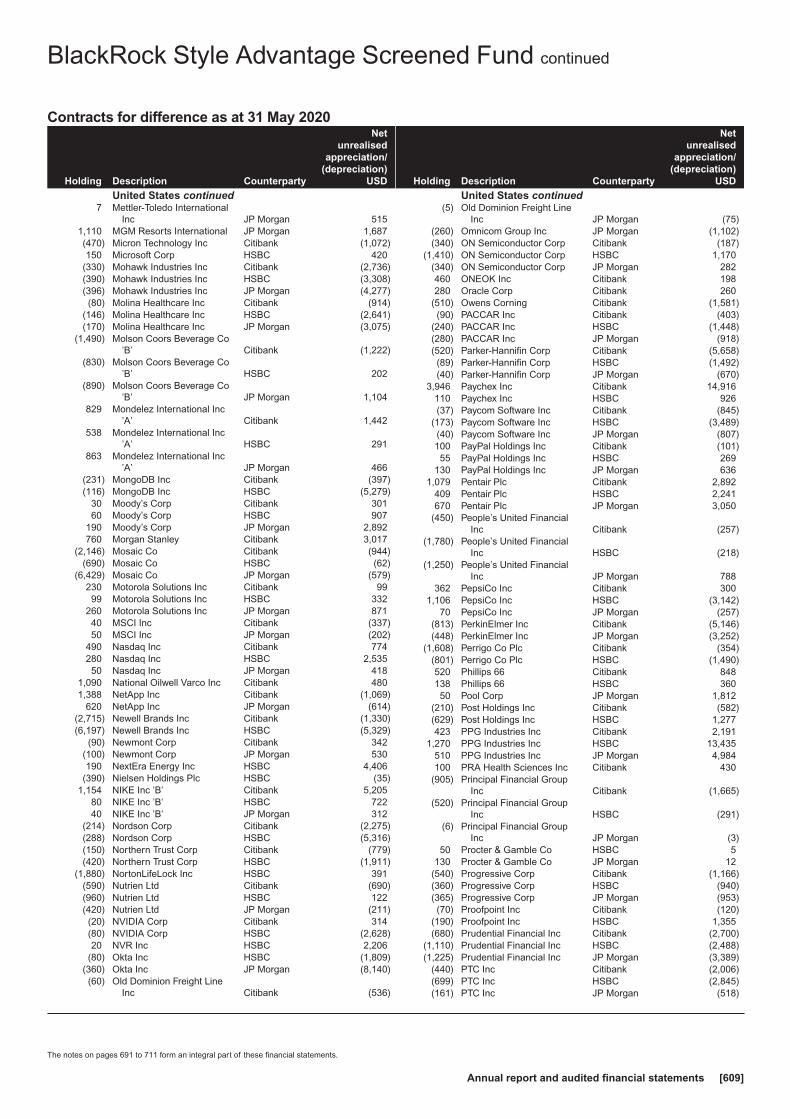
Contracts for difference as at 31 May 2020
Holding Description Counterparty
Netunrealised
appreciation/(depreciation)
USD
United States continued7 Mettler-Toledo International
Inc JP Morgan 5151,110 MGM Resorts International JP Morgan 1,687(470) Micron Technology Inc Citibank (1,072)150 Microsoft Corp HSBC 420
(330) Mohawk Industries Inc Citibank (2,736)(390) Mohawk Industries Inc HSBC (3,308)(396) Mohawk Industries Inc JP Morgan (4,277)(80) Molina Healthcare Inc Citibank (914)
(146) Molina Healthcare Inc HSBC (2,641)(170) Molina Healthcare Inc JP Morgan (3,075)
(1,490) Molson Coors Beverage Co’B’ Citibank (1,222)
(830) Molson Coors Beverage Co’B’ HSBC 202
(890) Molson Coors Beverage Co’B’ JP Morgan 1,104
829 Mondelez International Inc’A’ Citibank 1,442
538 Mondelez International Inc’A’ HSBC 291
863 Mondelez International Inc’A’ JP Morgan 466
(231) MongoDB Inc Citibank (397)(116) MongoDB Inc HSBC (5,279)
30 Moody’s Corp Citibank 30160 Moody’s Corp HSBC 907
190 Moody’s Corp JP Morgan 2,892760 Morgan Stanley Citibank 3,017
(2,146) Mosaic Co Citibank (944)(690) Mosaic Co HSBC (62)
(6,429) Mosaic Co JP Morgan (579)230 Motorola Solutions Inc Citibank 9999 Motorola Solutions Inc HSBC 332
260 Motorola Solutions Inc JP Morgan 87140 MSCI Inc Citibank (337)50 MSCI Inc JP Morgan (202)
490 Nasdaq Inc Citibank 774280 Nasdaq Inc HSBC 2,53550 Nasdaq Inc JP Morgan 418
1,090 National Oilwell Varco Inc Citibank 4801,388 NetApp Inc Citibank (1,069)
620 NetApp Inc JP Morgan (614)(2,715) Newell Brands Inc Citibank (1,330)(6,197) Newell Brands Inc HSBC (5,329)
(90) Newmont Corp Citibank 342(100) Newmont Corp JP Morgan 530190 NextEra Energy Inc HSBC 4,406
(390) Nielsen Holdings Plc HSBC (35)1,154 NIKE Inc ’B’ Citibank 5,205
80 NIKE Inc ’B’ HSBC 72240 NIKE Inc ’B’ JP Morgan 312
(214) Nordson Corp Citibank (2,275)(288) Nordson Corp HSBC (5,316)(150) Northern Trust Corp Citibank (779)(420) Northern Trust Corp HSBC (1,911)
(1,880) NortonLifeLock Inc HSBC 391(590) Nutrien Ltd Citibank (690)(960) Nutrien Ltd HSBC 122(420) Nutrien Ltd JP Morgan (211)(20) NVIDIA Corp Citibank 314(80) NVIDIA Corp HSBC (2,628)20 NVR Inc HSBC 2,206
(80) Okta Inc HSBC (1,809)(360) Okta Inc JP Morgan (8,140)(60) Old Dominion Freight Line
Inc Citibank (536)
Holding Description Counterparty
Netunrealised
appreciation/(depreciation)
USD
United States continued(5) Old Dominion Freight Line
Inc JP Morgan (75)(260) Omnicom Group Inc JP Morgan (1,102)(340) ON Semiconductor Corp Citibank (187)
(1,410) ON Semiconductor Corp HSBC 1,170(340) ON Semiconductor Corp JP Morgan 282460 ONEOK Inc Citibank 198280 Oracle Corp Citibank 260
(510) Owens Corning Citibank (1,581)(90) PACCAR Inc Citibank (403)
(240) PACCAR Inc HSBC (1,448)(280) PACCAR Inc JP Morgan (918)(520) Parker-Hannifin Corp Citibank (5,658)(89) Parker-Hannifin Corp HSBC (1,492)(40) Parker-Hannifin Corp JP Morgan (670)
3,946 Paychex Inc Citibank 14,916110 Paychex Inc HSBC 926(37) Paycom Software Inc Citibank (845)
(173) Paycom Software Inc HSBC (3,489)(40) Paycom Software Inc JP Morgan (807)100 PayPal Holdings Inc Citibank (101)55 PayPal Holdings Inc HSBC 269
130 PayPal Holdings Inc JP Morgan 6361,079 Pentair Plc Citibank 2,892
409 Pentair Plc HSBC 2,241670 Pentair Plc JP Morgan 3,050
(450) People’s United FinancialInc Citibank (257)
(1,780) People’s United FinancialInc HSBC (218)
(1,250) People’s United FinancialInc JP Morgan 788
362 PepsiCo Inc Citibank 3001,106 PepsiCo Inc HSBC (3,142)
70 PepsiCo Inc JP Morgan (257)(813) PerkinElmer Inc Citibank (5,146)(448) PerkinElmer Inc JP Morgan (3,252)
(1,608) Perrigo Co Plc Citibank (354)(801) Perrigo Co Plc HSBC (1,490)520 Phillips 66 Citibank 848138 Phillips 66 HSBC 36050 Pool Corp JP Morgan 1,812
(210) Post Holdings Inc Citibank (582)(629) Post Holdings Inc HSBC 1,277423 PPG Industries Inc Citibank 2,191
1,270 PPG Industries Inc HSBC 13,435510 PPG Industries Inc JP Morgan 4,984100 PRA Health Sciences Inc Citibank 430
(905) Principal Financial GroupInc Citibank (1,665)
(520) Principal Financial GroupInc HSBC (291)
(6) Principal Financial GroupInc JP Morgan (3)
50 Procter & Gamble Co HSBC 5130 Procter & Gamble Co JP Morgan 12
(540) Progressive Corp Citibank (1,166)(360) Progressive Corp HSBC (940)(365) Progressive Corp JP Morgan (953)(70) Proofpoint Inc Citibank (120)
(190) Proofpoint Inc HSBC 1,355(680) Prudential Financial Inc Citibank (2,700)
(1,110) Prudential Financial Inc HSBC (2,488)(1,225) Prudential Financial Inc JP Morgan (3,389)
(440) PTC Inc Citibank (2,006)(699) PTC Inc HSBC (2,845)(161) PTC Inc JP Morgan (518)
BlackRock Style Advantage Screened Fund continued
The notes on pages 691 to 711 form an integral part of these financial statements.
Annual report and audited financial statements [609]
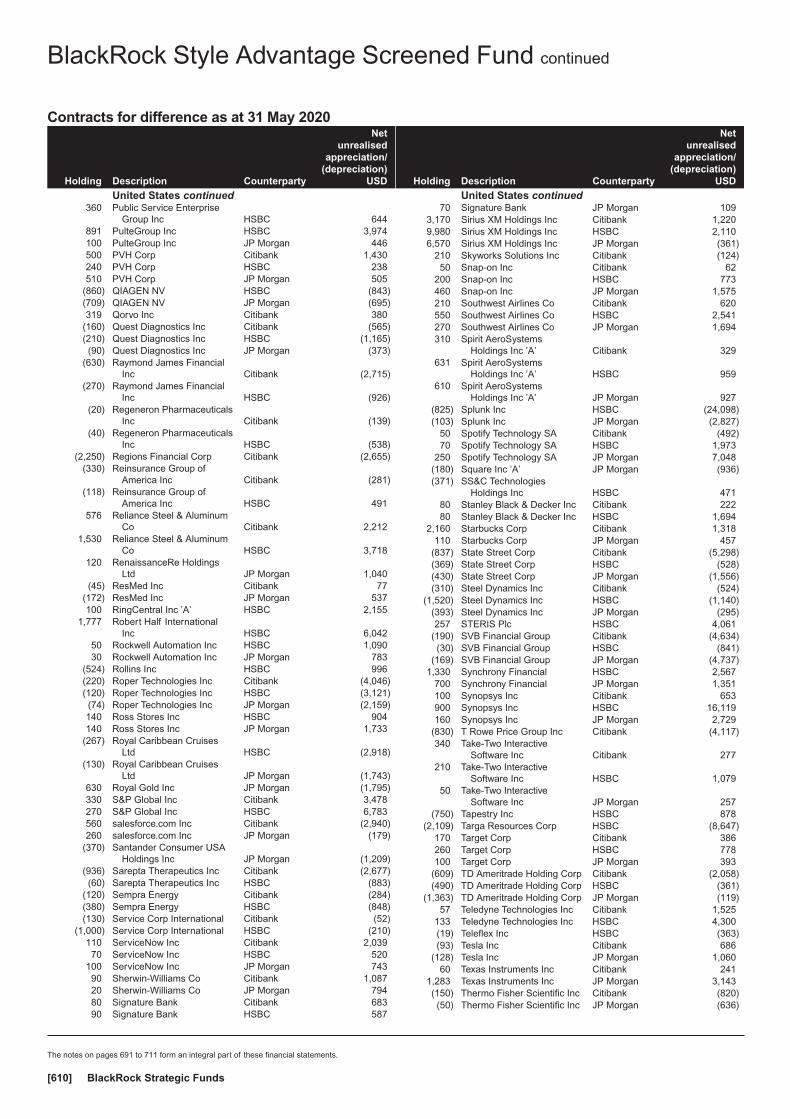
Contracts for difference as at 31 May 2020
Holding Description Counterparty
Netunrealised
appreciation/(depreciation)
USD
United States continued360 Public Service Enterprise
Group Inc HSBC 644891 PulteGroup Inc HSBC 3,974100 PulteGroup Inc JP Morgan 446500 PVH Corp Citibank 1,430240 PVH Corp HSBC 238510 PVH Corp JP Morgan 505
(860) QIAGEN NV HSBC (843)(709) QIAGEN NV JP Morgan (695)319 Qorvo Inc Citibank 380
(160) Quest Diagnostics Inc Citibank (565)(210) Quest Diagnostics Inc HSBC (1,165)(90) Quest Diagnostics Inc JP Morgan (373)
(630) Raymond James FinancialInc Citibank (2,715)
(270) Raymond James FinancialInc HSBC (926)
(20) Regeneron PharmaceuticalsInc Citibank (139)
(40) Regeneron PharmaceuticalsInc HSBC (538)
(2,250) Regions Financial Corp Citibank (2,655)(330) Reinsurance Group of
America Inc Citibank (281)(118) Reinsurance Group of
America Inc HSBC 491576 Reliance Steel & Aluminum
Co Citibank 2,2121,530 Reliance Steel & Aluminum
Co HSBC 3,718120 RenaissanceRe Holdings
Ltd JP Morgan 1,040(45) ResMed Inc Citibank 77
(172) ResMed Inc JP Morgan 537100 RingCentral Inc ’A’ HSBC 2,155
1,777 Robert Half InternationalInc HSBC 6,042
50 Rockwell Automation Inc HSBC 1,09030 Rockwell Automation Inc JP Morgan 783
(524) Rollins Inc HSBC 996(220) Roper Technologies Inc Citibank (4,046)(120) Roper Technologies Inc HSBC (3,121)(74) Roper Technologies Inc JP Morgan (2,159)140 Ross Stores Inc HSBC 904140 Ross Stores Inc JP Morgan 1,733
(267) Royal Caribbean CruisesLtd HSBC (2,918)
(130) Royal Caribbean CruisesLtd JP Morgan (1,743)
630 Royal Gold Inc JP Morgan (1,795)330 S&P Global Inc Citibank 3,478270 S&P Global Inc HSBC 6,783560 salesforce.com Inc Citibank (2,940)260 salesforce.com Inc JP Morgan (179)
(370) Santander Consumer USAHoldings Inc JP Morgan (1,209)
(936) Sarepta Therapeutics Inc Citibank (2,677)(60) Sarepta Therapeutics Inc HSBC (883)
(120) Sempra Energy Citibank (284)(380) Sempra Energy HSBC (848)(130) Service Corp International Citibank (52)
(1,000) Service Corp International HSBC (210)110 ServiceNow Inc Citibank 2,03970 ServiceNow Inc HSBC 520
100 ServiceNow Inc JP Morgan 74390 Sherwin-Williams Co Citibank 1,08720 Sherwin-Williams Co JP Morgan 79480 Signature Bank Citibank 68390 Signature Bank HSBC 587
Holding Description Counterparty
Netunrealised
appreciation/(depreciation)
USD
United States continued70 Signature Bank JP Morgan 109
3,170 Sirius XM Holdings Inc Citibank 1,2209,980 Sirius XM Holdings Inc HSBC 2,1106,570 Sirius XM Holdings Inc JP Morgan (361)
210 Skyworks Solutions Inc Citibank (124)50 Snap-on Inc Citibank 62
200 Snap-on Inc HSBC 773460 Snap-on Inc JP Morgan 1,575210 Southwest Airlines Co Citibank 620550 Southwest Airlines Co HSBC 2,541270 Southwest Airlines Co JP Morgan 1,694310 Spirit AeroSystems
Holdings Inc ’A’ Citibank 329631 Spirit AeroSystems
Holdings Inc ’A’ HSBC 959610 Spirit AeroSystems
Holdings Inc ’A’ JP Morgan 927(825) Splunk Inc HSBC (24,098)(103) Splunk Inc JP Morgan (2,827)
50 Spotify Technology SA Citibank (492)70 Spotify Technology SA HSBC 1,973
250 Spotify Technology SA JP Morgan 7,048(180) Square Inc ’A’ JP Morgan (936)(371) SS&C Technologies
Holdings Inc HSBC 47180 Stanley Black & Decker Inc Citibank 22280 Stanley Black & Decker Inc HSBC 1,694
2,160 Starbucks Corp Citibank 1,318110 Starbucks Corp JP Morgan 457
(837) State Street Corp Citibank (5,298)(369) State Street Corp HSBC (528)(430) State Street Corp JP Morgan (1,556)(310) Steel Dynamics Inc Citibank (524)
(1,520) Steel Dynamics Inc HSBC (1,140)(393) Steel Dynamics Inc JP Morgan (295)257 STERIS Plc HSBC 4,061
(190) SVB Financial Group Citibank (4,634)(30) SVB Financial Group HSBC (841)
(169) SVB Financial Group JP Morgan (4,737)1,330 Synchrony Financial HSBC 2,567
700 Synchrony Financial JP Morgan 1,351100 Synopsys Inc Citibank 653900 Synopsys Inc HSBC 16,119160 Synopsys Inc JP Morgan 2,729
(830) T Rowe Price Group Inc Citibank (4,117)340 Take-Two Interactive
Software Inc Citibank 277210 Take-Two Interactive
Software Inc HSBC 1,07950 Take-Two Interactive
Software Inc JP Morgan 257(750) Tapestry Inc HSBC 878
(2,109) Targa Resources Corp HSBC (8,647)170 Target Corp Citibank 386260 Target Corp HSBC 778100 Target Corp JP Morgan 393
(609) TD Ameritrade Holding Corp Citibank (2,058)(490) TD Ameritrade Holding Corp HSBC (361)
(1,363) TD Ameritrade Holding Corp JP Morgan (119)57 Teledyne Technologies Inc Citibank 1,525
133 Teledyne Technologies Inc HSBC 4,300(19) Teleflex Inc HSBC (363)(93) Tesla Inc Citibank 686
(128) Tesla Inc JP Morgan 1,06060 Texas Instruments Inc Citibank 241
1,283 Texas Instruments Inc JP Morgan 3,143(150) Thermo Fisher Scientific Inc Citibank (820)(50) Thermo Fisher Scientific Inc JP Morgan (636)
BlackRock Style Advantage Screened Fund continued
The notes on pages 691 to 711 form an integral part of these financial statements.
BlackRock Strategic Funds[610]

Contracts for difference as at 31 May 2020
Holding Description Counterparty
Netunrealised
appreciation/(depreciation)
USD
United States continued(260) Thomson Reuters Corp Citibank (273)(280) Thomson Reuters Corp HSBC (298)(270) Thomson Reuters Corp JP Morgan 259(480) Tiffany & Co HSBC 370(306) Tiffany & Co JP Morgan 264
1,322 TJX Cos Inc Citibank 3171,260 TJX Cos Inc HSBC 6,476
934 TJX Cos Inc JP Morgan 6,100634 Tractor Supply Co HSBC 8,166490 Tractor Supply Co JP Morgan 6,311362 Trane Technologies Plc Citibank 2,277
(109) TransUnion HSBC (689)(190) Travelers Cos Inc HSBC (1,714)(500) Trimble Inc Citibank 45(409) Trimble Inc HSBC (916)
(2,765) Truist Financial Corp Citibank (10,866)(889) Truist Financial Corp HSBC (871)(460) Truist Financial Corp JP Morgan (1,468)(280) Twilio Inc ’A’ Citibank 3,713(270) Twilio Inc ’A’ HSBC (4,231)
(2,340) Twitter Inc Citibank 4,633(250) Twitter Inc HSBC (438)
(1,560) Twitter Inc JP Morgan (1,483)(111) Tyler Technologies Inc HSBC (5,302)(20) Tyson Foods Inc ’A’ Citibank (27)
(210) Tyson Foods Inc ’A’ HSBC (34)480 UGI Corp HSBC 16870 Ulta Beauty Inc Citibank 1,068
120 Ulta Beauty Inc HSBC 69690 Ulta Beauty Inc JP Morgan 1,685
(60) Union Pacific Corp Citibank (259)(570) Union Pacific Corp HSBC (6,395)(110) Union Pacific Corp JP Morgan (1,234)330 United Parcel Service Inc ’B’ HSBC 1,824
(205) United Rentals Inc Citibank (1,218)(260) United Rentals Inc HSBC (4,399)(192) United Rentals Inc JP Morgan (3,249)(190) UnitedHealth Group Inc Citibank (2,607)(20) UnitedHealth Group Inc HSBC (333)
(110) UnitedHealth Group Inc JP Morgan (1,690)(90) Universal Display Corp Citibank (80)(40) Universal Display Corp JP Morgan 72570 US Foods Holding Corp HSBC (382)
1,530 US Foods Holding Corp JP Morgan (1,025)(123) Vail Resorts Inc HSBC (2,405)(220) Valero Energy Corp HSBC (128)(120) Varian Medical Systems Inc JP Morgan (490)(60) Veeva Systems Inc ’A’ HSBC (785)(40) Veeva Systems Inc ’A’ JP Morgan (760)806 VeriSign Inc HSBC 3,829152 VeriSign Inc JP Morgan 722(50) Verisk Analytics Inc Citibank (682)
(210) Verisk Analytics Inc HSBC (2,383)(92) Verisk Analytics Inc JP Morgan (1,044)
1,300 Verizon CommunicationsInc HSBC (2,132)
390 Verizon CommunicationsInc JP Morgan (640)
379 Vertex Pharmaceuticals Inc Citibank (1,156)(630) VF Corp Citibank (832)(740) VF Corp HSBC 940
(3,510) ViacomCBS Inc ’B’ Citibank (3,510)(240) ViacomCBS Inc ’B’ HSBC (602)
(2,790) ViacomCBS Inc ’B’ JP Morgan (7,003)(300) Visa Inc ’A’ Citibank (948)590 Voya Financial Inc HSBC (319)
(150) Vulcan Materials Co Citibank (1,326)(340) Vulcan Materials Co JP Morgan (3,059)
Holding Description Counterparty
Netunrealised
appreciation/(depreciation)
USD
United States continued130 Walgreens Boots Alliance
Inc JP Morgan 343(2,852) Walt Disney Co Citibank 5,675
(620) Walt Disney Co HSBC (4,259)(90) Walt Disney Co JP Morgan (1,130)80 Waste Management Inc Citibank 598
280 Waste Management Inc HSBC 2,335130 Waters Corp Citibank 1,686130 Waters Corp HSBC 1,874420 Waters Corp JP Morgan 5,769287 West Pharmaceutical
Services Inc Citibank (221)360 West Pharmaceutical
Services Inc HSBC 3,83880 West Pharmaceutical
Services Inc JP Morgan 8531,260 Western Digital Corp HSBC (1,749)
762 Western Union Co JP Morgan 110(760) Westrock Co Citibank (2,060)
(2,048) Westrock Co HSBC (2,458)(860) Westrock Co JP Morgan (1,820)(260) WEX Inc Citibank (2,176)
(3) WEX Inc HSBC (40)(60) Whirlpool Corp Citibank (17)380 Williams Cos Inc Citibank 5350 Willis Towers Watson Plc JP Morgan 394
350 Woodward Inc Citibank 2,13590 Woodward Inc HSBC 550
150 Workday Inc ’A’ Citibank 1,980310 Workday Inc ’A’ HSBC 5,346110 Workday Inc ’A’ JP Morgan 2,276130 WW Grainger Inc Citibank 2,067
1,722 Xerox Holdings Corp Citibank (1,446)675 Xerox Holdings Corp HSBC (1,343)
1,544 Xerox Holdings Corp JP Morgan (3,073)(130) Xilinx Inc Citibank (465)(260) Xylem Inc Citibank (1,071)
(1,444) Xylem Inc HSBC (4,823)(219) Xylem Inc JP Morgan (731)
40 Zebra Technologies Corp ’A’ Citibank 58430 Zebra Technologies Corp ’A’ HSBC 1,184
(75) Zendesk Inc Citibank (170)(22) Zendesk Inc JP Morgan (139)34 Zions Bancorp NA Citibank 104
2,702 Zions Bancorp NA HSBC 6,836515 Zions Bancorp NA JP Morgan 1,303
(804) Zoetis Inc HSBC (10,099)(110) Zoetis Inc JP Morgan (1,498)
(1,065) Zscaler Inc HSBC (18,701)
(18,025)
Total (Gross underlying exposure - USD 69,892,262) 3,313
* These securities were valued in consultation with the Investment Advisers. These securitieswere fair valued or suspended at financial year end as detailed in Note 2(a).
π Amounts which are less than 0.5 USD have been rounded down to zero.
BlackRock Style Advantage Screened Fund continued
The notes on pages 691 to 711 form an integral part of these financial statements.
Annual report and audited financial statements [611]
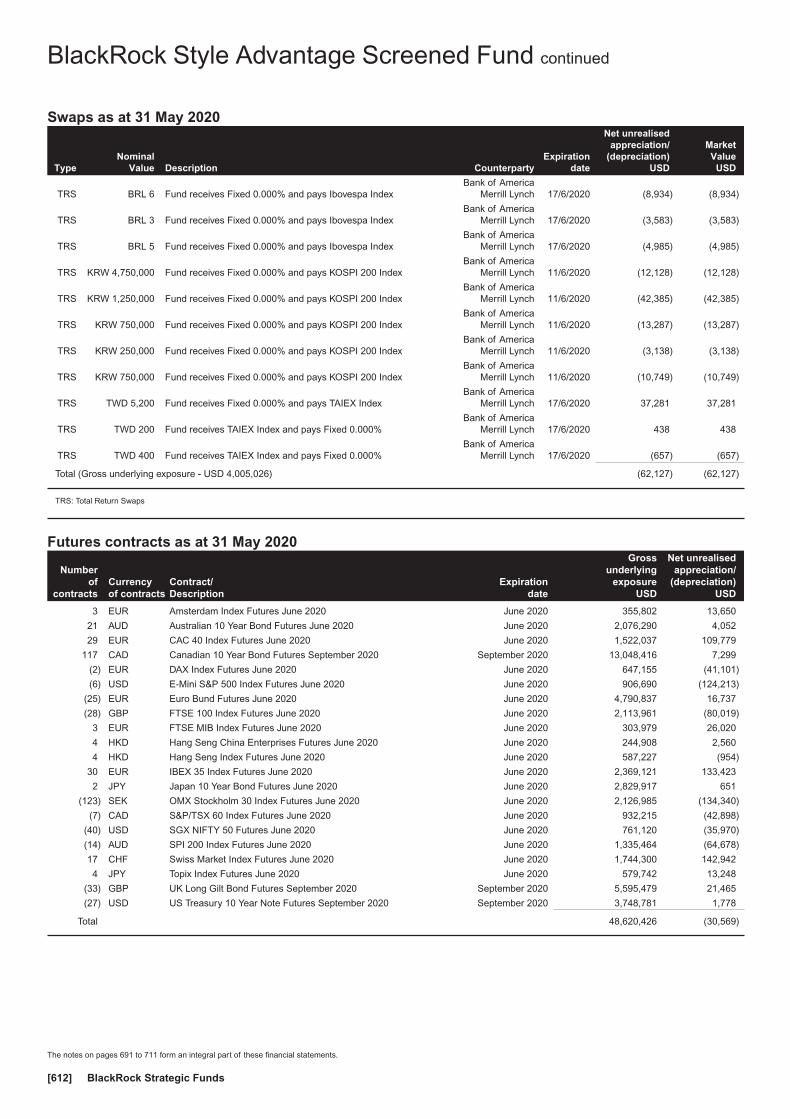
Swaps as at 31 May 2020
TypeNominal
Value Description CounterpartyExpiration
date
Net unrealisedappreciation/
(depreciation)USD
MarketValue
USD
TRS BRL 6 Fund receives Fixed 0.000% and pays Ibovespa IndexBank of America
Merrill Lynch 17/6/2020 (8,934) (8,934)
TRS BRL 3 Fund receives Fixed 0.000% and pays Ibovespa IndexBank of America
Merrill Lynch 17/6/2020 (3,583) (3,583)
TRS BRL 5 Fund receives Fixed 0.000% and pays Ibovespa IndexBank of America
Merrill Lynch 17/6/2020 (4,985) (4,985)
TRS KRW 4,750,000 Fund receives Fixed 0.000% and pays KOSPI 200 IndexBank of America
Merrill Lynch 11/6/2020 (12,128) (12,128)
TRS KRW 1,250,000 Fund receives Fixed 0.000% and pays KOSPI 200 IndexBank of America
Merrill Lynch 11/6/2020 (42,385) (42,385)
TRS KRW 750,000 Fund receives Fixed 0.000% and pays KOSPI 200 IndexBank of America
Merrill Lynch 11/6/2020 (13,287) (13,287)
TRS KRW 250,000 Fund receives Fixed 0.000% and pays KOSPI 200 IndexBank of America
Merrill Lynch 11/6/2020 (3,138) (3,138)
TRS KRW 750,000 Fund receives Fixed 0.000% and pays KOSPI 200 IndexBank of America
Merrill Lynch 11/6/2020 (10,749) (10,749)
TRS TWD 5,200 Fund receives Fixed 0.000% and pays TAIEX IndexBank of America
Merrill Lynch 17/6/2020 37,281 37,281
TRS TWD 200 Fund receives TAIEX Index and pays Fixed 0.000%Bank of America
Merrill Lynch 17/6/2020 438 438
TRS TWD 400 Fund receives TAIEX Index and pays Fixed 0.000%Bank of America
Merrill Lynch 17/6/2020 (657) (657)
Total (Gross underlying exposure - USD 4,005,026) (62,127) (62,127)
TRS: Total Return Swaps
Futures contracts as at 31 May 2020
Numberof
contractsCurrencyof contracts
Contract/Description
Expirationdate
Grossunderlying
exposureUSD
Net unrealisedappreciation/
(depreciation)USD
3 EUR Amsterdam Index Futures June 2020 June 2020 355,802 13,650
21 AUD Australian 10 Year Bond Futures June 2020 June 2020 2,076,290 4,052
29 EUR CAC 40 Index Futures June 2020 June 2020 1,522,037 109,779
117 CAD Canadian 10 Year Bond Futures September 2020 September 2020 13,048,416 7,299
(2) EUR DAX Index Futures June 2020 June 2020 647,155 (41,101)
(6) USD E-Mini S&P 500 Index Futures June 2020 June 2020 906,690 (124,213)
(25) EUR Euro Bund Futures June 2020 June 2020 4,790,837 16,737
(28) GBP FTSE 100 Index Futures June 2020 June 2020 2,113,961 (80,019)
3 EUR FTSE MIB Index Futures June 2020 June 2020 303,979 26,020
4 HKD Hang Seng China Enterprises Futures June 2020 June 2020 244,908 2,560
4 HKD Hang Seng Index Futures June 2020 June 2020 587,227 (954)
30 EUR IBEX 35 Index Futures June 2020 June 2020 2,369,121 133,423
2 JPY Japan 10 Year Bond Futures June 2020 June 2020 2,829,917 651
(123) SEK OMX Stockholm 30 Index Futures June 2020 June 2020 2,126,985 (134,340)
(7) CAD S&P/TSX 60 Index Futures June 2020 June 2020 932,215 (42,898)
(40) USD SGX NIFTY 50 Futures June 2020 June 2020 761,120 (35,970)
(14) AUD SPI 200 Index Futures June 2020 June 2020 1,335,464 (64,678)
17 CHF Swiss Market Index Futures June 2020 June 2020 1,744,300 142,942
4 JPY Topix Index Futures June 2020 June 2020 579,742 13,248
(33) GBP UK Long Gilt Bond Futures September 2020 September 2020 5,595,479 21,465
(27) USD US Treasury 10 Year Note Futures September 2020 September 2020 3,748,781 1,778
Total 48,620,426 (30,569)
BlackRock Style Advantage Screened Fund continued
The notes on pages 691 to 711 form an integral part of these financial statements.
BlackRock Strategic Funds[612]
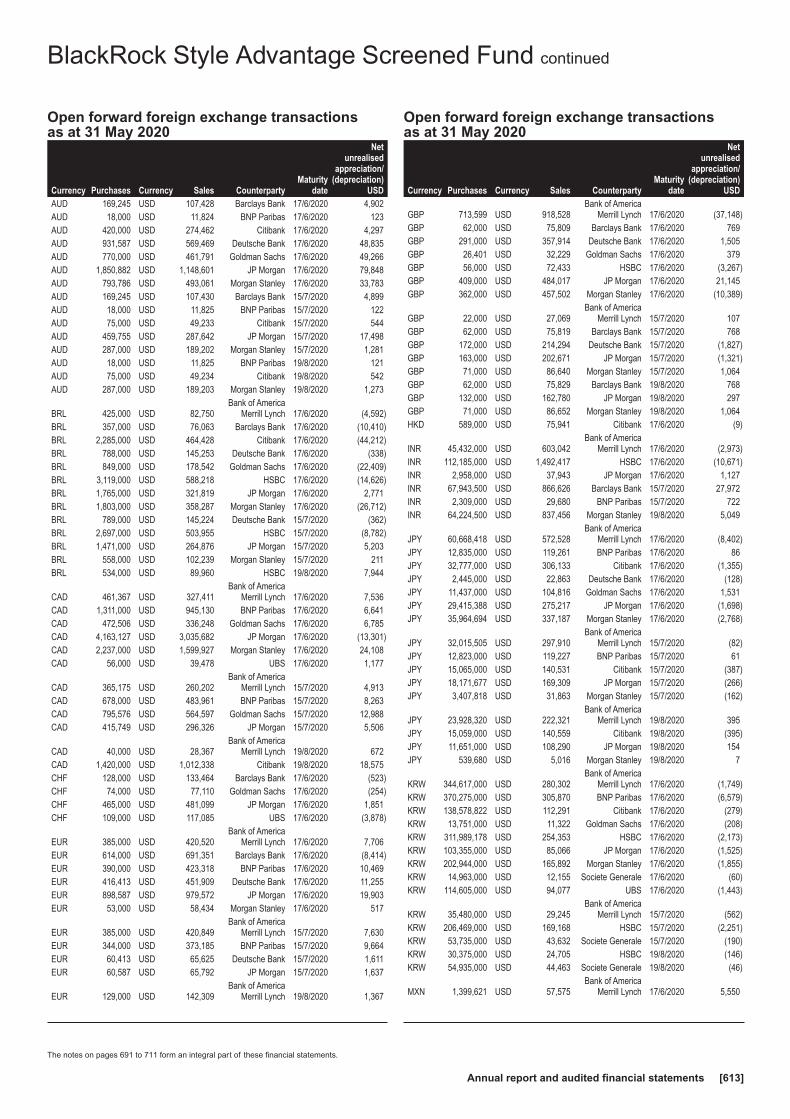
Open forward foreign exchange transactionsas at 31 May 2020
Currency Purchases Currency Sales CounterpartyMaturity
date
Netunrealised
appreciation/(depreciation)
USDAUD 169,245 USD 107,428 Barclays Bank 17/6/2020 4,902AUD 18,000 USD 11,824 BNP Paribas 17/6/2020 123AUD 420,000 USD 274,462 Citibank 17/6/2020 4,297AUD 931,587 USD 569,469 Deutsche Bank 17/6/2020 48,835AUD 770,000 USD 461,791 Goldman Sachs 17/6/2020 49,266AUD 1,850,882 USD 1,148,601 JP Morgan 17/6/2020 79,848AUD 793,786 USD 493,061 Morgan Stanley 17/6/2020 33,783AUD 169,245 USD 107,430 Barclays Bank 15/7/2020 4,899AUD 18,000 USD 11,825 BNP Paribas 15/7/2020 122AUD 75,000 USD 49,233 Citibank 15/7/2020 544AUD 459,755 USD 287,642 JP Morgan 15/7/2020 17,498AUD 287,000 USD 189,202 Morgan Stanley 15/7/2020 1,281AUD 18,000 USD 11,825 BNP Paribas 19/8/2020 121AUD 75,000 USD 49,234 Citibank 19/8/2020 542AUD 287,000 USD 189,203 Morgan Stanley 19/8/2020 1,273
BRL 425,000 USD 82,750Bank of America
Merrill Lynch 17/6/2020 (4,592)BRL 357,000 USD 76,063 Barclays Bank 17/6/2020 (10,410)BRL 2,285,000 USD 464,428 Citibank 17/6/2020 (44,212)BRL 788,000 USD 145,253 Deutsche Bank 17/6/2020 (338)BRL 849,000 USD 178,542 Goldman Sachs 17/6/2020 (22,409)BRL 3,119,000 USD 588,218 HSBC 17/6/2020 (14,626)BRL 1,765,000 USD 321,819 JP Morgan 17/6/2020 2,771BRL 1,803,000 USD 358,287 Morgan Stanley 17/6/2020 (26,712)BRL 789,000 USD 145,224 Deutsche Bank 15/7/2020 (362)BRL 2,697,000 USD 503,955 HSBC 15/7/2020 (8,782)BRL 1,471,000 USD 264,876 JP Morgan 15/7/2020 5,203BRL 558,000 USD 102,239 Morgan Stanley 15/7/2020 211BRL 534,000 USD 89,960 HSBC 19/8/2020 7,944
CAD 461,367 USD 327,411Bank of America
Merrill Lynch 17/6/2020 7,536CAD 1,311,000 USD 945,130 BNP Paribas 17/6/2020 6,641CAD 472,506 USD 336,248 Goldman Sachs 17/6/2020 6,785CAD 4,163,127 USD 3,035,682 JP Morgan 17/6/2020 (13,301)CAD 2,237,000 USD 1,599,927 Morgan Stanley 17/6/2020 24,108CAD 56,000 USD 39,478 UBS 17/6/2020 1,177
CAD 365,175 USD 260,202Bank of America
Merrill Lynch 15/7/2020 4,913CAD 678,000 USD 483,961 BNP Paribas 15/7/2020 8,263CAD 795,576 USD 564,597 Goldman Sachs 15/7/2020 12,988CAD 415,749 USD 296,326 JP Morgan 15/7/2020 5,506
CAD 40,000 USD 28,367Bank of America
Merrill Lynch 19/8/2020 672CAD 1,420,000 USD 1,012,338 Citibank 19/8/2020 18,575CHF 128,000 USD 133,464 Barclays Bank 17/6/2020 (523)CHF 74,000 USD 77,110 Goldman Sachs 17/6/2020 (254)CHF 465,000 USD 481,099 JP Morgan 17/6/2020 1,851CHF 109,000 USD 117,085 UBS 17/6/2020 (3,878)
EUR 385,000 USD 420,520Bank of America
Merrill Lynch 17/6/2020 7,706EUR 614,000 USD 691,351 Barclays Bank 17/6/2020 (8,414)EUR 390,000 USD 423,318 BNP Paribas 17/6/2020 10,469EUR 416,413 USD 451,909 Deutsche Bank 17/6/2020 11,255EUR 898,587 USD 979,572 JP Morgan 17/6/2020 19,903EUR 53,000 USD 58,434 Morgan Stanley 17/6/2020 517
EUR 385,000 USD 420,849Bank of America
Merrill Lynch 15/7/2020 7,630EUR 344,000 USD 373,185 BNP Paribas 15/7/2020 9,664EUR 60,413 USD 65,625 Deutsche Bank 15/7/2020 1,611EUR 60,587 USD 65,792 JP Morgan 15/7/2020 1,637
EUR 129,000 USD 142,309Bank of America
Merrill Lynch 19/8/2020 1,367
Open forward foreign exchange transactionsas at 31 May 2020
Currency Purchases Currency Sales CounterpartyMaturity
date
Netunrealised
appreciation/(depreciation)
USD
GBP 713,599 USD 918,528Bank of America
Merrill Lynch 17/6/2020 (37,148)GBP 62,000 USD 75,809 Barclays Bank 17/6/2020 769GBP 291,000 USD 357,914 Deutsche Bank 17/6/2020 1,505GBP 26,401 USD 32,229 Goldman Sachs 17/6/2020 379GBP 56,000 USD 72,433 HSBC 17/6/2020 (3,267)GBP 409,000 USD 484,017 JP Morgan 17/6/2020 21,145GBP 362,000 USD 457,502 Morgan Stanley 17/6/2020 (10,389)
GBP 22,000 USD 27,069Bank of America
Merrill Lynch 15/7/2020 107GBP 62,000 USD 75,819 Barclays Bank 15/7/2020 768GBP 172,000 USD 214,294 Deutsche Bank 15/7/2020 (1,827)GBP 163,000 USD 202,671 JP Morgan 15/7/2020 (1,321)GBP 71,000 USD 86,640 Morgan Stanley 15/7/2020 1,064GBP 62,000 USD 75,829 Barclays Bank 19/8/2020 768GBP 132,000 USD 162,780 JP Morgan 19/8/2020 297GBP 71,000 USD 86,652 Morgan Stanley 19/8/2020 1,064HKD 589,000 USD 75,941 Citibank 17/6/2020 (9)
INR 45,432,000 USD 603,042Bank of America
Merrill Lynch 17/6/2020 (2,973)INR 112,185,000 USD 1,492,417 HSBC 17/6/2020 (10,671)INR 2,958,000 USD 37,943 JP Morgan 17/6/2020 1,127INR 67,943,500 USD 866,626 Barclays Bank 15/7/2020 27,972INR 2,309,000 USD 29,680 BNP Paribas 15/7/2020 722INR 64,224,500 USD 837,456 Morgan Stanley 19/8/2020 5,049
JPY 60,668,418 USD 572,528Bank of America
Merrill Lynch 17/6/2020 (8,402)JPY 12,835,000 USD 119,261 BNP Paribas 17/6/2020 86JPY 32,777,000 USD 306,133 Citibank 17/6/2020 (1,355)JPY 2,445,000 USD 22,863 Deutsche Bank 17/6/2020 (128)JPY 11,437,000 USD 104,816 Goldman Sachs 17/6/2020 1,531JPY 29,415,388 USD 275,217 JP Morgan 17/6/2020 (1,698)JPY 35,964,694 USD 337,187 Morgan Stanley 17/6/2020 (2,768)
JPY 32,015,505 USD 297,910Bank of America
Merrill Lynch 15/7/2020 (82)JPY 12,823,000 USD 119,227 BNP Paribas 15/7/2020 61JPY 15,065,000 USD 140,531 Citibank 15/7/2020 (387)JPY 18,171,677 USD 169,309 JP Morgan 15/7/2020 (266)JPY 3,407,818 USD 31,863 Morgan Stanley 15/7/2020 (162)
JPY 23,928,320 USD 222,321Bank of America
Merrill Lynch 19/8/2020 395JPY 15,059,000 USD 140,559 Citibank 19/8/2020 (395)JPY 11,651,000 USD 108,290 JP Morgan 19/8/2020 154JPY 539,680 USD 5,016 Morgan Stanley 19/8/2020 7
KRW 344,617,000 USD 280,302Bank of America
Merrill Lynch 17/6/2020 (1,749)KRW 370,275,000 USD 305,870 BNP Paribas 17/6/2020 (6,579)KRW 138,578,822 USD 112,291 Citibank 17/6/2020 (279)KRW 13,751,000 USD 11,322 Goldman Sachs 17/6/2020 (208)KRW 311,989,178 USD 254,353 HSBC 17/6/2020 (2,173)KRW 103,355,000 USD 85,066 JP Morgan 17/6/2020 (1,525)KRW 202,944,000 USD 165,892 Morgan Stanley 17/6/2020 (1,855)KRW 14,963,000 USD 12,155 Societe Generale 17/6/2020 (60)KRW 114,605,000 USD 94,077 UBS 17/6/2020 (1,443)
KRW 35,480,000 USD 29,245Bank of America
Merrill Lynch 15/7/2020 (562)KRW 206,469,000 USD 169,168 HSBC 15/7/2020 (2,251)KRW 53,735,000 USD 43,632 Societe Generale 15/7/2020 (190)KRW 30,375,000 USD 24,705 HSBC 19/8/2020 (146)KRW 54,935,000 USD 44,463 Societe Generale 19/8/2020 (46)
MXN 1,399,621 USD 57,575Bank of America
Merrill Lynch 17/6/2020 5,550
BlackRock Style Advantage Screened Fund continued
The notes on pages 691 to 711 form an integral part of these financial statements.
Annual report and audited financial statements [613]

Open forward foreign exchange transactionsas at 31 May 2020
Currency Purchases Currency Sales CounterpartyMaturity
date
Netunrealised
appreciation/(depreciation)
USDMXN 247,000 USD 10,800 Citibank 17/6/2020 341MXN 1,707,000 USD 71,928 Goldman Sachs 17/6/2020 5,061MXN 13,155,000 USD 655,309 HSBC 17/6/2020 (61,994)MXN 12,830,379 USD 601,936 JP Morgan 17/6/2020 (23,262)
MXN 1,404,501 USD 57,545Bank of America
Merrill Lynch 15/7/2020 5,532MXN 855,000 USD 36,596 Goldman Sachs 15/7/2020 1,803MXN 2,075,499 USD 91,942 JP Morgan 15/7/2020 1,270MXN 858,000 USD 35,291 UBS 15/7/2020 3,243
MXN 1,411,333 USD 57,554Bank of America
Merrill Lynch 19/8/2020 5,515MXN 859,000 USD 36,592 Goldman Sachs 19/8/2020 1,795MXN 2,085,667 USD 91,936 JP Morgan 19/8/2020 1,268NOK 804,000 USD 77,404 JP Morgan 17/6/2020 5,340NOK 295,000 USD 29,619 UBS 19/8/2020 754
NZD 328,000 USD 198,387Bank of America
Merrill Lynch 17/6/2020 5,077NZD 13,231 USD 7,993 Barclays Bank 17/6/2020 214NZD 913,211 USD 546,003 BNP Paribas 17/6/2020 20,480NZD 160,325 USD 95,859 Citibank 17/6/2020 3,593NZD 790,000 USD 496,795 Deutsche Bank 17/6/2020 (6,743)NZD 180,890 USD 108,718 Goldman Sachs 17/6/2020 3,493NZD 202,074 USD 119,996 HSBC 17/6/2020 5,354NZD 1,121,500 USD 665,733 JP Morgan 17/6/2020 29,955NZD 155,270 USD 93,707 Morgan Stanley 17/6/2020 2,610
NZD 328,000 USD 198,351Bank of America
Merrill Lynch 15/7/2020 5,081NZD 565,285 USD 339,421 BNP Paribas 15/7/2020 11,181NZD 160,325 USD 95,845 Citibank 15/7/2020 3,592NZD 180,890 USD 108,691 Goldman Sachs 15/7/2020 3,501NZD 1,604,500 USD 942,163 JP Morgan 15/7/2020 52,979
NZD 152,000 USD 92,884Bank of America
Merrill Lynch 19/8/2020 1,367NZD 272,675 USD 163,084 BNP Paribas 19/8/2020 5,994NZD 160,325 USD 95,826 Citibank 19/8/2020 3,587NZD 1,740,000 USD 1,057,053 Morgan Stanley 19/8/2020 21,873
RUB 73,690,000 USD 1,007,013Bank of America
Merrill Lynch 17/6/2020 34,524RUB 983,000 USD 13,241 Deutsche Bank 17/6/2020 653RUB 75,494,000 USD 1,032,405 Goldman Sachs 17/6/2020 34,628RUB 6,007,000 USD 81,092 HSBC 17/6/2020 3,811RUB 4,076,000 USD 53,374 JP Morgan 17/6/2020 4,236
RUB 2,345,000 USD 31,640Bank of America
Merrill Lynch 15/7/2020 1,381RUB 986,000 USD 13,235 Deutsche Bank 15/7/2020 649RUB 31,203,500 USD 401,574 Goldman Sachs 15/7/2020 37,823RUB 4,680,000 USD 63,225 HSBC 15/7/2020 2,677RUB 2,345,000 USD 31,650 JP Morgan 15/7/2020 1,371RUB 990,000 USD 13,234 Goldman Sachs 19/8/2020 648RUB 22,027,000 USD 295,986 JP Morgan 19/8/2020 12,876
SEK 2,525,000 USD 258,313Bank of America
Merrill Lynch 17/6/2020 8,944SEK 2,363,000 USD 232,404 Barclays Bank 17/6/2020 17,705SEK 729,000 USD 75,852 Citibank 17/6/2020 1,308SEK 7,964,000 USD 818,006 Goldman Sachs 17/6/2020 24,934SEK 862,000 USD 87,966 JP Morgan 17/6/2020 3,271SEK 510,000 USD 50,883 Societe Generale 17/6/2020 3,096
TWD 1,188,000 USD 39,798Bank of America
Merrill Lynch 17/6/2020 (206)TWD 9,791,000 USD 327,168 Citibank 17/6/2020 (871)TWD 12,244,000 USD 413,252 Deutsche Bank 17/6/2020 (5,204)TWD 40,588,000 USD 1,362,624 JP Morgan 17/6/2020 (9,976)TWD 3,948,000 USD 132,453 Morgan Stanley 17/6/2020 (881)TWD 1,965,000 USD 65,984 UBS 17/6/2020 (497)
Open forward foreign exchange transactionsas at 31 May 2020
Currency Purchases Currency Sales CounterpartyMaturity
date
Netunrealised
appreciation/(depreciation)
USDTWD 948,000 USD 31,638 BNP Paribas 15/7/2020 22TWD 2,046,000 USD 69,112 Citibank 15/7/2020 (783)TWD 3,936,000 USD 132,467 HSBC 15/7/2020 (1,019)TWD 4,018,000 USD 135,535 JP Morgan 15/7/2020 (1,348)TWD 2,941,500 USD 99,837 HSBC 19/8/2020 (1,327)TWD 1,179,000 USD 39,765 JP Morgan 19/8/2020 (281)TWD 945,000 USD 31,623 Morgan Stanley 19/8/2020 25
USD 1,082,236 AUD 1,692,599Bank of America
Merrill Lynch 17/6/2020 (41,159)USD 1,258,536 AUD 1,925,000 Barclays Bank 17/6/2020 (19,105)USD 352,937 AUD 568,290 BNP Paribas 17/6/2020 (24,242)USD 205,894 AUD 343,000 Citibank 17/6/2020 (21,759)USD 497,595 AUD 784,945 Deutsche Bank 17/6/2020 (23,380)USD 1,348,873 AUD 2,072,987 Goldman Sachs 17/6/2020 (26,989)USD 392,481 AUD 627,180 JP Morgan 17/6/2020 (23,783)USD 251,006 AUD 385,000 UBS 17/6/2020 (4,523)
USD 650,315 AUD 1,017,775Bank of America
Merrill Lynch 15/7/2020 (25,185)USD 136,026 AUD 213,000 BNP Paribas 15/7/2020 (5,342)USD 70,079 AUD 110,339 Goldman Sachs 15/7/2020 (3,153)USD 262,049 AUD 412,886 JP Morgan 15/7/2020 (11,985)USD 1,292,321 AUD 2,158,000 Morgan Stanley 15/7/2020 (139,948)USD 123,752 AUD 192,000 UBS 15/7/2020 (3,679)
USD 2,239,260 AUD 3,459,000Bank of America
Merrill Lynch 19/8/2020 (56,408)USD 123,755 AUD 192,000 UBS 19/8/2020 (3,672)
USD 2,287,621 BRL 10,766,000Bank of America
Merrill Lynch 17/6/2020 307,728USD 32,024 BRL 170,000 Citibank 17/6/2020 761USD 408,032 BRL 1,900,000 Goldman Sachs 17/6/2020 58,617USD 36,174 BRL 182,500 JP Morgan 17/6/2020 2,612USD 31,969 BRL 170,000 Citibank 15/7/2020 756USD 1,316,087 BRL 6,995,000 HSBC 15/7/2020 31,791
USD 345,608 BRL 2,008,500Bank of America
Merrill Lynch 19/8/2020 (22,632)USD 31,919 BRL 170,000 Citibank 19/8/2020 751USD 1,116,965 CAD 1,593,324 Citibank 17/6/2020 (39,769)USD 99,057 CAD 138,790 Deutsche Bank 17/6/2020 (1,702)USD 928,280 CAD 1,297,665 Goldman Sachs 17/6/2020 (13,812)USD 1,714,454 CAD 2,417,221 JP Morgan 17/6/2020 (40,420)USD 757,497 CAD 1,049,000 Morgan Stanley 17/6/2020 (4,064)USD 99,065 CAD 138,790 Deutsche Bank 15/7/2020 (1,696)USD 495,376 CAD 689,784 Goldman Sachs 15/7/2020 (5,404)USD 255,387 CAD 358,426 JP Morgan 15/7/2020 (4,828)USD 190,492 CAD 265,000 Morgan Stanley 15/7/2020 (1,897)USD 250,704 CAD 347,000 Goldman Sachs 19/8/2020 (1,216)USD 190,501 CAD 265,000 Morgan Stanley 19/8/2020 (1,887)
USD 107,080 CHF 104,000Bank of America
Merrill Lynch 17/6/2020 (934)USD 200,509 CHF 186,000 Citibank 17/6/2020 7,329USD 511,420 CHF 496,000 Goldman Sachs 17/6/2020 (3,727)USD 88,644 CHF 84,000 JP Morgan 17/6/2020 1,402USD 43,946 CHF 41,500 Morgan Stanley 17/6/2020 844
USD 723,092 EUR 662,000Bank of America
Merrill Lynch 17/6/2020 (13,233)USD 5,276,088 EUR 4,697,000 Barclays Bank 17/6/2020 51,736USD 471,301 EUR 433,846 BNP Paribas 17/6/2020 (11,255)USD 16,790 EUR 15,000 Deutsche Bank 17/6/2020 106USD 270,405 EUR 243,154 JP Morgan 17/6/2020 (49)USD 427,624 EUR 387,000 UBS 17/6/2020 (2,825)
USD 723,528 EUR 662,000Bank of America
Merrill Lynch 15/7/2020 (13,233)USD 471,608 EUR 433,846 BNP Paribas 15/7/2020 (11,232)
BlackRock Style Advantage Screened Fund continued
The notes on pages 691 to 711 form an integral part of these financial statements.
BlackRock Strategic Funds[614]

Open forward foreign exchange transactionsas at 31 May 2020
Currency Purchases Currency Sales CounterpartyMaturity
date
Netunrealised
appreciation/(depreciation)
USDUSD 3,945,241 EUR 3,642,770 JP Morgan 15/7/2020 (108,916)
USD 418,382 EUR 381,000Bank of America
Merrill Lynch 19/8/2020 (5,964)USD 221,251 EUR 203,000 BNP Paribas 19/8/2020 (4,844)USD 3,859,213 EUR 3,563,000 Morgan Stanley 19/8/2020 (109,144)
USD 46,155 GBP 39,023Bank of America
Merrill Lynch 17/6/2020 (2,043)USD 397,727 GBP 308,000 Barclays Bank 17/6/2020 17,311USD 198,910 GBP 160,000 BNP Paribas 17/6/2020 1,291USD 81,517 GBP 66,000 Citibank 17/6/2020 (1)USD 62,186 GBP 50,000 Deutsche Bank 17/6/2020 431USD 333,808 GBP 271,000 Goldman Sachs 17/6/2020 (909)USD 118,230 GBP 100,000 HSBC 17/6/2020 (5,282)USD 477,568 GBP 384,977 JP Morgan 17/6/2020 2,076USD 766,835 GBP 625,000 Morgan Stanley 17/6/2020 (5,114)USD 67,092 GBP 54,000 Societe Generale 17/6/2020 396
USD 9,880 GBP 8,000Bank of America
Merrill Lynch 15/7/2020 (2)USD 62,199 GBP 50,000 Deutsche Bank 15/7/2020 435USD 67,104 GBP 54,000 JP Morgan 15/7/2020 399USD 260,792 GBP 213,000 Morgan Stanley 15/7/2020 (2,321)USD 260,825 GBP 213,000 Morgan Stanley 19/8/2020 (2,323)USD 37,199 HKD 289,000 Citibank 17/6/2020 (59)USD 84,718 HKD 658,000 HSBC 17/6/2020 (110)
USD 129,573 INR 10,035,000Bank of America
Merrill Lynch 17/6/2020 (2,970)USD 19,458 INR 1,504,000 BNP Paribas 17/6/2020 (407)USD 100,615 INR 7,805,000 Citibank 17/6/2020 (2,474)USD 84,055 INR 6,384,000 Deutsche Bank 17/6/2020 (265)USD 361,330 INR 27,573,000 HSBC 17/6/2020 (2,856)USD 410,223 INR 31,294,500 JP Morgan 17/6/2020 (3,116)USD 88,674 INR 6,909,000 Morgan Stanley 17/6/2020 (2,580)USD 80,700 INR 6,170,000 UBS 17/6/2020 (794)
USD 11,966 INR 917,000Bank of America
Merrill Lynch 15/7/2020 (108)USD 11,781 INR 903,000 Citibank 15/7/2020 (108)USD 19,431 INR 1,511,000 Goldman Sachs 15/7/2020 (464)USD 14,180 INR 1,090,800 HSBC 15/7/2020 (182)USD 13,133 INR 1,003,200 JP Morgan 15/7/2020 (76)USD 11,302 INR 866,000 Citibank 19/8/2020 (58)
USD 3,211 JPY 345,000Bank of America
Merrill Lynch 17/6/2020 3USD 73,303 JPY 7,948,500 Barclays Bank 17/6/2020 (606)USD 23,429 JPY 2,499,000 BNP Paribas 17/6/2020 192USD 390,937 JPY 41,345,000 Deutsche Bank 17/6/2020 6,489USD 437,178 JPY 46,282,000 Goldman Sachs 17/6/2020 6,824USD 1,163,835 JPY 124,993,000 JP Morgan 17/6/2020 1,584USD 266,057 JPY 27,943,000 Morgan Stanley 17/6/2020 6,228USD 42,808 JPY 4,612,000 UBS 17/6/2020 (76)
USD 3,213 JPY 345,000Bank of America
Merrill Lynch 15/7/2020 4USD 23,423 JPY 2,497,000 BNP Paribas 15/7/2020 195USD 174,437 JPY 18,716,000 Deutsche Bank 15/7/2020 329USD 86,989 JPY 9,264,000 Goldman Sachs 15/7/2020 810USD 493,527 JPY 53,423,000 JP Morgan 15/7/2020 (3,446)USD 42,791 JPY 4,608,000 UBS 15/7/2020 (75)
USD 383,673 JPY 41,207,500Bank of America
Merrill Lynch 19/8/2020 128USD 42,796 JPY 4,606,000 UBS 19/8/2020 (75)USD 652,560 KRW 774,756,000 Deutsche Bank 17/6/2020 26,330USD 1,512,124 KRW 1,803,766,000 HSBC 17/6/2020 54,154USD 19,208 KRW 23,423,000 JP Morgan 17/6/2020 275
USD 996,579 KRW 1,227,037,500Bank of America
Merrill Lynch 15/7/2020 4,595
Open forward foreign exchange transactionsas at 31 May 2020
Currency Purchases Currency Sales CounterpartyMaturity
date
Netunrealised
appreciation/(depreciation)
USDUSD 18,108 KRW 22,096,000 Deutsche Bank 15/7/2020 245USD 19,204 KRW 23,403,000 JP Morgan 15/7/2020 284USD 871,305 KRW 1,066,364,000 HSBC 19/8/2020 9,118
USD 151,894 MXN 3,616,655Bank of America
Merrill Lynch 17/6/2020 (11,224)USD 52,049 MXN 1,210,079 Barclays Bank 17/6/2020 (2,528)USD 214,731 MXN 4,628,000 BNP Paribas 17/6/2020 5,999USD 121,066 MXN 2,896,000 Citibank 17/6/2020 (9,549)USD 23,379 MXN 555,937 Deutsche Bank 17/6/2020 (1,695)USD 88,431 MXN 2,073,492 Goldman Sachs 17/6/2020 (5,088)USD 336,295 MXN 7,833,571 JP Morgan 17/6/2020 (17,013)USD 64,585 MXN 1,507,265 Morgan Stanley 17/6/2020 (3,396)USD 435,379 MXN 10,045,000 UBS 17/6/2020 (17,667)
USD 58,651 MXN 1,415,893Bank of America
Merrill Lynch 15/7/2020 (4,938)USD 170,151 MXN 4,137,500 Citibank 15/7/2020 (15,669)USD 126,175 MXN 3,040,417 JP Morgan 15/7/2020 (10,373)USD 3,918 MXN 94,690 Morgan Stanley 15/7/2020 (334)USD 44,797 MXN 1,102,000 UBS 15/7/2020 (4,695)USD 379,078 MXN 9,178,000 Barclays Bank 19/8/2020 (31,068)USD 104,550 NOK 1,077,000 Morgan Stanley 19/8/2020 (6,340)USD 184,257 NZD 309,512 Barclays Bank 17/6/2020 (7,739)USD 131,212 NZD 214,000 BNP Paribas 17/6/2020 (1,537)USD 216,335 NZD 360,000 Citibank 17/6/2020 (6,980)USD 77,080 NZD 126,676 Deutsche Bank 17/6/2020 (1,499)USD 308,056 NZD 509,312 Goldman Sachs 17/6/2020 (7,881)USD 114,387 NZD 188,000 JP Morgan 17/6/2020 (2,232)USD 64,774 NZD 105,000 Morgan Stanley 17/6/2020 (359)USD 131,189 NZD 214,000 BNP Paribas 15/7/2020 (1,538)USD 38,528 NZD 63,000 Citibank 15/7/2020 (546)USD 247,380 NZD 407,000 Goldman Sachs 15/7/2020 (5,049)USD 64,764 NZD 105,000 Morgan Stanley 15/7/2020 (359)USD 66,630 NZD 108,000 BNP Paribas 19/8/2020 (338)USD 38,519 NZD 63,000 Citibank 19/8/2020 (546)USD 64,749 NZD 105,000 Morgan Stanley 19/8/2020 (359)
USD 470,157 RUB 35,347,000Bank of America
Merrill Lynch 17/6/2020 (29,437)USD 227,468 RUB 17,323,000 Barclays Bank 17/6/2020 (17,376)USD 123,201 RUB 9,037,000 Citibank 17/6/2020 (4,529)USD 199,665 RUB 14,839,000 Goldman Sachs 17/6/2020 (10,070)USD 202,158 RUB 14,800,000 HSBC 17/6/2020 (7,026)USD 378,878 RUB 28,846,000 JP Morgan 17/6/2020 (28,833)USD 252,917 RUB 19,280,000 Morgan Stanley 17/6/2020 (19,587)
USD 82,671 RUB 6,216,000Bank of America
Merrill Lynch 15/7/2020 (4,861)USD 21,418 RUB 1,640,000 Barclays Bank 15/7/2020 (1,676)USD 21,297 RUB 1,632,000 Citibank 15/7/2020 (1,684)USD 19,947 RUB 1,504,000 Goldman Sachs 15/7/2020 (1,232)USD 108,200 RUB 8,011,000 JP Morgan 15/7/2020 (4,608)USD 24,900 RUB 1,786,000 JP Morgan 19/8/2020 (143)USD 255,604 SEK 2,500,000 Citibank 17/6/2020 (9,006)USD 460,485 SEK 4,360,000 HSBC 17/6/2020 (996)USD 834,039 SEK 8,283,000 JP Morgan 17/6/2020 (42,664)USD 130,407 SEK 1,296,000 Societe Generale 17/6/2020 (6,768)USD 12,706 SGD 18,000 Morgan Stanley 19/8/2020 (30)USD 1,238,041 TWD 36,753,000 BNP Paribas 17/6/2020 13,199USD 876,954 TWD 26,035,000 HSBC 17/6/2020 9,303USD 182,353 TWD 5,425,000 JP Morgan 17/6/2020 1,558USD 16,584 TWD 491,000 BNP Paribas 15/7/2020 187USD 59,047 TWD 1,741,000 Citibank 15/7/2020 903USD 35,735 TWD 1,066,500 Goldman Sachs 15/7/2020 117USD 182,340 TWD 5,400,000 JP Morgan 15/7/2020 1,999
BlackRock Style Advantage Screened Fund continued
The notes on pages 691 to 711 form an integral part of these financial statements.
Annual report and audited financial statements [615]
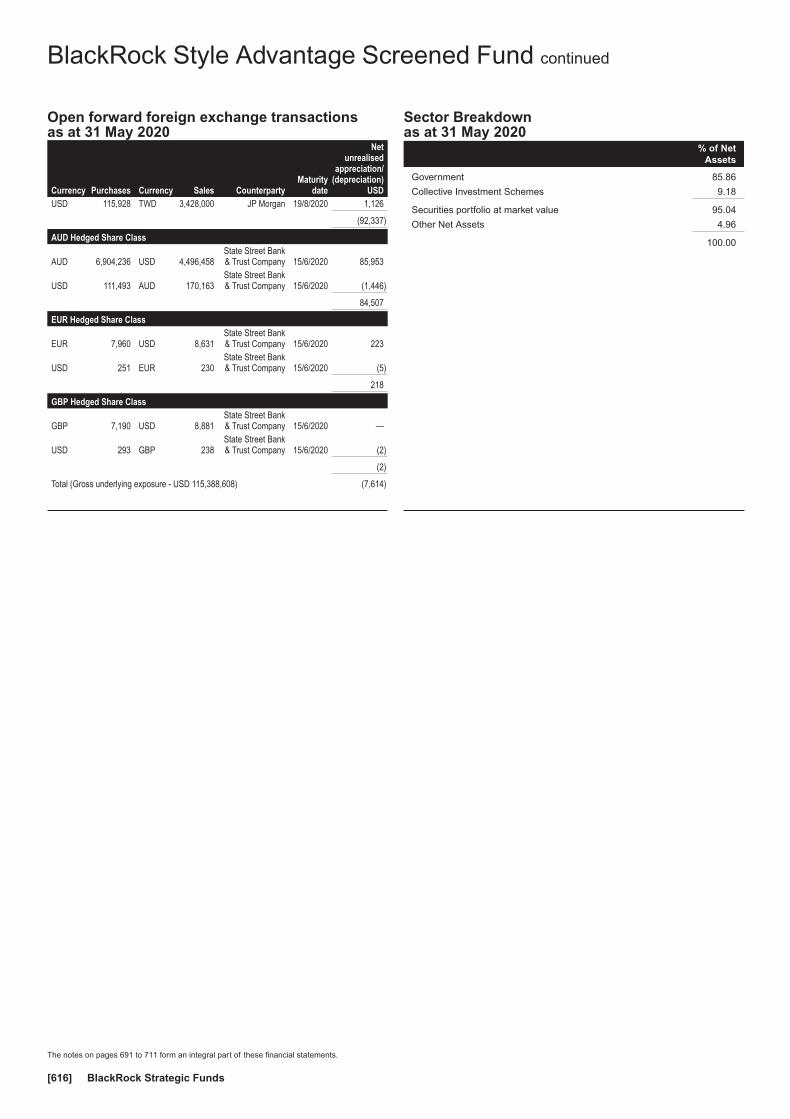
Open forward foreign exchange transactionsas at 31 May 2020
Currency Purchases Currency Sales CounterpartyMaturity
date
Netunrealised
appreciation/(depreciation)
USDUSD 115,928 TWD 3,428,000 JP Morgan 19/8/2020 1,126
(92,337)
AUD Hedged Share Class
AUD 6,904,236 USD 4,496,458State Street Bank& Trust Company 15/6/2020 85,953
USD 111,493 AUD 170,163State Street Bank& Trust Company 15/6/2020 (1,446)
84,507
EUR Hedged Share Class
EUR 7,960 USD 8,631State Street Bank& Trust Company 15/6/2020 223
USD 251 EUR 230State Street Bank& Trust Company 15/6/2020 (5)
218
GBP Hedged Share Class
GBP 7,190 USD 8,881State Street Bank& Trust Company 15/6/2020 —
USD 293 GBP 238State Street Bank& Trust Company 15/6/2020 (2)
(2)
Total (Gross underlying exposure - USD 115,388,608) (7,614)
Sector Breakdownas at 31 May 2020
% of NetAssets
Government 85.86
Collective Investment Schemes 9.18
Securities portfolio at market value 95.04
Other Net Assets 4.96
100.00
BlackRock Style Advantage Screened Fund continued
The notes on pages 691 to 711 form an integral part of these financial statements.
BlackRock Strategic Funds[616]

Portfolio of Investments as at 31 May 2020
Holding Description
MarketValue
USD
% ofNet
Assets
Transferable Securities and Money Market Instruments Admittedto an Official Stock Exchange Listing or Dealt in on AnotherRegulated Market
COMMON STOCKS / PREFERRED STOCKS & RIGHTSAustralia
4,819 Ampol Ltd 86,644 0.043,148 Aristocrat Leisure Ltd 53,738 0.02
30,783 Atlas Arteria Ltd (Unit) 136,068 0.0628,415 Australia & New Zealand
Banking Group Ltd^ 337,388 0.1522,101 Bendigo & Adelaide Bank Ltd 90,211 0.0420,734 Brambles Ltd 160,180 0.078,745 Challenger Ltd 29,078 0.019,896 Commonwealth Bank of
Australia 418,708 0.192,401 CSL Ltd 440,169 0.20
12,569 Downer EDI Ltd 37,623 0.0223,787 Goodman Group (REIT)^ 242,653 0.1163,808 IGO Ltd 212,594 0.1015,075 Insurance Australia Group Ltd 61,132 0.0311,920 Lendlease Group (Unit) 102,293 0.053,685 Macquarie Group Ltd 268,957 0.126,722 Mineral Resources Ltd 83,919 0.04
185,675 Mirvac Group (REIT) 289,596 0.1321,758 National Australia Bank Ltd 257,190 0.128,914 OZ Minerals Ltd 55,731 0.03
661 Rio Tinto Ltd 40,975 0.0226,499 Sims Ltd 136,830 0.0632,536 Stockland (REIT) 77,091 0.0414,713 Transurban Group (Unit) 139,542 0.063,209 Treasury Wine Estates Ltd 20,574 0.01
16,513 Westpac Banking Corp 188,726 0.0915,021 Woodside Petroleum Ltd 226,007 0.1017,634 Worley Ltd^ 98,311 0.04
4,291,928 1.95
Austria1,328 Erste Group Bank AG 29,327 0.01
29,327 0.01
Belgium4,075 Anheuser-Busch InBev SA 190,446 0.09
211 Galapagos NV 43,476 0.022,674 Umicore SA^ 117,715 0.05
351,637 0.16
Bermuda16,287 Axalta Coating Systems Ltd 374,275 0.175,783 Bunge Ltd 221,258 0.108,178 IHS Markit Ltd 566,245 0.25
10,252 Invesco Ltd 80,734 0.042,712 Marvell Technology Group Ltd 88,723 0.04
1,331,235 0.60
British Virgin Islands1,724 Capri Holdings Ltd 26,946 0.01
26,946 0.01
Canada1,309 Agnico Eagle Mines Ltd 83,893 0.046,534 Bank of Montreal^ 323,890 0.15
16,764 Bank of Nova Scotia 682,633 0.316,926 Brookfield Asset Management
Inc ’A’^ 220,031 0.1010,214 CAE Inc 154,532 0.07
94 Canadian Imperial Bank ofCommerce 6,075 0.00
1,896 Canadian Tire Corp Ltd ’A’^ 160,811 0.079,116 CCL Industries Inc ’B’ 300,392 0.141,674 Colliers International Group
Inc 85,860 0.04
Holding Description
MarketValue
USD
% ofNet
Assets
Canada continued921 Dollarama Inc 30,957 0.02
1,103 Franco-Nevada Corp 157,557 0.071,859 George Weston Ltd 133,691 0.068,721 Great-West Lifeco Inc 140,554 0.068,576 Hydro One Ltd 162,685 0.072,317 Innergex Renewable Energy
Inc 31,876 0.025,422 Loblaw Cos Ltd 269,122 0.129,195 Magna International Inc 382,232 0.174,364 Onex Corp 207,801 0.104,820 Osisko Gold Royalties Ltd 47,764 0.026,521 Parkland Corp 178,050 0.08
10,199 Rogers Communications Inc’B’ 426,041 0.19
7,513 Royal Bank of Canada^ 492,849 0.22496 Shopify Inc ’A’ 377,888 0.17776 Toromont Industries Ltd 37,520 0.02
16,103 Toronto-Dominion Bank 697,101 0.3214,796 Wheaton Precious Metals
Corp 646,321 0.291,441 WSP Global Inc^ 93,509 0.04
6,531,635 2.96
Cayman Islands11,200 Sands China Ltd 43,545 0.0241,000 Wharf Real Estate Investment
Co Ltd 157,555 0.07
201,100 0.09
Curacao23,141 Schlumberger Ltd 426,257 0.19
426,257 0.19
Denmark2,303 Chr Hansen Holding A/S^ 224,271 0.10
357 Genmab A/S 109,867 0.05910 H Lundbeck A/S 35,159 0.02
21,875 Novo Nordisk A/S ’B’ 1,432,391 0.655,826 Orsted A/S^ 680,851 0.31
2,482,539 1.13
Finland2,300 Kesko Oyj ’B’ 38,746 0.026,877 Neste Oyj 275,823 0.121,341 UPM-Kymmene Oyj 38,709 0.02
28,696 Wartsila Oyj Abp^ 223,998 0.10
577,276 0.26
France2,299 Amundi SA 168,848 0.08
43,571 AXA SA 802,021 0.361,373 Bouygues SA 42,717 0.02
14,388 Carrefour SA 216,943 0.10315 Christian Dior SE 132,960 0.06
23,422 CNP Assurances 245,726 0.117,629 Credit Agricole SA 66,982 0.037,009 Danone SA 483,986 0.22
488 Gaztransport Et Technigaz SA 36,682 0.022,041 Gecina SA (REIT) 259,857 0.12
921 Hermes International^ 766,236 0.35123 Kering SA 64,795 0.03
5,085 L’Oreal SA 1,481,983 0.67997 LVMH Moet Hennessy Louis
Vuitton SE 420,054 0.1919,510 Natixis SA 43,562 0.0227,613 Orange SA 335,137 0.151,045 Pernod Ricard SA 163,259 0.072,626 Peugeot SA 37,405 0.026,264 Renault SA 142,544 0.07
25,642 Rexel SA^ 260,548 0.12
BlackRock Systematic ESG World Equity Fund
The notes on pages 691 to 711 form an integral part of these financial statements.
Annual report and audited financial statements [617]

Portfolio of Investments as at 31 May 2020
Holding Description
MarketValue
USD
% ofNet
Assets
France continued4,076 Rubis SCA 196,430 0.098,604 Sanofi 846,795 0.385,770 Schneider Electric SE 577,051 0.26
710 Societe BIC SA 37,643 0.0215,405 Societe Generale SA 230,530 0.1017,833 TOTAL SA 667,458 0.30
402 Ubisoft Entertainment SA 31,442 0.01
8,759,594 3.97
Germany2,223 adidas AG 583,607 0.27
907 Allianz SE RegS 165,179 0.081,812 Bayerische Motoren Werke
AG (Pref) 83,657 0.044,271 Beiersdorf AG^ 450,408 0.201,233 Deutsche Boerse AG 203,873 0.09
10,906 Deutsche Post AG RegS 345,496 0.161,753 Duerr AG 41,675 0.02
25,348 E.ON SE 266,862 0.123,304 Merck KGaA 381,716 0.17
444 Puma SE 31,943 0.027,032 SAP SE 890,923 0.409,876 Siemens AG RegS 1,085,423 0.491,039 Symrise AG 114,261 0.05
542 Vonovia SE 31,231 0.01
4,676,254 2.12
Hong Kong44,600 AIA Group Ltd^ 361,470 0.16
154,500 BOC Hong Kong Holdings Ltd^ 430,343 0.202,300 Hang Seng Bank Ltd 34,968 0.02
199,000 Hong Kong & China Gas CoLtd^ 334,628 0.15
27,000 Link (REIT) 201,767 0.09166,000 Swire Properties Ltd^ 369,472 0.1711,000 Techtronic Industries Co Ltd^ 94,613 0.04
1,827,261 0.83
International5,661 Unibail-Rodamco-Westfield
(REIT)^ 306,743 0.14
306,743 0.14
Ireland8,561 Accenture Plc ’A’ 1,708,348 0.781,544 Allegion Plc 152,686 0.072,896 DCC Plc 241,571 0.116,507 Johnson Controls International
Plc 203,604 0.09948 Kingspan Group Plc 58,451 0.03
7,752 Medtronic Plc 752,487 0.341,352 Smurfit Kappa Group Plc 43,958 0.025,762 Trane Technologies Plc 516,563 0.23
3,677,668 1.67
Israel15,954 Bank Hapoalim BM 97,469 0.04
459 CyberArk Software Ltd 46,809 0.021,504 Wix.com Ltd 320,999 0.15
465,277 0.21
Italy21,252 Assicurazioni Generali SpA^ 297,516 0.1313,403 Hera SpA^ 50,940 0.0262,480 Intesa Sanpaolo SpA^ 108,672 0.0560,389 Italgas SpA 329,301 0.15
Holding Description
MarketValue
USD
% ofNet
Assets
Italy continued12,134 Mediobanca Banca di Credito
Finanziario SpA 79,147 0.0426,582 Terna Rete Elettrica Nazionale
SpA^ 179,062 0.08
1,044,638 0.47
Japan3,800 Aeon Co Ltd 84,203 0.045,700 Alfresa Holdings Corp^ 115,150 0.056,600 Alps Alpine Co Ltd 79,888 0.041,200 Asahi Group Holdings Ltd^ 45,271 0.02
27,900 Asahi Kasei Corp 220,471 0.1022,100 Astellas Pharma Inc 393,348 0.182,800 Benesse Holdings Inc^ 75,932 0.033,100 Canon Inc 63,951 0.033,100 Central Japan Railway Co^ 531,293 0.242,800 Chugai Pharmaceutical Co Ltd 413,629 0.193,800 COMSYS Holdings Corp^ 105,982 0.052,200 Daikin Industries Ltd^ 324,176 0.153,200 Daito Trust Construction Co
Ltd^ 338,698 0.1517,500 Daiwa House Industry Co Ltd^ 435,121 0.207,300 Denso Corp^ 280,354 0.134,200 DIC Corp^ 109,759 0.051,100 Dowa Holdings Co Ltd^ 35,383 0.029,800 East Japan Railway Co^ 769,860 0.351,200 Eisai Co Ltd^ 94,135 0.04
400 Fanuc Corp^ 71,454 0.03400 Fast Retailing Co Ltd^ 225,092 0.10
1,800 Fuji Media Holdings Inc 18,106 0.016,400 Fujifilm Holdings Corp^ 296,364 0.136,400 Hakuhodo DY Holdings Inc 79,669 0.041,300 Hitachi Transport System Ltd 35,810 0.021,700 Honda Motor Co Ltd^ 43,999 0.02
400 Hoshizaki Corp^ 32,353 0.0134,100 Isuzu Motors Ltd^ 320,029 0.151,500 Izumi Co Ltd 47,204 0.02
64,200 Japan Post Holdings Co Ltd^ 467,989 0.2181,500 JXTG Holdings Inc^ 313,907 0.1430,500 Kajima Corp^ 346,497 0.164,000 Kansai Paint Co Ltd^ 83,001 0.04
23,100 KDDI Corp^ 673,468 0.31900 Keyence Corp 371,078 0.17700 Koito Manufacturing Co Ltd 29,708 0.01
8,600 Komatsu Ltd^ 174,295 0.081,700 Kyocera Corp 92,155 0.041,700 Kyowa Exeo Corp^ 39,100 0.02
20,500 Lintec Corp 488,844 0.2257,900 Marubeni Corp^ 281,681 0.131,400 Maruha Nichiro Corp^ 30,339 0.01
900 MEIJI Holdings Co Ltd 67,857 0.0346,000 Mitsubishi Chemical Holdings
Corp 271,257 0.121,000 Nintendo Co Ltd 404,778 0.18
700 Nippon Express Co Ltd^ 36,053 0.02500 Nippon Shinyaku Co Ltd^ 43,137 0.02
5,400 Nippon Telegraph & TelephoneCorp 122,694 0.06
700 Nippon Television Holdings Inc 8,096 0.00400 Nitori Holdings Co Ltd 72,644 0.03
11,900 Nitto Denko Corp^ 644,977 0.2911,700 NTT DOCOMO Inc^ 321,039 0.152,800 Odakyu Electric Railway Co
Ltd^ 69,997 0.03900 Omron Corp 59,741 0.03
BlackRock Systematic ESG World Equity Fund continued
The notes on pages 691 to 711 form an integral part of these financial statements.
BlackRock Strategic Funds[618]

Portfolio of Investments as at 31 May 2020
Holding Description
MarketValue
USD
% ofNet
Assets
Japan continued800 Oriental Land Co Ltd 116,134 0.05
1,400 ORIX Corp^ 18,599 0.016,800 Pola Orbis Holdings Inc^ 132,504 0.06
17,700 Recruit Holdings Co Ltd 610,487 0.2828,500 Resona Holdings Inc^ 102,750 0.052,700 Ryohin Keikaku Co Ltd 40,890 0.021,800 Secom Co Ltd^ 156,196 0.075,600 Sekisui House Ltd 106,856 0.052,000 Shionogi & Co Ltd^ 118,273 0.05
500 Shiseido Co Ltd^ 30,540 0.015,200 Softbank Corp 66,036 0.03
10,000 SoftBank Group Corp^ 449,217 0.20600 Sohgo Security Services Co
Ltd 29,564 0.019,500 Sony Corp^ 607,103 0.282,200 Sumitomo Corp^ 26,548 0.01
500 Sumitomo Heavy IndustriesLtd^ 11,435 0.01
43,700 Sumitomo Mitsui FinancialGroup Inc^ 1,267,144 0.57
6,600 Sumitomo Mitsui TrustHoldings Inc^ 194,567 0.09
2,300 Suntory Beverage & Food Ltd^ 94,083 0.042,400 Sysmex Corp 192,107 0.09
22,500 T&D Holdings Inc 203,528 0.097,800 Taisei Corp 271,203 0.12
500 Taisho PharmaceuticalHoldings Co Ltd^ 31,795 0.01
14,900 Takeda Pharmaceutical CoLtd^ 580,541 0.26
16,700 Teijin Ltd 273,870 0.121,000 Tokyo Electron Ltd^ 199,879 0.09
10,900 Tokyo Gas Co Ltd^ 260,479 0.122,200 Tokyu Corp 34,933 0.02
17,500 Toray Industries Inc 85,234 0.043,100 Toyo Seikan Group Holdings
Ltd 33,027 0.024,700 Toyota Tsusho Corp 119,286 0.051,700 West Japan Railway Co 109,856 0.051,200 Yaskawa Electric Corp^ 43,174 0.023,600 Yokogawa Electric Corp^ 51,943 0.023,400 ZOZO Inc^ 62,712 0.03
17,933,509 8.13
Jersey3,844 Aptiv Plc 282,534 0.131,343 Experian Plc 47,023 0.025,715 Ferguson Plc 453,144 0.209,096 Janus Henderson Group Plc 197,292 0.09
11,368 WPP Plc 85,672 0.04
1,065,665 0.48
Luxembourg537 RTL Group SA 18,200 0.01
18,200 0.01
Netherlands13,813 ABN AMRO Bank NV - CVA 113,997 0.054,495 Akzo Nobel NV 368,868 0.17
171 Argenx SE 36,717 0.022,887 ASML Holding NV 945,564 0.43
18,948 ING Groep NV 123,697 0.054,542 Koninklijke DSM NV 584,845 0.26
34,257 Koninklijke KPN NV 84,222 0.041,326 Prosus NV 108,932 0.054,026 Randstad NV 171,413 0.087,364 Unilever NV 379,942 0.177,668 Wolters Kluwer NV 601,114 0.27
3,519,311 1.59
Holding Description
MarketValue
USD
% ofNet
Assets
New Zealand2,916 Fisher & Paykel Healthcare
Corp Ltd 54,232 0.02107,650 Mercury NZ Ltd^ 310,530 0.1434,017 Meridian Energy Ltd 100,237 0.05
464,999 0.21
Norway6,745 Aker BP ASA 108,868 0.05
30,223 Equinor ASA^ 438,053 0.209,753 Leroy Seafood Group ASA 55,019 0.036,586 Schibsted ASA ’A’ 164,077 0.072,552 Schibsted ASA ’B’ 61,556 0.033,050 Telenor ASA 46,168 0.02
873,741 0.40
Papua New Guinea51,642 Oil Search Ltd^ 119,276 0.05
119,276 0.05
Portugal55,649 Galp Energia SGPS SA 655,916 0.30
655,916 0.30
Singapore2,300 City Developments Ltd 12,511 0.017,900 DBS Group Holdings Ltd 108,802 0.05
131,000 SingaporeTelecommunications Ltd 230,735 0.10
16,400 United Overseas Bank Ltd 226,215 0.10
578,263 0.26
South Africa17,507 Investec Plc 31,709 0.01
31,709 0.01
Spain1,085 Acciona SA 107,255 0.05
196,299 Banco Bilbao VizcayaArgentaria SA 618,590 0.28
1,520 Grifols SA 47,342 0.026,978 Industria de Diseno Textil SA 194,445 0.098,824 Naturgy Energy Group SA 165,820 0.07
28,004 Repsol SA 261,506 0.12
1,394,958 0.63
Sweden7,920 Assa Abloy AB ’B’ 160,635 0.072,401 Atlas Copco AB ’A’^ 93,889 0.048,563 Atlas Copco AB ’B’ 302,224 0.147,711 Axfood AB 171,371 0.08
21,244 Boliden AB 459,991 0.212,015 Castellum AB 37,212 0.02
17,638 Fabege AB 212,702 0.107,860 Hufvudstaden AB ’A’ 99,652 0.04
527 L E Lundbergforetagen AB ’B’ 25,990 0.018,043 Lundin Energy AB 193,134 0.093,433 Sandvik AB 56,877 0.02
338 Skanska AB ’B’ 6,689 0.0056,614 Telia Co AB 194,242 0.09
2,014,608 0.91
Switzerland893 Alcon Inc 57,704 0.0340 Barry Callebaut AG RegS^ 80,897 0.04
6,325 Coca-Cola HBC AG 160,843 0.074,722 Credit Suisse Group AG RegS 42,837 0.02
616 Geberit AG RegS^ 300,454 0.14244 Givaudan SA RegS 881,562 0.40
3,671 Kuehne + Nagel InternationalAG RegS^ 527,287 0.24
BlackRock Systematic ESG World Equity Fund continued
The notes on pages 691 to 711 form an integral part of these financial statements.
Annual report and audited financial statements [619]
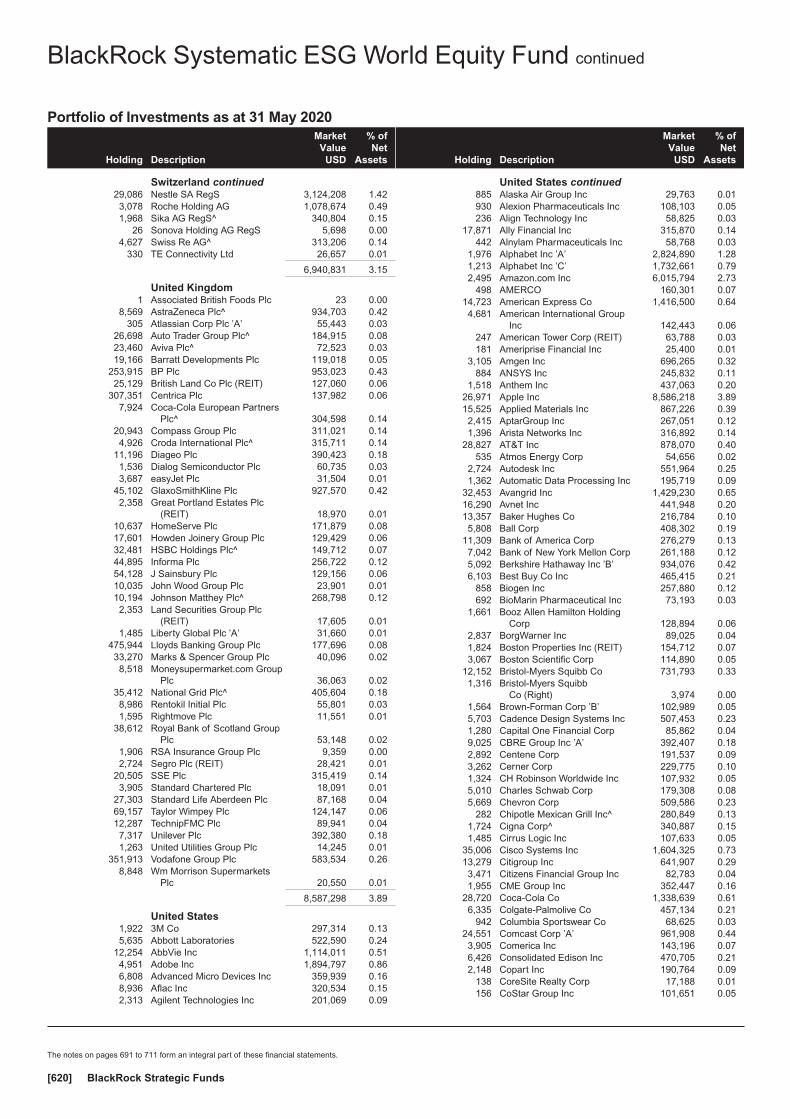
Portfolio of Investments as at 31 May 2020
Holding Description
MarketValue
USD
% ofNet
Assets
Switzerland continued29,086 Nestle SA RegS 3,124,208 1.423,078 Roche Holding AG 1,078,674 0.491,968 Sika AG RegS^ 340,804 0.15
26 Sonova Holding AG RegS 5,698 0.004,627 Swiss Re AG^ 313,206 0.14
330 TE Connectivity Ltd 26,657 0.01
6,940,831 3.15
United Kingdom1 Associated British Foods Plc 23 0.00
8,569 AstraZeneca Plc^ 934,703 0.42305 Atlassian Corp Plc ’A’ 55,443 0.03
26,698 Auto Trader Group Plc^ 184,915 0.0823,460 Aviva Plc^ 72,523 0.0319,166 Barratt Developments Plc 119,018 0.05
253,915 BP Plc 953,023 0.4325,129 British Land Co Plc (REIT) 127,060 0.06
307,351 Centrica Plc 137,982 0.067,924 Coca-Cola European Partners
Plc^ 304,598 0.1420,943 Compass Group Plc 311,021 0.144,926 Croda International Plc^ 315,711 0.14
11,196 Diageo Plc 390,423 0.181,536 Dialog Semiconductor Plc 60,735 0.033,687 easyJet Plc 31,504 0.01
45,102 GlaxoSmithKline Plc 927,570 0.422,358 Great Portland Estates Plc
(REIT) 18,970 0.0110,637 HomeServe Plc 171,879 0.0817,601 Howden Joinery Group Plc 129,429 0.0632,481 HSBC Holdings Plc^ 149,712 0.0744,895 Informa Plc 256,722 0.1254,128 J Sainsbury Plc 129,156 0.0610,035 John Wood Group Plc 23,901 0.0110,194 Johnson Matthey Plc^ 268,798 0.122,353 Land Securities Group Plc
(REIT) 17,605 0.011,485 Liberty Global Plc ’A’ 31,660 0.01
475,944 Lloyds Banking Group Plc 177,696 0.0833,270 Marks & Spencer Group Plc 40,096 0.028,518 Moneysupermarket.com Group
Plc 36,063 0.0235,412 National Grid Plc^ 405,604 0.188,986 Rentokil Initial Plc 55,801 0.031,595 Rightmove Plc 11,551 0.01
38,612 Royal Bank of Scotland GroupPlc 53,148 0.02
1,906 RSA Insurance Group Plc 9,359 0.002,724 Segro Plc (REIT) 28,421 0.01
20,505 SSE Plc 315,419 0.143,905 Standard Chartered Plc 18,091 0.01
27,303 Standard Life Aberdeen Plc 87,168 0.0469,157 Taylor Wimpey Plc 124,147 0.0612,287 TechnipFMC Plc 89,941 0.047,317 Unilever Plc 392,380 0.181,263 United Utilities Group Plc 14,245 0.01
351,913 Vodafone Group Plc 583,534 0.268,848 Wm Morrison Supermarkets
Plc 20,550 0.01
8,587,298 3.89
United States1,922 3M Co 297,314 0.135,635 Abbott Laboratories 522,590 0.24
12,254 AbbVie Inc 1,114,011 0.514,951 Adobe Inc 1,894,797 0.866,808 Advanced Micro Devices Inc 359,939 0.168,936 Aflac Inc 320,534 0.152,313 Agilent Technologies Inc 201,069 0.09
Holding Description
MarketValue
USD
% ofNet
Assets
United States continued885 Alaska Air Group Inc 29,763 0.01930 Alexion Pharmaceuticals Inc 108,103 0.05236 Align Technology Inc 58,825 0.03
17,871 Ally Financial Inc 315,870 0.14442 Alnylam Pharmaceuticals Inc 58,768 0.03
1,976 Alphabet Inc ’A’ 2,824,890 1.281,213 Alphabet Inc ’C’ 1,732,661 0.792,495 Amazon.com Inc 6,015,794 2.73
498 AMERCO 160,301 0.0714,723 American Express Co 1,416,500 0.644,681 American International Group
Inc 142,443 0.06247 American Tower Corp (REIT) 63,788 0.03181 Ameriprise Financial Inc 25,400 0.01
3,105 Amgen Inc 696,265 0.32884 ANSYS Inc 245,832 0.11
1,518 Anthem Inc 437,063 0.2026,971 Apple Inc 8,586,218 3.8915,525 Applied Materials Inc 867,226 0.392,415 AptarGroup Inc 267,051 0.121,396 Arista Networks Inc 316,892 0.14
28,827 AT&T Inc 878,070 0.40535 Atmos Energy Corp 54,656 0.02
2,724 Autodesk Inc 551,964 0.251,362 Automatic Data Processing Inc 195,719 0.09
32,453 Avangrid Inc 1,429,230 0.6516,290 Avnet Inc 441,948 0.2013,357 Baker Hughes Co 216,784 0.105,808 Ball Corp 408,302 0.19
11,309 Bank of America Corp 276,279 0.137,042 Bank of New York Mellon Corp 261,188 0.125,092 Berkshire Hathaway Inc ’B’ 934,076 0.426,103 Best Buy Co Inc 465,415 0.21
858 Biogen Inc 257,880 0.12692 BioMarin Pharmaceutical Inc 73,193 0.03
1,661 Booz Allen Hamilton HoldingCorp 128,894 0.06
2,837 BorgWarner Inc 89,025 0.041,824 Boston Properties Inc (REIT) 154,712 0.073,067 Boston Scientific Corp 114,890 0.05
12,152 Bristol-Myers Squibb Co 731,793 0.331,316 Bristol-Myers Squibb
Co (Right) 3,974 0.001,564 Brown-Forman Corp ’B’ 102,989 0.055,703 Cadence Design Systems Inc 507,453 0.231,280 Capital One Financial Corp 85,862 0.049,025 CBRE Group Inc ’A’ 392,407 0.182,892 Centene Corp 191,537 0.093,262 Cerner Corp 229,775 0.101,324 CH Robinson Worldwide Inc 107,932 0.055,010 Charles Schwab Corp 179,308 0.085,669 Chevron Corp 509,586 0.23
282 Chipotle Mexican Grill Inc^ 280,849 0.131,724 Cigna Corp^ 340,887 0.151,485 Cirrus Logic Inc 107,633 0.05
35,006 Cisco Systems Inc 1,604,325 0.7313,279 Citigroup Inc 641,907 0.293,471 Citizens Financial Group Inc 82,783 0.041,955 CME Group Inc 352,447 0.16
28,720 Coca-Cola Co 1,338,639 0.616,335 Colgate-Palmolive Co 457,134 0.21
942 Columbia Sportswear Co 68,625 0.0324,551 Comcast Corp ’A’ 961,908 0.443,905 Comerica Inc 143,196 0.076,426 Consolidated Edison Inc 470,705 0.212,148 Copart Inc 190,764 0.09
138 CoreSite Realty Corp 17,188 0.01156 CoStar Group Inc 101,651 0.05
BlackRock Systematic ESG World Equity Fund continued
The notes on pages 691 to 711 form an integral part of these financial statements.
BlackRock Strategic Funds[620]
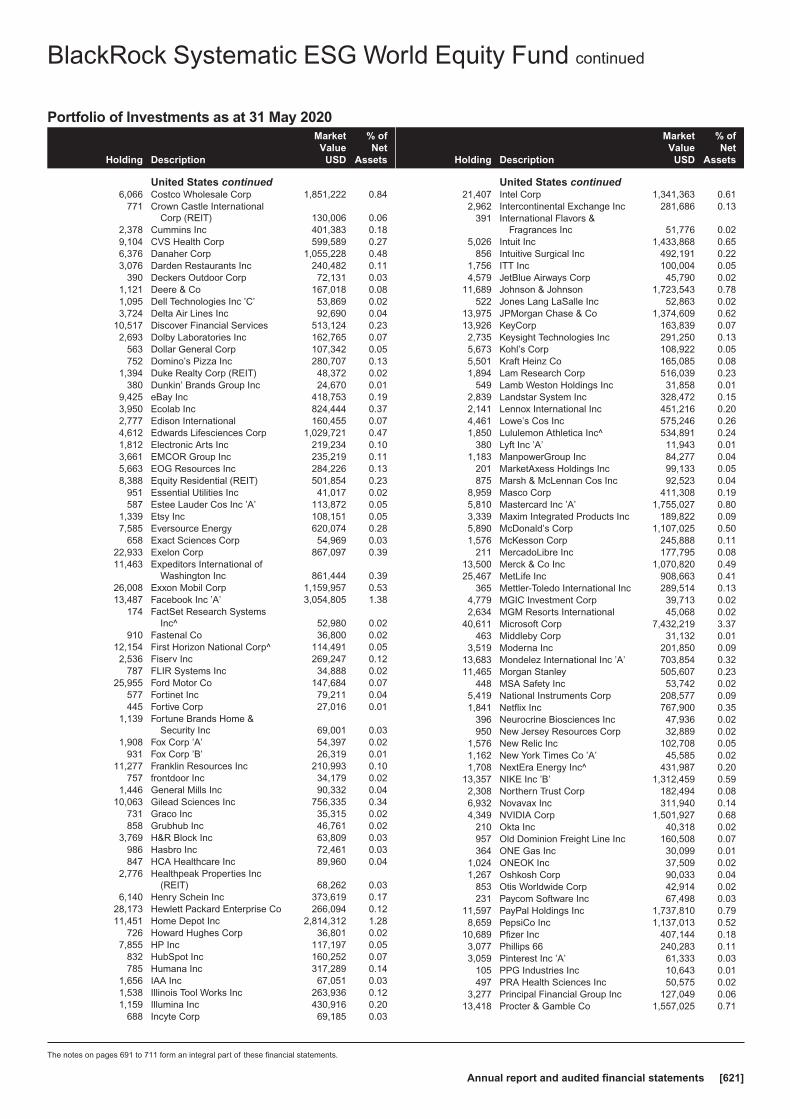
Portfolio of Investments as at 31 May 2020
Holding Description
MarketValue
USD
% ofNet
Assets
United States continued6,066 Costco Wholesale Corp 1,851,222 0.84
771 Crown Castle InternationalCorp (REIT) 130,006 0.06
2,378 Cummins Inc 401,383 0.189,104 CVS Health Corp 599,589 0.276,376 Danaher Corp 1,055,228 0.483,076 Darden Restaurants Inc 240,482 0.11
390 Deckers Outdoor Corp 72,131 0.031,121 Deere & Co 167,018 0.081,095 Dell Technologies Inc ’C’ 53,869 0.023,724 Delta Air Lines Inc 92,690 0.04
10,517 Discover Financial Services 513,124 0.232,693 Dolby Laboratories Inc 162,765 0.07
563 Dollar General Corp 107,342 0.05752 Domino’s Pizza Inc 280,707 0.13
1,394 Duke Realty Corp (REIT) 48,372 0.02380 Dunkin’ Brands Group Inc 24,670 0.01
9,425 eBay Inc 418,753 0.193,950 Ecolab Inc 824,444 0.372,777 Edison International 160,455 0.074,612 Edwards Lifesciences Corp 1,029,721 0.471,812 Electronic Arts Inc 219,234 0.103,661 EMCOR Group Inc 235,219 0.115,663 EOG Resources Inc 284,226 0.138,388 Equity Residential (REIT) 501,854 0.23
951 Essential Utilities Inc 41,017 0.02587 Estee Lauder Cos Inc ’A’ 113,872 0.05
1,339 Etsy Inc 108,151 0.057,585 Eversource Energy 620,074 0.28
658 Exact Sciences Corp 54,969 0.0322,933 Exelon Corp 867,097 0.3911,463 Expeditors International of
Washington Inc 861,444 0.3926,008 Exxon Mobil Corp 1,159,957 0.5313,487 Facebook Inc ’A’ 3,054,805 1.38
174 FactSet Research SystemsInc^ 52,980 0.02
910 Fastenal Co 36,800 0.0212,154 First Horizon National Corp^ 114,491 0.052,536 Fiserv Inc 269,247 0.12
787 FLIR Systems Inc 34,888 0.0225,955 Ford Motor Co 147,684 0.07
577 Fortinet Inc 79,211 0.04445 Fortive Corp 27,016 0.01
1,139 Fortune Brands Home &Security Inc 69,001 0.03
1,908 Fox Corp ’A’ 54,397 0.02931 Fox Corp ’B’ 26,319 0.01
11,277 Franklin Resources Inc 210,993 0.10757 frontdoor Inc 34,179 0.02
1,446 General Mills Inc 90,332 0.0410,063 Gilead Sciences Inc 756,335 0.34
731 Graco Inc 35,315 0.02858 Grubhub Inc 46,761 0.02
3,769 H&R Block Inc 63,809 0.03986 Hasbro Inc 72,461 0.03847 HCA Healthcare Inc 89,960 0.04
2,776 Healthpeak Properties Inc(REIT) 68,262 0.03
6,140 Henry Schein Inc 373,619 0.1728,173 Hewlett Packard Enterprise Co 266,094 0.1211,451 Home Depot Inc 2,814,312 1.28
726 Howard Hughes Corp 36,801 0.027,855 HP Inc 117,197 0.05
832 HubSpot Inc 160,252 0.07785 Humana Inc 317,289 0.14
1,656 IAA Inc 67,051 0.031,538 Illinois Tool Works Inc 263,936 0.121,159 Illumina Inc 430,916 0.20
688 Incyte Corp 69,185 0.03
Holding Description
MarketValue
USD
% ofNet
Assets
United States continued21,407 Intel Corp 1,341,363 0.612,962 Intercontinental Exchange Inc 281,686 0.13
391 International Flavors &Fragrances Inc 51,776 0.02
5,026 Intuit Inc 1,433,868 0.65856 Intuitive Surgical Inc 492,191 0.22
1,756 ITT Inc 100,004 0.054,579 JetBlue Airways Corp 45,790 0.02
11,689 Johnson & Johnson 1,723,543 0.78522 Jones Lang LaSalle Inc 52,863 0.02
13,975 JPMorgan Chase & Co 1,374,609 0.6213,926 KeyCorp 163,839 0.072,735 Keysight Technologies Inc 291,250 0.135,673 Kohl’s Corp 108,922 0.055,501 Kraft Heinz Co 165,085 0.081,894 Lam Research Corp 516,039 0.23
549 Lamb Weston Holdings Inc 31,858 0.012,839 Landstar System Inc 328,472 0.152,141 Lennox International Inc 451,216 0.204,461 Lowe’s Cos Inc 575,246 0.261,850 Lululemon Athletica Inc^ 534,891 0.24
380 Lyft Inc ’A’ 11,943 0.011,183 ManpowerGroup Inc 84,277 0.04
201 MarketAxess Holdings Inc 99,133 0.05875 Marsh & McLennan Cos Inc 92,523 0.04
8,959 Masco Corp 411,308 0.195,810 Mastercard Inc ’A’ 1,755,027 0.803,339 Maxim Integrated Products Inc 189,822 0.095,890 McDonald’s Corp 1,107,025 0.501,576 McKesson Corp 245,888 0.11
211 MercadoLibre Inc 177,795 0.0813,500 Merck & Co Inc 1,070,820 0.4925,467 MetLife Inc 908,663 0.41
365 Mettler-Toledo International Inc 289,514 0.134,779 MGIC Investment Corp 39,713 0.022,634 MGM Resorts International 45,068 0.02
40,611 Microsoft Corp 7,432,219 3.37463 Middleby Corp 31,132 0.01
3,519 Moderna Inc 201,850 0.0913,683 Mondelez International Inc ’A’ 703,854 0.3211,465 Morgan Stanley 505,607 0.23
448 MSA Safety Inc 53,742 0.025,419 National Instruments Corp 208,577 0.091,841 Netflix Inc 767,900 0.35
396 Neurocrine Biosciences Inc 47,936 0.02950 New Jersey Resources Corp 32,889 0.02
1,576 New Relic Inc 102,708 0.051,162 New York Times Co ’A’ 45,585 0.021,708 NextEra Energy Inc^ 431,987 0.20
13,357 NIKE Inc ’B’ 1,312,459 0.592,308 Northern Trust Corp 182,494 0.086,932 Novavax Inc 311,940 0.144,349 NVIDIA Corp 1,501,927 0.68
210 Okta Inc 40,318 0.02957 Old Dominion Freight Line Inc 160,508 0.07364 ONE Gas Inc 30,099 0.01
1,024 ONEOK Inc 37,509 0.021,267 Oshkosh Corp 90,033 0.04
853 Otis Worldwide Corp 42,914 0.02231 Paycom Software Inc 67,498 0.03
11,597 PayPal Holdings Inc 1,737,810 0.798,659 PepsiCo Inc 1,137,013 0.52
10,689 Pfizer Inc 407,144 0.183,077 Phillips 66 240,283 0.113,059 Pinterest Inc ’A’ 61,333 0.03
105 PPG Industries Inc 10,643 0.01497 PRA Health Sciences Inc 50,575 0.02
3,277 Principal Financial Group Inc 127,049 0.0613,418 Procter & Gamble Co 1,557,025 0.71
BlackRock Systematic ESG World Equity Fund continued
The notes on pages 691 to 711 form an integral part of these financial statements.
Annual report and audited financial statements [621]

Portfolio of Investments as at 31 May 2020
Holding Description
MarketValue
USD
% ofNet
Assets
United States continued477 Progressive Corp 36,672 0.02
7,382 Prologis Inc (REIT) 680,842 0.3123,288 Prudential Financial Inc 1,403,102 0.641,012 Public Service Enterprise
Group Inc 51,167 0.025,941 PVH Corp 279,286 0.132,639 QTS Realty Trust Inc ’A’
(REIT) 176,866 0.081,964 Qualcomm Inc 154,606 0.072,909 Regency Centers Corp
(REIT)^ 126,134 0.06847 Regeneron Pharmaceuticals
Inc 488,583 0.225,455 Reliance Steel & Aluminum Co 519,862 0.241,492 ResMed Inc 238,168 0.11
197 RingCentral Inc ’A’ 52,863 0.0215,477 Robert Half International Inc 785,922 0.361,867 Rockwell Automation Inc^ 398,586 0.18
259 Roku Inc 28,586 0.011,706 Roper Technologies Inc 657,578 0.30
698 Ross Stores Inc 68,348 0.032,484 S&P Global Inc 800,842 0.369,254 salesforce.com Inc 1,597,240 0.72
341 Sarepta Therapeutics Inc 52,330 0.021,563 SBA Communications Corp
(REIT)^ 487,625 0.22468 Seattle Genetics Inc 72,119 0.03
1,625 ServiceNow Inc 625,121 0.28639 Sherwin-Williams Co 376,614 0.17
1,999 Silicon Laboratories Inc 182,309 0.08143 Simon Property Group Inc
(REIT) 8,162 0.00153,957 Sirius XM Holdings Inc 876,015 0.40
228 Splunk Inc^ 41,599 0.0210,477 Starbucks Corp 819,616 0.37
759 State Street Corp 46,792 0.026,044 Steel Dynamics Inc 157,869 0.071,596 Stryker Corp 310,151 0.14
453 SVB Financial Group 96,888 0.046,896 Synchrony Financial 141,713 0.06
433 SYNNEX Corp 46,431 0.022,630 Synovus Financial Corp 50,233 0.021,598 Sysco Corp 88,258 0.043,417 T Rowe Price Group Inc 410,211 0.191,053 Target Corp 126,107 0.06
84 Teledyne Technologies Inc 30,664 0.01234 Telephone and Data Systems
Inc 4,673 0.00534 Tesla Inc 432,273 0.20450 Tetra Tech Inc 34,758 0.02
5,486 Texas Instruments Inc 644,331 0.292,201 Thermo Fisher Scientific Inc 760,952 0.35
549 Tiffany & Co 70,080 0.036,085 TJX Cos Inc^ 326,460 0.15
Holding Description
MarketValue
USD
% ofNet
Assets
United States continued3,193 Toro Co 225,107 0.104,612 Travelers Cos Inc 490,532 0.221,786 Trimble Inc 70,083 0.031,909 TriNet Group Inc 102,055 0.05
334 Twilio Inc ’A’ 65,250 0.037,875 Twitter Inc 241,290 0.112,191 Uber Technologies Inc 76,641 0.031,031 UDR Inc (REIT) 38,807 0.02
17,252 UGI Corp 538,952 0.242,545 United Parcel Service Inc ’B’ 251,866 0.115,558 UnitedHealth Group Inc 1,687,742 0.762,489 Valero Energy Corp 165,519 0.086,625 Valvoline Inc 120,376 0.055,101 Varian Medical Systems Inc 626,301 0.28
947 Veeva Systems Inc ’A’ 200,130 0.09891 Ventas Inc (REIT) 31,292 0.01642 VeriSign Inc 137,895 0.06177 Verisk Analytics Inc 30,253 0.01
16,148 Verizon Communications Inc 893,953 0.411,306 Vertex Pharmaceuticals Inc 368,174 0.173,902 VF Corp 222,258 0.101,972 ViacomCBS Inc ’B’ 40,603 0.02
10,725 Visa Inc ’A’^ 2,080,864 0.943,002 VMware Inc ’A’ 463,869 0.211,656 Walgreens Boots Alliance Inc 68,707 0.036,101 Walt Disney Co 707,899 0.323,370 Waters Corp 672,821 0.31
550 Wayfair Inc ’A’ 96,437 0.041,445 Welltower Inc (REIT) 71,513 0.03
463 Wingstop Inc 55,731 0.03265 Woodward Inc 18,004 0.01
3,068 Workday Inc ’A’ 556,382 0.252,462 WW Grainger Inc 760,290 0.342,741 Xerox Holdings Corp 44,240 0.022,666 Xilinx Inc 240,393 0.119,121 Xylem Inc 605,087 0.275,257 Yum! Brands Inc 473,761 0.21
62 Zendesk Inc 5,220 0.003,713 Zions Bancorp NA 123,457 0.065,513 Zoetis Inc 760,629 0.34
136,429,952 61.82
Total Common Stocks / Preferred Stocks & Rights 217,635,551 98.61
Total Transferable Securities and Money MarketInstruments Admitted to an Official Stock ExchangeListing or Dealt in on Another Regulated Market 217,635,551 98.61
Securities portfolio at market value 217,635,551 98.61
Other Net Assets 3,061,735 1.39
Total Net Assets (USD) 220,697,286 100.00
^ All or a portion of this security represents a security on loan.
Futures contracts as at 31 May 2020
Numberof
contractsCurrencyof contracts
Contract/Description
Expirationdate
Grossunderlying
exposureUSD
Net unrealisedappreciation
USD
11 USD E-Mini S&P 500 Index Futures June 2020 June 2020 1,662,265 88,228
9 USD MSCI EAFE Index Futures June 2020 June 2020 776,700 48,756
Total 2,438,965 136,984
BlackRock Systematic ESG World Equity Fund continued
The notes on pages 691 to 711 form an integral part of these financial statements.
BlackRock Strategic Funds[622]
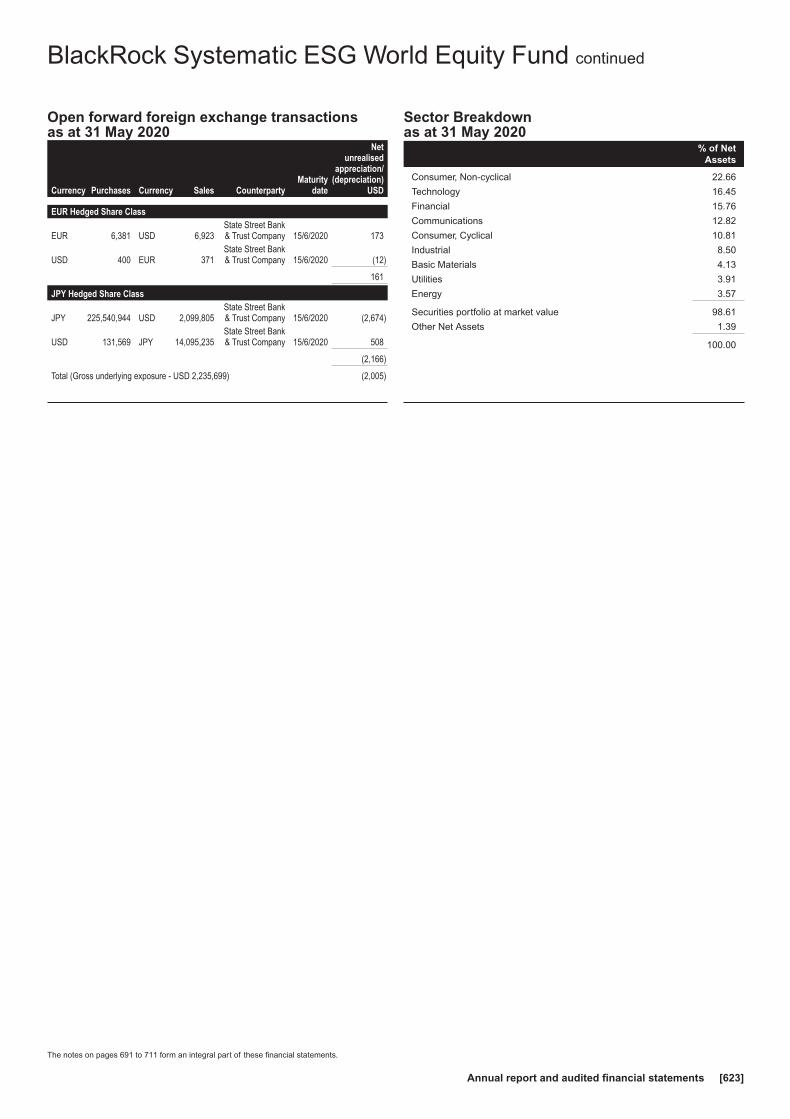
Open forward foreign exchange transactionsas at 31 May 2020
Currency Purchases Currency Sales CounterpartyMaturity
date
Netunrealised
appreciation/(depreciation)
USD
EUR Hedged Share Class
EUR 6,381 USD 6,923State Street Bank& Trust Company 15/6/2020 173
USD 400 EUR 371State Street Bank& Trust Company 15/6/2020 (12)
161
JPY Hedged Share Class
JPY 225,540,944 USD 2,099,805State Street Bank& Trust Company 15/6/2020 (2,674)
USD 131,569 JPY 14,095,235State Street Bank& Trust Company 15/6/2020 508
(2,166)
Total (Gross underlying exposure - USD 2,235,699) (2,005)
Sector Breakdownas at 31 May 2020
% of NetAssets
Consumer, Non-cyclical 22.66
Technology 16.45
Financial 15.76
Communications 12.82
Consumer, Cyclical 10.81
Industrial 8.50
Basic Materials 4.13
Utilities 3.91
Energy 3.57
Securities portfolio at market value 98.61
Other Net Assets 1.39
100.00
BlackRock Systematic ESG World Equity Fund continued
The notes on pages 691 to 711 form an integral part of these financial statements.
Annual report and audited financial statements [623]
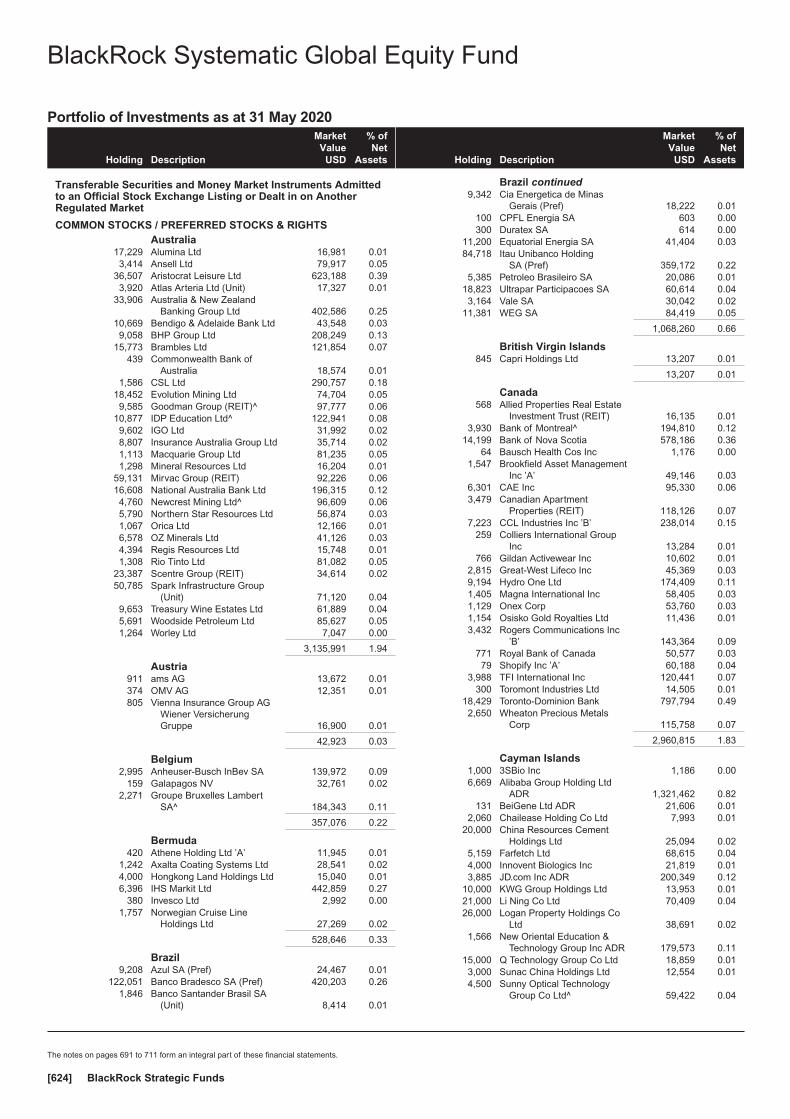
Portfolio of Investments as at 31 May 2020
Holding Description
MarketValue
USD
% ofNet
Assets
Transferable Securities and Money Market Instruments Admittedto an Official Stock Exchange Listing or Dealt in on AnotherRegulated Market
COMMON STOCKS / PREFERRED STOCKS & RIGHTSAustralia
17,229 Alumina Ltd 16,981 0.013,414 Ansell Ltd 79,917 0.05
36,507 Aristocrat Leisure Ltd 623,188 0.393,920 Atlas Arteria Ltd (Unit) 17,327 0.01
33,906 Australia & New ZealandBanking Group Ltd 402,586 0.25
10,669 Bendigo & Adelaide Bank Ltd 43,548 0.039,058 BHP Group Ltd 208,249 0.13
15,773 Brambles Ltd 121,854 0.07439 Commonwealth Bank of
Australia 18,574 0.011,586 CSL Ltd 290,757 0.18
18,452 Evolution Mining Ltd 74,704 0.059,585 Goodman Group (REIT)^ 97,777 0.06
10,877 IDP Education Ltd^ 122,941 0.089,602 IGO Ltd 31,992 0.028,807 Insurance Australia Group Ltd 35,714 0.021,113 Macquarie Group Ltd 81,235 0.051,298 Mineral Resources Ltd 16,204 0.01
59,131 Mirvac Group (REIT) 92,226 0.0616,608 National Australia Bank Ltd 196,315 0.124,760 Newcrest Mining Ltd^ 96,609 0.065,790 Northern Star Resources Ltd 56,874 0.031,067 Orica Ltd 12,166 0.016,578 OZ Minerals Ltd 41,126 0.034,394 Regis Resources Ltd 15,748 0.011,308 Rio Tinto Ltd 81,082 0.05
23,387 Scentre Group (REIT) 34,614 0.0250,785 Spark Infrastructure Group
(Unit) 71,120 0.049,653 Treasury Wine Estates Ltd 61,889 0.045,691 Woodside Petroleum Ltd 85,627 0.051,264 Worley Ltd 7,047 0.00
3,135,991 1.94
Austria911 ams AG 13,672 0.01374 OMV AG 12,351 0.01805 Vienna Insurance Group AG
Wiener VersicherungGruppe 16,900 0.01
42,923 0.03
Belgium2,995 Anheuser-Busch InBev SA 139,972 0.09
159 Galapagos NV 32,761 0.022,271 Groupe Bruxelles Lambert
SA^ 184,343 0.11
357,076 0.22
Bermuda420 Athene Holding Ltd ’A’ 11,945 0.01
1,242 Axalta Coating Systems Ltd 28,541 0.024,000 Hongkong Land Holdings Ltd 15,040 0.016,396 IHS Markit Ltd 442,859 0.27
380 Invesco Ltd 2,992 0.001,757 Norwegian Cruise Line
Holdings Ltd 27,269 0.02
528,646 0.33
Brazil9,208 Azul SA (Pref) 24,467 0.01
122,051 Banco Bradesco SA (Pref) 420,203 0.261,846 Banco Santander Brasil SA
(Unit) 8,414 0.01
Holding Description
MarketValue
USD
% ofNet
Assets
Brazil continued9,342 Cia Energetica de Minas
Gerais (Pref) 18,222 0.01100 CPFL Energia SA 603 0.00300 Duratex SA 614 0.00
11,200 Equatorial Energia SA 41,404 0.0384,718 Itau Unibanco Holding
SA (Pref) 359,172 0.225,385 Petroleo Brasileiro SA 20,086 0.01
18,823 Ultrapar Participacoes SA 60,614 0.043,164 Vale SA 30,042 0.02
11,381 WEG SA 84,419 0.05
1,068,260 0.66
British Virgin Islands845 Capri Holdings Ltd 13,207 0.01
13,207 0.01
Canada568 Allied Properties Real Estate
Investment Trust (REIT) 16,135 0.013,930 Bank of Montreal^ 194,810 0.12
14,199 Bank of Nova Scotia 578,186 0.3664 Bausch Health Cos Inc 1,176 0.00
1,547 Brookfield Asset ManagementInc ’A’ 49,146 0.03
6,301 CAE Inc 95,330 0.063,479 Canadian Apartment
Properties (REIT) 118,126 0.077,223 CCL Industries Inc ’B’ 238,014 0.15
259 Colliers International GroupInc 13,284 0.01
766 Gildan Activewear Inc 10,602 0.012,815 Great-West Lifeco Inc 45,369 0.039,194 Hydro One Ltd 174,409 0.111,405 Magna International Inc 58,405 0.031,129 Onex Corp 53,760 0.031,154 Osisko Gold Royalties Ltd 11,436 0.013,432 Rogers Communications Inc
’B’ 143,364 0.09771 Royal Bank of Canada 50,577 0.0379 Shopify Inc ’A’ 60,188 0.04
3,988 TFI International Inc 120,441 0.07300 Toromont Industries Ltd 14,505 0.01
18,429 Toronto-Dominion Bank 797,794 0.492,650 Wheaton Precious Metals
Corp 115,758 0.07
2,960,815 1.83
Cayman Islands1,000 3SBio Inc 1,186 0.006,669 Alibaba Group Holding Ltd
ADR 1,321,462 0.82131 BeiGene Ltd ADR 21,606 0.01
2,060 Chailease Holding Co Ltd 7,993 0.0120,000 China Resources Cement
Holdings Ltd 25,094 0.025,159 Farfetch Ltd 68,615 0.044,000 Innovent Biologics Inc 21,819 0.013,885 JD.com Inc ADR 200,349 0.12
10,000 KWG Group Holdings Ltd 13,953 0.0121,000 Li Ning Co Ltd 70,409 0.0426,000 Logan Property Holdings Co
Ltd 38,691 0.021,566 New Oriental Education &
Technology Group Inc ADR 179,573 0.1115,000 Q Technology Group Co Ltd 18,859 0.013,000 Sunac China Holdings Ltd 12,554 0.014,500 Sunny Optical Technology
Group Co Ltd^ 59,422 0.04
BlackRock Systematic Global Equity Fund
The notes on pages 691 to 711 form an integral part of these financial statements.
BlackRock Strategic Funds[624]
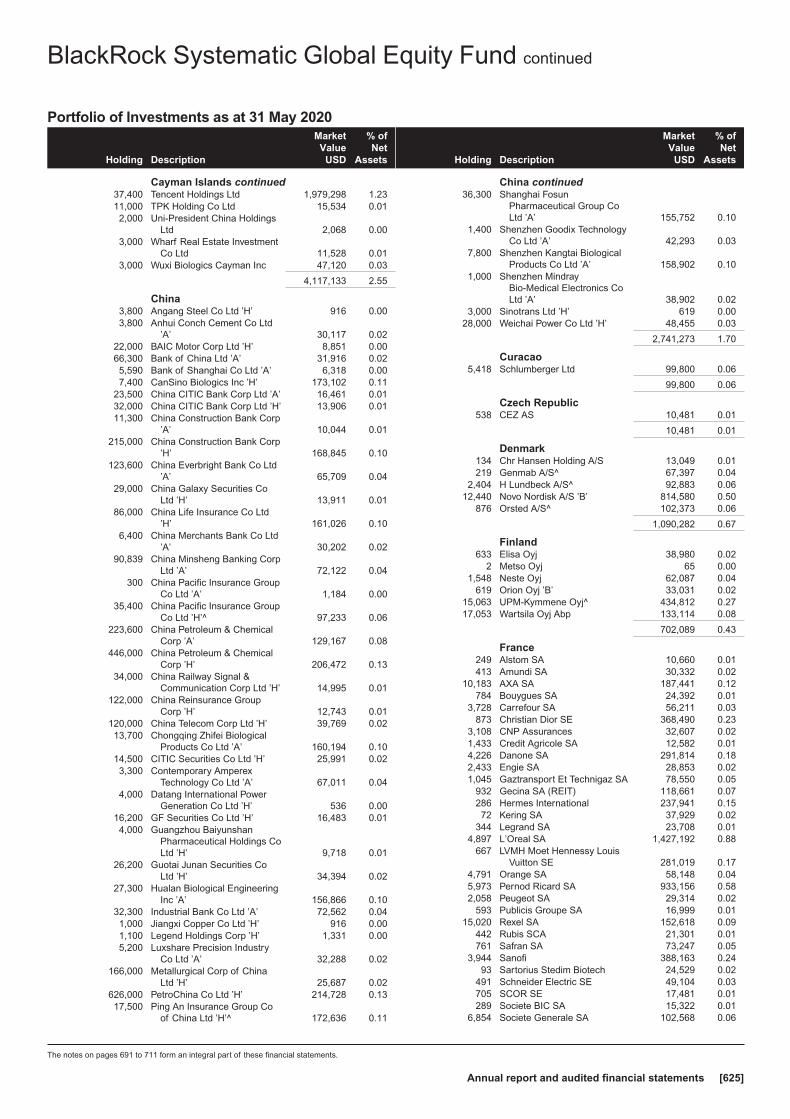
Portfolio of Investments as at 31 May 2020
Holding Description
MarketValue
USD
% ofNet
Assets
Cayman Islands continued37,400 Tencent Holdings Ltd 1,979,298 1.2311,000 TPK Holding Co Ltd 15,534 0.012,000 Uni-President China Holdings
Ltd 2,068 0.003,000 Wharf Real Estate Investment
Co Ltd 11,528 0.013,000 Wuxi Biologics Cayman Inc 47,120 0.03
4,117,133 2.55
China3,800 Angang Steel Co Ltd ’H’ 916 0.003,800 Anhui Conch Cement Co Ltd
’A’ 30,117 0.0222,000 BAIC Motor Corp Ltd ’H’ 8,851 0.0066,300 Bank of China Ltd ’A’ 31,916 0.025,590 Bank of Shanghai Co Ltd ’A’ 6,318 0.007,400 CanSino Biologics Inc ’H’ 173,102 0.11
23,500 China CITIC Bank Corp Ltd ’A’ 16,461 0.0132,000 China CITIC Bank Corp Ltd ’H’ 13,906 0.0111,300 China Construction Bank Corp
’A’ 10,044 0.01215,000 China Construction Bank Corp
’H’ 168,845 0.10123,600 China Everbright Bank Co Ltd
’A’ 65,709 0.0429,000 China Galaxy Securities Co
Ltd ’H’ 13,911 0.0186,000 China Life Insurance Co Ltd
’H’ 161,026 0.106,400 China Merchants Bank Co Ltd
’A’ 30,202 0.0290,839 China Minsheng Banking Corp
Ltd ’A’ 72,122 0.04300 China Pacific Insurance Group
Co Ltd ’A’ 1,184 0.0035,400 China Pacific Insurance Group
Co Ltd ’H’^ 97,233 0.06223,600 China Petroleum & Chemical
Corp ’A’ 129,167 0.08446,000 China Petroleum & Chemical
Corp ’H’ 206,472 0.1334,000 China Railway Signal &
Communication Corp Ltd ’H’ 14,995 0.01122,000 China Reinsurance Group
Corp ’H’ 12,743 0.01120,000 China Telecom Corp Ltd ’H’ 39,769 0.0213,700 Chongqing Zhifei Biological
Products Co Ltd ’A’ 160,194 0.1014,500 CITIC Securities Co Ltd ’H’ 25,991 0.023,300 Contemporary Amperex
Technology Co Ltd ’A’ 67,011 0.044,000 Datang International Power
Generation Co Ltd ’H’ 536 0.0016,200 GF Securities Co Ltd ’H’ 16,483 0.014,000 Guangzhou Baiyunshan
Pharmaceutical Holdings CoLtd ’H’ 9,718 0.01
26,200 Guotai Junan Securities CoLtd ’H’ 34,394 0.02
27,300 Hualan Biological EngineeringInc ’A’ 156,866 0.10
32,300 Industrial Bank Co Ltd ’A’ 72,562 0.041,000 Jiangxi Copper Co Ltd ’H’ 916 0.001,100 Legend Holdings Corp ’H’ 1,331 0.005,200 Luxshare Precision Industry
Co Ltd ’A’ 32,288 0.02166,000 Metallurgical Corp of China
Ltd ’H’ 25,687 0.02626,000 PetroChina Co Ltd ’H’ 214,728 0.1317,500 Ping An Insurance Group Co
of China Ltd ’H’^ 172,636 0.11
Holding Description
MarketValue
USD
% ofNet
Assets
China continued36,300 Shanghai Fosun
Pharmaceutical Group CoLtd ’A’ 155,752 0.10
1,400 Shenzhen Goodix TechnologyCo Ltd ’A’ 42,293 0.03
7,800 Shenzhen Kangtai BiologicalProducts Co Ltd ’A’ 158,902 0.10
1,000 Shenzhen MindrayBio-Medical Electronics CoLtd ’A’ 38,902 0.02
3,000 Sinotrans Ltd ’H’ 619 0.0028,000 Weichai Power Co Ltd ’H’ 48,455 0.03
2,741,273 1.70
Curacao5,418 Schlumberger Ltd 99,800 0.06
99,800 0.06
Czech Republic538 CEZ AS 10,481 0.01
10,481 0.01
Denmark134 Chr Hansen Holding A/S 13,049 0.01219 Genmab A/S^ 67,397 0.04
2,404 H Lundbeck A/S^ 92,883 0.0612,440 Novo Nordisk A/S ’B’ 814,580 0.50
876 Orsted A/S^ 102,373 0.06
1,090,282 0.67
Finland633 Elisa Oyj 38,980 0.02
2 Metso Oyj 65 0.001,548 Neste Oyj 62,087 0.04
619 Orion Oyj ’B’ 33,031 0.0215,063 UPM-Kymmene Oyj^ 434,812 0.2717,053 Wartsila Oyj Abp 133,114 0.08
702,089 0.43
France249 Alstom SA 10,660 0.01413 Amundi SA 30,332 0.02
10,183 AXA SA 187,441 0.12784 Bouygues SA 24,392 0.01
3,728 Carrefour SA 56,211 0.03873 Christian Dior SE 368,490 0.23
3,108 CNP Assurances 32,607 0.021,433 Credit Agricole SA 12,582 0.014,226 Danone SA 291,814 0.182,433 Engie SA 28,853 0.021,045 Gaztransport Et Technigaz SA 78,550 0.05
932 Gecina SA (REIT) 118,661 0.07286 Hermes International 237,941 0.1572 Kering SA 37,929 0.02
344 Legrand SA 23,708 0.014,897 L’Oreal SA 1,427,192 0.88
667 LVMH Moet Hennessy LouisVuitton SE 281,019 0.17
4,791 Orange SA 58,148 0.045,973 Pernod Ricard SA 933,156 0.582,058 Peugeot SA 29,314 0.02
593 Publicis Groupe SA 16,999 0.0115,020 Rexel SA 152,618 0.09
442 Rubis SCA 21,301 0.01761 Safran SA 73,247 0.05
3,944 Sanofi 388,163 0.2493 Sartorius Stedim Biotech 24,529 0.02
491 Schneider Electric SE 49,104 0.03705 SCOR SE 17,481 0.01289 Societe BIC SA 15,322 0.01
6,854 Societe Generale SA 102,568 0.06
BlackRock Systematic Global Equity Fund continued
The notes on pages 691 to 711 form an integral part of these financial statements.
Annual report and audited financial statements [625]
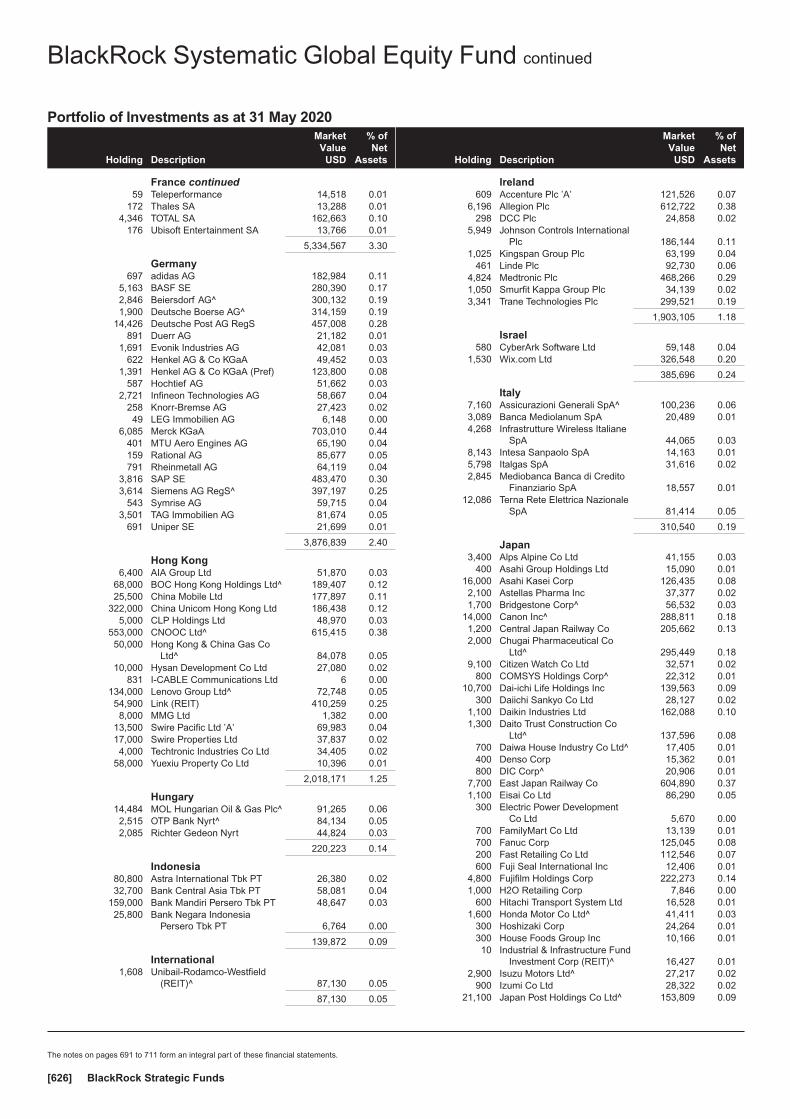
Portfolio of Investments as at 31 May 2020
Holding Description
MarketValue
USD
% ofNet
Assets
France continued59 Teleperformance 14,518 0.01
172 Thales SA 13,288 0.014,346 TOTAL SA 162,663 0.10
176 Ubisoft Entertainment SA 13,766 0.01
5,334,567 3.30
Germany697 adidas AG 182,984 0.11
5,163 BASF SE 280,390 0.172,846 Beiersdorf AG^ 300,132 0.191,900 Deutsche Boerse AG^ 314,159 0.19
14,426 Deutsche Post AG RegS 457,008 0.28891 Duerr AG 21,182 0.01
1,691 Evonik Industries AG 42,081 0.03622 Henkel AG & Co KGaA 49,452 0.03
1,391 Henkel AG & Co KGaA (Pref) 123,800 0.08587 Hochtief AG 51,662 0.03
2,721 Infineon Technologies AG 58,667 0.04258 Knorr-Bremse AG 27,423 0.0249 LEG Immobilien AG 6,148 0.00
6,085 Merck KGaA 703,010 0.44401 MTU Aero Engines AG 65,190 0.04159 Rational AG 85,677 0.05791 Rheinmetall AG 64,119 0.04
3,816 SAP SE 483,470 0.303,614 Siemens AG RegS^ 397,197 0.25
543 Symrise AG 59,715 0.043,501 TAG Immobilien AG 81,674 0.05
691 Uniper SE 21,699 0.01
3,876,839 2.40
Hong Kong6,400 AIA Group Ltd 51,870 0.03
68,000 BOC Hong Kong Holdings Ltd^ 189,407 0.1225,500 China Mobile Ltd 177,897 0.11
322,000 China Unicom Hong Kong Ltd 186,438 0.125,000 CLP Holdings Ltd 48,970 0.03
553,000 CNOOC Ltd^ 615,415 0.3850,000 Hong Kong & China Gas Co
Ltd^ 84,078 0.0510,000 Hysan Development Co Ltd 27,080 0.02
831 I-CABLE Communications Ltd 6 0.00134,000 Lenovo Group Ltd^ 72,748 0.0554,900 Link (REIT) 410,259 0.258,000 MMG Ltd 1,382 0.00
13,500 Swire Pacific Ltd ’A’ 69,983 0.0417,000 Swire Properties Ltd 37,837 0.024,000 Techtronic Industries Co Ltd 34,405 0.02
58,000 Yuexiu Property Co Ltd 10,396 0.01
2,018,171 1.25
Hungary14,484 MOL Hungarian Oil & Gas Plc^ 91,265 0.062,515 OTP Bank Nyrt^ 84,134 0.052,085 Richter Gedeon Nyrt 44,824 0.03
220,223 0.14
Indonesia80,800 Astra International Tbk PT 26,380 0.0232,700 Bank Central Asia Tbk PT 58,081 0.04
159,000 Bank Mandiri Persero Tbk PT 48,647 0.0325,800 Bank Negara Indonesia
Persero Tbk PT 6,764 0.00
139,872 0.09
International1,608 Unibail-Rodamco-Westfield
(REIT)^ 87,130 0.05
87,130 0.05
Holding Description
MarketValue
USD
% ofNet
Assets
Ireland609 Accenture Plc ’A’ 121,526 0.07
6,196 Allegion Plc 612,722 0.38298 DCC Plc 24,858 0.02
5,949 Johnson Controls InternationalPlc 186,144 0.11
1,025 Kingspan Group Plc 63,199 0.04461 Linde Plc 92,730 0.06
4,824 Medtronic Plc 468,266 0.291,050 Smurfit Kappa Group Plc 34,139 0.023,341 Trane Technologies Plc 299,521 0.19
1,903,105 1.18
Israel580 CyberArk Software Ltd 59,148 0.04
1,530 Wix.com Ltd 326,548 0.20
385,696 0.24
Italy7,160 Assicurazioni Generali SpA^ 100,236 0.063,089 Banca Mediolanum SpA 20,489 0.014,268 Infrastrutture Wireless Italiane
SpA 44,065 0.038,143 Intesa Sanpaolo SpA 14,163 0.015,798 Italgas SpA 31,616 0.022,845 Mediobanca Banca di Credito
Finanziario SpA 18,557 0.0112,086 Terna Rete Elettrica Nazionale
SpA 81,414 0.05
310,540 0.19
Japan3,400 Alps Alpine Co Ltd 41,155 0.03
400 Asahi Group Holdings Ltd 15,090 0.0116,000 Asahi Kasei Corp 126,435 0.082,100 Astellas Pharma Inc 37,377 0.021,700 Bridgestone Corp^ 56,532 0.03
14,000 Canon Inc^ 288,811 0.181,200 Central Japan Railway Co 205,662 0.132,000 Chugai Pharmaceutical Co
Ltd^ 295,449 0.189,100 Citizen Watch Co Ltd 32,571 0.02
800 COMSYS Holdings Corp^ 22,312 0.0110,700 Dai-ichi Life Holdings Inc 139,563 0.09
300 Daiichi Sankyo Co Ltd 28,127 0.021,100 Daikin Industries Ltd 162,088 0.101,300 Daito Trust Construction Co
Ltd^ 137,596 0.08700 Daiwa House Industry Co Ltd^ 17,405 0.01400 Denso Corp 15,362 0.01800 DIC Corp^ 20,906 0.01
7,700 East Japan Railway Co 604,890 0.371,100 Eisai Co Ltd 86,290 0.05
300 Electric Power DevelopmentCo Ltd 5,670 0.00
700 FamilyMart Co Ltd 13,139 0.01700 Fanuc Corp 125,045 0.08200 Fast Retailing Co Ltd 112,546 0.07600 Fuji Seal International Inc 12,406 0.01
4,800 Fujifilm Holdings Corp 222,273 0.141,000 H2O Retailing Corp 7,846 0.00
600 Hitachi Transport System Ltd 16,528 0.011,600 Honda Motor Co Ltd^ 41,411 0.03
300 Hoshizaki Corp 24,264 0.01300 House Foods Group Inc 10,166 0.0110 Industrial & Infrastructure Fund
Investment Corp (REIT)^ 16,427 0.012,900 Isuzu Motors Ltd^ 27,217 0.02
900 Izumi Co Ltd 28,322 0.0221,100 Japan Post Holdings Co Ltd^ 153,809 0.09
BlackRock Systematic Global Equity Fund continued
The notes on pages 691 to 711 form an integral part of these financial statements.
BlackRock Strategic Funds[626]

Portfolio of Investments as at 31 May 2020
Holding Description
MarketValue
USD
% ofNet
Assets
Japan continued500 Japan Tobacco Inc 9,936 0.01
11,000 JFE Holdings Inc^ 80,993 0.05197,150 JXTG Holdings Inc^ 759,348 0.47
5,600 Kajima Corp^ 63,619 0.043,100 Kaneka Corp 82,799 0.055,100 Kao Corp^ 409,982 0.25
18,200 KDDI Corp 530,611 0.333 Kenedix Office Investment
Corp (REIT)^ 16,678 0.01400 Keyence Corp 164,924 0.10
10,000 Kirin Holdings Co Ltd 205,225 0.13900 Konami Holdings Corp^ 31,669 0.02
25,700 Konica Minolta Inc^ 95,331 0.061,100 Kuraray Co Ltd 11,576 0.013,100 Kyocera Corp 168,048 0.10
500 Kyowa Exeo Corp 11,500 0.01900 Lintec Corp 21,462 0.01400 Mabuchi Motor Co Ltd 13,239 0.01700 Maruha Nichiro Corp 15,169 0.01400 Matsumotokiyoshi Holdings Co
Ltd 15,005 0.01200 MEIJI Holdings Co Ltd^ 15,079 0.01
31,900 Mitsubishi Chemical HoldingsCorp 188,111 0.12
600 Mitsubishi Materials Corp^ 13,683 0.0115,600 Mitsubishi Motors Corp^ 44,089 0.031,200 Mitsui Chemicals Inc 24,990 0.02
200 Mitsui Mining & Smelting CoLtd^ 4,317 0.00
400 MonotaRO Co Ltd^ 14,559 0.012,800 MS&AD Insurance Group
Holdings Inc^ 82,387 0.051,700 Murata Manufacturing Co Ltd 95,064 0.06
11,100 Nikon Corp^ 102,162 0.06400 Nintendo Co Ltd 161,911 0.10
5,300 Nippon Electric Glass Co Ltd^ 84,158 0.05300 Nippon Shinyaku Co Ltd 25,882 0.02
1,800 Nippon Shokubai Co Ltd^ 100,907 0.063,500 Nippon Telegraph & Telephone
Corp 79,524 0.05800 Nisshin Seifun Group Inc 12,487 0.01
1,200 Nitori Holdings Co Ltd 217,933 0.134,600 Nitto Denko Corp^ 249,319 0.155,200 NTT DOCOMO Inc 142,684 0.09
500 PeptiDream Inc 22,475 0.018,900 Pola Orbis Holdings Inc^ 173,425 0.118,800 Recruit Holdings Co Ltd 303,519 0.19
15,900 Resona Holdings Inc 57,324 0.04400 Rohm Co Ltd 26,961 0.02
7,800 Ryohin Keikaku Co Ltd 118,126 0.076,500 Seiko Epson Corp 73,360 0.04
900 Sekisui House Ltd 17,173 0.01600 Seria Co Ltd 19,272 0.01
1,800 Seven & i Holdings Co Ltd 61,699 0.04500 Shin-Etsu Chemical Co Ltd 58,662 0.04
1,800 Shionogi & Co Ltd 106,445 0.071,700 SoftBank Group Corp 76,367 0.054,300 Sony Corp^ 274,794 0.17
600 Sumitomo Bakelite Co Ltd 16,901 0.0143,200 Sumitomo Chemical Co Ltd^ 134,140 0.0813,600 Sumitomo Mitsui Financial
Group Inc^ 394,351 0.241,700 Sumitomo Rubber Industries
Ltd^ 17,322 0.011,900 Sundrug Co Ltd 64,119 0.04
400 Suntory Beverage & Food Ltd 16,362 0.01900 Sysmex Corp 72,040 0.04
12,300 T&D Holdings Inc^ 111,262 0.07500 Taisho Pharmaceutical
Holdings Co Ltd 31,795 0.02
Holding Description
MarketValue
USD
% ofNet
Assets
Japan continued9,400 Takeda Pharmaceutical Co
Ltd^ 366,247 0.239,400 Teijin Ltd 154,154 0.10
600 Terumo Corp 23,595 0.013,200 Tokyo Gas Co Ltd 76,471 0.057,000 Toray Industries Inc^ 34,094 0.02
14,100 Ube Industries Ltd^ 252,336 0.16600 Ulvac Inc^ 18,045 0.01
2,400 Unicharm Corp 89,472 0.051,500 Ushio Inc 17,864 0.012,400 Yamaha Motor Co Ltd 34,695 0.021,300 Yamato Holdings Co Ltd 28,812 0.02
700 Yamato Kogyo Co Ltd^ 14,480 0.01
10,875,209 6.73
Jersey12,476 Experian Plc 436,831 0.271,451 Janus Henderson Group Plc 31,472 0.02
17,372 Man Group Plc 30,606 0.02327 Novocure Ltd 21,889 0.01
520,798 0.32
Luxembourg15,449 ArcelorMittal SA 148,921 0.0915,004 Aroundtown SA 83,068 0.05
363 Grand City Properties SA 8,234 0.01986 Millicom International Cellular
SA SDR 23,593 0.01565 RTL Group SA 19,149 0.01
12,090 Subsea 7 SA^ 69,695 0.041,601 Tenaris SA 10,030 0.01
362,690 0.22
Malaysia25,300 Genting Bhd 23,278 0.0275,100 MISC Bhd 143,377 0.0915,400 Petronas Chemicals Group
Bhd 22,316 0.019,100 Public Bank Bhd 30,686 0.027,000 QL Resources Bhd 16,294 0.012,600 Tenaga Nasional Bhd 6,734 0.00
242,685 0.15
Mexico678,727 America Movil SAB de CV ’L’ 448,578 0.28
5,154 Fomento Economico MexicanoSAB de CV 34,226 0.02
1,500 Grupo Aeroportuario delPacifico SAB de CV ’B’ 9,866 0.00
4,091 Grupo Financiero BanorteSAB de CV ’O’ 12,567 0.01
505,237 0.31
Netherlands5,420 ABN AMRO Bank NV - CVA 44,731 0.031,958 Airbus SE 126,256 0.086,478 Akzo Nobel NV 531,597 0.331,021 ASML Holding NV 334,403 0.212,128 ASR Nederland NV 58,233 0.041,549 Euronext NV 144,855 0.09
644 Heineken NV 59,164 0.045,469 ING Groep NV 35,703 0.02
377 Just Eat Takeaway^ 41,199 0.023,394 Koninklijke DSM NV 437,024 0.27
13,812 NN Group NV 428,802 0.26367 NXP Semiconductors NV 36,550 0.02
1,674 Prosus NV 137,521 0.081,541 Signify NV 33,002 0.02
BlackRock Systematic Global Equity Fund continued
The notes on pages 691 to 711 form an integral part of these financial statements.
Annual report and audited financial statements [627]
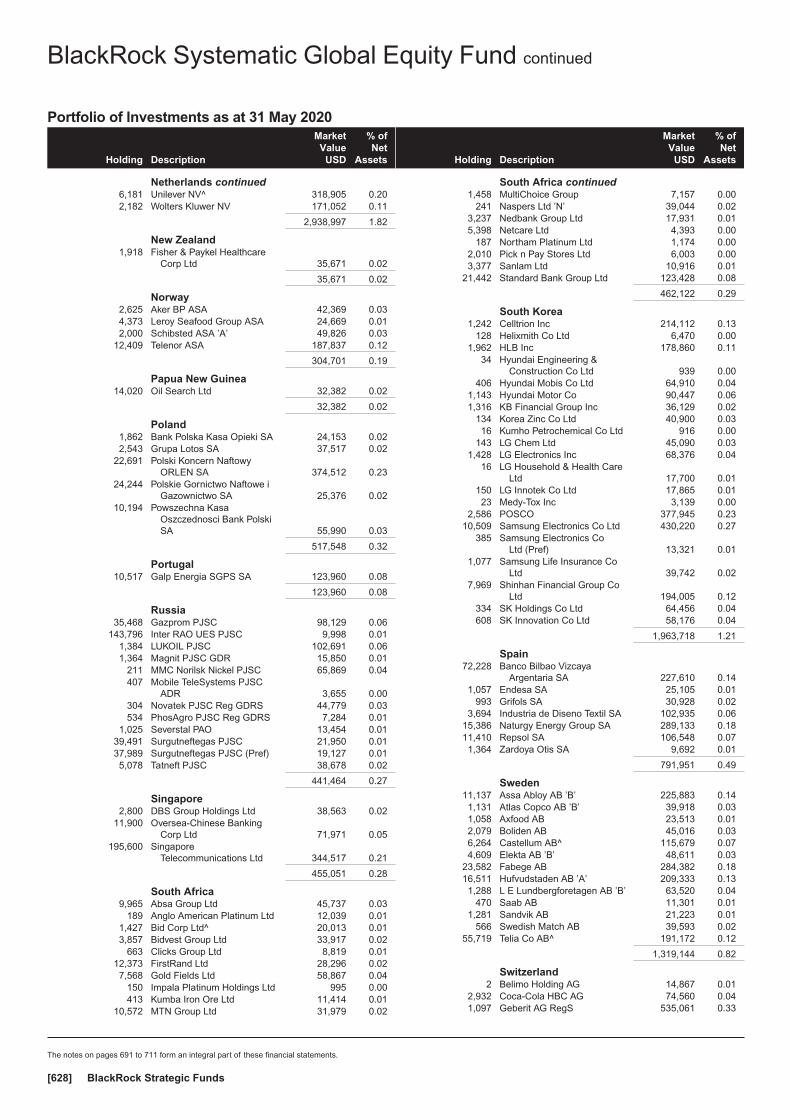
Portfolio of Investments as at 31 May 2020
Holding Description
MarketValue
USD
% ofNet
Assets
Netherlands continued6,181 Unilever NV^ 318,905 0.202,182 Wolters Kluwer NV 171,052 0.11
2,938,997 1.82
New Zealand1,918 Fisher & Paykel Healthcare
Corp Ltd 35,671 0.02
35,671 0.02
Norway2,625 Aker BP ASA 42,369 0.034,373 Leroy Seafood Group ASA 24,669 0.012,000 Schibsted ASA ’A’ 49,826 0.03
12,409 Telenor ASA 187,837 0.12
304,701 0.19
Papua New Guinea14,020 Oil Search Ltd 32,382 0.02
32,382 0.02
Poland1,862 Bank Polska Kasa Opieki SA 24,153 0.022,543 Grupa Lotos SA 37,517 0.02
22,691 Polski Koncern NaftowyORLEN SA 374,512 0.23
24,244 Polskie Gornictwo Naftowe iGazownictwo SA 25,376 0.02
10,194 Powszechna KasaOszczednosci Bank PolskiSA 55,990 0.03
517,548 0.32
Portugal10,517 Galp Energia SGPS SA 123,960 0.08
123,960 0.08
Russia35,468 Gazprom PJSC 98,129 0.06
143,796 Inter RAO UES PJSC 9,998 0.011,384 LUKOIL PJSC 102,691 0.061,364 Magnit PJSC GDR 15,850 0.01
211 MMC Norilsk Nickel PJSC 65,869 0.04407 Mobile TeleSystems PJSC
ADR 3,655 0.00304 Novatek PJSC Reg GDRS 44,779 0.03534 PhosAgro PJSC Reg GDRS 7,284 0.01
1,025 Severstal PAO 13,454 0.0139,491 Surgutneftegas PJSC 21,950 0.0137,989 Surgutneftegas PJSC (Pref) 19,127 0.015,078 Tatneft PJSC 38,678 0.02
441,464 0.27
Singapore2,800 DBS Group Holdings Ltd 38,563 0.02
11,900 Oversea-Chinese BankingCorp Ltd 71,971 0.05
195,600 SingaporeTelecommunications Ltd 344,517 0.21
455,051 0.28
South Africa9,965 Absa Group Ltd 45,737 0.03
189 Anglo American Platinum Ltd 12,039 0.011,427 Bid Corp Ltd^ 20,013 0.013,857 Bidvest Group Ltd 33,917 0.02
663 Clicks Group Ltd 8,819 0.0112,373 FirstRand Ltd 28,296 0.027,568 Gold Fields Ltd 58,867 0.04
150 Impala Platinum Holdings Ltd 995 0.00413 Kumba Iron Ore Ltd 11,414 0.01
10,572 MTN Group Ltd 31,979 0.02
Holding Description
MarketValue
USD
% ofNet
Assets
South Africa continued1,458 MultiChoice Group 7,157 0.00
241 Naspers Ltd ’N’ 39,044 0.023,237 Nedbank Group Ltd 17,931 0.015,398 Netcare Ltd 4,393 0.00
187 Northam Platinum Ltd 1,174 0.002,010 Pick n Pay Stores Ltd 6,003 0.003,377 Sanlam Ltd 10,916 0.01
21,442 Standard Bank Group Ltd 123,428 0.08
462,122 0.29
South Korea1,242 Celltrion Inc 214,112 0.13
128 Helixmith Co Ltd 6,470 0.001,962 HLB Inc 178,860 0.11
34 Hyundai Engineering &Construction Co Ltd 939 0.00
406 Hyundai Mobis Co Ltd 64,910 0.041,143 Hyundai Motor Co 90,447 0.061,316 KB Financial Group Inc 36,129 0.02
134 Korea Zinc Co Ltd 40,900 0.0316 Kumho Petrochemical Co Ltd 916 0.00
143 LG Chem Ltd 45,090 0.031,428 LG Electronics Inc 68,376 0.04
16 LG Household & Health CareLtd 17,700 0.01
150 LG Innotek Co Ltd 17,865 0.0123 Medy-Tox Inc 3,139 0.00
2,586 POSCO 377,945 0.2310,509 Samsung Electronics Co Ltd 430,220 0.27
385 Samsung Electronics CoLtd (Pref) 13,321 0.01
1,077 Samsung Life Insurance CoLtd 39,742 0.02
7,969 Shinhan Financial Group CoLtd 194,005 0.12
334 SK Holdings Co Ltd 64,456 0.04608 SK Innovation Co Ltd 58,176 0.04
1,963,718 1.21
Spain72,228 Banco Bilbao Vizcaya
Argentaria SA 227,610 0.141,057 Endesa SA 25,105 0.01
993 Grifols SA 30,928 0.023,694 Industria de Diseno Textil SA 102,935 0.06
15,386 Naturgy Energy Group SA 289,133 0.1811,410 Repsol SA 106,548 0.071,364 Zardoya Otis SA 9,692 0.01
791,951 0.49
Sweden11,137 Assa Abloy AB ’B’ 225,883 0.141,131 Atlas Copco AB ’B’ 39,918 0.031,058 Axfood AB 23,513 0.012,079 Boliden AB 45,016 0.036,264 Castellum AB^ 115,679 0.074,609 Elekta AB ’B’ 48,611 0.03
23,582 Fabege AB 284,382 0.1816,511 Hufvudstaden AB ’A’ 209,333 0.131,288 L E Lundbergforetagen AB ’B’ 63,520 0.04
470 Saab AB 11,301 0.011,281 Sandvik AB 21,223 0.01
566 Swedish Match AB 39,593 0.0255,719 Telia Co AB^ 191,172 0.12
1,319,144 0.82
Switzerland2 Belimo Holding AG 14,867 0.01
2,932 Coca-Cola HBC AG 74,560 0.041,097 Geberit AG RegS 535,061 0.33
BlackRock Systematic Global Equity Fund continued
The notes on pages 691 to 711 form an integral part of these financial statements.
BlackRock Strategic Funds[628]

Portfolio of Investments as at 31 May 2020
Holding Description
MarketValue
USD
% ofNet
Assets
Switzerland continued102 Givaudan SA RegS 368,521 0.23
22,362 Nestle SA RegS 2,401,965 1.497,232 Novartis AG RegS^ 627,920 0.39
405 Sika AG RegS 70,135 0.041,939 Sunrise Communications
Group AG^ 162,657 0.101,344 Swiss Re AG 90,977 0.06
279 Vifor Pharma AG 43,463 0.03
4,390,126 2.72
Taiwan1,000 ASPEED Technology Inc 51,624 0.03
24,000 AU Optronics Corp 6,059 0.0035,373 Cathay Financial Holding Co
Ltd 47,184 0.0310,000 Chipbond Technology Corp 20,450 0.0179,000 CTBC Financial Holding Co
Ltd 52,491 0.0319,000 Delta Electronics Inc 87,327 0.05
102,000 Fubon Financial Holding CoLtd 144,040 0.09
46,000 Innolux Corp 9,529 0.011,000 Largan Precision Co Ltd 127,727 0.08
26,000 MediaTek Inc 400,933 0.2542,000 Quanta Computer Inc 97,918 0.0627,000 Realtek Semiconductor Corp 232,456 0.14
137,000 Taiwan SemiconductorManufacturing Co Ltd 1,332,356 0.83
151,000 Uni-President EnterprisesCorp 366,122 0.23
2,976,216 1.84
Thailand255,500 Berli Jucker PCL NVDR 341,363 0.21
7,500 Gulf Energy Development PCL 8,723 0.015,700 PTT Exploration & Production
PCL NVDR 15,052 0.01
365,138 0.23
Turkey83,217 Akbank T.A.S. 69,479 0.0428,006 Enerjisa Enerji AS 32,310 0.0210,517 Ipek Dogal Enerji Kaynaklari
Arastirma Ve Uretim AS 23,236 0.0231,342 KOC Holding AS 75,113 0.059,734 Migros Ticaret AS 46,627 0.032,877 Tekfen Holding AS 5,953 0.001,501 Tofas Turk Otomobil Fabrikasi
AS 4,956 0.0022,205 Turk Telekomunikasyon AS 24,254 0.0217,953 Turkiye Garanti Bankasi AS 20,764 0.01
132,278 Turkiye Is Bankasi AS ’C’ 96,515 0.06
399,207 0.25
United Kingdom665 Anglo American Plc 13,906 0.01
4,588 AstraZeneca Plc 500,457 0.31251 Atlassian Corp Plc ’A’ 45,627 0.03
5,379 Auto Trader Group Plc 37,256 0.0210,172 Aviva Plc 31,445 0.02
270 Bellway Plc 8,607 0.00260 Bovis Homes Group Plc 2,440 0.00
14,859 BP Plc 55,770 0.033,237 British American Tobacco Plc 128,111 0.088,322 British Land Co Plc (REIT) 42,078 0.031,245 Britvic Plc 11,040 0.01
106,754 Centrica Plc 47,926 0.036,389 Coca-Cola European Partners
Plc 245,593 0.155,549 Compass Group Plc 82,407 0.05
202 Croda International Plc 12,946 0.01
Holding Description
MarketValue
USD
% ofNet
Assets
United Kingdom continued565 Dechra Pharmaceuticals Plc 19,497 0.01
24,472 Diageo Plc 853,378 0.531,401 Dialog Semiconductor Plc 55,397 0.03
23,355 Direct Line Insurance GroupPlc 76,727 0.05
9,823 Electrocomponents Plc 78,069 0.0518,714 GlaxoSmithKline Plc 384,873 0.241,112 HomeServe Plc 17,968 0.012,938 Howden Joinery Group Plc 21,605 0.01
10,207 IG Group Holdings Plc 97,382 0.0618,475 Informa Plc 105,645 0.071,391 International Game
Technology Plc 11,810 0.015,689 Intertek Group Plc 394,451 0.243,540 ITV Plc 3,505 0.00
27,198 J Sainsbury Plc 64,898 0.04941 JD Sports Fashion Plc 7,518 0.00
11,458 John Wood Group Plc 27,291 0.0237,857 Lloyds Banking Group Plc 14,134 0.0119,057 Meggitt Plc 65,831 0.0425,285 Moneysupermarket.com Group
Plc 107,050 0.0752,566 National Grid Plc 602,083 0.371,455 Pearson Plc 8,279 0.001,527 Redrow Plc 8,883 0.012,923 RELX Plc 68,699 0.04
51,878 Rentokil Initial Plc 322,154 0.208,888 Rightmove Plc^ 64,370 0.043,053 Rotork Plc 9,985 0.017,952 Royal Dutch Shell Plc ’A’ 124,139 0.082,887 Royal Dutch Shell Plc ’B’ 43,557 0.03
379 Smiths Group Plc 6,134 0.003,845 SSE Plc 59,146 0.041,724 Standard Chartered Plc 7,987 0.00
10,826 Taylor Wimpey Plc 19,434 0.011,942 TechnipFMC Plc (traded in
France) 14,252 0.017,788 TechnipFMC Plc (traded in
United States) 57,008 0.038,758 Tesco Plc 24,942 0.024,761 Unilever Plc 255,313 0.161,787 United Utilities Group Plc 20,155 0.019,369 Virgin Money UK Plc 10,428 0.01
165,211 Vodafone Group Plc 273,949 0.17602 WH Smith Plc 8,007 0.00
108,947 Wm Morrison SupermarketsPlc 253,031 0.16
5,934,573 3.67
United States6,215 3M Co 961,398 0.594,277 Abbott Laboratories 396,649 0.257,877 AbbVie Inc 716,098 0.443,687 Adobe Inc 1,411,052 0.872,269 Aflac Inc 81,389 0.05
471 AGCO Corp 26,324 0.023,219 Agilent Technologies Inc 279,828 0.171,160 Alexandria Real Estate
Equities Inc (REIT) 178,652 0.11774 Alexion Pharmaceuticals Inc 89,970 0.06371 Alnylam Pharmaceuticals Inc 49,328 0.03
1,516 Alphabet Inc ’A’ 2,167,274 1.341,559 Alphabet Inc ’C’ 2,226,891 1.386,096 Altria Group Inc 233,172 0.141,993 Amazon.com Inc 4,805,402 2.97
108 AMERCO 34,764 0.025,316 American Express Co 511,452 0.322,077 Amgen Inc 465,746 0.29
517 ANSYS Inc 143,773 0.0993 Anthem Inc 26,777 0.02
BlackRock Systematic Global Equity Fund continued
The notes on pages 691 to 711 form an integral part of these financial statements.
Annual report and audited financial statements [629]
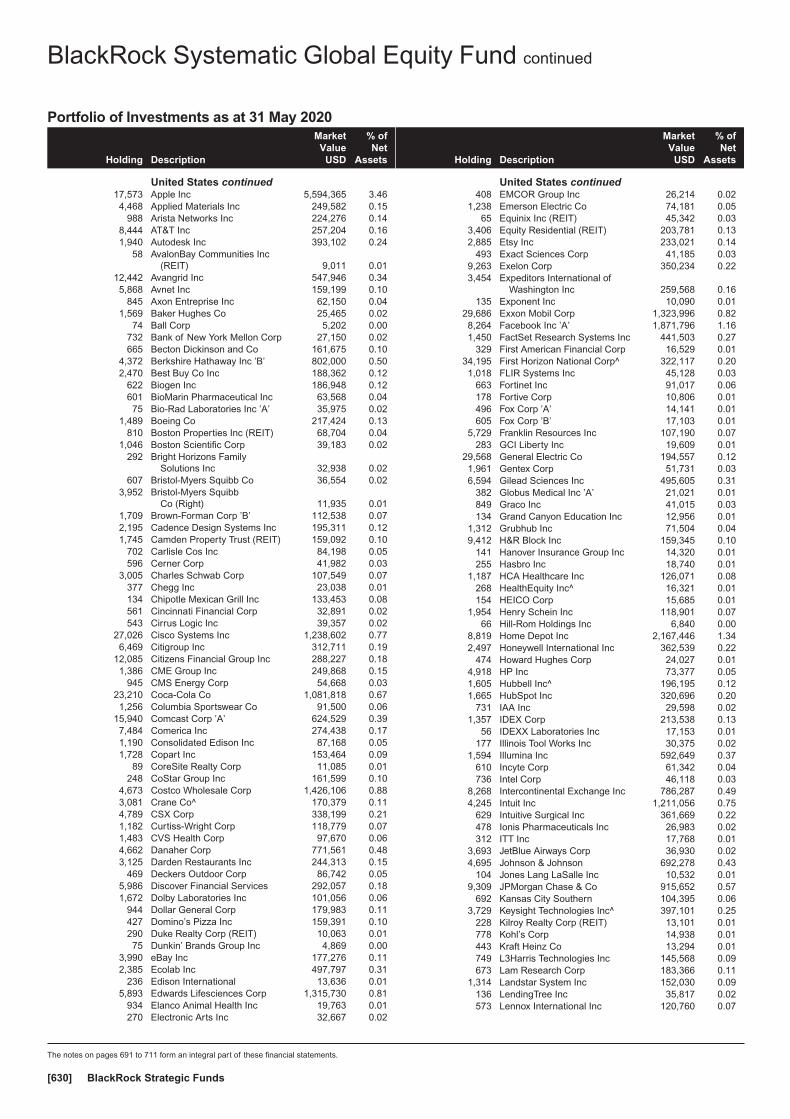
Portfolio of Investments as at 31 May 2020
Holding Description
MarketValue
USD
% ofNet
Assets
United States continued17,573 Apple Inc 5,594,365 3.464,468 Applied Materials Inc 249,582 0.15
988 Arista Networks Inc 224,276 0.148,444 AT&T Inc 257,204 0.161,940 Autodesk Inc 393,102 0.24
58 AvalonBay Communities Inc(REIT) 9,011 0.01
12,442 Avangrid Inc 547,946 0.345,868 Avnet Inc 159,199 0.10
845 Axon Entreprise Inc 62,150 0.041,569 Baker Hughes Co 25,465 0.02
74 Ball Corp 5,202 0.00732 Bank of New York Mellon Corp 27,150 0.02665 Becton Dickinson and Co 161,675 0.10
4,372 Berkshire Hathaway Inc ’B’ 802,000 0.502,470 Best Buy Co Inc 188,362 0.12
622 Biogen Inc 186,948 0.12601 BioMarin Pharmaceutical Inc 63,568 0.0475 Bio-Rad Laboratories Inc ’A’ 35,975 0.02
1,489 Boeing Co 217,424 0.13810 Boston Properties Inc (REIT) 68,704 0.04
1,046 Boston Scientific Corp 39,183 0.02292 Bright Horizons Family
Solutions Inc 32,938 0.02607 Bristol-Myers Squibb Co 36,554 0.02
3,952 Bristol-Myers SquibbCo (Right) 11,935 0.01
1,709 Brown-Forman Corp ’B’ 112,538 0.072,195 Cadence Design Systems Inc 195,311 0.121,745 Camden Property Trust (REIT) 159,092 0.10
702 Carlisle Cos Inc 84,198 0.05596 Cerner Corp 41,982 0.03
3,005 Charles Schwab Corp 107,549 0.07377 Chegg Inc 23,038 0.01134 Chipotle Mexican Grill Inc 133,453 0.08561 Cincinnati Financial Corp 32,891 0.02543 Cirrus Logic Inc 39,357 0.02
27,026 Cisco Systems Inc 1,238,602 0.776,469 Citigroup Inc 312,711 0.19
12,085 Citizens Financial Group Inc 288,227 0.181,386 CME Group Inc 249,868 0.15
945 CMS Energy Corp 54,668 0.0323,210 Coca-Cola Co 1,081,818 0.671,256 Columbia Sportswear Co 91,500 0.06
15,940 Comcast Corp ’A’ 624,529 0.397,484 Comerica Inc 274,438 0.171,190 Consolidated Edison Inc 87,168 0.051,728 Copart Inc 153,464 0.09
89 CoreSite Realty Corp 11,085 0.01248 CoStar Group Inc 161,599 0.10
4,673 Costco Wholesale Corp 1,426,106 0.883,081 Crane Co^ 170,379 0.114,789 CSX Corp 338,199 0.211,182 Curtiss-Wright Corp 118,779 0.071,483 CVS Health Corp 97,670 0.064,662 Danaher Corp 771,561 0.483,125 Darden Restaurants Inc 244,313 0.15
469 Deckers Outdoor Corp 86,742 0.055,986 Discover Financial Services 292,057 0.181,672 Dolby Laboratories Inc 101,056 0.06
944 Dollar General Corp 179,983 0.11427 Domino’s Pizza Inc 159,391 0.10290 Duke Realty Corp (REIT) 10,063 0.0175 Dunkin’ Brands Group Inc 4,869 0.00
3,990 eBay Inc 177,276 0.112,385 Ecolab Inc 497,797 0.31
236 Edison International 13,636 0.015,893 Edwards Lifesciences Corp 1,315,730 0.81
934 Elanco Animal Health Inc 19,763 0.01270 Electronic Arts Inc 32,667 0.02
Holding Description
MarketValue
USD
% ofNet
Assets
United States continued408 EMCOR Group Inc 26,214 0.02
1,238 Emerson Electric Co 74,181 0.0565 Equinix Inc (REIT) 45,342 0.03
3,406 Equity Residential (REIT) 203,781 0.132,885 Etsy Inc 233,021 0.14
493 Exact Sciences Corp 41,185 0.039,263 Exelon Corp 350,234 0.223,454 Expeditors International of
Washington Inc 259,568 0.16135 Exponent Inc 10,090 0.01
29,686 Exxon Mobil Corp 1,323,996 0.828,264 Facebook Inc ’A’ 1,871,796 1.161,450 FactSet Research Systems Inc 441,503 0.27
329 First American Financial Corp 16,529 0.0134,195 First Horizon National Corp^ 322,117 0.201,018 FLIR Systems Inc 45,128 0.03
663 Fortinet Inc 91,017 0.06178 Fortive Corp 10,806 0.01496 Fox Corp ’A’ 14,141 0.01605 Fox Corp ’B’ 17,103 0.01
5,729 Franklin Resources Inc 107,190 0.07283 GCI Liberty Inc 19,609 0.01
29,568 General Electric Co 194,557 0.121,961 Gentex Corp 51,731 0.036,594 Gilead Sciences Inc 495,605 0.31
382 Globus Medical Inc ’A’ 21,021 0.01849 Graco Inc 41,015 0.03134 Grand Canyon Education Inc 12,956 0.01
1,312 Grubhub Inc 71,504 0.049,412 H&R Block Inc 159,345 0.10
141 Hanover Insurance Group Inc 14,320 0.01255 Hasbro Inc 18,740 0.01
1,187 HCA Healthcare Inc 126,071 0.08268 HealthEquity Inc^ 16,321 0.01154 HEICO Corp 15,685 0.01
1,954 Henry Schein Inc 118,901 0.0766 Hill-Rom Holdings Inc 6,840 0.00
8,819 Home Depot Inc 2,167,446 1.342,497 Honeywell International Inc 362,539 0.22
474 Howard Hughes Corp 24,027 0.014,918 HP Inc 73,377 0.051,605 Hubbell Inc^ 196,195 0.121,665 HubSpot Inc 320,696 0.20
731 IAA Inc 29,598 0.021,357 IDEX Corp 213,538 0.13
56 IDEXX Laboratories Inc 17,153 0.01177 Illinois Tool Works Inc 30,375 0.02
1,594 Illumina Inc 592,649 0.37610 Incyte Corp 61,342 0.04736 Intel Corp 46,118 0.03
8,268 Intercontinental Exchange Inc 786,287 0.494,245 Intuit Inc 1,211,056 0.75
629 Intuitive Surgical Inc 361,669 0.22478 Ionis Pharmaceuticals Inc 26,983 0.02312 ITT Inc 17,768 0.01
3,693 JetBlue Airways Corp 36,930 0.024,695 Johnson & Johnson 692,278 0.43
104 Jones Lang LaSalle Inc 10,532 0.019,309 JPMorgan Chase & Co 915,652 0.57
692 Kansas City Southern 104,395 0.063,729 Keysight Technologies Inc^ 397,101 0.25
228 Kilroy Realty Corp (REIT) 13,101 0.01778 Kohl’s Corp 14,938 0.01443 Kraft Heinz Co 13,294 0.01749 L3Harris Technologies Inc 145,568 0.09673 Lam Research Corp 183,366 0.11
1,314 Landstar System Inc 152,030 0.09136 LendingTree Inc 35,817 0.02573 Lennox International Inc 120,760 0.07
BlackRock Systematic Global Equity Fund continued
The notes on pages 691 to 711 form an integral part of these financial statements.
BlackRock Strategic Funds[630]
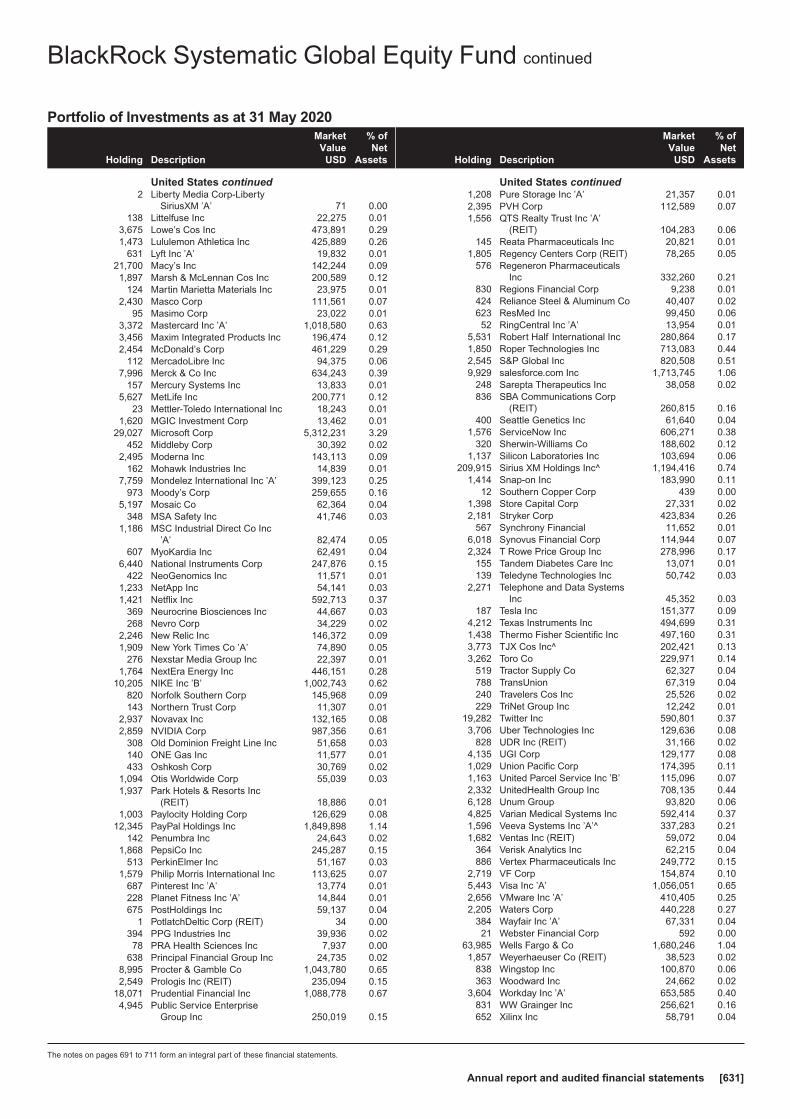
Portfolio of Investments as at 31 May 2020
Holding Description
MarketValue
USD
% ofNet
Assets
United States continued2 Liberty Media Corp-Liberty
SiriusXM ’A’ 71 0.00138 Littelfuse Inc 22,275 0.01
3,675 Lowe’s Cos Inc 473,891 0.291,473 Lululemon Athletica Inc 425,889 0.26
631 Lyft Inc ’A’ 19,832 0.0121,700 Macy’s Inc 142,244 0.091,897 Marsh & McLennan Cos Inc 200,589 0.12
124 Martin Marietta Materials Inc 23,975 0.012,430 Masco Corp 111,561 0.07
95 Masimo Corp 23,022 0.013,372 Mastercard Inc ’A’ 1,018,580 0.633,456 Maxim Integrated Products Inc 196,474 0.122,454 McDonald’s Corp 461,229 0.29
112 MercadoLibre Inc 94,375 0.067,996 Merck & Co Inc 634,243 0.39
157 Mercury Systems Inc 13,833 0.015,627 MetLife Inc 200,771 0.12
23 Mettler-Toledo International Inc 18,243 0.011,620 MGIC Investment Corp 13,462 0.01
29,027 Microsoft Corp 5,312,231 3.29452 Middleby Corp 30,392 0.02
2,495 Moderna Inc 143,113 0.09162 Mohawk Industries Inc 14,839 0.01
7,759 Mondelez International Inc ’A’ 399,123 0.25973 Moody’s Corp 259,655 0.16
5,197 Mosaic Co 62,364 0.04348 MSA Safety Inc 41,746 0.03
1,186 MSC Industrial Direct Co Inc’A’ 82,474 0.05
607 MyoKardia Inc 62,491 0.046,440 National Instruments Corp 247,876 0.15
422 NeoGenomics Inc 11,571 0.011,233 NetApp Inc 54,141 0.031,421 Netflix Inc 592,713 0.37
369 Neurocrine Biosciences Inc 44,667 0.03268 Nevro Corp 34,229 0.02
2,246 New Relic Inc 146,372 0.091,909 New York Times Co ’A’ 74,890 0.05
276 Nexstar Media Group Inc 22,397 0.011,764 NextEra Energy Inc 446,151 0.28
10,205 NIKE Inc ’B’ 1,002,743 0.62820 Norfolk Southern Corp 145,968 0.09143 Northern Trust Corp 11,307 0.01
2,937 Novavax Inc 132,165 0.082,859 NVIDIA Corp 987,356 0.61
308 Old Dominion Freight Line Inc 51,658 0.03140 ONE Gas Inc 11,577 0.01433 Oshkosh Corp 30,769 0.02
1,094 Otis Worldwide Corp 55,039 0.031,937 Park Hotels & Resorts Inc
(REIT) 18,886 0.011,003 Paylocity Holding Corp 126,629 0.08
12,345 PayPal Holdings Inc 1,849,898 1.14142 Penumbra Inc 24,643 0.02
1,868 PepsiCo Inc 245,287 0.15513 PerkinElmer Inc 51,167 0.03
1,579 Philip Morris International Inc 113,625 0.07687 Pinterest Inc ’A’ 13,774 0.01228 Planet Fitness Inc ’A’ 14,844 0.01675 PostHoldings Inc 59,137 0.04
1 PotlatchDeltic Corp (REIT) 34 0.00394 PPG Industries Inc 39,936 0.0278 PRA Health Sciences Inc 7,937 0.00
638 Principal Financial Group Inc 24,735 0.028,995 Procter & Gamble Co 1,043,780 0.652,549 Prologis Inc (REIT) 235,094 0.15
18,071 Prudential Financial Inc 1,088,778 0.674,945 Public Service Enterprise
Group Inc 250,019 0.15
Holding Description
MarketValue
USD
% ofNet
Assets
United States continued1,208 Pure Storage Inc ’A’ 21,357 0.012,395 PVH Corp 112,589 0.071,556 QTS Realty Trust Inc ’A’
(REIT) 104,283 0.06145 Reata Pharmaceuticals Inc 20,821 0.01
1,805 Regency Centers Corp (REIT) 78,265 0.05576 Regeneron Pharmaceuticals
Inc 332,260 0.21830 Regions Financial Corp 9,238 0.01424 Reliance Steel & Aluminum Co 40,407 0.02623 ResMed Inc 99,450 0.0652 RingCentral Inc ’A’ 13,954 0.01
5,531 Robert Half International Inc 280,864 0.171,850 Roper Technologies Inc 713,083 0.442,545 S&P Global Inc 820,508 0.519,929 salesforce.com Inc 1,713,745 1.06
248 Sarepta Therapeutics Inc 38,058 0.02836 SBA Communications Corp
(REIT) 260,815 0.16400 Seattle Genetics Inc 61,640 0.04
1,576 ServiceNow Inc 606,271 0.38320 Sherwin-Williams Co 188,602 0.12
1,137 Silicon Laboratories Inc 103,694 0.06209,915 Sirius XM Holdings Inc^ 1,194,416 0.74
1,414 Snap-on Inc 183,990 0.1112 Southern Copper Corp 439 0.00
1,398 Store Capital Corp 27,331 0.022,181 Stryker Corp 423,834 0.26
567 Synchrony Financial 11,652 0.016,018 Synovus Financial Corp 114,944 0.072,324 T Rowe Price Group Inc 278,996 0.17
155 Tandem Diabetes Care Inc 13,071 0.01139 Teledyne Technologies Inc 50,742 0.03
2,271 Telephone and Data SystemsInc 45,352 0.03
187 Tesla Inc 151,377 0.094,212 Texas Instruments Inc 494,699 0.311,438 Thermo Fisher Scientific Inc 497,160 0.313,773 TJX Cos Inc^ 202,421 0.133,262 Toro Co 229,971 0.14
519 Tractor Supply Co 62,327 0.04788 TransUnion 67,319 0.04240 Travelers Cos Inc 25,526 0.02229 TriNet Group Inc 12,242 0.01
19,282 Twitter Inc 590,801 0.373,706 Uber Technologies Inc 129,636 0.08
828 UDR Inc (REIT) 31,166 0.024,135 UGI Corp 129,177 0.081,029 Union Pacific Corp 174,395 0.111,163 United Parcel Service Inc ’B’ 115,096 0.072,332 UnitedHealth Group Inc 708,135 0.446,128 Unum Group 93,820 0.064,825 Varian Medical Systems Inc 592,414 0.371,596 Veeva Systems Inc ’A’^ 337,283 0.211,682 Ventas Inc (REIT) 59,072 0.04
364 Verisk Analytics Inc 62,215 0.04886 Vertex Pharmaceuticals Inc 249,772 0.15
2,719 VF Corp 154,874 0.105,443 Visa Inc ’A’ 1,056,051 0.652,656 VMware Inc ’A’ 410,405 0.252,205 Waters Corp 440,228 0.27
384 Wayfair Inc ’A’ 67,331 0.0421 Webster Financial Corp 592 0.00
63,985 Wells Fargo & Co 1,680,246 1.041,857 Weyerhaeuser Co (REIT) 38,523 0.02
838 Wingstop Inc 100,870 0.06363 Woodward Inc 24,662 0.02
3,604 Workday Inc ’A’ 653,585 0.40831 WW Grainger Inc 256,621 0.16652 Xilinx Inc 58,791 0.04
BlackRock Systematic Global Equity Fund continued
The notes on pages 691 to 711 form an integral part of these financial statements.
Annual report and audited financial statements [631]

Portfolio of Investments as at 31 May 2020
Holding Description
MarketValue
USD
% ofNet
Assets
United States continued7,431 Xylem Inc 492,973 0.311,526 Yum! Brands Inc 137,523 0.091,437 Zendesk Inc 120,995 0.07
165 Zions Bancorp NA 5,486 0.005,478 Zoetis Inc 755,800 0.47
91,337,751 56.53
Total Common Stocks / Preferred Stocks & Rights 158,440,458 98.06
EXCHANGE TRADED FUNDSFrance
USD 77,437 Lyxor MSCI India UCITS ETF 1,151,333 0.71
1,151,333 0.71
Total Exchange Traded Funds 1,151,333 0.71
Total Transferable Securities and Money MarketInstruments Admitted to an Official Stock ExchangeListing or Dealt in on Another Regulated Market 159,591,791 98.77
Holding Description
MarketValue
USD
% ofNet
Assets
Other Transferable Securities and Money Market Instruments
RIGHTSHong Kong
800 Legend Holdings Corp‘H’ (Right) — 0.00
— 0.00
Total Rights 0 0.00
Total Other Transferable Securities and MoneyMarket Instruments 0 0.00
Securities portfolio at market value 159,591,791 98.77
Other Net Assets 1,993,053 1.23
Total Net Assets (USD) 161,584,844 100.00
^ All or a portion of this security represents a security on loan.
Futures contracts as at 31 May 2020
Numberof
contractsCurrencyof contracts
Contract/Description
Expirationdate
Grossunderlying
exposureUSD
Net unrealisedappreciation
USD
7 USD E-Mini S&P 500 Index Futures June 2020 June 2020 1,057,805 70,230
6 USD MSCI EAFE Index Futures June 2020 June 2020 517,800 33,541
5 USD MSCI Emerging Markets Index Futures June 2020 June 2020 230,350 4,375
Total 1,805,955 108,146
Open forward foreign exchange transactionsas at 31 May 2020
Currency Purchases Currency Sales CounterpartyMaturity
date
Netunrealised
appreciation/(depreciation)
USD
EUR Hedged Share Class
EUR 364,606 USD 395,632State Street Bank& Trust Company 15/6/2020 9,895
USD 45,881 EUR 42,156State Street Bank& Trust Company 15/6/2020 (1,008)
8,887
Total (Gross underlying exposure - USD 452,413) 8,887
Sector Breakdownas at 31 May 2020
% of NetAssets
Consumer, Non-cyclical 23.88
Technology 16.01
Communications 15.63
Financial 14.95
Industrial 9.46
Consumer, Cyclical 8.35
Basic Materials 3.91
Energy 3.43
Utilities 2.35
Exchange Traded Funds 0.71
Diversified 0.09
Securities portfolio at market value 98.77
Other Net Assets 1.23
100.00
BlackRock Systematic Global Equity Fund continued
The notes on pages 691 to 711 form an integral part of these financial statements.
BlackRock Strategic Funds[632]
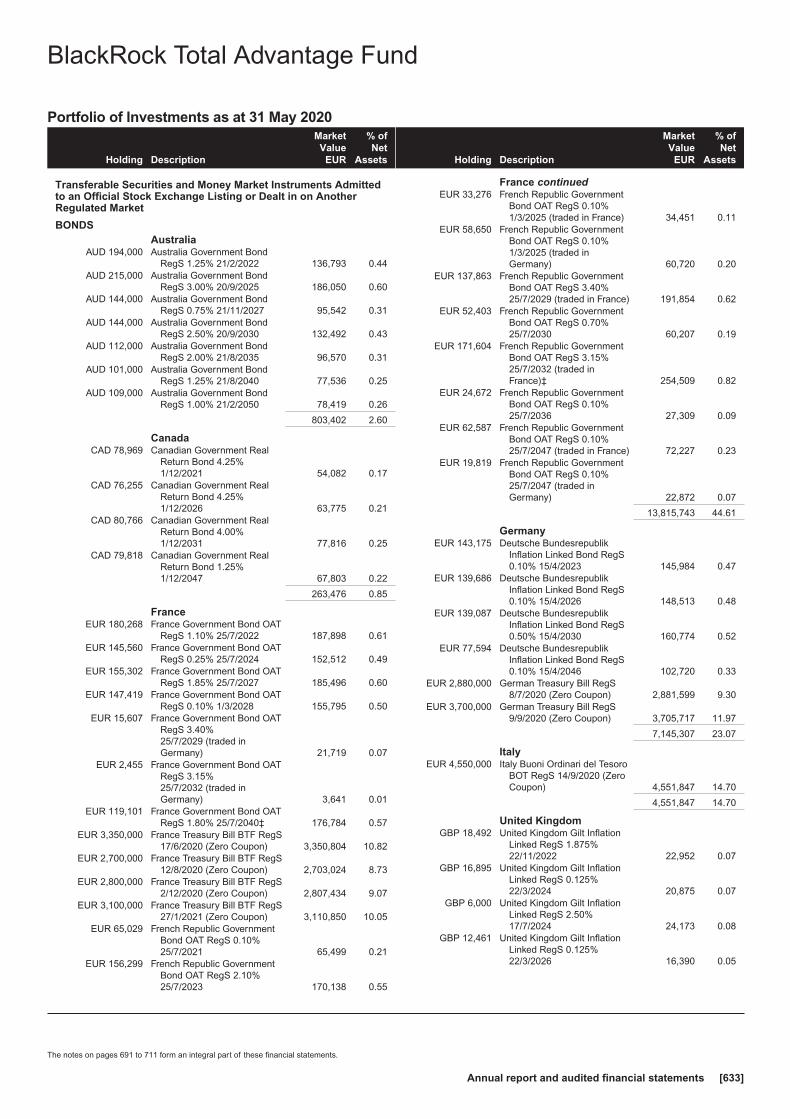
Portfolio of Investments as at 31 May 2020
Holding Description
MarketValue
EUR
% ofNet
Assets
Transferable Securities and Money Market Instruments Admittedto an Official Stock Exchange Listing or Dealt in on AnotherRegulated Market
BONDSAustralia
AUD 194,000 Australia Government BondRegS 1.25% 21/2/2022 136,793 0.44
AUD 215,000 Australia Government BondRegS 3.00% 20/9/2025 186,050 0.60
AUD 144,000 Australia Government BondRegS 0.75% 21/11/2027 95,542 0.31
AUD 144,000 Australia Government BondRegS 2.50% 20/9/2030 132,492 0.43
AUD 112,000 Australia Government BondRegS 2.00% 21/8/2035 96,570 0.31
AUD 101,000 Australia Government BondRegS 1.25% 21/8/2040 77,536 0.25
AUD 109,000 Australia Government BondRegS 1.00% 21/2/2050 78,419 0.26
803,402 2.60
CanadaCAD 78,969 Canadian Government Real
Return Bond 4.25%1/12/2021 54,082 0.17
CAD 76,255 Canadian Government RealReturn Bond 4.25%1/12/2026 63,775 0.21
CAD 80,766 Canadian Government RealReturn Bond 4.00%1/12/2031 77,816 0.25
CAD 79,818 Canadian Government RealReturn Bond 1.25%1/12/2047 67,803 0.22
263,476 0.85
FranceEUR 180,268 France Government Bond OAT
RegS 1.10% 25/7/2022 187,898 0.61EUR 145,560 France Government Bond OAT
RegS 0.25% 25/7/2024 152,512 0.49EUR 155,302 France Government Bond OAT
RegS 1.85% 25/7/2027 185,496 0.60EUR 147,419 France Government Bond OAT
RegS 0.10% 1/3/2028 155,795 0.50EUR 15,607 France Government Bond OAT
RegS 3.40%25/7/2029 (traded inGermany) 21,719 0.07
EUR 2,455 France Government Bond OATRegS 3.15%25/7/2032 (traded inGermany) 3,641 0.01
EUR 119,101 France Government Bond OATRegS 1.80% 25/7/2040‡ 176,784 0.57
EUR 3,350,000 France Treasury Bill BTF RegS17/6/2020 (Zero Coupon) 3,350,804 10.82
EUR 2,700,000 France Treasury Bill BTF RegS12/8/2020 (Zero Coupon) 2,703,024 8.73
EUR 2,800,000 France Treasury Bill BTF RegS2/12/2020 (Zero Coupon) 2,807,434 9.07
EUR 3,100,000 France Treasury Bill BTF RegS27/1/2021 (Zero Coupon) 3,110,850 10.05
EUR 65,029 French Republic GovernmentBond OAT RegS 0.10%25/7/2021 65,499 0.21
EUR 156,299 French Republic GovernmentBond OAT RegS 2.10%25/7/2023 170,138 0.55
Holding Description
MarketValue
EUR
% ofNet
Assets
France continuedEUR 33,276 French Republic Government
Bond OAT RegS 0.10%1/3/2025 (traded in France) 34,451 0.11
EUR 58,650 French Republic GovernmentBond OAT RegS 0.10%1/3/2025 (traded inGermany) 60,720 0.20
EUR 137,863 French Republic GovernmentBond OAT RegS 3.40%25/7/2029 (traded in France) 191,854 0.62
EUR 52,403 French Republic GovernmentBond OAT RegS 0.70%25/7/2030 60,207 0.19
EUR 171,604 French Republic GovernmentBond OAT RegS 3.15%25/7/2032 (traded inFrance)‡ 254,509 0.82
EUR 24,672 French Republic GovernmentBond OAT RegS 0.10%25/7/2036 27,309 0.09
EUR 62,587 French Republic GovernmentBond OAT RegS 0.10%25/7/2047 (traded in France) 72,227 0.23
EUR 19,819 French Republic GovernmentBond OAT RegS 0.10%25/7/2047 (traded inGermany) 22,872 0.07
13,815,743 44.61
GermanyEUR 143,175 Deutsche Bundesrepublik
Inflation Linked Bond RegS0.10% 15/4/2023 145,984 0.47
EUR 139,686 Deutsche BundesrepublikInflation Linked Bond RegS0.10% 15/4/2026 148,513 0.48
EUR 139,087 Deutsche BundesrepublikInflation Linked Bond RegS0.50% 15/4/2030 160,774 0.52
EUR 77,594 Deutsche BundesrepublikInflation Linked Bond RegS0.10% 15/4/2046 102,720 0.33
EUR 2,880,000 German Treasury Bill RegS8/7/2020 (Zero Coupon) 2,881,599 9.30
EUR 3,700,000 German Treasury Bill RegS9/9/2020 (Zero Coupon) 3,705,717 11.97
7,145,307 23.07
ItalyEUR 4,550,000 Italy Buoni Ordinari del Tesoro
BOT RegS 14/9/2020 (ZeroCoupon) 4,551,847 14.70
4,551,847 14.70
United KingdomGBP 18,492 United Kingdom Gilt Inflation
Linked RegS 1.875%22/11/2022 22,952 0.07
GBP 16,895 United Kingdom Gilt InflationLinked RegS 0.125%22/3/2024 20,875 0.07
GBP 6,000 United Kingdom Gilt InflationLinked RegS 2.50%17/7/2024 24,173 0.08
GBP 12,461 United Kingdom Gilt InflationLinked RegS 0.125%22/3/2026 16,390 0.05
BlackRock Total Advantage Fund
The notes on pages 691 to 711 form an integral part of these financial statements.
Annual report and audited financial statements [633]
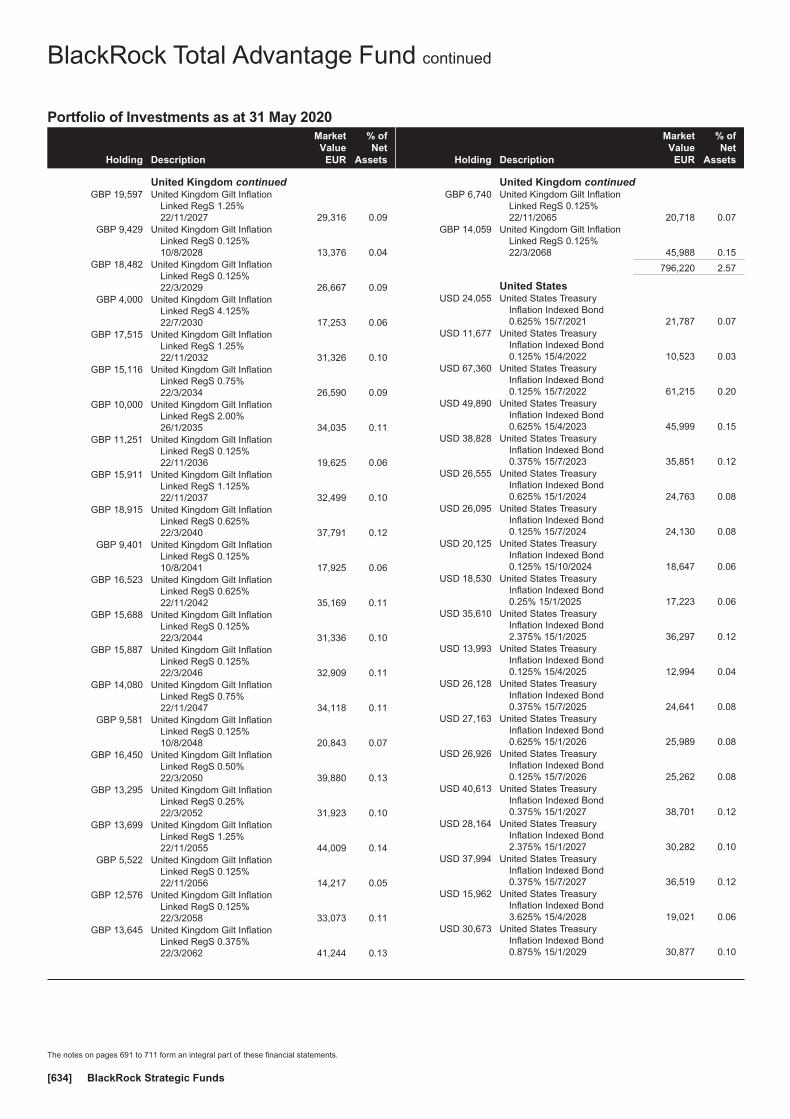
Portfolio of Investments as at 31 May 2020
Holding Description
MarketValue
EUR
% ofNet
Assets
United Kingdom continuedGBP 19,597 United Kingdom Gilt Inflation
Linked RegS 1.25%22/11/2027 29,316 0.09
GBP 9,429 United Kingdom Gilt InflationLinked RegS 0.125%10/8/2028 13,376 0.04
GBP 18,482 United Kingdom Gilt InflationLinked RegS 0.125%22/3/2029 26,667 0.09
GBP 4,000 United Kingdom Gilt InflationLinked RegS 4.125%22/7/2030 17,253 0.06
GBP 17,515 United Kingdom Gilt InflationLinked RegS 1.25%22/11/2032 31,326 0.10
GBP 15,116 United Kingdom Gilt InflationLinked RegS 0.75%22/3/2034 26,590 0.09
GBP 10,000 United Kingdom Gilt InflationLinked RegS 2.00%26/1/2035 34,035 0.11
GBP 11,251 United Kingdom Gilt InflationLinked RegS 0.125%22/11/2036 19,625 0.06
GBP 15,911 United Kingdom Gilt InflationLinked RegS 1.125%22/11/2037 32,499 0.10
GBP 18,915 United Kingdom Gilt InflationLinked RegS 0.625%22/3/2040 37,791 0.12
GBP 9,401 United Kingdom Gilt InflationLinked RegS 0.125%10/8/2041 17,925 0.06
GBP 16,523 United Kingdom Gilt InflationLinked RegS 0.625%22/11/2042 35,169 0.11
GBP 15,688 United Kingdom Gilt InflationLinked RegS 0.125%22/3/2044 31,336 0.10
GBP 15,887 United Kingdom Gilt InflationLinked RegS 0.125%22/3/2046 32,909 0.11
GBP 14,080 United Kingdom Gilt InflationLinked RegS 0.75%22/11/2047 34,118 0.11
GBP 9,581 United Kingdom Gilt InflationLinked RegS 0.125%10/8/2048 20,843 0.07
GBP 16,450 United Kingdom Gilt InflationLinked RegS 0.50%22/3/2050 39,880 0.13
GBP 13,295 United Kingdom Gilt InflationLinked RegS 0.25%22/3/2052 31,923 0.10
GBP 13,699 United Kingdom Gilt InflationLinked RegS 1.25%22/11/2055 44,009 0.14
GBP 5,522 United Kingdom Gilt InflationLinked RegS 0.125%22/11/2056 14,217 0.05
GBP 12,576 United Kingdom Gilt InflationLinked RegS 0.125%22/3/2058 33,073 0.11
GBP 13,645 United Kingdom Gilt InflationLinked RegS 0.375%22/3/2062 41,244 0.13
Holding Description
MarketValue
EUR
% ofNet
Assets
United Kingdom continuedGBP 6,740 United Kingdom Gilt Inflation
Linked RegS 0.125%22/11/2065 20,718 0.07
GBP 14,059 United Kingdom Gilt InflationLinked RegS 0.125%22/3/2068 45,988 0.15
796,220 2.57
United StatesUSD 24,055 United States Treasury
Inflation Indexed Bond0.625% 15/7/2021 21,787 0.07
USD 11,677 United States TreasuryInflation Indexed Bond0.125% 15/4/2022 10,523 0.03
USD 67,360 United States TreasuryInflation Indexed Bond0.125% 15/7/2022 61,215 0.20
USD 49,890 United States TreasuryInflation Indexed Bond0.625% 15/4/2023 45,999 0.15
USD 38,828 United States TreasuryInflation Indexed Bond0.375% 15/7/2023 35,851 0.12
USD 26,555 United States TreasuryInflation Indexed Bond0.625% 15/1/2024 24,763 0.08
USD 26,095 United States TreasuryInflation Indexed Bond0.125% 15/7/2024 24,130 0.08
USD 20,125 United States TreasuryInflation Indexed Bond0.125% 15/10/2024 18,647 0.06
USD 18,530 United States TreasuryInflation Indexed Bond0.25% 15/1/2025 17,223 0.06
USD 35,610 United States TreasuryInflation Indexed Bond2.375% 15/1/2025 36,297 0.12
USD 13,993 United States TreasuryInflation Indexed Bond0.125% 15/4/2025 12,994 0.04
USD 26,128 United States TreasuryInflation Indexed Bond0.375% 15/7/2025 24,641 0.08
USD 27,163 United States TreasuryInflation Indexed Bond0.625% 15/1/2026 25,989 0.08
USD 26,926 United States TreasuryInflation Indexed Bond0.125% 15/7/2026 25,262 0.08
USD 40,613 United States TreasuryInflation Indexed Bond0.375% 15/1/2027 38,701 0.12
USD 28,164 United States TreasuryInflation Indexed Bond2.375% 15/1/2027 30,282 0.10
USD 37,994 United States TreasuryInflation Indexed Bond0.375% 15/7/2027 36,519 0.12
USD 15,962 United States TreasuryInflation Indexed Bond3.625% 15/4/2028 19,021 0.06
USD 30,673 United States TreasuryInflation Indexed Bond0.875% 15/1/2029 30,877 0.10
BlackRock Total Advantage Fund continued
The notes on pages 691 to 711 form an integral part of these financial statements.
BlackRock Strategic Funds[634]
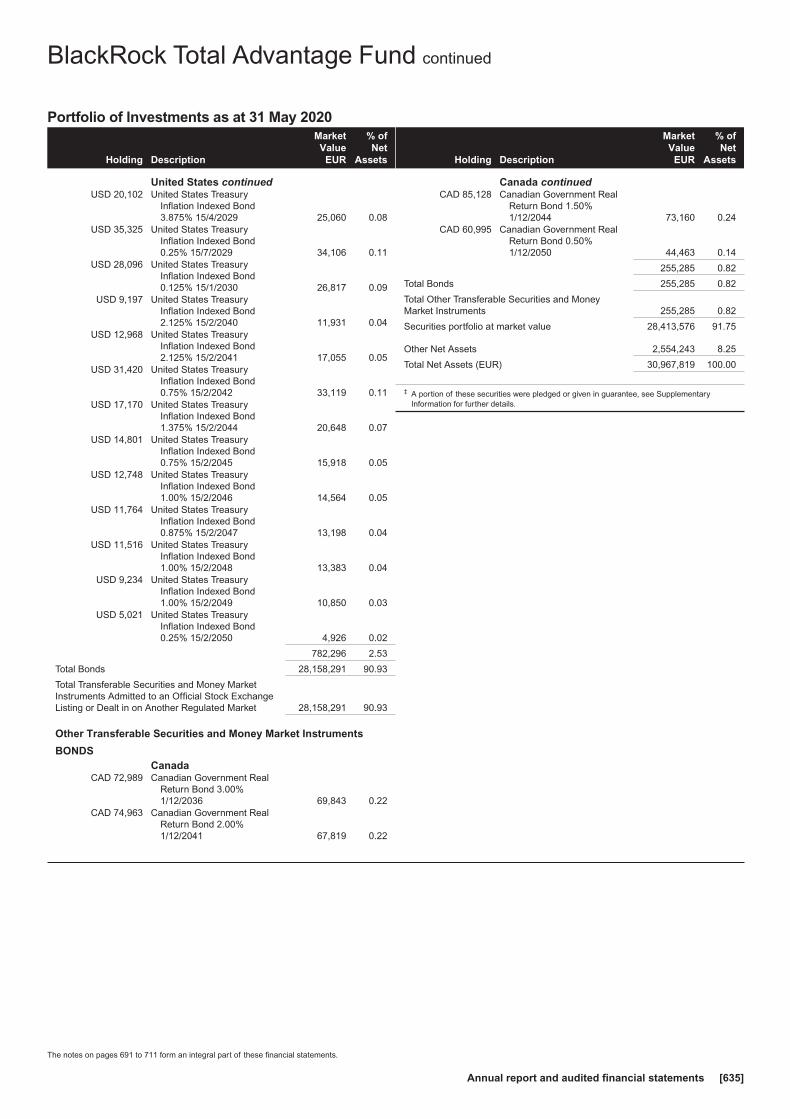
Portfolio of Investments as at 31 May 2020
Holding Description
MarketValue
EUR
% ofNet
Assets
United States continuedUSD 20,102 United States Treasury
Inflation Indexed Bond3.875% 15/4/2029 25,060 0.08
USD 35,325 United States TreasuryInflation Indexed Bond0.25% 15/7/2029 34,106 0.11
USD 28,096 United States TreasuryInflation Indexed Bond0.125% 15/1/2030 26,817 0.09
USD 9,197 United States TreasuryInflation Indexed Bond2.125% 15/2/2040 11,931 0.04
USD 12,968 United States TreasuryInflation Indexed Bond2.125% 15/2/2041 17,055 0.05
USD 31,420 United States TreasuryInflation Indexed Bond0.75% 15/2/2042 33,119 0.11
USD 17,170 United States TreasuryInflation Indexed Bond1.375% 15/2/2044 20,648 0.07
USD 14,801 United States TreasuryInflation Indexed Bond0.75% 15/2/2045 15,918 0.05
USD 12,748 United States TreasuryInflation Indexed Bond1.00% 15/2/2046 14,564 0.05
USD 11,764 United States TreasuryInflation Indexed Bond0.875% 15/2/2047 13,198 0.04
USD 11,516 United States TreasuryInflation Indexed Bond1.00% 15/2/2048 13,383 0.04
USD 9,234 United States TreasuryInflation Indexed Bond1.00% 15/2/2049 10,850 0.03
USD 5,021 United States TreasuryInflation Indexed Bond0.25% 15/2/2050 4,926 0.02
782,296 2.53
Total Bonds 28,158,291 90.93
Total Transferable Securities and Money MarketInstruments Admitted to an Official Stock ExchangeListing or Dealt in on Another Regulated Market 28,158,291 90.93
Other Transferable Securities and Money Market Instruments
BONDSCanada
CAD 72,989 Canadian Government RealReturn Bond 3.00%1/12/2036 69,843 0.22
CAD 74,963 Canadian Government RealReturn Bond 2.00%1/12/2041 67,819 0.22
Holding Description
MarketValue
EUR
% ofNet
Assets
Canada continuedCAD 85,128 Canadian Government Real
Return Bond 1.50%1/12/2044 73,160 0.24
CAD 60,995 Canadian Government RealReturn Bond 0.50%1/12/2050 44,463 0.14
255,285 0.82
Total Bonds 255,285 0.82
Total Other Transferable Securities and MoneyMarket Instruments 255,285 0.82
Securities portfolio at market value 28,413,576 91.75
Other Net Assets 2,554,243 8.25
Total Net Assets (EUR) 30,967,819 100.00
‡ A portion of these securities were pledged or given in guarantee, see SupplementaryInformation for further details.
BlackRock Total Advantage Fund continued
The notes on pages 691 to 711 form an integral part of these financial statements.
Annual report and audited financial statements [635]

Contracts for difference as at 31 May 2020
Holding Description Counterparty
Netunrealised
appreciation/(depreciation)
EUR
Australia(6,590) Adbri Ltd Citibank (1,101)(5,350) Adbri Ltd Credit Suisse (447)(5,618) Adbri Ltd JP Morgan (469)
(603) Afterpay Ltd Bank of AmericaMerrill Lynch (2,235)
(140) Afterpay Ltd Citibank (242)(649) Afterpay Ltd Credit Suisse (2,917)(120) Afterpay Ltd JP Morgan (539)550 AGL Energy Ltd Bank of America
Merrill Lynch 62118 AGL Energy Ltd Citibank 28729 AGL Energy Ltd Credit Suisse 117737 AGL Energy Ltd JP Morgan 119
1,590 ALS Ltd Credit Suisse 900(230) Altium Ltd Bank of America
Merrill Lynch (303)(400) Altium Ltd Credit Suisse (201)
1 Alumina Ltd Citibank —(8,770) AMP Ltd Bank of America
Merrill Lynch (968)(6,771) AMP Ltd Citibank (364)
(14,529) AMP Ltd Credit Suisse (1,908)(19) AMP Ltd JP Morgan (2)460 Ampol Ltd Bank of America
Merrill Lynch 527870 Ampol Ltd Credit Suisse 1,345480 Ansell Ltd Citibank 284
2,404 Ansell Ltd Credit Suisse 7,218135 Ansell Ltd JP Morgan 405
(760) APA Group (Unit) Credit Suisse (127)210 Aristocrat Leisure Ltd Bank of America
Merrill Lynch 63650 Aristocrat Leisure Ltd Citibank 78330 Aristocrat Leisure Ltd Credit Suisse 146260 ASX Ltd Credit Suisse 913800 ASX Ltd JP Morgan 2,808
3,380 Atlas Arteria Ltd (Unit) Bank of AmericaMerrill Lynch 1,412
5,010 Atlas Arteria Ltd (Unit) Credit Suisse 2,4228,374 Aurizon Holdings Ltd Bank of America
Merrill Lynch 9508,097 Aurizon Holdings Ltd Citibank 918
14,210 Aurizon Holdings Ltd Credit Suisse 2,205620 Australia & New Zealand
Banking Group Ltd Citibank 9841,490 Australia & New Zealand
Banking Group Ltd JP Morgan 2,038(4,485) Bank of Queensland Ltd Bank of America
Merrill Lynch (1,553)(5,795) Bank of Queensland Ltd JP Morgan (1,626)(4,510) Bendigo & Adelaide Bank
LtdBank of AmericaMerrill Lynch (1,211)
(2,150) Bendigo & Adelaide BankLtd JP Morgan (334)
631 BHP Group Ltd Citibank 121473 BHP Group Ltd Credit Suisse 915
(790) BlueScope Steel Ltd Credit Suisse (453)(650) BlueScope Steel Ltd JP Morgan (372)
(4,870) Challenger Ltd Citibank (1,134)(1,910) Challenger Ltd Credit Suisse (842)
700 CIMIC Group Ltd Bank of AmericaMerrill Lynch 852
806 CIMIC Group Ltd Citibank 539370 CIMIC Group Ltd Credit Suisse 422831 CIMIC Group Ltd JP Morgan 947
(4,502) Cleanaway WasteManagement Ltd
Bank of AmericaMerrill Lynch (296)
(4,520) Cleanaway WasteManagement Ltd Citibank (243)
Holding Description Counterparty
Netunrealised
appreciation/(depreciation)
EUR
Australia continued(1,118) Cleanaway Waste
Management Ltd Credit Suisse (47)(17,240) Cleanaway Waste
Management Ltd JP Morgan (720)4,080 Coca-Cola Amatil Ltd Bank of America
Merrill Lynch 4143,990 Coca-Cola Amatil Ltd Citibank 5722,640 Coca-Cola Amatil Ltd Credit Suisse 1581,549 Coca-Cola Amatil Ltd JP Morgan 92
50 Cochlear Ltd Bank of AmericaMerrill Lynch 145
50 Cochlear Ltd Credit Suisse 339230 Commonwealth Bank of
AustraliaBank of AmericaMerrill Lynch 570
780 Computershare Ltd Credit Suisse 778850 Computershare Ltd JP Morgan 847
(1,600) Crown Resorts Ltd Citibank (277)(890) Crown Resorts Ltd Credit Suisse (133)
80 CSL Ltd Bank of AmericaMerrill Lynch (1,223)
20 CSL Ltd Citibank (176)20 CSL Ltd Credit Suisse (298)30 CSL Ltd JP Morgan (447)
6,290 CSR Ltd Citibank 1,4643,710 CSR Ltd Credit Suisse 1,2183,780 CSR Ltd JP Morgan 1,241
(2,640) Domain Holdings AustraliaLtd Citibank 16
(3,060) Domain Holdings AustraliaLtd Credit Suisse (183)
(10,365) Downer EDI Ltd Bank of AmericaMerrill Lynch (3,403)
(2,990) Downer EDI Ltd Citibank (589)(188) Downer EDI Ltd Credit Suisse (50)
(3,645) Downer EDI Ltd JP Morgan (979)1,760 Evolution Mining Ltd Citibank 221
(2,010) Flight Centre Travel GroupLtd Credit Suisse (2,783)
(680) Fortescue Metals Group Ltd Citibank (130)(4,736) Harvey Norman Holdings
LtdBank of AmericaMerrill Lynch (1,216)
(1,690) Harvey Norman HoldingsLtd Credit Suisse (232)
(12,523) Harvey Norman HoldingsLtd JP Morgan (1,719)
(1) Iluka Resources Ltdπ Bank of AmericaMerrill Lynch —
3,009 Iluka Resources Ltd Credit Suisse 1,501(4,420) Incitec Pivot Ltd Citibank (290)(6,620) Incitec Pivot Ltd Credit Suisse 711
(484) Insurance Australia GroupLtd
Bank of AmericaMerrill Lynch (202)
(3,590) Insurance Australia GroupLtd Credit Suisse (1,779)
(4,970) Insurance Australia GroupLtd JP Morgan (2,462)
(334) IOOF Holdings Ltd Bank of AmericaMerrill Lynch (161)
(6,977) IOOF Holdings Ltd JP Morgan (1,707)(970) Lendlease Group (Unit) Bank of America
Merrill Lynch (1,036)(340) Lendlease Group (Unit) Citibank (308)
(1,936) Lendlease Group (Unit) JP Morgan (1,976)110 Macquarie Group Ltd Bank of America
Merrill Lynch 321280 Macquarie Group Ltd Credit Suisse 799346 Macquarie Group Ltd JP Morgan 987
(490) Magellan Financial GroupLtd
Bank of AmericaMerrill Lynch (1,179)
BlackRock Total Advantage Fund continued
The notes on pages 691 to 711 form an integral part of these financial statements.
BlackRock Strategic Funds[636]
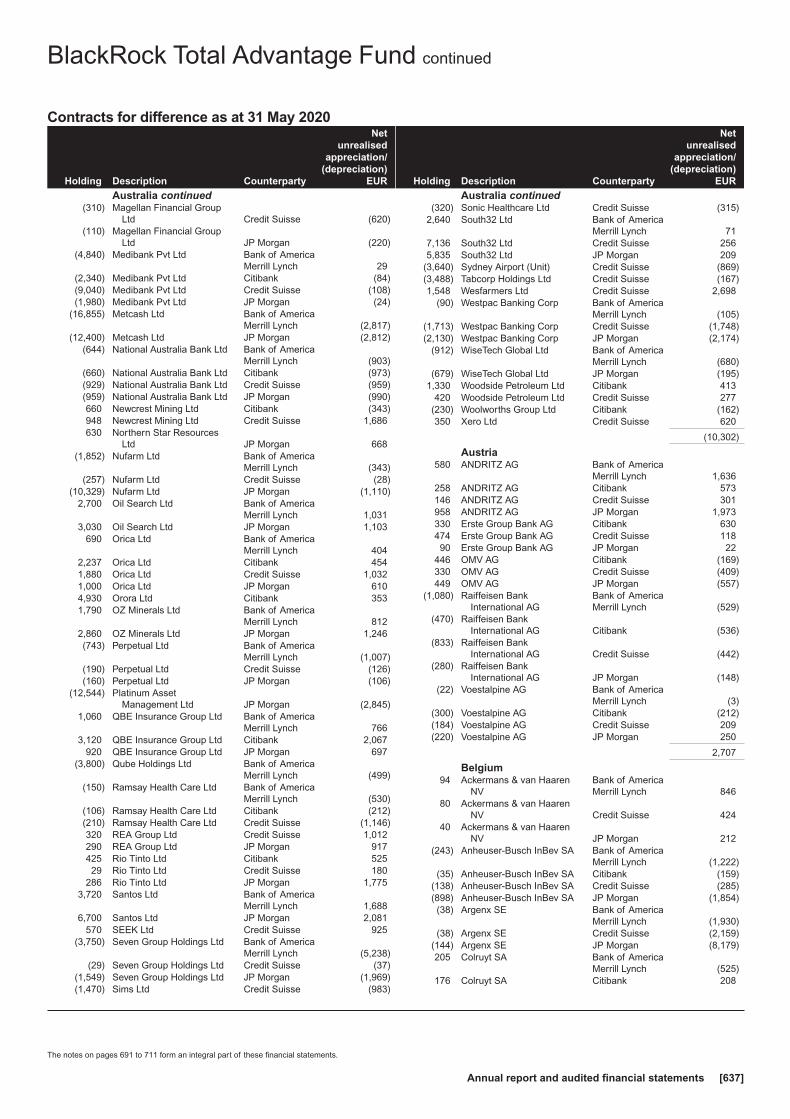
Contracts for difference as at 31 May 2020
Holding Description Counterparty
Netunrealised
appreciation/(depreciation)
EUR
Australia continued(310) Magellan Financial Group
Ltd Credit Suisse (620)(110) Magellan Financial Group
Ltd JP Morgan (220)(4,840) Medibank Pvt Ltd Bank of America
Merrill Lynch 29(2,340) Medibank Pvt Ltd Citibank (84)(9,040) Medibank Pvt Ltd Credit Suisse (108)(1,980) Medibank Pvt Ltd JP Morgan (24)
(16,855) Metcash Ltd Bank of AmericaMerrill Lynch (2,817)
(12,400) Metcash Ltd JP Morgan (2,812)(644) National Australia Bank Ltd Bank of America
Merrill Lynch (903)(660) National Australia Bank Ltd Citibank (973)(929) National Australia Bank Ltd Credit Suisse (959)(959) National Australia Bank Ltd JP Morgan (990)660 Newcrest Mining Ltd Citibank (343)948 Newcrest Mining Ltd Credit Suisse 1,686630 Northern Star Resources
Ltd JP Morgan 668(1,852) Nufarm Ltd Bank of America
Merrill Lynch (343)(257) Nufarm Ltd Credit Suisse (28)
(10,329) Nufarm Ltd JP Morgan (1,110)2,700 Oil Search Ltd Bank of America
Merrill Lynch 1,0313,030 Oil Search Ltd JP Morgan 1,103
690 Orica Ltd Bank of AmericaMerrill Lynch 404
2,237 Orica Ltd Citibank 4541,880 Orica Ltd Credit Suisse 1,0321,000 Orica Ltd JP Morgan 6104,930 Orora Ltd Citibank 3531,790 OZ Minerals Ltd Bank of America
Merrill Lynch 8122,860 OZ Minerals Ltd JP Morgan 1,246(743) Perpetual Ltd Bank of America
Merrill Lynch (1,007)(190) Perpetual Ltd Credit Suisse (126)(160) Perpetual Ltd JP Morgan (106)
(12,544) Platinum AssetManagement Ltd JP Morgan (2,845)
1,060 QBE Insurance Group Ltd Bank of AmericaMerrill Lynch 766
3,120 QBE Insurance Group Ltd Citibank 2,067920 QBE Insurance Group Ltd JP Morgan 697
(3,800) Qube Holdings Ltd Bank of AmericaMerrill Lynch (499)
(150) Ramsay Health Care Ltd Bank of AmericaMerrill Lynch (530)
(106) Ramsay Health Care Ltd Citibank (212)(210) Ramsay Health Care Ltd Credit Suisse (1,146)320 REA Group Ltd Credit Suisse 1,012290 REA Group Ltd JP Morgan 917425 Rio Tinto Ltd Citibank 52529 Rio Tinto Ltd Credit Suisse 180
286 Rio Tinto Ltd JP Morgan 1,7753,720 Santos Ltd Bank of America
Merrill Lynch 1,6886,700 Santos Ltd JP Morgan 2,081
570 SEEK Ltd Credit Suisse 925(3,750) Seven Group Holdings Ltd Bank of America
Merrill Lynch (5,238)(29) Seven Group Holdings Ltd Credit Suisse (37)
(1,549) Seven Group Holdings Ltd JP Morgan (1,969)(1,470) Sims Ltd Credit Suisse (983)
Holding Description Counterparty
Netunrealised
appreciation/(depreciation)
EUR
Australia continued(320) Sonic Healthcare Ltd Credit Suisse (315)
2,640 South32 Ltd Bank of AmericaMerrill Lynch 71
7,136 South32 Ltd Credit Suisse 2565,835 South32 Ltd JP Morgan 209
(3,640) Sydney Airport (Unit) Credit Suisse (869)(3,488) Tabcorp Holdings Ltd Credit Suisse (167)1,548 Wesfarmers Ltd Credit Suisse 2,698
(90) Westpac Banking Corp Bank of AmericaMerrill Lynch (105)
(1,713) Westpac Banking Corp Credit Suisse (1,748)(2,130) Westpac Banking Corp JP Morgan (2,174)
(912) WiseTech Global Ltd Bank of AmericaMerrill Lynch (680)
(679) WiseTech Global Ltd JP Morgan (195)1,330 Woodside Petroleum Ltd Citibank 413
420 Woodside Petroleum Ltd Credit Suisse 277(230) Woolworths Group Ltd Citibank (162)350 Xero Ltd Credit Suisse 620
(10,302)
Austria580 ANDRITZ AG Bank of America
Merrill Lynch 1,636258 ANDRITZ AG Citibank 573146 ANDRITZ AG Credit Suisse 301958 ANDRITZ AG JP Morgan 1,973330 Erste Group Bank AG Citibank 630474 Erste Group Bank AG Credit Suisse 11890 Erste Group Bank AG JP Morgan 22
446 OMV AG Citibank (169)330 OMV AG Credit Suisse (409)449 OMV AG JP Morgan (557)
(1,080) Raiffeisen BankInternational AG
Bank of AmericaMerrill Lynch (529)
(470) Raiffeisen BankInternational AG Citibank (536)
(833) Raiffeisen BankInternational AG Credit Suisse (442)
(280) Raiffeisen BankInternational AG JP Morgan (148)
(22) Voestalpine AG Bank of AmericaMerrill Lynch (3)
(300) Voestalpine AG Citibank (212)(184) Voestalpine AG Credit Suisse 209(220) Voestalpine AG JP Morgan 250
2,707
Belgium94 Ackermans & van Haaren
NVBank of AmericaMerrill Lynch 846
80 Ackermans & van HaarenNV Credit Suisse 424
40 Ackermans & van HaarenNV JP Morgan 212
(243) Anheuser-Busch InBev SA Bank of AmericaMerrill Lynch (1,222)
(35) Anheuser-Busch InBev SA Citibank (159)(138) Anheuser-Busch InBev SA Credit Suisse (285)(898) Anheuser-Busch InBev SA JP Morgan (1,854)(38) Argenx SE Bank of America
Merrill Lynch (1,930)(38) Argenx SE Credit Suisse (2,159)
(144) Argenx SE JP Morgan (8,179)205 Colruyt SA Bank of America
Merrill Lynch (525)176 Colruyt SA Citibank 208
BlackRock Total Advantage Fund continued
The notes on pages 691 to 711 form an integral part of these financial statements.
Annual report and audited financial statements [637]
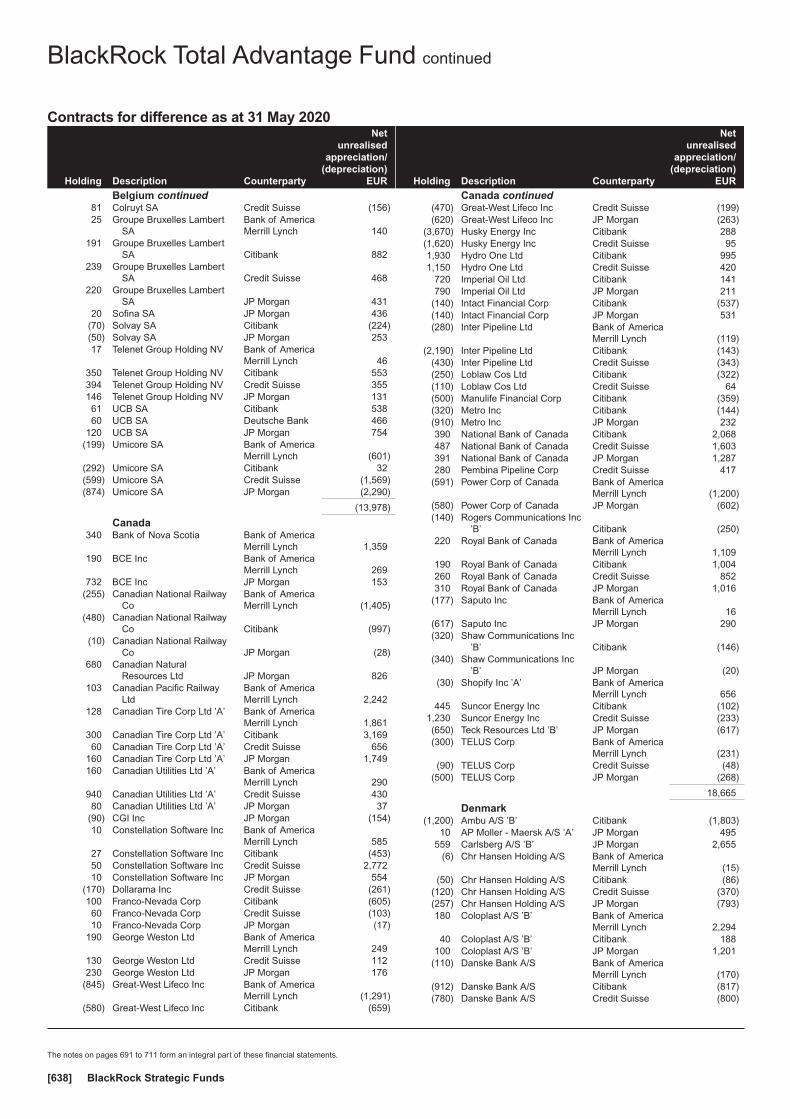
Contracts for difference as at 31 May 2020
Holding Description Counterparty
Netunrealised
appreciation/(depreciation)
EUR
Belgium continued81 Colruyt SA Credit Suisse (156)25 Groupe Bruxelles Lambert
SABank of AmericaMerrill Lynch 140
191 Groupe Bruxelles LambertSA Citibank 882
239 Groupe Bruxelles LambertSA Credit Suisse 468
220 Groupe Bruxelles LambertSA JP Morgan 431
20 Sofina SA JP Morgan 436(70) Solvay SA Citibank (224)(50) Solvay SA JP Morgan 25317 Telenet Group Holding NV Bank of America
Merrill Lynch 46350 Telenet Group Holding NV Citibank 553394 Telenet Group Holding NV Credit Suisse 355146 Telenet Group Holding NV JP Morgan 13161 UCB SA Citibank 53860 UCB SA Deutsche Bank 466
120 UCB SA JP Morgan 754(199) Umicore SA Bank of America
Merrill Lynch (601)(292) Umicore SA Citibank 32(599) Umicore SA Credit Suisse (1,569)(874) Umicore SA JP Morgan (2,290)
(13,978)
Canada340 Bank of Nova Scotia Bank of America
Merrill Lynch 1,359190 BCE Inc Bank of America
Merrill Lynch 269732 BCE Inc JP Morgan 153
(255) Canadian National RailwayCo
Bank of AmericaMerrill Lynch (1,405)
(480) Canadian National RailwayCo Citibank (997)
(10) Canadian National RailwayCo JP Morgan (28)
680 Canadian NaturalResources Ltd JP Morgan 826
103 Canadian Pacific RailwayLtd
Bank of AmericaMerrill Lynch 2,242
128 Canadian Tire Corp Ltd ’A’ Bank of AmericaMerrill Lynch 1,861
300 Canadian Tire Corp Ltd ’A’ Citibank 3,16960 Canadian Tire Corp Ltd ’A’ Credit Suisse 656
160 Canadian Tire Corp Ltd ’A’ JP Morgan 1,749160 Canadian Utilities Ltd ’A’ Bank of America
Merrill Lynch 290940 Canadian Utilities Ltd ’A’ Credit Suisse 43080 Canadian Utilities Ltd ’A’ JP Morgan 37
(90) CGI Inc JP Morgan (154)10 Constellation Software Inc Bank of America
Merrill Lynch 58527 Constellation Software Inc Citibank (453)50 Constellation Software Inc Credit Suisse 2,77210 Constellation Software Inc JP Morgan 554
(170) Dollarama Inc Credit Suisse (261)100 Franco-Nevada Corp Citibank (605)60 Franco-Nevada Corp Credit Suisse (103)10 Franco-Nevada Corp JP Morgan (17)
190 George Weston Ltd Bank of AmericaMerrill Lynch 249
130 George Weston Ltd Credit Suisse 112230 George Weston Ltd JP Morgan 176
(845) Great-West Lifeco Inc Bank of AmericaMerrill Lynch (1,291)
(580) Great-West Lifeco Inc Citibank (659)
Holding Description Counterparty
Netunrealised
appreciation/(depreciation)
EUR
Canada continued(470) Great-West Lifeco Inc Credit Suisse (199)(620) Great-West Lifeco Inc JP Morgan (263)
(3,670) Husky Energy Inc Citibank 288(1,620) Husky Energy Inc Credit Suisse 951,930 Hydro One Ltd Citibank 9951,150 Hydro One Ltd Credit Suisse 420
720 Imperial Oil Ltd Citibank 141790 Imperial Oil Ltd JP Morgan 211
(140) Intact Financial Corp Citibank (537)(140) Intact Financial Corp JP Morgan 531(280) Inter Pipeline Ltd Bank of America
Merrill Lynch (119)(2,190) Inter Pipeline Ltd Citibank (143)
(430) Inter Pipeline Ltd Credit Suisse (343)(250) Loblaw Cos Ltd Citibank (322)(110) Loblaw Cos Ltd Credit Suisse 64(500) Manulife Financial Corp Citibank (359)(320) Metro Inc Citibank (144)(910) Metro Inc JP Morgan 232390 National Bank of Canada Citibank 2,068487 National Bank of Canada Credit Suisse 1,603391 National Bank of Canada JP Morgan 1,287280 Pembina Pipeline Corp Credit Suisse 417
(591) Power Corp of Canada Bank of AmericaMerrill Lynch (1,200)
(580) Power Corp of Canada JP Morgan (602)(140) Rogers Communications Inc
’B’ Citibank (250)220 Royal Bank of Canada Bank of America
Merrill Lynch 1,109190 Royal Bank of Canada Citibank 1,004260 Royal Bank of Canada Credit Suisse 852310 Royal Bank of Canada JP Morgan 1,016
(177) Saputo Inc Bank of AmericaMerrill Lynch 16
(617) Saputo Inc JP Morgan 290(320) Shaw Communications Inc
’B’ Citibank (146)(340) Shaw Communications Inc
’B’ JP Morgan (20)(30) Shopify Inc ’A’ Bank of America
Merrill Lynch 656445 Suncor Energy Inc Citibank (102)
1,230 Suncor Energy Inc Credit Suisse (233)(650) Teck Resources Ltd ’B’ JP Morgan (617)(300) TELUS Corp Bank of America
Merrill Lynch (231)(90) TELUS Corp Credit Suisse (48)
(500) TELUS Corp JP Morgan (268)
18,665
Denmark(1,200) Ambu A/S ’B’ Citibank (1,803)
10 AP Moller - Maersk A/S ’A’ JP Morgan 495559 Carlsberg A/S ’B’ JP Morgan 2,655
(6) Chr Hansen Holding A/S Bank of AmericaMerrill Lynch (15)
(50) Chr Hansen Holding A/S Citibank (86)(120) Chr Hansen Holding A/S Credit Suisse (370)(257) Chr Hansen Holding A/S JP Morgan (793)180 Coloplast A/S ’B’ Bank of America
Merrill Lynch 2,29440 Coloplast A/S ’B’ Citibank 188
100 Coloplast A/S ’B’ JP Morgan 1,201(110) Danske Bank A/S Bank of America
Merrill Lynch (170)(912) Danske Bank A/S Citibank (817)(780) Danske Bank A/S Credit Suisse (800)
BlackRock Total Advantage Fund continued
The notes on pages 691 to 711 form an integral part of these financial statements.
BlackRock Strategic Funds[638]
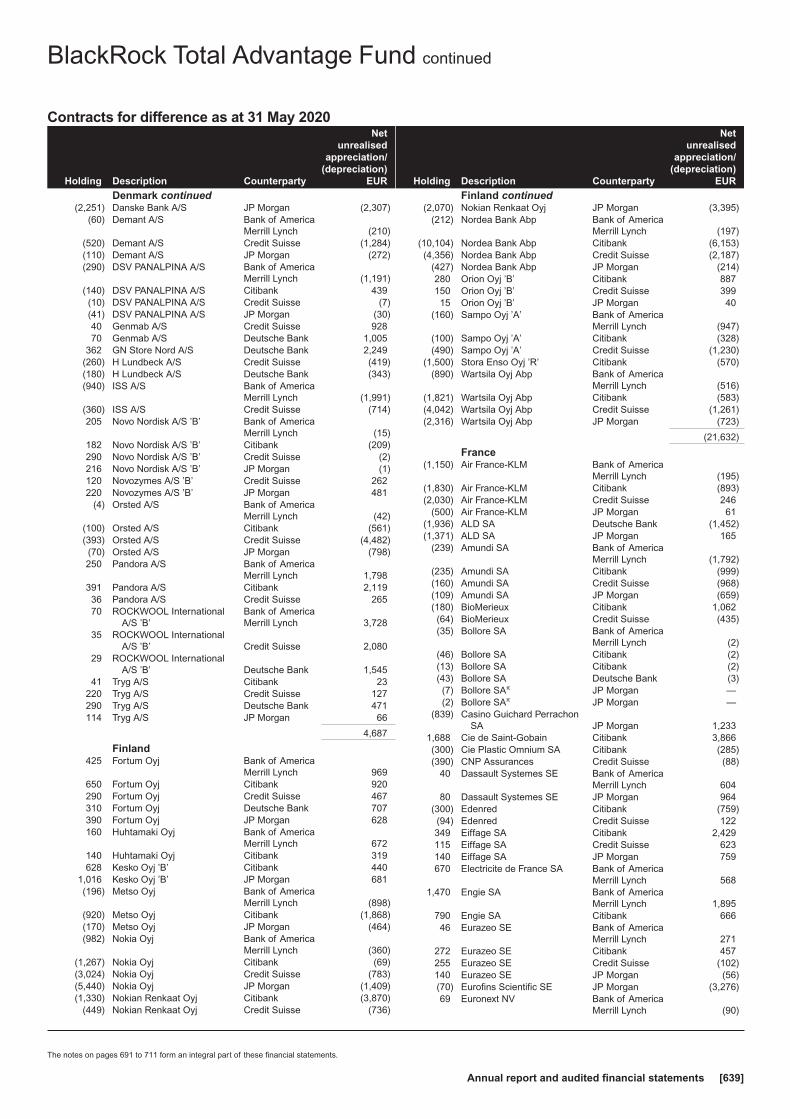
Contracts for difference as at 31 May 2020
Holding Description Counterparty
Netunrealised
appreciation/(depreciation)
EUR
Denmark continued(2,251) Danske Bank A/S JP Morgan (2,307)
(60) Demant A/S Bank of AmericaMerrill Lynch (210)
(520) Demant A/S Credit Suisse (1,284)(110) Demant A/S JP Morgan (272)(290) DSV PANALPINA A/S Bank of America
Merrill Lynch (1,191)(140) DSV PANALPINA A/S Citibank 439(10) DSV PANALPINA A/S Credit Suisse (7)(41) DSV PANALPINA A/S JP Morgan (30)40 Genmab A/S Credit Suisse 92870 Genmab A/S Deutsche Bank 1,005
362 GN Store Nord A/S Deutsche Bank 2,249(260) H Lundbeck A/S Credit Suisse (419)(180) H Lundbeck A/S Deutsche Bank (343)(940) ISS A/S Bank of America
Merrill Lynch (1,991)(360) ISS A/S Credit Suisse (714)205 Novo Nordisk A/S ’B’ Bank of America
Merrill Lynch (15)182 Novo Nordisk A/S ’B’ Citibank (209)290 Novo Nordisk A/S ’B’ Credit Suisse (2)216 Novo Nordisk A/S ’B’ JP Morgan (1)120 Novozymes A/S ’B’ Credit Suisse 262220 Novozymes A/S ’B’ JP Morgan 481
(4) Orsted A/S Bank of AmericaMerrill Lynch (42)
(100) Orsted A/S Citibank (561)(393) Orsted A/S Credit Suisse (4,482)(70) Orsted A/S JP Morgan (798)250 Pandora A/S Bank of America
Merrill Lynch 1,798391 Pandora A/S Citibank 2,11936 Pandora A/S Credit Suisse 26570 ROCKWOOL International
A/S ’B’Bank of AmericaMerrill Lynch 3,728
35 ROCKWOOL InternationalA/S ’B’ Credit Suisse 2,080
29 ROCKWOOL InternationalA/S ’B’ Deutsche Bank 1,545
41 Tryg A/S Citibank 23220 Tryg A/S Credit Suisse 127290 Tryg A/S Deutsche Bank 471114 Tryg A/S JP Morgan 66
4,687
Finland425 Fortum Oyj Bank of America
Merrill Lynch 969650 Fortum Oyj Citibank 920290 Fortum Oyj Credit Suisse 467310 Fortum Oyj Deutsche Bank 707390 Fortum Oyj JP Morgan 628160 Huhtamaki Oyj Bank of America
Merrill Lynch 672140 Huhtamaki Oyj Citibank 319628 Kesko Oyj ’B’ Citibank 440
1,016 Kesko Oyj ’B’ JP Morgan 681(196) Metso Oyj Bank of America
Merrill Lynch (898)(920) Metso Oyj Citibank (1,868)(170) Metso Oyj JP Morgan (464)(982) Nokia Oyj Bank of America
Merrill Lynch (360)(1,267) Nokia Oyj Citibank (69)(3,024) Nokia Oyj Credit Suisse (783)(5,440) Nokia Oyj JP Morgan (1,409)(1,330) Nokian Renkaat Oyj Citibank (3,870)
(449) Nokian Renkaat Oyj Credit Suisse (736)
Holding Description Counterparty
Netunrealised
appreciation/(depreciation)
EUR
Finland continued(2,070) Nokian Renkaat Oyj JP Morgan (3,395)
(212) Nordea Bank Abp Bank of AmericaMerrill Lynch (197)
(10,104) Nordea Bank Abp Citibank (6,153)(4,356) Nordea Bank Abp Credit Suisse (2,187)
(427) Nordea Bank Abp JP Morgan (214)280 Orion Oyj ’B’ Citibank 887150 Orion Oyj ’B’ Credit Suisse 39915 Orion Oyj ’B’ JP Morgan 40
(160) Sampo Oyj ’A’ Bank of AmericaMerrill Lynch (947)
(100) Sampo Oyj ’A’ Citibank (328)(490) Sampo Oyj ’A’ Credit Suisse (1,230)
(1,500) Stora Enso Oyj ’R’ Citibank (570)(890) Wartsila Oyj Abp Bank of America
Merrill Lynch (516)(1,821) Wartsila Oyj Abp Citibank (583)(4,042) Wartsila Oyj Abp Credit Suisse (1,261)(2,316) Wartsila Oyj Abp JP Morgan (723)
(21,632)
France(1,150) Air France-KLM Bank of America
Merrill Lynch (195)(1,830) Air France-KLM Citibank (893)(2,030) Air France-KLM Credit Suisse 246
(500) Air France-KLM JP Morgan 61(1,936) ALD SA Deutsche Bank (1,452)(1,371) ALD SA JP Morgan 165
(239) Amundi SA Bank of AmericaMerrill Lynch (1,792)
(235) Amundi SA Citibank (999)(160) Amundi SA Credit Suisse (968)(109) Amundi SA JP Morgan (659)(180) BioMerieux Citibank 1,062(64) BioMerieux Credit Suisse (435)(35) Bollore SA Bank of America
Merrill Lynch (2)(46) Bollore SA Citibank (2)(13) Bollore SA Citibank (2)(43) Bollore SA Deutsche Bank (3)(7) Bollore SAπ JP Morgan —(2) Bollore SAπ JP Morgan —
(839) Casino Guichard PerrachonSA JP Morgan 1,233
1,688 Cie de Saint-Gobain Citibank 3,866(300) Cie Plastic Omnium SA Citibank (285)(390) CNP Assurances Credit Suisse (88)
40 Dassault Systemes SE Bank of AmericaMerrill Lynch 604
80 Dassault Systemes SE JP Morgan 964(300) Edenred Citibank (759)(94) Edenred Credit Suisse 122349 Eiffage SA Citibank 2,429115 Eiffage SA Credit Suisse 623140 Eiffage SA JP Morgan 759670 Electricite de France SA Bank of America
Merrill Lynch 5681,470 Engie SA Bank of America
Merrill Lynch 1,895790 Engie SA Citibank 66646 Eurazeo SE Bank of America
Merrill Lynch 271272 Eurazeo SE Citibank 457255 Eurazeo SE Credit Suisse (102)140 Eurazeo SE JP Morgan (56)(70) Eurofins Scientific SE JP Morgan (3,276)69 Euronext NV Bank of America
Merrill Lynch (90)
BlackRock Total Advantage Fund continued
The notes on pages 691 to 711 form an integral part of these financial statements.
Annual report and audited financial statements [639]
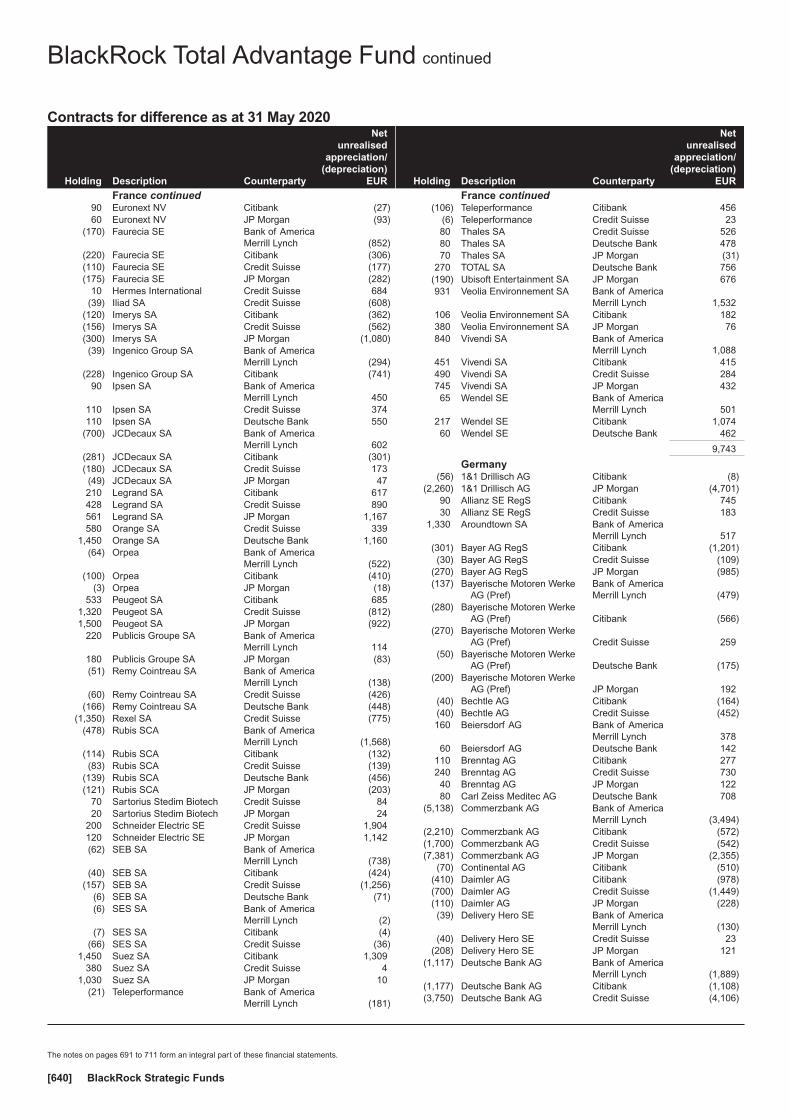
Contracts for difference as at 31 May 2020
Holding Description Counterparty
Netunrealised
appreciation/(depreciation)
EUR
France continued90 Euronext NV Citibank (27)60 Euronext NV JP Morgan (93)
(170) Faurecia SE Bank of AmericaMerrill Lynch (852)
(220) Faurecia SE Citibank (306)(110) Faurecia SE Credit Suisse (177)(175) Faurecia SE JP Morgan (282)
10 Hermes International Credit Suisse 684(39) Iliad SA Credit Suisse (608)
(120) Imerys SA Citibank (362)(156) Imerys SA Credit Suisse (562)(300) Imerys SA JP Morgan (1,080)(39) Ingenico Group SA Bank of America
Merrill Lynch (294)(228) Ingenico Group SA Citibank (741)
90 Ipsen SA Bank of AmericaMerrill Lynch 450
110 Ipsen SA Credit Suisse 374110 Ipsen SA Deutsche Bank 550
(700) JCDecaux SA Bank of AmericaMerrill Lynch 602
(281) JCDecaux SA Citibank (301)(180) JCDecaux SA Credit Suisse 173(49) JCDecaux SA JP Morgan 47210 Legrand SA Citibank 617428 Legrand SA Credit Suisse 890561 Legrand SA JP Morgan 1,167580 Orange SA Credit Suisse 339
1,450 Orange SA Deutsche Bank 1,160(64) Orpea Bank of America
Merrill Lynch (522)(100) Orpea Citibank (410)
(3) Orpea JP Morgan (18)533 Peugeot SA Citibank 685
1,320 Peugeot SA Credit Suisse (812)1,500 Peugeot SA JP Morgan (922)
220 Publicis Groupe SA Bank of AmericaMerrill Lynch 114
180 Publicis Groupe SA JP Morgan (83)(51) Remy Cointreau SA Bank of America
Merrill Lynch (138)(60) Remy Cointreau SA Credit Suisse (426)
(166) Remy Cointreau SA Deutsche Bank (448)(1,350) Rexel SA Credit Suisse (775)
(478) Rubis SCA Bank of AmericaMerrill Lynch (1,568)
(114) Rubis SCA Citibank (132)(83) Rubis SCA Credit Suisse (139)
(139) Rubis SCA Deutsche Bank (456)(121) Rubis SCA JP Morgan (203)
70 Sartorius Stedim Biotech Credit Suisse 8420 Sartorius Stedim Biotech JP Morgan 24
200 Schneider Electric SE Credit Suisse 1,904120 Schneider Electric SE JP Morgan 1,142(62) SEB SA Bank of America
Merrill Lynch (738)(40) SEB SA Citibank (424)
(157) SEB SA Credit Suisse (1,256)(6) SEB SA Deutsche Bank (71)(6) SES SA Bank of America
Merrill Lynch (2)(7) SES SA Citibank (4)
(66) SES SA Credit Suisse (36)1,450 Suez SA Citibank 1,309
380 Suez SA Credit Suisse 41,030 Suez SA JP Morgan 10
(21) Teleperformance Bank of AmericaMerrill Lynch (181)
Holding Description Counterparty
Netunrealised
appreciation/(depreciation)
EUR
France continued(106) Teleperformance Citibank 456
(6) Teleperformance Credit Suisse 2380 Thales SA Credit Suisse 52680 Thales SA Deutsche Bank 47870 Thales SA JP Morgan (31)
270 TOTAL SA Deutsche Bank 756(190) Ubisoft Entertainment SA JP Morgan 676931 Veolia Environnement SA Bank of America
Merrill Lynch 1,532106 Veolia Environnement SA Citibank 182380 Veolia Environnement SA JP Morgan 76840 Vivendi SA Bank of America
Merrill Lynch 1,088451 Vivendi SA Citibank 415490 Vivendi SA Credit Suisse 284745 Vivendi SA JP Morgan 43265 Wendel SE Bank of America
Merrill Lynch 501217 Wendel SE Citibank 1,07460 Wendel SE Deutsche Bank 462
9,743
Germany(56) 1&1 Drillisch AG Citibank (8)
(2,260) 1&1 Drillisch AG JP Morgan (4,701)90 Allianz SE RegS Citibank 74530 Allianz SE RegS Credit Suisse 183
1,330 Aroundtown SA Bank of AmericaMerrill Lynch 517
(301) Bayer AG RegS Citibank (1,201)(30) Bayer AG RegS Credit Suisse (109)
(270) Bayer AG RegS JP Morgan (985)(137) Bayerische Motoren Werke
AG (Pref)Bank of AmericaMerrill Lynch (479)
(280) Bayerische Motoren WerkeAG (Pref) Citibank (566)
(270) Bayerische Motoren WerkeAG (Pref) Credit Suisse 259
(50) Bayerische Motoren WerkeAG (Pref) Deutsche Bank (175)
(200) Bayerische Motoren WerkeAG (Pref) JP Morgan 192
(40) Bechtle AG Citibank (164)(40) Bechtle AG Credit Suisse (452)160 Beiersdorf AG Bank of America
Merrill Lynch 37860 Beiersdorf AG Deutsche Bank 142
110 Brenntag AG Citibank 277240 Brenntag AG Credit Suisse 73040 Brenntag AG JP Morgan 12280 Carl Zeiss Meditec AG Deutsche Bank 708
(5,138) Commerzbank AG Bank of AmericaMerrill Lynch (3,494)
(2,210) Commerzbank AG Citibank (572)(1,700) Commerzbank AG Credit Suisse (542)(7,381) Commerzbank AG JP Morgan (2,355)
(70) Continental AG Citibank (510)(410) Daimler AG Citibank (978)(700) Daimler AG Credit Suisse (1,449)(110) Daimler AG JP Morgan (228)(39) Delivery Hero SE Bank of America
Merrill Lynch (130)(40) Delivery Hero SE Credit Suisse 23
(208) Delivery Hero SE JP Morgan 121(1,117) Deutsche Bank AG Bank of America
Merrill Lynch (1,889)(1,177) Deutsche Bank AG Citibank (1,108)(3,750) Deutsche Bank AG Credit Suisse (4,106)
BlackRock Total Advantage Fund continued
The notes on pages 691 to 711 form an integral part of these financial statements.
BlackRock Strategic Funds[640]

Contracts for difference as at 31 May 2020
Holding Description Counterparty
Netunrealised
appreciation/(depreciation)
EUR
Germany continued(2,690) Deutsche Bank AG JP Morgan (3,470)
130 Deutsche Boerse AG Bank of AmericaMerrill Lynch 221
40 Deutsche Boerse AG Credit Suisse 640 Deutsche Boerse AG JP Morgan 47
1,127 Deutsche Post AG RegS Citibank 1,0591,163 Deutsche Post AG RegS Credit Suisse 1,989
260 Deutsche Post AG RegS JP Morgan 4451,100 Deutsche Telekom AG RegS Bank of America
Merrill Lynch 6272,400 Deutsche Telekom AG RegS Citibank 1,380
737 Deutsche Telekom AG RegS Credit Suisse 405(130) Deutsche Wohnen SE Credit Suisse (260)(510) E.ON SE JP Morgan (46)
1,051 Evonik Industries AG JP Morgan 2170 Fielmann AG Bank of America
Merrill Lynch 210140 Fielmann AG Citibank 33680 Fielmann AG Credit Suisse 228
258 Fraport AG Frankfurt AirportServices Worldwide
Bank of AmericaMerrill Lynch 2,152
250 Fraport AG Frankfurt AirportServices Worldwide Citibank 1,350
130 Fraport AG Frankfurt AirportServices Worldwide Deutsche Bank 1,084
349 Fraport AG Frankfurt AirportServices Worldwide JP Morgan 2,206
(170) Fresenius Medical Care AG& Co KGaA
Bank of AmericaMerrill Lynch (575)
(222) Fresenius Medical Care AG& Co KGaA Citibank (155)
(80) Fresenius Medical Care AG& Co KGaA Credit Suisse (307)
(80) Fresenius Medical Care AG& Co KGaA JP Morgan (208)
(170) Fresenius SE & Co KGaA Citibank (19)(160) Fresenius SE & Co KGaA JP Morgan (482)380 FUCHS PETROLUB SE
(Pref)Bank of AmericaMerrill Lynch 1,224
120 FUCHS PETROLUB SE(Pref) Deutsche Bank 386
930 GEA Group AG Bank of AmericaMerrill Lynch 3,264
550 GEA Group AG Citibank 1,183240 GEA Group AG Credit Suisse 1,152
1,040 GEA Group AG JP Morgan 4,992(142) Hapag-Lloyd AG Bank of America
Merrill Lynch 14,328(266) Hapag-Lloyd AG JP Morgan 18,966192 HeidelbergCement AG Bank of America
Merrill Lynch 1,073593 HeidelbergCement AG Citibank 2,32531 HeidelbergCement AG JP Morgan 38
150 Hella GmbH & Co KGaA JP Morgan 210210 Henkel AG & Co KGaA
(Pref) Citibank 65920 Henkel AG & Co KGaA
(Pref) JP Morgan 9280 HOCHTIEF AG Citibank 1,638568 HOCHTIEF AG Credit Suisse 4,658156 HOCHTIEF AG Deutsche Bank 2,090110 HOCHTIEF AG JP Morgan 902590 HUGO BOSS AG Bank of America
Merrill Lynch 1,103670 HUGO BOSS AG Citibank 998240 HUGO BOSS AG Credit Suisse 300350 HUGO BOSS AG Deutsche Bank 655480 HUGO BOSS AG JP Morgan 600
Holding Description Counterparty
Netunrealised
appreciation/(depreciation)
EUR
Germany continued(1,310) Infineon Technologies AG Bank of America
Merrill Lynch (3,223)(100) Infineon Technologies AG Credit Suisse (108)(210) Infineon Technologies AG JP Morgan (227)(120) KION Group AG Bank of America
Merrill Lynch (818)(100) KION Group AG Citibank (565)(98) KION Group AG Credit Suisse (463)
(459) KION Group AG JP Morgan (2,166)(118) LANXESS AG Citibank (150)(120) LANXESS AG JP Morgan (295)410 Merck KGaA Credit Suisse (902)
(1,480) METRO AG JP Morgan (1,060)(70) MTU Aero Engines AG Bank of America
Merrill Lynch (2,075)40 Muenchener
Rueckversicherungs-GesellschaftAG in Muenchen RegS Citibank 472
286 MuenchenerRueckversicherungs-GesellschaftAG in Muenchen RegS Credit Suisse 3,933
(219) OSRAM Licht AG JP Morgan 44(80) Porsche Automobil Holding
SE (Pref)Bank of AmericaMerrill Lynch (526)
(330) Porsche Automobil HoldingSE (Pref) Citibank (818)
(20) Porsche Automobil HoldingSE (Pref) Deutsche Bank (131)
(90) Porsche Automobil HoldingSE (Pref) JP Morgan (184)
(740) ProSiebenSat.1 Media SE Bank of AmericaMerrill Lynch (947)
(1,160) ProSiebenSat.1 Media SE Deutsche Bank (1,485)110 Puma SE Credit Suisse 506100 Puma SE Deutsche Bank 530
(120) QIAGEN NV Bank of AmericaMerrill Lynch (43)
(210) QIAGEN NV Credit Suisse 8(80) QIAGEN NV JP Morgan 319 Rational AG Bank of America
Merrill Lynch 1,14010 Rational AG Citibank 39010 Rational AG Deutsche Bank 60040 Rational AG JP Morgan 1,376
170 Rheinmetall AG Bank of AmericaMerrill Lynch 1,469
210 Rheinmetall AG Citibank 1,07980 Rheinmetall AG Deutsche Bank 691
150 Rheinmetall AG JP Morgan 966169 RTL Group SA Bank of America
Merrill Lynch 487143 RTL Group SA Citibank 260478 RTL Group SA Credit Suisse 440174 RTL Group SA JP Morgan 160(60) SAP SE Credit Suisse (372)(59) Sartorius AG (Pref) Citibank (366)(20) Sartorius AG (Pref) Credit Suisse (828)100 Scout24 AG Citibank 100130 Siemens Healthineers AG Citibank 147
(1,200) Suedzucker AG Citibank 1260 Symrise AG Bank of America
Merrill Lynch 25470 Symrise AG Citibank 14750 Symrise AG Credit Suisse 19060 Symrise AG JP Morgan 228
(14) Talanx AG Bank of AmericaMerrill Lynch (39)
(10) Talanx AG Credit Suisse 2
BlackRock Total Advantage Fund continued
The notes on pages 691 to 711 form an integral part of these financial statements.
Annual report and audited financial statements [641]
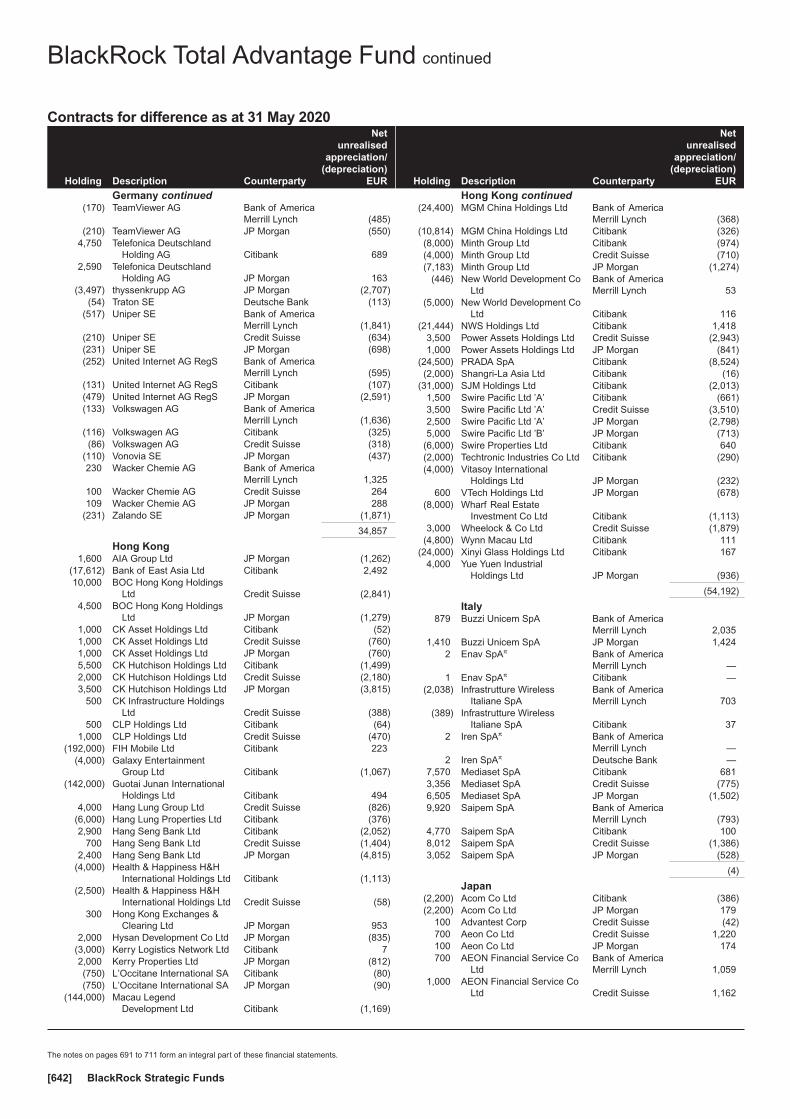
Contracts for difference as at 31 May 2020
Holding Description Counterparty
Netunrealised
appreciation/(depreciation)
EUR
Germany continued(170) TeamViewer AG Bank of America
Merrill Lynch (485)(210) TeamViewer AG JP Morgan (550)
4,750 Telefonica DeutschlandHolding AG Citibank 689
2,590 Telefonica DeutschlandHolding AG JP Morgan 163
(3,497) thyssenkrupp AG JP Morgan (2,707)(54) Traton SE Deutsche Bank (113)
(517) Uniper SE Bank of AmericaMerrill Lynch (1,841)
(210) Uniper SE Credit Suisse (634)(231) Uniper SE JP Morgan (698)(252) United Internet AG RegS Bank of America
Merrill Lynch (595)(131) United Internet AG RegS Citibank (107)(479) United Internet AG RegS JP Morgan (2,591)(133) Volkswagen AG Bank of America
Merrill Lynch (1,636)(116) Volkswagen AG Citibank (325)(86) Volkswagen AG Credit Suisse (318)
(110) Vonovia SE JP Morgan (437)230 Wacker Chemie AG Bank of America
Merrill Lynch 1,325100 Wacker Chemie AG Credit Suisse 264109 Wacker Chemie AG JP Morgan 288
(231) Zalando SE JP Morgan (1,871)
34,857
Hong Kong1,600 AIA Group Ltd JP Morgan (1,262)
(17,612) Bank of East Asia Ltd Citibank 2,49210,000 BOC Hong Kong Holdings
Ltd Credit Suisse (2,841)4,500 BOC Hong Kong Holdings
Ltd JP Morgan (1,279)1,000 CK Asset Holdings Ltd Citibank (52)1,000 CK Asset Holdings Ltd Credit Suisse (760)1,000 CK Asset Holdings Ltd JP Morgan (760)5,500 CK Hutchison Holdings Ltd Citibank (1,499)2,000 CK Hutchison Holdings Ltd Credit Suisse (2,180)3,500 CK Hutchison Holdings Ltd JP Morgan (3,815)
500 CK Infrastructure HoldingsLtd Credit Suisse (388)
500 CLP Holdings Ltd Citibank (64)1,000 CLP Holdings Ltd Credit Suisse (470)
(192,000) FIH Mobile Ltd Citibank 223(4,000) Galaxy Entertainment
Group Ltd Citibank (1,067)(142,000) Guotai Junan International
Holdings Ltd Citibank 4944,000 Hang Lung Group Ltd Credit Suisse (826)
(6,000) Hang Lung Properties Ltd Citibank (376)2,900 Hang Seng Bank Ltd Citibank (2,052)
700 Hang Seng Bank Ltd Credit Suisse (1,404)2,400 Hang Seng Bank Ltd JP Morgan (4,815)
(4,000) Health & Happiness H&HInternational Holdings Ltd Citibank (1,113)
(2,500) Health & Happiness H&HInternational Holdings Ltd Credit Suisse (58)
300 Hong Kong Exchanges &Clearing Ltd JP Morgan 953
2,000 Hysan Development Co Ltd JP Morgan (835)(3,000) Kerry Logistics Network Ltd Citibank 72,000 Kerry Properties Ltd JP Morgan (812)(750) L’Occitane International SA Citibank (80)(750) L’Occitane International SA JP Morgan (90)
(144,000) Macau LegendDevelopment Ltd Citibank (1,169)
Holding Description Counterparty
Netunrealised
appreciation/(depreciation)
EUR
Hong Kong continued(24,400) MGM China Holdings Ltd Bank of America
Merrill Lynch (368)(10,814) MGM China Holdings Ltd Citibank (326)(8,000) Minth Group Ltd Citibank (974)(4,000) Minth Group Ltd Credit Suisse (710)(7,183) Minth Group Ltd JP Morgan (1,274)
(446) New World Development CoLtd
Bank of AmericaMerrill Lynch 53
(5,000) New World Development CoLtd Citibank 116
(21,444) NWS Holdings Ltd Citibank 1,4183,500 Power Assets Holdings Ltd Credit Suisse (2,943)1,000 Power Assets Holdings Ltd JP Morgan (841)
(24,500) PRADA SpA Citibank (8,524)(2,000) Shangri-La Asia Ltd Citibank (16)
(31,000) SJM Holdings Ltd Citibank (2,013)1,500 Swire Pacific Ltd ’A’ Citibank (661)3,500 Swire Pacific Ltd ’A’ Credit Suisse (3,510)2,500 Swire Pacific Ltd ’A’ JP Morgan (2,798)5,000 Swire Pacific Ltd ’B’ JP Morgan (713)
(6,000) Swire Properties Ltd Citibank 640(2,000) Techtronic Industries Co Ltd Citibank (290)(4,000) Vitasoy International
Holdings Ltd JP Morgan (232)600 VTech Holdings Ltd JP Morgan (678)
(8,000) Wharf Real EstateInvestment Co Ltd Citibank (1,113)
3,000 Wheelock & Co Ltd Credit Suisse (1,879)(4,800) Wynn Macau Ltd Citibank 111
(24,000) Xinyi Glass Holdings Ltd Citibank 1674,000 Yue Yuen Industrial
Holdings Ltd JP Morgan (936)
(54,192)
Italy879 Buzzi Unicem SpA Bank of America
Merrill Lynch 2,0351,410 Buzzi Unicem SpA JP Morgan 1,424
2 Enav SpAπ Bank of AmericaMerrill Lynch —
1 Enav SpAπ Citibank —(2,038) Infrastrutture Wireless
Italiane SpABank of AmericaMerrill Lynch 703
(389) Infrastrutture WirelessItaliane SpA Citibank 37
2 Iren SpAπ Bank of AmericaMerrill Lynch —
2 Iren SpAπ Deutsche Bank —7,570 Mediaset SpA Citibank 6813,356 Mediaset SpA Credit Suisse (775)6,505 Mediaset SpA JP Morgan (1,502)9,920 Saipem SpA Bank of America
Merrill Lynch (793)4,770 Saipem SpA Citibank 1008,012 Saipem SpA Credit Suisse (1,386)3,052 Saipem SpA JP Morgan (528)
(4)
Japan(2,200) Acom Co Ltd Citibank (386)(2,200) Acom Co Ltd JP Morgan 179
100 Advantest Corp Credit Suisse (42)700 Aeon Co Ltd Credit Suisse 1,220100 Aeon Co Ltd JP Morgan 174700 AEON Financial Service Co
LtdBank of AmericaMerrill Lynch 1,059
1,000 AEON Financial Service CoLtd Credit Suisse 1,162
BlackRock Total Advantage Fund continued
The notes on pages 691 to 711 form an integral part of these financial statements.
BlackRock Strategic Funds[642]

Contracts for difference as at 31 May 2020
Holding Description Counterparty
Netunrealised
appreciation/(depreciation)
EUR
Japan continued600 AEON Financial Service Co
Ltd JP Morgan 697(400) Aeon Mall Co Ltd Bank of America
Merrill Lynch (97)300 AGC Inc Bank of America
Merrill Lynch 948100 AGC Inc Citibank 90900 AGC Inc JP Morgan 2,882
(500) Ain Holdings Inc Bank of AmericaMerrill Lynch (2,048)
(100) Ain Holdings Inc Citibank (209)(1,600) Air Water Inc JP Morgan (575)
(300) Aisin Seiki Co Ltd Bank of AmericaMerrill Lynch (790)
(200) Aisin Seiki Co Ltd Credit Suisse (560)(200) Aisin Seiki Co Ltd JP Morgan (560)
1,000 Ajinomoto Co Inc Credit Suisse (706)400 Alps Alpine Co Ltd Bank of America
Merrill Lynch 512600 Alps Alpine Co Ltd Credit Suisse 903600 Alps Alpine Co Ltd JP Morgan 903
4,300 Amada Co Ltd Bank of AmericaMerrill Lynch (36)
1,100 Amada Co Ltd Citibank 7171,200 Amada Co Ltd Credit Suisse (130)1,300 Amada Co Ltd JP Morgan (141)1,200 Amano Corp Bank of America
Merrill Lynch 1,465200 Amano Corp Citibank 137
(500) ANA Holdings Inc Bank of AmericaMerrill Lynch (1,191)
(300) ANA Holdings Inc Citibank (508)(800) ANA Holdings Inc Credit Suisse (2,762)
(1,200) ANA Holdings Inc JP Morgan (4,144)400 Anritsu Corp Bank of America
Merrill Lynch (204)500 Aozora Bank Ltd Bank of America
Merrill Lynch 928500 Aozora Bank Ltd JP Morgan 447
(100) Ariake Japan Co Ltd Citibank (84)(200) Ariake Japan Co Ltd Credit Suisse (2,107)(100) Ariake Japan Co Ltd Deutsche Bank (385)(100) Ariake Japan Co Ltd JP Morgan (1,053)300 Asahi Group Holdings Ltd Citibank 966200 Asahi Group Holdings Ltd JP Morgan 599
(700) Asahi Kasei Corp JP Morgan (636)(800) Asics Corp Credit Suisse (936)
6,100 Astellas Pharma Inc Credit Suisse 4,055200 Azbil Corp Bank of America
Merrill Lynch 35600 Azbil Corp Credit Suisse (19)900 Azbil Corp JP Morgan (745)
(400) Benefit One Inc Bank of AmericaMerrill Lynch (766)
(900) Benefit One Inc JP Morgan (2,943)1,500 Benesse Holdings Inc Credit Suisse (2,420)
300 Benesse Holdings Inc JP Morgan (484)300 Bridgestone Corp Bank of America
Merrill Lynch 976600 Bridgestone Corp Citibank 1,605
1,200 Bridgestone Corp Credit Suisse 2,749500 Bridgestone Corp JP Morgan 1,145
2,600 Brother Industries Ltd Bank of AmericaMerrill Lynch 3,652
1,600 Brother Industries Ltd JP Morgan 2,943600 Calbee Inc Bank of America
Merrill Lynch 863400 Calbee Inc Citibank 421
Holding Description Counterparty
Netunrealised
appreciation/(depreciation)
EUR
Japan continued400 Calbee Inc Credit Suisse (468)300 Calbee Inc JP Morgan (351)600 Canon Marketing Japan Inc Bank of America
Merrill Lynch 592700 Canon Marketing Japan Inc JP Morgan 351
(200) Capcom Co Ltd JP Morgan (702)(400) Casio Computer Co Ltd JP Morgan (907)(100) Central Japan Railway Co Credit Suisse (1,112)
2,800 Chiba Bank Ltd JP Morgan 492(300) Chubu Electric Power Co
IncBank of AmericaMerrill Lynch (20)
(2,200) Chubu Electric Power CoInc Credit Suisse 55
(100) Chubu Electric Power CoInc JP Morgan 3
100 Chugai Pharmaceutical CoLtd
Bank of AmericaMerrill Lynch 2,328
100 Chugai Pharmaceutical CoLtd JP Morgan 2,341
(1,200) Chugoku Bank Ltd Citibank (381)(800) Chugoku Bank Ltd Credit Suisse 174
1,600 Citizen Watch Co Ltd Bank of AmericaMerrill Lynch 575
3,500 Citizen Watch Co Ltd Citibank 849(300) Coca-Cola Bottlers Japan
Holdings IncBank of AmericaMerrill Lynch (690)
(500) Coca-Cola Bottlers JapanHoldings Inc Citibank (1,095)
(200) Coca-Cola Bottlers JapanHoldings Inc Credit Suisse (294)
300 COMSYS Holdings Corp JP Morgan (201)(1,800) Concordia Financial Group
LtdBank of AmericaMerrill Lynch (602)
(600) Concordia Financial GroupLtd Credit Suisse (140)
200 Cosmos PharmaceuticalCorp Citibank 786
(700) Credit Saison Co Ltd JP Morgan (636)(700) CyberAgent Inc Citibank (936)(300) CyberAgent Inc Credit Suisse (2,282)
1,300 Dai Nippon Printing Co Ltd Bank of AmericaMerrill Lynch 4,021
300 Dai Nippon Printing Co Ltd Credit Suisse 584600 Daicel Corp Bank of America
Merrill Lynch 2611,700 Daicel Corp Citibank 242(100) Daido Steel Co Ltd Bank of America
Merrill Lynch (180)(200) Daido Steel Co Ltd Credit Suisse (251)(900) Daifuku Co Ltd JP Morgan (6,847)
(1,100) Dai-ichi Life Holdings Inc Citibank (1,757)(1,800) Dai-ichi Life Holdings Inc Credit Suisse (1,603)
(100) Dai-ichi Life Holdings Inc JP Morgan (89)(100) Daiichi Sankyo Co Ltd Bank of America
Merrill Lynch (1,382)600 Daiichikosho Co Ltd Bank of America
Merrill Lynch 1,956200 Daiichikosho Co Ltd Citibank 293200 Daiichikosho Co Ltd Credit Suisse 638100 Daiichikosho Co Ltd JP Morgan 347
(100) Daito Trust Construction CoLtd JP Morgan (681)
(600) Daiwa House Industry CoLtd
Bank of AmericaMerrill Lynch (1,427)
(400) Daiwa House Industry CoLtd Citibank (515)
(200) Daiwa House Industry CoLtd Credit Suisse 82
BlackRock Total Advantage Fund continued
The notes on pages 691 to 711 form an integral part of these financial statements.
Annual report and audited financial statements [643]
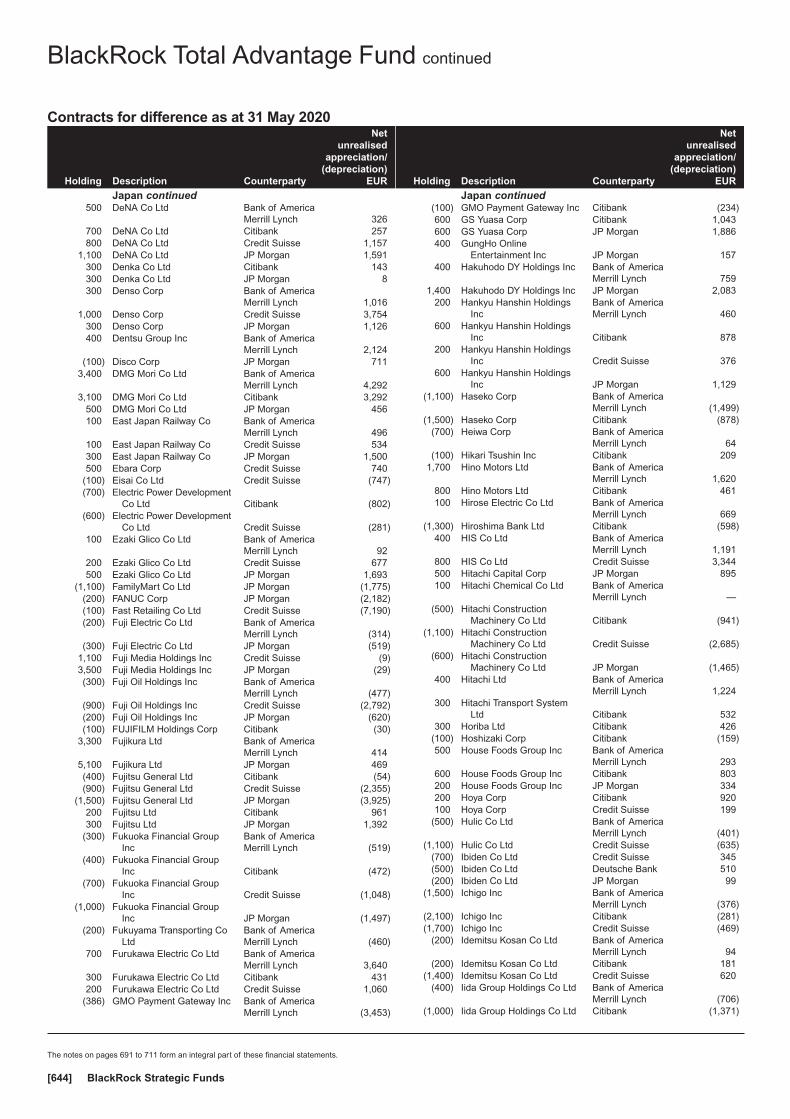
Contracts for difference as at 31 May 2020
Holding Description Counterparty
Netunrealised
appreciation/(depreciation)
EUR
Japan continued500 DeNA Co Ltd Bank of America
Merrill Lynch 326700 DeNA Co Ltd Citibank 257800 DeNA Co Ltd Credit Suisse 1,157
1,100 DeNA Co Ltd JP Morgan 1,591300 Denka Co Ltd Citibank 143300 Denka Co Ltd JP Morgan 8300 Denso Corp Bank of America
Merrill Lynch 1,0161,000 Denso Corp Credit Suisse 3,754
300 Denso Corp JP Morgan 1,126400 Dentsu Group Inc Bank of America
Merrill Lynch 2,124(100) Disco Corp JP Morgan 711
3,400 DMG Mori Co Ltd Bank of AmericaMerrill Lynch 4,292
3,100 DMG Mori Co Ltd Citibank 3,292500 DMG Mori Co Ltd JP Morgan 456100 East Japan Railway Co Bank of America
Merrill Lynch 496100 East Japan Railway Co Credit Suisse 534300 East Japan Railway Co JP Morgan 1,500500 Ebara Corp Credit Suisse 740
(100) Eisai Co Ltd Credit Suisse (747)(700) Electric Power Development
Co Ltd Citibank (802)(600) Electric Power Development
Co Ltd Credit Suisse (281)100 Ezaki Glico Co Ltd Bank of America
Merrill Lynch 92200 Ezaki Glico Co Ltd Credit Suisse 677500 Ezaki Glico Co Ltd JP Morgan 1,693
(1,100) FamilyMart Co Ltd JP Morgan (1,775)(200) FANUC Corp JP Morgan (2,182)(100) Fast Retailing Co Ltd Credit Suisse (7,190)(200) Fuji Electric Co Ltd Bank of America
Merrill Lynch (314)(300) Fuji Electric Co Ltd JP Morgan (519)
1,100 Fuji Media Holdings Inc Credit Suisse (9)3,500 Fuji Media Holdings Inc JP Morgan (29)(300) Fuji Oil Holdings Inc Bank of America
Merrill Lynch (477)(900) Fuji Oil Holdings Inc Credit Suisse (2,792)(200) Fuji Oil Holdings Inc JP Morgan (620)(100) FUJIFILM Holdings Corp Citibank (30)
3,300 Fujikura Ltd Bank of AmericaMerrill Lynch 414
5,100 Fujikura Ltd JP Morgan 469(400) Fujitsu General Ltd Citibank (54)(900) Fujitsu General Ltd Credit Suisse (2,355)
(1,500) Fujitsu General Ltd JP Morgan (3,925)200 Fujitsu Ltd Citibank 961300 Fujitsu Ltd JP Morgan 1,392
(300) Fukuoka Financial GroupInc
Bank of AmericaMerrill Lynch (519)
(400) Fukuoka Financial GroupInc Citibank (472)
(700) Fukuoka Financial GroupInc Credit Suisse (1,048)
(1,000) Fukuoka Financial GroupInc JP Morgan (1,497)
(200) Fukuyama Transporting CoLtd
Bank of AmericaMerrill Lynch (460)
700 Furukawa Electric Co Ltd Bank of AmericaMerrill Lynch 3,640
300 Furukawa Electric Co Ltd Citibank 431200 Furukawa Electric Co Ltd Credit Suisse 1,060
(386) GMO Payment Gateway Inc Bank of AmericaMerrill Lynch (3,453)
Holding Description Counterparty
Netunrealised
appreciation/(depreciation)
EUR
Japan continued(100) GMO Payment Gateway Inc Citibank (234)600 GS Yuasa Corp Citibank 1,043600 GS Yuasa Corp JP Morgan 1,886400 GungHo Online
Entertainment Inc JP Morgan 157400 Hakuhodo DY Holdings Inc Bank of America
Merrill Lynch 7591,400 Hakuhodo DY Holdings Inc JP Morgan 2,083
200 Hankyu Hanshin HoldingsInc
Bank of AmericaMerrill Lynch 460
600 Hankyu Hanshin HoldingsInc Citibank 878
200 Hankyu Hanshin HoldingsInc Credit Suisse 376
600 Hankyu Hanshin HoldingsInc JP Morgan 1,129
(1,100) Haseko Corp Bank of AmericaMerrill Lynch (1,499)
(1,500) Haseko Corp Citibank (878)(700) Heiwa Corp Bank of America
Merrill Lynch 64(100) Hikari Tsushin Inc Citibank 209
1,700 Hino Motors Ltd Bank of AmericaMerrill Lynch 1,620
800 Hino Motors Ltd Citibank 461100 Hirose Electric Co Ltd Bank of America
Merrill Lynch 669(1,300) Hiroshima Bank Ltd Citibank (598)
400 HIS Co Ltd Bank of AmericaMerrill Lynch 1,191
800 HIS Co Ltd Credit Suisse 3,344500 Hitachi Capital Corp JP Morgan 895100 Hitachi Chemical Co Ltd Bank of America
Merrill Lynch —(500) Hitachi Construction
Machinery Co Ltd Citibank (941)(1,100) Hitachi Construction
Machinery Co Ltd Credit Suisse (2,685)(600) Hitachi Construction
Machinery Co Ltd JP Morgan (1,465)400 Hitachi Ltd Bank of America
Merrill Lynch 1,224300 Hitachi Transport System
Ltd Citibank 532300 Horiba Ltd Citibank 426
(100) Hoshizaki Corp Citibank (159)500 House Foods Group Inc Bank of America
Merrill Lynch 293600 House Foods Group Inc Citibank 803200 House Foods Group Inc JP Morgan 334200 Hoya Corp Citibank 920100 Hoya Corp Credit Suisse 199
(500) Hulic Co Ltd Bank of AmericaMerrill Lynch (401)
(1,100) Hulic Co Ltd Credit Suisse (635)(700) Ibiden Co Ltd Credit Suisse 345(500) Ibiden Co Ltd Deutsche Bank 510(200) Ibiden Co Ltd JP Morgan 99
(1,500) Ichigo Inc Bank of AmericaMerrill Lynch (376)
(2,100) Ichigo Inc Citibank (281)(1,700) Ichigo Inc Credit Suisse (469)
(200) Idemitsu Kosan Co Ltd Bank of AmericaMerrill Lynch 94
(200) Idemitsu Kosan Co Ltd Citibank 181(1,400) Idemitsu Kosan Co Ltd Credit Suisse 620
(400) Iida Group Holdings Co Ltd Bank of AmericaMerrill Lynch (706)
(1,000) Iida Group Holdings Co Ltd Citibank (1,371)
BlackRock Total Advantage Fund continued
The notes on pages 691 to 711 form an integral part of these financial statements.
BlackRock Strategic Funds[644]
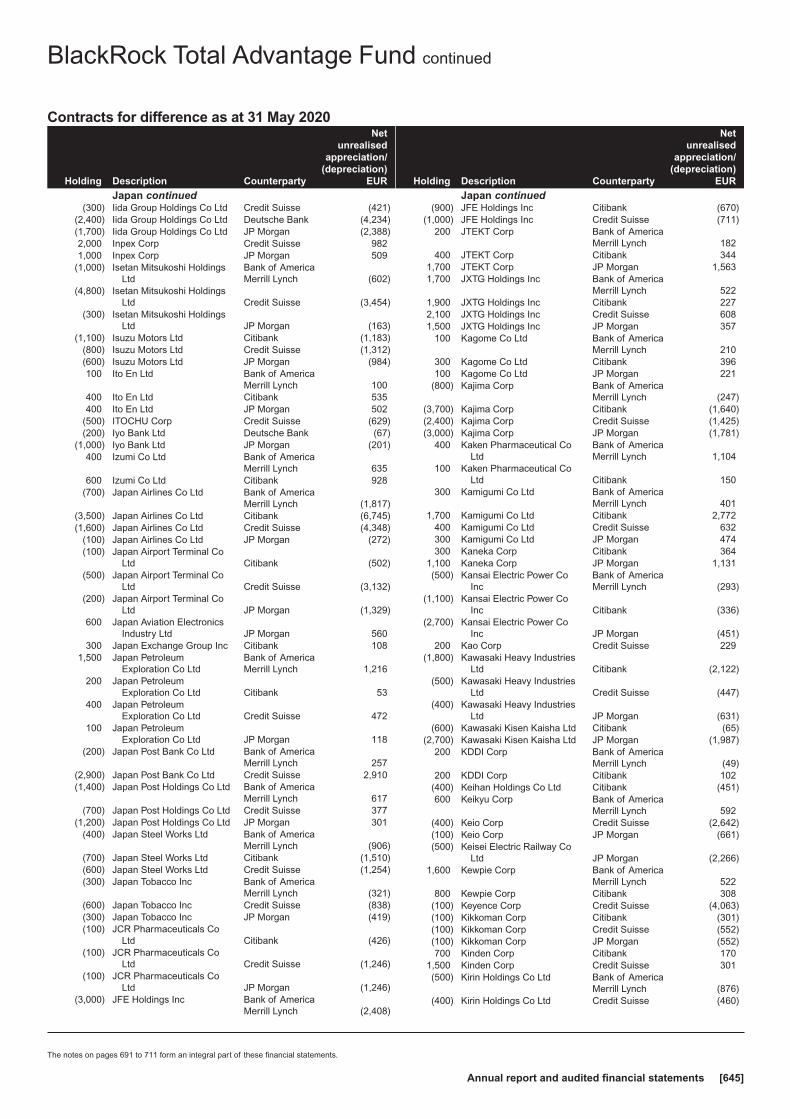
Contracts for difference as at 31 May 2020
Holding Description Counterparty
Netunrealised
appreciation/(depreciation)
EUR
Japan continued(300) Iida Group Holdings Co Ltd Credit Suisse (421)
(2,400) Iida Group Holdings Co Ltd Deutsche Bank (4,234)(1,700) Iida Group Holdings Co Ltd JP Morgan (2,388)2,000 Inpex Corp Credit Suisse 9821,000 Inpex Corp JP Morgan 509
(1,000) Isetan Mitsukoshi HoldingsLtd
Bank of AmericaMerrill Lynch (602)
(4,800) Isetan Mitsukoshi HoldingsLtd Credit Suisse (3,454)
(300) Isetan Mitsukoshi HoldingsLtd JP Morgan (163)
(1,100) Isuzu Motors Ltd Citibank (1,183)(800) Isuzu Motors Ltd Credit Suisse (1,312)(600) Isuzu Motors Ltd JP Morgan (984)100 Ito En Ltd Bank of America
Merrill Lynch 100400 Ito En Ltd Citibank 535400 Ito En Ltd JP Morgan 502
(500) ITOCHU Corp Credit Suisse (629)(200) Iyo Bank Ltd Deutsche Bank (67)
(1,000) Iyo Bank Ltd JP Morgan (201)400 Izumi Co Ltd Bank of America
Merrill Lynch 635600 Izumi Co Ltd Citibank 928
(700) Japan Airlines Co Ltd Bank of AmericaMerrill Lynch (1,817)
(3,500) Japan Airlines Co Ltd Citibank (6,745)(1,600) Japan Airlines Co Ltd Credit Suisse (4,348)
(100) Japan Airlines Co Ltd JP Morgan (272)(100) Japan Airport Terminal Co
Ltd Citibank (502)(500) Japan Airport Terminal Co
Ltd Credit Suisse (3,132)(200) Japan Airport Terminal Co
Ltd JP Morgan (1,329)600 Japan Aviation Electronics
Industry Ltd JP Morgan 560300 Japan Exchange Group Inc Citibank 108
1,500 Japan PetroleumExploration Co Ltd
Bank of AmericaMerrill Lynch 1,216
200 Japan PetroleumExploration Co Ltd Citibank 53
400 Japan PetroleumExploration Co Ltd Credit Suisse 472
100 Japan PetroleumExploration Co Ltd JP Morgan 118
(200) Japan Post Bank Co Ltd Bank of AmericaMerrill Lynch 257
(2,900) Japan Post Bank Co Ltd Credit Suisse 2,910(1,400) Japan Post Holdings Co Ltd Bank of America
Merrill Lynch 617(700) Japan Post Holdings Co Ltd Credit Suisse 377
(1,200) Japan Post Holdings Co Ltd JP Morgan 301(400) Japan Steel Works Ltd Bank of America
Merrill Lynch (906)(700) Japan Steel Works Ltd Citibank (1,510)(600) Japan Steel Works Ltd Credit Suisse (1,254)(300) Japan Tobacco Inc Bank of America
Merrill Lynch (321)(600) Japan Tobacco Inc Credit Suisse (838)(300) Japan Tobacco Inc JP Morgan (419)(100) JCR Pharmaceuticals Co
Ltd Citibank (426)(100) JCR Pharmaceuticals Co
Ltd Credit Suisse (1,246)(100) JCR Pharmaceuticals Co
Ltd JP Morgan (1,246)(3,000) JFE Holdings Inc Bank of America
Merrill Lynch (2,408)
Holding Description Counterparty
Netunrealised
appreciation/(depreciation)
EUR
Japan continued(900) JFE Holdings Inc Citibank (670)
(1,000) JFE Holdings Inc Credit Suisse (711)200 JTEKT Corp Bank of America
Merrill Lynch 182400 JTEKT Corp Citibank 344
1,700 JTEKT Corp JP Morgan 1,5631,700 JXTG Holdings Inc Bank of America
Merrill Lynch 5221,900 JXTG Holdings Inc Citibank 2272,100 JXTG Holdings Inc Credit Suisse 6081,500 JXTG Holdings Inc JP Morgan 357
100 Kagome Co Ltd Bank of AmericaMerrill Lynch 210
300 Kagome Co Ltd Citibank 396100 Kagome Co Ltd JP Morgan 221
(800) Kajima Corp Bank of AmericaMerrill Lynch (247)
(3,700) Kajima Corp Citibank (1,640)(2,400) Kajima Corp Credit Suisse (1,425)(3,000) Kajima Corp JP Morgan (1,781)
400 Kaken Pharmaceutical CoLtd
Bank of AmericaMerrill Lynch 1,104
100 Kaken Pharmaceutical CoLtd Citibank 150
300 Kamigumi Co Ltd Bank of AmericaMerrill Lynch 401
1,700 Kamigumi Co Ltd Citibank 2,772400 Kamigumi Co Ltd Credit Suisse 632300 Kamigumi Co Ltd JP Morgan 474300 Kaneka Corp Citibank 364
1,100 Kaneka Corp JP Morgan 1,131(500) Kansai Electric Power Co
IncBank of AmericaMerrill Lynch (293)
(1,100) Kansai Electric Power CoInc Citibank (336)
(2,700) Kansai Electric Power CoInc JP Morgan (451)
200 Kao Corp Credit Suisse 229(1,800) Kawasaki Heavy Industries
Ltd Citibank (2,122)(500) Kawasaki Heavy Industries
Ltd Credit Suisse (447)(400) Kawasaki Heavy Industries
Ltd JP Morgan (631)(600) Kawasaki Kisen Kaisha Ltd Citibank (65)
(2,700) Kawasaki Kisen Kaisha Ltd JP Morgan (1,987)200 KDDI Corp Bank of America
Merrill Lynch (49)200 KDDI Corp Citibank 102
(400) Keihan Holdings Co Ltd Citibank (451)600 Keikyu Corp Bank of America
Merrill Lynch 592(400) Keio Corp Credit Suisse (2,642)(100) Keio Corp JP Morgan (661)(500) Keisei Electric Railway Co
Ltd JP Morgan (2,266)1,600 Kewpie Corp Bank of America
Merrill Lynch 522800 Kewpie Corp Citibank 308
(100) Keyence Corp Credit Suisse (4,063)(100) Kikkoman Corp Citibank (301)(100) Kikkoman Corp Credit Suisse (552)(100) Kikkoman Corp JP Morgan (552)700 Kinden Corp Citibank 170
1,500 Kinden Corp Credit Suisse 301(500) Kirin Holdings Co Ltd Bank of America
Merrill Lynch (876)(400) Kirin Holdings Co Ltd Credit Suisse (460)
BlackRock Total Advantage Fund continued
The notes on pages 691 to 711 form an integral part of these financial statements.
Annual report and audited financial statements [645]

Contracts for difference as at 31 May 2020
Holding Description Counterparty
Netunrealised
appreciation/(depreciation)
EUR
Japan continued(300) Kirin Holdings Co Ltd JP Morgan (345)(100) Kobayashi Pharmaceutical
Co LtdBank of AmericaMerrill Lynch 167
(100) Kobayashi PharmaceuticalCo Ltd Credit Suisse 318
(100) Kobayashi PharmaceuticalCo Ltd JP Morgan 318
(500) Kobe Bussan Co Ltd Citibank (1,839)(300) Kobe Bussan Co Ltd Credit Suisse (828)(200) Koei Tecmo Holdings Co Ltd Bank of America
Merrill Lynch (50)(600) Koei Tecmo Holdings Co Ltd Citibank (25)(200) Koei Tecmo Holdings Co Ltd Credit Suisse (204)(200) Koei Tecmo Holdings Co Ltd JP Morgan (204)(900) Komatsu Ltd Citibank (779)
(1,600) Komatsu Ltd Credit Suisse (1,946)(400) Komatsu Ltd Deutsche Bank (468)(700) Konami Holdings Corp JP Morgan (2,048)(900) Konica Minolta Inc Bank of America
Merrill Lynch (233)(1,100) Konica Minolta Inc Credit Suisse (92)
(100) Kose Corp Citibank (518)(100) Kose Corp JP Morgan (326)400 K’s Holdings Corp Citibank 201400 K’s Holdings Corp Credit Suisse 632500 K’s Holdings Corp JP Morgan 790
(800) Kubota Corp Bank of AmericaMerrill Lynch (391)
(600) Kubota Corp Citibank (281)(400) Kubota Corp Credit Suisse (380)(900) Kubota Corp JP Morgan (854)(300) Kusuri no Aoki Holdings Co
Ltd JP Morgan (1,480)300 Kyocera Corp Citibank 700300 Kyocera Corp JP Morgan 70
(100) Kyoritsu Maintenance CoLtd
Bank of AmericaMerrill Lynch (449)
(900) Kyoritsu Maintenance CoLtd Credit Suisse (3,615)
(200) Kyoritsu Maintenance CoLtd JP Morgan (940)
(400) Kyowa Exeo Corp Bank of AmericaMerrill Lynch 134
(900) Kyowa Exeo Corp JP Morgan 1,603300 Kyowa Kirin Co Ltd Bank of America
Merrill Lynch 850300 Kyowa Kirin Co Ltd Citibank 507400 Kyowa Kirin Co Ltd Credit Suisse 1,030400 Kyowa Kirin Co Ltd JP Morgan 1,030
(500) Kyushu Electric Power CoInc
Bank of AmericaMerrill Lynch (151)
(2,400) Kyushu Electric Power CoInc Citibank (1,023)
(800) Kyushu Electric Power CoInc Credit Suisse (187)
(1,500) Kyushu Electric Power CoInc JP Morgan (351)
(5,100) Kyushu Financial Group Inc Citibank (895)(5,700) Kyushu Financial Group Inc Credit Suisse (858)(1,300) Kyushu Financial Group Inc JP Morgan (196)(1,200) Kyushu Railway Co Credit Suisse (1,826)
(500) Lasertec Corp Credit Suisse (4,933)700 Lawson Inc Credit Suisse 2,400600 Lawson Inc JP Morgan 2,057
1,500 LIXIL Group Corp Credit Suisse 1,530400 LIXIL Group Corp JP Morgan 408
(400) M3 Inc Bank of AmericaMerrill Lynch (1,923)
(100) M3 Inc Citibank (192)
Holding Description Counterparty
Netunrealised
appreciation/(depreciation)
EUR
Japan continued(400) M3 Inc JP Morgan (1,371)700 Mabuchi Motor Co Ltd Bank of America
Merrill Lynch 2,224400 Mabuchi Motor Co Ltd Credit Suisse 936
(4,700) Maeda Corp Bank of AmericaMerrill Lynch (747)
(700) Maeda Corp Citibank (310)(2,800) Maeda Corp Credit Suisse 609
(800) Maeda Corp JP Morgan 174(100) Makita Corp Bank of America
Merrill Lynch (230)(100) Makita Corp Citibank (84)(400) Makita Corp Credit Suisse (886)(500) Mani Inc Credit Suisse (1,701)(800) Mani Inc JP Morgan (2,722)300 Maruha Nichiro Corp Bank of America
Merrill Lynch 401300 Maruha Nichiro Corp Citibank 356
(1,500) Marui Group Co Ltd Citibank (2,834)(400) Marui Group Co Ltd Credit Suisse (908)(800) Marui Group Co Ltd JP Morgan (1,581)(200) Maruichi Steel Tube Ltd Credit Suisse (525)(800) Matsui Securities Co Ltd Citibank (468)(100) Matsumotokiyoshi Holdings
Co LtdBank of AmericaMerrill Lynch (176)
(200) Matsumotokiyoshi HoldingsCo Ltd Citibank (125)
(2,400) Mazda Motor Corp Bank of AmericaMerrill Lynch (1,445)
(1,300) Mazda Motor Corp Credit Suisse (1,130)(2,000) Mebuki Financial Group Inc Citibank (268)
(12,100) Mebuki Financial Group Inc Credit Suisse (1,315)600 Medipal Holdings Corp Bank of America
Merrill Lynch 838100 Medipal Holdings Corp Citibank 84
1,700 Medipal Holdings Corp Credit Suisse 853300 Megmilk Snow Brand Co
Ltd Credit Suisse 414800 Megmilk Snow Brand Co
Ltd JP Morgan 775400 MEIJI Holdings Co Ltd Credit Suisse 1,873100 MEIJI Holdings Co Ltd JP Morgan 468
(800) MINEBEA MITSUMI Inc Citibank (676)(300) MINEBEA MITSUMI Inc Credit Suisse (309)(800) MISUMI Group Inc JP Morgan (1,552)900 Mitsubishi Chemical
Holdings CorpBank of AmericaMerrill Lynch 368
2,000 Mitsubishi ChemicalHoldings Corp Credit Suisse 477
(300) Mitsubishi Corp Bank of AmericaMerrill Lynch (484)
(800) Mitsubishi Corp Citibank (916)(300) Mitsubishi Corp Credit Suisse (435)
1,200 Mitsubishi Electric Corp Citibank 983600 Mitsubishi Electric Corp Credit Suisse 419
1,100 Mitsubishi Electric Corp JP Morgan 768500 Mitsubishi Gas Chemical Co
IncBank of AmericaMerrill Lynch 690
400 Mitsubishi Gas Chemical CoInc Credit Suisse 920
400 Mitsubishi Heavy IndustriesLtd
Bank of AmericaMerrill Lynch 798
100 Mitsubishi Heavy IndustriesLtd Citibank 167
300 Mitsubishi Heavy IndustriesLtd Credit Suisse 255
200 Mitsubishi Heavy IndustriesLtd JP Morgan 170
400 Mitsubishi Logistics Corp Citibank 940
BlackRock Total Advantage Fund continued
The notes on pages 691 to 711 form an integral part of these financial statements.
BlackRock Strategic Funds[646]
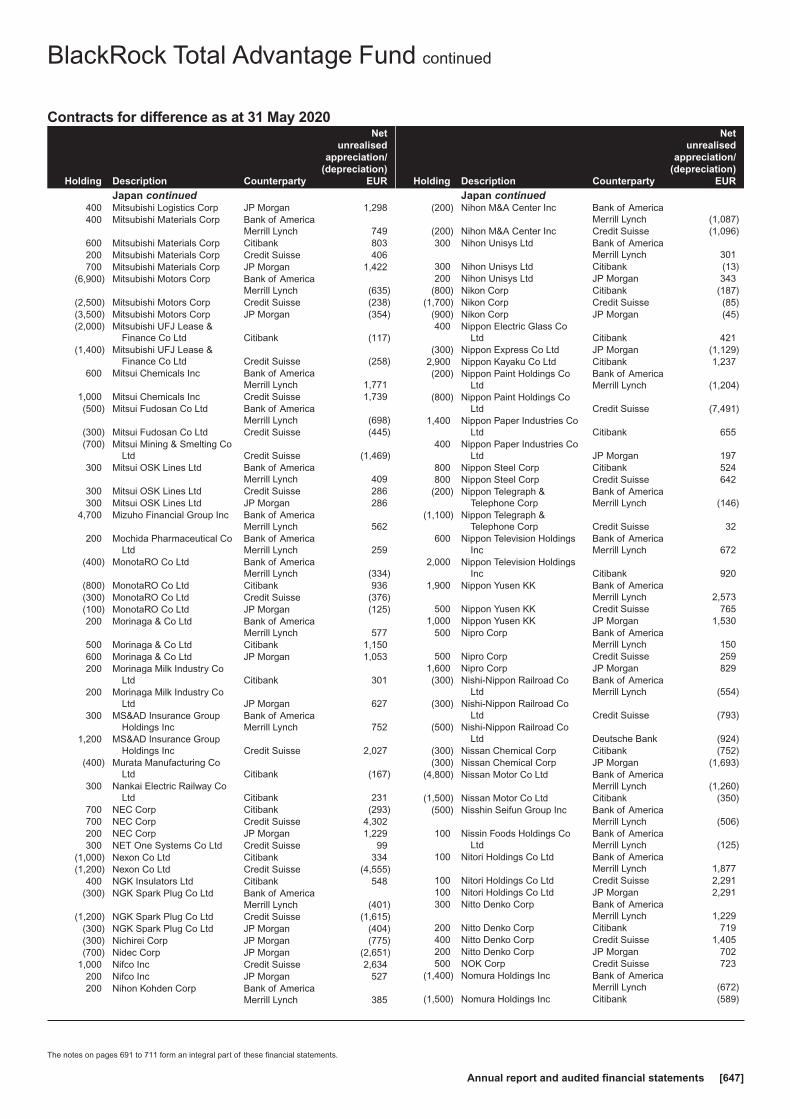
Contracts for difference as at 31 May 2020
Holding Description Counterparty
Netunrealised
appreciation/(depreciation)
EUR
Japan continued400 Mitsubishi Logistics Corp JP Morgan 1,298400 Mitsubishi Materials Corp Bank of America
Merrill Lynch 749600 Mitsubishi Materials Corp Citibank 803200 Mitsubishi Materials Corp Credit Suisse 406700 Mitsubishi Materials Corp JP Morgan 1,422
(6,900) Mitsubishi Motors Corp Bank of AmericaMerrill Lynch (635)
(2,500) Mitsubishi Motors Corp Credit Suisse (238)(3,500) Mitsubishi Motors Corp JP Morgan (354)(2,000) Mitsubishi UFJ Lease &
Finance Co Ltd Citibank (117)(1,400) Mitsubishi UFJ Lease &
Finance Co Ltd Credit Suisse (258)600 Mitsui Chemicals Inc Bank of America
Merrill Lynch 1,7711,000 Mitsui Chemicals Inc Credit Suisse 1,739(500) Mitsui Fudosan Co Ltd Bank of America
Merrill Lynch (698)(300) Mitsui Fudosan Co Ltd Credit Suisse (445)(700) Mitsui Mining & Smelting Co
Ltd Credit Suisse (1,469)300 Mitsui OSK Lines Ltd Bank of America
Merrill Lynch 409300 Mitsui OSK Lines Ltd Credit Suisse 286300 Mitsui OSK Lines Ltd JP Morgan 286
4,700 Mizuho Financial Group Inc Bank of AmericaMerrill Lynch 562
200 Mochida Pharmaceutical CoLtd
Bank of AmericaMerrill Lynch 259
(400) MonotaRO Co Ltd Bank of AmericaMerrill Lynch (334)
(800) MonotaRO Co Ltd Citibank 936(300) MonotaRO Co Ltd Credit Suisse (376)(100) MonotaRO Co Ltd JP Morgan (125)200 Morinaga & Co Ltd Bank of America
Merrill Lynch 577500 Morinaga & Co Ltd Citibank 1,150600 Morinaga & Co Ltd JP Morgan 1,053200 Morinaga Milk Industry Co
Ltd Citibank 301200 Morinaga Milk Industry Co
Ltd JP Morgan 627300 MS&AD Insurance Group
Holdings IncBank of AmericaMerrill Lynch 752
1,200 MS&AD Insurance GroupHoldings Inc Credit Suisse 2,027
(400) Murata Manufacturing CoLtd Citibank (167)
300 Nankai Electric Railway CoLtd Citibank 231
700 NEC Corp Citibank (293)700 NEC Corp Credit Suisse 4,302200 NEC Corp JP Morgan 1,229300 NET One Systems Co Ltd Credit Suisse 99
(1,000) Nexon Co Ltd Citibank 334(1,200) Nexon Co Ltd Credit Suisse (4,555)
400 NGK Insulators Ltd Citibank 548(300) NGK Spark Plug Co Ltd Bank of America
Merrill Lynch (401)(1,200) NGK Spark Plug Co Ltd Credit Suisse (1,615)
(300) NGK Spark Plug Co Ltd JP Morgan (404)(300) Nichirei Corp JP Morgan (775)(700) Nidec Corp JP Morgan (2,651)
1,000 Nifco Inc Credit Suisse 2,634200 Nifco Inc JP Morgan 527200 Nihon Kohden Corp Bank of America
Merrill Lynch 385
Holding Description Counterparty
Netunrealised
appreciation/(depreciation)
EUR
Japan continued(200) Nihon M&A Center Inc Bank of America
Merrill Lynch (1,087)(200) Nihon M&A Center Inc Credit Suisse (1,096)300 Nihon Unisys Ltd Bank of America
Merrill Lynch 301300 Nihon Unisys Ltd Citibank (13)200 Nihon Unisys Ltd JP Morgan 343
(800) Nikon Corp Citibank (187)(1,700) Nikon Corp Credit Suisse (85)
(900) Nikon Corp JP Morgan (45)400 Nippon Electric Glass Co
Ltd Citibank 421(300) Nippon Express Co Ltd JP Morgan (1,129)
2,900 Nippon Kayaku Co Ltd Citibank 1,237(200) Nippon Paint Holdings Co
LtdBank of AmericaMerrill Lynch (1,204)
(800) Nippon Paint Holdings CoLtd Credit Suisse (7,491)
1,400 Nippon Paper Industries CoLtd Citibank 655
400 Nippon Paper Industries CoLtd JP Morgan 197
800 Nippon Steel Corp Citibank 524800 Nippon Steel Corp Credit Suisse 642
(200) Nippon Telegraph &Telephone Corp
Bank of AmericaMerrill Lynch (146)
(1,100) Nippon Telegraph &Telephone Corp Credit Suisse 32
600 Nippon Television HoldingsInc
Bank of AmericaMerrill Lynch 672
2,000 Nippon Television HoldingsInc Citibank 920
1,900 Nippon Yusen KK Bank of AmericaMerrill Lynch 2,573
500 Nippon Yusen KK Credit Suisse 7651,000 Nippon Yusen KK JP Morgan 1,530
500 Nipro Corp Bank of AmericaMerrill Lynch 150
500 Nipro Corp Credit Suisse 2591,600 Nipro Corp JP Morgan 829(300) Nishi-Nippon Railroad Co
LtdBank of AmericaMerrill Lynch (554)
(300) Nishi-Nippon Railroad CoLtd Credit Suisse (793)
(500) Nishi-Nippon Railroad CoLtd Deutsche Bank (924)
(300) Nissan Chemical Corp Citibank (752)(300) Nissan Chemical Corp JP Morgan (1,693)
(4,800) Nissan Motor Co Ltd Bank of AmericaMerrill Lynch (1,260)
(1,500) Nissan Motor Co Ltd Citibank (350)(500) Nisshin Seifun Group Inc Bank of America
Merrill Lynch (506)100 Nissin Foods Holdings Co
LtdBank of AmericaMerrill Lynch (125)
100 Nitori Holdings Co Ltd Bank of AmericaMerrill Lynch 1,877
100 Nitori Holdings Co Ltd Credit Suisse 2,291100 Nitori Holdings Co Ltd JP Morgan 2,291300 Nitto Denko Corp Bank of America
Merrill Lynch 1,229200 Nitto Denko Corp Citibank 719400 Nitto Denko Corp Credit Suisse 1,405200 Nitto Denko Corp JP Morgan 702500 NOK Corp Credit Suisse 723
(1,400) Nomura Holdings Inc Bank of AmericaMerrill Lynch (672)
(1,500) Nomura Holdings Inc Citibank (589)
BlackRock Total Advantage Fund continued
The notes on pages 691 to 711 form an integral part of these financial statements.
Annual report and audited financial statements [647]

Contracts for difference as at 31 May 2020
Holding Description Counterparty
Netunrealised
appreciation/(depreciation)
EUR
Japan continued200 NS Solutions Corp JP Morgan 358
4,600 NTN Corp Bank of AmericaMerrill Lynch 961
7,700 NTN Corp Credit Suisse 1,3521,000 NTT Data Corp Credit Suisse 953
600 NTT Data Corp JP Morgan 572500 NTT DOCOMO Inc Bank of America
Merrill Lynch (424)200 NTT DOCOMO Inc Citibank (33)300 NTT DOCOMO Inc JP Morgan (460)700 Obayashi Corp Bank of America
Merrill Lynch 509900 Obayashi Corp Credit Suisse 271
(400) OBIC Business ConsultantsCo Ltd Credit Suisse (1,940)
(100) Obic Co Ltd Citibank (911)(200) Obic Co Ltd Credit Suisse (2,625)(600) Odakyu Electric Railway Co
LtdBank of AmericaMerrill Lynch (1,294)
(2,400) Oji Holdings Corp Bank of AmericaMerrill Lynch (261)
(1,100) Oji Holdings Corp Citibank 74(200) OKUMA Corp Citibank (443)(600) OKUMA Corp Credit Suisse (1,003)(300) OKUMA Corp JP Morgan (502)800 Olympus Corp Bank of America
Merrill Lynch 1,629400 Olympus Corp Citibank 607200 Ono Pharmaceutical Co Ltd Bank of America
Merrill Lynch 603600 Ono Pharmaceutical Co Ltd Citibank 1,146900 Ono Pharmaceutical Co Ltd Credit Suisse 3,446
(800) Open House Co Ltd Citibank (1,960)(400) Open House Co Ltd Credit Suisse (1,940)(100) Oracle Corp Japan Bank of America
Merrill Lynch 142(5,100) Orient Corp JP Morgan (466)
(400) Oriental Land Co Ltd Bank of AmericaMerrill Lynch (4,548)
500 ORIX Corp Bank of AmericaMerrill Lynch 784
1,000 ORIX Corp Citibank 936700 OSG Corp Bank of America
Merrill Lynch 603300 OSG Corp Credit Suisse 281
(200) Otsuka Corp Bank of AmericaMerrill Lynch (627)
(200) Otsuka Corp Citibank (844)800 Otsuka Holdings Co Ltd Bank of America
Merrill Lynch 4,093200 Otsuka Holdings Co Ltd Credit Suisse 1,042
(300) PALTAC Corp Credit Suisse 401(100) PALTAC Corp JP Morgan 134(700) Pan Pacific International
Holdings Corp Credit Suisse (674)(900) Park24 Co Ltd Credit Suisse (2,905)
(6,500) Penta-Ocean ConstructionCo Ltd
Bank of AmericaMerrill Lynch (1,250)
(5,100) Penta-Ocean ConstructionCo Ltd Citibank (682)
(1,800) Penta-Ocean ConstructionCo Ltd JP Morgan (90)
(100) PeptiDream Inc Bank of AmericaMerrill Lynch (393)
(100) PeptiDream Inc Citibank (238)(400) PeptiDream Inc Credit Suisse (1,923)(500) PeptiDream Inc JP Morgan (2,404)(200) Pigeon Corp Citibank (201)(800) Pigeon Corp Credit Suisse (1,070)
Holding Description Counterparty
Netunrealised
appreciation/(depreciation)
EUR
Japan continued(200) Pigeon Corp JP Morgan (268)100 Pola Orbis Holdings Inc Bank of America
Merrill Lynch 1001,200 Pola Orbis Holdings Inc Credit Suisse 1,776
700 Rakuten Inc Bank of AmericaMerrill Lynch (123)
2,700 Rakuten Inc Credit Suisse (578)200 Recruit Holdings Co Ltd Credit Suisse 938300 Recruit Holdings Co Ltd JP Morgan 1,407
(700) Relo Group Inc Credit Suisse (1,130)(700) Relo Group Inc JP Morgan (1,130)
(1,000) Renesas Electronics Corp JP Morgan 191(1,600) Resona Holdings Inc Citibank (657)(9,300) Resona Holdings Inc Credit Suisse (4,922)(1,000) Resona Holdings Inc JP Morgan (529)
600 Resorttrust Inc Citibank 5821,600 Ricoh Co Ltd Bank of America
Merrill Lynch 1,0431,800 Ricoh Co Ltd Citibank 8431,200 Ricoh Co Ltd Credit Suisse 331
600 Ricoh Co Ltd JP Morgan 166300 Rohm Co Ltd Citibank 201200 Rohm Co Ltd Credit Suisse 635700 Sankyo Co Ltd Bank of America
Merrill Lynch 205400 Sankyo Co Ltd Credit Suisse (448)300 Sankyo Co Ltd JP Morgan (336)400 Sankyu Inc Bank of America
Merrill Lynch 1,488300 Sankyu Inc Citibank 1,267
(900) Sanrio Co Ltd Credit Suisse (1,279)1,000 Santen Pharmaceutical Co
Ltd Credit Suisse 911600 Santen Pharmaceutical Co
Ltd JP Morgan 5474,300 Sanwa Holdings Corp JP Morgan 3,236
400 Sapporo Holdings Ltd Bank of AmericaMerrill Lynch 779
500 Sapporo Holdings Ltd Citibank 673600 Sapporo Holdings Ltd JP Morgan 702200 Sawai Pharmaceutical Co
LtdBank of AmericaMerrill Lynch 1,003
100 Sawai Pharmaceutical CoLtd Citibank 309
300 Sawai Pharmaceutical CoLtd Credit Suisse 125
300 Sawai Pharmaceutical CoLtd JP Morgan 125
(400) SBI Holdings Inc Citibank (351)(600) SBI Holdings Inc Credit Suisse (988)(200) SBI Holdings Inc Deutsche Bank (281)(400) SCREEN Holdings Co Ltd Bank of America
Merrill Lynch 2,391100 SCSK Corp JP Morgan 284100 Secom Co Ltd Bank of America
Merrill Lynch 318200 Secom Co Ltd Citibank 458200 Secom Co Ltd JP Morgan 510
1,500 Seibu Holdings Inc Bank of AmericaMerrill Lynch 1,806
400 Seibu Holdings Inc Citibank 87400 Seibu Holdings Inc JP Morgan 492500 Seino Holdings Co Ltd Bank of America
Merrill Lynch 6982,000 Seino Holdings Co Ltd Citibank 2,257
600 Seino Holdings Co Ltd Credit Suisse 943500 Sekisui Chemical Co Ltd Citibank 422400 Sekisui Chemical Co Ltd Credit Suisse 488
BlackRock Total Advantage Fund continued
The notes on pages 691 to 711 form an integral part of these financial statements.
BlackRock Strategic Funds[648]

Contracts for difference as at 31 May 2020
Holding Description Counterparty
Netunrealised
appreciation/(depreciation)
EUR
Japan continued3,300 Sekisui Chemical Co Ltd Deutsche Bank 4,939
100 Sekisui Chemical Co Ltd JP Morgan 122900 Sekisui House Ltd Bank of America
Merrill Lynch 1,8773,200 Sekisui House Ltd Citibank 3,3841,100 Sekisui House Ltd Credit Suisse 1,7702,400 Sekisui House Ltd JP Morgan 3,863
300 Seven & i Holdings Co Ltd Bank of AmericaMerrill Lynch 529
100 Seven & i Holdings Co Ltd Credit Suisse 195(1,600) Seven Bank Ltd Bank of America
Merrill Lynch (294)(400) SG Holdings Co Ltd Bank of America
Merrill Lynch (1,438)(1,000) SG Holdings Co Ltd Citibank (1,338)
(200) SG Holdings Co Ltd Credit Suisse (811)(200) SG Holdings Co Ltd JP Morgan (811)
(1,200) Sharp Corp Credit Suisse (214)(1,300) Sharp Corp JP Morgan 152(1,200) Shikoku Electric Power Co
IncBank of AmericaMerrill Lynch (40)
(1,600) Shikoku Electric Power CoInc Citibank (120)
(1,600) Shikoku Electric Power CoInc Credit Suisse (120)
(700) Shikoku Electric Power CoInc JP Morgan (53)
(200) Shimano Inc Credit Suisse (4,448)(2,000) Shimizu Corp Bank of America
Merrill Lynch (1,120)(800) Shimizu Corp Citibank (395)(100) Shimizu Corp Credit Suisse (32)
(1,500) Shimizu Corp JP Morgan (477)100 Shionogi & Co Ltd Bank of America
Merrill Lynch 541200 Shionogi & Co Ltd Credit Suisse 671
(100) Shiseido Co Ltd Citibank (139)(300) Shiseido Co Ltd JP Morgan (451)
3,000 Shizuoka Bank Ltd Bank of AmericaMerrill Lynch 1,630
(600) SHO-BOND Holdings CoLtd
Bank of AmericaMerrill Lynch (2,107)
(900) SHO-BOND Holdings CoLtd Citibank (1,956)
(100) SHO-BOND Holdings CoLtd JP Morgan (493)
(100) Shochiku Co Ltd Citibank (635)(200) Shochiku Co Ltd JP Morgan (2,943)(700) Showa Denko KK JP Morgan (1,773)
1,400 Skylark Holdings Co Ltd Credit Suisse 550100 Skylark Holdings Co Ltd JP Morgan 39
(100) SMC Corp Citibank (878)(300) SMS Co Ltd Citibank (130)(500) SMS Co Ltd JP Morgan (1,175)(836) SoftBank Group Corp Citibank (1,573)400 Sohgo Security Services Co
Ltd Citibank (67)6,800 Sojitz Corp Bank of America
Merrill Lynch 1,0233,700 Sojitz Corp JP Morgan 186(300) Sony Corp Bank of America
Merrill Lynch (23)300 Sotetsu Holdings Inc JP Morgan 843
(600) Subaru Corp Bank of AmericaMerrill Lynch (1,289)
(200) Subaru Corp Citibank (327)(700) Subaru Corp Credit Suisse (1,542)(500) Subaru Corp JP Morgan (1,102)900 Sugi Holdings Co Ltd Citibank 75
Holding Description Counterparty
Netunrealised
appreciation/(depreciation)
EUR
Japan continued100 Sugi Holdings Co Ltd Credit Suisse 493
(200) SUMCO Corp Bank of AmericaMerrill Lynch (3)
(500) SUMCO Corp Citibank (96)(300) SUMCO Corp JP Morgan (256)800 Sumitomo Bakelite Co Ltd Credit Suisse 1,612400 Sumitomo Bakelite Co Ltd JP Morgan 806600 Sumitomo Chemical Co Ltd Citibank 125
2,500 Sumitomo Chemical Co Ltd Credit Suisse 1044,000 Sumitomo Chemical Co Ltd JP Morgan 167
500 Sumitomo DainipponPharma Co Ltd Citibank 581
300 Sumitomo DainipponPharma Co Ltd Credit Suisse 58
700 Sumitomo DainipponPharma Co Ltd JP Morgan 135
1,900 Sumitomo ElectricIndustries Ltd
Bank of AmericaMerrill Lynch 2,700
1,700 Sumitomo ElectricIndustries Ltd Credit Suisse 2,409
1,300 Sumitomo ElectricIndustries Ltd JP Morgan 1,842
(900) Sumitomo Metal Mining CoLtd
Bank of AmericaMerrill Lynch (1,674)
(300) Sumitomo Metal Mining CoLtd Citibank (515)
(200) Sumitomo Metal Mining CoLtd Credit Suisse (478)
(700) Sumitomo Metal Mining CoLtd JP Morgan (1,674)
700 Sumitomo Mitsui FinancialGroup Inc
Bank of AmericaMerrill Lynch 2,397
700 Sumitomo Mitsui FinancialGroup Inc Credit Suisse 2,081
500 Sumitomo Mitsui FinancialGroup Inc JP Morgan 1,486
(100) Sumitomo Mitsui TrustHoldings Inc Citibank (265)
(800) Sumitomo Mitsui TrustHoldings Inc Credit Suisse (736)
300 Sumitomo Osaka CementCo Ltd
Bank of AmericaMerrill Lynch 552
200 Sumitomo Osaka CementCo Ltd Citibank 25
1,000 Sumitomo RubberIndustries Ltd Citibank 334
1,400 Sumitomo RubberIndustries Ltd Credit Suisse 1,007
600 Sumitomo RubberIndustries Ltd Deutsche Bank 381
500 Sundrug Co Ltd Citibank 1,129200 Sundrug Co Ltd Deutsche Bank (125)100 Suntory Beverage & Food
LtdBank of AmericaMerrill Lynch 268
500 Suntory Beverage & FoodLtd Citibank 1,170
300 Suntory Beverage & FoodLtd Credit Suisse 1,053
800 Suntory Beverage & FoodLtd JP Morgan 2,809
(200) Suzuken Co Ltd Citibank (468)100 Sysmex Corp Credit Suisse 900100 Sysmex Corp JP Morgan 881
(1,000) T&D Holdings Inc Bank of AmericaMerrill Lynch (1,196)
(800) T&D Holdings Inc JP Morgan (874)(600) Tadano Ltd Bank of America
Merrill Lynch (356)(1,700) Tadano Ltd Credit Suisse (782)
BlackRock Total Advantage Fund continued
The notes on pages 691 to 711 form an integral part of these financial statements.
Annual report and audited financial statements [649]
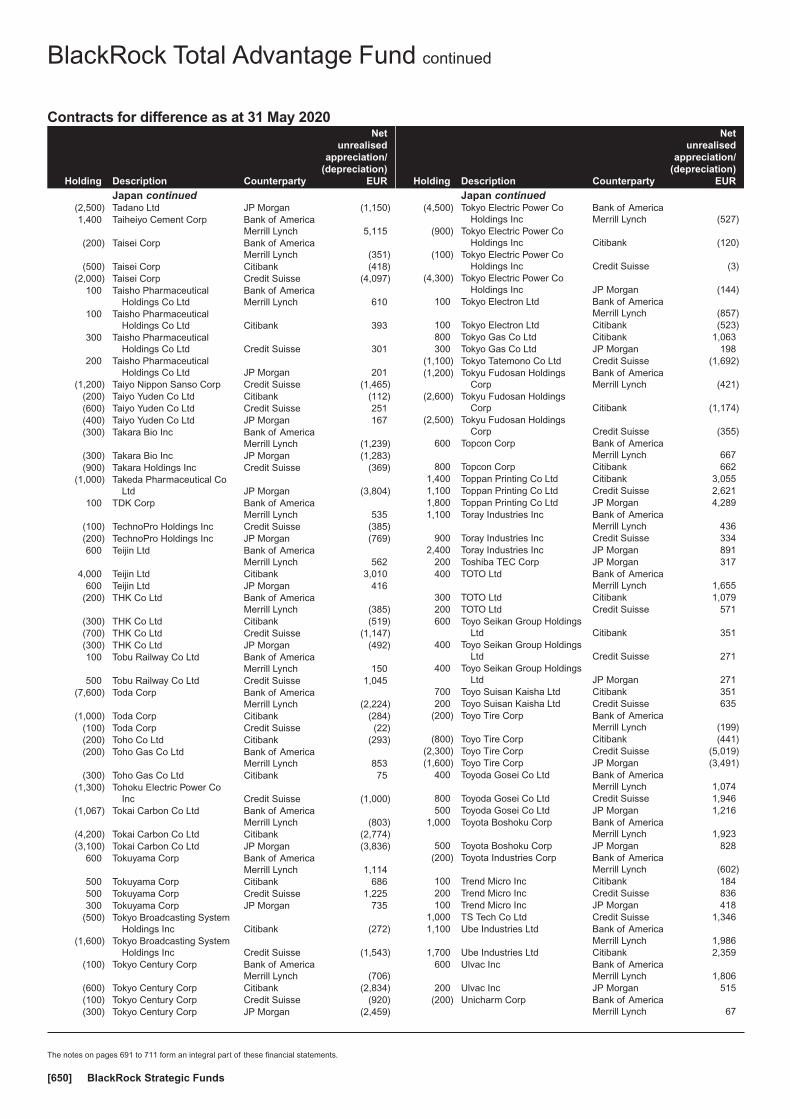
Contracts for difference as at 31 May 2020
Holding Description Counterparty
Netunrealised
appreciation/(depreciation)
EUR
Japan continued(2,500) Tadano Ltd JP Morgan (1,150)1,400 Taiheiyo Cement Corp Bank of America
Merrill Lynch 5,115(200) Taisei Corp Bank of America
Merrill Lynch (351)(500) Taisei Corp Citibank (418)
(2,000) Taisei Corp Credit Suisse (4,097)100 Taisho Pharmaceutical
Holdings Co LtdBank of AmericaMerrill Lynch 610
100 Taisho PharmaceuticalHoldings Co Ltd Citibank 393
300 Taisho PharmaceuticalHoldings Co Ltd Credit Suisse 301
200 Taisho PharmaceuticalHoldings Co Ltd JP Morgan 201
(1,200) Taiyo Nippon Sanso Corp Credit Suisse (1,465)(200) Taiyo Yuden Co Ltd Citibank (112)(600) Taiyo Yuden Co Ltd Credit Suisse 251(400) Taiyo Yuden Co Ltd JP Morgan 167(300) Takara Bio Inc Bank of America
Merrill Lynch (1,239)(300) Takara Bio Inc JP Morgan (1,283)(900) Takara Holdings Inc Credit Suisse (369)
(1,000) Takeda Pharmaceutical CoLtd JP Morgan (3,804)
100 TDK Corp Bank of AmericaMerrill Lynch 535
(100) TechnoPro Holdings Inc Credit Suisse (385)(200) TechnoPro Holdings Inc JP Morgan (769)600 Teijin Ltd Bank of America
Merrill Lynch 5624,000 Teijin Ltd Citibank 3,010
600 Teijin Ltd JP Morgan 416(200) THK Co Ltd Bank of America
Merrill Lynch (385)(300) THK Co Ltd Citibank (519)(700) THK Co Ltd Credit Suisse (1,147)(300) THK Co Ltd JP Morgan (492)100 Tobu Railway Co Ltd Bank of America
Merrill Lynch 150500 Tobu Railway Co Ltd Credit Suisse 1,045
(7,600) Toda Corp Bank of AmericaMerrill Lynch (2,224)
(1,000) Toda Corp Citibank (284)(100) Toda Corp Credit Suisse (22)(200) Toho Co Ltd Citibank (293)(200) Toho Gas Co Ltd Bank of America
Merrill Lynch 853(300) Toho Gas Co Ltd Citibank 75
(1,300) Tohoku Electric Power CoInc Credit Suisse (1,000)
(1,067) Tokai Carbon Co Ltd Bank of AmericaMerrill Lynch (803)
(4,200) Tokai Carbon Co Ltd Citibank (2,774)(3,100) Tokai Carbon Co Ltd JP Morgan (3,836)
600 Tokuyama Corp Bank of AmericaMerrill Lynch 1,114
500 Tokuyama Corp Citibank 686500 Tokuyama Corp Credit Suisse 1,225300 Tokuyama Corp JP Morgan 735
(500) Tokyo Broadcasting SystemHoldings Inc Citibank (272)
(1,600) Tokyo Broadcasting SystemHoldings Inc Credit Suisse (1,543)
(100) Tokyo Century Corp Bank of AmericaMerrill Lynch (706)
(600) Tokyo Century Corp Citibank (2,834)(100) Tokyo Century Corp Credit Suisse (920)(300) Tokyo Century Corp JP Morgan (2,459)
Holding Description Counterparty
Netunrealised
appreciation/(depreciation)
EUR
Japan continued(4,500) Tokyo Electric Power Co
Holdings IncBank of AmericaMerrill Lynch (527)
(900) Tokyo Electric Power CoHoldings Inc Citibank (120)
(100) Tokyo Electric Power CoHoldings Inc Credit Suisse (3)
(4,300) Tokyo Electric Power CoHoldings Inc JP Morgan (144)
100 Tokyo Electron Ltd Bank of AmericaMerrill Lynch (857)
100 Tokyo Electron Ltd Citibank (523)800 Tokyo Gas Co Ltd Citibank 1,063300 Tokyo Gas Co Ltd JP Morgan 198
(1,100) Tokyo Tatemono Co Ltd Credit Suisse (1,692)(1,200) Tokyu Fudosan Holdings
CorpBank of AmericaMerrill Lynch (421)
(2,600) Tokyu Fudosan HoldingsCorp Citibank (1,174)
(2,500) Tokyu Fudosan HoldingsCorp Credit Suisse (355)
600 Topcon Corp Bank of AmericaMerrill Lynch 667
800 Topcon Corp Citibank 6621,400 Toppan Printing Co Ltd Citibank 3,0551,100 Toppan Printing Co Ltd Credit Suisse 2,6211,800 Toppan Printing Co Ltd JP Morgan 4,2891,100 Toray Industries Inc Bank of America
Merrill Lynch 436900 Toray Industries Inc Credit Suisse 334
2,400 Toray Industries Inc JP Morgan 891200 Toshiba TEC Corp JP Morgan 317400 TOTO Ltd Bank of America
Merrill Lynch 1,655300 TOTO Ltd Citibank 1,079200 TOTO Ltd Credit Suisse 571600 Toyo Seikan Group Holdings
Ltd Citibank 351400 Toyo Seikan Group Holdings
Ltd Credit Suisse 271400 Toyo Seikan Group Holdings
Ltd JP Morgan 271700 Toyo Suisan Kaisha Ltd Citibank 351200 Toyo Suisan Kaisha Ltd Credit Suisse 635
(200) Toyo Tire Corp Bank of AmericaMerrill Lynch (199)
(800) Toyo Tire Corp Citibank (441)(2,300) Toyo Tire Corp Credit Suisse (5,019)(1,600) Toyo Tire Corp JP Morgan (3,491)
400 Toyoda Gosei Co Ltd Bank of AmericaMerrill Lynch 1,074
800 Toyoda Gosei Co Ltd Credit Suisse 1,946500 Toyoda Gosei Co Ltd JP Morgan 1,216
1,000 Toyota Boshoku Corp Bank of AmericaMerrill Lynch 1,923
500 Toyota Boshoku Corp JP Morgan 828(200) Toyota Industries Corp Bank of America
Merrill Lynch (602)100 Trend Micro Inc Citibank 184200 Trend Micro Inc Credit Suisse 836100 Trend Micro Inc JP Morgan 418
1,000 TS Tech Co Ltd Credit Suisse 1,3461,100 Ube Industries Ltd Bank of America
Merrill Lynch 1,9861,700 Ube Industries Ltd Citibank 2,359
600 Ulvac Inc Bank of AmericaMerrill Lynch 1,806
200 Ulvac Inc JP Morgan 515(200) Unicharm Corp Bank of America
Merrill Lynch 67
BlackRock Total Advantage Fund continued
The notes on pages 691 to 711 form an integral part of these financial statements.
BlackRock Strategic Funds[650]
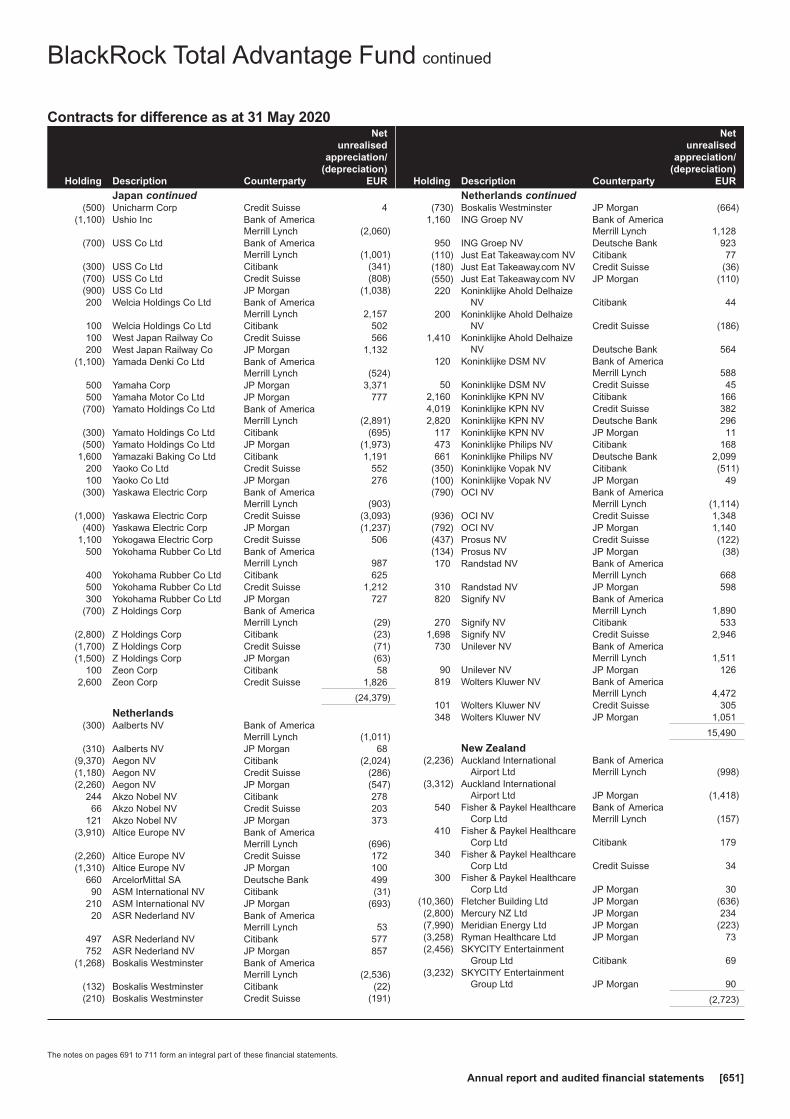
Contracts for difference as at 31 May 2020
Holding Description Counterparty
Netunrealised
appreciation/(depreciation)
EUR
Japan continued(500) Unicharm Corp Credit Suisse 4
(1,100) Ushio Inc Bank of AmericaMerrill Lynch (2,060)
(700) USS Co Ltd Bank of AmericaMerrill Lynch (1,001)
(300) USS Co Ltd Citibank (341)(700) USS Co Ltd Credit Suisse (808)(900) USS Co Ltd JP Morgan (1,038)200 Welcia Holdings Co Ltd Bank of America
Merrill Lynch 2,157100 Welcia Holdings Co Ltd Citibank 502100 West Japan Railway Co Credit Suisse 566200 West Japan Railway Co JP Morgan 1,132
(1,100) Yamada Denki Co Ltd Bank of AmericaMerrill Lynch (524)
500 Yamaha Corp JP Morgan 3,371500 Yamaha Motor Co Ltd JP Morgan 777
(700) Yamato Holdings Co Ltd Bank of AmericaMerrill Lynch (2,891)
(300) Yamato Holdings Co Ltd Citibank (695)(500) Yamato Holdings Co Ltd JP Morgan (1,973)
1,600 Yamazaki Baking Co Ltd Citibank 1,191200 Yaoko Co Ltd Credit Suisse 552100 Yaoko Co Ltd JP Morgan 276
(300) Yaskawa Electric Corp Bank of AmericaMerrill Lynch (903)
(1,000) Yaskawa Electric Corp Credit Suisse (3,093)(400) Yaskawa Electric Corp JP Morgan (1,237)
1,100 Yokogawa Electric Corp Credit Suisse 506500 Yokohama Rubber Co Ltd Bank of America
Merrill Lynch 987400 Yokohama Rubber Co Ltd Citibank 625500 Yokohama Rubber Co Ltd Credit Suisse 1,212300 Yokohama Rubber Co Ltd JP Morgan 727
(700) Z Holdings Corp Bank of AmericaMerrill Lynch (29)
(2,800) Z Holdings Corp Citibank (23)(1,700) Z Holdings Corp Credit Suisse (71)(1,500) Z Holdings Corp JP Morgan (63)
100 Zeon Corp Citibank 582,600 Zeon Corp Credit Suisse 1,826
(24,379)
Netherlands(300) Aalberts NV Bank of America
Merrill Lynch (1,011)(310) Aalberts NV JP Morgan 68
(9,370) Aegon NV Citibank (2,024)(1,180) Aegon NV Credit Suisse (286)(2,260) Aegon NV JP Morgan (547)
244 Akzo Nobel NV Citibank 27866 Akzo Nobel NV Credit Suisse 203
121 Akzo Nobel NV JP Morgan 373(3,910) Altice Europe NV Bank of America
Merrill Lynch (696)(2,260) Altice Europe NV Credit Suisse 172(1,310) Altice Europe NV JP Morgan 100
660 ArcelorMittal SA Deutsche Bank 49990 ASM International NV Citibank (31)
210 ASM International NV JP Morgan (693)20 ASR Nederland NV Bank of America
Merrill Lynch 53497 ASR Nederland NV Citibank 577752 ASR Nederland NV JP Morgan 857
(1,268) Boskalis Westminster Bank of AmericaMerrill Lynch (2,536)
(132) Boskalis Westminster Citibank (22)(210) Boskalis Westminster Credit Suisse (191)
Holding Description Counterparty
Netunrealised
appreciation/(depreciation)
EUR
Netherlands continued(730) Boskalis Westminster JP Morgan (664)
1,160 ING Groep NV Bank of AmericaMerrill Lynch 1,128
950 ING Groep NV Deutsche Bank 923(110) Just Eat Takeaway.com NV Citibank 77(180) Just Eat Takeaway.com NV Credit Suisse (36)(550) Just Eat Takeaway.com NV JP Morgan (110)220 Koninklijke Ahold Delhaize
NV Citibank 44200 Koninklijke Ahold Delhaize
NV Credit Suisse (186)1,410 Koninklijke Ahold Delhaize
NV Deutsche Bank 564120 Koninklijke DSM NV Bank of America
Merrill Lynch 58850 Koninklijke DSM NV Credit Suisse 45
2,160 Koninklijke KPN NV Citibank 1664,019 Koninklijke KPN NV Credit Suisse 3822,820 Koninklijke KPN NV Deutsche Bank 296
117 Koninklijke KPN NV JP Morgan 11473 Koninklijke Philips NV Citibank 168661 Koninklijke Philips NV Deutsche Bank 2,099
(350) Koninklijke Vopak NV Citibank (511)(100) Koninklijke Vopak NV JP Morgan 49(790) OCI NV Bank of America
Merrill Lynch (1,114)(936) OCI NV Credit Suisse 1,348(792) OCI NV JP Morgan 1,140(437) Prosus NV Credit Suisse (122)(134) Prosus NV JP Morgan (38)170 Randstad NV Bank of America
Merrill Lynch 668310 Randstad NV JP Morgan 598820 Signify NV Bank of America
Merrill Lynch 1,890270 Signify NV Citibank 533
1,698 Signify NV Credit Suisse 2,946730 Unilever NV Bank of America
Merrill Lynch 1,51190 Unilever NV JP Morgan 126
819 Wolters Kluwer NV Bank of AmericaMerrill Lynch 4,472
101 Wolters Kluwer NV Credit Suisse 305348 Wolters Kluwer NV JP Morgan 1,051
15,490
New Zealand(2,236) Auckland International
Airport LtdBank of AmericaMerrill Lynch (998)
(3,312) Auckland InternationalAirport Ltd JP Morgan (1,418)
540 Fisher & Paykel HealthcareCorp Ltd
Bank of AmericaMerrill Lynch (157)
410 Fisher & Paykel HealthcareCorp Ltd Citibank 179
340 Fisher & Paykel HealthcareCorp Ltd Credit Suisse 34
300 Fisher & Paykel HealthcareCorp Ltd JP Morgan 30
(10,360) Fletcher Building Ltd JP Morgan (636)(2,800) Mercury NZ Ltd JP Morgan 234(7,990) Meridian Energy Ltd JP Morgan (223)(3,258) Ryman Healthcare Ltd JP Morgan 73(2,456) SKYCITY Entertainment
Group Ltd Citibank 69(3,232) SKYCITY Entertainment
Group Ltd JP Morgan 90
(2,723)
BlackRock Total Advantage Fund continued
The notes on pages 691 to 711 form an integral part of these financial statements.
Annual report and audited financial statements [651]
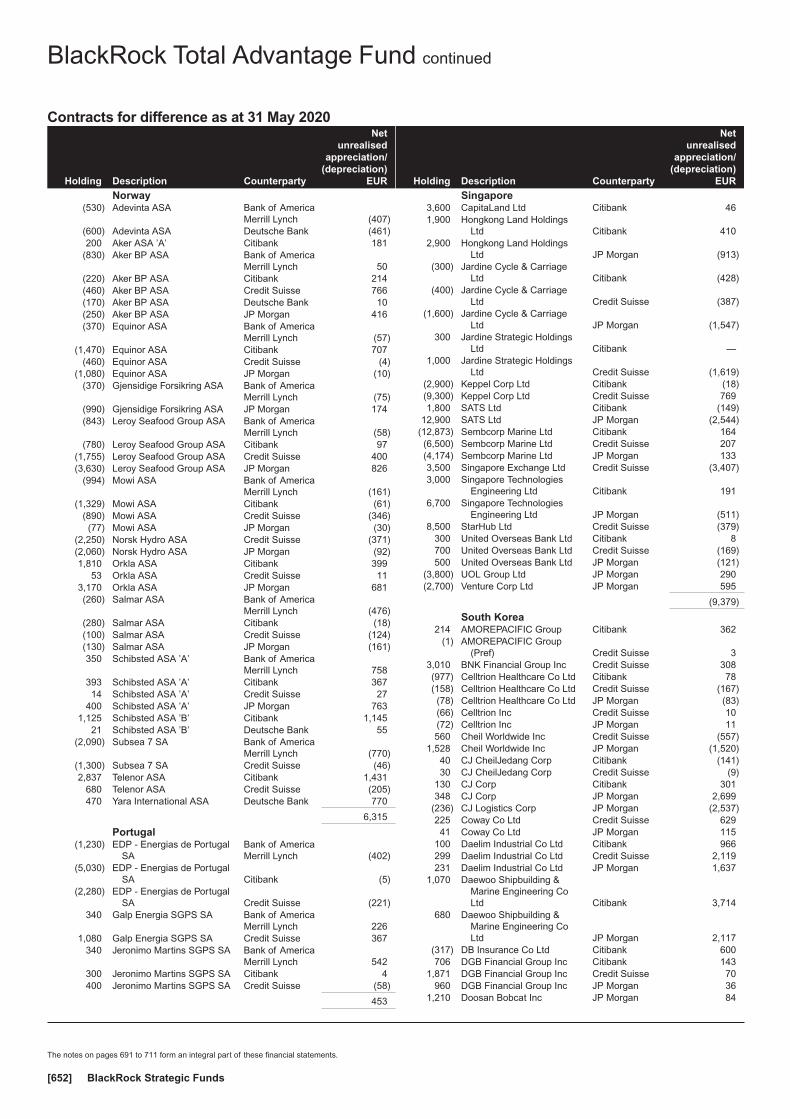
Contracts for difference as at 31 May 2020
Holding Description Counterparty
Netunrealised
appreciation/(depreciation)
EUR
Norway(530) Adevinta ASA Bank of America
Merrill Lynch (407)(600) Adevinta ASA Deutsche Bank (461)200 Aker ASA ’A’ Citibank 181
(830) Aker BP ASA Bank of AmericaMerrill Lynch 50
(220) Aker BP ASA Citibank 214(460) Aker BP ASA Credit Suisse 766(170) Aker BP ASA Deutsche Bank 10(250) Aker BP ASA JP Morgan 416(370) Equinor ASA Bank of America
Merrill Lynch (57)(1,470) Equinor ASA Citibank 707
(460) Equinor ASA Credit Suisse (4)(1,080) Equinor ASA JP Morgan (10)
(370) Gjensidige Forsikring ASA Bank of AmericaMerrill Lynch (75)
(990) Gjensidige Forsikring ASA JP Morgan 174(843) Leroy Seafood Group ASA Bank of America
Merrill Lynch (58)(780) Leroy Seafood Group ASA Citibank 97
(1,755) Leroy Seafood Group ASA Credit Suisse 400(3,630) Leroy Seafood Group ASA JP Morgan 826
(994) Mowi ASA Bank of AmericaMerrill Lynch (161)
(1,329) Mowi ASA Citibank (61)(890) Mowi ASA Credit Suisse (346)(77) Mowi ASA JP Morgan (30)
(2,250) Norsk Hydro ASA Credit Suisse (371)(2,060) Norsk Hydro ASA JP Morgan (92)1,810 Orkla ASA Citibank 399
53 Orkla ASA Credit Suisse 113,170 Orkla ASA JP Morgan 681(260) Salmar ASA Bank of America
Merrill Lynch (476)(280) Salmar ASA Citibank (18)(100) Salmar ASA Credit Suisse (124)(130) Salmar ASA JP Morgan (161)350 Schibsted ASA ’A’ Bank of America
Merrill Lynch 758393 Schibsted ASA ’A’ Citibank 36714 Schibsted ASA ’A’ Credit Suisse 27
400 Schibsted ASA ’A’ JP Morgan 7631,125 Schibsted ASA ’B’ Citibank 1,145
21 Schibsted ASA ’B’ Deutsche Bank 55(2,090) Subsea 7 SA Bank of America
Merrill Lynch (770)(1,300) Subsea 7 SA Credit Suisse (46)2,837 Telenor ASA Citibank 1,431
680 Telenor ASA Credit Suisse (205)470 Yara International ASA Deutsche Bank 770
6,315
Portugal(1,230) EDP - Energias de Portugal
SABank of AmericaMerrill Lynch (402)
(5,030) EDP - Energias de PortugalSA Citibank (5)
(2,280) EDP - Energias de PortugalSA Credit Suisse (221)
340 Galp Energia SGPS SA Bank of AmericaMerrill Lynch 226
1,080 Galp Energia SGPS SA Credit Suisse 367340 Jeronimo Martins SGPS SA Bank of America
Merrill Lynch 542300 Jeronimo Martins SGPS SA Citibank 4400 Jeronimo Martins SGPS SA Credit Suisse (58)
453
Holding Description Counterparty
Netunrealised
appreciation/(depreciation)
EUR
Singapore3,600 CapitaLand Ltd Citibank 461,900 Hongkong Land Holdings
Ltd Citibank 4102,900 Hongkong Land Holdings
Ltd JP Morgan (913)(300) Jardine Cycle & Carriage
Ltd Citibank (428)(400) Jardine Cycle & Carriage
Ltd Credit Suisse (387)(1,600) Jardine Cycle & Carriage
Ltd JP Morgan (1,547)300 Jardine Strategic Holdings
Ltd Citibank —1,000 Jardine Strategic Holdings
Ltd Credit Suisse (1,619)(2,900) Keppel Corp Ltd Citibank (18)(9,300) Keppel Corp Ltd Credit Suisse 7691,800 SATS Ltd Citibank (149)
12,900 SATS Ltd JP Morgan (2,544)(12,873) Sembcorp Marine Ltd Citibank 164(6,500) Sembcorp Marine Ltd Credit Suisse 207(4,174) Sembcorp Marine Ltd JP Morgan 1333,500 Singapore Exchange Ltd Credit Suisse (3,407)3,000 Singapore Technologies
Engineering Ltd Citibank 1916,700 Singapore Technologies
Engineering Ltd JP Morgan (511)8,500 StarHub Ltd Credit Suisse (379)
300 United Overseas Bank Ltd Citibank 8700 United Overseas Bank Ltd Credit Suisse (169)500 United Overseas Bank Ltd JP Morgan (121)
(3,800) UOL Group Ltd JP Morgan 290(2,700) Venture Corp Ltd JP Morgan 595
(9,379)
South Korea214 AMOREPACIFIC Group Citibank 362
(1) AMOREPACIFIC Group(Pref) Credit Suisse 3
3,010 BNK Financial Group Inc Credit Suisse 308(977) Celltrion Healthcare Co Ltd Citibank 78(158) Celltrion Healthcare Co Ltd Credit Suisse (167)(78) Celltrion Healthcare Co Ltd JP Morgan (83)(66) Celltrion Inc Credit Suisse 10(72) Celltrion Inc JP Morgan 11560 Cheil Worldwide Inc Credit Suisse (557)
1,528 Cheil Worldwide Inc JP Morgan (1,520)40 CJ CheilJedang Corp Citibank (141)30 CJ CheilJedang Corp Credit Suisse (9)
130 CJ Corp Citibank 301348 CJ Corp JP Morgan 2,699
(236) CJ Logistics Corp JP Morgan (2,537)225 Coway Co Ltd Credit Suisse 62941 Coway Co Ltd JP Morgan 115
100 Daelim Industrial Co Ltd Citibank 966299 Daelim Industrial Co Ltd Credit Suisse 2,119231 Daelim Industrial Co Ltd JP Morgan 1,637
1,070 Daewoo Shipbuilding &Marine Engineering CoLtd Citibank 3,714
680 Daewoo Shipbuilding &Marine Engineering CoLtd JP Morgan 2,117
(317) DB Insurance Co Ltd Citibank 600706 DGB Financial Group Inc Citibank 143
1,871 DGB Financial Group Inc Credit Suisse 70960 DGB Financial Group Inc JP Morgan 36
1,210 Doosan Bobcat Inc JP Morgan 84
BlackRock Total Advantage Fund continued
The notes on pages 691 to 711 form an integral part of these financial statements.
BlackRock Strategic Funds[652]
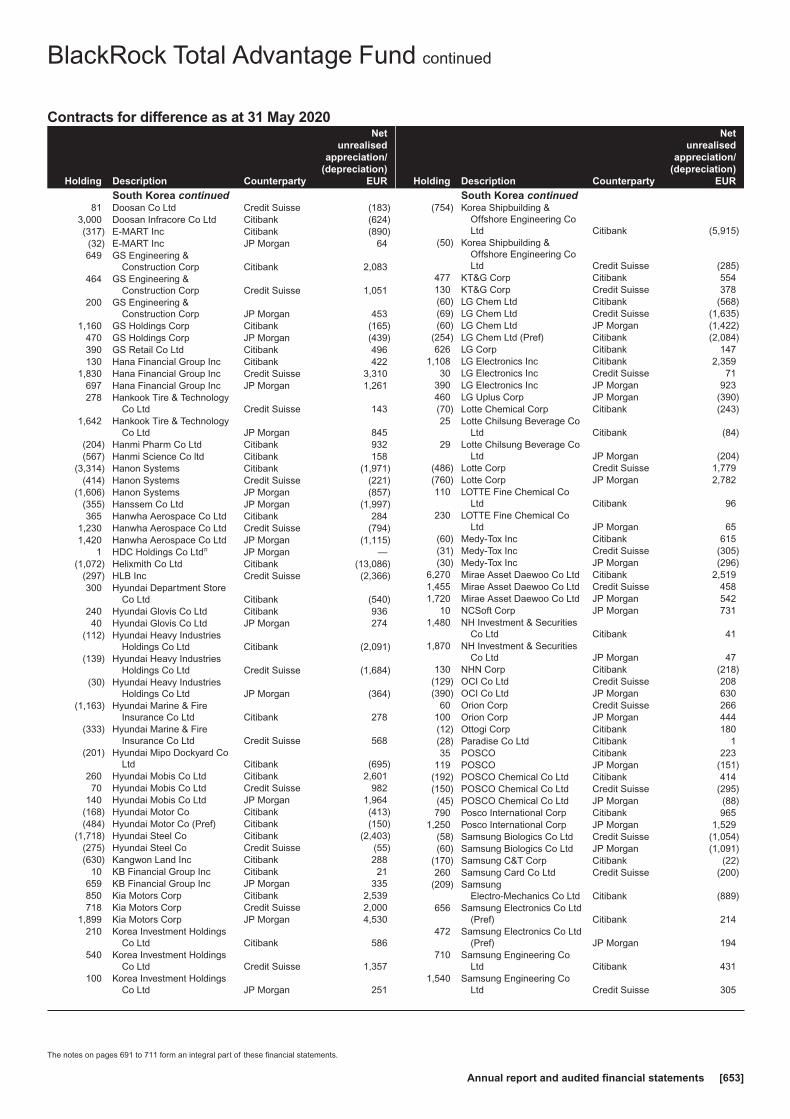
Contracts for difference as at 31 May 2020
Holding Description Counterparty
Netunrealised
appreciation/(depreciation)
EUR
South Korea continued81 Doosan Co Ltd Credit Suisse (183)
3,000 Doosan Infracore Co Ltd Citibank (624)(317) E-MART Inc Citibank (890)(32) E-MART Inc JP Morgan 64649 GS Engineering &
Construction Corp Citibank 2,083464 GS Engineering &
Construction Corp Credit Suisse 1,051200 GS Engineering &
Construction Corp JP Morgan 4531,160 GS Holdings Corp Citibank (165)
470 GS Holdings Corp JP Morgan (439)390 GS Retail Co Ltd Citibank 496130 Hana Financial Group Inc Citibank 422
1,830 Hana Financial Group Inc Credit Suisse 3,310697 Hana Financial Group Inc JP Morgan 1,261278 Hankook Tire & Technology
Co Ltd Credit Suisse 1431,642 Hankook Tire & Technology
Co Ltd JP Morgan 845(204) Hanmi Pharm Co Ltd Citibank 932(567) Hanmi Science Co ltd Citibank 158
(3,314) Hanon Systems Citibank (1,971)(414) Hanon Systems Credit Suisse (221)
(1,606) Hanon Systems JP Morgan (857)(355) Hanssem Co Ltd JP Morgan (1,997)365 Hanwha Aerospace Co Ltd Citibank 284
1,230 Hanwha Aerospace Co Ltd Credit Suisse (794)1,420 Hanwha Aerospace Co Ltd JP Morgan (1,115)
1 HDC Holdings Co Ltdπ JP Morgan —(1,072) Helixmith Co Ltd Citibank (13,086)
(297) HLB Inc Credit Suisse (2,366)300 Hyundai Department Store
Co Ltd Citibank (540)240 Hyundai Glovis Co Ltd Citibank 93640 Hyundai Glovis Co Ltd JP Morgan 274
(112) Hyundai Heavy IndustriesHoldings Co Ltd Citibank (2,091)
(139) Hyundai Heavy IndustriesHoldings Co Ltd Credit Suisse (1,684)
(30) Hyundai Heavy IndustriesHoldings Co Ltd JP Morgan (364)
(1,163) Hyundai Marine & FireInsurance Co Ltd Citibank 278
(333) Hyundai Marine & FireInsurance Co Ltd Credit Suisse 568
(201) Hyundai Mipo Dockyard CoLtd Citibank (695)
260 Hyundai Mobis Co Ltd Citibank 2,60170 Hyundai Mobis Co Ltd Credit Suisse 982
140 Hyundai Mobis Co Ltd JP Morgan 1,964(168) Hyundai Motor Co Citibank (413)(484) Hyundai Motor Co (Pref) Citibank (150)
(1,718) Hyundai Steel Co Citibank (2,403)(275) Hyundai Steel Co Credit Suisse (55)(630) Kangwon Land Inc Citibank 288
10 KB Financial Group Inc Citibank 21659 KB Financial Group Inc JP Morgan 335850 Kia Motors Corp Citibank 2,539718 Kia Motors Corp Credit Suisse 2,000
1,899 Kia Motors Corp JP Morgan 4,530210 Korea Investment Holdings
Co Ltd Citibank 586540 Korea Investment Holdings
Co Ltd Credit Suisse 1,357100 Korea Investment Holdings
Co Ltd JP Morgan 251
Holding Description Counterparty
Netunrealised
appreciation/(depreciation)
EUR
South Korea continued(754) Korea Shipbuilding &
Offshore Engineering CoLtd Citibank (5,915)
(50) Korea Shipbuilding &Offshore Engineering CoLtd Credit Suisse (285)
477 KT&G Corp Citibank 554130 KT&G Corp Credit Suisse 378(60) LG Chem Ltd Citibank (568)(69) LG Chem Ltd Credit Suisse (1,635)(60) LG Chem Ltd JP Morgan (1,422)
(254) LG Chem Ltd (Pref) Citibank (2,084)626 LG Corp Citibank 147
1,108 LG Electronics Inc Citibank 2,35930 LG Electronics Inc Credit Suisse 71
390 LG Electronics Inc JP Morgan 923460 LG Uplus Corp JP Morgan (390)(70) Lotte Chemical Corp Citibank (243)25 Lotte Chilsung Beverage Co
Ltd Citibank (84)29 Lotte Chilsung Beverage Co
Ltd JP Morgan (204)(486) Lotte Corp Credit Suisse 1,779(760) Lotte Corp JP Morgan 2,782110 LOTTE Fine Chemical Co
Ltd Citibank 96230 LOTTE Fine Chemical Co
Ltd JP Morgan 65(60) Medy-Tox Inc Citibank 615(31) Medy-Tox Inc Credit Suisse (305)(30) Medy-Tox Inc JP Morgan (296)
6,270 Mirae Asset Daewoo Co Ltd Citibank 2,5191,455 Mirae Asset Daewoo Co Ltd Credit Suisse 4581,720 Mirae Asset Daewoo Co Ltd JP Morgan 542
10 NCSoft Corp JP Morgan 7311,480 NH Investment & Securities
Co Ltd Citibank 411,870 NH Investment & Securities
Co Ltd JP Morgan 47130 NHN Corp Citibank (218)
(129) OCI Co Ltd Credit Suisse 208(390) OCI Co Ltd JP Morgan 630
60 Orion Corp Credit Suisse 266100 Orion Corp JP Morgan 444(12) Ottogi Corp Citibank 180(28) Paradise Co Ltd Citibank 135 POSCO Citibank 223
119 POSCO JP Morgan (151)(192) POSCO Chemical Co Ltd Citibank 414(150) POSCO Chemical Co Ltd Credit Suisse (295)(45) POSCO Chemical Co Ltd JP Morgan (88)790 Posco International Corp Citibank 965
1,250 Posco International Corp JP Morgan 1,529(58) Samsung Biologics Co Ltd Credit Suisse (1,054)(60) Samsung Biologics Co Ltd JP Morgan (1,091)
(170) Samsung C&T Corp Citibank (22)260 Samsung Card Co Ltd Credit Suisse (200)
(209) SamsungElectro-Mechanics Co Ltd Citibank (889)
656 Samsung Electronics Co Ltd(Pref) Citibank 214
472 Samsung Electronics Co Ltd(Pref) JP Morgan 194
710 Samsung Engineering CoLtd Citibank 431
1,540 Samsung Engineering CoLtd Credit Suisse 305
BlackRock Total Advantage Fund continued
The notes on pages 691 to 711 form an integral part of these financial statements.
Annual report and audited financial statements [653]

Contracts for difference as at 31 May 2020
Holding Description Counterparty
Netunrealised
appreciation/(depreciation)
EUR
South Korea continued2,940 Samsung Engineering Co
Ltd JP Morgan 581(3,594) Samsung Heavy Industries
Co LtdBank of AmericaMerrill Lynch (1,775)
(6,023) Samsung Heavy IndustriesCo Ltd Citibank (2,952)
(860) Samsung Heavy IndustriesCo Ltd JP Morgan (306)
(67) Samsung Life Insurance CoLtd Citibank (24)
(193) Samsung SDI Co Ltd Citibank (3,166)204 Samsung SDS Co Ltd Citibank 2,33980 Samsung SDS Co Ltd Credit Suisse 68652 Samsung SDS Co Ltd JP Morgan 446
260 Samsung Securities Co Ltd Credit Suisse (272)586 Samsung Securities Co Ltd JP Morgan (613)260 Shinhan Financial Group Co
Ltd Citibank 2011,204 Shinhan Financial Group Co
Ltd Credit Suisse (313)300 Shinhan Financial Group Co
Ltd JP Morgan (78)(572) SK Hynix Inc Citibank (42)(256) SK Innovation Co Ltd Citibank (2,765)(40) SK Innovation Co Ltd Credit Suisse (534)
(3,906) SK Networks Co Ltd Citibank (437)60 SK Telecom Co Ltd Citibank 31640 SK Telecom Co Ltd Credit Suisse 170
104 SK Telecom Co Ltd JP Morgan 441(697) SKC Co Ltd Citibank (2,195)(578) SKC Co Ltd JP Morgan (2,404)(571) S-Oil Corp Citibank (670)(234) S-Oil Corp Credit Suisse (110)
(1,110) Ssangyong CementIndustrial Co Ltd Citibank (35)
(1,000) Ssangyong CementIndustrial Co Ltd Credit Suisse 159
(475) Yuhan Corp Citibank 56(245) Yuhan Corp Credit Suisse (356)(575) Yuhan Corp JP Morgan (835)
(2,918)
Spain849 ACS Actividades de
Construccion y ServiciosSA Credit Suisse (611)
983 ACS Actividades deConstruccion y ServiciosSA JP Morgan (708)
28 Aena SME SA Bank of AmericaMerrill Lynch 708
48 Aena SME SA Citibank 643174 Aena SME SA Credit Suisse 3,758200 Repsol SA Bank of America
Merrill Lynch 59647 Repsol SA Citibank 69
1,266 Repsol SA Credit Suisse (299)1,577 Repsol SA JP Morgan (372)
3,247
Sweden550 Assa Abloy AB ’B’ JP Morgan 220190 Atlas Copco AB ’A’ Credit Suisse 589
(700) Boliden AB Bank of AmericaMerrill Lynch (869)
(1,729) Boliden AB Citibank 395(780) Boliden AB Credit Suisse (416)(160) Boliden AB JP Morgan (85)
Holding Description Counterparty
Netunrealised
appreciation/(depreciation)
EUR
Sweden continued360 Castellum AB Citibank 173450 Electrolux AB ’B’ Bank of America
Merrill Lynch 745700 Electrolux AB ’B’ Credit Suisse 1,056370 Electrolux AB ’B’ Deutsche Bank 613
(870) Electrolux Professional AB’B’ Credit Suisse (384)
(530) Electrolux Professional AB’B’ JP Morgan (234)
(670) Elekta AB ’B’ Bank of AmericaMerrill Lynch (654)
(740) Elekta AB ’B’ Citibank 80(630) Elekta AB ’B’ Credit Suisse (481)(420) Elekta AB ’B’ JP Morgan (321)(442) Epiroc AB ’B’ Bank of America
Merrill Lynch (282)(803) Epiroc AB ’B’ Credit Suisse (279)(614) Epiroc AB ’B’ JP Morgan (213)
(1,892) EQT AB Citibank 180(451) EQT AB Credit Suisse 82(120) EQT AB JP Morgan 22
2,312 Essity AB ’B’ Citibank 1,0561,840 Hennes & Mauritz AB ’B’ Bank of America
Merrill Lynch 4,19410 Hennes & Mauritz AB ’B’ Credit Suisse 11
(87) Hexagon AB ’B’ Bank of AmericaMerrill Lynch (512)
(99) Hexagon AB ’B’ Citibank (348)(391) Hexagon AB ’B’ Credit Suisse (1,619)(100) Hexagon AB ’B’ JP Morgan (414)454 Hufvudstaden AB Bank of America
Merrill Lynch 359489 Hufvudstaden AB Citibank 293849 Hufvudstaden AB JP Morgan (517)(20) ICA Gruppen AB Bank of America
Merrill Lynch (28)(280) ICA Gruppen AB Citibank (437)(211) ICA Gruppen AB Credit Suisse (504)(40) ICA Gruppen AB JP Morgan (96)
1,790 Industrivarden AB ’A’ Credit Suisse 1,4652,359 Industrivarden AB ’C’ Bank of America
Merrill Lynch 4,984918 Industrivarden AB ’C’ Citibank 1,123
(1,411) Investment AB Latour ’B’ Citibank 27(1,309) Investment AB Latour ’B’ Credit Suisse (2,367)(2,439) Investment AB Latour ’B’ JP Morgan (4,410)
218 Investor AB ’B’ Citibank 5421,122 Investor AB ’B’ Credit Suisse 2,285
310 Lundin Energy AB Bank of AmericaMerrill Lynch 207
1,050 Lundin Energy AB Credit Suisse 70184 Lundin Energy AB JP Morgan 12
(415) Nibe Industrier AB ’B’ Bank of AmericaMerrill Lynch (857)
(320) Nibe Industrier AB ’B’ Citibank (410)(677) Nibe Industrier AB ’B’ Credit Suisse (1,756)
(1,448) Saab AB ’B’ JP Morgan (2,164)30 Sandvik AB Citibank 41
1,247 Sandvik AB Credit Suisse 777725 Sandvik AB JP Morgan 45296 Securitas AB ’B’ Citibank 74
1,200 Securitas AB ’B’ Credit Suisse 611645 Securitas AB ’B’ JP Morgan 328970 Skanska AB ’B’ JP Morgan 212
(450) SKF AB ’B’ Bank of AmericaMerrill Lynch (1,081)
(420) SKF AB ’B’ Credit Suisse (640)
BlackRock Total Advantage Fund continued
The notes on pages 691 to 711 form an integral part of these financial statements.
BlackRock Strategic Funds[654]
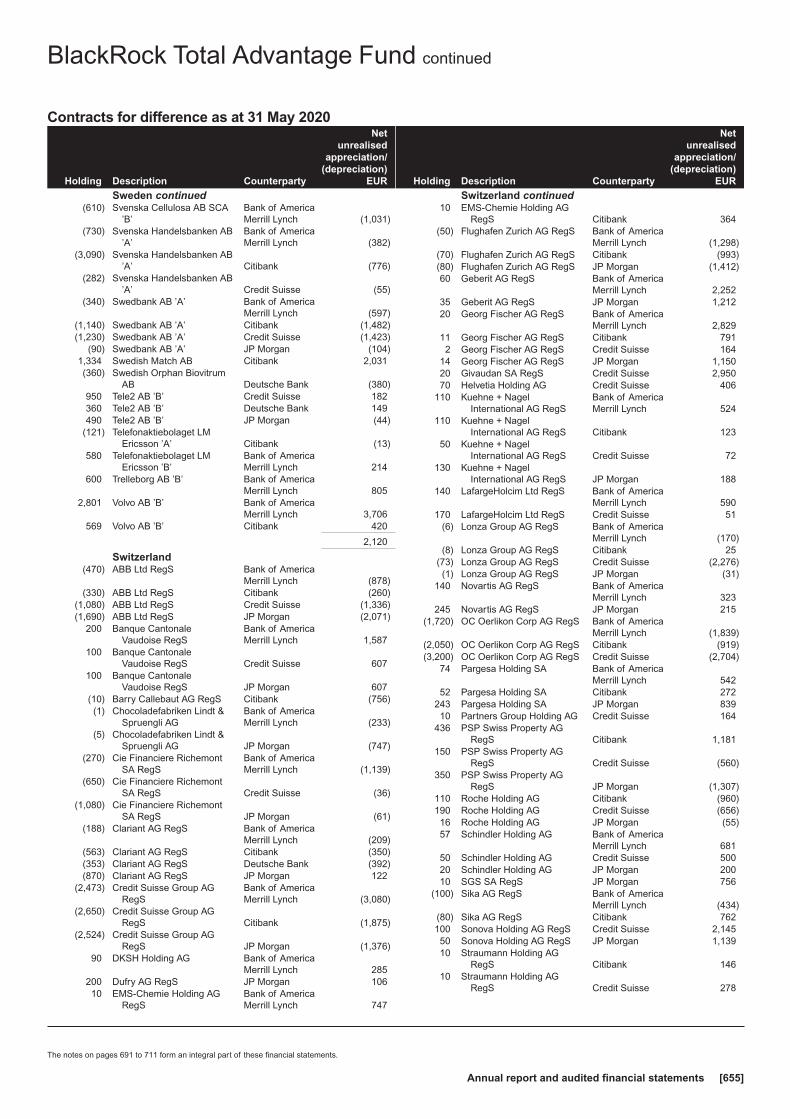
Contracts for difference as at 31 May 2020
Holding Description Counterparty
Netunrealised
appreciation/(depreciation)
EUR
Sweden continued(610) Svenska Cellulosa AB SCA
’B’Bank of AmericaMerrill Lynch (1,031)
(730) Svenska Handelsbanken AB’A’
Bank of AmericaMerrill Lynch (382)
(3,090) Svenska Handelsbanken AB’A’ Citibank (776)
(282) Svenska Handelsbanken AB’A’ Credit Suisse (55)
(340) Swedbank AB ’A’ Bank of AmericaMerrill Lynch (597)
(1,140) Swedbank AB ’A’ Citibank (1,482)(1,230) Swedbank AB ’A’ Credit Suisse (1,423)
(90) Swedbank AB ’A’ JP Morgan (104)1,334 Swedish Match AB Citibank 2,031(360) Swedish Orphan Biovitrum
AB Deutsche Bank (380)950 Tele2 AB ’B’ Credit Suisse 182360 Tele2 AB ’B’ Deutsche Bank 149490 Tele2 AB ’B’ JP Morgan (44)
(121) Telefonaktiebolaget LMEricsson ’A’ Citibank (13)
580 Telefonaktiebolaget LMEricsson ’B’
Bank of AmericaMerrill Lynch 214
600 Trelleborg AB ’B’ Bank of AmericaMerrill Lynch 805
2,801 Volvo AB ’B’ Bank of AmericaMerrill Lynch 3,706
569 Volvo AB ’B’ Citibank 420
2,120
Switzerland(470) ABB Ltd RegS Bank of America
Merrill Lynch (878)(330) ABB Ltd RegS Citibank (260)
(1,080) ABB Ltd RegS Credit Suisse (1,336)(1,690) ABB Ltd RegS JP Morgan (2,071)
200 Banque CantonaleVaudoise RegS
Bank of AmericaMerrill Lynch 1,587
100 Banque CantonaleVaudoise RegS Credit Suisse 607
100 Banque CantonaleVaudoise RegS JP Morgan 607
(10) Barry Callebaut AG RegS Citibank (756)(1) Chocoladefabriken Lindt &
Spruengli AGBank of AmericaMerrill Lynch (233)
(5) Chocoladefabriken Lindt &Spruengli AG JP Morgan (747)
(270) Cie Financiere RichemontSA RegS
Bank of AmericaMerrill Lynch (1,139)
(650) Cie Financiere RichemontSA RegS Credit Suisse (36)
(1,080) Cie Financiere RichemontSA RegS JP Morgan (61)
(188) Clariant AG RegS Bank of AmericaMerrill Lynch (209)
(563) Clariant AG RegS Citibank (350)(353) Clariant AG RegS Deutsche Bank (392)(870) Clariant AG RegS JP Morgan 122
(2,473) Credit Suisse Group AGRegS
Bank of AmericaMerrill Lynch (3,080)
(2,650) Credit Suisse Group AGRegS Citibank (1,875)
(2,524) Credit Suisse Group AGRegS JP Morgan (1,376)
90 DKSH Holding AG Bank of AmericaMerrill Lynch 285
200 Dufry AG RegS JP Morgan 10610 EMS-Chemie Holding AG
RegSBank of AmericaMerrill Lynch 747
Holding Description Counterparty
Netunrealised
appreciation/(depreciation)
EUR
Switzerland continued10 EMS-Chemie Holding AG
RegS Citibank 364(50) Flughafen Zurich AG RegS Bank of America
Merrill Lynch (1,298)(70) Flughafen Zurich AG RegS Citibank (993)(80) Flughafen Zurich AG RegS JP Morgan (1,412)60 Geberit AG RegS Bank of America
Merrill Lynch 2,25235 Geberit AG RegS JP Morgan 1,21220 Georg Fischer AG RegS Bank of America
Merrill Lynch 2,82911 Georg Fischer AG RegS Citibank 7912 Georg Fischer AG RegS Credit Suisse 164
14 Georg Fischer AG RegS JP Morgan 1,15020 Givaudan SA RegS Credit Suisse 2,95070 Helvetia Holding AG Credit Suisse 406
110 Kuehne + NagelInternational AG RegS
Bank of AmericaMerrill Lynch 524
110 Kuehne + NagelInternational AG RegS Citibank 123
50 Kuehne + NagelInternational AG RegS Credit Suisse 72
130 Kuehne + NagelInternational AG RegS JP Morgan 188
140 LafargeHolcim Ltd RegS Bank of AmericaMerrill Lynch 590
170 LafargeHolcim Ltd RegS Credit Suisse 51(6) Lonza Group AG RegS Bank of America
Merrill Lynch (170)(8) Lonza Group AG RegS Citibank 25
(73) Lonza Group AG RegS Credit Suisse (2,276)(1) Lonza Group AG RegS JP Morgan (31)
140 Novartis AG RegS Bank of AmericaMerrill Lynch 323
245 Novartis AG RegS JP Morgan 215(1,720) OC Oerlikon Corp AG RegS Bank of America
Merrill Lynch (1,839)(2,050) OC Oerlikon Corp AG RegS Citibank (919)(3,200) OC Oerlikon Corp AG RegS Credit Suisse (2,704)
74 Pargesa Holding SA Bank of AmericaMerrill Lynch 542
52 Pargesa Holding SA Citibank 272243 Pargesa Holding SA JP Morgan 83910 Partners Group Holding AG Credit Suisse 164
436 PSP Swiss Property AGRegS Citibank 1,181
150 PSP Swiss Property AGRegS Credit Suisse (560)
350 PSP Swiss Property AGRegS JP Morgan (1,307)
110 Roche Holding AG Citibank (960)190 Roche Holding AG Credit Suisse (656)16 Roche Holding AG JP Morgan (55)57 Schindler Holding AG Bank of America
Merrill Lynch 68150 Schindler Holding AG Credit Suisse 50020 Schindler Holding AG JP Morgan 20010 SGS SA RegS JP Morgan 756
(100) Sika AG RegS Bank of AmericaMerrill Lynch (434)
(80) Sika AG RegS Citibank 762100 Sonova Holding AG RegS Credit Suisse 2,14550 Sonova Holding AG RegS JP Morgan 1,13910 Straumann Holding AG
RegS Citibank 14610 Straumann Holding AG
RegS Credit Suisse 278
BlackRock Total Advantage Fund continued
The notes on pages 691 to 711 form an integral part of these financial statements.
Annual report and audited financial statements [655]
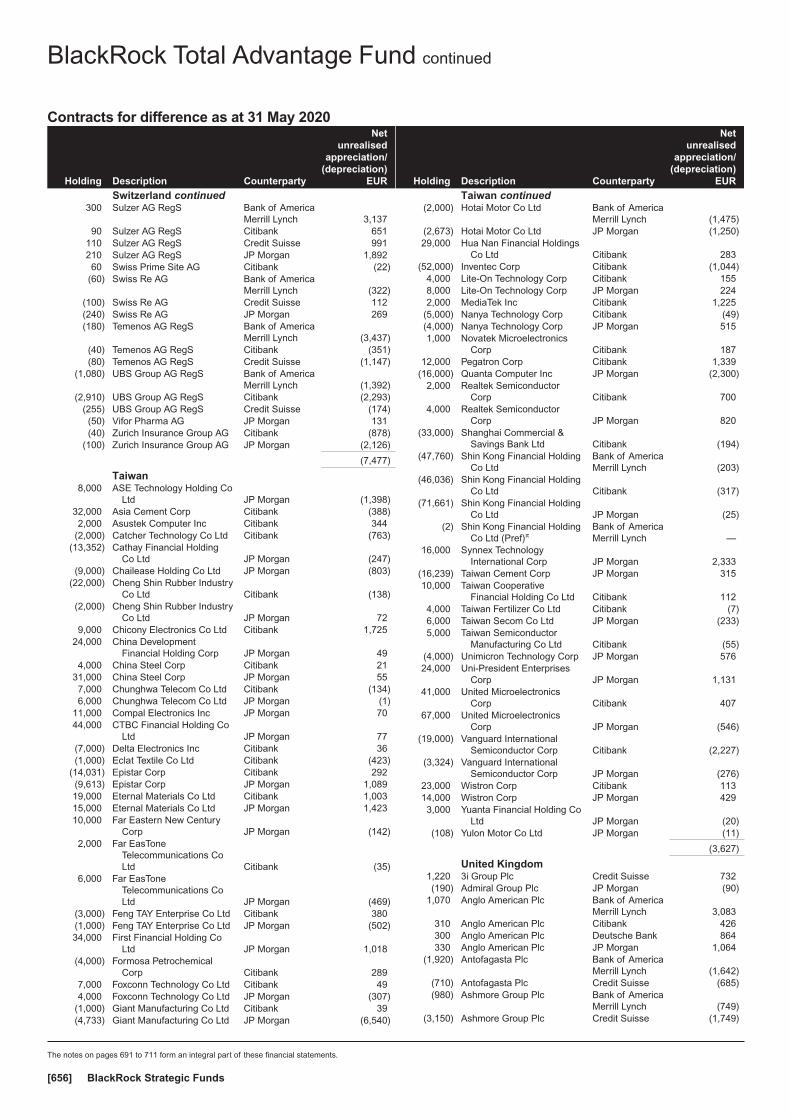
Contracts for difference as at 31 May 2020
Holding Description Counterparty
Netunrealised
appreciation/(depreciation)
EUR
Switzerland continued300 Sulzer AG RegS Bank of America
Merrill Lynch 3,13790 Sulzer AG RegS Citibank 651
110 Sulzer AG RegS Credit Suisse 991210 Sulzer AG RegS JP Morgan 1,89260 Swiss Prime Site AG Citibank (22)
(60) Swiss Re AG Bank of AmericaMerrill Lynch (322)
(100) Swiss Re AG Credit Suisse 112(240) Swiss Re AG JP Morgan 269(180) Temenos AG RegS Bank of America
Merrill Lynch (3,437)(40) Temenos AG RegS Citibank (351)(80) Temenos AG RegS Credit Suisse (1,147)
(1,080) UBS Group AG RegS Bank of AmericaMerrill Lynch (1,392)
(2,910) UBS Group AG RegS Citibank (2,293)(255) UBS Group AG RegS Credit Suisse (174)(50) Vifor Pharma AG JP Morgan 131(40) Zurich Insurance Group AG Citibank (878)
(100) Zurich Insurance Group AG JP Morgan (2,126)
(7,477)
Taiwan8,000 ASE Technology Holding Co
Ltd JP Morgan (1,398)32,000 Asia Cement Corp Citibank (388)2,000 Asustek Computer Inc Citibank 344
(2,000) Catcher Technology Co Ltd Citibank (763)(13,352) Cathay Financial Holding
Co Ltd JP Morgan (247)(9,000) Chailease Holding Co Ltd JP Morgan (803)
(22,000) Cheng Shin Rubber IndustryCo Ltd Citibank (138)
(2,000) Cheng Shin Rubber IndustryCo Ltd JP Morgan 72
9,000 Chicony Electronics Co Ltd Citibank 1,72524,000 China Development
Financial Holding Corp JP Morgan 494,000 China Steel Corp Citibank 21
31,000 China Steel Corp JP Morgan 557,000 Chunghwa Telecom Co Ltd Citibank (134)6,000 Chunghwa Telecom Co Ltd JP Morgan (1)
11,000 Compal Electronics Inc JP Morgan 7044,000 CTBC Financial Holding Co
Ltd JP Morgan 77(7,000) Delta Electronics Inc Citibank 36(1,000) Eclat Textile Co Ltd Citibank (423)
(14,031) Epistar Corp Citibank 292(9,613) Epistar Corp JP Morgan 1,08919,000 Eternal Materials Co Ltd Citibank 1,00315,000 Eternal Materials Co Ltd JP Morgan 1,42310,000 Far Eastern New Century
Corp JP Morgan (142)2,000 Far EasTone
Telecommunications CoLtd Citibank (35)
6,000 Far EasToneTelecommunications CoLtd JP Morgan (469)
(3,000) Feng TAY Enterprise Co Ltd Citibank 380(1,000) Feng TAY Enterprise Co Ltd JP Morgan (502)34,000 First Financial Holding Co
Ltd JP Morgan 1,018(4,000) Formosa Petrochemical
Corp Citibank 2897,000 Foxconn Technology Co Ltd Citibank 494,000 Foxconn Technology Co Ltd JP Morgan (307)
(1,000) Giant Manufacturing Co Ltd Citibank 39(4,733) Giant Manufacturing Co Ltd JP Morgan (6,540)
Holding Description Counterparty
Netunrealised
appreciation/(depreciation)
EUR
Taiwan continued(2,000) Hotai Motor Co Ltd Bank of America
Merrill Lynch (1,475)(2,673) Hotai Motor Co Ltd JP Morgan (1,250)29,000 Hua Nan Financial Holdings
Co Ltd Citibank 283(52,000) Inventec Corp Citibank (1,044)
4,000 Lite-On Technology Corp Citibank 1558,000 Lite-On Technology Corp JP Morgan 2242,000 MediaTek Inc Citibank 1,225
(5,000) Nanya Technology Corp Citibank (49)(4,000) Nanya Technology Corp JP Morgan 5151,000 Novatek Microelectronics
Corp Citibank 18712,000 Pegatron Corp Citibank 1,339
(16,000) Quanta Computer Inc JP Morgan (2,300)2,000 Realtek Semiconductor
Corp Citibank 7004,000 Realtek Semiconductor
Corp JP Morgan 820(33,000) Shanghai Commercial &
Savings Bank Ltd Citibank (194)(47,760) Shin Kong Financial Holding
Co LtdBank of AmericaMerrill Lynch (203)
(46,036) Shin Kong Financial HoldingCo Ltd Citibank (317)
(71,661) Shin Kong Financial HoldingCo Ltd JP Morgan (25)
(2) Shin Kong Financial HoldingCo Ltd (Pref)π
Bank of AmericaMerrill Lynch —
16,000 Synnex TechnologyInternational Corp JP Morgan 2,333
(16,239) Taiwan Cement Corp JP Morgan 31510,000 Taiwan Cooperative
Financial Holding Co Ltd Citibank 1124,000 Taiwan Fertilizer Co Ltd Citibank (7)6,000 Taiwan Secom Co Ltd JP Morgan (233)5,000 Taiwan Semiconductor
Manufacturing Co Ltd Citibank (55)(4,000) Unimicron Technology Corp JP Morgan 57624,000 Uni-President Enterprises
Corp JP Morgan 1,13141,000 United Microelectronics
Corp Citibank 40767,000 United Microelectronics
Corp JP Morgan (546)(19,000) Vanguard International
Semiconductor Corp Citibank (2,227)(3,324) Vanguard International
Semiconductor Corp JP Morgan (276)23,000 Wistron Corp Citibank 11314,000 Wistron Corp JP Morgan 4293,000 Yuanta Financial Holding Co
Ltd JP Morgan (20)(108) Yulon Motor Co Ltd JP Morgan (11)
(3,627)
United Kingdom1,220 3i Group Plc Credit Suisse 732(190) Admiral Group Plc JP Morgan (90)
1,070 Anglo American Plc Bank of AmericaMerrill Lynch 3,083
310 Anglo American Plc Citibank 426300 Anglo American Plc Deutsche Bank 864330 Anglo American Plc JP Morgan 1,064
(1,920) Antofagasta Plc Bank of AmericaMerrill Lynch (1,642)
(710) Antofagasta Plc Credit Suisse (685)(980) Ashmore Group Plc Bank of America
Merrill Lynch (749)(3,150) Ashmore Group Plc Credit Suisse (1,749)
BlackRock Total Advantage Fund continued
The notes on pages 691 to 711 form an integral part of these financial statements.
BlackRock Strategic Funds[656]
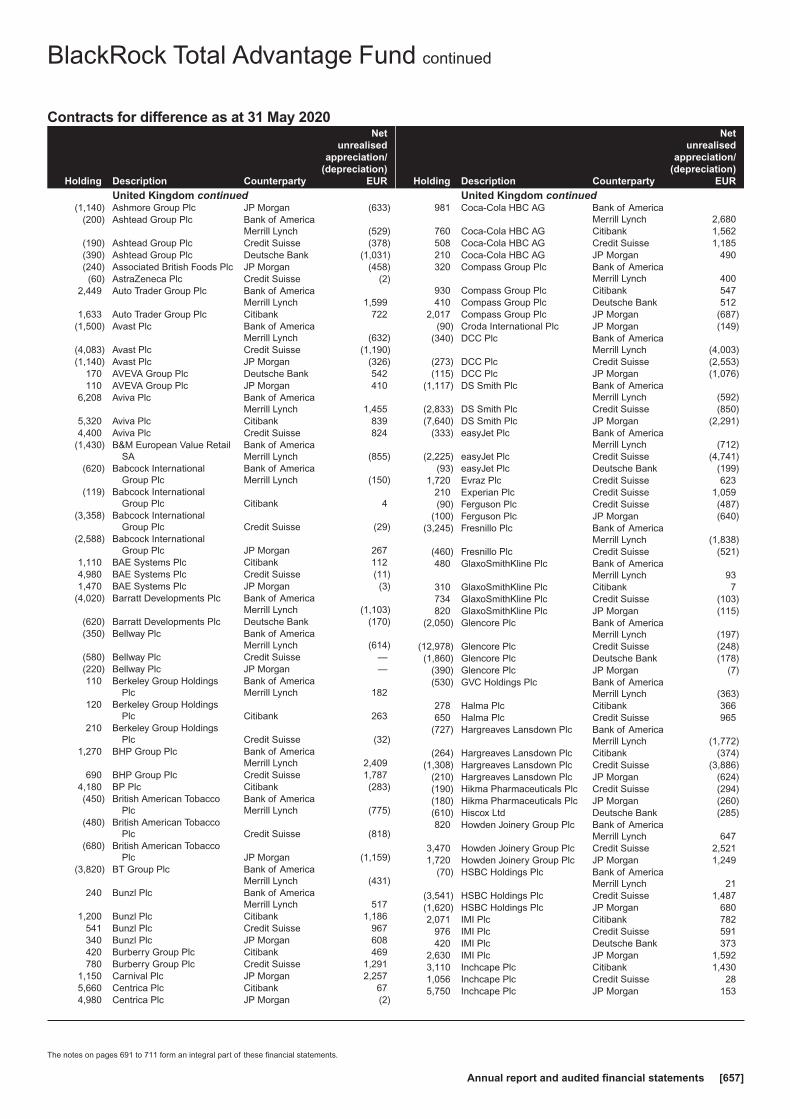
Contracts for difference as at 31 May 2020
Holding Description Counterparty
Netunrealised
appreciation/(depreciation)
EUR
United Kingdom continued(1,140) Ashmore Group Plc JP Morgan (633)
(200) Ashtead Group Plc Bank of AmericaMerrill Lynch (529)
(190) Ashtead Group Plc Credit Suisse (378)(390) Ashtead Group Plc Deutsche Bank (1,031)(240) Associated British Foods Plc JP Morgan (458)(60) AstraZeneca Plc Credit Suisse (2)
2,449 Auto Trader Group Plc Bank of AmericaMerrill Lynch 1,599
1,633 Auto Trader Group Plc Citibank 722(1,500) Avast Plc Bank of America
Merrill Lynch (632)(4,083) Avast Plc Credit Suisse (1,190)(1,140) Avast Plc JP Morgan (326)
170 AVEVA Group Plc Deutsche Bank 542110 AVEVA Group Plc JP Morgan 410
6,208 Aviva Plc Bank of AmericaMerrill Lynch 1,455
5,320 Aviva Plc Citibank 8394,400 Aviva Plc Credit Suisse 824
(1,430) B&M European Value RetailSA
Bank of AmericaMerrill Lynch (855)
(620) Babcock InternationalGroup Plc
Bank of AmericaMerrill Lynch (150)
(119) Babcock InternationalGroup Plc Citibank 4
(3,358) Babcock InternationalGroup Plc Credit Suisse (29)
(2,588) Babcock InternationalGroup Plc JP Morgan 267
1,110 BAE Systems Plc Citibank 1124,980 BAE Systems Plc Credit Suisse (11)1,470 BAE Systems Plc JP Morgan (3)
(4,020) Barratt Developments Plc Bank of AmericaMerrill Lynch (1,103)
(620) Barratt Developments Plc Deutsche Bank (170)(350) Bellway Plc Bank of America
Merrill Lynch (614)(580) Bellway Plc Credit Suisse —(220) Bellway Plc JP Morgan —110 Berkeley Group Holdings
PlcBank of AmericaMerrill Lynch 182
120 Berkeley Group HoldingsPlc Citibank 263
210 Berkeley Group HoldingsPlc Credit Suisse (32)
1,270 BHP Group Plc Bank of AmericaMerrill Lynch 2,409
690 BHP Group Plc Credit Suisse 1,7874,180 BP Plc Citibank (283)(450) British American Tobacco
PlcBank of AmericaMerrill Lynch (775)
(480) British American TobaccoPlc Credit Suisse (818)
(680) British American TobaccoPlc JP Morgan (1,159)
(3,820) BT Group Plc Bank of AmericaMerrill Lynch (431)
240 Bunzl Plc Bank of AmericaMerrill Lynch 517
1,200 Bunzl Plc Citibank 1,186541 Bunzl Plc Credit Suisse 967340 Bunzl Plc JP Morgan 608420 Burberry Group Plc Citibank 469780 Burberry Group Plc Credit Suisse 1,291
1,150 Carnival Plc JP Morgan 2,2575,660 Centrica Plc Citibank 674,980 Centrica Plc JP Morgan (2)
Holding Description Counterparty
Netunrealised
appreciation/(depreciation)
EUR
United Kingdom continued981 Coca-Cola HBC AG Bank of America
Merrill Lynch 2,680760 Coca-Cola HBC AG Citibank 1,562508 Coca-Cola HBC AG Credit Suisse 1,185210 Coca-Cola HBC AG JP Morgan 490320 Compass Group Plc Bank of America
Merrill Lynch 400930 Compass Group Plc Citibank 547410 Compass Group Plc Deutsche Bank 512
2,017 Compass Group Plc JP Morgan (687)(90) Croda International Plc JP Morgan (149)
(340) DCC Plc Bank of AmericaMerrill Lynch (4,003)
(273) DCC Plc Credit Suisse (2,553)(115) DCC Plc JP Morgan (1,076)
(1,117) DS Smith Plc Bank of AmericaMerrill Lynch (592)
(2,833) DS Smith Plc Credit Suisse (850)(7,640) DS Smith Plc JP Morgan (2,291)
(333) easyJet Plc Bank of AmericaMerrill Lynch (712)
(2,225) easyJet Plc Credit Suisse (4,741)(93) easyJet Plc Deutsche Bank (199)
1,720 Evraz Plc Credit Suisse 623210 Experian Plc Credit Suisse 1,059(90) Ferguson Plc Credit Suisse (487)
(100) Ferguson Plc JP Morgan (640)(3,245) Fresnillo Plc Bank of America
Merrill Lynch (1,838)(460) Fresnillo Plc Credit Suisse (521)480 GlaxoSmithKline Plc Bank of America
Merrill Lynch 93310 GlaxoSmithKline Plc Citibank 7734 GlaxoSmithKline Plc Credit Suisse (103)820 GlaxoSmithKline Plc JP Morgan (115)
(2,050) Glencore Plc Bank of AmericaMerrill Lynch (197)
(12,978) Glencore Plc Credit Suisse (248)(1,860) Glencore Plc Deutsche Bank (178)
(390) Glencore Plc JP Morgan (7)(530) GVC Holdings Plc Bank of America
Merrill Lynch (363)278 Halma Plc Citibank 366650 Halma Plc Credit Suisse 965
(727) Hargreaves Lansdown Plc Bank of AmericaMerrill Lynch (1,772)
(264) Hargreaves Lansdown Plc Citibank (374)(1,308) Hargreaves Lansdown Plc Credit Suisse (3,886)
(210) Hargreaves Lansdown Plc JP Morgan (624)(190) Hikma Pharmaceuticals Plc Credit Suisse (294)(180) Hikma Pharmaceuticals Plc JP Morgan (260)(610) Hiscox Ltd Deutsche Bank (285)820 Howden Joinery Group Plc Bank of America
Merrill Lynch 6473,470 Howden Joinery Group Plc Credit Suisse 2,5211,720 Howden Joinery Group Plc JP Morgan 1,249
(70) HSBC Holdings Plc Bank of AmericaMerrill Lynch 21
(3,541) HSBC Holdings Plc Credit Suisse 1,487(1,620) HSBC Holdings Plc JP Morgan 6802,071 IMI Plc Citibank 782
976 IMI Plc Credit Suisse 591420 IMI Plc Deutsche Bank 373
2,630 IMI Plc JP Morgan 1,5923,110 Inchcape Plc Citibank 1,4301,056 Inchcape Plc Credit Suisse 285,750 Inchcape Plc JP Morgan 153
BlackRock Total Advantage Fund continued
The notes on pages 691 to 711 form an integral part of these financial statements.
Annual report and audited financial statements [657]

Contracts for difference as at 31 May 2020
Holding Description Counterparty
Netunrealised
appreciation/(depreciation)
EUR
United Kingdom continued1,080 Informa Plc Bank of America
Merrill Lynch 5881,270 Informa Plc Citibank 4131,640 Informa Plc JP Morgan 585
710 Intermediate Capital GroupPlc
Bank of AmericaMerrill Lynch 1,601
500 Intermediate Capital GroupPlc Citibank 772
930 Intermediate Capital GroupPlc Credit Suisse 1,539
3,060 Investec Plc Citibank 514,120 Investec Plc JP Morgan (227)
(7,647) J Sainsbury Plc Bank of AmericaMerrill Lynch (505)
(10,180) J Sainsbury Plc Credit Suisse (271)(640) J Sainsbury Plc JP Morgan (17)
1,040 JD Sports Fashion Plc Bank of AmericaMerrill Lynch 1,466
470 JD Sports Fashion Plc JP Morgan 562(1,030) Johnson Matthey Plc Credit Suisse (1,956)
(160) Johnson Matthey Plc JP Morgan (304)(109) Just Eat Takeaway.com NV Credit Suisse (10)(43) Just Eat Takeaway.com NV Deutsche Bank (101)
(118) Just Eat Takeaway.com NV JP Morgan (10)(2,294) KAZ Minerals Plc Bank of America
Merrill Lynch (1,677)(3,044) KAZ Minerals Plc Credit Suisse (2,279)(2,988) KAZ Minerals Plc JP Morgan (2,237)(4,540) Legal & General Group Plc Bank of America
Merrill Lynch (804)(2,050) Legal & General Group Plc Credit Suisse (143)(5,420) Legal & General Group Plc JP Morgan 61(5,700) M&G Plc Credit Suisse (1,213)(7,340) Marks & Spencer Group Plc Bank of America
Merrill Lynch (1,022)(10,478) Marks & Spencer Group Plc Credit Suisse (1,166)(4,010) Marks & Spencer Group Plc Deutsche Bank (559)4,400 Meggitt Plc Bank of America
Merrill Lynch 1,2071,930 Meggitt Plc Citibank 3791,525 Meggitt Plc Credit Suisse 5791,550 Meggitt Plc Deutsche Bank 4251,620 Meggitt Plc JP Morgan 615
(5,366) Melrose Industries Plc Bank of AmericaMerrill Lynch (1,684)
(4,090) Melrose Industries Plc Credit Suisse (1,017)(9,520) Melrose Industries Plc JP Morgan (2,367)
910 Micro Focus InternationalPlc JP Morgan (234)
(310) Mondi Plc Credit Suisse (506)(3,069) National Grid Plc Bank of America
Merrill Lynch (361)(520) National Grid Plc Deutsche Bank (61)(35) Ocado Group Plc Bank of America
Merrill Lynch (94)(1,144) Ocado Group Plc Credit Suisse (3,590)
(259) Ocado Group Plc JP Morgan (813)980 Pearson Plc Citibank 59
1,050 Pearson Plc Credit Suisse 68910 Pearson Plc Deutsche Bank 361
(360) Pennon Group Plc Credit Suisse 17(130) Persimmon Plc Bank of America
Merrill Lynch (296)(729) Persimmon Plc Credit Suisse (696)
(1,229) Persimmon Plc JP Morgan (1,174)3 Playtech Plc JP Morgan 1
(1,160) Prudential Plc Bank of AmericaMerrill Lynch —
Holding Description Counterparty
Netunrealised
appreciation/(depreciation)
EUR
United Kingdom continued(195) Prudential Plc Citibank (83)
(2,430) Prudential Plc Credit Suisse 1,576(660) Prudential Plc Deutsche Bank —
(1,686) Prudential Plc JP Morgan 1,339(871) Quilter Plc Bank of America
Merrill Lynch (113)(10,960) Quilter Plc Credit Suisse (864)(1,440) Quilter Plc JP Morgan (114)
(11) Reckitt Benckiser Group Plc Bank of AmericaMerrill Lynch (11)
(507) Reckitt Benckiser Group Plc Credit Suisse (1,566)(207) Reckitt Benckiser Group Plc JP Morgan (639)220 RELX Plc Bank of America
Merrill Lynch 293403 RELX Plc Citibank 92393 RELX Plc Credit Suisse 186
(1,191) Renishaw Plc Bank of AmericaMerrill Lynch (2,381)
(50) Renishaw Plc Credit Suisse (73)(13) Renishaw Plc JP Morgan (19)
1,030 Rentokil Initial Plc Citibank 66631 Rightmove Plc Bank of America
Merrill Lynch 5922,455 Rightmove Plc Citibank 1,5113,160 Rightmove Plc Credit Suisse 2,246
21 Rightmove Plc JP Morgan 15437 Rio Tinto Plc Credit Suisse 3,085
3,740 Rolls-Royce Holdings Plc Bank of AmericaMerrill Lynch 1,363
2,030 Rolls-Royce Holdings Plc Citibank 432,470 Rolls-Royce Holdings Plc Deutsche Bank 900
10,460 Rolls-Royce Holdings Plc JP Morgan (12)(3,940) Royal Bank of Scotland
Group PlcBank of AmericaMerrill Lynch (309)
(3,368) Royal Bank of ScotlandGroup Plc Citibank (273)
(6,500) Royal Bank of ScotlandGroup Plc Credit Suisse (72)
(150) Royal Bank of ScotlandGroup Plc JP Morgan (2)
950 Royal Dutch Shell Plc ’A’ Bank of AmericaMerrill Lynch 380
120 Royal Dutch Shell Plc ’A’ Citibank (38)784 Royal Dutch Shell Plc ’A’ Credit Suisse (434)455 Royal Dutch Shell Plc ’A’ JP Morgan (139)
3,384 RSA Insurance Group Plc Bank of AmericaMerrill Lynch 1,361
1,850 RSA Insurance Group Plc Citibank 4604,660 RSA Insurance Group Plc Credit Suisse 8983,740 RSA Insurance Group Plc JP Morgan 6154,661 Sage Group Plc Citibank 559
940 Sage Group Plc Credit Suisse 5011,230 Sage Group Plc JP Morgan 656(520) Schroders Plc Bank of America
Merrill Lynch (1,438)(150) Schroders Plc Credit Suisse (435)(340) Schroders Plc JP Morgan (736)200 Severn Trent Plc Credit Suisse (105)820 Smith & Nephew Plc Citibank 82569 Smith & Nephew Plc Credit Suisse 398
1,340 Smith & Nephew Plc JP Morgan 938(1,330) Smiths Group Plc Bank of America
Merrill Lynch (1,470)(1,519) Smiths Group Plc Credit Suisse (852)
(278) Smiths Group Plc JP Morgan (156)(23) Spirax-Sarco Engineering
PlcBank of AmericaMerrill Lynch (200)
BlackRock Total Advantage Fund continued
The notes on pages 691 to 711 form an integral part of these financial statements.
BlackRock Strategic Funds[658]
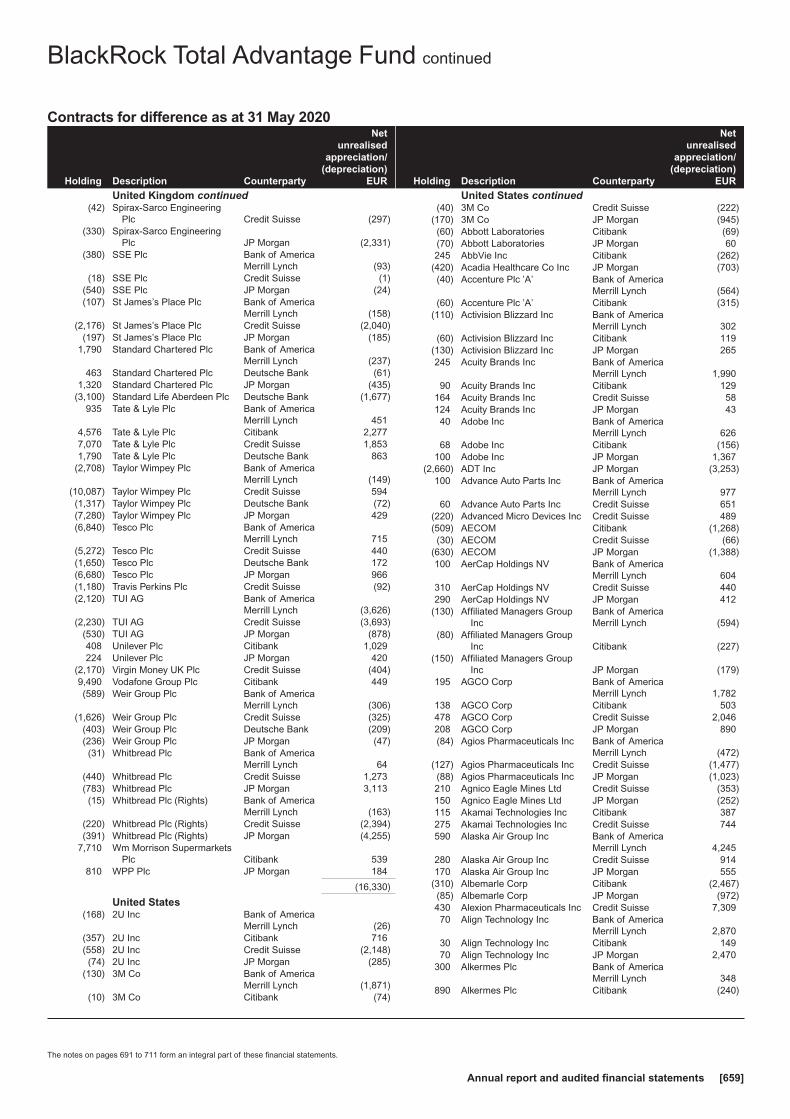
Contracts for difference as at 31 May 2020
Holding Description Counterparty
Netunrealised
appreciation/(depreciation)
EUR
United Kingdom continued(42) Spirax-Sarco Engineering
Plc Credit Suisse (297)(330) Spirax-Sarco Engineering
Plc JP Morgan (2,331)(380) SSE Plc Bank of America
Merrill Lynch (93)(18) SSE Plc Credit Suisse (1)
(540) SSE Plc JP Morgan (24)(107) St James’s Place Plc Bank of America
Merrill Lynch (158)(2,176) St James’s Place Plc Credit Suisse (2,040)
(197) St James’s Place Plc JP Morgan (185)1,790 Standard Chartered Plc Bank of America
Merrill Lynch (237)463 Standard Chartered Plc Deutsche Bank (61)
1,320 Standard Chartered Plc JP Morgan (435)(3,100) Standard Life Aberdeen Plc Deutsche Bank (1,677)
935 Tate & Lyle Plc Bank of AmericaMerrill Lynch 451
4,576 Tate & Lyle Plc Citibank 2,2777,070 Tate & Lyle Plc Credit Suisse 1,8531,790 Tate & Lyle Plc Deutsche Bank 863
(2,708) Taylor Wimpey Plc Bank of AmericaMerrill Lynch (149)
(10,087) Taylor Wimpey Plc Credit Suisse 594(1,317) Taylor Wimpey Plc Deutsche Bank (72)(7,280) Taylor Wimpey Plc JP Morgan 429(6,840) Tesco Plc Bank of America
Merrill Lynch 715(5,272) Tesco Plc Credit Suisse 440(1,650) Tesco Plc Deutsche Bank 172(6,680) Tesco Plc JP Morgan 966(1,180) Travis Perkins Plc Credit Suisse (92)(2,120) TUI AG Bank of America
Merrill Lynch (3,626)(2,230) TUI AG Credit Suisse (3,693)
(530) TUI AG JP Morgan (878)408 Unilever Plc Citibank 1,029224 Unilever Plc JP Morgan 420
(2,170) Virgin Money UK Plc Credit Suisse (404)9,490 Vodafone Group Plc Citibank 449(589) Weir Group Plc Bank of America
Merrill Lynch (306)(1,626) Weir Group Plc Credit Suisse (325)
(403) Weir Group Plc Deutsche Bank (209)(236) Weir Group Plc JP Morgan (47)(31) Whitbread Plc Bank of America
Merrill Lynch 64(440) Whitbread Plc Credit Suisse 1,273(783) Whitbread Plc JP Morgan 3,113(15) Whitbread Plc (Rights) Bank of America
Merrill Lynch (163)(220) Whitbread Plc (Rights) Credit Suisse (2,394)(391) Whitbread Plc (Rights) JP Morgan (4,255)
7,710 Wm Morrison SupermarketsPlc Citibank 539
810 WPP Plc JP Morgan 184
(16,330)
United States(168) 2U Inc Bank of America
Merrill Lynch (26)(357) 2U Inc Citibank 716(558) 2U Inc Credit Suisse (2,148)(74) 2U Inc JP Morgan (285)
(130) 3M Co Bank of AmericaMerrill Lynch (1,871)
(10) 3M Co Citibank (74)
Holding Description Counterparty
Netunrealised
appreciation/(depreciation)
EUR
United States continued(40) 3M Co Credit Suisse (222)
(170) 3M Co JP Morgan (945)(60) Abbott Laboratories Citibank (69)(70) Abbott Laboratories JP Morgan 60245 AbbVie Inc Citibank (262)
(420) Acadia Healthcare Co Inc JP Morgan (703)(40) Accenture Plc ’A’ Bank of America
Merrill Lynch (564)(60) Accenture Plc ’A’ Citibank (315)
(110) Activision Blizzard Inc Bank of AmericaMerrill Lynch 302
(60) Activision Blizzard Inc Citibank 119(130) Activision Blizzard Inc JP Morgan 265245 Acuity Brands Inc Bank of America
Merrill Lynch 1,99090 Acuity Brands Inc Citibank 129
164 Acuity Brands Inc Credit Suisse 58124 Acuity Brands Inc JP Morgan 4340 Adobe Inc Bank of America
Merrill Lynch 62668 Adobe Inc Citibank (156)
100 Adobe Inc JP Morgan 1,367(2,660) ADT Inc JP Morgan (3,253)
100 Advance Auto Parts Inc Bank of AmericaMerrill Lynch 977
60 Advance Auto Parts Inc Credit Suisse 651(220) Advanced Micro Devices Inc Credit Suisse 489(509) AECOM Citibank (1,268)(30) AECOM Credit Suisse (66)
(630) AECOM JP Morgan (1,388)100 AerCap Holdings NV Bank of America
Merrill Lynch 604310 AerCap Holdings NV Credit Suisse 440290 AerCap Holdings NV JP Morgan 412
(130) Affiliated Managers GroupInc
Bank of AmericaMerrill Lynch (594)
(80) Affiliated Managers GroupInc Citibank (227)
(150) Affiliated Managers GroupInc JP Morgan (179)
195 AGCO Corp Bank of AmericaMerrill Lynch 1,782
138 AGCO Corp Citibank 503478 AGCO Corp Credit Suisse 2,046208 AGCO Corp JP Morgan 890(84) Agios Pharmaceuticals Inc Bank of America
Merrill Lynch (472)(127) Agios Pharmaceuticals Inc Credit Suisse (1,477)(88) Agios Pharmaceuticals Inc JP Morgan (1,023)210 Agnico Eagle Mines Ltd Credit Suisse (353)150 Agnico Eagle Mines Ltd JP Morgan (252)115 Akamai Technologies Inc Citibank 387275 Akamai Technologies Inc Credit Suisse 744590 Alaska Air Group Inc Bank of America
Merrill Lynch 4,245280 Alaska Air Group Inc Credit Suisse 914170 Alaska Air Group Inc JP Morgan 555
(310) Albemarle Corp Citibank (2,467)(85) Albemarle Corp JP Morgan (972)430 Alexion Pharmaceuticals Inc Credit Suisse 7,30970 Align Technology Inc Bank of America
Merrill Lynch 2,87030 Align Technology Inc Citibank 14970 Align Technology Inc JP Morgan 2,470
300 Alkermes Plc Bank of AmericaMerrill Lynch 348
890 Alkermes Plc Citibank (240)
BlackRock Total Advantage Fund continued
The notes on pages 691 to 711 form an integral part of these financial statements.
Annual report and audited financial statements [659]
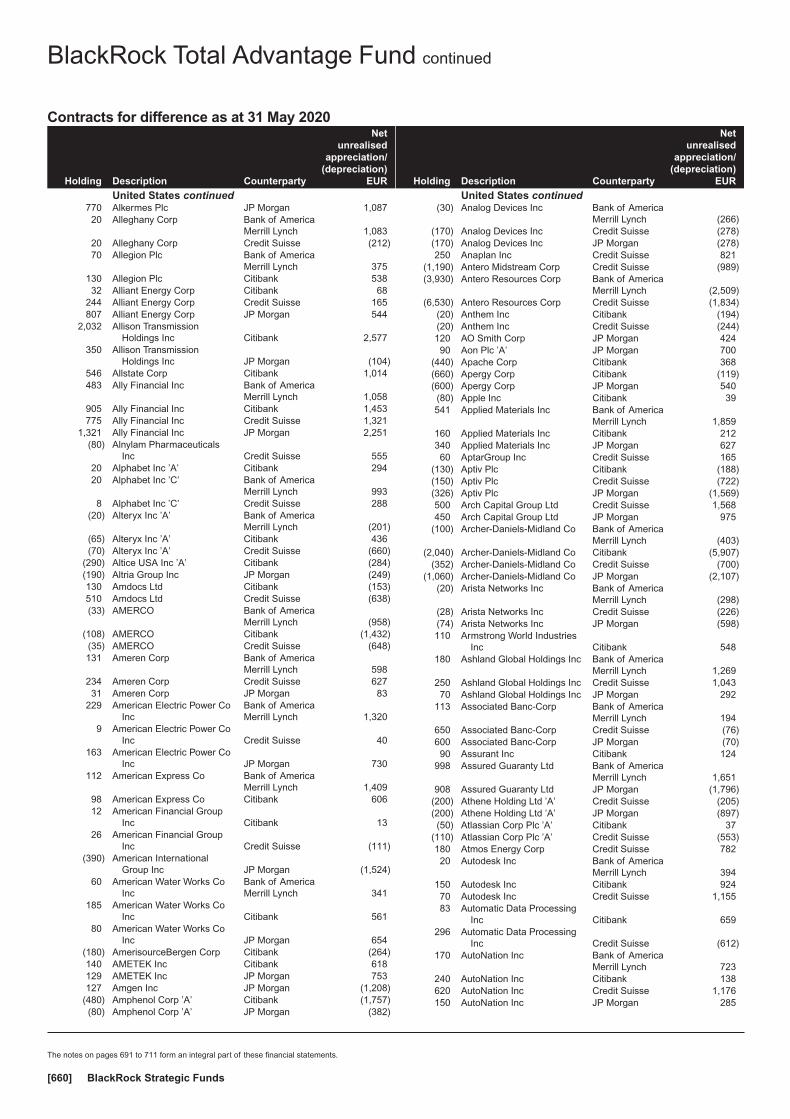
Contracts for difference as at 31 May 2020
Holding Description Counterparty
Netunrealised
appreciation/(depreciation)
EUR
United States continued770 Alkermes Plc JP Morgan 1,08720 Alleghany Corp Bank of America
Merrill Lynch 1,08320 Alleghany Corp Credit Suisse (212)70 Allegion Plc Bank of America
Merrill Lynch 375130 Allegion Plc Citibank 53832 Alliant Energy Corp Citibank 68
244 Alliant Energy Corp Credit Suisse 165807 Alliant Energy Corp JP Morgan 544
2,032 Allison TransmissionHoldings Inc Citibank 2,577
350 Allison TransmissionHoldings Inc JP Morgan (104)
546 Allstate Corp Citibank 1,014483 Ally Financial Inc Bank of America
Merrill Lynch 1,058905 Ally Financial Inc Citibank 1,453775 Ally Financial Inc Credit Suisse 1,321
1,321 Ally Financial Inc JP Morgan 2,251(80) Alnylam Pharmaceuticals
Inc Credit Suisse 55520 Alphabet Inc ’A’ Citibank 29420 Alphabet Inc ’C’ Bank of America
Merrill Lynch 9938 Alphabet Inc ’C’ Credit Suisse 288
(20) Alteryx Inc ’A’ Bank of AmericaMerrill Lynch (201)
(65) Alteryx Inc ’A’ Citibank 436(70) Alteryx Inc ’A’ Credit Suisse (660)
(290) Altice USA Inc ’A’ Citibank (284)(190) Altria Group Inc JP Morgan (249)130 Amdocs Ltd Citibank (153)510 Amdocs Ltd Credit Suisse (638)(33) AMERCO Bank of America
Merrill Lynch (958)(108) AMERCO Citibank (1,432)(35) AMERCO Credit Suisse (648)131 Ameren Corp Bank of America
Merrill Lynch 598234 Ameren Corp Credit Suisse 62731 Ameren Corp JP Morgan 83
229 American Electric Power CoInc
Bank of AmericaMerrill Lynch 1,320
9 American Electric Power CoInc Credit Suisse 40
163 American Electric Power CoInc JP Morgan 730
112 American Express Co Bank of AmericaMerrill Lynch 1,409
98 American Express Co Citibank 60612 American Financial Group
Inc Citibank 1326 American Financial Group
Inc Credit Suisse (111)(390) American International
Group Inc JP Morgan (1,524)60 American Water Works Co
IncBank of AmericaMerrill Lynch 341
185 American Water Works CoInc Citibank 561
80 American Water Works CoInc JP Morgan 654
(180) AmerisourceBergen Corp Citibank (264)140 AMETEK Inc Citibank 618129 AMETEK Inc JP Morgan 753127 Amgen Inc JP Morgan (1,208)
(480) Amphenol Corp ’A’ Citibank (1,757)(80) Amphenol Corp ’A’ JP Morgan (382)
Holding Description Counterparty
Netunrealised
appreciation/(depreciation)
EUR
United States continued(30) Analog Devices Inc Bank of America
Merrill Lynch (266)(170) Analog Devices Inc Credit Suisse (278)(170) Analog Devices Inc JP Morgan (278)250 Anaplan Inc Credit Suisse 821
(1,190) Antero Midstream Corp Credit Suisse (989)(3,930) Antero Resources Corp Bank of America
Merrill Lynch (2,509)(6,530) Antero Resources Corp Credit Suisse (1,834)
(20) Anthem Inc Citibank (194)(20) Anthem Inc Credit Suisse (244)120 AO Smith Corp JP Morgan 42490 Aon Plc ’A’ JP Morgan 700
(440) Apache Corp Citibank 368(660) Apergy Corp Citibank (119)(600) Apergy Corp JP Morgan 540(80) Apple Inc Citibank 39541 Applied Materials Inc Bank of America
Merrill Lynch 1,859160 Applied Materials Inc Citibank 212340 Applied Materials Inc JP Morgan 62760 AptarGroup Inc Credit Suisse 165
(130) Aptiv Plc Citibank (188)(150) Aptiv Plc Credit Suisse (722)(326) Aptiv Plc JP Morgan (1,569)500 Arch Capital Group Ltd Credit Suisse 1,568450 Arch Capital Group Ltd JP Morgan 975
(100) Archer-Daniels-Midland Co Bank of AmericaMerrill Lynch (403)
(2,040) Archer-Daniels-Midland Co Citibank (5,907)(352) Archer-Daniels-Midland Co Credit Suisse (700)
(1,060) Archer-Daniels-Midland Co JP Morgan (2,107)(20) Arista Networks Inc Bank of America
Merrill Lynch (298)(28) Arista Networks Inc Credit Suisse (226)(74) Arista Networks Inc JP Morgan (598)110 Armstrong World Industries
Inc Citibank 548180 Ashland Global Holdings Inc Bank of America
Merrill Lynch 1,269250 Ashland Global Holdings Inc Credit Suisse 1,04370 Ashland Global Holdings Inc JP Morgan 292
113 Associated Banc-Corp Bank of AmericaMerrill Lynch 194
650 Associated Banc-Corp Credit Suisse (76)600 Associated Banc-Corp JP Morgan (70)90 Assurant Inc Citibank 124
998 Assured Guaranty Ltd Bank of AmericaMerrill Lynch 1,651
908 Assured Guaranty Ltd JP Morgan (1,796)(200) Athene Holding Ltd ’A’ Credit Suisse (205)(200) Athene Holding Ltd ’A’ JP Morgan (897)(50) Atlassian Corp Plc ’A’ Citibank 37
(110) Atlassian Corp Plc ’A’ Credit Suisse (553)180 Atmos Energy Corp Credit Suisse 78220 Autodesk Inc Bank of America
Merrill Lynch 394150 Autodesk Inc Citibank 92470 Autodesk Inc Credit Suisse 1,15583 Automatic Data Processing
Inc Citibank 659296 Automatic Data Processing
Inc Credit Suisse (612)170 AutoNation Inc Bank of America
Merrill Lynch 723240 AutoNation Inc Citibank 138620 AutoNation Inc Credit Suisse 1,176150 AutoNation Inc JP Morgan 285
BlackRock Total Advantage Fund continued
The notes on pages 691 to 711 form an integral part of these financial statements.
BlackRock Strategic Funds[660]

Contracts for difference as at 31 May 2020
Holding Description Counterparty
Netunrealised
appreciation/(depreciation)
EUR
United States continued13 AutoZone Inc Bank of America
Merrill Lynch 8268 AutoZone Inc Citibank 1635 AutoZone Inc Credit Suisse 395
60 Avalara Inc Bank of AmericaMerrill Lynch 53
(159) Avangrid Inc Bank of AmericaMerrill Lynch (623)
(190) Avangrid Inc Citibank (526)(240) Avangrid Inc Credit Suisse (337)
70 Avery Dennison Corp Bank of AmericaMerrill Lynch 606
161 Avery Dennison Corp JP Morgan 1221,590 Axalta Coating Systems Ltd Bank of America
Merrill Lynch 4,690756 Axalta Coating Systems Ltd Citibank 979563 Axalta Coating Systems Ltd Credit Suisse 1,706
1,050 Axalta Coating Systems Ltd JP Morgan 3,182280 Axis Capital Holdings Ltd Citibank 23180 Axis Capital Holdings Ltd Credit Suisse 487150 Axis Capital Holdings Ltd JP Morgan (174)(84) Baker Hughes Co Bank of America
Merrill Lynch (187)(244) Baker Hughes Co Citibank (244)(733) Baker Hughes Co Credit Suisse (804)(363) Baker Hughes Co JP Morgan (398)(430) Ball Corp Bank of America
Merrill Lynch (3,121)(180) Ball Corp Credit Suisse (1,183)(61) Ball Corp JP Morgan (315)260 Bank of New York Mellon
Corp JP Morgan 1,165(98) Bank OZK Bank of America
Merrill Lynch (241)(692) Bank OZK Citibank (915)(557) Bank OZK Credit Suisse (235)(211) Bank OZK JP Morgan (89)
70 BankUnited Inc Bank of AmericaMerrill Lynch 276
3,130 BankUnited Inc Citibank 7,037530 BankUnited Inc Credit Suisse 234
1,360 BankUnited Inc JP Morgan 599(350) Barrick Gold Corp Bank of America
Merrill Lynch 1,161(380) Barrick Gold Corp Credit Suisse 1,039(320) Bausch Health Cos Inc Bank of America
Merrill Lynch (751)(220) Bausch Health Cos Inc Citibank (117)
(1,100) Bausch Health Cos Inc Credit Suisse (1,523)(296) Bausch Health Cos Inc JP Morgan (410)(90) Baxter International Inc Bank of America
Merrill Lynch (197)(19) Becton Dickinson and Co Bank of America
Merrill Lynch 259(192) Becton Dickinson and Co Credit Suisse 1,962(19) Becton Dickinson and Co JP Morgan 194
(130) Berry Global Group Inc Bank of AmericaMerrill Lynch (511)
205 Best Buy Co Inc Bank of AmericaMerrill Lynch (433)
90 Best Buy Co Inc Citibank (53)361 Best Buy Co Inc Credit Suisse (779)313 Best Buy Co Inc JP Morgan (681)
3,380 BGC Partners Inc ’A’ Citibank 612,290 BGC Partners Inc ’A’ JP Morgan (577)
272 Biogen Inc Citibank (971)(80) BioMarin Pharmaceutical
IncBank of AmericaMerrill Lynch (866)
30 Bio-Rad Laboratories Inc ’A’ Citibank 195
Holding Description Counterparty
Netunrealised
appreciation/(depreciation)
EUR
United States continued40 Bio-Rad Laboratories Inc ’A’ Credit Suisse 83950 Bio-Rad Laboratories Inc ’A’ JP Morgan 1,048
(32) Bio-Techne Corp Citibank 179(73) Bio-Techne Corp Credit Suisse 678
(290) Black Knight Inc Citibank (613)(130) Black Knight Inc JP Morgan (491)(60) Bluebird Bio Inc Citibank 308
(380) Bluebird Bio Inc JP Morgan (615)(70) Boeing Co Bank of America
Merrill Lynch (1,638)(102) Boeing Co Citibank (779)(80) Boeing Co Credit Suisse (905)
9 Booking Holdings Inc Bank of AmericaMerrill Lynch 2,052
350 Booz Allen HamiltonHolding Corp Citibank 563
41 Booz Allen HamiltonHolding Corp Credit Suisse 170
615 Booz Allen HamiltonHolding Corp JP Morgan 2,555
(190) BorgWarner Inc Credit Suisse (741)(74) Boston Scientific Corp Bank of America
Merrill Lynch (175)(416) Boston Scientific Corp Citibank (580)
50 Bright Horizons FamilySolutions Inc
Bank of AmericaMerrill Lynch 615
80 Bright Horizons FamilySolutions Inc Citibank 486
250 Bright Horizons FamilySolutions Inc Credit Suisse 99
(440) Brighthouse Financial Inc JP Morgan (503)491 Bristol-Myers Squibb Co
CVR (Rights)Bank of AmericaMerrill Lynch 31
360 Bristol-Myers Squibb CoCVR (Rights) Citibank (332)
93 Bristol-Myers Squibb CoCVR (Rights) Credit Suisse (63)
290 Bristol-Myers Squibb CoCVR (Rights) JP Morgan (196)
(30) Broadcom Inc Bank of AmericaMerrill Lynch (657)
(40) Broadcom Inc Citibank (291)(60) Broadcom Inc JP Morgan (524)
(110) Broadridge FinancialSolutions Inc Citibank (217)
(130) Broadridge FinancialSolutions Inc Credit Suisse (256)
(147) Brookfield AssetManagement Inc ’A’ Citibank (194)
(735) Brookfield AssetManagement Inc ’A’ Credit Suisse 1,077
240 Brown & Brown Inc Citibank 369200 Brown & Brown Inc Credit Suisse 636(15) Brown-Forman Corp ’B’ Bank of America
Merrill Lynch 6(180) Brown-Forman Corp ’B’ Citibank (173)(180) Brown-Forman Corp ’B’ Credit Suisse 19(190) Brown-Forman Corp ’B’ JP Morgan 20130 Brunswick Corp Bank of America
Merrill Lynch 656130 Brunswick Corp JP Morgan 719
(410) Bunge Ltd Bank of AmericaMerrill Lynch (1,449)
(580) Bunge Ltd Citibank (1,502)190 Burlington Stores Inc Bank of America
Merrill Lynch 7,36880 Burlington Stores Inc Credit Suisse 2,29090 Burlington Stores Inc JP Morgan 2,576
(20) Cable One Inc JP Morgan 192
BlackRock Total Advantage Fund continued
The notes on pages 691 to 711 form an integral part of these financial statements.
Annual report and audited financial statements [661]

Contracts for difference as at 31 May 2020
Holding Description Counterparty
Netunrealised
appreciation/(depreciation)
EUR
United States continued380 Cabot Corp Bank of America
Merrill Lynch 2,402210 Cabot Corp Citibank 353280 Cabot Oil & Gas Corp JP Morgan (239)30 CACI International Inc ’A’ Bank of America
Merrill Lynch 412160 CACI International Inc ’A’ Citibank 963325 Cadence Design Systems
Inc Credit Suisse 1,906457 Cadence Design Systems
Inc JP Morgan 2,680(739) Caesars Entertainment
CorpBank of AmericaMerrill Lynch (857)
(1,349) Caesars EntertainmentCorp Citibank (255)
(97) Caesars EntertainmentCorp JP Morgan (141)
(23) Cantel Medical Corp Bank of AmericaMerrill Lynch (167)
(674) Cantel Medical Corp Citibank (3,819)(49) Cantel Medical Corp JP Morgan (181)368 Capital One Financial Corp Bank of America
Merrill Lynch 2,995239 Capital One Financial Corp Citibank 1,47730 Capital One Financial Corp Credit Suisse 132
(421) Capri Holdings Ltd Citibank (428)(907) Capri Holdings Ltd Credit Suisse (506)(30) Capri Holdings Ltd JP Morgan (17)
(120) Cardinal Health Inc Credit Suisse (490)146 Carlisle Cos Inc Citibank 59910 Carlisle Cos Incπ Credit Suisse —
(80) CarMax Inc Bank of AmericaMerrill Lynch (804)
(190) CarMax Inc Citibank (928)(130) CarMax Inc Credit Suisse (1,203)(60) CarMax Inc JP Morgan (555)
(670) Carnival Corp Citibank (482)80 Carter’s Inc Bank of America
Merrill Lynch 73080 Carter’s Inc Citibank 289
100 Carter’s Inc Credit Suisse 56480 Carter’s Inc JP Morgan 451
(60) Carvana Co Bank of AmericaMerrill Lynch (20)
(30) Carvana Co Citibank 92(400) Carvana Co JP Morgan 2,064
40 Casey’s General Stores Inc Citibank 15860 Casey’s General Stores Inc JP Morgan 216
(538) Catalent Inc Bank of AmericaMerrill Lynch (2,574)
(389) Catalent Inc Citibank (101)(132) Catalent Inc Credit Suisse (813)(196) Catalent Inc JP Morgan (1,207)(360) Caterpillar Inc Bank of America
Merrill Lynch (3,409)(50) Caterpillar Inc Citibank (269)(70) Caterpillar Inc JP Morgan (399)190 Cboe Global Markets Inc Citibank 810210 Cboe Global Markets Inc Credit Suisse 754
(220) CBRE Group Inc ’A’ Credit Suisse (372)130 CDK Global Inc Citibank 18140 CDK Global Inc Credit Suisse (206)53 CDW Corp Citibank 169
136 CDW Corp Credit Suisse 91140 CDW Corp JP Morgan 93(60) Centene Corp Bank of America
Merrill Lynch 133(110) Centene Corp Citibank (138)(430) Centene Corp JP Morgan (135)
Holding Description Counterparty
Netunrealised
appreciation/(depreciation)
EUR
United States continued(3,650) Centennial Resource
Development Inc ’A’Bank of AmericaMerrill Lynch (581)
(3,395) Centennial ResourceDevelopment Inc ’A’ Citibank (31)
(6,253) Centennial ResourceDevelopment Inc ’A’ Credit Suisse (1,125)
(4,075) Centennial ResourceDevelopment Inc ’A’ JP Morgan (733)
610 CenturyLink Inc Bank of AmericaMerrill Lynch 208
(20) Ceridian HCM Holding Inc Bank of AmericaMerrill Lynch (98)
(40) Ceridian HCM Holding Inc Citibank (191)(671) Ceridian HCM Holding Inc Credit Suisse (2,100)(75) Ceridian HCM Holding Inc JP Morgan (235)455 Cerner Corp Bank of America
Merrill Lynch 2,181430 Cerner Corp Citibank 1,22280 Cerner Corp Credit Suisse 122
800 Cerner Corp JP Morgan 1,357190 CF Industries Holdings Inc Citibank 238(90) Charles River Laboratories
International IncBank of AmericaMerrill Lynch (457)
(40) Charles River LaboratoriesInternational Inc Citibank (66)
(430) Charles Schwab Corp Citibank (1,145)(320) Charles Schwab Corp Credit Suisse 207(230) Charles Schwab Corp JP Morgan (361)(10) Charter Communications
Inc ’A’Bank of AmericaMerrill Lynch (346)
(30) Charter CommunicationsInc ’A’ Citibank (782)
44 Chemed Corp Citibank 154(490) Chemours Co Bank of America
Merrill Lynch (1,009)(1,020) Chemours Co Citibank (853)
(200) Chemours Co Credit Suisse (85)(230) Cheniere Energy Inc Citibank 494(140) Cheniere Energy Inc Credit Suisse (214)(140) Cheniere Energy Inc JP Morgan 91
10 Chipotle Mexican Grill Inc Bank of AmericaMerrill Lynch 217
(160) Choice Hotels InternationalInc Credit Suisse (1,049)
(320) Choice Hotels InternationalInc JP Morgan (2,098)
820 Ciena Corp Bank of AmericaMerrill Lynch 3,503
305 Ciena Corp Citibank 436(70) Cigna Corp Bank of America
Merrill Lynch (477)(50) Cigna Corp Citibank (393)(70) Cigna Corp Credit Suisse (533)380 Cinemark Holdings Inc Bank of America
Merrill Lynch 1,0901,180 Cinemark Holdings Inc Citibank 1,093(470) Cisco Systems Inc Credit Suisse (1,200)(160) Cisco Systems Inc JP Morgan (409)758 CIT Group Inc Bank of America
Merrill Lynch 2,802300 CIT Group Inc Citibank 634120 CIT Group Inc Credit Suisse 201980 CIT Group Inc JP Morgan 1,639290 Citigroup Inc Bank of America
Merrill Lynch 1,674140 Citigroup Inc JP Morgan 959208 Citizens Financial Group Inc Bank of America
Merrill Lynch 7351,029 Citizens Financial Group Inc Citibank 2,378
BlackRock Total Advantage Fund continued
The notes on pages 691 to 711 form an integral part of these financial statements.
BlackRock Strategic Funds[662]
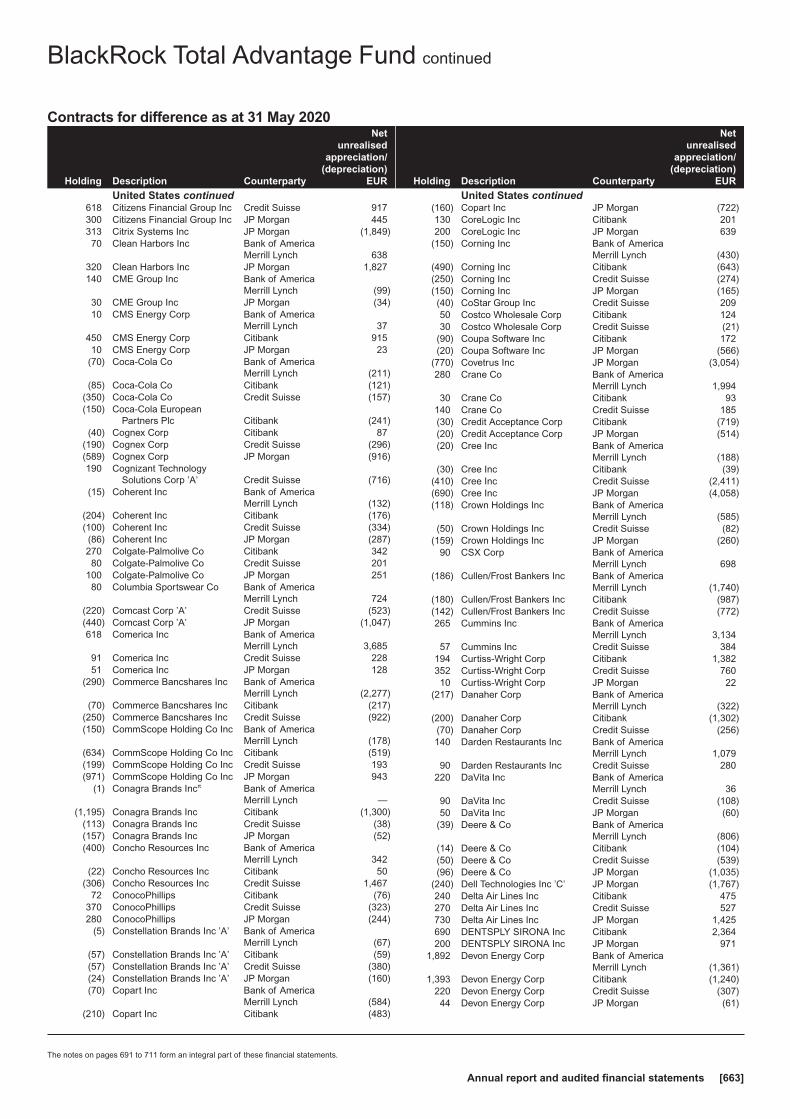
Contracts for difference as at 31 May 2020
Holding Description Counterparty
Netunrealised
appreciation/(depreciation)
EUR
United States continued618 Citizens Financial Group Inc Credit Suisse 917300 Citizens Financial Group Inc JP Morgan 445313 Citrix Systems Inc JP Morgan (1,849)70 Clean Harbors Inc Bank of America
Merrill Lynch 638320 Clean Harbors Inc JP Morgan 1,827140 CME Group Inc Bank of America
Merrill Lynch (99)30 CME Group Inc JP Morgan (34)10 CMS Energy Corp Bank of America
Merrill Lynch 37450 CMS Energy Corp Citibank 91510 CMS Energy Corp JP Morgan 23
(70) Coca-Cola Co Bank of AmericaMerrill Lynch (211)
(85) Coca-Cola Co Citibank (121)(350) Coca-Cola Co Credit Suisse (157)(150) Coca-Cola European
Partners Plc Citibank (241)(40) Cognex Corp Citibank 87
(190) Cognex Corp Credit Suisse (296)(589) Cognex Corp JP Morgan (916)190 Cognizant Technology
Solutions Corp ’A’ Credit Suisse (716)(15) Coherent Inc Bank of America
Merrill Lynch (132)(204) Coherent Inc Citibank (176)(100) Coherent Inc Credit Suisse (334)(86) Coherent Inc JP Morgan (287)270 Colgate-Palmolive Co Citibank 34280 Colgate-Palmolive Co Credit Suisse 201
100 Colgate-Palmolive Co JP Morgan 25180 Columbia Sportswear Co Bank of America
Merrill Lynch 724(220) Comcast Corp ’A’ Credit Suisse (523)(440) Comcast Corp ’A’ JP Morgan (1,047)618 Comerica Inc Bank of America
Merrill Lynch 3,68591 Comerica Inc Credit Suisse 22851 Comerica Inc JP Morgan 128
(290) Commerce Bancshares Inc Bank of AmericaMerrill Lynch (2,277)
(70) Commerce Bancshares Inc Citibank (217)(250) Commerce Bancshares Inc Credit Suisse (922)(150) CommScope Holding Co Inc Bank of America
Merrill Lynch (178)(634) CommScope Holding Co Inc Citibank (519)(199) CommScope Holding Co Inc Credit Suisse 193(971) CommScope Holding Co Inc JP Morgan 943
(1) Conagra Brands Incπ Bank of AmericaMerrill Lynch —
(1,195) Conagra Brands Inc Citibank (1,300)(113) Conagra Brands Inc Credit Suisse (38)(157) Conagra Brands Inc JP Morgan (52)(400) Concho Resources Inc Bank of America
Merrill Lynch 342(22) Concho Resources Inc Citibank 50
(306) Concho Resources Inc Credit Suisse 1,46772 ConocoPhillips Citibank (76)
370 ConocoPhillips Credit Suisse (323)280 ConocoPhillips JP Morgan (244)
(5) Constellation Brands Inc ’A’ Bank of AmericaMerrill Lynch (67)
(57) Constellation Brands Inc ’A’ Citibank (59)(57) Constellation Brands Inc ’A’ Credit Suisse (380)(24) Constellation Brands Inc ’A’ JP Morgan (160)(70) Copart Inc Bank of America
Merrill Lynch (584)(210) Copart Inc Citibank (483)
Holding Description Counterparty
Netunrealised
appreciation/(depreciation)
EUR
United States continued(160) Copart Inc JP Morgan (722)130 CoreLogic Inc Citibank 201200 CoreLogic Inc JP Morgan 639
(150) Corning Inc Bank of AmericaMerrill Lynch (430)
(490) Corning Inc Citibank (643)(250) Corning Inc Credit Suisse (274)(150) Corning Inc JP Morgan (165)(40) CoStar Group Inc Credit Suisse 20950 Costco Wholesale Corp Citibank 12430 Costco Wholesale Corp Credit Suisse (21)
(90) Coupa Software Inc Citibank 172(20) Coupa Software Inc JP Morgan (566)
(770) Covetrus Inc JP Morgan (3,054)280 Crane Co Bank of America
Merrill Lynch 1,99430 Crane Co Citibank 93
140 Crane Co Credit Suisse 185(30) Credit Acceptance Corp Citibank (719)(20) Credit Acceptance Corp JP Morgan (514)(20) Cree Inc Bank of America
Merrill Lynch (188)(30) Cree Inc Citibank (39)
(410) Cree Inc Credit Suisse (2,411)(690) Cree Inc JP Morgan (4,058)(118) Crown Holdings Inc Bank of America
Merrill Lynch (585)(50) Crown Holdings Inc Credit Suisse (82)
(159) Crown Holdings Inc JP Morgan (260)90 CSX Corp Bank of America
Merrill Lynch 698(186) Cullen/Frost Bankers Inc Bank of America
Merrill Lynch (1,740)(180) Cullen/Frost Bankers Inc Citibank (987)(142) Cullen/Frost Bankers Inc Credit Suisse (772)265 Cummins Inc Bank of America
Merrill Lynch 3,13457 Cummins Inc Credit Suisse 384
194 Curtiss-Wright Corp Citibank 1,382352 Curtiss-Wright Corp Credit Suisse 76010 Curtiss-Wright Corp JP Morgan 22
(217) Danaher Corp Bank of AmericaMerrill Lynch (322)
(200) Danaher Corp Citibank (1,302)(70) Danaher Corp Credit Suisse (256)140 Darden Restaurants Inc Bank of America
Merrill Lynch 1,07990 Darden Restaurants Inc Credit Suisse 280
220 DaVita Inc Bank of AmericaMerrill Lynch 36
90 DaVita Inc Credit Suisse (108)50 DaVita Inc JP Morgan (60)
(39) Deere & Co Bank of AmericaMerrill Lynch (806)
(14) Deere & Co Citibank (104)(50) Deere & Co Credit Suisse (539)(96) Deere & Co JP Morgan (1,035)
(240) Dell Technologies Inc ’C’ JP Morgan (1,767)240 Delta Air Lines Inc Citibank 475270 Delta Air Lines Inc Credit Suisse 527730 Delta Air Lines Inc JP Morgan 1,425690 DENTSPLY SIRONA Inc Citibank 2,364200 DENTSPLY SIRONA Inc JP Morgan 971
1,892 Devon Energy Corp Bank of AmericaMerrill Lynch (1,361)
1,393 Devon Energy Corp Citibank (1,240)220 Devon Energy Corp Credit Suisse (307)44 Devon Energy Corp JP Morgan (61)
BlackRock Total Advantage Fund continued
The notes on pages 691 to 711 form an integral part of these financial statements.
Annual report and audited financial statements [663]
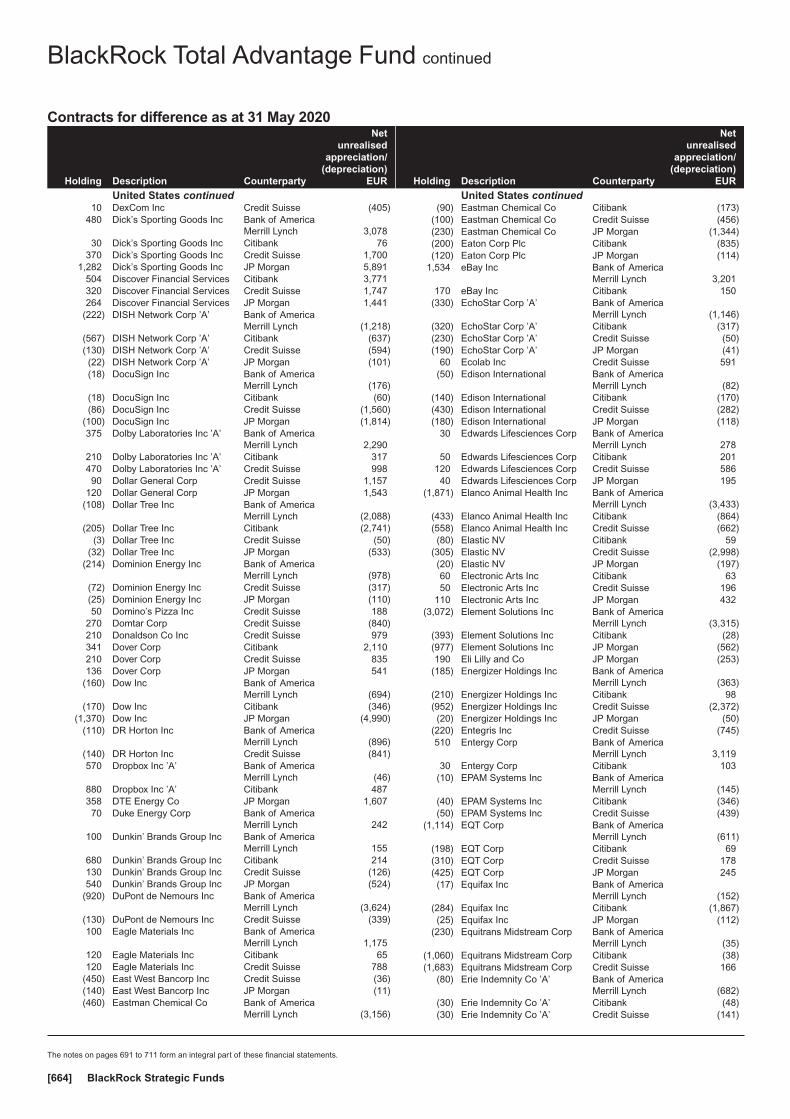
Contracts for difference as at 31 May 2020
Holding Description Counterparty
Netunrealised
appreciation/(depreciation)
EUR
United States continued10 DexCom Inc Credit Suisse (405)
480 Dick’s Sporting Goods Inc Bank of AmericaMerrill Lynch 3,078
30 Dick’s Sporting Goods Inc Citibank 76370 Dick’s Sporting Goods Inc Credit Suisse 1,700
1,282 Dick’s Sporting Goods Inc JP Morgan 5,891504 Discover Financial Services Citibank 3,771320 Discover Financial Services Credit Suisse 1,747264 Discover Financial Services JP Morgan 1,441
(222) DISH Network Corp ’A’ Bank of AmericaMerrill Lynch (1,218)
(567) DISH Network Corp ’A’ Citibank (637)(130) DISH Network Corp ’A’ Credit Suisse (594)(22) DISH Network Corp ’A’ JP Morgan (101)(18) DocuSign Inc Bank of America
Merrill Lynch (176)(18) DocuSign Inc Citibank (60)(86) DocuSign Inc Credit Suisse (1,560)
(100) DocuSign Inc JP Morgan (1,814)375 Dolby Laboratories Inc ’A’ Bank of America
Merrill Lynch 2,290210 Dolby Laboratories Inc ’A’ Citibank 317470 Dolby Laboratories Inc ’A’ Credit Suisse 99890 Dollar General Corp Credit Suisse 1,157
120 Dollar General Corp JP Morgan 1,543(108) Dollar Tree Inc Bank of America
Merrill Lynch (2,088)(205) Dollar Tree Inc Citibank (2,741)
(3) Dollar Tree Inc Credit Suisse (50)(32) Dollar Tree Inc JP Morgan (533)
(214) Dominion Energy Inc Bank of AmericaMerrill Lynch (978)
(72) Dominion Energy Inc Credit Suisse (317)(25) Dominion Energy Inc JP Morgan (110)50 Domino’s Pizza Inc Credit Suisse 188
270 Domtar Corp Credit Suisse (840)210 Donaldson Co Inc Credit Suisse 979341 Dover Corp Citibank 2,110210 Dover Corp Credit Suisse 835136 Dover Corp JP Morgan 541
(160) Dow Inc Bank of AmericaMerrill Lynch (694)
(170) Dow Inc Citibank (346)(1,370) Dow Inc JP Morgan (4,990)
(110) DR Horton Inc Bank of AmericaMerrill Lynch (896)
(140) DR Horton Inc Credit Suisse (841)570 Dropbox Inc ’A’ Bank of America
Merrill Lynch (46)880 Dropbox Inc ’A’ Citibank 487358 DTE Energy Co JP Morgan 1,60770 Duke Energy Corp Bank of America
Merrill Lynch 242100 Dunkin’ Brands Group Inc Bank of America
Merrill Lynch 155680 Dunkin’ Brands Group Inc Citibank 214130 Dunkin’ Brands Group Inc Credit Suisse (126)540 Dunkin’ Brands Group Inc JP Morgan (524)
(920) DuPont de Nemours Inc Bank of AmericaMerrill Lynch (3,624)
(130) DuPont de Nemours Inc Credit Suisse (339)100 Eagle Materials Inc Bank of America
Merrill Lynch 1,175120 Eagle Materials Inc Citibank 65120 Eagle Materials Inc Credit Suisse 788
(450) East West Bancorp Inc Credit Suisse (36)(140) East West Bancorp Inc JP Morgan (11)(460) Eastman Chemical Co Bank of America
Merrill Lynch (3,156)
Holding Description Counterparty
Netunrealised
appreciation/(depreciation)
EUR
United States continued(90) Eastman Chemical Co Citibank (173)
(100) Eastman Chemical Co Credit Suisse (456)(230) Eastman Chemical Co JP Morgan (1,344)(200) Eaton Corp Plc Citibank (835)(120) Eaton Corp Plc JP Morgan (114)
1,534 eBay Inc Bank of AmericaMerrill Lynch 3,201
170 eBay Inc Citibank 150(330) EchoStar Corp ’A’ Bank of America
Merrill Lynch (1,146)(320) EchoStar Corp ’A’ Citibank (317)(230) EchoStar Corp ’A’ Credit Suisse (50)(190) EchoStar Corp ’A’ JP Morgan (41)
60 Ecolab Inc Credit Suisse 591(50) Edison International Bank of America
Merrill Lynch (82)(140) Edison International Citibank (170)(430) Edison International Credit Suisse (282)(180) Edison International JP Morgan (118)
30 Edwards Lifesciences Corp Bank of AmericaMerrill Lynch 278
50 Edwards Lifesciences Corp Citibank 201120 Edwards Lifesciences Corp Credit Suisse 58640 Edwards Lifesciences Corp JP Morgan 195
(1,871) Elanco Animal Health Inc Bank of AmericaMerrill Lynch (3,433)
(433) Elanco Animal Health Inc Citibank (864)(558) Elanco Animal Health Inc Credit Suisse (662)(80) Elastic NV Citibank 59
(305) Elastic NV Credit Suisse (2,998)(20) Elastic NV JP Morgan (197)60 Electronic Arts Inc Citibank 6350 Electronic Arts Inc Credit Suisse 196
110 Electronic Arts Inc JP Morgan 432(3,072) Element Solutions Inc Bank of America
Merrill Lynch (3,315)(393) Element Solutions Inc Citibank (28)(977) Element Solutions Inc JP Morgan (562)190 Eli Lilly and Co JP Morgan (253)
(185) Energizer Holdings Inc Bank of AmericaMerrill Lynch (363)
(210) Energizer Holdings Inc Citibank 98(952) Energizer Holdings Inc Credit Suisse (2,372)(20) Energizer Holdings Inc JP Morgan (50)
(220) Entegris Inc Credit Suisse (745)510 Entergy Corp Bank of America
Merrill Lynch 3,11930 Entergy Corp Citibank 103
(10) EPAM Systems Inc Bank of AmericaMerrill Lynch (145)
(40) EPAM Systems Inc Citibank (346)(50) EPAM Systems Inc Credit Suisse (439)
(1,114) EQT Corp Bank of AmericaMerrill Lynch (611)
(198) EQT Corp Citibank 69(310) EQT Corp Credit Suisse 178(425) EQT Corp JP Morgan 245(17) Equifax Inc Bank of America
Merrill Lynch (152)(284) Equifax Inc Citibank (1,867)(25) Equifax Inc JP Morgan (112)
(230) Equitrans Midstream Corp Bank of AmericaMerrill Lynch (35)
(1,060) Equitrans Midstream Corp Citibank (38)(1,683) Equitrans Midstream Corp Credit Suisse 166
(80) Erie Indemnity Co ’A’ Bank of AmericaMerrill Lynch (682)
(30) Erie Indemnity Co ’A’ Citibank (48)(30) Erie Indemnity Co ’A’ Credit Suisse (141)
BlackRock Total Advantage Fund continued
The notes on pages 691 to 711 form an integral part of these financial statements.
BlackRock Strategic Funds[664]
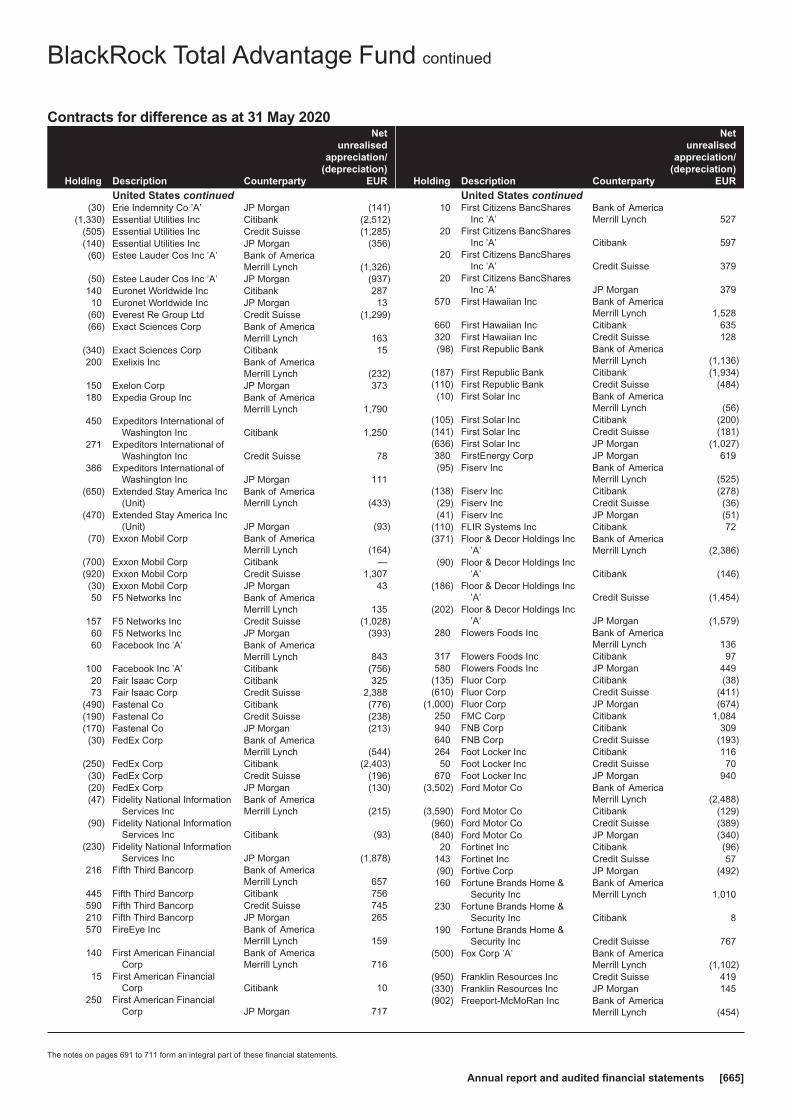
Contracts for difference as at 31 May 2020
Holding Description Counterparty
Netunrealised
appreciation/(depreciation)
EUR
United States continued(30) Erie Indemnity Co ’A’ JP Morgan (141)
(1,330) Essential Utilities Inc Citibank (2,512)(505) Essential Utilities Inc Credit Suisse (1,285)(140) Essential Utilities Inc JP Morgan (356)(60) Estee Lauder Cos Inc ’A’ Bank of America
Merrill Lynch (1,326)(50) Estee Lauder Cos Inc ’A’ JP Morgan (937)140 Euronet Worldwide Inc Citibank 28710 Euronet Worldwide Inc JP Morgan 13
(60) Everest Re Group Ltd Credit Suisse (1,299)(66) Exact Sciences Corp Bank of America
Merrill Lynch 163(340) Exact Sciences Corp Citibank 15200 Exelixis Inc Bank of America
Merrill Lynch (232)150 Exelon Corp JP Morgan 373180 Expedia Group Inc Bank of America
Merrill Lynch 1,790450 Expeditors International of
Washington Inc Citibank 1,250271 Expeditors International of
Washington Inc Credit Suisse 78386 Expeditors International of
Washington Inc JP Morgan 111(650) Extended Stay America Inc
(Unit)Bank of AmericaMerrill Lynch (433)
(470) Extended Stay America Inc(Unit) JP Morgan (93)
(70) Exxon Mobil Corp Bank of AmericaMerrill Lynch (164)
(700) Exxon Mobil Corp Citibank —(920) Exxon Mobil Corp Credit Suisse 1,307(30) Exxon Mobil Corp JP Morgan 4350 F5 Networks Inc Bank of America
Merrill Lynch 135157 F5 Networks Inc Credit Suisse (1,028)60 F5 Networks Inc JP Morgan (393)60 Facebook Inc ’A’ Bank of America
Merrill Lynch 843100 Facebook Inc ’A’ Citibank (756)20 Fair Isaac Corp Citibank 32573 Fair Isaac Corp Credit Suisse 2,388
(490) Fastenal Co Citibank (776)(190) Fastenal Co Credit Suisse (238)(170) Fastenal Co JP Morgan (213)(30) FedEx Corp Bank of America
Merrill Lynch (544)(250) FedEx Corp Citibank (2,403)(30) FedEx Corp Credit Suisse (196)(20) FedEx Corp JP Morgan (130)(47) Fidelity National Information
Services IncBank of AmericaMerrill Lynch (215)
(90) Fidelity National InformationServices Inc Citibank (93)
(230) Fidelity National InformationServices Inc JP Morgan (1,878)
216 Fifth Third Bancorp Bank of AmericaMerrill Lynch 657
445 Fifth Third Bancorp Citibank 756590 Fifth Third Bancorp Credit Suisse 745210 Fifth Third Bancorp JP Morgan 265570 FireEye Inc Bank of America
Merrill Lynch 159140 First American Financial
CorpBank of AmericaMerrill Lynch 716
15 First American FinancialCorp Citibank 10
250 First American FinancialCorp JP Morgan 717
Holding Description Counterparty
Netunrealised
appreciation/(depreciation)
EUR
United States continued10 First Citizens BancShares
Inc ’A’Bank of AmericaMerrill Lynch 527
20 First Citizens BancSharesInc ’A’ Citibank 597
20 First Citizens BancSharesInc ’A’ Credit Suisse 379
20 First Citizens BancSharesInc ’A’ JP Morgan 379
570 First Hawaiian Inc Bank of AmericaMerrill Lynch 1,528
660 First Hawaiian Inc Citibank 635320 First Hawaiian Inc Credit Suisse 128(98) First Republic Bank Bank of America
Merrill Lynch (1,136)(187) First Republic Bank Citibank (1,934)(110) First Republic Bank Credit Suisse (484)(10) First Solar Inc Bank of America
Merrill Lynch (56)(105) First Solar Inc Citibank (200)(141) First Solar Inc Credit Suisse (181)(636) First Solar Inc JP Morgan (1,027)380 FirstEnergy Corp JP Morgan 619(95) Fiserv Inc Bank of America
Merrill Lynch (525)(138) Fiserv Inc Citibank (278)(29) Fiserv Inc Credit Suisse (36)(41) Fiserv Inc JP Morgan (51)
(110) FLIR Systems Inc Citibank 72(371) Floor & Decor Holdings Inc
’A’Bank of AmericaMerrill Lynch (2,386)
(90) Floor & Decor Holdings Inc’A’ Citibank (146)
(186) Floor & Decor Holdings Inc’A’ Credit Suisse (1,454)
(202) Floor & Decor Holdings Inc’A’ JP Morgan (1,579)
280 Flowers Foods Inc Bank of AmericaMerrill Lynch 136
317 Flowers Foods Inc Citibank 97580 Flowers Foods Inc JP Morgan 449
(135) Fluor Corp Citibank (38)(610) Fluor Corp Credit Suisse (411)
(1,000) Fluor Corp JP Morgan (674)250 FMC Corp Citibank 1,084940 FNB Corp Citibank 309640 FNB Corp Credit Suisse (193)264 Foot Locker Inc Citibank 11650 Foot Locker Inc Credit Suisse 70
670 Foot Locker Inc JP Morgan 940(3,502) Ford Motor Co Bank of America
Merrill Lynch (2,488)(3,590) Ford Motor Co Citibank (129)
(960) Ford Motor Co Credit Suisse (389)(840) Ford Motor Co JP Morgan (340)
20 Fortinet Inc Citibank (96)143 Fortinet Inc Credit Suisse 57(90) Fortive Corp JP Morgan (492)160 Fortune Brands Home &
Security IncBank of AmericaMerrill Lynch 1,010
230 Fortune Brands Home &Security Inc Citibank 8
190 Fortune Brands Home &Security Inc Credit Suisse 767
(500) Fox Corp ’A’ Bank of AmericaMerrill Lynch (1,102)
(950) Franklin Resources Inc Credit Suisse 419(330) Franklin Resources Inc JP Morgan 145(902) Freeport-McMoRan Inc Bank of America
Merrill Lynch (454)
BlackRock Total Advantage Fund continued
The notes on pages 691 to 711 form an integral part of these financial statements.
Annual report and audited financial statements [665]
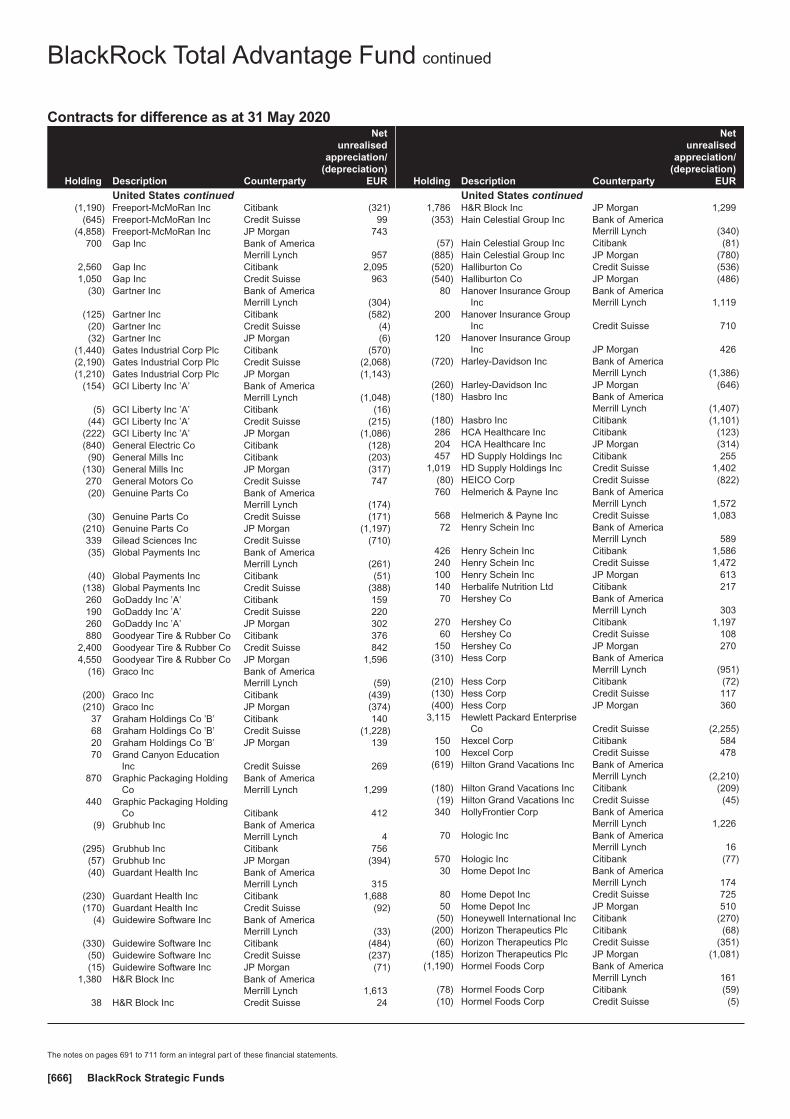
Contracts for difference as at 31 May 2020
Holding Description Counterparty
Netunrealised
appreciation/(depreciation)
EUR
United States continued(1,190) Freeport-McMoRan Inc Citibank (321)
(645) Freeport-McMoRan Inc Credit Suisse 99(4,858) Freeport-McMoRan Inc JP Morgan 743
700 Gap Inc Bank of AmericaMerrill Lynch 957
2,560 Gap Inc Citibank 2,0951,050 Gap Inc Credit Suisse 963
(30) Gartner Inc Bank of AmericaMerrill Lynch (304)
(125) Gartner Inc Citibank (582)(20) Gartner Inc Credit Suisse (4)(32) Gartner Inc JP Morgan (6)
(1,440) Gates Industrial Corp Plc Citibank (570)(2,190) Gates Industrial Corp Plc Credit Suisse (2,068)(1,210) Gates Industrial Corp Plc JP Morgan (1,143)
(154) GCI Liberty Inc ’A’ Bank of AmericaMerrill Lynch (1,048)
(5) GCI Liberty Inc ’A’ Citibank (16)(44) GCI Liberty Inc ’A’ Credit Suisse (215)
(222) GCI Liberty Inc ’A’ JP Morgan (1,086)(840) General Electric Co Citibank (128)(90) General Mills Inc Citibank (203)
(130) General Mills Inc JP Morgan (317)270 General Motors Co Credit Suisse 747(20) Genuine Parts Co Bank of America
Merrill Lynch (174)(30) Genuine Parts Co Credit Suisse (171)
(210) Genuine Parts Co JP Morgan (1,197)339 Gilead Sciences Inc Credit Suisse (710)(35) Global Payments Inc Bank of America
Merrill Lynch (261)(40) Global Payments Inc Citibank (51)
(138) Global Payments Inc Credit Suisse (388)260 GoDaddy Inc ’A’ Citibank 159190 GoDaddy Inc ’A’ Credit Suisse 220260 GoDaddy Inc ’A’ JP Morgan 302880 Goodyear Tire & Rubber Co Citibank 376
2,400 Goodyear Tire & Rubber Co Credit Suisse 8424,550 Goodyear Tire & Rubber Co JP Morgan 1,596
(16) Graco Inc Bank of AmericaMerrill Lynch (59)
(200) Graco Inc Citibank (439)(210) Graco Inc JP Morgan (374)
37 Graham Holdings Co ’B’ Citibank 14068 Graham Holdings Co ’B’ Credit Suisse (1,228)20 Graham Holdings Co ’B’ JP Morgan 13970 Grand Canyon Education
Inc Credit Suisse 269870 Graphic Packaging Holding
CoBank of AmericaMerrill Lynch 1,299
440 Graphic Packaging HoldingCo Citibank 412
(9) Grubhub Inc Bank of AmericaMerrill Lynch 4
(295) Grubhub Inc Citibank 756(57) Grubhub Inc JP Morgan (394)(40) Guardant Health Inc Bank of America
Merrill Lynch 315(230) Guardant Health Inc Citibank 1,688(170) Guardant Health Inc Credit Suisse (92)
(4) Guidewire Software Inc Bank of AmericaMerrill Lynch (33)
(330) Guidewire Software Inc Citibank (484)(50) Guidewire Software Inc Credit Suisse (237)(15) Guidewire Software Inc JP Morgan (71)
1,380 H&R Block Inc Bank of AmericaMerrill Lynch 1,613
38 H&R Block Inc Credit Suisse 24
Holding Description Counterparty
Netunrealised
appreciation/(depreciation)
EUR
United States continued1,786 H&R Block Inc JP Morgan 1,299(353) Hain Celestial Group Inc Bank of America
Merrill Lynch (340)(57) Hain Celestial Group Inc Citibank (81)
(885) Hain Celestial Group Inc JP Morgan (780)(520) Halliburton Co Credit Suisse (536)(540) Halliburton Co JP Morgan (486)
80 Hanover Insurance GroupInc
Bank of AmericaMerrill Lynch 1,119
200 Hanover Insurance GroupInc Credit Suisse 710
120 Hanover Insurance GroupInc JP Morgan 426
(720) Harley-Davidson Inc Bank of AmericaMerrill Lynch (1,386)
(260) Harley-Davidson Inc JP Morgan (646)(180) Hasbro Inc Bank of America
Merrill Lynch (1,407)(180) Hasbro Inc Citibank (1,101)286 HCA Healthcare Inc Citibank (123)204 HCA Healthcare Inc JP Morgan (314)457 HD Supply Holdings Inc Citibank 255
1,019 HD Supply Holdings Inc Credit Suisse 1,402(80) HEICO Corp Credit Suisse (822)760 Helmerich & Payne Inc Bank of America
Merrill Lynch 1,572568 Helmerich & Payne Inc Credit Suisse 1,08372 Henry Schein Inc Bank of America
Merrill Lynch 589426 Henry Schein Inc Citibank 1,586240 Henry Schein Inc Credit Suisse 1,472100 Henry Schein Inc JP Morgan 613140 Herbalife Nutrition Ltd Citibank 21770 Hershey Co Bank of America
Merrill Lynch 303270 Hershey Co Citibank 1,19760 Hershey Co Credit Suisse 108
150 Hershey Co JP Morgan 270(310) Hess Corp Bank of America
Merrill Lynch (951)(210) Hess Corp Citibank (72)(130) Hess Corp Credit Suisse 117(400) Hess Corp JP Morgan 360
3,115 Hewlett Packard EnterpriseCo Credit Suisse (2,255)
150 Hexcel Corp Citibank 584100 Hexcel Corp Credit Suisse 478
(619) Hilton Grand Vacations Inc Bank of AmericaMerrill Lynch (2,210)
(180) Hilton Grand Vacations Inc Citibank (209)(19) Hilton Grand Vacations Inc Credit Suisse (45)340 HollyFrontier Corp Bank of America
Merrill Lynch 1,22670 Hologic Inc Bank of America
Merrill Lynch 16570 Hologic Inc Citibank (77)30 Home Depot Inc Bank of America
Merrill Lynch 17480 Home Depot Inc Credit Suisse 72550 Home Depot Inc JP Morgan 510
(50) Honeywell International Inc Citibank (270)(200) Horizon Therapeutics Plc Citibank (68)(60) Horizon Therapeutics Plc Credit Suisse (351)
(185) Horizon Therapeutics Plc JP Morgan (1,081)(1,190) Hormel Foods Corp Bank of America
Merrill Lynch 161(78) Hormel Foods Corp Citibank (59)(10) Hormel Foods Corp Credit Suisse (5)
BlackRock Total Advantage Fund continued
The notes on pages 691 to 711 form an integral part of these financial statements.
BlackRock Strategic Funds[666]
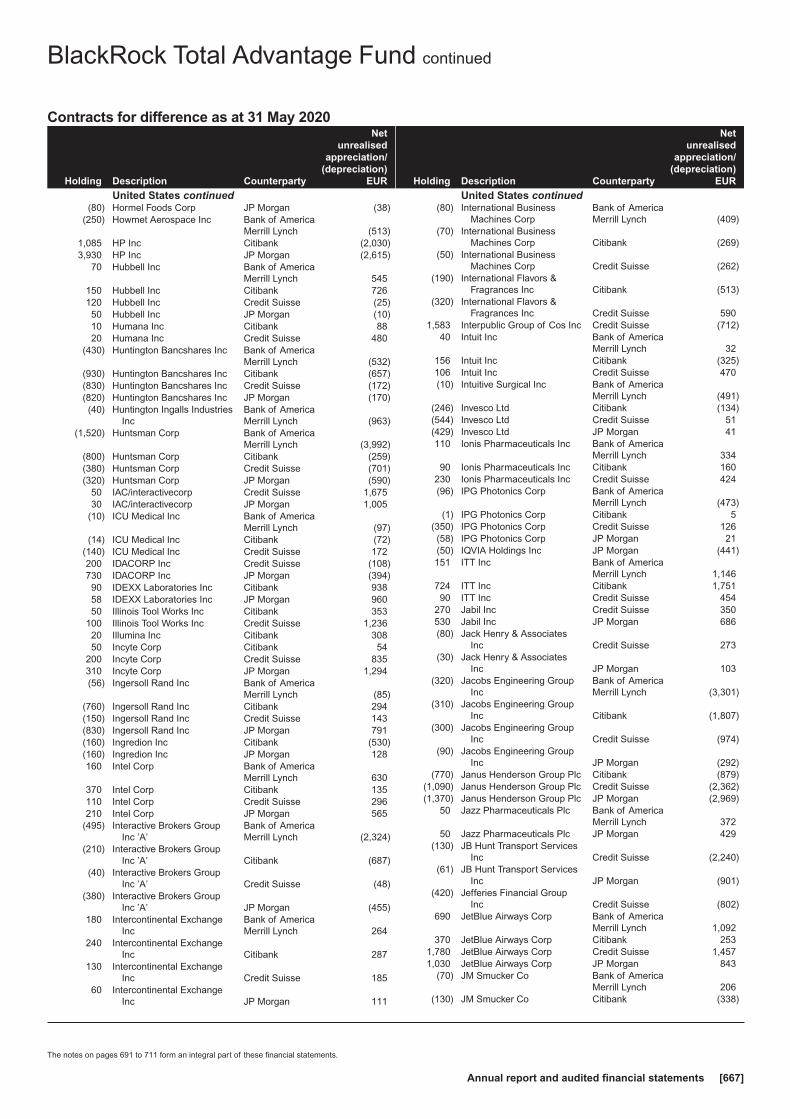
Contracts for difference as at 31 May 2020
Holding Description Counterparty
Netunrealised
appreciation/(depreciation)
EUR
United States continued(80) Hormel Foods Corp JP Morgan (38)
(250) Howmet Aerospace Inc Bank of AmericaMerrill Lynch (513)
1,085 HP Inc Citibank (2,030)3,930 HP Inc JP Morgan (2,615)
70 Hubbell Inc Bank of AmericaMerrill Lynch 545
150 Hubbell Inc Citibank 726120 Hubbell Inc Credit Suisse (25)50 Hubbell Inc JP Morgan (10)10 Humana Inc Citibank 8820 Humana Inc Credit Suisse 480
(430) Huntington Bancshares Inc Bank of AmericaMerrill Lynch (532)
(930) Huntington Bancshares Inc Citibank (657)(830) Huntington Bancshares Inc Credit Suisse (172)(820) Huntington Bancshares Inc JP Morgan (170)(40) Huntington Ingalls Industries
IncBank of AmericaMerrill Lynch (963)
(1,520) Huntsman Corp Bank of AmericaMerrill Lynch (3,992)
(800) Huntsman Corp Citibank (259)(380) Huntsman Corp Credit Suisse (701)(320) Huntsman Corp JP Morgan (590)
50 IAC/interactivecorp Credit Suisse 1,67530 IAC/interactivecorp JP Morgan 1,005
(10) ICU Medical Inc Bank of AmericaMerrill Lynch (97)
(14) ICU Medical Inc Citibank (72)(140) ICU Medical Inc Credit Suisse 172200 IDACORP Inc Credit Suisse (108)730 IDACORP Inc JP Morgan (394)90 IDEXX Laboratories Inc Citibank 93858 IDEXX Laboratories Inc JP Morgan 96050 Illinois Tool Works Inc Citibank 353
100 Illinois Tool Works Inc Credit Suisse 1,23620 Illumina Inc Citibank 30850 Incyte Corp Citibank 54
200 Incyte Corp Credit Suisse 835310 Incyte Corp JP Morgan 1,294(56) Ingersoll Rand Inc Bank of America
Merrill Lynch (85)(760) Ingersoll Rand Inc Citibank 294(150) Ingersoll Rand Inc Credit Suisse 143(830) Ingersoll Rand Inc JP Morgan 791(160) Ingredion Inc Citibank (530)(160) Ingredion Inc JP Morgan 128160 Intel Corp Bank of America
Merrill Lynch 630370 Intel Corp Citibank 135110 Intel Corp Credit Suisse 296210 Intel Corp JP Morgan 565
(495) Interactive Brokers GroupInc ’A’
Bank of AmericaMerrill Lynch (2,324)
(210) Interactive Brokers GroupInc ’A’ Citibank (687)
(40) Interactive Brokers GroupInc ’A’ Credit Suisse (48)
(380) Interactive Brokers GroupInc ’A’ JP Morgan (455)
180 Intercontinental ExchangeInc
Bank of AmericaMerrill Lynch 264
240 Intercontinental ExchangeInc Citibank 287
130 Intercontinental ExchangeInc Credit Suisse 185
60 Intercontinental ExchangeInc JP Morgan 111
Holding Description Counterparty
Netunrealised
appreciation/(depreciation)
EUR
United States continued(80) International Business
Machines CorpBank of AmericaMerrill Lynch (409)
(70) International BusinessMachines Corp Citibank (269)
(50) International BusinessMachines Corp Credit Suisse (262)
(190) International Flavors &Fragrances Inc Citibank (513)
(320) International Flavors &Fragrances Inc Credit Suisse 590
1,583 Interpublic Group of Cos Inc Credit Suisse (712)40 Intuit Inc Bank of America
Merrill Lynch 32156 Intuit Inc Citibank (325)106 Intuit Inc Credit Suisse 470(10) Intuitive Surgical Inc Bank of America
Merrill Lynch (491)(246) Invesco Ltd Citibank (134)(544) Invesco Ltd Credit Suisse 51(429) Invesco Ltd JP Morgan 41110 Ionis Pharmaceuticals Inc Bank of America
Merrill Lynch 33490 Ionis Pharmaceuticals Inc Citibank 160
230 Ionis Pharmaceuticals Inc Credit Suisse 424(96) IPG Photonics Corp Bank of America
Merrill Lynch (473)(1) IPG Photonics Corp Citibank 5
(350) IPG Photonics Corp Credit Suisse 126(58) IPG Photonics Corp JP Morgan 21(50) IQVIA Holdings Inc JP Morgan (441)151 ITT Inc Bank of America
Merrill Lynch 1,146724 ITT Inc Citibank 1,75190 ITT Inc Credit Suisse 454
270 Jabil Inc Credit Suisse 350530 Jabil Inc JP Morgan 686(80) Jack Henry & Associates
Inc Credit Suisse 273(30) Jack Henry & Associates
Inc JP Morgan 103(320) Jacobs Engineering Group
IncBank of AmericaMerrill Lynch (3,301)
(310) Jacobs Engineering GroupInc Citibank (1,807)
(300) Jacobs Engineering GroupInc Credit Suisse (974)
(90) Jacobs Engineering GroupInc JP Morgan (292)
(770) Janus Henderson Group Plc Citibank (879)(1,090) Janus Henderson Group Plc Credit Suisse (2,362)(1,370) Janus Henderson Group Plc JP Morgan (2,969)
50 Jazz Pharmaceuticals Plc Bank of AmericaMerrill Lynch 372
50 Jazz Pharmaceuticals Plc JP Morgan 429(130) JB Hunt Transport Services
Inc Credit Suisse (2,240)(61) JB Hunt Transport Services
Inc JP Morgan (901)(420) Jefferies Financial Group
Inc Credit Suisse (802)690 JetBlue Airways Corp Bank of America
Merrill Lynch 1,092370 JetBlue Airways Corp Citibank 253
1,780 JetBlue Airways Corp Credit Suisse 1,4571,030 JetBlue Airways Corp JP Morgan 843
(70) JM Smucker Co Bank of AmericaMerrill Lynch 206
(130) JM Smucker Co Citibank (338)
BlackRock Total Advantage Fund continued
The notes on pages 691 to 711 form an integral part of these financial statements.
Annual report and audited financial statements [667]
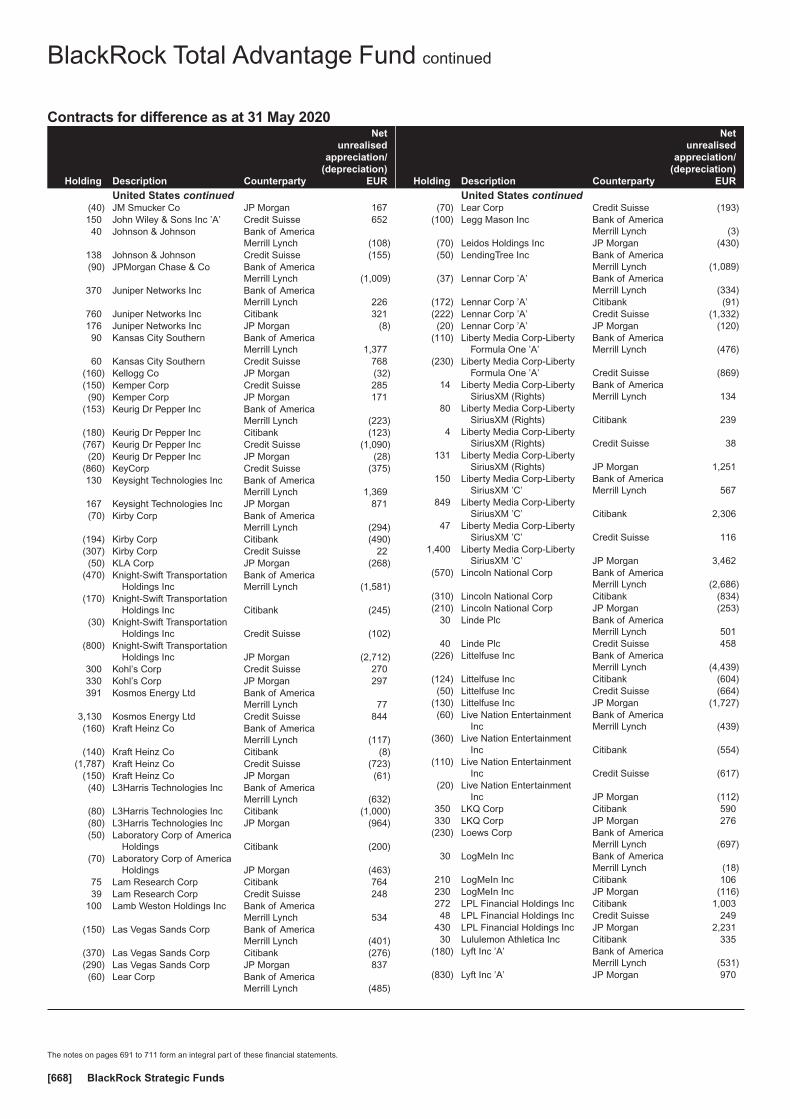
Contracts for difference as at 31 May 2020
Holding Description Counterparty
Netunrealised
appreciation/(depreciation)
EUR
United States continued(40) JM Smucker Co JP Morgan 167150 John Wiley & Sons Inc ’A’ Credit Suisse 65240 Johnson & Johnson Bank of America
Merrill Lynch (108)138 Johnson & Johnson Credit Suisse (155)(90) JPMorgan Chase & Co Bank of America
Merrill Lynch (1,009)370 Juniper Networks Inc Bank of America
Merrill Lynch 226760 Juniper Networks Inc Citibank 321176 Juniper Networks Inc JP Morgan (8)90 Kansas City Southern Bank of America
Merrill Lynch 1,37760 Kansas City Southern Credit Suisse 768
(160) Kellogg Co JP Morgan (32)(150) Kemper Corp Credit Suisse 285(90) Kemper Corp JP Morgan 171
(153) Keurig Dr Pepper Inc Bank of AmericaMerrill Lynch (223)
(180) Keurig Dr Pepper Inc Citibank (123)(767) Keurig Dr Pepper Inc Credit Suisse (1,090)(20) Keurig Dr Pepper Inc JP Morgan (28)
(860) KeyCorp Credit Suisse (375)130 Keysight Technologies Inc Bank of America
Merrill Lynch 1,369167 Keysight Technologies Inc JP Morgan 871(70) Kirby Corp Bank of America
Merrill Lynch (294)(194) Kirby Corp Citibank (490)(307) Kirby Corp Credit Suisse 22(50) KLA Corp JP Morgan (268)
(470) Knight-Swift TransportationHoldings Inc
Bank of AmericaMerrill Lynch (1,581)
(170) Knight-Swift TransportationHoldings Inc Citibank (245)
(30) Knight-Swift TransportationHoldings Inc Credit Suisse (102)
(800) Knight-Swift TransportationHoldings Inc JP Morgan (2,712)
300 Kohl’s Corp Credit Suisse 270330 Kohl’s Corp JP Morgan 297391 Kosmos Energy Ltd Bank of America
Merrill Lynch 773,130 Kosmos Energy Ltd Credit Suisse 844(160) Kraft Heinz Co Bank of America
Merrill Lynch (117)(140) Kraft Heinz Co Citibank (8)
(1,787) Kraft Heinz Co Credit Suisse (723)(150) Kraft Heinz Co JP Morgan (61)(40) L3Harris Technologies Inc Bank of America
Merrill Lynch (632)(80) L3Harris Technologies Inc Citibank (1,000)(80) L3Harris Technologies Inc JP Morgan (964)(50) Laboratory Corp of America
Holdings Citibank (200)(70) Laboratory Corp of America
Holdings JP Morgan (463)75 Lam Research Corp Citibank 76439 Lam Research Corp Credit Suisse 248
100 Lamb Weston Holdings Inc Bank of AmericaMerrill Lynch 534
(150) Las Vegas Sands Corp Bank of AmericaMerrill Lynch (401)
(370) Las Vegas Sands Corp Citibank (276)(290) Las Vegas Sands Corp JP Morgan 837(60) Lear Corp Bank of America
Merrill Lynch (485)
Holding Description Counterparty
Netunrealised
appreciation/(depreciation)
EUR
United States continued(70) Lear Corp Credit Suisse (193)
(100) Legg Mason Inc Bank of AmericaMerrill Lynch (3)
(70) Leidos Holdings Inc JP Morgan (430)(50) LendingTree Inc Bank of America
Merrill Lynch (1,089)(37) Lennar Corp ’A’ Bank of America
Merrill Lynch (334)(172) Lennar Corp ’A’ Citibank (91)(222) Lennar Corp ’A’ Credit Suisse (1,332)(20) Lennar Corp ’A’ JP Morgan (120)
(110) Liberty Media Corp-LibertyFormula One ’A’
Bank of AmericaMerrill Lynch (476)
(230) Liberty Media Corp-LibertyFormula One ’A’ Credit Suisse (869)
14 Liberty Media Corp-LibertySiriusXM (Rights)
Bank of AmericaMerrill Lynch 134
80 Liberty Media Corp-LibertySiriusXM (Rights) Citibank 239
4 Liberty Media Corp-LibertySiriusXM (Rights) Credit Suisse 38
131 Liberty Media Corp-LibertySiriusXM (Rights) JP Morgan 1,251
150 Liberty Media Corp-LibertySiriusXM ’C’
Bank of AmericaMerrill Lynch 567
849 Liberty Media Corp-LibertySiriusXM ’C’ Citibank 2,306
47 Liberty Media Corp-LibertySiriusXM ’C’ Credit Suisse 116
1,400 Liberty Media Corp-LibertySiriusXM ’C’ JP Morgan 3,462
(570) Lincoln National Corp Bank of AmericaMerrill Lynch (2,686)
(310) Lincoln National Corp Citibank (834)(210) Lincoln National Corp JP Morgan (253)
30 Linde Plc Bank of AmericaMerrill Lynch 501
40 Linde Plc Credit Suisse 458(226) Littelfuse Inc Bank of America
Merrill Lynch (4,439)(124) Littelfuse Inc Citibank (604)(50) Littelfuse Inc Credit Suisse (664)
(130) Littelfuse Inc JP Morgan (1,727)(60) Live Nation Entertainment
IncBank of AmericaMerrill Lynch (439)
(360) Live Nation EntertainmentInc Citibank (554)
(110) Live Nation EntertainmentInc Credit Suisse (617)
(20) Live Nation EntertainmentInc JP Morgan (112)
350 LKQ Corp Citibank 590330 LKQ Corp JP Morgan 276
(230) Loews Corp Bank of AmericaMerrill Lynch (697)
30 LogMeIn Inc Bank of AmericaMerrill Lynch (18)
210 LogMeIn Inc Citibank 106230 LogMeIn Inc JP Morgan (116)272 LPL Financial Holdings Inc Citibank 1,00348 LPL Financial Holdings Inc Credit Suisse 249
430 LPL Financial Holdings Inc JP Morgan 2,23130 Lululemon Athletica Inc Citibank 335
(180) Lyft Inc ’A’ Bank of AmericaMerrill Lynch (531)
(830) Lyft Inc ’A’ JP Morgan 970
BlackRock Total Advantage Fund continued
The notes on pages 691 to 711 form an integral part of these financial statements.
BlackRock Strategic Funds[668]
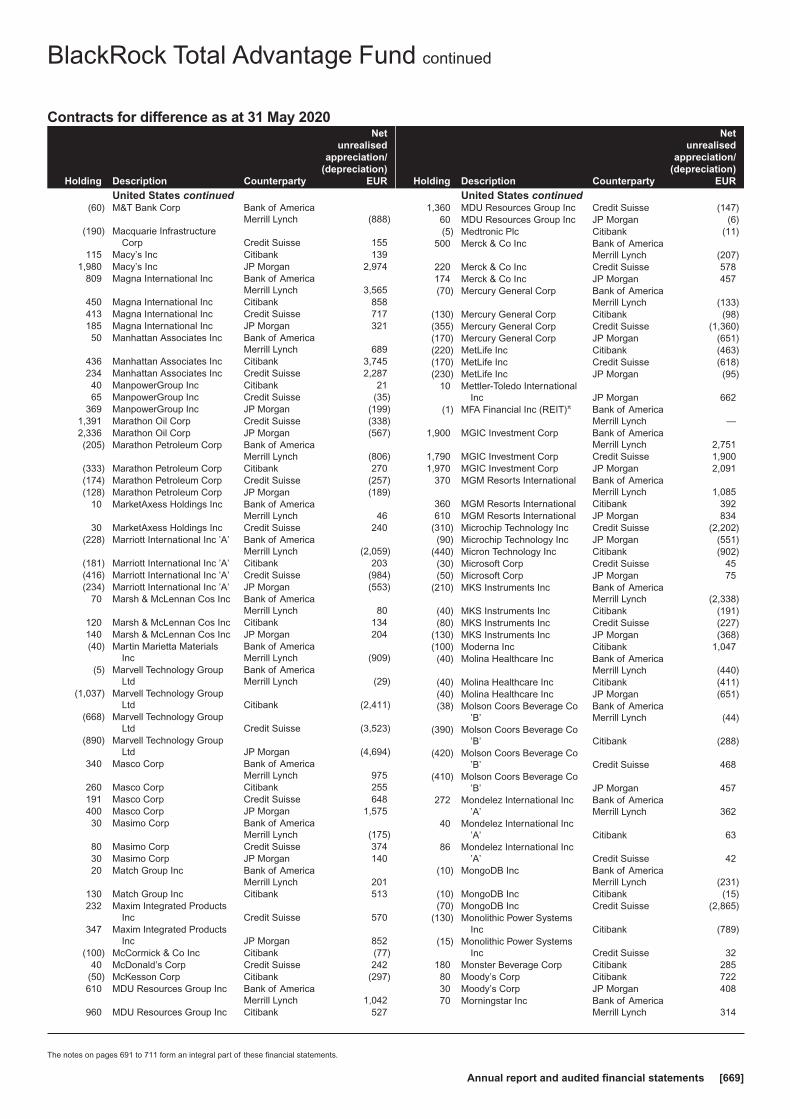
Contracts for difference as at 31 May 2020
Holding Description Counterparty
Netunrealised
appreciation/(depreciation)
EUR
United States continued(60) M&T Bank Corp Bank of America
Merrill Lynch (888)(190) Macquarie Infrastructure
Corp Credit Suisse 155115 Macy’s Inc Citibank 139
1,980 Macy’s Inc JP Morgan 2,974809 Magna International Inc Bank of America
Merrill Lynch 3,565450 Magna International Inc Citibank 858413 Magna International Inc Credit Suisse 717185 Magna International Inc JP Morgan 32150 Manhattan Associates Inc Bank of America
Merrill Lynch 689436 Manhattan Associates Inc Citibank 3,745234 Manhattan Associates Inc Credit Suisse 2,28740 ManpowerGroup Inc Citibank 2165 ManpowerGroup Inc Credit Suisse (35)
369 ManpowerGroup Inc JP Morgan (199)1,391 Marathon Oil Corp Credit Suisse (338)2,336 Marathon Oil Corp JP Morgan (567)(205) Marathon Petroleum Corp Bank of America
Merrill Lynch (806)(333) Marathon Petroleum Corp Citibank 270(174) Marathon Petroleum Corp Credit Suisse (257)(128) Marathon Petroleum Corp JP Morgan (189)
10 MarketAxess Holdings Inc Bank of AmericaMerrill Lynch 46
30 MarketAxess Holdings Inc Credit Suisse 240(228) Marriott International Inc ’A’ Bank of America
Merrill Lynch (2,059)(181) Marriott International Inc ’A’ Citibank 203(416) Marriott International Inc ’A’ Credit Suisse (984)(234) Marriott International Inc ’A’ JP Morgan (553)
70 Marsh & McLennan Cos Inc Bank of AmericaMerrill Lynch 80
120 Marsh & McLennan Cos Inc Citibank 134140 Marsh & McLennan Cos Inc JP Morgan 204(40) Martin Marietta Materials
IncBank of AmericaMerrill Lynch (909)
(5) Marvell Technology GroupLtd
Bank of AmericaMerrill Lynch (29)
(1,037) Marvell Technology GroupLtd Citibank (2,411)
(668) Marvell Technology GroupLtd Credit Suisse (3,523)
(890) Marvell Technology GroupLtd JP Morgan (4,694)
340 Masco Corp Bank of AmericaMerrill Lynch 975
260 Masco Corp Citibank 255191 Masco Corp Credit Suisse 648400 Masco Corp JP Morgan 1,57530 Masimo Corp Bank of America
Merrill Lynch (175)80 Masimo Corp Credit Suisse 37430 Masimo Corp JP Morgan 14020 Match Group Inc Bank of America
Merrill Lynch 201130 Match Group Inc Citibank 513232 Maxim Integrated Products
Inc Credit Suisse 570347 Maxim Integrated Products
Inc JP Morgan 852(100) McCormick & Co Inc Citibank (77)
40 McDonald’s Corp Credit Suisse 242(50) McKesson Corp Citibank (297)610 MDU Resources Group Inc Bank of America
Merrill Lynch 1,042960 MDU Resources Group Inc Citibank 527
Holding Description Counterparty
Netunrealised
appreciation/(depreciation)
EUR
United States continued1,360 MDU Resources Group Inc Credit Suisse (147)
60 MDU Resources Group Inc JP Morgan (6)(5) Medtronic Plc Citibank (11)
500 Merck & Co Inc Bank of AmericaMerrill Lynch (207)
220 Merck & Co Inc Credit Suisse 578174 Merck & Co Inc JP Morgan 457(70) Mercury General Corp Bank of America
Merrill Lynch (133)(130) Mercury General Corp Citibank (98)(355) Mercury General Corp Credit Suisse (1,360)(170) Mercury General Corp JP Morgan (651)(220) MetLife Inc Citibank (463)(170) MetLife Inc Credit Suisse (618)(230) MetLife Inc JP Morgan (95)
10 Mettler-Toledo InternationalInc JP Morgan 662
(1) MFA Financial Inc (REIT)π Bank of AmericaMerrill Lynch —
1,900 MGIC Investment Corp Bank of AmericaMerrill Lynch 2,751
1,790 MGIC Investment Corp Credit Suisse 1,9001,970 MGIC Investment Corp JP Morgan 2,091
370 MGM Resorts International Bank of AmericaMerrill Lynch 1,085
360 MGM Resorts International Citibank 392610 MGM Resorts International JP Morgan 834
(310) Microchip Technology Inc Credit Suisse (2,202)(90) Microchip Technology Inc JP Morgan (551)
(440) Micron Technology Inc Citibank (902)(30) Microsoft Corp Credit Suisse 45(50) Microsoft Corp JP Morgan 75
(210) MKS Instruments Inc Bank of AmericaMerrill Lynch (2,338)
(40) MKS Instruments Inc Citibank (191)(80) MKS Instruments Inc Credit Suisse (227)
(130) MKS Instruments Inc JP Morgan (368)(100) Moderna Inc Citibank 1,047(40) Molina Healthcare Inc Bank of America
Merrill Lynch (440)(40) Molina Healthcare Inc Citibank (411)(40) Molina Healthcare Inc JP Morgan (651)(38) Molson Coors Beverage Co
’B’Bank of AmericaMerrill Lynch (44)
(390) Molson Coors Beverage Co’B’ Citibank (288)
(420) Molson Coors Beverage Co’B’ Credit Suisse 468
(410) Molson Coors Beverage Co’B’ JP Morgan 457
272 Mondelez International Inc’A’
Bank of AmericaMerrill Lynch 362
40 Mondelez International Inc’A’ Citibank 63
86 Mondelez International Inc’A’ Credit Suisse 42
(10) MongoDB Inc Bank of AmericaMerrill Lynch (231)
(10) MongoDB Inc Citibank (15)(70) MongoDB Inc Credit Suisse (2,865)
(130) Monolithic Power SystemsInc Citibank (789)
(15) Monolithic Power SystemsInc Credit Suisse 32
180 Monster Beverage Corp Citibank 28580 Moody’s Corp Citibank 72230 Moody’s Corp JP Morgan 40870 Morningstar Inc Bank of America
Merrill Lynch 314
BlackRock Total Advantage Fund continued
The notes on pages 691 to 711 form an integral part of these financial statements.
Annual report and audited financial statements [669]
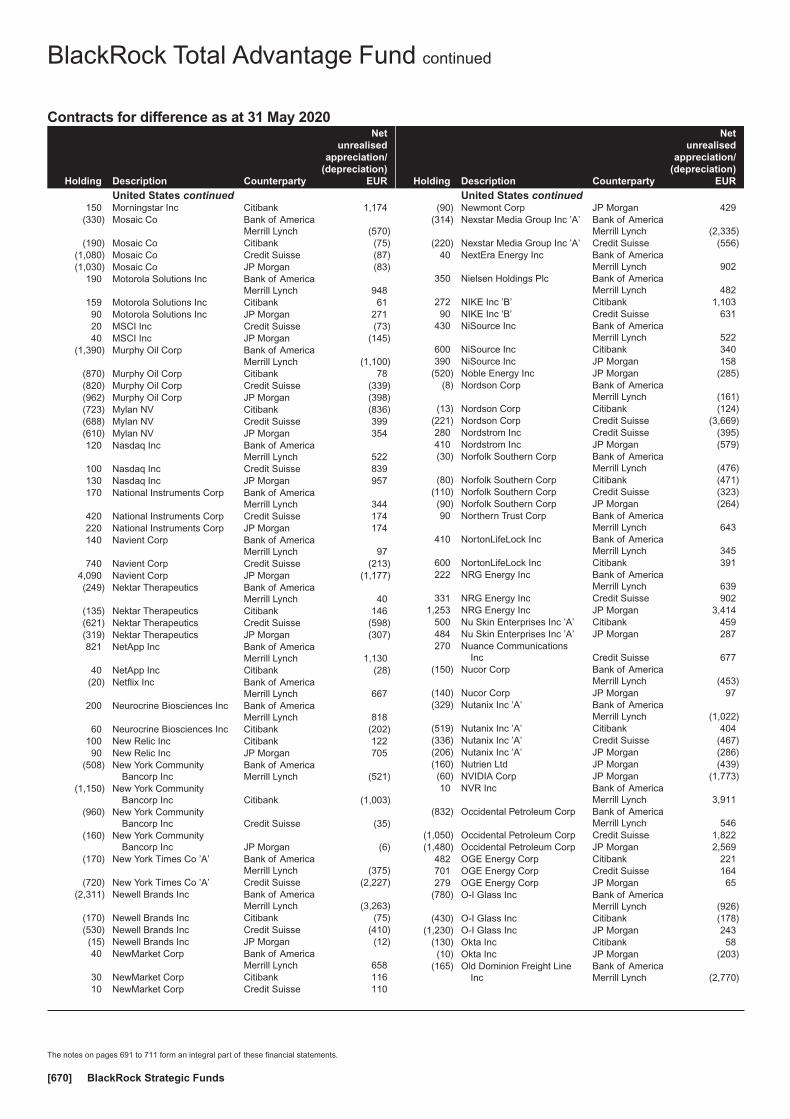
Contracts for difference as at 31 May 2020
Holding Description Counterparty
Netunrealised
appreciation/(depreciation)
EUR
United States continued150 Morningstar Inc Citibank 1,174
(330) Mosaic Co Bank of AmericaMerrill Lynch (570)
(190) Mosaic Co Citibank (75)(1,080) Mosaic Co Credit Suisse (87)(1,030) Mosaic Co JP Morgan (83)
190 Motorola Solutions Inc Bank of AmericaMerrill Lynch 948
159 Motorola Solutions Inc Citibank 6190 Motorola Solutions Inc JP Morgan 27120 MSCI Inc Credit Suisse (73)40 MSCI Inc JP Morgan (145)
(1,390) Murphy Oil Corp Bank of AmericaMerrill Lynch (1,100)
(870) Murphy Oil Corp Citibank 78(820) Murphy Oil Corp Credit Suisse (339)(962) Murphy Oil Corp JP Morgan (398)(723) Mylan NV Citibank (836)(688) Mylan NV Credit Suisse 399(610) Mylan NV JP Morgan 354120 Nasdaq Inc Bank of America
Merrill Lynch 522100 Nasdaq Inc Credit Suisse 839130 Nasdaq Inc JP Morgan 957170 National Instruments Corp Bank of America
Merrill Lynch 344420 National Instruments Corp Credit Suisse 174220 National Instruments Corp JP Morgan 174140 Navient Corp Bank of America
Merrill Lynch 97740 Navient Corp Credit Suisse (213)
4,090 Navient Corp JP Morgan (1,177)(249) Nektar Therapeutics Bank of America
Merrill Lynch 40(135) Nektar Therapeutics Citibank 146(621) Nektar Therapeutics Credit Suisse (598)(319) Nektar Therapeutics JP Morgan (307)821 NetApp Inc Bank of America
Merrill Lynch 1,13040 NetApp Inc Citibank (28)
(20) Netflix Inc Bank of AmericaMerrill Lynch 667
200 Neurocrine Biosciences Inc Bank of AmericaMerrill Lynch 818
60 Neurocrine Biosciences Inc Citibank (202)100 New Relic Inc Citibank 12290 New Relic Inc JP Morgan 705
(508) New York CommunityBancorp Inc
Bank of AmericaMerrill Lynch (521)
(1,150) New York CommunityBancorp Inc Citibank (1,003)
(960) New York CommunityBancorp Inc Credit Suisse (35)
(160) New York CommunityBancorp Inc JP Morgan (6)
(170) New York Times Co ’A’ Bank of AmericaMerrill Lynch (375)
(720) New York Times Co ’A’ Credit Suisse (2,227)(2,311) Newell Brands Inc Bank of America
Merrill Lynch (3,263)(170) Newell Brands Inc Citibank (75)(530) Newell Brands Inc Credit Suisse (410)(15) Newell Brands Inc JP Morgan (12)40 NewMarket Corp Bank of America
Merrill Lynch 65830 NewMarket Corp Citibank 11610 NewMarket Corp Credit Suisse 110
Holding Description Counterparty
Netunrealised
appreciation/(depreciation)
EUR
United States continued(90) Newmont Corp JP Morgan 429
(314) Nexstar Media Group Inc ’A’ Bank of AmericaMerrill Lynch (2,335)
(220) Nexstar Media Group Inc ’A’ Credit Suisse (556)40 NextEra Energy Inc Bank of America
Merrill Lynch 902350 Nielsen Holdings Plc Bank of America
Merrill Lynch 482272 NIKE Inc ’B’ Citibank 1,10390 NIKE Inc ’B’ Credit Suisse 631
430 NiSource Inc Bank of AmericaMerrill Lynch 522
600 NiSource Inc Citibank 340390 NiSource Inc JP Morgan 158
(520) Noble Energy Inc JP Morgan (285)(8) Nordson Corp Bank of America
Merrill Lynch (161)(13) Nordson Corp Citibank (124)
(221) Nordson Corp Credit Suisse (3,669)280 Nordstrom Inc Credit Suisse (395)410 Nordstrom Inc JP Morgan (579)(30) Norfolk Southern Corp Bank of America
Merrill Lynch (476)(80) Norfolk Southern Corp Citibank (471)
(110) Norfolk Southern Corp Credit Suisse (323)(90) Norfolk Southern Corp JP Morgan (264)90 Northern Trust Corp Bank of America
Merrill Lynch 643410 NortonLifeLock Inc Bank of America
Merrill Lynch 345600 NortonLifeLock Inc Citibank 391222 NRG Energy Inc Bank of America
Merrill Lynch 639331 NRG Energy Inc Credit Suisse 902
1,253 NRG Energy Inc JP Morgan 3,414500 Nu Skin Enterprises Inc ’A’ Citibank 459484 Nu Skin Enterprises Inc ’A’ JP Morgan 287270 Nuance Communications
Inc Credit Suisse 677(150) Nucor Corp Bank of America
Merrill Lynch (453)(140) Nucor Corp JP Morgan 97(329) Nutanix Inc ’A’ Bank of America
Merrill Lynch (1,022)(519) Nutanix Inc ’A’ Citibank 404(336) Nutanix Inc ’A’ Credit Suisse (467)(206) Nutanix Inc ’A’ JP Morgan (286)(160) Nutrien Ltd JP Morgan (439)(60) NVIDIA Corp JP Morgan (1,773)10 NVR Inc Bank of America
Merrill Lynch 3,911(832) Occidental Petroleum Corp Bank of America
Merrill Lynch 546(1,050) Occidental Petroleum Corp Credit Suisse 1,822(1,480) Occidental Petroleum Corp JP Morgan 2,569
482 OGE Energy Corp Citibank 221701 OGE Energy Corp Credit Suisse 164279 OGE Energy Corp JP Morgan 65
(780) O-I Glass Inc Bank of AmericaMerrill Lynch (926)
(430) O-I Glass Inc Citibank (178)(1,230) O-I Glass Inc JP Morgan 243
(130) Okta Inc Citibank 58(10) Okta Inc JP Morgan (203)
(165) Old Dominion Freight LineInc
Bank of AmericaMerrill Lynch (2,770)
BlackRock Total Advantage Fund continued
The notes on pages 691 to 711 form an integral part of these financial statements.
BlackRock Strategic Funds[670]

Contracts for difference as at 31 May 2020
Holding Description Counterparty
Netunrealised
appreciation/(depreciation)
EUR
United States continued440 Old Republic International
Corp Citibank 226870 Old Republic International
Corp JP Morgan 427(1,150) Olin Corp Bank of America
Merrill Lynch (951)(1,710) Olin Corp Citibank (1,399)(1,330) Olin Corp Credit Suisse 239(1,170) Olin Corp JP Morgan (411)
(90) Ollie’s Bargain OutletHoldings Inc
Bank of AmericaMerrill Lynch (1,663)
(120) Ollie’s Bargain OutletHoldings Inc Citibank (905)
(320) Ollie’s Bargain OutletHoldings Inc Credit Suisse (7,016)
(60) Ollie’s Bargain OutletHoldings Inc JP Morgan (1,316)
294 Omnicom Group Inc Credit Suisse (301)(200) ON Semiconductor Corp Bank of America
Merrill Lynch (385)(540) ON Semiconductor Corp Citibank (267)(200) ON Semiconductor Corp Credit Suisse 149550 OneMain Holdings Inc Bank of America
Merrill Lynch 1,840140 OneMain Holdings Inc Citibank 285590 OneMain Holdings Inc Credit Suisse 780
(340) Oracle Corp JP Morgan 154 O’Reilly Automotive Inc Citibank 49130 O’Reilly Automotive Inc Credit Suisse 34010 O’Reilly Automotive Inc JP Morgan 113
(130) Packaging Corp of America Bank of AmericaMerrill Lynch (1,056)
(120) Packaging Corp of America Citibank (752)(60) Packaging Corp of America JP Morgan (98)
(610) PagerDuty Inc Bank of AmericaMerrill Lynch (143)
(30) Palo Alto Networks Inc Bank of AmericaMerrill Lynch (209)
(104) Parker-Hannifin Corp Bank of AmericaMerrill Lynch (2,289)
(240) Parker-Hannifin Corp Credit Suisse (3,617)39 Patterson-UTI Energy Inc Citibank 18
2,310 Patterson-UTI Energy Inc JP Morgan 1,534332 Paychex Inc Bank of America
Merrill Lynch 2,368815 Paychex Inc Credit Suisse 3,115100 Paychex Inc JP Morgan 382(28) Paycom Software Inc Citibank (575)(35) Paycom Software Inc Credit Suisse (635)(20) Paycom Software Inc JP Morgan (363)120 PayPal Holdings Inc Citibank (109)383 Pentair Plc Citibank 923264 Pentair Plc JP Morgan 964
(540) People’s United FinancialInc JP Morgan 306
70 PepsiCo Inc Bank of AmericaMerrill Lynch (292)
250 PepsiCo Inc Citibank 18740 PepsiCo Inc Credit Suisse (105)50 PepsiCo Inc JP Morgan (131)
(147) PerkinElmer Inc Bank of AmericaMerrill Lynch (910)
(70) PerkinElmer Inc Citibank (398)(295) PerkinElmer Inc Credit Suisse (1,926)(60) PerkinElmer Inc JP Morgan (392)
(321) Perrigo Co Plc Citibank (64)(529) Perrigo Co Plc Credit Suisse (885)(65) Perrigo Co Plc JP Morgan (109)
Holding Description Counterparty
Netunrealised
appreciation/(depreciation)
EUR
United States continued(210) Pfizer Inc Bank of America
Merrill Lynch (62)(150) Pfizer Inc Citibank (80)(350) Pfizer Inc JP Morgan (274)
80 Phillips 66 Credit Suisse 500(340) Pilgrim’s Pride Corp Bank of America
Merrill Lynch 138(220) Pilgrim’s Pride Corp Citibank 105(227) Pilgrim’s Pride Corp Credit Suisse 233(120) Pilgrim’s Pride Corp JP Morgan 123390 Pinnacle Financial Partners
Inc Credit Suisse 74320 Pinnacle Financial Partners
Inc JP Morgan 60(90) Pioneer Natural Resources
CoBank of AmericaMerrill Lynch (629)
(70) Pioneer Natural ResourcesCo Credit Suisse (560)
150 Planet Fitness Inc ’A’ Citibank 289(444) Pluralsight Inc ’A’ Bank of America
Merrill Lynch (683)(79) Pluralsight Inc ’A’ Citibank 59
(622) Pluralsight Inc ’A’ Credit Suisse (1,331)(132) Pluralsight Inc ’A’ JP Morgan (283)100 Polaris Inc Bank of America
Merrill Lynch 1,236120 Polaris Inc Citibank 42870 Polaris Inc JP Morgan 929
1,157 Popular Inc Citibank 2,0391 Popular Inc Credit Suisse 2
(17) Post Holdings Inc Bank of AmericaMerrill Lynch (42)
(440) Post Holdings Inc Citibank (1,096)(85) Post Holdings Inc Credit Suisse 155210 PPG Industries Inc Bank of America
Merrill Lynch 2,727160 PPG Industries Inc Citibank 74580 PPG Industries Inc Credit Suisse 675
210 PPG Industries Inc JP Morgan 1,771(290) Principal Financial Group
IncBank of AmericaMerrill Lynch (1,283)
(300) Principal Financial GroupInc Citibank (496)
(80) Principal Financial GroupInc Credit Suisse (40)
(140) Principal Financial GroupInc JP Morgan (71)
50 Procter & Gamble Co Bank of AmericaMerrill Lynch 64
80 Procter & Gamble Co Citibank 24780 Procter & Gamble Co Credit Suisse 6
(180) Progressive Corp Bank of AmericaMerrill Lynch (108)
(250) Progressive Corp Citibank (486)(50) Proofpoint Inc Citibank (77)(60) Proofpoint Inc Credit Suisse 385
(123) Prosperity Bancshares Inc Bank of AmericaMerrill Lynch (959)
(40) Prosperity Bancshares Inc Citibank (142)(268) Prosperity Bancshares Inc JP Morgan (1,092)(360) Prudential Financial Inc Bank of America
Merrill Lynch (2,370)(460) Prudential Financial Inc Citibank (1,642)(300) Prudential Financial Inc Credit Suisse (343)(250) Prudential Financial Inc JP Morgan (286)(263) PTC Inc Bank of America
Merrill Lynch (2,311)(85) PTC Inc Citibank (349)
BlackRock Total Advantage Fund continued
The notes on pages 691 to 711 form an integral part of these financial statements.
Annual report and audited financial statements [671]
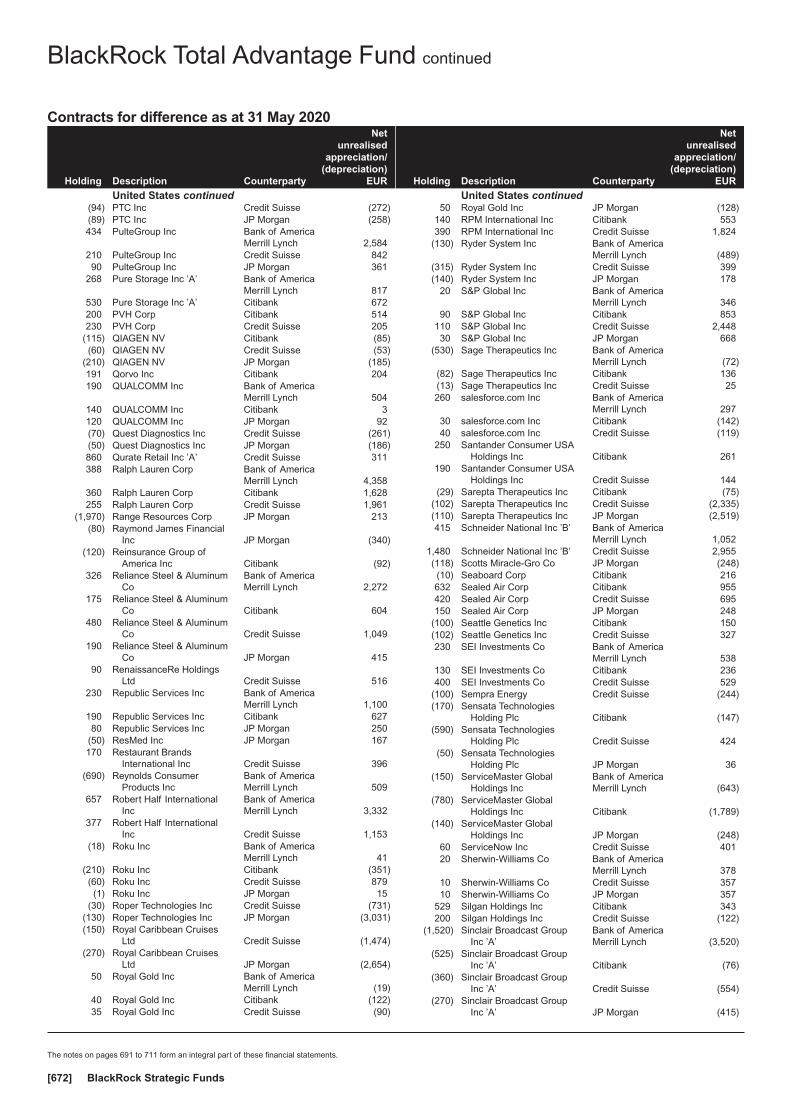
Contracts for difference as at 31 May 2020
Holding Description Counterparty
Netunrealised
appreciation/(depreciation)
EUR
United States continued(94) PTC Inc Credit Suisse (272)(89) PTC Inc JP Morgan (258)434 PulteGroup Inc Bank of America
Merrill Lynch 2,584210 PulteGroup Inc Credit Suisse 84290 PulteGroup Inc JP Morgan 361
268 Pure Storage Inc ’A’ Bank of AmericaMerrill Lynch 817
530 Pure Storage Inc ’A’ Citibank 672200 PVH Corp Citibank 514230 PVH Corp Credit Suisse 205
(115) QIAGEN NV Citibank (85)(60) QIAGEN NV Credit Suisse (53)
(210) QIAGEN NV JP Morgan (185)191 Qorvo Inc Citibank 204190 QUALCOMM Inc Bank of America
Merrill Lynch 504140 QUALCOMM Inc Citibank 3120 QUALCOMM Inc JP Morgan 92(70) Quest Diagnostics Inc Credit Suisse (261)(50) Quest Diagnostics Inc JP Morgan (186)860 Qurate Retail Inc ’A’ Credit Suisse 311388 Ralph Lauren Corp Bank of America
Merrill Lynch 4,358360 Ralph Lauren Corp Citibank 1,628255 Ralph Lauren Corp Credit Suisse 1,961
(1,970) Range Resources Corp JP Morgan 213(80) Raymond James Financial
Inc JP Morgan (340)(120) Reinsurance Group of
America Inc Citibank (92)326 Reliance Steel & Aluminum
CoBank of AmericaMerrill Lynch 2,272
175 Reliance Steel & AluminumCo Citibank 604
480 Reliance Steel & AluminumCo Credit Suisse 1,049
190 Reliance Steel & AluminumCo JP Morgan 415
90 RenaissanceRe HoldingsLtd Credit Suisse 516
230 Republic Services Inc Bank of AmericaMerrill Lynch 1,100
190 Republic Services Inc Citibank 62780 Republic Services Inc JP Morgan 250
(50) ResMed Inc JP Morgan 167170 Restaurant Brands
International Inc Credit Suisse 396(690) Reynolds Consumer
Products IncBank of AmericaMerrill Lynch 509
657 Robert Half InternationalInc
Bank of AmericaMerrill Lynch 3,332
377 Robert Half InternationalInc Credit Suisse 1,153
(18) Roku Inc Bank of AmericaMerrill Lynch 41
(210) Roku Inc Citibank (351)(60) Roku Inc Credit Suisse 879(1) Roku Inc JP Morgan 15
(30) Roper Technologies Inc Credit Suisse (731)(130) Roper Technologies Inc JP Morgan (3,031)(150) Royal Caribbean Cruises
Ltd Credit Suisse (1,474)(270) Royal Caribbean Cruises
Ltd JP Morgan (2,654)50 Royal Gold Inc Bank of America
Merrill Lynch (19)40 Royal Gold Inc Citibank (122)35 Royal Gold Inc Credit Suisse (90)
Holding Description Counterparty
Netunrealised
appreciation/(depreciation)
EUR
United States continued50 Royal Gold Inc JP Morgan (128)
140 RPM International Inc Citibank 553390 RPM International Inc Credit Suisse 1,824
(130) Ryder System Inc Bank of AmericaMerrill Lynch (489)
(315) Ryder System Inc Credit Suisse 399(140) Ryder System Inc JP Morgan 178
20 S&P Global Inc Bank of AmericaMerrill Lynch 346
90 S&P Global Inc Citibank 853110 S&P Global Inc Credit Suisse 2,44830 S&P Global Inc JP Morgan 668
(530) Sage Therapeutics Inc Bank of AmericaMerrill Lynch (72)
(82) Sage Therapeutics Inc Citibank 136(13) Sage Therapeutics Inc Credit Suisse 25260 salesforce.com Inc Bank of America
Merrill Lynch 29730 salesforce.com Inc Citibank (142)40 salesforce.com Inc Credit Suisse (119)
250 Santander Consumer USAHoldings Inc Citibank 261
190 Santander Consumer USAHoldings Inc Credit Suisse 144
(29) Sarepta Therapeutics Inc Citibank (75)(102) Sarepta Therapeutics Inc Credit Suisse (2,335)(110) Sarepta Therapeutics Inc JP Morgan (2,519)415 Schneider National Inc ’B’ Bank of America
Merrill Lynch 1,0521,480 Schneider National Inc ’B’ Credit Suisse 2,955(118) Scotts Miracle-Gro Co JP Morgan (248)(10) Seaboard Corp Citibank 216632 Sealed Air Corp Citibank 955420 Sealed Air Corp Credit Suisse 695150 Sealed Air Corp JP Morgan 248
(100) Seattle Genetics Inc Citibank 150(102) Seattle Genetics Inc Credit Suisse 327230 SEI Investments Co Bank of America
Merrill Lynch 538130 SEI Investments Co Citibank 236400 SEI Investments Co Credit Suisse 529
(100) Sempra Energy Credit Suisse (244)(170) Sensata Technologies
Holding Plc Citibank (147)(590) Sensata Technologies
Holding Plc Credit Suisse 424(50) Sensata Technologies
Holding Plc JP Morgan 36(150) ServiceMaster Global
Holdings IncBank of AmericaMerrill Lynch (643)
(780) ServiceMaster GlobalHoldings Inc Citibank (1,789)
(140) ServiceMaster GlobalHoldings Inc JP Morgan (248)
60 ServiceNow Inc Credit Suisse 40120 Sherwin-Williams Co Bank of America
Merrill Lynch 37810 Sherwin-Williams Co Credit Suisse 35710 Sherwin-Williams Co JP Morgan 357
529 Silgan Holdings Inc Citibank 343200 Silgan Holdings Inc Credit Suisse (122)
(1,520) Sinclair Broadcast GroupInc ’A’
Bank of AmericaMerrill Lynch (3,520)
(525) Sinclair Broadcast GroupInc ’A’ Citibank (76)
(360) Sinclair Broadcast GroupInc ’A’ Credit Suisse (554)
(270) Sinclair Broadcast GroupInc ’A’ JP Morgan (415)
BlackRock Total Advantage Fund continued
The notes on pages 691 to 711 form an integral part of these financial statements.
BlackRock Strategic Funds[672]

Contracts for difference as at 31 May 2020
Holding Description Counterparty
Netunrealised
appreciation/(depreciation)
EUR
United States continued1,120 Sirius XM Holdings Inc JP Morgan (55)
400 Six Flags EntertainmentCorp
Bank of AmericaMerrill Lynch 1,626
250 Six Flags EntertainmentCorp Citibank 20
670 Skechers USA Inc ’A’ Citibank 1,151(1,340) SLM Corp Bank of America
Merrill Lynch (121)(50) Smartsheet Inc ’A’ Bank of America
Merrill Lynch (149)(330) Smartsheet Inc ’A’ Credit Suisse 68(70) Smartsheet Inc ’A’ JP Morgan 1450 Snap-on Inc Citibank 5660 Snap-on Inc JP Morgan 151
(290) SolarWinds Corp Bank of AmericaMerrill Lynch (391)
(1,270) SolarWinds Corp Citibank (46)(670) SolarWinds Corp Credit Suisse (651)(130) Sonoco Products Co Bank of America
Merrill Lynch (714)(120) Sonoco Products Co JP Morgan (431)130 Southern Co JP Morgan 182270 Spirit AeroSystems
Holdings Inc ’A’ Credit Suisse 369500 Spirit AeroSystems
Holdings Inc ’A’ JP Morgan 1,113(80) Splunk Inc Citibank 130(70) Splunk Inc Credit Suisse (1,839)
(160) Splunk Inc JP Morgan (4,203)150 Spotify Technology SA Credit Suisse 3,803644 Sprouts Farmers Market Inc Bank of America
Merrill Lynch (64)2,040 Sprouts Farmers Market Inc Credit Suisse (789)
410 Starbucks Corp Credit Suisse 133629 Starbucks Corp JP Morgan 204
(230) State Street Corp Citibank (1,309)(100) State Street Corp Credit Suisse (648)(150) State Street Corp JP Morgan (193)
77 Steel Dynamics Inc Bank of AmericaMerrill Lynch 249
28 Steel Dynamics Inc Citibank 43(384) Stericycle Inc Bank of America
Merrill Lynch (2,172)(70) Stericycle Inc Citibank (201)
(126) Stericycle Inc Credit Suisse (219)(13) Stericycle Inc JP Morgan (23)50 STERIS Plc Citibank 29580 STERIS Plc Credit Suisse 1,1379 STERIS Plc JP Morgan 128
260 Sterling Bancorp Bank of AmericaMerrill Lynch 625
250 Sterling Bancorp Credit Suisse 156880 Sterling Bancorp JP Morgan 55016 Stryker Corp Bank of America
Merrill Lynch 20268 Stryker Corp JP Morgan 138
(70) SVB Financial Group Citibank (1,535)(40) SVB Financial Group Credit Suisse (1,008)
(380) Switch Inc ’A’ Bank of AmericaMerrill Lynch (376)
(1,080) Switch Inc ’A’ Credit Suisse (1,544)(1,145) Switch Inc ’A’ JP Morgan (1,637)
544 Synchrony Financial Citibank 1,321832 Synchrony Financial Credit Suisse 1,44440 Synopsys Inc Bank of America
Merrill Lynch 680185 Synopsys Inc Citibank 1,086102 Synopsys Inc Credit Suisse 1,598
Holding Description Counterparty
Netunrealised
appreciation/(depreciation)
EUR
United States continued45 Synopsys Inc JP Morgan 785
(180) Synovus Financial Corp Bank of AmericaMerrill Lynch (499)
(10) Synovus Financial Corp Citibank (15)(740) Synovus Financial Corp Credit Suisse 419(151) Synovus Financial Corp JP Morgan 86110 Sysco Corp JP Morgan 442(60) T Rowe Price Group Inc Citibank (268)
(130) T Rowe Price Group Inc Credit Suisse (700)50 Take-Two Interactive
Software IncBank of AmericaMerrill Lynch 110
(290) Tapestry Inc Citibank 70(190) Tapestry Inc JP Morgan 200110 Target Corp Bank of America
Merrill Lynch (117)110 Target Corp Citibank 225
(120) TCF Financial Corp Bank of AmericaMerrill Lynch (663)
(760) TCF Financial Corp Citibank (2,358)(490) TCF Financial Corp JP Morgan (599)(160) TD Ameritrade Holding Corp Bank of America
Merrill Lynch (555)(140) TD Ameritrade Holding Corp Credit Suisse 55(430) TD Ameritrade Holding Corp JP Morgan 170
30 Teledyne Technologies Inc Bank of AmericaMerrill Lynch 1,348
39 Teledyne Technologies Inc Citibank 93926 Teledyne Technologies Inc JP Morgan 756
280 Tempur Sealy InternationalInc Citibank 1,526
80 Tempur Sealy InternationalInc Credit Suisse 673
180 Tempur Sealy InternationalInc JP Morgan 1,515
300 Teradata Corp Bank of AmericaMerrill Lynch 405
150 Teradata Corp Credit Suisse (337)420 Teradata Corp JP Morgan (944)
1,003 Teradyne Inc Citibank 2,941383 Teradyne Inc Credit Suisse 31710 Teradyne Inc JP Morgan 8
(47) Tesla Inc Bank of AmericaMerrill Lynch (437)
(10) Tesla Inc JP Morgan 89117 Texas Instruments Inc Citibank 423421 Texas Instruments Inc Credit Suisse 928
(370) TFS Financial Corp Bank of AmericaMerrill Lynch (403)
(428) TFS Financial Corp Citibank (373)(642) TFS Financial Corp Credit Suisse (46)(575) TFS Financial Corp JP Morgan (41)(30) Thermo Fisher Scientific Inc Credit Suisse (343)(30) Thermo Fisher Scientific Inc JP Morgan (343)(80) Thomson Reuters Corp Bank of America
Merrill Lynch (64)(348) Thor Industries Inc Bank of America
Merrill Lynch (4,263)(57) Thor Industries Inc Citibank (165)
(254) Thor Industries Inc JP Morgan (1,866)(137) Tiffany & Co Bank of America
Merrill Lynch (79)(47) Tiffany & Co Credit Suisse 38(20) Tiffany & Co JP Morgan 16120 Timken Co Citibank 151444 Timken Co JP Morgan 1,206160 TJX Cos Inc Bank of America
Merrill Lynch 932344 TJX Cos Inc Credit Suisse 1,590
BlackRock Total Advantage Fund continued
The notes on pages 691 to 711 form an integral part of these financial statements.
Annual report and audited financial statements [673]
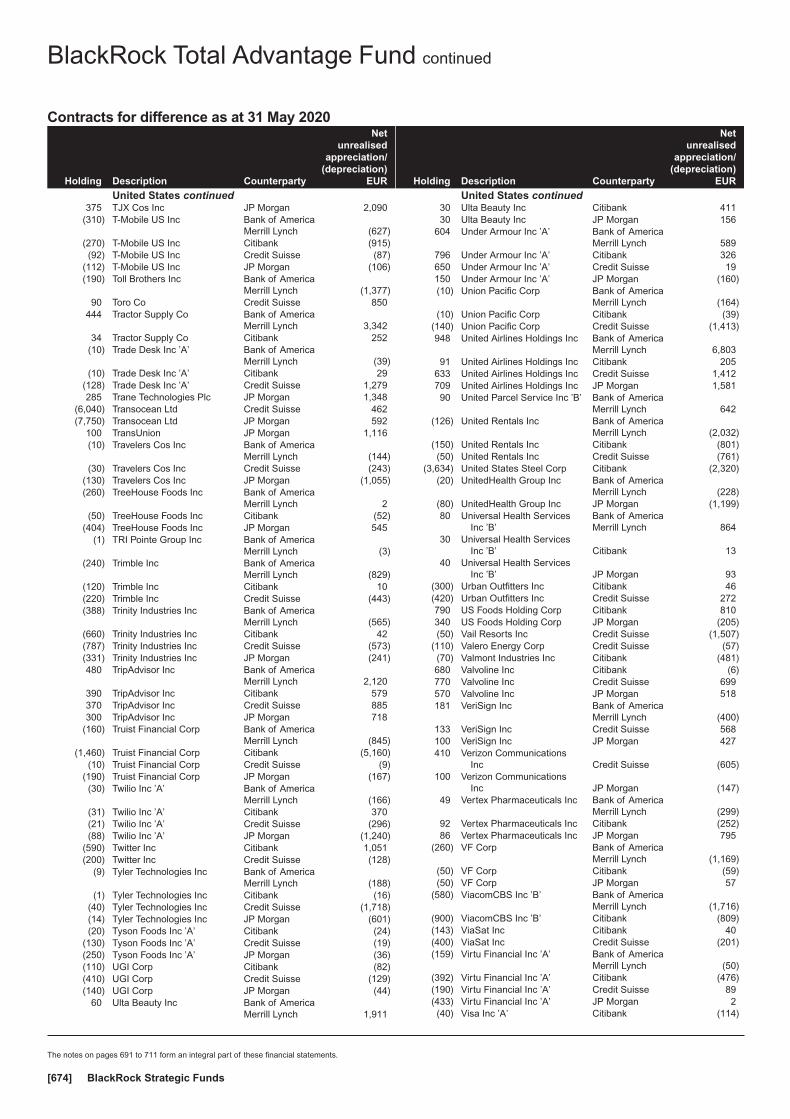
Contracts for difference as at 31 May 2020
Holding Description Counterparty
Netunrealised
appreciation/(depreciation)
EUR
United States continued375 TJX Cos Inc JP Morgan 2,090
(310) T-Mobile US Inc Bank of AmericaMerrill Lynch (627)
(270) T-Mobile US Inc Citibank (915)(92) T-Mobile US Inc Credit Suisse (87)
(112) T-Mobile US Inc JP Morgan (106)(190) Toll Brothers Inc Bank of America
Merrill Lynch (1,377)90 Toro Co Credit Suisse 850
444 Tractor Supply Co Bank of AmericaMerrill Lynch 3,342
34 Tractor Supply Co Citibank 252(10) Trade Desk Inc ’A’ Bank of America
Merrill Lynch (39)(10) Trade Desk Inc ’A’ Citibank 29
(128) Trade Desk Inc ’A’ Credit Suisse 1,279285 Trane Technologies Plc JP Morgan 1,348
(6,040) Transocean Ltd Credit Suisse 462(7,750) Transocean Ltd JP Morgan 592
100 TransUnion JP Morgan 1,116(10) Travelers Cos Inc Bank of America
Merrill Lynch (144)(30) Travelers Cos Inc Credit Suisse (243)
(130) Travelers Cos Inc JP Morgan (1,055)(260) TreeHouse Foods Inc Bank of America
Merrill Lynch 2(50) TreeHouse Foods Inc Citibank (52)
(404) TreeHouse Foods Inc JP Morgan 545(1) TRI Pointe Group Inc Bank of America
Merrill Lynch (3)(240) Trimble Inc Bank of America
Merrill Lynch (829)(120) Trimble Inc Citibank 10(220) Trimble Inc Credit Suisse (443)(388) Trinity Industries Inc Bank of America
Merrill Lynch (565)(660) Trinity Industries Inc Citibank 42(787) Trinity Industries Inc Credit Suisse (573)(331) Trinity Industries Inc JP Morgan (241)480 TripAdvisor Inc Bank of America
Merrill Lynch 2,120390 TripAdvisor Inc Citibank 579370 TripAdvisor Inc Credit Suisse 885300 TripAdvisor Inc JP Morgan 718
(160) Truist Financial Corp Bank of AmericaMerrill Lynch (845)
(1,460) Truist Financial Corp Citibank (5,160)(10) Truist Financial Corp Credit Suisse (9)
(190) Truist Financial Corp JP Morgan (167)(30) Twilio Inc ’A’ Bank of America
Merrill Lynch (166)(31) Twilio Inc ’A’ Citibank 370(21) Twilio Inc ’A’ Credit Suisse (296)(88) Twilio Inc ’A’ JP Morgan (1,240)
(590) Twitter Inc Citibank 1,051(200) Twitter Inc Credit Suisse (128)
(9) Tyler Technologies Inc Bank of AmericaMerrill Lynch (188)
(1) Tyler Technologies Inc Citibank (16)(40) Tyler Technologies Inc Credit Suisse (1,718)(14) Tyler Technologies Inc JP Morgan (601)(20) Tyson Foods Inc ’A’ Citibank (24)
(130) Tyson Foods Inc ’A’ Credit Suisse (19)(250) Tyson Foods Inc ’A’ JP Morgan (36)(110) UGI Corp Citibank (82)(410) UGI Corp Credit Suisse (129)(140) UGI Corp JP Morgan (44)
60 Ulta Beauty Inc Bank of AmericaMerrill Lynch 1,911
Holding Description Counterparty
Netunrealised
appreciation/(depreciation)
EUR
United States continued30 Ulta Beauty Inc Citibank 41130 Ulta Beauty Inc JP Morgan 156
604 Under Armour Inc ’A’ Bank of AmericaMerrill Lynch 589
796 Under Armour Inc ’A’ Citibank 326650 Under Armour Inc ’A’ Credit Suisse 19150 Under Armour Inc ’A’ JP Morgan (160)(10) Union Pacific Corp Bank of America
Merrill Lynch (164)(10) Union Pacific Corp Citibank (39)
(140) Union Pacific Corp Credit Suisse (1,413)948 United Airlines Holdings Inc Bank of America
Merrill Lynch 6,80391 United Airlines Holdings Inc Citibank 205
633 United Airlines Holdings Inc Credit Suisse 1,412709 United Airlines Holdings Inc JP Morgan 1,58190 United Parcel Service Inc ’B’ Bank of America
Merrill Lynch 642(126) United Rentals Inc Bank of America
Merrill Lynch (2,032)(150) United Rentals Inc Citibank (801)(50) United Rentals Inc Credit Suisse (761)
(3,634) United States Steel Corp Citibank (2,320)(20) UnitedHealth Group Inc Bank of America
Merrill Lynch (228)(80) UnitedHealth Group Inc JP Morgan (1,199)80 Universal Health Services
Inc ’B’Bank of AmericaMerrill Lynch 864
30 Universal Health ServicesInc ’B’ Citibank 13
40 Universal Health ServicesInc ’B’ JP Morgan 93
(300) Urban Outfitters Inc Citibank 46(420) Urban Outfitters Inc Credit Suisse 272790 US Foods Holding Corp Citibank 810340 US Foods Holding Corp JP Morgan (205)(50) Vail Resorts Inc Credit Suisse (1,507)
(110) Valero Energy Corp Credit Suisse (57)(70) Valmont Industries Inc Citibank (481)680 Valvoline Inc Citibank (6)770 Valvoline Inc Credit Suisse 699570 Valvoline Inc JP Morgan 518181 VeriSign Inc Bank of America
Merrill Lynch (400)133 VeriSign Inc Credit Suisse 568100 VeriSign Inc JP Morgan 427410 Verizon Communications
Inc Credit Suisse (605)100 Verizon Communications
Inc JP Morgan (147)49 Vertex Pharmaceuticals Inc Bank of America
Merrill Lynch (299)92 Vertex Pharmaceuticals Inc Citibank (252)86 Vertex Pharmaceuticals Inc JP Morgan 795
(260) VF Corp Bank of AmericaMerrill Lynch (1,169)
(50) VF Corp Citibank (59)(50) VF Corp JP Morgan 57
(580) ViacomCBS Inc ’B’ Bank of AmericaMerrill Lynch (1,716)
(900) ViacomCBS Inc ’B’ Citibank (809)(143) ViaSat Inc Citibank 40(400) ViaSat Inc Credit Suisse (201)(159) Virtu Financial Inc ’A’ Bank of America
Merrill Lynch (50)(392) Virtu Financial Inc ’A’ Citibank (476)(190) Virtu Financial Inc ’A’ Credit Suisse 89(433) Virtu Financial Inc ’A’ JP Morgan 2(40) Visa Inc ’A’ Citibank (114)
BlackRock Total Advantage Fund continued
The notes on pages 691 to 711 form an integral part of these financial statements.
BlackRock Strategic Funds[674]
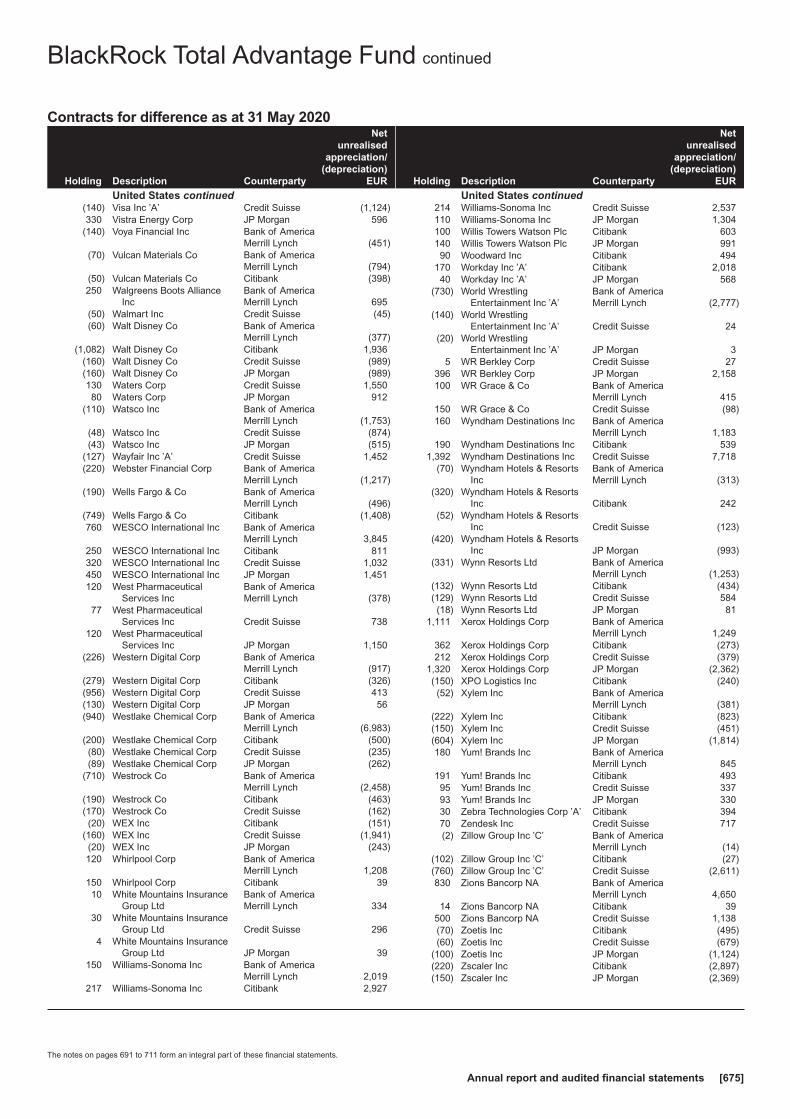
Contracts for difference as at 31 May 2020
Holding Description Counterparty
Netunrealised
appreciation/(depreciation)
EUR
United States continued(140) Visa Inc ’A’ Credit Suisse (1,124)330 Vistra Energy Corp JP Morgan 596
(140) Voya Financial Inc Bank of AmericaMerrill Lynch (451)
(70) Vulcan Materials Co Bank of AmericaMerrill Lynch (794)
(50) Vulcan Materials Co Citibank (398)250 Walgreens Boots Alliance
IncBank of AmericaMerrill Lynch 695
(50) Walmart Inc Credit Suisse (45)(60) Walt Disney Co Bank of America
Merrill Lynch (377)(1,082) Walt Disney Co Citibank 1,936
(160) Walt Disney Co Credit Suisse (989)(160) Walt Disney Co JP Morgan (989)130 Waters Corp Credit Suisse 1,55080 Waters Corp JP Morgan 912
(110) Watsco Inc Bank of AmericaMerrill Lynch (1,753)
(48) Watsco Inc Credit Suisse (874)(43) Watsco Inc JP Morgan (515)
(127) Wayfair Inc ’A’ Credit Suisse 1,452(220) Webster Financial Corp Bank of America
Merrill Lynch (1,217)(190) Wells Fargo & Co Bank of America
Merrill Lynch (496)(749) Wells Fargo & Co Citibank (1,408)760 WESCO International Inc Bank of America
Merrill Lynch 3,845250 WESCO International Inc Citibank 811320 WESCO International Inc Credit Suisse 1,032450 WESCO International Inc JP Morgan 1,451120 West Pharmaceutical
Services IncBank of AmericaMerrill Lynch (378)
77 West PharmaceuticalServices Inc Credit Suisse 738
120 West PharmaceuticalServices Inc JP Morgan 1,150
(226) Western Digital Corp Bank of AmericaMerrill Lynch (917)
(279) Western Digital Corp Citibank (326)(956) Western Digital Corp Credit Suisse 413(130) Western Digital Corp JP Morgan 56(940) Westlake Chemical Corp Bank of America
Merrill Lynch (6,983)(200) Westlake Chemical Corp Citibank (500)(80) Westlake Chemical Corp Credit Suisse (235)(89) Westlake Chemical Corp JP Morgan (262)
(710) Westrock Co Bank of AmericaMerrill Lynch (2,458)
(190) Westrock Co Citibank (463)(170) Westrock Co Credit Suisse (162)(20) WEX Inc Citibank (151)
(160) WEX Inc Credit Suisse (1,941)(20) WEX Inc JP Morgan (243)120 Whirlpool Corp Bank of America
Merrill Lynch 1,208150 Whirlpool Corp Citibank 3910 White Mountains Insurance
Group LtdBank of AmericaMerrill Lynch 334
30 White Mountains InsuranceGroup Ltd Credit Suisse 296
4 White Mountains InsuranceGroup Ltd JP Morgan 39
150 Williams-Sonoma Inc Bank of AmericaMerrill Lynch 2,019
217 Williams-Sonoma Inc Citibank 2,927
Holding Description Counterparty
Netunrealised
appreciation/(depreciation)
EUR
United States continued214 Williams-Sonoma Inc Credit Suisse 2,537110 Williams-Sonoma Inc JP Morgan 1,304100 Willis Towers Watson Plc Citibank 603140 Willis Towers Watson Plc JP Morgan 99190 Woodward Inc Citibank 494
170 Workday Inc ’A’ Citibank 2,01840 Workday Inc ’A’ JP Morgan 568
(730) World WrestlingEntertainment Inc ’A’
Bank of AmericaMerrill Lynch (2,777)
(140) World WrestlingEntertainment Inc ’A’ Credit Suisse 24
(20) World WrestlingEntertainment Inc ’A’ JP Morgan 3
5 WR Berkley Corp Credit Suisse 27396 WR Berkley Corp JP Morgan 2,158100 WR Grace & Co Bank of America
Merrill Lynch 415150 WR Grace & Co Credit Suisse (98)160 Wyndham Destinations Inc Bank of America
Merrill Lynch 1,183190 Wyndham Destinations Inc Citibank 539
1,392 Wyndham Destinations Inc Credit Suisse 7,718(70) Wyndham Hotels & Resorts
IncBank of AmericaMerrill Lynch (313)
(320) Wyndham Hotels & ResortsInc Citibank 242
(52) Wyndham Hotels & ResortsInc Credit Suisse (123)
(420) Wyndham Hotels & ResortsInc JP Morgan (993)
(331) Wynn Resorts Ltd Bank of AmericaMerrill Lynch (1,253)
(132) Wynn Resorts Ltd Citibank (434)(129) Wynn Resorts Ltd Credit Suisse 584(18) Wynn Resorts Ltd JP Morgan 81
1,111 Xerox Holdings Corp Bank of AmericaMerrill Lynch 1,249
362 Xerox Holdings Corp Citibank (273)212 Xerox Holdings Corp Credit Suisse (379)
1,320 Xerox Holdings Corp JP Morgan (2,362)(150) XPO Logistics Inc Citibank (240)(52) Xylem Inc Bank of America
Merrill Lynch (381)(222) Xylem Inc Citibank (823)(150) Xylem Inc Credit Suisse (451)(604) Xylem Inc JP Morgan (1,814)180 Yum! Brands Inc Bank of America
Merrill Lynch 845191 Yum! Brands Inc Citibank 49395 Yum! Brands Inc Credit Suisse 33793 Yum! Brands Inc JP Morgan 33030 Zebra Technologies Corp ’A’ Citibank 39470 Zendesk Inc Credit Suisse 717(2) Zillow Group Inc ’C’ Bank of America
Merrill Lynch (14)(102) Zillow Group Inc ’C’ Citibank (27)(760) Zillow Group Inc ’C’ Credit Suisse (2,611)830 Zions Bancorp NA Bank of America
Merrill Lynch 4,65014 Zions Bancorp NA Citibank 39
500 Zions Bancorp NA Credit Suisse 1,138(70) Zoetis Inc Citibank (495)(60) Zoetis Inc Credit Suisse (679)
(100) Zoetis Inc JP Morgan (1,124)(220) Zscaler Inc Citibank (2,897)(150) Zscaler Inc JP Morgan (2,369)
BlackRock Total Advantage Fund continued
The notes on pages 691 to 711 form an integral part of these financial statements.
Annual report and audited financial statements [675]
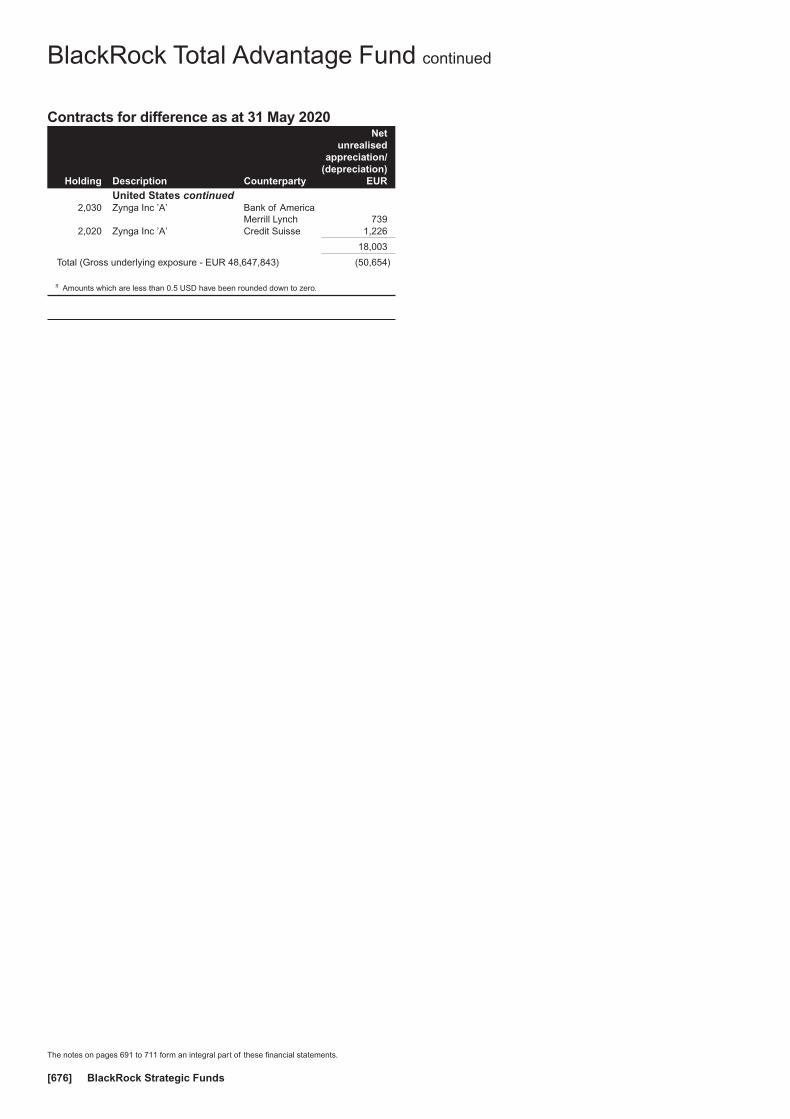
Contracts for difference as at 31 May 2020
Holding Description Counterparty
Netunrealised
appreciation/(depreciation)
EUR
United States continued2,030 Zynga Inc ’A’ Bank of America
Merrill Lynch 7392,020 Zynga Inc ’A’ Credit Suisse 1,226
18,003
Total (Gross underlying exposure - EUR 48,647,843) (50,654)
π Amounts which are less than 0.5 USD have been rounded down to zero.
BlackRock Total Advantage Fund continued
The notes on pages 691 to 711 form an integral part of these financial statements.
BlackRock Strategic Funds[676]
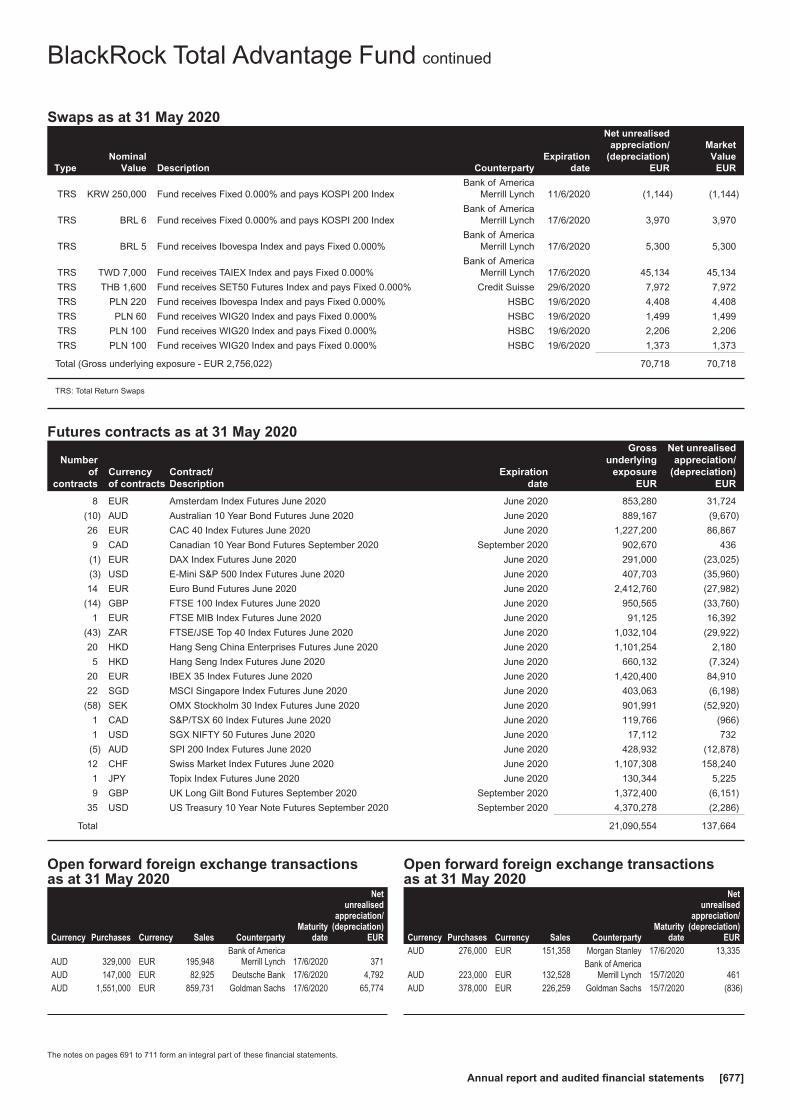
Swaps as at 31 May 2020
TypeNominal
Value Description CounterpartyExpiration
date
Net unrealisedappreciation/
(depreciation)EUR
MarketValue
EUR
TRS KRW 250,000 Fund receives Fixed 0.000% and pays KOSPI 200 IndexBank of America
Merrill Lynch 11/6/2020 (1,144) (1,144)
TRS BRL 6 Fund receives Fixed 0.000% and pays KOSPI 200 IndexBank of America
Merrill Lynch 17/6/2020 3,970 3,970
TRS BRL 5 Fund receives Ibovespa Index and pays Fixed 0.000%Bank of America
Merrill Lynch 17/6/2020 5,300 5,300
TRS TWD 7,000 Fund receives TAIEX Index and pays Fixed 0.000%Bank of America
Merrill Lynch 17/6/2020 45,134 45,134
TRS THB 1,600 Fund receives SET50 Futures Index and pays Fixed 0.000% Credit Suisse 29/6/2020 7,972 7,972
TRS PLN 220 Fund receives Ibovespa Index and pays Fixed 0.000% HSBC 19/6/2020 4,408 4,408
TRS PLN 60 Fund receives WIG20 Index and pays Fixed 0.000% HSBC 19/6/2020 1,499 1,499
TRS PLN 100 Fund receives WIG20 Index and pays Fixed 0.000% HSBC 19/6/2020 2,206 2,206
TRS PLN 100 Fund receives WIG20 Index and pays Fixed 0.000% HSBC 19/6/2020 1,373 1,373
Total (Gross underlying exposure - EUR 2,756,022) 70,718 70,718
TRS: Total Return Swaps
Futures contracts as at 31 May 2020
Numberof
contractsCurrencyof contracts
Contract/Description
Expirationdate
Grossunderlying
exposureEUR
Net unrealisedappreciation/
(depreciation)EUR
8 EUR Amsterdam Index Futures June 2020 June 2020 853,280 31,724
(10) AUD Australian 10 Year Bond Futures June 2020 June 2020 889,167 (9,670)
26 EUR CAC 40 Index Futures June 2020 June 2020 1,227,200 86,867
9 CAD Canadian 10 Year Bond Futures September 2020 September 2020 902,670 436
(1) EUR DAX Index Futures June 2020 June 2020 291,000 (23,025)
(3) USD E-Mini S&P 500 Index Futures June 2020 June 2020 407,703 (35,960)
14 EUR Euro Bund Futures June 2020 June 2020 2,412,760 (27,982)
(14) GBP FTSE 100 Index Futures June 2020 June 2020 950,565 (33,760)
1 EUR FTSE MIB Index Futures June 2020 June 2020 91,125 16,392
(43) ZAR FTSE/JSE Top 40 Index Futures June 2020 June 2020 1,032,104 (29,922)
20 HKD Hang Seng China Enterprises Futures June 2020 June 2020 1,101,254 2,180
5 HKD Hang Seng Index Futures June 2020 June 2020 660,132 (7,324)
20 EUR IBEX 35 Index Futures June 2020 June 2020 1,420,400 84,910
22 SGD MSCI Singapore Index Futures June 2020 June 2020 403,063 (6,198)
(58) SEK OMX Stockholm 30 Index Futures June 2020 June 2020 901,991 (52,920)
1 CAD S&P/TSX 60 Index Futures June 2020 June 2020 119,766 (966)
1 USD SGX NIFTY 50 Futures June 2020 June 2020 17,112 732
(5) AUD SPI 200 Index Futures June 2020 June 2020 428,932 (12,878)
12 CHF Swiss Market Index Futures June 2020 June 2020 1,107,308 158,240
1 JPY Topix Index Futures June 2020 June 2020 130,344 5,225
9 GBP UK Long Gilt Bond Futures September 2020 September 2020 1,372,400 (6,151)
35 USD US Treasury 10 Year Note Futures September 2020 September 2020 4,370,278 (2,286)
Total 21,090,554 137,664
Open forward foreign exchange transactionsas at 31 May 2020
Currency Purchases Currency Sales CounterpartyMaturity
date
Netunrealised
appreciation/(depreciation)
EUR
AUD 329,000 EUR 195,948Bank of America
Merrill Lynch 17/6/2020 371AUD 147,000 EUR 82,925 Deutsche Bank 17/6/2020 4,792AUD 1,551,000 EUR 859,731 Goldman Sachs 17/6/2020 65,774
Open forward foreign exchange transactionsas at 31 May 2020
Currency Purchases Currency Sales CounterpartyMaturity
date
Netunrealised
appreciation/(depreciation)
EURAUD 276,000 EUR 151,358 Morgan Stanley 17/6/2020 13,335
AUD 223,000 EUR 132,528Bank of America
Merrill Lynch 15/7/2020 461AUD 378,000 EUR 226,259 Goldman Sachs 15/7/2020 (836)
BlackRock Total Advantage Fund continued
The notes on pages 691 to 711 form an integral part of these financial statements.
Annual report and audited financial statements [677]
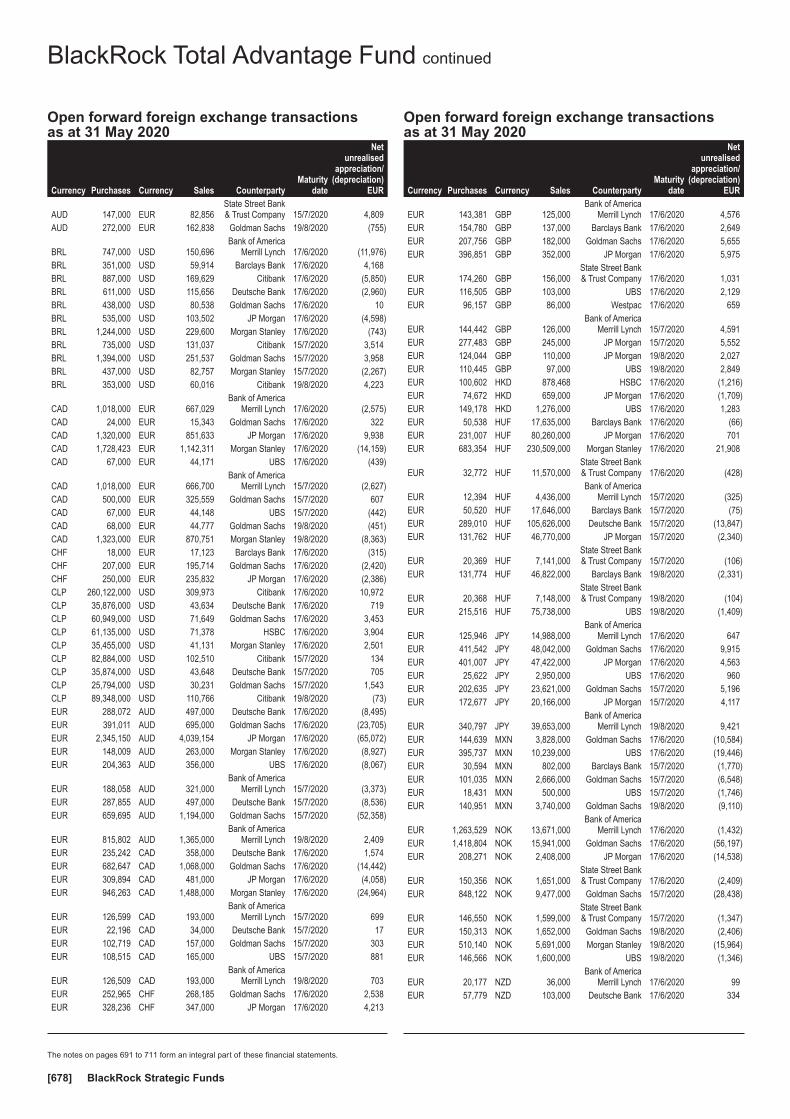
Open forward foreign exchange transactionsas at 31 May 2020
Currency Purchases Currency Sales CounterpartyMaturity
date
Netunrealised
appreciation/(depreciation)
EUR
AUD 147,000 EUR 82,856State Street Bank& Trust Company 15/7/2020 4,809
AUD 272,000 EUR 162,838 Goldman Sachs 19/8/2020 (755)
BRL 747,000 USD 150,696Bank of America
Merrill Lynch 17/6/2020 (11,976)BRL 351,000 USD 59,914 Barclays Bank 17/6/2020 4,168BRL 887,000 USD 169,629 Citibank 17/6/2020 (5,850)BRL 611,000 USD 115,656 Deutsche Bank 17/6/2020 (2,960)BRL 438,000 USD 80,538 Goldman Sachs 17/6/2020 10BRL 535,000 USD 103,502 JP Morgan 17/6/2020 (4,598)BRL 1,244,000 USD 229,600 Morgan Stanley 17/6/2020 (743)BRL 735,000 USD 131,037 Citibank 15/7/2020 3,514BRL 1,394,000 USD 251,537 Goldman Sachs 15/7/2020 3,958BRL 437,000 USD 82,757 Morgan Stanley 15/7/2020 (2,267)BRL 353,000 USD 60,016 Citibank 19/8/2020 4,223
CAD 1,018,000 EUR 667,029Bank of America
Merrill Lynch 17/6/2020 (2,575)CAD 24,000 EUR 15,343 Goldman Sachs 17/6/2020 322CAD 1,320,000 EUR 851,633 JP Morgan 17/6/2020 9,938CAD 1,728,423 EUR 1,142,311 Morgan Stanley 17/6/2020 (14,159)CAD 67,000 EUR 44,171 UBS 17/6/2020 (439)
CAD 1,018,000 EUR 666,700Bank of America
Merrill Lynch 15/7/2020 (2,627)CAD 500,000 EUR 325,559 Goldman Sachs 15/7/2020 607CAD 67,000 EUR 44,148 UBS 15/7/2020 (442)CAD 68,000 EUR 44,777 Goldman Sachs 19/8/2020 (451)CAD 1,323,000 EUR 870,751 Morgan Stanley 19/8/2020 (8,363)CHF 18,000 EUR 17,123 Barclays Bank 17/6/2020 (315)CHF 207,000 EUR 195,714 Goldman Sachs 17/6/2020 (2,420)CHF 250,000 EUR 235,832 JP Morgan 17/6/2020 (2,386)CLP 260,122,000 USD 309,973 Citibank 17/6/2020 10,972CLP 35,876,000 USD 43,634 Deutsche Bank 17/6/2020 719CLP 60,949,000 USD 71,649 Goldman Sachs 17/6/2020 3,453CLP 61,135,000 USD 71,378 HSBC 17/6/2020 3,904CLP 35,455,000 USD 41,131 Morgan Stanley 17/6/2020 2,501CLP 82,884,000 USD 102,510 Citibank 15/7/2020 134CLP 35,874,000 USD 43,648 Deutsche Bank 15/7/2020 705CLP 25,794,000 USD 30,231 Goldman Sachs 15/7/2020 1,543CLP 89,348,000 USD 110,766 Citibank 19/8/2020 (73)EUR 288,072 AUD 497,000 Deutsche Bank 17/6/2020 (8,495)EUR 391,011 AUD 695,000 Goldman Sachs 17/6/2020 (23,705)EUR 2,345,150 AUD 4,039,154 JP Morgan 17/6/2020 (65,072)EUR 148,009 AUD 263,000 Morgan Stanley 17/6/2020 (8,927)EUR 204,363 AUD 356,000 UBS 17/6/2020 (8,067)
EUR 188,058 AUD 321,000Bank of America
Merrill Lynch 15/7/2020 (3,373)EUR 287,855 AUD 497,000 Deutsche Bank 15/7/2020 (8,536)EUR 659,695 AUD 1,194,000 Goldman Sachs 15/7/2020 (52,358)
EUR 815,802 AUD 1,365,000Bank of America
Merrill Lynch 19/8/2020 2,409EUR 235,242 CAD 358,000 Deutsche Bank 17/6/2020 1,574EUR 682,647 CAD 1,068,000 Goldman Sachs 17/6/2020 (14,442)EUR 309,894 CAD 481,000 JP Morgan 17/6/2020 (4,058)EUR 946,263 CAD 1,488,000 Morgan Stanley 17/6/2020 (24,964)
EUR 126,599 CAD 193,000Bank of America
Merrill Lynch 15/7/2020 699EUR 22,196 CAD 34,000 Deutsche Bank 15/7/2020 17EUR 102,719 CAD 157,000 Goldman Sachs 15/7/2020 303EUR 108,515 CAD 165,000 UBS 15/7/2020 881
EUR 126,509 CAD 193,000Bank of America
Merrill Lynch 19/8/2020 703EUR 252,965 CHF 268,185 Goldman Sachs 17/6/2020 2,538EUR 328,236 CHF 347,000 JP Morgan 17/6/2020 4,213
Open forward foreign exchange transactionsas at 31 May 2020
Currency Purchases Currency Sales CounterpartyMaturity
date
Netunrealised
appreciation/(depreciation)
EUR
EUR 143,381 GBP 125,000Bank of America
Merrill Lynch 17/6/2020 4,576EUR 154,780 GBP 137,000 Barclays Bank 17/6/2020 2,649EUR 207,756 GBP 182,000 Goldman Sachs 17/6/2020 5,655EUR 396,851 GBP 352,000 JP Morgan 17/6/2020 5,975
EUR 174,260 GBP 156,000State Street Bank& Trust Company 17/6/2020 1,031
EUR 116,505 GBP 103,000 UBS 17/6/2020 2,129EUR 96,157 GBP 86,000 Westpac 17/6/2020 659
EUR 144,442 GBP 126,000Bank of America
Merrill Lynch 15/7/2020 4,591EUR 277,483 GBP 245,000 JP Morgan 15/7/2020 5,552EUR 124,044 GBP 110,000 JP Morgan 19/8/2020 2,027EUR 110,445 GBP 97,000 UBS 19/8/2020 2,849EUR 100,602 HKD 878,468 HSBC 17/6/2020 (1,216)EUR 74,672 HKD 659,000 JP Morgan 17/6/2020 (1,709)EUR 149,178 HKD 1,276,000 UBS 17/6/2020 1,283EUR 50,538 HUF 17,635,000 Barclays Bank 17/6/2020 (66)EUR 231,007 HUF 80,260,000 JP Morgan 17/6/2020 701EUR 683,354 HUF 230,509,000 Morgan Stanley 17/6/2020 21,908
EUR 32,772 HUF 11,570,000State Street Bank& Trust Company 17/6/2020 (428)
EUR 12,394 HUF 4,436,000Bank of America
Merrill Lynch 15/7/2020 (325)EUR 50,520 HUF 17,646,000 Barclays Bank 15/7/2020 (75)EUR 289,010 HUF 105,626,000 Deutsche Bank 15/7/2020 (13,847)EUR 131,762 HUF 46,770,000 JP Morgan 15/7/2020 (2,340)
EUR 20,369 HUF 7,141,000State Street Bank& Trust Company 15/7/2020 (106)
EUR 131,774 HUF 46,822,000 Barclays Bank 19/8/2020 (2,331)
EUR 20,368 HUF 7,148,000State Street Bank& Trust Company 19/8/2020 (104)
EUR 215,516 HUF 75,738,000 UBS 19/8/2020 (1,409)
EUR 125,946 JPY 14,988,000Bank of America
Merrill Lynch 17/6/2020 647EUR 411,542 JPY 48,042,000 Goldman Sachs 17/6/2020 9,915EUR 401,007 JPY 47,422,000 JP Morgan 17/6/2020 4,563EUR 25,622 JPY 2,950,000 UBS 17/6/2020 960EUR 202,635 JPY 23,621,000 Goldman Sachs 15/7/2020 5,196EUR 172,677 JPY 20,166,000 JP Morgan 15/7/2020 4,117
EUR 340,797 JPY 39,653,000Bank of America
Merrill Lynch 19/8/2020 9,421EUR 144,639 MXN 3,828,000 Goldman Sachs 17/6/2020 (10,584)EUR 395,737 MXN 10,239,000 UBS 17/6/2020 (19,446)EUR 30,594 MXN 802,000 Barclays Bank 15/7/2020 (1,770)EUR 101,035 MXN 2,666,000 Goldman Sachs 15/7/2020 (6,548)EUR 18,431 MXN 500,000 UBS 15/7/2020 (1,746)EUR 140,951 MXN 3,740,000 Goldman Sachs 19/8/2020 (9,110)
EUR 1,263,529 NOK 13,671,000Bank of America
Merrill Lynch 17/6/2020 (1,432)EUR 1,418,804 NOK 15,941,000 Goldman Sachs 17/6/2020 (56,197)EUR 208,271 NOK 2,408,000 JP Morgan 17/6/2020 (14,538)
EUR 150,356 NOK 1,651,000State Street Bank& Trust Company 17/6/2020 (2,409)
EUR 848,122 NOK 9,477,000 Goldman Sachs 15/7/2020 (28,438)
EUR 146,550 NOK 1,599,000State Street Bank& Trust Company 15/7/2020 (1,347)
EUR 150,313 NOK 1,652,000 Goldman Sachs 19/8/2020 (2,406)EUR 510,140 NOK 5,691,000 Morgan Stanley 19/8/2020 (15,964)EUR 146,566 NOK 1,600,000 UBS 19/8/2020 (1,346)
EUR 20,177 NZD 36,000Bank of America
Merrill Lynch 17/6/2020 99EUR 57,779 NZD 103,000 Deutsche Bank 17/6/2020 334
BlackRock Total Advantage Fund continued
The notes on pages 691 to 711 form an integral part of these financial statements.
BlackRock Strategic Funds[678]

Open forward foreign exchange transactionsas at 31 May 2020
Currency Purchases Currency Sales CounterpartyMaturity
date
Netunrealised
appreciation/(depreciation)
EUREUR 134,631 NZD 248,000 Goldman Sachs 17/6/2020 (3,682)EUR 108,727 NZD 197,000 JP Morgan 17/6/2020 (1,143)EUR 246,854 NZD 460,000 Morgan Stanley 17/6/2020 (9,694)
EUR 20,159 NZD 36,000Bank of America
Merrill Lynch 15/7/2020 97EUR 57,734 NZD 103,000 Deutsche Bank 15/7/2020 333EUR 67,743 NZD 124,000 JP Morgan 15/7/2020 (1,361)EUR 212,745 PLN 966,000 Goldman Sachs 17/6/2020 (4,562)EUR 135,005 PLN 604,000 JP Morgan 17/6/2020 (868)EUR 71,502 PLN 323,000 UBS 17/6/2020 (1,159)EUR 51,821 PLN 236,000 Goldman Sachs 15/7/2020 (1,235)EUR 71,446 PLN 323,000 UBS 15/7/2020 (1,169)
EUR 71,384 PLN 323,000State Street Bank& Trust Company 19/8/2020 (1,178)
EUR 34,956 SEK 378,000 Barclays Bank 17/6/2020 (1,014)EUR 531,877 SEK 5,732,200 Goldman Sachs 17/6/2020 (13,599)EUR 341,612 SEK 3,780,000 JP Morgan 17/6/2020 (18,093)EUR 77,255 SEK 821,000 UBS 17/6/2020 (872)EUR 77,229 SEK 821,000 Barclays Bank 15/7/2020 (871)EUR 255,163 SEK 2,798,000 JP Morgan 15/7/2020 (11,007)EUR 106,734 SGD 166,000 HSBC 17/6/2020 1,161EUR 374,314 SGD 582,000 JP Morgan 17/6/2020 4,172EUR 396,476 SGD 630,000 Morgan Stanley 17/6/2020 (4,193)
EUR 543,755 SGD 848,000State Street Bank& Trust Company 17/6/2020 4,442
EUR 209,002 SGD 323,000 UBS 17/6/2020 3,579EUR 106,680 SGD 166,000 HSBC 15/7/2020 1,160EUR 522,679 SGD 808,000 JP Morgan 15/7/2020 9,065EUR 163,955 SGD 254,000 UBS 15/7/2020 2,496EUR 709,954 SGD 1,090,000 JP Morgan 19/8/2020 17,514EUR 118,963 SGD 185,000 UBS 19/8/2020 1,439EUR 312,558 THB 11,089,000 HSBC 17/6/2020 (835)EUR 134,729 THB 4,812,000 JP Morgan 17/6/2020 (1,266)EUR 219,317 THB 7,835,000 HSBC 15/7/2020 (1,964)EUR 524,340 USD 571,000 Deutsche Bank 17/6/2020 10,978EUR 1,818,032 USD 1,988,000 JP Morgan 17/6/2020 30,703EUR 4,882,922 USD 5,473,787 Morgan Stanley 17/6/2020 (38,334)
EUR 270,222 USD 300,000State Street Bank& Trust Company 17/6/2020 504
EUR 37,645 USD 41,000 UBS 17/6/2020 783
EUR 117,151 USD 127,000Bank of America
Merrill Lynch 15/7/2020 3,038EUR 121,080 USD 131,000 Deutsche Bank 15/7/2020 3,373EUR 37,623 USD 41,000 UBS 15/7/2020 783EUR 120,991 USD 131,000 Goldman Sachs 19/8/2020 3,372EUR 37,595 USD 41,000 Westpac 19/8/2020 783EUR 14,045 ZAR 272,000 Deutsche Bank 17/6/2020 110EUR 219,699 ZAR 4,365,000 Goldman Sachs 17/6/2020 (3,925)EUR 178,573 ZAR 3,399,000 HSBC 17/6/2020 4,438EUR 17,792 ZAR 341,000 UBS 17/6/2020 322
EUR 17,771 ZAR 342,000Bank of America
Merrill Lynch 15/7/2020 310
EUR 148,479 ZAR 3,039,000State Street Bank& Trust Company 15/7/2020 (6,676)
EUR 17,759 ZAR 343,000Bank of America
Merrill Lynch 19/8/2020 321EUR 29,843 ZAR 603,000 UBS 19/8/2020 (813)GBP 89,000 EUR 100,861 Deutsche Bank 17/6/2020 (2,032)GBP 42,000 EUR 46,011 Goldman Sachs 17/6/2020 628GBP 292,000 EUR 313,882 HSBC 17/6/2020 10,367GBP 160,000 EUR 174,008 JP Morgan 17/6/2020 3,663GBP 233,000 EUR 257,698 Morgan Stanley 17/6/2020 1,035
GBP 41,000 EUR 46,431State Street Bank& Trust Company 17/6/2020 (902)
Open forward foreign exchange transactionsas at 31 May 2020
Currency Purchases Currency Sales CounterpartyMaturity
date
Netunrealised
appreciation/(depreciation)
EURGBP 98,702 EUR 113,439 UBS 17/6/2020 (3,836)GBP 30,000 EUR 33,533 Deutsche Bank 15/7/2020 (235)GBP 41,000 EUR 46,403 HSBC 15/7/2020 (896)
GBP 60,000 EUR 68,422State Street Bank& Trust Company 15/7/2020 (1,827)
GBP 62,000 EUR 71,142 UBS 15/7/2020 (2,326)GBP 30,000 EUR 33,513 Deutsche Bank 19/8/2020 (236)HKD 49,000 EUR 5,842 HSBC 17/6/2020 (163)HKD 2,230,000 EUR 262,447 UBS 17/6/2020 (3,979)
HUF 18,258,000 EUR 51,812Bank of America
Merrill Lynch 17/6/2020 580HUF 22,826,000 EUR 65,151 Goldman Sachs 17/6/2020 349HUF 44,343,000 EUR 125,483 JP Morgan 17/6/2020 1,759
HUF 98,128,000 EUR 274,909State Street Bank& Trust Company 17/6/2020 6,670
HUF 27,368,000 EUR 80,896 UBS 17/6/2020 (2,363)
HUF 18,275,000 EUR 51,795Bank of America
Merrill Lynch 15/7/2020 604
HUF 33,732,000 EUR 94,023State Street Bank& Trust Company 15/7/2020 2,695
INR 2,345,000 USD 30,495 Goldman Sachs 17/6/2020 430INR 98,920,000 USD 1,315,950 HSBC 17/6/2020 (8,460)INR 32,369,000 USD 427,388 JP Morgan 17/6/2020 129INR 58,268,000 USD 743,214 Barclays Bank 15/7/2020 21,554INR 18,118,000 USD 236,250 Morgan Stanley 19/8/2020 1,279
JPY 3,276,000 EUR 27,909Bank of America
Merrill Lynch 17/6/2020 (522)JPY 2,089,000 EUR 18,046 Deutsche Bank 17/6/2020 (582)JPY 25,137,000 EUR 213,932 Goldman Sachs 17/6/2020 (3,788)JPY 21,628,000 EUR 180,746 JP Morgan 17/6/2020 62JPY 24,132,000 EUR 203,063 Morgan Stanley 17/6/2020 (1,321)
JPY 6,141,000 EUR 53,032State Street Bank& Trust Company 17/6/2020 (1,694)
JPY 28,432,334 EUR 237,803 UBS 17/6/2020 (110)
JPY 24,580,000 EUR 209,515Bank of America
Merrill Lynch 15/7/2020 (4,060)JPY 2,088,000 EUR 18,038 Deutsche Bank 15/7/2020 (585)JPY 6,572,000 EUR 55,686 JP Morgan 15/7/2020 (753)
JPY 6,140,000 EUR 53,011State Street Bank& Trust Company 15/7/2020 (1,689)
JPY 21,309,000 EUR 181,609 Goldman Sachs 19/8/2020 (3,532)
JPY 6,141,000 EUR 53,008State Street Bank& Trust Company 19/8/2020 (1,688)
KRW 47,445,000 USD 39,001Bank of America
Merrill Lynch 17/6/2020 (587)KRW 47,366,000 USD 38,772 Citibank 17/6/2020 (437)KRW 163,235,122 USD 133,472 Deutsche Bank 17/6/2020 (1,376)KRW 193,577,000 USD 156,462 Goldman Sachs 17/6/2020 5KRW 478,809,753 USD 393,503 HSBC 17/6/2020 (5,830)KRW 111,037,000 USD 91,052 JP Morgan 17/6/2020 (1,170)KRW 311,489,000 USD 251,403 Morgan Stanley 17/6/2020 335KRW 176,504,125 USD 144,934 UBS 17/6/2020 (2,038)KRW 194,940,000 USD 159,977 Citibank 15/7/2020 (2,139)KRW 86,765,000 USD 70,666 Deutsche Bank 15/7/2020 (469)KRW 250,135,000 USD 205,839 HSBC 15/7/2020 (3,253)MXN 528,000 EUR 20,387 Barclays Bank 17/6/2020 1,023MXN 1,410,000 EUR 58,671 Goldman Sachs 17/6/2020 (1,497)MXN 9,773,000 EUR 427,475 UBS 17/6/2020 (31,187)
MXN 1,425,000 EUR 56,356State Street Bank& Trust Company 15/7/2020 1,147
MXN 306,000 EUR 11,290 UBS 15/7/2020 1,058MXN 534,000 EUR 20,408 Barclays Bank 19/8/2020 1,018
MXN 900,000 EUR 35,990State Street Bank& Trust Company 19/8/2020 121
BlackRock Total Advantage Fund continued
The notes on pages 691 to 711 form an integral part of these financial statements.
Annual report and audited financial statements [679]

Open forward foreign exchange transactionsas at 31 May 2020
Currency Purchases Currency Sales CounterpartyMaturity
date
Netunrealised
appreciation/(depreciation)
EURNOK 6,283,000 EUR 543,000 Goldman Sachs 17/6/2020 38,358NOK 13,318,000 EUR 1,146,507 JP Morgan 17/6/2020 85,791NOK 5,161,000 EUR 453,266 Morgan Stanley 17/6/2020 24,274NOK 67,000 EUR 5,939 Barclays Bank 15/7/2020 258NOK 2,064,000 EUR 179,490 Goldman Sachs 15/7/2020 11,416
NZD 648,000 EUR 358,012Bank of America
Merrill Lynch 17/6/2020 3,386NZD 449,000 EUR 239,657 Goldman Sachs 17/6/2020 10,756NZD 786,000 EUR 434,321 JP Morgan 17/6/2020 4,042NZD 148,000 EUR 81,533 UBS 17/6/2020 1,009
NZD 388,000 EUR 214,339Bank of America
Merrill Lynch 15/7/2020 1,890NZD 137,000 EUR 76,574 Deutsche Bank 15/7/2020 (225)NZD 260,000 EUR 143,326 Goldman Sachs 15/7/2020 1,570NZD 420,000 EUR 226,438 JP Morgan 15/7/2020 7,624NZD 206,000 EUR 113,976 HSBC 19/8/2020 713NZD 744,000 EUR 417,364 Morgan Stanley 19/8/2020 (3,150)
NZD 39,000 EUR 21,784State Street Bank& Trust Company 19/8/2020 (71)
PLN 496,000 EUR 108,720 Goldman Sachs 17/6/2020 2,858PLN 534,000 EUR 122,573 HSBC 17/6/2020 (2,446)PLN 2,962,000 EUR 678,841 JP Morgan 17/6/2020 (12,522)PLN 172,000 EUR 39,708 Morgan Stanley 17/6/2020 (1,016)
PLN 132,000 EUR 28,807State Street Bank& Trust Company 17/6/2020 887
PLN 213,000 EUR 46,656 UBS 17/6/2020 1,260PLN 217,000 EUR 47,223 Deutsche Bank 15/7/2020 1,562PLN 57,000 EUR 12,518 Goldman Sachs 15/7/2020 296PLN 439,000 EUR 96,143 HSBC 15/7/2020 2,550PLN 517,000 EUR 113,935 JP Morgan 15/7/2020 2,294PLN 213,000 EUR 46,629 UBS 15/7/2020 1,257PLN 1,222,000 EUR 267,481 HSBC 19/8/2020 7,039PLN 439,000 EUR 96,060 JP Morgan 19/8/2020 2,560
RUB 34,840,000 USD 476,249Bank of America
Merrill Lynch 17/6/2020 14,543RUB 34,844,000 USD 476,956 Goldman Sachs 17/6/2020 13,958RUB 9,199,000 USD 124,732 HSBC 17/6/2020 4,752RUB 2,298,000 USD 28,589 JP Morgan 17/6/2020 3,498RUB 16,787,000 USD 214,672 Goldman Sachs 15/7/2020 19,513RUB 9,242,000 USD 124,856 HSBC 15/7/2020 4,750RUB 17,138,000 USD 230,291 JP Morgan 19/8/2020 8,995SEK 5,269,000 EUR 477,984 Barclays Bank 17/6/2020 23,414SEK 544,000 EUR 50,925 Credit Suisse 17/6/2020 842SEK 3,352,000 EUR 306,821 Goldman Sachs 17/6/2020 12,155SEK 3,848,000 EUR 358,346 JP Morgan 17/6/2020 7,829SEK 2,078,000 EUR 197,191 Morgan Stanley 17/6/2020 551SEK 1,293,000 EUR 118,103 Barclays Bank 15/7/2020 4,899SEK 2,689,000 EUR 247,103 Goldman Sachs 15/7/2020 8,698SEK 1,899,000 EUR 178,182 JP Morgan 15/7/2020 2,468SEK 2,078,000 EUR 197,130 Morgan Stanley 15/7/2020 547SEK 1,495,000 EUR 140,185 Goldman Sachs 19/8/2020 1,971SEK 991,000 EUR 93,336 JP Morgan 19/8/2020 896SEK 2,079,000 EUR 197,143 Morgan Stanley 19/8/2020 544SGD 985,782 EUR 633,836 Goldman Sachs 17/6/2020 (6,895)SGD 61,000 EUR 39,300 HSBC 17/6/2020 (505)SGD 287,000 EUR 182,094 JP Morgan 17/6/2020 433SGD 61,000 EUR 39,280 Morgan Stanley 15/7/2020 (504)THB 1,936,000 EUR 53,915 Goldman Sachs 17/6/2020 800THB 13,450,000 EUR 381,644 HSBC 17/6/2020 (1,525)THB 24,374,000 EUR 695,005 JP Morgan 17/6/2020 (6,157)THB 4,014,000 EUR 114,290 HSBC 15/7/2020 (925)THB 26,436,000 EUR 755,878 JP Morgan 15/7/2020 (9,257)THB 10,822,000 EUR 310,955 HSBC 19/8/2020 (5,573)
Open forward foreign exchange transactionsas at 31 May 2020
Currency Purchases Currency Sales CounterpartyMaturity
date
Netunrealised
appreciation/(depreciation)
EURTHB 12,888,000 EUR 370,080 JP Morgan 19/8/2020 (6,398)TWD 10,061,620 USD 337,118 Barclays Bank 17/6/2020 (1,619)TWD 11,208,000 USD 375,478 Citibank 17/6/2020 (1,759)TWD 9,677,000 USD 324,225 Deutsche Bank 17/6/2020 (1,552)TWD 9,815,000 USD 329,945 HSBC 17/6/2020 (2,559)TWD 1,646,000 USD 54,779 JP Morgan 17/6/2020 68TWD 1,040,380 USD 34,859 Morgan Stanley 17/6/2020 (168)TWD 1,813,000 USD 61,169 Barclays Bank 15/7/2020 (559)TWD 1,325,000 USD 44,757 Citibank 15/7/2020 (456)TWD 19,038,000 USD 638,355 Goldman Sachs 15/7/2020 (2,295)TWD 1,638,000 USD 54,792 Goldman Sachs 19/8/2020 58TWD 17,737,000 USD 602,009 HSBC 19/8/2020 (7,185)
USD 915,388 BRL 4,308,000Bank of America
Merrill Lynch 17/6/2020 110,707USD 163,213 BRL 760,000 Goldman Sachs 17/6/2020 21,080USD 26,233 BRL 123,000 Morgan Stanley 17/6/2020 3,248USD 413,358 BRL 2,197,000 HSBC 15/7/2020 8,972
USD 516 BRL 3,000Bank of America
Merrill Lynch 19/8/2020 (30)
USD 333,855 CLP 278,318,000Bank of America
Merrill Lynch 17/6/2020 (9,764)USD 378,771 CLP 311,857,000 Citibank 17/6/2020 (6,729)USD 112,759 CLP 92,775,000 Credit Suisse 17/6/2020 (1,932)USD 27,461 CLP 22,985,000 Deutsche Bank 17/6/2020 (906)USD 136,049 CLP 115,560,000 Goldman Sachs 17/6/2020 (6,366)USD 27,460 CLP 22,969,000 Deutsche Bank 15/7/2020 (888)USD 812,209 CLP 697,857,000 Goldman Sachs 15/7/2020 (46,852)USD 974,875 CLP 799,534,000 Goldman Sachs 19/8/2020 (13,992)
USD 220,000 EUR 203,016Bank of America
Merrill Lynch 17/6/2020 (5,223)USD 1,591,000 EUR 1,426,178 Goldman Sachs 17/6/2020 4,224USD 1,334,000 EUR 1,227,629 JP Morgan 17/6/2020 (28,284)USD 193,000 EUR 172,348 Morgan Stanley 17/6/2020 1,170
USD 634,000 EUR 580,372State Street Bank& Trust Company 17/6/2020 (10,368)
USD 743,719 EUR 683,162Bank of America
Merrill Lynch 15/7/2020 (14,912)USD 318,000 EUR 293,491 JP Morgan 15/7/2020 (7,760)USD 2,017,285 EUR 1,852,621 JP Morgan 19/8/2020 (41,397)
USD 185,699 INR 14,363,000Bank of America
Merrill Lynch 17/6/2020 (3,603)USD 77,673 INR 6,034,000 Citibank 17/6/2020 (1,820)USD 271,623 INR 20,589,000 Deutsche Bank 17/6/2020 (286)USD 347,590 INR 26,899,000 HSBC 17/6/2020 (6,917)USD 565,263 INR 43,051,000 JP Morgan 17/6/2020 (3,018)USD 63,731 INR 4,965,000 Morgan Stanley 17/6/2020 (1,661)USD 19,218 INR 1,500,000 UBS 17/6/2020 (534)
USD 31,589 INR 2,420,000Bank of America
Merrill Lynch 15/7/2020 (247)USD 78,604 INR 6,012,000 Citibank 15/7/2020 (499)USD 101,663 INR 7,921,000 Goldman Sachs 15/7/2020 (2,364)USD 410,995 INR 31,576,000 HSBC 15/7/2020 (4,276)USD 83,159 INR 6,363,000 JP Morgan 15/7/2020 (558)USD 169,193 INR 12,973,000 JP Morgan 19/8/2020 (887)
USD 144,533 KRW 177,575,932Bank of America
Merrill Lynch 17/6/2020 898USD 61,019 KRW 75,049,068 Deutsche Bank 17/6/2020 322USD 1,290,370 KRW 1,543,699,000 HSBC 17/6/2020 38,308
USD 867,993 KRW 1,068,070,000Bank of America
Merrill Lynch 15/7/2020 4,065USD 73,163 KRW 89,954,000 Deutsche Bank 15/7/2020 396USD 18,091 KRW 22,504,000 HSBC 15/7/2020 (92)USD 73,232 KRW 90,006,000 Deutsche Bank 19/8/2020 413
BlackRock Total Advantage Fund continued
The notes on pages 691 to 711 form an integral part of these financial statements.
BlackRock Strategic Funds[680]
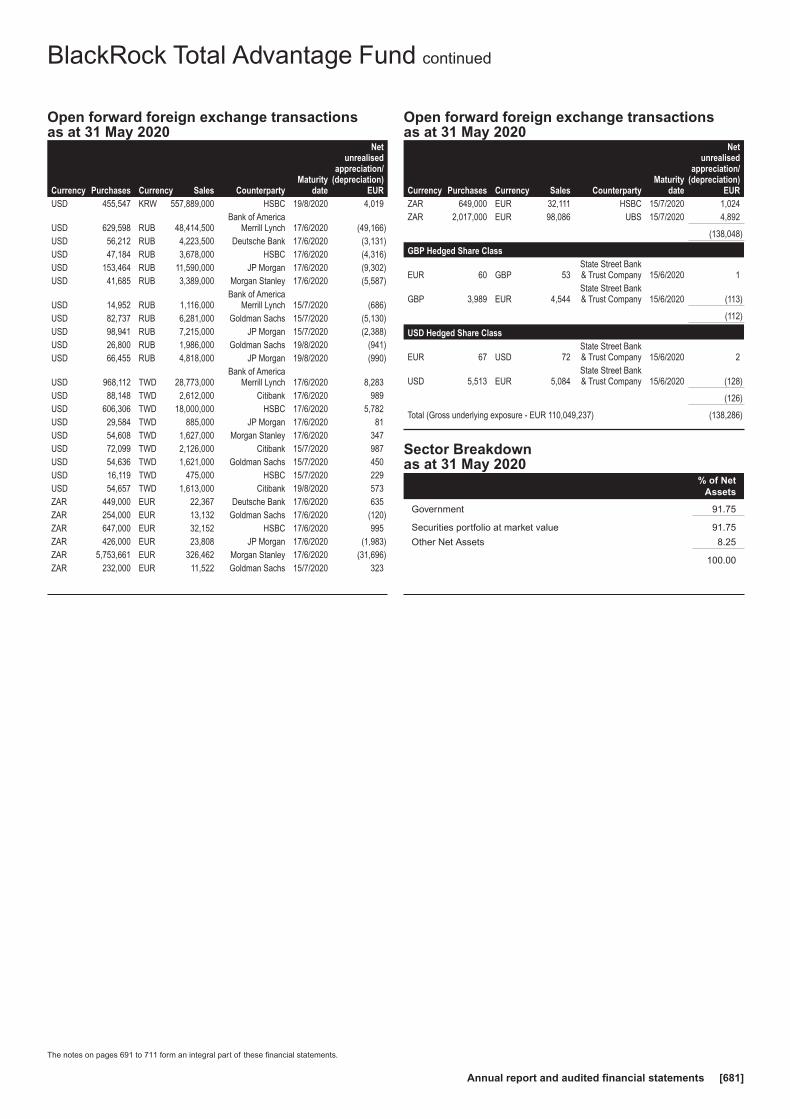
Open forward foreign exchange transactionsas at 31 May 2020
Currency Purchases Currency Sales CounterpartyMaturity
date
Netunrealised
appreciation/(depreciation)
EURUSD 455,547 KRW 557,889,000 HSBC 19/8/2020 4,019
USD 629,598 RUB 48,414,500Bank of America
Merrill Lynch 17/6/2020 (49,166)USD 56,212 RUB 4,223,500 Deutsche Bank 17/6/2020 (3,131)USD 47,184 RUB 3,678,000 HSBC 17/6/2020 (4,316)USD 153,464 RUB 11,590,000 JP Morgan 17/6/2020 (9,302)USD 41,685 RUB 3,389,000 Morgan Stanley 17/6/2020 (5,587)
USD 14,952 RUB 1,116,000Bank of America
Merrill Lynch 15/7/2020 (686)USD 82,737 RUB 6,281,000 Goldman Sachs 15/7/2020 (5,130)USD 98,941 RUB 7,215,000 JP Morgan 15/7/2020 (2,388)USD 26,800 RUB 1,986,000 Goldman Sachs 19/8/2020 (941)USD 66,455 RUB 4,818,000 JP Morgan 19/8/2020 (990)
USD 968,112 TWD 28,773,000Bank of America
Merrill Lynch 17/6/2020 8,283USD 88,148 TWD 2,612,000 Citibank 17/6/2020 989USD 606,306 TWD 18,000,000 HSBC 17/6/2020 5,782USD 29,584 TWD 885,000 JP Morgan 17/6/2020 81USD 54,608 TWD 1,627,000 Morgan Stanley 17/6/2020 347USD 72,099 TWD 2,126,000 Citibank 15/7/2020 987USD 54,636 TWD 1,621,000 Goldman Sachs 15/7/2020 450USD 16,119 TWD 475,000 HSBC 15/7/2020 229USD 54,657 TWD 1,613,000 Citibank 19/8/2020 573ZAR 449,000 EUR 22,367 Deutsche Bank 17/6/2020 635ZAR 254,000 EUR 13,132 Goldman Sachs 17/6/2020 (120)ZAR 647,000 EUR 32,152 HSBC 17/6/2020 995ZAR 426,000 EUR 23,808 JP Morgan 17/6/2020 (1,983)ZAR 5,753,661 EUR 326,462 Morgan Stanley 17/6/2020 (31,696)ZAR 232,000 EUR 11,522 Goldman Sachs 15/7/2020 323
Open forward foreign exchange transactionsas at 31 May 2020
Currency Purchases Currency Sales CounterpartyMaturity
date
Netunrealised
appreciation/(depreciation)
EURZAR 649,000 EUR 32,111 HSBC 15/7/2020 1,024ZAR 2,017,000 EUR 98,086 UBS 15/7/2020 4,892
(138,048)
GBP Hedged Share Class
EUR 60 GBP 53State Street Bank& Trust Company 15/6/2020 1
GBP 3,989 EUR 4,544State Street Bank& Trust Company 15/6/2020 (113)
(112)
USD Hedged Share Class
EUR 67 USD 72State Street Bank& Trust Company 15/6/2020 2
USD 5,513 EUR 5,084State Street Bank& Trust Company 15/6/2020 (128)
(126)
Total (Gross underlying exposure - EUR 110,049,237) (138,286)
Sector Breakdownas at 31 May 2020
% of NetAssets
Government 91.75
Securities portfolio at market value 91.75
Other Net Assets 8.25
100.00
BlackRock Total Advantage Fund continued
The notes on pages 691 to 711 form an integral part of these financial statements.
Annual report and audited financial statements [681]
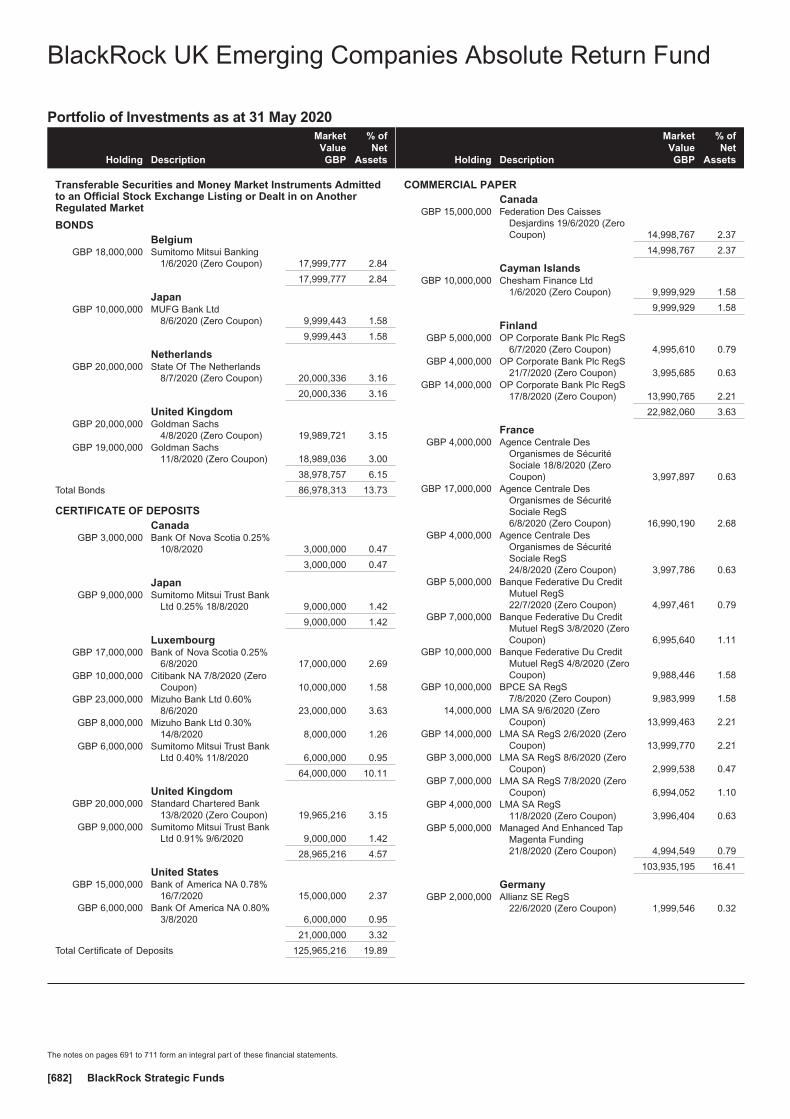
Portfolio of Investments as at 31 May 2020
Holding Description
MarketValueGBP
% ofNet
Assets
Transferable Securities and Money Market Instruments Admittedto an Official Stock Exchange Listing or Dealt in on AnotherRegulated Market
BONDSBelgium
GBP 18,000,000 Sumitomo Mitsui Banking1/6/2020 (Zero Coupon) 17,999,777 2.84
17,999,777 2.84
JapanGBP 10,000,000 MUFG Bank Ltd
8/6/2020 (Zero Coupon) 9,999,443 1.58
9,999,443 1.58
NetherlandsGBP 20,000,000 State Of The Netherlands
8/7/2020 (Zero Coupon) 20,000,336 3.16
20,000,336 3.16
United KingdomGBP 20,000,000 Goldman Sachs
4/8/2020 (Zero Coupon) 19,989,721 3.15GBP 19,000,000 Goldman Sachs
11/8/2020 (Zero Coupon) 18,989,036 3.00
38,978,757 6.15
Total Bonds 86,978,313 13.73
CERTIFICATE OF DEPOSITSCanada
GBP 3,000,000 Bank Of Nova Scotia 0.25%10/8/2020 3,000,000 0.47
3,000,000 0.47
JapanGBP 9,000,000 Sumitomo Mitsui Trust Bank
Ltd 0.25% 18/8/2020 9,000,000 1.42
9,000,000 1.42
LuxembourgGBP 17,000,000 Bank of Nova Scotia 0.25%
6/8/2020 17,000,000 2.69GBP 10,000,000 Citibank NA 7/8/2020 (Zero
Coupon) 10,000,000 1.58GBP 23,000,000 Mizuho Bank Ltd 0.60%
8/6/2020 23,000,000 3.63GBP 8,000,000 Mizuho Bank Ltd 0.30%
14/8/2020 8,000,000 1.26GBP 6,000,000 Sumitomo Mitsui Trust Bank
Ltd 0.40% 11/8/2020 6,000,000 0.95
64,000,000 10.11
United KingdomGBP 20,000,000 Standard Chartered Bank
13/8/2020 (Zero Coupon) 19,965,216 3.15GBP 9,000,000 Sumitomo Mitsui Trust Bank
Ltd 0.91% 9/6/2020 9,000,000 1.42
28,965,216 4.57
United StatesGBP 15,000,000 Bank of America NA 0.78%
16/7/2020 15,000,000 2.37GBP 6,000,000 Bank Of America NA 0.80%
3/8/2020 6,000,000 0.95
21,000,000 3.32
Total Certificate of Deposits 125,965,216 19.89
Holding Description
MarketValueGBP
% ofNet
Assets
COMMERCIAL PAPERCanada
GBP 15,000,000 Federation Des CaissesDesjardins 19/6/2020 (ZeroCoupon) 14,998,767 2.37
14,998,767 2.37
Cayman IslandsGBP 10,000,000 Chesham Finance Ltd
1/6/2020 (Zero Coupon) 9,999,929 1.58
9,999,929 1.58
FinlandGBP 5,000,000 OP Corporate Bank Plc RegS
6/7/2020 (Zero Coupon) 4,995,610 0.79GBP 4,000,000 OP Corporate Bank Plc RegS
21/7/2020 (Zero Coupon) 3,995,685 0.63GBP 14,000,000 OP Corporate Bank Plc RegS
17/8/2020 (Zero Coupon) 13,990,765 2.21
22,982,060 3.63
FranceGBP 4,000,000 Agence Centrale Des
Organismes de SécuritéSociale 18/8/2020 (ZeroCoupon) 3,997,897 0.63
GBP 17,000,000 Agence Centrale DesOrganismes de SécuritéSociale RegS6/8/2020 (Zero Coupon) 16,990,190 2.68
GBP 4,000,000 Agence Centrale DesOrganismes de SécuritéSociale RegS24/8/2020 (Zero Coupon) 3,997,786 0.63
GBP 5,000,000 Banque Federative Du CreditMutuel RegS22/7/2020 (Zero Coupon) 4,997,461 0.79
GBP 7,000,000 Banque Federative Du CreditMutuel RegS 3/8/2020 (ZeroCoupon) 6,995,640 1.11
GBP 10,000,000 Banque Federative Du CreditMutuel RegS 4/8/2020 (ZeroCoupon) 9,988,446 1.58
GBP 10,000,000 BPCE SA RegS7/8/2020 (Zero Coupon) 9,983,999 1.58
14,000,000 LMA SA 9/6/2020 (ZeroCoupon) 13,999,463 2.21
GBP 14,000,000 LMA SA RegS 2/6/2020 (ZeroCoupon) 13,999,770 2.21
GBP 3,000,000 LMA SA RegS 8/6/2020 (ZeroCoupon) 2,999,538 0.47
GBP 7,000,000 LMA SA RegS 7/8/2020 (ZeroCoupon) 6,994,052 1.10
GBP 4,000,000 LMA SA RegS11/8/2020 (Zero Coupon) 3,996,404 0.63
GBP 5,000,000 Managed And Enhanced TapMagenta Funding21/8/2020 (Zero Coupon) 4,994,549 0.79
103,935,195 16.41
GermanyGBP 2,000,000 Allianz SE RegS
22/6/2020 (Zero Coupon) 1,999,546 0.32
BlackRock UK Emerging Companies Absolute Return Fund
The notes on pages 691 to 711 form an integral part of these financial statements.
BlackRock Strategic Funds[682]

Portfolio of Investments as at 31 May 2020
Holding Description
MarketValueGBP
% ofNet
Assets
Germany continuedGBP 28,000,000 Erste Abwicklungsanstalt
RegS 28/9/2020 (ZeroCoupon) 27,990,721 4.42
GBP 8,000,000 FMS Wertmanagement AoerRegS 5/8/2020 (ZeroCoupon) 7,995,305 1.26
37,985,572 6.00
IrelandGBP 6,000,000 Matchpoint Finance Plc
5/6/2020 (Zero Coupon) 5,999,339 0.95GBP 3,000,000 Matchpoint Finance Plc
9/7/2020 (Zero Coupon) 2,998,130 0.47
8,997,469 1.42
LuxembourgGBP 10,000,000 Albion Capital Corp SA RegS
22/6/2020 (Zero Coupon) 9,998,110 1.57GBP 10,000,000 Albion Capital Corp SA RegS
29/6/2020 (Zero Coupon) 9,997,535 1.58GBP 10,000,000 Allianz SE RegS
21/7/2020 (Zero Coupon) 9,990,062 1.58GBP 9,000,000 BPCE SA RegS
6/7/2020 (Zero Coupon) 8,991,735 1.42GBP 6,000,000 ING Bank NV RegS
6/7/2020 (Zero Coupon) 5,994,671 0.95GBP 2,000,000 OP Corporate Bank Plc RegS
27/7/2020 (Zero Coupon) 1,997,217 0.32
46,969,330 7.42
NetherlandsGBP 15,000,000 Paccar Financial Europe BV
RegS 8/6/2020 (ZeroCoupon) 14,999,002 2.37
14,999,002 2.37
United KingdomGBP 9,000,000 Transport For London RegS
15/6/2020 (Zero Coupon) 8,998,424 1.42
8,998,424 1.42
United StatesGBP 10,000,000 Mont Blanc Capital Corp RegS
16/6/2020 (Zero Coupon) 9,999,022 1.58GBP 25,000,000 Nieuw Amsterdam
Receivables Corp2/6/2020 (Zero Coupon) 24,999,671 3.95
25,000,000 Nieuw AmsterdamReceivables Corp9/6/2020 (Zero Coupon) 24,999,329 3.94
59,998,022 9.47
Total Commercial Papers 329,863,770 52.09
Total Transferable Securities and Money MarketInstruments Admitted to an Official Stock ExchangeListing or Dealt in on Another Regulated Market 542,807,299 85.71
Other Transferable Securities and Money Market Instruments
BONDSBelgium
GBP 18,000,000 Sumitomo Mitsui Banking Corp1/9/2020 (Zero Coupon) 17,988,665 2.84
17,988,665 2.84
JapanGBP 6,000,000 Sumitomo Mitsui Banking Corp
15/6/2020 (Zero Coupon) 5,999,666 0.95
5,999,666 0.95
Holding Description
MarketValueGBP
% ofNet
Assets
NetherlandsGBP 6,000,000 ABN AMRO Bank NV 0.54%
6/7/2020 6,001,445 0.95
6,001,445 0.95
United KingdomGBP 6,000,000 United Kingdom Treasury Bill
22/6/2020 (Zero Coupon) 5,999,880 0.95GBP 10,000,000 United Kingdom Treasury Bill
13/7/2020 (Zero Coupon) 9,999,150 1.58GBP 6,000,000 United Kingdom Treasury Bill
27/7/2020 (Zero Coupon) 5,999,460 0.94
21,998,490 3.47
Total Bonds 51,988,266 8.21
Total Other Transferable Securities and MoneyMarket Instruments 51,988,266 8.21
Collective Investment Schemes~
Ireland61,043,814 Institutional Cash Series Plc -
Institutional Sterling LiquidityFund Agency Dis 61,043,814 9.64
61,043,814 9.64
Total Collective Investment Schemes 61,043,814 9.64
Securities portfolio at market value 655,839,379 103.56
Other Net Liabilities (22,521,257) (3.56)
Total Net Assets (GBP) 633,318,122 100.00
~ Investment in related party fund, see further information in Note 10.
BlackRock UK Emerging Companies Absolute Return Fundcontinued
The notes on pages 691 to 711 form an integral part of these financial statements.
Annual report and audited financial statements [683]
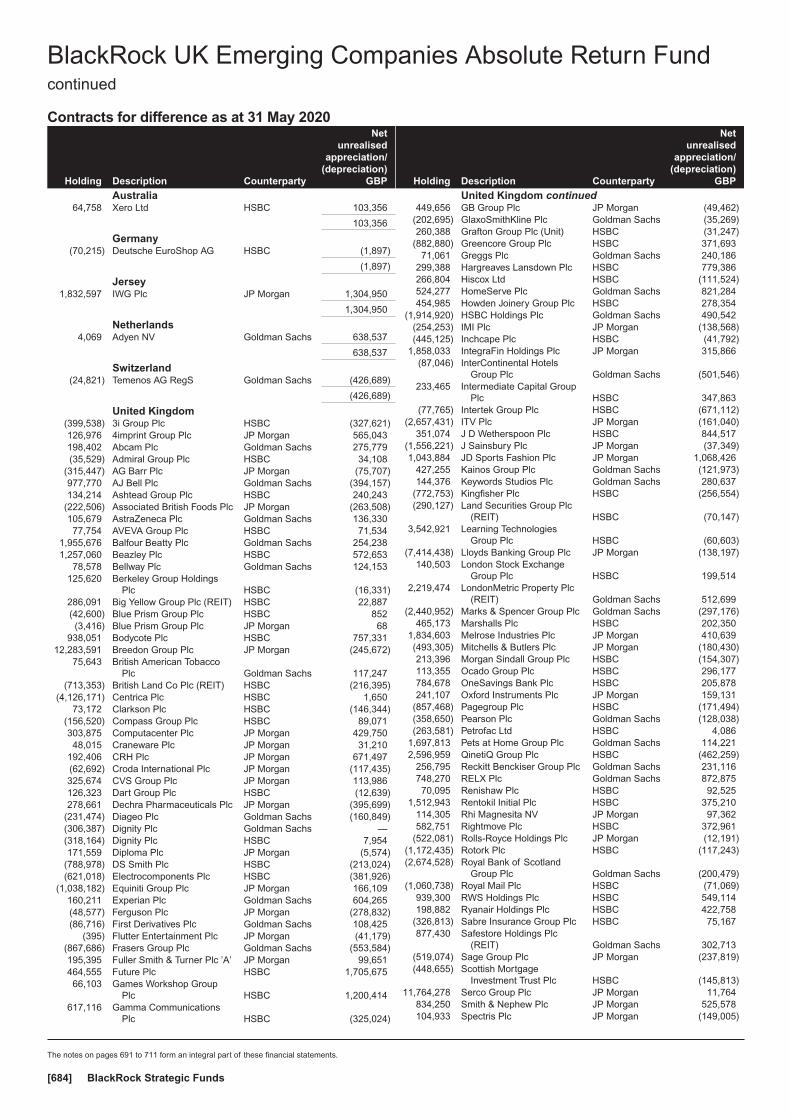
Contracts for difference as at 31 May 2020
Holding Description Counterparty
Netunrealised
appreciation/(depreciation)
GBP
Australia64,758 Xero Ltd HSBC 103,356
103,356
Germany(70,215) Deutsche EuroShop AG HSBC (1,897)
(1,897)
Jersey1,832,597 IWG Plc JP Morgan 1,304,950
1,304,950
Netherlands4,069 Adyen NV Goldman Sachs 638,537
638,537
Switzerland(24,821) Temenos AG RegS Goldman Sachs (426,689)
(426,689)
United Kingdom(399,538) 3i Group Plc HSBC (327,621)126,976 4imprint Group Plc JP Morgan 565,043198,402 Abcam Plc Goldman Sachs 275,779(35,529) Admiral Group Plc HSBC 34,108
(315,447) AG Barr Plc JP Morgan (75,707)977,770 AJ Bell Plc Goldman Sachs (394,157)134,214 Ashtead Group Plc HSBC 240,243
(222,506) Associated British Foods Plc JP Morgan (263,508)105,679 AstraZeneca Plc Goldman Sachs 136,33077,754 AVEVA Group Plc HSBC 71,534
1,955,676 Balfour Beatty Plc Goldman Sachs 254,2381,257,060 Beazley Plc HSBC 572,653
78,578 Bellway Plc Goldman Sachs 124,153125,620 Berkeley Group Holdings
Plc HSBC (16,331)286,091 Big Yellow Group Plc (REIT) HSBC 22,887(42,600) Blue Prism Group Plc HSBC 852(3,416) Blue Prism Group Plc JP Morgan 68
938,051 Bodycote Plc HSBC 757,33112,283,591 Breedon Group Plc JP Morgan (245,672)
75,643 British American TobaccoPlc Goldman Sachs 117,247
(713,353) British Land Co Plc (REIT) HSBC (216,395)(4,126,171) Centrica Plc HSBC 1,650
73,172 Clarkson Plc HSBC (146,344)(156,520) Compass Group Plc HSBC 89,071303,875 Computacenter Plc JP Morgan 429,75048,015 Craneware Plc JP Morgan 31,210
192,406 CRH Plc JP Morgan 671,497(62,692) Croda International Plc JP Morgan (117,435)325,674 CVS Group Plc JP Morgan 113,986126,323 Dart Group Plc HSBC (12,639)278,661 Dechra Pharmaceuticals Plc JP Morgan (395,699)
(231,474) Diageo Plc Goldman Sachs (160,849)(306,387) Dignity Plc Goldman Sachs —(318,164) Dignity Plc HSBC 7,954171,559 Diploma Plc JP Morgan (5,574)
(788,978) DS Smith Plc HSBC (213,024)(621,018) Electrocomponents Plc HSBC (381,926)
(1,038,182) Equiniti Group Plc JP Morgan 166,109160,211 Experian Plc Goldman Sachs 604,265(48,577) Ferguson Plc JP Morgan (278,832)(86,716) First Derivatives Plc Goldman Sachs 108,425
(395) Flutter Entertainment Plc JP Morgan (41,179)(867,686) Frasers Group Plc Goldman Sachs (553,584)195,395 Fuller Smith & Turner Plc ’A’ JP Morgan 99,651464,555 Future Plc HSBC 1,705,67566,103 Games Workshop Group
Plc HSBC 1,200,414617,116 Gamma Communications
Plc HSBC (325,024)
Holding Description Counterparty
Netunrealised
appreciation/(depreciation)
GBP
United Kingdom continued449,656 GB Group Plc JP Morgan (49,462)
(202,695) GlaxoSmithKline Plc Goldman Sachs (35,269)260,388 Grafton Group Plc (Unit) HSBC (31,247)
(882,880) Greencore Group Plc HSBC 371,69371,061 Greggs Plc Goldman Sachs 240,186
299,388 Hargreaves Lansdown Plc HSBC 779,386266,804 Hiscox Ltd HSBC (111,524)524,277 HomeServe Plc Goldman Sachs 821,284454,985 Howden Joinery Group Plc HSBC 278,354
(1,914,920) HSBC Holdings Plc Goldman Sachs 490,542(254,253) IMI Plc JP Morgan (138,568)(445,125) Inchcape Plc HSBC (41,792)
1,858,033 IntegraFin Holdings Plc JP Morgan 315,866(87,046) InterContinental Hotels
Group Plc Goldman Sachs (501,546)233,465 Intermediate Capital Group
Plc HSBC 347,863(77,765) Intertek Group Plc HSBC (671,112)
(2,657,431) ITV Plc JP Morgan (161,040)351,074 J D Wetherspoon Plc HSBC 844,517
(1,556,221) J Sainsbury Plc JP Morgan (37,349)1,043,884 JD Sports Fashion Plc JP Morgan 1,068,426
427,255 Kainos Group Plc Goldman Sachs (121,973)144,376 Keywords Studios Plc Goldman Sachs 280,637
(772,753) Kingfisher Plc HSBC (256,554)(290,127) Land Securities Group Plc
(REIT) HSBC (70,147)3,542,921 Learning Technologies
Group Plc HSBC (60,603)(7,414,438) Lloyds Banking Group Plc JP Morgan (138,197)
140,503 London Stock ExchangeGroup Plc HSBC 199,514
2,219,474 LondonMetric Property Plc(REIT) Goldman Sachs 512,699
(2,440,952) Marks & Spencer Group Plc Goldman Sachs (297,176)465,173 Marshalls Plc HSBC 202,350
1,834,603 Melrose Industries Plc JP Morgan 410,639(493,305) Mitchells & Butlers Plc JP Morgan (180,430)213,396 Morgan Sindall Group Plc HSBC (154,307)113,355 Ocado Group Plc HSBC 296,177784,678 OneSavings Bank Plc HSBC 205,878241,107 Oxford Instruments Plc JP Morgan 159,131
(857,468) Pagegroup Plc HSBC (171,494)(358,650) Pearson Plc Goldman Sachs (128,038)(263,581) Petrofac Ltd HSBC 4,086
1,697,813 Pets at Home Group Plc Goldman Sachs 114,2212,596,959 QinetiQ Group Plc HSBC (462,259)
256,795 Reckitt Benckiser Group Plc Goldman Sachs 231,116748,270 RELX Plc Goldman Sachs 872,87570,095 Renishaw Plc HSBC 92,525
1,512,943 Rentokil Initial Plc HSBC 375,210114,305 Rhi Magnesita NV JP Morgan 97,362582,751 Rightmove Plc HSBC 372,961
(522,081) Rolls-Royce Holdings Plc JP Morgan (12,191)(1,172,435) Rotork Plc HSBC (117,243)(2,674,528) Royal Bank of Scotland
Group Plc Goldman Sachs (200,479)(1,060,738) Royal Mail Plc HSBC (71,069)
939,300 RWS Holdings Plc HSBC 549,114198,882 Ryanair Holdings Plc HSBC 422,758
(326,813) Sabre Insurance Group Plc HSBC 75,167877,430 Safestore Holdings Plc
(REIT) Goldman Sachs 302,713(519,074) Sage Group Plc JP Morgan (237,819)(448,655) Scottish Mortgage
Investment Trust Plc HSBC (145,813)11,764,278 Serco Group Plc JP Morgan 11,764
834,250 Smith & Nephew Plc JP Morgan 525,578104,933 Spectris Plc JP Morgan (149,005)
BlackRock UK Emerging Companies Absolute Return Fundcontinued
The notes on pages 691 to 711 form an integral part of these financial statements.
BlackRock Strategic Funds[684]

Contracts for difference as at 31 May 2020
Holding Description Counterparty
Netunrealised
appreciation/(depreciation)
GBP
United Kingdom continued(44,832) Spirax-Sarco Engineering
Plc JP Morgan (285,132)3,163,354 Spirent Communications Plc Goldman Sachs 118,457(903,815) SSP Group Plc HSBC (341,846)(519,112) St James’s Place Plc HSBC (445,349)
1,399,979 Taylor Wimpey Plc Goldman Sachs 69,2991,918,383 Tesco Plc JP Morgan 147,504
943,432 Trainline Plc JP Morgan 1,048,317(2,780,652) Tritax Big Box Plc (REIT) HSBC (289,188)
(108,175) Unilever Plc JP Morgan (182,816)(252,047) UNITE Group Plc (REIT) HSBC (180,214)(162,844) Victrex Plc HSBC (170,986)
(2,740,653) Vodafone Group Plc Goldman Sachs (363,959)1,449,014 Watches of Switzerland
Group Plc HSBC 589,983284,418 WH Smith Plc JP Morgan 190,41283,493 XP Power Ltd HSBC 180,244
1,038,764 YouGov Plc HSBC 644,034
12,078,269
United States28,253 Abbott Laboratories HSBC (21,961)51,804 Activision Blizzard Inc HSBC (95,215)(8,277) Align Technology Inc Goldman Sachs (305,533)6,140 Alphabet Inc ’C’ Goldman Sachs 274,5245,603 Amazon.com Inc JP Morgan 143,041
13,387 ANSYS Inc Goldman Sachs 261,87622,032 Apple Inc HSBC 149,51486,767 Chegg Inc HSBC (141,913)32,168 Citrix Systems Inc JP Morgan (186,201)12,617 Coupa Software Inc JP Morgan 260,04717,329 Edwards Lifesciences Corp Goldman Sachs 144,66017,793 Etsy Inc Goldman Sachs (30,247)43,903 Facebook Inc ’A’ JP Morgan 357,25556,241 Fidelity National Information
Services Inc Goldman Sachs 154,59623,741 Freshpet Inc HSBC 46,90351,812 IHS Markit Ltd Goldman Sachs 112,430
(16,025) International Flavors &Fragrances Inc Goldman Sachs (54,496)
10,564 Intuit Inc JP Morgan 42,1694,934 Intuitive Surgical Inc JP Morgan 148,6935,939 MarketAxess Holdings Inc Goldman Sachs 24,765
15,229 Masimo Corp JP Morgan 64,12057,641 Mastercard Inc ’A’ Goldman Sachs 1,013,54326,322 Medtronic Plc JP Morgan (41,772)
106,200 Microsoft Corp HSBC (143,601)15,728 MongoDB Inc JP Morgan 555,7099,296 MSCI Inc HSBC (30,408)
16,840 Okta Inc Goldman Sachs 144,991103,315 PayPal Holdings Inc HSBC 409,06135,568 PayPal Holdings Inc JP Morgan 140,826
(78,188) Rollins Inc JP Morgan 120,28415,277 S&P Global Inc HSBC 306,14621,505 salesforce.com Inc Goldman Sachs (38,649)12,864 ServiceNow Inc HSBC 77,3894,039 Shopify Inc ’A’ Goldman Sachs (17,674)
35,788 Splunk Inc HSBC 560,17215,737 Take-Two Interactive
Software Inc Goldman Sachs 31,2187,115 Take-Two Interactive
Software Inc JP Morgan 20,79810,500 Thermo Fisher Scientific Inc HSBC 108,1418,971 Trade Desk Inc ’A’ Goldman Sachs 31,815
19,328 Verisk Analytics Inc Goldman Sachs 256,02738,096 Visa Inc ’A’ Goldman Sachs 324,805
(10,526) WW Grainger Inc JP Morgan (199,091)
4,978,757
Total (Gross underlying exposure - GBP 674,335,935) 18,675,283
BlackRock UK Emerging Companies Absolute Return Fundcontinued
The notes on pages 691 to 711 form an integral part of these financial statements.
Annual report and audited financial statements [685]

Futures contracts as at 31 May 2020
Numberof
contractsCurrencyof contracts
Contract/Description
Expirationdate
Grossunderlying
exposureGBP
Net unrealised(depreciation)
GBP
(287) USD E-Mini S&P 500 Index Futures June 2020 June 2020 35,115,999 (4,888,497)
(779) GBP FTSE 100 Index Futures June 2020 June 2020 47,620,270 (3,314,475)
(1,235) GBP FTSE 250 Index Futures June 2020 June 2020 42,150,550 (5,395,416)
Total 124,886,819 (13,598,388)
Open forward foreign exchange transactionsas at 31 May 2020
Currency Purchases Currency Sales CounterpartyMaturity
date
Netunrealised
appreciation/(depreciation)
GBP
CHF Hedged Share Class
CHF 41,820,162 GBP 34,938,027State Street Bank& Trust Company 15/6/2020 226,717
GBP 1,048,766 CHF 1,245,554State Street Bank& Trust Company 15/6/2020 1,434
228,151
EUR Hedged Share Class
EUR 395,724,308 GBP 347,788,106State Street Bank& Trust Company 15/6/2020 8,566,462
GBP 11,679,927 EUR 13,117,136State Street Bank& Trust Company 15/6/2020 (132,216)
8,434,246
USD Hedged Share Class
GBP 2,392,156 USD 2,926,496State Street Bank& Trust Company 15/6/2020 22,726
USD 87,527,855 GBP 70,897,364State Street Bank& Trust Company 15/6/2020 (30,702)
(7,976)
Total (Gross underlying exposure - GBP 477,614,875) 8,654,421
Sector Breakdownas at 31 May 2020
% of NetAssets
Financial 75.15
Government 11.99
Collective Investment Schemes 9.64
Consumer, Cyclical 3.63
Mortgage Securities 3.15
Securities portfolio at market value 103.56
Other Net Liabilities (3.56)
100.00
BlackRock UK Emerging Companies Absolute Return Fundcontinued
The notes on pages 691 to 711 form an integral part of these financial statements.
BlackRock Strategic Funds[686]
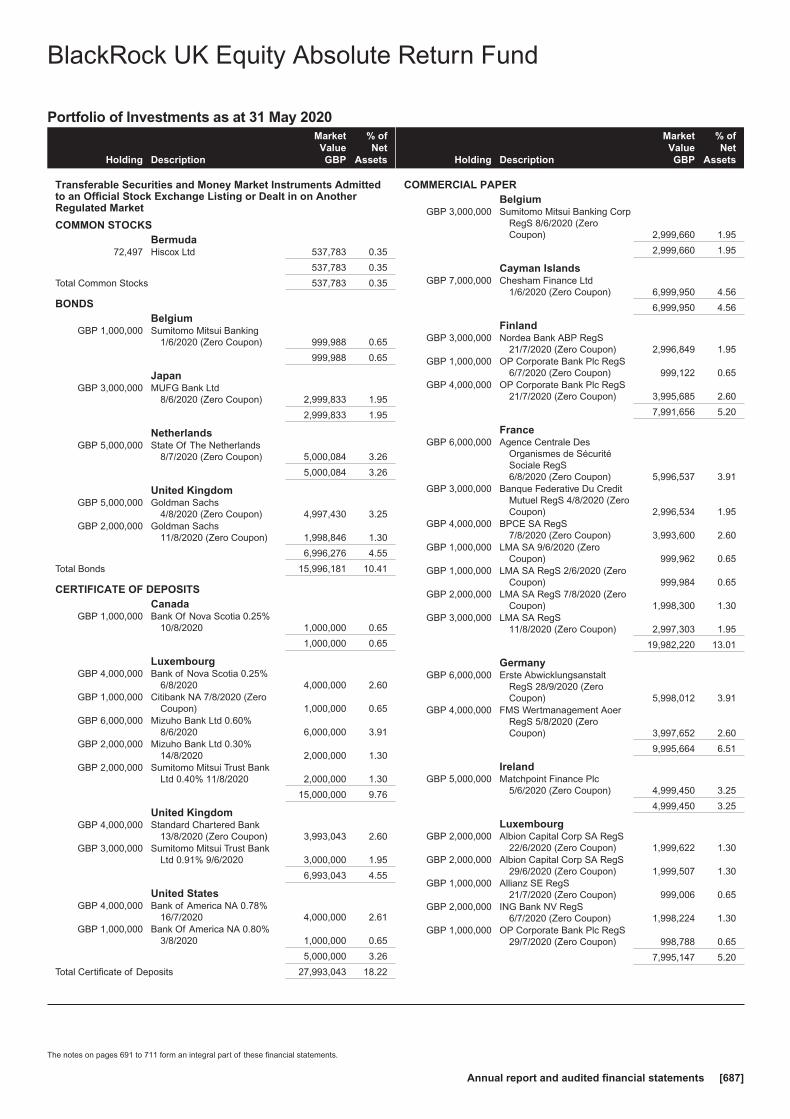
Portfolio of Investments as at 31 May 2020
Holding Description
MarketValueGBP
% ofNet
Assets
Transferable Securities and Money Market Instruments Admittedto an Official Stock Exchange Listing or Dealt in on AnotherRegulated Market
COMMON STOCKSBermuda
72,497 Hiscox Ltd 537,783 0.35
537,783 0.35
Total Common Stocks 537,783 0.35
BONDSBelgium
GBP 1,000,000 Sumitomo Mitsui Banking1/6/2020 (Zero Coupon) 999,988 0.65
999,988 0.65
JapanGBP 3,000,000 MUFG Bank Ltd
8/6/2020 (Zero Coupon) 2,999,833 1.95
2,999,833 1.95
NetherlandsGBP 5,000,000 State Of The Netherlands
8/7/2020 (Zero Coupon) 5,000,084 3.26
5,000,084 3.26
United KingdomGBP 5,000,000 Goldman Sachs
4/8/2020 (Zero Coupon) 4,997,430 3.25GBP 2,000,000 Goldman Sachs
11/8/2020 (Zero Coupon) 1,998,846 1.30
6,996,276 4.55
Total Bonds 15,996,181 10.41
CERTIFICATE OF DEPOSITSCanada
GBP 1,000,000 Bank Of Nova Scotia 0.25%10/8/2020 1,000,000 0.65
1,000,000 0.65
LuxembourgGBP 4,000,000 Bank of Nova Scotia 0.25%
6/8/2020 4,000,000 2.60GBP 1,000,000 Citibank NA 7/8/2020 (Zero
Coupon) 1,000,000 0.65GBP 6,000,000 Mizuho Bank Ltd 0.60%
8/6/2020 6,000,000 3.91GBP 2,000,000 Mizuho Bank Ltd 0.30%
14/8/2020 2,000,000 1.30GBP 2,000,000 Sumitomo Mitsui Trust Bank
Ltd 0.40% 11/8/2020 2,000,000 1.30
15,000,000 9.76
United KingdomGBP 4,000,000 Standard Chartered Bank
13/8/2020 (Zero Coupon) 3,993,043 2.60GBP 3,000,000 Sumitomo Mitsui Trust Bank
Ltd 0.91% 9/6/2020 3,000,000 1.95
6,993,043 4.55
United StatesGBP 4,000,000 Bank of America NA 0.78%
16/7/2020 4,000,000 2.61GBP 1,000,000 Bank Of America NA 0.80%
3/8/2020 1,000,000 0.65
5,000,000 3.26
Total Certificate of Deposits 27,993,043 18.22
Holding Description
MarketValueGBP
% ofNet
Assets
COMMERCIAL PAPERBelgium
GBP 3,000,000 Sumitomo Mitsui Banking CorpRegS 8/6/2020 (ZeroCoupon) 2,999,660 1.95
2,999,660 1.95
Cayman IslandsGBP 7,000,000 Chesham Finance Ltd
1/6/2020 (Zero Coupon) 6,999,950 4.56
6,999,950 4.56
FinlandGBP 3,000,000 Nordea Bank ABP RegS
21/7/2020 (Zero Coupon) 2,996,849 1.95GBP 1,000,000 OP Corporate Bank Plc RegS
6/7/2020 (Zero Coupon) 999,122 0.65GBP 4,000,000 OP Corporate Bank Plc RegS
21/7/2020 (Zero Coupon) 3,995,685 2.60
7,991,656 5.20
FranceGBP 6,000,000 Agence Centrale Des
Organismes de SécuritéSociale RegS6/8/2020 (Zero Coupon) 5,996,537 3.91
GBP 3,000,000 Banque Federative Du CreditMutuel RegS 4/8/2020 (ZeroCoupon) 2,996,534 1.95
GBP 4,000,000 BPCE SA RegS7/8/2020 (Zero Coupon) 3,993,600 2.60
GBP 1,000,000 LMA SA 9/6/2020 (ZeroCoupon) 999,962 0.65
GBP 1,000,000 LMA SA RegS 2/6/2020 (ZeroCoupon) 999,984 0.65
GBP 2,000,000 LMA SA RegS 7/8/2020 (ZeroCoupon) 1,998,300 1.30
GBP 3,000,000 LMA SA RegS11/8/2020 (Zero Coupon) 2,997,303 1.95
19,982,220 13.01
GermanyGBP 6,000,000 Erste Abwicklungsanstalt
RegS 28/9/2020 (ZeroCoupon) 5,998,012 3.91
GBP 4,000,000 FMS Wertmanagement AoerRegS 5/8/2020 (ZeroCoupon) 3,997,652 2.60
9,995,664 6.51
IrelandGBP 5,000,000 Matchpoint Finance Plc
5/6/2020 (Zero Coupon) 4,999,450 3.25
4,999,450 3.25
LuxembourgGBP 2,000,000 Albion Capital Corp SA RegS
22/6/2020 (Zero Coupon) 1,999,622 1.30GBP 2,000,000 Albion Capital Corp SA RegS
29/6/2020 (Zero Coupon) 1,999,507 1.30GBP 1,000,000 Allianz SE RegS
21/7/2020 (Zero Coupon) 999,006 0.65GBP 2,000,000 ING Bank NV RegS
6/7/2020 (Zero Coupon) 1,998,224 1.30GBP 1,000,000 OP Corporate Bank Plc RegS
29/7/2020 (Zero Coupon) 998,788 0.65
7,995,147 5.20
BlackRock UK Equity Absolute Return Fund
The notes on pages 691 to 711 form an integral part of these financial statements.
Annual report and audited financial statements [687]

Portfolio of Investments as at 31 May 2020
Holding Description
MarketValueGBP
% ofNet
Assets
NetherlandsGBP 4,000,000 Paccar Financial Europe BV
RegS 8/6/2020 (ZeroCoupon) 3,999,734 2.60
3,999,734 2.60
United KingdomGBP 4,000,000 Transport For London RegS
15/6/2020 (Zero Coupon) 3,999,299 2.60
3,999,299 2.60
United StatesGBP 8,000,000 Nieuw Amsterdam
Receivables Corp2/6/2020 (Zero Coupon) 7,999,895 5.21
GBP 8,000,000 Nieuw AmsterdamReceivables Corp9/6/2020 (Zero Coupon) 7,999,785 5.20
15,999,680 10.41
Total Commercial Papers 84,962,460 55.29
Total Transferable Securities and Money MarketInstruments Admitted to an Official Stock ExchangeListing or Dealt in on Another Regulated Market 129,489,467 84.27
Other Transferable Securities and Money Market Instruments
BONDSBelgium
GBP 1,000,000 Sumitomo Mitsui Banking Corp1/9/2020 (Zero Coupon) 999,370 0.65
999,370 0.65
FranceGBP 3,000,000 Banque Federative Du Credit
Mutuel SA 1/9/2020 (ZeroCoupon) 2,997,336 1.95
2,997,336 1.95
NetherlandsGBP 1,000,000 ABN AMRO Bank NV 0.54%
6/7/2020 1,000,241 0.65
1,000,241 0.65
United KingdomGBP 1,500,000 United Kingdom Treasury Bill
22/6/2020 (Zero Coupon) 1,499,970 0.98GBP 5,000,000 United Kingdom Treasury Bill
13/7/2020 (Zero Coupon) 4,999,575 3.25GBP 1,500,000 United Kingdom Treasury Bill
27/7/2020 (Zero Coupon) 1,499,865 0.98
7,999,410 5.21
Total Bonds 12,996,357 8.46
Total Other Transferable Securities and MoneyMarket Instruments 12,996,357 8.46
Collective Investment Schemes~
Ireland14,825,422 Institutional Cash Series Plc -
Institutional Sterling LiquidityFund Agency Dis 14,825,422 9.65
14,825,422 9.65
Total Collective Investment Schemes 14,825,422 9.65
Securities portfolio at market value 157,311,246 102.38
Other Net Liabilities (3,660,520) (2.38)
Total Net Assets (GBP) 153,650,726 100.00
~ Investment in related party fund, see further information in Note 10.
BlackRock UK Equity Absolute Return Fund continued
The notes on pages 691 to 711 form an integral part of these financial statements.
BlackRock Strategic Funds[688]
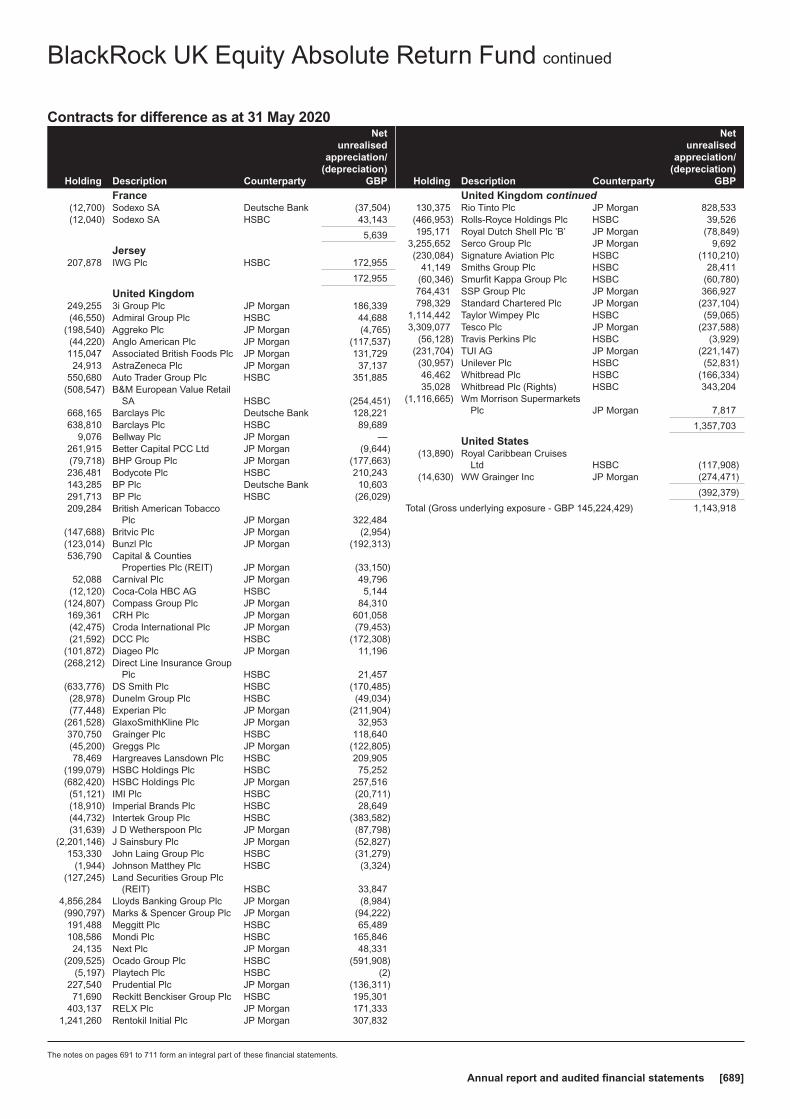
Contracts for difference as at 31 May 2020
Holding Description Counterparty
Netunrealised
appreciation/(depreciation)
GBP
France(12,700) Sodexo SA Deutsche Bank (37,504)(12,040) Sodexo SA HSBC 43,143
5,639
Jersey207,878 IWG Plc HSBC 172,955
172,955
United Kingdom249,255 3i Group Plc JP Morgan 186,339(46,550) Admiral Group Plc HSBC 44,688
(198,540) Aggreko Plc JP Morgan (4,765)(44,220) Anglo American Plc JP Morgan (117,537)115,047 Associated British Foods Plc JP Morgan 131,72924,913 AstraZeneca Plc JP Morgan 37,137
550,680 Auto Trader Group Plc HSBC 351,885(508,547) B&M European Value Retail
SA HSBC (254,451)668,165 Barclays Plc Deutsche Bank 128,221638,810 Barclays Plc HSBC 89,689
9,076 Bellway Plc JP Morgan —261,915 Better Capital PCC Ltd JP Morgan (9,644)(79,718) BHP Group Plc JP Morgan (177,663)236,481 Bodycote Plc HSBC 210,243143,285 BP Plc Deutsche Bank 10,603291,713 BP Plc HSBC (26,029)209,284 British American Tobacco
Plc JP Morgan 322,484(147,688) Britvic Plc JP Morgan (2,954)(123,014) Bunzl Plc JP Morgan (192,313)536,790 Capital & Counties
Properties Plc (REIT) JP Morgan (33,150)52,088 Carnival Plc JP Morgan 49,796
(12,120) Coca-Cola HBC AG HSBC 5,144(124,807) Compass Group Plc JP Morgan 84,310169,361 CRH Plc JP Morgan 601,058(42,475) Croda International Plc JP Morgan (79,453)(21,592) DCC Plc HSBC (172,308)
(101,872) Diageo Plc JP Morgan 11,196(268,212) Direct Line Insurance Group
Plc HSBC 21,457(633,776) DS Smith Plc HSBC (170,485)(28,978) Dunelm Group Plc HSBC (49,034)(77,448) Experian Plc JP Morgan (211,904)
(261,528) GlaxoSmithKline Plc JP Morgan 32,953370,750 Grainger Plc HSBC 118,640(45,200) Greggs Plc JP Morgan (122,805)78,469 Hargreaves Lansdown Plc HSBC 209,905
(199,079) HSBC Holdings Plc HSBC 75,252(682,420) HSBC Holdings Plc JP Morgan 257,516(51,121) IMI Plc HSBC (20,711)(18,910) Imperial Brands Plc HSBC 28,649(44,732) Intertek Group Plc HSBC (383,582)(31,639) J D Wetherspoon Plc JP Morgan (87,798)
(2,201,146) J Sainsbury Plc JP Morgan (52,827)153,330 John Laing Group Plc HSBC (31,279)
(1,944) Johnson Matthey Plc HSBC (3,324)(127,245) Land Securities Group Plc
(REIT) HSBC 33,8474,856,284 Lloyds Banking Group Plc JP Morgan (8,984)(990,797) Marks & Spencer Group Plc JP Morgan (94,222)191,488 Meggitt Plc HSBC 65,489108,586 Mondi Plc HSBC 165,84624,135 Next Plc JP Morgan 48,331
(209,525) Ocado Group Plc HSBC (591,908)(5,197) Playtech Plc HSBC (2)
227,540 Prudential Plc JP Morgan (136,311)71,690 Reckitt Benckiser Group Plc HSBC 195,301
403,137 RELX Plc JP Morgan 171,3331,241,260 Rentokil Initial Plc JP Morgan 307,832
Holding Description Counterparty
Netunrealised
appreciation/(depreciation)
GBP
United Kingdom continued130,375 Rio Tinto Plc JP Morgan 828,533
(466,953) Rolls-Royce Holdings Plc HSBC 39,526195,171 Royal Dutch Shell Plc ’B’ JP Morgan (78,849)
3,255,652 Serco Group Plc JP Morgan 9,692(230,084) Signature Aviation Plc HSBC (110,210)
41,149 Smiths Group Plc HSBC 28,411(60,346) Smurfit Kappa Group Plc HSBC (60,780)764,431 SSP Group Plc JP Morgan 366,927798,329 Standard Chartered Plc JP Morgan (237,104)
1,114,442 Taylor Wimpey Plc HSBC (59,065)3,309,077 Tesco Plc JP Morgan (237,588)
(56,128) Travis Perkins Plc HSBC (3,929)(231,704) TUI AG JP Morgan (221,147)(30,957) Unilever Plc HSBC (52,831)46,462 Whitbread Plc HSBC (166,334)35,028 Whitbread Plc (Rights) HSBC 343,204
(1,116,665) Wm Morrison SupermarketsPlc JP Morgan 7,817
1,357,703
United States(13,890) Royal Caribbean Cruises
Ltd HSBC (117,908)(14,630) WW Grainger Inc JP Morgan (274,471)
(392,379)
Total (Gross underlying exposure - GBP 145,224,429) 1,143,918
BlackRock UK Equity Absolute Return Fund continued
The notes on pages 691 to 711 form an integral part of these financial statements.
Annual report and audited financial statements [689]
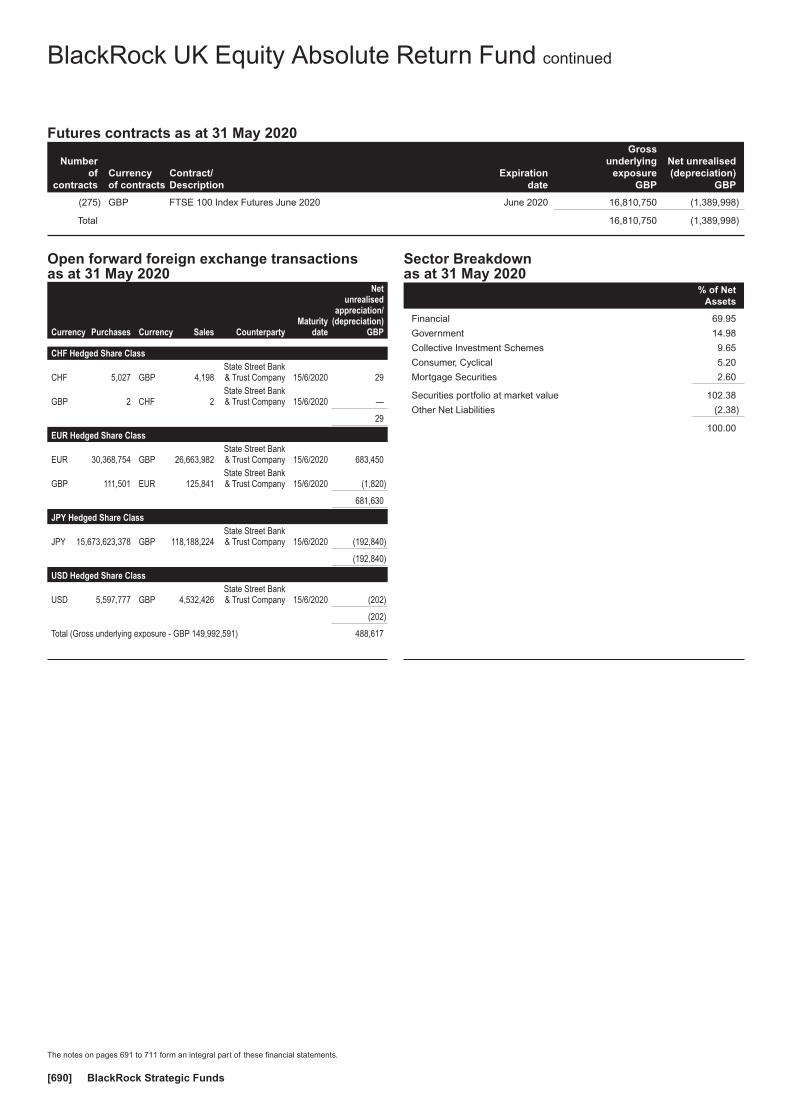
Futures contracts as at 31 May 2020
Numberof
contractsCurrencyof contracts
Contract/Description
Expirationdate
Grossunderlying
exposureGBP
Net unrealised(depreciation)
GBP
(275) GBP FTSE 100 Index Futures June 2020 June 2020 16,810,750 (1,389,998)
Total 16,810,750 (1,389,998)
Open forward foreign exchange transactionsas at 31 May 2020
Currency Purchases Currency Sales CounterpartyMaturity
date
Netunrealised
appreciation/(depreciation)
GBP
CHF Hedged Share Class
CHF 5,027 GBP 4,198State Street Bank& Trust Company 15/6/2020 29
GBP 2 CHF 2State Street Bank& Trust Company 15/6/2020 —
29
EUR Hedged Share Class
EUR 30,368,754 GBP 26,663,982State Street Bank& Trust Company 15/6/2020 683,450
GBP 111,501 EUR 125,841State Street Bank& Trust Company 15/6/2020 (1,820)
681,630
JPY Hedged Share Class
JPY 15,673,623,378 GBP 118,188,224State Street Bank& Trust Company 15/6/2020 (192,840)
(192,840)
USD Hedged Share Class
USD 5,597,777 GBP 4,532,426State Street Bank& Trust Company 15/6/2020 (202)
(202)
Total (Gross underlying exposure - GBP 149,992,591) 488,617
Sector Breakdownas at 31 May 2020
% of NetAssets
Financial 69.95
Government 14.98
Collective Investment Schemes 9.65
Consumer, Cyclical 5.20
Mortgage Securities 2.60
Securities portfolio at market value 102.38
Other Net Liabilities (2.38)
100.00
BlackRock UK Equity Absolute Return Fund continued
The notes on pages 691 to 711 form an integral part of these financial statements.
BlackRock Strategic Funds[690]
1. OrganisationBlackRock Strategic Funds (the “Company”) is a public limitedcompany (société anonyme) established under the laws of theGrand Duchy of Luxembourg as an open-ended variable capitalinvestment company (société d’investissement à capital variable).The Company has been authorised by the Commission deSurveillance du Secteur Financier (the “CSSF”) as a UCITSpursuant to the provisions of Part I of the 2010 Law and isregulated pursuant to such law.
The Company has appointed BlackRock (Luxembourg) S.A. asits Management Company.
As at 31 May 2020, the Company offered shares in 35 Funds(each a “Fund”, together the “Funds”). The Company is anumbrella structure comprising separate Funds with segregatedliability. Each Fund shall have segregated liability from the otherFunds and the Company shall not be liable as a whole to thirdparties for the liabilities of each Fund. Each Fund shall be madeup of a separate Portfolio of Investments maintained andinvested in accordance with the investment objectives applicableto such Fund. Each Fund is a separate pool of assets and isrepresented by separate shares of each Fund which are dividedinto share classes as detailed in Appendix I.
The classes of shares have equivalent rights in the Companybut carry different features and charging structures which aremore fully described in the Company’s Prospectus.
Share Classes LaunchedShare Classes launched during the year are disclosed inAppendix I.
Significant events during the year
� A new Prospectus was issued on 1 June 2019.
� Effective 3 June 2019, a new performance fee model wasadopted. A related Shareholder notification letter wascirculated on 1 May 2019. Further details are disclosed inNote 7.
� Effective 11 June 2019, BlackRock Fixed Income CreditStrategies Fund, denominated in EUR was launched.
� An updated Prospectus was issued on 20 June 2019.
� Effective 21 June 2019, BlackRock ESG Euro Corporate BondFund, denominated in EUR was launched.
� Effective 30 October 2019, BlackRock Sustainable Euro BondFund changed name to BlackRock ESG Euro Bond Fund.
� An updated Prospectus was issued on 30 October 2019.
� Effective 31 October 2019, Martha Boeckenfeld resigned fromthe Board.
� As part of an internal restructuring with the aim to streamlineState Street’s banking entity structure across Europe, StateStreet Bank Luxembourg S.C.A. (the �Depositary and Fund
Accountant�), in their capacity as the Company’s Depositaryand Fund Accountant, merged into State Street BankInternational GmbH with effect from 4 November 2019 (the�Merger Date�). Since the Merger Date, State Street BankInternational GmbH continues to carry out the depositary andcentral administration agent functions through State StreetBank International GmbH, Luxembourg Branch.As legal successor of the Depositary and Fund Accountant,State Street Bank International GmbH, Luxembourg Branchhas assumed the same duties and responsibilities, and hasthe same rights under the existing agreements with theCompany. Any agreements in place with the Depositary andFund Accountant have been transferred to State Street BankInternational GmbH, Luxembourg Branch by operation of law.State Street Bank International GmbH, Luxembourg Branch,is supervised by the European Central Bank, the GermanFederal Financial Services Supervisory Authority (�BaFin�)and the German Central Bank and has been authorised to actas depositary and central administration agent by the CSSF inLuxembourg. State Street Bank International GmbH,Luxembourg Branch is registered in the LuxembourgCommercial and Companies’ Register (�RCS�) under numberB 148186.
� An updated Prospectus was issued on 16 January 2020.
� An updated Prospectus was issued on 7 February 2020.
� Effective 29 February 2020, Francine Keiser resigned from theBoard.
� An updated Prospectus was issued on 29 April 2020.
� On 11 May 2020, PNC Financial Services Group Inc. (�PNCGroup�) announced its intent to sell its investment inBlackRock, Inc. through a registered offering and relatedbuyback by BlackRock, Inc. Further details on PNC Group aredisclosed in Note 10.
� An updated Prospectus was issued on 13 May 2020.
� Effective 13 May 2020, BlackRock Impact World Equity Fundchanged name to BlackRock Systematic ESG World EquityFund.
� Effective 18 May 2020, Denise Voss was appointed asDirector of the Board.
2. Summary of Significant Accounting PoliciesThe financial statements have been prepared in accordancewith generally accepted accounting principles in Luxembourgand with the legal and regulatory requirements relating to thepreparation of the financial statements as prescribed by theLuxembourg authorities for Luxembourg UCITS and include thefollowing significant accounting policies:
Notes to the Financial Statements
Annual report and audited financial statements [691]

(a) Valuation of Investments, Other Assets and Other Liabilities
The Company’s investments, other assets and other liabilitiesare valued as follows:
� transferable securities which are admitted to an officialexchange listing or dealt in on another regulated market, arevalued on the basis of the latest available price prevailing onthe valuation date. For securities traded on markets closingafter the time of the valuation, last known prices as of thistime or such other time may be used. Where such securitiesor other assets are quoted or dealt in, on or by more than onestock exchange or regulated market, the Board may in itsdiscretion select one of such stock exchanges or regulatedmarkets for such purposes. Discrepancies in the value ofsecurities may result, for example, where the underlyingmarkets are closed for business at the time of calculating theNAV of certain Funds or where governments chose to imposefiscal or transaction charges on foreign investment. As aresult, the Board have implemented fair value techniques inorder to estimate the fair value of these investments. Suchsecurities and derivatives shall be valued at their probablerealisation value as determined by the competent persons(the Directors). Because of the inherent uncertainty in the fairvalue process, these estimated values may significantly differfrom the values that would have been used had a readymarket for the securities existed, and from the values that maybe ultimately recovered;
� for non-quoted securities or securities not traded or dealt in onany stock exchange or other regulated market (includingsecurities of closed-ended investment funds), as well asquoted or non-quoted securities on such other markets forwhich no valuation price is available, or securities for whichthe quoted prices are, in the opinion of the Board, notrepresentative of the fair market value, the value shall bedetermined prudently and in good faith by the Board on thebasis of their expected disposal or acquisition price;
� if in any case a particular value is not ascertainable by themethods outlined above, or if the Board considers that someother method of valuation more accurately reflects the fairvalue of the relevant security or other asset for the purposeconcerned, the method of valuation of the security or otherasset will be such as the Board in their absolute discretiondecides. Discrepancies in the value of securities may result,for example, where the underlying markets are closed forbusiness at the time of calculating the NAV of certain Funds.In such cases the Board may set specific thresholds, that,where exceeded, result in an adjustment to the value of thesesecurities to their fair value by applying a specific indexadjustment. Additionally, where governments choose toimpose fiscal or transaction charges on foreign investment,the Board may adjust the NAV to reflect such charges.
� as at 31 May 2020, the adjusted fair value applied to certainsecurities and/or derivatives are disclosed in the table below:
Fund Currency Fair value% of Net
Assets
BlackRock Americas Diversified EquityAbsolute Return Fund USD (1,580,364) (0.17)BlackRock Asia Pacific Absolute ReturnFund USD 549,012 1.80BlackRock Asia Pacific Diversified EquityAbsolute Return Fund USD 83,857 0.32BlackRock European Absolute Return Fund EUR 11 0.00BlackRock European Diversified EquityAbsolute Return Fund EUR (8,453) (0.23)BlackRock European OpportunitiesExtension Fund EUR 329,825 0.04BlackRock Global Event Driven Fund USD 10,039,520 0.30BlackRock Global Long/Short Equity Fund USD (206) 0.00BlackRock Style Advantage Screened Fund USD 34,016 0.12
� for certain Funds which have terminated operations and heldilliquid securities at the termination dates, the market value ofthe illiquid securities were provided for against the net assetvalue of each respective Fund. This effectively wrote down thevalue of the securities to zero, and recognised the loss in theStatement of Operations and Changes in Net Assets within�Net realised gain/(loss) on investments� during the financialyear in which the termination occurred. As at 31 May 2020,BlackRock Latin American Opportunities Fund (terminated on8 March 2019) and BlackRock Multi-Manager AlternativeStrategies Fund (terminated on 13 May 2019) held openilliquid positions, which together accounted for less than1.00% of the net asset value of the Funds as at the lastValuation Point prior to each Fund’s date of termination. If theilliquid securities are subsequently disposed of, or a value isrealised, this will be distributed to the shareholders of therespective Funds proportionate to each shareholder’s holdingin the Fund as at the date of termination;
� investments in open-ended collective investment schemes arevalued on the basis of the last available NAV of the units orshares of such collective investment scheme;
� certain Funds may decide to issue Share Classes which havedifferent valuation points, termed “Snap” and “Close”. The“Snap” valuation point takes a value at a time other than atmarket close, and the “Close” valuation point takes the valuebased on market closing prices. Consequently, the net assetvalues and performance per Share of such Share Classes areexpected to differ from each other as a result of theapplication of different valuation points. During the year ended31 May 2020, X Class non-distributing AUD hedged ofBlackRock Style Advantage Fund adopted a dual valuationpoint. This has resulted in a variation between the Fund’sNAVs as calculated under Snap and Close valuation points.The NAV of the Fund presented on the Statement of NetAssets is calculated using the Snap valuation point. As at31 May 2020, the percentage variation between the Fund’sSnap and Close NAVs is 0.15%. As at 31 May 2020, the NAVand NAV per share of X Class non-distributing AUD hedged atthe Snap valuation point is AUD 1,568,824,772 and AUD91.52. As at 31 May 2020, the NAV and NAV per share of XClass non-distributing AUD hedged at the Close valuationpoint is AUD 1,573,795,917 and AUD 91.81;
Notes to the Financial Statements continued
BlackRock Strategic Funds[692]
� securities lending: securities are delivered to a third partybroker in accordance with lending agent instructions andcontinue to be valued as part of the portfolios of the Funds;
� liquid assets such as time deposits and money marketinstruments are valued at amortised cost which approximatestheir fair value;
� cash at bank and other assets are valued at their nominalamount;
� assets which include, in particular, cash owned to bank,interest and dividends receivable, receivable for investmentssold and receivable for Fund shares subscribed are valued atnominal value unless it appears unlikely that such nominalamount is obtainable;
� liabilities which include, in particular, interest and dividendspayable, income distribution payable, payable for investmentspurchased and payable for Fund shares redeemed are valuedat their nominal value.
(b) Net realised gains and losses on Investments
Net realised gains and losses on sales of investments havebeen determined on the basis of the average cost method.
(c) Income/Expense from Investments, Cash Accounts andfinancial derivatives instruments
The Company takes credit for income from its investments onthe following basis:
� interest income/expense is accrued daily and includes theamortisation on a straight line basis of premiums andaccretion on a straight line basis of discounts;
� bank interest, fixed deposit and money market deposit interestincome are recognised on an accrual basis;
� dividend income is accrued on the ex-dividend date and isshown net of withholding tax;
� securities lending income is accrued on a weekly basis;
� negative yield expense on financial assets relating to interestfrom a negative effective interest rate on assets held isaccreted daily and is recognised in the Statement ofOperations and Changes in Net Assets over the life of theunderlying instrument;
� when a bond has been identified as being in default, theinterest accrual on the defaulted security is stopped. Onconfirmation of default from relevant parties, the amountreceivable is written off;
� the interest rate of any perpetual bonds in the Portfolio ofInvestments disclosed under the description is the interestrate applicable at the year end and is for information only asthese are bonds with a variable interest rate.
(d) Financial Derivative Instruments
During the year, the Funds have entered into a number offorward foreign exchange transactions and futures contracts.Open forward foreign exchange transactions and futurescontracts are valued at the fair market value to close thecontracts on the valuation date. Surpluses/deficits arising from
these and unsettled contracts are taken to unrealisedappreciation/(depreciation) and are included under assets orliabilities (as appropriate) in the Statement of Net Assets. Thenet change in unrealised appreciation or depreciation and thenet realised gains or losses on settlement or closingtransactions of forward foreign exchange transactions andfutures contracts are presented in the Statement of Operationsand Changes in Net Assets.
The Funds can write covered call and put options or swaptionsand purchase call and put options or swaptions. When theFunds write and/or purchase an option or a swaption, anamount equal to the premium received or paid by the Funds isreflected as a liability or an asset. The liability for a writtenoption or swaption and the asset for a purchased option orswaption is subsequently marked to market to reflect the currentvalue of the option or the swaption. When a security is sold orbought through an exercise of an option or a swaption, thepremium received (or paid) is deducted from (or added to) thebasis of the security sold or bought. When an option or aswaption expires (or the Funds enter into a closing transaction),the Funds realise a gain or loss on the option or the swaption tothe extent of the premiums received or paid (or gain or loss tothe extent the cost of the closing transactions exceeds premiumpaid or received). For futures-style options, the Funds do notprepay the premium. The Funds post margin as in a futurescontract, and the option premium is marked to market daily. Thepurchased options/swaptions at market value and writtenoptions/swaptions at market value are included under assets orliabilities (as appropriate) in the Statement of Net Assets. Thenet change in unrealised appreciation or depreciation and thenet realised gains or losses on expiration or closing transactionsof options or swaptions are presented in the Statement ofOperations and Changes in Net Assets.
During the year, the Funds have entered into Contracts fordifference (“CFDs”). CFDs allow investors to take synthetic longor synthetic short positions with a variable margin. Unlikeshares, with CFDs the buyer is potentially liable for far morethan the amount they paid on margin.
CFDs positions are entered into subject to a daily financingcharge, applied at a previously agreed rate above or below theapplicable benchmark. The related interest income or expenseis accrued daily and disclosed as Contracts for differenceinterest in a net position in the Statement of Operations andChanges in Net Assets. Interest income receivable and expensepayable is disclosed in a net position as �Interest and dividendsreceivable� or �Interest and dividends payable� in the Statementof Net Assets.
CFDs positions are subject to dividend receipts or payments insuch cases where a position is held on the day a dividend hasbeen declared. The related dividend income or expense isaccrued on the ex-dividend date and disclosed net ofwithholding tax as Contracts for difference dividends, net ofwithholding taxes in the Statement of Operations and Changesin Net Assets. Dividend income receivable and expense payableis disclosed in a net position as �Interest and dividendsreceivable� or �Interest and dividends payable� in the Statementof Net Assets.
Notes to the Financial Statements continued
Annual report and audited financial statements [693]
The fair market value of the CFDs is determined by the tradedprice on the exchange on which the underlying securities orother assets are traded or admitted for trading. For underlyingsecurities traded on markets closing after the time of thevaluation, last known prices as of this time or such other timemay be used.
The net unrealised appreciation and net unrealised depreciationon Contracts for difference is included under assets or liabilities(as appropriate) in the Statement of Net Assets.
The change in market value, if any, is recorded as net change inunrealised appreciation or depreciation in the Statement ofOperations and Changes in Net Assets. Net realised gains orlosses on reset or termination of the CFDs are presented in theStatement of Operations and Changes in Net Assets.
Net realised gains and losses on sales of CFDs have beendetermined on the basis of the First In First Out (“FIFO”) costmethod.
The Funds had unsettled CFD transactions as of 31 May 2020,which are included within �Receivable for investments sold� and�Payable for investments purchased� in the Statement of NetAssets. CFDs are separately disclosed after the Portfolio ofInvestments.
The Funds may enter into Swap transactions (“swaps”), in whichthe Funds and a counterparty agree to make periodic netpayments on a specified notional amount. Swap transactionsare privately negotiated in the OTC market and may be enteredinto as a bilateral contract (“OTC swaps”) or centrally cleared(“centrally cleared swaps”). These periodic payments receivedor made are recorded in the Statement of Operations andChanges in Net Assets as net realised gains or losses,respectively. Swaps are valued utilising quotes received daily bythe Funds’ pricing service, central clearing houses or brokers,which are derived using daily swap curves and models thatincorporate a number of market data factors, such asdiscounted cash flows, trades and values of the underlyingreference instruments. In a centrally cleared swap, immediatelyfollowing execution of the swap agreement, the swapagreement is novated to a clearing counterparty and the Fundfaces the clearing counterparty through a broker. Upon enteringinto a centrally cleared swap, the Fund is required to depositinitial margin with the broker in the form of cash or certaineligible securities in an amount that varies depending on thesize and risk profile of the particular swap. Any upfrontpayments made or received upon entering a swap contract aretreated as part of the swap’s net realised gain or loss. The dailychange in valuation of centrally cleared swaps is recorded as areceivable or payable for variation margin in “Cash at bank” or“Cash owed to bank” position of the Statement of Net Assetsuntil the centrally cleared swap is terminated at which time a netrealised gain or loss is recorded. The net change in unrealisedappreciation or depreciation and the net realised gains or losseson Swap transactions are disclosed in Statement of Operationsand Changes in Net Assets. Interest income receivable andexpense payable on swaps is accrued on a daily basis anddisclosed in a net position as �Interest and dividends receivable�or �Interest and dividends payable� in the Statement of NetAssets. The Funds had unsettled swap transactions as of31 May 2020, which are included within �Receivable forinvestments sold� and �Payable for investments purchased� inthe Statement of Net Assets. Swaps are separately disclosedafter the Portfolio of Investments.
Net realised gains and losses on sales of Swaps have beendetermined on the basis of the First In First Out (“FIFO”) costmethod.
Funds may purchase “To Be Announced” securities contracts(“TBAs”). This refers to the common trading practice in themortgage-backed securities market whereby a contract ispurchased which entitles the buyer to a security from amortgage pool for a fixed price at a future date. At the time ofpurchase the exact security is not known, but its maincharacteristics are specified. Although the price has beenestablished at the time of purchase, the principal value has notbeen finalised. As a TBA is not settled at the time of purchase,this may lead to leveraged positions within a Fund. Purchasing aTBA involves a risk of loss if the value of the security to bepurchased declines prior to the settlement date. Risks may alsoarise upon entering into these contracts from the potentialinability of counterparties to meet the terms of their contracts.TBAs are separately disclosed at the end of the Portfolio ofInvestments.
The Funds may dispose of a commitment prior to settlement if itis deemed appropriate to do so. Proceeds of TBA sales are notreceived until the contractual settlement date. During the time aTBA sale commitment is outstanding, equivalent deliverablesecurities, or an offsetting TBA purchase commitment(deliverable on or before the sale commitment date), are held ascover for the transaction.
If the TBA sale commitment is closed through the acquisition ofan offsetting purchase commitment, the Fund realises a gain orloss on the commitment without regard to any unrealised gain orloss on the underlying security. If the Fund delivers securitiesunder the commitment, the Fund realises a gain or loss from thesale of the securities upon the unit price established at the datethe commitment was entered into.
The Funds had unsettled TBA transactions as of 31 May 2020,which are included within �Receivable for investments sold� and�Payable for investments purchased� in the Statement of NetAssets.
The market values of the TBAs are presented in the Statementof Net Assets. The net change in unrealised appreciation ordepreciation and the net realised gains or losses on sales of theTBAs are presented in the Statement of Operations andChanges in Net Assets.
Net realised gains and losses on sales of TBA have beendetermined on the basis of the First In First Out (“FIFO”) costmethod.
(e) Foreign Exchange
The cost of investments in currencies other than the currency ofdenomination of the respective Fund has been translated at therates of exchange ruling at the time of purchase. Investmentsand other assets and liabilities in currencies other than thecurrency of denomination of the respective Fund have beentranslated at the exchange rate prevailing at the Fund’svaluation point in Luxembourg on 31 May 2020. The net changein unrealised appreciation or depreciation and the net realisedgains or losses on disposal or settlement of other assets orliabilities in currencies other than the currency of denominationof the respective Fund are presented in the Statement ofOperations and Changes in Net Assets.
Notes to the Financial Statements continued
BlackRock Strategic Funds[694]

Income and expenses in currencies other than the currency ofdenomination of the respective Fund have been translated atthe rates of exchange prevailing on transaction date.
The following exchange rates were used to translate theinvestments and other assets and other liabilities denominatedin currencies for all Funds other than the base currency of theFund at the respective Fund valuation point at 31 May 2020:
All Funds (except theBlackRock DynamicDiversified Growth Fund)
BlackRockDynamicDiversifiedGrowth Fund
BlackRock UKEmergingCompaniesAbsoluteReturnFund andBlackRock UKEquity AbsoluteReturn Fund
CCY EUR USD EUR GBP
AED 0.2448 0.2722 0.2447 0.2204ARS 0.0131 0.0146 0.0131 0.0118AUD 0.5969 0.6637 0.5968 0.5374BRL 0.1655 0.1840 0.1655 0.1490CAD 0.6529 0.7260 0.6504 0.5878CHF 0.9337 1.0382 0.9358 0.8406CLP 0.0011 0.0012 0.0011 0.0010CNH 0.1255 0.1395 0.1255 0.1130CNY 0.1259 0.1399 0.1258 0.1133COP 0.0002 0.0003 0.0002 0.0002CZK 0.0371 0.0413 0.0371 0.0334DKK 0.1342 0.1492 0.1342 0.1208EGP 0.0567 0.0631 0.0567 0.0511EUR 1.0000 1.1120 1.0000 0.9003GBP 1.1107 1.2350 1.1114 1.0000GHS 0.1555 0.1729 0.1554 0.1400HKD 0.1160 0.1290 0.1160 0.1044HUF 0.0029 0.0032 0.0029 0.0026IDR 0.0001 0.0001 0.0001 0.0001ILS 0.2554 0.2840 0.2566 0.2300INR 0.0119 0.0132 0.0119 0.0107JPY 0.0084 0.0093 0.0083 0.0075KRW 0.0007 0.0008 0.0007 0.0007KZT 0.0022 0.0024 0.0022 0.0020LKR 0.0048 0.0054 0.0048 0.0043MXN 0.0407 0.0452 0.0406 0.0366MYR 0.2069 0.2300 0.2068 0.1862NGN 0.0023 0.0026 0.0023 0.0021NOK 0.0925 0.1029 0.0925 0.0833NZD 0.5579 0.6204 0.5567 0.5023PEN 0.2616 0.2909 0.2617 0.2355PHP 0.0178 0.0198 0.0178 0.0160PLN 0.2250 0.2502 0.2245 0.2026QAR 0.2470 0.2746 0.2469 0.2224RON 0.2062 0.2293 0.2065 0.1857RUB 0.0127 0.0142 0.0127 0.0115SEK 0.0952 0.1058 0.0955 0.0857SGD 0.6361 0.7074 0.6361 0.5727THB 0.0283 0.0314 0.0283 0.0255TRY 0.1315 0.1462 0.1318 0.1184TWD 0.0300 0.0333 0.0299 0.0270UAH 0.0335 0.0372 0.0334 0.0302USD 0.8993 1.0000 0.8990 0.8097UYU 0.0208 0.0231 0.0208 0.0187ZAR 0.0513 0.0571 0.0510 0.0462ZMW 0.0491 0.0546 0.0491 0.0442
(f) Combined Financial Statements
The accounts of each Fund are expressed in the Fund’s basecurrency. The combined figures of the Company are expressedin USD and include the total of the financial statements of thedifferent Funds, translated if necessary. For the translation ofthe Statement of Net Assets, the exchange rate prevailing at theFunds’ valuation point in Luxembourg as at 31 May 2020 for allFunds expressed in EUR excluding BlackRock DynamicDiversified Growth Fund is:
EUR
USD 0.8993
For the BlackRock Dynamic Diversified Growth Fund, theexchange rate prevailing at the Fund’s valuation point inLuxembourg as at 31 May 2020 is:
EUR
USD 0.8990
For the BlackRock UK Emerging Companies Absolute ReturnFund and BlackRock UK Equity Absolute Return Fund, theexchange rate prevailing at the Fund’s valuation point inLuxembourg as at 31 May 2020 is:
GBP
USD 0.8097
For the Statement of Operations and Changes in Net Assets,the following exchange rate is the average rate calculated overthe year for all Funds expressed in Euros excluding BlackRockDynamic Diversified Growth Fund:
EUR
USD 0.9045
For the BlackRock Dynamic Diversified Growth Fund, thefollowing exchange rate is the average rate calculated over theyear:
EUR
USD 0.9044
For the BlackRock UK Emerging Companies Absolute ReturnFund and BlackRock UK Equity Absolute Return Fund, thefollowing exchange rate is the average rate calculated over theyear:
GBP
USD 0.7934
The combined figures in the Statement of Operations andChanges in Net Assets have been calculated using the averageexchange rates throughout the year. The resulting Foreignexchange adjustment of USD (76,932,073) represents themovement in exchange rates between 1 June 2019 and 31 May2020. This is a notional amount, which has no impact on the NetAssets of the individual Funds.
Notes to the Financial Statements continued
Annual report and audited financial statements [695]

(g) Income Equalisation
The Company operates Income Equalisation arrangements witha view to ensure that the level of net income accrued within aFund and attributable to each share is not affected by the issue,conversion or redemption of Fund shares during an accountingyear.
The Income Equalisation is included in the Movements in sharecapital in the Statement of Operations and Changes in NetAssets.
(h) Dilution
The Directors may adjust the NAV per Share for a Fund in orderto reduce the effect of “dilution” on that Fund. Dilution occurswhen the actual cost of purchasing or selling the underlyingassets of a Fund deviates from the carrying value of theseassets in the Fund’s valuation, due to factors such as dealingand brokerage charges, taxes and duties, market movement andany spread between the buying and selling prices of theunderlying assets. Dilution may have an adverse effect on thevalue of a Fund and therefore impact Shareholders. Byadjusting the NAV per Share this effect can be reduced orprevented and Shareholders can be protected from the impactof dilution. The Directors may adjust the NAV of a Fund if onany Dealing Day the value of the aggregate transactions inShares of all Share Classes of that Fund results in a netincrease or decrease which exceeds one or more thresholdsthat are set by the Directors for that Fund. The amount by whichthe NAV of a Fund may be adjusted on any given Dealing Day isrelated to the anticipated cost of market dealing for that Fund. Insuch circumstances the NAV of the relevant Fund may beadjusted by an amount not exceeding 1.50%, or 3% in the caseof bond Funds, of that NAV. Under exceptional circumstancesthe Directors may, in the interest of Shareholders, decide totemporarily increase the maximum swing factor indicated aboveand inform investors thereof. The adjustment will be an additionwhen the net movement results in an increase in the value of allShares of the Fund and a deduction when it results in adecrease.
As certain stock markets and jurisdictions may have differentcharging structures on the buy and sell sides, particularly inrelation to duties and taxes, the resulting adjustment may bedifferent for net inflows than for net outflows. In addition, theDirectors may also agree to include extraordinary fiscal chargesin the amount of the adjustment. These extraordinary fiscalcharges vary from market to market and are currently expectednot to exceed 2.5% of that NAV. Where a Fund invests primarilyin certain asset types, such as government bonds or moneymarket securities, the Directors may decide that it is notappropriate to make such an adjustment. In accordance with theProspectus, such dilution adjustment was applied as at 31 May2020 to BlackRock Global Real Asset Securities Fund andBlackRock Global Event Driven Fund.
During the financial year from 1 June 2019 to 31 May2020 dilution adjustments were applied to all Funds exceptBlackRock Asia Extension Fund and BlackRock TotalAdvantage Fund.
The published/dealing NAV per share is disclosed in the ThreeYear Summary of Net Asset Values and may include a dilutionadjustment. This adjustment is not recognised in the Statementof Net Assets or the Statement of Operations and Changes inNet Assets.
(i) Transaction costs
Transaction costs are incremental costs that are directlyattributable to the acquisition, issue or disposal of securities andderivatives. An incremental cost is one that would not have beenincurred if the entity had not acquired, issued or disposed of thesecurity. When a security is recognised initially, it is measured atits market value, plus transaction costs that are directlyattributable to the acquisition or issue of the security.
Transaction costs excluding depositary transaction fees onpurchases or sales of securities are included within net realisedgain/(loss) or net change in unrealisedappreciation/(depreciation) within the Statement of Operationsand Changes in Net Assets of each Fund. Depositarytransaction fees are included in Depositary fees in theStatement of Operations and Changes in Net Assets of theFund. Refer to Note 6 for further information.
(j) Foreign currencies on other transactions
Foreign currencies on other transactions relate to realised andunrealised appreciation or depreciation on cash balances andspot contracts and are disclosed in the Statement of Operationsand Changes in Net Assets.
3. Management CompanyBlackRock (Luxembourg) S.A. (the “Management Company”)has been appointed by the Company to act as its ManagementCompany. The Management Company is authorised to act as afund management company in accordance with Chapter 15 ofthe 2010 Law.
The Company has signed a management company agreementwith the Management Company. Under this agreement, theManagement Company is entrusted with the day-to-daymanagement of the Company, with responsibility for performingdirectly or by way of delegation all operational functions relatingto the Company’s investment management, administration andmarketing of the Funds.
In agreement with the Company, the Management Companyhas decided to delegate several of its functions as is furtherdescribed in the Prospectus.
The Management Company is a wholly owned subsidiary withinthe BlackRock Group. It is regulated by the CSSF.
4. Management and Distribution FeesDuring the year, the Company paid management fees to theManagement Company.
The Company pays management fees at an annual rate asshown in Appendix F of the Prospectus. The level ofmanagement fee varies from 0.30% to 1.80% of the NAV, withthe exception of Class X shares, which do not pay amanagement fee but rather a fee to the Investment Advisers oraffiliates under an agreement. The level of management feevaries according to which Fund and Share Class the investorbuys. These fees accrue daily, are based on the NAV of therelevant Fund and are paid monthly. Certain costs and fees arepaid out of the management fees, including the fees of theInvestment Advisers.
Where a Fund invests a substantial proportion of its net assetsin other UCITS and other Undertakings for Collective Investment(“UCIs”), the Investment Adviser will ensure that the total
Notes to the Financial Statements continued
BlackRock Strategic Funds[696]
management fee (excluding any performance fee, if any)charged to such Fund (including management fees from otherUCITS and UCIs in which it invests) shall not exceed 3.75% ofthe NAV of the Fund.
During the year, the following Funds were subject tomanagement fee rebate linked to investments into target fundsmanaged by BlackRock disclosed in the Statement ofOperations and Changes in Net Assets under the caption“Management fee rebate”:
BlackRock Dynamic Diversified Growth Fund, BlackRockEmerging Markets Flexi Dynamic Bond Fund, BlackRockEuropean Select Strategies Fund, BlackRock Fixed IncomeCredit Strategies Fund, BlackRock Fixed Income StrategiesFund, BlackRock Global Absolute Return Bond Fund,BlackRock Macro Opportunities Fund, BlackRock ManagedIndex Portfolios – Conservative, BlackRock Managed IndexPortfolios – Defensive, BlackRock Managed Index Portfolios –Growth and BlackRock Managed Index Portfolios – Moderate.
During the year, all Funds, with the exception of those disclosedbelow, were subject to fee reimbursement from the ManagementCompany, as disclosed in the Statement of Operations andChanges in Net Assets under the caption �Reimbursement ofexpenses�:
BlackRock Americas Diversified Equity Absolute Fund,BlackRock Asia Extension Fund, BlackRock DynamicDiversified Growth Fund, BlackRock European Absolute ReturnFund, BlackRock European Opportunities Extension Fund,BlackRock Europeam Unconstrained Equity Fund, BlackRockFixed Income Strategies Fund.
During the year, the Company paid distribution fees toBlackRock Investment Management (UK) Limited who acted asPrincipal Distributor.
The Company pays annual distribution fees between 1.25% and1.00% of the NAV for Class C Shares and 0.50% of the NAV forClass E Shares. These fees accrue daily, are based on the NAVof the relevant Fund reflecting, when applicable, any adjustmentto the NAV of the relevant Fund, and are paid monthly.
The management and distribution fees per Share Class perFund are disclosed in detail in the Prospectus and KIID of theCompany. Management and distribution fees payable at 31 May2020 are included in the Statement of Net Assets under thecaption “Accrued expenses and other liabilities”.
5. Administration FeesThe Company pays an administration fee to the ManagementCompany.
The level of administration fee may vary at the Board’sdiscretion, as agreed with the Management Company, and willapply at different rates across the various Funds and ShareClasses issued by the Company. However, it has been agreedbetween the Board and the Management Company that theadministration fee currently paid shall not exceed 0.30% perannum. It is accrued daily, based on the NAV of the relevantShare Class and paid monthly.
The Board and the Management Company set the level of theadministration fee at a rate which aims to ensure that the totalexpense ratio of each Fund remains competitive whencompared across a broad market of similar investment products
available to investors in the Funds, taking into account a numberof criteria such as the market sector of each Fund and theFund’s performance relative to its peer group.
The administration fee is used by the Management Company tomeet all fixed and variable operating and administrative costsand expenses incurred by the Company, with the exception ofthe depositary fees, distribution fees, securities lending fees,any fees arising from borrowings (including for the avoidance ofdoubt any commitment fee that may be due to the lender), anyprofessional services costs relating to withholding tax reclaims(plus any taxes or interest thereon), and any taxes at aninvestment or Company level. Any commitment fees arising fromborrowings or professional services costs relating to withholdingtax reclaims will be allocated between the relevant Funds on afair and equitable basis.
These operating and administrative costs and expenses includeall third party expenses and other recoverable costs incurred byor on behalf of the Company from time to time, including but notlimited to, fund accounting fees, transfer agency fees (includingsub-transfer agency and associated platform dealing charges),all professional costs, such as consultancy, legal, tax advisoryand audit fees, Directors’ fees, travel expenses, reasonableout-of-pocket expenses, printing, publication, translation and allother costs relating to shareholder reporting, regulatory filingand licence fees, correspondent and other banking charges,software support and maintenance, operational costs andexpenses attributed to the Investor Servicing teams and otherglobal administration services provided by various BlackRockGroup companies.
The Management Company bears the financial risk of ensuringthat the Funds’ total expense ratio remains competitive.Accordingly the Management Company is entitled to retain anyamount of the administration fee paid to it which is in excess ofthe actual expenses incurred by the Company during any yearwhereas any costs and expenses incurred by the Company inany year which exceed the amount of administration fee that ispaid to the Management Company, shall be borne by theManagement Company or another BlackRock Group company.
Administration fees payable at 31 May 2020 are included in theStatement of Net Assets under the caption “Accrued expensesand other liabilities”.
Directors of the Company who are not employees of theBlackRock Group received a fee of EUR 30,000 per annumgross of taxation in return for their duties performed during theyear ended 31 May 2020. The Chairman receives a fee ofEUR 33,500 per annum gross of taxation. Directors who areemployees of the BlackRock Group are not entitled to receive aDirectors fee.
Directors fee is included in the Statement of Net Assets underthe caption �Accrued expenses and other liabilities�.
Detailed below are the fees paid to Deloitte Audit, S.à r.l. for theyear ended 31 May 2020.
31 May 2020EUR
Audit and audit related services(excluding VAT) 443,325Non-audit services –
Notes to the Financial Statements continued
Annual report and audited financial statements [697]
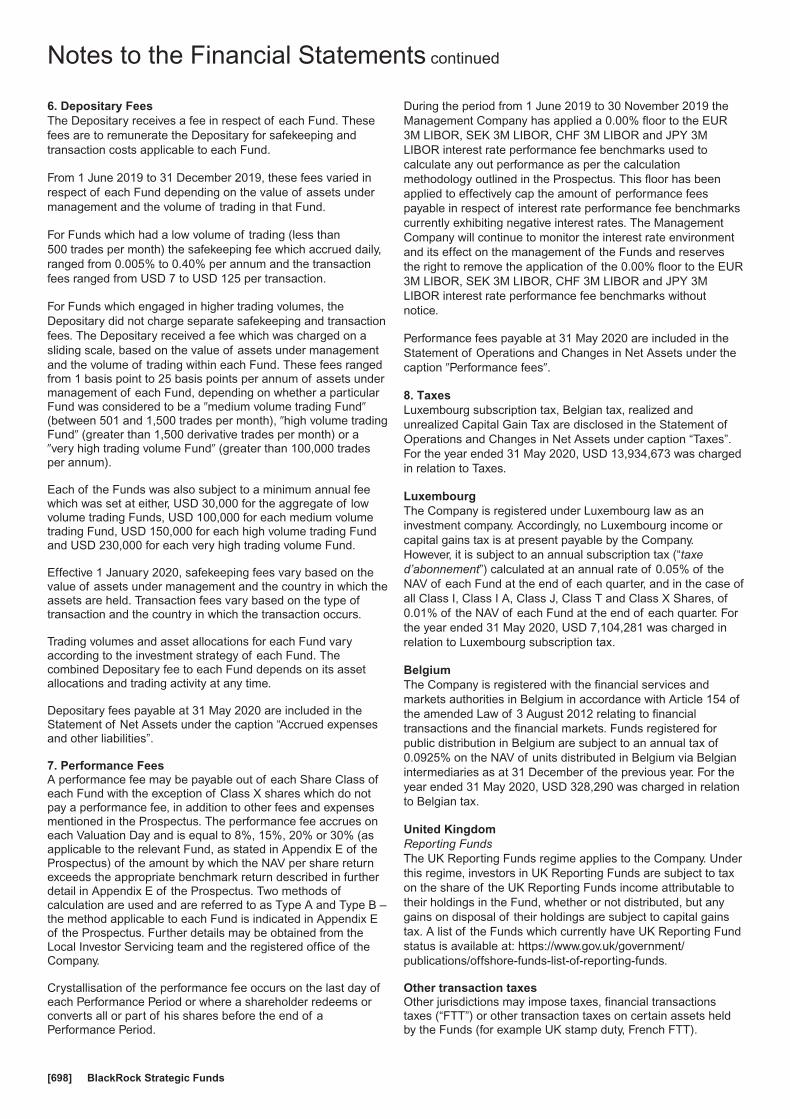
6. Depositary FeesThe Depositary receives a fee in respect of each Fund. Thesefees are to remunerate the Depositary for safekeeping andtransaction costs applicable to each Fund.
From 1 June 2019 to 31 December 2019, these fees varied inrespect of each Fund depending on the value of assets undermanagement and the volume of trading in that Fund.
For Funds which had a low volume of trading (less than500 trades per month) the safekeeping fee which accrued daily,ranged from 0.005% to 0.40% per annum and the transactionfees ranged from USD 7 to USD 125 per transaction.
For Funds which engaged in higher trading volumes, theDepositary did not charge separate safekeeping and transactionfees. The Depositary received a fee which was charged on asliding scale, based on the value of assets under managementand the volume of trading within each Fund. These fees rangedfrom 1 basis point to 25 basis points per annum of assets undermanagement of each Fund, depending on whether a particularFund was considered to be a �medium volume trading Fund�(between 501 and 1,500 trades per month), �high volume tradingFund� (greater than 1,500 derivative trades per month) or a�very high trading volume Fund� (greater than 100,000 tradesper annum).
Each of the Funds was also subject to a minimum annual feewhich was set at either, USD 30,000 for the aggregate of lowvolume trading Funds, USD 100,000 for each medium volumetrading Fund, USD 150,000 for each high volume trading Fundand USD 230,000 for each very high trading volume Fund.
Effective 1 January 2020, safekeeping fees vary based on thevalue of assets under management and the country in which theassets are held. Transaction fees vary based on the type oftransaction and the country in which the transaction occurs.
Trading volumes and asset allocations for each Fund varyaccording to the investment strategy of each Fund. Thecombined Depositary fee to each Fund depends on its assetallocations and trading activity at any time.
Depositary fees payable at 31 May 2020 are included in theStatement of Net Assets under the caption “Accrued expensesand other liabilities”.
7. Performance FeesA performance fee may be payable out of each Share Class ofeach Fund with the exception of Class X shares which do notpay a performance fee, in addition to other fees and expensesmentioned in the Prospectus. The performance fee accrues oneach Valuation Day and is equal to 8%, 15%, 20% or 30% (asapplicable to the relevant Fund, as stated in Appendix E of theProspectus) of the amount by which the NAV per share returnexceeds the appropriate benchmark return described in furtherdetail in Appendix E of the Prospectus. Two methods ofcalculation are used and are referred to as Type A and Type B –the method applicable to each Fund is indicated in Appendix Eof the Prospectus. Further details may be obtained from theLocal Investor Servicing team and the registered office of theCompany.
Crystallisation of the performance fee occurs on the last day ofeach Performance Period or where a shareholder redeems orconverts all or part of his shares before the end of aPerformance Period.
During the period from 1 June 2019 to 30 November 2019 theManagement Company has applied a 0.00% floor to the EUR3M LIBOR, SEK 3M LIBOR, CHF 3M LIBOR and JPY 3MLIBOR interest rate performance fee benchmarks used tocalculate any out performance as per the calculationmethodology outlined in the Prospectus. This floor has beenapplied to effectively cap the amount of performance feespayable in respect of interest rate performance fee benchmarkscurrently exhibiting negative interest rates. The ManagementCompany will continue to monitor the interest rate environmentand its effect on the management of the Funds and reservesthe right to remove the application of the 0.00% floor to the EUR3M LIBOR, SEK 3M LIBOR, CHF 3M LIBOR and JPY 3MLIBOR interest rate performance fee benchmarks withoutnotice.
Performance fees payable at 31 May 2020 are included in theStatement of Operations and Changes in Net Assets under thecaption �Performance fees�.
8. TaxesLuxembourg subscription tax, Belgian tax, realized andunrealized Capital Gain Tax are disclosed in the Statement ofOperations and Changes in Net Assets under caption “Taxes”.For the year ended 31 May 2020, USD 13,934,673 was chargedin relation to Taxes.
LuxembourgThe Company is registered under Luxembourg law as aninvestment company. Accordingly, no Luxembourg income orcapital gains tax is at present payable by the Company.However, it is subject to an annual subscription tax (“taxed’abonnement”) calculated at an annual rate of 0.05% of theNAV of each Fund at the end of each quarter, and in the case ofall Class I, Class I A, Class J, Class T and Class X Shares, of0.01% of the NAV of each Fund at the end of each quarter. Forthe year ended 31 May 2020, USD 7,104,281 was charged inrelation to Luxembourg subscription tax.
BelgiumThe Company is registered with the financial services andmarkets authorities in Belgium in accordance with Article 154 ofthe amended Law of 3 August 2012 relating to financialtransactions and the financial markets. Funds registered forpublic distribution in Belgium are subject to an annual tax of0.0925% on the NAV of units distributed in Belgium via Belgianintermediaries as at 31 December of the previous year. For theyear ended 31 May 2020, USD 328,290 was charged in relationto Belgian tax.
United KingdomReporting FundsThe UK Reporting Funds regime applies to the Company. Underthis regime, investors in UK Reporting Funds are subject to taxon the share of the UK Reporting Funds income attributable totheir holdings in the Fund, whether or not distributed, but anygains on disposal of their holdings are subject to capital gainstax. A list of the Funds which currently have UK Reporting Fundstatus is available at: https://www.gov.uk/government/publications/offshore-funds-list-of-reporting-funds.
Other transaction taxesOther jurisdictions may impose taxes, financial transactionstaxes (“FTT”) or other transaction taxes on certain assets heldby the Funds (for example UK stamp duty, French FTT).
Notes to the Financial Statements continued
BlackRock Strategic Funds[698]
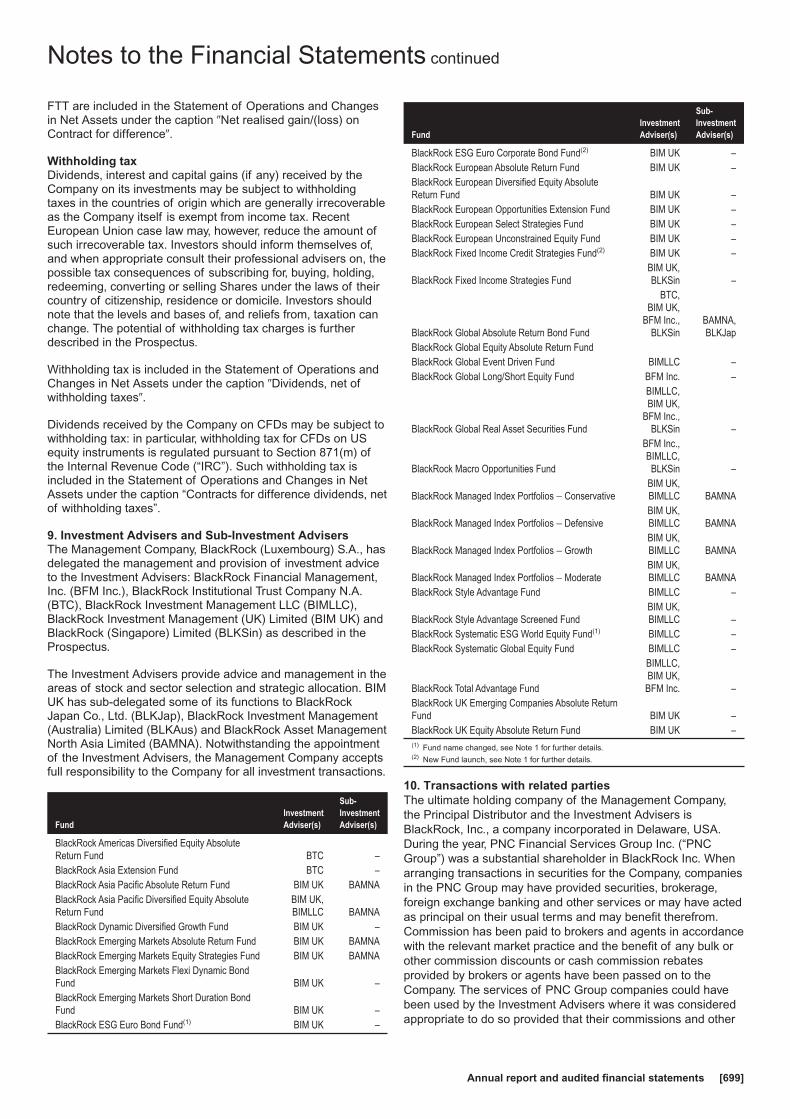
FTT are included in the Statement of Operations and Changesin Net Assets under the caption �Net realised gain/(loss) onContract for difference�.
Withholding taxDividends, interest and capital gains (if any) received by theCompany on its investments may be subject to withholdingtaxes in the countries of origin which are generally irrecoverableas the Company itself is exempt from income tax. RecentEuropean Union case law may, however, reduce the amount ofsuch irrecoverable tax. Investors should inform themselves of,and when appropriate consult their professional advisers on, thepossible tax consequences of subscribing for, buying, holding,redeeming, converting or selling Shares under the laws of theircountry of citizenship, residence or domicile. Investors shouldnote that the levels and bases of, and reliefs from, taxation canchange. The potential of withholding tax charges is furtherdescribed in the Prospectus.
Withholding tax is included in the Statement of Operations andChanges in Net Assets under the caption �Dividends, net ofwithholding taxes�.
Dividends received by the Company on CFDs may be subject towithholding tax: in particular, withholding tax for CFDs on USequity instruments is regulated pursuant to Section 871(m) ofthe Internal Revenue Code (“IRC”). Such withholding tax isincluded in the Statement of Operations and Changes in NetAssets under the caption “Contracts for difference dividends, netof withholding taxes”.
9. Investment Advisers and Sub-Investment AdvisersThe Management Company, BlackRock (Luxembourg) S.A., hasdelegated the management and provision of investment adviceto the Investment Advisers: BlackRock Financial Management,Inc. (BFM Inc.), BlackRock Institutional Trust Company N.A.(BTC), BlackRock Investment Management LLC (BIMLLC),BlackRock Investment Management (UK) Limited (BIM UK) andBlackRock (Singapore) Limited (BLKSin) as described in theProspectus.
The Investment Advisers provide advice and management in theareas of stock and sector selection and strategic allocation. BIMUK has sub-delegated some of its functions to BlackRockJapan Co., Ltd. (BLKJap), BlackRock Investment Management(Australia) Limited (BLKAus) and BlackRock Asset ManagementNorth Asia Limited (BAMNA). Notwithstanding the appointmentof the Investment Advisers, the Management Company acceptsfull responsibility to the Company for all investment transactions.
FundInvestmentAdviser(s)
Sub-InvestmentAdviser(s)
BlackRock Americas Diversified Equity AbsoluteReturn Fund BTC –BlackRock Asia Extension Fund BTC –BlackRock Asia Pacific Absolute Return Fund BIM UK BAMNABlackRock Asia Pacific Diversified Equity AbsoluteReturn Fund
BIM UK,BIMLLC BAMNA
BlackRock Dynamic Diversified Growth Fund BIM UK –BlackRock Emerging Markets Absolute Return Fund BIM UK BAMNABlackRock Emerging Markets Equity Strategies Fund BIM UK BAMNABlackRock Emerging Markets Flexi Dynamic BondFund BIM UK –BlackRock Emerging Markets Short Duration BondFund BIM UK –BlackRock ESG Euro Bond Fund(1) BIM UK –
FundInvestmentAdviser(s)
Sub-InvestmentAdviser(s)
BlackRock ESG Euro Corporate Bond Fund(2) BIM UK –BlackRock European Absolute Return Fund BIM UK –BlackRock European Diversified Equity AbsoluteReturn Fund BIM UK –BlackRock European Opportunities Extension Fund BIM UK –BlackRock European Select Strategies Fund BIM UK –BlackRock European Unconstrained Equity Fund BIM UK –BlackRock Fixed Income Credit Strategies Fund(2) BIM UK –
BlackRock Fixed Income Strategies FundBIM UK,BLKSin –
BlackRock Global Absolute Return Bond Fund
BTC,BIM UK,
BFM Inc.,BLKSin
BAMNA,BLKJap
BlackRock Global Equity Absolute Return FundBlackRock Global Event Driven Fund BIMLLC –BlackRock Global Long/Short Equity Fund BFM Inc. –
BlackRock Global Real Asset Securities Fund
BIMLLC,BIM UK,
BFM Inc.,BLKSin –
BlackRock Macro Opportunities Fund
BFM Inc.,BIMLLC,
BLKSin –
BlackRock Managed Index Portfolios − ConservativeBIM UK,BIMLLC BAMNA
BlackRock Managed Index Portfolios − DefensiveBIM UK,BIMLLC BAMNA
BlackRock Managed Index Portfolios − GrowthBIM UK,BIMLLC BAMNA
BlackRock Managed Index Portfolios − ModerateBIM UK,BIMLLC BAMNA
BlackRock Style Advantage Fund BIMLLC –
BlackRock Style Advantage Screened FundBIM UK,BIMLLC –
BlackRock Systematic ESG World Equity Fund(1) BIMLLC –BlackRock Systematic Global Equity Fund BIMLLC –
BlackRock Total Advantage Fund
BIMLLC,BIM UK,
BFM Inc. –BlackRock UK Emerging Companies Absolute ReturnFund BIM UK –BlackRock UK Equity Absolute Return Fund BIM UK –(1) Fund name changed, see Note 1 for further details.(2) New Fund launch, see Note 1 for further details.
10. Transactions with related partiesThe ultimate holding company of the Management Company,the Principal Distributor and the Investment Advisers isBlackRock, Inc., a company incorporated in Delaware, USA.During the year, PNC Financial Services Group Inc. (“PNCGroup”) was a substantial shareholder in BlackRock Inc. Whenarranging transactions in securities for the Company, companiesin the PNC Group may have provided securities, brokerage,foreign exchange banking and other services or may have actedas principal on their usual terms and may benefit therefrom.Commission has been paid to brokers and agents in accordancewith the relevant market practice and the benefit of any bulk orother commission discounts or cash commission rebatesprovided by brokers or agents have been passed on to theCompany. The services of PNC Group companies could havebeen used by the Investment Advisers where it was consideredappropriate to do so provided that their commissions and other
Notes to the Financial Statements continued
Annual report and audited financial statements [699]
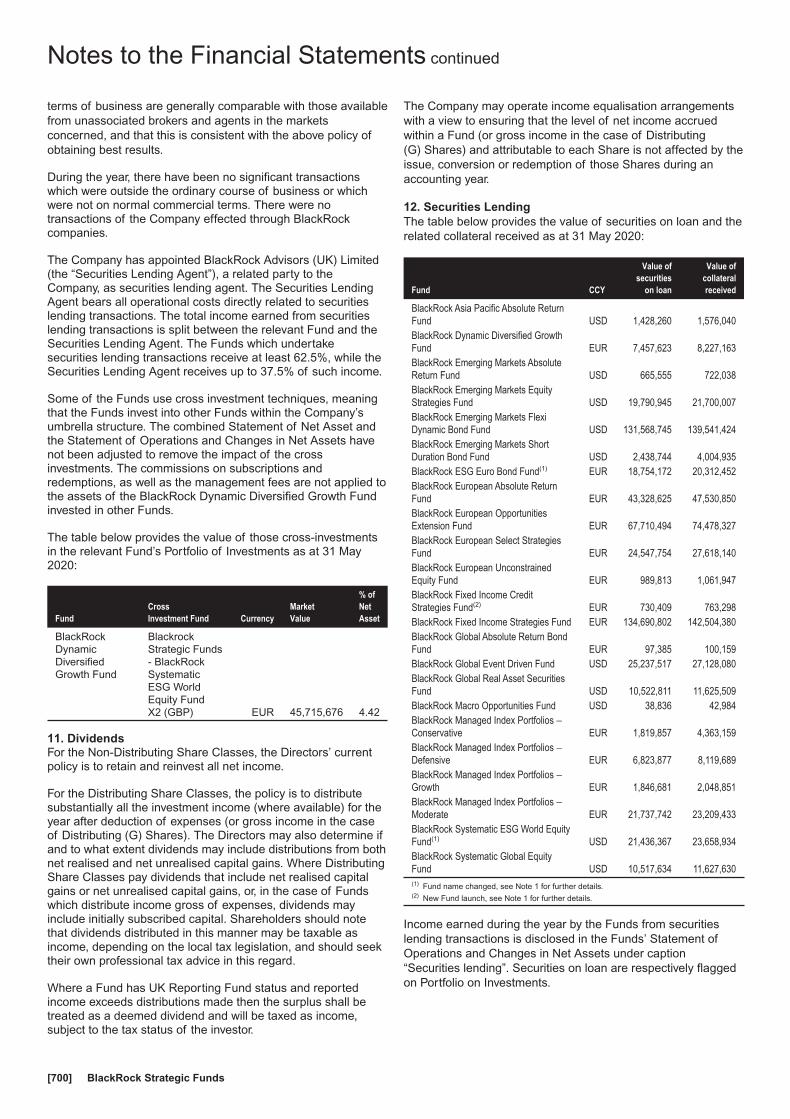
terms of business are generally comparable with those availablefrom unassociated brokers and agents in the marketsconcerned, and that this is consistent with the above policy ofobtaining best results.
During the year, there have been no significant transactionswhich were outside the ordinary course of business or whichwere not on normal commercial terms. There were notransactions of the Company effected through BlackRockcompanies.
The Company has appointed BlackRock Advisors (UK) Limited(the “Securities Lending Agent”), a related party to theCompany, as securities lending agent. The Securities LendingAgent bears all operational costs directly related to securitieslending transactions. The total income earned from securitieslending transactions is split between the relevant Fund and theSecurities Lending Agent. The Funds which undertakesecurities lending transactions receive at least 62.5%, while theSecurities Lending Agent receives up to 37.5% of such income.
Some of the Funds use cross investment techniques, meaningthat the Funds invest into other Funds within the Company’sumbrella structure. The combined Statement of Net Asset andthe Statement of Operations and Changes in Net Assets havenot been adjusted to remove the impact of the crossinvestments. The commissions on subscriptions andredemptions, as well as the management fees are not applied tothe assets of the BlackRock Dynamic Diversified Growth Fundinvested in other Funds.
The table below provides the value of those cross-investmentsin the relevant Fund’s Portfolio of Investments as at 31 May2020:
FundCrossInvestment Fund Currency
MarketValue
% ofNetAsset
BlackRockDynamicDiversifiedGrowth Fund
BlackrockStrategic Funds- BlackRockSystematicESG WorldEquity FundX2 (GBP) EUR 45,715,676 4.42
11. DividendsFor the Non-Distributing Share Classes, the Directors’ currentpolicy is to retain and reinvest all net income.
For the Distributing Share Classes, the policy is to distributesubstantially all the investment income (where available) for theyear after deduction of expenses (or gross income in the caseof Distributing (G) Shares). The Directors may also determine ifand to what extent dividends may include distributions from bothnet realised and net unrealised capital gains. Where DistributingShare Classes pay dividends that include net realised capitalgains or net unrealised capital gains, or, in the case of Fundswhich distribute income gross of expenses, dividends mayinclude initially subscribed capital. Shareholders should notethat dividends distributed in this manner may be taxable asincome, depending on the local tax legislation, and should seektheir own professional tax advice in this regard.
Where a Fund has UK Reporting Fund status and reportedincome exceeds distributions made then the surplus shall betreated as a deemed dividend and will be taxed as income,subject to the tax status of the investor.
The Company may operate income equalisation arrangementswith a view to ensuring that the level of net income accruedwithin a Fund (or gross income in the case of Distributing(G) Shares) and attributable to each Share is not affected by theissue, conversion or redemption of those Shares during anaccounting year.
12. Securities LendingThe table below provides the value of securities on loan and therelated collateral received as at 31 May 2020:
Fund CCY
Value ofsecurities
on loan
Value ofcollateralreceived
BlackRock Asia Pacific Absolute ReturnFund USD 1,428,260 1,576,040BlackRock Dynamic Diversified GrowthFund EUR 7,457,623 8,227,163BlackRock Emerging Markets AbsoluteReturn Fund USD 665,555 722,038BlackRock Emerging Markets EquityStrategies Fund USD 19,790,945 21,700,007BlackRock Emerging Markets FlexiDynamic Bond Fund USD 131,568,745 139,541,424BlackRock Emerging Markets ShortDuration Bond Fund USD 2,438,744 4,004,935BlackRock ESG Euro Bond Fund(1) EUR 18,754,172 20,312,452BlackRock European Absolute ReturnFund EUR 43,328,625 47,530,850BlackRock European OpportunitiesExtension Fund EUR 67,710,494 74,478,327BlackRock European Select StrategiesFund EUR 24,547,754 27,618,140BlackRock European UnconstrainedEquity Fund EUR 989,813 1,061,947BlackRock Fixed Income CreditStrategies Fund(2) EUR 730,409 763,298BlackRock Fixed Income Strategies Fund EUR 134,690,802 142,504,380BlackRock Global Absolute Return BondFund EUR 97,385 100,159BlackRock Global Event Driven Fund USD 25,237,517 27,128,080BlackRock Global Real Asset SecuritiesFund USD 10,522,811 11,625,509BlackRock Macro Opportunities Fund USD 38,836 42,984BlackRock Managed Index Portfolios −Conservative EUR 1,819,857 4,363,159BlackRock Managed Index Portfolios −Defensive EUR 6,823,877 8,119,689BlackRock Managed Index Portfolios −Growth EUR 1,846,681 2,048,851BlackRock Managed Index Portfolios −Moderate EUR 21,737,742 23,209,433BlackRock Systematic ESG World EquityFund(1) USD 21,436,367 23,658,934BlackRock Systematic Global EquityFund USD 10,517,634 11,627,630(1) Fund name changed, see Note 1 for further details.(2) New Fund launch, see Note 1 for further details.
Income earned during the year by the Funds from securitieslending transactions is disclosed in the Funds’ Statement ofOperations and Changes in Net Assets under caption“Securities lending”. Securities on loan are respectively flaggedon Portfolio on Investments.
Notes to the Financial Statements continued
BlackRock Strategic Funds[700]

13. Transaction costsIn order to achieve its investment objective, a Fund will incurtransactions costs in relation to trading activity on its Portfolio ofInvestments. Disclosed in the table below are separatelyidentifiable transaction costs incurred by each Fund for the yearended 31 May 2020. These include broker commissions andsettlement fees.
Fund CCY Transaction Costs
BlackRock Americas Diversified Equity AbsoluteReturn Fund USD 30,264BlackRock Asia Extension Fund USD -BlackRock Asia Pacific Absolute Return Fund USD 86,227BlackRock Asia Pacific Diversified Equity AbsoluteReturn Fund USD -BlackRock Dynamic Diversified Growth Fund EUR 119,400BlackRock Emerging Markets Absolute Return Fund USD 106,835BlackRock Emerging Markets Equity Strategies Fund USD 3,132,943BlackRock Emerging Markets Flexi Dynamic BondFund USD 846BlackRock Emerging Markets Short Duration BondFund USD 78BlackRock ESG Euro Bond Fund(1) EUR -BlackRock ESG Euro Corporate Bond Fund(2) EUR -BlackRock European Absolute Return Fund EUR 246,918BlackRock European Diversified Equity AbsoluteReturn Fund EUR -BlackRock European Opportunities Extension Fund EUR 217,168BlackRock European Select Strategies Fund EUR 475,350BlackRock European Unconstrained Equity Fund EUR 37,411BlackRock Fixed Income Credit Strategies Fund(2) EUR 740BlackRock Fixed Income Strategies Fund EUR 14,434BlackRock Global Absolute Return Bond Fund EUR 196BlackRock Global Equity Absolute Return Fund USD 19,899BlackRock Global Event Driven Fund USD 87,554BlackRock Global Long/Short Equity Fund USD -BlackRock Global Real Asset Securities Fund USD 175,307BlackRock Macro Opportunities Fund USD 4,882BlackRock Managed Index Portfolios − Conservative EUR 6,535BlackRock Managed Index Portfolios − Defensive EUR 6,386BlackRock Managed Index Portfolios − Growth EUR 22,745BlackRock Managed Index Portfolios − Moderate EUR 28,960BlackRock Style Advantage Fund USD -BlackRock Style Advantage Screened Fund USD -BlackRock Systematic ESG World Equity Fund(1) USD 182,760BlackRock Systematic Global Equity Fund USD 215,164BlackRock Total Advantage Fund EUR -BlackRock UK Emerging Companies Absolute ReturnFund GBP 6,375BlackRock UK Equity Absolute Return Fund GBP 89(1) Fund name changed, see Note 1 for further details.(2) New Fund launch, see Note 1 for further details.
Not all transaction costs are separately identifiable. For CFDs,swaps, forward foreign exchange transactions, futures contracts,options, swaptions and TBAs transaction costs are included inthe purchase and sales price of the investment. Whilst notseparately identifiable these transaction costs are capturedwithin the performance of each Fund. Market impact costs arenot separately identifiable and are therefore also not disclosedin the above table.
14. Credit FacilityThe Company entered into a credit facility with JPMorgan ChaseBank, N.A. (“JPMorgan”) whereby JPMorgan, together withother syndicated lenders, will make a portion of a USD1.225 billion credit facility available to the Luxembourg Funds.The portion of the USD 1.225 billion credit facility will beallocated to the Funds based on the Allocation Notice dated31 December 2019.
This credit facility will be utilised by the Funds for temporaryfunding purposes, including, without limitation, the funding ofinvestor redemptions. Any interest and commitment fees inrelation to drawdowns from such credit facility are paid out ofthe assets of the relevant Funds. Any new Funds will notautomatically be subject to a credit line and will therefore berequired to be added by way of a joinder process. This processincludes, inter alia, any necessary due diligence being carriedout by the lenders in order to approve the addition of the newFunds. During this for the year ended, such Funds will not besubject to, or able to draw down on, any credit line.Furthermore, there is no guarantee that the addition of any newFunds will be approved by the lenders, or that credit will beavailable to a Fund since the credit line is subject to availability(on an equitable allocation basis) between the Funds and otherBlackRock Funds participating in the credit agreement. As such,certain Funds may not be subject to the credit line and will notincur any fees with respect to same.
A loan commitment fee is charged on a daily basis in relation tothis credit facility which is included in the Statement ofOperations and Changes in Net Assets under caption “Loancommitment fees”. The loan commitment fee is charged at0.10% on the outstanding balance.
No portion of the credit facility was used during the year ended31 May 2020.
15. Amounts due from/to brokerDue from/to broker on the Statement of Net Assets consists ofcash collateral and margin paid/received to/from Funds’ clearingbrokers and various counterparties.
16. Total Expense RatioTotal Expense Ratio (“TER”) is calculated as the total of allexpenses (excluding bank interest, negative yield expense onfinancial assets and expense reimbursements), divided by theaverage net assets of the share classes, expressed as apercentage. All data is annualised.
The Management fees may be used in part to pay remunerationfor distribution activities concerning the Company.Reimbursement may be made to institutional investors whichfrom a commercial perspective hold shares of the Company forthird parties.
The TERs for the year from 1 June 2019 to 31 May 2020 are asfollows:
Notes to the Financial Statements continued
Annual report and audited financial statements [701]
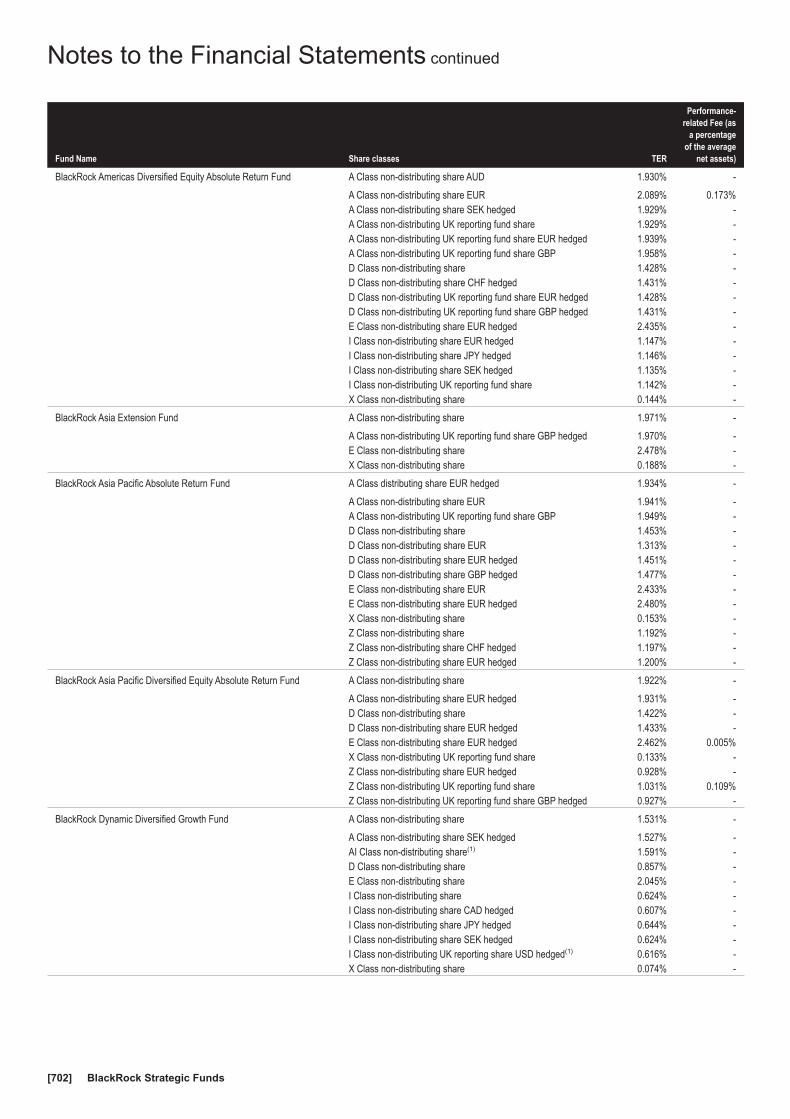
Fund Name Share classes TER
Performance-related Fee (as
a percentageof the average
net assets)
BlackRock Americas Diversified Equity Absolute Return Fund A Class non-distributing share AUD 1.930% -
A Class non-distributing share EUR 2.089% 0.173%A Class non-distributing share SEK hedged 1.929% -A Class non-distributing UK reporting fund share 1.929% -A Class non-distributing UK reporting fund share EUR hedged 1.939% -A Class non-distributing UK reporting fund share GBP 1.958% -D Class non-distributing share 1.428% -D Class non-distributing share CHF hedged 1.431% -D Class non-distributing UK reporting fund share EUR hedged 1.428% -D Class non-distributing UK reporting fund share GBP hedged 1.431% -E Class non-distributing share EUR hedged 2.435% -I Class non-distributing share EUR hedged 1.147% -I Class non-distributing share JPY hedged 1.146% -I Class non-distributing share SEK hedged 1.135% -I Class non-distributing UK reporting fund share 1.142% -X Class non-distributing share 0.144% -
BlackRock Asia Extension Fund A Class non-distributing share 1.971% -
A Class non-distributing UK reporting fund share GBP hedged 1.970% -E Class non-distributing share 2.478% -X Class non-distributing share 0.188% -
BlackRock Asia Pacific Absolute Return Fund A Class distributing share EUR hedged 1.934% -
A Class non-distributing share EUR 1.941% -A Class non-distributing UK reporting fund share GBP 1.949% -D Class non-distributing share 1.453% -D Class non-distributing share EUR 1.313% -D Class non-distributing share EUR hedged 1.451% -D Class non-distributing share GBP hedged 1.477% -E Class non-distributing share EUR 2.433% -E Class non-distributing share EUR hedged 2.480% -X Class non-distributing share 0.153% -Z Class non-distributing share 1.192% -Z Class non-distributing share CHF hedged 1.197% -Z Class non-distributing share EUR hedged 1.200% -
BlackRock Asia Pacific Diversified Equity Absolute Return Fund A Class non-distributing share 1.922% -
A Class non-distributing share EUR hedged 1.931% -D Class non-distributing share 1.422% -D Class non-distributing share EUR hedged 1.433% -E Class non-distributing share EUR hedged 2.462% 0.005%X Class non-distributing UK reporting fund share 0.133% -Z Class non-distributing share EUR hedged 0.928% -Z Class non-distributing UK reporting fund share 1.031% 0.109%Z Class non-distributing UK reporting fund share GBP hedged 0.927% -
BlackRock Dynamic Diversified Growth Fund A Class non-distributing share 1.531% -
A Class non-distributing share SEK hedged 1.527% -AI Class non-distributing share(1) 1.591% -D Class non-distributing share 0.857% -E Class non-distributing share 2.045% -I Class non-distributing share 0.624% -I Class non-distributing share CAD hedged 0.607% -I Class non-distributing share JPY hedged 0.644% -I Class non-distributing share SEK hedged 0.624% -I Class non-distributing UK reporting share USD hedged(1) 0.616% -X Class non-distributing share 0.074% -
Notes to the Financial Statements continued
BlackRock Strategic Funds[702]

Fund Name Share classes TER
Performance-related Fee (as
a percentageof the average
net assets)
BlackRock Emerging Markets Absolute Return Fund A Class distributing UK reporting fund share GBP hedged 2.208% 0.000%
A Class non-distributing share 2.203% 0.027%A Class non-distributing share EUR hedged 2.198% -D Class distributing UK reporting fund share GBP hedged 1.695% 0.000%D Class non-distributing UK reporting fund share 1.831% 0.117%D Class non-distributing UK reporting fund share EUR hedged 1.690% 0.005%E Class non-distributing share EUR hedged 2.699% 0.002%I Class distributing UK reporting fund share GBP 1.331% 0.000%I Class distributing UK reporting fund share GBP hedged(1) 1.387% -I Class non-distributing share EUR 1.397% -I Class non-distributing share EUR hedged 1.406% 0.013%I Class non-distributing UK reporting fund share 1.402% -X Class non-distributing share 0.407% -
BlackRock Emerging Markets Equity Strategies Fund A Class non-distributing share 1.941% -
A Class non-distributing share CHF hedged 1.921% -D Class distributing share 1.421% -D Class non-distributing share CHF hedged 1.483% -D Class non-distributing share EUR hedged 1.452% -D Class non-distributing UK reporting fund share 1.437% -D Class non-distributing UK reporting fund share EUR 1.437% -D Class non-distributing UK reporting fund share GBP 1.437% -E Class non-distributing share EUR 2.444% -I Class non-distributing share 1.148% -I Class non-distributing share EUR 1.152% -X Class non-distributing share 0.147% -Z Class non-distributing share GBP 0.834% -Z Class non-distributing UK reporting fund share 0.836% -
BlackRock Emerging Markets Flexi Dynamic Bond Fund A Class distributing UK reporting fund share GBP hedged 1.774% -
A Class non-distributing share 1.763% -A Class non-distributing share EUR hedged 1.778% -A Class non-distributing share SEK hedged 1.805% -A Class non-distributing UK reporting fund share CHF hedged 1.756% -AI Class non-distributing share EUR hedged(1) 1.776% -D Class distributing UK reporting fund share 1.008% -D Class distributing UK reporting fund share EUR 1.003% -D Class distributing UK reporting fund share EUR hedged 0.989% -D Class distributing UK reporting fund share GBP 1.020% -D Class distributing UK reporting fund share GBP hedged 0.997% -D Class non-distributing UK reporting fund share 1.023% -D Class non-distributing UK reporting fund share CHF hedged 1.014% -D Class non-distributing UK reporting fund share EUR hedged 1.018% -E Class non-distributing share 2.270% -E Class non-distributing share EUR hedged 2.281% -I Class distributing share EUR 0.828% -I Class distributing share EUR hedged 0.828% -I Class distributing share (G) EUR hedged 0.833% -I Class distributing UK reporting fund share 0.875% -I Class non-distributing share EUR hedged 0.866% -I Class non-distributing UK reporting fund share 0.837% -X Class distributing share EUR 0.074% -X Class non-distributing share 0.086% -X Class non-distributing share AUD hedged 0.085% -X Class non-distributing share CAD hedged 0.085% -
Notes to the Financial Statements continued
Annual report and audited financial statements [703]
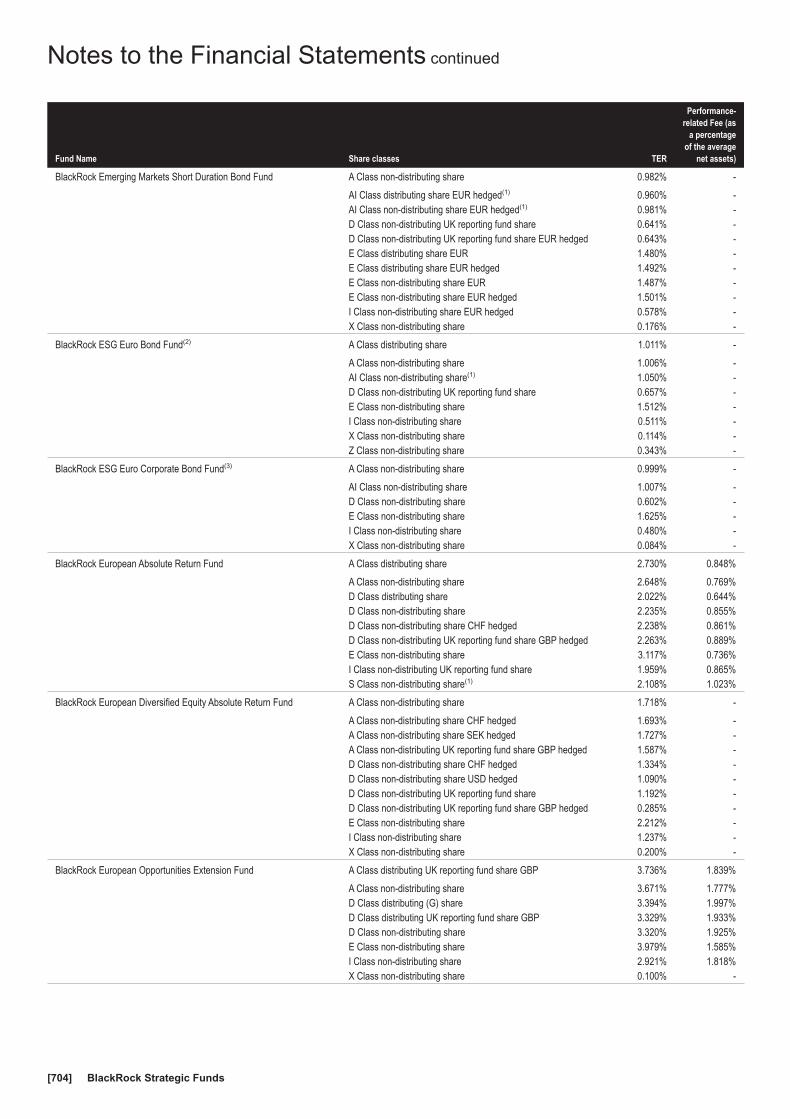
Fund Name Share classes TER
Performance-related Fee (as
a percentageof the average
net assets)
BlackRock Emerging Markets Short Duration Bond Fund A Class non-distributing share 0.982% -
AI Class distributing share EUR hedged(1) 0.960% -AI Class non-distributing share EUR hedged(1) 0.981% -D Class non-distributing UK reporting fund share 0.641% -D Class non-distributing UK reporting fund share EUR hedged 0.643% -E Class distributing share EUR 1.480% -E Class distributing share EUR hedged 1.492% -E Class non-distributing share EUR 1.487% -E Class non-distributing share EUR hedged 1.501% -I Class non-distributing share EUR hedged 0.578% -X Class non-distributing share 0.176% -
BlackRock ESG Euro Bond Fund(2) A Class distributing share 1.011% -
A Class non-distributing share 1.006% -AI Class non-distributing share(1) 1.050% -D Class non-distributing UK reporting fund share 0.657% -E Class non-distributing share 1.512% -I Class non-distributing share 0.511% -X Class non-distributing share 0.114% -Z Class non-distributing share 0.343% -
BlackRock ESG Euro Corporate Bond Fund(3) A Class non-distributing share 0.999% -
AI Class non-distributing share 1.007% -D Class non-distributing share 0.602% -E Class non-distributing share 1.625% -I Class non-distributing share 0.480% -X Class non-distributing share 0.084% -
BlackRock European Absolute Return Fund A Class distributing share 2.730% 0.848%
A Class non-distributing share 2.648% 0.769%D Class distributing share 2.022% 0.644%D Class non-distributing share 2.235% 0.855%D Class non-distributing share CHF hedged 2.238% 0.861%D Class non-distributing UK reporting fund share GBP hedged 2.263% 0.889%E Class non-distributing share 3.117% 0.736%I Class non-distributing UK reporting fund share 1.959% 0.865%S Class non-distributing share(1) 2.108% 1.023%
BlackRock European Diversified Equity Absolute Return Fund A Class non-distributing share 1.718% -
A Class non-distributing share CHF hedged 1.693% -A Class non-distributing share SEK hedged 1.727% -A Class non-distributing UK reporting fund share GBP hedged 1.587% -D Class non-distributing share CHF hedged 1.334% -D Class non-distributing share USD hedged 1.090% -D Class non-distributing UK reporting fund share 1.192% -D Class non-distributing UK reporting fund share GBP hedged 0.285% -E Class non-distributing share 2.212% -I Class non-distributing share 1.237% -X Class non-distributing share 0.200% -
BlackRock European Opportunities Extension Fund A Class distributing UK reporting fund share GBP 3.736% 1.839%
A Class non-distributing share 3.671% 1.777%D Class distributing (G) share 3.394% 1.997%D Class distributing UK reporting fund share GBP 3.329% 1.933%D Class non-distributing share 3.320% 1.925%E Class non-distributing share 3.979% 1.585%I Class non-distributing share 2.921% 1.818%X Class non-distributing share 0.100% -
Notes to the Financial Statements continued
BlackRock Strategic Funds[704]
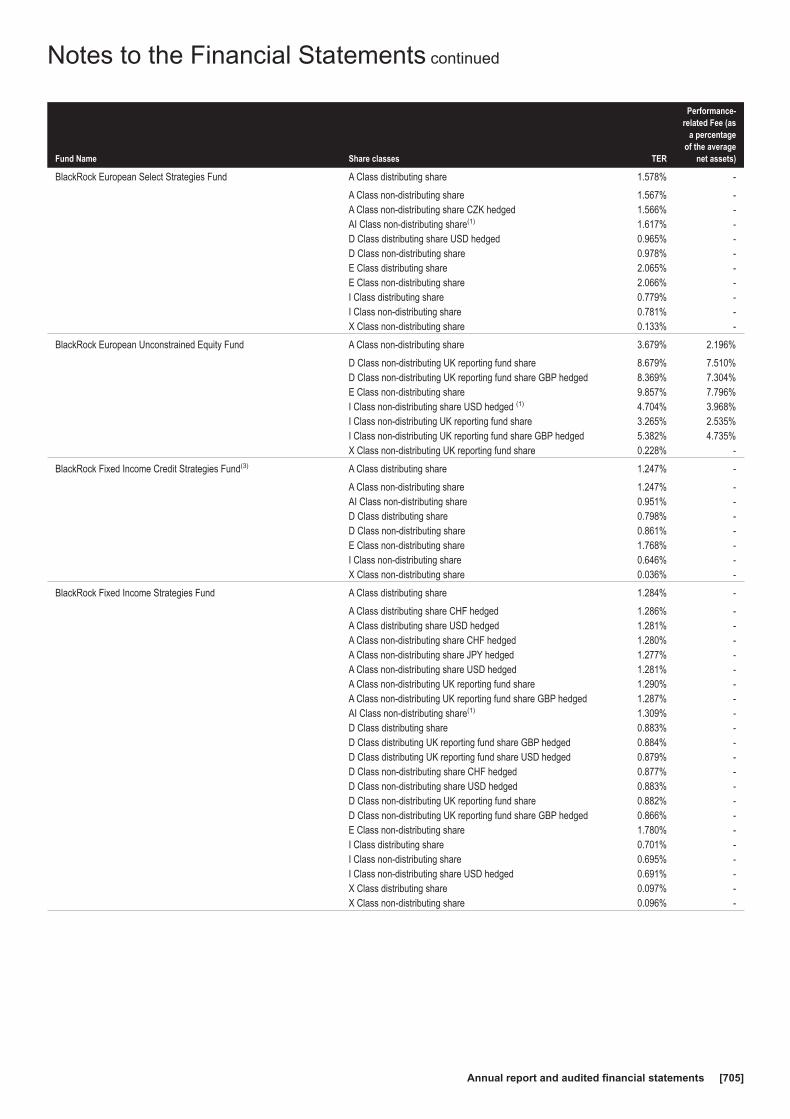
Fund Name Share classes TER
Performance-related Fee (as
a percentageof the average
net assets)
BlackRock European Select Strategies Fund A Class distributing share 1.578% -
A Class non-distributing share 1.567% -A Class non-distributing share CZK hedged 1.566% -AI Class non-distributing share(1) 1.617% -D Class distributing share USD hedged 0.965% -D Class non-distributing share 0.978% -E Class distributing share 2.065% -E Class non-distributing share 2.066% -I Class distributing share 0.779% -I Class non-distributing share 0.781% -X Class non-distributing share 0.133% -
BlackRock European Unconstrained Equity Fund A Class non-distributing share 3.679% 2.196%
D Class non-distributing UK reporting fund share 8.679% 7.510%D Class non-distributing UK reporting fund share GBP hedged 8.369% 7.304%E Class non-distributing share 9.857% 7.796%I Class non-distributing share USD hedged (1) 4.704% 3.968%I Class non-distributing UK reporting fund share 3.265% 2.535%I Class non-distributing UK reporting fund share GBP hedged 5.382% 4.735%X Class non-distributing UK reporting fund share 0.228% -
BlackRock Fixed Income Credit Strategies Fund(3) A Class distributing share 1.247% -
A Class non-distributing share 1.247% -AI Class non-distributing share 0.951% -D Class distributing share 0.798% -D Class non-distributing share 0.861% -E Class non-distributing share 1.768% -I Class non-distributing share 0.646% -X Class non-distributing share 0.036% -
BlackRock Fixed Income Strategies Fund A Class distributing share 1.284% -
A Class distributing share CHF hedged 1.286% -A Class distributing share USD hedged 1.281% -A Class non-distributing share CHF hedged 1.280% -A Class non-distributing share JPY hedged 1.277% -A Class non-distributing share USD hedged 1.281% -A Class non-distributing UK reporting fund share 1.290% -A Class non-distributing UK reporting fund share GBP hedged 1.287% -AI Class non-distributing share(1) 1.309% -D Class distributing share 0.883% -D Class distributing UK reporting fund share GBP hedged 0.884% -D Class distributing UK reporting fund share USD hedged 0.879% -D Class non-distributing share CHF hedged 0.877% -D Class non-distributing share USD hedged 0.883% -D Class non-distributing UK reporting fund share 0.882% -D Class non-distributing UK reporting fund share GBP hedged 0.866% -E Class non-distributing share 1.780% -I Class distributing share 0.701% -I Class non-distributing share 0.695% -I Class non-distributing share USD hedged 0.691% -X Class distributing share 0.097% -X Class non-distributing share 0.096% -
Notes to the Financial Statements continued
Annual report and audited financial statements [705]
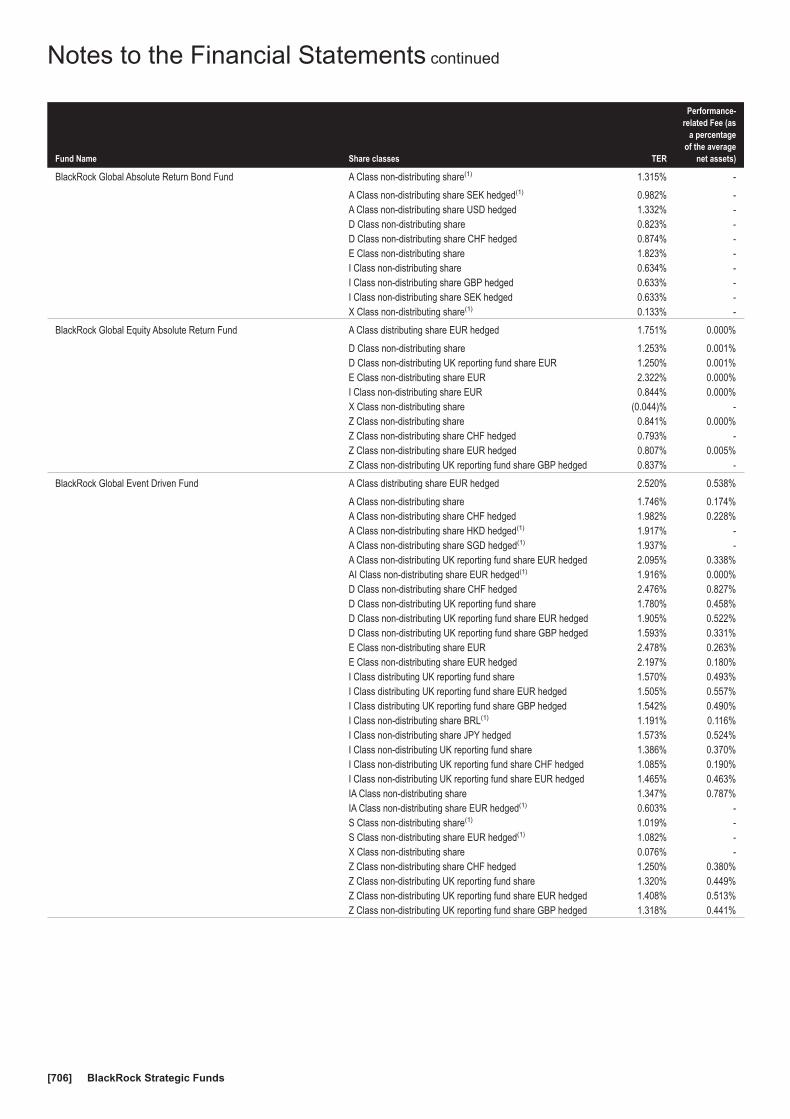
Fund Name Share classes TER
Performance-related Fee (as
a percentageof the average
net assets)
BlackRock Global Absolute Return Bond Fund A Class non-distributing share(1) 1.315% -
A Class non-distributing share SEK hedged(1) 0.982% -A Class non-distributing share USD hedged 1.332% -D Class non-distributing share 0.823% -D Class non-distributing share CHF hedged 0.874% -E Class non-distributing share 1.823% -I Class non-distributing share 0.634% -I Class non-distributing share GBP hedged 0.633% -I Class non-distributing share SEK hedged 0.633% -X Class non-distributing share(1) 0.133% -
BlackRock Global Equity Absolute Return Fund A Class distributing share EUR hedged 1.751% 0.000%
D Class non-distributing share 1.253% 0.001%D Class non-distributing UK reporting fund share EUR 1.250% 0.001%E Class non-distributing share EUR 2.322% 0.000%I Class non-distributing share EUR 0.844% 0.000%X Class non-distributing share (0.044)% -Z Class non-distributing share 0.841% 0.000%Z Class non-distributing share CHF hedged 0.793% -Z Class non-distributing share EUR hedged 0.807% 0.005%Z Class non-distributing UK reporting fund share GBP hedged 0.837% -
BlackRock Global Event Driven Fund A Class distributing share EUR hedged 2.520% 0.538%
A Class non-distributing share 1.746% 0.174%A Class non-distributing share CHF hedged 1.982% 0.228%A Class non-distributing share HKD hedged(1) 1.917% -A Class non-distributing share SGD hedged(1) 1.937% -A Class non-distributing UK reporting fund share EUR hedged 2.095% 0.338%AI Class non-distributing share EUR hedged(1) 1.916% 0.000%D Class non-distributing share CHF hedged 2.476% 0.827%D Class non-distributing UK reporting fund share 1.780% 0.458%D Class non-distributing UK reporting fund share EUR hedged 1.905% 0.522%D Class non-distributing UK reporting fund share GBP hedged 1.593% 0.331%E Class non-distributing share EUR 2.478% 0.263%E Class non-distributing share EUR hedged 2.197% 0.180%I Class distributing UK reporting fund share 1.570% 0.493%I Class distributing UK reporting fund share EUR hedged 1.505% 0.557%I Class distributing UK reporting fund share GBP hedged 1.542% 0.490%I Class non-distributing share BRL(1) 1.191% 0.116%I Class non-distributing share JPY hedged 1.573% 0.524%I Class non-distributing UK reporting fund share 1.386% 0.370%I Class non-distributing UK reporting fund share CHF hedged 1.085% 0.190%I Class non-distributing UK reporting fund share EUR hedged 1.465% 0.463%IA Class non-distributing share 1.347% 0.787%IA Class non-distributing share EUR hedged(1) 0.603% -S Class non-distributing share(1) 1.019% -S Class non-distributing share EUR hedged(1) 1.082% -X Class non-distributing share 0.076% -Z Class non-distributing share CHF hedged 1.250% 0.380%Z Class non-distributing UK reporting fund share 1.320% 0.449%Z Class non-distributing UK reporting fund share EUR hedged 1.408% 0.513%Z Class non-distributing UK reporting fund share GBP hedged 1.318% 0.441%
Notes to the Financial Statements continued
BlackRock Strategic Funds[706]
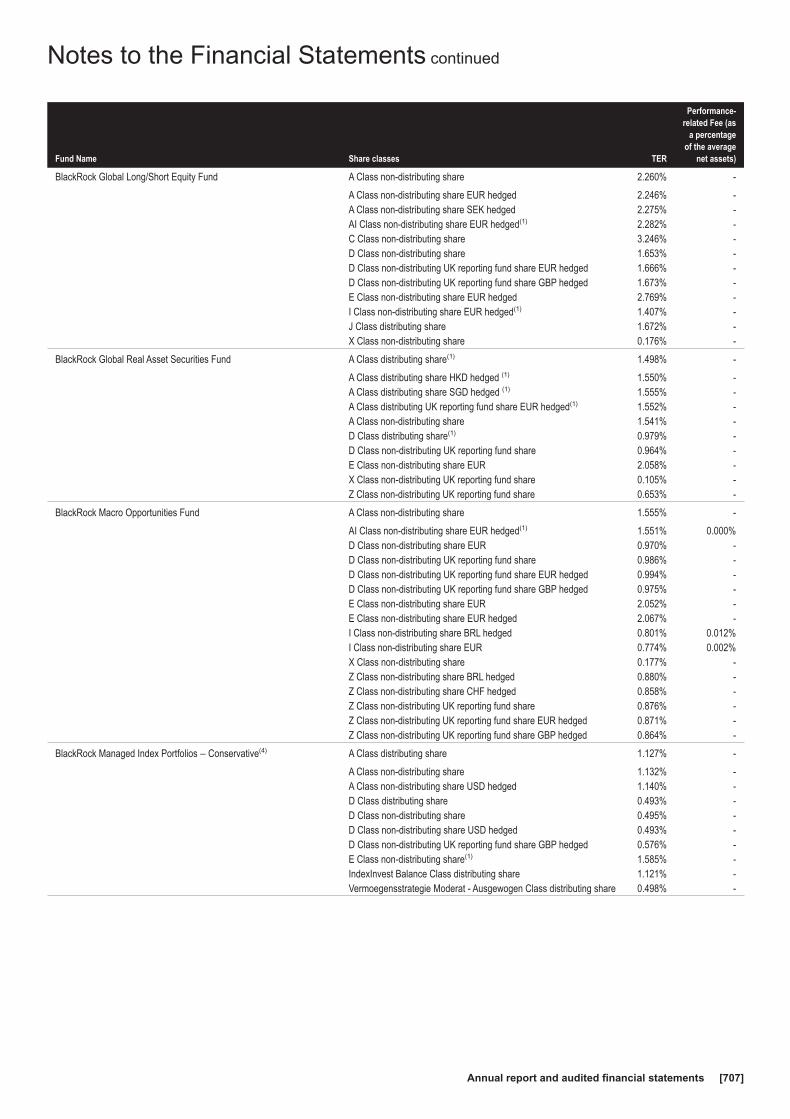
Fund Name Share classes TER
Performance-related Fee (as
a percentageof the average
net assets)
BlackRock Global Long/Short Equity Fund A Class non-distributing share 2.260% -
A Class non-distributing share EUR hedged 2.246% -A Class non-distributing share SEK hedged 2.275% -AI Class non-distributing share EUR hedged(1) 2.282% -C Class non-distributing share 3.246% -D Class non-distributing share 1.653% -D Class non-distributing UK reporting fund share EUR hedged 1.666% -D Class non-distributing UK reporting fund share GBP hedged 1.673% -E Class non-distributing share EUR hedged 2.769% -I Class non-distributing share EUR hedged(1) 1.407% -J Class distributing share 1.672% -X Class non-distributing share 0.176% -
BlackRock Global Real Asset Securities Fund A Class distributing share(1) 1.498% -
A Class distributing share HKD hedged (1) 1.550% -A Class distributing share SGD hedged (1) 1.555% -A Class distributing UK reporting fund share EUR hedged(1) 1.552% -A Class non-distributing share 1.541% -D Class distributing share(1) 0.979% -D Class non-distributing UK reporting fund share 0.964% -E Class non-distributing share EUR 2.058% -X Class non-distributing UK reporting fund share 0.105% -Z Class non-distributing UK reporting fund share 0.653% -
BlackRock Macro Opportunities Fund A Class non-distributing share 1.555% -
AI Class non-distributing share EUR hedged(1) 1.551% 0.000%D Class non-distributing share EUR 0.970% -D Class non-distributing UK reporting fund share 0.986% -D Class non-distributing UK reporting fund share EUR hedged 0.994% -D Class non-distributing UK reporting fund share GBP hedged 0.975% -E Class non-distributing share EUR 2.052% -E Class non-distributing share EUR hedged 2.067% -I Class non-distributing share BRL hedged 0.801% 0.012%I Class non-distributing share EUR 0.774% 0.002%X Class non-distributing share 0.177% -Z Class non-distributing share BRL hedged 0.880% -Z Class non-distributing share CHF hedged 0.858% -Z Class non-distributing UK reporting fund share 0.876% -Z Class non-distributing UK reporting fund share EUR hedged 0.871% -Z Class non-distributing UK reporting fund share GBP hedged 0.864% -
BlackRock Managed Index Portfolios − Conservative(4) A Class distributing share 1.127% -
A Class non-distributing share 1.132% -A Class non-distributing share USD hedged 1.140% -D Class distributing share 0.493% -D Class non-distributing share 0.495% -D Class non-distributing share USD hedged 0.493% -D Class non-distributing UK reporting fund share GBP hedged 0.576% -E Class non-distributing share(1) 1.585% -IndexInvest Balance Class distributing share 1.121% -Vermoegensstrategie Moderat - Ausgewogen Class distributing share 0.498% -
Notes to the Financial Statements continued
Annual report and audited financial statements [707]
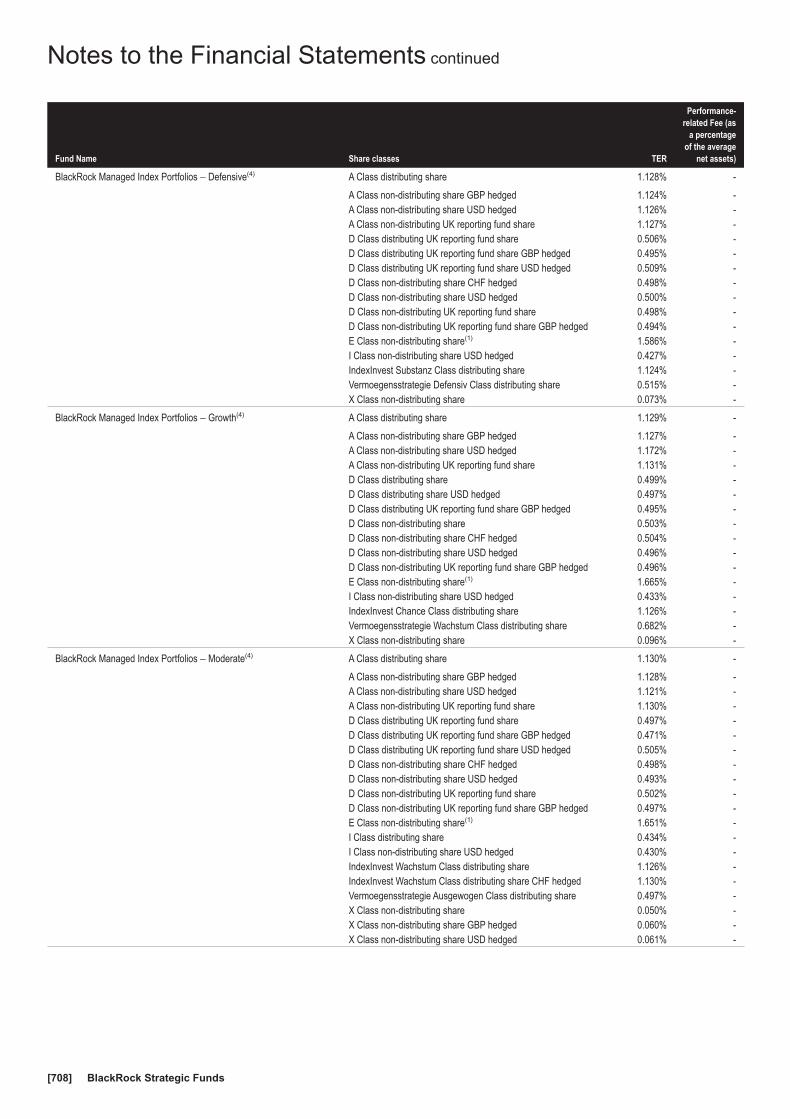
Fund Name Share classes TER
Performance-related Fee (as
a percentageof the average
net assets)
BlackRock Managed Index Portfolios − Defensive(4) A Class distributing share 1.128% -
A Class non-distributing share GBP hedged 1.124% -A Class non-distributing share USD hedged 1.126% -A Class non-distributing UK reporting fund share 1.127% -D Class distributing UK reporting fund share 0.506% -D Class distributing UK reporting fund share GBP hedged 0.495% -D Class distributing UK reporting fund share USD hedged 0.509% -D Class non-distributing share CHF hedged 0.498% -D Class non-distributing share USD hedged 0.500% -D Class non-distributing UK reporting fund share 0.498% -D Class non-distributing UK reporting fund share GBP hedged 0.494% -E Class non-distributing share(1) 1.586% -I Class non-distributing share USD hedged 0.427% -IndexInvest Substanz Class distributing share 1.124% -Vermoegensstrategie Defensiv Class distributing share 0.515% -X Class non-distributing share 0.073% -
BlackRock Managed Index Portfolios − Growth(4) A Class distributing share 1.129% -
A Class non-distributing share GBP hedged 1.127% -A Class non-distributing share USD hedged 1.172% -A Class non-distributing UK reporting fund share 1.131% -D Class distributing share 0.499% -D Class distributing share USD hedged 0.497% -D Class distributing UK reporting fund share GBP hedged 0.495% -D Class non-distributing share 0.503% -D Class non-distributing share CHF hedged 0.504% -D Class non-distributing share USD hedged 0.496% -D Class non-distributing UK reporting fund share GBP hedged 0.496% -E Class non-distributing share(1) 1.665% -I Class non-distributing share USD hedged 0.433% -IndexInvest Chance Class distributing share 1.126% -Vermoegensstrategie Wachstum Class distributing share 0.682% -X Class non-distributing share 0.096% -
BlackRock Managed Index Portfolios − Moderate(4) A Class distributing share 1.130% -
A Class non-distributing share GBP hedged 1.128% -A Class non-distributing share USD hedged 1.121% -A Class non-distributing UK reporting fund share 1.130% -D Class distributing UK reporting fund share 0.497% -D Class distributing UK reporting fund share GBP hedged 0.471% -D Class distributing UK reporting fund share USD hedged 0.505% -D Class non-distributing share CHF hedged 0.498% -D Class non-distributing share USD hedged 0.493% -D Class non-distributing UK reporting fund share 0.502% -D Class non-distributing UK reporting fund share GBP hedged 0.497% -E Class non-distributing share(1) 1.651% -I Class distributing share 0.434% -I Class non-distributing share USD hedged 0.430% -IndexInvest Wachstum Class distributing share 1.126% -IndexInvest Wachstum Class distributing share CHF hedged 1.130% -Vermoegensstrategie Ausgewogen Class distributing share 0.497% -X Class non-distributing share 0.050% -X Class non-distributing share GBP hedged 0.060% -X Class non-distributing share USD hedged 0.061% -
Notes to the Financial Statements continued
BlackRock Strategic Funds[708]
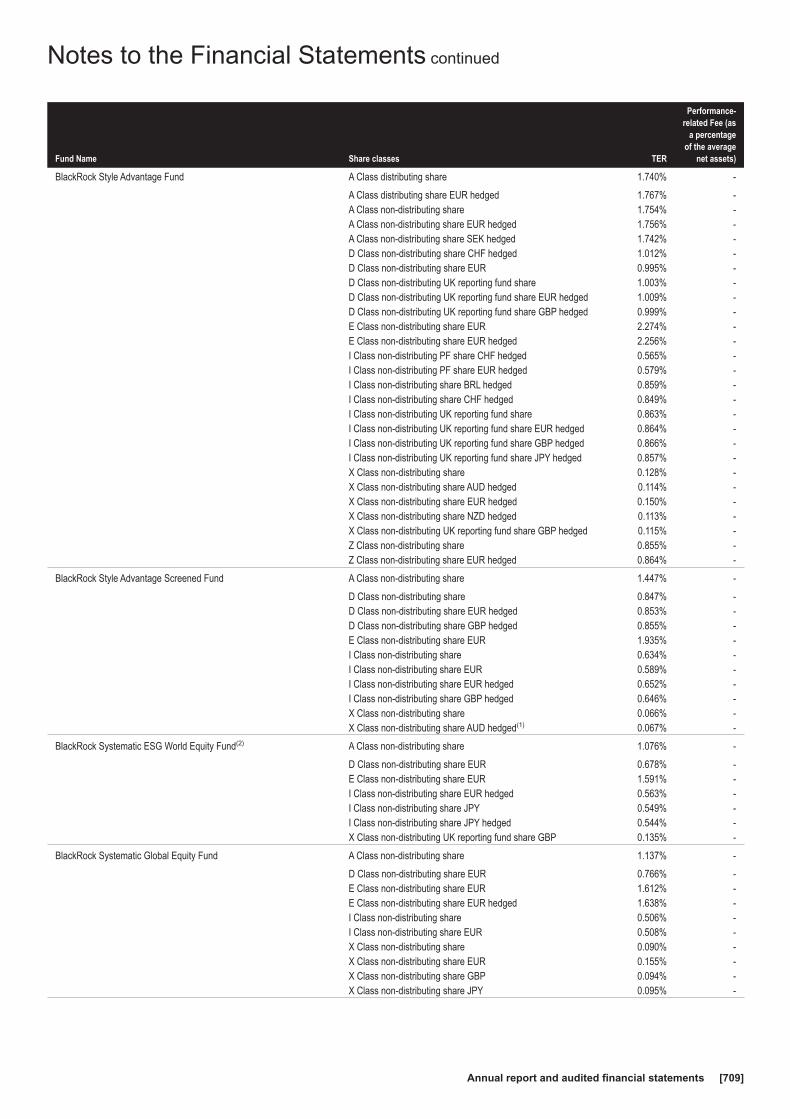
Fund Name Share classes TER
Performance-related Fee (as
a percentageof the average
net assets)
BlackRock Style Advantage Fund A Class distributing share 1.740% -
A Class distributing share EUR hedged 1.767% -A Class non-distributing share 1.754% -A Class non-distributing share EUR hedged 1.756% -A Class non-distributing share SEK hedged 1.742% -D Class non-distributing share CHF hedged 1.012% -D Class non-distributing share EUR 0.995% -D Class non-distributing UK reporting fund share 1.003% -D Class non-distributing UK reporting fund share EUR hedged 1.009% -D Class non-distributing UK reporting fund share GBP hedged 0.999% -E Class non-distributing share EUR 2.274% -E Class non-distributing share EUR hedged 2.256% -I Class non-distributing PF share CHF hedged 0.565% -I Class non-distributing PF share EUR hedged 0.579% -I Class non-distributing share BRL hedged 0.859% -I Class non-distributing share CHF hedged 0.849% -I Class non-distributing UK reporting fund share 0.863% -I Class non-distributing UK reporting fund share EUR hedged 0.864% -I Class non-distributing UK reporting fund share GBP hedged 0.866% -I Class non-distributing UK reporting fund share JPY hedged 0.857% -X Class non-distributing share 0.128% -X Class non-distributing share AUD hedged 0.114% -X Class non-distributing share EUR hedged 0.150% -X Class non-distributing share NZD hedged 0.113% -X Class non-distributing UK reporting fund share GBP hedged 0.115% -Z Class non-distributing share 0.855% -Z Class non-distributing share EUR hedged 0.864% -
BlackRock Style Advantage Screened Fund A Class non-distributing share 1.447% -
D Class non-distributing share 0.847% -D Class non-distributing share EUR hedged 0.853% -D Class non-distributing share GBP hedged 0.855% -E Class non-distributing share EUR 1.935% -I Class non-distributing share 0.634% -I Class non-distributing share EUR 0.589% -I Class non-distributing share EUR hedged 0.652% -I Class non-distributing share GBP hedged 0.646% -X Class non-distributing share 0.066% -X Class non-distributing share AUD hedged(1) 0.067% -
BlackRock Systematic ESG World Equity Fund(2) A Class non-distributing share 1.076% -
D Class non-distributing share EUR 0.678% -E Class non-distributing share EUR 1.591% -I Class non-distributing share EUR hedged 0.563% -I Class non-distributing share JPY 0.549% -I Class non-distributing share JPY hedged 0.544% -X Class non-distributing UK reporting fund share GBP 0.135% -
BlackRock Systematic Global Equity Fund A Class non-distributing share 1.137% -
D Class non-distributing share EUR 0.766% -E Class non-distributing share EUR 1.612% -E Class non-distributing share EUR hedged 1.638% -I Class non-distributing share 0.506% -I Class non-distributing share EUR 0.508% -X Class non-distributing share 0.090% -X Class non-distributing share EUR 0.155% -X Class non-distributing share GBP 0.094% -X Class non-distributing share JPY 0.095% -
Notes to the Financial Statements continued
Annual report and audited financial statements [709]

Fund Name Share classes TER
Performance-related Fee (as
a percentageof the average
net assets)
BlackRock Total Advantage Fund A Class non-distributing share 1.411% -
D Class non-distributing share 0.836% -D Class non-distributing share USD hedged 0.847% -D Class non-distributing UK reporting fund share GBP hedged 0.840% -E Class non-distributing share 1.368% -I Class non-distributing share 0.629% -X Class non-distributing share 0.111% -
BlackRock UK Emerging Companies Absolute Return Fund A Class non-distributing share CHF hedged 1.821% -
A Class non-distributing share EUR hedged 3.025% 1.170%A Class non-distributing share USD hedged 3.755% 1.928%A Class non-distributing UK reporting fund share 1.821% -D Class non-distributing share CHF hedged 2.989% 1.613%D Class non-distributing share EUR hedged 2.614% 1.234%D Class non-distributing UK reporting fund share 2.712% 1.344%D Class non-distributing UK reporting fund share USD hedged 3.017% 1.654%I Class distributing UK reporting fund share(1) 2.921% 1.838%I Class non-distributing share CHF hedged 2.778% 1.693%I Class non-distributing share EUR hedged 2.798% 1.708%I Class non-distributing share USD hedged 2.535% 1.445%I Class non-distributing UK reporting fund share 2.394% 1.308%S Class non-distributing UK reporting fund share 2.432% 1.364%X Class non-distributing UK reporting fund share 0.116% -Z Class non-distributing share CHF hedged 2.474% 1.343%Z Class non-distributing UK reporting fund share 2.495% 1.364%Z Class non-distributing UK reporting fund share EUR hedged 2.466% 1.330%Z Class non-distributing UK reporting fund share USD hedged 2.356% 1.226%
BlackRock UK Equity Absolute Return Fund A Class distributing share EUR hedged 1.862% -
A Class non-distributing share EUR hedged 1.884% -A Class non-distributing UK reporting fund share 1.862% -D Class non-distributing share CHF hedged 1.140% 0.017%D Class non-distributing share EUR 1.491% 0.390%D Class non-distributing share EUR hedged 2.200% 1.042%D Class non-distributing share USD hedged 1.271% 0.161%D Class non-distributing UK reporting fund share 1.171% 0.070%E Class non-distributing share EUR 2.548% 0.171%E Class non-distributing share EUR hedged 2.394% -I Class non-distributing share EUR hedged 1.115% 0.271%I Class non-distributing share JPY hedged 0.940% 0.098%I Class non-distributing share USD hedged 1.051% 0.214%X Class non-distributing UK reporting fund share 0.091% -
(1) New Share Class launched, see Appendix I for further details.(2) Fund name changed, see Note 1 for further details.(3) New Fund launch, see Note 1 for further details.(4) Fund invests in underlying target funds which do not publish a TER in accordance with the SFAMA guidelines.
The TERs were calculated in accordance with the Swiss Funds and Asset Management Association (“SFAMA”) guidelines on thecalculation and disclosure of the TER for collective investment schemes. The SFAMA guidelines were last amended on 20 April2015.
Certain Funds, as indicated above, invest a significant portion of their net assets in underlying target funds which do not publish aTER in accordance with the SFAMA guidelines. Therefore, the prorated TER of the underlying target funds has not been included inthe TER of the Funds disclosed above. This waiver provision complies with the SFAMA guidelines.
Notes to the Financial Statements continued
BlackRock Strategic Funds[710]

17. Subsequent EventsEffective 2 June 2020, the BlackRock European Diversified Equity Absolute Return Fund, denominated in EUR was terminated.
Effective 17 June 2020, the BlackRock Asia Extension Fund, denominated in USD was terminated.
An updated Prospectus was issued on 5 August 2020.
There have been no other events subsequent to the financial year end, and up to the date of the approval of the financialstatements, which in the opinion of the Board may have had a material impact on the financial statements for the financial yearended 31 May 2020.
18. Approval dateThe financial statements were approved by the Board on 25 September 2020.
Notes to the Financial Statements continued
Annual report and audited financial statements [711]
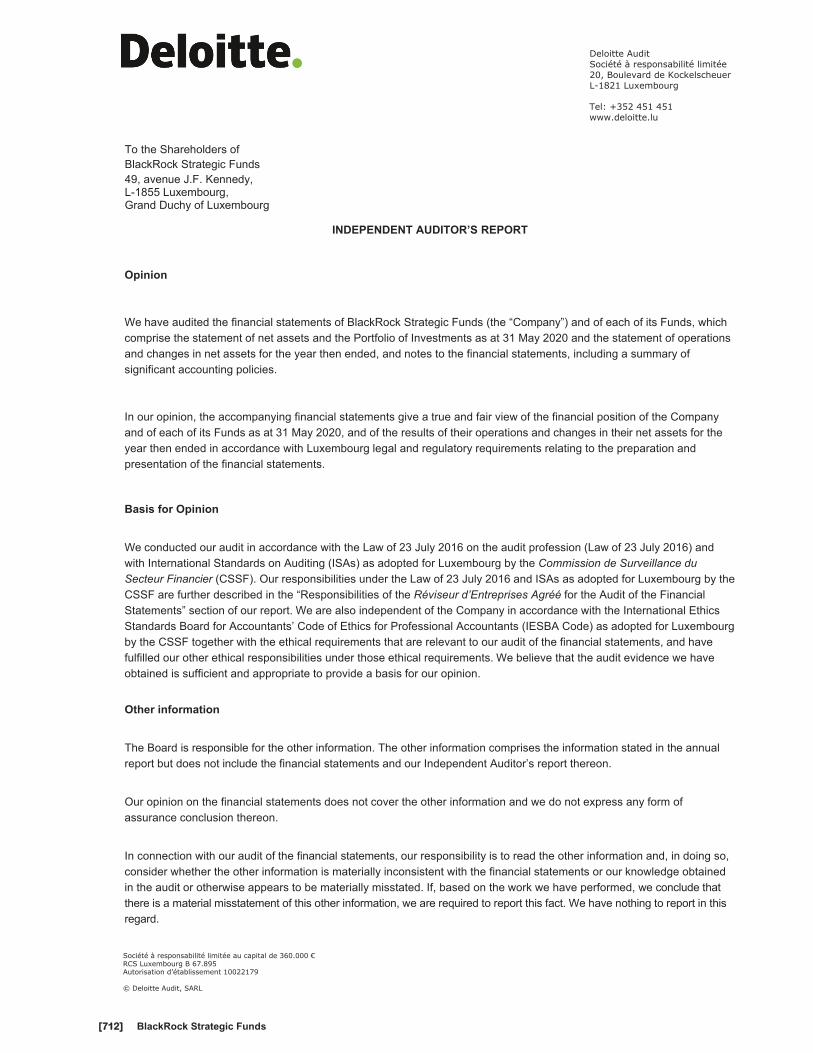
To the Shareholders of BlackRock Strategic Funds49, avenue J.F. Kennedy,L-1855 Luxembourg,Grand Duchy of Luxembourg
BlackRock Strategic Funds
INDEPENDENT AUDITOR’S REPORT
Opinion
We have audited the financial statements of BlackRock Strategic Funds (the “Company”) and of each of its Funds, whichcomprise the statement of net assets and the Portfolio of Investments as at 31 May 2020 and the statement of operationsand changes in net assets for the year then ended, and notes to the financial statements, including a summary ofsignificant accounting policies.
In our opinion, the accompanying financial statements give a true and fair view of the financial position of the Companyand of each of its Funds as at 31 May 2020, and of the results of their operations and changes in their net assets for theyear then ended in accordance with Luxembourg legal and regulatory requirements relating to the preparation andpresentation of the financial statements.
Basis for Opinion
We conducted our audit in accordance with the Law of 23 July 2016 on the audit profession (Law of 23 July 2016) andwith International Standards on Auditing (ISAs) as adopted for Luxembourg by the Commission de Surveillance duSecteur Financier (CSSF). Our responsibilities under the Law of 23 July 2016 and ISAs as adopted for Luxembourg by theCSSF are further described in the “Responsibilities of the Réviseur d’Entreprises Agréé for the Audit of the FinancialStatements” section of our report. We are also independent of the Company in accordance with the International EthicsStandards Board for Accountants’ Code of Ethics for Professional Accountants (IESBA Code) as adopted for Luxembourgby the CSSF together with the ethical requirements that are relevant to our audit of the financial statements, and havefulfilled our other ethical responsibilities under those ethical requirements. We believe that the audit evidence we haveobtained is sufficient and appropriate to provide a basis for our opinion.
Other information
The Board is responsible for the other information. The other information comprises the information stated in the annualreport but does not include the financial statements and our Independent Auditor’s report thereon.
Our opinion on the financial statements does not cover the other information and we do not express any form ofassurance conclusion thereon.
In connection with our audit of the financial statements, our responsibility is to read the other information and, in doing so, consider whether the other information is materially inconsistent with the financial statements or our knowledge obtainedin the audit or otherwise appears to be materially misstated. If, based on the work we have performed, we

Responsibilities of the Board for the Financial Statements
The Board is responsible for the preparation and fair presentation of the financial statements in accordance withLuxembourg legal and regulatory requirements relating to the preparation and presentation of the financialstatements, and for such internal control as the Board determines is necessary to enable the preparation of financialstatements that are free from material misstatement, whether due to fraud or error.
In preparing the financial statements, the Board is responsible for assessing the Company’s ability to continue as a going concern, disclosing, as applicable, matters related to going concern and using the going concern basis of accounting unless the Board either intends to liquidate the Company or to cease operations, or has no realistic alternative but to do so.
Responsibilities of the Réviseur d’Entreprises Agréé for the Audit of the Financial Statements
The objectives of our audit are to obtain reasonable assurance about whether the financial statements as a whole are free from material misstatement, whether due to fraud or error, and to issue a report of the Réviseurd’Entreprises Agréé that includes our opinion. Reasonable assurance is a high level of assurance, but is not a guarantee that an audit conducted in accordance with the Law dated 23 July 2016 and with ISAs as adopted for Luxembourg by the CSSF will always detect a material misstatement when it exists. Misstatements can arise fromfraud or error and are considered material if, individually or in the aggregate, they could reasonably be expected to influence the economic decisions of users taken on the basis of these financial statements.
As part of an audit in accordance with the Law dated 23 July 2016 and with ISAs as adopted for Luxembourg by theCSSF, we exercise professional judgment and maintain professional skepticism throughout the audit. We also:
Identify and assess the risks of material misstatement of the financial statements, whether due to fraud or error,design and perform audit procedures responsive to those risks, and obtain audit evidence that is sufficient andappropriate to provide a basis for our opinion. The risk of not detecting a material misstatement resulting fromfraud is higher than for one resulting from error, as fraud may involve collusion, forgery, intentional omissions,misrepresentations, or the override of internal control.Obtain an understanding of internal control relevant to the audit in order to design audit procedures that areappropriate in the circumstances, but not for the purpose of expressing an opinion on the effectiveness of theCompany’s internal control.Evaluate the appropriateness of accounting policies used and the reasonableness of accounting estimates andrelated disclosures made by the Board.Conclude on the appropriateness of the Board use of the going concern basis of accounting and, based on theaudit evidence obtained, whether a material uncertainty exists related to events or conditions that may castsignificant doubt on the Company’s ability to continue as a going concern. If we conclude that a materialuncertainty exists, we are required to draw attention in our report of the Réviseur d’Entreprises Agréé to the
Annual report and audited financial statements

Evaluate the overall presentation, structure and content of the financial statements, including thedisclosures, and whether the financial statements represent the underlying transactions and events in a manner that achieves fair presentation.
We communicate with those charged with governance regarding, among other matters, the planned scope and timingof the audit and significant audit findings, including any significant deficiencies in internal control that we identify during our audit.
For Deloitte Audit, Cabinet de Révision Agréé
Justin Griffiths, Réviseur d’Entreprises AgrééPartner
September 2020
[7 BlackRock Strategic Funds
Justin Griffiths, R

Share Classes In IssueAs at 31 May 2020, the Company offers the following shareclasses.
A ClassA Class distributing share CHF hedgedA Class distributing share EURA Class distributing share EUR hedgedA Class distributing share HKD hedgedA Class distributing share SGD hedgedA Class distributing share USDA Class distributing share USD hedgedA Class distributing UK reporting fund share EUR hedgedA Class distributing UK reporting fund share GBPA Class distributing UK reporting fund share GBP hedgedA Class non-distributing share AUDA Class non-distributing share CHF hedgedA Class non-distributing share CZK hedgedA Class non-distributing share EURA Class non-distributing share EUR hedgedA Class non-distributing share GBP hedgedA Class non-distributing share HKD hedgedA Class non-distributing share JPY hedgedA Class non-distributing share SEK hedgedA Class non-distributing share SGD hedgedA Class non-distributing share USDA Class non-distributing share USD hedgedA Class non-distributing UK reporting fund share CHF hedgedA Class non-distributing UK reporting fund share EURA Class non-distributing UK reporting fund share EUR hedgedA Class non-distributing UK reporting fund share GBPA Class non-distributing UK reporting fund share GBP hedgedA Class non-distributing UK reporting fund share USDAI Class(1), (2)
AI Class distributing share EUR hedgedAI Class non-distributing share EURAI Class non-distributing share EUR hedgedC Class(1)
C Class non-distributing share USDD Class(1)
D Class distributing (G) share EURD Class distributing share EURD Class distributing share USDD Class distributing share USD hedgedD Class distributing UK reporting fund share EURD Class distributing UK reporting fund share EUR hedgedD Class distributing UK reporting fund share GBPD Class distributing UK reporting fund share GBP hedgedD Class distributing UK reporting fund share USDD Class distributing UK reporting fund share USD hedgedD Class non-distributing share CHF hedgedD Class non-distributing share EURD Class non-distributing share USDD Class non-distributing share EUR hedgedD Class non-distributing share GBP hedgedD Class non-distributing share USD hedgedD Class non-distributing UK reporting fund share CHF hedgedD Class non-distributing UK reporting fund share EURD Class non-distributing UK reporting fund share EUR hedgedD Class non-distributing UK reporting fund share GBPD Class non-distributing UK reporting fund share GBP hedgedD Class non-distributing UK reporting fund share USDD Class non-distributing UK reporting fund share USD hedged
E ClassE Class distributing share EURE Class distributing share EUR hedgedE Class non-distributing share EURE Class non-distributing share EUR hedgedE Class non-distributing share USDI Class(1)
I Class distributing share (G) EUR hedgedI Class distributing share EURI Class distributing share EUR hedgedI Class distributing UK reporting fund share EUR hedgedI Class distributing UK reporting fund share GBPI Class distributing UK reporting fund share GBP hedgedI Class distributing UK reporting fund share USDI Class non-distributing PF share CHF hedgedI Class non-distributing PF share EUR hedgedI Class non-distributing share BRLI Class non-distributing share CAD hedgedI Class non-distributing share CHF hedgedI Class non-distributing share EURI Class non-distributing share EUR hedgedI Class non-distributing share GBP hedgedI Class non-distributing share JPYI Class non-distributing share JPY hedgedI Class non-distributing share SEK hedgedI Class non-distributing share USDI Class non-distributing share USD hedgedI Class non-distributing UK reporting fund share EURI Class non-distributing UK reporting fund share GBPI Class non-distributing UK reporting fund share USDI Class non-distributing UK reporting fund share CHF hedgedI Class non-distributing UK reporting fund share EUR hedgedI Class non-distributing UK reporting fund share GBP hedgedI Class non-distributing UK reporting fund share JPY hedgedI Class non-distributing UK reporting share USD hedgedIA Class(1)
IA Class non-distributing share EUR hedgedIA Class non-distributing share USDIndexInvest Class(1),(2)
IndexInvest Balance Class distributing share EURIndexInvest Chance Class distributing share EURIndexInvest Substanz Class distributing share EURIndexInvest Wachstum Class distributing share EURIndexInvest Wachstum Class distributing share CHF hedgedJ Class(1)
J Class distributing share USDS Class(1)
S Class non-distributing share EURS Class non-distributing share EUR hedgedS Class non-distributing share USDS Class non-distributing UK reporting fund share GBPVermoegensstrategie Class(1)
Vermoegensstrategie Ausgewogen Class distributing share EURVermoegensstrategie Defensiv Class distributing share EURVermoegensstrategie Moderat - Ausgewogen Class dist. sharesEURVermoegensstrategie Wachstum Class distributing share EURX Class(2)
X Class distributing share AUDX Class distributing share EURX Class non-distributing share AUD hedgedX Class non-distributing share CAD hedgedX Class non-distributing share EUR
Appendix I – Share Classes (Unaudited)
Annual report and audited financial statements [715]

X Class non-distributing share EUR hedgedX Class non-distributing share GBPX Class non-distributing share GBP hedgedX Class non-distributing share JPYX Class non-distributing share NZD hedgedX Class non-distributing share USDX Class non-distributing share USD hedgedX Class non-distributing UK reporting fund share EURX Class non-distributing UK reporting fund share GBPX Class non-distributing UK reporting fund share GBP hedgedX Class non-distributing UK reporting fund share USDZ Class(1)
Z Class non-distributing share BRL hedged
Z Class non-distributing share CHF hedgedZ Class non-distributing share EURZ Class non-distributing share EUR hedgedZ Class non-distributing share GBPZ Class non-distributing share USDZ Class non-distributing UK reporting fund share EUR hedgedZ Class non-distributing UK reporting fund share GBPZ Class non-distributing UK reporting fund share GBP hedgedZ Class non-distributing UK reporting fund share USDZ Class non-distributing UK reporting fund share USD hedged
(1) Available at the Management Company’s discretion.(2) Available to institutional investors.
Share Classes LaunchedThe dates disclosed are the launch and reactivation dates but the classes may have been seeded at a later date.
Effective date Fund Type
11 June 2019 BlackRock Fixed Income Credit Strategies Fund A Class distributing share11 June 2019 BlackRock Fixed Income Credit Strategies Fund A Class non-distributing share11 June 2019 BlackRock Fixed Income Credit Strategies Fund D Class distributing share11 June 2019 BlackRock Fixed Income Credit Strategies Fund D Class non-distributing share11 June 2019 BlackRock Fixed Income Credit Strategies Fund E Class non-distributing share11 June 2019 BlackRock Fixed Income Credit Strategies Fund I Class non-distributing share11 June 2019 BlackRock Fixed Income Credit Strategies Fund X Class non-distributing share19 June 2019 BlackRock Global Event Driven Fund I Class non-distributing share BRL21 June 2019 BlackRock ESG Euro Corporate Bond Fund A Class non-distributing share21 June 2019 BlackRock ESG Euro Corporate Bond Fund D Class non-distributing share21 June 2019 BlackRock ESG Euro Corporate Bond Fund I Class non-distributing share21 June 2019 BlackRock ESG Euro Corporate Bond Fund X Class non-distributing share26 June 2019 BlackRock Emerging Markets Absolute Return Fund I Class distributing UK reporting fund share GBP
hedged10 July 2019 BlackRock Dynamic Diversified Growth Fund AI Class non-distributing share10 July 2019 BlackRock Emerging Markets Flexi Dynamic Bond Fund AI Class non-distributing share EUR hedged10 July 2019 BlackRock Emerging Markets Short Duration Bond Fund AI Class distributing share EUR hedged10 July 2019 BlackRock Emerging Markets Short Duration Bond Fund AI Class non-distributing share EUR hedged10 July 2019 BlackRock European Select Strategies Fund AI Class non-distributing share10 July 2019 BlackRock Fixed Income Strategies Fund AI Class non-distributing share10 July 2019 BlackRock Global Long/Short Equity Fund AI Class non-distributing share EUR hedged10 July 2019 BlackRock Macro Opportunities Fund AI Class non-distributing share EUR hedged17 July 2019 BlackRock ESG Euro Corporate Bond Fund AI Class non-distributing share17 July 2019 BlackRock ESG Euro Corporate Bond Fund E Class non-distributing share17 July 2019 BlackRock Global Long/Short Equity Fund I Class non-distributing share EUR hedged
4 September 2019 BlackRock Global Real Asset Securities Fund D Class distributing share25 September 2019 BlackRock Fixed Income Credit Strategies Fund AI Class non-distributing share25 September 2019 BlackRock Style Advantage Screened Fund X Class non-distributing share AUD hedged
23 October 2019 BlackRock UK Emerging Companies Absolute Return Fund I Class distributing UK reporting fund share30 October 2019 BlackRock Global Real Asset Securities Fund A Class distributing share
6 November 2019 BlackRock Managed Index Portfolios − Conservative E Class non-distributing share6 November 2019 BlackRock Managed Index Portfolios − Defensive E Class non-distributing share6 November 2019 BlackRock Managed Index Portfolios − Growth E Class non-distributing share6 November 2019 BlackRock Managed Index Portfolios − Moderate E Class non-distributing share
13 November 2019 BlackRock European Unconstrained Equity Fund I Class non-distributing share USD hedged13 November 2019 BlackRock Global Real Asset Securities Fund A Class distributing share HKD hedged13 November 2019 BlackRock Global Real Asset Securities Fund A Class distributing share SGD hedged4 December 2019 BlackRock Dynamic Diversified Growth Fund I Class non-distributing UK reporting share USD
hedged8 January 2020 BlackRock Global Real Asset Securities Fund A Class distributing UK reporting fund share EUR
hedged15 January 2020 BlackRock European Absolute Return Fund S Class non-distributing share15 January 2020 BlackRock Global Event Driven Fund S Class non-distributing share15 January 2020 BlackRock Global Event Driven Fund S Class non-distributing share EUR hedged
Appendix I – Share Classes (Unaudited) continued
BlackRock Strategic Funds[716]
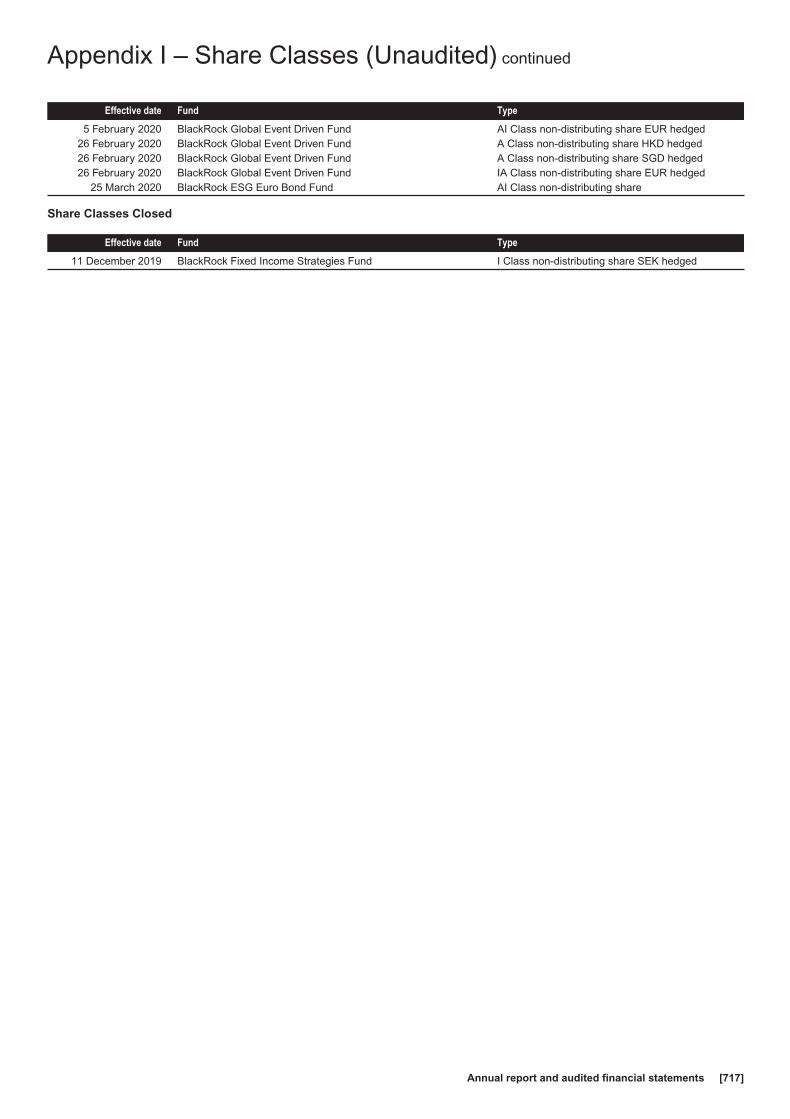
Effective date Fund Type
5 February 2020 BlackRock Global Event Driven Fund AI Class non-distributing share EUR hedged26 February 2020 BlackRock Global Event Driven Fund A Class non-distributing share HKD hedged26 February 2020 BlackRock Global Event Driven Fund A Class non-distributing share SGD hedged26 February 2020 BlackRock Global Event Driven Fund IA Class non-distributing share EUR hedged
25 March 2020 BlackRock ESG Euro Bond Fund AI Class non-distributing share
Share Classes Closed
Effective date Fund Type
11 December 2019 BlackRock Fixed Income Strategies Fund I Class non-distributing share SEK hedged
Appendix I – Share Classes (Unaudited) continued
Annual report and audited financial statements [717]
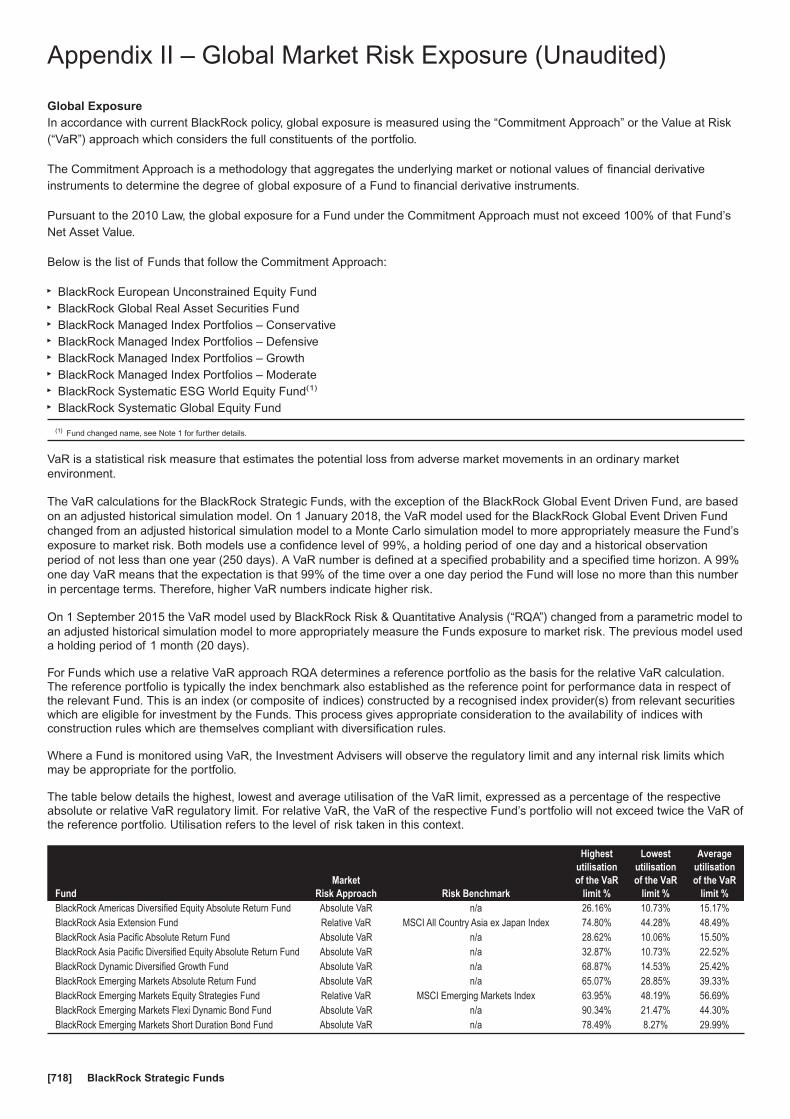
Global ExposureIn accordance with current BlackRock policy, global exposure is measured using the “Commitment Approach” or the Value at Risk(“VaR”) approach which considers the full constituents of the portfolio.
The Commitment Approach is a methodology that aggregates the underlying market or notional values of financial derivativeinstruments to determine the degree of global exposure of a Fund to financial derivative instruments.
Pursuant to the 2010 Law, the global exposure for a Fund under the Commitment Approach must not exceed 100% of that Fund’sNet Asset Value.
Below is the list of Funds that follow the Commitment Approach:
� BlackRock European Unconstrained Equity Fund� BlackRock Global Real Asset Securities Fund� BlackRock Managed Index Portfolios – Conservative� BlackRock Managed Index Portfolios – Defensive� BlackRock Managed Index Portfolios – Growth� BlackRock Managed Index Portfolios – Moderate� BlackRock Systematic ESG World Equity Fund(1)
� BlackRock Systematic Global Equity Fund
(1) Fund changed name, see Note 1 for further details.
VaR is a statistical risk measure that estimates the potential loss from adverse market movements in an ordinary marketenvironment.
The VaR calculations for the BlackRock Strategic Funds, with the exception of the BlackRock Global Event Driven Fund, are basedon an adjusted historical simulation model. On 1 January 2018, the VaR model used for the BlackRock Global Event Driven Fundchanged from an adjusted historical simulation model to a Monte Carlo simulation model to more appropriately measure the Fund’sexposure to market risk. Both models use a confidence level of 99%, a holding period of one day and a historical observationperiod of not less than one year (250 days). A VaR number is defined at a specified probability and a specified time horizon. A 99%one day VaR means that the expectation is that 99% of the time over a one day period the Fund will lose no more than this numberin percentage terms. Therefore, higher VaR numbers indicate higher risk.
On 1 September 2015 the VaR model used by BlackRock Risk & Quantitative Analysis (“RQA”) changed from a parametric model toan adjusted historical simulation model to more appropriately measure the Funds exposure to market risk. The previous model useda holding period of 1 month (20 days).
For Funds which use a relative VaR approach RQA determines a reference portfolio as the basis for the relative VaR calculation.The reference portfolio is typically the index benchmark also established as the reference point for performance data in respect ofthe relevant Fund. This is an index (or composite of indices) constructed by a recognised index provider(s) from relevant securitieswhich are eligible for investment by the Funds. This process gives appropriate consideration to the availability of indices withconstruction rules which are themselves compliant with diversification rules.
Where a Fund is monitored using VaR, the Investment Advisers will observe the regulatory limit and any internal risk limits whichmay be appropriate for the portfolio.
The table below details the highest, lowest and average utilisation of the VaR limit, expressed as a percentage of the respectiveabsolute or relative VaR regulatory limit. For relative VaR, the VaR of the respective Fund’s portfolio will not exceed twice the VaR ofthe reference portfolio. Utilisation refers to the level of risk taken in this context.
FundMarket
Risk Approach Risk Benchmark
Highestutilisationof the VaR
limit %
Lowestutilisationof the VaR
limit %
Averageutilisationof the VaR
limit %BlackRock Americas Diversified Equity Absolute Return Fund Absolute VaR n/a 26.16% 10.73% 15.17%BlackRock Asia Extension Fund Relative VaR MSCI All Country Asia ex Japan Index 74.80% 44.28% 48.49%BlackRock Asia Pacific Absolute Return Fund Absolute VaR n/a 28.62% 10.06% 15.50%BlackRock Asia Pacific Diversified Equity Absolute Return Fund Absolute VaR n/a 32.87% 10.73% 22.52%BlackRock Dynamic Diversified Growth Fund Absolute VaR n/a 68.87% 14.53% 25.42%BlackRock Emerging Markets Absolute Return Fund Absolute VaR n/a 65.07% 28.85% 39.33%BlackRock Emerging Markets Equity Strategies Fund Relative VaR MSCI Emerging Markets Index 63.95% 48.19% 56.69%BlackRock Emerging Markets Flexi Dynamic Bond Fund Absolute VaR n/a 90.34% 21.47% 44.30%BlackRock Emerging Markets Short Duration Bond Fund Absolute VaR n/a 78.49% 8.27% 29.99%
Appendix II – Global Market Risk Exposure (Unaudited)
BlackRock Strategic Funds[718]

FundMarket
Risk Approach Risk Benchmark
Highestutilisationof the VaR
limit %
Lowestutilisationof the VaR
limit %
Averageutilisationof the VaR
limit %
BlackRock ESG Euro Bond Fund(1) Relative VaRBloomberg Barclays MSCI Euro Aggregate
Sustainable SRI Index 54.82% 44.69% 48.66%
BlackRock ESG Euro Corporate Bond Fund(2) Relative VaRBloomberg Barclays MSCI Euro Corporate
Sustainable SRI Index 74.67% 34.45% 46.33%BlackRock European Absolute Return Fund Absolute VaR n/a 32.42% 10.96% 19.05%BlackRock European Diversified Equity Absolute Return Fund Absolute VaR n/a 42.26% 1.34% 27.61%BlackRock European Opportunities Extension Fund Relative VaR S&P Europe BMI Index 60.27% 41.61% 53.81%
BlackRock European Select Strategies Fund Relative VaR
75% Barclays Pan European AggregateIndex (Hedged EUR) / 25% MSCI Europe
Index (Hedged EUR) 73.65% 42.94% 54.12%BlackRock Fixed Income Credit Strategies Fund(2) Absolute VaR n/a 61.04% 2.34% 14.37%BlackRock Fixed Income Strategies Fund Absolute VaR n/a 32.20% 2.24% 8.10%BlackRock Global Absolute Return Bond Fund Absolute VaR n/a 39.35% 2.01% 8.79%BlackRock Global Equity Absolute Return Fund Absolute VaR n/a 60.82% 16.77% 26.28%BlackRock Global Event Driven Fund Absolute VaR n/a 65.62% 11.00% 24.30%BlackRock Global Long/Short Equity Fund Absolute VaR n/a 40.03% 10.96% 17.93%BlackRock Macro Opportunities Fund Absolute VaR n/a 46.29% 6.93% 18.09%BlackRock Style Advantage Fund Absolute VaR n/a 44.50% 19.68% 26.85%BlackRock Style Advantage Screened Fund Absolute VaR n/a 40.03% 18.78% 26.32%BlackRock Total Advantage Fund Absolute VaR n/a 65.74% 19.23% 28.04%BlackRock UK Emerging Companies Absolute Return Fund Absolute VaR n/a 74.91% 16.55% 30.76%BlackRock UK Equity Absolute Return Fund Absolute VaR n/a 40.25% 7.38% 15.91%(1) Fund name changed, see Note 1 for further details.(2) New Fund launch, see Note 1 for further details.
LeverageThe use of derivatives may expose Funds to a higher degree of risk. In particular, derivative contracts can be highly volatile, and theamount of initial margin is generally small relative to the size of the contract so that transactions may be leveraged in terms ofmarket exposure. A relatively small market movement may have a potentially larger impact on derivatives than on standard bonds orequities. Leveraged derivative positions can therefore increase Funds volatility.
For the purposes of this disclosure, leverage is the investment exposure gained through the use of financial derivative instruments.It is calculated using the sum of the notional values of all of the financial derivative instruments held by the relevant Fund, withoutnetting, and is expressed as a percentage of the NAV.
Disclosed in the table below is the level of leverage employed during the year.
FundAverage leverage employed
during the yearBlackRock Americas Diversified Equity Absolute Return Fund 519.68%BlackRock Asia Extension Fund 142.37%BlackRock Asia Pacific Absolute Return Fund 57.79%BlackRock Asia Pacific Diversified Equity Absolute Return Fund 422.51%BlackRock Dynamic Diversified Growth Fund 143.05%BlackRock Emerging Markets Absolute Return Fund 127.28%BlackRock Emerging Markets Equity Strategies Fund 68.15%BlackRock Emerging Markets Flexi Dynamic Bond Fund 852.86%BlackRock Emerging Markets Short Duration Bond Fund 174.60%BlackRock ESG Euro Bond Fund(1) 67.75%BlackRock ESG Euro Corporate Bond Fund(2) 61.88%BlackRock European Absolute Return Fund 75.94%BlackRock European Diversified Equity Absolute Return Fund 533.64%BlackRock European Opportunities Extension Fund 99.15%BlackRock European Select Strategies Fund 151.54%BlackRock Fixed Income Credit Strategies Fund(2) 202.86%BlackRock Fixed Income Strategies Fund 371.16%BlackRock Global Absolute Return Bond Fund 773.55%BlackRock Global Equity Absolute Return Fund 166.99%BlackRock Global Event Driven Fund 102.93%BlackRock Global Long/Short Equity Fund 458.96%BlackRock Macro Opportunities Fund 1,261.92%
Appendix II – Global Market Risk Exposure (Unaudited)continued
(Unaudited) [719]
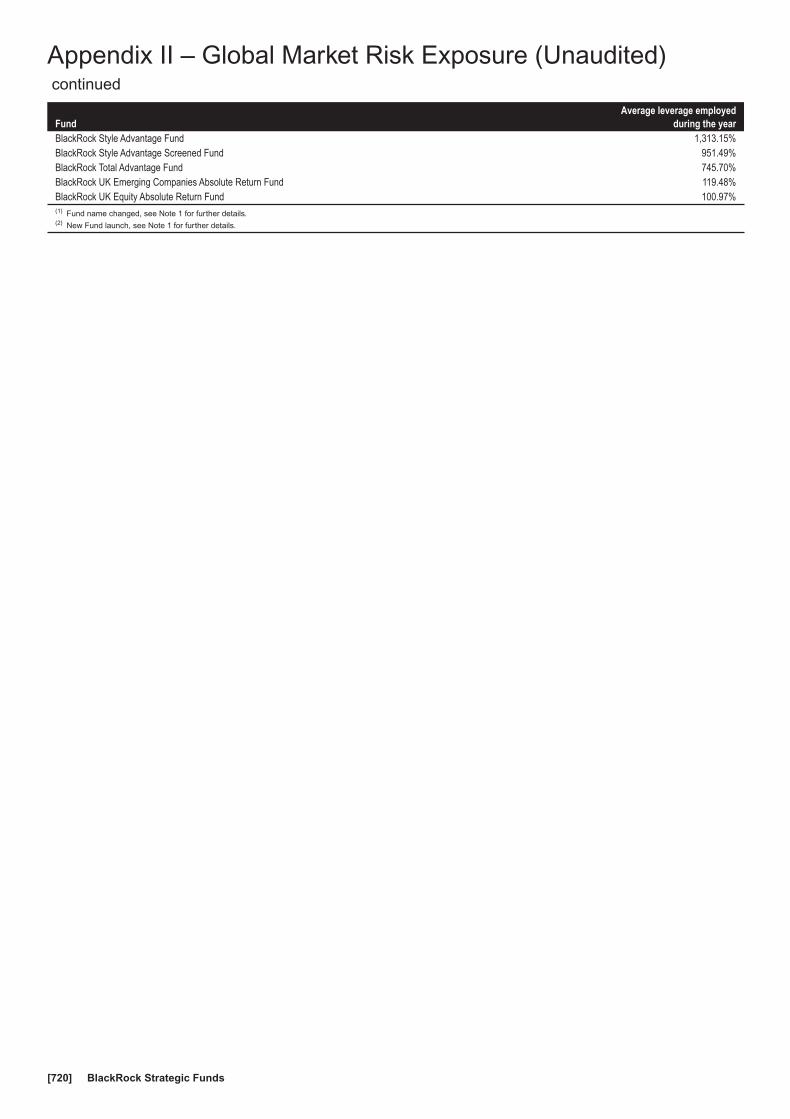
FundAverage leverage employed
during the yearBlackRock Style Advantage Fund 1,313.15%BlackRock Style Advantage Screened Fund 951.49%BlackRock Total Advantage Fund 745.70%BlackRock UK Emerging Companies Absolute Return Fund 119.48%BlackRock UK Equity Absolute Return Fund 100.97%(1) Fund name changed, see Note 1 for further details.(2) New Fund launch, see Note 1 for further details.
Appendix II – Global Market Risk Exposure (Unaudited)continued
BlackRock Strategic Funds[720]
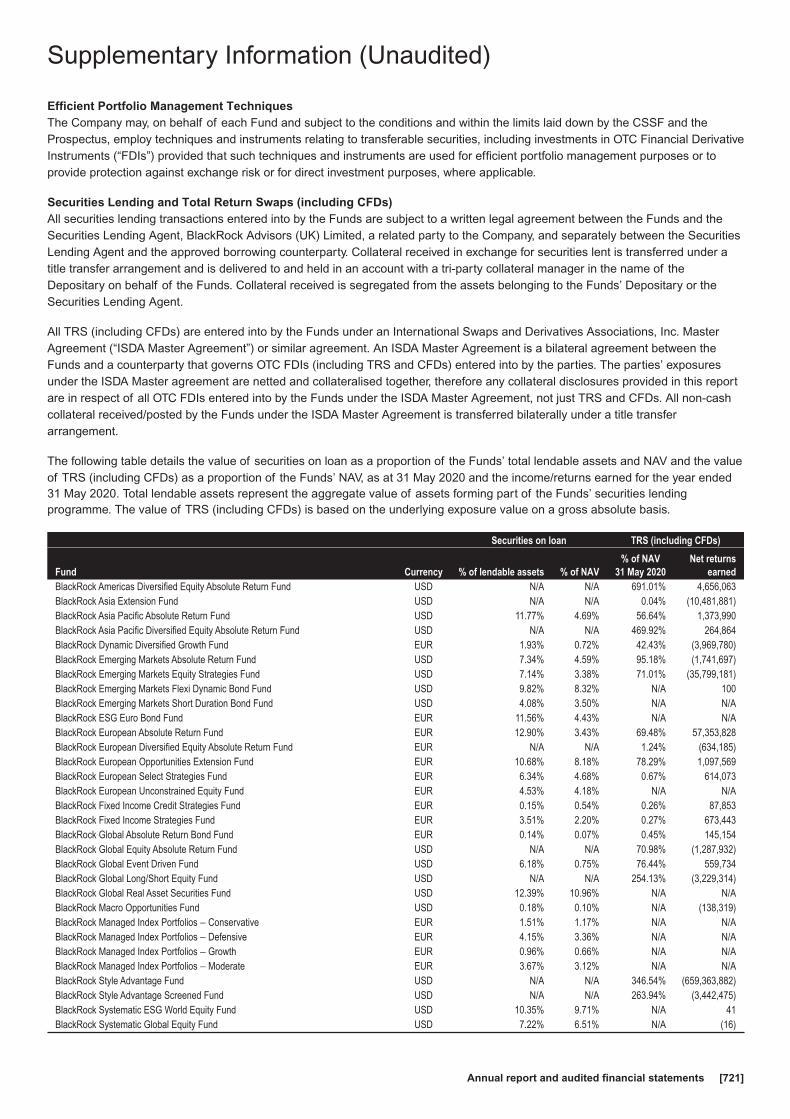
Efficient Portfolio Management TechniquesThe Company may, on behalf of each Fund and subject to the conditions and within the limits laid down by the CSSF and theProspectus, employ techniques and instruments relating to transferable securities, including investments in OTC Financial DerivativeInstruments (“FDIs”) provided that such techniques and instruments are used for efficient portfolio management purposes or toprovide protection against exchange risk or for direct investment purposes, where applicable.
Securities Lending and Total Return Swaps (including CFDs)All securities lending transactions entered into by the Funds are subject to a written legal agreement between the Funds and theSecurities Lending Agent, BlackRock Advisors (UK) Limited, a related party to the Company, and separately between the SecuritiesLending Agent and the approved borrowing counterparty. Collateral received in exchange for securities lent is transferred under atitle transfer arrangement and is delivered to and held in an account with a tri-party collateral manager in the name of theDepositary on behalf of the Funds. Collateral received is segregated from the assets belonging to the Funds’ Depositary or theSecurities Lending Agent.
All TRS (including CFDs) are entered into by the Funds under an International Swaps and Derivatives Associations, Inc. MasterAgreement (“ISDA Master Agreement”) or similar agreement. An ISDA Master Agreement is a bilateral agreement between theFunds and a counterparty that governs OTC FDIs (including TRS and CFDs) entered into by the parties. The parties’ exposuresunder the ISDA Master agreement are netted and collateralised together, therefore any collateral disclosures provided in this reportare in respect of all OTC FDIs entered into by the Funds under the ISDA Master Agreement, not just TRS and CFDs. All non-cashcollateral received/posted by the Funds under the ISDA Master Agreement is transferred bilaterally under a title transferarrangement.
The following table details the value of securities on loan as a proportion of the Funds’ total lendable assets and NAV and the valueof TRS (including CFDs) as a proportion of the Funds’ NAV, as at 31 May 2020 and the income/returns earned for the year ended31 May 2020. Total lendable assets represent the aggregate value of assets forming part of the Funds’ securities lendingprogramme. The value of TRS (including CFDs) is based on the underlying exposure value on a gross absolute basis.
Securities on loan TRS (including CFDs)
Fund Currency % of lendable assets % of NAV% of NAV
31 May 2020Net returns
earnedBlackRock Americas Diversified Equity Absolute Return Fund USD N/A N/A 691.01% 4,656,063BlackRock Asia Extension Fund USD N/A N/A 0.04% (10,481,881)BlackRock Asia Pacific Absolute Return Fund USD 11.77% 4.69% 56.64% 1,373,990BlackRock Asia Pacific Diversified Equity Absolute Return Fund USD N/A N/A 469.92% 264,864BlackRock Dynamic Diversified Growth Fund EUR 1.93% 0.72% 42.43% (3,969,780)BlackRock Emerging Markets Absolute Return Fund USD 7.34% 4.59% 95.18% (1,741,697)BlackRock Emerging Markets Equity Strategies Fund USD 7.14% 3.38% 71.01% (35,799,181)BlackRock Emerging Markets Flexi Dynamic Bond Fund USD 9.82% 8.32% N/A 100BlackRock Emerging Markets Short Duration Bond Fund USD 4.08% 3.50% N/A N/ABlackRock ESG Euro Bond Fund EUR 11.56% 4.43% N/A N/ABlackRock European Absolute Return Fund EUR 12.90% 3.43% 69.48% 57,353,828BlackRock European Diversified Equity Absolute Return Fund EUR N/A N/A 1.24% (634,185)BlackRock European Opportunities Extension Fund EUR 10.68% 8.18% 78.29% 1,097,569BlackRock European Select Strategies Fund EUR 6.34% 4.68% 0.67% 614,073BlackRock European Unconstrained Equity Fund EUR 4.53% 4.18% N/A N/ABlackRock Fixed Income Credit Strategies Fund EUR 0.15% 0.54% 0.26% 87,853BlackRock Fixed Income Strategies Fund EUR 3.51% 2.20% 0.27% 673,443BlackRock Global Absolute Return Bond Fund EUR 0.14% 0.07% 0.45% 145,154BlackRock Global Equity Absolute Return Fund USD N/A N/A 70.98% (1,287,932)BlackRock Global Event Driven Fund USD 6.18% 0.75% 76.44% 559,734BlackRock Global Long/Short Equity Fund USD N/A N/A 254.13% (3,229,314)BlackRock Global Real Asset Securities Fund USD 12.39% 10.96% N/A N/ABlackRock Macro Opportunities Fund USD 0.18% 0.10% N/A (138,319)BlackRock Managed Index Portfolios − Conservative EUR 1.51% 1.17% N/A N/ABlackRock Managed Index Portfolios − Defensive EUR 4.15% 3.36% N/A N/ABlackRock Managed Index Portfolios − Growth EUR 0.96% 0.66% N/A N/ABlackRock Managed Index Portfolios − Moderate EUR 3.67% 3.12% N/A N/ABlackRock Style Advantage Fund USD N/A N/A 346.54% (659,363,882)BlackRock Style Advantage Screened Fund USD N/A N/A 263.94% (3,442,475)BlackRock Systematic ESG World Equity Fund USD 10.35% 9.71% N/A 41BlackRock Systematic Global Equity Fund USD 7.22% 6.51% N/A (16)
Supplementary Information (Unaudited)
Annual report and audited financial statements [721]

Securities on loan TRS (including CFDs)
Fund Currency % of lendable assets % of NAV% of NAV
31 May 2020Net returns
earnedBlackRock Total Advantage Fund EUR N/A N/A 165.99% (4,101,287)BlackRock UK Emerging Companies Absolute Return Fund GBP N/A N/A 106.48% 38,788,937BlackRock UK Equity Absolute Return Fund GBP N/A N/A 94.52% 676,171
The total income earned from securities lending transactions is split between the relevant Fund and the Securities Lending Agent.The Funds receives at least 62.5% while the Securities Lending Agent receives up to 37.5% of such income, with all operationalcosts borne out of the Securities Lending Agent’s share. Income earned during the year ended by the Funds from securities lendingtransactions is disclosed in the Funds’ Statement of Operations and Changes in Net Assets under caption “Securities lending”. Allreturns and costs from TRS (including CFDs) will accrue to the Funds and are not subject to any returns or cost sharingarrangements with the Fund’s Management Company or any other third parties.
The following table details the value of securities on loan (individually identified in the relevant Funds’ Portfolio of Investments) andassociated collateral received and the underlying exposure value on a gross absolute basis for TRS (including CFDs), analysed bycounterparty, as at 31 May 2020.
Securities Lending
TRS(including
CFDs)
Counterparty
Counterparty'scountry of
establishmentAmount on
loanCollateralreceived
Underlyingexposure
31 May 2020
BlackRock Americas Diversified Equity Absolute Return Fund (in USD)Bank of America NA United States N/A N/A 896,818,849Barclays Bank Plc United Kingdom N/A N/A 974,293,014Goldman Sachs International United States N/A N/A 1,200,103,904HSBC Bank Plc United Kingdom N/A N/A 1,322,351,536Morgan Stanley Group Inc United States N/A N/A 2,082,143,877Total N/A N/A 6,475,711,180BlackRock Asia Extension Fund (in USD)JP Morgan Securities Plc United Kingdom N/A N/A 61,743Total N/A N/A 61,743BlackRock Asia Pacific Absolute Return Fund (in USD)Bank of America NA United States N/A N/A 5,344,124Citigroup Global Markets Ltd United Kingdom 424,484 461,831 N/AJP Morgan Securities Plc United Kingdom 515,181 572,290 5,832,281Morgan Stanley Group Inc United States N/A N/A 6,079,696UBS AG Switzerland 488,595 541,919 N/ATotal 1,428,260 1,576,040 17,256,101BlackRock Asia Pacific Diversified Equity Absolute Return Fund (in USD)Citibank NA United States N/A N/A 32,554,300Goldman Sachs United States N/A N/A 19,977,411HSBC Bank Plc United Kingdom N/A N/A 20,948,926JP Morgan Securities Plc United Kingdom N/A N/A 50,610,264Total N/A N/A 124,090,901BlackRock Dynamic Diversified Growth Fund (in EUR)Bank of America NA United States N/A N/A 8,330,474Barclays Bank Plc United Kingdom N/A N/A 39,717,261BNP Paribas SA France N/A N/A 28,669,270Citigroup Global Markets Ltd United Kingdom N/A N/A 42,880,838Goldman Sachs International United States 292,760 313,571 N/AHSBC Bank Plc United Kingdom 2,602,564 2,868,902 N/AJP Morgan Securities Plc United Kingdom 1,583,211 1,759,526 302,981,579Morgan Stanley Group Inc United States N/A N/A 10,028,062Natixis S.A. France 533,126 576,285 N/ASociete Generale SA France N/A N/A 6,264,541The Bank of Nova Scotia Canada 1,663,385 1,840,895 N/AUBS AG Switzerland 782,577 867,984 N/ATotal 7,457,623 8,227,163 438,872,025
Supplementary Information (Unaudited) continued
BlackRock Strategic Funds[722]
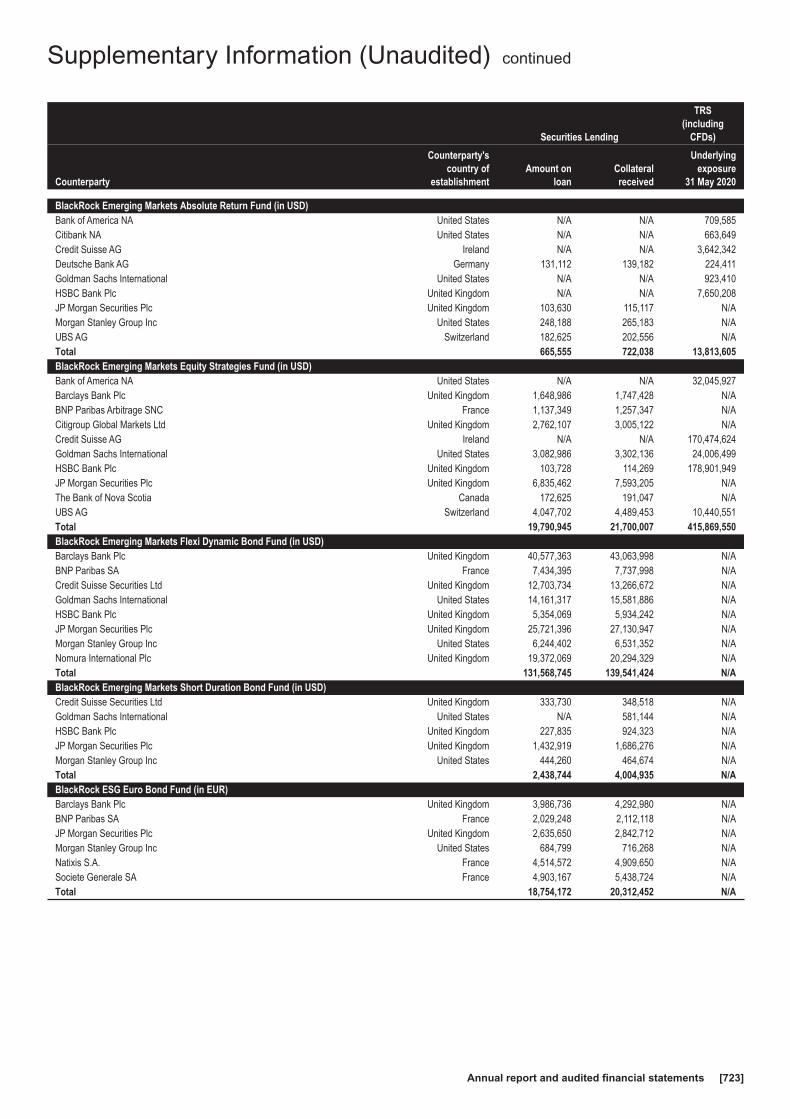
Securities Lending
TRS(including
CFDs)
Counterparty
Counterparty'scountry of
establishmentAmount on
loanCollateralreceived
Underlyingexposure
31 May 2020
BlackRock Emerging Markets Absolute Return Fund (in USD)Bank of America NA United States N/A N/A 709,585Citibank NA United States N/A N/A 663,649Credit Suisse AG Ireland N/A N/A 3,642,342Deutsche Bank AG Germany 131,112 139,182 224,411Goldman Sachs International United States N/A N/A 923,410HSBC Bank Plc United Kingdom N/A N/A 7,650,208JP Morgan Securities Plc United Kingdom 103,630 115,117 N/AMorgan Stanley Group Inc United States 248,188 265,183 N/AUBS AG Switzerland 182,625 202,556 N/ATotal 665,555 722,038 13,813,605BlackRock Emerging Markets Equity Strategies Fund (in USD)Bank of America NA United States N/A N/A 32,045,927Barclays Bank Plc United Kingdom 1,648,986 1,747,428 N/ABNP Paribas Arbitrage SNC France 1,137,349 1,257,347 N/ACitigroup Global Markets Ltd United Kingdom 2,762,107 3,005,122 N/ACredit Suisse AG Ireland N/A N/A 170,474,624Goldman Sachs International United States 3,082,986 3,302,136 24,006,499HSBC Bank Plc United Kingdom 103,728 114,269 178,901,949JP Morgan Securities Plc United Kingdom 6,835,462 7,593,205 N/AThe Bank of Nova Scotia Canada 172,625 191,047 N/AUBS AG Switzerland 4,047,702 4,489,453 10,440,551Total 19,790,945 21,700,007 415,869,550BlackRock Emerging Markets Flexi Dynamic Bond Fund (in USD)Barclays Bank Plc United Kingdom 40,577,363 43,063,998 N/ABNP Paribas SA France 7,434,395 7,737,998 N/ACredit Suisse Securities Ltd United Kingdom 12,703,734 13,266,672 N/AGoldman Sachs International United States 14,161,317 15,581,886 N/AHSBC Bank Plc United Kingdom 5,354,069 5,934,242 N/AJP Morgan Securities Plc United Kingdom 25,721,396 27,130,947 N/AMorgan Stanley Group Inc United States 6,244,402 6,531,352 N/ANomura International Plc United Kingdom 19,372,069 20,294,329 N/ATotal 131,568,745 139,541,424 N/ABlackRock Emerging Markets Short Duration Bond Fund (in USD)Credit Suisse Securities Ltd United Kingdom 333,730 348,518 N/AGoldman Sachs International United States N/A 581,144 N/AHSBC Bank Plc United Kingdom 227,835 924,323 N/AJP Morgan Securities Plc United Kingdom 1,432,919 1,686,276 N/AMorgan Stanley Group Inc United States 444,260 464,674 N/ATotal 2,438,744 4,004,935 N/ABlackRock ESG Euro Bond Fund (in EUR)Barclays Bank Plc United Kingdom 3,986,736 4,292,980 N/ABNP Paribas SA France 2,029,248 2,112,118 N/AJP Morgan Securities Plc United Kingdom 2,635,650 2,842,712 N/AMorgan Stanley Group Inc United States 684,799 716,268 N/ANatixis S.A. France 4,514,572 4,909,650 N/ASociete Generale SA France 4,903,167 5,438,724 N/ATotal 18,754,172 20,312,452 N/A
Supplementary Information (Unaudited) continued
Annual report and audited financial statements [723]
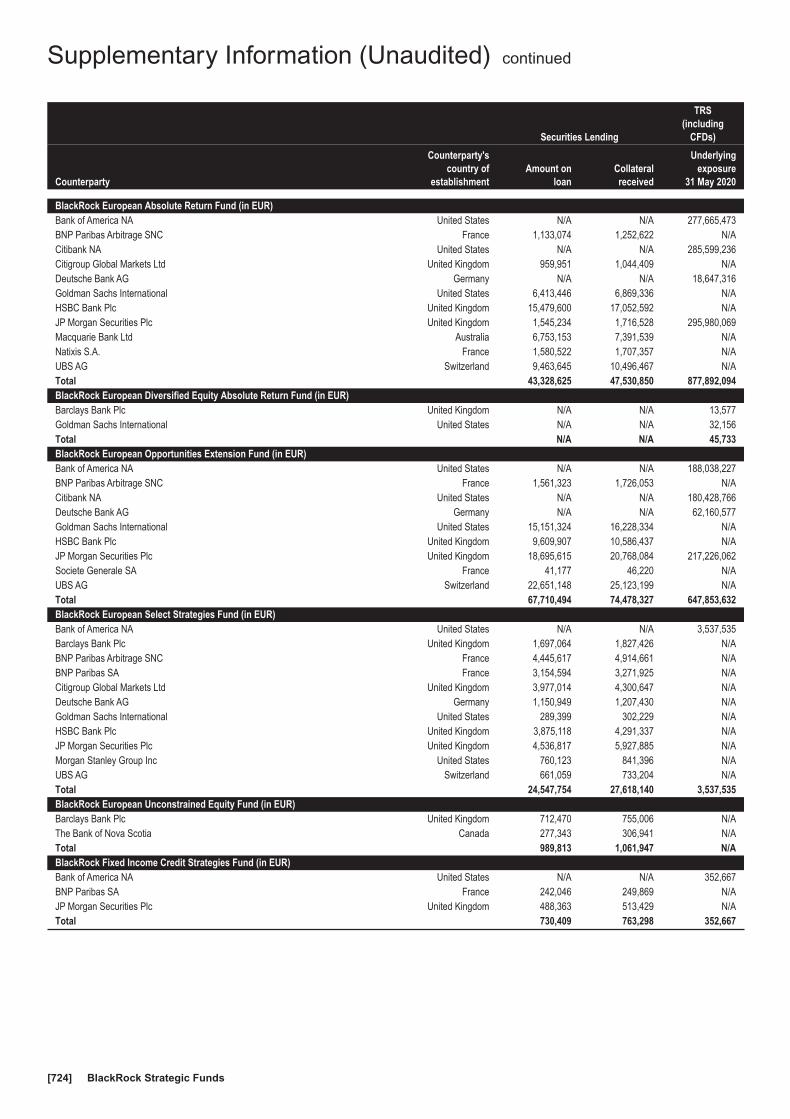
Securities Lending
TRS(including
CFDs)
Counterparty
Counterparty'scountry of
establishmentAmount on
loanCollateralreceived
Underlyingexposure
31 May 2020
BlackRock European Absolute Return Fund (in EUR)Bank of America NA United States N/A N/A 277,665,473BNP Paribas Arbitrage SNC France 1,133,074 1,252,622 N/ACitibank NA United States N/A N/A 285,599,236Citigroup Global Markets Ltd United Kingdom 959,951 1,044,409 N/ADeutsche Bank AG Germany N/A N/A 18,647,316Goldman Sachs International United States 6,413,446 6,869,336 N/AHSBC Bank Plc United Kingdom 15,479,600 17,052,592 N/AJP Morgan Securities Plc United Kingdom 1,545,234 1,716,528 295,980,069Macquarie Bank Ltd Australia 6,753,153 7,391,539 N/ANatixis S.A. France 1,580,522 1,707,357 N/AUBS AG Switzerland 9,463,645 10,496,467 N/ATotal 43,328,625 47,530,850 877,892,094BlackRock European Diversified Equity Absolute Return Fund (in EUR)Barclays Bank Plc United Kingdom N/A N/A 13,577Goldman Sachs International United States N/A N/A 32,156Total N/A N/A 45,733BlackRock European Opportunities Extension Fund (in EUR)Bank of America NA United States N/A N/A 188,038,227BNP Paribas Arbitrage SNC France 1,561,323 1,726,053 N/ACitibank NA United States N/A N/A 180,428,766Deutsche Bank AG Germany N/A N/A 62,160,577Goldman Sachs International United States 15,151,324 16,228,334 N/AHSBC Bank Plc United Kingdom 9,609,907 10,586,437 N/AJP Morgan Securities Plc United Kingdom 18,695,615 20,768,084 217,226,062Societe Generale SA France 41,177 46,220 N/AUBS AG Switzerland 22,651,148 25,123,199 N/ATotal 67,710,494 74,478,327 647,853,632BlackRock European Select Strategies Fund (in EUR)Bank of America NA United States N/A N/A 3,537,535Barclays Bank Plc United Kingdom 1,697,064 1,827,426 N/ABNP Paribas Arbitrage SNC France 4,445,617 4,914,661 N/ABNP Paribas SA France 3,154,594 3,271,925 N/ACitigroup Global Markets Ltd United Kingdom 3,977,014 4,300,647 N/ADeutsche Bank AG Germany 1,150,949 1,207,430 N/AGoldman Sachs International United States 289,399 302,229 N/AHSBC Bank Plc United Kingdom 3,875,118 4,291,337 N/AJP Morgan Securities Plc United Kingdom 4,536,817 5,927,885 N/AMorgan Stanley Group Inc United States 760,123 841,396 N/AUBS AG Switzerland 661,059 733,204 N/ATotal 24,547,754 27,618,140 3,537,535BlackRock European Unconstrained Equity Fund (in EUR)Barclays Bank Plc United Kingdom 712,470 755,006 N/AThe Bank of Nova Scotia Canada 277,343 306,941 N/ATotal 989,813 1,061,947 N/ABlackRock Fixed Income Credit Strategies Fund (in EUR)Bank of America NA United States N/A N/A 352,667BNP Paribas SA France 242,046 249,869 N/AJP Morgan Securities Plc United Kingdom 488,363 513,429 N/ATotal 730,409 763,298 352,667
Supplementary Information (Unaudited) continued
BlackRock Strategic Funds[724]
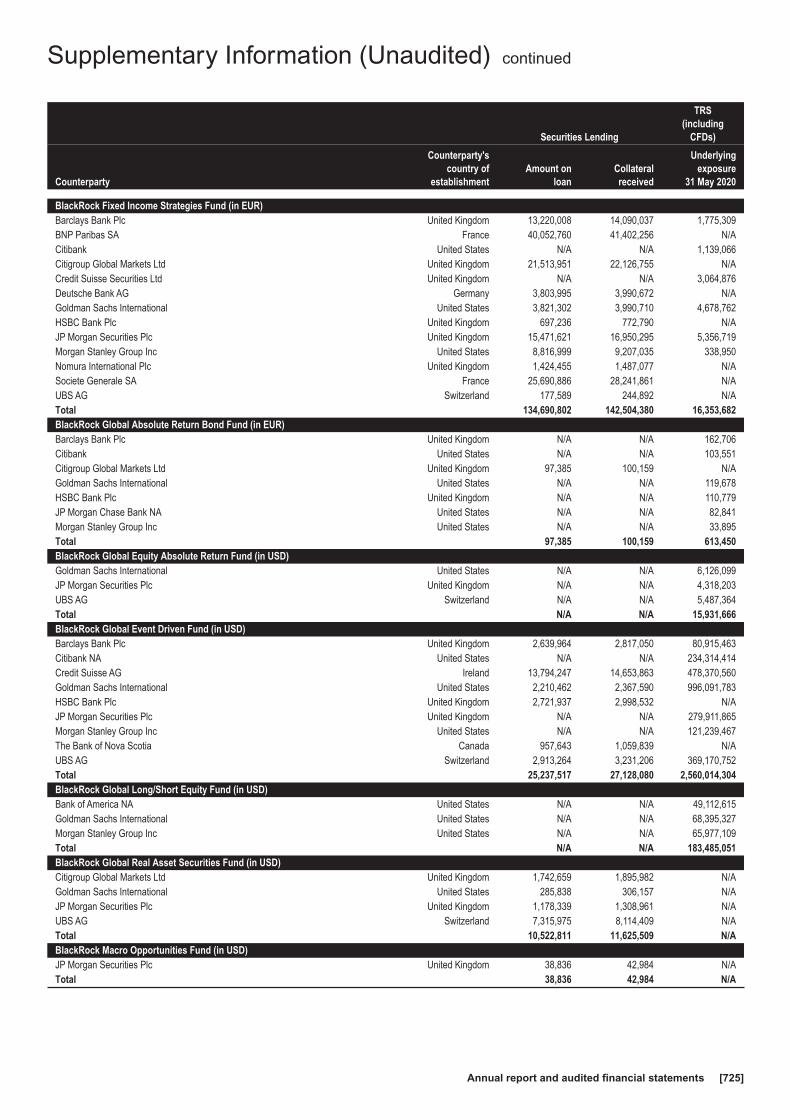
Securities Lending
TRS(including
CFDs)
Counterparty
Counterparty'scountry of
establishmentAmount on
loanCollateralreceived
Underlyingexposure
31 May 2020
BlackRock Fixed Income Strategies Fund (in EUR)Barclays Bank Plc United Kingdom 13,220,008 14,090,037 1,775,309BNP Paribas SA France 40,052,760 41,402,256 N/ACitibank United States N/A N/A 1,139,066Citigroup Global Markets Ltd United Kingdom 21,513,951 22,126,755 N/ACredit Suisse Securities Ltd United Kingdom N/A N/A 3,064,876Deutsche Bank AG Germany 3,803,995 3,990,672 N/AGoldman Sachs International United States 3,821,302 3,990,710 4,678,762HSBC Bank Plc United Kingdom 697,236 772,790 N/AJP Morgan Securities Plc United Kingdom 15,471,621 16,950,295 5,356,719Morgan Stanley Group Inc United States 8,816,999 9,207,035 338,950Nomura International Plc United Kingdom 1,424,455 1,487,077 N/ASociete Generale SA France 25,690,886 28,241,861 N/AUBS AG Switzerland 177,589 244,892 N/ATotal 134,690,802 142,504,380 16,353,682BlackRock Global Absolute Return Bond Fund (in EUR)Barclays Bank Plc United Kingdom N/A N/A 162,706Citibank United States N/A N/A 103,551Citigroup Global Markets Ltd United Kingdom 97,385 100,159 N/AGoldman Sachs International United States N/A N/A 119,678HSBC Bank Plc United Kingdom N/A N/A 110,779JP Morgan Chase Bank NA United States N/A N/A 82,841Morgan Stanley Group Inc United States N/A N/A 33,895Total 97,385 100,159 613,450BlackRock Global Equity Absolute Return Fund (in USD)Goldman Sachs International United States N/A N/A 6,126,099JP Morgan Securities Plc United Kingdom N/A N/A 4,318,203UBS AG Switzerland N/A N/A 5,487,364Total N/A N/A 15,931,666BlackRock Global Event Driven Fund (in USD)Barclays Bank Plc United Kingdom 2,639,964 2,817,050 80,915,463Citibank NA United States N/A N/A 234,314,414Credit Suisse AG Ireland 13,794,247 14,653,863 478,370,560Goldman Sachs International United States 2,210,462 2,367,590 996,091,783HSBC Bank Plc United Kingdom 2,721,937 2,998,532 N/AJP Morgan Securities Plc United Kingdom N/A N/A 279,911,865Morgan Stanley Group Inc United States N/A N/A 121,239,467The Bank of Nova Scotia Canada 957,643 1,059,839 N/AUBS AG Switzerland 2,913,264 3,231,206 369,170,752Total 25,237,517 27,128,080 2,560,014,304BlackRock Global Long/Short Equity Fund (in USD)Bank of America NA United States N/A N/A 49,112,615Goldman Sachs International United States N/A N/A 68,395,327Morgan Stanley Group Inc United States N/A N/A 65,977,109Total N/A N/A 183,485,051BlackRock Global Real Asset Securities Fund (in USD)Citigroup Global Markets Ltd United Kingdom 1,742,659 1,895,982 N/AGoldman Sachs International United States 285,838 306,157 N/AJP Morgan Securities Plc United Kingdom 1,178,339 1,308,961 N/AUBS AG Switzerland 7,315,975 8,114,409 N/ATotal 10,522,811 11,625,509 N/ABlackRock Macro Opportunities Fund (in USD)JP Morgan Securities Plc United Kingdom 38,836 42,984 N/ATotal 38,836 42,984 N/A
Supplementary Information (Unaudited) continued
Annual report and audited financial statements [725]
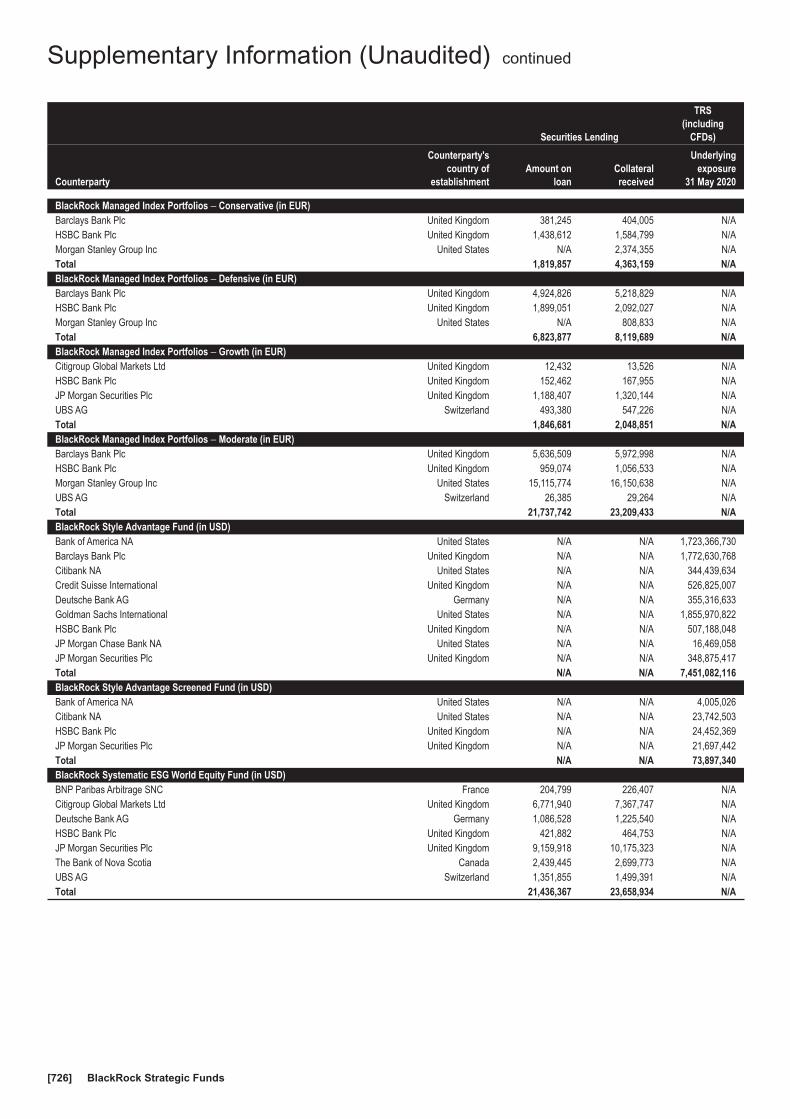
Securities Lending
TRS(including
CFDs)
Counterparty
Counterparty'scountry of
establishmentAmount on
loanCollateralreceived
Underlyingexposure
31 May 2020
BlackRock Managed Index Portfolios − Conservative (in EUR)Barclays Bank Plc United Kingdom 381,245 404,005 N/AHSBC Bank Plc United Kingdom 1,438,612 1,584,799 N/AMorgan Stanley Group Inc United States N/A 2,374,355 N/ATotal 1,819,857 4,363,159 N/ABlackRock Managed Index Portfolios − Defensive (in EUR)Barclays Bank Plc United Kingdom 4,924,826 5,218,829 N/AHSBC Bank Plc United Kingdom 1,899,051 2,092,027 N/AMorgan Stanley Group Inc United States N/A 808,833 N/ATotal 6,823,877 8,119,689 N/ABlackRock Managed Index Portfolios − Growth (in EUR)Citigroup Global Markets Ltd United Kingdom 12,432 13,526 N/AHSBC Bank Plc United Kingdom 152,462 167,955 N/AJP Morgan Securities Plc United Kingdom 1,188,407 1,320,144 N/AUBS AG Switzerland 493,380 547,226 N/ATotal 1,846,681 2,048,851 N/ABlackRock Managed Index Portfolios − Moderate (in EUR)Barclays Bank Plc United Kingdom 5,636,509 5,972,998 N/AHSBC Bank Plc United Kingdom 959,074 1,056,533 N/AMorgan Stanley Group Inc United States 15,115,774 16,150,638 N/AUBS AG Switzerland 26,385 29,264 N/ATotal 21,737,742 23,209,433 N/ABlackRock Style Advantage Fund (in USD)Bank of America NA United States N/A N/A 1,723,366,730Barclays Bank Plc United Kingdom N/A N/A 1,772,630,768Citibank NA United States N/A N/A 344,439,634Credit Suisse International United Kingdom N/A N/A 526,825,007Deutsche Bank AG Germany N/A N/A 355,316,633Goldman Sachs International United States N/A N/A 1,855,970,822HSBC Bank Plc United Kingdom N/A N/A 507,188,048JP Morgan Chase Bank NA United States N/A N/A 16,469,058JP Morgan Securities Plc United Kingdom N/A N/A 348,875,417Total N/A N/A 7,451,082,116BlackRock Style Advantage Screened Fund (in USD)Bank of America NA United States N/A N/A 4,005,026Citibank NA United States N/A N/A 23,742,503HSBC Bank Plc United Kingdom N/A N/A 24,452,369JP Morgan Securities Plc United Kingdom N/A N/A 21,697,442Total N/A N/A 73,897,340BlackRock Systematic ESG World Equity Fund (in USD)BNP Paribas Arbitrage SNC France 204,799 226,407 N/ACitigroup Global Markets Ltd United Kingdom 6,771,940 7,367,747 N/ADeutsche Bank AG Germany 1,086,528 1,225,540 N/AHSBC Bank Plc United Kingdom 421,882 464,753 N/AJP Morgan Securities Plc United Kingdom 9,159,918 10,175,323 N/AThe Bank of Nova Scotia Canada 2,439,445 2,699,773 N/AUBS AG Switzerland 1,351,855 1,499,391 N/ATotal 21,436,367 23,658,934 N/A
Supplementary Information (Unaudited) continued
BlackRock Strategic Funds[726]

Securities Lending
TRS(including
CFDs)
Counterparty
Counterparty'scountry of
establishmentAmount on
loanCollateralreceived
Underlyingexposure
31 May 2020
BlackRock Systematic Global Equity Fund (in USD)Barclays Bank Plc United Kingdom 226,765 240,302 N/ABNP Paribas Arbitrage SNC France 58,134 64,268 N/ACitigroup Global Markets Ltd United Kingdom 2,814,242 3,061,844 N/AGoldman Sachs International United States 157,297 168,478 N/AHSBC Bank Plc United Kingdom 1,224,737 1,349,192 N/AJP Morgan Securities Plc United Kingdom 4,702,236 5,223,493 N/ASociete Generale SA France 75,363 84,593 N/AUBS AG Switzerland 1,258,860 1,435,460 N/ATotal 10,517,634 11,627,630 N/ABlackRock Total Advantage Fund (in EUR)Bank of America NA United States N/A N/A 11,954,964Citibank NA United States N/A N/A 13,474,906Credit Suisse International United Kingdom N/A N/A 12,822,128Deutsche Bank AG Germany N/A N/A 604,453HSBC Bank Plc United Kingdom N/A N/A 186,123JP Morgan Securities Plc United Kingdom N/A N/A 12,361,307Total N/A N/A 51,403,881BlackRock UK Emerging Companies Absolute Return Fund (in GBP)Goldman Sachs International United States N/A N/A 209,558,817HSBC Bank Plc United Kingdom N/A N/A 262,497,453JP Morgan Securities Plc United Kingdom N/A N/A 202,279,670Total N/A N/A 674,335,940BlackRock UK Equity Absolute Return Fund (in GBP)Deutsche Bank AG Germany N/A N/A 1,917,764HSBC Bank Plc United Kingdom N/A N/A 44,846,188JP Morgan Securities Plc United Kingdom N/A N/A 98,460,477Total N/A N/A 145,224,429
All securities on loan have an open maturity tenor as they are recallable or terminable on a daily basis.
The following table provides an analysis of the maturity tenor of TRS (including CFDs) as at 31 May 2020:
Maturity Tenor
1 day 2 to 7 days 8 to 30 days 31 to 90 days91 to
365 daysMore than365 days
Opentransactions Total
BlackRock Americas Diversified Equity Absolute Return Fund (in USD)TRS (including CFDs) - - - - 7,647,300 - 6,468,063,880 6,475,711,180BlackRock Asia Extension Fund (in USD)TRS (including CFDs) - - - - - - 61,743 61,743BlackRock Asia Pacific Absolute Return Fund (in USD)TRS (including CFDs) - - - - - - 17,256,101 17,256,101BlackRock Asia Pacific Diversified Equity Absolute Return Fund (in USD)TRS (including CFDs) - - 592,878 - 19,977,411 - 103,520,612 124,090,901BlackRock Dynamic Diversified Growth Fund (in EUR)TRS (including CFDs) - - 3,769,104 - 145,470,836 289,632,085 - 438,872,025BlackRock Emerging Markets Absolute Return Fund (in USD)TRS (including CFDs) - - - - - - 13,813,605 13,813,605BlackRock Emerging Markets Equity Strategies Fund (in USD)TRS (including CFDs) - - - - - - 415,869,550 415,869,550BlackRock European Absolute Return Fund (in EUR)TRS (including CFDs) - - - - - - 877,892,094 877,892,094BlackRock European Diversified Equity Absolute Return Fund (in EUR)TRS (including CFDs) - - - - - - 45,733 45,733BlackRock European Opportunities Extension Fund (in EUR)TRS (including CFDs) - - - - - - 647,853,632 647,853,632
Supplementary Information (Unaudited) continued
Annual report and audited financial statements [727]

Maturity Tenor
1 day 2 to 7 days 8 to 30 days 31 to 90 days91 to
365 daysMore than365 days
Opentransactions Total
BlackRock European Select Strategies Fund (in EUR)TRS (including CFDs) - - - - - - 3,537,535 3,537,535BlackRock Fixed Income Credit Strategies Fund (in EUR)TRS (including CFDs) - - - - - - 352,667 352,667BlackRock Fixed Income Strategies Fund (in EUR)TRS (including CFDs) - - 9,195,004 1,079,508 2,836,026 3,243,144 - 16,353,682BlackRock Global Absolute Return Bond Fund (in EUR)TRS (including CFDs) - - 502,671 - - - 110,779 613,450BlackRock Global Equity Absolute Return Fund (in USD)TRS (including CFDs) - - - - - - 15,931,666 15,931,666BlackRock Global Event Driven Fund (in USD)TRS (including CFDs) - - - - - - 2,560,014,304 2,560,014,304BlackRock Global Long/Short Equity Fund (in USD)TRS (including CFDs) - - - - - - 183,485,051 183,485,051BlackRock Style Advantage Fund (in USD)TRS (including CFDs) - - 328,630,352 - - - 7,122,451,764 7,451,082,116BlackRock Style Advantage Screened Fund (in USD)TRS (including CFDs) - - 4,005,026 - - - 69,892,314 73,897,340BlackRock Total Advantage Fund (in EUR)TRS (including CFDs) - - 2,756,022 - - - 48,647,859 51,403,881BlackRock UK Emerging Companies Absolute Return Fund (in GBP)TRS (including CFDs) - - - - - - 674,335,940 674,335,940BlackRock UK Equity Absolute Return Fund (in GBP)TRS (including CFDs) - - - - - - 145,224,429 145,224,429
The above maturity tenor analysis has been based on therespective transaction contractual maturity date. Opentransactions are those transactions that are recallable orterminable on a daily basis and include CFDs.
CollateralThe Funds engage in activities which may require collateral tobe provided to a counterparty (“collateral posted”) or may holdcollateral received (“collateral received”) from a counterparty.
The following table provides an analysis by currency of the cashand underlying non-cash collateral received/posted by way oftitle transfer collateral arrangement by the Funds, in respect ofsecurities lending transactions and OTC FDIs (including TRSand CFDs), as at 31 May 2020.
Currency
Cashcollateralreceived
Cashcollateral
posted
Non-cashcollateralreceived
Non-cashcollateral
posted
BlackRock Americas Diversified Equity Absolute Return Fund (in USD)OTC derivative transactions
USD 16,840,000 2,750,000 - -Total 16,840,000 2,750,000 - -BlackRock Asia Extension Fund (in USD)OTC derivative transactions
USD 932,000 - - -Total 932,000 - - -
Currency
Cashcollateralreceived
Cashcollateral
posted
Non-cashcollateralreceived
Non-cashcollateral
posted
BlackRock Asia Pacific Absolute Return Fund (in USD)Securities lending transactions
AUD - - 33,524 -CAD - - 28,759 -CHF - - 94,112 -DKK - - 47,271 -EUR - - 301,075 -GBP - - 451,575 -JPY - - 358,734 -NOK - - 37 -SEK - - 45,282 -USD - - 215,671 -OTC derivative transactions
USD 13,000 930,000 - -Total 13,000 930,000 1,576,040 -BlackRock Asia Pacific Diversified Equity Absolute Return Fund (in USD)OTC derivative transactions
USD 2,890,000 1,320,000 - -Total 2,890,000 1,320,000 - -
Supplementary Information (Unaudited) continued
BlackRock Strategic Funds[728]

Currency
Cashcollateralreceived
Cashcollateral
posted
Non-cashcollateralreceived
Non-cashcollateral
posted
BlackRock Dynamic Diversified Growth Fund (in EUR)Securities lending transactions
AUD - - 80,889 -CAD - - 209,384 -CHF - - 36,373 -EUR - - 811,024 -GBP - - 1,466,925 -JPY - - 2,903,884 -MXN - - 7,435 -USD - - 2,711,249 -OTC derivative transactions
EUR 7,940,000 2,120,000 - -Total 7,940,000 2,120,000 8,227,163 -BlackRock Emerging Markets Absolute Return Fund (in USD)Securities lending transactions
AUD - - 7,609 -CAD - - 5,786 -CHF - - 1,760 -EUR - - 209,744 -GBP - - 195,569 -JPY - - 156,037 -USD - - 145,533 -OTC derivative transactions
USD - 1,560,000 - -Total - 1,560,000 722,038 -BlackRock Emerging Markets Equity Strategies Fund (in USD)Securities lending transactions
AUD - - 495,302 -CAD - - 410,840 -CHF - - 672,137 -DKK - - 307,590 -EUR - - 4,939,971 -GBP - - 5,051,602 -JPY - - 4,975,245 -MXN - - 296 -NOK - - 240 -SEK - - 408,947 -USD - - 4,437,837 -OTC derivative transactions
USD 1,180,000 13,396,000 - -Total 1,180,000 13,396,000 21,700,007 -BlackRock Emerging Markets Flexi Dynamic Bond Fund (in USD)Securities lending transactions
AUD - - 85,786 -CAD - - 3,137,882 -DKK - - 3,289,759 -EUR - - 93,139,598 -GBP - - 14,043,212 -JPY - - 1,975,246 -SEK - - 96,238 -USD - - 23,773,703 -Total - - 139,541,424 -
Currency
Cashcollateralreceived
Cashcollateral
posted
Non-cashcollateralreceived
Non-cashcollateral
posted
BlackRock Emerging Markets Short Duration Bond Fund (in USD)Securities lending transactions
AUD - - 60,757 -CAD - - 239,302 -EUR - - 1,519,266 -GBP - - 454,343 -JPY - - 631,450 -USD - - 1,099,817 -OTC derivative transactions
USD 830,000 170,000 - -Total 830,000 170,000 4,004,935 -BlackRock ESG Euro Bond Fund (in EUR)Securities lending transactions
AUD - - 137,910 -CAD - - 10,725 -CHF - - 1,285,857 -DKK - - 499,687 -EUR - - 12,128,210 -GBP - - 1,418,652 -JPY - - 3,684,751 -NOK - - 561,705 -USD - - 584,955 -Total - - 20,312,452 -BlackRock European Absolute Return Fund (in EUR)Securities lending transactions
AUD - - 353,070 -CAD - - 86,257 -CHF - - 250,072 -DKK - - 106,900 -EUR - - 4,261,906 -GBP - - 8,339,403 -JPY - - 12,745,722 -MXN - - 44,193 -NOK - - 83 -SEK - - 216,275 -USD - - 21,126,969 -OTC derivative transactions
EUR 2,710,000 36,620,000 - -Total 2,710,000 36,620,000 47,530,850 -BlackRock European Opportunities Extension Fund (in EUR)Securities lending transactions
AUD - - 1,348,022 -CAD - - 1,043,617 -CHF - - 336,340 -EUR - - 12,267,087 -GBP - - 20,655,116 -JPY - - 20,104,372 -MXN - - 27,436 -SEK - - 156,914 -USD - - 18,539,423 -OTC derivative transactions
EUR 12,140,000 2,710,000 - -Total 12,140,000 2,710,000 74,478,327 -
Supplementary Information (Unaudited) continued
Annual report and audited financial statements [729]

Currency
Cashcollateralreceived
Cashcollateral
posted
Non-cashcollateralreceived
Non-cashcollateral
posted
BlackRock European Select Strategies Fund (in EUR)Securities lending transactions
AUD - - 541,284 -CAD - - 236,332 -CHF - - 1,166,016 -DKK - - 398,946 -EUR - - 8,979,080 -GBP - - 2,809,151 -JPY - - 5,175,261 -MXN - - 1,562 -NOK - - 307 -SEK - - 823,927 -USD - - 7,486,274 -OTC derivative transactions
EUR - 1,341,000 - 32,349,645Total - 1,341,000 27,618,140 32,349,645BlackRock European Unconstrained Equity Fund (in EUR)Securities lending transactions
CAD - - 27,394 -CHF - - 720 -EUR - - 419,010 -GBP - - 233,514 -JPY - - 46,161 -USD - - 335,148 -Total - - 1,061,947 -BlackRock Fixed Income Credit Strategies Fund (in EUR)Securities lending transactions
EUR - - 646,074 -GBP - - 47,711 -USD - - 69,513 -OTC derivative transactions
EUR 4,000 605,000 - -Total 4,000 605,000 763,298 -BlackRock Fixed Income Strategies Fund (in EUR)Securities lending transactions
AUD - - 2,627,874 -CAD - - 511,549 -CHF - - 1,143,698 -DKK - - 447,280 -EUR - - 81,929,228 -GBP - - 16,736,940 -JPY - - 9,924,563 -NOK - - 169,740 -SEK - - 1,613 -USD - - 29,011,895 -OTC derivative transactions
EUR 7,185,000 40,670,587 - 178,972,374Total 7,185,000 40,670,587 142,504,380 178,972,374BlackRock Global Absolute Return Bond Fund (in EUR)Securities lending transactions
DKK - - 1,151 -EUR - - 59,448 -GBP - - 14,560 -USD - - 25,000 -OTC derivative transactions
EUR 420,000 2,097,000 4,782,514 -Total 420,000 2,097,000 4,882,673 -
Currency
Cashcollateralreceived
Cashcollateral
posted
Non-cashcollateralreceived
Non-cashcollateral
posted
BlackRock Global Equity Absolute Return Fund (in USD)OTC derivative transactions
USD - 100,000 - -Total - 100,000 - -BlackRock Global Event Driven Fund (in USD)Securities lending transactions
AUD - - 51,332 -CAD - - 84,868 -CHF - - 7,900 -EUR - - 10,956,478 -GBP - - 5,849,019 -JPY - - 2,251,064 -MXN - - 7,771 -USD - - 7,919,648 -OTC derivative transactions
USD 35,860,000 35,893,000 - -Total 35,860,000 35,893,000 27,128,080 -BlackRock Global Long/Short Equity Fund (in USD)OTC derivative transactions
USD 1,212,000 - - -Total 1,212,000 - - -BlackRock Global Real Asset Securities Fund (in USD)Securities lending transactions
AUD - - 191,517 -CAD - - 65,777 -CHF - - 370,468 -DKK - - 194,063 -EUR - - 1,621,052 -GBP - - 5,340,408 -JPY - - 2,325,412 -NOK - - 151 -SEK - - 185,896 -USD - - 1,330,765 -Total - - 11,625,509 -BlackRock Macro Opportunities Fund (in USD)Securities lending transactions
AUD - - 2,069 -CAD - - 5,895 -EUR - - 4,461 -GBP - - 7,900 -JPY - - 14,422 -USD - - 8,237 -OTC derivative transactions
USD 360,000 1,561,000 - -Total 360,000 1,561,000 42,984 -BlackRock Managed Index Portfolios − Conservative (in EUR)Securities lending transactions
CAD - - 3,866 -CHF - - 2,862 -EUR - - 1,182,662 -GBP - - 497,555 -JPY - - 1,299,335 -MXN - - 4,107 -USD - - 1,372,772 -Total - - 4,363,159 -
Supplementary Information (Unaudited) continued
BlackRock Strategic Funds[730]
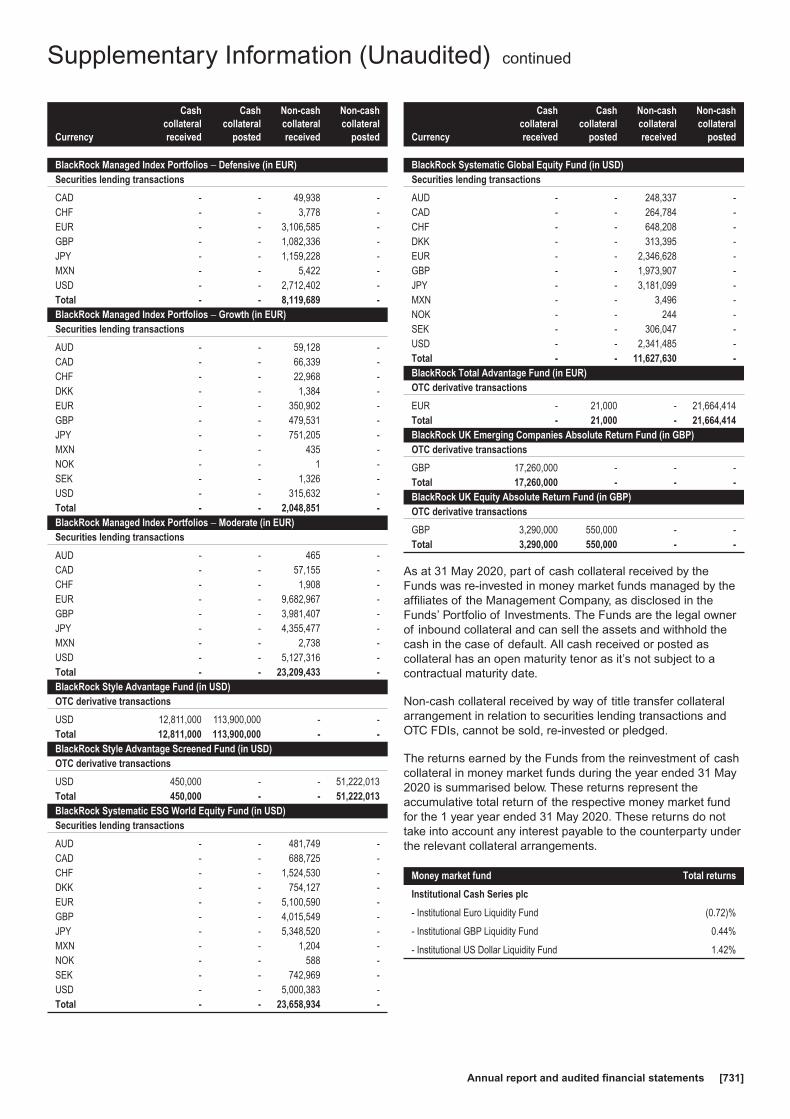
Currency
Cashcollateralreceived
Cashcollateral
posted
Non-cashcollateralreceived
Non-cashcollateral
posted
BlackRock Managed Index Portfolios − Defensive (in EUR)Securities lending transactions
CAD - - 49,938 -CHF - - 3,778 -EUR - - 3,106,585 -GBP - - 1,082,336 -JPY - - 1,159,228 -MXN - - 5,422 -USD - - 2,712,402 -Total - - 8,119,689 -BlackRock Managed Index Portfolios − Growth (in EUR)Securities lending transactions
AUD - - 59,128 -CAD - - 66,339 -CHF - - 22,968 -DKK - - 1,384 -EUR - - 350,902 -GBP - - 479,531 -JPY - - 751,205 -MXN - - 435 -NOK - - 1 -SEK - - 1,326 -USD - - 315,632 -Total - - 2,048,851 -BlackRock Managed Index Portfolios − Moderate (in EUR)Securities lending transactions
AUD - - 465 -CAD - - 57,155 -CHF - - 1,908 -EUR - - 9,682,967 -GBP - - 3,981,407 -JPY - - 4,355,477 -MXN - - 2,738 -USD - - 5,127,316 -Total - - 23,209,433 -BlackRock Style Advantage Fund (in USD)OTC derivative transactions
USD 12,811,000 113,900,000 - -Total 12,811,000 113,900,000 - -BlackRock Style Advantage Screened Fund (in USD)OTC derivative transactions
USD 450,000 - - 51,222,013Total 450,000 - - 51,222,013BlackRock Systematic ESG World Equity Fund (in USD)Securities lending transactions
AUD - - 481,749 -CAD - - 688,725 -CHF - - 1,524,530 -DKK - - 754,127 -EUR - - 5,100,590 -GBP - - 4,015,549 -JPY - - 5,348,520 -MXN - - 1,204 -NOK - - 588 -SEK - - 742,969 -USD - - 5,000,383 -Total - - 23,658,934 -
Currency
Cashcollateralreceived
Cashcollateral
posted
Non-cashcollateralreceived
Non-cashcollateral
posted
BlackRock Systematic Global Equity Fund (in USD)Securities lending transactions
AUD - - 248,337 -CAD - - 264,784 -CHF - - 648,208 -DKK - - 313,395 -EUR - - 2,346,628 -GBP - - 1,973,907 -JPY - - 3,181,099 -MXN - - 3,496 -NOK - - 244 -SEK - - 306,047 -USD - - 2,341,485 -Total - - 11,627,630 -BlackRock Total Advantage Fund (in EUR)OTC derivative transactions
EUR - 21,000 - 21,664,414Total - 21,000 - 21,664,414BlackRock UK Emerging Companies Absolute Return Fund (in GBP)OTC derivative transactions
GBP 17,260,000 - - -Total 17,260,000 - - -BlackRock UK Equity Absolute Return Fund (in GBP)OTC derivative transactions
GBP 3,290,000 550,000 - -Total 3,290,000 550,000 - -
As at 31 May 2020, part of cash collateral received by theFunds was re-invested in money market funds managed by theaffiliates of the Management Company, as disclosed in theFunds’ Portfolio of Investments. The Funds are the legal ownerof inbound collateral and can sell the assets and withhold thecash in the case of default. All cash received or posted ascollateral has an open maturity tenor as it’s not subject to acontractual maturity date.
Non-cash collateral received by way of title transfer collateralarrangement in relation to securities lending transactions andOTC FDIs, cannot be sold, re-invested or pledged.
The returns earned by the Funds from the reinvestment of cashcollateral in money market funds during the year ended 31 May2020 is summarised below. These returns represent theaccumulative total return of the respective money market fundfor the 1 year year ended 31 May 2020. These returns do nottake into account any interest payable to the counterparty underthe relevant collateral arrangements.
Money market fund Total returns
Institutional Cash Series plc
- Institutional Euro Liquidity Fund (0.72)%
- Institutional GBP Liquidity Fund 0.44%
- Institutional US Dollar Liquidity Fund 1.42%
Supplementary Information (Unaudited) continued
Annual report and audited financial statements [731]
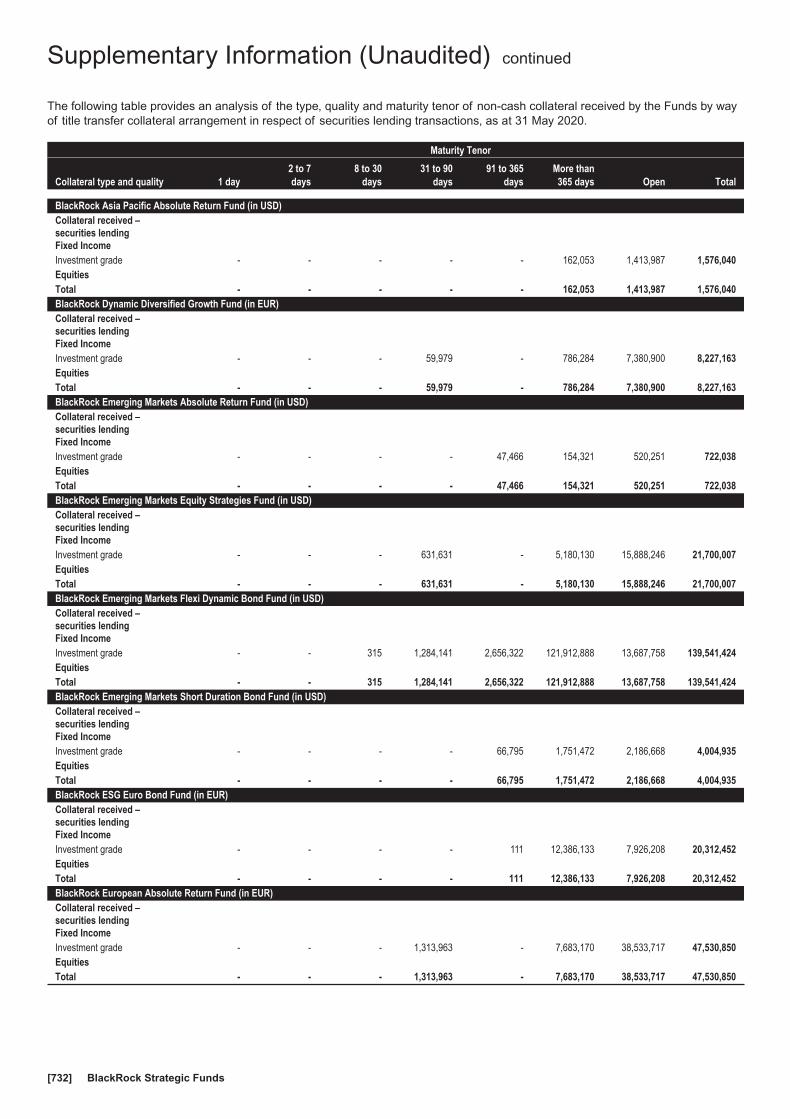
The following table provides an analysis of the type, quality and maturity tenor of non-cash collateral received by the Funds by wayof title transfer collateral arrangement in respect of securities lending transactions, as at 31 May 2020.
Maturity Tenor
Collateral type and quality 1 day2 to 7days
8 to 30days
31 to 90days
91 to 365days
More than365 days Open Total
BlackRock Asia Pacific Absolute Return Fund (in USD)Collateral received –securities lendingFixed IncomeInvestment grade - - - - - 162,053 1,413,987 1,576,040EquitiesTotal - - - - - 162,053 1,413,987 1,576,040BlackRock Dynamic Diversified Growth Fund (in EUR)Collateral received –securities lendingFixed IncomeInvestment grade - - - 59,979 - 786,284 7,380,900 8,227,163EquitiesTotal - - - 59,979 - 786,284 7,380,900 8,227,163BlackRock Emerging Markets Absolute Return Fund (in USD)Collateral received –securities lendingFixed IncomeInvestment grade - - - - 47,466 154,321 520,251 722,038EquitiesTotal - - - - 47,466 154,321 520,251 722,038BlackRock Emerging Markets Equity Strategies Fund (in USD)Collateral received –securities lendingFixed IncomeInvestment grade - - - 631,631 - 5,180,130 15,888,246 21,700,007EquitiesTotal - - - 631,631 - 5,180,130 15,888,246 21,700,007BlackRock Emerging Markets Flexi Dynamic Bond Fund (in USD)Collateral received –securities lendingFixed IncomeInvestment grade - - 315 1,284,141 2,656,322 121,912,888 13,687,758 139,541,424EquitiesTotal - - 315 1,284,141 2,656,322 121,912,888 13,687,758 139,541,424BlackRock Emerging Markets Short Duration Bond Fund (in USD)Collateral received –securities lendingFixed IncomeInvestment grade - - - - 66,795 1,751,472 2,186,668 4,004,935EquitiesTotal - - - - 66,795 1,751,472 2,186,668 4,004,935BlackRock ESG Euro Bond Fund (in EUR)Collateral received –securities lendingFixed IncomeInvestment grade - - - - 111 12,386,133 7,926,208 20,312,452EquitiesTotal - - - - 111 12,386,133 7,926,208 20,312,452BlackRock European Absolute Return Fund (in EUR)Collateral received –securities lendingFixed IncomeInvestment grade - - - 1,313,963 - 7,683,170 38,533,717 47,530,850EquitiesTotal - - - 1,313,963 - 7,683,170 38,533,717 47,530,850
Supplementary Information (Unaudited) continued
BlackRock Strategic Funds[732]
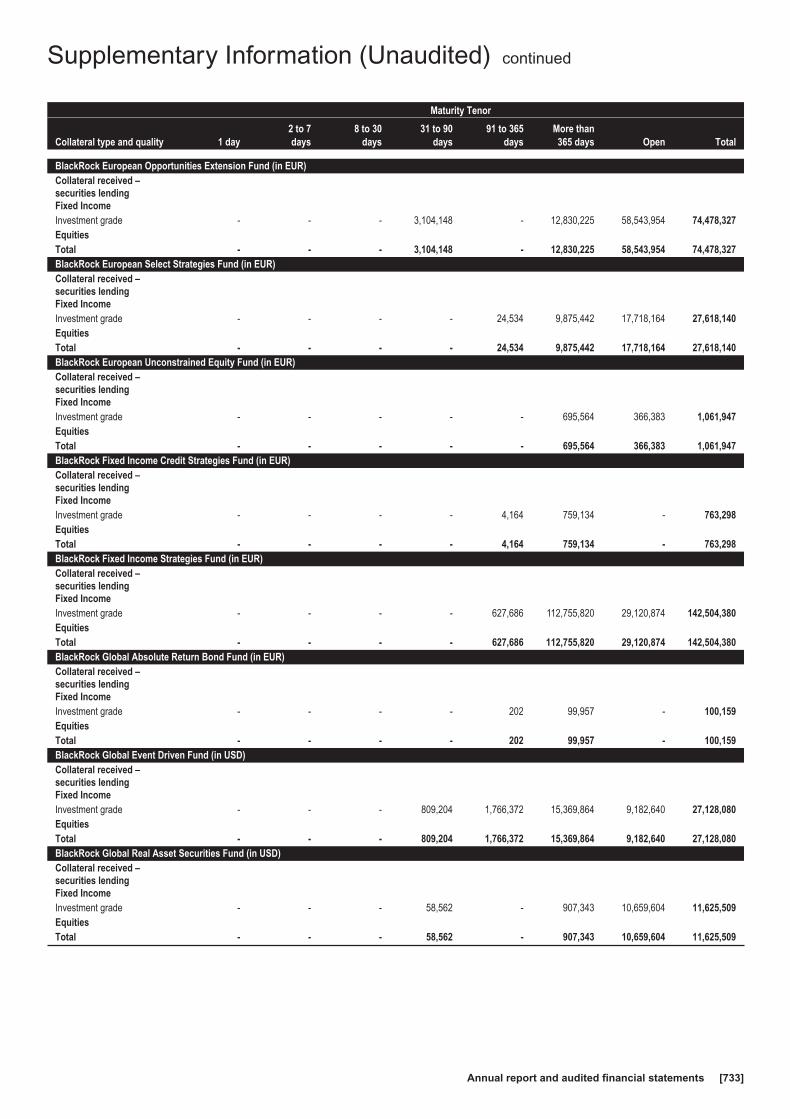
Maturity Tenor
Collateral type and quality 1 day2 to 7days
8 to 30days
31 to 90days
91 to 365days
More than365 days Open Total
BlackRock European Opportunities Extension Fund (in EUR)Collateral received –securities lendingFixed IncomeInvestment grade - - - 3,104,148 - 12,830,225 58,543,954 74,478,327EquitiesTotal - - - 3,104,148 - 12,830,225 58,543,954 74,478,327BlackRock European Select Strategies Fund (in EUR)Collateral received –securities lendingFixed IncomeInvestment grade - - - - 24,534 9,875,442 17,718,164 27,618,140EquitiesTotal - - - - 24,534 9,875,442 17,718,164 27,618,140BlackRock European Unconstrained Equity Fund (in EUR)Collateral received –securities lendingFixed IncomeInvestment grade - - - - - 695,564 366,383 1,061,947EquitiesTotal - - - - - 695,564 366,383 1,061,947BlackRock Fixed Income Credit Strategies Fund (in EUR)Collateral received –securities lendingFixed IncomeInvestment grade - - - - 4,164 759,134 - 763,298EquitiesTotal - - - - 4,164 759,134 - 763,298BlackRock Fixed Income Strategies Fund (in EUR)Collateral received –securities lendingFixed IncomeInvestment grade - - - - 627,686 112,755,820 29,120,874 142,504,380EquitiesTotal - - - - 627,686 112,755,820 29,120,874 142,504,380BlackRock Global Absolute Return Bond Fund (in EUR)Collateral received –securities lendingFixed IncomeInvestment grade - - - - 202 99,957 - 100,159EquitiesTotal - - - - 202 99,957 - 100,159BlackRock Global Event Driven Fund (in USD)Collateral received –securities lendingFixed IncomeInvestment grade - - - 809,204 1,766,372 15,369,864 9,182,640 27,128,080EquitiesTotal - - - 809,204 1,766,372 15,369,864 9,182,640 27,128,080BlackRock Global Real Asset Securities Fund (in USD)Collateral received –securities lendingFixed IncomeInvestment grade - - - 58,562 - 907,343 10,659,604 11,625,509EquitiesTotal - - - 58,562 - 907,343 10,659,604 11,625,509
Supplementary Information (Unaudited) continued
Annual report and audited financial statements [733]
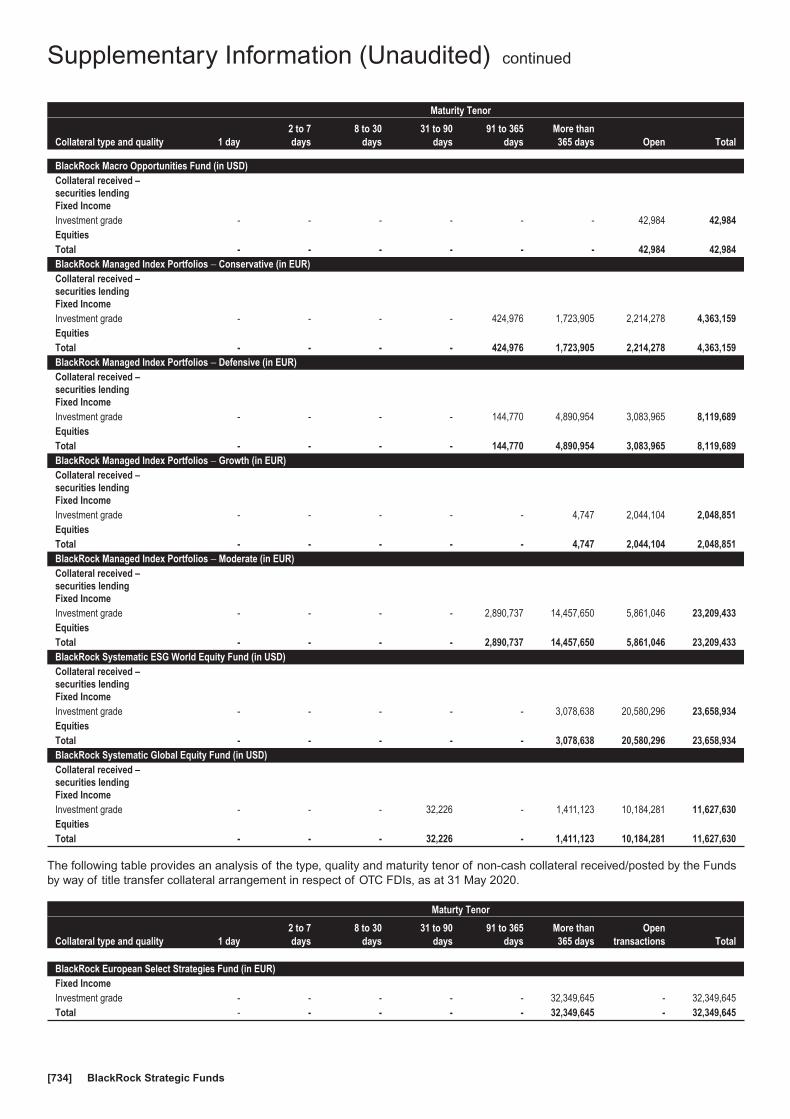
Maturity Tenor
Collateral type and quality 1 day2 to 7days
8 to 30days
31 to 90days
91 to 365days
More than365 days Open Total
BlackRock Macro Opportunities Fund (in USD)Collateral received –securities lendingFixed IncomeInvestment grade - - - - - - 42,984 42,984EquitiesTotal - - - - - - 42,984 42,984BlackRock Managed Index Portfolios − Conservative (in EUR)Collateral received –securities lendingFixed IncomeInvestment grade - - - - 424,976 1,723,905 2,214,278 4,363,159EquitiesTotal - - - - 424,976 1,723,905 2,214,278 4,363,159BlackRock Managed Index Portfolios − Defensive (in EUR)Collateral received –securities lendingFixed IncomeInvestment grade - - - - 144,770 4,890,954 3,083,965 8,119,689EquitiesTotal - - - - 144,770 4,890,954 3,083,965 8,119,689BlackRock Managed Index Portfolios − Growth (in EUR)Collateral received –securities lendingFixed IncomeInvestment grade - - - - - 4,747 2,044,104 2,048,851EquitiesTotal - - - - - 4,747 2,044,104 2,048,851BlackRock Managed Index Portfolios − Moderate (in EUR)Collateral received –securities lendingFixed IncomeInvestment grade - - - - 2,890,737 14,457,650 5,861,046 23,209,433EquitiesTotal - - - - 2,890,737 14,457,650 5,861,046 23,209,433BlackRock Systematic ESG World Equity Fund (in USD)Collateral received –securities lendingFixed IncomeInvestment grade - - - - - 3,078,638 20,580,296 23,658,934EquitiesTotal - - - - - 3,078,638 20,580,296 23,658,934BlackRock Systematic Global Equity Fund (in USD)Collateral received –securities lendingFixed IncomeInvestment grade - - - 32,226 - 1,411,123 10,184,281 11,627,630EquitiesTotal - - - 32,226 - 1,411,123 10,184,281 11,627,630
The following table provides an analysis of the type, quality and maturity tenor of non-cash collateral received/posted by the Fundsby way of title transfer collateral arrangement in respect of OTC FDIs, as at 31 May 2020.
Maturty Tenor
Collateral type and quality 1 day2 to 7days
8 to 30days
31 to 90days
91 to 365days
More than365 days
Opentransactions Total
BlackRock European Select Strategies Fund (in EUR)Fixed IncomeInvestment grade - - - - - 32,349,645 - 32,349,645Total - - - - - 32,349,645 - 32,349,645
Supplementary Information (Unaudited) continued
BlackRock Strategic Funds[734]
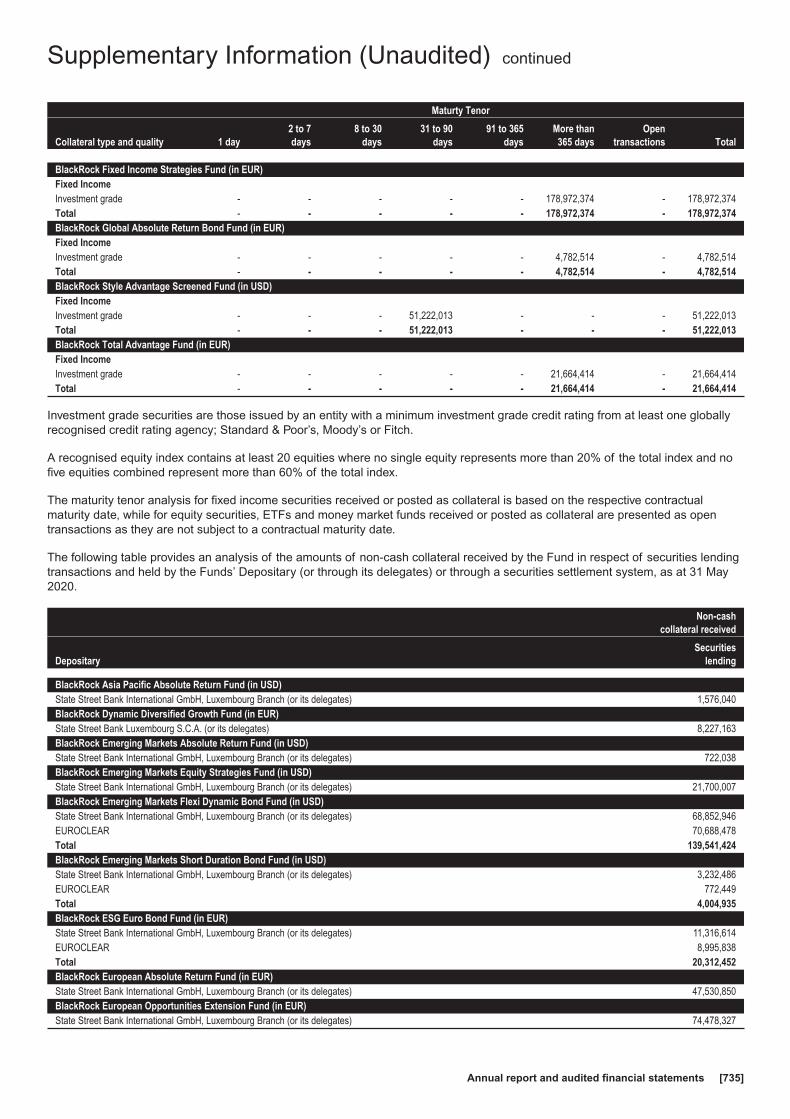
Maturty Tenor
Collateral type and quality 1 day2 to 7days
8 to 30days
31 to 90days
91 to 365days
More than365 days
Opentransactions Total
BlackRock Fixed Income Strategies Fund (in EUR)Fixed IncomeInvestment grade - - - - - 178,972,374 - 178,972,374Total - - - - - 178,972,374 - 178,972,374BlackRock Global Absolute Return Bond Fund (in EUR)Fixed IncomeInvestment grade - - - - - 4,782,514 - 4,782,514Total - - - - - 4,782,514 - 4,782,514BlackRock Style Advantage Screened Fund (in USD)Fixed IncomeInvestment grade - - - 51,222,013 - - - 51,222,013Total - - - 51,222,013 - - - 51,222,013BlackRock Total Advantage Fund (in EUR)Fixed IncomeInvestment grade - - - - - 21,664,414 - 21,664,414Total - - - - - 21,664,414 - 21,664,414
Investment grade securities are those issued by an entity with a minimum investment grade credit rating from at least one globallyrecognised credit rating agency; Standard & Poor’s, Moody’s or Fitch.
A recognised equity index contains at least 20 equities where no single equity represents more than 20% of the total index and nofive equities combined represent more than 60% of the total index.
The maturity tenor analysis for fixed income securities received or posted as collateral is based on the respective contractualmaturity date, while for equity securities, ETFs and money market funds received or posted as collateral are presented as opentransactions as they are not subject to a contractual maturity date.
The following table provides an analysis of the amounts of non-cash collateral received by the Fund in respect of securities lendingtransactions and held by the Funds’ Depositary (or through its delegates) or through a securities settlement system, as at 31 May2020.
Non-cashcollateral received
DepositarySecurities
lending
BlackRock Asia Pacific Absolute Return Fund (in USD)State Street Bank International GmbH, Luxembourg Branch (or its delegates) 1,576,040BlackRock Dynamic Diversified Growth Fund (in EUR)State Street Bank Luxembourg S.C.A. (or its delegates) 8,227,163BlackRock Emerging Markets Absolute Return Fund (in USD)State Street Bank International GmbH, Luxembourg Branch (or its delegates) 722,038BlackRock Emerging Markets Equity Strategies Fund (in USD)State Street Bank International GmbH, Luxembourg Branch (or its delegates) 21,700,007BlackRock Emerging Markets Flexi Dynamic Bond Fund (in USD)State Street Bank International GmbH, Luxembourg Branch (or its delegates) 68,852,946EUROCLEAR 70,688,478Total 139,541,424BlackRock Emerging Markets Short Duration Bond Fund (in USD)State Street Bank International GmbH, Luxembourg Branch (or its delegates) 3,232,486EUROCLEAR 772,449Total 4,004,935BlackRock ESG Euro Bond Fund (in EUR)State Street Bank International GmbH, Luxembourg Branch (or its delegates) 11,316,614EUROCLEAR 8,995,838Total 20,312,452BlackRock European Absolute Return Fund (in EUR)State Street Bank International GmbH, Luxembourg Branch (or its delegates) 47,530,850BlackRock European Opportunities Extension Fund (in EUR)State Street Bank International GmbH, Luxembourg Branch (or its delegates) 74,478,327
Supplementary Information (Unaudited) continued
Annual report and audited financial statements [735]
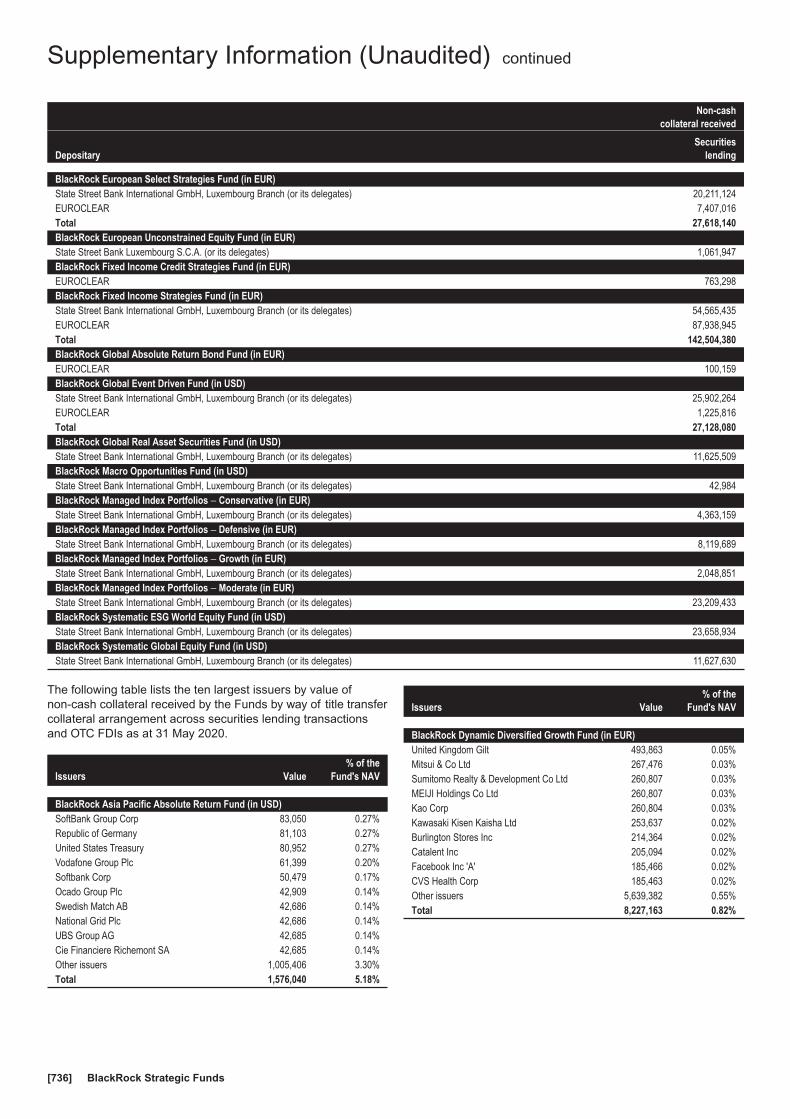
Non-cashcollateral received
DepositarySecurities
lending
BlackRock European Select Strategies Fund (in EUR)State Street Bank International GmbH, Luxembourg Branch (or its delegates) 20,211,124EUROCLEAR 7,407,016Total 27,618,140BlackRock European Unconstrained Equity Fund (in EUR)State Street Bank Luxembourg S.C.A. (or its delegates) 1,061,947BlackRock Fixed Income Credit Strategies Fund (in EUR)EUROCLEAR 763,298BlackRock Fixed Income Strategies Fund (in EUR)State Street Bank International GmbH, Luxembourg Branch (or its delegates) 54,565,435EUROCLEAR 87,938,945Total 142,504,380BlackRock Global Absolute Return Bond Fund (in EUR)EUROCLEAR 100,159BlackRock Global Event Driven Fund (in USD)State Street Bank International GmbH, Luxembourg Branch (or its delegates) 25,902,264EUROCLEAR 1,225,816Total 27,128,080BlackRock Global Real Asset Securities Fund (in USD)State Street Bank International GmbH, Luxembourg Branch (or its delegates) 11,625,509BlackRock Macro Opportunities Fund (in USD)State Street Bank International GmbH, Luxembourg Branch (or its delegates) 42,984BlackRock Managed Index Portfolios − Conservative (in EUR)State Street Bank International GmbH, Luxembourg Branch (or its delegates) 4,363,159BlackRock Managed Index Portfolios − Defensive (in EUR)State Street Bank International GmbH, Luxembourg Branch (or its delegates) 8,119,689BlackRock Managed Index Portfolios − Growth (in EUR)State Street Bank International GmbH, Luxembourg Branch (or its delegates) 2,048,851BlackRock Managed Index Portfolios − Moderate (in EUR)State Street Bank International GmbH, Luxembourg Branch (or its delegates) 23,209,433BlackRock Systematic ESG World Equity Fund (in USD)State Street Bank International GmbH, Luxembourg Branch (or its delegates) 23,658,934BlackRock Systematic Global Equity Fund (in USD)State Street Bank International GmbH, Luxembourg Branch (or its delegates) 11,627,630
The following table lists the ten largest issuers by value ofnon-cash collateral received by the Funds by way of title transfercollateral arrangement across securities lending transactionsand OTC FDIs as at 31 May 2020.
Issuers Value% of the
Fund's NAV
BlackRock Asia Pacific Absolute Return Fund (in USD)SoftBank Group Corp 83,050 0.27%Republic of Germany 81,103 0.27%United States Treasury 80,952 0.27%Vodafone Group Plc 61,399 0.20%Softbank Corp 50,479 0.17%Ocado Group Plc 42,909 0.14%Swedish Match AB 42,686 0.14%National Grid Plc 42,686 0.14%UBS Group AG 42,685 0.14%Cie Financiere Richemont SA 42,685 0.14%Other issuers 1,005,406 3.30%Total 1,576,040 5.18%
Issuers Value% of the
Fund's NAV
BlackRock Dynamic Diversified Growth Fund (in EUR)United Kingdom Gilt 493,863 0.05%Mitsui & Co Ltd 267,476 0.03%Sumitomo Realty & Development Co Ltd 260,807 0.03%MEIJI Holdings Co Ltd 260,807 0.03%Kao Corp 260,804 0.03%Kawasaki Kisen Kaisha Ltd 253,637 0.02%Burlington Stores Inc 214,364 0.02%Catalent Inc 205,094 0.02%Facebook Inc 'A' 185,466 0.02%CVS Health Corp 185,463 0.02%Other issuers 5,639,382 0.55%Total 8,227,163 0.82%
Supplementary Information (Unaudited) continued
BlackRock Strategic Funds[736]
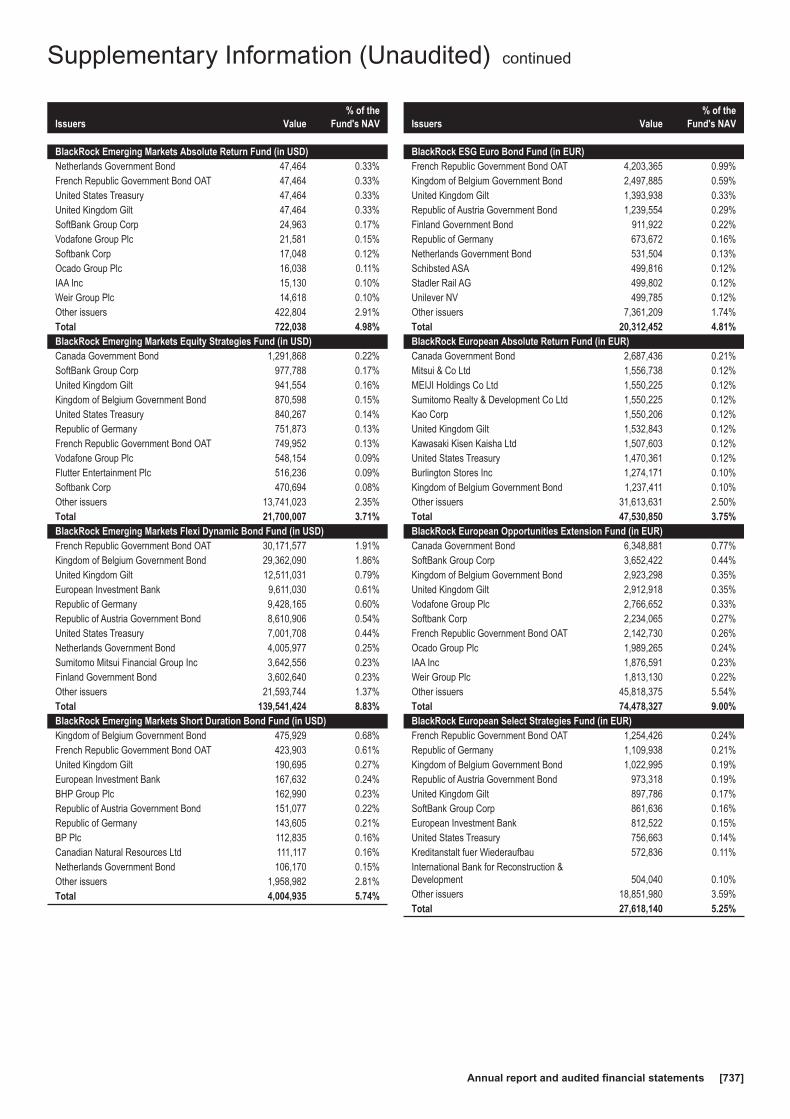
Issuers Value% of the
Fund's NAV
BlackRock Emerging Markets Absolute Return Fund (in USD)Netherlands Government Bond 47,464 0.33%French Republic Government Bond OAT 47,464 0.33%United States Treasury 47,464 0.33%United Kingdom Gilt 47,464 0.33%SoftBank Group Corp 24,963 0.17%Vodafone Group Plc 21,581 0.15%Softbank Corp 17,048 0.12%Ocado Group Plc 16,038 0.11%IAA Inc 15,130 0.10%Weir Group Plc 14,618 0.10%Other issuers 422,804 2.91%Total 722,038 4.98%BlackRock Emerging Markets Equity Strategies Fund (in USD)Canada Government Bond 1,291,868 0.22%SoftBank Group Corp 977,788 0.17%United Kingdom Gilt 941,554 0.16%Kingdom of Belgium Government Bond 870,598 0.15%United States Treasury 840,267 0.14%Republic of Germany 751,873 0.13%French Republic Government Bond OAT 749,952 0.13%Vodafone Group Plc 548,154 0.09%Flutter Entertainment Plc 516,236 0.09%Softbank Corp 470,694 0.08%Other issuers 13,741,023 2.35%Total 21,700,007 3.71%BlackRock Emerging Markets Flexi Dynamic Bond Fund (in USD)French Republic Government Bond OAT 30,171,577 1.91%Kingdom of Belgium Government Bond 29,362,090 1.86%United Kingdom Gilt 12,511,031 0.79%European Investment Bank 9,611,030 0.61%Republic of Germany 9,428,165 0.60%Republic of Austria Government Bond 8,610,906 0.54%United States Treasury 7,001,708 0.44%Netherlands Government Bond 4,005,977 0.25%Sumitomo Mitsui Financial Group Inc 3,642,556 0.23%Finland Government Bond 3,602,640 0.23%Other issuers 21,593,744 1.37%Total 139,541,424 8.83%BlackRock Emerging Markets Short Duration Bond Fund (in USD)Kingdom of Belgium Government Bond 475,929 0.68%French Republic Government Bond OAT 423,903 0.61%United Kingdom Gilt 190,695 0.27%European Investment Bank 167,632 0.24%BHP Group Plc 162,990 0.23%Republic of Austria Government Bond 151,077 0.22%Republic of Germany 143,605 0.21%BP Plc 112,835 0.16%Canadian Natural Resources Ltd 111,117 0.16%Netherlands Government Bond 106,170 0.15%Other issuers 1,958,982 2.81%Total 4,004,935 5.74%
Issuers Value% of the
Fund's NAV
BlackRock ESG Euro Bond Fund (in EUR)French Republic Government Bond OAT 4,203,365 0.99%Kingdom of Belgium Government Bond 2,497,885 0.59%United Kingdom Gilt 1,393,938 0.33%Republic of Austria Government Bond 1,239,554 0.29%Finland Government Bond 911,922 0.22%Republic of Germany 673,672 0.16%Netherlands Government Bond 531,504 0.13%Schibsted ASA 499,816 0.12%Stadler Rail AG 499,802 0.12%Unilever NV 499,785 0.12%Other issuers 7,361,209 1.74%Total 20,312,452 4.81%BlackRock European Absolute Return Fund (in EUR)Canada Government Bond 2,687,436 0.21%Mitsui & Co Ltd 1,556,738 0.12%MEIJI Holdings Co Ltd 1,550,225 0.12%Sumitomo Realty & Development Co Ltd 1,550,225 0.12%Kao Corp 1,550,206 0.12%United Kingdom Gilt 1,532,843 0.12%Kawasaki Kisen Kaisha Ltd 1,507,603 0.12%United States Treasury 1,470,361 0.12%Burlington Stores Inc 1,274,171 0.10%Kingdom of Belgium Government Bond 1,237,411 0.10%Other issuers 31,613,631 2.50%Total 47,530,850 3.75%BlackRock European Opportunities Extension Fund (in EUR)Canada Government Bond 6,348,881 0.77%SoftBank Group Corp 3,652,422 0.44%Kingdom of Belgium Government Bond 2,923,298 0.35%United Kingdom Gilt 2,912,918 0.35%Vodafone Group Plc 2,766,652 0.33%Softbank Corp 2,234,065 0.27%French Republic Government Bond OAT 2,142,730 0.26%Ocado Group Plc 1,989,265 0.24%IAA Inc 1,876,591 0.23%Weir Group Plc 1,813,130 0.22%Other issuers 45,818,375 5.54%Total 74,478,327 9.00%BlackRock European Select Strategies Fund (in EUR)French Republic Government Bond OAT 1,254,426 0.24%Republic of Germany 1,109,938 0.21%Kingdom of Belgium Government Bond 1,022,995 0.19%Republic of Austria Government Bond 973,318 0.19%United Kingdom Gilt 897,786 0.17%SoftBank Group Corp 861,636 0.16%European Investment Bank 812,522 0.15%United States Treasury 756,663 0.14%Kreditanstalt fuer Wiederaufbau 572,836 0.11%International Bank for Reconstruction &Development 504,040 0.10%Other issuers 18,851,980 3.59%Total 27,618,140 5.25%
Supplementary Information (Unaudited) continued
Annual report and audited financial statements [737]
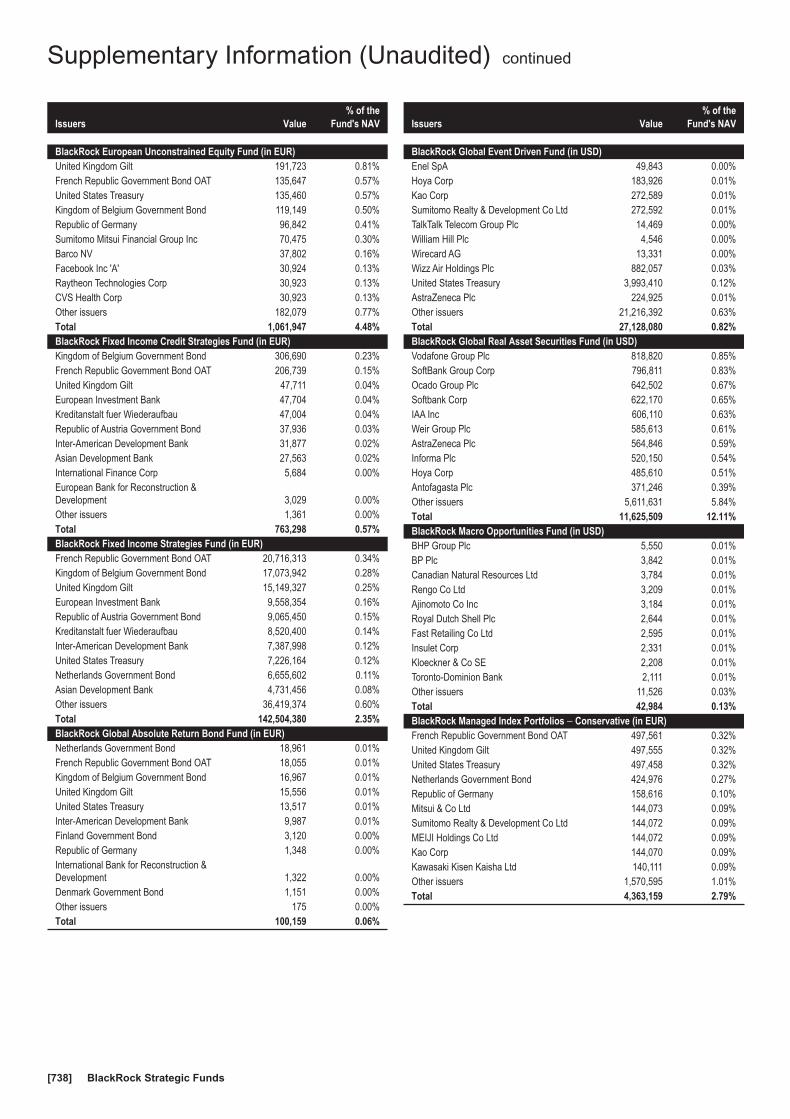
Issuers Value% of the
Fund's NAV
BlackRock European Unconstrained Equity Fund (in EUR)United Kingdom Gilt 191,723 0.81%French Republic Government Bond OAT 135,647 0.57%United States Treasury 135,460 0.57%Kingdom of Belgium Government Bond 119,149 0.50%Republic of Germany 96,842 0.41%Sumitomo Mitsui Financial Group Inc 70,475 0.30%Barco NV 37,802 0.16%Facebook Inc 'A' 30,924 0.13%Raytheon Technologies Corp 30,923 0.13%CVS Health Corp 30,923 0.13%Other issuers 182,079 0.77%Total 1,061,947 4.48%BlackRock Fixed Income Credit Strategies Fund (in EUR)Kingdom of Belgium Government Bond 306,690 0.23%French Republic Government Bond OAT 206,739 0.15%United Kingdom Gilt 47,711 0.04%European Investment Bank 47,704 0.04%Kreditanstalt fuer Wiederaufbau 47,004 0.04%Republic of Austria Government Bond 37,936 0.03%Inter-American Development Bank 31,877 0.02%Asian Development Bank 27,563 0.02%International Finance Corp 5,684 0.00%European Bank for Reconstruction &Development 3,029 0.00%Other issuers 1,361 0.00%Total 763,298 0.57%BlackRock Fixed Income Strategies Fund (in EUR)French Republic Government Bond OAT 20,716,313 0.34%Kingdom of Belgium Government Bond 17,073,942 0.28%United Kingdom Gilt 15,149,327 0.25%European Investment Bank 9,558,354 0.16%Republic of Austria Government Bond 9,065,450 0.15%Kreditanstalt fuer Wiederaufbau 8,520,400 0.14%Inter-American Development Bank 7,387,998 0.12%United States Treasury 7,226,164 0.12%Netherlands Government Bond 6,655,602 0.11%Asian Development Bank 4,731,456 0.08%Other issuers 36,419,374 0.60%Total 142,504,380 2.35%BlackRock Global Absolute Return Bond Fund (in EUR)Netherlands Government Bond 18,961 0.01%French Republic Government Bond OAT 18,055 0.01%Kingdom of Belgium Government Bond 16,967 0.01%United Kingdom Gilt 15,556 0.01%United States Treasury 13,517 0.01%Inter-American Development Bank 9,987 0.01%Finland Government Bond 3,120 0.00%Republic of Germany 1,348 0.00%International Bank for Reconstruction &Development 1,322 0.00%Denmark Government Bond 1,151 0.00%Other issuers 175 0.00%Total 100,159 0.06%
Issuers Value% of the
Fund's NAV
BlackRock Global Event Driven Fund (in USD)Enel SpA 49,843 0.00%Hoya Corp 183,926 0.01%Kao Corp 272,589 0.01%Sumitomo Realty & Development Co Ltd 272,592 0.01%TalkTalk Telecom Group Plc 14,469 0.00%William Hill Plc 4,546 0.00%Wirecard AG 13,331 0.00%Wizz Air Holdings Plc 882,057 0.03%United States Treasury 3,993,410 0.12%AstraZeneca Plc 224,925 0.01%Other issuers 21,216,392 0.63%Total 27,128,080 0.82%BlackRock Global Real Asset Securities Fund (in USD)Vodafone Group Plc 818,820 0.85%SoftBank Group Corp 796,811 0.83%Ocado Group Plc 642,502 0.67%Softbank Corp 622,170 0.65%IAA Inc 606,110 0.63%Weir Group Plc 585,613 0.61%AstraZeneca Plc 564,846 0.59%Informa Plc 520,150 0.54%Hoya Corp 485,610 0.51%Antofagasta Plc 371,246 0.39%Other issuers 5,611,631 5.84%Total 11,625,509 12.11%BlackRock Macro Opportunities Fund (in USD)BHP Group Plc 5,550 0.01%BP Plc 3,842 0.01%Canadian Natural Resources Ltd 3,784 0.01%Rengo Co Ltd 3,209 0.01%Ajinomoto Co Inc 3,184 0.01%Royal Dutch Shell Plc 2,644 0.01%Fast Retailing Co Ltd 2,595 0.01%Insulet Corp 2,331 0.01%Kloeckner & Co SE 2,208 0.01%Toronto-Dominion Bank 2,111 0.01%Other issuers 11,526 0.03%Total 42,984 0.13%BlackRock Managed Index Portfolios − Conservative (in EUR)French Republic Government Bond OAT 497,561 0.32%United Kingdom Gilt 497,555 0.32%United States Treasury 497,458 0.32%Netherlands Government Bond 424,976 0.27%Republic of Germany 158,616 0.10%Mitsui & Co Ltd 144,073 0.09%Sumitomo Realty & Development Co Ltd 144,072 0.09%MEIJI Holdings Co Ltd 144,072 0.09%Kao Corp 144,070 0.09%Kawasaki Kisen Kaisha Ltd 140,111 0.09%Other issuers 1,570,595 1.01%Total 4,363,159 2.79%
Supplementary Information (Unaudited) continued
BlackRock Strategic Funds[738]

Issuers Value% of the
Fund's NAV
BlackRock Managed Index Portfolios − Defensive (in EUR)French Republic Government Bond OAT 1,082,406 0.53%United Kingdom Gilt 1,082,336 0.53%United States Treasury 1,081,109 0.53%Kingdom of Belgium Government Bond 823,595 0.41%Republic of Germany 705,780 0.35%Sumitomo Mitsui Financial Group Inc 487,144 0.24%Barco NV 261,299 0.13%Mitsui & Co Ltd 190,184 0.09%MEIJI Holdings Co Ltd 190,183 0.09%Sumitomo Realty & Development Co Ltd 190,183 0.09%Other issuers 2,025,470 1.00%Total 8,119,689 3.99%BlackRock Managed Index Portfolios − Growth (in EUR)SoftBank Group Corp 129,534 0.05%Flutter Entertainment Plc 83,179 0.03%Vodafone Group Plc 72,280 0.03%Unicharm Corp 69,650 0.03%Softbank Corp 64,639 0.02%Roche Holding AG 58,326 0.02%Fast Retailing Co Ltd 55,405 0.02%Hoya Corp 55,074 0.02%Toyota Motor Corp 54,140 0.02%Ingenico Group SA 43,435 0.02%Other issuers 1,363,189 0.49%Total 2,048,851 0.75%BlackRock Managed Index Portfolios − Moderate (in EUR)French Republic Government Bond OAT 3,963,869 0.57%United Kingdom Gilt 3,963,786 0.57%United States Treasury 3,962,366 0.57%Netherlands Government Bond 2,890,735 0.42%Republic of Germany 1,492,563 0.21%Kingdom of Belgium Government Bond 942,612 0.14%Sumitomo Mitsui Financial Group Inc 557,541 0.08%Kaken Pharmaceutical Co Ltd 471,961 0.07%JSP Corp 457,243 0.07%Nishimatsuya Chain Co Ltd 430,427 0.06%Other issuers 4,076,330 0.59%Total 23,209,433 3.35%
Issuers Value% of the
Fund's NAV
BlackRock Systematic ESG World Equity Fund (in USD)Republic of Germany 1,293,866 0.59%United States Treasury 1,291,450 0.59%SoftBank Group Corp 779,032 0.35%Infineon Technologies AG 765,566 0.35%Flutter Entertainment Plc 734,932 0.33%National Grid Plc 680,986 0.31%Swedish Match AB 680,978 0.31%Cie Financiere Richemont SA 680,971 0.31%UBS Group AG 680,966 0.31%Unicharm Corp 536,842 0.24%Other issuers 15,533,345 7.04%Total 23,658,934 10.73%BlackRock Systematic Global Equity Fund (in USD)United States Treasury 587,854 0.36%Republic of Germany 568,521 0.35%SoftBank Group Corp 453,959 0.28%Flutter Entertainment Plc 367,973 0.23%National Grid Plc 283,000 0.18%Swedish Match AB 282,997 0.18%Cie Financiere Richemont SA 282,994 0.18%UBS Group AG 282,992 0.18%Infineon Technologies AG 282,983 0.18%Unicharm Corp 275,587 0.17%Other issuers 7,958,770 4.93%Total 11,627,630 7.22%
Non-cash collateral issuer(OTC derivatives transactions) Value
% of theFund's NAV
BlackRock Global Absolute Return Bond Fund (in EUR)Republic of Germany 4,782,514 3.54%
No securities collateral received from a single issuer, in relationto efficient portfolio management and OTC FDIs, has exceeded20% of any of the respective Funds’ NAV at the year end.
None of the Funds has been fully collateralised in securitiesissued or guaranteed by an EU member state at the year end.
Supplementary Information (Unaudited) continued
Annual report and audited financial statements [739]

Want to know more?blackrockinternational.com | +44 (0)20 7743 3000
© 2020 BlackRock, Inc. All Rights reserved. BLACKROCK, BLACKROCK SOLUTIONS, iSHARES, SO WHAT DO I DO WITHMY MONEY, INVESTING FOR A NEW WORLD, and BUILT FOR THESE TIMES are registered and unregistered trademarks ofBlackRock, Inc. or its subsidiaries in the United States and elsewhere. All other trademarks are those of their respective owners.
Copyright © 2022 FDOKUMEN