FINANCIAL STATEMENTS - wiit.cloud
139
FINANCIAL STATEMENTS 2018 Report on Operations
-
Upload
khangminh22 -
Category
Documents
-
view
2 -
download
0
Transcript of FINANCIAL STATEMENTS - wiit.cloud
FINANCIAL
STATEMENTS
2018
Report on Operations
2
2
Company: Wiit S.p.A.
Registered office: Milano, Via Muzio Attendolo detto Sforza n.7
VAT no. and Tax Code: 01615150214
Share Capital: 2,652,066.00 fully paid-in
Milan Register of Companies No. n. 01615150214
R.E.A. (economic and administrative
index) No.
n. 1654427
Number of shares 2.652.066
Wiit Spa is subject to the management and coordination activities of Wiit Fin S.r.l.
Letter to the shareholders
Shareholders,
over the past few years, the harmonization of accounting rules has been one of the
main objectives of the European Community to facilitate the development and
efficiency of European financial markets.
The application of different accounting principles in each member country has in fact
determined a low degree of comparability of the financial statements of European
companies, constituting in fact a brake on the development of these markets. The
European accounting legislation (and in particular the IV and VII directive, respectively
regarding the financial statements and the consolidated financial statements),
differently applied in the individual member countries, was no longer adequate to
guarantee this objective.
We therefore remind you that starting from 2015 the Company has decided to apply
the IAS / IFRS international accounting standards issued by the IASB (International
Accounting Standard Board) and therefore the attached financial statements have
been prepared in compliance with the aforementioned principles.
Chairman & Managing Director
(Riccardo Mazzanti)

4
FINANCIAL STATEMENTS 2018 - REPORT ON OPERATIONS
5
FINANCIAL STATEMENTS 2018 - REPORT ON OPERATIONS
INDEX
Profile ................................................................................................................................ 6
L’offerta ..................................................................... Errore. Il segnalibro non è definito.
Corporate Bodies ............................................... Errore. Il segnalibro non è definito.
Report on Operations ....................................... Errore. Il segnalibro non è definito.
Operating conditions and business developmentErrore. Il segnalibro non è definito.
Research and development activities ......................................................................... 26
Relations with subsidiaries, associates, holding companies and sister companies . 27
Information relating to risks and uncertainties pursuant to art. 2428, paragraph 2, point
6-bis, of the Italian Civil Code
................................................................................... Errore. Il segnalibro non è definito.
Business outlook ............................................................................................................... 34
Programmatic Security Document ............................................................................... 35
Proposed allocation of profit for the year ............. Errore. Il segnalibro non è definito.
6
FINANCIAL STATEMENTS 2018 - REPORT ON OPERATIONS
Profile
WIIT S.p.A. is a company that heads up a Group that operates in the Cloud Computing
sector whose core business consists of the preparation and provision of IT infrastructures
designed to cater for specific customer requirements (mainly in Hosted Private Cloud
and Hybrid Cloud mode) and the provision of complementary services for the
configuration, management and control of the infrastructures in order to ensure their
functionality and continuous availability (primarily PaaS or Platform-as-a-Service).
The company provides Cloud solutions for the so-called “critical applications” of its
customers and, that is, the applications which, if they failed to function correctly, could
impact the customer’s “business continuity”, and which must therefore function
correctly and continuously. The main market ERP – Enterprise Resource Planning
applications, such as SAP, Oracle and Microsoft fall under these types of applications,
plus the critical applications developed on an ad hoc basis to meet the customer’s
business needs (so-called “custom” applications).
For the performance of its operating activities, the company makes use of two
proprietary Data Centres, the main one of which, located in Milan, is TIER IV certified
(i.e. maximum level of reliability) by the Uptime Institute.
In order to ensure the “business continuity” of its customers, the company’s services are
provided through several servers and storage devices, a set-up that ensures they are
constantly available in the event one of them malfunctions or stops working. Hence the
company provides its customers with the Business Continuity and Disaster Recovery
service (which allows data processing systems and all critical customer data to be
replicated almost in real time) and saves the data on a daily basis (back-up).
The Offer
WIIT’s offer is focused on the Hosted Private Cloud and Hybrid Cloud sectors, which
involve the creation of custom IT infrastructures for customers. To a lesser extent, the
Group provides Cloud services in the Public Cloud sector, integrating and managing
the solutions - more standardised - offered by the large market operators, in order to
adjust them into line with the needs of its customers.
As part of its activities, the company offers its own services to customers by combining
the different basic component of each service category, in order to construct a custom
Hosted Private Cloud and/or Hybrid Cloud proposal, based on the specific service,
performance and security requirements of each customer.
7
FINANCIAL STATEMENTS 2018 - REPORT ON OPERATIONS
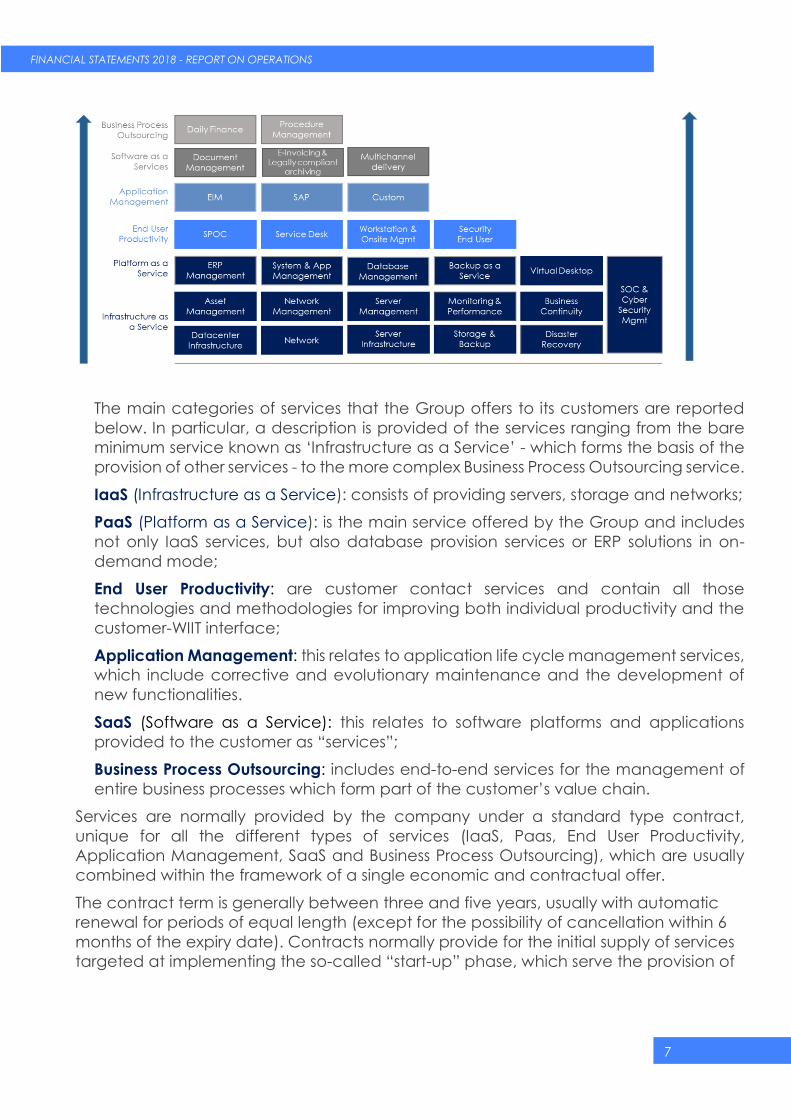
The main categories of services that the Group offers to its customers are reported
below. In particular, a description is provided of the services ranging from the bare
minimum service known as ‘Infrastructure as a Service’ - which forms the basis of the
provision of other services - to the more complex Business Process Outsourcing service.
IaaS (Infrastructure as a Service): consists of providing servers, storage and networks;
PaaS (Platform as a Service): is the main service offered by the Group and includes
not only IaaS services, but also database provision services or ERP solutions in on-
demand mode;
End User Productivity: are customer contact services and contain all those
technologies and methodologies for improving both individual productivity and the
customer-WIIT interface;
Application Management: this relates to application life cycle management services,
which include corrective and evolutionary maintenance and the development of
new functionalities.
SaaS (Software as a Service): this relates to software platforms and applications
provided to the customer as “services”;
Business Process Outsourcing: includes end-to-end services for the management of
entire business processes which form part of the customer’s value chain.
Services are normally provided by the company under a standard type contract,
unique for all the different types of services (IaaS, Paas, End User Productivity,
Application Management, SaaS and Business Process Outsourcing), which are usually
combined within the framework of a single economic and contractual offer.
The contract term is generally between three and five years, usually with automatic
renewal for periods of equal length (except for the possibility of cancellation within 6
months of the expiry date). Contracts normally provide for the initial supply of services
targeted at implementing the so-called “start-up” phase, which serve the provision of

8
FINANCIAL STATEMENTS 2018 - REPORT ON OPERATIONS
the services offered by the Group (“start-up activities”) and subsequent provision of
the specific services requested by the customer.
Certificazions
The company makes use of two proprietary Data Centres, the main one of which, located in Milan, is TIER
IV certified (i.e. maximum level of reliability) by the Uptime Institute. As of today, there are 47 data centres
in the world certified as TIER IV by the Uptime Institute) in the category “Constructed Facility”
(https://uptimeinstitute.com/TierCertification/constructed-facility-certifications.php).
In relation to Data Centres, over time the company has obtained international certifications, in particular
for the security of its own services, such as certifications ISO20000 (Process Compliance), ISO27001
(Information Security), and ISO22301 (Business Continuity) and for the methods of provision of services
compliant with standard ITIL (Infrastructure Library).
The company has also certified the information systems management model of its customers according
to international standard ISO/IEC 20000:2005, as well as its own organisation according to standard ISO
9001 for the development and provision of Business Process Outsourcing services such as: Help Desk IT,
Desktop Management, Server Management, Application Management, Asset Management, System
Housing and Hosting Document Processing System Management.
In order to guarantee the correct management and protection of the data and information managed
through its information systems, in 2012, the company obtained international certification ISO/IEC
27001:2005 (international regulation which sets out the requirements that must be satisfied by a security
management system in information technologies) and has developed a methodology regarding business
continuity based on directive ISO 22301, moving from an approach not based solely on technology, but
able to direct all the processes involved in the restoration of operations.
In addition to these certifications, the company is a top SAP partner and one of the two companies
worldwide to have obtained, as of today, 5 of the 6 SAP operating certifications in the Outsourcing
Operation domain (https://www.sap.com/dmc/exp/2018_Partner_Guide/#/partners).
9
FINANCIAL STATEMENTS 2018 - REPORT ON OPERATIONS
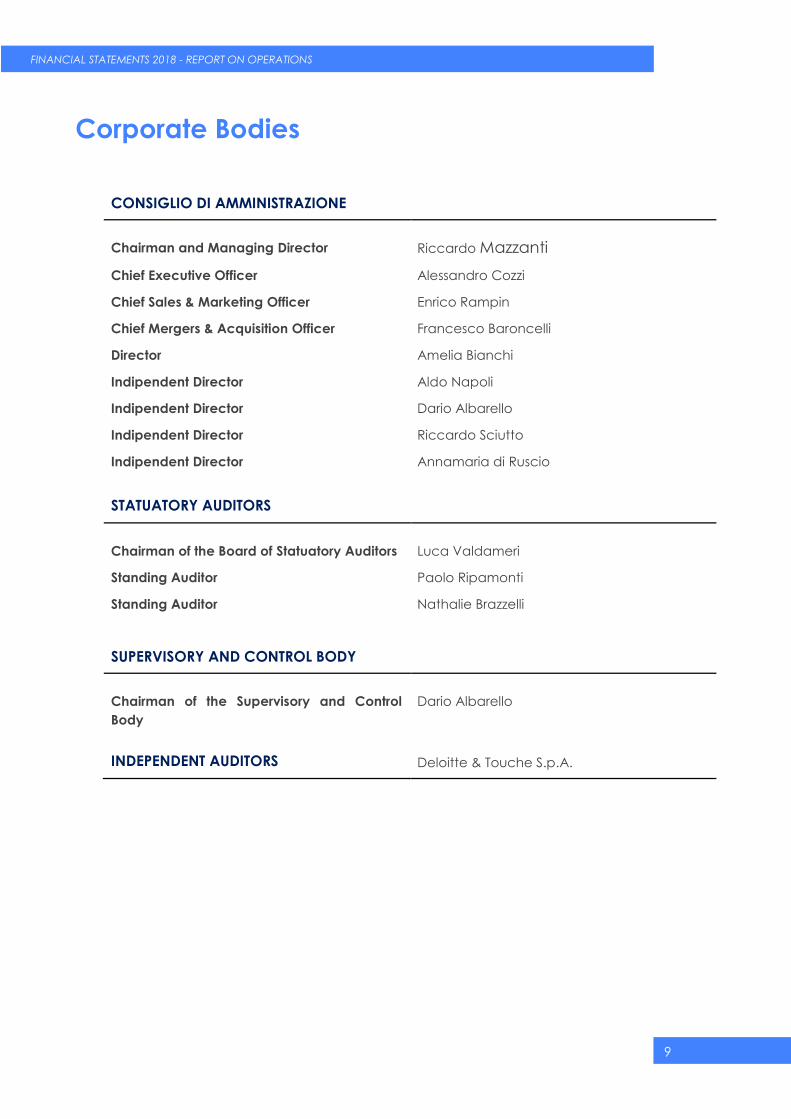
Corporate Bodies
CONSIGLIO DI AMMINISTRAZIONE
Chairman and Managing Director Riccardo Mazzanti
Chief Executive Officer Alessandro Cozzi
Chief Sales & Marketing Officer Enrico Rampin
Chief Mergers & Acquisition Officer Francesco Baroncelli
Director Amelia Bianchi
Indipendent Director Aldo Napoli
Indipendent Director Dario Albarello
Indipendent Director Riccardo Sciutto
Indipendent Director Annamaria di Ruscio
STATUATORY AUDITORS
Chairman of the Board of Statuatory Auditors Luca Valdameri
Standing Auditor Paolo Ripamonti
Standing Auditor Nathalie Brazzelli
SUPERVISORY AND CONTROL BODY
Chairman of the Supervisory and Control
Body
Dario Albarello
INDEPENDENT AUDITORS Deloitte & Touche S.p.A.
10
FINANCIAL STATEMENTS 2018 - REPORT ON OPERATIONS
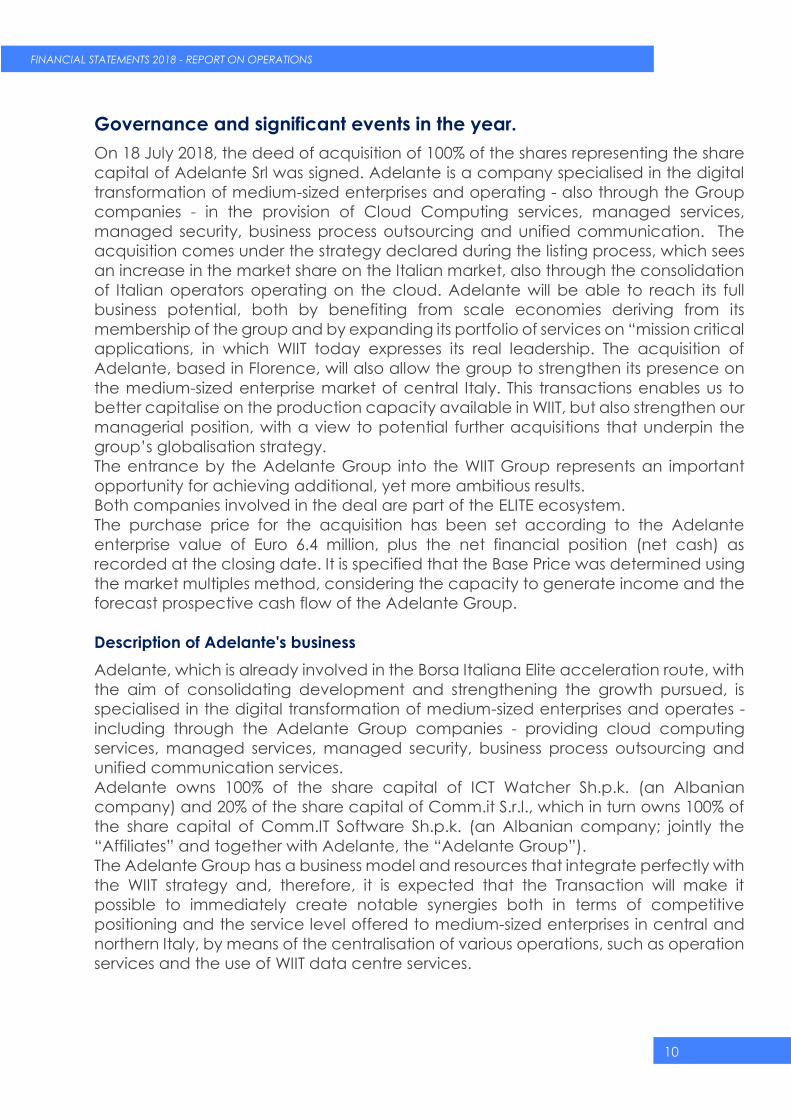
Governance and significant events in the year.
On 18 July 2018, the deed of acquisition of 100% of the shares representing the share
capital of Adelante Srl was signed. Adelante is a company specialised in the digital
transformation of medium-sized enterprises and operating - also through the Group
companies - in the provision of Cloud Computing services, managed services,
managed security, business process outsourcing and unified communication. The
acquisition comes under the strategy declared during the listing process, which sees
an increase in the market share on the Italian market, also through the consolidation
of Italian operators operating on the cloud. Adelante will be able to reach its full
business potential, both by benefiting from scale economies deriving from its
membership of the group and by expanding its portfolio of services on “mission critical
applications, in which WIIT today expresses its real leadership. The acquisition of
Adelante, based in Florence, will also allow the group to strengthen its presence on
the medium-sized enterprise market of central Italy. This transactions enables us to
better capitalise on the production capacity available in WIIT, but also strengthen our
managerial position, with a view to potential further acquisitions that underpin the
group’s globalisation strategy.
The entrance by the Adelante Group into the WIIT Group represents an important
opportunity for achieving additional, yet more ambitious results.
Both companies involved in the deal are part of the ELITE ecosystem.
The purchase price for the acquisition has been set according to the Adelante
enterprise value of Euro 6.4 million, plus the net financial position (net cash) as
recorded at the closing date. It is specified that the Base Price was determined using
the market multiples method, considering the capacity to generate income and the
forecast prospective cash flow of the Adelante Group.
Description of Adelante's business
Adelante, which is already involved in the Borsa Italiana Elite acceleration route, with
the aim of consolidating development and strengthening the growth pursued, is
specialised in the digital transformation of medium-sized enterprises and operates -
including through the Adelante Group companies - providing cloud computing
services, managed services, managed security, business process outsourcing and
unified communication services.
Adelante owns 100% of the share capital of ICT Watcher Sh.p.k. (an Albanian
company) and 20% of the share capital of Comm.it S.r.l., which in turn owns 100% of
the share capital of Comm.IT Software Sh.p.k. (an Albanian company; jointly the
“Affiliates” and together with Adelante, the “Adelante Group”).
The Adelante Group has a business model and resources that integrate perfectly with
the WIIT strategy and, therefore, it is expected that the Transaction will make it
possible to immediately create notable synergies both in terms of competitive
positioning and the service level offered to medium-sized enterprises in central and
northern Italy, by means of the centralisation of various operations, such as operation
services and the use of WIIT data centre services.
11
FINANCIAL STATEMENTS 2018 - REPORT ON OPERATIONS
On 3 December 2018, the Consolidating company completed the acquisition of
65.03% of the shares representing the share capital of Foster S.r.l., a company that
owns a document management platform through which the Group provides, among
other things, enterprise information management and digital business process
outsourcing services, hence obtaining control of 100% of the shares representing
share capital.
In November 2018, the Board of Directors examined and approved the proposed
listing of ordinary WIIT shares on the MTA (screen-based equities market), organised
and managed by Borsa Italiana S.p.A. and, given the conditions were satisfied, on
the STAR Segment.
By means of the listing, the Group will be able to attract the attention of a broader
and diversified investor base with benefits not only in terms of an increase in value
and visibility, Group positioning with respect to its competitors and strategic partners
but also in relation to greater market liquidity with respect to the liquidity that normally
characterises a multi-lateral trading system. In addition, the listing on the MTA, taking
into account the obligations which companies listed on said market must fulfil, will
further boost the professional growth of the management and, generally speaking,
the Group structure, with the resultant benefits stemming from said growth.

12
FINANCIAL STATEMENTS 2018 - REPORT ON OPERATIONS
Report on Operations
13
FINANCIAL STATEMENTS 2018 - REPORT ON OPERATIONS
Report on Operations Dear Shareholders,
Over the last few years, harmonisation of accounting rules has been one of the main
objectives of the European Community, in order to facilitate the development and
efficiency of the European financial markets.
The application of different accounting standards in each member country has
actually meant that the financial statements of European companies are difficult to
compare, indeed putting the brakes on the development of these markets. The
European accounting regulations (and in particular Directives IV and VII, regarding
the separate financial statements and the consolidated financial statements
respectively), applied differently in the individual member countries, are no longer
suitable for guaranteeing said objective.
Therefore, we should also point out to you that, as of 2015, the Company started to
apply the international accounting standards (IAS/IFRS) issued by the IASB
(International Accounting Standards Board) and, therefore, the attached financial
statements were drafted in compliance with the aforementioned standards.
Operating conditions and business development
The Group offers Cloud and IT Outsourcing for critical applications. The offer is
composed of the following multi-year and ongoing services:
Hosted Private Cloud, for companies that intend to make use of the Cloud services
provided by Outsourced Data Centres; and
Hybrid Cloud, for companies that intend to use a hybrid model of the following types
of infrastructures: Private Cloud (within the company), Hosted Private Cloud (data
centre outside the company with largely dedicated and customised infrastructures)
and Public Cloud (data centre outside the company and standard and shared
infrastructures).
The Group also boasts advanced Cyber Security solutions.
The generally rather high level of efficiency and the long-term contracts in the
portfolio allow WIIT to approach 2019 with a competitive offer and with expectations
of natural growth.
The sector in which the company operates presents indicators of growth which,
together with the consolidated ability to acquire and retain customers, to continue
to seize numerous internal growth opportunities and to evaluate interesting external
growth opportunities, means we have positive expectations for the year 2019.
Pursuant to art. 2428, it should be noted that the activities are carried out in the Milan
office, via Muzio Attendolo detto Sforza 7 and in the secondary offices of Rome in Via
Ercolano Salvi 12, of Castelfranco Veneto (TV) in Piazza della Serenissima 20 as
regards the consolidating company, as well as in the offices of Bagno a Ripoli in Via
14
FINANCIAL STATEMENTS 2018 - REPORT ON OPERATIONS
S.Pertini 7 and Tirana Torre Drin Via Abdi Toptani, respectively for Adelante Srl and
ICTW.
In July 2016, the consolidating company established a subsidiary in Switzerland, which
started to operate continuously in both Switzerland and in the USA (Florida).
General economic trend
Growth of the global economy continued in the last few months, but signs of a
cyclical deterioration in many advanced and emerging economies materialised;
global trade prospects continue to worsen, after the slowdown in the first part of last
year. Uncertainties over the economic situation have had repercussions on the
international financial markets, with a decrease in long-term yields and fall in share
prices. Global prospects were impacted by risks relating to a negative outcome to
commercial negotiations between the United States and China, the possible
heightening of financial tensions in emerging countries and the methods with which
Brexit will be implemented.
Growth weakened in the Euro area; in November, industrial production fell
significantly in Germany, France and Italy. Inflation, although remaining at largely
positive values fell due to the slowdown in the prices of energy products. The
Governing Council of the ECB reiterated its intention to maintain a significant
monetary stimulus for a prolonged period.
In Italy, after a halt in growth in the third quarter, the available economic indicators
suggest that activity could have fallen further in the fourth quarter. The reduction in
domestic demand contributed to the weakening in the summer months, in particular
investments and, to a lesser extent, household spending. According to the customary
economic survey conducted by the Bank of Italy in collaboration with Il Sole 24 Ore,
the investment plans of industrial and services companies will be reduced in scope in
2019 as a result of both political and economic uncertainty and commercial tensions.
The trend in Italian exports was still favourable in the second half of the year; the
slowdown in global trade, however, influenced the prospective valuations of
companies regarding foreign orders. The current account balance remains largely
positive; the country’s net foreign debt position continues to improve, which fell by a
little over 3% of GDP at the end of September.
Overall inflation fell to 1.2% in December, especially due to the deceleration in the
prices of energy products; the trend in the core component remained weak (0.5%).
Company expectations regarding the trend in prices were revised downward slightly.
In addition to the global factors of uncertainty outlined, the downside risks for growth
are connected to a possible fresh increase in sovereign yields, a more rapid
deterioration in private sector financing conditions and a further downturn in
companies’ propensity to invest. A more marked dissipation of tensions on the
Government bond yields could instead promote higher rates of growth.
15
FINANCIAL STATEMENTS 2018 - REPORT ON OPERATIONS
Growth in demand and trends in the macro-markets in which the Company operates
The Group operates primarily in the ICT services market, and more specifically, the
Cloud Computing segment.
In preparing this section, the Parent Company Wiit S.p.A. used the information taken
predominantly from the Assinform Report entitled “Il Digitale in Italia – 2018 Mercati,
Dinamiche, Policy” (The Digital Industry in Italy - 2018 Markets, Trends, Policies). Some
information has been taken from the Observatory of the Polytechnic of October 2018
called “Cloud Transformation Observatory - Cloud Transformation: evolving towards
the agile organisation with clouds”.
The Cloud market is experiencing a period of profound change, supported by the
growing perception of its role as an enabler for emerging technological trends, the
path that business users are taking to develop and migrate their information systems
and the corresponding change in the offer portfolio of the players in the Digital
market.
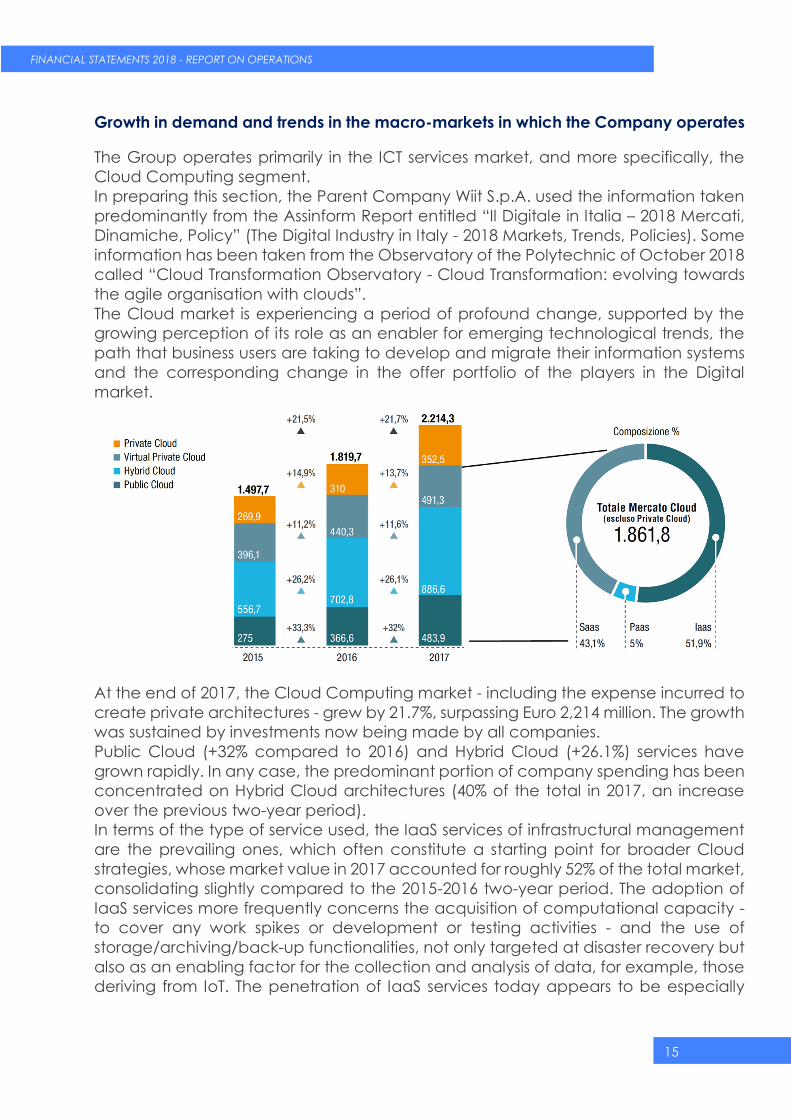
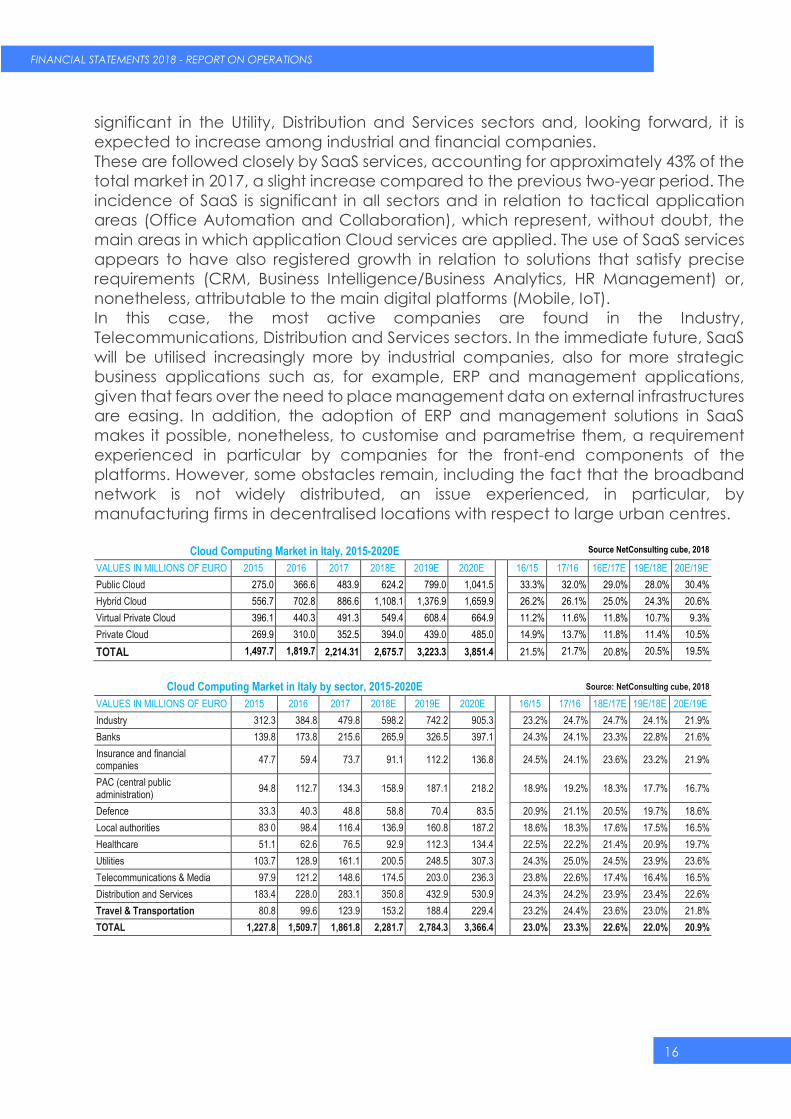
At the end of 2017, the Cloud Computing market - including the expense incurred to
create private architectures - grew by 21.7%, surpassing Euro 2,214 million. The growth
was sustained by investments now being made by all companies.
Public Cloud (+32% compared to 2016) and Hybrid Cloud (+26.1%) services have
grown rapidly. In any case, the predominant portion of company spending has been
concentrated on Hybrid Cloud architectures (40% of the total in 2017, an increase
over the previous two-year period).
In terms of the type of service used, the IaaS services of infrastructural management
are the prevailing ones, which often constitute a starting point for broader Cloud
strategies, whose market value in 2017 accounted for roughly 52% of the total market,
consolidating slightly compared to the 2015-2016 two-year period. The adoption of
IaaS services more frequently concerns the acquisition of computational capacity -
to cover any work spikes or development or testing activities - and the use of
storage/archiving/back-up functionalities, not only targeted at disaster recovery but
also as an enabling factor for the collection and analysis of data, for example, those
deriving from IoT. The penetration of IaaS services today appears to be especially
16
FINANCIAL STATEMENTS 2018 - REPORT ON OPERATIONS
significant in the Utility, Distribution and Services sectors and, looking forward, it is
expected to increase among industrial and financial companies.
These are followed closely by SaaS services, accounting for approximately 43% of the
total market in 2017, a slight increase compared to the previous two-year period. The
incidence of SaaS is significant in all sectors and in relation to tactical application
areas (Office Automation and Collaboration), which represent, without doubt, the
main areas in which application Cloud services are applied. The use of SaaS services
appears to have also registered growth in relation to solutions that satisfy precise
requirements (CRM, Business Intelligence/Business Analytics, HR Management) or,
nonetheless, attributable to the main digital platforms (Mobile, IoT).
In this case, the most active companies are found in the Industry,
Telecommunications, Distribution and Services sectors. In the immediate future, SaaS
will be utilised increasingly more by industrial companies, also for more strategic
business applications such as, for example, ERP and management applications,
given that fears over the need to place management data on external infrastructures
are easing. In addition, the adoption of ERP and management solutions in SaaS
makes it possible, nonetheless, to customise and parametrise them, a requirement
experienced in particular by companies for the front-end components of the
platforms. However, some obstacles remain, including the fact that the broadband
network is not widely distributed, an issue experienced, in particular, by
manufacturing firms in decentralised locations with respect to large urban centres.
Cloud Computing Market in Italy, 2015-2020E Source NetConsulting cube, 2018
VALUES IN MILLIONS OF EURO 2015 2016 2017 2018E 2019E 2020E 16/15 17/16 16E/17E 19E/18E 20E/19E
Public Cloud 275.0 366.6 483.9 624.2 799.0 1,041.5 33.3% 32.0% 29.0% 28.0% 30.4%
Hybrid Cloud 556.7 702.8 886.6 1,108.1 1,376.9 1,659.9 26.2% 26.1% 25.0% 24.3% 20.6%
Virtual Private Cloud 396.1 440.3 491.3 549.4 608.4 664.9 11.2% 11.6% 11.8% 10.7% 9.3%
Private Cloud 269.9 310.0 352.5 394.0 439.0 485.0 14.9% 13.7% 11.8% 11.4% 10.5%
TOTAL 1,497.7 1,819.7 2,214.31 2,675.7 3,223.3 3,851.4 21.5% 21.7% 20.8% 20.5% 19.5%
Cloud Computing Market in Italy by sector, 2015-2020E Source: NetConsulting cube, 2018
VALUES IN MILLIONS OF EURO 2015 2016 2017 2018E 2019E 2020E 16/15 17/16 18E/17E 19E/18E 20E/19E
Industry 312.3 384.8 479.8 598.2 742.2 905.3 23.2% 24.7% 24.7% 24.1% 21.9%
Banks 139.8 173.8 215.6 265.9 326.5 397.1 24.3% 24.1% 23.3% 22.8% 21.6%
Insurance and financial companies
47.7 59.4 73.7 91.1 112.2 136.8
24.5% 24.1% 23.6% 23.2% 21.9%
PAC (central public administration)
94.8 112.7 134.3 158.9 187.1 218.2
18.9% 19.2% 18.3% 17.7% 16.7%
Defence 33.3 40.3 48.8 58.8 70.4 83.5 20.9% 21.1% 20.5% 19.7% 18.6%
Local authorities 83 0 98.4 116.4 136.9 160.8 187.2 18.6% 18.3% 17.6% 17.5% 16.5%
Healthcare 51.1 62.6 76.5 92.9 112.3 134.4 22.5% 22.2% 21.4% 20.9% 19.7%
Utilities 103.7 128.9 161.1 200.5 248.5 307.3 24.3% 25.0% 24.5% 23.9% 23.6%
Telecommunications & Media 97.9 121.2 148.6 174.5 203.0 236.3 23.8% 22.6% 17.4% 16.4% 16.5%
Distribution and Services 183.4 228.0 283.1 350.8 432.9 530.9 24.3% 24.2% 23.9% 23.4% 22.6%
Travel & Transportation 80.8 99.6 123.9 153.2 188.4 229.4 23.2% 24.4% 23.6% 23.0% 21.8%
TOTAL 1,227.8 1,509.7 1,861.8 2,281.7 2,784.3 3,366.4 23.0% 23.3% 22.6% 22.0% 20.9%
17
FINANCIAL STATEMENTS 2018 - REPORT ON OPERATIONS
According to the figures of the Observatory of the Polytechnic (which interviewed
142 large companies and 285 small and medium companies), the Cloud is viewed as
an ally by three out of four companies, who consider it a key element in introducing
innovations, which would otherwise be too costly to achieve internally in terms of
times, costs and skills. However, it is not just a matter of technological innovation but
also of flexibility to change: in fact, for 74% of companies, the Cloud makes it possible
to enhance the company’s agility. This means guaranteeing that the technological
layer is always updated and in step with market rates, which best supports the
development and rapid release of new services and which makes it possible not to
focus on technical-operational management but on the company’s business
priorities. In fact, in 59% of cases, the Cloud is identified as a tool that allows IT to best
respond to business requirements, and in 57% of responses, a factor that enables the
transformation of the business.
A process of transformation of company IT systems has taken hold in the last few
years, in which businesses have now moved from using the Cloud solely for a few
specific processes, to making it the bedrock of their IT strategy.
Again according to the Observatory of the Polytechnic, Hybrid and Virtual Private
Cloud services are used by one out of two companies.
Marketing Communication & Brand Positioning
The Company’s marketing strategy focuses on activities targeted at raising
awareness of the WIIT brand and the generation of new business opportunities, by
operating on off-line and on-line channels. In relation to brand awareness, the
Company has run multi-channel advertising campaigns with the goal of reaching the
decision-makers of the WIIT customer target. For these purposes, the Company takes
advantage, by way of an example, of its presence on walls in the national and
European departure areas of Milano Linate, as well as on LCD screens throughout the
Milano Linate and Milano Malpensa airports, or the presence and communication
through all the main business-oriented social media like Linkedin, Twitter, Youtube.
Public relations and press office activities have also endorsed brand-related
information with articles and editorials in general interest and specialist newspapers.
Lead generation campaigns (i.e. targeted at identifying users potentially interested
in purchasing services supplied by WIIT), supported by surveys and studies aimed at
chief information officers and chief financial officers of companies who could
become potential customers, have made it possible to improve the management of
customer relations and provide the sales department with support in creating new
opportunities.
An Inbound Marketing project was launched in 2018 which consists of the creation of
digital content in line with the interests of customers (actual or potential) in order to
attract additional customers to the Company’s services. In particular, this project
involves the publication of WIIT Magazine, an integrated section of the company site,
whose contents are also disseminated through company social media. The objective
of the project is to grow and spread the culture and knowledge of the Cloud
18
FINANCIAL STATEMENTS 2018 - REPORT ON OPERATIONS
dedicated to company strategic applications among the management of Italian
companies, through a description of the best practices applied by WIIT.
The visibility of WIIT Magazine and WIIT services is also supported by Google AdWords
campaigns on specific keywords in the Cloud world, as well as landing pages and
banners on portals of interest to customers. All the company marketing activities are
tracked and managed in the company CRM.
In order to improve the visibility of the Cloud services dedicated to critical
applications, every year WIIT takes part in SAP Now, the most important SAP event
targeted at its customers/potential customers.
In order to promote knowledge in Italy of the main factors of technological
innovation, WIIT is a partner and active member of the Cloud Observatory of the
Milan Polytechnic. The Observatory is, on the one hand, a privileged spectator of the
degree of dissemination of the Cloud as a model in support of business innovation
and, on the other, an advisor for industry operators in proposing suggestions for
consideration and innovation of the offer portfolio, through committees and work
groups that represent opportunities for comparing the customer’s needs with the
potential of Cloud services (supply).
Competition
The company has created and adopted service models that make provision for
direct control of the entire supply chain of technical components and services, with
internal skills and proprietary assets, including, in particular, the primary Data Centre
in Milan, certified at level “Tier IV”, by the Uptime Institute LLC of Seattle (United
States), which represents the highest level of reliability, i.e. business continuity without
incurring interruptions.
The Company’s positioning is a result of the strategy that has, over the years, involved
the construction of a broad offering in the infrastructural domain, and natural growth
thanks to its excellence in providing services.
In the Company’s opinion, the competitors in the domestic Cloud and IT Outsourcing
market can be divided into 3 macro groups:
Very large multi-national companies set up to serve large customers, equipped with
an extensive and clear organisational structure.
National medium-large companies (or that cover several European countries) that
offer a vast range of advisory, system integration, application and hardware sales
services, for which the cloud services are typically not the core business.
National companies that offer a customised niche service for a small number of
customers or that operate on a captive market.
Operating performance in the sectors in which the Company and the Group operate
19
FINANCIAL STATEMENTS 2018 - REPORT ON OPERATIONS
As regards your Company and the Group, the year ended must be viewed in a very
positive light.
The Company also recorded healthy growth in terms of the value of orders (year value)
compared to 2017, in this way guaranteeing the prospect of further growth in the value
of production in 2019.
The consolidated value of production rose by 29.05% compared to 2017. This positive
figure is indicative of the health status of the Company’s income statement,
demonstrating the huge customer appreciation for the Group, for whom WIIT is a high
quality point of reference and also extremely competitive from a financial point of view.
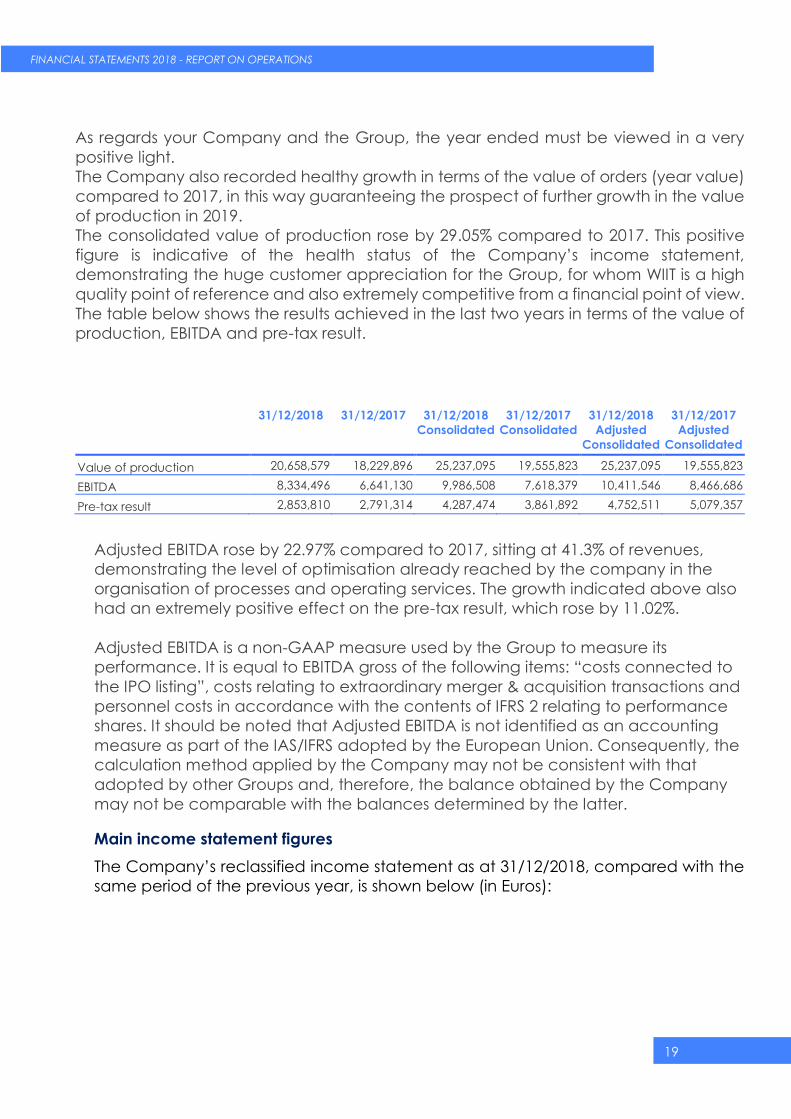
The table below shows the results achieved in the last two years in terms of the value of
production, EBITDA and pre-tax result.
31/12/2018 31/12/2017 31/12/2018
Consolidated
31/12/2017
Consolidated
31/12/2018
Adjusted
Consolidated
31/12/2017
Adjusted
Consolidated
Value of production 20,658,579 18,229,896 25,237,095 19,555,823 25,237,095 19,555,823
EBITDA 8,334,496 6,641,130 9,986,508 7,618,379 10,411,546 8,466,686
Pre-tax result 2,853,810 2,791,314 4,287,474 3,861,892 4,752,511 5,079,357
Adjusted EBITDA rose by 22.97% compared to 2017, sitting at 41.3% of revenues,
demonstrating the level of optimisation already reached by the company in the
organisation of processes and operating services. The growth indicated above also
had an extremely positive effect on the pre-tax result, which rose by 11.02%.
Adjusted EBITDA is a non-GAAP measure used by the Group to measure its
performance. It is equal to EBITDA gross of the following items: “costs connected to
the IPO listing”, costs relating to extraordinary merger & acquisition transactions and
personnel costs in accordance with the contents of IFRS 2 relating to performance
shares. It should be noted that Adjusted EBITDA is not identified as an accounting
measure as part of the IAS/IFRS adopted by the European Union. Consequently, the
calculation method applied by the Company may not be consistent with that
adopted by other Groups and, therefore, the balance obtained by the Company
may not be comparable with the balances determined by the latter.
Main income statement figures
The Company’s reclassified income statement as at 31/12/2018, compared with the
same period of the previous year, is shown below (in Euros):
20
FINANCIAL STATEMENTS 2018 - REPORT ON OPERATIONS
31/12/2018 31/12/2017 31/12/2018
Consolidated
31/12/2017
Consolidated
31/12/2018
Adjusted
Consolidated
31/12/2017
Adjusted
Consolidated
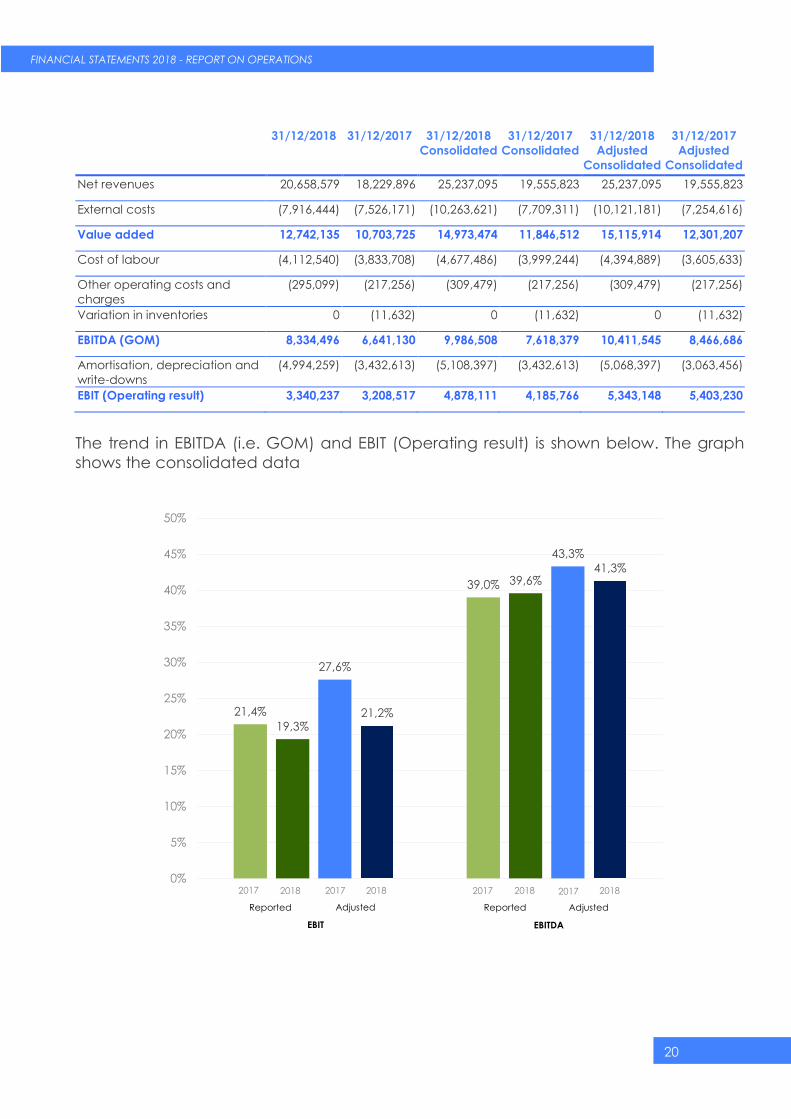
Net revenues 20,658,579 18,229,896 25,237,095 19,555,823 25,237,095 19,555,823
External costs (7,916,444) (7,526,171) (10,263,621) (7,709,311) (10,121,181) (7,254,616)
Value added 12,742,135 10,703,725 14,973,474 11,846,512 15,115,914 12,301,207
Cost of labour (4,112,540) (3,833,708) (4,677,486) (3,999,244) (4,394,889) (3,605,633)
Other operating costs and
charges
(295,099) (217,256) (309,479) (217,256) (309,479) (217,256)
Variation in inventories 0 (11,632) 0 (11,632) 0 (11,632)
EBITDA (GOM) 8,334,496 6,641,130 9,986,508 7,618,379 10,411,545 8,466,686
Amortisation, depreciation and
write-downs
(4,994,259) (3,432,613) (5,108,397) (3,432,613) (5,068,397) (3,063,456)
EBIT (Operating result) 3,340,237 3,208,517 4,878,111 4,185,766 5,343,148 5,403,230
The trend in EBITDA (i.e. GOM) and EBIT (Operating result) is shown below. The graph
shows the consolidated data
21,4%
39,0%
19,3%
39,6%
27,6%
43,3%
21,2%
41,3%
0%
5%
10%
15%
20%
25%
30%
35%
40%
45%
50%
2017 2018 2017 2018 2017 2017 2018 2018
Adjusted Adjusted Reported Reported
EBITDA EBIT
21
FINANCIAL STATEMENTS 2018 - REPORT ON OPERATIONS
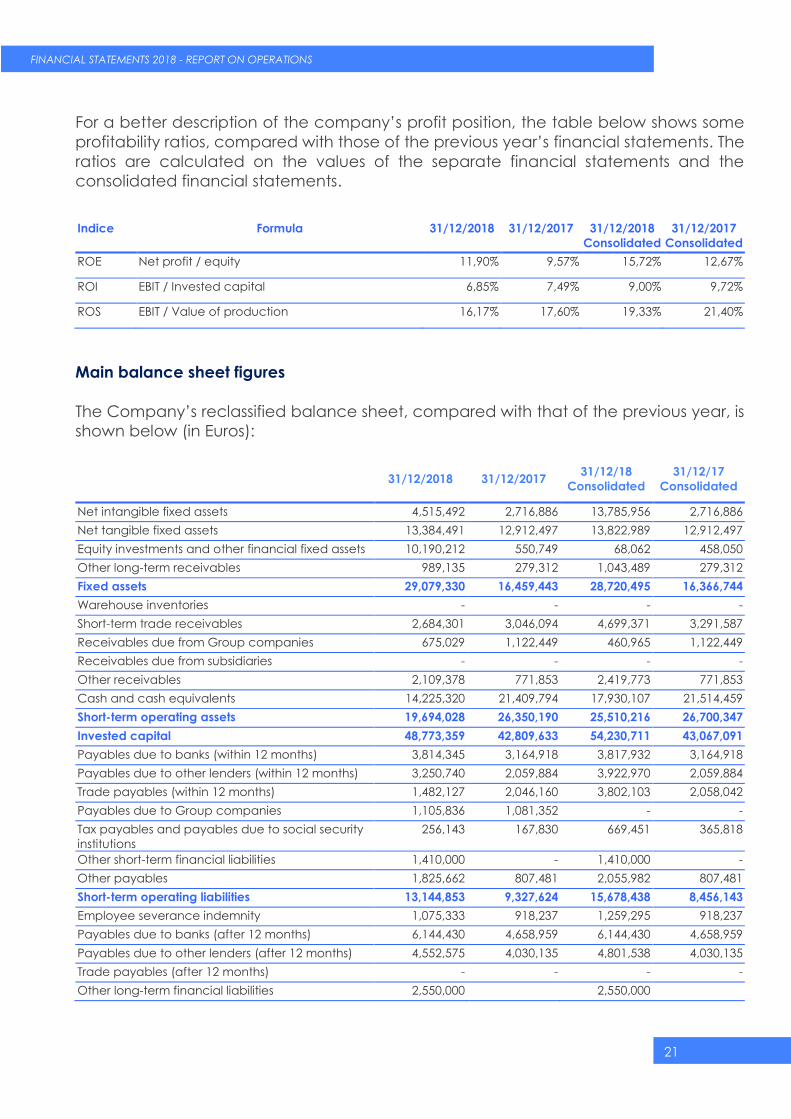
For a better description of the company’s profit position, the table below shows some
profitability ratios, compared with those of the previous year’s financial statements. The
ratios are calculated on the values of the separate financial statements and the
consolidated financial statements.
Indice Formula 31/12/2018 31/12/2017 31/12/2018
Consolidated
31/12/2017
Consolidated
ROE Net profit / equity 11,90% 9,57% 15,72% 12,67%
ROI EBIT / Invested capital 6,85% 7,49% 9,00% 9,72%
ROS EBIT / Value of production 16,17% 17,60% 19,33% 21,40%
Main balance sheet figures
The Company’s reclassified balance sheet, compared with that of the previous year, is
shown below (in Euros):
31/12/2018 31/12/2017 31/12/18
Consolidated
31/12/17
Consolidated
Net intangible fixed assets 4,515,492 2,716,886 13,785,956 2,716,886
Net tangible fixed assets 13,384,491 12,912,497 13,822,989 12,912,497
Equity investments and other financial fixed assets 10,190,212 550,749 68,062 458,050
Other long-term receivables 989,135 279,312 1,043,489 279,312
Fixed assets 29,079,330 16,459,443 28,720,495 16,366,744
Warehouse inventories - - - -
Short-term trade receivables 2,684,301 3,046,094 4,699,371 3,291,587
Receivables due from Group companies 675,029 1,122,449 460,965 1,122,449
Receivables due from subsidiaries - - - -
Other receivables 2,109,378 771,853 2,419,773 771,853
Cash and cash equivalents 14,225,320 21,409,794 17,930,107 21,514,459
Short-term operating assets 19,694,028 26,350,190 25,510,216 26,700,347
Invested capital 48,773,359 42,809,633 54,230,711 43,067,091
Payables due to banks (within 12 months) 3,814,345 3,164,918 3,817,932 3,164,918
Payables due to other lenders (within 12 months) 3,250,740 2,059,884 3,922,970 2,059,884
Trade payables (within 12 months) 1,482,127 2,046,160 3,802,103 2,058,042
Payables due to Group companies 1,105,836 1,081,352 - -
Tax payables and payables due to social security
institutions
256,143 167,830 669,451 365,818
Other short-term financial liabilities 1,410,000 - 1,410,000 -
Other payables 1,825,662 807,481 2,055,982 807,481
Short-term operating liabilities 13,144,853 9,327,624 15,678,438 8,456,143
Employee severance indemnity 1,075,333 918,237 1,259,295 918,237
Payables due to banks (after 12 months) 6,144,430 4,658,959 6,144,430 4,658,959
Payables due to other lenders (after 12 months) 4,552,575 4,030,135 4,801,538 4,030,135
Trade payables (after 12 months) - - - -
Other long-term financial liabilities 2,550,000 2,550,000
22
FINANCIAL STATEMENTS 2018 - REPORT ON OPERATIONS
Other medium and long-term payables 1,339,529 220,000 1,339,529 220,000
Deferred tax payables 41,245 28,854 214,022 28,854
Medium/long-term liabilities 15,703,112 9,856,185 16,308,814 9,856,185
Third-party capital 28,847,965 19,183,809 31,987,252 18,312,328
Shareholders’ equity 19,925,394 23,625,823 22,243,459 24,754,763
Own funds 19,925,394 23,625,823 22,243,459 24,754,763
Own funds and third-party capital 48,773,359 42,809,633 54,230,711 43,067,091
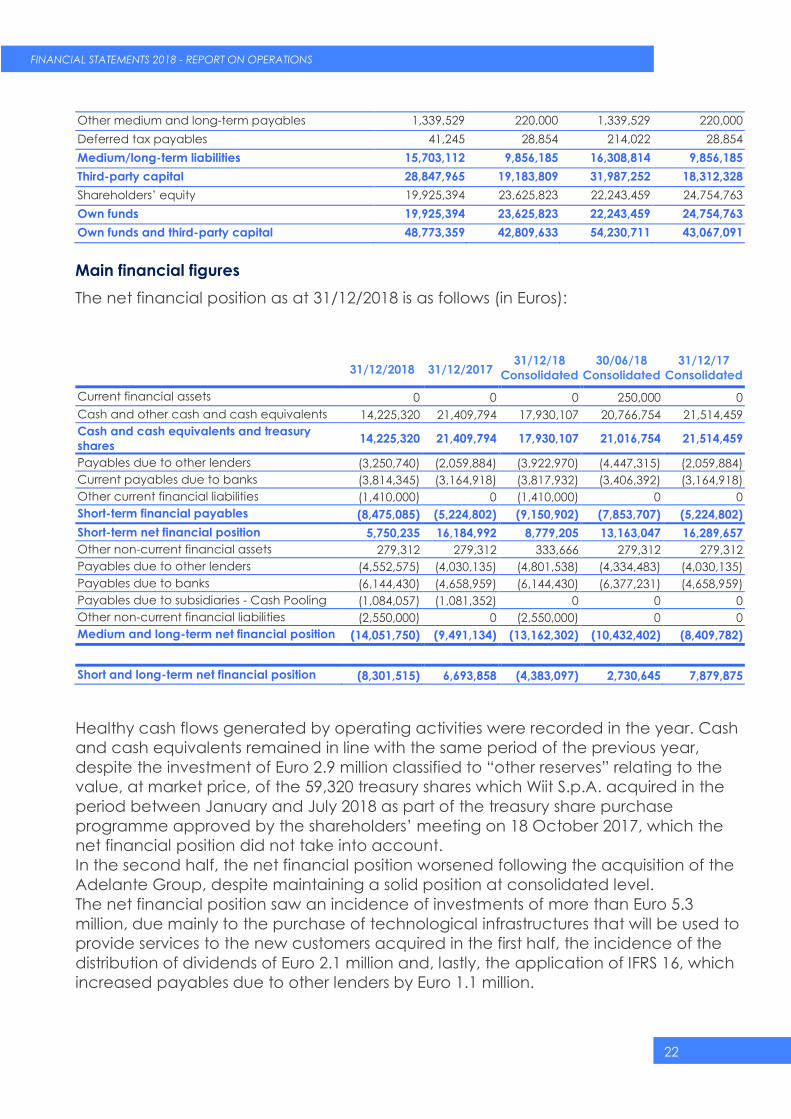
Main financial figures
The net financial position as at 31/12/2018 is as follows (in Euros):
31/12/2018 31/12/2017
31/12/18
Consolidated
30/06/18
Consolidated
31/12/17
Consolidated
Current financial assets 0 0 0 250,000 0
Cash and other cash and cash equivalents 14,225,320 21,409,794 17,930,107 20,766,754 21,514,459
Cash and cash equivalents and treasury
shares 14,225,320 21,409,794 17,930,107 21,016,754 21,514,459
Payables due to other lenders (3,250,740) (2,059,884) (3,922,970) (4,447,315) (2,059,884)
Current payables due to banks (3,814,345) (3,164,918) (3,817,932) (3,406,392) (3,164,918)
Other current financial liabilities (1,410,000) 0 (1,410,000) 0 0
Short-term financial payables (8,475,085) (5,224,802) (9,150,902) (7,853,707) (5,224,802)
Short-term net financial position 5,750,235 16,184,992 8,779,205 13,163,047 16,289,657
Other non-current financial assets 279,312 279,312 333,666 279,312 279,312
Payables due to other lenders (4,552,575) (4,030,135) (4,801,538) (4,334,483) (4,030,135)
Payables due to banks (6,144,430) (4,658,959) (6,144,430) (6,377,231) (4,658,959)
Payables due to subsidiaries - Cash Pooling (1,084,057) (1,081,352) 0 0 0
Other non-current financial liabilities (2,550,000) 0 (2,550,000) 0 0
Medium and long-term net financial position (14,051,750) (9,491,134) (13,162,302) (10,432,402) (8,409,782)
Short and long-term net financial position (8,301,515) 6,693,858 (4,383,097) 2,730,645 7,879,875
Healthy cash flows generated by operating activities were recorded in the year. Cash
and cash equivalents remained in line with the same period of the previous year,
despite the investment of Euro 2.9 million classified to “other reserves” relating to the
value, at market price, of the 59,320 treasury shares which Wiit S.p.A. acquired in the
period between January and July 2018 as part of the treasury share purchase
programme approved by the shareholders’ meeting on 18 October 2017, which the
net financial position did not take into account.
In the second half, the net financial position worsened following the acquisition of the
Adelante Group, despite maintaining a solid position at consolidated level.
The net financial position saw an incidence of investments of more than Euro 5.3
million, due mainly to the purchase of technological infrastructures that will be used to
provide services to the new customers acquired in the first half, the incidence of the
distribution of dividends of Euro 2.1 million and, lastly, the application of IFRS 16, which
increased payables due to other lenders by Euro 1.1 million.
23
FINANCIAL STATEMENTS 2018 - REPORT ON OPERATIONS
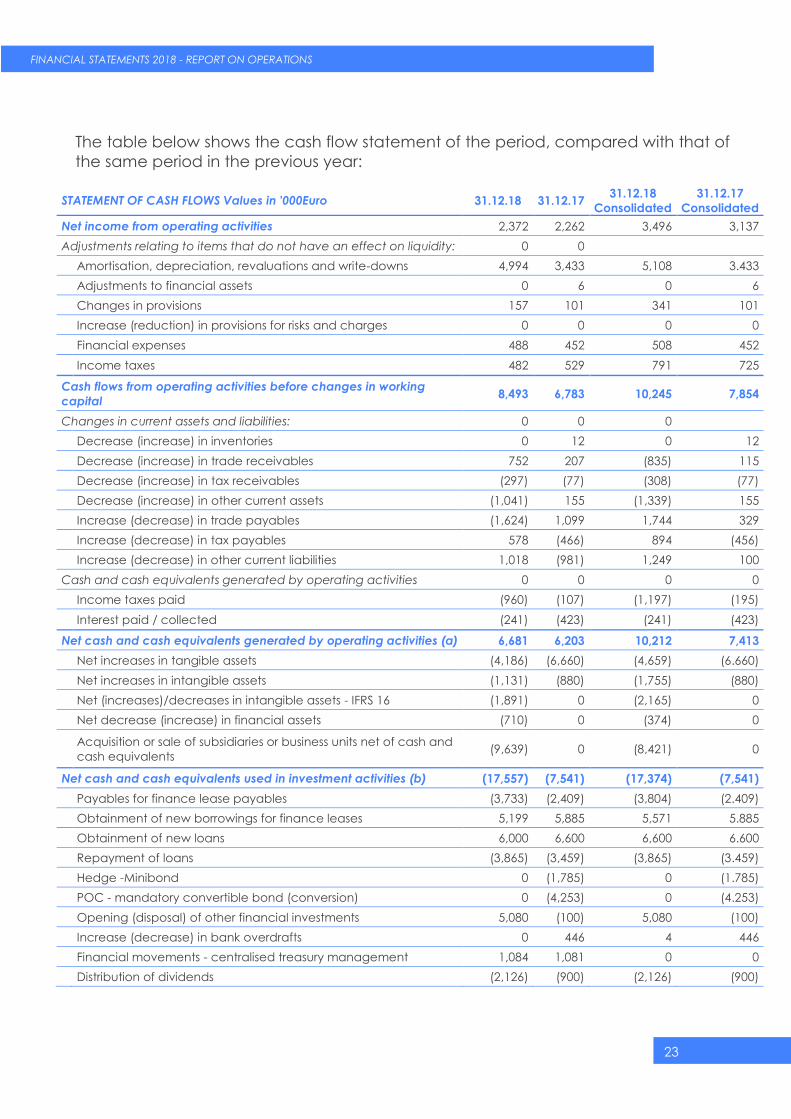
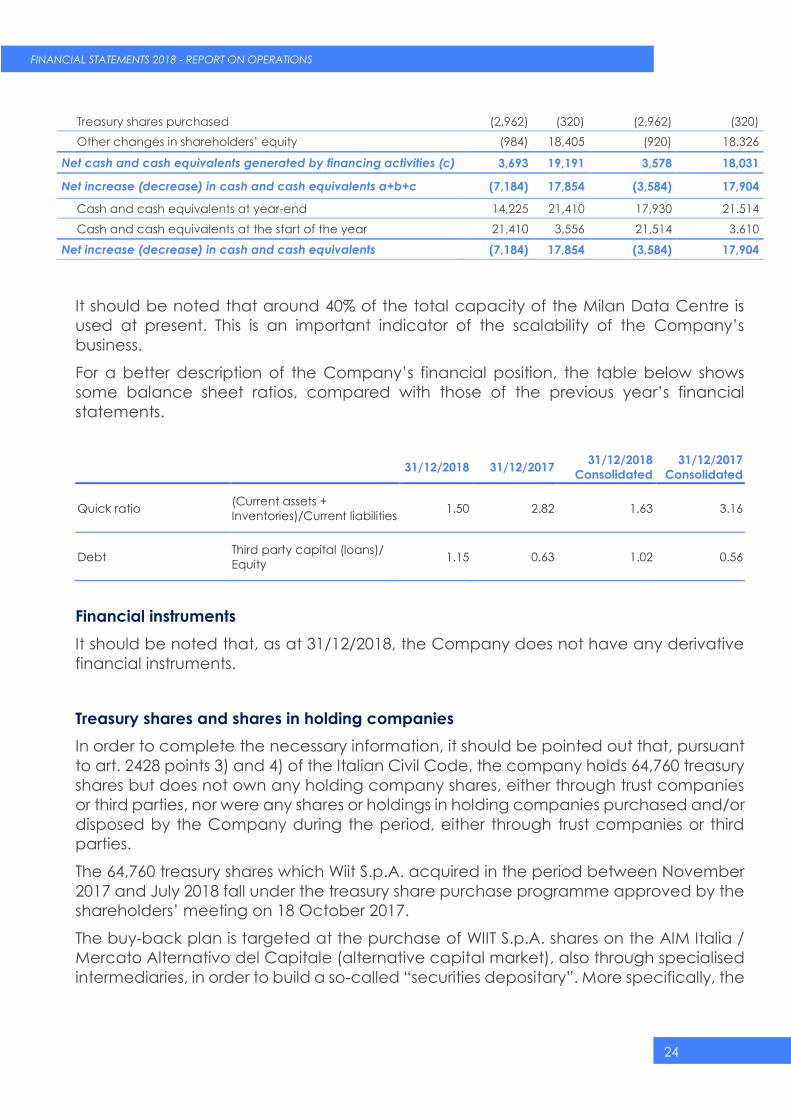
The table below shows the cash flow statement of the period, compared with that of
the same period in the previous year:
STATEMENT OF CASH FLOWS Values in '000Euro 31.12.18 31.12.17 31.12.18
Consolidated
31.12.17
Consolidated
Net income from operating activities 2,372 2,262 3,496 3,137
Adjustments relating to items that do not have an effect on liquidity: 0 0
Amortisation, depreciation, revaluations and write-downs 4,994 3,433 5,108 3.433
Adjustments to financial assets 0 6 0 6
Changes in provisions 157 101 341 101
Increase (reduction) in provisions for risks and charges 0 0 0 0
Financial expenses 488 452 508 452
Income taxes 482 529 791 725
Cash flows from operating activities before changes in working
capital 8,493 6,783 10,245 7,854
Changes in current assets and liabilities: 0 0 0
Decrease (increase) in inventories 0 12 0 12
Decrease (increase) in trade receivables 752 207 (835) 115
Decrease (increase) in tax receivables (297) (77) (308) (77)
Decrease (increase) in other current assets (1,041) 155 (1,339) 155
Increase (decrease) in trade payables (1,624) 1,099 1,744 329
Increase (decrease) in tax payables 578 (466) 894 (456)
Increase (decrease) in other current liabilities 1,018 (981) 1,249 100
Cash and cash equivalents generated by operating activities 0 0 0 0
Income taxes paid (960) (107) (1,197) (195)
Interest paid / collected (241) (423) (241) (423)
Net cash and cash equivalents generated by operating activities (a) 6,681 6,203 10,212 7,413
Net increases in tangible assets (4,186) (6,660) (4,659) (6.660)
Net increases in intangible assets (1,131) (880) (1,755) (880)
Net (increases)/decreases in intangible assets - IFRS 16 (1,891) 0 (2,165) 0
Net decrease (increase) in financial assets (710) 0 (374) 0
Acquisition or sale of subsidiaries or business units net of cash and
cash equivalents (9,639) 0 (8,421) 0
Net cash and cash equivalents used in investment activities (b) (17,557) (7,541) (17,374) (7,541)
Payables for finance lease payables (3,733) (2,409) (3,804) (2.409)
Obtainment of new borrowings for finance leases 5,199 5,885 5,571 5.885
Obtainment of new loans 6,000 6,600 6,600 6.600
Repayment of loans (3,865) (3,459) (3,865) (3.459)
Hedge -Minibond 0 (1,785) 0 (1.785)
POC - mandatory convertible bond (conversion) 0 (4,253) 0 (4.253)
Opening (disposal) of other financial investments 5,080 (100) 5,080 (100)
Increase (decrease) in bank overdrafts 0 446 4 446
Financial movements - centralised treasury management 1,084 1,081 0 0
Distribution of dividends (2,126) (900) (2,126) (900)
24
FINANCIAL STATEMENTS 2018 - REPORT ON OPERATIONS
Treasury shares purchased (2,962) (320) (2,962) (320)
Other changes in shareholders’ equity (984) 18,405 (920) 18.326
Net cash and cash equivalents generated by financing activities (c) 3,693 19,191 3,578 18,031
Net increase (decrease) in cash and cash equivalents a+b+c (7,184) 17,854 (3,584) 17,904
Cash and cash equivalents at year-end 14,225 21,410 17,930 21.514
Cash and cash equivalents at the start of the year 21,410 3,556 21,514 3.610
Net increase (decrease) in cash and cash equivalents (7,184) 17,854 (3,584) 17,904
It should be noted that around 40% of the total capacity of the Milan Data Centre is
used at present. This is an important indicator of the scalability of the Company’s
business.
For a better description of the Company’s financial position, the table below shows
some balance sheet ratios, compared with those of the previous year’s financial
statements.
31/12/2018 31/12/2017 31/12/2018
Consolidated
31/12/2017
Consolidated
Quick ratio (Current assets +
Inventories)/Current liabilities 1.50 2.82 1.63 3.16
Debt Third party capital (loans)/
Equity 1.15 0.63 1.02 0.56
Financial instruments
It should be noted that, as at 31/12/2018, the Company does not have any derivative
financial instruments.
Treasury shares and shares in holding companies
In order to complete the necessary information, it should be pointed out that, pursuant
to art. 2428 points 3) and 4) of the Italian Civil Code, the company holds 64,760 treasury
shares but does not own any holding company shares, either through trust companies
or third parties, nor were any shares or holdings in holding companies purchased and/or
disposed by the Company during the period, either through trust companies or third
parties.
The 64,760 treasury shares which Wiit S.p.A. acquired in the period between November
2017 and July 2018 fall under the treasury share purchase programme approved by the
shareholders’ meeting on 18 October 2017.
The buy-back plan is targeted at the purchase of WIIT S.p.A. shares on the AIM Italia /
Mercato Alternativo del Capitale (alternative capital market), also through specialised
intermediaries, in order to build a so-called “securities depositary”. More specifically, the
25
FINANCIAL STATEMENTS 2018 - REPORT ON OPERATIONS
purchase programme is targeted at providing the Company with a stock of treasury
shares to be used as consideration in the context of extraordinary finance transactions
and/or for other uses considered of financial-managerial and/or strategic interest for
the Company, also for the exchange of equity investments with other entities as part of
transactions of interest to the Company.
Information on the environment and personnel
Taking account of the company’s social role, as also highlighted in the report on
operations of the Consiglio Nazionale dei Dottori Commercialisti e degli Esperti Contabili
(National Institute of Chartered Accountants), it is considered appropriate to provide
the following information regarding the environment and personnel.
Personnel
In 2018, there were no workplace fatalities involving personnel listed in the employee
register.
In 2018, there were no serious workplace accidents that involved serious or very serious
injuries to personnel listed in the employee register.
In 2018, no charges were registered against employees or former employees relating to
occupational illnesses and cases of mobbing, for which the company was held to be
definitively liable.
Environment
During 2018, no damages caused to the environment were verified, for which the
company was held to be definitively culpable.
No final sanctions or penalties were imposed on our company in 2018 for
environmental offences or damages.

26
FINANCIAL STATEMENTS 2018 - REPORT ON OPERATIONS
3.2 Research and development activities
Research and development activities include both internal and external costs
incurred, which relate largely to development of the ICT infrastructure. This infrastructure
allows WIIT to provide its services effectively and competitively; we are talking essentially
about the cost of implementing the IT framework through which WIIT interacts with its
customers and is able to provide them with all the services provided for in the contract.
This ICT infrastructure represents, to all intents and purposes, the Company’s strategic
asset, on which the Company’s competitiveness and capacity for market expansion
depend. Capitalised investments of Euro 567,519 were made during the year.

27
FINANCIAL STATEMENTS 2018 - REPORT ON OPERATIONS
Rapporti con imprese controllate, collegate, controllanti e
consorelle
RELATIONS WITH SUBSIDIARIES, ASSOCIATES,
HOLDING COMPANIES AND SISTER
COMPANIES
28
FINANCIAL STATEMENTS 2018 - REPORT ON OPERATIONS
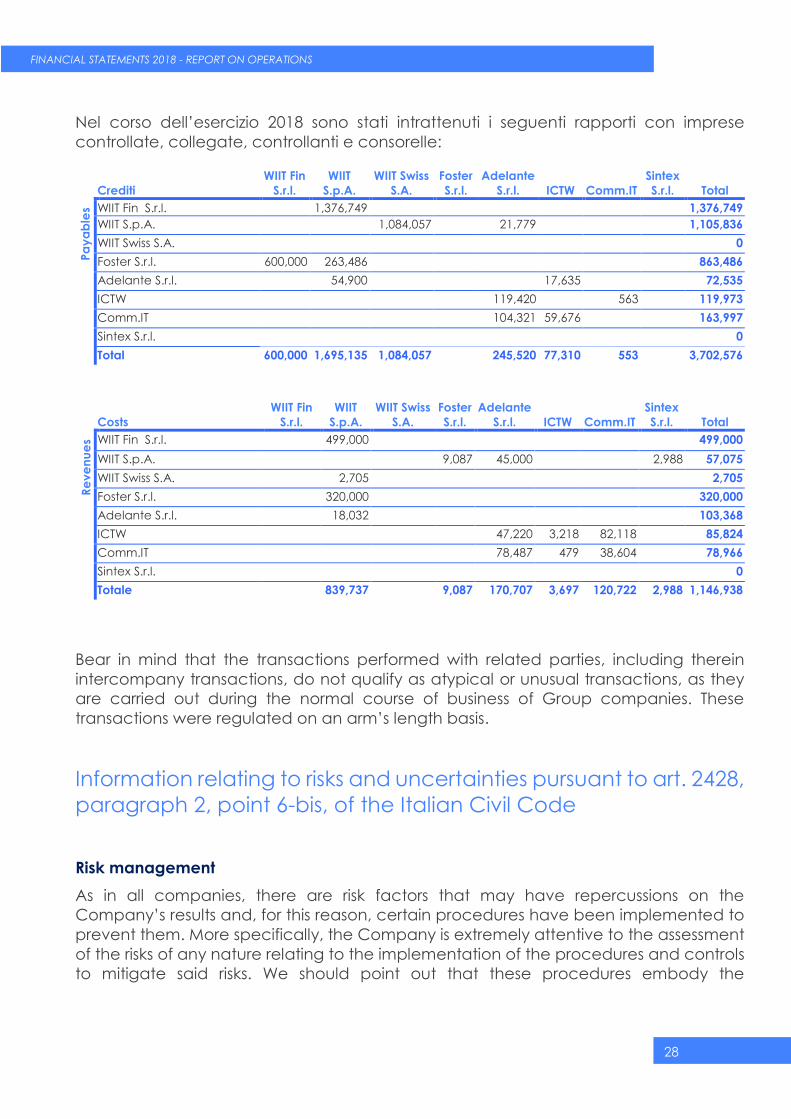
Nel corso dell’esercizio 2018 sono stati intrattenuti i seguenti rapporti con imprese
controllate, collegate, controllanti e consorelle:
Crediti
WIIT Fin
S.r.l.
WIIT
S.p.A.
WIIT Swiss
S.A.
Foster
S.r.l.
Adelante
S.r.l. ICTW Comm.IT
Sintex
S.r.l. Total
Pa
ya
ble
s WIIT Fin S.r.l. 1,376,749 1,376,749
WIIT S.p.A. 1,084,057 21,779 1,105,836
WIIT Swiss S.A. 0
Foster S.r.l. 600,000 263,486 863,486
Adelante S.r.l. 54,900 17,635 72,535
ICTW 119,420 563 119,973
Comm.IT 104,321 59,676 163,997
Sintex S.r.l. 0
Total 600,000 1,695,135 1,084,057 245,520 77,310 553 3,702,576
Costs
WIIT Fin
S.r.l.
WIIT
S.p.A.
WIIT Swiss
S.A.
Foster
S.r.l.
Adelante
S.r.l. ICTW Comm.IT
Sintex
S.r.l. Total
Re
ve
nu
es WIIT Fin S.r.l. 499,000 499,000
WIIT S.p.A. 9,087 45,000 2,988 57,075
WIIT Swiss S.A. 2,705 2,705
Foster S.r.l. 320,000 320,000
Adelante S.r.l. 18,032 103,368
ICTW 47,220 3,218 82,118 85,824
Comm.IT 78,487 479 38,604 78,966
Sintex S.r.l. 0
Totale 839,737 9,087 170,707 3,697 120,722 2,988 1,146,938
Bear in mind that the transactions performed with related parties, including therein
intercompany transactions, do not qualify as atypical or unusual transactions, as they
are carried out during the normal course of business of Group companies. These
transactions were regulated on an arm’s length basis.
Information relating to risks and uncertainties pursuant to art. 2428,
paragraph 2, point 6-bis, of the Italian Civil Code
Risk management
As in all companies, there are risk factors that may have repercussions on the
Company’s results and, for this reason, certain procedures have been implemented to
prevent them. More specifically, the Company is extremely attentive to the assessment
of the risks of any nature relating to the implementation of the procedures and controls
to mitigate said risks. We should point out that these procedures embody the
29
FINANCIAL STATEMENTS 2018 - REPORT ON OPERATIONS
company’s commitments and responsibilities and are based on the utmost
transparency and correctness.
In addition, the Board of Directors, by means of resolution dated 30 July 2013, based on
prior approval of the Organisational and Management Model, including the risk analysis
as set forth in art. 6, paragraph 1, letter a) of Legislative Decree 231/01, also resolved
the appointment of the Supervisory Body, whose task is to monitor the functioning and
observance of the model and oversee its updates.
The risk analysis conducted for the implementation of the Model is incorporated in a
scenario in which the company already possessed an integrated management system,
the DPS and the associated evolution, and already held the certifications relating to
quality (ISO 9001), Management of IT Services (ISO 20000) and security (ISO 27001).
Therefore, as required by art. 2428 of the Italian Civil Code, we summarise the risk factors
below, and the additional general elements, and refer you to the specific
documentation for further details.
EXTERNAL RISKS
Financial risks
The Group is not greatly exposed to financial risks. In fact, as it operates primarily in the
Euro area, the company is only marginally exposed to exchange rate risks due to
transactions in foreign currency; revenues and operating cash flows are not subject to
fluctuations in market interest rates and no significant credit risks are evident given that
the financial counterparties are represented by leading customers considered solvent
by the market.
The financial risks to which the Group is exposed are connected primarily to the
obtainment of funds on the market (liquidity risk) and fluctuations in interest rates
(interest rate risk).
It is certified that, in choosing financing and investment transactions, the Company has
adopted prudence and limited risk criteria and that no speculative transactions were
entered into. The Company covers these financial expenses with cash from operating
activities. In order to monitor the financial risks through an integrated reporting system
and allow analytical planning of future activities, the Company is equipped with a
management control system. The Company also did not make use of derivative
financial instruments to hedge risks linked to the procurement of funding.
However, the main types of financial risk are outlined below, with the relevant
comments on the degree of significance of the exposure to the various risk categories.
Currency risk
Currency risk is defined as the risk of the value of a financial instrument changing as a
result of fluctuations in exchange rates.
30
FINANCIAL STATEMENTS 2018 - REPORT ON OPERATIONS
The WIIT Group is exposed to risk if significant changes in exchange rates occur, taking
into account that, as at the Date of the Prospectus, the Group does not adopt
exchange rate hedging policies.
In particular, the Group is subject (i) to exchange rate risk of a translation nature,
deriving from the fact that the consolidating company Wiit S.p.A., despite preparing its
financial statements in Euro, holds the entire share capital of WIIT Swiss, a Swiss company
that drafts its financial statements in Swiss Francs. Therefore, fluctuations in the exchange
rates used to convert the financial statement figures of WIIT Swiss, originally stated in
Swiss Francs, could influence both the Group’s economic result and its consolidated
shareholders’ equity; and (ii) exchange rate risk of a settlement nature, deriving from
the purchases of services also in non-Euro currencies or US dollars and Albanian Lek (to
a very limited degree).
However, the fact that the core business is performed in the “Euro Area” limits the
Group’s exposure to currency risks deriving from transactions in currencies other than
the functional currency (Euro).
Interest rate risk
Interest rate risk management aims to ensure a balanced debt structure, by minimising
the cost of funding over time.
Interest rate risk is defined as the risk of the value of a financial instrument changing as
a result of fluctuations in market interest rates.
The Group is exposed to the risk of significant fluctuations in interest rates and the risk of
the policies adopted to neutralise these fluctuations being insufficient.
Fluctuations in interest rates influence the market value of the company’s financial
assets and liabilities and the level of net financial expenses, given some of the loans
taken out by the Group are at a variable rate.
Over the years, the Company has taken out almost exclusively medium-term loans with
a variable rate linked to the performance of the 3-month Euribor and at a fixed rate,
and constantly monitors the trend in cash flows.
The details relating to loans in place are reported in the notes to the financial
statements.
Market risk
Market risk is defined as the risk of the value of a financial instrument changing as a
result of fluctuations in market prices.
The Group is exposed to risks connected with the current global economic-financial
situation and, in particular, to the performance of the Italian market as the main market
for the sale of services provided by the Group. More specifically, the instability of the
global political, macroeconomic and financial scenario (in particular in Italy), could
have a major impact on the Group’s productive capacity and growth prospects, with
31
FINANCIAL STATEMENTS 2018 - REPORT ON OPERATIONS
potential negative repercussions on the business, prospects and economic, equity and
financial position of the Parent Company and the Group.
At European level, it should be noted that fears have emerged, on more than one
occasion recently, that the European Union could come to an end or that the individual
member states could abandon the Euro. The UK’s exit from the European Union,
following the referendum on 23 June 2016 (Brexit) is currently the object of international
negotiations to determine the methods that will be used to implement it. In addition,
following the global economic-financial crisis in 2007-2008, the sovereign debt crisis in
Greece, Ireland, Iceland, Portugal, Spain and Cyprus, had a significant impact on the
European financial markets, determining an increase in bond yields and elevated
volatility of the spread on the sovereign debt of many European Union countries,
including Italy. Signs of improvement in the international economic situation have been
observed in more recent periods, to a more significant degree in the US and in China
and in some EU countries, and less marked in other European countries (including Italy).
The Group constantly monitors market risk.
Credit risk
Credit risk is defined as a probable financial loss generated by the non-fulfilment of a
third party payment obligation to the Company.
The WIIT Group is exposed to the risk that its customers may be late or fail to fulfil their
payment obligations according to the agreed terms and methods and the risk of the
internal procedures adopted in relation to the evaluation of the credit rating and
solvency of the customers being insufficient to guarantee successful collections.
Any missed payments, payment delays or other failures to fulfil obligations may be due
to customer insolvency or bankruptcy, to economic events or customer-specific
situations. Late payments could delay cash inflows.
The Company does not have significant concentrations of credit risks, also thanks to the
fact that it does not carry out significant operations in the Public Administration sector,
in line with the Company’s strategic choice.
The Company manages this risk through the selection of counterparties considered
solvent by the market and with a high credit standing, or through the supply of highly
critical and non-interruptible services by its customers.
For commercial purposes, policies are adopted targeted at ensuring the solvency of its
customers, and limiting the exposure to credit risk with respect to an individual customer,
through activities that involve the evaluation of customers and their monitoring.
All receivables are periodically subject to an analytical evaluation per individual
customer, with write-downs effected in the event of impairment.
All details relating to trade receivables are reported in the notes to the financial
statements.
32
FINANCIAL STATEMENTS 2018 - REPORT ON OPERATIONS
Liquidity risk
Liquidity risk is defined as the risk of the Company encountering difficulties in obtaining
the necessary funds to meet its obligations connected with financial liabilities.
Prudent liquidity risk management is pursued by monitoring cash flows, financing
requirements and the liquidity of the Company, with the goal of ensuring effective
management of financial resources through the proper management of any liquidity
surpluses or surpluses convertible to cash and the subscription of suitable credit lines.
Risks deriving from the general conditions of the economy
The Information Technology market is naturally connected to the performance of the
economy. An unfavourable economic phase could slow demand with subsequent
equity, economic and financial effects, especially on subsidiaries.
Risks connected to IT services
The services sector in which the Company operates is characterised by rapid
technological changes and the constant evolution of professional skills and expertise.
The risks connected with the development of the ICT market are mitigated by said
sector in which the company operates and by the internal contractual policies which
make provision for contracts that guarantee a high backlog level and a long-term
business vision.
The phase of contraction in services and IT spending by companies has also promoted
the growth of WIIT, enhancing the offering and the ability of the company to rationalise
and lower the costs of its customers with respect to their competitors.
Risks connected with the evolution of the regulatory framework
In carrying out hosting provider activities, the Group is subject to Directive 2000/31/EC
and Legislative Decree no. 70/2003. Although the aforementioned regulatory provisions
recognise a merely passive role for the hosting provider, limited to an activity of “a mere
technical, automatic and passive nature”, the most recent case law, both Italian and
EU, has also recognised an active role for the provider.
As regards the above, this means that, if said new interpretation should be confirmed,
the provider would also be considered responsible for the content of the information
stored on its servers, given considered the manager. The result is that, in the future, the
Group could therefore be deemed responsible for the contents stored on the Group’s
infrastructures (e.g. information uploaded by customers to its websites) and could,
therefore be involved in the associated disputes (regarding, for example, intellectual
property, civil and/or criminal liability, etc.).
It should be noted that the Group companies are qualified as data controllers pursuant
to Regulation EU 679/2016 on the protection of natural persons with regards to personal
33
FINANCIAL STATEMENTS 2018 - REPORT ON OPERATIONS
data processing and are therefore required to observe the relevant regulation, with the
subsequent costs of compliance (see First Section, Chapter 4, Paragraph 4.1.9. of the
Prospectus).
Lastly, it should be noted that the Parent Company will be required to incur costs and
expenses, including significant, to ensure observance of and compliance with the
legislative and regulatory provisions currently in force, applicable to companies listed
on a regulated market such as the MTA.
INTERNAL RISKS
Risks relating to the dependency on key personnel
The Parent Company and the Group are exposed to the risk of an interruption to
professional collaboration relations with certain top management figures who hold a
key role as well as to the risk of being unable to replace these figures in an adequate
and timely manner. In fact, although the Group has not registered, over the course of
the last few years, turnover of its management and although it believes it is equipped
with an operating structure able to ensure business continuity, it is, nonetheless, exposed
to said risk.
In fact, the Parent Company believes that the success of the WIIT Group depends
largely on some key figures in its top management which, thanks to consolidated
experience in the sector and, as part of their specific responsibilities and competences,
have assumed a key role, over time, in the management of the Group’s business,
making a significant contribution to the development of its activities.
Although, as stated, from an operating and management perspective, the Group
believes it has a structure capable of ensuring business continuity, the loss of the
professional contribution from one or more key figures could have negative
repercussions on the development of activities and on the implementation times of the
Group’s growth strategy. However, the Consolidating company constantly monitors this
risk in order to ensure it is in a position to promptly replace these figures with equally
qualified persons able to guarantee the same operating and professional contribution
and avoid possible negative effects on development activities and on the growth
prospects of the Holding Company and the Group.
Risks relating to customer dependency
Today, the Holding Company and the Group offer services to companies operating in
the various markets (Finance, Service Provider, Defence, Manufacturing and Utility)
which also have extremely different characteristics.
Company revenues are equally distributed, despite the fact that the exit of some major
customers from the portfolio could impact the Company’s economic, equity and
financial position, without however jeopardising business continuity.
34
FINANCIAL STATEMENTS 2018 - REPORT ON OPERATIONS
Risks connected with contractual commitments
The Company provides outsourced services with a high technology content and high
value and the associated underlying contracts may involve the application of penalties
with regards to observance of the agreed service levels.
At contractual level, maximum penalty amounts are envisaged in relation to the value
of the services provided.
The Company has also taken out insurance policies, deemed adequate, to protect itself
against the risks deriving from civil liability for a total maximum annual amount of Euro 5
million.
In respect of projects of economic/financial importance, extra policies are subscribed,
in addition to the cover referred to above, in order to avoid the negative impacts on
the Company’s economic/equity and financial position.
Business outlook
The year 2019 is another year of significant growth in revenues and profit margins.
The Company continues to strengthen its sales structure for the direct coverage of the
market, also thanks to marketing activities targeted at enhancing the brand and the
analysis of the specific needs of the Company’s target customers.
At the moment of the preparation of this report, there are no events or situations,
including extraordinary or provisional, as such to require significant revisions of the
budget values.
In February 2019, following approval by the Board of Directors on 13 November 2018
and the Shareholders’ Meeting on 30 November 2018, the Parent Company filed the
communication at Consob pursuant to articles 113 of Legislative Decree 58/98, as
amended, and article 52 of the Regulation adopted by CONSOB Resolution no. 11971
of 14 May 1999, as amended (“Issuers’ Regulation”), regarding the application for
approval of the prospectus for admission to trading of ordinary shares of WIIT (the
“Shares”) on the Screen-Based Equities market (“MTA”), organised and managed by
Borsa Italiana S.p.A. (“Borsa Italiana”), potentially the STAR segment.
At the same time, WIIT presented to Borsa Italiana the application for admission of the
Shares to listing on the MTA, potentially the STAR segment, as well as the application for
revocation of its Shares from trading on AIM Italia, subject to their concurrent admission
to trading on the MTA.
35
FINANCIAL STATEMENTS 2018 - REPORT ON OPERATIONS
Programmatic Security Document
Pursuant to annex B, point 26 of Legislative Decree 196/2003, containing the Personal
Data Protection Code, the directors acknowledge that the Parent Company has
adjusted itself into line with the measures governing the protection of personal data, in
light of the provisions introduced by Legislative Decree 196/2003, according to the terms
and methods indicated herein. Following the repeal of the obligation to update the
Programmatic Security Document (DPS) by 31 March of each year (art. 45, letter c) of
Decree Law no. 5 of 9 February 2012, WIIT retained the latest version of the DPS of 30
March 2011 and continued to manage the other security measures, with particular
reference to electronic authentication, the management of authentication credentials,
the authorisation system and the periodic updating of the profile of those responsible,
with the appropriate procedure “Logical accesses and user management” filed at the
Company’s registered office, subject to certification according to the ISO20000 and
ISO27001 standards and which are free to consult at the Company’s registered office.
In 2018, Wiit S.p.A. will become compliant with new European regulation 2016/679 on
privacy (GDPR).
Proposed allocation of profit for the year
In relation to a consolidated profit of Euro 3,496,340, the Parent Company proposes to
allocate its profit of Euro 2,371,788 achieved in the year to the legal reserve (Euro 17,199)
and for the distribution of dividends to shareholders (Euro 2,354,589) for each of the WIIT
shares outstanding excluding treasury shares, for a total of Euro 0.90 per share.
Milan, 15/02/2019 On behalf of the Board of Directors
The Chairman
(Riccardo Mazzanti)
FINANCIAL
STATEMENTS
2018
Financial Statements Wiit S.p.A.

2
Financial Statements AS at 31 December 2018
Company: Wiit S.p.A.
Registered office: Milano, Via Muzio Attendolo detto
Sforza n.7
VAT no. And Tax Code: 01615150214
Share Capital: 2,652,066.00 fully paid-in
Milan Register of Companies
No.
n. 01615150214
R.E.A. (economic and
administrative index) No.
n. 1654427
Number of shares 2,652,066
Wiit Spa is subject to the management and coordination activities of Wiit Fin S.r.l.
sz
<<
3
Financial Statements AS at 31 December 2018
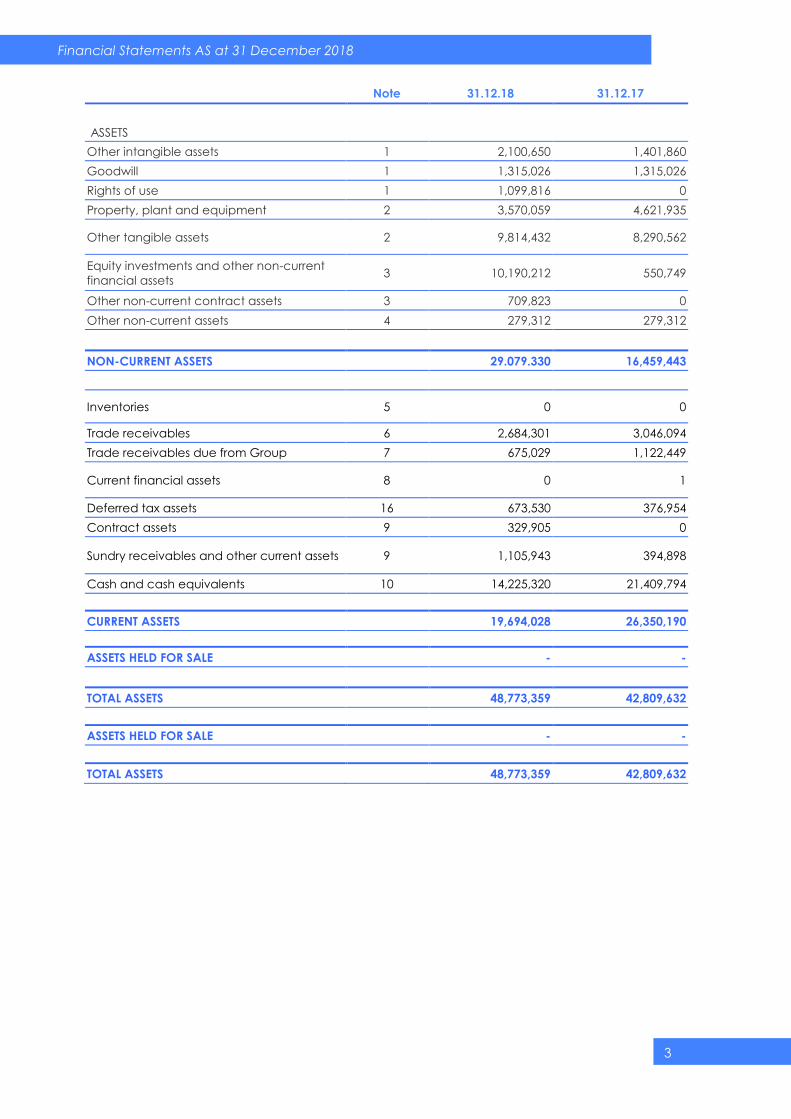
Note 31.12.18 31.12.17
ASSETS
Other intangible assets 1 2,100,650 1,401,860
Goodwill 1 1,315,026 1,315,026
Rights of use 1 1,099,816 0
Property, plant and equipment 2 3,570,059 4,621,935
Other tangible assets 2 9,814,432 8,290,562
Equity investments and other non-current
financial assets 3 10,190,212 550,749
Other non-current contract assets 3 709,823 0
Other non-current assets 4 279,312 279,312
NON-CURRENT ASSETS 29.079.330 16,459,443
Inventories 5 0 0
Trade receivables 6 2,684,301 3,046,094
Trade receivables due from Group 7 675,029 1,122,449
Current financial assets 8 0 1
Deferred tax assets 16 673,530 376,954
Contract assets 9 329,905 0
Sundry receivables and other current assets 9 1,105,943 394,898
Cash and cash equivalents 10 14,225,320 21,409,794
CURRENT ASSETS 19,694,028 26,350,190
ASSETS HELD FOR SALE - -
TOTAL ASSETS 48,773,359 42,809,632
ASSETS HELD FOR SALE - -
TOTAL ASSETS 48,773,359 42,809,632
4
Financial Statements AS at 31 December 2018
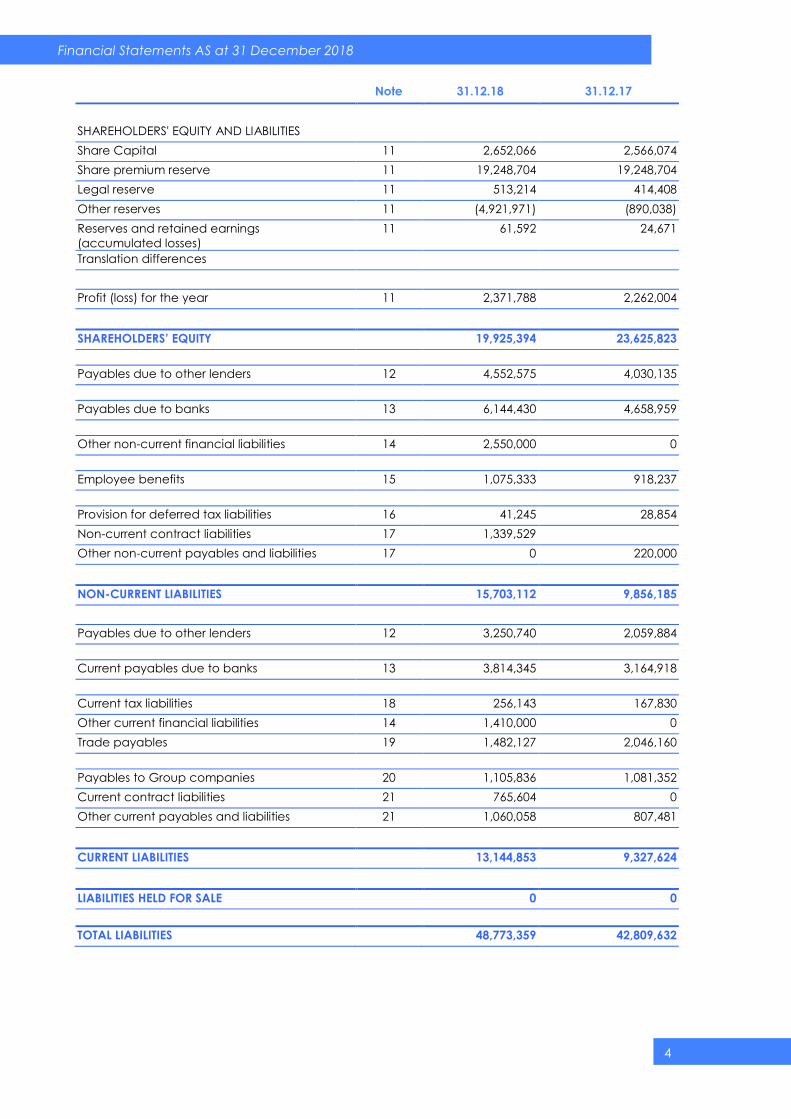
Note 31.12.18 31.12.17
PATRIMONIO NETTO E PASSIVO
SHAREHOLDERS' EQUITY AND LIABILITIES Importi da IVE CEE
Share Capital 11 2,652,066 2,566,074
Share premium reserve 11 19,248,704 19,248,704
Legal reserve 11 513,214 414,408
Other reserves 11 (4,921,971) (890,038)
Reserves and retained earnings
(accumulated losses)
11 61,592 24,671
Translation differences
Profit (loss) for the year 11 2,371,788 2,262,004
SHAREHOLDERS’ EQUITY 19,925,394 23,625,823
Payables due to other lenders 12 4,552,575 4,030,135
Payables due to banks 13 6,144,430 4,658,959
Other non-current financial liabilities 14 2,550,000 0
Employee benefits 15 1,075,333 918,237
Provision for deferred tax liabilities 16 41,245 28,854
Non-current contract liabilities 17 1,339,529
Other non-current payables and liabilities 17 0 220,000
NON-CURRENT LIABILITIES 15,703,112 9,856,185
Payables due to other lenders 12 3,250,740 2,059,884
Current payables due to banks 13 3,814,345 3,164,918
Current tax liabilities 18 256,143 167,830
Other current financial liabilities 14 1,410,000 0
Trade payables 19 1,482,127 2,046,160
Payables to Group companies 20 1,105,836 1,081,352
Current contract liabilities 21 765,604 0
Other current payables and liabilities 21 1,060,058 807,481
CURRENT LIABILITIES 13,144,853 9,327,624
LIABILITIES HELD FOR SALE 0 0
TOTAL LIABILITIES 48,773,359 42,809,632

5
Financial Statements AS at 31 December 2018
INCOME STATEMENT
Note 31.12.18 31.12.17
OPERATING REVENUE AND INCOME
Revenues from sales and services 22 19,988,618 17,482,598
Other revenues and income 23 669,961 747,298
Total operating revenue and income 20,658,579 18,229,896
OPERATING COSTS
Purchases and provision of services 24 (7,916,444) (7,526,171)
Cost of labour 5 (4,112,540) (3,833,708)
Amortisation, depreciation and write-downs 25 (4,994,259) (3,432,613)
Provisions 26
Other operating costs and charges 26 (295,099) (217,256)
Change in inventories of raw materials,
consumables and goods for resale
27 0 (11,632)
Total operating costs -17,318,342 -15,021,380
EBIT 3,340,237 3,208,516
Write-down of equity investments 28 0 (5,999)
Financial income 29 1,690 40,867
Financial expenses 30 (488,117) (451,994)
Exchange gains (losses) 31 0 (77)
PRE-TAX RESULT 2,853,810 2,791,314
Income taxes 32 (482,022) (529,311)
PROFIT (LOSS) FROM CONTINUING OPERATIONS 2.371.788 2,262,004
Profit from discontinued operations 33 0 0
PROFIT (LOSS) FOR THE PERIOD 2,371,788 2,262,004
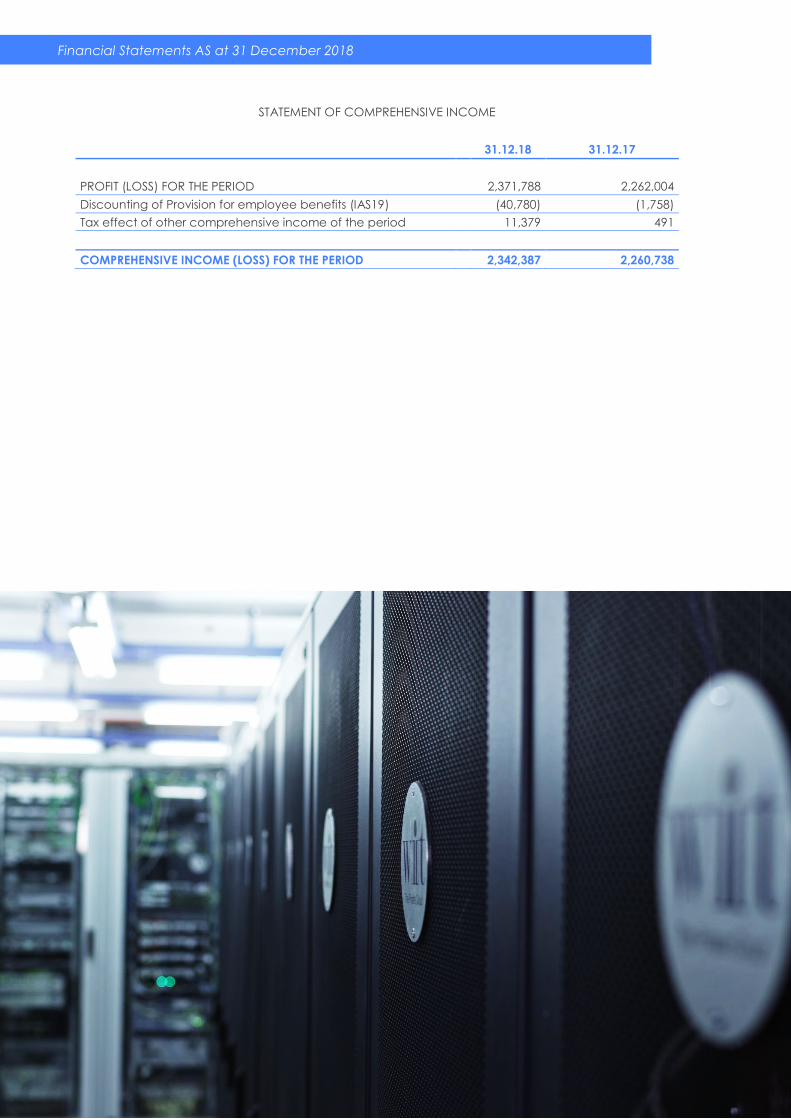
6
Financial Statements AS at 31 December 2018
STATEMENT OF COMPREHENSIVE INCOME
31.12.18 31.12.17
PROFIT (LOSS) FOR THE PERIOD 2,371,788 2,262,004
Discounting of Provision for employee benefits (IAS19) (40,780) (1,758)
Tax effect of other comprehensive income of the period 11,379 491
COMPREHENSIVE INCOME (LOSS) FOR THE PERIOD 2,342,387 2,260,738
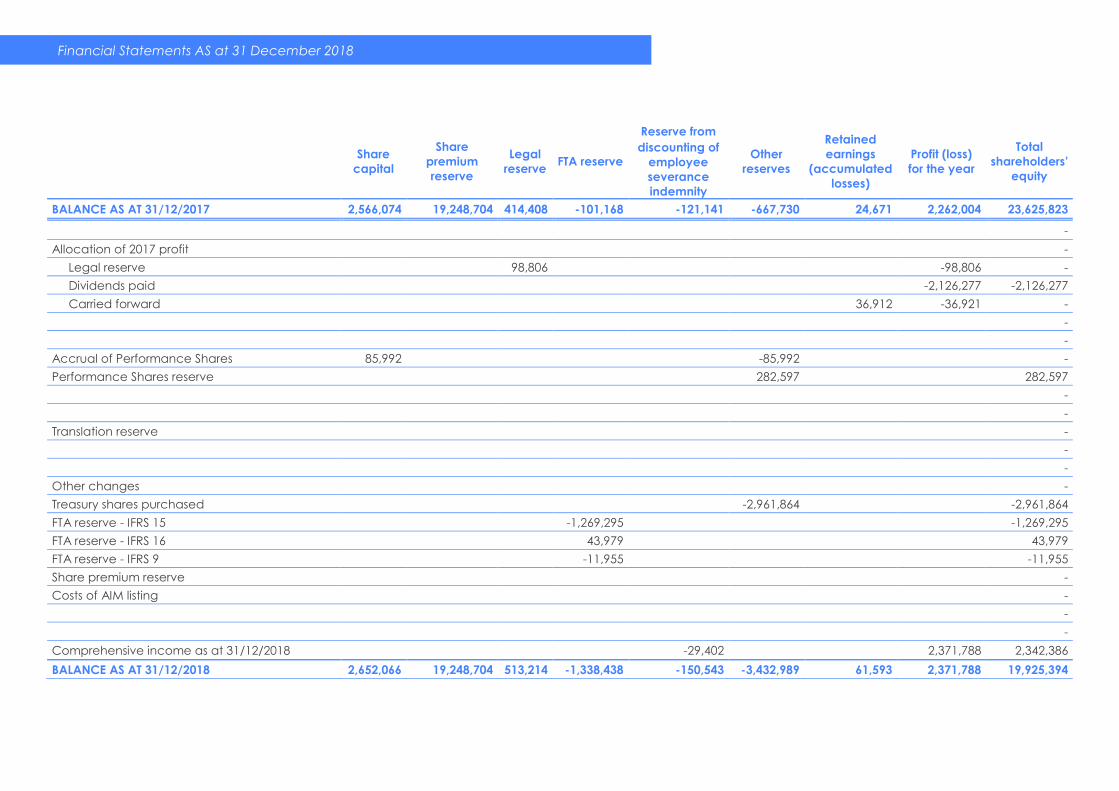
Financial Statements AS at 31 December 2018
Share
capital
Share
premium
reserve
Legal
reserve FTA reserve
Reserve from
Other
reserves
Retained
earnings
(accumulated
losses)
Profit (loss)
for the year
Total
shareholders’
equity
discounting of
employee
severance
indemnity
BALANCE AS AT 31/12/2017 2,566,074 19,248,704 414,408 -101,168 -121,141 -667,730 24,671 2,262,004 23,625,823
-
Allocation of 2017 profit -
Legal reserve 98,806 -98,806 -
Dividends paid -2,126,277 -2,126,277
Carried forward 36,912 -36,921 -
-
-
Accrual of Performance Shares 85,992 -85,992 -
Performance Shares reserve 282,597 282,597
-
-
Translation reserve -
-
-
Other changes -
Treasury shares purchased -2,961,864 -2,961,864
FTA reserve - IFRS 15 -1,269,295 -1,269,295
FTA reserve - IFRS 16 43,979 43,979
FTA reserve - IFRS 9 -11,955 -11,955
Share premium reserve -
Costs of AIM listing -
-
-
Comprehensive income as at 31/12/2018 -29,402 2,371,788 2,342,386
BALANCE AS AT 31/12/2018 2,652,066 19,248,704 513,214 -1,338,438 -150,543 -3,432,989 61,593 2,371,788 19,925,394
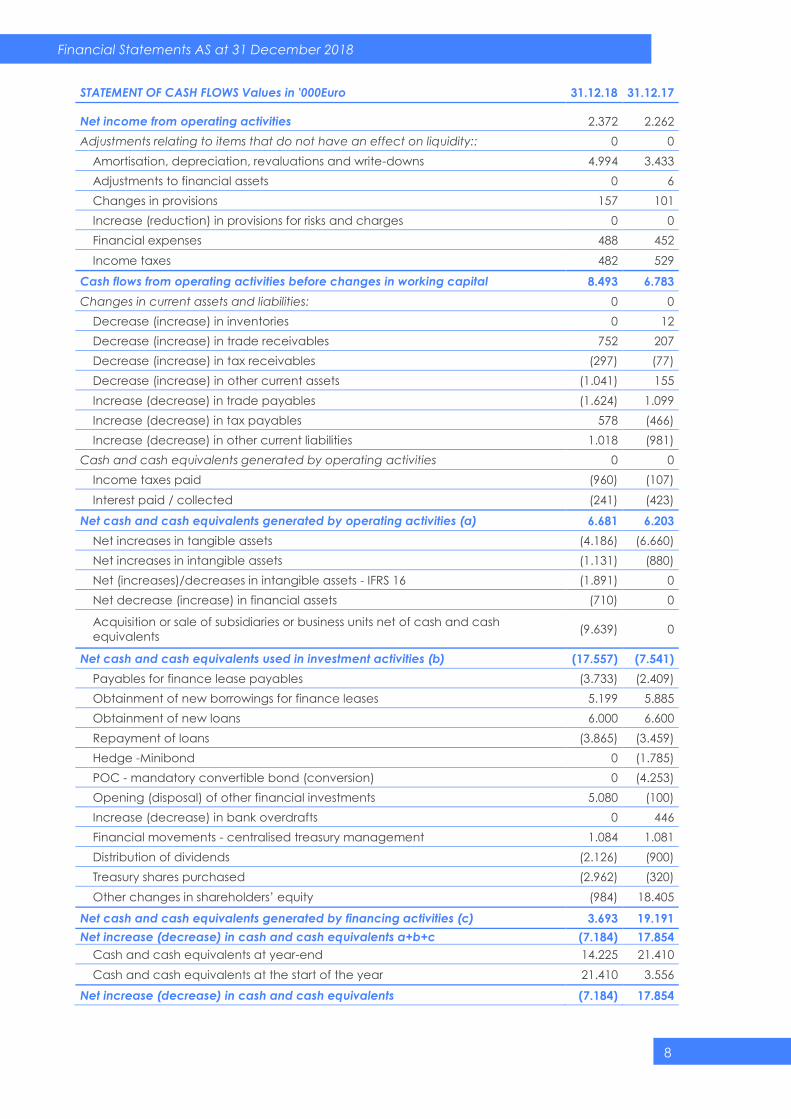
Financial Statements AS at 31 December 2018
8
STATEMENT OF CASH FLOWS Values in '000Euro 31.12.18 31.12.17
Net income from operating activities 2.372 2.262
Adjustments relating to items that do not have an effect on liquidity:: 0 0
Amortisation, depreciation, revaluations and write-downs 4.994 3.433
Adjustments to financial assets 0 6
Changes in provisions 157 101
Increase (reduction) in provisions for risks and charges 0 0
Financial expenses 488 452
Income taxes 482 529
Cash flows from operating activities before changes in working capital 8.493 6.783
Changes in current assets and liabilities: 0 0
Decrease (increase) in inventories 0 12
Decrease (increase) in trade receivables 752 207
Decrease (increase) in tax receivables (297) (77)
Decrease (increase) in other current assets (1.041) 155
Increase (decrease) in trade payables (1.624) 1.099
Increase (decrease) in tax payables 578 (466)
Increase (decrease) in other current liabilities 1.018 (981)
Cash and cash equivalents generated by operating activities 0 0
Income taxes paid (960) (107)
Interest paid / collected (241) (423)
Net cash and cash equivalents generated by operating activities (a) 6.681 6.203
Net increases in tangible assets (4.186) (6.660)
Net increases in intangible assets (1.131) (880)
Net (increases)/decreases in intangible assets - IFRS 16 (1.891) 0
Net decrease (increase) in financial assets (710) 0
Acquisition or sale of subsidiaries or business units net of cash and cash
equivalents (9.639) 0
Net cash and cash equivalents used in investment activities (b) (17.557) (7.541)
Payables for finance lease payables (3.733) (2.409)
Obtainment of new borrowings for finance leases 5.199 5.885
Obtainment of new loans 6.000 6.600
Repayment of loans (3.865) (3.459)
Hedge -Minibond 0 (1.785)
POC - mandatory convertible bond (conversion) 0 (4.253)
Opening (disposal) of other financial investments 5.080 (100)
Increase (decrease) in bank overdrafts 0 446
Financial movements - centralised treasury management 1.084 1.081
Distribution of dividends (2.126) (900)
Treasury shares purchased (2.962) (320)
Other changes in shareholders’ equity (984) 18.405
Net cash and cash equivalents generated by financing activities (c) 3.693 19.191
Net increase (decrease) in cash and cash equivalents a+b+c (7.184) 17.854
Cash and cash equivalents at year-end 14.225 21.410
Cash and cash equivalents at the start of the year 21.410 3.556
Net increase (decrease) in cash and cash equivalents (7.184) 17.854
Financial Statements AS at 31 December 2018
9
Notes to the financial statements as at 31 December 2018
Wiit S.p.A. (the Company) is a joint-stock company incorporated in Italy, with
registered office in Via Muzio Attendolo detto Sforza no. 7, Milan and
operates in the IT services sector on the basis of outsourcing contracts, with a
special focus on managing the IT processes of its customers in the following
sectors:
- finance;
- manufacturing;
- services;
- telecommunications.
The activity is performed by using specific and innovative work organisational
models and specialised assets and personnel.
ACCOUNTING STANDARDS
Statement of compliance and basis of preparation
The financial statements of Wiit S.p.A. for the year ended as at 31 December
2018 were drafted in compliance with the International Financial Reporting
Standards (IFRS) issued by the International Accounting Standards Board (IASB)
and adopted by the European Union. The reference to IFRS also includes all
applicable International Accounting Standards (IAS). They were drafted in
Euros, the current currency of the country in which the Company operates
predominantly, with amounts rounded to the nearest thousand, and is
compared with the previous year’s financial statements drafted using the same
criteria. They comprise the statement of financial position, income statement,
statement of comprehensive income, statement of changes in shareholders’
equity, the statement of cash flows and these notes. The financial statements
have been prepared on the basis of the historical cost principle, and the going
concern assumption. With reference to the latter assumption, despite the
presence of a difficult economic and financial environment, the Company,
also by virtue of its strong competitive positioning, high level of profitability and
the solidity of its capital and financial structure, considered itself to be a going
concern in accordance with paragraphs 25 and 26 of IAS 1.
Financial statements layouts
The Company adopted the following financial statements layouts:
a statement of financial position which shows current and non-current
assets and current and non-current liabilities separately;
an income statement which classifies costs by nature;
a statement of comprehensive income, which shows cost and revenue
items which are not recognised under profit (loss) for the year as required
or permitted by IFRS;
a statement of cash flows which presents the cash flows from operating
activities using the indirect method.
Financial Statements AS at 31 December 2018
10
The adoption of these layouts allows a more meaningful representation of the
equity, economic and financial position of the Company.
Measurement criteria
The accounting policies and measurement criteria adopted for the drafting of
the financial statements for the year ended as at 31 December 2018,
unchanged with respect to the previous year, are reported below:
INTANGIBLE ASSETS
Business combinations and goodwill
Business combinations are recognised according to the acquisition method.
According to said method, the consideration transferred in a business
combination is measured at fair value, calculated as the sum of the fair values
of the assets transferred and liabilities assumed by the Company at the
acquisition date and of the equity instruments issued in exchange for control of
the acquiree.
At the acquisition date, the identifiable assets acquired and the liabilities
assumed are booked at fair value on the acquisition date; the following items
constitute an exception, as they are instead measured according to their
reference principle:
- deferred tax assets and deferred tax liabilities;
- assets and liabilities for employee benefits;
- liabilities or equity instruments relating to share-based payments of the
acquiree or share-based payments relating to the Group, issued as a
replacement of the contracts of the acquiree;
- assets held for sale and discontinued assets and liabilities.
The value of goodwill is determined as the excess between the sum of the
considerations transferred in the business combination, the value of
shareholders’ equity attributable to non-controlling interests and the fair value
of any equity investment held previously in the acquiree with respect to the fair
value of the net assets acquired and liabilities assumed at the date of
acquisition. If the value of the net assets acquired and liabilities assumed at the
date of acquisition exceeds the sum of the considerations transferred, the
value of shareholders’ equity attributable to non-controlling interests and the
fair value of any equity investment held previously in the acquiree, this excess
(“Negative goodwill”) is recognised immediately in the income statement as
income deriving from the transaction concluded.
The costs connected with business combinations are recognised in the income
statement.
Goodwill is initially recognised at cost and subsequently reduced only in the
event of accumulated impairment.
Annually, or more frequently if specific events or changed circumstances
indicate the possibility that it has suffered impairment, the goodwill is subject to
impairment testing, according to the provisions of IAS 36 (Impairment of assets);
Financial Statements AS at 31 December 2018
11
the original value is, nonetheless, not written back if the reasons for the
impairment no longer apply.
Goodwill is not revalued, not even in application of specific laws.
Any liabilities connected to the business combinations for conditional
payments are booked at estimated fair value at the date of acquisition of the
companies and of the business units relating to the business combinations.
In the event of the transfer of a part or of the entire entity acquired previously
and the emergence of goodwill from its acquisition, in determining the capital
gains or losses from the transfer, account is taken of the corresponding residual
value of the goodwill.
In relation to the acquisitions prior to the date of adoption of IFRS, the Company
has availed itself of the right set out in IFRS 1 to not apply IFRS 3 - business
combinations to acquisitions completed before the transition date.
Consequently, the goodwill that emerged in relation to acquisitions completed
in the past were not re-stated and were recognised at the value calculated on
the basis of the previous accounting standards, net of amortisation accounted
for up to 31 December 2013, the date of transition to the international
accounting standards and any losses due to impairment. Research and development costs Development costs are only booked to assets if the costs can be determined reliably, the Company has the intention and the availability of resources to complete said asset, there is a technical feasibility of completing the asset to make it ready for use and the expected volumes and prices indicate that the costs incurred in the development phase may generate future economic benefits. Capitalised development costs include solely the expenses incurred which can be attributed directly to the development process. Capitalised development costs are amortised systematically, from the start of production, over the estimated life of the product or process, which was measured at five years. All other development costs are recognised to the income statement when incurred. Research costs are charged to the income statement at the moment they are incurred. Rights of use The definition of lease takes account of a criterion based on control (right of use) of an asset for distinguishing lease contracts from service contracts, identifying as discriminating factors: identification of the asset, the right to replace the same, the right to obtain substantially all of the economic benefits arising from the use of the asset and the right to direct the use of the asset underlying the contract. Assets with a value of less than Euro 5,000 and leases with a term of equal to or less than 12 months were not recognised as lease agreements. Assets forming the object of the operating lease are booked under assets with a contra-item in financial payables. Non-lease components were split off and accounted for separately from lease components. These assets are amortised on the basis of the lease term.
Other intangible assets
Other intangible assets acquired are booked to assets, according to the
provisions of IAS 38, when it is probable that use of the asset will generate future
economic benefits and the cost of the asset can be measured reliably. If these
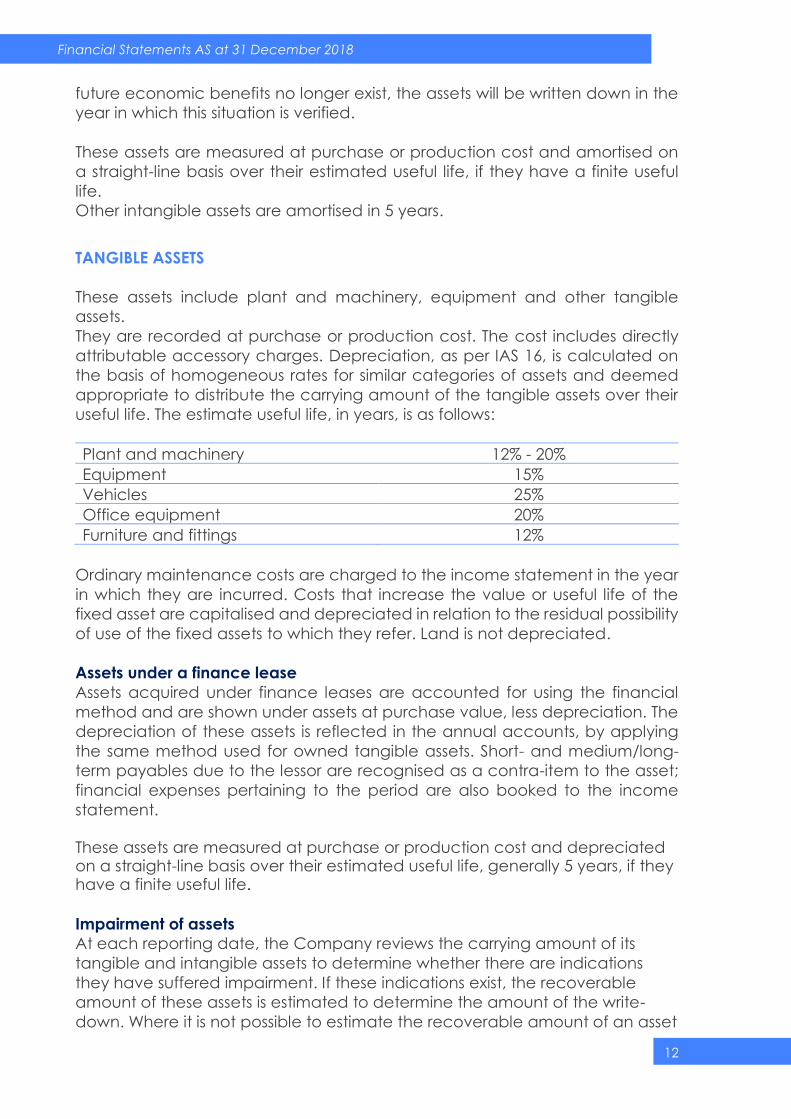
Financial Statements AS at 31 December 2018
12
future economic benefits no longer exist, the assets will be written down in the
year in which this situation is verified.
These assets are measured at purchase or production cost and amortised on
a straight-line basis over their estimated useful life, if they have a finite useful
life.
Other intangible assets are amortised in 5 years.
TANGIBLE ASSETS
These assets include plant and machinery, equipment and other tangible
assets.
They are recorded at purchase or production cost. The cost includes directly
attributable accessory charges. Depreciation, as per IAS 16, is calculated on
the basis of homogeneous rates for similar categories of assets and deemed
appropriate to distribute the carrying amount of the tangible assets over their
useful life. The estimate useful life, in years, is as follows:
Plant and machinery 12% - 20%
Equipment 15%
Vehicles 25%
Office equipment 20%
Furniture and fittings 12%
Ordinary maintenance costs are charged to the income statement in the year
in which they are incurred. Costs that increase the value or useful life of the
fixed asset are capitalised and depreciated in relation to the residual possibility
of use of the fixed assets to which they refer. Land is not depreciated.
Assets under a finance lease
Assets acquired under finance leases are accounted for using the financial
method and are shown under assets at purchase value, less depreciation. The
depreciation of these assets is reflected in the annual accounts, by applying
the same method used for owned tangible assets. Short- and medium/long-
term payables due to the lessor are recognised as a contra-item to the asset;
financial expenses pertaining to the period are also booked to the income
statement.
These assets are measured at purchase or production cost and depreciated on a straight-line basis over their estimated useful life, generally 5 years, if they have a finite useful life.
Impairment of assets
At each reporting date, the Company reviews the carrying amount of its
tangible and intangible assets to determine whether there are indications
they have suffered impairment. If these indications exist, the recoverable
amount of these assets is estimated to determine the amount of the write-
down. Where it is not possible to estimate the recoverable amount of an asset

Financial Statements AS at 31 December 2018
13
on an individual basis, the Company estimates the recoverable amount of
the cash-generating unit to which the asset belongs.
In particular, the recoverable amount of the cash-generating units (which
generally coincide with the legal entities to which the fixed assets refer) is
verified through the determination of the value in use. The recoverable
amount is the higher of the net sale price and the value in use. In determining
the value in use, the future cash flows net of taxes, estimated on the basis of
past experience, are discounted to their present value using a rate net of
taxes that reflects the current valuations of the present market value of
money and the specific risks of the asset. The main assumptions used to
calculate the value in use concern the discount rate, the growth rate,
expectations regarding changes in sale prices and the trend in direct costs
during the period assumed for the calculation. The growth rates adopted are
based on the growth forecasts of the relevant industrial sector. The variations
in the sale prices are based on past experiences and on future market
expectations. The Company prepares forecasts of the operating cash flows
deriving from the most recent budget drafted by the Directors and approved
by the Company’s Board of Directors, draws up forecasts for the next five
years and determines the terminal value (present value of the perpetual
yield) on the basis of a medium and long-term growth rate in line with that of
the specific relevant sector.
If the recoverable amount of an asset (or a cash-generating unit) is estimated
to be lower than the associated carrying amount, the carrying amount is
reduced to the lower recoverable amount, recognising the loss of value in the
income statement.
When the reasons for maintaining a write-down no longer apply, the carrying
amount of the asset (or the cash-generating unit), with the exception of
goodwill, is increased to the new value deriving from the estimate of its
recoverable amount, but not over the net carrying amount that the asset
would have had if no write-down had been effected for impairment. The
write-back is booked to the income statement.
FINANCIAL INSTRUMENTS
Presentation
The financial instruments held by the Company are included in the financial
statement items described below:
Non-current assets: Equity investments and Other financial assets.
Current assets: Trade receivables, Current financial assets, Other
receivables and current assets and Cash and cash equivalents.
Non-current liabilities: Payables due to banks, Financial payables and
liabilities and Other non-current liabilities.
Current liabilities: Trade payables, Payables due to banks, Current
financial liabilities and Other current liabilities.
The item “Cash and cash equivalents” includes bank deposits, shares of
liquidity funds and other highly tradable securities which can be readily
Financial Statements AS at 31 December 2018
14
converted to cash and which are subject to the risk of an insignificant
change in value.
Financial assets represented by debt instruments or equity instruments are
initially recognised at the settlement date.
At the moment of initial recognition, financial assets held for trading are
recognised at fair value, unlike the other categories of financial assets, as
they do not include the transaction costs or income connected with said
instrument which are booked to income statement. Cash and cash
equivalents are held to meet short-term cash commitments, instead of for
investment or other purposes. For an investment to be considered as a cash
or cash equivalent, it must be readily convertible to a known amount of cash
and must be subject to an insignificant risk of a change in value. Therefore,
an investment is usually classified as cash or cash equivalent only when it has
a short-term expiry, of no later than three months from the purchase date.
Measurement
Equity investments in subsidiaries and associates are recognised at cost
adjusted for impairment.
Equity investments in subsidiaries and associates are subject to impairment
testing every year, or if necessary, more frequently. If there is evidence that
these equity investments have suffered impairment, it is recognised in the
income statement as a write-down. In the event any amount pertaining to
the Company of the losses of the investee exceeds the carrying amount of
the equity investment, and the Company has the obligation to cover them,
the value of the equity investment is eliminated, the share of additional
losses is recognised as a provision for risks and charges under liabilities in the
statement of financial position. If the loss in value subsequently no longer
applies or reduces, a write-back is booked to the income statement up to
the limits of the cost.
Equity investments in associates are measured at fair value.
Equity investments classified as held for sale are accounted for in
compliance with IFRS 5.
Other financial assets and securities, held with the intention of being
retained until maturity, are accounted for on the basis of the trading date
and, at the moment of initial recognition in the financial statements, are
measured at acquisition cost (representative of the fair value), inclusive, of
the accessory costs of the transaction. These assets are subsequently
measured at amortised cost, determined using the effective interest rate
method.
Trade receivables, Current financial assets, Other receivables and current
assets and Cash and cash equivalents are measured at amortised cost, if
they have a pre-established maturity, calculated using the effective interest
rate method. When financial assets do not have a pre-established maturity,
they are measured at cost.
Receivables falling due after one year, non-interest bearing or which accrue
interest at below-market rates, are discounted using market rates.
Financial Statements AS at 31 December 2018
15
Valuations are performed regularly in order to verify whether there is
objective evidence that the financial assets, considered individually or as
part of a group of assets, have suffered impairment. If said evidence exists,
the impairment is recognised as a cost in the income statement for the
period.
After initial recognition, available-for-sale financial instruments and those
held for trading are measured at fair value. If the market price is not
available, the fair value of the available-for-sale financial instruments is
determined using the most suitable measurement techniques, such as the
analysis of discounted cash flows based on market information available at
the reporting date.
Gains and losses on available-for-sale financial assets are booked directly to
the statement of comprehensive income until the moment the financial
asset is sold or written down; at that moment, the accumulated gains or
losses, including those previously recognised in the statement of
comprehensive income, are included in the income statement of the
period. Gains and losses generated by the changes in the fair value of the
financial instruments classified as held for trading are booked to the income
statement of the period.
Trade payables, Current and non-current financial liabilities and Other
current and non-current liabilities are booked, at the moment of first-time
recognition in the financial statements, at fair value (normally represented
by the cost of the transaction), including the accessory costs of the
transaction.
INVENTORIES
Warehouse inventories are valued at the lower of the purchase or production
cost, calculated on the basis of the weighted average cost method, and the
corresponding market value, represented by the cost of replacing the
purchase materials and the presumed realisable value for finished and semi-
finished products, calculated by taking into account both manufacturing costs
and the direct sale costs still to be incurred. Obsolete and slow-moving stock
are written down in relation to their possible use or sale. The write-down of
inventories is eliminated in subsequent years if the reasons for said write-down
no longer apply.
PROVISIONS FOR RISKS AND CHARGES
Provisions for risks and charges represent probable liabilities, whose amount
and/or expiry are uncertain, deriving from past events, whose materialisation
will entail a financial outlay. Provisions are set aside exclusively in the presence
of a current obligation (legal or implicit), which makes the use of financial
resources necessary, provided that said obligation can be reliably estimated.
The amount recognised as a provision represents the best estimate of the
necessary expense to fulfil the obligation at the reporting date. The allocated

Financial Statements AS at 31 December 2018
16
provisions are re-examined as at each reporting date and adjusted to reflect
the best current estimate.
Where the financial outlay relating to the obligation must occur beyond the
normal payment terms and the effect of discounting is significant, the amount
of the provision is represented by the present value of future expected
payments to extinguish the obligation.
Contingent assets and liabilities are not recognised in the financial statements;
however adequate information is provided in this regard.
LOANS
Loans are initially measured at cost, net of accessory expenses to acquire the
loan. This value is subsequently adjusted to take account of any difference
between the initial value and the repayment value throughout the term of the
loan, using the effective interest rate method.
Loans are classified under current liabilities unless the company has the
unconditional right to defer the extinguishing of said liability for at least twelve
months after the reference date.
EMPLOYEE PROVISIONS
Short-term benefits
Short-term benefits to employees are booked to the income statement in the
period in which the work is performed.
Post-employment benefits
Effective from 1 January 2007, the Finance Law (Law 296/2006) and the
associated implementing decrees introduced significant changes to the
regulation of employee severance indemnity (TFR), including employees’
decisions regarding the allocation of their employee severance indemnity
being accrued. In particular, the new provisions established the requirement to
pay new flows of employee severance indemnity to forms of pension chosen
beforehand by the employee or, in the event the employee opts to retain said
flows in the company, to a treasury account held at INPS (National Social
Security Institute). These legislative amendments involved a new accounting
classification of the provision for employee severance indemnity.
Before the reform introduced by Law 296/2006, the international accounting
standards actually placed the provision for employee severance indemnity
under “defined benefit plans”; by contrast, now only TFR accrued as at 31
December 2006 continues to fall under “defined benefit plans”, while that
accrued after said date is classified as a “defined contribution plan”. This is
because all the company’s obligations are fulfilled with the periodic payment
of a contribution to third party entities. Therefore, the discounted amounts are
no longer allocated to the income statement, but the disbursements made to
the different forms of pension chosen by the employee or to the separate
treasury service established at INPS are recognised under personnel costs,
calculated on the basis of art. 2120 of the Italian Civil Code.
Financial Statements AS at 31 December 2018
17
Defined benefit plans
The provision for employee severance indemnity (limited to the amount
accrued as at 31 December 2006) is calculated by an independent actuary
using the projected unit method to determine the liability. All actuarial effects
are booked to shareholders’ equity and included in the statement of
comprehensive income.
Defined contribution plans
The Company participates in Government or privately managed defined
contribution pension plans, on a mandatory, contractual or voluntary basis. As
already outlined, provisions for employee severance indemnity which,
calculated on the basis of art. 2120 of the Italian Civil Code, are paid to
different forms of pension chosen by the employee or to the separate treasury
service established at INPS, fall into this category. Payment of the contributions
marks the fulfilment of the Company’s obligation to its employees. The
contributions therefore constitute costs in the period in which they are due.
Stock option plan
The Company approved a stock option plan intended for directors vested with
special roles and executives who hold strategic positions in the Parent
Company. According to the provisions of IFRS 2 - Share-based payments, this
plan represents a component of beneficiaries’ pay; therefore, the cost is
represented by the fair value of the stock options at the assignment date,
determined using financial valuation techniques, by also taking account of the
market conditions, and is booked to the income statement on a pro-rata basis
over the period to which the stock option plan refers, with a contra-item in
shareholders’ equity.
Recognition of revenues and costs
Revenues are recognised net of discounts, rebates and premiums, as well as of
the taxes directly related to the sale of the goods and provision of the services.
Revenues are measured on the basis of the consideration provided for
contractually with the customer and do not include amounts collected on
behalf of third parties. The Group recognises revenues at the time control of the
promised goods or services is transferred to the customer.
Costs and expenses are booked to the financial statements according to the
accrual principle.
Financial income
Financial income includes interest income on funds invested and income
deriving from financial instruments. Interest income is booked to the income
statement at the moment it accrues, considering the actual return.
Financial expenses
Financial expenses include interest expense on financial payables calculated
using the effective interest rate method and bank charges.
Financial Statements AS at 31 December 2018
18
Income taxes for the year
Income taxes comprise all the taxes calculated on the Company's taxable
income. Income taxes are booked to the income statement, with the
exception of those relating to items charged or credited directly to
shareholders’ equity, in which cases the tax effect is recognised directly to
shareholders’ equity. Other non-income related taxes, such as taxes on
properties, are included under operating charges. Deferred taxes are
allocated according to the balance sheet liability method. They are
calculated on all temporary differences that emerge between the tax base of
an asset or liability and the carrying amount, with the exception of goodwill
that is not tax deductible and those differences from investments in subsidiaries
which are not expected to be cancelled in the foreseeable future. Deferred
tax assets are recognised to the extent it is likely that sufficient future taxable
income will be generated against which they can be recovered. Current and
deferred tax assets and liabilities are offset when the income taxes are applied
by the same tax authority and when there is a legal right to offset. Deferred tax
assets and deferred tax liabilities are determined using the tax rates that are
expected to be used, in the legal system of the country in which the Company
operates, in the years in which the temporary differences will be realised or
extinguished.
Dividends
Dividends are accounted for on an accrual basis at the moment in which the
right to receive them arises, which corresponds to the distribution resolution.
Treasury shares
Treasury shares are booked as a reduction of shareholders’ equity. The carrying
amount of treasury shares and revenues deriving from any subsequent sales
are booked as movements in shareholders’ equity.
Use of estimates
Drafting of the financial statements and the associated notes, in application of
IFRS, required Management to prepare estimates and assumptions which have
an effect on the values of the assets and liabilities in the financial statements
and on the information relating to contingent assets and liabilities at the
reporting date. The final results could differ from these estimates. The estimates
are used to measure the tangible and intangible assets subject to impairment
testing, as described above, as well as to the recognise the provisions for credit
risks, for inventory obsolescence, amortisation/depreciation, write-downs of
assets, employee benefits, taxes and other provisions. In particular:
Recoverability of the value of tangible and intangible assets
The procedure for determining the impairment of tangible and intangible
assets described in the accounting standard “Impairment” implies - in
estimating the value in use - the use of the Business Plan of the investees which
are based on a set of assumptions and hypotheses relating to future events
and actions of the administrative bodies of the investees, which may not
Financial Statements AS at 31 December 2018
19
necessarily materialise. By contrast, in estimating the market value, assumptions
are made regarding the foreseeable trend in trading between third parties
based on the historical performances which may not actually recur.
Provisions for credit risks
Receivables are adjusted by the associated bad debt provision to take
account of their recoverable amount. The determination of the amount of the
write-downs requires subjective evaluations by Directors based on the
documentation and the information available regarding the solvency of the
customer, as well as on experience and the historical trends in collections.
Provisions for inventory obsolescence
Obsolete and slow-moving stock is systematically valued and, in the event in
which its recoverable amount is lower than its carrying amount, is written down.
Write-downs are calculated on the basis of management assumptions and
estimates, deriving from experience and the past results achieved.
Employee benefits
The present value of the liabilities for employee benefits depends on a number
of factors that are determined with actuarial techniques, using certain
assumptions. The assumptions regard the discount rate, estimates of future
salary increases, mortality and termination rates. Each variation in the above-
mentioned assumptions may have significant effects on the liability for pension
benefits.
Income taxes
The determination of the Company’s tax liability requires Management to use
judgments with reference to the transactions whose tax implications are not
certain at the close of the year. Furthermore, deferred tax assets are measured
on the basis of the expected income for future years; the measurement of this
expected income depends on factors which could change over time and
determine significant effects on the valuation of deferred tax assets.
Other provisions and funds
With reference to the processes of estimating the risk of contingent liabilities
from disputes, the Directors rely on the communications received regarding the
progress status of the collection procedures and disputes sent by the legal
representatives who represent the Company in the disputes. These estimates
are determined by taking into account the progressive development of the
disputes.
The estimates and assumptions are reviewed periodically, and the effects of
each change are immediately recognised in the income statement.

Financial Statements AS at 31 December 2018
20
NEW ACCOUNTING STANDARDS
Financial Statements AS at 31 December 2018
21
IFRS ACCOUNTING STANDARDS, AMENDMENTS AND INTERPRETATIONS APPLIED
FROM 1 JANUARY 2018
The following amendments were applied for the first time by the Group as of 1
January 2018:
IFRS 15 – Revenue from Contracts with Customers (published on 28 May
2014 and supplemented with further clarifications published on 12 April
2016) is intended to replace the standards IAS 18 – Revenue and IAS 11
– Construction Contracts, as well as the interpretations IFRIC 13 –
Customer Loyalty Programmes, IFRIC 15 – Agreements for the
Construction of Real Estate, IFRIC 18 – Transfers of Assets from Customers
and SIC 31 – Revenues-Barter Transactions Involving Advertising Services.
The standard establishes a new revenue recognition model to be
applied to all customer contracts except those falling within the scope
of other IAS/IFRS standards such as leases, insurance contracts and
financial instruments. The key steps for revenue recognition according to
the new model are:
identification of the contract with the customer;
identification of the performance obligations of the contract;
determination of the price;
allocation of the price to the contract performance obligations;
revenue recognition criteria when the entity meets each
performance obligation.
The standard was applied from 1 January 2018. The directors identified
the performance obligations contained in the contract and reallocated
the revenues and costs related to them and decided to account for the
effects of the first-time application of the standard by adopting the
modified retrospective approach. The effect of the first-time application
involved a change in shareholders’ equity through the creation of a
special negative reserve amounting to Euro 1,269,295, an increase in
contract liabilities of Euro 2,393,898, an increase in contract assets of Euro
633,434 and the effect of deferred taxes of Euro 491,169.
IFRS 16 – Leases (published on 13 January 2016), intended to replace
IAS 17 – Leases, as well as the interpretations IFRIC 4 Determining
whether an Arrangement contains a Lease, SIC-15 Operating Leases—
Incentives and SIC-27 Evaluating the Substance of Transactions
Involving the Legal Form of a Lease.
The new standard provides a new definition of lease and introduces a
criterion based on control (right of use) of an asset for distinguishing lease
contracts from service contracts, identifying as discriminating factors:
identification of the asset, the right to replace the same, the right to
obtain substantially all of the economic benefits arising from the use of

Financial Statements AS at 31 December 2018
22
the asset and the right to direct the use of the asset underlying the
contract.
The standard establishes a single model of recognition and valuation of
lease contracts for the lessee which entails recognising the asset
covered by the lease, including operating lease, under assets with an
offsetting financial payable, while also providing the possibility of not
recognising as leases contracts which refer to “low-value assets” (i.e.
leases regarding assets with a value of less than Euro 5,000) and leases
with a contract term less than or equal to 12 months. On the contrary,
the standard does not include significant changes for lessors.
The directors applied IFRS 16 early from 1 January 2018, jointly with
application of IFRS 15. In particular, the directors completed the project for
the implementation of the new standard, which made provision for a first
phase of detailed analysis of the contracts and the accounting effects and
a second phase of implementation and/or adjustment of the administrative
processes and of the accounting system. The directors applied IFRS 16 by
adopting the modified retrospective approach and decided to determine
the right of use as equal to the net carrying amount that it would have had
in the event in which the standard had been applied from the contract start
date using, however, the discount rate defined at the transition date. The
effect of the first-time application involved a change in shareholders’ equity
through the creation of a special reserve amounting to Euro 43,979, a net
increase in intangible fixed assets of Euro 1,484,252, an increase in financial
payables of Euro 1,423,256 and the effect of deferred taxes of Euro 17,017.
Final version of IFRS 9 – Financial Instruments (published on 24 July 2014).
The document includes the results of the IASB project to replace IAS 39:
introduces some new criteria for the classification and measurement
of financial assets and financial liabilities (together with the
measurement of non-substantial modifications in financial liabilities);
With reference to the impairment model, the new standard requires
that the estimate of losses on receivables be made on the basis of the
expected losses model (and not on the incurred losses model used by
IAS 39) using supporting information, available without unreasonable
burden or effort, which includes historical, current and prospective
data;
introduces a new hedge accounting model (increase in the types of
transactions eligible for hedge accounting, change of method of
accounting of forward contracts and options when included in a
hedge accounting relationship, modifications to the effectiveness
test).
The new standard was applied from 1 January 2018. The effect of the
first-time application involved a change in shareholders’ equity through
the creation of a special negative reserve amounting to Euro 11,995, an
Financial Statements AS at 31 December 2018
23
increase in the bad debt provision of Euro 16,581 and the effect of
deferred tax assets of Euro 4,626.
Amendment to IFRS 2 “Classification and measurement of share-based
payment transactions” (published on 20 June 2016), which contains
some clarifications in relation to the accounting of the effects of vesting
conditions in the presence of cash-settled share-based payments, the
classification of share-based payments with net settlement
characteristics and the accounting of the amendments to the terms and
conditions of a share-based payment that change their classification
from cash-settled to equity-settled. The amendments were applied from
1 January 2018. The adoption of this amendment did not have any
effects on the Group’s consolidated financial statements.
Document “Annual Improvements to IFRSs: 2014-2016 Cycle”, published
on 8 December 2016 (including IFRS 1 First-Time Adoption of International
Financial Reporting Standards - Deletion of short-term exemptions for first-
time adopters, IAS 28 Investments in Associates and Joint Ventures –
Measuring investees at fair value through profit or loss: an investment-by-
investment choice or a consistent policy choice, IFRS 12 Disclosure of
Interests in Other Entities – Clarification of the scope of the Standard)
which partially supplement the pre-existing standards. The majority of the
amendments were applied from 1 January 2018. The adoption of these
amendments did not have any effects on the Group’s consolidated
financial statements..
Amendment to IAS 40 “Transfers of Investment Property” (published on 8
December 2016). These amendments clarify the transfers of a property
to, or from investment property. In particular, an entity must classify a
property between, or from investment property only when there is
evidence of a change in use of the property. This change must be
related to a specific event that has happened and therefore must not
concern a mere change of intention by the management of an entity.
These amendments were applied from 1 January 2018. The adoption of
these amendments did not have any effects on the Group’s
consolidated financial statements.
Interpretation IFRIC 22 “Foreign Currency Transactions and Advance
Consideration” (published on 8 December 2016). The Interpretation aims to
provide guidelines for foreign currency transactions when an entity recognises
a non-monetary asset or non-monetary liability arising from the payment or
receipt of advance consideration before the entity recognises the related
asset, expense or income. This document addresses how an entity should
determine the date of the transaction and, consequently, the spot exchange
rate to use when foreign currency transactions are carried out in which the
payment is made or received in advance. IFRIC 22 was applied from 1 January
2018. The adoption of this interpretation did not have any effects on the
Group’s consolidated financial statements.

Financial Statements AS at 31 December 2018
24
IFRS ACCOUNTING STANDARDS, AMENDMENTS AND INTERPRETATIONS
ENDORSED BY THE EUROPEAN UNION, STILL NOT MANDATORILY APPLICABLE AND
NOT ADOPTED EARLY BY THE GROUP AS AT 31 DECEMBER 2018
Amendment to IFRS 9 - Prepayment Features with Negative
Compensation (published on 12 October 2017). This document specifies
that instruments which involve an early repayment would respect the
“SPPI” test also in the case in which the reasonable additional
compensation to be paid in the case of an early repayment is a negative
compensation for the lender. The amendment applies from 1 January
2019, but early application is permitted.
On 7 June 2017, the IASB published the interpretation IFRIC 23 –
Uncertainty over Income Tax Treatments. The document addresses the
uncertainties over income tax treatments.
The document requires uncertainties in determining tax assets or liabilities to
be reflected in the financial statements only when an entity will pay or recover
the amount in question. Furthermore, the document does not contain any
new disclosure obligation but stresses that the entity must establish whether it
is necessary to provide information on the considerations made by
management and relating to the uncertainty over the accounting of taxes,
in accordance with IAS 11.
IFRS ACCOUNTING STANDARDS, AMENDMENTS AND INTERPRETATIONS STILL NOT
ENDORSED BY THE EUROPEAN UNION
As at 31 December 2018, the competent bodies of the European Union still
had not concluded the endorsement process for the adoption of the
amendments and standards described below.
On 18 May 2017, the IASB published IFRS 17 – Insurance Contracts which
is intended to replace IFRS 4 – Insurance Contracts.
The objective of the new standard is to ensure that an entity provides
relevant information that faithfully represents rights and obligations from
insurance contracts it issues. The IASB developed the standard to
eliminate inconsistencies and weaknesses in existing accounting
practices by providing a single principle‑based framework to account
for all types of insurance contracts, including reinsurance contracts that
an insurer holds. The standard is applicable as from 1 January 2021 but
early application is allowed only for entities that apply IFRS 9 – Financial
Instruments and IFRS 15 – Revenue from Contracts with Customers. The
Directors do not expect the adoption of this standard to have any
significant effects on the Group’s consolidated financial statements.
The new interpretation applies from 1 January 2019, but early application
is permitted. The Directors are currently evaluating the potential effects
of the introduction of this interpretation on the Group’s consolidated
Financial Statements AS at 31 December 2018
25
financial statements.
Amendment to IAS 28 “Long-term Interests in Associates and Joint
Ventures” (published on 12 October 2017)”. This document clarifies the
need to apply IFRS 9, including the requirements relating to impairment,
to other long-term interests in associates and joint ventures for which the
equity method is not applied. The amendment applies from 1 January
2019, but early application is permitted. The Directors are currently
evaluating the potential effects of the introduction of these
amendments on the Group’s consolidated financial statements.
Document “Annual Improvements to IFRSs 2015-2017 Cycle”, published
on 12 December 2017 (including IFRS 3 Business Combinations and IFRS
11 Joint Arrangements – Remeasurement of previously held interest in a
joint operation, IAS 12 Income Taxes – Income tax consequences of
payments on financial instruments classified as equity, IAS 23 Borrowing
costs Disclosure of Interests in Other Entities – Borrowing costs eligible for
capitalisation) which acknowledges the amendments to some
standards as part of their annual improvement process. The
amendments apply from 1 January 2019, but early application is
permitted. The Directors are currently evaluating the potential effects of
the introduction of these amendments on the Group’s consolidated
financial statements.
Amendment to IAS 19 “Plant Amendment, Curtailment or Settlement”
(published on 7 February 2018). The document clarifies how an entity
should recognise a modification (i.e. a curtailment or a settlement) of a
defined-benefit plan. The amendments require an entity to update its
assumptions and remeasure the net plan liability or asset. The
amendments clarify that after said event is verified, an entity must use
updated assumptions to measure the current service cost and the
interest for the rest of the reference period after the event. The
amendments apply from 1 January 2019, but early application is
permitted. The Directors are currently evaluating the potential effects of
the introduction of these amendments on the Group’s consolidated
financial statements.
Amendment to IFRS 10 and IAS 28 “Sales or Contribution of Assets
between an Investor and its Associate or Joint Venture” (published on 11
September 2014). The document was published in order to resolve the
present conflict between IAS 28 and IFRS 10 relating to the measurement
of the profit or loss resulting from the transfer or contribution of a non-
monetary asset to a joint venture or associate in exchange for a share in
the latter’s capital. The IASB has currently suspended the application of
this amendment. The Directors are currently evaluating the potential
effects of the introduction of these amendments on the Group’s
consolidated financial statements.
Amendment to IFRS 3 – Business Combinations (published on 22
October 2018).
The amendment clarifies the differences between business
Financial Statements AS at 31 December 2018
26
combinations and acquisitions of a group of assets. While the previous
definition of “business combination” focused on the contribution of a
direct return to investors or other shareholders in the form of dividends,
lower costs or other economic benefits, the definition introduced by
the amendment emphasises that the objective of a business
combination is to provide goods and services to customers. The
distinction between a business combination and the acquisition of an
asset or group of assets is important for the purposes of recognising
goodwill, only permitted in the case of business combinations. The
amendment applies from 1 January 2020, but early application is
permitted.
Amendments to IAS 1 and IAS 8 “Definition of Material” (published on
31 October 2018). The amendments introduce a new definition of the
concept of relevance, in order to make it clearer for companies to
define whether the information must be included in their financial
statements. The amendments apply from 1 January 2020, but early
application is permitted.
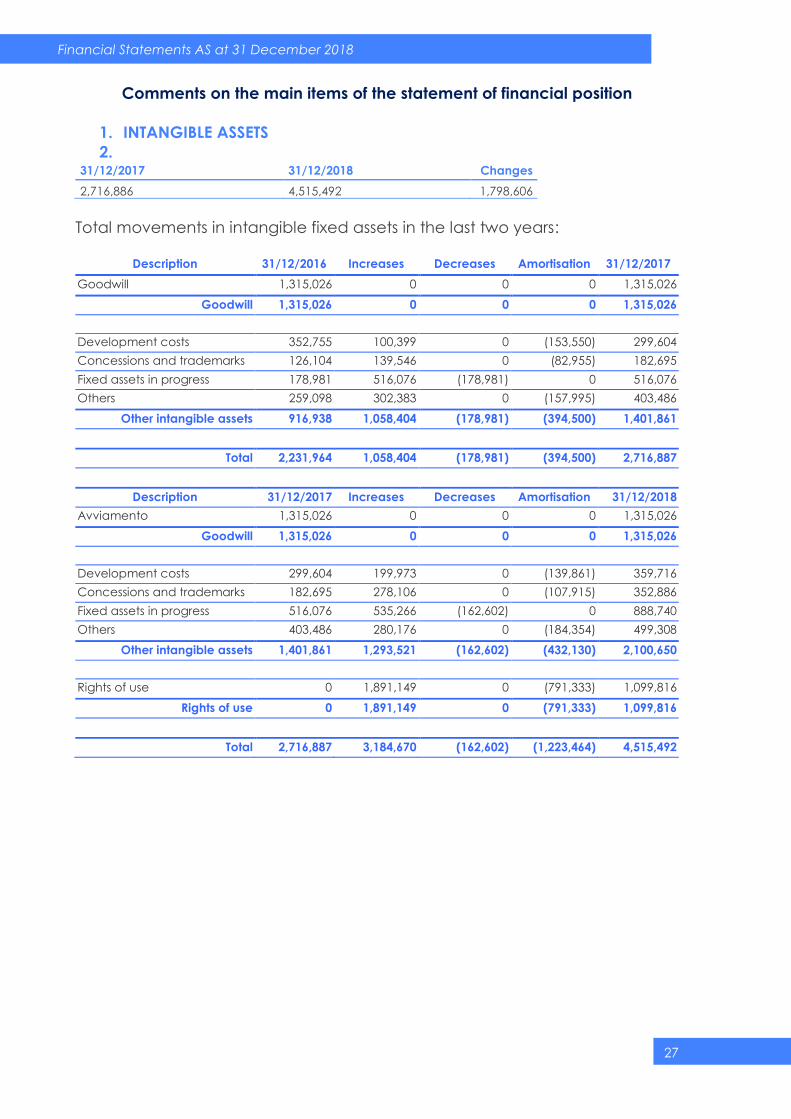
Financial Statements AS at 31 December 2018
27
Comments on the main items of the statement of financial position
1. INTANGIBLE ASSETS
2. 31/12/2017 31/12/2018 Changes
2,716,886 4,515,492 1,798,606
Total movements in intangible fixed assets in the last two years:
Description 31/12/2016 Increases Decreases Amortisation 31/12/2017
Goodwill 1,315,026 0 0 0 1,315,026
Goodwill 1,315,026 0 0 0 1,315,026
Development costs 352,755 100,399 0 (153,550) 299,604
Concessions and trademarks 126,104 139,546 0 (82,955) 182,695
Fixed assets in progress 178,981 516,076 (178,981) 0 516,076
Others 259,098 302,383 0 (157,995) 403,486
Other intangible assets 916,938 1,058,404 (178,981) (394,500) 1,401,861
Total 2,231,964 1,058,404 (178,981) (394,500) 2,716,887
Description 31/12/2017 Increases Decreases Amortisation 31/12/2018
Avviamento 1,315,026 0 0 0 1,315,026
Goodwill 1,315,026 0 0 0 1,315,026
Development costs 299,604 199,973 0 (139,861) 359,716
Concessions and trademarks 182,695 278,106 0 (107,915) 352,886
Fixed assets in progress 516,076 535,266 (162,602) 0 888,740
Others 403,486 280,176 0 (184,354) 499,308
Other intangible assets 1,401,861 1,293,521 (162,602) (432,130) 2,100,650
Rights of use 0 1,891,149 0 (791,333) 1,099,816
Rights of use 0 1,891,149 0 (791,333) 1,099,816
Total 2,716,887 3,184,670 (162,602) (1,223,464) 4,515,492
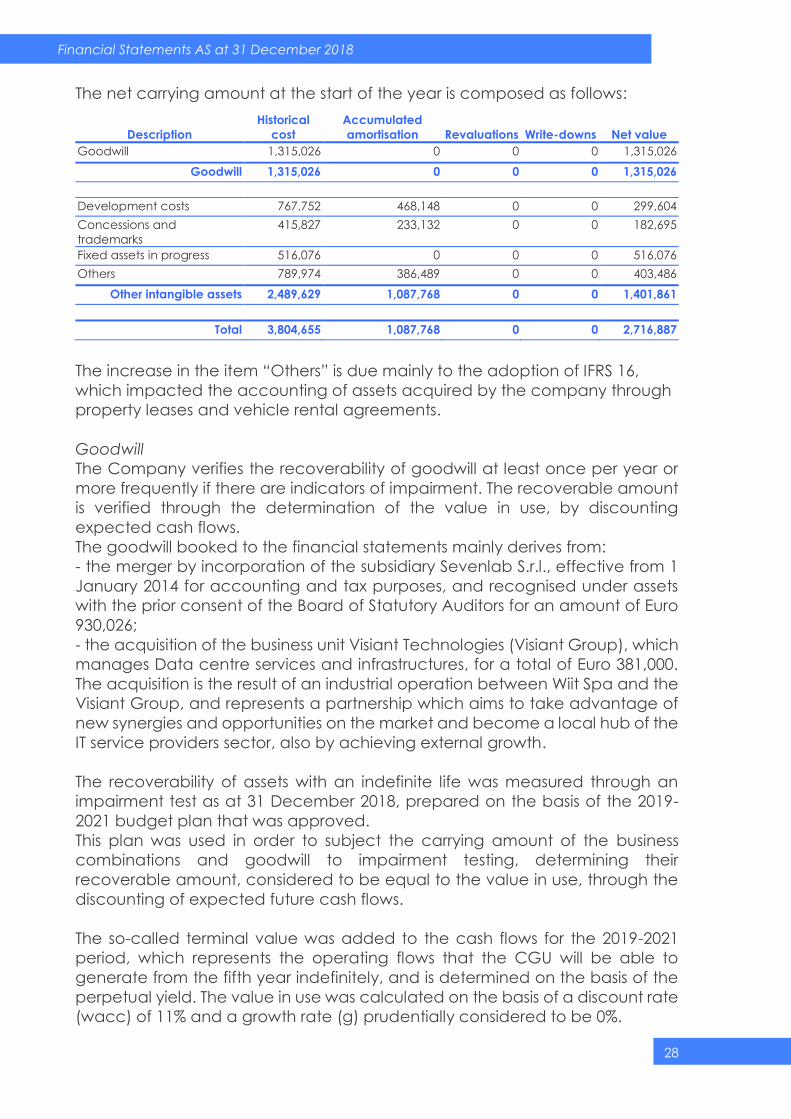
Financial Statements AS at 31 December 2018
28
The net carrying amount at the start of the year is composed as follows:
Description
Historical
cost
Accumulated
amortisation Revaluations Write-downs Net value
Goodwill 1,315,026 0 0 0 1,315,026
Goodwill 1,315,026 0 0 0 1,315,026
Development costs 767,752 468,148 0 0 299,604
Concessions and
trademarks
415,827 233,132 0 0 182,695
Fixed assets in progress 516,076 0 0 0 516,076
Others 789,974 386,489 0 0 403,486
Other intangible assets 2,489,629 1,087,768 0 0 1,401,861
Total 3,804,655 1,087,768 0 0 2,716,887
The increase in the item “Others” is due mainly to the adoption of IFRS 16,
which impacted the accounting of assets acquired by the company through
property leases and vehicle rental agreements.
Goodwill
The Company verifies the recoverability of goodwill at least once per year or
more frequently if there are indicators of impairment. The recoverable amount
is verified through the determination of the value in use, by discounting
expected cash flows.
The goodwill booked to the financial statements mainly derives from:
- the merger by incorporation of the subsidiary Sevenlab S.r.l., effective from 1
January 2014 for accounting and tax purposes, and recognised under assets
with the prior consent of the Board of Statutory Auditors for an amount of Euro
930,026;
- the acquisition of the business unit Visiant Technologies (Visiant Group), which
manages Data centre services and infrastructures, for a total of Euro 381,000.
The acquisition is the result of an industrial operation between Wiit Spa and the
Visiant Group, and represents a partnership which aims to take advantage of
new synergies and opportunities on the market and become a local hub of the
IT service providers sector, also by achieving external growth.
The recoverability of assets with an indefinite life was measured through an
impairment test as at 31 December 2018, prepared on the basis of the 2019-
2021 budget plan that was approved.
This plan was used in order to subject the carrying amount of the business
combinations and goodwill to impairment testing, determining their
recoverable amount, considered to be equal to the value in use, through the
discounting of expected future cash flows.
The so-called terminal value was added to the cash flows for the 2019-2021
period, which represents the operating flows that the CGU will be able to
generate from the fifth year indefinitely, and is determined on the basis of the
perpetual yield. The value in use was calculated on the basis of a discount rate
(wacc) of 11% and a growth rate (g) prudentially considered to be 0%.

Financial Statements AS at 31 December 2018
29
The recoverable amount determined on the basis of the assumptions and
valuation techniques cited above is higher than the carrying amount of the
assets with an indefinite life.
As at 31 December 2018, it should be noted that the performances of sales,
profitability and orders in 2018 confirm the strong trend on the basis of which
the plan was developed.
Therefore, the Directors believe that are there no indicators of the risk of non-
recoverability of the carrying amount of goodwill.
All intangible fixed assets, with the exception of goodwill, are amortised over 5
years.
Concessions, trademarks and patents
Concessions and trademarks refer essentially to the protection of the
company's trademarks.
Development costs
Development activities include both internal and external costs incurred, which
relate largely to development of its ICT infrastructure. This infrastructure enables
WIIT to provide its services effectively and competitively; this relates essentially
to the cost of implementing the IT platforms and framework through which the
Group provides and manages the services set out in the contracts and
interacts with its customers.
IT Security is one of the services for which the Group is investing heavily in R&D,
as it predicts significant growth in demand from its customers. In fact, the cost
of the activities is connected primarily to the implementation of the “Wiit Cyber
Security Roadmap”, infrastructures and services for managing IT security for all
systems in WIIT’s Data Centres, or the customer’s Data Centres, both internal
WIIT systems and those of the customers to whom WIIT provides its services.
Development costs include those relating to the “Wiit Orchestrator” project.
This project provides the possibility of activating, monitoring and centrally
managing systems which can be active in both “private cloud” environments
and “hosted private cloud” and “public cloud” environments. The platform
also offers the possibility of putting the end customer in a position to
independently manage, from an operational perspective, some of its
environments hosted in the WIIT cloud or other Clouds.
In addition to the “WIIT Cloud Orchestrator” project as described above, it
includes some key functionalities within the macro project “WIIT Cyber Security
Roadmap”, which were concluded in 2018.
In particular, in 2017, with a view to improving its network infrastructure, WIIT
implemented a project called “WIIT Cyber Security Roadmap”, targeted at
both increasing the level of security of the entire architecture used by WIIT and
implementing a new offering in the portfolio dedicated to Cyber Security.
Financial Statements AS at 31 December 2018
30
The following problems were analysed:
Segregation of customer networks
Control of accesses to internal systems and of WIIT customers
Control of traffic from customers and internal users of WIIT
Control of bandwidth used by customers for the internet and for the
services/systems present in WIIT’s Milan Data Centre
Risks and problems from DDoS attacks and Intrusion prevention
Following the evaluations conducted on the systems aimed at improving the
levels of security of the entire architecture, the following activities were
undertaken and completed:
Activation of two-factor authentication (Strong Authentication) for
remote access to the WIIT network, through the implementation of
Safenet Gemalto
Implementation of an ESA Anti-spam system with sandbox
functionality
Implementation of balancer
Implementation of a security and quick assessment framework
Password Management system (CyberArk)
Intangible fixed assets in progress
As regards assets in progress, other components of the WIIT security
infrastructure are also at the analysis and implementation phase, including:
Traffic shaping technologies: for controlling internet bandwidth and
bandwidth for the systems/services present in the Data Centre
accessed by interconnected customers
Log management technologies for the management and analysis
of system logs
Anti-DDoS System
Integration of Next Generation Firewall
Automation systems for SAP DB Copies and patch management, with
particular attention to the security patches.
In addition, the item “Fixed assets in progress” also includes the development
costs relating to E-billing.
The E-billing management services which WIIT intends to provide at the end of
the project make provision, also through third party intermediaries, for the
management of the “End to End” process of the tax documents regarding the
sales and distribution cycle and purchasing cycle, all guaranteeing
compliance with the applicable legislation.
The services provide for the activation of a software platform, based on the
Alfresco document system, on which the users can manage their physical
documents.
The platform that we are creating contains a specific “Finance” area with
custom functionalities for displaying, searching, exporting and sharing
documents.
Functionalities were developed for integration with ERP systems (e.g. SAP) for
managing the sales and distribution cycle and the purchasing cycle, which

Financial Statements AS at 31 December 2018
31
allow customer invoices to be submitted for transmission and the automatic
registration and accounting of supplier invoices.
Communication interfaces will be developed to enable the transmission and
exchange of data with intermediaries to the SOGEI (MEF) SDI, in order to
manage the transmission of customer invoices as regards the sales and
distribution cycle and the receipt of supplier invoices for the purchasing cycle.
In order to monitor communication activities between the different
components (ERP, Alfresco platform and intermediary systems) a reporting
system was developed that manages the analysis of the documentation
drafted and the outcome of communications, providing accurate feedback
to users (e.g. via e-mail) on any errors or unsuccessful additions.
Lastly, the system enables the management of the process of digital storage of
documents, compliant with the regulations, regarding the sales and distribution
cycle and the purchasing cycle, by interacting with the providers selected
beforehand.
“Automated Billing” is another project in the process of being implemented,
which integrates and completes the WIIT Cloud Orchestrator project, and
consists of the automation of processes from the point of view of the volumes
of resources and the associated economic aspects. The system involves the
collection and processing of volumes of activities and resources provided, also
for the purposes of the automated reporting and billing, also on the basis of the
different methods of consumption by customers (self-provisioned, plafond
based, on-demand, etc.).
The projects and functionalities referred to above augment already existing
ones which represent, to all intents and purposes, as a whole, the company’s
strategic assets, on which the company’s competitiveness and capacity for
market expansion depend.
Others
The increase in the item “Others” is due primarily to the capitalisation of long-
term costs and software licences purchased by the company.
Rights of use
The item “Rights of use” stems from the adoption of IFRS 16, which had an
impact on the accounting of the assets acquired by the company through
property leases and vehicle rental agreements. This item also includes rentals
of properties and the long-term rental of the company’s car fleet.
It should also be noted that, on completion of the analysis, the current
performance of Wiit S.p.A., whose historical trend is outlined in the notes and
the 2019-2021 business plan, lead us to believe that the value in use of the
above-mentioned fixed assets, i.e. the present value of the expected future
cash flows deriving from or attributable to the continued use of the same, is
considerably higher than the residual value at which these are recognised in
the financial statements.
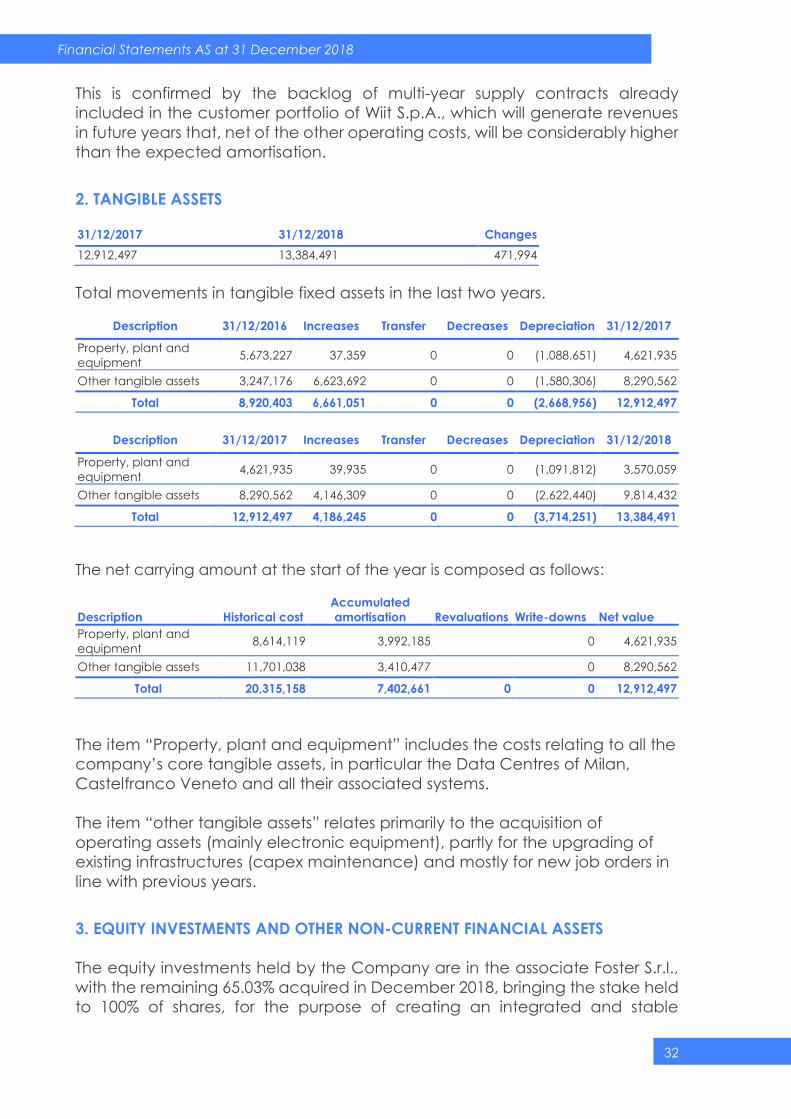
Financial Statements AS at 31 December 2018
32
This is confirmed by the backlog of multi-year supply contracts already
included in the customer portfolio of Wiit S.p.A., which will generate revenues
in future years that, net of the other operating costs, will be considerably higher
than the expected amortisation.
2. TANGIBLE ASSETS 31/12/2017 31/12/2018 Changes
12,912,497 13,384,491 471,994
Total movements in tangible fixed assets in the last two years.
Description 31/12/2016 Increases Transfer Decreases Depreciation 31/12/2017
Property, plant and
equipment 5,673,227 37,359 0 0 (1,088,651) 4,621,935
Other tangible assets 3,247,176 6,623,692 0 0 (1,580,306) 8,290,562
Total 8,920,403 6,661,051 0 0 (2,668,956) 12,912,497
Description 31/12/2017 Increases Transfer Decreases Depreciation 31/12/2018
Property, plant and
equipment 4,621,935 39,935 0 0 (1,091,812) 3,570,059
Other tangible assets 8,290,562 4,146,309 0 0 (2,622,440) 9,814,432
Total 12,912,497 4,186,245 0 0 (3,714,251) 13,384,491
The net carrying amount at the start of the year is composed as follows:
Description Historical cost
Accumulated
amortisation Revaluations Write-downs Net value
Property, plant and
equipment 8,614,119 3,992,185 0 4,621,935
Other tangible assets 11,701,038 3,410,477 0 8,290,562
Total 20,315,158 7,402,661 0 0 12,912,497
The item “Property, plant and equipment” includes the costs relating to all the
company’s core tangible assets, in particular the Data Centres of Milan,
Castelfranco Veneto and all their associated systems.
The item “other tangible assets” relates primarily to the acquisition of
operating assets (mainly electronic equipment), partly for the upgrading of
existing infrastructures (capex maintenance) and mostly for new job orders in
line with previous years.
3. EQUITY INVESTMENTS AND OTHER NON-CURRENT FINANCIAL ASSETS
The equity investments held by the Company are in the associate Foster S.r.l.,
with the remaining 65.03% acquired in December 2018, bringing the stake held
to 100% of shares, for the purpose of creating an integrated and stable
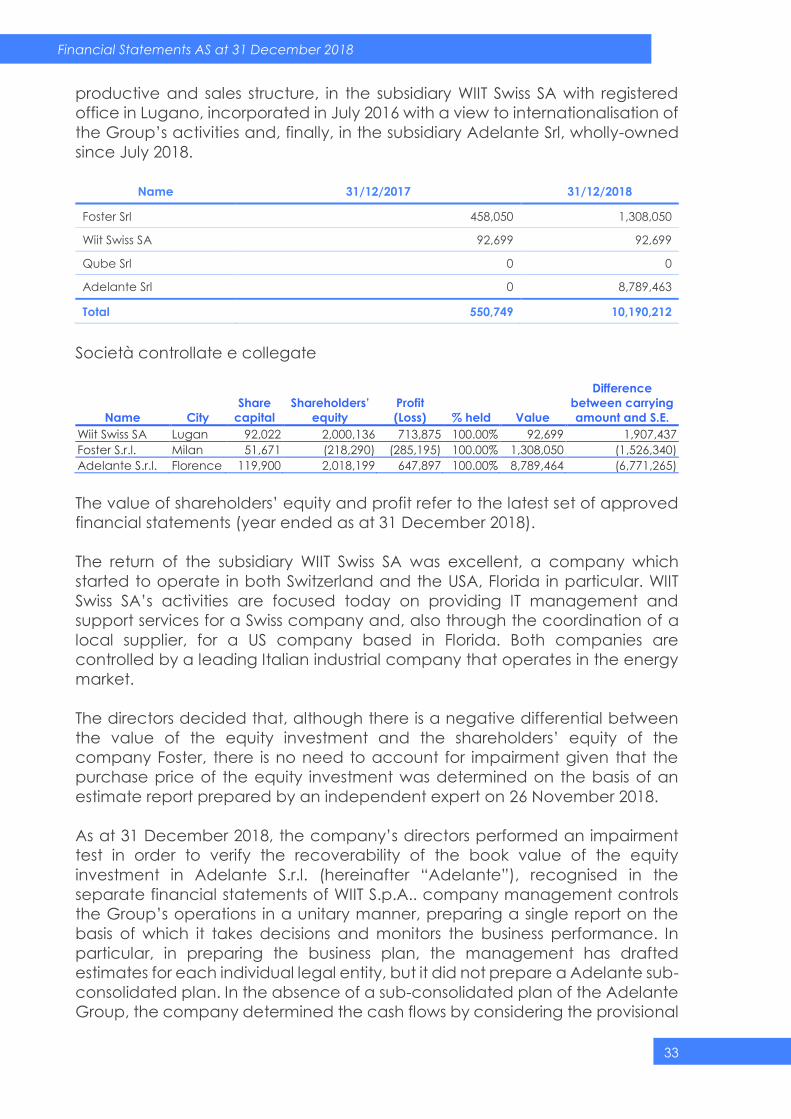
Financial Statements AS at 31 December 2018
33
productive and sales structure, in the subsidiary WIIT Swiss SA with registered
office in Lugano, incorporated in July 2016 with a view to internationalisation of
the Group’s activities and, finally, in the subsidiary Adelante Srl, wholly-owned
since July 2018.
Name 31/12/2017 31/12/2018
Foster Srl 458,050 1,308,050
Wiit Swiss SA 92,699 92,699
Qube Srl 0 0
Adelante Srl 0 8,789,463
Total 550,749 10,190,212
Società controllate e collegate
Name City
Share
capital
Shareholders’
equity
Profit
(Loss) % held Value
Difference
between carrying
amount and S.E.
Wiit Swiss SA Lugan 92,022 2,000,136 713,875 100.00% 92,699 1,907,437
Foster S.r.l. Milan 51,671 (218,290) (285,195) 100.00% 1,308,050 (1,526,340)
Adelante S.r.l. Florence 119,900 2,018,199 647,897 100.00% 8,789,464 (6,771,265)
The value of shareholders’ equity and profit refer to the latest set of approved
financial statements (year ended as at 31 December 2018).
The return of the subsidiary WIIT Swiss SA was excellent, a company which
started to operate in both Switzerland and the USA, Florida in particular. WIIT
Swiss SA’s activities are focused today on providing IT management and
support services for a Swiss company and, also through the coordination of a
local supplier, for a US company based in Florida. Both companies are
controlled by a leading Italian industrial company that operates in the energy
market.
The directors decided that, although there is a negative differential between
the value of the equity investment and the shareholders’ equity of the
company Foster, there is no need to account for impairment given that the
purchase price of the equity investment was determined on the basis of an
estimate report prepared by an independent expert on 26 November 2018.
As at 31 December 2018, the company’s directors performed an impairment
test in order to verify the recoverability of the book value of the equity
investment in Adelante S.r.l. (hereinafter “Adelante”), recognised in the
separate financial statements of WIIT S.p.A.. company management controls
the Group’s operations in a unitary manner, preparing a single report on the
basis of which it takes decisions and monitors the business performance. In
particular, in preparing the business plan, the management has drafted
estimates for each individual legal entity, but it did not prepare a Adelante sub-
consolidated plan. In the absence of a sub-consolidated plan of the Adelante
Group, the company determined the cash flows by considering the provisional
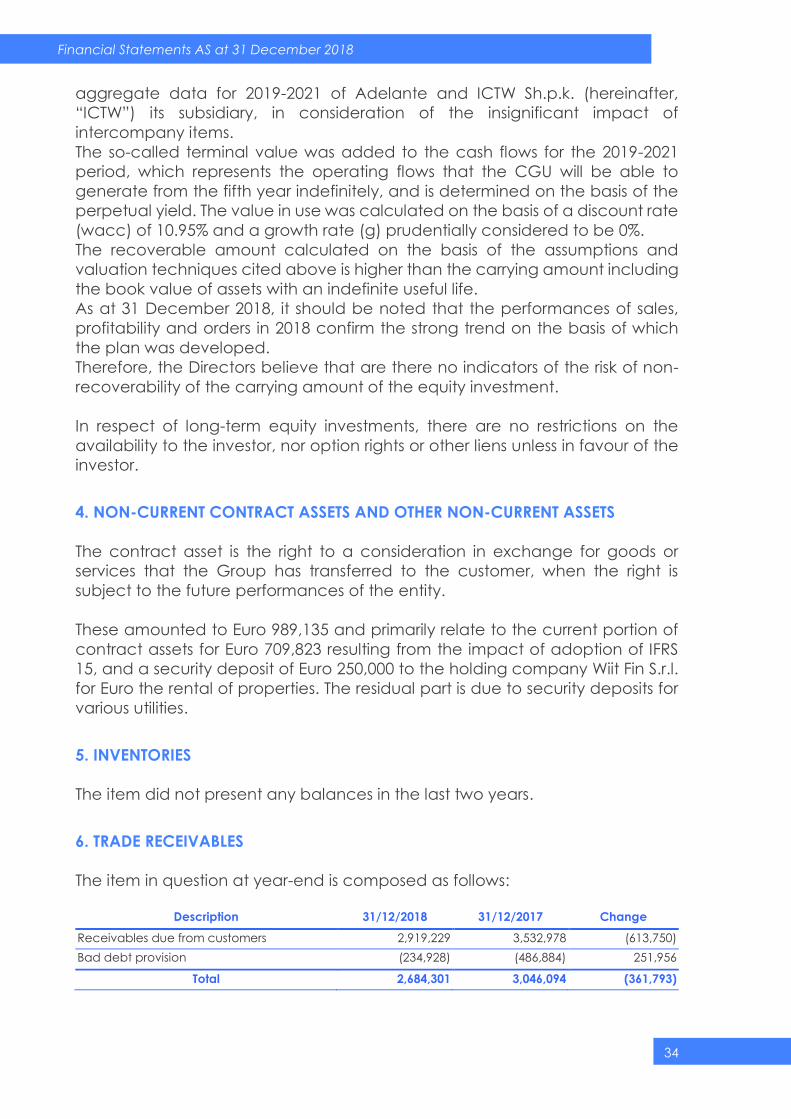
Financial Statements AS at 31 December 2018
34
aggregate data for 2019-2021 of Adelante and ICTW Sh.p.k. (hereinafter,
“ICTW”) its subsidiary, in consideration of the insignificant impact of
intercompany items.
The so-called terminal value was added to the cash flows for the 2019-2021
period, which represents the operating flows that the CGU will be able to
generate from the fifth year indefinitely, and is determined on the basis of the
perpetual yield. The value in use was calculated on the basis of a discount rate
(wacc) of 10.95% and a growth rate (g) prudentially considered to be 0%.
The recoverable amount calculated on the basis of the assumptions and
valuation techniques cited above is higher than the carrying amount including
the book value of assets with an indefinite useful life.
As at 31 December 2018, it should be noted that the performances of sales,
profitability and orders in 2018 confirm the strong trend on the basis of which
the plan was developed.
Therefore, the Directors believe that are there no indicators of the risk of non-
recoverability of the carrying amount of the equity investment.
In respect of long-term equity investments, there are no restrictions on the
availability to the investor, nor option rights or other liens unless in favour of the
investor.
4. NON-CURRENT CONTRACT ASSETS AND OTHER NON-CURRENT ASSETS
The contract asset is the right to a consideration in exchange for goods or
services that the Group has transferred to the customer, when the right is
subject to the future performances of the entity.
These amounted to Euro 989,135 and primarily relate to the current portion of
contract assets for Euro 709,823 resulting from the impact of adoption of IFRS
15, and a security deposit of Euro 250,000 to the holding company Wiit Fin S.r.l.
for Euro the rental of properties. The residual part is due to security deposits for
various utilities.
5. INVENTORIES
The item did not present any balances in the last two years.
6. TRADE RECEIVABLES
The item in question at year-end is composed as follows:
Description 31/12/2018 31/12/2017 Change
Receivables due from customers 2,919,229 3,532,978 (613,750)
Bad debt provision (234,928) (486,884) 251,956
Total 2,684,301 3,046,094 (361,793)
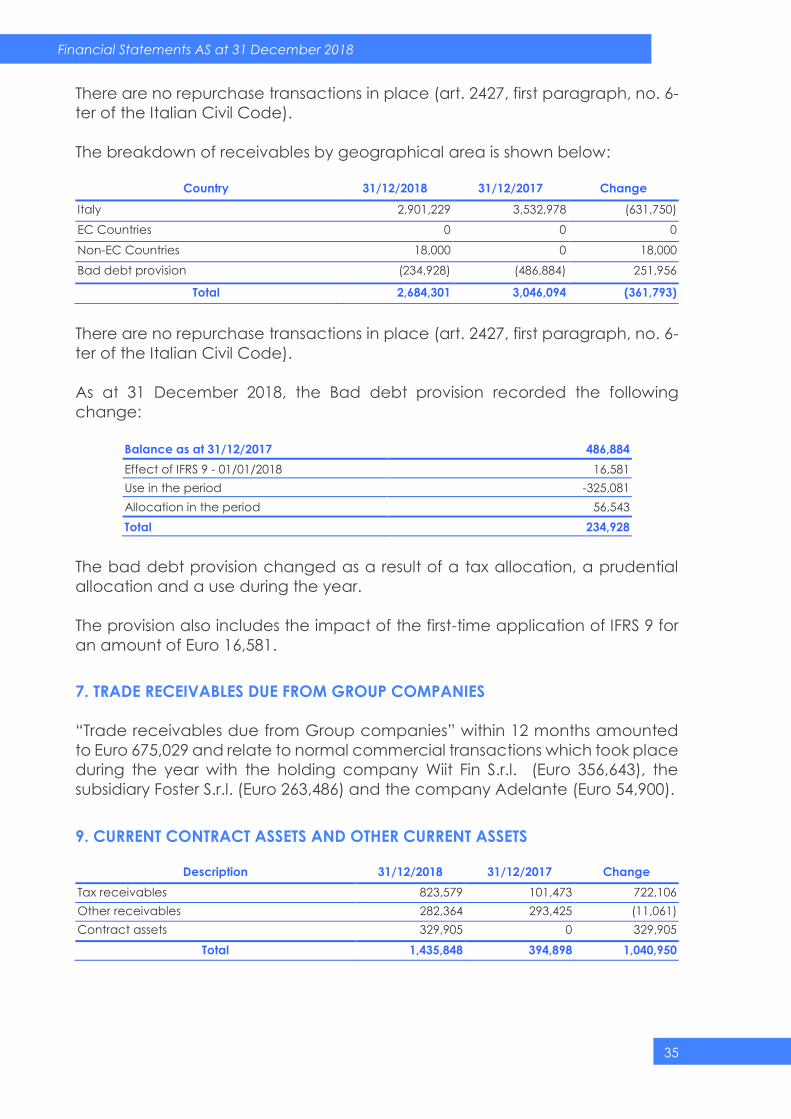
Financial Statements AS at 31 December 2018
35
There are no repurchase transactions in place (art. 2427, first paragraph, no. 6-
ter of the Italian Civil Code).
The breakdown of receivables by geographical area is shown below:
Country 31/12/2018 31/12/2017 Change
Italy 2,901,229 3,532,978 (631,750)
EC Countries 0 0 0
Non-EC Countries 18,000 0 18,000
Bad debt provision (234,928) (486,884) 251,956
Total 2,684,301 3,046,094 (361,793)
There are no repurchase transactions in place (art. 2427, first paragraph, no. 6-
ter of the Italian Civil Code).
As at 31 December 2018, the Bad debt provision recorded the following
change:
Balance as at 31/12/2017 486,884
Effect of IFRS 9 - 01/01/2018 16,581
Use in the period -325,081
Allocation in the period 56,543
Total 234,928
The bad debt provision changed as a result of a tax allocation, a prudential
allocation and a use during the year.
The provision also includes the impact of the first-time application of IFRS 9 for
an amount of Euro 16,581.
7. TRADE RECEIVABLES DUE FROM GROUP COMPANIES
“Trade receivables due from Group companies” within 12 months amounted
to Euro 675,029 and relate to normal commercial transactions which took place
during the year with the holding company Wiit Fin S.r.l. (Euro 356,643), the
subsidiary Foster S.r.l. (Euro 263,486) and the company Adelante (Euro 54,900).
9. CURRENT CONTRACT ASSETS AND OTHER CURRENT ASSETS
Description 31/12/2018 31/12/2017 Change
Tax receivables 823,579 101,473 722,106
Other receivables 282,364 293,425 (11,061)
Contract assets 329,905 0 329,905
Total 1,435,848 394,898 1,040,950
Financial Statements AS at 31 December 2018
36
Tax receivables include the IRES credit of Euro 53,473 generated before the
application of the tax consolidation system and receivables due from the
holding company for tax consolidation amounting to Euro 770 thousand. Other
receivables refer mainly to interest contributions and the tax credit of Euro
155,960, and advances to employees.
As at 31 December 2018, the item related to current contract assets amounted
to Euro 329,904 and derive from the application of IFRS 15.
10. CASH AND CASH EQUIVALENTS
The item “Cash and cash equivalents”, amounting to Euro 14,225,320 as at 31
December 2018, is composed of the credit balances of bank current accounts
(Euro 4,753,489) and, investments in securities with no disinvestment restrictions
(Euro 7,771,831), in view of the future short-term use to implement the
Company’s growth plans. In particular, this relates to an investment in a fund
with diversified securities in order to obtain the best return. In addition, following
the purchase of the Adelante Group, on July 18, 2018, the company deposited
a sum of Euro 1.7 million (equivalent to the balance of the Basic Price) in a term
current account with instructions for release in favour of the seller as guarantee
of the full payment of the Basic Price.
11. SHAREHOLDERS’ EQUITY
Share capital is composed of 2,652,066 shares with no nominal value. Share
capital subscribed and paid-up changed during the year, due to the “Wiit
Performance Share” plan, which makes provision for the allocation of UNITS to
key personnel, with the subsequent accrual of Company shares.
As at 31 December 2018, shares outstanding therefore totalled 2,652,066.
As at 31 December 2018, Wiit S.p.A. holds 64,760 treasury shares (2.4 % of share
capital), recognised in the financial statements for a total value of Euro
3,282,008.
In compliance with International Financial Reporting Standards (IFRS), this value
was used to reduce shareholders’ equity.
The Group’s share capital is composed as follows (art. 2427, first paragraph,
nos. 17 and 18 of the Italian Civil Code).
Shares No.
Ordinary 2,652,066
The items of shareholders’ equity are distinguished according to their origin,
possibility of use, distributability and use in the previous three years (art. 2427,
first paragraph, no.7-bis of the Italian Civil Code).
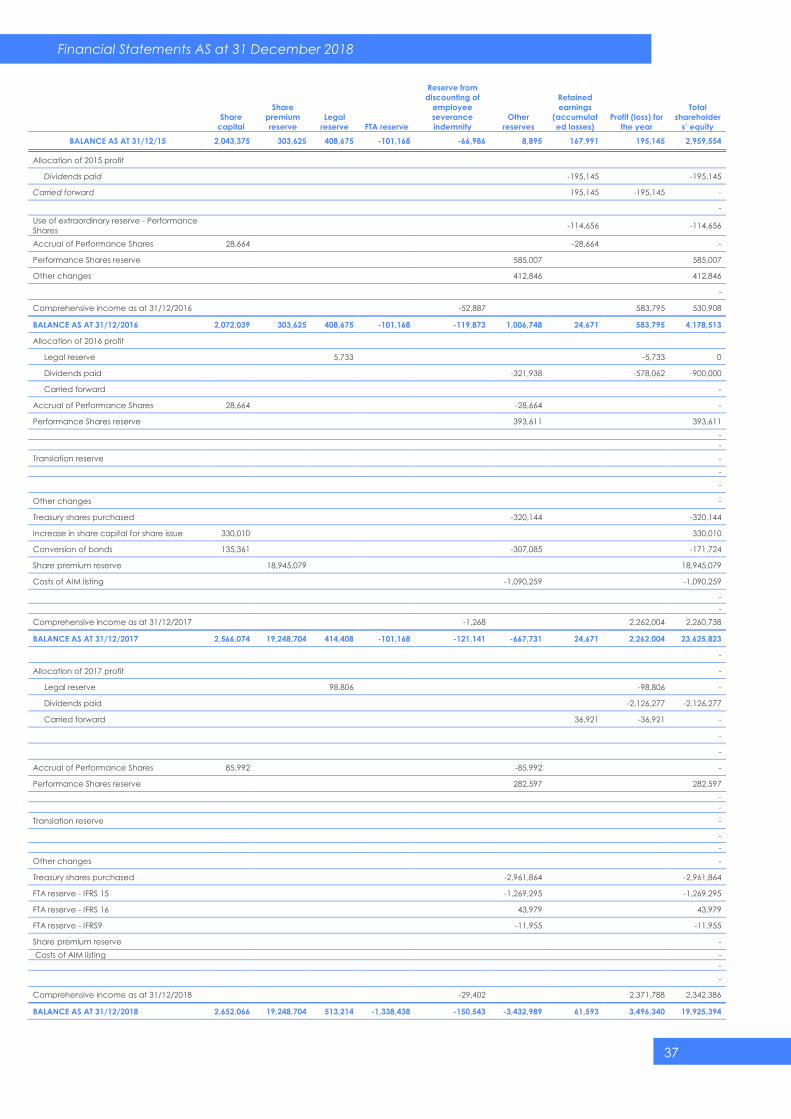
Financial Statements AS at 31 December 2018
37
Share
capital
Share
premium
reserve
Legal
reserve FTA reserve
Reserve from
discounting of
employee
severance
indemnity
Other
reserves
Retained
earnings
(accumulat
ed losses)
Profit (loss) for
the year
Total
shareholder
s’ equity
BALANCE AS AT 31/12/15 2,043,375 303,625 408,675 -101,168 -66,986 8,895 167,991 195,145 2,959,554
Allocation of 2015 profit
Dividends paid -195,145 -195,145
Carried forward 195,145 -195,145 -
-
Use of extraordinary reserve - Performance
Shares -114,656 -114,656
Accrual of Performance Shares 28,664 -28,664 -
Performance Shares reserve 585,007 585,007
Other changes 412,846 412,846
-
Comprehensive income as at 31/12/2016 -52,887 583,795 530,908
BALANCE AS AT 31/12/2016 2,072,039 303,625 408,675 -101,168 -119,873 1,006,748 24,671 583,795 4,178,513
Allocation of 2016 profit
Legal reserve 5,733 -5,733 0
Dividends paid -321,938 -578,062 -900,000
Carried forward -
Accrual of Performance Shares 28,664 -28,664 -
Performance Shares reserve 393,611 393,611
-
-
Translation reserve -
-
-
Other changes -
Treasury shares purchased -320,144 -320,144
Increase in share capital for share issue 330,010 330,010
Conversion of bonds 135,361 -307,085 -171,724
Share premium reserve 18,945,079 18,945,079
Costs of AIM listing -1,090,259 -1,090,259
-
-
Comprehensive income as at 31/12/2017 -1,268 2,262,004 2,260,738
BALANCE AS AT 31/12/2017 2,566,074 19,248,704 414,408 -101,168 -121,141 -667,731 24,671 2,262,004 23,625,823
-
Allocation of 2017 profit -
Legal reserve 98,806 -98,806 -
Dividends paid -2,126,277 -2,126,277
Carried forward 36,921 -36,921 -
-
-
Accrual of Performance Shares 85,992 -85,992 -
Performance Shares reserve 282,597 282,597
-
-
Translation reserve -
-
-
Other changes -
Treasury shares purchased -2,961,864 -2,961,864
FTA reserve - IFRS 15 -1,269,295 -1,269,295
FTA reserve - IFRS 16 43,979 43,979
FTA reserve - IFRS9 -11,955 -11,955
Share premium reserve -
Costs of AIM listing -
-
-
Comprehensive income as at 31/12/2018 -29,402 2,371,788 2,342,386
BALANCE AS AT 31/12/2018 2,652,066 19,248,704 513,214 -1,338,438 -150,543 -3,432,989 61,593 3,496,340 19,925,394
38
Financial Statements AS at 31 December 2018
The amount of Euro 939,278 classified under other reserves incorporates the
recognition of IFRS 2, relating to the assignment of UNITS set forth in the
“Performance Share 2016-2018” plan, calculated on the basis of the UNITS
assigned. The fair value of the shares was determined by an appointed expert
and documented in a fairness opinion. This reserve can be distributed.
The amount of Euro 3,282,008 classified to “other reserves” relates to the
value, at market price, of the 64,760 treasury shares which Wiit S.p.A. acquired
in the period between November 2017 and July 2018 as part of the treasury
share purchase programme approved by the shareholders’ meeting on 18
October 2017.
The buy-back plan is targeted at the purchase of WIIT S.p.A. shares on the
AIM Italia / Mercato Alternativo del Capitale (alternative capital market), also
through specialised intermediaries, in order to build a so-called “securities
depositary”. More specifically, the purchase programme is targeted at
providing the Company with a stock of treasury shares to be used as
consideration in the context of extraordinary finance transactions and/or for
other uses considered of financial-managerial and/or strategic interest for the
Company, also for the exchange of equity investments with other entities as
part of transactions of interest to the Company.
The Group decided to arrange for the early adoption of IFRS 16, together with
standards IFRS 15 and IFRS 9, by applying the mixed retrospective method,
which involved a negative impact in shareholders’ equity as at 1 January
2018 of Euro 1,269,295 (IFRS 15) and Euro 11,955 (IFRS 9) and a positive impact
of Euro 43,979 (IFRS 16).
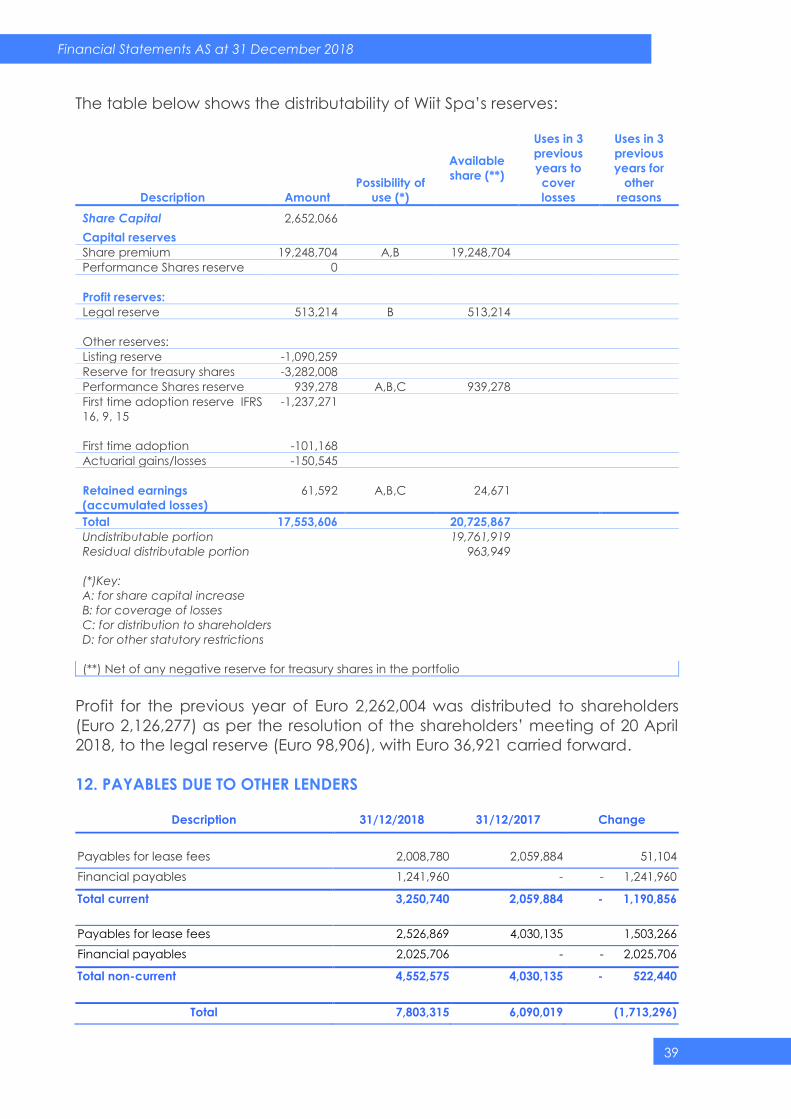
39
Financial Statements AS at 31 December 2018
The table below shows the distributability of Wiit Spa’s reserves:
Description Amount
Possibility of
use (*)
Available
share (**)
Uses in 3
previous
years to
cover
losses
Uses in 3
previous
years for
other
reasons
Share Capital 2,652,066
Capital reserves
Share premium 19,248,704 A,B 19,248,704
Performance Shares reserve 0
Profit reserves:
Legal reserve 513,214 B 513,214
Other reserves:
Listing reserve -1,090,259
Reserve for treasury shares -3,282,008
Performance Shares reserve 939,278 A,B,C 939,278
First time adoption reserve IFRS
16, 9, 15
-1,237,271
First time adoption -101,168
Actuarial gains/losses -150,545
Retained earnings
(accumulated losses)
61,592 A,B,C 24,671
Total 17,553,606 20,725,867
Undistributable portion 19,761,919
Residual distributable portion 963,949
(*)Key:
A: for share capital increase
B: for coverage of losses
C: for distribution to shareholders
D: for other statutory restrictions
(**) Net of any negative reserve for treasury shares in the portfolio
Profit for the previous year of Euro 2,262,004 was distributed to shareholders
(Euro 2,126,277) as per the resolution of the shareholders’ meeting of 20 April
2018, to the legal reserve (Euro 98,906), with Euro 36,921 carried forward.
12. PAYABLES DUE TO OTHER LENDERS
Description 31/12/2018 31/12/2017 Change
Payables for lease fees 2,008,780 2,059,884 51,104
Financial payables 1,241,960 - - 1,241,960
Total current 3,250,740 2,059,884 - 1,190,856
Payables for lease fees 2,526,869 4,030,135 1,503,266
Financial payables 2,025,706 - - 2,025,706
Total non-current 4,552,575 4,030,135 - 522,440
Total 7,803,315 6,090,019 (1,713,296)

40
Financial Statements AS at 31 December 2018
The item includes the capital amounts of lease fees falling due based on the
financial method (IAS 17).
The early adoption of IFRS 16 involved an increase in financial payables of
Euro 1,423,256 as at 1 January 2018.
The balance sheet item payables due to other lenders includes the financial
payables of the property leases and the vehicle rental agreements, relating
to the above-mentioned standard.
13. FINANCIAL PAYABLES TO BANKS
Payables due to banks as at 31 December 2018, amounting to Euro 9,958,775,
include the amount due for mortgages payable and represent the actual
payable for principal, interest and accessory charges accrued and payable.
Mortgages are not secured by collateral or other forms of guarantee. The
current portion amounts to Euro 3,814,345 while the long-term portion stands
at Euro 6,144,430.
DISBURSING ENTITY Current Non-current Total Expiry Rates
INTESA SAN PAOLO 38,912 - 38,912 30/03/2019 EUR3M+2%
BANCO POPOLARE
VERONA
100,000 - 100,000 15/06/2019 EUR3M+1.8%
CARIGE 145,434 - 145,434 30/06/2019 EUR3M+1.1%
INTESA - MEDIOCREDITO 183,333 - 183,333 30/09/2019 EUR3M+2.5%
INTESA SAN PAOLO 499,991 503,751 1,003,742 30/10/2020 FISSO 0.75%
CREDITO VALTELLINESE 662,169 1,173,217 1,835,386 05/07/2021 FISSO 1.22%
CREDITO VALTELLINESE 499,951 761,724 1,261,676 05/04/2021 FISSO 1.25%
CARIGE 124,853 201,011 325,863 31/07/2021 FISSO 1.30%
INTESA SAN PAOLO 662,219 1,173,144 1,835,363 14/09/2021 FISSO 0.89%
MONTE DEI PASCHI DI
SIENA
400,000 1,200,000 1,600,000 31/12/2022 EUR6M+0.7%
CREDEM 497,483 1,131,583 1,629,067 08/01/2022 FISSO 0.67%
Total 3,814,345 6,144,430 9,958,775
As at 31 December 2018, there were no financial instruments for hedging or
trading relating to the aforementioned loan agreements.
14. OTHER FINANCIAL LIABILITIES Description 31/12/2018 31/12/2017 Change
Current sundry payables due to third parties 1,410,000 0 1,410,000
Non-current sundry payables due to third
parties 2,550,000 0 2,550,000
Total 3,960,000 0 3,960,000

41
Financial Statements AS at 31 December 2018
Other financial liabilities include the purchase price for the acquisition of the
Adelante Group, has was set according to the Adelante enterprise value of
Euro 6.4 million, plus the net financial position (net cash) as recorded at the
closing date. At the closing date, an amount of Euro 4 million was paid,
including the net financial position. The residual part of Euro 3.4 million will be
paid in 4 deferred price instalments by June 2022.
In addition to the Base Price, subject to the achievement of certain targets
defined in the Adelante Group business plan, which envisages strong growth
in profits for each of the financial years 2018, 2019, 2020 and 2021, the
entitlement to payment of an earn out (the “Earn Out”) of up to
approximately Euro 4.4 million will be recognised. Based on the information
reported, we point out that, at the end of 2018, the non-recurring part
includes an amount of Euro 2.550 million in relation to the balance of the
consideration, while the first tranche of Euro 850 thousand and the earn-out
accrued for 2018 of Euro 460 thousand are classified in the current part. In
addition, the final instalment of Euro 100 thousand as the balance for
purchase of the Visiant business unit is classified in the current part.
15. EMPLOYEE BENEFITS
Description 31/12/2018 31/12/2017 Change
Liability at 1 January 918,236 817,011 101,225
Financial charges (2,638) (1,960) (678)
Service cost 161,874 146,720 15,154
Payments made (42,920) (45,293) 2,373
Actuarial losses 40,780 1,758 39,022
Total 1,075,333 918,236 157,096
The valuation of employee severance indemnity is based on the following
assumptions:
Financial assumptions
31.12.2018 31.12.2017
Discount rate Euro Composite AA curves as at
31/12/2018
Euro Composite AA curves as at
29/12/2017
Inflation 1.50% 1.50%
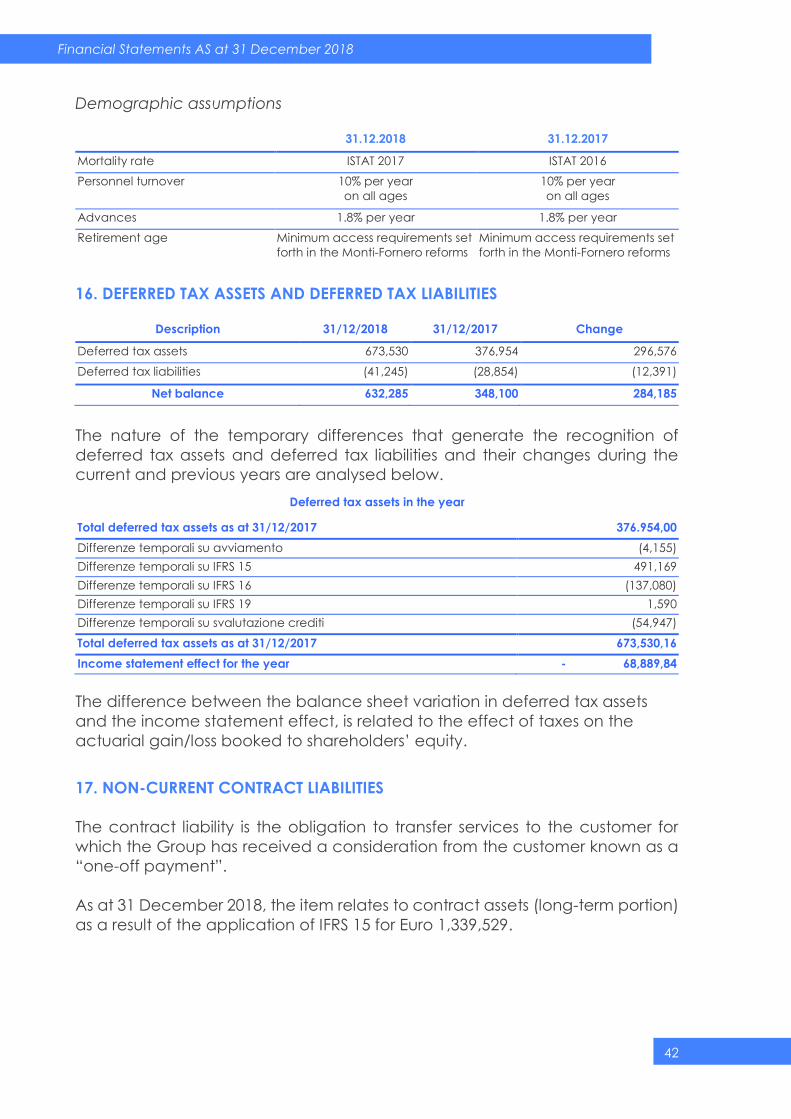
42
Financial Statements AS at 31 December 2018
Demographic assumptions
31.12.2018 31.12.2017
Mortality rate ISTAT 2017 ISTAT 2016
Personnel turnover 10% per year
on all ages
10% per year
on all ages
Advances 1.8% per year 1.8% per year
Retirement age Minimum access requirements set
forth in the Monti-Fornero reforms
Minimum access requirements set
forth in the Monti-Fornero reforms
16. DEFERRED TAX ASSETS AND DEFERRED TAX LIABILITIES
Description 31/12/2018 31/12/2017 Change
Deferred tax assets 673,530 376,954 296,576
Deferred tax liabilities (41,245) (28,854) (12,391)
Net balance 632,285 348,100 284,185
The nature of the temporary differences that generate the recognition of
deferred tax assets and deferred tax liabilities and their changes during the
current and previous years are analysed below.
Deferred tax assets in the year
Total deferred tax assets as at 31/12/2017 376.954,00
Differenze temporali su avviamento (4,155)
Differenze temporali su IFRS 15 491,169
Differenze temporali su IFRS 16 (137,080)
Differenze temporali su IFRS 19 1,590
Differenze temporali su svalutazione crediti (54,947)
Total deferred tax assets as at 31/12/2017 673,530,16
Income statement effect for the year - 68,889,84
The difference between the balance sheet variation in deferred tax assets
and the income statement effect, is related to the effect of taxes on the
actuarial gain/loss booked to shareholders’ equity.
17. NON-CURRENT CONTRACT LIABILITIES
The contract liability is the obligation to transfer services to the customer for
which the Group has received a consideration from the customer known as a
“one-off payment”.
As at 31 December 2018, the item relates to contract assets (long-term portion)
as a result of the application of IFRS 15 for Euro 1,339,529.
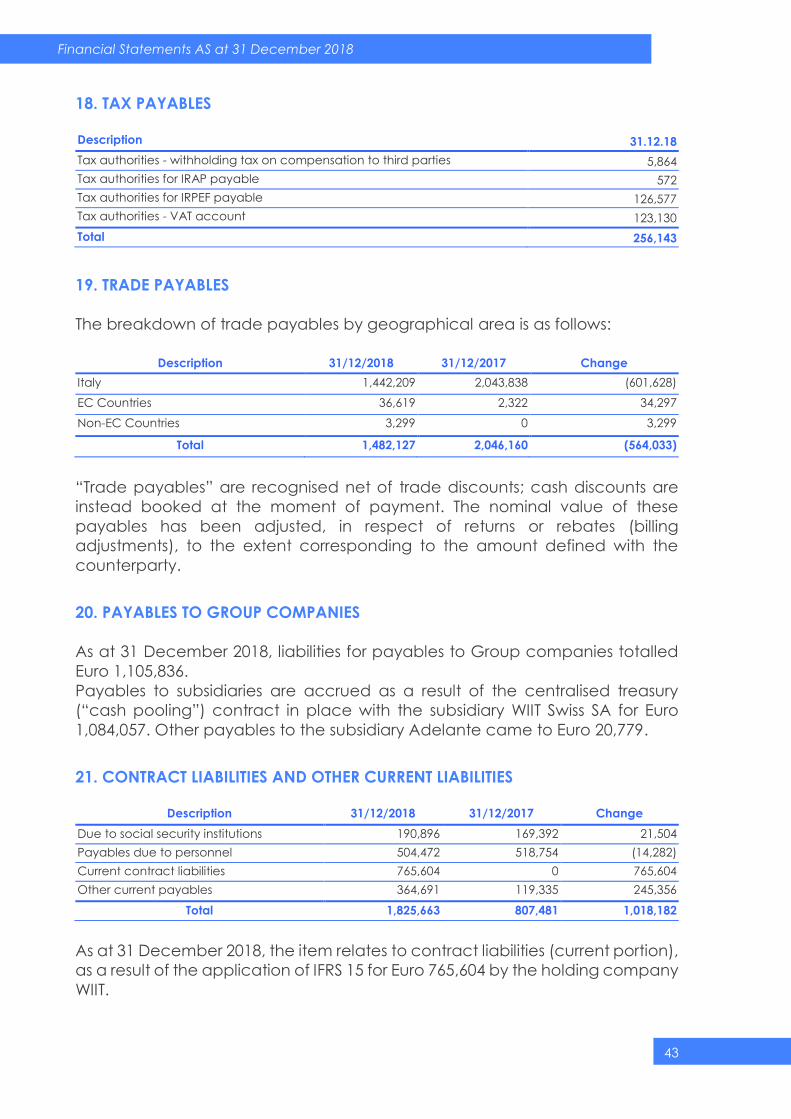
43
Financial Statements AS at 31 December 2018
18. TAX PAYABLES
Description 31.12.18
Tax authorities - withholding tax on compensation to third parties 5,864
Tax authorities for IRAP payable 572
Tax authorities for IRPEF payable 126,577
Tax authorities - VAT account 123,130
Total 256,143
19. TRADE PAYABLES
The breakdown of trade payables by geographical area is as follows:
Description 31/12/2018 31/12/2017 Change
Italy 1,442,209 2,043,838 (601,628)
EC Countries 36,619 2,322 34,297
Non-EC Countries 3,299 0 3,299
Total 1,482,127 2,046,160 (564,033)
“Trade payables” are recognised net of trade discounts; cash discounts are
instead booked at the moment of payment. The nominal value of these
payables has been adjusted, in respect of returns or rebates (billing
adjustments), to the extent corresponding to the amount defined with the
counterparty.
20. PAYABLES TO GROUP COMPANIES
As at 31 December 2018, liabilities for payables to Group companies totalled
Euro 1,105,836.
Payables to subsidiaries are accrued as a result of the centralised treasury
(“cash pooling”) contract in place with the subsidiary WIIT Swiss SA for Euro
1,084,057. Other payables to the subsidiary Adelante came to Euro 20,779.
21. CONTRACT LIABILITIES AND OTHER CURRENT LIABILITIES
Description 31/12/2018 31/12/2017 Change
Due to social security institutions 190,896 169,392 21,504
Payables due to personnel 504,472 518,754 (14,282)
Current contract liabilities 765,604 0 765,604
Other current payables 364,691 119,335 245,356
Total 1,825,663 807,481 1,018,182
As at 31 December 2018, the item relates to contract liabilities (current portion),
as a result of the application of IFRS 15 for Euro 765,604 by the holding company
WIIT.
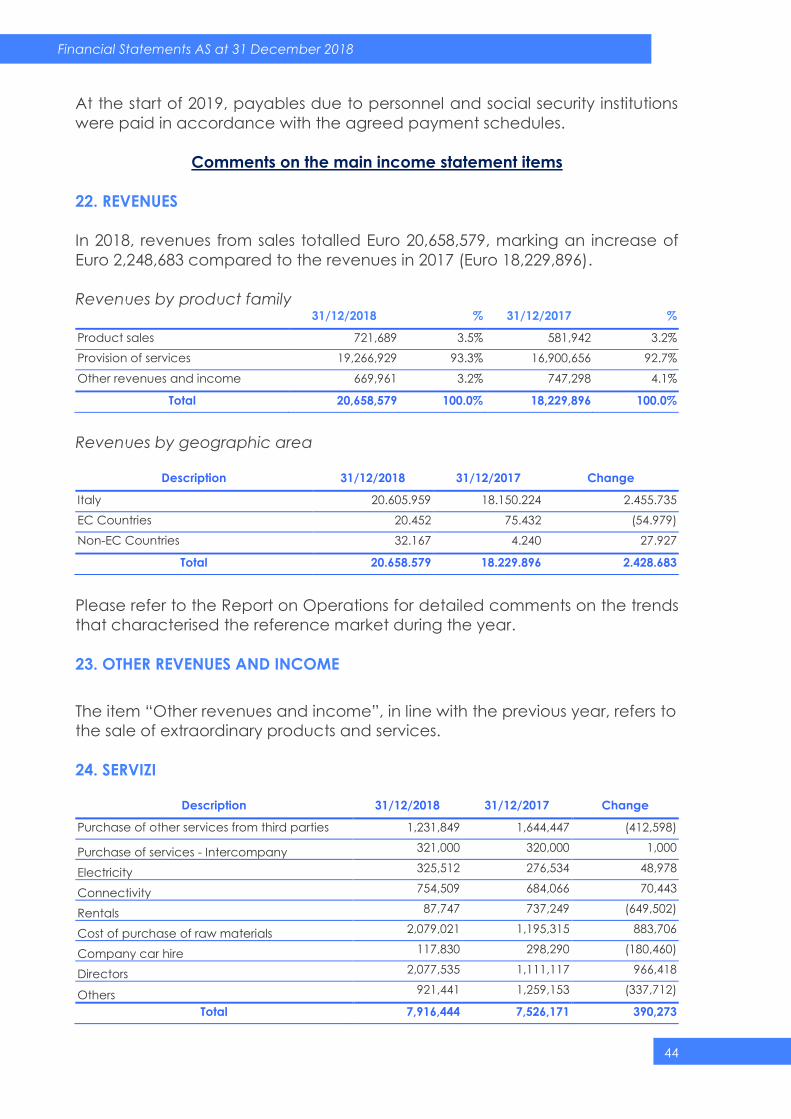
44
Financial Statements AS at 31 December 2018
At the start of 2019, payables due to personnel and social security institutions
were paid in accordance with the agreed payment schedules.
Comments on the main income statement items
22. REVENUES
In 2018, revenues from sales totalled Euro 20,658,579, marking an increase of
Euro 2,248,683 compared to the revenues in 2017 (Euro 18,229,896).
Revenues by product family 31/12/2018 % 31/12/2017 %
Product sales 721,689 3.5% 581,942 3.2%
Provision of services 19,266,929 93.3% 16,900,656 92.7%
Other revenues and income 669,961 3.2% 747,298 4.1%
Total 20,658,579 100.0% 18,229,896 100.0%
Revenues by geographic area
Description 31/12/2018 31/12/2017 Change
Italy 20.605.959 18.150.224 2.455.735
EC Countries 20.452 75.432 (54.979)
Non-EC Countries 32.167 4.240 27.927
Total 20.658.579 18.229.896 2.428.683
Please refer to the Report on Operations for detailed comments on the trends
that characterised the reference market during the year.
23. OTHER REVENUES AND INCOME
The item “Other revenues and income”, in line with the previous year, refers to
the sale of extraordinary products and services.
24. SERVIZI
Description 31/12/2018 31/12/2017 Change
Purchase of other services from third parties 1,231,849 1,644,447 (412,598)
Purchase of services - Intercompany 321,000 320,000 1,000
Electricity 325,512 276,534 48,978
Connectivity 754,509 684,066 70,443
Rentals 87,747 737,249 (649,502)
Cost of purchase of raw materials 2,079,021 1,195,315 883,706
Company car hire 117,830 298,290 (180,460)
Directors 2,077,535 1,111,117 966,418
Others 921,441 1,259,153 (337,712)
Total 7,916,444 7,526,171 390,273

45
Financial Statements AS at 31 December 2018
The increase in the costs of “Purchase of raw materials” is a direct result of the
rise in revenues.
25. COST OF LABOUR
Description 31/12/2018 31/12/2017 Change
Salaries and wages 3,054,326 2,904,212 150,114
Social security contributions 896,339 782,776 113,563
Employee severance indemnity 161,874 146,720 15,154
Total 4,112,540 3,833,708 278,832
The average number of Company employees in 2018 was 99, compared to 95
in 2017. The research and development activities carried out in the reference
period remained constant with respect to the previous year.
26. AMORTISATION, DEPRECIATION AND WRITE-DOWNS
Amortisation/depreciation was calculated on the basis of the useful life of the
asset and its use in the production phase.
The item includes amortisation/depreciation of Euro 4,937,716 and write-downs
of receivables for Euro 56,543
27. OTHER OPERATING COSTS
31/12/2018 31/12/2017 Change
Contingent liabilities 0 0 0
Other sundry costs 295,099 217,256 77,843
Total 295,099 217,256 77,843
The item “other operating costs”, amounting to Euro 295,099, includes types of
costs of a residual nature including bank charges, donations, penalties and
sanctions.
28. WRITE-DOWN OF EQUITY INVESTMENTS
There were no write-downs of equity investments in the year.
29. FINANCIAL INCOME
The financial income indicated is composed of interest income on bank
current accounts and securities recorded under financial fixed assets.
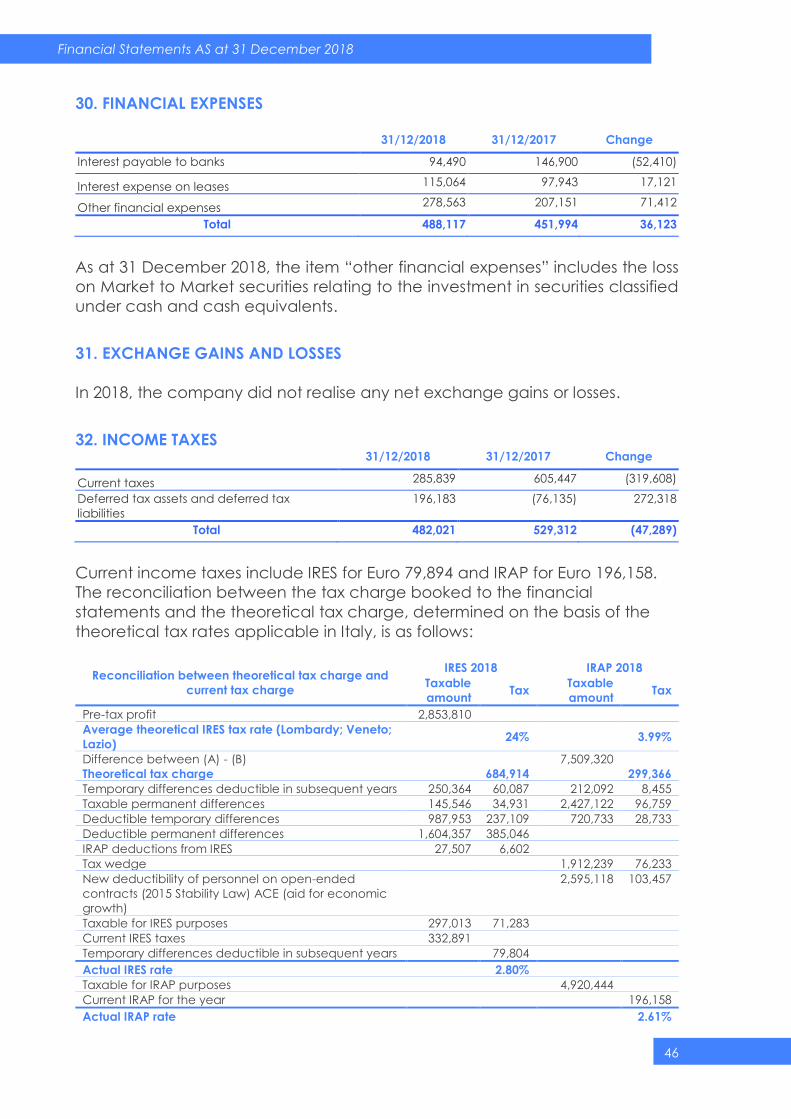
46
Financial Statements AS at 31 December 2018
30. FINANCIAL EXPENSES
31/12/2018 31/12/2017 Change
Interest payable to banks 94,490 146,900 (52,410)
Interest expense on leases 115,064 97,943 17,121
Other financial expenses 278,563 207,151 71,412
Total 488,117 451,994 36,123
As at 31 December 2018, the item “other financial expenses” includes the loss
on Market to Market securities relating to the investment in securities classified
under cash and cash equivalents.
31. EXCHANGE GAINS AND LOSSES
In 2018, the company did not realise any net exchange gains or losses.
32. INCOME TAXES 31/12/2018 31/12/2017 Change
Current taxes 285,839 605,447 (319,608)
Deferred tax assets and deferred tax
liabilities
196,183 (76,135) 272,318
Total 482,021 529,312 (47,289)
Current income taxes include IRES for Euro 79,894 and IRAP for Euro 196,158.
The reconciliation between the tax charge booked to the financial
statements and the theoretical tax charge, determined on the basis of the
theoretical tax rates applicable in Italy, is as follows:
Reconciliation between theoretical tax charge and
current tax charge
IRES 2018 IRAP 2018
Taxable
amount Tax
Taxable
amount Tax
Pre-tax profit 2,853,810
Average theoretical IRES tax rate (Lombardy; Veneto;
Lazio) 24% 3.99%
Difference between (A) - (B) 7,509,320
Theoretical tax charge 684,914 299,366
Temporary differences deductible in subsequent years 250,364 60,087 212,092 8,455
Taxable permanent differences 145,546 34,931 2,427,122 96,759
Deductible temporary differences 987,953 237,109 720,733 28,733
Deductible permanent differences 1,604,357 385,046
IRAP deductions from IRES 27,507 6,602
Tax wedge 1,912,239 76,233
New deductibility of personnel on open-ended
contracts (2015 Stability Law) ACE (aid for economic
growth)
2,595,118 103,457
Taxable for IRES purposes 297,013 71,283
Current IRES taxes 332,891
Temporary differences deductible in subsequent years 79,804
Actual IRES rate 2.80%
Taxable for IRAP purposes 4,920,444
Current IRAP for the year 196,158
Actual IRAP rate 2.61%
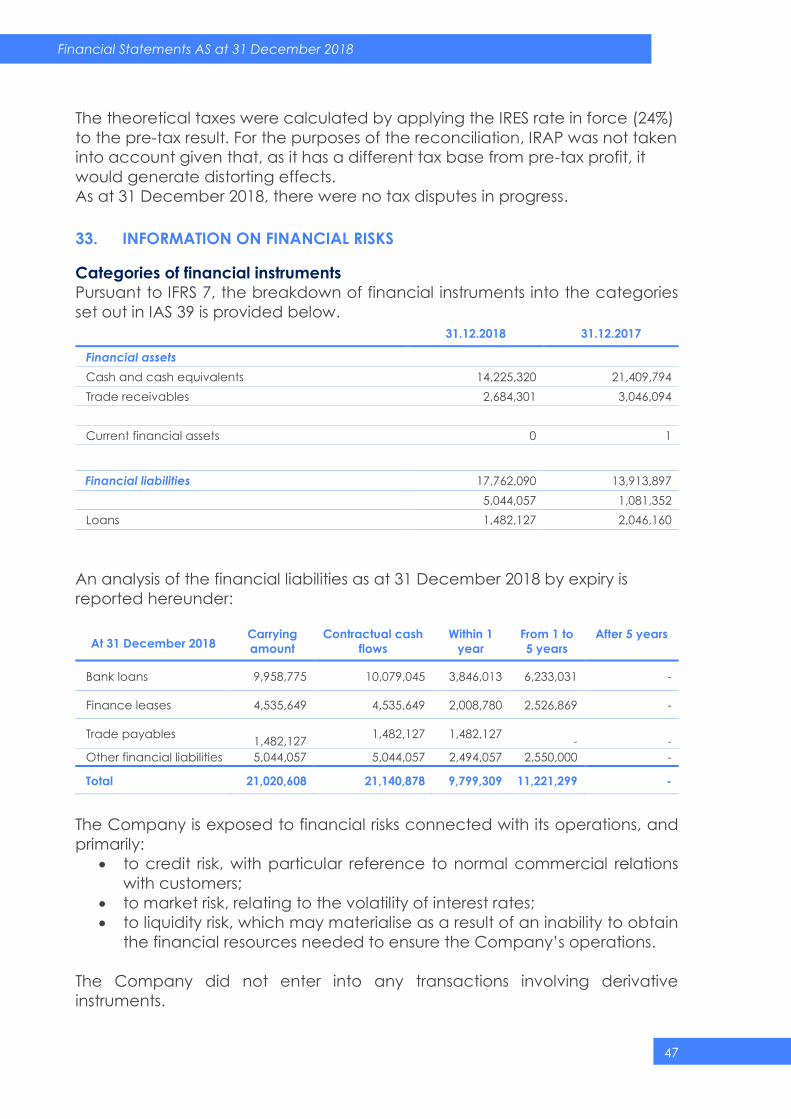
47
Financial Statements AS at 31 December 2018
The theoretical taxes were calculated by applying the IRES rate in force (24%)
to the pre-tax result. For the purposes of the reconciliation, IRAP was not taken
into account given that, as it has a different tax base from pre-tax profit, it
would generate distorting effects.
As at 31 December 2018, there were no tax disputes in progress.
33. INFORMATION ON FINANCIAL RISKS
Categories of financial instruments
Pursuant to IFRS 7, the breakdown of financial instruments into the categories
set out in IAS 39 is provided below.
31.12.2018 31.12.2017
Financial assets
Cash and cash equivalents 14,225,320 21,409,794
Trade receivables 2,684,301 3,046,094
Current financial assets 0 1
Financial liabilities 17,762,090 13,913,897
5,044,057 1,081,352
Loans 1,482,127 2,046,160
An analysis of the financial liabilities as at 31 December 2018 by expiry is
reported hereunder:
At 31 December 2018 Carrying
amount
Contractual cash
flows
Within 1
year
From 1 to
5 years
After 5 years
Bank loans 9,958,775 10,079,045 3,846,013 6,233,031 -
Finance leases 4,535,649 4,535,649 2,008,780 2,526,869 -
Trade payables
1,482,127 1,482,127 1,482,127
-
-
Other financial liabilities 5,044,057 5,044,057 2,494,057 2,550,000 -
Total 21,020,608 21,140,878 9,799,309 11,221,299 -
The Company is exposed to financial risks connected with its operations, and
primarily:
to credit risk, with particular reference to normal commercial relations
with customers;
to market risk, relating to the volatility of interest rates;
to liquidity risk, which may materialise as a result of an inability to obtain
the financial resources needed to ensure the Company’s operations.
The Company did not enter into any transactions involving derivative
instruments.
48
Financial Statements AS at 31 December 2018
Management of credit risk
Credit risk is defined as a probable financial loss generated by the non-
fulfilment of a third party payment obligation to the Company.
The Company does not have significant concentrations of credit risks, also
thanks to the fact that it does not carry out significant operations in the Public
Administration sector, in line with the Company’s strategic choice.
The Company manages this risk through the selection of counterparties
considered solvent by the market and with a high credit standing, or through
the supply of highly critical and non-interruptible services by its customers.
For commercial purposes, policies are adopted targeted at ensuring the
solvency of its customers, and limiting the exposure to credit risk with respect to
an individual customer, through activities that involve the evaluation of
customers and their monitoring.
All receivables are periodically subject to an analytical evaluation per
individual customer, with write-downs effected in the event of impairment.
All details relating to trade receivables are reported in the notes to the financial
statements.
Management of currency risk
Currency risk is defined as the risk of the value of a financial instrument
changing as a result of fluctuations in exchange rates. The fact the core
business is performed in the “Euro Area” limits the Company’s exposure to
currency risks deriving from transactions in currencies other than the functional
currency (Euro).
Management of interest rate risk
Interest rate risk management aims to ensure a balanced debt structure, by
minimising the cost of funding over time.
Interest rate risk is defined as the risk of the value of a financial instrument
changing as a result of fluctuations in market interest rates.
Over the years, the Company has taken out almost exclusively medium/long-
term loans with a variable rate linked to the performance of the 3-month
Euribor and at a fixed rate.
The details relating to loans in place are reported in the notes to the financial
statements.
Sensitivity analysis
With reference to financial assets and financial liabilities at variable rate as at
31 December 2018 and 31 December 2017, a hypothetical increase
(decrease) in interest rates of 100 basis points with respect to the year-end
interest rates as at the same date, in a situation where other variables remain
constant, would involve an increase of around Euro 38 thousand in financial
expenses.
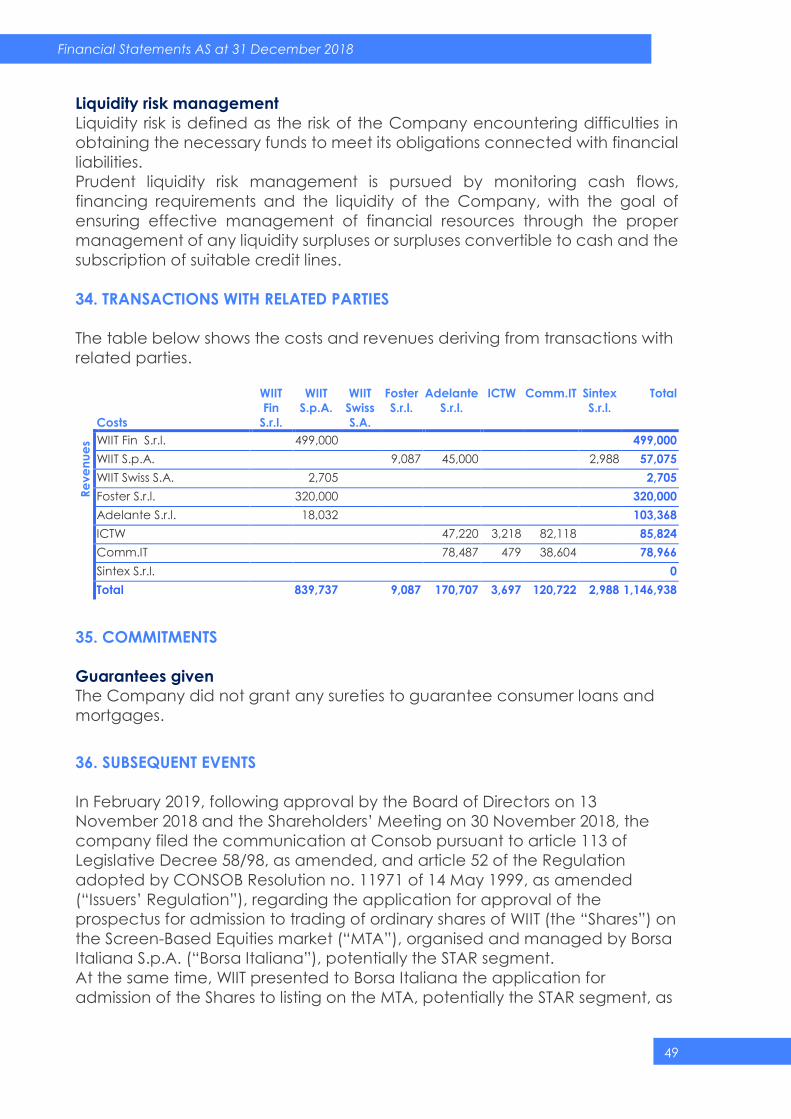
49
Financial Statements AS at 31 December 2018
Liquidity risk management
Liquidity risk is defined as the risk of the Company encountering difficulties in
obtaining the necessary funds to meet its obligations connected with financial
liabilities.
Prudent liquidity risk management is pursued by monitoring cash flows,
financing requirements and the liquidity of the Company, with the goal of
ensuring effective management of financial resources through the proper
management of any liquidity surpluses or surpluses convertible to cash and the
subscription of suitable credit lines.
34. TRANSACTIONS WITH RELATED PARTIES
The table below shows the costs and revenues deriving from transactions with
related parties.
Costs
WIIT
Fin
S.r.l.
WIIT
S.p.A.
WIIT
Swiss
S.A.
Foster
S.r.l.
Adelante
S.r.l.
ICTW Comm.IT Sintex
S.r.l.
Total
Re
ve
nu
es WIIT Fin S.r.l. 499,000 499,000
WIIT S.p.A. 9,087 45,000 2,988 57,075
WIIT Swiss S.A. 2,705 2,705
Foster S.r.l. 320,000 320,000
Adelante S.r.l. 18,032 103,368
ICTW 47,220 3,218 82,118 85,824
Comm.IT 78,487 479 38,604 78,966
Sintex S.r.l. 0
Total 839,737 9,087 170,707 3,697 120,722 2,988 1,146,938
35. COMMITMENTS
Guarantees given
The Company did not grant any sureties to guarantee consumer loans and
mortgages.
36. SUBSEQUENT EVENTS
In February 2019, following approval by the Board of Directors on 13
November 2018 and the Shareholders’ Meeting on 30 November 2018, the
company filed the communication at Consob pursuant to article 113 of
Legislative Decree 58/98, as amended, and article 52 of the Regulation
adopted by CONSOB Resolution no. 11971 of 14 May 1999, as amended
(“Issuers’ Regulation”), regarding the application for approval of the
prospectus for admission to trading of ordinary shares of WIIT (the “Shares”) on
the Screen-Based Equities market (“MTA”), organised and managed by Borsa
Italiana S.p.A. (“Borsa Italiana”), potentially the STAR segment.
At the same time, WIIT presented to Borsa Italiana the application for
admission of the Shares to listing on the MTA, potentially the STAR segment, as

50
Financial Statements AS at 31 December 2018
well as the application for revocation of its Shares from trading on AIM Italia,
subject to their concurrent admission to trading on the MTA.
Subject to the admission of the Shares to trading on the MTA and effective
from the date of the start of trading thereof, it intends to comply with the
regime of simplification set out in article 70, paragraph 8 and article 71,
paragraph 1-bis of the Issuers’ Regulation. Therefore, it will avail of the option
to derogate from the obligations to publish the informative documents set out
in article 70, paragraph 6 and article 71, paragraph 1 of said Issuers’
Regulation in the event of significant mergers, spin-offs or share capital
increase by means of the conferral of assets in kind, acquisitions or disposals.

Consolidato Al 31 Dicembre 2018
FINANCIAL
STATEMENTS
2018
Consolidated Financial Statements Wiit S.p.A.
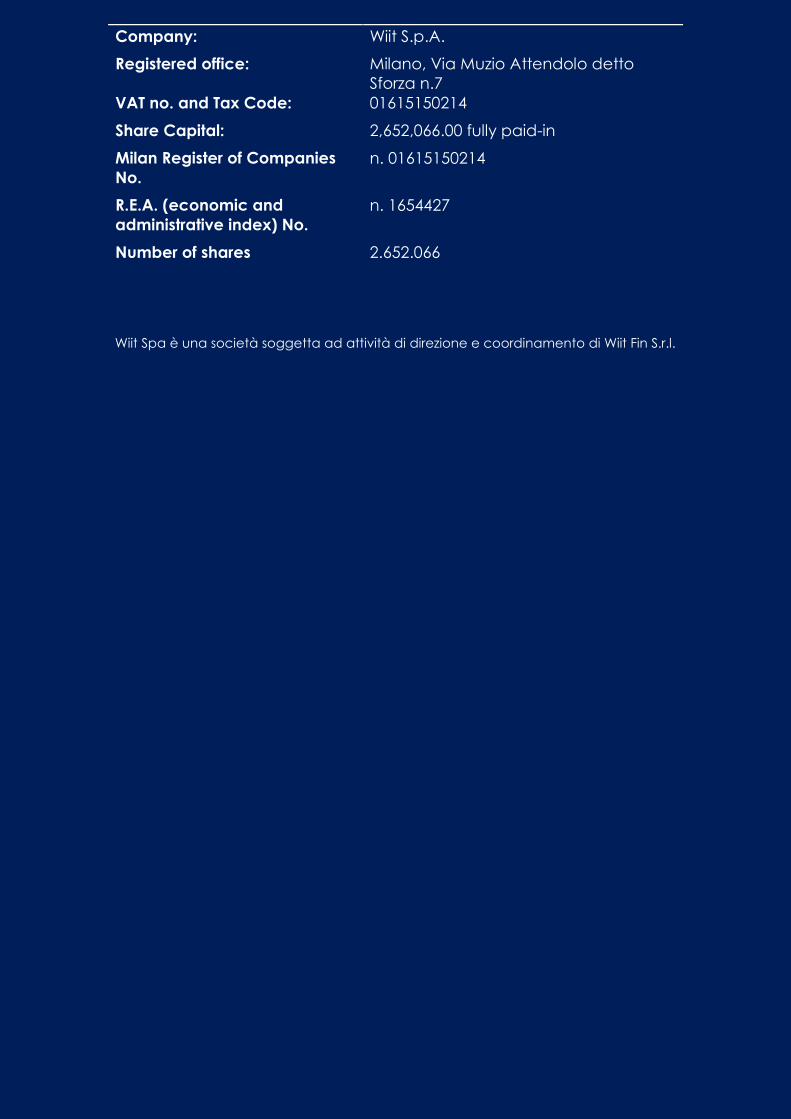
2
Consolidated Financial Statements at 31 December 2018
Company: Wiit S.p.A.
Registered office: Milano, Via Muzio Attendolo detto
Sforza n.7
VAT no. and Tax Code: 01615150214
Share Capital: 2,652,066.00 fully paid-in
Milan Register of Companies
No.
n. 01615150214
R.E.A. (economic and
administrative index) No.
n. 1654427
Number of shares 2.652.066
Wiit Spa è una società soggetta ad attività di direzione e coordinamento di Wiit Fin S.r.l.
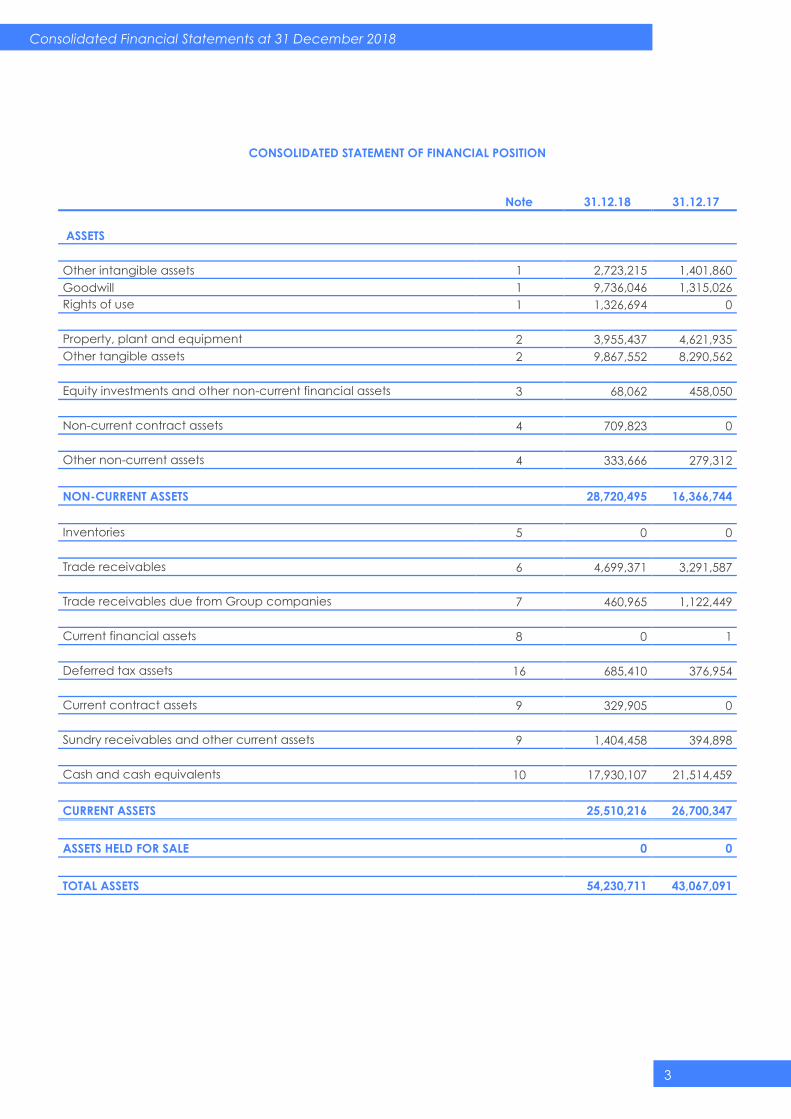
3
Consolidated Financial Statements at 31 December 2018
CONSOLIDATED STATEMENT OF FINANCIAL POSITION
Note 31.12.18 31.12.17
ASSETS
Other intangible assets 1 2,723,215 1,401,860
Goodwill 1 9,736,046 1,315,026
Rights of use 1 1,326,694 0
Property, plant and equipment 2 3,955,437 4,621,935
Other tangible assets 2 9,867,552 8,290,562
Equity investments and other non-current financial assets 3 68,062 458,050
Non-current contract assets 4 709,823 0
Other non-current assets 4 333,666 279,312
NON-CURRENT ASSETS 28,720,495 16,366,744
Inventories 5 0 0
Trade receivables 6 4,699,371 3,291,587
Trade receivables due from Group companies 7 460,965 1,122,449
Current financial assets 8 0 1
Deferred tax assets 16 685,410 376,954
Current contract assets 9 329,905 0
Sundry receivables and other current assets 9 1,404,458 394,898
Cash and cash equivalents 10 17,930,107 21,514,459
CURRENT ASSETS 25,510,216 26,700,347
ASSETS HELD FOR SALE 0 0
TOTAL ASSETS 54,230,711 43,067,091
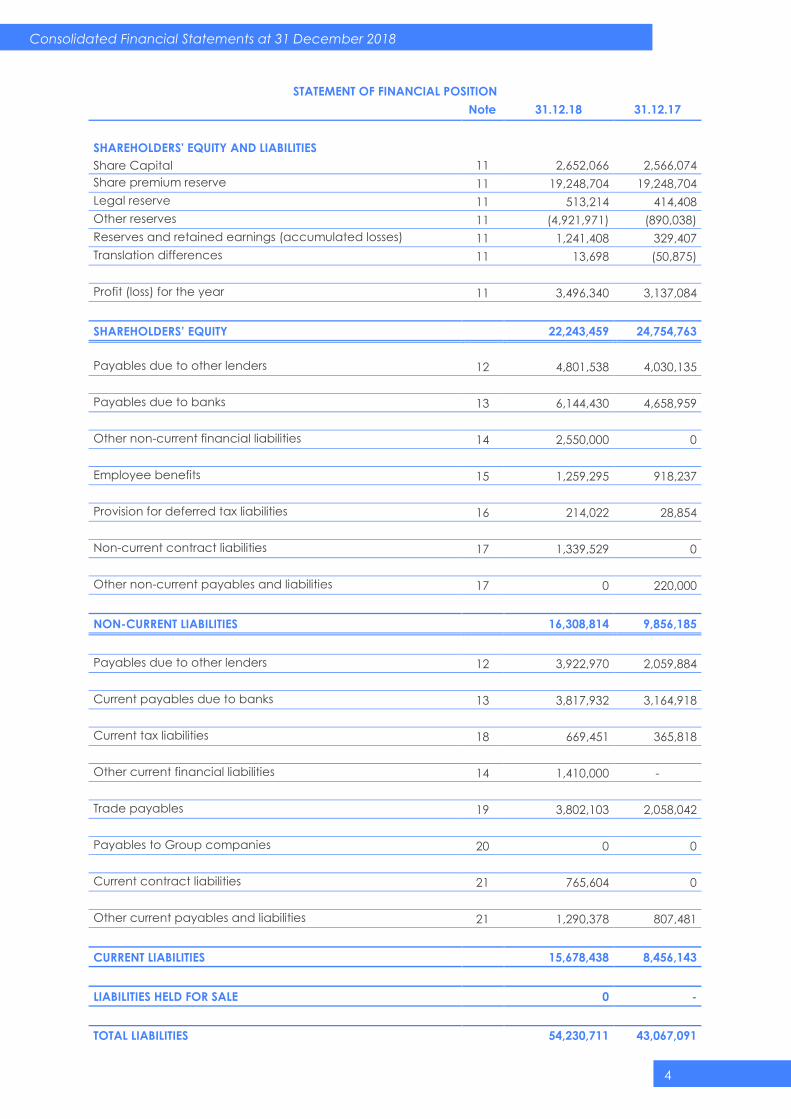
4
Consolidated Financial Statements at 31 December 2018
STATEMENT OF FINANCIAL POSITION
Note 31.12.18 31.12.17
SHAREHOLDERS' EQUITY AND LIABILITIES
Share Capital 11 2,652,066 2,566,074
Share premium reserve 11 19,248,704 19,248,704
Legal reserve 11 513,214 414,408
Other reserves 11 (4,921,971) (890,038)
Reserves and retained earnings (accumulated losses) 11 1,241,408 329,407
Translation differences 11 13,698 (50,875)
Profit (loss) for the year 11 3,496,340 3,137,084
SHAREHOLDERS’ EQUITY 22,243,459 24,754,763
Payables due to other lenders 12 4,801,538 4,030,135
Payables due to banks 13 6,144,430 4,658,959
Other non-current financial liabilities 14 2,550,000 0
Employee benefits 15 1,259,295 918,237
Provision for deferred tax liabilities 16 214,022 28,854
Non-current contract liabilities 17 1,339,529 0
Other non-current payables and liabilities 17 0 220,000
NON-CURRENT LIABILITIES 16,308,814 9,856,185
Payables due to other lenders 12 3,922,970 2,059,884
Current payables due to banks 13 3,817,932 3,164,918
Current tax liabilities 18 669,451 365,818
Other current financial liabilities 14 1,410,000 -
Trade payables 19 3,802,103 2,058,042
Payables to Group companies 20 0 0
Current contract liabilities 21 765,604 0
Other current payables and liabilities 21 1,290,378 807,481
CURRENT LIABILITIES 15,678,438 8,456,143
LIABILITIES HELD FOR SALE 0 -
TOTAL LIABILITIES 54,230,711 43,067,091
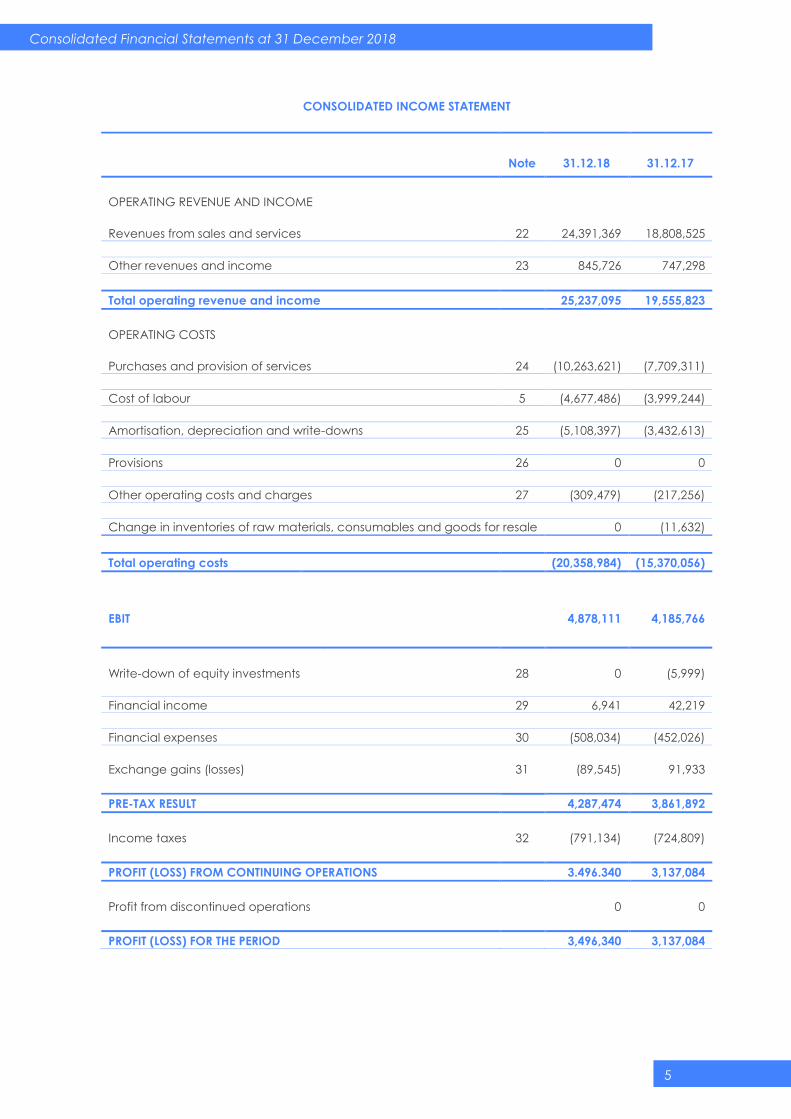
5
Consolidated Financial Statements at 31 December 2018
CONSOLIDATED INCOME STATEMENT
Note 31.12.18 31.12.17
OPERATING REVENUE AND INCOME
Revenues from sales and services 22 24,391,369 18,808,525
Other revenues and income 23 845,726 747,298
Total operating revenue and income 25,237,095 19,555,823
OPERATING COSTS
Purchases and provision of services 24 (10,263,621) (7,709,311)
Cost of labour 5 (4,677,486) (3,999,244)
Amortisation, depreciation and write-downs 25 (5,108,397) (3,432,613)
Provisions 26 0 0
Other operating costs and charges 27 (309,479) (217,256)
Change in inventories of raw materials, consumables and goods for resale 0 (11,632)
Total operating costs (20,358,984) (15,370,056)
EBIT
4,878,111 4,185,766
Write-down of equity investments 28 0 (5,999)
Financial income 29 6,941 42,219
Financial expenses 30 (508,034) (452,026)
Exchange gains (losses) 31 (89,545) 91,933
PRE-TAX RESULT 4,287,474 3,861,892
Income taxes 32 (791,134) (724,809)
PROFIT (LOSS) FROM CONTINUING OPERATIONS 3.496.340 3,137,084
Profit from discontinued operations 0 0
PROFIT (LOSS) FOR THE PERIOD 3,496,340 3,137,084
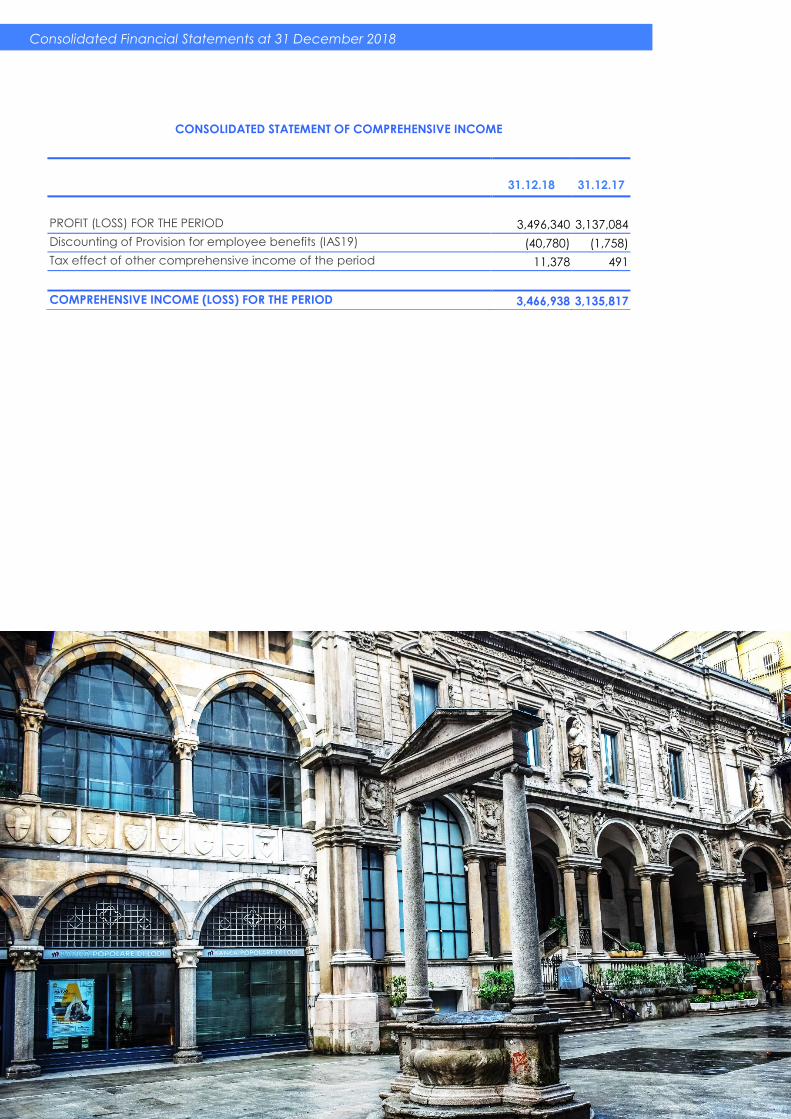
6
Consolidated Financial Statements at 31 December 2018
CONSOLIDATED STATEMENT OF COMPREHENSIVE INCOME
31.12.18 31.12.17
PROFIT (LOSS) FOR THE PERIOD 3,496,340 3,137,084
Discounting of Provision for employee benefits (IAS19) (40,780) (1,758)
Tax effect of other comprehensive income of the period 11,378 491
COMPREHENSIVE INCOME (LOSS) FOR THE PERIOD 3,466,938 3,135,817
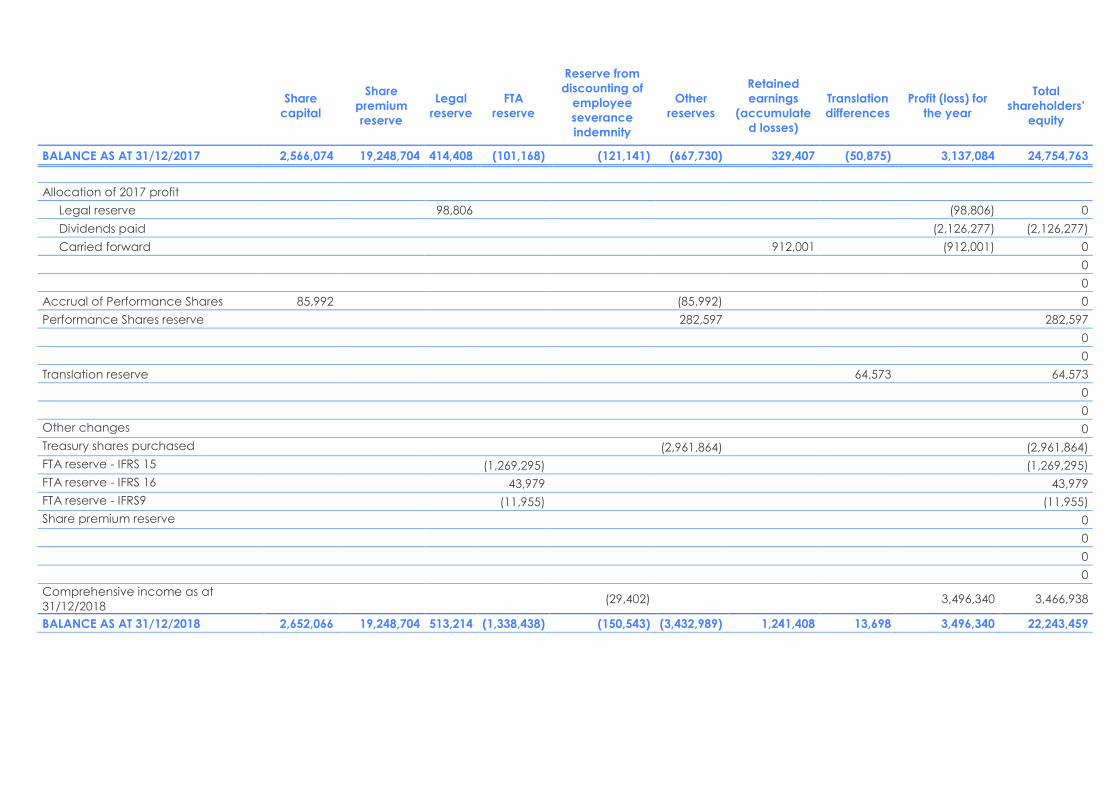
Share
capital
Share
premium
reserve
Legal
reserve
FTA
reserve
Reserve from
discounting of
employee
severance
indemnity
Other
reserves
Retained
earnings
(accumulate
d losses)
Translation
differences
Profit (loss) for
the year
Total
shareholders’
equity
BALANCE AS AT 31/12/2017 2,566,074 19,248,704 414,408 (101,168) (121,141) (667,730) 329,407 (50,875) 3,137,084 24,754,763
Allocation of 2017 profit
Legal reserve 98,806 (98,806) 0
Dividends paid (2,126,277) (2,126,277)
Carried forward 912,001 (912,001) 0
0
0
Accrual of Performance Shares 85,992 (85,992) 0
Performance Shares reserve 282,597 282,597
0
0
Translation reserve 64,573 64,573
0
0
Other changes 0
Treasury shares purchased (2,961,864) (2,961,864)
FTA reserve - IFRS 15 (1,269,295) (1,269,295)
FTA reserve - IFRS 16 43,979 43,979
FTA reserve - IFRS9 (11,955) (11,955)
Share premium reserve 0
0
0
0
Comprehensive income as at
31/12/2018 (29,402) 3,496,340 3,466,938
BALANCE AS AT 31/12/2018 2,652,066 19,248,704 513,214 (1,338,438) (150,543) (3,432,989) 1,241,408 13,698 3,496,340 22,243,459
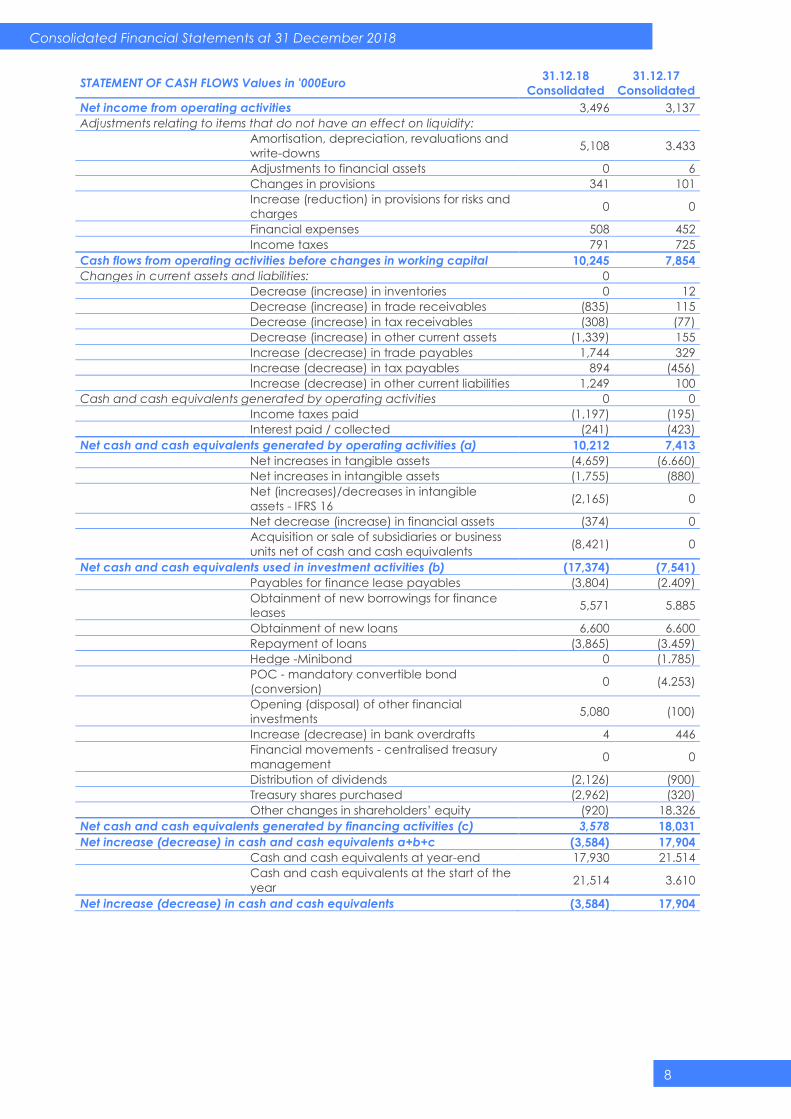
8
Consolidated Financial Statements at 31 December 2018
STATEMENT OF CASH FLOWS Values in '000Euro 31.12.18
Consolidated
31.12.17
Consolidated Net income from operating activities 3,496 3,137
Adjustments relating to items that do not have an effect on liquidity:
Amortisation, depreciation, revaluations and
write-downs 5,108 3.433
Adjustments to financial assets 0 6
Changes in provisions 341 101
Increase (reduction) in provisions for risks and
charges 0 0
Financial expenses 508 452
Income taxes 791 725
Cash flows from operating activities before changes in working capital 10,245 7,854
Changes in current assets and liabilities: 0
Decrease (increase) in inventories 0 12
Decrease (increase) in trade receivables (835) 115
Decrease (increase) in tax receivables (308) (77)
Decrease (increase) in other current assets (1,339) 155
Increase (decrease) in trade payables 1,744 329
Increase (decrease) in tax payables 894 (456)
Increase (decrease) in other current liabilities 1,249 100
Cash and cash equivalents generated by operating activities 0 0
Income taxes paid (1,197) (195)
Interest paid / collected (241) (423)
Net cash and cash equivalents generated by operating activities (a) 10,212 7,413
Net increases in tangible assets (4,659) (6.660)
Net increases in intangible assets (1,755) (880)
Net (increases)/decreases in intangible
assets - IFRS 16 (2,165) 0
Net decrease (increase) in financial assets (374) 0
Acquisition or sale of subsidiaries or business
units net of cash and cash equivalents (8,421) 0
Net cash and cash equivalents used in investment activities (b) (17,374) (7,541)
Payables for finance lease payables (3,804) (2.409)
Obtainment of new borrowings for finance
leases 5,571 5.885
Obtainment of new loans 6,600 6.600
Repayment of loans (3,865) (3.459)
Hedge -Minibond 0 (1.785)
POC - mandatory convertible bond
(conversion) 0 (4.253)
Opening (disposal) of other financial
investments 5,080 (100)
Increase (decrease) in bank overdrafts 4 446
Financial movements - centralised treasury
management 0 0
Distribution of dividends (2,126) (900)
Treasury shares purchased (2,962) (320)
Other changes in shareholders’ equity (920) 18.326
Net cash and cash equivalents generated by financing activities (c) 3,578 18,031
Net increase (decrease) in cash and cash equivalents a+b+c (3,584) 17,904
Cash and cash equivalents at year-end 17,930 21.514
Cash and cash equivalents at the start of the
year 21,514 3.610
Net increase (decrease) in cash and cash equivalents (3,584) 17,904
9
Consolidated Financial Statements at 31 December 2018
GROUP STRUCTURE
Parent Company
WIIT S.p.A.
Direct and indirect subsidiaries and share attributable to the Group
As at 31 December 2018, the WIIT Group is composed of five companies: WIIT
S.p.A., the consolidating company, a joint-stock company incorporated in
Italy, with registered office in Via Muzio Attendolo detto Sforza no. 7, Milan,
and the subsidiaries WIIT Swiss S.A., incorporated in Switzerland with registered
office in Dottikon – Bleicheweg 5 (CH) wholly-owned by the consolidating
company Foster S.r.l., a limited liability company incorporated in Italy with
registered office in Via Muzio Attendolo detto Sforza no. 7, Milan, wholly-
owned by Adelante S.r.l., a limited liability company incorporated in Italy with
registered office in Via Sandro Pertini 7, Bagno a Ripoli (FI), wholly-owned by
the consolidating company and ICT Watcher Sh.p.k. with registered office in
Rruga Abdyl Frasheri, building 8, Tirana, an Albanian company wholly-owned
by the subsidiary Adelante S.r.l..
Notes to the consolidated financial statements as at 31 December 2018
Wiit S.p.A. (the consolidating company) established the subsidiary Wiit Swiss
SA in 2016, holding a controlling interest from 2016.
On 18 July 2018, the acquisition of 100% of the shares representing the share
capital of Adelante was completed. Adelante is a company specialised in
the digital transformation of medium-sized enterprises and operating - also
through the Group companies - in the provision of Cloud Computing services,
managed services, managed security, business process outsourcing and
unified communication.
On 3 December 2018, the consolidating company completed the acquisition
of 65.03% of the shares representing the share capital of Foster, a company
that owns a document management platform through which the Group
provides, among other things, enterprise information management and
digital business process outsourcing services.
The companies operate in the IT services sector through outsourcing
contracts, with a special focus on managing the IT processes of their
customers in the following sectors:
- finance;
- manufacturing;
- services;
- telecommunications.
The activity is performed by using specific and innovative work organisational
models and specialised assets and personnel.
ACCOUNTING STANDARDS
10
Consolidated Financial Statements at 31 December 2018
Statement of compliance and basis of preparation
The consolidated financial statements of Wiit S.p.A. for the year ended as at 31
December 2018 were drafted in compliance with the International Financial
Reporting Standards (IFRS) issued by the International Accounting Standards
Board (IASB) and adopted by the European Union. The reference to IFRS also
includes all applicable International Accounting Standards (IAS). They were
drafted in Euros, the current currency of the country in which the Company
operates predominantly. They comprise the statement of financial position,
income statement, statement of comprehensive income, statement of
changes in shareholders’ equity, the statement of cash flows and these notes.
The financial statements have been prepared on the basis of the historical cost
principle, and the going concern assumption. With reference to the latter
assumption, despite the presence of a difficult economic and financial
environment, the Company, also by virtue of its strong competitive positioning,
high level of profitability and the solidity of its capital and financial structure,
considered itself to be a going concern in accordance with paragraphs 25 and
26 of IAS 1.
Financial statements layouts
The Company adopted the following financial statements layouts:
a statement of financial position which shows current and non-current
assets and current and non-current liabilities separately;
an income statement which classifies costs by nature;
a statement of comprehensive income, which shows cost and revenue
items which are not recognised under profit (loss) for the year as required
or permitted by IFRS;
a statement of cash flows which presents the cash flows from operating
activities using the indirect method.
The adoption of these layouts allows a more meaningful representation of the
equity, economic and financial position of the Company.
Consolidation Area
The Consolidated Financial Statements of the WIIT Group include the annual
data of WIIT and the direct and indirect Subsidiaries, taken from the financial
statements approved by the respective Boards of Directors, appropriately
adjusted, where necessary, to bring them into line with the accounting
standards (IAS/IFRS) adopted by the Company in preparing the Consolidated
Financial Statements.
Companies in respect of which Wiit S.p.A. simultaneously satisfies the following
three requirements are considered subsidiaries: (A) power over the company;
(b) exposure, or rights, to variable returns from involvement with the company;
(c) the ability to use its power to affect the amount of said variable returns. The
subsidiaries, if they carry out a significant activity for a correct representation
of the equity, economic and financial position of the Group, are consolidated
from the date in which control is acquired until the date in which control
ceases.
WIIT Swiss SA., which the Group acquired control of in July 2016, was
consolidated from the 2016 financial statements.
11
Consolidated Financial Statements at 31 December 2018
The scope of consolidation as at 31 December 2018 includes the parent
company WIIT, the companies WIIT Swiss S.A., Foster S.r.l., Adelante S.r.l. and
ICT Watcher Sh.p.k., wholly-owned by WIIT directly and indirectly. The
consolidated income statement reflects the annual values of Wiit S.p.A. and
Wiit Swiss, while with reference to Adelante S.r.l., ICTW Sh.p.k. and Foster S.r.l., it
reflects the values from the acquisition date.
Adoption of the international accounting standards
Following the entry into force of Legislative Decree no. 38 of 28 February 2005,
which regulates the right to draft the separate financial statements and the
consolidated financial statements in compliance with the international
accounting standards, based on the options set forth in art. 5 of Regulation (EC)
no. 1606/2002 issued by the European Parliament and European Council in July
2002, the WIIT Group voluntarily adopted these accounting standards as of the
drafting of the financial statements of WIIT S.p.A. as at 31 December 2015. These
financial statements were, for the first time, filed according to the methods
dictated by the aforementioned law. The Group, therefore, from 1 January
2015, applied the valuation and measurement criteria established in the
international accounting standards and the relevant interpretation principles
(“IFRIC”) previously called the Standing Interpretations Committee (“SIC”),
endorsed by the European Commission and deemed applicable to
transactions carried out by the Group.
Consolidation criteria
The data used for consolidation are taken from the economic and equity
positions prepared by the Directors of the individual subsidiaries. These data
have been appropriately modified and reclassified, where necessary, to
bring them into line with the international accounting standards and the
classification criteria that are homogeneous within the Group.
The consolidation criteria adopted are as follows:
a) Assets and liabilities, income and expenses of the financial statements
subject to line-by-line consolidation are inserted in the Group’s financial
statements, regardless of the size of the equity investment. In addition, the
carrying amount of the equity investments is eliminated against the
shareholders’ equity pertaining to the investees.
b) The positive differences resulting from the elimination of the equity
investments against the reported shareholders’ equity on the date of first-
time consolidation are booked at the higher values attributable to the assets
and liabilities and, for the residual part, to goodwill.
c) Payables/receivables, costs/revenues between consolidated companies
and profits/losses resulting from intercompany transactions are eliminated.
d) In the presence of minority shareholders, the portion of shareholders’ equity
and net income for the year pertaining to them would be attributed to the
appropriate items of the consolidated statement of financial position and
income statement.
Translation to Euro of statements of financial position drafted in foreign currencyI
The separate financial statements of each Group company are prepared in
the currency of the primary economic environment in which it operates
(functional currency). For the purposes of the consolidated financial
12
Consolidated Financial Statements at 31 December 2018
statements, the financial statements of each foreign entity are stated in Euros,
which is the functional currency of the Group and the presentation currency of
the consolidated financial statements.
The statement of financial position items in the financial statements expressed
in a non-Euro currency are translated using the current exchange rates at year-
end. By contrast, income statement items are translated using the average
exchange rates for the year.
Exchange differences from the translation resulting from a comparison
between the initial shareholders’ equity translated at the current exchange
rates and said shareholders’ equity translated using historical exchange rates,
as well as the difference between the economic result stated at the average
exchange rates and that stated at current exchange rates, are booked to the
shareholders’ equity item “Other reserves”.
The exchange rates used to translate the financial statements of the foreign
subsidiary to Euros, prepared in local currency, are reported in the following
table:
Description of the currency Year-end exchange rate -
31/12/2018
Average exchange rate
2018
Swiss Franc 1.1269 1.1550
Lek 123.53 127.62
Measurement criteria
The accounting policies and measurement criteria adopted for the drafting of
the financial statements for the year ended as at 31 December 2018,
unchanged with respect to the previous year, are reported below:
INTANGIBLE ASSETS
Business combinations and goodwill
Business combinations are recognised according to the acquisition method.
According to said method, the consideration transferred in a business
combination is measured at fair value, calculated as the sum of the fair values
of the assets transferred and liabilities assumed by the Company at the
acquisition date and of the equity instruments issued in exchange for control of
the acquiree.
At the acquisition date, the identifiable assets acquired and the liabilities
assumed are booked at fair value on the acquisition date; the following items
constitute an exception, as they are instead measured according to their
reference principle:
- deferred tax assets and deferred tax liabilities;
- assets and liabilities for employee benefits;
- liabilities or equity instruments relating to share-based payments of the
acquiree or share-based payments relating to the Group, issued as a
replacement of the contracts of the acquiree;
- assets held for sale and discontinued assets and liabilities.
The value of goodwill is determined as the excess between the sum of the
considerations transferred in the business combination, the value of
shareholders’ equity attributable to non-controlling interests and the fair value
13
Consolidated Financial Statements at 31 December 2018
of any equity investment held previously in the acquiree with respect to the fair
value of the net assets acquired and liabilities assumed at the date of
acquisition. If the value of the net assets acquired and liabilities assumed at the
date of acquisition exceeds the sum of the considerations transferred, the
value of shareholders’ equity attributable to non-controlling interests and the
fair value of any equity investment held previously in the acquiree, this excess
(“Negative goodwill”) is recognised immediately in the income statement as
income deriving from the transaction concluded.
The costs connected with business combinations are recognised in the income
statement.
Goodwill is initially recognised at cost and subsequently reduced only in the
event of accumulated impairment.
Annually, or more frequently if specific events or changed circumstances
indicate the possibility that it has suffered impairment, the goodwill is subject to
impairment testing, according to the provisions of IAS 36 (Impairment of assets);
the original value is, nonetheless, not written back if the reasons for the
impairment no longer apply.
Goodwill is not revalued, not even in application of specific laws.
Any liabilities connected to the business combinations for conditional
payments are booked at estimated fair value at the date of acquisition of the
companies and of the business units relating to the business combinations.
In the event of the transfer of a part or of the entire entity acquired previously
and the emergence of goodwill from its acquisition, in determining the capital
gains or losses from the transfer, account is taken of the corresponding residual
value of the goodwill.
In relation to the acquisitions prior to the date of adoption of IFRS, the Company
has availed itself of the right set out in IFRS 1 to not apply IFRS 3 - business
combinations to acquisitions completed before the transition date.
Consequently, the goodwill that emerged in relation to acquisitions completed
in the past were not re-stated and were recognised at the value calculated on
the basis of the previous accounting standards, net of amortisation accounted
for up to 31 December 2013, the date of transition to the international
accounting standards of the holding company and any losses due to
impairment.
Research and development costs Development costs are only booked to assets if the costs can be determined reliably, the Company has the intention and the availability of resources to complete said asset, there is a technical feasibility of completing the asset to make it ready for use and the expected volumes and prices indicate that the costs incurred in the development phase may generate future economic benefits. Capitalised development costs include solely the expenses incurred which can be attributed directly to the development process. Capitalised development costs are amortised systematically, from the start of production, over the estimated life of the product or process, which was measured at five years. All other development costs are recognised to the income statement when incurred.
14
Consolidated Financial Statements at 31 December 2018
Research costs are charged to the income statement at the moment they are incurred.
Rights of use The definition of lease takes account of a criterion based on control (right of use) of an asset for distinguishing lease contracts from service contracts, identifying as discriminating factors: identification of the asset, the right to replace the same, the right to obtain substantially all of the economic benefits arising from the use of the asset and the right to direct the use of the asset underlying the contract. Assets with a value of less than Euro 5,000 and leases with a term of equal to or less than 12 months were not recognised as lease agreements. Assets forming the object of the operating lease are booked under assets with a contra-item in financial payables. Non-lease components were split off and accounted for separately from lease components. These assets are amortised on the basis of the lease term.
Other intangible assets
Other Intangible assets acquired are booked to assets, according to the
provisions of IAS 38, when it is probable that use of the asset will generate future
economic benefits and the cost of the asset can be measured reliably. If these
future economic benefits no longer exist, the assets will be written down in the
year in which this situation is verified.
These assets are measured at purchase or production cost and amortised on
a straight-line basis over their estimated useful life, if they have a finite useful
life.
Other intangible assets are amortised in 5 years.
TANGIBLE ASSETS
These assets include plant and machinery, equipment and other tangible
assets.
They are recorded at purchase or production cost. The cost includes directly
attributable accessory charges. Depreciation, as per IAS 16, is calculated on
the basis of homogeneous rates for similar categories of assets and deemed
appropriate to distribute the carrying amount of the tangible assets over their
useful life. The estimate useful life, in years, is as follows:
Plant and machinery 12% - 20%
Equipment 15%
Vehicles 25%
Office equipment 20%
Furniture and fittings 12%
Ordinary maintenance costs are charged to the income statement in the year
in which they are incurred. Costs that increase the value or useful life of the
fixed asset are capitalised and depreciated in relation to the residual possibility
of use of the fixed assets to which they refer.
Assets under a finance lease Assets acquired under finance leases are accounted for using the financial method and are shown under assets at purchase value, less depreciation. The depreciation of these assets is reflected in the annual accounts, by applying
15
Consolidated Financial Statements at 31 December 2018
the same method used for owned tangible assets. Short- and medium/long-term payables due to the lessor are recognised as a contra-item to the asset; financial expenses pertaining to the period are also booked to the income statement. These assets are measured at purchase or production cost and depreciated on a straight-line basis over their estimated useful life, generally 5 years, if they have a finite useful life.
Impairment of assets
At each reporting date, the Company reviews the carrying amount of its
tangible and intangible assets to determine whether there are indications they
have suffered impairment. If these indications exist, the recoverable amount of
these assets is estimated to determine the amount of the write-down. Where it
is not possible to estimate the recoverable amount of an asset on an individual
basis, the Company estimates the recoverable amount of the cash-generating
unit to which the asset belongs.
In particular, the recoverable amount of the cash-generating units (which
generally coincide with the legal entities to which the fixed assets refer) is
verified through the determination of the value in use. The recoverable amount
is the higher of the net sale price and the value in use. In determining the value
in use, the future cash flows net of taxes, estimated on the basis of past
experience, are discounted to their present value using a rate net of taxes that
reflects the current valuations of the present market value of money and the
specific risks of the asset. The main assumptions used to calculate the value in
use concern the discount rate, the growth rate, expectations regarding
changes in sale prices and the trend in direct costs during the period assumed
for the calculation. The growth rates adopted are based on the growth
forecasts of the relevant industrial sector. The variations in the sale prices are
based on past experiences and on future market expectations. The Company
prepares forecasts of the operating cash flows deriving from the most recent
budget drafted by the Directors and approved by the Company’s Board of
Directors, draws up forecasts for the next five years and determines the terminal
value (present value of the perpetual yield) on the basis of a medium and long-
term growth rate in line with that of the specific relevant sector.
If the recoverable amount of an asset (or a cash-generating unit) is estimated
to be lower than the associated carrying amount, the carrying amount is
reduced to the lower recoverable amount, recognising the loss of value in the
income statement.
When the reasons for maintaining a write-down no longer apply, the carrying
amount of the asset (or the cash-generating unit), with the exception of
goodwill, is increased to the new value deriving from the estimate of its
recoverable amount, but not over the net carrying amount that the asset
would have had if no write-down had been effected for impairment. The write-
back is booked to the income statement.
16
Consolidated Financial Statements at 31 December 2018
FINANCIAL INSTRUMENTS
Presentation
The financial instruments held by the Company are included in the financial
statement items described below:
- Non-current assets: Equity investments and Other financial assets.
- Current assets: Trade receivables, Current financial assets, Other
receivables and current assets and Cash and cash equivalents.
- Non-current liabilities: Payables due to banks, Financial payables and
liabilities and Other non-current liabilities.
- Current liabilities: Trade payables, Payables due to banks, Current financial
liabilities and Other current liabilities.
The item “Cash and cash equivalents” includes bank deposits, shares of
liquidity funds and other highly tradable securities which can be readily
converted to cash and which are subject to the risk of an insignificant change
in value.
Financial assets represented by debt instruments or equity instruments are
initially recognised at the settlement date.
At the moment of initial recognition, financial assets held for trading are
recognised at fair value, unlike the other categories of financial assets, as they
do not include the transaction costs or income connected with said instrument
which are booked to income statement.
Measurement
Equity investments in associates are measured at fair value. Equity investments
in associates over which a significant influence is exercised are accounted for
based on the equity method.
Equity investments classified as held for sale are accounted for in compliance
with IFRS 5.
Other financial assets and securities, held with the intention of being retained
until maturity, are accounted for on the basis of the trading date and, at the
moment of initial recognition in the financial statements, are measured at
acquisition cost (representative of the fair value), inclusive, of the accessory
costs of the transaction. These assets are subsequently measured at amortised
cost, determined using the effective interest rate method.
Trade receivables, Current financial assets, Other receivables and current
assets and Cash and cash equivalents, are measured at amortised cost, if they
have a pre-established maturity, calculated using the effective interest rate
method. When financial assets do not have a pre-established maturity, they
are measured at cost.
Receivables falling due after one year, non-interest bearing or which accrue
interest at below-market rates, are discounted using market rates.
Valuations are performed regularly in order to verify whether there is objective
evidence that the financial assets, considered individually or as part of a group
of assets, have suffered impairment. If said evidence exists, the impairment is
recognised as a cost in the income statement for the period. In addition, with
reference to impairment, loan losses are estimated on the basis of the
expected loss model, using reliable information, available without undue costs
17
Consolidated Financial Statements at 31 December 2018
or unreasonable efforts, that include historical, current and forward-looking
data. This impairment model applies to all financial instruments, i.e. to financial
assets measured at amortised cost, and those designated at fair value.
After initial recognition, available-for-sale financial instruments and those held
for trading are measured at fair value. If the market price is not available, the
fair value of the available-for-sale financial instruments is determined using the
most suitable measurement techniques, such as the analysis of discounted
cash flows based on market information available at the reporting date.
Gains and losses on available-for-sale financial assets are booked directly to
the statement of comprehensive income until the moment the financial asset
is sold or written down; at that moment, the accumulated gains or losses,
including those previously recognised in the statement of comprehensive
income, are included in the income statement of the period. Gains and losses
generated by the changes in the fair value of the financial instruments
classified as held for trading are booked to the income statement of the period.
Trade payables, Current and non-current financial liabilities and Other current
and non-current liabilities are booked, at the moment of first-time recognition
in the financial statements, at fair value (normally represented by the cost of
the transaction), including the accessory costs of the transaction.
INVENTORIES
Warehouse inventories are valued at the lower of the purchase or production
cost, calculated on the basis of the weighted average cost method, and the
corresponding market value, represented by the cost of replacing the
purchase materials and the presumed realisable value for finished and semi-
finished products, calculated by taking into account both manufacturing costs
and the direct sale costs still to be incurred. Obsolete and slow-moving stock
are written down in relation to their possible use or sale. The write-down of
inventories is eliminated in subsequent years if the reasons for said write-down
no longer apply.
PROVISIONS FOR RISKS AND CHARGES
Provisions for risks and charges represent probable liabilities, whose amount
and/or expiry are uncertain, deriving from past events, whose materialisation
will entail a financial outlay. Provisions are set aside exclusively in the presence
of a current obligation (legal or implicit), which makes the use of financial
resources necessary, provided that said obligation can be reliably estimated.
The amount recognised as a provision represents the best estimate of the
necessary expense to fulfil the obligation at the reporting date. The allocated
provisions are re-examined as at each reporting date and adjusted to reflect
the best current estimate.
Where the financial outlay relating to the obligation must occur beyond the
normal payment terms and the effect of discounting is significant, the amount
of the provision is represented by the present value of future expected
payments to extinguish the obligation.
Contingent assets and liabilities are not recognised in the financial statements;
however adequate information is provided in this regard.
18
Consolidated Financial Statements at 31 December 2018
LOANS
Loans are initially measured at cost, net of accessory expenses to acquire the
loan. This value is subsequently adjusted to take account of any difference
between the initial value and the repayment value throughout the term of the
loan, using the effective interest rate method.
Loans are classified under current liabilities unless the Group has the
unconditional right to defer the extinguishing of said liability for at least twelve
months after the reference date.
EMPLOYEE PROVISIONS
Short-term benefits
Short-term benefits to employees are booked to the income statement in the
period in which the work is performed.
Post-employment benefits
Effective from 1 January 2007, the Finance Law (Law 296/2006) and the
associated implementing decrees introduced significant changes to the
regulation of employee severance indemnity (TFR), including employees’
decisions regarding the allocation of their employee severance indemnity
being accrued. In particular, the new provisions established the requirement to
pay new flows of employee severance indemnity to forms of pension chosen
beforehand by the employee or, in the event the employee opts to retain said
flows in the company, to a treasury account held at INPS (National Social
Security Institute). These legislative amendments involved a new accounting
classification of the provision for employee severance indemnity.
Before the reform introduced by Law 296/2006, the international accounting
standards actually placed the provision for employee severance indemnity
under “defined benefit plans”; by contrast, now only TFR accrued as at 31
December 2006 continues to fall under “defined benefit plans”, while that
accrued after said date is classified as a “defined contribution plan”. This is
because all the company’s obligations are fulfilled with the periodic payment
of a contribution to third party entities. Therefore, the discounted amounts are
no longer allocated to the income statement, but the disbursements made to
the different forms of pension chosen by the employee or to the separate
treasury service established at INPS are recognised under personnel costs,
calculated on the basis of art. 2120 of the Italian Civil Code.
Defined benefit plans
The provision for employee severance indemnity is calculated by an
independent actuary using the projected unit method to determine the
liability. All actuarial effects are booked to shareholders’ equity and included
in the statement of comprehensive income.
19
Consolidated Financial Statements at 31 December 2018
Defined contribution plans
The Company participates in Government or privately managed defined
contribution pension plans, on a mandatory, contractual or voluntary basis. As
already outlined, provisions for employee severance indemnity which,
calculated on the basis of art. 2120 of the Italian Civil Code, are paid to
different forms of pension chosen by the employee or to the separate treasury
service established at INPS, fall into this category. Payment of the contributions
marks the fulfilment of the Company’s obligation to its employees. The
contributions therefore constitute costs in the period in which they are due.
Stock option plan
The Company approved a stock option plan intended for directors vested with
special roles and executives who hold strategic positions in the Parent
Company. According to the provisions of IFRS 2 - Share-based payments, this
plan represents a component of beneficiaries’ pay; therefore, the cost is
represented by the fair value of the stock options at the assignment date,
determined using financial valuation techniques, by also taking account of the
market conditions, and is booked to the income statement on a pro-rata basis
over the period to which the stock option plan refers, with a contra-item in
shareholders’ equity.
CRITERIA FOR TRANSLATING FOREIGN CURRENCY ITEMS
Receivables and payables originally stated in foreign currency are translated
to Euro at the exchange rates prevailing on the date the transactions that gave
rise to them took place. The exchange rate differences realised at the time of
collection of the receivables and settlement of the payables in foreign
currency are booked to the income statement. Income and expenses relating
to foreign currency transactions are booked at the current exchange rate on
the date in which the relevant transaction is carried out.
At year-end, the assets and liabilities in foreign currency, with the exception of
non-current assets, are booked at the spot exchange rate at year-end and the
associated exchange gains and losses are booked to the income statement. If
the translation gives rise to a net profit, a restricted reserve will be allocated for
a corresponding amount, not distributable until it is actually realised.
RECOGNITION OF REVENUES AND COSTS
Revenues are recognised net of discounts, rebates and premiums, as well as of
the taxes directly related to the sale of the goods and provision of the services.
Revenues are measured on the basis of the consideration provided for
contractually with the customer and do not include amounts collected on
behalf of third parties. The Group recognises revenues at the time control of the
promised goods or services is transferred to the customer.
Costs and expenses are booked to the financial statements according to the
accrual principle.
Financial income
Financial income includes interest income on funds invested and income
deriving from financial instruments. Interest income is booked to the income
statement at the moment it accrues, considering the actual return.
20
Consolidated Financial Statements at 31 December 2018
Financial expenses
Financial expenses include interest expense on financial payables calculated
using the effective interest rate method and bank charges.
Income taxes for the year
Income taxes comprise all the taxes calculated on the Company's taxable
income. Income taxes are booked to the income statement, with the
exception of those relating to items charged or credited directly to
shareholders’ equity, in which cases the tax effect is recognised directly to
shareholders’ equity. Other non-income related taxes, such as taxes on
properties, are included under operating charges. Deferred taxes are
allocated according to the balance sheet liability method. They are
calculated on all temporary differences that emerge between the tax base of
an asset or liability and the carrying amount, with the exception of goodwill
that is not tax deductible and those differences from investments in subsidiaries
which are not expected to be cancelled in the foreseeable future. Deferred
tax assets are recognised to the extent it is likely that sufficient future taxable
income will be generated against which they can be recovered. Current and
deferred tax assets and liabilities are offset when the income taxes are applied
by the same tax authority and when there is a legal right to offset. Deferred tax
assets and deferred tax liabilities are determined using the tax rates that are
expected to be used, in the legal system of the country in which the Company
operates, in the years in which the temporary differences will be realised or
extinguished.
Use of estimates
Drafting of the financial statements and the associated notes, in application of
IFRS, required Management to prepare estimates and assumptions which have
an effect on the values of the assets and liabilities in the financial statements
and on the information relating to contingent assets and liabilities at the
reporting date. The final results could differ from these estimates. The estimates
are used to measure the tangible and intangible assets subject to impairment
testing, as described above, as well as to the recognise the provisions for credit
risks, for inventory obsolescence, amortisation/depreciation, write-downs of
assets, employee benefits, taxes and other provisions. In particular:
Recoverability of the value of tangible and intangible assets
The procedure for determining the impairment of tangible and intangible
assets described in the accounting standard “Impairment” implies - in
estimating the value in use - the use of the Business Plan of the investees which
are based on a set of assumptions and hypotheses relating to future events
and actions of the administrative bodies of the investees, which may not
necessarily materialise. By contrast, in estimating the market value, assumptions
are made regarding the foreseeable trend in trading between third parties
based on the historical performances which may not actually recur.
Provisions for credit risks
Receivables are adjusted by the associated bad debt provision to take
account of their recoverable amount. The determination of the amount of the
write-downs requires subjective evaluations by Directors based on the
21
Consolidated Financial Statements at 31 December 2018
documentation and the information available regarding the solvency of the
customer, as well as on experience and the historical trends in collections.
Provisions for inventory obsolescence
Obsolete and slow-moving stock is systematically valued and, in the event in
which its recoverable amount is lower than its carrying amount, is written down.
Write-downs are calculated on the basis of management assumptions and
estimates, deriving from experience and the past results achieved.
Employee benefits
The present value of the liabilities for employee benefits depends on a number
of factors that are determined with actuarial techniques, using certain
assumptions. The assumptions regard the discount rate, estimates of future
salary increases, mortality and termination rates. Each variation in the above-
mentioned assumptions may have significant effects on the liability for pension
benefits.
Income taxes
The determination of the Company’s tax liability requires Management to use
judgments with reference to the transactions whose tax implications are not
certain at the close of the year. Furthermore, deferred tax assets are measured
on the basis of the expected income for future years; the measurement of this
expected income depends on factors which could change over time and
determine significant effects on the valuation of deferred tax assets.
Other provisions and funds
With reference to the processes of estimating the risk of contingent liabilities
from disputes, the Directors rely on the communications received regarding the
progress status of the collection procedures and disputes sent by the legal
representatives who represent the Company in the disputes. These estimates
are determined by taking into account the progressive development of the
disputes.
The estimates and assumptions are reviewed periodically, and the effects of
each change are immediately recognised in the income statement.
22
Consolidated Financial Statements at 31 December 2018
NEW ACCOUNTING STANDARDS
23
Consolidated Financial Statements at 31 December 2018
IFRS ACCOUNTING STANDARDS, AMENDMENTS AND INTERPRETATIONS APPLIED
FROM 1 JANUARY 2018
The following amendments were applied for the first time by the Group as of 1
January 2018:
IFRS 15 – Revenue from Contracts with Customers (published on 28 May
2018 and supplemented with further clarifications published on 12 April
2016) is intended to replace the standards IAS 18 – Revenue and IAS 11
– Construction Contracts, as well as the interpretations IFRIC 13 –
Customer Loyalty Programmes, IFRIC 15 – Agreements for the
Construction of Real Estate, IFRIC 18 – Transfers of Assets from Customers
and SIC 31 – Revenues-Barter Transactions Involving Advertising Services.
The standard establishes a new revenue recognition model to be
applied to all customer contracts except those falling within the scope
of other IAS/IFRS standards such as leases, insurance contracts and
financial instruments. The key steps for revenue recognition according to
the new model are:
identification of the contract with the customer;
identification of the performance obligations of the contract;
determination of the price;
allocation of the price to the contract performance
obligations;
revenue recognition criteria when the entity meets each
performance obligation.
The standard was applied from 1 January 2018. The directors identified
the performance obligations contained in the contract and reallocated
the revenues and costs related to them and decided to account for the
effects of the first-time application of the standard by adopting the
modified retrospective approach. The effect of the first-time application
involved a change in shareholders’ equity through the creation of a
special negative reserve amounting to Euro 1,269,294, an increase in
contract liabilities of Euro 2,393,898, an increase in contract assets of Euro
633,434 and the effect of deferred taxes of Euro 491,169.
IFRS 16 – Leases (published on 13 January 2016), intended to replace IAS
17 – Leases, as well as the interpretations IFRIC 4 Determining whether an
Arrangement contains a Lease, SIC-15 Operating Leases—Incentives
and SIC-27 Evaluating the Substance of Transactions Involving the Legal
Form of a Lease.
The new standard provides a new definition of lease and introduces a
criterion based on control (right of use) of an asset for distinguishing lease
contracts from service contracts, identifying as discriminating factors:
identification of the asset, the right to replace the same, the right to
obtain substantially all of the economic benefits arising from the use of
the asset and the right to direct the use of the asset underlying the
contract.
24
Consolidated Financial Statements at 31 December 2018
The standard establishes a single model of recognition and valuation of
lease contracts for the lessee which entails recognising the asset covered
by the lease, including operating lease, under assets with an offsetting
financial payable, while also providing the possibility of not recognising
as leases contracts which refer to “low-value assets” (i.e. leases
regarding assets with a value of less than Euro 5,000) and leases with a
contract term less than or equal to 12 months. On the contrary, the
standard does not include significant changes for lessors.
The directors applied IFRS 16 early from 1 January 2018, jointly with
application of IFRS 15. In particular, the directors completed the project
for the implementation of the new standard, which made provision for a
first phase of detailed analysis of the contracts and the accounting
effects and a second phase of implementation and/or adjustment of the
administrative processes and of the accounting system. The directors
applied IFRS 16 by adopting the modified retrospective approach and
decided to determine the right of use as equal to the net carrying
amount that it would have had in the event in which the standard had
been applied from the contract start date using, however, the discount
rate defined at the transition date. The effect of the first-time application
involved a change in shareholders’ equity through the creation of a
special reserve amounting to Euro 43,979, a net increase in intangible
fixed assets of Euro 1,484,252, an increase in financial payables of Euro
1,423,256 and the effect of deferred taxes of Euro 17,017.
IFRS 9 – Financial Instruments (published on 24 July 2014). The document
includes the results of the IASB project to replace IAS 39:
introduces some new criteria for the classification and
measurement of financial assets and financial liabilities
(together with the measurement of non-substantial
modifications in financial liabilities);
With reference to the impairment model, the new standard
requires that the estimate of losses on receivables be made on
the basis of the expected losses model (and not on the incurred
losses model used by IAS 39) using supporting information,
available without unreasonable burden or effort, which
includes historical, current and prospective data.
introduces a new hedge accounting model (increase in the
types of transactions eligible for hedge accounting, change of
method of accounting of forward contracts and options when
included in a hedge accounting relationship, modifications to
the effectiveness test).
The new standard was applied from 1 January 2018. The effect of the
first-time application involved a change in shareholders’ equity through
the creation of a special negative reserve amounting to Euro 11,995, an
increase in the bad debt provision of Euro 16,581 and the effect of
deferred tax assets of Euro 4,626.
Amendment to IFRS 2 “Classification and measurement of share-based
payment transactions” (published on 20 June 2016), which contains

25
Consolidated Financial Statements at 31 December 2018
some clarifications in relation to the accounting of the effects of vesting
conditions in the presence of cash-settled share-based payments, the
classification of share-based payments with net settlement
characteristics and the accounting of the amendments to the terms and
conditions of a share-based payment that change their classification
from cash-settled to equity-settled. The amendments were applied from
1 January 2018. The adoption of this amendment did not have any
effects on the Group’s consolidated financial statements.
Document “Annual Improvements to IFRSs: 2014-2016 Cycle”, published
on 8 December 2016 (including IFRS 1 First-Time Adoption of
International Financial Reporting Standards - Deletion of short-term
exemptions for first-time adopters, IAS 28 Investments in Associates and
Joint Ventures – Measuring investees at fair value through profit or loss:
an investment-by-investment choice or a consistent policy choice, IFRS
12 Disclosure of Interests in Other Entities – Clarification of the scope of
the Standard) which partially supplement the pre-existing standards.
The majority of the amendments were applied from 1 January 2018. The
adoption of these amendments did not have any effects on the
Group’s consolidated financial statements.
Amendment to IAS 40 “Transfers of Investment Property” (published on 8
December 2016). These amendments clarify the transfers of a property
to, or from investment property. In particular, an entity must classify a
property between, or from investment property only when there is
evidence of a change in use of the property. This change must be
related to a specific event that has happened and therefore must not
concern a mere change of intention by the management of an entity.
These amendments were applied from 1 January 2018. The adoption of
these amendments did not have any effects on the Group’s
consolidated financial statements.
Interpretation IFRIC 22 “Foreign Currency Transactions and Advance
Consideration” (published on 8 December 2016). The Interpretation aims
to provide guidelines for foreign currency transactions when an entity
recognises a non-monetary asset or non-monetary liability arising from
the payment or receipt of advance consideration before the entity
recognises the related asset, expense or income. This document
addresses how an entity should determine the date of the transaction
and, consequently, the spot exchange rate to use when foreign
currency transactions are carried out in which the payment is made or
received in advance. IFRIC 22 was applied from 1 January 2018. The
adoption of this interpretation did not have any effects on the Group’s
consolidated financial statements.
26
Consolidated Financial Statements at 31 December 2018
IFRS ACCOUNTING STANDARDS, AMENDMENTS AND INTERPRETATIONS
ENDORSED BY THE EUROPEAN UNION, STILL NOT MANDATORILY APPLICABLE AND
NOT ADOPTED EARLY BY THE GROUP AS AT 31 DECEMBER 2018
Amendment to IFRS 9 - Prepayment Features with Negative
Compensation (published on 12 October 2017). This document specifies
that instruments which involve an early repayment would respect the
“SPPI” test also in the case in which the reasonable additional
compensation to be paid in the case of an early repayment is a negative
compensation for the lender. The amendment applies from 1 January
2019, but early application is permitted.
On 7 June 2017, the IASB published the interpretation IFRIC 23 –
Uncertainty over Income Tax Treatments. The document addresses the
uncertainties over income tax treatments.
The document requires uncertainties in determining tax assets or liabilities
to be reflected in the financial statements only when an entity will pay or
recover the amount in question. Furthermore, the document does not
contain any new disclosure obligation but stresses that the entity must
establish whether it is necessary to provide information on the
considerations made by management and relating to the uncertainty
over the accounting of taxes, in accordance with IAS 1.
The Directors are currently evaluating the potential effects of the introduction
of these amendments on the Group’s consolidated financial statements.
IFRS ACCOUNTING STANDARDS, AMENDMENTS AND INTERPRETATIONS STILL NOT
ENDORSED BY THE EUROPEAN UNION
As at 31 December 2018, the competent bodies of the European Union still
had not concluded the endorsement process for the adoption of the
amendments and standards described below.
On 18 May 2017, the IASB published IFRS 17 – Insurance Contracts which
is intended to replace IFRS 4 – Insurance Contracts.
The objective of the new standard is to ensure that an entity provides
relevant information that faithfully represents rights and obligations from
insurance contracts it issues. The IASB developed the standard to
eliminate inconsistencies and weaknesses in existing accounting
practices by providing a single principle‑based framework to account
for all types of insurance contracts, including reinsurance contracts that
an insurer holds. The standard is applicable as from 1 January 2021 but
early application is allowed only for entities that apply IFRS 9 – Financial
Instruments and IFRS 15 – Revenue from Contracts with Customers. The
Directors do not expect the adoption of this standard to have any
significant effects on the Group’s consolidated financial statements.
The new interpretation applies from 1 January 2019, but early application
is permitted. The Directors are currently evaluating the potential effects
of the introduction of this interpretation on the Group’s consolidated
financial statements.
27
Consolidated Financial Statements at 31 December 2018
Amendment to IAS 28 “Long-term Interests in Associates and Joint
Ventures” (published on 12 October 2017)”. This document clarifies the
need to apply IFRS 9, including the requirements relating to impairment,
to other long-term interests in associates and joint ventures for which the
equity method is not applied. The amendment applies from 1 January
2019, but early application is permitted. The Directors are currently
evaluating the potential effects of the introduction of these
amendments on the Group’s consolidated financial statements.
Document “Annual Improvements to IFRSs 2015-2017 Cycle”, published
on 12 December 2017 (including IFRS 3 Business Combinations and IFRS
11 Joint Arrangements – Remeasurement of previously held interest in a
joint operation, IAS 12 Income Taxes – Income tax consequences of
payments on financial instruments classified as equity, IAS 23 Borrowing
costs Disclosure of Interests in Other Entities – Borrowing costs eligible for
capitalisation) which acknowledges the amendments to some
standards as part of their annual improvement process. The
amendments apply from 1 January 2019, but early application is
permitted. The Directors are currently evaluating the potential effects of
the introduction of these amendments on the Group’s consolidated
financial statements.
Amendment to IAS 19 “Plant Amendment, Curtailment or Settlement”
(published on 7 February 2018). The document clarifies how an entity
should recognise a modification (i.e. a curtailment or a settlement) of
a defined-benefit plan. The amendments require an entity to update
its assumptions and remeasure the net plan liability or asset. The
amendments clarify that after said event is verified, an entity must use
updated assumptions to measure the current service cost and the
interest for the rest of the reference period after the event. The
amendments apply from 1 January 2019, but early application is
permitted. The Directors are currently evaluating the potential effects
of the introduction of these amendments on the Group’s consolidated
financial statements.
Amendment to IFRS 10 and IAS 28 “Sales or Contribution of Assets
between an Investor and its Associate or Joint Venture” (published on
11 September 2014). The document was published in order to resolve
the present conflict between IAS 28 and IFRS 10 relating to the
measurement of the profit or loss resulting from the transfer or
contribution of a non-monetary asset to a joint venture or associate in
exchange for a share in the latter’s capital. The IASB has currently
suspended the application of this amendment. The Directors are
currently evaluating the potential effects of the introduction of these
amendments on the Group’s consolidated financial statements.
Amendment to IFRS 3 – Business Combinations (published on 22
October 2018).
The amendment clarifies the differences between business
combinations and acquisitions of a group of assets. While the previous
28
Consolidated Financial Statements at 31 December 2018
definition of “business combination” focused on the contribution of a
direct return to investors or other shareholders in the form of dividends,
lower costs or other economic benefits, the definition introduced by
the amendment emphasises that the objective of a business
combination is to provide goods and services to customers. The
distinction between a business combination and the acquisition of an
asset or group of assets is important for the purposes of recognising
goodwill, only permitted in the case of business combinations. The
amendment applies from 1 January 2020, but early application is
permitted.
Amendments to IAS 1 and IAS 8 “Definition of Material” (published on 31
October 2018). The amendments introduce a new definition of the
concept of relevance, in order to make it clearer for companies to
define whether the information must be included in their financial
statements. The amendments apply from 1 January 2020, but early
application is permitted.
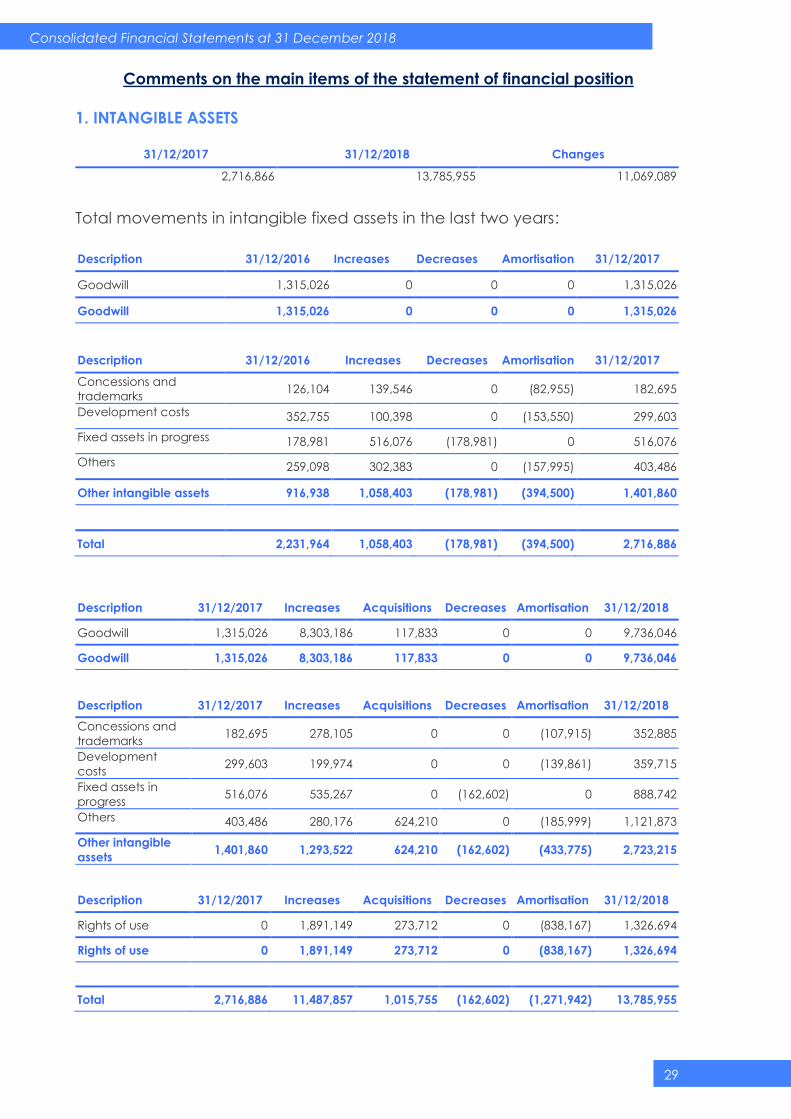
29
Consolidated Financial Statements at 31 December 2018
Comments on the main items of the statement of financial position
1. INTANGIBLE ASSETS
31/12/2017 31/12/2018 Changes
2,716,866 13,785,955 11,069,089
Total movements in intangible fixed assets in the last two years:
Description 31/12/2016 Increases Decreases Amortisation 31/12/2017
Goodwill 1,315,026 0 0 0 1,315,026
Goodwill 1,315,026 0 0 0 1,315,026
Description 31/12/2016 Increases Decreases Amortisation 31/12/2017
Concessions and
trademarks 126,104 139,546 0 (82,955) 182,695
Development costs 352,755 100,398 0 (153,550) 299,603
Fixed assets in progress 178,981 516,076 (178,981) 0 516,076
Others 259,098 302,383 0 (157,995) 403,486
Other intangible assets 916,938 1,058,403 (178,981) (394,500) 1,401,860
Total 2,231,964 1,058,403 (178,981) (394,500) 2,716,886
Description 31/12/2017 Increases Acquisitions Decreases Amortisation 31/12/2018
Goodwill 1,315,026 8,303,186 117,833 0 0 9,736,046
Goodwill 1,315,026 8,303,186 117,833 0 0 9,736,046
Description 31/12/2017 Increases Acquisitions Decreases Amortisation 31/12/2018
Concessions and
trademarks 182,695 278,105 0 0 (107,915) 352,885
Development
costs 299,603 199,974 0 0 (139,861) 359,715
Fixed assets in
progress 516,076 535,267 0 (162,602) 0 888,742
Others 403,486 280,176 624,210 0 (185,999) 1,121,873
Other intangible
assets 1,401,860 1,293,522 624,210 (162,602) (433,775) 2,723,215
Description 31/12/2017 Increases Acquisitions Decreases Amortisation 31/12/2018
Rights of use 0 1,891,149 273,712 0 (838,167) 1,326,694
Rights of use 0 1,891,149 273,712 0 (838,167) 1,326,694
Total 2,716,886 11,487,857 1,015,755 (162,602) (1,271,942) 13,785,955
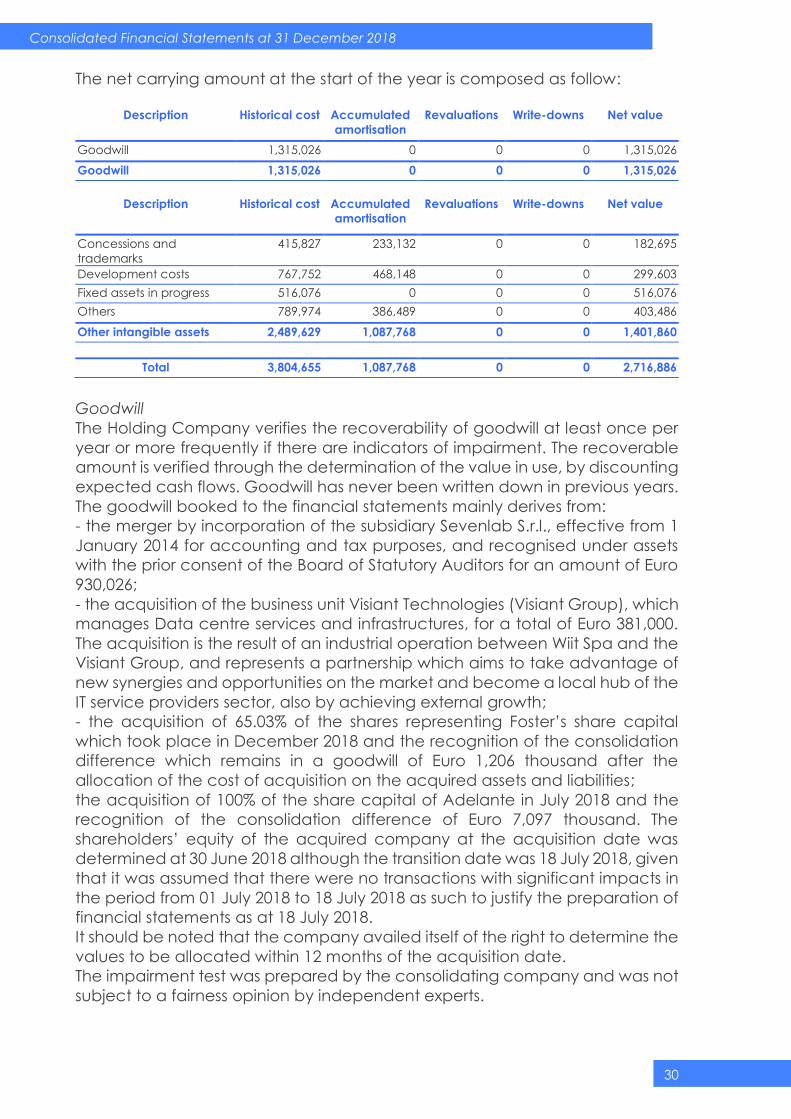
30
Consolidated Financial Statements at 31 December 2018
The net carrying amount at the start of the year is composed as follow:
Description Historical cost Accumulated
amortisation
Revaluations Write-downs Net value
Goodwill 1,315,026 0 0 0 1,315,026
Goodwill 1,315,026 0 0 0 1,315,026
Description Historical cost Accumulated
amortisation
Revaluations Write-downs Net value
Concessions and
trademarks
415,827 233,132 0 0 182,695
Development costs 767,752 468,148 0 0 299,603
Fixed assets in progress 516,076 0 0 0 516,076
Others 789,974 386,489 0 0 403,486
Other intangible assets 2,489,629 1,087,768 0 0 1,401,860
Total 3,804,655 1,087,768 0 0 2,716,886
Goodwill
The Holding Company verifies the recoverability of goodwill at least once per
year or more frequently if there are indicators of impairment. The recoverable
amount is verified through the determination of the value in use, by discounting
expected cash flows. Goodwill has never been written down in previous years.
The goodwill booked to the financial statements mainly derives from:
- the merger by incorporation of the subsidiary Sevenlab S.r.l., effective from 1
January 2014 for accounting and tax purposes, and recognised under assets
with the prior consent of the Board of Statutory Auditors for an amount of Euro
930,026;
- the acquisition of the business unit Visiant Technologies (Visiant Group), which
manages Data centre services and infrastructures, for a total of Euro 381,000.
The acquisition is the result of an industrial operation between Wiit Spa and the
Visiant Group, and represents a partnership which aims to take advantage of
new synergies and opportunities on the market and become a local hub of the
IT service providers sector, also by achieving external growth;
- the acquisition of 65.03% of the shares representing Foster’s share capital
which took place in December 2018 and the recognition of the consolidation
difference which remains in a goodwill of Euro 1,206 thousand after the
allocation of the cost of acquisition on the acquired assets and liabilities;
the acquisition of 100% of the share capital of Adelante in July 2018 and the
recognition of the consolidation difference of Euro 7,097 thousand. The
shareholders’ equity of the acquired company at the acquisition date was
determined at 30 June 2018 although the transition date was 18 July 2018, given
that it was assumed that there were no transactions with significant impacts in
the period from 01 July 2018 to 18 July 2018 as such to justify the preparation of
financial statements as at 18 July 2018.
It should be noted that the company availed itself of the right to determine the
values to be allocated within 12 months of the acquisition date.
The impairment test was prepared by the consolidating company and was not
subject to a fairness opinion by independent experts.

31
Consolidated Financial Statements at 31 December 2018
The recoverability of assets with an indefinite life was measured through an
impairment test as at 31 December 2018, prepared on the basis of the 2019-
2021 budget plan that was approved.
In relation to the identification of the CGU, taking into consideration that
identifying a CGU implies a subjective judgment, as indicated in paragraph 68
of IAS 36, the Group decided to operate through a single CGU coinciding with
the Group, given that the Group, also as a result of the acquisition of Adelante
and Foster, is composed of a single group of assets that generate independent
cash inflows taking into account the fact that:
a) it operates in a single business area (Strategic Business Unit) relating to
the provision of Cloud services for the so-called “critical applications” of
its customers and, that is, the applications which, if they failed to function
correctly, could impact the customer’s “business continuity”, and which
must therefore function correctly and continuously;
b) the component of the services provided by WIIT to its customers relating
to EIM and E-billing services are based entirely on the proprietary
document platform of Foster and essentially connected to the same
c) the decision-making bodies of WIIT and Adelante are composed almost
entirely of the same people. More specifically, the sole director of the
Adelante Group is one of the WIIT directors with decision-making
responsibilities in the same entity (M&A), while the current Board of
Directors of Adelante also contains WIIT directors;
d) the Group’s management expressed the desire to create synergies and
integrate the services offered by WIIT for Adelante Group customers and
vice versa. Further additions and synergies relate to the infrastructures
(Data Centre), business support services (connectivity, telephony,
customer help desk service management), internal resources (technical
and administrative) and administrative advisory services (tax advisors,
legal advisors etc.);
e) The rental agreement for the Data Centre used by the Adelante Group
(expiring in 2019) will not be renewed as the data will be migrated to the
Data Centre owned by WIIT;
f) the management of investments will be centralised at WIIT, which will
also support the investments for Adelante and Foster;
g) the management of financing will be centralised at WIIT (during the years
of the plan, no provision is made for the obtainment of loans by Adelante
and/or Foster).
h) company management controls the Group’s operations in a unitary
manner, preparing a single report on the basis of which it takes decisions
and monitors the business performance. In particular, in preparing the
business plan, the management has drafted estimates for each
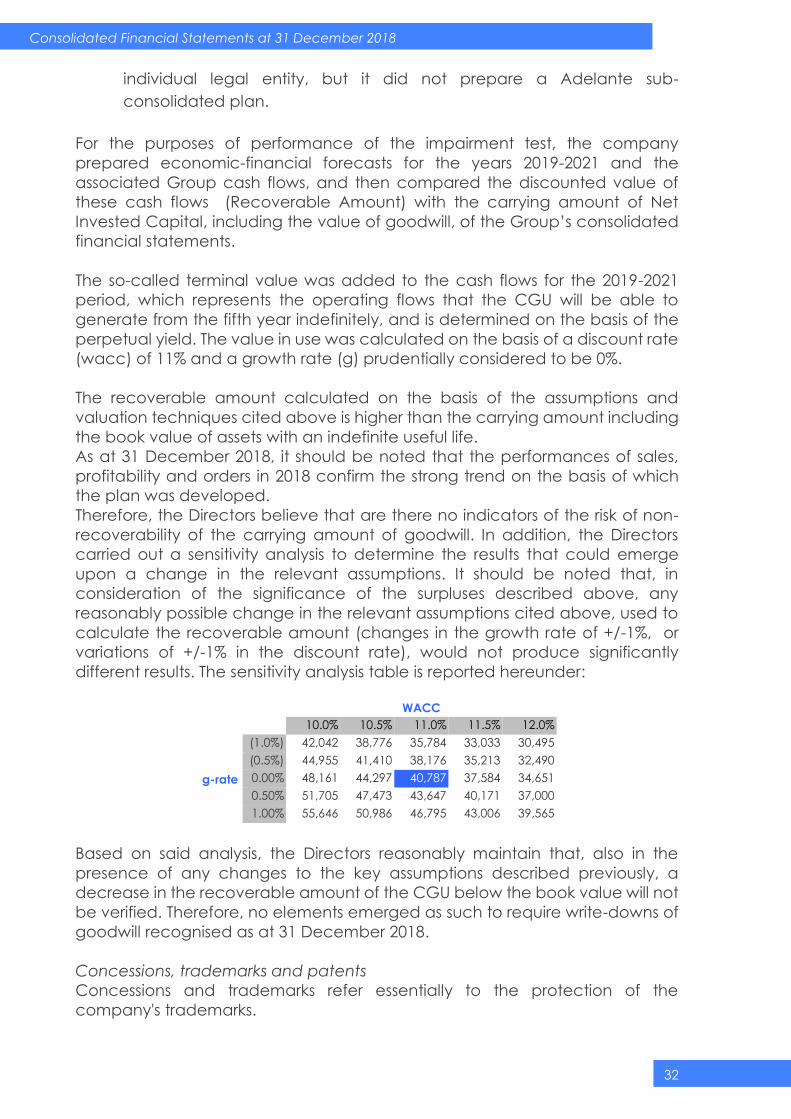
32
Consolidated Financial Statements at 31 December 2018
individual legal entity, but it did not prepare a Adelante sub-
consolidated plan.
For the purposes of performance of the impairment test, the company
prepared economic-financial forecasts for the years 2019-2021 and the
associated Group cash flows, and then compared the discounted value of
these cash flows (Recoverable Amount) with the carrying amount of Net
Invested Capital, including the value of goodwill, of the Group’s consolidated
financial statements.
The so-called terminal value was added to the cash flows for the 2019-2021
period, which represents the operating flows that the CGU will be able to
generate from the fifth year indefinitely, and is determined on the basis of the
perpetual yield. The value in use was calculated on the basis of a discount rate
(wacc) of 11% and a growth rate (g) prudentially considered to be 0%.
The recoverable amount calculated on the basis of the assumptions and
valuation techniques cited above is higher than the carrying amount including
the book value of assets with an indefinite useful life.
As at 31 December 2018, it should be noted that the performances of sales,
profitability and orders in 2018 confirm the strong trend on the basis of which
the plan was developed.
Therefore, the Directors believe that are there no indicators of the risk of non-
recoverability of the carrying amount of goodwill. In addition, the Directors
carried out a sensitivity analysis to determine the results that could emerge
upon a change in the relevant assumptions. It should be noted that, in
consideration of the significance of the surpluses described above, any
reasonably possible change in the relevant assumptions cited above, used to
calculate the recoverable amount (changes in the growth rate of +/-1%, or
variations of +/-1% in the discount rate), would not produce significantly
different results. The sensitivity analysis table is reported hereunder:
WACC
10.0% 10.5% 11.0% 11.5% 12.0%
g-rate
(1.0%) 42,042 38,776 35,784 33,033 30,495
(0.5%) 44,955 41,410 38,176 35,213 32,490
0.00% 48,161 44,297 40,787 37,584 34,651
0.50% 51,705 47,473 43,647 40,171 37,000
1.00% 55,646 50,986 46,795 43,006 39,565
Based on said analysis, the Directors reasonably maintain that, also in the
presence of any changes to the key assumptions described previously, a
decrease in the recoverable amount of the CGU below the book value will not
be verified. Therefore, no elements emerged as such to require write-downs of
goodwill recognised as at 31 December 2018.
Concessions, trademarks and patents
Concessions and trademarks refer essentially to the protection of the
company's trademarks.
33
Consolidated Financial Statements at 31 December 2018
Development costs
Development activities include both internal and external costs incurred, which
relate largely to development of its ICT infrastructure. This infrastructure enables
WIIT to provide its services effectively and competitively; this relates essentially
to the cost of implementing the IT platforms and framework through which the
Group provides and manages the services set out in the contracts and
interacts with its customers.
IT Security is one of the services for which the Group is investing heavily in R&D,
as it predicts significant growth in demand from its customers. In fact, the cost
of the activities is connected primarily to the implementation of the “Wiit Cyber
Security Roadmap”, infrastructures and services for managing IT security for all
systems in WIIT’s Data Centres, or the customer’s Data Centres, both internal
WIIT systems and those of the customers to whom WIIT provides its services.
Development costs include those relating to the “Wiit Orchestrator” project.
This project provides the possibility of activating, monitoring and centrally
managing systems which can be active in both “private cloud” environments
and “hosted private cloud” and “public cloud” environments. The platform
also offers the possibility of putting the end customer in a position to
independently manage, from an operational perspective, some of its
environments hosted in the WIIT cloud or other Clouds.
In addition to the “WIIT Cloud Orchestrator” project as described above, it
includes some key functionalities within the macro project “WIIT Cyber Security
Roadmap”, which were concluded in 2018.
In particular, in 2017, with a view to improving its network infrastructure, WIIT
implemented a project called “WIIT Cyber Security Roadmap”, targeted at
both increasing the level of security of the entire architecture used by WIIT and
implementing a new offering in the portfolio dedicated to Cyber Security.
The following problems were analysed:
Segregation of customer networks
Control of accesses to internal systems and of WIIT customers
Control of traffic from customers and internal users of WIIT
Control of bandwidth used by customers for the internet and for the
services/systems present in WIIT’s Milan Data Centre
Risks and problems from DDoS attacks and Intrusion prevention.
Following the evaluations conducted on the systems aimed at improving the
levels of security of the entire architecture, the following activities were
undertaken and completed:
Activation of two-factor authentication (Strong Authentication) for remote
access to the WIIT network, through the implementation of Safenet Gemalto
Implementation of an ESA Anti-spam system with sandbox
functionality
Implementation of balancer
34
Consolidated Financial Statements at 31 December 2018
Implementation of a security and quick assessment framework
Password Management system (CyberArk)
Intangible fixed assets in progress
As regards assets in progress, other components of the WIIT security
infrastructure (Wiit Cyber Security Roadmap) are also at the implementation
phase, including:
Traffic shaping technologies: for controlling internet bandwidth and
bandwidth for the systems/services present in the Data Centre
accessed by interconnected customers
Log management technologies for the management and analysis of
system logs
Anti-DDoS System
Integration of Next Generation Firewall
Automation systems for SAP DB Copies and patch management, with
particular attention to the security patches.
In addition, the item “Fixed assets in progress” also includes the development
costs relating to E-billing.
The E-billing management services which WIIT intends to provide at the end of
the project make provision, also through third party intermediaries, for the
management of the “End to End” process of the tax documents regarding the
sales and distribution cycle and purchasing cycle, all guaranteeing
compliance with the applicable legislation.
The services provide for the activation of a software platform, based on the
Alfresco document system, on which the users can manage their physical
documents.
The platform that we are creating contains a specific “Finance” area with
custom functionalities for displaying, searching, exporting and sharing
documents.
Functionalities were developed for integration with ERP systems (e.g. SAP) for
managing the sales and distribution cycle and the purchasing cycle, which
allow customer invoices to be submitted for transmission and the automatic
registration and accounting of supplier invoices.
Communication interfaces will be developed to enable the transmission and
exchange of data with intermediaries to the SOGEI (MEF) SDI, in order to
manage the transmission of customer invoices as regards the sales and
distribution cycle and the receipt of supplier invoices for the purchasing cycle.
In order to monitor communication activities between the different
components (ERP, Alfresco platform and intermediary systems) a reporting
system was developed that manages the analysis of the documentation
drafted and the outcome of communications, providing accurate feedback
to users (e.g. via e-mail) on any errors or unsuccessful additions.
Lastly, the system enables the management of the process of digital storage of
documents, compliant with the regulations, regarding the sales and distribution
cycle and the purchasing cycle, by interacting with the providers selected
beforehand.
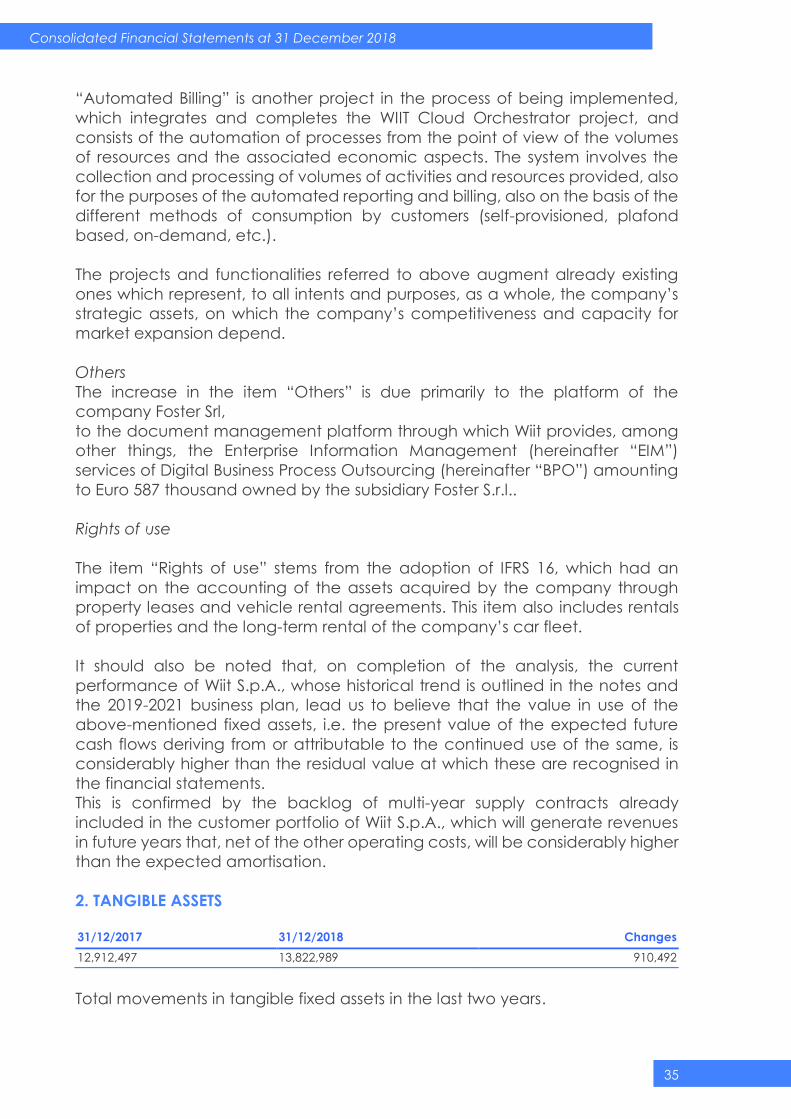
35
Consolidated Financial Statements at 31 December 2018
“Automated Billing” is another project in the process of being implemented,
which integrates and completes the WIIT Cloud Orchestrator project, and
consists of the automation of processes from the point of view of the volumes
of resources and the associated economic aspects. The system involves the
collection and processing of volumes of activities and resources provided, also
for the purposes of the automated reporting and billing, also on the basis of the
different methods of consumption by customers (self-provisioned, plafond
based, on-demand, etc.).
The projects and functionalities referred to above augment already existing
ones which represent, to all intents and purposes, as a whole, the company’s
strategic assets, on which the company’s competitiveness and capacity for
market expansion depend.
Others
The increase in the item “Others” is due primarily to the platform of the
company Foster Srl,
to the document management platform through which Wiit provides, among
other things, the Enterprise Information Management (hereinafter “EIM”)
services of Digital Business Process Outsourcing (hereinafter “BPO”) amounting
to Euro 587 thousand owned by the subsidiary Foster S.r.l..
Rights of use
The item “Rights of use” stems from the adoption of IFRS 16, which had an
impact on the accounting of the assets acquired by the company through
property leases and vehicle rental agreements. This item also includes rentals
of properties and the long-term rental of the company’s car fleet.
It should also be noted that, on completion of the analysis, the current
performance of Wiit S.p.A., whose historical trend is outlined in the notes and
the 2019-2021 business plan, lead us to believe that the value in use of the
above-mentioned fixed assets, i.e. the present value of the expected future
cash flows deriving from or attributable to the continued use of the same, is
considerably higher than the residual value at which these are recognised in
the financial statements.
This is confirmed by the backlog of multi-year supply contracts already
included in the customer portfolio of Wiit S.p.A., which will generate revenues
in future years that, net of the other operating costs, will be considerably higher
than the expected amortisation.
2. TANGIBLE ASSETS
31/12/2017 31/12/2018 Changes
12,912,497 13,822,989 910,492
Total movements in tangible fixed assets in the last two years.
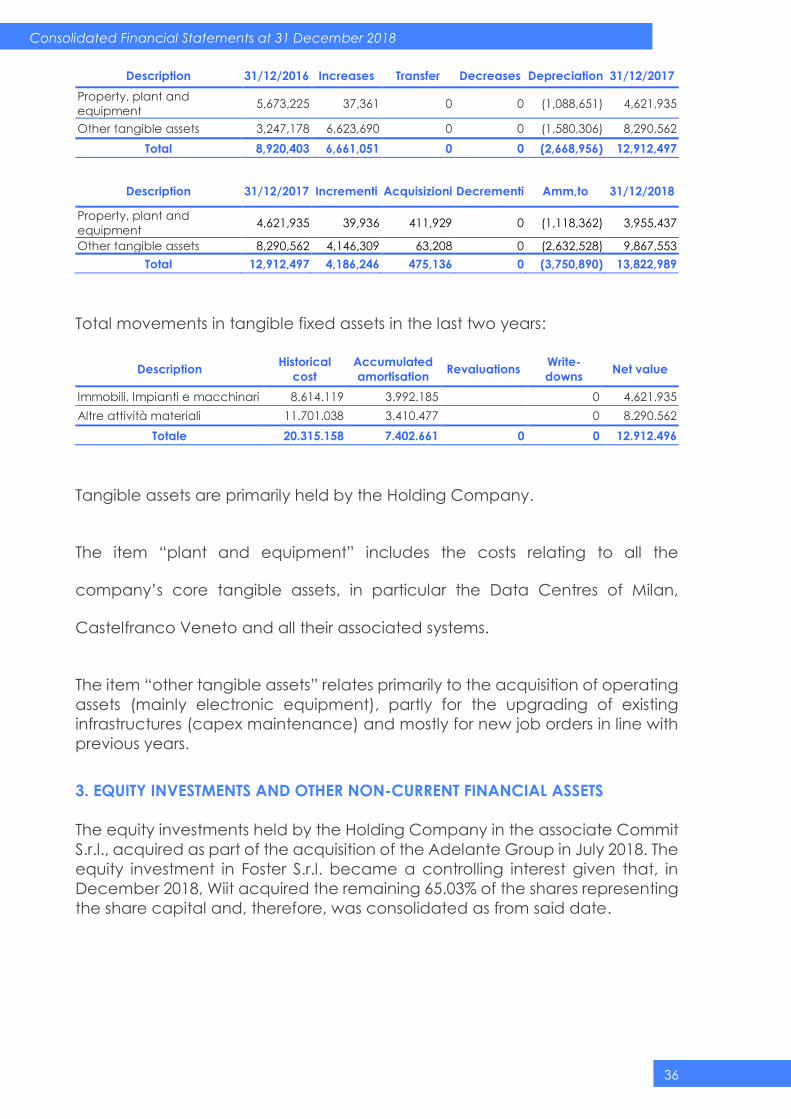
36
Consolidated Financial Statements at 31 December 2018
Description 31/12/2016 Increases Transfer Decreases Depreciation 31/12/2017
Property, plant and
equipment 5,673,225 37,361 0 0 (1,088,651) 4,621,935
Other tangible assets 3,247,178 6,623,690 0 0 (1,580,306) 8,290,562
Total 8,920,403 6,661,051 0 0 (2,668,956) 12,912,497
Description 31/12/2017 Incrementi Acquisizioni Decrementi Amm,to 31/12/2018
Property, plant and
equipment 4,621,935 39,936 411,929 0 (1,118,362) 3,955,437
Other tangible assets 8,290,562 4,146,309 63,208 0 (2,632,528) 9,867,553
Total 12,912,497 4,186,246 475,136 0 (3,750,890) 13,822,989
Total movements in tangible fixed assets in the last two years:
Description Historical
cost
Accumulated
amortisation Revaluations
Write-
downs Net value
Immobili, Impianti e macchinari 8.614.119 3.992.185 0 4.621.935
Altre attività materiali 11.701.038 3.410.477 0 8.290.562
Totale 20.315.158 7.402.661 0 0 12.912.496
Tangible assets are primarily held by the Holding Company.
The item “plant and equipment” includes the costs relating to all the
company’s core tangible assets, in particular the Data Centres of Milan,
Castelfranco Veneto and all their associated systems.
The item “other tangible assets” relates primarily to the acquisition of operating
assets (mainly electronic equipment), partly for the upgrading of existing
infrastructures (capex maintenance) and mostly for new job orders in line with
previous years.
3. EQUITY INVESTMENTS AND OTHER NON-CURRENT FINANCIAL ASSETS
The equity investments held by the Holding Company in the associate Commit
S.r.l., acquired as part of the acquisition of the Adelante Group in July 2018. The
equity investment in Foster S.r.l. became a controlling interest given that, in
December 2018, Wiit acquired the remaining 65.03% of the shares representing
the share capital and, therefore, was consolidated as from said date.
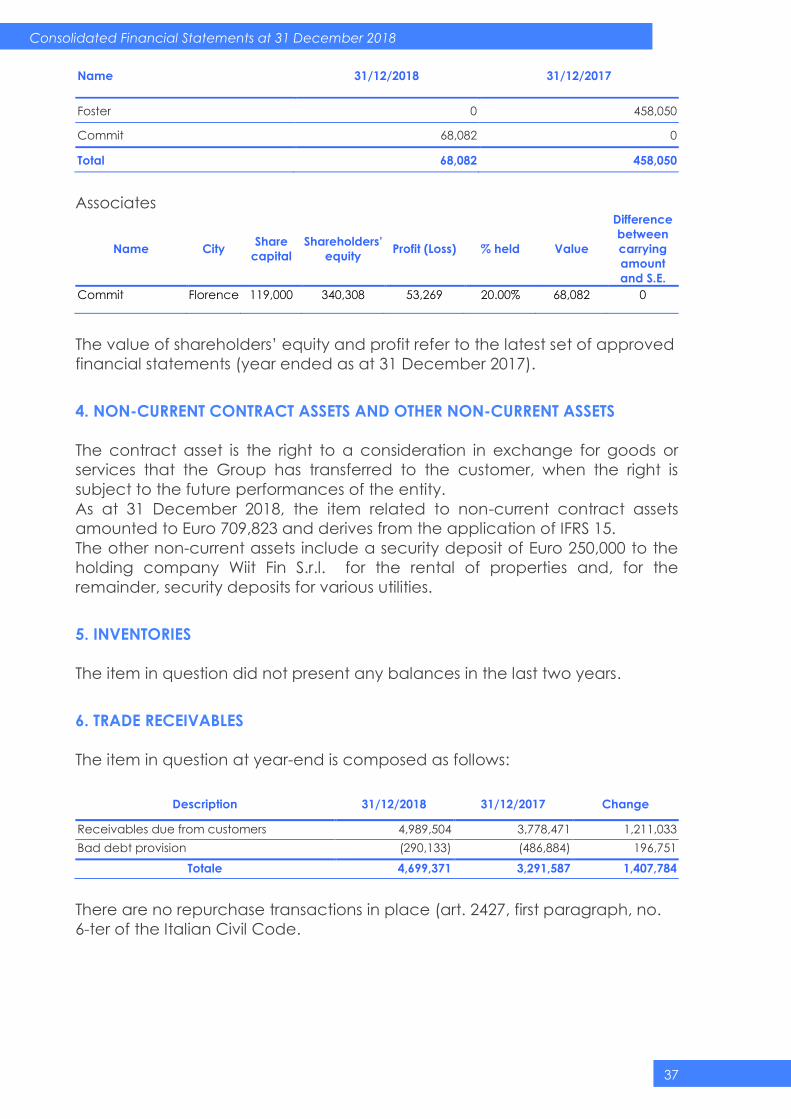
37
Consolidated Financial Statements at 31 December 2018
Name 31/12/2018 31/12/2017
Foster 0 458,050
Commit 68,082 0
Total 68,082 458,050
Associates
Name City Share
capital
Shareholders’
equity Profit (Loss) % held Value
Difference
between
carrying
amount
and S.E.
Commit Florence 119,000 340,308 53,269 20.00% 68,082 0
The value of shareholders’ equity and profit refer to the latest set of approved
financial statements (year ended as at 31 December 2017).
4. NON-CURRENT CONTRACT ASSETS AND OTHER NON-CURRENT ASSETS
The contract asset is the right to a consideration in exchange for goods or
services that the Group has transferred to the customer, when the right is
subject to the future performances of the entity.
As at 31 December 2018, the item related to non-current contract assets
amounted to Euro 709,823 and derives from the application of IFRS 15.
The other non-current assets include a security deposit of Euro 250,000 to the
holding company Wiit Fin S.r.l. for the rental of properties and, for the
remainder, security deposits for various utilities.
5. INVENTORIES
The item in question did not present any balances in the last two years.
6. TRADE RECEIVABLES
The item in question at year-end is composed as follows:
Description 31/12/2018 31/12/2017 Change
Receivables due from customers 4,989,504 3,778,471 1,211,033
Bad debt provision (290,133) (486,884) 196,751
Totale 4,699,371 3,291,587 1,407,784
There are no repurchase transactions in place (art. 2427, first paragraph, no.
6-ter of the Italian Civil Code.
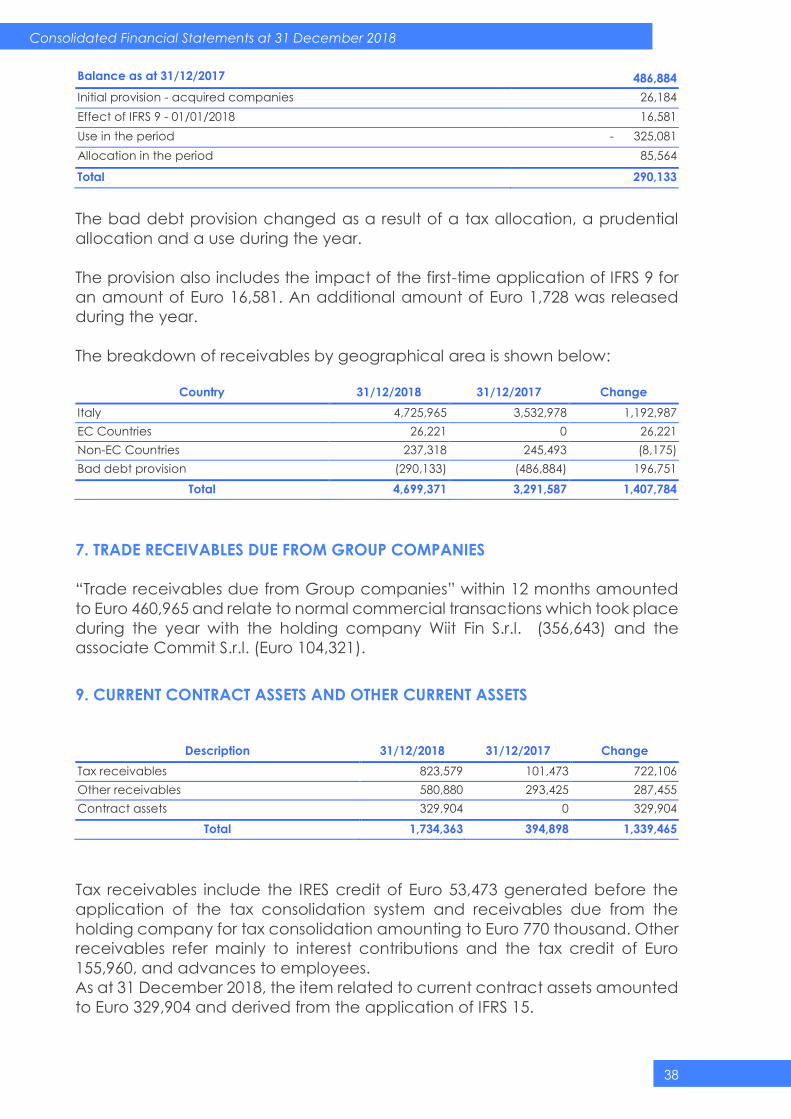
38
Consolidated Financial Statements at 31 December 2018
Balance as at 31/12/2017 486,884
Initial provision - acquired companies 26,184
Effect of IFRS 9 - 01/01/2018 16,581
Use in the period - 325,081
Allocation in the period 85,564
Total 290,133
The bad debt provision changed as a result of a tax allocation, a prudential
allocation and a use during the year.
The provision also includes the impact of the first-time application of IFRS 9 for
an amount of Euro 16,581. An additional amount of Euro 1,728 was released
during the year.
The breakdown of receivables by geographical area is shown below:
Country 31/12/2018 31/12/2017 Change
Italy 4,725,965 3,532,978 1,192,987
EC Countries 26,221 0 26,221
Non-EC Countries 237,318 245,493 (8,175)
Bad debt provision (290,133) (486,884) 196,751
Total 4,699,371 3,291,587 1,407,784
7. TRADE RECEIVABLES DUE FROM GROUP COMPANIES
“Trade receivables due from Group companies” within 12 months amounted
to Euro 460,965 and relate to normal commercial transactions which took place
during the year with the holding company Wiit Fin S.r.l. (356,643) and the
associate Commit S.r.l. (Euro 104,321).
9. CURRENT CONTRACT ASSETS AND OTHER CURRENT ASSETS
Description 31/12/2018 31/12/2017 Change
Tax receivables 823,579 101,473 722,106
Other receivables 580,880 293,425 287,455
Contract assets 329,904 0 329,904
Total 1,734,363 394,898 1,339,465
Tax receivables include the IRES credit of Euro 53,473 generated before the
application of the tax consolidation system and receivables due from the
holding company for tax consolidation amounting to Euro 770 thousand. Other
receivables refer mainly to interest contributions and the tax credit of Euro
155,960, and advances to employees.
As at 31 December 2018, the item related to current contract assets amounted
to Euro 329,904 and derived from the application of IFRS 15.
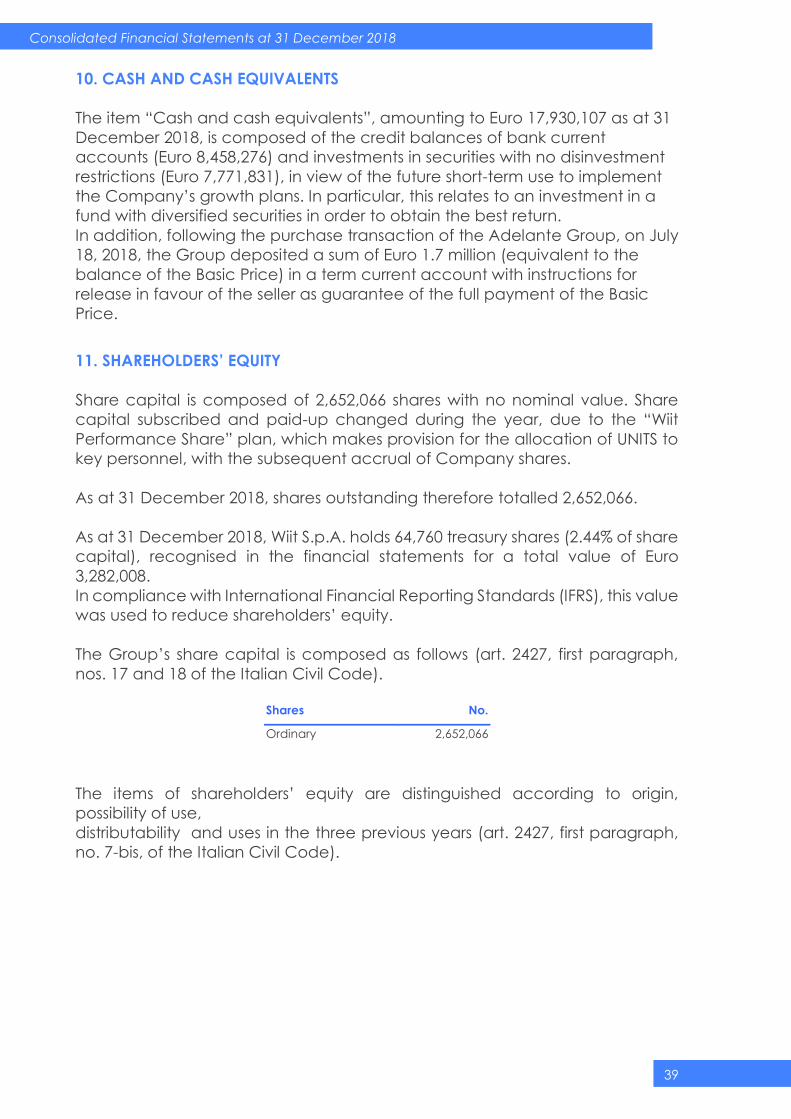
39
Consolidated Financial Statements at 31 December 2018
10. CASH AND CASH EQUIVALENTS
The item “Cash and cash equivalents”, amounting to Euro 17,930,107 as at 31
December 2018, is composed of the credit balances of bank current
accounts (Euro 8,458,276) and investments in securities with no disinvestment
restrictions (Euro 7,771,831), in view of the future short-term use to implement
the Company’s growth plans. In particular, this relates to an investment in a
fund with diversified securities in order to obtain the best return.
In addition, following the purchase transaction of the Adelante Group, on July
18, 2018, the Group deposited a sum of Euro 1.7 million (equivalent to the
balance of the Basic Price) in a term current account with instructions for
release in favour of the seller as guarantee of the full payment of the Basic
Price.
11. SHAREHOLDERS’ EQUITY
Share capital is composed of 2,652,066 shares with no nominal value. Share
capital subscribed and paid-up changed during the year, due to the “Wiit
Performance Share” plan, which makes provision for the allocation of UNITS to
key personnel, with the subsequent accrual of Company shares.
As at 31 December 2018, shares outstanding therefore totalled 2,652,066.
As at 31 December 2018, Wiit S.p.A. holds 64,760 treasury shares (2.44% of share
capital), recognised in the financial statements for a total value of Euro
3,282,008.
In compliance with International Financial Reporting Standards (IFRS), this value
was used to reduce shareholders’ equity.
The Group’s share capital is composed as follows (art. 2427, first paragraph,
nos. 17 and 18 of the Italian Civil Code).
Shares No.
Ordinary 2,652,066
The items of shareholders’ equity are distinguished according to origin,
possibility of use,
distributability and uses in the three previous years (art. 2427, first paragraph,
no. 7-bis, of the Italian Civil Code).
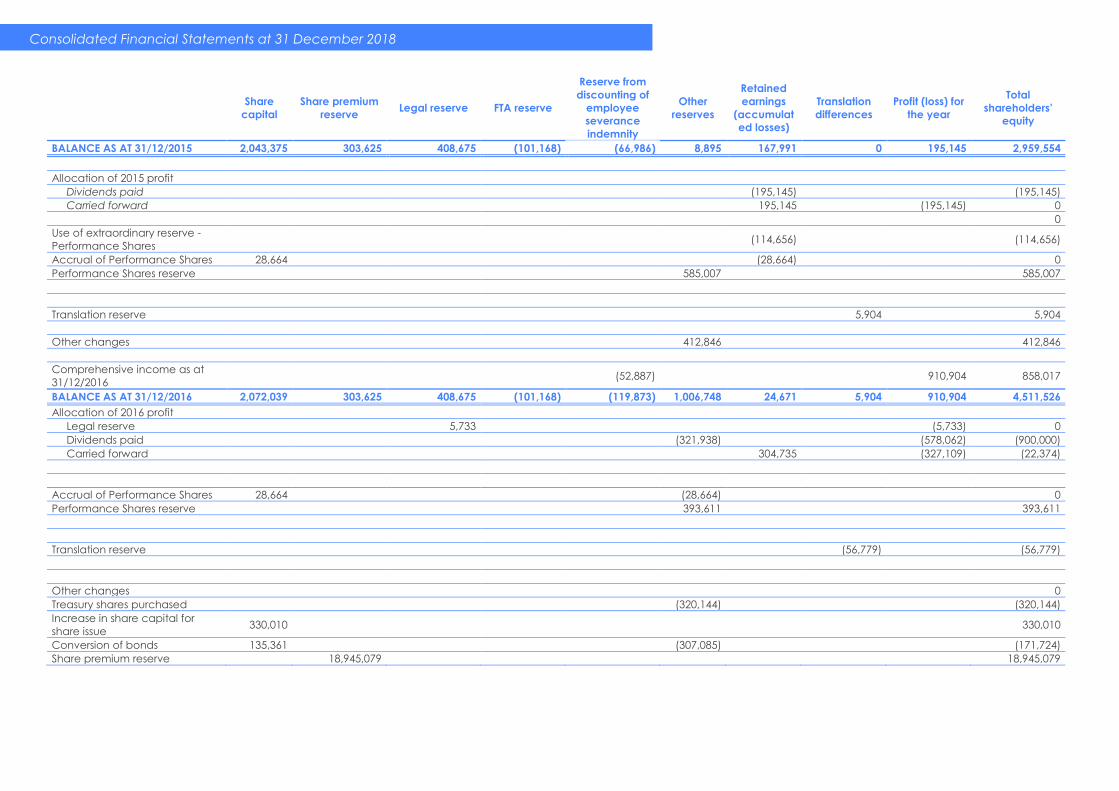
Consolidated Financial Statements at 31 December 2018
Share
capital
Share premium
reserve Legal reserve FTA reserve
Reserve from
discounting of
employee
severance
indemnity
Other
reserves
Retained
earnings
(accumulat
ed losses)
Translation
differences
Profit (loss) for
the year
Total
shareholders’
equity
BALANCE AS AT 31/12/2015 2,043,375 303,625 408,675 (101,168) (66,986) 8,895 167,991 0 195,145 2,959,554
Allocation of 2015 profit
Dividends paid (195,145) (195,145)
Carried forward 195,145 (195,145) 0
0
Use of extraordinary reserve -
Performance Shares
(114,656) (114,656)
Accrual of Performance Shares 28,664 (28,664) 0
Performance Shares reserve 585,007 585,007
Translation reserve 5,904 5,904
Other changes 412,846 412,846
Comprehensive income as at
31/12/2016 (52,887) 910,904 858,017
BALANCE AS AT 31/12/2016 2,072,039 303,625 408,675 (101,168) (119,873) 1,006,748 24,671 5,904 910,904 4,511,526 Allocation of 2016 profit
Legal reserve 5,733 (5,733) 0
Dividends paid (321,938) (578,062) (900,000)
Carried forward 304,735 (327,109) (22,374)
Accrual of Performance Shares 28,664 (28,664) 0
Performance Shares reserve 393,611 393,611
Translation reserve (56,779) (56,779)
Other changes 0
Treasury shares purchased (320,144) (320,144)
Increase in share capital for
share issue 330,010 330,010
Conversion of bonds 135,361 (307,085) (171,724)
Share premium reserve 18,945,079 18,945,079
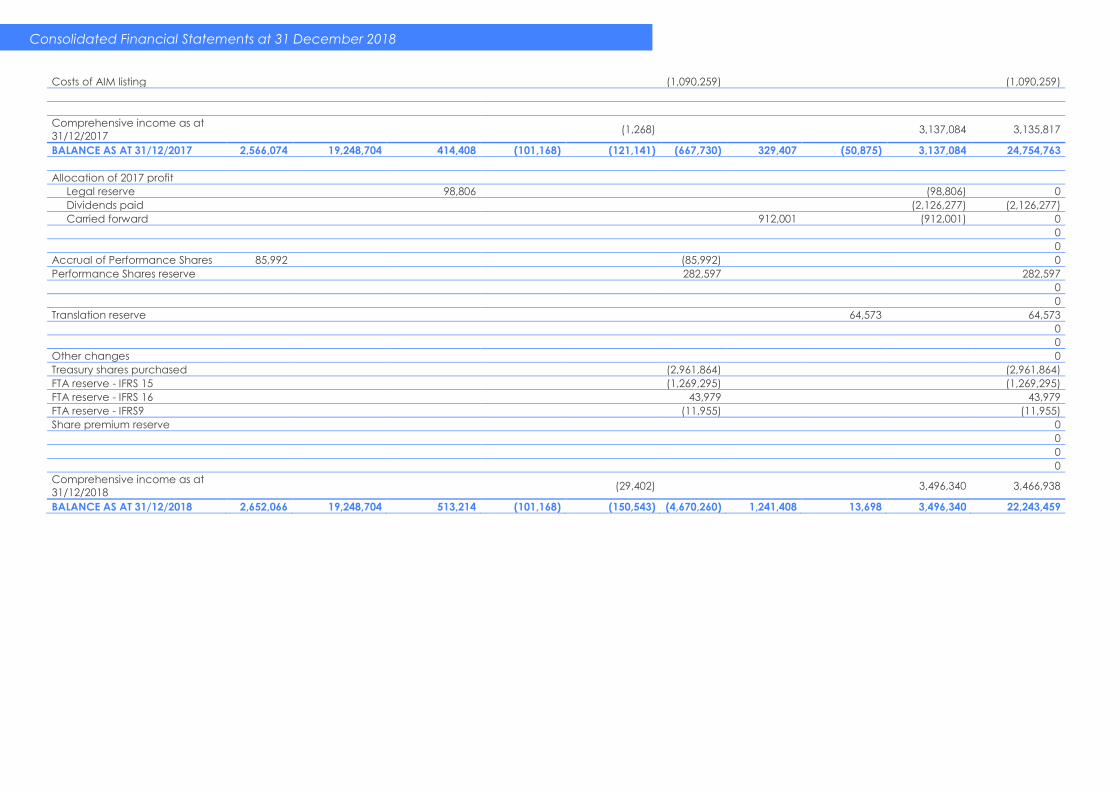
Consolidated Financial Statements at 31 December 2018
Costs of AIM listing (1,090,259) (1,090,259)
Comprehensive income as at
31/12/2017 (1,268) 3,137,084 3,135,817
BALANCE AS AT 31/12/2017 2,566,074 19,248,704 414,408 (101,168) (121,141) (667,730) 329,407 (50,875) 3,137,084 24,754,763
Allocation of 2017 profit
Legal reserve 98,806 (98,806) 0
Dividends paid (2,126,277) (2,126,277)
Carried forward 912,001 (912,001) 0
0
0
Accrual of Performance Shares 85,992 (85,992) 0
Performance Shares reserve 282,597 282,597
0
0
Translation reserve 64,573 64,573 0 0
Other changes 0
Treasury shares purchased (2,961,864) (2,961,864)
FTA reserve - IFRS 15 (1,269,295) (1,269,295)
FTA reserve - IFRS 16 43,979 43,979
FTA reserve - IFRS9 (11,955) (11,955)
Share premium reserve 0
0
0
0
Comprehensive income as at
31/12/2018 (29,402) 3,496,340 3,466,938
BALANCE AS AT 31/12/2018 2,652,066 19,248,704 513,214 (101,168) (150,543) (4,670,260) 1,241,408 13,698 3,496,340 22,243,459
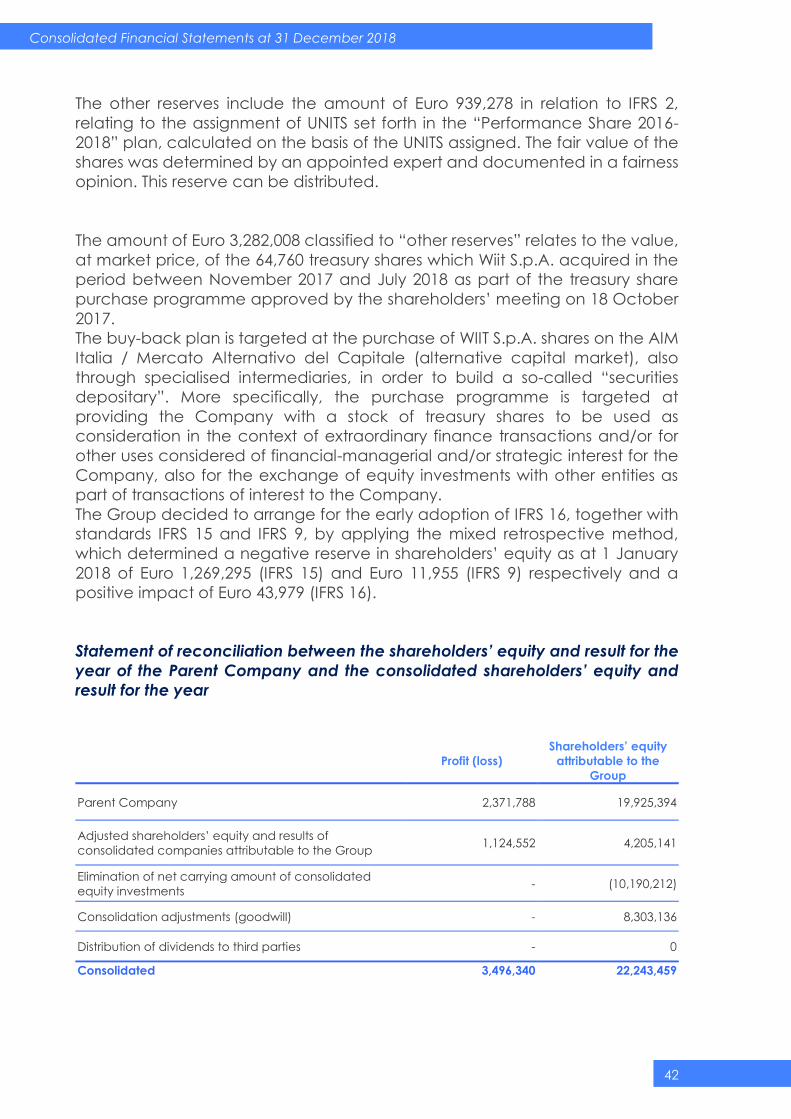
Consolidated Financial Statements at 31 December 2018
42
The other reserves include the amount of Euro 939,278 in relation to IFRS 2,
relating to the assignment of UNITS set forth in the “Performance Share 2016-
2018” plan, calculated on the basis of the UNITS assigned. The fair value of the
shares was determined by an appointed expert and documented in a fairness
opinion. This reserve can be distributed.
The amount of Euro 3,282,008 classified to “other reserves” relates to the value,
at market price, of the 64,760 treasury shares which Wiit S.p.A. acquired in the
period between November 2017 and July 2018 as part of the treasury share
purchase programme approved by the shareholders’ meeting on 18 October
2017.
The buy-back plan is targeted at the purchase of WIIT S.p.A. shares on the AIM
Italia / Mercato Alternativo del Capitale (alternative capital market), also
through specialised intermediaries, in order to build a so-called “securities
depositary”. More specifically, the purchase programme is targeted at
providing the Company with a stock of treasury shares to be used as
consideration in the context of extraordinary finance transactions and/or for
other uses considered of financial-managerial and/or strategic interest for the
Company, also for the exchange of equity investments with other entities as
part of transactions of interest to the Company.
The Group decided to arrange for the early adoption of IFRS 16, together with
standards IFRS 15 and IFRS 9, by applying the mixed retrospective method,
which determined a negative reserve in shareholders’ equity as at 1 January
2018 of Euro 1,269,295 (IFRS 15) and Euro 11,955 (IFRS 9) respectively and a
positive impact of Euro 43,979 (IFRS 16).
Statement of reconciliation between the shareholders’ equity and result for the
year of the Parent Company and the consolidated shareholders’ equity and
result for the year
Profit (loss)
Shareholders’ equity
attributable to the
Group
Parent Company 2,371,788 19,925,394
Adjusted shareholders’ equity and results of
consolidated companies attributable to the Group 1,124,552 4,205,141
Elimination of net carrying amount of consolidated
equity investments - (10,190,212)
Consolidation adjustments (goodwill) - 8,303,136
Distribution of dividends to third parties - 0
Consolidated 3,496,340 22,243,459
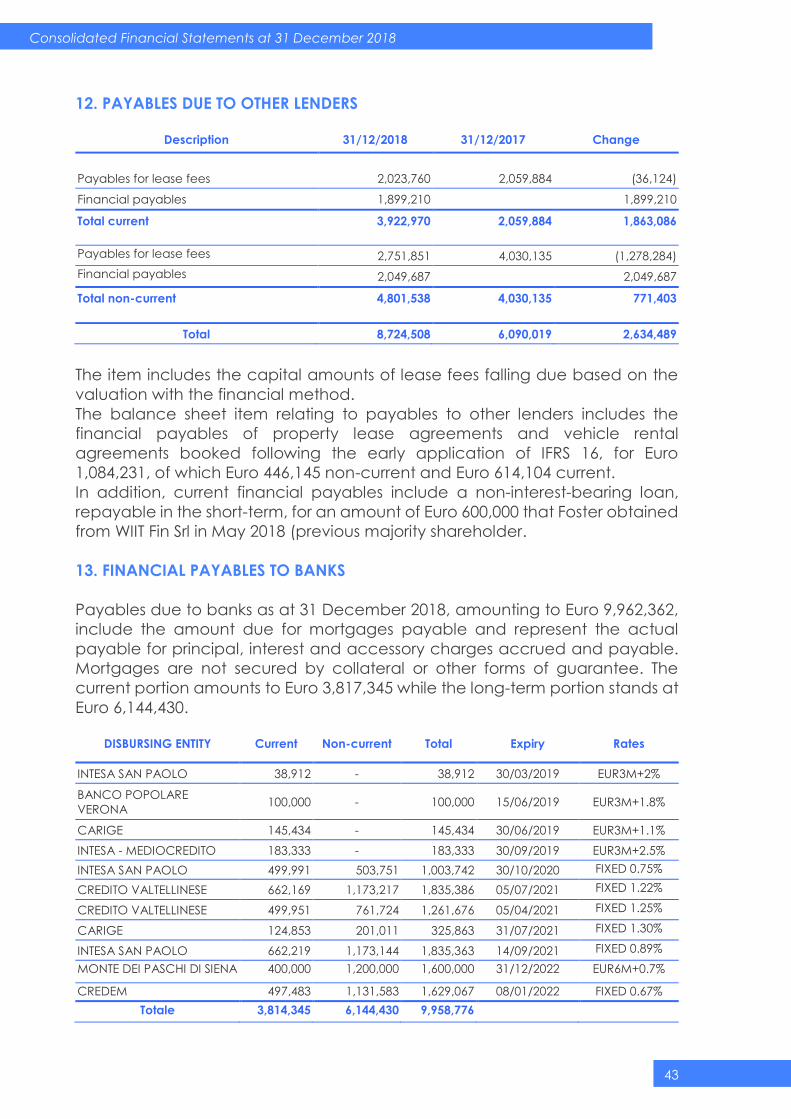
Consolidated Financial Statements at 31 December 2018
43
12. PAYABLES DUE TO OTHER LENDERS
Description 31/12/2018 31/12/2017 Change
Payables for lease fees 2,023,760 2,059,884 (36,124)
Financial payables 1,899,210 1,899,210
Total current 3,922,970 2,059,884 1,863,086
Payables for lease fees 2,751,851 4,030,135 (1,278,284)
Financial payables 2,049,687 2,049,687
Total non-current 4,801,538 4,030,135 771,403
Total 8,724,508 6,090,019 2,634,489
The item includes the capital amounts of lease fees falling due based on the
valuation with the financial method.
The balance sheet item relating to payables to other lenders includes the
financial payables of property lease agreements and vehicle rental
agreements booked following the early application of IFRS 16, for Euro
1,084,231, of which Euro 446,145 non-current and Euro 614,104 current.
In addition, current financial payables include a non-interest-bearing loan,
repayable in the short-term, for an amount of Euro 600,000 that Foster obtained
from WIIT Fin Srl in May 2018 (previous majority shareholder.
13. FINANCIAL PAYABLES TO BANKS
Payables due to banks as at 31 December 2018, amounting to Euro 9,962,362,
include the amount due for mortgages payable and represent the actual
payable for principal, interest and accessory charges accrued and payable.
Mortgages are not secured by collateral or other forms of guarantee. The
current portion amounts to Euro 3,817,345 while the long-term portion stands at
Euro 6,144,430.
DISBURSING ENTITY Current Non-current Total Expiry Rates
INTESA SAN PAOLO 38,912 - 38,912 30/03/2019 EUR3M+2%
BANCO POPOLARE
VERONA 100,000 - 100,000 15/06/2019 EUR3M+1.8%
CARIGE 145,434 - 145,434 30/06/2019 EUR3M+1.1%
INTESA - MEDIOCREDITO 183,333 - 183,333 30/09/2019 EUR3M+2.5%
INTESA SAN PAOLO 499,991 503,751 1,003,742 30/10/2020 FIXED 0.75%
CREDITO VALTELLINESE 662,169 1,173,217 1,835,386 05/07/2021 FIXED 1.22%
CREDITO VALTELLINESE 499,951 761,724 1,261,676 05/04/2021 FIXED 1.25%
CARIGE 124,853 201,011 325,863 31/07/2021 FIXED 1.30%
INTESA SAN PAOLO 662,219 1,173,144 1,835,363 14/09/2021 FIXED 0.89%
MONTE DEI PASCHI DI SIENA 400,000 1,200,000 1,600,000 31/12/2022 EUR6M+0.7%
CREDEM 497,483 1,131,583 1,629,067 08/01/2022 FIXED 0.67%
Totale 3,814,345 6,144,430 9,958,776
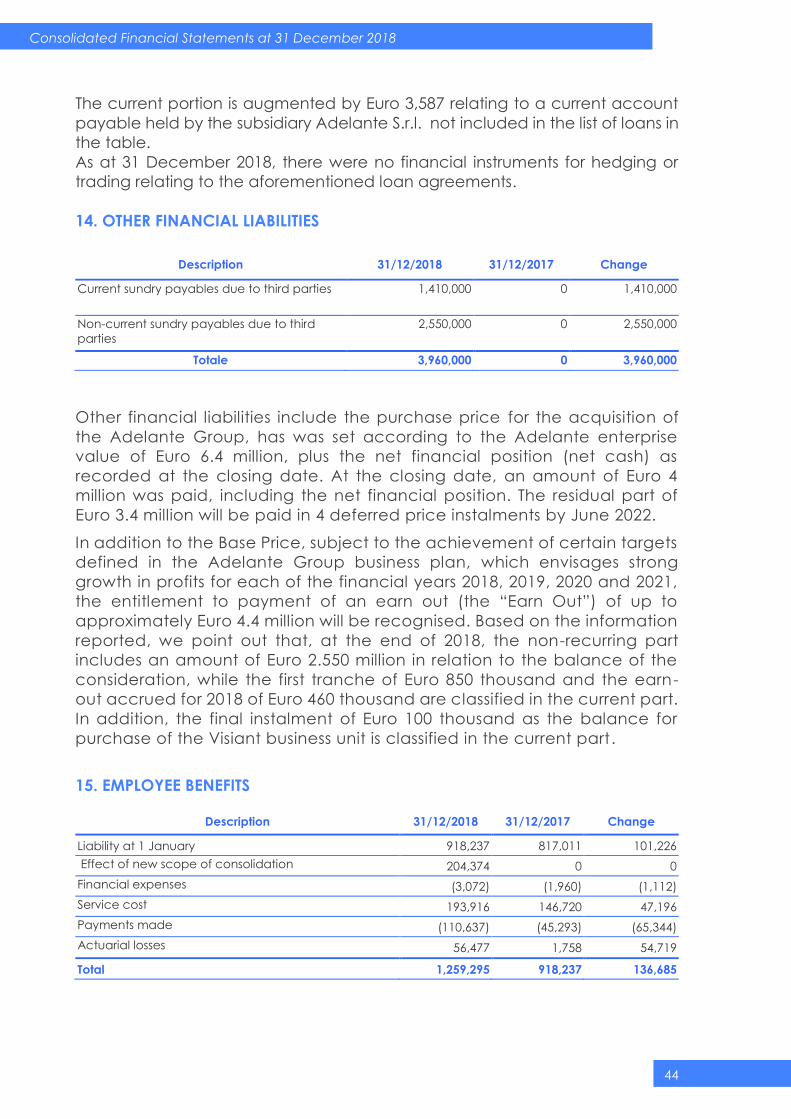
Consolidated Financial Statements at 31 December 2018
44
The current portion is augmented by Euro 3,587 relating to a current account
payable held by the subsidiary Adelante S.r.l. not included in the list of loans in
the table.
As at 31 December 2018, there were no financial instruments for hedging or
trading relating to the aforementioned loan agreements.
14. OTHER FINANCIAL LIABILITIES
Description 31/12/2018 31/12/2017 Change
Current sundry payables due to third parties 1,410,000 0 1,410,000
Non-current sundry payables due to third
parties
2,550,000 0 2,550,000
Totale 3,960,000 0 3,960,000
Other financial liabilities include the purchase price for the acquisition of
the Adelante Group, has was set according to the Adelante enterprise
value of Euro 6.4 million, plus the net financial position (net cash) as
recorded at the closing date. At the closing date, an amount of Euro 4
million was paid, including the net financial position. The residual part of
Euro 3.4 million will be paid in 4 deferred price instalments by June 2022.
In addition to the Base Price, subject to the achievement of certain targets
defined in the Adelante Group business plan, which envisages strong
growth in profits for each of the financial years 2018, 2019, 2020 and 2021,
the entitlement to payment of an earn out (the “Earn Out”) of up to
approximately Euro 4.4 million will be recognised. Based on the information
reported, we point out that, at the end of 2018, the non-recurring part
includes an amount of Euro 2.550 million in relation to the balance of the
consideration, while the first tranche of Euro 850 thousand and the earn-
out accrued for 2018 of Euro 460 thousand are classified in the current part.
In addition, the final instalment of Euro 100 thousand as the balance for
purchase of the Visiant business unit is classified in the current part.
15. EMPLOYEE BENEFITS
Description 31/12/2018 31/12/2017 Change
Liability at 1 January 918,237 817,011 101,226
Effect of new scope of consolidation 204,374 0 0
Financial expenses (3,072) (1,960) (1,112)
Service cost 193,916 146,720 47,196
Payments made (110,637) (45,293) (65,344)
Actuarial losses 56,477 1,758 54,719
Total 1,259,295 918,237 136,685
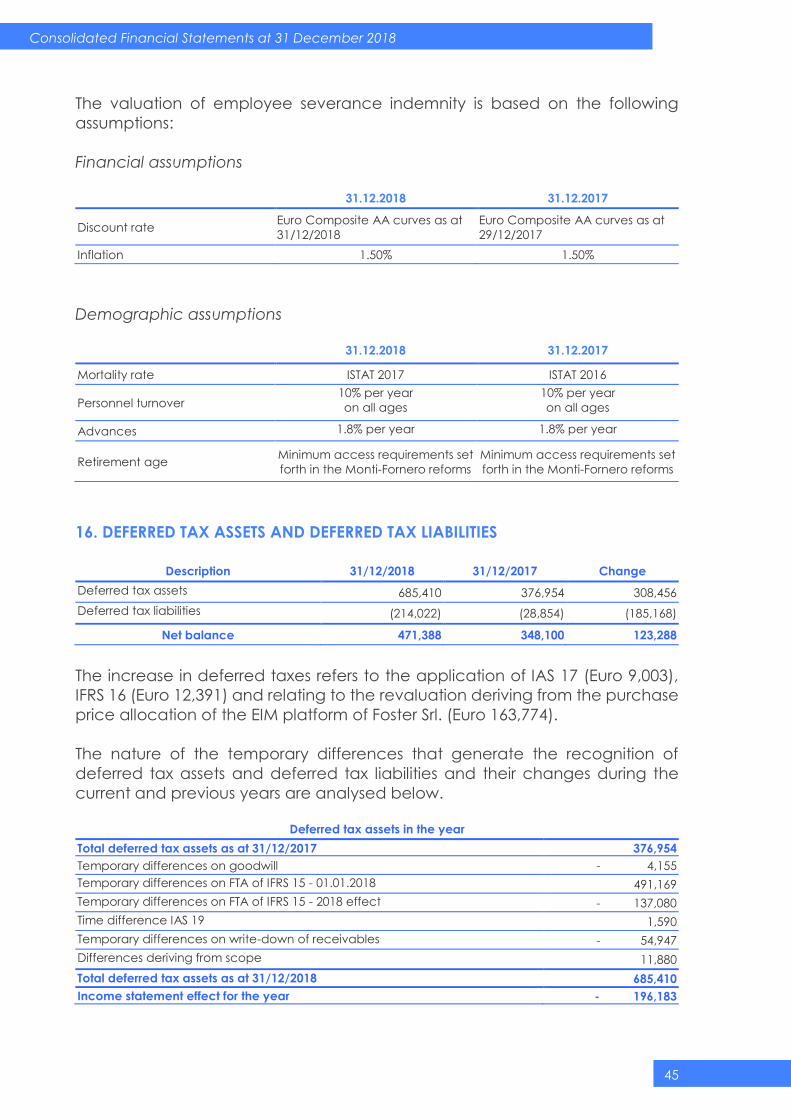
Consolidated Financial Statements at 31 December 2018
45
The valuation of employee severance indemnity is based on the following
assumptions:
Financial assumptions
31.12.2018 31.12.2017
Discount rate Euro Composite AA curves as at
31/12/2018
Euro Composite AA curves as at
29/12/2017
Inflation 1.50% 1.50%
Demographic assumptions
31.12.2018 31.12.2017
Mortality rate ISTAT 2017 ISTAT 2016
Personnel turnover 10% per year
on all ages
10% per year
on all ages
Advances 1.8% per year 1.8% per year
Retirement age Minimum access requirements set
forth in the Monti-Fornero reforms
Minimum access requirements set
forth in the Monti-Fornero reforms
16. DEFERRED TAX ASSETS AND DEFERRED TAX LIABILITIES
Description 31/12/2018 31/12/2017 Change
Deferred tax assets 685,410 376,954 308,456
Deferred tax liabilities (214,022) (28,854) (185,168)
Net balance 471,388 348,100 123,288
The increase in deferred taxes refers to the application of IAS 17 (Euro 9,003),
IFRS 16 (Euro 12,391) and relating to the revaluation deriving from the purchase
price allocation of the EIM platform of Foster Srl. (Euro 163,774).
The nature of the temporary differences that generate the recognition of
deferred tax assets and deferred tax liabilities and their changes during the
current and previous years are analysed below.
Deferred tax assets in the year
Total deferred tax assets as at 31/12/2017 376,954
Temporary differences on goodwill - 4,155
Temporary differences on FTA of IFRS 15 - 01.01.2018 491,169
Temporary differences on FTA of IFRS 15 - 2018 effect - 137,080
Time difference IAS 19 1,590
Temporary differences on write-down of receivables - 54,947
Differences deriving from scope 11,880
Total deferred tax assets as at 31/12/2018 685,410
Income statement effect for the year - 196,183
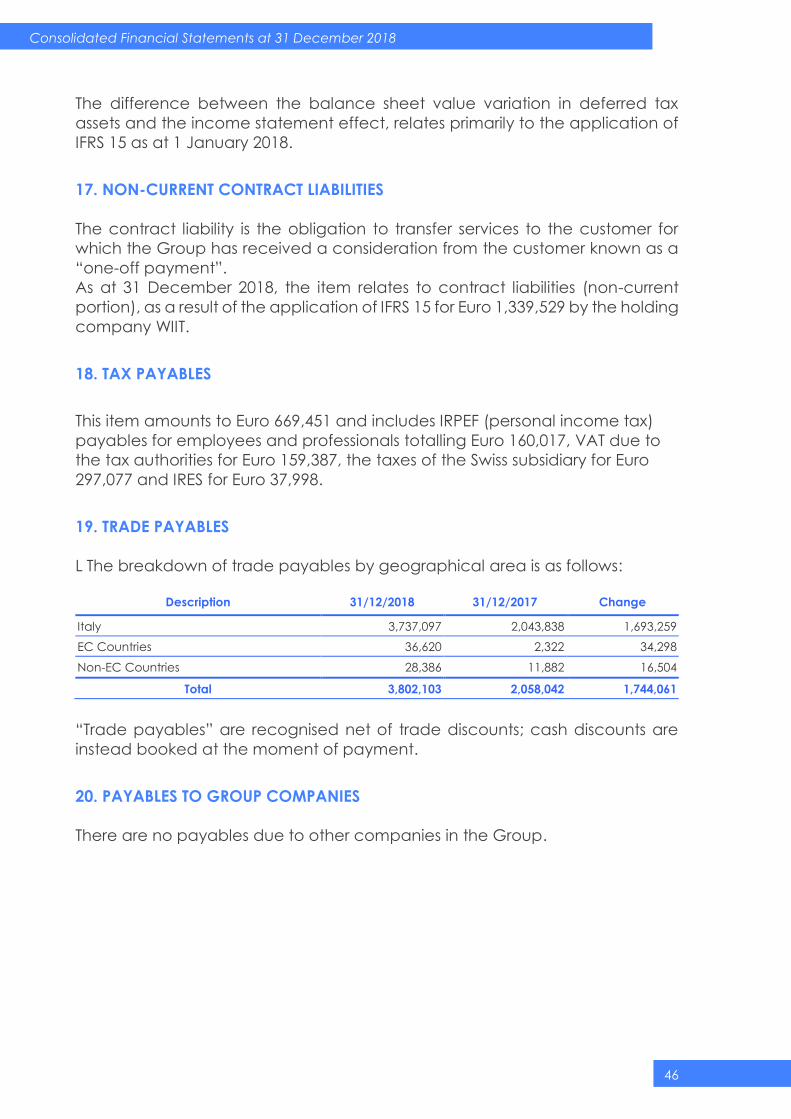
Consolidated Financial Statements at 31 December 2018
46
The difference between the balance sheet value variation in deferred tax
assets and the income statement effect, relates primarily to the application of
IFRS 15 as at 1 January 2018.
17. NON-CURRENT CONTRACT LIABILITIES
The contract liability is the obligation to transfer services to the customer for
which the Group has received a consideration from the customer known as a
“one-off payment”.
As at 31 December 2018, the item relates to contract liabilities (non-current
portion), as a result of the application of IFRS 15 for Euro 1,339,529 by the holding
company WIIT.
18. TAX PAYABLES
This item amounts to Euro 669,451 and includes IRPEF (personal income tax)
payables for employees and professionals totalling Euro 160,017, VAT due to
the tax authorities for Euro 159,387, the taxes of the Swiss subsidiary for Euro
297,077 and IRES for Euro 37,998.
19. TRADE PAYABLES
L The breakdown of trade payables by geographical area is as follows:
Description 31/12/2018 31/12/2017 Change
Italy 3,737,097 2,043,838 1,693,259
EC Countries 36,620 2,322 34,298
Non-EC Countries 28,386 11,882 16,504
Total 3,802,103 2,058,042 1,744,061
“Trade payables” are recognised net of trade discounts; cash discounts are
instead booked at the moment of payment.
20. PAYABLES TO GROUP COMPANIES
There are no payables due to other companies in the Group.
Consolidated Financial Statements at 31 December 2018
47
21. CURRENT CONTRACT LIABILITIES AND OTHER CURRENT LIABILITIES
Description 31/12/2018 31/12/2017 Change
Due to social security institutions 197,073 169,392 27,681
Payables due to personnel 587,447 518,754 68,693
Other current payables 505,858 119,335 386,523
Contract liabilities 765,604 0 765,604
Total 2,055,982 807,481 1,248,501
As at 31 December 2018, the item relates to contract liabilities (current portion),
as a result of the application of IFRS 15 for Euro 765,604 by the holding company
WIIT.
At the start of 2019, payables due to personnel and social security institutions
were paid in accordance with the agreed payment schedules.
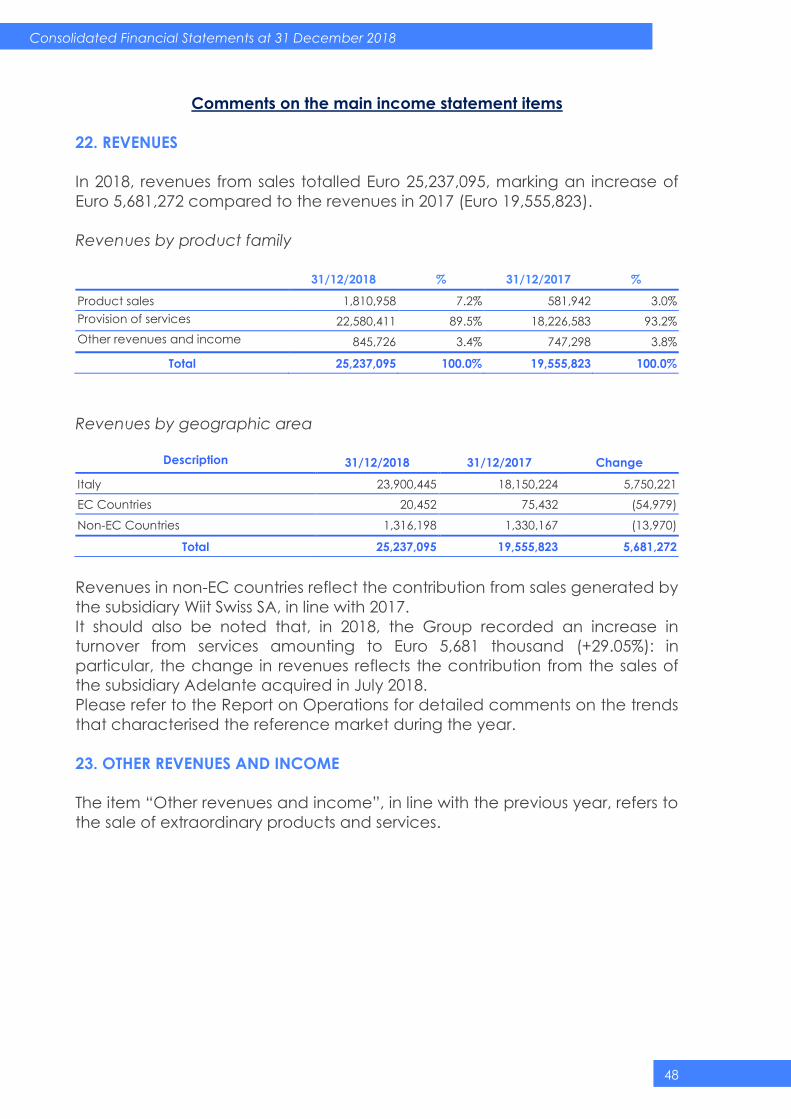
Consolidated Financial Statements at 31 December 2018
48
Comments on the main income statement items
22. REVENUES
In 2018, revenues from sales totalled Euro 25,237,095, marking an increase of
Euro 5,681,272 compared to the revenues in 2017 (Euro 19,555,823).
Revenues by product family
31/12/2018 % 31/12/2017 %
Product sales 1,810,958 7.2% 581,942 3.0%
Provision of services 22,580,411 89.5% 18,226,583 93.2%
Other revenues and income 845,726 3.4% 747,298 3.8%
Total 25,237,095 100.0% 19,555,823 100.0%
Revenues by geographic area
Description 31/12/2018 31/12/2017 Change
Italy 23,900,445 18,150,224 5,750,221
EC Countries 20,452 75,432 (54,979)
Non-EC Countries 1,316,198 1,330,167 (13,970)
Total 25,237,095 19,555,823 5,681,272
Revenues in non-EC countries reflect the contribution from sales generated by
the subsidiary Wiit Swiss SA, in line with 2017.
It should also be noted that, in 2018, the Group recorded an increase in
turnover from services amounting to Euro 5,681 thousand (+29.05%): in
particular, the change in revenues reflects the contribution from the sales of
the subsidiary Adelante acquired in July 2018.
Please refer to the Report on Operations for detailed comments on the trends
that characterised the reference market during the year.
23. OTHER REVENUES AND INCOME
The item “Other revenues and income”, in line with the previous year, refers to
the sale of extraordinary products and services.
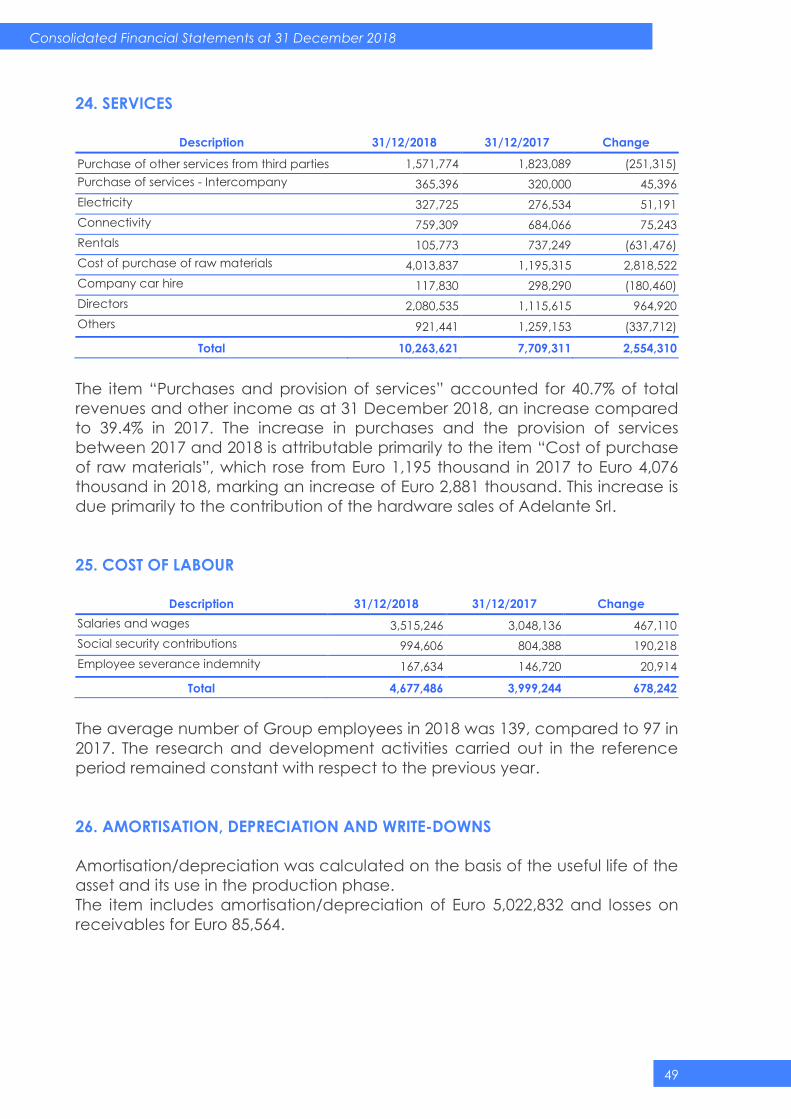
Consolidated Financial Statements at 31 December 2018
49
24. SERVICES
Description 31/12/2018 31/12/2017 Change
Purchase of other services from third parties 1,571,774 1,823,089 (251,315)
Purchase of services - Intercompany 365,396 320,000 45,396
Electricity 327,725 276,534 51,191
Connectivity 759,309 684,066 75,243
Rentals 105,773 737,249 (631,476)
Cost of purchase of raw materials 4,013,837 1,195,315 2,818,522
Company car hire 117,830 298,290 (180,460)
Directors 2,080,535 1,115,615 964,920
Others 921,441 1,259,153 (337,712)
Total 10,263,621 7,709,311 2,554,310
The item “Purchases and provision of services” accounted for 40.7% of total
revenues and other income as at 31 December 2018, an increase compared
to 39.4% in 2017. The increase in purchases and the provision of services
between 2017 and 2018 is attributable primarily to the item “Cost of purchase
of raw materials”, which rose from Euro 1,195 thousand in 2017 to Euro 4,076
thousand in 2018, marking an increase of Euro 2,881 thousand. This increase is
due primarily to the contribution of the hardware sales of Adelante Srl.
25. COST OF LABOUR
Description 31/12/2018 31/12/2017 Change
Salaries and wages 3,515,246 3,048,136 467,110
Social security contributions 994,606 804,388 190,218
Employee severance indemnity 167,634 146,720 20,914
Total 4,677,486 3,999,244 678,242
The average number of Group employees in 2018 was 139, compared to 97 in
2017. The research and development activities carried out in the reference
period remained constant with respect to the previous year.
26. AMORTISATION, DEPRECIATION AND WRITE-DOWNS
Amortisation/depreciation was calculated on the basis of the useful life of the
asset and its use in the production phase.
The item includes amortisation/depreciation of Euro 5,022,832 and losses on
receivables for Euro 85,564.
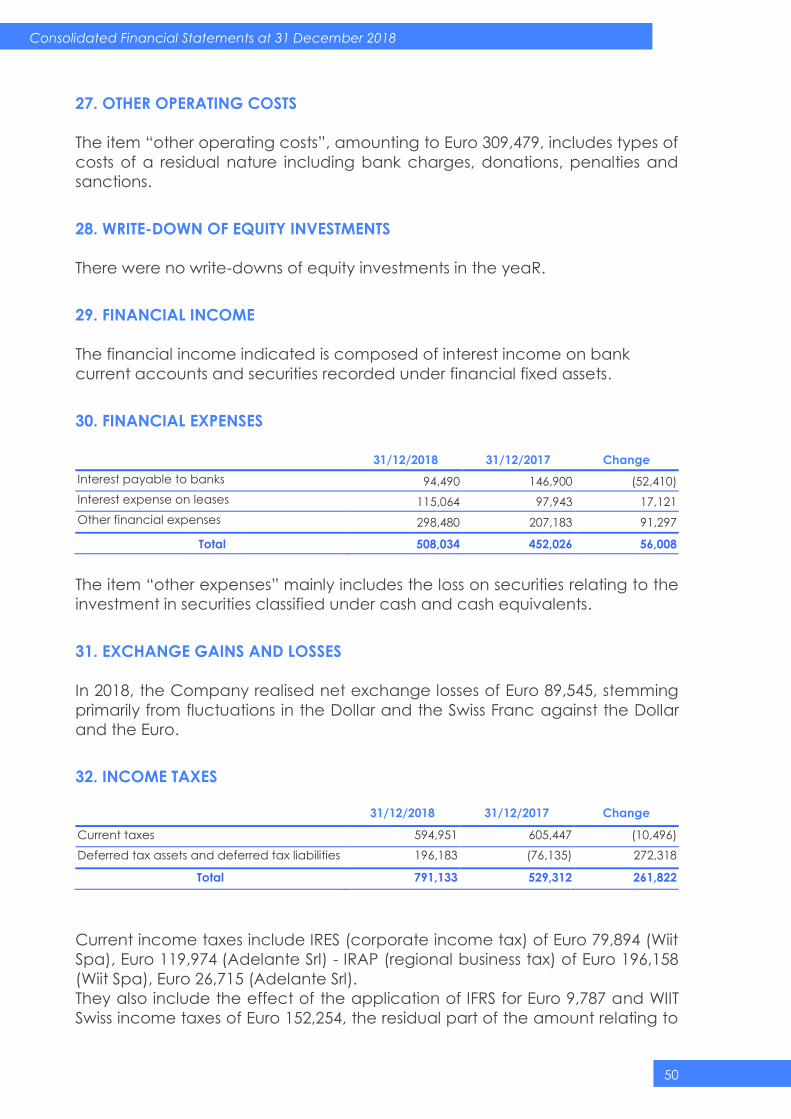
Consolidated Financial Statements at 31 December 2018
50
27. OTHER OPERATING COSTS
The item “other operating costs”, amounting to Euro 309,479, includes types of
costs of a residual nature including bank charges, donations, penalties and
sanctions.
28. WRITE-DOWN OF EQUITY INVESTMENTS
There were no write-downs of equity investments in the yeaR.
29. FINANCIAL INCOME
The financial income indicated is composed of interest income on bank
current accounts and securities recorded under financial fixed assets.
30. FINANCIAL EXPENSES
31/12/2018 31/12/2017 Change
Interest payable to banks 94,490 146,900 (52,410)
Interest expense on leases 115,064 97,943 17,121
Other financial expenses 298,480 207,183 91,297
Total 508,034 452,026 56,008
The item “other expenses” mainly includes the loss on securities relating to the
investment in securities classified under cash and cash equivalents.
31. EXCHANGE GAINS AND LOSSES
In 2018, the Company realised net exchange losses of Euro 89,545, stemming
primarily from fluctuations in the Dollar and the Swiss Franc against the Dollar
and the Euro.
32. INCOME TAXES
31/12/2018 31/12/2017 Change
Current taxes 594,951 605,447 (10,496)
Deferred tax assets and deferred tax liabilities 196,183 (76,135) 272,318
Total 791,133 529,312 261,822
Current income taxes include IRES (corporate income tax) of Euro 79,894 (Wiit
Spa), Euro 119,974 (Adelante Srl) - IRAP (regional business tax) of Euro 196,158
(Wiit Spa), Euro 26,715 (Adelante Srl).
They also include the effect of the application of IFRS for Euro 9,787 and WIIT
Swiss income taxes of Euro 152,254, the residual part of the amount relating to
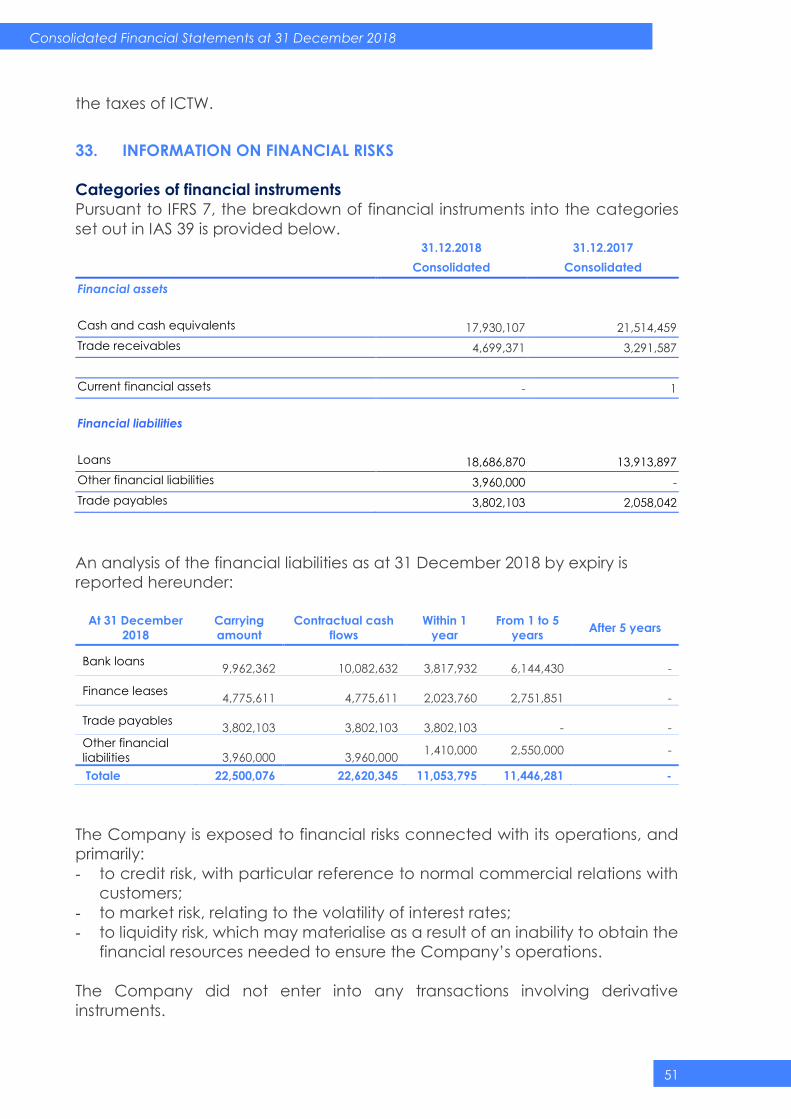
Consolidated Financial Statements at 31 December 2018
51
the taxes of ICTW.
33. INFORMATION ON FINANCIAL RISKS
Categories of financial instruments
Pursuant to IFRS 7, the breakdown of financial instruments into the categories
set out in IAS 39 is provided below. 31.12.2018 31.12.2017
Consolidated Consolidated
Financial assets
Cash and cash equivalents 17,930,107 21,514,459
Trade receivables 4,699,371 3,291,587
Current financial assets - 1
Financial liabilities
Loans 18,686,870 13,913,897
Other financial liabilities 3,960,000 -
Trade payables 3,802,103 2,058,042
An analysis of the financial liabilities as at 31 December 2018 by expiry is
reported hereunder:
At 31 December
2018
Carrying
amount
Contractual cash
flows
Within 1
year
From 1 to 5
years After 5 years
Bank loans
9,962,362
10,082,632
3,817,932
6,144,430
-
Finance leases
4,775,611
4,775,611
2,023,760
2,751,851
-
Trade payables
3,802,103
3,802,103
3,802,103
-
-
Other financial
liabilities
3,960,000
3,960,000 1,410,000 2,550,000 -
Totale 22,500,076 22,620,345 11,053,795 11,446,281 -
The Company is exposed to financial risks connected with its operations, and
primarily:
- to credit risk, with particular reference to normal commercial relations with
customers;
- to market risk, relating to the volatility of interest rates;
- to liquidity risk, which may materialise as a result of an inability to obtain the
financial resources needed to ensure the Company’s operations.
The Company did not enter into any transactions involving derivative
instruments.
Consolidated Financial Statements at 31 December 2018
52
Management of credit risk
Credit risk is defined as a probable financial loss generated by the non-
fulfilment of a third party payment obligation to the Company.
The Company does not have significant concentrations of credit risks, also
thanks to the fact that it does not carry out significant operations in the Public
Administration sector, in line with the Company’s strategic choice.
The Company manages this risk through the selection of counterparties
considered solvent by the market and with a high credit standing, or through
the supply of highly critical and non-interruptible services by its customers.
For commercial purposes, policies are adopted targeted at ensuring the
solvency of its customers, and limiting the exposure to credit risk with respect to
an individual customer, through activities that involve the evaluation of
customers and their monitoring.
All receivables are periodically subject to an analytical evaluation per
individual customer, with write-downs effected in the event of impairment.
All details relating to trade receivables are reported in the notes to the financial
statements.
Management of currency risk
Currency risk is defined as the risk of the value of a financial instrument
changing as a result of fluctuations in exchange rates. The fact the core
business is performed in the “Euro Area” limits the Company’s exposure to
currency risks deriving from transactions in currencies other than the functional
currency (Euro).
Management of interest rate risk
Interest rate risk management aims to ensure a balanced debt structure, by
minimising the cost of funding over time.
Interest rate risk is defined as the risk of the value of a financial instrument
changing as a result of fluctuations in market interest rates.
Over the years, the Company has taken out almost exclusively medium/long-
term loans with a variable rate linked to the performance of the 3-month
Euribor and at a fixed rate.
The details relating to loans in place are reported in the notes to the financial
statements.
Sensitivity analysis
With reference to financial assets and financial liabilities at variable rate as at
31 December 2018 and 31 December 2017, a hypothetical increase
(decrease) in interest rates of 100 basis points with respect to the year-end
interest rates as at the same date, in a situation where other variables remain
constant, would involve an increase of around Euro 38 thousand in financial
expenses.
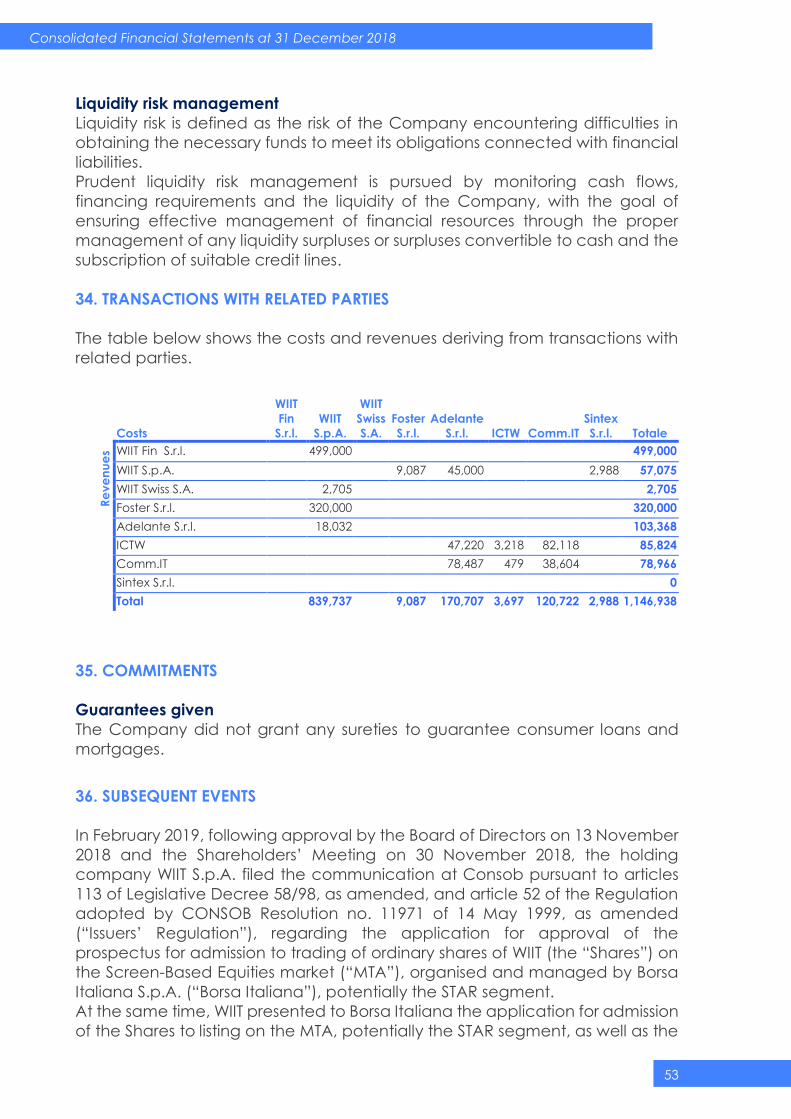
Consolidated Financial Statements at 31 December 2018
53
Liquidity risk management
Liquidity risk is defined as the risk of the Company encountering difficulties in
obtaining the necessary funds to meet its obligations connected with financial
liabilities.
Prudent liquidity risk management is pursued by monitoring cash flows,
financing requirements and the liquidity of the Company, with the goal of
ensuring effective management of financial resources through the proper
management of any liquidity surpluses or surpluses convertible to cash and the
subscription of suitable credit lines.
34. TRANSACTIONS WITH RELATED PARTIES
The table below shows the costs and revenues deriving from transactions with
related parties.
Costs
WIIT
Fin
S.r.l.
WIIT
S.p.A.
WIIT
Swiss
S.A.
Foster
S.r.l.
Adelante
S.r.l. ICTW Comm.IT
Sintex
S.r.l. Totale
Re
ve
nu
es WIIT Fin S.r.l. 499,000 499,000
WIIT S.p.A. 9,087 45,000 2,988 57,075
WIIT Swiss S.A. 2,705 2,705
Foster S.r.l. 320,000 320,000
Adelante S.r.l. 18,032 103,368
ICTW 47,220 3,218 82,118 85,824
Comm.IT 78,487 479 38,604 78,966
Sintex S.r.l. 0
Total 839,737 9,087 170,707 3,697 120,722 2,988 1,146,938
35. COMMITMENTS
Guarantees given
The Company did not grant any sureties to guarantee consumer loans and
mortgages.
36. SUBSEQUENT EVENTS
In February 2019, following approval by the Board of Directors on 13 November
2018 and the Shareholders’ Meeting on 30 November 2018, the holding
company WIIT S.p.A. filed the communication at Consob pursuant to articles
113 of Legislative Decree 58/98, as amended, and article 52 of the Regulation
adopted by CONSOB Resolution no. 11971 of 14 May 1999, as amended
(“Issuers’ Regulation”), regarding the application for approval of the
prospectus for admission to trading of ordinary shares of WIIT (the “Shares”) on
the Screen-Based Equities market (“MTA”), organised and managed by Borsa
Italiana S.p.A. (“Borsa Italiana”), potentially the STAR segment.
At the same time, WIIT presented to Borsa Italiana the application for admission
of the Shares to listing on the MTA, potentially the STAR segment, as well as the

Consolidated Financial Statements at 31 December 2018
54
application for revocation of its Shares from trading on AIM Italia, subject to
their concurrent admission to trading on the MTA.
Subject to the admission of the Shares to trading on the MTA and effective from
the date of the start of trading thereof, it intends to comply with the regime of
simplification set out in article 70, paragraph 8 and article 71, paragraph 1-bis
of the Issuers’ Regulation. Therefore, it will avail of the option to derogate from
the obligations to publish the informative documents set out in article 70,
paragraph 6 and article 71, paragraph 1 of said Issuers’ Regulation in the event
of significant mergers, spin-offs or share capital increase by means of the
conferral of assets in kind, acquisitions or disposals.