TENARIS S.A. CONSOLIDATED FINANCIAL STATEMENTS ...
56
Tenaris S.A. Consolidated Financial Statements for the years ended December 31, 2016, 2015 and 2014 TENARIS S.A. CONSOLIDATED FINANCIAL STATEMENTS For the years ended December 31, 2016, 2015 and 2014 29, Avenue de la Porte-Neuve – 3rd Floor. L – 2227 Luxembourg R.C.S. Luxembourg: B 85 203
-
Upload
khangminh22 -
Category
Documents
-
view
1 -
download
0
Transcript of TENARIS S.A. CONSOLIDATED FINANCIAL STATEMENTS ...
Tenaris S.A. Consolidated Financial Statements for the years ended December 31, 2016, 2015 and 2014
TENARIS S.A.
CONSOLIDATED FINANCIAL STATEMENTS
For the years ended December 31, 2016, 2015 and 2014
29, Avenue de la Porte-Neuve – 3rd Floor. L – 2227 Luxembourg R.C.S. Luxembourg: B 85 203

Tenaris S.A. Consolidated Financial Statements for the years ended December 31, 2016, 2015 and 2014
- 1 -
CONSOLIDATED INCOME STATEMENT
(all amounts in thousands of US dollars, unless otherwise stated)
Year ended December 31,
Notes 2016 2015 2014
Continuing operations Net sales 1 4,293,592 6,903,123 10,141,459 Cost of sales 2 (3,165,684) (4,747,760) (6,140,415)
Gross profit
1,127,908 2,155,363 4,001,044 Selling, general and administrative expenses 3 (1,196,929) (1,593,597) (1,932,778) Other operating income 5 21,127 14,603 27,855 Other operating expenses 5 (11,163) (410,574) (215,589)
Operating (loss) income (59,057) 165,795 1,880,532 Finance Income 6 66,204 34,574 38,211 Finance Cost 6 (22,329) (23,058) (44,388) Other financial results 6 (21,921) 3,076 39,575
(Loss) income before equity in earnings of non-consolidated companies and income tax
(37,103) 180,387 1,913,930
Equity in earnings (losses) of non-consolidated companies 7 71,533 (39,558) (164,616)
Income before income tax
34,430 140,829 1,749,314 Income tax 8 (17,102) (234,384) (580,431)
Income (Loss) for continuing operations 17,328 (93,555) 1,168,883
Discontinued operations Result for discontinued operations 28 41,411 19,130 12,293
Income (loss) for the period 58,739 (74,425) 1,181,176
Attributable to: Owners of the parent 55,298 (80,162) 1,158,517 Non-controlling interests
3,441 5,737 22,659
58,739 (74,425) 1,181,176
Earnings per share attributable to the owners of the parent during the period: Weighted average number of ordinary shares (thousands)
1,180,537 1,180,537 1,180,537
Continuing operations Basic and diluted earnings (losses) per share (U.S. dollars per share) 0.01 (0.08) 0.97
Basic and diluted earnings (losses) per ADS (U.S. dollars per ADS) (*)
0.02 (0.17) 1.94 Continuing and discontinued operations Basic and diluted earnings (losses) per share (U.S. dollars per share) 0.05 (0.07) 0.98 Basic and diluted earnings (losses) per ADS (U.S. dollars per ADS) (*) 0.09 (0.14) 1.96 (*) Each ADS equals two shares. CONSOLIDATED STATEMENT OF COMPREHENSIVE INCOME
(all amounts in thousands of U.S. dollars) Year ended December 31,
2016 2015 2014
Income (loss) for the year 58,739 (74,425) 1,181,176 Items that may be subsequently reclassified to profit or loss: Currency translation adjustment 37,187 (256,260) (197,711) Change in value of cash flow hedges (7,525) 10,699 (8,036) Change in value of available for sale financial instruments - 2,486 (2,447) Share of other comprehensive income of non-consolidated companies: - Currency translation adjustment 3,473 (92,914) (54,688) - Changes in the fair value of derivatives held as cash flow hedges and others 421 (3,790) 60 Income tax related to cash flow hedges and available for sale financial instruments (23) (284) 400
33,533 (340,063) (262,422)
Items that will not be reclassified to profit or loss: Remeasurements of post employment benefit obligations (230) 14,181 1,850 Income tax on items that will not be reclassified (1,760) (4,242) (513) Remeasurements of post employment benefit obligations of non-consolidated companies (5,475) (449) (3,917)
(7,465) 9,490 (2,580)
Other comprehensive income (loss) for the year, net of tax 26,068 (330,573) (265,002)
Total comprehensive income (loss) for the year 84,807 (404,998) 916,174
Attributable to: Owners of the parent 81,702 (410,187) 894,929 Non-controlling interests 3,105 5,189 21,245
84,807 (404,998) 916,174
Total comprehensive income (loss) for the year attributable to Owners of the parent arises from Continuing operations 40,291 (429,317) 882,636 Discontinued operations 41,411 19,130 12,293
81,702 (410,187) 894,929
The accompanying notes are an integral part of these Consolidated Financial Statements.
Tenaris S.A. Consolidated Financial Statements for the years ended December 31, 2016, 2015 and 2014
- 2 -
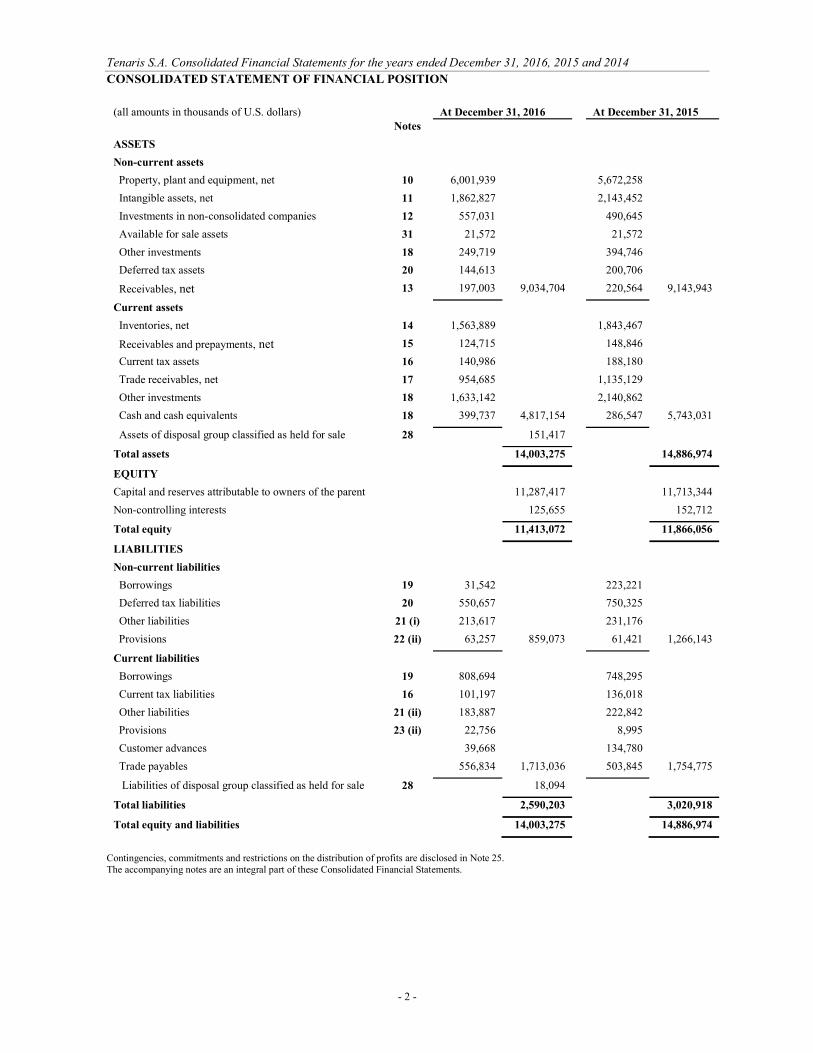
CONSOLIDATED STATEMENT OF FINANCIAL POSITION
(all amounts in thousands of U.S. dollars) At December 31, 2016 At December 31, 2015 Notes
ASSETS
Non-current assets
Property, plant and equipment, net 10 6,001,939 5,672,258
Intangible assets, net 11 1,862,827 2,143,452
Investments in non-consolidated companies 12 557,031 490,645
Available for sale assets 31 21,572 21,572
Other investments 18 249,719 394,746
Deferred tax assets 20 144,613 200,706
Receivables, net 13 197,003 9,034,704 220,564 9,143,943
Current assets
Inventories, net 14 1,563,889 1,843,467
Receivables and prepayments, net 15 124,715 148,846
Current tax assets 16 140,986 188,180
Trade receivables, net 17 954,685 1,135,129
Other investments 18 1,633,142 2,140,862
Cash and cash equivalents 18 399,737 4,817,154 286,547 5,743,031
Assets of disposal group classified as held for sale 28 151,417
Total assets 14,003,275 14,886,974
EQUITY
Capital and reserves attributable to owners of the parent 11,287,417 11,713,344
Non-controlling interests 125,655 152,712
Total equity 11,413,072 11,866,056
LIABILITIES
Non-current liabilities
Borrowings 19 31,542 223,221
Deferred tax liabilities 20 550,657 750,325
Other liabilities 21 (i) 213,617 231,176
Provisions 22 (ii) 63,257 859,073 61,421 1,266,143
Current liabilities
Borrowings 19 808,694 748,295
Current tax liabilities 16 101,197 136,018
Other liabilities 21 (ii) 183,887 222,842
Provisions 23 (ii) 22,756 8,995
Customer advances 39,668 134,780
Trade payables 556,834 1,713,036 503,845 1,754,775
Liabilities of disposal group classified as held for sale 28 18,094
Total liabilities 2,590,203 3,020,918
Total equity and liabilities 14,003,275 14,886,974
Contingencies, commitments and restrictions on the distribution of profits are disclosed in Note 25. The accompanying notes are an integral part of these Consolidated Financial Statements.

Tenaris S.A. Consolidated Financial Statements for the years ended December 31, 2016, 2015 and 2014
- 3 -
CONSOLIDATED STATEMENT OF CHANGES IN EQUITY (all amounts in thousands of U.S. dollars)
Attributable to owners of the parent
Share Capital (1)
Legal Reserves
Share Premium
Currency Translation Adjustment
Other Reserves (2)
Retained Earnings (3) Total
Non-controlling
interests Total Balance at December 31, 2015 1,180,537 118,054 609,733 (1,006,767) (298,682) 11,110,469 11,713,344 152,712 11,866,056
Income for the year - - - - - 55,298 55,298 3,441 58,739
Currency translation adjustment - - - 37,339 - - 37,339 (152) 37,187 Remeasurements of post employment benefit obligations, net of taxes - - - - (1,781) - (1,781) (209) (1,990) Change in value of available for sale financial instruments and cash flow hedges net of tax - - - - (7,573) - (7,573) 25 (7,548) Share of other comprehensive income of non-consolidated companies - - - 3,473 (5,054) - (1,581) - (1,581)
Other comprehensive income (loss) for the year - - - 40,812 (14,408) - 26,404 (336) 26,068 Total comprehensive income (loss) for the year - - - 40,812 (14,408) 55,298 81,702 3,105 84,807 Acquisition of non-controlling interests - - - - 2 - 2 (1,073) (1,071) Dividends paid in cash - - - - - (507,631) (507,631) (29,089) (536,720)
Balance at December 31, 2016 1,180,537 118,054 609,733 (965,955) (313,088) 10,658,136 11,287,417 125,655 11,413,072
(1) The Company has an authorized share capital of a single class of 2.5 billion shares having a nominal value of $1.00 per share. As of December 31, 2016 there were 1,180,536,830 shares issued. All issued shares are fully paid. (2) Other reserves include mainly the result of transactions with non-controlling interest that do not result in a loss of control, the remeasurement of post-employment benefit obligations and the changes in value of cash flow hedges and in available for sale financial instruments.
(3) The Distributable Reserve and Retained Earnings calculated according to Luxembourg Law are disclosed in Note 25.
The accompanying notes are an integral part of these Consolidated Financial Statements.

Tenaris S.A. Consolidated Financial Statements for the years ended December 31, 2016, 2015 and 2014
- 4 -
CONSOLIDATED STATEMENT OF CHANGES IN EQUITY (Cont.)
(all amounts in thousands of U.S. dollars) Attributable to owners of the parent
Share Capital (1)
Legal Reserves
Share Premium
Currency Translation Adjustment
Other Reserves
(2) Retained Earnings Total
Non-controlling
interests Total
Balance at December 31, 2014 1,180,537 118,054 609,733 (658,284) (317,799) 11,721,873 12,654,114 152,200 12,806,314
(Loss) income for the year - - - - - (80,162) (80,162) 5,737 (74,425) Currency translation adjustment - - - (255,569) - - (255,569) (691) (256,260) Remeasurements of post employment benefit obligations, net of taxes - - - - 10,213 - 10,213 (274) 9,939 Change in value of available for sale financial instruments and cash flow hedges net of tax - - - - 12,484 - 12,484 417 12,901 Share of other comprehensive income of non-consolidated companies - - - (92,914) (4,239) - (97,153) - (97,153)
Other comprehensive (loss) income for the year - - - (348,483) 18,458 - (330,025) (548) (330,573) Total comprehensive (loss) income for the year - - - (348,483) 18,458 (80,162) (410,187) 5,189 (404,998) Acquisition of non-controlling interests - - - - 659 - 659 (1,727) (1,068) Dividends paid in cash - - - - - (531,242) (531,242) (2,950) (534,192)
Balance at December 31, 2015 1,180,537 118,054 609,733 (1,006,767) (298,682) 11,110,469 11,713,344 152,712 11,866,056
Attributable to owners of the parent
Share Capital
(1) Legal
Reserves Share
Premium
Currency Translation Adjustment
Other Reserves
(2) Retained Earnings Total
Non-controlling
interests Total
Balance at December 31, 2013 1,180,537 118,054 609,733 (406,744) (305,758) 11,094,598 12,290,420 179,446 12,469,866
Income for the year - - - - - 1,158,517 1,158,517 22,659 1,181,176
Currency translation adjustment - - - (196,852) - - (196,852) (859) (197,711) Remeasurements of post employment benefit obligations, net of taxes - - - - 1,503 - 1,503 (166) 1,337 Change in value of available for sale financial instruments and cash flow hedges net of tax - - - - (9,694) - (9,694) (389) (10,083) Share of other comprehensive income of non-consolidated companies - - - (54,688) (3,857) - (58,545) - (58,545)
Other comprehensive (loss) income for the year - - - (251,540) (12,048) - (263,588) (1,414) (265,002) Total comprehensive income for the year - - - (251,540) (12,048) 1,158,517 894,929 21,245 916,174 Acquisition of non-controlling interests - - - - 7 - 7 (152) (145) Dividends paid in cash - - - - - (531,242) (531,242) (48,339) (579,581)
Balance at December 31, 2014 1,180,537 118,054 609,733 (658,284) (317,799) 11,721,873 12,654,114 152,200 12,806,314
(1) The Company has an authorized share capital of a single class of 2.5 billion shares having a nominal value of $1.00 per share. As of December 31, 2015 and 2014 there were 1,180,536,830 shares issued. All issued shares are fully paid.
(2) Other reserves include mainly the result of transactions with non-controlling interest that do not result in a loss of control, the remeasurement of post-employment benefit obligations and the changes in value of cash flow hedges and in available for
sale financial instruments.
The accompanying notes are an integral part of these Consolidated Financial Statements.
Tenaris S.A. Consolidated Financial Statements for the years ended December 31, 2016, 2015 and 2014
- 5 -
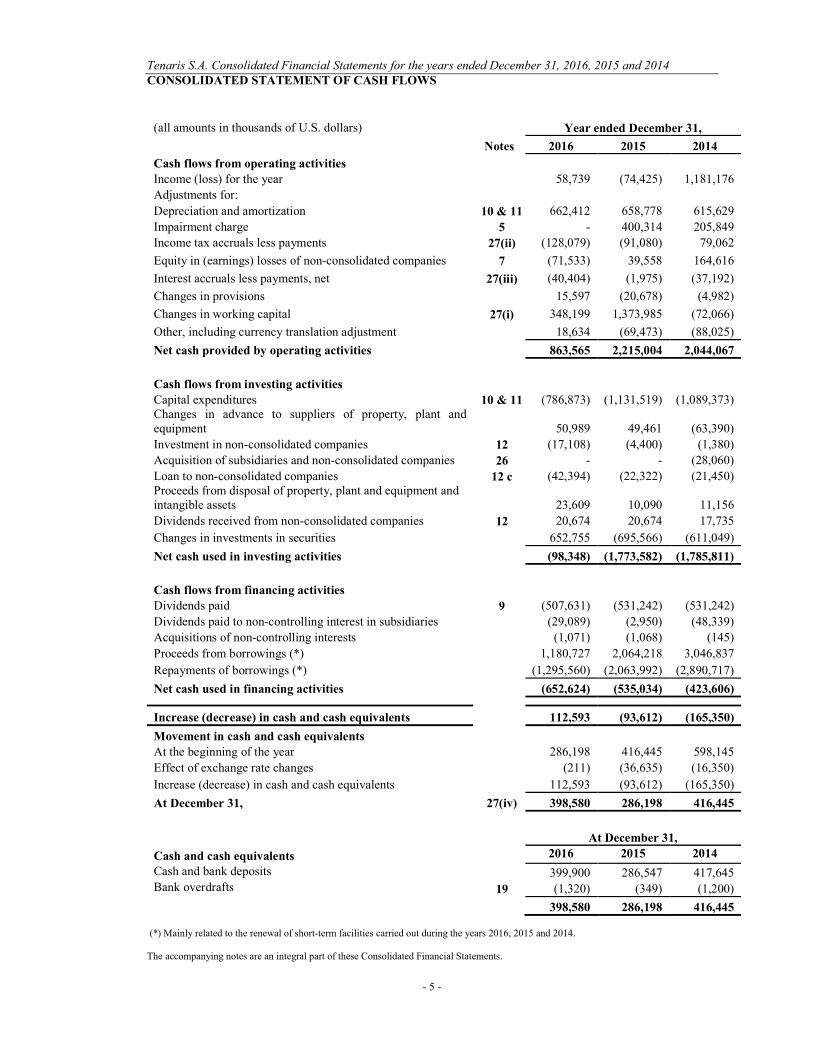
CONSOLIDATED STATEMENT OF CASH FLOWS
(all amounts in thousands of U.S. dollars) Year ended December 31,
Notes 2016 2015 2014
Cash flows from operating activities
Income (loss) for the year 58,739 (74,425) 1,181,176
Adjustments for:
Depreciation and amortization 10 & 11 662,412 658,778 615,629
Impairment charge 5 - 400,314 205,849
Income tax accruals less payments 27(ii) (128,079) (91,080) 79,062
Equity in (earnings) losses of non-consolidated companies 7 (71,533) 39,558 164,616
Interest accruals less payments, net 27(iii) (40,404) (1,975) (37,192)
Changes in provisions 15,597 (20,678) (4,982)
Changes in working capital 27(i) 348,199 1,373,985 (72,066)
Other, including currency translation adjustment 18,634 (69,473) (88,025)
Net cash provided by operating activities 863,565 2,215,004 2,044,067
Cash flows from investing activities Capital expenditures 10 & 11 (786,873) (1,131,519) (1,089,373)
Changes in advance to suppliers of property, plant and equipment 50,989 49,461 (63,390)
Investment in non-consolidated companies 12 (17,108) (4,400) (1,380)
Acquisition of subsidiaries and non-consolidated companies 26 - - (28,060)
Loan to non-consolidated companies 12 c (42,394) (22,322) (21,450) Proceeds from disposal of property, plant and equipment and intangible assets 23,609 10,090 11,156
Dividends received from non-consolidated companies 12 20,674 20,674 17,735
Changes in investments in securities 652,755 (695,566) (611,049)
Net cash used in investing activities (98,348) (1,773,582) (1,785,811)
Cash flows from financing activities
Dividends paid 9 (507,631) (531,242) (531,242)
Dividends paid to non-controlling interest in subsidiaries (29,089) (2,950) (48,339)
Acquisitions of non-controlling interests (1,071) (1,068) (145)
Proceeds from borrowings (*) 1,180,727 2,064,218 3,046,837
Repayments of borrowings (*) (1,295,560) (2,063,992) (2,890,717)
Net cash used in financing activities (652,624) (535,034) (423,606)
Increase (decrease) in cash and cash equivalents 112,593 (93,612) (165,350)
Movement in cash and cash equivalents At the beginning of the year 286,198 416,445 598,145
Effect of exchange rate changes (211) (36,635) (16,350)
Increase (decrease) in cash and cash equivalents 112,593 (93,612) (165,350)
At December 31, 27(iv) 398,580 286,198 416,445
At December 31,
Cash and cash equivalents 2016 2015 2014
Cash and bank deposits 399,900 286,547 417,645 Bank overdrafts 19 (1,320) (349) (1,200)
398,580 286,198 416,445 (*) Mainly related to the renewal of short-term facilities carried out during the years 2016, 2015 and 2014. The accompanying notes are an integral part of these Consolidated Financial Statements.
Tenaris S.A. Consolidated Financial Statements for the years ended December 31, 2016, 2015 and 2014
- 6 -
INDEX TO THE NOTES TO THE CONSOLIDATED FINANCIAL STATEMENTS
I GENERAL INFORMATION IV OTHER NOTES TO THE CONSOLIDATED FINANCIAL STATEMENTS
1 Segment information
II ACCOUNTING POLICIES (“AP”) 2 Cost of sales
A Basis of presentation 3 Selling, general and administrative expenses
B Group accounting 4 Labor costs (included in Cost of sales and in Selling, general and administrative expenses)
C Segment information 5 Other operating income and expenses
D Foreign currency translation 6 Financial results
E Property, plant and equipment 7 Equity in earnings (losses) of non-consolidated companies
F Intangible assets 8 Income tax
G Impairment of non-financial assets 9 Dividends distribution
H Other investments 10 Property, plant and equipment, net
I Inventories 11 Intangible assets, net
J Trade and other receivables 12 Investments in non-consolidated companies
K Cash and cash equivalents 13 Receivables - non current
L Equity 14 Inventories
M Borrowings 15 Receivables and prepayments
N Current and Deferred income tax 16 Current tax assets and liabilities
O Employee benefits 17 Trade receivables
P Provisions 18 Cash and cash equivalents and Other investments
Q Trade payables 19 Borrowings
R Revenue recognition 20 Deferred income tax
S Cost of sales and sales expenses 21 Other liabilities
T Earnings per share 22 Non-current allowances and provisions
U Financial instruments 23 Current allowances and provisions
24 Derivative financial instruments
25 Contingencies, commitments and restrictions on the distribution of profits
III FINANCIAL RISK MANAGEMENT 26 Acquisition of subsidiaries and non-consolidated companies
27 Cash flow disclosures
A Financial Risk Factors 28 Net assets of disposal group classified as held for sale
B Category of Financial Instruments and Classification Within the Fair Value Hierarchy
29 Related party transactions
C Fair value estimation 30 Principal subsidiaries
D Accounting for derivative financial instruments and hedging activities
31 Nationalization of Venezuelan Subsidiaries
32 Fees paid to the Company's principal accountant
33 Subsequent event
Tenaris S.A. Consolidated Financial Statements for the years ended December 31, 2016, 2015 and 2014
- 7 -
I. GENERAL INFORMATION
Tenaris S.A. (the "Company") was established as a public limited liability company (societé anonyme) under the laws of the Grand-Duchy of Luxembourg on December 17, 2001. The Company holds, either directly or indirectly, controlling interests in various subsidiaries in the steel pipe manufacturing and distribution businesses. References in these Consolidated Financial Statements to “Tenaris” refer to Tenaris S.A. and its consolidated subsidiaries. A list of the principal Company’s subsidiaries is included in Note 30 to these Consolidated Financial Statements. The Company’s shares trade on the Buenos Aires Stock Exchange, the Italian Stock Exchange and the Mexican Stock Exchange; the Company’s American Depositary Securities (“ADS”) trade on the New York Stock Exchange. These Consolidated Financial Statements were approved for issuance by the Company’s Board of Directors on February 22, 2017. II. ACCOUNTING POLICIES
The principal accounting policies applied in the preparation of these Consolidated Financial Statements are set out below. These policies have been consistently applied to all the years presented, unless otherwise stated.
A Basis of presentation
The Consolidated Financial Statements of Tenaris have been prepared in accordance with International Financial Reporting Standards (“IFRS”), as issued by the International Accounting Standards Board (“IASB”) and adopted by the European Union, under the historical cost convention, as modified by the revaluation of available for sale financial assets, financial assets and liabilities (including derivative instruments) at fair value through profit or loss and plan assets measured at fair value. The Consolidated Financial Statements are, unless otherwise noted, presented in thousands of U.S. dollars (“$”). Whenever necessary, certain comparative amounts have been reclassified to conform to changes in presentation in the current year. Following the sale of the steel electric conduit business in North America, known as Republic Conduit, the results of the mentioned business are presented as discontinued operations in accordance with IFRS 5 "Non-current Assets Held for Sale and Discontinued Operations". Consequently, all amounts related to discontinued operations within each line item of the Consolidated Income Statement are reclassified into discontinued operations. The Consolidated Statement of Cash Flows includes the cash flows for continuing and discontinued operations, cash flows from discontinued operations and earnings per share are disclosed separately in note 28, as well as additional information detailing net assets of disposal group classified as held for sale and discontinued operations. The preparation of Consolidated Financial Statements in conformity with IFRS requires management to make certain accounting estimates and assumptions that might affect the reported amounts of assets and liabilities and the disclosure of contingent assets and liabilities at the reporting dates, and the reported amounts of revenues and expenses during the reporting years. Actual results may differ from these estimates. (1) New and amended standards not yet adopted and relevant for Tenaris
IFRS 15, “Revenue from contracts with customers” In May 2014, the IASB issued IFRS 15, "Revenue from contracts with customers", which sets out the requirements in accounting for revenue arising from contracts with customers and which is based on the principle that revenue is recognized when control of a good or service is transferred to the customer. IFRS 15 must be applied on annual periods beginning on or after January 1, 2018. IFRS 9, “Financial instruments” In July 2014, the IASB issued IFRS 9, "Financial instruments", which replaces the guidance in IAS 39. It includes requirements on the classification and measurement of financial assets and liabilities, as well as an expected credit losses model that replaces the current incurred loss impairment model. IFRS 9 must be applied on annual periods beginning on or after January 1, 2018.

Tenaris S.A. Consolidated Financial Statements for the years ended December 31, 2016, 2015 and 2014
- 8 -
A Basis of presentation (Cont.)
(1) New and amended standards not yet adopted and relevant for Tenaris (Cont.) These standards are not effective for the financial year beginning January 1, 2016 and have not been early adopted. These standards were endorsed by the EU.
The Company's management is currently assessing the potential impact that the application of these standards may have on the Company's financial condition or results of operations. The management does not expect these standards to have a significant impact on the classification and measurement of its assets and liabilities. Others accounting pronouncements issued during 2016 and as of the date of these Consolidated Financial Statements have no material effect on the Company’s financial condition or result of operations. (2) New and amended standards adopted for Tenaris The Amendment to IAS 1, “Presentation of financial statements” on the disclosure initiative, has been applied on the year starting January 1, 2016, with no significant impact on the Company’s Consolidated Financial Statements. B Group accounting
(1) Subsidiaries and transactions with non-controlling interests Subsidiaries are all entities over which Tenaris has control. Tenaris controls an entity when it is exposed to, or has rights to, variable returns from its involvement with the entity and has the ability to affect those returns through its power over the entity. Subsidiaries are fully consolidated from the date on which control is exercised by the Company and are no longer consolidated from the date control ceases. The purchase method of accounting is used to account for the acquisition of subsidiaries by Tenaris. The cost of an acquisition is measured as the fair value of the assets given, equity instruments issued and liabilities incurred or assumed at the date of exchange. Acquisition-related costs are expensed as incurred. Identifiable assets acquired, liabilities and contingent liabilities assumed in a business combination are measured initially at their fair values at the acquisition date. Any non-controlling interest in the acquiree is measured either at fair value or at the non-controlling interest’s proportionate share of the acquiree’s net assets. The excess of the aggregate of the consideration transferred and the amount of any non-controlling interest in the acquiree over the fair value of the identifiable net assets acquired is recorded as goodwill. If this is less than the fair value of the net assets of the subsidiary acquired, the difference is recognized directly in the Consolidated Income Statement. Transactions with non-controlling interests that do not result in a loss of control are accounted as transactions with equity owners of the Company. For purchases from non-controlling interests, the difference between any consideration paid and the relevant share acquired of the carrying value of net assets of the subsidiary is recorded in equity. Gains or losses on disposals to non-controlling interests are also recorded in equity. Material intercompany transactions, balances and unrealized gains (losses) on transactions between Tenaris subsidiaries have been eliminated in consolidation. However, since the functional currency of some subsidiaries is its respective local currency, some financial gains (losses) arising from intercompany transactions are generated. These are included in the Consolidated Income Statement under Other financial results.

Tenaris S.A. Consolidated Financial Statements for the years ended December 31, 2016, 2015 and 2014
- 9 -
B Group accounting (Cont.)
(2) Non-consolidated companies Non-consolidated companies are all entities in which Tenaris has significant influence but not control, generally accompanying a shareholding of between 20% and 50% of the voting rights. Investments in non-consolidated companies (associated and joint ventures) are accounted for by the equity method of accounting and are initially recognized at cost. The Company’s investment in non-consolidated companies includes goodwill identified in acquisition, net of any accumulated impairment loss. Unrealized results on transactions between Tenaris and its non-consolidated companies are eliminated to the extent of Tenaris’s interest in the non-consolidated companies. Unrealized losses are also eliminated unless the transaction provides evidence of an impairment indicator of the asset transferred. Financial statements of non-consolidated companies have been adjusted where necessary to ensure consistency with IFRS. The Company’s pro-rata share of earnings in non-consolidated companies is recorded in the Consolidated Income Statement under Equity in earnings (losses) of non-consolidated companies. The Company’s pro-rata share of changes in other reserves is recognized in the Consolidated Statement of Changes in Equity under Other Reserves. At December 31, 2016, Tenaris holds 11.46% of Ternium S.A (“Ternium”)’s common stock. The following factors and circumstances evidence that Tenaris has significant influence (as defined by IAS 28, “Investments in associates companies and Joint Ventures”) over Ternium, and as a result the Company’s investment in Ternium has been accounted for under the equity method: Both the Company and Ternium are under the indirect common control of San Faustin S.A.; Four out of eight members of Ternium’s Board of Directors (including Ternium’s chairman) are also
members of the Company’s Board of Directors; Under the shareholders’ agreement by and between the Company and Techint Holdings S.à r.l, a wholly
owned subsidiary of San Faustin S.A. and Ternium’s main shareholder, dated January 9, 2006, Techint Holdings S.à r.l, is required to take actions within its power to cause (a) one of the members of Ternium’s Board of Directors to be nominated by the Company and (b) any director nominated by the Company to be only removed from Ternium’s Board of Directors pursuant to previous written instructions of the Company.
At December 31, 2016, Tenaris holds through its Brazilian subsidiary Confab Industrial S.A. (“Confab”), 5.2% of the shares with voting rights and 3.08% of Siderúrgicas de Minas Gerais S.A. Usiminas (“Usiminas”) total share capital. The acquisition of Usiminas shares was part of a larger transaction performed on January 16, 2012, pursuant to which Ternium, certain of its subsidiaries and Confab joined Usiminas’ existing control group through the acquisition of ordinary shares representing 27.7% of Usiminas’ total voting capital and 13.8% of Usiminas’ total share capital. The rights of Ternium and its subsidiaries and Confab within the Ternium - Tenaris Group are governed under a separate shareholders agreement. Those circumstances evidence that Tenaris has significant influence over Usiminas, consequently, accounted it for under the equity method (as defined by IAS 28). In April and May 2016 Tenaris’s subsidiary Confab subscribed, in the aggregate, to 1.3 million preferred shares (BRL1.28 per share) for a total amount of BRL1.6 million (approximately $0.5 million) and 11.5 million ordinary shares (BRL5.00 per share) for a total amount of BRL57.5 (approximately $16.6 million). The preferred and ordinary shares were issued on June 3, 2016 and July 19, 2016, respectively. Consequently as of December 31, 2016 Tenaris owns 36.5 million ordinary shares and 1.3 million preferred shares of Usiminas. Tenaris carries its investment in Ternium and Usiminas under the equity method, with no additional goodwill or intangible assets recognized. Tenaris reviews investments in non-consolidated companies for impairment whenever events or changes in circumstances indicate that the asset’s carrying amount may not be recoverable, such as a significant or prolonged decline in fair value below the carrying value. At December 31, 2016, 2015 and 2014, no impairment provisions were recorded on Tenaris’s investment in Ternium while in 2014 and 2015, impairment charges were recorded on Tenaris’s investment in Usiminas. See Note 7 and Note 12.

Tenaris S.A. Consolidated Financial Statements for the years ended December 31, 2016, 2015 and 2014
- 10 -
C Segment information The Company is organized in one major business segment, Tubes, which is also the reportable operating segment. The Tubes segment includes the production and sale of both seamless and welded steel tubular products and related services mainly for the oil and gas industry, particularly oil country tubular goods (OCTG) used in drilling operations, and for other industrial applications with production processes that consist in the transformation of steel into tubular products. Business activities included in this segment are mainly dependent on the oil and gas industry worldwide, as this industry is a major consumer of steel pipe products, particularly OCTG used in drilling activities. Demand for steel pipe products from the oil and gas industry has historically been volatile and depends primarily upon the number of oil and natural gas wells being drilled, completed and reworked, and the depth and drilling conditions of these wells. Sales are generally made to end users, with exports being done through a centrally managed global distribution network and domestic sales are made through local subsidiaries. Corporate general and administrative expenses have been allocated to the Tubes segment. Others includes all other business activities and operating segments that are not required to be separately reported, including the production and selling of sucker rods, industrial equipment, coiled tubing, energy and raw materials that exceed internal requirements. Tenaris’s Chief Operating Decision Maker (CEO) holds monthly meetings with senior management, in which operating and financial performance information is reviewed, including financial information that differs from IFRS principally as follows: The use of direct cost methodology to calculate the inventories, while under IFRS it is at full cost, including
absorption of production overheads and depreciations; The use of costs based on previously internally defined cost estimates, while, under IFRS, costs are
calculated at historical cost; Other timing differences. Tenaris groups its geographical information in five areas: North America, South America, Europe, Middle East and Africa and Asia Pacific. For purposes of reporting geographical information, net sales are allocated to geographical areas based on the customer’s location; allocation of assets, capital expenditures and associated depreciations and amortizations are based on the geographical location of the assets. D Foreign currency translation
(1) Functional and presentation currency
IAS 21 (revised) “The effects of changes in foreign exchange rates” defines the functional currency as the currency of the primary economic environment in which an entity operates. The functional and presentation currency of the Company is the U.S. dollar. The U.S. dollar is the currency that best reflects the economic substance of the underlying events and circumstances relevant to Tenaris’s global operations. Except for the Brazilian and Italian subsidiaries whose functional currencies are their local currencies, Tenaris determined that the functional currency of its other subsidiaries is the U.S. dollar, based on the following principal considerations: Sales are mainly negotiated, denominated and settled in U.S. dollars. If priced in a currency other than the
U.S. dollar, the sales price considers exposure to fluctuation in the exchange rate versus the U.S. dollar; Prices of their critical raw materials and inputs are priced and settled in U.S. dollars; Transaction and operational environment and the cash flow of these operations have the U.S. dollar as
reference currency; Significant level of integration of the local operations within Tenaris’s international global distribution
network; Net financial assets and liabilities are mainly received and maintained in U.S. dollars; The exchange rate of certain legal currencies has long-been affected by recurring and severe economic
crises.

Tenaris S.A. Consolidated Financial Statements for the years ended December 31, 2016, 2015 and 2014
- 11 -
D Foreign currency translation (Cont.)
(2) Transactions in currencies other than the functional currency Transactions in currencies other than the functional currency are translated into the functional currency using the exchange rates prevailing at the date of the transactions or valuation where items are re-measured.
At the end of each reporting period: (i) monetary items denominated in currencies other than the functional currency are translated using the closing rates; (ii) non-monetary items that are measured in terms of historical cost in a currency other than the functional currency are translated using the exchange rates prevailing at the date of the transactions; and (iii) non-monetary items that are measured at fair value in a currency other than the functional currency are translated using the exchange rates prevailing at the date when the fair value was determined. Foreign exchange gains and losses resulting from the settlement of such transactions and from the translation at year-end exchange rates of monetary assets and liabilities denominated in currencies other than the functional currency are recorded as gains and losses from foreign exchange and included in “Other financial results” in the Consolidated Income Statement, except when deferred in equity as qualifying cash flow hedges and qualifying net investment hedges. Translation differences in non-monetary financial assets and liabilities such as equities held at fair value through profit or loss are recognized in profit or loss as part of the “fair value gain or loss,” while translation differences on non-monetary financial assets such as equities classified as available for sale are included in the “available for sale reserve” in equity. Tenaris had no such assets or liabilities for any of the periods presented. (3) Translation of financial information in currencies other than the functional currency
Results of operations for subsidiaries whose functional currencies are not the U.S. dollar are translated into U.S. dollars at the average exchange rates for each quarter of the year. Financial statement positions are translated at the end-of-year exchange rates. Translation differences are recognized in a separate component of equity as currency translation adjustments. In the case of a sale or other disposal of any of such subsidiaries, any accumulated translation difference would be recognized in income as a gain or loss from the sale. E Property, plant and equipment
Property, plant and equipment are recognized at historical acquisition or construction cost less accumulated depreciation and impairment losses. Historical cost includes expenditure that is directly attributable to the acquisition of the items. Property, plant and equipment acquired through acquisitions accounted for as business combinations have been valued initially at the fair market value of the assets acquired. Major overhaul and rebuilding expenditures are capitalized as property, plant and equipment only when it is probable that future economic benefits associated with the item will flow to the group and the investment enhances the condition of assets beyond its original condition. The carrying amount of the replaced part is derecognized. Ordinary maintenance expenses on manufacturing properties are recorded as cost of products sold in the year in which they are incurred. Borrowing costs that are attributable to the acquisition or construction of certain capital assets are capitalized as part of the cost of the asset, in accordance with IAS 23(R) “Borrowing Costs”. Assets for which borrowing costs are capitalized are those that require a substantial period of time to prepare for their intended use. Depreciation method is reviewed at each year end. Depreciation is calculated using the straight-line method to depreciate the cost of each asset to its residual value over its estimated useful life, as follows: Land No Depreciation Buildings and improvements 30-50 years Plant and production equipment 10-40 years Vehicles, furniture and fixtures, and other equipment 4-10 years The assets’ residual values and useful lives of significant plant and production equipment are reviewed and adjusted, if appropriate, at each year-end date. Management’s re-estimation of assets useful lives, performed in accordance with IAS 16 “Property, Plant and Equipment”, did not materially affect depreciation expenses for 2016, 2015 and 2014.

Tenaris S.A. Consolidated Financial Statements for the years ended December 31, 2016, 2015 and 2014
- 12 -
E Property, plant and equipment (Cont.)
Tenaris depreciates each significant part of an item of property, plant and equipment for its different production facilities that (i) can be properly identified as an independent component with a cost that is significant in relation to the total cost of the item, and (ii) has a useful operating life that is different from another significant part of that same item of property, plant and equipment. Gains and losses on disposals are determined by comparing the proceeds with the carrying amount of assets and are recognized under Other operating income or Other operating expenses in the Consolidated Income Statement.
F Intangible assets
(1) Goodwill
Goodwill represents the excess of the acquisition cost over the fair value of Tenaris’s share of net identifiable assets acquired as part of business combinations determined mainly by independent valuations. Goodwill is tested annually for impairment and carried at cost less accumulated impairment losses. Impairment losses on goodwill are not reversed. Goodwill is included in the Consolidated Statement of Financial Position under Intangible assets, net.
For the purpose of impairment testing, goodwill is allocated to a subsidiary or group of subsidiaries that are expected to benefit from the business combination which generated the goodwill being tested.
(2) Information systems projects
Costs associated with maintaining computer software programs are generally recognized as an expense as incurred. However, costs directly related to the development, acquisition and implementation of information systems are recognized as intangible assets if it is probable that they have economic benefits exceeding one year. Information systems projects recognized as assets are amortized using the straight-line method over their useful lives, generally not exceeding a period of 3 years. Amortization charges are mainly classified as Selling, general and administrative expenses in the Consolidated Income Statement. Management’s re-estimation of assets useful lives, performed in accordance with IAS 38 “Intangible Assets”, did not materially affect depreciation expenses for 2016, 2015 and 2014. (3) Licenses, patents, trademarks and proprietary technology
Licenses, patents, trademarks, and proprietary technology acquired in a business combination are initially recognized at fair value at the acquisition date. Licenses, patents, proprietary technology and those trademarks that have a finite useful life are carried at cost less accumulated amortization. Amortization is calculated using the straight-line method to allocate the cost over their estimated useful lives, and does not exceed a period of 10 years. Amortization charges are mainly classified as Selling, general and administrative expenses in the Consolidated Income Statement. The balance of acquired trademarks that have indefinite useful lives according to external appraisal amounts to $86.7 million at December 31, 2016 and 2015, included in Hydril CGU. Main factors considered in the determination of the indefinite useful lives, include the years that they have been in service and their recognition among customers in the industry. Management’s re-estimation of assets useful lives, performed in accordance with IAS 38, did not materially affect depreciation expenses for 2016, 2015 and 2014. (4) Research and development
Research expenditures as well as development costs that do not fulfill the criteria for capitalization are recorded as Cost of sales in the Consolidated Income Statement as incurred. Research and development expenditures included in Cost of sales for the years 2016, 2015 and 2014 totaled $68.6 million, $89.0 million and $106.9 million, respectively.
Tenaris S.A. Consolidated Financial Statements for the years ended December 31, 2016, 2015 and 2014
- 13 -
F Intangible assets
(5) Customer relationships
In accordance with IFRS 3 "Business Combinations" and IAS 38, Tenaris has recognized the value of customer relationships separately from goodwill attributable to the acquisition of Maverick and Hydril groups. Customer relationships acquired in a business combination are recognized at fair value at the acquisition date, have a finite useful life and are carried at cost less accumulated amortization. Amortization is calculated using the straight line method over the expected life of approximately 14 years for Maverick and 10 years for Hydril. In 2015 the Company reviewed the useful life of Prudential’s customer relationships, related to Maverick acquisition, and decided to reduce the remaining amortization period from 5 years to 2 years. As of December 2016 the residual value of Maverick and Hydril customer relationships amount to $308 million and $17 million and the residual useful life is 4 years and 1 year respectively. G Impairment of non-financial assets
Long-lived assets including identifiable intangible assets are reviewed for impairment at the lowest level for which there are separately identifiable cash flows (cash generating units, or CGU). Most of the Company’s principal subsidiaries that constitute a CGU have a single main production facility and, accordingly, each of such subsidiary represents the lowest level of asset aggregation that generates largely independent cash inflows. Assets that are subject to amortization are reviewed for impairment whenever events or changes in circumstances indicate that the carrying amount may not be recoverable. Intangible assets with indefinite useful life, including goodwill, are subject to at least an annual impairment test. In assessing whether there is any indication that a CGU may be impaired, external and internal sources of information are analyzed. Material facts and circumstances specifically considered in the analysis usually include the discount rate used in Tenaris’s cash flow projections and the business condition in terms of competitive and economic factors, such as the cost of raw materials, oil and gas prices, competitive environment, capital expenditure programs for Tenaris’s customers and the evolution of the rig count. An impairment loss is recognized for the amount by which the asset’s carrying amount exceeds its recoverable amount. The recoverable amount is the higher between the asset’s value in use and fair value less costs to sell. Any impairment loss is allocated to reduce the carrying amount of the assets of the CGU in the following order:
(a) first, to reduce the carrying amount of any goodwill allocated to the CGU; and (b) then, to the other assets of the unit (group of units) pro-rata on the basis of the carrying amount of each
asset in the unit (group of units), considering not to reduce the carrying amount of the asset below the highest of its fair value less cost to sell, its value in use or zero.
The value in use of each CGU is determined on the basis of the present value of net future cash flows which would be generated by such CGU. Tenaris uses cash flow projections for a five year period with a terminal value calculated based on perpetuity and appropriate discount rates. For purposes of calculating the fair value less costs to sell, Tenaris uses the estimated value of future cash flows that a market participant could generate from the corresponding CGU. Management judgment is required to estimate discounted future cash flows. Actual cash flows and values could vary significantly from the forecasted future cash flows and related values derived using discounting techniques. Non-financial assets other than goodwill that suffered an impairment are reviewed for possible reversal at each reporting date.
Tenaris S.A. Consolidated Financial Statements for the years ended December 31, 2016, 2015 and 2014
- 14 -
H Other investments Other investments consist primarily of investments in financial instruments and time deposits with a maturity of more than three months at the date of purchase. Certain non-derivative financial assets that the Company has both the ability and the intention to hold to maturity have been categorized as held to maturity financial assets. They are carried at amortized cost and the results are recognized in Financial Results in the Consolidated Income Statement using the effective interest method. Held to maturity instruments with maturities greater than 12 months after the balance sheet date are included in the non-current assets. All other investments in financial instruments and time deposits are categorized as financial assets “at fair value through profit or loss” because such investments are both (i) held for trading and (ii) designated as such upon initial recognition because they are managed and their performance is evaluated on a fair value basis. The results of these investments are recognized in Financial Results in the Consolidated Income Statement. Purchases and sales of financial investments are recognized as of their settlement date. The fair values of quoted investments are generally based on current bid prices. If the market for a financial investment is not active or the securities are not listed, Tenaris estimates the fair value by using standard valuation techniques (see Section III Financial Risk Management). I Inventories
Inventories are stated at the lower between cost and net realizable value. The cost of finished goods and goods in process is comprised of raw materials, direct labor and utilities (based on FIFO method) and other direct costs and related production overhead costs, and it excludes borrowing costs. Tenaris estimates net realizable value of inventories by grouping, where applicable, similar or related items. Net realizable value is the estimated selling price in the ordinary course of business, less any estimated costs of completion and selling expenses. Goods in transit at year end are valued based on supplier’s invoice cost. Tenaris establishes an allowance for obsolete or slow-moving inventory related to finished goods, goods in process, supplies and spare parts. For slow moving or obsolete finished products, an allowance is established based on management’s analysis of product aging. An allowance for obsolete and slow-moving inventory of supplies and spare parts is established based on management's analysis of such items to be used as intended and the consideration of potential obsolescence due to technological changes. J Trade and other receivables Trade and other receivables are recognized initially at fair value, generally the original invoice amount. Tenaris analyzes its trade receivables on a regular basis and, when aware of a specific counterparty’s difficulty or inability to meet its obligations, impairs any amounts due by means of a charge to an allowance for doubtful accounts. In addition, trade accounts receivable overdue by more than 180 days and which are not covered by a credit collateral, guarantee, insurance or similar surety, are fully provisioned. K Cash and cash equivalents
Cash and cash equivalents are comprised of cash at banks, liquidity funds and short-term investments with a maturity of less than three months at the date of purchase which are readily convertible to known amounts of cash. Assets recorded in cash and cash equivalents are carried at fair market value or at historical cost which approximates fair market value.
In the Consolidated Statement of Financial Position, bank overdrafts are included in Borrowings in current liabilities. For the purposes of the Consolidated Statement of Cash Flows, cash and cash equivalents includes overdrafts.
Tenaris S.A. Consolidated Financial Statements for the years ended December 31, 2016, 2015 and 2014
- 15 -
L Equity (1) Equity components
The Consolidated Statement of Changes in Equity includes: The value of share capital, legal reserve, share premium and other distributable reserves calculated in
accordance with Luxembourg law; The currency translation adjustment, other reserves, retained earnings and non-controlling interest calculated
in accordance with IFRS.
(2) Share capital
The Company has an authorized share capital of a single class of 2.5 billion shares having a nominal value of $1.00 per share. Total ordinary shares issued and outstanding as of December 31, 2016, 2015 and 2014 are 1,180,536,830 with a par value of $1.00 per share with one vote each. All issued shares are fully paid.
(3) Dividends distribution by the Company to shareholders
Dividends distributions are recorded in the Company’s financial statements when Company’s shareholders have the right to receive the payment, or when interim dividends are approved by the Board of Directors in accordance with the by-laws of the Company. Dividends may be paid by the Company to the extent that it has distributable retained earnings, calculated in accordance with Luxembourg law (see Note 25 (iii)).
M Borrowings
Borrowings are recognized initially at fair value net of transaction costs incurred and subsequently measured at amortized cost.
N Current and Deferred income tax The tax expense for the period comprises current and deferred tax. Tax is recognized in the Consolidated Income Statement, except for tax items recognized in the Consolidated Statement of Other Comprehensive Income. The current income tax charge is calculated on the basis of the tax laws enacted or substantively enacted at the reporting date in the countries where the Company’s subsidiaries operate and generate taxable income. Management periodically evaluates positions taken in tax returns with respect to situations in which applicable tax regulations are subject to interpretation and establishes provisions when appropriate. Deferred income tax is recognized applying the liability method on temporary differences arising between the tax basis of assets and liabilities and their carrying amounts in the financial statements. The principal temporary differences arise from fair value adjustments of assets acquired in business combinations, the effect of currency translation on depreciable fixed assets and inventories, depreciation on property, plant and equipment, valuation of inventories and provisions for pension plans. Deferred tax assets are also recognized for net operating loss carry-forwards. Deferred tax assets and liabilities are measured at the tax rates that are expected to apply in the time period when the asset is realized or the liability is settled, based on tax laws that have been enacted or substantively enacted at the reporting date. Deferred tax assets are recognized to the extent it is probable that future taxable income will be available against which the temporary differences can be utilized. At the end of each reporting period, Tenaris reassesses unrecognized deferred tax assets. Tenaris recognizes a previously unrecognized deferred tax asset to the extent that it has become probable that future taxable income will allow the deferred tax asset to be recovered.

Tenaris S.A. Consolidated Financial Statements for the years ended December 31, 2016, 2015 and 2014
- 16 -
O Employee benefits
(1) Post employment benefits
The Company has defined benefit and defined contribution plans. A defined benefit plan is a pension plan that defines an amount of pension benefit that an employee will receive on retirement, usually dependent on one or more factors such as age, years of service and compensation. The liability recognized in the statement of financial position in respect of defined benefit pension plans is the present value of the defined benefit obligation at the end of the reporting period less the fair value of plan assets, if any. The defined benefit obligation is calculated annually (at year end) by independent actuaries using the projected unit credit method. The present value of the defined benefit obligation is determined by discounting the estimated future cash outflows using interest rates of high-quality corporate bonds that are denominated in the currency in which the benefits will be paid, and that have terms to maturity approximating to the terms of the related pension obligation. Actuarial gains and losses arising from experience adjustments and changes in actuarial assumptions are charged or credited to equity in Other comprehensive income in the period in which they arise. Past-service costs are recognized immediately in the Income Statement. For defined benefit plans, net interest income/expense is calculated based on the surplus or deficit derived by the difference between the defined benefit obligations less fair value of plan assets. For defined contribution plans, the Company pays contributions to publicly or privately administered pension insurance plans on a mandatory, contractual or voluntary basis. The Company has no further payment obligations once the contributions have been paid. The contributions are recognized as employee benefit expense when they are due. Prepaid contributions are recognized as an asset to the extent that a cash refund or a reduction in the future payments is available. Tenaris sponsors funded and unfunded defined benefit pension plans in certain subsidiaries. The most significant are: An unfunded defined benefit employee retirement plan for certain senior officers. The plan is designed to
provide certain benefits to those officers (additional to those contemplated under applicable labor laws) in case of termination of the employment relationship due to certain specified events, including retirement. This unfunded plan provides defined benefits based on years of service and final average salary.
Employees’ service rescission indemnity: the cost of this obligation is charged to the Consolidated Income Statement over the expected service lives of employees. This provision is primarily related to the liability accrued for employees at Tenaris’s Italian subsidiary. As from January 1, 2007 as a consequence of a change in an Italian law, employees were entitled to make contributions to external funds, thus, Tenaris’s Italian subsidiary pays every year the required contribution to the funds with no further obligation. As a result, the plan changed from a defined benefit plan to a defined contribution plan effective from that date, but only limited to the contributions of 2007 onwards.
Funded retirement benefit plans held in Canada for salary and hourly employees hired prior a certain date
based on years of service and, in the case of salaried employees, final average salary. Plan assets consist primarily of investments in equities and money market funds. Both plans were replaced for defined contribution plans. Effective June 2016 the salary plan was frozen for the purposes of credited service as well as determination of final average pay.
Funded retirement benefit plan held in the US for the benefit of some employees hired prior a certain date,
frozen for the purposes of credited service as well as determination of final average pay for the retirement benefit calculation. Plan assets consist primarily of investments in equities and money market funds. Additionally, an unfunded postretirement health and life plan that offers limited medical and life insurance benefits to the retirees, hired before a certain date.

Tenaris S.A. Consolidated Financial Statements for the years ended December 31, 2016, 2015 and 2014
- 17 -
O Employee benefits (Cont.)
(2) Other long term benefits
During 2007, Tenaris launched an employee retention and long term incentive program (the “Program”) applicable to certain senior officers and employees of the Company, who will be granted a number of Units throughout the duration of the Program. The value of each of these Units is based on Tenaris’s shareholders’ equity (excluding non-controlling interest). Also, the beneficiaries of the Program are entitled to receive cash amounts based on (i) the amount of dividend payments made by Tenaris to its shareholders, and (ii) the number of Units held by each beneficiary to the Program. Units vest ratably over a period of four years and will be redeemed by the Company ten years after grant date, with the option of an early redemption at seven years after grant date. As the cash payment of the benefit is tied to the book value of the shares, and not to their market value, Tenaris valued this long-term incentive program as a long term benefit plan as classified in IAS 19 “Employee Benefits”. As of December 31, 2016 and 2015, the outstanding liability corresponding to the Program amounts to $78.7 million and $84.0 million, respectively. The total value of the units granted to date under the program, considering the number of units and the book value per share as of December 31, 2016 and 2015, is $92.9 million and $105.3 million, respectively. (3) Other compensation obligations
Employee entitlements to annual leave and long-service leave are accrued as earned. Compensation to employees in the event of dismissal is charged to income in the year in which it becomes payable. P Provisions
Tenaris is subject to various claims, lawsuits and other legal proceedings, including customer claims, in which a third party is seeking payment for alleged damages, reimbursement for losses or indemnity. Tenaris’s potential liability with respect to such claims, lawsuits and other legal proceedings cannot be estimated with certainty. Management periodically reviews the status of each significant matter and assesses potential financial exposure. If, as a result of past events, a potential loss from a claim or proceeding is considered probable and the amount can be reasonably estimated, a provision is recorded. Accruals for loss contingencies reflect a reasonable estimate of the losses to be incurred based on information available to management as of the date of preparation of the financial statements, and take into consideration Tenaris’s litigation and settlement strategies. These estimates are primarily constructed with the assistance of legal counsel. As the scope of liabilities become better defined, there may be changes in the estimates of future costs which could have a material adverse effect on its results of operations, financial condition and cash flows. If Tenaris expects to be reimbursed for an accrued expense, as would be the case for an expense or loss covered under an insurance contract, and reimbursement is considered virtually certain, the expected reimbursement is recognized as a receivable. Q Trade payables
Trade payables are recognized initially at fair value, generally the nominal invoice amount. R Revenue recognition Revenue comprises the fair value of the consideration received or receivable for the sale of goods and services in the ordinary course of Tenaris’s activities. Revenue is shown net of value-added tax, returns, rebates and discounts and after eliminating sales within the group.
Tenaris’s products and services are sold based upon purchase orders, contracts or upon other persuasive evidence of an arrangement with customers, including that the sales price is known or determinable. Sales are recognized as revenue upon delivery, when neither continuing managerial involvement nor effective control over the products is retained by Tenaris and when collection is reasonably assured. Delivery is defined by the transfer of risk and may include delivery to a storage facility located at one of the Company’s subsidiaries. For bill and hold transactions revenue is recognized only to the extent (a) it is highly probable delivery will be made; (b) the products have been specifically identified and are ready for delivery; (c) the sales contract specifically acknowledges the deferred delivery instructions; (d) the usual payment terms apply.

Tenaris S.A. Consolidated Financial Statements for the years ended December 31, 2016, 2015 and 2014
- 18 -
R Revenue recognition (Cont.)
The percentage of total sales that were generated from bill and hold arrangements for products located in Tenaris’s storage facilities that have not been shipped to customers amounted to 2.8%, 3.0% and 1.2% as of December 31, 2016, 2015 and 2014, respectively. The Company has not experienced any material claims requesting the cancellation of bill and hold transactions. Other revenues earned by Tenaris are recognized on the following basis:
Construction contracts (mainly applicable to Tenaris Brazilian subsidiaries and amounted to 37 million, 0.86% of total sales). The revenue recognition of the contracts follows the IAS 11 ”Construction Contracts" guidance, that means, when the outcome of a construction contract can be estimated reliably and it is probable that the contract will be profitable, contract revenue is recognized over the period of the contract by reference to the stage of completion (measured by reference to the contract costs incurred up to the end of the reporting period as a percentage of total estimated costs for each contract).
Interest income: on the effective yield basis. Dividend income from investments in other companies: when Tenaris’s right to receive payment is
established. S Cost of sales and sales expenses
Cost of sales and sales expenses are recognized in the Consolidated Income Statement on the accrual basis of accounting. Commissions, freight and other selling expenses, including shipping and handling costs, are recorded in Selling, general and administrative expenses in the Consolidated Income Statement. T Earnings per share Earnings per share are calculated by dividing the income attributable to owners of the parent by the daily weighted average number of common shares outstanding during the year. U Financial instruments Non derivative financial instruments comprise investments in financial debt instruments and equity, time deposits, trade and other receivables, cash and cash equivalents, borrowings and trade and other payables. Tenaris’s non derivative financial instruments are classified into the following categories: Financial instruments at fair value through profit and loss: comprise mainly Other Investments expiring in
less than ninety days from the measurement date (included within cash and cash equivalents) and investments in certain financial debt instruments and time deposits held for trading.
Loans and receivables: comprise cash and cash equivalents, trade receivables and other receivables and are measured at amortized cost using the effective interest rate method less any impairment.
Available for sale assets: comprise the Company’s interest in the Venezuelan Companies (see Note 31). Held to maturity: comprise financial assets that the Company has both the ability and the intention to hold to
maturity. They are measured at amortized cost using the effective interest method. Other financial liabilities: comprise borrowings, trade and other payables and are measured at amortized cost
using the effective interest rate method. The categorization depends on the nature and purpose that the Company sets to the financial instrument. Financial assets and liabilities are recognized and derecognized on their settlement date. Accounting for derivative financial instruments and hedging activities is included within the Section III, Financial Risk Management.
Tenaris S.A. Consolidated Financial Statements for the years ended December 31, 2016, 2015 and 2014
- 19 -
III. FINANCIAL RISK MANAGEMENT The multinational nature of Tenaris’s operations and customer base exposes the Company to a variety of risks, mainly related to market risks (including the effects of changes in foreign currency exchange rates and interest rates), credit risk and capital market risk. In order to manage the volatility related to these exposures, the management evaluates exposures on a consolidated basis, taking advantage of logical exposure netting. The Company or its subsidiaries may then enter into various derivative transactions in order to prevent potential adverse impacts on Tenaris’s financial performance. Such derivative transactions are executed in accordance with internal policies and hedging practices. The Company’s objectives, policies and processes for managing these risks remained unchanged during 2016. A. Financial Risk Factors (i) Capital Risk Management
Tenaris seeks to maintain a low debt to total equity ratio considering the industry and the markets where it operates. The year-end ratio of debt to total equity (where “debt” comprises financial borrowings and “total equity” is the sum of financial borrowings and equity) is 0.07 as of December 31, 2016 and 0.08 as of December 31, 2015. The Company does not have to comply with regulatory capital adequacy requirements. (ii) Foreign exchange risk
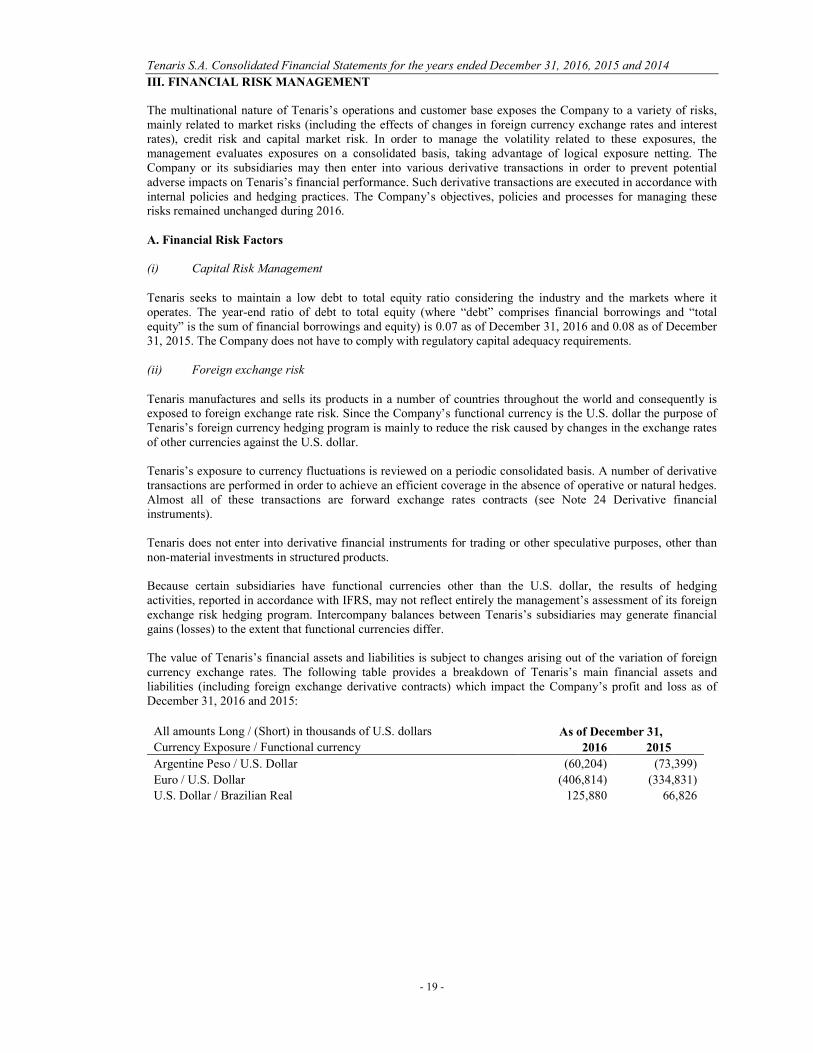
Tenaris manufactures and sells its products in a number of countries throughout the world and consequently is exposed to foreign exchange rate risk. Since the Company’s functional currency is the U.S. dollar the purpose of Tenaris’s foreign currency hedging program is mainly to reduce the risk caused by changes in the exchange rates of other currencies against the U.S. dollar. Tenaris’s exposure to currency fluctuations is reviewed on a periodic consolidated basis. A number of derivative transactions are performed in order to achieve an efficient coverage in the absence of operative or natural hedges. Almost all of these transactions are forward exchange rates contracts (see Note 24 Derivative financial instruments). Tenaris does not enter into derivative financial instruments for trading or other speculative purposes, other than non-material investments in structured products. Because certain subsidiaries have functional currencies other than the U.S. dollar, the results of hedging activities, reported in accordance with IFRS, may not reflect entirely the management’s assessment of its foreign exchange risk hedging program. Intercompany balances between Tenaris’s subsidiaries may generate financial gains (losses) to the extent that functional currencies differ. The value of Tenaris’s financial assets and liabilities is subject to changes arising out of the variation of foreign currency exchange rates. The following table provides a breakdown of Tenaris’s main financial assets and liabilities (including foreign exchange derivative contracts) which impact the Company’s profit and loss as of December 31, 2016 and 2015:
All amounts Long / (Short) in thousands of U.S. dollars As of December 31, Currency Exposure / Functional currency 2016 2015
Argentine Peso / U.S. Dollar (60,204) (73,399)
Euro / U.S. Dollar (406,814) (334,831)
U.S. Dollar / Brazilian Real 125,880 66,826

Tenaris S.A. Consolidated Financial Statements for the years ended December 31, 2016, 2015 and 2014
- 20 -
A. Financial Risk Factors (Cont.) (ii) Foreign exchange risk (Cont.)
The main relevant exposures correspond to: Argentine Peso / U.S. dollar
As of December 31, 2016 and 2015 consisting primarily of Argentine Peso-denominated financial, trade, social and fiscal payables at certain Argentine subsidiaries which functional currency is the U.S. dollar. A change of 1% in the ARS/USD exchange rate would have generated a pre-tax gain / loss of $0.6 million and $0.7 million as of December 31, 2016 and 2015, respectively.
Euro / U.S. dollar
As of December 31, 2016 and 2015, consisting primarily of Euro-denominated intercompany liabilities at certain subsidiaries which functional currency is the U.S. dollar. A change of 1% in the EUR/USD exchange rate would have generated a pre-tax gain / loss of $4.1 million and $3.3 million as of December 31, 2016 and 2015, respectively, which would have been to a large extent offset by changes in currency translation adjustment included in Tenaris’s net equity position.
U.S. dollar / Brazilian Real As of December 31, 2016 consisting primarily of Cash and cash equivalent and Other investments denominated in U.S. dollar at subsidiaries which functional currency is the Brazilian real. A change of 1% in the BRL/USD exchange rate would generate a pre-tax gain / loss of $1.3 million and $0.7 million in December 31, 2016 and 2015, respectively (including a gain / loss of $0.5 million in 2016 and $0.7 million in 2015 due to foreign exchange derivative contracts entered to preserve the U.S. dollar value of trade receivables and cash denominated in Brazilian Real), which would have been to a large extent offset by changes in currency translation adjustment included in Tenaris’s net equity position.
Considering the balances held as of December 31, 2016 on financial assets and liabilities exposed to foreign exchange rate fluctuations, Tenaris estimates that the impact of a simultaneous 1% appreciation / depreciation movement in the levels of foreign currencies exchange rates relative to the U.S. dollar, would be a pre-tax gain / loss of $6.6 million (including a loss / gain of $4.0 million due to foreign exchange derivative contracts), which would be partially offset by changes to Tenaris’s net equity position of $4.2 million. For balances held as of December 31, 2015, a simultaneous 1% favorable / unfavorable movement in the foreign currencies exchange rates relative to the U.S. dollar, would have generated a pre-tax gain / loss of $5.1 million (including a loss / gain of $5.3 million due to foreign exchange derivative contracts), which would have been partially offset by changes to Tenaris’s net equity position of $3.9 million. (iii) Interest rate risk
Tenaris is subject to interest rate risk on its investment portfolio and its debt. The Company uses a mix of variable and fixed rate debt in combination with its investment portfolio strategy. From time to time, the Company may choose to enter into foreign exchange derivative contracts and / or interest rate swaps to mitigate the exposure to changes in the interest rates.
The following table summarizes the proportions of variable-rate and fixed-rate debt as of each year end. As of December 31, 2016 2015
Amount in thousands
of U.S. dollars % Amount in thousands
of U.S. dollars %
Fixed rate 820,600 98% 954,681 98% Variable rate 19,636 2% 16,835 2% Total (*) 840,236 971,516
(*) As of December 31, 2016 approximately 66% of the total debt balance corresponded to fixed-rate borrowings where the original period was nonetheless equal to or less than 360 days. This compares to approximately 59% of the total outstanding debt balance as of December 31, 2015. The Company estimates that, if market interest rates applicable to Tenaris’s borrowings had been 100 basis points higher, then the additional pre-tax loss would have been $8.8 million in 2016 and $10.8 million in 2015.
Tenaris S.A. Consolidated Financial Statements for the years ended December 31, 2016, 2015 and 2014
- 21 -
A. Financial Risk Factors (Cont.) (iv) Credit risk
Credit risk arises from cash and cash equivalents, deposits with banks and financial institutions, as well as credit exposures to customers, including outstanding receivables and committed transactions. The Company also actively monitors the creditworthiness of its treasury, derivative and insurance counterparties in order to minimize its credit risk. There is no significant concentration of credit risk from customers. No single customer comprised more than 10% of Tenaris’s net sales in 2016, 2015 and 2014. Tenaris’s credit policies related to sales of products and services are designed to identify customers with acceptable credit history and to allow Tenaris to require the use of credit insurance, letters of credit and other instruments designed to minimize credit risks whenever deemed necessary. Tenaris maintains allowances for impairment for potential credit losses (See Section II J). As of December 31, 2016 and 2015 trade receivables amount to $954,7 million and $1,135.1 million respectively. Trade receivables have guarantees under credit insurance of $222.1 million and $325.1 million, letter of credit and other bank guarantees of $117.8 million and $20.5 million, and other guarantees of $15.6 million and $7.9 million as of December 31, 2016 and 2015 respectively. As of December 31, 2016 and 2015 past due trade receivables amounted to $249.0 million and $333.8 million, respectively. Out of those amounts $83.1 million and $84.9 million are guaranteed trade receivables while $85.7 million and $101.5 million are included in the allowance for doubtful accounts. Both the allowance for doubtful accounts and the existing guarantees are sufficient to cover doubtful trade receivables. (v) Counterparty risk
Tenaris has investment guidelines with specific parameters to limit issuer risk on marketable securities. Counterparties for derivatives and cash transactions are limited to high credit quality financial institutions, normally investment grade. Approximately 82% of Tenaris’s liquid financial assets correspond to Investment Grade-rated instruments as of December 31, 2016, in comparison with approximately 92% as of December 31, 2015. (vi) Liquidity risk Tenaris financing strategy aims to maintain adequate financial resources and access to additional liquidity. During 2016, Tenaris has counted on cash flows from operations as well as additional bank financing to fund its transactions. Management maintains sufficient cash and marketable securities to finance normal operations and believes that Tenaris also has appropriate access to market for short-term working capital needs. Liquid financial assets as a whole (comprising cash and cash equivalents and other investments) were 16% of total assets at the end of 2016 compared to 19% at the end of 2015. Tenaris has a conservative approach to the management of its liquidity, which consists of cash in banks, liquidity funds and short-term investments mainly with a maturity of less than three months at the date of purchase. Tenaris holds primarily investments in money market funds and variable or fixed-rate securities from investment grade issuers. As of December 31, 2016 and 2015, Tenaris does not have direct exposure to financial instruments issued by European sovereign counterparties. Tenaris holds its investments primarily in U.S. dollars. As of December 31, 2016 and 2015, U.S. dollar denominated liquid assets represented approximately 95% and 87% of total liquid financial assets respectively.
Tenaris S.A. Consolidated Financial Statements for the years ended December 31, 2016, 2015 and 2014
- 22 -
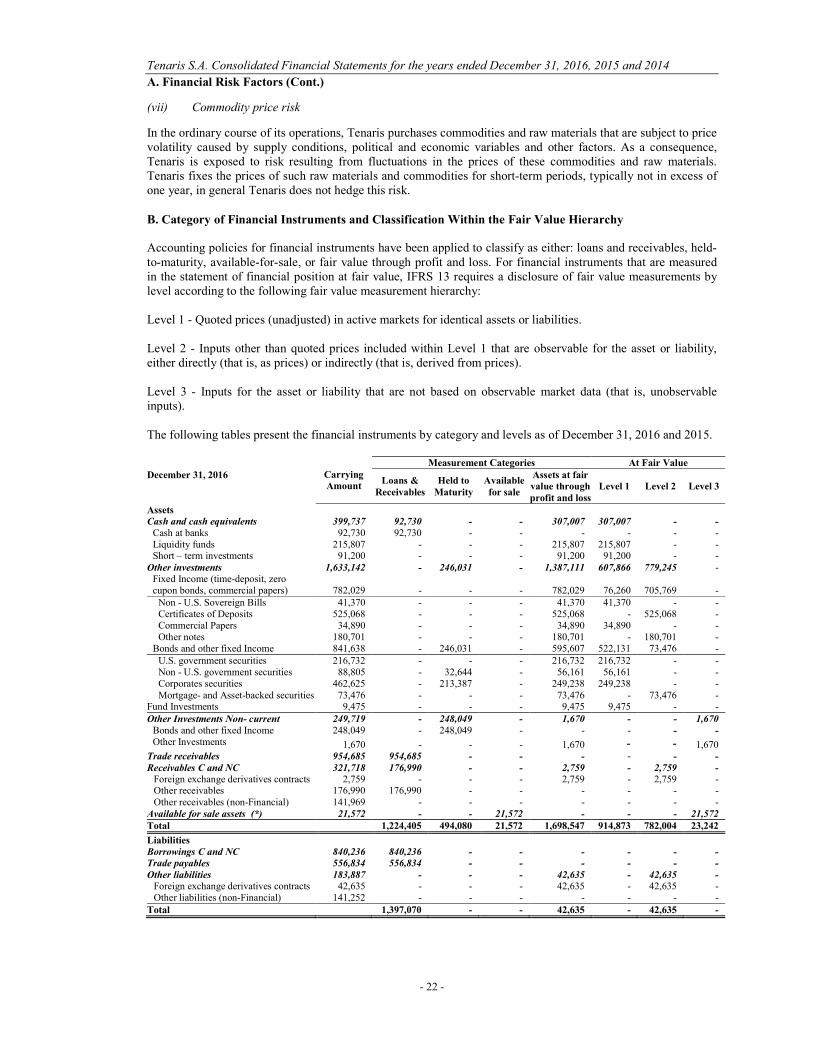
A. Financial Risk Factors (Cont.) (vii) Commodity price risk In the ordinary course of its operations, Tenaris purchases commodities and raw materials that are subject to price volatility caused by supply conditions, political and economic variables and other factors. As a consequence, Tenaris is exposed to risk resulting from fluctuations in the prices of these commodities and raw materials. Tenaris fixes the prices of such raw materials and commodities for short-term periods, typically not in excess of one year, in general Tenaris does not hedge this risk. B. Category of Financial Instruments and Classification Within the Fair Value Hierarchy Accounting policies for financial instruments have been applied to classify as either: loans and receivables, held-to-maturity, available-for-sale, or fair value through profit and loss. For financial instruments that are measured in the statement of financial position at fair value, IFRS 13 requires a disclosure of fair value measurements by level according to the following fair value measurement hierarchy: Level 1 - Quoted prices (unadjusted) in active markets for identical assets or liabilities. Level 2 - Inputs other than quoted prices included within Level 1 that are observable for the asset or liability, either directly (that is, as prices) or indirectly (that is, derived from prices). Level 3 - Inputs for the asset or liability that are not based on observable market data (that is, unobservable inputs). The following tables present the financial instruments by category and levels as of December 31, 2016 and 2015.
Carrying Amount
Measurement Categories At Fair Value December 31, 2016
Loans & Receivables
Held to Maturity
Available for sale
Assets at fair value through profit and loss
Level 1 Level 2 Level 3
Assets Cash and cash equivalents 399,737 92,730 - - 307,007 307,007 - -
Cash at banks 92,730 92,730 - - - - - - Liquidity funds 215,807 - - - 215,807 215,807 - - Short – term investments 91,200 - - - 91,200 91,200 - -
Other investments 1,633,142 - 246,031 - 1,387,111 607,866 779,245 - Fixed Income (time-deposit, zero cupon bonds, commercial papers) 782,029 - - - 782,029 76,260 705,769 -
Non - U.S. Sovereign Bills 41,370 - - - 41,370 41,370 - - Certificates of Deposits 525,068 - - - 525,068 - 525,068 - Commercial Papers 34,890 - - - 34,890 34,890 - - Other notes 180,701 - - - 180,701 - 180,701 -
Bonds and other fixed Income 841,638 - 246,031 - 595,607 522,131 73,476 - U.S. government securities 216,732 - - - 216,732 216,732 - - Non - U.S. government securities 88,805 - 32,644 - 56,161 56,161 - - Corporates securities 462,625 - 213,387 - 249,238 249,238 - - Mortgage- and Asset-backed securities 73,476 - - - 73,476 - 73,476 -
Fund Investments 9,475 - - - 9,475 9,475 - - Other Investments Non- current 249,719 - 248,049 - 1,670 - - 1,670
Bonds and other fixed Income 248,049 - 248,049 - - - - - Other Investments 1,670 - - - 1,670 - - 1,670
Trade receivables 954,685 954,685 - - - - - - Receivables C and NC 321,718 176,990 - - 2,759 - 2,759 -
Foreign exchange derivatives contracts 2,759 - - - 2,759 - 2,759 - Other receivables 176,990 176,990 - - - - - - Other receivables (non-Financial) 141,969 - - - - - - -
Available for sale assets (*) 21,572 - - 21,572 - - - 21,572 Total 1,224,405 494,080 21,572 1,698,547 914,873 782,004 23,242
Liabilities Borrowings C and NC 840,236 840,236 - - - - - -
Trade payables 556,834 556,834 - - - - - - Other liabilities 183,887 - - - 42,635 - 42,635 -
Foreign exchange derivatives contracts 42,635 - - - 42,635 - 42,635 - Other liabilities (non-Financial) 141,252 - - - - - - -
Total 1,397,070 - - 42,635 - 42,635 -
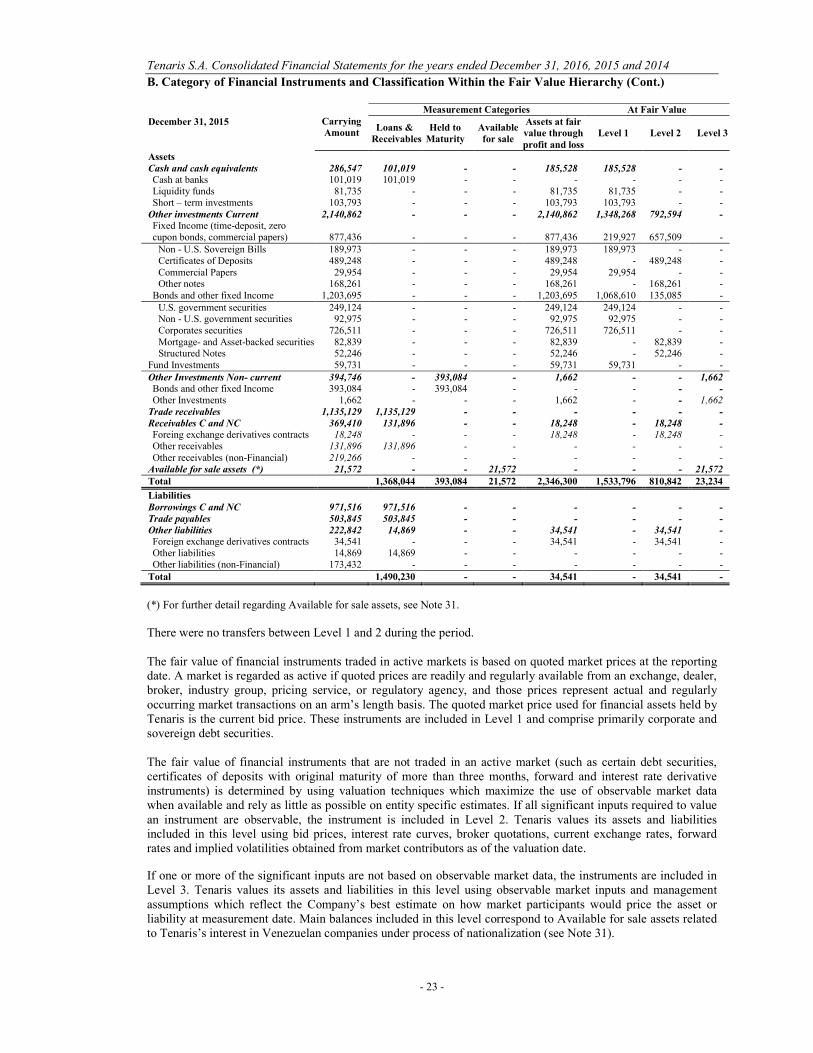
Tenaris S.A. Consolidated Financial Statements for the years ended December 31, 2016, 2015 and 2014
- 23 -
B. Category of Financial Instruments and Classification Within the Fair Value Hierarchy (Cont.)
Carrying Amount
Measurement Categories At Fair Value December 31, 2015
Loans & Receivables
Held to Maturity
Available for sale
Assets at fair value through profit and loss
Level 1 Level 2 Level 3
Assets Cash and cash equivalents 286,547 101,019 - - 185,528 185,528 - - Cash at banks 101,019 101,019 - - - - - - Liquidity funds 81,735 - - - 81,735 81,735 - - Short – term investments 103,793 - - - 103,793 103,793 - -
Other investments Current 2,140,862 - - - 2,140,862 1,348,268 792,594 - Fixed Income (time-deposit, zero cupon bonds, commercial papers) 877,436 - - - 877,436 219,927 657,509 -
Non - U.S. Sovereign Bills 189,973 - - - 189,973 189,973 - - Certificates of Deposits 489,248 - - - 489,248 - 489,248 - Commercial Papers 29,954 - - - 29,954 29,954 - - Other notes 168,261 - - - 168,261 - 168,261 -
Bonds and other fixed Income 1,203,695 - - - 1,203,695 1,068,610 135,085 - U.S. government securities 249,124 - - - 249,124 249,124 - - Non - U.S. government securities 92,975 - - - 92,975 92,975 - - Corporates securities 726,511 - - - 726,511 726,511 - - Mortgage- and Asset-backed securities 82,839 - - - 82,839 - 82,839 - Structured Notes 52,246 - - - 52,246 - 52,246 -
Fund Investments 59,731 - - - 59,731 59,731 - - Other Investments Non- current 394,746 - 393,084 - 1,662 - - 1,662 Bonds and other fixed Income 393,084 - 393,084 - - - - - Other Investments 1,662 - - - 1,662 - - 1,662
Trade receivables 1,135,129 1,135,129 - - - - - - Receivables C and NC 369,410 131,896 - - 18,248 - 18,248 - Foreing exchange derivatives contracts 18,248 - - - 18,248 - 18,248 - Other receivables 131,896 131,896 - - - - - - Other receivables (non-Financial) 219,266 - - - - - - -
Available for sale assets (*) 21,572 - - 21,572 - - - 21,572 Total 1,368,044 393,084 21,572 2,346,300 1,533,796 810,842 23,234
Liabilities Borrowings C and NC 971,516 971,516 - - - - - - Trade payables 503,845 503,845 - - - - - - Other liabilities 222,842 14,869 - - 34,541 - 34,541 - Foreign exchange derivatives contracts 34,541 - - - 34,541 - 34,541 - Other liabilities 14,869 14,869 - - - - - - Other liabilities (non-Financial) 173,432 - - - - - - -
Total 1,490,230 - - 34,541 - 34,541 -
(*) For further detail regarding Available for sale assets, see Note 31. There were no transfers between Level 1 and 2 during the period. The fair value of financial instruments traded in active markets is based on quoted market prices at the reporting date. A market is regarded as active if quoted prices are readily and regularly available from an exchange, dealer, broker, industry group, pricing service, or regulatory agency, and those prices represent actual and regularly occurring market transactions on an arm’s length basis. The quoted market price used for financial assets held by Tenaris is the current bid price. These instruments are included in Level 1 and comprise primarily corporate and sovereign debt securities. The fair value of financial instruments that are not traded in an active market (such as certain debt securities, certificates of deposits with original maturity of more than three months, forward and interest rate derivative instruments) is determined by using valuation techniques which maximize the use of observable market data when available and rely as little as possible on entity specific estimates. If all significant inputs required to value an instrument are observable, the instrument is included in Level 2. Tenaris values its assets and liabilities included in this level using bid prices, interest rate curves, broker quotations, current exchange rates, forward rates and implied volatilities obtained from market contributors as of the valuation date. If one or more of the significant inputs are not based on observable market data, the instruments are included in Level 3. Tenaris values its assets and liabilities in this level using observable market inputs and management assumptions which reflect the Company’s best estimate on how market participants would price the asset or liability at measurement date. Main balances included in this level correspond to Available for sale assets related to Tenaris’s interest in Venezuelan companies under process of nationalization (see Note 31).
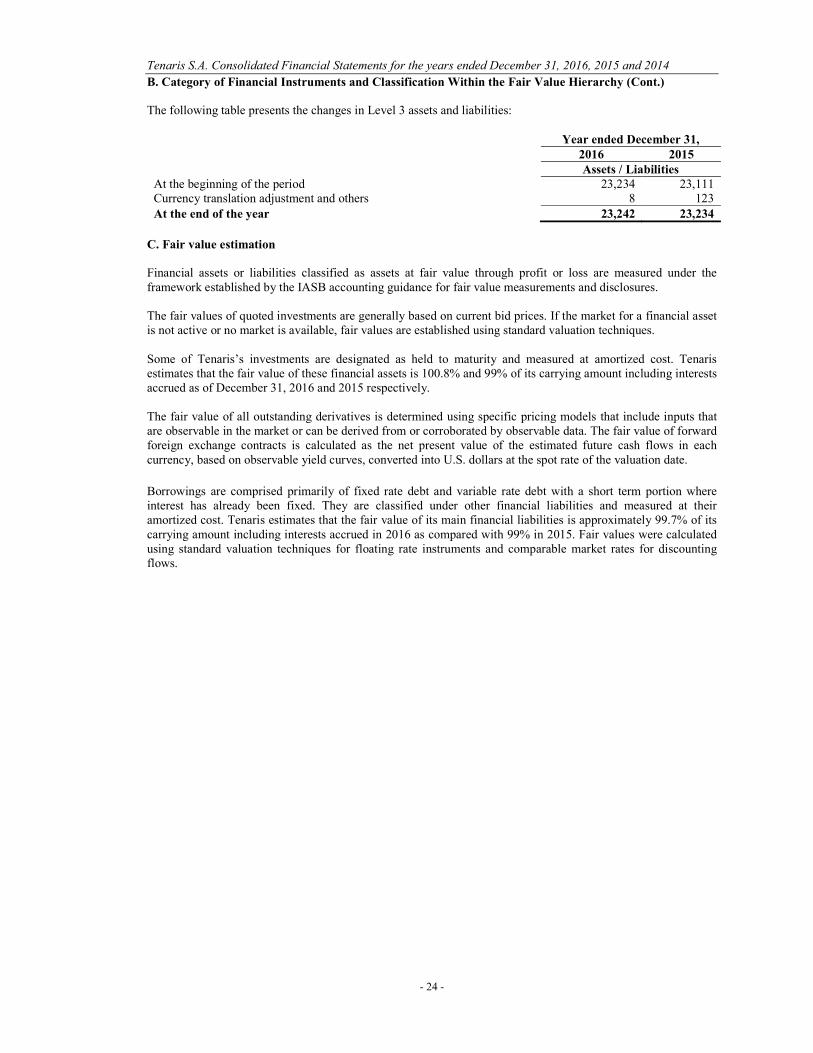
Tenaris S.A. Consolidated Financial Statements for the years ended December 31, 2016, 2015 and 2014
- 24 -
B. Category of Financial Instruments and Classification Within the Fair Value Hierarchy (Cont.) The following table presents the changes in Level 3 assets and liabilities:
Year ended December 31, 2016 2015 Assets / Liabilities
At the beginning of the period 23,234 23,111 Currency translation adjustment and others 8 123 At the end of the year 23,242 23,234
C. Fair value estimation Financial assets or liabilities classified as assets at fair value through profit or loss are measured under the framework established by the IASB accounting guidance for fair value measurements and disclosures. The fair values of quoted investments are generally based on current bid prices. If the market for a financial asset is not active or no market is available, fair values are established using standard valuation techniques. Some of Tenaris’s investments are designated as held to maturity and measured at amortized cost. Tenaris estimates that the fair value of these financial assets is 100.8% and 99% of its carrying amount including interests accrued as of December 31, 2016 and 2015 respectively. The fair value of all outstanding derivatives is determined using specific pricing models that include inputs that are observable in the market or can be derived from or corroborated by observable data. The fair value of forward foreign exchange contracts is calculated as the net present value of the estimated future cash flows in each currency, based on observable yield curves, converted into U.S. dollars at the spot rate of the valuation date.
Borrowings are comprised primarily of fixed rate debt and variable rate debt with a short term portion where interest has already been fixed. They are classified under other financial liabilities and measured at their amortized cost. Tenaris estimates that the fair value of its main financial liabilities is approximately 99.7% of its carrying amount including interests accrued in 2016 as compared with 99% in 2015. Fair values were calculated using standard valuation techniques for floating rate instruments and comparable market rates for discounting flows.

Tenaris S.A. Consolidated Financial Statements for the years ended December 31, 2016, 2015 and 2014
- 25 -
D. Accounting for derivative financial instruments and hedging activities Derivative financial instruments are initially recognized in the statement of financial position at fair value through profit and loss on each date a derivative contract is entered into and are subsequently remeasured at fair value. Specific tools are used for calculation of each instrument’s fair value and these tools are tested for consistency on a monthly basis. Market rates are used for all pricing operations. These include exchange rates, deposit rates and other discount rates matching the nature of each underlying risk.
As a general rule, Tenaris recognizes the full amount related to the change in fair value of derivative financial instruments in Financial results in the Consolidated Income Statement.
Tenaris designates certain derivatives as hedges of particular risks associated with recognized assets or liabilities or highly probable forecast transactions. These transactions (mainly currency forward contracts on highly probable forecast transactions) are classified as cash flow hedges. The effective portion of the fair value of derivatives that are designated and qualify as cash flow hedges is recognized in equity. Amounts accumulated in equity are then recognized in the income statement in the same period as the offsetting losses and gains on the hedged item. The gain or loss relating to the ineffective portion is recognized immediately in the income statement. The fair value of Tenaris’s derivative financial instruments (assets or liabilities) continues to be reflected in the statement of financial position. The full fair value of a hedging derivative is classified as a current or non-current asset or liability according to its expiry date. For transactions designated and qualifying for hedge accounting, Tenaris documents at the inception of the transaction the relationship between hedging instruments and hedged items, as well as its risk management objectives and strategy for undertaking various hedge transactions. Tenaris also documents its assessment on an ongoing basis, of whether the derivatives that are used in hedging transactions are highly effective in offsetting changes in the fair value or cash flow of hedged items. At December 31, 2016 and 2015, the effective portion of designated cash flow hedges which is included in “Other Reserves” in equity amounts to $4.7 million debit and $2.8 million credit respectively (see Note 24 Derivative financial instruments). The fair values of various derivative instruments used for hedging purposes are disclosed in Note 24. Movements in the hedging reserve included within “Other Reserves” in equity are also shown in Note 24.

Tenaris S.A. Consolidated Financial Statements for the years ended December 31, 2016, 2015 and 2014
- 26 -
IV. OTHER NOTES TO THE CONSOLIDATED FINANCIAL STATEMENTS (In the notes all amounts are shown in thousands of U.S. dollars, unless otherwise stated) 1 Segment information
As mentioned in section II. AP – C, the Segment Information is disclosed as follows:
Reportable operating segments
(all amounts in thousands of U.S. dollars)
Year ended December 31, 2016 Tubes Other
Total continuing operations
Total discontinued operations
IFRS - Net Sales 4,015,491 278,101 4,293,592 234,911 Management View - Operating income 19,630 18,817 38,447 62,298
· Differences in cost of sales and others (118,381) (6,962) (125,343) 3,540 · Differences in depreciation and amortization 27,640 199 27,839 -
IFRS - Operating (loss) income (71,111) 12,054 (59,057) 65,838 Financial income (expense), net 21,954 (88) (Loss) income before equity in earnings of non-consolidated companies and income tax (37,103) 65,750 Equity in earnings of non-consolidated companies 71,533 - Income before income tax 34,430 65,750
Capital expenditures 751,854 33,108 784,962 1,911 Depreciation and amortization 642,896 14,213 657,109 5,303
(all amounts in thousands of U.S. dollars)
Year ended December 31, 2015 Tubes Other
Total continuing operations
Total discontinued operations
IFRS - Net Sales 6,443,814 459,309 6,903,123 197,630 Management View - Operating income 685,870 27,884 713,754 38,547
· Differences in cost of sales and others (228,948) (880) (229,828) (8,914) · Differences in impairment / Depreciation and amortization (319,293) 1,162 (318,131) -
IFRS - Operating income 137,629 28,166 165,795 29,633 Financial income (expense), net
14,592 (382)
Income before equity in earnings of non-consolidated companies and income tax 180,387 29,251 Equity in losses of non-consolidated companies (39,558) - Income before income tax 140,829 29,251 Capital expenditures 1,088,901 41,412 1,130,313 1,206 Depreciation and amortization 638,456 14,857 653,313 5,465
(all amounts in thousands of U.S. dollars)
Year ended December 31, 2014 Tubes Other
Total continuing operations
Total discontinued operations
IFRS - Net Sales 9,581,615 559,844 10,141,459 196,503 Management View - Operating income 2,022,429 10,568 2,032,997 17,167
· Differences in cost of sales and others (35,463) 4,080 (31,383) 1,117 · Differences in impairment / Depreciation and amortization (121,289) 207 (121,082) -
IFRS - Operating income 1,865,677 14,855 1,880,532 18,284 Financial income (expense), net 33,398 (361) Income before equity in earnings of non-consolidated companies and income tax 1,913,930 17,923 Equity in losses of non-consolidated companies (164,616) - Income before income tax 1,749,314 17,923
Capital expenditures 1,051,148 36,989 1,088,137 1,236 Depreciation and amortization 593,671 15,976 609,647 5,982
Transactions between segments, which were eliminated in consolidation, are mainly related to sales of scrap, energy, surplus raw materials and others from the Other segment to the Tubes segment for $47,939, $57,468 and $233,863 in 2016, 2015 and 2014, respectively. Net income under Management view amounted to $96.1 million, while under IFRS amounted to $58.7 million income. In addition to the amounts reconciled above, the main differences arise from the impact of functional currencies on financial result, deferred income taxes as well as the result of investment in non-consolidated companies and changes on the valuation of inventories according to cost estimation internally defined.

Tenaris S.A. Consolidated Financial Statements for the years ended December 31, 2016, 2015 and 2014
- 27 -
1 Segment information (Cont.)
Geographical information
(all amounts in thousands of U.S. dollars)
North America
South America
Europe Middle East
& Africa Asia Pacific
Unallocated (*)
Total continuing operations
Total discontinued operations
Year ended December 31, 2016 Net sales 1,320,297 1,210,527 565,173 1,055,994 141,601 - 4,293,592 234,911Total assets 7,467,842 2,803,848 1,925,784 593,649 482,132 578,603 13,851,858 151,417Trade receivables 229,390 204,746 161,291 308,919 50,339 - 954,685 33,620Property, plant and equipment, net 3,652,032 1,237,391 847,318 106,941 158,257 - 6,001,939 41,470Capital expenditures 646,545 59,780 35,270 24,166 19,201 - 784,962 1,911Depreciation and amortization 381,811 128,458 113,875 11,053 21,912 - 657,109 5,303 Year ended December 31, 2015
Net sales 2,668,724 2,132,221 728,815 1,096,688 276,675 - 6,903,123 197,630Total assets 8,625,806 2,931,297 1,877,429 429,317 423,479 512,217 14,799,545 87,429Trade receivables 339,499 396,834 181,084 137,278 52,494 - 1,107,189 27,940Property, plant and equipment, net 3,207,661 1,269,995 907,466 86,181 155,299 - 5,626,602 45,656Capital expenditures 822,396 168,140 82,344 36,867 20,566 - 1,130,313 1,206Depreciation and amortization 385,189 125,754 112,742 9,912 19,716 - 653,313 5,465
Year ended December 31, 2014 Net sales 4,782,113 2,124,607 979,042 1,843,778 411,919 - 10,141,459 196,503Total assets 9,433,050 3,340,973 1,857,285 598,175 498,694 665,202 16,393,379 117,299Trade receivables 709,294 554,542 259,115 340,880 74,993 - 1,938,824 24,570Property, plant and equipment, net 2,903,848 1,303,162 683,283 60,354 158,995 - 5,109,642 49,915Capital expenditures 609,016 338,995 111,232 10,891 18,003 - 1,088,137 1,236Depreciation and amortization 339,203 120,905 119,226 10,154 20,159 - 609,647 5,982
There are no revenues from external customers attributable to the Company’s country of incorporation (Luxembourg). For geographical information purposes, “North America” comprises Canada, Mexico and the USA (24.8%); “South America” comprises principally Argentina (16.5%), Brazil and Colombia; “Europe” comprises principally Italy, Norway and Romania; “Middle East and Africa” comprises principally Kuwait, Nigeria, Egypt and Saudi Arabia and; “Asia Pacific” comprises principally China, Japan and Indonesia. (*) Includes Investments in non-consolidated companies and Available for sale assets for $21.6 million in 2016, 2015 and 2014 (see Note 12 and 31).
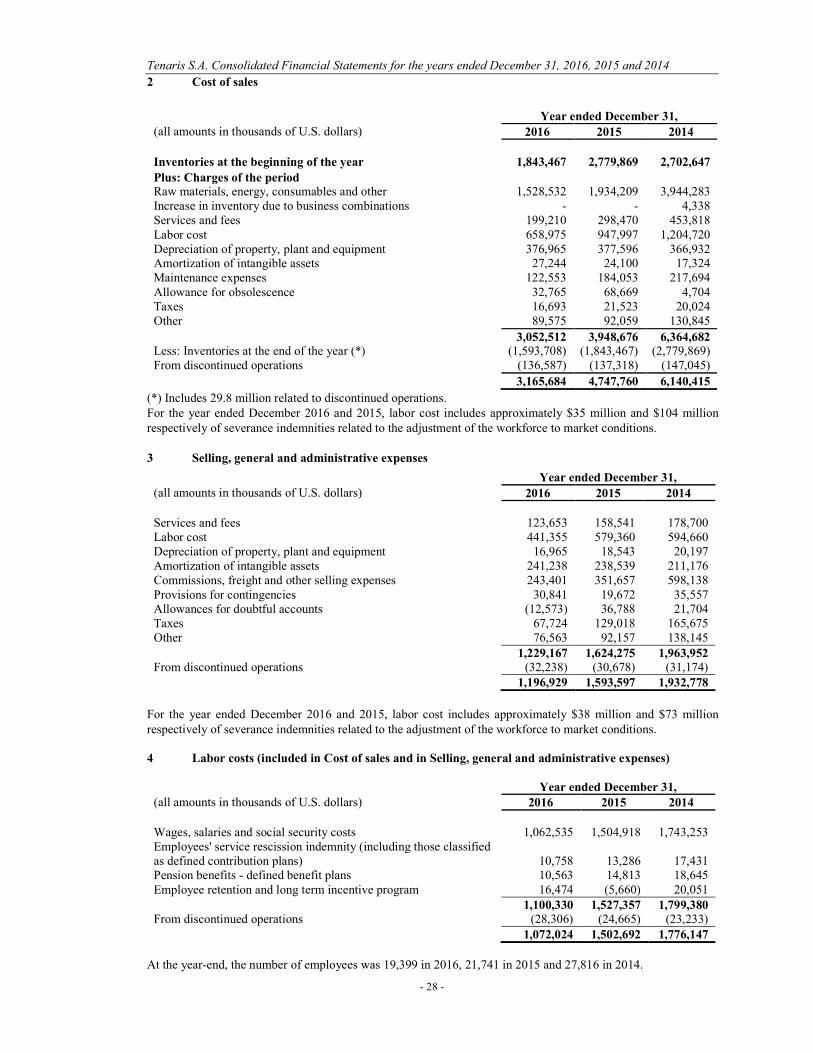
Tenaris S.A. Consolidated Financial Statements for the years ended December 31, 2016, 2015 and 2014
- 28 -
2 Cost of sales
Year ended December 31, (all amounts in thousands of U.S. dollars) 2016 2015 2014
Inventories at the beginning of the year 1,843,467 2,779,869 2,702,647
Plus: Charges of the period Raw materials, energy, consumables and other 1,528,532 1,934,209 3,944,283 Increase in inventory due to business combinations - - 4,338 Services and fees 199,210 298,470 453,818 Labor cost 658,975 947,997 1,204,720 Depreciation of property, plant and equipment 376,965 377,596 366,932 Amortization of intangible assets 27,244 24,100 17,324 Maintenance expenses 122,553 184,053 217,694 Allowance for obsolescence 32,765 68,669 4,704 Taxes 16,693 21,523 20,024 Other 89,575 92,059 130,845
3,052,512 3,948,676 6,364,682 Less: Inventories at the end of the year (*) (1,593,708) (1,843,467) (2,779,869) From discontinued operations (136,587) (137,318) (147,045)
3,165,684 4,747,760 6,140,415
(*) Includes 29.8 million related to discontinued operations. For the year ended December 2016 and 2015, labor cost includes approximately $35 million and $104 million respectively of severance indemnities related to the adjustment of the workforce to market conditions. 3 Selling, general and administrative expenses
Year ended December 31, (all amounts in thousands of U.S. dollars) 2016 2015 2014
Services and fees 123,653 158,541 178,700 Labor cost 441,355 579,360 594,660 Depreciation of property, plant and equipment 16,965 18,543 20,197 Amortization of intangible assets 241,238 238,539 211,176 Commissions, freight and other selling expenses 243,401 351,657 598,138 Provisions for contingencies 30,841 19,672 35,557 Allowances for doubtful accounts (12,573) 36,788 21,704 Taxes 67,724 129,018 165,675 Other 76,563 92,157 138,145
1,229,167 1,624,275 1,963,952 From discontinued operations (32,238) (30,678) (31,174)
1,196,929 1,593,597 1,932,778
For the year ended December 2016 and 2015, labor cost includes approximately $38 million and $73 million respectively of severance indemnities related to the adjustment of the workforce to market conditions. 4 Labor costs (included in Cost of sales and in Selling, general and administrative expenses)
Year ended December 31, (all amounts in thousands of U.S. dollars) 2016 2015 2014
Wages, salaries and social security costs 1,062,535 1,504,918 1,743,253 Employees' service rescission indemnity (including those classified as defined contribution plans) 10,758 13,286 17,431 Pension benefits - defined benefit plans 10,563 14,813 18,645 Employee retention and long term incentive program 16,474 (5,660) 20,051
1,100,330 1,527,357 1,799,380 From discontinued operations (28,306) (24,665) (23,233)
1,072,024 1,502,692 1,776,147
At the year-end, the number of employees was 19,399 in 2016, 21,741 in 2015 and 27,816 in 2014.

Tenaris S.A. Consolidated Financial Statements for the years ended December 31, 2016, 2015 and 2014
- 29 -
4 Labor costs (included in Cost of sales and in Selling, general and administrative expenses) (Cont.) The following table shows the geographical distribution of the employees:
Country 2016 2015 2014 Argentina 4,755 5,388 6,421 Mexico 4,968 5,101 5,518 Brazil 1,166 2,050 3,835 USA 1,636 2,190 3,549 Italy 1,979 2,030 2,352 Romania 1,631 1,624 1,725 Canada 473 546 1,225 Indonesia 509 532 677 Colombia 750 636 614 Japan 458 508 588 Other 1,074 1,136 1,312
19,399 21,741 27,816
From discontinued operations (323) (292) (267) 19,076 21,449 27,549
5 Other operating income and expenses
Year ended December 31, (all amounts in thousands of U.S. dollars) 2016 2015 2014
Other operating income
Net income from other sales 16,275 7,480 8,843 Net rents 4,852 6,462 4,041 Other - 661 14,971
21,127 14,603 27,855
Other operating expenses Contributions to welfare projects and non-profits organizations 9,534 9,052 9,961 Provisions for legal claims and contingencies 10 1 (760) Loss on fixed assets and material supplies disposed / scrapped 57 94 203 Impairment charge - 400,314 205,849 Allowance for doubtful receivables 432 1,114 336 Other 1,378 - -
11,411 410,575 215,589
From discontinued operations (248) (1) - 11,163 410,574 215,589
Impairment charge Tenaris regularly conducts assessments of the carrying values of its assets. The value-in-use was used to determine the recoverable value. Value-in-use is calculated by discounting the estimated cash flows over a five year period based on forecasts approved by management. For the subsequent years beyond the five-year period, a terminal value is calculated based on perpetuity considering a nominal growth rate of 2%. The growth rate considers the long-term average growth rate for the oil and gas industry, the higher demand to offset depletion of existing fields and the Company’s expected market penetration. Tenaris’s main source of revenue is the sale of products and services to the oil and gas industry and the level of such sales is sensitive to international oil and gas prices and their impact on drilling activities. For purposes of assessing key assumptions, Tenaris uses external sources of information and management judgment based on past experience. The main key assumptions, used in estimating the value in use are discount rate, growth rate and competitive and economic factors applied to determine Tenaris’s cash flow projections, such as the cost of raw materials, oil and gas prices, competitive environment, capital expenditure programs for Tenaris’s customers and the evolution of the rig count. The discount rates used are based on the respective weighted average cost of capital (WACC) which is considered to be a good indicator of capital cost. For each CGU where assets are allocated, a specific WACC was determined taking into account the industry, country and size of the business. In 2016, the main discount rates used were in a range between 9.1% and 10.9%.
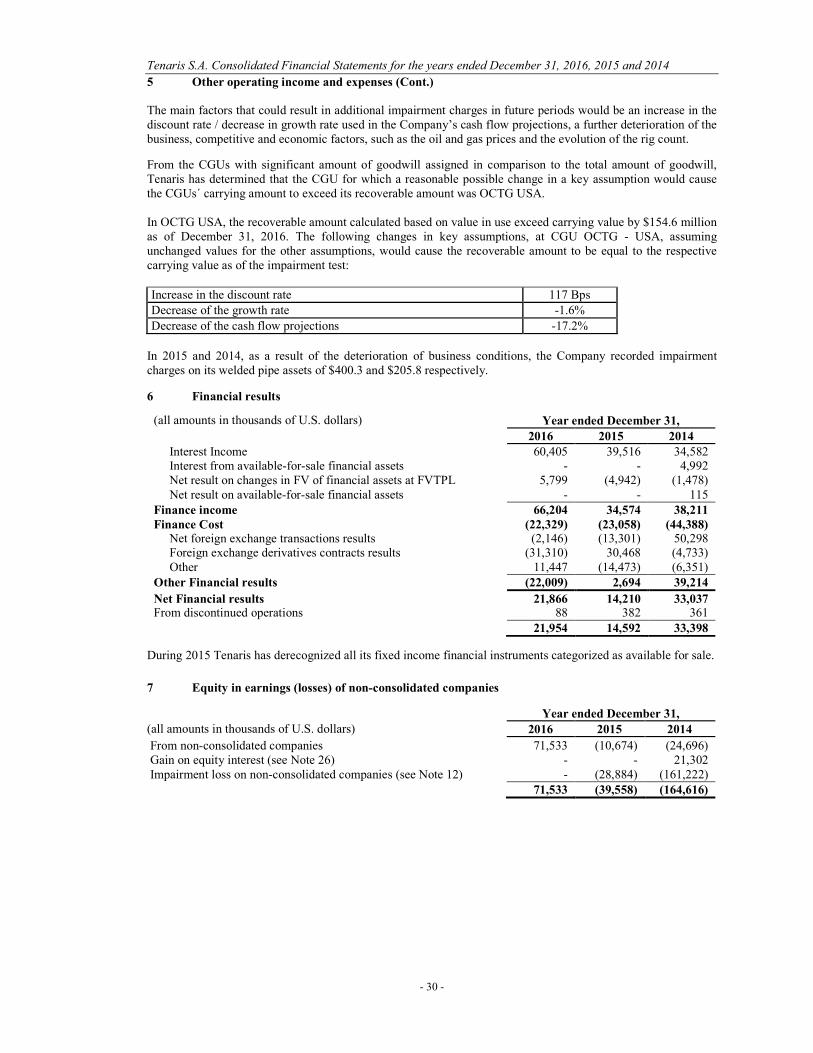
Tenaris S.A. Consolidated Financial Statements for the years ended December 31, 2016, 2015 and 2014
- 30 -
5 Other operating income and expenses (Cont.) The main factors that could result in additional impairment charges in future periods would be an increase in the discount rate / decrease in growth rate used in the Company’s cash flow projections, a further deterioration of the business, competitive and economic factors, such as the oil and gas prices and the evolution of the rig count. From the CGUs with significant amount of goodwill assigned in comparison to the total amount of goodwill, Tenaris has determined that the CGU for which a reasonable possible change in a key assumption would cause the CGUs´ carrying amount to exceed its recoverable amount was OCTG USA. In OCTG USA, the recoverable amount calculated based on value in use exceed carrying value by $154.6 million as of December 31, 2016. The following changes in key assumptions, at CGU OCTG - USA, assuming unchanged values for the other assumptions, would cause the recoverable amount to be equal to the respective carrying value as of the impairment test: Increase in the discount rate 117 Bps Decrease of the growth rate -1.6%
Decrease of the cash flow projections -17.2%
In 2015 and 2014, as a result of the deterioration of business conditions, the Company recorded impairment charges on its welded pipe assets of $400.3 and $205.8 respectively. 6 Financial results
(all amounts in thousands of U.S. dollars) Year ended December 31, 2016 2015 2014 Interest Income 60,405 39,516 34,582 Interest from available-for-sale financial assets - - 4,992 Net result on changes in FV of financial assets at FVTPL 5,799 (4,942) (1,478) Net result on available-for-sale financial assets - - 115 Finance income 66,204 34,574 38,211 Finance Cost (22,329) (23,058) (44,388) Net foreign exchange transactions results (2,146) (13,301) 50,298 Foreign exchange derivatives contracts results (31,310) 30,468 (4,733) Other 11,447 (14,473) (6,351) Other Financial results (22,009) 2,694 39,214
Net Financial results 21,866 14,210 33,037 From discontinued operations 88 382 361
21,954 14,592 33,398 During 2015 Tenaris has derecognized all its fixed income financial instruments categorized as available for sale.
7 Equity in earnings (losses) of non-consolidated companies Year ended December 31, (all amounts in thousands of U.S. dollars) 2016 2015 2014 From non-consolidated companies 71,533 (10,674) (24,696) Gain on equity interest (see Note 26) - - 21,302 Impairment loss on non-consolidated companies (see Note 12) - (28,884) (161,222)
71,533 (39,558) (164,616)

Tenaris S.A. Consolidated Financial Statements for the years ended December 31, 2016, 2015 and 2014
- 31 -
8 Income tax
Year ended December 31,
(all amounts in thousands of U.S. dollars) 2016 2015 2014 Current tax 174,410 164,562 695,136 Deferred tax (132,969) 79,943 (109,075)
41,441 244,505 586,061
From discontinued operations (24,339) (10,121) (5,630) 17,102 234,384 580,431
The tax on Tenaris’s income before tax differs from the theoretical amount that would arise using the tax rate in each country as follows:
Year ended December 31,
(all amounts in thousands of U.S. dollars) 2016 2015 2014 Income before income tax 34,430 140,829 1,749,314
Tax calculated at the tax rate in each country (*) (91,628) (71,588) 307,193 Non taxable income / Non deductible expenses, net (*) 51,062 149,632 132,442 Changes in the tax rates 4,720 6,436 3,249 Effect of currency translation on tax base (**) 105,758 151,615 138,925 Accrual / Utilization of previously unrecognized tax losses (***) (52,810) (1,711) (1,378)
Tax charge 17,102 234,384 580,431 (*) Include the effect of the impairment charges of approximately $400.3 million and $205.8 million in 2015 and 2014, respectively. (**) Tenaris applies the liability method to recognize deferred income tax on temporary differences between the tax basis of assets and their
carrying amounts in the financial statements. By application of this method, Tenaris recognizes gains and losses on deferred income tax due to the effect of the change in the value on the tax basis in subsidiaries (mainly Mexican, Colombia and Argentinian), which have a functional currency different than their local currency. These gains and losses are required by IFRS even though the revalued / devalued tax basis of the relevant assets will not result in any deduction / obligation for tax purposes in future periods.
(***) It includes a deferred tax income of approximately $45 million booked in the last quarter of 2016 related to a capital loss generated
from the dissolution of some companies which effects can be carried forward and used to offset any future capital gains in the United States.
9 Dividends distribution On November 3, 2016, the Company’s Board of Directors approved the payment of an interim dividend of $0.13 per share ($0.26 per ADS), or approximately $153 million, paid on November 23, 2016, with an ex-dividend date of November 21, 2016. On May 4, 2016 the Company’s Shareholders approved an annual dividend in the amount of $0.45 per share ($0.90 per ADS). The amount approved included the interim dividend previously paid in November 25, 2015 in the amount of $0.15 per share ($0.30 per ADS). The balance, amounting to $0.30 per share ($0.60 per ADS), was paid on May 25, 2016. In the aggregate, the interim dividend paid in November 2015 and the balance paid in May 2016 amounted to approximately $531.2 million. On May 6, 2015 the Company’s Shareholders approved an annual dividend in the amount of $0.45 per share ($0.90 per ADS). The amount approved included the interim dividend previously paid in November 27, 2014 in the amount of $0.15 per share ($0.30 per ADS). The balance, amounting to $0.30 per share ($0.60 per ADS), was paid on May 20, 2015. In the aggregate, the interim dividend paid in November 2014 and the balance paid in May 2015 amounted to approximately $531.2 million. On May 7, 2014 the Company’s Shareholders approved an annual dividend in the amount of $0.43 per share ($0.86 per ADS). The amount approved included the interim dividend previously paid in November 21, 2013 in the amount of $0.13 per share ($0.26 per ADS). The balance, amounting to $0.30 per share ($0.60 per ADS), was paid on May 22, 2014. In the aggregate, the interim dividend paid in November 2013 and the balance paid in May 2014 amounted to approximately $507.6 million.

Tenaris S.A. Consolidated Financial Statements for the years ended December 31, 2016, 2015 and 2014
- 32 -
10 Property, plant and equipment, net
Year ended December 31, 2016
Land, building and
improvements
Plant and production equipment
Vehicles, furniture
and fixtures
Work in progress
Spare parts and equipment Total
Cost Values at the beginning of the year 1,766,103 8,419,792 366,972 1,217,682 32,651 11,803,200
Translation differences 10,483 (2,284) 3,716 2,604 (290) 14,229 Additions (*) 572 1,445 747 750,075 4,656 757,495 Disposals / Consumptions (5,774) (22,306) (11,037) (4,852) (2,494) (46,463) Transfer to assets held for sale (34,849) (61,380) (1,103) (1,407) (177) (98,916)
Transfers / Reclassifications 100,079 356,420 13,694 (474,063) 1,640 (2,230) Values at the end of the year 1,836,614 8,691,687 372,989 1,490,039 35,986 12,427,315
Depreciation and impairment Accumulated at the beginning of the year 455,499 5,432,715 228,966 - 13,762 6,130,942
Translation differences 2,240 (6,087) 2,953 - (358) (1,252) Depreciation charge 46,150 324,886 22,361 - 533 393,930 Transfers / Reclassifications 2,856 (6,761) (333) - (3,396) (7,634)
Transfer to assets held for sale (8,552) (47,928) (966) - - (57,446) Disposals / Consumptions (3,064) (21,228) (8,872) - - (33,164) Accumulated at the end of the year 495,129 5,675,597 244,109 - 10,541 6,425,376 At December 31, 2016 1,341,485 3,016,090 128,880 1,490,039 25,445 6,001,939
Year ended December 31, 2015
Land, building and
improvements
Plant and production equipment
Vehicles, furniture
and fixtures
Work in progress
Spare parts and
equipment Total
Cost Values at the beginning of the year 1,633,797 8,233,902 359,554 846,538 38,075 11,111,866
Translation differences (28,711) (250,470) (9,382) (10,352) (1,919) (300,834) Additions (*) 13,065 16,064 2,022 1,036,818 (2,246) 1,065,723 Disposals / Consumptions (1,892) (55,452) (8,940) (5,691) (285) (72,260) Transfers / Reclassifications 149,844 475,748 23,718 (649,631) (974) (1,295) Values at the end of the year 1,766,103 8,419,792 366,972 1,217,682 32,651 11,803,200
Depreciation and impairment Accumulated at the beginning of the year 418,210 5,301,765 216,982 - 15,352 5,952,309 Translation differences (8,956) (135,538) (7,528) - (1,093) (153,115) Depreciation charge 45,644 325,241 24,313 - 941 396,139 Transfers / Reclassifications 2,474 (4,114) 1,987 - (1,485) (1,138) Disposals / Consumptions (1,873) (54,639) (6,788) - 47 (63,253) Accumulated at the end of the year 455,499 5,432,715 228,966 - 13,762 6,130,942 At December 31, 2015 1,310,604 2,987,077 138,006 1,217,682 18,889 5,672,258
Property, plant and equipment include capitalized interests for net amounts at December 31, 2016 and 2015 of $25.4 million and $15.5 million, respectively. The average capitalization interest rates applied were 1.28% during 2016 and 1.53% during 2015.
(*) The increase is mainly due to progress in the construction of the greenfield seamless facility in Bay City, Texas.
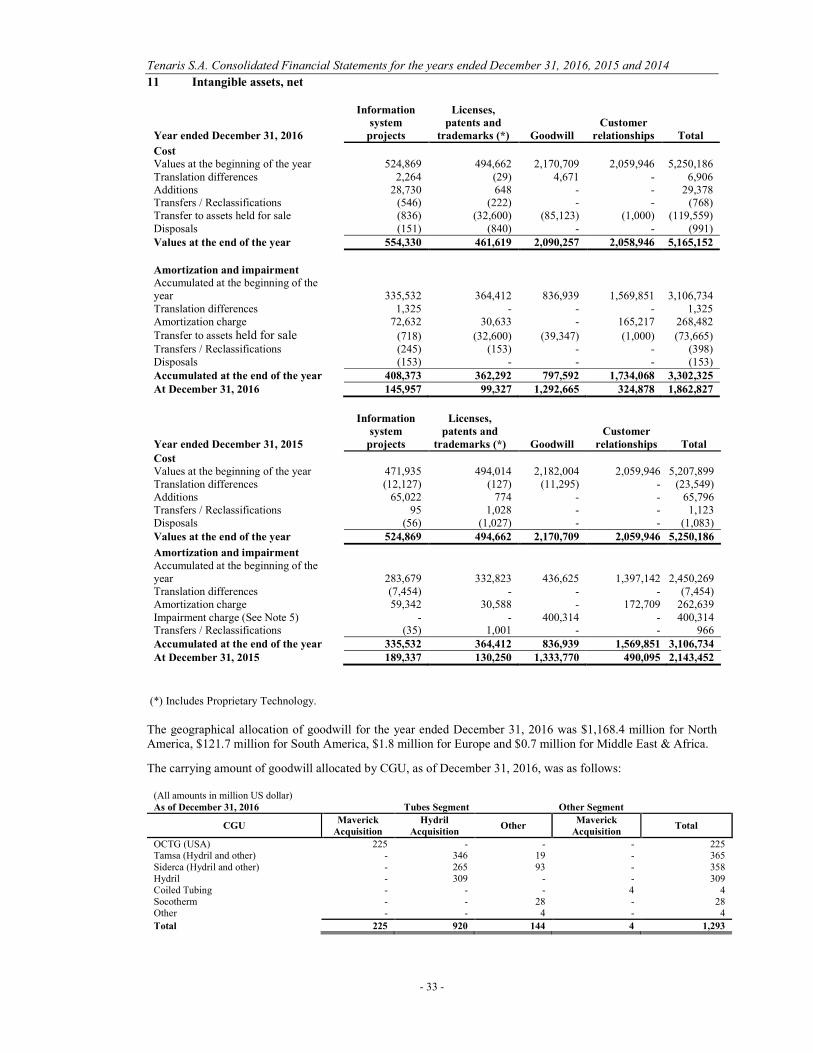
Tenaris S.A. Consolidated Financial Statements for the years ended December 31, 2016, 2015 and 2014
- 33 -
11 Intangible assets, net
Year ended December 31, 2016
Information system
projects
Licenses, patents and
trademarks (*) Goodwill Customer
relationships Total
Cost Values at the beginning of the year 524,869 494,662 2,170,709 2,059,946 5,250,186 Translation differences 2,264 (29) 4,671 - 6,906 Additions 28,730 648 - - 29,378 Transfers / Reclassifications (546) (222) - - (768) Transfer to assets held for sale (836) (32,600) (85,123) (1,000) (119,559) Disposals (151) (840) - - (991) Values at the end of the year 554,330 461,619 2,090,257 2,058,946 5,165,152
Amortization and impairment Accumulated at the beginning of the year 335,532 364,412 836,939 1,569,851 3,106,734 Translation differences 1,325 - - - 1,325 Amortization charge 72,632 30,633 - 165,217 268,482 Transfer to assets held for sale (718) (32,600) (39,347) (1,000) (73,665) Transfers / Reclassifications (245) (153) - - (398) Disposals (153) - - - (153) Accumulated at the end of the year 408,373 362,292 797,592 1,734,068 3,302,325 At December 31, 2016 145,957 99,327 1,292,665 324,878 1,862,827
Year ended December 31, 2015
Information system
projects
Licenses, patents and
trademarks (*) Goodwill Customer
relationships Total
Cost Values at the beginning of the year 471,935 494,014 2,182,004 2,059,946 5,207,899 Translation differences (12,127) (127) (11,295) - (23,549) Additions 65,022 774 - - 65,796 Transfers / Reclassifications 95 1,028 - - 1,123 Disposals (56) (1,027) - - (1,083) Values at the end of the year 524,869 494,662 2,170,709 2,059,946 5,250,186
Amortization and impairment Accumulated at the beginning of the year 283,679 332,823 436,625 1,397,142 2,450,269 Translation differences (7,454) - - - (7,454) Amortization charge 59,342 30,588 - 172,709 262,639 Impairment charge (See Note 5) - - 400,314 - 400,314 Transfers / Reclassifications (35) 1,001 - - 966 Accumulated at the end of the year 335,532 364,412 836,939 1,569,851 3,106,734 At December 31, 2015 189,337 130,250 1,333,770 490,095 2,143,452
(*) Includes Proprietary Technology.
The geographical allocation of goodwill for the year ended December 31, 2016 was $1,168.4 million for North America, $121.7 million for South America, $1.8 million for Europe and $0.7 million for Middle East & Africa. The carrying amount of goodwill allocated by CGU, as of December 31, 2016, was as follows:
(All amounts in million US dollar) As of December 31, 2016 Tubes Segment Other Segment
CGU Maverick
Acquisition Hydril
Acquisition Other
Maverick Acquisition
Total
OCTG (USA) 225 - - - 225 Tamsa (Hydril and other) - 346 19 - 365 Siderca (Hydril and other) - 265 93 - 358 Hydril - 309 - - 309 Coiled Tubing - - - 4 4 Socotherm - - 28 - 28 Other - - 4 - 4
Total 225 920 144 4 1,293
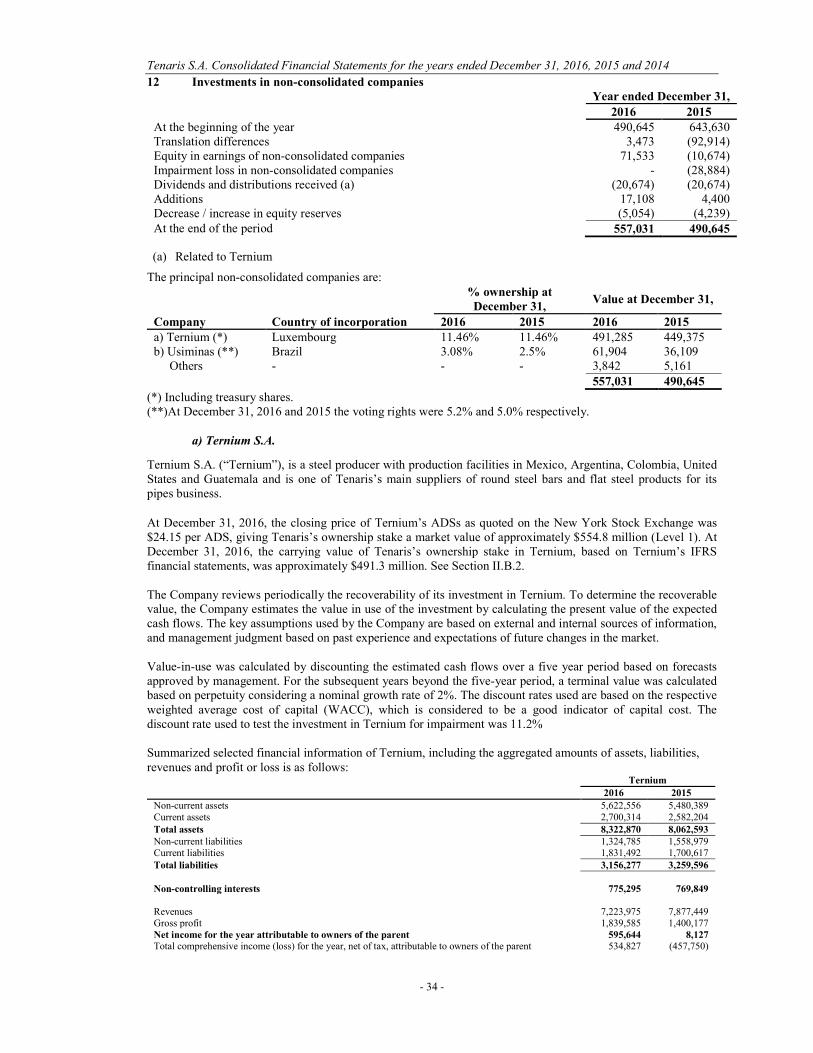
Tenaris S.A. Consolidated Financial Statements for the years ended December 31, 2016, 2015 and 2014
- 34 -
12 Investments in non-consolidated companies Year ended December 31, 2016 2015 At the beginning of the year 490,645 643,630 Translation differences 3,473 (92,914) Equity in earnings of non-consolidated companies 71,533 (10,674) Impairment loss in non-consolidated companies - (28,884) Dividends and distributions received (a) (20,674) (20,674) Additions 17,108 4,400 Decrease / increase in equity reserves (5,054) (4,239) At the end of the period 557,031 490,645
(a) Related to Ternium
The principal non-consolidated companies are: % ownership at December 31,
Value at December 31,
Company Country of incorporation 2016 2015 2016 2015 a) Ternium (*) Luxembourg 11.46% 11.46% 491,285 449,375 b) Usiminas (**) Brazil 3.08% 2.5% 61,904 36,109 Others - - - 3,842 5,161
557,031 490,645
(*) Including treasury shares. (**)At December 31, 2016 and 2015 the voting rights were 5.2% and 5.0% respectively.
a) Ternium S.A. Ternium S.A. (“Ternium”), is a steel producer with production facilities in Mexico, Argentina, Colombia, United States and Guatemala and is one of Tenaris’s main suppliers of round steel bars and flat steel products for its pipes business.
At December 31, 2016, the closing price of Ternium’s ADSs as quoted on the New York Stock Exchange was $24.15 per ADS, giving Tenaris’s ownership stake a market value of approximately $554.8 million (Level 1). At December 31, 2016, the carrying value of Tenaris’s ownership stake in Ternium, based on Ternium’s IFRS financial statements, was approximately $491.3 million. See Section II.B.2. The Company reviews periodically the recoverability of its investment in Ternium. To determine the recoverable value, the Company estimates the value in use of the investment by calculating the present value of the expected cash flows. The key assumptions used by the Company are based on external and internal sources of information, and management judgment based on past experience and expectations of future changes in the market. Value-in-use was calculated by discounting the estimated cash flows over a five year period based on forecasts approved by management. For the subsequent years beyond the five-year period, a terminal value was calculated based on perpetuity considering a nominal growth rate of 2%. The discount rates used are based on the respective weighted average cost of capital (WACC), which is considered to be a good indicator of capital cost. The discount rate used to test the investment in Ternium for impairment was 11.2% Summarized selected financial information of Ternium, including the aggregated amounts of assets, liabilities, revenues and profit or loss is as follows:
Ternium
2016 2015
Non-current assets 5,622,556 5,480,389 Current assets 2,700,314 2,582,204 Total assets 8,322,870 8,062,593 Non-current liabilities 1,324,785 1,558,979 Current liabilities 1,831,492 1,700,617 Total liabilities 3,156,277 3,259,596
Non-controlling interests 775,295 769,849 Revenues 7,223,975 7,877,449 Gross profit 1,839,585 1,400,177 Net income for the year attributable to owners of the parent 595,644 8,127 Total comprehensive income (loss) for the year, net of tax, attributable to owners of the parent 534,827 (457,750)

Tenaris S.A. Consolidated Financial Statements for the years ended December 31, 2016, 2015 and 2014
- 35 -
12 Investments in non-consolidated companies (Cont.)
b) Usiminas S.A. Usiminas is a Brazilian producer of high quality flat steel products used in the energy, automotive and other industries and it is Tenaris’s principal supplier of flat steel in Brazil for its pipes and industrial equipment businesses. As of December 31, 2016 the closing price of the Usiminas’ ordinary and preferred shares, as quoted on the BM&FBovespa Stock Exchange, was BRL8.26 ($2.53) and BRL4.1 ($1.26), respectively, giving Tenaris’s ownership stake a market value of approximately $94.1 million (Level 1). As that date, the carrying value of Tenaris’s ownership stake in Usiminas was approximately $61.9 million. The Company reviews periodically the recoverability of its investment in Usiminas. To determine the recoverable value, the Company estimates the value in use of the investment by calculating the present value of the expected cash flows. There is a significant interaction among the principal assumptions made in estimating Usiminas’ cash flow projections, which include iron ore and steel prices, foreign exchange and interest rates, Brazilian GDP and steel consumption in the Brazilian market. The key assumptions used by the Company are based on external and internal sources of information, and management judgment based on past experience and expectations of future changes in the market. During 2015 and 2014 the Company recorded an impairment charge of $28.9 million and $161.2 million respectively. Summarized selected financial information of Usiminas, including the aggregated amounts of assets, liabilities, revenues and profit or loss is as follows:
Usiminas
2016 2015
Non-current assets 6,085,811 5,343,038 Current assets 1,970,015 1,765,733 Total assets 8,055,826 7,108,771 Non-current liabilities 2,856,883 2,117,536 Current liabilities 537,646 1,151,383 Total liabilities 3,394,529 3,268,919
Non-controlling interests 508,083 405,880 Revenues 2,442,596 3,115,551 Gross profit 150,999 70,801 Net loss for the year attributable to owners of the parent (166,153) (1,053,806)
c) Techgen, S.A. de C.V. (“Techgen”)
Techgen is a Mexican natural gas-fired combined cycle electric power plant in the Pesquería area of the State of Nuevo León, Mexico. The company started producing energy on December 1st, 2016 and is fully operational, with a power capacity of between 850 and 900 megawatts. As of December 31, 2016, Tenaris held 22% of Techgen’s share capital, and its affiliates Ternium and Tecpetrol International S.A. (a wholly-owned subsidiary of San Faustin S.A., the controlling shareholder of both Tenaris and Ternium) held 48% and 30% respectively. Techgen is a party to transportation capacity agreements for a purchasing capacity of 150,000 MMBtu/Gas per day starting on August 1, 2016 and ending on July 31, 2036, and a party to a contract for the purchase of power generation equipment and other services related to the equipment. As of December 31, 2016, Tenaris’s exposure under these agreements amounted to $61.3 million and $5.3 million respectively. Tenaris issued a corporate guarantee covering 22% of the obligations of Techgen under a syndicated loan agreement between Techgen and several banks. The loan agreement amounted to $800 million and has been used in the construction of the facility. The main covenants under the corporate guarantee are limitations on the sale of certain assets and compliance with financial ratios (e.g. leverage ratio). As of December 31, 2016, the loan agreement has been fully disbursed for $800 million, as a result, the amount guaranteed by Tenaris was approximately $176 million. During 2016 the shareholders of Techgen made additional investments in Techgen, in term of subsidiary loans, which in case of Tenaris amounted to $42.4 million. As of December 31, 2016 these loans amount to $86.2 million.

Tenaris S.A. Consolidated Financial Statements for the years ended December 31, 2016, 2015 and 2014
- 36 -
13 Receivables – non current
Year ended December 31,
2016 2015 Government entities 913 1,113 Employee advances and loans 7,202 11,485 Tax credits 32,769 25,660 Receivables from related parties 91,419 62,675 Legal deposits 13,876 14,719 Advances to suppliers and other advances 19,520 70,509 Others 32,217 35,515 197,916 221,676 Allowances for doubtful accounts (see Note 22 (i)) (913) (1,112)
197,003 220,564
14 Inventories
Year ended December 31, 2016 2015 Finished goods 653,482 741,437 Goods in process 375,822 407,126 Raw materials 160,284 277,184 Supplies 451,777 503,692 Goods in transit 162,766 143,228 1,804,131 2,072,667 Allowance for obsolescence (see Note 23 (i)) (240,242) (229,200)
1,563,889 1,843,467
15 Receivables and prepayments
Year ended December 31, 2016 2015 Prepaid expenses and other receivables 28,278 29,463 Government entities 3,052 3,498 Employee advances and loans 10,458 10,951 Advances to suppliers and other advances 16,088 27,823 Government tax refunds on exports 9,350 7,053 Receivables from related parties 24,742 14,249 Derivative financial instruments 2,759 18,155 Miscellaneous 36,320 44,736 131,047 155,928 Allowance for other doubtful accounts (see Note 23 (i)) (6,332) (7,082) 124,715 148,846
16 Current tax assets and liabilities
Year ended December 31,
Current tax assets 2016 2015 V.A.T. credits 61,552 60,730 Prepaid taxes 79,434 127,450 140,986 188,180
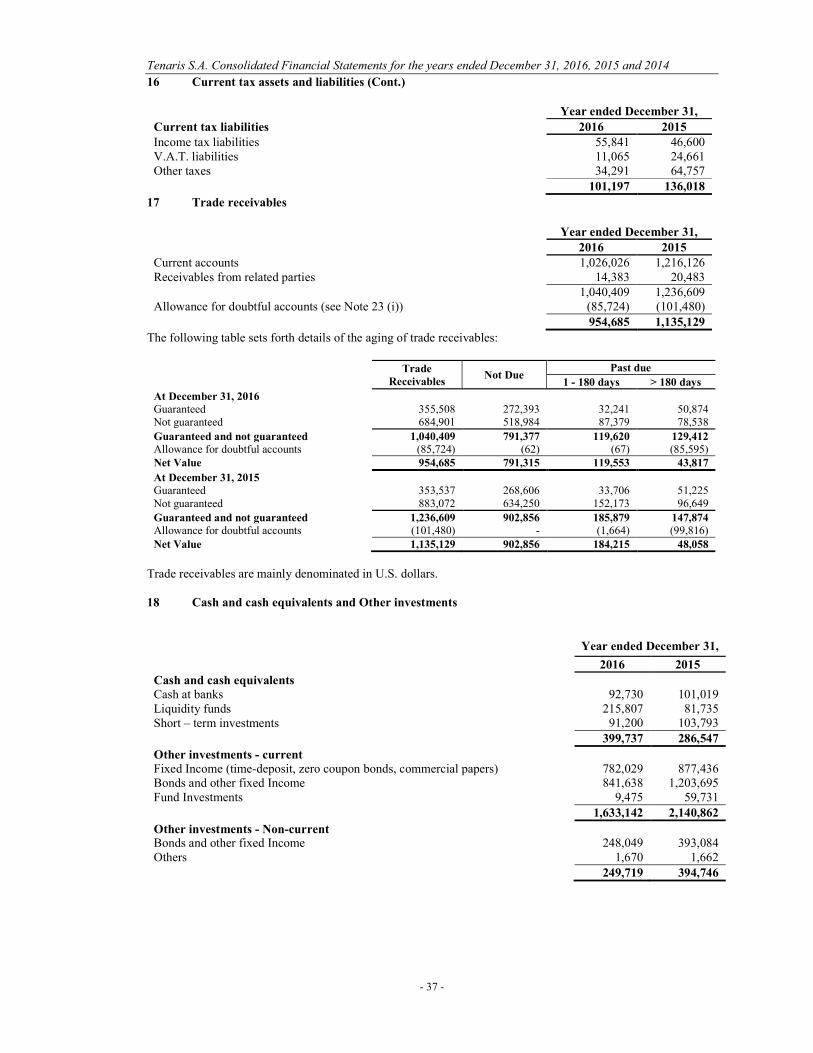
Tenaris S.A. Consolidated Financial Statements for the years ended December 31, 2016, 2015 and 2014
- 37 -
16 Current tax assets and liabilities (Cont.)
Year ended December 31,
Current tax liabilities 2016 2015 Income tax liabilities 55,841 46,600 V.A.T. liabilities 11,065 24,661 Other taxes 34,291 64,757 101,197 136,018
17 Trade receivables
Year ended December 31, 2016 2015 Current accounts 1,026,026 1,216,126 Receivables from related parties 14,383 20,483 1,040,409 1,236,609 Allowance for doubtful accounts (see Note 23 (i)) (85,724) (101,480) 954,685 1,135,129
The following table sets forth details of the aging of trade receivables:
Trade Receivables
Not Due Past due
1 - 180 days > 180 days
At December 31, 2016 Guaranteed 355,508 272,393 32,241 50,874 Not guaranteed 684,901 518,984 87,379 78,538
Guaranteed and not guaranteed 1,040,409 791,377 119,620 129,412 Allowance for doubtful accounts (85,724) (62) (67) (85,595) Net Value 954,685 791,315 119,553 43,817
At December 31, 2015 Guaranteed 353,537 268,606 33,706 51,225 Not guaranteed 883,072 634,250 152,173 96,649
Guaranteed and not guaranteed 1,236,609 902,856 185,879 147,874 Allowance for doubtful accounts (101,480) - (1,664) (99,816) Net Value 1,135,129 902,856 184,215 48,058
Trade receivables are mainly denominated in U.S. dollars.
18 Cash and cash equivalents and Other investments
Year ended December 31,
2016 2015
Cash and cash equivalents Cash at banks 92,730 101,019 Liquidity funds 215,807 81,735 Short – term investments 91,200 103,793 399,737 286,547
Other investments - current Fixed Income (time-deposit, zero coupon bonds, commercial papers) 782,029 877,436 Bonds and other fixed Income 841,638 1,203,695 Fund Investments 9,475 59,731 1,633,142 2,140,862
Other investments - Non-current Bonds and other fixed Income 248,049 393,084 Others 1,670 1,662 249,719 394,746

Tenaris S.A. Consolidated Financial Statements for the years ended December 31, 2016, 2015 and 2014
- 38 -
19 Borrowings
Year ended December 31, 2016 2015 Non-current Bank borrowings 31,544 223,050 Finance lease liabilities 35 171 Costs of issue of debt (37) - 31,542 223,221
Current Bank borrowings and other loans including related companies 807,252 747,704 Bank overdrafts 1,320 349 Finance lease liabilities 130 371 Costs of issue of debt (8) (129) 808,694 748,295
Total Borrowings 840,236 971,516
The maturity of borrowings is as follows:
1 year or less
1 - 2 years
2 – 3 years
3 - 4 years
4 - 5 years
Over 5 years Total
At December 31, 2016 Financial lease 130 35 - - - - 165 Other borrowings 808,564 1,198 3,739 3,360 3,632 19,578 840,071 Total borrowings 808,694 1,233 3,739 3,360 3,632 19,578 840,236
Interest to be accrued (*) 6,461 1,172 1,161 1,142 1,116 237 11,289 Total 815,155 2,405 4,900 4,502 4,748 19,815 851,525
1 year or
less 1 - 2 years
2 – 3 years
3 - 4 years
4 - 5 years
Over 5 years Total
At December 31, 2015 Financial lease 371 138 29 4 - - 542
Other borrowings 747,924 201,152 1,261 1,285 880 18,472 970,974 Total borrowings 748,295 201,290 1,290 1,289 880 18,472 971,516
Interest to be accrued (*) 1,152 1,050 1,031 1,010 990 1,046 6,279
Total 749,447 202,340 2,321 2,299 1,870 19,518 977,795
(*) Includes the effect of hedge accounting.
Significant borrowings include:
In million of USD Disbursement date Borrower Type Original & Outstanding Final maturity
2016 Tamsa Bank loans 391 2017 2015 TuboCaribe Bank loan 200 Jan-17 2016 Siderca Bank loans 198 2017
As of December 31, 2016, Tenaris was in compliance with all of its covenants. The weighted average interest rates before tax shown below were calculated using the rates set for each instrument in its corresponding currency as of December 31, 2016 and 2015 (considering hedge accounting where applicable).
2016 2015 Total borrowings 1.97% 1.52%

Tenaris S.A. Consolidated Financial Statements for the years ended December 31, 2016, 2015 and 2014
- 39 -
19 Borrowings (Cont.) Breakdown of long-term borrowings by currency and rate is as follows: Non-current borrowings
Year ended December 31,
Currency Interest rates 2016 2015 USD Fixed 19,461 219,778 EUR Fixed 10,701 2,922 Others Variable 1,380 521 Total non-current borrowings 31,542 223,221
Breakdown of short-term borrowings by currency and rate is as follows: Current borrowings
Year ended December 31,
Currency Interest rates 2016 2015 USD Variable 17,081 16,046 USD Fixed 200,448 2,482 EUR Variable 99 66 EUR Fixed 841 1,047 MXN Fixed 391,318 614,916 ARS Fixed 197,637 113,326 ARS Variable 1,041 37 Others Variable 35 165 Others Fixed 194 210 Total current borrowings 808,694 748,295
20 Deferred income tax
Deferred income taxes are calculated in full on temporary differences under the liability method using the tax rate of each country.
The evolution of deferred tax assets and liabilities during the year are as follows:
Deferred tax liabilities
Fixed assets
Inventories Intangible
and Other (*) Total
At the beginning of the year 299,139 42,516 549,557 891,212 Translation differences (540) - 44 (496) Charged directly to Other Comprehensive Income - - (40) (40) Transfer to assets held for sale (5,724) (5,724) Income statement credit (29,819) (5,625) (34,848) (70,292) At December 31, 2016 263,056 36,891 514,713 814,660
Fixed assets Inventories Intangible and
Other (*) Total
At the beginning of the year 346,385 44,234 482,446 873,065 Translation differences / reclassifications (28,343) - 11,154 (17,189) Charged directly to Other Comprehensive Income - - 3,999 3,999 Income statement (credit) / charge (18,903) (1,718) 51,958 31,337 At December 31, 2015 299,139 42,516 549,557 891,212
(*) Includes the effect of currency translation on tax base explained in Note 8.
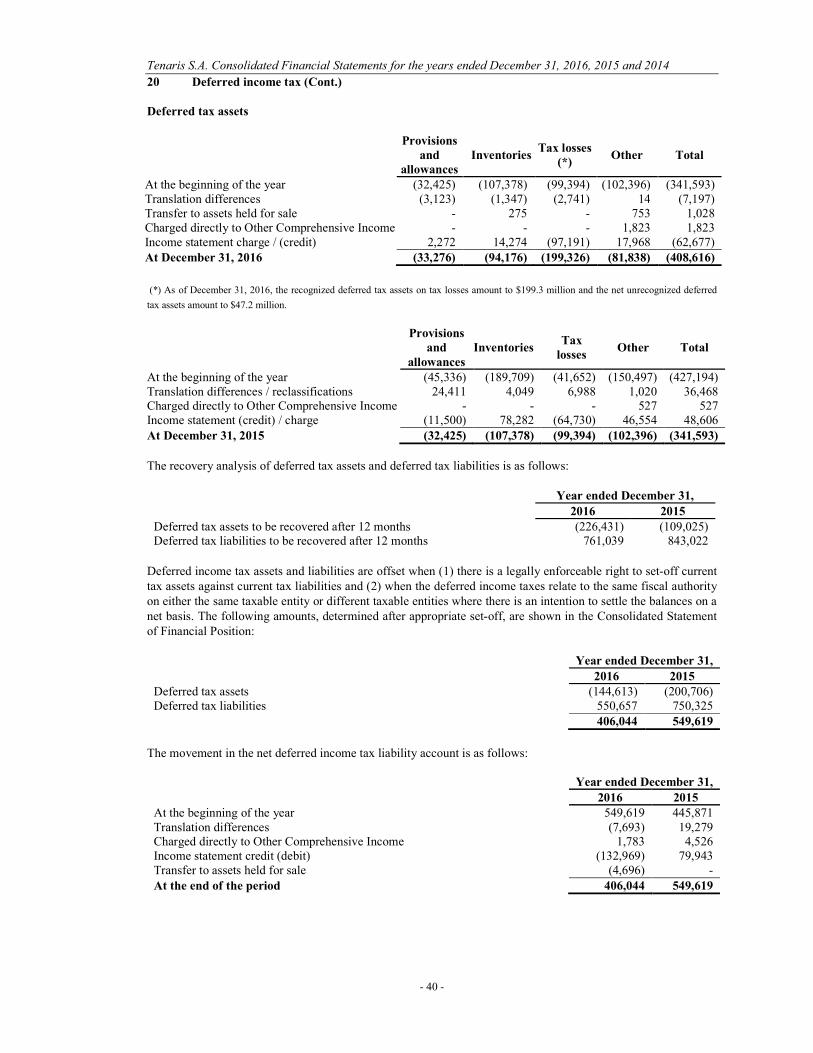
Tenaris S.A. Consolidated Financial Statements for the years ended December 31, 2016, 2015 and 2014
- 40 -
20 Deferred income tax (Cont.)
Deferred tax assets
Provisions
and allowances
Inventories Tax losses
(*) Other Total
At the beginning of the year (32,425) (107,378) (99,394) (102,396) (341,593) Translation differences (3,123) (1,347) (2,741) 14 (7,197) Transfer to assets held for sale - 275 - 753 1,028 Charged directly to Other Comprehensive Income - - - 1,823 1,823 Income statement charge / (credit) 2,272 14,274 (97,191) 17,968 (62,677) At December 31, 2016 (33,276) (94,176) (199,326) (81,838) (408,616)
(*) As of December 31, 2016, the recognized deferred tax assets on tax losses amount to $199.3 million and the net unrecognized deferred
tax assets amount to $47.2 million.
Provisions
and allowances
Inventories Tax
losses Other Total
At the beginning of the year (45,336) (189,709) (41,652) (150,497) (427,194) Translation differences / reclassifications 24,411 4,049 6,988 1,020 36,468 Charged directly to Other Comprehensive Income - - - 527 527 Income statement (credit) / charge (11,500) 78,282 (64,730) 46,554 48,606 At December 31, 2015 (32,425) (107,378) (99,394) (102,396) (341,593)
The recovery analysis of deferred tax assets and deferred tax liabilities is as follows:
Year ended December 31, 2016 2015 Deferred tax assets to be recovered after 12 months (226,431) (109,025) Deferred tax liabilities to be recovered after 12 months 761,039 843,022
Deferred income tax assets and liabilities are offset when (1) there is a legally enforceable right to set-off current tax assets against current tax liabilities and (2) when the deferred income taxes relate to the same fiscal authority on either the same taxable entity or different taxable entities where there is an intention to settle the balances on a net basis. The following amounts, determined after appropriate set-off, are shown in the Consolidated Statement of Financial Position:
Year ended December 31, 2016 2015 Deferred tax assets (144,613) (200,706) Deferred tax liabilities 550,657 750,325 406,044 549,619
The movement in the net deferred income tax liability account is as follows:
Year ended December 31, 2016 2015 At the beginning of the year 549,619 445,871 Translation differences (7,693) 19,279 Charged directly to Other Comprehensive Income 1,783 4,526 Income statement credit (debit) (132,969) 79,943 Transfer to assets held for sale (4,696) - At the end of the period 406,044 549,619
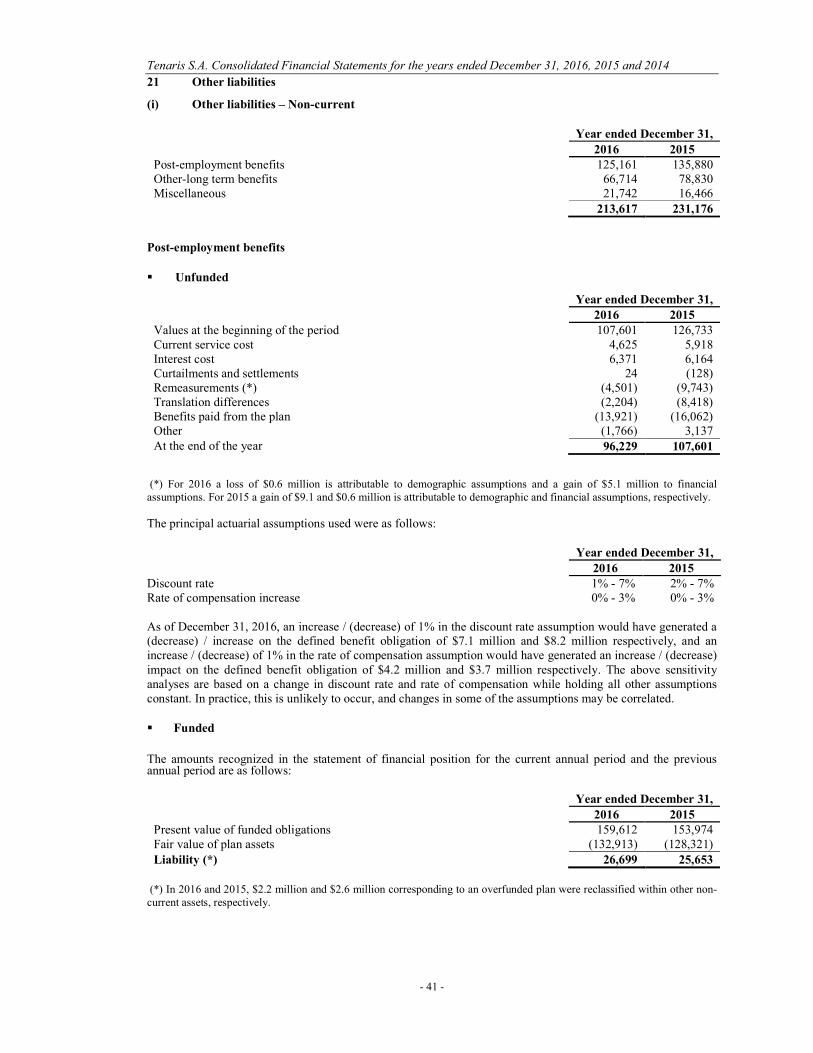
Tenaris S.A. Consolidated Financial Statements for the years ended December 31, 2016, 2015 and 2014
- 41 -
21 Other liabilities
(i) Other liabilities – Non-current
Year ended December 31,
2016 2015 Post-employment benefits 125,161 135,880 Other-long term benefits 66,714 78,830 Miscellaneous 21,742 16,466 213,617 231,176
Post-employment benefits
Unfunded
Year ended December 31, 2016 2015 Values at the beginning of the period 107,601 126,733 Current service cost 4,625 5,918 Interest cost 6,371 6,164 Curtailments and settlements 24 (128) Remeasurements (*) (4,501) (9,743) Translation differences (2,204) (8,418) Benefits paid from the plan (13,921) (16,062) Other (1,766) 3,137 At the end of the year 96,229 107,601
(*) For 2016 a loss of $0.6 million is attributable to demographic assumptions and a gain of $5.1 million to financial assumptions. For 2015 a gain of $9.1 and $0.6 million is attributable to demographic and financial assumptions, respectively. The principal actuarial assumptions used were as follows:
Year ended December 31,
2016 2015
Discount rate 1% - 7% 2% - 7% Rate of compensation increase 0% - 3% 0% - 3% As of December 31, 2016, an increase / (decrease) of 1% in the discount rate assumption would have generated a (decrease) / increase on the defined benefit obligation of $7.1 million and $8.2 million respectively, and an increase / (decrease) of 1% in the rate of compensation assumption would have generated an increase / (decrease) impact on the defined benefit obligation of $4.2 million and $3.7 million respectively. The above sensitivity analyses are based on a change in discount rate and rate of compensation while holding all other assumptions constant. In practice, this is unlikely to occur, and changes in some of the assumptions may be correlated. Funded
The amounts recognized in the statement of financial position for the current annual period and the previous annual period are as follows:
Year ended December 31,
2016 2015 Present value of funded obligations 159,612 153,974 Fair value of plan assets (132,913) (128,321) Liability (*) 26,699 25,653
(*) In 2016 and 2015, $2.2 million and $2.6 million corresponding to an overfunded plan were reclassified within other non-current assets, respectively.

Tenaris S.A. Consolidated Financial Statements for the years ended December 31, 2016, 2015 and 2014
- 42 -
21 Other liabilities (Cont.) (i) Other liabilities – Non-current (Cont.) The movement in the present value of funded obligations is as follows:
Year ended December 31,
2016 2015 At the beginning of the year 153,974 183,085 Translation differences 384 (18,507) Current service cost 162 1,155 Interest cost 6,403 6,725 Remeasurements (*) 7,753 (6,124) Benefits paid (9,064) (12,360) At the end of the year 159,612 153,974
(*) For 2016 a gain of $0.9 million is attributable to demographic assumptions and a loss of $8.7 million to financial assumptions. For 2015 a gain of $1.1 and $5.0 million is attributable to demographic and financial assumptions, respectively. The movement in the fair value of plan assets is as follows:
Year ended December 31, 2016 2015 At the beginning of the year (128,321) (147,991) Return on plan assets (7,022) (5,021) Remeasurements (3,022) 1,686 Translation differences 365 15,651 Contributions paid to the plan (4,374) (5,066) Benefits paid from the plan 9,064 12,360 Other 397 60 At the end of the year (132,913) (128,321)
The major categories of plan assets as a percentage of total plan assets are as follows:
Year ended December 31, 2016 2015 Equity instruments 52.4% 52.3% Debt instruments 43.9% 44.3% Others 3.7% 3.4%
The principal actuarial assumptions used were as follows:
Year ended December 31,
2016 2015
Discount rate 4% 4%
Rate of compensation increase 0 % - 3 % 0 % - 2 %
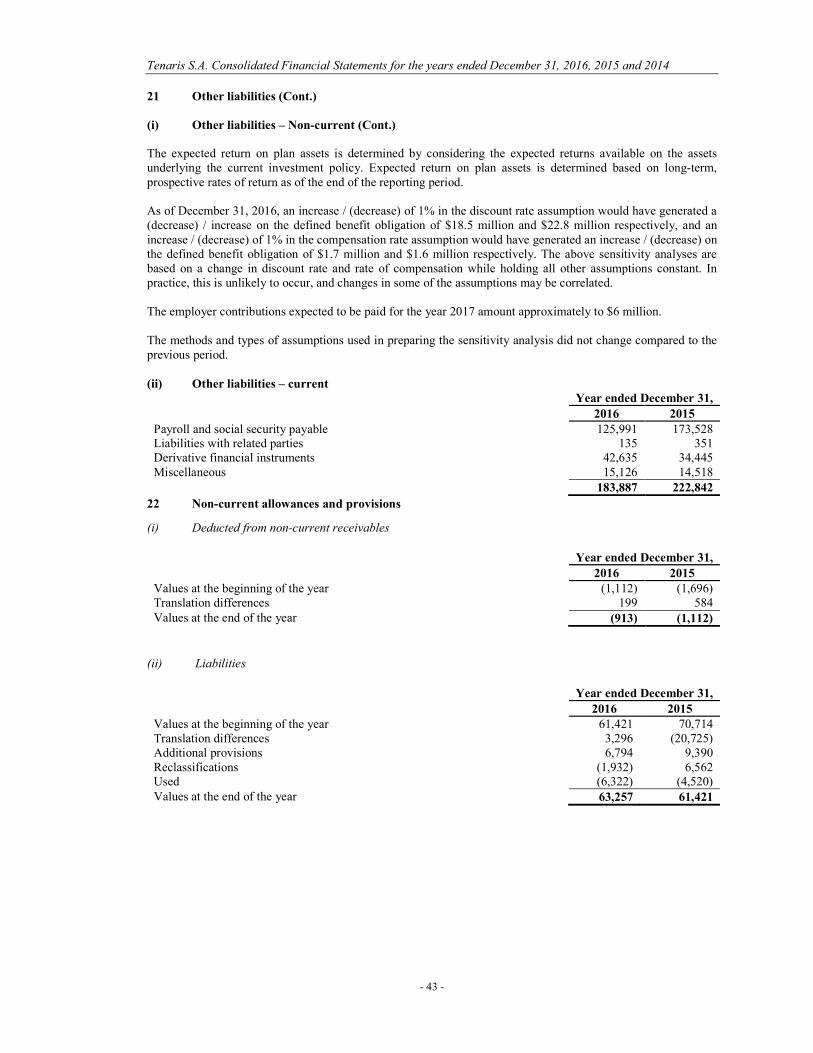
Tenaris S.A. Consolidated Financial Statements for the years ended December 31, 2016, 2015 and 2014
- 43 -
21 Other liabilities (Cont.) (i) Other liabilities – Non-current (Cont.) The expected return on plan assets is determined by considering the expected returns available on the assets underlying the current investment policy. Expected return on plan assets is determined based on long-term, prospective rates of return as of the end of the reporting period. As of December 31, 2016, an increase / (decrease) of 1% in the discount rate assumption would have generated a (decrease) / increase on the defined benefit obligation of $18.5 million and $22.8 million respectively, and an increase / (decrease) of 1% in the compensation rate assumption would have generated an increase / (decrease) on the defined benefit obligation of $1.7 million and $1.6 million respectively. The above sensitivity analyses are based on a change in discount rate and rate of compensation while holding all other assumptions constant. In practice, this is unlikely to occur, and changes in some of the assumptions may be correlated. The employer contributions expected to be paid for the year 2017 amount approximately to $6 million. The methods and types of assumptions used in preparing the sensitivity analysis did not change compared to the previous period. (ii) Other liabilities – current
Year ended December 31, 2016 2015 Payroll and social security payable 125,991 173,528 Liabilities with related parties 135 351 Derivative financial instruments 42,635 34,445 Miscellaneous 15,126 14,518 183,887 222,842
22 Non-current allowances and provisions (i) Deducted from non-current receivables
Year ended December 31, 2016 2015 Values at the beginning of the year (1,112) (1,696) Translation differences 199 584 Values at the end of the year (913) (1,112)
(ii) Liabilities
Year ended December 31, 2016 2015 Values at the beginning of the year 61,421 70,714 Translation differences 3,296 (20,725) Additional provisions 6,794 9,390 Reclassifications (1,932) 6,562 Used (6,322) (4,520) Values at the end of the year 63,257 61,421
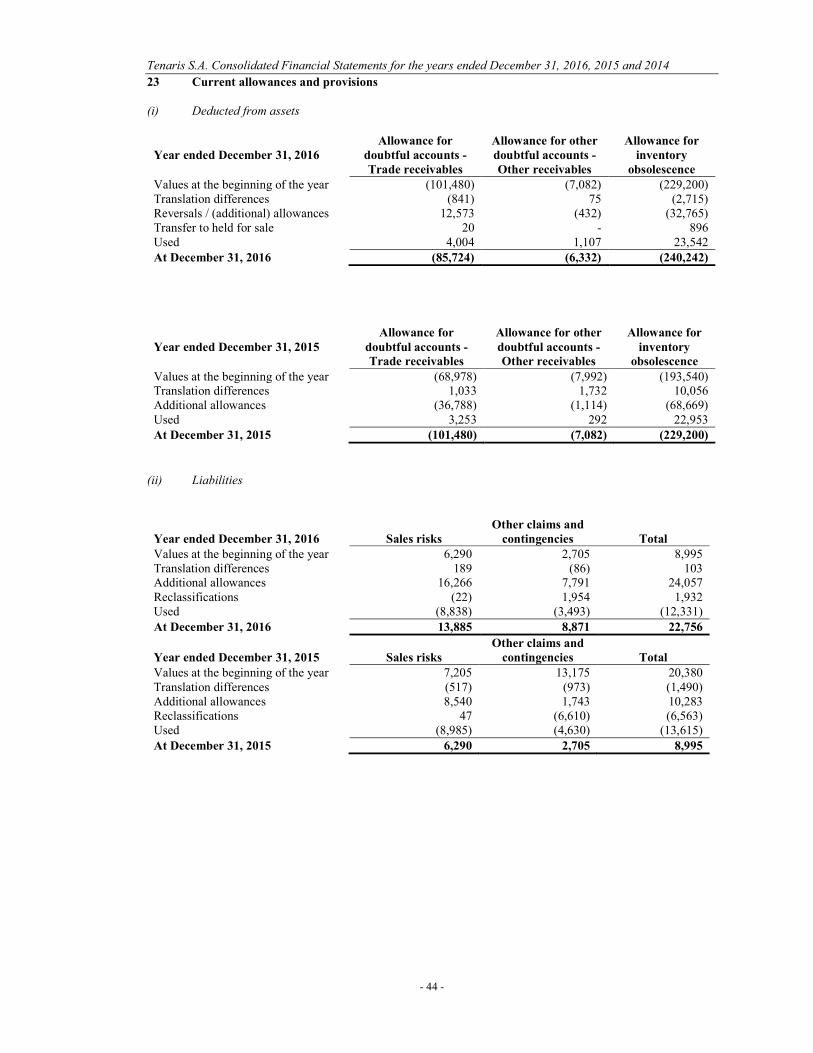
Tenaris S.A. Consolidated Financial Statements for the years ended December 31, 2016, 2015 and 2014
- 44 -
23 Current allowances and provisions
(i) Deducted from assets
Year ended December 31, 2016 Allowance for
doubtful accounts - Trade receivables
Allowance for other doubtful accounts - Other receivables
Allowance for inventory
obsolescence Values at the beginning of the year (101,480) (7,082) (229,200) Translation differences (841) 75 (2,715) Reversals / (additional) allowances 12,573 (432) (32,765) Transfer to held for sale 20 - 896 Used 4,004 1,107 23,542 At December 31, 2016 (85,724) (6,332) (240,242)
Year ended December 31, 2015 Allowance for
doubtful accounts - Trade receivables
Allowance for other doubtful accounts - Other receivables
Allowance for inventory
obsolescence Values at the beginning of the year (68,978) (7,992) (193,540) Translation differences 1,033 1,732 10,056 Additional allowances (36,788) (1,114) (68,669) Used 3,253 292 22,953 At December 31, 2015 (101,480) (7,082) (229,200)
(ii) Liabilities
Year ended December 31, 2016 Sales risks Other claims and
contingencies Total Values at the beginning of the year 6,290 2,705 8,995 Translation differences 189 (86) 103 Additional allowances 16,266 7,791 24,057 Reclassifications (22) 1,954 1,932 Used (8,838) (3,493) (12,331) At December 31, 2016 13,885 8,871 22,756
Year ended December 31, 2015 Sales risks Other claims and
contingencies Total Values at the beginning of the year 7,205 13,175 20,380 Translation differences (517) (973) (1,490) Additional allowances 8,540 1,743 10,283 Reclassifications 47 (6,610) (6,563) Used (8,985) (4,630) (13,615) At December 31, 2015 6,290 2,705 8,995

Tenaris S.A. Consolidated Financial Statements for the years ended December 31, 2016, 2015 and 2014
- 45 -
24 Derivative financial instruments
Net fair values of derivative financial instruments
The net fair values of derivative financial instruments disclosed within Other Receivables and Other Liabilities at the reporting date, in accordance with IAS 39, are:
Year ended December 31, 2016 2015 Foreign exchange derivatives contracts 2,759 18,248 Contracts with positive fair values 2,759 18,248
Foreign exchange derivatives contracts (42,635) (34,541) Contracts with negative fair values (42,635) (34,541) Total (39,876) (16,293)
Foreign exchange derivative contracts and hedge accounting
Tenaris applies hedge accounting to certain cash flow hedges of highly probable forecast transactions. The net fair values of exchange rate derivatives and those derivatives that were designated for hedge accounting as of December 2016 and 2015, were as follows:
Fair Value Hedge Accounting Reserve
Purchase currency Sell currency Term 2016 2015 2016 2015 MXN USD 2017 (35,165) (24,364) 9 320 USD MXN 2017 694 14,466 (2,280) (21) EUR USD 2017 (360) 331 - - USD EUR 2017 (33) 957 (1,435) (819) JPY USD 2017 (179) (24) 73 - USD KWD 2017 (2,447) 28 (1,016) 28 USD ARS 2017 (748) - - - ARS USD 2017 318 (8,639) (93) 3,175 USD BRL 2017 (1,581) 402 - - USD GBP 2017 - 85 - - Others (375) 465 - 100 Total (39,876) (16,293) (4,742) 2,783
Following is a summary of the hedge reserve evolution:
Equity Reserve Dec-14
Movements 2015
Equity Reserve Dec-15
Movements 2016
Equity Reserve Dec-16
Foreign Exchange (7,916) 10,699 2,783 (7,525) (4,742) Total Cash flow Hedge (7,916) 10,699 2,783 (7,525) (4,742)
Tenaris estimates that the cash flow hedge reserve at December 31, 2016 will be recycled to the Consolidated Income Statement during 2017.

Tenaris S.A. Consolidated Financial Statements for the years ended December 31, 2016, 2015 and 2014
- 46 -
25 Contingencies, commitments and restrictions on the distribution of profits
(i) Contingencies
Tenaris is from time to time subject to various claims, lawsuits and other legal proceedings, including customer claims, in which third parties are seeking payment for alleged damages, reimbursement for losses or indemnity. Some of these claims, lawsuits and other legal proceedings involve highly complex issues, and often these issues are subject to substantial uncertainties. Accordingly, the potential liability with respect to a large portion of such claims, lawsuits and other legal proceedings cannot be estimated with certainty. Management with the assistance of legal counsel periodically reviews the status of each significant matter and assesses potential financial exposure. If a potential loss from a claim, lawsuit or proceeding is considered probable and the amount can be reasonably estimated, a provision is recorded. Accruals for loss contingencies reflect a reasonable estimate of the losses to be incurred based on information available to management as of the date of preparation of the financial statements, and take into consideration litigation and settlement strategies. The Company believes that the aggregate provisions recorded for potential losses in these financial statements (Notes 22 and 23) are adequate based upon currently available information. However, if management’s estimates prove incorrect, current reserves could be inadequate and Tenaris could incur a charge to earnings which could have a material adverse effect on Tenaris’s results of operations, financial condition, net worth and cash flows. Set forth below is a description of Tenaris’s material ongoing legal proceedings:
Tax assessment in Italy Dalmine, an Italian subsidiary of Tenaris, received on December 24, 2012 a tax assessment from the Italian tax authorities related to allegedly omitted withholding tax on dividend payments made in 2007. The assessment, which was for an estimated amount of EUR295 million (approximately $310.9 million), comprising principal, interest and penalties, was appealed with the first-instance tax court in Milan. In February 2014, the first-instance tax court issued its decision on this tax assessment, partially reversing the assessment and lowering the claimed amount to approximately EUR9 million (approximately $9.5 million), including principal, interest and penalties. On October 2, 2014, the Italian tax authorities appealed against the second-instance tax court decision on the 2007 assessment. On June 12, 2015, the second-instance tax court accepted Dalmine’s defense arguments and rejected the appeal by the Italian tax authorities, thus reversing the entire 2007 assessment and recognizing that the dividend payment was exempt from withholding tax. The Italian tax authorities have appealed the second-instance tax court decision before the Supreme Court.
On December 24, 2013, Dalmine received a second tax assessment from the Italian tax authorities, based on the same arguments as those in the first assessment, relating to allegedly omitted withholding tax on dividend payments made in 2008 – the last such distribution made by Dalmine. Dalmine appealed the assessment with the first-instance tax court in Milan. On January 27, 2016, the first-instance tax court rejected Dalmine’s appeal. This first-instance ruling, which held that Dalmine is required to pay an amount of EUR223 million (approximately $235.1 million), including principal interest and penalties, contradicts the first and second-instance tax court rulings in connection with the 2007 assessment. Dalmine obtained the suspension of the interim payment that would have been due, based on the first-instance decision, through the filing with the tax authorities of a bank guarantee, and appealed the January 2016 ruling with the second-instance tax court. Tenaris continues to believe that Dalmine has correctly applied the relevant legal provisions and based on, among other things, the tax court decisions on the 2007 assessment and the opinion of legal counsel, Tenaris believes that it is not probable that the ultimate resolution of either the 2007 or the 2008 tax assessment will result in a material obligation. CSN claims relating to the January 2012 acquisition of Usiminas shares
In 2013, Confab was notified of a lawsuit filed in Brazil by Companhia Siderúrgica Nacional (CSN) and various entities affiliated with CSN against Confab and the other entities that acquired a participation in Usiminas’ control group in January 2012.
Tenaris S.A. Consolidated Financial Statements for the years ended December 31, 2016, 2015 and 2014
- 47 -
25 Contingencies, commitments and restrictions on the distribution of profits (Cont.)
(i) Contingencies (Cont.) CSN claims relating to the January 2012 acquisition of Usiminas shares (Cont.) The CSN lawsuit alleges that, under applicable Brazilian laws and rules, the acquirers were required to launch a tag-along tender offer to all non-controlling holders of Usiminas ordinary shares for a price per share equal to 80% of the price per share paid in such acquisition, or BRL28.8, and seeks an order to compel the acquirers to launch an offer at that price plus interest. If so ordered, the offer would need to be made to 182,609,851 ordinary shares of Usiminas not belonging to Usiminas’ control group, and Confab would have a 17.9% share in that offer. On September 23, 2013, the first instance court issued its decision finding in favor of Confab and the other defendants and dismissing the CSN lawsuit. The claimants appealed the first instance court decision with the Sao Paulo court of appeals. On February 8, 2017, the court of appeals issued its decision on the merits and maintained the understanding of the first instance court, holding that Confab and the other defendants did not have the obligation to launch a tender offer. The decision of the court of appeals has not yet been published, and CSN may still file a motion for clarification and/or appeal to the Superior Court of Justice or the Federal Supreme Court.
Separately, on November 10, 2014, CSN filed a complaint with Brazil’s securities regulator Comissão de Valores Mobiliários (CVM) on the same grounds and with the same purpose as the lawsuit referred to above. In this complaint, CSN sought to reverse a February 2012 decision by the CVM, which had determined that the above mentioned acquisition did not trigger any tender offer requirement. On December 2, 2016, CVM rendered its decision on this complaint, reaffirming its previous decision from 2012 and rejecting all the new allegations presented by CSN.
Finally, on December 11, 2014, CSN filed a claim with Brazil’s antitrust regulator Conselho Administrativo de Defesa Econômica (“CADE”). In its claim, CSN alleged that the antitrust clearance request related to the January 2012 acquisition, which was approved by CADE without restrictions in August 2012, contained a false and deceitful description of the acquisition aimed at frustrating the minority shareholders’ right to a tag-along tender offer, and requested that CADE investigate and reopen the antitrust review of the acquisition and suspend the Company’s voting rights in Usiminas until the review is completed. On May 6, 2015, CADE rejected CSN’s claim. CSN did not appeal the decision and on May 19, 2015, CADE finally closed the file. Tenaris continues to believe that all of CSN's claims and allegations are groundless and without merit, as confirmed by several opinions of Brazilian legal counsel, the decisions issued by CVM in February 2012 and December 2016, and the first and second instance court decisions referred to above. Accordingly, no provision was recorded in these Consolidated Financial Statements Veracel Celulose Accident Litigation On September 21, 2007, an accident occurred in the premises of Veracel Celulose S.A. (“Veracel”) in connection with a rupture in one of the tanks used in an evaporation system manufactured by Confab. The Veracel accident allegedly resulted in material damages to Veracel. Itaú Seguros S.A. (“Itaú”), Veracel’s insurer at the time of the Veracel accident, initiated a lawsuit against Confab seeking reimbursement of damages paid to Veracel in connection with the Veracel accident. Veracel initiated a second lawsuit against Confab seeking reimbursement of the amount paid as insurance deductible in connection with the Veracel accident and other amounts not covered by insurance. Itaú and Veracel claim that the Veracel accident was caused by failures and defects attributable to the evaporation system manufactured by Confab. Confab believes that the Veracel accident was caused by the improper handling by Veracel’s personnel of the equipment supplied by Confab in violation of Confab’s instructions. The two lawsuits have been consolidated, and are now being considered by the 6th Civil Court of São Caetano do Sul; however, each lawsuit will be adjudicated through a separate ruling. Both proceedings are currently at evidentiary stage.

Tenaris S.A. Consolidated Financial Statements for the years ended December 31, 2016, 2015 and 2014
- 48 -
25 Contingencies, commitments and restrictions on the distribution of profits (Cont.)
(i) Contingencies (Cont.) Veracel Celulose Accident Litigation (Cont.) On March 10, 2016, a court-appointed expert issued its report on certain technical matters concerning the Veracel accident. Based upon a technical opinion received from a third-party expert, in August 2016, Confab filed its objections to the expert’s report. Other parties have also filed their observations and/or opinions concerning the experts’ report, which are currently subject to the court examination. As of December 31, 2016, the estimated amount of Itaú’s claim is approximately BRL 74.5 million (approximately $22.9 million), and the estimated amount of Veracel’s claim is approximately BRL 47.7 million (approximately $14.6 million), for an aggregate amount BRL 122.2 million ($37.5 million). The final result of this claim depends largely on the court’s evaluation of technical matters arising from the expert’s opinion and objections presented by Confab. No provision has been recorded in these Consolidated Financial Statements. Petroamazonas Penalties On January 22, 2016, Petroamazonas (“PAM”), an Ecuadorian state-owned oil company, imposed penalties to the Company’s Uruguayan subsidiary, Tenaris Global Services S.A. (“TGS”), for its alleged failure to comply with delivery terms under a pipe supply agreement. The penalties amount to approximately $ 22.5 million as of the date hereof. Tenaris believes, based on the advice of counsel, that PAM has no legal basis to impose the penalties and that TGS has meritorious defenses against PAM. However, in light of the prevailing political circumstances in Ecuador, the Company cannot predict the outcome of a claim against a state-owned company and it is not possible to estimate the amount or range of loss in case of an unfavorable outcome. Ongoing investigation
The Company has learned that Italian and Swiss authorities are investigating whether certain payments were made from accounts of entities presumably associated with affiliates of the Company to accounts controlled by an individual allegedly related with officers of Petróleo Brasileiro S.A. and whether any such payments were intended to benefit Confab Industrial S.A., a Brazilian subsidiary of the Company. Any such payments could violate certain applicable laws, including the U.S. Foreign Corrupt Practices Act. The Company had previously reviewed certain of these matters in connection with an investigation by the Brazilian authorities related to “Operation Lava Jato” and the Audit Committee of the Company’s Board of Directors has engaged external counsel in connection with a review of the alleged payments and related matters. In addition, the Company has voluntarily notified the U.S. Securities and Exchange Commission and the U.S. Department of Justice. The Company intends to share the results of this review with the appropriate authorities, and to cooperate with any investigations that may be conducted by such authorities. At this time, the Company cannot predict the outcome of these matters or estimate the range of potential loss or extent of risk, if any, to the Company’s business that may result from resolution of these matters.
(ii) Commitments Set forth is a description of Tenaris’s main outstanding commitments: A Tenaris company is a party to a contract with Nucor Corporation under which it is committed to purchase
on a monthly basis a minimum volume of hot-rolled steel coils at prices that are negotiated annually by reference to prices to comparable Nucor customers. The contract became effective in January 2013 and will be in force until December 2017; provided, however, that either party may terminate the contract at any time after January 1, 2015 with a 12-month prior notice. Due to the current weak pipe demand associated with the reduction in drilling activity, the parties entered into a temporary agreement pursuant to which application of the minimum volume requirements were suspended, and the company is temporarily allowed to purchase steel volumes in accordance with its needs. As of December 31, 2016, the estimated aggregate contract amount through December 31, 2017, calculated at current prices, is approximately $423 million.
A Tenaris company entered into various contracts with suppliers pursuant to which it committed to purchase goods and services for a total amount of approximately $175.8 million related to the investment plan to expand Tenaris’s U.S. operations with the construction of a state-of-the-art seamless pipe mill in Bay City, Texas. As of December 31, 2016 approximately $1.349 million had already been invested.
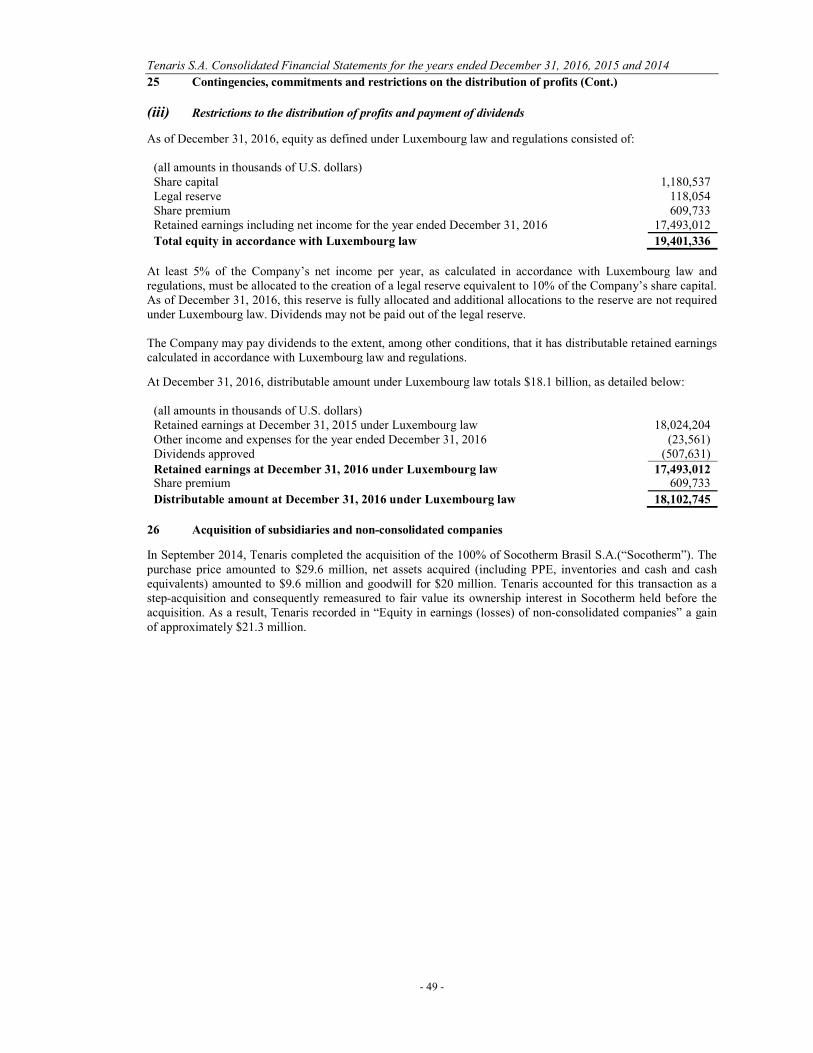
Tenaris S.A. Consolidated Financial Statements for the years ended December 31, 2016, 2015 and 2014
- 49 -
25 Contingencies, commitments and restrictions on the distribution of profits (Cont.)
(iii) Restrictions to the distribution of profits and payment of dividends As of December 31, 2016, equity as defined under Luxembourg law and regulations consisted of:
(all amounts in thousands of U.S. dollars) Share capital 1,180,537 Legal reserve 118,054 Share premium 609,733 Retained earnings including net income for the year ended December 31, 2016 17,493,012
Total equity in accordance with Luxembourg law 19,401,336
At least 5% of the Company’s net income per year, as calculated in accordance with Luxembourg law and regulations, must be allocated to the creation of a legal reserve equivalent to 10% of the Company’s share capital. As of December 31, 2016, this reserve is fully allocated and additional allocations to the reserve are not required under Luxembourg law. Dividends may not be paid out of the legal reserve. The Company may pay dividends to the extent, among other conditions, that it has distributable retained earnings calculated in accordance with Luxembourg law and regulations. At December 31, 2016, distributable amount under Luxembourg law totals $18.1 billion, as detailed below:
(all amounts in thousands of U.S. dollars) Retained earnings at December 31, 2015 under Luxembourg law 18,024,204 Other income and expenses for the year ended December 31, 2016 (23,561) Dividends approved (507,631) Retained earnings at December 31, 2016 under Luxembourg law 17,493,012 Share premium 609,733
Distributable amount at December 31, 2016 under Luxembourg law 18,102,745
26 Acquisition of subsidiaries and non-consolidated companies In September 2014, Tenaris completed the acquisition of the 100% of Socotherm Brasil S.A.(“Socotherm”). The purchase price amounted to $29.6 million, net assets acquired (including PPE, inventories and cash and cash equivalents) amounted to $9.6 million and goodwill for $20 million. Tenaris accounted for this transaction as a step-acquisition and consequently remeasured to fair value its ownership interest in Socotherm held before the acquisition. As a result, Tenaris recorded in “Equity in earnings (losses) of non-consolidated companies” a gain of approximately $21.3 million.
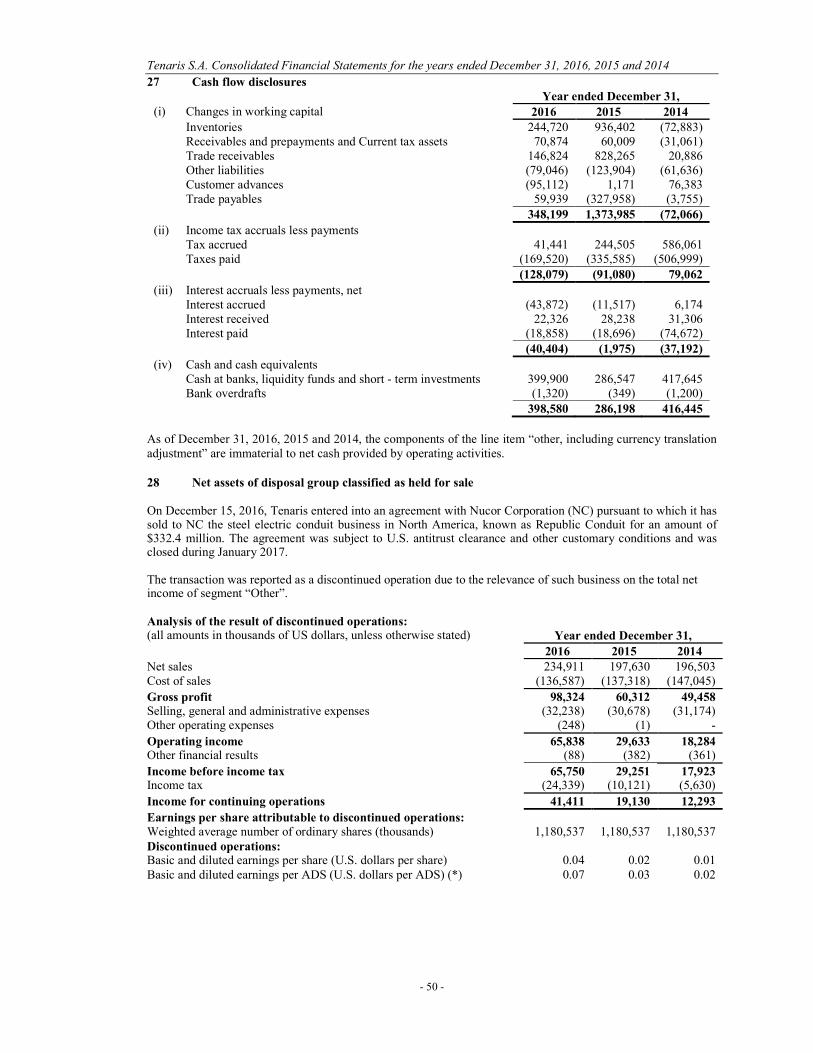
Tenaris S.A. Consolidated Financial Statements for the years ended December 31, 2016, 2015 and 2014
- 50 -
27 Cash flow disclosures
Year ended December 31,
(i) Changes in working capital 2016 2015 2014 Inventories 244,720 936,402 (72,883) Receivables and prepayments and Current tax assets 70,874 60,009 (31,061)
Trade receivables 146,824 828,265 20,886
Other liabilities (79,046) (123,904) (61,636) Customer advances (95,112) 1,171 76,383 Trade payables 59,939 (327,958) (3,755)
348,199 1,373,985 (72,066)
(ii) Income tax accruals less payments Tax accrued 41,441 244,505 586,061 Taxes paid (169,520) (335,585) (506,999)
(128,079) (91,080) 79,062
(iii) Interest accruals less payments, net Interest accrued (43,872) (11,517) 6,174 Interest received 22,326 28,238 31,306
Interest paid (18,858) (18,696) (74,672)
(40,404) (1,975) (37,192)
(iv) Cash and cash equivalents Cash at banks, liquidity funds and short - term investments 399,900 286,547 417,645
Bank overdrafts (1,320) (349) (1,200)
398,580 286,198 416,445
As of December 31, 2016, 2015 and 2014, the components of the line item “other, including currency translation adjustment” are immaterial to net cash provided by operating activities. 28 Net assets of disposal group classified as held for sale On December 15, 2016, Tenaris entered into an agreement with Nucor Corporation (NC) pursuant to which it has sold to NC the steel electric conduit business in North America, known as Republic Conduit for an amount of $332.4 million. The agreement was subject to U.S. antitrust clearance and other customary conditions and was closed during January 2017. The transaction was reported as a discontinued operation due to the relevance of such business on the total net income of segment “Other”. Analysis of the result of discontinued operations: (all amounts in thousands of US dollars, unless otherwise stated) Year ended December 31,
2016 2015 2014
Net sales 234,911 197,630 196,503 Cost of sales (136,587) (137,318) (147,045)
Gross profit 98,324 60,312 49,458 Selling, general and administrative expenses (32,238) (30,678) (31,174) Other operating expenses (248) (1) -
Operating income 65,838 29,633 18,284 Other financial results (88) (382) (361)
Income before income tax 65,750 29,251 17,923 Income tax (24,339) (10,121) (5,630)
Income for continuing operations 41,411 19,130 12,293
Earnings per share attributable to discontinued operations:
Weighted average number of ordinary shares (thousands) 1,180,537 1,180,537 1,180,537 Discontinued operations: Basic and diluted earnings per share (U.S. dollars per share) 0.04 0.02 0.01 Basic and diluted earnings per ADS (U.S. dollars per ADS) (*) 0.07 0.03 0.02

Tenaris S.A. Consolidated Financial Statements for the years ended December 31, 2016, 2015 and 2014
- 51 -
28 Net assets of disposal group classified as held for sale (Cont.) Summarized cash flow information is as follows:
2016 2015 2014 Cash at the beginning 15,343 13,848 18,790 Cash at the end
18,820 15,343 13,848
Increase (decrease) in cash 3,477 1,495 (4,942) Provided by operating activities 24,535 42,701 8,294 Used in investing activities (1,058) (1,206) (1,236) Used in financing activities (20,000) (40,000) (12,000)
These amounts were estimated only for disclosure purposes, as cash flows from discontinued operations were not managed separately from other cash flows. On January 20, 2017, the sale was completed and Tenaris estimates a net profit after bank fees and other related expenses of approximately $189.2 million. Current and non-current assets and liabilities of disposal group
ASSETS At December 31, 2016 Non-current assets Property, plant and equipment, net 41,470 Intangible assets, net (*) 45,894 87,364
Current assets Inventories, net 29,819 Receivables and prepayments, net 451 Trade receivables, net 33,620 Cash and cash equivalents 163 64,053
Total assets of disposal group classified as held for sale 151,417
LIABILITIES Non-current liabilities Deferred tax liabilities 4,696 Other liabilities 680 5,376
Current liabilities Current tax liabilities 4,100 Other liabilities 1,668 Trade payables 6,950 12,718
Total liabilities of disposal group classified as held for sale 18,094
(*) Includes $45.8 million of goodwill
29 Related party transactions As of December 31, 2016: San Faustin S.A., a Luxembourg Société Anonyme (“San Faustin”), owned 713,605,187 shares in the
Company, representing 60.45% of the Company’s capital and voting rights. San Faustin owned all of its shares in the Company through its wholly-owned subsidiary Techint Holdings
S.à r.l., a Luxembourg Société à Responsabilité Limitée, who is the holder of record of the above-mentioned Tenaris shares.
Rocca & Partners Stichting Administratiekantoor Aandelen San Faustin, a Dutch private foundation
(Stichting) (“RP STAK”) held voting rights in San Faustin sufficient to control San Faustin. No person or group of persons controls RP STAK.
Based on the information most recently available to the Company, Tenaris’s directors and senior management as a group owned 0.10% of the Company’s outstanding shares.
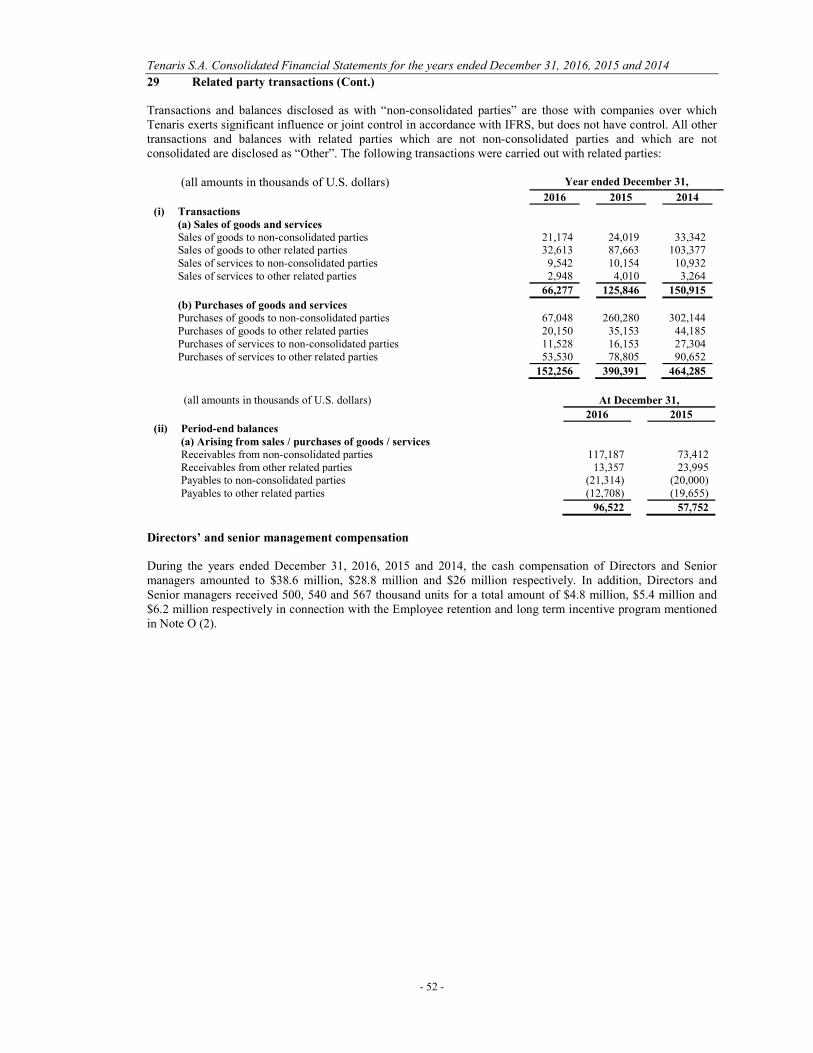
Tenaris S.A. Consolidated Financial Statements for the years ended December 31, 2016, 2015 and 2014
- 52 -
29 Related party transactions (Cont.) Transactions and balances disclosed as with “non-consolidated parties” are those with companies over which Tenaris exerts significant influence or joint control in accordance with IFRS, but does not have control. All other transactions and balances with related parties which are not non-consolidated parties and which are not consolidated are disclosed as “Other”. The following transactions were carried out with related parties:
(all amounts in thousands of U.S. dollars) Year ended December 31,
2016
2015 2014
(i) Transactions (a) Sales of goods and services Sales of goods to non-consolidated parties 21,174 24,019 33,342 Sales of goods to other related parties 32,613 87,663 103,377 Sales of services to non-consolidated parties 9,542 10,154 10,932 Sales of services to other related parties 2,948 4,010 3,264
66,277 125,846 150,915
(b) Purchases of goods and services Purchases of goods to non-consolidated parties 67,048 260,280 302,144 Purchases of goods to other related parties 20,150 35,153 44,185 Purchases of services to non-consolidated parties 11,528 16,153 27,304 Purchases of services to other related parties 53,530 78,805 90,652
152,256 390,391 464,285
(all amounts in thousands of U.S. dollars) At December 31,
2016 2015 (ii) Period-end balances (a) Arising from sales / purchases of goods / services Receivables from non-consolidated parties 117,187 73,412 Receivables from other related parties 13,357 23,995 Payables to non-consolidated parties (21,314) (20,000) Payables to other related parties (12,708) (19,655)
96,522 57,752
Directors’ and senior management compensation During the years ended December 31, 2016, 2015 and 2014, the cash compensation of Directors and Senior managers amounted to $38.6 million, $28.8 million and $26 million respectively. In addition, Directors and Senior managers received 500, 540 and 567 thousand units for a total amount of $4.8 million, $5.4 million and $6.2 million respectively in connection with the Employee retention and long term incentive program mentioned in Note O (2).
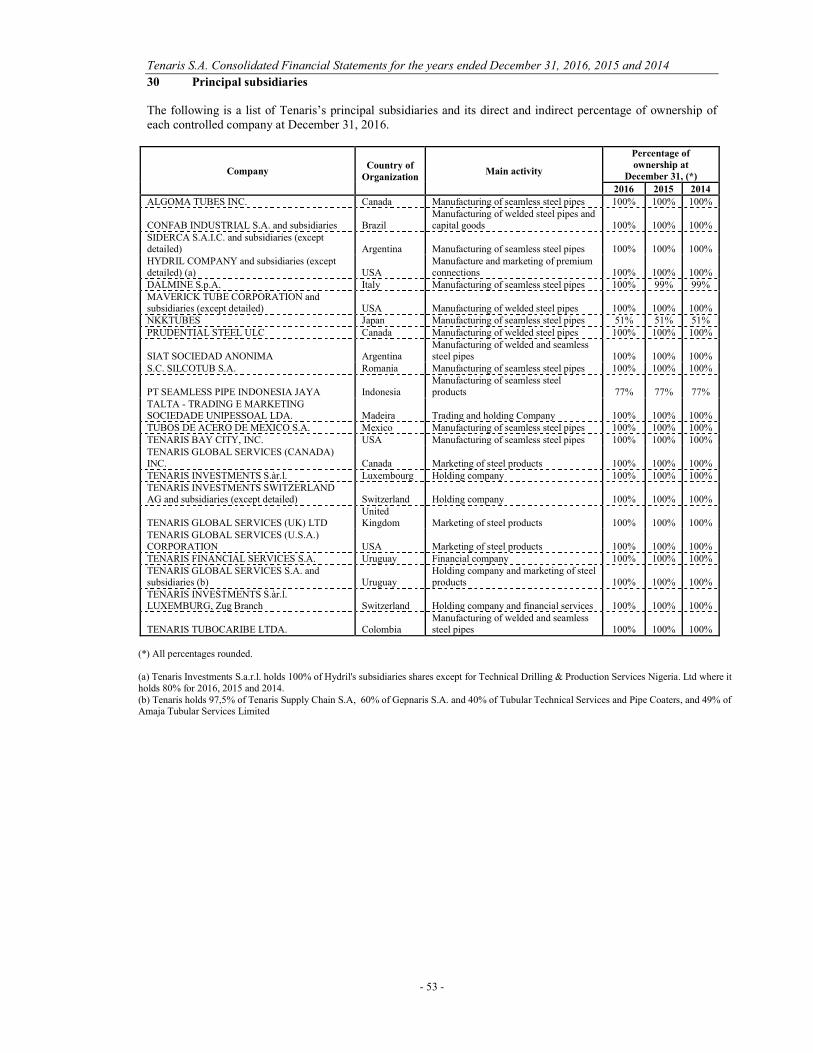
Tenaris S.A. Consolidated Financial Statements for the years ended December 31, 2016, 2015 and 2014
- 53 -
30 Principal subsidiaries The following is a list of Tenaris’s principal subsidiaries and its direct and indirect percentage of ownership of each controlled company at December 31, 2016.
Company Country of
Organization Main activity
Percentage of ownership at
December 31, (*)
2016 2015 2014
ALGOMA TUBES INC. Canada Manufacturing of seamless steel pipes 100% 100% 100%
CONFAB INDUSTRIAL S.A. and subsidiaries Brazil Manufacturing of welded steel pipes and capital goods 100% 100% 100%
SIDERCA S.A.I.C. and subsidiaries (except detailed) Argentina Manufacturing of seamless steel pipes 100% 100% 100% HYDRIL COMPANY and subsidiaries (except detailed) (a) USA
Manufacture and marketing of premium connections 100% 100% 100%
DALMINE S.p.A. Italy Manufacturing of seamless steel pipes 100% 99% 99% MAVERICK TUBE CORPORATION and subsidiaries (except detailed) USA Manufacturing of welded steel pipes 100% 100% 100% NKKTUBES Japan Manufacturing of seamless steel pipes 51% 51% 51% PRUDENTIAL STEEL ULC Canada Manufacturing of welded steel pipes 100% 100% 100%
SIAT SOCIEDAD ANONIMA Argentina Manufacturing of welded and seamless steel pipes 100% 100% 100%
S.C. SILCOTUB S.A. Romania Manufacturing of seamless steel pipes 100% 100% 100%
PT SEAMLESS PIPE INDONESIA JAYA Indonesia Manufacturing of seamless steel products 77% 77% 77%
TALTA - TRADING E MARKETING SOCIEDADE UNIPESSOAL LDA. Madeira Trading and holding Company 100% 100% 100% TUBOS DE ACERO DE MEXICO S.A. Mexico Manufacturing of seamless steel pipes 100% 100% 100% TENARIS BAY CITY, INC. USA Manufacturing of seamless steel pipes 100% 100% 100% TENARIS GLOBAL SERVICES (CANADA) INC. Canada Marketing of steel products 100% 100% 100% TENARIS INVESTMENTS S.àr.l. Luxembourg Holding company 100% 100% 100% TENARIS INVESTMENTS SWITZERLAND AG and subsidiaries (except detailed) Switzerland Holding company 100% 100% 100%
TENARIS GLOBAL SERVICES (UK) LTD United Kingdom Marketing of steel products 100% 100% 100%
TENARIS GLOBAL SERVICES (U.S.A.) CORPORATION USA Marketing of steel products 100% 100% 100% TENARIS FINANCIAL SERVICES S.A. Uruguay Financial company 100% 100% 100% TENARIS GLOBAL SERVICES S.A. and subsidiaries (b) Uruguay
Holding company and marketing of steel products 100% 100% 100%
TENARIS INVESTMENTS S.àr.l. LUXEMBURG, Zug Branch Switzerland Holding company and financial services 100% 100% 100%
TENARIS TUBOCARIBE LTDA. Colombia Manufacturing of welded and seamless steel pipes 100% 100% 100%
(*) All percentages rounded. (a) Tenaris Investments S.a.r.l. holds 100% of Hydril's subsidiaries shares except for Technical Drilling & Production Services Nigeria. Ltd where it holds 80% for 2016, 2015 and 2014. (b) Tenaris holds 97,5% of Tenaris Supply Chain S.A, 60% of Gepnaris S.A. and 40% of Tubular Technical Services and Pipe Coaters, and 49% of Amaja Tubular Services Limited
Tenaris S.A. Consolidated Financial Statements for the years ended December 31, 2016, 2015 and 2014
- 54 -
31 Nationalization of Venezuelan Subsidiaries In May 2009, within the framework of Decree Law 6058, Venezuela’s President announced the nationalization of, among other companies, the Company's majority-owned subsidiaries TAVSA - Tubos de Acero de Venezuela S.A. (“Tavsa”) and, Matesi Materiales Siderúrgicos S.A (“Matesi”), and Complejo Siderúrgico de Guayana, C.A (“Comsigua”), in which the Company has a non-controlling interest (collectively, the “Venezuelan Companies”). Tenaris and its wholly-owned subsidiary Talta - Trading e Marketing Sociedad Unipessoal Lda (“Talta”), initiated arbitration proceedings against Venezuela before the ICSID in Washington D.C. in connection with these nationalizations. On January 29, 2016, the tribunal released its award on the arbitration proceeding concerning the nationalization of Matesi. The award upheld Tenaris’s and Talta’s claim that Venezuela had expropriated their investments in Matesi in violation of Venezuelan law as well as the bilateral investment treaties entered into by Venezuela with the Belgium-Luxembourg Economic Union and Portugal. The award granted compensation in the amount of $87.3 million for the breaches and ordered Venezuela to pay an additional amount of $85.5 million in pre-award interest, aggregating to a total award of $172.8 million, payable in full and net of any applicable Venezuelan tax, duty or charge. The tribunal granted Venezuela a grace period of six months from the date of the award to make payment in full of the amount due without incurring post-award interest, and resolved that if no, or no full, payment is made by then, post-award interest will apply at the rate of 9% per annum. On March 14, 2016, Venezuela requested the rectification of the award pursuant to article 49(2) of the ICSID Convention and ICSID Arbitration Rule 49. The tribunal denied Venezuela’s request on June 24, 2016, ordering Venezuela to reimburse Tenaris and Talta for their costs. On September 21, 2016, Venezuela submitted a request for annulment of the award as well as the stay of enforcement of the award in accordance with the ICSID Convention and Arbitration Rules. The annulment request was registered on September 29, 2016, and the ad hoc committee that will hear Venezuela’s request was constituted on December 27, 2016. The parties are in the process of exchanging briefs. A hearing is scheduled to be held in the first quarter of 2017 regarding Tenaris’s and Talta’s opposition to Venezuela’s request to continue stay enforcement of the award. Following that hearing, there will be a further exchange of briefs and an oral hearing on Venezuela’s annulment request, currently proposed to be held in the last quarter of 2017. Concerning the arbitration proceeding relating to the nationalization of Tenaris’s shareholdings in Tavsa and Comsigua, on December 12, 2016, the tribunal issued its award upholding Tenaris’s and Talta’s claim that Venezuela had expropriated their investments in Tavsa and Comsigua in violation of the bilateral investment treaties entered into by Venezuela with the Belgium-Luxembourg Economic Union and Portugal. The award granted compensation in the amount of $137 million and ordered Venezuela to reimburse Tenaris and Talta $3.3 million in legal fees and ICSID administrative costs. In addition, Venezuela was ordered to pay interest from April 30, 2008 until the day of effective payment at a rate equivalent to LIBOR + 4% per annum, which as of December 31, 2016 amounted $76 million. The deadline for filing a request for annulment of the award expires on April 11, 2017. Based on the facts and circumstances described above and following the guidance set forth by IAS 27R, the Company ceased consolidating the results of operations and cash flows of the Venezuelan Companies as from June 30, 2009, and classified its investments in the Venezuelan Companies as financial assets based on the definitions contained in paragraphs 11(c)(i) and 13 of IAS 32. The Company classified its interests in the Venezuelan Companies as available-for-sale investments since management believes they do not fulfil the requirements for classification within any of the remaining categories provided by IAS 39 and such classification is the most appropriate accounting treatment applicable to non-voluntary dispositions of assets. Tenaris or its subsidiaries have net receivables with the Venezuelan Companies as of December 31, 2016, for a total amount of approximately $27 million. The Company records its interest in the Venezuelan Companies at its carrying amount at June 30, 2009, and not at fair value, following the guidance set forth by paragraphs 46(c), AG80 and AG81 of IAS 39.
Tenaris S.A. Consolidated Financial Statements for the years ended December 31, 2016, 2015 and 2014
- 55 -
32 Fees paid to the Company's principal accountant Total fees accrued for professional services rendered by PwC Network firms to Tenaris S.A. and its subsidiaries are detailed as follows:
(all amounts in thousands of U.S. dollars) Year ended December 31,
2016 2015 2014
Audit Fees 3,588 4,372 5,231 Audit-Related Fees 64 78 142 Tax Fees 14 25 89 All Other Fees 3 15 35 Total 3,669 4,490 5,497
33 Subsequent event
Annual Dividend Proposal
On February 22, 2017 the Company’s Board of Directors proposed, for the approval of the Annual General Shareholders' meeting to be held on May 3, 2017, the payment of an annual dividend of $0.41 per share ($0.82 per ADS), or approximately $484 million, which includes the interim dividend of $0.13 per share ($0.26 per ADS) or approximately $153 million, paid on November 23, 2016. If the annual dividend is approved by the shareholders, a dividend of $0.28 per share ($0.56 per ADS), or approximately $331 million will be paid on May 24, 2017, with an ex-dividend date of May 22, 2017. These Consolidated Financial Statements do not reflect this dividend payable.
Edgardo Carlos Chief Financial Officer