CONSOLIDATED FINANCIAL STATEMENTS - NET
62
www.ocpgroup.ma CONSOLIDATED FINANCIAL STATEMENTS AT 31 DECEMBER 2021
-
Upload
khangminh22 -
Category
Documents
-
view
2 -
download
0
Transcript of CONSOLIDATED FINANCIAL STATEMENTS - NET
www.ocpgroup.ma
CONSOLIDATED FINANCIAL
STATEMENTSAT 31 DECEMBER 2021
Contents
Key figures and significant events of the period 3
KEY FIGURES 3
SIGNIFICANT EVENTS OF THE PERIOD 3
EVENTS AFTER THE REPORTING PERIOD 3
Consolidated Financial Statements 4
NOTE 1 - ACCOUNTING RULES AND METHODS 10
NOTE 2 - CONSOLIDATION SCOPE 11
NOTE 3 - SEGMENT REPORTING 12
NOTE 4- OPERATIONAL DATA 15
NOTE 5- EXPENSES AND EMPLOYEE BENEFITS 24
NOTE 6 INVESTMENTS IN ASSOCIATES AND JOINT VENTURES 27
NOTE 7 – OTHER OPERATING ITEMS 31
NOTE 8 – PROPERTY, PLANT AND EQUIPMENT AND INTANGIBLE ASSETS 33
NOTE 9 – PROVISIONS AND CONTINGENT LIABILITIES 40
NOTE 10 – FINANCIAL INSTRUMENTS, NET DEBT AND NET COST OF FINANCING 42
NOTE 11 – CORPORATE INCOME TAXES 50
NOTE 12 – EQUITY, DIVIDENDS AND EARNINGS PER SHARE 53
NOTE 13 – RELATIONS WITH THE SHAREHOLDERS 54
Statutory auditors’ opinion on the consolidated financial information at 31 December 2021
55
OCP GROUPConsolidated Financial Statements
At 31 December 20212
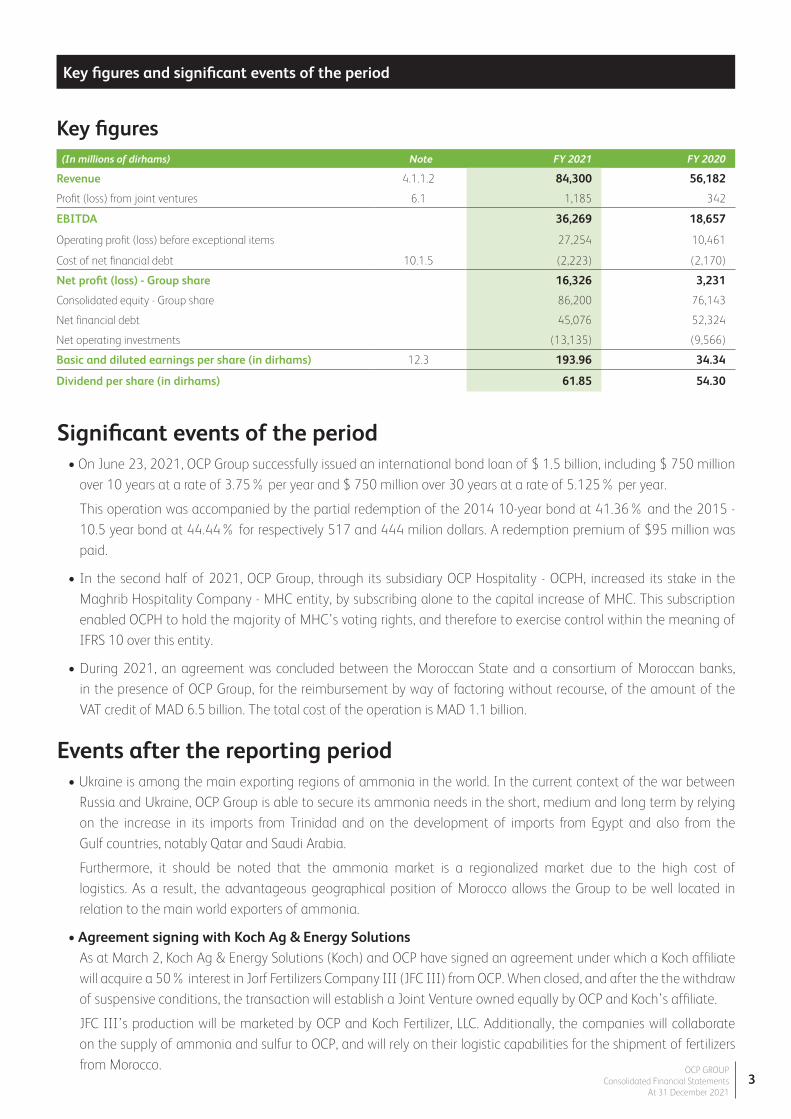
Significant events of the period• On June 23, 2021, OCP Group successfully issued an international bond loan of $ 1.5 billion, including $ 750 million
over 10 years at a rate of 3.75% per year and $ 750 million over 30 years at a rate of 5.125% per year.
This operation was accompanied by the partial redemption of the 2014 10-year bond at 41.36% and the 2015 - 10.5 year bond at 44.44% for respectively 517 and 444 milion dollars. A redemption premium of $95 million was paid.
• In the second half of 2021, OCP Group, through its subsidiary OCP Hospitality - OCPH, increased its stake in the Maghrib Hospitality Company - MHC entity, by subscribing alone to the capital increase of MHC. This subscription enabled OCPH to hold the majority of MHC’s voting rights, and therefore to exercise control within the meaning of IFRS 10 over this entity.
• During 2021, an agreement was concluded between the Moroccan State and a consortium of Moroccan banks, in the presence of OCP Group, for the reimbursement by way of factoring without recourse, of the amount of the VAT credit of MAD 6.5 billion. The total cost of the operation is MAD 1.1 billion.
Events after the reporting period• Ukraine is among the main exporting regions of ammonia in the world. In the current context of the war between
Russia and Ukraine, OCP Group is able to secure its ammonia needs in the short, medium and long term by relying on the increase in its imports from Trinidad and on the development of imports from Egypt and also from the Gulf countries, notably Qatar and Saudi Arabia.
Furthermore, it should be noted that the ammonia market is a regionalized market due to the high cost of logistics. As a result, the advantageous geographical position of Morocco allows the Group to be well located in relation to the main world exporters of ammonia.
• Agreement signing with Koch Ag & Energy Solutions As at March 2, Koch Ag & Energy Solutions (Koch) and OCP have signed an agreement under which a Koch affiliate will acquire a 50% interest in Jorf Fertilizers Company III (JFC III) from OCP. When closed, and after the the withdraw of suspensive conditions, the transaction will establish a Joint Venture owned equally by OCP and Koch’s affiliate.
JFC III’s production will be marketed by OCP and Koch Fertilizer, LLC. Additionally, the companies will collaborate on the supply of ammonia and sulfur to OCP, and will rely on their logistic capabilities for the shipment of fertilizers from Morocco.
(In millions of dirhams) Note FY 2021 FY 2020
Revenue 4.1.1.2 84,300 56,182
Profit (loss) from joint ventures 6.1 1,185 342
EBITDA 36,269 18,657
Operating profit (loss) before exceptional items 27,254 10,461
Cost of net financial debt 10.1.5 (2,223) (2,170)
Net profit (loss) - Group share 16,326 3,231
Consolidated equity - Group share 86,200 76,143
Net financial debt 45,076 52,324
Net operating investments (13,135) (9,566)
Basic and diluted earnings per share (in dirhams) 12.3 193.96 34.34
Dividend per share (in dirhams) 61.85 54.30
Key figures
Key figures and significant events of the period
OCP GROUPConsolidated Financial Statements
At 31 December 20213

Consolidated Financial Statements
(In millions of dirhams) Note FY 2021 FY 2020
Revenue 4.1.1.2 84,300 56,182
Production held as inventory 278 (1,633)
Purchases consumed 4.2.2 (29,360) (18,123)
External expenses 4.2.2 (9,969) (8,224)
Personnel expenses 5.1 (10,550) (9,099)
Taxes (278) (306)
Profit (loss) from joint ventures 6.1 1,185 342
Exchange gains and losses on operating receivables and payables 620 (435)
Other operating income and expenses 44 (48)
EBITDA 36,269 18,657
Amortization, depreciation and operating provisions 8.4 - 9.2 (9,016) (8,196)
Operating profit (loss) before exceptional items 27,254 10,461
Other non-recurring operating income and expenses 7.2 (1,454) (4,199)
Operating profit (loss) 25,799 6,262
Cost of gross financial debt (2,384) (2,436)
Financial income from cash investments 161 266
Cost of net financial debt 10.1.5 (2,223) (2,170)
Exchange gains and losses on financial receivables and payables 10.2.3 (899) 654
Other financial income and expenses 10.2.3 (2,178) (449)
Financial profit (loss) (5,299) (1,966)
Profit (loss) before tax 20,500 4,295
Corporate Income Tax 11.2 - 11.3 (4,164) (904)
Net profit (loss) for the period 16,336 3,391
Net profit (loss) - Group share 16,326 3,231
Net profit (loss) - Non-controlling interests 10 160
Basic and diluted earnings per share in dirhams 193.96 34.34
Consolidated Statement of Profit and Loss
OCP GROUPConsolidated Financial Statements
At 31 December 20214
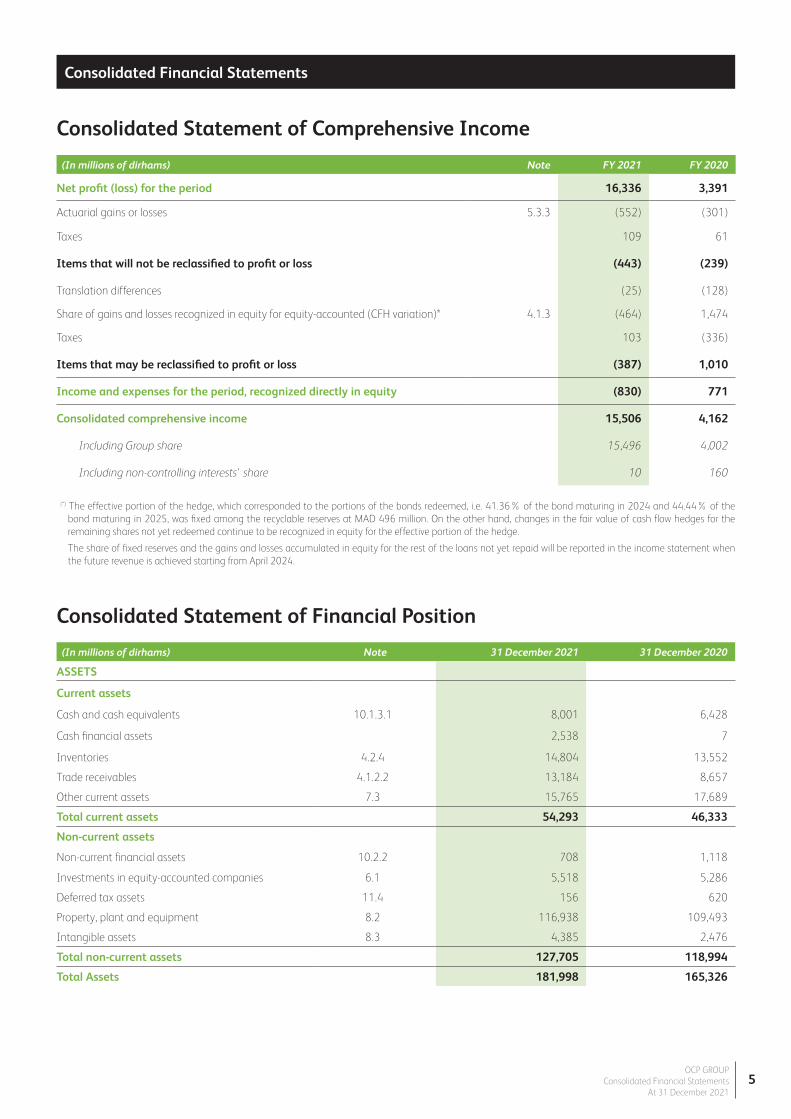
Consolidated Statement of Comprehensive Income
(In millions of dirhams) Note 31 December 2021 31 December 2020
ASSETS
Current assets
Cash and cash equivalents 10.1.3.1 8,001 6,428
Cash financial assets 2,538 7
Inventories 4.2.4 14,804 13,552
Trade receivables 4.1.2.2 13,184 8,657
Other current assets 7.3 15,765 17,689
Total current assets 54,293 46,333
Non-current assets
Non-current financial assets 10.2.2 708 1,118
Investments in equity-accounted companies 6.1 5,518 5,286
Deferred tax assets 11.4 156 620
Property, plant and equipment 8.2 116,938 109,493
Intangible assets 8.3 4,385 2,476
Total non-current assets 127,705 118,994
Total Assets 181,998 165,326
Consolidated Statement of Financial Position
(*) The effective portion of the hedge, which corresponded to the portions of the bonds redeemed, i.e. 41.36% of the bond maturing in 2024 and 44.44% of the bond maturing in 2025, was fixed among the recyclable reserves at MAD 496 million. On the other hand, changes in the fair value of cash flow hedges for the remaining shares not yet redeemed continue to be recognized in equity for the effective portion of the hedge.
The share of fixed reserves and the gains and losses accumulated in equity for the rest of the loans not yet repaid will be reported in the income statement when the future revenue is achieved starting from April 2024.
Consolidated Financial Statements
OCP GROUPConsolidated Financial Statements
At 31 December 20215
(In millions of dirhams) Note FY 2021 FY 2020
Net profit (loss) for the period 16,336 3,391
Actuarial gains or losses 5.3.3 (552) (301)
Taxes 109 61
Items that will not be reclassified to profit or loss (443) (239)
Translation differences (25) (128)
Share of gains and losses recognized in equity for equity-accounted (CFH variation)* 4.1.3 (464) 1,474
Taxes 103 (336)
Items that may be reclassified to profit or loss (387) 1,010
Income and expenses for the period, recognized directly in equity (830) 771
Consolidated comprehensive income 15,506 4,162
Including Group share 15,496 4,002
Including non-controlling interests' share 10 160
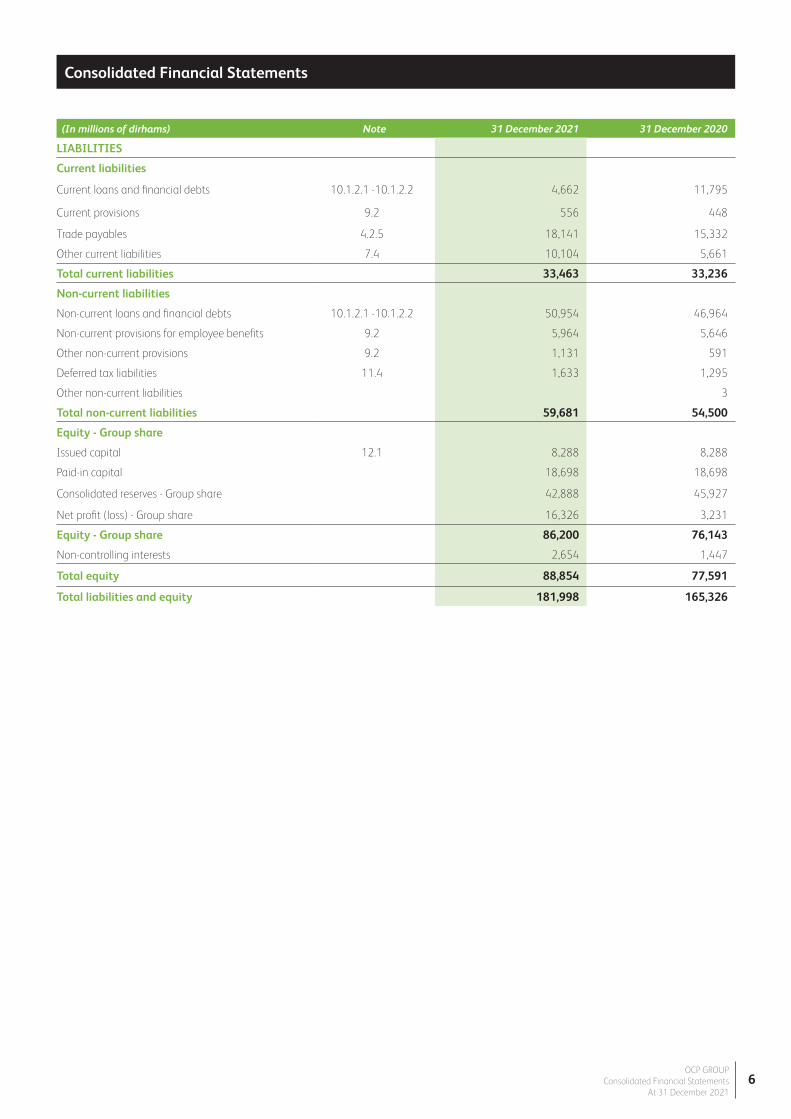
(In millions of dirhams) Note 31 December 2021 31 December 2020
LIABILITIES
Current liabilities
Current loans and financial debts 10.1.2.1 -10.1.2.2 4,662 11,795
Current provisions 9.2 556 448
Trade payables 4.2.5 18,141 15,332
Other current liabilities 7.4 10,104 5,661
Total current liabilities 33,463 33,236
Non-current liabilities
Non-current loans and financial debts 10.1.2.1 -10.1.2.2 50,954 46,964
Non-current provisions for employee benefits 9.2 5,964 5,646
Other non-current provisions 9.2 1,131 591
Deferred tax liabilities 11.4 1,633 1,295
Other non-current liabilities 3
Total non-current liabilities 59,681 54,500
Equity - Group share
Issued capital 12.1 8,288 8,288
Paid-in capital 18,698 18,698
Consolidated reserves - Group share 42,888 45,927
Net profit (loss) - Group share 16,326 3,231
Equity - Group share 86,200 76,143
Non-controlling interests 2,654 1,447
Total equity 88,854 77,591
Total liabilities and equity 181,998 165,326
Consolidated Financial Statements
OCP GROUPConsolidated Financial Statements
At 31 December 20216

(1) Defined benefit plans are subject to a provision, determined on the basis of an actuarial valuation of the commitment using the projected unit credit method and taking into account demographic and financial assumptions. Actuarial assumptions are reviewed on an annual basis. Differences related to changes in actuarial assumptions and experience-related adjustments are actuarial gains and losses recorded in non-recyclable equity in accordance with the provisions of IAS 19R.
(2) OCP SA closed two perpetual subordinated bond issue with early repayment and deferred payment options for a total amount of MAD 10 billion issued in five tranches. Given the characteristics of this hybrid issue, the financing is recognized in equity according to IFRS 9.
Consolidated Statement of Changes in Equity
(In millions of dirhams)Issued capital
Paid-in capital
actuarial gains or losses (1)
hybrid securities (2)
Other consolidated reserves
Translation difference
financial assets at fair value
by OCI (3)
Share of gains and losses recognized in equity (CFH
variation) (4)
Net profit (loss)Total equity - Group
share Non-controlling
interests (5) Total equity
Equity as at 1st January 2020 8,288 18,698 (3,244) 9,075 42,618 (273) (521) (293) 2,843 77,191 1,436 78,627
Allocation of profit (loss) for FY 2020 2,843 (2,843)
Consolidated comprehensive income for FY 2020 (239) (128) 1,139 3,231 4,002 160 4,162
Subordinated debt's coupons (410) (410) (410)
Change in scope
Dividends paid (4,461) (4,461) (170) (4,631)
Others (180) (180) 22 (158)
Equity as at 31 December 2020 8,288 18,698 (3,484) 8,665 40,820 (401) (521) 846 3,231 76,143 1,448 77,590
Equity as at 1st January 2021 8,288 18,698 (3,484) 8,665 40,820 (401) (521) 846 3,231 76,143 1,448 77,590
Allocation of profit (loss) for FY 2021 3,231 (3,231)
Consolidated comprehensive income for FY 2021 (443) (25) (362) 16,326 15,496 10 15,506
Subordinated debt's coupons (393) (393) (393)
Change in scope 1,372 1,372
Dividends paid (5,081) (5,081) (173) (5,254)
Others 35 35 (2) 33
Equity as at 31 December 2021 8,288 18,698 (3,926) 8,272 39,005 (426) (521) 484 16,326 86,200 2,654 88,854
Consolidated Financial Statements
OCP GROUPConsolidated Financial Statements
At 31 December 20217

(3) It represents the depreciation of the Group’s investment in Heringer..
(4) The Group sets up a foreign currency cash-flow hedge. This strategy results in the recognition for the effective part, of the currency effect on the debt until maturity, as OCI (Other Comprehensive Income).
(5) This represents non-controlling interests in JFCV, Maghrib Hospitality Company and Société La Mamounia.
OCP GROUPConsolidated Financial Statements
At 31 December 20218
(In millions of dirhams)Issued capital
Paid-in capital
actuarial gains or losses (1)
hybrid securities (2)
Other consolidated reserves
Translation difference
financial assets at fair value
by OCI (3)
Share of gains and losses recognized in equity (CFH
variation) (4)
Net profit (loss)Total equity - Group
share Non-controlling
interests (5) Total equity
Equity as at 1st January 2020 8,288 18,698 (3.244) 9,075 42,618 (273) (521) (293) 2,843 77,191 1,436 78,627
Allocation of profit (loss) for FY 2020 2,843 (2,843)
Consolidated comprehensive income for FY 2020 (239) (128) 1,139 3,231 4,002 160 4,162
Subordinated debt's coupons (410) (410) (410)
Change in scope
Dividends paid (4,461) (4,461) (170) (4,631)
Others (180) (180) 22 (158)
Equity as at 31 December 2020 8,288 18,698 (3,484) 8,665 40,820 (401) (521) 846 3,231 76,143 1,447 77,591
Equity as at 1st January 2021 8,288 18,698 (3,484) 8,665 40,820 (401) (521) 846 3,231 76,143 1,447 77,591
Allocation of profit (loss) for FY 2021 3,231 (3,231)
Consolidated comprehensive income for FY 2021 (443) (25) (362) 16,326 15,496 10 15,506
Subordinated debt's coupons (393) (393) (393)
Change in scope 1,372 1,372
Dividends paid (5,081) (5,081) (173) (5,254)
Others 35 35 (2) 33
Equity as at 31 December 2021 8,288 18,698 (3,926) 8,272 39,005 (426) (521) 484 16,326 86,200 2,654 88,854
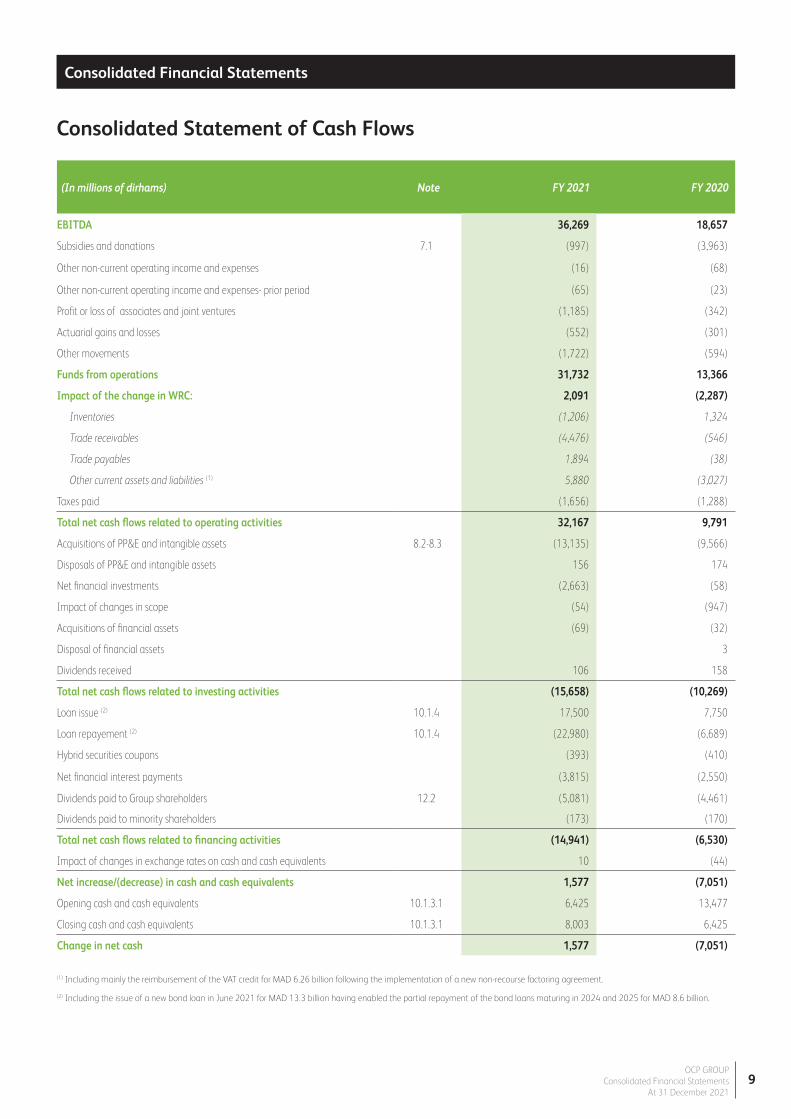
(In millions of dirhams) Note FY 2021 FY 2020
EBITDA 36,269 18,657
Subsidies and donations 7.1 (997) (3,963)
Other non-current operating income and expenses (16) (68)
Other non-current operating income and expenses- prior period (65) (23)
Profit or loss of associates and joint ventures (1,185) (342)
Actuarial gains and losses (552) (301)
Other movements (1,722) (594)
Funds from operations 31,732 13,366
Impact of the change in WRC: 2,091 (2,287)
Inventories (1,206) 1,324
Trade receivables (4,476) (546)
Trade payables 1,894 (38)
Other current assets and liabilities (1) 5,880 (3,027)
Taxes paid (1,656) (1,288)
Total net cash flows related to operating activities 32,167 9,791
Acquisitions of PP&E and intangible assets 8.2-8.3 (13,135) (9,566)
Disposals of PP&E and intangible assets 156 174
Net financial investments (2,663) (58)
Impact of changes in scope (54) (947)
Acquisitions of financial assets (69) (32)
Disposal of financial assets 3
Dividends received 106 158
Total net cash flows related to investing activities (15,658) (10,269)
Loan issue (2) 10.1.4 17,500 7,750
Loan repayement (2) 10.1.4 (22,980) (6,689)
Hybrid securities coupons (393) (410)
Net financial interest payments (3,815) (2,550)
Dividends paid to Group shareholders 12.2 (5,081) (4,461)
Dividends paid to minority shareholders (173) (170)
Total net cash flows related to financing activities (14,941) (6,530)
Impact of changes in exchange rates on cash and cash equivalents 10 (44)
Net increase/(decrease) in cash and cash equivalents 1,577 (7,051)
Opening cash and cash equivalents 10.1.3.1 6,425 13,477
Closing cash and cash equivalents 10.1.3.1 8,003 6,425
Change in net cash 1,577 (7,051)
Consolidated Statement of Cash Flows
(1) Including mainly the reimbursement of the VAT credit for MAD 6.26 billion following the implementation of a new non-recourse factoring agreement.
(2) Including the issue of a new bond loan in June 2021 for MAD 13.3 billion having enabled the partial repayment of the bond loans maturing in 2024 and 2025 for MAD 8.6 billion.
Consolidated Financial Statements
OCP GROUPConsolidated Financial Statements
At 31 December 20219
OCP GROUPConsolidated Financial Statements
At 31 December 202110
Consolidated Financial StatementsConsolidated Financial Statements
Note 1 - Accounting rules and methods
1.1. BASES FOR THE PREPARATION OF THE FINANCIAL STATEMENTS
In accordance with Opinion No. 5 of the Conseil National de la Comptabilité (CNC National Accounting Council)
of 26 May 2005, and in compliance with the provisions of Article III, paragraph 2 of the circular of the «Autorité
Marocaine du Marché des Capitaux -AMMC» entered into force on 1st April 2012, the consolidated financial
statements of OCP Group are prepared in accordance with the standards and interpretations drawn up by the
International Accounting Standards Board (IASB) and the IFRS Interpretation Committee respectively, and adopted
by the European Union. The reporting currency for the consolidated financial statements is the Moroccan dirham.
The consolidated financial statements of OCP Group on 31 December 2021 were approved by the Executive Board
on 9 March 2022.
The accounting principles and methods adopted for the preparation of the consolidated accounts as at 31 December
2021 are identical to those used for the year ended 31 December 2020. These financial statements are prepared
in accordance with the IFRS as adopted in the European Union.
1.2. STANDARDS AND INTERPRETATIONS APPLIED AT 1ST JANUARY 2021
There were no standards and interpretations that were to apply starting from January 1, 2021.

OCP GROUPConsolidated Financial Statements
At 31 December 202111
Consolidated Financial StatementsConsolidated Financial Statements
Note 2 - Consolidation scope and scope change
2.1. CONSOLIDATION SCOPE
* New entity which absorbed Lydex-Lycée d’Excellence.
** New integration in the consolidation scope.
Entity Country of location Currency
31 December 2021 31 December 2020
Consolidation method
% InterestConsolidation
method%
Interest
Industrial
OCP SA - Holding Morocco MADParent
company (Full)100.00
Parent company (Full)
100.00
Fertinagro Biotech Spain EUR Equity method 20.00 Equity method 20.00
Groupe PRAYON Belgium EUR Equity method 50.00 Equity method 50.00
Jorf Fertilizer Company I - JFC I Morocco MAD Full 100.00 Full 100.00
Jorf Fertilizer Company II - JFC II Morocco MAD Full 100.00 Full 100.00
Jorf Fertilizer Company III - JFC III Morocco MAD Full 100.00 Full 100.00
Jorf Fertilizer Company IV - JFC IV Morocco MAD Full 100.00 Full 100.00
Jorf Fertilizer Company V - JFC V Morocco MAD Full 60.00 Full 60.00
Euro Maroc Phosphore- EMA Morocco MAD Equity method 33.33 Equity method 33.33
Indo Maroc Phosphore - IMA Morocco MAD Equity method 33.33 Equity method 33.33
Pakistan Maroc Phosphore - PMP Morocco MAD Equity method 50.00 Equity method 50.00
Paradeep Phosphates Ltd. - PPL India INR Equity method 50.00 Equity method 50.00
Phosboucraa Morocco MAD Full 100.00 Full 100.00
Trading
Black Sea Fertilizer Trading Company Turkey TRY Full 100.00 Full 100.00
OCP AFRICA Morocco MAD Full 100.00 Full 100.00
OCP Fertilizantes Brazil BRL Full 100.00 Full 100.00
OCP North America USA USD Full 100.00 Full 100.00
SAFTCO Swiss USD Full 100.00 Full 100.00
Others
Association pour la Promotion de l'Enseignement d'Excellence - APEE* Morocco MAD Full 100.00 Full 100.00
Centre d'Etudes et de Recherches des Phosphates Minéraux -CER Morocco MAD Full 100.00 Full 100.00
Dupont Ocp Operations Consulting - DOOC Morocco MAD Full 100.00 Equity method 50.00
Foncière Endowment 1 - FE1 Morocco MAD Full 100.00 Full 100.00
Fondation OCP Morocco MAD Full 100.00 Full 100.00
Fondation PB Morocco MAD Full 100.00 Full 100.00
Jacobs Engineering - JESA Morocco MAD Equity method 50.00 Equity method 50.00
Moroccan Foundation For Advanced Science, Innovation and Research- MASCIR**
Morocco MAD Full 100.00
Moroccan Hospitality Company SA-MHC Morocco MAD Full 61.50 Equity method 50.00
OCP Innovation Fund For Agriculture - OIFFA Morocco MAD Full 100.00 Full 100.00
OCP International Netherlands USD Full 100.00 Full 100.00
OCP International SAS France EUR Full 100.00 Full 100.00
OCP Hospitality Morocco MAD Full 100.00 Full 100.00
OCP Solutions (Ex SMESI) Morocco MAD Full 100.00 Full 100.00
Société d'Aménagement et de Développement de Mazagan - SAEDM Morocco MAD Equity method 51.00 Equity method 51.00
Société d'Aménagement et de Développement Vert - SADV Morocco MAD Full 100.00 Full 100.00
Société Foncière de la Lagune-SFL Morocco MAD Equity method 30.80
Société La Mamounia- SLM Morocco MAD Full 32.00
Société Palais Jamai- SPJ Morocco MAD Full 61.50
Société de Transports Régionaux - SOTREG Morocco MAD Full 100.00 Full 100.00
Université MED6 polytechnique Endowment Holding - UM6PEH Morocco MAD Full 100.00 Full 100.00
Université MED6 polytechnique - UM6P Morocco MAD Full 100.00 Full 100.00
TEAL Technology & Services - TTS Morocco MAD Equity method 49.00 Equity method 49.00

OCP GROUPConsolidated Financial Statements
At 31 December 202112
Consolidated Financial StatementsConsolidated Financial Statements
2.2. SCOPE CHANGE
The consolidation scope of the Group has undergone the following changes:
• OCP Group increased its stake in the entity Dupont OCP Opérations Consulting to hold 100% of its capital. This entity
is now controlled by OCP and fully consolidated. The impacts of the integration of this entity are not significant.
• In July 2021, the OCP Group subscribed alone to the capital increase of its subsidiary Maghrib Hospitality
Company – MHC. Then, increasing its stake to 61.5%. MHC is now fully consolidated. The Hassan II Fund has
become a minority shareholder within MHC.
Following the integration of MHC, the share of the net assets acquired from La Mamounia was estimated at MAD
457 million. As the value of the shares has been fixed at MAD 2,343 million, a new goodwill was then calculated
for MAD 1,886 million. The group has 12 months from the date of acquisition of control to allocate this goodwill.
In addition, the amount of the non-controlling interest in SLM was estimated at MAD 421 million from the date of
takeover.
• The 100% integration into the consolidation scope of the MAScIR Foundation, Moroccan Foundation for Advanced
Science, Innovation and Research. It is a Moroccan research center belonging to the Mohammed IV Polytechnic
University. Its objective is to promote scientific research and technological development in order to support the
development of Morocco and participate in the development of a new knowledge economy.
Note 3 - Segment reporting
The presentation of the Group segment information has been modified. It is now disclosed by production axis in
accordance with the Group’s organization and internal reporting:
- Northern Axis (Khouribga – Jorf Lasfar): this axis hosts the integrated phosphate chemical processing hub.
Phosphate extracted at Khouribga is transported by slurry pipeline to Jorf Lasfar, where it is processed into phosphoric
acid and fertilizers. The finished products are exported from OCP port at Jorf Lasfar.
- Central Axis (Youssoufia and Benguérir – Safi) and Phosboucraâ: this axis hosts:
• The integrated phosphate chemical processing hub. The phosphate extracted at Youssoufia and Benguérir is
transported by rail to Safi, where it is processed into phosphoric acid and fertilizer. The finished products are
exported from OCP port at Safi.
• Phosboucraâ’s extraction site. The phosphate that is extracted there is transported by conveyers to the processing
center at Laâyoune, then exported by sea from Laâyoune port.
- Head office and other activities: it hosts the corporate activities and the activities of international entities.
OCP GROUPConsolidated Financial Statements
At 31 December 202113
Consolidated Financial StatementsConsolidated Financial Statements
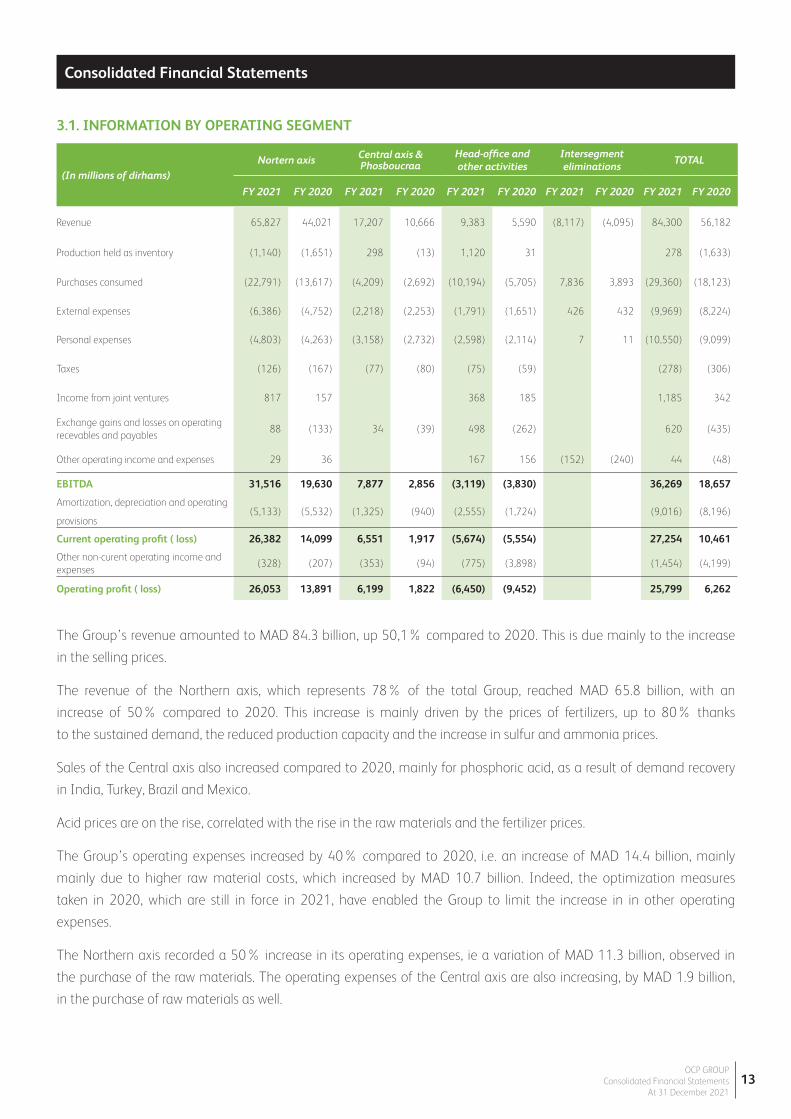
3.1. INFORMATION BY OPERATING SEGMENT
(In millions of dirhams)Nortern axis Central axis &
PhosboucraaHead-office and other activities
Intersegment eliminations
TOTAL
FY 2021 FY 2020 FY 2021 FY 2020 FY 2021 FY 2020 FY 2021 FY 2020 FY 2021 FY 2020
Revenue 65,827 44,021 17,207 10,666 9,383 5,590 (8,117) (4,095) 84,300 56,182
Production held as inventory (1,140) (1,651) 298 (13) 1,120 31 278 (1,633)
Purchases consumed (22,791) (13,617) (4,209) (2,692) (10,194) (5,705) 7,836 3,893 (29,360) (18,123)
External expenses (6,386) (4,752) (2,218) (2,253) (1,791) (1,651) 426 432 (9,969) (8,224)
Personal expenses (4,803) (4,263) (3,158) (2,732) (2,598) (2,114) 7 11 (10,550) (9,099)
Taxes (126) (167) (77) (80) (75) (59) (278) (306)
Income from joint ventures 817 157 368 185 1,185 342
Exchange gains and losses on operating recevables and payables
88 (133) 34 (39) 498 (262) 620 (435)
Other operating income and expenses 29 36 167 156 (152) (240) 44 (48)
EBITDA 31,516 19,630 7,877 2,856 (3,119) (3,830) 36,269 18,657
Amortization, depreciation and operating
provisions(5,133) (5,532) (1,325) (940) (2,555) (1,724) (9,016) (8,196)
Current operating profit ( loss) 26,382 14,099 6,551 1,917 (5,674) (5,554) 27,254 10,461
Other non-curent operating income and expenses
(328) (207) (353) (94) (775) (3,898) (1,454) (4,199)
Operating profit ( loss) 26,053 13,891 6,199 1,822 (6,450) (9,452) 25,799 6,262
The Group’s revenue amounted to MAD 84.3 billion, up 50,1% compared to 2020. This is due mainly to the increase
in the selling prices.
The revenue of the Northern axis, which represents 78% of the total Group, reached MAD 65.8 billion, with an
increase of 50% compared to 2020. This increase is mainly driven by the prices of fertilizers, up to 80% thanks
to the sustained demand, the reduced production capacity and the increase in sulfur and ammonia prices.
Sales of the Central axis also increased compared to 2020, mainly for phosphoric acid, as a result of demand recovery
in India, Turkey, Brazil and Mexico.
Acid prices are on the rise, correlated with the rise in the raw materials and the fertilizer prices.
The Group’s operating expenses increased by 40% compared to 2020, i.e. an increase of MAD 14.4 billion, mainly
mainly due to higher raw material costs, which increased by MAD 10.7 billion. Indeed, the optimization measures
taken in 2020, which are still in force in 2021, have enabled the Group to limit the increase in in other operating
expenses.
The Northern axis recorded a 50% increase in its operating expenses, ie a variation of MAD 11.3 billion, observed in
the purchase of the raw materials. The operating expenses of the Central axis are also increasing, by MAD 1.9 billion,
in the purchase of raw materials as well.
OCP GROUPConsolidated Financial Statements
At 31 December 202114
Consolidated Financial StatementsConsolidated Financial Statements
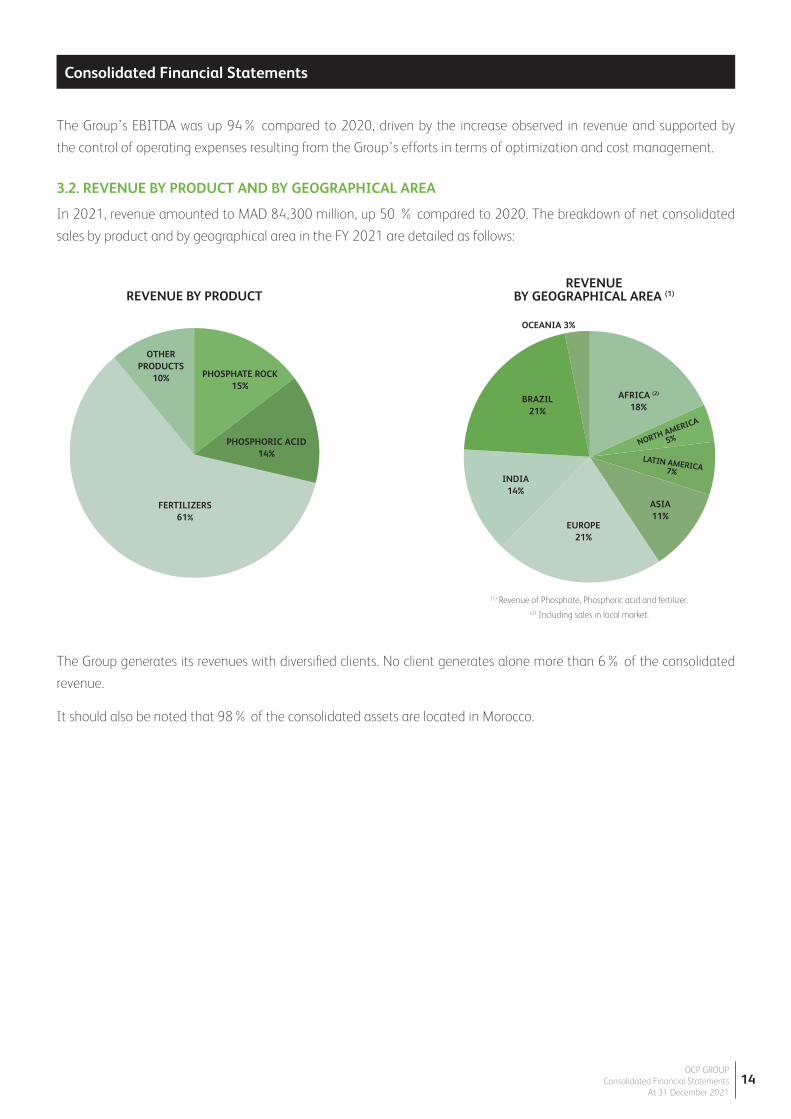
REVENUE BY GEOGRAPHICAL AREA (1)
INDIA14%
BRAZIL21%
EUROPE 21%
ASIA 11%
OCEANIA 3%
AFRICA (2)
18%
(1) Revenue of Phosphate, Phosphoric acid and fertilizer.(2) Including sales in local market.
FERTILIZERS61%
REVENUE BY PRODUCT
OTHER PRODUCTS
10%
PHOSPHORIC ACID14%
PHOSPHATE ROCK15%
NORTH AMERICA
5%
LATIN AMERICA 7%
The Group generates its revenues with diversified clients. No client generates alone more than 6% of the consolidated
revenue.
It should also be noted that 98% of the consolidated assets are located in Morocco.
The Group’s EBITDA was up 94% compared to 2020, driven by the increase observed in revenue and supported by
the control of operating expenses resulting from the Group’s efforts in terms of optimization and cost management.
3.2. REVENUE BY PRODUCT AND BY GEOGRAPHICAL AREA
In 2021, revenue amounted to MAD 84,300 million, up 50 % compared to 2020. The breakdown of net consolidated
sales by product and by geographical area in the FY 2021 are detailed as follows:

OCP GROUPConsolidated Financial Statements
At 31 December 202115
Consolidated Financial StatementsConsolidated Financial Statements
Note 4 - Operational data
4.1. OPERATING REVENUE
4.1.1 REVENUE
4.1.1.1 ACCOUNTING TREATMENT OF REVENUES
Revenue from the sale of goods is measured at the fair value of the consideration received or receivable, net of returns
and rebates, trade discounts and quantity discounts. Revenue is recognized upon the control transfer of the goods,
and when the amount of revenue can be reasonably estimated. This transfer of ownership is made at the time of
delivery of goods for local sales and as per Incoterms for export sales:
• Sales carried out FOB (Free on Board): transfer of risk takes place when the goods are placed on board the
ship at the port of shipment. This primarily concerns sales related to the mining activities.
• Sales carried out under the incoterm CFR (Cost and Freight): OCP bears, in addition, the transport costs
to the destination port, loading costs, export formalities and the related duties and taxes..
4.1.1.2 INFORMATION BY PRODUCT FAMILY
(In millions of dirhams) FY 2021 FY 2020
Phosphates 12,216 9,287
Phosphoric Acid 12,209 8,076
Fertilizer 51,283 32,749
Other income 8,590 6,070
Revenue 84,300 56,182
(In millions of dirhams) Phosphates Phosphoric Acid Fertilizers
FY 2021 FY 2020 FY 2021 FY 2020 FY 2021 FY 2020Main markets
Local sales 3,321 1,891 1,608 1,250 791 518
South America 1,692 2,063 1,706 516 17,981 12,080
Europe 3,466 2,511 5,606 2,346 8,210 6,419
Africa 5 5,698 5,294
North America 128 79 166 3,900 2,628
India 1,993 1,594 2,855 3,324 6,139 4,235
Asia 1,440 869 356 473 6,557 1,423
Oceania 298 230 2,008 153
Total 12,216 9,287 12,209 8,076 51,283 32,749

OCP GROUPConsolidated Financial Statements
At 31 December 202116
Consolidated Financial StatementsConsolidated Financial Statements
(In millions of dirhams) Phosphates Phosphoric Acid Fertilizers
FY 2021 FY 2020 FY 2021 FY 2020 FY 2021 FY 2020Break down by third parties
Revenue 19,372 14,527 12,210 8,076 58,747 36,307
Outside the group 8,879 7,412 10,695 6,866 51,284 32,749
Joints ventures 3,337 1,875 1,515 1,210
Intercompany sales 7,156 5,240 7,463 3,558
Eliminations 7,156 5,240 7,463 3,558
Total 12,216 9,287 12,209 8,076 51,283 32,749
Revenue realized in 2021 was up 50.1% compared to 2020.
- Phosphates sales increased by 31.6% between 2020 and 2021.
Overall, the rise in Phosphate prices allowed to absorb the slight drop in volumes sold for export. This decrease
observed mainly in Latin and North America was offset by the increase in sales in Asia, Europe and locally in Morocco.
In fact, the drop in volumes in Latin America, mainly in Mexico, is due to the anticipatory storage strategy of our
client Fertinal, taking advantage of the favorable freight rate in the region at the end of 2020, and in Brazil mainly
at Mosaic Fertilizantes do Brazil due to the impact of the competitive prices of the Bayovar mine.
The sales reduction in North America is explained by a higher shipped level during the first half of 2020 following
the closure of the Bayovar mine due to the spread of the Covid-19 pandemic.
Sales in Asia recorded an increase mainly in Pakistan, explained by the return to the normal level of production after
shutdowns caused by the spread of Covid-19 in the country in 2020.
Moreover, in Europe, an increase in shipments was recorded in Norway. The collapse of the Murmansk bridge in Russia
allowed higher exports for OCP in the region.
Finally, sales on the local market recorded an increase catching up on the drop in production and the prolonged
stoppages observed during 2020 in the joint ventures Pakistan Maroc Phosphore-PMP and Indo Maroc Phosphore-
IMACID due to the spread of Covid-19.
Phosphate export prices increased in 2021. They stand at $100/T FOB during 2021 against $75/T FOB during
2020. This increase was strongly correlated with the rise in inputs for the production of fertilizers, including sulphur,
ammonia and sulfuric acid. With regard to the domestic market, the increase in the price of phosphate concerns
the K09 quality, the local price of which remains indexed to the average export price.
- Phosphoric acid sales increased by 51.1% between 2020 and 2021, i.e. MAD +4.1 billion.
This increase is explained by the rise in sales prices in correlation with the rise in input prices, thus recording an
impact of mad +4.1 billion between 2020 and 2021.
This increase allowed to absorb the decline in volumes in Asia and Oceania, mainly explained by an arbitrage of
sales in favor of the Group’s Joint Ventures in this region, as well as locally, explained by the drop in supplies of pretreated
acid from Europe Morocco Phosphore-EMAPHOS.
Sales in Latin America increased due to new volumes served in Mexico for Fertinal Group and in Brazil following
the return of ICL Brazil to OCP’s customer portfolio.
OCP GROUPConsolidated Financial Statements
At 31 December 202117
Consolidated Financial StatementsConsolidated Financial Statements
Finally, sales in Europe increased, particularly in Turkey following the recovery in demand following a strategy to
optimize acid consumption by producers in 2020.
Acid selling prices recorded an increase in 2021, particularly for export, mainly explained by the rise in sulfur prices.
- Fertilizer sales showed an increase of MAD 18.5 billion between 2020 and 2021 (+56.6%).
This increase is explained by the rise in the fertilizer prices on the international markets in line with higher input
prices, in particular ammonia, sulfuric acid and sulphur. The average market price per ton grew up from $297/T in
2020 to $533/T in 2021.
This price increase was largely offset the decline in volumes observed in North America and Latin America.
The decline in sales in North America is mainly due to the effect of the import tax in the United States of 19.97%
which was imposed on OCP following the request filed by Mosaic in 2020. Nevertheless, this drop was partially offset
by the placement of new volumes in Canada resulting from Mosaic’s low production capacity following the recovery
of the American market.
Imports from the Latin American market also experienced a sharp drop, particularly in Brazil, explained by the
postponement of loading in favor of Africa, and also a drop in Argentina due to the high levels of inventory built up
in 2020 thanks to the granted import subsidies.
In addition, a drop in sales to Asia was noted compared to 2020, while recording both an increase in sales,
particularly to Bangladesh and Pakistan, where demand has recovered compared to 2020, and a decrease sales
to India following the resumption of local production strongly impacted by Covid-19 in the first half of 2020.
The African market, for its part, showed an increase in sales volumes, explained by the beneficial impact from
winning the call for tenders in Benin, and by the regulations in Nigeria which encourage the import of fertilizers for
local blending.
Finally, on the local market, an increase in volumes was recorded following the rise in demand due to a good
agricultural season in 2021 especially after the drought observed the agricultural season in 2020.
- Others products.
Other income mainly concerns the “Freight” activity and other ancillary products, in particular the sale of the liquid
sulphur, urea, ammonium nitrate, potassium chloride, etc. This line amounts to MAD 8.6 billion during 2021 in
comparison to MAD 6.1 billion recorded during 2020.
OCP GROUPConsolidated Financial Statements
At 31 December 202118
Consolidated Financial StatementsConsolidated Financial Statements
4.1.2 TRADE RECEIVABLES
4.1.2.1 ACCOUNTING TREATMENT OF TRADE RECEIVABLES
This category includes operating receivables as well as deposits and guarantees. Upon initial recognition, the
receivables are recorded in the balance sheet at their fair value that is generally equal to the nominal value, net
of the discount effect when is applicable. At the closing date, these assets are measured using the amortized cost
method. A loss in value is recorded depending on both the expected loss when the receivables are recognized and
to the risk of non-recovery.
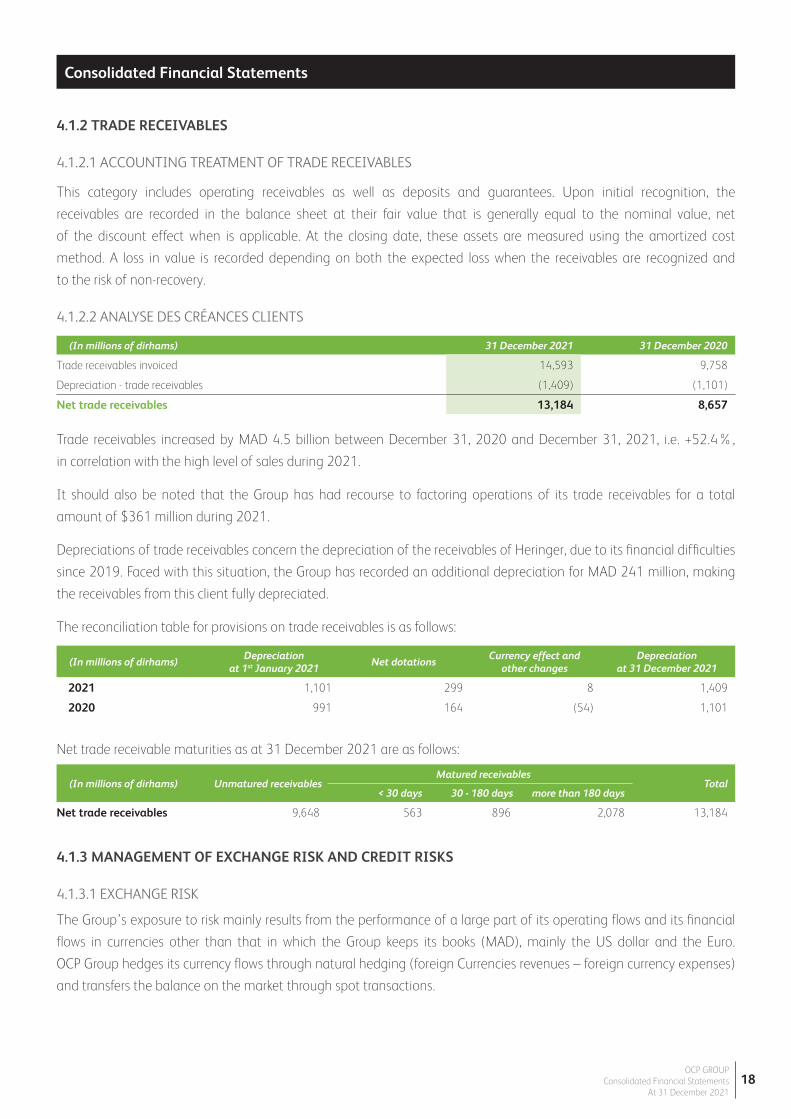
4.1.2.2 ANALYSE DES CRÉANCES CLIENTS
(In millions of dirhams) 31 December 2021 31 December 2020
Trade receivables invoiced 14,593 9,758
Depreciation - trade receivables (1,409) (1,101)
Net trade receivables 13,184 8,657
(In millions of dirhams)Depreciation
at 1st January 2021Net dotations
Currency effect and other changes
Depreciation at 31 December 2021
2021 1,101 299 8 1,409
2020 991 164 (54) 1,101
(In millions of dirhams) Unmatured receivablesMatured receivables
Total < 30 days 30 - 180 days more than 180 days
Net trade receivables 9,648 563 896 2,078 13,184
4.1.3 MANAGEMENT OF EXCHANGE RISK AND CREDIT RISKS
4.1.3.1 EXCHANGE RISK
The Group’s exposure to risk mainly results from the performance of a large part of its operating flows and its financial
flows in currencies other than that in which the Group keeps its books (MAD), mainly the US dollar and the Euro.
OCP Group hedges its currency flows through natural hedging (foreign Currencies revenues – foreign currency expenses)
and transfers the balance on the market through spot transactions.
Trade receivables increased by MAD 4.5 billion between December 31, 2020 and December 31, 2021, i.e. +52.4%,
in correlation with the high level of sales during 2021.
It should also be noted that the Group has had recourse to factoring operations of its trade receivables for a total
amount of $361 million during 2021.
Depreciations of trade receivables concern the depreciation of the receivables of Heringer, due to its financial difficulties
since 2019. Faced with this situation, the Group has recorded an additional depreciation for MAD 241 million, making
the receivables from this client fully depreciated.
The reconciliation table for provisions on trade receivables is as follows:
Net trade receivable maturities as at 31 December 2021 are as follows:
OCP GROUPConsolidated Financial Statements
At 31 December 202119
Consolidated Financial StatementsConsolidated Financial Statements
4.1.3.2 FOREIGN EXCHANGE RISK ON FINANCING FLOWS
Setting up exchange rate hedge accounting:
As part of these activities, OCP realizes sales in dollars and has issued two bonds in dollars in fine respectively on
April 25, 2014 and April 22, 2015. The first debt of $ 1.25 billion comes to maturity on April 25, 2024 and the
second debt of $ 1 billion matures on October 22, 2025. At each closing, these debts generate an exchange rate
effect in income under IAS 21. In this context, OCP aimed to limit this impact by using hedge accounting.
Evaluation of the hedging relationship in the COVID-19 context:
In this particular context of the Covid-19 observed during 2020, OCP affirms that the circumstances of the pandemic
will not be likely to reduce the level of activity and Group revenue. Thus, the Group achieved during 2021 a revenue
of $ 9.4 billion (MAD 84.3 billion) in 2021 up 50 % compared to 2020. Consequently, the assumptions validating
the effectiveness of the hedging relationship remain fully maintained and the hedging documentation is still verified.
According to the strategy initially described, OCP expects the hedge to be highly effective; it must be regularly tested
over the life of the transaction and must be between 80% and 125%.
Since the partial redemption of the bond issues on June 23, 2021, for respectively 41.36% of the 2024 tranche
($517 million) and 44.44% of the 2025 tranche (MAD 444.4 million), the hedging reserves cumulative cash
flows corresponding to this operation will be maintained in other comprehensive income for a total amount of MAD
496 million and will be gradually recycled in the P&L when the revenue is realized starting from April 2024 for the
2024-tranche and from October 2025 for the 2025-tranche. The rest of these non-repurchased tranches continue
to serve as hedging instruments for future revenue that would be realizable in 2024 and 2025.
4.1.3.3 CREDIT RISKS
The credit risk stems in particular from the client risk in the event that the customers are unable to fulfill their
commitments under the agreed conditions, bank and political risk.
OCP Group is present in more than fifty countries in the world. Its turnover is mainly generated by export sales.
OCP Group counts among its clients large international groups that have been in business relations with the Group
for several years.
Credit risk management is based on the following elements:
• OCP has a comprehensive credit risk hedging policy based on periodic assessments of the financial strength of its
clients and counterparties.
• The Group carries out a very active monitoring of trade receivables and counterparty risks. The monitoring is also
permanent and rigorous with preventive reminders and in case of exceeding deadlines.
• Reporting and monitoring indicators are produced monthly to assess the payment performance of customers and
counterparties.
The Group applies a preventive policy, in particular by using credit insurance and other forms of guarantees and cover
applicable to trade receivables provided by leading financial institutions, as well as by setting up a program for the
disposal of receivables without recourse to renowned banking and factoring establishments.
OCP GROUPConsolidated Financial Statements
At 31 December 202120
Consolidated Financial StatementsConsolidated Financial Statements
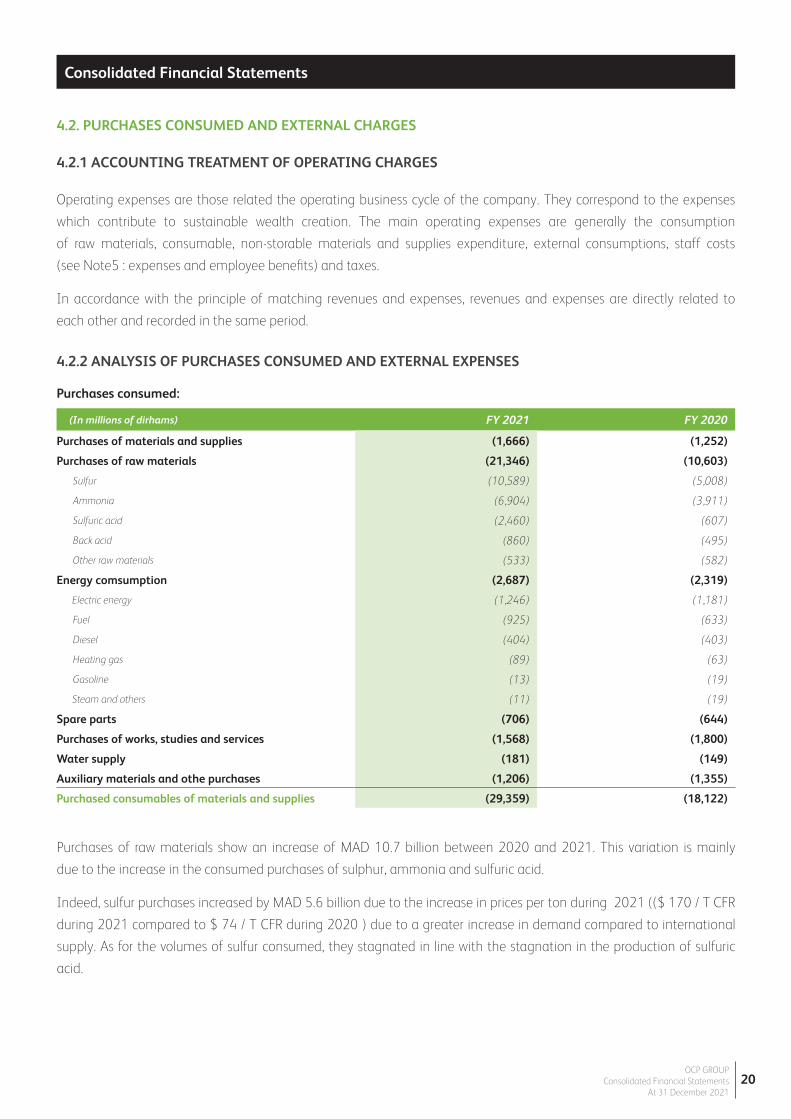
(In millions of dirhams) FY 2021 FY 2020
Purchases of materials and supplies (1,666) (1,252)
Purchases of raw materials (21,346) (10,603)
Sulfur (10,589) (5,008)
Ammonia (6,904) (3,911)
Sulfuric acid (2,460) (607)
Back acid (860) (495)
Other raw materials (533) (582)
Energy comsumption (2,687) (2,319)
Electric energy (1,246) (1,181)
Fuel (925) (633)
Diesel (404) (403)
Heating gas (89) (63)
Gasoline (13) (19)
Steam and others (11) (19)
Spare parts (706) (644)
Purchases of works, studies and services (1,568) (1,800)
Water supply (181) (149)
Auxiliary materials and othe purchases (1,206) (1,355)
Purchased consumables of materials and supplies (29,359) (18,122)
Purchases consumed:
Purchases of raw materials show an increase of MAD 10.7 billion between 2020 and 2021. This variation is mainly
due to the increase in the consumed purchases of sulphur, ammonia and sulfuric acid.
Indeed, sulfur purchases increased by MAD 5.6 billion due to the increase in prices per ton during 2021 (($ 170 / T CFR
during 2021 compared to $ 74 / T CFR during 2020 ) due to a greater increase in demand compared to international
supply. As for the volumes of sulfur consumed, they stagnated in line with the stagnation in the production of sulfuric
acid.
4.2. PURCHASES CONSUMED AND EXTERNAL CHARGES
4.2.1 ACCOUNTING TREATMENT OF OPERATING CHARGES
Operating expenses are those related the operating business cycle of the company. They correspond to the expenses
which contribute to sustainable wealth creation. The main operating expenses are generally the consumption
of raw materials, consumable, non-storable materials and supplies expenditure, external consumptions, staff costs
(see Note5 : expenses and employee benefits) and taxes.
In accordance with the principle of matching revenues and expenses, revenues and expenses are directly related to
each other and recorded in the same period.
4.2.2 ANALYSIS OF PURCHASES CONSUMED AND EXTERNAL EXPENSES
OCP GROUPConsolidated Financial Statements
At 31 December 202121
Consolidated Financial StatementsConsolidated Financial Statements
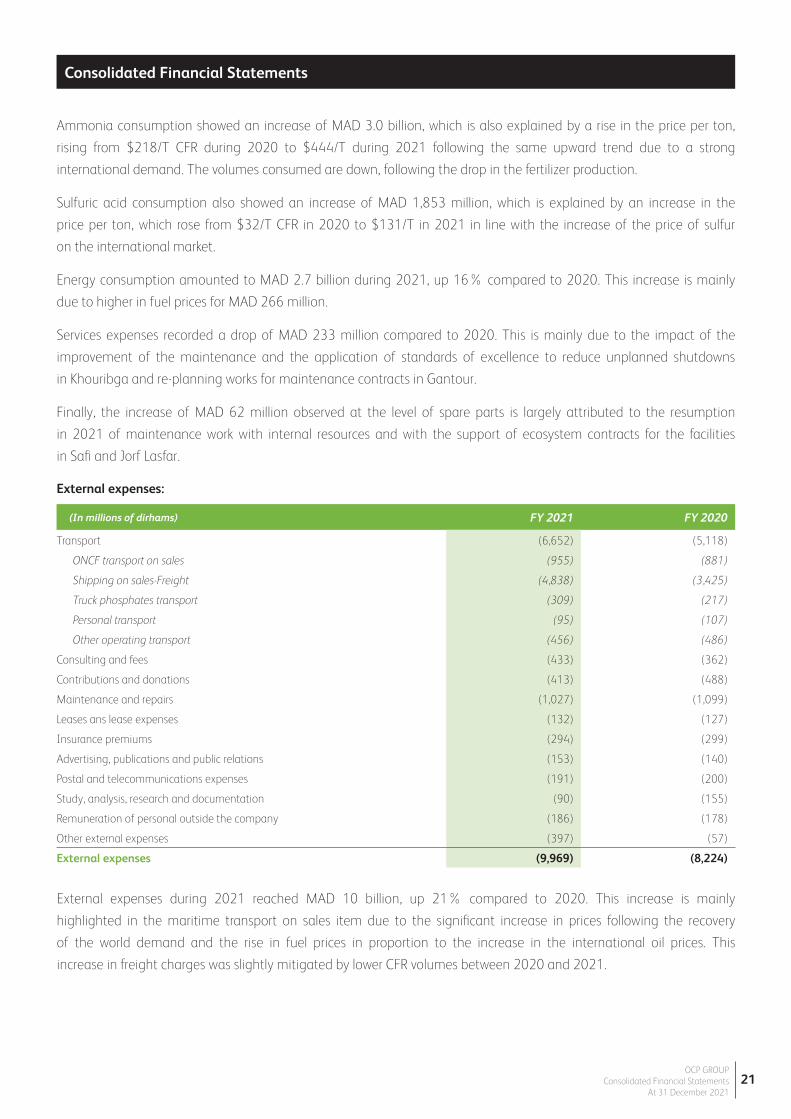
(In millions of dirhams) FY 2021 FY 2020
Transport (6,652) (5,118)
ONCF transport on sales (955) (881)
Shipping on sales-Freight (4,838) (3,425)
Truck phosphates transport (309) (217)
Personal transport (95) (107)
Other operating transport (456) (486)
Consulting and fees (433) (362)
Contributions and donations (413) (488)
Maintenance and repairs (1,027) (1,099)
Leases ans lease expenses (132) (127)
Insurance premiums (294) (299)
Advertising, publications and public relations (153) (140)
Postal and telecommunications expenses (191) (200)
Study, analysis, research and documentation (90) (155)
Remuneration of personal outside the company (186) (178)
Other external expenses (397) (57)
External expenses (9,969) (8,224)
External expenses:
External expenses during 2021 reached MAD 10 billion, up 21% compared to 2020. This increase is mainly
highlighted in the maritime transport on sales item due to the significant increase in prices following the recovery
of the world demand and the rise in fuel prices in proportion to the increase in the international oil prices. This
increase in freight charges was slightly mitigated by lower CFR volumes between 2020 and 2021.
Ammonia consumption showed an increase of MAD 3.0 billion, which is also explained by a rise in the price per ton,
rising from $218/T CFR during 2020 to $444/T during 2021 following the same upward trend due to a strong
international demand. The volumes consumed are down, following the drop in the fertilizer production.
Sulfuric acid consumption also showed an increase of MAD 1,853 million, which is explained by an increase in the
price per ton, which rose from $32/T CFR in 2020 to $131/T in 2021 in line with the increase of the price of sulfur
on the international market.
Energy consumption amounted to MAD 2.7 billion during 2021, up 16% compared to 2020. This increase is mainly
due to higher in fuel prices for MAD 266 million.
Services expenses recorded a drop of MAD 233 million compared to 2020. This is mainly due to the impact of the
improvement of the maintenance and the application of standards of excellence to reduce unplanned shutdowns
in Khouribga and re-planning works for maintenance contracts in Gantour.
Finally, the increase of MAD 62 million observed at the level of spare parts is largely attributed to the resumption
in 2021 of maintenance work with internal resources and with the support of ecosystem contracts for the facilities
in Safi and Jorf Lasfar.
OCP GROUPConsolidated Financial Statements
At 31 December 202122
Consolidated Financial StatementsConsolidated Financial Statements
4.2.3 RISKS RELATED TO RAW MATERIALS
Sulphur supplies
2021 shows a sharp increase in the price of sulfur in the international market, the «FOB middle East Spot» for
example went from $110/T in January 2021 to $273/T in December 2021. In this context, OCP group imported
nearly 6.8 million tons in 2021, using part of its stock previously built up. These imports have been diversified and
come from all exporting regions: Middle East, Europe, North America (US Gulf & Canada), and FSU (Russia,
Kazakhstan). The Group import requirement should increase in the coming years to reach 8.5 to 9 million tons in
2025, in order to meet the sulfur needs due to the start-up of new production capacities in Morocco.
Ammonia supplies
The global economic recovery, as well as several production stoppages of the major ammonia exporters, have
caused prices to increase significantly in 2021. This trend has been amplified by the rise in the price of natural
gas worldwide and specifically in Europe, natural gas being the main input in the production of ammonia.
Consequently, the price of ammonia was multiplied by 4: The «FOB Black Sea Spot» for example increased from
$249/T in January to $999/T in December 2021.
In this context, the OCP group imported nearly 1.7 million tons of ammonia in 2021. As the ammonia trade is
regionalized, this volume was imported mainly from Trinidad and FSU: 2 leading regions in ammonia exports.
In 2021, the OCP group benefited from competitive prices, in particular thanks to its geographical location and the
long-term contracts concluded with the main suppliers.
Moreover, and in the particular context of the war in the Ukraine region, one of the main ammonia exporting
regions in the world, OCP Group remains able to secure its short, medium and long-term ammonia needs by
relying on the increase in its imports from Trinidad and on the development of imports from Egypt and also from
the Gulf countries, notably Qatar and Saudi Arabia.
4.2.4 INVENTORIES
4.2.4.1 ACCOUNTING TREATMENT OF INVENTORIES
Inventories are evaluated at the lower of cost and net realizable value.
The cost of inventories is determined according to the weighted average cost method. It comprises the costs of
purchase, production, conversion and other costs incurred in bringing the inventories to their present location
and condition. For manufactured inventories and work-in-progress, the cost includes an appropriate share of the
overheads based on normal production capacity.
When the sale is recognized, the inventories are then accounted as expenses in current operating income at the
same period as the corresponding product.
Net realizable value is the estimated selling price in the ordinary course of business less the estimated costs of
completion and the estimated costs necessary to make the sale these costs do not include any expenses due to sub-
activity.

OCP GROUPConsolidated Financial Statements
At 31 December 202123
Consolidated Financial StatementsConsolidated Financial Statements
4.2.4.2 ANALYSIS OF THE INVENTORIES EVOLUTION
Inventories of consumables and supplies consists mainly of non-strategic spare parts for installations. The life of these
parts is short. So, they do not have the character of an asset. The risk of obsolescence of these parts is an indication
of impairment that is reviewed annually to estimate whether impairment is required.
Total inventories at the end of December 2021 amounted to MAD 14.8 billion, up by MAD 1.3 billion compared to
the end of December 2020. This increase is explained by a higher weighted average effect due to the rise in the prices
of essential raw materials: sulphur, ammonia and sulfuric acid; this increase was offset by a volume effect mainly
related to phosphate following the orientation of the activity towards a strategy of recovery and valuation of
inventories at Gantour and Khouribga.
4.2.5 TRADE PAYABLES
Trade payables correspond to payables and fixed assets liabilities. They recorded an increase of 18.3% at the end
of December 2021 compared to the end of December 2020 due to the importance of the receptions noted at the
end of 2021 and the start of new projects during the same year.
(In millions of dirhams)31 December 2021 31 December 2020
Gross Depreciation Net Gross Depreciation Net
Consumable materials and supplies 6,825 (1,557) 5,268 5,834 (1,519) 4,315
In-process inventory 6,148 (373) 5,775 6,759 (88) 6,671
Finished products 3,902 (140) 3,762 2,800 (234) 2,566
Total Inventories 16,874 (2,070) 14,804 15,393 (1,841) 13,552
(In millions of dirhams) 31 December 2021 31 December 2020
Trade payables 6,894 4,915
Fixed assets liabilities 11,247 10,416
Trade payables 18,141 15,332
OCP GROUPConsolidated Financial Statements
At 31 December 202124
Consolidated Financial StatementsConsolidated Financial Statements
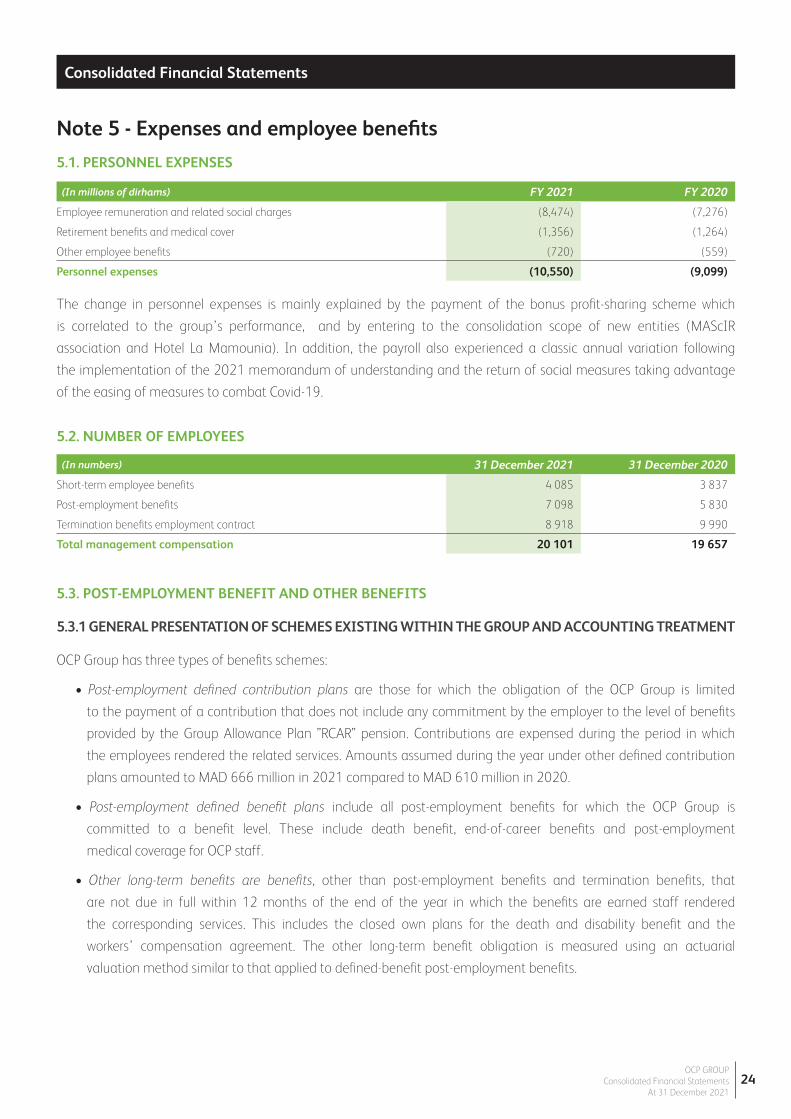
The change in personnel expenses is mainly explained by the payment of the bonus profit-sharing scheme which
is correlated to the group’s performance, and by entering to the consolidation scope of new entities (MAScIR
association and Hotel La Mamounia). In addition, the payroll also experienced a classic annual variation following
the implementation of the 2021 memorandum of understanding and the return of social measures taking advantage
of the easing of measures to combat Covid-19.
5.2. NUMBER OF EMPLOYEES
5.3. POST-EMPLOYMENT BENEFIT AND OTHER BENEFITS
5.3.1 GENERAL PRESENTATION OF SCHEMES EXISTING WITHIN THE GROUP AND ACCOUNTING TREATMENT
OCP Group has three types of benefits schemes:
• Post-employment defined contribution plans are those for which the obligation of the OCP Group is limited
to the payment of a contribution that does not include any commitment by the employer to the level of benefits
provided by the Group Allowance Plan ”RCAR” pension. Contributions are expensed during the period in which
the employees rendered the related services. Amounts assumed during the year under other defined contribution
plans amounted to MAD 666 million in 2021 compared to MAD 610 million in 2020.
• Post-employment defined benefit plans include all post-employment benefits for which the OCP Group is
committed to a benefit level. These include death benefit, end-of-career benefits and post-employment
medical coverage for OCP staff.
• Other long-term benefits are benefits, other than post-employment benefits and termination benefits, that
are not due in full within 12 months of the end of the year in which the benefits are earned staff rendered
the corresponding services. This includes the closed own plans for the death and disability benefit and the
workers’ compensation agreement. The other long-term benefit obligation is measured using an actuarial
valuation method similar to that applied to defined-benefit post-employment benefits.
(In millions of dirhams) FY 2021 FY 2020
Employee remuneration and related social charges (8,474) (7,276)
Retirement benefits and medical cover (1,356) (1,264)
Other employee benefits (720) (559)
Personnel expenses (10,550) (9,099)
Note 5 - Expenses and employee benefits
5.1. PERSONNEL EXPENSES
(In numbers) 31 December 2021 31 December 2020
Short-term employee benefits 4 085 3 837
Post-employment benefits 7 098 5 830
Termination benefits employment contract 8 918 9 990
Total management compensation 20 101 19 657
OCP GROUPConsolidated Financial Statements
At 31 December 202125
Consolidated Financial StatementsConsolidated Financial Statements
Defined benefit plans are subject to a provision, determined on the basis of an actuarial valuation of the commitment
using the projected unit credit method, taking into account demographic and financial assumptions. Actuarial
assumptions are reviewed on an annual basis.
Differences related to changes in actuarial assumptions and experience-related adjustments (the effect of differences
between previous actuarial assumptions and what actually happened) are actuarial gains and losses recorded
in non-recyclable equity in accordance with the provisions of IAS 19 revised and appear in the «Actuarial Gap» column
in the consolidated statement of changes in equity.
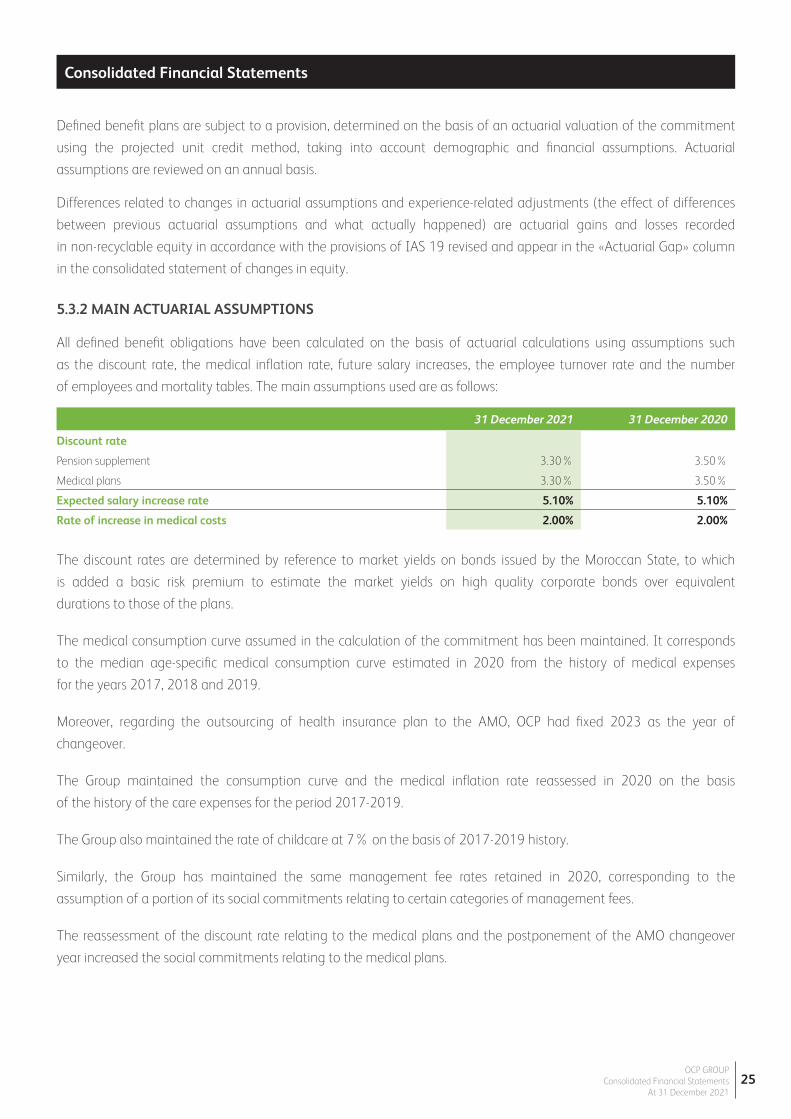
5.3.2 MAIN ACTUARIAL ASSUMPTIONS
All defined benefit obligations have been calculated on the basis of actuarial calculations using assumptions such
as the discount rate, the medical inflation rate, future salary increases, the employee turnover rate and the number
of employees and mortality tables. The main assumptions used are as follows:
The discount rates are determined by reference to market yields on bonds issued by the Moroccan State, to which
is added a basic risk premium to estimate the market yields on high quality corporate bonds over equivalent
durations to those of the plans.
The medical consumption curve assumed in the calculation of the commitment has been maintained. It corresponds
to the median age-specific medical consumption curve estimated in 2020 from the history of medical expenses
for the years 2017, 2018 and 2019.
Moreover, regarding the outsourcing of health insurance plan to the AMO, OCP had fixed 2023 as the year of
changeover.
The Group maintained the consumption curve and the medical inflation rate reassessed in 2020 on the basis
of the history of the care expenses for the period 2017-2019.
The Group also maintained the rate of childcare at 7% on the basis of 2017-2019 history.
Similarly, the Group has maintained the same management fee rates retained in 2020, corresponding to the
assumption of a portion of its social commitments relating to certain categories of management fees.
The reassessment of the discount rate relating to the medical plans and the postponement of the AMO changeover
year increased the social commitments relating to the medical plans.
31 December 2021 31 December 2020
Discount rate
Pension supplement 3.30% 3.50%
Medical plans 3.30% 3.50%
Expected salary increase rate 5.10% 5.10%
Rate of increase in medical costs 2.00% 2.00%
OCP GROUPConsolidated Financial Statements
At 31 December 202126
Consolidated Financial StatementsConsolidated Financial Statements
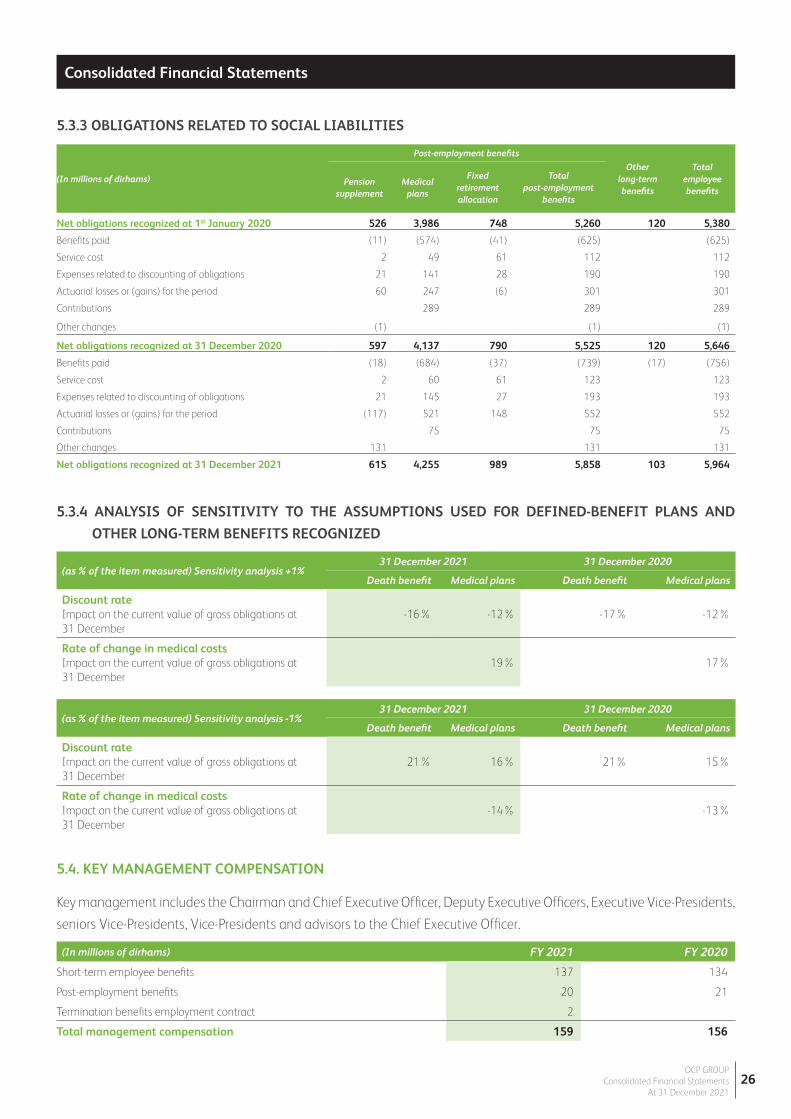
5.3.3 OBLIGATIONS RELATED TO SOCIAL LIABILITIES
5.4. KEY MANAGEMENT COMPENSATION
Key management includes the Chairman and Chief Executive Officer, Deputy Executive Officers, Executive Vice-Presidents,
seniors Vice-Presidents, Vice-Presidents and advisors to the Chief Executive Officer.
5.3.4 ANALYSIS OF SENSITIVITY TO THE ASSUMPTIONS USED FOR DEFINED-BENEFIT PLANS AND
OTHER LONG-TERM BENEFITS RECOGNIZED
(In millions of dirhams)
Post-employment benefits
Other long-term benefits
Total employee benefits
Pension supplement
Medical plans
Fixed retirement allocation
Total post-employment
benefits
Net obligations recognized at 1st January 2020 526 3,986 748 5,260 120 5,380
Benefits paid (11) (574) (41) (625) (625)
Service cost 2 49 61 112 112
Expenses related to discounting of obligations 21 141 28 190 190
Actuarial losses or (gains) for the period 60 247 (6) 301 301
Contributions 289 289 289
Other changes (1) (1) (1)
Net obligations recognized at 31 December 2020 597 4,137 790 5,525 120 5,646
Benefits paid (18) (684) (37) (739) (17) (756)
Service cost 2 60 61 123 123
Expenses related to discounting of obligations 21 145 27 193 193
Actuarial losses or (gains) for the period (117) 521 148 552 552
Contributions 75 75 75
Other changes 131 131 131
Net obligations recognized at 31 December 2021 615 4,255 989 5,858 103 5,964
(as % of the item measured) Sensitivity analysis +1%31 December 2021 31 December 2020
Death benefit Medical plans Death benefit Medical plans
Discount rateImpact on the current value of gross obligations at 31 December
-16% -12% -17% -12%
Rate of change in medical costsImpact on the current value of gross obligations at 31 December
19% 17%
(as % of the item measured) Sensitivity analysis -1%31 December 2021 31 December 2020
Death benefit Medical plans Death benefit Medical plans
Discount rateImpact on the current value of gross obligations at 31 December
21% 16% 21% 15%
Rate of change in medical costsImpact on the current value of gross obligations at 31 December
-14% -13%
(In millions of dirhams) FY 2021 FY 2020
Short-term employee benefits 137 134
Post-employment benefits 20 21
Termination benefits employment contract 2
Total management compensation 159 156

OCP GROUPConsolidated Financial Statements
At 31 December 202127
Consolidated Financial StatementsConsolidated Financial Statements
Note 6 - Investments in Joint Ventures and associates
6.1. ANALYSIS OF INVESTMENTS IN JOINT VENTURES AND ASSOCIATES
Group’s investments in associates and joint ventures are analyzed as follows:
The profits (losses) of joint ventures and associates are analyzed as follows:
OCP Group received dividends from its joint ventures and associates , the details of these dividends are as follows:
(1) SAEDM, SFL and TTS being associated companies.(2) Maghreb Hospitality Company has been controlled by OCP since the second half of 2021.(3) Includes JESA.
(*) For 2021, the MHC result corresponds to the share relating to the first semester given that the entity is controlled from July 2021.
(In millions of dirhams) 31 December 2021 31 December 2020
Paradeep Phosphates Limited - PPL 1,375 1,132
Groupe Prayon 1,386 1,274
Pakistan Maroc Phosphore - PMP 1,064 732
Euro Maroc Phosphore - EMA 316 196
Indo Maroc Phosphore - IMA 695 370
Fertinagro Biotech 387 384
Société d'Aménagement et de Développement de Mazagan - SAEDM (1) 287 288
Maghreb Hospitality Company - MHC (2) 953
Société Foncière la Lagune - SFL (1) 47
Teal Technology Services - TTS (1) 14 12
Others (3) (53) (55)
Total interests in joint-ventures 5,518 5,286
(In millions of dirhams) FY 2021 FY 2020
Paradeep Phosphates Limited - PPL 221 178
Groupe Prayon 159 81
Pakistan Maroc Phosphore - PMP 394 83
Euro Maroc Phosphore - EMA 64 31
Indo Maroc Phosphore - IMA 358 42
Fertinagro Biotech 24 27
Teal Technology Services - TTS 3
Maghreb Hospitality Company - MHC (*) (61) (47)
Société d’Aménagement et de Développement de Mazagan - SAEDM (1)
Others 24 (54)
Total profit (loss) of joint-ventures 1,185 342
(En millions de dirhams) FY 2021 FY 2020
Pakistan Maroc Phosphore - PMP 63 125
Indo Maroc Phosphore - IMA 33 33
Teal Technology Services - TTS 3
Total dividends from joint-ventures 99 158

OCP GROUPConsolidated Financial Statements
At 31 December 202128
Consolidated Financial StatementsConsolidated Financial Statements
6.2. STATEMENT OF FINANCIAL POSITION AND INCOME STATEMENTS OF ASSOCIATES AND JOINT VENTURES
The note hereafter details at 100% the lines of the Statement of Financial Position and income statement of the
consolidated associates and joint ventures:
Statement of Financial Position
(In millions of dirhams) PRAYON EMAPHOS IMACID PMP PPL SAEDM Fertinagro Others
ASSETS
Current assets
Cash and cash equivalents 485 28 201 46 103 2 781 910
Cash financial assets 5 1,194
Inventories 1,903 350 166 241 1,827 1,319 977 2
Trade receivables 566 303 1,341 1,435 2,310 1,352 1,551
Current tax receivables 49
Other current assets 130 234 975 798 1,045 121 34 667 Total current assets 3,084 920 2,683 2,519 6,479 1,442 3,143 3,179
Non-current assets
Non-current financial assets 11 533 193 7
Investments in equity-accounted companies 860
Equity securities 16 5 1 135
Deferred tax assets 125 16
Property, plant and equipment 2,047 225 499 538 1,936 4 899 90
Intangible assets 101 226 19 19 1 7 98 35
Total non-current assets 3,161 451 518 558 2,490 11 1,190 267
TOTAL ASSETS 6,245 1,371 3,201 3,077 8,969 1,453 4,333 3,446
(In millions of dirhams) PRAYON EMAPHOS IMACID PMP PPL SAEDM Fertinagro Others
LIABILITIES
Current liabilities
Current loans and financial debts 1,169 2,314 Current provisions 13 3 93 53
Trade payables 1,206 295 734 761 2,797 199 790
Current tax liabilities 30 247 159 74 59
Other current liabilities 397 (74) 54 2 197 165 2,387 1,302
Total current liabilities 2,785 252 1,037 921 5,474 364 2,387 2,204
Non-current liabilities
Non-current loans and financial debts 738 157 9 614 527 Non-current provisions for employee benefits 183 33 Other non-current provisions 21 1 Deferred tax liabilities 209 116 Other non-current liabilities 10 12 Total non-current liabilities 1,161 157 9 763 527 12 Equity - Group share 524 347 620 800 718 608 642 66 Paid-in capital 110
Reserves 1,459 305 266 559 1,576 (1) 987 9
Retained earnings 187 (43) 183 1,084
Net profit (loss) - Group share 317 201 1,090 787 440 (3) 122 83
Total equity 2,299 962 2,164 2,146 2,734 562 1,934 1,242
TOTAL LIABILITIES AND EQUITY 6,245 1,371 3,201 3,077 8,969 1,453 4,333 3,446

OCP GROUPConsolidated Financial Statements
At 31 December 202129
Consolidated Financial StatementsConsolidated Financial Statements
Income statement
6.3. SERVICES PROVIDED BY OCP TO ITS JOINT VENTURES
OCP provides its joint ventures with various services as summarized below:
6.3.1 SUPPLY OF PHOSPHATE AND PHOSPHORIC ACID
Contractual provisions govern OCP’s supply of phosphate to its joint ventures. These provisions concern notably the
following:
• The quality of the rock, defined according to the annual specifications determined by the joint ventures;
• The price invoiced to the joint ventures which corresponds to the average export market prices for the year. The same
price formula is used for all of the joint ventures;
• And other conditions related to invoicing and payment terms.
Under these transactions, OCP recorded sales of phosphates to joint ventures for MAD 3,894 million in 2021 against
MAD 2,155 million in 2020.
OCP also supplies phosphoric acid to its joint ventures EMAPHOS, PPL and PRAYON. In regard to these sales, OCP recorded
a revenue of MAD 3,440 million in 2021 in comparison to MAD 2,290 million in 2020.
(In millions of dirhams) PRAYON EMAPHOS IMACID PMP PPL SAEDM Fertinagro Others
Revenue 9,511 2,069 4,575 3,778 7,264 122 2,429
Production held as inventory (7) 37 32 163 (3) 2
Purchases consumed (5,963) (1,656) (2,760) (2,322) (5,882) (35) (1,227)
External expenses (1,824) (143) (454) (389) (3) (149)
Personnel expenses (1,232) (9) (122) (11) (842)
Taxes (2) (2) (1) (146) (4) (6)
Exchange gains and losses on operating receivables and payables
9 14 14
Other operating income and expenses 59 2 22 27 (702) 55 12
EBITDA 544 279 1,432 1,130 574 (1) 122 219
Amortization, depreciation and operating provisions (341) (9) (58) (105) (82) (2) (66)
I - OPERATING PROFIT BEFORE EXCEPTIONAL ITEMS
203 270 1,374 1,025 493 (3) 122 153
Other non-current operating income and expenses (4) (6) (11) (9)
II - OPERATING PROFIT 203 266 1,369 1,014 493 (3) 122 144
Cost of net financial debt (22) (2) 4 8 (52) (22) 4
Exchange gains and losses on financial receivables and payables
Other financial income and expenses (5) (9) 22 III - FINANCIAL PROFIT (22) (8) 4 (1) (52) 4
IV - PROFIT BEFORE TAX 181 258 1,373 1,014 440 (3) 122 148
Corporate tax (36) (58) (283) (227) (65)
Profit (loss) from joint ventures 174
VI - NET PROFIT FOR THE PERIOD 317 201 1,090 787 440 (3) 122 83
OCP GROUPConsolidated Financial Statements
At 31 December 202130
Consolidated Financial StatementsConsolidated Financial Statements
6.3.2 SUPPLY OF SERVICES AND UTILITIES
The services and utilities provided by OCP to its joint ventures that are based on the Jorf Lasfar platform concern mainly
the infrastructure use in Jorf Lasfar, the utilities supply of liquid sulfur, water, steam etc., which are necessary for
the industrial exploitation, the know-how of the OCP personnel, the services of maintenance of the installations
and equipment and the services of handling, and finally the rental of the storage equipment.
6.3.3 LEASES
OCP has signed lease agreements with local joint ventures based on the Jorf Lasfar platform. Rents are payable in
advance at the beginning of the year and revised according to the terms and conditions set out in the contracts.
6.3.4 FINANCIAL AGREEMENT
OCP has concluded cash pooling agreements with certain joint ventures (Indo Maroc Phosphore-IMA, Pakistan Maroc
Phosphore-PMP, etc.).
6.3.5 OTHER SERVICES
OCP also provides marketing services (marketing products manufactured by the joint ventures) and chartering services
to some of its joint ventures.
OCP also signed a multiparty contract for the sale of spare parts on the Jorf Lasfar platform in 2017 with several
subsidiaries and joint ventures, including Indo Maroc Phosphore-IMA and Euro Maroc Phosphore-EMAPHOS.
6.3.6 BENEFITS PROVIDED BY JOINT VENTURES TO OCP
JESA S.A provides OCP with engineering services through the Framework Services Agreement signed in 2017.
Teal Technology & Services TTS and OCP have entered into a Master Services Agreement through which TTS provides
data center services, digital transformation and outsourcing of existing businesses.
OCP GROUPConsolidated Financial Statements
At 31 December 202131
Consolidated Financial StatementsConsolidated Financial Statements
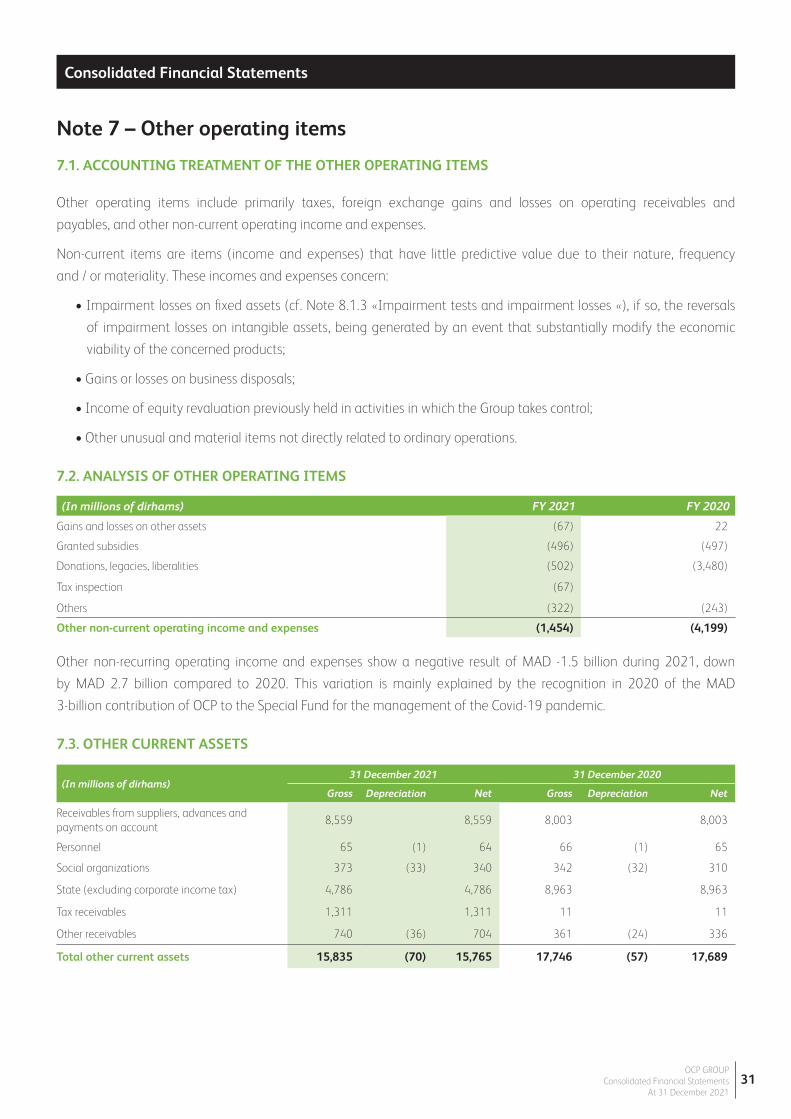
Note 7 – Other operating items
7.1. ACCOUNTING TREATMENT OF THE OTHER OPERATING ITEMS
Other operating items include primarily taxes, foreign exchange gains and losses on operating receivables and
payables, and other non-current operating income and expenses.
Non-current items are items (income and expenses) that have little predictive value due to their nature, frequency
and / or materiality. These incomes and expenses concern:
• Impairment losses on fixed assets (cf. Note 8.1.3 «Impairment tests and impairment losses «), if so, the reversals
of impairment losses on intangible assets, being generated by an event that substantially modify the economic
viability of the concerned products;
• Gains or losses on business disposals;
• Income of equity revaluation previously held in activities in which the Group takes control;
• Other unusual and material items not directly related to ordinary operations.
7.2. ANALYSIS OF OTHER OPERATING ITEMS
Other non-recurring operating income and expenses show a negative result of MAD -1.5 billion during 2021, down
by MAD 2.7 billion compared to 2020. This variation is mainly explained by the recognition in 2020 of the MAD
3-billion contribution of OCP to the Special Fund for the management of the Covid-19 pandemic.
7.3. OTHER CURRENT ASSETS
(In millions of dirhams) FY 2021 FY 2020
Gains and losses on other assets (67) 22
Granted subsidies (496) (497)
Donations, legacies, liberalities (502) (3,480)
Tax inspection (67)
Others (322) (243)
Other non-current operating income and expenses (1,454) (4,199)
(In millions of dirhams)31 December 2021 31 December 2020
Gross Depreciation Net Gross Depreciation Net
Receivables from suppliers, advances and payments on account
8,559 8,559 8,003 8,003
Personnel 65 (1) 64 66 (1) 65
Social organizations 373 (33) 340 342 (32) 310
State (excluding corporate income tax) 4,786 4,786 8,963 8,963
Tax receivables 1,311 1,311 11 11
Other receivables 740 (36) 704 361 (24) 336
Total other current assets 15,835 (70) 15,765 17,746 (57) 17,689
OCP GROUPConsolidated Financial Statements
At 31 December 202132
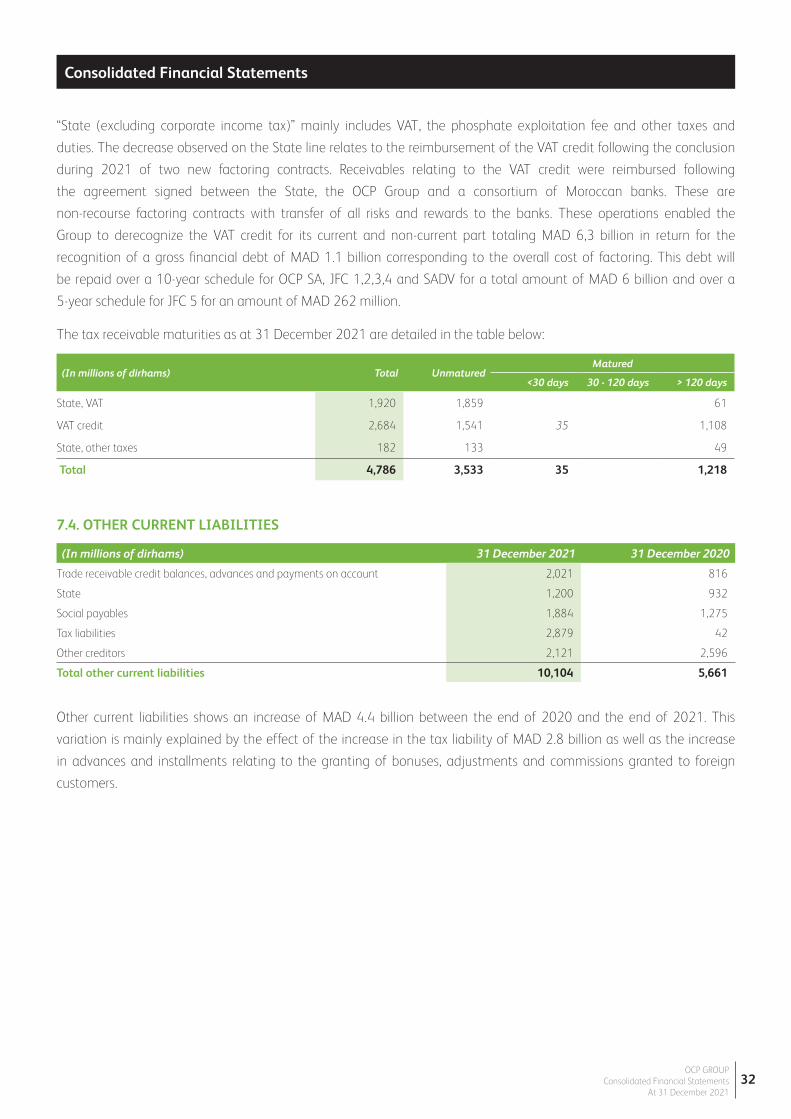
Consolidated Financial StatementsConsolidated Financial Statements
“State (excluding corporate income tax)” mainly includes VAT, the phosphate exploitation fee and other taxes and
duties. The decrease observed on the State line relates to the reimbursement of the VAT credit following the conclusion
during 2021 of two new factoring contracts. Receivables relating to the VAT credit were reimbursed following
the agreement signed between the State, the OCP Group and a consortium of Moroccan banks. These are
non-recourse factoring contracts with transfer of all risks and rewards to the banks. These operations enabled the
Group to derecognize the VAT credit for its current and non-current part totaling MAD 6,3 billion in return for the
recognition of a gross financial debt of MAD 1.1 billion corresponding to the overall cost of factoring. This debt will
be repaid over a 10-year schedule for OCP SA, JFC 1,2,3,4 and SADV for a total amount of MAD 6 billion and over a
5-year schedule for JFC 5 for an amount of MAD 262 million.
The tax receivable maturities as at 31 December 2021 are detailed in the table below:
Other current liabilities shows an increase of MAD 4.4 billion between the end of 2020 and the end of 2021. This
variation is mainly explained by the effect of the increase in the tax liability of MAD 2.8 billion as well as the increase
in advances and installments relating to the granting of bonuses, adjustments and commissions granted to foreign
customers.
7.4. OTHER CURRENT LIABILITIES
(In millions of dirhams) Total UnmaturedMatured
<30 days 30 - 120 days > 120 days
State, VAT 1,920 1,859 61
VAT credit 2,684 1,541 35 1,108
State, other taxes 182 133 49
Total 4,786 3,533 35 1,218
(In millions of dirhams) 31 December 2021 31 December 2020
Trade receivable credit balances, advances and payments on account 2,021 816
State 1,200 932
Social payables 1,884 1,275
Tax liabilities 2,879 42
Other creditors 2,121 2,596
Total other current liabilities 10,104 5,661

OCP GROUPConsolidated Financial Statements
At 31 December 202133
Consolidated Financial StatementsConsolidated Financial Statements
Note 8 – Property, plant & equipment and intangible assets
8.1. ACCOUNTING TREATMENT OF ASSETS
8.1.1 PROPERTY, PLANT & EQUIPMENT
Measurement and useful lives of operating assets
The equipment controllers and maintenance managers in the Northern, Central and Phosboucrâa axis identify the
useful lives of the various categories of assets (main assets and components). These lives correspond to the potential
duration of technical utilization. The useful lives and depreciation methods used are examined at the close of each
period and prospectively adjusted, if necessary.
Property, plant & Equipment (PP&E) are recognized at their historic acquisition cost, production cost or cost of entry
to the Group, less depreciation and possible loss of value. Borrowing costs incurred during the construction of a
qualified asset are incorporated into the cost of the asset. Costs of day-to-day maintenance are recognized as
maintenance costs if the frequency of renewal of this maintenance in terms of volume is annual. The partial or total
restoration of one or several components constitutes major maintenance. This is recognized in fixed assets and the net
carrying amount is derecognized.
Depreciation
In accordance with the component approach, the Group uses differentiated depreciation periods for each of the
significant components of the same asset if the useful life of one of the components is different from the useful life
of the principal asset to which it belongs. Depreciation is calculated using the straight-line method on useful lives
corresponding to the following technical lives:
The useful lives are reviewed at the end of each annual closing and adjusted prospectively if necessary.
Leases
Since January 1, 2019, the Group has applied IFRS 16 “Leases” according to the so-called “simplified retrospective”
transition method. With the application of this new standard, the OCP Group now recognizes all of its rental
agreements in the balance sheet, with the exception of contracts with a duration of less than 12 months or those
relating to goods with a value less than 5,000 dollar.
On the transition date, the Group did not change the value of the assets and liabilities related to leases qualified
as finance leases according to IAS 17. The assets have been reclassified under right of use and the finance lease debts
are now presented with the rental debts.
Property, plant and equipment Duration
Mining land 10 to 30 years
Buildings 15 to 60 years
Technical installations equipment and tools 5 to 30 years
Transport equipment 5 to 30 years
Furniture, office equipment, fitings 3 to 30 years

OCP GROUPConsolidated Financial Statements
At 31 December 202134
Consolidated Financial StatementsConsolidated Financial Statements
Borrowing costs
Borrowing costs directly attributable to the acquisition, construction or production of a ‘qualifying asset’ are included
in the cost of the asset, in accordance with IAS 23 “Borrowing costs”.
OCP capitalize the borrowing costs for MAD 262 million in 2021, versus an amount of MAD 203 million in 2020.
8.1.2 INTANGIBLE ASSETS
Initial and subsequent measurement
Intangible assets are composed of patents, licenses, softwares, research and development costs. They are recognized
t their acquisition cost less accumulated amortization and impairment losses. Expenses thus recorded in assets
include costs for equipment and services, costs of personnel directly assigned to the production and preparation
of some softwares for its own their use and costs of borrowing if eligibility conditions are satisfied.
Expenses undertaken over the development phase are capitalized when the criteria for recognition of an asset set
forth in IAS 38 are met: technical feasibility, intention to complete the asset and to use it or to sell it, probability of
future economic benefits, availability of resources, ability to measure the development expenses reliably. Expenses
incurred during the research phase are not capitalized, but are expensed.
Depreciation
Intangible assets consist mainly of softwares and are amortized on a straight-line basis according to their useful life,
which ranges from 1 year to 5 years.
Development expenditures
The development phase starts when the deposit has been analyzed as economically feasible and a decision has
been taken to develop it. Only the expenditure incurred before the production phase and for the development
of the deposit is capitalized. Development expenditure incurred to maintain the existing production is recognized as
expenses.
Goodwill
Following the integration of the MHC level in July 2021, new goodwill was calculated on Société La Mamounia entity for
MAD 1,886 million.
The group has 12 months from the date of takeover to allocate this goodwill..
8.1.3 IMPAIRMENT TESTS AND IMPAIRMENT LOSSES
Valuations used for impairment tests
The assumptions and estimates which are made to determine the recoverable value of goodwill, intangible assets
and PP&E relate in particular to the market prospects necessary to evaluate cash flows and the discount rates used.
Any modification of these assumptions could have a significant effect on the amount of the recoverable value, and
could lead to a modification of the impairment to be recognized.
A cash-generating unit (CGU) is the smallest identifiable group of assets that generates cash inflows that are largely
independent of the cash inflows from other assets or groups of assets.
OCP GROUPConsolidated Financial Statements
At 31 December 202135
Consolidated Financial StatementsConsolidated Financial Statements
Given the group’s activities, three main cash generating units are identified:
- Northern Axis (Khouribga – Jorf Lasfar): this axis hosts the integrated phosphate chemical processing hub.
Phosphate extracted at Khouribga is transported by slurry pipeline to Jorf Lasfar, where it is processed into phosphoric
acid and fertilizer. The finished products are exported from the OCP port in Jorf Lasfar.
- Central Axis (Youssoufia and Benguérir – Safi): this axis hosts the integrated phosphate chemical processing
hub. The phosphate extracted at Youssoufia and Benguérir is transported by rail to Safi, where it is processed into
phosphoric acid and fertilizer. The finished products are exported from the OCP port at Safi.
- Phosboucraâ Axis : Phosboucraâ extraction site. The phosphate that is extracted there is transported by conveyers
to the processing center at Laâyoune and then exported by sea.
The impairment tests for assets apply the following rules:
• Goodwill and intangible assets with indefinite useful lives are tested for impairment at least once a year.
• PP&E and intangible assets with finite lives are tested for impairment if there is an indication of impairment, as
defined hereafter:
- Significant reduction in the market price of the asset,
- Obsolescence or physical deterioration of the asset,
- Significant negative changes in the past or planned use of an asset,
- Significant change in the technological, economic or legal environment,
- Increase in interest rates or yield which could affect useful value.
An impairment loss is recognized when the recoverable value of a CGU is lower than the net carrying amount of the
assets that belong to it. The recoverable amount of a CGU is the higher of its fair value less costs to sell, and its
value in use. The value in use is equal to the present value of the future cash flows that it generates, as per the
budget and strategic plan approved by the Board of Directors, increased, by its exit value at the end of its expected useful
life.
Despite the health emergency crisis linked to COVID-19, OCP continues to operate at a normal rate to serve its
customers on the national and international market as part of a Business Continuity Plan.
Orders from OCP customers remain at a normal level and the various units of the Group are operating at their full
capacity to meet the order books, which are filling up at a regular rate. In addition, the forecast landing of the Group’s
performance indicators affirms the maintenance of the margin rate at its usual level due to the expected increase
in revenue and cost containment.
Consequently, taking into account all of these indicators, the Group’s assets show no indication of impairment as of
31 December 2021.
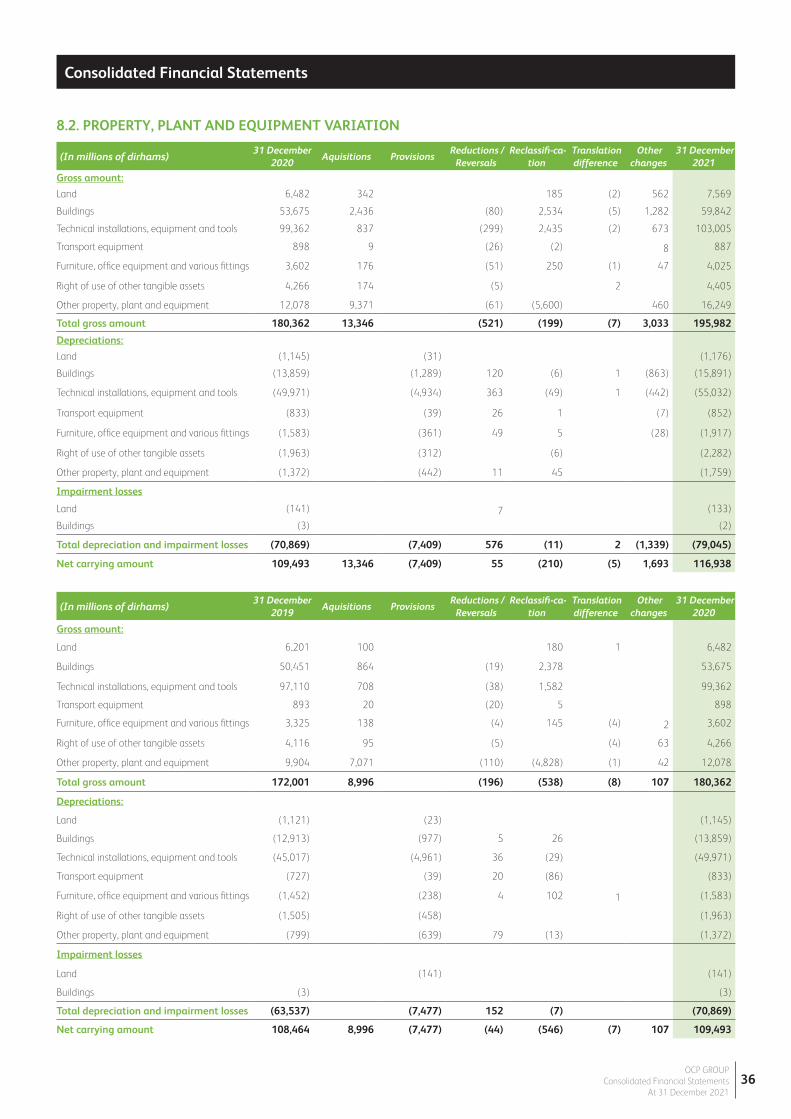
OCP GROUPConsolidated Financial Statements
At 31 December 202136
Consolidated Financial StatementsConsolidated Financial Statements
8.2. PROPERTY, PLANT AND EQUIPMENT VARIATION
(In millions of dirhams)31 December
2020 Aquisitions Provisions
Reductions / Reversals
Reclassifi-ca-tion
Translation difference
Other changes
31 December 2021
Gross amount:
Land 6,482 342 185 (2) 562 7,569
Buildings 53,675 2,436 (80) 2,534 (5) 1,282 59,842
Technical installations, equipment and tools 99,362 837 (299) 2,435 (2) 673 103,005
Transport equipment 898 9 (26) (2) 8 887
Furniture, office equipment and various fittings 3,602 176 (51) 250 (1) 47 4,025
Right of use of other tangible assets 4,266 174 (5) 2 4,405
Other property, plant and equipment 12,078 9,371 (61) (5,600) 460 16,249
Total gross amount 180,362 13,346 (521) (199) (7) 3,033 195,982
Depreciations:
Land (1,145) (31) (1,176)
Buildings (13,859) (1,289) 120 (6) 1 (863) (15,891)
Technical installations, equipment and tools (49,971) (4,934) 363 (49) 1 (442) (55,032)
Transport equipment (833) (39) 26 1 (7) (852)
Furniture, office equipment and various fittings (1,583) (361) 49 5 (28) (1,917)
Right of use of other tangible assets (1,963) (312) (6) (2,282)
Other property, plant and equipment (1,372) (442) 11 45 (1,759)
Impairment losses
Land (141) 7 (133)
Buildings (3) (2)
Total depreciation and impairment losses (70,869) (7,409) 576 (11) 2 (1,339) (79,045)
Net carrying amount 109,493 13,346 (7,409) 55 (210) (5) 1,693 116,938
(In millions of dirhams)31 December
2019 Aquisitions Provisions
Reductions / Reversals
Reclassifi-ca-tion
Translation difference
Other changes
31 December 2020
Gross amount:
Land 6,201 100 180 1 6,482
Buildings 50,451 864 (19) 2,378 53,675
Technical installations, equipment and tools 97,110 708 (38) 1,582 99,362
Transport equipment 893 20 (20) 5 898
Furniture, office equipment and various fittings 3,325 138 (4) 145 (4) 2 3,602
Right of use of other tangible assets 4,116 95 (5) (4) 63 4,266
Other property, plant and equipment 9,904 7,071 (110) (4,828) (1) 42 12,078
Total gross amount 172,001 8,996 (196) (538) (8) 107 180,362
Depreciations:
Land (1,121) (23) (1,145)
Buildings (12,913) (977) 5 26 (13,859)
Technical installations, equipment and tools (45,017) (4,961) 36 (29) (49,971)
Transport equipment (727) (39) 20 (86) (833)
Furniture, office equipment and various fittings (1,452) (238) 4 102 1 (1,583)
Right of use of other tangible assets (1,505) (458) (1,963)
Other property, plant and equipment (799) (639) 79 (13) (1,372)
Impairment losses
Land (141) (141)
Buildings (3) (3)
Total depreciation and impairment losses (63,537) (7,477) 152 (7) (70,869)
Net carrying amount 108,464 8,996 (7,477) (44) (546) (7) 107 109,493
OCP GROUPConsolidated Financial Statements
At 31 December 202137
Consolidated Financial StatementsConsolidated Financial Statements
The main increases during 2021 are related to the mining, chemical and hotels activities and relate to the following
projects:
Mining activities
• Commissioning of the second part of the flexible conveyor at the Béni Amir mine;
• Mobilization of the main contractors and progress to 48% of the construction of the laundry in Benguerir.
The objective is to ensure a production of 3 MT/year by 2020 and 9 MT/year by 2025 in order to meet the
needs of the Safi site, while reducing the cost of transport by train to Youssoufia and Safi by the transport
of the washed product floated instead of raw phosphate;
• Review of parcel plans and start of requests for authorization to pass for the Benguerir Slurry Pipeline;
• The Boucraâ mining site has seen several achievements, mainly the finalization of the earthmoving works
of the storage halls and the civil engineering works of the storage tanks of the fertilizer complex. The purpose
of this complex is to upgrade Boucraâ phosphates by producing phosphoric acid and fertilizers with an
annual capacity of 1 MT of DAP/MAP equivalent fertilizer and 0.5 MT of P2O5. In addition, the site began in
situ tests of the tubular piles for the access bridge to the new phosphate port and launched the first phase of
development of the new electric substation;
The Boucraâ site also witnessed the launch of the dewatering and excavation work on the Booster Wall
of the new phosphate port, the launch of the prefabrication of the caissons and metal headers of the
said port, as well as the launch of phase 1 of the new electric substation of Phosboucraâ (shielded post
225/ 132/30 kV).
Chemical activity
• Progress of engineering and construction work for the new fertilizer lines project, as well as a review of the
schedule for carrying out the said project in accelerated mode for an implementation in service from September
2022;
• Testing and commissioning of the fourth sulfur fusion & filtration line at the Jorf Lasfar site, and launching of
phase 2 of the same sulfur fusion & filtration project with storage tanks;
• Start of production of the NPS product from the JFC 4 unit;
• Pronouncement of the environmental acceptability of the Desalination Phase 2 project;
• Study of port structures and facilities for the new Safi port project.
Hospitality
On July 27, 2021, the Joint-Venture Maghrib Hospitality Company-MHC finalized the acquisition of the Michelifin
assets including the hotel and the Golf. This operation includes the land and buildings relating to the hotel, the
business of the hotel and that of the Golf, for a total amount of MAD 1.1 billion.
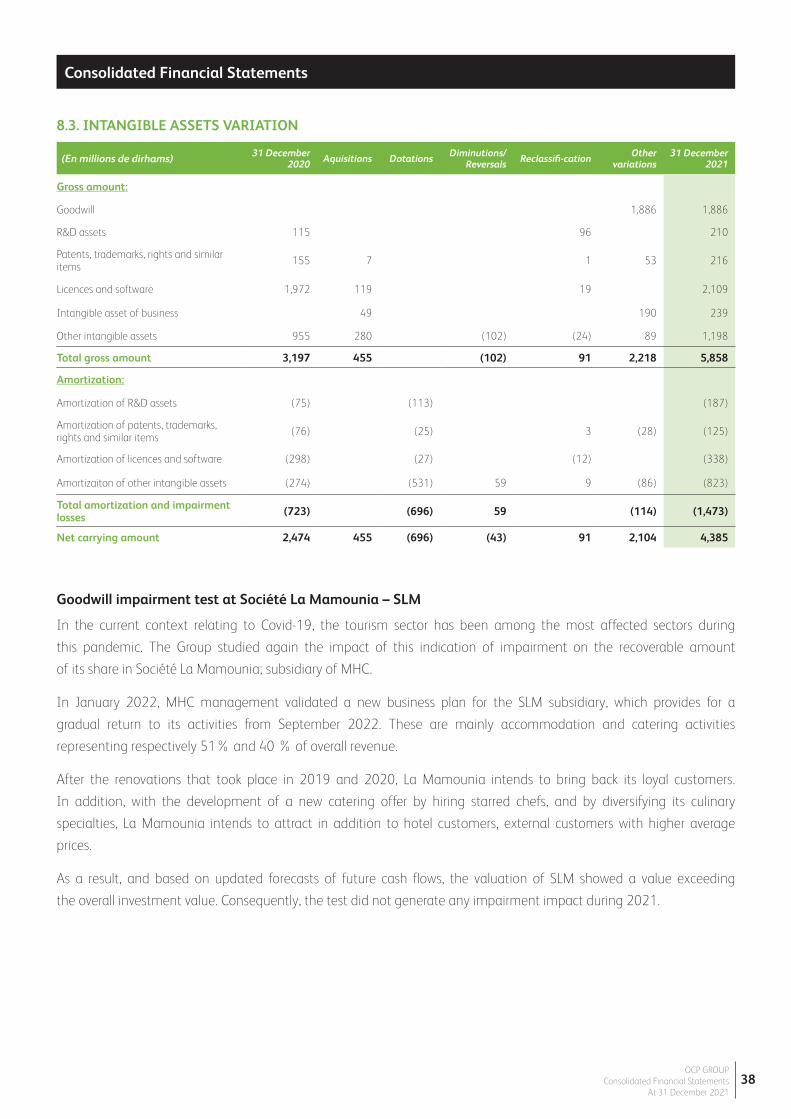
OCP GROUPConsolidated Financial Statements
At 31 December 202138
Consolidated Financial StatementsConsolidated Financial Statements
Goodwill impairment test at Société La Mamounia – SLM
In the current context relating to Covid-19, the tourism sector has been among the most affected sectors during
this pandemic. The Group studied again the impact of this indication of impairment on the recoverable amount
of its share in Société La Mamounia; subsidiary of MHC.
In January 2022, MHC management validated a new business plan for the SLM subsidiary, which provides for a
gradual return to its activities from September 2022. These are mainly accommodation and catering activities
representing respectively 51% and 40 % of overall revenue.
After the renovations that took place in 2019 and 2020, La Mamounia intends to bring back its loyal customers.
In addition, with the development of a new catering offer by hiring starred chefs, and by diversifying its culinary
specialties, La Mamounia intends to attract in addition to hotel customers, external customers with higher average
prices.
As a result, and based on updated forecasts of future cash flows, the valuation of SLM showed a value exceeding
the overall investment value. Consequently, the test did not generate any impairment impact during 2021.
8.3. INTANGIBLE ASSETS VARIATION
(En millions de dirhams) 31 December 2020 Aquisitions Dotations Diminutions/
Reversals Reclassifi-cation Other variations
31 December 2021
Gross amount:
Goodwill 1,886 1,886
R&D assets 115 96 210
Patents, trademarks, rights and similar items 155 7 1 53 216
Licences and software 1,972 119 19 2,109
Intangible asset of business 49 190 239
Other intangible assets 955 280 (102) (24) 89 1,198
Total gross amount 3,197 455 (102) 91 2,218 5,858
Amortization:
Amortization of R&D assets (75) (113) (187)
Amortization of patents, trademarks, rights and similar items (76) (25) 3 (28) (125)
Amortization of licences and software (298) (27) (12) (338)
Amortizaiton of other intangible assets (274) (531) 59 9 (86) (823)
Total amortization and impairment losses (723) (696) 59 (114) (1,473)
Net carrying amount 2,474 455 (696) (43) 91 2,104 4,385
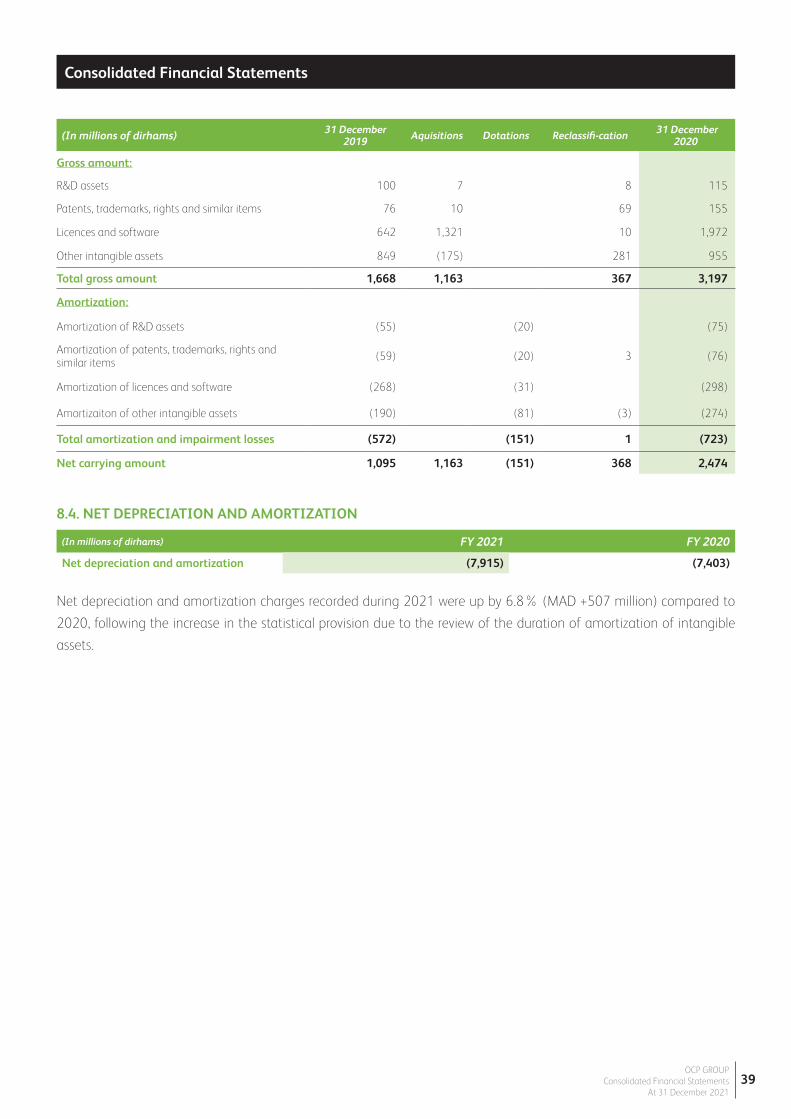
OCP GROUPConsolidated Financial Statements
At 31 December 202139
Consolidated Financial StatementsConsolidated Financial Statements
Net depreciation and amortization charges recorded during 2021 were up by 6.8% (MAD +507 million) compared to
2020, following the increase in the statistical provision due to the review of the duration of amortization of intangible
assets.
8.4. NET DEPRECIATION AND AMORTIZATION
(In millions of dirhams) FY 2021 FY 2020
Net depreciation and amortization (7,915) (7,403)
(In millions of dirhams) 31 December 2019 Aquisitions Dotations Reclassifi-cation 31 December
2020
Gross amount:
R&D assets 100 7 8 115
Patents, trademarks, rights and similar items 76 10 69 155
Licences and software 642 1,321 10 1,972
Other intangible assets 849 (175) 281 955
Total gross amount 1,668 1,163 367 3,197
Amortization:
Amortization of R&D assets (55) (20) (75)
Amortization of patents, trademarks, rights and similar items (59) (20) 3 (76)
Amortization of licences and software (268) (31) (298)
Amortizaiton of other intangible assets (190) (81) (3) (274)
Total amortization and impairment losses (572) (151) 1 (723)
Net carrying amount 1,095 1,163 (151) 368 2,474
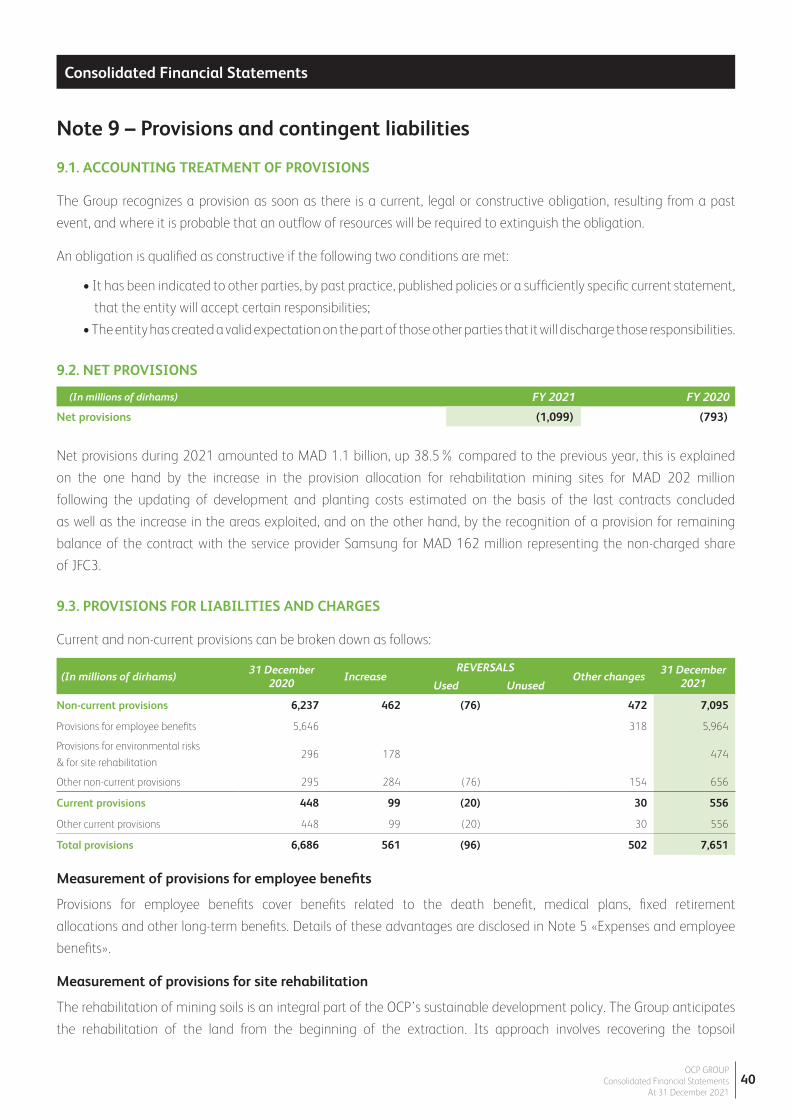
OCP GROUPConsolidated Financial Statements
At 31 December 202140
Consolidated Financial StatementsConsolidated Financial Statements
(In millions of dirhams) FY 2021 FY 2020
Net provisions (1,099) (793)
Note 9 – Provisions and contingent liabilities
9.1. ACCOUNTING TREATMENT OF PROVISIONS
The Group recognizes a provision as soon as there is a current, legal or constructive obligation, resulting from a past
event, and where it is probable that an outflow of resources will be required to extinguish the obligation.
An obligation is qualified as constructive if the following two conditions are met:
• It has been indicated to other parties, by past practice, published policies or a sufficiently specific current statement,
that the entity will accept certain responsibilities;
• The entity has created a valid expectation on the part of those other parties that it will discharge those responsibilities.
9.2. NET PROVISIONS
Net provisions during 2021 amounted to MAD 1.1 billion, up 38.5% compared to the previous year, this is explained
on the one hand by the increase in the provision allocation for rehabilitation mining sites for MAD 202 million
following the updating of development and planting costs estimated on the basis of the last contracts concluded
as well as the increase in the areas exploited, and on the other hand, by the recognition of a provision for remaining
balance of the contract with the service provider Samsung for MAD 162 million representing the non-charged share
of JFC3.
9.3. PROVISIONS FOR LIABILITIES AND CHARGES
Current and non-current provisions can be broken down as follows:
Measurement of provisions for employee benefits
Provisions for employee benefits cover benefits related to the death benefit, medical plans, fixed retirement
allocations and other long-term benefits. Details of these advantages are disclosed in Note 5 «Expenses and employee
benefits».
Measurement of provisions for site rehabilitation
The rehabilitation of mining soils is an integral part of the OCP’s sustainable development policy. The Group anticipates
the rehabilitation of the land from the beginning of the extraction. Its approach involves recovering the topsoil
(In millions of dirhams)31 December
2020Increase
REVERSALSOther changes
31 December 2021Used Unused
Non-current provisions 6,237 462 (76) 472 7,095
Provisions for employee benefits 5,646 318 5,964
Provisions for environmental risks
& for site rehabilitation 296 178 474
Other non-current provisions 295 284 (76) 154 656
Current provisions 448 99 (20) 30 556
Other current provisions 448 99 (20) 30 556
Total provisions 6,686 561 (96) 502 7,651

OCP GROUPConsolidated Financial Statements
At 31 December 202141
Consolidated Financial StatementsConsolidated Financial Statements
(In millions of dirhams) 31 December 2021 31 December 2020
Letters of credit 1,176 1,650
Miscellaneous rights and commitments 836 728
Total Commitments given 2,012 2,378
and storing it during the operation of the mine. Subsequently, at the end of the operation, these excavated materials
are used to create a regular ground and prepare the soil for agricultural use. The Group also takes advantage of the
opportunity to initiate agricultural and forestry activities that benefit the communities. This approach is based on the
involvement of the local populations as well as the authorities and associations or agencies concerned at the start
of the project. In addition to respecting the peculiarities of the soils and the local climatic conditions, the cultures
and the introduced activities are done in the light of the local know-how. The former Khouribga mine testifies to the
value of this approach.
The increase in the provision for rehabilitation of mining sites is due to the updating of development and planting
costs estimated on the basis of the last contracts concluded as well as the increase in the areas exploited.
Other provisions
The increase in the line of other non-current provisions is mainly related to the provision for remaining balance of the
contract with Samsung for MAD 162 million presenting the non-reinvoiced share of JFC3.
9.4. CONTINGENT LIABILITIES
Contingent liabilities concern bank guarantees and other items arising in the ordinary course of the Group’s business.
Group OCP does not expect these items to result in significant liabilities.
9.5. COMMITMENT GIVEN
The commitments given correspond to customs guarantees and those of customers, letters of credit-import, as well as the
various rights and commitments given registered and not proven.
OCP GROUPConsolidated Financial Statements
At 31 December 202142
Consolidated Financial StatementsConsolidated Financial Statements
Note 10 – Financial instruments, net debt and net cost of financing
10.1. CASH MANAGEMENT FINANCIAL ASSETS, FINANCIAL LIABILITIES, NET DEBT AND NET COST OF
FINANCING
10.1.1 DEFINITIONS AND ACCOUNTING TREATMENT
Financial liabilities
Financial liabilities include financial loans and debts, and bank overdrafts, they are initially recognized at the fair
value of the amount required to settle the corresponding obligation, less related costs. Upon subsequent measurement,
these financial liabilities are recognized at amortized cost, using the effective interest rate method. The interest
calculated at the effective interest rate is recognized in the item “Cost of gross financial debt” over the term of the
financial debt.
Financial assets and liabilities are classified as current when expected maturity of the instrument cash flows is less than
one year.
Cash and cash equivalents
“Cash and cash equivalents” include cash as well as short-term investments (with a maturity of less than three months)
classified in this category as long as the following criteria are met:
• Highly liquid,
• Easily convertible to a known cash amount,
• Subject to a negligible risk of change in value.
Short-term investments primarily correspond to cash unit trusts measured at fair value at the closing date, and changes
in fair value are recognized in financial profit or loss.
Cash management financial assets
Cash financial assets mainly correspond to term deposits. These are investments whose maturity and income
conditions are determined when they are made and which the Group intends and has the means to keep until their
maturity. They are measured at amortized cost. Remuneration of term deposits is recognized in financial profit or loss.
Net debt
Net debt is defined as the sum of current and non-current financial debt less cash and cash equivalents and financial
cash assets.
Cost of net financial debt
The cost of net financial debt includes the cost of gross debt plus financial income from cash investments:
• Cost of gross debt: This includes interest charges calculated using the effective interest rate method, the costs
of early repayment of loans or cancelation of lines of credit.
• Financial income from cash investments: This is composed of income from investments of cash and cash
equivalents as well as financial cash assets.
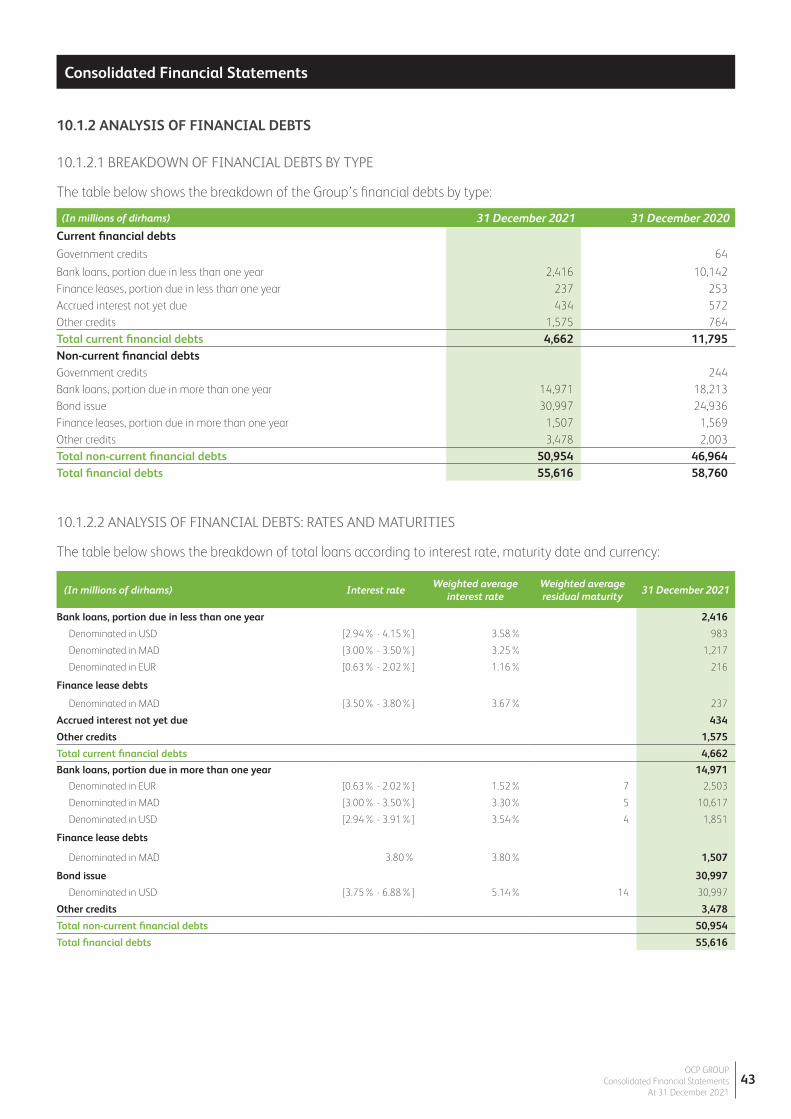
OCP GROUPConsolidated Financial Statements
At 31 December 202143
Consolidated Financial StatementsConsolidated Financial Statements
10.1.2 ANALYSIS OF FINANCIAL DEBTS
10.1.2.1 BREAKDOWN OF FINANCIAL DEBTS BY TYPE
The table below shows the breakdown of the Group’s financial debts by type:
(In millions of dirhams) 31 December 2021 31 December 2020
Current financial debts
Government credits 64
Bank loans, portion due in less than one year 2,416 10,142 Finance leases, portion due in less than one year 237 253 Accrued interest not yet due 434 572 Other credits 1,575 764 Total current financial debts 4,662 11,795 Non-current financial debtsGovernment credits 244 Bank loans, portion due in more than one year 14,971 18,213 Bond issue 30,997 24,936 Finance leases, portion due in more than one year 1,507 1,569 Other credits 3,478 2,003 Total non-current financial debts 50,954 46,964 Total financial debts 55,616 58,760
10.1.2.2 ANALYSIS OF FINANCIAL DEBTS: RATES AND MATURITIES
The table below shows the breakdown of total loans according to interest rate, maturity date and currency:
(In millions of dirhams) Interest rateWeighted average
interest rateWeighted average residual maturity
31 December 2021
Bank loans, portion due in less than one year 2,416
Denominated in USD [2.94% - 4.15%] 3.58% 983
Denominated in MAD [3.00% - 3.50%] 3.25% 1,217
Denominated in EUR [0.63% - 2.02%] 1.16% 216
Finance lease debts
Denominated in MAD [3.50% - 3.80%] 3.67% 237
Accrued interest not yet due 434
Other credits 1,575
Total current financial debts 4,662
Bank loans, portion due in more than one year 14,971
Denominated in EUR [0.63% - 2.02%] 1.52% 7 2,503
Denominated in MAD [3.00% - 3.50%] 3.30% 5 10,617
Denominated in USD [2.94% - 3.91%] 3.54% 4 1,851
Finance lease debts
Denominated in MAD 3.80% 3.80% 1,507
Bond issue 30,997
Denominated in USD [3.75% - 6.88%] 5.14% 14 30,997
Other credits 3,478
Total non-current financial debts 50,954
Total financial debts 55,616
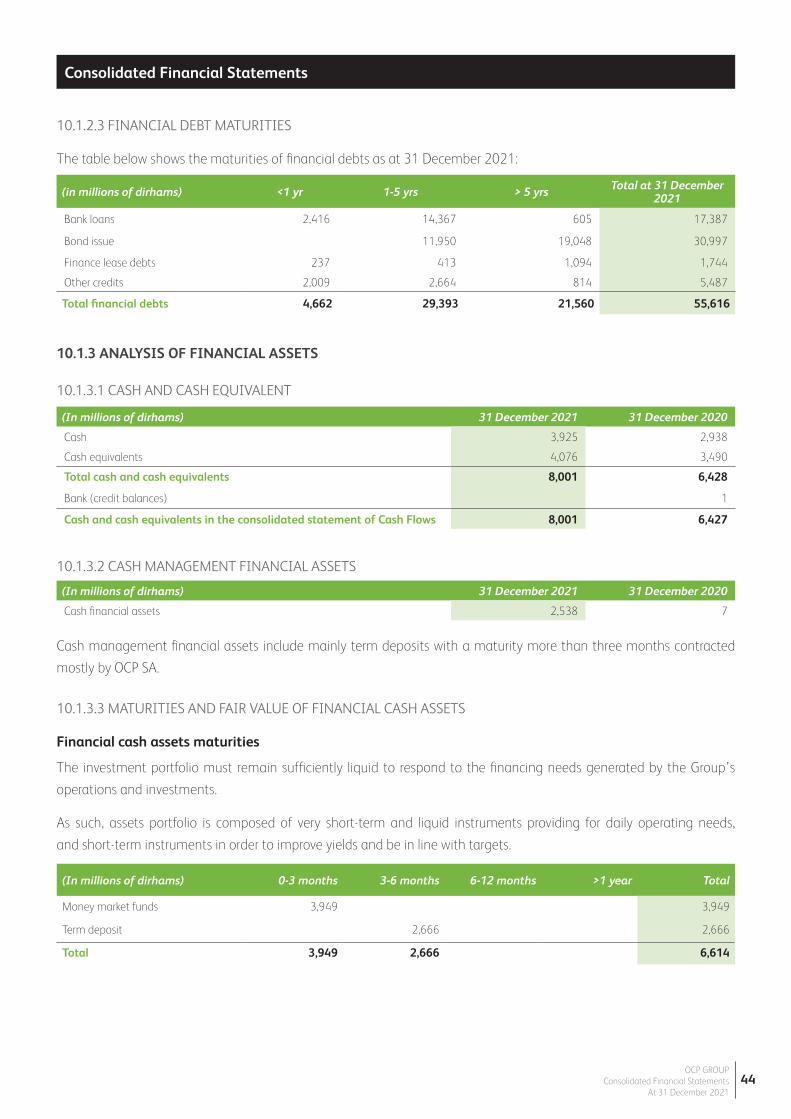
OCP GROUPConsolidated Financial Statements
At 31 December 202144
Consolidated Financial StatementsConsolidated Financial Statements
(in millions of dirhams) <1 yr 1-5 yrs > 5 yrs Total at 31 December 2021
Bank loans 2,416 14,367 605 17,387
Bond issue 11,950 19,048 30,997
Finance lease debts 237 413 1,094 1,744
Other credits 2,009 2,664 814 5,487
Total financial debts 4,662 29,393 21,560 55,616
(In millions of dirhams) 31 December 2021 31 December 2020
Cash 3,925 2,938
Cash equivalents 4,076 3,490
Total cash and cash equivalents 8,001 6,428
Bank (credit balances) 1
Cash and cash equivalents in the consolidated statement of Cash Flows 8,001 6,427
(In millions of dirhams) 31 December 2021 31 December 2020
Cash financial assets 2,538 7
(In millions of dirhams) 0-3 months 3-6 months 6-12 months >1 year Total
Money market funds 3,949 3,949
Term deposit 2,666 2,666
Total 3,949 2,666 6,614
10.1.2.3 FINANCIAL DEBT MATURITIES
The table below shows the maturities of financial debts as at 31 December 2021:
10.1.3 ANALYSIS OF FINANCIAL ASSETS
10.1.3.1 CASH AND CASH EQUIVALENT
10.1.3.2 CASH MANAGEMENT FINANCIAL ASSETS
Cash management financial assets include mainly term deposits with a maturity more than three months contracted
mostly by OCP SA.
10.1.3.3 MATURITIES AND FAIR VALUE OF FINANCIAL CASH ASSETS
Financial cash assets maturities
The investment portfolio must remain sufficiently liquid to respond to the financing needs generated by the Group’s
operations and investments.
As such, assets portfolio is composed of very short-term and liquid instruments providing for daily operating needs,
and short-term instruments in order to improve yields and be in line with targets.

OCP GROUPConsolidated Financial Statements
At 31 December 202145
Consolidated Financial StatementsConsolidated Financial Statements
(In millions of dirhams) 31 December 2021 31 December 2020
Financial credits 18,374 28,560
Bonds 30,997 24,936
Other loans and assimilated debts 4,502 3,441
Bank overdrafts 3
Gross financial and bond debt 53,871 56,939
Financial debts from IFRS 16 leases 1,744 1,820
Other Financial debts 1,744 1,820 Cash equivalents 4,076 3,490
Cash 3,925 2,938
Financial assets for cash management 2,538 7
Financial assets 10,540 6,435
Net financial and bond debt 43,332 50,504
Total Gross financial debt 55,616 58,759
Total Net financial debt 45,076 52,324
(In millions of dirhams) FY 2021 FY 2020Interest expenses (2,384) (2,436) Cost of gross financial debt (2,384) (2,436) Financial income from cash investments 81 162 Other financial income 80 104 Financial income from cash investments 161 266 Cost of net financial debt (2,223) (2,170)
(In millions of dirhams) 31 Decembre 2021 31 Decembre 2020
Net change in cash (1,577) 7,051 Change in marketable securities (2,532) 567 Insuance / repayment of loans (3,144) (800) Other variations 4 8
Change in net financial debt (7,248) 6,826
10.1.4 ANALYSIS OF NET DEBT
It should be noted that OCP Group contracted, during 2021 new loans amounting to MAD 17.5 billion including:
• A bond loan of $750 million at 10 years, offering a coupon of 3.75% and a bond loan of $750 million at 30 years,
offering a coupon of 5.125%.
• Medium and long-term financing from international financial institutions for a total amount of $ 450 million.
These issues were absorbed by repayments of a total debt of MAD 23 billion, including MAD 9 billion relating to the
partial redemption of bond issues for 2014 - 10 years up to 41.36% and 2015 - 10.5 years up to by 44.44% (for
respectively 517 and 444 million dollars).
10.1.5 COST OF NET DEBT
The cost of net debt can be broken down as follows:
Reconciliation of net financial debt with cash flow in statement of Cash Flows:
The cost of gross financial debt shows a slight decrease of MAD 53 million between 2021 and 2020. This decline is
explained by the drop in interest charges due to the repayments of loans made in 2021.
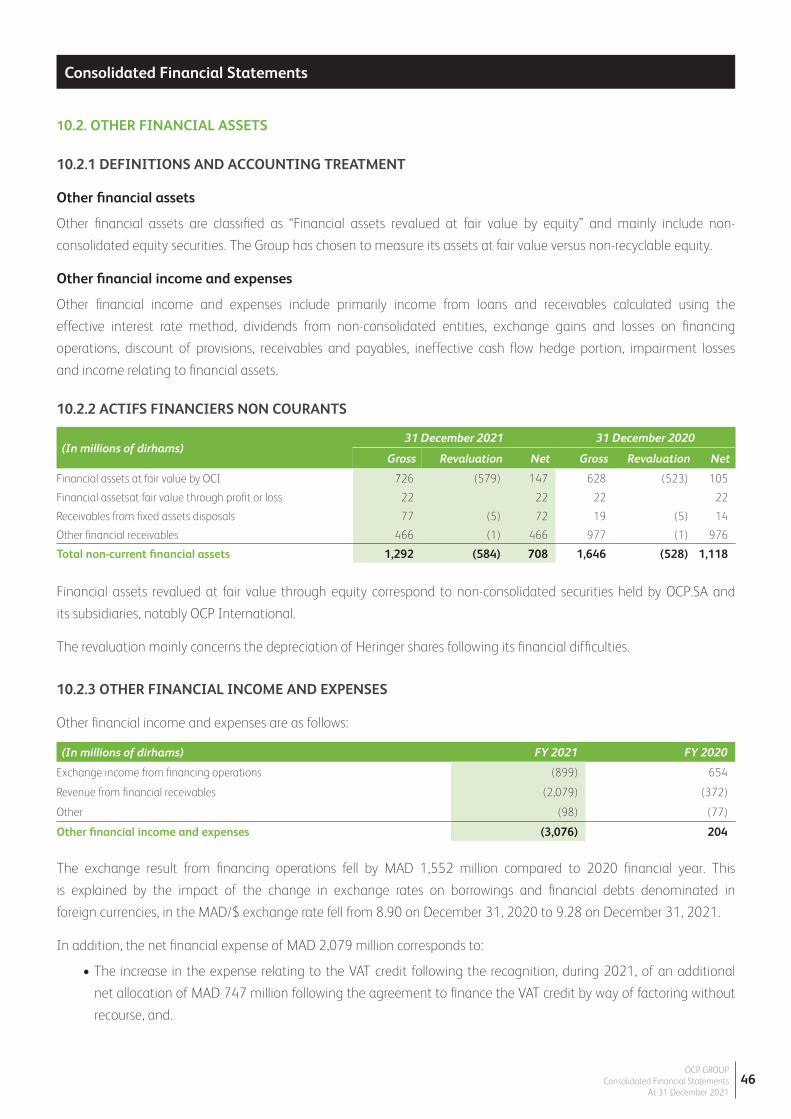
OCP GROUPConsolidated Financial Statements
At 31 December 202146
Consolidated Financial StatementsConsolidated Financial Statements
(In millions of dirhams) FY 2021 FY 2020
Exchange income from financing operations (899) 654
Revenue from financial receivables (2,079) (372)
Other (98) (77)
Other financial income and expenses (3,076) 204
(In millions of dirhams)31 December 2021 31 December 2020
Gross Revaluation Net Gross Revaluation Net
Financial assets at fair value by OCI 726 (579) 147 628 (523) 105
Financial assetsat fair value through profit or loss 22 22 22 22
Receivables from fixed assets disposals 77 (5) 72 19 (5) 14
Other financial receivables 466 (1) 466 977 (1) 976
Total non-current financial assets 1,292 (584) 708 1,646 (528) 1,118
10.2. OTHER FINANCIAL ASSETS
10.2.1 DEFINITIONS AND ACCOUNTING TREATMENT
Other financial assets
Other financial assets are classified as “Financial assets revalued at fair value by equity” and mainly include non-
consolidated equity securities. The Group has chosen to measure its assets at fair value versus non-recyclable equity.
Other financial income and expenses
Other financial income and expenses include primarily income from loans and receivables calculated using the
effective interest rate method, dividends from non-consolidated entities, exchange gains and losses on financing
operations, discount of provisions, receivables and payables, ineffective cash flow hedge portion, impairment losses
and income relating to financial assets.
10.2.2 ACTIFS FINANCIERS NON COURANTS
Financial assets revalued at fair value through equity correspond to non-consolidated securities held by OCP.SA and
its subsidiaries, notably OCP International.
The revaluation mainly concerns the depreciation of Heringer shares following its financial difficulties.
10.2.3 OTHER FINANCIAL INCOME AND EXPENSES
Other financial income and expenses are as follows:
The exchange result from financing operations fell by MAD 1,552 million compared to 2020 financial year. This
is explained by the impact of the change in exchange rates on borrowings and financial debts denominated in
foreign currencies, in the MAD/$ exchange rate fell from 8.90 on December 31, 2020 to 9.28 on December 31, 2021.
In addition, the net financial expense of MAD 2,079 million corresponds to:
• The increase in the expense relating to the VAT credit following the recognition, during 2021, of an additional
net allocation of MAD 747 million following the agreement to finance the VAT credit by way of factoring without
recourse, and.
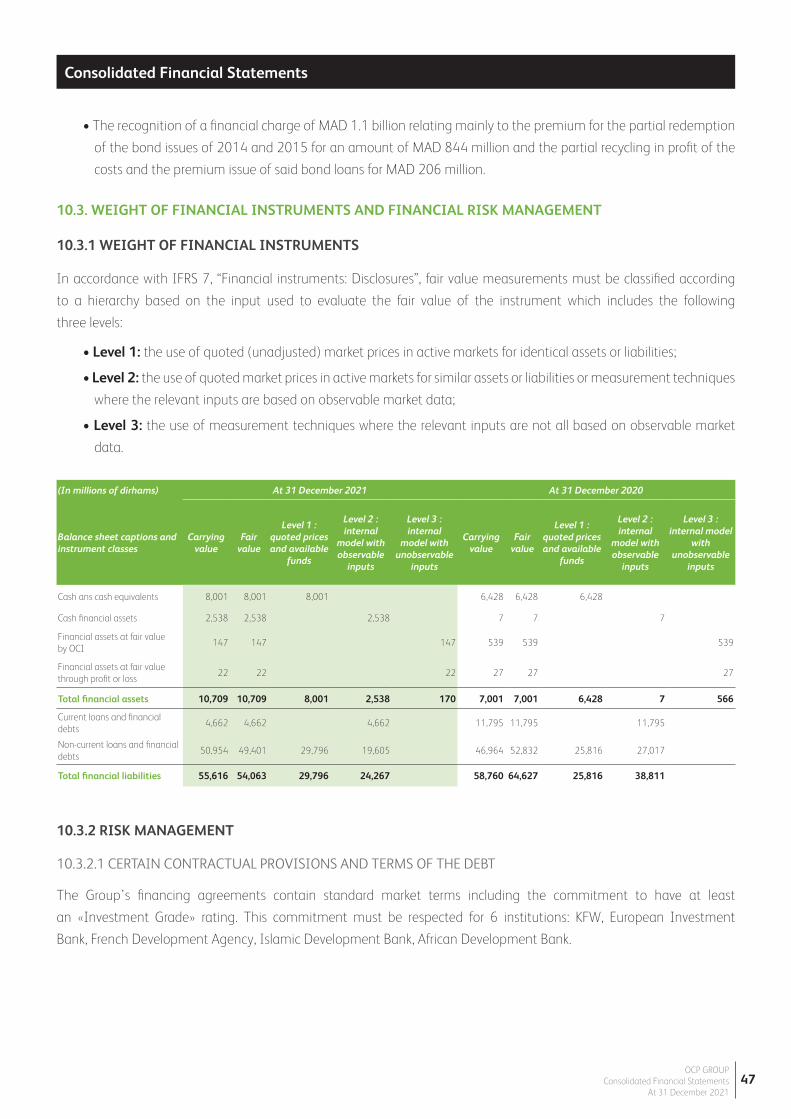
OCP GROUPConsolidated Financial Statements
At 31 December 202147
Consolidated Financial StatementsConsolidated Financial Statements
(In millions of dirhams) At 31 December 2021 At 31 December 2020
Balance sheet captions and instrument classes
Carrying value
Fair value
Level 1 : quoted prices and available
funds
Level 2 : internal
model with observable
inputs
Level 3 : internal
model with unobservable
inputs
Carrying value
Fair value
Level 1 : quoted prices and available
funds
Level 2 : internal
model with observable
inputs
Level 3 : internal model
with unobservable
inputs
Cash ans cash equivalents 8,001 8,001 8,001 6,428 6,428 6,428
Cash financial assets 2,538 2,538 2,538 2,538 2,538 2,538 7 7 7 7 7 7
Financial assets at fair value by OCI
147 147 147 147 147 147 539 539 539 539 539 539
Financial assets at fair value through profit or loss
22 22 22 22 22 22 27 27 27 27 27 27
Total financial assets 10,709 10,709 10,709 10,709 8,001 8,001 2,538 2,538 170 170 7,001 7,001 7,001 7,001 6,428 6,428 7 7 566 566
Current loans and financialdebts
4,662 4,662 4,662 4,662 4,662 4,662 11,795 11,795 11,795 11,795 11,795 11,795
Non-current loans and financialdebts
50,954 50,954 49,401 49,401 29,796 29,796 19,605 19,605 46,964 46,964 52,832 52,832 25,816 25,816 27,017 27,017
Total financial liabilities 55,616 55,616 54,063 54,063 29,796 29,796 24,267 24,267 58,760 58,760 64,627 64,627 25,816 25,816 38,811 38,811
• The recognition of a financial charge of MAD 1.1 billion relating mainly to the premium for the partial redemption
of the bond issues of 2014 and 2015 for an amount of MAD 844 million and the partial recycling in profit of the
costs and the premium issue of said bond loans for MAD 206 million.
10.3. WEIGHT OF FINANCIAL INSTRUMENTS AND FINANCIAL RISK MANAGEMENT
10.3.1 WEIGHT OF FINANCIAL INSTRUMENTS
In accordance with IFRS 7, “Financial instruments: Disclosures”, fair value measurements must be classified according
to a hierarchy based on the input used to evaluate the fair value of the instrument which includes the following
three levels:
• Level 1: the use of quoted (unadjusted) market prices in active markets for identical assets or liabilities;
• Level 2: the use of quoted market prices in active markets for similar assets or liabilities or measurement techniques
where the relevant inputs are based on observable market data;
• Level 3: the use of measurement techniques where the relevant inputs are not all based on observable market
data.
10.3.2 RISK MANAGEMENT
10.3.2.1 CERTAIN CONTRACTUAL PROVISIONS AND TERMS OF THE DEBT
The Group’s financing agreements contain standard market terms including the commitment to have at least
an «Investment Grade» rating. This commitment must be respected for 6 institutions: KFW, European Investment
Bank, French Development Agency, Islamic Development Bank, African Development Bank.
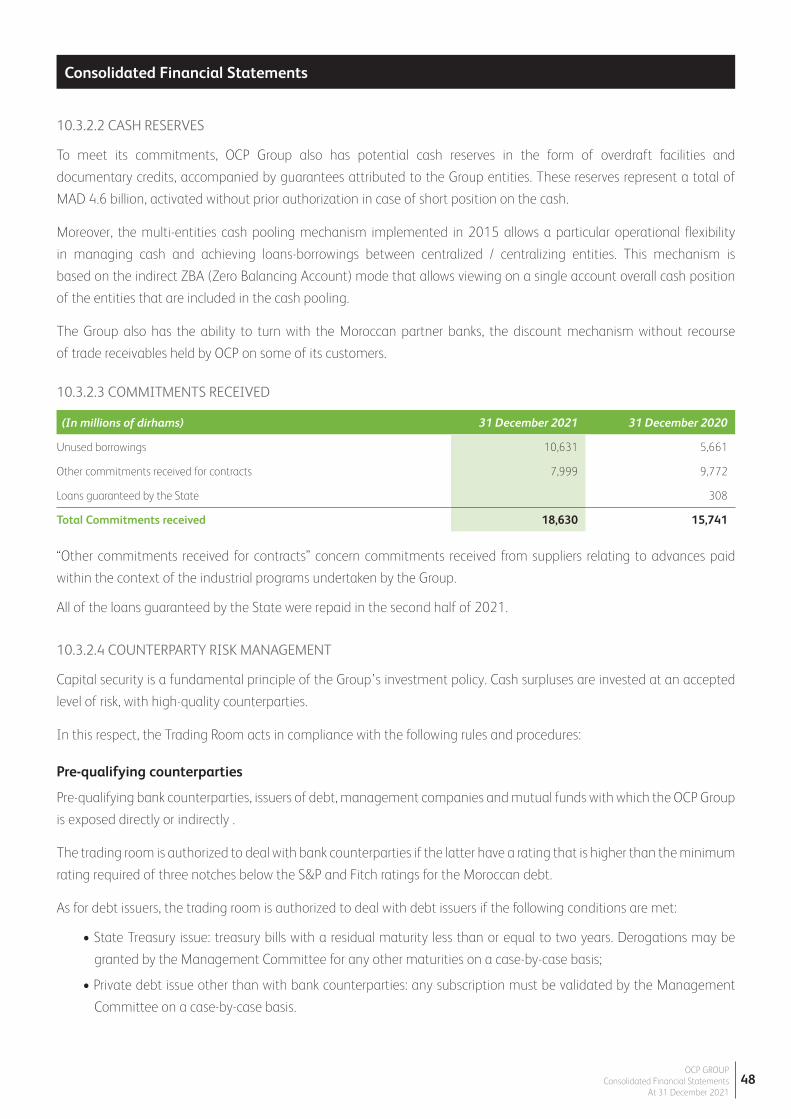
OCP GROUPConsolidated Financial Statements
At 31 December 202148
Consolidated Financial StatementsConsolidated Financial Statements
10.3.2.2 CASH RESERVES
To meet its commitments, OCP Group also has potential cash reserves in the form of overdraft facilities and
documentary credits, accompanied by guarantees attributed to the Group entities. These reserves represent a total of
MAD 4.6 billion, activated without prior authorization in case of short position on the cash.
Moreover, the multi-entities cash pooling mechanism implemented in 2015 allows a particular operational flexibility
in managing cash and achieving loans-borrowings between centralized / centralizing entities. This mechanism is
based on the indirect ZBA (Zero Balancing Account) mode that allows viewing on a single account overall cash position
of the entities that are included in the cash pooling.
The Group also has the ability to turn with the Moroccan partner banks, the discount mechanism without recourse
of trade receivables held by OCP on some of its customers.
10.3.2.3 COMMITMENTS RECEIVED
“Other commitments received for contracts” concern commitments received from suppliers relating to advances paid
within the context of the industrial programs undertaken by the Group.
All of the loans guaranteed by the State were repaid in the second half of 2021.
10.3.2.4 COUNTERPARTY RISK MANAGEMENT
Capital security is a fundamental principle of the Group’s investment policy. Cash surpluses are invested at an accepted
level of risk, with high-quality counterparties.
In this respect, the Trading Room acts in compliance with the following rules and procedures:
Pre-qualifying counterparties
Pre-qualifying bank counterparties, issuers of debt, management companies and mutual funds with which the OCP Group
is exposed directly or indirectly .
The trading room is authorized to deal with bank counterparties if the latter have a rating that is higher than the minimum
rating required of three notches below the S&P and Fitch ratings for the Moroccan debt.
As for debt issuers, the trading room is authorized to deal with debt issuers if the following conditions are met:
• State Treasury issue: treasury bills with a residual maturity less than or equal to two years. Derogations may be
granted by the Management Committee for any other maturities on a case-by-case basis;
• Private debt issue other than with bank counterparties: any subscription must be validated by the Management
Committee on a case-by-case basis.
(In millions of dirhams) 31 December 2021 31 December 2020
Unused borrowings 10,631 5,661
Other commitments received for contracts 7,999 9,772
Loans guaranteed by the State 308
Total Commitments received 18,630 15,741
OCP GROUPConsolidated Financial Statements
At 31 December 202149
Consolidated Financial StatementsConsolidated Financial Statements
Finally, the prequalification of UCITS consists of the following two stages:
• Choice of the management company: the management company must have a minimum management rating
of M2 according to the Fitch scale;
• Choice of the UCITS: the investment mainly concerns low-sensitivity, fairly liquid UCITS in order to allow the
Group to manage its liquidity under the best conditions.
Diversifying the counterparties
Diversifying the counterparties to which Group OCP is exposed in accordance with prudential rules that are defined
internally.
Fixing limits by type of instruments held by counterparties
Outstanding direct investment with a bank counterparty is classified by instrument type and is limited according to the
credit standard of the said counterparty. These limits fix:
• The maximum outstanding amount authorized with a counterparty as a percentage of equity;
• The outstanding amount with a counterparty by instrument type which must not exceed the Group’s total
outstanding amount invested directly in this type of instrument;
• The outstanding amount with a counterparty by instrument type which must not exceed a percentage of the
counterparty’s total outstanding amount in this type of instrument.
Otherwise, the outstanding amount with a UCITS is limited according to the credit rating of the management
company and of such a UCITS. These limits fix the maximum outstanding amount authorized with a UCITS as a
percentage of net assets and the maximum outstanding amount authorized with the management company.
Any exception to the rules above is subject to validation by the Executive Committee.
10.3.2.5 LIQUIDITY RISK
The investment portfolio must remain sufficiently liquid to respond to the financing needs generated by the Group’s
operations and investment. To this end, it must be composed of liquid, flexible and available instruments.
The breakdown of assets invested between the investment portfolios is based on cash flow forecasts and is as follows:
• Very short-term, liquid instruments, providing for daily operating needs;
• Short-term instruments, in conformity with counterparty risk management, generating a yield which is in line with
the yield targeted by the investment policy.
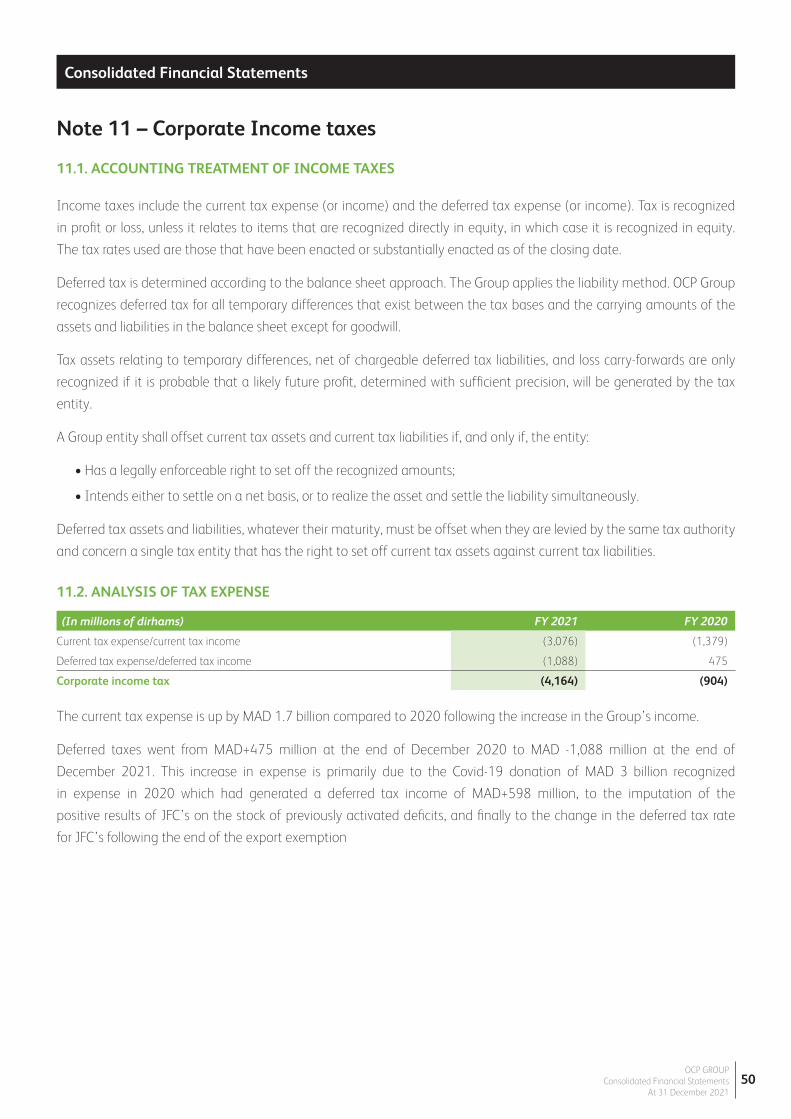
OCP GROUPConsolidated Financial Statements
At 31 December 202150
Consolidated Financial StatementsConsolidated Financial Statements
Note 11 – Corporate Income taxes
11.1. ACCOUNTING TREATMENT OF INCOME TAXES
Income taxes include the current tax expense (or income) and the deferred tax expense (or income). Tax is recognized
in profit or loss, unless it relates to items that are recognized directly in equity, in which case it is recognized in equity.
The tax rates used are those that have been enacted or substantially enacted as of the closing date.
Deferred tax is determined according to the balance sheet approach. The Group applies the liability method. OCP Group
recognizes deferred tax for all temporary differences that exist between the tax bases and the carrying amounts of the
assets and liabilities in the balance sheet except for goodwill.
Tax assets relating to temporary differences, net of chargeable deferred tax liabilities, and loss carry-forwards are only
recognized if it is probable that a likely future profit, determined with sufficient precision, will be generated by the tax
entity.
A Group entity shall offset current tax assets and current tax liabilities if, and only if, the entity:
• Has a legally enforceable right to set off the recognized amounts;
• Intends either to settle on a net basis, or to realize the asset and settle the liability simultaneously.
Deferred tax assets and liabilities, whatever their maturity, must be offset when they are levied by the same tax authority
and concern a single tax entity that has the right to set off current tax assets against current tax liabilities.
11.2. ANALYSIS OF TAX EXPENSE
(In millions of dirhams) FY 2021 FY 2020
Current tax expense/current tax income (3,076) (1,379)
Deferred tax expense/deferred tax income (1,088) 475
Corporate income tax (4,164) (904)
The current tax expense is up by MAD 1.7 billion compared to 2020 following the increase in the Group’s income.
Deferred taxes went from MAD+475 million at the end of December 2020 to MAD -1,088 million at the end of
December 2021. This increase in expense is primarily due to the Covid-19 donation of MAD 3 billion recognized
in expense in 2020 which had generated a deferred tax income of MAD+598 million, to the imputation of the
positive results of JFC’s on the stock of previously activated deficits, and finally to the change in the deferred tax rate
for JFC’s following the end of the export exemption
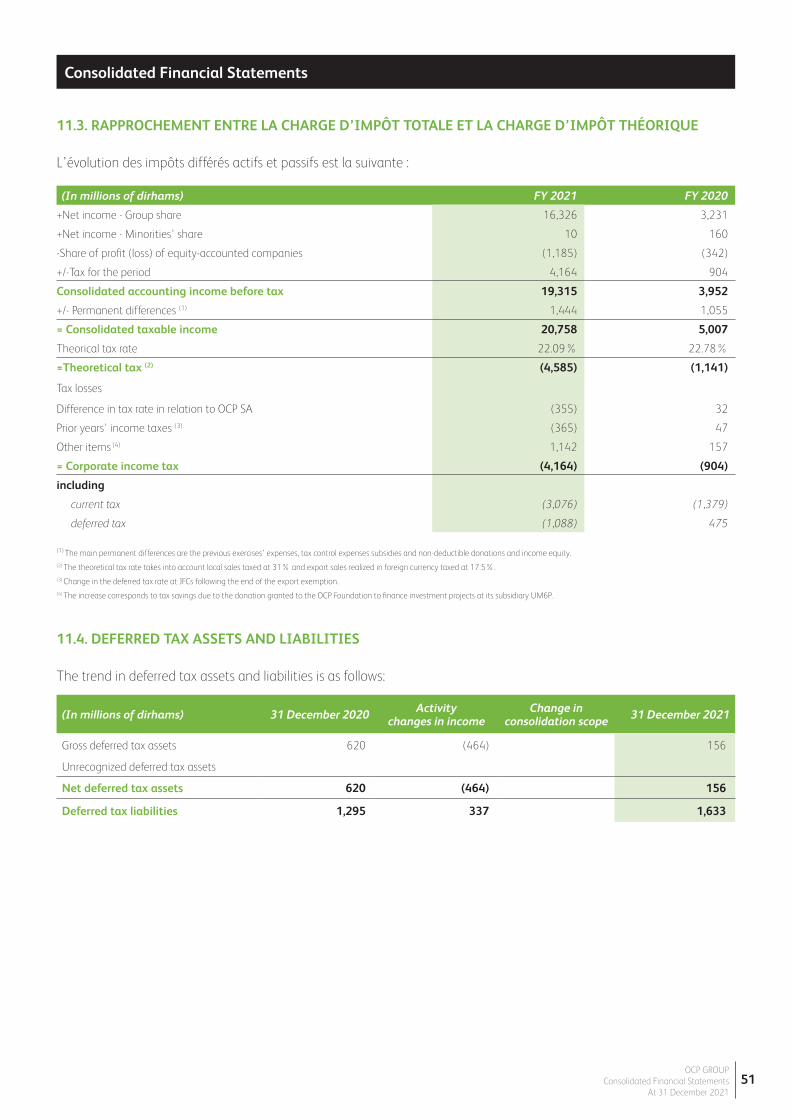
OCP GROUPConsolidated Financial Statements
At 31 December 202151
Consolidated Financial StatementsConsolidated Financial Statements
11.3. RAPPROCHEMENT ENTRE LA CHARGE D’IMPÔT TOTALE ET LA CHARGE D’IMPÔT THÉORIQUE
L’évolution des impôts différés actifs et passifs est la suivante :
11.4. DEFERRED TAX ASSETS AND LIABILITIES
The trend in deferred tax assets and liabilities is as follows:
(In millions of dirhams) FY 2021 FY 2020
+Net income - Group share 16,326 3,231
+Net income - Minorities' share 10 160
-Share of profit (loss) of equity-accounted companies (1,185) (342)
+/-Tax for the period 4,164 904
Consolidated accounting income before tax 19,315 3,952
+/- Permanent differences (1) 1,444 1,055
= Consolidated taxable income 20,758 5,007
Theorical tax rate 22.09% 22.78%
=Theoretical tax (2) (4,585) (1,141)
Tax losses
Difference in tax rate in relation to OCP SA (355) 32
Prior years' income taxes (3) (365) 47
Other items (4) 1,142 157
= Corporate income tax (4,164) (904)
including
current tax (3,076) (1,379)
deferred tax (1,088) 475
(1) The main permanent differences are the previous exercises’ expenses, tax control expenses subsidies and non-deductible donations and income equity.(2) The theoretical tax rate takes into account local sales taxed at 31% and export sales realized in foreign currency taxed at 17.5%.(3) Change in the deferred tax rate at JFCs following the end of the export exemption.(4) The increase corresponds to tax savings due to the donation granted to the OCP Foundation to finance investment projects at its subsidiary UM6P.
(In millions of dirhams) 31 December 2020 Activity changes in income
Change in consolidation scope 31 December 2021
Gross deferred tax assets 620 (464) 156
Unrecognized deferred tax assets
Net deferred tax assets 620 (464) 156
Deferred tax liabilities 1,295 337 1,633
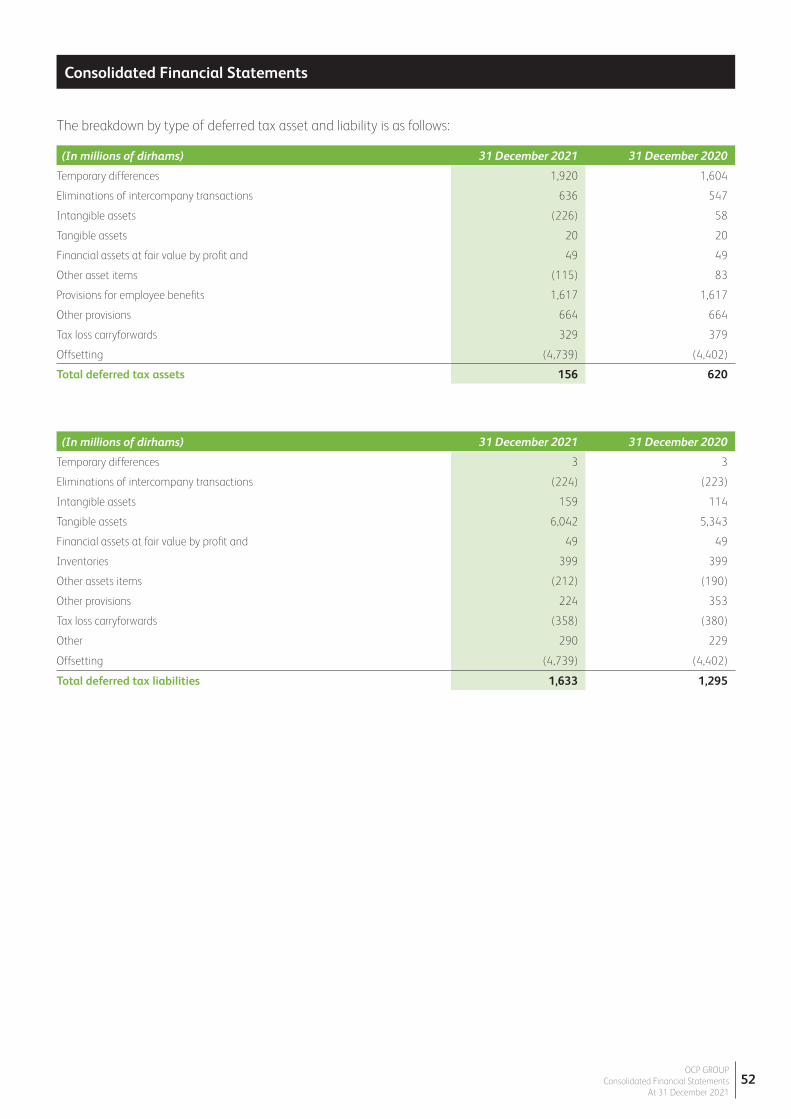
OCP GROUPConsolidated Financial Statements
At 31 December 202152
Consolidated Financial StatementsConsolidated Financial Statements
The breakdown by type of deferred tax asset and liability is as follows:
(In millions of dirhams) 31 December 2021 31 December 2020
Temporary differences 3 3
Eliminations of intercompany transactions (224) (223)
Intangible assets 159 114
Tangible assets 6,042 5,343
Financial assets at fair value by profit and 49 49
Inventories 399 399
Other assets items (212) (190)
Other provisions 224 353
Tax loss carryforwards (358) (380)
Other 290 229
Offsetting (4,739) (4,402)
Total deferred tax liabilities 1,633 1,295
(In millions of dirhams) 31 December 2021 31 December 2020
Temporary differences 1,920 1,604
Eliminations of intercompany transactions 636 547
Intangible assets (226) 58
Tangible assets 20 20
Financial assets at fair value by profit and 49 49
Other asset items (115) 83
Provisions for employee benefits 1,617 1,617
Other provisions 664 664
Tax loss carryforwards 329 379
Offsetting (4,739) (4,402)
Total deferred tax assets 156 620
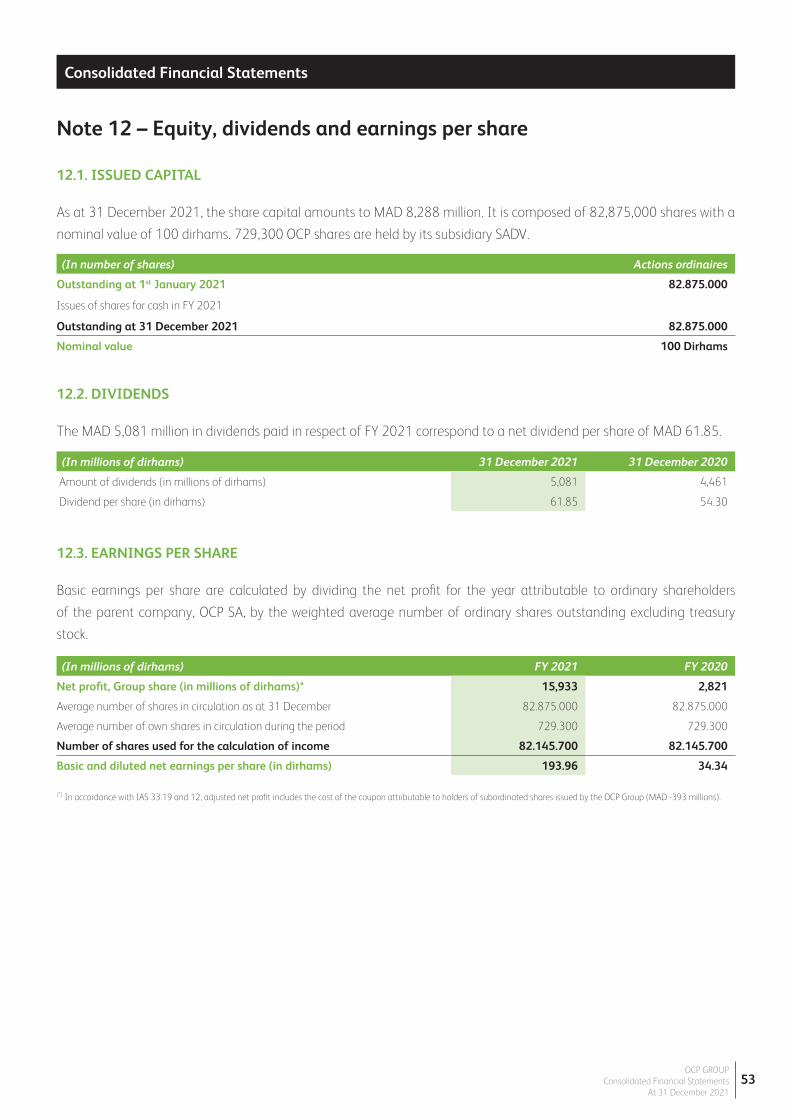
OCP GROUPConsolidated Financial Statements
At 31 December 202153
Consolidated Financial StatementsConsolidated Financial Statements
Note 12 – Equity, dividends and earnings per share
12.1. ISSUED CAPITAL
As at 31 December 2021, the share capital amounts to MAD 8,288 million. It is composed of 82,875,000 shares with a
nominal value of 100 dirhams. 729,300 OCP shares are held by its subsidiary SADV.
12.2. DIVIDENDS
The MAD 5,081 million in dividends paid in respect of FY 2021 correspond to a net dividend per share of MAD 61.85.
12.3. EARNINGS PER SHARE
Basic earnings per share are calculated by dividing the net profit for the year attributable to ordinary shareholders
of the parent company, OCP SA, by the weighted average number of ordinary shares outstanding excluding treasury
stock.
(In number of shares) Actions ordinaires
Outstanding at 1st January 2021 82.875.000
Issues of shares for cash in FY 2021 Outstanding at 31 December 2021 82.875.000
Nominal value 100 Dirhams
(In millions of dirhams) FY 2021 FY 2020
Net profit, Group share (in millions of dirhams)* 15,933 2,821
Average number of shares in circulation as at 31 December 82.875.000 82.875.000
Average number of own shares in circulation during the period 729.300 729.300
Number of shares used for the calculation of income 82.145.700 82.145.700
Basic and diluted net earnings per share (in dirhams) 193.96 34.34
(In millions of dirhams) 31 December 2021 31 December 2020
Amount of dividends (in millions of dirhams) 5,081 4,461
Dividend per share (in dirhams) 61.85 54.30
(*) In accordance with IAS 33.19 and 12, adjusted net profit includes the cost of the coupon attributable to holders of subordinated shares issued by the OCP Group (MAD -393 millions).
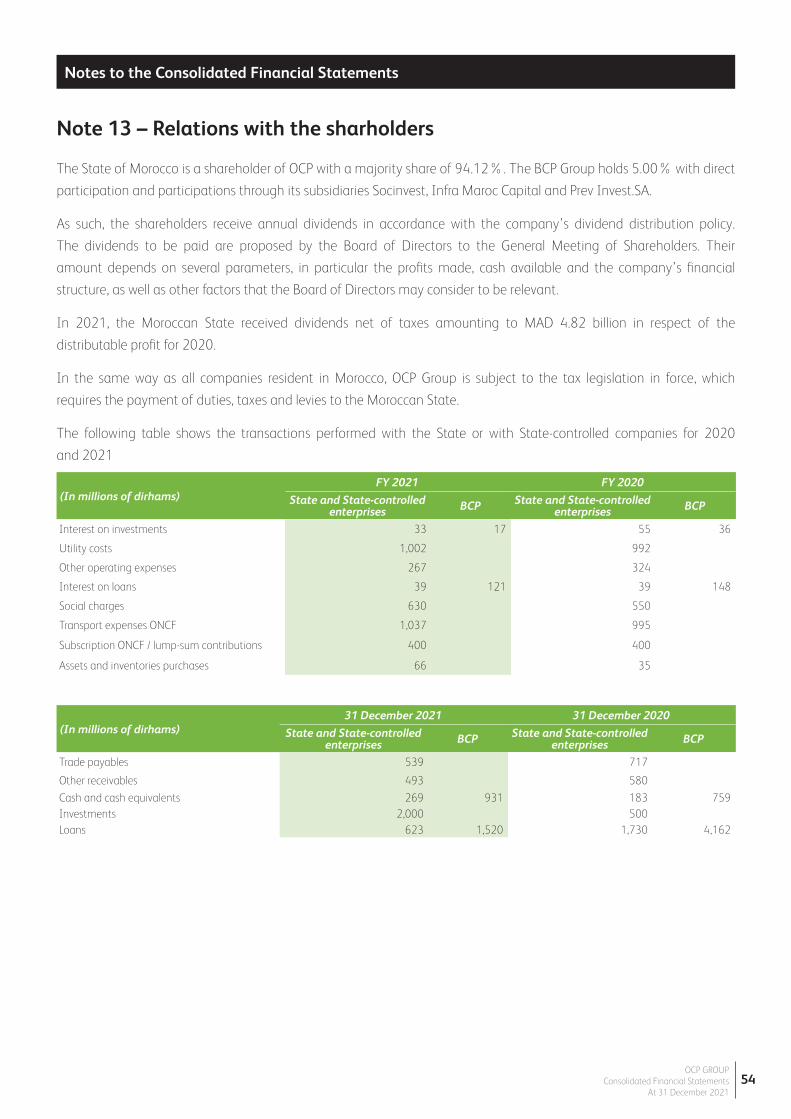
OCP GROUPConsolidated Financial Statements
At 31 December 202154
Notes to the Consolidated Financial Statements
Note 13 – Relations with the sharholders
The State of Morocco is a shareholder of OCP with a majority share of 94.12%. The BCP Group holds 5.00% with direct
participation and participations through its subsidiaries Socinvest, Infra Maroc Capital and Prev Invest.SA.
As such, the shareholders receive annual dividends in accordance with the company’s dividend distribution policy.
The dividends to be paid are proposed by the Board of Directors to the General Meeting of Shareholders. Their
amount depends on several parameters, in particular the profits made, cash available and the company’s financial
structure, as well as other factors that the Board of Directors may consider to be relevant.
In 2021, the Moroccan State received dividends net of taxes amounting to MAD 4.82 billion in respect of the
distributable profit for 2020.
In the same way as all companies resident in Morocco, OCP Group is subject to the tax legislation in force, which
requires the payment of duties, taxes and levies to the Moroccan State.
The following table shows the transactions performed with the State or with State-controlled companies for 2020
and 2021
(In millions of dirhams)FY 2021 FY 2020
State and State-controlled enterprises BCP State and State-controlled
enterprises BCP
Interest on investments 33 17 55 36
Utility costs 1,002 992
Other operating expenses 267 324
Interest on loans 39 121 39 148
Social charges 630 550
Transport expenses ONCF 1,037 995
Subscription ONCF / lump-sum contributions 400 400
Assets and inventories purchases 66 35
(In millions of dirhams)31 December 2021 31 December 2020
State and State-controlled enterprises BCP State and State-controlled
enterprises BCP
Trade payables 539 717
Other receivables 493 580
Cash and cash equivalents 269 931 183 759 Investments 2,000 500 Loans 623 1,520 1,730 4,162

Statutory auditors’ opinion on the consolidated financial information
GROUPE OCPÉtats financiers consolidés
Au 31 décembre 202056
Statutory auditors’ opinion on the consolidated financial information
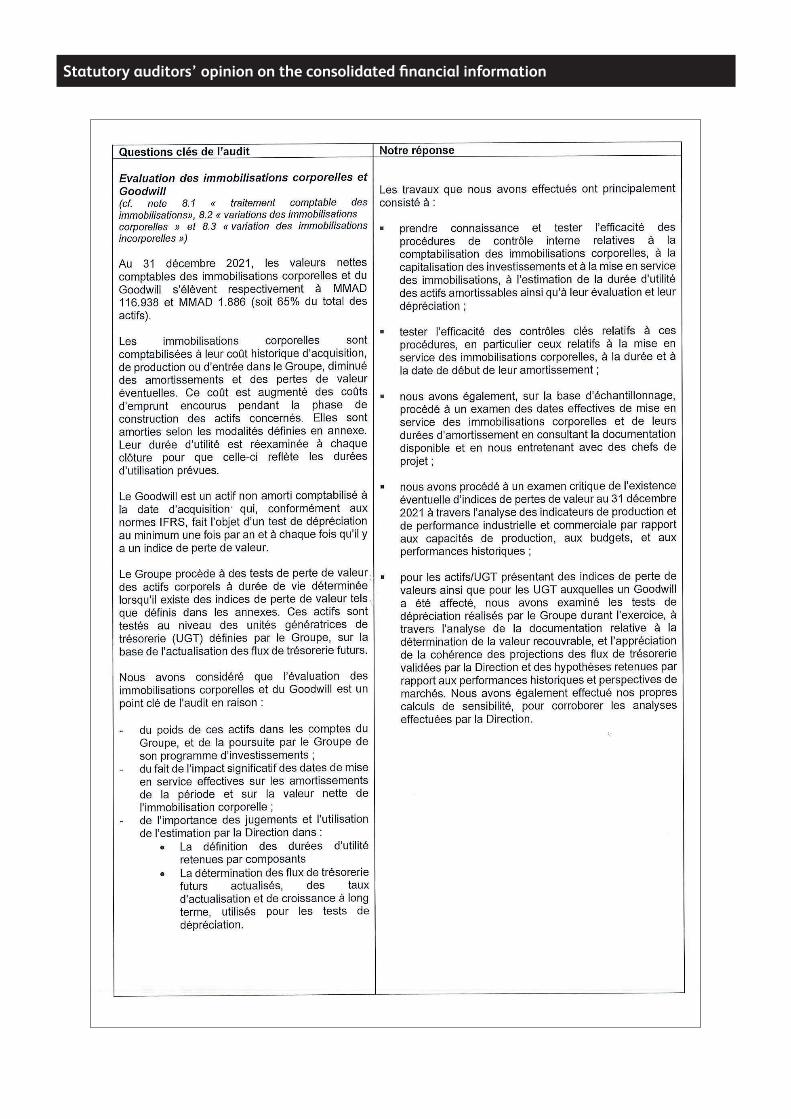
Statutory auditors’ opinion on the consolidated financial information

Statutory auditors’ opinion on the consolidated financial information

Statutory auditors’ opinion on the consolidated financial information

Statutory auditors’ opinion on the consolidated financial information

Statutory auditors’ opinion on the consolidated financial information

2 4, rue Al Abtal Hay Erraha 20 200 Casablanca Marocwww.ocpgroup.ma