CONSOLIDATED ANNUAL FINANCIAL STATEMENTS - Distell
124
00i. WWW.DISTELL.CO.ZA CONSOLIDATED ANNUAL FINANCIAL STATEMENTS FOR THE YEAR ENDED 30 JUNE 2021
-
Upload
khangminh22 -
Category
Documents
-
view
1 -
download
0
Transcript of CONSOLIDATED ANNUAL FINANCIAL STATEMENTS - Distell

00i.WWW.DISTELL.CO.ZA
CONSOLIDATED ANNUAL FINANCIAL STATEMENTSFOR THE YEAR ENDED 30 JUNE 2021
00ii. 2 0 2 1 C O N S O L I D A T E D A n n u a l f i n a n c i a l s t a t e m e n t s
IndexCurrency of financial statements 001
Directors’ responsibilities for financial reporting 002
Group chief executive officer and Group chief financial officer responsibility statement 003
Certificate by the company secretary 003
Audit committee report 004
Report of the board of directors 006
Independent auditor’s report 011
Statements of financial position 016
Income statements 017
Statements of comprehensive income 018
Statements of changes in equity 019
Statements of cash flows 022
Notes to the annual financial statements 023
Report on the assurance engagement on the compilation of pro forma financial information 116
Analysis of shareholders 118
Definitions and ratios 119
Dates of importance to shareholders 120
Administration 120
CONTENTS
CONSOLIDATED ANNUAL FINANCIAL STATEMENTS
001.WWW.DISTELL.CO.ZA
CURRENCY OF FINANCIAL STATEMENTS
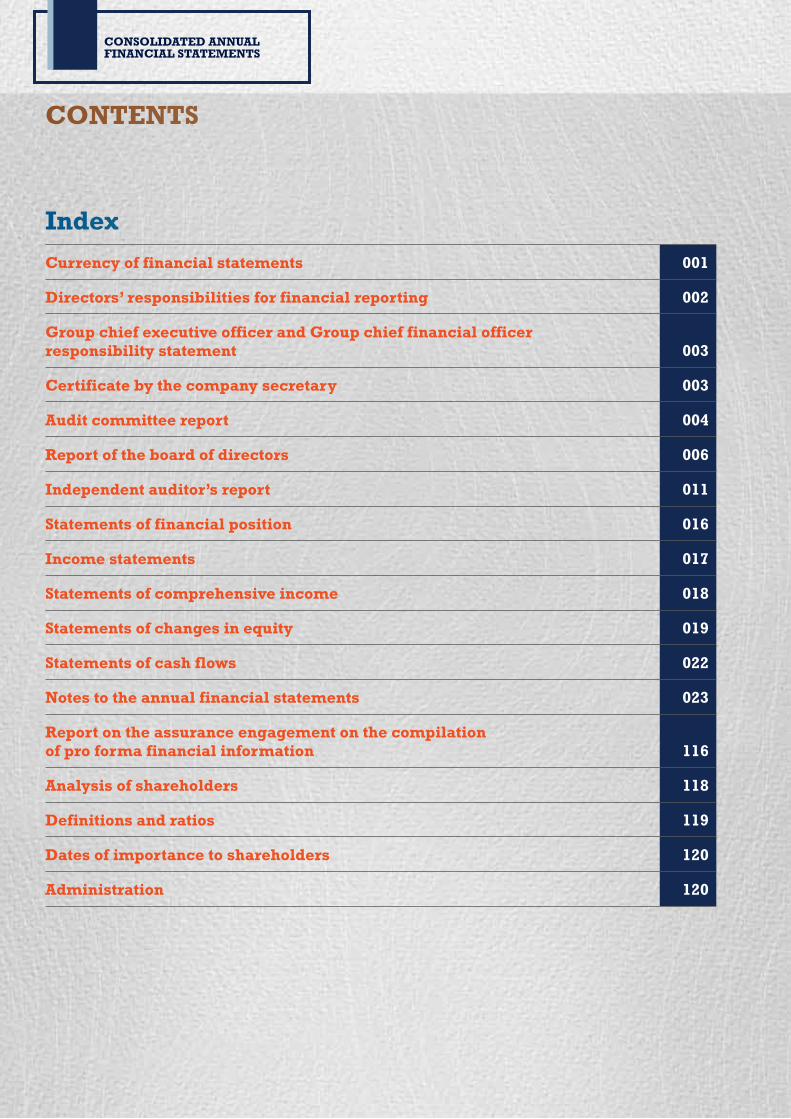
The annual financial statements are expressed in South African rand (R).
The rand cost of a unit of the following major currencies at 30 June was:
2021 2020
US dollar 14,33 17,34
UK pound 19,84 21,28
Euro 17,05 19,43
Canadian dollar 11,56 12,67
Botswana pula 1,31 1,48
Australian dollar 10,77 11,88
Kenyan shilling 0,13 0,16
Chinese yuan 2,22 2,45
Angolan kwanza 0,02 0,03
002. 2 0 2 1 C O N S O L I D A T E D A n n u a l f i n a n c i a l s t a t e m e n t s
CONSOLIDATED ANNUAL FINANCIAL STATEMENTS
DIRECTORS’ RESPONSIBILITIES for financial reporting
The South African Companies Act, No. 71 of 2008, as amended (the Companies Act) requires the directors to prepare annual financial statements for each financial year which fairly present the state of affairs of the Company and the Group and the profits or losses for the period. In preparing these annual financial statements, they must:
• select suitable accounting policies and apply them consistently;
• make judgements and estimates that are reasonable and prudent;
• state whether set accounting standards have been followed, subject to any material departures disclosed and explained in the annual financial statements; and
• prepare the annual financial statements on the going concern basis unless it is inappropriate to presume the Group will continue in business.
The directors are responsible for keeping proper accounting records, which disclose with reasonable accuracy at any time the financial position of the Company, to ensure the financial statements comply with the Companies Act. They have general responsibility for taking such steps as are reasonably accessible to them to safeguard the assets of the Group and to prevent and detect fraud and other irregularities.
These annual financial statements are prepared in accordance with International Financial Reporting Standards and incorporate full and responsible disclosure in line with the accounting policies of the Group, supported by reasonable and prudent judgements and estimates.
The board of directors approves any change in accounting policy, with their effects fully explained in the annual financial statements.
The directors have reviewed the Group’s budget and cash flow projections for the period to 30 June 2022. Based on these projections, which includes evaluating the expected impact of COVID-19 and the restrictions on trading implemented by various governments, and considering the Group’s current financial position and the financing facilities available to it, they are satisfied it has adequate resources to continue its operations in the foreseeable future. The annual financial statements were prepared on a going concern basis.
No event, material to the understanding of this report, has occurred between the financial year-end and the date of this report.
A copy of the annual financial statements of the Group is available on the Company’s website. The directors are responsible for the maintenance and integrity, including implementing controls and security, of statutory and audited information on the Company’s website.
The annual financial statements as set out on pages 3 to 114 and the supplementary information set out on pages 115 to 120 were supervised by the Group chief financial officer, Lucas Verwey CA(SA), approved by the board of directors and are signed on its behalf:
JJ Durand RM Rushton
Chairman Group chief executive officer
Stellenbosch20 September 2021
003.WWW.DISTELL.CO.ZA
GROUP CHIEF EXECUTIVE OFFICER AND GROUP CHIEF FINANCIAL OFFICER RESPONSIBILITY STATEMENT
CERTIFICATE BY THE COMPANY SECRETARY
The directors, whose names are stated below, hereby confirm that:
• the annual financial statements set out on pages 3 to 114, fairly present in all material respects the financial position, financial performance and cash flows of Distell Group Holdings Limited (the Group) in terms of IFRS;
• no facts have been omitted or untrue statements made that would make the annual financial statements false or misleading;
• internal financial controls have been put in place to ensure that material information relating to the Group and its consolidated subsidiaries have been provided to effectively prepare the financial statements of the Group; and
• the internal financial controls are adequate and effective and can be relied upon in compiling the annual financial statements, having fulfilled our role and function within the combined assurance model pursuant to principle 15 of the King IV Code. Where we are not satisfied, we have disclosed to the audit committee and the auditors the deficiencies in design and operational effectiveness of the internal financial controls and any fraud that involves directors, and have taken the necessary remedial action.
RM Rushton LC Verwey
Group chief executive officer Group chief financial officer
Stellenbosch20 September 2021
In terms of section 88(2)(e) of the Companies Act I, Lizelle Malan, being company secretary of Distell Group Holdings Limited, hereby certify that all returns and notices of Distell Group Holdings Limited required in terms of the Companies Act have in respect of the year under review, been filed with the Companies and Intellectual Property Commission and that all such returns and notices appear to be true, correct and up to date.
L Malan
Company secretary
Stellenbosch20 September 2021
004. 2 0 2 1 C O N S O L I D A T E D A n n u a l f i n a n c i a l s t a t e m e n t s
CONSOLIDATED ANNUAL FINANCIAL STATEMENTS
AUDIT COMMITTEE REPORTto the shareholders of Distell Group Holdings Limited
The audit committee has pleasure in submitting this report, as required in terms of the Companies Act.
Composition – The committee comprises four independent non-executive directors, nominated by the nomination committee and the board and appointed by the shareholders.
Attendance – The committee meets at least four times per year (Refer to page 104 of the integrated report for the schedule of attendance) and the Group chief executive officer, Group chief financial officer, external auditors, chief audit executive and selected senior management are invited to attend the meetings.
Discharging its responsibilities on integrated reporting – governed by its board-approved terms of reference, the committee discharged its responsibilities by performing the following activities:
• Reviewed and approved Distell’s integrated report, annual financial statements, interim reports and other financial media releases and recommend final approval to the board
• Reviewed the adequacy and effectiveness of the financial reporting process and the systems of internal control
• Reviewed the external auditor’s report and representation letter signed by management
• Ensured compliance of published information with relevant legislation, reporting standards and good governance
• Considered any significant legal and tax matters that could have a material impact on the financial statements of the Group
• Met separately with management, the external auditor and the internal auditor to discuss matters that the respective parties believed should be discussed privately for the committee’s consideration in satisfying itself that no material control weaknesses existed
Discharging its responsibilities on external auditors – governed by its board-approved terms of reference, the committee discharged its responsibilities by performing the following activities:
• Satisfied itself with the independence of the external auditor, approved the audit fee as well as the fees for non-audit services (fees paid to auditors are detailed in note 18.3) and nominated to the shareholders for appointment PwC as the external auditor, and Ms Rika Labuschaigne as the designated auditor.
Discharging its responsibilities on internal audit – governed by its board-approved terms of reference, the committee discharged its responsibilities by performing the following activities:
• Oversaw the internal audit function and approved the annual internal audit plan
• Approved the internal audit and audit committee terms of reference as well as the event matrix and work plan
• Evaluated the independence, resources, performance and effectiveness of the internal audit function
• Reviewed and considered the significant findings raised by internal audit as well as the adequacy of management’s corrective actions
• Received assurance on the adequacy of internal financial controls
005.WWW.DISTELL.CO.ZA
Discharging its responsibilities on Group finance – governed by its board-approved terms of reference, the committee discharged its responsibilities by performing the following activities:
• As required by the JSE Listings Requirements, the committee considered the experience and expertise of Distell’s chief financial officer, Mr Lucas Verwey (his biographical details are detailed on page 92 of the integrated report), and is satisfied that it is appropriate.
• The committee also reviewed and satisfied itself that the composition, experience and skills of the finance function are appropriate and meet the Group’s requirements.
Consider key matters – the following matters were considered to be of key significance relating to the financial results of this year:
• The impact of the coronavirus pandemic (COVID-19) on the financial results of the Group, including the judgements and assumptions applied by management in assessing the carrying values of property, plant and equipment, investments, intangible assets, inventory and trade and other receivables at year-end
• The mitigating plans introduced by management to manage the impact thereof, including available banking facilities and cash flow forecasts to ensure the continued solvency and liquidity of the Group
• The assessment of the going concern assumptions for the Group
The committee was satisfied that the judgements and assumptions applied in the financial statements adequately provided for the impact of COVID-19 and that the Group will be able to continue to trade as a going concern as disclosed in more detail in the notes to the annual financial statements.
The committee evaluated the impairment assessment of the investment in Best Global Brands Limited and concurred that no additional impairment is required this financial year. The expected credit loss assessment of the savings bonds of the Reserve Bank of Zimbabwe remains unchanged from the previous financial year and no value is attributed to the bonds.
The committee further considered the assessment of the impairment of the goodwill and trademarks of Distell International Limited due to the significant judgements and estimates involved. The committee concurred with management’s assessment that no impairment was required.
Catharina Sevillano-Barredo
Audit committee chairperson
Stellenbosch20 September 2021
006. 2 0 2 1 C O N S O L I D A T E D A n n u a l f i n a n c i a l s t a t e m e n t s
CONSOLIDATED ANNUAL FINANCIAL STATEMENTS
REPORT OF THE BOARD OF DIRECTORSfor the year ended 30 June 2021
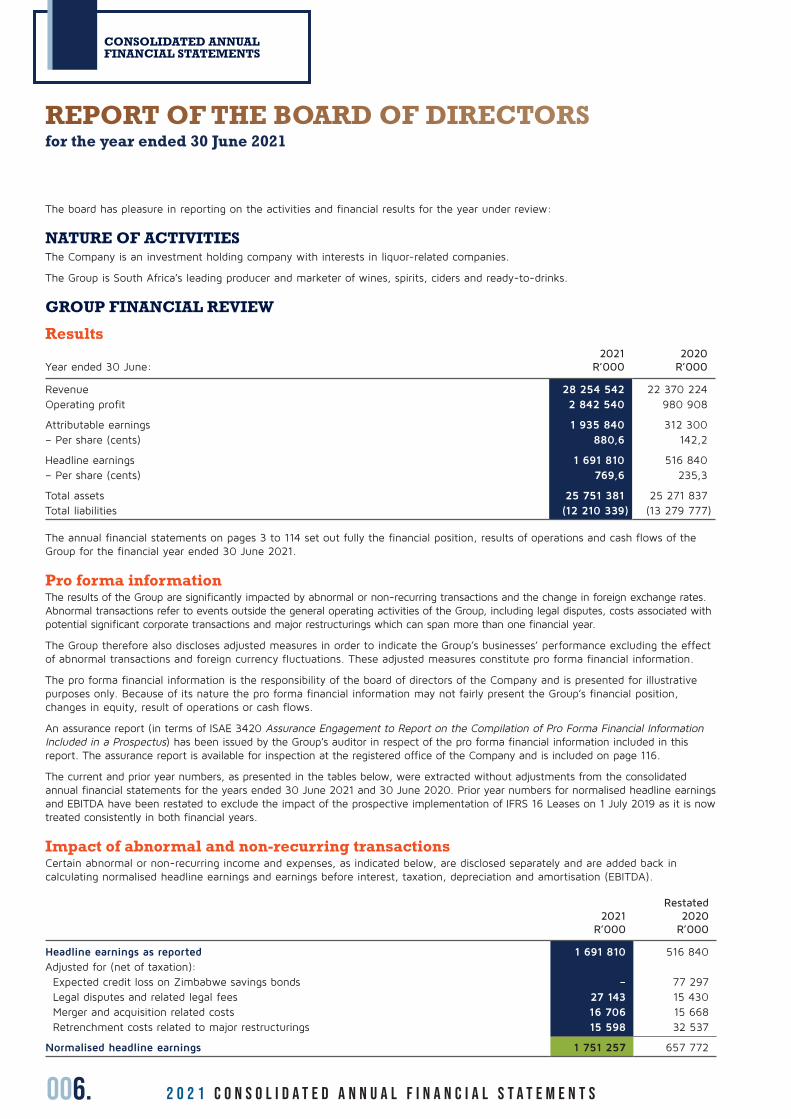
The board has pleasure in reporting on the activities and financial results for the year under review:
NATURE OF ACTIVITIESThe Company is an investment holding company with interests in liquor-related companies.
The Group is South Africa’s leading producer and marketer of wines, spirits, ciders and ready-to-drinks.
GROUP FINANCIAL REVIEW
Results
Year ended 30 June:2021
R’0002020
R’000
Revenue 28 254 542 22 370 224 Operating profit 2 842 540 980 908
Attributable earnings 1 935 840 312 300 – Per share (cents) 880,6 142,2
Headline earnings 1 691 810 516 840 – Per share (cents) 769,6 235,3
Total assets 25 751 381 25 271 837 Total liabilities (12 210 339) (13 279 777)
The annual financial statements on pages 3 to 114 set out fully the financial position, results of operations and cash flows of the Group for the financial year ended 30 June 2021.
Pro forma informationThe results of the Group are significantly impacted by abnormal or non-recurring transactions and the change in foreign exchange rates. Abnormal transactions refer to events outside the general operating activities of the Group, including legal disputes, costs associated with potential significant corporate transactions and major restructurings which can span more than one financial year.
The Group therefore also discloses adjusted measures in order to indicate the Group’s businesses’ performance excluding the effect of abnormal transactions and foreign currency fluctuations. These adjusted measures constitute pro forma financial information.
The pro forma financial information is the responsibility of the board of directors of the Company and is presented for illustrative purposes only. Because of its nature the pro forma financial information may not fairly present the Group’s financial position, changes in equity, result of operations or cash flows.
An assurance report (in terms of ISAE 3420 Assurance Engagement to Report on the Compilation of Pro Forma Financial Information Included in a Prospectus) has been issued by the Group’s auditor in respect of the pro forma financial information included in this report. The assurance report is available for inspection at the registered office of the Company and is included on page 116.
The current and prior year numbers, as presented in the tables below, were extracted without adjustments from the consolidated annual financial statements for the years ended 30 June 2021 and 30 June 2020. Prior year numbers for normalised headline earnings and EBITDA have been restated to exclude the impact of the prospective implementation of IFRS 16 Leases on 1 July 2019 as it is now treated consistently in both financial years.
Impact of abnormal and non-recurring transactionsCertain abnormal or non-recurring income and expenses, as indicated below, are disclosed separately and are added back in calculating normalised headline earnings and earnings before interest, taxation, depreciation and amortisation (EBITDA).
2021R’000
Restated2020
R’000
Headline earnings as reported 1 691 810 516 840 Adjusted for (net of taxation):Expected credit loss on Zimbabwe savings bonds – 77 297 Legal disputes and related legal fees 27 143 15 430 Merger and acquisition related costs 16 706 15 668 Retrenchment costs related to major restructurings 15 598 32 537
Normalised headline earnings 1 751 257 657 772
007.WWW.DISTELL.CO.ZA
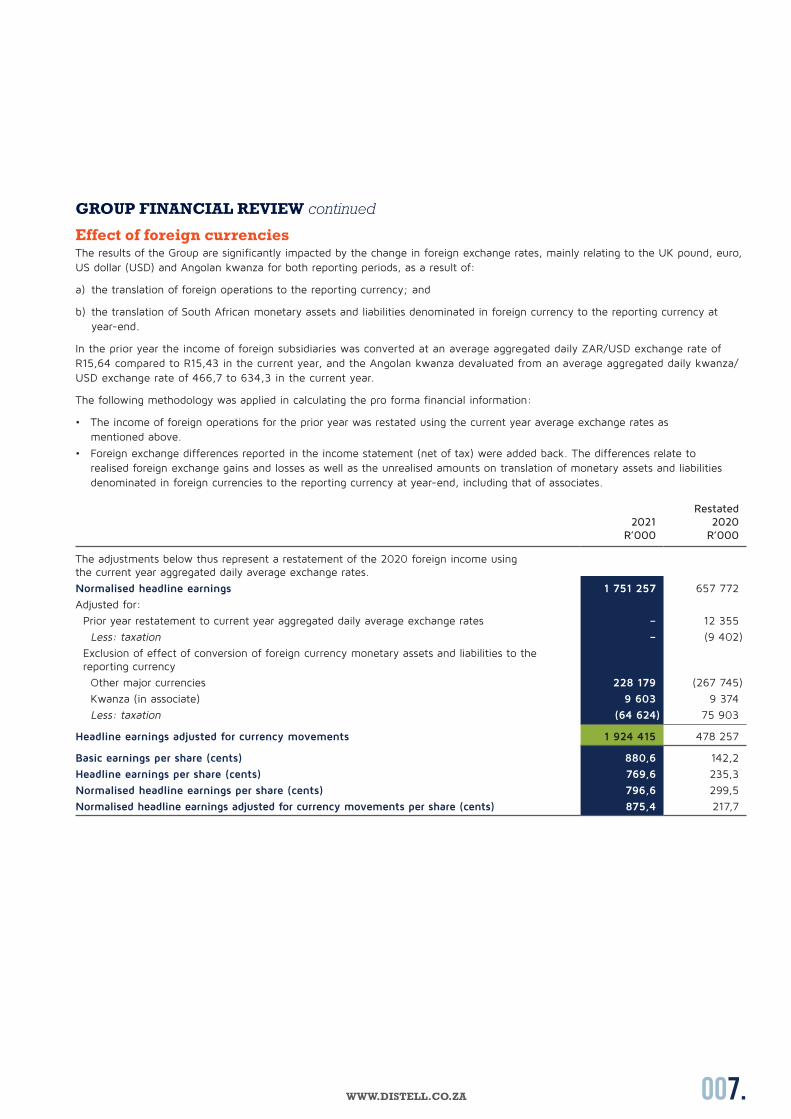
GROUP FINANCIAL REVIEW continued
Effect of foreign currenciesThe results of the Group are significantly impacted by the change in foreign exchange rates, mainly relating to the UK pound, euro, US dollar (USD) and Angolan kwanza for both reporting periods, as a result of:
a) the translation of foreign operations to the reporting currency; and
b) the translation of South African monetary assets and liabilities denominated in foreign currency to the reporting currency at year-end.
In the prior year the income of foreign subsidiaries was converted at an average aggregated daily ZAR/USD exchange rate of R15,64 compared to R15,43 in the current year, and the Angolan kwanza devaluated from an average aggregated daily kwanza/USD exchange rate of 466,7 to 634,3 in the current year.
The following methodology was applied in calculating the pro forma financial information:
• The income of foreign operations for the prior year was restated using the current year average exchange rates as mentioned above.
• Foreign exchange differences reported in the income statement (net of tax) were added back. The differences relate to realised foreign exchange gains and losses as well as the unrealised amounts on translation of monetary assets and liabilities denominated in foreign currencies to the reporting currency at year-end, including that of associates.
2021R’000
Restated2020
R’000
The adjustments below thus represent a restatement of the 2020 foreign income using the current year aggregated daily average exchange rates.
Normalised headline earnings 1 751 257 657 772
Adjusted for:
Prior year restatement to current year aggregated daily average exchange rates – 12 355
Less: taxation – (9 402)
Exclusion of effect of conversion of foreign currency monetary assets and liabilities to the reporting currency
Other major currencies 228 179 (267 745)
Kwanza (in associate) 9 603 9 374
Less: taxation (64 624) 75 903
Headline earnings adjusted for currency movements 1 924 415 478 257
Basic earnings per share (cents) 880,6 142,2
Headline earnings per share (cents) 769,6 235,3
Normalised headline earnings per share (cents) 796,6 299,5
Normalised headline earnings adjusted for currency movements per share (cents) 875,4 217,7
008. 2 0 2 1 C O N S O L I D A T E D A n n u a l f i n a n c i a l s t a t e m e n t s
CONSOLIDATED ANNUAL FINANCIAL STATEMENTS
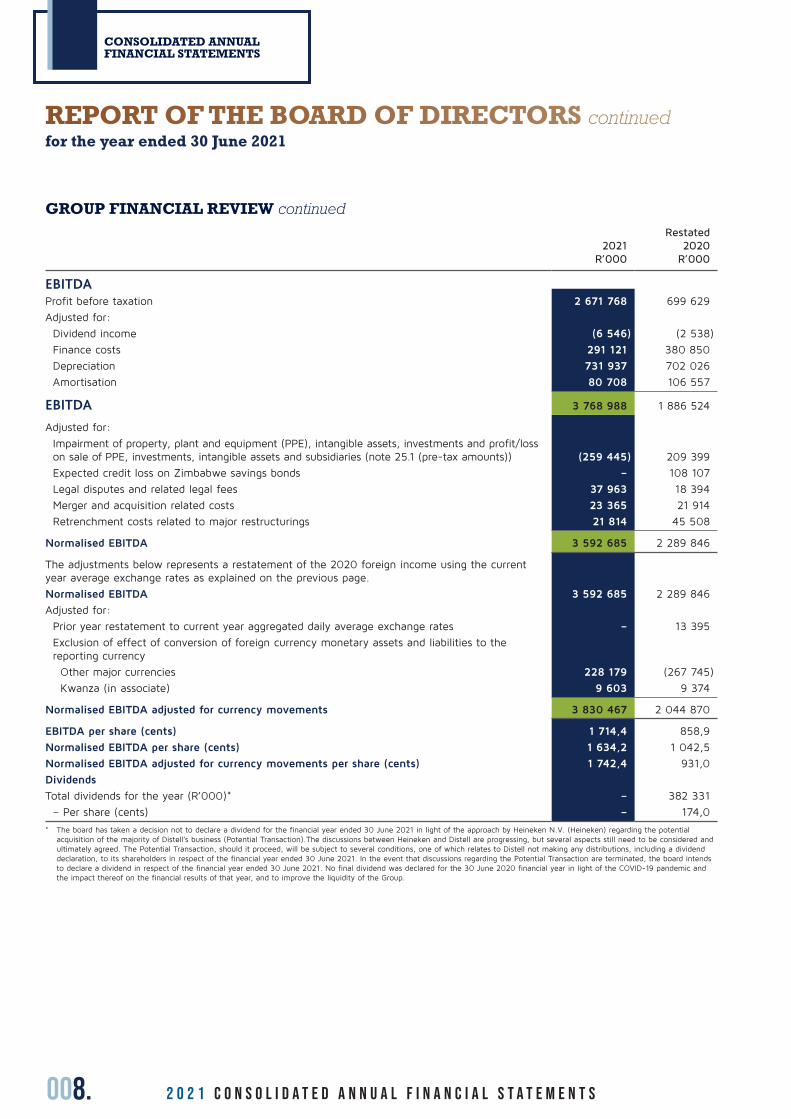
GROUP FINANCIAL REVIEW continued
2021R’000
Restated2020
R’000
EBITDAProfit before taxation 2 671 768 699 629
Adjusted for:
Dividend income (6 546) (2 538)
Finance costs 291 121 380 850
Depreciation 731 937 702 026
Amortisation 80 708 106 557
EBITDA 3 768 988 1 886 524
Adjusted for:
Impairment of property, plant and equipment (PPE), intangible assets, investments and profit/loss on sale of PPE, investments, intangible assets and subsidiaries (note 25.1 (pre-tax amounts)) (259 445) 209 399
Expected credit loss on Zimbabwe savings bonds – 108 107
Legal disputes and related legal fees 37 963 18 394
Merger and acquisition related costs 23 365 21 914
Retrenchment costs related to major restructurings 21 814 45 508
Normalised EBITDA 3 592 685 2 289 846
The adjustments below represents a restatement of the 2020 foreign income using the current year average exchange rates as explained on the previous page.
Normalised EBITDA 3 592 685 2 289 846
Adjusted for:
Prior year restatement to current year aggregated daily average exchange rates – 13 395
Exclusion of effect of conversion of foreign currency monetary assets and liabilities to the reporting currency
Other major currencies 228 179 (267 745)
Kwanza (in associate) 9 603 9 374
Normalised EBITDA adjusted for currency movements 3 830 467 2 044 870
EBITDA per share (cents) 1 714,4 858,9
Normalised EBITDA per share (cents) 1 634,2 1 042,5
Normalised EBITDA adjusted for currency movements per share (cents) 1 742,4 931,0
Dividends
Total dividends for the year (R’000)* – 382 331
– Per share (cents) – 174,0
* The board has taken a decision not to declare a dividend for the financial year ended 30 June 2021 in light of the approach by Heineken N.V. (Heineken) regarding the potential acquisition of the majority of Distell’s business (Potential Transaction).The discussions between Heineken and Distell are progressing, but several aspects still need to be considered and ultimately agreed. The Potential Transaction, should it proceed, will be subject to several conditions, one of which relates to Distell not making any distributions, including a dividend declaration, to its shareholders in respect of the financial year ended 30 June 2021. In the event that discussions regarding the Potential Transaction are terminated, the board intends to declare a dividend in respect of the financial year ended 30 June 2021. No final dividend was declared for the 30 June 2020 financial year in light of the COVID-19 pandemic and the impact thereof on the financial results of that year, and to improve the liquidity of the Group.
REPORT OF THE BOARD OF DIRECTORS continuedfor the year ended 30 June 2021
009.WWW.DISTELL.CO.ZA
KEY MATTERS IMPACTING THIS YEAR’S RESULTSThe following matter had a specific material impact on this year’s financial results:
COVID-19 and the restrictions imposed by various governments to limit the spread of the virus, the most significant being the various total bans on alcohol sales by the South African government and the resultant loss in revenue, the ability of customers to honour their debts, obsolete and slow-moving inventory.
Refer to the next section and the rest of the annual financial statements for more details about the impact of COVID-19.
IMPACT OF THE COVID-19 PANDEMICThe COVID-19 pandemic (the pandemic) had a significant impact on the Group and the entire world, both in terms of affecting people (employees, customers and consumers) and the world economy over the past two financial years.
The pandemic and, in particular, the South African government’s restrictions and various bans on the trading of alcoholic beverages, had a significant impact on the trading of the Group since the start of the lockdown in South Africa on 26 March 2020. Following the resumption of trade when bans were lifted, the Group was able to capture opportunities in the domestic market amid severe disruptions experienced by all participants, including competitors and customers. The Group was able to continue with its export programme during domestic bans, although operations in the Botswana, Lesotho, Namibia and Eswatini (BLNE) regions, as well as to a lesser extent in various other territories the Group operates, were adversely affected by specific country bans or restrictions on alcohol sales.
Effective from 27 June 2021 to 25 July 2021, the South African government implemented a further ban on the domestic sale of alcoholic beverages which will again negatively impact the overall alcoholic beverage industry in South Africa, which remains the biggest contributor to the overall Group results and performance.
The full impact and duration of the pandemic remains uncertain, but the Group showed remarkable resilience amid these uncertain times and was able to significantly improve its financial performance in the current financial year. The structures and processes implemented to monitor and mitigate against existing and emerging risks to the business, including liquidity risk, remain in place and a continued focus of management and the board.
Key areas considered to assess the impact of COVID-19 includes, with reference to notes to the annual financial statements for more detail:
• Going concern (notes 32.1(c) and 41)
• Inventory provisions (note 6)
• Expected credit losses (note 3 and 7)
• Impairment of non-financial assets (note 2 and 5)
• Impairment of equity-accounted investments (note 4)
• Borrowings (note 12)
Also refer to note 1.2 to the financial statements for a summary of these matters.
SUBSIDIARY COMPANIES AND INVESTMENTSParticulars of subsidiary companies, associated companies and joint venture companies are disclosed in notes 38 to 40.
DIRECTORSThe names of the directors, their attendance at meetings and their membership of board committees appear on pages 96 to 97 and 104 of the integrated report.
SHARE SCHEMESA Conditional Share Plan Scheme (CSP Scheme) was established during 2017 financial year to incentivise, motivate and retain the appropriate calibre of employees and executives by providing employees of the Group with the opportunity to receive full value shares as remuneration and the opportunity to share in the success of Distell. No further grants are made under the previous Distell Equity Settled Share Appreciation Right Scheme (the SAR Scheme).
Refer to note 9 to the annual financial statements for full details on the CSP as well as the SAR Schemes.
010. 2 0 2 1 C O N S O L I D A T E D A n n u a l f i n a n c i a l s t a t e m e n t s
CONSOLIDATED ANNUAL FINANCIAL STATEMENTS
REPORT OF THE BOARD OF DIRECTORS continuedfor the year ended 30 June 2021
DIRECTORS’ INTERESTS AND EMOLUMENTSParticulars of the emoluments of directors and their interests in the issued share capital of the Company and in contracts are disclosed in notes 34 to 36 to the annual financial statements.
POTENTIAL ACQUISITION BY HEINEKENDuring May 2021 shareholders were advised that Heineken had approached Distell regarding the potential acquisition of the majority of Distell’s business. The parties remain in discussions and shareholders will be advised of the outcome, if any, once more certainty is reached.
EVENTS SUBSEQUENT TO STATEMENT OF FINANCIAL POSITION DATECivil unrest occurred in South Africa’s KwaZulu-Natal and Gauteng provinces from 9 to 17 July 2021 which resulted in violence and the destruction and looting of property and businesses.
One of the Group’s distribution centres in KwaZulu-Natal was damaged and our operations disrupted. Initial assessments placed the damage between R80,0 million and R100,0 million. All other sites in South Africa were without major damage. The Group is in the process of lodging insurance claims to recover losses incurred.
The impact of the civil unrest is regarded as a non-adjusting event in terms of IAS 10 Events after the Reporting Period. No adjustments were therefore made to the amounts recognised in the financial statements of 30 June 2021.
The directors are not aware of any other matter or circumstance arising since the end of the financial year that would significantly affect the operations of the Group or the results of its operations.
HOLDING COMPANYThe holding company of the Group is Remgro Limited.
The Group structure appears on page 164 of the integrated report.
SECRETARYThe name and address of the company secretary appears on the inside back cover.
APPROVALThe annual financial statements set out on pages 3 to 114 and the supplementary information set out on pages 115 to 120 have been approved by the board.
Signed on behalf of the board of directors:
JJ Durand RM Rushton
Chairman Group chief executive officer
Stellenbosch20 September 2021
011.WWW.DISTELL.CO.ZA
INDEPENDENT AUDITOR’S REPORTto the Shareholders of Distell Group Holdings Limited
REPORT ON THE AUDIT OF THE CONSOLIDATED AND SEPARATE FINANCIAL STATEMENTS
Our opinionIn our opinion, the consolidated and separate financial statements present fairly, in all material respects, the consolidated and separate financial position of Distell Group Holdings Limited (the Company) and its subsidiaries (together the Group) as at 30 June 2021, and its consolidated and separate financial performance and its consolidated and separate cash flows for the year then ended in accordance with International Financial Reporting Standards and the requirements of the Companies Act of South Africa.
What we have audited
Distell Group Holdings Limited’s consolidated and separate financial statements set out on pages 16 to 114 comprise:
• the consolidated and separate statements of financial position as at 30 June 2021;
• the consolidated and separate income statements for the year then ended;
• the consolidated and separate statements of comprehensive income for the year then ended;
• the consolidated and separate statements of changes in equity for the year then ended;
• the consolidated and separate statements of cash flows for the year then ended; and
• the notes to the financial statements, which include a summary of significant accounting policies.
Basis for opinionWe conducted our audit in accordance with International Standards on Auditing (ISAs). Our responsibilities under those standards are further described in the Auditor’s responsibilities for the audit of the consolidated and separate financial statements section of our report.
We believe that the audit evidence we have obtained is sufficient and appropriate to provide a basis for our opinion.
Independence
We are independent of the Group in accordance with the Independent Regulatory Board for Auditors’ Code of Professional Conduct for Registered Auditors (IRBA Code) and other independence requirements applicable to performing audits of financial statements in South Africa. We have fulfilled our other ethical responsibilities in accordance with the IRBA Code and in accordance with other ethical requirements applicable to performing audits in South Africa. The IRBA Code is consistent with the corresponding sections of the International Ethics Standards Board for Accountants’ International Code of Ethics for Professional Accountants (including International Independence Standards).
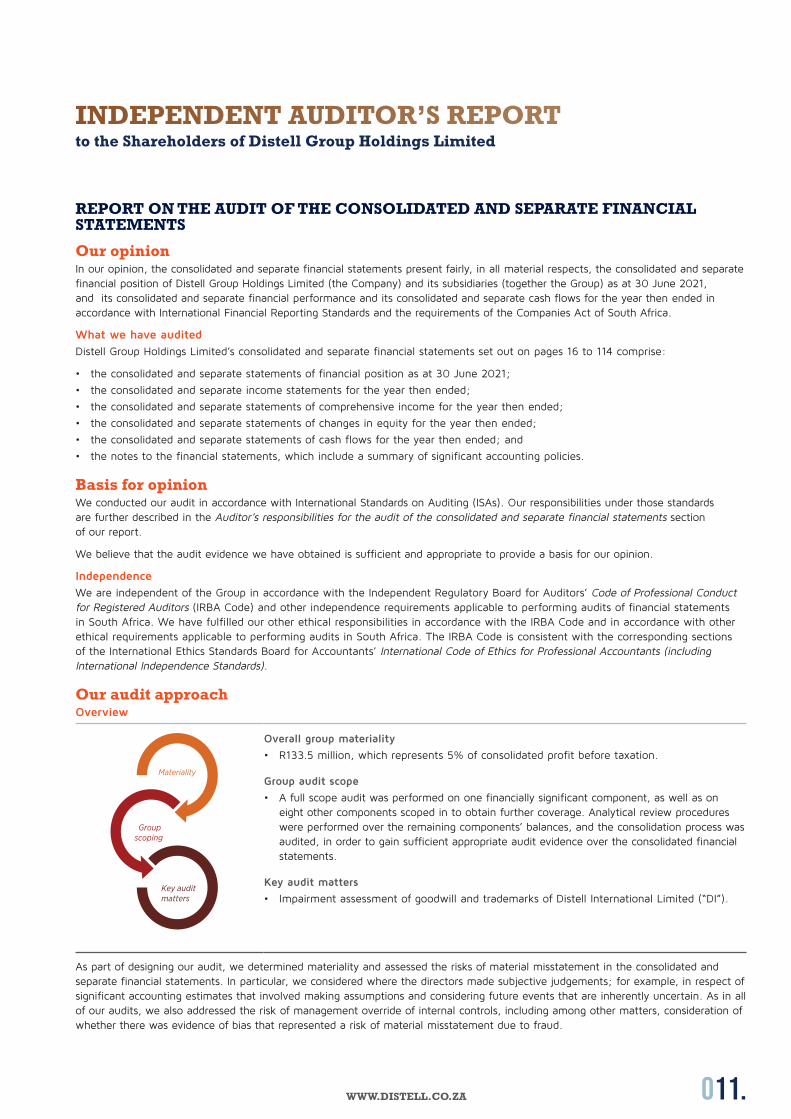
Our audit approachOverview
Groupscoping
Key audit matters
Materiality
Overall group materiality
• R133.5 million, which represents 5% of consolidated profit before taxation.
Group audit scope
• A full scope audit was performed on one financially significant component, as well as on eight other components scoped in to obtain further coverage. Analytical review procedures were performed over the remaining components’ balances, and the consolidation process was audited, in order to gain sufficient appropriate audit evidence over the consolidated financial statements.
Key audit matters
• Impairment assessment of goodwill and trademarks of Distell International Limited (“DI”).
As part of designing our audit, we determined materiality and assessed the risks of material misstatement in the consolidated and separate financial statements. In particular, we considered where the directors made subjective judgements; for example, in respect of significant accounting estimates that involved making assumptions and considering future events that are inherently uncertain. As in all of our audits, we also addressed the risk of management override of internal controls, including among other matters, consideration of whether there was evidence of bias that represented a risk of material misstatement due to fraud.
012. 2 0 2 1 C O N S O L I D A T E D A n n u a l f i n a n c i a l s t a t e m e n t s
CONSOLIDATED ANNUAL FINANCIAL STATEMENTS
INDEPENDENT AUDITOR’S REPORT continuedto the Shareholders of Distell Group Holdings Limited
Materiality
The scope of our audit was influenced by our application of materiality. An audit is designed to obtain reasonable assurance whether the financial statements are free from material misstatement. Misstatements may arise due to fraud or error. They are considered material if individually or in aggregate, they could reasonably be expected to influence the economic decisions of users taken on the basis of the consolidated financial statements.
Based on our professional judgement, we determined certain quantitative thresholds for materiality, including the overall group materiality for the consolidated financial statements as a whole as set out in the table below. These, together with qualitative considerations, helped us to determine the scope of our audit and the nature, timing and extent of our audit procedures and to evaluate the effect of misstatements, both individually and in aggregate on the financial statements as a whole.
Overall group materiality R133.5 million.
How we determined it 5% of consolidated profit before taxation.
Rationale for the materiality benchmark applied
We chose consolidated profit before tax as the benchmark because, in our view, it is the benchmark against which the performance of the Group is most commonly measured by users, and is a generally accepted benchmark. We chose 5% which is consistent with quantitative materiality thresholds used for profit-oriented companies in this sector.
How we tailored our group audit scope
We tailored the scope of our audit in order to perform sufficient work to enable us to provide an opinion on the consolidated financial statements as a whole, taking into account the structure of the Group, the accounting processes and controls, and the industry in which the Group operates.
We have identified one financially significant component based on this component’s contribution to consolidated profit before taxation. A full scope audit was performed on this component. In order to ensure that sufficient work was performed over material line items in the financial statements, we have also scoped in eight other components for full scope audits. The Group engagement team further performed analytical review procedures over the remaining components’ balances, and audited the consolidation process, in order to gain sufficient appropriate evidence over the consolidated financial statements.
In establishing the approach to the group audit, we determined the extent of the work that needed to be performed by us, as the group engagement team, and by other auditors operating under our instruction, in order to issue our audit opinion on the consolidated financial statements of the Group.
The group engagement team performed the audit of the financially significant component, and six of the eight components that were scoped in to ensure sufficient coverage over material line items in the consolidated financial statements. Component audit teams performed the audits of the remaining two components. We determined the necessary level of our involvement in the audit work at these components to be able to conclude whether sufficient appropriate audit evidence has been obtained as the basis for our opinion on the consolidated financial statements as a whole.
Detailed group audit instructions were communicated to the component audit teams. The instructions covered those areas that we required the component auditors to focus on, as well as information that we required them to report to us. We examined reporting received from the component audit teams and assessed the impact thereof on the consolidated financial statements.
We assessed the competence, knowledge and experience of the component auditors and evaluated the procedures performed on the significant audit areas to assess the adequacy thereof to conclude whether sufficient appropriate audit evidence has been obtained as the basis for our audit opinion on the consolidated financial statements.
Key audit mattersKey audit matters are those matters that, in our professional judgment, were of most significance in our audit of the consolidated and separate financial statements of the current period. These matters were addressed in the context of our audit of the consolidated and separate financial statements as a whole, and in forming our opinion thereon, and we do not provide a separate opinion on these matters.

013.WWW.DISTELL.CO.ZA
Key audit matter How our audit addressed the key audit matter
Impairment assessment of goodwill and trademarks of Distell International Limited (“DI”)This key audit matter relates to the consolidated financial statements only
The Group has R2.083 billion of intangible assets, of which R1.5 billion relates to the indefinite life intangible assets of DI, its Scotch whisky operations. The R1.5 billion consists of goodwill of R1.038 billion and indefinite life trademarks of R462 million, as disclosed in note 5 to the consolidated financial statements.
All trademarks were classified as indefinite life intangible assets at the time of the acquisition of DI. The Group performs annual impairment tests on the goodwill and the trademark balances based on value-in-use calculations, to assess the recoverability of the carrying value of the cash-generating unit (“CGU”) to which these assets belong. Management recognised no impairment of goodwill or indefinite life trademarks relating to DI in the current financial year.
We considered the assessment of impairment of goodwill and indefinite life trademarks of DI to be a matter of most significance to our audit due to the significant judgements and estimates involved, including those relating to growth rates, discount rates and the underlying cash flows. In determining projected cash flows, management prepared different scenarios reflecting different growth forecasts to take into account the impact of potential fluctuations in the predicted sales volumes. Probabilities were assigned to each scenario and the recoverable amount was determined based on the sum of these probability-weighted outcomes.
Changes in these assumptions might lead to significant changes in the recoverable amounts of the related assets.
We obtained management’s impairment assessment and performed the following procedures:
• Using our valuation expertise:
− We considered the valuation methodologies used by management in determining the recoverable amount of the CGU with reference to the requirements of IAS 36 and industry practice;
− We assessed the reasonableness of management’s discount rates by performing a recalculation thereof and benchmarking the discount rates applied to the CGU against industry-specific market information available for similar companies, as well as considering territory-specific factors. While our range is, itself subjective, the discount rate adopted by management fell outside of our independently determined range. We discussed with management the rationale for the discount rate applied and agreed that it was a reasonable explanation;
− We assessed the reasonableness of the long-term growth rates applied by comparing them to the industry average long-term growth rates; and
− Using management’s projected cash flows and our independently determined discount and long term growth rates, we assessed the reasonability of the recoverable amount calculated by management. We found that management’s recoverable value was within our range of reasonable values.
• We assessed the projected future cash flows, incorporating the forecast growth rate, used in the valuation models by understanding the process followed by management in determining these forecasts, and by agreeing the forecast information to approved budgets and business plans. In order to test the robustness of management’s projections and estimates, we compared the actual results for the 2021 financial year to the 2021 forecasts in the prior year budget. We discussed with management and assessed the reasonability of the variances. Based on our work performed, we accepted management’s forecasts.
• The procedures noted above were performed in respect of each of the scenarios prepared by management.
• In addition, we reperformed management’s sensitivity analysis as disclosed in note 5 to the consolidated financial statements and performed our own independent sensitivity calculation on the assumptions, to assess the degree by which the key assumptions (the discount rates and growth rates) needed to change in order to trigger an impairment charge. We discussed these with management and considered the likelihood of such changes occurring. Based on our work performed, we accepted management’s conclusions regarding the reasonability of the key assumptions applied in the models.
• We assessed the presentation and disclosure included in the consolidated financial statements against the requirements of IAS 36: Impairment of Assets.
014. 2 0 2 1 C O N S O L I D A T E D A n n u a l f i n a n c i a l s t a t e m e n t s
CONSOLIDATED ANNUAL FINANCIAL STATEMENTS
INDEPENDENT AUDITOR’S REPORT continuedto the Shareholders of Distell Group Holdings Limited
Other informationThe directors are responsible for the other information. The other information comprises the information included in the document titled “Consolidated annual financial statements for the year ended 30 June 2021”, which includes the Report of the Board of Directors, the Audit Committee Report and the Certificate by the Company Secretary as required by the Companies Act of South Africa and the document titled “2021 Integrated Annual Report”. The other information does not include the consolidated or the separate financial statements and our auditor’s report thereon.
Our opinion on the consolidated and separate financial statements does not cover the other information and we do not express an audit opinion or any form of assurance conclusion thereon.
In connection with our audit of the consolidated and separate financial statements, our responsibility is to read the other information identified above and, in doing so, consider whether the other information is materially inconsistent with the consolidated and separate financial statements or our knowledge obtained in the audit, or otherwise appears to be materially misstated.
If, based on the work we have performed, we conclude that there is a material misstatement of this other information, we are required to report that fact. We have nothing to report in this regard.
Responsibilities of the directors for the consolidated and separate financial statementsThe directors are responsible for the preparation and fair presentation of the consolidated and separate financial statements in accordance with International Financial Reporting Standards and the requirements of the Companies Act of South Africa, and for such internal control as the directors determine is necessary to enable the preparation of consolidated and separate financial statements that are free from material misstatement, whether due to fraud or error.
In preparing the consolidated and separate financial statements, the directors are responsible for assessing the Group and the Company’s ability to continue as a going concern, disclosing, as applicable, matters related to going concern and using the going concern basis of accounting unless the directors either intend to liquidate the Group and/or the Company or to cease operations, or have no realistic alternative but to do so.
Auditor’s responsibilities for the audit of the consolidated and separate financial statementsOur objectives are to obtain reasonable assurance about whether the consolidated and separate financial statements as a whole are free from material misstatement, whether due to fraud or error, and to issue an auditor’s report that includes our opinion. Reasonable assurance is a high level of assurance, but is not a guarantee that an audit conducted in accordance with ISAs will always detect a material misstatement when it exists. Misstatements can arise from fraud or error and are considered material if, individually or in the aggregate, they could reasonably be expected to influence the economic decisions of users taken on the basis of these consolidated and separate financial statements.
As part of an audit in accordance with ISAs, we exercise professional judgement and maintain professional scepticism throughout the audit. We also:
• Identify and assess the risks of material misstatement of the consolidated and separate financial statements, whether due to fraud or error, design and perform audit procedures responsive to those risks, and obtain audit evidence that is sufficient and appropriate to provide a basis for our opinion. The risk of not detecting a material misstatement resulting from fraud is higher than for one resulting from error, as fraud may involve collusion, forgery, intentional omissions, misrepresentations, or the override of internal control.
• Obtain an understanding of internal control relevant to the audit in order to design audit procedures that are appropriate in the circumstances, but not for the purpose of expressing an opinion on the effectiveness of the Group’s and the Company’s internal control.
• Evaluate the appropriateness of accounting policies used and the reasonableness of accounting estimates and related disclosures made by the directors.
• Conclude on the appropriateness of the directors’ use of the going concern basis of accounting and, based on the audit evidence obtained, whether a material uncertainty exists related to events or conditions that may cast significant doubt on the Group’s and the Company’s ability to continue as a going concern. If we conclude that a material uncertainty exists, we are required to draw attention in our auditor’s report to the related disclosures in the consolidated and separate financial statements or, if such disclosures are inadequate, to modify our opinion. Our conclusions are based on the audit evidence obtained up to the date of our auditor’s report. However, future events or conditions may cause the Group and / or Company to cease to continue as a going concern.

015.WWW.DISTELL.CO.ZA
• Evaluate the overall presentation, structure and content of the consolidated and separate financial statements, including the disclosures, and whether the consolidated and separate financial statements represent the underlying transactions and events in a manner that achieves fair presentation.
• Obtain sufficient appropriate audit evidence regarding the financial information of the entities or business activities within the group to express an opinion on the consolidated financial statements. We are responsible for the direction, supervision and performance of the group audit. We remain solely responsible for our audit opinion.
We communicate with the directors regarding, among other matters, the planned scope and timing of the audit and significant audit findings, including any significant deficiencies in internal control that we identify during our audit.
We also provide the directors with a statement that we have complied with relevant ethical requirements regarding independence, and to communicate with them all relationships and other matters that may reasonably be thought to bear on our independence, and where applicable, actions taken to eliminate threats or safeguards applied.
From the matters communicated with the directors, we determine those matters that were of most significance in the audit of the consolidated and separate financial statements of the current period and are therefore the key audit matters. We describe these matters in our auditor’s report unless law or regulation precludes public disclosure about the matter or when, in extremely rare circumstances, we determine that a matter should not be communicated in our report because the adverse consequences of doing so would reasonably be expected to outweigh the public interest benefits of such communication.
Report on other legal and regulatory requirements In terms of the IRBA Rule published in Government Gazette Number 39475 dated 4 December 2015, we report that PricewaterhouseCoopers Inc. has been the auditor of Distell Group Holdings Limited and its predecessor companies for 76 years.
PricewaterhouseCoopers Inc.
Director: RM LabuschaigneRegistered AuditorStellenbosch, South Africa20 September 2021
016. 2 0 2 1 C O N S O L I D A T E D A n n u a l f i n a n c i a l s t a t e m e n t s
CONSOLIDATED ANNUAL FINANCIAL STATEMENTS
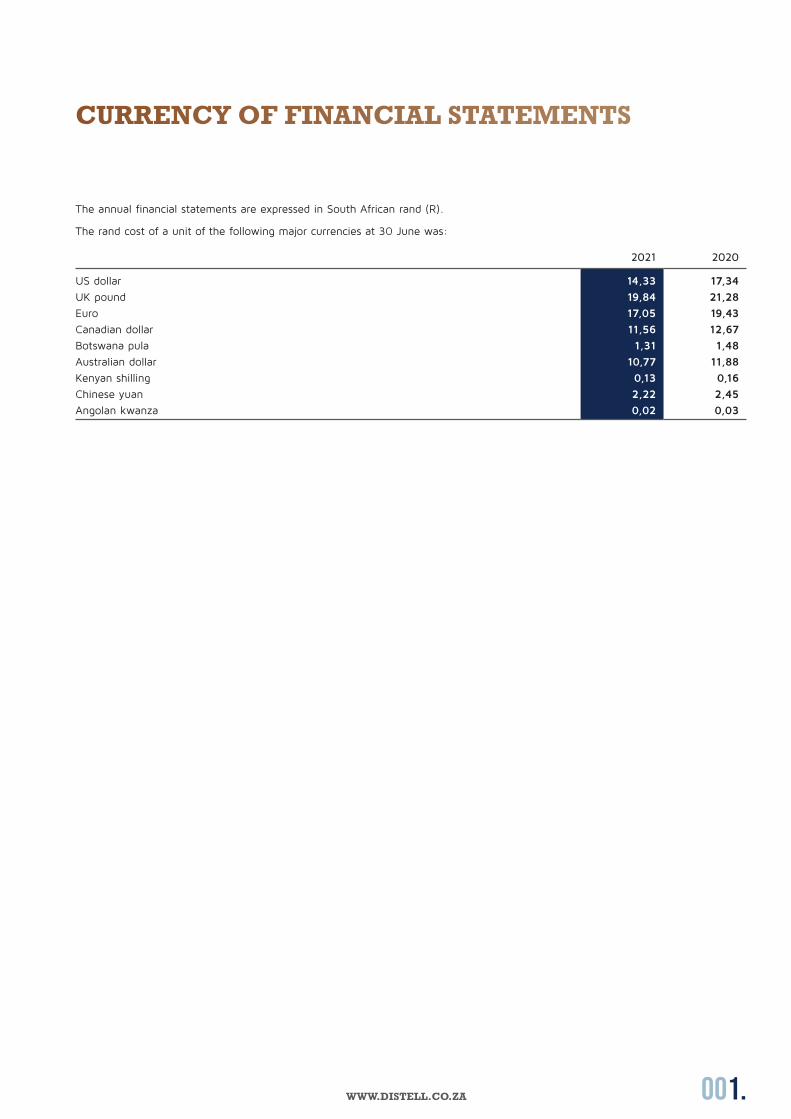
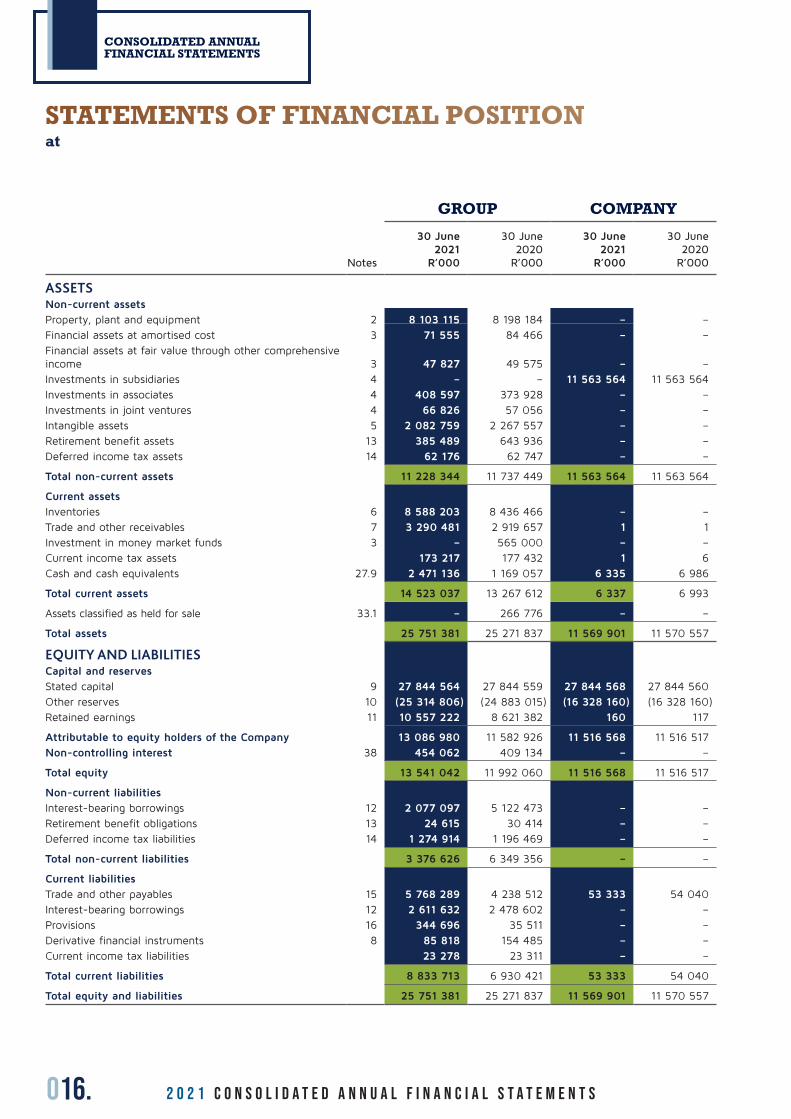
STATEMENTS OF FINANCIAL POSITIONat
GROUP COMPANY
Notes
30 June2021
R’000
30 June2020
R’000
30 June2021
R’000
30 June2020
R’000
ASSETSNon-current assets
Property, plant and equipment 2 8 103 115 8 198 184 – –
Financial assets at amortised cost 3 71 555 84 466 – –
Financial assets at fair value through other comprehensive income 3 47 827 49 575 – –
Investments in subsidiaries 4 – – 11 563 564 11 563 564
Investments in associates 4 408 597 373 928 – –
Investments in joint ventures 4 66 826 57 056 – –
Intangible assets 5 2 082 759 2 267 557 – –
Retirement benefit assets 13 385 489 643 936 – –
Deferred income tax assets 14 62 176 62 747 – –
Total non-current assets 11 228 344 11 737 449 11 563 564 11 563 564
Current assets
Inventories 6 8 588 203 8 436 466 – –
Trade and other receivables 7 3 290 481 2 919 657 1 1
Investment in money market funds 3 – 565 000 – –
Current income tax assets 173 217 177 432 1 6
Cash and cash equivalents 27.9 2 471 136 1 169 057 6 335 6 986
Total current assets 14 523 037 13 267 612 6 337 6 993
Assets classified as held for sale 33.1 – 266 776 – –
Total assets 25 751 381 25 271 837 11 569 901 11 570 557
EQUITY AND LIABILITIESCapital and reserves
Stated capital 9 27 844 564 27 844 559 27 844 568 27 844 560
Other reserves 10 (25 314 806) (24 883 015) (16 328 160) (16 328 160)
Retained earnings 11 10 557 222 8 621 382 160 117
Attributable to equity holders of the Company 13 086 980 11 582 926 11 516 568 11 516 517
Non-controlling interest 38 454 062 409 134 – –
Total equity 13 541 042 11 992 060 11 516 568 11 516 517
Non-current liabilities
Interest-bearing borrowings 12 2 077 097 5 122 473 – –
Retirement benefit obligations 13 24 615 30 414 – –
Deferred income tax liabilities 14 1 274 914 1 196 469 – –
Total non-current liabilities 3 376 626 6 349 356 – –
Current liabilities
Trade and other payables 15 5 768 289 4 238 512 53 333 54 040
Interest-bearing borrowings 12 2 611 632 2 478 602 – –
Provisions 16 344 696 35 511 – –
Derivative financial instruments 8 85 818 154 485 – –
Current income tax liabilities 23 278 23 311 – –
Total current liabilities 8 833 713 6 930 421 53 333 54 040
Total equity and liabilities 25 751 381 25 271 837 11 569 901 11 570 557

017.WWW.DISTELL.CO.ZA
INCOME STATEMENTSfor the year ended 30 June
GROUP COMPANY
Notes2021
R’0002020
R’0002021
R’0002020
R’000
Revenue 17 28 254 542 22 370 224 – 940 677
Operating costs 18 (25 671 447) (21 179 917) (12) (19)
Costs of goods sold (20 430 795) (16 065 724) – –
Sales and marketing costs (2 542 523) (2 779 851) – –
Distribution costs (1 362 550) (1 154 545) – –
Administration and other costs (1 273 546) (955 391) (12) (19)
Net impairment losses on financial assets (62 033) (224 406) – –
Other gains and losses 19 259 445 (209 399) – –
Operating profit 2 842 540 980 908 (12) 940 658
Dividend income 20 6 546 2 538 – –
Finance income 21 66 324 61 128 79 131
Finance costs 22 (357 445) (441 978) – –
Share of equity-accounted earnings 23 113 803 97 033 – –
Profit before taxation 2 671 768 699 629 67 940 789
Taxation 24 (669 279) (305 009) (24) (37)
Profit for the year 2 002 489 394 620 43 940 752
Attributable to:
Equity holders of the Company 1 935 840 312 300 43 940 752
Non-controlling interest 66 649 82 320 – –
2 002 489 394 620 43 940 752
Earnings per ordinary share (cents) 25
Basic earnings basis 880,6 142,2
Diluted earnings basis 877,8 142,1
018. 2 0 2 1 C O N S O L I D A T E D A n n u a l f i n a n c i a l s t a t e m e n t s
CONSOLIDATED ANNUAL FINANCIAL STATEMENTS
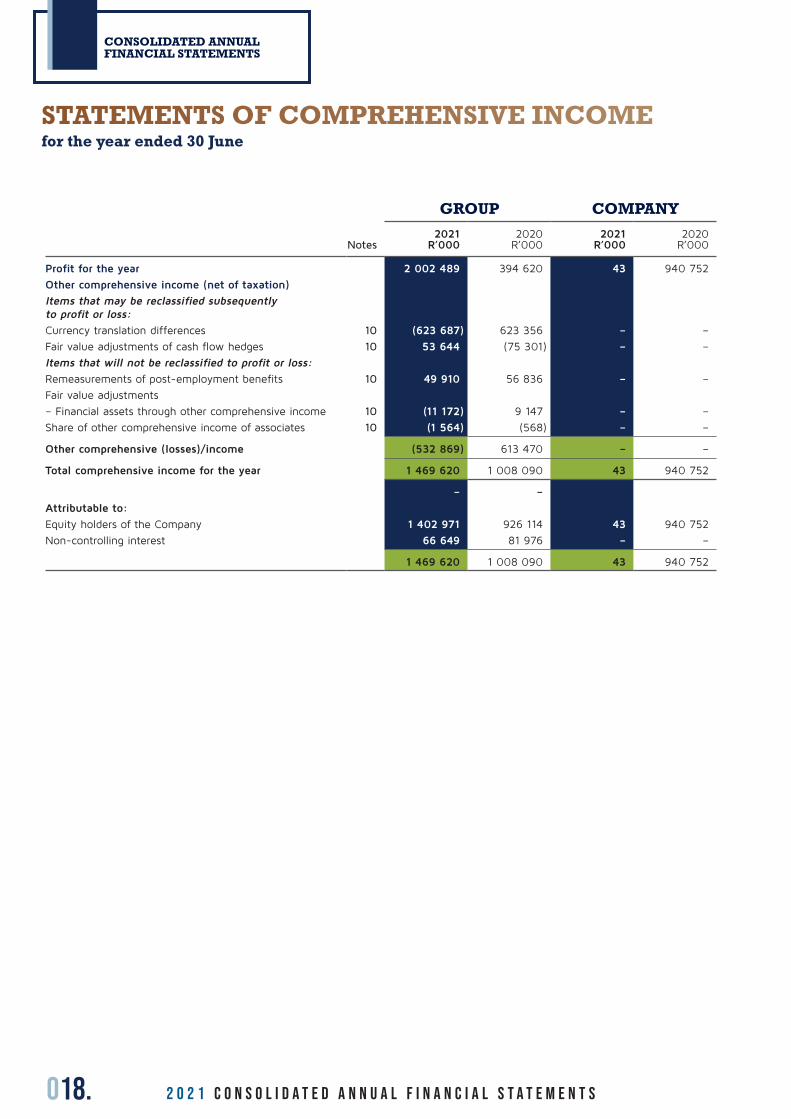
STATEMENTS OF COMPREHENSIVE INCOME for the year ended 30 June
GROUP COMPANY 2021 2020 2021 2020
Notes R’000 R’000 R’000 R’000
Profit for the year 2 002 489 394 620 43 940 752
Other comprehensive income (net of taxation)
Items that may be reclassified subsequently to profit or loss:
Currency translation differences 10 (623 687) 623 356 – –
Fair value adjustments of cash flow hedges 10 53 644 (75 301) – –
Items that will not be reclassified to profit or loss:
Remeasurements of post-employment benefits 10 49 910 56 836 – –
Fair value adjustments
– Financial assets through other comprehensive income 10 (11 172) 9 147 – –
Share of other comprehensive income of associates 10 (1 564) (568) – –
Other comprehensive (losses)/income (532 869) 613 470 – –
Total comprehensive income for the year 1 469 620 1 008 090 43 940 752
– –
Attributable to:
Equity holders of the Company 1 402 971 926 114 43 940 752
Non-controlling interest 66 649 81 976 – –
1 469 620 1 008 090 43 940 752
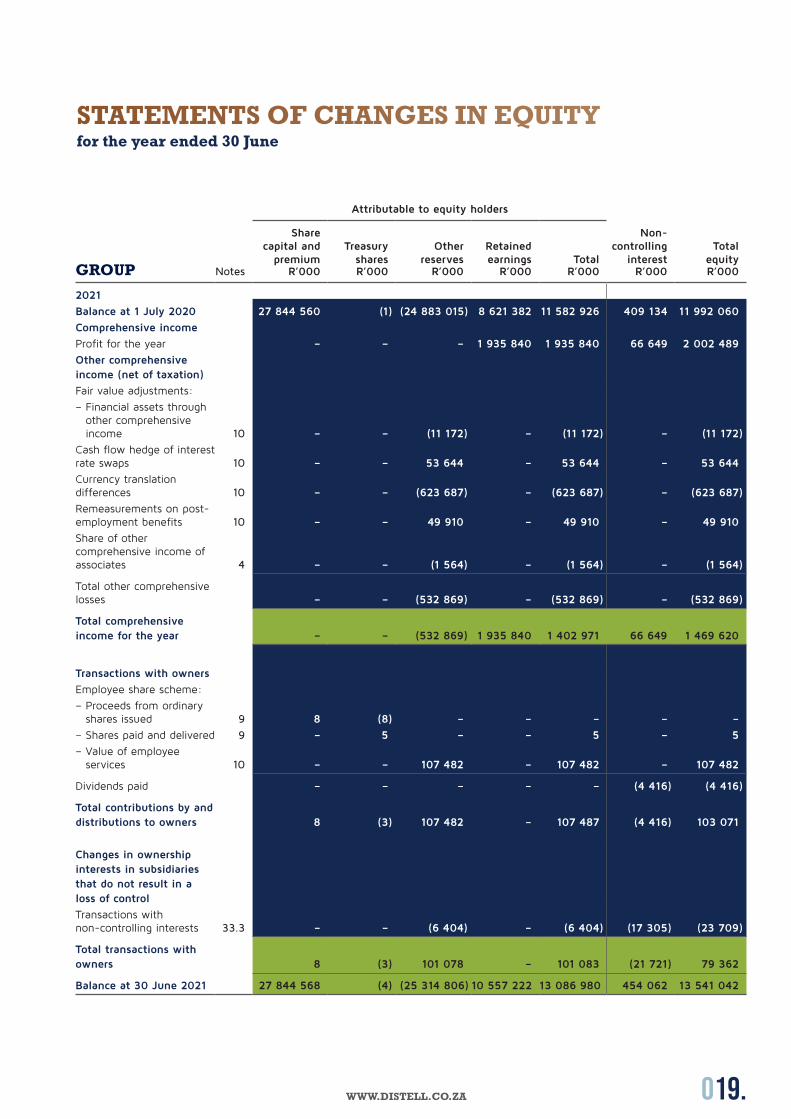
019.WWW.DISTELL.CO.ZA
Attributable to equity holders
Share capital and
premiumTreasury
sharesOther
reservesRetained earnings Total
Non-controlling
interestTotal
equityGROUP Notes R’000 R’000 R’000 R’000 R’000 R’000 R’000
2021
Balance at 1 July 2020 27 844 560 (1) (24 883 015) 8 621 382 11 582 926 409 134 11 992 060
Comprehensive income
Profit for the year – – – 1 935 840 1 935 840 66 649 2 002 489
Other comprehensive income (net of taxation)
Fair value adjustments:
– Financial assets through other comprehensive income 10 – – (11 172) – (11 172) – (11 172)
Cash flow hedge of interest rate swaps 10 – – 53 644 – 53 644 – 53 644
Currency translation differences 10 – – (623 687) – (623 687) – (623 687)
Remeasurements on post-employment benefits 10 – – 49 910 – 49 910 – 49 910
Share of other comprehensive income of associates 4 – – (1 564) – (1 564) – (1 564)
Total other comprehensive losses – – (532 869) – (532 869) – (532 869)
Total comprehensive income for the year – – (532 869) 1 935 840 1 402 971 66 649 1 469 620
Transactions with owners
Employee share scheme:
– Proceeds from ordinary shares issued 9 8 (8) – – – – –
– Shares paid and delivered 9 – 5 – – 5 – 5
– Value of employee services 10 – – 107 482 – 107 482 – 107 482
Dividends paid – – – – – (4 416) (4 416)
Total contributions by and distributions to owners 8 (3) 107 482 – 107 487 (4 416) 103 071
Changes in ownership interests in subsidiaries that do not result in a loss of control
Transactions with non-controlling interests 33.3 – – (6 404) – (6 404) (17 305) (23 709)
Total transactions with owners 8 (3) 101 078 – 101 083 (21 721) 79 362
Balance at 30 June 2021 27 844 568 (4) (25 314 806) 10 557 222 13 086 980 454 062 13 541 042
STATEMENTS OF CHANGES IN EQUITY for the year ended 30 June
020. 2 0 2 1 C O N S O L I D A T E D A n n u a l f i n a n c i a l s t a t e m e n t s
CONSOLIDATED ANNUAL FINANCIAL STATEMENTS
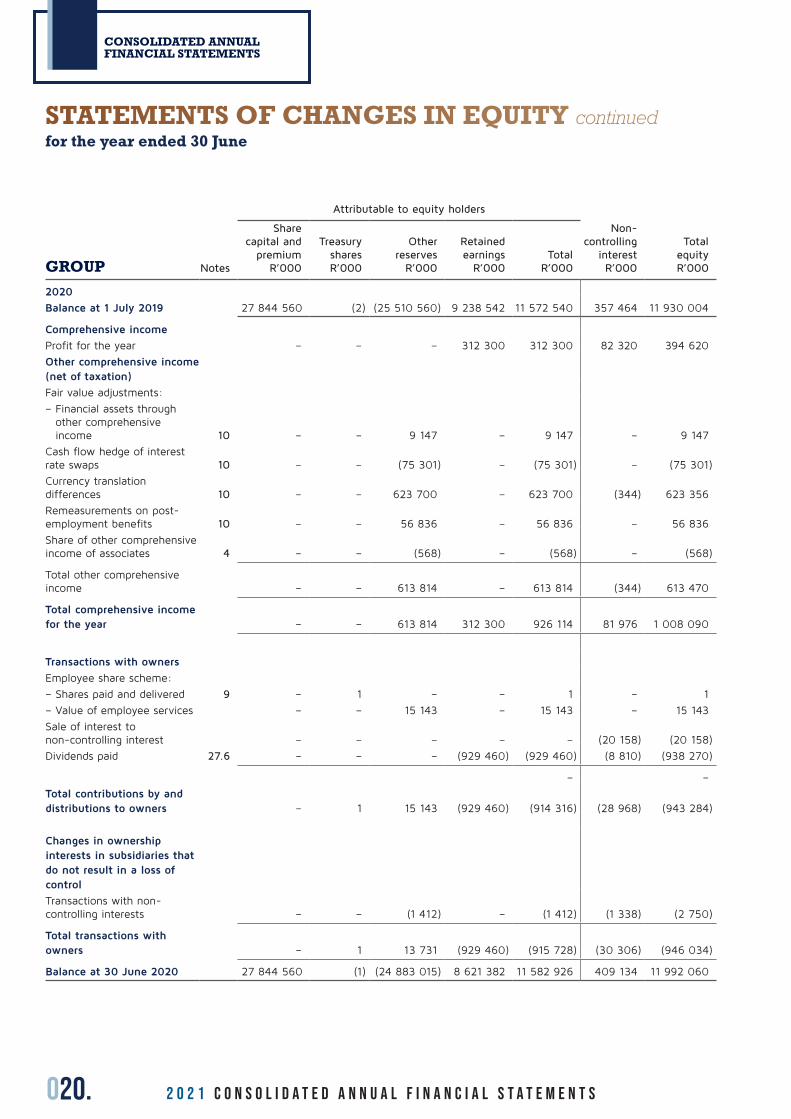
Attributable to equity holders
Non-controlling
interestR’000
Total equityR’000GROUP Notes
Share capital and
premiumR’000
Treasury sharesR’000
Other reserves
R’000
Retained earnings
R’000Total
R’000
2020
Balance at 1 July 2019 27 844 560 (2) (25 510 560) 9 238 542 11 572 540 357 464 11 930 004
Comprehensive income
Profit for the year – – – 312 300 312 300 82 320 394 620
Other comprehensive income (net of taxation)
Fair value adjustments:
– Financial assets through other comprehensive income 10 – – 9 147 – 9 147 – 9 147
Cash flow hedge of interest rate swaps 10 – – (75 301) – (75 301) – (75 301)
Currency translation differences 10 – – 623 700 – 623 700 (344) 623 356
Remeasurements on post-employment benefits 10 – – 56 836 – 56 836 – 56 836
Share of other comprehensive income of associates 4 – – (568) – (568) – (568)
Total other comprehensive income – – 613 814 – 613 814 (344) 613 470
Total comprehensive income for the year – – 613 814 312 300 926 114 81 976 1 008 090
Transactions with owners
Employee share scheme:
– Shares paid and delivered 9 – 1 – – 1 – 1
– Value of employee services – – 15 143 – 15 143 – 15 143
Sale of interest to non-controlling interest – – – – – (20 158) (20 158)
Dividends paid 27.6 – – – (929 460) (929 460) (8 810) (938 270)
– –
Total contributions by and distributions to owners – 1 15 143 (929 460) (914 316) (28 968) (943 284)
Changes in ownership interests in subsidiaries that do not result in a loss of control
Transactions with non-controlling interests – – (1 412) – (1 412) (1 338) (2 750)
Total transactions with owners – 1 13 731 (929 460) (915 728) (30 306) (946 034)
Balance at 30 June 2020 27 844 560 (1) (24 883 015) 8 621 382 11 582 926 409 134 11 992 060
STATEMENTS OF CHANGES IN EQUITY continuedfor the year ended 30 June
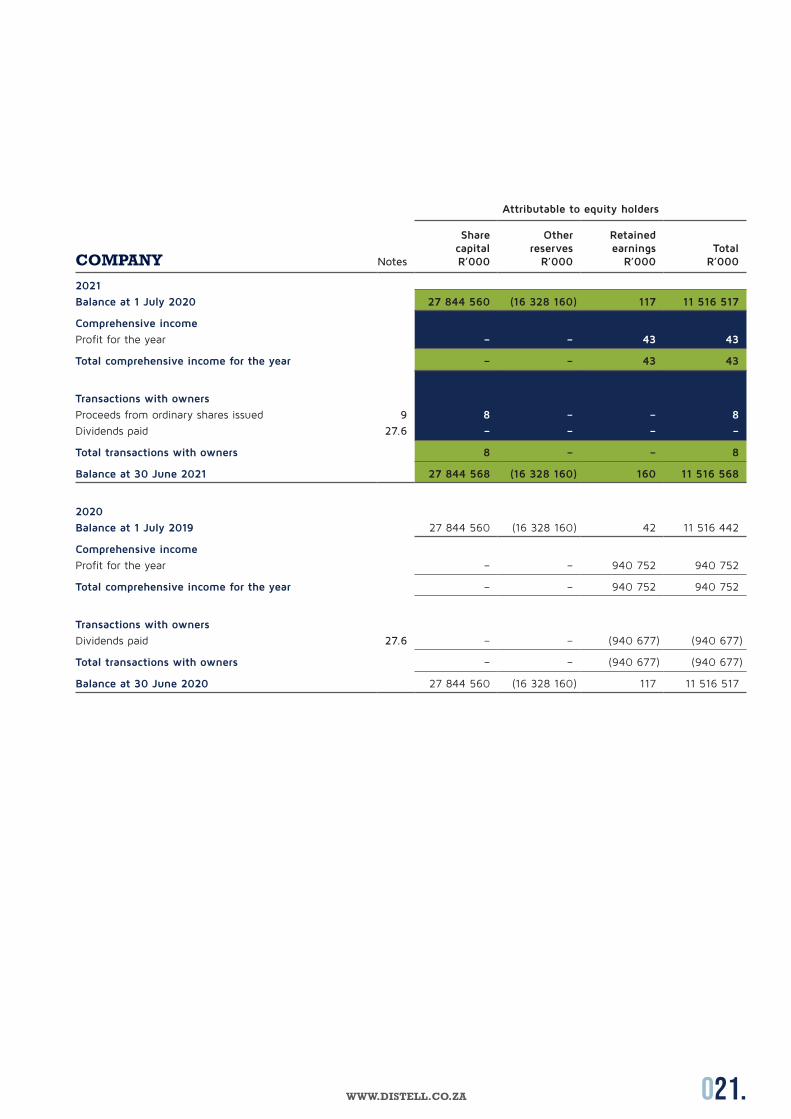
021.WWW.DISTELL.CO.ZA
Attributable to equity holders
COMPANY Notes
Share capitalR’000
Other reserves
R’000
Retained earnings
R’000Total
R’000
2021
Balance at 1 July 2020 27 844 560 (16 328 160) 117 11 516 517
Comprehensive income
Profit for the year – – 43 43
Total comprehensive income for the year – – 43 43
Transactions with owners
Proceeds from ordinary shares issued 9 8 – – 8
Dividends paid 27.6 – – – –
Total transactions with owners 8 – – 8
Balance at 30 June 2021 27 844 568 (16 328 160) 160 11 516 568
2020
Balance at 1 July 2019 27 844 560 (16 328 160) 42 11 516 442
Comprehensive income
Profit for the year – – 940 752 940 752
Total comprehensive income for the year – – 940 752 940 752
Transactions with owners
Dividends paid 27.6 – – (940 677) (940 677)
Total transactions with owners – – (940 677) (940 677)
Balance at 30 June 2020 27 844 560 (16 328 160) 117 11 516 517

022. 2 0 2 1 C O N S O L I D A T E D A n n u a l f i n a n c i a l s t a t e m e n t s
CONSOLIDATED ANNUAL FINANCIAL STATEMENTS
GROUP COMPANY
Notes
2021
R’0002020
R’000
2021
R’0002020
R’000
Cash flows from operating activities
Operating profit 2 842 540 980 908 (12) 940 658
Non-cash flow items 27.1 957 687 1 189 647 – –
Working capital changes 27.2 772 914 (293 304) – –
Cash generated from operations 4 573 141 1 877 251 (12) 940 658
Dividend income 20 6 546 2 538 – –
Finance income 27.3 66 324 35 359 79 131
Finance costs 27.4 (368 606) (460 334) – –
Taxation paid 27.5 (602 635) (413 035) (19) (39)
Proceeds from retirement benefit assets transferred to Group 13.2 405 000 – – –
Net cash generated from operating activities 4 079 770 1 041 779 48 940 750
Cash flows from investment activities
Purchases of property, plant and equipment (PPE) to maintain operations 27.7 (441 054) (458 115) – –
Purchases of PPE to expand operations 27.8 (436 780) (900 641) – –
Proceeds from disposal of PPE 68 109 102 010 – –
Proceeds from disposal of assets classified as held for sale 384 781 –
Purchases of financial assets and money market funds (1 322) (631 816) (707) –
Proceeds from financial assets and money market funds 581 364 24 714 – 3 679
Purchases of associates and joint ventures 4 (12 500) (9 836) – –
Proceeds from associates and joint ventures disposed 4 67 631 –
Purchases of intangible assets 5 (73 456) (120 790) – –
Proceeds from disposal of intangible assets 1 441 – –
Proceeds from disposal of subsidiaries, net of cash disposed – (5 845) – –
Acquisition of subsidiaries, net of cash acquired 33.3 (23 425) – – –
Cash inflow/(outflow) from investment activities 113 349 (1 999 878) (707) 3 679
Cash flows from financing activities
Shares issued 5 1 8 –
Proceeds from interest-bearing borrowings 27.10 28 837 159 906 – –
Repayment of interest-bearing borrowings 27.10 (400 000) – – –
Lease payments 29.3 (123 274) (129 903) – –
Dividends paid to Company’s shareholders 27.6 – (929 460) – (940 677)
Dividends paid to non-controlling interests (4 416) (8 810) – –
Cash outflow from financing activities (498 848) (908 266) 8 (940 677)
Increase/(Decrease) in net cash, cash equivalents and bank overdrafts 3 694 271 (1 866 365) (651) 3 752
Cash, cash equivalents and bank overdrafts at the beginning of the year (1 180 943) 630 816 6 986 3 234
Exchange losses on cash, cash equivalents and bank overdrafts (42 192) 54 606 – –
Cash, cash equivalents and bank overdrafts at the end of the year 27.9 2 471 136 (1 180 943) 6 335 6 986
STATEMENTS OF CASH FLOWSfor the year ended 30 June
023.WWW.DISTELL.CO.ZA
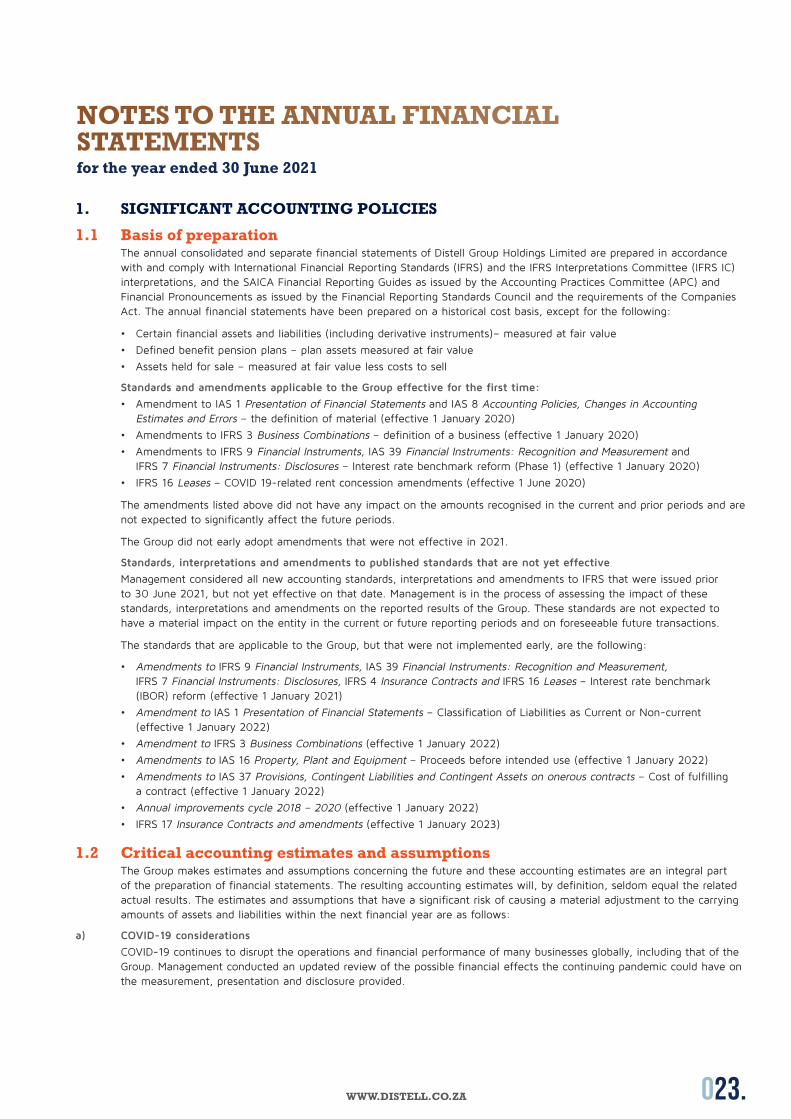
1. SIGNIFICANT ACCOUNTING POLICIES
1.1 Basis of preparationThe annual consolidated and separate financial statements of Distell Group Holdings Limited are prepared in accordance with and comply with International Financial Reporting Standards (IFRS) and the IFRS Interpretations Committee (IFRS IC) interpretations, and the SAICA Financial Reporting Guides as issued by the Accounting Practices Committee (APC) and Financial Pronouncements as issued by the Financial Reporting Standards Council and the requirements of the Companies Act. The annual financial statements have been prepared on a historical cost basis, except for the following:
• Certain financial assets and liabilities (including derivative instruments)– measured at fair value
• Defined benefit pension plans – plan assets measured at fair value
• Assets held for sale – measured at fair value less costs to sell
Standards and amendments applicable to the Group effective for the first time:
• Amendment to IAS 1 Presentation of Financial Statements and IAS 8 Accounting Policies, Changes in Accounting Estimates and Errors – the definition of material (effective 1 January 2020)
• Amendments to IFRS 3 Business Combinations – definition of a business (effective 1 January 2020)
• Amendments to IFRS 9 Financial Instruments, IAS 39 Financial Instruments: Recognition and Measurement and IFRS 7 Financial Instruments: Disclosures – Interest rate benchmark reform (Phase 1) (effective 1 January 2020)
• IFRS 16 Leases – COVID 19-related rent concession amendments (effective 1 June 2020)
The amendments listed above did not have any impact on the amounts recognised in the current and prior periods and are not expected to significantly affect the future periods.
The Group did not early adopt amendments that were not effective in 2021.
Standards, interpretations and amendments to published standards that are not yet effective
Management considered all new accounting standards, interpretations and amendments to IFRS that were issued prior to 30 June 2021, but not yet effective on that date. Management is in the process of assessing the impact of these standards, interpretations and amendments on the reported results of the Group. These standards are not expected to have a material impact on the entity in the current or future reporting periods and on foreseeable future transactions.
The standards that are applicable to the Group, but that were not implemented early, are the following:
• Amendments to IFRS 9 Financial Instruments, IAS 39 Financial Instruments: Recognition and Measurement, IFRS 7 Financial Instruments: Disclosures, IFRS 4 Insurance Contracts and IFRS 16 Leases – Interest rate benchmark (IBOR) reform (effective 1 January 2021)
• Amendment to IAS 1 Presentation of Financial Statements – Classification of Liabilities as Current or Non-current (effective 1 January 2022)
• Amendment to IFRS 3 Business Combinations (effective 1 January 2022)
• Amendments to IAS 16 Property, Plant and Equipment – Proceeds before intended use (effective 1 January 2022)
• Amendments to IAS 37 Provisions, Contingent Liabilities and Contingent Assets on onerous contracts – Cost of fulfilling a contract (effective 1 January 2022)
• Annual improvements cycle 2018 – 2020 (effective 1 January 2022)
• IFRS 17 Insurance Contracts and amendments (effective 1 January 2023)
1.2 Critical accounting estimates and assumptionsThe Group makes estimates and assumptions concerning the future and these accounting estimates are an integral part of the preparation of financial statements. The resulting accounting estimates will, by definition, seldom equal the related actual results. The estimates and assumptions that have a significant risk of causing a material adjustment to the carrying amounts of assets and liabilities within the next financial year are as follows:
a) COVID-19 considerations
COVID-19 continues to disrupt the operations and financial performance of many businesses globally, including that of the Group. Management conducted an updated review of the possible financial effects the continuing pandemic could have on the measurement, presentation and disclosure provided.
NOTES TO THE ANNUAL FINANCIAL STATEMENTS for the year ended 30 June 2021
024. 2 0 2 1 C O N S O L I D A T E D A n n u a l f i n a n c i a l s t a t e m e n t s
CONSOLIDATED ANNUAL FINANCIAL STATEMENTS
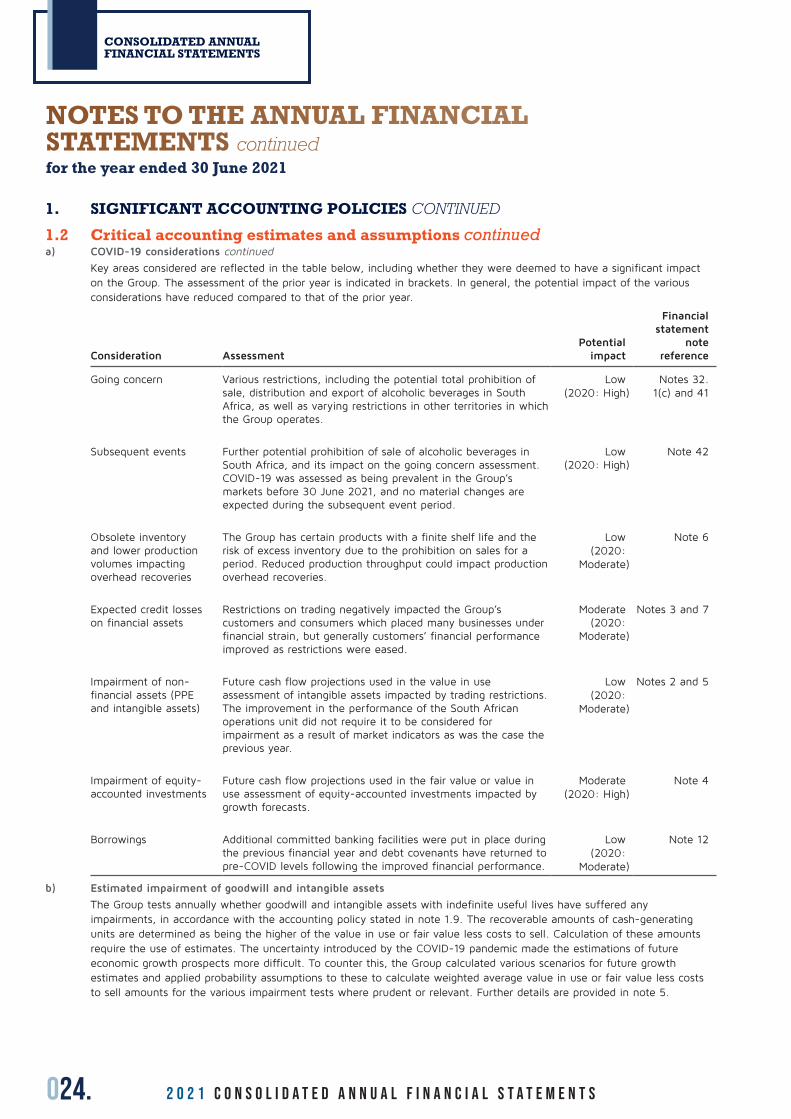
1. SIGNIFICANT ACCOUNTING POLICIES CONTINUED
1.2 Critical accounting estimates and assumptions continueda) COVID-19 considerations continued
Key areas considered are reflected in the table below, including whether they were deemed to have a significant impact on the Group. The assessment of the prior year is indicated in brackets. In general, the potential impact of the various considerations have reduced compared to that of the prior year.
Consideration AssessmentPotential
impact
Financial statement
note reference
Going concern Various restrictions, including the potential total prohibition of sale, distribution and export of alcoholic beverages in South Africa, as well as varying restrictions in other territories in which the Group operates.
Low (2020: High)
Notes 32.1(c) and 41
Subsequent events Further potential prohibition of sale of alcoholic beverages in South Africa, and its impact on the going concern assessment. COVID-19 was assessed as being prevalent in the Group’s markets before 30 June 2021, and no material changes are expected during the subsequent event period.
Low(2020: High)
Note 42
Obsolete inventory and lower production volumes impacting overhead recoveries
The Group has certain products with a finite shelf life and the risk of excess inventory due to the prohibition on sales for a period. Reduced production throughput could impact production overhead recoveries.
Low (2020:
Moderate)
Note 6
Expected credit losses on financial assets
Restrictions on trading negatively impacted the Group’s customers and consumers which placed many businesses under financial strain, but generally customers’ financial performance improved as restrictions were eased.
Moderate(2020:
Moderate)
Notes 3 and 7
Impairment of non-financial assets (PPE and intangible assets)
Future cash flow projections used in the value in use assessment of intangible assets impacted by trading restrictions. The improvement in the performance of the South African operations unit did not require it to be considered for impairment as a result of market indicators as was the case the previous year.
Low(2020:
Moderate)
Notes 2 and 5
Impairment of equity-accounted investments
Future cash flow projections used in the fair value or value in use assessment of equity-accounted investments impacted by growth forecasts.
Moderate(2020: High)
Note 4
Borrowings Additional committed banking facilities were put in place during the previous financial year and debt covenants have returned to pre-COVID levels following the improved financial performance.
Low(2020:
Moderate)
Note 12
b) Estimated impairment of goodwill and intangible assets
The Group tests annually whether goodwill and intangible assets with indefinite useful lives have suffered any impairments, in accordance with the accounting policy stated in note 1.9. The recoverable amounts of cash-generating units are determined as being the higher of the value in use or fair value less costs to sell. Calculation of these amounts require the use of estimates. The uncertainty introduced by the COVID-19 pandemic made the estimations of future economic growth prospects more difficult. To counter this, the Group calculated various scenarios for future growth estimates and applied probability assumptions to these to calculate weighted average value in use or fair value less costs to sell amounts for the various impairment tests where prudent or relevant. Further details are provided in note 5.
NOTES TO THE ANNUAL FINANCIAL STATEMENTS continuedfor the year ended 30 June 2021
025.WWW.DISTELL.CO.ZA
1. SIGNIFICANT ACCOUNTING POLICIES CONTINUED
1.2 Critical accounting estimates and assumptions continuedc) Retirement benefits and contingent asset
The present value of the pension obligation depends on a number of factors that are determined on an actuarial basis using a number of assumptions. The assumptions used in determining the net cost/(income) for pension include the discount rate. Any changes in these assumptions will impact the carrying amount of pension obligations.
The Group determines the appropriate discount rate at the end of each year. This is the interest rate that should be used to determine the present value of estimated future cash flows expected to be required to settle the pension obligations. In determining the appropriate discount rate, the Group considers the interest rates of high-quality corporate bonds that are denominated in the currency in which the benefits will be paid and that have terms to maturity approximating the terms of the related pension obligation.
Other key assumptions for pension obligations are based, in part, on current market conditions. Further details are provided in note 13.
Some entities in the Group are participants in a benefit fund that provides disability benefits to employees. The benefit fund is in the process to be liquidated and it is probable that a portion of the balance of the net assets in the fund, currently amounting to R76,1 million, will be paid to the Group on finalisation of the liquidation process. The Group’s potential interest in the net asset of the benefit fund is regarded as a contingent asset and no amount has been recognised in the financial statements relating to that.
d) Impairment of financial assets
The Group follows the guidance of IFRS 9 to determine when a financial asset is impaired. This determination requires significant judgement. In making this judgement the Group evaluates, among other factors, the expected loss rates based on historical information and adjusted to reflect current and forward-looking information and macro-economic factors.
The temporary prohibition in trading due to restrictions imposed to combat the spread of COVID-19 impacted the operations of many of the Group’s customers. The impairment considerations for the expected credit loss assessment of the trade receivables specifically required significant judgement this year and is based on forward-looking information relating to the economy of South Africa, and the rest of the world, and the potential recoverability of these trade receivables.
e) Impairment of associates
The considerations to determine when an investment in an associated company is impaired requires significant judgement. The impairment consideration for the investment in associate company Best Global Brands specifically required significant judgement this year and is based on forward-looking information relating to the economy of Angola, exchange rate movements and the potential recoverability of this investment.
f) Property, plant and equipment
It is necessary for the Group to make use of judgement when determining the useful life of PPE. Furthermore, customers have a right to return certain containers in exchange for a deposit and these containers are consequently used for more than one period. These returnable containers are thus classified as PPE. Further details are provided in note 2.
g) Consolidation of entities where the Group holds less than 50% shareholding
The Company controls Distell Group Limited through its direct 47,2% shareholding and its 52,8% shareholding indirectly owned by its fully owned subsidiaries Remgro-Capevin Investments Proprietary Limited and Capevin Holdings Limited.
1.3 Basis of consolidationSubsidiaries
Subsidiaries are all entities (including structured entities) that are, directly or indirectly, controlled by the Group. Control is established where the Group is exposed, or has rights, to variable returns from its involvement with the entity and has the ability to affect those returns through its power over the entity. Subsidiaries are fully consolidated from the date on which effective control is transferred to the Group. They are deconsolidated from the date that control ceases.
026. 2 0 2 1 C O N S O L I D A T E D A n n u a l f i n a n c i a l s t a t e m e n t s
CONSOLIDATED ANNUAL FINANCIAL STATEMENTS
1. SIGNIFICANT ACCOUNTING POLICIES CONTINUED
1.3 Basis of consolidation continuedSubsidiaries continued
The Group applies the acquisition method of accounting to account for business combinations. The consideration transferred for the acquisition of a subsidiary is the fair values of the assets transferred, the liabilities incurred and the equity interests issued by the Group. The consideration transferred includes the fair value of any asset or liability resulting from a contingent consideration arrangement. Acquisition-related costs are expensed as incurred. Identifiable assets acquired and liabilities and contingent liabilities assumed in a business combination are measured initially at their fair values at the acquisition date. On an acquisition-by-acquisition basis, the Group recognises any non-controlling interest in the acquiree, either at fair value or at the non-controlling interest’s proportionate share of the recognised amounts of the acquiree’s identifiable net assets.
If the business combination is achieved in stages, the acquisition date carrying value of the acquirer’s previously held equity interest in the acquiree is remeasured to fair value at the acquisition date. Any gains or losses arising from such remeasurement are recognised in profit or loss.
Any contingent consideration to be transferred by the Group is recognised at fair value at the acquisition date. Subsequent changes to the fair value of the contingent consideration that is deemed to be an asset or liability is recognised in profit or loss. Contingent consideration that is classified as equity is not remeasured and its subsequent settlement is accounted for within equity.
The excess of the consideration transferred, the amount of any non-controlling interest in the acquiree and the acquisition date fair value of any previous equity interest in the acquiree over the fair value of the Group’s share of the identifiable net assets acquired is recorded as goodwill. If this is less than the fair value of the net assets of the subsidiary acquired in the case of a bargain purchase, the difference is recognised directly in the income statement. Transactions with owners are recognised in equity only when control is not lost.
Intercompany transactions, balances, income and expenses on transactions between Group companies are eliminated. Unrealised gains and losses resulting from intercompany transactions that are recognised in assets are also eliminated. Unrealised losses are considered an impairment indicator of the asset transferred. Accounting policies of subsidiaries have been changed where necessary to ensure consistency with the policies adopted by the Group.
The investments of Distell Group Holdings Limited in the ordinary shares of its subsidiaries, Distell Group Limited and Capevin Holdings Limited, are carried at cost less impairment losses in the separate financial statements.
Changes in ownership interests in subsidiaries without change of control
Transactions with non-controlling interests that do not result in loss of control are accounted for as equity transactions – that is, as transactions with the owners in their capacity as owners. The difference between fair value of any consideration paid and the relevant share acquired of the carrying value of net assets of the subsidiary is recorded in equity. Gains or losses on disposals to non-controlling interests are also recorded in equity.
Disposal of subsidiaries
When the Group ceases to have control, any retained interest in the entity is remeasured to its fair value at the date when control is lost, with the change in carrying amount recognised in profit or loss. The fair value is the initial carrying amount for the purposes of subsequently accounting for the retained interest as an associate, joint venture or financial asset. In addition, any amounts previously recognised in other comprehensive income in respect of that entity are accounted for as if the Group had directly disposed of the related assets or liabilities. This may mean that amounts previously recognised in other comprehensive income are reclassified to profit or loss.
Associates
Associates are all entities over which the Group has and exercises significant influence, generally accompanying a shareholding of between 20% and 50% of the voting rights, but which it does not control. Investments in associates are accounted for using the equity method of accounting and are initially recognised at cost, and the carrying amount is increased or decreased to recognise the investor’s share of the profit or loss of the investee after the date of acquisition. The Group’s investment in associates includes goodwill identified on acquisition.
If the ownership interest in an associate is reduced, but significant influence is retained, only a proportionate share of the amounts previously recognised in other comprehensive income is reclassified to profit or loss where appropriate.
NOTES TO THE ANNUAL FINANCIAL STATEMENTS continuedfor the year ended 30 June 2021
027.WWW.DISTELL.CO.ZA
1. SIGNIFICANT ACCOUNTING POLICIES CONTINUED
1.3 Basis of consolidation continuedAssociates continued
The Group’s share of post-acquisition profit or loss is recognised in the income statement and its share of post-acquisition movements in other comprehensive income is recognised in other comprehensive income, with a corresponding adjustment to the carrying amount of the investment. When the Group’s share of losses in an associate equal or exceeds its interest in the associate, including any other unsecured receivables, the Group does not recognise further losses, unless it has incurred legal or constructive obligations or made payments on behalf of the associate.
The Group determines, at each reporting date, whether there is any objective evidence that the investment in the associate is impaired. If this is the case, the Group calculates the amount of impairment as the difference between the recoverable amount of the associate and its carrying value and recognises the amount adjacent to ‘share of equity-accounted earnings of an associate’ in the income statement.
Unrealised gains and losses resulting from intercompany transactions between the Group and its associate are recognised in the Group’s financial statements only to the extent of unrelated investor’s interest in the associate. Unrealised losses are also eliminated unless the transaction provides evidence of an impairment of the asset transferred. Accounting policies of associates have been changed where necessary to ensure consistency with the policies adopted by the Group.
Dilution gains and losses arising on investment in associates are recognised in the income statement.
Joint ventures
The Group applies IFRS 11 to all joint arrangements. Under IFRS 11, investments in joint arrangements are classified as either joint operations or joint ventures, depending on the contractual rights and obligations of each investor. The Group has assessed the nature of its joint arrangements and determined them to be joint ventures. Joint ventures are accounted for using the equity method.
Under the equity method of accounting, interests in joint ventures are initially recognised at cost and adjusted thereafter to recognise the Group’s share of the post-acquisition profits or losses and movements in other comprehensive income. When the Group’s share of losses in a joint venture equals or exceeds its interests in the joint ventures, the Group does not recognise further losses, unless it has incurred obligations or made payments on behalf of the joint ventures.
Unrealised gains on transactions between the Group and its joint ventures are eliminated to the extent of the Group’s interest in the joint ventures. Unrealised losses are also eliminated unless the transaction provides evidence of an impairment of the asset transferred. Accounting policies of the joint ventures have been changed, where necessary, to ensure consistency with the policies adopted by the Group.
1.4 Foreign currency translationFunctional and presentation currency
Items included in the financial statements of each of the Group’s entities are measured using the currency of the primary economic environment in which the entity operates (the functional currency). The consolidated financial statements are prepared in South African rand (R), which is the Company’s functional and the Group’s presentation currency.
Foreign Group entities
The results and the financial position of all Group entities that have a functional currency that is different from the presentation currency of the Group are translated into the presentation currency as follows:
• Assets and liabilities for each statement of financial position presented are translated at the closing rate at the date of that statement of financial position.
• Specific transactions in equity are translated at rates of exchange ruling at the transaction dates.
• Income and expenses for each income statement presented are translated at the average exchange rates (unless this average is not a reasonable approximation of the cumulative effect of the rates prevailing on the transaction dates, in which case income and expenses are translated at the rate on the dates of the transactions).
• All resulting exchange differences are recognised in other comprehensive income as part of a foreign currency translation reserve (FCTR).
028. 2 0 2 1 C O N S O L I D A T E D A n n u a l f i n a n c i a l s t a t e m e n t s
CONSOLIDATED ANNUAL FINANCIAL STATEMENTS
1. SIGNIFICANT ACCOUNTING POLICIES CONTINUED
1.4 Foreign currency translation continuedForeign Group entities continued
• On consolidation, exchange rate differences arising from the translation of the net investment in foreign operations, and of borrowings and other currency instruments designated as hedges of such investments, if applicable, are also taken to the FCTR. When a foreign operation is sold, all related exchange rate differences that were recorded in the FCTR are recognised in the income statement as part of the profit or loss on sale. When a partial disposal takes place, the FCTR is proportionately reattributed to the non-controlling shareholders in terms of IAS 21. The Group’s net investment in a subsidiary or joint venture is equal to the equity investment plus all monetary items that are receivable from or payable to the subsidiary or joint venture, for which settlement is neither planned nor likely to occur in the foreseeable future.
• Goodwill and fair value adjustments arising on the acquisition of a foreign entity are treated as assets and liabilities of the foreign entity and are translated at the closing rate.
Transactions and balances
Foreign currency transactions are translated into the functional currency using the exchange rates prevailing at the dates of the transactions or valuation where items are remeasured. Foreign exchange gains and losses resulting from the settlement of such transactions and from the translation at year-end exchange rates of monetary assets and liabilities denominated in foreign currencies are recognised in profit or loss.
Foreign exchange gains and losses that relate to borrowings and cash and cash equivalents are presented in the income statement within ‘finance income or costs’. All other foreign exchange gains and losses are presented in the income statement within ‘costs of goods sold’.
Changes in the fair value of monetary securities denominated in foreign currency classified as financial assets at fair value through other comprehensive income (FVOCI) are analysed between translation differences resulting from changes in the amortised cost of the security, and other changes in the carrying amount of the security. Translation differences related to changes in amortised cost are recognised in profit or loss, and other changes in the carrying amount are recognised in other comprehensive income.
Translation differences on non-monetary financial assets and liabilities, such as equities held at fair value through profit or loss, are recognised in profit or loss as part of the fair value gain or loss. Translation differences on non-monetary financial assets such as equities classified as financial assets at FVOCI are recorded in other comprehensive income.
1.5 Segment reportingOperating segments are reported in a manner consistent with the internal reporting provided to the chief operating decision-maker (executive management team). Operating segments are individual components of an entity that engage in business activities from which it may earn revenues and incur expenses, and whose operating results are regularly reviewed by the entity’s chief operating decision-maker and for which discrete financial information is available. Operating segments which display similar economic characteristics are aggregated for reporting purposes.
1.6 Property, plant, equipment and grapevinesPPE and grapevines are tangible assets held by the Group for use in the manufacturing and distribution of its products and are expected to be used during more than one period. All PPE and grapevines are stated at historical costs less subsequent depreciation and accumulated impairment. The historical cost includes all expenditure that is directly attributable to the acquisition of the PPE and grapevines, and the costs of dismantling and preparing the site for grapevines, and is depreciated on a straight-line basis, from the date that assets are available for use, at rates appropriate to the various classes of assets involved, taking into account the estimated useful life and residual values of the individual items.
Returnable bottles, pallets and divider boards in circulation are recorded within PPE and a corresponding liability is recorded at the point of the sale of the products packaged in these items in respect of the obligation to repay the customers’ deposits. Deposits paid by customers for returnable items are reflected in the consolidated statement of financial position within current liabilities. Refer to note 1.19 for further details in this regard.
NOTES TO THE ANNUAL FINANCIAL STATEMENTS continuedfor the year ended 30 June 2021
029.WWW.DISTELL.CO.ZA
1. SIGNIFICANT ACCOUNTING POLICIES CONTINUED
1.6 Property, plant, equipment and grapevines continuedGrapevines are measured at accumulated costs until maturity, similar to the accounting for a self-constructed item of property, plant and equipment. Land is not depreciated as it is deemed to have an unlimited useful life. Improvements to leasehold properties are recognised as PPE when it is probable that future economic benefits will flow to the Group. Improvements to leasehold properties are shown at cost and written off over the shorter of its useful life or the remaining period of the lease. Assets under construction are defined as assets still in the construction phase and not yet available for use. These assets are carried at initial cost and are not depreciated. Depreciation on these assets commences when they become available for use and depreciation periods are based on management’s assessment of their useful lives, or in the case of leasehold improvements and certain leased plant and equipment, the shorter of the lease term or the useful life of the assets.
Management determines the estimated useful lives and the related depreciation charges at acquisition.
Useful lives:Buildings 5 – 60 yearsStainless steel tanks 3 – 45 yearsOther machinery and barrels 2 – 45 yearsEquipment and vehicles 2 – 33 yearsGrapevines 20 yearsRight-of-use assets: equipment and vehicles 2-5 years Right-of-use assets: property 2-7 yearsReturnable containers:Bottles 5 yearsCrates 14 yearsPallets and divider boards 5 years
The assets’ residual values and useful lives are reviewed, and adjusted if appropriate, at the end of each reporting period.
Subsequent costs are included in the asset’s carrying amount or recognised as a separate asset, as appropriate, to the extent that it is probable that future economic benefits associated with the item will flow to the Group and the cost of the item can be measured reliably. The carrying amount of the replaced part is derecognised. All other repairs and maintenance are charged to the income statement during the financial period in which they are incurred.
An asset’s carrying amount is written down immediately to its recoverable amount if the asset’s carrying amount is greater than its estimated recoverable amount. The recoverable amount is calculated as the higher of the asset’s fair value less costs to sell and the value in use. Also refer to note 1.9 for impairment of non-financial assets.
Gains and losses on disposal or scrapping of PPE, this being the difference between the net proceeds on disposals or scrappings and the carrying amount, are recognised in the income statement within ‘other gains and losses’.
1.7 Biological assetsThe Group owns grapevines which are accounted for under IAS 16 (see note 1.6). Grapes harvested from the Group’s grapevines are measured at its fair value less cost to sell at the point of harvest. Such measurement is the cost at that date when transferring the harvest produce to inventory.
1.8 Intangible assets Goodwill
Goodwill arises on the acquisition of subsidiaries and represents the excess of the consideration transferred over the Group’s interest in the fair value of the net identifiable assets of the acquired subsidiaries at the date of acquisition. Goodwill on acquisition of subsidiaries is included in ‘intangible assets’. Goodwill on acquisition of associates and joint ventures is included in ‘investments in associates’ or ‘investments in joint ventures’ and is tested for impairment as part of the overall balance. Goodwill denominated in a foreign currency is translated at closing rates.
030. 2 0 2 1 C O N S O L I D A T E D A n n u a l f i n a n c i a l s t a t e m e n t s
CONSOLIDATED ANNUAL FINANCIAL STATEMENTS
1. SIGNIFICANT ACCOUNTING POLICIES CONTINUED
1.8 Intangible assets continuedTrademarks and other intangibles
Separately acquired trademarks and other intangibles, like customer relationships, that have a finite useful life are carried at cost less accumulated amortisation. Amortisation is calculated using the straight-line method to allocate the cost of trademarks over their estimated useful lives. Trademarks and other intangibles are deemed as having an indefinite useful life when there is no foreseeable limit on the time it is expected to provide future cash flows. Trademarks and other intangibles that are deemed to have an indefinite useful life are carried at cost less accumulated impairment losses and are tested annually for impairment.
Industrial property rights
Industrial property rights are intangible assets held by the Group for use in the manufacturing and distribution of its products and are expected to be used during more than one period. All industrial property rights are stated at historical costs less subsequent amortisation and accumulated impairment. The historical cost includes all expenditure that is directly attributable to the acquisition of the industrial property rights and is depreciated on a straight-line basis, from the date that assets are available for use, over 60 years, taking into account the residual values.
Computer software
Acquired computer software (which is not an integral part of computer hardware) and software licences and the direct costs associated with the development and installation thereof are capitalised.
Costs associated with developing or maintaining software are recognised as an expense when incurred. Development costs that are directly attributable to the design and testing of identifiable and unique software products controlled by the Group are recognised as intangible assets when the following criteria are met:
• It is technically feasible to complete the software product so that it will be available for use
• Management intends to complete the software product and use it or sell it
• There is an ability to use or sell the software product
• It can be demonstrated how the software product will generate probable future economic benefits
• Adequate technical, financial and other resources to complete the development
• The expenditure attributable to the software product during its development can be reliably measured
Development costs previously recognised as an expense are not recognised as an asset in a subsequent period.
Directly attributable costs that are capitalised as part of the software product include the software development employee cost and an appropriate portion of relevant overheads.
Computer software is depreciated on the straight-line method over its estimated useful life (three to seventeen years) when available for use.
1.9 Impairment of non-financial assetsAssets that have an indefinite useful life – or intangible assets not ready for use – are not subject to amortisation and are tested for impairment annually. Assets that are subject to amortisation are reviewed for impairment whenever events or changes in circumstances indicate that the full carrying amount may not be recoverable. An impairment loss is recognised for the amount by which the asset’s carrying amount exceeds its recoverable amount. The recoverable amount is the higher of an asset’s fair value less costs to sell and value in use. For the purpose of assessing impairment, assets are grouped at the lowest levels for which there are separately identifiable cash flows (cash-generating units (CGUs)). Non-financial assets, other than goodwill, that suffered impairment are reviewed for possible reversal of impairment at each reporting date.
For the purpose of impairment testing, goodwill acquired in a business combination is allocated to each of the CGUs, or groups of CGUs, that are expected to benefit from the synergies of the combination. Each unit or group of units to which the goodwill is allocated represents the lowest level within the entity at which the goodwill is monitored for internal management purposes. Goodwill is monitored at a company level (where it is attributed to a company) or CGU level which is lower than the operating segment level.
NOTES TO THE ANNUAL FINANCIAL STATEMENTS continuedfor the year ended 30 June 2021

031.WWW.DISTELL.CO.ZA
1. SIGNIFICANT ACCOUNTING POLICIES CONTINUED
1.9 Impairment of non-financial assets continuedGoodwill impairment reviews are undertaken annually, or more frequently if events or changes in circumstances indicate a potential impairment. The carrying value of goodwill is compared to the recoverable amount, which is the higher of value in use and the fair value less costs of disposal. Any impairment is recognised immediately as an expense and is not subsequently reversed.
1.10 Financial assetsClassification
The Group classifies its financial assets in the following categories:
• Financial assets at amortised cost
• Financial assets at fair value through profit and loss (FVPL)
• Financial assets at fair value through other comprehensive income (FVOCI)
The classification is dependent on the purpose for which the financial asset was acquired. Management determines the classification of its financial assets at initial recognition. For investments in equity instruments that are not held for trading, this will depend on whether the Group has made an irrevocable election at the time of initial recognition to account for the equity investment at FVOCI. Debt investments are only reclassified when its business model for managing those assets changes.
Recognition and measurement
The Group measures a financial asset at its fair value at initial recognition. In the case of a financial asset not at FVPL, transaction costs that are directly attributable to the acquisition of the financial asset are added to the fair value. Transaction costs of financial assets carried at FVPL are expensed in profit or loss.
Financial assets with embedded derivatives are considered in their entirety when determining whether their cash flows are solely payment of principal and interest.
Financial assets at amortised cost
Financial assets at amortised cost are non-derivative debt instruments with fixed or determinable payments of principal and interest. They are included in current assets, except for maturities greater than 12 months after the end of the reporting period. These are classified as non-current assets. Interest income from these financial assets is included in finance income using the effective interest rate method. Any gain or loss arising on derecognition is recognised directly in profit or loss and presented in ‘other gains and losses’. Impairment losses are presented as a separate line item in the statement of profit or loss.
Financial assets at FVOCI
Financial assets at FVOCI are non-derivative equity instruments that are designated in this category. Where the Group has elected to present fair value gains and losses on equity investments in OCI, there is no subsequent reclassification of fair value gains and losses to the income statement following the derecognition of the investment. Dividends from such investments continue to be recognised in the income statement as other income when the Group’s right to receive payments is established. FVOCI are included in non-current assets unless management intends to dispose of the investment within 12 months of the end of the reporting period.
Financial assets at FVPL
Financial assets at FVPL are financial assets held for trading and which are not elected to be classified as FVOCI on initial recognition. A financial asset is classified in this category if acquired principally for the purpose of selling in the short term. Changes in the fair value of financial assets at FVPL are recognised in ‘other gains and losses’ in the income statement. Dividends from such investments continue to be recognised in the income statement as other income when the Group’s right to receive payments is established. Assets in this category are classified as current assets if expected to be settled within 12 months of the end of the reporting period.
032. 2 0 2 1 C O N S O L I D A T E D A n n u a l f i n a n c i a l s t a t e m e n t s
CONSOLIDATED ANNUAL FINANCIAL STATEMENTS
1. SIGNIFICANT ACCOUNTING POLICIES CONTINUED
1.10 Financial assets continuedImpairment of financial assets
The Group assesses the expected credit losses associated with its debt instruments carried at amortised cost on a forward-looking basis. The impairment methodology applied depends on whether there has been a significant increase in credit risk.
Assets carried at amortised cost
The loss allowances for financial assets carried at amortised cost are based on assumptions about risk of default and expected loss rates. The Group uses judgement in making these assumptions and selecting the inputs to the impairment calculation, based on the Group’s past history, existing market conditions, as well as forward-looking estimates at the end of each reporting period. The debt instruments are considered to have minimal credit risk when they have a low risk of default and the issuer has a strong capacity to meet its contractual cash flow obligations in the near term. The investment in the savings bonds of the Reserve Bank of Zimbabwe are not considered to have minimal credit risk.
The calculation of the expected credit loss allowance on trade receivables is described in note 1.16.
While cash and cash equivalents are also subject to the calculation of an expected credit loss allowance per IFRS 9, the identified impairment loss was immaterial.
1.11 Derivative financial instruments and hedging activitiesThe Group is party to financial instruments that reduce exposure to fluctuations in foreign currency exchange and interest rates. These instruments mainly comprise forward foreign exchange contracts and interest rate swaps. The purpose of these instruments is to reduce risk.
Since the adoption of IFRS 9, derivatives are initially recognised at fair value on the date a derivative contract is entered into and are subsequently remeasured at their fair value. The method of recognising the resulting gain or loss depends on whether the derivative is designated as a hedging instrument and, if so, the nature of the item being hedged.
The Group designates certain derivatives as either:
• hedges of the fair value of recognised assets or liabilities or a firm commitment (fair value hedges);
• hedges of a particular risk associated with the cash flows of recognised assets and liabilities and highly probable forecast transactions (cash flow hedges); or
• hedges of a net investment in a foreign operation (net investment hedges).
At inception of the hedge relationship, the Group documents the economic relationship between hedging instruments and hedged items including whether changes in the cash flows of the hedging instruments are expected to offset changes in the cash flows of hedged items. The Group documents its risk management objective and strategy for undertaking its hedge transactions.
The full fair value of a hedging derivative is classified as a non-current asset or liability when the remaining maturity of the hedged item is more than 12 months; it is classified as a current asset or liability when the remaining maturity of the hedged item is less than 12 months. Trading derivatives are classified as a current asset or liability.
(i) Cash flow hedges that qualify for hedge accounting
The effective portion of changes in the fair value of derivatives that are designated and qualify as cash flow hedges is recognised in the cash flow hedge reserve within equity. The gain or loss relating to the ineffective portion is recognised immediately in profit or loss, within ‘other gains and losses’.
When option contracts are used to hedge forecast transactions, the Group designates only the intrinsic value of the options as the hedging instrument.
Gains or losses relating to the effective portion of the change in intrinsic value of the options are recognised in the cash flow hedge reserve within equity. The changes in the time value of the options that relate to the hedged item (aligned time value) are recognised within OCI in the costs of hedging reserve within equity.
NOTES TO THE ANNUAL FINANCIAL STATEMENTS continuedfor the year ended 30 June 2021
033.WWW.DISTELL.CO.ZA
1. SIGNIFICANT ACCOUNTING POLICIES CONTINUED
1.11 Derivative financial instruments and hedging activities continued(i) Cash flow hedges that qualify for hedge accounting continued
When forward contracts are used to hedge forecast transactions, the Group generally designates only the change in fair value of the forward contract related to the spot component as the hedging instrument. Gains or losses relating to the effective portion of the change in the spot component of the forward contracts are recognised in the cash flow hedge reserve within equity. The change in the forward element of the contract that relates to the hedged item (aligned forward element) is recognised within OCI in the costs of hedging reserve within equity. In some cases, the entity may designate the full change in fair value of the forward contract (including forward points) as the hedging instrument. In such cases, the gains or losses relating to the effective portion of the change in fair value of the entire forward contract are recognised in the cash flow hedge reserve within equity.
Amounts accumulated in equity are reclassified in the periods when the hedged item affects profit or loss, as follows:
• Where the hedged item subsequently results in the recognition of a non-financial asset (such as inventory), both the deferred hedging gains and losses and the deferred time value of the option contracts or deferred forward points, if any, are included within the initial cost of the asset. The deferred amounts are ultimately recognised in profit or loss as the hedged item affects profit or loss (for example through costs of goods sold).
• The gain or loss relating to the effective portion of the interest rate swaps hedging variable rate borrowings is recognised in profit or loss within finance cost at the same time as the interest expense on the hedged borrowings.
When a hedging instrument expires, or is sold or terminated, or when a hedge no longer meets the criteria for hedge accounting, any cumulative deferred gain or loss and deferred costs of hedging in equity at that time remains in equity until the forecast transaction occurs, resulting in the recognition of a non-financial asset such as inventory. When the forecast transaction is no longer expected to occur, the cumulative gain or loss and deferred costs of hedging that were reported in equity are immediately reclassified to profit or loss.
(ii) Net investment hedges
Hedges of net investments in foreign operations, if and when applicable, are accounted for similarly to cash flow hedges.
Any gain or loss on the hedging instrument relating to the effective portion of the hedge is recognised in other comprehensive income and accumulated in reserves in equity. The gain or loss relating to the ineffective portion is recognised immediately in profit or loss within ’other gains and losses’.
Gains and losses accumulated in equity are reclassified to profit or loss when the foreign operation is partially disposed of or sold.
(iii) Derivatives that do not qualify for hedge accounting
Certain derivative instruments do not qualify for hedge accounting. Changes in the fair value of any derivative instrument that does not qualify for hedge accounting are recognised immediately in profit or loss and are included in ’administration and other costs’.
1.12 Financial guaranteesFinancial guarantee contracts are recognised as a financial liability at the time the guarantee is issued. The liability is initially measured at fair value and subsequently at the higher of:
• the amount determined in accordance with the expected credit loss model under IFRS 9 Financial Instruments; and
• the amount initially recognised less, where appropriate, the cumulative amount of income recognised in accordance with the principles of IFRS 15 Revenue from Contracts with Customers.
The fair value of financial guarantees is determined based on the present value of the difference in cash flows between the contractual payments required under the debt instrument and the payments that would be required without the guarantee, or the estimated amount that would be payable to a third party for assuming the obligations.
Where guarantees in relation to loans or other payables of associates are provided for no compensation, the fair values are accounted for as contributions and recognised as part of the cost of the investment.
034. 2 0 2 1 C O N S O L I D A T E D A n n u a l f i n a n c i a l s t a t e m e n t s
CONSOLIDATED ANNUAL FINANCIAL STATEMENTS
1. SIGNIFICANT ACCOUNTING POLICIES CONTINUED
1.13 Current and deferred income taxThe tax expense for the period comprises current and deferred tax. Tax is recognised in the income statement, except to the extent that it relates to items recognised in other comprehensive income or directly in equity. In this case, the tax is also recognised in other comprehensive income or directly in equity, respectively.
Current income tax
The current income tax charge is calculated on the basis of the tax laws enacted or substantively enacted at the statement of financial position date in the countries where the Company’s subsidiaries, joint ventures and associates operate and generate taxable income. Management periodically evaluates positions taken in tax returns with respect to situations in which applicable tax regulation is subject to interpretation and establishes provisions, where appropriate, on the basis of amounts expected to be paid to the tax authorities.
The Group is subject to income taxes in numerous jurisdictions. Judgement may be required in determining the provision for income taxes. There are many transactions and calculations for which the ultimate tax determination may be uncertain. The Group recognises liabilities for anticipated tax audit issues based on estimates of whether additional taxes will be due. Where the final tax outcome of these matters is different from the amounts that were initially recorded, such differences will impact the current tax and deferred tax assets and liabilities in the period in which such determination is made. Additional disclosure will be provided where this applies.
Deferred income tax
Deferred income tax is provided in full at currently enacted or substantially enacted tax rates using the liability method. Provision is made for all temporary differences arising between the taxation bases of assets and liabilities and their statement of financial position carrying values.
No deferred income tax is accounted for if it arises from initial recognition of an asset or liability in a transaction other than a business combination that, at the time of the transaction, affects neither accounting nor taxable profit or loss. Deferred tax liabilities are not recognised if they arise from the initial recognition of goodwill. Deferred income tax is determined using tax rates (and laws) that have been enacted or substantially enacted by the statement of financial position date and are expected to apply when the related deferred income tax asset is realised or the deferred income tax liability is settled.
Deferred income tax assets are recognised to the extent that it is probable that future taxable profit will be available against which the temporary differences can be utilised. Management applies judgement to determine whether sufficient future taxable profit will be available after considering, among others, factors such as profit history, forecasted cash flows and budgets.
Deferred income tax is provided on temporary differences arising on investments in subsidiaries, associates and joint ventures, except where the timing of the reversal of the temporary difference can be controlled by the Group and it is probable that it will not reverse in the foreseeable future. Generally the Group is unable to control the reversal of the temporary differences for associates.
Deferred income tax assets and liabilities are offset when there is a legally enforceable right to off-set current tax assets against current tax liabilities and when the deferred income tax assets and liabilities relate to income taxes levied by the same taxation authority on either the taxable entity or different taxable entities where there is an intention to settle the balances on a net basis.
Taxation rates
The normal South African company tax rate used for the year ending 30 June 2021 is 28% (2020: 28%). Deferred tax assets and liabilities for South African entities at 30 June 2021 have been calculated using the rates currently enacted or substantially enacted, this being the rate that the Group expects to apply to the periods when the assets are realised or the liabilities are settled. Capital gains tax is calculated as 80% (2020: 80%) of the company tax rate. International tax rates vary from jurisdiction to jurisdiction.
In preparing the tax rate reconciliation, the tax charge is reconciled to the tax rate of the parent, i.e. the South African company tax rate.
NOTES TO THE ANNUAL FINANCIAL STATEMENTS continuedfor the year ended 30 June 2021
035.WWW.DISTELL.CO.ZA
1. SIGNIFICANT ACCOUNTING POLICIES CONTINUED
1.13 Current and deferred income tax continuedDividend withholding tax (DWT)
Shareholders are subject to DWT on dividends received, unless they are exempt in terms of the amended tax law. DWT is levied at 20% (2020: 20%) of the dividend received. The DWT is categorised as a withholding tax as the tax is withheld and paid to tax authorities by the company paying the dividend or by a regulated intermediary and not the beneficial owner of the dividend.
1.14 LeasesThe Group leases various farming land, warehouses, machinery, equipment and vehicles under non-cancellable lease agreements. The leases have varying terms, renewal rights and escalation clauses. The majority of escalation clauses are linked to the consumer price index (CPI) or equivalent inflation rate and there are no contingent or restrictive lease arrangements.
Contracts may contain both lease and non-lease components. The Group allocates the consideration in the contract to the lease and non-lease components based on their relative stand-alone prices. However, for leases of real estate for which the Group is a lessee, it has elected not to separate lease and non-lease components and instead accounts for these as a single lease component.
Lease terms are negotiated on an individual basis and contain a wide range of different terms and conditions. The lease agreements do not impose any covenants other than the security interests in the leased assets that are held by the lessor. Leased assets may not be used as security for borrowing purposes.
Assets and liabilities arising from a lease are initially measured on a present value basis. Lease liabilities include the net present value of the following lease payments:
• Fixed payments (including in-substance fixed payments), less any lease incentives receivable
• Variable lease payment that are based on an index or a rate, initially measured using the index or rate as at the commencement date
• Amounts expected to be payable by the Group under residual value guarantees
• The exercise price of a purchase option if the Group is reasonably certain to exercise that option
• Payments of penalties for terminating the lease, if applicable
Lease payments to be made under reasonably certain extension options are also included in the measurement of the liability.
The lease payments are discounted using the interest rate implicit in the lease. If that rate cannot be readily determined, the incremental borrowing rate of the Group entity incurring the lease is used, being the rate that the individual company would have to pay to borrow the funds necessary to obtain an asset of similar value to the right-of-use asset in a similar economic environment with similar terms, security and conditions.
To determine the incremental borrowing rate, the Group:
• where possible, uses recent third-party financing received by the individual lessee as a starting point, adjusted to reflect changes in financing conditions since third party financing was received;
• uses a build-up approach that starts with a risk-free interest rate adjusted for credit risk for leases held by the Group, which does not have recent third party financing; and
• makes adjustments specific to the lease, for example term, country, currency and security.
The Group is exposed to potential future increases in variable lease payments based on an index or rate, which are not included in the lease liability until they take effect. When adjustments to lease payments based on an index or rate take effect, the lease liability is reassessed and adjusted against the right-of-use asset.
Right-of-use assets are measured at cost comprising the following:
• The amount of the initial measurement of the lease liability
• Any lease payments made at or before the commencement date less any lease incentives received
• Any initial direct costs
• Restoration costs

036. 2 0 2 1 C O N S O L I D A T E D A n n u a l f i n a n c i a l s t a t e m e n t s
CONSOLIDATED ANNUAL FINANCIAL STATEMENTS
1. SIGNIFICANT ACCOUNTING POLICIES CONTINUED
1.14 Leases continuedRight-of-use assets are depreciated over the shorter of the asset’s useful life and the lease term on a straight-line basis. If the Group is reasonably certain to exercise a purchase option, the right-of-use asset is depreciated over the underlying asset’s useful life.
Payments associated with short-term leases of equipment and vehicles and all leases of low-value assets are recognised on a straight-line basis as an expense in profit or loss. Short-term leases are leases with a lease term of 12 months or less. Low-value assets comprise IT equipment and small items of office furniture. A lease agreement of which the underlying asset’s value is R80 000 or less will be considered a low-value lease.
Some property and equipment leases contain extension and termination options. These options provide operational flexibility for managing the assets required for the Group’s operations. The majority of extension and termination options held are exercisable only by the Group lessee entity and not by the respective lessor.
The Group sometimes provides residual value guarantees for vehicle leases to optimise costs.
1.15 Inventories Inventories are stated at the lower of cost and net realisable value. Cost is determined by the first-in first-out (FIFO) method. The cost of finished goods and work in progress comprises raw materials, direct labour, other direct costs and related production overheads (based on normal operating capacity), but excludes borrowing cost.
Net realisable value is the estimated selling price in the ordinary course of business, less the applicable costs of completion and selling expenses.
1.16 Trade and other receivablesTrade receivables are amounts due from customers for goods sold in the ordinary course of business. They are generally due for settlement within 30 to 120 days, depending on the type of customer, and therefore are all classified as current. The Group holds the trade and other receivables with the objective to collect the contractual cash flows. Trade and other receivables are initially recognised at fair value and subsequently measured at amortised cost using the effective interest rate method, less provision for expected credit losses. Fair value is determined as the estimated future cash flows discounted at a market-related interest rate.
The Group applies the IFRS 9 simplified approach to measuring expected credit losses which uses a lifetime expected loss allowance for all trade receivables.
To measure the expected credit losses, trade receivables have been grouped based on shared credit risk characteristics and the days past due.
The expected loss rates are based on the payment profiles of sales over a period of 36 months and the corresponding historical credit losses experienced within this period. The historical loss rates are adjusted to reflect current and forward-looking information on macroeconomic factors affecting the ability of the customers to settle the receivables. The Group has identified the gross domestic product (GDP) and the unemployment rate of the countries in which it sells its goods and services to be the most relevant factors, and accordingly adjusts the historical loss rates based on expected changes in these factors.
Trade receivables are written off when there is no reasonable expectation of recovery. Indicators that there is no reasonable expectation of recovery include, among others, the failure of a debtor to engage in a repayment plan with the Group, and a failure to make contractual payments for a period of greater than 90 days past due.
The Group applies the general approach to measuring expected credit losses for all financial assets that are classified within other receivables. The stage the other receivable is classified in determines if a lifetime or 12-month expected credit loss allowance is recognised. For stage 1, where credit risk has not increased significantly since initial recognition, a 12-month loss allowance is used. For stage 2, where credit risk has increased significantly since initial recognition, and stage 3, where the financial asset is credit impaired, a lifetime credit loss is recognised.
Impairment losses on trade and receivables are presented as ‘net impairment losses’ within operating profit. Subsequent recoveries of amounts previously written off are credited against the same line item.
NOTES TO THE ANNUAL FINANCIAL STATEMENTS continuedfor the year ended 30 June 2021
037.WWW.DISTELL.CO.ZA
1. SIGNIFICANT ACCOUNTING POLICIES CONTINUED
1.17 Cash and cash equivalentsCash and cash equivalents comprise cash on hand, deposits held at call with banks, other short-term highly liquid investments with original maturities of three months or less and bank overdrafts. Bank overdrafts are included in current interest-bearing borrowings in the statement of financial position.
1.18 Stated capitalOrdinary shares are classified as equity. Incremental costs directly attributable to the issue of new shares or options are shown in equity as a deduction from proceeds, net of taxation.
Where entities controlled by the Group purchase the Company’s shares, the consideration paid, including attributable transaction costs net of income taxes, is deducted from total shareholders’ equity as treasury shares until they are sold or cancelled. Where such shares are subsequently sold, any consideration received, net of any directly attributable incremental transaction costs and the related income tax effects, is included in equity attributable to the Company’s equity holders. Dividends received on treasury shares are eliminated on consolidation.
1.19 Trade and other payablesTrade payables are obligations to pay for goods or services that have been acquired in the ordinary course of business from suppliers. Accounts payable are classified as current liabilities if payment is due within one year or less (or in the normal operating cycle of the business if longer). If not, they are presented as non-current liabilities.
Trade and other payables are recognised initially at fair value and subsequently measured at amortised cost using the effective interest rate method.
For returnable containers a liability is recorded in respect of the obligation to repay the customers’ deposits, at the point of sale of the products packaged in these items. The deposit value is an amount imposed by the Group on the purchaser to expedite the return of the Group’s containers for re-use. It is arbitrarily set by the Group with a view to the efficient use of the asset – it is not an attempt to value the asset nor to sell it, but is set to encourage the purchaser to return the container in return for the deposit. Deposits paid by customers for returnable items are reflected in the consolidated statement of financial position within current liabilities.
1.20 BorrowingsBorrowings are recognised initially at fair value, net of transaction costs incurred. Borrowings are subsequently stated at amortised cost. Any difference between the proceeds (net of transaction costs) and the redemption value is recognised in the income statement over the period of the borrowings using the effective interest rate method. Borrowings are classified as current liabilities unless the Group has the unconditional right to defer settlement of the liability for at least 12 months after the statement of financial position date.
Fees paid on the establishment of loan facilities are recognised as transaction costs of the loan to the extent that it is probable that some or all of the facility will be drawn down. In this case the fee is deferred until the drawdown occurs. To the extent there is no evidence that it is probable that some or all of the facility will be drawn down, the fee is capitalised as a prepayment for liquidity services and amortised over the period of the facility to which it relates.
If a modification of loan terms is not considered to result in an extinguishment of the initial borrowings, the cash flows of the modified borrowings are discounted at the original effective interest rate and the difference is recognised in profit or loss. A substantial debt modification or a debt exchange with substantially different terms is accounted for as an extinguishment of the original financial liability. This results in derecognition of the original loan and the recognition of a new financial liability at its fair value. The difference between the carrying amount of the original financial liability and the fair value of the new financial liability is recognised in profit or loss.
Borrowing costs
Borrowing costs that are directly attributable to the acquisition, construction or production of a qualifying asset are capitalised as part of the cost of that asset until such time as the asset is ready for its intended use. When funds are borrowed specifically for the purpose of obtaining a qualifying asset, the amount to be capitalised is the actual borrowing costs less any temporary investment income on those borrowings. General borrowing costs are capitalised by calculating the weighted average expenditure on the qualifying asset and applying a weighted average borrowing rate to the expenditure.
038. 2 0 2 1 C O N S O L I D A T E D A n n u a l f i n a n c i a l s t a t e m e n t s
CONSOLIDATED ANNUAL FINANCIAL STATEMENTS
1. SIGNIFICANT ACCOUNTING POLICIES CONTINUED
1.20 Borrowings continuedBorrowing costs continued
The borrowing costs capitalised do not exceed the total borrowing costs incurred. The capitalisation of borrowing costs commences when expenditures for the asset have occurred, borrowing costs have been incurred or when activities that are necessary to prepare the asset for its intended use or sale are in progress. Capitalisation is suspended during extended periods in which active development is interrupted. Capitalisation ceases when, substantially, all the activities necessary to prepare the qualifying asset for its intended use or sale are complete.
All other borrowing costs are recognised as an expense in profit or loss in the period in which they are incurred.
1.21 ProvisionsProvisions are recognised when the Group has a present legal or constructive obligation, as a result of past events, and it is probable that an outflow of resources embodying economic benefits will be required to settle the obligation, and a reliable estimate of the amount of the obligation can be made. Provisions are measured at the present value of the expenditures expected to be required to settle the obligation using a pre-tax rate that reflects current market assessments of the time value of money and the risks specific to the obligation. The increase in the provision due to the passage of time is recognised as interest expense. Provisions are not recognised for future operating losses.
1.22 Employee benefitsRetirement funds
The Group provides pension, retirement or provident fund benefits to all permanent employees.
The schemes are generally funded through payments to insurance companies or trustee-administered funds, which are determined by periodic actuarial calculations. The Group has both defined contribution and defined benefit plans.
A defined contribution plan is a plan under which the Group pays fixed contributions to a separate entity. The Group has no legal or constructive obligations to pay further contributions if the fund does not hold sufficient assets to pay all employees the benefits relating to employee service in the current and prior periods.
The Group’s contributions to defined contribution plans, in respect of services rendered in a particular period, are recognised as an expense in that period. Additional contributions are recognised as an expense in the period during which the associated services are rendered by employees.
A defined benefit plan is a plan that is not a defined contribution plan. This plan defines an amount of pension benefit an employee will receive on retirement, dependent on one or more factors such as age, years of service and compensation.
The liability recognised in the statement of financial position in respect of defined benefit pension plans is the present value of the defined benefit obligation at the end of the reporting period less the fair value of plan assets. The defined benefit obligation is actuarially valued every three years and reviewed every year by independent actuaries using the projected unit credit method. The present value of the defined benefit obligation is determined by discounting the estimated future cash outflows using interest rates of government bonds that are denominated in the currency in which the benefits will be paid and that have terms to maturity approximating the terms of the related pension obligation.
Current service costs are recognised immediately in the income statement.
Actuarial gains and losses arising from experience adjustments and changes in actuarial assumptions are charged or credited to equity in other comprehensive income in the period in which they arise. Past service costs are recognised immediately in the income statement.
Post-retirement medical benefits
The Group makes provision for actuarially determined future medical benefits of employees who remained in service up to retirement age and complete a minimum service period. The expected costs of these benefits are accrued over the period of employment based on past services. This post-retirement medical benefit obligation is measured as the present value of the estimated future cash outflows based on a number of assumptions. These assumptions include, among others, healthcare cost inflation, discount rates, salary inflation and promotions and experience increases, expected retirement age and continuation at retirement. Valuations of this obligation are carried out every year by independent qualified actuaries, in respect of past service liabilities and actuarial gains or losses arising from experience adjustments and changes in actuarial assumptions, and are charged or credited to equity in other comprehensive income in the period in which they arise. The projected unit credit method is used to determine the present value of the post-retirement medical benefit obligation.
NOTES TO THE ANNUAL FINANCIAL STATEMENTS continuedfor the year ended 30 June 2021
039.WWW.DISTELL.CO.ZA
1. SIGNIFICANT ACCOUNTING POLICIES CONTINUED
1.22 Employee benefits continuedShare-based compensation
The Group grants conditional shares and share appreciation rights (SARs) to its employees under equity-settled share incentives schemes through the Distell Group Holdings Limited Conditional Share Plan Scheme (CSP), as well as an Equity-Settled Share Appreciation Rights Scheme (SAR Scheme).
A CSP or SAR Scheme share is considered equity settled when it is settled by an issue of a Distell Group Holdings Limited share. The CSP and the SAR Scheme rules, as appropriate, indicate whether it is to be settled by the issue of Distell Group Holdings shares or not.
The fair value of the employee services received in exchange for the grant of the CSP shares/SARs is recognised as an expense over the vesting period. The fair value is determined at grant date with reference to the fair value of the CSP shares/SARs granted, including any market performance conditions and excluding the impact of any service and non-market performance vesting conditions (for example, profitability, sales growth targets and remaining an employee of the entity over a specified time period), as well as including the impact of any non-vesting conditions (for example, the requirement for employees to save). Non-market vesting conditions are included in assumptions about the number of CSP shares/SARs that are expected to vest. At each statement of financial position date, the entity revises its estimates of the number of CSP shares/SARs that are expected to vest. It recognises the impact of the revision of original estimates, if any, in the income statement and a corresponding adjustment to equity over the remaining vesting period. The proceeds received net of any directly attributable transaction costs are credited to share capital (nominal value) when the CSP shares/SARs are exercised.
The grant by the Company of CSP shares/SARs relating to its equity instruments to the employees of subsidiary undertakings in the Group is treated as a capital contribution. The fair value of employee services received, measured with reference to the grant date fair value, is recognised over the vesting period as an increase to investment in subsidiary undertakings, with a corresponding credit to equity in the parent’s accounts.
Long-service awards
Long-service awards are provided to employees who achieve certain predetermined milestones of service within the Group. The Group’s obligation is valued by independent qualified professionals at year-end and the corresponding liability is raised. Costs incurred are set off against the liability. Movements in the liability resulting from the valuation, including notional interest, are charged against the income statement upon valuation. The projected unit credit method is used to determine the present value of the long-service awards obligation.
Bonus plans
The Group recognises a liability and an expense for bonuses and profit-sharing, based on a formula that takes into consideration the profit attributable to the Company’s shareholders after certain adjustments. The Group recognises a provision where contractually obliged or where there is a past practice that has created a constructive obligation.
1.23 Revenue from contracts with customers and other incomeRevenue recognition
Revenue comprises the fair value of the consideration received or receivable for the sale of goods in the ordinary course of the Group’s activities, including excise duty, but net of value added tax (VAT), general sales taxes (GST), rebates and discounts, and after eliminating sales within the Group. The Group’s revenue consists mostly of sales of liquor products delivered to customers at the point of sale and does not have multiple performance obligations included in it. The Group recognises revenue when it transfers control over a good to a customer.
Excise duty is not directly related to sales, unlike VAT. It is not recognised as a separate item on invoices. Increases in excise duty are not always directly passed on to customers and the Group cannot reclaim the excise duty where customers do not pay for products received. The Group considers excise duty as a cost to the Group and reflects it in ‘costs of goods sold’ and, consequently, any excise duty that is recovered in and forms part of the transaction price is included in revenue.
Revenue is recognised as follows:
Sales of goods are recognised when control of goods is transferred to the customer which is upon delivery of products and customer acceptance.
040. 2 0 2 1 C O N S O L I D A T E D A n n u a l f i n a n c i a l s t a t e m e n t s
CONSOLIDATED ANNUAL FINANCIAL STATEMENTS
1. SIGNIFICANT ACCOUNTING POLICIES CONTINUED
1.23 Revenue from contracts with customers and other income continuedRevenue recognition continued
The Group manufactures and sells a range of alcoholic and non-alcoholic products in various categories and to a range of customers, including the wholesalers, retailers and redistributors. Sales are recognised when control of the products has transferred, being when the products are delivered to the customer, the customer has full discretion over the products, and there is no unfulfilled obligation that could affect the customers’ acceptance of the products. Delivery occurs when the products have been shipped to the specific location, the risks of obsolescence and loss, i.e. risks and rewards of ownership, have been transferred to the customer, and either the customer has accepted the products in accordance with the sales contract, the acceptance provisions have lapsed, or the Group has objective evidence that all criteria for acceptance have been satisfied and therefore has right to payment.
The products sold often include various types of discounts, including volume discounts based on aggregate sales and early settlement discounts which are considered to represent variable consideration. Revenue from these sales is recognised based on the price specified in the contract, net of the estimated discounts. Accumulated experience is used to estimate and provide for the discounts, using the expected value method, and revenue is only recognised to the extent that it is highly probable that a significant reversal will not occur. A liability (included in trade and other payables) is recognised for expected discounts payable to customers in relation to sales made until the end of the reporting period. No element of financing is deemed present as the sales are made with credit terms which are consistent with market practice.
The Group’s obligation to replace or accept return of faulty products is recognised as a refund liability (included in trade and other payables) and a right to the returned goods (included in other current assets) is recognised for the products expected to be returned. The value of the returned goods is based on the cost of the products expected to be returned. Accumulated experience is used to estimate such returns at the time of sale at a category level (expected value method). Because the number of products returned has been steady for years, it is highly probable that a significant reversal in the cumulative revenue recognised will not occur. The validity of this assumption and the estimated amount of returns are reassessed at each reporting date.
A receivable is recognised when control of goods is transferred upon delivery as this is the point in time that the consideration is unconditional because only the passage of time is required before the payment is due, which is generally considered to be less than 12 months.
The Group makes payments in the form of various rebates and allowances to customers linked to distribution or sales and marketing functions carried out by them. Due to such consideration paid or payable to a customer of the Group not relating to distinct services provided by the customer to the Group, these costs are accounted for against revenue at the later of when the Group recognises revenue for the transfer of the related goods or when the Group pays or promises to pay the consideration to the customer.
Recognition of other income streams
• Interest income is recognised on a time-proportion basis using the effective interest rate method.
• Dividend income is recognised when the shareholder has an irrevocable right to receive payment.
1.24 Earnings per shareEarnings and headline earnings per share are calculated by dividing the net profit attributable to shareholders by the weighted average number of ordinary shares in issue during the year, excluding the ordinary shares held by the Group as treasury shares.
For the diluted earnings per share, the weighted average number of ordinary shares in issue is adjusted to assume conversion of all ordinary shares with dilutive potential. CSP shares and SARs have dilutive potential. For the CSP/SARs a calculation is done to determine the number of shares that could have been acquired, at the average share price, based on the monetary value of subscription rights attached to outstanding CSP shares/SARs in order to determine the ‘bonus’ element. The ‘bonus’ shares are added to the ordinary shares in issue. No adjustment is made to net profit, as the CSP shares/SARs have no income statement effect.
NOTES TO THE ANNUAL FINANCIAL STATEMENTS continuedfor the year ended 30 June 2021
041.WWW.DISTELL.CO.ZA
1. SIGNIFICANT ACCOUNTING POLICIES CONTINUED
1.25 Dividend distributionDividend distribution to the Company’s shareholders is recognised as a liability in the Group’s financial statements in the period in which the dividends are approved by the Company’s shareholders.
1.26 Non-current assets held for saleNon-current assets (or disposal groups) held for sale are classified as assets held for sale and are stated at the lower of the carrying amount and fair value, less costs to sell if their carrying amount is recovered principally through a sale transaction rather than through continued use.
An impairment loss is recognised for any initial or subsequent write-down of the asset (or disposal group) to fair value less costs to sell. A gain is recognised for any subsequent increases in fair value less costs to sell off an asset (or disposal group), but not in excess of any cumulative impairment loss previously recognised. A gain or loss not previously recognised by the date of the sale of the non-current asset (or disposal group) is recognised at the date of recognition.
Non-current assets (including those that are part of a disposal group) are not depreciated or amortised while they are classified as held for sale. Interest and other expenses attributable to the liabilities of a disposal group classified as held for sale continue to be recognised.
1.27 Related partiesIndividuals or entities are related parties if one party has the ability, directly or indirectly, to control or jointly control the other party or exercise significant influence over the other party in making financial and/or operating decisions. Key management personnel are also considered to be related parties and are defined as members of the executive committee of Distell Limited – the main operating company of the Group.
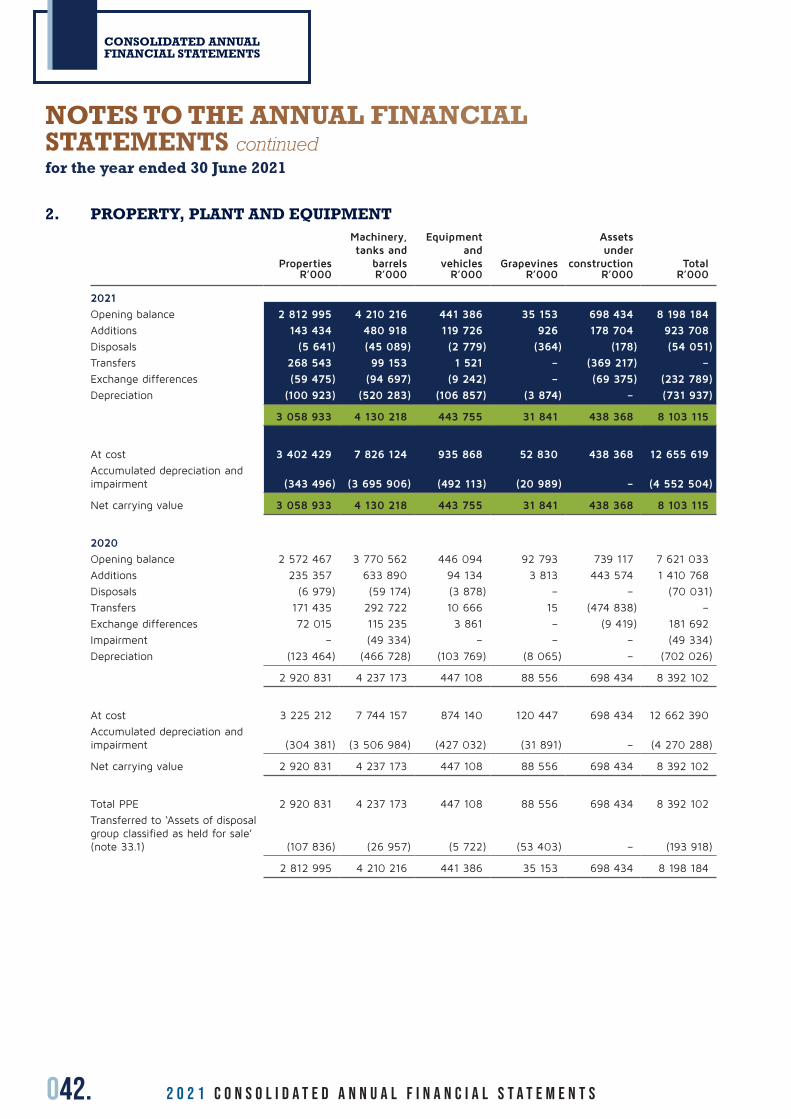
042. 2 0 2 1 C O N S O L I D A T E D A n n u a l f i n a n c i a l s t a t e m e n t s
CONSOLIDATED ANNUAL FINANCIAL STATEMENTS
2. PROPERTY, PLANT AND EQUIPMENT
Properties
Machinery, tanks and
barrels
Equipment and
vehicles Grapevines
Assets under
construction TotalR’000 R’000 R’000 R’000 R’000 R’000
2021
Opening balance 2 812 995 4 210 216 441 386 35 153 698 434 8 198 184
Additions 143 434 480 918 119 726 926 178 704 923 708
Disposals (5 641) (45 089) (2 779) (364) (178) (54 051)
Transfers 268 543 99 153 1 521 – (369 217) –
Exchange differences (59 475) (94 697) (9 242) – (69 375) (232 789)
Depreciation (100 923) (520 283) (106 857) (3 874) – (731 937)
3 058 933 4 130 218 443 755 31 841 438 368 8 103 115
At cost 3 402 429 7 826 124 935 868 52 830 438 368 12 655 619
Accumulated depreciation and impairment (343 496) (3 695 906) (492 113) (20 989) – (4 552 504)
Net carrying value 3 058 933 4 130 218 443 755 31 841 438 368 8 103 115
2020
Opening balance 2 572 467 3 770 562 446 094 92 793 739 117 7 621 033
Additions 235 357 633 890 94 134 3 813 443 574 1 410 768
Disposals (6 979) (59 174) (3 878) – – (70 031)
Transfers 171 435 292 722 10 666 15 (474 838) –
Exchange differences 72 015 115 235 3 861 – (9 419) 181 692
Impairment – (49 334) – – – (49 334)
Depreciation (123 464) (466 728) (103 769) (8 065) – (702 026)
2 920 831 4 237 173 447 108 88 556 698 434 8 392 102
At cost 3 225 212 7 744 157 874 140 120 447 698 434 12 662 390
Accumulated depreciation and impairment (304 381) (3 506 984) (427 032) (31 891) – (4 270 288)
Net carrying value 2 920 831 4 237 173 447 108 88 556 698 434 8 392 102
Total PPE 2 920 831 4 237 173 447 108 88 556 698 434 8 392 102
Transferred to ‘Assets of disposal group classified as held for sale’ (note 33.1) (107 836) (26 957) (5 722) (53 403) – (193 918)
2 812 995 4 210 216 441 386 35 153 698 434 8 198 184
NOTES TO THE ANNUAL FINANCIAL STATEMENTS continuedfor the year ended 30 June 2021
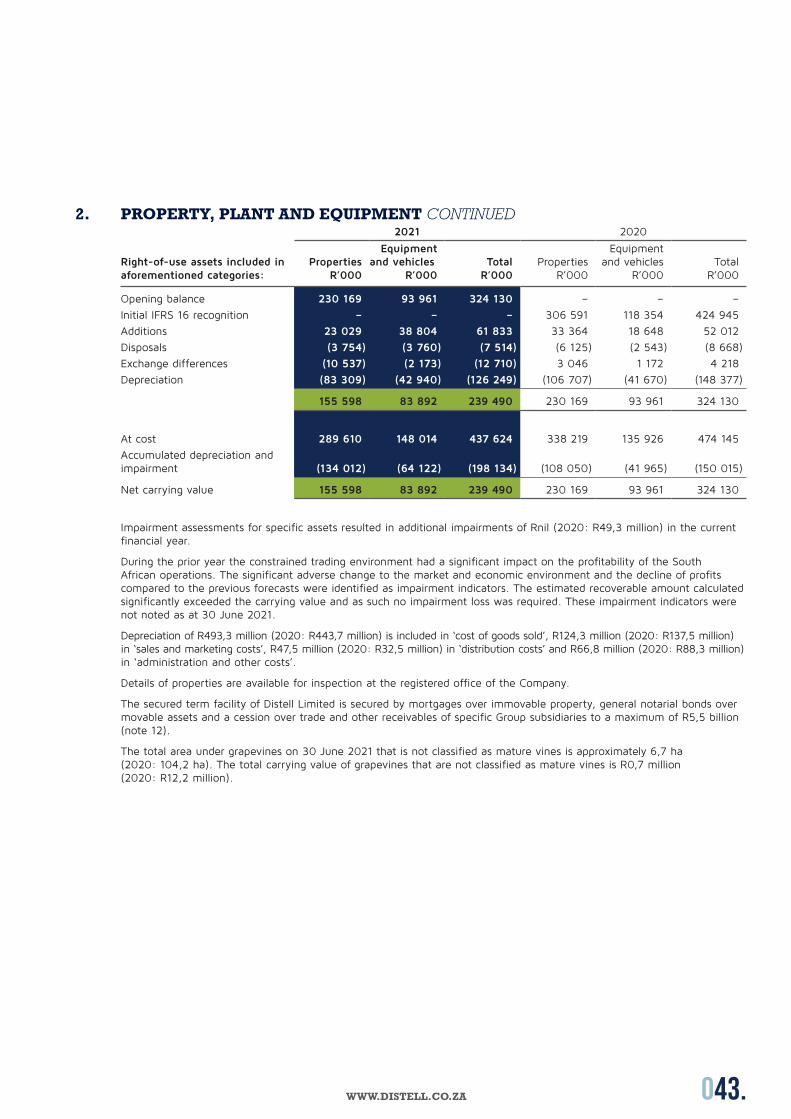
043.WWW.DISTELL.CO.ZA
2. PROPERTY, PLANT AND EQUIPMENT CONTINUED2021 2020
Right-of-use assets included in aforementioned categories:
PropertiesR’000
Equipment and vehicles
R’000Total
R’000Properties
R’000
Equipment and vehicles
R’000Total
R’000
Opening balance 230 169 93 961 324 130 – – –
Initial IFRS 16 recognition – – – 306 591 118 354 424 945
Additions 23 029 38 804 61 833 33 364 18 648 52 012
Disposals (3 754) (3 760) (7 514) (6 125) (2 543) (8 668)
Exchange differences (10 537) (2 173) (12 710) 3 046 1 172 4 218
Depreciation (83 309) (42 940) (126 249) (106 707) (41 670) (148 377)
155 598 83 892 239 490 230 169 93 961 324 130
At cost 289 610 148 014 437 624 338 219 135 926 474 145
Accumulated depreciation and impairment (134 012) (64 122) (198 134) (108 050) (41 965) (150 015)
Net carrying value 155 598 83 892 239 490 230 169 93 961 324 130
Impairment assessments for specific assets resulted in additional impairments of Rnil (2020: R49,3 million) in the current financial year.
During the prior year the constrained trading environment had a significant impact on the profitability of the South African operations. The significant adverse change to the market and economic environment and the decline of profits compared to the previous forecasts were identified as impairment indicators. The estimated recoverable amount calculated significantly exceeded the carrying value and as such no impairment loss was required. These impairment indicators were not noted as at 30 June 2021.
Depreciation of R493,3 million (2020: R443,7 million) is included in ‘cost of goods sold’, R124,3 million (2020: R137,5 million) in ‘sales and marketing costs’, R47,5 million (2020: R32,5 million) in ‘distribution costs’ and R66,8 million (2020: R88,3 million) in ‘administration and other costs’.
Details of properties are available for inspection at the registered office of the Company.
The secured term facility of Distell Limited is secured by mortgages over immovable property, general notarial bonds over movable assets and a cession over trade and other receivables of specific Group subsidiaries to a maximum of R5,5 billion (note 12).
The total area under grapevines on 30 June 2021 that is not classified as mature vines is approximately 6,7 ha (2020: 104,2 ha). The total carrying value of grapevines that are not classified as mature vines is R0,7 million (2020: R12,2 million).
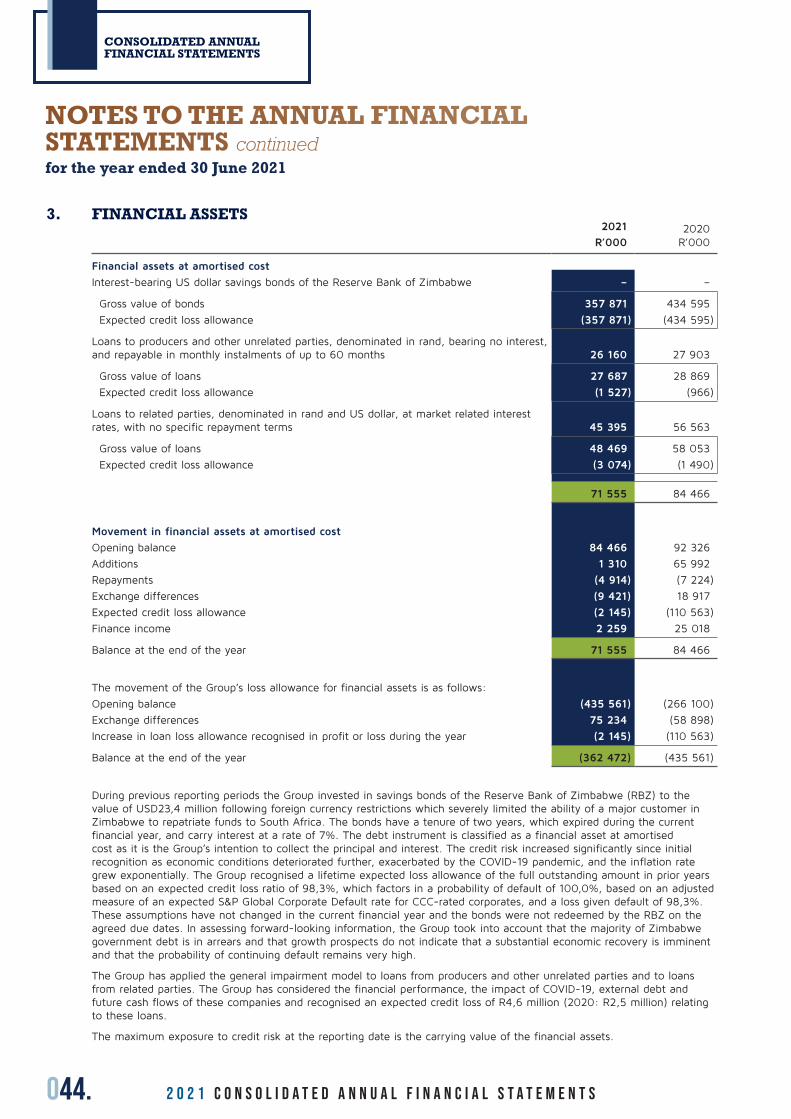
044. 2 0 2 1 C O N S O L I D A T E D A n n u a l f i n a n c i a l s t a t e m e n t s
CONSOLIDATED ANNUAL FINANCIAL STATEMENTS
3. FINANCIAL ASSETS2021
R’0002020
R’000
Financial assets at amortised cost
Interest-bearing US dollar savings bonds of the Reserve Bank of Zimbabwe – –
Gross value of bonds 357 871 434 595
Expected credit loss allowance (357 871) (434 595)
Loans to producers and other unrelated parties, denominated in rand, bearing no interest, and repayable in monthly instalments of up to 60 months 26 160 27 903
Gross value of loans 27 687 28 869
Expected credit loss allowance (1 527) (966)
Loans to related parties, denominated in rand and US dollar, at market related interest rates, with no specific repayment terms 45 395 56 563
Gross value of loans 48 469 58 053
Expected credit loss allowance (3 074) (1 490)
71 555 84 466
Movement in financial assets at amortised cost
Opening balance 84 466 92 326
Additions 1 310 65 992
Repayments (4 914) (7 224)
Exchange differences (9 421) 18 917
Expected credit loss allowance (2 145) (110 563)
Finance income 2 259 25 018
Balance at the end of the year 71 555 84 466
The movement of the Group’s loss allowance for financial assets is as follows:
Opening balance (435 561) (266 100)
Exchange differences 75 234 (58 898)
Increase in loan loss allowance recognised in profit or loss during the year (2 145) (110 563)
Balance at the end of the year (362 472) (435 561)
During previous reporting periods the Group invested in savings bonds of the Reserve Bank of Zimbabwe (RBZ) to the value of USD23,4 million following foreign currency restrictions which severely limited the ability of a major customer in Zimbabwe to repatriate funds to South Africa. The bonds have a tenure of two years, which expired during the current financial year, and carry interest at a rate of 7%. The debt instrument is classified as a financial asset at amortised cost as it is the Group’s intention to collect the principal and interest. The credit risk increased significantly since initial recognition as economic conditions deteriorated further, exacerbated by the COVID-19 pandemic, and the inflation rate grew exponentially. The Group recognised a lifetime expected loss allowance of the full outstanding amount in prior years based on an expected credit loss ratio of 98,3%, which factors in a probability of default of 100,0%, based on an adjusted measure of an expected S&P Global Corporate Default rate for CCC-rated corporates, and a loss given default of 98,3%. These assumptions have not changed in the current financial year and the bonds were not redeemed by the RBZ on the agreed due dates. In assessing forward-looking information, the Group took into account that the majority of Zimbabwe government debt is in arrears and that growth prospects do not indicate that a substantial economic recovery is imminent and that the probability of continuing default remains very high.
The Group has applied the general impairment model to loans from producers and other unrelated parties and to loans from related parties. The Group has considered the financial performance, the impact of COVID-19, external debt and future cash flows of these companies and recognised an expected credit loss of R4,6 million (2020: R2,5 million) relating to these loans.
The maximum exposure to credit risk at the reporting date is the carrying value of the financial assets.
NOTES TO THE ANNUAL FINANCIAL STATEMENTS continuedfor the year ended 30 June 2021
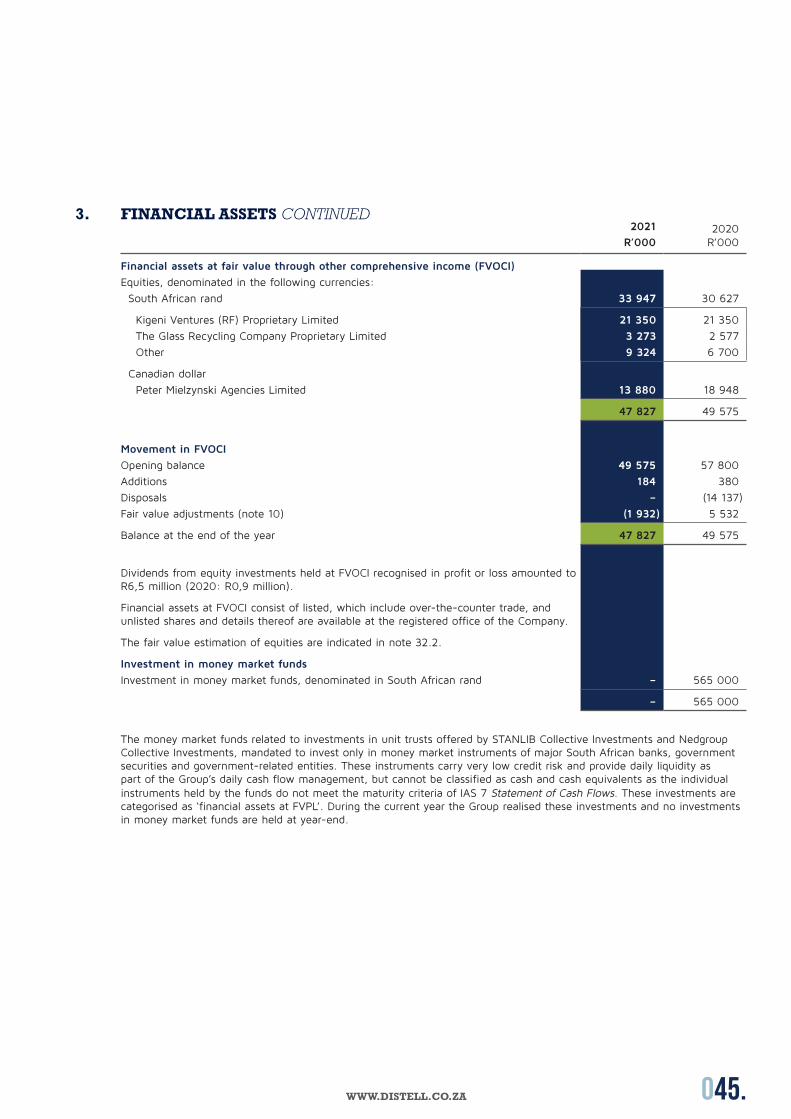
045.WWW.DISTELL.CO.ZA
3. FINANCIAL ASSETS CONTINUED2021
R’0002020
R’000
Financial assets at fair value through other comprehensive income (FVOCI)
Equities, denominated in the following currencies:
South African rand 33 947 30 627
Kigeni Ventures (RF) Proprietary Limited 21 350 21 350
The Glass Recycling Company Proprietary Limited 3 273 2 577
Other 9 324 6 700
Canadian dollar
Peter Mielzynski Agencies Limited 13 880 18 948
47 827 49 575
Movement in FVOCI
Opening balance 49 575 57 800
Additions 184 380
Disposals – (14 137)
Fair value adjustments (note 10) (1 932) 5 532
Balance at the end of the year 47 827 49 575
Dividends from equity investments held at FVOCI recognised in profit or loss amounted to R6,5 million (2020: R0,9 million).
Financial assets at FVOCI consist of listed, which include over-the-counter trade, and unlisted shares and details thereof are available at the registered office of the Company.
The fair value estimation of equities are indicated in note 32.2.
Investment in money market funds
Investment in money market funds, denominated in South African rand – 565 000
– 565 000
The money market funds related to investments in unit trusts offered by STANLIB Collective Investments and Nedgroup Collective Investments, mandated to invest only in money market instruments of major South African banks, government securities and government-related entities. These instruments carry very low credit risk and provide daily liquidity as part of the Group’s daily cash flow management, but cannot be classified as cash and cash equivalents as the individual instruments held by the funds do not meet the maturity criteria of IAS 7 Statement of Cash Flows. These investments are categorised as ‘financial assets at FVPL’. During the current year the Group realised these investments and no investments in money market funds are held at year-end.
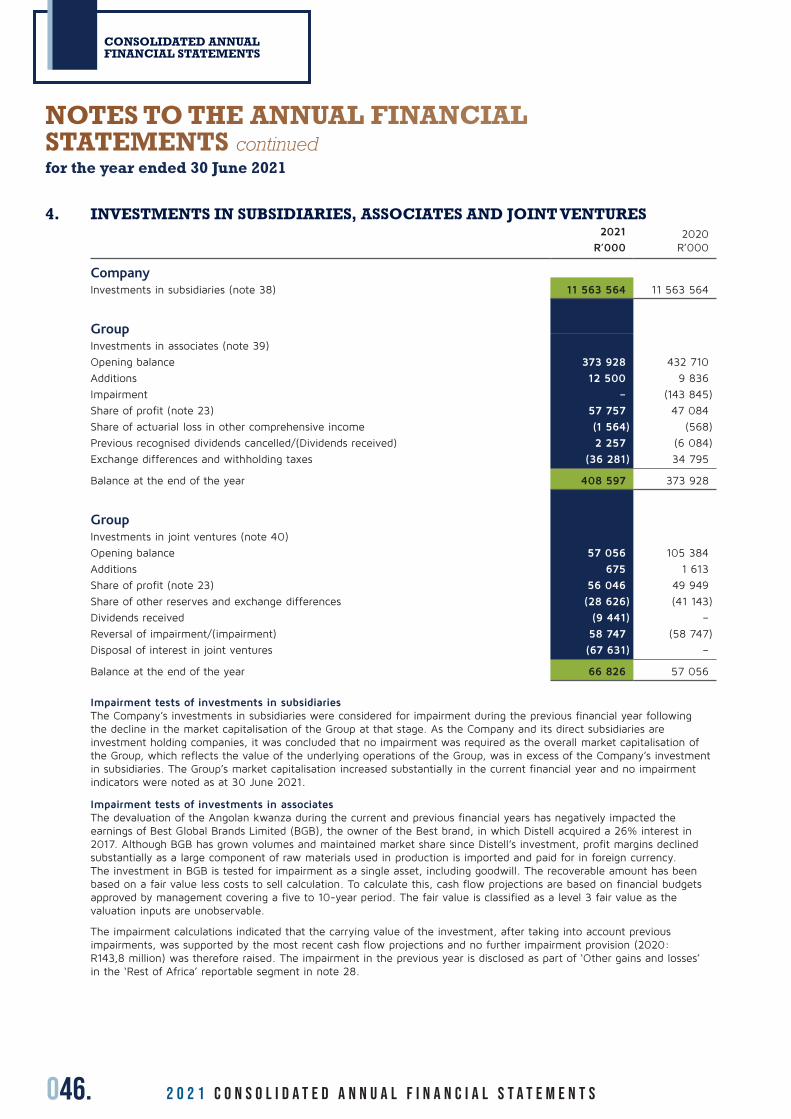
046. 2 0 2 1 C O N S O L I D A T E D A n n u a l f i n a n c i a l s t a t e m e n t s
CONSOLIDATED ANNUAL FINANCIAL STATEMENTS
4. INVESTMENTS IN SUBSIDIARIES, ASSOCIATES AND JOINT VENTURES2021
R’0002020
R’000
CompanyInvestments in subsidiaries (note 38) 11 563 564 11 563 564
GroupInvestments in associates (note 39)
Opening balance 373 928 432 710
Additions 12 500 9 836
Impairment – (143 845)
Share of profit (note 23) 57 757 47 084
Share of actuarial loss in other comprehensive income (1 564) (568)
Previous recognised dividends cancelled/(Dividends received) 2 257 (6 084)
Exchange differences and withholding taxes (36 281) 34 795
Balance at the end of the year 408 597 373 928
GroupInvestments in joint ventures (note 40)
Opening balance 57 056 105 384
Additions 675 1 613
Share of profit (note 23) 56 046 49 949
Share of other reserves and exchange differences (28 626) (41 143)
Dividends received (9 441) –
Reversal of impairment/(impairment) 58 747 (58 747)
Disposal of interest in joint ventures (67 631) –
Balance at the end of the year 66 826 57 056
Impairment tests of investments in subsidiariesThe Company’s investments in subsidiaries were considered for impairment during the previous financial year following the decline in the market capitalisation of the Group at that stage. As the Company and its direct subsidiaries are investment holding companies, it was concluded that no impairment was required as the overall market capitalisation of the Group, which reflects the value of the underlying operations of the Group, was in excess of the Company’s investment in subsidiaries. The Group’s market capitalisation increased substantially in the current financial year and no impairment indicators were noted as at 30 June 2021.
Impairment tests of investments in associatesThe devaluation of the Angolan kwanza during the current and previous financial years has negatively impacted the earnings of Best Global Brands Limited (BGB), the owner of the Best brand, in which Distell acquired a 26% interest in 2017. Although BGB has grown volumes and maintained market share since Distell’s investment, profit margins declined substantially as a large component of raw materials used in production is imported and paid for in foreign currency. The investment in BGB is tested for impairment as a single asset, including goodwill. The recoverable amount has been based on a fair value less costs to sell calculation. To calculate this, cash flow projections are based on financial budgets approved by management covering a five to 10-year period. The fair value is classified as a level 3 fair value as the valuation inputs are unobservable.
The impairment calculations indicated that the carrying value of the investment, after taking into account previous impairments, was supported by the most recent cash flow projections and no further impairment provision (2020: R143,8 million) was therefore raised. The impairment in the previous year is disclosed as part of ‘Other gains and losses’ in the ‘Rest of Africa’ reportable segment in note 28.
NOTES TO THE ANNUAL FINANCIAL STATEMENTS continuedfor the year ended 30 June 2021
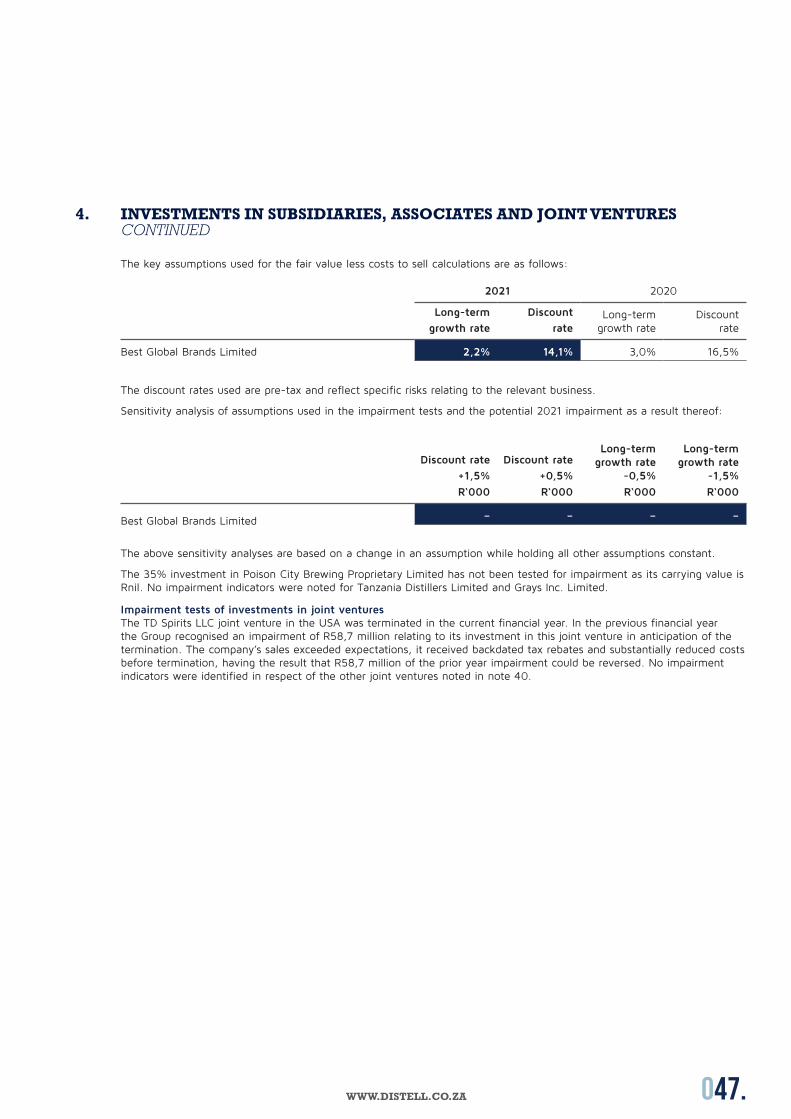
047.WWW.DISTELL.CO.ZA
4. INVESTMENTS IN SUBSIDIARIES, ASSOCIATES AND JOINT VENTURES CONTINUED
The key assumptions used for the fair value less costs to sell calculations are as follows:
2021 2020
Long-term
growth rate
Discount
rateLong-term
growth rateDiscount
rate
Best Global Brands Limited 2,2% 14,1% 3,0% 16,5%
The discount rates used are pre-tax and reflect specific risks relating to the relevant business.
Sensitivity analysis of assumptions used in the impairment tests and the potential 2021 impairment as a result thereof:
Discount rate
+1,5%
Discount rate
+0,5%
Long-term growth rate
-0,5%
Long-term growth rate
-1,5%
R‘000 R‘000 R‘000 R‘000
Best Global Brands Limited – – – –
The above sensitivity analyses are based on a change in an assumption while holding all other assumptions constant.
The 35% investment in Poison City Brewing Proprietary Limited has not been tested for impairment as its carrying value is Rnil. No impairment indicators were noted for Tanzania Distillers Limited and Grays Inc. Limited.
Impairment tests of investments in joint venturesThe TD Spirits LLC joint venture in the USA was terminated in the current financial year. In the previous financial year the Group recognised an impairment of R58,7 million relating to its investment in this joint venture in anticipation of the termination. The company’s sales exceeded expectations, it received backdated tax rebates and substantially reduced costs before termination, having the result that R58,7 million of the prior year impairment could be reversed. No impairment indicators were identified in respect of the other joint ventures noted in note 40.

048. 2 0 2 1 C O N S O L I D A T E D A n n u a l f i n a n c i a l s t a t e m e n t s
CONSOLIDATED ANNUAL FINANCIAL STATEMENTS
5. INTANGIBLE ASSETSIndustrial property
rightsR‘000
Capitalisedsoftware
R‘000 Goodwill
R‘000
Trademarks and other
intangibles R‘000
Total R‘000
2021Opening balance 9 659 177 758 1 208 131 872 009 2 267 557 Additions – 73 456 – – 73 456 Exchange differences (2 554) (387) (86 821) (87 783) (177 545)Disposals – (1) – – (1)Amortisation (184) (55 170) – (25 354) (80 708)
Balance at the end of the year 6 921 195 656 1 121 310 758 872 2 082 759
Cost 9 904 563 189 1 121 310 883 282 2 577 685Accumulated amortisation and impairment (2 983) (367 533) – (124 410) (494 926)
Net carrying value 6 921 195 656 1 121 310 758 872 2 082 759
Finite useful life 6 921 195 656 – 91 446 294 023 Indefinite useful life – – 1 121 310 667 426 1 788 736
6 921 195 656 1 121 310 758 872 2 082 759
2020Opening balance 14 937 137 667 1 023 386 775 997 1 951 987 Additions – 112 488 – 8 302 120 790 Exchange differences (5 021) 824 184 745 136 130 316 678 Disposals – (441) – – (441)Amortisation (257) (72 780) – (33 520) (106 557)
Balance at the end of the year 9 659 177 758 1 208 131 886 909 2 282 457
Cost 13 501 520 042 1 208 131 985 967 2 727 641 Accumulated amortisation and impairment (3 842) (342 284) – (99 058) (445 184)
Net carrying value 9 659 177 758 1 208 131 886 909 2 282 457
Finite useful life 9 659 177 758 – 132 636 320 053 Indefinite useful life – – 1 208 131 754 273 1 962 404
9 659 177 758 1 208 131 886 909 2 282 457
Total intangible assets 9 659 177 758 1 208 131 886 909 2 282 457 Transfer to ‘Assets of disposal group classified as held for sale’ (note 33.1) – – – (14 900) (14 900)
9 659 177 758 1 208 131 872 009 2 267 557
Amortisation is included in ‘administration and other costs’ in the income statement.
Included in trademarks and other intangibles are brand names, customer relationships and distribution rights relating to the acquisition of Distell International Limited, KWA Holdings E.A. Limited, Imported Premium Vodka Company Limited and by Henry Tayler and Ries Limited in prior years. These entities constitute the cash-generating units to which these items are attributed. The Alto trademark was sold in the current financial year.
Management regards the trademarks as having an indefinite useful life as there are no foreseeable limits on the time the trademarks are expected to provide future cash flows. COVID-19 had a short-term impact on the performance of these brands, but it recovered subsequently and it is not foreseen that it will impact the long-term viability of these brands. The trademarks are protected in all the major markets where they are sold and there is not believed to be any legal, regulatory or contractual provisions that limit the useful lives of these brands. The brands included in trademarks above are Scottish Leader, Black Bottle, Bunnahabhain, Tobermory, Deanston, Ledaig, Cruz Vodka, Kibao, Kingfisher, Caprice Wines, Hunter’s Choice, Altar Wines and Yatta Juice.
NOTES TO THE ANNUAL FINANCIAL STATEMENTS continuedfor the year ended 30 June 2021
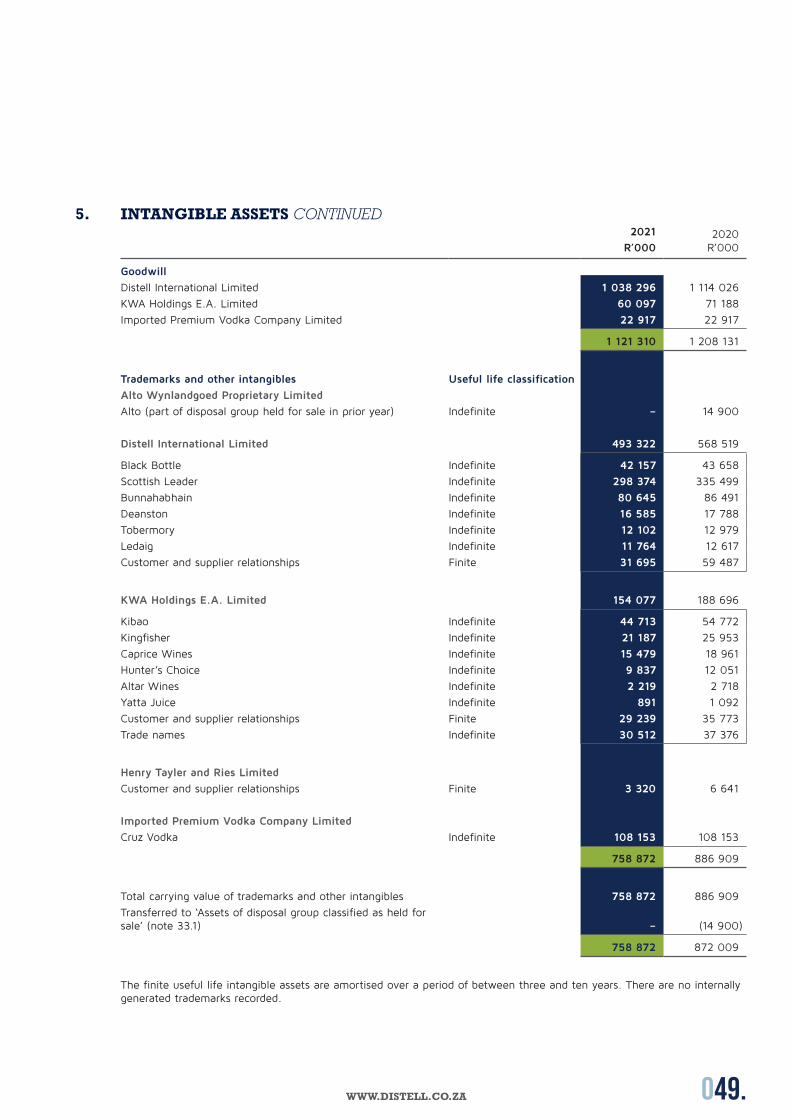
049.WWW.DISTELL.CO.ZA
5. INTANGIBLE ASSETS CONTINUED2021
R’0002020
R’000
Goodwill
Distell International Limited 1 038 296 1 114 026
KWA Holdings E.A. Limited 60 097 71 188
Imported Premium Vodka Company Limited 22 917 22 917
1 121 310 1 208 131
Trademarks and other intangibles Useful life classification
Alto Wynlandgoed Proprietary Limited
Alto (part of disposal group held for sale in prior year) Indefinite – 14 900
Distell International Limited 493 322 568 519
Black Bottle Indefinite 42 157 43 658
Scottish Leader Indefinite 298 374 335 499
Bunnahabhain Indefinite 80 645 86 491
Deanston Indefinite 16 585 17 788
Tobermory Indefinite 12 102 12 979
Ledaig Indefinite 11 764 12 617
Customer and supplier relationships Finite 31 695 59 487
KWA Holdings E.A. Limited 154 077 188 696
Kibao Indefinite 44 713 54 772
Kingfisher Indefinite 21 187 25 953
Caprice Wines Indefinite 15 479 18 961
Hunter’s Choice Indefinite 9 837 12 051
Altar Wines Indefinite 2 219 2 718
Yatta Juice Indefinite 891 1 092
Customer and supplier relationships Finite 29 239 35 773
Trade names Indefinite 30 512 37 376
Henry Tayler and Ries Limited
Customer and supplier relationships Finite 3 320 6 641
Imported Premium Vodka Company Limited
Cruz Vodka Indefinite 108 153 108 153
758 872 886 909
Total carrying value of trademarks and other intangibles 758 872 886 909
Transferred to ‘Assets of disposal group classified as held for sale’ (note 33.1) – (14 900)
758 872 872 009
The finite useful life intangible assets are amortised over a period of between three and ten years. There are no internally generated trademarks recorded.
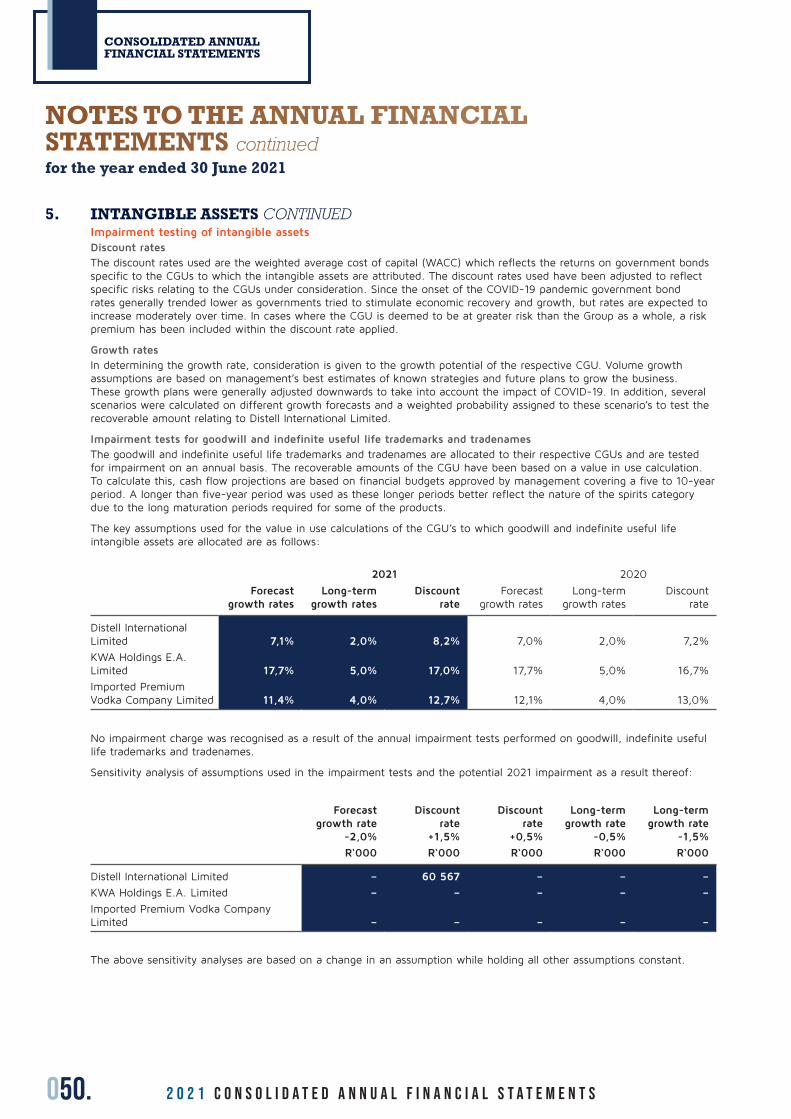
050. 2 0 2 1 C O N S O L I D A T E D A n n u a l f i n a n c i a l s t a t e m e n t s
CONSOLIDATED ANNUAL FINANCIAL STATEMENTS
5. INTANGIBLE ASSETS CONTINUEDImpairment testing of intangible assetsDiscount ratesThe discount rates used are the weighted average cost of capital (WACC) which reflects the returns on government bonds specific to the CGUs to which the intangible assets are attributed. The discount rates used have been adjusted to reflect specific risks relating to the CGUs under consideration. Since the onset of the COVID-19 pandemic government bond rates generally trended lower as governments tried to stimulate economic recovery and growth, but rates are expected to increase moderately over time. In cases where the CGU is deemed to be at greater risk than the Group as a whole, a risk premium has been included within the discount rate applied.
Growth ratesIn determining the growth rate, consideration is given to the growth potential of the respective CGU. Volume growth assumptions are based on management’s best estimates of known strategies and future plans to grow the business. These growth plans were generally adjusted downwards to take into account the impact of COVID-19. In addition, several scenarios were calculated on different growth forecasts and a weighted probability assigned to these scenario’s to test the recoverable amount relating to Distell International Limited.
Impairment tests for goodwill and indefinite useful life trademarks and tradenamesThe goodwill and indefinite useful life trademarks and tradenames are allocated to their respective CGUs and are tested for impairment on an annual basis. The recoverable amounts of the CGU have been based on a value in use calculation. To calculate this, cash flow projections are based on financial budgets approved by management covering a five to 10-year period. A longer than five-year period was used as these longer periods better reflect the nature of the spirits category due to the long maturation periods required for some of the products.
The key assumptions used for the value in use calculations of the CGU’s to which goodwill and indefinite useful life intangible assets are allocated are as follows:
2021 2020
Forecast growth rates
Long-term growth rates
Discount rate
Forecast growth rates
Long-term growth rates
Discount rate
Distell International Limited 7,1% 2,0% 8,2% 7,0% 2,0% 7,2%
KWA Holdings E.A. Limited 17,7% 5,0% 17,0% 17,7% 5,0% 16,7%
Imported Premium Vodka Company Limited 11,4% 4,0% 12,7% 12,1% 4,0% 13,0%
No impairment charge was recognised as a result of the annual impairment tests performed on goodwill, indefinite useful life trademarks and tradenames.
Sensitivity analysis of assumptions used in the impairment tests and the potential 2021 impairment as a result thereof:
Forecast growth rate
-2,0%
Discount rate
+1,5%
Discount rate
+0,5%
Long-term growth rate
-0,5%
Long-term growth rate
-1,5%
R‘000 R‘000 R‘000 R‘000 R‘000
Distell International Limited – 60 567 – – –
KWA Holdings E.A. Limited – – – – –
Imported Premium Vodka Company Limited – – – – –
The above sensitivity analyses are based on a change in an assumption while holding all other assumptions constant.
NOTES TO THE ANNUAL FINANCIAL STATEMENTS continuedfor the year ended 30 June 2021
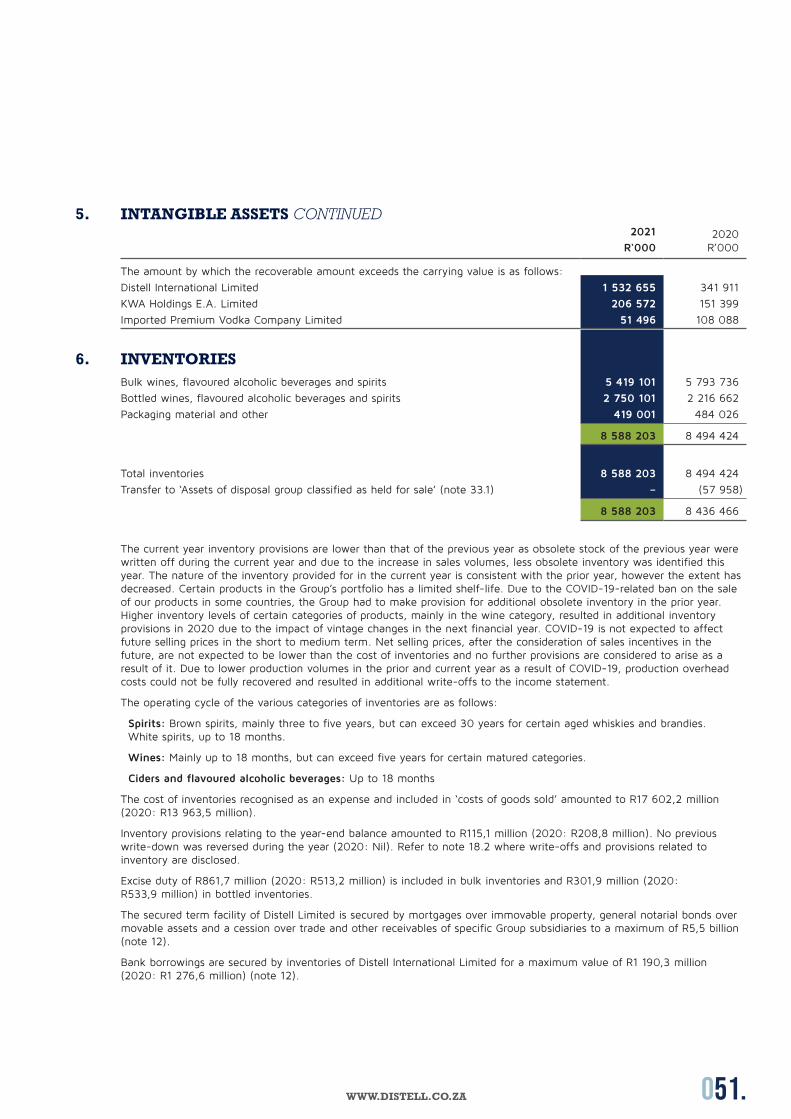
051.WWW.DISTELL.CO.ZA
5. INTANGIBLE ASSETS CONTINUED2021
R‘0002020
R’000
The amount by which the recoverable amount exceeds the carrying value is as follows:
Distell International Limited 1 532 655 341 911
KWA Holdings E.A. Limited 206 572 151 399
Imported Premium Vodka Company Limited 51 496 108 088
6. INVENTORIESBulk wines, flavoured alcoholic beverages and spirits 5 419 101 5 793 736
Bottled wines, flavoured alcoholic beverages and spirits 2 750 101 2 216 662
Packaging material and other 419 001 484 026
8 588 203 8 494 424
Total inventories 8 588 203 8 494 424
Transfer to ‘Assets of disposal group classified as held for sale’ (note 33.1) – (57 958)
8 588 203 8 436 466
The current year inventory provisions are lower than that of the previous year as obsolete stock of the previous year were written off during the current year and due to the increase in sales volumes, less obsolete inventory was identified this year. The nature of the inventory provided for in the current year is consistent with the prior year, however the extent has decreased. Certain products in the Group’s portfolio has a limited shelf-life. Due to the COVID-19-related ban on the sale of our products in some countries, the Group had to make provision for additional obsolete inventory in the prior year. Higher inventory levels of certain categories of products, mainly in the wine category, resulted in additional inventory provisions in 2020 due to the impact of vintage changes in the next financial year. COVID-19 is not expected to affect future selling prices in the short to medium term. Net selling prices, after the consideration of sales incentives in the future, are not expected to be lower than the cost of inventories and no further provisions are considered to arise as a result of it. Due to lower production volumes in the prior and current year as a result of COVID-19, production overhead costs could not be fully recovered and resulted in additional write-offs to the income statement.
The operating cycle of the various categories of inventories are as follows:
Spirits: Brown spirits, mainly three to five years, but can exceed 30 years for certain aged whiskies and brandies. White spirits, up to 18 months.
Wines: Mainly up to 18 months, but can exceed five years for certain matured categories.
Ciders and flavoured alcoholic beverages: Up to 18 months
The cost of inventories recognised as an expense and included in ‘costs of goods sold’ amounted to R17 602,2 million (2020: R13 963,5 million).
Inventory provisions relating to the year-end balance amounted to R115,1 million (2020: R208,8 million). No previous write-down was reversed during the year (2020: Nil). Refer to note 18.2 where write-offs and provisions related to inventory are disclosed.
Excise duty of R861,7 million (2020: R513,2 million) is included in bulk inventories and R301,9 million (2020: R533,9 million) in bottled inventories.
The secured term facility of Distell Limited is secured by mortgages over immovable property, general notarial bonds over movable assets and a cession over trade and other receivables of specific Group subsidiaries to a maximum of R5,5 billion (note 12).
Bank borrowings are secured by inventories of Distell International Limited for a maximum value of R1 190,3 million (2020: R1 276,6 million) (note 12).
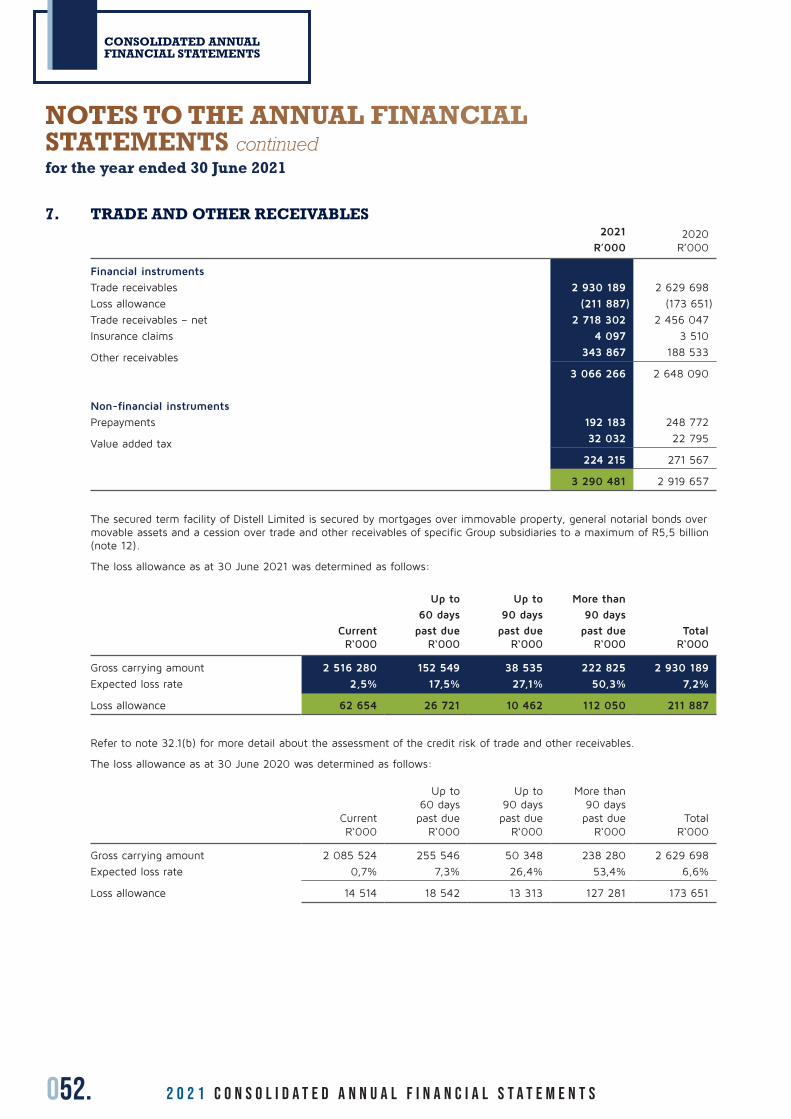
052. 2 0 2 1 C O N S O L I D A T E D A n n u a l f i n a n c i a l s t a t e m e n t s
CONSOLIDATED ANNUAL FINANCIAL STATEMENTS
7. TRADE AND OTHER RECEIVABLES2021
R’0002020
R’000
Financial instruments
Trade receivables 2 930 189 2 629 698
Loss allowance (211 887) (173 651)
Trade receivables – net 2 718 302 2 456 047
Insurance claims 4 097 3 510
Other receivables 343 867 188 533
3 066 266 2 648 090
Non-financial instruments
Prepayments 192 183 248 772
Value added tax 32 032 22 795
224 215 271 567
3 290 481 2 919 657
The secured term facility of Distell Limited is secured by mortgages over immovable property, general notarial bonds over movable assets and a cession over trade and other receivables of specific Group subsidiaries to a maximum of R5,5 billion (note 12).
The loss allowance as at 30 June 2021 was determined as follows:
CurrentR‘000
Up to
60 days
past dueR‘000
Up to
90 days
past dueR‘000
More than
90 days
past dueR‘000
TotalR‘000
Gross carrying amount 2 516 280 152 549 38 535 222 825 2 930 189
Expected loss rate 2,5% 17,5% 27,1% 50,3% 7,2%
Loss allowance 62 654 26 721 10 462 112 050 211 887
Refer to note 32.1(b) for more detail about the assessment of the credit risk of trade and other receivables.
The loss allowance as at 30 June 2020 was determined as follows:
CurrentR‘000
Up to 60 days past due
R‘000
Up to 90 days past due
R‘000
More than 90 days past due
R‘000 TotalR‘000
Gross carrying amount 2 085 524 255 546 50 348 238 280 2 629 698
Expected loss rate 0,7% 7,3% 26,4% 53,4% 6,6%
Loss allowance 14 514 18 542 13 313 127 281 173 651
NOTES TO THE ANNUAL FINANCIAL STATEMENTS continuedfor the year ended 30 June 2021
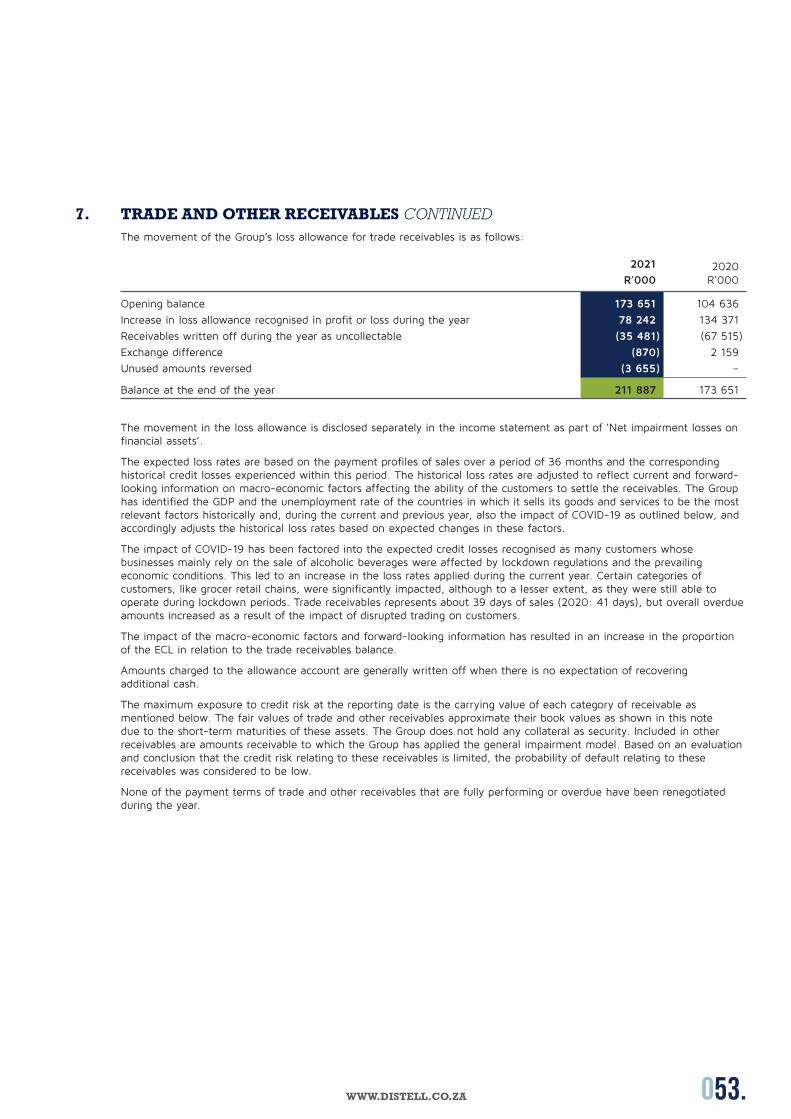
053.WWW.DISTELL.CO.ZA
7. TRADE AND OTHER RECEIVABLES CONTINUEDThe movement of the Group’s loss allowance for trade receivables is as follows:
2021
R’000 2020R’000
Opening balance 173 651 104 636
Increase in loss allowance recognised in profit or loss during the year 78 242 134 371
Receivables written off during the year as uncollectable (35 481) (67 515)
Exchange difference (870) 2 159
Unused amounts reversed (3 655) –
Balance at the end of the year 211 887 173 651
The movement in the loss allowance is disclosed separately in the income statement as part of ‘Net impairment losses on financial assets’.
The expected loss rates are based on the payment profiles of sales over a period of 36 months and the corresponding historical credit losses experienced within this period. The historical loss rates are adjusted to reflect current and forward-looking information on macro-economic factors affecting the ability of the customers to settle the receivables. The Group has identified the GDP and the unemployment rate of the countries in which it sells its goods and services to be the most relevant factors historically and, during the current and previous year, also the impact of COVID-19 as outlined below, and accordingly adjusts the historical loss rates based on expected changes in these factors.
The impact of COVID-19 has been factored into the expected credit losses recognised as many customers whose businesses mainly rely on the sale of alcoholic beverages were affected by lockdown regulations and the prevailing economic conditions. This led to an increase in the loss rates applied during the current year. Certain categories of customers, like grocer retail chains, were significantly impacted, although to a lesser extent, as they were still able to operate during lockdown periods. Trade receivables represents about 39 days of sales (2020: 41 days), but overall overdue amounts increased as a result of the impact of disrupted trading on customers.
The impact of the macro-economic factors and forward-looking information has resulted in an increase in the proportion of the ECL in relation to the trade receivables balance.
Amounts charged to the allowance account are generally written off when there is no expectation of recovering additional cash.
The maximum exposure to credit risk at the reporting date is the carrying value of each category of receivable as mentioned below. The fair values of trade and other receivables approximate their book values as shown in this note due to the short-term maturities of these assets. The Group does not hold any collateral as security. Included in other receivables are amounts receivable to which the Group has applied the general impairment model. Based on an evaluation and conclusion that the credit risk relating to these receivables is limited, the probability of default relating to these receivables was considered to be low.
None of the payment terms of trade and other receivables that are fully performing or overdue have been renegotiated during the year.
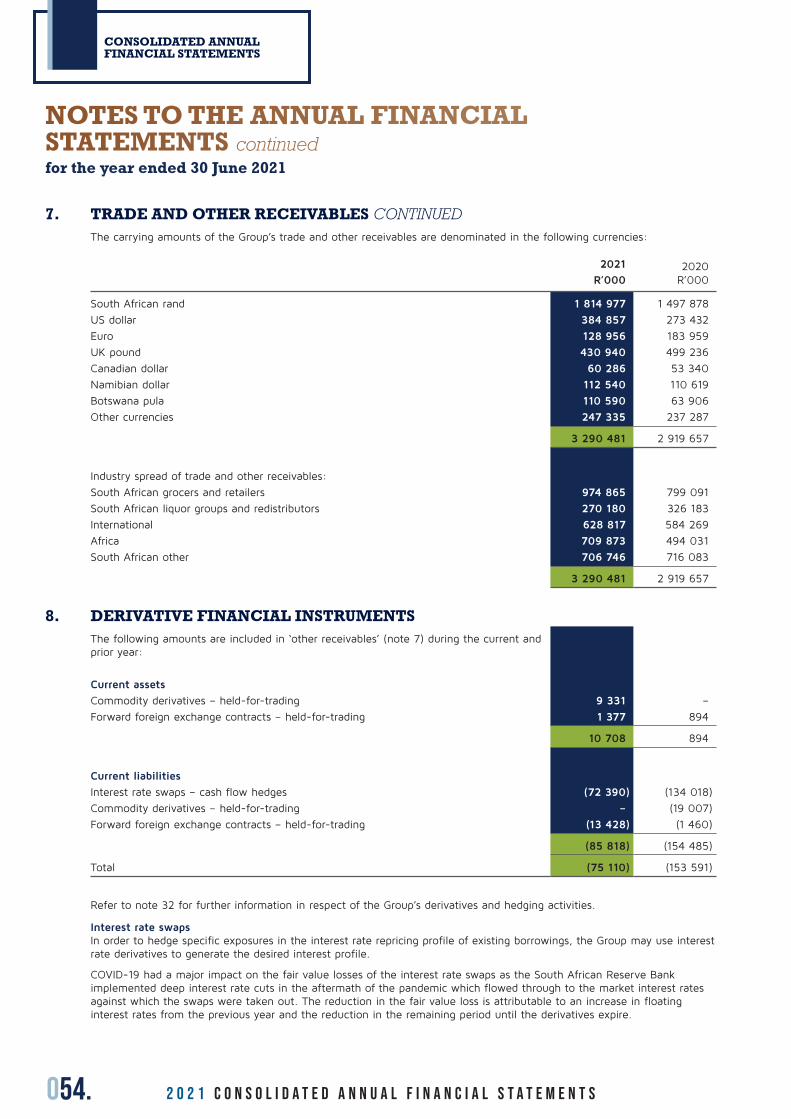
054. 2 0 2 1 C O N S O L I D A T E D A n n u a l f i n a n c i a l s t a t e m e n t s
CONSOLIDATED ANNUAL FINANCIAL STATEMENTS
7. TRADE AND OTHER RECEIVABLES CONTINUEDThe carrying amounts of the Group’s trade and other receivables are denominated in the following currencies:
2021
R’000 2020R’000
South African rand 1 814 977 1 497 878
US dollar 384 857 273 432
Euro 128 956 183 959
UK pound 430 940 499 236
Canadian dollar 60 286 53 340
Namibian dollar 112 540 110 619
Botswana pula 110 590 63 906
Other currencies 247 335 237 287
3 290 481 2 919 657
Industry spread of trade and other receivables:
South African grocers and retailers 974 865 799 091
South African liquor groups and redistributors 270 180 326 183
International 628 817 584 269
Africa 709 873 494 031
South African other 706 746 716 083
3 290 481 2 919 657
8. DERIVATIVE FINANCIAL INSTRUMENTSThe following amounts are included in ‘other receivables’ (note 7) during the current and prior year:
Current assets
Commodity derivatives – held-for-trading 9 331 –
Forward foreign exchange contracts – held-for-trading 1 377 894
10 708 894
Current liabilities
Interest rate swaps – cash flow hedges (72 390) (134 018)
Commodity derivatives – held-for-trading – (19 007)
Forward foreign exchange contracts – held-for-trading (13 428) (1 460)
(85 818) (154 485)
Total (75 110) (153 591)
Refer to note 32 for further information in respect of the Group’s derivatives and hedging activities.
Interest rate swapsIn order to hedge specific exposures in the interest rate repricing profile of existing borrowings, the Group may use interest rate derivatives to generate the desired interest profile.
COVID-19 had a major impact on the fair value losses of the interest rate swaps as the South African Reserve Bank implemented deep interest rate cuts in the aftermath of the pandemic which flowed through to the market interest rates against which the swaps were taken out. The reduction in the fair value loss is attributable to an increase in floating interest rates from the previous year and the reduction in the remaining period until the derivatives expire.
NOTES TO THE ANNUAL FINANCIAL STATEMENTS continuedfor the year ended 30 June 2021
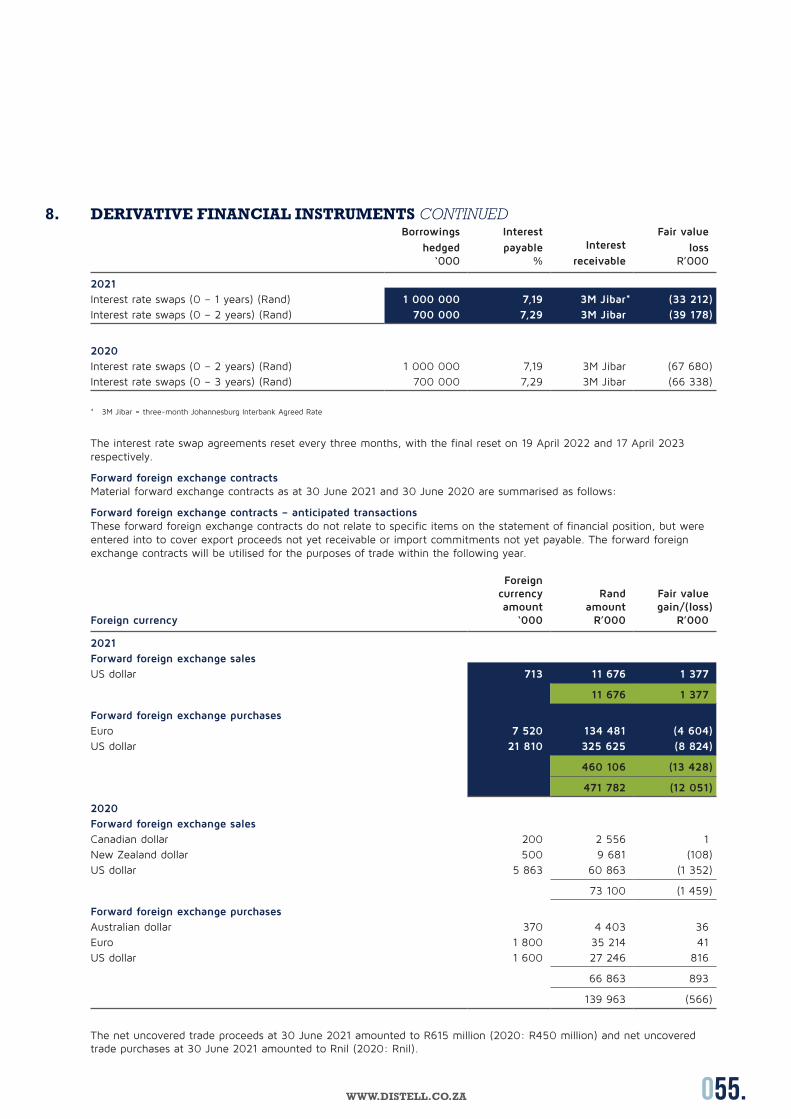
055.WWW.DISTELL.CO.ZA
8. DERIVATIVE FINANCIAL INSTRUMENTS CONTINUEDBorrowings
hedged ‘000
Interest
payable%
Interest
receivable
Fair value
lossR’000
2021
Interest rate swaps (0 – 1 years) (Rand) 1 000 000 7,19 3M Jibar* (33 212)
Interest rate swaps (0 – 2 years) (Rand) 700 000 7,29 3M Jibar (39 178)
2020
Interest rate swaps (0 – 2 years) (Rand) 1 000 000 7,19 3M Jibar (67 680)
Interest rate swaps (0 – 3 years) (Rand) 700 000 7,29 3M Jibar (66 338)
* 3M Jibar = three-month Johannesburg Interbank Agreed Rate
The interest rate swap agreements reset every three months, with the final reset on 19 April 2022 and 17 April 2023 respectively.
Forward foreign exchange contractsMaterial forward exchange contracts as at 30 June 2021 and 30 June 2020 are summarised as follows:
Forward foreign exchange contracts – anticipated transactionsThese forward foreign exchange contracts do not relate to specific items on the statement of financial position, but were entered into to cover export proceeds not yet receivable or import commitments not yet payable. The forward foreign exchange contracts will be utilised for the purposes of trade within the following year.
Foreign currency
Foreign currency amount
‘000
Rand amount
R’000
Fair value gain/(loss)
R’000
2021
Forward foreign exchange sales
US dollar 713 11 676 1 377
11 676 1 377
Forward foreign exchange purchases
Euro 7 520 134 481 (4 604)
US dollar 21 810 325 625 (8 824)
460 106 (13 428)
471 782 (12 051)
2020
Forward foreign exchange sales
Canadian dollar 200 2 556 1
New Zealand dollar 500 9 681 (108)
US dollar 5 863 60 863 (1 352)
73 100 (1 459)
Forward foreign exchange purchases
Australian dollar 370 4 403 36
Euro 1 800 35 214 41
US dollar 1 600 27 246 816
66 863 893
139 963 (566)
The net uncovered trade proceeds at 30 June 2021 amounted to R615 million (2020: R450 million) and net uncovered trade purchases at 30 June 2021 amounted to Rnil (2020: Rnil).
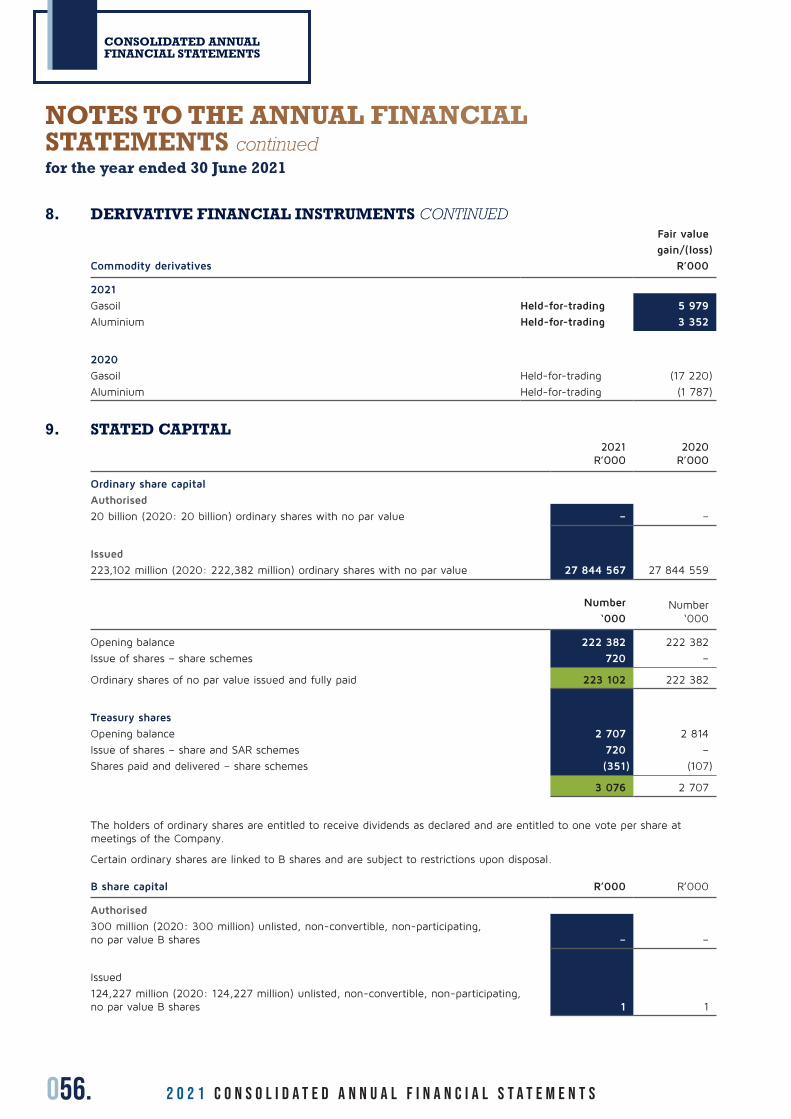
056. 2 0 2 1 C O N S O L I D A T E D A n n u a l f i n a n c i a l s t a t e m e n t s
CONSOLIDATED ANNUAL FINANCIAL STATEMENTS
8. DERIVATIVE FINANCIAL INSTRUMENTS CONTINUED
Commodity derivatives
Fair value
gain/(loss)
R’000
2021
Gasoil Held-for-trading 5 979
Aluminium Held-for-trading 3 352
2020
Gasoil Held-for-trading (17 220)
Aluminium Held-for-trading (1 787)
9. STATED CAPITAL2021
R’0002020
R’000
Ordinary share capital
Authorised
20 billion (2020: 20 billion) ordinary shares with no par value – –
Issued
223,102 million (2020: 222,382 million) ordinary shares with no par value 27 844 567 27 844 559
Number
‘000 Number
‘000
Opening balance 222 382 222 382
Issue of shares – share schemes 720 –
Ordinary shares of no par value issued and fully paid 223 102 222 382
Treasury shares
Opening balance 2 707 2 814
Issue of shares – share and SAR schemes 720 –
Shares paid and delivered – share schemes (351) (107)
3 076 2 707
The holders of ordinary shares are entitled to receive dividends as declared and are entitled to one vote per share at meetings of the Company.
Certain ordinary shares are linked to B shares and are subject to restrictions upon disposal.
B share capital R’000 R’000
Authorised
300 million (2020: 300 million) unlisted, non-convertible, non-participating, no par value B shares – –
Issued
124,227 million (2020: 124,227 million) unlisted, non-convertible, non-participating, no par value B shares 1 1
NOTES TO THE ANNUAL FINANCIAL STATEMENTS continuedfor the year ended 30 June 2021
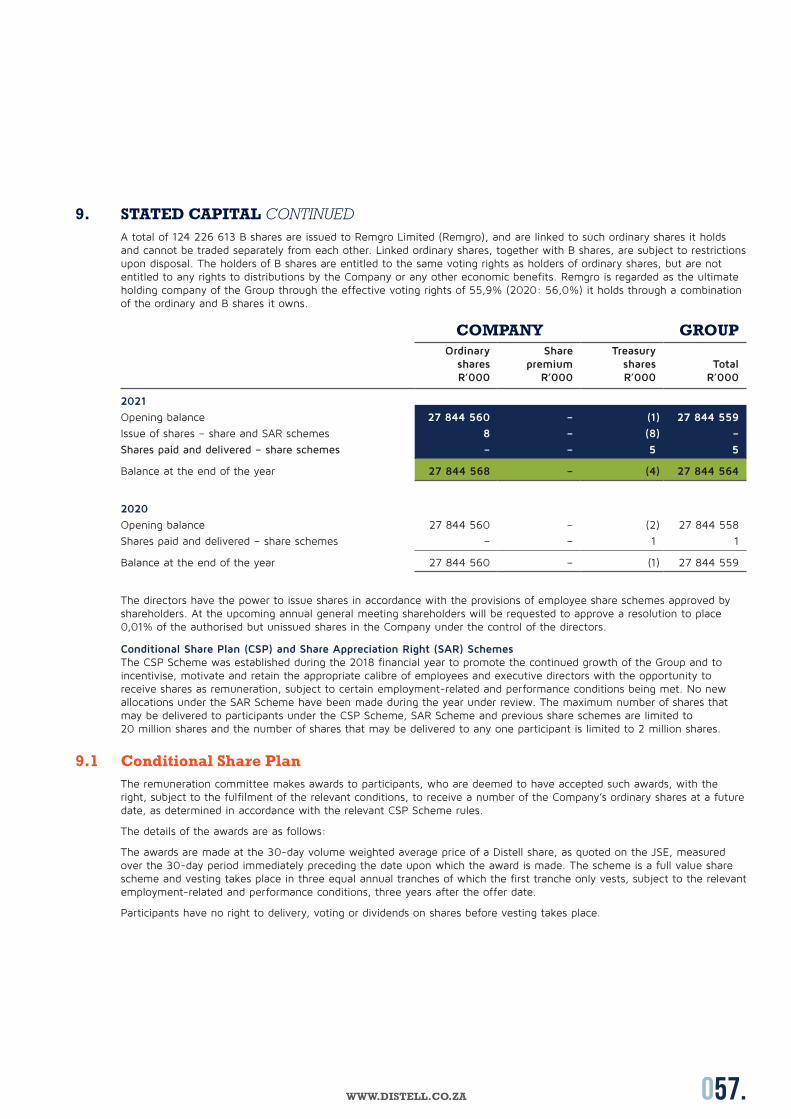
057.WWW.DISTELL.CO.ZA
9. STATED CAPITAL CONTINUEDA total of 124 226 613 B shares are issued to Remgro Limited (Remgro), and are linked to such ordinary shares it holds and cannot be traded separately from each other. Linked ordinary shares, together with B shares, are subject to restrictions upon disposal. The holders of B shares are entitled to the same voting rights as holders of ordinary shares, but are not entitled to any rights to distributions by the Company or any other economic benefits. Remgro is regarded as the ultimate holding company of the Group through the effective voting rights of 55,9% (2020: 56,0%) it holds through a combination of the ordinary and B shares it owns.
COMPANY GROUP Ordinary
shares R’000
Share premium
R’000
Treasury shares R’000
Total R’000
2021
Opening balance 27 844 560 – (1) 27 844 559
Issue of shares – share and SAR schemes 8 – (8) –
Shares paid and delivered – share schemes – – 5 5
Balance at the end of the year 27 844 568 – (4) 27 844 564
2020
Opening balance 27 844 560 – (2) 27 844 558
Shares paid and delivered – share schemes – – 1 1
Balance at the end of the year 27 844 560 – (1) 27 844 559
The directors have the power to issue shares in accordance with the provisions of employee share schemes approved by shareholders. At the upcoming annual general meeting shareholders will be requested to approve a resolution to place 0,01% of the authorised but unissued shares in the Company under the control of the directors.
Conditional Share Plan (CSP) and Share Appreciation Right (SAR) SchemesThe CSP Scheme was established during the 2018 financial year to promote the continued growth of the Group and to incentivise, motivate and retain the appropriate calibre of employees and executive directors with the opportunity to receive shares as remuneration, subject to certain employment-related and performance conditions being met. No new allocations under the SAR Scheme have been made during the year under review. The maximum number of shares that may be delivered to participants under the CSP Scheme, SAR Scheme and previous share schemes are limited to 20 million shares and the number of shares that may be delivered to any one participant is limited to 2 million shares.
9.1 Conditional Share PlanThe remuneration committee makes awards to participants, who are deemed to have accepted such awards, with the right, subject to the fulfilment of the relevant conditions, to receive a number of the Company’s ordinary shares at a future date, as determined in accordance with the relevant CSP Scheme rules.
The details of the awards are as follows:
The awards are made at the 30-day volume weighted average price of a Distell share, as quoted on the JSE, measured over the 30-day period immediately preceding the date upon which the award is made. The scheme is a full value share scheme and vesting takes place in three equal annual tranches of which the first tranche only vests, subject to the relevant employment-related and performance conditions, three years after the offer date.
Participants have no right to delivery, voting or dividends on shares before vesting takes place.
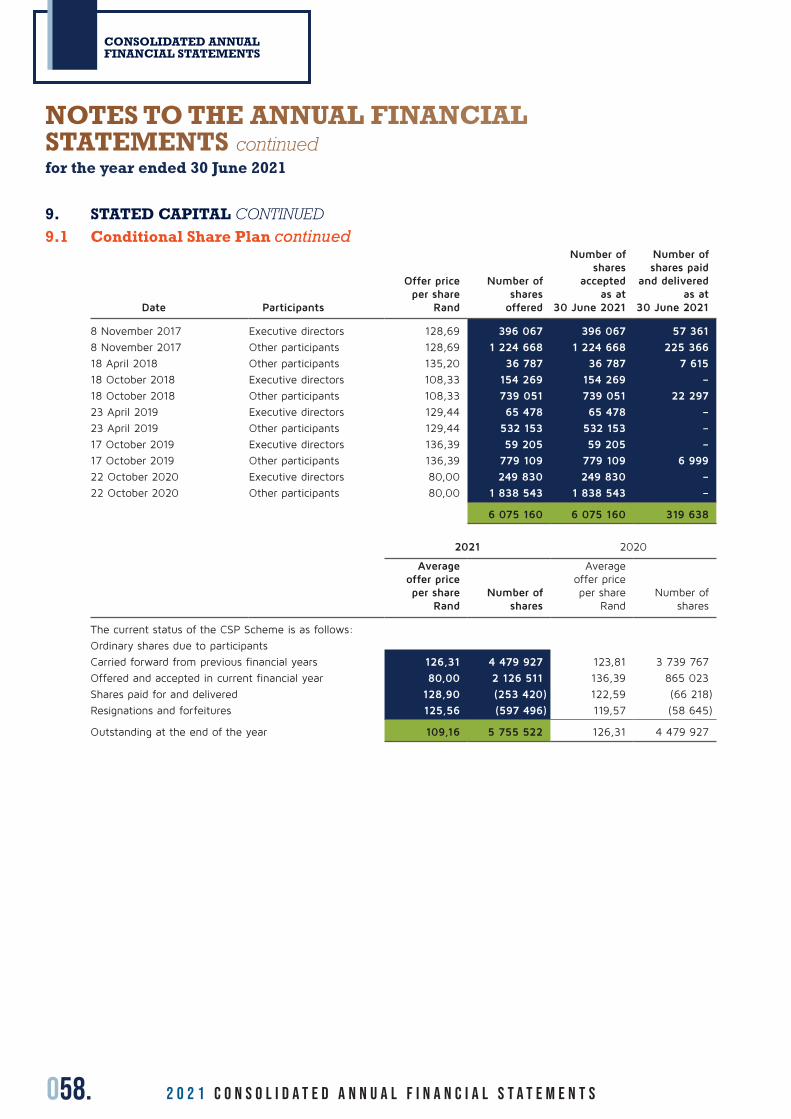
058. 2 0 2 1 C O N S O L I D A T E D A n n u a l f i n a n c i a l s t a t e m e n t s
CONSOLIDATED ANNUAL FINANCIAL STATEMENTS
9. STATED CAPITAL CONTINUED9.1 Conditional Share Plan continued
Date Participants
Offer price per share
Rand
Number of shares
offered
Number of shares
accepted as at
30 June 2021
Number of shares paid
and delivered as at
30 June 2021
8 November 2017 Executive directors 128,69 396 067 396 067 57 361
8 November 2017 Other participants 128,69 1 224 668 1 224 668 225 366
18 April 2018 Other participants 135,20 36 787 36 787 7 615
18 October 2018 Executive directors 108,33 154 269 154 269 –
18 October 2018 Other participants 108,33 739 051 739 051 22 297
23 April 2019 Executive directors 129,44 65 478 65 478 –
23 April 2019 Other participants 129,44 532 153 532 153 –
17 October 2019 Executive directors 136,39 59 205 59 205 –
17 October 2019 Other participants 136,39 779 109 779 109 6 999
22 October 2020 Executive directors 80,00 249 830 249 830 –
22 October 2020 Other participants 80,00 1 838 543 1 838 543 –
6 075 160 6 075 160 319 638
2021 2020
Average offer price per share
Rand Number of
shares
Average offer price per share
Rand Number of
shares
The current status of the CSP Scheme is as follows:
Ordinary shares due to participants
Carried forward from previous financial years 126,31 4 479 927 123,81 3 739 767
Offered and accepted in current financial year 80,00 2 126 511 136,39 865 023
Shares paid for and delivered 128,90 (253 420) 122,59 (66 218)
Resignations and forfeitures 125,56 (597 496) 119,57 (58 645)
Outstanding at the end of the year 109,16 5 755 522 126,31 4 479 927
NOTES TO THE ANNUAL FINANCIAL STATEMENTS continuedfor the year ended 30 June 2021
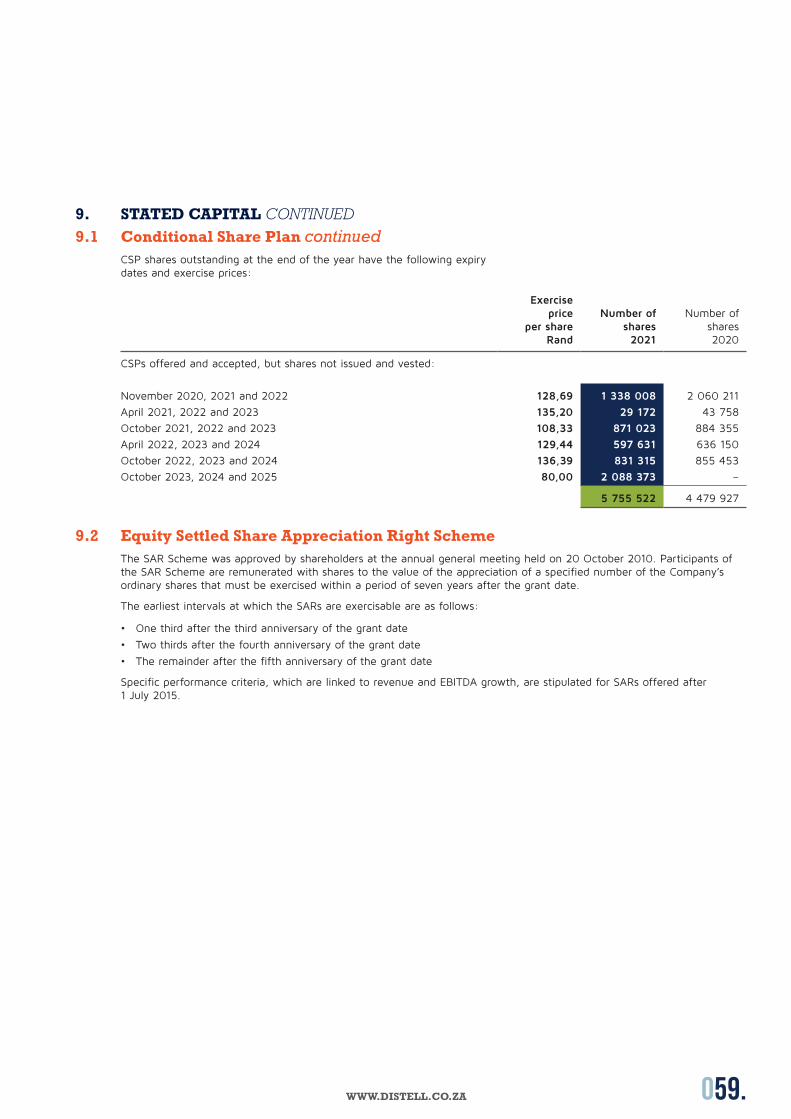
059.WWW.DISTELL.CO.ZA
9. STATED CAPITAL CONTINUED9.1 Conditional Share Plan continued
CSP shares outstanding at the end of the year have the following expiry dates and exercise prices:
Exercise price
per share Rand
Number of shares2021
Number of shares2020
CSPs offered and accepted, but shares not issued and vested:
November 2020, 2021 and 2022 128,69 1 338 008 2 060 211
April 2021, 2022 and 2023 135,20 29 172 43 758
October 2021, 2022 and 2023 108,33 871 023 884 355
April 2022, 2023 and 2024 129,44 597 631 636 150
October 2022, 2023 and 2024 136,39 831 315 855 453
October 2023, 2024 and 2025 80,00 2 088 373 –
5 755 522 4 479 927
9.2 Equity Settled Share Appreciation Right SchemeThe SAR Scheme was approved by shareholders at the annual general meeting held on 20 October 2010. Participants of the SAR Scheme are remunerated with shares to the value of the appreciation of a specified number of the Company’s ordinary shares that must be exercised within a period of seven years after the grant date.
The earliest intervals at which the SARs are exercisable are as follows:
• One third after the third anniversary of the grant date
• Two thirds after the fourth anniversary of the grant date
• The remainder after the fifth anniversary of the grant date
Specific performance criteria, which are linked to revenue and EBITDA growth, are stipulated for SARs offered after 1 July 2015.
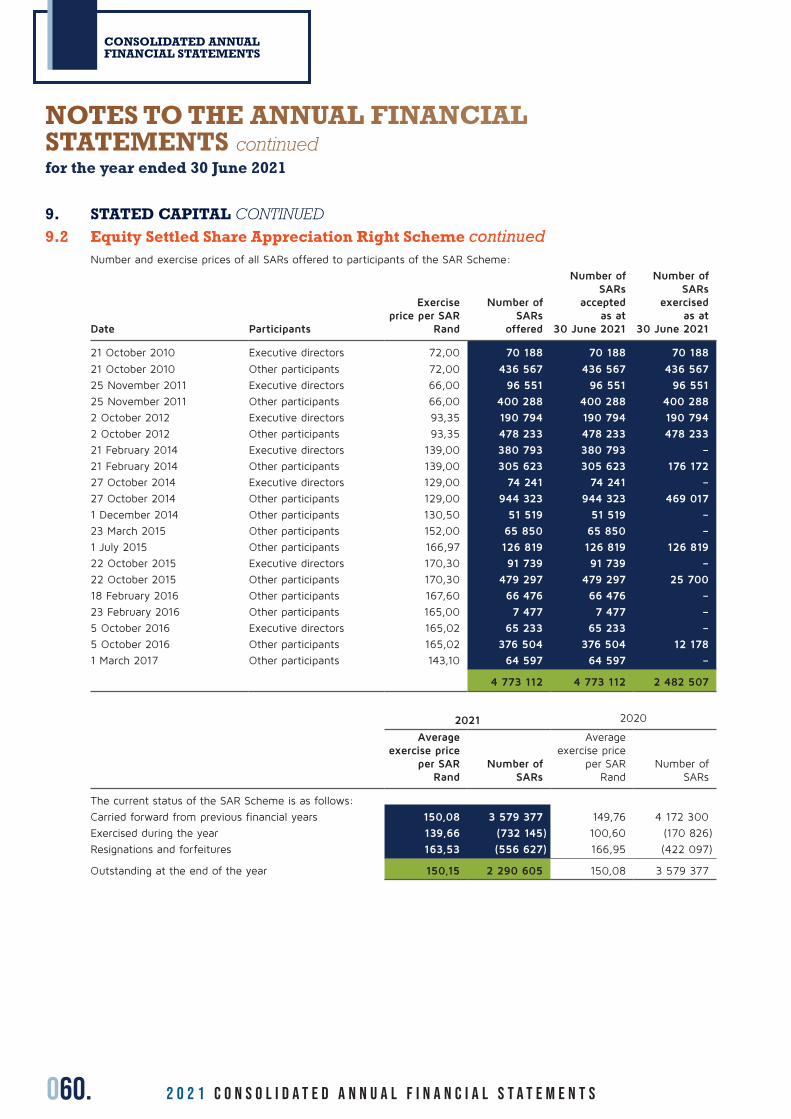
060. 2 0 2 1 C O N S O L I D A T E D A n n u a l f i n a n c i a l s t a t e m e n t s
CONSOLIDATED ANNUAL FINANCIAL STATEMENTS
9. STATED CAPITAL CONTINUED9.2 Equity Settled Share Appreciation Right Scheme continued
Number and exercise prices of all SARs offered to participants of the SAR Scheme:
Date Participants
Exercise price per SAR
Rand
Number of SARs
offered
Number of SARs
accepted as at
30 June 2021
Number of SARs
exercised as at
30 June 2021
21 October 2010 Executive directors 72,00 70 188 70 188 70 188
21 October 2010 Other participants 72,00 436 567 436 567 436 567
25 November 2011 Executive directors 66,00 96 551 96 551 96 551
25 November 2011 Other participants 66,00 400 288 400 288 400 288
2 October 2012 Executive directors 93,35 190 794 190 794 190 794
2 October 2012 Other participants 93,35 478 233 478 233 478 233
21 February 2014 Executive directors 139,00 380 793 380 793 –
21 February 2014 Other participants 139,00 305 623 305 623 176 172
27 October 2014 Executive directors 129,00 74 241 74 241 –
27 October 2014 Other participants 129,00 944 323 944 323 469 017
1 December 2014 Other participants 130,50 51 519 51 519 –
23 March 2015 Other participants 152,00 65 850 65 850 –
1 July 2015 Other participants 166,97 126 819 126 819 126 819
22 October 2015 Executive directors 170,30 91 739 91 739 –
22 October 2015 Other participants 170,30 479 297 479 297 25 700
18 February 2016 Other participants 167,60 66 476 66 476 –
23 February 2016 Other participants 165,00 7 477 7 477 –
5 October 2016 Executive directors 165,02 65 233 65 233 –
5 October 2016 Other participants 165,02 376 504 376 504 12 178
1 March 2017 Other participants 143,10 64 597 64 597 –
4 773 112 4 773 112 2 482 507
2021 2020
Average exercise price
per SAR Rand
Number of SARs
Average exercise price
per SAR Rand
Number of SARs
The current status of the SAR Scheme is as follows:
Carried forward from previous financial years 150,08 3 579 377 149,76 4 172 300
Exercised during the year 139,66 (732 145) 100,60 (170 826)
Resignations and forfeitures 163,53 (556 627) 166,95 (422 097)
Outstanding at the end of the year 150,15 2 290 605 150,08 3 579 377
NOTES TO THE ANNUAL FINANCIAL STATEMENTS continuedfor the year ended 30 June 2021
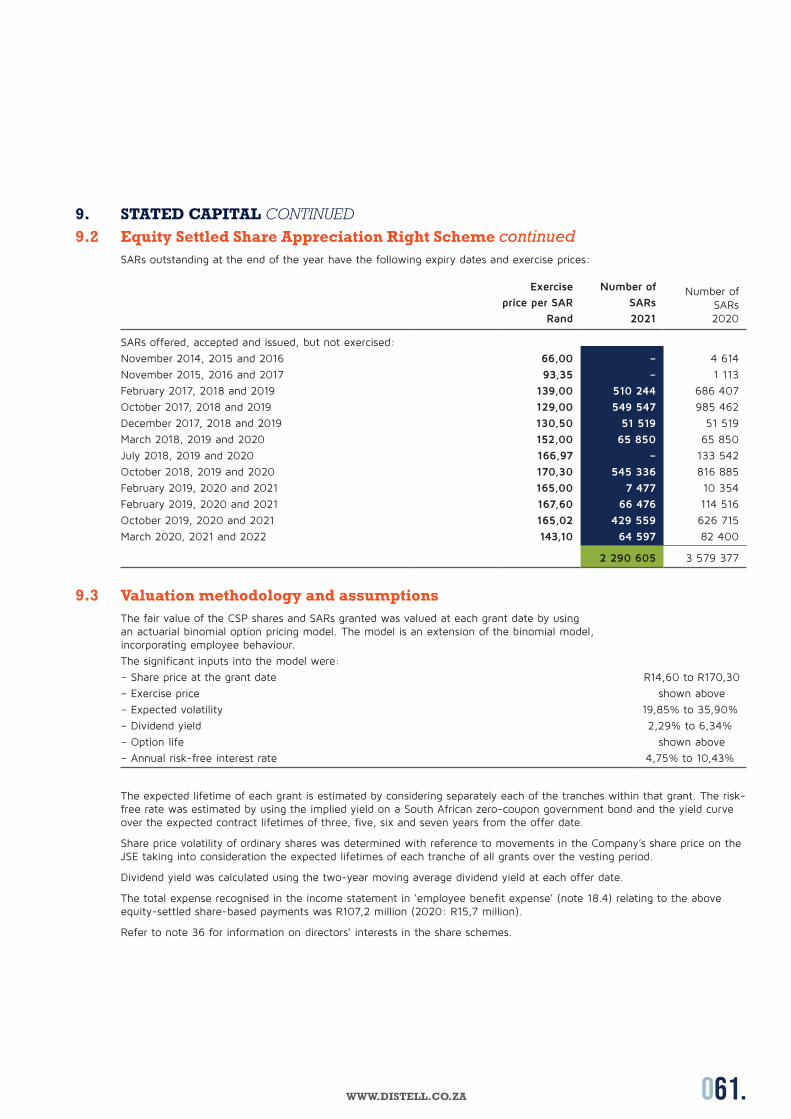
061.WWW.DISTELL.CO.ZA
9. STATED CAPITAL CONTINUED9.2 Equity Settled Share Appreciation Right Scheme continued
SARs outstanding at the end of the year have the following expiry dates and exercise prices:
Exercise
price per SAR
Rand
Number of
SARs
2021
Number of SARs 2020
SARs offered, accepted and issued, but not exercised:
November 2014, 2015 and 2016 66,00 – 4 614
November 2015, 2016 and 2017 93,35 – 1 113
February 2017, 2018 and 2019 139,00 510 244 686 407
October 2017, 2018 and 2019 129,00 549 547 985 462
December 2017, 2018 and 2019 130,50 51 519 51 519
March 2018, 2019 and 2020 152,00 65 850 65 850
July 2018, 2019 and 2020 166,97 – 133 542
October 2018, 2019 and 2020 170,30 545 336 816 885
February 2019, 2020 and 2021 165,00 7 477 10 354
February 2019, 2020 and 2021 167,60 66 476 114 516
October 2019, 2020 and 2021 165,02 429 559 626 715
March 2020, 2021 and 2022 143,10 64 597 82 400
2 290 605 3 579 377
9.3 Valuation methodology and assumptionsThe fair value of the CSP shares and SARs granted was valued at each grant date by using an actuarial binomial option pricing model. The model is an extension of the binomial model, incorporating employee behaviour.
The significant inputs into the model were:
– Share price at the grant date R14,60 to R170,30
– Exercise price shown above
– Expected volatility 19,85% to 35,90%
– Dividend yield 2,29% to 6,34%
– Option life shown above
– Annual risk-free interest rate 4,75% to 10,43%
The expected lifetime of each grant is estimated by considering separately each of the tranches within that grant. The risk-free rate was estimated by using the implied yield on a South African zero-coupon government bond and the yield curve over the expected contract lifetimes of three, five, six and seven years from the offer date.
Share price volatility of ordinary shares was determined with reference to movements in the Company’s share price on the JSE taking into consideration the expected lifetimes of each tranche of all grants over the vesting period.
Dividend yield was calculated using the two-year moving average dividend yield at each offer date.
The total expense recognised in the income statement in ‘employee benefit expense’ (note 18.4) relating to the above equity-settled share-based payments was R107,2 million (2020: R15,7 million).
Refer to note 36 for information on directors’ interests in the share schemes.
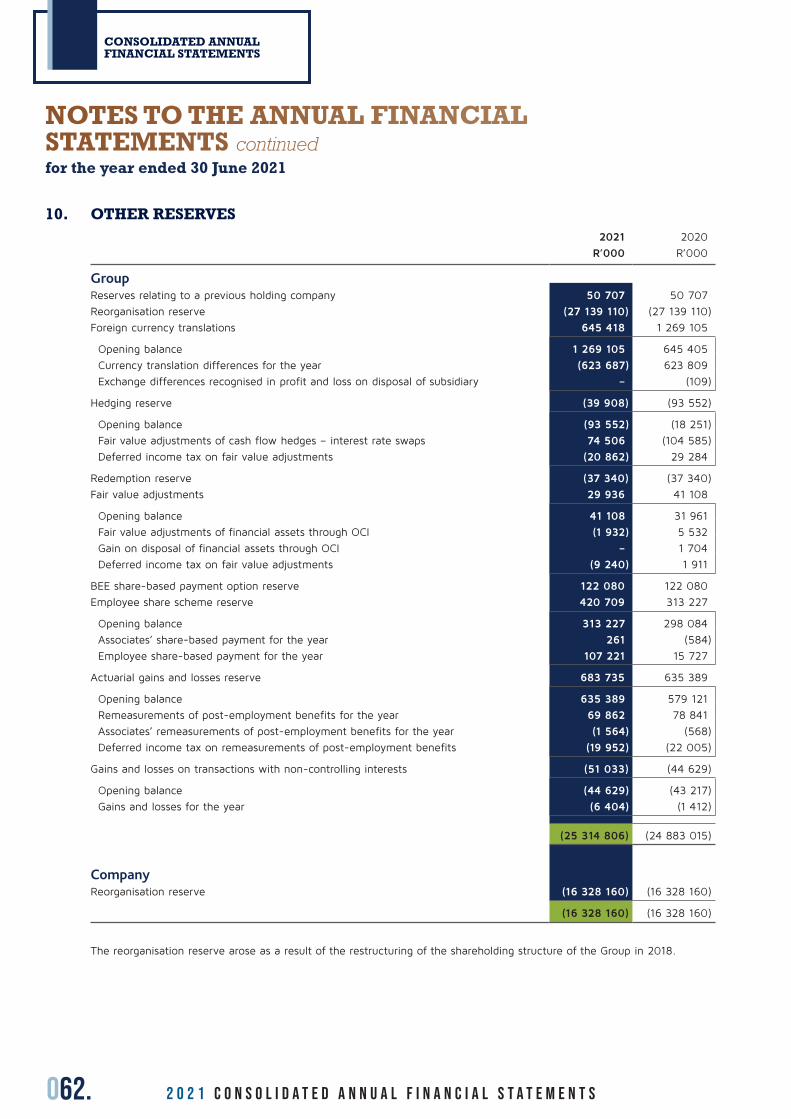
062. 2 0 2 1 C O N S O L I D A T E D A n n u a l f i n a n c i a l s t a t e m e n t s
CONSOLIDATED ANNUAL FINANCIAL STATEMENTS
10. OTHER RESERVES2021 2020
R’000 R’000
GroupReserves relating to a previous holding company 50 707 50 707
Reorganisation reserve (27 139 110) (27 139 110)
Foreign currency translations 645 418 1 269 105
Opening balance 1 269 105 645 405
Currency translation differences for the year (623 687) 623 809
Exchange differences recognised in profit and loss on disposal of subsidiary – (109)
Hedging reserve (39 908) (93 552)
Opening balance (93 552) (18 251)
Fair value adjustments of cash flow hedges – interest rate swaps 74 506 (104 585)
Deferred income tax on fair value adjustments (20 862) 29 284
Redemption reserve (37 340) (37 340)
Fair value adjustments 29 936 41 108
Opening balance 41 108 31 961
Fair value adjustments of financial assets through OCI (1 932) 5 532
Gain on disposal of financial assets through OCI – 1 704
Deferred income tax on fair value adjustments (9 240) 1 911
BEE share-based payment option reserve 122 080 122 080
Employee share scheme reserve 420 709 313 227
Opening balance 313 227 298 084
Associates’ share-based payment for the year 261 (584)
Employee share-based payment for the year 107 221 15 727
Actuarial gains and losses reserve 683 735 635 389
Opening balance 635 389 579 121
Remeasurements of post-employment benefits for the year 69 862 78 841
Associates’ remeasurements of post-employment benefits for the year (1 564) (568)
Deferred income tax on remeasurements of post-employment benefits (19 952) (22 005)
Gains and losses on transactions with non-controlling interests (51 033) (44 629)
Opening balance (44 629) (43 217)
Gains and losses for the year (6 404) (1 412)
(25 314 806) (24 883 015)
CompanyReorganisation reserve (16 328 160) (16 328 160)
(16 328 160) (16 328 160)
The reorganisation reserve arose as a result of the restructuring of the shareholding structure of the Group in 2018.
NOTES TO THE ANNUAL FINANCIAL STATEMENTS continuedfor the year ended 30 June 2021
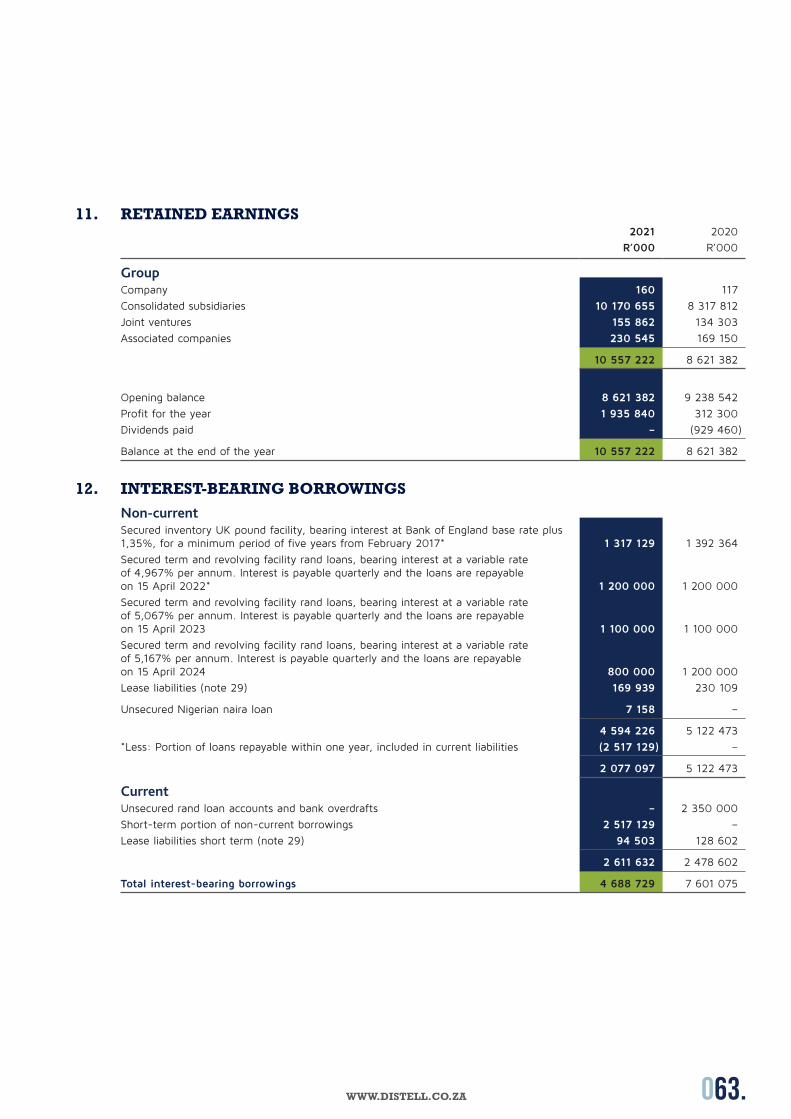
063.WWW.DISTELL.CO.ZA
11. RETAINED EARNINGS 2021
R’000
2020
R’000
GroupCompany 160 117
Consolidated subsidiaries 10 170 655 8 317 812
Joint ventures 155 862 134 303
Associated companies 230 545 169 150
10 557 222 8 621 382
Opening balance 8 621 382 9 238 542
Profit for the year 1 935 840 312 300
Dividends paid – (929 460)
Balance at the end of the year 10 557 222 8 621 382
12. INTEREST-BEARING BORROWINGSNon-currentSecured inventory UK pound facility, bearing interest at Bank of England base rate plus 1,35%, for a minimum period of five years from February 2017* 1 317 129 1 392 364
Secured term and revolving facility rand loans, bearing interest at a variable rate of 4,967% per annum. Interest is payable quarterly and the loans are repayable on 15 April 2022* 1 200 000 1 200 000
Secured term and revolving facility rand loans, bearing interest at a variable rate of 5,067% per annum. Interest is payable quarterly and the loans are repayable on 15 April 2023 1 100 000 1 100 000
Secured term and revolving facility rand loans, bearing interest at a variable rate of 5,167% per annum. Interest is payable quarterly and the loans are repayable on 15 April 2024 800 000 1 200 000
Lease liabilities (note 29) 169 939 230 109
Unsecured Nigerian naira loan 7 158 –
4 594 226 5 122 473
*Less: Portion of loans repayable within one year, included in current liabilities (2 517 129) –
2 077 097 5 122 473
CurrentUnsecured rand loan accounts and bank overdrafts – 2 350 000
Short-term portion of non-current borrowings 2 517 129 –
Lease liabilities short term (note 29) 94 503 128 602
2 611 632 2 478 602
Total interest-bearing borrowings 4 688 729 7 601 075
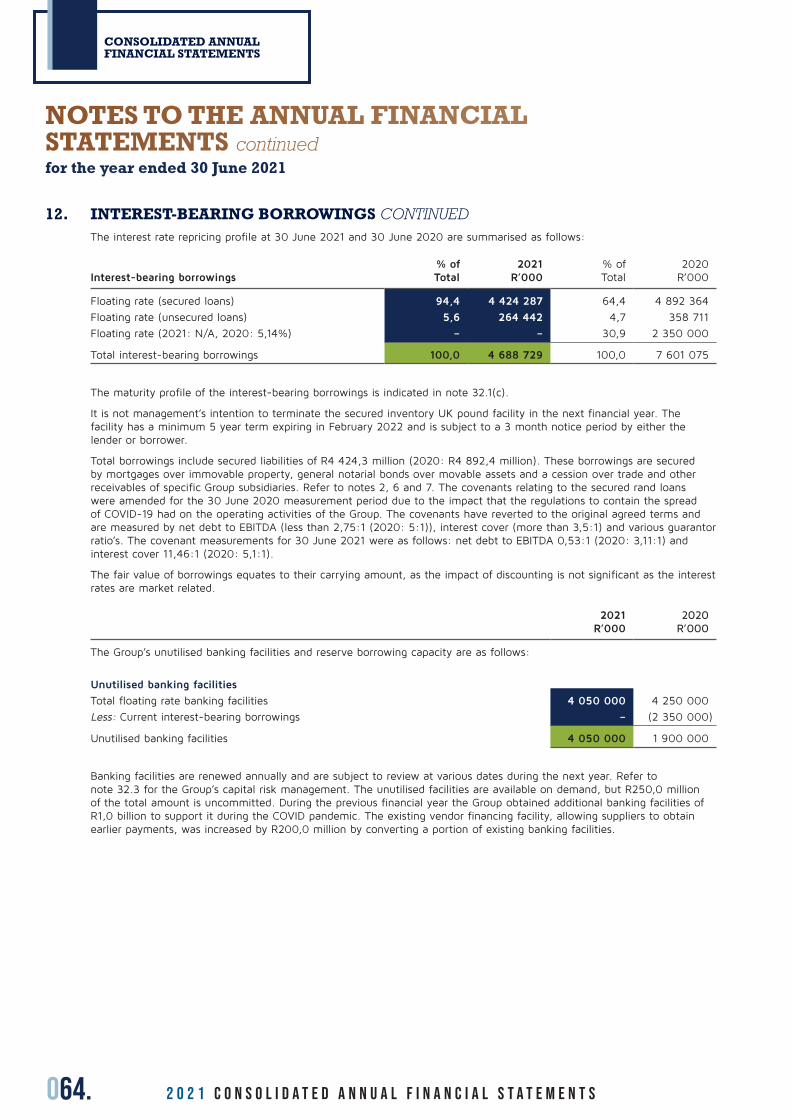
064. 2 0 2 1 C O N S O L I D A T E D A n n u a l f i n a n c i a l s t a t e m e n t s
CONSOLIDATED ANNUAL FINANCIAL STATEMENTS
12. INTEREST-BEARING BORROWINGS CONTINUEDThe interest rate repricing profile at 30 June 2021 and 30 June 2020 are summarised as follows:
Interest-bearing borrowings% of Total
2021 R’000
% of Total
2020 R’000
Floating rate (secured loans) 94,4 4 424 287 64,4 4 892 364
Floating rate (unsecured loans) 5,6 264 442 4,7 358 711
Floating rate (2021: N/A, 2020: 5,14%) – – 30,9 2 350 000
Total interest-bearing borrowings 100,0 4 688 729 100,0 7 601 075
The maturity profile of the interest-bearing borrowings is indicated in note 32.1(c).
It is not management’s intention to terminate the secured inventory UK pound facility in the next financial year. The facility has a minimum 5 year term expiring in February 2022 and is subject to a 3 month notice period by either the lender or borrower.
Total borrowings include secured liabilities of R4 424,3 million (2020: R4 892,4 million). These borrowings are secured by mortgages over immovable property, general notarial bonds over movable assets and a cession over trade and other receivables of specific Group subsidiaries. Refer to notes 2, 6 and 7. The covenants relating to the secured rand loans were amended for the 30 June 2020 measurement period due to the impact that the regulations to contain the spread of COVID-19 had on the operating activities of the Group. The covenants have reverted to the original agreed terms and are measured by net debt to EBITDA (less than 2,75:1 (2020: 5:1)), interest cover (more than 3,5:1) and various guarantor ratio’s. The covenant measurements for 30 June 2021 were as follows: net debt to EBITDA 0,53:1 (2020: 3,11:1) and interest cover 11,46:1 (2020: 5,1:1).
The fair value of borrowings equates to their carrying amount, as the impact of discounting is not significant as the interest rates are market related.
2021 R’000
2020 R’000
The Group’s unutilised banking facilities and reserve borrowing capacity are as follows:
Unutilised banking facilities
Total floating rate banking facilities 4 050 000 4 250 000
Less: Current interest-bearing borrowings – (2 350 000)
Unutilised banking facilities 4 050 000 1 900 000
Banking facilities are renewed annually and are subject to review at various dates during the next year. Refer to note 32.3 for the Group’s capital risk management. The unutilised facilities are available on demand, but R250,0 million of the total amount is uncommitted. During the previous financial year the Group obtained additional banking facilities of R1,0 billion to support it during the COVID pandemic. The existing vendor financing facility, allowing suppliers to obtain earlier payments, was increased by R200,0 million by converting a portion of existing banking facilities.
NOTES TO THE ANNUAL FINANCIAL STATEMENTS continuedfor the year ended 30 June 2021

065.WWW.DISTELL.CO.ZA
13. RETIREMENT BENEFITS
Statement of financial position2021
R’0002020
R’000
Assets
Pension benefits (note 13.1) (40 317) (43 309)
Post-retirement medical benefits (note 13.2) (345 172) (600 627)
(385 489) (643 936)
Liabilities
Post-retirement medical obligation (note 13.2) 24 615 30 414
24 615 30 414
Net retirement benefit asset (360 874) (613 522)
Income statement charge for:
Pension benefits (1 800) (2 333)
Post-retirement medical benefits (91 832) (30 834)
(93 632) (33 167)
Actuarial gains and losses
Remeasurements recognised in other comprehensive income (before taxation) 69 487 78 944
Cumulative actuarial gains recognised in other comprehensive income (before taxation) 937 449 867 962
13.1 Pension benefitsDefined benefit pension funds
The Group operates two defined benefit pension funds and three defined contribution provident funds. All permanent employees have access to these funds. These schemes are regulated by the Pension Funds Act, No. 24 of 1956, as amended, and are managed by trustees and administered by independent administrators. Fund assets are held independently of the Group’s assets. There were no amendments to the funds during the current financial year.
The defined benefit pension funds are actuarially valued every three years and reviewed every year using the projected unit credit method. The latest full actuarial valuation was performed on 31 May 2018 and indicated that the plans are in a sound financial position. The 31 May 2021 full actuarial valuation is currently being performed and will only be available after year-end.
Statement of financial position2021
R’0002020
R’000
Amounts recognised in the statement of financial position are as follows:
Present value of funded obligations 235 775 254 079
Fair value of plan assets (347 120) (351 156)
Funded position (111 345) (97 077)
Asset not recognised in terms of IAS 19, paragraph 65 limit* 71 028 53 768
Net asset in statement of financial position (40 317) (43 309)
* The ‘IAS 19, paragraph 65 limit’ ensures that the asset to be recognised in the Group’s statement of financial position is subject to a maximum of the sum of any unrecognised actuarial losses, past service costs and the present value of any economic benefits available to the Group in the form of refunds or reductions in future contributions. The movement in this limit pertains to a reduction in effect of asset limit of R12,4 million and interest cost of R4,8 million.
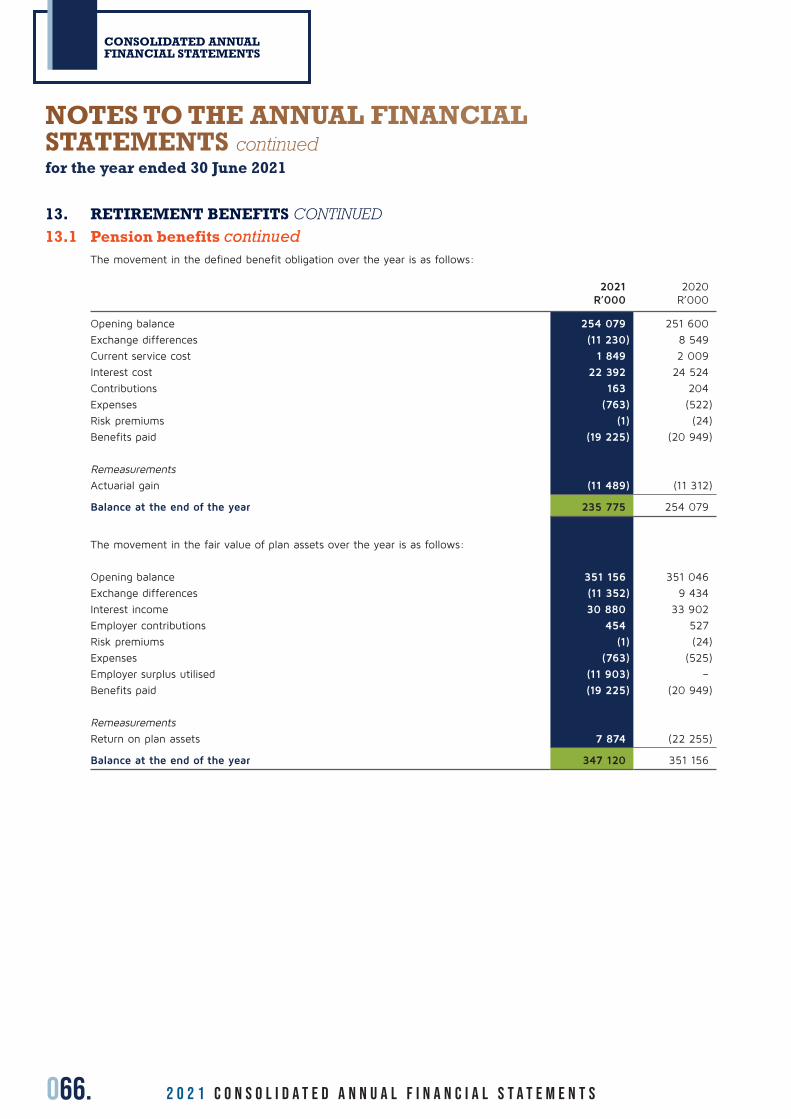
066. 2 0 2 1 C O N S O L I D A T E D A n n u a l f i n a n c i a l s t a t e m e n t s
CONSOLIDATED ANNUAL FINANCIAL STATEMENTS
13. RETIREMENT BENEFITS CONTINUED13.1 Pension benefits continued
The movement in the defined benefit obligation over the year is as follows:
2021R’000
2020R’000
Opening balance 254 079 251 600
Exchange differences (11 230) 8 549
Current service cost 1 849 2 009
Interest cost 22 392 24 524
Contributions 163 204
Expenses (763) (522)
Risk premiums (1) (24)
Benefits paid (19 225) (20 949)
Remeasurements
Actuarial gain (11 489) (11 312)
Balance at the end of the year 235 775 254 079
The movement in the fair value of plan assets over the year is as follows:
Opening balance 351 156 351 046
Exchange differences (11 352) 9 434
Interest income 30 880 33 902
Employer contributions 454 527
Risk premiums (1) (24)
Expenses (763) (525)
Employer surplus utilised (11 903) –
Benefits paid (19 225) (20 949)
Remeasurements
Return on plan assets 7 874 (22 255)
Balance at the end of the year 347 120 351 156
NOTES TO THE ANNUAL FINANCIAL STATEMENTS continuedfor the year ended 30 June 2021
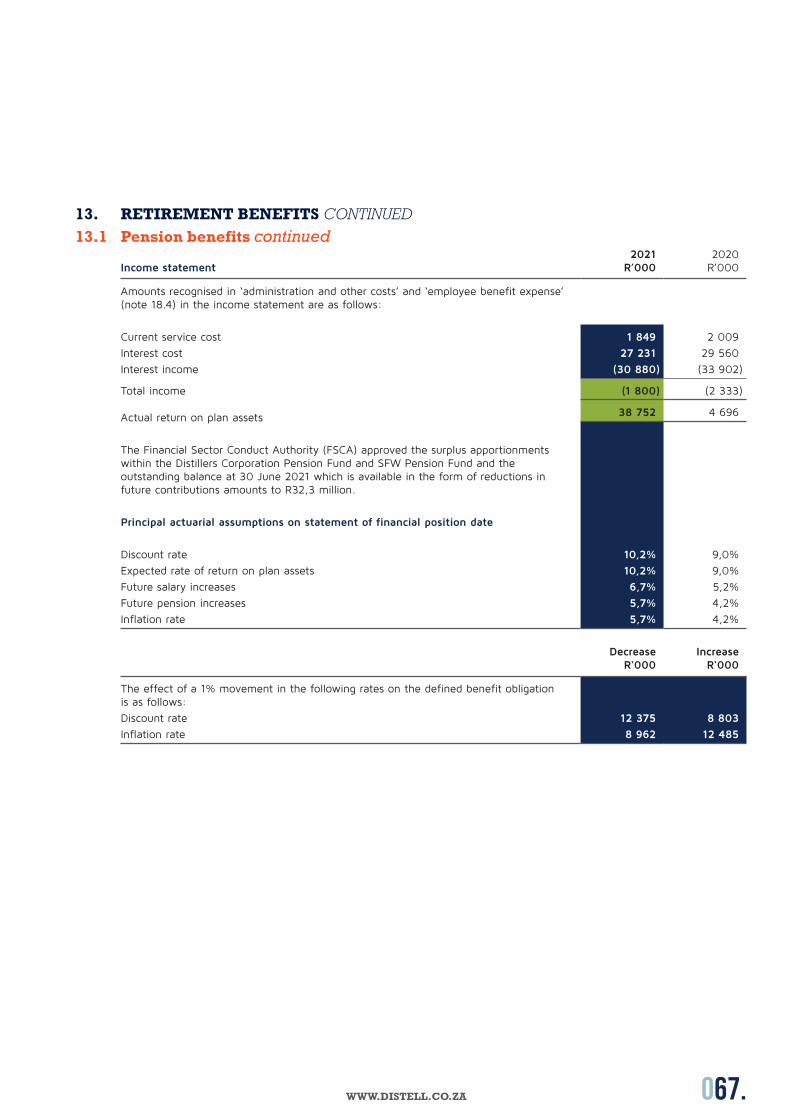
067.WWW.DISTELL.CO.ZA
13. RETIREMENT BENEFITS CONTINUED13.1 Pension benefits continued
Income statement2021
R’0002020
R’000
Amounts recognised in ‘administration and other costs’ and ‘employee benefit expense’ (note 18.4) in the income statement are as follows:
Current service cost 1 849 2 009
Interest cost 27 231 29 560
Interest income (30 880) (33 902)
Total income (1 800) (2 333)
Actual return on plan assets 38 752 4 696
The Financial Sector Conduct Authority (FSCA) approved the surplus apportionments within the Distillers Corporation Pension Fund and SFW Pension Fund and the outstanding balance at 30 June 2021 which is available in the form of reductions in future contributions amounts to R32,3 million.
Principal actuarial assumptions on statement of financial position date
Discount rate 10,2% 9,0%
Expected rate of return on plan assets 10,2% 9,0%
Future salary increases 6,7% 5,2%
Future pension increases 5,7% 4,2%
Inflation rate 5,7% 4,2%
Decrease R‘000
Increase R‘000
The effect of a 1% movement in the following rates on the defined benefit obligation is as follows:
Discount rate 12 375 8 803
Inflation rate 8 962 12 485
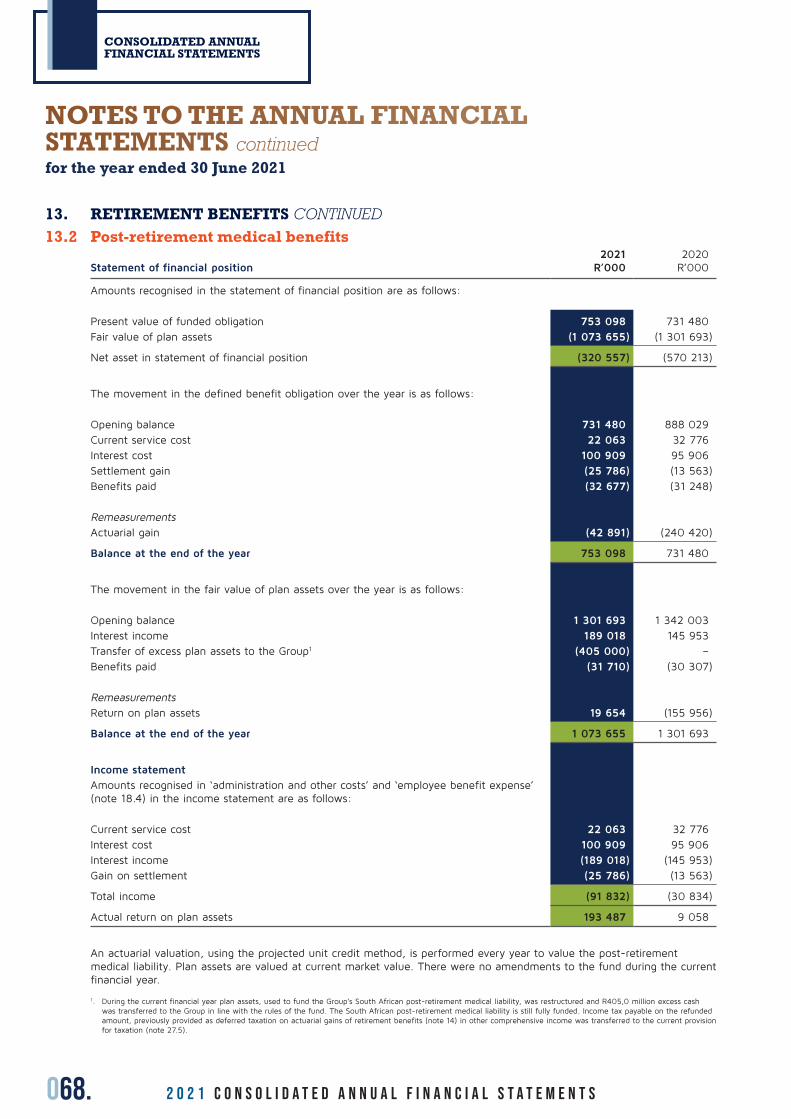
068. 2 0 2 1 C O N S O L I D A T E D A n n u a l f i n a n c i a l s t a t e m e n t s
CONSOLIDATED ANNUAL FINANCIAL STATEMENTS
13. RETIREMENT BENEFITS CONTINUED13.2 Post-retirement medical benefits
Statement of financial position2021
R’0002020
R’000
Amounts recognised in the statement of financial position are as follows:
Present value of funded obligation 753 098 731 480
Fair value of plan assets (1 073 655) (1 301 693)
Net asset in statement of financial position (320 557) (570 213)
The movement in the defined benefit obligation over the year is as follows:
Opening balance 731 480 888 029
Current service cost 22 063 32 776
Interest cost 100 909 95 906
Settlement gain (25 786) (13 563)
Benefits paid (32 677) (31 248)
RemeasurementsActuarial gain (42 891) (240 420)
Balance at the end of the year 753 098 731 480
The movement in the fair value of plan assets over the year is as follows:
Opening balance 1 301 693 1 342 003
Interest income 189 018 145 953
Transfer of excess plan assets to the Group1 (405 000) –
Benefits paid (31 710) (30 307)
RemeasurementsReturn on plan assets 19 654 (155 956)
Balance at the end of the year 1 073 655 1 301 693
Income statement
Amounts recognised in ‘administration and other costs’ and ‘employee benefit expense’ (note 18.4) in the income statement are as follows:
Current service cost 22 063 32 776
Interest cost 100 909 95 906
Interest income (189 018) (145 953)
Gain on settlement (25 786) (13 563)
Total income (91 832) (30 834)
Actual return on plan assets 193 487 9 058
An actuarial valuation, using the projected unit credit method, is performed every year to value the post-retirement medical liability. Plan assets are valued at current market value. There were no amendments to the fund during the current financial year.
1. During the current financial year plan assets, used to fund the Group’s South African post-retirement medical liability, was restructured and R405,0 million excess cash was transferred to the Group in line with the rules of the fund. The South African post-retirement medical liability is still fully funded. Income tax payable on the refunded amount, previously provided as deferred taxation on actuarial gains of retirement benefits (note 14) in other comprehensive income was transferred to the current provision for taxation (note 27.5).
NOTES TO THE ANNUAL FINANCIAL STATEMENTS continuedfor the year ended 30 June 2021
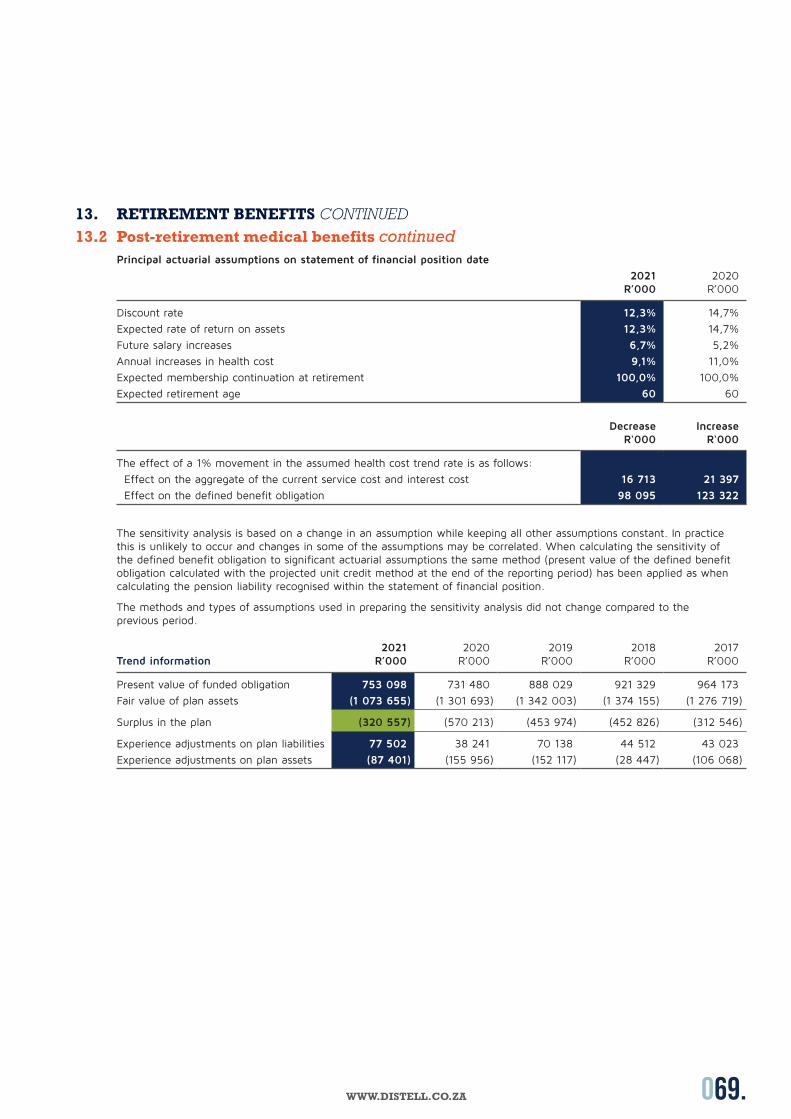
069.WWW.DISTELL.CO.ZA
13. RETIREMENT BENEFITS CONTINUED13.2 Post-retirement medical benefits continued
Principal actuarial assumptions on statement of financial position date
2021R’000
2020R’000
Discount rate 12,3% 14,7%
Expected rate of return on assets 12,3% 14,7%
Future salary increases 6,7% 5,2%
Annual increases in health cost 9,1% 11,0%
Expected membership continuation at retirement 100,0% 100,0%
Expected retirement age 60 60
Decrease R‘000
Increase R‘000
The effect of a 1% movement in the assumed health cost trend rate is as follows:
Effect on the aggregate of the current service cost and interest cost 16 713 21 397
Effect on the defined benefit obligation 98 095 123 322
The sensitivity analysis is based on a change in an assumption while keeping all other assumptions constant. In practice this is unlikely to occur and changes in some of the assumptions may be correlated. When calculating the sensitivity of the defined benefit obligation to significant actuarial assumptions the same method (present value of the defined benefit obligation calculated with the projected unit credit method at the end of the reporting period) has been applied as when calculating the pension liability recognised within the statement of financial position.
The methods and types of assumptions used in preparing the sensitivity analysis did not change compared to the previous period.
Trend information2021
R’0002020
R’0002019
R’0002018
R’0002017
R’000
Present value of funded obligation 753 098 731 480 888 029 921 329 964 173
Fair value of plan assets (1 073 655) (1 301 693) (1 342 003) (1 374 155) (1 276 719)
Surplus in the plan (320 557) (570 213) (453 974) (452 826) (312 546)
Experience adjustments on plan liabilities 77 502 38 241 70 138 44 512 43 023
Experience adjustments on plan assets (87 401) (155 956) (152 117) (28 447) (106 068)
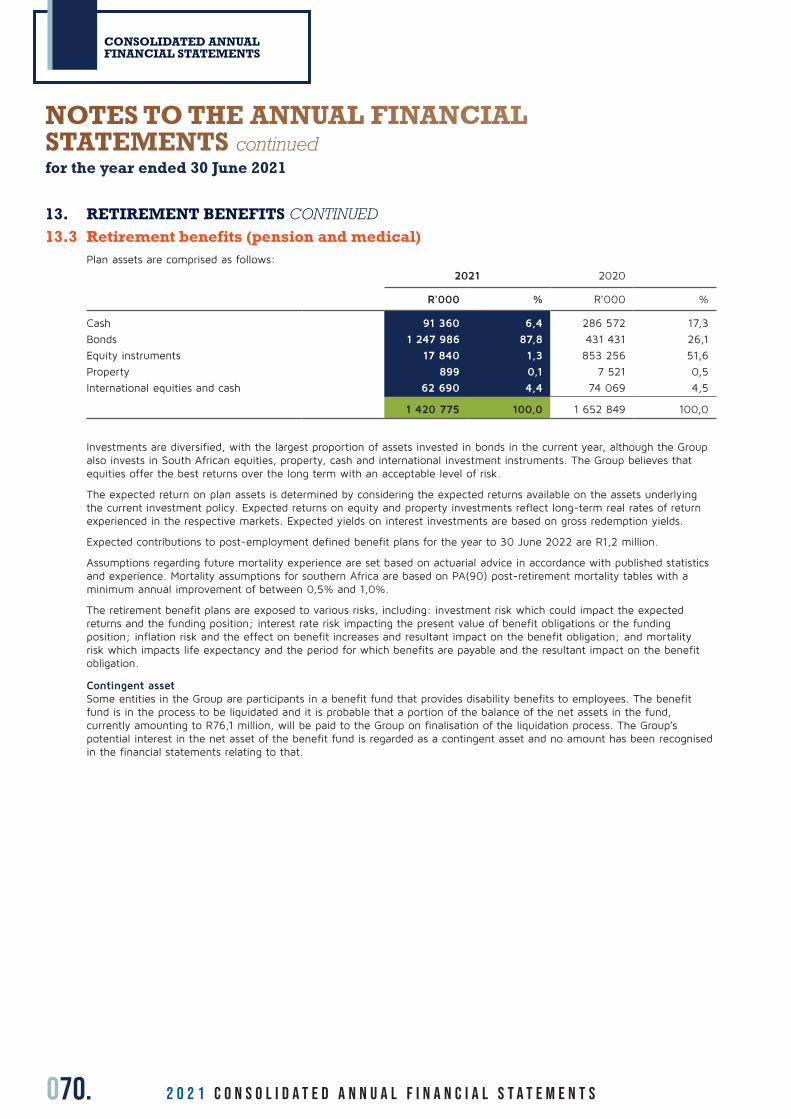
070. 2 0 2 1 C O N S O L I D A T E D A n n u a l f i n a n c i a l s t a t e m e n t s
CONSOLIDATED ANNUAL FINANCIAL STATEMENTS
13. RETIREMENT BENEFITS CONTINUED13.3 Retirement benefits (pension and medical)
Plan assets are comprised as follows:
2021 2020
R‘000 % R‘000 %
Cash 91 360 6,4 286 572 17,3
Bonds 1 247 986 87,8 431 431 26,1
Equity instruments 17 840 1,3 853 256 51,6
Property 899 0,1 7 521 0,5
International equities and cash 62 690 4,4 74 069 4,5
1 420 775 100,0 1 652 849 100,0
Investments are diversified, with the largest proportion of assets invested in bonds in the current year, although the Group also invests in South African equities, property, cash and international investment instruments. The Group believes that equities offer the best returns over the long term with an acceptable level of risk.
The expected return on plan assets is determined by considering the expected returns available on the assets underlying the current investment policy. Expected returns on equity and property investments reflect long-term real rates of return experienced in the respective markets. Expected yields on interest investments are based on gross redemption yields.
Expected contributions to post-employment defined benefit plans for the year to 30 June 2022 are R1,2 million.
Assumptions regarding future mortality experience are set based on actuarial advice in accordance with published statistics and experience. Mortality assumptions for southern Africa are based on PA(90) post-retirement mortality tables with a minimum annual improvement of between 0,5% and 1,0%.
The retirement benefit plans are exposed to various risks, including: investment risk which could impact the expected returns and the funding position; interest rate risk impacting the present value of benefit obligations or the funding position; inflation risk and the effect on benefit increases and resultant impact on the benefit obligation; and mortality risk which impacts life expectancy and the period for which benefits are payable and the resultant impact on the benefit obligation.
Contingent assetSome entities in the Group are participants in a benefit fund that provides disability benefits to employees. The benefit fund is in the process to be liquidated and it is probable that a portion of the balance of the net assets in the fund, currently amounting to R76,1 million, will be paid to the Group on finalisation of the liquidation process. The Group’s potential interest in the net asset of the benefit fund is regarded as a contingent asset and no amount has been recognised in the financial statements relating to that.
NOTES TO THE ANNUAL FINANCIAL STATEMENTS continuedfor the year ended 30 June 2021
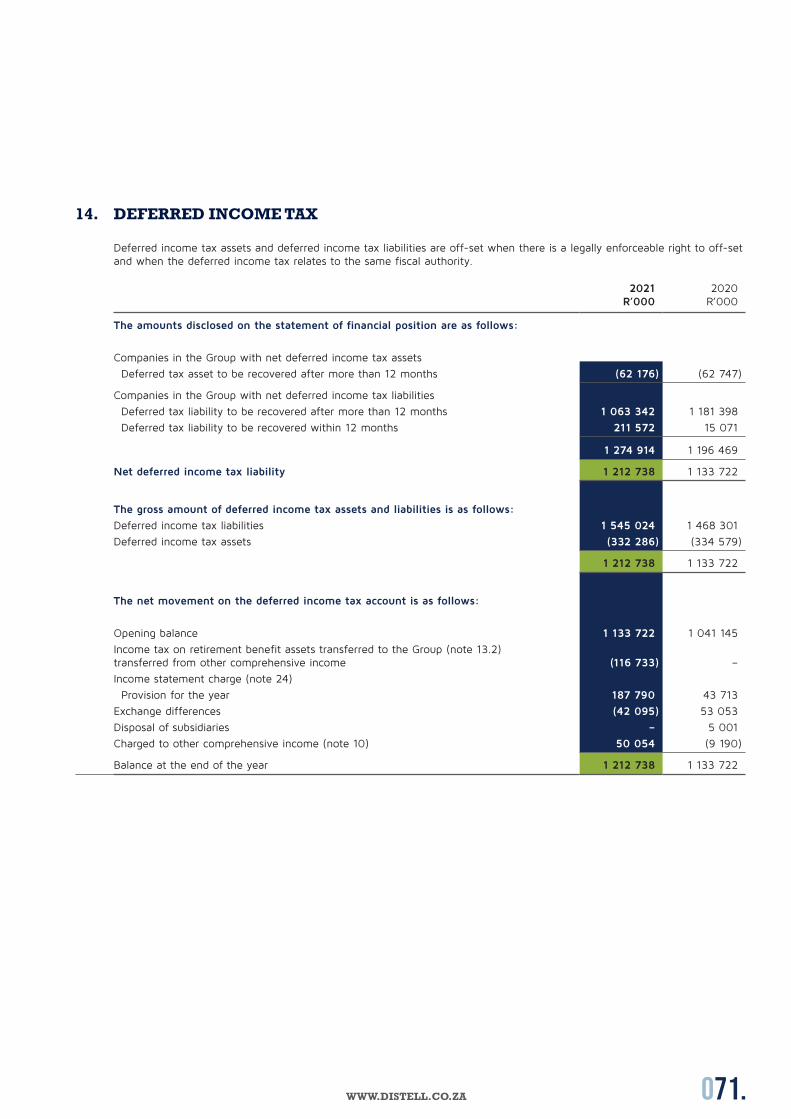
071.WWW.DISTELL.CO.ZA
14. DEFERRED INCOME TAX
Deferred income tax assets and deferred income tax liabilities are off-set when there is a legally enforceable right to off-set and when the deferred income tax relates to the same fiscal authority.
2021R’000
2020R’000
The amounts disclosed on the statement of financial position are as follows:
Companies in the Group with net deferred income tax assets
Deferred tax asset to be recovered after more than 12 months (62 176) (62 747)
Companies in the Group with net deferred income tax liabilities
Deferred tax liability to be recovered after more than 12 months 1 063 342 1 181 398
Deferred tax liability to be recovered within 12 months 211 572 15 071
1 274 914 1 196 469
Net deferred income tax liability 1 212 738 1 133 722
The gross amount of deferred income tax assets and liabilities is as follows:
Deferred income tax liabilities 1 545 024 1 468 301
Deferred income tax assets (332 286) (334 579)
1 212 738 1 133 722
The net movement on the deferred income tax account is as follows:
Opening balance 1 133 722 1 041 145
Income tax on retirement benefit assets transferred to the Group (note 13.2) transferred from other comprehensive income (116 733) –
Income statement charge (note 24)
Provision for the year 187 790 43 713
Exchange differences (42 095) 53 053
Disposal of subsidiaries – 5 001
Charged to other comprehensive income (note 10) 50 054 (9 190)
Balance at the end of the year 1 212 738 1 133 722
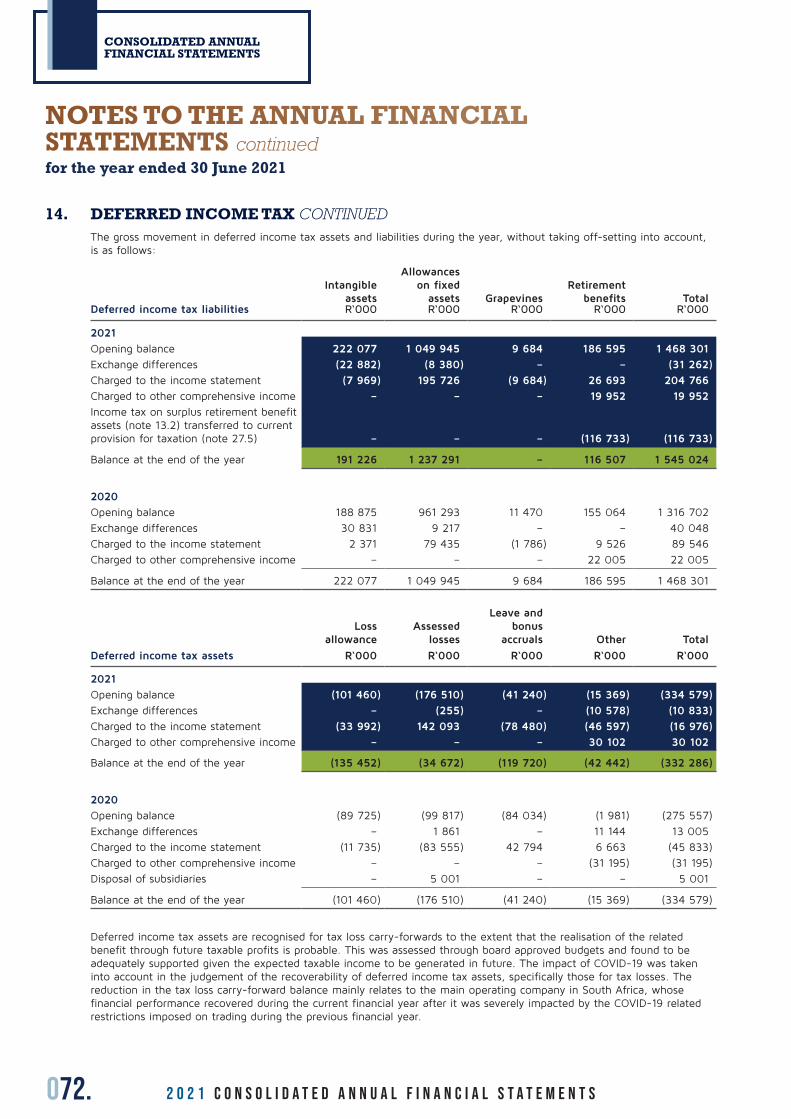
072. 2 0 2 1 C O N S O L I D A T E D A n n u a l f i n a n c i a l s t a t e m e n t s
CONSOLIDATED ANNUAL FINANCIAL STATEMENTS
14. DEFERRED INCOME TAX CONTINUEDThe gross movement in deferred income tax assets and liabilities during the year, without taking off-setting into account, is as follows:
Intangible assets
Allowances on fixed
assets GrapevinesRetirement
benefits Total Deferred income tax liabilities R‘000 R‘000 R‘000 R‘000 R‘000
2021
Opening balance 222 077 1 049 945 9 684 186 595 1 468 301
Exchange differences (22 882) (8 380) – – (31 262)
Charged to the income statement (7 969) 195 726 (9 684) 26 693 204 766
Charged to other comprehensive income – – – 19 952 19 952
Income tax on surplus retirement benefit assets (note 13.2) transferred to current provision for taxation (note 27.5) – – – (116 733) (116 733)
Balance at the end of the year 191 226 1 237 291 – 116 507 1 545 024
2020
Opening balance 188 875 961 293 11 470 155 064 1 316 702
Exchange differences 30 831 9 217 – – 40 048
Charged to the income statement 2 371 79 435 (1 786) 9 526 89 546
Charged to other comprehensive income – – – 22 005 22 005
Balance at the end of the year 222 077 1 049 945 9 684 186 595 1 468 301
Loss allowance
Assessed losses
Leave and bonus
accruals Other Total
Deferred income tax assets R‘000 R‘000 R‘000 R‘000 R‘000
2021
Opening balance (101 460) (176 510) (41 240) (15 369) (334 579)
Exchange differences – (255) – (10 578) (10 833)
Charged to the income statement (33 992) 142 093 (78 480) (46 597) (16 976)
Charged to other comprehensive income – – – 30 102 30 102
Balance at the end of the year (135 452) (34 672) (119 720) (42 442) (332 286)
2020
Opening balance (89 725) (99 817) (84 034) (1 981) (275 557)
Exchange differences – 1 861 – 11 144 13 005
Charged to the income statement (11 735) (83 555) 42 794 6 663 (45 833)
Charged to other comprehensive income – – – (31 195) (31 195)
Disposal of subsidiaries – 5 001 – – 5 001
Balance at the end of the year (101 460) (176 510) (41 240) (15 369) (334 579)
Deferred income tax assets are recognised for tax loss carry-forwards to the extent that the realisation of the related benefit through future taxable profits is probable. This was assessed through board approved budgets and found to be adequately supported given the expected taxable income to be generated in future. The impact of COVID-19 was taken into account in the judgement of the recoverability of deferred income tax assets, specifically those for tax losses. The reduction in the tax loss carry-forward balance mainly relates to the main operating company in South Africa, whose financial performance recovered during the current financial year after it was severely impacted by the COVID-19 related restrictions imposed on trading during the previous financial year.
NOTES TO THE ANNUAL FINANCIAL STATEMENTS continuedfor the year ended 30 June 2021

073.WWW.DISTELL.CO.ZA
14. DEFERRED INCOME TAX CONTINUEDRefer to note 24 for taxation losses and capital development expenses (farming) available for off-set against future taxable income.
No deferred tax liability has been recognised for the withholding tax and other taxes that would be payable on the unremitted earnings of subsidiaries and equity accounted investments. For subsidiaries the Group is able to control the timing of any distributions and none of the distributions will give rise to tax liabilities. For equity accounted investments it is not probable that any distributions will be made in the foreseeable future. Similarly, tax is not provided where it is expected at the reporting date that such distributions will not give rise to a tax liability.
15. TRADE AND OTHER PAYABLES2021
R’0002020
R’000
Group Financial instruments
Trade payables 3 310 643 1 867 227
Accrued expenses 274 526 210 485
Refund liability 45 569 26 955
Returnable container refund liability 64 613 49 489
3 695 351 2 154 156
Non-financial instruments
Accrued leave pay 137 794 156 454
Excise duty 1 846 926 1 812 443
Value added tax 88 218 115 459
2 072 938 2 084 356
5 768 289 4 238 512
As a result of the impact of COVID-19, the Group was granted an extension of three months for the excise duty that was originally due to be paid during May and June 2020.
The carrying amounts of trade and other payables are considered to be the same as their fair values, due to their short-term nature.
The carrying amounts of the Group’s trade and other payables are denominated in the following currencies:
South African rand 4 850 137 3 472 220
US dollar 114 537 19 677
Euro 35 536 24 759
UK pound 443 694 527 649
Kenyan shilling 75 943 99 527
Taiwan dollar 104 103 31 539
Canadian dollar 31 901 17 037
Namibian dollar 43 829 34 283
Other currencies 68 609 11 821
5 768 289 4 238 512
CompanyIntergroup loan 47 278 47 264
Unclaimed dividends 6 055 6 776
53 333 54 040
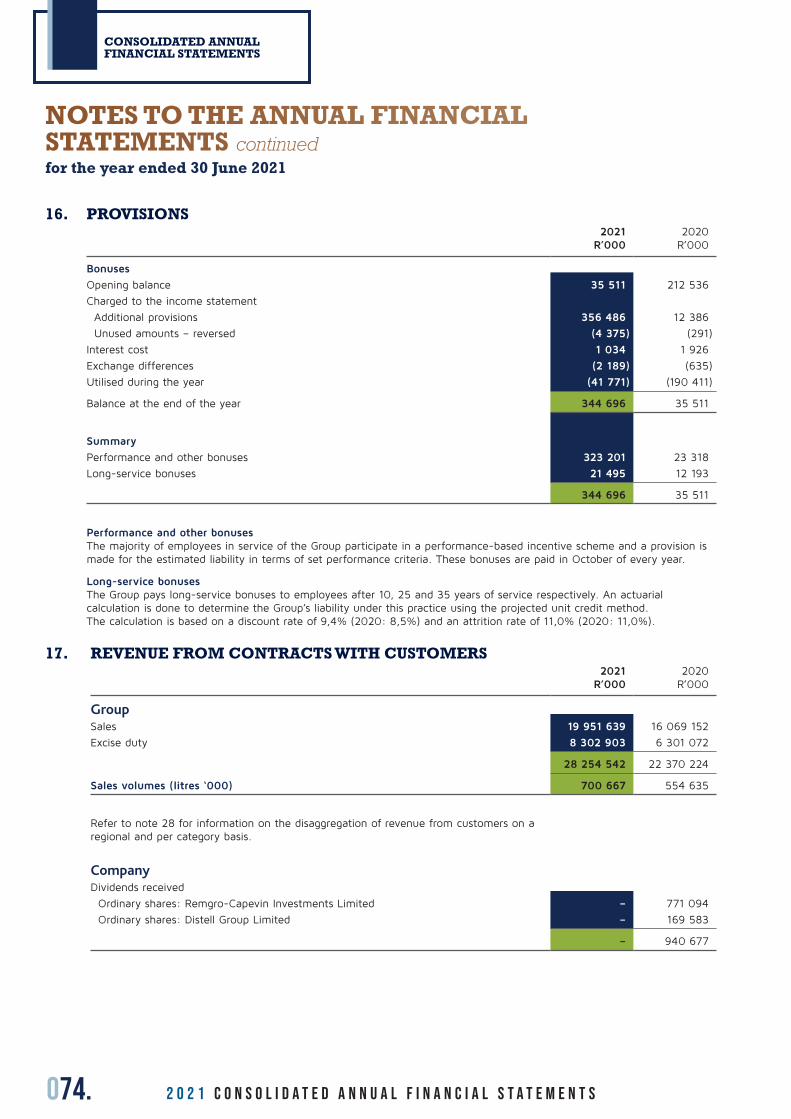
074. 2 0 2 1 C O N S O L I D A T E D A n n u a l f i n a n c i a l s t a t e m e n t s
CONSOLIDATED ANNUAL FINANCIAL STATEMENTS
16. PROVISIONS2021
R’0002020
R’000
Bonuses
Opening balance 35 511 212 536
Charged to the income statement
Additional provisions 356 486 12 386
Unused amounts – reversed (4 375) (291)
Interest cost 1 034 1 926
Exchange differences (2 189) (635)
Utilised during the year (41 771) (190 411)
Balance at the end of the year 344 696 35 511
Summary
Performance and other bonuses 323 201 23 318
Long-service bonuses 21 495 12 193
344 696 35 511
Performance and other bonusesThe majority of employees in service of the Group participate in a performance-based incentive scheme and a provision is made for the estimated liability in terms of set performance criteria. These bonuses are paid in October of every year.
Long-service bonusesThe Group pays long-service bonuses to employees after 10, 25 and 35 years of service respectively. An actuarial calculation is done to determine the Group’s liability under this practice using the projected unit credit method. The calculation is based on a discount rate of 9,4% (2020: 8,5%) and an attrition rate of 11,0% (2020: 11,0%).
17. REVENUE FROM CONTRACTS WITH CUSTOMERS2021
R’0002020
R’000
GroupSales 19 951 639 16 069 152
Excise duty 8 302 903 6 301 072
28 254 542 22 370 224
Sales volumes (litres ‘000) 700 667 554 635
Refer to note 28 for information on the disaggregation of revenue from customers on a regional and per category basis.
CompanyDividends received
Ordinary shares: Remgro-Capevin Investments Limited – 771 094
Ordinary shares: Distell Group Limited – 169 583
– 940 677
NOTES TO THE ANNUAL FINANCIAL STATEMENTS continuedfor the year ended 30 June 2021

075.WWW.DISTELL.CO.ZA
18. OPERATING COSTS18.1 Costs classified by function
2021R’000
2020R’000
Costs of goods sold 20 430 795 16 065 724
Sales and marketing costs 2 542 523 2 779 851
Distribution costs 1 362 550 1 154 545
Administration and other costs 1 273 546 955 391
Net impairment losses on financial assets 62 033 224 406
25 671 447 21 179 917
18.2 Costs classified by natureGroupAdministrative and managerial fees 18 599 16 332
Advertising costs and promotions 1 067 169 1 140 529
Amortisation of intangible assets (note 5) 80 708 106 557
Auditors’ remuneration (note 18.3) 21 368 19 279
Depreciation of PPE (note 2) 731 937 702 026
Employee benefit expense (note 18.4) 2 879 251 2 630 684
Net impairment losses on financial assets 62 033 224 406
Maintenance and repairs 308 458 236 834
Net foreign exchange losses 226 751 (266 325)
Lease expenses (notes 18.5 and 29) 120 912 106 656
Raw materials and consumables used 17 602 212 13 963 472
Research expenditure: trademarks and brands 33 428 27 671
Services 937 403 746 103
Supplies (including water and electricity) 571 032 476 906
Transportation costs 462 392 397 719
Write-offs and provisions related to inventory 217 347 316 475
Other expenses 330 447 334 593
25 671 447 21 179 917
CompanyAdministrative costs 12 19
12 19
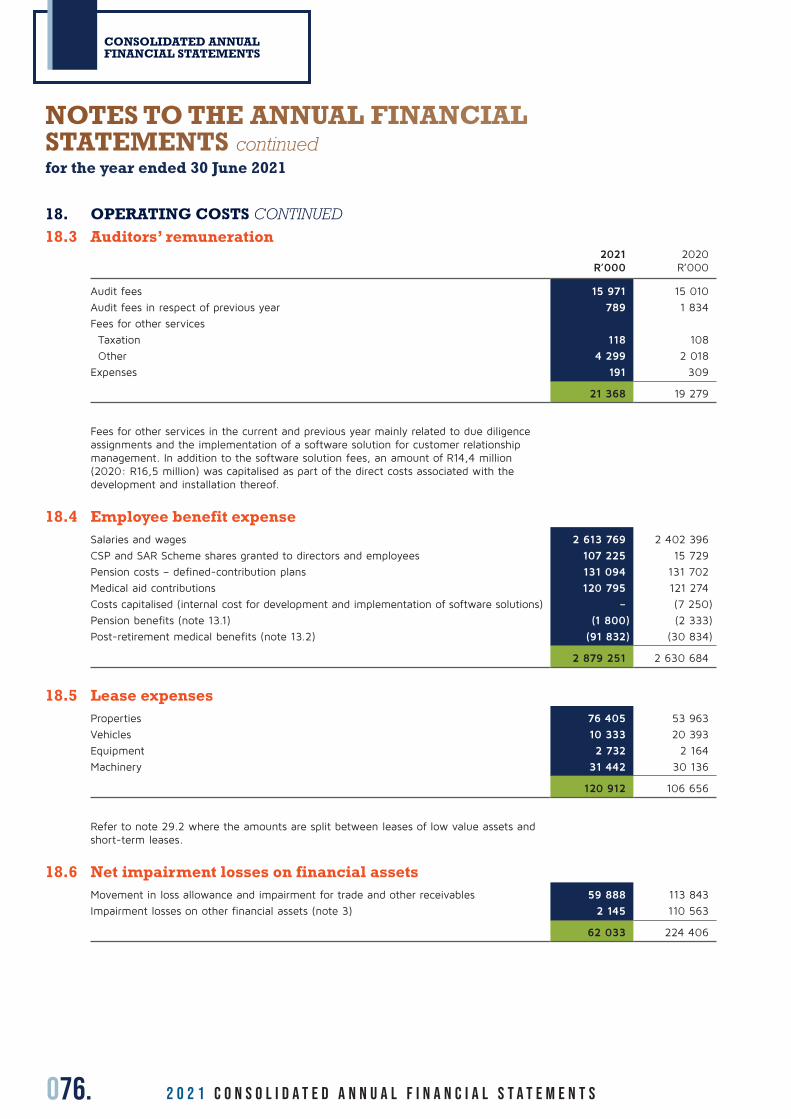
076. 2 0 2 1 C O N S O L I D A T E D A n n u a l f i n a n c i a l s t a t e m e n t s
CONSOLIDATED ANNUAL FINANCIAL STATEMENTS
18. OPERATING COSTS CONTINUED18.3 Auditors’ remuneration
2021R’000
2020R’000
Audit fees 15 971 15 010
Audit fees in respect of previous year 789 1 834
Fees for other services
Taxation 118 108
Other 4 299 2 018
Expenses 191 309
21 368 19 279
Fees for other services in the current and previous year mainly related to due diligence assignments and the implementation of a software solution for customer relationship management. In addition to the software solution fees, an amount of R14,4 million (2020: R16,5 million) was capitalised as part of the direct costs associated with the development and installation thereof.
18.4 Employee benefit expenseSalaries and wages 2 613 769 2 402 396
CSP and SAR Scheme shares granted to directors and employees 107 225 15 729
Pension costs – defined-contribution plans 131 094 131 702
Medical aid contributions 120 795 121 274
Costs capitalised (internal cost for development and implementation of software solutions) – (7 250)
Pension benefits (note 13.1) (1 800) (2 333)
Post-retirement medical benefits (note 13.2) (91 832) (30 834)
2 879 251 2 630 684
18.5 Lease expensesProperties 76 405 53 963
Vehicles 10 333 20 393
Equipment 2 732 2 164
Machinery 31 442 30 136
120 912 106 656
Refer to note 29.2 where the amounts are split between leases of low value assets and short-term leases.
18.6 Net impairment losses on financial assetsMovement in loss allowance and impairment for trade and other receivables 59 888 113 843
Impairment losses on other financial assets (note 3) 2 145 110 563
62 033 224 406
NOTES TO THE ANNUAL FINANCIAL STATEMENTS continuedfor the year ended 30 June 2021
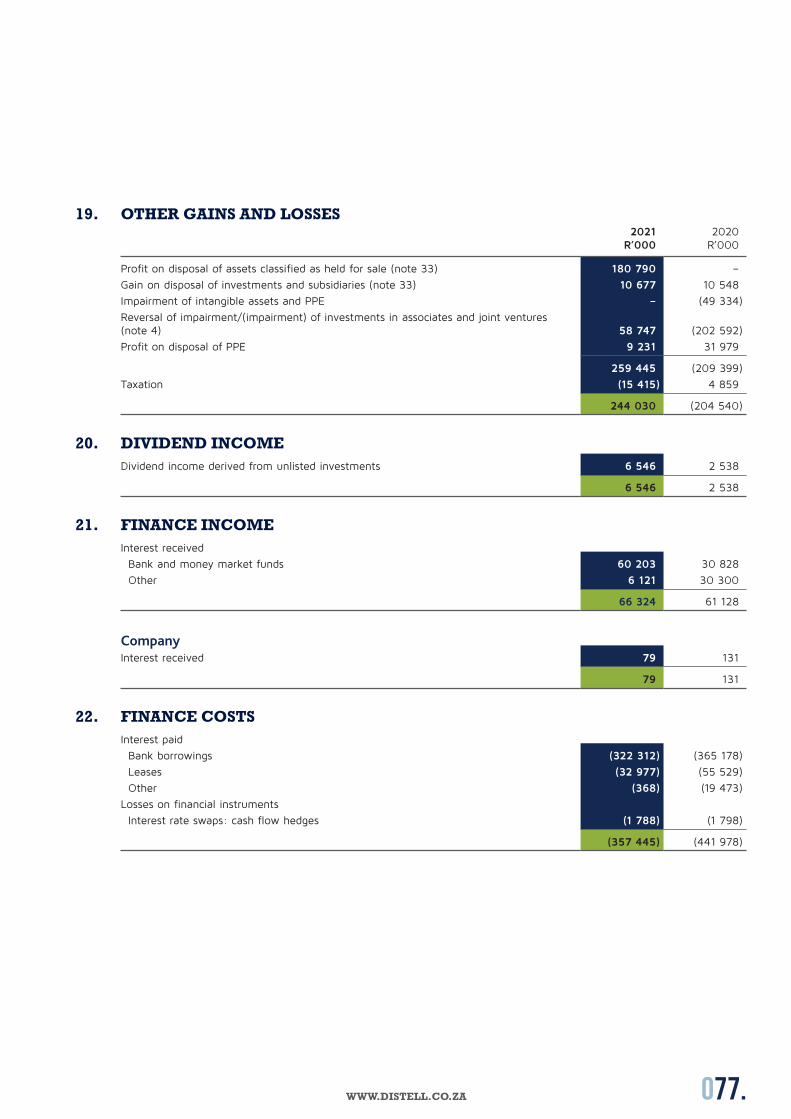
077.WWW.DISTELL.CO.ZA
19. OTHER GAINS AND LOSSES2021
R’0002020
R’000
Profit on disposal of assets classified as held for sale (note 33) 180 790 –
Gain on disposal of investments and subsidiaries (note 33) 10 677 10 548
Impairment of intangible assets and PPE – (49 334)
Reversal of impairment/(impairment) of investments in associates and joint ventures (note 4) 58 747 (202 592)
Profit on disposal of PPE 9 231 31 979
259 445 (209 399)
Taxation (15 415) 4 859
244 030 (204 540)
20. DIVIDEND INCOMEDividend income derived from unlisted investments 6 546 2 538
6 546 2 538
21. FINANCE INCOMEInterest received
Bank and money market funds 60 203 30 828
Other 6 121 30 300
66 324 61 128
CompanyInterest received 79 131
79 131
22. FINANCE COSTSInterest paid
Bank borrowings (322 312) (365 178)
Leases (32 977) (55 529)
Other (368) (19 473)
Losses on financial instruments
Interest rate swaps: cash flow hedges (1 788) (1 798)
(357 445) (441 978)

078. 2 0 2 1 C O N S O L I D A T E D A n n u a l f i n a n c i a l s t a t e m e n t s
CONSOLIDATED ANNUAL FINANCIAL STATEMENTS
23. SHARE OF EQUITY-ACCOUNTED EARNINGS2021
R’0002020
R’000
Share of profit of associates
Share of profit before taxation 99 052 72 285
Share of taxation (41 295) (25 201)
Share of profit for the year 57 757 47 084
Share of profit of joint ventures
Share of profit before taxation 84 894 75 426
Share of taxation (28 848) (25 477)
Share of profit for the year 56 046 49 949
113 803 97 033
24. TAXATION24.1 Normal company taxation
GroupCurrent taxation
current year 491 009 250 352
previous year (9 520) 10 944
Deferred taxation 187 790 43 713
669 279 305 009
Composition
Normal South African taxation 539 435 139 717
Foreign taxation 129 844 165 292
669 279 305 009
CompanyNormal South African taxation
current year 24 37
The income tax charged to other comprehensive income during the year is as follows:
Deferred taxation
Fair value adjustments of cash flow hedges – interest rate swaps 20 862 (29 284)
Fair value adjustments of financial assets through OCI 9 240 (1 911)
Remeasurements of post-employment benefits 19 952 22 005
50 054 (9 190)
NOTES TO THE ANNUAL FINANCIAL STATEMENTS continuedfor the year ended 30 June 2021
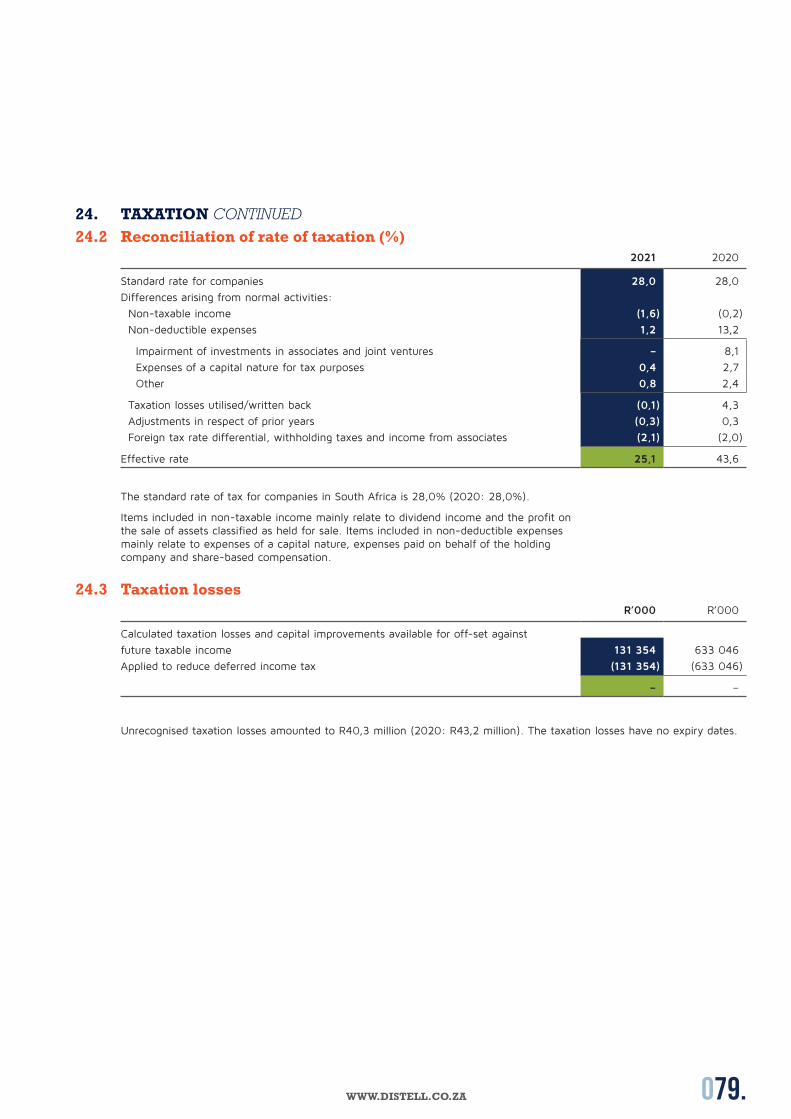
079.WWW.DISTELL.CO.ZA
24. TAXATION CONTINUED24.2 Reconciliation of rate of taxation (%)
2021 2020
Standard rate for companies 28,0 28,0
Differences arising from normal activities:
Non-taxable income (1,6) (0,2)
Non-deductible expenses 1,2 13,2
Impairment of investments in associates and joint ventures – 8,1
Expenses of a capital nature for tax purposes 0,4 2,7
Other 0,8 2,4
Taxation losses utilised/written back (0,1) 4,3
Adjustments in respect of prior years (0,3) 0,3
Foreign tax rate differential, withholding taxes and income from associates (2,1) (2,0)
Effective rate 25,1 43,6
The standard rate of tax for companies in South Africa is 28,0% (2020: 28,0%).
Items included in non-taxable income mainly relate to dividend income and the profit on the sale of assets classified as held for sale. Items included in non-deductible expenses mainly relate to expenses of a capital nature, expenses paid on behalf of the holding company and share-based compensation.
24.3 Taxation lossesR’000 R’000
Calculated taxation losses and capital improvements available for off-set against
future taxable income 131 354 633 046
Applied to reduce deferred income tax (131 354) (633 046)
– –
Unrecognised taxation losses amounted to R40,3 million (2020: R43,2 million). The taxation losses have no expiry dates.
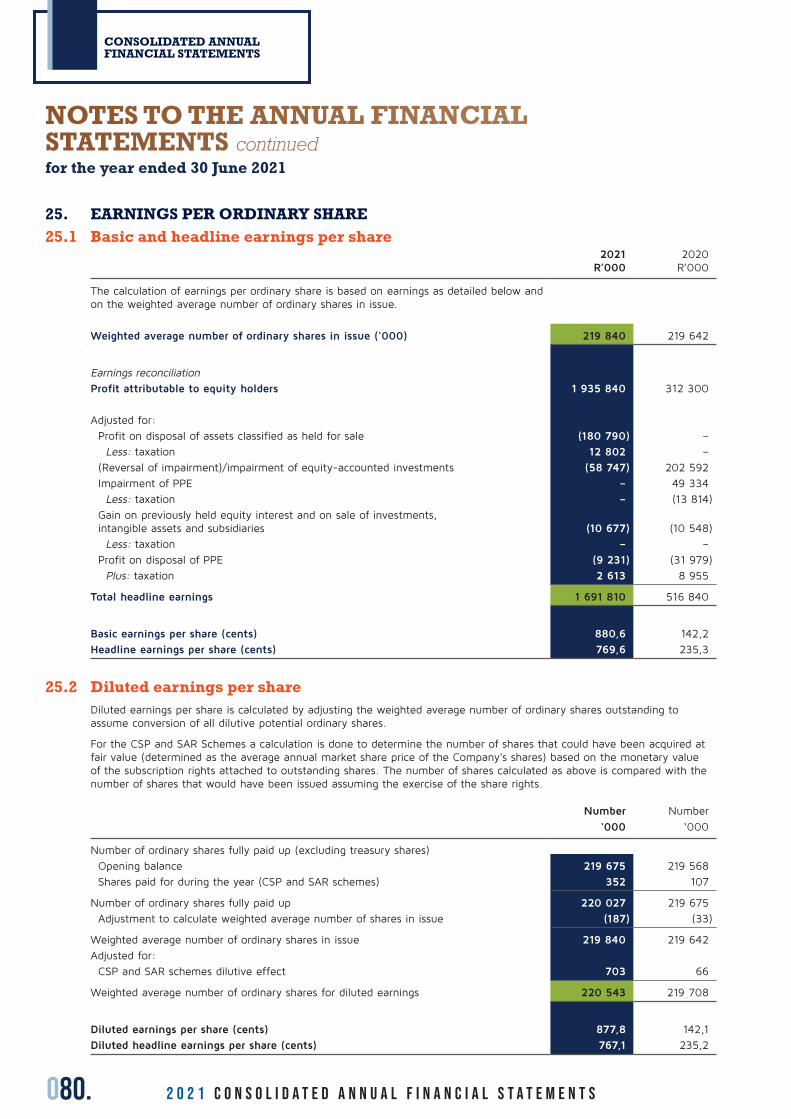
080. 2 0 2 1 C O N S O L I D A T E D A n n u a l f i n a n c i a l s t a t e m e n t s
CONSOLIDATED ANNUAL FINANCIAL STATEMENTS
25. EARNINGS PER ORDINARY SHARE25.1 Basic and headline earnings per share
2021R’000
2020R’000
The calculation of earnings per ordinary share is based on earnings as detailed below and on the weighted average number of ordinary shares in issue.
Weighted average number of ordinary shares in issue (‘000) 219 840 219 642
Earnings reconciliation
Profit attributable to equity holders 1 935 840 312 300
Adjusted for:
Profit on disposal of assets classified as held for sale (180 790) –
Less: taxation 12 802 –
(Reversal of impairment)/impairment of equity-accounted investments (58 747) 202 592
Impairment of PPE – 49 334
Less: taxation – (13 814)
Gain on previously held equity interest and on sale of investments, intangible assets and subsidiaries (10 677) (10 548)
Less: taxation – –
Profit on disposal of PPE (9 231) (31 979)
Plus: taxation 2 613 8 955
Total headline earnings 1 691 810 516 840
Basic earnings per share (cents) 880,6 142,2
Headline earnings per share (cents) 769,6 235,3
25.2 Diluted earnings per shareDiluted earnings per share is calculated by adjusting the weighted average number of ordinary shares outstanding to assume conversion of all dilutive potential ordinary shares.
For the CSP and SAR Schemes a calculation is done to determine the number of shares that could have been acquired at fair value (determined as the average annual market share price of the Company’s shares) based on the monetary value of the subscription rights attached to outstanding shares. The number of shares calculated as above is compared with the number of shares that would have been issued assuming the exercise of the share rights.
Number
‘000
Number
‘000
Number of ordinary shares fully paid up (excluding treasury shares)
Opening balance 219 675 219 568
Shares paid for during the year (CSP and SAR schemes) 352 107
Number of ordinary shares fully paid up 220 027 219 675
Adjustment to calculate weighted average number of shares in issue (187) (33)
Weighted average number of ordinary shares in issue 219 840 219 642
Adjusted for:
CSP and SAR schemes dilutive effect 703 66
Weighted average number of ordinary shares for diluted earnings 220 543 219 708
Diluted earnings per share (cents) 877,8 142,1
Diluted headline earnings per share (cents) 767,1 235,2
NOTES TO THE ANNUAL FINANCIAL STATEMENTS continuedfor the year ended 30 June 2021

081.WWW.DISTELL.CO.ZA
26. DIVIDENDS2021
R’0002020
R’000
Paid nil (2020: 174,0 cents) – 382 331
Declared nil (2020: nil) – –
Total nil (2020: 174,0 cents) – 382 331
No final dividend was declared for the financial years ended 30 June 2021 and 2020.
27. CASH FLOW INFORMATION27.1 Non-cash flow items
2021R’000
2020R’000
Depreciation 731 937 702 026
Intangible assets amortisation 80 708 106 557
Profit on disposal of PPE (9 231) (31 979)
Gain on acquisition/disposal of previously held interest in subsidiary (10 679) (10 548)
Expected credit loss of trade receivables 38 236 69 015
Provision for retirement benefits (84 054) (35 984)
Provision for leave and bonuses 350 956 13 386
Profit on disposal of assets classified as held for sale (180 790) –
CSPs and SARs granted to directors and employees 107 225 15 729
Loss allowance on financial assets at amortised cost 2 145 110 563
Impairment of PPE – 49 334
(Reversal of impairment)/Impairment of investments (58 747) 202 592
Other (10 019) (1 044)
957 687 1 189 647
27.2 Working capital changesIncrease in inventories (255 275) (2 107)
(Increase)/Decrease in trade and other receivables (513 055) 817 315
Increase/(Decrease) in trade and other payables 1 541 244 (1 108 512)
772 914 (293 304)
27.3 Finance income
Finance income per income statement 66 324 61 128
Movement in provision for finance income – (25 769)
66 324 35 359
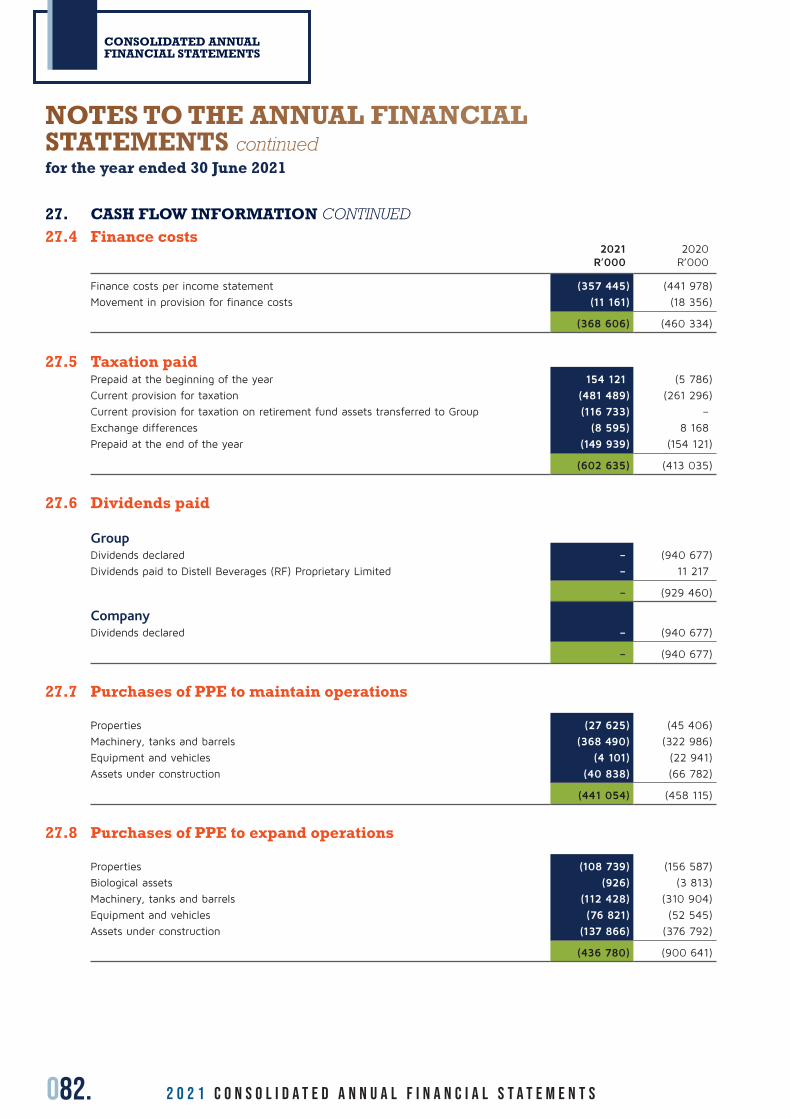
082. 2 0 2 1 C O N S O L I D A T E D A n n u a l f i n a n c i a l s t a t e m e n t s
CONSOLIDATED ANNUAL FINANCIAL STATEMENTS
27. CASH FLOW INFORMATION CONTINUED27.4 Finance costs
2021R’000
2020R’000
Finance costs per income statement (357 445) (441 978)
Movement in provision for finance costs (11 161) (18 356)
(368 606) (460 334)
27.5 Taxation paidPrepaid at the beginning of the year 154 121 (5 786)
Current provision for taxation (481 489) (261 296)
Current provision for taxation on retirement fund assets transferred to Group (116 733) –
Exchange differences (8 595) 8 168
Prepaid at the end of the year (149 939) (154 121)
(602 635) (413 035)
27.6 Dividends paid
GroupDividends declared – (940 677)
Dividends paid to Distell Beverages (RF) Proprietary Limited – 11 217
– (929 460)
CompanyDividends declared – (940 677)
– (940 677)
27.7 Purchases of PPE to maintain operations
Properties (27 625) (45 406)
Machinery, tanks and barrels (368 490) (322 986)
Equipment and vehicles (4 101) (22 941)
Assets under construction (40 838) (66 782)
(441 054) (458 115)
27.8 Purchases of PPE to expand operations
Properties (108 739) (156 587)
Biological assets (926) (3 813)
Machinery, tanks and barrels (112 428) (310 904)
Equipment and vehicles (76 821) (52 545)
Assets under construction (137 866) (376 792)
(436 780) (900 641)
NOTES TO THE ANNUAL FINANCIAL STATEMENTS continuedfor the year ended 30 June 2021
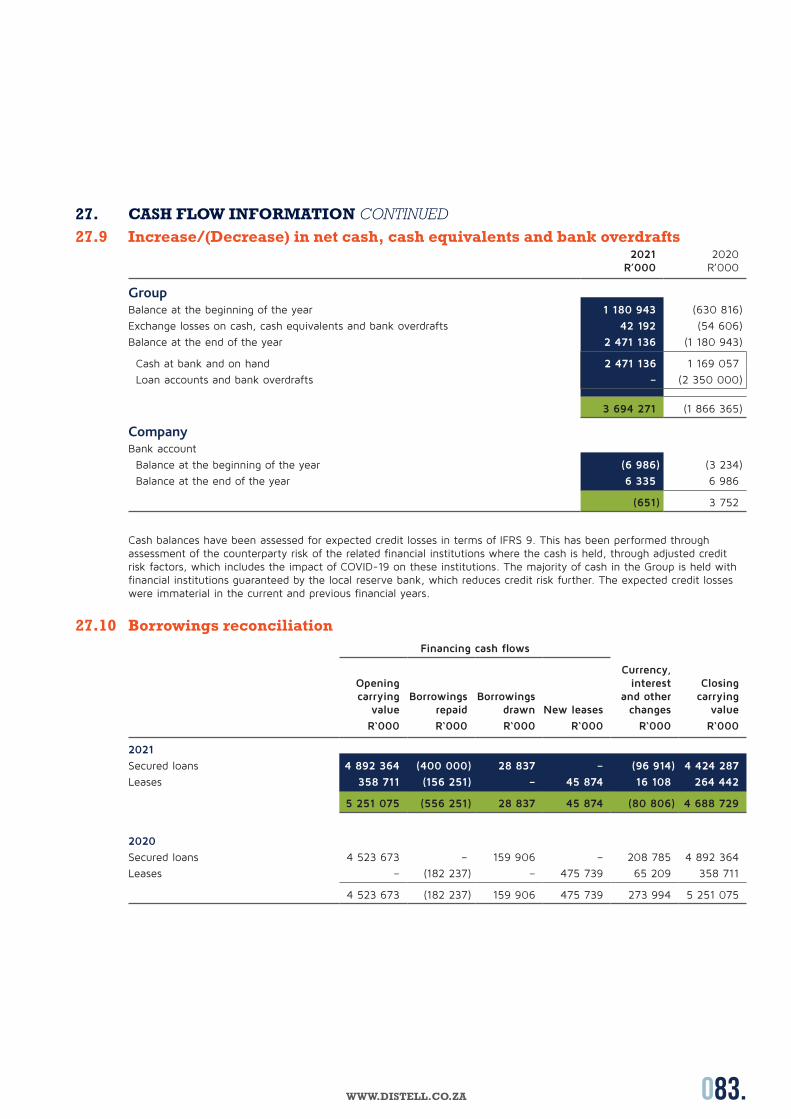
083.WWW.DISTELL.CO.ZA
27. CASH FLOW INFORMATION CONTINUED27.9 Increase/(Decrease) in net cash, cash equivalents and bank overdrafts
2021R’000
2020R’000
GroupBalance at the beginning of the year 1 180 943 (630 816)
Exchange losses on cash, cash equivalents and bank overdrafts 42 192 (54 606)
Balance at the end of the year 2 471 136 (1 180 943)
Cash at bank and on hand 2 471 136 1 169 057
Loan accounts and bank overdrafts – (2 350 000)
3 694 271 (1 866 365)
CompanyBank account
Balance at the beginning of the year (6 986) (3 234)
Balance at the end of the year 6 335 6 986
(651) 3 752
Cash balances have been assessed for expected credit losses in terms of IFRS 9. This has been performed through assessment of the counterparty risk of the related financial institutions where the cash is held, through adjusted credit risk factors, which includes the impact of COVID-19 on these institutions. The majority of cash in the Group is held with financial institutions guaranteed by the local reserve bank, which reduces credit risk further. The expected credit losses were immaterial in the current and previous financial years.
27.10 Borrowings reconciliationFinancing cash flows
Opening carrying
valueBorrowings
repaidBorrowings
drawn New leases
Currency, interest
and other changes
Closing carrying
value
R‘000 R‘000 R‘000 R‘000 R‘000 R‘000
2021
Secured loans 4 892 364 (400 000) 28 837 – (96 914) 4 424 287
Leases 358 711 (156 251) – 45 874 16 108 264 442
5 251 075 (556 251) 28 837 45 874 (80 806) 4 688 729
2020
Secured loans 4 523 673 – 159 906 – 208 785 4 892 364
Leases – (182 237) – 475 739 65 209 358 711
4 523 673 (182 237) 159 906 475 739 273 994 5 251 075
084. 2 0 2 1 C O N S O L I D A T E D A n n u a l f i n a n c i a l s t a t e m e n t s
CONSOLIDATED ANNUAL FINANCIAL STATEMENTS
28. SEGMENT REPORTINGManagement has determined the operating segments based on the reports reviewed by the executive management team (regarded as the chief operating decision-maker) for the purpose of assessing performance, allocating resources and making strategic decisions.
The executive management considers the business from a geographic perspective with reference to the performance of South Africa and other international operations. Revenue includes excise duty.
The reportable operating segments derive their revenue primarily from the production, marketing and distribution of alcoholic beverages and other non-alcoholic items. The Group derives revenue from the transfer of goods at a point in time in geographical regions and various categories.
The Group is not reliant on any one major customer due to the large number of customers and their dispersion across geographical areas.
Segment revenue represents sales to end-customers in the specific geographic regions. Cost of goods sold are based on standard production costs as production is centralised in specific regions which services various geographies. Production cost variances from standard are disclosed under ‘corporate’. Where production variances relate to specific regions, it is re-allocated from ‘corporate’ to the regions and is included in ‘allocations’. A portion of other corporate costs are also allocated to regions and is included in ‘allocations’.
Financial liabilities are also not reviewed on a segmental basis and are not disclosed separately.
The executive management team assesses the performance of the operating segments based on a measure of adjusted operating profit. This measurement basis excludes, for example, corporate service cost centres such as global marketing, corporate governance, corporate affairs, business improvement, human resources, information technology, corporate finance, supply chain and the effects of equity-settled share-based payments and unrealised gains/losses on financial instruments that are shown separately under ‘corporate’. Finance income and finance costs are also not allocated to segments as this type of activity is driven by the central treasury function, which manages the cash position of the Group. See the disaggregation of corporate costs at the end of this note.
Operating segments that have been aggregated meet the aggregation criteria as per IFRS 8 paragraph 12. In addition, they have similar economic characteristics based on similar gross profit margins and all sell products manufactured by the Group. The operating segments that have been aggregated within the ‘International’ column consist out of Europe, Asia-Pacific, Taiwan, North America, Latin America and travel retail. Information pertaining to Corporate activities is presented to ensure segment information presented reconciles to the consolidated financial statements, however is not considered to represent an operating segment.
NOTES TO THE ANNUAL FINANCIAL STATEMENTS continuedfor the year ended 30 June 2021

085.WWW.DISTELL.CO.ZA
28. SEGMENT REPORTING CONTINUEDThe segment information provided to the executive management team for the reportable segments is as follows:
2021South Africa
R’000BLNER’000
Rest of AfricaR’000
InternationalR’000
CorporateR’000
TotalR’000
Revenue 20 536 935 2 061 328 2 802 132 2 783 621 70 526 28 254 542
Costs of goods sold (14 862 513) (1 498 775) (2 059 162) (1 628 214) (382 131) (20 430 795)
Material costs and overheads (14 862 453) (1 476 950) (2 000 498) (1 560 276) (303 867) (20 204 044)
Currency conversion gains and losses (60) (21 825) (58 664) (67 938) (78 264) (226 751)
Gross profit 5 674 422 562 553 742 970 1 155 407 (311 605) 7 823 747
Operating costs (2 439 547) (249 820) (375 125) (819 478) (1 356 682) (5 240 652)
Operating profit before allocations 3 234 875 312 733 367 845 335 929 (1 668 287) 2 583 095
Equity-accounted earnings (3 615) – 95 064 21 056 1 298 113 803
EBIT before allocations (excluding other gains and losses) 3 231 260 312 733 462 909 356 985 (1 666 989) 2 696 898
Allocations (846 160) (87 230) (106 060) (80 115) 1 119 565 –
EBIT after allocations (excluding other gains and losses) 2 385 100 225 503 356 849 276 870 (547 424) 2 696 898
Other gains and losses 10 069 – – 69 480 179 896 259 445
Equity-accounted earnings 3 615 – (95 064) (21 056) (1 298) (113 803)
Operating profit 2 398 784 225 503 261 785 325 294 (368 826) 2 842 540
EBIT before allocations attributable to:
Equity holders of the Company 3 219 539 312 733 406 970 356 985 (1 665 978) 2 630 249
Non-controlling interest 11 721 – 55 939 – (1 011) 66 649
3 231 260 312 733 462 909 356 985 (1 666 989) 2 696 898
Non-current assets 6 954 954 133 663 1 372 932 2 766 795 – 11 228 344
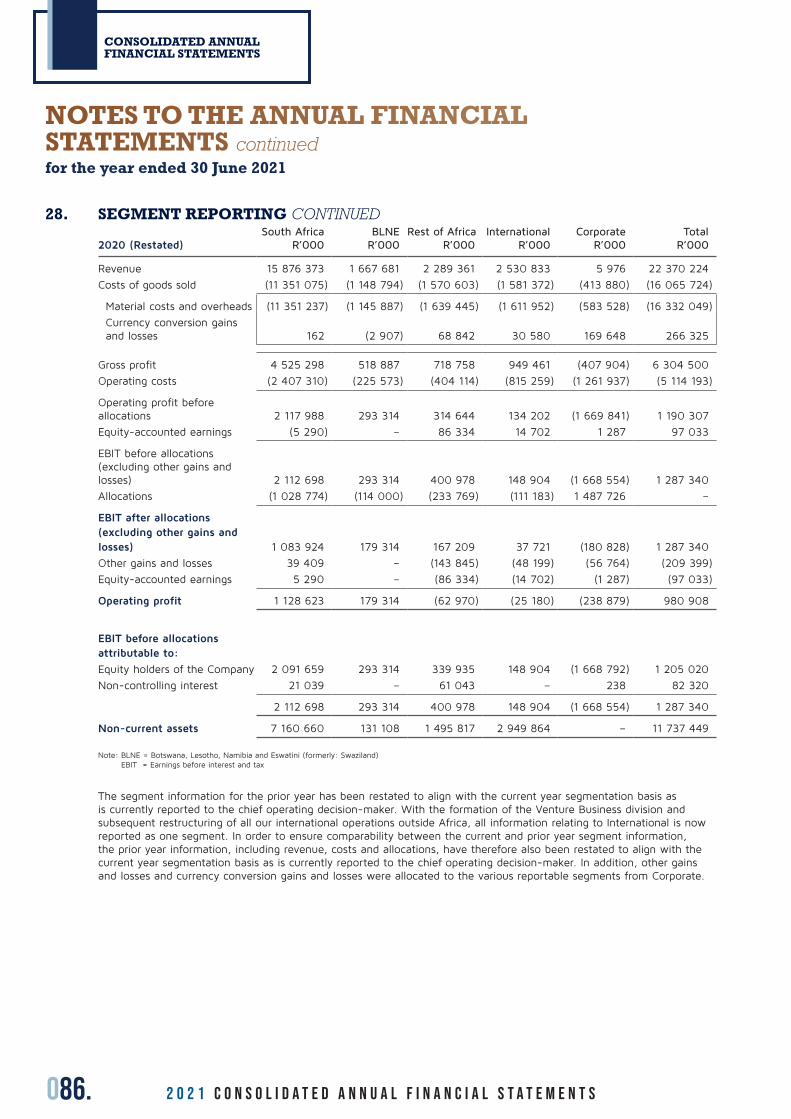
086. 2 0 2 1 C O N S O L I D A T E D A n n u a l f i n a n c i a l s t a t e m e n t s
CONSOLIDATED ANNUAL FINANCIAL STATEMENTS
28. SEGMENT REPORTING CONTINUED
2020 (Restated)South Africa
R’000BLNE
R’000Rest of Africa
R’000International
R’000Corporate
R’000Total
R’000
Revenue 15 876 373 1 667 681 2 289 361 2 530 833 5 976 22 370 224
Costs of goods sold (11 351 075) (1 148 794) (1 570 603) (1 581 372) (413 880) (16 065 724)
Material costs and overheads (11 351 237) (1 145 887) (1 639 445) (1 611 952) (583 528) (16 332 049)
Currency conversion gains and losses 162 (2 907) 68 842 30 580 169 648 266 325
Gross profit 4 525 298 518 887 718 758 949 461 (407 904) 6 304 500
Operating costs (2 407 310) (225 573) (404 114) (815 259) (1 261 937) (5 114 193)
Operating profit before allocations 2 117 988 293 314 314 644 134 202 (1 669 841) 1 190 307
Equity-accounted earnings (5 290) – 86 334 14 702 1 287 97 033
EBIT before allocations (excluding other gains and losses) 2 112 698 293 314 400 978 148 904 (1 668 554) 1 287 340
Allocations (1 028 774) (114 000) (233 769) (111 183) 1 487 726 –
EBIT after allocations (excluding other gains and losses) 1 083 924 179 314 167 209 37 721 (180 828) 1 287 340
Other gains and losses 39 409 – (143 845) (48 199) (56 764) (209 399)
Equity-accounted earnings 5 290 – (86 334) (14 702) (1 287) (97 033)
Operating profit 1 128 623 179 314 (62 970) (25 180) (238 879) 980 908
EBIT before allocations attributable to:
Equity holders of the Company 2 091 659 293 314 339 935 148 904 (1 668 792) 1 205 020
Non-controlling interest 21 039 – 61 043 – 238 82 320
2 112 698 293 314 400 978 148 904 (1 668 554) 1 287 340
Non-current assets 7 160 660 131 108 1 495 817 2 949 864 – 11 737 449
Note: BLNE = Botswana, Lesotho, Namibia and Eswatini (formerly: Swaziland) EBIT = Earnings before interest and tax
The segment information for the prior year has been restated to align with the current year segmentation basis as is currently reported to the chief operating decision-maker. With the formation of the Venture Business division and subsequent restructuring of all our international operations outside Africa, all information relating to International is now reported as one segment. In order to ensure comparability between the current and prior year segment information, the prior year information, including revenue, costs and allocations, have therefore also been restated to align with the current year segmentation basis as is currently reported to the chief operating decision-maker. In addition, other gains and losses and currency conversion gains and losses were allocated to the various reportable segments from Corporate.
NOTES TO THE ANNUAL FINANCIAL STATEMENTS continuedfor the year ended 30 June 2021
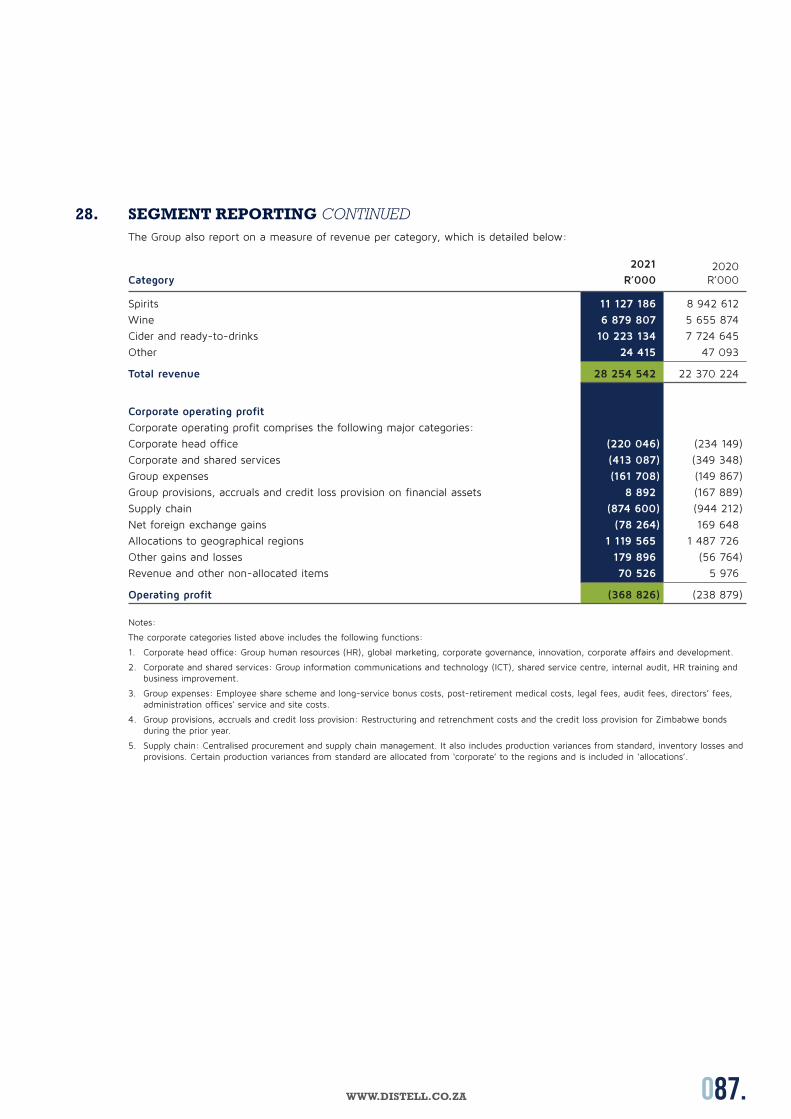
087.WWW.DISTELL.CO.ZA
28. SEGMENT REPORTING CONTINUEDThe Group also report on a measure of revenue per category, which is detailed below:
Category
2021
R’0002020
R’000
Spirits 11 127 186 8 942 612
Wine 6 879 807 5 655 874
Cider and ready-to-drinks 10 223 134 7 724 645
Other 24 415 47 093
Total revenue 28 254 542 22 370 224
Corporate operating profit
Corporate operating profit comprises the following major categories:
Corporate head office (220 046) (234 149)
Corporate and shared services (413 087) (349 348)
Group expenses (161 708) (149 867)
Group provisions, accruals and credit loss provision on financial assets 8 892 (167 889)
Supply chain (874 600) (944 212)
Net foreign exchange gains (78 264) 169 648
Allocations to geographical regions 1 119 565 1 487 726
Other gains and losses 179 896 (56 764)
Revenue and other non-allocated items 70 526 5 976
Operating profit (368 826) (238 879)
Notes:
The corporate categories listed above includes the following functions:
1. Corporate head office: Group human resources (HR), global marketing, corporate governance, innovation, corporate affairs and development.
2. Corporate and shared services: Group information communications and technology (ICT), shared service centre, internal audit, HR training and business improvement.
3. Group expenses: Employee share scheme and long-service bonus costs, post-retirement medical costs, legal fees, audit fees, directors’ fees, administration offices’ service and site costs.
4. Group provisions, accruals and credit loss provision: Restructuring and retrenchment costs and the credit loss provision for Zimbabwe bonds during the prior year.
5. Supply chain: Centralised procurement and supply chain management. It also includes production variances from standard, inventory losses and provisions. Certain production variances from standard are allocated from ‘corporate’ to the regions and is included in ‘allocations’.
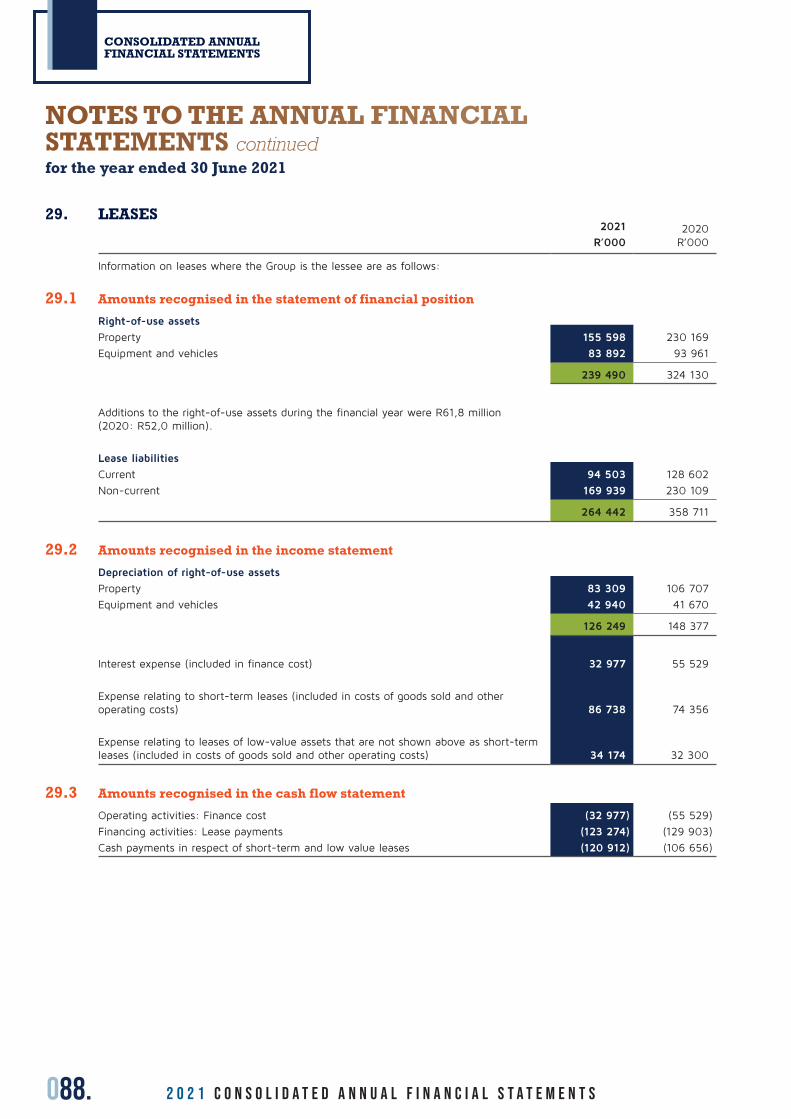
088. 2 0 2 1 C O N S O L I D A T E D A n n u a l f i n a n c i a l s t a t e m e n t s
CONSOLIDATED ANNUAL FINANCIAL STATEMENTS
29. LEASES2021
R’0002020
R’000
Information on leases where the Group is the lessee are as follows:
29.1 Amounts recognised in the statement of financial position
Right-of-use assets
Property 155 598 230 169
Equipment and vehicles 83 892 93 961
239 490 324 130
Additions to the right-of-use assets during the financial year were R61,8 million (2020: R52,0 million).
Lease liabilities
Current 94 503 128 602
Non-current 169 939 230 109
264 442 358 711
29.2 Amounts recognised in the income statement
Depreciation of right-of-use assets
Property 83 309 106 707
Equipment and vehicles 42 940 41 670
126 249 148 377
Interest expense (included in finance cost) 32 977 55 529
Expense relating to short-term leases (included in costs of goods sold and other operating costs) 86 738 74 356
Expense relating to leases of low-value assets that are not shown above as short-term leases (included in costs of goods sold and other operating costs) 34 174 32 300
29.3 Amounts recognised in the cash flow statement
Operating activities: Finance cost (32 977) (55 529)
Financing activities: Lease payments (123 274) (129 903)
Cash payments in respect of short-term and low value leases (120 912) (106 656)
NOTES TO THE ANNUAL FINANCIAL STATEMENTS continuedfor the year ended 30 June 2021
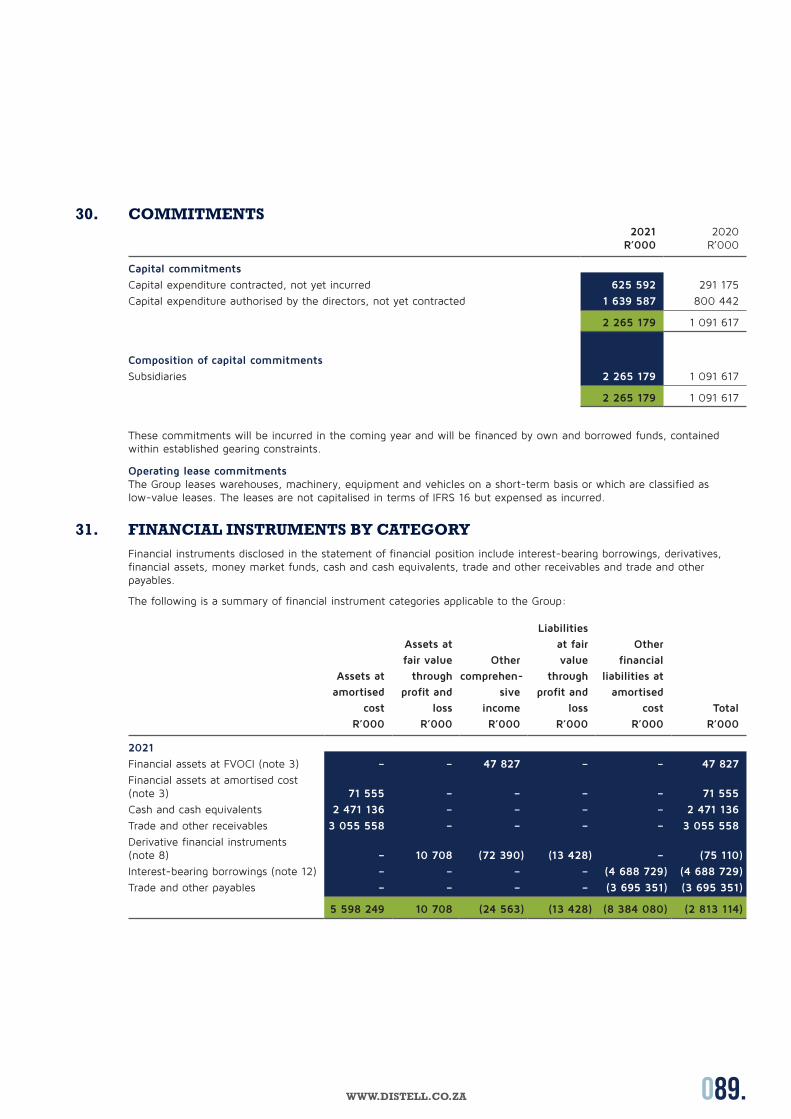
089.WWW.DISTELL.CO.ZA
30. COMMITMENTS2021
R’0002020
R’000
Capital commitments
Capital expenditure contracted, not yet incurred 625 592 291 175
Capital expenditure authorised by the directors, not yet contracted 1 639 587 800 442
2 265 179 1 091 617
Composition of capital commitments
Subsidiaries 2 265 179 1 091 617
2 265 179 1 091 617
These commitments will be incurred in the coming year and will be financed by own and borrowed funds, contained within established gearing constraints.
Operating lease commitmentsThe Group leases warehouses, machinery, equipment and vehicles on a short-term basis or which are classified as low-value leases. The leases are not capitalised in terms of IFRS 16 but expensed as incurred.
31. FINANCIAL INSTRUMENTS BY CATEGORYFinancial instruments disclosed in the statement of financial position include interest-bearing borrowings, derivatives, financial assets, money market funds, cash and cash equivalents, trade and other receivables and trade and other payables.
The following is a summary of financial instrument categories applicable to the Group:
Assets at
amortised
cost
R’000
Assets at
fair value
through
profit and
loss
R’000
Other
comprehen-
sive
income
R’000
Liabilities
at fair
value
through
profit and
loss
R’000
Other
financial
liabilities at
amortised
cost
R’000
Total
R’000
2021
Financial assets at FVOCI (note 3) – – 47 827 – – 47 827
Financial assets at amortised cost (note 3) 71 555 – – – – 71 555
Cash and cash equivalents 2 471 136 – – – – 2 471 136
Trade and other receivables 3 055 558 – – – – 3 055 558
Derivative financial instruments (note 8) – 10 708 (72 390) (13 428) – (75 110)
Interest-bearing borrowings (note 12) – – – – (4 688 729) (4 688 729)
Trade and other payables – – – – (3 695 351) (3 695 351)
5 598 249 10 708 (24 563) (13 428) (8 384 080) (2 813 114)

090. 2 0 2 1 C O N S O L I D A T E D A n n u a l f i n a n c i a l s t a t e m e n t s
CONSOLIDATED ANNUAL FINANCIAL STATEMENTS
31. FINANCIAL INSTRUMENTS BY CATEGORY CONTINUED
Assets at
amortised
cost
R’000
Assets at
fair value
through
profit and
loss
R’000
Other
comprehen-
sive
income
R’000
Liabilities
at fair
value
through
profit and
loss
R’000
Other
financial
liabilities at
amortised
cost
R’000
Total
R’000
2020
Financial assets at FVOCI (note 3) – – 49 575 – – 49 575
Financial assets at amortised cost (note 3) 84 466 – – – – 84 466
Money market funds (note 3) – 565 000 – – – 565 000
Cash and cash equivalents 1 169 057 – – – – 1 169 057
Trade and other receivables 2 647 196 – – – – 2 647 196
Derivative financial instruments (note 8) – 894 (134 018) (20 467) – (153 591)
Interest-bearing borrowings (note 12) – – – – (7 601 075) (7 601 075)
Trade and other payables – – – – (2 154 156) (2 154 156)
3 900 719 565 894 (84 443) (20 467) (9 755 231) (5 393 528)
32. FINANCIAL RISK MANAGEMENT32.1 Financial risk factors
The board of directors oversees the adequacy and functioning of the entire system of risk management and internal control, assisted by management. Group internal audit provides independent assurance on the entire risk management and internal control system. Regional and subsidiary company management are responsible for managing performance, underlying risks and effectiveness of operations, within the rules set by the board, supported and supervised by Group departments. The audit and risk committees review the internal control environment and risk management systems within the Group and report their activities to the board. The board members receive reports on treasury activities, including confirmation of compliance with treasury risk management policies.
The Group’s activities expose it to a variety of financial risks: market risk (including interest rate risk and foreign currency risk), credit risk and liquidity risk. The board approves prudent treasury policies for managing each of the risks summarised below.
The Group’s corporate treasury department is responsible for controlling and reducing exposure to interest rate, liquidity and currency transaction risks. Senior executives and advisers meet on a regular basis to analyse currency and interest rate exposures and re-evaluate treasury management strategies against revised economic forecasts. Group policies, covering specific areas such as foreign exchange risk, interest rate risk, credit risks, use of derivative financial instruments and non-derivative financial instruments, and investment of excess liquidity, are reviewed annually by the board. The Group, through its training and management standards and procedures, aims to develop a disciplined and constructive control environment in which all employees understand their roles and responsibilities. The Group treasury department does not undertake speculative financial transactions.
NOTES TO THE ANNUAL FINANCIAL STATEMENTS continuedfor the year ended 30 June 2021

091.WWW.DISTELL.CO.ZA
32. FINANCIAL RISK MANAGEMENT CONTINUED32.1 Financial risk factors continued32.1(a) Market risk
The Group’s activities expose it primarily to the financial risks of changes in foreign currency exchange rates and interest rates. The Group is not materially exposed to equity price risk on investments held and classified in the consolidated statement of financial position as fair value through OCI.
(i) Foreign currency risk managementThe Group operates internationally and has transactional currency exposures, which principally arise from commercial transactions, recognised assets and liabilities and investment in foreign operations. In order to manage this risk the Group may enter into transactions in terms of approved policies and limits which make use of financial instruments that include forward foreign exchange contracts. Foreign subsidiaries do not have material transactional currency exposures as they mainly operate in their functional currencies. Refer to note 7 (trade receivables) and note 15 (trade payables) for balances denominated in foreign currencies.
The Group does not speculate or engage in the trading of financial instruments.
The Group is primarily exposed to the currencies of the US dollar, euro and UK pound. If the rand had weakened/strengthened by 10% against the USD on 30 June 2021, with all other variables remaining constant, the post-tax profit for the year would have been R48,8 million (2020: R27,5 million) lower/higher, mainly as a result of translating outstanding foreign currency denominated monetary items.
Had the rand at 30 June 2021 weakened/strengthened by 10% against the euro, with all other variables remaining constant, the post-tax profit for the year would have been R9,3 million (2020: R29,5 million) lower/higher.
Similarly, had the rand at 30 June 2021 weakened/strengthened by 10% against the UK pound, with all other variables remaining constant, the post-tax profit for the year would have been R52,0 million (2020: R39,9 million) lower/higher.
(ii) Price risk managementThe Group is exposed to equity securities price risk because of investments held by the Group and classified as fair value through OCI in the consolidated statement of financial position. The Group is not materially exposed to commodity price risk. To manage the price risk the Group diversifies its portfolio.
(iii) Interest rate risk managementThe Group’s interest rate risk arises from long-term borrowings and cash. Borrowings at variable interest rates expose the Group to cash flow interest rate risk, while fixed rate borrowings expose the Group to fair value interest rate risk. Refer to note 12 and note 27.9 for details of these balances.
The Group is exposed to interest rate risk arising from the repricing of forward cover and floating rate debt as well as incremental funding/new borrowings and the rollover of maturing debt/refinancing of existing borrowings.
The management of the actual debt and investment portfolios is done by adjusting the repricing and maturity profiles of the debt and/or investment portfolios from time to time, relative to that of the benchmark portfolios as well as using derivative instruments to alter the repricing profiles of the actual portfolios relative to the benchmark portfolios.
The Group enters into interest rate swaps that have similar critical terms as the hedged debt, such as reference rate, reset dates, payment dates, maturities and notional amount. Refer to note 8 for details of interest rate swaps at year-end. The Group does not hedge 100% of its loans, therefore the hedged item is identified as a proportion of the outstanding loans up to the notional amount of the swaps. All critical terms matched during the year.
Hedge effectiveness is determined at the inception of the hedge relationship, and through periodic prospective effectiveness assessments to ensure that an economic relationship exists between the hedged item and hedging instrument. Hedge ineffectiveness for interest rate swaps may occur due to:
• the credit value/debit value adjustment on the interest rate swaps which is not matched by the loan; and
• differences in critical terms between the interest rate swaps and loans.
There was insignificant ineffectiveness during 2021 and 2020 in relation to the interest rate swaps.
As at 30 June 2021, if the floating interest rates had been 100 basis points higher/lower and all other variables held constant, the Group’s post-tax profit for the year would have increased/decreased as a result of interest received/paid on cash and cash equivalents and borrowings by R15,8 million (2020: R42,2 million).
The other financial instruments in the Group’s statement of financial position are not exposed to interest rate risk.
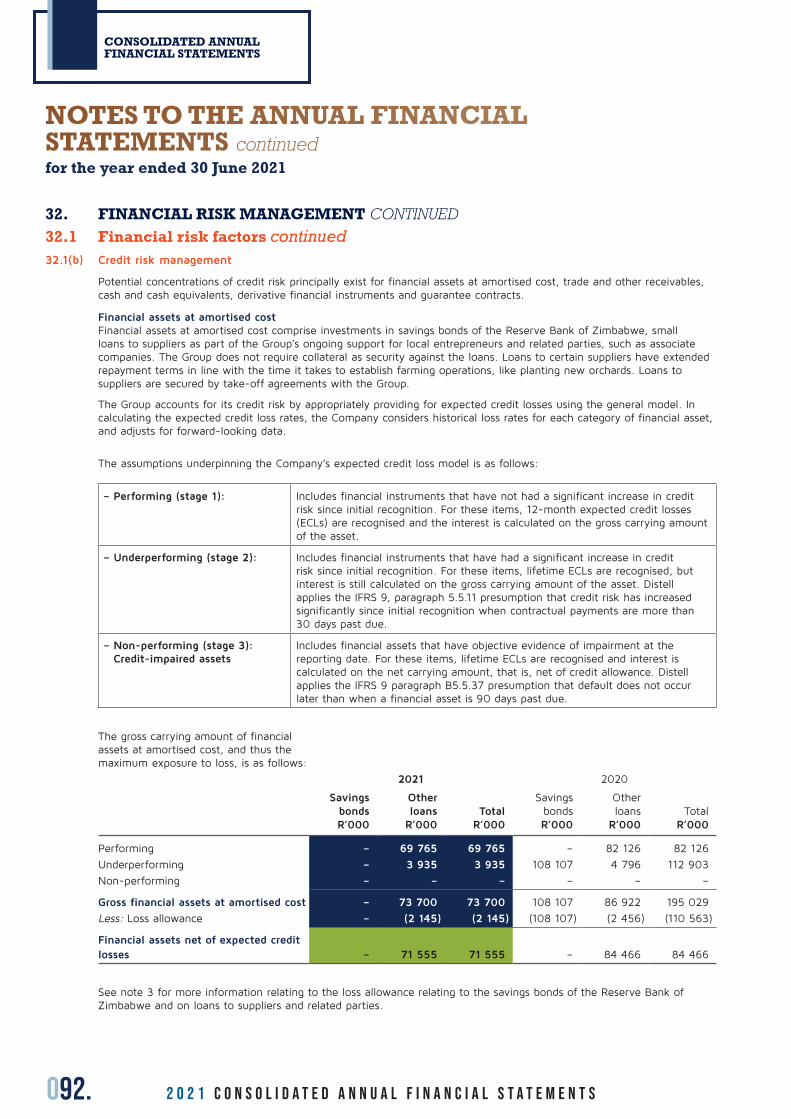
092. 2 0 2 1 C O N S O L I D A T E D A n n u a l f i n a n c i a l s t a t e m e n t s
CONSOLIDATED ANNUAL FINANCIAL STATEMENTS
32. FINANCIAL RISK MANAGEMENT CONTINUED32.1 Financial risk factors continued32.1(b) Credit risk management
Potential concentrations of credit risk principally exist for financial assets at amortised cost, trade and other receivables, cash and cash equivalents, derivative financial instruments and guarantee contracts.
Financial assets at amortised costFinancial assets at amortised cost comprise investments in savings bonds of the Reserve Bank of Zimbabwe, small loans to suppliers as part of the Group’s ongoing support for local entrepreneurs and related parties, such as associate companies. The Group does not require collateral as security against the loans. Loans to certain suppliers have extended repayment terms in line with the time it takes to establish farming operations, like planting new orchards. Loans to suppliers are secured by take-off agreements with the Group.
The Group accounts for its credit risk by appropriately providing for expected credit losses using the general model. In calculating the expected credit loss rates, the Company considers historical loss rates for each category of financial asset, and adjusts for forward-looking data.
The assumptions underpinning the Company’s expected credit loss model is as follows:
– Performing (stage 1): Includes financial instruments that have not had a significant increase in credit risk since initial recognition. For these items, 12-month expected credit losses (ECLs) are recognised and the interest is calculated on the gross carrying amount of the asset.
– Underperforming (stage 2): Includes financial instruments that have had a significant increase in credit risk since initial recognition. For these items, lifetime ECLs are recognised, but interest is still calculated on the gross carrying amount of the asset. Distell applies the IFRS 9, paragraph 5.5.11 presumption that credit risk has increased significantly since initial recognition when contractual payments are more than 30 days past due.
– Non-performing (stage 3): Credit-impaired assets
Includes financial assets that have objective evidence of impairment at the reporting date. For these items, lifetime ECLs are recognised and interest is calculated on the net carrying amount, that is, net of credit allowance. Distell applies the IFRS 9 paragraph B5.5.37 presumption that default does not occur later than when a financial asset is 90 days past due.
The gross carrying amount of financial assets at amortised cost, and thus the maximum exposure to loss, is as follows:
2021 2020
Savings bondsR’000
Other loans
R’000Total
R’000
Savings bondsR’000
Other loans
R’000Total
R’000
Performing – 69 765 69 765 – 82 126 82 126
Underperforming – 3 935 3 935 108 107 4 796 112 903
Non-performing – – – – – –
Gross financial assets at amortised cost – 73 700 73 700 108 107 86 922 195 029
Less: Loss allowance – (2 145) (2 145) (108 107) (2 456) (110 563)
Financial assets net of expected credit losses – 71 555 71 555 – 84 466 84 466
See note 3 for more information relating to the loss allowance relating to the savings bonds of the Reserve Bank of Zimbabwe and on loans to suppliers and related parties.
NOTES TO THE ANNUAL FINANCIAL STATEMENTS continuedfor the year ended 30 June 2021
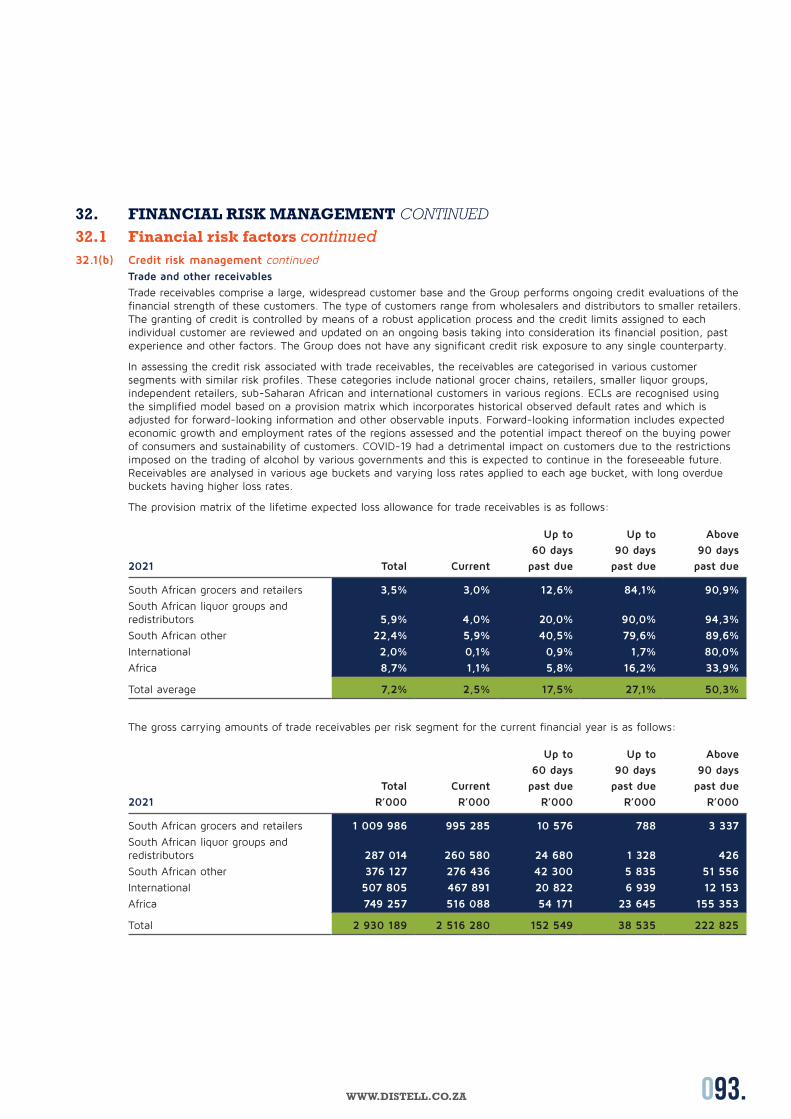
093.WWW.DISTELL.CO.ZA
32. FINANCIAL RISK MANAGEMENT CONTINUED32.1 Financial risk factors continued32.1(b) Credit risk management continued
Trade and other receivables
Trade receivables comprise a large, widespread customer base and the Group performs ongoing credit evaluations of the financial strength of these customers. The type of customers range from wholesalers and distributors to smaller retailers. The granting of credit is controlled by means of a robust application process and the credit limits assigned to each individual customer are reviewed and updated on an ongoing basis taking into consideration its financial position, past experience and other factors. The Group does not have any significant credit risk exposure to any single counterparty.
In assessing the credit risk associated with trade receivables, the receivables are categorised in various customer segments with similar risk profiles. These categories include national grocer chains, retailers, smaller liquor groups, independent retailers, sub-Saharan African and international customers in various regions. ECLs are recognised using the simplified model based on a provision matrix which incorporates historical observed default rates and which is adjusted for forward-looking information and other observable inputs. Forward-looking information includes expected economic growth and employment rates of the regions assessed and the potential impact thereof on the buying power of consumers and sustainability of customers. COVID-19 had a detrimental impact on customers due to the restrictions imposed on the trading of alcohol by various governments and this is expected to continue in the foreseeable future. Receivables are analysed in various age buckets and varying loss rates applied to each age bucket, with long overdue buckets having higher loss rates.
The provision matrix of the lifetime expected loss allowance for trade receivables is as follows:
2021 Total Current
Up to
60 days
past due
Up to
90 days
past due
Above
90 days
past due
South African grocers and retailers 3,5% 3,0% 12,6% 84,1% 90,9%
South African liquor groups and redistributors 5,9% 4,0% 20,0% 90,0% 94,3%
South African other 22,4% 5,9% 40,5% 79,6% 89,6%
International 2,0% 0,1% 0,9% 1,7% 80,0%
Africa 8,7% 1,1% 5,8% 16,2% 33,9%
Total average 7,2% 2,5% 17,5% 27,1% 50,3%
The gross carrying amounts of trade receivables per risk segment for the current financial year is as follows:
2021
Total
R’000
Current
R’000
Up to
60 days
past due
R’000
Up to
90 days
past due
R’000
Above
90 days
past due
R’000
South African grocers and retailers 1 009 986 995 285 10 576 788 3 337
South African liquor groups and redistributors 287 014 260 580 24 680 1 328 426
South African other 376 127 276 436 42 300 5 835 51 556
International 507 805 467 891 20 822 6 939 12 153
Africa 749 257 516 088 54 171 23 645 155 353
Total 2 930 189 2 516 280 152 549 38 535 222 825
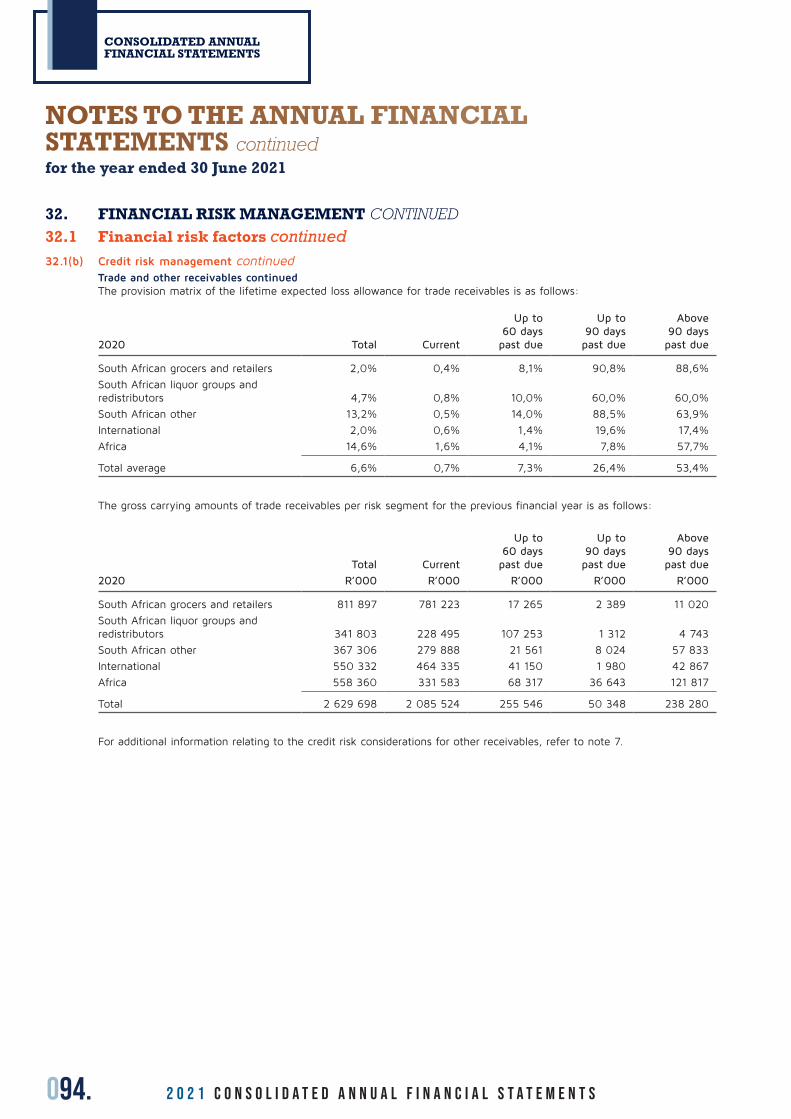
094. 2 0 2 1 C O N S O L I D A T E D A n n u a l f i n a n c i a l s t a t e m e n t s
CONSOLIDATED ANNUAL FINANCIAL STATEMENTS
32. FINANCIAL RISK MANAGEMENT CONTINUED32.1 Financial risk factors continued32.1(b) Credit risk management continued
Trade and other receivables continuedThe provision matrix of the lifetime expected loss allowance for trade receivables is as follows:
2020 Total Current
Up to 60 days past due
Up to 90 days past due
Above 90 days past due
South African grocers and retailers 2,0% 0,4% 8,1% 90,8% 88,6%
South African liquor groups and redistributors 4,7% 0,8% 10,0% 60,0% 60,0%
South African other 13,2% 0,5% 14,0% 88,5% 63,9%
International 2,0% 0,6% 1,4% 19,6% 17,4%
Africa 14,6% 1,6% 4,1% 7,8% 57,7%
Total average 6,6% 0,7% 7,3% 26,4% 53,4%
The gross carrying amounts of trade receivables per risk segment for the previous financial year is as follows:
Total Current
Up to 60 days past due
Up to 90 days past due
Above 90 days past due
2020 R’000 R’000 R’000 R’000 R’000
South African grocers and retailers 811 897 781 223 17 265 2 389 11 020
South African liquor groups and redistributors 341 803 228 495 107 253 1 312 4 743
South African other 367 306 279 888 21 561 8 024 57 833
International 550 332 464 335 41 150 1 980 42 867
Africa 558 360 331 583 68 317 36 643 121 817
Total 2 629 698 2 085 524 255 546 50 348 238 280
For additional information relating to the credit risk considerations for other receivables, refer to note 7.
NOTES TO THE ANNUAL FINANCIAL STATEMENTS continuedfor the year ended 30 June 2021

095.WWW.DISTELL.CO.ZA
32. FINANCIAL RISK MANAGEMENT CONTINUED32.1 Financial risk factors continued32.1(b) Credit risk management continued
Cash and cash equivalents and money market funds
The Group only deposits cash with banks with high credit ratings. At year-end the Group’s cash was invested with financial institutions that have been awarded the following Moody’s short-term credit rating:
Cash and cash equivalents2021
R’0002020
R’000
NP (2020: P-3) 2 469 447 1 167 057
Cash 1 689 2 000
2 471 136 1 169 057
Money market funds – 565 000
Cash and cash equivalents are stage 1 financial assets and there has been no significant movement between stages. No amount has been recognised for 12-month ECLs as the amounts are not material due to low probability of default.
The investment in money market funds are only held by approved institutions with an acceptable creditworthiness. Refer to note 3 for additional information.
Derivative financial instrumentsThe Group is exposed to credit-related losses in the event of non-performance by counterparties relating to derivative financial instruments. The counterparties to these contracts are major financial institutions with Moody’s short-term credit ratings of NP. The Group continually monitors its positions and the credit ratings of its counterparties and limits the extent to which it enters into contracts with any one party.
The carrying amount of the financial assets recorded in the financial statements, which is net of impaired losses, represents the Group’s maximum exposure to credit risk.
Guarantee contractsThe Group is also exposed to credit-related losses in the event of non-performance by counterparties to financial guarantee contracts relating to vineyard development loans granted by financial institutions to certain farmers of R13,3 million (2020: R20,2 million) and staff housing loans of R3,8 million (2020: R3,8 million). The guarantees relating to vineyard development loans are secured by mortgage bonds over farming property with a market value in excess of the loan obligations. The Group continually monitors its positions and limits its exposure with any one party.
At 30 June 2021 the Group did not consider there to be a significant concentration of credit risk which had not been adequately provided for.
32.1(c) Liquidity risk management
The Group manages liquidity risk through the compilation and monitoring of cash flow forecasts, as well as ensuring that adequate borrowing facilities are maintained. Refer to note 12 regarding the Group’s unutilised banking facilities and reserve borrowing capacities. Banking facilities are renewed annually and are subject to review at various dates during the next year.
The table below analyses the Group’s financial liabilities and derivative financial instruments which will be settled on a gross basis into relevant maturity groupings based on the remaining period at the statement of financial position date to contract maturity date. The amounts disclosed in the table are the contracted undiscounted cash flows. Balances due within 12 months equal their carrying balances as the impact of discounting is not significant.
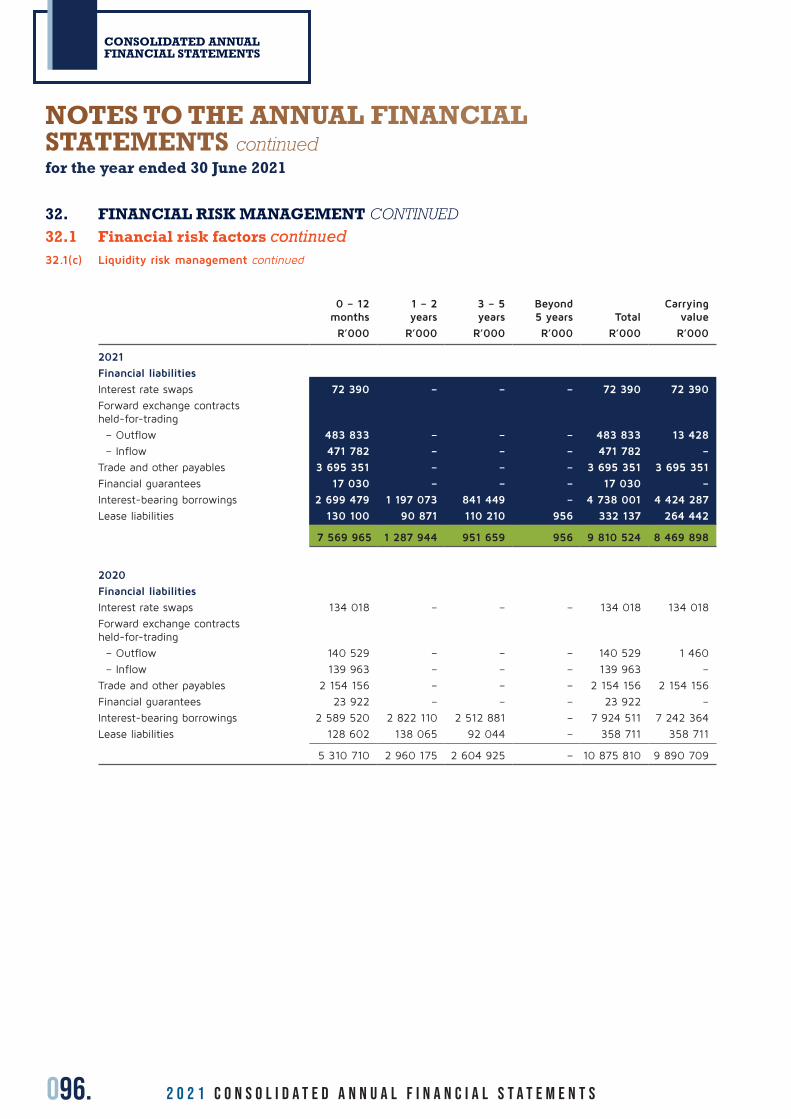
096. 2 0 2 1 C O N S O L I D A T E D A n n u a l f i n a n c i a l s t a t e m e n t s
CONSOLIDATED ANNUAL FINANCIAL STATEMENTS
32. FINANCIAL RISK MANAGEMENT CONTINUED32.1 Financial risk factors continued32.1(c) Liquidity risk management continued
0 – 12 months
1 – 2years
3 – 5 years
Beyond 5 years Total
Carrying value
R’000 R’000 R’000 R’000 R’000 R’000
2021
Financial liabilities
Interest rate swaps 72 390 – – – 72 390 72 390
Forward exchange contracts held-for-trading
– Outflow 483 833 – – – 483 833 13 428
– Inflow 471 782 – – – 471 782 –
Trade and other payables 3 695 351 – – – 3 695 351 3 695 351
Financial guarantees 17 030 – – – 17 030 –
Interest-bearing borrowings 2 699 479 1 197 073 841 449 – 4 738 001 4 424 287
Lease liabilities 130 100 90 871 110 210 956 332 137 264 442
7 569 965 1 287 944 951 659 956 9 810 524 8 469 898
2020
Financial liabilities
Interest rate swaps 134 018 – – – 134 018 134 018
Forward exchange contracts held-for-trading
– Outflow 140 529 – – – 140 529 1 460
– Inflow 139 963 – – – 139 963 –
Trade and other payables 2 154 156 – – – 2 154 156 2 154 156
Financial guarantees 23 922 – – – 23 922 –
Interest-bearing borrowings 2 589 520 2 822 110 2 512 881 – 7 924 511 7 242 364
Lease liabilities 128 602 138 065 92 044 – 358 711 358 711
5 310 710 2 960 175 2 604 925 – 10 875 810 9 890 709
NOTES TO THE ANNUAL FINANCIAL STATEMENTS continuedfor the year ended 30 June 2021

097.WWW.DISTELL.CO.ZA
32. FINANCIAL RISK MANAGEMENT CONTINUED32.1 Financial risk factors continued32.1(c) Liquidity risk management continued
Impact of COVID-19 pandemic
The pandemic and, in particular, the South African government’s ban and restrictions on the trading of alcoholic beverages, had a significant impact on the trading of the Group since the start of the first lockdown on 26 March 2020. The Group showed resilience and was able to improve its financial health following further bans from mid July 2020 to mid-August 2020, and again during January 2021. Easing of export restrictions provided the Group the ability to operate, although at a much reduced capacity, during the periods of the ban on sale of alcohol in South Africa. Operations in the BLNE regions, as well as to a lesser extent in various other territories the Group operates, were also adversely affected by specific country bans or restrictions on alcohol sales in the period up to 30 June 2021.
Although the duration of the pandemic is still uncertain, the Group has put in place the necessary structures and processes to monitor and mitigate against existing and emerging risks to the business, including liquidity risk.
The following actions were taken:
(i) All discretionary spend has been prioritised while ensuring continued efficient operations of the Group.
(ii) The board has taken the decision to temporarily suspend dividend payments. This decision has been extended following ongoing discussions between Heineken and Distell.
(iii) A portion of the Group’s capital expenditure programme was deferred and reprioritised without compromising the Group’s growth prospects or compliance obligations.
(iv) The Group unlocked value through the planned sale of two of its premium wine farms, Alto and Plaisir de Merle and by returning excess plan assets, used to fund the Group’s post-retirement medical liability, to the Group.
(v) By using forecasting models, month-by-month liquidity analyses are monitored and updated continuously. The analyses demonstrate that the Group is liquid and will continue to meet its obligations for the next 12 months and beyond.
During June 2020 the measurement of the debt to EBITDA covenant was amended by the financial institutions from 2,75:1 to 5:1 on its South African rand term funding for the 30 June 2020 measurement period. The covenant has reverted back to 2,75:1 for measurement periods after 30 June 2020 and the Group was able to comfortably meet all covenant requirements. The covenant measurements for 30 June 2021 were as follows: net debt to EBITDA 0,53:1 (2020: 3,11:1) and interest cover 11,46:1 (2020: 5,1:1).
The Group has sufficient committed banking facilities in South Africa which will allow it to meet its forecasted financial commitments for the next financial year based on the various scenarios the Group considered for how long sales restrictions could be in place.
32.2 Fair value estimationThe below analyses assets and liabilities carried at fair value, by valuation method. The different levels have been defined as follows:
Level 1: Quoted prices (unadjusted) in active markets for identical assets or liabilities .
Level 2: Inputs other than quoted prices included within level 1 that are observable inputs, which reflect the market conditions, including that of COVID-19 in their expectations of future cash flows related to the asset or liability, either directly (that is, as prices) or indirectly (that is, derived from prices).
Level 3: Inputs for the asset or liability that are not based on observable market data (that is, unobservable inputs).
Specific valuation techniques used to value these assets and liabilities include:
Cash and cash equivalents, trade and other receivables and financial assets at amortised cost: The carrying amounts reported in the statement of financial position approximate fair values due to the short-term maturities of these amounts. In assessing the carrying amounts, the impact of COVID-19 was considered and expected credit losses adjusted accordingly.
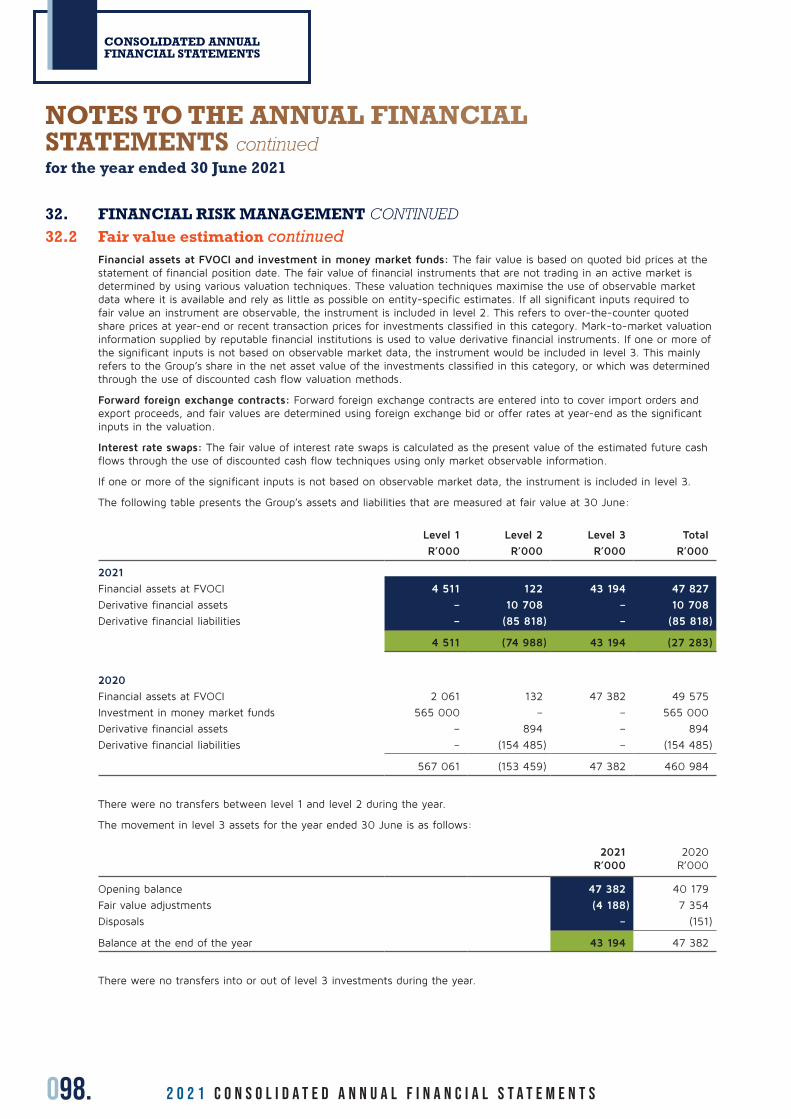
098. 2 0 2 1 C O N S O L I D A T E D A n n u a l f i n a n c i a l s t a t e m e n t s
CONSOLIDATED ANNUAL FINANCIAL STATEMENTS
32. FINANCIAL RISK MANAGEMENT CONTINUED32.2 Fair value estimation continued
Financial assets at FVOCI and investment in money market funds: The fair value is based on quoted bid prices at the statement of financial position date. The fair value of financial instruments that are not trading in an active market is determined by using various valuation techniques. These valuation techniques maximise the use of observable market data where it is available and rely as little as possible on entity-specific estimates. If all significant inputs required to fair value an instrument are observable, the instrument is included in level 2. This refers to over-the-counter quoted share prices at year-end or recent transaction prices for investments classified in this category. Mark-to-market valuation information supplied by reputable financial institutions is used to value derivative financial instruments. If one or more of the significant inputs is not based on observable market data, the instrument would be included in level 3. This mainly refers to the Group’s share in the net asset value of the investments classified in this category, or which was determined through the use of discounted cash flow valuation methods.
Forward foreign exchange contracts: Forward foreign exchange contracts are entered into to cover import orders and export proceeds, and fair values are determined using foreign exchange bid or offer rates at year-end as the significant inputs in the valuation.
Interest rate swaps: The fair value of interest rate swaps is calculated as the present value of the estimated future cash flows through the use of discounted cash flow techniques using only market observable information.
If one or more of the significant inputs is not based on observable market data, the instrument is included in level 3.
The following table presents the Group’s assets and liabilities that are measured at fair value at 30 June:
Level 1 Level 2 Level 3 Total
R’000 R’000 R’000 R’000
2021
Financial assets at FVOCI 4 511 122 43 194 47 827
Derivative financial assets – 10 708 – 10 708
Derivative financial liabilities – (85 818) – (85 818)
4 511 (74 988) 43 194 (27 283)
2020
Financial assets at FVOCI 2 061 132 47 382 49 575
Investment in money market funds 565 000 – – 565 000
Derivative financial assets – 894 – 894
Derivative financial liabilities – (154 485) – (154 485)
567 061 (153 459) 47 382 460 984
There were no transfers between level 1 and level 2 during the year.
The movement in level 3 assets for the year ended 30 June is as follows:
2021R’000
2020R’000
Opening balance 47 382 40 179
Fair value adjustments (4 188) 7 354
Disposals – (151)
Balance at the end of the year 43 194 47 382
There were no transfers into or out of level 3 investments during the year.
NOTES TO THE ANNUAL FINANCIAL STATEMENTS continuedfor the year ended 30 June 2021
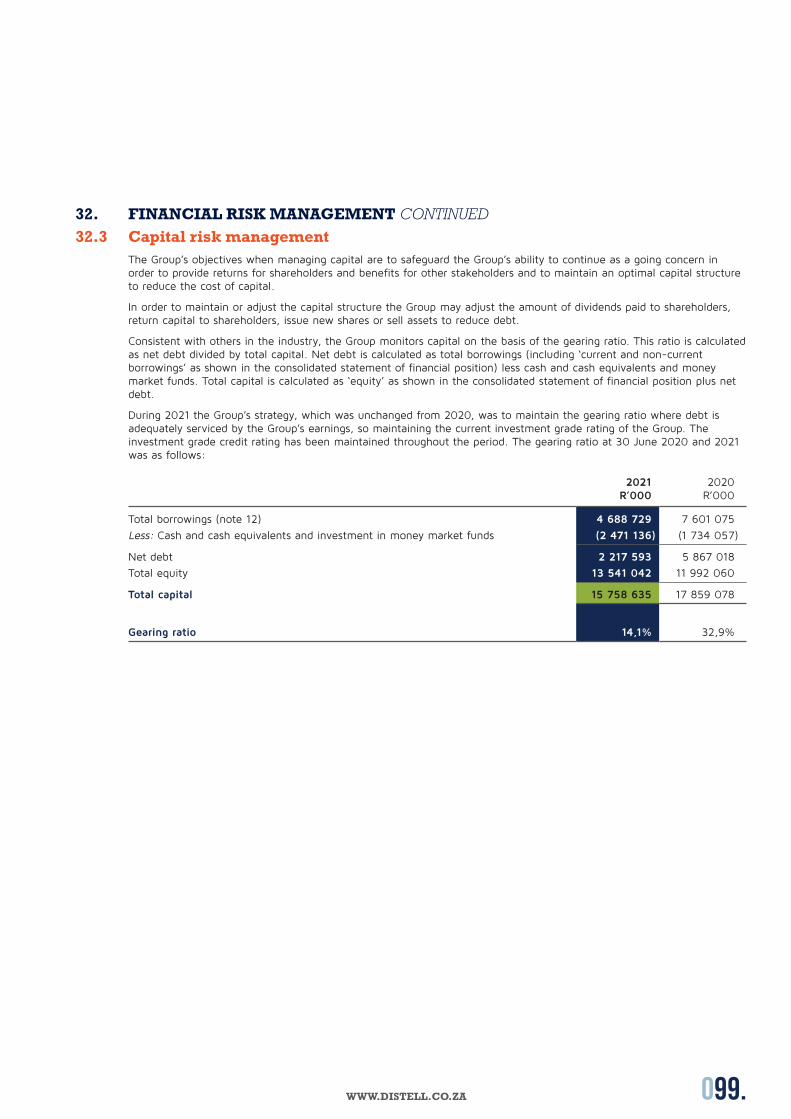
099.WWW.DISTELL.CO.ZA
32. FINANCIAL RISK MANAGEMENT CONTINUED32.3 Capital risk management
The Group’s objectives when managing capital are to safeguard the Group’s ability to continue as a going concern in order to provide returns for shareholders and benefits for other stakeholders and to maintain an optimal capital structure to reduce the cost of capital.
In order to maintain or adjust the capital structure the Group may adjust the amount of dividends paid to shareholders, return capital to shareholders, issue new shares or sell assets to reduce debt.
Consistent with others in the industry, the Group monitors capital on the basis of the gearing ratio. This ratio is calculated as net debt divided by total capital. Net debt is calculated as total borrowings (including ‘current and non-current borrowings’ as shown in the consolidated statement of financial position) less cash and cash equivalents and money market funds. Total capital is calculated as ‘equity’ as shown in the consolidated statement of financial position plus net debt.
During 2021 the Group’s strategy, which was unchanged from 2020, was to maintain the gearing ratio where debt is adequately serviced by the Group’s earnings, so maintaining the current investment grade rating of the Group. The investment grade credit rating has been maintained throughout the period. The gearing ratio at 30 June 2020 and 2021 was as follows:
2021R’000
2020R’000
Total borrowings (note 12) 4 688 729 7 601 075
Less: Cash and cash equivalents and investment in money market funds (2 471 136) (1 734 057)
Net debt 2 217 593 5 867 018
Total equity 13 541 042 11 992 060
Total capital 15 758 635 17 859 078
Gearing ratio 14,1% 32,9%
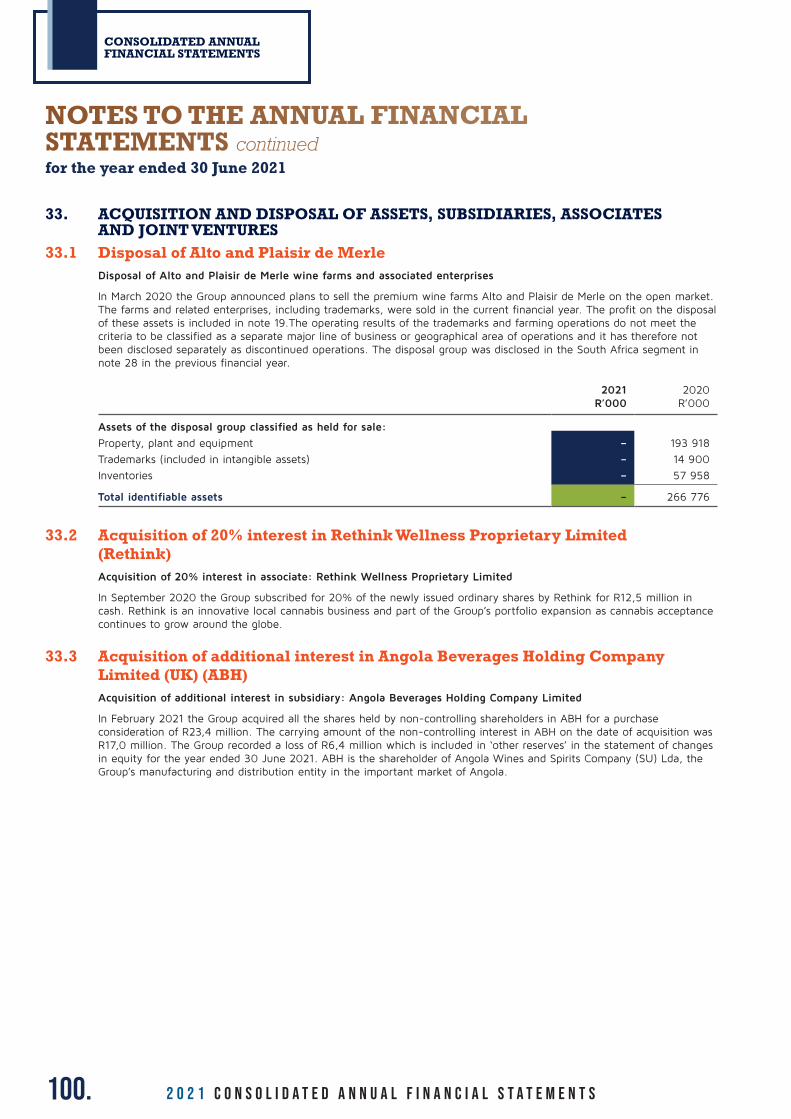
100. 2 0 2 1 C O N S O L I D A T E D A n n u a l f i n a n c i a l s t a t e m e n t s
CONSOLIDATED ANNUAL FINANCIAL STATEMENTS
33. ACQUISITION AND DISPOSAL OF ASSETS, SUBSIDIARIES, ASSOCIATES AND JOINT VENTURES
33.1 Disposal of Alto and Plaisir de MerleDisposal of Alto and Plaisir de Merle wine farms and associated enterprises
In March 2020 the Group announced plans to sell the premium wine farms Alto and Plaisir de Merle on the open market. The farms and related enterprises, including trademarks, were sold in the current financial year. The profit on the disposal of these assets is included in note 19.The operating results of the trademarks and farming operations do not meet the criteria to be classified as a separate major line of business or geographical area of operations and it has therefore not been disclosed separately as discontinued operations. The disposal group was disclosed in the South Africa segment in note 28 in the previous financial year.
2021R’000
2020R’000
Assets of the disposal group classified as held for sale:
Property, plant and equipment – 193 918
Trademarks (included in intangible assets) – 14 900
Inventories – 57 958
Total identifiable assets – 266 776
33.2 Acquisition of 20% interest in Rethink Wellness Proprietary Limited (Rethink) Acquisition of 20% interest in associate: Rethink Wellness Proprietary Limited
In September 2020 the Group subscribed for 20% of the newly issued ordinary shares by Rethink for R12,5 million in cash. Rethink is an innovative local cannabis business and part of the Group’s portfolio expansion as cannabis acceptance continues to grow around the globe.
33.3 Acquisition of additional interest in Angola Beverages Holding Company Limited (UK) (ABH) Acquisition of additional interest in subsidiary: Angola Beverages Holding Company Limited
In February 2021 the Group acquired all the shares held by non-controlling shareholders in ABH for a purchase consideration of R23,4 million. The carrying amount of the non-controlling interest in ABH on the date of acquisition was R17,0 million. The Group recorded a loss of R6,4 million which is included in ‘other reserves’ in the statement of changes in equity for the year ended 30 June 2021. ABH is the shareholder of Angola Wines and Spirits Company (SU) Lda, the Group’s manufacturing and distribution entity in the important market of Angola.
NOTES TO THE ANNUAL FINANCIAL STATEMENTS continuedfor the year ended 30 June 2021
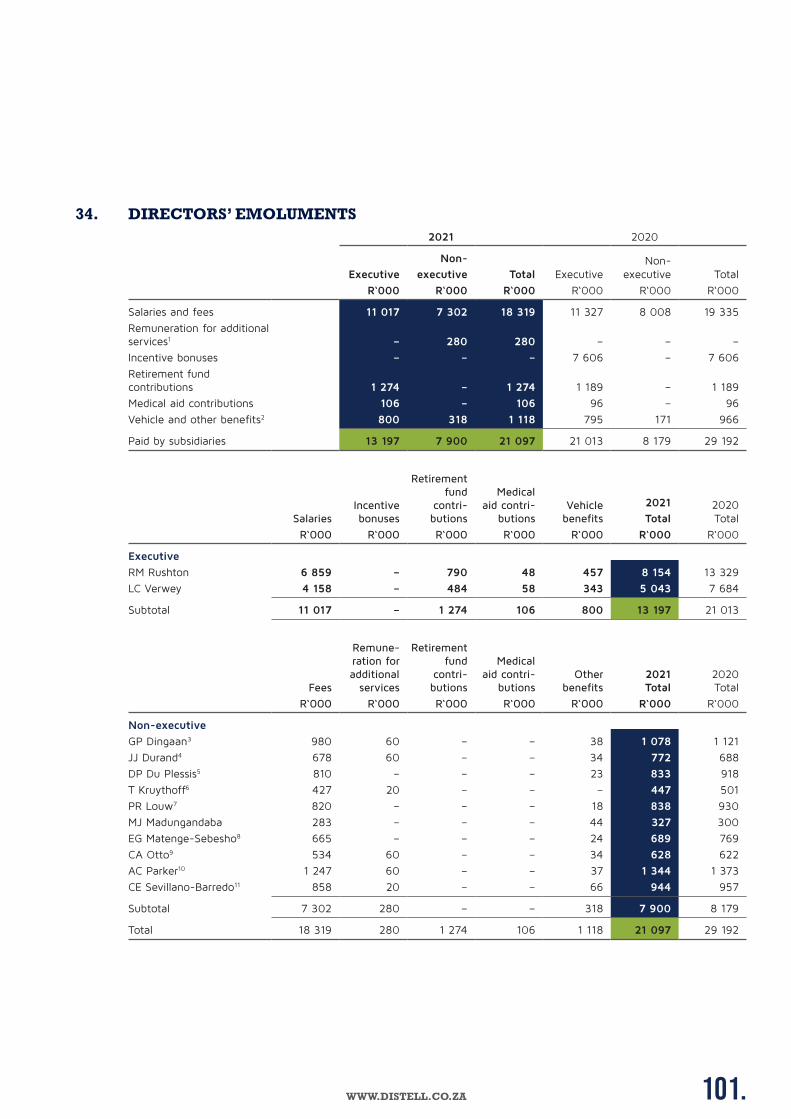
101.WWW.DISTELL.CO.ZA
34. DIRECTORS’ EMOLUMENTS2021 2020
Executive
Non-
executive Total ExecutiveNon-
executive Total
R‘000 R‘000 R‘000 R‘000 R‘000 R‘000
Salaries and fees 11 017 7 302 18 319 11 327 8 008 19 335
Remuneration for additional services1 – 280 280 – – –
Incentive bonuses – – – 7 606 – 7 606
Retirement fund contributions 1 274 – 1 274 1 189 – 1 189
Medical aid contributions 106 – 106 96 – 96
Vehicle and other benefits2 800 318 1 118 795 171 966
Paid by subsidiaries 13 197 7 900 21 097 21 013 8 179 29 192
SalariesIncentive bonuses
Retirement fund
contri-butions
Medical aid contri-
butionsVehicle benefits
2021
Total2020 Total
R‘000 R‘000 R‘000 R‘000 R‘000 R‘000 R‘000
Executive
RM Rushton 6 859 – 790 48 457 8 154 13 329
LC Verwey 4 158 – 484 58 343 5 043 7 684
Subtotal 11 017 – 1 274 106 800 13 197 21 013
Fees
Remune-ration for additional
services
Retirement fund
contri-butions
Medical aid contri-
butionsOther
benefits2021 Total
2020 Total
R‘000 R‘000 R‘000 R‘000 R‘000 R‘000 R‘000
Non-executive
GP Dingaan3 980 60 – – 38 1 078 1 121
JJ Durand4 678 60 – – 34 772 688
DP Du Plessis5 810 – – – 23 833 918
T Kruythoff6 427 20 – – – 447 501
PR Louw7 820 – – – 18 838 930
MJ Madungandaba 283 – – – 44 327 300
EG Matenge-Sebesho8 665 – – – 24 689 769
CA Otto9 534 60 – – 34 628 622
AC Parker10 1 247 60 – – 37 1 344 1 373
CE Sevillano-Barredo11 858 20 – – 66 944 957
Subtotal 7 302 280 – – 318 7 900 8 179
Total 18 319 280 1 274 106 1 118 21 097 29 192
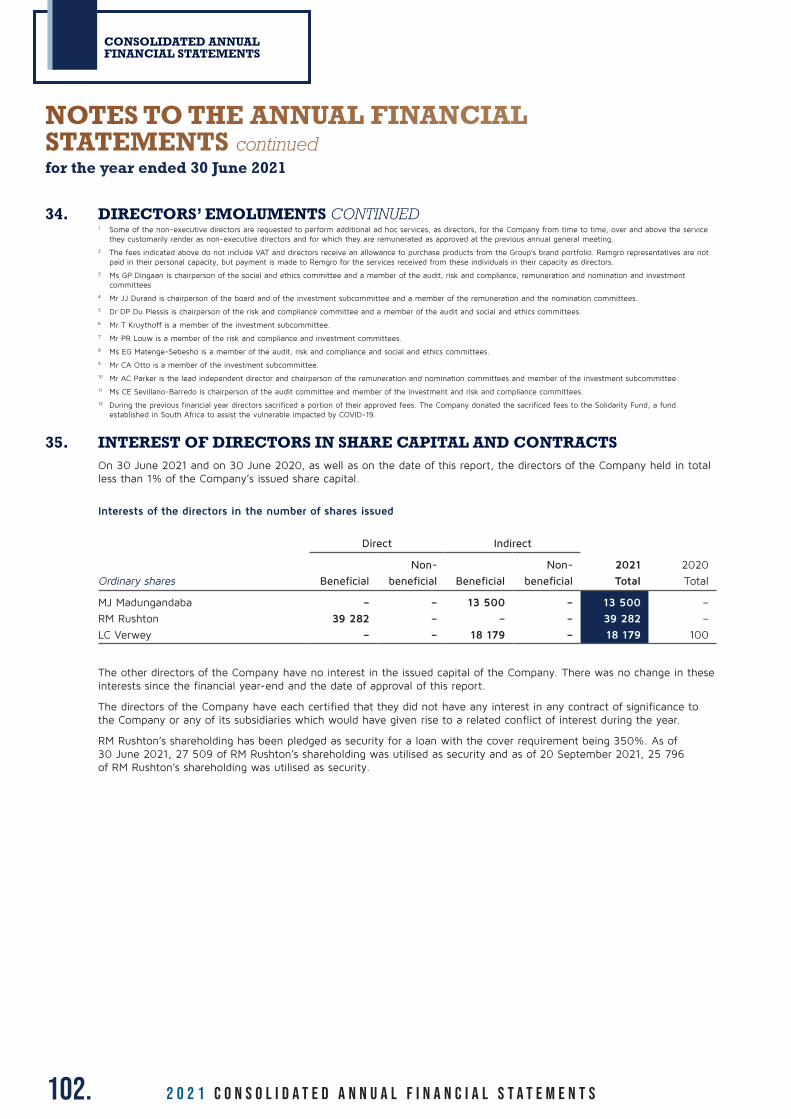
102. 2 0 2 1 C O N S O L I D A T E D A n n u a l f i n a n c i a l s t a t e m e n t s
CONSOLIDATED ANNUAL FINANCIAL STATEMENTS
34. DIRECTORS’ EMOLUMENTS CONTINUED1 Some of the non-executive directors are requested to perform additional ad hoc services, as directors, for the Company from time to time, over and above the service
they customarily render as non-executive directors and for which they are remunerated as approved at the previous annual general meeting.
2 The fees indicated above do not include VAT and directors receive an allowance to purchase products from the Group’s brand portfolio. Remgro representatives are not paid in their personal capacity, but payment is made to Remgro for the services received from these individuals in their capacity as directors.
3 Ms GP Dingaan is chairperson of the social and ethics committee and a member of the audit, risk and compliance, remuneration and nomination and investment committees
4 Mr JJ Durand is chairperson of the board and of the investment subcommittee and a member of the remuneration and the nomination committees.
5 Dr DP Du Plessis is chairperson of the risk and compliance committee and a member of the audit and social and ethics committees.
6 Mr T Kruythoff is a member of the investment subcommittee.
7 Mr PR Louw is a member of the risk and compliance and investment committees.
8 Ms EG Matenge-Sebesho is a member of the audit, risk and compliance and social and ethics committees.
9 Mr CA Otto is a member of the investment subcommittee.
10 Mr AC Parker is the lead independent director and chairperson of the remuneration and nomination committees and member of the investment subcommittee.
11 Ms CE Sevillano-Barredo is chairperson of the audit committee and member of the investment and risk and compliance committees.
12 During the previous financial year directors sacrificed a portion of their approved fees. The Company donated the sacrificed fees to the Solidarity Fund, a fund established in South Africa to assist the vulnerable impacted by COVID-19.
35. INTEREST OF DIRECTORS IN SHARE CAPITAL AND CONTRACTSOn 30 June 2021 and on 30 June 2020, as well as on the date of this report, the directors of the Company held in total less than 1% of the Company’s issued share capital.
Interests of the directors in the number of shares issued
Direct Indirect
Non- Non- 2021 2020
Ordinary shares Beneficial beneficial Beneficial beneficial Total Total
MJ Madungandaba – – 13 500 – 13 500 –
RM Rushton 39 282 – – – 39 282 –
LC Verwey – – 18 179 – 18 179 100
The other directors of the Company have no interest in the issued capital of the Company. There was no change in these interests since the financial year-end and the date of approval of this report.
The directors of the Company have each certified that they did not have any interest in any contract of significance to the Company or any of its subsidiaries which would have given rise to a related conflict of interest during the year.
RM Rushton’s shareholding has been pledged as security for a loan with the cover requirement being 350%. As of 30 June 2021, 27 509 of RM Rushton’s shareholding was utilised as security and as of 20 September 2021, 25 796 of RM Rushton’s shareholding was utilised as security.
NOTES TO THE ANNUAL FINANCIAL STATEMENTS continuedfor the year ended 30 June 2021

103.WWW.DISTELL.CO.ZA
36. SHARE SCHEMESCSP Scheme
In the current financial year 249 830 (2020: 59 205) shares were offered to directors.
Current status
Ordinary shares
Participant
Shares accepted prior to 30 June
2020
Shares accepted
in the year to
30 June 2021
Offer price Rand
Number of shares paid and delivered
prior to 30 June
2020
Number of shares paid and delivered
in the year to
30 June 2021
Share price on date of
payment and
delivery Rand
Number of shares forfeited
in the year to
30 June 2021
Balance of shares accepted
as at 30 June
2021
Executive
RM Rushton 317 304 – 128,69 – 39 282 94,50 66 486 211 536
RM Rushton 118 638 – 108,33 – – – – 118 638
RM Rushton 40 086 – 129,44 – – – – 40 086
RM Rushton 45 756 – 136,39 – – – – 45 756
RM Rushton 154 100 80,00 – – – – 154 100
LC Verwey 190 755 – 128,69 – 18 079 94,50 45 506 127 170
LC Verwey 35 631 – 108,33 – – – – 35 631
LC Verwey 25 392 – 129,44 – – – – 25 392
LC Verwey 13 449 136,39 – – – – 13 449
LC Verwey 95 730 80,00 – – – – 95 730
Total 787 011 249 830 – 57 361 111 992 867 488
SAR Scheme
In the current and previous financial year no additional SARs were offered to directors.
Current status
SARs
Participant
SARs accepted prior to
30 June 2020
Number of SARs
forfeited prior to
30 June 2021
Offer price Rand
Number of SARs
exercised prior to 30 June
2020
Number of SARs
forfeited in the
year to 30 June
2021
Share price on exercise
date Rand
Increase in value *R‘000
Balance of SARs
accepted as at
30 June 2021
Executive
RM Rushton 342 834 – 139,00 – – – – 342 834
RM Rushton 28 941 – 129,00 – – – – 28 941
RM Rushton 142 116 (51 158) 170,30 – (25 300) – – 65 658
RM Rushton 45 867 (8 148) 165,02 – (8 148) – – 29 571
LC Verwey 48 450 – 152,00 – – – – 48 450
LC Verwey 56 451 (20 320) 170,30 – (10 050) – – 26 081
LC Verwey 55 314 (9 826) 165,02 – (9 826) – – 35 662
Total 719 973 (89 452) – (53 324) – 577 197
* Refers to the increase in value of the SARs of the indicated participants from the offer date to the exercise date during the current financial year. See note 9 for details of the scheme.
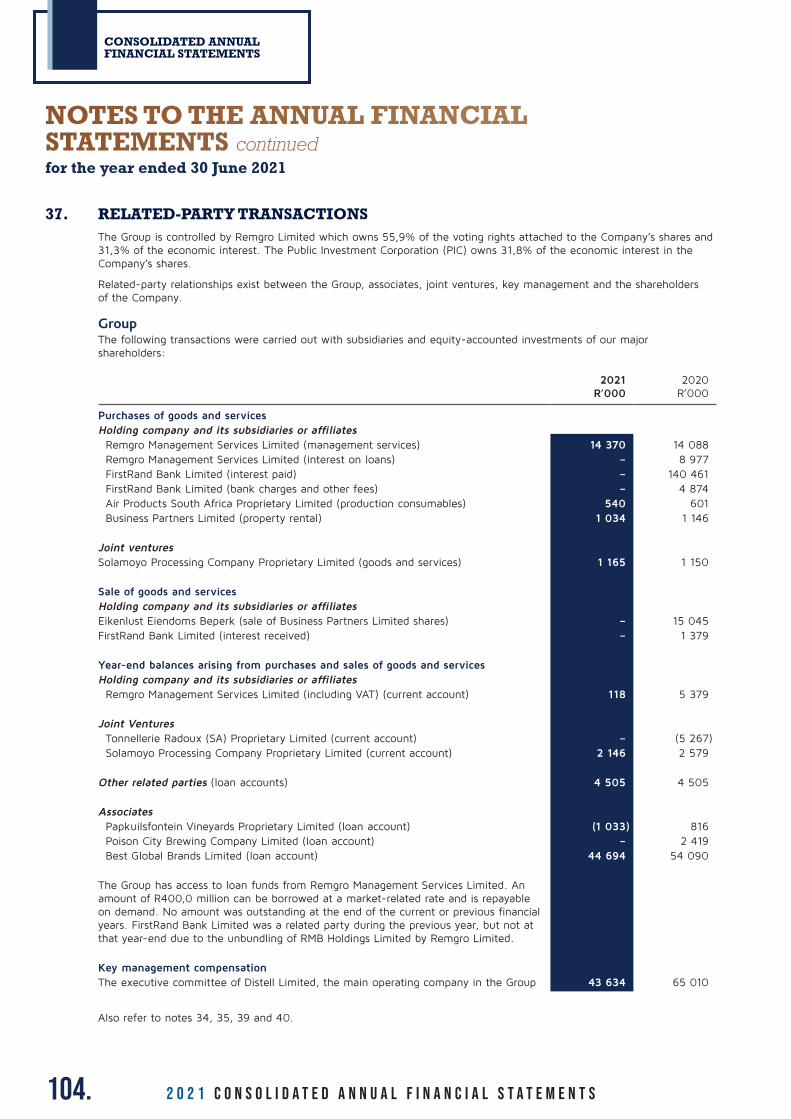
104. 2 0 2 1 C O N S O L I D A T E D A n n u a l f i n a n c i a l s t a t e m e n t s
CONSOLIDATED ANNUAL FINANCIAL STATEMENTS
37. RELATED-PARTY TRANSACTIONSThe Group is controlled by Remgro Limited which owns 55,9% of the voting rights attached to the Company’s shares and 31,3% of the economic interest. The Public Investment Corporation (PIC) owns 31,8% of the economic interest in the Company’s shares.
Related-party relationships exist between the Group, associates, joint ventures, key management and the shareholders of the Company.
GroupThe following transactions were carried out with subsidiaries and equity-accounted investments of our major shareholders:
2021R’000
2020R’000
Purchases of goods and servicesHolding company and its subsidiaries or affiliatesRemgro Management Services Limited (management services) 14 370 14 088 Remgro Management Services Limited (interest on loans) – 8 977 FirstRand Bank Limited (interest paid) – 140 461 FirstRand Bank Limited (bank charges and other fees) – 4 874 Air Products South Africa Proprietary Limited (production consumables) 540 601 Business Partners Limited (property rental) 1 034 1 146
Joint venturesSolamoyo Processing Company Proprietary Limited (goods and services) 1 165 1 150
Sale of goods and servicesHolding company and its subsidiaries or affiliatesEikenlust Eiendoms Beperk (sale of Business Partners Limited shares) – 15 045 FirstRand Bank Limited (interest received) – 1 379
Year-end balances arising from purchases and sales of goods and servicesHolding company and its subsidiaries or affiliatesRemgro Management Services Limited (including VAT) (current account) 118 5 379
Joint VenturesTonnellerie Radoux (SA) Proprietary Limited (current account) – (5 267)Solamoyo Processing Company Proprietary Limited (current account) 2 146 2 579
Other related parties (loan accounts) 4 505 4 505
AssociatesPapkuilsfontein Vineyards Proprietary Limited (loan account) (1 033) 816 Poison City Brewing Company Limited (loan account) – 2 419 Best Global Brands Limited (loan account) 44 694 54 090
The Group has access to loan funds from Remgro Management Services Limited. An amount of R400,0 million can be borrowed at a market-related rate and is repayable on demand. No amount was outstanding at the end of the current or previous financial years. FirstRand Bank Limited was a related party during the previous year, but not at that year-end due to the unbundling of RMB Holdings Limited by Remgro Limited.
Key management compensationThe executive committee of Distell Limited, the main operating company in the Group 43 634 65 010
Also refer to notes 34, 35, 39 and 40.
NOTES TO THE ANNUAL FINANCIAL STATEMENTS continuedfor the year ended 30 June 2021
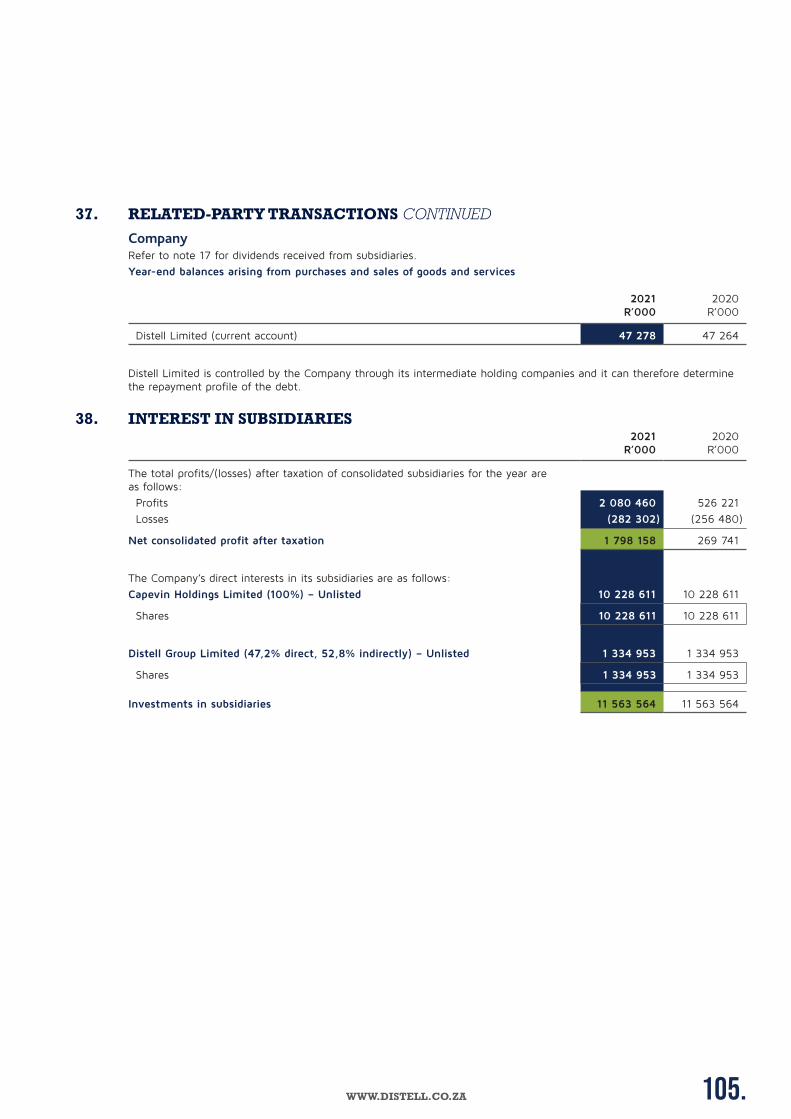
105.WWW.DISTELL.CO.ZA
37. RELATED-PARTY TRANSACTIONS CONTINUEDCompanyRefer to note 17 for dividends received from subsidiaries.
Year-end balances arising from purchases and sales of goods and services
2021R’000
2020R’000
Distell Limited (current account) 47 278 47 264
Distell Limited is controlled by the Company through its intermediate holding companies and it can therefore determine the repayment profile of the debt.
38. INTEREST IN SUBSIDIARIES2021
R’0002020
R’000
The total profits/(losses) after taxation of consolidated subsidiaries for the year are as follows:
Profits 2 080 460 526 221
Losses (282 302) (256 480)
Net consolidated profit after taxation 1 798 158 269 741
The Company’s direct interests in its subsidiaries are as follows:
Capevin Holdings Limited (100%) – Unlisted 10 228 611 10 228 611
Shares 10 228 611 10 228 611
Distell Group Limited (47,2% direct, 52,8% indirectly) – Unlisted 1 334 953 1 334 953
Shares 1 334 953 1 334 953
Investments in subsidiaries 11 563 564 11 563 564
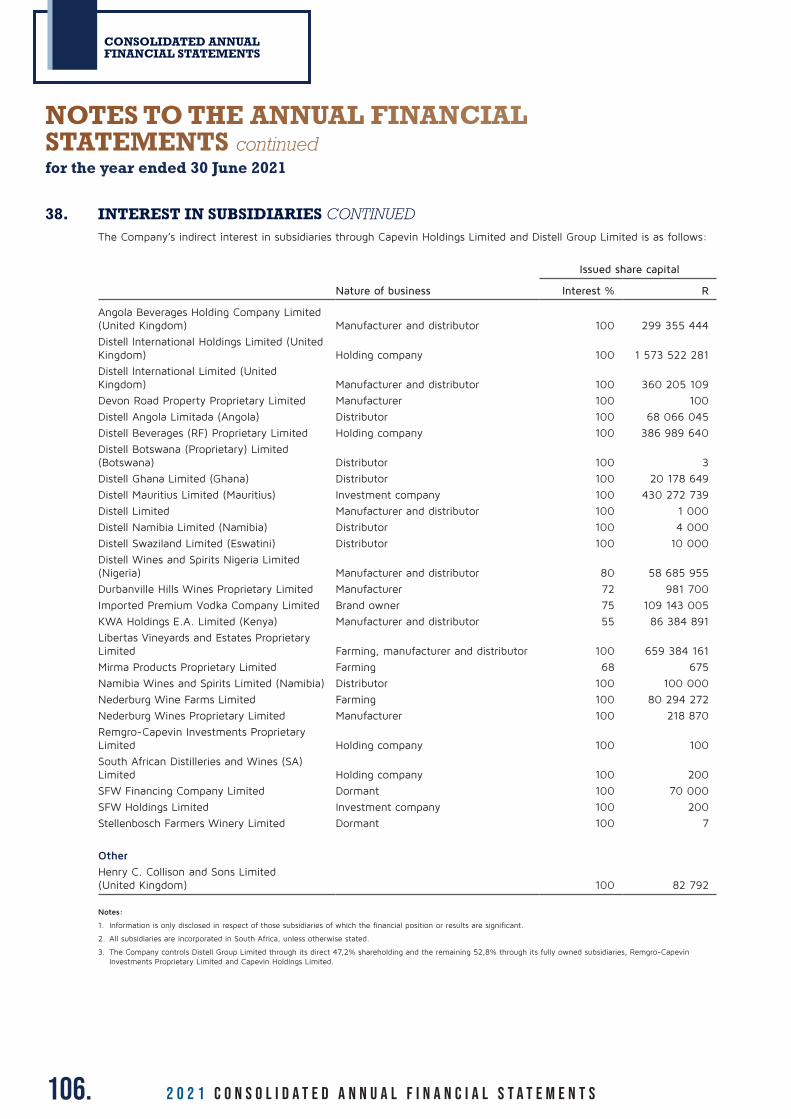
106. 2 0 2 1 C O N S O L I D A T E D A n n u a l f i n a n c i a l s t a t e m e n t s
CONSOLIDATED ANNUAL FINANCIAL STATEMENTS
38. INTEREST IN SUBSIDIARIES CONTINUEDThe Company’s indirect interest in subsidiaries through Capevin Holdings Limited and Distell Group Limited is as follows:
Issued share capital
Nature of business Interest % R
Angola Beverages Holding Company Limited (United Kingdom) Manufacturer and distributor 100 299 355 444
Distell International Holdings Limited (United Kingdom) Holding company 100 1 573 522 281
Distell International Limited (United Kingdom) Manufacturer and distributor 100 360 205 109
Devon Road Property Proprietary Limited Manufacturer 100 100
Distell Angola Limitada (Angola) Distributor 100 68 066 045
Distell Beverages (RF) Proprietary Limited Holding company 100 386 989 640
Distell Botswana (Proprietary) Limited (Botswana) Distributor 100 3
Distell Ghana Limited (Ghana) Distributor 100 20 178 649
Distell Mauritius Limited (Mauritius) Investment company 100 430 272 739
Distell Limited Manufacturer and distributor 100 1 000
Distell Namibia Limited (Namibia) Distributor 100 4 000
Distell Swaziland Limited (Eswatini) Distributor 100 10 000
Distell Wines and Spirits Nigeria Limited (Nigeria) Manufacturer and distributor 80 58 685 955
Durbanville Hills Wines Proprietary Limited Manufacturer 72 981 700
Imported Premium Vodka Company Limited Brand owner 75 109 143 005
KWA Holdings E.A. Limited (Kenya) Manufacturer and distributor 55 86 384 891
Libertas Vineyards and Estates Proprietary Limited Farming, manufacturer and distributor 100 659 384 161
Mirma Products Proprietary Limited Farming 68 675
Namibia Wines and Spirits Limited (Namibia) Distributor 100 100 000
Nederburg Wine Farms Limited Farming 100 80 294 272
Nederburg Wines Proprietary Limited Manufacturer 100 218 870
Remgro-Capevin Investments Proprietary Limited Holding company 100 100
South African Distilleries and Wines (SA) Limited Holding company 100 200
SFW Financing Company Limited Dormant 100 70 000
SFW Holdings Limited Investment company 100 200
Stellenbosch Farmers Winery Limited Dormant 100 7
Other
Henry C. Collison and Sons Limited (United Kingdom) 100 82 792
Notes:
1. Information is only disclosed in respect of those subsidiaries of which the financial position or results are significant.
2. All subsidiaries are incorporated in South Africa, unless otherwise stated.
3. The Company controls Distell Group Limited through its direct 47,2% shareholding and the remaining 52,8% through its fully owned subsidiaries, Remgro-Capevin Investments Proprietary Limited and Capevin Holdings Limited.
NOTES TO THE ANNUAL FINANCIAL STATEMENTS continuedfor the year ended 30 June 2021
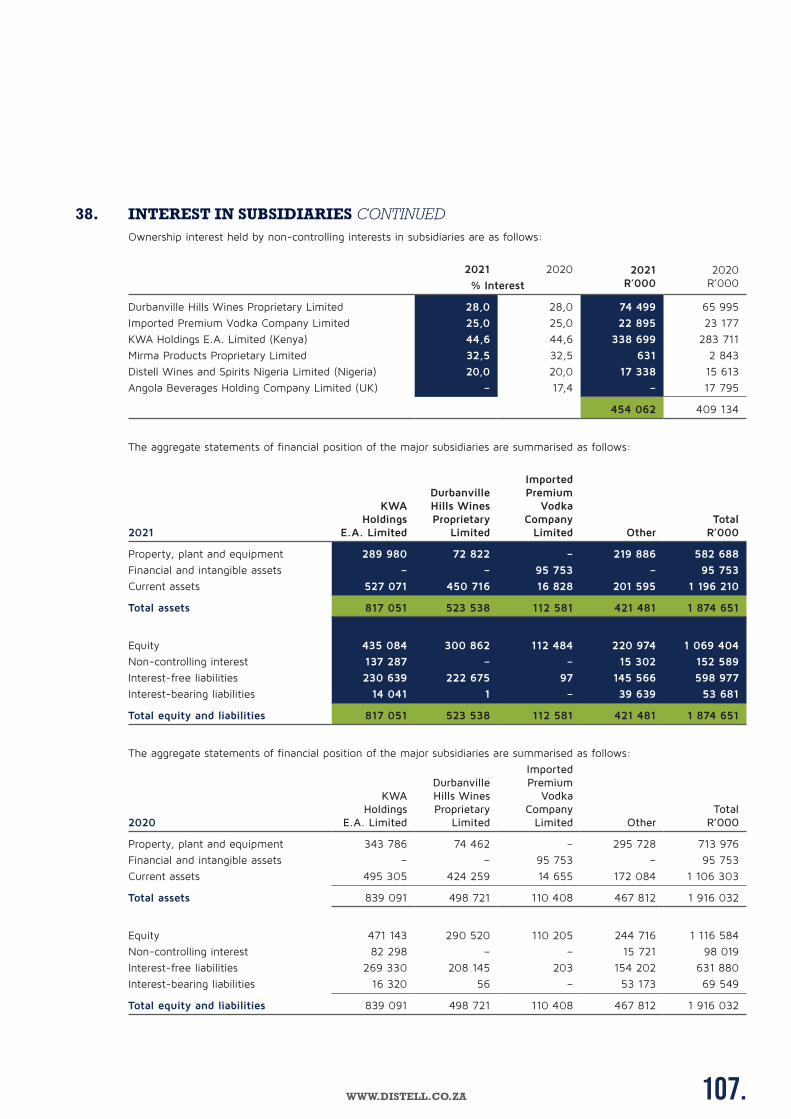
107.WWW.DISTELL.CO.ZA
38. INTEREST IN SUBSIDIARIES CONTINUEDOwnership interest held by non-controlling interests in subsidiaries are as follows:
2021 2020 2021R’000
2020R’000% Interest
Durbanville Hills Wines Proprietary Limited 28,0 28,0 74 499 65 995
Imported Premium Vodka Company Limited 25,0 25,0 22 895 23 177
KWA Holdings E.A. Limited (Kenya) 44,6 44,6 338 699 283 711
Mirma Products Proprietary Limited 32,5 32,5 631 2 843
Distell Wines and Spirits Nigeria Limited (Nigeria) 20,0 20,0 17 338 15 613
Angola Beverages Holding Company Limited (UK) – 17,4 – 17 795
454 062 409 134
The aggregate statements of financial position of the major subsidiaries are summarised as follows:
2021
KWA Holdings
E.A. Limited
Durbanville Hills Wines Proprietary
Limited
Imported Premium
Vodka Company
Limited OtherTotal
R’000
Property, plant and equipment 289 980 72 822 – 219 886 582 688
Financial and intangible assets – – 95 753 – 95 753
Current assets 527 071 450 716 16 828 201 595 1 196 210
Total assets 817 051 523 538 112 581 421 481 1 874 651
Equity 435 084 300 862 112 484 220 974 1 069 404
Non-controlling interest 137 287 – – 15 302 152 589
Interest-free liabilities 230 639 222 675 97 145 566 598 977
Interest-bearing liabilities 14 041 1 – 39 639 53 681
Total equity and liabilities 817 051 523 538 112 581 421 481 1 874 651
The aggregate statements of financial position of the major subsidiaries are summarised as follows:
2020
KWA Holdings
E.A. Limited
Durbanville Hills Wines Proprietary
Limited
Imported Premium
Vodka Company
Limited OtherTotal
R’000
Property, plant and equipment 343 786 74 462 – 295 728 713 976
Financial and intangible assets – – 95 753 – 95 753
Current assets 495 305 424 259 14 655 172 084 1 106 303
Total assets 839 091 498 721 110 408 467 812 1 916 032
Equity 471 143 290 520 110 205 244 716 1 116 584
Non-controlling interest 82 298 – – 15 721 98 019
Interest-free liabilities 269 330 208 145 203 154 202 631 880
Interest-bearing liabilities 16 320 56 – 53 173 69 549
Total equity and liabilities 839 091 498 721 110 408 467 812 1 916 032
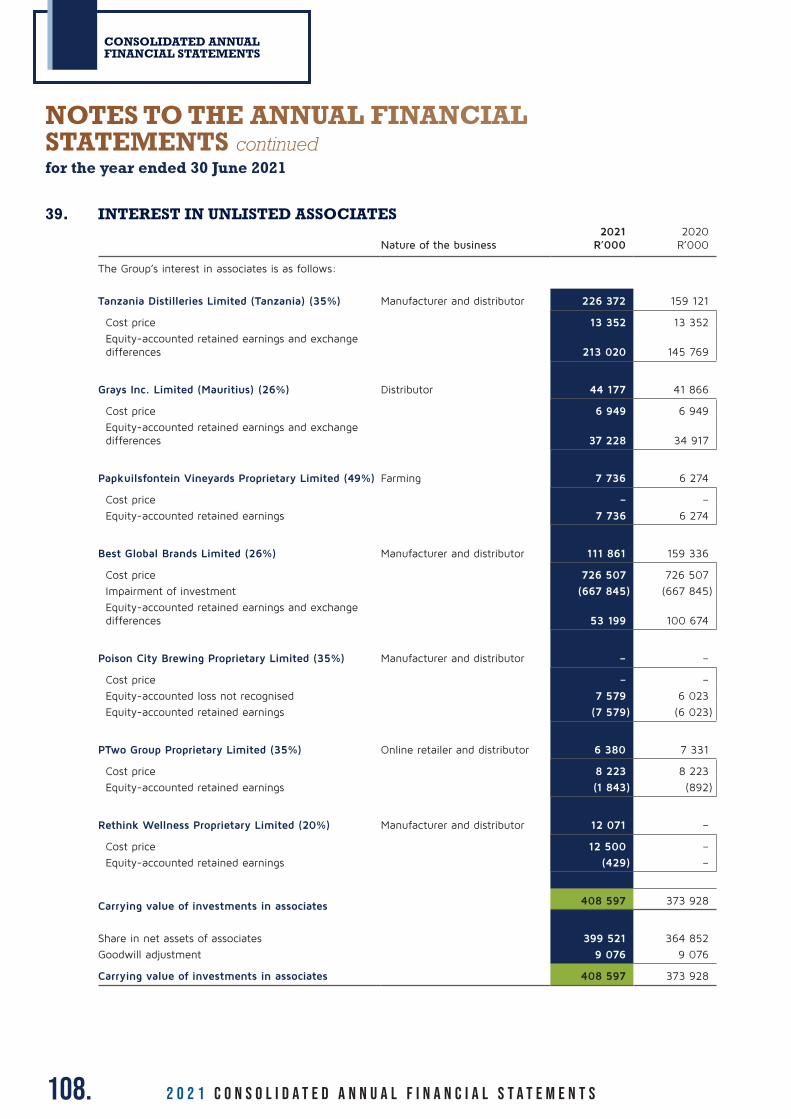
108. 2 0 2 1 C O N S O L I D A T E D A n n u a l f i n a n c i a l s t a t e m e n t s
CONSOLIDATED ANNUAL FINANCIAL STATEMENTS
39. INTEREST IN UNLISTED ASSOCIATES
Nature of the business2021
R’0002020
R’000
The Group’s interest in associates is as follows:
Tanzania Distilleries Limited (Tanzania) (35%) Manufacturer and distributor 226 372 159 121
Cost price 13 352 13 352
Equity-accounted retained earnings and exchange differences 213 020 145 769
Grays Inc. Limited (Mauritius) (26%) Distributor 44 177 41 866
Cost price 6 949 6 949
Equity-accounted retained earnings and exchange differences 37 228 34 917
Papkuilsfontein Vineyards Proprietary Limited (49%) Farming 7 736 6 274
Cost price – –
Equity-accounted retained earnings 7 736 6 274
Best Global Brands Limited (26%) Manufacturer and distributor 111 861 159 336
Cost price 726 507 726 507
Impairment of investment (667 845) (667 845)
Equity-accounted retained earnings and exchange differences 53 199 100 674
Poison City Brewing Proprietary Limited (35%) Manufacturer and distributor – –
Cost price – –
Equity-accounted loss not recognised 7 579 6 023
Equity-accounted retained earnings (7 579) (6 023)
PTwo Group Proprietary Limited (35%) Online retailer and distributor 6 380 7 331
Cost price 8 223 8 223
Equity-accounted retained earnings (1 843) (892)
Rethink Wellness Proprietary Limited (20%) Manufacturer and distributor 12 071 –
Cost price 12 500 –
Equity-accounted retained earnings (429) –
Carrying value of investments in associates 408 597 373 928
Share in net assets of associates 399 521 364 852
Goodwill adjustment 9 076 9 076
Carrying value of investments in associates 408 597 373 928
NOTES TO THE ANNUAL FINANCIAL STATEMENTS continuedfor the year ended 30 June 2021
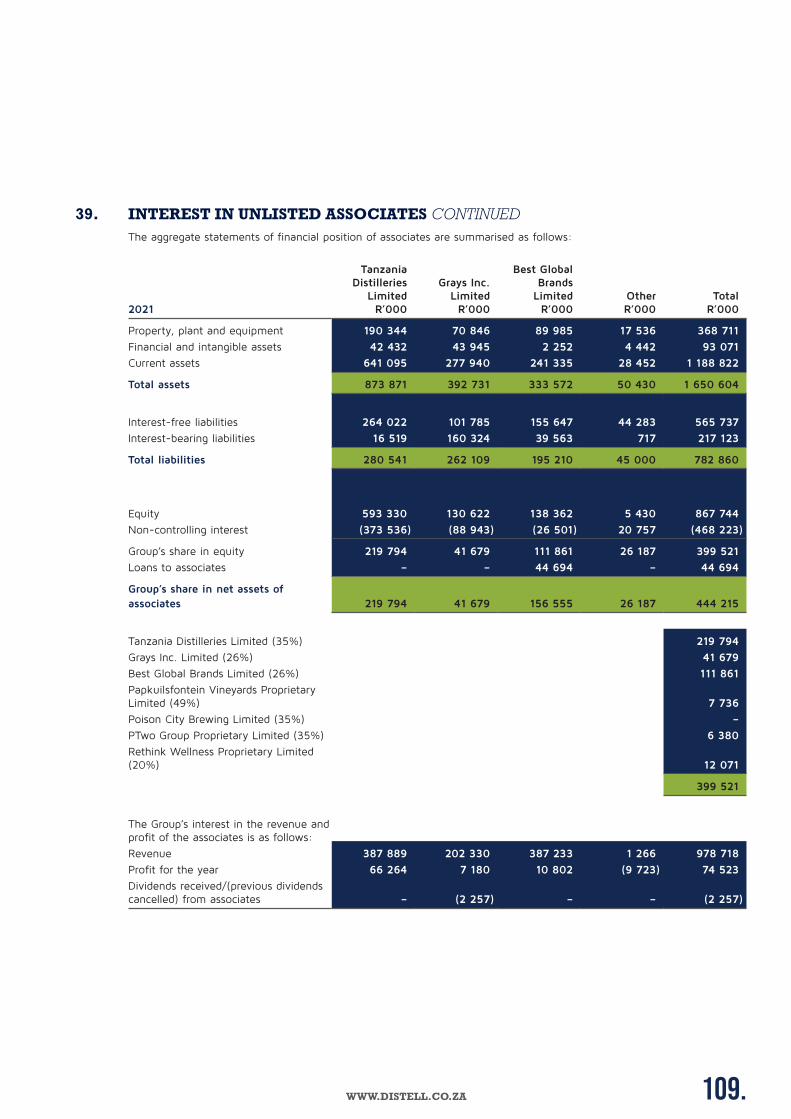
109.WWW.DISTELL.CO.ZA
39. INTEREST IN UNLISTED ASSOCIATES CONTINUEDThe aggregate statements of financial position of associates are summarised as follows:
2021
Tanzania Distilleries
Limited R’000
Grays Inc. LimitedR’000
Best Global Brands
Limited R’000
OtherR’000
Total R’000
Property, plant and equipment 190 344 70 846 89 985 17 536 368 711
Financial and intangible assets 42 432 43 945 2 252 4 442 93 071
Current assets 641 095 277 940 241 335 28 452 1 188 822
Total assets 873 871 392 731 333 572 50 430 1 650 604
Interest-free liabilities 264 022 101 785 155 647 44 283 565 737
Interest-bearing liabilities 16 519 160 324 39 563 717 217 123
Total liabilities 280 541 262 109 195 210 45 000 782 860
Equity 593 330 130 622 138 362 5 430 867 744
Non-controlling interest (373 536) (88 943) (26 501) 20 757 (468 223)
Group’s share in equity 219 794 41 679 111 861 26 187 399 521
Loans to associates – – 44 694 – 44 694
Group’s share in net assets of associates 219 794 41 679 156 555 26 187 444 215
Tanzania Distilleries Limited (35%) 219 794
Grays Inc. Limited (26%) 41 679
Best Global Brands Limited (26%) 111 861
Papkuilsfontein Vineyards Proprietary Limited (49%) 7 736
Poison City Brewing Limited (35%) –
PTwo Group Proprietary Limited (35%) 6 380
Rethink Wellness Proprietary Limited (20%) 12 071
399 521
The Group’s interest in the revenue and profit of the associates is as follows:
Revenue 387 889 202 330 387 233 1 266 978 718
Profit for the year 66 264 7 180 10 802 (9 723) 74 523
Dividends received/(previous dividends cancelled) from associates – (2 257) – – (2 257)

110. 2 0 2 1 C O N S O L I D A T E D A n n u a l f i n a n c i a l s t a t e m e n t s
CONSOLIDATED ANNUAL FINANCIAL STATEMENTS
39. INTEREST IN UNLISTED ASSOCIATES CONTINUEDThe aggregate statements of financial position of associates are summarised as follows:
2020
Tanzania Distilleries
Limited R’000
Grays Inc. LimitedR’000
Best Global Brands
Limited R’000
Other R’000
Total R’000
Property, plant and equipment 247 343 34 980 118 903 14 995 416 221
Financial and intangible assets 46 695 51 303 97 259 4 556 199 813
Current assets 620 948 316 801 271 693 2 791 1 212 233
Total assets 914 986 403 084 487 855 22 342 1 828 267
Interest-free liabilities 376 680 206 505 167 317 32 302 782 804
Interest-bearing liabilities 24 675 51 856 6 186 768 83 485
Total liabilities 401 355 258 361 173 503 33 070 866 289
Equity 513 631 144 723 314 352 (10 728) 961 978
Non-controlling interest (361 088) (105 355) (155 016) 24 333 (597 126)
Group’s share in equity 152 543 39 368 159 336 13 605 364 852
Loans to associates – – 54 090 2 419 56 509
Group’s share in net assets of associates 152 543 39 368 213 426 16 024 421 361
Tanzania Distilleries Limited (35%) 152 543
Grays Inc. Limited (26%) 39 368
Best Global Brands Limited (26%) 159 336
Papkuilsfontein Vineyards Proprietary Limited (49%) 6 274
Poison City Brewing Limited (35%) –
PTwo Group Proprietary Limited (35%) 7 331
364 852
The Group’s interest in the revenue and profit of the associates is as follows:
Revenue 375 522 200 937 392 510 11 898 980 867
Profit for the year 52 991 3 818 10 949 (15 770) 51 988
Dividends received from associates – 4 471 – – 4 471
Notes:
1. All associates are incorporated in South Africa, unless otherwise stated.
2. The statutory year-ends of Tanzania Distilleries Limited (31 December) and Grays Inc. Limited (31 December) are different to those of the rest of the Group. The associates are equity accounted using management prepared information on a basis coterminous with the Group’s accounting reference date.
3. Included in ‘other’ is Papkuilsfontein Vineyards Proprietary Limited, Poison City Brewing Limited, PTwo Group Proprietary Limited and Rethink Wellness Proprietary Limited.
NOTES TO THE ANNUAL FINANCIAL STATEMENTS continuedfor the year ended 30 June 2021
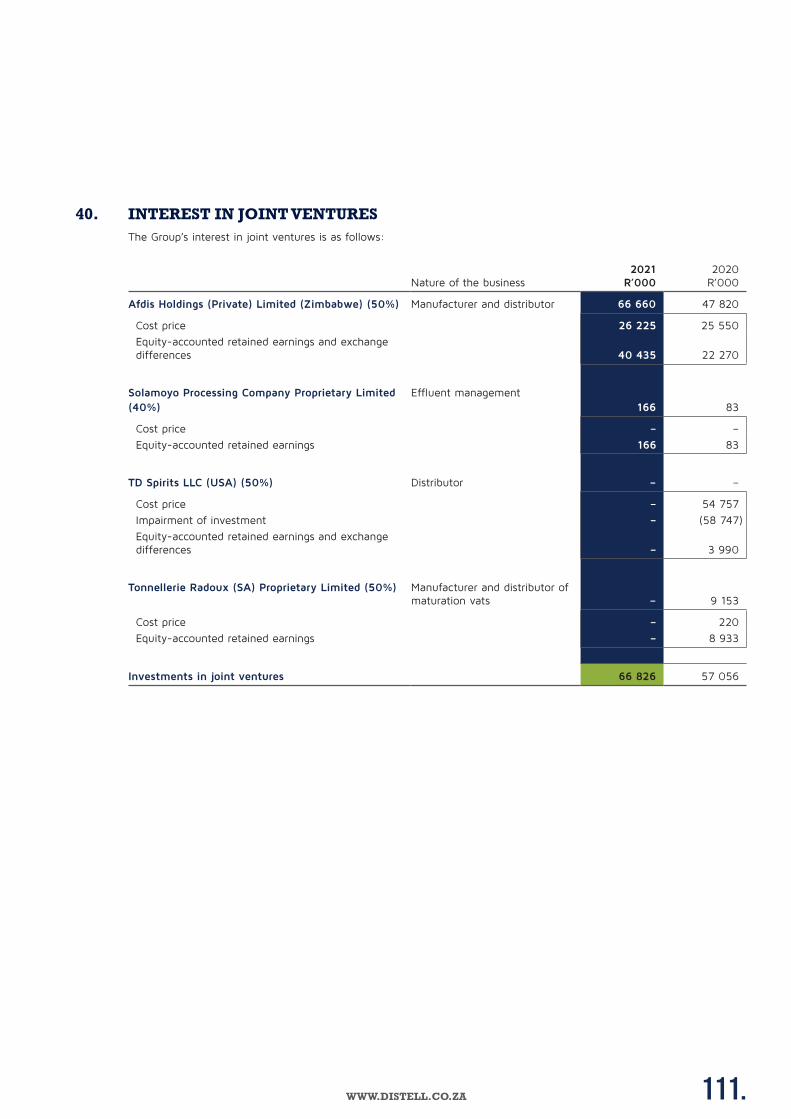
111.WWW.DISTELL.CO.ZA
40. INTEREST IN JOINT VENTURESThe Group’s interest in joint ventures is as follows:
Nature of the business2021
R’0002020
R’000
Afdis Holdings (Private) Limited (Zimbabwe) (50%) Manufacturer and distributor 66 660 47 820
Cost price 26 225 25 550
Equity-accounted retained earnings and exchange differences 40 435 22 270
Solamoyo Processing Company Proprietary Limited (40%)
Effluent management 166 83
Cost price – –
Equity-accounted retained earnings 166 83
TD Spirits LLC (USA) (50%) Distributor – –
Cost price – 54 757
Impairment of investment – (58 747)
Equity-accounted retained earnings and exchange differences – 3 990
Tonnellerie Radoux (SA) Proprietary Limited (50%) Manufacturer and distributor of maturation vats – 9 153
Cost price – 220
Equity-accounted retained earnings – 8 933
Investments in joint ventures 66 826 57 056
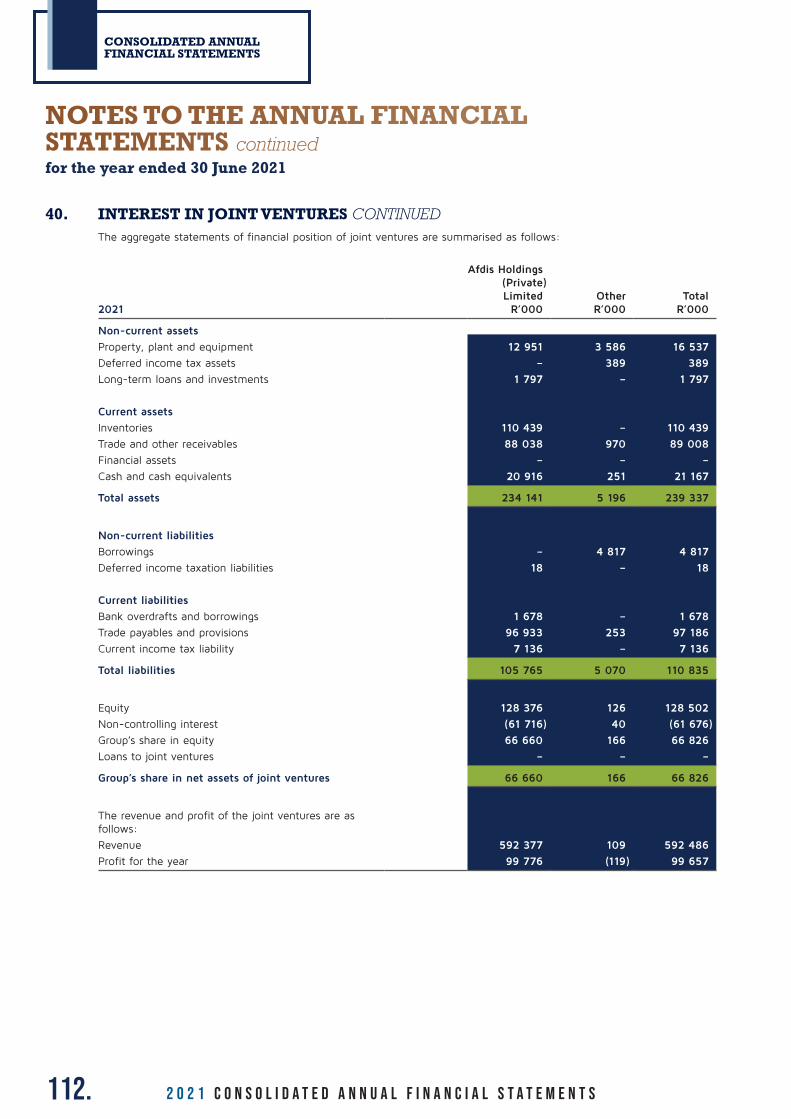
112. 2 0 2 1 C O N S O L I D A T E D A n n u a l f i n a n c i a l s t a t e m e n t s
CONSOLIDATED ANNUAL FINANCIAL STATEMENTS
40. INTEREST IN JOINT VENTURES CONTINUEDThe aggregate statements of financial position of joint ventures are summarised as follows:
2021
Afdis Holdings (Private) Limited
R’000OtherR’000
Total R’000
Non-current assets
Property, plant and equipment 12 951 3 586 16 537
Deferred income tax assets – 389 389
Long-term loans and investments 1 797 – 1 797
Current assets
Inventories 110 439 – 110 439
Trade and other receivables 88 038 970 89 008
Financial assets – – –
Cash and cash equivalents 20 916 251 21 167
Total assets 234 141 5 196 239 337
Non-current liabilities
Borrowings – 4 817 4 817
Deferred income taxation liabilities 18 – 18
Current liabilities
Bank overdrafts and borrowings 1 678 – 1 678
Trade payables and provisions 96 933 253 97 186
Current income tax liability 7 136 – 7 136
Total liabilities 105 765 5 070 110 835
Equity 128 376 126 128 502
Non-controlling interest (61 716) 40 (61 676)
Group’s share in equity 66 660 166 66 826
Loans to joint ventures – – –
Group’s share in net assets of joint ventures 66 660 166 66 826
The revenue and profit of the joint ventures are as follows:
Revenue 592 377 109 592 486
Profit for the year 99 776 (119) 99 657
NOTES TO THE ANNUAL FINANCIAL STATEMENTS continuedfor the year ended 30 June 2021
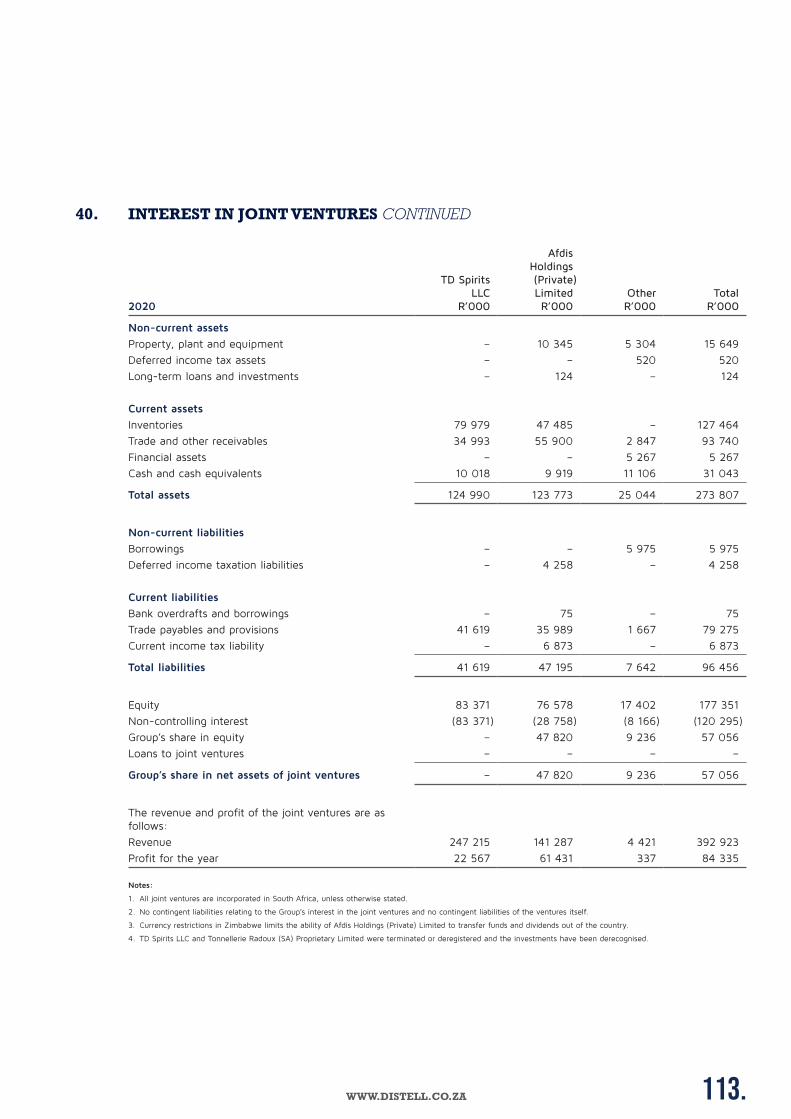
113.WWW.DISTELL.CO.ZA
40. INTEREST IN JOINT VENTURES CONTINUED
2020
TD Spirits LLC
R’000
Afdis Holdings (Private) Limited
R’000OtherR’000
Total R’000
Non-current assets
Property, plant and equipment – 10 345 5 304 15 649
Deferred income tax assets – – 520 520
Long-term loans and investments – 124 – 124
Current assets
Inventories 79 979 47 485 – 127 464
Trade and other receivables 34 993 55 900 2 847 93 740
Financial assets – – 5 267 5 267
Cash and cash equivalents 10 018 9 919 11 106 31 043
Total assets 124 990 123 773 25 044 273 807
Non-current liabilities
Borrowings – – 5 975 5 975
Deferred income taxation liabilities – 4 258 – 4 258
Current liabilities
Bank overdrafts and borrowings – 75 – 75
Trade payables and provisions 41 619 35 989 1 667 79 275
Current income tax liability – 6 873 – 6 873
Total liabilities 41 619 47 195 7 642 96 456
Equity 83 371 76 578 17 402 177 351
Non-controlling interest (83 371) (28 758) (8 166) (120 295)
Group’s share in equity – 47 820 9 236 57 056
Loans to joint ventures – – – –
Group’s share in net assets of joint ventures – 47 820 9 236 57 056
The revenue and profit of the joint ventures are as follows:
Revenue 247 215 141 287 4 421 392 923
Profit for the year 22 567 61 431 337 84 335
Notes:
1. All joint ventures are incorporated in South Africa, unless otherwise stated.
2. No contingent liabilities relating to the Group’s interest in the joint ventures and no contingent liabilities of the ventures itself.
3. Currency restrictions in Zimbabwe limits the ability of Afdis Holdings (Private) Limited to transfer funds and dividends out of the country.
4. TD Spirits LLC and Tonnellerie Radoux (SA) Proprietary Limited were terminated or deregistered and the investments have been derecognised.
114. 2 0 2 1 C O N S O L I D A T E D A n n u a l f i n a n c i a l s t a t e m e n t s
CONSOLIDATED ANNUAL FINANCIAL STATEMENTS
41. GOING CONCERNCOVID-19 and further alcohol bans in South AfricaOn the evening of Sunday, 27 June 2021 the South African government again announced measures to curb the spread of COVID-19. These measures included a ban on the sale of alcoholic beverages with immediate effect, a curfew from 21:00 to 04:00. The ban on the sale of alcohol was extended for a further two weeks on 11 July 2021 and was lifted with effect from 26 July 2021 when the Group was allowed to trade again. The Group was still allowed to manufacture products in South Africa during the ban on the sale of alcohol and to continue with its normal export activities. The frequent alcohol bans and COVID-19 related restrictions continue to have a negative impact on many liquor related businesses in South Africa. Other major territories in which the Group operates have not been impacted to this extent and are able to trade mostly normally in line with general economic constraints in the various territories.
The Group evaluated the adverse consequences of the alcohol ban on its liquidity forecast, its assessment of expected credit losses, inventory provisions for slow and obsolete stock and cash flow forecasts for certain intangible assets.
Going concernThe Group has a strong balance sheet, underpinned by the recent consolidation of and upgrades to its production network, powerful and well-known brands across the portfolio range servicing consumer needs over various price points and a strong customer base covering all channels and geographies.
The Group has access to committed banking facilities of R7,3 billion for its South African operations, of which R1,3 billion (net after cash and cash equivalents) was utilised on 30 June 2021. Management regards the Group as having sufficient financial and operational capacity to continue operations, albeit in a severely constrained trading environment in South Africa.
42. EVENTS SUBSEQUENT TO STATEMENT OF FINANCIAL POSITION DATECivil unrest in South AfricaCivil unrest occurred in South Africa’s KwaZulu-Natal and Gauteng provinces from 9 to 17 July 2021 which resulted in violence and the destruction and looting of property and businesses.
One of the Group’s distribution centres in KwaZulu-Natal was damaged and our operations disrupted. Initial assessments placed the damage between R80,0 million and R100,0 million. All other sites in South Africa were without major damage. The Group is in the process of lodging insurance claims to recover losses incurred.
The businesses of many of our customers and consumers in the affected areas were also severely damaged or destroyed during the unrest. Distell will continue to assist all our customers to help rebuild their businesses and support them as trade resumes.
The impact of the civil unrest is regarded as a non-adjusting event in terms of IAS 10 Events after the Reporting Period. No adjustments were therefore made to the amounts recognised in the financial statements of 30 June 2021.
The directors are not aware of any other matter or circumstance arising since the end of the financial year that would significantly affect the operations of the Group or the results of its operations.
NOTES TO THE ANNUAL FINANCIAL STATEMENTS continuedfor the year ended 30 June 2021

115.WWW.DISTELL.CO.ZA
SUPPLEMENTARY
INFORMATION

116. 2 0 2 1 C O N S O L I D A T E D A n n u a l f i n a n c i a l s t a t e m e n t s
SUPPLEMENTARY INFORMATION
TO THE DIRECTORS OF DISTELL GROUP HOLDINGS LIMITEDWe have completed our assurance engagement to report on the compilation of the pro forma financial information of Distell Group Holdings Limited (the “Company”) by the directors. The pro forma financial information, as set out on pages 6 to 8 of the Consolidated annual financial statements for the year ended 30 June 2021 (“Consolidated annual financial statements”), consist of the impact of abnormal and non-recurring transactions and the effect of foreign currencies on information disclosed in the Consolidated annual financial statements for the year ended 30 June 2021, and related notes. The applicable criteria on the basis of which the directors have compiled the pro forma financial information are specified in the JSE Limited (JSE) Listings Requirements and described in the report of the board of directors included in the Consolidated annual financial statements.
The pro forma financial information has been compiled by the directors to illustrate the impact of abnormal and non-recurring transactions and the effect of foreign currencies on headline earnings and earnings before interest, taxation, depreciation and amortisation (“EBITDA”). As part of this process, information about the Company’s financial performance has been extracted by the directors from the Company’s consolidated annual financial statements for the year ended 30 June 2021, on which an audit report has been published.
Directors' responsibilityThe directors of the Company are responsible for compiling the pro forma financial information on the basis of the applicable criteria specified in the JSE Listings Requirements and described in the report of the board of directors included in the Consolidated annual financial statements.
Our independence and quality controlWe are independent of the Group in accordance with the Independent Regulatory Board for Auditors’ Code of Professional Conduct for Registered Auditors (IRBA Code) and other independence requirements applicable to performing audits of financial statements in South Africa. We have fulfilled our other ethical responsibilities in accordance with the IRBA Code and in accordance with other ethical requirements applicable to performing audits in South Africa. The IRBA Code is consistent with the corresponding sections of the International Ethics Standards Board for Accountants’ International Code of Ethics for Professional Accountants (including International Independence Standards).
Reporting accountant’s responsibilityOur responsibility is to express an opinion about whether the pro forma financial information has been compiled, in all material respects, by the directors on the basis of the applicable criteria specified in the JSE Listings Requirements and described in the report of the board of directors included in the Consolidated annual financial statements.
We conducted our engagement in accordance with the International Standard on Assurance Engagements (ISAE) 3420, Assurance Engagements to Report on the Compilation of Pro Forma Financial Information Included in a Prospectus issued by the International Auditing and Assurance Standards Board. This standard requires that we plan and perform our procedures to obtain reasonable assurance about whether the pro forma financial information has been compiled, in all material respects, on the basis specified in the JSE Listings Requirements.
For purposes of this engagement, we are not responsible for updating or reissuing any reports or opinions on any historical financial information used in compiling the pro forma financial information, nor have we, in the course of this engagement, performed an audit or review of the financial information used in compiling the pro forma financial information.
The purpose of pro forma financial information is solely to illustrate the impact of a significant event or transaction on unadjusted financial information of the Company as if the event had occurred or the transaction had been undertaken at an earlier date selected for purposes of the illustration. Accordingly, we do not provide any assurance that the actual outcome of the event or transaction would have been as presented.
REPORT ON THE ASSURANCE ENGAGEMENT ON THE COMPILATION OF PRO FORMA FINANCIAL INFORMATION INCLUDED IN THE CONSOLIDATED ANNUAL FINANCIAL STATEMENTSfor the year ended 30 June 2021
117.WWW.DISTELL.CO.ZA
A reasonable assurance engagement to report on whether the pro forma financial information has been compiled, in all material respects, on the basis of the applicable criteria involves performing procedures to assess whether the applicable criteria used by the directors in the compilation of the pro forma financial information provide a reasonable basis for presenting the significant effects directly attributable to the event or transaction, and to obtain sufficient appropriate evidence about whether:
• The related pro forma adjustments give appropriate effect to those criteria; and
• The pro forma financial information reflects the proper application of those adjustments to the unadjusted financial information.
The procedures selected depend on our judgement, having regard to our understanding of the nature of the Company, the event or transaction in respect of which the pro forma financial information has been compiled, and other relevant engagement circumstances.
Our engagement also involves evaluating the overall presentation of the pro forma financial information.
We believe that the evidence we have obtained is sufficient and appropriate to provide a basis for our opinion.
OpinionIn our opinion, the pro forma financial information has been compiled, in all material respects, on the basis of the applicable criteria specified by the JSE Listings Requirements and described in the report of the board of directors included in the Consolidated annual financial statements.
PricewaterhouseCoopers Inc. Director: RM LabuschaigneRegistered Auditor Stellenbosch20 September 2021
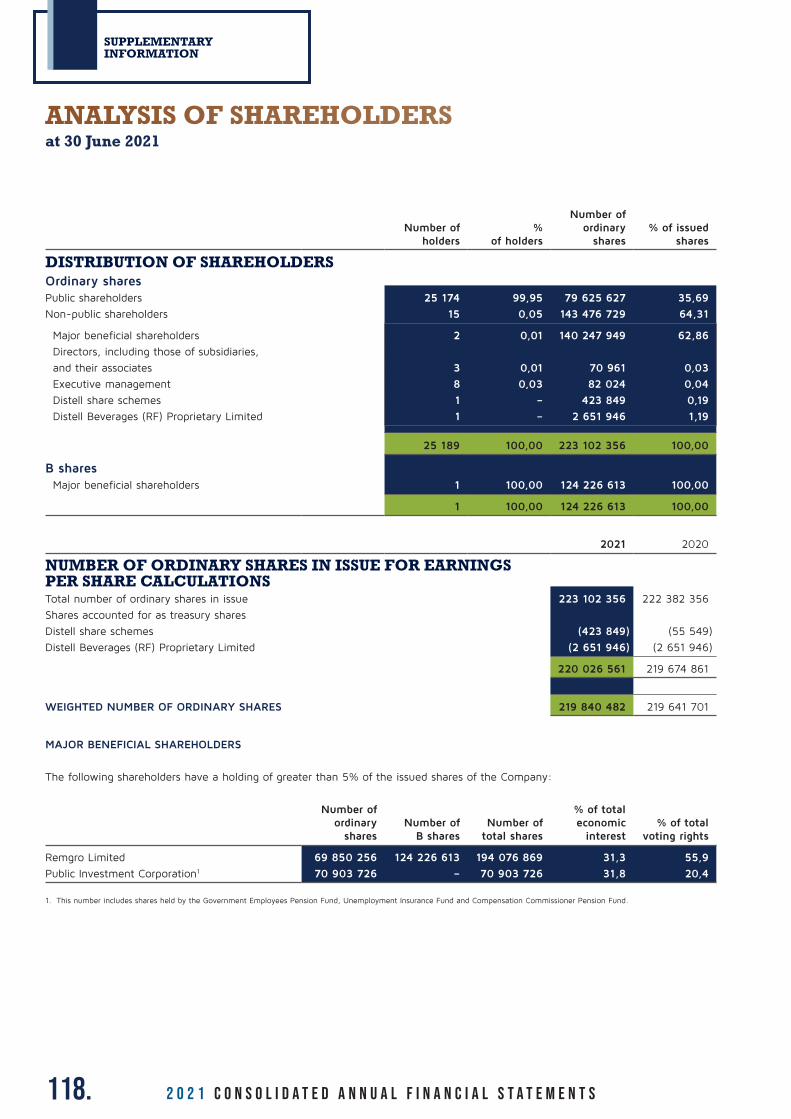
118. 2 0 2 1 C O N S O L I D A T E D A n n u a l f i n a n c i a l s t a t e m e n t s
SUPPLEMENTARY INFORMATION
Number ofholders
%of holders
Number of ordinary
shares% of issued
shares
DISTRIBUTION OF SHAREHOLDERSOrdinary sharesPublic shareholders 25 174 99,95 79 625 627 35,69
Non-public shareholders 15 0,05 143 476 729 64,31
Major beneficial shareholders 2 0,01 140 247 949 62,86
Directors, including those of subsidiaries,
and their associates 3 0,01 70 961 0,03
Executive management 8 0,03 82 024 0,04
Distell share schemes 1 – 423 849 0,19
Distell Beverages (RF) Proprietary Limited 1 – 2 651 946 1,19
25 189 100,00 223 102 356 100,00
B sharesMajor beneficial shareholders 1 100,00 124 226 613 100,00
1 100,00 124 226 613 100,00
2021 2020
NUMBER OF ORDINARY SHARES IN ISSUE FOR EARNINGS PER SHARE CALCULATIONSTotal number of ordinary shares in issue 223 102 356 222 382 356
Shares accounted for as treasury shares
Distell share schemes (423 849) (55 549)
Distell Beverages (RF) Proprietary Limited (2 651 946) (2 651 946)
220 026 561 219 674 861
WEIGHTED NUMBER OF ORDINARY SHARES 219 840 482 219 641 701
MAJOR BENEFICIAL SHAREHOLDERS
The following shareholders have a holding of greater than 5% of the issued shares of the Company:
Number of ordinary
sharesNumber of
B sharesNumber of
total shares
% of total economic
interest% of total
voting rights
Remgro Limited 69 850 256 124 226 613 194 076 869 31,3 55,9
Public Investment Corporation1 70 903 726 – 70 903 726 31,8 20,4
1. This number includes shares held by the Government Employees Pension Fund, Unemployment Insurance Fund and Compensation Commissioner Pension Fund.
ANALYSIS OF SHAREHOLDERSat 30 June 2021
119.WWW.DISTELL.CO.ZA
1) ACID TEST RATIO
Current assets, excluding inventories, divided by total current liabilities.
2) CASH FLOW PER ORDINARY SHARE
Cash flow from operating activities before dividends paid, divided by the weighted number of ordinary shares in issue. This basis identifies the cash stream actually achieved in the period under review.
3) CASH AND CASH EQUIVALENTS
For the purposes of the cash flow statement, cash and cash equivalents comprise cash on hand and deposits held on call with banks, net of bank overdrafts. In the statement of financial position, bank overdrafts are included in interest-bearing borrowings under current liabilities.
4) CURRENT RATIO
Current assets divided by total current liabilities.
5) DIVIDEND COVER
Headline earnings per ordinary share divided by dividends per ordinary share.
6) DIVIDEND YIELD
Dividends per ordinary share divided by the weighted average price per share during the year.
7) EBITDA
Earnings before Interest, Tax, Depreciation, Amortisation and including Distell’s share of equity accounted earnings, but excluding dividends received.
8) EARNINGS PER ORDINARY SHARE
Basic earnings basis
Earnings attributable to equity holders divided by the weighted average number of ordinary shares in issue.
Headline basis
Earnings attributable to equity holders, after taking into account the adjustments explained in note 25.1, divided by the weighted average number of ordinary shares in issue.
Normalised earnings basis
Earnings attributable to equity holders, after taking into account foreign exchange movements, divided by the weighted average number of ordinary shares in issue.
Normalised headline basis
Headline earnings attributable to equity holders, after taking into account foreign exchange movements, divided by the weighted average number of ordinary shares in issue.
DEFINITIONS AND RATIOS
9) EARNINGS YIELD
Headline earnings per ordinary share divided by the closing share price at year-end on the JSE Limited (JSE).
10) EFFECTIVE TAX RATE
The tax charge for the year divided by the profit before taxation.
11) FINANCIAL GEARING RATIO
The ratio of interest-bearing borrowings, net of cash and cash equivalents and money market funds, to total equity.
12) INTEREST-FREE BORROWINGS TO TOTAL ASSETS
Interest-free borrowings, excluding post-retirement medical liability, divided by total assets (both excluding deferred income tax).
13) NET ASSET TURN
Revenue divided by net assets at year-end.
14) NET ASSET VALUE PER ORDINARY SHARE
Total equity divided by the number of ordinary shares in issue.
15) PRE-TAX RETURN ON EQUITY
Profit before taxation as a percentage of closing equity.
16) PRICE EARNINGS RATIO
The closing share price at year-end on the JSE, divided by headline earnings per ordinary share for that year.
17) RETURN ON EQUITY
Headline earnings divided by closing equity.
18) TOTAL RETURN TO SHAREHOLDERS
This represents the internal rate of return over a specified period. It is computed by recognising the market price of a Distell ordinary share at the beginning of the period as a cash outflow, recognising the annual cash dividend streams per share and the closing share price at the end of the current year as inflows and then determining the discount rate inherent to these cash flow streams.
120. 2 0 2 1 C O N S O L I D A T E D A n n u a l f i n a n c i a l s t a t e m e n t s
SUPPLEMENTARY INFORMATION
ANNUAL GENERAL MEETING November 2021
FINANCIAL REPORT
Interim report February 2022
Preliminary announcement of annual results August 2022
Annual financial statements September 2022
ORDINARY DIVIDENDS
Interim dividends
Declaration February 2022
Payable March 2022
Final dividends
Declaration August 2022
Payable September 2022
DATES OF IMPORTANCE TO SHAREHOLDERS
Distell Group Holdings Limited
Incorporated in the Republic of South Africa
(Registration number: 2016/394974/06)
ISIN: ZAE000248811
JSE share code: DGH
Company Secretary
L Malan
Registered office
Aan-de-Wagenweg, Stellenbosch 7600
PO Box 184, Stellenbosch 7599
Telephone: 021 809 7000
Facsimile: 021 886 4611
Email: [email protected]
Transfer secretaries
Computershare Investor Services Proprietary Limited
Rosebank Towers, 15 Biermann Avenue, Rosebank 2196
PO Box 61051, Marshalltown 2107
Telephone: 011 370 7700
Facsimile: 011 688 5238
ADMINISTRATION
Auditors
PricewaterhouseCoopers Inc.
Stellenbosch
Listing
JSE Limited
Sector: Consumer Staples – Food, Beverage and Tobacco – Beverages – Distillers and Vintners
Sponsor
Rand Merchant Bank (a division of FirstRand Bank Limited)
Website
www.distell.co.za

WWW.DISTELL.CO.ZA
GREYMATTERFINCH # 15061

00122. 2 0 2 1 C O N S O L I D A T E D A n n u a l f i n a n c i a l s t a t e m e n t s
CONSOLIDATED ANNUAL FINANCIAL STATEMENTS
www.distell.co.za
CIDERS AND RTDs We pioneered the cider category in South Africa to become the second largest global producer of ciders:• Savanna
• Hunter’s
• Extreme
• Bernini
SPIRITSOur premium and accessible spirit brands include local brands in key African markets:• Amarula
• Bunnahabhain
• Scottish Leader
• Viceroy
WINES Distell owns key wine brands, including:• 4th Street
• Drostdy-Hof
• Nederburg
• Sedgwick’s Old Brown
WE ARE DISTELLDistell is a business with deep roots in South Africa with a growing African and international presence. We are Africa’s leading producer and global marketer of wines, spirits, ciders and other ready-to-drinks (RTDs).
CREATING AND SHARING VALUE Our purpose captures the customer and consumer experience associated with our award-winning brands. It recognises our role as a corporate citizen and our obligation to act responsibly and pursue excellence in everything we do.
OUR PERFORMANCE IN 2021The year has been undoubtedly challenging. However, it also presented an opportunity for us to realign the Group’s strategy. Distell has proven to be a resilient African business with a strong and diverse portfolio. This will enable us to thrive in the long term.
Brands