Audited Consolidated Financial Statements - Notified
84
Q4 International Petroleum Corporation Audited Consolidated Financial Statements For the years ended December 31, 2020 and 2019
-
Upload
khangminh22 -
Category
Documents
-
view
0 -
download
0
Transcript of Audited Consolidated Financial Statements - Notified

Q4International Petroleum Corporation
Audited Consolidated FinancialStatementsFor the years ended December 31, 2020 and 2019
Contents
Consolidated Financial StatementsFor the years ended December 31, 2020 and 2019, AUDITED
Report of Management 3
Report of Independent Auditor 4
Consolidated Statement of Operations 8
Consolidated Statement of Comprehensive Income 9
Consolidated Balance Sheet 10
Consolidated Statement of Cash Flow 11
Consolidated Statement of Changes in Equity 12
Notes to the Consolidated Financial Statements 13
2

Consolidated Financial StatementsFor the years ended December 31, 2020 and 2019, AUDITED
REPORT OF MANAGEMENT
The accompanying consolidated financial statements of International Petroleum Corporation (“IPC” or the “Corporation” and, together with its subsidiaries, the “Group”) and other information contained in the management’s discussion and analysis are the responsibility of management and have been approved by the Board of Directors. The consolidated financial statements have been prepared by management in accordance with International Financial Reporting Standards (“IFRS”) as issued by the International Accounting Standards Board (“IASB”) as outlined in Part 1 of the Handbook of the Chartered Professional Accountants of Canada, and include some amounts that are based on management’s estimates and judgment.
The Board of Directors carries out its responsibility for the consolidated financial statements principally through its Audit Committee, which is comprised solely of independent directors. The Audit Committee reviews the Group’s annual consolidated financial statements and recommends its approval to the Board of Directors. The Corporation’s auditors have full access to the Audit Committee, with and without management being present. These consolidated financial statements have been audited by PricewaterhouseCoopers SA, Chartered Professional Accountants, Licensed Public Accountants.
(Signed) Mike Nicholson (Signed) Christophe NerguararianDirector, President and Chief Executive Officer Chief Financial Officer
Vancouver, CanadaFebruary 9, 2021
3
PricewaterhouseCoopers SA, avenue Giuseppe-Motta 50, case postale, 1211 Genève 2 Téléphone: +41 58 792 91 00, Téléfax: +41 58 792 91 10, www.pwc.ch
PricewaterhouseCoopers SA is a member of the global PricewaterhouseCoopers network of firms, each of which is a separate and independent legal entity.
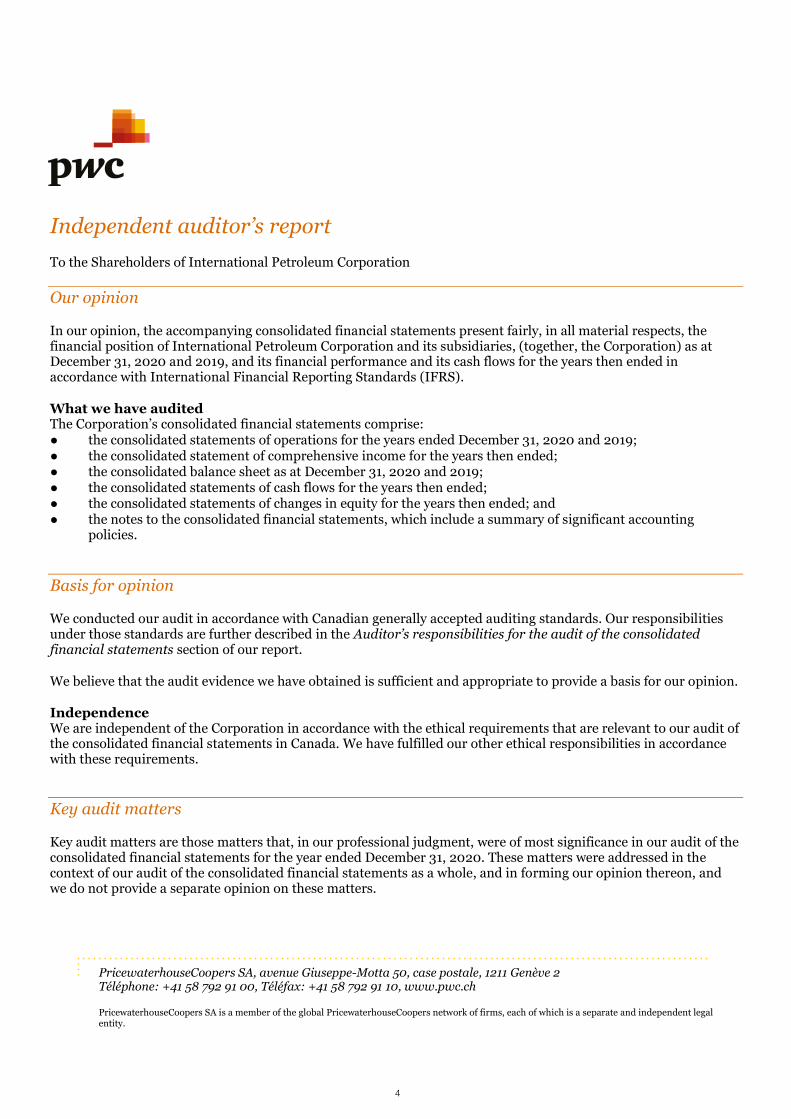
Independent auditor’s reportTo the Shareholders of International Petroleum Corporation
Our opinion
In our opinion, the accompanying consolidated financial statements present fairly, in all material respects, the financial position of International Petroleum Corporation and its subsidiaries, (together, the Corporation) as at December 31, 2020 and 2019, and its financial performance and its cash flows for the years then ended in accordance with International Financial Reporting Standards (IFRS).
What we have auditedThe Corporation’s consolidated financial statements comprise:
the consolidated statements of operations for the years ended December 31, 2020 and 2019;the consolidated statement of comprehensive income for the years then ended;the consolidated balance sheet as at December 31, 2020 and 2019;the consolidated statements of cash flows for the years then ended; the consolidated statements of changes in equity for the years then ended; andthe notes to the consolidated financial statements, which include a summary of significant accounting policies.
Basis for opinion
We conducted our audit in accordance with Canadian generally accepted auditing standards. Our responsibilities under those standards are further described in the Auditor’s responsibilities for the audit of the consolidated financial statements section of our report.
We believe that the audit evidence we have obtained is sufficient and appropriate to provide a basis for our opinion.
IndependenceWe are independent of the Corporation in accordance with the ethical requirements that are relevant to our audit of the consolidated financial statements in Canada. We have fulfilled our other ethical responsibilities in accordance with these requirements.
Key audit matters
Key audit matters are those matters that, in our professional judgment, were of most significance in our audit of the consolidated financial statements for the year ended December 31, 2020. These matters were addressed in the context of our audit of the consolidated financial statements as a whole, and in forming our opinion thereon, and we do not provide a separate opinion on these matters.
4
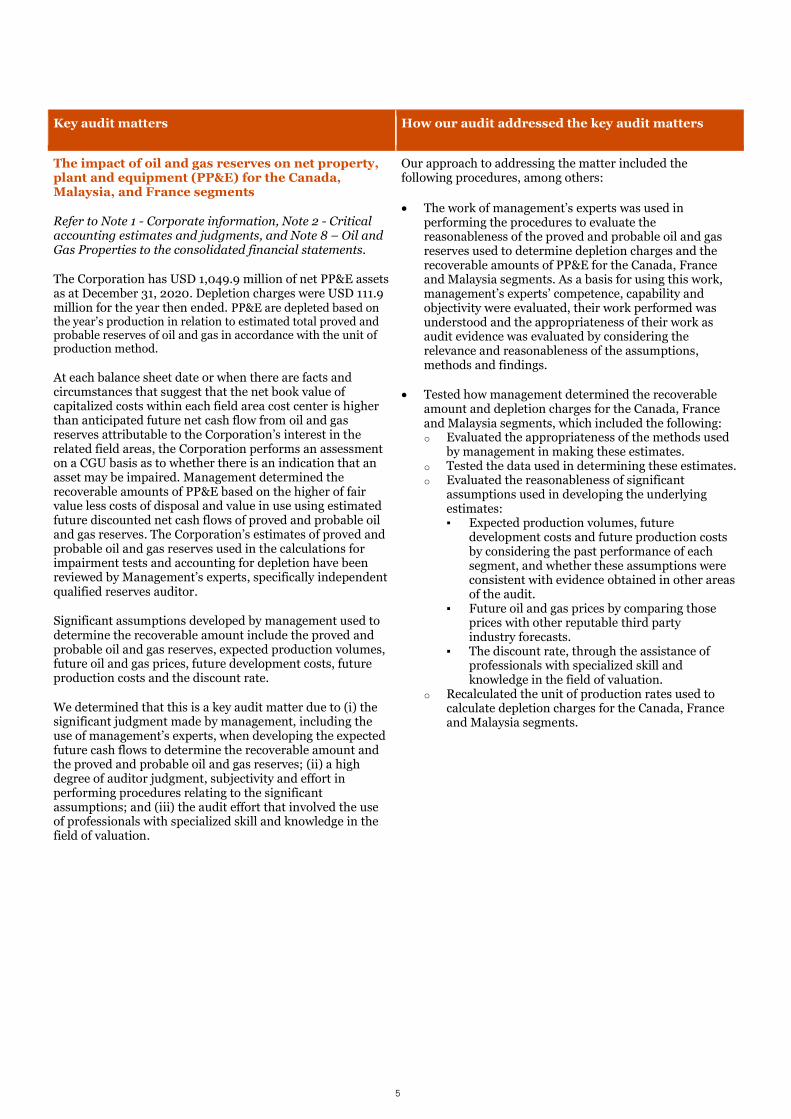
Key audit matters How our audit addressed the key audit matters
The impact of oil and gas reserves on net property, plant and equipment (PP&E) for the Canada, Malaysia, and France segments
Refer to Note 1 - Corporate information, Note 2 - Critical accounting estimates and judgments, and Note 8 – Oil and Gas Properties to the consolidated financial statements.
The Corporation has USD 1,049.9 million of net PP&E assets as at December 31, 2020. Depletion charges were USD 111.9million for the year then ended. PP&E are depleted based on the year’s production in relation to estimated total proved and probable reserves of oil and gas in accordance with the unit of production method.
At each balance sheet date or when there are facts and circumstances that suggest that the net book value of capitalized costs within each field area cost center is higher than anticipated future net cash flow from oil and gas reserves attributable to the Corporation’s interest in the related field areas, the Corporation performs an assessmenton a CGU basis as to whether there is an indication that an asset may be impaired. Management determined the recoverable amounts of PP&E based on the higher of fair value less costs of disposal and value in use using estimated future discounted net cash flows of proved and probable oil and gas reserves. The Corporation’s estimates of proved and probable oil and gas reserves used in the calculations for impairment tests and accounting for depletion have been reviewed by Management’s experts, specifically independent qualified reserves auditor.
Significant assumptions developed by management used to determine the recoverable amount include the proved and probable oil and gas reserves, expected production volumes, future oil and gas prices, future development costs, future production costs and the discount rate.
We determined that this is a key audit matter due to (i) the significant judgment made by management, including the use of management’s experts, when developing the expected future cash flows to determine the recoverable amount and the proved and probable oil and gas reserves; (ii) a high degree of auditor judgment, subjectivity and effort in performing procedures relating to the significant assumptions; and (iii) the audit effort that involved the use of professionals with specialized skill and knowledge in the field of valuation.
Our approach to addressing the matter included the following procedures, among others:
The work of management’s experts was used in performing the procedures to evaluate the reasonableness of the proved and probable oil and gas reserves used to determine depletion charges and the recoverable amounts of PP&E for the Canada, France and Malaysia segments. As a basis for using this work, management’s experts’ competence, capability and objectivity were evaluated, their work performed was understood and the appropriateness of their work as audit evidence was evaluated by considering the relevance and reasonableness of the assumptions, methods and findings.
Tested how management determined the recoverable amount and depletion charges for the Canada, France and Malaysia segments, which included the following:o Evaluated the appropriateness of the methods used
by management in making these estimates.o Tested the data used in determining these estimates.o Evaluated the reasonableness of significant
assumptions used in developing the underlyingestimates:
Expected production volumes, future development costs and future production costs by considering the past performance of each segment, and whether these assumptions were consistent with evidence obtained in other areas of the audit.Future oil and gas prices by comparing those prices with other reputable third party industry forecasts.The discount rate, through the assistance of professionals with specialized skill and knowledge in the field of valuation.
o Recalculated the unit of production rates used tocalculate depletion charges for the Canada, Franceand Malaysia segments.
5

Key audit matters How our audit addressed the key audit matters
Valuation of assets acquired and liabilities assumed in the Granite acquisition
Refer to Note 1 - Corporate information, Note 2 - Critical accounting estimates and judgments, and Note 9 – Granite Acquisition to the consolidated financial statements.
The Corporation acquired all of the issued and outstanding shares of Granite for a total cash consideration of USD 27.7 million on March 5, 2020. The Corporation performed a preliminary purchase price allocation for the acquisition.This transaction has been accounted for as a business combination, and in accordance with IFRS 3 Business Combinations (“IFRS 3”), the assets acquired and liabilities assumed have been recorded at their fair values. The fair value of assets acquired and liabilities assumed in a business combination is estimated based on information available at the date of acquisition.
We considered this a key audit matter due to (i) the significant judgment made by management in estimating the fair value of assets acquired and liabilities assumed in a business combination; and (ii) a high degree of auditor judgment, subjectivity and effort in performing procedures and evaluating audit evidence relating to management’s estimates.
Our approach to addressing the matter included the following procedures, among others:
Assessed management’s conclusions in relation to the treatment of the acquisition as a business combination in accordance with IFRS 3 by assessing the presence of inputs, processes, and outputs that characterise a business; Tested how management estimated the fair values of the assets acquired and liabilities assumed, which included the following:o Reviewed the purchase agreement;o Evaluated the suitability of management’s
model for estimating the fair value of the assetsacquired and liabilities assumed;
o Tested the material aspects of management’spreliminary purchase price allocation;
o Checked the mathematical accuracy ofmanagement’s model; and
o Traced the total consideration paid to actualcash outflows
Reviewed the related disclosures for compliance with IFRS 3
Responsibilities of management and those charged with governance for the consolidated financial statementsManagement is responsible for the preparation and fair presentation of the consolidated financial statements in accordance with IFRS, and for such internal control as management determines is necessary to enable the preparation of consolidated financial statements that are free from material misstatement, whether due to fraud or error.
In preparing the consolidated financial statements, management is responsible for assessing the Corporation’s ability to continue as a going concern, disclosing, as applicable, matters related to going concern and using the going concern basis of accounting unless management either intends to liquidate the Corporation or to cease operations, or has no realistic alternative but to do so.
Those charged with governance are responsible for overseeing the Corporation’s financial reporting process.
Auditor’s responsibilities for the audit of the consolidated financial statementsOur objectives are to obtain reasonable assurance about whether the consolidated financial statements as a whole are free from material misstatement, whether due to fraud or error, and to issue an auditor’s report that includes our opinion. Reasonable assurance is a high level of assurance, but is not a guarantee that an audit conducted in accordance with Canadian generally accepted auditing standards will always detect a material misstatement when it exists. Misstatements can arise from fraud or error and are considered material if, individually or in the aggregate,
6

they could reasonably be expected to influence the economic decisions of users taken on the basis of these consolidated financial statements.
As part of an audit in accordance with Canadian generally accepted auditing standards, we exercise professional judgment and maintain professional skepticism throughout the audit. We also:
Identify and assess the risks of material misstatement of the consolidated financial statements, whether due to fraud or error, design and perform audit procedures responsive to those risks, and obtain audit evidence that is sufficient and appropriate to provide a basis for our opinion. The risk of not detecting a material misstatement resulting from fraud is higher than for one resulting from error, as fraud may involve collusion, forgery, intentional omissions, misrepresentations, or the override of internal control.
Obtain an understanding of internal control relevant to the audit in order to design audit procedures that are appropriate in the circumstances, but not for the purpose of expressing an opinion on the effectiveness of the Corporation’s internal control.
Evaluate the appropriateness of accounting policies used and the reasonableness of accounting estimates and related disclosures made by management.
Conclude on the appropriateness of management’s use of the going concern basis of accounting and, based on the audit evidence obtained, whether a material uncertainty exists related to events or conditions that may cast significant doubt on the Corporation’s ability to continue as a going concern. If we conclude that a material uncertainty exists, we are required to draw attention in our auditor’s report to the related disclosures in the consolidated financial statements or, if such disclosures are inadequate, to modify our opinion. Our conclusions are based on the audit evidence obtained up to the date of our auditor’s report. However, future events or conditions may cause the Corporation to cease to continue as a going concern.
Evaluate the overall presentation, structure and content of the consolidated financial statements, including the disclosures, and whether the consolidated financial statements represent the underlying transactions and events in a manner that achieves fair presentation.
Obtain sufficient appropriate audit evidence regarding the financial information of the entities or business activities within the Corporation to express an opinion on the consolidated financial statements. We are responsible for the direction, supervision and performance of the group audit. We remain solely responsible for our audit opinion.
We communicate with those charged with governance regarding, among other matters, the planned scope and timing of the audit and significant audit findings, including any significant deficiencies in internal control that we identify during our audit.
From the matters communicated with those charged with governance, we determine those matters that were of most significance in the audit of the consolidated financial statements of the current period and are therefore the key audit matters. We describe these matters in our auditor’s report unless law or regulation precludes public disclosure about the matter or when, in extremely rare circumstances, we determine that a matter should not be communicated in our report because the adverse consequences of doing so would reasonably be expected to outweigh the public interest benefits of such communication.
PricewaterhouseCoopers SA
Luc Schulthess Colin Johnson
February 9, 2021
7

Consolidated Statement of OperationsFor the years ended December 31, 2020 and 2019, AUDITED
USD Thousands Note 2020 2019
Revenue 3 324,164 553,749
Cost of sales
Production costs 4 (204,628) (240,771)
Depletion and decommissioning costs 8 (111,896) (121,659)
Depreciation of other assets (11,681) (23,020)
Exploration and business development costs (6,802) (15,395)
Impairment costs of oil and gas properties 8 (73,143) –
Gross profit / (loss) 3 (83,986) 152,904
General, administration and depreciation expenses (12,788) (12,042)
Profit / (loss) before financial items (96,774) 140,862
Finance income 5 13,103 14,364
Finance costs 6 (28,090) (32,390)
Net financial items (14,987) (18,026)
Profit / (loss) before tax (111,761) 122,836
Income tax recovery / (expense) 7 33,820 (19,248)
Net result (77,941) 103,588
Net result attributable to:
Shareholders of the Parent Company (77,854) 103,564
Non-controlling interest (87) 24
(77,941) 103,588
Earnings per share – USD1 17 (0.50) 0.63
Earnings per share fully diluted – USD1 17 (0.49) 0.62
1 Based on net result attributable to shareholders of the Parent Company
See accompanying notes to the consolidated financial statements
8

Consolidated Statement of Comprehensive IncomeFor the years ended December 31, 2020 and 2019, AUDITED
USD Thousands Note 2020 2019
Net result (77,941) 103,588
Other comprehensive income/(loss)
Items that may be reclassified to profit or loss, net of tax:
Hedging gains / (losses) reclassified to profit or loss 3 1,983 2,345
Cash flow hedges gain / (loss) (2,819) (2,889)
Currency translation adjustments 10,491 12,781
Items that will not be reclassified to profit or loss, net of tax:
Re-measurements on defined pension plan 21 (703) (959)
Total comprehensive income / (loss) (68,989) 114,866
Total comprehensive income/ (loss) attributable to:
Shareholders of the Parent Company (68,914) 114,846
Non-controlling interest (75) 20
(68,989) 114,866
See accompanying notes to the consolidated financial statements
9

Consolidated Balance SheetFor the years ended December 31, 2020 and 2019, AUDITED
USD Thousands Note December 31, 2020 December 31, 2019
ASSETS
Non-current assets
Oil and gas properties 8 1,070,904 1,105,495
Other tangible fixed assets 10 59,198 69,015
Right-of-use assets 11 1,965 2,700
Deferred tax assets 7 88,347 57,523
Other assets 12 20,239 17,867
Total non-current assets 1,240,653 1,252,600
Current assets
Inventories 13 17,070 17,220
Trade and other receivables 14 66,151 77,834
Derivative instruments 23 1,591 420
Current tax receivables 1,157 996
Cash and cash equivalents 15 6,498 15,571
Total current assets 92,467 112,041
TOTAL ASSETS 1,333,120 1,364,641
LIABILITIES
Non-current liabilities
Financial liabilities 19 301,153 244,732
Lease liabilities 11 1,347 1,906
Provisions 20 196,945 179,997
Deferred tax liabilities 7 28,085 47,565
Total non-current liabilities 527,530 474,200
Current liabilities
Trade and other payables 22 63,350 85,826
Financial liabilities 19 22,982 –
Current tax liabilities 184 2,706
Lease liabilities 11 671 844
Provisions 20 7,204 9,840
Derivative instruments 23 2,746 416
Total current liabilities 97,137 99,632
EQUITY
Shareholders’ equity 708,321 790,602
Non-controlling interest 132 207
Net shareholders’ equity 708,453 790,809
TOTAL EQUITY AND LIABILITIES 1,333,120 1,364,641
Approved by the Board of Directors
(Signed) C. Ashley Heppenstall (Signed) Mike NicholsonDirector Director
See accompanying notes to the consolidated financial statements
10

Consolidated Statement of Cash FlowFor the years ended December 31, 2020 and 2019, AUDITED
USD Thousands Note 2020 2019
Cash flow from operating activities
Net result (77,941) 103,588
Adjustments for non-cash related items:
Depletion, depreciation and amortization 8,10,11 125,280 146,255
Exploration costs 8 6,141 13,741
Impairment costs 8 73,143 –
Income tax 7 (33,820) 19,248
Capitalized financing fees 6 1,979 2,044
Foreign currency exchange 5 (13,028) (9,553)
Interest expense 6 13,401 17,508
Unwinding of asset retirement obligation discount 6 10,837 10,664
Change in pension liability 20 603 697
Share-based costs 18 4,798 3,969
Other 1,205 259
Cash flow generated from operations (before working capital adjustments and income taxes) 112,598 308,420
Changes in working capital (10,414) (5,302)
Decommissioning costs paid 20 (4,324) (6,315)
Other payments 20 (4,629) (3,588)
Income taxes paid (2,609) (4,923)
Interest paid (13,475) (17,651)
Net cash flow from operating activities 77,147 270,641
Cash flow used in investing activities
Investment in oil and gas properties 8 (77,659) (180,587)
Investment in other fixed assets 10 (426) (1,035)
Acquisition of the Suffield Assets – (995)
Acquisition of Granite 9 (27,709) –
Net cash (outflow) from investing activities (105,794) (182,617)
Cash flow from financing activities
Borrowings / (Repayments) 19 41,549 (49,869)
Paid financing fees (3,182) (606)
Repayment to Lundin Energy – (14,243)
Purchase of own shares 16 (17,602) (16,938)
Other payments (854) (905)
Net cash (outflow) from financing activities 19,911 (82,561)
Change in cash and cash equivalents (8,736) 5,463
Cash and cash equivalents at the beginning of the period 15,571 10,626
Currency exchange difference in cash and cash equivalents (337) (518)
Cash and cash equivalents at the end of the period 6,498 15,571
See accompanying notes to the consolidated financial statements
11
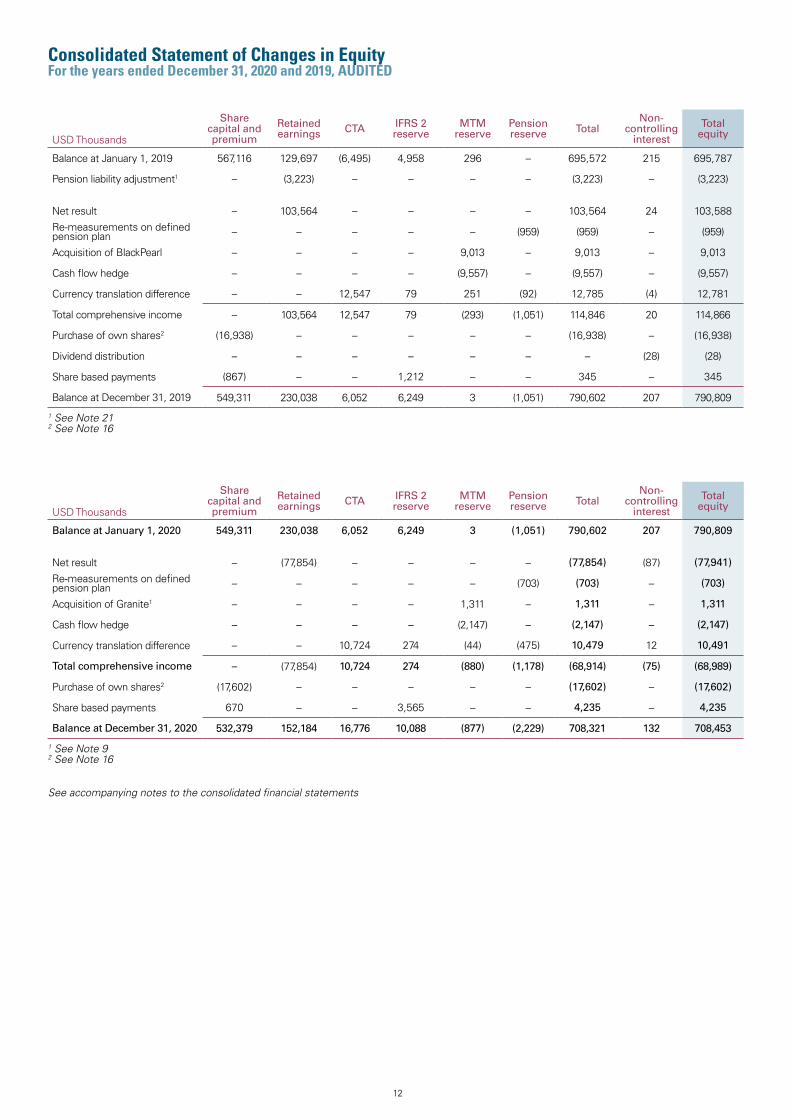
Consolidated Statement of Changes in EquityFor the years ended December 31, 2020 and 2019, AUDITED
1 See Note 92 See Note 16
1 See Note 212 See Note 16
USD Thousands
Share capital and premium
Retained earnings CTA IFRS 2
reserveMTM
reservePension reserve Total
Non-controlling
interest
Totalequity
Balance at January 1, 2019 567,116 129,697 (6,495) 4,958 296 – 695,572 215 695,787
Pension liability adjustment1 – (3,223) – – – – (3,223) – (3,223)
Net result – 103,564 – – – – 103,564 24 103,588
Re-measurements on defined pension plan – – – – – (959) (959) – (959)
Acquisition of BlackPearl – – – – 9,013 – 9,013 – 9,013
Cash flow hedge – – – – (9,557) – (9,557) – (9,557)
Currency translation difference – – 12,547 79 251 (92) 12,785 (4) 12,781
Total comprehensive income – 103,564 12,547 79 (293) (1,051) 114,846 20 114,866
Purchase of own shares2 (16,938) – – – – – (16,938) – (16,938)
Dividend distribution – – – – – – – (28) (28)
Share based payments (867) – – 1,212 – – 345 – 345
Balance at December 31, 2019 549,311 230,038 6,052 6,249 3 (1,051) 790,602 207 790,809
USD Thousands
Share capital and premium
Retained earnings CTA IFRS 2
reserveMTM
reservePension reserve Total
Non-controlling
interest
Totalequity
Balance at January 1, 2020 549,311 230,038 6,052 6,249 3 (1,051) 790,602 207 790,809
Net result – (77,854) – – – – (77,854) (87) (77,941)
Re-measurements on defined pension plan – – – – – (703) (703) – (703)
Acquisition of Granite1 – – – – 1,311 – 1,311 – 1,311
Cash flow hedge – – – – (2,147) – (2,147) – (2,147)
Currency translation difference – – 10,724 274 (44) (475) 10,479 12 10,491
Total comprehensive income – (77,854) 10,724 274 (880) (1,178) (68,914) (75) (68,989)
Purchase of own shares2 (17,602) – – – – – (17,602) – (17,602)
Share based payments 670 – – 3,565 – – 4,235 – 4,235
Balance at December 31, 2020 532,379 152,184 16,776 10,088 (877) (2,229) 708,321 132 708,453
See accompanying notes to the consolidated financial statements
12

Notes to the Consolidated Financial StatementsFor the years ended December 31, 2020 and 2019, AUDITED
1. CORPORATE INFORMATION
A. The Group
International Petroleum Corporation (“IPC” or the “Corporation” and, together with its subsidiaries, the “Group”) is in the business of exploring for, developing and producing oil and gas. IPC holds a portfolio of oil and gas production assets and development projects in Canada, Malaysia and France with exposure to growth opportunities.
The Corporation’s common shares are listed on the Toronto Stock Exchange (“TSX”) in Canada and the Nasdaq Stockholm Exchange in Sweden. The Corporation is incorporated and domiciled in British Columbia, Canada under the Business Corporations Act. The address of its registered office is Suite 2600, 595 Burrard Street, P.O. Box 49314, Vancouver, BC V7X 1L3, Canada and its business address is Suite 2000, 885 West Georgia Street, Vancouver, BC V6C 3E8, Canada.
On March 5, 2020, IPC completed the acquisition of all of the issued and outstanding shares of Granite Oil Corp. (“Granite”) by way of a plan of arrangement under the Business Corporations Act (Alberta) (the “Granite Acquisition”).
B. Basis of preparation
The consolidated financial statements have been prepared in accordance with International Financial Reporting Standards (“IFRS”) as issued by the International Accounting Standards Board (“IASB”).
These consolidated financial statements are presented in United States Dollars (USD), which is the Group’s presentation and functional currency. The consolidated financial statements have been prepared on a historical cost basis, except for items that are required to be accounted for at fair value as detailed in the Group’s accounting policies. Intercompany transactions and balances have been eliminated. Certain comparative figures have been reclassified to conform with the financial statements presentation in the current year.
These consolidated financial statements have been approved by the Board of Directors of IPC and authorized for issuance on February 9, 2021.
C. Going concern
The Group’s consolidated financial statements for the year ended December 31, 2020, have been prepared on a going concern basis, which assumes that the Group will be able to realize its assets and discharge its liabilities in the normal course of business as they become due in the foreseeable future.
D. Changes in accounting policies and disclosures
During the year ended December 31, 2020, the Group applied the amended accounting standards, interpretations and annual improvement points that are effective as of January 1, 2020. The application of the amdendments did not have a material impact on the consolidated financial statements.
There are no plans for the early adoption of published standards, interpretations, or amendments prior to their mandatory effective date. The Group does not expect that other changes in IFRS will have a material impact on the consolidated financial statements.
E. Basis of Consolidation
SubsidiariesSubsidiaries are all entities over which the Group has control and are consolidated. The Corporation controls an entity when it is exposed to, or has rights to, variable returns from its involvement with the entity and has the ability to affect those returns through its power over the entity.
The non-controlling interest in a subsidiary represents the portion of the subsidiary not owned by Group companies. The equity of the subsidiary relating to the non-controlling shareholders is shown as a separate item within changes in net equity.
Inter-company transactions, balances, income and expenses on transactions between companies are eliminated. Profits and losses resulting from intercompany transactions that are recognized in assets are also eliminated.
F. Joint Arrangements
Oil and gas operations of the Group are conducted as co-licencees in unincorporated joint ventures with other companies and are classified as joint operations. The consolidated financial statements reflect the relevant proportions of production, capital costs, operating costs and current assets and liabilities of the joint operation applicable to the Corporation’s interests.
13
Notes to the Consolidated Financial StatementsFor the years ended December 31, 2020 and 2019, AUDITED
G. Foreign Currency Translation
Transactions and balancesMonetary assets and liabilities denominated in foreign currencies are translated at the rates of exchange prevailing at the balance sheet date and foreign exchange currency differences are recognized in the consolidated statement of operations. Transactions in foreign currencies are translated at exchange rates prevailing at the transaction date. Foreign exchange gains and losses are presented within finance income and costs in the consolidated statement of operations.
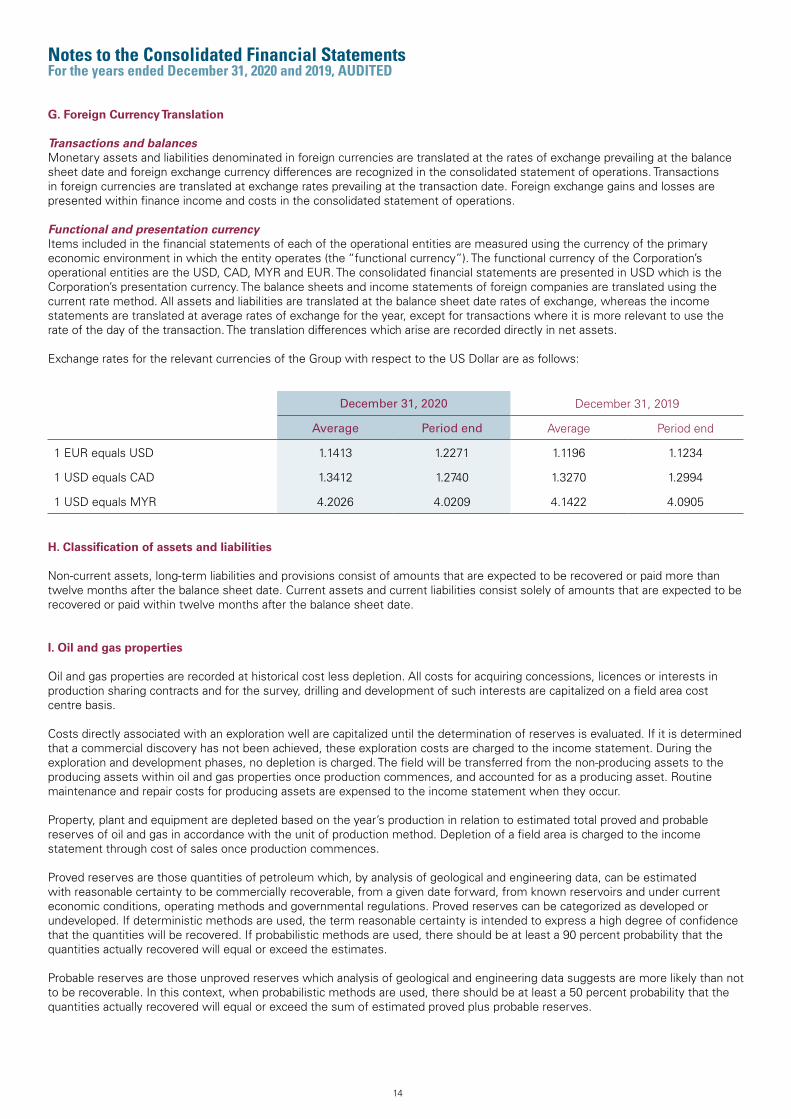
Functional and presentation currencyItems included in the financial statements of each of the operational entities are measured using the currency of the primary economic environment in which the entity operates (the “functional currency”). The functional currency of the Corporation’s operational entities are the USD, CAD, MYR and EUR. The consolidated financial statements are presented in USD which is the Corporation’s presentation currency. The balance sheets and income statements of foreign companies are translated using the current rate method. All assets and liabilities are translated at the balance sheet date rates of exchange, whereas the income statements are translated at average rates of exchange for the year, except for transactions where it is more relevant to use the rate of the day of the transaction. The translation differences which arise are recorded directly in net assets.
Exchange rates for the relevant currencies of the Group with respect to the US Dollar are as follows:
H. Classification of assets and liabilities
Non-current assets, long-term liabilities and provisions consist of amounts that are expected to be recovered or paid more than twelve months after the balance sheet date. Current assets and current liabilities consist solely of amounts that are expected to be recovered or paid within twelve months after the balance sheet date.
I. Oil and gas properties
Oil and gas properties are recorded at historical cost less depletion. All costs for acquiring concessions, licences or interests in production sharing contracts and for the survey, drilling and development of such interests are capitalized on a field area cost centre basis.
Costs directly associated with an exploration well are capitalized until the determination of reserves is evaluated. If it is determined that a commercial discovery has not been achieved, these exploration costs are charged to the income statement. During the exploration and development phases, no depletion is charged. The field will be transferred from the non-producing assets to the producing assets within oil and gas properties once production commences, and accounted for as a producing asset. Routine maintenance and repair costs for producing assets are expensed to the income statement when they occur.
Property, plant and equipment are depleted based on the year’s production in relation to estimated total proved and probable reserves of oil and gas in accordance with the unit of production method. Depletion of a field area is charged to the income statement through cost of sales once production commences.
Proved reserves are those quantities of petroleum which, by analysis of geological and engineering data, can be estimated with reasonable certainty to be commercially recoverable, from a given date forward, from known reservoirs and under current economic conditions, operating methods and governmental regulations. Proved reserves can be categorized as developed or undeveloped. If deterministic methods are used, the term reasonable certainty is intended to express a high degree of confidence that the quantities will be recovered. If probabilistic methods are used, there should be at least a 90 percent probability that the quantities actually recovered will equal or exceed the estimates.
Probable reserves are those unproved reserves which analysis of geological and engineering data suggests are more likely than not to be recoverable. In this context, when probabilistic methods are used, there should be at least a 50 percent probability that the quantities actually recovered will equal or exceed the sum of estimated proved plus probable reserves.
December 31, 2020 December 31, 2019
Average Period end Average Period end
1 EUR equals USD 1.1413 1.2271 1.1196 1.1234
1 USD equals CAD 1.3412 1.2740 1.3270 1.2994
1 USD equals MYR 4.2026 4.0209 4.1422 4.0905
14

Notes to the Consolidated Financial StatementsFor the years ended December 31, 2020 and 2019, AUDITED
Proceeds from the sale or farm-out of oil and gas concessions in the exploration stage are offset against the related capitalized costs of each cost centre with any excess of net proceeds over all costs capitalized included in the income statement. In the event of a sale in the exploration stage, any deficit is included in the income statement.
Impairment tests are performed annually or when there are indicators of impairment that suggest that the net book value of capitalized costs within each field area cost centre less any provision for asset retirement obligation costs, royalties and deferred production or revenue related taxes is higher than the anticipated future net cash flow from oil and gas reserves attributable to the Corporation’s interest in the related field areas. Capitalized costs cannot be carried unless those costs can be supported by future cash flows from that asset. Provision is made for any impairment, where the net carrying value, according to the above, exceeds the recoverable amount, which is the higher of value in use and fair value less costs of disposal, determined through estimated future discounted net cash flows using prices and cost levels used by management in their internal forecasting. If there is a decision to not continue with a field specific exploration program, the costs will be expensed at the time the decision is made.
J. Other tangible fixed assets
Other tangible fixed assets are stated at cost less accumulated depreciation. The cost includes the original purchase price of the asset and the costs attributable to bringing the asset to its working condition for its intended use. Depreciation is based on cost and is calculated on a straight line basis over the estimated economic life of 3 to 5 years for office equipment and other assets. The Floating Production Storage and Offloading (“FPSO”) located on the Bertam field, Malaysia, is being depreciated on a unit of production basis from July 2019 based on the Bertam field 2P reserves. Prior to this date the Bertam FPSO was being depreciated on a straight line basis over the six year lease period on the Bertam field from April 2015.
Additional costs to existing assets are included in the assets’ net book value or recognized as a separate asset, as appropriate, only when it is probable that future economic benefits associated with the item will flow to the Group and the cost of the item can be measured reliably. The net book value of any replaced parts is written off. Other additional expenses are deemed to be repair and maintenance costs and are charged to the income statement when they are incurred.
The net book value is written down immediately to its recoverable amount when the net book value is higher. The recoverable amount is the higher of an asset’s fair value less cost of disposal and value in use. The assets’ residual values and useful lives are reviewed, and adjusted if appropriate, at the end of each reporting period.
K. Leases
The Group leases various offices, warehouses, equipment and cars. Rental contracts are typically made for fixed periods of 3 to 5 years but may have extension options. Lease terms are negotiated on an individual basis and contain a wide range of different terms and conditions.
Right-of-use assets and corresponding liabilities are recognized when the leased asset is available for use by the Group. Each lease payment is allocated between the liability and finance cost. The finance cost is charged to profit or loss over the period so as to produce a constant periodic rate of interest on the remaining balance of the liability for each period. The right-of-use asset is depreciated over the shorter of the asset’s useful life and the lease term on a straight-line basis.
Assets and liabilities arising from a lease are initially measured on a present value basis. Lease liabilities include the net present value of the fixed and variable lease payments and the exercise price of the purchase option. The lease payments are discounted using the incremental borrowing rate and are classified as finance leases. The right-of-use assets are measured at cost comprising the amount of the initial measurement of the lease liability, any lease payments made and any initial direct costs.
Payments associated with short-term leases and leases of low-value assets are recognized on a straight-line basis as an expense in profit or loss.
15

Notes to the Consolidated Financial StatementsFor the years ended December 31, 2020 and 2019, AUDITED
L. Impairment of Assets
At each balance sheet date or when there are facts and circumstances that suggest that the net book value of capitalized costs within each field area cost center is higher than anticipated future net cash flow from oil and gas reserves attributable to the Corporation’s interest in the related field areas, the Corporation performs an assessment as to whether there is an indication that an asset may be impaired. Management determined the recoverable amounts of property, plant and equipment based on the higher of fair value less costs of disposal and value in use using estimated future discounted net cash flows of proved and probable oil and gas reserves. The Corporation’s estimates of proved and probable oil and gas reserves used in the calculations for impairment tests and accounting for depletion have been reviewed by Management’s experts, specifically independent qualified reserves auditor.
The recoverable amount is the higher of fair value less costs of disposal and value in use. In determining fair value less costs of disposal, recent market transactions are considered, if available. In the absence of such transactions, an appropriate valuation model is used. Value in use is calculated by discounting estimated future cash flows to their present value using a discount rate that reflects current market assessments of the time value of money and the risks specific to the asset. When the recoverable amount is less than the carrying value an impairment loss is recognized with the expensed charge to the income statement. If indications exist that previously recognized impairment losses no longer exist or are decreased, the recoverable amount is estimated. When a previously recognized impairment loss is reversed the carrying amount of the asset is increased to the estimated recoverable amount but the increased carrying amount may not exceed the carrying amount after depreciation that would have been determined had no impairment loss been recognized for the asset in prior years. If the asset does not generate cash inflows that are largely independent of those from other assets or groups of assets, the asset is tested as part of a CGU, which is the smallest identifiable group of assets that generates cash inflows that are largely independent of the cash inflows from other assets or groups of assets. An impairment loss is the amount by which the carrying amount of the individual asset or CGU exceeds its recoverable amount.
M. Financial Instruments
Financial assets and financial liabilities are recognized on the consolidated balance sheet on the trade date, the date on which the Group becomes a party to the contractual provisions of the financial instrument. All financial instruments are required to be classified and measured at fair value on initial recognition. Measurement in subsequent periods is dependent upon the classification of the financial instrument. The Group classifies its financial instruments in the following categories:
Financial Assets at Amortized CostAssets that are held for collection of contractual cash flows where those cash flows represent solely payments of principal and interest are measured at amortized cost. The Group’s loans and receivables consist of fixed or determined cash flows related solely to principal and interest amounts or contractual sales of oil. The Group’s intent is to hold these receivables until cash flows are collected. Loans and receivables are recognized initially at fair value, net of any transaction costs incurred and subsequently measured at amortized cost.
Financial Assets at Fair Value through Profit or Loss (“FVTPL”)Financial assets measured at FVTPL are assets which do not qualify as financial assets at amortized cost or at fair value through other comprehensive income.
Financial Liabilities at Amortized CostFinancial liabilities are measured at amortized cost, unless they are required to be measured at FVTPL, or the Group has opted to measure them at FVTPL. Borrowings and accounts payable are recognized initially at fair value, net of any transaction costs incurred, and subsequently at amortized cost using the effective interest method.
Financial Liabilities at FVTPLFinancial liabilities measured at FVTPL are liabilities which include embedded derivatives and cannot be classified as amortized cost.
Impairment of Financial AssetsThe measurement of impairment of financial assets is based on the expected credit losses model. For the trade and other receivables, the Group applies the simplified approach which requires the use of the lifetime expected loss provision for all trade receivables. In estimating the lifetime expected loss provision, the Group considered historical industry default rates as well as credit ratings of major customers. Additional disclosure related to the Group’s financial assets is included in Note 23.
16

Notes to the Consolidated Financial StatementsFor the years ended December 31, 2020 and 2019, AUDITED
N. Derivative Financial Instruments and Hedging Activities
Derivatives are initially recognized at fair value on the date a derivative contract is entered into and are subsequently remeasured to their fair value. The method of recognizing the resulting gain or loss depends on whether the derivative is designated as a hedging instrument, and if so, the nature of the item being hedged. The Group designates certain derivatives as either hedges of a particular risk associated with a recognized asset or liability or a highly probable forecasted transaction, hedges of the fair value of recognized assets and liabilities or a firm commitment, or hedges of a net investment in a foreign operation.
The Group documents at the inception of the transaction the relationship between hedging instruments and the hedged items, as well as its risk management objectives and strategy for undertaking various hedging transactions. The Group also documents its assessment, both at hedge inception and on an ongoing basis, of whether the derivatives that are used in hedging transactions are highly effective in offsetting changes in fair values or cash flows of the hedged items. The fair values of various derivative financial instruments used for hedging purposes are disclosed in Note 23. Movements on the hedging reserve is reflected in other comprehensive income. The full fair value of a hedging derivative is classified as a non-current asset or liability when the remaining maturity of the hedged item is more than twelve months and as a current asset or liability when the remaining maturity of the hedged item is less than twelve months.
Cash flow hedge The effective portion of changes in the fair value of derivatives that are designated and qualify as cash flow hedges is recognized in other comprehensive income. The gain or loss relating to the ineffective portion, if any, is recognized immediately within finance income or costs. Amounts accumulated in equity are reclassified to profit or loss in the periods when the hedged item affects profit or loss. When a hedging instrument expires or is sold, or when a hedge no longer meets the criteria for hedge accounting, any cumulative gain or loss existing in equity at that time remains in equity and is recognized when the forecast transaction is ultimately recognized in the profit or loss. When a forecasted transaction is no longer expected to occur, the cumulative gain or loss that was reported in equity is immediately recognized in profit or loss as finance income or costs.
O. Inventories
Inventories of consumable well supplies are stated at the lower of cost and net realizable value, cost being determined on a weighted average cost basis. Net realizable value is the estimated selling price in the ordinary course of business, less applicable variable selling expenses. Inventories of hydrocarbons are stated at the lower of cost and net realizable value. Under or overlifted positions of hydrocarbons are valued at market prices prevailing at the balance sheet date. An underlift of production from a field is included in the current receivables and valued at the reporting date spot price or prevailing contract price and an overlift of production from a field is included in the current liabilities and valued at the reporting date spot price or prevailing contract price. A change in the over or underlift position is reflected in the income statement as revenue.
P. Cash and cash equivalents
Cash and cash equivalents include cash at bank and cash in hand.
Q. Provisions
A provision is reported when the Group has a legal or constructive obligation as a consequence of an event and when it is more likely than not that an outflow of resources is required to settle the obligation and a reliable estimate can be made of the amount.
Provisions are measured at the present value of the expenditures expected to be required to settle the obligation using a discount rate that reflects current market assessments of the time value of money and the risks specific to the obligation. The increase in the provision due to passage of time is recognized as financial expense.
On fields where there is an obligation to contribute to asset retirement obligation costs, a provision is recorded to recognize the future commitment. An asset is created, as part of the oil and gas property, to represent the discounted value of the anticipated asset retirement obligation liability and depleted over the life of the field on a unit of production basis. The corresponding accounting entry to the creation of the asset recognizes the discounted value of the future liability. The discount applied to the anticipated asset retirement obligation liability is subsequently released over the life of the field and is charged to financial expenses. Changes in asset retirement obligation costs and reserves are treated prospectively and consistent with the treatment applied upon initial recognition.
17
Notes to the Consolidated Financial StatementsFor the years ended December 31, 2020 and 2019, AUDITED
R. Revenue and Other Operating Revenue
Revenue associated with the sale of crude oil and natural gas is measured based on the consideration specified in a contract with a customer and excludes amounts collected on behalf of third parties. The Group recognizes revenue when it transfers control of the product or service to a customer, which is generally when title passes from the Group to its customer. The Group satisfies its performance obligations in contracts with customers upon the delivery of crude oil and natural gas, which is generally at a point in time and the amounts of revenue recognized relating to performance obligations satisfied over time are not significant.
Royalties payments to governments and other mineral interest owners are recognized as a cost in the revenue section.
Production and sales taxes directly attributable to fields, including export duties, are expensed in the income statement and classified as direct production taxes included within production costs. Production taxes payable in cash are accrued in the accounting period in which the liability arises.
The Group recognizes revenue from the FPSO in other operating revenue as earned from third party participants in the Bertam field, Malaysia. Other operating revenue also includes pipeline tariffs earned.
S. Employee Benefits
Short-term employee benefitsShort-term employee benefits such as salaries, social premiums and holiday pay, are expensed when incurred.
Pension obligationsThe pension obligations consist of defined contribution plans for all companies within the Group except for one Swiss subsidiary, International Petroleum SA. A defined contribution plan is a pension plan under which the Group pays fixed contributions. The Group has no further payment obligations once the contributions have been paid. The contributions are recognized as an expense when they are due.
International Petroleum SA has a defined benefit pension plan that is managed through a private pension plan. Independent actuaries determine the cost of the defined benefit plan on an annual basis, and the subsidiary pays the annual insurance premium. The pension plan provides benefits coverage to the employees of International Petroleum SA in the event of retirement, death or disability. International Petroleum SA and its employees jointly finance retirement and risk benefits. Employees of International Petroleum SA pay 40% of the savings contributions, of the risk contributions and of the cost contributions and International Petroleum SA contributes the difference between the total of all required pension plan contributions and the total of all employees’ contributions.
Share-based paymentsThe Group operates an equity-settled, share-based compensation plan under which the entity receives services from employees, directors and officers as consideration for equity instruments of the Corporation. Equity-settled share-based payments are recognized in the income statement as expenses during the vesting period and as equity in the balance sheet. The option is measured at fair value at the date of the grant using an appropriate options pricing model and is charged to the income statement over the vesting period without revaluation of the value of the option.
T. Taxation
The components of tax are current and deferred. Tax is recognized in the income statement, except to the extent that it relates to items recognized in other comprehensive income or directly in equity, in which case it is accounted for consistently with the related item.
Current tax is tax that is to be paid or received for the year in question and also includes adjustments of current tax attributable to previous periods.
Deferred income tax is a non-cash charge provided, using the liability method, on temporary differences arising between the tax bases of assets and liabilities and their carrying values. Temporary differences can occur for example where investment expenditure is capitalized for accounting purposes but the tax deduction is accelerated or where asset retirement obligation costs are provided for in the financial statements but not deductible for tax purposes until they are actually incurred. However, the deferred income tax is not accounted for if it arises from initial recognition of an asset or liability in a transaction other than a business combination that at the time of the transaction affects neither accounting nor taxable profit nor loss.
18
Notes to the Consolidated Financial StatementsFor the years ended December 31, 2020 and 2019, AUDITED
Deferred income tax is provided on temporary differences arising on investments in subsidiaries and associates, except where the timing of the reversal of the temporary difference is controlled by the Corporation and it is probable that the temporary difference will not reverse in the foreseeable future. Deferred income tax is determined using tax rates (and laws) that have been enacted or substantively enacted by the balance sheet date and are expected to apply when the related deferred income tax asset is realized or the deferred income tax liability is settled. Deferred income tax assets are recognized to the extent that it is probable that future taxable profit will be available against which the temporary differences can be utilized.
Deferred tax assets are offset against deferred tax liabilities in the balance sheet where they relate to the same jurisdiction and there is a legally enforceable right to offset.
U. Segment Reporting
Operating segments are reported in a manner consistent with the internal reporting provided to the chief operating decision maker, which, due to the unique nature of each country’s operations, commercial terms or fiscal environment, is at a country level.
V. Business combinations
Acquisitions of businesses are accounted for using the purchase method of accounting whereby all identifiable assets and liabilities are recorded at their fair values as at the date of acquisition. Any excess purchase price over the aggregate fair value of net assets is recorded as goodwill. Goodwill is identified and allocated to cash-generating units (“CGU”), or groups of CGUs, that are expected to benefit from the synergies of the acquisition. Goodwill is not amortized. Any excess of the aggregate fair value of net assets over the purchase price is recognized in the consolidated statement of operations.
A CGU to which goodwill has been allocated is tested for impairment at least annually or when events or circumstances indicate that an assessment for impairment is required. For goodwill arising on an acquisition in a financial year, the CGU to which the goodwill has been allocated is tested for impairment before the end of that financial year.
When the recoverable amount of the CGU is less than the carrying amount of that CGU, the impairment loss is allocated to reduce the carrying amount of any goodwill allocated to that CGU first, and then to the other assets of that CGU pro rata on the basis of the carrying amount of each asset in the CGU. Any impairment loss for goodwill is recognized directly in the consolidated statement of earnings. An impairment loss for goodwill is not reversed in subsequent periods.
On disposal of a subsidiary, the attributable amount of goodwill is included in the determination of the gain or loss on disposal.
19
Notes to the Consolidated Financial StatementsFor the years ended December 31, 2020 and 2019, AUDITED
2. CRITICAL ACCOUNTING ESTIMATES AND JUDGMENTS
In connection with the preparation of the consolidated financial statements, the Group’s management has made assumptions and estimates about future events and applied judgments that affect the reported values of assets, liabilities, revenues, expenses and related disclosures. The assumptions, estimates and judgments are based on historical experience, current trends and other factors that management believes to be relevant at the time the consolidated financial statements are prepared. On a regular basis, management reviews the accounting policies, assumptions, estimates and judgments to ensure that the consolidated financial statements are presented fairly in accordance with IFRS. However, because future events and their effects cannot be determined with certainty, actual results could differ from these assumptions and estimates, and such differences could be material.
Management believes the following critical accounting policies affect the more significant judgments and estimates used in the preparation of the consolidated financial statements:
Estimates in oil and gas reservesEstimates of oil and gas reserves are used in the calculations for impairment tests and accounting for depletion and asset retirement obligation. Standard recognized evaluation techniques are used to estimate the proved and probable reserves. These techniques take into account the future level of development required to produce the reserves. An independent qualified reserves auditor reviews these estimates. Changes in estimates in oil and gas reserves, resulting in different future production profiles, will affect the discounted cash flows used in impairment testing, the anticipated date of site decommissioning and restoration and the depletion charges in accordance with the unit of production method. Changes in estimates in oil and gas reserves could for example result from additional drilling, observation of long-term reservoir performance or changes in economic factors such as oil price and inflation rates.
Impairment of oil and gas properties Key assumptions in the impairment models relate to prices and costs that are based on forward curves and the long-term corporate assumptions. Annual impairment tests are performed in conjunction with the annual reserves certification process. The impairment test requires the use of estimates. For the purpose of determining a potential impairment, the significant assumptions developed by management used to determine the recoverable amount include the proved and probable oil and gas reserves, expected production volumes, future oil and gas prices, future development costs, future production costs and the discount rate. These assumptions and judgements of management that are based on them are subject to change as new information becomes available. Changes in economic conditions can also affect the rate used to discount future cash flow estimates and the discount rate applied is reviewed throughout the year.
Provision for asset retirement obligations Amounts used in recording a provision for asset retirement obligations are estimates based on current legal and constructive requirements and current technology and price levels for the removal of facilities and decommissioning. Due to changes in relation to these items, the future actual cash outflows in relation to the site decommissioning and restoration can be different. To reflect the effects due to changes in legislation, requirements and technology and price levels, the carrying amounts of asset retirement obligation provisions are reviewed on a regular basis.
Deferred income tax assetsThe Group accounts for differences that arise between the carrying amount of assets and liabilities and their tax bases in accordance with IAS 12, Income Taxes, which requires deferred income tax assets only to be recognized to the extent that is probable that future taxable profits will be available against which the temporary differences can be utilized. Management estimates future taxable profits based on the financial models used to value its oil and gas properties. Any change to the estimates and assumptions used for the key operational and financial variables used within the business models could affect the amount of deferred income tax assets recognized.
The effects of changes in estimates do not give rise to prior year adjustments and are treated prospectively over the estimated remaining commercial reserves of each field. While the Group uses its best estimates and judgement, actual results could differ from these estimates.
Fair value of assets acquired and liabilities assumed in a business combinationThe fair value of assets acquired and liabilities assumed in a business combination, including contingentconsideration and any goodwill, is estimated based on information available at the date of acquisition. Various valuationtechniques are applied for measuring fair value including market comparables and discounted cash flows which relyon assumptions such as forward commodity prices, reserves and resources estimates, production costs and discount rates. Changes in these variables could significantly impact the carrying value of the net assets.
20
Notes to the Consolidated Financial StatementsFor the years ended December 31, 2020 and 2019, AUDITED
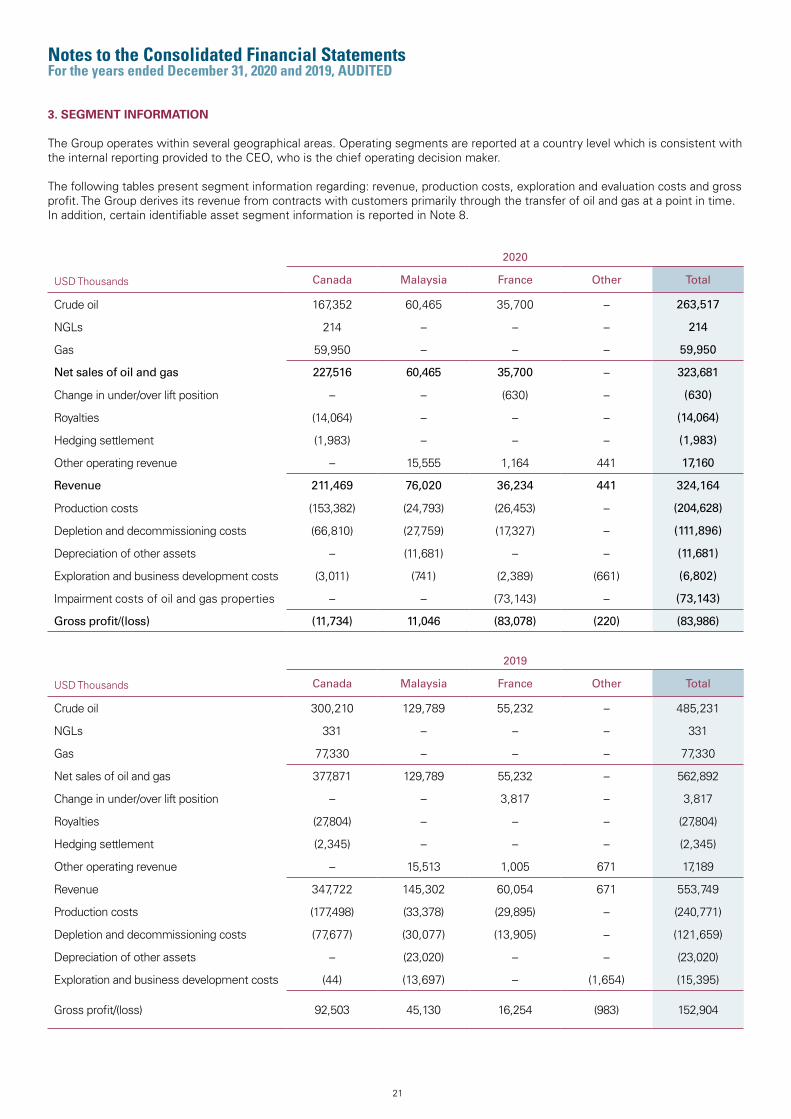
2020
USD Thousands Canada Malaysia France Other Total
Crude oil 167,352 60,465 35,700 – 263,517
NGLs 214 – – – 214
Gas 59,950 – – – 59,950
Net sales of oil and gas 227,516 60,465 35,700 – 323,681
Change in under/over lift position – – (630) – (630)
Royalties (14,064) – – – (14,064)
Hedging settlement (1,983) – – – (1,983)
Other operating revenue – 15,555 1,164 441 17,160
Revenue 211,469 76,020 36,234 441 324,164
Production costs (153,382) (24,793) (26,453) – (204,628)
Depletion and decommissioning costs (66,810) (27,759) (17,327) – (111,896)
Depreciation of other assets – (11,681) – – (11,681)
Exploration and business development costs (3,011) (741) (2,389) (661) (6,802)
Impairment costs of oil and gas properties – – (73,143) – (73,143)
Gross profit/(loss) (11,734) 11,046 (83,078) (220) (83,986)
2019
USD Thousands Canada Malaysia France Other Total
Crude oil 300,210 129,789 55,232 – 485,231
NGLs 331 – – – 331
Gas 77,330 – – – 77,330
Net sales of oil and gas 377,871 129,789 55,232 – 562,892
Change in under/over lift position – – 3,817 – 3,817
Royalties (27,804) – – – (27,804)
Hedging settlement (2,345) – – – (2,345)
Other operating revenue – 15,513 1,005 671 17,189
Revenue 347,722 145,302 60,054 671 553,749
Production costs (177,498) (33,378) (29,895) – (240,771)
Depletion and decommissioning costs (77,677) (30,077) (13,905) – (121,659)
Depreciation of other assets – (23,020) – – (23,020)
Exploration and business development costs (44) (13,697) – (1,654) (15,395)
Gross profit/(loss) 92,503 45,130 16,254 (983) 152,904
3. SEGMENT INFORMATION
The Group operates within several geographical areas. Operating segments are reported at a country level which is consistent with the internal reporting provided to the CEO, who is the chief operating decision maker.
The following tables present segment information regarding: revenue, production costs, exploration and evaluation costs and gross profit. The Group derives its revenue from contracts with customers primarily through the transfer of oil and gas at a point in time. In addition, certain identifiable asset segment information is reported in Note 8.
21

Notes to the Consolidated Financial StatementsFor the years ended December 31, 2020 and 2019, AUDITED
USD Thousands
Assets Liabilities
2020 2019 2020 2019
Malaysia 338,092 306,302 268,968 209,357
France 167,916 233,625 152,645 165,177
Canada 1,196,937 1,277,012 986,344 994,966
Corporate 165,607 375,651 (30,069) 149,854
Other 95,145 60,691 (122,644) (56,882)
Intercompany balance elimination (630,881) (888,640) (630,881) (888,640)
Total Assets / Liabilities 1,332,816 1,364,641 624,363 573,832
Shareholders’ equity N/A N/A 708,321 790,602
Non-controlling interest N/A N/A 132 207
Total equity for the group N/A N/A 708,453 790,809
Total consolidated 1,332,816 1,364,641 1,332,816 1,364,641
USD Thousands 2020 2019
Cost of operations 154,411 180,894
Tariff and transportation expenses 21,875 25,173
Direct production taxes 7,510 7,741
Operating costs 183,796 213,808
Cost of blending1 20,691 21,919
Change in inventory position 141 5,044
Total production costs 204,628 240,771
USD Thousands 2020 2019
Foreign exchange gain, net 13,028 9,553
Interest income 75 235
Other financial income – 4,576
Total finance income 13,103 14,364
4. PRODUCTION COSTS
5. FINANCE INCOME
1 In Canada, oil production is blended with purchased condensate diluent to meet pipeline specifications. Cost of blending represents the contracted purchase of diluent used for blending net of proceeds from the sale of surplus diluent. For the year ended December 31, 2020, a cost of USD 1,258 thousand was recognized relating to the difference between the cost and sale proceeds of the surplus diluent.
22

Notes to the Consolidated Financial StatementsFor the years ended December 31, 2020 and 2019, AUDITED
USD Thousands 2020 2019
Interest expense (13,401) (17,508)
Unwinding of asset retirement obligation discount (10,837) (10,664)
Amortization of loan fees (1,979) (2,044)
Loan commitment fees (1,204) (1,606)
Other financial costs (669) (568)
Total finance costs (28,090) (32,390)
USD Thousands 2020 2019
(111,761) 122,836
27,940 (33,166)
848 (2,049)
(4,651) (2,637)
3,939 –
8,736 9,256
(5,904) 3,216
1,852 6,298
1,060 (166)
Profit / (loss) before tax
Tax calculated at the corporate tax rate in Canada 25%
Effect of foreign and domestic tax rates
Tax effect of expenses non-deductible/taxable for tax purposes
Tax effect of statutory rate change
Tax effect of income not subject to tax
Tax effect of (recognition) / derecognition of unrecorded tax losses
Tax effect due to true-up of provision to prior year tax filings
Other
Total tax 33,820 (19,248)
USD Thousands 2020 2019
Current tax (113) (5,034)
Deferred tax 33,933 (14,214)
Total tax recovery / (expense) 33,820 (19,248)
6. FINANCE COSTS
7. INCOME TAX RECOVERY / (EXPENSE)
The deferred tax amount arises primarily where there is a difference in depletion for tax and accounting purposes. The deferred tax credit in the statement of operations for the current period mainly relates to the increased tax losses incurred during the year 2020.
The tax on the Group’s profit before tax differs from the theoretical amount that would arise using the tax rate of Canada as follows:
23

Notes to the Consolidated Financial StatementsFor the years ended December 31, 2020 and 2019, AUDITED
USD Thousands 2020 2019
Unused tax loss carry forward 133,753 92,855
Other 2,841 1,020
Deferred tax assets 136,594 93,875
Accelerated allowances 76,014 83,811
Other 318 106
Deferred tax liabilities 76,332 83,917
Deferred taxes, net 60,262 9,958
Specification of deferred tax assets and tax liabilities1
1 The specification of deferred tax assets and tax liabilities does not agree to the face of the balance sheet due to the netting off of balances in the balance sheet when they relate to the same jurisdiction.
1 The reclassification to the property, plant and equipment producing pool relates to the successful appraisal drilling in Malaysia.
The deferred tax liabilities consist of accelerated allowances, being the difference between the book and the tax value of oil and gas properties. The deferred tax liabilities will be released over the life of the oil and gas assets as the book value is depleted for accounting purposes.
Deferred tax assets in relation to tax loss carried forwards are only recognized in so far that there is a reasonable certainty as to the timing and the extent of their realization. The recognized unused tax loss carry forward mainly relates to the acquisition of BlackPearl in December 2018 and to the Granite Acquisition (see Note 9). The group has concluded that the deferred assets will be recoverable using the estimated future taxable income based on the approved business plans and budgets.
8. OIL AND GAS PROPERTIES
USD Thousands Canada Malaysia France Total
Cost
January 1, 2020 13,899 6,761 6,954 27,614
Additions 4,264 460 522 5,246
Expensed exploration and evaluation costs (3,011) (741) (2,389) (6,141)
Reclassification1 (84) (6,436) (51) (6,571)
Currency translation adjustments 341 – 497 838
Net book value December 31, 2020 15,409 44 5,533 20,986
USD Thousands Canada Malaysia France Total
Cost
January 1, 2019 – 2,844 6,600 9,444
Additions 13,654 17,330 477 31,461
Expensed exploration and evaluation costs (44) (13,413) – (13,457)
Currency translation adjustments 289 – (123) 166
Net book value December 31, 2019 13,899 6,761 6,954 27,614
Exploration and Evaluation Assets
USD Thousands 2020 2019
Exploration and Evaluation Assets 20,986 27,614
Property, plant and Equipment 1,049,918 1,077,881
Oil and Gas Properties 1,070,904 1,105,495
24

Notes to the Consolidated Financial StatementsFor the years ended December 31, 2020 and 2019, AUDITED
Property, Plant and Equipment
USD Thousands Canada Malaysia France Total
Cost
January 1, 2020 905,394 493,231 385,775 1,784,400
Granite Acquisition (see Note 9) 47,076 – – 47,076
Additions 40,816 20,274 11,323 72,413
Change in estimates (11,395) 3,787 4,423 (3,185)
Reclassification 84 6,436 51 6,571
Currency translation adjustments 22,630 – 36,088 58,718
December 31, 2020 1,004,605 523,728 437,660 1,965,993
Accumulated depletion
January 1, 2020 (122,595) (392,432) (191,492) (706,519)
Depletion charge for the period (66,810) (27,759) (17,327) (111,896)
Impairment costs of oil and gas properties – – (73,143) (73,143)
Currency translation adjustments (5,917) – (18,600) (24,517)
December 31, 2020 (195,322) (420,191) (300,562) (916,075)
Net book value December 31, 2020 809,283 103,537 137,098 1,049,918
USD Thousands Canada Malaysia France Total
Cost
January 1, 2019 788,879 448,976 351,772 1,589,627
BlackPearl Acquisition 12,346 – – 12,346
Additions 72,719 36,714 39,693 149,126
Change in estimates (9,204) 7,541 734 (929)
Currency translation adjustments 40,654 – (6,424) 34,230
December 31, 2019 905,394 493,231 385,775 1,784,400
Accumulated depletion
January 1, 2019 (41,257) (362,071) (180,875) (584,203)
Depletion charge for the period (77,677) (30,077) (13,905) (121,659)
Write-off – (284) – (284)
Currency translation adjustments (3,661) – 3,288 (373)
December 31, 2019 (122,595) (392,432) (191,492) (706,519)
Net book value December 31, 2019 782,799 100,799 194,283 1,077,881
Impairment testThe Group carried out its impairment testing at December 31, 2020, on a CGU basis in conjunction with the annual reserves audit process. The Group used appropriate oil or natural gas price curves based on forward forecasts as at December 31, 2020, a future cost inflation factor of 2% (2019: 2%) per annum, production and cost profiles based on proved and probable reserves (2P reserves) as at December 31, 2020 and a discount rate of 8.5% (8% at December 31, 2019) to calculate the estimated future post-tax cash flows.
25

Notes to the Consolidated Financial StatementsFor the years ended December 31, 2020 and 2019, AUDITED
As a result of the testing, the Group booked an impairment of USD 73 million (USD 54 million after tax) for the Paris Basin assets, France, as at December 31, 2020.
Using a discount rate of 10% instead of 8.5% would result in an additional Group impairment charge of approximately USD 5 million post tax. A USD 2/bbl decrease in the oil price curve would result in an additional Group impairment charge of approximately USD 13 million post tax. Using a flat gas price curve at CAD 2.70/mcf would not result in an impairment charge.
The following prices were used in the impairment testing as at December 31, 2020:
Price Decks 2021 2022 2023 2024 2025
Average annual
increase thereafter
Dated Brent (USD/bbl) 49.42 52.85 56.04 57.87 59.00 2%
West Texas Intermediate (USD/bbl) 46.88 51.14 54.83 56.48 57.62 2%
Western Canadian Select (USD/bbl) 34.02 37.38 40.73 42.10 42.95 2%
Empress Gas (CAD/MMbtu) 3.04 2.99 2.93 2.97 3.03 2%
9. GRANITE ACQUISITION
On March 5, 2020, IPC completed the acquisition of all of the issued and outstanding shares of Granite. At such date, Granite became a wholly-owned subsidiary of IPC.
The Granite Acquisition has been accounted for as a business combination with IPC being the acquirer, and in accordance with IFRS 3 Business Combinations, the assets acquired and liabilities assumed have been recorded at their fair values.
Total cash consideration provided, after preliminary closing adjustments, amounted to USD 27.7 million (CAD 37.1 million).
The amounts recognized in respect of the identifiable assets acquired and liabilities assumed are as set out in the table below.
USD Thousands
Trade and other receivables 1,620
Prepaid expenses and deposits 599
Fair value of risk management assets 1,748
Deferred tax assets 16,730
Property, plant and equipment 47,076
Other fixed assets 85
Accounts payable and accrued liabilities (6,691)
Decommissioning liabilities (4,498)
Short-term debt (27,649)
MTM reserve in equity (1,311)
Total Consideration 27,709
Settled by:
Cash payment for 39,061,575 common shares of Granite 27,709
The Corporation performed a preliminary purchase price allocation for the acquisition. The amounts disclosed above were determined provisionally pending the finalization of the valuation for those assets and liabilities. Up to twelve months from the effective date of the Granite Acquisition, further adjustments may be made to the fair values assigned to the identifiable assets acquired and liabilities assumed. No such further adjustments are expected.
Acquisition-related costs of approximately USD 0.5 million have been recognized in the statement of operations during the year ended December 31, 2020.
Decommissioning liabilitiesThe fair value of the decommissioning liability at the acquisition date was based on the estimated future cash flows to decommission the acquired oil and natural gas properties at the end of their useful life. The discount rate used to determine the net present value of the decommissioning obligation was a credit risk adjusted rate of 8%.
26

Notes to the Consolidated Financial StatementsFor the years ended December 31, 2020 and 2019, AUDITED
10. OTHER TANGIBLE FIXED ASSETS
USD Thousands FPSO Other Total
Cost
January 1, 2020 205,989 9,420 215,409
Granite Acquisition (see Note 9) – 85 85
Additions – 426 426
Disposals – (79) (79)
Currency translation adjustments 2,074 561 2,635
December 31, 2020 208,063 10,413 218,476
Accumulated depreciation
January 1, 2020 (140,735) (5,659) (146,394)
Depreciation charge for the period (11,681) (882) (12,563)
Disposals – 79 79
Currency translation adjustments – (400) (400)
December 31, 2020 (152,416) (6,862) (159,278)
Net book value December 31, 2020 55,647 3,551 59,198
USD Thousands FPSO Other Total
Cost
January 1, 2019 206,421 9,203 215,624
Additions – 1,035 1,035
Disposals – (838) (838)
Currency translation adjustments (432) 20 (412)
December 31, 2019 205,989 9,420 215,409
Accumulated depreciation
January 1, 2019 (117,715) (5,760) (123,475)
Depreciation charge for the period (23,020) (786) (23,806)
Disposals – 838 838
Currency translation adjustments – 49 49
December 31, 2019 (140,735) (5,659) (146,394)
Net book value December 31, 2019 65,254 3,761 69,015
The FPSO located on the Bertam field, Malaysia, is being depreciated on a unit of production basis from July 2019 based on the Bertam field 2P reserves. The depreciation charge is included in the depreciation of other assets line in the statement of operations.
For office equipment and other assets, the depreciation charge for the year is based on cost and an estimated useful life of 3 to 5 years. The depreciation charge is included within the general, administration and depreciation expenses in the statement of operations.
27

Notes to the Consolidated Financial StatementsFor the years ended December 31, 2020 and 2019, AUDITED
11. RIGHT-OF-USE ASSETS AND LEASE LIABILITIES
12. OTHER ASSETS
USD Thousands Buildings
January 1, 2020 2,700
Additions 60
Depreciation (821)
Currency translation adjustments 26
Right-of-use-assets as at December 31, 2020 1,965
Current 671
Non-Current 1,347
Lease Liabilities as at December 31, 2020 2,018
USD Thousands Buildings
January 1, 2019 –
Book value recognized at January 1, 2019 following IFRS 16 adoption 3,137
Additions 333
Depreciation (790)
Currency translation adjustments 20
Right-of-use assets as at December 31, 2019 2,700
Current 844
Non-Current 1,906
Lease Liabilities as at December 31, 2019 2,750
Long-term receivables represent cash payments made to an asset retirement obligation fund in respect of the Bertam asset, Malaysia.
USD Thousands December 31, 2020 December 31, 2019
Long-term receivables 20,210 17,840
Financial assets 29 27
20,239 17,867
28

Notes to the Consolidated Financial StatementsFor the years ended December 31, 2020 and 2019, AUDITED
14. TRADE AND OTHER RECEIVABLES
USD Thousands December 31, 2020 December 31, 2019
Trade receivables 51,614 59,386
Underlift 5,057 5,250
Joint operations debtors 1,792 2,412
Prepaid expenses and accrued income 5,524 4,493
Other 2,164 6,293
66,151 77,834
15. CASH AND CASH EQUIVALENTS
Cash and cash equivalents include only cash at hand or held in bank accounts.
16. SHARE CAPITAL
The Group’s issued common share capital is as follows:
The common shares of IPC trade on both the Toronto Stock Exchange and the Nasdaq Stockholm.
As at January 1, 2019, the total number of common shares issued and outstanding in IPC was 163,720,065. In November 2019, IPC announced the commencement of a share repurchase program. During the period up to the end of Q1 2020, IPC repurchased an aggregate of 8,377,308 common shares and all of these shares were cancelled. IPC suspended further share repurchases under the program which expired in November 2020. As at December 31, 2020 and as at February 9, 2021, IPC had a total of 155,342,757 common shares issued and outstanding.
In addition, IPC has 117,485,389 outstanding class A preferred shares, issued as a part of an internal corporate structuring to a wholly-owned subsidiary of IPC. Such preferred shares are not listed on any stock exchange, do not carry the right to vote on matters to be decided by the holders of IPC’s common shares and does not impact the earnings per share calculations.
Number of shares
Balance at January 1, 2019 163,720,065
Cancellation of repurchased common shares (3,929,196)
Balance at December 31, 2019 159,790,869
Cancellation of repurchased common shares (4,448,112)
Balance at December 31, 2020 155,342,757
13. INVENTORIES
USD Thousands December 31, 2020 December 31, 2019
Hydrocarbon stocks 6,606 6,123
Well supplies and operational spares 10,464 11,097
17,070 17,220
29

Notes to the Consolidated Financial StatementsFor the years ended December 31, 2020 and 2019, AUDITED
17. EARNINGS PER SHARE
Basic earnings per share are based on net result attributable to the common shareholders and is calculated based upon the weighted-average number of common shares outstanding during the periods presented.
18. SHARE BASED PAYMENTS
The Group has the following equity-settled share-based compensation plans: (a) a stock option plan (“Stock Option Plan”); and (b) a Performance and Restricted Share Plan approved in July 2018.
Stock Option PlanThe Stock Option Plan was approved by the Board and provides for the grant of stock option awards to employees, consultants and directors. The plan gives the participants a right to buy common shares of IPC at an exercise price equal to the market value at the date of grant. The Board granted stock options under the Stock Option Plan on February 21, 2017, with a three year vesting period and a four year term, whereby the stock options vested equally in three tranches: one third after one year, one third after two years and the final third after three years. The plan is effective from February 21, 2017, and the total outstanding number of stock options at December 31, 2020, is 1,808,566. Each original stock-option was fair valued at the date of grant at CAD 2.01 using a Black-Scholes option pricing model. The assumptions used in the calculation were a risk free rate of 1.02%, expected volatility of 53.70%, dividend yield rate of 0%, and an exercise price of CAD 4.77.
The number of awards outstanding under the Stock Option Plan at December 31, 2020, are summarized in the table below.
IPC Performance and Restricted Share PlanThe shareholders of IPC approved at the Annual General Meeting held on July 10, 2018, a Performance and Restricted Share Plan. The plan is effective from July 10, 2018, and awards under the plan will be accounted from the date of grant.
The IPC Performance Share Plan (“PSP”) 2018 awards are subject to continued employment and to certain performance conditions being met. The total outstanding number of awards at December 31, 2020, is 501,500 which vest on June 30, 2021. Each award was fair valued at the grant date at CAD 5.39 using an adjusted share price calculated with a hybrid valuation model based on the Monte Carlo simulation. The assumptions used in the calculation of the adjusted share price were a risk free rate of 2.00%, expected volatility of 42.50%, dividend yield rate of 0%, and an exercise price of CAD zero.
The IPC PSP 2019 awards are subject to continued employment and to certain performance conditions being met. The total outstanding number of awards at December 31, 2020, is 902,933 which vest on June 30, 2022. Each award was fair valued at the grant date at CAD 4.28 using an adjusted share price calculated with a hybrid valuation model based on the Monte Carlo simulation. The assumptions used in the calculation of the adjusted share price were a risk free rate of 2.00%, expected volatility of 42.50%, dividend yield rate of 0%, and an exercise price of CAD zero.
USD Thousands 2020 2019
Net result attributable to shareholders of the Parent Company, USD (77,854,090) 103,563,460
Weighted average number of shares for the period 156,439,552 163,709,271
Earnings per share, USD (0.50) 0.63
Weighted average diluted number of shares for the period 158,427,821 166,332,393
Earnings per share fully diluted, USD (0.49) 0.62
IPC Stock Option Plan 2020
Outstanding at January 1, 2020 1,808,566
Awarded during the period –
Forfeited during the period –
Exercised during the period –
Outstanding at December 31, 2020 1,808,566
Share options exercisable:
At December 31,2020 1,808,566
30

Notes to the Consolidated Financial StatementsFor the years ended December 31, 2020 and 2019, AUDITED
The IPC PSP 2020 awards are subject to continued employment and to certain performance conditions being met. The total outstanding number of awards at December 31, 2020, is 1,086,000 which vest on March 1, 2023. Each award was fair valued at the grant date at CAD 3.65 using an adjusted share price calculated with a hybrid valuation model based on the Monte Carlo simulation. The assumptions used in the calculation of the adjusted share price were a risk free rate of 2.00%, expected volatility of 42.50%, dividend yield rate of 0%, and an exercise price of CAD zero.
The second third of the IPC Restricted Share Plan (“RSP”) 2018 awards vested on June 30, 2020, at a price of CAD 2.56 per award. The total outstanding number of 2018 awards under the IPC RSP as at December 31, 2020, is 65,152 which vest on June 30, 2021, subject to continued employment. Each award was fair valued at the grant date at CAD 8.75.
The first third of the IPC RSP 2019 awards vested on June 30, 2020, at a price of CAD 2.56 per award. The total outstanding number of 2019 awards under the IPC RSP as at December 31, 2020, is 287,393 which vest over two years on each of June 30, 2021 and June 30, 2022, subject to continued employment. Each award was fair valued at the grant date at CAD 5.84.
The total outstanding number of IPC RSP 2020 awards as at December 31, 2020, is 646,446 which vest over three years as to one-third on each of March 1, 2021, March 1, 2022, and March 1, 2023, subject to continued employment. Each award was fair valued at the grant date at CAD 4.35.
IPC Performance Share Plan 2018 Awards 2019 Awards 2020 Awards Total
Outstanding at January 1, 2020 501,500 902,933 – 1,404,433
Awarded during the period – – 1,086,000 1,086,000
Forfeited during the period – – – –
Vested during the period – – – –
Outstanding at December 31, 2020 501,500 902,933 1,086,000 2,490,433
Vesting date
June 30, 2021 501,500 – – 501,500
June 30, 2022 – 902,933 – 902,933
March 1, 2023 – – 1,086,000 1,086,000
Outstanding at December 31, 2020 501,500 902,933 1,086,000 2,490,433
IPC Restricted Share Plan 2018 Awards 2019 Awards 2020 Awards Total
Outstanding at January 1, 2020 135,267 460,791 – 596,058
Awarded during the period – – 646,446 646,446
Forfeited during the period (3,794) (27,126) – (30,920)
Vested during the period (66,321) (146,272) – (212,593)
Outstanding at December 31, 2020 65,152 287,393 646,446 998,991
Vesting date
June 30, 2021 65,152 143,697 – 208,849
March 1, 2021 – – 215,482 215,482
June 30, 2022 – 143,696 – 143,696
March 1, 2022 – – 215,482 215,482
March 1, 2023 – – 215,482 215,482
Outstanding at December 31, 2020 65,152 287,393 646,446 998,991
In connection with the BlackPearl Acquisition, the Group granted awards under the IPC RSP for certain officers and employees. The first third vested on December 31, 2019, at a price of CAD 5.76 per award. The total outstanding number of awards as at December 31, 2020, is 182,939 which vest over two years on each of December 31, 2020 and December 31, 2021, subject to continued employment. Each award was fair valued at the grant date at CAD 4.35.
31

Notes to the Consolidated Financial StatementsFor the years ended December 31, 2020 and 2019, AUDITED
IPC Restricted Share Plan - BlackPearl 2019 RSP
Outstanding at January 1, 2020 314,365
Awarded during the period –
Forfeited during the period (28,382)
Vested during the period (103,044)
Outstanding at December 31, 2020 182,939
Vesting date
December 31, 2020 91,470
December 31, 2021 91,469
Outstanding at December 31, 2020 182,939
Under the IPC Performance and Restricted Share Plan in 2019, the Group proposed to non-employee directors of the Corporation to elect for awards for fees for services performed as a director and otherwise payable in cash. These awards will vest immediately at the time of grant. However, these awards may not be redeemed before the end of service as a director of the Corporation. The total outstanding RSP awards outstanding as at December 31, 2020, is 96,465. In 2019 there were 25,349 awards issued with a fair value at the grant date at CAD 5.76. In 2020 there were 25,335 awards issued with a fair value at the grant date at CAD 2.56 and 45,872 awards issued with a fair value at the grant date at CAD 2.85.
The costs charged to the statement of operations of the Group for the Share-Based payments are summarized in the following table:
USD Thousands 2020 2019
IPC Stock Option Plan 44 365
IPC Transitional PSP – 2016 Awards – 646
IPC Transitional RSP – 2016 Awards – 86
IPC PSP – 2018 Awards 682 680
IPC RSP – 2018 Awards 224 455
IPC PSP – 2019 Awards 987 1,242
IPC RSP – 2019 Awards 983 495
IPC PSP – 2020 Awards 822 –
IPC RSP – 2020 Awards 1,056 –
4,798 3,969
19. FINANCIAL LIABILITIES
USD Thousands December 31, 2020 December 31, 2019
Bank loans 327,691 247,074
Capitalized financing fees (3,556) (2,342)
324,135 244,732
As at January 1, 2019, the Group had a reserve-based lending credit facility of USD 175 million (the “International RBL”) with a maturity to end June 2022 in connection with its oil and gas assets in France and Malaysia. In addition, the Group had reserve-based lending credit facilities in aggregate of CAD 320 million and outstanding senior secured notes of CAD 75 million in connection with its oil and gas assets in Canada.
In June 2019, the Group combined its reserve-based lending facilities in Canada into one reserve-based lending credit facility of CAD 375 million (the “Canadian RBL”) with a maturity date in May 2021. The senior secured notes of CAD 75 million were fully repaid and cancelled in June 2019, from a drawdown under the Canadian RBL.
In May 2020, IPC entered into a EUR 13 million unsecured credit facility in France (the “France Facility”) under a financial assistance program instituted by the French government. The France Facility has an initial term of 12 months and is extendable by the Group for up to a further five years at IPC’s discretion. IPC intends to extend the France Facility for the additional five years. The France Facility amount was fully drawn as at December 31, 2020, and as at February 9, 2021.
32

Notes to the Consolidated Financial StatementsFor the years ended December 31, 2020 and 2019, AUDITED
In June 2020, the Group amended and extended the International RBL to a facility size of USD 125 million, with a maturity at the end of December 2024. In July 2020, the facility size was further increased to USD 140 million.
In July 2020, the Group also amended and extended the Canadian RBL to a facility size of CAD 350 million with a maturity extended by 12 months until the end of May 2022. Under the Canadian RBL, the Group is required, and has satisfied the requirement, to hedge 30% of forecast production in Canada (other than in respect of the Ferguson asset) over the period from October 1, 2020 to June 30, 2021.
The borrowing base availability under the International RBL was agreed in December 2020 at USD 102 million of which USD 80 million was drawn as at December 31, 2020. The borrowing base availability under the Canadian RBL was amended in December 2020 to CAD 325 million of which CAD 266 million was drawn as at December 31, 2020.
In March 2020, in connection with the completion of the Granite Acquisition, the Group assumed the bank debt of Granite consisting of a revolving credit facility of CAD 42.5 million (the “Granite Facility”). In December 2020, the Granite Facility was amended to a CAD 30 million revolving credit facility, reducing down to CAD 25 million as at July 1, 2021 with a maturity of December 21, 2021. The Granite Facility was drawn as to CAD 29 million as at December 31, 2020. Under the Granite Facility, the Group is required, and has satisfied the current requirement, to hedge 50% of forecast production up to December 31, 2021 in respect of the Ferguson asset.
With the exception of the Granite Facility, no facility repayment schedule results in mandatory repayment within the twelve months following December 31, 2020. As such, the amounts drawn under the International RBL, the France Facility and the Canadian RBL as at December 31, 2020, are classified as non-current.
The Group is in compliance with the covenants of the financing facilities as at December 31, 2020 and 2019.
The net debt and the movements in net debt can be summarized as follows:
USD Thousands Cash Leaseliabilities
Bank loans due before 1 year
Bank loans due after 1 year Total
Net debt as at January 1, 2020 15,571 (2,750) – (247,074) (234,253)
Granite Acquisition (see Note 9) – – (27,649) – (27,649)
Cash flows (8,736) – 7,585 (49,134) (50,285)
Lease liabilities – 732 – – 732
Currency translation adjustments (337) – (2,918) (8,501) (11,756)
Net debt as at December 31, 2020 6,498 (2,018) (22,982) (304,709) (323,211)
Net debt (excluding lease liabilities) (321,193)
USD Thousands Cash Leaseliabilities
Bank loans due after 1 year
Senior secured notes due after 1 year Total
Net debt as at January 1, 2019 10,626 – (232,357) (55,030) (276,761)
Cash flows 5,463 – (5,161) 55,030 55,332
Lease liabilities – (2,750) – – (2,750)
Currency translation adjustments (518) – (9,556) – (10,074)
Net debt as at December 31, 2019 15,571 (2,750) (247,074) – (234,253)
Net debt (excluding lease liabilities) (231,503)
33

Notes to the Consolidated Financial StatementsFor the years ended December 31, 2020 and 2019, AUDITED
20. PROVISIONS
USD ThousandsAsset
retirement obligation
Farm-in obligation
Pension obligation Other Total
January 1, 2020 176,305 6,720 4,413 2,399 189,837
Granite Acquisition (see Note 9) 4,498 – – – 4,498
Additions – – 603 1,269 1,872
Unwinding of asset retirement obligation discount 10,837 – – – 10,837
Changes in estimates (2,563) (622) 703 – (2,482)
Payments (4,324) (1,814) (636) (2,179) (8,953)
Reclassification1 1,967 – – – 1,967
Currency translation adjustments 5,981 66 475 51 6,573
December 31, 2020 192,701 4,350 5,558 1,540 204,149
Non-current 187,012 3,107 5,558 1,268 196,945
Current 5,689 1,243 – 272 7,204
Total 192,701 4,350 5,558 1,540 204,149
USD ThousandsAsset
retirement obligation
Farm-in obligation
Pension obligation Other Total
January 1, 20191 168,537 6,047 – 5,638 180,222
Pension liability adjustment2 – – 3,223 – 3,223
Additions – – 697 227 924
Release of provisions3 – – – (2,004) (2,004)
Unwinding of asset retirement obligation discount 10,664 – – – 10,664
Changes in estimates (3,386) 2,457 959 – 30
Payments3 (6,315) (1,822) (558) (1,208) (9,903)
Reclassification4, 5 2,413 – – (381) 2,032
Currency translation adjustments 4,392 38 92 127 4,649
December 31, 2019 176,305 6,720 4,413 2,399 189,837
Non-current 168,908 4,277 4,413 2,399 179,997
Current 7,397 2,443 – – 9,840
Total 176,305 6,720 4,413 2,399 189,837
1 The reclassification of the asset retirement obligation related to the 2020 payment to the asset retirement obligation fund in respect of the Bertam asset, Malaysia (see Note 12).
1 For comparative purposes, the asset retirement obligation has been restated to appropriately reflect the asset retirement obligation on a gross basis in Malaysia. The impact of this adjustment was not considered material to the current or comparative periods (see Note 12).2 See Note 213 The release of the provision and the other payments related to the unrealized and realized contingent consideration relating to the acquisition of the Suffield Assets.4 The reclassification of the asset retirement obligation related to the 2019 payment to the asset retirement obligation fund in respect of the Bertam asset, Malaysia (see Note 12).5 The Suffield Assets contingent consideration related to the price of gas for November and December 2019 was reclassified to current liabilities for an amount of CAD 519 thousand.
The farm-in obligation relates to future payments for historic costs on Block PM307 in Malaysia payable on reaching certain Bertam field production milestones.
In calculating the present value of the asset retirement obligation provision, a blended rate of 6% (2019: 6%) was used, based on a credit risk adjusted rate.
34

Notes to the Consolidated Financial StatementsFor the years ended December 31, 2020 and 2019, AUDITED
21. PENSION LIABILITY
The Group operates a pension plan in Switzerland that is managed through a private pension plan. As of January 1, 2019, the Group began to account for its pension plan in accordance with IAS 19 which has resulted in a USD 3,223 thousand adjustment to opening retained earnings to record the pension liability on that date. The impact of this adjustment was not considered material to the current or comparative periods. The amount recognized in the balance sheet associated with the Swiss pension plan is as follows:
The movement in the defined benefit obligation over the year is as follows:
USD Thousands December 31, 2020 December 31, 2019
Present value of defined benefit obligation 15,316 10,760
Fair value of plan assets (9,758) (6,347)
Pension obligation – December 31, 2020 5,558 4,413
USD ThousandsFor the year ended December 31, 2020
For the year ended December 31, 2019
Opening balance 10,760 8,506
Current service cost 786 656
Additional contributions paid by employees 1,920 450
Ordinary contributions paid by employees 424 372
Interest expense on defined benefit obligation 27 76
Actuarial loss on defined benefit obligation 777 956
Administration costs 12 12
Benefits paid from plan assets (452) (484)
Past service cost (206) –
Foreign exchange loss 1,268 216
Defined benefit obligation, ending balance 15,316 10,760
The weighted average duration of the defined benefit obligation is 20.5 years. There is no maturity profile since the average remaining life before active employees reach final age according to the plan is 11.5 years.
The movement in the fair value of the plan assets over the year is as follows:
USD ThousandsFor the year ended December 31, 2020
For the year ended December 31, 2019
Opening balance 6,347 5,282
Additional contributions paid by employees 1,920 450
Ordinary contributions paid by employer 636 558
Ordinary contributions paid by employees 424 372
Interest income on plan assets 16 47
Return on plan assets excluding interest income 73 (3)
Foreign exchange gain 794 125
Benefits paid from plan assets (452) (484)
Fair value of plan assets, ending balance 9,758 6,347
The plan assets are under an insurance contract comprised entirely of free funds and reserves, such as fluctuation reserves and employer contribution reserves, for which there is no quoted price in an active market.
35
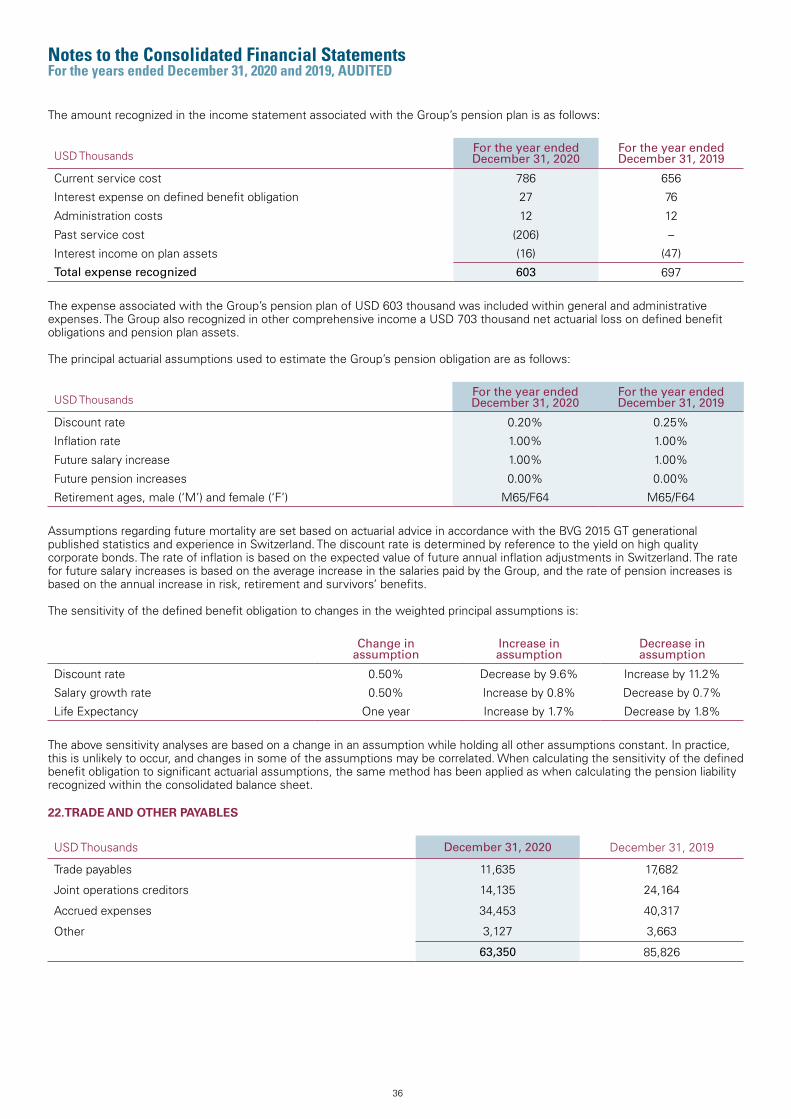
Notes to the Consolidated Financial StatementsFor the years ended December 31, 2020 and 2019, AUDITED
The amount recognized in the income statement associated with the Group’s pension plan is as follows:
The expense associated with the Group’s pension plan of USD 603 thousand was included within general and administrative expenses. The Group also recognized in other comprehensive income a USD 703 thousand net actuarial loss on defined benefit obligations and pension plan assets.
The principal actuarial assumptions used to estimate the Group’s pension obligation are as follows:
Assumptions regarding future mortality are set based on actuarial advice in accordance with the BVG 2015 GT generational published statistics and experience in Switzerland. The discount rate is determined by reference to the yield on high quality corporate bonds. The rate of inflation is based on the expected value of future annual inflation adjustments in Switzerland. The rate for future salary increases is based on the average increase in the salaries paid by the Group, and the rate of pension increases is based on the annual increase in risk, retirement and survivors’ benefits.
The sensitivity of the defined benefit obligation to changes in the weighted principal assumptions is:
The above sensitivity analyses are based on a change in an assumption while holding all other assumptions constant. In practice, this is unlikely to occur, and changes in some of the assumptions may be correlated. When calculating the sensitivity of the defined benefit obligation to significant actuarial assumptions, the same method has been applied as when calculating the pension liability recognized within the consolidated balance sheet.
USD ThousandsFor the year ended December 31, 2020
For the year ended December 31, 2019
Current service cost 786 656
Interest expense on defined benefit obligation 27 76
Administration costs 12 12
Past service cost (206) –
Interest income on plan assets (16) (47)
Total expense recognized 603 697
USD ThousandsFor the year ended December 31, 2020
For the year ended December 31, 2019
Discount rate 0.20% 0.25%
Inflation rate 1.00% 1.00%
Future salary increase 1.00% 1.00%
Future pension increases 0.00% 0.00%
Retirement ages, male (‘M’) and female (‘F’) M65/F64 M65/F64
Change inassumption
Increase inassumption
Decrease inassumption
Discount rate 0.50% Decrease by 9.6% Increase by 11.2%
Salary growth rate 0.50% Increase by 0.8% Decrease by 0.7%
Life Expectancy One year Increase by 1.7% Decrease by 1.8%
22.TRADE AND OTHER PAYABLES
USD Thousands December 31, 2020 December 31, 2019
Trade payables 11,635 17,682
Joint operations creditors 14,135 24,164
Accrued expenses 34,453 40,317
Other 3,127 3,663
63,350 85,826
36

Notes to the Consolidated Financial StatementsFor the years ended December 31, 2020 and 2019, AUDITED
23. FINANCIAL ASSETS AND LIABILITIES
Financial assets and liabilities by category
The accounting policies for financial instruments have been applied to the line items below:
December 31, 2020USD Thousands
TotalFinancial assets
at amortized cost
Fair value recognized in profit or loss
(FVTPL)
Derivatives used for hedging
Other non-current financial assets 1,965 1,965 – –
Other assets 20,239 20,239 – –
Derivative instruments 1,591 – – 1,591
Joint operation debtors 1,792 1,792 – –
Other current receivables1 59,992 54,935 5,057 –
Cash and cash equivalents 6,498 6,498 – –
Financial assets 92,077 85,429 5,057 1,591
December 31, 2020USD Thousands
TotalFinancial
liabilities at amortized cost
Fair value recognized in profit or loss
(FVTPL)
Derivatives used for hedging
Non-current financial liabilities 302,500 302,500 – –
Current financial liabilities 22,982 22,982 – –
Derivative instruments 2,746 – – 2,746
Joint operation creditors 14,135 14,135 – –
Other current liabilities 15,617 15,617 – –
Financial liabilities 357,980 355,234 – 2,746
December 31, 2019USD Thousands
TotalFinancial assets
at amortized cost
Fair value recognized in profit or loss
(FVTPL)
Derivatives used for hedging
Other non-current financial assets 2,700 2,700 – –
Other assets 17,867 17,867 – –
Derivative instruments 420 – – 420
Joint operation debtors 2,412 2,412 – –
Other current receivables1 71,925 66,675 5,250 –
Cash and cash equivalents 15,571 15,571 – –
Financial assets 110,895 105,225 5,250 420
1 Prepayments are not included in other current assets, as prepayments are not deemed to be financial instruments
1 Prepayments are not included in other current assets, as prepayments are not deemed to be financial instruments
December 31, 2019USD Thousands
TotalFinancial
liabilities at amortized cost
Fair value recognized in profit or loss
(FVTPL)
Derivatives used for hedging
Long term financial liabilities 246,638 246,638 – –
Derivative instruments 416 – – 416
Joint operation creditors 24,164 24,164 – –
Other current liabilities 24,895 24,895 – –
Financial liabilities 296,113 295,697 – 416
37
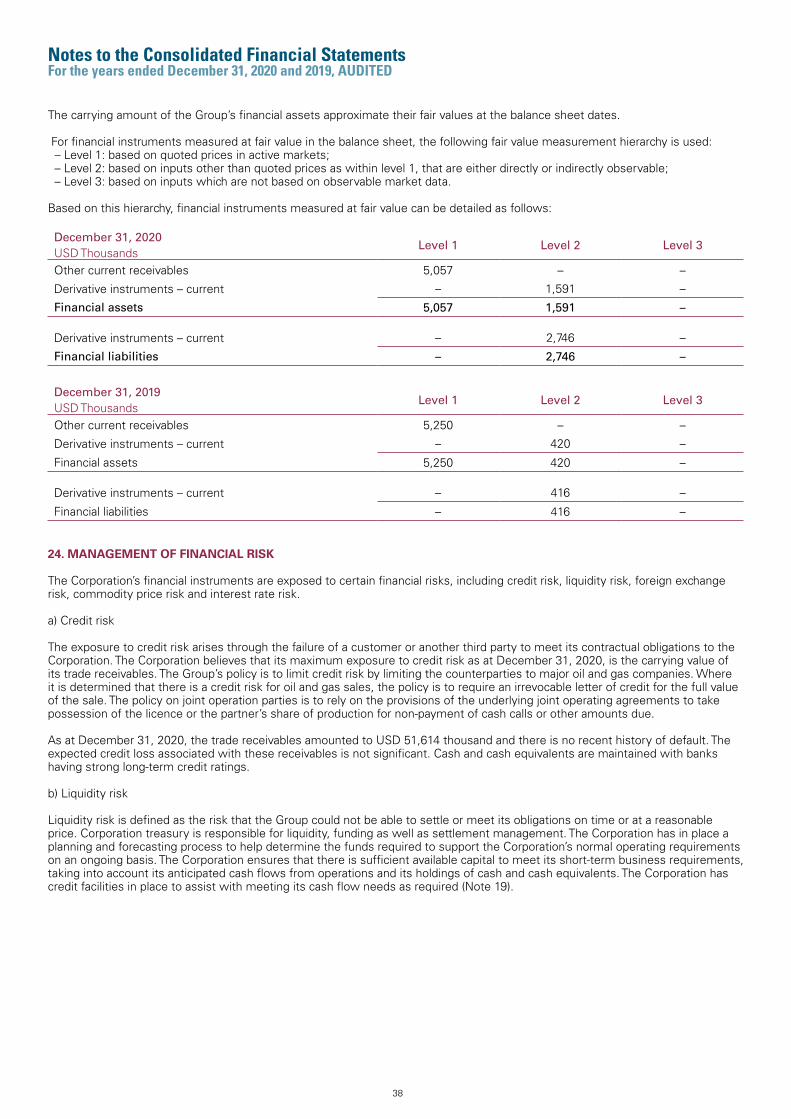
Notes to the Consolidated Financial StatementsFor the years ended December 31, 2020 and 2019, AUDITED
The carrying amount of the Group’s financial assets approximate their fair values at the balance sheet dates.
For financial instruments measured at fair value in the balance sheet, the following fair value measurement hierarchy is used: – Level 1: based on quoted prices in active markets; – Level 2: based on inputs other than quoted prices as within level 1, that are either directly or indirectly observable; – Level 3: based on inputs which are not based on observable market data.
Based on this hierarchy, financial instruments measured at fair value can be detailed as follows:
December 31, 2020USD Thousands
Level 1 Level 2 Level 3
Other current receivables 5,057 – –
Derivative instruments – current – 1,591 –
Financial assets 5,057 1,591 –
Derivative instruments – current – 2,746 –
Financial liabilities – 2,746 –
December 31, 2019USD Thousands
Level 1 Level 2 Level 3
Other current receivables 5,250 – –
Derivative instruments – current – 420 –
Financial assets 5,250 420 –
Derivative instruments – current – 416 –
Financial liabilities – 416 –
24. MANAGEMENT OF FINANCIAL RISK
The Corporation’s financial instruments are exposed to certain financial risks, including credit risk, liquidity risk, foreign exchange risk, commodity price risk and interest rate risk.
a) Credit risk
The exposure to credit risk arises through the failure of a customer or another third party to meet its contractual obligations to the Corporation. The Corporation believes that its maximum exposure to credit risk as at December 31, 2020, is the carrying value of its trade receivables. The Group’s policy is to limit credit risk by limiting the counterparties to major oil and gas companies. Where it is determined that there is a credit risk for oil and gas sales, the policy is to require an irrevocable letter of credit for the full value of the sale. The policy on joint operation parties is to rely on the provisions of the underlying joint operating agreements to take possession of the licence or the partner’s share of production for non-payment of cash calls or other amounts due.
As at December 31, 2020, the trade receivables amounted to USD 51,614 thousand and there is no recent history of default. The expected credit loss associated with these receivables is not significant. Cash and cash equivalents are maintained with banks having strong long-term credit ratings.
b) Liquidity risk
Liquidity risk is defined as the risk that the Group could not be able to settle or meet its obligations on time or at a reasonable price. Corporation treasury is responsible for liquidity, funding as well as settlement management. The Corporation has in place a planning and forecasting process to help determine the funds required to support the Corporation’s normal operating requirements on an ongoing basis. The Corporation ensures that there is sufficient available capital to meet its short-term business requirements, taking into account its anticipated cash flows from operations and its holdings of cash and cash equivalents. The Corporation has credit facilities in place to assist with meeting its cash flow needs as required (Note 19).
38

Notes to the Consolidated Financial StatementsFor the years ended December 31, 2020 and 2019, AUDITED
The table below analyses the Group’s financial liabilities into relevant maturity groupings based on the remaining period at the balance sheet date to the contractual maturity date. Loan repayments are made upon a net present value calculation of the assets’ future cash flows. No loan repayments are currently forecast under this calculation.
USD Thousands December 31, 2020 December 31, 2019
Non-current
Repayment within 2 - 5 years:
- Bank loans 304,709 247,074
304,709 247,074
Current
Repayment within 6 to 12 months:
- Bank loans 22,982 –
Repayment within 6 months:
- Trade payables 11,635 17,682
- Joint operation creditors 14,135 24,164
- Other current liabilities 3,127 3,663
- Current tax liabilities 184 2,706
52,063 48,215
c) Foreign exchange risk
The Group operates internationally and is exposed to foreign exchange risk arising from various currencies, primarily with respect to EUR and CAD. The Group’s risk management objective is to manage cash flow risk related to foreign denominated cash flows. The Corporation is exposed to currency risk related to changes in rates of exchange between foreign denominated balances and the functional currencies of the Group’s principal operating subsidiaries. The Group’s revenues are denominated in US dollars, while most of its operating and capital expenditures are denominated in the local currencies. A significant change in the currency exchange rates between the US dollar and foreign currencies could have a material effect on the Group’s net earnings and on other comprehensive income.
The following tables summarize the effects that a change in these currencies against the US Dollar would have on operating result and equity through the conversion of the income statements of the Group’s subsidiaries from functional currency to the presentation currency US Dollar for the years ended at December 31, 2020 and 2019.
Shift of currency exchange ratesUSD Thousands
Average rate2020
USD weakening10%
USD strengthening 10%
Operating profit in the financial statements (96,775) (96,775)
EUR /USD 0.8762 0.7965 0.9638
CAD/USD 1.3412 1.2193 1.4753
Total effect on operating profit 9,714 (9,714)
Shift of currency exchange ratesUSD Thousands
Average rate2019
USD weakening10%
USD strengthening 10%
Operating profit in the financial statements 140,862 140,862
EUR /USD 0.8932 0.8120 0.9825
CAD/USD 1.3270 1.2064 1.4597
Total effect on operating profit (10,672) 10,672
39

Notes to the Consolidated Financial StatementsFor the years ended December 31, 2020 and 2019, AUDITED
d) Commodity price risk
The Group is subject to price risk associated with fluctuations in the market prices for oil and gas. Prices of oil and gas are affected by the normal economic drivers of supply and demand as well as the financial investors and market uncertainty. Factors that influence these include operational decisions, natural disasters, economic conditions, political instability or conflicts or actions by major oil exporting countries. Price fluctuations can affect the Corporation’s financial position.
Commodity price risk is the risk that future cash flows will fluctuate as a result of changes in the price of oil and natural gas. Commodity prices are impacted by world economic events that affect supply and demand, which are generally beyond the Group’s control. Changes in crude oil prices may significantly affect the Corporation’s results of operations, cash generated from operating activities, capital spending and the Corporation’s ability to meet its obligations. The majority of the Corporation’s production is sold under short-term contracts; consequently the Group is at risk to near term price movements. The Corporation manages this risk by constantly monitoring commodity prices and factoring them into operational decisions, such as contracting or expanding its capital expenditures program.
The Corporation enters into certain risk management contracts in order to manage the exposure to market risks from fluctuations in commodity prices. These risk management contracts are not used for trading or speculative purposes. The Corporation has designated its risk management contracts as effective accounting hedges, and thus has applied hedge accounting. As a result, all risk management contracts are recorded at fair value at each reporting period with the change in fair value being recognized on the statement of comprehensive income.
The outstanding derivative instruments can be specified as follows:
Fair value of outstanding derivative instruments in the balance sheet
The Group had gas price sale financial hedges outstanding as at December 31, 2020, which are summarized as follows:
USD Thousands
December 31, 2020 December 31, 2019
Assets Liabilities Assets Liabilities
Oil price hedge – 2,743 58 416
Gas price hedge 1,591 3 362 –
Total 1,591 2,746 420 416
Non-current – – – –
Current 1,591 2,746 420 416
Total 1,591 2,746 420 416
Period Volume (Gigajoules (GJ) per day) Type Average Pricing
January 1, 2021 – March 31, 2021 5,000 AECO Swap CAD 3.06/GJ
April 1, 2021 – June 30, 2021 40,000 AECO Swap CAD 2.49/GJ
July 1, 2021 – September 30, 2021 20,000 AECO Swap CAD 2.53/GJ
October 1, 2021 – October 31, 2021 15,000 AECO Swap CAD 2.52/GJ
Period Volume(barrels per day) Type Average Pricing
January 1, 2021 - March 31, 2021 2,200 WCS Swap USD 27.28/bbl
April 1, 2021 - June 30, 2021 2,150 WCS Swap USD 27.99/bbl
January 1, 2021 - June 30, 2021 300 WTI Collar USD 35/bbl - 45.83/bbl
February 1, 2021 - March 31, 2021 300 WCS/WTI Differential USD -14.78/bbl
April 1, 2021 - June 30, 2021 300 WCS/WTI Differential USD -14.65/bbl
The Group had oil price sale financial hedges outstanding as at December 31, 2020, which are summarized as follows:
All of the above hedges are treated as effective and changes to the fair value are reflected in other comprehensive income.
40

Notes to the Consolidated Financial StatementsFor the years ended December 31, 2020 and 2019, AUDITED
The table below summarizes the effect that a change in the oil and gas price would have had on the net result and equity at December 31, 2020 and 2019:
e) Interest rate risk
The Group’s exposure to interest rate risk arises from both the interest rate impact on its cash and cash equivalents as well as on its debt facilities. As at December 31, 2020, the Group’s long-term debt is comprised of partially floating rate debt tied to LIBOR. As such, changes in interest rate will have an impact on interest expense.
The total interest expense for 2020 amounted to USD 13,401 thousand (2019: USD 17,508 thousand). A 100 basis point shift in the interest rate would have resulted in a change in the total interest expense for the year of USD 3,255 thousand (2019: USD 3,125 thousand).
25. MANAGEMENT OF CAPITAL RISK
The objectives when managing capital are to safeguard the Group’s ability to continue as a going concern and to meet its committed work program requirements in order to create shareholder value. The Corporation may put in place new credit facilities, repay debt, or other such restructuring activities as appropriate. Management continuously monitors and manages the capital, liquidity and net debt position in order to assess the requirement for changes to the capital structure to meet the objectives and to maintain flexibility.
No significant changes were made in the objectives, policies or procedures during the year ended December 31, 2020 or in the comparative periods.
Through the ongoing management of its capital, the Corporation will modify the structure of its capital based on changing economic conditions in the jurisdictions in which it operates. In doing so, the Corporation may issue new shares or debt, buy back issued shares, or pay off any outstanding debt.
26. SALARY AND OTHER COMPENSATION EXPENSES
a) Employee compensation expenses
The following table provides a breakdown of gross salaries, short-term benefits, share-based compensation and other compensation expenses included in the consolidated statement of comprehensive income (loss):
2020 Net result (USD Thousands) (77,941) (77,941)
Possible shift (%) (10%) 10%
Total effect on net income (USD Thousands) (23,081) 23,081
USD Thousands 2020 2019
Salaries, bonuses and other short-term benefits 40,914 45,266
Security social costs 6,387 5,896
Share-based incentive plans1 4,798 3,969
52,099 55,131
1 Vested during the period and based on IFRS 2 valuation (see Note 18)
b) Remuneration of Directors and Senior Management
Remuneration of Directors and Senior Management includes all amounts earned and awarded to the Group’s Board of Directors and Senior Management. Senior Management includes the Group’s President and Chief Executive Officer, Chief Financial Officer, General Counsel and Corporate Secretary, Chief Operating Officer, Senior Vice President Canada, Vice President of Asset Management and Corporate Planning Canada, Vice President of Exploration Canada and Vice President of Corporate Planning and Investor Relations.
Directors’ fees include Board and Committee fees. Senior Management’s remuneration includes salary, short-term benefits, bonuses and any other compensation earned in 2019 and in 2020.
2019 Net result (USD Thousands) 103,588 103,588
Possible shift (%) (10%) 10%
Total effect on net income (USD Thousands) (41,459) 41,459
41
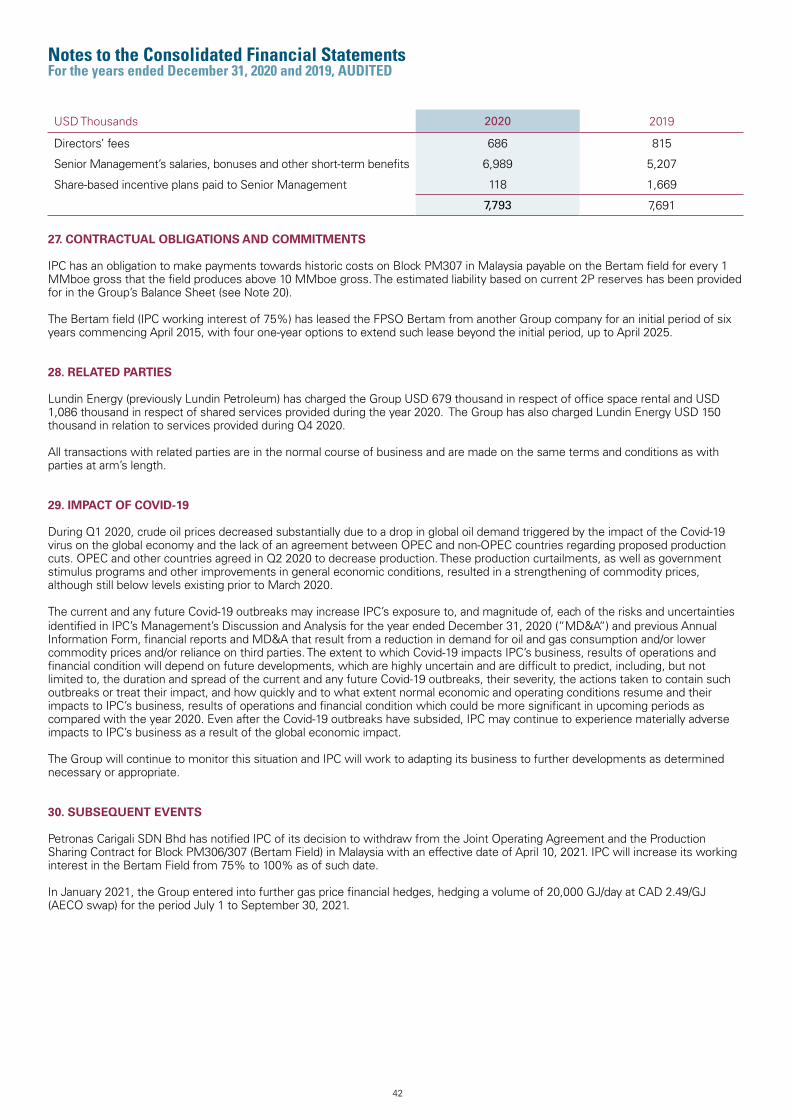
Notes to the Consolidated Financial StatementsFor the years ended December 31, 2020 and 2019, AUDITED
USD Thousands 2020 2019
Directors’ fees 686 815
Senior Management’s salaries, bonuses and other short-term benefits 6,989 5,207
Share-based incentive plans paid to Senior Management 118 1,669
7,793 7,691
27. CONTRACTUAL OBLIGATIONS AND COMMITMENTS
IPC has an obligation to make payments towards historic costs on Block PM307 in Malaysia payable on the Bertam field for every 1 MMboe gross that the field produces above 10 MMboe gross. The estimated liability based on current 2P reserves has been provided for in the Group’s Balance Sheet (see Note 20).
The Bertam field (IPC working interest of 75%) has leased the FPSO Bertam from another Group company for an initial period of six years commencing April 2015, with four one-year options to extend such lease beyond the initial period, up to April 2025.
28. RELATED PARTIES
Lundin Energy (previously Lundin Petroleum) has charged the Group USD 679 thousand in respect of office space rental and USD 1,086 thousand in respect of shared services provided during the year 2020. The Group has also charged Lundin Energy USD 150 thousand in relation to services provided during Q4 2020.
All transactions with related parties are in the normal course of business and are made on the same terms and conditions as with parties at arm’s length.
29. IMPACT OF COVID-19
During Q1 2020, crude oil prices decreased substantially due to a drop in global oil demand triggered by the impact of the Covid-19 virus on the global economy and the lack of an agreement between OPEC and non-OPEC countries regarding proposed production cuts. OPEC and other countries agreed in Q2 2020 to decrease production. These production curtailments, as well as government stimulus programs and other improvements in general economic conditions, resulted in a strengthening of commodity prices, although still below levels existing prior to March 2020.
The current and any future Covid-19 outbreaks may increase IPC’s exposure to, and magnitude of, each of the risks and uncertainties identified in IPC’s Management’s Discussion and Analysis for the year ended December 31, 2020 (“MD&A“) and previous Annual Information Form, financial reports and MD&A that result from a reduction in demand for oil and gas consumption and/or lower commodity prices and/or reliance on third parties. The extent to which Covid-19 impacts IPC’s business, results of operations and financial condition will depend on future developments, which are highly uncertain and are difficult to predict, including, but not limited to, the duration and spread of the current and any future Covid-19 outbreaks, their severity, the actions taken to contain such outbreaks or treat their impact, and how quickly and to what extent normal economic and operating conditions resume and their impacts to IPC’s business, results of operations and financial condition which could be more significant in upcoming periods as compared with the year 2020. Even after the Covid-19 outbreaks have subsided, IPC may continue to experience materially adverse impacts to IPC’s business as a result of the global economic impact. The Group will continue to monitor this situation and IPC will work to adapting its business to further developments as determined necessary or appropriate.
30. SUBSEQUENT EVENTS
Petronas Carigali SDN Bhd has notified IPC of its decision to withdraw from the Joint Operating Agreement and the Production Sharing Contract for Block PM306/307 (Bertam Field) in Malaysia with an effective date of April 10, 2021. IPC will increase its working interest in the Bertam Field from 75% to 100% as of such date.
In January 2021, the Group entered into further gas price financial hedges, hedging a volume of 20,000 GJ/day at CAD 2.49/GJ (AECO swap) for the period July 1 to September 30, 2021.
42

Corporate OfficeInternational Petroleum CorpSuite 2000885 West Georgia StreetVancouver, BCV6C 3E8, Canada
Tel: +1 604 689 7842E-mail: [email protected]: international-petroleum.com
Q4Management’s Discussion and Analysis
International Petroleum Corporation
For the three months ended and year endedDecember 31, 2020

2
Contents
INTRODUCTION 3
2020 HIGHLIGHTS 4
• Operational and Resource and 2021 Business Plan Highlights 4 • Financial Highlights 4
OPERATIONS REVIEW 5
• Business Overview 5 • Operations Overview 7
FINANCIAL REVIEW 10
• Financial Results 10 • Capital Expenditure 21 • Financial Position and Liquidity 22 • Non-IFRS Measures 23 • Off-Balance Sheet Arrangements 25 • Outstanding Share Data 25 • Contractual Obligations and Commitments 25 • Critical Accounting Policies and Estimates 26 • Transactions with Related Parties 26 • Financial Risk Management 26
RISK AND UNCERTAINTIES 27
DISCLOSURE CONTROLS AND INTERNAL CONTROL OVER FINANCIAL REPORTING 34
CAUTIONARY STATEMENT REGARDING FORWARD-LOOKING INFORMATION 35
RESERVES AND RESOURCE ADVISORY 37
OTHER SUPPLEMENTARY INFORMATION 39
Non-IFRS MeasuresReferences are made in this MD&A to “operating cash flow” (OCF), “free cash flow” (FCF), “Earnings Before Interest, Tax, Depreciation and Amortization” (EBITDA), “operating costs” and “net debt”/”net cash” which are not generally accepted accounting measures under International Financial Reporting Standards (IFRS) and do not have any standardized meaning prescribed by IFRS and, therefore, may not be comparable with definitions of OCF, FCF, EBITDA, operating costs and net debt/net cash that may be used by other public companies. Management believes that OCF, FCF, EBITDA, operating costs and net debt/net cash are useful supplemental measures that may assist shareholders and investors in assessing the cash generated by and the financial performance and position of the Corporation. Non-IFRS measures should not be considered in isolation or as a substitute for measures prepared in accordance with IFRS. The definition and reconciliation of each non-IFRS measure is presented in this MD&A. See “Non-IFRS Measures” on page 23.
Forward-Looking Statements Certain statements contained in this MD&A constitute “forward-looking statements” or “forward-looking information” (within the meaning of applicable securities legislation). Such statements and information (together, "forward-looking statements") relate to future events, including the Corporation's future performance, business prospects or opportunities. Any statements that express or involve discussions with respect to predictions, expectations, beliefs, plans, projections, forecasts, guidance, budgets, objectives, assumptions or future events or performance (often, but not always, using words or phrases such as "seek", "anticipate", "plan", "continue", "estimate", "expect", "may", "will", "project", “forecast”, "predict", "potential", "targeting", "intend", "could", "might", "should", "believe", "budget" and similar expressions) are not statements of historical fact and may be "forward-looking statements". Although IPC believes that the expectations and assumptions on which such forward-looking statements are based are reasonable, undue reliance should not be placed on the forward-looking statements because IPC can give no assurances that they will prove to be correct. Since forward-looking statements address future events and conditions, by their very nature they involve inherent risks and uncertainties. Actual results could differ materially from those currently anticipated due to a number of factors and risks. For additional information underlying forward-looking statements, refer to the “Cautionary Statement Regarding Forward-Looking Information” on page 3 5.
Reserves estimates, contingent resource estimates and estimates of future net revenue in respect of IPC’s oil and gas assets in Canada are effective as of December 31, 2020 and are included in the reports prepared by Sproule Associates Limited (Sproule), an independent qualified reserves evaluator, in accordance with National Instrument 51-101 – Standards of Disclosure for Oil and Gas Activities (NI 51-101) and the Canadian Oil and Gas Evaluation Handbook (the COGE Handbook) and using Sproule’s December 31, 2020 price forecasts.
Reserve estimates, contingent resource estimates and estimates of future net revenue in respect of IPC’s oil and gas assets in France and Malaysia are effective as of December 31, 2020, and are included in the report prepared by ERC Equipoise Ltd. (ERCE), an independent qualified reserves auditor, in accordance with NI 51-101 and the COGE Handbook, and using Sproule’s December 31, 2020, price forecasts.
Certain abbreviations and technical terms used in this MD&A are defined or described under the heading “Other Supplementary Information”.
The Covid-19 virus and the restrictions and disruptions related to it have had a drastic adverse effect on the world demand for, and prices of, oil and gas as well as the market price of the shares of oil and gas companies generally, including the Corporation’s common shares. There can be no assurance that these adverse effects will not continue or that commodity prices will not decrease or remain volatile in the future. These factors are beyond the control of the Corporation and it is difficult to assess how these, and other factors, will continue to affect the Corporation and the market price of IPC’s common shares. In light of the current situation, as at the date of this MD&A, the Corporation continues to review and assess its business plans and assumptions regarding the business environment, as well as its estimates of future production, cash flows, operating costs and capital expenditures. See “Risks and Uncertainties”.

Management’s Discussion and Analysis For the three months ended and year ended December 31, 2020
3
INTRODUCTION This management’s discussion and analysis (“MD&A”) for International Petroleum Corporation (“IPC” or the “Corporation” and, together with its subsidiaries, the “Group”) is dated February 9, 2021, and is intended to provide an overview of the Group’s operations, financial performance and current and future business opportunities. This MD&A should be read in conjunction with IPC’s audited consolidated financial statements and accompanying notes for the year ended December 31, 2020 (“Financial Statements”). Group Overview The Group is in the business of exploring for, developing and producing oil and gas. IPC holds a portfolio of oil and gas production assets and development projects in Canada, Malaysia and France with exposure to growth opportunities. The Corporation’s common shares are listed on the Toronto Stock Exchange (“TSX”) in Canada and the Nasdaq Stockholm Exchange in Sweden. The Corporation is incorporated and domiciled in British Columbia, Canada under the Business Corporations Act. The address of its registered office is Suite 2600, 595 Burrard Street, P.O. Box 49314, Vancouver, BC V7X 1L3, Canada and its business address is Suite 2000, 885 West Georgia Street, Vancouver, BC V6C 3E8, Canada. Basis of Preparation The MD&A and the Financial Statements have been prepared in accordance with International Financial Reporting Standards (“IFRS”) as issued by the International Accounting Standards Board (“IASB”). Financial information is presented in United States Dollars (“USD”). However, as the Group operates in Europe and in Canada, certain financial information prepared by subsidiaries has been reported in Euros (“EUR”) and in Canadian Dollars (“CAD”). In addition, certain costs relating to the operations in Malaysia, which are reported in USD, are incurred in Malaysian Ringgit (“MYR”). Exchange rates for the relevant currencies of the Group with respect to the US Dollar are as follows: December 31, 2020 December 31, 2019
Average Period end Average Year end
1 EUR equals USD 1.1413 1.2271 1.1196 1.1234
1 USD equals CAD 1.3412 1.2740 1.3270 1.2994
1 USD equals MYR 4.2026 4.0209 4.1422 4.0905

Management’s Discussion and Analysis For the three months ended and year ended December 31, 2020
4
HIGHLIGHTS 2020 Operational and Resource and 2021 Business Plan Highlights
• Average net production of approximately 44,900 barrels of oil equivalent (boe) per day (boepd) for the fourth quarter of 2020 (43% heavy crude oil, 18% light and medium crude oil and 39% natural gas)1.
• Full year 2020 average net production of approximately 42,100 boepd, in line with Q3 2020 guidance (39% heavy crude oil, 20% light and medium crude oil and 41% natural gas)1.
• Full year 2020 operating costs2 per boe of USD 11.9, in line with Q3 2020 guidance. • Capital expenditure for full year 2020 of USD 82 million, marginally above Q3 2020 guidance after the decision to
advance work at Onion Lake Thermal, Canada. • Completed the acquisition of Granite Oil Corp. (Granite) in Q1 2020, adding the Ferguson light oil asset to IPC’s
Canadian business. • First IPC Sustainability Report published in Q3 2020. • Proved plus probable (2P) reserves as at December 31, 2020 of 272 million boe (MMboe), with a reserves life index
(RLI) of 18 years1. • Contingent resources (best estimate, unrisked) as at December 31, 2020 of 1,102 MMboe1. • 2021 average net production guidance of 41,000 to 43,000 boepd.1 • 2021 operating costs guidance2 at USD 14.6 per boe. • Full year 2021 capital expenditure budget of USD 37 million, with a focus in 2021 on free cash flow generation and
debt reduction. • Forecast cumulative free cash flow2 for 2021 to 2025 of approximately USD 600 million to USD 900 million,
generating estimated average annual free cash flow yield over the five year period of between 28% and 42%.3
1 See “Supplemental Information regarding Product Types” in the “Reserves and Resources Advisory” below and the Corporation’s material change report dated February 9, 2021 (MCR), available on the SEDAR website (www.sedar.com) or IPC's website (www.international-petroleum.com). 2 See definition on page 23 under “Non-IFRS measures”. 3 Estimated free cash flow generation is based on IPC’s current business plans over the period of 2021 to 2025. Assumptions include average net production over that period of approximately 45 Mboepd, average Brent oil prices of USD 55 to 65 per boe escalating by 2% per year, average gas prices of CAD 2.50 per Mcf, and average Brent to Western Canadian Select differentials as estimated by IPC’s independent reserves evaluator and as further described in the MCR. IPC’s current business plans and assumptions, and the business environment, are subject to change. Actual results may differ materially from forward-looking estimates and forecasts. See ”Cautionary Statement regarding Forward-Looking Information” below. Free cash flow yield is based on IPC’s market capitalization at close February 5, 2021 (23.36 SEK/share, 8.4 SEK/USD, USD 433 million).
2020 Financial Highlights
1 See definition on page 23 under “Non-IFRS measures”
• Full year 2020 operating cash flow (OCF)1 of USD 119 million and USD 46 million for the fourth quarter 2020. • Full year 2020 free cash flow (FCF)1 generation of USD 9 million and USD 29 million for the fourth quarter 2020. • Net debt1 of USD 321 million as at December 31, 2020. • Net debt1 to EBITDA1 ratio of 2.96 times as at December 31, 2020. • Full year 2020 net result of USD (78 million) and USD (45 million) for the fourth quarter 2020 including a non-cash
impairment charge of USD 54 million after tax on the French Paris Basin assets.
Three months ended December 31
Year ended December 31
USD Thousands 2020 2019 2020 2019
Revenue 103,353 145,535 324,164 553,749
Gross profit / (loss) (60,570) 43,245 (83,986) 152,904
Net result (45,250) 38,372 (77,941) 103,588
Operating cash flow1 46,019 78,888 119,423 307,944
Free cash flow1 28,571 4,432 9,342 89,308
EBITDA1 43,004 77,353 108,451 302,513
Net Debt1 321,193 231,503 321,193 231,503

Management’s Discussion and Analysis For the three months ended and year ended December 31, 2020
5
OPERATIONS REVIEW Business Overview 2020 was certainly the year when we were all called upon to rise up and face the unprecedented challenge of dealing with the outbreak of the Covid-19 pandemic effects. The restrictions we all had to endure to combat the virus in early 2020 turned our world upside down, leading to a collapse in oil demand and profound oil price weakness. The lack of an early agreement by OPEC+ on a supply response only served to exacerbate market balances which had already become severely dislocated.
Thankfully though, following agreement on the deepest production curtailments we have ever seen from the OPEC+ group and other producers, including ourselves, we began to see some positive results. Those actions managed to flatten the curve of inventory builds towards the end of the second quarter of 2020. This in turn led to the oil market moving into deficit during the second half of 2020 with a draw down in excessive inventory levels as the rebalancing process commenced. As a result of the market tightening, average Brent oil prices increased from second quarter levels of around USD 30 per barrel to around USD 45 per barrel during the fourth quarter.
As we look forward into 2021, uncertainties remain as we continue to see new variants and waves of Covid-19 infections. The pace of recovery in oil demand will be dependent on the successful roll out of the vaccination program and the easing of restrictions on mobility. For a sustained recovery in oil prices, discipline and compliance on the supply side measures announced by OPEC+ will also be essential, particularly when considering the timing of easing of the supply curtailments.
As a result, we believe it is prudent to exercise caution with respect to future capital expenditure and growth plans. We held firm on our reset 2020 expenditure program even as we saw oil prices recovering in the second half of the year. We have set a limited capital budget for 2021 with a focus on free cash flow generation and debt reduction. We do not expect to see a return to organic production growth until we see stronger evidence of a more balanced market.
That being said, the massive collapse in investment combined with the redirection of future capital investment away from upstream oil and gas in favour of renewable energy by the majors, along with the dramatic reductions in US shale drilling activity, could set the scene for brighter times ahead. IPC believes that we are very well positioned to benefit from the recovery.
We expect to continue with our opportunistic approach with respect to further business development opportunities. Despite the turmoil the sector has been through, we have already witnessed an uptick in activity levels in the Mergers and Acquisitions (“M&A”) market and anticipate that this will continue in the months ahead.
Update of 2020 Business Plan
Given that IPC operates the majority of our assets, during the first half of 2020 we had the financial and operational flexibility to react swiftly to the situation and to positively position the Corporation to navigate through the period of low commodity prices. All discretionary 2020 expenditures were deferred or cancelled. In addition, during the second quarter of 2020, we took the decision to temporarily curtail production from fields that were not expected to generate positive cash flows at the low pricing levels we were experiencing. These production curtailments related to a portion of our oil production. Our Canadian gas production was not curtailed as we continued to generate strong positive cash flows.
With the improvement in our business outlook, and in particular the strengthening of Canadian crude oil prices, we took the decision in late Q2 2020, to progressively bring back on stream our oil production from our Suffield Oil asset and our Onion Lake Thermal asset. In addition, production from our Paris Basin assets in France had returned to pre-curtailment levels by June 2020.
During the second half of 2020, the recovery of our Canadian oil production was running ahead of forecast and, by Q3 2020, we guided that we expected production for the full year 2020 to be in excess of our high end guidance range of 37,000 to 40,000 boepd at above 41,000 boepd. We are pleased to report that our production recovery continued during the fourth quarter resulting in our full year net production averaging in excess of 42,000 boepd. A particular achievement of our operating teams across all our sites was the fact that none of our assets faced any interruption as a result of the Covid-19 outbreak during 2020.
IPC’s 2020 capital and decommissioning expenditures of USD 82 million were marginally above our Q3 guidance by USD 2 million as we elected to accelerate Onion Lake Thermal Pad D’ project works into a more favourable weather window. IPC’s 2020 unit operating costs of USD 12 per boe came in at the lower end of our guidance range of USD 12 to 13 per boe.
Our full year operating cash flow amounted to USD 119 million. Notwithstanding the market turmoil, we were able to generate a positive free cash flow of approximately USD 9 million during 2020 as a result of the business reset measures we put in place.
Management’s Discussion and Analysis For the three months ended and year ended December 31, 2020
6
Fourth Quarter 2020 Performance
During the fourth quarter of 2020, our assets delivered average net production of 44,900 boepd, a 7% increase over our Q3 2020 production levels as we continued with the ramp up of the majority of our curtailed oil production in Canada. Our operating costs per boe for the fourth quarter of 2020 was USD 11.9, at the low end of our guidance range.
Operating cash flow generation for the fourth quarter of 2020 amounted to USD 46.0 million, stronger than forecast as a result of stronger oil prices and better than forecast production. Moreover, as a result of our spending reductions, operational choices made and our hedging program, IPC generated USD 29 million of free cash flow during the fourth quarter of 2020.
Capital and decommissioning expenditures during the fourth quarter of 2020 of USD 9.2 million was marginally above forecast following the decision to advance work on Onion Lake Thermal. The limited level of expenditure in Q4 2020 reflects the implementation of our expenditure reduction program previously announced.
Net debt as at December 31, 2020 was USD 321 million.
Maximizing Financial Flexibility
During the first quarter of 2020, we generated in excess of USD 40 million of negative free cash flow as we commenced our front-end loaded investment program that was aimed at growing our production. Given the collapse in oil prices late in Q1 2020, it was clear that our original growth program was not going to be sustainable. As a result, our business reset plan was put in place aimed at maximizing our free cash flow generation to navigate through the weak oil price environment. In Q2 2020, we already delivered free cash flow neutrality and moreover, in the second half of 2020 we were able to generate in excess of USD 50 million of positive free cash flow. For the full year 2020, our reset program delivered what it set out to achieve with IPC generating a USD 9 million free cash flow surplus.
In parallel to our business reset, it was also very important to ensure that we had continued access to our banking facilities. In early Q3 2020, we were pleased to report that we had successfully concluded our discussions with our Canadian and international banking partners. Maturities of our credit facilities were extended and in total we were able to increase the size of these available credit facilities by more than USD 10 million whilst removing any leverage ratio covenants.
As we move into 2021, the focus on free cash flow generation and debt reductions continues with a minimal capital budget proposed that is expected to allow us to sustain production at around our average 2020 levels and achieve our 2021 production guidance.
HSE Performance
Health, Safety & Environmental performance remains a priority for all operational assets. Our objective is to reduce risk and eliminate hazards to prevent the occurrence of accidents, ill health and environmental damage, as these are essential to the success of our operations. During 2020, IPC recorded no material safety or environmental incidents.
In response to the Covid-19 outbreak, we remain focused on protecting the health and safety of our employees, contractors and other stakeholders, while also working to ensure business continuity. Throughout 2020, IPC implemented and continued the health protocols throughout the organization.
Sustainability Reporting
Responsible operatorship and ensuring that we adhere to the highest principles of business conduct have been an integral part of how we do business since the creation of IPC in 2017. Over the past three years, IPC has rapidly grown our business with the completion of three acquisitions in Canada as well as significant investments in our French and Malaysian businesses.
In parallel, we have made a concerted effort to further develop and improve our sustainability strategy. An important part of this journey involves the measurement and transparent reporting of a broad range of ESG metrics. Alongside the publication of our third quarter 2020 report, we were very pleased to publish our inaugural Sustainability Report. We encourage everyone to read it and see first-hand the good work that is being done within our company.
As previously announced, IPC targets a reduction of our net GHG emissions intensity by the end of 2025 to 50% of the Corporation's 2019 baseline.

Management’s Discussion and Analysis For the three months ended and year ended December 31, 2020
7
Operations Overview Reserves and Resources The 2P reserves attributable to IPC oil and gas assets stand at 272 MMboe as at December 31, 2020, certified by independent third party reserves auditors. The reserves life index (RLI) as at December 31, 2020, is approximately 18 years. Best estimate contingent resources as at December 31, 2020 are 1,102 MMboe (unrisked). See “Reserves and Resources Advisory” below. IPC remains focused on organic growth, continuing to mature and high grade opportunities across all our operated assets in 2021. Following the decision to ramp up curtailed oil production in Canada in response to stronger commodity pricing through the second half of 2020, our production increases were ahead of our forecast. IPC continues to review all deferred operational and development activities to identify and prioritise those which generate positive returns at current pricing levels whilst preserving strong free cash flow generation. Ensuring health and safety of our employees, contractors and other stakeholders, remains a top priority. Production The average net production during the fourth quarter of 2020 exceeded revised guidance at 44,900 boepd, driven by strong reservoir performance and well optimisation at the Suffield assets in addition to the continued ramp up at Onion Lake Thermal in Canada. Exceptional operational performance and facility uptime was achieved at the Bertam field in Malaysia and France delivered stable low-decline production, in line with guidance expectations. As a result of the strong production performance in the second half of 2020, IPC delivered a full year 2020 net average production in excess of 42,000 boepd and an exit rate in excess of 44,000 boepd. The production during Q4 2020 with comparatives are summarized below:
Three months ended December 31
Year ended December 31
Production
in Mboepd 2020 2019 2020 2019
Crude oil
Canada – Northern Assets 12.0 14.0 10.6 13.1
Canada – Southern Assets 8.4 6.5 7.1 6.4
Malaysia 4.2 5.4 4.4 5.8
France 2.9 3.2 2.8 2.5
Total crude oil production 27.5 29.1 24.9 27.8
Gas
Canada – Northern Assets 0.1 0.1 0.1 0.1
Canada – Southern Assets 17.3 18.0 17.1 17.9
Total gas production 17.4 18.1 17.2 18.0
Total production 44.9 47.2 42.1 45.8
Quantity in MMboe 4.13 4.34 15.42 16.72
See “Supplemental Information regarding Product Types” in “Reserves and Resource Advisory”.
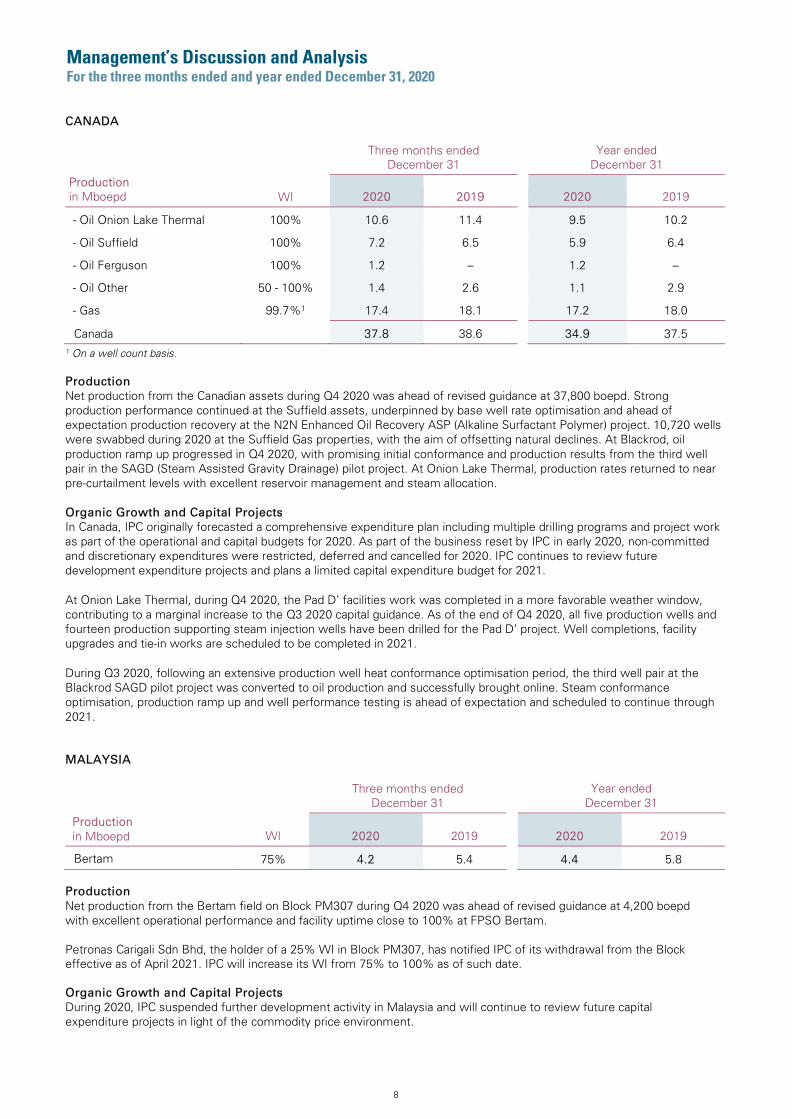
Management’s Discussion and Analysis For the three months ended and year ended December 31, 2020
8
CANADA
Three months ended
December 31 Year ended
December 31 Production in Mboepd WI 2020 2019 2020 2019
- Oil Onion Lake Thermal 100% 10.6 11.4 9.5 10.2
- Oil Suffield 100% 7.2 6.5 5.9 6.4
- Oil Ferguson 100% 1.2 – 1.2 –
- Oil Other 50 - 100% 1.4 2.6 1.1 2.9
- Gas 99.7%1 17.4 18.1 17.2 18.0
Canada 37.8 38.6 34.9 37.5 1 On a well count basis. Production Net production from the Canadian assets during Q4 2020 was ahead of revised guidance at 37,800 boepd. Strong production performance continued at the Suffield assets, underpinned by base well rate optimisation and ahead of expectation production recovery at the N2N Enhanced Oil Recovery ASP (Alkaline Surfactant Polymer) project. 10,720 wells were swabbed during 2020 at the Suffield Gas properties, with the aim of offsetting natural declines. At Blackrod, oil production ramp up progressed in Q4 2020, with promising initial conformance and production results from the third well pair in the SAGD (Steam Assisted Gravity Drainage) pilot project. At Onion Lake Thermal, production rates returned to near pre-curtailment levels with excellent reservoir management and steam allocation. Organic Growth and Capital Projects In Canada, IPC originally forecasted a comprehensive expenditure plan including multiple drilling programs and project work as part of the operational and capital budgets for 2020. As part of the business reset by IPC in early 2020, non-committed and discretionary expenditures were restricted, deferred and cancelled for 2020. IPC continues to review future development expenditure projects and plans a limited capital expenditure budget for 2021. At Onion Lake Thermal, during Q4 2020, the Pad D’ facilities work was completed in a more favorable weather window, contributing to a marginal increase to the Q3 2020 capital guidance. As of the end of Q4 2020, all five production wells and fourteen production supporting steam injection wells have been drilled for the Pad D’ project. Well completions, facility upgrades and tie-in works are scheduled to be completed in 2021. During Q3 2020, following an extensive production well heat conformance optimisation period, the third well pair at the Blackrod SAGD pilot project was converted to oil production and successfully brought online. Steam conformance optimisation, production ramp up and well performance testing is ahead of expectation and scheduled to continue through 2021. MALAYSIA
Three months ended
December 31 Year ended
December 31
Production in Mboepd WI 2020 2019 2020 2019
Bertam 75% 4.2 5.4 4.4 5.8 Production Net production from the Bertam field on Block PM307 during Q4 2020 was ahead of revised guidance at 4,200 boepd with excellent operational performance and facility uptime close to 100% at FPSO Bertam. Petronas Carigali Sdn Bhd, the holder of a 25% WI in Block PM307, has notified IPC of its withdrawal from the Block effective as of April 2021. IPC will increase its WI from 75% to 100% as of such date. Organic Growth and Capital Projects During 2020, IPC suspended further development activity in Malaysia and will continue to review future capital expenditure projects in light of the commodity price environment.

Management’s Discussion and Analysis For the three months ended and year ended December 31, 2020
9
FRANCE
Three months ended December 31
Year ended December 31
Production in Mboepd WI 2020 2019 2020 2019
France
- Paris Basin 100%1 2.5 2.7 2.4 2.0
- Aquitaine 50% 0.4 0.5 0.4 0.5 2.9 3.2 2.8 2.5
1 Except for the working interest in the Dommartin Lettree field of 43%. Production Net production in France during Q4 2020 was in line with revised guidance at 2,900 boepd with steady production performance at all the major producing fields. IPC currently delivers oil production from its Paris Basin assets for sale at the Total-operated Grandpuits refinery under a contract with Total until December 31, 2021. In Q3 2020, Total announced it will discontinue crude oil refining in the first quarter of 2021. IPC continues maturing alternative transport and marketing solutions that were implemented during previous periods of downtime at the refinery. IPC currently expects the new transportation solutions to increase the net operating costs by around USD 5 per bbl. Organic Growth During 2020, IPC suspended further development activity in France and will continue to review future capital expenditure projects in light of the commodity price environment.

Management’s Discussion and Analysis For the three months ended and year ended December 31, 2020
10
FINANCIAL REVIEW Financial Results Selected Annual Financial Information Selected consolidated statement of operations is as follows:
USD Thousands 2020 2019 2018
Revenue 324,164 553,749 454,443
Gross profit (83,986) 152,904 146,864
Net result (77,941) 103,588 103,644
Earnings per share – USD (0.50) 0.63 1.13
Earnings per share fully diluted – USD (0.49) 0.62 1.12
Operating cash flow1 119,423 307,944 279,018
EBITDA1 108,451 302,513 264,041
Net debt at period end1 321,193 231,503 276,761
1 See definition on page 23 under “Non-IFRS measures”. Summarized consolidated balance sheet information is as follows:
USD Thousands December 31, 2020 December 31, 2019 December 31, 2018
Non-current assets 1,240,653 1,252,600 1,200,035
Current assets 92,467 112,041 98,899
Total assets 1,333,120 1,364,641 1,298,934
Total non-current liabilities 527,530 474,200 506,832
Current liabilities 97,137 99,632 96,315
Total liabilities 624,667 573,832 587,296
Net assets 708,453 790,809 695,787
Working capital (including cash) (4,670) 12,409 2,584

Management’s Discussion and Analysis For the three months ended and year ended December 31, 2020
11
Selected Interim Financial Information Selected interim condensed consolidated statement of operations is as follows:
USD Thousands 2020 Q4-20 Q3-20 Q2-20 Q1-20 2019 Q4-19 Q3-19 Q2-19 Q1-19
Revenue 324,164 103,353 95,346 44,929 80,536 553,749 145,535 131.437 129,357 147,420
Gross profit (83,986) (60,570) 5,557 (16,537) (12,436) 152,904 43,245 23,487 39,287 46,885
Net result (77,941) (45,250) 8,850 (1,472) (40,069) 103,588 38,372 6,330 25,744 33,142
Earnings per share – USD (0.50) (0.29) 0.06 (0.01) (0.25) 0.63 0.23 0.04 0.16 0.20 Earnings per share fully diluted – USD (0.49) (0.29) 0.06 (0.01) (0.25) 0.62 0.23 0.04 0.15 0.20
Operating cash flow1 119,423 46,019 37,181 14,742 21,481 307,944 78,888 69,504 76,496 83,056
EBITDA1 108,451 43,004 34,251 12,187 19,009 302,513 77,353 68,885 74,600 81,675
Net debt at period end1 321,193 321,193 322,092 341,367 302,473 231,503 231,503 207,778 239,322 256,962
1 See definition on page 23 under “Non-IFRS measures”.

Management’s Discussion and Analysis For the three months ended and year ended December 31, 2020
12
Segment Information The Group operates within several geographical areas. Operating segments are reported at a country level, with Canada being further analyzed by main areas: (i) Canada – Northern Assets (comprising mainly of the Onion Lake Thermal asset) and (ii) Canada – Southern Assets (comprising of the Suffield Assets and the Ferguson asset). This is consistent with the internal reporting provided to IPC management. The following tables present certain segment information.
Three months ended – December 31, 2020
USD Thousands Canada –
Northern Assets Canada –
Southern Assets Malaysia1 France Other Total
Crude oil 31,835 28,352 18,569 10,333 – 89,089
NGLs – 72 – – – 72
Gas 97 18,528 – – – 18,625
Net sales of oil and gas 31,932 46,952 18,569 10,333 – 107,786
Change in under/over lift position – – – 2,430 – 2,430
Royalties (2,954) (2,596) – – – (5,550)
Hedging settlement (1,867) (3,866) – – – (5,733)
Other operating revenue – – 3,910 384 126 4,420
Revenue 27,111 40,490 22,479 13,147 126 103,353
Production costs (including inventory movements) (16,589) (24,106) (8,803) (7,724) – (57,222)
Depletion (7,381) (11,262) (6,553) (4,597) – (29,793)
Depreciation of other assets – – (2,751) – – (2,751)
Exploration and business development costs (24) – (829) (33) (128) (1,014)
Impairment costs of oil and gas properties – – – (73,143) – (73,143)
Gross profit/(loss) 3,117 5,122 3,543 (72,350) (2) (60,570)
Three months ended – December 31, 2019
USD Thousands Canada –
Northern Assets Canada –
Southern Assets Malaysia1 France Other Total
Crude oil 43,791 27,950 36,618 16,167 – 124,526
NGLs – 79 – – – 79
Gas 122 19,335 – – – 19,457
Net sales of oil and gas 43,913 47,364 36,618 16,167 – 144,062
Change in under/over lift position – – – 3,030 – 3,030
Royalties (4,662) (1,838) – – – (6,500)
Hedging settlement 523 – – – – 523
Other operating revenue – – 3,910 301 209 4,420
Revenue 39,774 45,526 40,528 19,498 209 145,535
Production costs (including inventory movements) (19,194) (25,252) (12,286) (8,590) – (65,322)
Depletion (8,283) (12,560) (7,034) (4,581) – (32,458)
Depreciation of other assets – – (3,805) – – (3,805)
Exploration and business development costs – – (262) – (443) (705)
Gross profit/(loss) 12,297 7,714 17,141 6,327 (234) 43,245

Management’s Discussion and Analysis For the three months ended and year ended December 31, 2020
13
Year ended – December 31, 2020
USD Thousands Canada –
Northern Assets Canada –
Southern Assets Malaysia1 France Other Total
Crude oil 89,206 78,146 60,465 35,700 – 263,517
NGLs – 214 – – – 214
Gas 334 59,616 – – – 59,950
Net sales of oil and gas 89,540 137,976 60,465 35,700 – 323,681
Change in under/over lift position – – – (630) – (630)
Royalties (8,202) (5,862) – – – (14,064)
Hedging settlement 1,351 (3,334) – – – (1,983)
Other operating revenue – – 15,555 1,164 441 17,160
Revenue 82,689 128,780 76,020 36,234 441 324,164
Production costs (including inventory movements) (64,623) (88,759) (24,793) (26,453) – (204,628)
Depletion (26,255) (40,555) (27,759) (17,327) – (111,896)
Depreciation of other assets – – (11,681) – – (11,681)
Exploration and business development costs (3,011) – (741) (2,389) (661) (6,802)
Impairment costs of oil and gas properties – – – (73,143) – (73,143)
Gross profit/(loss) (11,200) (534) 11,046 (83,078) (220) (83,986)
Year ended – December 31, 2019
USD Thousands Canada –
Northern Assets Canada –
Southern Assets Malaysia1 France Other Total
Crude oil 176,267 123,943 129,789 55,232 – 485,231
NGLs – 331 – – – 331
Gas 277 77,053 – – – 77,330
Net sales of oil and gas 176,544 201,327 129,789 55,232 – 562,892
Change in under/over lift position – – – 3,817 – 3,817
Royalties (20,207) (7,597) – – – (27,804)
Hedging settlement (1,971) (374) – – – (2,345)
Other operating revenue – – 15,513 1,005 671 17,189
Revenue 154,366 193,356 145,302 60,054 671 553,749
Production costs (including inventory movements) (70,165) (107,333) (33,378) (29,895) – (240,771)
Depletion (28,441) (49,236) (30,077) (13,905) – (121,659)
Depreciation of other assets – – (23,020) – – (23,020)
Exploration and business development costs (44) – (13,697) – (1,654) (15,395)
Gross profit/(loss) 55,716 36,787 45,130 16,254 (983) 152,904
1 The segment Malaysia includes the FPSO Bertam which is owned by the Group. The self-to-self payment of the lease fee for the FPSO Bertam has been eliminated from the revenue and the production costs.
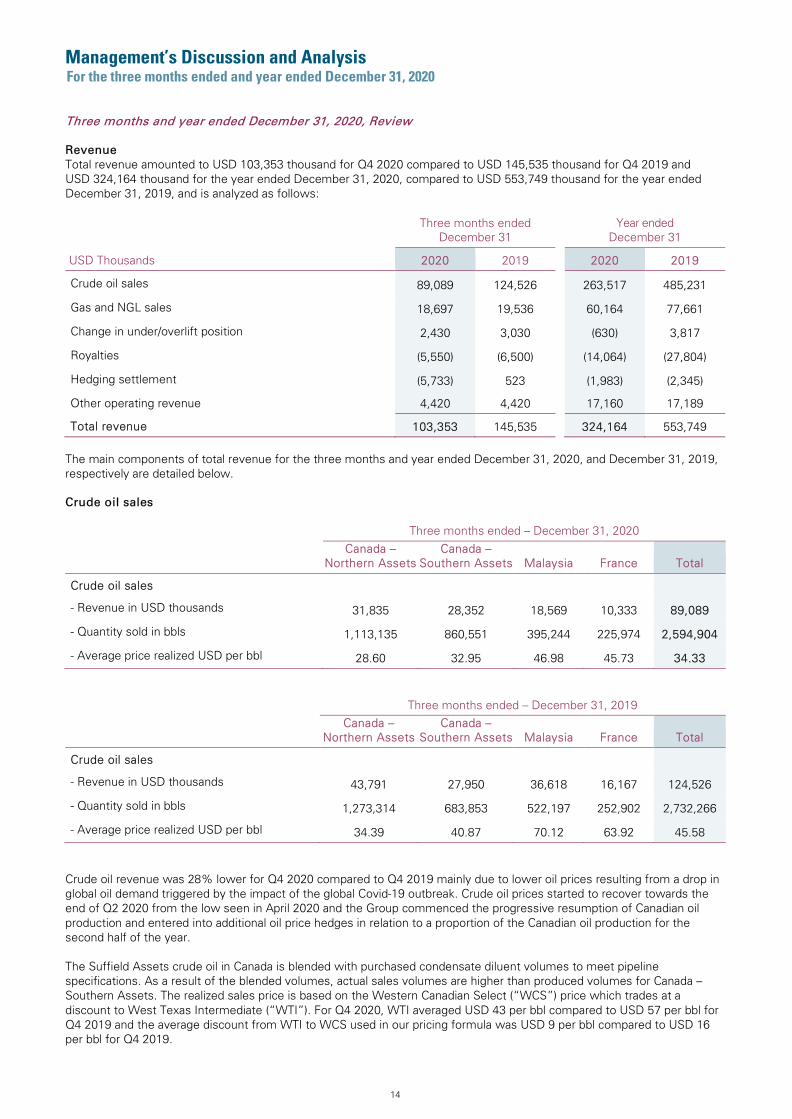
Management’s Discussion and Analysis For the three months ended and year ended December 31, 2020
14
Three months and year ended December 31, 2020, Review Revenue Total revenue amounted to USD 103,353 thousand for Q4 2020 compared to USD 145,535 thousand for Q4 2019 and USD 324,164 thousand for the year ended December 31, 2020, compared to USD 553,749 thousand for the year ended December 31, 2019, and is analyzed as follows:
Three months ended December 31
Year ended December 31
USD Thousands 2020 2019 2020 2019
Crude oil sales 89,089 124,526 263,517 485,231
Gas and NGL sales 18,697 19,536 60,164 77,661
Change in under/overlift position 2,430 3,030 (630) 3,817
Royalties (5,550) (6,500) (14,064) (27,804)
Hedging settlement (5,733) 523 (1,983) (2,345)
Other operating revenue 4,420 4,420 17,160 17,189
Total revenue 103,353 145,535 324,164 553,749 The main components of total revenue for the three months and year ended December 31, 2020, and December 31, 2019, respectively are detailed below. Crude oil sales Three months ended – December 31, 2020 Canada –
Northern Assets Canada –
Southern Assets Malaysia France Total
Crude oil sales - Revenue in USD thousands 31,835 28,352 18,569 10,333 89,089
- Quantity sold in bbls 1,113,135 860,551 395,244 225,974 2,594,904
- Average price realized USD per bbl 28.60 32.95 46.98 45.73 34.33
Three months ended – December 31, 2019 Canada –
Northern Assets Canada –
Southern Assets Malaysia France Total
Crude oil sales - Revenue in USD thousands 43,791 27,950 36,618 16,167 124,526
- Quantity sold in bbls 1,273,314 683,853 522,197 252,902 2,732,266
- Average price realized USD per bbl 34.39 40.87 70.12 63.92 45.58 Crude oil revenue was 28% lower for Q4 2020 compared to Q4 2019 mainly due to lower oil prices resulting from a drop in global oil demand triggered by the impact of the global Covid-19 outbreak. Crude oil prices started to recover towards the end of Q2 2020 from the low seen in April 2020 and the Group commenced the progressive resumption of Canadian oil production and entered into additional oil price hedges in relation to a proportion of the Canadian oil production for the second half of the year. The Suffield Assets crude oil in Canada is blended with purchased condensate diluent volumes to meet pipeline specifications. As a result of the blended volumes, actual sales volumes are higher than produced volumes for Canada – Southern Assets. The realized sales price is based on the Western Canadian Select (“WCS”) price which trades at a discount to West Texas Intermediate (“WTI”). For Q4 2020, WTI averaged USD 43 per bbl compared to USD 57 per bbl for Q4 2019 and the average discount from WTI to WCS used in our pricing formula was USD 9 per bbl compared to USD 16 per bbl for Q4 2019.
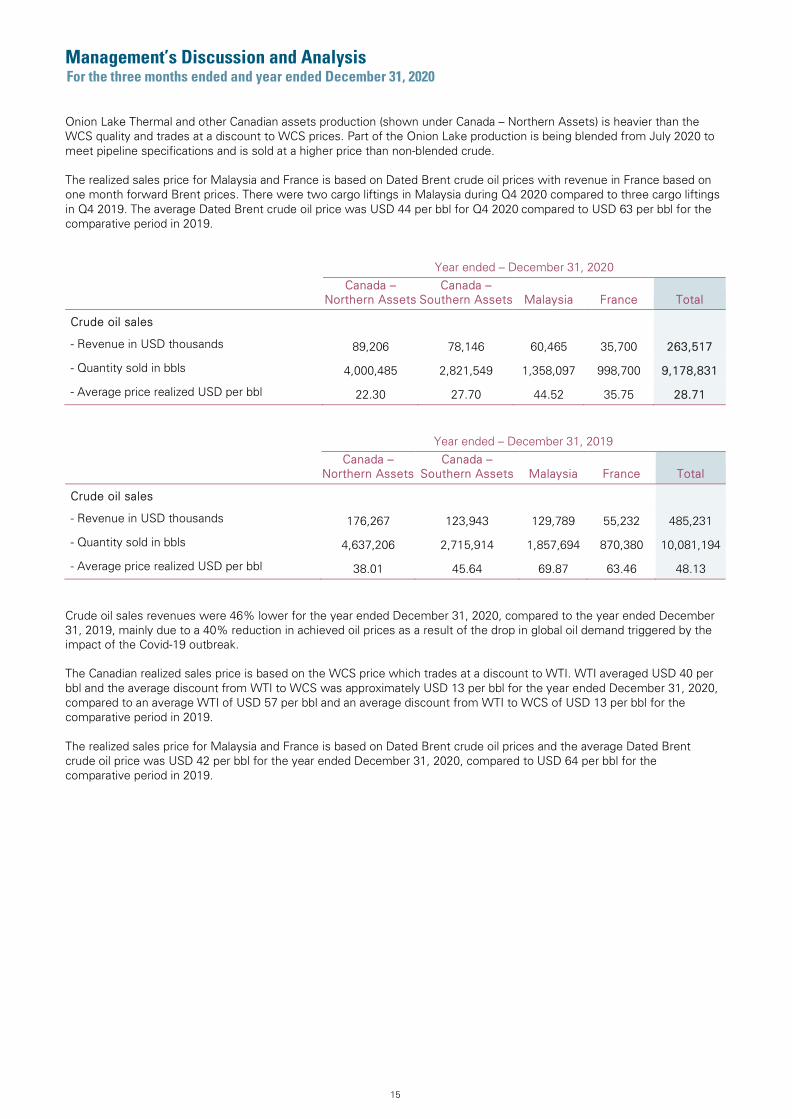
Management’s Discussion and Analysis For the three months ended and year ended December 31, 2020
15
Onion Lake Thermal and other Canadian assets production (shown under Canada – Northern Assets) is heavier than the WCS quality and trades at a discount to WCS prices. Part of the Onion Lake production is being blended from July 2020 to meet pipeline specifications and is sold at a higher price than non-blended crude. The realized sales price for Malaysia and France is based on Dated Brent crude oil prices with revenue in France based on one month forward Brent prices. There were two cargo liftings in Malaysia during Q4 2020 compared to three cargo liftings in Q4 2019. The average Dated Brent crude oil price was USD 44 per bbl for Q4 2020 compared to USD 63 per bbl for the comparative period in 2019. Year ended – December 31, 2020 Canada –
Northern Assets Canada –
Southern Assets Malaysia France Total
Crude oil sales - Revenue in USD thousands 89,206 78,146 60,465 35,700 263,517
- Quantity sold in bbls 4,000,485 2,821,549 1,358,097 998,700 9,178,831
- Average price realized USD per bbl 22.30 27.70 44.52 35.75 28.71 Year ended – December 31, 2019 Canada –
Northern Assets Canada –
Southern Assets Malaysia France Total
Crude oil sales - Revenue in USD thousands 176,267 123,943 129,789 55,232 485,231
- Quantity sold in bbls 4,637,206 2,715,914 1,857,694 870,380 10,081,194
- Average price realized USD per bbl 38.01 45.64 69.87 63.46 48.13 Crude oil sales revenues were 46% lower for the year ended December 31, 2020, compared to the year ended December 31, 2019, mainly due to a 40% reduction in achieved oil prices as a result of the drop in global oil demand triggered by the impact of the Covid-19 outbreak. The Canadian realized sales price is based on the WCS price which trades at a discount to WTI. WTI averaged USD 40 per bbl and the average discount from WTI to WCS was approximately USD 13 per bbl for the year ended December 31, 2020, compared to an average WTI of USD 57 per bbl and an average discount from WTI to WCS of USD 13 per bbl for the comparative period in 2019. The realized sales price for Malaysia and France is based on Dated Brent crude oil prices and the average Dated Brent crude oil price was USD 42 per bbl for the year ended December 31, 2020, compared to USD 64 per bbl for the comparative period in 2019.
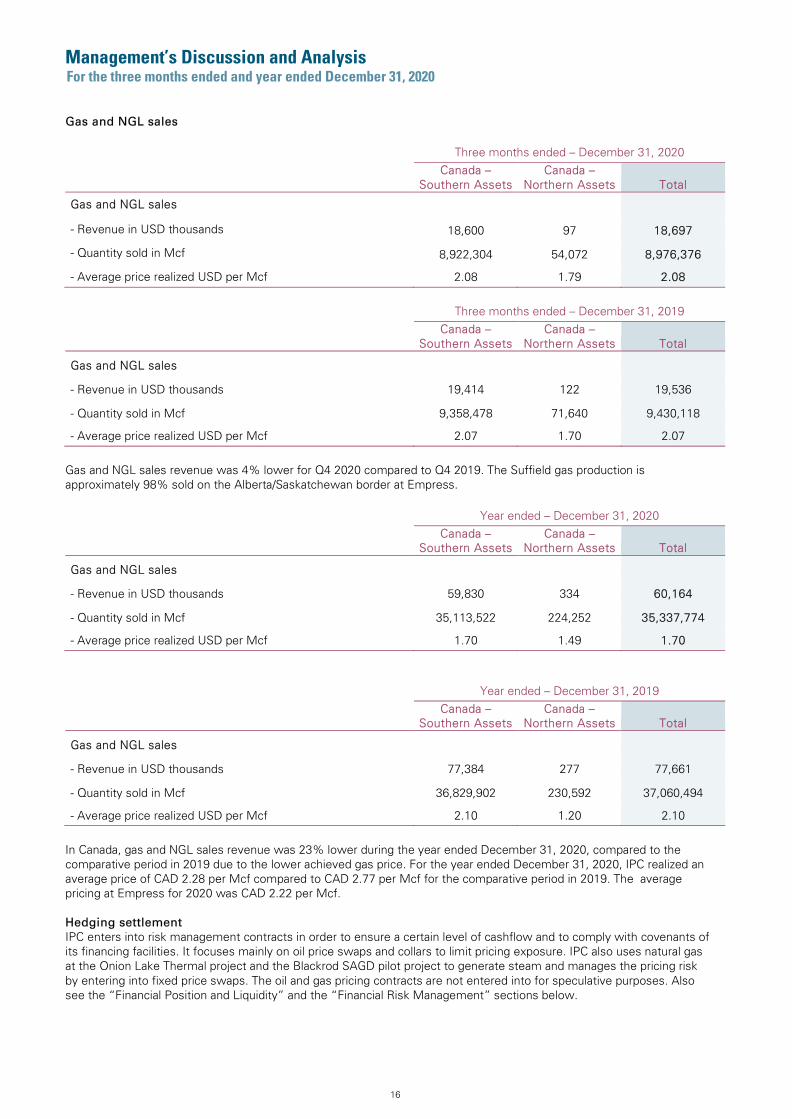
Management’s Discussion and Analysis For the three months ended and year ended December 31, 2020
16
Gas and NGL sales
Three months ended – December 31, 2020 Canada –
Southern Assets Canada –
Northern Assets Total
Gas and NGL sales
- Revenue in USD thousands 18,600 97 18,697
- Quantity sold in Mcf 8,922,304 54,072 8,976,376
- Average price realized USD per Mcf 2.08 1.79 2.08
Three months ended – December 31, 2019 Canada –
Southern Assets Canada –
Northern Assets Total
Gas and NGL sales
- Revenue in USD thousands 19,414 122 19,536
- Quantity sold in Mcf 9,358,478 71,640 9,430,118
- Average price realized USD per Mcf 2.07 1.70 2.07
Gas and NGL sales revenue was 4% lower for Q4 2020 compared to Q4 2019. The Suffield gas production is approximately 98% sold on the Alberta/Saskatchewan border at Empress.
Year ended – December 31, 2020 Canada –
Southern Assets Canada –
Northern Assets Total
Gas and NGL sales
- Revenue in USD thousands 59,830 334 60,164
- Quantity sold in Mcf 35,113,522 224,252 35,337,774
- Average price realized USD per Mcf 1.70 1.49 1.70
Year ended – December 31, 2019 Canada –
Southern Assets Canada –
Northern Assets Total
Gas and NGL sales
- Revenue in USD thousands 77,384 277 77,661
- Quantity sold in Mcf 36,829,902 230,592 37,060,494
- Average price realized USD per Mcf 2.10 1.20 2.10
In Canada, gas and NGL sales revenue was 23% lower during the year ended December 31, 2020, compared to the comparative period in 2019 due to the lower achieved gas price. For the year ended December 31, 2020, IPC realized an average price of CAD 2.28 per Mcf compared to CAD 2.77 per Mcf for the comparative period in 2019. The average pricing at Empress for 2020 was CAD 2.22 per Mcf.
Hedging settlement IPC enters into risk management contracts in order to ensure a certain level of cashflow and to comply with covenants of its financing facilities. It focuses mainly on oil price swaps and collars to limit pricing exposure. IPC also uses natural gas at the Onion Lake Thermal project and the Blackrod SAGD pilot project to generate steam and manages the pricing risk by entering into fixed price swaps. The oil and gas pricing contracts are not entered into for speculative purposes. Also see the “Financial Position and Liquidity” and the “Financial Risk Management” sections below.

Management’s Discussion and Analysis For the three months ended and year ended December 31, 2020
17
The realized hedging settlements for Q4 2020 amounted to a loss of USD 5,733 thousand and for the year ended December 31, 2020, amounted to a loss of USD 1,983 thousand, consisting of a gain of USD 671 thousand on the gas contracts and a loss of USD 2,654 thousand on the oil contracts. Also see the “Financial Position and Liquidity” and the “Financial Risk Management” sections below.
Other operating revenue Other operating revenue amounted to USD 4,420 thousand for Q4 2020 compared to USD 4,420 thousand for Q4 2019 and USD 17,160 thousand for the year ended December 31, 2020, compared to USD 17,189 thousand for the year ended December 31, 2019. Other operating revenue consists of lease fee income, tariff income and fees for strategic storage of inventory in France. The significant part of other operating revenue is third party lease fee income received by the Group for the leasing of the owned FPSO Bertam to the Bertam field in Malaysia.
Production costs Production costs including inventory movements amounted to USD 57,222 thousand for Q4 2020 compared to USD 65,322 thousand for Q4 2019 and USD 204,628 thousand for the year ended December 31, 2020, compared to USD 240,771 thousand for the year ended December 31, 2019, and is analyzed as follows:
Three months ended – December 31, 2020
USD Thousands
Canada – Southern Assets
Canada – Northern Assets Malaysia France Other3 Total
Operating costs1 20,367 14,176 18,621 7,597 (11,730) 49,031
USD/boe2 8.60 12.71 48.62 28.70 n/a 11.87
Cost of blending 3,106 3,677 – – – 6,783
Change in inventory position 62 (693) 1,912 127 – 1,408
Production costs 24,106 16,589 20,533 7,724 (11,730) 57,222
Three months ended – December 31, 2019
USD Thousands
Canada – Southern Assets
Canada – Northern Assets Malaysia France Other3 Total
Operating costs1 19,616 19,194 18,189 8,286 (11,730) 53,555
USD/boe2 8.71 14.71 36.87 28.24 n/a 12.33
Cost of blending 5,069 – – – – 5,069
Change in inventory position 567 – 5,827 304 – 6,698
Production costs 25,252 19,194 24,016 8,590 (11,730) 65,322
Year ended – December 31, 2020
USD Thousands
Canada – Southern Assets
Canada – Northern Assets Malaysia France Other3 Total
Operating costs1 75,054 57,616 72,152 25,639 (46,665) 183,796
USD/boe2 8.48 14.69 44.47 25.14 n/a 11.92
Cost of blending 13,334 7,357 – – – 20,691
Change in inventory position 371 (350) (694) 814 – 141
Production costs 88,759 64,623 71,458 26,453 (46,665) 204,628

Management’s Discussion and Analysis For the three months ended and year ended December 31, 2020
18
Year ended – December 31, 2019
USD Thousands
Canada – Southern Assets
Canada – Northern Assets Malaysia France Other3 Total
Operating costs1 85,419 70,165 75,471 29,291 (46,538) 213,808
USD/boe2 9.62 14.60 35.78 31.89 n/a 12.79
Cost of blending 21,919 – – – – 21,919
Change in inventory position (5) – 4,445 604 – 5,044
Production costs 107,333 70,165 79,916 29,895 (46,538) 240,771
1 See definition on page 23 under “Non-IFRS measures”. 2 USD/boe in the tables above is calculated by dividing the cost by the production volume for each country for the period. 3 Included in the Malaysia operating costs is the lease cost for the FPSO Bertam which is owned by the Group. Other represents the FPSO Bertam lease fee self-to-self payment elimination. Netting the self-to-self elimination against the operating costs in Malaysia reduces the operating cost per boe for Malaysia to USD 17.99 and USD 13.09 for Q4 2020 and Q4 2019, respectively, and USD 15.71 and USD 13.72 for the year ended December 31, 2020, and the year ended December 31, 2019, respectively.
Operating costs Operating costs amounted to USD 49,031 thousand for Q4 2020 compared to USD 53,555 thousand for Q4 2019 and USD 183,796 thousand for the year ended December 31, 2020, compared to USD 213,808 thousand for the year ended December 31, 2019. Operating costs per boe amounted to USD 11.87 per boe in Q4 2020 compared with USD 12.33 per boe in Q4 2019 and to USD 11.92 per boe for the full year 2020 which was at the lower end of CMD guidance of USD 12 to 13 per boe. During 2020, in respect of relief subsidies related to the Covid-19 pandemic provided by governmental authorities to oil and gas companies, the Group received approximately USD 5,900 thousand, including wage subsidies and site rehabilitation costs.
Cost of blending For the Suffield Assets in Canada, oil production is blended with purchased condensate diluent to meet pipeline specifications. From July 2020, a portion of Onion Lake oil production is also blended and exported by pipeline. The cost of the diluent net of proceeds from the sale of surplus diluent amounted to USD 6,783 thousand for Q4 2020 compared to USD 5,069 thousand for Q4 2019 and USD 20,691 thousand for the year ended December 31, 2020, compared to USD 21,919 thousand for the year ended December 31, 2019.
As a result of the blending, actual sales volumes are higher than produced barrels. A profit of USD 11 thousand and a cost of USD 445 thousand was recognized relating to the difference between the cost and sale proceeds of the surplus diluent for Q4 2020 and Q4 2019 respectively, and costs of USD 1,258 thousand and USD 2,289 thousand were recognized for the year ended December 31, 2020, and December 31, 2019, respectively.
Change in inventory position The Bertam field in Malaysia is located offshore and production is lifted and sold from the FPSO Bertam when a cargo parcel size is reached. Accordingly, the timing of a lifting varies based on the inventory level on the FPSO facility and the change in inventory position varies, both positively and negatively, from period to period. Inventories are valued at the lower of cost including depletion, and market value, and the difference in the valuation between period ends is reflected in the change in inventory position in the statement of operations. At the end of year 2020, IPC had crude entitlement of 81,000 barrels of oil on the FPSO Bertam facility.

Management’s Discussion and Analysis For the three months ended and year ended December 31, 2020
19
Depletion and decommissioning costs The total depletion and decommissioning costs amounted to USD 29,793 thousand for Q4 2020 compared to USD 32,458 thousand for Q4 2019 and USD 111,896 thousand for the year ended December 31, 2020, compared to USD 121,659 thousand for the year ended December 31, 2019. The depletion charge is analyzed in the following tables:
Three months ended – December 31, 2020 Canada –
Southern Assets Canada –
Northern Assets Malaysia France Total
Depletion cost in USD thousands 11,262 7,381 6,553 4,597 29,793
USD per boe 4.76 6.62 17.11 17.37 7.21
Three months ended – December 31, 2019 Canada –
Southern Assets Canada –
Northern Assets Malaysia France Total
Depletion cost in USD thousands 12,560 8,283 7,034 4,581 32,458
USD per boe 5.58 6.35 14.26 15.61 7.47
Year ended – December 31, 2020
Canada – Southern Assets
Canada – Northern Assets Malaysia France Total
Depletion cost in USD thousands 40,555 26,255 27,759 17,327 111,896
USD per boe 4.58 6.70 17.11 16.99 7.26
Year ended – December 31, 2019 Canada –
Southern Assets Canada –
Northern Assets Malaysia France Total
Depletion cost in USD thousands 49,236 28,441 30,077 13,905 121,659
USD per boe 5.55 5.92 14.26 15.14 7.28
The depletion charge is derived by applying the depletion rate per boe to the volumes produced in the period by each field.
Depreciation of other assets The total depreciation of other assets amounted to USD 2,751 thousand for Q4 2020 compared to USD 3,805 thousand for Q4 2019 and USD 11,681 thousand for the year ended December 31, 2020, compared to USD 23,020 thousand for the year ended December 31, 2019. This related to the depreciation of the FPSO Bertam, which is being depreciated on a unit of production basis from July 2019 based on the Bertam field 2P reserves. Prior to this date the Bertam FPSO was being depreciated on a straight line basis over the six year lease period on the Bertam field from April 2015.
Exploration and business development costs The total exploration and business developments costs amounted to USD 1,014 thousand for Q4 2020 and USD 6,802 thousand for the year ended December 31, 2020. The charge in Q4 2020 mainly relates to study costs in Malaysia. The full year costs also includes exploration costs expensed in France as future development on the exploration licences is unlikely and to appraisal wells drilled in Canada in 2019 where performance was below expectation.
Impairment costs of oil and gas properties A non-cash impairment charge of USD 73,143 thousand pre-tax (USD 54,254 thousand after tax) was taken as a result of the impairment testing performed at the year end. The impairment related to the Paris Basin assets in France, as a result of lower oil pricing, the estimated impact of additional transportation costs following the announcement of the closure of the Total operated Grandpuits refinery and the reflection of cessation of production in 2040 in accordance with the French hydrocarbon law.
General, administrative and depreciation expenses General, administrative and depreciation expenses amounted to USD 12,788 thousand for the year ended December 31, 2020, compared to USD 12,042 thousand for the year ended December 31, 2019.

Management’s Discussion and Analysis For the three months ended and year ended December 31, 2020
20
Net financial items Net financial items amounted to a credit of USD 14,987 thousand for the year ended December 31, 2020, compared to USD 18,026 thousand for the year ended December 31, 2019, and included a largely non-cash net foreign exchange gain of USD 13,028 thousand for 2020 compared to a net foreign exchange gain of USD 9,553 thousand for 2019. The foreign exchange movements mainly result from the revaluation of intra-group loan funding balances.
Excluding foreign exchange movements, the net financial items amounted to a charge of USD 28,015 thousand for the year ended December 31, 2020, compared to USD 27,579 thousand for the year ended December 31, 2019.
The interest expense amounted to USD 13,401 thousand for the year ended December 31, 2020, compared to interest expense USD 17,508 thousand for the comparative period in 2019. The comparative interest expense in 2019 includes interest on senior notes acquired on the BlackPearl acquisition and the make whole provision costs when repaying these in Q2 2019.
The unwinding of the asset retirement obligation discount rate amounted to USD 10,837 thousand for the year ended December 31, 2020, compared to USD 10,664 thousand for year ended December 31, 2019.
Income tax The corporate income tax amounted to a credit of USD 33,820 thousand for the year ended December 31, 2020, compared to a charge of USD 19,248 thousand for the year ended December 31, 2019. The income tax movements in 2020 relate to deferred taxes with minimal cash taxes and includes a USD 18,889 thousand deferred tax credit on the impairment charge relating to the Paris Basin assets reflected at the year end,
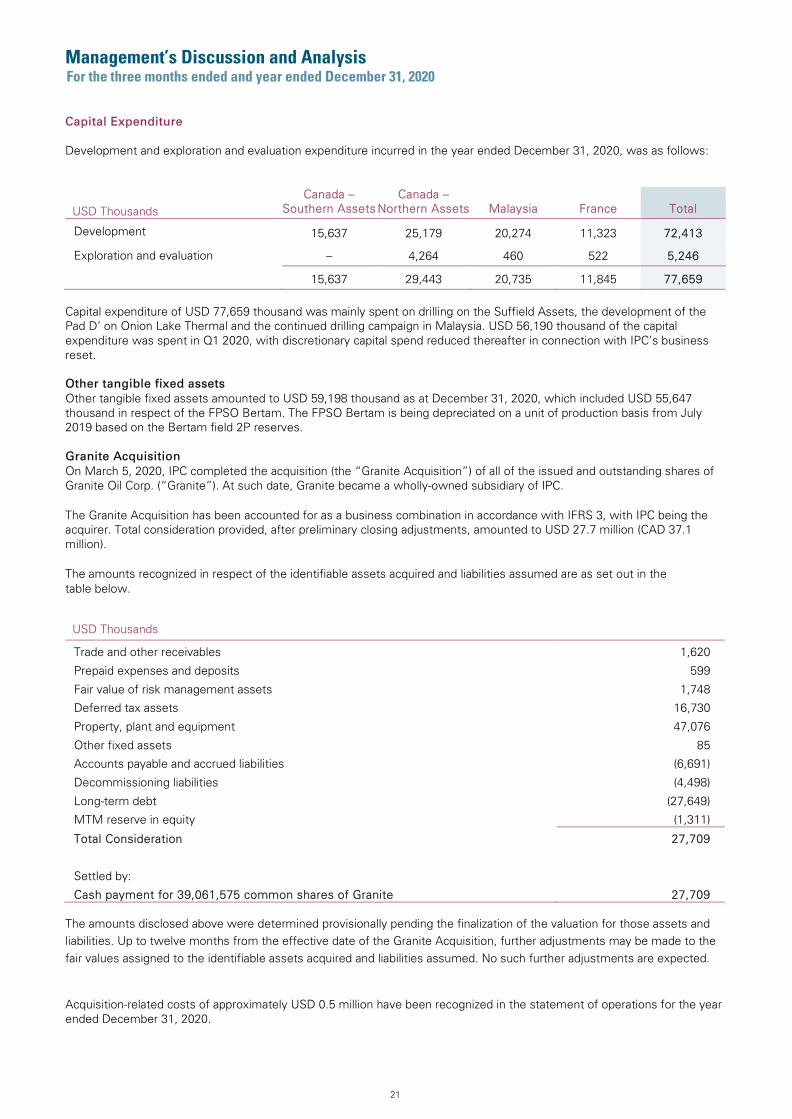
Management’s Discussion and Analysis For the three months ended and year ended December 31, 2020
21
Capital Expenditure
Development and exploration and evaluation expenditure incurred in the year ended December 31, 2020, was as follows:
USD Thousands Canada –
Southern Assets Canada –
Northern Assets Malaysia France Total
Development 15,637 25,179 20,274 11,323 72,413
Exploration and evaluation – 4,264 460 522 5,246
15,637 29,443 20,735 11,845 77,659
Capital expenditure of USD 77,659 thousand was mainly spent on drilling on the Suffield Assets, the development of the Pad D’ on Onion Lake Thermal and the continued drilling campaign in Malaysia. USD 56,190 thousand of the capital expenditure was spent in Q1 2020, with discretionary capital spend reduced thereafter in connection with IPC’s business reset.
Other tangible fixed assets Other tangible fixed assets amounted to USD 59,198 thousand as at December 31, 2020, which included USD 55,647 thousand in respect of the FPSO Bertam. The FPSO Bertam is being depreciated on a unit of production basis from July 2019 based on the Bertam field 2P reserves.
Granite Acquisition On March 5, 2020, IPC completed the acquisition (the “Granite Acquisition”) of all of the issued and outstanding shares of Granite Oil Corp. (“Granite”). At such date, Granite became a wholly-owned subsidiary of IPC.
The Granite Acquisition has been accounted for as a business combination in accordance with IFRS 3, with IPC being the acquirer. Total consideration provided, after preliminary closing adjustments, amounted to USD 27.7 million (CAD 37.1 million).
The amounts recognized in respect of the identifiable assets acquired and liabilities assumed are as set out in the table below.
USD Thousands
Trade and other receivables 1,620
Prepaid expenses and deposits 599
Fair value of risk management assets 1,748
Deferred tax assets 16,730
Property, plant and equipment 47,076
Other fixed assets 85
Accounts payable and accrued liabilities (6,691)
Decommissioning liabilities (4,498)
Long-term debt (27,649)
MTM reserve in equity (1,311)
Total Consideration 27,709
Settled by:
Cash payment for 39,061,575 common shares of Granite 27,709
The amounts disclosed above were determined provisionally pending the finalization of the valuation for those assets and liabilities. Up to twelve months from the effective date of the Granite Acquisition, further adjustments may be made to the fair values assigned to the identifiable assets acquired and liabilities assumed. No such further adjustments are expected.
Acquisition-related costs of approximately USD 0.5 million have been recognized in the statement of operations for the year ended December 31, 2020.

Management’s Discussion and Analysis For the three months ended and year ended December 31, 2020
22
Financial Position and Liquidity
Financing
As at January 1, 2019, the Group had a reserve-based lending credit facility of USD 175 million (the “International RBL”) with a maturity to end June 2022 in connection with its oil and gas assets in France and Malaysia. In addition, the Group had reserve-based lending credit facilities in aggregate of CAD 320 million and outstanding senior secured notes of CAD 75 million in connection with its oil and gas assets in Canada.
In June 2019, the Group combined its reserve-based lending facilities in Canada into one reserve-based lending credit facility of CAD 375 million (the “Canadian RBL”) with a maturity date in May 2021. The senior secured notes of CAD 75 million were fully repaid and cancelled in June 2019, from a drawdown under the Canadian RBL.
In May 2020, IPC entered into a EUR 13 million unsecured credit facility in France (the “France Facility”) under a financial assistance program instituted by the French government. The France Facility has an initial term of 12 months and is extendable by the Group for up to a further five years at IPC’s discretion. IPC intends to extend the France Facility for the additional five years. The France Facility amount was fully drawn as at December 31, 2020 and as at February 9, 2021.
In June 2020, the Group amended and extended the International RBL to a facility size of USD 125 million, with a maturity at the end of December 2024. In July 2020, the facility size was further increased to USD 140 million.
In July 2020, the Group also amended and extended the Canadian RBL to a facility size of CAD 350 million with a maturity extended by 12 months until the end of May 2022. Under the Canadian RBL, the Group is required, and has satisfied the requirement, to hedge 30% of forecast production in Canada (other than in respect of the Ferguson asset) over the period from October 1, 2020 to June 30, 2021.
In March 2020, in connection with the completion of the Granite Acquisition, the Group assumed the bank debt of Granite consisting of a revolving credit facility of CAD 42.5 million (the “Granite Facility”). In December 2020, the Granite Facility was amended to a CAD 30 million revolving credit facility, reducing down to CAD 25 million as at July1, 2021 with a maturity of December 21, 2021. The Granite Facility was drawn as to CAD 29 million as at December 31, 2020. Under the Granite Facility, the Group is required, and has satisfied the current requirement, to hedge 50% of forecast production up to December 31, 2021 in respect of the Ferguson asset.
The borrowing base availability under the International RBL was agreed in December 2020 at USD 102 million of which USD 80 million was drawn as at December 31, 2020. The borrowing base availability under the Canadian RBL was amended in December 2020 to CAD 325 million of which CAD 266 million was drawn as at December 31, 2020.
Total net debt as at December 31, 2020 amounted to USD 321.2 million.
With the exception of the Granite Facility , no facility repayment schedule results in mandatory repayment within the twelve months following December 31, 2020. As such, the amounts drawn under the International RBL, the France Facility and the Canadian RBL as at December 31, 2020 are classified as non-current.
The Group is in compliance with the covenants of the financing facilities as at December 31, 2020.
Cash and cash equivalents held amounted to USD 6,498 thousand as at December 31, 2020. The Corporation holds cash to meet imminent operational funding requirements in the different countries.
Working Capital As at December 31, 2020, the Group had a net negative working capital balance including cash of USD 4,670 thousand compared to a positive working capital balance of USD 12,409 thousand as at December 31, 2019. The difference as at December 31, 2020 from December 31, 2019 is mainly as a result of lower trade receivables due to the lower oil price and the reclassification of the Granite Facility outstanding amount to current liabilities from non-current during the year. The outstanding amount under the Granite Facility as at December 31, 2020 was USD 22,982 thousand and is included in the net debt balance of USD 321.2 million as at December 31, 2020.
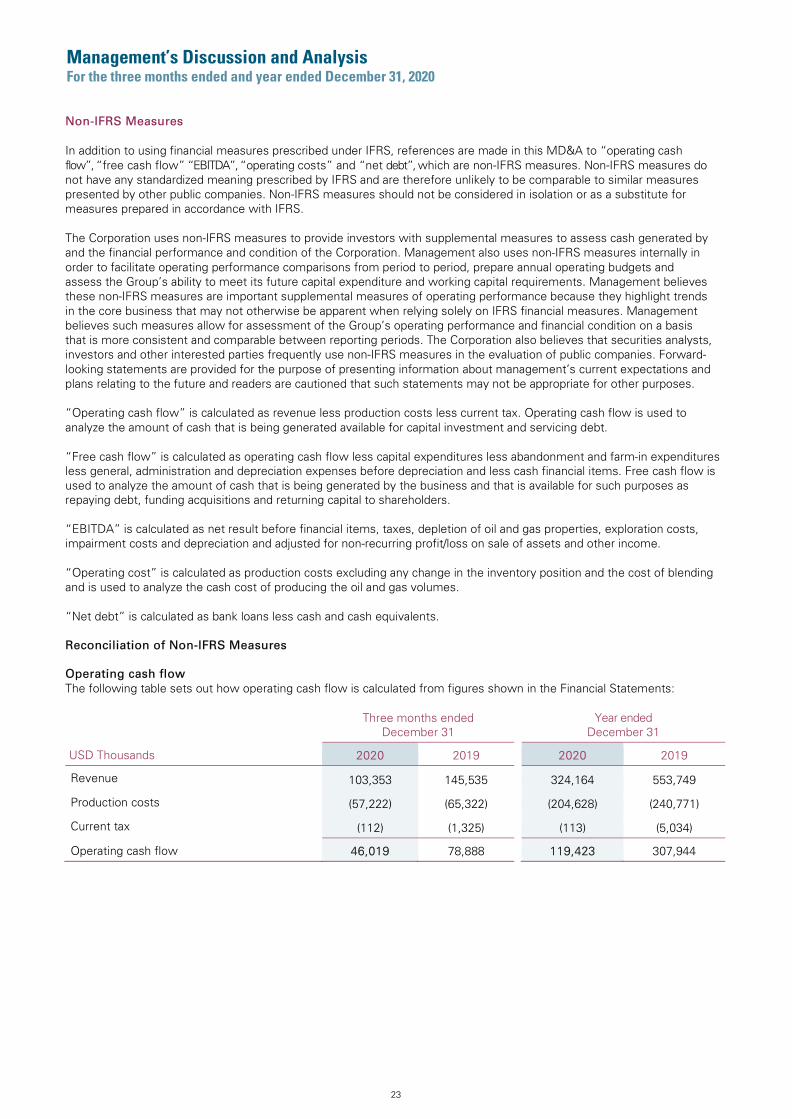
Management’s Discussion and Analysis For the three months ended and year ended December 31, 2020
23
Non-IFRS Measures
In addition to using financial measures prescribed under IFRS, references are made in this MD&A to “operating cash flow”, “free cash flow” “EBITDA”, “operating costs” and “net debt”, which are non-IFRS measures. Non-IFRS measures do not have any standardized meaning prescribed by IFRS and are therefore unlikely to be comparable to similar measures presented by other public companies. Non-IFRS measures should not be considered in isolation or as a substitute for measures prepared in accordance with IFRS.
The Corporation uses non-IFRS measures to provide investors with supplemental measures to assess cash generated by and the financial performance and condition of the Corporation. Management also uses non-IFRS measures internally in order to facilitate operating performance comparisons from period to period, prepare annual operating budgets and assess the Group’s ability to meet its future capital expenditure and working capital requirements. Management believes these non-IFRS measures are important supplemental measures of operating performance because they highlight trends in the core business that may not otherwise be apparent when relying solely on IFRS financial measures. Management believes such measures allow for assessment of the Group’s operating performance and financial condition on a basis that is more consistent and comparable between reporting periods. The Corporation also believes that securities analysts, investors and other interested parties frequently use non-IFRS measures in the evaluation of public companies. Forward-looking statements are provided for the purpose of presenting information about management’s current expectations and plans relating to the future and readers are cautioned that such statements may not be appropriate for other purposes.
“Operating cash flow” is calculated as revenue less production costs less current tax. Operating cash flow is used to analyze the amount of cash that is being generated available for capital investment and servicing debt.
“Free cash flow” is calculated as operating cash flow less capital expenditures less abandonment and farm-in expenditures less general, administration and depreciation expenses before depreciation and less cash financial items. Free cash flow is used to analyze the amount of cash that is being generated by the business and that is available for such purposes as repaying debt, funding acquisitions and returning capital to shareholders.
“EBITDA” is calculated as net result before financial items, taxes, depletion of oil and gas properties, exploration costs, impairment costs and depreciation and adjusted for non-recurring profit/loss on sale of assets and other income.
“Operating cost” is calculated as production costs excluding any change in the inventory position and the cost of blending and is used to analyze the cash cost of producing the oil and gas volumes.
“Net debt” is calculated as bank loans less cash and cash equivalents.
Reconciliation of Non-IFRS Measures
Operating cash flow The following table sets out how operating cash flow is calculated from figures shown in the Financial Statements:
Three months ended December 31
Year ended December 31
USD Thousands 2020 2019 2020 2019
Revenue 103,353 145,535 324,164 553,749
Production costs (57,222) (65,322) (204,628) (240,771)
Current tax (112) (1,325) (113) (5,034)
Operating cash flow 46,019 78,888 119,423 307,944
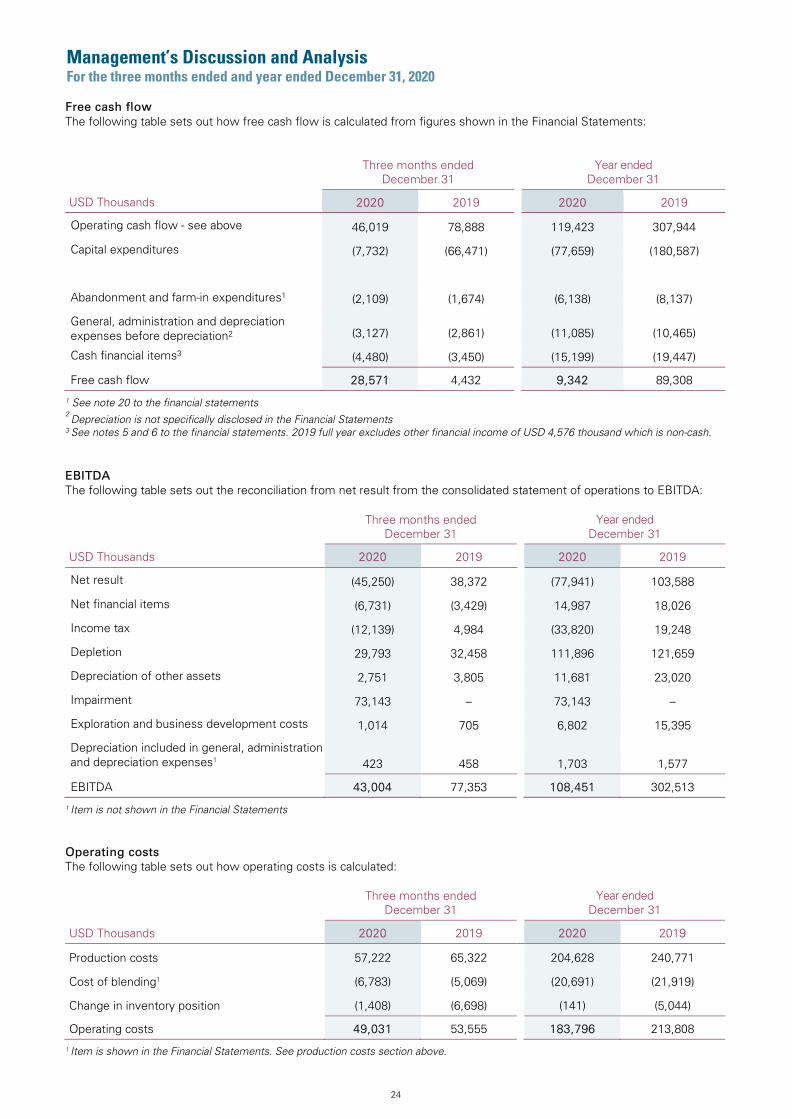
Management’s Discussion and Analysis For the three months ended and year ended December 31, 2020
24
Free cash flow The following table sets out how free cash flow is calculated from figures shown in the Financial Statements:
Three months ended December 31
Year ended December 31
USD Thousands 2020 2019 2020 2019
Operating cash flow - see above 46,019 78,888 119,423 307,944
Capital expenditures (7,732) (66,471) (77,659) (180,587)
Abandonment and farm-in expenditures1 (2,109) (1,674) (6,138) (8,137)
General, administration and depreciation expenses before depreciation2 (3,127) (2,861) (11,085) (10,465)
Cash financial items3 (4,480) (3,450) (15,199) (19,447)
Free cash flow 28,571 4,432 9,342 89,308
1 See note 20 to the financial statements 2 Depreciation is not specifically disclosed in the Financial Statements
3 See notes 5 and 6 to the financial statements. 2019 full year excludes other financial income of USD 4,576 thousand which is non-cash.
EBITDA The following table sets out the reconciliation from net result from the consolidated statement of operations to EBITDA:
Three months ended December 31
Year ended December 31
USD Thousands 2020 2019 2020 2019
Net result (45,250) 38,372 (77,941) 103,588
Net financial items (6,731) (3,429) 14,987 18,026
Income tax (12,139) 4,984 (33,820) 19,248
Depletion 29,793 32,458 111,896 121,659
Depreciation of other assets 2,751 3,805 11,681 23,020
Impairment 73,143 – 73,143 –
Exploration and business development costs 1,014 705 6,802 15,395
Depreciation included in general, administration and depreciation expenses1 423 458 1,703 1,577
EBITDA 43,004 77,353 108,451 302,513
1 Item is not shown in the Financial Statements
Operating costs The following table sets out how operating costs is calculated:
Three months ended December 31
Year ended December 31
USD Thousands 2020 2019 2020 2019
Production costs 57,222 65,322 204,628 240,771
Cost of blending1 (6,783) (5,069) (20,691) (21,919)
Change in inventory position (1,408) (6,698) (141) (5,044)
Operating costs 49,031 53,555 183,796 213,808
1 Item is shown in the Financial Statements. See production costs section above.
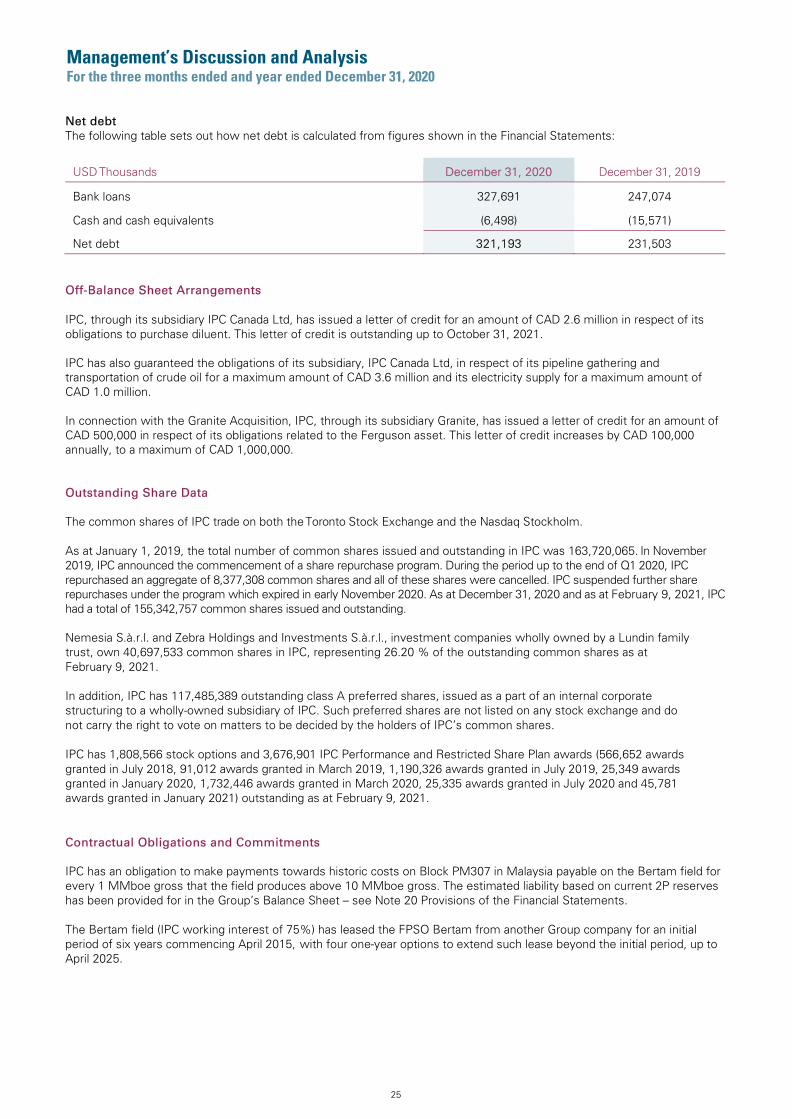
Management’s Discussion and Analysis For the three months ended and year ended December 31, 2020
25
Net debt The following table sets out how net debt is calculated from figures shown in the Financial Statements:
USD Thousands December 31, 2020 December 31, 2019
Bank loans 327,691 247,074
Cash and cash equivalents (6,498) (15,571)
Net debt 321,193 231,503
Off-Balance Sheet Arrangements
IPC, through its subsidiary IPC Canada Ltd, has issued a letter of credit for an amount of CAD 2.6 million in respect of its obligations to purchase diluent. This letter of credit is outstanding up to October 31, 2021.
IPC has also guaranteed the obligations of its subsidiary, IPC Canada Ltd, in respect of its pipeline gathering and transportation of crude oil for a maximum amount of CAD 3.6 million and its electricity supply for a maximum amount of CAD 1.0 million.
In connection with the Granite Acquisition, IPC, through its subsidiary Granite, has issued a letter of credit for an amount of CAD 500,000 in respect of its obligations related to the Ferguson asset. This letter of credit increases by CAD 100,000 annually, to a maximum of CAD 1,000,000.
Outstanding Share Data
The common shares of IPC trade on both the Toronto Stock Exchange and the Nasdaq Stockholm.
As at January 1, 2019, the total number of common shares issued and outstanding in IPC was 163,720,065. In November 2019, IPC announced the commencement of a share repurchase program. During the period up to the end of Q1 2020, IPC repurchased an aggregate of 8,377,308 common shares and all of these shares were cancelled. IPC suspended further share repurchases under the program which expired in early November 2020. As at December 31, 2020 and as at February 9, 2021, IPC had a total of 155,342,757 common shares issued and outstanding.
Nemesia S.à.r.l. and Zebra Holdings and Investments S.à.r.l., investment companies wholly owned by a Lundin family trust, own 40,697,533 common shares in IPC, representing 26.20 % of the outstanding common shares as at February 9, 2021.
In addition, IPC has 117,485,389 outstanding class A preferred shares, issued as a part of an internal corporate structuring to a wholly-owned subsidiary of IPC. Such preferred shares are not listed on any stock exchange and do not carry the right to vote on matters to be decided by the holders of IPC’s common shares.
IPC has 1,808,566 stock options and 3,676,901 IPC Performance and Restricted Share Plan awards (566,652 awards granted in July 2018, 91,012 awards granted in March 2019, 1,190,326 awards granted in July 2019, 25,349 awards granted in January 2020, 1,732,446 awards granted in March 2020, 25,335 awards granted in July 2020 and 45,781 awards granted in January 2021) outstanding as at February 9, 2021.
Contractual Obligations and Commitments
IPC has an obligation to make payments towards historic costs on Block PM307 in Malaysia payable on the Bertam field for every 1 MMboe gross that the field produces above 10 MMboe gross. The estimated liability based on current 2P reserves has been provided for in the Group’s Balance Sheet – see Note 20 Provisions of the Financial Statements.
The Bertam field (IPC working interest of 75%) has leased the FPSO Bertam from another Group company for an initial period of six years commencing April 2015, with four one-year options to extend such lease beyond the initial period, up to April 2025.

Management’s Discussion and Analysis For the three months ended and year ended December 31, 2020
26
Critical Accounting Policies and Estimates
In connection with the preparation of the Corporation’s consolidated financial statements, management has made assumptions and estimates about future events and applied judgments that affect the reported values of assets, liabilities, revenues, expenses and related disclosures. These assumptions, estimates and judgments are based on historical experience, current trends and other factors that they believe to be relevant at the time the financial statements are prepared. The management reviews the accounting policies, assumptions, estimates and judgments to ensure that the financial statements are presented fairly in accordance with IFRS. However, because future events and their effects cannot be determined with certainty, actual results could differ from these assumptions and estimates, and such differences could be material.
Transactions with Related Parties
Lundin Energy (previously “Lundin Petroleum”) has charged the Group USD 679 thousand in respect of office space rental and USD 1,086 thousand in respect of shared services provided during the year 2020. The Group has also charged Lundin Energy USD 150 thousand in relation to services provided during Q4 2020.
All transactions with related parties are in the normal course of business and are made on the same terms and conditions as with parties at arm’s length.
Financial Risk Management
As an international oil and gas exploration and production company, IPC is exposed to financial risks such as interest rate risk, currency risk, credit risk, liquidity risks as well as the risk related to the fluctuation in the oil price. The Group seeks to control these risks through sound management practice and the use of internationally accepted financial instruments, such as oil and gas price, interest rate or foreign exchange hedges as the case may be. Financial instruments will be solely used for the purpose of managing risks in the business. As at December 31, 2020, the Corporation had entered into oil and gas price hedges – see below.
Management believes that the cash resources, other current assets and cash flow from operations are sufficient to finance the Group’s operations and capital expenditures program over the next year.
Capital Management The Group’s objectives when managing capital are to safeguard the Group’s ability to continue as a going concern and to meet its committed financial liabilities and work program requirements in order to create shareholder value. The Group may put in place new credit facilities, repay debt, or pursue other such restructuring activities as appropriate.
Management of the Corporation will continuously monitor and manage the Group’s capital, liquidity and net debt position in order to assess the requirement for changes to the capital structure to meet the objectives and to maintain flexibility.
Price of Oil and Gas Prices of oil and gas are affected by the normal economic drivers of supply and demand as well as by financial investors and market uncertainty. Factors that influence these prices include operational decisions, prices of competing fuels, natural disasters, economic conditions, transportation constraints, political instability or conflicts or actions by major oil exporting countries. Price fluctuations will affect the Group’s financial position.
Based on analysis of the circumstances, the management assesses the benefits of forward hedging monthly sales contracts for the purpose of protecting cash flow. If management believes that a hedging contract will appropriately help manage cash flow then it may choose to enter into a commodity price hedge. In addition, see the Financial Position and Liquidity section above regarding applicable credit facility covenants to hedge future production.
The Group had gas price sale financial hedges outstanding as at December 31, 2020, which are summarized as follows:
Period Volume
(Gigajoules (GJ) per day)
Type Average Pricing
January 1, 2021 – March 31, 2021 5,000 AECO Swap CAD 3.06/GJ April 1, 2021 – June 30, 2021 40,000 AECO Swap CAD 2.49/GJ July 1, 2021 – September 30, 2021 20,000 AECO Swap CAD 2.53/GJ October 1, 2021 – October 31, 2021 15,000 AECO Swap CAD 2.52/GJ

Management’s Discussion and Analysis For the three months ended and year ended December 31, 2020
27
The Group had oil price sales hedges outstanding as at December 31, 2020, which are summarized as follows:
Period Volume (barrels per day)
Type Average Pricing
January 1, 2021 – March 31, 2021 2,200 WCS Swap USD 27.28/bbl
April 1, 2021 – June 30, 2021 2,150 WCS Swap USD 27.99/bbl
January 1, 2021 – June 30, 2021 300 WTI Collar USD 35/bbl - 45.83/bbl
February 1, 2021 – March 31, 2021 300 WCS/WTI Differential USD 14.78/bbl
April 1, 2021 – June 30, 2021 300 WCS/WTI Differential USD 14.65/bbl
All of the above hedges are treated as effective and changes to the fair value are reflected in other comprehensive income.
These hedges had a net negative fair value of USD 1,155 thousand at December 31, 2020.
Currency Risk The Group’s policy on currency rate hedging is, in the case of currency exposure, to consider fixing the rate of exchange. The Group will take into account the currency exposure, current rates of exchange and market expectations in comparison to historic trends and volatility in making the decision to hedge.
Interest Rate Risk Interest rate risk is the risk to earnings due to uncertain future interest rates on borrowings. The Group will take into account the level of external debt, current interest rates and market expectations in comparison to historic trends and volatility in making the decision to hedge.
Credit Risk The Group may be exposed to third party credit risk through contractual arrangements with counterparties who buy the Group’s hydrocarbon products. The Group’s policy is to limit credit risk by only entering into oil and gas sales agreements with reputable and creditworthy oil and gas and trading companies. Where it is determined that there is a credit risk for oil and gas sales, the Group’s policy is to require credit enhancement from the purchaser.
The Group’s policy on joint venture parties is to rely on the provisions of the underlying joint operating agreements to take possession of the licence or the joint venture partner’s share of production for non-payment of cash calls or other amounts due. In addition, cash is to be held and transacted only through major banks.
RISK AND UNCERTAINTIES
IPC is engaged in the exploration, development and production of oil and gas and its operations are subject to various risks and uncertainties which include but are not limited to those listed below. The risks and uncertainties below are not the only ones that the Group faces. Additional risks and uncertainties not presently known to the Group or that the Group currently considers immaterial may also impair the business and operations of the Group and cause the price of the IPC’s shares to decline. If any of the following risks actually occur, the Group’s business may be harmed and the financial condition and results of operations may suffer significantly.
See also “Cautionary Statement Regarding Forward-Looking Information” and “Reserves and Resource Advisory” in this MD&A.
The Covid-19 virus and the restrictions and disruptions related to it have had a drastic adverse effect on the world demand for, and prices of, oil and gas as well as the market price of the shares of oil and gas companies generally, including the Corporation’s common shares. There can be no assurance that these adverse effects will not continue or that commodity prices will not decrease or remain volatile in the future. These factors are beyond the control of the Corporation and it is difficult to assess how these, and other factors, will continue to affect the Corporation and the market price of IPC’s common shares. In light of the current situation, as at the date of this MD&A, the Corporation continues to review and assess its business plans and assumptions regarding the business environment, as well as its estimates of future production, cash flows, operating costs and capital expenditures.
The current and any future Covid-19 outbreaks may increase IPC’s exposure to, and magnitude of, each of the risks and uncertainties identified below that result from a reduction in demand for oil and gas consumption and/or lower commodity prices and/or reliance on third parties. The extent to which Covid-19 impacts IPC’s business, results of operations and financial condition will depend on future developments, which are highly uncertain and are difficult to predict, including, but not limited to, the duration and spread of the current and any future Covid-19 outbreaks, their severity, the actions taken to contain such outbreaks or treat their impact, and how quickly and to what extent normal economic and operating conditions resume and their impacts to IPC’s business, results of operations and financial condition which could be more significant in upcoming periods as compared with previous periods. Even after the Covid-19 outbreaks have subsided, IPC may continue to experience materially adverse impacts to IPC’s business as a result of the global economic impact.

28
Management’s Discussion and Analysis For the three months ended and year ended December 31, 2020
Non Financial Risks
Exploration, Development and Production Risks: Oil and natural gas operations involve many risks that even a combination of experience, knowledge and careful evaluation may not be able to overcome. The long-term commercial success of the Group depends on its ability to find, acquire, develop and commercially produce oil and natural gas reserves. Without the continual addition of new reserves, any existing reserves associated with the Group’s oil and gas assets at any particular time, and the production therefrom, will decline over time as such existing reserves are exploited. There is a risk that additional commercial quantities of oil and natural gas will not be discovered or acquired by the Group. Production delays and declines from normal field operating conditions cannot be eliminated and can be expected to adversely affect revenue and cash flow levels to varying degrees.
Future oil and gas development may involve unprofitable efforts, not only from dry wells, but also from wells that are productive but do not produce sufficient petroleum substances to return a profit after drilling, operating and other costs. Completion of a well does not assure a profit on the investment or recovery of drilling, completion and operating costs. In addition, drilling hazards or environmental damage could greatly increase the cost of operations, and various field operating conditions may adversely affect the production from successful wells. These conditions include delays in obtaining governmental approvals or consents, shut-ins of connected wells resulting from extreme weather conditions, insufficient storage or transportation capacity or other geological and mechanical conditions. Production delays and declines from normal field operating conditions cannot be eliminated and can be expected to adversely affect revenue and cash flow levels to varying degrees. In addition, the Covid-19 virus, and the restrictions and disruptions related to it, may cause production delays and interruptions which could have adverse effects on the Corporation, its revenues and cash flows and the market price of the Corporation’s common shares.
Oil and natural gas exploration, development and production operations are subject to all the risks and hazards typically associated with such operations, including hazards such as fire, explosion, blowouts, cratering, sour gas releases and spills, each of which could result in substantial damage to oil and natural gas wells, production facilities, other property and the environment or personal injury. In accordance with industry practice, the Group will not fully insure against all of these risks, nor are all such risks insurable. The Group maintains liability insurance in an amount that it considers consistent with industry practice. Due to the nature of these risks, however, there is a risk that such liabilities could exceed policy limits, in which event the Group could incur significant costs.
Volatility in Oil and Gas Commodity Prices: The marketability and price of oil and natural gas that may be acquired or discovered by the Corporation is and will continue to be affected by numerous factors beyond its control. The Corporation’s ability to market its oil and natural gas may depend upon its ability to acquire space on pipelines that deliver oil and natural gas to commercial markets. The Corporation may also be affected by deliverability uncertainties related to the proximity of its reserves to pipelines and processing and storage facilities and operational problems affecting such pipelines and facilities as well as extensive government regulation relating to price, taxes, royalties, land tenure, allowable production, the export of oil and natural gas and many other aspects of the oil and natural gas business.
Prices for oil and gas are subject to large fluctuations in response to relatively minor changes in the supply of and demand for oil and gas, market uncertainty and a variety of additional factors beyond the control of the Corporation. These factors include economic conditions in Europe, Asia, the United States, Canada and elsewhere, the actions of OPEC, governmental regulation, political instability in the Middle East and elsewhere, the foreign supply of oil and gas, risks of supply disruption, the price of foreign imports, the availability of alternative fuel sources and the potential for increased supply of oil and gas for unconventional shale oil and shale gas and other services.
The Covid-19 virus and the restrictions and disruptions related to it have had a drastic adverse effect on the world demand for, and prices of, oil and gas as well as the market price of the shares of oil and gas companies generally, including the Corporation’s common shares. There can be no assurance that these adverse effects will not continue or that commodity prices will not decrease or remain volatile in the future. These factors are beyond the control of the Corporation and it is difficult to assess how these, and other factors, will continue to affect the Corporation and the market price of the Corporation’s common shares.
Oil and natural gas prices have fluctuated widely during recent years and may continue to be volatile in the future. Any substantial and extended decline in the price of oil and gas would have an adverse effect on the carrying value of the reserves and resources, borrowing capacity, revenues, profitability and cash flows associated with operation of the Group’s assets and may have a material adverse effect on the business, financial condition, results of operations and prospects associated with the Group’s assets.
The Group’s financial performance also depends on revenues from the sale of commodities which differ in quality and location from underlying commodity prices quoted on financial exchanges. Of particular importance are the price differentials in Canada between the Group’s heavy crude oil (in particular the heavy crude oil differential) and quoted market prices. The market price for heavy crude oil and bitumen in Canada is generally lower than market prices for light oil, due principally to the higher costs associated with refining a barrel of heavy crude oil and higher transportation costs (diluent is required to be purchased and blended with heavy crude oil to transport on most pipelines). Heavy crude oil differentials are also influenced by other factors such as capacity and interruptions, refining demand and the quality of the oil produced, all of which are beyond the Group’s control. It is difficult to predict future price differentials and any increase in heavy crude oil differentials could have an adverse effect on the Group’s business, financial condition, results of operations and cash flows.

29
Management’s Discussion and Analysis For the three months ended and year ended December 31, 2020
In order to transport crude oil production in Canada to sales markets, the Group is required to meet certain pipeline specifications. Heavy crude oil and bitumen is usually blended with a lighter hydrocarbon (commonly referred to as diluent) to increase its flow characteristics. The cost of diluent is generally correlated to crude oil prices. A shortfall in the supply of diluent may cause its price to increase which would adversely affect the Group’s financial position and cash flow.
Climate Change: Physical climate change related risks can be event-driven with increased severity of extreme weather events, such as cyclones, hurricanes, or floods, or long-term shifts in climate patterns with sustained higher temperatures or sea level rise. These physical risks may have financial and operational implications for the Corporation, such as direct damage to assets and indirect impacts from supply chain disruption.
Reputational risks arise from the surge of societal pressure on the fossil fuel industry in relation to its contribution to global greenhouse gas emissions. Maintaining a positive reputation in the eyes of investors, regulators, communities, employees and the general public is an important aspect for the success of the Corporation. Negative impact on the industry and the Corporation’s reputation could result in the long-term delays in obtaining regulatory approvals, increased operating costs, lower shareholder confidence, or availability of insurance and financing.
Regulatory climate change related risks arise from increased environmental regulation. A breach of such regulations may result in the imposition of fines or issuance of clean up orders in respect of the Group or the Group’s assets, some of which may be material. Furthermore, management of the Corporation believes the political climate appears to favour new programs for environmental laws and regulation, particularly in relation to the reduction of emissions or emissions intensity. There is a risk that any such programs, laws or regulations, if proposed and enacted, may contain emission reduction targets which will require substantial capital investments to adapt processes in place or lead to financial penalties or charges as a result of the failure to meet such targets.
Climate change policy is evolving at regional, national and international levels, and political and economic events may significantly affect the scope and timing of climate change measures that are ultimately put in place. Implementation of strategies by any level of government within the countries in which the Corporation operates, and whether to meet international agreed limits, or as otherwise determined, for reducing greenhouse gases could have a material impact on the operations and financial condition of the Corporation. In addition, concerns about climate change have resulted in a number of environmental activists and members of the public opposing the continued exploitation, transportation and development of fossil fuels. Given the evolving nature of the debate related to climate change and the control of greenhouse gases and resulting requirements, it is not possible to predict the impact on the Group and its operations and financial condition.
For example, emission and carbon tax regulations in Canada are evolving and as these regulations are established or amended, they may have an impact on organizations involved in heavy oil production. It is difficult to assess the overall impact these regulations will have on the Group at this time but it could result in increased costs to comply, delays in having projects approved and potentially a reduction in demand for oil from these regions, all of which could have a material negative impact on the Group’s business.
Operational Risks Relating to Facilities and Pipelines: The pipelines and facilities associated with the Group’s assets, including the FPSO Bertam, are exposed to operational risks that can lead to hydrocarbon releases, production interruptions and unplanned outages. Other operating risks relating to the facilities and pipelines associated with the Group’s assets include: the breakdown or failure of equipment; issues and failures affecting the FPSO Bertam; breakdown or malicious attacks on information systems or processes; the performance of equipment at levels below those originally intended; operator error; disputes and other issues with interconnected facilities; and catastrophic events such as natural disasters, fires, explosions, fractures, acts of terrorists and saboteurs and other similar events, many of which will be beyond the control of the Group. In addition, the Covid-19 virus, and the restrictions and disruptions related to it, may cause production delays and interruptions which could have adverse effects on the Corporation, its revenues and cash flows and the market price of the Corporation’s common shares. The occurrence or continuance of any of these or other operational events could curtail sales or production or materially increase the cost of operating the facilities and pipelines associated with the Group’s oil and gas assets and reduce revenues accordingly.
The Group’s financial performance is significantly affected by the cost of operating and the capital costs associated with its assets. Operating and capital costs are affected by a number of factors including, but not limited to inflationary price pressure, scheduling delays, failure to maintain quality construction standards and supply chain disruptions. Electricity, chemicals, supplies, abandonment, reclamation and labour costs are examples of operating costs that are susceptible to significant fluctuations. Fluctuations in operating and capital costs could negatively impact the Group’s business, financial condition, results of operations, cash flows and value of it oil and gas reserves.
Uncertainties Associated with Estimating Reserves and Resources Volumes: There are numerous uncertainties inherent in estimating quantities of oil and natural gas reserves and resources (contingent and prospective) and the future cash flows attributed to such reserves and resources. The cash flow information associated with reserves and resources set forth herein are estimates only. The actual production, revenues, taxes and development and operating expenditures with respect to the reserves and resources associated with the Group’s assets will vary from estimates thereof and such variations could be material. Estimates of reserves that may be developed and produced in the future are often based upon volumetric calculations and upon analogy to similar types of reserves rather than actual production history. There is uncertainty that it will be commercially viable to produce any portion of the contingent resources.

Management’s Discussion and Analysis For the three months ended and year ended December 31, 2020
30
In accordance with applicable securities laws, the Corporation and the Corporation’s independent reserves auditors have used forecast prices and costs in estimating the reserves, resources and future net cash flows as summarized herein. Actual future net cash flows will be affected by other factors, such as actual production levels, supply and demand for oil and natural gas, curtailments or increases in consumption by oil and natural gas purchasers, changes in governmental regulation or taxation and the impact of inflation on costs.
References to “contingent resources” do not constitute, and should be distinguished from, references to “reserves”. References to “prospective resources” do not constitute, and should be distinguished from, references to “contingent resources” and “reserves”. This MD&A contains estimates of the net present value of the future net revenue from IPC's reserves. The estimated values of future net revenue disclosed in this MD&A do not represent fair market value. There is no assurance that the forecast prices and cost assumptions used in the reserve evaluations will be attained and variances could be material. See also “Reserves and Resource Advisory” below.
SAGD Recovery Process: The Group has implemented a SAGD recovery process at the Onion Lake Thermal project and would use the SAGD process at the Blackrod project. The SAGD recovery process requires a significant amount of natural gas or other fuels to produce steam for use in the recovery process. The amount of steam required in the production process can vary and impact costs significantly. The quality and performance of the reservoir can impact the timing, cost and levels of production using this technology. There can be no assurance that the Group’s operations will produce at the expected levels or on schedule.
In addition, a significant amount of water is used in SAGD operations. Government regulations apply to access to and use of water. Any shortages in water supplies could lead to increased costs and have a material adverse effect on results of operation and financial condition.
Regulatory Approvals and Compliance and Changes in Legislation and the Regulatory Environment: Oil and natural gas operations (including exploration, development, production, pricing, marketing and transportation) are subject to extensive controls and regulations imposed by various levels of government, which may be amended from time to time. Governments may regulate or intervene with respect to exploration, production and abandonment activities, price, taxes, royalties and the exportation of oil and natural gas. The implementation of new regulations or the modification of existing regulations affecting the oil and natural gas industry could reduce demand for crude oil and natural gas and increase the costs associated with the Group’s oil and gas assets, any of which may have a material adverse effect on the business, financial condition, results of operations and prospects of the Group’s oil and gas assets. In order to conduct oil and gas operations, the Group will require regulatory permits, licences, registrations, approvals, authorizations and concessions from various governmental authorities. There is a risk that the permits, licences, registrations, approvals, authorizations and concessions currently granted to the Group (including, for example, the Malaysian flagging status for the FPSO Bertam) will not be renewed or that the Group will be unable to obtain all of the permits, licences, registrations, approvals, authorizations and concessions that may be required to conduct operations that it may wish to undertake.
The French government has enacted legislation to cease granting new petroleum exploration licenses in France and to restrict the production of oil and gas under existing production licenses in France from 2040. The Group continues to work closely with other industry participants and the French authorities with respect to this legislation.
In Alberta, the oil and gas regulatory authorities have implemented regulations regarding the ability to transfer leases, licenses, permits, wells and facilities between parties. These authorities have increased the minimum abandonment liability rating of the buyer before they will accept a transfer of oil and gas assets. These regulations may make it difficult and costly for producers, such as IPC, to transfer or sell assets to other parties.
Aboriginal Land Claims in Canada: In Canada, aboriginal groups have filed claims in respect of their aboriginal and treaty rights against the federal and certain provincial governments, as well as private individuals and companies. The Group is not aware of any claims made with respect to its properties or assets; however; if a claim arose and was successful, it may have a material adverse effect on the Group’s business, financial condition, results of operation and prospects. The majority of the Group’s interests at Onion Lake are situated on traditional reserve lands and are subject to the federal rules and regulations of Indian Oil and Gas Canada as well as of the Onion Lake Cree Nation of Saskatchewan/Alberta. There are risks associated with the management of the Group’s interests on these lands, including access and lease terms.
Change of Control under Licences: Certain of the licence areas associated with the Group’s oil and gas assets, including in France and in Canada, require government consent or compliance with regulations imposed by oil and gas regulatory authorities to effect a change of control of the owner or an assignment of the ownership interest in the licence area. There may also be contractual restrictions on assignment and change of control, including in the Suffield area of Canada where certain operations are conducted within a Canadian Forces Base under access agreements with Canadian federal government and the Alberta provincial government. Accordingly, should the ownership interest in these licence areas be reduced or if there is a change of control of the Corporation, consent may be required in order to remain in compliance with the applicable licences and concessions. The failure to obtain such consent may have a material adverse effect on the Corporation. Further, the requirement to obtain such consent may limit the ability of a third party to effect a change of control transaction with the Corporation.

31
Management’s Discussion and Analysis For the three months ended and year ended December 31, 2020
Failure to Realize Anticipated Benefits of Acquisitions and Dispositions: The Group may make acquisitions and dispositions of businesses and assets in the ordinary course of business, including the recent acquisitions of the Suffield assets, BlackPearl and Granite. Achieving the benefits of acquisitions depends in part on successfully consolidating functions and integrating operations and procedures in a timely and efficient manner as well as the Group’s ability to realize the anticipated growth opportunities and synergies from combining the acquired businesses and operations with those of the Group. In addition, non-core assets may be periodically disposed of, so that the Group can focus its efforts and resources more efficiently. Depending on the state of the market for such non-core assets, certain non-core assets of the Group, if disposed of, could be expected to realize less than their carrying value on the financial statements of the Group.
Reliance on Third-Party Operators: The Group has partners in many of the licence, lease and PSC areas associated with the Group’s assets. In some cases, including in the Aquitaine Basin in France, the Group is not the operator of the licence and concession areas and must depend on the competence, expertise, judgment and financial resources (in addition to those of its own and, where relevant, other partnership and joint venture companies) of the partner operator and the operator’s compliance with the terms of the licences, leases, PSCs and contractual arrangements. Mismanagement of licence areas by the Group’s partner operators or defaults by them in meeting required obligations may result in significant exploration, production or development delays, losses or increased costs to the Group. In addition, the Covid-19 virus, and the restrictions and disruptions related to it, may adversely affect third-party operators which could have adverse effects on the Corporation, its revenues and cash flows and the market price of the Corporation’s common shares.
Reliance on Third-Party Infrastructure: The Group delivers the products associated with the Group’s assets by gathering, processing and pipeline systems, some of which it does not own. The amount of oil and natural gas that the Group is able to produce and sell is subject to the accessibility, availability, proximity and capacity of these gathering, processing and pipeline systems. The lack of availability of capacity in any of the gathering, processing and pipeline systems, and in particular the processing facilities (for example, Total announced in Q3 2020 that Total is ceasing crude oil transportation, storage and refining operations at the Grandpuits refinery in the Paris Basin, France), could result in the Corporation’s inability to realize the full economic potential of its production or in a reduction of the price offered for the Corporation’s production or increased operating or transportation costs. Any significant change in market factors or other conditions affecting these infrastructure systems and facilities, as well as any delays in constructing new infrastructure systems and facilities could harm the Group’s business financial condition, results of operations, cash flows and future prospects. In addition, the Covid-19 virus, and the restrictions and disruptions related to it, may adversely affect third-party infrastructure which could have adverse effects on the Corporation, its revenues and cash flows and the market price of the Corporation’s common shares.
Credit Facilities: The Group is party to credit facilities with international financial institutions. The terms of these facilities contain operating and financial covenants and restrictions on the ability of the Group to, among other things, incur or lend additional debt, pay dividends and make restricted payments, encumber its assets, sell assets and enter into certain merger or consolidation transactions. The failure of the Group to comply with the covenants contained in these facilities could result in an event of default, which could, through acceleration of debt, enforcement of security or otherwise, materially and adversely affect the operating results and financial condition of the Group.
In addition, the maximum amount that the Group is permitted to borrow under its credit facilities is subject to periodic review by the lenders. The Group’s lenders generally review its oil and gas production and reserves, forecast oil and gas prices, general business environment and other factors to establish the amount which the Group is entitled to borrow. In the event the lenders decide to reduce the amount of credit available under the senior credit facilities, the Group may be required to repay all or a portion of the amounts owing thereunder. The Covid-19 virus and the restrictions and disruptions related to it have had a drastic adverse effect on the world demand for, and prices of, oil and gas. There can be no assurance that these adverse effects will not continue or that commodity prices will not decrease or remain volatile in the future. These factors are beyond the control of the Corporation and it is difficult to assess how these, and other factors, will continue to affect the Corporation and its access to credit facilities and other debt instruments.
Competition for Resources and Markets: The international petroleum industry is competitive in all its phases. The Group competes with numerous other organizations in the search for, and the acquisition of, oil and natural gas properties and in the marketing of oil and natural gas. The Corporation’s competitors include oil and natural gas companies that may have substantially greater financial resources, staff and facilities than those of the Corporation. The Corporation’s ability to increase its reserves and resources in the future depends not only on its ability to explore and develop its present properties, but also on its ability to select and acquire other suitable producing properties or prospects for exploratory and development drilling. Competitive factors in the distribution and marketing of oil and natural gas include price and methods and reliability of delivery and storage. Competition may also be presented by alternate fuel sources.
Marketing: A decline in the Group’s ability to market oil and gas production could have a material adverse effect on its production levels or on the price that the Group receives for production, which in turn may affect the financial condition of the Corporation and the market price of the Corporation’s common shares. IPC’s business depends in part upon the availability, proximity and capacity of oil and gas gathering systems, pipelines and processing facilities (for example, the Total-operated Grandpuits facility which is ceasing crude oil transportation, storage and refining operations) as well as, potentially, rail loading facilities and railcars. Applicable regulation of oil and gas production, processing and transportation, tax and energy policies, general economic conditions, and changes in supply and demand could adversely affect IPC’s ability to produce and market oil and gas. If market factors change and inhibit the marketing of production, overall production or realized prices may decline, which may affect the financial condition of the Corporation and the market price of the Corporation’s common shares.
32
Management’s Discussion and Analysis For the three months ended and year ended December 31, 2020
Hedging Strategies: From time to time, the Group may enter into agreements to receive fixed prices on its oil and natural gas production to offset the risk of revenue losses if commodity prices decline; however, if commodity prices increase beyond the levels set in such agreements, the Group will not benefit from such increases. In addition, the Group may be subject to minimum hedging requirements under its credit facilities. Similarly, from time to time, the Group may enter into agreements to fix the exchange rate of certain currencies. However, if a currency declines in value compared to another currency, the operation of the Group’s assets will not benefit from the fluctuating exchange rate if an agreement has fixed such exchange rate.
Fraud, Bribery and Corruption: The operations relating to the Group’s oil and gas assets are governed by the laws of many jurisdictions, which generally prohibit bribery and other forms of corruption. While the Corporation has implemented an anti-corruption compliance program across the Group, the Corporation cannot guarantee that the Group’s employees, officers, directors, agents, or business partners have not in the past or will not in the future engage in conduct undetected by the processes and procedures to be adopted by the Corporation and for which the Corporation might be held liable under applicable anti-corruption laws. Despite the Corporation’s compliance program and other related training initiatives, it is possible that the Corporation, or some of its subsidiaries, employees or contractors, could be subject to an investigation related to charges of bribery or corruption as a result of the unauthorized actions of its employees or contractors, which could result in significant corporate disruption, onerous penalties and reputational damage.
Decommissioning, Abandonment and Reclamation Costs: The Group is responsible for compliance with all applicable laws, regulations and contractual requirements regarding the decommissioning, abandonment and reclamation of the Group’s assets at the end of their economic life, the costs of which may be substantial. It is not possible to predict these costs with certainty since they will be a function of requirements at the time of decommissioning, abandonment and reclamation and the actual costs may exceed current estimates. Laws, regulations and contractual requirements with regard to abandonment and decommissioning may be implemented or amended in the future.
Third-Party Credit Risk: The Group may be exposed to third party credit risk through the contractual arrangements associated with the Group’s assets with its current or future joint venture partners, marketers of its petroleum and natural gas production, third party uses of its facilities and other parties. In the event such entities fail to meet their contractual obligations in respect of the Group’s assets, such failures may have a material adverse effect on the Group’s business, financial condition, results of operations and prospects.
Repatriation of Earnings: A portion of the revenue-generating operations of the Group’s assets is located in Malaysia. In December 2016, the Central Bank of Malaysia implemented measures to facilitate its management of foreign exchange risk. These rules to date have not had a material adverse effect on the Group, but there is a risk that the Central Bank of Malaysia or another authority may implement further measures that will restrict the future repatriation of earnings.
Expiration and Renewal of Licences, Leases and Production Sharing Contracts: Certain properties constituting the Group’s oil and gas assets are held in the form of licences, leases and PSCs. If the holder of the licence, lease or PSC or the operator of the licence, lease or PSC fails to meet the specific requirement of a licence, lease or PSC, including compliance with environmental, health and safety requirements, the licence, lease or PSC may terminate or expire. There is a risk that the obligations required to maintain each licence, lease or PSC will not be met. The termination or expiration of the licence, lease or PSC, or the working interests relating to a licence may have a material adverse effect on the business, financial condition, results of operations and prospects associated with the Group’s oil and gas assets. From time to time, the licences and leases may, in accordance with their terms, become due for renewal; there is a risk that these licences, leases and PSCs associated with the Group’s oil and gas assets will not be renewed by the relevant government authorities, on terms that will be acceptable to the Corporation. There also can be significant delay in obtaining licence renewals which may already affect the operations associated with the Group’s oil and gas assets.
Litigation: In the normal course of the Group’s operations, it may become involved in, named as a party to, or be the subject of, various legal proceedings. The outcome of outstanding, pending or future proceedings cannot be predicted with certainty and may be determined adversely to the Group and as a result, could have a material adverse effect on the Group’s assets, liabilities, business, financial condition and results of operations.
Economic and Political Developments in Countries in which the Group Operates: International operations are subject to political, economic and other uncertainties. The Group’s assets could also be adversely affected by changes in applicable laws and policies of Canada, Malaysia and France (including relating to the Covid-19 virus), which could have a negative impact on the Group.
In response to the Covid-19 virus, there are public health restrictions and other related disruptions which could have adverse effects on the business and operations of the Corporation, including production delays or interruptions. These factors are beyond the control of the Corporation and it is difficult to assess how these, and other factors, will continue to affect the Corporation and the market price of the Corporation’s common shares. In light of the current situation, as at the date of this MD&A, the Corporation continues to review and assess its business plans and assumptions regarding the business environment, as well as its estimates of future production, cash flows, operating costs and capital expenditures.
Terrorism and Sabotage: If any of the properties, wells or facilities comprising the Group’s assets is the subject of terrorist attack or sabotage, it may have a material adverse effect on the Group's business, financial condition, results of operations, cash flows and future prospects.

Management’s Discussion and Analysis For the three months ended and year ended December 31, 2020
33
Information Security: The Group is heavily dependent on its information systems and computer based programs. Failure, malfunction or security breaches by computer hackers and cyberterrorists of any such systems or programs may have a material adverse effect on the Group’s business and systems, potentially affecting network assets and people’s privacy.
The Group manages cyber security risk by ensuring appropriate technologies, processes and practices are effectively designed and implemented to help prevent, detect and respond to threats as they emerge and evolve. The primary risks to the Group include, loss of data, destruction or corruption of data, compromising of confidential customer or employee information, leaked information, disruption of business, theft or extortion of funds, regulatory infractions, loss of competitive advantage and reputational damage.
Potential Conflicts of Interest: Certain of the individuals who are directors of the Corporation are also directors of other oil and gas companies and as such may, in certain circumstances, have a conflict of interest requiring them to abstain from certain decisions.
Significant Shareholder: Nemesia S.à.r.l. and Zebra Holdings and Investments S.à.r.l., investment companies wholly owned by a Lundin family trust (the “Trust Entities”), own approximately 26 % of the aggregate voting shares of the Corporation. The Trust Entities’ holdings may allow them to significantly affect substantially all the actions taken by the shareholders of the Corporation, including the election of directors. As long as the Trust Entities maintain a significant interest in the Corporation, it is likely that the Trust Entities will exercise significant influence on the ability of the Corporation to, among other things, amend the articles of the Corporation, enter into a change in control transaction of the Corporation that might otherwise be beneficial to its shareholders and may also discourage acquisition bids for the Corporation. There is a risk that the interests of the Trust Entities will not be aligned with the interests of other shareholders.
Financial Risks
Management Estimates and Assumptions: In preparing consolidated financial statements in conformity with IFRS, estimates and assumptions are used by management in determining the reported amounts of assets and liabilities, revenues and expenses recognized during the periods presented and disclosures of contingent assets and liabilities known to exist as of the date of the financial statements. These estimates and assumptions must be made because certain information that is used in the preparation of such financial statements is dependent on future events, cannot be calculated with a high degree of precision from data available, or is not capable of being readily calculated based on generally accepted methodologies. In some cases, these estimates are particularly difficult to determine and the Corporation must exercise significant judgment. Actual results for all estimates could differ materially from the estimates and assumptions used by the Corporation, which could have a material adverse effect on the Group's business, financial condition, results of operations, cash flows and future prospects.
Disclosure Controls and Procedures and Internal Controls over Financial Reporting: Effective disclosure controls and procedures and internal controls over financial reporting are necessary for the Corporation to provide reliable financial and other disclosures and to help prevent fraud. The Corporation cannot be certain that the procedures it undertakes to help ensure the reliability of its financial reports and other disclosures, including those imposed on it under Canadian securities laws, will ensure that it maintains adequate control over financial processes and reporting. Failure to implement required new or improved controls, or difficulties encountered in their implementation, could harm the Group’s results of operations or cause it to fail to meet its reporting obligations. If the Corporation or its independent auditor discover a material weakness, the disclosure of that fact, even if quickly remedied, could reduce the market’s confidence in the Corporation’s consolidated financial statements and harm the trading price of the common shares.
Income Taxes: Income tax laws relating to the oil and gas industry, such as the treatment of resource taxation or dividends, may in the future be changed or interpreted in a manner that adversely affects the Group’s assets. Furthermore, there is a risk that the relevant tax authorities will not agree with management’s calculation of the income for tax purposes associated with the Group’s assets or that such tax authorities will change their administrative practices to the detriment of the Corporation. In the event of a successful reassessment of the Corporation’s income tax returns, such reassessment may have an impact on current and future taxes payable.
Additional Funding Requirements: The Corporation’s cash flow from its reserves may not be sufficient to fund its ongoing activities at all times. From time to time, the Corporation may require additional financing in order to carry out its oil and gas acquisition, exploration and development activities. Failure to obtain such financing on a timely basis could cause the Corporation to forfeit its interest in certain properties, miss certain acquisition opportunities and reduce or terminate its operations. If the Corporation’s revenues from its reserves decrease as a result of lower oil and natural gas prices or otherwise, it will affect the Corporation’s ability to expend the necessary capital to replace its reserves or to maintain its production. If the Corporation’s funds from operations is not sufficient to satisfy its capital expenditure requirements, there is a risk that debt or equity financing will be unavailable to meet these requirements or, if available, will be on terms unacceptable to the Corporation. Continued uncertainty in domestic and international credit markets could materially affect the Corporation’s ability to access sufficient capital for its capital expenditures and acquisitions, and as a result, may have a material adverse effect on the Corporation’s ability to execute its business strategy and on its business, financial condition, results of operations and prospects and also negatively impact the market price of the common shares.
Management’s Discussion and Analysis For the three months ended and year ended December 31, 2020
34
Variations in Foreign Exchange Rates and Interest Rates: World oil and gas prices are quoted in United States dollars and are therefore affected by exchange rates, which will fluctuate over time. Material increases in the value of the United States dollar will negatively impact the Corporation’s production revenues. Future exchange rates could accordingly impact the future value of the Corporation’s reserves and resources as determined by independent evaluators. To the extent that the Corporation engages in risk management activities related to foreign exchange rates, there will be a credit risk associated with counterparties of the Corporation. An increase in interest rates could result in a significant increase in the amount the Corporation pays to service any debt that it may incur, which could negatively impact the market price of the common shares.
Issuance of Debt: From time to time, the Corporation may enter into transactions to acquire assets or the shares of other organizations. These transactions may be financed in whole or in part with debt, which may create debt or increase the Corporation’s then-existing debt levels above industry standards for oil and natural gas companies of similar size. Depending on future exploration and development plans, the Corporation may require additional equity and/or debt financing that may not be available or, if available, may not be available on favorable terms. The level of the indebtedness that the Corporation may have from time to time could impair the Corporation’s ability to obtain additional financing on a timely basis to take advantage of business opportunities that may arise.
Common Share Price Volatility: The market price for common shares may be volatile and subject to wide fluctuations in response to numerous factors, many of which are beyond the Corporation’s control, including the following:
• Actual or anticipated fluctuations in the Corporation’s results of operations;• Recommendations by securities research analysts;• Changes in the economic performance or market valuations of other companies that investors deem
comparable to the Corporation;• The loss of executive officers and other key personnel of the Corporation;• Sales or perceived sales of additional common shares;• Significant acquisitions or business combinations, strategic partnerships, joint ventures or capital;• Commitments by or involving the Corporation or its competitors; and• Trends, concerns, technological or competitive developments, regulatory changes and other related issues in
the Corporation’s business segments or target markets.
Financial markets can experience significant price and volume fluctuations that may particularly affect the market prices of equity securities of companies and that may be unrelated to the operating performance, underlying asset values or prospects of such companies. Accordingly, the market price of the common shares may decline even if the Corporation’s operating results, underlying asset values or prospects have not changed. These factors, as well as other related factors, may cause decreases in asset values, which may result in impairment losses. The Covid-19 virus and the restrictions and disruptions related to it have had a drastic adverse effect on the world demand for, and prices of, oil and gas as well as the market price of the shares of oil and gas companies generally. These factors are beyond the control of the Corporation and it is difficult to assess how these, and other factors, will continue to affect the Corporation and the market price of the common shares.
DISCLOSURE CONTROLS AND INTERNAL CONTROL OVER FINANCIAL REPORTING
Disclosure Controls and Procedures Disclosure controls and procedures have been designed to provide reasonable assurance that information required to be disclosed by the Corporation in its annual filings, interim filings or other reports filed or submitted by it under securities legislation is recorded, processed, summarized and reported within the time periods specified in the securities legislation. Management, under the supervision of the Chief Executive Officer and the Chief Financial Officer, is responsible for the design and operation of disclosure controls and procedures.
Internal Controls over Financial Reporting Management is also responsible for the design of the Group’s internal controls over financial reporting in order to provide reasonable assurance regarding the reliability of financial reporting and the preparation of financial statements for external purposes in accordance with IFRS. However, due to inherent limitations, internal control over financial reporting may not prevent or detect all misstatements and fraud.
There have been no material changes to the Groups internal control over financial reporting during the three and twelve month periods ended December 31, 2020, that have materially affected, or are reasonably likely to materially affect, the Group’s internal control over financial reporting.
Control Framework Management assesses the effectiveness of the Corporation’s internal control over financial reporting using the Internal Control – Integrated Framework (2013 Framework) issued by the Committee of Sponsoring Organizations of the Treadway Commission (COSO).

35
Management’s Discussion and Analysis For the three months ended and year ended December 31, 2020
CAUTIONARY STATEMENT REGARDING FORWARD-LOOKING INFORMATION
This MD&A contains statements and information which constitute "forward-looking statements" or "forward-looking information" (within the meaning of applicable securities legislation). Such statements and information (together, "forward-looking statements") relate to future events, including the Corporation's future performance, business prospects or opportunities. Actual results may differ materially from those expressed or implied by forward-looking statements. The forward-looking statements contained in this MD&A are expressly qualified by this cautionary statement. Forward-looking statements speak only as of the date of this MD&A, unless otherwise indicated. IPC does not intend, and does not assume any obligation, to update these forward-looking statements, except as required by applicable laws.
The Covid-19 virus and the restrictions and disruptions related to it have had a drastic adverse effect on the world demand for, and prices of, oil and gas as well as the market price of the shares of oil and gas companies generally, including the Corporation’s common shares. There can be no assurance that these adverse effects will not continue or that commodity prices will not decrease or remain volatile in the future. These factors are beyond the control of the Corporation and it is difficult to assess how these, and other factors, will continue to affect the Corporation and the market price of IPC’s common shares. In light of the current situation, as at the date of this MD&A, the Corporation continues to review and assess its business plans and assumptions regarding the business environment, as well as its estimates of future production, cash flows, operating costs and capital expenditures.
All statements other than statements of historical fact may be forward-looking statements. Any statements that express or involve discussions with respect to predictions, expectations, beliefs, plans, projections, forecasts, guidance, budgets, objectives, assumptions or future events or performance (often, but not always, using words or phrases such as "seek", "anticipate", "plan", "continue", "estimate", "expect", "may", "will", "project", “forecast”, "predict", "potential", "targeting", "intend", "could", "might", "should", "believe", "budget" and similar expressions) are not statements of historical fact and may be "forward-looking statements".
Forward-looking statements include, but are not limited to, statements with respect to: • IPC’s ability to maximize liquidity and financial flexibility in connection with the current and any future Covid-19
outbreaks and reductions in commodity prices;• the expectation that recent actions will assist in reducing inventory builds and in rebalancing markets, including
supply and demand for oil and gas;• the potential for an improved future economic environment, including resulting from a lack of capital investment
and drilling in the oil and gas industry;• 2021 production range, operating costs and capital and decommissioning expenditure estimates;• estimates of future production, cash flows, operating costs and capital expenditures that are based on IPC’s
current business plans and assumptions regarding the business environment, which are subject to change;• IPC’s financial and operational flexibility to continue to react to recent events and navigate the Corporation through
periods of low commodity prices;• IPC’s ability, as market conditions evolve and if determined necessary from time to time, to reduce expenditures
and curtail production, and then to resume such production;• IPC’s continued access to its existing credit facilities, including current financial headroom, on terms acceptable to
the Corporation;• the ability to fully fund 2021 expenditures from cash flows and current borrowing capacity;• IPC’s flexibility to remain within existing financial headroom;• IPC’s ability to maintain operations, production and business in light of the current and any future Covid-19
outbreaks and the restrictions and disruptions related thereto, including risks related to production delays andinterruptions, changes in laws and regulations and reliance on third-party operators and infrastructure;
• IPC’s intention and ability to continue to implement our strategies to build long-term shareholder value;• the ability of IPC’s portfolio of assets to provide a solid foundation for organic and inorganic growth;• the continued facility uptime and reservoir performance in IPC’s areas of operation;• future development potential of the Suffield and Ferguson operations, including future oil drilling and gas
optimization programs;• development of the Blackrod project in Canada;• current and future drilling pad production and timing and success of facility upgrades and tie-in work at Onion Lake
Thermal;• the ability to maintain current and forecast production in France;• the ability of IPC to identify and implement alternative transportation and marketing options for Paris Basin
production in connection with the announced closure of the Total-operated Grandpuits refinery, on termsacceptable to the Corporation;
• the ability of IPC to achieve and maintain current and forecast production in Malaysia;• the withdrawal of PCSB from the Block PM307 and the ability of IPC to increase its WI in such Block to 100%;• the existence of future M&A opportunities and the ability of IPC to participate in such opportunities;• IPC’s ability to implement its GHG emissions intensity and climate strategies and to achieve its net GHG emissions
intensity reduction targets;• estimates of reserves;• estimates of contingent resources;• the ability to generate free cash flows and use that cash to repay debt; and• future drilling and other exploration and development activities.

Management’s Discussion and Analysis For the three months ended and year ended December 31, 2020
36
Statements relating to "reserves" and "contingent resources" are also deemed to be forward-looking statements, as they involve the implied assessment, based on certain estimates and assumptions, that the reserves and resources described exist in the quantities predicted or estimated and that the reserves and resources can be profitably produced in the future. Ultimate recovery of reserves or resources is based on forecasts of future results, estimates of amounts not yet determinable and assumptions of management. See also "Reserves and Resource Advisory".
The forward-looking statements are based on certain key expectations and assumptions made by IPC, including expectations and assumptions concerning: prevailing commodity prices and currency exchange rates; applicable royalty rates and tax laws; interest rates; future well production rates and reserve and contingent resource volumes; operating costs; the timing of receipt of regulatory approvals; the performance of existing wells; the success obtained in drilling new wells; anticipated timing and results of capital expenditures; the sufficiency of budgeted capital expenditures in carrying out planned activities; the timing, location and extent of future drilling operations; the successful completion of acquisitions and dispositions; the benefits of acquisitions; the state of the economy and the exploration and production business in the jurisdictions in which IPC operates and globally; the availability and cost of financing, labour and services; and the ability to market crude oil, natural gas and natural gas liquids successfully.
Although IPC believes that the expectations and assumptions on which such forward-looking statements are based are reasonable, undue reliance should not be placed on the forward-looking statements because IPC can give no assurances that they will prove to be correct. Since forward-looking statements address future events and conditions, by their very nature they involve inherent risks and uncertainties. Actual results could differ materially from those currently anticipated due to a number of factors and risks.
These include, but are not limited to: • The risks associated with the oil and gas industry in general such as operational risks in development, exploration
and production;• Delays or changes in plans with respect to exploration or development projects or capital expenditures;• The uncertainty of estimates and projections relating to reserves, resources, production, revenues, costs and
expenses;• Health, safety and environmental risks;• Commodity price fluctuations;• Interest rate and exchange rate fluctuations;• Marketing and transportation;• Loss of markets;• Environmental risks;• Competition;• Incorrect assessment of the value of acquisitions;• Failure to complete or realize the anticipated benefits of acquisitions or dispositions;• The ability to access sufficient capital from internal and external sources;• Failure to obtain required regulatory and other approvals; and• Changes in legislation, including but not limited to tax laws, royalties, environmental and abandonment regulations.
Readers are cautioned that the foregoing list of factors is not exhaustive. See also “Risk and Uncertainties” above.
Additional information on these and other factors that could affect IPC, or its operations or financial results, are included in the Financial Statements, the Corporation’s material change report dated February 9, 2021 (MCR), the Corporation’s Annual Information Form (AIF) for the year ended December 31, 2019, (See “Cautionary Statement Regarding Forward-Looking Information”, “Reserves and Resources Advisory” and “Risk Factors”) and other reports on file with applicable securities regulatory authorities, including previous financial reports, management’s discussion and analysis and material change reports, which may be accessed through the SEDAR website (www.sedar.com) or IPC's website (www.international-petroleum.com).

Management’s Discussion and Analysis For the three months ended and year ended December 31, 2020
37
RESERVES AND RESOURCE ADVISORY
This MD&A contains references to estimates of gross and net reserves and resources attributed to the Corporation's oil and gas assets. Gross reserves / resources are the working interest (operating or non-operating) share before deduction of royalties and without including any royalty interests. Net reserves / resources are the working interest (operating or non-operating) share after deduction of royalty obligations, plus royalty interests in reserves/resources, and in respect of PSCs in Malaysia, adjusted for cost and profit oil. Unless otherwise indicated, reserves / resource volumes are presented on a gross basis.
Reserve estimates, contingent resource estimates and estimates of future net revenue in respect of IPC’s oil and gas assets in Canada are effective as of December 31, 2020, and are included in the reports prepared by Sproule Associates Limited (Sproule), an independent qualified reserves evaluator, in accordance with National Instrument 51-101 – Standards of Disclosure for Oil and Gas Activities (NI 51-101) and the Canadian Oil and Gas Evaluation Handbook (the COGE Handbook) and using Sproule’s December 31, 2020 price forecasts.
Reserve estimates, contingent resource estimates and estimates of future net revenue in respect of IPC’s oil and gas assets in France and Malaysia are effective as of December 31, 2020, and are included in the report prepared by ERC Equipoise Ltd. (ERCE), an independent qualified reserves auditor, in accordance with NI 51-101 and the COGE Handbook, and using Sproule’s December 31, 2020 price forecasts.
The price forecasts used in the Sproule and ERCE reports are available on the website of Sproule (sproule.com) and are contained in the MCR.
The reserve life index (RLI) is calculated by dividing the 2P reserves of 272 MMboe as at December 31, 2020, by the mid-point of the 2021 production guidance of 41,000 to 43,000 boepd.
The product types comprising the 2P reserves and the contingent resources described in this MD&A are contained in the MCR. See also “Supplemental Information regarding Product Types” below. Light, medium and heavy crude oil reserves/resources disclosed in this MD&A include solution gas and other by-products.
"2P reserves" means proved plus probable reserves. "Proved reserves" are those reserves that can be estimated with a high degree of certainty to be recoverable. It is likely that the actual remaining quantities recovered will exceed the estimated proved reserves. "Probable reserves" are those additional reserves that are less certain to be recovered than proved reserves. It is equally likely that the actual remaining quantities recovered will be greater or less than the sum of the estimated proved plus probable reserves.
Each of the reserves categories reported (proved and probable) may be divided into developed and undeveloped categories. “Developed reserves” are those reserves that are expected to be recovered from existing wells and installed facilities or, if facilities have not been installed, that would involve a low expenditure (for example, when compared to the cost of drilling a well) to put the reserves on production. The developed category may be subdivided into producing and non-producing. “Developed producing reserves” are those reserves that are expected to be recovered from completion intervals open at the time of the estimate. These reserves may be currently producing or, if shut-in, they must have previously been on production, and the date of resumption of production must be known with reasonable certainty. “Developed non-producing reserves” are those reserves that either have not been on production, or have previously been on production, but are shut-in, and the date of resumption of production is unknown. “Undeveloped reserves” are those reserves expected to be recovered from known accumulations where a significant expenditure (for example, when compared to the cost of drilling a well) is required to render them capable of production. They must fully meet the requirements of the reserves classification (proved, probable) to which they are assigned.
Contingent resources are those quantities of petroleum estimated, as of a given date, to be potentially recoverable from known accumulations using established technology or technology under development, but which are not currently considered to be commercially recoverable due to one or more contingencies. Contingencies are conditions that must be satisfied for a portion of contingent resources to be classified as reserves that are: (a) specific to the project being evaluated; and (b) expected to be resolved within a reasonable timeframe. Contingencies may include factors such as economic, legal, environmental, political, and regulatory matters, or a lack of markets. It is also appropriate to classify as contingent resources the estimated discovered recoverable quantities associated with a project in the early evaluation stage. Contingent resources are further classified in accordance with the level of certainty associated with the estimates and may be sub-classified based on a project maturity and/or characterized by their economic status.
There are three classifications of contingent resources: low estimate, best estimate and high estimate. Best estimate is a classification of estimated resources described in the COGE Handbook as being considered to be the best estimate of the quantity that will be actually recovered. It is equally likely that the actual remaining quantities recovered will be greater or less than the best estimate. If probabilistic methods are used, there should be at least a 50% probability that the quantities actually recovered will equal or exceed the best estimate.
Contingent resources are further classified based on project maturity. The project maturity subclasses include development pending, development on hold, development unclarified and development not viable. All of the Corporation’s contingent resources are classified as either development on hold or development unclarified. Development on hold is defined as a contingent resource where there is a reasonable chance of development, but there are major non-technical contingencies to be resolved that are usually beyond the control of the operator. Development unclarified is defined as a contingent resource that requires further appraisal to clarify the potential for development and has been assigned a lower chance of development until contingencies can be clearly defined. Chance of development is the probability of a project being commercially viable.
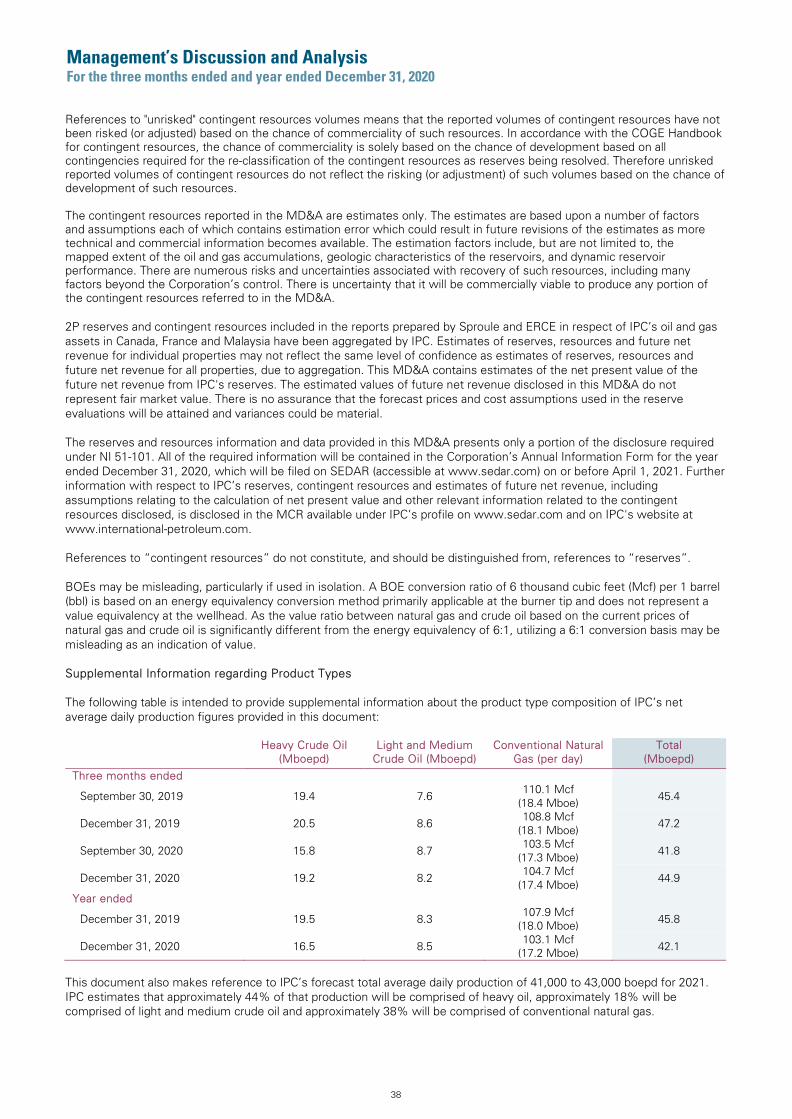
Management’s Discussion and Analysis For the three months ended and year ended December 31, 2020
38
References to "unrisked" contingent resources volumes means that the reported volumes of contingent resources have not been risked (or adjusted) based on the chance of commerciality of such resources. In accordance with the COGE Handbook for contingent resources, the chance of commerciality is solely based on the chance of development based on all contingencies required for the re-classification of the contingent resources as reserves being resolved. Therefore unrisked reported volumes of contingent resources do not reflect the risking (or adjustment) of such volumes based on the chance of development of such resources.
The contingent resources reported in the MD&A are estimates only. The estimates are based upon a number of factors and assumptions each of which contains estimation error which could result in future revisions of the estimates as more technical and commercial information becomes available. The estimation factors include, but are not limited to, the mapped extent of the oil and gas accumulations, geologic characteristics of the reservoirs, and dynamic reservoir performance. There are numerous risks and uncertainties associated with recovery of such resources, including many factors beyond the Corporation’s control. There is uncertainty that it will be commercially viable to produce any portion of the contingent resources referred to in the MD&A.
2P reserves and contingent resources included in the reports prepared by Sproule and ERCE in respect of IPC’s oil and gas assets in Canada, France and Malaysia have been aggregated by IPC. Estimates of reserves, resources and future net revenue for individual properties may not reflect the same level of confidence as estimates of reserves, resources and future net revenue for all properties, due to aggregation. This MD&A contains estimates of the net present value of the future net revenue from IPC's reserves. The estimated values of future net revenue disclosed in this MD&A do not represent fair market value. There is no assurance that the forecast prices and cost assumptions used in the reserve evaluations will be attained and variances could be material.
The reserves and resources information and data provided in this MD&A presents only a portion of the disclosure required under NI 51-101. All of the required information will be contained in the Corporation’s Annual Information Form for the year ended December 31, 2020, which will be filed on SEDAR (accessible at www.sedar.com) on or before April 1, 2021. Further information with respect to IPC’s reserves, contingent resources and estimates of future net revenue, including assumptions relating to the calculation of net present value and other relevant information related to the contingent resources disclosed, is disclosed in the MCR available under IPC’s profile on www.sedar.com and on IPC's website at www.international-petroleum.com.
References to “contingent resources” do not constitute, and should be distinguished from, references to “reserves”.
BOEs may be misleading, particularly if used in isolation. A BOE conversion ratio of 6 thousand cubic feet (Mcf) per 1 barrel (bbl) is based on an energy equivalency conversion method primarily applicable at the burner tip and does not represent a value equivalency at the wellhead. As the value ratio between natural gas and crude oil based on the current prices of natural gas and crude oil is significantly different from the energy equivalency of 6:1, utilizing a 6:1 conversion basis may be misleading as an indication of value.
Supplemental Information regarding Product Types
The following table is intended to provide supplemental information about the product type composition of IPC’s net average daily production figures provided in this document:
Heavy Crude Oil (Mboepd)
Light and Medium Crude Oil (Mboepd)
Conventional Natural Gas (per day)
Total (Mboepd)
Three months ended
September 30, 2019 19.4 7.6 110.1 Mcf
(18.4 Mboe) 45.4
December 31, 2019 20.5 8.6 108.8 Mcf
(18.1 Mboe) 47.2
September 30, 2020 15.8 8.7 103.5 Mcf
(17.3 Mboe) 41.8
December 31, 2020 19.2 8.2 104.7 Mcf
(17.4 Mboe) 44.9
Year ended
December 31, 2019 19.5 8.3 107.9 Mcf
(18.0 Mboe) 45.8
December 31, 2020 16.5 8.5 103.1 Mcf
(17.2 Mboe) 42.1
This document also makes reference to IPC’s forecast total average daily production of 41,000 to 43,000 boepd for 2021. IPC estimates that approximately 44% of that production will be comprised of heavy oil, approximately 18% will be comprised of light and medium crude oil and approximately 38% will be comprised of conventional natural gas.

Management’s Discussion and Analysis For the three months ended and year ended December 31, 2020
39
OTHER SUPPLEMENTARY INFORMATION
Abbreviations
CAD or CA$ Canadian dollar EUR or € Euro USD or US$ US dollar MYR Malaysian Ringgit FPSO Floating Production Storage and Offloading (facility)
Oil related terms and measurements
AECO The daily average benchmark price for natural gas at the AECO hub in southeast Alberta API An indication of the specific gravity of crude oil on the API (American Petroleum Institute) gravity scale ASP Alkaline surfactant polymer (an EOR process) bbl Barrel (1 barrel = 159 litres) boe1 Barrels of oil equivalents boepd Barrels of oil equivalents per day bopd Barrels of oil per day Bscf Billion standard cubic feet Empress The benchmark price for natural gas at the Empress point at the Alberta/Saskatchewan border EOR Enhanced Oil Recovery Mbbl Thousand barrels MMbbl Million barrels Mboe Thousand barrels of oil equivalents Mboepd Thousand barrels of oil equivalents per day Mbopd Thousand barrels of oil per day MMboe Million barrels of oil equivalents MMbtu Million British thermal units Mcf Thousand cubic feet NGL Natural gas liquid SAGD Steam assisted gravity drainage (a thermal recovery process) WTI West Texas Intermediate (a light oil reference price) WCS Western Canadian Select (a heavy oil reference price)
1 All volume references to boe are calculated on the basis of six thousand cubic feet of natural gas to one barrel of oil equivalent (6 Mcf: 1 bbl) unless otherwise indicated. This conversion ratio is based on an energy equivalency conversion method primarily applicable at the burner tip and does not represent a value equivalency at the wellhead. Boes may be misleading, particularly if used in isolation. Given that the value ratio based on the current price of crude oil as compared to natural gas is significantly different from the energy equivalency of 6:1, utilizing a conversion on a 6:1 basis may be misleading as an indication of value.
Management’s Discussion and Analysis For the three months ended and year ended December 31, 2020
40
DIRECTORS C. Ashley Heppenstall Director, Chairman London, England Mike Nicholson Director, President and Chief Executive Officer Geneva, Switzerland Chris Bruijnzeels Director Abcoude, The Netherlands Donald K. Charter Director Toronto, Ontario, Canada Torstein Sanness Director Oslo, Norway Daniella Dimitrov Director Toronto, Ontario, Canada Lukas (Harry) H. Lundin Director Toronto, Ontario, Canada OFFICERS Christophe Nerguararian Chief Financial Officer Geneva, Switzerland William Lundin Chief Operating Officer Geneva, Switzerland Jeffrey Fountain General Counsel and Corporate Secretary Geneva, Switzerland Chris Hogue Senior Vice President Canada Calgary, Alberta, Canada Ryan Adair Vice President Asset Management and Corporate Planning Canada Calgary, Alberta, Canada
INVESTOR RELATIONS Rebecca Gordon VP Corporate Planning and Investor Relations Geneva, Switzerland Sophia Shane Vancouver, British Columbia Canada CORPORATE OFFICE Suite 2000 – 885 West Georgia Street Vancouver, British Columbia V6C 3E8 Canada Telephone: +1 604 689 7842 Facsimile: +1 604 689 4250 Website: www.international-petroleum.com OPERATIONS OFFICE 5 Chemin de la Pallanterie 1222 Vésenaz Switzerland Telephone: +41 22 595 10 50 E-mail: [email protected] REGISTERED AND RECORDS OFFICE Suite 2600 - 595 Burrard Street Vancouver, British Columbia V7X 1L3 Canada INDEPENDENT AUDITORS PricewaterhouseCoopers SA, Switzerland TRANSFER AGENT Computershare Trust Company of Canada Calgary, Alberta, and Toronto, Ontario MEDIA RELATIONS Robert Eriksson Stockholm, Sweden STOCK EXCHANGE LISTINGS Toronto Stock Exchange and NASDAQ Stockholm Trading Symbol: IPCO

Corporate OfficeInternational Petroleum CorpSuite 2000885 West Georgia StreetVancouver, BCV6C 3E8, Canada
Tel: +1 604 689 7842E-mail: [email protected]: international-petroleum.com