Invesco Funds Audited Annual Report
340
Invesco Funds Audited Annual Report Société d’Investissement à Capital Variable For the year ended 29 February 2016 (R.C.S. Luxembourg B34457)
-
Upload
khangminh22 -
Category
Documents
-
view
0 -
download
0
Transcript of Invesco Funds Audited Annual Report
Invesco Funds Audited Annual ReportSociété d’Investissement à Capital Variable
For the year ended 29 February 2016
(R.C.S. Luxembourg B34457)
Contact us
Invesco Global Asset Management DACCentral Quay, Riverside IVSir John Rogersons Quay, Dublin 2, IrelandTelephone: +353 1 439 8000Website: www.invesco.com
241182 Invesco SICAV English cover spread 28/06/2016 23:48 Page 1

Perivan Financial Print 241182
Registered Office: 2-4 rue Eugène Ruppert, L-2453 Luxembourg
No subscription can be accepted on the basis of financial reports alone. Subscriptions, in order to be valid, must be made on the basis of the currentProspectus supplemented by a copy of the latest available Audited Annual Report and a copy of the latest Unaudited Semi-Annual Report, if later than suchAudited Annual Report.
Copies of the Prospectus, Audited Annual Report and Unaudited Interim Report may be obtained at the Registered Office of the Company (Invesco Funds),2-4 rue Eugène Ruppert, L-2453 Luxembourg, as well as from the offices of the Global Distributor in Dublin. Notices of all General Meetings will be published inthe Luxemburger Wort and, to the extent required by law, in the Mémorial, Recueil des Sociétés et Associations (“Mémorial”) and will be sent to holders ofregistered Shares at their address in the Register of Shareholders by post at least 8 days prior to meetings. In the event of any discrepancy betweentranslations from English text into foreign languages, please note that the English text will prevail.
Equalisation is calculated for tax reporting purposes and is not disclosed in the Audited Annual or Interim Report.
241182 Invesco SICAV English cover spread 28/06/2016 23:48 Page 2
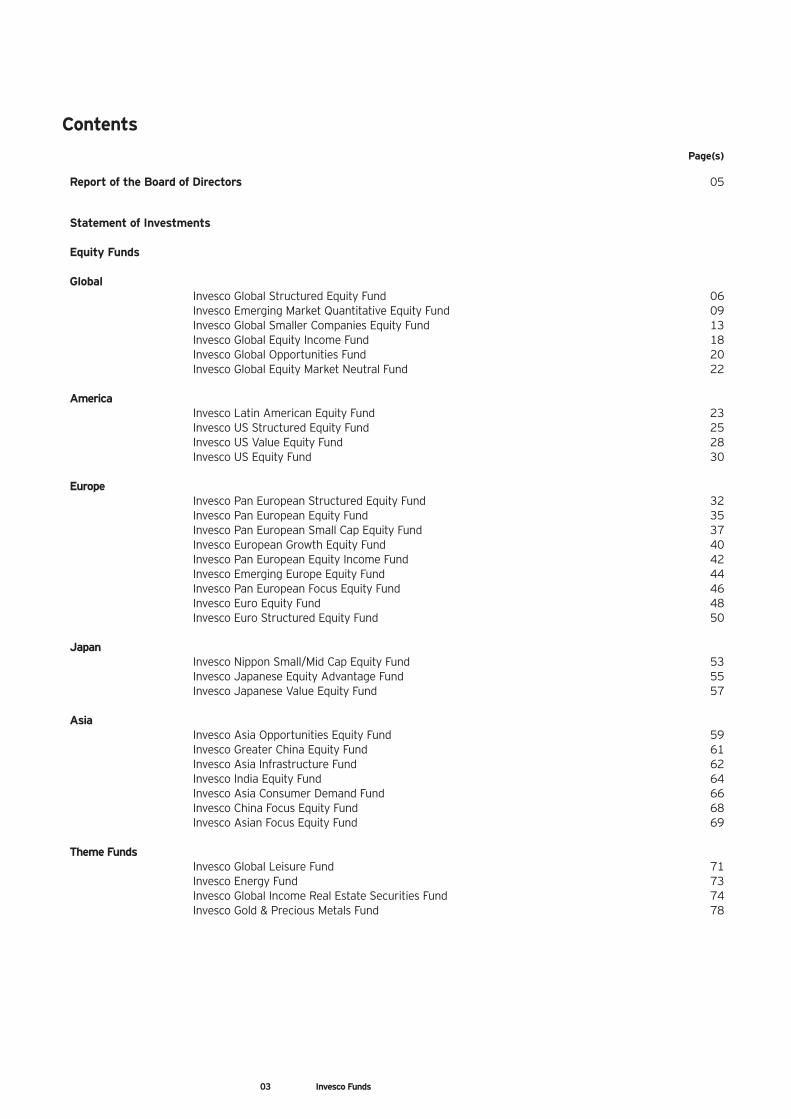
03 Invesco Funds
Page(s)
Report of the Board of Directors 05
Statement of Investments Equity Funds Global Invesco Global Structured Equity Fund 06 Invesco Emerging Market Quantitative Equity Fund 09 Invesco Global Smaller Companies Equity Fund 13 Invesco Global Equity Income Fund 18 Invesco Global Opportunities Fund 20 Invesco Global Equity Market Neutral Fund 22
America Invesco Latin American Equity Fund 23 Invesco US Structured Equity Fund 25 Invesco US Value Equity Fund 28 Invesco US Equity Fund 30
Europe Invesco Pan European Structured Equity Fund 32 Invesco Pan European Equity Fund 35 Invesco Pan European Small Cap Equity Fund 37 Invesco European Growth Equity Fund 40 Invesco Pan European Equity Income Fund 42 Invesco Emerging Europe Equity Fund 44 Invesco Pan European Focus Equity Fund 46 Invesco Euro Equity Fund 48 Invesco Euro Structured Equity Fund 50
Japan Invesco Nippon Small/Mid Cap Equity Fund 53 Invesco Japanese Equity Advantage Fund 55 Invesco Japanese Value Equity Fund 57
Asia Invesco Asia Opportunities Equity Fund 59 Invesco Greater China Equity Fund 61 Invesco Asia Infrastructure Fund 62 Invesco India Equity Fund 64 Invesco Asia Consumer Demand Fund 66 Invesco China Focus Equity Fund 68 Invesco Asian Focus Equity Fund 69
Theme Funds Invesco Global Leisure Fund 71 Invesco Energy Fund 73 Invesco Global Income Real Estate Securities Fund 74 Invesco Gold & Precious Metals Fund 78
Contents
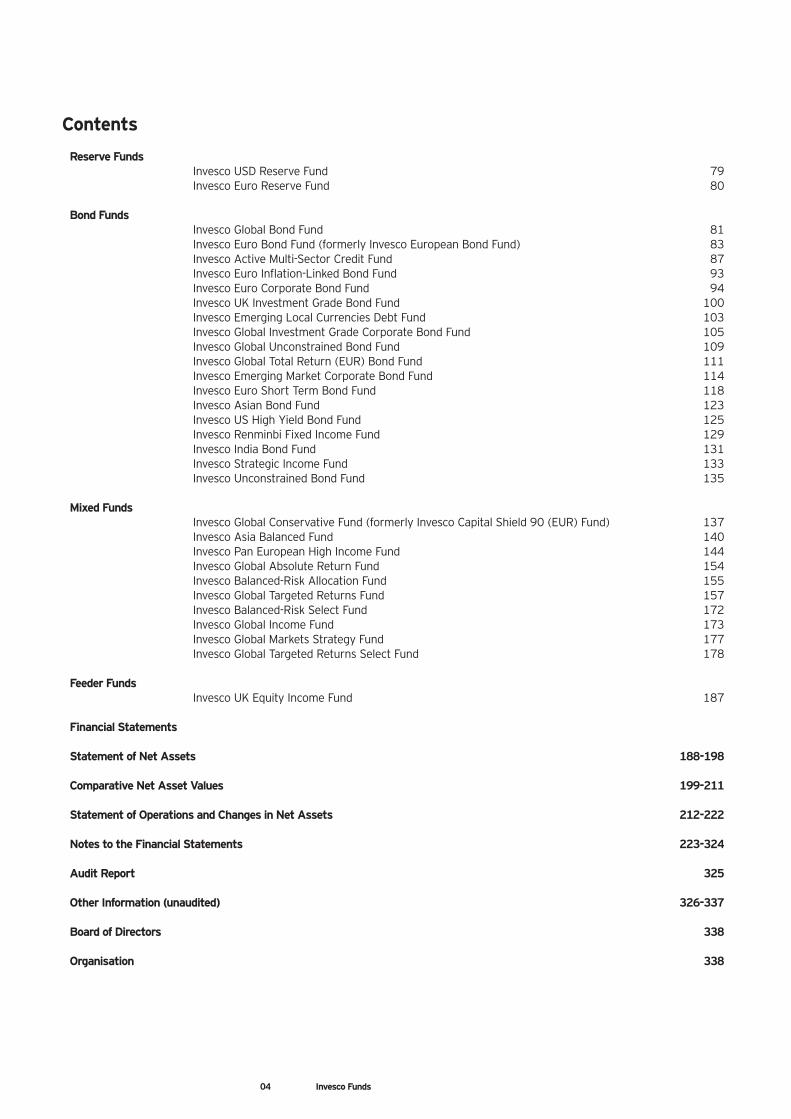
04 Invesco Funds
Reserve Funds Invesco USD Reserve Fund 79 Invesco Euro Reserve Fund 80
Bond Funds Invesco Global Bond Fund 81 Invesco Euro Bond Fund (formerly Invesco European Bond Fund) 83 Invesco Active Multi-Sector Credit Fund 87 Invesco Euro Inflation-Linked Bond Fund 93 Invesco Euro Corporate Bond Fund 94 Invesco UK Investment Grade Bond Fund 100 Invesco Emerging Local Currencies Debt Fund 103 Invesco Global Investment Grade Corporate Bond Fund 105 Invesco Global Unconstrained Bond Fund 109 Invesco Global Total Return (EUR) Bond Fund 111 Invesco Emerging Market Corporate Bond Fund 114 Invesco Euro Short Term Bond Fund 118 Invesco Asian Bond Fund 123 Invesco US High Yield Bond Fund 125 Invesco Renminbi Fixed Income Fund 129 Invesco India Bond Fund 131 Invesco Strategic Income Fund 133 Invesco Unconstrained Bond Fund 135
Mixed Funds Invesco Global Conservative Fund (formerly Invesco Capital Shield 90 (EUR) Fund) 137 Invesco Asia Balanced Fund 140 Invesco Pan European High Income Fund 144 Invesco Global Absolute Return Fund 154 Invesco Balanced-Risk Allocation Fund 155 Invesco Global Targeted Returns Fund 157 Invesco Balanced-Risk Select Fund 172 Invesco Global Income Fund 173 Invesco Global Markets Strategy Fund 177 Invesco Global Targeted Returns Select Fund 178
Feeder Funds Invesco UK Equity Income Fund 187
Financial Statements
Statement of Net Assets 188-198 Comparative Net Asset Values 199-211 Statement of Operations and Changes in Net Assets 212-222 Notes to the Financial Statements 223-324 Audit Report 325 Other Information (unaudited) 326-337 Board of Directors 338 Organisation 338
Contents
Report of the Board of Directors
Dear Shareholders,
The following report provides a summary of the financial results of the Invesco Funds for the year ended 29 February 2016 together with a market review forthat year.
– The Assets Under Management decreased from USD 45,087,949,520 on 28 February 2015 to USD 42,251,031,368 on 29 February 2016.– The Net Proceeds from issue of shares was USD 2,694,564,535 for the year.– The Net Income for the year ended 29 February 2016 was USD 579,493,729 compared with USD 353,014,131 on 28 February 2015.
The following report covers the year from 1 March 2015 to 29 February 2016.
Market OverviewFor much of the year global equity markets remained unsettled with heightened financial volatility, renewed pressure on commodity prices and concerns overglobal economic growth. A lack of clarity – particularly around interest rates – dominated. The major debate in financial markets had been around US monetarypolicy. When would the US Federal Reserve (Fed) start raising interest rates and at what pace would they proceed to normalise monetary policy from that point?
Confidence in the prospects for global economic growth had been shaken in the wake of the rebalancing of the Chinese economy. Making the adjustment to morenormalised levels of economic growth smoothly had proved to be difficult and as such, the global equity market reaction was very pronounced. There was a bigshare price correction in China’s domestic A share market in July 2015 following an excessive climb in share prices earlier in the year, peaking in late April.Investor sentiment had been extremely bullish and individuals were encouraged by the Chinese authorities to invest in the stock market, often for the first time,creating a sizeable bubble. While initially seen as a domestic China story, the bubble subsequently deflated rapidly. It ricocheted into the Chinese H share market(available to international investors), before spreading to the rest of Asia and beyond. Combined with broader emerging market weakness and sliding commodityprices, ‘risk-off’ market sentiment prevailed for much of the period under review.
Elsewhere, Europe continued on its path of economic recovery. While growth in developed economies was reasonable, it was disappointing by historical standards.However, the outlook for emerging markets, and for Latin America in particular, remained the most challenging. Commodity weakness continued to weigh on theregion. With the worries concerning China and its currency driving a stronger US$, the macro correlation trade continued to pile pressure on commodity prices.The oil market was oversupplied with too much inventory hence the oil price had struggled to find any stability.
By December, both Brent and US light crude were impacted after an unexpected increase in the amount of US stockpiles extended anxiety over a world-wide glut.However, the most significant news over the month came when the US Federal Reserve (Fed) announced – for the first time in nearly a decade – that it wouldraise interest rates, by 25 basis points. Global equity markets embraced the end of the zero interest rate policy era in the US, quelling fears that participants wouldrecoil at the prospect of higher interest rates. The US central bank insisted it would raise interest rates slowly. Fed chair Janet Yellen said at the time that the bankexpected that the US economy would continue to perform well into 2016.
However, the US equity market, and global equity markets more broadly, had a gloomy start to 2016. Fears of a slowdown in global economic growth driven byconcerns over China and plunging commodities prices continued to rattle markets in what some commentators likened to the volatility of the 1930s. Economicgrowth in the US came to a near-halt in the final quarter of 2015 and dented the prospect of further interest rate rises in the US for the foreseeable future. Globalequity markets received a temporary boost at the end of January when the Bank of Japan announced its surprise move to negative interest rates in an attemptto protect the flagging economy from market volatility and continued fears over global economic growth.
Wariness persisted into February amid uncertainty over the outlook for the US economy and the impact of US Fed policy on the banking sector in particular. Theundertone of caution was exacerbated by concerns about the health of the global economy with China still at its centre. At the sector level, financial stocksexperienced a volatile month. The sell-off in US bank stocks was at the forefront of a heavy sell-off in the sector globally. The focus shifted to European banks ascontinued concerns about the health of the global economy, coupled with worries about the impact of negative interest rates, triggered a broad-based flight fromperceived ‘risky assets’. News around US economic growth, however, received a boost when the US Commerce Department announced that it had revised itslatest estimate of fourth quarter GDP growth to 1% from its estimate of 0.7% the previous month.
It was a mixed twelve months for bond markets. The year began with inflation falling sharply as a result of a collapse in oil prices through the second half of 2014.This in turn led to strong performance from the core government bond markets with higher quality corporate bonds also rallying strongly. The announcement ofthe European Central Banks Quantitative Easing programme in January provided further support. This dynamic began to change in the spring. German governmentbond markets, where yields had reached extraordinarily low levels, led the sell-off initially. High yield bond markets with their high income cushion and lowersensitivity to interest rate risk held up reasonably well. However, this changed over the summer. Although it was widely known that China’s economic growth wasslowing the decision by the Peoples Bank of China to devalue the Chinese yuan took financial markets by surprise.
The ensuing collapse in Chinese equities, and significant selling in commodity and emerging markets highlighted a general deterioration in risk appetite globally.Corporate bond yields rose with high yield spreads reaching levels not seen for a number of years. However, this soon reversed as investor’s appetite for incomeoffset their credit risk fears. Further impetus was given to the autumn rally by an expectation that the European Central Bank would significantly increase theamount of monetary stimulus it is providing the Eurozone economy. In the event the announcement by the ECB failed to meet expectations and corporate bondyield rose again into year end.
According to data from Merrill Lynch, Gilts had a total return of 0.5% in this 12 month period while German Bunds returned 0.3%. Sterling investment gradereturned 0.5% and European currency high yield returned 1.6% (all returns in local currency).
Dated: 28 June 2016
The information contained in this report relates to historical data and bears no relevance for the future development of the Fund.
05 Invesco Funds
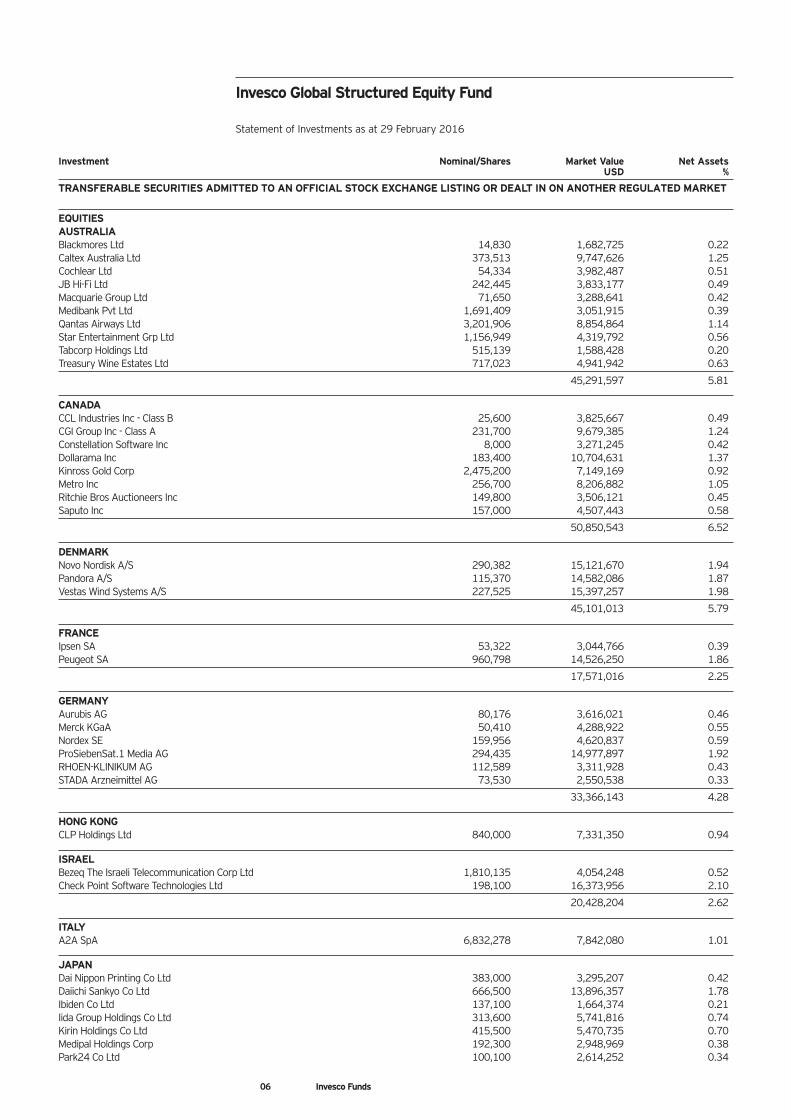
Investment Nominal/Shares Market Value Net Assets USD %
TRANSFERABLE SECURITIES ADMITTED TO AN OFFICIAL STOCK EXCHANGE LISTING OR DEALT IN ON ANOTHER REGULATED MARKET
EQUITIESAUSTRALIABlackmores Ltd 14,830 1,682,725 0.22Caltex Australia Ltd 373,513 9,747,626 1.25Cochlear Ltd 54,334 3,982,487 0.51JB Hi-Fi Ltd 242,445 3,833,177 0.49Macquarie Group Ltd 71,650 3,288,641 0.42Medibank Pvt Ltd 1,691,409 3,051,915 0.39Qantas Airways Ltd 3,201,906 8,854,864 1.14Star Entertainment Grp Ltd 1,156,949 4,319,792 0.56Tabcorp Holdings Ltd 515,139 1,588,428 0.20Treasury Wine Estates Ltd 717,023 4,941,942 0.63
45,291,597 5.81
CANADACCL Industries Inc - Class B 25,600 3,825,667 0.49CGI Group Inc - Class A 231,700 9,679,385 1.24Constellation Software Inc 8,000 3,271,245 0.42Dollarama Inc 183,400 10,704,631 1.37Kinross Gold Corp 2,475,200 7,149,169 0.92Metro Inc 256,700 8,206,882 1.05Ritchie Bros Auctioneers Inc 149,800 3,506,121 0.45Saputo Inc 157,000 4,507,443 0.58
50,850,543 6.52
DENMARKNovo Nordisk A/S 290,382 15,121,670 1.94Pandora A/S 115,370 14,582,086 1.87Vestas Wind Systems A/S 227,525 15,397,257 1.98
45,101,013 5.79
FRANCEIpsen SA 53,322 3,044,766 0.39Peugeot SA 960,798 14,526,250 1.86
17,571,016 2.25
GERMANYAurubis AG 80,176 3,616,021 0.46Merck KGaA 50,410 4,288,922 0.55Nordex SE 159,956 4,620,837 0.59ProSiebenSat.1 Media AG 294,435 14,977,897 1.92RHOEN-KLINIKUM AG 112,589 3,311,928 0.43STADA Arzneimittel AG 73,530 2,550,538 0.33
33,366,143 4.28
HONG KONGCLP Holdings Ltd 840,000 7,331,350 0.94
ISRAELBezeq The Israeli Telecommunication Corp Ltd 1,810,135 4,054,248 0.52Check Point Software Technologies Ltd 198,100 16,373,956 2.10
20,428,204 2.62
ITALYA2A SpA 6,832,278 7,842,080 1.01
JAPANDai Nippon Printing Co Ltd 383,000 3,295,207 0.42Daiichi Sankyo Co Ltd 666,500 13,896,357 1.78Ibiden Co Ltd 137,100 1,664,374 0.21Iida Group Holdings Co Ltd 313,600 5,741,816 0.74Kirin Holdings Co Ltd 415,500 5,470,735 0.70Medipal Holdings Corp 192,300 2,948,969 0.38Park24 Co Ltd 100,100 2,614,252 0.34
Invesco Global Structured Equity Fund
Statement of Investments as at 29 February 2016
06 Invesco Funds
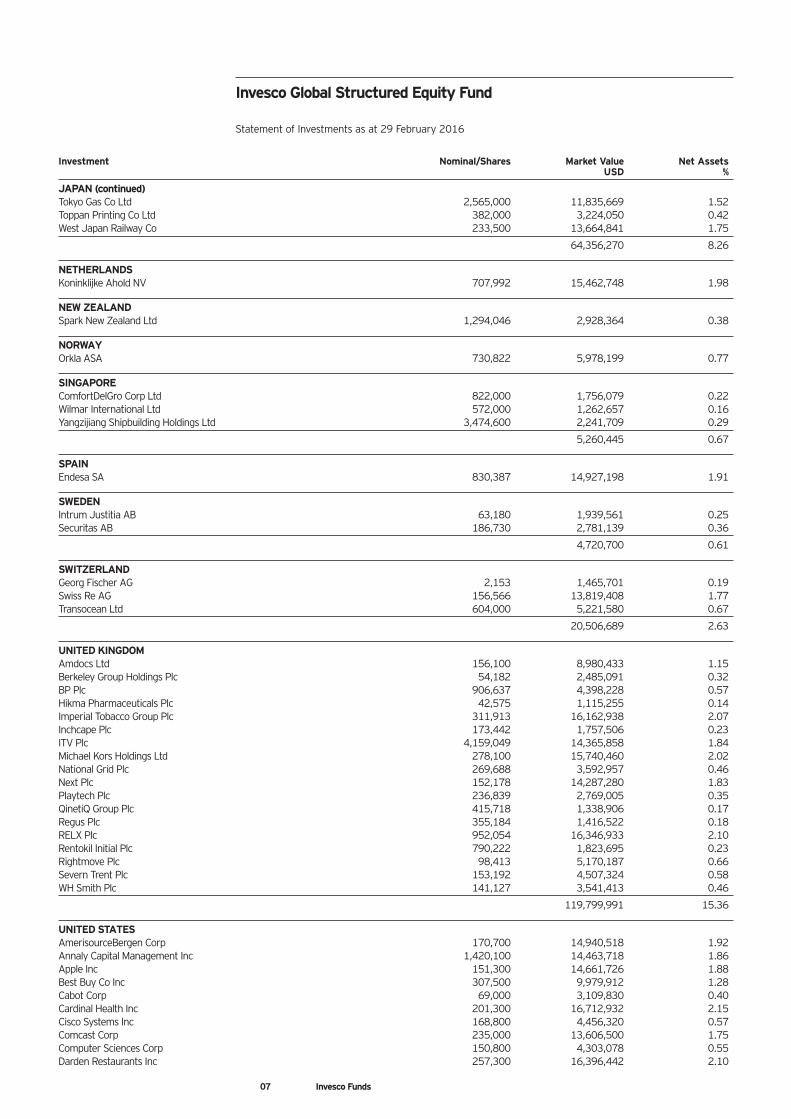
Investment Nominal/Shares Market Value Net Assets USD %
JAPAN (continued)Tokyo Gas Co Ltd 2,565,000 11,835,669 1.52Toppan Printing Co Ltd 382,000 3,224,050 0.42West Japan Railway Co 233,500 13,664,841 1.75
64,356,270 8.26
NETHERLANDSKoninklijke Ahold NV 707,992 15,462,748 1.98
NEW ZEALANDSpark New Zealand Ltd 1,294,046 2,928,364 0.38
NORWAYOrkla ASA 730,822 5,978,199 0.77
SINGAPOREComfortDelGro Corp Ltd 822,000 1,756,079 0.22Wilmar International Ltd 572,000 1,262,657 0.16Yangzijiang Shipbuilding Holdings Ltd 3,474,600 2,241,709 0.29
5,260,445 0.67
SPAINEndesa SA 830,387 14,927,198 1.91
SWEDENIntrum Justitia AB 63,180 1,939,561 0.25Securitas AB 186,730 2,781,139 0.36
4,720,700 0.61
SWITZERLANDGeorg Fischer AG 2,153 1,465,701 0.19Swiss Re AG 156,566 13,819,408 1.77Transocean Ltd 604,000 5,221,580 0.67
20,506,689 2.63
UNITED KINGDOMAmdocs Ltd 156,100 8,980,433 1.15Berkeley Group Holdings Plc 54,182 2,485,091 0.32BP Plc 906,637 4,398,228 0.57Hikma Pharmaceuticals Plc 42,575 1,115,255 0.14Imperial Tobacco Group Plc 311,913 16,162,938 2.07Inchcape Plc 173,442 1,757,506 0.23ITV Plc 4,159,049 14,365,858 1.84Michael Kors Holdings Ltd 278,100 15,740,460 2.02National Grid Plc 269,688 3,592,957 0.46Next Plc 152,178 14,287,280 1.83Playtech Plc 236,839 2,769,005 0.35QinetiQ Group Plc 415,718 1,338,906 0.17Regus Plc 355,184 1,416,522 0.18RELX Plc 952,054 16,346,933 2.10Rentokil Initial Plc 790,222 1,823,695 0.23Rightmove Plc 98,413 5,170,187 0.66Severn Trent Plc 153,192 4,507,324 0.58WH Smith Plc 141,127 3,541,413 0.46
119,799,991 15.36
UNITED STATESAmerisourceBergen Corp 170,700 14,940,518 1.92Annaly Capital Management Inc 1,420,100 14,463,718 1.86Apple Inc 151,300 14,661,726 1.88Best Buy Co Inc 307,500 9,979,912 1.28Cabot Corp 69,000 3,109,830 0.40Cardinal Health Inc 201,300 16,712,932 2.15Cisco Systems Inc 168,800 4,456,320 0.57Comcast Corp 235,000 13,606,500 1.75Computer Sciences Corp 150,800 4,303,078 0.55Darden Restaurants Inc 257,300 16,396,442 2.10
Invesco Global Structured Equity Fund
Statement of Investments as at 29 February 2016
07 Invesco Funds
Invesco Global Structured Equity Fund
Statement of Investments as at 29 February 2016
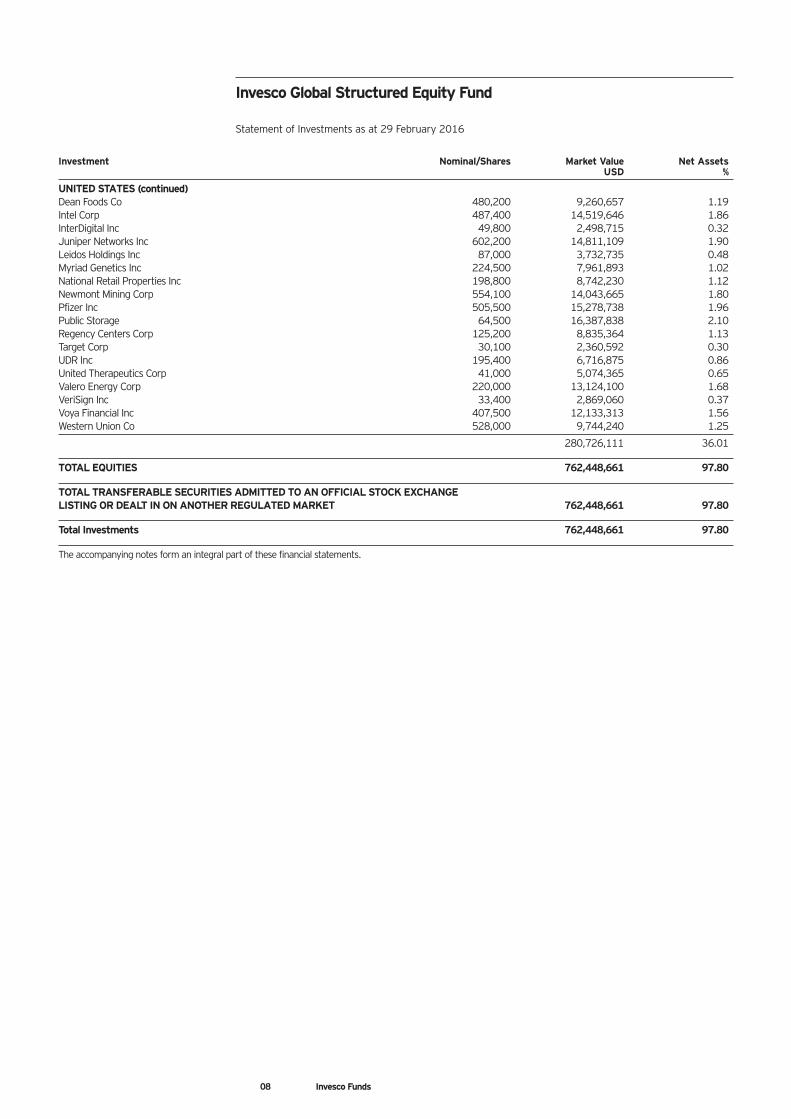
Investment Nominal/Shares Market Value Net Assets USD %
UNITED STATES (continued)Dean Foods Co 480,200 9,260,657 1.19Intel Corp 487,400 14,519,646 1.86InterDigital Inc 49,800 2,498,715 0.32Juniper Networks Inc 602,200 14,811,109 1.90Leidos Holdings Inc 87,000 3,732,735 0.48Myriad Genetics Inc 224,500 7,961,893 1.02National Retail Properties Inc 198,800 8,742,230 1.12Newmont Mining Corp 554,100 14,043,665 1.80Pfizer Inc 505,500 15,278,738 1.96Public Storage 64,500 16,387,838 2.10Regency Centers Corp 125,200 8,835,364 1.13Target Corp 30,100 2,360,592 0.30UDR Inc 195,400 6,716,875 0.86United Therapeutics Corp 41,000 5,074,365 0.65Valero Energy Corp 220,000 13,124,100 1.68VeriSign Inc 33,400 2,869,060 0.37Voya Financial Inc 407,500 12,133,313 1.56Western Union Co 528,000 9,744,240 1.25
280,726,111 36.01
TOTAL EQUITIES 762,448,661 97.80
TOTAL TRANSFERABLE SECURITIES ADMITTED TO AN OFFICIAL STOCK EXCHANGE LISTING OR DEALT IN ON ANOTHER REGULATED MARKET 762,448,661 97.80
Total Investments 762,448,661 97.80
The accompanying notes form an integral part of these financial statements.
08 Invesco Funds
Investment Nominal/Shares Market Value Net Assets USD %
TRANSFERABLE SECURITIES ADMITTED TO AN OFFICIAL STOCK EXCHANGE LISTING OR DEALT IN ON ANOTHER REGULATED MARKET
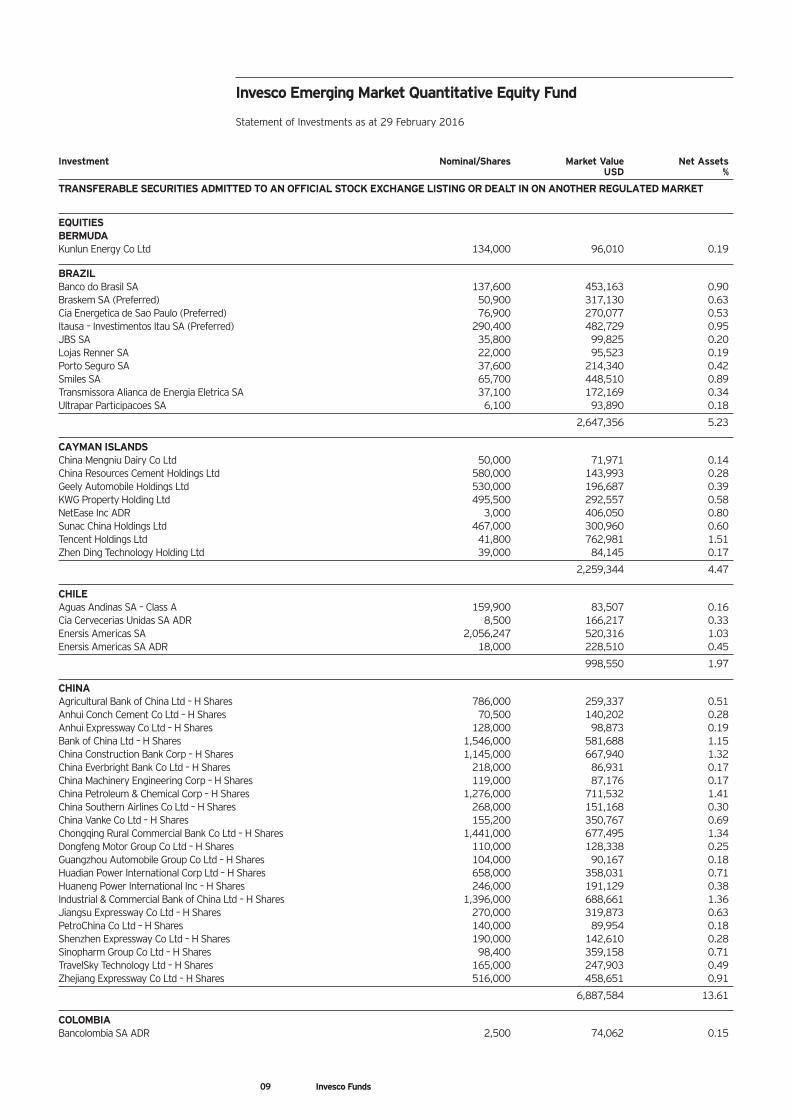
EQUITIESBERMUDAKunlun Energy Co Ltd 134,000 96,010 0.19
BRAZILBanco do Brasil SA 137,600 453,163 0.90Braskem SA (Preferred) 50,900 317,130 0.63Cia Energetica de Sao Paulo (Preferred) 76,900 270,077 0.53Itausa – Investimentos Itau SA (Preferred) 290,400 482,729 0.95JBS SA 35,800 99,825 0.20Lojas Renner SA 22,000 95,523 0.19Porto Seguro SA 37,600 214,340 0.42Smiles SA 65,700 448,510 0.89Transmissora Alianca de Energia Eletrica SA 37,100 172,169 0.34Ultrapar Participacoes SA 6,100 93,890 0.18
2,647,356 5.23
CAYMAN ISLANDSChina Mengniu Dairy Co Ltd 50,000 71,971 0.14China Resources Cement Holdings Ltd 580,000 143,993 0.28Geely Automobile Holdings Ltd 530,000 196,687 0.39KWG Property Holding Ltd 495,500 292,557 0.58NetEase Inc ADR 3,000 406,050 0.80Sunac China Holdings Ltd 467,000 300,960 0.60Tencent Holdings Ltd 41,800 762,981 1.51Zhen Ding Technology Holding Ltd 39,000 84,145 0.17
2,259,344 4.47
CHILEAguas Andinas SA – Class A 159,900 83,507 0.16Cia Cervecerias Unidas SA ADR 8,500 166,217 0.33Enersis Americas SA 2,056,247 520,316 1.03Enersis Americas SA ADR 18,000 228,510 0.45
998,550 1.97
CHINAAgricultural Bank of China Ltd – H Shares 786,000 259,337 0.51Anhui Conch Cement Co Ltd – H Shares 70,500 140,202 0.28Anhui Expressway Co Ltd – H Shares 128,000 98,873 0.19Bank of China Ltd – H Shares 1,546,000 581,688 1.15China Construction Bank Corp – H Shares 1,145,000 667,940 1.32China Everbright Bank Co Ltd – H Shares 218,000 86,931 0.17China Machinery Engineering Corp – H Shares 119,000 87,176 0.17China Petroleum & Chemical Corp – H Shares 1,276,000 711,532 1.41China Southern Airlines Co Ltd – H Shares 268,000 151,168 0.30China Vanke Co Ltd – H Shares 155,200 350,767 0.69Chongqing Rural Commercial Bank Co Ltd – H Shares 1,441,000 677,495 1.34Dongfeng Motor Group Co Ltd – H Shares 110,000 128,338 0.25Guangzhou Automobile Group Co Ltd – H Shares 104,000 90,167 0.18Huadian Power International Corp Ltd – H Shares 658,000 358,031 0.71Huaneng Power International Inc – H Shares 246,000 191,129 0.38Industrial & Commercial Bank of China Ltd – H Shares 1,396,000 688,661 1.36Jiangsu Expressway Co Ltd – H Shares 270,000 319,873 0.63PetroChina Co Ltd – H Shares 140,000 89,954 0.18Shenzhen Expressway Co Ltd – H Shares 190,000 142,610 0.28Sinopharm Group Co Ltd – H Shares 98,400 359,158 0.71TravelSky Technology Ltd – H Shares 165,000 247,903 0.49Zhejiang Expressway Co Ltd – H Shares 516,000 458,651 0.91
6,887,584 13.61
COLOMBIABancolombia SA ADR 2,500 74,062 0.15
Invesco Emerging Market Quantitative Equity Fund
Statement of Investments as at 29 February 2016
09 Invesco Funds
Investment Nominal/Shares Market Value Net Assets USD %
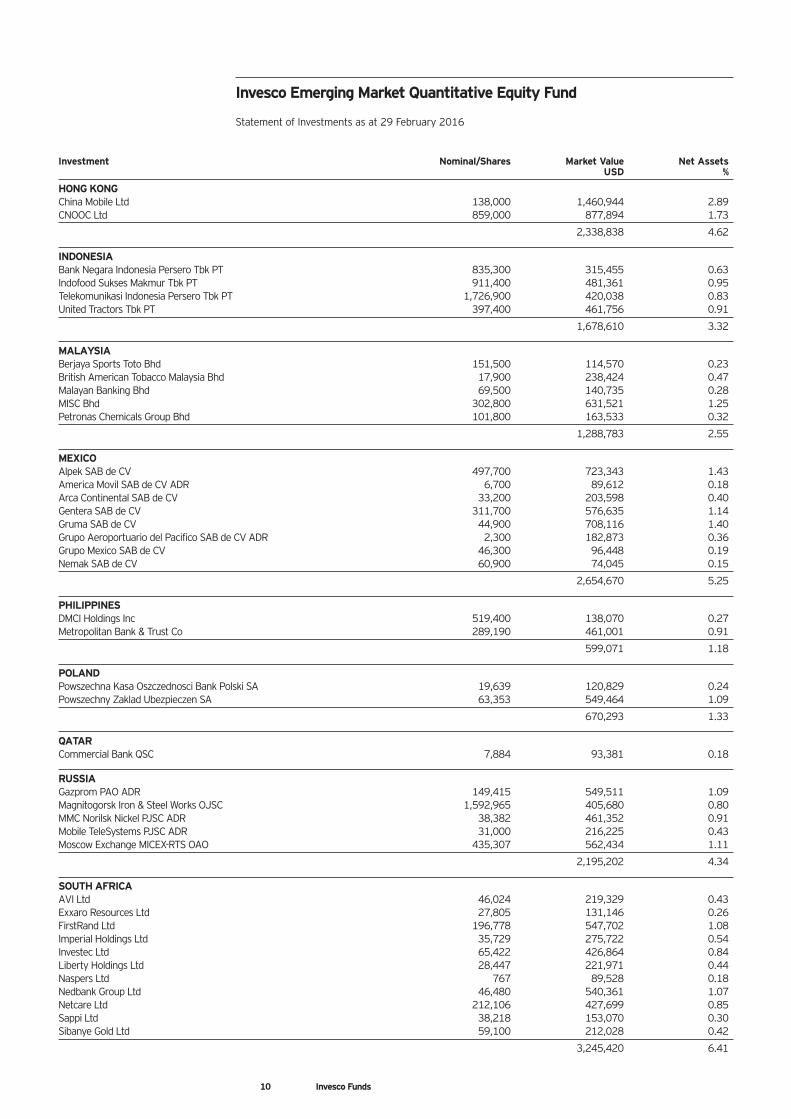
HONG KONGChina Mobile Ltd 138,000 1,460,944 2.89CNOOC Ltd 859,000 877,894 1.73
2,338,838 4.62
INDONESIABank Negara Indonesia Persero Tbk PT 835,300 315,455 0.63Indofood Sukses Makmur Tbk PT 911,400 481,361 0.95Telekomunikasi Indonesia Persero Tbk PT 1,726,900 420,038 0.83United Tractors Tbk PT 397,400 461,756 0.91
1,678,610 3.32
MALAYSIABerjaya Sports Toto Bhd 151,500 114,570 0.23British American Tobacco Malaysia Bhd 17,900 238,424 0.47Malayan Banking Bhd 69,500 140,735 0.28MISC Bhd 302,800 631,521 1.25Petronas Chemicals Group Bhd 101,800 163,533 0.32
1,288,783 2.55
MEXICOAlpek SAB de CV 497,700 723,343 1.43America Movil SAB de CV ADR 6,700 89,612 0.18Arca Continental SAB de CV 33,200 203,598 0.40Gentera SAB de CV 311,700 576,635 1.14Gruma SAB de CV 44,900 708,116 1.40Grupo Aeroportuario del Pacifico SAB de CV ADR 2,300 182,873 0.36Grupo Mexico SAB de CV 46,300 96,448 0.19Nemak SAB de CV 60,900 74,045 0.15
2,654,670 5.25
PHILIPPINESDMCI Holdings Inc 519,400 138,070 0.27Metropolitan Bank & Trust Co 289,190 461,001 0.91
599,071 1.18
POLANDPowszechna Kasa Oszczednosci Bank Polski SA 19,639 120,829 0.24Powszechny Zaklad Ubezpieczen SA 63,353 549,464 1.09
670,293 1.33
QATARCommercial Bank QSC 7,884 93,381 0.18
RUSSIAGazprom PAO ADR 149,415 549,511 1.09Magnitogorsk Iron & Steel Works OJSC 1,592,965 405,680 0.80MMC Norilsk Nickel PJSC ADR 38,382 461,352 0.91Mobile TeleSystems PJSC ADR 31,000 216,225 0.43Moscow Exchange MICEX-RTS OAO 435,307 562,434 1.11
2,195,202 4.34
SOUTH AFRICAAVI Ltd 46,024 219,329 0.43Exxaro Resources Ltd 27,805 131,146 0.26FirstRand Ltd 196,778 547,702 1.08Imperial Holdings Ltd 35,729 275,722 0.54Investec Ltd 65,422 426,864 0.84Liberty Holdings Ltd 28,447 221,971 0.44Naspers Ltd 767 89,528 0.18Nedbank Group Ltd 46,480 540,361 1.07Netcare Ltd 212,106 427,699 0.85Sappi Ltd 38,218 153,070 0.30Sibanye Gold Ltd 59,100 212,028 0.42
3,245,420 6.41
Invesco Emerging Market Quantitative Equity Fund
Statement of Investments as at 29 February 2016
10 Invesco Funds
Investment Nominal/Shares Market Value Net Assets USD %
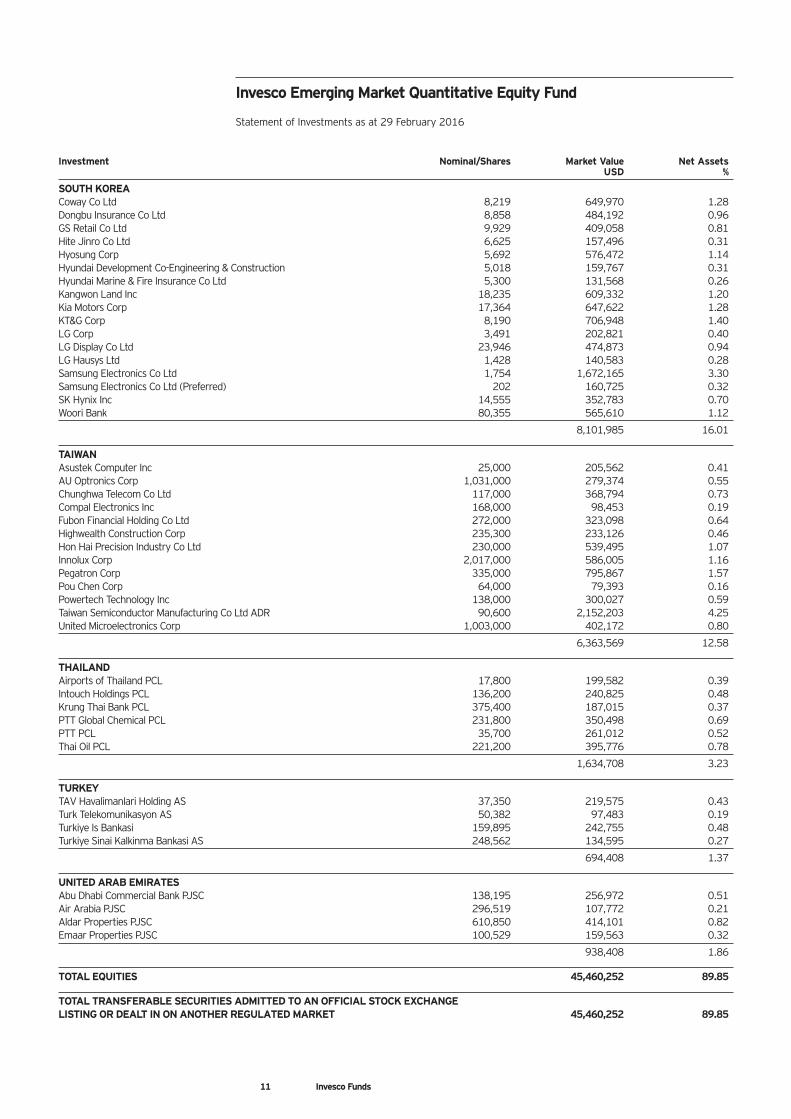
SOUTH KOREACoway Co Ltd 8,219 649,970 1.28Dongbu Insurance Co Ltd 8,858 484,192 0.96GS Retail Co Ltd 9,929 409,058 0.81Hite Jinro Co Ltd 6,625 157,496 0.31Hyosung Corp 5,692 576,472 1.14Hyundai Development Co-Engineering & Construction 5,018 159,767 0.31Hyundai Marine & Fire Insurance Co Ltd 5,300 131,568 0.26Kangwon Land Inc 18,235 609,332 1.20Kia Motors Corp 17,364 647,622 1.28KT&G Corp 8,190 706,948 1.40LG Corp 3,491 202,821 0.40LG Display Co Ltd 23,946 474,873 0.94LG Hausys Ltd 1,428 140,583 0.28Samsung Electronics Co Ltd 1,754 1,672,165 3.30Samsung Electronics Co Ltd (Preferred) 202 160,725 0.32SK Hynix Inc 14,555 352,783 0.70Woori Bank 80,355 565,610 1.12
8,101,985 16.01
TAIWANAsustek Computer Inc 25,000 205,562 0.41AU Optronics Corp 1,031,000 279,374 0.55Chunghwa Telecom Co Ltd 117,000 368,794 0.73Compal Electronics Inc 168,000 98,453 0.19Fubon Financial Holding Co Ltd 272,000 323,098 0.64Highwealth Construction Corp 235,300 233,126 0.46Hon Hai Precision Industry Co Ltd 230,000 539,495 1.07Innolux Corp 2,017,000 586,005 1.16Pegatron Corp 335,000 795,867 1.57Pou Chen Corp 64,000 79,393 0.16Powertech Technology Inc 138,000 300,027 0.59Taiwan Semiconductor Manufacturing Co Ltd ADR 90,600 2,152,203 4.25United Microelectronics Corp 1,003,000 402,172 0.80
6,363,569 12.58
THAILANDAirports of Thailand PCL 17,800 199,582 0.39Intouch Holdings PCL 136,200 240,825 0.48Krung Thai Bank PCL 375,400 187,015 0.37PTT Global Chemical PCL 231,800 350,498 0.69PTT PCL 35,700 261,012 0.52Thai Oil PCL 221,200 395,776 0.78
1,634,708 3.23
TURKEYTAV Havalimanlari Holding AS 37,350 219,575 0.43Turk Telekomunikasyon AS 50,382 97,483 0.19Turkiye Is Bankasi 159,895 242,755 0.48Turkiye Sinai Kalkinma Bankasi AS 248,562 134,595 0.27
694,408 1.37
UNITED ARAB EMIRATESAbu Dhabi Commercial Bank PJSC 138,195 256,972 0.51Air Arabia PJSC 296,519 107,772 0.21Aldar Properties PJSC 610,850 414,101 0.82Emaar Properties PJSC 100,529 159,563 0.32
938,408 1.86
TOTAL EQUITIES 45,460,252 89.85
TOTAL TRANSFERABLE SECURITIES ADMITTED TO AN OFFICIAL STOCK EXCHANGE LISTING OR DEALT IN ON ANOTHER REGULATED MARKET 45,460,252 89.85
Invesco Emerging Market Quantitative Equity Fund
Statement of Investments as at 29 February 2016
11 Invesco Funds

Investment Nominal/Shares Market Value Net Assets USD %
OTHER TRANSFERABLE SECURITIESEQUITIESCHILEEnersis Chile Npv** 2,056,247 – –
TOTAL EQUITIES – –
TOTAL OTHER TRANSFERABLE SECURITIES – –
OPEN-ENDED FUNDSFRANCELyxor ETF MSCI India 292,750 3,793,547 7.50
TOTAL OPEN-ENDED FUNDS 3,793,547 7.50
Total Investments 49,253,799 97.35
The accompanying notes form an integral part of these financial statements.
**Securities valued at fair market value as determined in good faith pursuant to procedures established by the Directors.
Invesco Emerging Market Quantitative Equity Fund
Statement of Investments as at 29 February 2016
12 Invesco Funds
Investment Nominal/Shares Market Value Net Assets USD %
TRANSFERABLE SECURITIES ADMITTED TO AN OFFICIAL STOCK EXCHANGE LISTING OR DEALT IN ON ANOTHER REGULATED MARKET
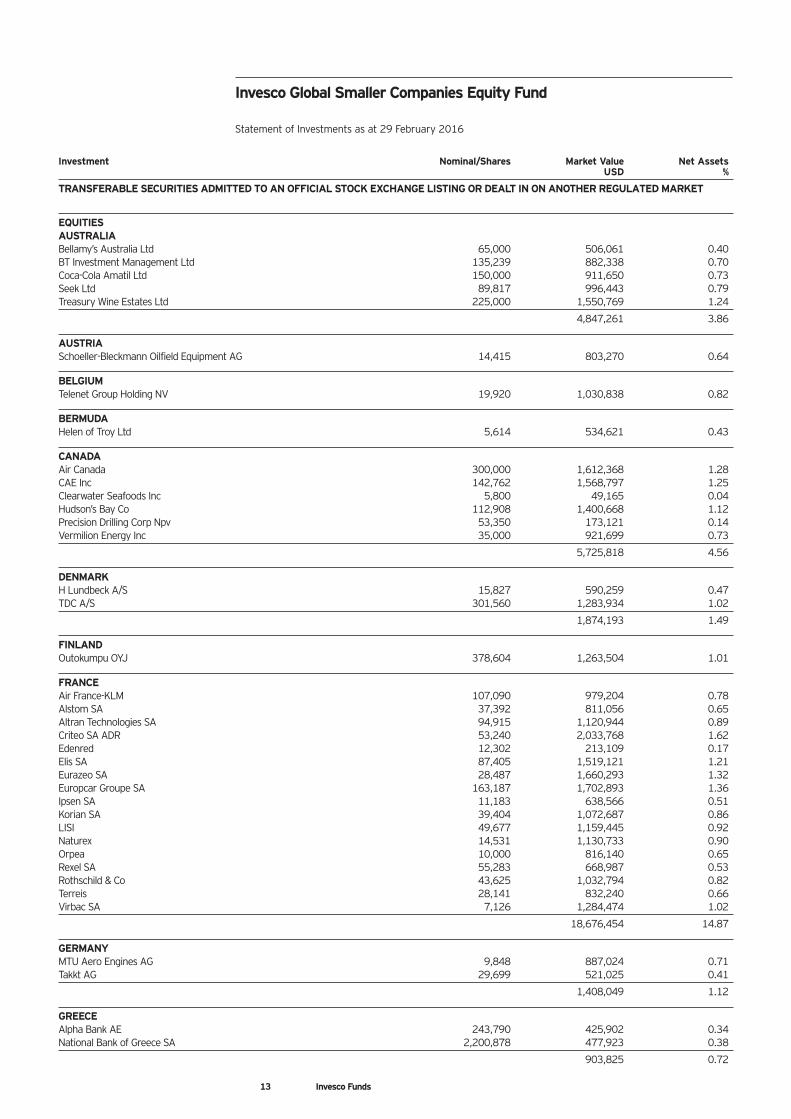
EQUITIESAUSTRALIABellamy’s Australia Ltd 65,000 506,061 0.40BT Investment Management Ltd 135,239 882,338 0.70Coca-Cola Amatil Ltd 150,000 911,650 0.73Seek Ltd 89,817 996,443 0.79Treasury Wine Estates Ltd 225,000 1,550,769 1.24
4,847,261 3.86
AUSTRIASchoeller-Bleckmann Oilfield Equipment AG 14,415 803,270 0.64
BELGIUMTelenet Group Holding NV 19,920 1,030,838 0.82
BERMUDAHelen of Troy Ltd 5,614 534,621 0.43
CANADAAir Canada 300,000 1,612,368 1.28CAE Inc 142,762 1,568,797 1.25Clearwater Seafoods Inc 5,800 49,165 0.04Hudson’s Bay Co 112,908 1,400,668 1.12Precision Drilling Corp Npv 53,350 173,121 0.14Vermilion Energy Inc 35,000 921,699 0.73
5,725,818 4.56
DENMARKH Lundbeck A/S 15,827 590,259 0.47TDC A/S 301,560 1,283,934 1.02
1,874,193 1.49
FINLANDOutokumpu OYJ 378,604 1,263,504 1.01
FRANCEAir France-KLM 107,090 979,204 0.78Alstom SA 37,392 811,056 0.65Altran Technologies SA 94,915 1,120,944 0.89Criteo SA ADR 53,240 2,033,768 1.62Edenred 12,302 213,109 0.17Elis SA 87,405 1,519,121 1.21Eurazeo SA 28,487 1,660,293 1.32Europcar Groupe SA 163,187 1,702,893 1.36Ipsen SA 11,183 638,566 0.51Korian SA 39,404 1,072,687 0.86LISI 49,677 1,159,445 0.92Naturex 14,531 1,130,733 0.90Orpea 10,000 816,140 0.65Rexel SA 55,283 668,987 0.53Rothschild & Co 43,625 1,032,794 0.82Terreis 28,141 832,240 0.66Virbac SA 7,126 1,284,474 1.02
18,676,454 14.87
GERMANYMTU Aero Engines AG 9,848 887,024 0.71Takkt AG 29,699 521,025 0.41
1,408,049 1.12
GREECEAlpha Bank AE 243,790 425,902 0.34National Bank of Greece SA 2,200,878 477,923 0.38
903,825 0.72
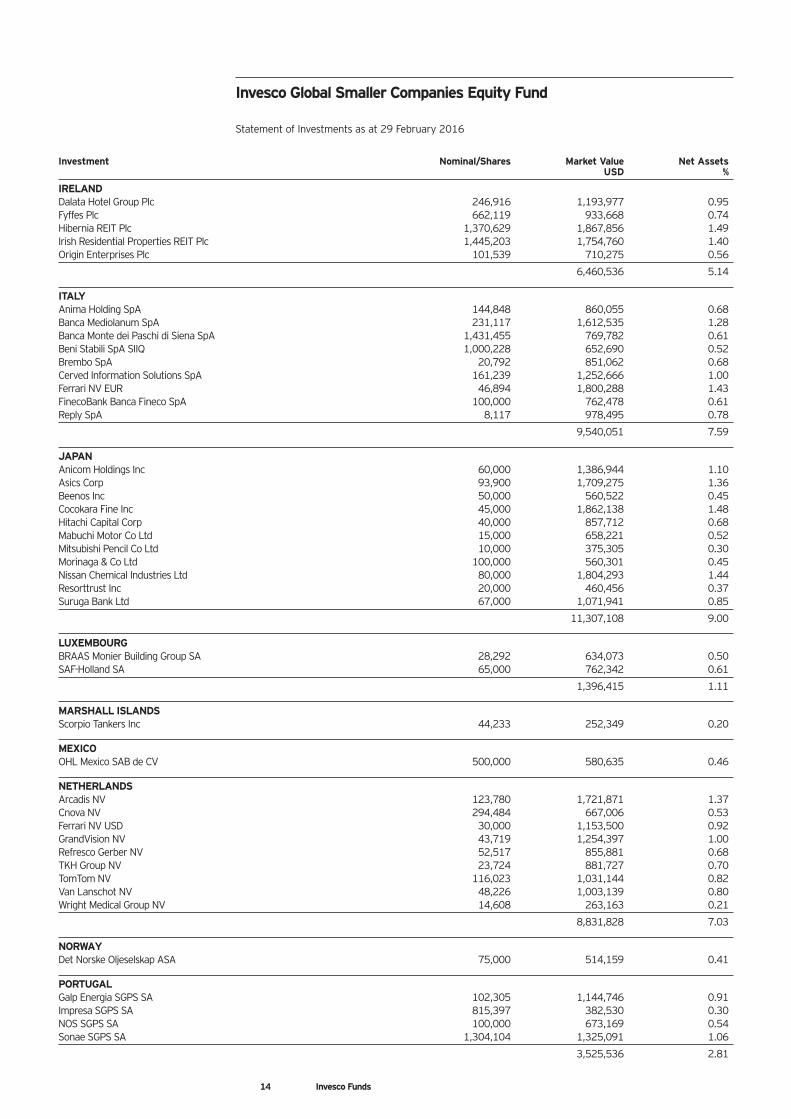
Invesco Global Smaller Companies Equity Fund
Statement of Investments as at 29 February 2016
13 Invesco Funds
Investment Nominal/Shares Market Value Net Assets USD %
IRELANDDalata Hotel Group Plc 246,916 1,193,977 0.95Fyffes Plc 662,119 933,668 0.74Hibernia REIT Plc 1,370,629 1,867,856 1.49Irish Residential Properties REIT Plc 1,445,203 1,754,760 1.40Origin Enterprises Plc 101,539 710,275 0.56
6,460,536 5.14
ITALYAnima Holding SpA 144,848 860,055 0.68Banca Mediolanum SpA 231,117 1,612,535 1.28Banca Monte dei Paschi di Siena SpA 1,431,455 769,782 0.61Beni Stabili SpA SIIQ 1,000,228 652,690 0.52Brembo SpA 20,792 851,062 0.68Cerved Information Solutions SpA 161,239 1,252,666 1.00Ferrari NV EUR 46,894 1,800,288 1.43FinecoBank Banca Fineco SpA 100,000 762,478 0.61Reply SpA 8,117 978,495 0.78
9,540,051 7.59
JAPANAnicom Holdings Inc 60,000 1,386,944 1.10Asics Corp 93,900 1,709,275 1.36Beenos Inc 50,000 560,522 0.45Cocokara Fine Inc 45,000 1,862,138 1.48Hitachi Capital Corp 40,000 857,712 0.68Mabuchi Motor Co Ltd 15,000 658,221 0.52Mitsubishi Pencil Co Ltd 10,000 375,305 0.30Morinaga & Co Ltd 100,000 560,301 0.45Nissan Chemical Industries Ltd 80,000 1,804,293 1.44Resorttrust Inc 20,000 460,456 0.37Suruga Bank Ltd 67,000 1,071,941 0.85
11,307,108 9.00
LUXEMBOURGBRAAS Monier Building Group SA 28,292 634,073 0.50SAF-Holland SA 65,000 762,342 0.61
1,396,415 1.11
MARSHALL ISLANDSScorpio Tankers Inc 44,233 252,349 0.20
MEXICOOHL Mexico SAB de CV 500,000 580,635 0.46
NETHERLANDSArcadis NV 123,780 1,721,871 1.37Cnova NV 294,484 667,006 0.53Ferrari NV USD 30,000 1,153,500 0.92GrandVision NV 43,719 1,254,397 1.00Refresco Gerber NV 52,517 855,881 0.68TKH Group NV 23,724 881,727 0.70TomTom NV 116,023 1,031,144 0.82Van Lanschot NV 48,226 1,003,139 0.80Wright Medical Group NV 14,608 263,163 0.21
8,831,828 7.03
NORWAYDet Norske Oljeselskap ASA 75,000 514,159 0.41
PORTUGALGalp Energia SGPS SA 102,305 1,144,746 0.91Impresa SGPS SA 815,397 382,530 0.30NOS SGPS SA 100,000 673,169 0.54Sonae SGPS SA 1,304,104 1,325,091 1.06
3,525,536 2.81
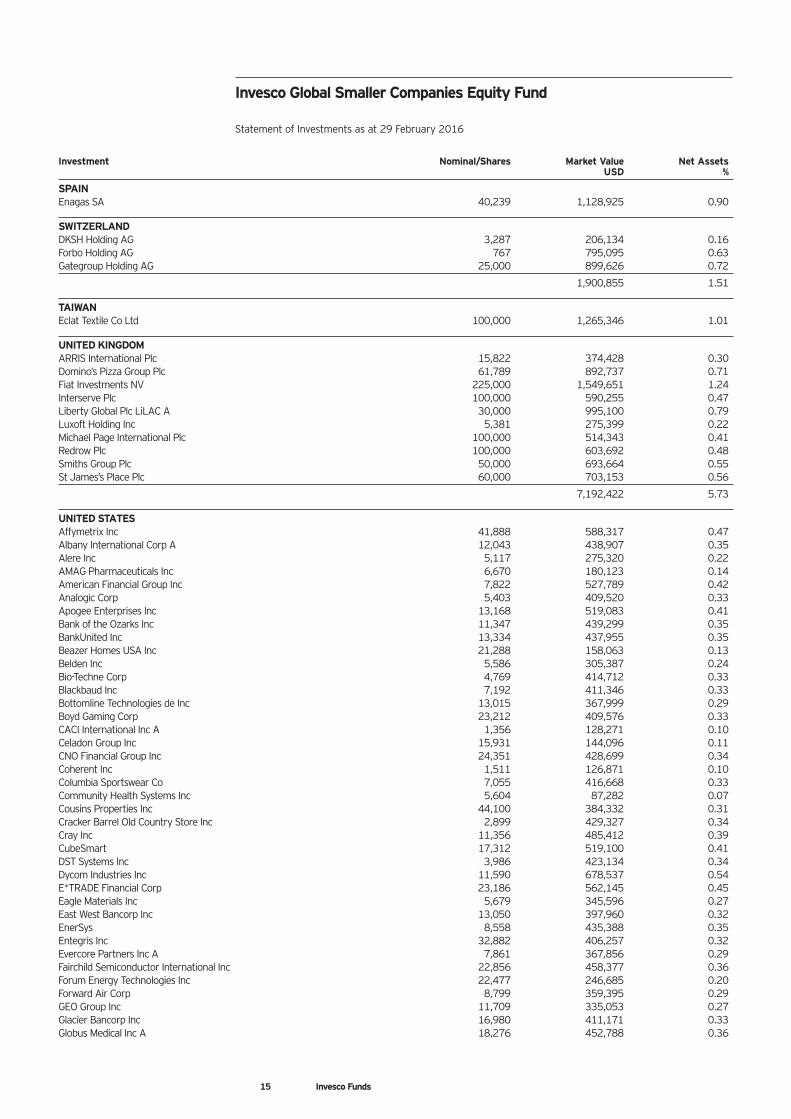
Invesco Global Smaller Companies Equity Fund
Statement of Investments as at 29 February 2016
14 Invesco Funds
Investment Nominal/Shares Market Value Net Assets USD %
SPAINEnagas SA 40,239 1,128,925 0.90
SWITZERLANDDKSH Holding AG 3,287 206,134 0.16Forbo Holding AG 767 795,095 0.63Gategroup Holding AG 25,000 899,626 0.72
1,900,855 1.51
TAIWANEclat Textile Co Ltd 100,000 1,265,346 1.01
UNITED KINGDOMARRIS International Plc 15,822 374,428 0.30Domino’s Pizza Group Plc 61,789 892,737 0.71Fiat Investments NV 225,000 1,549,651 1.24Interserve Plc 100,000 590,255 0.47Liberty Global Plc LiLAC A 30,000 995,100 0.79Luxoft Holding Inc 5,381 275,399 0.22Michael Page International Plc 100,000 514,343 0.41Redrow Plc 100,000 603,692 0.48Smiths Group Plc 50,000 693,664 0.55St James’s Place Plc 60,000 703,153 0.56
7,192,422 5.73
UNITED STATESAffymetrix Inc 41,888 588,317 0.47Albany International Corp A 12,043 438,907 0.35Alere Inc 5,117 275,320 0.22AMAG Pharmaceuticals Inc 6,670 180,123 0.14American Financial Group Inc 7,822 527,789 0.42Analogic Corp 5,403 409,520 0.33Apogee Enterprises Inc 13,168 519,083 0.41Bank of the Ozarks Inc 11,347 439,299 0.35BankUnited Inc 13,334 437,955 0.35Beazer Homes USA Inc 21,288 158,063 0.13Belden Inc 5,586 305,387 0.24Bio-Techne Corp 4,769 414,712 0.33Blackbaud Inc 7,192 411,346 0.33Bottomline Technologies de Inc 13,015 367,999 0.29Boyd Gaming Corp 23,212 409,576 0.33CACI International Inc A 1,356 128,271 0.10Celadon Group Inc 15,931 144,096 0.11CNO Financial Group Inc 24,351 428,699 0.34Coherent Inc 1,511 126,871 0.10Columbia Sportswear Co 7,055 416,668 0.33Community Health Systems Inc 5,604 87,282 0.07Cousins Properties Inc 44,100 384,332 0.31Cracker Barrel Old Country Store Inc 2,899 429,327 0.34Cray Inc 11,356 485,412 0.39CubeSmart 17,312 519,100 0.41DST Systems Inc 3,986 423,134 0.34Dycom Industries Inc 11,590 678,537 0.54E*TRADE Financial Corp 23,186 562,145 0.45Eagle Materials Inc 5,679 345,596 0.27East West Bancorp Inc 13,050 397,960 0.32EnerSys 8,558 435,388 0.35Entegris Inc 32,882 406,257 0.32Evercore Partners Inc A 7,861 367,856 0.29Fairchild Semiconductor International Inc 22,856 458,377 0.36Forum Energy Technologies Inc 22,477 246,685 0.20Forward Air Corp 8,799 359,395 0.29GEO Group Inc 11,709 335,053 0.27Glacier Bancorp Inc 16,980 411,171 0.33Globus Medical Inc A 18,276 452,788 0.36
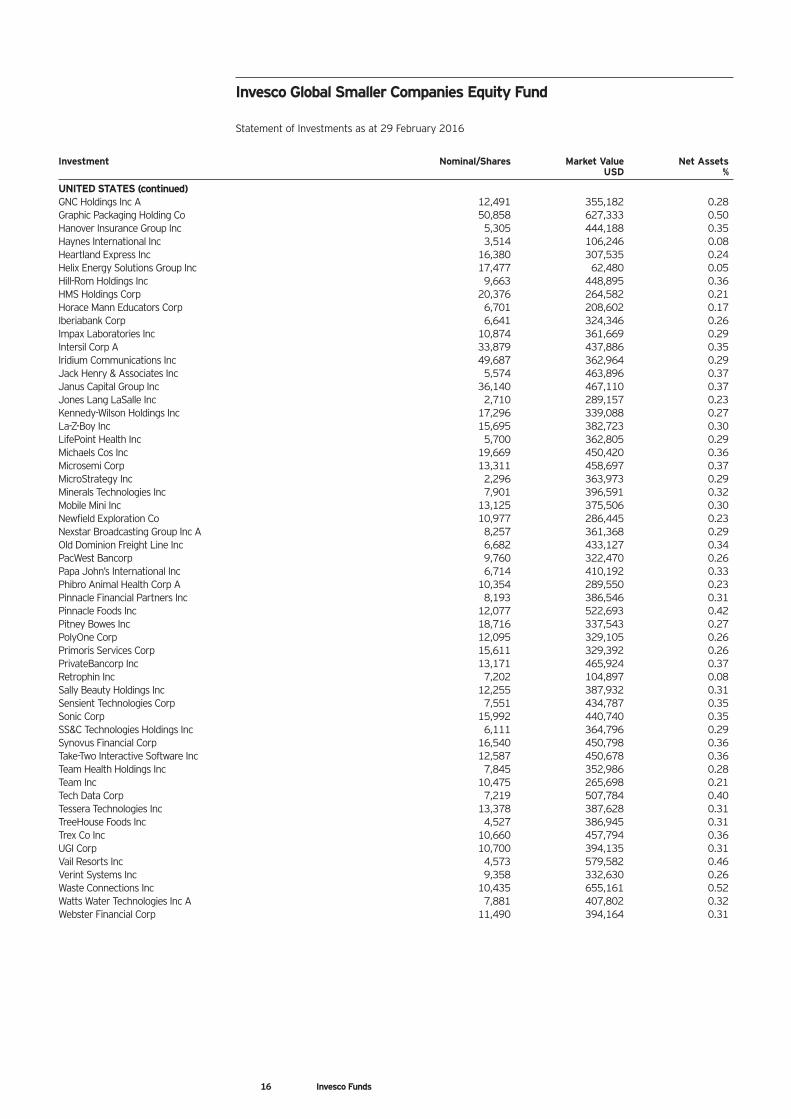
Invesco Global Smaller Companies Equity Fund
Statement of Investments as at 29 February 2016
15 Invesco Funds
Investment Nominal/Shares Market Value Net Assets USD %
UNITED STATES (continued)GNC Holdings Inc A 12,491 355,182 0.28Graphic Packaging Holding Co 50,858 627,333 0.50Hanover Insurance Group Inc 5,305 444,188 0.35Haynes International Inc 3,514 106,246 0.08Heartland Express Inc 16,380 307,535 0.24Helix Energy Solutions Group Inc 17,477 62,480 0.05Hill-Rom Holdings Inc 9,663 448,895 0.36HMS Holdings Corp 20,376 264,582 0.21Horace Mann Educators Corp 6,701 208,602 0.17Iberiabank Corp 6,641 324,346 0.26Impax Laboratories Inc 10,874 361,669 0.29Intersil Corp A 33,879 437,886 0.35Iridium Communications Inc 49,687 362,964 0.29Jack Henry & Associates Inc 5,574 463,896 0.37Janus Capital Group Inc 36,140 467,110 0.37Jones Lang LaSalle Inc 2,710 289,157 0.23Kennedy-Wilson Holdings Inc 17,296 339,088 0.27La-Z-Boy Inc 15,695 382,723 0.30LifePoint Health Inc 5,700 362,805 0.29Michaels Cos Inc 19,669 450,420 0.36Microsemi Corp 13,311 458,697 0.37MicroStrategy Inc 2,296 363,973 0.29Minerals Technologies Inc 7,901 396,591 0.32Mobile Mini Inc 13,125 375,506 0.30Newfield Exploration Co 10,977 286,445 0.23Nexstar Broadcasting Group Inc A 8,257 361,368 0.29Old Dominion Freight Line Inc 6,682 433,127 0.34PacWest Bancorp 9,760 322,470 0.26Papa John’s International Inc 6,714 410,192 0.33Phibro Animal Health Corp A 10,354 289,550 0.23Pinnacle Financial Partners Inc 8,193 386,546 0.31Pinnacle Foods Inc 12,077 522,693 0.42Pitney Bowes Inc 18,716 337,543 0.27PolyOne Corp 12,095 329,105 0.26Primoris Services Corp 15,611 329,392 0.26PrivateBancorp Inc 13,171 465,924 0.37Retrophin Inc 7,202 104,897 0.08Sally Beauty Holdings Inc 12,255 387,932 0.31Sensient Technologies Corp 7,551 434,787 0.35Sonic Corp 15,992 440,740 0.35SS&C Technologies Holdings Inc 6,111 364,796 0.29Synovus Financial Corp 16,540 450,798 0.36Take-Two Interactive Software Inc 12,587 450,678 0.36Team Health Holdings Inc 7,845 352,986 0.28Team Inc 10,475 265,698 0.21Tech Data Corp 7,219 507,784 0.40Tessera Technologies Inc 13,378 387,628 0.31TreeHouse Foods Inc 4,527 386,945 0.31Trex Co Inc 10,660 457,794 0.36UGI Corp 10,700 394,135 0.31Vail Resorts Inc 4,573 579,582 0.46Verint Systems Inc 9,358 332,630 0.26Waste Connections Inc 10,435 655,161 0.52Watts Water Technologies Inc A 7,881 407,802 0.32Webster Financial Corp 11,490 394,164 0.31
Invesco Global Smaller Companies Equity Fund
Statement of Investments as at 29 February 2016
16 Invesco Funds
Investment Nominal/Shares Market Value Net Assets USD %
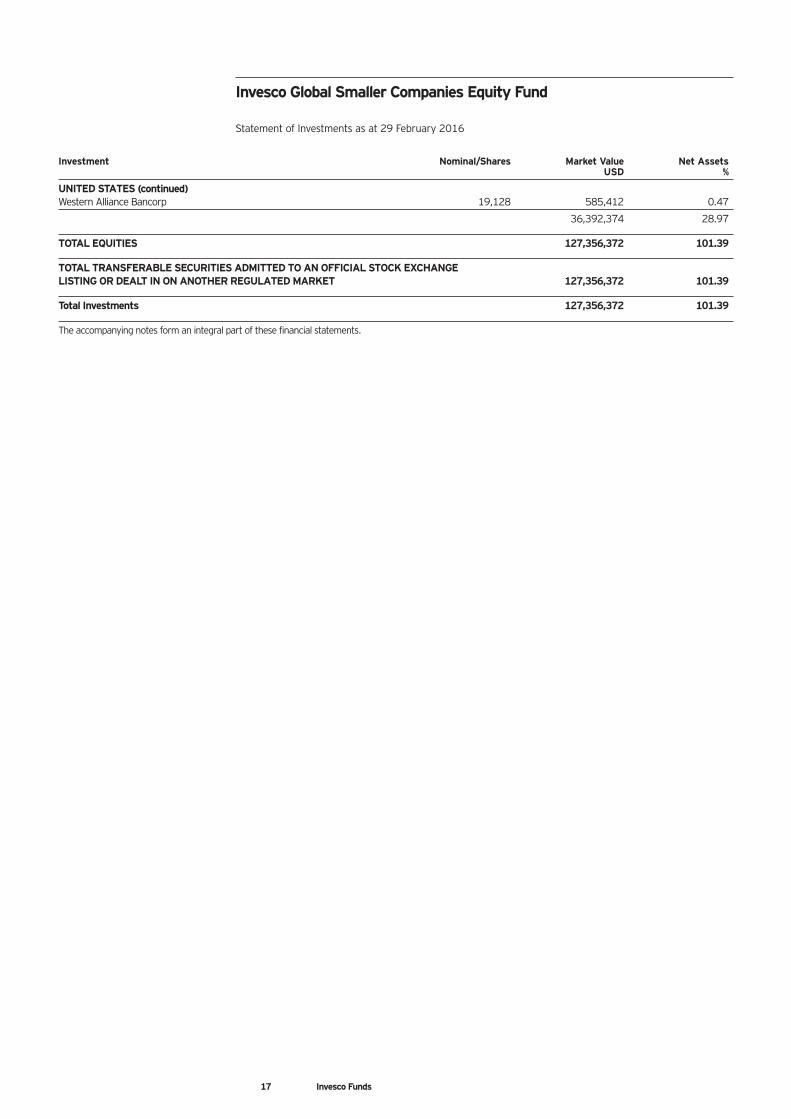
UNITED STATES (continued)Western Alliance Bancorp 19,128 585,412 0.47
36,392,374 28.97
TOTAL EQUITIES 127,356,372 101.39
TOTAL TRANSFERABLE SECURITIES ADMITTED TO AN OFFICIAL STOCK EXCHANGE LISTING OR DEALT IN ON ANOTHER REGULATED MARKET 127,356,372 101.39
Total Investments 127,356,372 101.39
The accompanying notes form an integral part of these financial statements.
Invesco Global Smaller Companies Equity Fund
Statement of Investments as at 29 February 2016
17 Invesco Funds
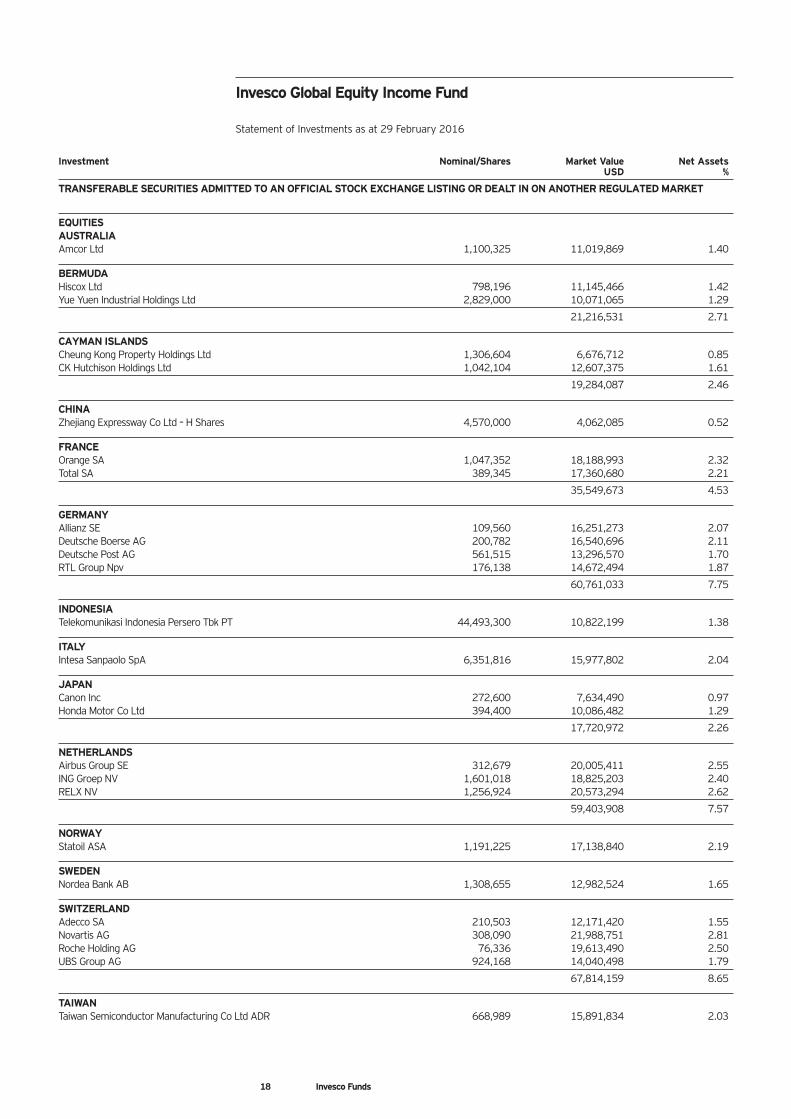
Invesco Global Equity Income Fund
Statement of Investments as at 29 February 2016
Investment Nominal/Shares Market Value Net Assets USD %
TRANSFERABLE SECURITIES ADMITTED TO AN OFFICIAL STOCK EXCHANGE LISTING OR DEALT IN ON ANOTHER REGULATED MARKET
EQUITIESAUSTRALIAAmcor Ltd 1,100,325 11,019,869 1.40
BERMUDAHiscox Ltd 798,196 11,145,466 1.42Yue Yuen Industrial Holdings Ltd 2,829,000 10,071,065 1.29
21,216,531 2.71
CAYMAN ISLANDSCheung Kong Property Holdings Ltd 1,306,604 6,676,712 0.85CK Hutchison Holdings Ltd 1,042,104 12,607,375 1.61
19,284,087 2.46
CHINAZhejiang Expressway Co Ltd – H Shares 4,570,000 4,062,085 0.52
FRANCEOrange SA 1,047,352 18,188,993 2.32Total SA 389,345 17,360,680 2.21
35,549,673 4.53
GERMANYAllianz SE 109,560 16,251,273 2.07Deutsche Boerse AG 200,782 16,540,696 2.11Deutsche Post AG 561,515 13,296,570 1.70RTL Group Npv 176,138 14,672,494 1.87
60,761,033 7.75
INDONESIATelekomunikasi Indonesia Persero Tbk PT 44,493,300 10,822,199 1.38
ITALYIntesa Sanpaolo SpA 6,351,816 15,977,802 2.04
JAPANCanon Inc 272,600 7,634,490 0.97Honda Motor Co Ltd 394,400 10,086,482 1.29
17,720,972 2.26
NETHERLANDSAirbus Group SE 312,679 20,005,411 2.55ING Groep NV 1,601,018 18,825,203 2.40RELX NV 1,256,924 20,573,294 2.62
59,403,908 7.57
NORWAYStatoil ASA 1,191,225 17,138,840 2.19
SWEDENNordea Bank AB 1,308,655 12,982,524 1.65
SWITZERLANDAdecco SA 210,503 12,171,420 1.55Novartis AG 308,090 21,988,751 2.81Roche Holding AG 76,336 19,613,490 2.50UBS Group AG 924,168 14,040,498 1.79
67,814,159 8.65
TAIWANTaiwan Semiconductor Manufacturing Co Ltd ADR 668,989 15,891,834 2.03
18 Invesco Funds
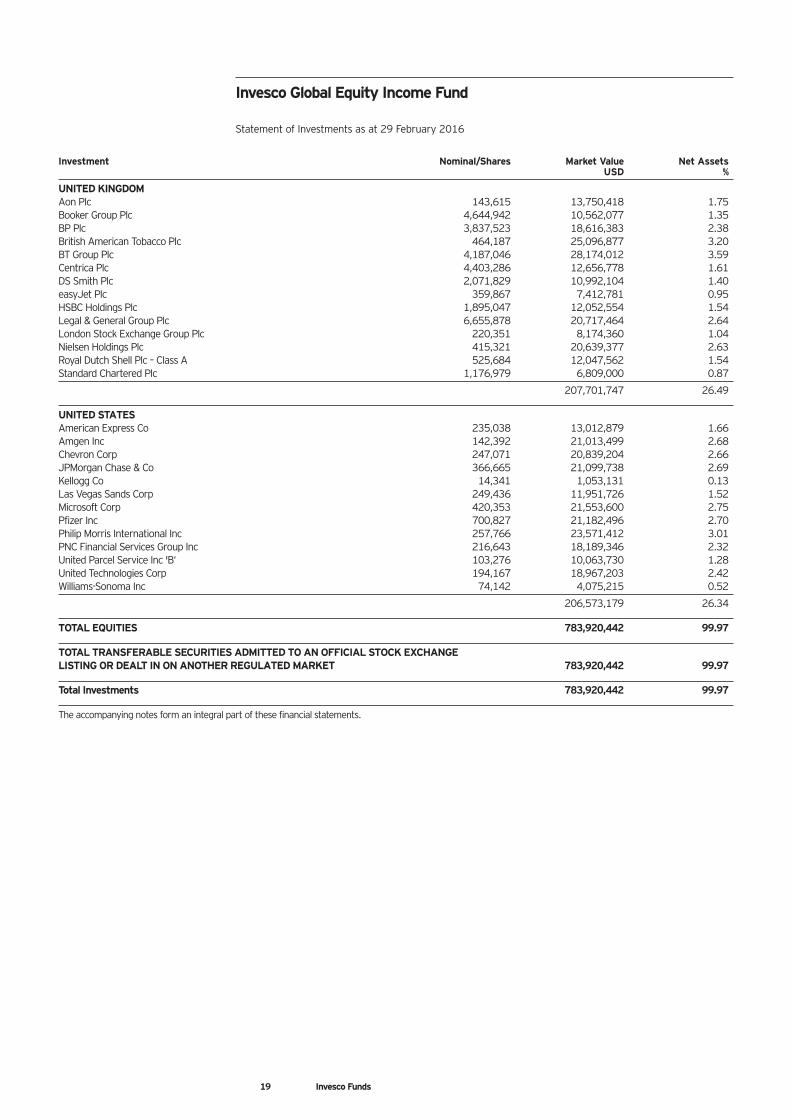
Invesco Global Equity Income Fund
Statement of Investments as at 29 February 2016
Investment Nominal/Shares Market Value Net Assets USD %
UNITED KINGDOMAon Plc 143,615 13,750,418 1.75Booker Group Plc 4,644,942 10,562,077 1.35BP Plc 3,837,523 18,616,383 2.38British American Tobacco Plc 464,187 25,096,877 3.20BT Group Plc 4,187,046 28,174,012 3.59Centrica Plc 4,403,286 12,656,778 1.61DS Smith Plc 2,071,829 10,992,104 1.40easyJet Plc 359,867 7,412,781 0.95HSBC Holdings Plc 1,895,047 12,052,554 1.54Legal & General Group Plc 6,655,878 20,717,464 2.64London Stock Exchange Group Plc 220,351 8,174,360 1.04Nielsen Holdings Plc 415,321 20,639,377 2.63Royal Dutch Shell Plc – Class A 525,684 12,047,562 1.54Standard Chartered Plc 1,176,979 6,809,000 0.87
207,701,747 26.49
UNITED STATESAmerican Express Co 235,038 13,012,879 1.66Amgen Inc 142,392 21,013,499 2.68Chevron Corp 247,071 20,839,204 2.66JPMorgan Chase & Co 366,665 21,099,738 2.69Kellogg Co 14,341 1,053,131 0.13Las Vegas Sands Corp 249,436 11,951,726 1.52Microsoft Corp 420,353 21,553,600 2.75Pfizer Inc 700,827 21,182,496 2.70Philip Morris International Inc 257,766 23,571,412 3.01PNC Financial Services Group Inc 216,643 18,189,346 2.32United Parcel Service Inc 'B‘ 103,276 10,063,730 1.28United Technologies Corp 194,167 18,967,203 2.42Williams-Sonoma Inc 74,142 4,075,215 0.52
206,573,179 26.34
TOTAL EQUITIES 783,920,442 99.97
TOTAL TRANSFERABLE SECURITIES ADMITTED TO AN OFFICIAL STOCK EXCHANGE LISTING OR DEALT IN ON ANOTHER REGULATED MARKET 783,920,442 99.97
Total Investments 783,920,442 99.97
The accompanying notes form an integral part of these financial statements.
19 Invesco Funds
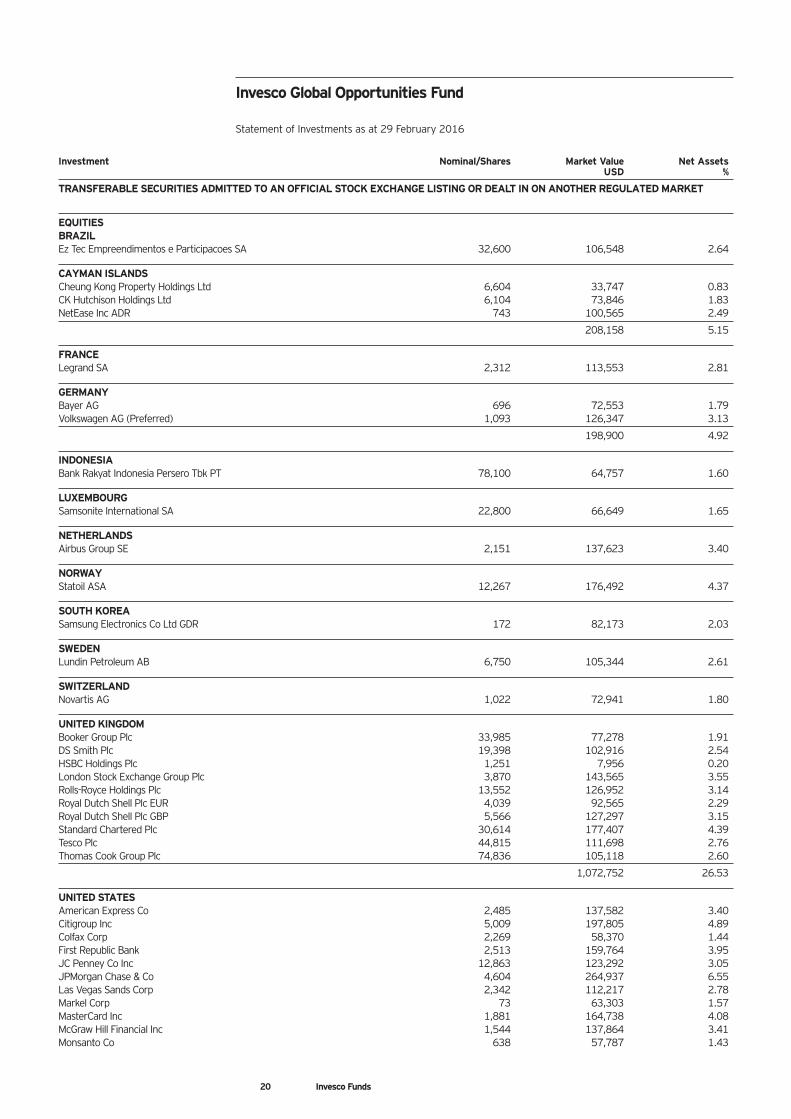
Invesco Global Opportunities Fund
Statement of Investments as at 29 February 2016
Investment Nominal/Shares Market Value Net Assets USD %
TRANSFERABLE SECURITIES ADMITTED TO AN OFFICIAL STOCK EXCHANGE LISTING OR DEALT IN ON ANOTHER REGULATED MARKET
EQUITIESBRAZILEz Tec Empreendimentos e Participacoes SA 32,600 106,548 2.64
CAYMAN ISLANDSCheung Kong Property Holdings Ltd 6,604 33,747 0.83CK Hutchison Holdings Ltd 6,104 73,846 1.83NetEase Inc ADR 743 100,565 2.49
208,158 5.15
FRANCELegrand SA 2,312 113,553 2.81
GERMANYBayer AG 696 72,553 1.79Volkswagen AG (Preferred) 1,093 126,347 3.13
198,900 4.92
INDONESIABank Rakyat Indonesia Persero Tbk PT 78,100 64,757 1.60
LUXEMBOURGSamsonite International SA 22,800 66,649 1.65
NETHERLANDSAirbus Group SE 2,151 137,623 3.40
NORWAYStatoil ASA 12,267 176,492 4.37
SOUTH KOREASamsung Electronics Co Ltd GDR 172 82,173 2.03
SWEDENLundin Petroleum AB 6,750 105,344 2.61
SWITZERLANDNovartis AG 1,022 72,941 1.80
UNITED KINGDOMBooker Group Plc 33,985 77,278 1.91DS Smith Plc 19,398 102,916 2.54HSBC Holdings Plc 1,251 7,956 0.20London Stock Exchange Group Plc 3,870 143,565 3.55Rolls-Royce Holdings Plc 13,552 126,952 3.14Royal Dutch Shell Plc EUR 4,039 92,565 2.29Royal Dutch Shell Plc GBP 5,566 127,297 3.15Standard Chartered Plc 30,614 177,407 4.39Tesco Plc 44,815 111,698 2.76Thomas Cook Group Plc 74,836 105,118 2.60
1,072,752 26.53
UNITED STATESAmerican Express Co 2,485 137,582 3.40Citigroup Inc 5,009 197,805 4.89Colfax Corp 2,269 58,370 1.44First Republic Bank 2,513 159,764 3.95JC Penney Co Inc 12,863 123,292 3.05JPMorgan Chase & Co 4,604 264,937 6.55Las Vegas Sands Corp 2,342 112,217 2.78Markel Corp 73 63,303 1.57MasterCard Inc 1,881 164,738 4.08McGraw Hill Financial Inc 1,544 137,864 3.41Monsanto Co 638 57,787 1.43
20 Invesco Funds
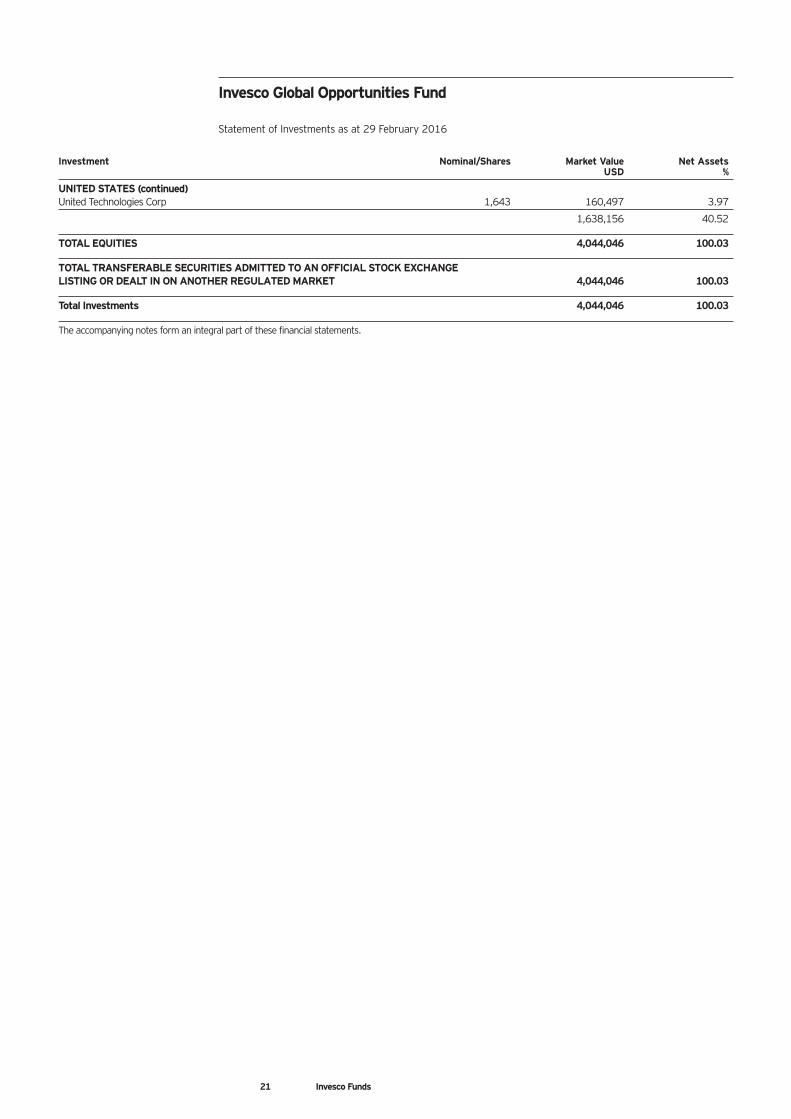
Invesco Global Opportunities Fund
Statement of Investments as at 29 February 2016
Investment Nominal/Shares Market Value Net Assets USD %
UNITED STATES (continued)United Technologies Corp 1,643 160,497 3.97
1,638,156 40.52
TOTAL EQUITIES 4,044,046 100.03
TOTAL TRANSFERABLE SECURITIES ADMITTED TO AN OFFICIAL STOCK EXCHANGE LISTING OR DEALT IN ON ANOTHER REGULATED MARKET 4,044,046 100.03
Total Investments 4,044,046 100.03
The accompanying notes form an integral part of these financial statements.
21 Invesco Funds
Invesco Global Equity Market Neutral Fund
As at 29 February 2016, this Fund holds only derivatives. Please see notes 8 – 18 for details of these holdings.
22 Invesco Funds
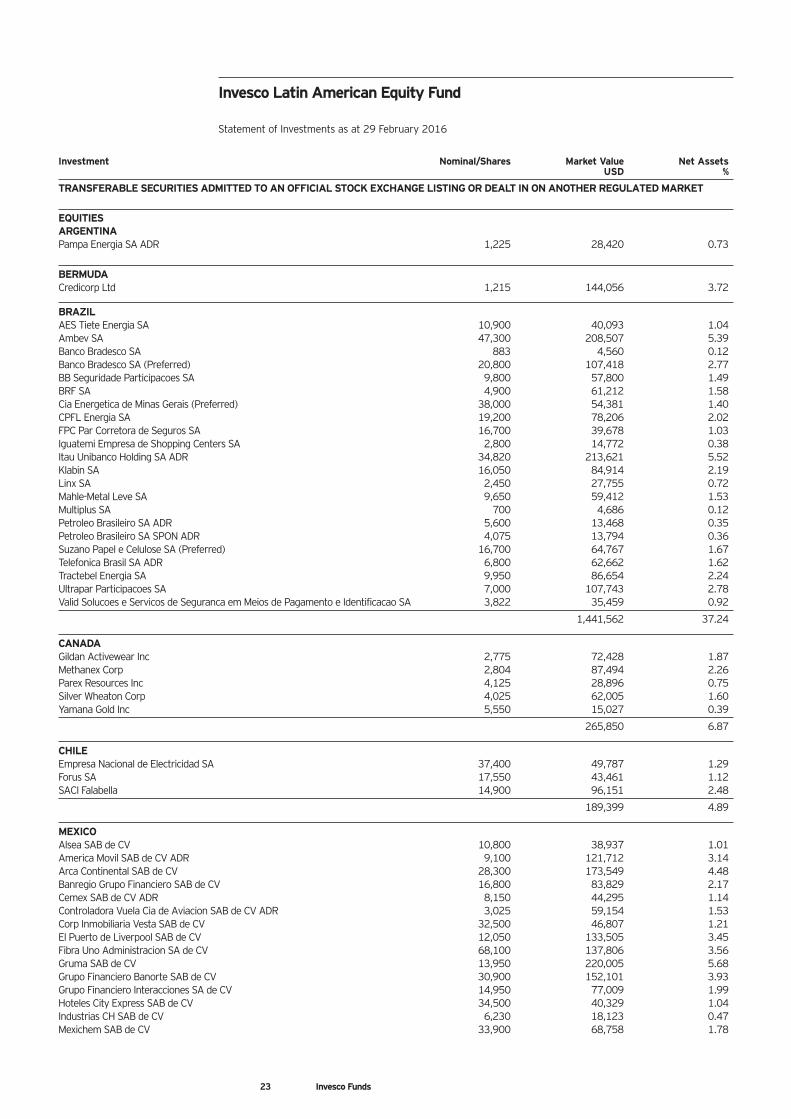
Invesco Latin American Equity Fund
Statement of Investments as at 29 February 2016
Investment Nominal/Shares Market Value Net Assets USD %
TRANSFERABLE SECURITIES ADMITTED TO AN OFFICIAL STOCK EXCHANGE LISTING OR DEALT IN ON ANOTHER REGULATED MARKET
EQUITIESARGENTINAPampa Energia SA ADR 1,225 28,420 0.73
BERMUDACredicorp Ltd 1,215 144,056 3.72
BRAZILAES Tiete Energia SA 10,900 40,093 1.04Ambev SA 47,300 208,507 5.39Banco Bradesco SA 883 4,560 0.12Banco Bradesco SA (Preferred) 20,800 107,418 2.77BB Seguridade Participacoes SA 9,800 57,800 1.49BRF SA 4,900 61,212 1.58Cia Energetica de Minas Gerais (Preferred) 38,000 54,381 1.40CPFL Energia SA 19,200 78,206 2.02FPC Par Corretora de Seguros SA 16,700 39,678 1.03Iguatemi Empresa de Shopping Centers SA 2,800 14,772 0.38Itau Unibanco Holding SA ADR 34,820 213,621 5.52Klabin SA 16,050 84,914 2.19Linx SA 2,450 27,755 0.72Mahle-Metal Leve SA 9,650 59,412 1.53Multiplus SA 700 4,686 0.12Petroleo Brasileiro SA ADR 5,600 13,468 0.35Petroleo Brasileiro SA SPON ADR 4,075 13,794 0.36Suzano Papel e Celulose SA (Preferred) 16,700 64,767 1.67Telefonica Brasil SA ADR 6,800 62,662 1.62Tractebel Energia SA 9,950 86,654 2.24Ultrapar Participacoes SA 7,000 107,743 2.78Valid Solucoes e Servicos de Seguranca em Meios de Pagamento e Identificacao SA 3,822 35,459 0.92
1,441,562 37.24
CANADAGildan Activewear Inc 2,775 72,428 1.87Methanex Corp 2,804 87,494 2.26Parex Resources Inc 4,125 28,896 0.75Silver Wheaton Corp 4,025 62,005 1.60Yamana Gold Inc 5,550 15,027 0.39
265,850 6.87
CHILEEmpresa Nacional de Electricidad SA 37,400 49,787 1.29Forus SA 17,550 43,461 1.12SACI Falabella 14,900 96,151 2.48
189,399 4.89
MEXICOAlsea SAB de CV 10,800 38,937 1.01America Movil SAB de CV ADR 9,100 121,712 3.14Arca Continental SAB de CV 28,300 173,549 4.48Banregio Grupo Financiero SAB de CV 16,800 83,829 2.17Cemex SAB de CV ADR 8,150 44,295 1.14Controladora Vuela Cia de Aviacion SAB de CV ADR 3,025 59,154 1.53Corp Inmobiliaria Vesta SAB de CV 32,500 46,807 1.21El Puerto de Liverpool SAB de CV 12,050 133,505 3.45Fibra Uno Administracion SA de CV 68,100 137,806 3.56Gruma SAB de CV 13,950 220,005 5.68Grupo Financiero Banorte SAB de CV 30,900 152,101 3.93Grupo Financiero Interacciones SA de CV 14,950 77,009 1.99Hoteles City Express SAB de CV 34,500 40,329 1.04Industrias CH SAB de CV 6,230 18,123 0.47Mexichem SAB de CV 33,900 68,758 1.78
23 Invesco Funds
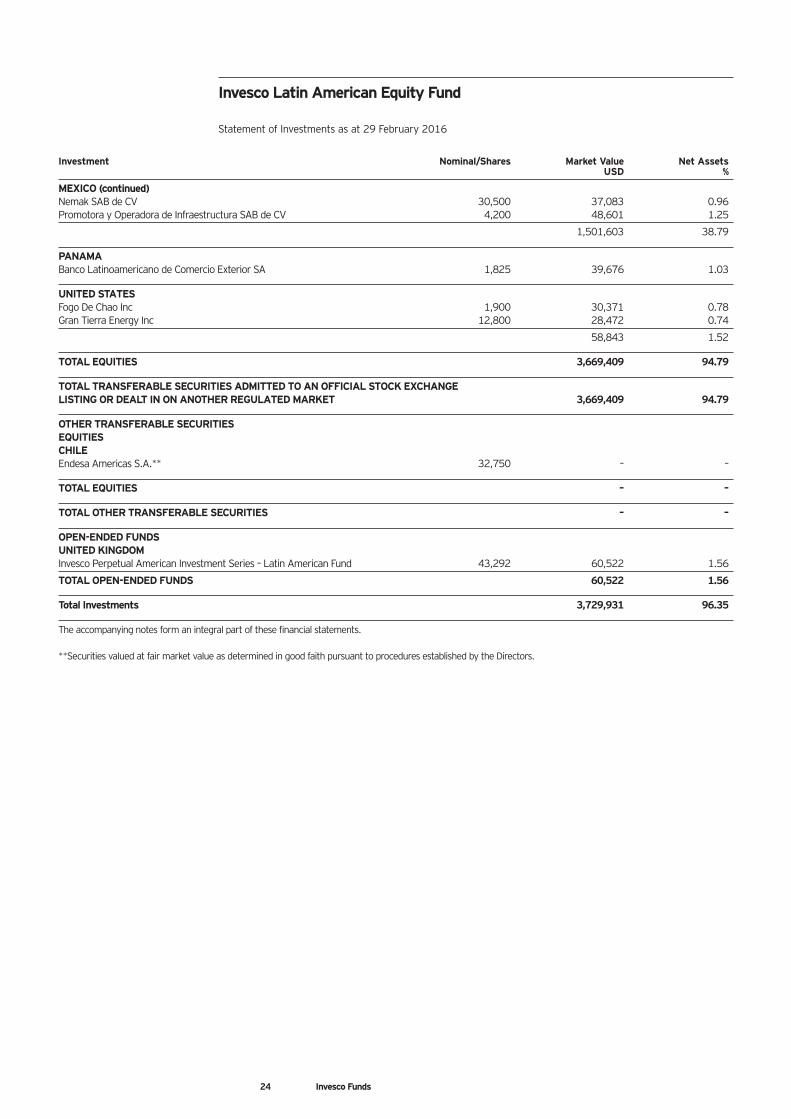
Invesco Latin American Equity Fund
Statement of Investments as at 29 February 2016
Investment Nominal/Shares Market Value Net Assets USD %
MEXICO (continued)Nemak SAB de CV 30,500 37,083 0.96Promotora y Operadora de Infraestructura SAB de CV 4,200 48,601 1.25
1,501,603 38.79
PANAMABanco Latinoamericano de Comercio Exterior SA 1,825 39,676 1.03
UNITED STATESFogo De Chao Inc 1,900 30,371 0.78Gran Tierra Energy Inc 12,800 28,472 0.74
58,843 1.52
TOTAL EQUITIES 3,669,409 94.79
TOTAL TRANSFERABLE SECURITIES ADMITTED TO AN OFFICIAL STOCK EXCHANGE LISTING OR DEALT IN ON ANOTHER REGULATED MARKET 3,669,409 94.79
OTHER TRANSFERABLE SECURITIESEQUITIESCHILEEndesa Americas S.A.** 32,750 – –
TOTAL EQUITIES – –
TOTAL OTHER TRANSFERABLE SECURITIES – –
OPEN-ENDED FUNDSUNITED KINGDOMInvesco Perpetual American Investment Series – Latin American Fund 43,292 60,522 1.56
TOTAL OPEN-ENDED FUNDS 60,522 1.56
Total Investments 3,729,931 96.35
The accompanying notes form an integral part of these financial statements.
**Securities valued at fair market value as determined in good faith pursuant to procedures established by the Directors.
24 Invesco Funds
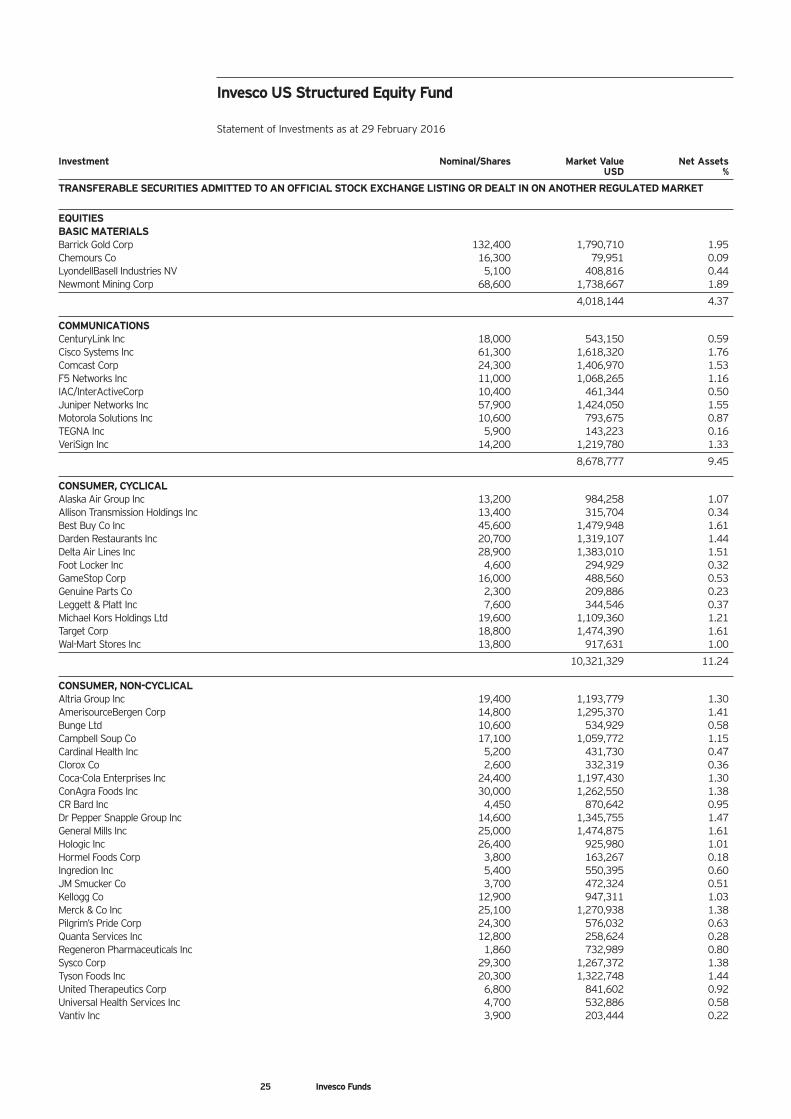
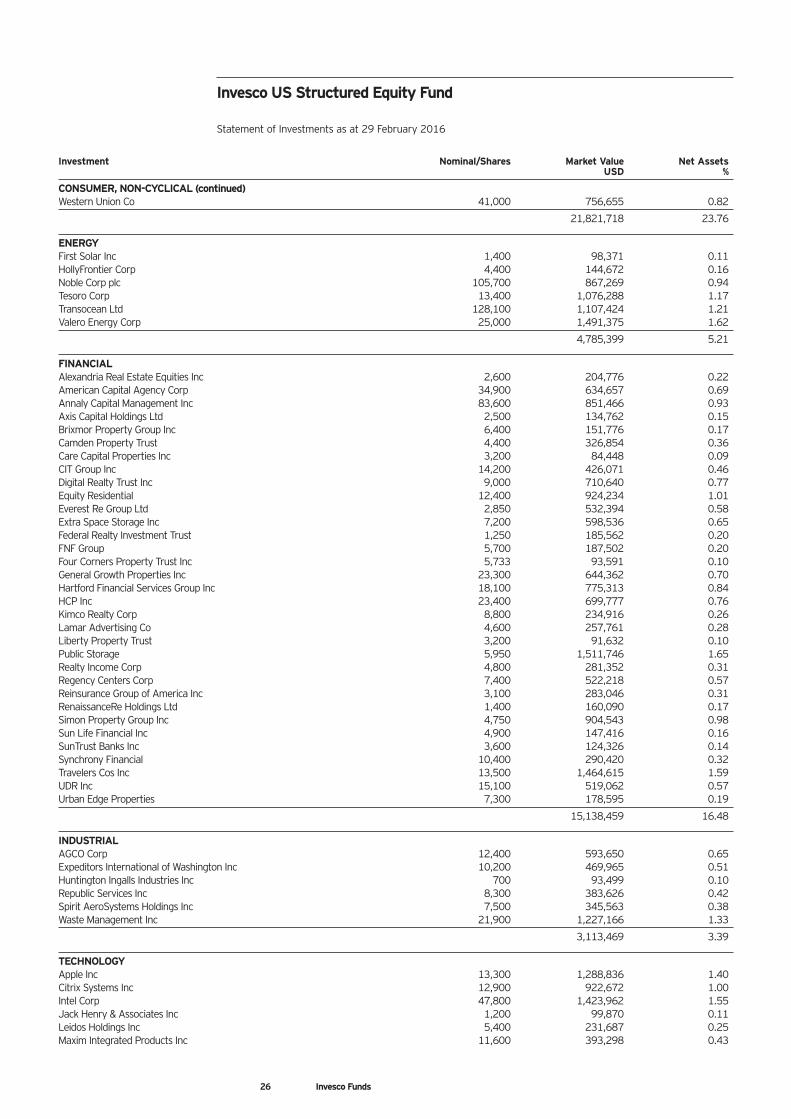
Invesco US Structured Equity Fund
Statement of Investments as at 29 February 2016
Investment Nominal/Shares Market Value Net Assets USD %
TRANSFERABLE SECURITIES ADMITTED TO AN OFFICIAL STOCK EXCHANGE LISTING OR DEALT IN ON ANOTHER REGULATED MARKET
EQUITIESBASIC MATERIALSBarrick Gold Corp 132,400 1,790,710 1.95Chemours Co 16,300 79,951 0.09LyondellBasell Industries NV 5,100 408,816 0.44Newmont Mining Corp 68,600 1,738,667 1.89
4,018,144 4.37
COMMUNICATIONSCenturyLink Inc 18,000 543,150 0.59Cisco Systems Inc 61,300 1,618,320 1.76Comcast Corp 24,300 1,406,970 1.53F5 Networks Inc 11,000 1,068,265 1.16IAC/InterActiveCorp 10,400 461,344 0.50Juniper Networks Inc 57,900 1,424,050 1.55Motorola Solutions Inc 10,600 793,675 0.87TEGNA Inc 5,900 143,223 0.16VeriSign Inc 14,200 1,219,780 1.33
8,678,777 9.45
CONSUMER, CYCLICALAlaska Air Group Inc 13,200 984,258 1.07Allison Transmission Holdings Inc 13,400 315,704 0.34Best Buy Co Inc 45,600 1,479,948 1.61Darden Restaurants Inc 20,700 1,319,107 1.44Delta Air Lines Inc 28,900 1,383,010 1.51Foot Locker Inc 4,600 294,929 0.32GameStop Corp 16,000 488,560 0.53Genuine Parts Co 2,300 209,886 0.23Leggett & Platt Inc 7,600 344,546 0.37Michael Kors Holdings Ltd 19,600 1,109,360 1.21Target Corp 18,800 1,474,390 1.61Wal-Mart Stores Inc 13,800 917,631 1.00
10,321,329 11.24
CONSUMER, NON-CYCLICALAltria Group Inc 19,400 1,193,779 1.30AmerisourceBergen Corp 14,800 1,295,370 1.41Bunge Ltd 10,600 534,929 0.58Campbell Soup Co 17,100 1,059,772 1.15Cardinal Health Inc 5,200 431,730 0.47Clorox Co 2,600 332,319 0.36Coca-Cola Enterprises Inc 24,400 1,197,430 1.30ConAgra Foods Inc 30,000 1,262,550 1.38CR Bard Inc 4,450 870,642 0.95Dr Pepper Snapple Group Inc 14,600 1,345,755 1.47General Mills Inc 25,000 1,474,875 1.61Hologic Inc 26,400 925,980 1.01Hormel Foods Corp 3,800 163,267 0.18Ingredion Inc 5,400 550,395 0.60JM Smucker Co 3,700 472,324 0.51Kellogg Co 12,900 947,311 1.03Merck & Co Inc 25,100 1,270,938 1.38Pilgrim’s Pride Corp 24,300 576,032 0.63Quanta Services Inc 12,800 258,624 0.28Regeneron Pharmaceuticals Inc 1,860 732,989 0.80Sysco Corp 29,300 1,267,372 1.38Tyson Foods Inc 20,300 1,322,748 1.44United Therapeutics Corp 6,800 841,602 0.92Universal Health Services Inc 4,700 532,886 0.58Vantiv Inc 3,900 203,444 0.22
25 Invesco Funds
Invesco US Structured Equity Fund
Statement of Investments as at 29 February 2016
Investment Nominal/Shares Market Value Net Assets USD %
CONSUMER, NON-CYCLICAL (continued)Western Union Co 41,000 756,655 0.82
21,821,718 23.76
ENERGYFirst Solar Inc 1,400 98,371 0.11HollyFrontier Corp 4,400 144,672 0.16Noble Corp plc 105,700 867,269 0.94Tesoro Corp 13,400 1,076,288 1.17Transocean Ltd 128,100 1,107,424 1.21Valero Energy Corp 25,000 1,491,375 1.62
4,785,399 5.21
FINANCIALAlexandria Real Estate Equities Inc 2,600 204,776 0.22American Capital Agency Corp 34,900 634,657 0.69Annaly Capital Management Inc 83,600 851,466 0.93Axis Capital Holdings Ltd 2,500 134,762 0.15Brixmor Property Group Inc 6,400 151,776 0.17Camden Property Trust 4,400 326,854 0.36Care Capital Properties Inc 3,200 84,448 0.09CIT Group Inc 14,200 426,071 0.46Digital Realty Trust Inc 9,000 710,640 0.77Equity Residential 12,400 924,234 1.01Everest Re Group Ltd 2,850 532,394 0.58Extra Space Storage Inc 7,200 598,536 0.65Federal Realty Investment Trust 1,250 185,562 0.20FNF Group 5,700 187,502 0.20Four Corners Property Trust Inc 5,733 93,591 0.10General Growth Properties Inc 23,300 644,362 0.70Hartford Financial Services Group Inc 18,100 775,313 0.84HCP Inc 23,400 699,777 0.76Kimco Realty Corp 8,800 234,916 0.26Lamar Advertising Co 4,600 257,761 0.28Liberty Property Trust 3,200 91,632 0.10Public Storage 5,950 1,511,746 1.65Realty Income Corp 4,800 281,352 0.31Regency Centers Corp 7,400 522,218 0.57Reinsurance Group of America Inc 3,100 283,046 0.31RenaissanceRe Holdings Ltd 1,400 160,090 0.17Simon Property Group Inc 4,750 904,543 0.98Sun Life Financial Inc 4,900 147,416 0.16SunTrust Banks Inc 3,600 124,326 0.14Synchrony Financial 10,400 290,420 0.32Travelers Cos Inc 13,500 1,464,615 1.59UDR Inc 15,100 519,062 0.57Urban Edge Properties 7,300 178,595 0.19
15,138,459 16.48
INDUSTRIALAGCO Corp 12,400 593,650 0.65Expeditors International of Washington Inc 10,200 469,965 0.51Huntington Ingalls Industries Inc 700 93,499 0.10Republic Services Inc 8,300 383,626 0.42Spirit AeroSystems Holdings Inc 7,500 345,563 0.38Waste Management Inc 21,900 1,227,166 1.33
3,113,469 3.39
TECHNOLOGYApple Inc 13,300 1,288,836 1.40Citrix Systems Inc 12,900 922,672 1.00Intel Corp 47,800 1,423,962 1.55Jack Henry & Associates Inc 1,200 99,870 0.11Leidos Holdings Inc 5,400 231,687 0.25Maxim Integrated Products Inc 11,600 393,298 0.43
26 Invesco Funds
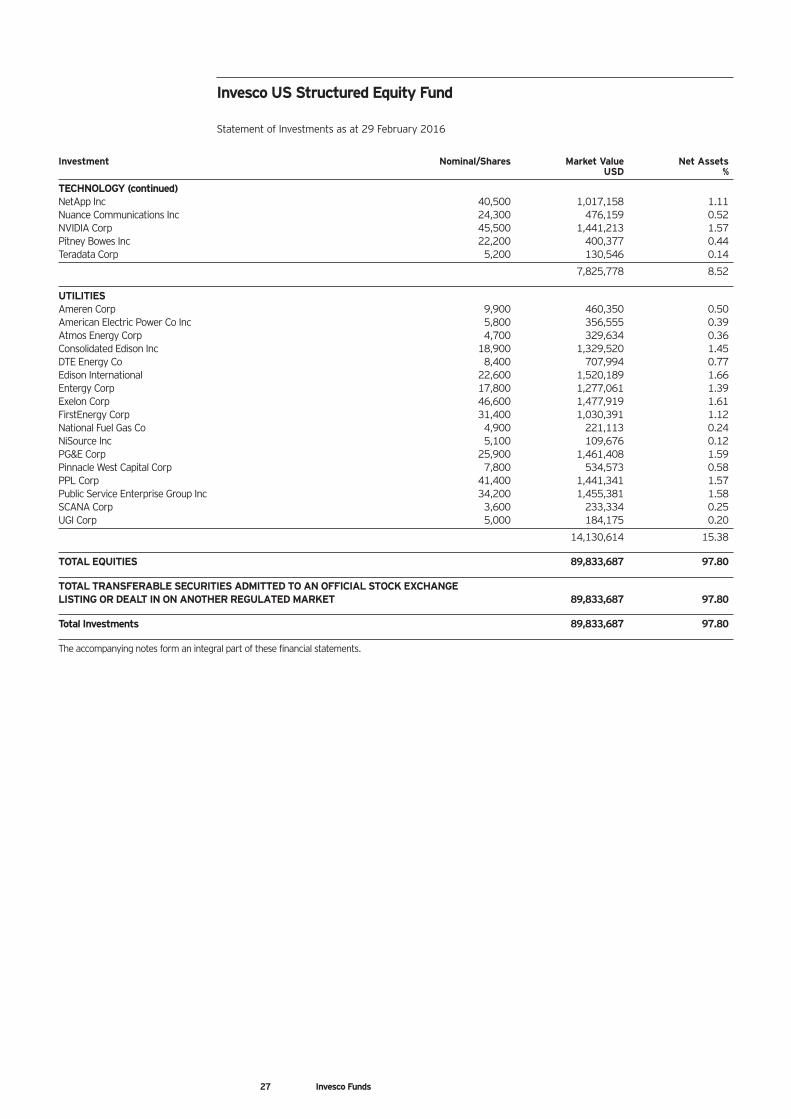
Invesco US Structured Equity Fund
Statement of Investments as at 29 February 2016
Investment Nominal/Shares Market Value Net Assets USD %
TECHNOLOGY (continued)NetApp Inc 40,500 1,017,158 1.11Nuance Communications Inc 24,300 476,159 0.52NVIDIA Corp 45,500 1,441,213 1.57Pitney Bowes Inc 22,200 400,377 0.44Teradata Corp 5,200 130,546 0.14
7,825,778 8.52
UTILITIESAmeren Corp 9,900 460,350 0.50American Electric Power Co Inc 5,800 356,555 0.39Atmos Energy Corp 4,700 329,634 0.36Consolidated Edison Inc 18,900 1,329,520 1.45DTE Energy Co 8,400 707,994 0.77Edison International 22,600 1,520,189 1.66Entergy Corp 17,800 1,277,061 1.39Exelon Corp 46,600 1,477,919 1.61FirstEnergy Corp 31,400 1,030,391 1.12National Fuel Gas Co 4,900 221,113 0.24NiSource Inc 5,100 109,676 0.12PG&E Corp 25,900 1,461,408 1.59Pinnacle West Capital Corp 7,800 534,573 0.58PPL Corp 41,400 1,441,341 1.57Public Service Enterprise Group Inc 34,200 1,455,381 1.58SCANA Corp 3,600 233,334 0.25UGI Corp 5,000 184,175 0.20
14,130,614 15.38
TOTAL EQUITIES 89,833,687 97.80
TOTAL TRANSFERABLE SECURITIES ADMITTED TO AN OFFICIAL STOCK EXCHANGE LISTING OR DEALT IN ON ANOTHER REGULATED MARKET 89,833,687 97.80
Total Investments 89,833,687 97.80
The accompanying notes form an integral part of these financial statements.
27 Invesco Funds
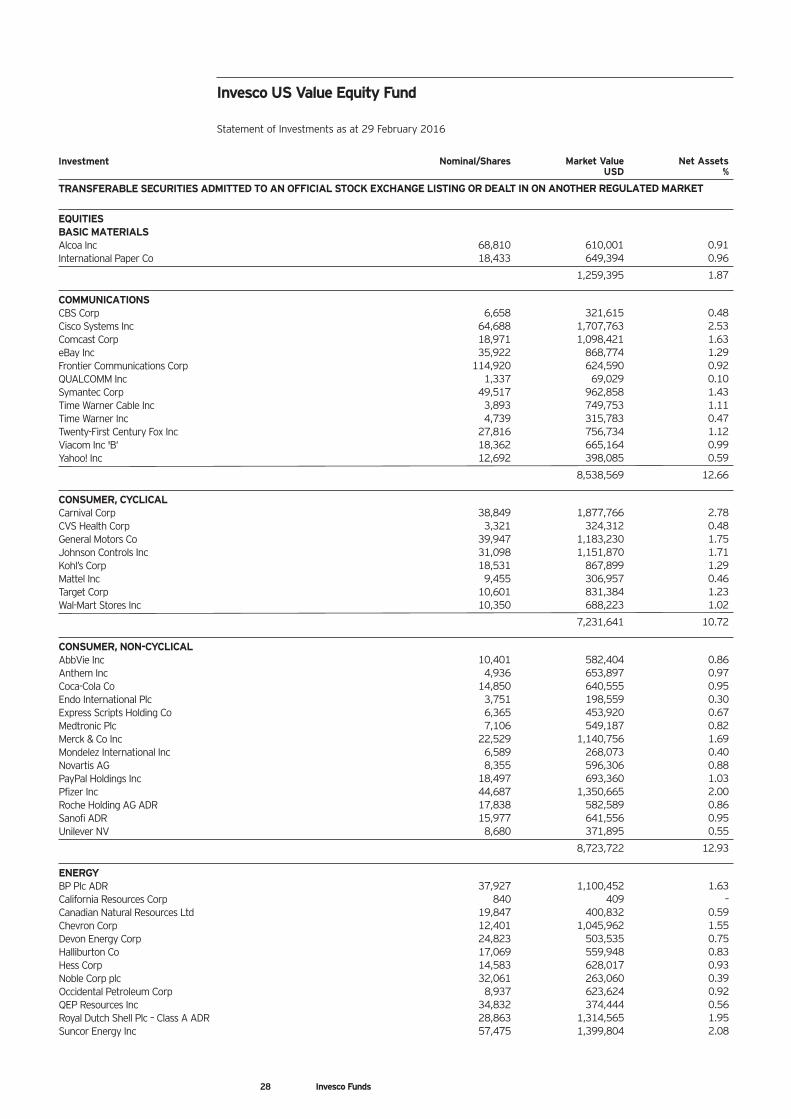
Investment Nominal/Shares Market Value Net Assets USD %
TRANSFERABLE SECURITIES ADMITTED TO AN OFFICIAL STOCK EXCHANGE LISTING OR DEALT IN ON ANOTHER REGULATED MARKET
EQUITIESBASIC MATERIALSAlcoa Inc 68,810 610,001 0.91International Paper Co 18,433 649,394 0.96
1,259,395 1.87
COMMUNICATIONSCBS Corp 6,658 321,615 0.48Cisco Systems Inc 64,688 1,707,763 2.53Comcast Corp 18,971 1,098,421 1.63eBay Inc 35,922 868,774 1.29Frontier Communications Corp 114,920 624,590 0.92QUALCOMM Inc 1,337 69,029 0.10Symantec Corp 49,517 962,858 1.43Time Warner Cable Inc 3,893 749,753 1.11Time Warner Inc 4,739 315,783 0.47Twenty-First Century Fox Inc 27,816 756,734 1.12Viacom Inc 'B‘ 18,362 665,164 0.99Yahoo! Inc 12,692 398,085 0.59
8,538,569 12.66
CONSUMER, CYCLICALCarnival Corp 38,849 1,877,766 2.78CVS Health Corp 3,321 324,312 0.48General Motors Co 39,947 1,183,230 1.75Johnson Controls Inc 31,098 1,151,870 1.71Kohl’s Corp 18,531 867,899 1.29Mattel Inc 9,455 306,957 0.46Target Corp 10,601 831,384 1.23Wal-Mart Stores Inc 10,350 688,223 1.02
7,231,641 10.72
CONSUMER, NON-CYCLICALAbbVie Inc 10,401 582,404 0.86Anthem Inc 4,936 653,897 0.97Coca-Cola Co 14,850 640,555 0.95Endo International Plc 3,751 198,559 0.30Express Scripts Holding Co 6,365 453,920 0.67Medtronic Plc 7,106 549,187 0.82Merck & Co Inc 22,529 1,140,756 1.69Mondelez International Inc 6,589 268,073 0.40Novartis AG 8,355 596,306 0.88PayPal Holdings Inc 18,497 693,360 1.03Pfizer Inc 44,687 1,350,665 2.00Roche Holding AG ADR 17,838 582,589 0.86Sanofi ADR 15,977 641,556 0.95Unilever NV 8,680 371,895 0.55
8,723,722 12.93
ENERGYBP Plc ADR 37,927 1,100,452 1.63California Resources Corp 840 409 –Canadian Natural Resources Ltd 19,847 400,832 0.59Chevron Corp 12,401 1,045,962 1.55Devon Energy Corp 24,823 503,535 0.75Halliburton Co 17,069 559,948 0.83Hess Corp 14,583 628,017 0.93Noble Corp plc 32,061 263,060 0.39Occidental Petroleum Corp 8,937 623,624 0.92QEP Resources Inc 34,832 374,444 0.56Royal Dutch Shell Plc – Class A ADR 28,863 1,314,565 1.95Suncor Energy Inc 57,475 1,399,804 2.08
28 Invesco Funds
Invesco US Value Equity Fund
Statement of Investments as at 29 February 2016
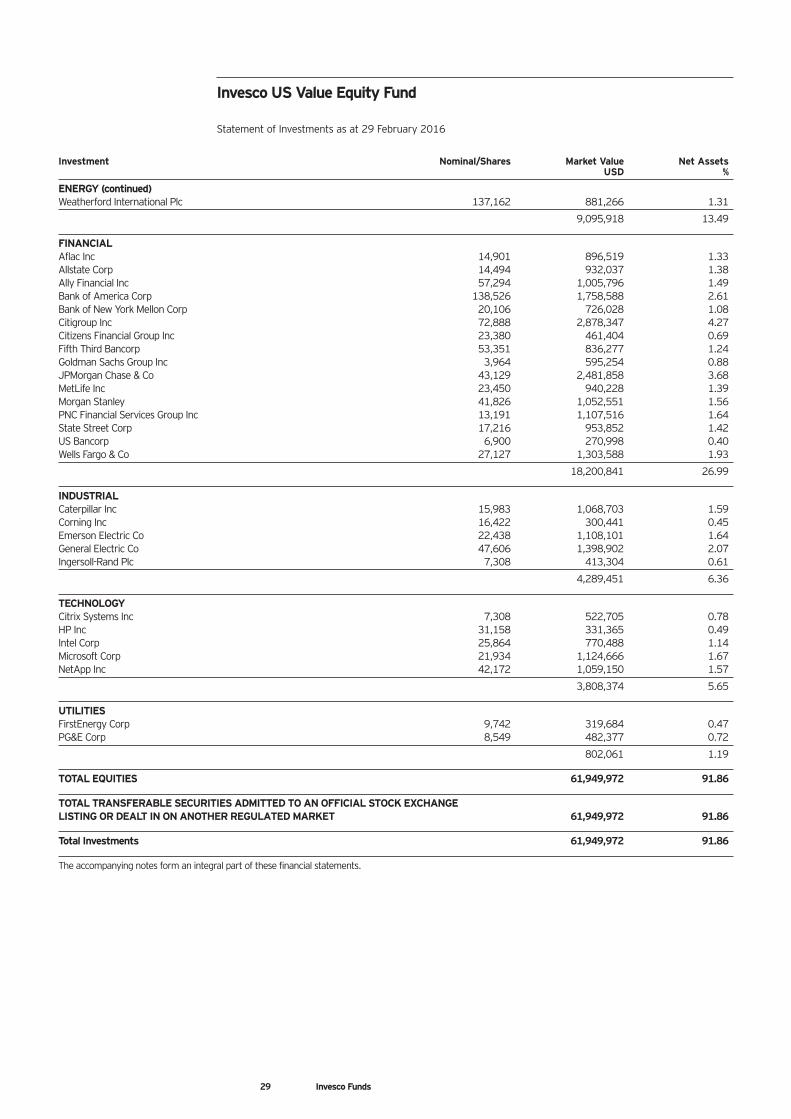
Invesco US Value Equity Fund
Statement of Investments as at 29 February 2016
Investment Nominal/Shares Market Value Net Assets USD %
ENERGY (continued)Weatherford International Plc 137,162 881,266 1.31
9,095,918 13.49
FINANCIALAflac Inc 14,901 896,519 1.33Allstate Corp 14,494 932,037 1.38Ally Financial Inc 57,294 1,005,796 1.49Bank of America Corp 138,526 1,758,588 2.61Bank of New York Mellon Corp 20,106 726,028 1.08Citigroup Inc 72,888 2,878,347 4.27Citizens Financial Group Inc 23,380 461,404 0.69Fifth Third Bancorp 53,351 836,277 1.24Goldman Sachs Group Inc 3,964 595,254 0.88JPMorgan Chase & Co 43,129 2,481,858 3.68MetLife Inc 23,450 940,228 1.39Morgan Stanley 41,826 1,052,551 1.56PNC Financial Services Group Inc 13,191 1,107,516 1.64State Street Corp 17,216 953,852 1.42US Bancorp 6,900 270,998 0.40Wells Fargo & Co 27,127 1,303,588 1.93
18,200,841 26.99
INDUSTRIALCaterpillar Inc 15,983 1,068,703 1.59Corning Inc 16,422 300,441 0.45Emerson Electric Co 22,438 1,108,101 1.64General Electric Co 47,606 1,398,902 2.07Ingersoll-Rand Plc 7,308 413,304 0.61
4,289,451 6.36
TECHNOLOGYCitrix Systems Inc 7,308 522,705 0.78HP Inc 31,158 331,365 0.49Intel Corp 25,864 770,488 1.14Microsoft Corp 21,934 1,124,666 1.67NetApp Inc 42,172 1,059,150 1.57
3,808,374 5.65
UTILITIESFirstEnergy Corp 9,742 319,684 0.47PG&E Corp 8,549 482,377 0.72
802,061 1.19
TOTAL EQUITIES 61,949,972 91.86
TOTAL TRANSFERABLE SECURITIES ADMITTED TO AN OFFICIAL STOCK EXCHANGE LISTING OR DEALT IN ON ANOTHER REGULATED MARKET 61,949,972 91.86
Total Investments 61,949,972 91.86
The accompanying notes form an integral part of these financial statements.
29 Invesco Funds
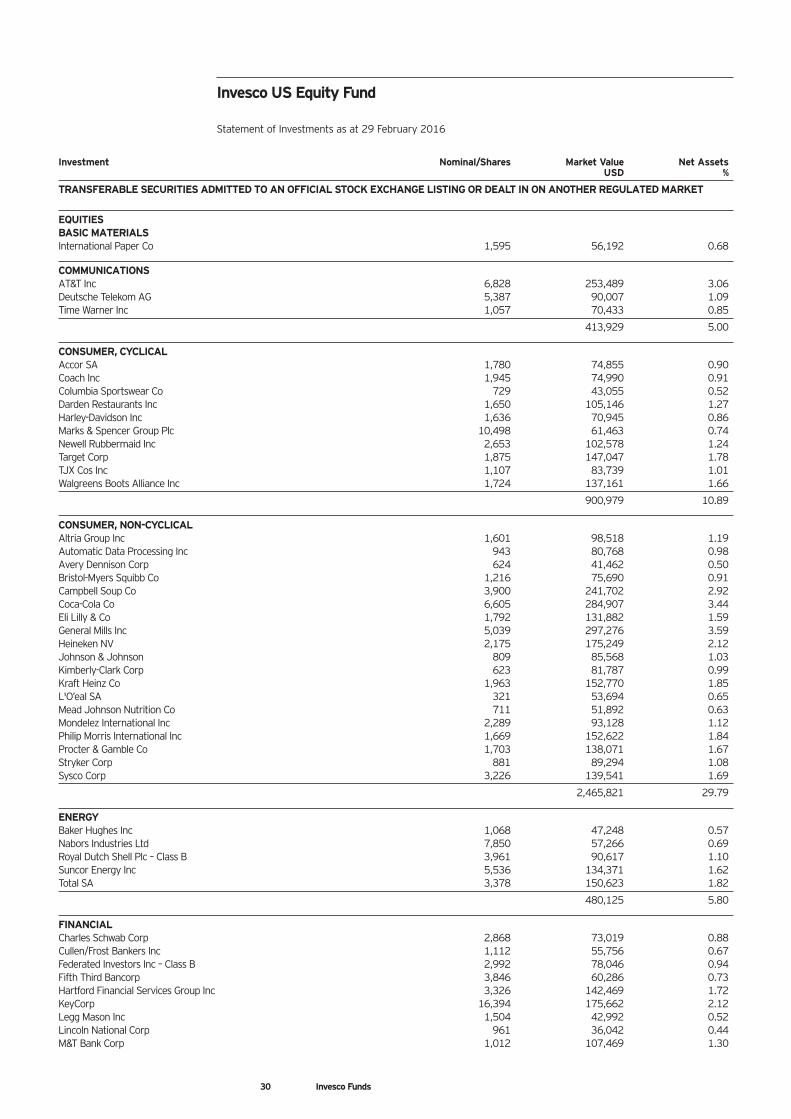
Investment Nominal/Shares Market Value Net Assets USD %
TRANSFERABLE SECURITIES ADMITTED TO AN OFFICIAL STOCK EXCHANGE LISTING OR DEALT IN ON ANOTHER REGULATED MARKET
EQUITIESBASIC MATERIALSInternational Paper Co 1,595 56,192 0.68
COMMUNICATIONSAT&T Inc 6,828 253,489 3.06Deutsche Telekom AG 5,387 90,007 1.09Time Warner Inc 1,057 70,433 0.85
413,929 5.00
CONSUMER, CYCLICALAccor SA 1,780 74,855 0.90Coach Inc 1,945 74,990 0.91Columbia Sportswear Co 729 43,055 0.52Darden Restaurants Inc 1,650 105,146 1.27Harley-Davidson Inc 1,636 70,945 0.86Marks & Spencer Group Plc 10,498 61,463 0.74Newell Rubbermaid Inc 2,653 102,578 1.24Target Corp 1,875 147,047 1.78TJX Cos Inc 1,107 83,739 1.01Walgreens Boots Alliance Inc 1,724 137,161 1.66
900,979 10.89
CONSUMER, NON-CYCLICALAltria Group Inc 1,601 98,518 1.19Automatic Data Processing Inc 943 80,768 0.98Avery Dennison Corp 624 41,462 0.50Bristol-Myers Squibb Co 1,216 75,690 0.91Campbell Soup Co 3,900 241,702 2.92Coca-Cola Co 6,605 284,907 3.44Eli Lilly & Co 1,792 131,882 1.59General Mills Inc 5,039 297,276 3.59Heineken NV 2,175 175,249 2.12Johnson & Johnson 809 85,568 1.03Kimberly-Clark Corp 623 81,787 0.99Kraft Heinz Co 1,963 152,770 1.85L'O’eal SA 321 53,694 0.65Mead Johnson Nutrition Co 711 51,892 0.63Mondelez International Inc 2,289 93,128 1.12Philip Morris International Inc 1,669 152,622 1.84Procter & Gamble Co 1,703 138,071 1.67Stryker Corp 881 89,294 1.08Sysco Corp 3,226 139,541 1.69
2,465,821 29.79
ENERGYBaker Hughes Inc 1,068 47,248 0.57Nabors Industries Ltd 7,850 57,266 0.69Royal Dutch Shell Plc – Class B 3,961 90,617 1.10Suncor Energy Inc 5,536 134,371 1.62Total SA 3,378 150,623 1.82
480,125 5.80
FINANCIALCharles Schwab Corp 2,868 73,019 0.88Cullen/Frost Bankers Inc 1,112 55,756 0.67Federated Investors Inc – Class B 2,992 78,046 0.94Fifth Third Bancorp 3,846 60,286 0.73Hartford Financial Services Group Inc 3,326 142,469 1.72KeyCorp 16,394 175,662 2.12Legg Mason Inc 1,504 42,992 0.52Lincoln National Corp 961 36,042 0.44M&T Bank Corp 1,012 107,469 1.30
30 Invesco Funds
Invesco US Equity Fund
Statement of Investments as at 29 February 2016
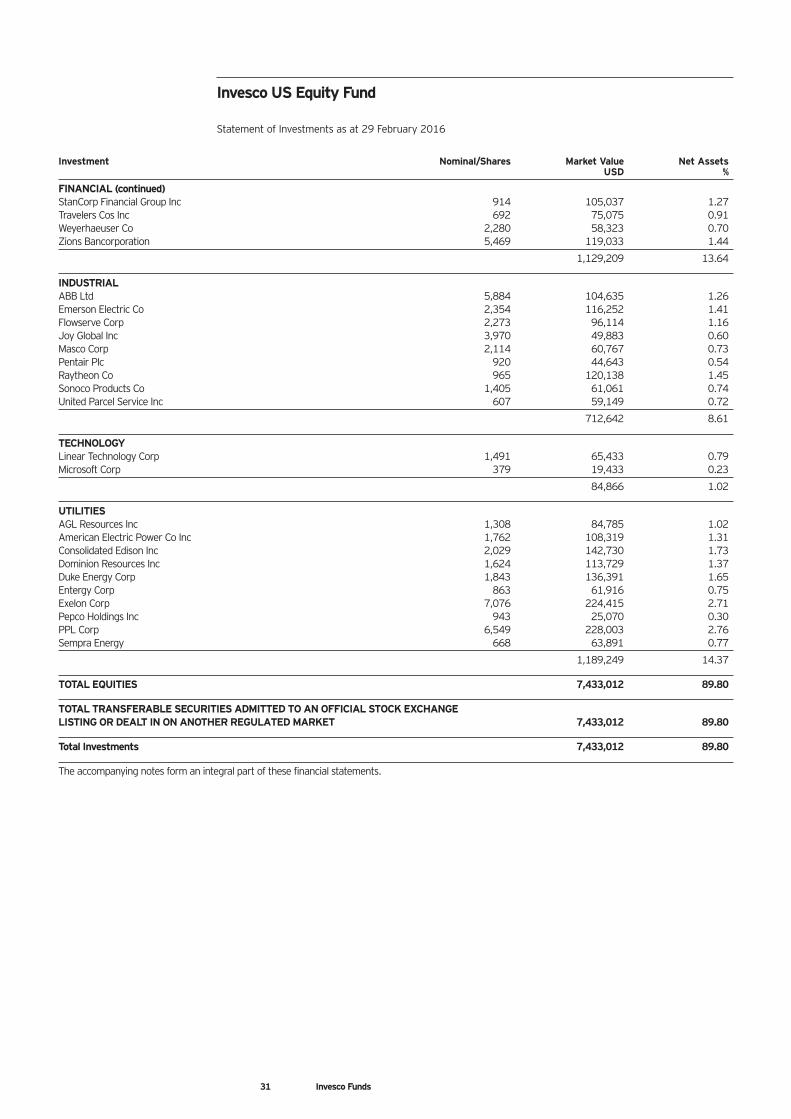
Investment Nominal/Shares Market Value Net Assets USD %
FINANCIAL (continued)StanCorp Financial Group Inc 914 105,037 1.27Travelers Cos Inc 692 75,075 0.91Weyerhaeuser Co 2,280 58,323 0.70Zions Bancorporation 5,469 119,033 1.44
1,129,209 13.64
INDUSTRIALABB Ltd 5,884 104,635 1.26Emerson Electric Co 2,354 116,252 1.41Flowserve Corp 2,273 96,114 1.16Joy Global Inc 3,970 49,883 0.60Masco Corp 2,114 60,767 0.73Pentair Plc 920 44,643 0.54Raytheon Co 965 120,138 1.45Sonoco Products Co 1,405 61,061 0.74United Parcel Service Inc 607 59,149 0.72
712,642 8.61
TECHNOLOGYLinear Technology Corp 1,491 65,433 0.79Microsoft Corp 379 19,433 0.23
84,866 1.02
UTILITIESAGL Resources Inc 1,308 84,785 1.02American Electric Power Co Inc 1,762 108,319 1.31Consolidated Edison Inc 2,029 142,730 1.73Dominion Resources Inc 1,624 113,729 1.37Duke Energy Corp 1,843 136,391 1.65Entergy Corp 863 61,916 0.75Exelon Corp 7,076 224,415 2.71Pepco Holdings Inc 943 25,070 0.30PPL Corp 6,549 228,003 2.76Sempra Energy 668 63,891 0.77
1,189,249 14.37
TOTAL EQUITIES 7,433,012 89.80
TOTAL TRANSFERABLE SECURITIES ADMITTED TO AN OFFICIAL STOCK EXCHANGE LISTING OR DEALT IN ON ANOTHER REGULATED MARKET 7,433,012 89.80
Total Investments 7,433,012 89.80
The accompanying notes form an integral part of these financial statements.
31 Invesco Funds
Invesco US Equity Fund
Statement of Investments as at 29 February 2016
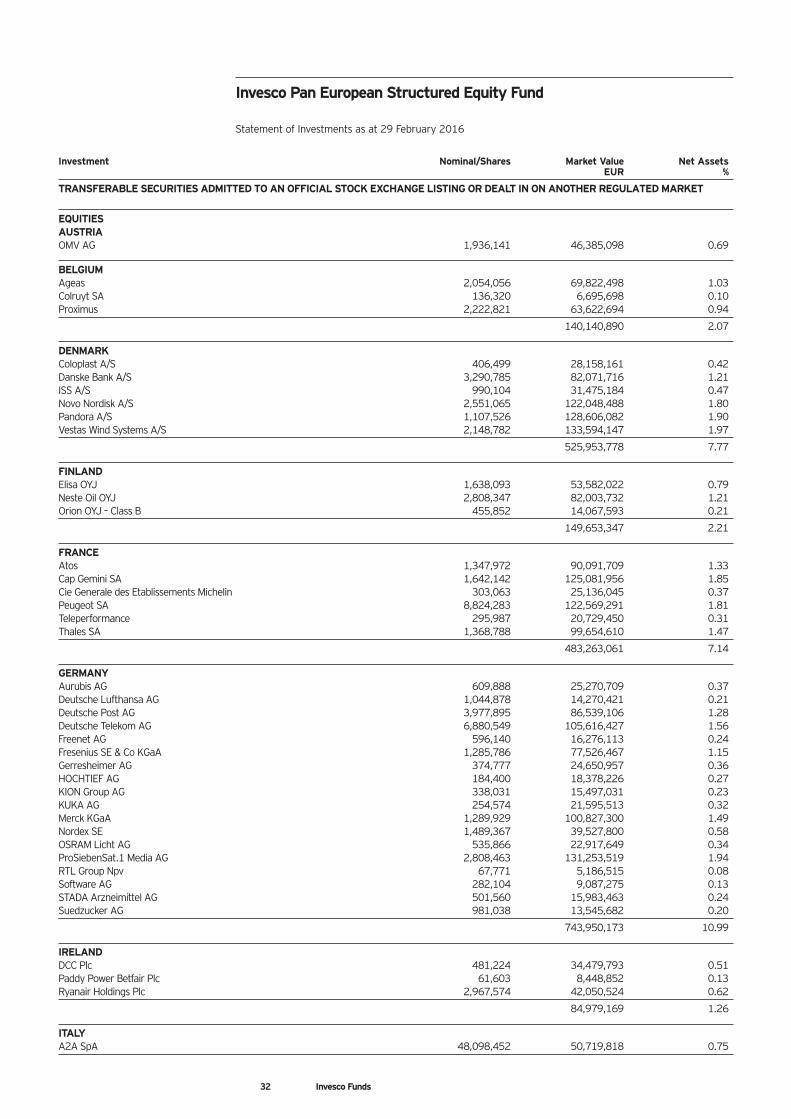
Investment Nominal/Shares Market Value Net Assets EUR %
TRANSFERABLE SECURITIES ADMITTED TO AN OFFICIAL STOCK EXCHANGE LISTING OR DEALT IN ON ANOTHER REGULATED MARKET
EQUITIESAUSTRIAOMV AG 1,936,141 46,385,098 0.69
BELGIUMAgeas 2,054,056 69,822,498 1.03Colruyt SA 136,320 6,695,698 0.10Proximus 2,222,821 63,622,694 0.94
140,140,890 2.07
DENMARKColoplast A/S 406,499 28,158,161 0.42Danske Bank A/S 3,290,785 82,071,716 1.21ISS A/S 990,104 31,475,184 0.47Novo Nordisk A/S 2,551,065 122,048,488 1.80Pandora A/S 1,107,526 128,606,082 1.90Vestas Wind Systems A/S 2,148,782 133,594,147 1.97
525,953,778 7.77
FINLANDElisa OYJ 1,638,093 53,582,022 0.79Neste Oil OYJ 2,808,347 82,003,732 1.21Orion OYJ – Class B 455,852 14,067,593 0.21
149,653,347 2.21
FRANCEAtos 1,347,972 90,091,709 1.33Cap Gemini SA 1,642,142 125,081,956 1.85Cie Generale des Etablissements Michelin 303,063 25,136,045 0.37Peugeot SA 8,824,283 122,569,291 1.81Teleperformance 295,987 20,729,450 0.31Thales SA 1,368,788 99,654,610 1.47
483,263,061 7.14
GERMANYAurubis AG 609,888 25,270,709 0.37Deutsche Lufthansa AG 1,044,878 14,270,421 0.21Deutsche Post AG 3,977,895 86,539,106 1.28Deutsche Telekom AG 6,880,549 105,616,427 1.56Freenet AG 596,140 16,276,113 0.24Fresenius SE & Co KGaA 1,285,786 77,526,467 1.15Gerresheimer AG 374,777 24,650,957 0.36HOCHTIEF AG 184,400 18,378,226 0.27KION Group AG 338,031 15,497,031 0.23KUKA AG 254,574 21,595,513 0.32Merck KGaA 1,289,929 100,827,300 1.49Nordex SE 1,489,367 39,527,800 0.58OSRAM Licht AG 535,866 22,917,649 0.34ProSiebenSat.1 Media AG 2,808,463 131,253,519 1.94RTL Group Npv 67,771 5,186,515 0.08Software AG 282,104 9,087,275 0.13STADA Arzneimittel AG 501,560 15,983,463 0.24Suedzucker AG 981,038 13,545,682 0.20
743,950,173 10.99
IRELANDDCC Plc 481,224 34,479,793 0.51Paddy Power Betfair Plc 61,603 8,448,852 0.13Ryanair Holdings Plc 2,967,574 42,050,524 0.62
84,979,169 1.26
ITALYA2A SpA 48,098,452 50,719,818 0.75
Invesco Pan European Structured Equity Fund
Statement of Investments as at 29 February 2016
32 Invesco Funds
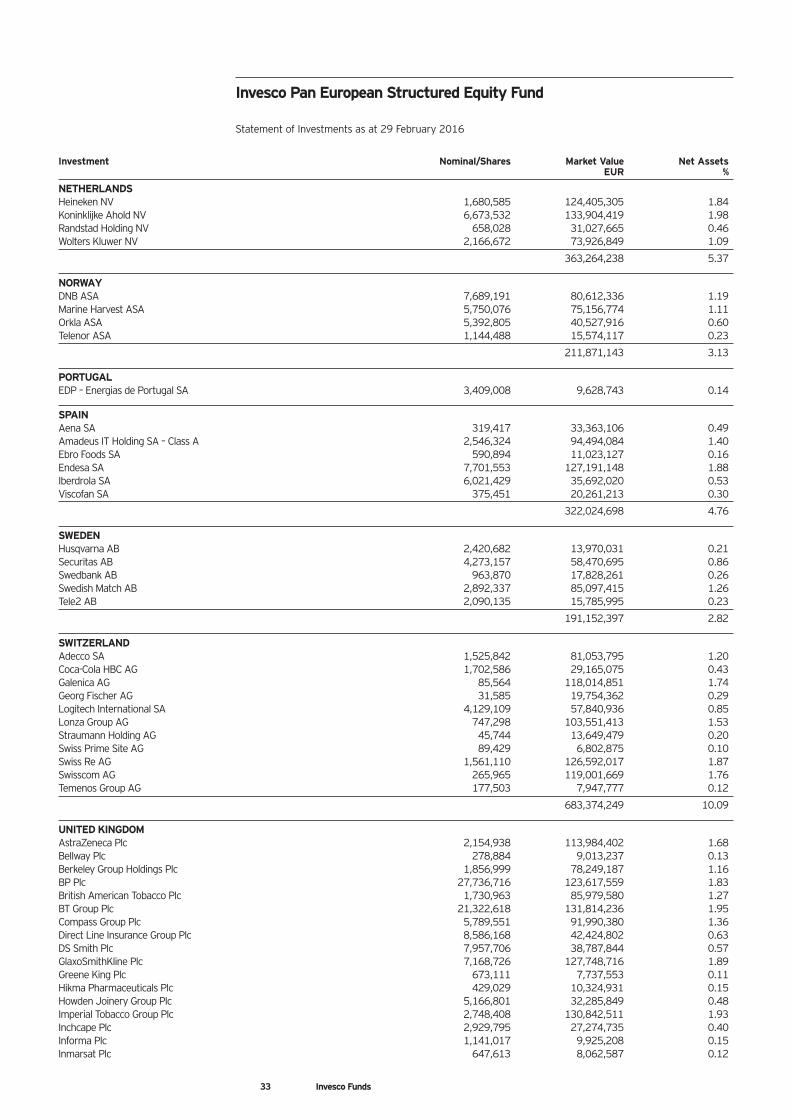
Investment Nominal/Shares Market Value Net Assets EUR %
NETHERLANDSHeineken NV 1,680,585 124,405,305 1.84Koninklijke Ahold NV 6,673,532 133,904,419 1.98Randstad Holding NV 658,028 31,027,665 0.46Wolters Kluwer NV 2,166,672 73,926,849 1.09
363,264,238 5.37
NORWAYDNB ASA 7,689,191 80,612,336 1.19Marine Harvest ASA 5,750,076 75,156,774 1.11Orkla ASA 5,392,805 40,527,916 0.60Telenor ASA 1,144,488 15,574,117 0.23
211,871,143 3.13
PORTUGALEDP – Energias de Portugal SA 3,409,008 9,628,743 0.14
SPAINAena SA 319,417 33,363,106 0.49Amadeus IT Holding SA – Class A 2,546,324 94,494,084 1.40Ebro Foods SA 590,894 11,023,127 0.16Endesa SA 7,701,553 127,191,148 1.88Iberdrola SA 6,021,429 35,692,020 0.53Viscofan SA 375,451 20,261,213 0.30
322,024,698 4.76
SWEDENHusqvarna AB 2,420,682 13,970,031 0.21Securitas AB 4,273,157 58,470,695 0.86Swedbank AB 963,870 17,828,261 0.26Swedish Match AB 2,892,337 85,097,415 1.26Tele2 AB 2,090,135 15,785,995 0.23
191,152,397 2.82
SWITZERLANDAdecco SA 1,525,842 81,053,795 1.20Coca-Cola HBC AG 1,702,586 29,165,075 0.43Galenica AG 85,564 118,014,851 1.74Georg Fischer AG 31,585 19,754,362 0.29Logitech International SA 4,129,109 57,840,936 0.85Lonza Group AG 747,298 103,551,413 1.53Straumann Holding AG 45,744 13,649,479 0.20Swiss Prime Site AG 89,429 6,802,875 0.10Swiss Re AG 1,561,110 126,592,017 1.87Swisscom AG 265,965 119,001,669 1.76Temenos Group AG 177,503 7,947,777 0.12
683,374,249 10.09
UNITED KINGDOMAstraZeneca Plc 2,154,938 113,984,402 1.68Bellway Plc 278,884 9,013,237 0.13Berkeley Group Holdings Plc 1,856,999 78,249,187 1.16BP Plc 27,736,716 123,617,559 1.83British American Tobacco Plc 1,730,963 85,979,580 1.27BT Group Plc 21,322,618 131,814,236 1.95Compass Group Plc 5,789,551 91,990,380 1.36Direct Line Insurance Group Plc 8,586,168 42,424,802 0.63DS Smith Plc 7,957,706 38,787,844 0.57GlaxoSmithKline Plc 7,168,726 127,748,716 1.89Greene King Plc 673,111 7,737,553 0.11Hikma Pharmaceuticals Plc 429,029 10,324,931 0.15Howden Joinery Group Plc 5,166,801 32,285,849 0.48Imperial Tobacco Group Plc 2,748,408 130,842,511 1.93Inchcape Plc 2,929,795 27,274,735 0.40Informa Plc 1,141,017 9,925,208 0.15Inmarsat Plc 647,613 8,062,587 0.12
Invesco Pan European Structured Equity Fund
Statement of Investments as at 29 February 2016
33 Invesco Funds
Investment Nominal/Shares Market Value Net Assets EUR %
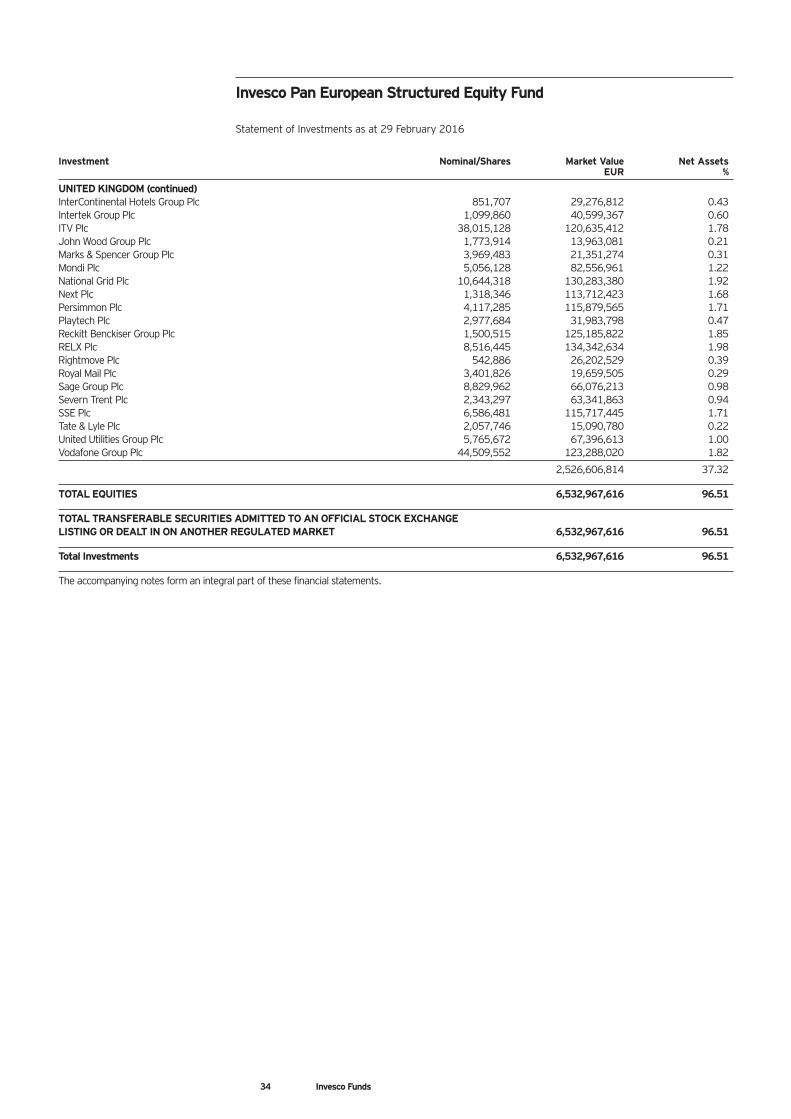
UNITED KINGDOM (continued)InterContinental Hotels Group Plc 851,707 29,276,812 0.43Intertek Group Plc 1,099,860 40,599,367 0.60ITV Plc 38,015,128 120,635,412 1.78John Wood Group Plc 1,773,914 13,963,081 0.21Marks & Spencer Group Plc 3,969,483 21,351,274 0.31Mondi Plc 5,056,128 82,556,961 1.22National Grid Plc 10,644,318 130,283,380 1.92Next Plc 1,318,346 113,712,423 1.68Persimmon Plc 4,117,285 115,879,565 1.71Playtech Plc 2,977,684 31,983,798 0.47Reckitt Benckiser Group Plc 1,500,515 125,185,822 1.85RELX Plc 8,516,445 134,342,634 1.98Rightmove Plc 542,886 26,202,529 0.39Royal Mail Plc 3,401,826 19,659,505 0.29Sage Group Plc 8,829,962 66,076,213 0.98Severn Trent Plc 2,343,297 63,341,863 0.94SSE Plc 6,586,481 115,717,445 1.71Tate & Lyle Plc 2,057,746 15,090,780 0.22United Utilities Group Plc 5,765,672 67,396,613 1.00Vodafone Group Plc 44,509,552 123,288,020 1.82
2,526,606,814 37.32
TOTAL EQUITIES 6,532,967,616 96.51
TOTAL TRANSFERABLE SECURITIES ADMITTED TO AN OFFICIAL STOCK EXCHANGE LISTING OR DEALT IN ON ANOTHER REGULATED MARKET 6,532,967,616 96.51
Total Investments 6,532,967,616 96.51
The accompanying notes form an integral part of these financial statements.
Invesco Pan European Structured Equity Fund
Statement of Investments as at 29 February 2016
34 Invesco Funds
Investment Nominal/Shares Market Value Net Assets EUR %
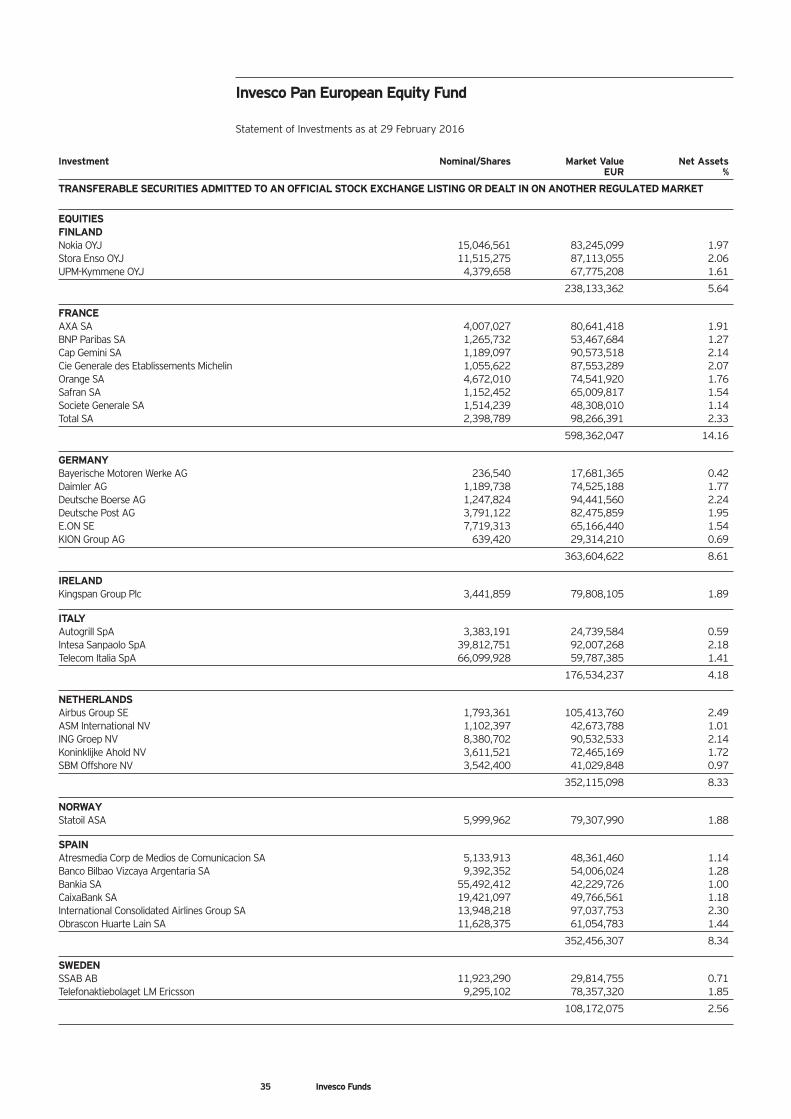
TRANSFERABLE SECURITIES ADMITTED TO AN OFFICIAL STOCK EXCHANGE LISTING OR DEALT IN ON ANOTHER REGULATED MARKET
EQUITIESFINLANDNokia OYJ 15,046,561 83,245,099 1.97Stora Enso OYJ 11,515,275 87,113,055 2.06UPM-Kymmene OYJ 4,379,658 67,775,208 1.61
238,133,362 5.64
FRANCEAXA SA 4,007,027 80,641,418 1.91BNP Paribas SA 1,265,732 53,467,684 1.27Cap Gemini SA 1,189,097 90,573,518 2.14Cie Generale des Etablissements Michelin 1,055,622 87,553,289 2.07Orange SA 4,672,010 74,541,920 1.76Safran SA 1,152,452 65,009,817 1.54Societe Generale SA 1,514,239 48,308,010 1.14Total SA 2,398,789 98,266,391 2.33
598,362,047 14.16
GERMANYBayerische Motoren Werke AG 236,540 17,681,365 0.42Daimler AG 1,189,738 74,525,188 1.77Deutsche Boerse AG 1,247,824 94,441,560 2.24Deutsche Post AG 3,791,122 82,475,859 1.95E.ON SE 7,719,313 65,166,440 1.54KION Group AG 639,420 29,314,210 0.69
363,604,622 8.61
IRELANDKingspan Group Plc 3,441,859 79,808,105 1.89
ITALYAutogrill SpA 3,383,191 24,739,584 0.59Intesa Sanpaolo SpA 39,812,751 92,007,268 2.18Telecom Italia SpA 66,099,928 59,787,385 1.41
176,534,237 4.18
NETHERLANDSAirbus Group SE 1,793,361 105,413,760 2.49ASM International NV 1,102,397 42,673,788 1.01ING Groep NV 8,380,702 90,532,533 2.14Koninklijke Ahold NV 3,611,521 72,465,169 1.72SBM Offshore NV 3,542,400 41,029,848 0.97
352,115,098 8.33
NORWAYStatoil ASA 5,999,962 79,307,990 1.88
SPAINAtresmedia Corp de Medios de Comunicacion SA 5,133,913 48,361,460 1.14Banco Bilbao Vizcaya Argentaria SA 9,392,352 54,006,024 1.28Bankia SA 55,492,412 42,229,726 1.00CaixaBank SA 19,421,097 49,766,561 1.18International Consolidated Airlines Group SA 13,948,218 97,037,753 2.30Obrascon Huarte Lain SA 11,628,375 61,054,783 1.44
352,456,307 8.34
SWEDENSSAB AB 11,923,290 29,814,755 0.71Telefonaktiebolaget LM Ericsson 9,295,102 78,357,320 1.85
108,172,075 2.56
Invesco Pan European Equity Fund
Statement of Investments as at 29 February 2016
35 Invesco Funds
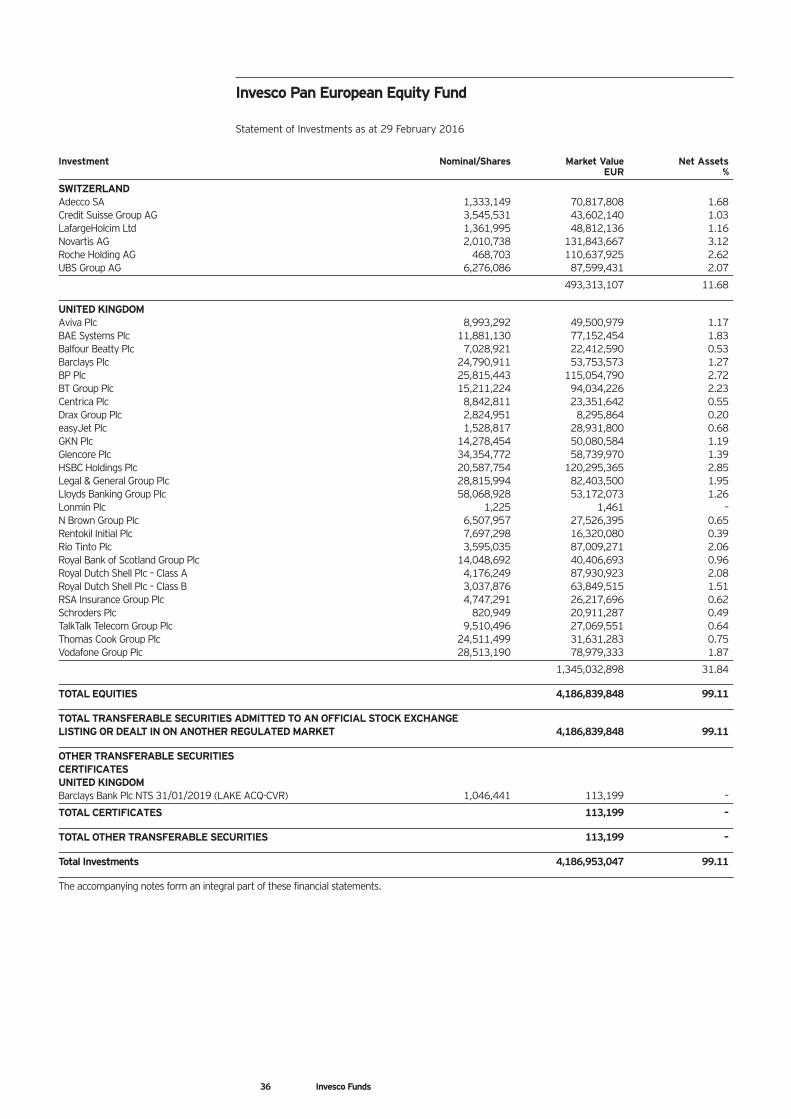
Investment Nominal/Shares Market Value Net Assets EUR %
SWITZERLANDAdecco SA 1,333,149 70,817,808 1.68Credit Suisse Group AG 3,545,531 43,602,140 1.03LafargeHolcim Ltd 1,361,995 48,812,136 1.16Novartis AG 2,010,738 131,843,667 3.12Roche Holding AG 468,703 110,637,925 2.62UBS Group AG 6,276,086 87,599,431 2.07
493,313,107 11.68
UNITED KINGDOMAviva Plc 8,993,292 49,500,979 1.17BAE Systems Plc 11,881,130 77,152,454 1.83Balfour Beatty Plc 7,028,921 22,412,590 0.53Barclays Plc 24,790,911 53,753,573 1.27BP Plc 25,815,443 115,054,790 2.72BT Group Plc 15,211,224 94,034,226 2.23Centrica Plc 8,842,811 23,351,642 0.55Drax Group Plc 2,824,951 8,295,864 0.20easyJet Plc 1,528,817 28,931,800 0.68GKN Plc 14,278,454 50,080,584 1.19Glencore Plc 34,354,772 58,739,970 1.39HSBC Holdings Plc 20,587,754 120,295,365 2.85Legal & General Group Plc 28,815,994 82,403,500 1.95Lloyds Banking Group Plc 58,068,928 53,172,073 1.26Lonmin Plc 1,225 1,461 –N Brown Group Plc 6,507,957 27,526,395 0.65Rentokil Initial Plc 7,697,298 16,320,080 0.39Rio Tinto Plc 3,595,035 87,009,271 2.06Royal Bank of Scotland Group Plc 14,048,692 40,406,693 0.96Royal Dutch Shell Plc – Class A 4,176,249 87,930,923 2.08Royal Dutch Shell Plc – Class B 3,037,876 63,849,515 1.51RSA Insurance Group Plc 4,747,291 26,217,696 0.62Schroders Plc 820,949 20,911,287 0.49TalkTalk Telecom Group Plc 9,510,496 27,069,551 0.64Thomas Cook Group Plc 24,511,499 31,631,283 0.75Vodafone Group Plc 28,513,190 78,979,333 1.87
1,345,032,898 31.84
TOTAL EQUITIES 4,186,839,848 99.11
TOTAL TRANSFERABLE SECURITIES ADMITTED TO AN OFFICIAL STOCK EXCHANGE LISTING OR DEALT IN ON ANOTHER REGULATED MARKET 4,186,839,848 99.11
OTHER TRANSFERABLE SECURITIESCERTIFICATESUNITED KINGDOMBarclays Bank Plc NTS 31/01/2019 (LAKE ACQ-CVR) 1,046,441 113,199 –
TOTAL CERTIFICATES 113,199 –
TOTAL OTHER TRANSFERABLE SECURITIES 113,199 –
Total Investments 4,186,953,047 99.11
The accompanying notes form an integral part of these financial statements.
Invesco Pan European Equity Fund
Statement of Investments as at 29 February 2016
36 Invesco Funds
Investment Nominal/Shares Market Value Net Assets EUR %
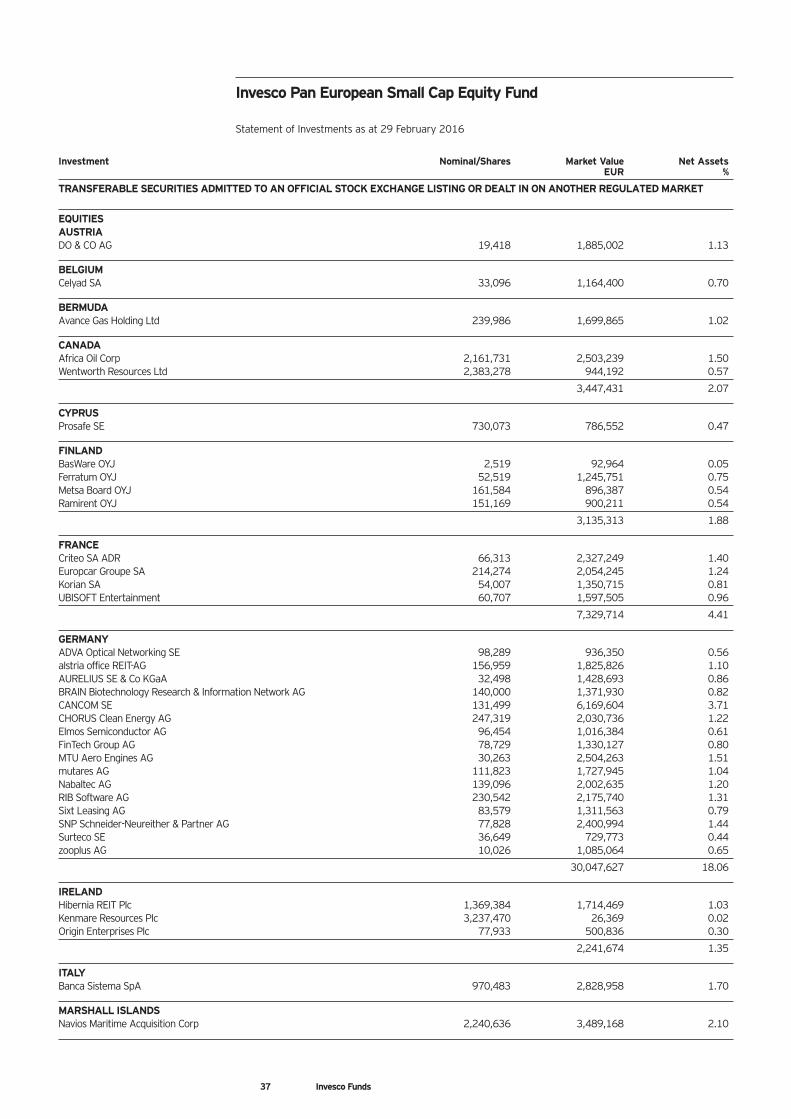
TRANSFERABLE SECURITIES ADMITTED TO AN OFFICIAL STOCK EXCHANGE LISTING OR DEALT IN ON ANOTHER REGULATED MARKET
EQUITIESAUSTRIADO & CO AG 19,418 1,885,002 1.13
BELGIUMCelyad SA 33,096 1,164,400 0.70
BERMUDAAvance Gas Holding Ltd 239,986 1,699,865 1.02
CANADAAfrica Oil Corp 2,161,731 2,503,239 1.50Wentworth Resources Ltd 2,383,278 944,192 0.57
3,447,431 2.07
CYPRUSProsafe SE 730,073 786,552 0.47
FINLANDBasWare OYJ 2,519 92,964 0.05Ferratum OYJ 52,519 1,245,751 0.75Metsa Board OYJ 161,584 896,387 0.54Ramirent OYJ 151,169 900,211 0.54
3,135,313 1.88
FRANCECriteo SA ADR 66,313 2,327,249 1.40Europcar Groupe SA 214,274 2,054,245 1.24Korian SA 54,007 1,350,715 0.81UBISOFT Entertainment 60,707 1,597,505 0.96
7,329,714 4.41
GERMANYADVA Optical Networking SE 98,289 936,350 0.56alstria office REIT-AG 156,959 1,825,826 1.10AURELIUS SE & Co KGaA 32,498 1,428,693 0.86BRAIN Biotechnology Research & Information Network AG 140,000 1,371,930 0.82CANCOM SE 131,499 6,169,604 3.71CHORUS Clean Energy AG 247,319 2,030,736 1.22Elmos Semiconductor AG 96,454 1,016,384 0.61FinTech Group AG 78,729 1,330,127 0.80MTU Aero Engines AG 30,263 2,504,263 1.51mutares AG 111,823 1,727,945 1.04Nabaltec AG 139,096 2,002,635 1.20RIB Software AG 230,542 2,175,740 1.31Sixt Leasing AG 83,579 1,311,563 0.79SNP Schneider-Neureither & Partner AG 77,828 2,400,994 1.44Surteco SE 36,649 729,773 0.44zooplus AG 10,026 1,085,064 0.65
30,047,627 18.06
IRELANDHibernia REIT Plc 1,369,384 1,714,469 1.03Kenmare Resources Plc 3,237,470 26,369 0.02Origin Enterprises Plc 77,933 500,836 0.30
2,241,674 1.35
ITALYBanca Sistema SpA 970,483 2,828,958 1.70
MARSHALL ISLANDSNavios Maritime Acquisition Corp 2,240,636 3,489,168 2.10
Invesco Pan European Small Cap Equity Fund
Statement of Investments as at 29 February 2016
37 Invesco Funds
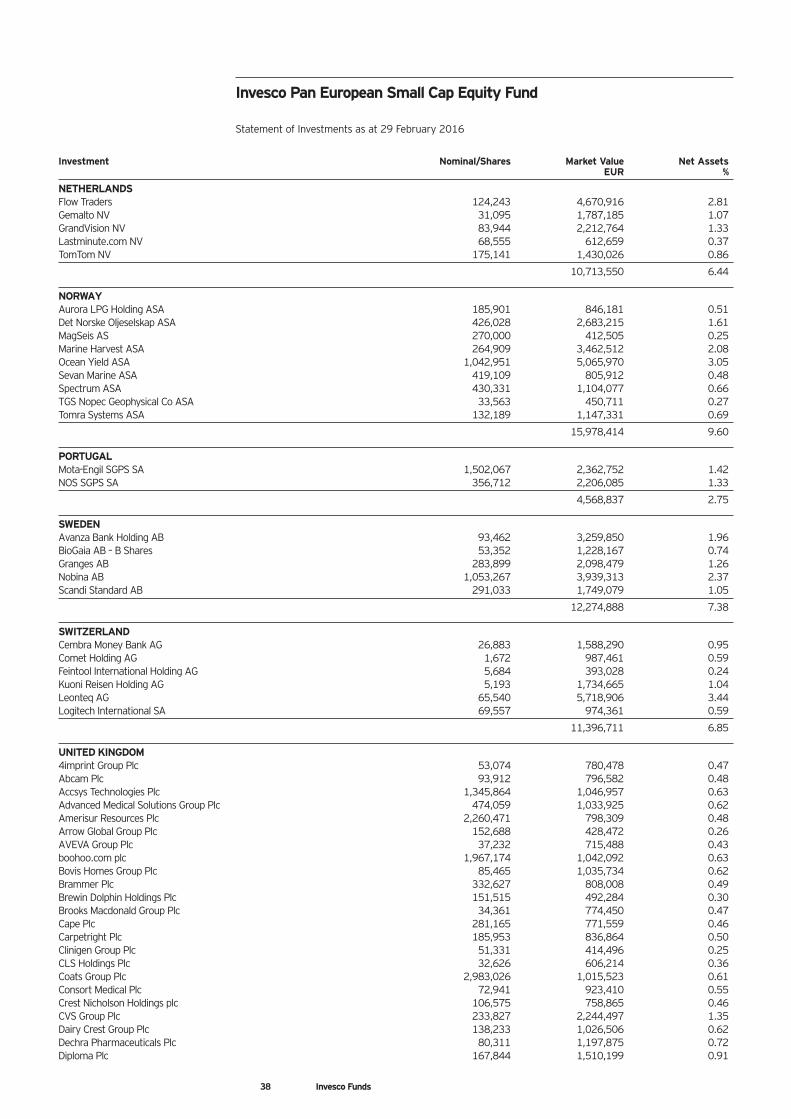
Investment Nominal/Shares Market Value Net Assets EUR %
NETHERLANDSFlow Traders 124,243 4,670,916 2.81Gemalto NV 31,095 1,787,185 1.07GrandVision NV 83,944 2,212,764 1.33Lastminute.com NV 68,555 612,659 0.37TomTom NV 175,141 1,430,026 0.86
10,713,550 6.44
NORWAYAurora LPG Holding ASA 185,901 846,181 0.51Det Norske Oljeselskap ASA 426,028 2,683,215 1.61MagSeis AS 270,000 412,505 0.25Marine Harvest ASA 264,909 3,462,512 2.08Ocean Yield ASA 1,042,951 5,065,970 3.05Sevan Marine ASA 419,109 805,912 0.48Spectrum ASA 430,331 1,104,077 0.66TGS Nopec Geophysical Co ASA 33,563 450,711 0.27Tomra Systems ASA 132,189 1,147,331 0.69
15,978,414 9.60
PORTUGALMota-Engil SGPS SA 1,502,067 2,362,752 1.42NOS SGPS SA 356,712 2,206,085 1.33
4,568,837 2.75
SWEDENAvanza Bank Holding AB 93,462 3,259,850 1.96BioGaia AB – B Shares 53,352 1,228,167 0.74Granges AB 283,899 2,098,479 1.26Nobina AB 1,053,267 3,939,313 2.37Scandi Standard AB 291,033 1,749,079 1.05
12,274,888 7.38
SWITZERLANDCembra Money Bank AG 26,883 1,588,290 0.95Comet Holding AG 1,672 987,461 0.59Feintool International Holding AG 5,684 393,028 0.24Kuoni Reisen Holding AG 5,193 1,734,665 1.04Leonteq AG 65,540 5,718,906 3.44Logitech International SA 69,557 974,361 0.59
11,396,711 6.85
UNITED KINGDOM4imprint Group Plc 53,074 780,478 0.47Abcam Plc 93,912 796,582 0.48Accsys Technologies Plc 1,345,864 1,046,957 0.63Advanced Medical Solutions Group Plc 474,059 1,033,925 0.62Amerisur Resources Plc 2,260,471 798,309 0.48Arrow Global Group Plc 152,688 428,472 0.26AVEVA Group Plc 37,232 715,488 0.43boohoo.com plc 1,967,174 1,042,092 0.63Bovis Homes Group Plc 85,465 1,035,734 0.62Brammer Plc 332,627 808,008 0.49Brewin Dolphin Holdings Plc 151,515 492,284 0.30Brooks Macdonald Group Plc 34,361 774,450 0.47Cape Plc 281,165 771,559 0.46Carpetright Plc 185,953 836,864 0.50Clinigen Group Plc 51,331 414,496 0.25CLS Holdings Plc 32,626 606,214 0.36Coats Group Plc 2,983,026 1,015,523 0.61Consort Medical Plc 72,941 923,410 0.55Crest Nicholson Holdings plc 106,575 758,865 0.46CVS Group Plc 233,827 2,244,497 1.35Dairy Crest Group Plc 138,233 1,026,506 0.62Dechra Pharmaceuticals Plc 80,311 1,197,875 0.72Diploma Plc 167,844 1,510,199 0.91
Invesco Pan European Small Cap Equity Fund
Statement of Investments as at 29 February 2016
38 Invesco Funds
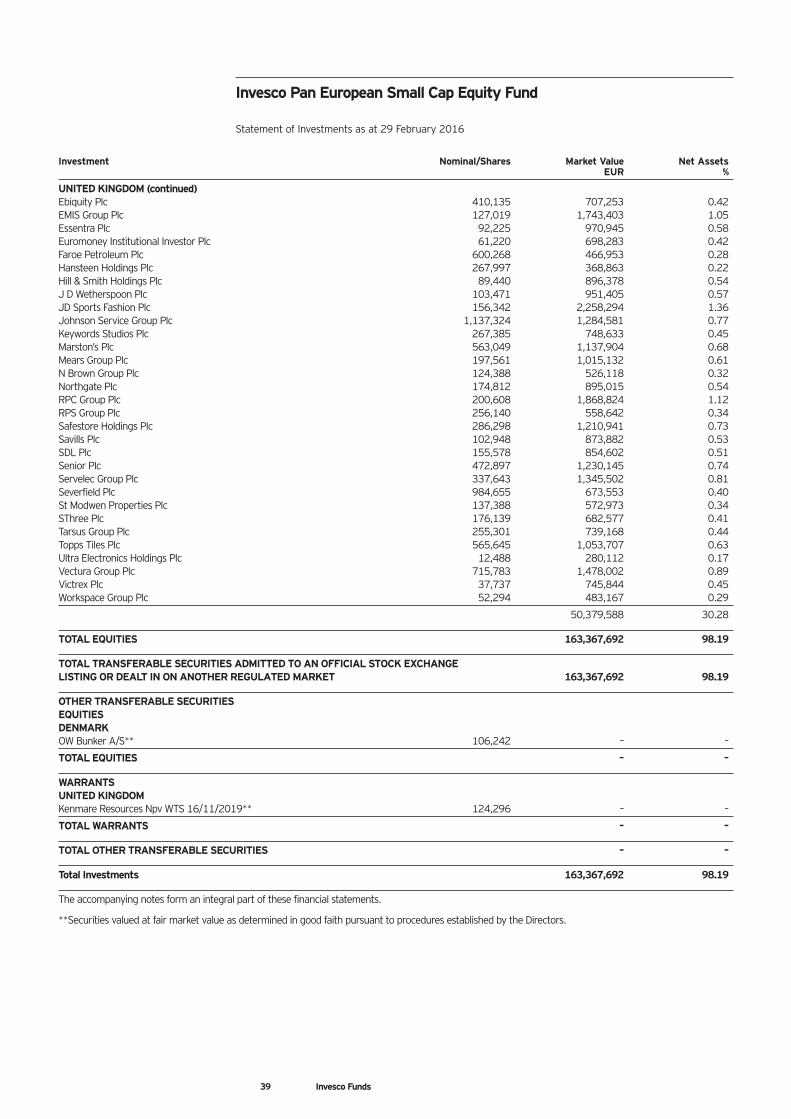
Investment Nominal/Shares Market Value Net Assets EUR %
UNITED KINGDOM (continued)Ebiquity Plc 410,135 707,253 0.42EMIS Group Plc 127,019 1,743,403 1.05Essentra Plc 92,225 970,945 0.58Euromoney Institutional Investor Plc 61,220 698,283 0.42Faroe Petroleum Plc 600,268 466,953 0.28Hansteen Holdings Plc 267,997 368,863 0.22Hill & Smith Holdings Plc 89,440 896,378 0.54J D Wetherspoon Plc 103,471 951,405 0.57JD Sports Fashion Plc 156,342 2,258,294 1.36Johnson Service Group Plc 1,137,324 1,284,581 0.77Keywords Studios Plc 267,385 748,633 0.45Marston’s Plc 563,049 1,137,904 0.68Mears Group Plc 197,561 1,015,132 0.61N Brown Group Plc 124,388 526,118 0.32Northgate Plc 174,812 895,015 0.54RPC Group Plc 200,608 1,868,824 1.12RPS Group Plc 256,140 558,642 0.34Safestore Holdings Plc 286,298 1,210,941 0.73Savills Plc 102,948 873,882 0.53SDL Plc 155,578 854,602 0.51Senior Plc 472,897 1,230,145 0.74Servelec Group Plc 337,643 1,345,502 0.81Severfield Plc 984,655 673,553 0.40St Modwen Properties Plc 137,388 572,973 0.34SThree Plc 176,139 682,577 0.41Tarsus Group Plc 255,301 739,168 0.44Topps Tiles Plc 565,645 1,053,707 0.63Ultra Electronics Holdings Plc 12,488 280,112 0.17Vectura Group Plc 715,783 1,478,002 0.89Victrex Plc 37,737 745,844 0.45Workspace Group Plc 52,294 483,167 0.29
50,379,588 30.28
TOTAL EQUITIES 163,367,692 98.19
TOTAL TRANSFERABLE SECURITIES ADMITTED TO AN OFFICIAL STOCK EXCHANGE LISTING OR DEALT IN ON ANOTHER REGULATED MARKET 163,367,692 98.19
OTHER TRANSFERABLE SECURITIESEQUITIESDENMARKOW Bunker A/S** 106,242 – –
TOTAL EQUITIES – –
WARRANTSUNITED KINGDOMKenmare Resources Npv WTS 16/11/2019** 124,296 – –
TOTAL WARRANTS – –
TOTAL OTHER TRANSFERABLE SECURITIES – –
Total Investments 163,367,692 98.19
The accompanying notes form an integral part of these financial statements.
**Securities valued at fair market value as determined in good faith pursuant to procedures established by the Directors.
Invesco Pan European Small Cap Equity Fund
Statement of Investments as at 29 February 2016
39 Invesco Funds
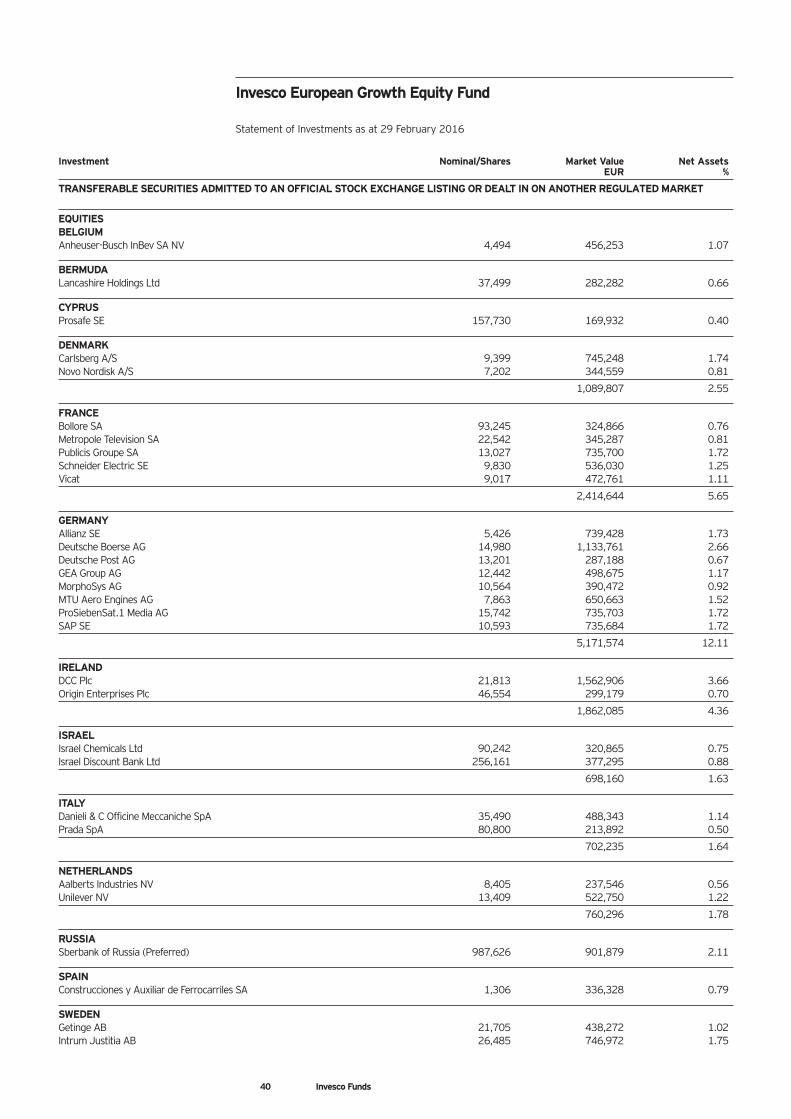
Invesco European Growth Equity Fund
Statement of Investments as at 29 February 2016
Investment Nominal/Shares Market Value Net Assets EUR %
TRANSFERABLE SECURITIES ADMITTED TO AN OFFICIAL STOCK EXCHANGE LISTING OR DEALT IN ON ANOTHER REGULATED MARKET
EQUITIESBELGIUMAnheuser-Busch InBev SA NV 4,494 456,253 1.07
BERMUDALancashire Holdings Ltd 37,499 282,282 0.66
CYPRUSProsafe SE 157,730 169,932 0.40
DENMARKCarlsberg A/S 9,399 745,248 1.74Novo Nordisk A/S 7,202 344,559 0.81
1,089,807 2.55
FRANCEBollore SA 93,245 324,866 0.76Metropole Television SA 22,542 345,287 0.81Publicis Groupe SA 13,027 735,700 1.72Schneider Electric SE 9,830 536,030 1.25Vicat 9,017 472,761 1.11
2,414,644 5.65
GERMANYAllianz SE 5,426 739,428 1.73Deutsche Boerse AG 14,980 1,133,761 2.66Deutsche Post AG 13,201 287,188 0.67GEA Group AG 12,442 498,675 1.17MorphoSys AG 10,564 390,472 0.92MTU Aero Engines AG 7,863 650,663 1.52ProSiebenSat.1 Media AG 15,742 735,703 1.72SAP SE 10,593 735,684 1.72
5,171,574 12.11
IRELANDDCC Plc 21,813 1,562,906 3.66Origin Enterprises Plc 46,554 299,179 0.70
1,862,085 4.36
ISRAELIsrael Chemicals Ltd 90,242 320,865 0.75Israel Discount Bank Ltd 256,161 377,295 0.88
698,160 1.63
ITALYDanieli & C Officine Meccaniche SpA 35,490 488,343 1.14Prada SpA 80,800 213,892 0.50
702,235 1.64
NETHERLANDSAalberts Industries NV 8,405 237,546 0.56Unilever NV 13,409 522,750 1.22
760,296 1.78
RUSSIASberbank of Russia (Preferred) 987,626 901,879 2.11
SPAINConstrucciones y Auxiliar de Ferrocarriles SA 1,306 336,328 0.79
SWEDENGetinge AB 21,705 438,272 1.02Intrum Justitia AB 26,485 746,972 1.75
40 Invesco Funds
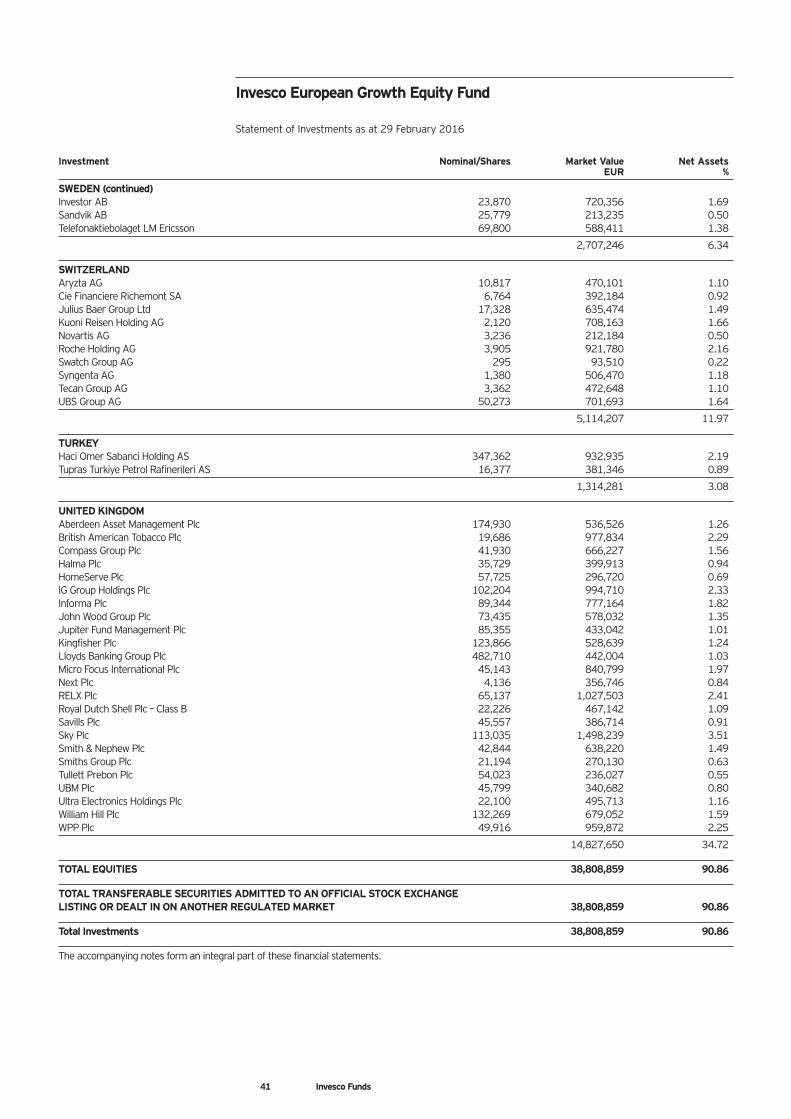
Investment Nominal/Shares Market Value Net Assets EUR %
SWEDEN (continued)Investor AB 23,870 720,356 1.69Sandvik AB 25,779 213,235 0.50Telefonaktiebolaget LM Ericsson 69,800 588,411 1.38
2,707,246 6.34
SWITZERLANDAryzta AG 10,817 470,101 1.10Cie Financiere Richemont SA 6,764 392,184 0.92Julius Baer Group Ltd 17,328 635,474 1.49Kuoni Reisen Holding AG 2,120 708,163 1.66Novartis AG 3,236 212,184 0.50Roche Holding AG 3,905 921,780 2.16Swatch Group AG 295 93,510 0.22Syngenta AG 1,380 506,470 1.18Tecan Group AG 3,362 472,648 1.10UBS Group AG 50,273 701,693 1.64
5,114,207 11.97
TURKEYHaci Omer Sabanci Holding AS 347,362 932,935 2.19Tupras Turkiye Petrol Rafinerileri AS 16,377 381,346 0.89
1,314,281 3.08
UNITED KINGDOMAberdeen Asset Management Plc 174,930 536,526 1.26British American Tobacco Plc 19,686 977,834 2.29Compass Group Plc 41,930 666,227 1.56Halma Plc 35,729 399,913 0.94HomeServe Plc 57,725 296,720 0.69IG Group Holdings Plc 102,204 994,710 2.33Informa Plc 89,344 777,164 1.82John Wood Group Plc 73,435 578,032 1.35Jupiter Fund Management Plc 85,355 433,042 1.01Kingfisher Plc 123,866 528,639 1.24Lloyds Banking Group Plc 482,710 442,004 1.03Micro Focus International Plc 45,143 840,799 1.97Next Plc 4,136 356,746 0.84RELX Plc 65,137 1,027,503 2.41Royal Dutch Shell Plc – Class B 22,226 467,142 1.09Savills Plc 45,557 386,714 0.91Sky Plc 113,035 1,498,239 3.51Smith & Nephew Plc 42,844 638,220 1.49Smiths Group Plc 21,194 270,130 0.63Tullett Prebon Plc 54,023 236,027 0.55UBM Plc 45,799 340,682 0.80Ultra Electronics Holdings Plc 22,100 495,713 1.16William Hill Plc 132,269 679,052 1.59WPP Plc 49,916 959,872 2.25
14,827,650 34.72
TOTAL EQUITIES 38,808,859 90.86
TOTAL TRANSFERABLE SECURITIES ADMITTED TO AN OFFICIAL STOCK EXCHANGE LISTING OR DEALT IN ON ANOTHER REGULATED MARKET 38,808,859 90.86
Total Investments 38,808,859 90.86
The accompanying notes form an integral part of these financial statements.
Invesco European Growth Equity Fund
Statement of Investments as at 29 February 2016
41 Invesco Funds
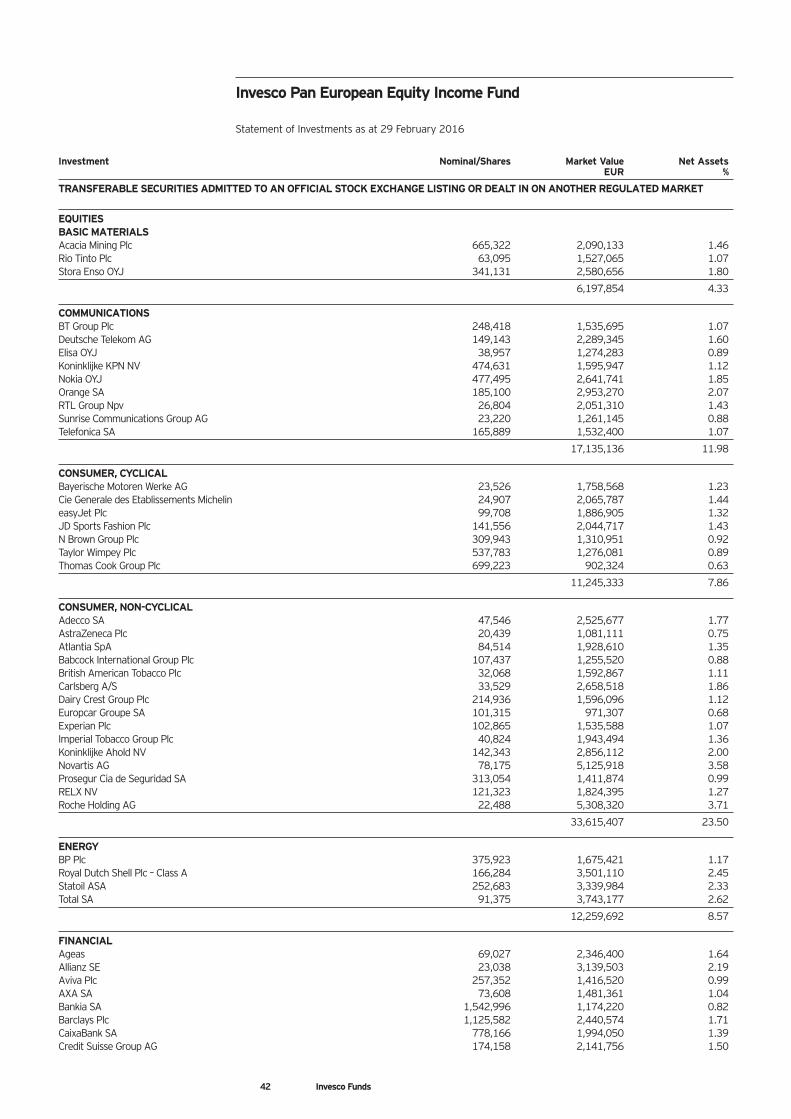
Investment Nominal/Shares Market Value Net Assets EUR %
TRANSFERABLE SECURITIES ADMITTED TO AN OFFICIAL STOCK EXCHANGE LISTING OR DEALT IN ON ANOTHER REGULATED MARKET
EQUITIESBASIC MATERIALSAcacia Mining Plc 665,322 2,090,133 1.46Rio Tinto Plc 63,095 1,527,065 1.07Stora Enso OYJ 341,131 2,580,656 1.80
6,197,854 4.33
COMMUNICATIONSBT Group Plc 248,418 1,535,695 1.07Deutsche Telekom AG 149,143 2,289,345 1.60Elisa OYJ 38,957 1,274,283 0.89Koninklijke KPN NV 474,631 1,595,947 1.12Nokia OYJ 477,495 2,641,741 1.85Orange SA 185,100 2,953,270 2.07RTL Group Npv 26,804 2,051,310 1.43Sunrise Communications Group AG 23,220 1,261,145 0.88Telefonica SA 165,889 1,532,400 1.07
17,135,136 11.98
CONSUMER, CYCLICALBayerische Motoren Werke AG 23,526 1,758,568 1.23Cie Generale des Etablissements Michelin 24,907 2,065,787 1.44easyJet Plc 99,708 1,886,905 1.32JD Sports Fashion Plc 141,556 2,044,717 1.43N Brown Group Plc 309,943 1,310,951 0.92Taylor Wimpey Plc 537,783 1,276,081 0.89Thomas Cook Group Plc 699,223 902,324 0.63
11,245,333 7.86
CONSUMER, NON-CYCLICALAdecco SA 47,546 2,525,677 1.77AstraZeneca Plc 20,439 1,081,111 0.75Atlantia SpA 84,514 1,928,610 1.35Babcock International Group Plc 107,437 1,255,520 0.88British American Tobacco Plc 32,068 1,592,867 1.11Carlsberg A/S 33,529 2,658,518 1.86Dairy Crest Group Plc 214,936 1,596,096 1.12Europcar Groupe SA 101,315 971,307 0.68Experian Plc 102,865 1,535,588 1.07Imperial Tobacco Group Plc 40,824 1,943,494 1.36Koninklijke Ahold NV 142,343 2,856,112 2.00Novartis AG 78,175 5,125,918 3.58Prosegur Cia de Seguridad SA 313,054 1,411,874 0.99RELX NV 121,323 1,824,395 1.27Roche Holding AG 22,488 5,308,320 3.71
33,615,407 23.50
ENERGYBP Plc 375,923 1,675,421 1.17Royal Dutch Shell Plc – Class A 166,284 3,501,110 2.45Statoil ASA 252,683 3,339,984 2.33Total SA 91,375 3,743,177 2.62
12,259,692 8.57
FINANCIALAgeas 69,027 2,346,400 1.64Allianz SE 23,038 3,139,503 2.19Aviva Plc 257,352 1,416,520 0.99AXA SA 73,608 1,481,361 1.04Bankia SA 1,542,996 1,174,220 0.82Barclays Plc 1,125,582 2,440,574 1.71CaixaBank SA 778,166 1,994,050 1.39Credit Suisse Group AG 174,158 2,141,756 1.50
Invesco Pan European Equity Income Fund
Statement of Investments as at 29 February 2016
42 Invesco Funds
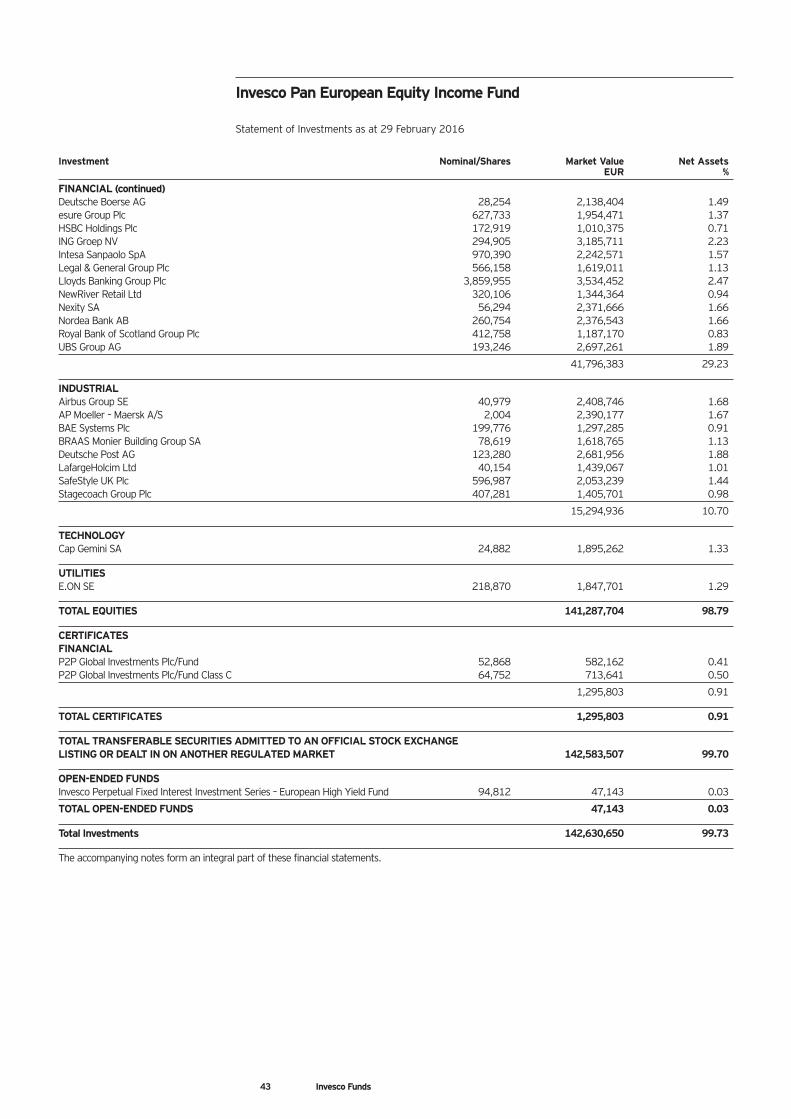
43 Invesco Funds
Investment Nominal/Shares Market Value Net Assets EUR %
FINANCIAL (continued)Deutsche Boerse AG 28,254 2,138,404 1.49esure Group Plc 627,733 1,954,471 1.37HSBC Holdings Plc 172,919 1,010,375 0.71ING Groep NV 294,905 3,185,711 2.23Intesa Sanpaolo SpA 970,390 2,242,571 1.57Legal & General Group Plc 566,158 1,619,011 1.13Lloyds Banking Group Plc 3,859,955 3,534,452 2.47NewRiver Retail Ltd 320,106 1,344,364 0.94Nexity SA 56,294 2,371,666 1.66Nordea Bank AB 260,754 2,376,543 1.66Royal Bank of Scotland Group Plc 412,758 1,187,170 0.83UBS Group AG 193,246 2,697,261 1.89
41,796,383 29.23
INDUSTRIALAirbus Group SE 40,979 2,408,746 1.68AP Moeller – Maersk A/S 2,004 2,390,177 1.67BAE Systems Plc 199,776 1,297,285 0.91BRAAS Monier Building Group SA 78,619 1,618,765 1.13Deutsche Post AG 123,280 2,681,956 1.88LafargeHolcim Ltd 40,154 1,439,067 1.01SafeStyle UK Plc 596,987 2,053,239 1.44Stagecoach Group Plc 407,281 1,405,701 0.98
15,294,936 10.70
TECHNOLOGYCap Gemini SA 24,882 1,895,262 1.33
UTILITIESE.ON SE 218,870 1,847,701 1.29
TOTAL EQUITIES 141,287,704 98.79
CERTIFICATESFINANCIALP2P Global Investments Plc/Fund 52,868 582,162 0.41P2P Global Investments Plc/Fund Class C 64,752 713,641 0.50
1,295,803 0.91
TOTAL CERTIFICATES 1,295,803 0.91
TOTAL TRANSFERABLE SECURITIES ADMITTED TO AN OFFICIAL STOCK EXCHANGE LISTING OR DEALT IN ON ANOTHER REGULATED MARKET 142,583,507 99.70
OPEN-ENDED FUNDSInvesco Perpetual Fixed Interest Investment Series – European High Yield Fund 94,812 47,143 0.03
TOTAL OPEN-ENDED FUNDS 47,143 0.03
Total Investments 142,630,650 99.73
The accompanying notes form an integral part of these financial statements.
Invesco Pan European Equity Income Fund
Statement of Investments as at 29 February 2016
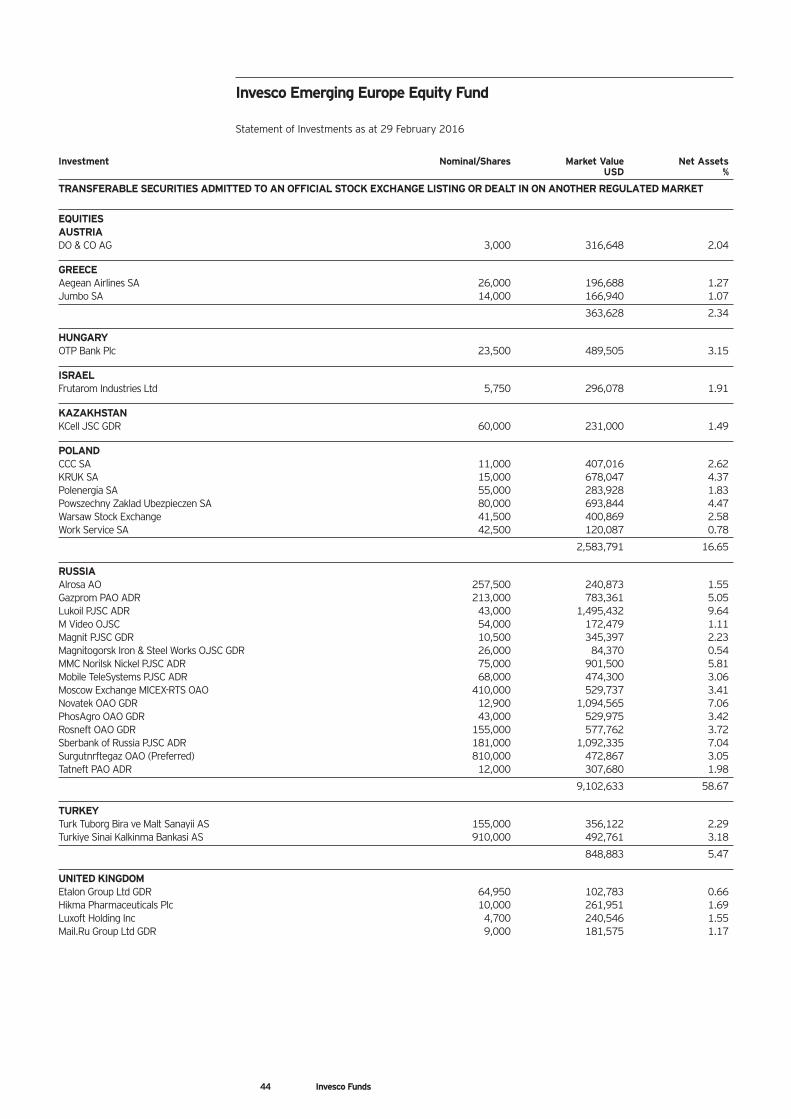
44 Invesco Funds
Investment Nominal/Shares Market Value Net Assets USD %
TRANSFERABLE SECURITIES ADMITTED TO AN OFFICIAL STOCK EXCHANGE LISTING OR DEALT IN ON ANOTHER REGULATED MARKET
EQUITIESAUSTRIADO & CO AG 3,000 316,648 2.04
GREECEAegean Airlines SA 26,000 196,688 1.27Jumbo SA 14,000 166,940 1.07
363,628 2.34
HUNGARYOTP Bank Plc 23,500 489,505 3.15
ISRAELFrutarom Industries Ltd 5,750 296,078 1.91
KAZAKHSTANKCell JSC GDR 60,000 231,000 1.49
POLANDCCC SA 11,000 407,016 2.62KRUK SA 15,000 678,047 4.37Polenergia SA 55,000 283,928 1.83Powszechny Zaklad Ubezpieczen SA 80,000 693,844 4.47Warsaw Stock Exchange 41,500 400,869 2.58Work Service SA 42,500 120,087 0.78
2,583,791 16.65
RUSSIAAlrosa AO 257,500 240,873 1.55Gazprom PAO ADR 213,000 783,361 5.05Lukoil PJSC ADR 43,000 1,495,432 9.64M Video OJSC 54,000 172,479 1.11Magnit PJSC GDR 10,500 345,397 2.23Magnitogorsk Iron & Steel Works OJSC GDR 26,000 84,370 0.54MMC Norilsk Nickel PJSC ADR 75,000 901,500 5.81Mobile TeleSystems PJSC ADR 68,000 474,300 3.06Moscow Exchange MICEX-RTS OAO 410,000 529,737 3.41Novatek OAO GDR 12,900 1,094,565 7.06PhosAgro OAO GDR 43,000 529,975 3.42Rosneft OAO GDR 155,000 577,762 3.72Sberbank of Russia PJSC ADR 181,000 1,092,335 7.04Surgutnrftegaz OAO (Preferred) 810,000 472,867 3.05Tatneft PAO ADR 12,000 307,680 1.98
9,102,633 58.67
TURKEYTurk Tuborg Bira ve Malt Sanayii AS 155,000 356,122 2.29Turkiye Sinai Kalkinma Bankasi AS 910,000 492,761 3.18
848,883 5.47
UNITED KINGDOMEtalon Group Ltd GDR 64,950 102,783 0.66Hikma Pharmaceuticals Plc 10,000 261,951 1.69Luxoft Holding Inc 4,700 240,546 1.55Mail.Ru Group Ltd GDR 9,000 181,575 1.17
Invesco Emerging Europe Equity Fund
Statement of Investments as at 29 February 2016
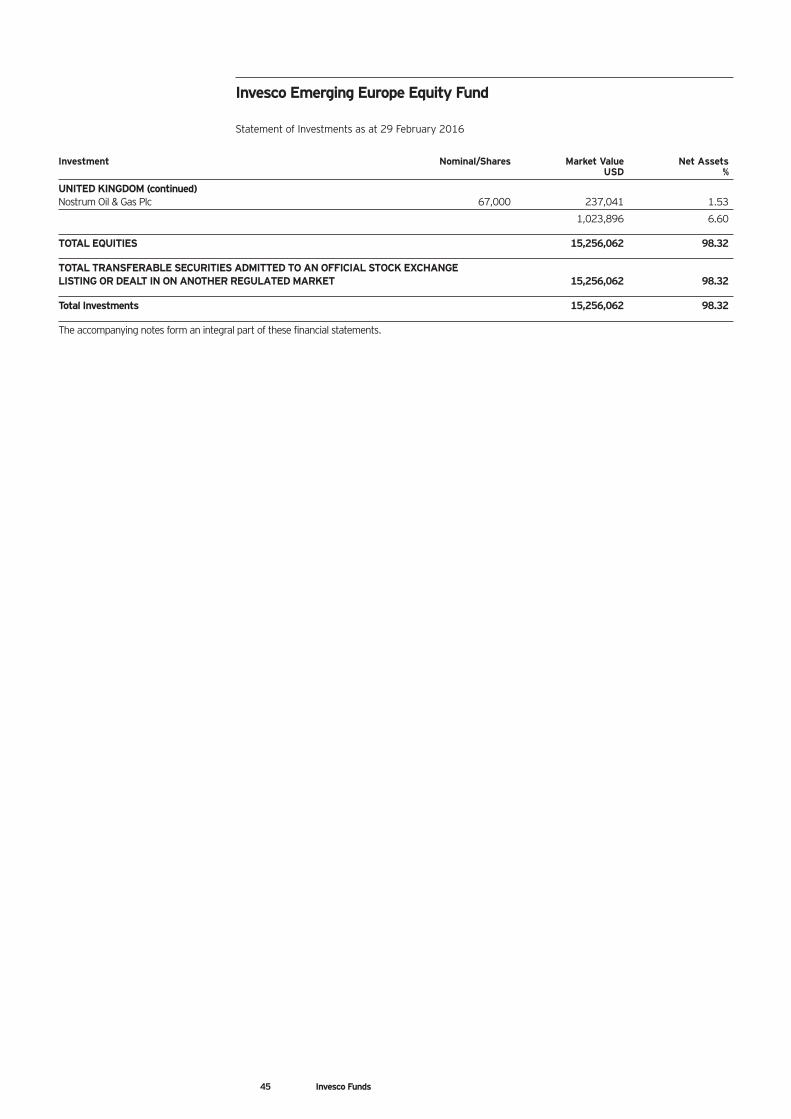
45 Invesco Funds
Investment Nominal/Shares Market Value Net Assets USD %
UNITED KINGDOM (continued)Nostrum Oil & Gas Plc 67,000 237,041 1.53
1,023,896 6.60
TOTAL EQUITIES 15,256,062 98.32
TOTAL TRANSFERABLE SECURITIES ADMITTED TO AN OFFICIAL STOCK EXCHANGE LISTING OR DEALT IN ON ANOTHER REGULATED MARKET 15,256,062 98.32
Total Investments 15,256,062 98.32
The accompanying notes form an integral part of these financial statements.
Invesco Emerging Europe Equity Fund
Statement of Investments as at 29 February 2016
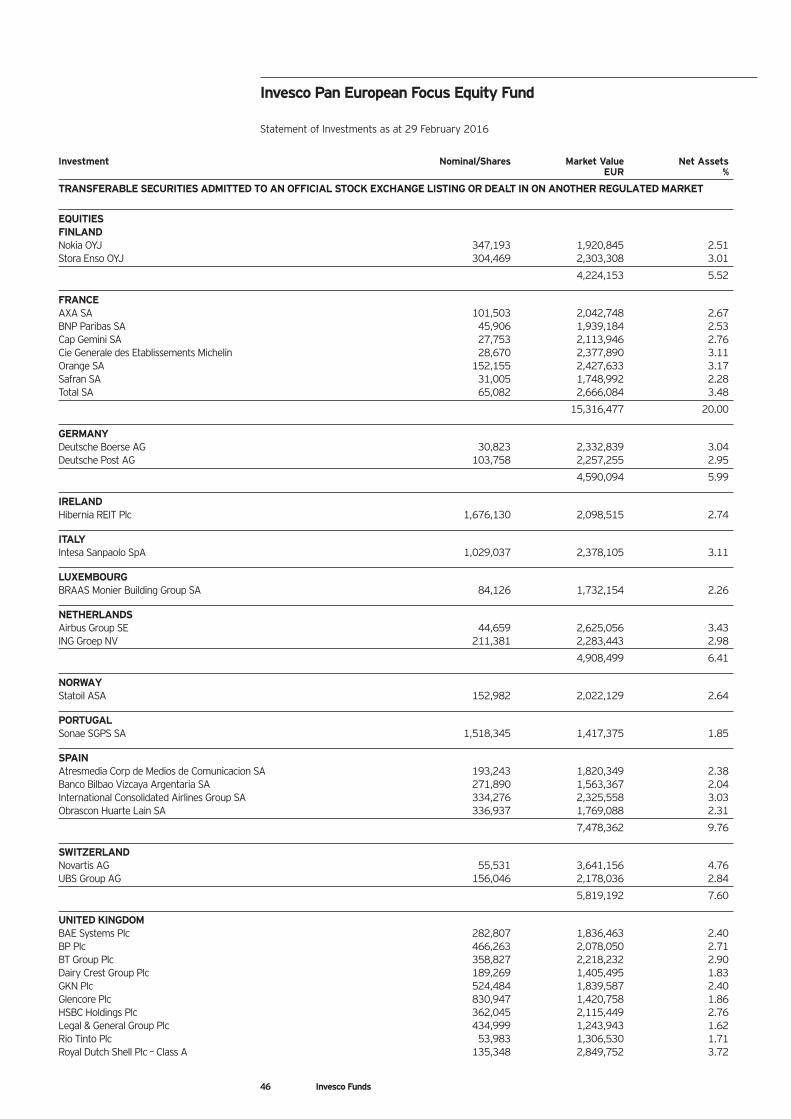
Investment Nominal/Shares Market Value Net Assets EUR %
TRANSFERABLE SECURITIES ADMITTED TO AN OFFICIAL STOCK EXCHANGE LISTING OR DEALT IN ON ANOTHER REGULATED MARKET
EQUITIESFINLANDNokia OYJ 347,193 1,920,845 2.51Stora Enso OYJ 304,469 2,303,308 3.01
4,224,153 5.52
FRANCEAXA SA 101,503 2,042,748 2.67BNP Paribas SA 45,906 1,939,184 2.53Cap Gemini SA 27,753 2,113,946 2.76Cie Generale des Etablissements Michelin 28,670 2,377,890 3.11Orange SA 152,155 2,427,633 3.17Safran SA 31,005 1,748,992 2.28Total SA 65,082 2,666,084 3.48
15,316,477 20.00
GERMANYDeutsche Boerse AG 30,823 2,332,839 3.04Deutsche Post AG 103,758 2,257,255 2.95
4,590,094 5.99
IRELANDHibernia REIT Plc 1,676,130 2,098,515 2.74
ITALYIntesa Sanpaolo SpA 1,029,037 2,378,105 3.11
LUXEMBOURGBRAAS Monier Building Group SA 84,126 1,732,154 2.26
NETHERLANDSAirbus Group SE 44,659 2,625,056 3.43ING Groep NV 211,381 2,283,443 2.98
4,908,499 6.41
NORWAYStatoil ASA 152,982 2,022,129 2.64
PORTUGALSonae SGPS SA 1,518,345 1,417,375 1.85
SPAINAtresmedia Corp de Medios de Comunicacion SA 193,243 1,820,349 2.38Banco Bilbao Vizcaya Argentaria SA 271,890 1,563,367 2.04International Consolidated Airlines Group SA 334,276 2,325,558 3.03Obrascon Huarte Lain SA 336,937 1,769,088 2.31
7,478,362 9.76
SWITZERLANDNovartis AG 55,531 3,641,156 4.76UBS Group AG 156,046 2,178,036 2.84
5,819,192 7.60
UNITED KINGDOMBAE Systems Plc 282,807 1,836,463 2.40BP Plc 466,263 2,078,050 2.71BT Group Plc 358,827 2,218,232 2.90Dairy Crest Group Plc 189,269 1,405,495 1.83GKN Plc 524,484 1,839,587 2.40Glencore Plc 830,947 1,420,758 1.86HSBC Holdings Plc 362,045 2,115,449 2.76Legal & General Group Plc 434,999 1,243,943 1.62Rio Tinto Plc 53,983 1,306,530 1.71Royal Dutch Shell Plc – Class A 135,348 2,849,752 3.72
Invesco Pan European Focus Equity Fund
Statement of Investments as at 29 February 2016
46 Invesco Funds
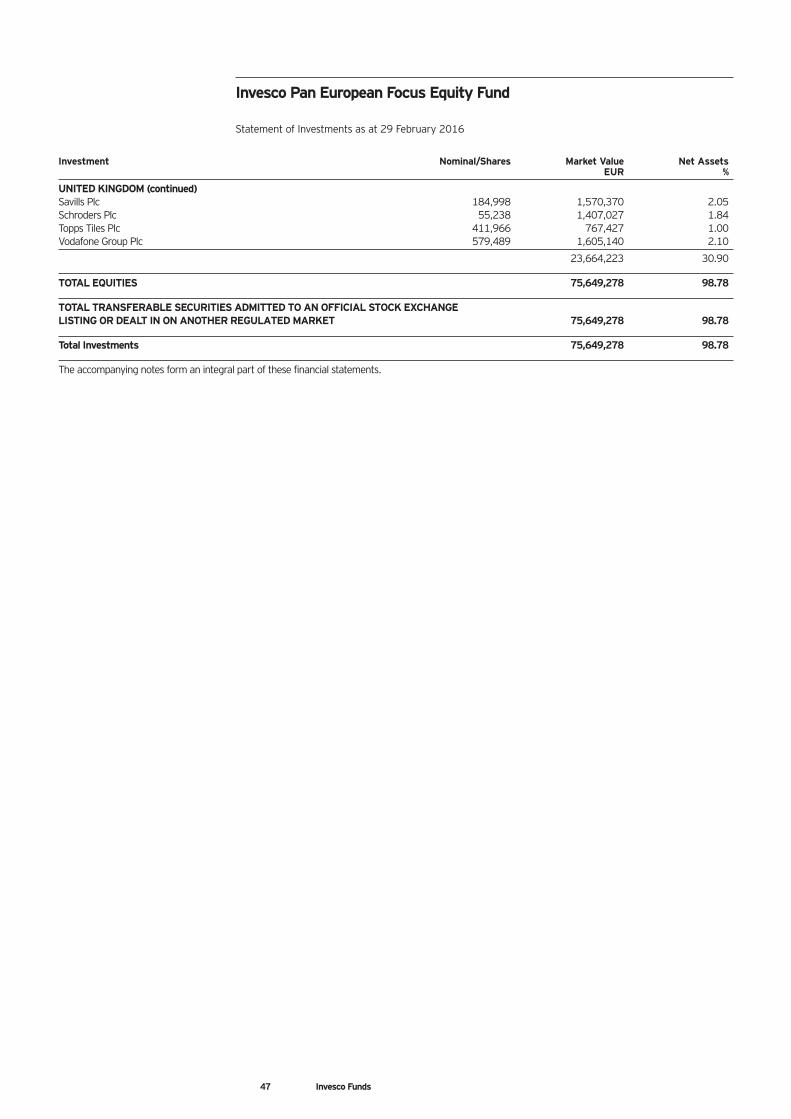
Invesco Pan European Focus Equity Fund
Statement of Investments as at 29 February 2016
Investment Nominal/Shares Market Value Net Assets EUR %
UNITED KINGDOM (continued)Savills Plc 184,998 1,570,370 2.05Schroders Plc 55,238 1,407,027 1.84Topps Tiles Plc 411,966 767,427 1.00Vodafone Group Plc 579,489 1,605,140 2.10
23,664,223 30.90
TOTAL EQUITIES 75,649,278 98.78
TOTAL TRANSFERABLE SECURITIES ADMITTED TO AN OFFICIAL STOCK EXCHANGE LISTING OR DEALT IN ON ANOTHER REGULATED MARKET 75,649,278 98.78
Total Investments 75,649,278 98.78
The accompanying notes form an integral part of these financial statements.
47 Invesco Funds
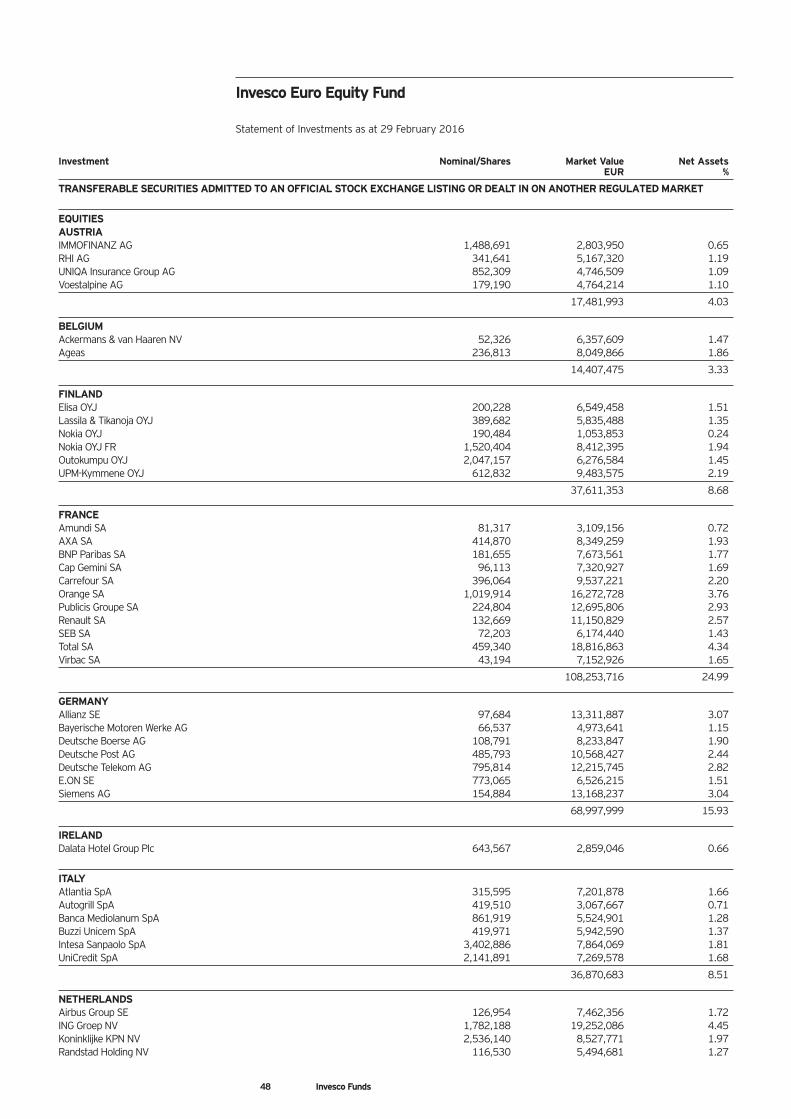
Invesco Euro Equity Fund
Statement of Investments as at 29 February 2016
Investment Nominal/Shares Market Value Net Assets EUR %
TRANSFERABLE SECURITIES ADMITTED TO AN OFFICIAL STOCK EXCHANGE LISTING OR DEALT IN ON ANOTHER REGULATED MARKET
EQUITIESAUSTRIAIMMOFINANZ AG 1,488,691 2,803,950 0.65RHI AG 341,641 5,167,320 1.19UNIQA Insurance Group AG 852,309 4,746,509 1.09Voestalpine AG 179,190 4,764,214 1.10
17,481,993 4.03
BELGIUMAckermans & van Haaren NV 52,326 6,357,609 1.47Ageas 236,813 8,049,866 1.86
14,407,475 3.33
FINLANDElisa OYJ 200,228 6,549,458 1.51Lassila & Tikanoja OYJ 389,682 5,835,488 1.35Nokia OYJ 190,484 1,053,853 0.24Nokia OYJ FR 1,520,404 8,412,395 1.94Outokumpu OYJ 2,047,157 6,276,584 1.45UPM-Kymmene OYJ 612,832 9,483,575 2.19
37,611,353 8.68
FRANCEAmundi SA 81,317 3,109,156 0.72AXA SA 414,870 8,349,259 1.93BNP Paribas SA 181,655 7,673,561 1.77Cap Gemini SA 96,113 7,320,927 1.69Carrefour SA 396,064 9,537,221 2.20Orange SA 1,019,914 16,272,728 3.76Publicis Groupe SA 224,804 12,695,806 2.93Renault SA 132,669 11,150,829 2.57SEB SA 72,203 6,174,440 1.43Total SA 459,340 18,816,863 4.34Virbac SA 43,194 7,152,926 1.65
108,253,716 24.99
GERMANYAllianz SE 97,684 13,311,887 3.07Bayerische Motoren Werke AG 66,537 4,973,641 1.15Deutsche Boerse AG 108,791 8,233,847 1.90Deutsche Post AG 485,793 10,568,427 2.44Deutsche Telekom AG 795,814 12,215,745 2.82E.ON SE 773,065 6,526,215 1.51Siemens AG 154,884 13,168,237 3.04
68,997,999 15.93
IRELANDDalata Hotel Group Plc 643,567 2,859,046 0.66
ITALYAtlantia SpA 315,595 7,201,878 1.66Autogrill SpA 419,510 3,067,667 0.71Banca Mediolanum SpA 861,919 5,524,901 1.28Buzzi Unicem SpA 419,971 5,942,590 1.37Intesa Sanpaolo SpA 3,402,886 7,864,069 1.81UniCredit SpA 2,141,891 7,269,578 1.68
36,870,683 8.51
NETHERLANDSAirbus Group SE 126,954 7,462,356 1.72ING Groep NV 1,782,188 19,252,086 4.45Koninklijke KPN NV 2,536,140 8,527,771 1.97Randstad Holding NV 116,530 5,494,681 1.27
48 Invesco Funds
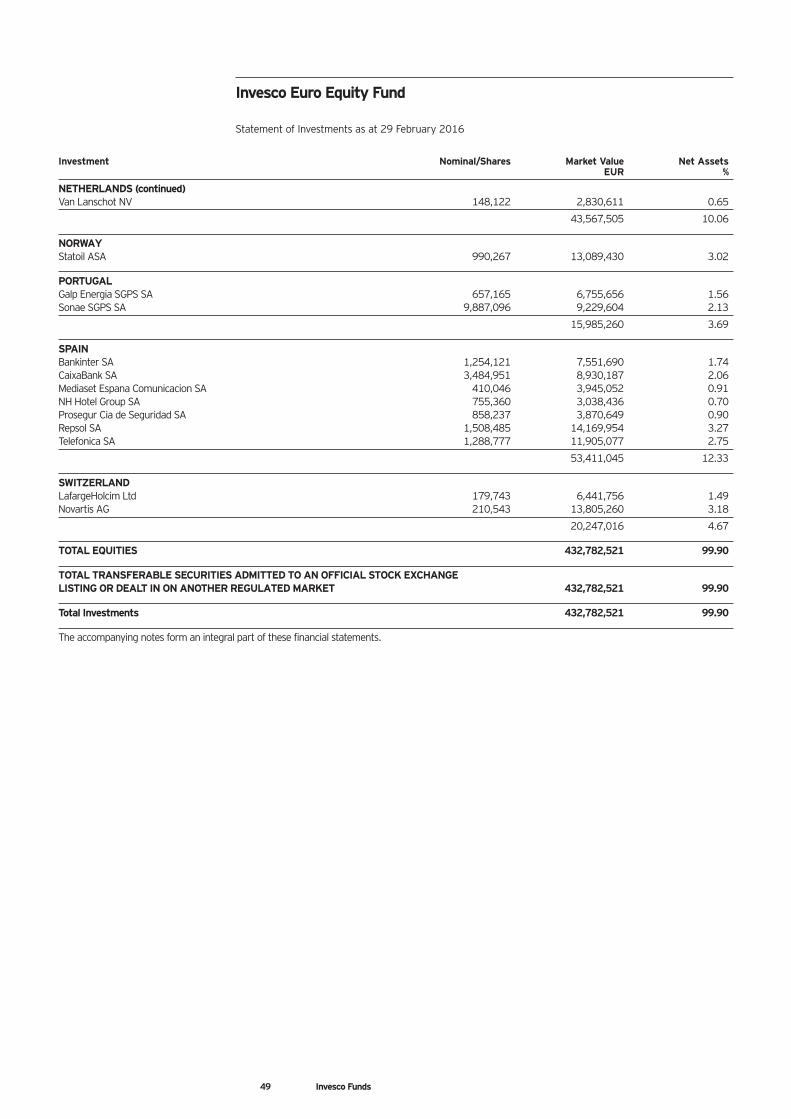
49 Invesco Funds
Investment Nominal/Shares Market Value Net Assets EUR %
NETHERLANDS (continued)Van Lanschot NV 148,122 2,830,611 0.65
43,567,505 10.06
NORWAYStatoil ASA 990,267 13,089,430 3.02
PORTUGALGalp Energia SGPS SA 657,165 6,755,656 1.56Sonae SGPS SA 9,887,096 9,229,604 2.13
15,985,260 3.69
SPAINBankinter SA 1,254,121 7,551,690 1.74CaixaBank SA 3,484,951 8,930,187 2.06Mediaset Espana Comunicacion SA 410,046 3,945,052 0.91NH Hotel Group SA 755,360 3,038,436 0.70Prosegur Cia de Seguridad SA 858,237 3,870,649 0.90Repsol SA 1,508,485 14,169,954 3.27Telefonica SA 1,288,777 11,905,077 2.75
53,411,045 12.33
SWITZERLANDLafargeHolcim Ltd 179,743 6,441,756 1.49Novartis AG 210,543 13,805,260 3.18
20,247,016 4.67
TOTAL EQUITIES 432,782,521 99.90
TOTAL TRANSFERABLE SECURITIES ADMITTED TO AN OFFICIAL STOCK EXCHANGE LISTING OR DEALT IN ON ANOTHER REGULATED MARKET 432,782,521 99.90
Total Investments 432,782,521 99.90
The accompanying notes form an integral part of these financial statements.
Invesco Euro Equity Fund
Statement of Investments as at 29 February 2016
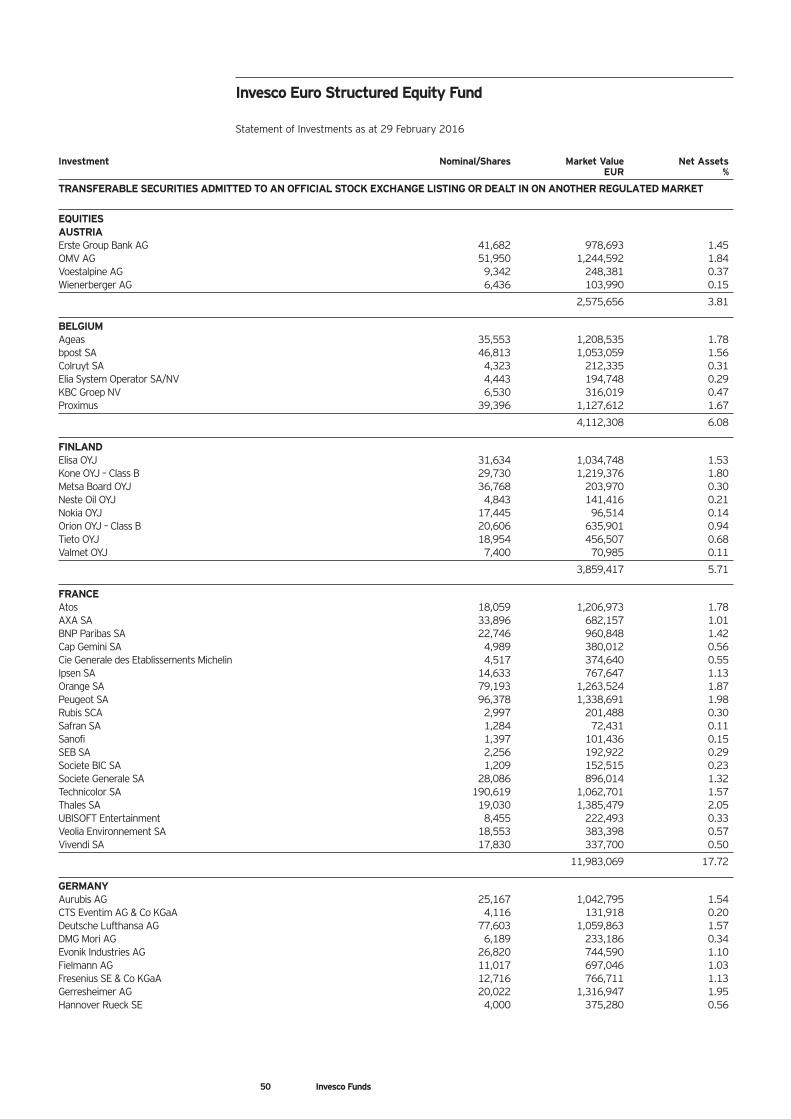
50 Invesco Funds
Invesco Euro Structured Equity Fund
Statement of Investments as at 29 February 2016
Investment Nominal/Shares Market Value Net Assets EUR %
TRANSFERABLE SECURITIES ADMITTED TO AN OFFICIAL STOCK EXCHANGE LISTING OR DEALT IN ON ANOTHER REGULATED MARKET
EQUITIESAUSTRIAErste Group Bank AG 41,682 978,693 1.45OMV AG 51,950 1,244,592 1.84Voestalpine AG 9,342 248,381 0.37Wienerberger AG 6,436 103,990 0.15
2,575,656 3.81
BELGIUMAgeas 35,553 1,208,535 1.78bpost SA 46,813 1,053,059 1.56Colruyt SA 4,323 212,335 0.31Elia System Operator SA/NV 4,443 194,748 0.29KBC Groep NV 6,530 316,019 0.47Proximus 39,396 1,127,612 1.67
4,112,308 6.08
FINLANDElisa OYJ 31,634 1,034,748 1.53Kone OYJ – Class B 29,730 1,219,376 1.80Metsa Board OYJ 36,768 203,970 0.30Neste Oil OYJ 4,843 141,416 0.21Nokia OYJ 17,445 96,514 0.14Orion OYJ – Class B 20,606 635,901 0.94Tieto OYJ 18,954 456,507 0.68Valmet OYJ 7,400 70,985 0.11
3,859,417 5.71
FRANCEAtos 18,059 1,206,973 1.78AXA SA 33,896 682,157 1.01BNP Paribas SA 22,746 960,848 1.42Cap Gemini SA 4,989 380,012 0.56Cie Generale des Etablissements Michelin 4,517 374,640 0.55Ipsen SA 14,633 767,647 1.13Orange SA 79,193 1,263,524 1.87Peugeot SA 96,378 1,338,691 1.98Rubis SCA 2,997 201,488 0.30Safran SA 1,284 72,431 0.11Sanofi 1,397 101,436 0.15SEB SA 2,256 192,922 0.29Societe BIC SA 1,209 152,515 0.23Societe Generale SA 28,086 896,014 1.32Technicolor SA 190,619 1,062,701 1.57Thales SA 19,030 1,385,479 2.05UBISOFT Entertainment 8,455 222,493 0.33Veolia Environnement SA 18,553 383,398 0.57Vivendi SA 17,830 337,700 0.50
11,983,069 17.72
GERMANYAurubis AG 25,167 1,042,795 1.54CTS Eventim AG & Co KGaA 4,116 131,918 0.20Deutsche Lufthansa AG 77,603 1,059,863 1.57DMG Mori AG 6,189 233,186 0.34Evonik Industries AG 26,820 744,590 1.10Fielmann AG 11,017 697,046 1.03Fresenius SE & Co KGaA 12,716 766,711 1.13Gerresheimer AG 20,022 1,316,947 1.95Hannover Rueck SE 4,000 375,280 0.56
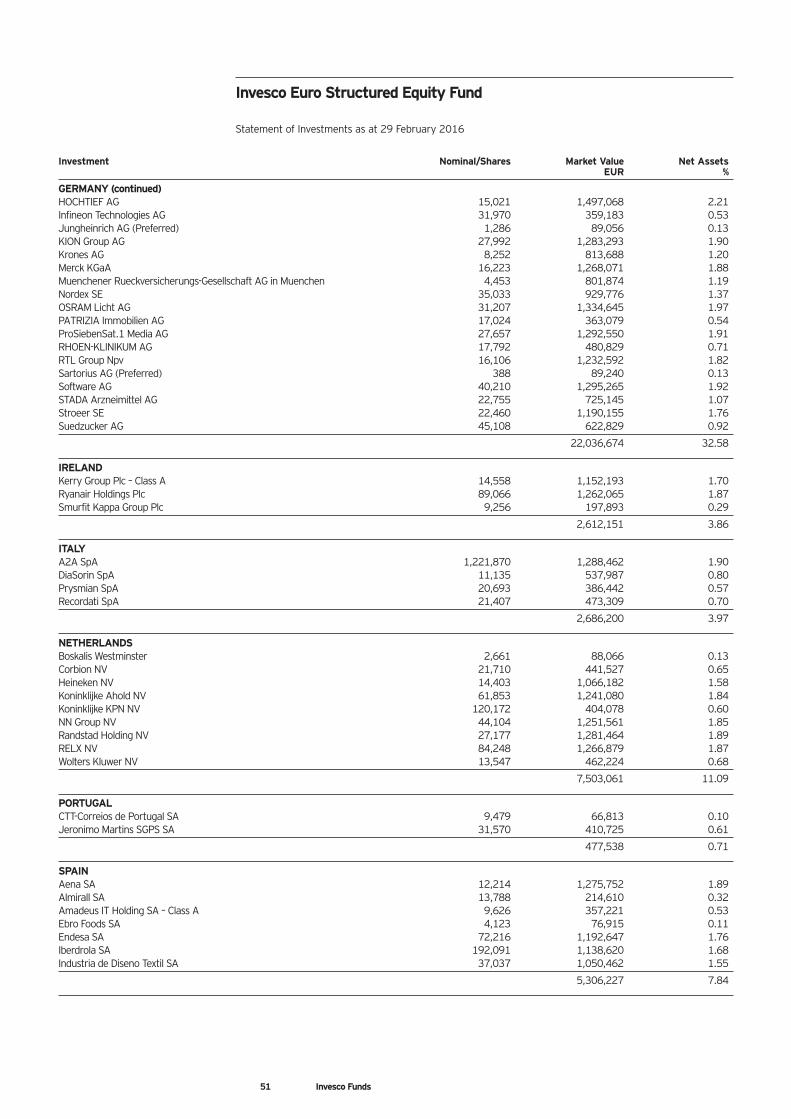
51 Invesco Funds
Investment Nominal/Shares Market Value Net Assets EUR %
GERMANY (continued)HOCHTIEF AG 15,021 1,497,068 2.21Infineon Technologies AG 31,970 359,183 0.53Jungheinrich AG (Preferred) 1,286 89,056 0.13KION Group AG 27,992 1,283,293 1.90Krones AG 8,252 813,688 1.20Merck KGaA 16,223 1,268,071 1.88Muenchener Rueckversicherungs-Gesellschaft AG in Muenchen 4,453 801,874 1.19Nordex SE 35,033 929,776 1.37OSRAM Licht AG 31,207 1,334,645 1.97PATRIZIA Immobilien AG 17,024 363,079 0.54ProSiebenSat.1 Media AG 27,657 1,292,550 1.91RHOEN-KLINIKUM AG 17,792 480,829 0.71RTL Group Npv 16,106 1,232,592 1.82Sartorius AG (Preferred) 388 89,240 0.13Software AG 40,210 1,295,265 1.92STADA Arzneimittel AG 22,755 725,145 1.07Stroeer SE 22,460 1,190,155 1.76Suedzucker AG 45,108 622,829 0.92
22,036,674 32.58
IRELANDKerry Group Plc – Class A 14,558 1,152,193 1.70Ryanair Holdings Plc 89,066 1,262,065 1.87Smurfit Kappa Group Plc 9,256 197,893 0.29
2,612,151 3.86
ITALYA2A SpA 1,221,870 1,288,462 1.90DiaSorin SpA 11,135 537,987 0.80Prysmian SpA 20,693 386,442 0.57Recordati SpA 21,407 473,309 0.70
2,686,200 3.97
NETHERLANDSBoskalis Westminster 2,661 88,066 0.13Corbion NV 21,710 441,527 0.65Heineken NV 14,403 1,066,182 1.58Koninklijke Ahold NV 61,853 1,241,080 1.84Koninklijke KPN NV 120,172 404,078 0.60NN Group NV 44,104 1,251,561 1.85Randstad Holding NV 27,177 1,281,464 1.89RELX NV 84,248 1,266,879 1.87Wolters Kluwer NV 13,547 462,224 0.68
7,503,061 11.09
PORTUGALCTT-Correios de Portugal SA 9,479 66,813 0.10Jeronimo Martins SGPS SA 31,570 410,725 0.61
477,538 0.71
SPAINAena SA 12,214 1,275,752 1.89Almirall SA 13,788 214,610 0.32Amadeus IT Holding SA – Class A 9,626 357,221 0.53Ebro Foods SA 4,123 76,915 0.11Endesa SA 72,216 1,192,647 1.76Iberdrola SA 192,091 1,138,620 1.68Industria de Diseno Textil SA 37,037 1,050,462 1.55
5,306,227 7.84
Invesco Euro Structured Equity Fund
Statement of Investments as at 29 February 2016
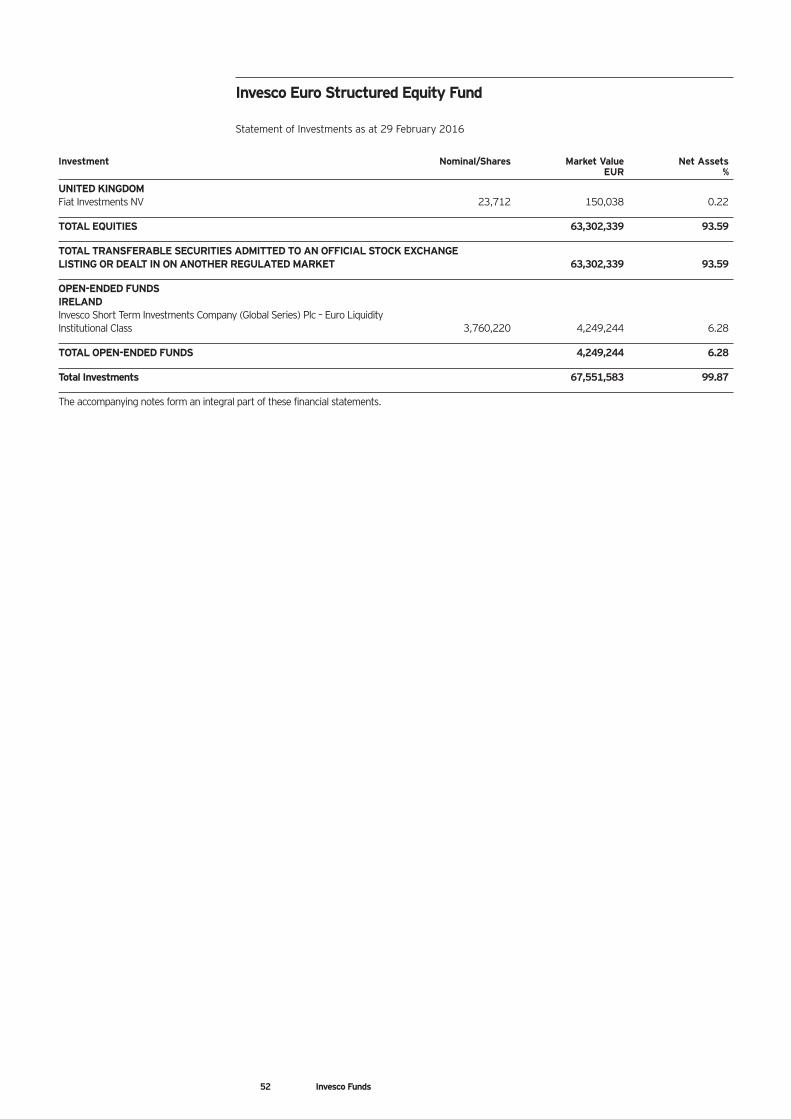
52 Invesco Funds
Investment Nominal/Shares Market Value Net Assets EUR %
UNITED KINGDOMFiat Investments NV 23,712 150,038 0.22
TOTAL EQUITIES 63,302,339 93.59
TOTAL TRANSFERABLE SECURITIES ADMITTED TO AN OFFICIAL STOCK EXCHANGE LISTING OR DEALT IN ON ANOTHER REGULATED MARKET 63,302,339 93.59
OPEN-ENDED FUNDSIRELANDInvesco Short Term Investments Company (Global Series) Plc – Euro Liquidity Institutional Class 3,760,220 4,249,244 6.28
TOTAL OPEN-ENDED FUNDS 4,249,244 6.28
Total Investments 67,551,583 99.87
The accompanying notes form an integral part of these financial statements.
Invesco Euro Structured Equity Fund
Statement of Investments as at 29 February 2016
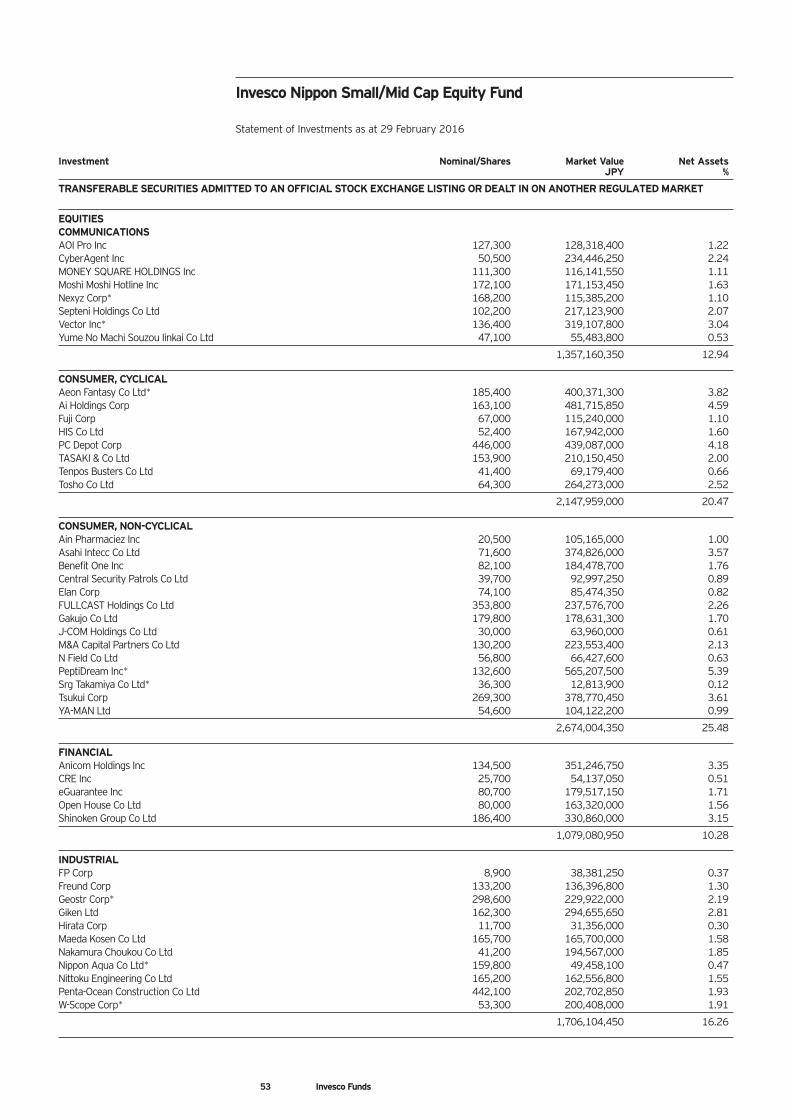
53 Invesco Funds
Investment Nominal/Shares Market Value Net Assets JPY %
TRANSFERABLE SECURITIES ADMITTED TO AN OFFICIAL STOCK EXCHANGE LISTING OR DEALT IN ON ANOTHER REGULATED MARKET
EQUITIESCOMMUNICATIONSAOI Pro Inc 127,300 128,318,400 1.22CyberAgent Inc 50,500 234,446,250 2.24MONEY SQUARE HOLDINGS Inc 111,300 116,141,550 1.11Moshi Moshi Hotline Inc 172,100 171,153,450 1.63Nexyz Corp* 168,200 115,385,200 1.10Septeni Holdings Co Ltd 102,200 217,123,900 2.07Vector Inc* 136,400 319,107,800 3.04Yume No Machi Souzou Iinkai Co Ltd 47,100 55,483,800 0.53
1,357,160,350 12.94
CONSUMER, CYCLICALAeon Fantasy Co Ltd* 185,400 400,371,300 3.82Ai Holdings Corp 163,100 481,715,850 4.59Fuji Corp 67,000 115,240,000 1.10HIS Co Ltd 52,400 167,942,000 1.60PC Depot Corp 446,000 439,087,000 4.18TASAKI & Co Ltd 153,900 210,150,450 2.00Tenpos Busters Co Ltd 41,400 69,179,400 0.66Tosho Co Ltd 64,300 264,273,000 2.52
2,147,959,000 20.47
CONSUMER, NON-CYCLICALAin Pharmaciez Inc 20,500 105,165,000 1.00Asahi Intecc Co Ltd 71,600 374,826,000 3.57Benefit One Inc 82,100 184,478,700 1.76Central Security Patrols Co Ltd 39,700 92,997,250 0.89Elan Corp 74,100 85,474,350 0.82FULLCAST Holdings Co Ltd 353,800 237,576,700 2.26Gakujo Co Ltd 179,800 178,631,300 1.70J-COM Holdings Co Ltd 30,000 63,960,000 0.61M&A Capital Partners Co Ltd 130,200 223,553,400 2.13N Field Co Ltd 56,800 66,427,600 0.63PeptiDream Inc* 132,600 565,207,500 5.39Srg Takamiya Co Ltd* 36,300 12,813,900 0.12Tsukui Corp 269,300 378,770,450 3.61YA-MAN Ltd 54,600 104,122,200 0.99
2,674,004,350 25.48
FINANCIALAnicom Holdings Inc 134,500 351,246,750 3.35CRE Inc 25,700 54,137,050 0.51eGuarantee Inc 80,700 179,517,150 1.71Open House Co Ltd 80,000 163,320,000 1.56Shinoken Group Co Ltd 186,400 330,860,000 3.15
1,079,080,950 10.28
INDUSTRIALFP Corp 8,900 38,381,250 0.37Freund Corp 133,200 136,396,800 1.30Geostr Corp* 298,600 229,922,000 2.19Giken Ltd 162,300 294,655,650 2.81Hirata Corp 11,700 31,356,000 0.30Maeda Kosen Co Ltd 165,700 165,700,000 1.58Nakamura Choukou Co Ltd 41,200 194,567,000 1.85Nippon Aqua Co Ltd* 159,800 49,458,100 0.47Nittoku Engineering Co Ltd 165,200 162,556,800 1.55Penta-Ocean Construction Co Ltd 442,100 202,702,850 1.93W-Scope Corp* 53,300 200,408,000 1.91
1,706,104,450 16.26
Invesco Nippon Small/Mid Cap Equity Fund
Statement of Investments as at 29 February 2016
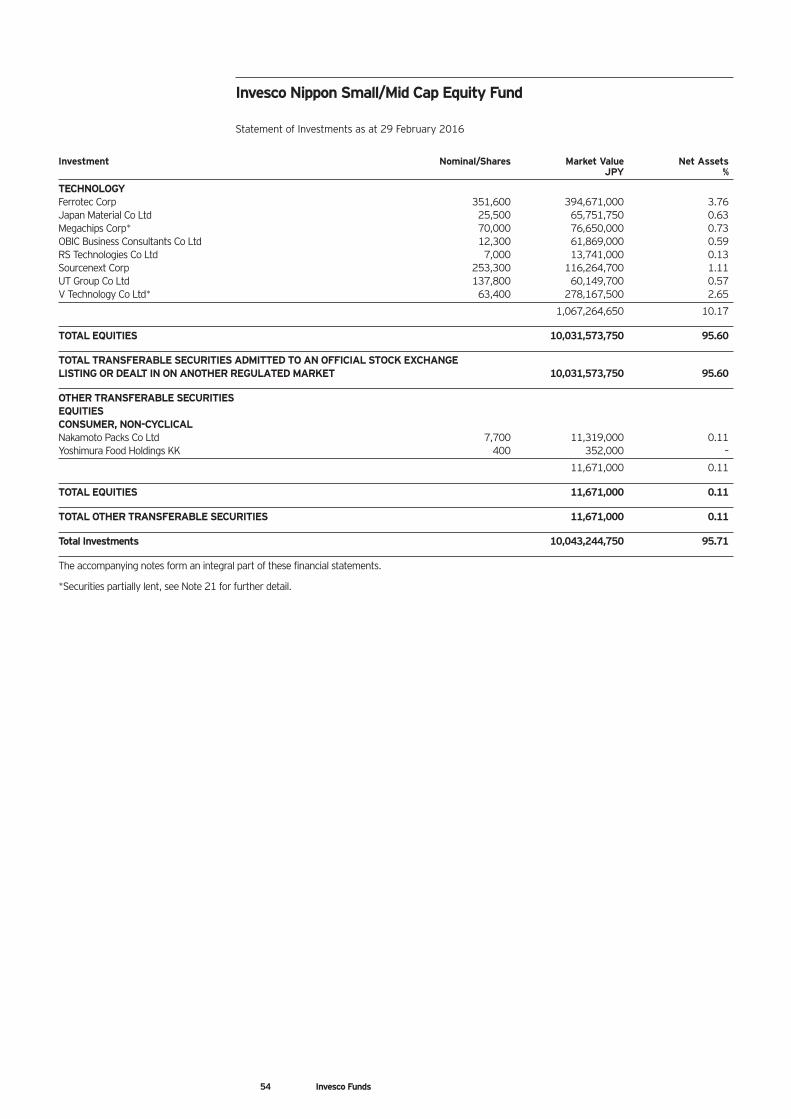
54 Invesco Funds
Investment Nominal/Shares Market Value Net Assets JPY %
TECHNOLOGYFerrotec Corp 351,600 394,671,000 3.76Japan Material Co Ltd 25,500 65,751,750 0.63Megachips Corp* 70,000 76,650,000 0.73OBIC Business Consultants Co Ltd 12,300 61,869,000 0.59RS Technologies Co Ltd 7,000 13,741,000 0.13Sourcenext Corp 253,300 116,264,700 1.11UT Group Co Ltd 137,800 60,149,700 0.57V Technology Co Ltd* 63,400 278,167,500 2.65
1,067,264,650 10.17
TOTAL EQUITIES 10,031,573,750 95.60
TOTAL TRANSFERABLE SECURITIES ADMITTED TO AN OFFICIAL STOCK EXCHANGE LISTING OR DEALT IN ON ANOTHER REGULATED MARKET 10,031,573,750 95.60
OTHER TRANSFERABLE SECURITIESEQUITIESCONSUMER, NON-CYCLICALNakamoto Packs Co Ltd 7,700 11,319,000 0.11Yoshimura Food Holdings KK 400 352,000 –
11,671,000 0.11
TOTAL EQUITIES 11,671,000 0.11
TOTAL OTHER TRANSFERABLE SECURITIES 11,671,000 0.11
Total Investments 10,043,244,750 95.71
The accompanying notes form an integral part of these financial statements.
*Securities partially lent, see Note 21 for further detail.
Invesco Nippon Small/Mid Cap Equity Fund
Statement of Investments as at 29 February 2016
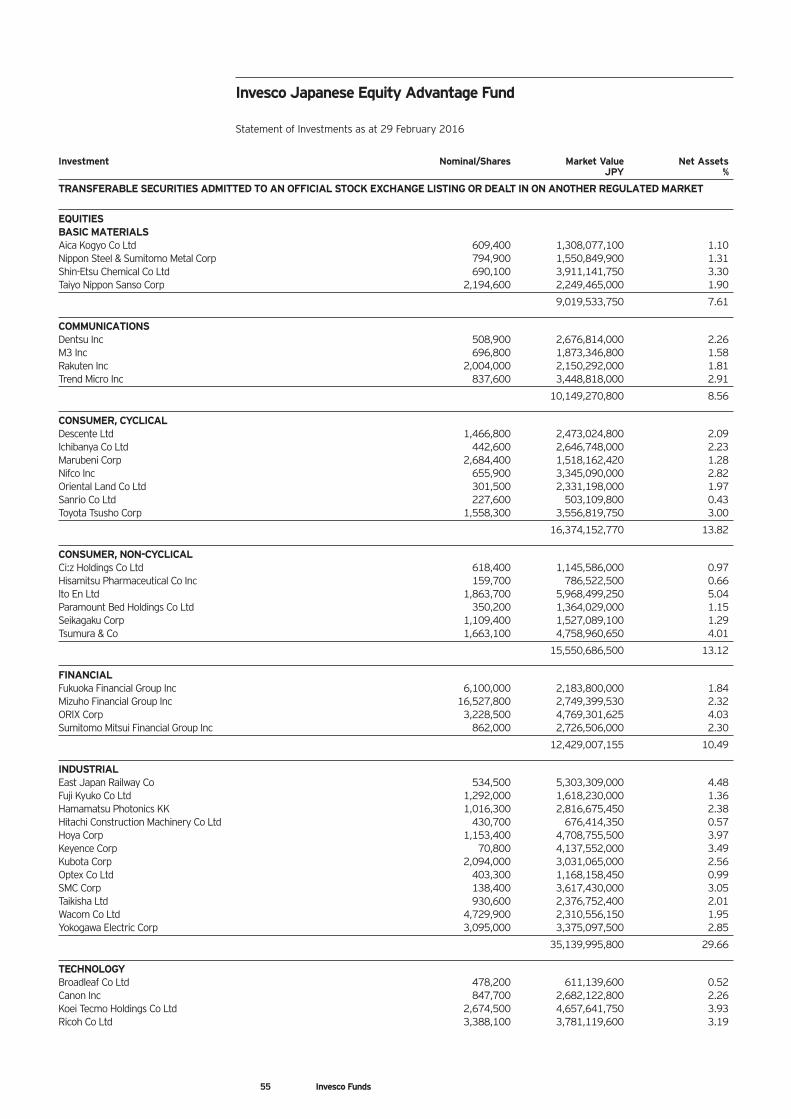
55 Invesco Funds
Investment Nominal/Shares Market Value Net Assets JPY %
TRANSFERABLE SECURITIES ADMITTED TO AN OFFICIAL STOCK EXCHANGE LISTING OR DEALT IN ON ANOTHER REGULATED MARKET
EQUITIESBASIC MATERIALSAica Kogyo Co Ltd 609,400 1,308,077,100 1.10Nippon Steel & Sumitomo Metal Corp 794,900 1,550,849,900 1.31Shin-Etsu Chemical Co Ltd 690,100 3,911,141,750 3.30Taiyo Nippon Sanso Corp 2,194,600 2,249,465,000 1.90
9,019,533,750 7.61
COMMUNICATIONSDentsu Inc 508,900 2,676,814,000 2.26M3 Inc 696,800 1,873,346,800 1.58Rakuten Inc 2,004,000 2,150,292,000 1.81Trend Micro Inc 837,600 3,448,818,000 2.91
10,149,270,800 8.56
CONSUMER, CYCLICALDescente Ltd 1,466,800 2,473,024,800 2.09Ichibanya Co Ltd 442,600 2,646,748,000 2.23Marubeni Corp 2,684,400 1,518,162,420 1.28Nifco Inc 655,900 3,345,090,000 2.82Oriental Land Co Ltd 301,500 2,331,198,000 1.97Sanrio Co Ltd 227,600 503,109,800 0.43Toyota Tsusho Corp 1,558,300 3,556,819,750 3.00
16,374,152,770 13.82
CONSUMER, NON-CYCLICALCi:z Holdings Co Ltd 618,400 1,145,586,000 0.97Hisamitsu Pharmaceutical Co Inc 159,700 786,522,500 0.66Ito En Ltd 1,863,700 5,968,499,250 5.04Paramount Bed Holdings Co Ltd 350,200 1,364,029,000 1.15Seikagaku Corp 1,109,400 1,527,089,100 1.29Tsumura & Co 1,663,100 4,758,960,650 4.01
15,550,686,500 13.12
FINANCIALFukuoka Financial Group Inc 6,100,000 2,183,800,000 1.84Mizuho Financial Group Inc 16,527,800 2,749,399,530 2.32ORIX Corp 3,228,500 4,769,301,625 4.03Sumitomo Mitsui Financial Group Inc 862,000 2,726,506,000 2.30
12,429,007,155 10.49
INDUSTRIALEast Japan Railway Co 534,500 5,303,309,000 4.48Fuji Kyuko Co Ltd 1,292,000 1,618,230,000 1.36Hamamatsu Photonics KK 1,016,300 2,816,675,450 2.38Hitachi Construction Machinery Co Ltd 430,700 676,414,350 0.57Hoya Corp 1,153,400 4,708,755,500 3.97Keyence Corp 70,800 4,137,552,000 3.49Kubota Corp 2,094,000 3,031,065,000 2.56Optex Co Ltd 403,300 1,168,158,450 0.99SMC Corp 138,400 3,617,430,000 3.05Taikisha Ltd 930,600 2,376,752,400 2.01Wacom Co Ltd 4,729,900 2,310,556,150 1.95Yokogawa Electric Corp 3,095,000 3,375,097,500 2.85
35,139,995,800 29.66
TECHNOLOGYBroadleaf Co Ltd 478,200 611,139,600 0.52Canon Inc 847,700 2,682,122,800 2.26Koei Tecmo Holdings Co Ltd 2,674,500 4,657,641,750 3.93Ricoh Co Ltd 3,388,100 3,781,119,600 3.19
Invesco Japanese Equity Advantage Fund
Statement of Investments as at 29 February 2016
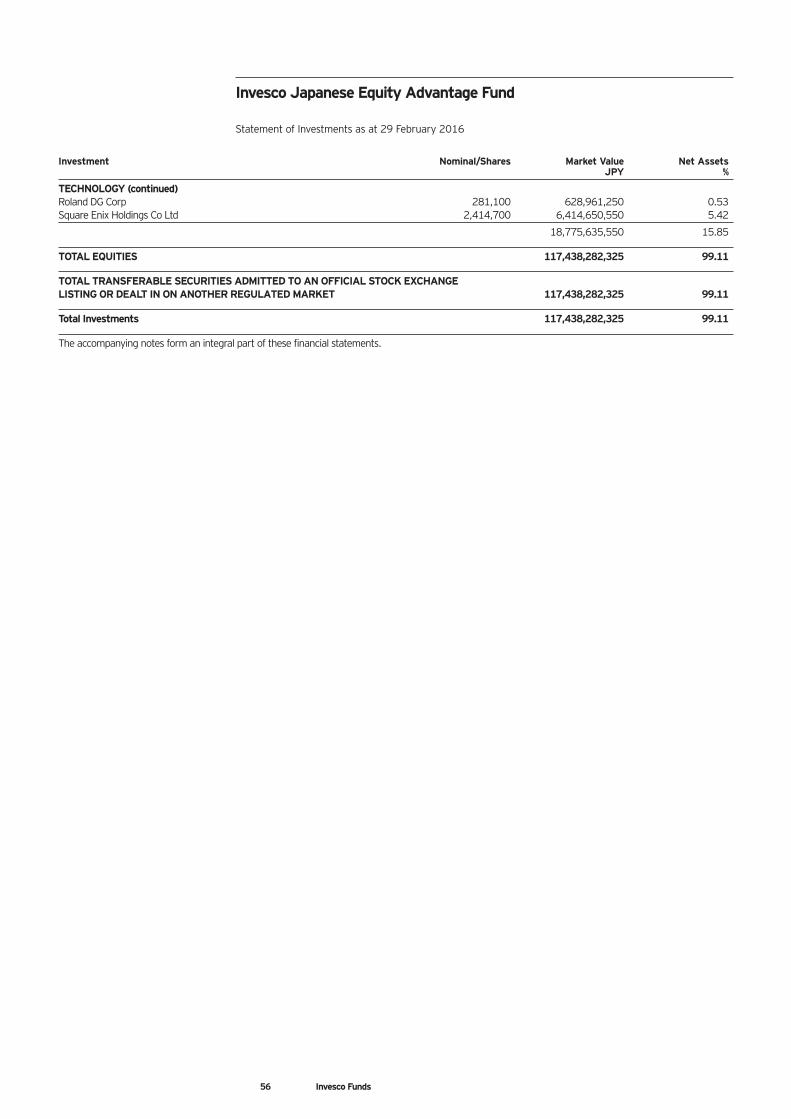
56 Invesco Funds
Investment Nominal/Shares Market Value Net Assets JPY %
TECHNOLOGY (continued)Roland DG Corp 281,100 628,961,250 0.53Square Enix Holdings Co Ltd 2,414,700 6,414,650,550 5.42
18,775,635,550 15.85
TOTAL EQUITIES 117,438,282,325 99.11
TOTAL TRANSFERABLE SECURITIES ADMITTED TO AN OFFICIAL STOCK EXCHANGE LISTING OR DEALT IN ON ANOTHER REGULATED MARKET 117,438,282,325 99.11
Total Investments 117,438,282,325 99.11
The accompanying notes form an integral part of these financial statements.
Invesco Japanese Equity Advantage Fund
Statement of Investments as at 29 February 2016
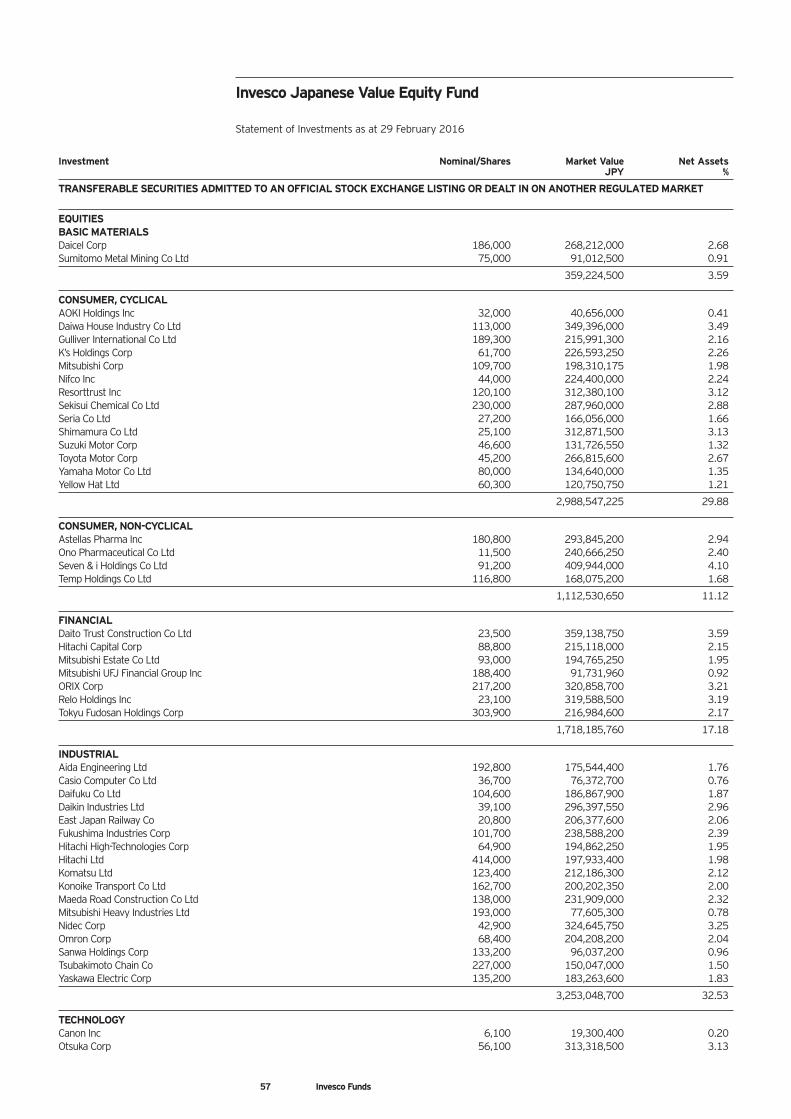
57 Invesco Funds
Investment Nominal/Shares Market Value Net Assets JPY %
TRANSFERABLE SECURITIES ADMITTED TO AN OFFICIAL STOCK EXCHANGE LISTING OR DEALT IN ON ANOTHER REGULATED MARKET
EQUITIESBASIC MATERIALSDaicel Corp 186,000 268,212,000 2.68Sumitomo Metal Mining Co Ltd 75,000 91,012,500 0.91
359,224,500 3.59
CONSUMER, CYCLICALAOKI Holdings Inc 32,000 40,656,000 0.41Daiwa House Industry Co Ltd 113,000 349,396,000 3.49Gulliver International Co Ltd 189,300 215,991,300 2.16K’s Holdings Corp 61,700 226,593,250 2.26Mitsubishi Corp 109,700 198,310,175 1.98Nifco Inc 44,000 224,400,000 2.24Resorttrust Inc 120,100 312,380,100 3.12Sekisui Chemical Co Ltd 230,000 287,960,000 2.88Seria Co Ltd 27,200 166,056,000 1.66Shimamura Co Ltd 25,100 312,871,500 3.13Suzuki Motor Corp 46,600 131,726,550 1.32Toyota Motor Corp 45,200 266,815,600 2.67Yamaha Motor Co Ltd 80,000 134,640,000 1.35Yellow Hat Ltd 60,300 120,750,750 1.21
2,988,547,225 29.88
CONSUMER, NON-CYCLICALAstellas Pharma Inc 180,800 293,845,200 2.94Ono Pharmaceutical Co Ltd 11,500 240,666,250 2.40Seven & i Holdings Co Ltd 91,200 409,944,000 4.10Temp Holdings Co Ltd 116,800 168,075,200 1.68
1,112,530,650 11.12
FINANCIALDaito Trust Construction Co Ltd 23,500 359,138,750 3.59Hitachi Capital Corp 88,800 215,118,000 2.15Mitsubishi Estate Co Ltd 93,000 194,765,250 1.95Mitsubishi UFJ Financial Group Inc 188,400 91,731,960 0.92ORIX Corp 217,200 320,858,700 3.21Relo Holdings Inc 23,100 319,588,500 3.19Tokyu Fudosan Holdings Corp 303,900 216,984,600 2.17
1,718,185,760 17.18
INDUSTRIALAida Engineering Ltd 192,800 175,544,400 1.76Casio Computer Co Ltd 36,700 76,372,700 0.76Daifuku Co Ltd 104,600 186,867,900 1.87Daikin Industries Ltd 39,100 296,397,550 2.96East Japan Railway Co 20,800 206,377,600 2.06Fukushima Industries Corp 101,700 238,588,200 2.39Hitachi High-Technologies Corp 64,900 194,862,250 1.95Hitachi Ltd 414,000 197,933,400 1.98Komatsu Ltd 123,400 212,186,300 2.12Konoike Transport Co Ltd 162,700 200,202,350 2.00Maeda Road Construction Co Ltd 138,000 231,909,000 2.32Mitsubishi Heavy Industries Ltd 193,000 77,605,300 0.78Nidec Corp 42,900 324,645,750 3.25Omron Corp 68,400 204,208,200 2.04Sanwa Holdings Corp 133,200 96,037,200 0.96Tsubakimoto Chain Co 227,000 150,047,000 1.50Yaskawa Electric Corp 135,200 183,263,600 1.83
3,253,048,700 32.53
TECHNOLOGYCanon Inc 6,100 19,300,400 0.20Otsuka Corp 56,100 313,318,500 3.13
Invesco Japanese Value Equity Fund
Statement of Investments as at 29 February 2016
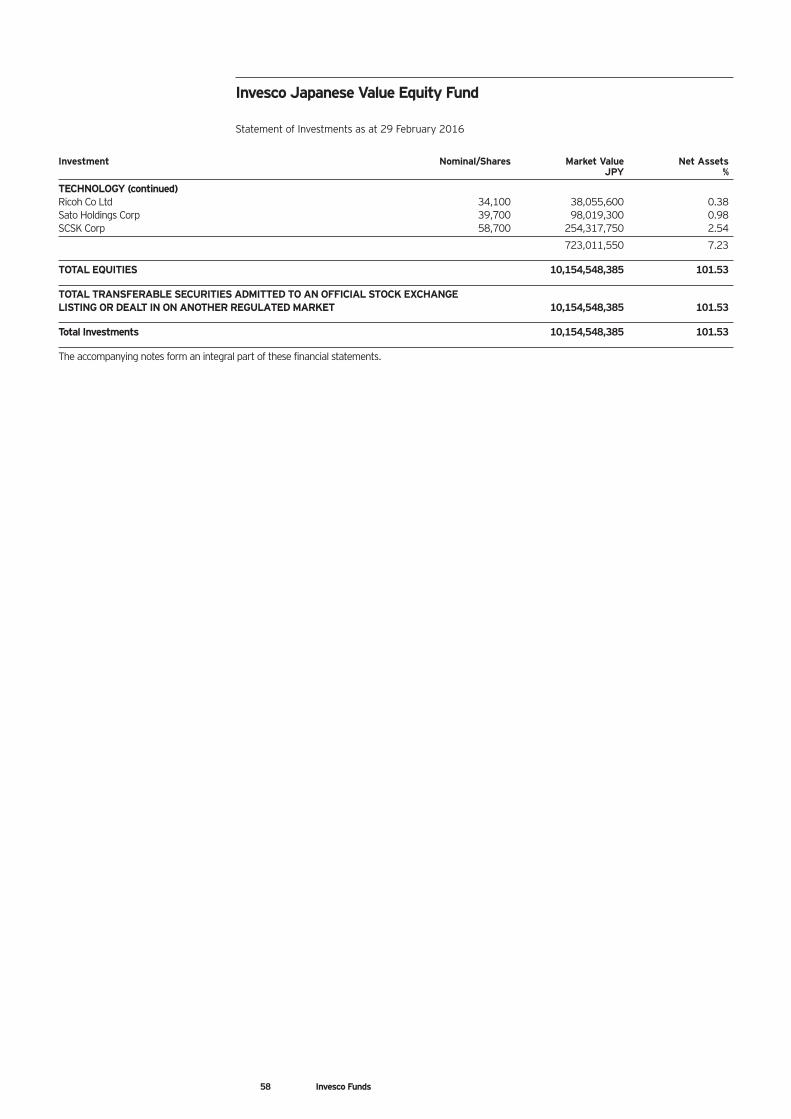
58 Invesco Funds
Investment Nominal/Shares Market Value Net Assets JPY %
TECHNOLOGY (continued)Ricoh Co Ltd 34,100 38,055,600 0.38Sato Holdings Corp 39,700 98,019,300 0.98SCSK Corp 58,700 254,317,750 2.54
723,011,550 7.23
TOTAL EQUITIES 10,154,548,385 101.53
TOTAL TRANSFERABLE SECURITIES ADMITTED TO AN OFFICIAL STOCK EXCHANGE LISTING OR DEALT IN ON ANOTHER REGULATED MARKET 10,154,548,385 101.53
Total Investments 10,154,548,385 101.53
The accompanying notes form an integral part of these financial statements.
Invesco Japanese Value Equity Fund
Statement of Investments as at 29 February 2016
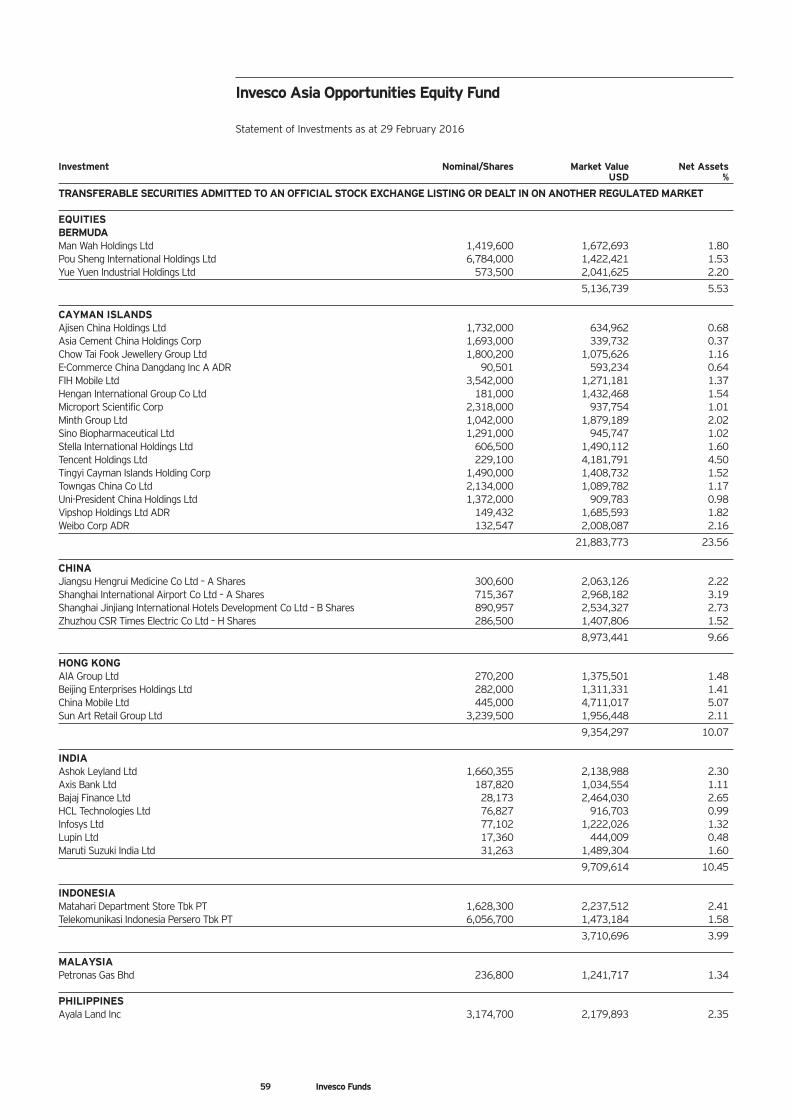
59 Invesco Funds
Investment Nominal/Shares Market Value Net Assets USD %
TRANSFERABLE SECURITIES ADMITTED TO AN OFFICIAL STOCK EXCHANGE LISTING OR DEALT IN ON ANOTHER REGULATED MARKET
EQUITIES BERMUDAMan Wah Holdings Ltd 1,419,600 1,672,693 1.80Pou Sheng International Holdings Ltd 6,784,000 1,422,421 1.53Yue Yuen Industrial Holdings Ltd 573,500 2,041,625 2.20
5,136,739 5.53
CAYMAN ISLANDSAjisen China Holdings Ltd 1,732,000 634,962 0.68Asia Cement China Holdings Corp 1,693,000 339,732 0.37Chow Tai Fook Jewellery Group Ltd 1,800,200 1,075,626 1.16E-Commerce China Dangdang Inc A ADR 90,501 593,234 0.64FIH Mobile Ltd 3,542,000 1,271,181 1.37Hengan International Group Co Ltd 181,000 1,432,468 1.54Microport Scientific Corp 2,318,000 937,754 1.01Minth Group Ltd 1,042,000 1,879,189 2.02Sino Biopharmaceutical Ltd 1,291,000 945,747 1.02Stella International Holdings Ltd 606,500 1,490,112 1.60Tencent Holdings Ltd 229,100 4,181,791 4.50Tingyi Cayman Islands Holding Corp 1,490,000 1,408,732 1.52Towngas China Co Ltd 2,134,000 1,089,782 1.17Uni-President China Holdings Ltd 1,372,000 909,783 0.98Vipshop Holdings Ltd ADR 149,432 1,685,593 1.82Weibo Corp ADR 132,547 2,008,087 2.16
21,883,773 23.56
CHINAJiangsu Hengrui Medicine Co Ltd – A Shares 300,600 2,063,126 2.22Shanghai International Airport Co Ltd – A Shares 715,367 2,968,182 3.19Shanghai Jinjiang International Hotels Development Co Ltd – B Shares 890,957 2,534,327 2.73Zhuzhou CSR Times Electric Co Ltd – H Shares 286,500 1,407,806 1.52
8,973,441 9.66
HONG KONGAIA Group Ltd 270,200 1,375,501 1.48Beijing Enterprises Holdings Ltd 282,000 1,311,331 1.41China Mobile Ltd 445,000 4,711,017 5.07Sun Art Retail Group Ltd 3,239,500 1,956,448 2.11
9,354,297 10.07
INDIAAshok Leyland Ltd 1,660,355 2,138,988 2.30Axis Bank Ltd 187,820 1,034,554 1.11Bajaj Finance Ltd 28,173 2,464,030 2.65HCL Technologies Ltd 76,827 916,703 0.99Infosys Ltd 77,102 1,222,026 1.32Lupin Ltd 17,360 444,009 0.48Maruti Suzuki India Ltd 31,263 1,489,304 1.60
9,709,614 10.45
INDONESIAMatahari Department Store Tbk PT 1,628,300 2,237,512 2.41Telekomunikasi Indonesia Persero Tbk PT 6,056,700 1,473,184 1.58
3,710,696 3.99
MALAYSIAPetronas Gas Bhd 236,800 1,241,717 1.34
PHILIPPINESAyala Land Inc 3,174,700 2,179,893 2.35
Invesco Asia Opportunities Equity Fund
Statement of Investments as at 29 February 2016
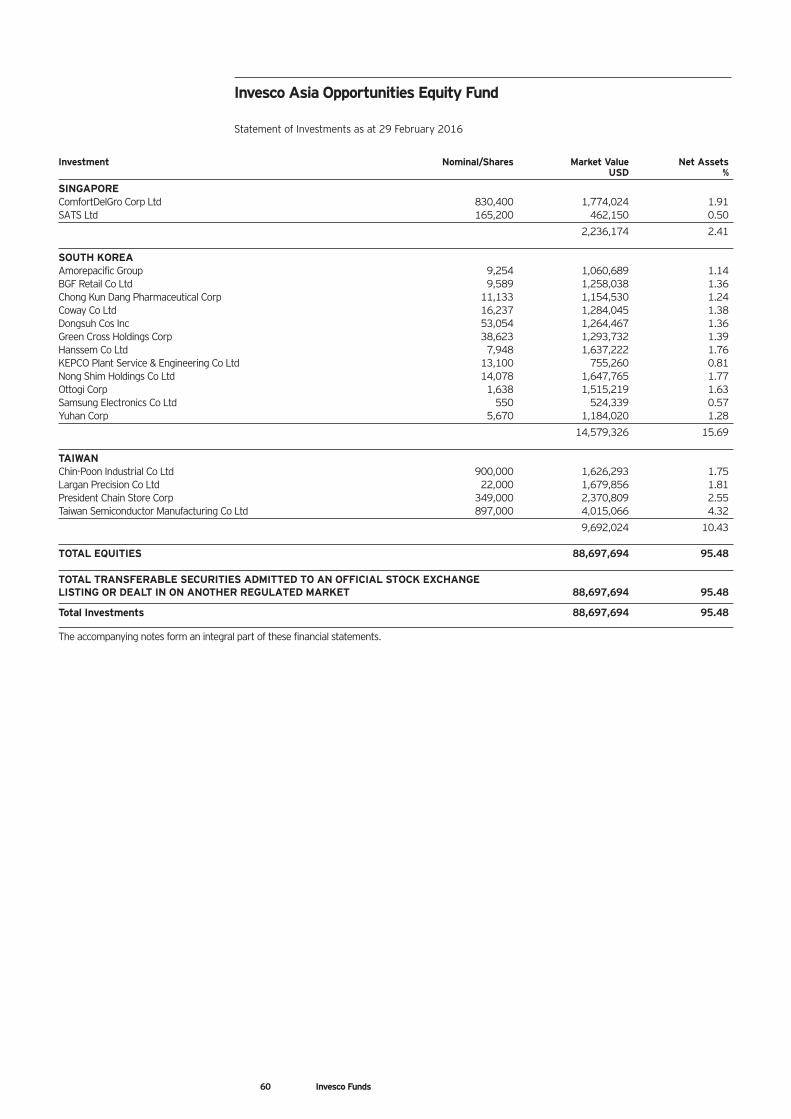
60 Invesco Funds
Invesco Asia Opportunities Equity Fund
Statement of Investments as at 29 February 2016
Investment Nominal/Shares Market Value Net Assets USD %
SINGAPOREComfortDelGro Corp Ltd 830,400 1,774,024 1.91SATS Ltd 165,200 462,150 0.50
2,236,174 2.41
SOUTH KOREAAmorepacific Group 9,254 1,060,689 1.14BGF Retail Co Ltd 9,589 1,258,038 1.36Chong Kun Dang Pharmaceutical Corp 11,133 1,154,530 1.24Coway Co Ltd 16,237 1,284,045 1.38Dongsuh Cos Inc 53,054 1,264,467 1.36Green Cross Holdings Corp 38,623 1,293,732 1.39Hanssem Co Ltd 7,948 1,637,222 1.76KEPCO Plant Service & Engineering Co Ltd 13,100 755,260 0.81Nong Shim Holdings Co Ltd 14,078 1,647,765 1.77Ottogi Corp 1,638 1,515,219 1.63Samsung Electronics Co Ltd 550 524,339 0.57Yuhan Corp 5,670 1,184,020 1.28
14,579,326 15.69
TAIWANChin-Poon Industrial Co Ltd 900,000 1,626,293 1.75Largan Precision Co Ltd 22,000 1,679,856 1.81President Chain Store Corp 349,000 2,370,809 2.55Taiwan Semiconductor Manufacturing Co Ltd 897,000 4,015,066 4.32
9,692,024 10.43
TOTAL EQUITIES 88,697,694 95.48
TOTAL TRANSFERABLE SECURITIES ADMITTED TO AN OFFICIAL STOCK EXCHANGELISTING OR DEALT IN ON ANOTHER REGULATED MARKET 88,697,694 95.48
Total Investments 88,697,694 95.48
The accompanying notes form an integral part of these financial statements.
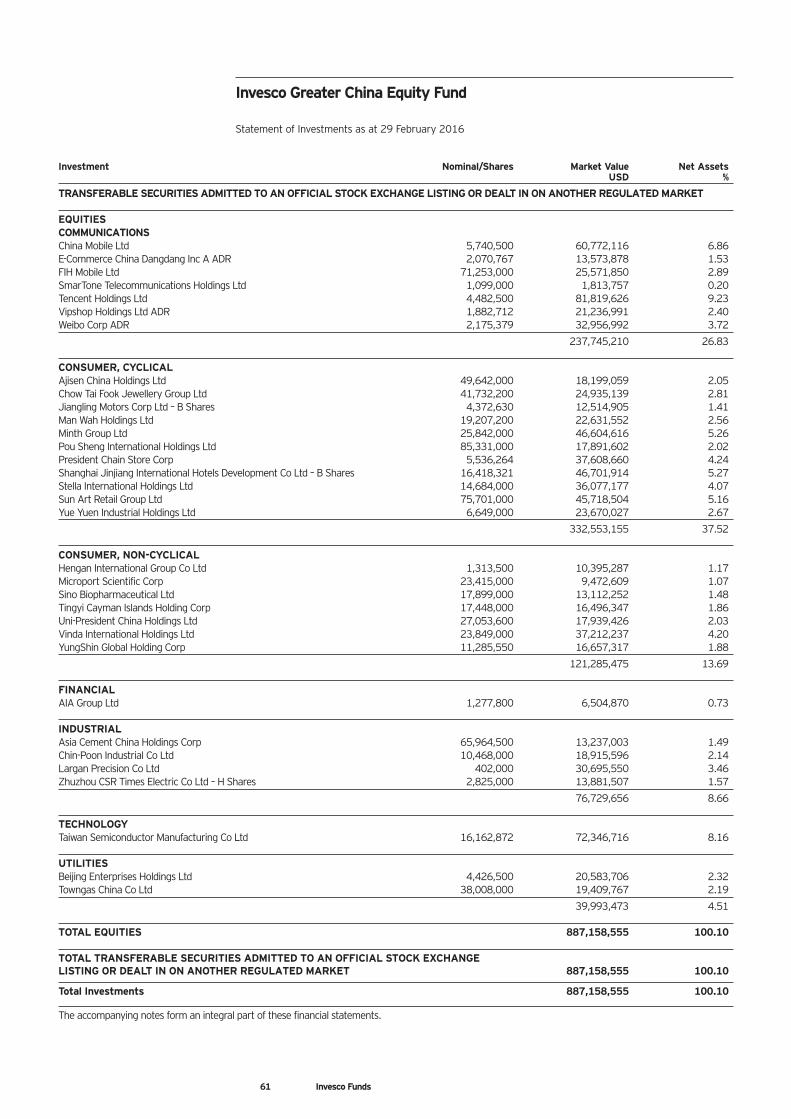
61 Invesco Funds
Invesco Greater China Equity Fund
Statement of Investments as at 29 February 2016
Investment Nominal/Shares Market Value Net Assets USD %
TRANSFERABLE SECURITIES ADMITTED TO AN OFFICIAL STOCK EXCHANGE LISTING OR DEALT IN ON ANOTHER REGULATED MARKET
EQUITIESCOMMUNICATIONSChina Mobile Ltd 5,740,500 60,772,116 6.86E-Commerce China Dangdang Inc A ADR 2,070,767 13,573,878 1.53FIH Mobile Ltd 71,253,000 25,571,850 2.89SmarTone Telecommunications Holdings Ltd 1,099,000 1,813,757 0.20Tencent Holdings Ltd 4,482,500 81,819,626 9.23Vipshop Holdings Ltd ADR 1,882,712 21,236,991 2.40Weibo Corp ADR 2,175,379 32,956,992 3.72
237,745,210 26.83
CONSUMER, CYCLICALAjisen China Holdings Ltd 49,642,000 18,199,059 2.05Chow Tai Fook Jewellery Group Ltd 41,732,200 24,935,139 2.81Jiangling Motors Corp Ltd – B Shares 4,372,630 12,514,905 1.41Man Wah Holdings Ltd 19,207,200 22,631,552 2.56Minth Group Ltd 25,842,000 46,604,616 5.26Pou Sheng International Holdings Ltd 85,331,000 17,891,602 2.02President Chain Store Corp 5,536,264 37,608,660 4.24Shanghai Jinjiang International Hotels Development Co Ltd – B Shares 16,418,321 46,701,914 5.27Stella International Holdings Ltd 14,684,000 36,077,177 4.07Sun Art Retail Group Ltd 75,701,000 45,718,504 5.16Yue Yuen Industrial Holdings Ltd 6,649,000 23,670,027 2.67
332,553,155 37.52
CONSUMER, NON-CYCLICALHengan International Group Co Ltd 1,313,500 10,395,287 1.17Microport Scientific Corp 23,415,000 9,472,609 1.07Sino Biopharmaceutical Ltd 17,899,000 13,112,252 1.48Tingyi Cayman Islands Holding Corp 17,448,000 16,496,347 1.86Uni-President China Holdings Ltd 27,053,600 17,939,426 2.03Vinda International Holdings Ltd 23,849,000 37,212,237 4.20YungShin Global Holding Corp 11,285,550 16,657,317 1.88
121,285,475 13.69
FINANCIALAIA Group Ltd 1,277,800 6,504,870 0.73
INDUSTRIALAsia Cement China Holdings Corp 65,964,500 13,237,003 1.49Chin-Poon Industrial Co Ltd 10,468,000 18,915,596 2.14Largan Precision Co Ltd 402,000 30,695,550 3.46Zhuzhou CSR Times Electric Co Ltd – H Shares 2,825,000 13,881,507 1.57
76,729,656 8.66
TECHNOLOGYTaiwan Semiconductor Manufacturing Co Ltd 16,162,872 72,346,716 8.16
UTILITIESBeijing Enterprises Holdings Ltd 4,426,500 20,583,706 2.32Towngas China Co Ltd 38,008,000 19,409,767 2.19
39,993,473 4.51
TOTAL EQUITIES 887,158,555 100.10
TOTAL TRANSFERABLE SECURITIES ADMITTED TO AN OFFICIAL STOCK EXCHANGELISTING OR DEALT IN ON ANOTHER REGULATED MARKET 887,158,555 100.10
Total Investments 887,158,555 100.10
The accompanying notes form an integral part of these financial statements.
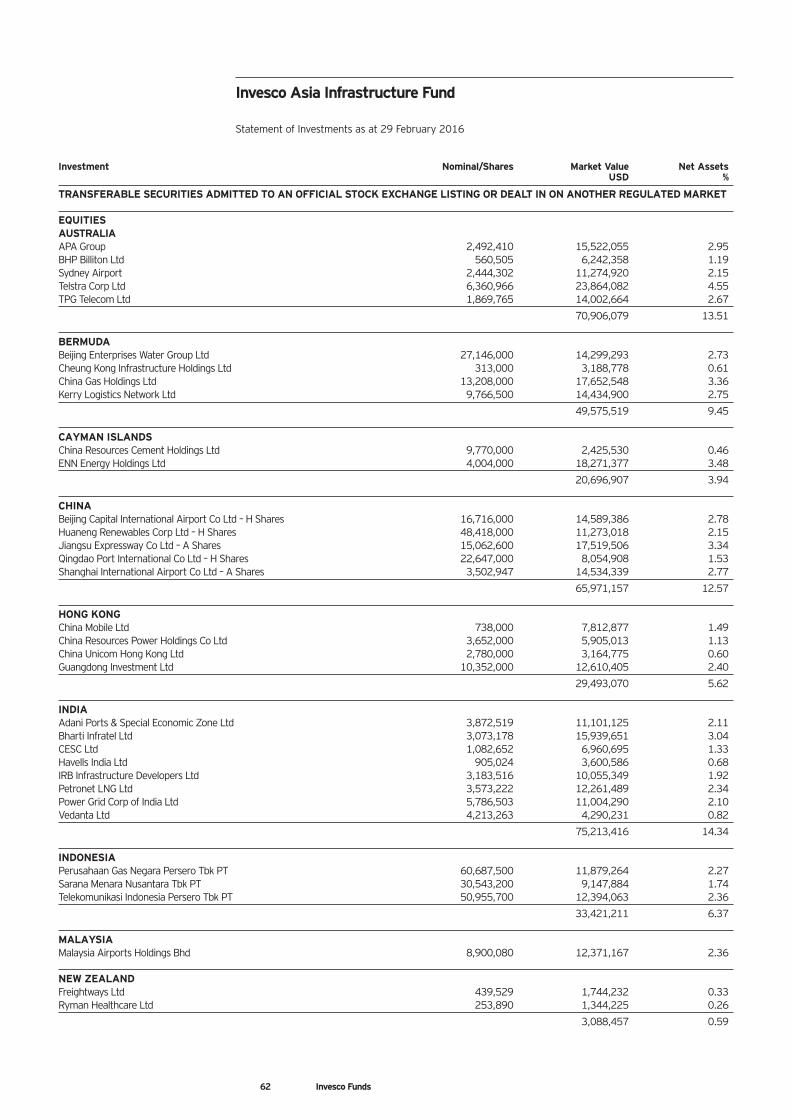
62 Invesco Funds
Investment Nominal/Shares Market Value Net Assets USD %
TRANSFERABLE SECURITIES ADMITTED TO AN OFFICIAL STOCK EXCHANGE LISTING OR DEALT IN ON ANOTHER REGULATED MARKET
EQUITIESAUSTRALIAAPA Group 2,492,410 15,522,055 2.95BHP Billiton Ltd 560,505 6,242,358 1.19Sydney Airport 2,444,302 11,274,920 2.15Telstra Corp Ltd 6,360,966 23,864,082 4.55TPG Telecom Ltd 1,869,765 14,002,664 2.67
70,906,079 13.51
BERMUDABeijing Enterprises Water Group Ltd 27,146,000 14,299,293 2.73Cheung Kong Infrastructure Holdings Ltd 313,000 3,188,778 0.61China Gas Holdings Ltd 13,208,000 17,652,548 3.36Kerry Logistics Network Ltd 9,766,500 14,434,900 2.75
49,575,519 9.45
CAYMAN ISLANDSChina Resources Cement Holdings Ltd 9,770,000 2,425,530 0.46ENN Energy Holdings Ltd 4,004,000 18,271,377 3.48
20,696,907 3.94
CHINABeijing Capital International Airport Co Ltd – H Shares 16,716,000 14,589,386 2.78Huaneng Renewables Corp Ltd – H Shares 48,418,000 11,273,018 2.15Jiangsu Expressway Co Ltd – A Shares 15,062,600 17,519,506 3.34Qingdao Port International Co Ltd – H Shares 22,647,000 8,054,908 1.53Shanghai International Airport Co Ltd – A Shares 3,502,947 14,534,339 2.77
65,971,157 12.57
HONG KONGChina Mobile Ltd 738,000 7,812,877 1.49China Resources Power Holdings Co Ltd 3,652,000 5,905,013 1.13China Unicom Hong Kong Ltd 2,780,000 3,164,775 0.60Guangdong Investment Ltd 10,352,000 12,610,405 2.40
29,493,070 5.62
INDIAAdani Ports & Special Economic Zone Ltd 3,872,519 11,101,125 2.11Bharti Infratel Ltd 3,073,178 15,939,651 3.04CESC Ltd 1,082,652 6,960,695 1.33Havells India Ltd 905,024 3,600,586 0.68IRB Infrastructure Developers Ltd 3,183,516 10,055,349 1.92Petronet LNG Ltd 3,573,222 12,261,489 2.34Power Grid Corp of India Ltd 5,786,503 11,004,290 2.10Vedanta Ltd 4,213,263 4,290,231 0.82
75,213,416 14.34
INDONESIAPerusahaan Gas Negara Persero Tbk PT 60,687,500 11,879,264 2.27Sarana Menara Nusantara Tbk PT 30,543,200 9,147,884 1.74Telekomunikasi Indonesia Persero Tbk PT 50,955,700 12,394,063 2.36
33,421,211 6.37
MALAYSIAMalaysia Airports Holdings Bhd 8,900,080 12,371,167 2.36 NEW ZEALANDFreightways Ltd 439,529 1,744,232 0.33Ryman Healthcare Ltd 253,890 1,344,225 0.26
3,088,457 0.59
Invesco Asia Infrastructure Fund
Statement of Investments as at 29 February 2016
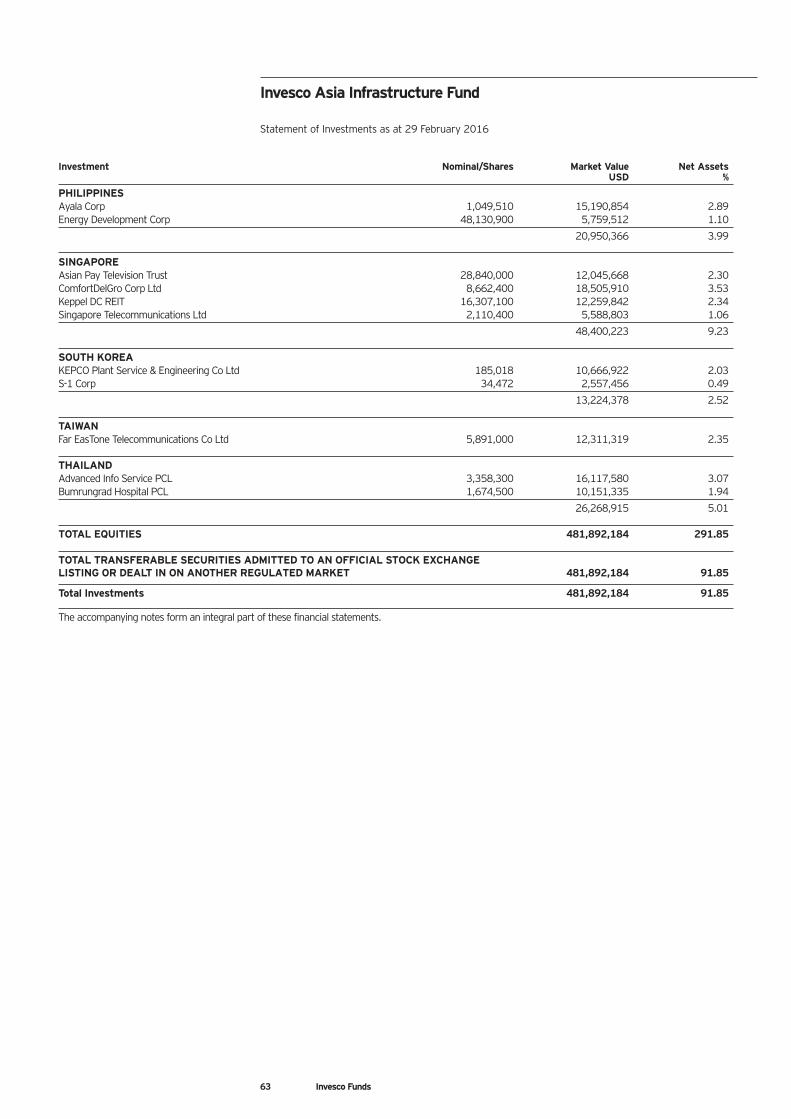
63 Invesco Funds
Invesco Asia Infrastructure Fund
Statement of Investments as at 29 February 2016
Investment Nominal/Shares Market Value Net Assets USD %
PHILIPPINESAyala Corp 1,049,510 15,190,854 2.89Energy Development Corp 48,130,900 5,759,512 1.10
20,950,366 3.99
SINGAPOREAsian Pay Television Trust 28,840,000 12,045,668 2.30ComfortDelGro Corp Ltd 8,662,400 18,505,910 3.53Keppel DC REIT 16,307,100 12,259,842 2.34Singapore Telecommunications Ltd 2,110,400 5,588,803 1.06
48,400,223 9.23
SOUTH KOREAKEPCO Plant Service & Engineering Co Ltd 185,018 10,666,922 2.03S-1 Corp 34,472 2,557,456 0.49
13,224,378 2.52
TAIWANFar EasTone Telecommunications Co Ltd 5,891,000 12,311,319 2.35
THAILANDAdvanced Info Service PCL 3,358,300 16,117,580 3.07Bumrungrad Hospital PCL 1,674,500 10,151,335 1.94
26,268,915 5.01
TOTAL EQUITIES 481,892,184 291.85
TOTAL TRANSFERABLE SECURITIES ADMITTED TO AN OFFICIAL STOCK EXCHANGELISTING OR DEALT IN ON ANOTHER REGULATED MARKET 481,892,184 91.85
Total Investments 481,892,184 91.85
The accompanying notes form an integral part of these financial statements.
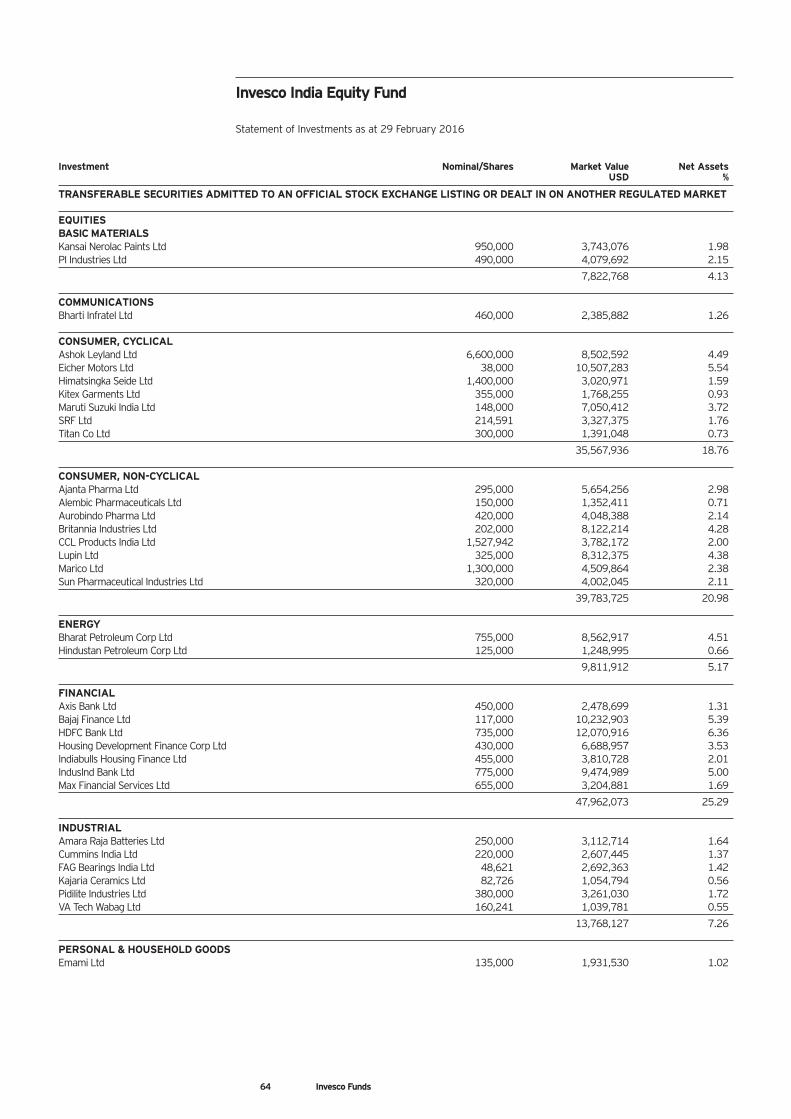
64 Invesco Funds
Investment Nominal/Shares Market Value Net Assets USD %
TRANSFERABLE SECURITIES ADMITTED TO AN OFFICIAL STOCK EXCHANGE LISTING OR DEALT IN ON ANOTHER REGULATED MARKET
EQUITIESBASIC MATERIALSKansai Nerolac Paints Ltd 950,000 3,743,076 1.98PI Industries Ltd 490,000 4,079,692 2.15
7,822,768 4.13
COMMUNICATIONSBharti Infratel Ltd 460,000 2,385,882 1.26
CONSUMER, CYCLICALAshok Leyland Ltd 6,600,000 8,502,592 4.49Eicher Motors Ltd 38,000 10,507,283 5.54Himatsingka Seide Ltd 1,400,000 3,020,971 1.59Kitex Garments Ltd 355,000 1,768,255 0.93Maruti Suzuki India Ltd 148,000 7,050,412 3.72SRF Ltd 214,591 3,327,375 1.76Titan Co Ltd 300,000 1,391,048 0.73
35,567,936 18.76
CONSUMER, NON-CYCLICALAjanta Pharma Ltd 295,000 5,654,256 2.98Alembic Pharmaceuticals Ltd 150,000 1,352,411 0.71Aurobindo Pharma Ltd 420,000 4,048,388 2.14Britannia Industries Ltd 202,000 8,122,214 4.28CCL Products India Ltd 1,527,942 3,782,172 2.00Lupin Ltd 325,000 8,312,375 4.38Marico Ltd 1,300,000 4,509,864 2.38Sun Pharmaceutical Industries Ltd 320,000 4,002,045 2.11
39,783,725 20.98
ENERGYBharat Petroleum Corp Ltd 755,000 8,562,917 4.51Hindustan Petroleum Corp Ltd 125,000 1,248,995 0.66
9,811,912 5.17
FINANCIALAxis Bank Ltd 450,000 2,478,699 1.31Bajaj Finance Ltd 117,000 10,232,903 5.39HDFC Bank Ltd 735,000 12,070,916 6.36Housing Development Finance Corp Ltd 430,000 6,688,957 3.53Indiabulls Housing Finance Ltd 455,000 3,810,728 2.01IndusInd Bank Ltd 775,000 9,474,989 5.00Max Financial Services Ltd 655,000 3,204,881 1.69
47,962,073 25.29
INDUSTRIALAmara Raja Batteries Ltd 250,000 3,112,714 1.64Cummins India Ltd 220,000 2,607,445 1.37FAG Bearings India Ltd 48,621 2,692,363 1.42Kajaria Ceramics Ltd 82,726 1,054,794 0.56Pidilite Industries Ltd 380,000 3,261,030 1.72VA Tech Wabag Ltd 160,241 1,039,781 0.55
13,768,127 7.26
PERSONAL & HOUSEHOLD GOODSEmami Ltd 135,000 1,931,530 1.02
Invesco India Equity Fund
Statement of Investments as at 29 February 2016
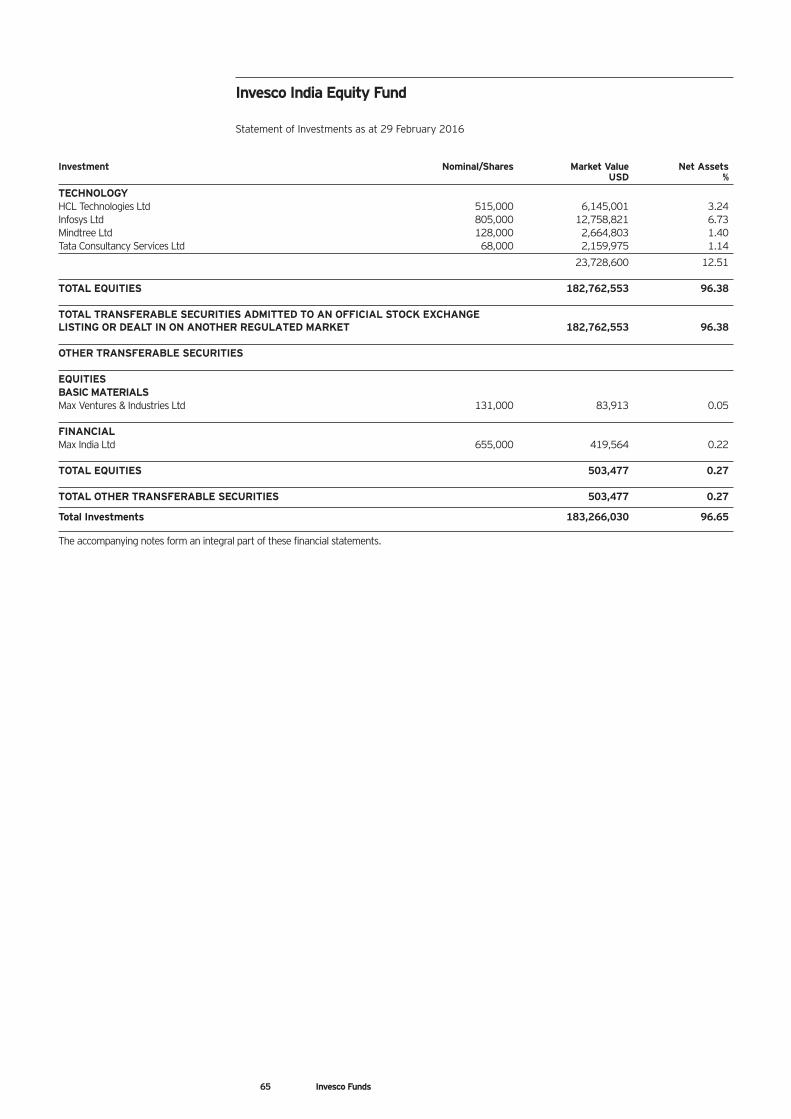
65 Invesco Funds
Investment Nominal/Shares Market Value Net Assets USD %
TECHNOLOGYHCL Technologies Ltd 515,000 6,145,001 3.24Infosys Ltd 805,000 12,758,821 6.73Mindtree Ltd 128,000 2,664,803 1.40Tata Consultancy Services Ltd 68,000 2,159,975 1.14
23,728,600 12.51
TOTAL EQUITIES 182,762,553 96.38
TOTAL TRANSFERABLE SECURITIES ADMITTED TO AN OFFICIAL STOCK EXCHANGELISTING OR DEALT IN ON ANOTHER REGULATED MARKET 182,762,553 96.38
OTHER TRANSFERABLE SECURITIES
EQUITIESBASIC MATERIALSMax Ventures & Industries Ltd 131,000 83,913 0.05
FINANCIALMax India Ltd 655,000 419,564 0.22
TOTAL EQUITIES 503,477 0.27
TOTAL OTHER TRANSFERABLE SECURITIES 503,477 0.27
Total Investments 183,266,030 96.65
The accompanying notes form an integral part of these financial statements.
Invesco India Equity Fund
Statement of Investments as at 29 February 2016
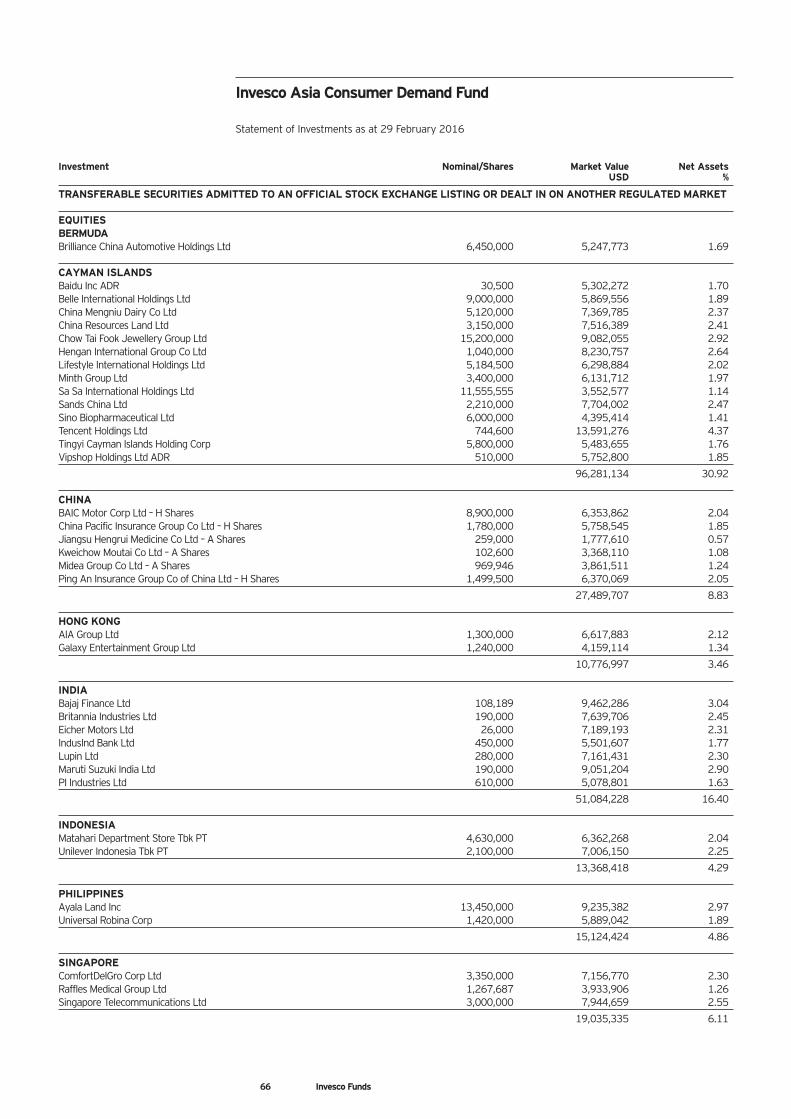
66 Invesco Funds
Investment Nominal/Shares Market Value Net Assets USD %
TRANSFERABLE SECURITIES ADMITTED TO AN OFFICIAL STOCK EXCHANGE LISTING OR DEALT IN ON ANOTHER REGULATED MARKET
EQUITIESBERMUDABrilliance China Automotive Holdings Ltd 6,450,000 5,247,773 1.69
CAYMAN ISLANDSBaidu Inc ADR 30,500 5,302,272 1.70Belle International Holdings Ltd 9,000,000 5,869,556 1.89China Mengniu Dairy Co Ltd 5,120,000 7,369,785 2.37China Resources Land Ltd 3,150,000 7,516,389 2.41Chow Tai Fook Jewellery Group Ltd 15,200,000 9,082,055 2.92Hengan International Group Co Ltd 1,040,000 8,230,757 2.64Lifestyle International Holdings Ltd 5,184,500 6,298,884 2.02Minth Group Ltd 3,400,000 6,131,712 1.97Sa Sa International Holdings Ltd 11,555,555 3,552,577 1.14Sands China Ltd 2,210,000 7,704,002 2.47Sino Biopharmaceutical Ltd 6,000,000 4,395,414 1.41Tencent Holdings Ltd 744,600 13,591,276 4.37Tingyi Cayman Islands Holding Corp 5,800,000 5,483,655 1.76Vipshop Holdings Ltd ADR 510,000 5,752,800 1.85
96,281,134 30.92
CHINABAIC Motor Corp Ltd – H Shares 8,900,000 6,353,862 2.04China Pacific Insurance Group Co Ltd – H Shares 1,780,000 5,758,545 1.85Jiangsu Hengrui Medicine Co Ltd – A Shares 259,000 1,777,610 0.57Kweichow Moutai Co Ltd – A Shares 102,600 3,368,110 1.08Midea Group Co Ltd – A Shares 969,946 3,861,511 1.24Ping An Insurance Group Co of China Ltd – H Shares 1,499,500 6,370,069 2.05
27,489,707 8.83
HONG KONGAIA Group Ltd 1,300,000 6,617,883 2.12Galaxy Entertainment Group Ltd 1,240,000 4,159,114 1.34
10,776,997 3.46
INDIABajaj Finance Ltd 108,189 9,462,286 3.04Britannia Industries Ltd 190,000 7,639,706 2.45Eicher Motors Ltd 26,000 7,189,193 2.31IndusInd Bank Ltd 450,000 5,501,607 1.77Lupin Ltd 280,000 7,161,431 2.30Maruti Suzuki India Ltd 190,000 9,051,204 2.90PI Industries Ltd 610,000 5,078,801 1.63
51,084,228 16.40
INDONESIAMatahari Department Store Tbk PT 4,630,000 6,362,268 2.04Unilever Indonesia Tbk PT 2,100,000 7,006,150 2.25
13,368,418 4.29
PHILIPPINESAyala Land Inc 13,450,000 9,235,382 2.97Universal Robina Corp 1,420,000 5,889,042 1.89
15,124,424 4.86
SINGAPOREComfortDelGro Corp Ltd 3,350,000 7,156,770 2.30Raffles Medical Group Ltd 1,267,687 3,933,906 1.26Singapore Telecommunications Ltd 3,000,000 7,944,659 2.55
19,035,335 6.11
Invesco Asia Consumer Demand Fund
Statement of Investments as at 29 February 2016
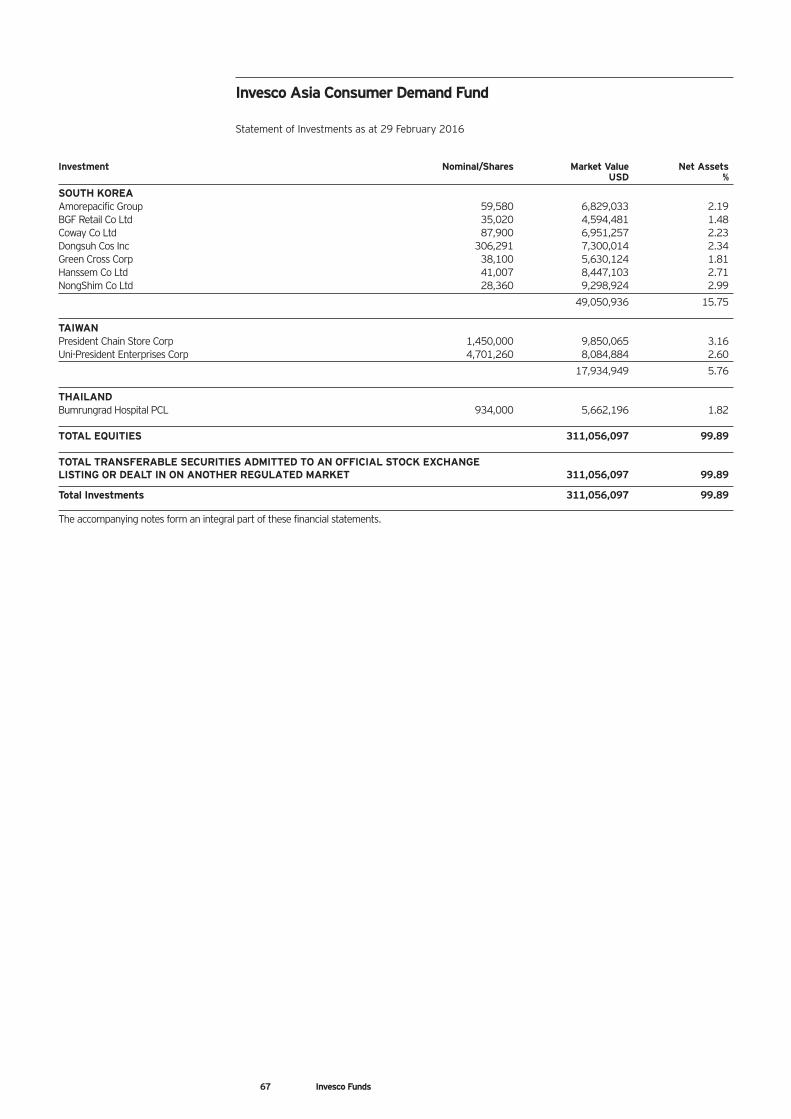
Investment Nominal/Shares Market Value Net Assets USD %
SOUTH KOREAAmorepacific Group 59,580 6,829,033 2.19BGF Retail Co Ltd 35,020 4,594,481 1.48Coway Co Ltd 87,900 6,951,257 2.23Dongsuh Cos Inc 306,291 7,300,014 2.34Green Cross Corp 38,100 5,630,124 1.81Hanssem Co Ltd 41,007 8,447,103 2.71NongShim Co Ltd 28,360 9,298,924 2.99
49,050,936 15.75
TAIWANPresident Chain Store Corp 1,450,000 9,850,065 3.16Uni-President Enterprises Corp 4,701,260 8,084,884 2.60
17,934,949 5.76
THAILANDBumrungrad Hospital PCL 934,000 5,662,196 1.82
TOTAL EQUITIES 311,056,097 99.89
TOTAL TRANSFERABLE SECURITIES ADMITTED TO AN OFFICIAL STOCK EXCHANGELISTING OR DEALT IN ON ANOTHER REGULATED MARKET 311,056,097 99.89
Total Investments 311,056,097 99.89
The accompanying notes form an integral part of these financial statements.
Invesco Asia Consumer Demand Fund
Statement of Investments as at 29 February 2016
67 Invesco Funds
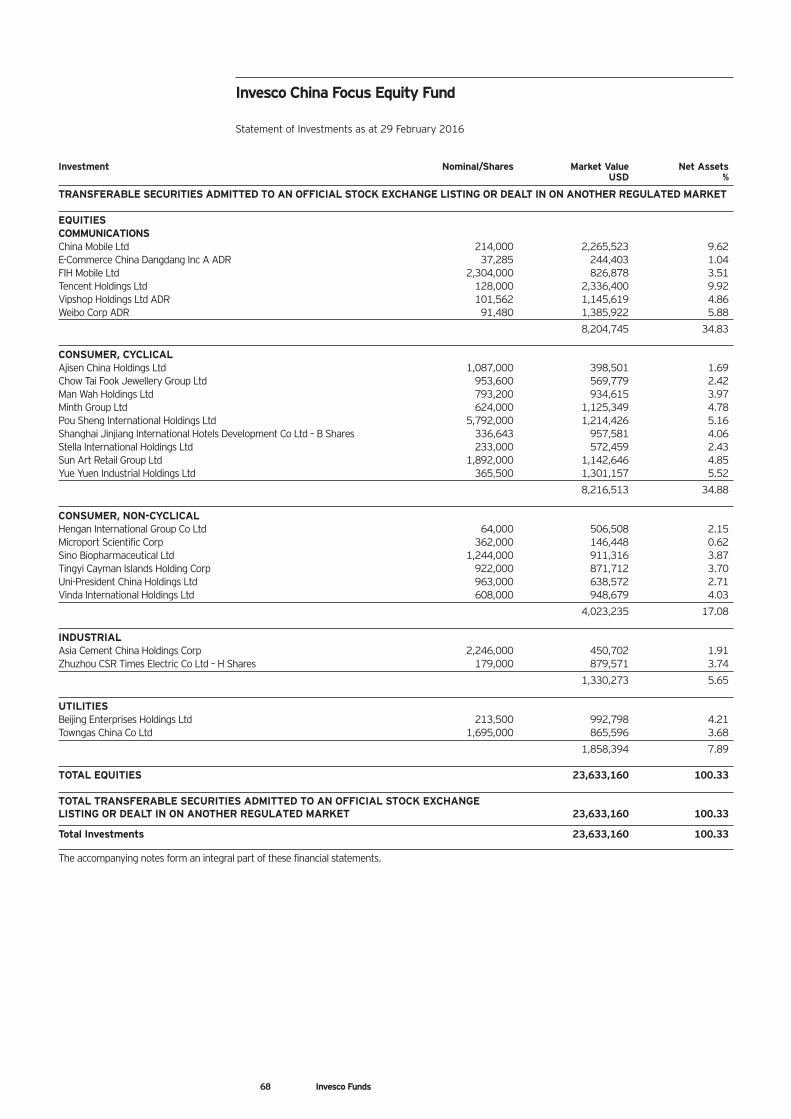
68 Invesco Funds
Investment Nominal/Shares Market Value Net Assets USD %
TRANSFERABLE SECURITIES ADMITTED TO AN OFFICIAL STOCK EXCHANGE LISTING OR DEALT IN ON ANOTHER REGULATED MARKET
EQUITIESCOMMUNICATIONSChina Mobile Ltd 214,000 2,265,523 9.62E-Commerce China Dangdang Inc A ADR 37,285 244,403 1.04FIH Mobile Ltd 2,304,000 826,878 3.51Tencent Holdings Ltd 128,000 2,336,400 9.92Vipshop Holdings Ltd ADR 101,562 1,145,619 4.86Weibo Corp ADR 91,480 1,385,922 5.88
8,204,745 34.83
CONSUMER, CYCLICALAjisen China Holdings Ltd 1,087,000 398,501 1.69Chow Tai Fook Jewellery Group Ltd 953,600 569,779 2.42Man Wah Holdings Ltd 793,200 934,615 3.97Minth Group Ltd 624,000 1,125,349 4.78Pou Sheng International Holdings Ltd 5,792,000 1,214,426 5.16Shanghai Jinjiang International Hotels Development Co Ltd – B Shares 336,643 957,581 4.06Stella International Holdings Ltd 233,000 572,459 2.43Sun Art Retail Group Ltd 1,892,000 1,142,646 4.85Yue Yuen Industrial Holdings Ltd 365,500 1,301,157 5.52
8,216,513 34.88
CONSUMER, NON-CYCLICALHengan International Group Co Ltd 64,000 506,508 2.15Microport Scientific Corp 362,000 146,448 0.62Sino Biopharmaceutical Ltd 1,244,000 911,316 3.87Tingyi Cayman Islands Holding Corp 922,000 871,712 3.70Uni-President China Holdings Ltd 963,000 638,572 2.71Vinda International Holdings Ltd 608,000 948,679 4.03
4,023,235 17.08
INDUSTRIALAsia Cement China Holdings Corp 2,246,000 450,702 1.91Zhuzhou CSR Times Electric Co Ltd – H Shares 179,000 879,571 3.74
1,330,273 5.65
UTILITIESBeijing Enterprises Holdings Ltd 213,500 992,798 4.21Towngas China Co Ltd 1,695,000 865,596 3.68
1,858,394 7.89
TOTAL EQUITIES 23,633,160 100.33
TOTAL TRANSFERABLE SECURITIES ADMITTED TO AN OFFICIAL STOCK EXCHANGELISTING OR DEALT IN ON ANOTHER REGULATED MARKET 23,633,160 100.33
Total Investments 23,633,160 100.33
The accompanying notes form an integral part of these financial statements.
Invesco China Focus Equity Fund
Statement of Investments as at 29 February 2016
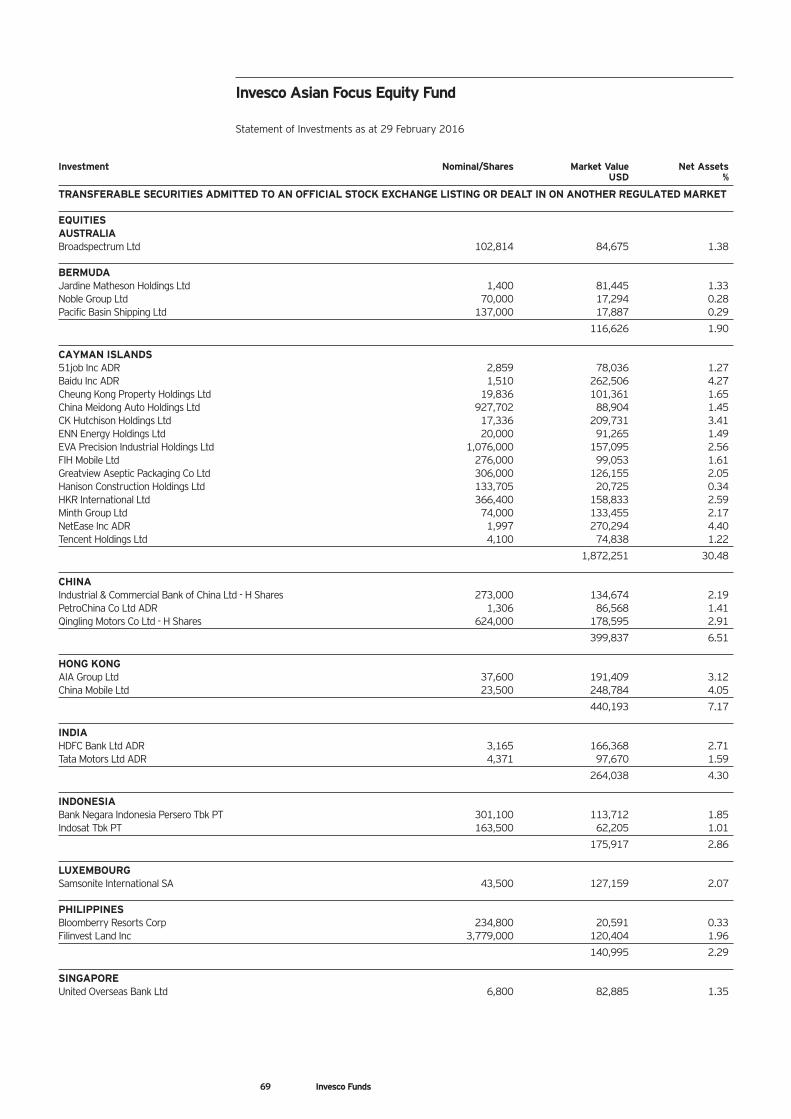
69 Invesco Funds
Investment Nominal/Shares Market Value Net Assets USD %
TRANSFERABLE SECURITIES ADMITTED TO AN OFFICIAL STOCK EXCHANGE LISTING OR DEALT IN ON ANOTHER REGULATED MARKET
EQUITIESAUSTRALIABroadspectrum Ltd 102,814 84,675 1.38
BERMUDAJardine Matheson Holdings Ltd 1,400 81,445 1.33Noble Group Ltd 70,000 17,294 0.28Pacific Basin Shipping Ltd 137,000 17,887 0.29
116,626 1.90
CAYMAN ISLANDS51job Inc ADR 2,859 78,036 1.27Baidu Inc ADR 1,510 262,506 4.27Cheung Kong Property Holdings Ltd 19,836 101,361 1.65China Meidong Auto Holdings Ltd 927,702 88,904 1.45CK Hutchison Holdings Ltd 17,336 209,731 3.41ENN Energy Holdings Ltd 20,000 91,265 1.49EVA Precision Industrial Holdings Ltd 1,076,000 157,095 2.56FIH Mobile Ltd 276,000 99,053 1.61Greatview Aseptic Packaging Co Ltd 306,000 126,155 2.05Hanison Construction Holdings Ltd 133,705 20,725 0.34HKR International Ltd 366,400 158,833 2.59Minth Group Ltd 74,000 133,455 2.17NetEase Inc ADR 1,997 270,294 4.40Tencent Holdings Ltd 4,100 74,838 1.22
1,872,251 30.48
CHINAIndustrial & Commercial Bank of China Ltd - H Shares 273,000 134,674 2.19PetroChina Co Ltd ADR 1,306 86,568 1.41Qingling Motors Co Ltd - H Shares 624,000 178,595 2.91
399,837 6.51
HONG KONGAIA Group Ltd 37,600 191,409 3.12China Mobile Ltd 23,500 248,784 4.05
440,193 7.17
INDIAHDFC Bank Ltd ADR 3,165 166,368 2.71Tata Motors Ltd ADR 4,371 97,670 1.59
264,038 4.30
INDONESIABank Negara Indonesia Persero Tbk PT 301,100 113,712 1.85Indosat Tbk PT 163,500 62,205 1.01
175,917 2.86
LUXEMBOURGSamsonite International SA 43,500 127,159 2.07
PHILIPPINESBloomberry Resorts Corp 234,800 20,591 0.33Filinvest Land Inc 3,779,000 120,404 1.96
140,995 2.29
SINGAPOREUnited Overseas Bank Ltd 6,800 82,885 1.35
Invesco Asian Focus Equity Fund
Statement of Investments as at 29 February 2016
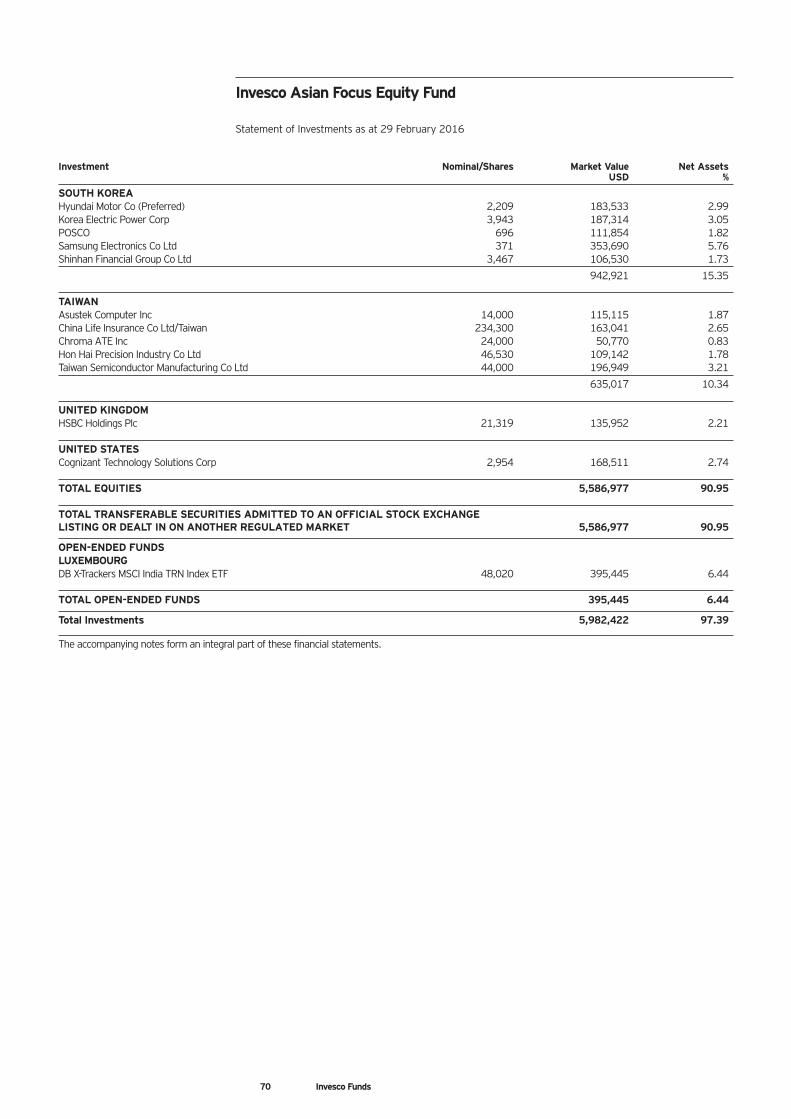
70 Invesco Funds
Investment Nominal/Shares Market Value Net Assets USD %
SOUTH KOREAHyundai Motor Co (Preferred) 2,209 183,533 2.99Korea Electric Power Corp 3,943 187,314 3.05POSCO 696 111,854 1.82Samsung Electronics Co Ltd 371 353,690 5.76Shinhan Financial Group Co Ltd 3,467 106,530 1.73
942,921 15.35
TAIWANAsustek Computer Inc 14,000 115,115 1.87China Life Insurance Co Ltd/Taiwan 234,300 163,041 2.65Chroma ATE Inc 24,000 50,770 0.83Hon Hai Precision Industry Co Ltd 46,530 109,142 1.78Taiwan Semiconductor Manufacturing Co Ltd 44,000 196,949 3.21
635,017 10.34
UNITED KINGDOMHSBC Holdings Plc 21,319 135,952 2.21
UNITED STATESCognizant Technology Solutions Corp 2,954 168,511 2.74
TOTAL EQUITIES 5,586,977 90.95
TOTAL TRANSFERABLE SECURITIES ADMITTED TO AN OFFICIAL STOCK EXCHANGELISTING OR DEALT IN ON ANOTHER REGULATED MARKET 5,586,977 90.95
OPEN-ENDED FUNDSLUXEMBOURGDB X-Trackers MSCI India TRN Index ETF 48,020 395,445 6.44
TOTAL OPEN-ENDED FUNDS 395,445 6.44
Total Investments 5,982,422 97.39
The accompanying notes form an integral part of these financial statements.
Invesco Asian Focus Equity Fund
Statement of Investments as at 29 February 2016
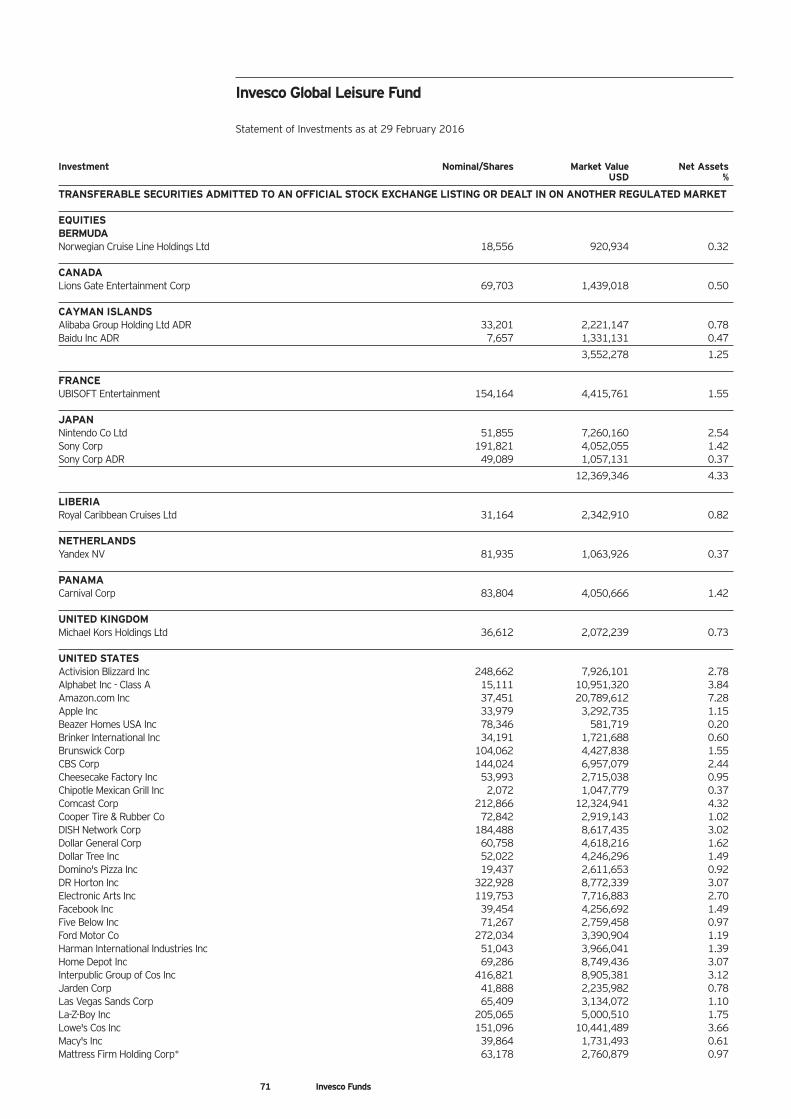
71 Invesco Funds
Investment Nominal/Shares Market Value Net Assets USD %
TRANSFERABLE SECURITIES ADMITTED TO AN OFFICIAL STOCK EXCHANGE LISTING OR DEALT IN ON ANOTHER REGULATED MARKET
EQUITIESBERMUDANorwegian Cruise Line Holdings Ltd 18,556 920,934 0.32
CANADALions Gate Entertainment Corp 69,703 1,439,018 0.50
CAYMAN ISLANDSAlibaba Group Holding Ltd ADR 33,201 2,221,147 0.78Baidu Inc ADR 7,657 1,331,131 0.47
3,552,278 1.25
FRANCEUBISOFT Entertainment 154,164 4,415,761 1.55
JAPANNintendo Co Ltd 51,855 7,260,160 2.54Sony Corp 191,821 4,052,055 1.42Sony Corp ADR 49,089 1,057,131 0.37
12,369,346 4.33
LIBERIARoyal Caribbean Cruises Ltd 31,164 2,342,910 0.82
NETHERLANDSYandex NV 81,935 1,063,926 0.37
PANAMACarnival Corp 83,804 4,050,666 1.42
UNITED KINGDOMMichael Kors Holdings Ltd 36,612 2,072,239 0.73
UNITED STATESActivision Blizzard Inc 248,662 7,926,101 2.78Alphabet Inc - Class A 15,111 10,951,320 3.84Amazon.com Inc 37,451 20,789,612 7.28Apple Inc 33,979 3,292,735 1.15Beazer Homes USA Inc 78,346 581,719 0.20Brinker International Inc 34,191 1,721,688 0.60Brunswick Corp 104,062 4,427,838 1.55CBS Corp 144,024 6,957,079 2.44Cheesecake Factory Inc 53,993 2,715,038 0.95Chipotle Mexican Grill Inc 2,072 1,047,779 0.37Comcast Corp 212,866 12,324,941 4.32Cooper Tire & Rubber Co 72,842 2,919,143 1.02DISH Network Corp 184,488 8,617,435 3.02Dollar General Corp 60,758 4,618,216 1.62Dollar Tree Inc 52,022 4,246,296 1.49Domino's Pizza Inc 19,437 2,611,653 0.92DR Horton Inc 322,928 8,772,339 3.07Electronic Arts Inc 119,753 7,716,883 2.70Facebook Inc 39,454 4,256,692 1.49Five Below Inc 71,267 2,759,458 0.97Ford Motor Co 272,034 3,390,904 1.19Harman International Industries Inc 51,043 3,966,041 1.39Home Depot Inc 69,286 8,749,436 3.07Interpublic Group of Cos Inc 416,821 8,905,381 3.12Jarden Corp 41,888 2,235,982 0.78Las Vegas Sands Corp 65,409 3,134,072 1.10La-Z-Boy Inc 205,065 5,000,510 1.75Lowe's Cos Inc 151,096 10,441,489 3.66Macy's Inc 39,864 1,731,493 0.61Mattress Firm Holding Corp* 63,178 2,760,879 0.97
Invesco Global Leisure Fund
Statement of Investments as at 29 February 2016
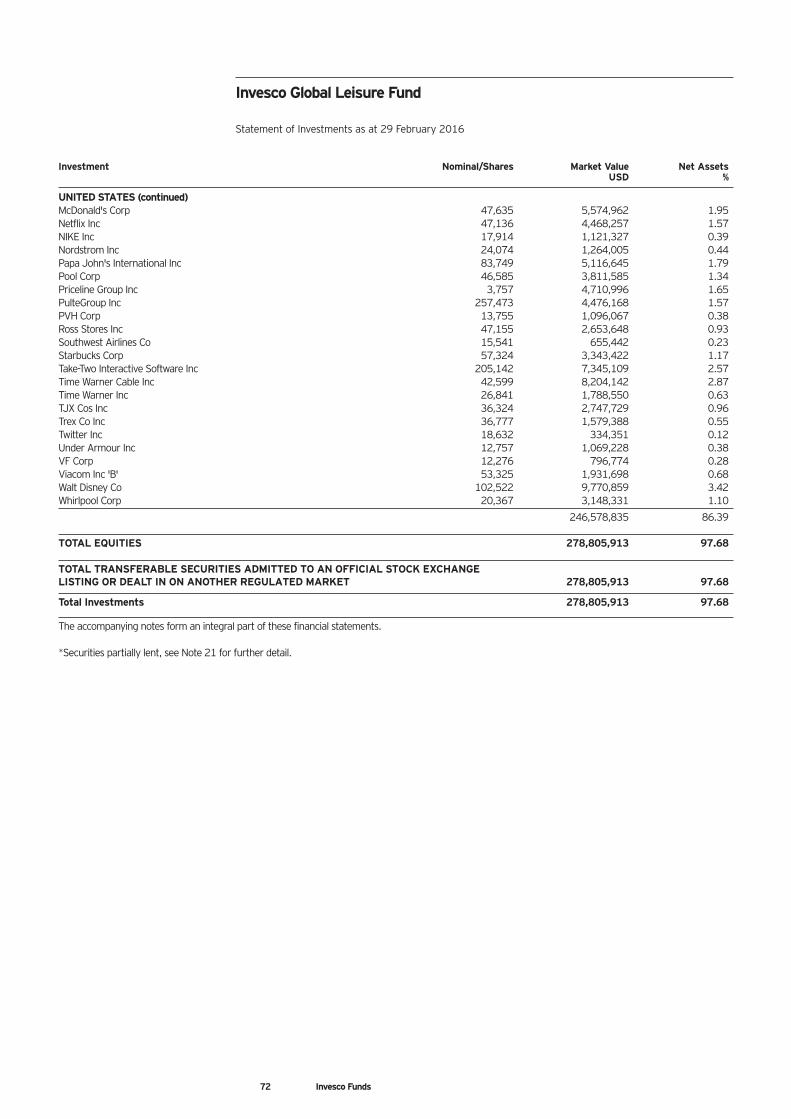
72 Invesco Funds
Investment Nominal/Shares Market Value Net Assets USD %
UNITED STATES (continued)McDonald's Corp 47,635 5,574,962 1.95Netflix Inc 47,136 4,468,257 1.57NIKE Inc 17,914 1,121,327 0.39Nordstrom Inc 24,074 1,264,005 0.44Papa John's International Inc 83,749 5,116,645 1.79Pool Corp 46,585 3,811,585 1.34Priceline Group Inc 3,757 4,710,996 1.65PulteGroup Inc 257,473 4,476,168 1.57PVH Corp 13,755 1,096,067 0.38Ross Stores Inc 47,155 2,653,648 0.93Southwest Airlines Co 15,541 655,442 0.23Starbucks Corp 57,324 3,343,422 1.17Take-Two Interactive Software Inc 205,142 7,345,109 2.57Time Warner Cable Inc 42,599 8,204,142 2.87Time Warner Inc 26,841 1,788,550 0.63TJX Cos Inc 36,324 2,747,729 0.96Trex Co Inc 36,777 1,579,388 0.55Twitter Inc 18,632 334,351 0.12Under Armour Inc 12,757 1,069,228 0.38VF Corp 12,276 796,774 0.28Viacom Inc 'B' 53,325 1,931,698 0.68Walt Disney Co 102,522 9,770,859 3.42Whirlpool Corp 20,367 3,148,331 1.10
246,578,835 86.39
TOTAL EQUITIES 278,805,913 97.68
TOTAL TRANSFERABLE SECURITIES ADMITTED TO AN OFFICIAL STOCK EXCHANGELISTING OR DEALT IN ON ANOTHER REGULATED MARKET 278,805,913 97.68
Total Investments 278,805,913 97.68
The accompanying notes form an integral part of these financial statements.
*Securities partially lent, see Note 21 for further detail.
Invesco Global Leisure Fund
Statement of Investments as at 29 February 2016
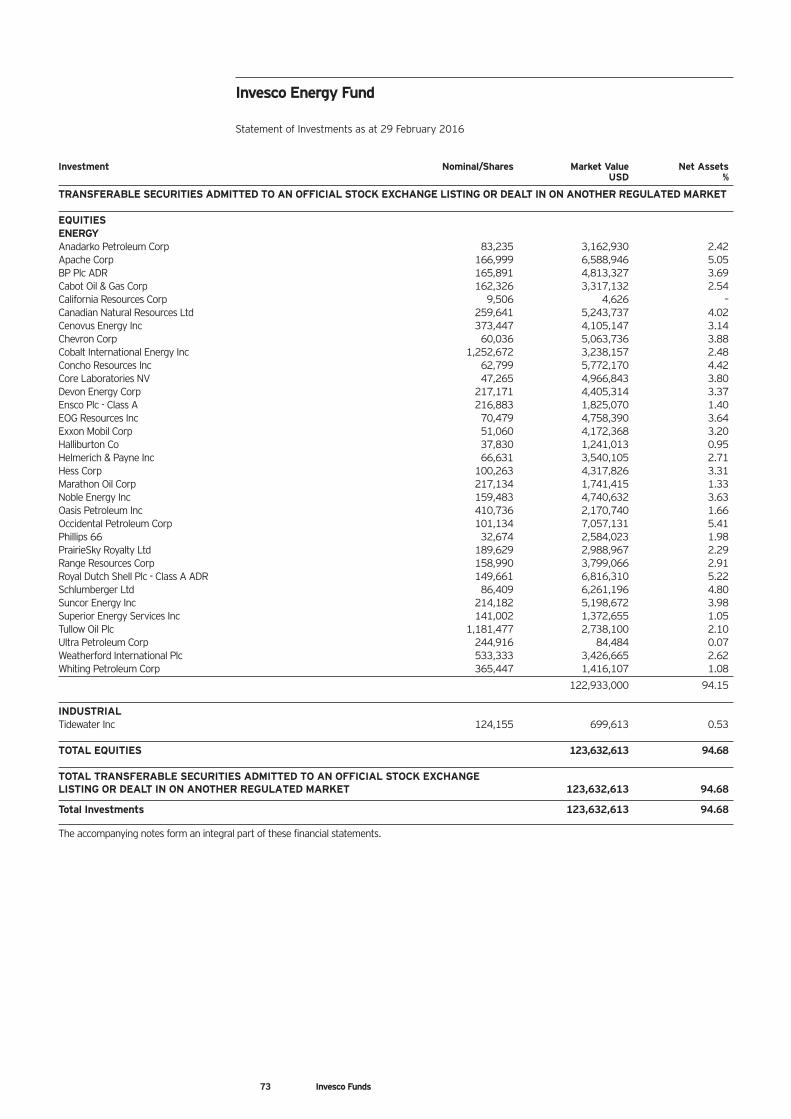
73 Invesco Funds
Investment Nominal/Shares Market Value Net Assets USD %
TRANSFERABLE SECURITIES ADMITTED TO AN OFFICIAL STOCK EXCHANGE LISTING OR DEALT IN ON ANOTHER REGULATED MARKET
EQUITIESENERGYAnadarko Petroleum Corp 83,235 3,162,930 2.42Apache Corp 166,999 6,588,946 5.05BP Plc ADR 165,891 4,813,327 3.69Cabot Oil & Gas Corp 162,326 3,317,132 2.54California Resources Corp 9,506 4,626 –Canadian Natural Resources Ltd 259,641 5,243,737 4.02Cenovus Energy Inc 373,447 4,105,147 3.14Chevron Corp 60,036 5,063,736 3.88Cobalt International Energy Inc 1,252,672 3,238,157 2.48Concho Resources Inc 62,799 5,772,170 4.42Core Laboratories NV 47,265 4,966,843 3.80Devon Energy Corp 217,171 4,405,314 3.37Ensco Plc - Class A 216,883 1,825,070 1.40EOG Resources Inc 70,479 4,758,390 3.64Exxon Mobil Corp 51,060 4,172,368 3.20Halliburton Co 37,830 1,241,013 0.95Helmerich & Payne Inc 66,631 3,540,105 2.71Hess Corp 100,263 4,317,826 3.31Marathon Oil Corp 217,134 1,741,415 1.33Noble Energy Inc 159,483 4,740,632 3.63Oasis Petroleum Inc 410,736 2,170,740 1.66Occidental Petroleum Corp 101,134 7,057,131 5.41Phillips 66 32,674 2,584,023 1.98PrairieSky Royalty Ltd 189,629 2,988,967 2.29Range Resources Corp 158,990 3,799,066 2.91Royal Dutch Shell Plc - Class A ADR 149,661 6,816,310 5.22Schlumberger Ltd 86,409 6,261,196 4.80Suncor Energy Inc 214,182 5,198,672 3.98Superior Energy Services Inc 141,002 1,372,655 1.05Tullow Oil Plc 1,181,477 2,738,100 2.10Ultra Petroleum Corp 244,916 84,484 0.07Weatherford International Plc 533,333 3,426,665 2.62Whiting Petroleum Corp 365,447 1,416,107 1.08
122,933,000 94.15
INDUSTRIALTidewater Inc 124,155 699,613 0.53
TOTAL EQUITIES 123,632,613 94.68
TOTAL TRANSFERABLE SECURITIES ADMITTED TO AN OFFICIAL STOCK EXCHANGELISTING OR DEALT IN ON ANOTHER REGULATED MARKET 123,632,613 94.68
Total Investments 123,632,613 94.68
The accompanying notes form an integral part of these financial statements.
Invesco Energy Fund
Statement of Investments as at 29 February 2016
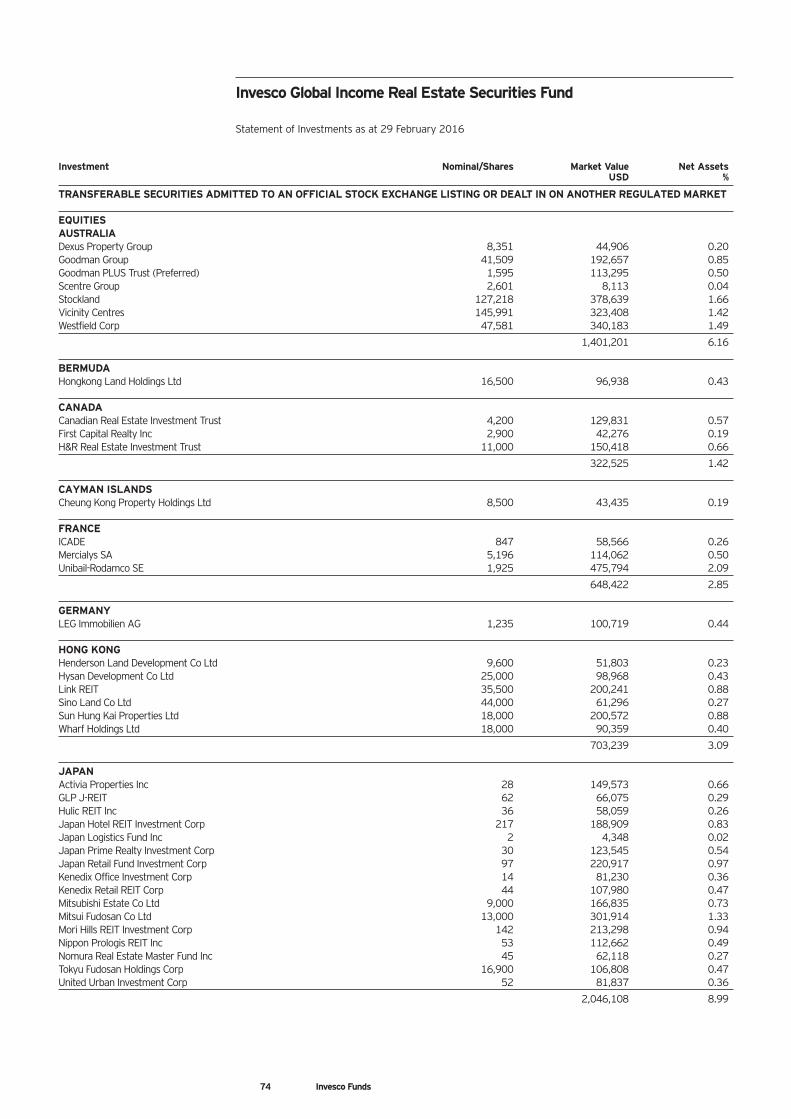
74 Invesco Funds
Investment Nominal/Shares Market Value Net Assets USD %
TRANSFERABLE SECURITIES ADMITTED TO AN OFFICIAL STOCK EXCHANGE LISTING OR DEALT IN ON ANOTHER REGULATED MARKET
EQUITIESAUSTRALIADexus Property Group 8,351 44,906 0.20Goodman Group 41,509 192,657 0.85Goodman PLUS Trust (Preferred) 1,595 113,295 0.50Scentre Group 2,601 8,113 0.04Stockland 127,218 378,639 1.66Vicinity Centres 145,991 323,408 1.42Westfield Corp 47,581 340,183 1.49
1,401,201 6.16
BERMUDAHongkong Land Holdings Ltd 16,500 96,938 0.43
CANADACanadian Real Estate Investment Trust 4,200 129,831 0.57First Capital Realty Inc 2,900 42,276 0.19H&R Real Estate Investment Trust 11,000 150,418 0.66
322,525 1.42
CAYMAN ISLANDSCheung Kong Property Holdings Ltd 8,500 43,435 0.19
FRANCEICADE 847 58,566 0.26Mercialys SA 5,196 114,062 0.50Unibail-Rodamco SE 1,925 475,794 2.09
648,422 2.85
GERMANYLEG Immobilien AG 1,235 100,719 0.44
HONG KONGHenderson Land Development Co Ltd 9,600 51,803 0.23Hysan Development Co Ltd 25,000 98,968 0.43Link REIT 35,500 200,241 0.88Sino Land Co Ltd 44,000 61,296 0.27Sun Hung Kai Properties Ltd 18,000 200,572 0.88Wharf Holdings Ltd 18,000 90,359 0.40
703,239 3.09
JAPANActivia Properties Inc 28 149,573 0.66GLP J-REIT 62 66,075 0.29Hulic REIT Inc 36 58,059 0.26Japan Hotel REIT Investment Corp 217 188,909 0.83Japan Logistics Fund Inc 2 4,348 0.02Japan Prime Realty Investment Corp 30 123,545 0.54Japan Retail Fund Investment Corp 97 220,917 0.97Kenedix Office Investment Corp 14 81,230 0.36Kenedix Retail REIT Corp 44 107,980 0.47Mitsubishi Estate Co Ltd 9,000 166,835 0.73Mitsui Fudosan Co Ltd 13,000 301,914 1.33Mori Hills REIT Investment Corp 142 213,298 0.94Nippon Prologis REIT Inc 53 112,662 0.49Nomura Real Estate Master Fund Inc 45 62,118 0.27Tokyu Fudosan Holdings Corp 16,900 106,808 0.47United Urban Investment Corp 52 81,837 0.36
2,046,108 8.99
Invesco Global Income Real Estate Securities Fund
Statement of Investments as at 29 February 2016
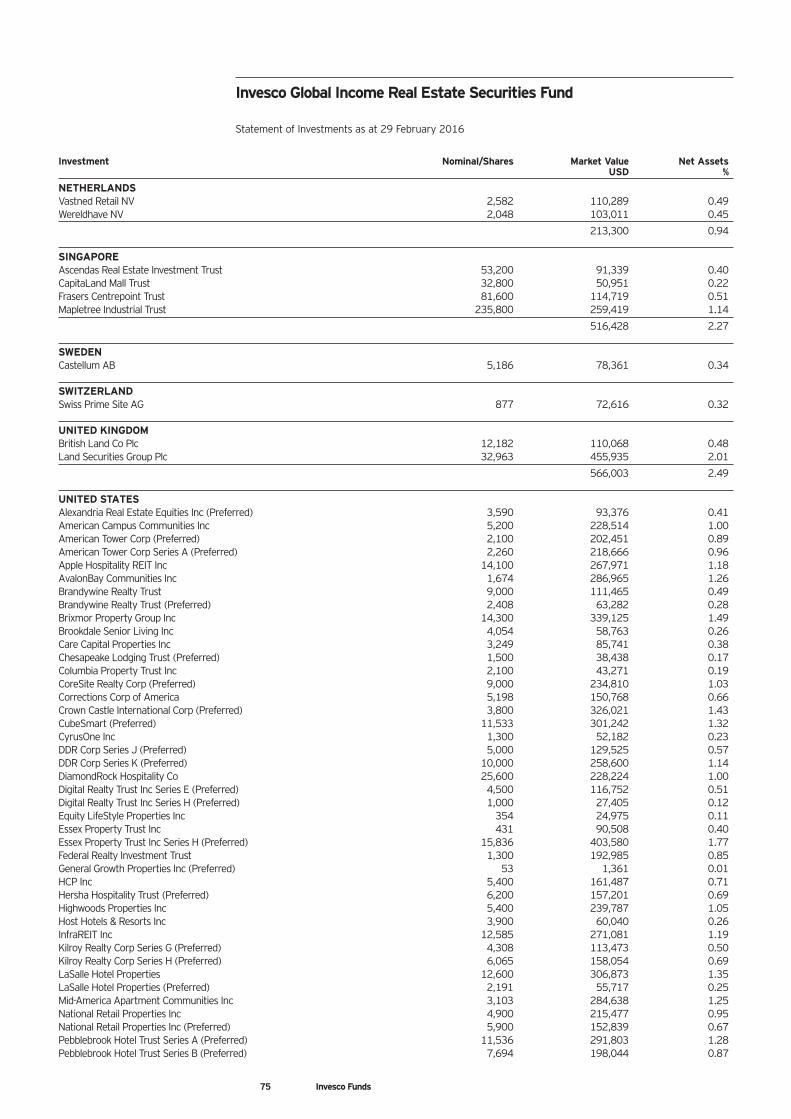
Invesco Global Income Real Estate Securities Fund
Statement of Investments as at 29 February 2016
Investment Nominal/Shares Market Value Net Assets USD %
NETHERLANDSVastned Retail NV 2,582 110,289 0.49Wereldhave NV 2,048 103,011 0.45
213,300 0.94
SINGAPOREAscendas Real Estate Investment Trust 53,200 91,339 0.40CapitaLand Mall Trust 32,800 50,951 0.22Frasers Centrepoint Trust 81,600 114,719 0.51Mapletree Industrial Trust 235,800 259,419 1.14
516,428 2.27
SWEDENCastellum AB 5,186 78,361 0.34
SWITZERLANDSwiss Prime Site AG 877 72,616 0.32
UNITED KINGDOMBritish Land Co Plc 12,182 110,068 0.48Land Securities Group Plc 32,963 455,935 2.01
566,003 2.49
UNITED STATESAlexandria Real Estate Equities Inc (Preferred) 3,590 93,376 0.41American Campus Communities Inc 5,200 228,514 1.00American Tower Corp (Preferred) 2,100 202,451 0.89American Tower Corp Series A (Preferred) 2,260 218,666 0.96Apple Hospitality REIT Inc 14,100 267,971 1.18AvalonBay Communities Inc 1,674 286,965 1.26Brandywine Realty Trust 9,000 111,465 0.49Brandywine Realty Trust (Preferred) 2,408 63,282 0.28Brixmor Property Group Inc 14,300 339,125 1.49Brookdale Senior Living Inc 4,054 58,763 0.26Care Capital Properties Inc 3,249 85,741 0.38Chesapeake Lodging Trust (Preferred) 1,500 38,438 0.17Columbia Property Trust Inc 2,100 43,271 0.19CoreSite Realty Corp (Preferred) 9,000 234,810 1.03Corrections Corp of America 5,198 150,768 0.66Crown Castle International Corp (Preferred) 3,800 326,021 1.43CubeSmart (Preferred) 11,533 301,242 1.32CyrusOne Inc 1,300 52,182 0.23DDR Corp Series J (Preferred) 5,000 129,525 0.57DDR Corp Series K (Preferred) 10,000 258,600 1.14DiamondRock Hospitality Co 25,600 228,224 1.00Digital Realty Trust Inc Series E (Preferred) 4,500 116,752 0.51Digital Realty Trust Inc Series H (Preferred) 1,000 27,405 0.12Equity LifeStyle Properties Inc 354 24,975 0.11Essex Property Trust Inc 431 90,508 0.40Essex Property Trust Inc Series H (Preferred) 15,836 403,580 1.77Federal Realty Investment Trust 1,300 192,985 0.85General Growth Properties Inc (Preferred) 53 1,361 0.01HCP Inc 5,400 161,487 0.71Hersha Hospitality Trust (Preferred) 6,200 157,201 0.69Highwoods Properties Inc 5,400 239,787 1.05Host Hotels & Resorts Inc 3,900 60,040 0.26InfraREIT Inc 12,585 271,081 1.19Kilroy Realty Corp Series G (Preferred) 4,308 113,473 0.50Kilroy Realty Corp Series H (Preferred) 6,065 158,054 0.69LaSalle Hotel Properties 12,600 306,873 1.35LaSalle Hotel Properties (Preferred) 2,191 55,717 0.25Mid-America Apartment Communities Inc 3,103 284,638 1.25National Retail Properties Inc 4,900 215,477 0.95National Retail Properties Inc (Preferred) 5,900 152,839 0.67Pebblebrook Hotel Trust Series A (Preferred) 11,536 291,803 1.28Pebblebrook Hotel Trust Series B (Preferred) 7,694 198,044 0.87
75 Invesco Funds
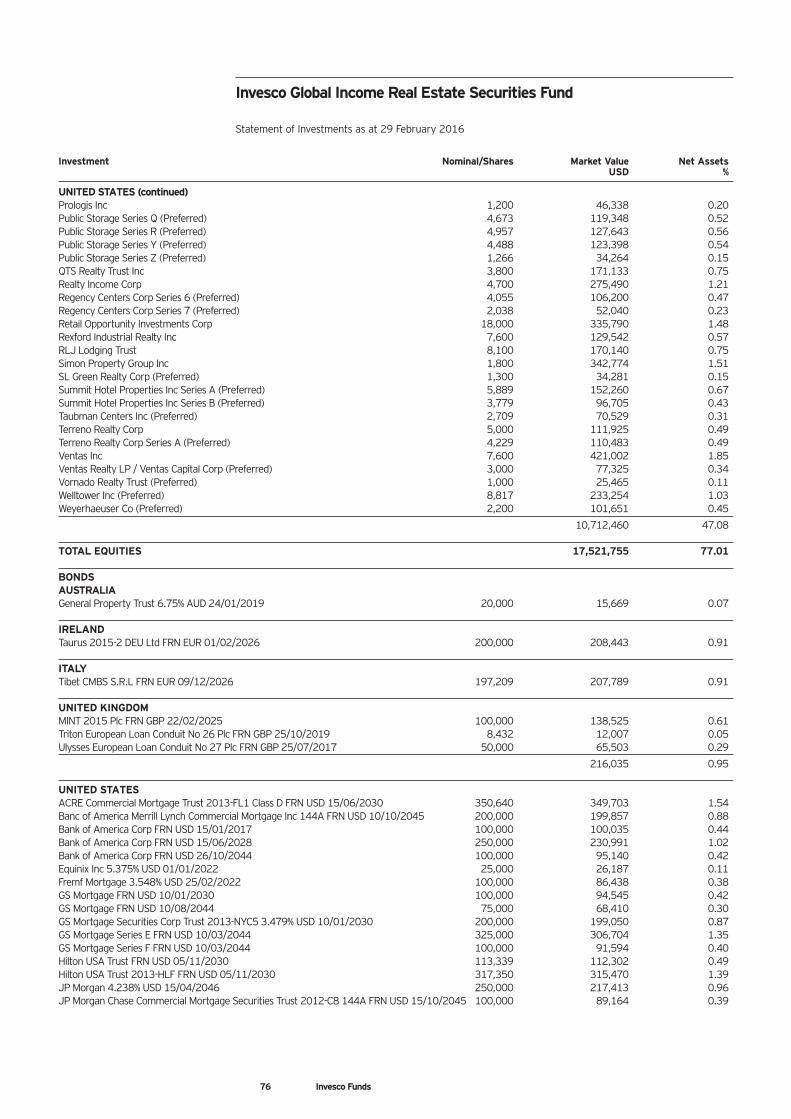
Investment Nominal/Shares Market Value Net Assets USD %
UNITED STATES (continued)Prologis Inc 1,200 46,338 0.20Public Storage Series Q (Preferred) 4,673 119,348 0.52Public Storage Series R (Preferred) 4,957 127,643 0.56Public Storage Series Y (Preferred) 4,488 123,398 0.54Public Storage Series Z (Preferred) 1,266 34,264 0.15QTS Realty Trust Inc 3,800 171,133 0.75Realty Income Corp 4,700 275,490 1.21Regency Centers Corp Series 6 (Preferred) 4,055 106,200 0.47Regency Centers Corp Series 7 (Preferred) 2,038 52,040 0.23Retail Opportunity Investments Corp 18,000 335,790 1.48Rexford Industrial Realty Inc 7,600 129,542 0.57RLJ Lodging Trust 8,100 170,140 0.75Simon Property Group Inc 1,800 342,774 1.51SL Green Realty Corp (Preferred) 1,300 34,281 0.15Summit Hotel Properties Inc Series A (Preferred) 5,889 152,260 0.67Summit Hotel Properties Inc Series B (Preferred) 3,779 96,705 0.43Taubman Centers Inc (Preferred) 2,709 70,529 0.31Terreno Realty Corp 5,000 111,925 0.49Terreno Realty Corp Series A (Preferred) 4,229 110,483 0.49Ventas Inc 7,600 421,002 1.85Ventas Realty LP / Ventas Capital Corp (Preferred) 3,000 77,325 0.34Vornado Realty Trust (Preferred) 1,000 25,465 0.11Welltower Inc (Preferred) 8,817 233,254 1.03Weyerhaeuser Co (Preferred) 2,200 101,651 0.45
10,712,460 47.08
TOTAL EQUITIES 17,521,755 77.01
BONDSAUSTRALIAGeneral Property Trust 6.75% AUD 24/01/2019 20,000 15,669 0.07
IRELANDTaurus 2015-2 DEU Ltd FRN EUR 01/02/2026 200,000 208,443 0.91
ITALYTibet CMBS S.R.L FRN EUR 09/12/2026 197,209 207,789 0.91
UNITED KINGDOMMINT 2015 Plc FRN GBP 22/02/2025 100,000 138,525 0.61Triton European Loan Conduit No 26 Plc FRN GBP 25/10/2019 8,432 12,007 0.05Ulysses European Loan Conduit No 27 Plc FRN GBP 25/07/2017 50,000 65,503 0.29
216,035 0.95
UNITED STATESACRE Commercial Mortgage Trust 2013-FL1 Class D FRN USD 15/06/2030 350,640 349,703 1.54Banc of America Merrill Lynch Commercial Mortgage Inc 144A FRN USD 10/10/2045 200,000 199,857 0.88Bank of America Corp FRN USD 15/01/2017 100,000 100,035 0.44Bank of America Corp FRN USD 15/06/2028 250,000 230,991 1.02Bank of America Corp FRN USD 26/10/2044 100,000 95,140 0.42Equinix Inc 5.375% USD 01/01/2022 25,000 26,187 0.11Fremf Mortgage 3.548% USD 25/02/2022 100,000 86,438 0.38GS Mortgage FRN USD 10/01/2030 100,000 94,545 0.42GS Mortgage FRN USD 10/08/2044 75,000 68,410 0.30GS Mortgage Securities Corp Trust 2013-NYC5 3.479% USD 10/01/2030 200,000 199,050 0.87GS Mortgage Series E FRN USD 10/03/2044 325,000 306,704 1.35GS Mortgage Series F FRN USD 10/03/2044 100,000 91,594 0.40Hilton USA Trust FRN USD 05/11/2030 113,339 112,302 0.49Hilton USA Trust 2013-HLF FRN USD 05/11/2030 317,350 315,470 1.39JP Morgan 4.238% USD 15/04/2046 250,000 217,413 0.96JP Morgan Chase Commercial Mortgage Securities Trust 2012-C8 144A FRN USD 15/10/2045 100,000 89,164 0.39
Invesco Global Income Real Estate Securities Fund
Statement of Investments as at 29 February 2016
76 Invesco Funds
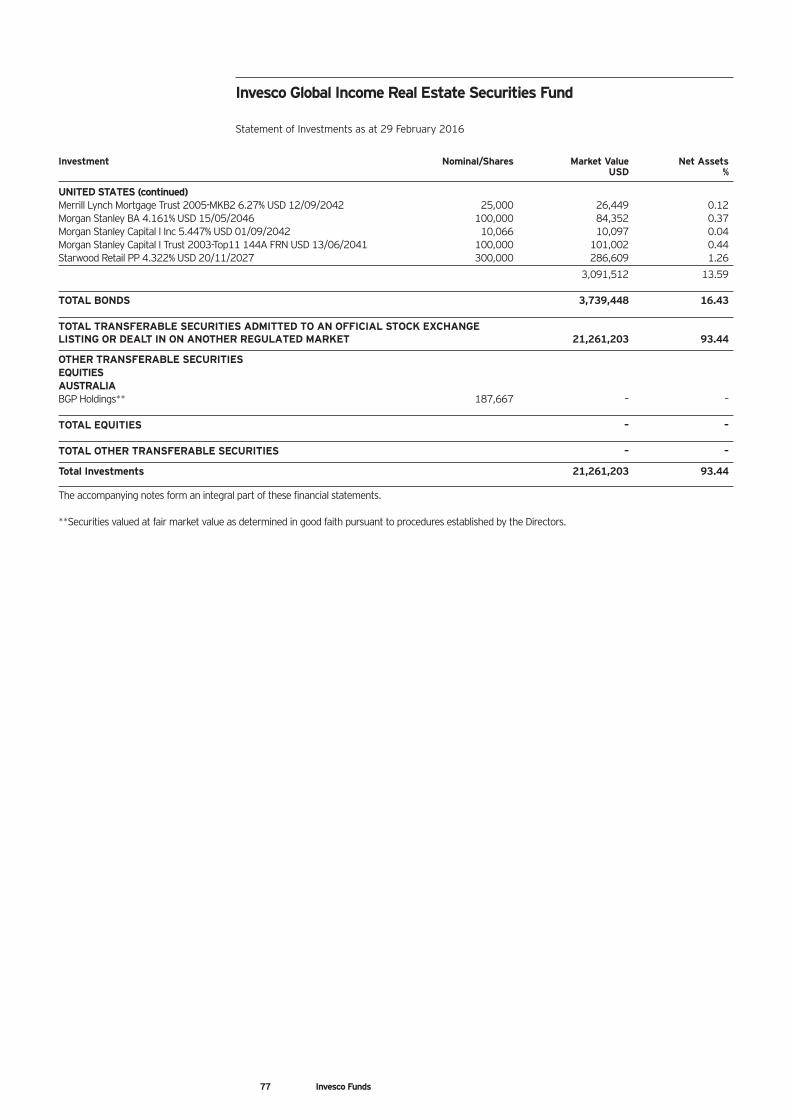
Investment Nominal/Shares Market Value Net Assets USD %
UNITED STATES (continued)Merrill Lynch Mortgage Trust 2005-MKB2 6.27% USD 12/09/2042 25,000 26,449 0.12Morgan Stanley BA 4.161% USD 15/05/2046 100,000 84,352 0.37Morgan Stanley Capital I Inc 5.447% USD 01/09/2042 10,066 10,097 0.04Morgan Stanley Capital I Trust 2003-Top11 144A FRN USD 13/06/2041 100,000 101,002 0.44Starwood Retail PP 4.322% USD 20/11/2027 300,000 286,609 1.26
3,091,512 13.59
TOTAL BONDS 3,739,448 16.43
TOTAL TRANSFERABLE SECURITIES ADMITTED TO AN OFFICIAL STOCK EXCHANGELISTING OR DEALT IN ON ANOTHER REGULATED MARKET 21,261,203 93.44
OTHER TRANSFERABLE SECURITIESEQUITIES AUSTRALIABGP Holdings** 187,667 – –
TOTAL EQUITIES – –
TOTAL OTHER TRANSFERABLE SECURITIES – –
Total Investments 21,261,203 93.44
The accompanying notes form an integral part of these financial statements.
**Securities valued at fair market value as determined in good faith pursuant to procedures established by the Directors.
Invesco Global Income Real Estate Securities Fund
Statement of Investments as at 29 February 2016
77 Invesco Funds
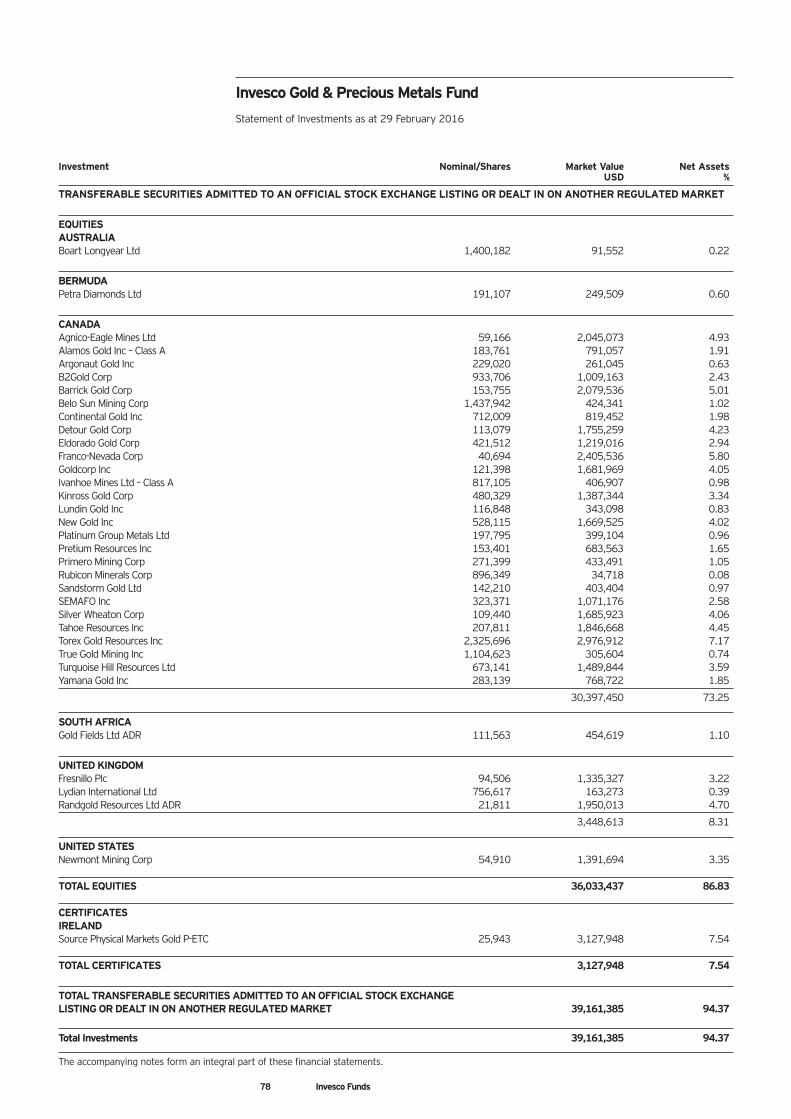
78 Invesco Funds
Investment Nominal/Shares Market Value Net AssetsUSD %
TRANSFERABLE SECURITIES ADMITTED TO AN OFFICIAL STOCK EXCHANGE LISTING OR DEALT IN ON ANOTHER REGULATED MARKET
EQUITIESAUSTRALIABoart Longyear Ltd 1,400,182 91,552 0.22
BERMUDAPetra Diamonds Ltd 191,107 249,509 0.60
CANADAAgnico-Eagle Mines Ltd 59,166 2,045,073 4.93Alamos Gold Inc – Class A 183,761 791,057 1.91Argonaut Gold Inc 229,020 261,045 0.63B2Gold Corp 933,706 1,009,163 2.43Barrick Gold Corp 153,755 2,079,536 5.01Belo Sun Mining Corp 1,437,942 424,341 1.02Continental Gold Inc 712,009 819,452 1.98Detour Gold Corp 113,079 1,755,259 4.23Eldorado Gold Corp 421,512 1,219,016 2.94Franco-Nevada Corp 40,694 2,405,536 5.80Goldcorp Inc 121,398 1,681,969 4.05Ivanhoe Mines Ltd – Class A 817,105 406,907 0.98Kinross Gold Corp 480,329 1,387,344 3.34Lundin Gold Inc 116,848 343,098 0.83New Gold Inc 528,115 1,669,525 4.02Platinum Group Metals Ltd 197,795 399,104 0.96Pretium Resources Inc 153,401 683,563 1.65Primero Mining Corp 271,399 433,491 1.05Rubicon Minerals Corp 896,349 34,718 0.08Sandstorm Gold Ltd 142,210 403,404 0.97SEMAFO Inc 323,371 1,071,176 2.58Silver Wheaton Corp 109,440 1,685,923 4.06Tahoe Resources Inc 207,811 1,846,668 4.45Torex Gold Resources Inc 2,325,696 2,976,912 7.17True Gold Mining Inc 1,104,623 305,604 0.74Turquoise Hill Resources Ltd 673,141 1,489,844 3.59Yamana Gold Inc 283,139 768,722 1.85
30,397,450 73.25
SOUTH AFRICAGold Fields Ltd ADR 111,563 454,619 1.10
UNITED KINGDOMFresnillo Plc 94,506 1,335,327 3.22Lydian International Ltd 756,617 163,273 0.39Randgold Resources Ltd ADR 21,811 1,950,013 4.70
3,448,613 8.31
UNITED STATESNewmont Mining Corp 54,910 1,391,694 3.35
TOTAL EQUITIES 36,033,437 86.83
CERTIFICATESIRELANDSource Physical Markets Gold P-ETC 25,943 3,127,948 7.54
TOTAL CERTIFICATES 3,127,948 7.54
TOTAL TRANSFERABLE SECURITIES ADMITTED TO AN OFFICIAL STOCK EXCHANGE LISTING OR DEALT IN ON ANOTHER REGULATED MARKET 39,161,385 94.37
Total Investments 39,161,385 94.37
The accompanying notes form an integral part of these financial statements.
Invesco Gold & Precious Metals Fund
Statement of Investments as at 29 February 2016
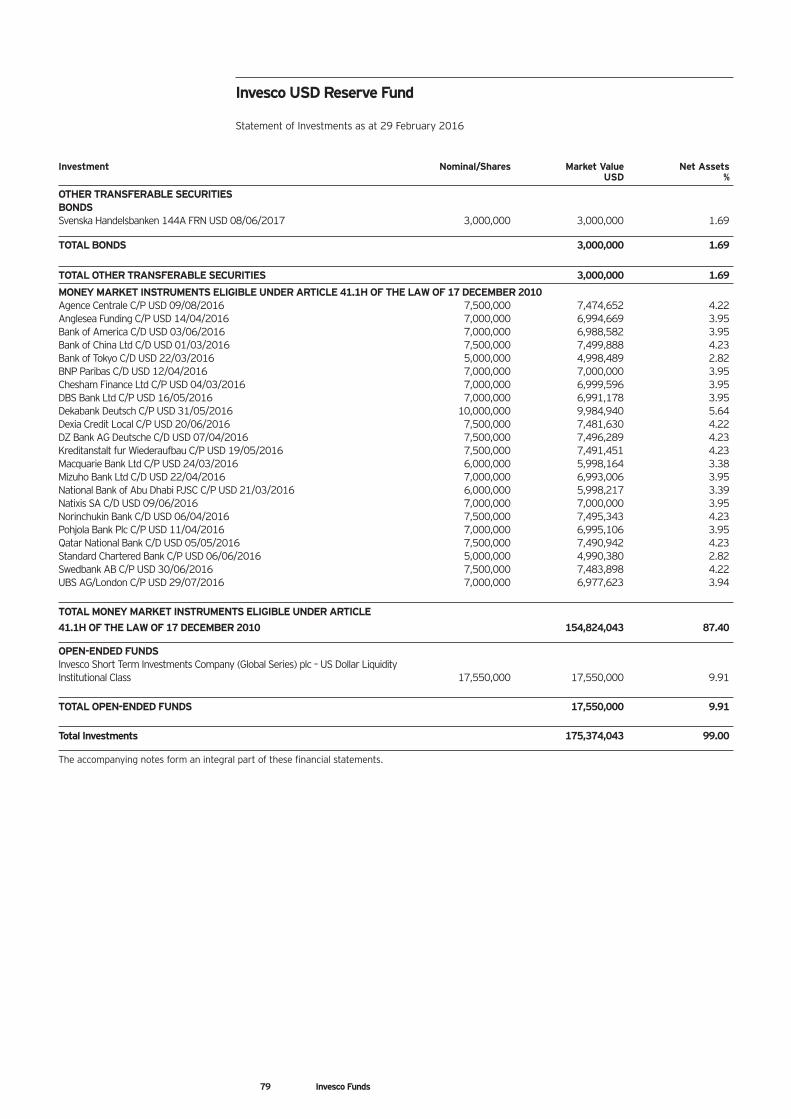
79 Invesco Funds
Investment Nominal/Shares Market Value Net AssetsUSD %
OTHER TRANSFERABLE SECURITIESBONDSSvenska Handelsbanken 144A FRN USD 08/06/2017 3,000,000 3,000,000 1.69
TOTAL BONDS 3,000,000 1.69
TOTAL OTHER TRANSFERABLE SECURITIES 3,000,000 1.69
MONEY MARKET INSTRUMENTS ELIGIBLE UNDER ARTICLE 41.1H OF THE LAW OF 17 DECEMBER 2010Agence Centrale C/P USD 09/08/2016 7,500,000 7,474,652 4.22Anglesea Funding C/P USD 14/04/2016 7,000,000 6,994,669 3.95Bank of America C/D USD 03/06/2016 7,000,000 6,988,582 3.95Bank of China Ltd C/D USD 01/03/2016 7,500,000 7,499,888 4.23Bank of Tokyo C/D USD 22/03/2016 5,000,000 4,998,489 2.82BNP Paribas C/D USD 12/04/2016 7,000,000 7,000,000 3.95Chesham Finance Ltd C/P USD 04/03/2016 7,000,000 6,999,596 3.95DBS Bank Ltd C/P USD 16/05/2016 7,000,000 6,991,178 3.95Dekabank Deutsch C/P USD 31/05/2016 10,000,000 9,984,940 5.64Dexia Credit Local C/P USD 20/06/2016 7,500,000 7,481,630 4.22DZ Bank AG Deutsche C/D USD 07/04/2016 7,500,000 7,496,289 4.23Kreditanstalt fur Wiederaufbau C/P USD 19/05/2016 7,500,000 7,491,451 4.23Macquarie Bank Ltd C/P USD 24/03/2016 6,000,000 5,998,164 3.38Mizuho Bank Ltd C/D USD 22/04/2016 7,000,000 6,993,006 3.95National Bank of Abu Dhabi PJSC C/P USD 21/03/2016 6,000,000 5,998,217 3.39Natixis SA C/D USD 09/06/2016 7,000,000 7,000,000 3.95Norinchukin Bank C/D USD 06/04/2016 7,500,000 7,495,343 4.23Pohjola Bank Plc C/P USD 11/04/2016 7,000,000 6,995,106 3.95Qatar National Bank C/D USD 05/05/2016 7,500,000 7,490,942 4.23Standard Chartered Bank C/P USD 06/06/2016 5,000,000 4,990,380 2.82Swedbank AB C/P USD 30/06/2016 7,500,000 7,483,898 4.22UBS AG/London C/P USD 29/07/2016 7,000,000 6,977,623 3.94
TOTAL MONEY MARKET INSTRUMENTS ELIGIBLE UNDER ARTICLE 41.1H OF THE LAW OF 17 DECEMBER 2010 154,824,043 87.40
OPEN-ENDED FUNDSInvesco Short Term Investments Company (Global Series) plc – US Dollar Liquidity Institutional Class 17,550,000 17,550,000 9.91
TOTAL OPEN-ENDED FUNDS 17,550,000 9.91
Total Investments 175,374,043 99.00
The accompanying notes form an integral part of these financial statements.
Invesco USD Reserve Fund
Statement of Investments as at 29 February 2016
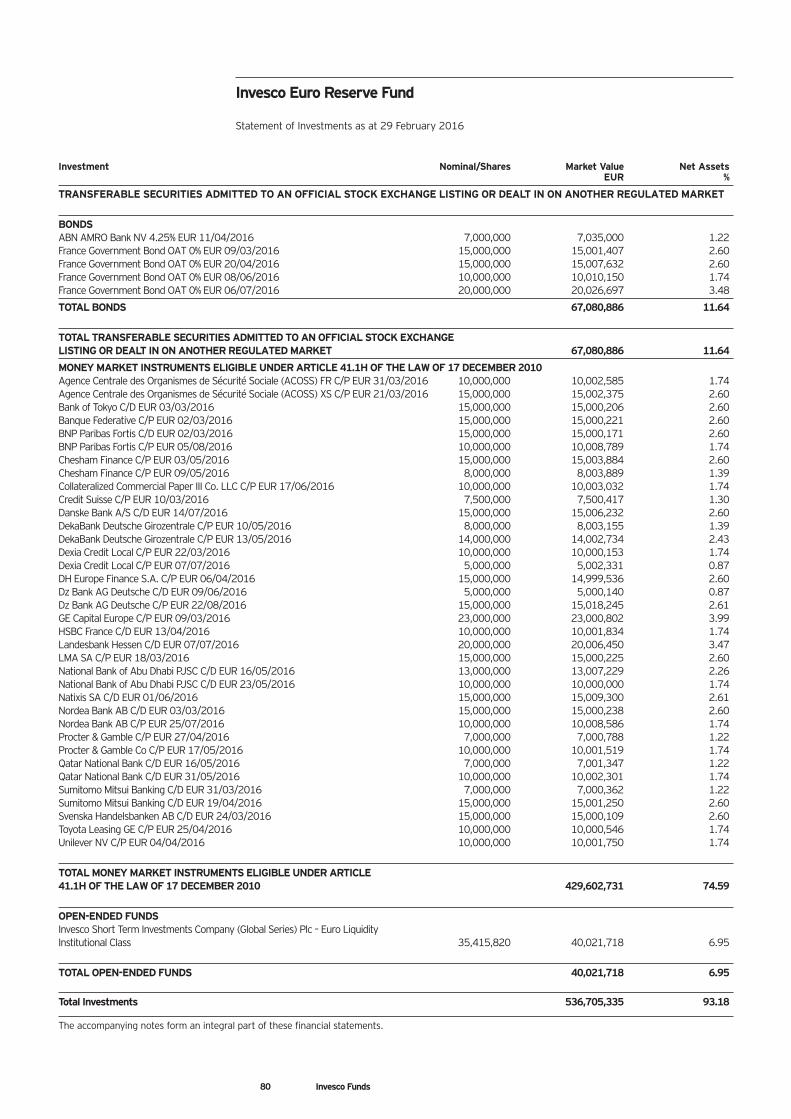
80 Invesco Funds
Investment Nominal/Shares Market Value Net AssetsEUR %
TRANSFERABLE SECURITIES ADMITTED TO AN OFFICIAL STOCK EXCHANGE LISTING OR DEALT IN ON ANOTHER REGULATED MARKET
BONDSABN AMRO Bank NV 4.25% EUR 11/04/2016 7,000,000 7,035,000 1.22France Government Bond OAT 0% EUR 09/03/2016 15,000,000 15,001,407 2.60France Government Bond OAT 0% EUR 20/04/2016 15,000,000 15,007,632 2.60France Government Bond OAT 0% EUR 08/06/2016 10,000,000 10,010,150 1.74France Government Bond OAT 0% EUR 06/07/2016 20,000,000 20,026,697 3.48
TOTAL BONDS 67,080,886 11.64
TOTAL TRANSFERABLE SECURITIES ADMITTED TO AN OFFICIAL STOCK EXCHANGE LISTING OR DEALT IN ON ANOTHER REGULATED MARKET 67,080,886 11.64
MONEY MARKET INSTRUMENTS ELIGIBLE UNDER ARTICLE 41.1H OF THE LAW OF 17 DECEMBER 2010Agence Centrale des Organismes de Sécurité Sociale (ACOSS) FR C/P EUR 31/03/2016 10,000,000 10,002,585 1.74Agence Centrale des Organismes de Sécurité Sociale (ACOSS) XS C/P EUR 21/03/2016 15,000,000 15,002,375 2.60Bank of Tokyo C/D EUR 03/03/2016 15,000,000 15,000,206 2.60Banque Federative C/P EUR 02/03/2016 15,000,000 15,000,221 2.60BNP Paribas Fortis C/D EUR 02/03/2016 15,000,000 15,000,171 2.60BNP Paribas Fortis C/P EUR 05/08/2016 10,000,000 10,008,789 1.74Chesham Finance C/P EUR 03/05/2016 15,000,000 15,003,884 2.60Chesham Finance C/P EUR 09/05/2016 8,000,000 8,003,889 1.39Collateralized Commercial Paper III Co. LLC C/P EUR 17/06/2016 10,000,000 10,003,032 1.74Credit Suisse C/P EUR 10/03/2016 7,500,000 7,500,417 1.30Danske Bank A/S C/D EUR 14/07/2016 15,000,000 15,006,232 2.60DekaBank Deutsche Girozentrale C/P EUR 10/05/2016 8,000,000 8,003,155 1.39DekaBank Deutsche Girozentrale C/P EUR 13/05/2016 14,000,000 14,002,734 2.43Dexia Credit Local C/P EUR 22/03/2016 10,000,000 10,000,153 1.74Dexia Credit Local C/P EUR 07/07/2016 5,000,000 5,002,331 0.87DH Europe Finance S.A. C/P EUR 06/04/2016 15,000,000 14,999,536 2.60Dz Bank AG Deutsche C/D EUR 09/06/2016 5,000,000 5,000,140 0.87Dz Bank AG Deutsche C/P EUR 22/08/2016 15,000,000 15,018,245 2.61GE Capital Europe C/P EUR 09/03/2016 23,000,000 23,000,802 3.99HSBC France C/D EUR 13/04/2016 10,000,000 10,001,834 1.74Landesbank Hessen C/D EUR 07/07/2016 20,000,000 20,006,450 3.47LMA SA C/P EUR 18/03/2016 15,000,000 15,000,225 2.60National Bank of Abu Dhabi PJSC C/D EUR 16/05/2016 13,000,000 13,007,229 2.26National Bank of Abu Dhabi PJSC C/D EUR 23/05/2016 10,000,000 10,000,000 1.74Natixis SA C/D EUR 01/06/2016 15,000,000 15,009,300 2.61Nordea Bank AB C/D EUR 03/03/2016 15,000,000 15,000,238 2.60Nordea Bank AB C/P EUR 25/07/2016 10,000,000 10,008,586 1.74Procter & Gamble C/P EUR 27/04/2016 7,000,000 7,000,788 1.22Procter & Gamble Co C/P EUR 17/05/2016 10,000,000 10,001,519 1.74Qatar National Bank C/D EUR 16/05/2016 7,000,000 7,001,347 1.22Qatar National Bank C/D EUR 31/05/2016 10,000,000 10,002,301 1.74Sumitomo Mitsui Banking C/D EUR 31/03/2016 7,000,000 7,000,362 1.22Sumitomo Mitsui Banking C/D EUR 19/04/2016 15,000,000 15,001,250 2.60Svenska Handelsbanken AB C/D EUR 24/03/2016 15,000,000 15,000,109 2.60Toyota Leasing GE C/P EUR 25/04/2016 10,000,000 10,000,546 1.74Unilever NV C/P EUR 04/04/2016 10,000,000 10,001,750 1.74
TOTAL MONEY MARKET INSTRUMENTS ELIGIBLE UNDER ARTICLE 41.1H OF THE LAW OF 17 DECEMBER 2010 429,602,731 74.59
OPEN-ENDED FUNDSInvesco Short Term Investments Company (Global Series) Plc – Euro Liquidity Institutional Class 35,415,820 40,021,718 6.95
TOTAL OPEN-ENDED FUNDS 40,021,718 6.95
Total Investments 536,705,335 93.18
The accompanying notes form an integral part of these financial statements.
Invesco Euro Reserve Fund
Statement of Investments as at 29 February 2016
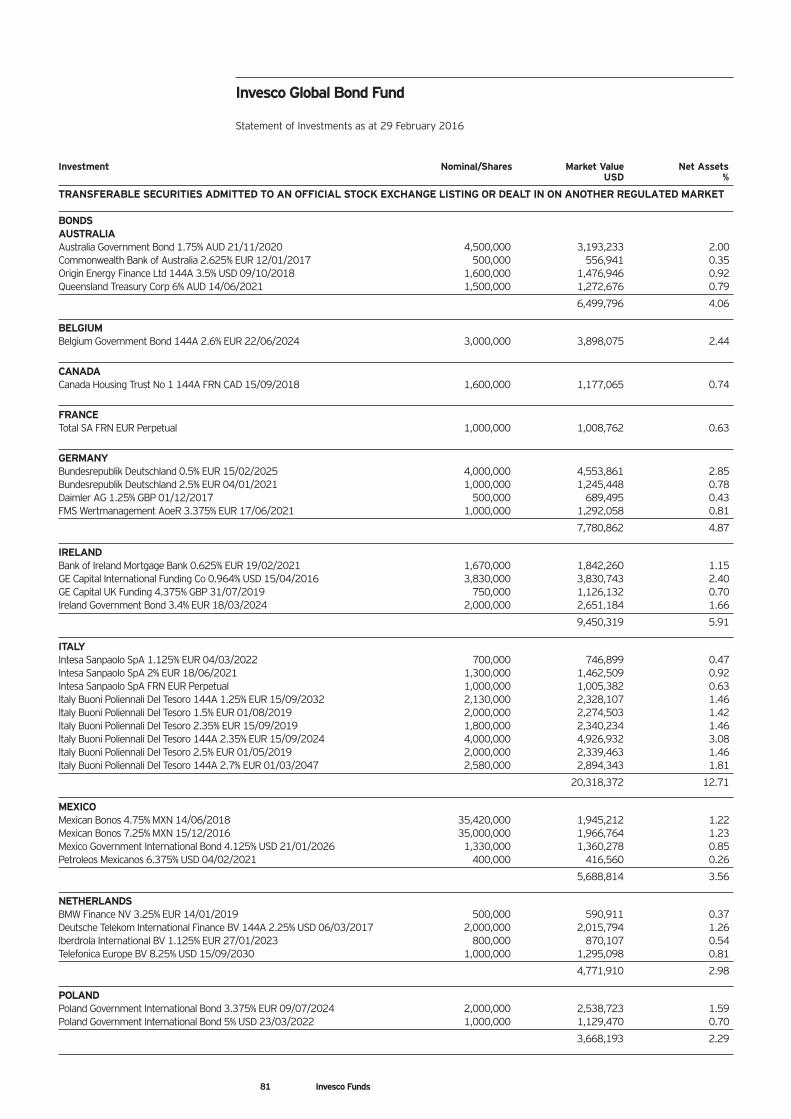
81 Invesco Funds
Investment Nominal/Shares Market Value Net AssetsUSD %
TRANSFERABLE SECURITIES ADMITTED TO AN OFFICIAL STOCK EXCHANGE LISTING OR DEALT IN ON ANOTHER REGULATED MARKET
BONDSAUSTRALIAAustralia Government Bond 1.75% AUD 21/11/2020 4,500,000 3,193,233 2.00Commonwealth Bank of Australia 2.625% EUR 12/01/2017 500,000 556,941 0.35Origin Energy Finance Ltd 144A 3.5% USD 09/10/2018 1,600,000 1,476,946 0.92Queensland Treasury Corp 6% AUD 14/06/2021 1,500,000 1,272,676 0.79
6,499,796 4.06
BELGIUMBelgium Government Bond 144A 2.6% EUR 22/06/2024 3,000,000 3,898,075 2.44
CANADACanada Housing Trust No 1 144A FRN CAD 15/09/2018 1,600,000 1,177,065 0.74
FRANCETotal SA FRN EUR Perpetual 1,000,000 1,008,762 0.63
GERMANYBundesrepublik Deutschland 0.5% EUR 15/02/2025 4,000,000 4,553,861 2.85Bundesrepublik Deutschland 2.5% EUR 04/01/2021 1,000,000 1,245,448 0.78Daimler AG 1.25% GBP 01/12/2017 500,000 689,495 0.43FMS Wertmanagement AoeR 3.375% EUR 17/06/2021 1,000,000 1,292,058 0.81
7,780,862 4.87
IRELANDBank of Ireland Mortgage Bank 0.625% EUR 19/02/2021 1,670,000 1,842,260 1.15GE Capital International Funding Co 0.964% USD 15/04/2016 3,830,000 3,830,743 2.40GE Capital UK Funding 4.375% GBP 31/07/2019 750,000 1,126,132 0.70Ireland Government Bond 3.4% EUR 18/03/2024 2,000,000 2,651,184 1.66
9,450,319 5.91
ITALYIntesa Sanpaolo SpA 1.125% EUR 04/03/2022 700,000 746,899 0.47Intesa Sanpaolo SpA 2% EUR 18/06/2021 1,300,000 1,462,509 0.92Intesa Sanpaolo SpA FRN EUR Perpetual 1,000,000 1,005,382 0.63Italy Buoni Poliennali Del Tesoro 144A 1.25% EUR 15/09/2032 2,130,000 2,328,107 1.46Italy Buoni Poliennali Del Tesoro 1.5% EUR 01/08/2019 2,000,000 2,274,503 1.42Italy Buoni Poliennali Del Tesoro 2.35% EUR 15/09/2019 1,800,000 2,340,234 1.46Italy Buoni Poliennali Del Tesoro 144A 2.35% EUR 15/09/2024 4,000,000 4,926,932 3.08Italy Buoni Poliennali Del Tesoro 2.5% EUR 01/05/2019 2,000,000 2,339,463 1.46Italy Buoni Poliennali Del Tesoro 144A 2.7% EUR 01/03/2047 2,580,000 2,894,343 1.81
20,318,372 12.71
MEXICOMexican Bonos 4.75% MXN 14/06/2018 35,420,000 1,945,212 1.22Mexican Bonos 7.25% MXN 15/12/2016 35,000,000 1,966,764 1.23Mexico Government International Bond 4.125% USD 21/01/2026 1,330,000 1,360,278 0.85Petroleos Mexicanos 6.375% USD 04/02/2021 400,000 416,560 0.26
5,688,814 3.56
NETHERLANDSBMW Finance NV 3.25% EUR 14/01/2019 500,000 590,911 0.37Deutsche Telekom International Finance BV 144A 2.25% USD 06/03/2017 2,000,000 2,015,794 1.26Iberdrola International BV 1.125% EUR 27/01/2023 800,000 870,107 0.54Telefonica Europe BV 8.25% USD 15/09/2030 1,000,000 1,295,098 0.81
4,771,910 2.98
POLANDPoland Government International Bond 3.375% EUR 09/07/2024 2,000,000 2,538,723 1.59Poland Government International Bond 5% USD 23/03/2022 1,000,000 1,129,470 0.70
3,668,193 2.29
Invesco Global Bond Fund
Statement of Investments as at 29 February 2016
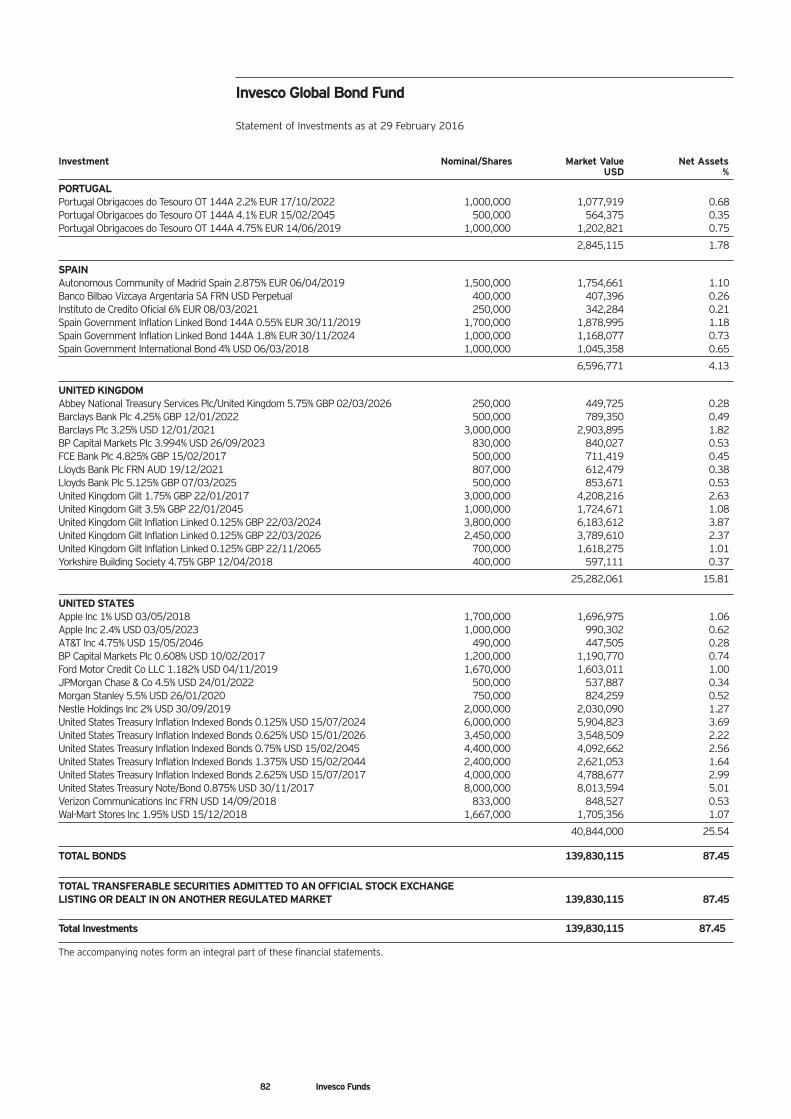
Invesco Global Bond Fund
Statement of Investments as at 29 February 2016
82 Invesco Funds
Investment Nominal/Shares Market Value Net AssetsUSD %
PORTUGAL Portugal Obrigacoes do Tesouro OT 144A 2.2% EUR 17/10/2022 1,000,000 1,077,919 0.68Portugal Obrigacoes do Tesouro OT 144A 4.1% EUR 15/02/2045 500,000 564,375 0.35Portugal Obrigacoes do Tesouro OT 144A 4.75% EUR 14/06/2019 1,000,000 1,202,821 0.75
2,845,115 1.78
SPAINAutonomous Community of Madrid Spain 2.875% EUR 06/04/2019 1,500,000 1,754,661 1.10Banco Bilbao Vizcaya Argentaria SA FRN USD Perpetual 400,000 407,396 0.26Instituto de Credito Oficial 6% EUR 08/03/2021 250,000 342,284 0.21Spain Government Inflation Linked Bond 144A 0.55% EUR 30/11/2019 1,700,000 1,878,995 1.18Spain Government Inflation Linked Bond 144A 1.8% EUR 30/11/2024 1,000,000 1,168,077 0.73Spain Government International Bond 4% USD 06/03/2018 1,000,000 1,045,358 0.65
6,596,771 4.13
UNITED KINGDOMAbbey National Treasury Services Plc/United Kingdom 5.75% GBP 02/03/2026 250,000 449,725 0.28Barclays Bank Plc 4.25% GBP 12/01/2022 500,000 789,350 0.49Barclays Plc 3.25% USD 12/01/2021 3,000,000 2,903,895 1.82BP Capital Markets Plc 3.994% USD 26/09/2023 830,000 840,027 0.53FCE Bank Plc 4.825% GBP 15/02/2017 500,000 711,419 0.45Lloyds Bank Plc FRN AUD 19/12/2021 807,000 612,479 0.38Lloyds Bank Plc 5.125% GBP 07/03/2025 500,000 853,671 0.53United Kingdom Gilt 1.75% GBP 22/01/2017 3,000,000 4,208,216 2.63United Kingdom Gilt 3.5% GBP 22/01/2045 1,000,000 1,724,671 1.08United Kingdom Gilt Inflation Linked 0.125% GBP 22/03/2024 3,800,000 6,183,612 3.87United Kingdom Gilt Inflation Linked 0.125% GBP 22/03/2026 2,450,000 3,789,610 2.37United Kingdom Gilt Inflation Linked 0.125% GBP 22/11/2065 700,000 1,618,275 1.01Yorkshire Building Society 4.75% GBP 12/04/2018 400,000 597,111 0.37
25,282,061 15.81
UNITED STATESApple Inc 1% USD 03/05/2018 1,700,000 1,696,975 1.06Apple Inc 2.4% USD 03/05/2023 1,000,000 990,302 0.62AT&T Inc 4.75% USD 15/05/2046 490,000 447,505 0.28BP Capital Markets Plc 0.608% USD 10/02/2017 1,200,000 1,190,770 0.74Ford Motor Credit Co LLC 1.182% USD 04/11/2019 1,670,000 1,603,011 1.00JPMorgan Chase & Co 4.5% USD 24/01/2022 500,000 537,887 0.34Morgan Stanley 5.5% USD 26/01/2020 750,000 824,259 0.52Nestle Holdings Inc 2% USD 30/09/2019 2,000,000 2,030,090 1.27United States Treasury Inflation Indexed Bonds 0.125% USD 15/07/2024 6,000,000 5,904,823 3.69United States Treasury Inflation Indexed Bonds 0.625% USD 15/01/2026 3,450,000 3,548,509 2.22United States Treasury Inflation Indexed Bonds 0.75% USD 15/02/2045 4,400,000 4,092,662 2.56United States Treasury Inflation Indexed Bonds 1.375% USD 15/02/2044 2,400,000 2,621,053 1.64United States Treasury Inflation Indexed Bonds 2.625% USD 15/07/2017 4,000,000 4,788,677 2.99United States Treasury Note/Bond 0.875% USD 30/11/2017 8,000,000 8,013,594 5.01Verizon Communications Inc FRN USD 14/09/2018 833,000 848,527 0.53Wal-Mart Stores Inc 1.95% USD 15/12/2018 1,667,000 1,705,356 1.07
40,844,000 25.54
TOTAL BONDS 139,830,115 87.45
TOTAL TRANSFERABLE SECURITIES ADMITTED TO AN OFFICIAL STOCK EXCHANGE LISTING OR DEALT IN ON ANOTHER REGULATED MARKET 139,830,115 87.45
Total Investments 139,830,115 87.45
The accompanying notes form an integral part of these financial statements.
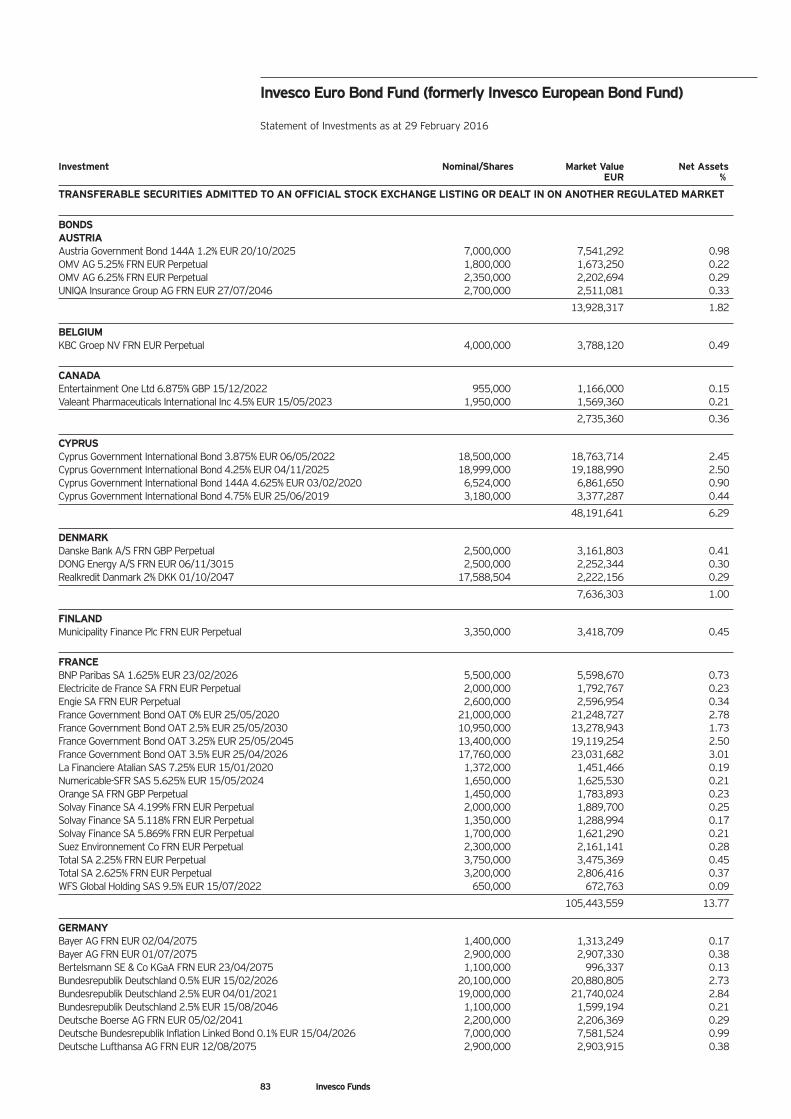
83 Invesco Funds
Investment Nominal/Shares Market Value Net AssetsEUR %
TRANSFERABLE SECURITIES ADMITTED TO AN OFFICIAL STOCK EXCHANGE LISTING OR DEALT IN ON ANOTHER REGULATED MARKET
BONDSAUSTRIAAustria Government Bond 144A 1.2% EUR 20/10/2025 7,000,000 7,541,292 0.98OMV AG 5.25% FRN EUR Perpetual 1,800,000 1,673,250 0.22OMV AG 6.25% FRN EUR Perpetual 2,350,000 2,202,694 0.29UNIQA Insurance Group AG FRN EUR 27/07/2046 2,700,000 2,511,081 0.33
13,928,317 1.82
BELGIUMKBC Groep NV FRN EUR Perpetual 4,000,000 3,788,120 0.49
CANADAEntertainment One Ltd 6.875% GBP 15/12/2022 955,000 1,166,000 0.15Valeant Pharmaceuticals International Inc 4.5% EUR 15/05/2023 1,950,000 1,569,360 0.21
2,735,360 0.36
CYPRUSCyprus Government International Bond 3.875% EUR 06/05/2022 18,500,000 18,763,714 2.45Cyprus Government International Bond 4.25% EUR 04/11/2025 18,999,000 19,188,990 2.50Cyprus Government International Bond 144A 4.625% EUR 03/02/2020 6,524,000 6,861,650 0.90Cyprus Government International Bond 4.75% EUR 25/06/2019 3,180,000 3,377,287 0.44
48,191,641 6.29
DENMARKDanske Bank A/S FRN GBP Perpetual 2,500,000 3,161,803 0.41DONG Energy A/S FRN EUR 06/11/3015 2,500,000 2,252,344 0.30Realkredit Danmark 2% DKK 01/10/2047 17,588,504 2,222,156 0.29
7,636,303 1.00
FINLANDMunicipality Finance Plc FRN EUR Perpetual 3,350,000 3,418,709 0.45
FRANCEBNP Paribas SA 1.625% EUR 23/02/2026 5,500,000 5,598,670 0.73Electricite de France SA FRN EUR Perpetual 2,000,000 1,792,767 0.23Engie SA FRN EUR Perpetual 2,600,000 2,596,954 0.34France Government Bond OAT 0% EUR 25/05/2020 21,000,000 21,248,727 2.78France Government Bond OAT 2.5% EUR 25/05/2030 10,950,000 13,278,943 1.73France Government Bond OAT 3.25% EUR 25/05/2045 13,400,000 19,119,254 2.50France Government Bond OAT 3.5% EUR 25/04/2026 17,760,000 23,031,682 3.01La Financiere Atalian SAS 7.25% EUR 15/01/2020 1,372,000 1,451,466 0.19Numericable-SFR SAS 5.625% EUR 15/05/2024 1,650,000 1,625,530 0.21Orange SA FRN GBP Perpetual 1,450,000 1,783,893 0.23Solvay Finance SA 4.199% FRN EUR Perpetual 2,000,000 1,889,700 0.25Solvay Finance SA 5.118% FRN EUR Perpetual 1,350,000 1,288,994 0.17Solvay Finance SA 5.869% FRN EUR Perpetual 1,700,000 1,621,290 0.21Suez Environnement Co FRN EUR Perpetual 2,300,000 2,161,141 0.28Total SA 2.25% FRN EUR Perpetual 3,750,000 3,475,369 0.45Total SA 2.625% FRN EUR Perpetual 3,200,000 2,806,416 0.37WFS Global Holding SAS 9.5% EUR 15/07/2022 650,000 672,763 0.09
105,443,559 13.77
GERMANYBayer AG FRN EUR 02/04/2075 1,400,000 1,313,249 0.17Bayer AG FRN EUR 01/07/2075 2,900,000 2,907,330 0.38Bertelsmann SE & Co KGaA FRN EUR 23/04/2075 1,100,000 996,337 0.13Bundesrepublik Deutschland 0.5% EUR 15/02/2026 20,100,000 20,880,805 2.73Bundesrepublik Deutschland 2.5% EUR 04/01/2021 19,000,000 21,740,024 2.84Bundesrepublik Deutschland 2.5% EUR 15/08/2046 1,100,000 1,599,194 0.21Deutsche Boerse AG FRN EUR 05/02/2041 2,200,000 2,206,369 0.29Deutsche Bundesrepublik Inflation Linked Bond 0.1% EUR 15/04/2026 7,000,000 7,581,524 0.99Deutsche Lufthansa AG FRN EUR 12/08/2075 2,900,000 2,903,915 0.38
Invesco Euro Bond Fund (formerly Invesco European Bond Fund)
Statement of Investments as at 29 February 2016
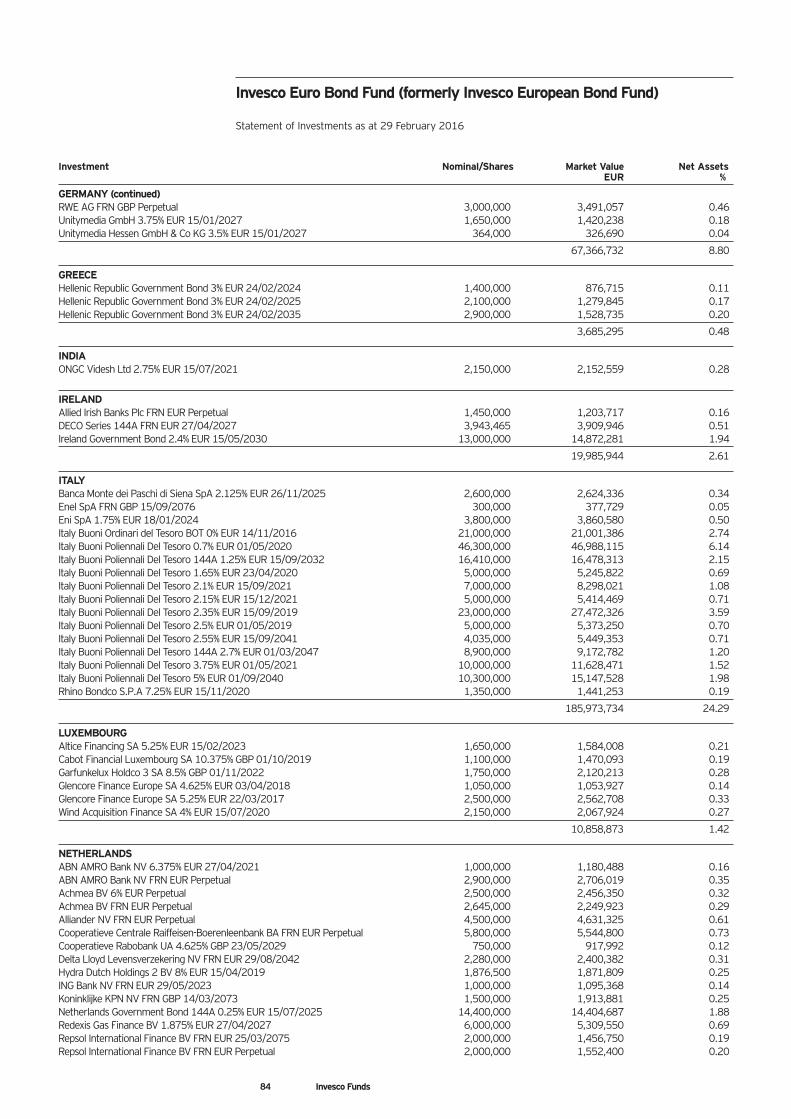
84 Invesco Funds
Investment Nominal/Shares Market Value Net AssetsEUR %
GERMANY (continued)RWE AG FRN GBP Perpetual 3,000,000 3,491,057 0.46Unitymedia GmbH 3.75% EUR 15/01/2027 1,650,000 1,420,238 0.18Unitymedia Hessen GmbH & Co KG 3.5% EUR 15/01/2027 364,000 326,690 0.04
67,366,732 8.80
GREECEHellenic Republic Government Bond 3% EUR 24/02/2024 1,400,000 876,715 0.11Hellenic Republic Government Bond 3% EUR 24/02/2025 2,100,000 1,279,845 0.17Hellenic Republic Government Bond 3% EUR 24/02/2035 2,900,000 1,528,735 0.20
3,685,295 0.48
INDIAONGC Videsh Ltd 2.75% EUR 15/07/2021 2,150,000 2,152,559 0.28
IRELANDAllied Irish Banks Plc FRN EUR Perpetual 1,450,000 1,203,717 0.16DECO Series 144A FRN EUR 27/04/2027 3,943,465 3,909,946 0.51Ireland Government Bond 2.4% EUR 15/05/2030 13,000,000 14,872,281 1.94
19,985,944 2.61
ITALYBanca Monte dei Paschi di Siena SpA 2.125% EUR 26/11/2025 2,600,000 2,624,336 0.34Enel SpA FRN GBP 15/09/2076 300,000 377,729 0.05Eni SpA 1.75% EUR 18/01/2024 3,800,000 3,860,580 0.50Italy Buoni Ordinari del Tesoro BOT 0% EUR 14/11/2016 21,000,000 21,001,386 2.74Italy Buoni Poliennali Del Tesoro 0.7% EUR 01/05/2020 46,300,000 46,988,115 6.14Italy Buoni Poliennali Del Tesoro 144A 1.25% EUR 15/09/2032 16,410,000 16,478,313 2.15Italy Buoni Poliennali Del Tesoro 1.65% EUR 23/04/2020 5,000,000 5,245,822 0.69Italy Buoni Poliennali Del Tesoro 2.1% EUR 15/09/2021 7,000,000 8,298,021 1.08Italy Buoni Poliennali Del Tesoro 2.15% EUR 15/12/2021 5,000,000 5,414,469 0.71Italy Buoni Poliennali Del Tesoro 2.35% EUR 15/09/2019 23,000,000 27,472,326 3.59Italy Buoni Poliennali Del Tesoro 2.5% EUR 01/05/2019 5,000,000 5,373,250 0.70Italy Buoni Poliennali Del Tesoro 2.55% EUR 15/09/2041 4,035,000 5,449,353 0.71Italy Buoni Poliennali Del Tesoro 144A 2.7% EUR 01/03/2047 8,900,000 9,172,782 1.20Italy Buoni Poliennali Del Tesoro 3.75% EUR 01/05/2021 10,000,000 11,628,471 1.52Italy Buoni Poliennali Del Tesoro 5% EUR 01/09/2040 10,300,000 15,147,528 1.98Rhino Bondco S.P.A 7.25% EUR 15/11/2020 1,350,000 1,441,253 0.19
185,973,734 24.29
LUXEMBOURGAltice Financing SA 5.25% EUR 15/02/2023 1,650,000 1,584,008 0.21Cabot Financial Luxembourg SA 10.375% GBP 01/10/2019 1,100,000 1,470,093 0.19Garfunkelux Holdco 3 SA 8.5% GBP 01/11/2022 1,750,000 2,120,213 0.28Glencore Finance Europe SA 4.625% EUR 03/04/2018 1,050,000 1,053,927 0.14Glencore Finance Europe SA 5.25% EUR 22/03/2017 2,500,000 2,562,708 0.33Wind Acquisition Finance SA 4% EUR 15/07/2020 2,150,000 2,067,924 0.27
10,858,873 1.42
NETHERLANDSABN AMRO Bank NV 6.375% EUR 27/04/2021 1,000,000 1,180,488 0.16ABN AMRO Bank NV FRN EUR Perpetual 2,900,000 2,706,019 0.35Achmea BV 6% EUR Perpetual 2,500,000 2,456,350 0.32Achmea BV FRN EUR Perpetual 2,645,000 2,249,923 0.29Alliander NV FRN EUR Perpetual 4,500,000 4,631,325 0.61Cooperatieve Centrale Raiffeisen-Boerenleenbank BA FRN EUR Perpetual 5,800,000 5,544,800 0.73Cooperatieve Rabobank UA 4.625% GBP 23/05/2029 750,000 917,992 0.12Delta Lloyd Levensverzekering NV FRN EUR 29/08/2042 2,280,000 2,400,382 0.31Hydra Dutch Holdings 2 BV 8% EUR 15/04/2019 1,876,500 1,871,809 0.25ING Bank NV FRN EUR 29/05/2023 1,000,000 1,095,368 0.14Koninklijke KPN NV FRN GBP 14/03/2073 1,500,000 1,913,881 0.25Netherlands Government Bond 144A 0.25% EUR 15/07/2025 14,400,000 14,404,687 1.88Redexis Gas Finance BV 1.875% EUR 27/04/2027 6,000,000 5,309,550 0.69Repsol International Finance BV FRN EUR 25/03/2075 2,000,000 1,456,750 0.19Repsol International Finance BV FRN EUR Perpetual 2,000,000 1,552,400 0.20
Invesco Euro Bond Fund (formerly Invesco European Bond Fund)
Statement of Investments as at 29 February 2016
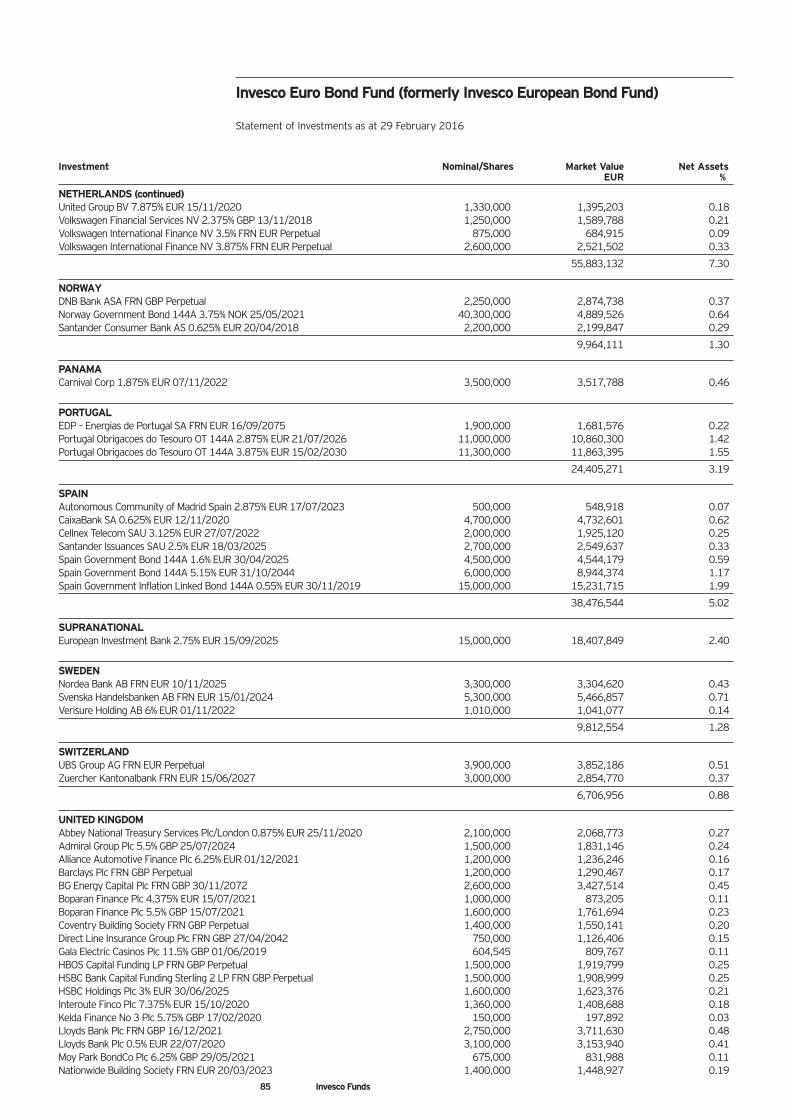
85 Invesco Funds
Investment Nominal/Shares Market Value Net AssetsEUR %
NETHERLANDS (continued)United Group BV 7.875% EUR 15/11/2020 1,330,000 1,395,203 0.18Volkswagen Financial Services NV 2.375% GBP 13/11/2018 1,250,000 1,589,788 0.21Volkswagen International Finance NV 3.5% FRN EUR Perpetual 875,000 684,915 0.09Volkswagen International Finance NV 3.875% FRN EUR Perpetual 2,600,000 2,521,502 0.33
55,883,132 7.30
NORWAYDNB Bank ASA FRN GBP Perpetual 2,250,000 2,874,738 0.37Norway Government Bond 144A 3.75% NOK 25/05/2021 40,300,000 4,889,526 0.64Santander Consumer Bank AS 0.625% EUR 20/04/2018 2,200,000 2,199,847 0.29
9,964,111 1.30
PANAMACarnival Corp 1.875% EUR 07/11/2022 3,500,000 3,517,788 0.46
PORTUGALEDP – Energias de Portugal SA FRN EUR 16/09/2075 1,900,000 1,681,576 0.22Portugal Obrigacoes do Tesouro OT 144A 2.875% EUR 21/07/2026 11,000,000 10,860,300 1.42Portugal Obrigacoes do Tesouro OT 144A 3.875% EUR 15/02/2030 11,300,000 11,863,395 1.55
24,405,271 3.19
SPAINAutonomous Community of Madrid Spain 2.875% EUR 17/07/2023 500,000 548,918 0.07CaixaBank SA 0.625% EUR 12/11/2020 4,700,000 4,732,601 0.62Cellnex Telecom SAU 3.125% EUR 27/07/2022 2,000,000 1,925,120 0.25Santander Issuances SAU 2.5% EUR 18/03/2025 2,700,000 2,549,637 0.33Spain Government Bond 144A 1.6% EUR 30/04/2025 4,500,000 4,544,179 0.59Spain Government Bond 144A 5.15% EUR 31/10/2044 6,000,000 8,944,374 1.17Spain Government Inflation Linked Bond 144A 0.55% EUR 30/11/2019 15,000,000 15,231,715 1.99
38,476,544 5.02
SUPRANATIONALEuropean Investment Bank 2.75% EUR 15/09/2025 15,000,000 18,407,849 2.40
SWEDENNordea Bank AB FRN EUR 10/11/2025 3,300,000 3,304,620 0.43Svenska Handelsbanken AB FRN EUR 15/01/2024 5,300,000 5,466,857 0.71Verisure Holding AB 6% EUR 01/11/2022 1,010,000 1,041,077 0.14
9,812,554 1.28
SWITZERLANDUBS Group AG FRN EUR Perpetual 3,900,000 3,852,186 0.51Zuercher Kantonalbank FRN EUR 15/06/2027 3,000,000 2,854,770 0.37
6,706,956 0.88
UNITED KINGDOMAbbey National Treasury Services Plc/London 0.875% EUR 25/11/2020 2,100,000 2,068,773 0.27Admiral Group Plc 5.5% GBP 25/07/2024 1,500,000 1,831,146 0.24Alliance Automotive Finance Plc 6.25% EUR 01/12/2021 1,200,000 1,236,246 0.16Barclays Plc FRN GBP Perpetual 1,200,000 1,290,467 0.17BG Energy Capital Plc FRN GBP 30/11/2072 2,600,000 3,427,514 0.45Boparan Finance Plc 4.375% EUR 15/07/2021 1,000,000 873,205 0.11Boparan Finance Plc 5.5% GBP 15/07/2021 1,600,000 1,761,694 0.23Coventry Building Society FRN GBP Perpetual 1,400,000 1,550,141 0.20Direct Line Insurance Group Plc FRN GBP 27/04/2042 750,000 1,126,406 0.15Gala Electric Casinos Plc 11.5% GBP 01/06/2019 604,545 809,767 0.11HBOS Capital Funding LP FRN GBP Perpetual 1,500,000 1,919,799 0.25HSBC Bank Capital Funding Sterling 2 LP FRN GBP Perpetual 1,500,000 1,908,999 0.25HSBC Holdings Plc 3% EUR 30/06/2025 1,600,000 1,623,376 0.21Interoute Finco Plc 7.375% EUR 15/10/2020 1,360,000 1,408,688 0.18Kelda Finance No 3 Plc 5.75% GBP 17/02/2020 150,000 197,892 0.03Lloyds Bank Plc FRN GBP 16/12/2021 2,750,000 3,711,630 0.48Lloyds Bank Plc 0.5% EUR 22/07/2020 3,100,000 3,153,940 0.41Moy Park BondCo Plc 6.25% GBP 29/05/2021 675,000 831,988 0.11Nationwide Building Society FRN EUR 20/03/2023 1,400,000 1,448,927 0.19
Invesco Euro Bond Fund (formerly Invesco European Bond Fund)
Statement of Investments as at 29 February 2016
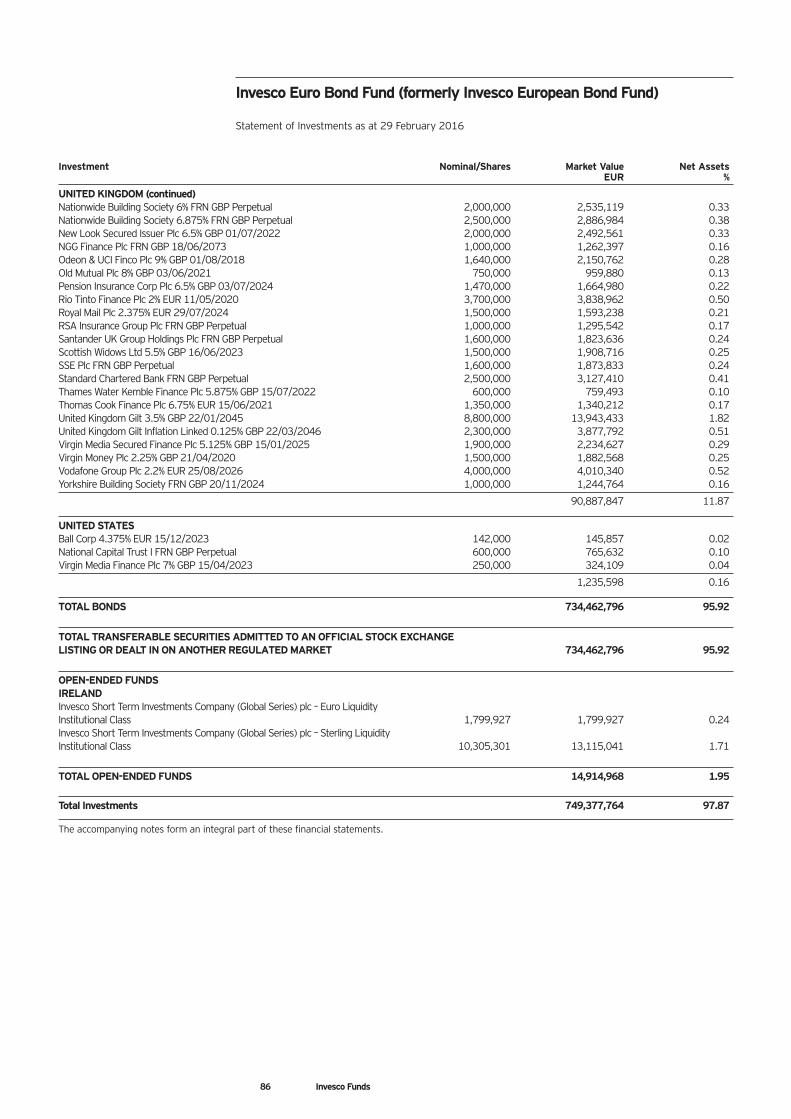
Investment Nominal/Shares Market Value Net AssetsEUR %
UNITED KINGDOM (continued)Nationwide Building Society 6% FRN GBP Perpetual 2,000,000 2,535,119 0.33Nationwide Building Society 6.875% FRN GBP Perpetual 2,500,000 2,886,984 0.38New Look Secured Issuer Plc 6.5% GBP 01/07/2022 2,000,000 2,492,561 0.33NGG Finance Plc FRN GBP 18/06/2073 1,000,000 1,262,397 0.16Odeon & UCI Finco Plc 9% GBP 01/08/2018 1,640,000 2,150,762 0.28Old Mutual Plc 8% GBP 03/06/2021 750,000 959,880 0.13Pension Insurance Corp Plc 6.5% GBP 03/07/2024 1,470,000 1,664,980 0.22Rio Tinto Finance Plc 2% EUR 11/05/2020 3,700,000 3,838,962 0.50Royal Mail Plc 2.375% EUR 29/07/2024 1,500,000 1,593,238 0.21RSA Insurance Group Plc FRN GBP Perpetual 1,000,000 1,295,542 0.17Santander UK Group Holdings Plc FRN GBP Perpetual 1,600,000 1,823,636 0.24Scottish Widows Ltd 5.5% GBP 16/06/2023 1,500,000 1,908,716 0.25SSE Plc FRN GBP Perpetual 1,600,000 1,873,833 0.24Standard Chartered Bank FRN GBP Perpetual 2,500,000 3,127,410 0.41Thames Water Kemble Finance Plc 5.875% GBP 15/07/2022 600,000 759,493 0.10Thomas Cook Finance Plc 6.75% EUR 15/06/2021 1,350,000 1,340,212 0.17United Kingdom Gilt 3.5% GBP 22/01/2045 8,800,000 13,943,433 1.82United Kingdom Gilt Inflation Linked 0.125% GBP 22/03/2046 2,300,000 3,877,792 0.51Virgin Media Secured Finance Plc 5.125% GBP 15/01/2025 1,900,000 2,234,627 0.29Virgin Money Plc 2.25% GBP 21/04/2020 1,500,000 1,882,568 0.25Vodafone Group Plc 2.2% EUR 25/08/2026 4,000,000 4,010,340 0.52Yorkshire Building Society FRN GBP 20/11/2024 1,000,000 1,244,764 0.16
90,887,847 11.87
UNITED STATESBall Corp 4.375% EUR 15/12/2023 142,000 145,857 0.02National Capital Trust I FRN GBP Perpetual 600,000 765,632 0.10Virgin Media Finance Plc 7% GBP 15/04/2023 250,000 324,109 0.04
1,235,598 0.16
TOTAL BONDS 734,462,796 95.92
TOTAL TRANSFERABLE SECURITIES ADMITTED TO AN OFFICIAL STOCK EXCHANGE LISTING OR DEALT IN ON ANOTHER REGULATED MARKET 734,462,796 95.92
OPEN-ENDED FUNDSIRELANDInvesco Short Term Investments Company (Global Series) plc – Euro Liquidity Institutional Class 1,799,927 1,799,927 0.24Invesco Short Term Investments Company (Global Series) plc – Sterling Liquidity Institutional Class 10,305,301 13,115,041 1.71
TOTAL OPEN-ENDED FUNDS 14,914,968 1.95
Total Investments 749,377,764 97.87
The accompanying notes form an integral part of these financial statements.
Invesco Euro Bond Fund (formerly Invesco European Bond Fund)
Statement of Investments as at 29 February 2016
86 Invesco Funds
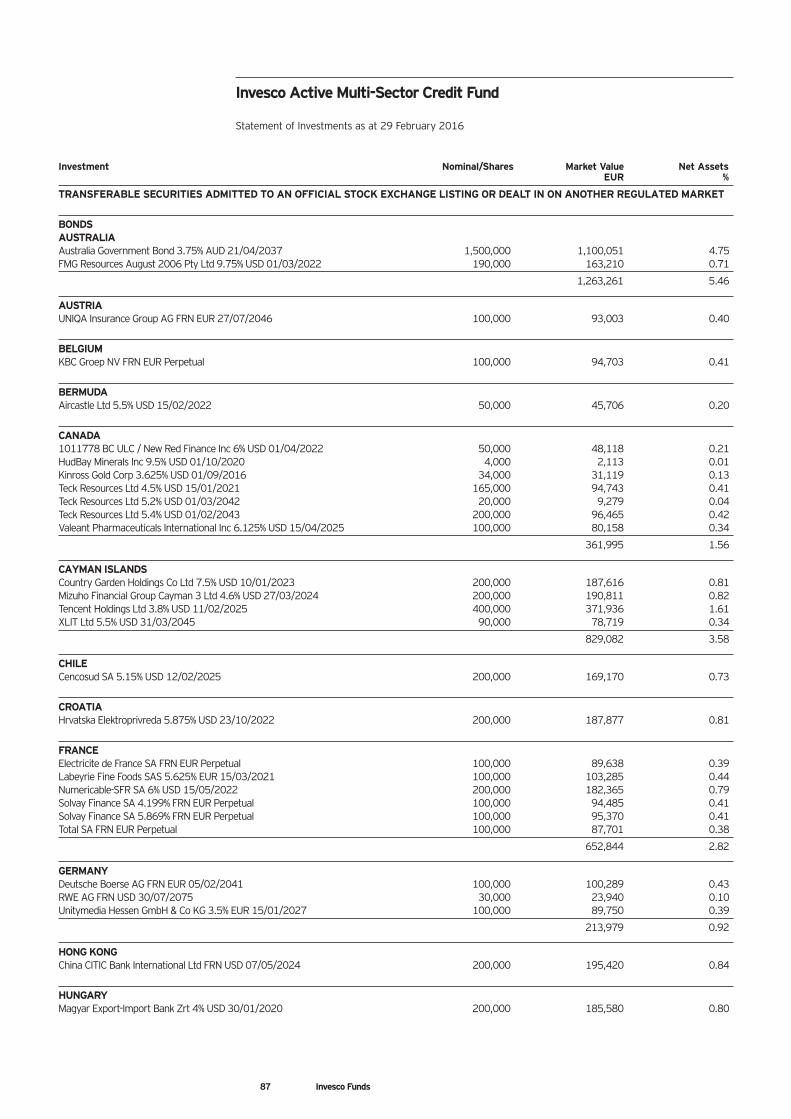
Investment Nominal/Shares Market Value Net AssetsEUR %
TRANSFERABLE SECURITIES ADMITTED TO AN OFFICIAL STOCK EXCHANGE LISTING OR DEALT IN ON ANOTHER REGULATED MARKET
BONDSAUSTRALIAAustralia Government Bond 3.75% AUD 21/04/2037 1,500,000 1,100,051 4.75FMG Resources August 2006 Pty Ltd 9.75% USD 01/03/2022 190,000 163,210 0.71
1,263,261 5.46
AUSTRIAUNIQA Insurance Group AG FRN EUR 27/07/2046 100,000 93,003 0.40
BELGIUMKBC Groep NV FRN EUR Perpetual 100,000 94,703 0.41
BERMUDAAircastle Ltd 5.5% USD 15/02/2022 50,000 45,706 0.20
CANADA1011778 BC ULC / New Red Finance Inc 6% USD 01/04/2022 50,000 48,118 0.21HudBay Minerals Inc 9.5% USD 01/10/2020 4,000 2,113 0.01Kinross Gold Corp 3.625% USD 01/09/2016 34,000 31,119 0.13Teck Resources Ltd 4.5% USD 15/01/2021 165,000 94,743 0.41Teck Resources Ltd 5.2% USD 01/03/2042 20,000 9,279 0.04Teck Resources Ltd 5.4% USD 01/02/2043 200,000 96,465 0.42Valeant Pharmaceuticals International Inc 6.125% USD 15/04/2025 100,000 80,158 0.34
361,995 1.56
CAYMAN ISLANDSCountry Garden Holdings Co Ltd 7.5% USD 10/01/2023 200,000 187,616 0.81Mizuho Financial Group Cayman 3 Ltd 4.6% USD 27/03/2024 200,000 190,811 0.82Tencent Holdings Ltd 3.8% USD 11/02/2025 400,000 371,936 1.61XLIT Ltd 5.5% USD 31/03/2045 90,000 78,719 0.34
829,082 3.58
CHILECencosud SA 5.15% USD 12/02/2025 200,000 169,170 0.73
CROATIAHrvatska Elektroprivreda 5.875% USD 23/10/2022 200,000 187,877 0.81
FRANCEElectricite de France SA FRN EUR Perpetual 100,000 89,638 0.39Labeyrie Fine Foods SAS 5.625% EUR 15/03/2021 100,000 103,285 0.44Numericable-SFR SA 6% USD 15/05/2022 200,000 182,365 0.79Solvay Finance SA 4.199% FRN EUR Perpetual 100,000 94,485 0.41Solvay Finance SA 5.869% FRN EUR Perpetual 100,000 95,370 0.41Total SA FRN EUR Perpetual 100,000 87,701 0.38
652,844 2.82
GERMANYDeutsche Boerse AG FRN EUR 05/02/2041 100,000 100,289 0.43RWE AG FRN USD 30/07/2075 30,000 23,940 0.10Unitymedia Hessen GmbH & Co KG 3.5% EUR 15/01/2027 100,000 89,750 0.39
213,979 0.92
HONG KONGChina CITIC Bank International Ltd FRN USD 07/05/2024 200,000 195,420 0.84
HUNGARYMagyar Export-Import Bank Zrt 4% USD 30/01/2020 200,000 185,580 0.80
Invesco Active Multi-Sector Credit Fund
Statement of Investments as at 29 February 2016
87 Invesco Funds
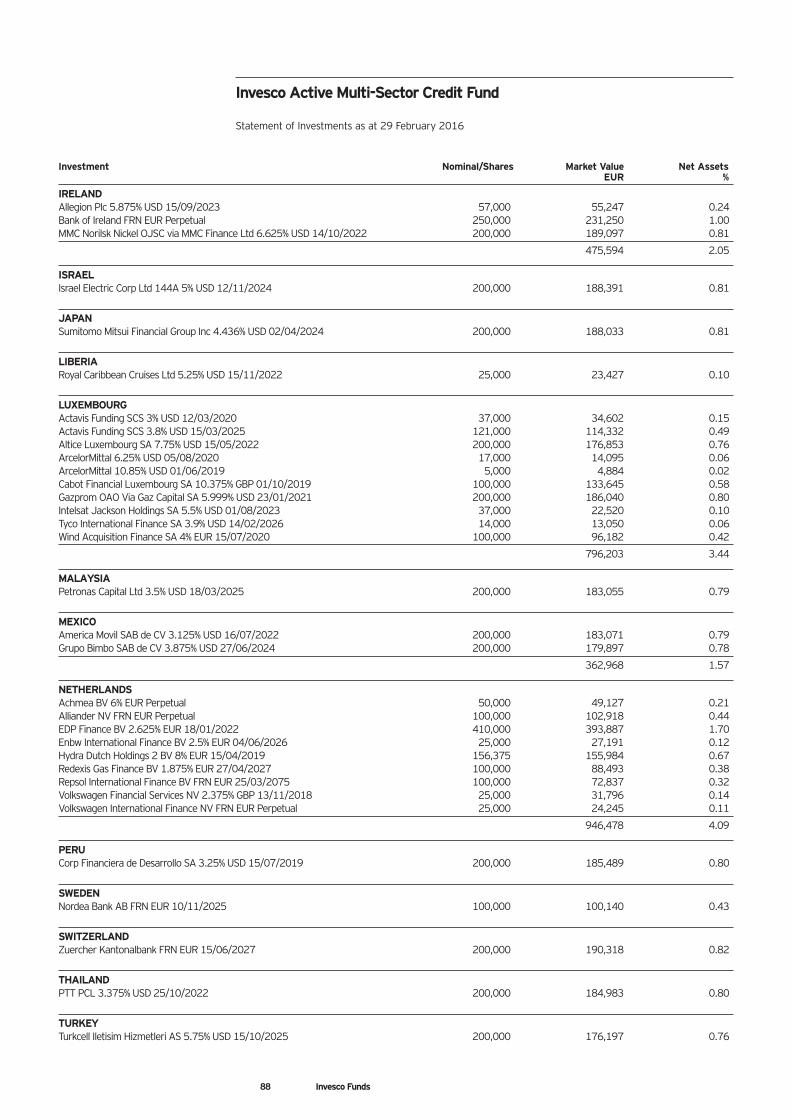
88 Invesco Funds
Investment Nominal/Shares Market Value Net AssetsEUR %
IRELANDAllegion Plc 5.875% USD 15/09/2023 57,000 55,247 0.24Bank of Ireland FRN EUR Perpetual 250,000 231,250 1.00MMC Norilsk Nickel OJSC via MMC Finance Ltd 6.625% USD 14/10/2022 200,000 189,097 0.81
475,594 2.05
ISRAELIsrael Electric Corp Ltd 144A 5% USD 12/11/2024 200,000 188,391 0.81
JAPANSumitomo Mitsui Financial Group Inc 4.436% USD 02/04/2024 200,000 188,033 0.81
LIBERIARoyal Caribbean Cruises Ltd 5.25% USD 15/11/2022 25,000 23,427 0.10
LUXEMBOURGActavis Funding SCS 3% USD 12/03/2020 37,000 34,602 0.15Actavis Funding SCS 3.8% USD 15/03/2025 121,000 114,332 0.49Altice Luxembourg SA 7.75% USD 15/05/2022 200,000 176,853 0.76ArcelorMittal 6.25% USD 05/08/2020 17,000 14,095 0.06ArcelorMittal 10.85% USD 01/06/2019 5,000 4,884 0.02Cabot Financial Luxembourg SA 10.375% GBP 01/10/2019 100,000 133,645 0.58Gazprom OAO Via Gaz Capital SA 5.999% USD 23/01/2021 200,000 186,040 0.80Intelsat Jackson Holdings SA 5.5% USD 01/08/2023 37,000 22,520 0.10Tyco International Finance SA 3.9% USD 14/02/2026 14,000 13,050 0.06Wind Acquisition Finance SA 4% EUR 15/07/2020 100,000 96,182 0.42
796,203 3.44
MALAYSIAPetronas Capital Ltd 3.5% USD 18/03/2025 200,000 183,055 0.79
MEXICOAmerica Movil SAB de CV 3.125% USD 16/07/2022 200,000 183,071 0.79Grupo Bimbo SAB de CV 3.875% USD 27/06/2024 200,000 179,897 0.78
362,968 1.57
NETHERLANDSAchmea BV 6% EUR Perpetual 50,000 49,127 0.21Alliander NV FRN EUR Perpetual 100,000 102,918 0.44EDP Finance BV 2.625% EUR 18/01/2022 410,000 393,887 1.70Enbw International Finance BV 2.5% EUR 04/06/2026 25,000 27,191 0.12Hydra Dutch Holdings 2 BV 8% EUR 15/04/2019 156,375 155,984 0.67Redexis Gas Finance BV 1.875% EUR 27/04/2027 100,000 88,493 0.38Repsol International Finance BV FRN EUR 25/03/2075 100,000 72,837 0.32Volkswagen Financial Services NV 2.375% GBP 13/11/2018 25,000 31,796 0.14Volkswagen International Finance NV FRN EUR Perpetual 25,000 24,245 0.11
946,478 4.09
PERUCorp Financiera de Desarrollo SA 3.25% USD 15/07/2019 200,000 185,489 0.80
SWEDENNordea Bank AB FRN EUR 10/11/2025 100,000 100,140 0.43
SWITZERLANDZuercher Kantonalbank FRN EUR 15/06/2027 200,000 190,318 0.82
THAILANDPTT PCL 3.375% USD 25/10/2022 200,000 184,983 0.80
TURKEYTurkcell Iletisim Hizmetleri AS 5.75% USD 15/10/2025 200,000 176,197 0.76
Invesco Active Multi-Sector Credit Fund
Statement of Investments as at 29 February 2016
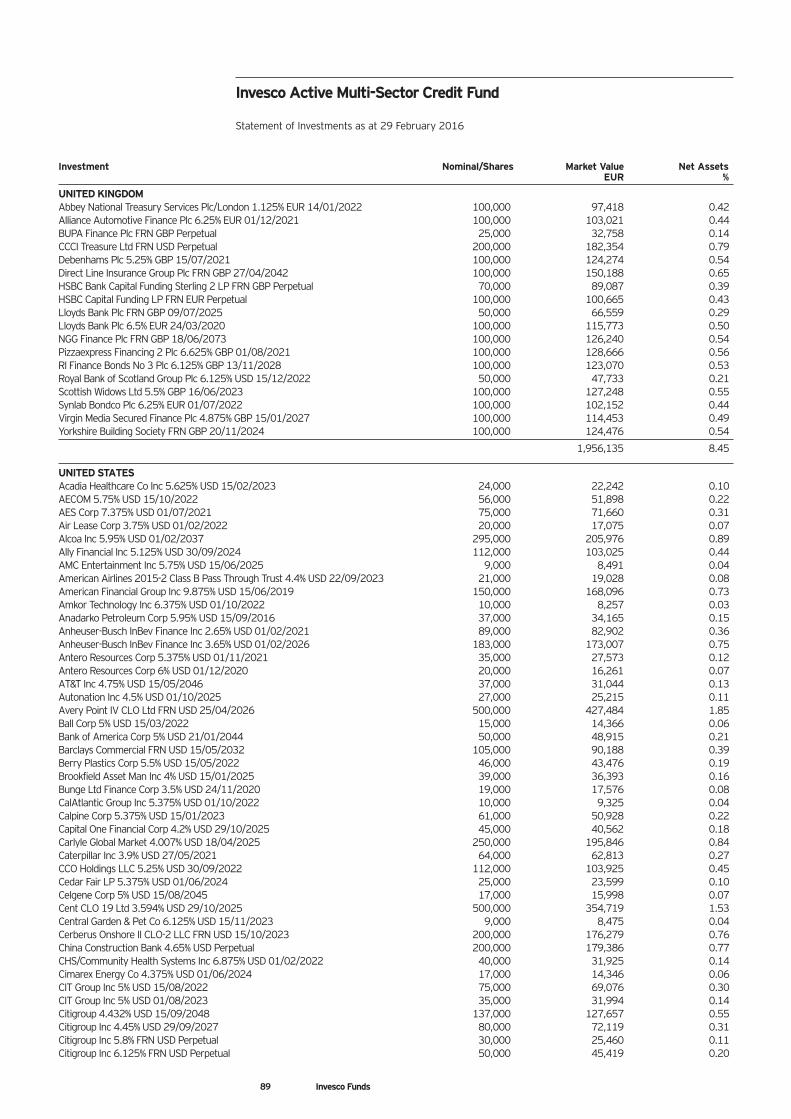
89 Invesco Funds
Investment Nominal/Shares Market Value Net AssetsEUR %
UNITED KINGDOMAbbey National Treasury Services Plc/London 1.125% EUR 14/01/2022 100,000 97,418 0.42Alliance Automotive Finance Plc 6.25% EUR 01/12/2021 100,000 103,021 0.44BUPA Finance Plc FRN GBP Perpetual 25,000 32,758 0.14CCCI Treasure Ltd FRN USD Perpetual 200,000 182,354 0.79Debenhams Plc 5.25% GBP 15/07/2021 100,000 124,274 0.54Direct Line Insurance Group Plc FRN GBP 27/04/2042 100,000 150,188 0.65HSBC Bank Capital Funding Sterling 2 LP FRN GBP Perpetual 70,000 89,087 0.39HSBC Capital Funding LP FRN EUR Perpetual 100,000 100,665 0.43Lloyds Bank Plc FRN GBP 09/07/2025 50,000 66,559 0.29Lloyds Bank Plc 6.5% EUR 24/03/2020 100,000 115,773 0.50NGG Finance Plc FRN GBP 18/06/2073 100,000 126,240 0.54Pizzaexpress Financing 2 Plc 6.625% GBP 01/08/2021 100,000 128,666 0.56Rl Finance Bonds No 3 Plc 6.125% GBP 13/11/2028 100,000 123,070 0.53Royal Bank of Scotland Group Plc 6.125% USD 15/12/2022 50,000 47,733 0.21Scottish Widows Ltd 5.5% GBP 16/06/2023 100,000 127,248 0.55Synlab Bondco Plc 6.25% EUR 01/07/2022 100,000 102,152 0.44Virgin Media Secured Finance Plc 4.875% GBP 15/01/2027 100,000 114,453 0.49Yorkshire Building Society FRN GBP 20/11/2024 100,000 124,476 0.54
1,956,135 8.45
UNITED STATESAcadia Healthcare Co Inc 5.625% USD 15/02/2023 24,000 22,242 0.10AECOM 5.75% USD 15/10/2022 56,000 51,898 0.22AES Corp 7.375% USD 01/07/2021 75,000 71,660 0.31Air Lease Corp 3.75% USD 01/02/2022 20,000 17,075 0.07Alcoa Inc 5.95% USD 01/02/2037 295,000 205,976 0.89Ally Financial Inc 5.125% USD 30/09/2024 112,000 103,025 0.44AMC Entertainment Inc 5.75% USD 15/06/2025 9,000 8,491 0.04American Airlines 2015-2 Class B Pass Through Trust 4.4% USD 22/09/2023 21,000 19,028 0.08American Financial Group Inc 9.875% USD 15/06/2019 150,000 168,096 0.73Amkor Technology Inc 6.375% USD 01/10/2022 10,000 8,257 0.03Anadarko Petroleum Corp 5.95% USD 15/09/2016 37,000 34,165 0.15Anheuser-Busch InBev Finance Inc 2.65% USD 01/02/2021 89,000 82,902 0.36Anheuser-Busch InBev Finance Inc 3.65% USD 01/02/2026 183,000 173,007 0.75Antero Resources Corp 5.375% USD 01/11/2021 35,000 27,573 0.12Antero Resources Corp 6% USD 01/12/2020 20,000 16,261 0.07AT&T Inc 4.75% USD 15/05/2046 37,000 31,044 0.13Autonation Inc 4.5% USD 01/10/2025 27,000 25,215 0.11Avery Point IV CLO Ltd FRN USD 25/04/2026 500,000 427,484 1.85Ball Corp 5% USD 15/03/2022 15,000 14,366 0.06Bank of America Corp 5% USD 21/01/2044 50,000 48,915 0.21Barclays Commercial FRN USD 15/05/2032 105,000 90,188 0.39Berry Plastics Corp 5.5% USD 15/05/2022 46,000 43,476 0.19Brookfield Asset Man Inc 4% USD 15/01/2025 39,000 36,393 0.16Bunge Ltd Finance Corp 3.5% USD 24/11/2020 19,000 17,576 0.08CalAtlantic Group Inc 5.375% USD 01/10/2022 10,000 9,325 0.04Calpine Corp 5.375% USD 15/01/2023 61,000 50,928 0.22Capital One Financial Corp 4.2% USD 29/10/2025 45,000 40,562 0.18Carlyle Global Market 4.007% USD 18/04/2025 250,000 195,846 0.84Caterpillar Inc 3.9% USD 27/05/2021 64,000 62,813 0.27CCO Holdings LLC 5.25% USD 30/09/2022 112,000 103,925 0.45Cedar Fair LP 5.375% USD 01/06/2024 25,000 23,599 0.10Celgene Corp 5% USD 15/08/2045 17,000 15,998 0.07Cent CLO 19 Ltd 3.594% USD 29/10/2025 500,000 354,719 1.53Central Garden & Pet Co 6.125% USD 15/11/2023 9,000 8,475 0.04Cerberus Onshore II CLO-2 LLC FRN USD 15/10/2023 200,000 176,279 0.76China Construction Bank 4.65% USD Perpetual 200,000 179,386 0.77CHS/Community Health Systems Inc 6.875% USD 01/02/2022 40,000 31,925 0.14Cimarex Energy Co 4.375% USD 01/06/2024 17,000 14,346 0.06CIT Group Inc 5% USD 15/08/2022 75,000 69,076 0.30CIT Group Inc 5% USD 01/08/2023 35,000 31,994 0.14Citigroup 4.432% USD 15/09/2048 137,000 127,657 0.55Citigroup Inc 4.45% USD 29/09/2027 80,000 72,119 0.31Citigroup Inc 5.8% FRN USD Perpetual 30,000 25,460 0.11Citigroup Inc 6.125% FRN USD Perpetual 50,000 45,419 0.20
Invesco Active Multi-Sector Credit Fund
Statement of Investments as at 29 February 2016
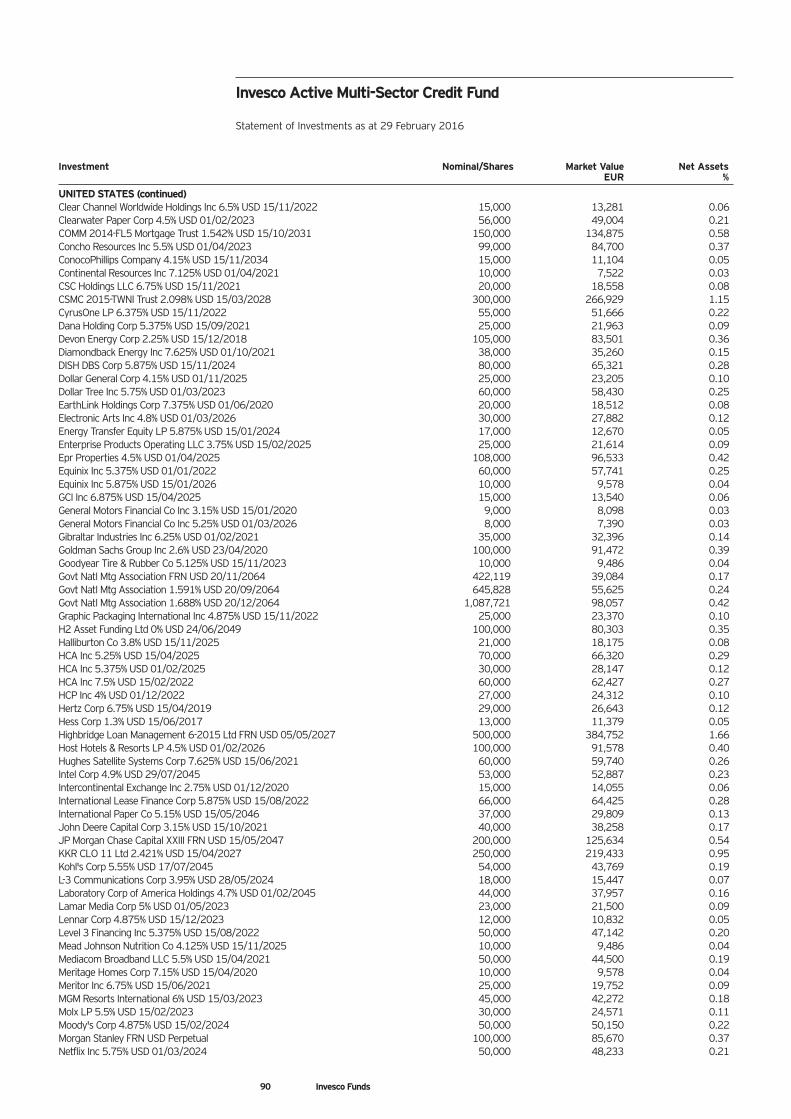
90 Invesco Funds
Investment Nominal/Shares Market Value Net AssetsEUR %
UNITED STATES (continued)Clear Channel Worldwide Holdings Inc 6.5% USD 15/11/2022 15,000 13,281 0.06Clearwater Paper Corp 4.5% USD 01/02/2023 56,000 49,004 0.21COMM 2014-FL5 Mortgage Trust 1.542% USD 15/10/2031 150,000 134,875 0.58Concho Resources Inc 5.5% USD 01/04/2023 99,000 84,700 0.37ConocoPhillips Company 4.15% USD 15/11/2034 15,000 11,104 0.05Continental Resources Inc 7.125% USD 01/04/2021 10,000 7,522 0.03CSC Holdings LLC 6.75% USD 15/11/2021 20,000 18,558 0.08CSMC 2015-TWNI Trust 2.098% USD 15/03/2028 300,000 266,929 1.15CyrusOne LP 6.375% USD 15/11/2022 55,000 51,666 0.22Dana Holding Corp 5.375% USD 15/09/2021 25,000 21,963 0.09Devon Energy Corp 2.25% USD 15/12/2018 105,000 83,501 0.36Diamondback Energy Inc 7.625% USD 01/10/2021 38,000 35,260 0.15DISH DBS Corp 5.875% USD 15/11/2024 80,000 65,321 0.28Dollar General Corp 4.15% USD 01/11/2025 25,000 23,205 0.10Dollar Tree Inc 5.75% USD 01/03/2023 60,000 58,430 0.25EarthLink Holdings Corp 7.375% USD 01/06/2020 20,000 18,512 0.08Electronic Arts Inc 4.8% USD 01/03/2026 30,000 27,882 0.12Energy Transfer Equity LP 5.875% USD 15/01/2024 17,000 12,670 0.05Enterprise Products Operating LLC 3.75% USD 15/02/2025 25,000 21,614 0.09Epr Properties 4.5% USD 01/04/2025 108,000 96,533 0.42Equinix Inc 5.375% USD 01/01/2022 60,000 57,741 0.25Equinix Inc 5.875% USD 15/01/2026 10,000 9,578 0.04GCI Inc 6.875% USD 15/04/2025 15,000 13,540 0.06General Motors Financial Co Inc 3.15% USD 15/01/2020 9,000 8,098 0.03General Motors Financial Co Inc 5.25% USD 01/03/2026 8,000 7,390 0.03Gibraltar Industries Inc 6.25% USD 01/02/2021 35,000 32,396 0.14Goldman Sachs Group Inc 2.6% USD 23/04/2020 100,000 91,472 0.39Goodyear Tire & Rubber Co 5.125% USD 15/11/2023 10,000 9,486 0.04Govt Natl Mtg Association FRN USD 20/11/2064 422,119 39,084 0.17Govt Natl Mtg Association 1.591% USD 20/09/2064 645,828 55,625 0.24Govt Natl Mtg Association 1.688% USD 20/12/2064 1,087,721 98,057 0.42Graphic Packaging International Inc 4.875% USD 15/11/2022 25,000 23,370 0.10H2 Asset Funding Ltd 0% USD 24/06/2049 100,000 80,303 0.35Halliburton Co 3.8% USD 15/11/2025 21,000 18,175 0.08HCA Inc 5.25% USD 15/04/2025 70,000 66,320 0.29HCA Inc 5.375% USD 01/02/2025 30,000 28,147 0.12HCA Inc 7.5% USD 15/02/2022 60,000 62,427 0.27HCP Inc 4% USD 01/12/2022 27,000 24,312 0.10Hertz Corp 6.75% USD 15/04/2019 29,000 26,643 0.12Hess Corp 1.3% USD 15/06/2017 13,000 11,379 0.05Highbridge Loan Management 6-2015 Ltd FRN USD 05/05/2027 500,000 384,752 1.66Host Hotels & Resorts LP 4.5% USD 01/02/2026 100,000 91,578 0.40Hughes Satellite Systems Corp 7.625% USD 15/06/2021 60,000 59,740 0.26Intel Corp 4.9% USD 29/07/2045 53,000 52,887 0.23Intercontinental Exchange Inc 2.75% USD 01/12/2020 15,000 14,055 0.06International Lease Finance Corp 5.875% USD 15/08/2022 66,000 64,425 0.28International Paper Co 5.15% USD 15/05/2046 37,000 29,809 0.13John Deere Capital Corp 3.15% USD 15/10/2021 40,000 38,258 0.17JP Morgan Chase Capital XXIII FRN USD 15/05/2047 200,000 125,634 0.54KKR CLO 11 Ltd 2.421% USD 15/04/2027 250,000 219,433 0.95Kohl's Corp 5.55% USD 17/07/2045 54,000 43,769 0.19L-3 Communications Corp 3.95% USD 28/05/2024 18,000 15,447 0.07Laboratory Corp of America Holdings 4.7% USD 01/02/2045 44,000 37,957 0.16Lamar Media Corp 5% USD 01/05/2023 23,000 21,500 0.09Lennar Corp 4.875% USD 15/12/2023 12,000 10,832 0.05Level 3 Financing Inc 5.375% USD 15/08/2022 50,000 47,142 0.20Mead Johnson Nutrition Co 4.125% USD 15/11/2025 10,000 9,486 0.04Mediacom Broadband LLC 5.5% USD 15/04/2021 50,000 44,500 0.19Meritage Homes Corp 7.15% USD 15/04/2020 10,000 9,578 0.04Meritor Inc 6.75% USD 15/06/2021 25,000 19,752 0.09MGM Resorts International 6% USD 15/03/2023 45,000 42,272 0.18Molx LP 5.5% USD 15/02/2023 30,000 24,571 0.11Moody's Corp 4.875% USD 15/02/2024 50,000 50,150 0.22Morgan Stanley FRN USD Perpetual 100,000 85,670 0.37Netflix Inc 5.75% USD 01/03/2024 50,000 48,233 0.21
Invesco Active Multi-Sector Credit Fund
Statement of Investments as at 29 February 2016
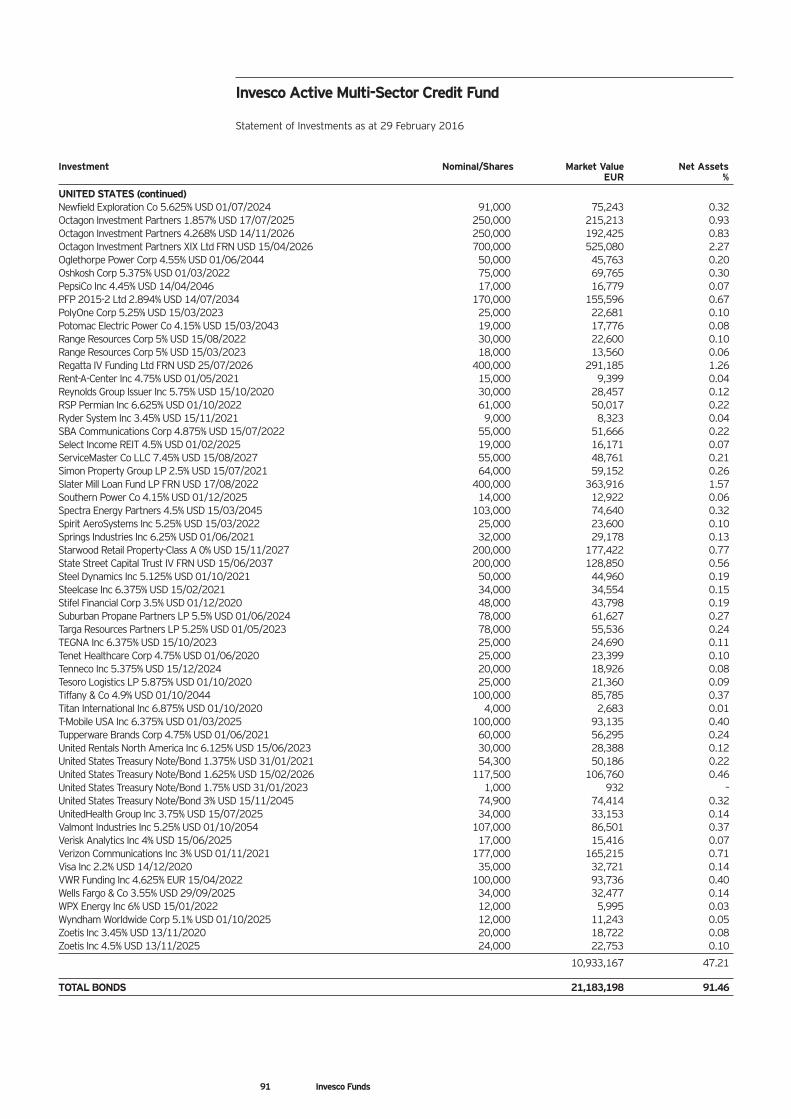
91 Invesco Funds
Investment Nominal/Shares Market Value Net AssetsEUR %
UNITED STATES (continued)Newfield Exploration Co 5.625% USD 01/07/2024 91,000 75,243 0.32Octagon Investment Partners 1.857% USD 17/07/2025 250,000 215,213 0.93Octagon Investment Partners 4.268% USD 14/11/2026 250,000 192,425 0.83Octagon Investment Partners XIX Ltd FRN USD 15/04/2026 700,000 525,080 2.27Oglethorpe Power Corp 4.55% USD 01/06/2044 50,000 45,763 0.20Oshkosh Corp 5.375% USD 01/03/2022 75,000 69,765 0.30PepsiCo Inc 4.45% USD 14/04/2046 17,000 16,779 0.07PFP 2015-2 Ltd 2.894% USD 14/07/2034 170,000 155,596 0.67PolyOne Corp 5.25% USD 15/03/2023 25,000 22,681 0.10Potomac Electric Power Co 4.15% USD 15/03/2043 19,000 17,776 0.08Range Resources Corp 5% USD 15/08/2022 30,000 22,600 0.10Range Resources Corp 5% USD 15/03/2023 18,000 13,560 0.06Regatta IV Funding Ltd FRN USD 25/07/2026 400,000 291,185 1.26Rent-A-Center Inc 4.75% USD 01/05/2021 15,000 9,399 0.04Reynolds Group Issuer Inc 5.75% USD 15/10/2020 30,000 28,457 0.12RSP Permian Inc 6.625% USD 01/10/2022 61,000 50,017 0.22Ryder System Inc 3.45% USD 15/11/2021 9,000 8,323 0.04SBA Communications Corp 4.875% USD 15/07/2022 55,000 51,666 0.22Select Income REIT 4.5% USD 01/02/2025 19,000 16,171 0.07ServiceMaster Co LLC 7.45% USD 15/08/2027 55,000 48,761 0.21Simon Property Group LP 2.5% USD 15/07/2021 64,000 59,152 0.26Slater Mill Loan Fund LP FRN USD 17/08/2022 400,000 363,916 1.57Southern Power Co 4.15% USD 01/12/2025 14,000 12,922 0.06Spectra Energy Partners 4.5% USD 15/03/2045 103,000 74,640 0.32Spirit AeroSystems Inc 5.25% USD 15/03/2022 25,000 23,600 0.10Springs Industries Inc 6.25% USD 01/06/2021 32,000 29,178 0.13Starwood Retail Property-Class A 0% USD 15/11/2027 200,000 177,422 0.77State Street Capital Trust IV FRN USD 15/06/2037 200,000 128,850 0.56Steel Dynamics Inc 5.125% USD 01/10/2021 50,000 44,960 0.19Steelcase Inc 6.375% USD 15/02/2021 34,000 34,554 0.15Stifel Financial Corp 3.5% USD 01/12/2020 48,000 43,798 0.19Suburban Propane Partners LP 5.5% USD 01/06/2024 78,000 61,627 0.27Targa Resources Partners LP 5.25% USD 01/05/2023 78,000 55,536 0.24TEGNA Inc 6.375% USD 15/10/2023 25,000 24,690 0.11Tenet Healthcare Corp 4.75% USD 01/06/2020 25,000 23,399 0.10Tenneco Inc 5.375% USD 15/12/2024 20,000 18,926 0.08Tesoro Logistics LP 5.875% USD 01/10/2020 25,000 21,360 0.09Tiffany & Co 4.9% USD 01/10/2044 100,000 85,785 0.37Titan International Inc 6.875% USD 01/10/2020 4,000 2,683 0.01T-Mobile USA Inc 6.375% USD 01/03/2025 100,000 93,135 0.40Tupperware Brands Corp 4.75% USD 01/06/2021 60,000 56,295 0.24United Rentals North America Inc 6.125% USD 15/06/2023 30,000 28,388 0.12United States Treasury Note/Bond 1.375% USD 31/01/2021 54,300 50,186 0.22United States Treasury Note/Bond 1.625% USD 15/02/2026 117,500 106,760 0.46United States Treasury Note/Bond 1.75% USD 31/01/2023 1,000 932 –United States Treasury Note/Bond 3% USD 15/11/2045 74,900 74,414 0.32UnitedHealth Group Inc 3.75% USD 15/07/2025 34,000 33,153 0.14Valmont Industries Inc 5.25% USD 01/10/2054 107,000 86,501 0.37Verisk Analytics Inc 4% USD 15/06/2025 17,000 15,416 0.07Verizon Communications Inc 3% USD 01/11/2021 177,000 165,215 0.71Visa Inc 2.2% USD 14/12/2020 35,000 32,721 0.14VWR Funding Inc 4.625% EUR 15/04/2022 100,000 93,736 0.40Wells Fargo & Co 3.55% USD 29/09/2025 34,000 32,477 0.14WPX Energy Inc 6% USD 15/01/2022 12,000 5,995 0.03Wyndham Worldwide Corp 5.1% USD 01/10/2025 12,000 11,243 0.05Zoetis Inc 3.45% USD 13/11/2020 20,000 18,722 0.08Zoetis Inc 4.5% USD 13/11/2025 24,000 22,753 0.10
10,933,167 47.21
TOTAL BONDS 21,183,198 91.46
Invesco Active Multi-Sector Credit Fund
Statement of Investments as at 29 February 2016
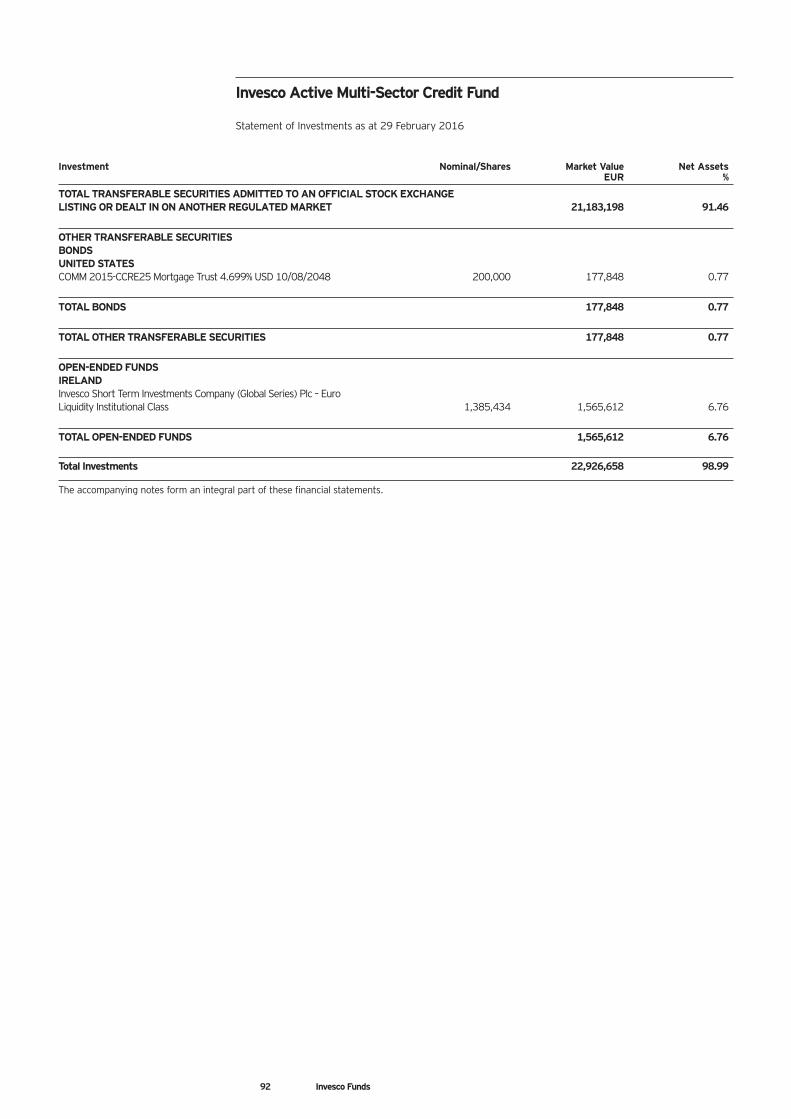
92 Invesco Funds
Investment Nominal/Shares Market Value Net AssetsEUR %
TOTAL TRANSFERABLE SECURITIES ADMITTED TO AN OFFICIAL STOCK EXCHANGE LISTING OR DEALT IN ON ANOTHER REGULATED MARKET 21,183,198 91.46
OTHER TRANSFERABLE SECURITIESBONDSUNITED STATESCOMM 2015-CCRE25 Mortgage Trust 4.699% USD 10/08/2048 200,000 177,848 0.77
TOTAL BONDS 177,848 0.77
TOTAL OTHER TRANSFERABLE SECURITIES 177,848 0.77
OPEN-ENDED FUNDSIRELANDInvesco Short Term Investments Company (Global Series) Plc – Euro Liquidity Institutional Class 1,385,434 1,565,612 6.76
TOTAL OPEN-ENDED FUNDS 1,565,612 6.76
Total Investments 22,926,658 98.99
The accompanying notes form an integral part of these financial statements.
Invesco Active Multi-Sector Credit Fund
Statement of Investments as at 29 February 2016
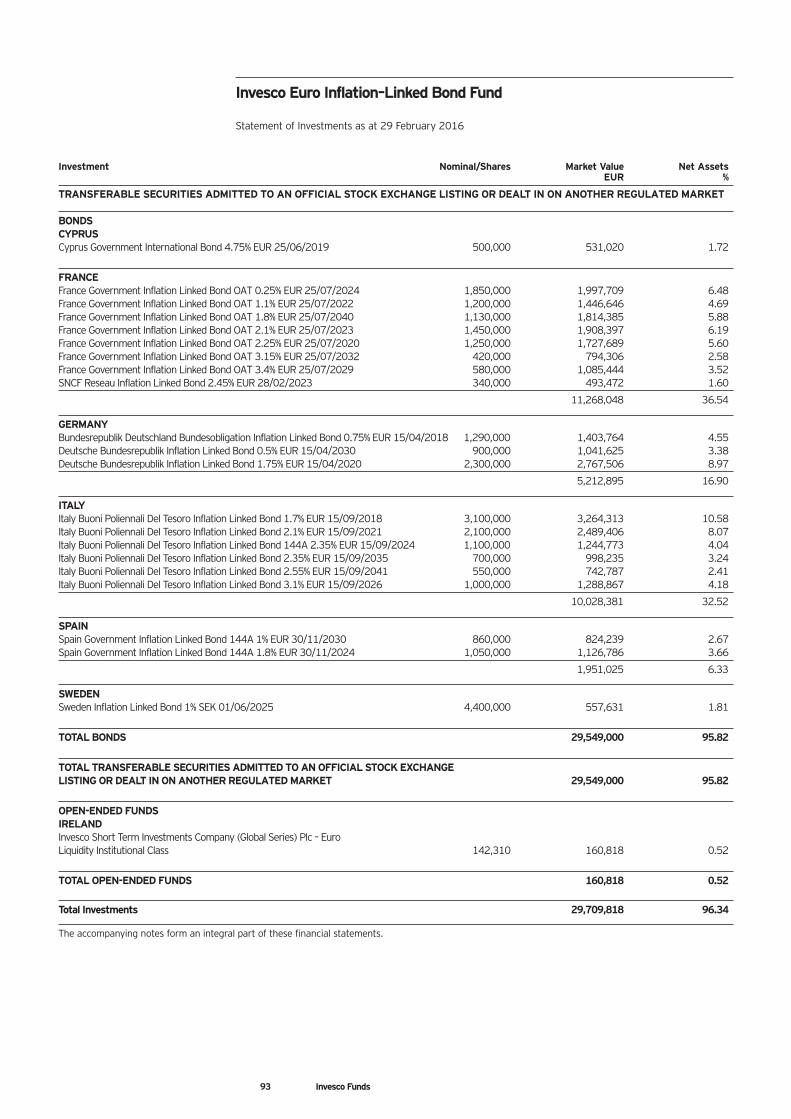
93 Invesco Funds
Investment Nominal/Shares Market Value Net AssetsEUR %
TRANSFERABLE SECURITIES ADMITTED TO AN OFFICIAL STOCK EXCHANGE LISTING OR DEALT IN ON ANOTHER REGULATED MARKET
BONDSCYPRUSCyprus Government International Bond 4.75% EUR 25/06/2019 500,000 531,020 1.72
FRANCEFrance Government Inflation Linked Bond OAT 0.25% EUR 25/07/2024 1,850,000 1,997,709 6.48France Government Inflation Linked Bond OAT 1.1% EUR 25/07/2022 1,200,000 1,446,646 4.69France Government Inflation Linked Bond OAT 1.8% EUR 25/07/2040 1,130,000 1,814,385 5.88France Government Inflation Linked Bond OAT 2.1% EUR 25/07/2023 1,450,000 1,908,397 6.19France Government Inflation Linked Bond OAT 2.25% EUR 25/07/2020 1,250,000 1,727,689 5.60France Government Inflation Linked Bond OAT 3.15% EUR 25/07/2032 420,000 794,306 2.58France Government Inflation Linked Bond OAT 3.4% EUR 25/07/2029 580,000 1,085,444 3.52SNCF Reseau Inflation Linked Bond 2.45% EUR 28/02/2023 340,000 493,472 1.60
11,268,048 36.54
GERMANYBundesrepublik Deutschland Bundesobligation Inflation Linked Bond 0.75% EUR 15/04/2018 1,290,000 1,403,764 4.55Deutsche Bundesrepublik Inflation Linked Bond 0.5% EUR 15/04/2030 900,000 1,041,625 3.38Deutsche Bundesrepublik Inflation Linked Bond 1.75% EUR 15/04/2020 2,300,000 2,767,506 8.97
5,212,895 16.90
ITALYItaly Buoni Poliennali Del Tesoro Inflation Linked Bond 1.7% EUR 15/09/2018 3,100,000 3,264,313 10.58Italy Buoni Poliennali Del Tesoro Inflation Linked Bond 2.1% EUR 15/09/2021 2,100,000 2,489,406 8.07Italy Buoni Poliennali Del Tesoro Inflation Linked Bond 144A 2.35% EUR 15/09/2024 1,100,000 1,244,773 4.04Italy Buoni Poliennali Del Tesoro Inflation Linked Bond 2.35% EUR 15/09/2035 700,000 998,235 3.24Italy Buoni Poliennali Del Tesoro Inflation Linked Bond 2.55% EUR 15/09/2041 550,000 742,787 2.41Italy Buoni Poliennali Del Tesoro Inflation Linked Bond 3.1% EUR 15/09/2026 1,000,000 1,288,867 4.18
10,028,381 32.52
SPAINSpain Government Inflation Linked Bond 144A 1% EUR 30/11/2030 860,000 824,239 2.67Spain Government Inflation Linked Bond 144A 1.8% EUR 30/11/2024 1,050,000 1,126,786 3.66
1,951,025 6.33
SWEDENSweden Inflation Linked Bond 1% SEK 01/06/2025 4,400,000 557,631 1.81
TOTAL BONDS 29,549,000 95.82
TOTAL TRANSFERABLE SECURITIES ADMITTED TO AN OFFICIAL STOCK EXCHANGE LISTING OR DEALT IN ON ANOTHER REGULATED MARKET 29,549,000 95.82
OPEN-ENDED FUNDSIRELANDInvesco Short Term Investments Company (Global Series) Plc – Euro Liquidity Institutional Class 142,310 160,818 0.52
TOTAL OPEN-ENDED FUNDS 160,818 0.52
Total Investments 29,709,818 96.34
The accompanying notes form an integral part of these financial statements.
Invesco Euro Inflation–Linked Bond Fund
Statement of Investments as at 29 February 2016
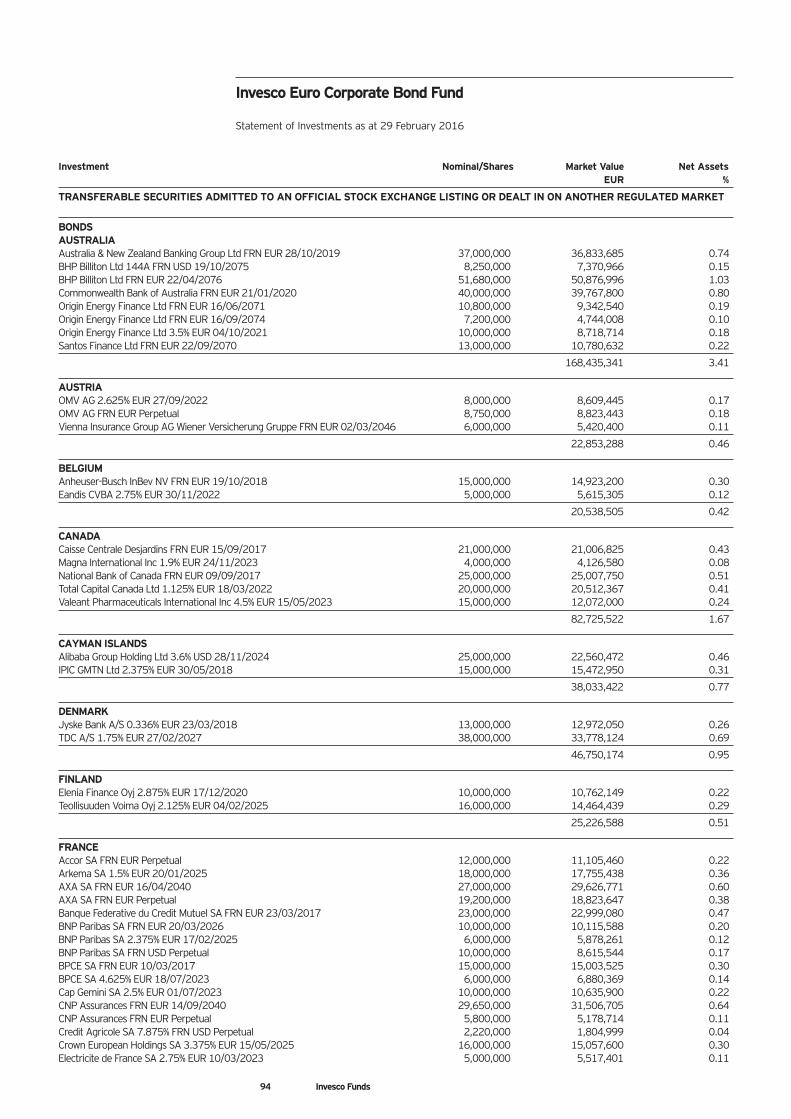
94 Invesco Funds
Investment Nominal/Shares Market Value Net AssetsEUR %
TRANSFERABLE SECURITIES ADMITTED TO AN OFFICIAL STOCK EXCHANGE LISTING OR DEALT IN ON ANOTHER REGULATED MARKET
BONDSAUSTRALIAAustralia & New Zealand Banking Group Ltd FRN EUR 28/10/2019 37,000,000 36,833,685 0.74BHP Billiton Ltd 144A FRN USD 19/10/2075 8,250,000 7,370,966 0.15BHP Billiton Ltd FRN EUR 22/04/2076 51,680,000 50,876,996 1.03Commonwealth Bank of Australia FRN EUR 21/01/2020 40,000,000 39,767,800 0.80Origin Energy Finance Ltd FRN EUR 16/06/2071 10,800,000 9,342,540 0.19Origin Energy Finance Ltd FRN EUR 16/09/2074 7,200,000 4,744,008 0.10Origin Energy Finance Ltd 3.5% EUR 04/10/2021 10,000,000 8,718,714 0.18Santos Finance Ltd FRN EUR 22/09/2070 13,000,000 10,780,632 0.22
168,435,341 3.41
AUSTRIAOMV AG 2.625% EUR 27/09/2022 8,000,000 8,609,445 0.17OMV AG FRN EUR Perpetual 8,750,000 8,823,443 0.18Vienna Insurance Group AG Wiener Versicherung Gruppe FRN EUR 02/03/2046 6,000,000 5,420,400 0.11
22,853,288 0.46
BELGIUMAnheuser-Busch InBev NV FRN EUR 19/10/2018 15,000,000 14,923,200 0.30Eandis CVBA 2.75% EUR 30/11/2022 5,000,000 5,615,305 0.12
20,538,505 0.42
CANADACaisse Centrale Desjardins FRN EUR 15/09/2017 21,000,000 21,006,825 0.43Magna International Inc 1.9% EUR 24/11/2023 4,000,000 4,126,580 0.08National Bank of Canada FRN EUR 09/09/2017 25,000,000 25,007,750 0.51Total Capital Canada Ltd 1.125% EUR 18/03/2022 20,000,000 20,512,367 0.41Valeant Pharmaceuticals International Inc 4.5% EUR 15/05/2023 15,000,000 12,072,000 0.24
82,725,522 1.67
CAYMAN ISLANDSAlibaba Group Holding Ltd 3.6% USD 28/11/2024 25,000,000 22,560,472 0.46IPIC GMTN Ltd 2.375% EUR 30/05/2018 15,000,000 15,472,950 0.31
38,033,422 0.77
DENMARKJyske Bank A/S 0.336% EUR 23/03/2018 13,000,000 12,972,050 0.26TDC A/S 1.75% EUR 27/02/2027 38,000,000 33,778,124 0.69
46,750,174 0.95
FINLANDElenia Finance Oyj 2.875% EUR 17/12/2020 10,000,000 10,762,149 0.22Teollisuuden Voima Oyj 2.125% EUR 04/02/2025 16,000,000 14,464,439 0.29
25,226,588 0.51
FRANCEAccor SA FRN EUR Perpetual 12,000,000 11,105,460 0.22Arkema SA 1.5% EUR 20/01/2025 18,000,000 17,755,438 0.36AXA SA FRN EUR 16/04/2040 27,000,000 29,626,771 0.60AXA SA FRN EUR Perpetual 19,200,000 18,823,647 0.38Banque Federative du Credit Mutuel SA FRN EUR 23/03/2017 23,000,000 22,999,080 0.47BNP Paribas SA FRN EUR 20/03/2026 10,000,000 10,115,588 0.20BNP Paribas SA 2.375% EUR 17/02/2025 6,000,000 5,878,261 0.12BNP Paribas SA FRN USD Perpetual 10,000,000 8,615,544 0.17BPCE SA FRN EUR 10/03/2017 15,000,000 15,003,525 0.30BPCE SA 4.625% EUR 18/07/2023 6,000,000 6,880,369 0.14Cap Gemini SA 2.5% EUR 01/07/2023 10,000,000 10,635,900 0.22CNP Assurances FRN EUR 14/09/2040 29,650,000 31,506,705 0.64CNP Assurances FRN EUR Perpetual 5,800,000 5,178,714 0.11Credit Agricole SA 7.875% FRN USD Perpetual 2,220,000 1,804,999 0.04Crown European Holdings SA 3.375% EUR 15/05/2025 16,000,000 15,057,600 0.30Electricite de France SA 2.75% EUR 10/03/2023 5,000,000 5,517,401 0.11
Invesco Euro Corporate Bond Fund
Statement of Investments as at 29 February 2016
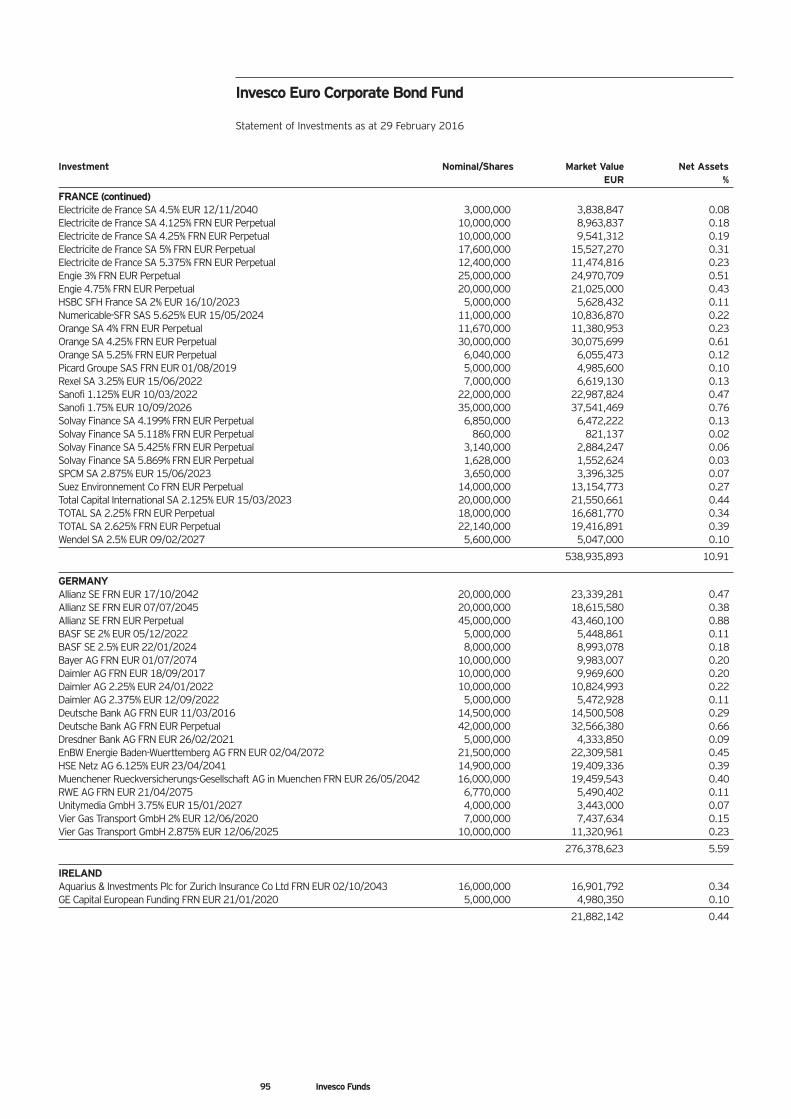
95 Invesco Funds
Investment Nominal/Shares Market Value Net AssetsEUR %
FRANCE (continued)Electricite de France SA 4.5% EUR 12/11/2040 3,000,000 3,838,847 0.08Electricite de France SA 4.125% FRN EUR Perpetual 10,000,000 8,963,837 0.18Electricite de France SA 4.25% FRN EUR Perpetual 10,000,000 9,541,312 0.19Electricite de France SA 5% FRN EUR Perpetual 17,600,000 15,527,270 0.31Electricite de France SA 5.375% FRN EUR Perpetual 12,400,000 11,474,816 0.23Engie 3% FRN EUR Perpetual 25,000,000 24,970,709 0.51Engie 4.75% FRN EUR Perpetual 20,000,000 21,025,000 0.43HSBC SFH France SA 2% EUR 16/10/2023 5,000,000 5,628,432 0.11Numericable-SFR SAS 5.625% EUR 15/05/2024 11,000,000 10,836,870 0.22Orange SA 4% FRN EUR Perpetual 11,670,000 11,380,953 0.23Orange SA 4.25% FRN EUR Perpetual 30,000,000 30,075,699 0.61Orange SA 5.25% FRN EUR Perpetual 6,040,000 6,055,473 0.12Picard Groupe SAS FRN EUR 01/08/2019 5,000,000 4,985,600 0.10Rexel SA 3.25% EUR 15/06/2022 7,000,000 6,619,130 0.13Sanofi 1.125% EUR 10/03/2022 22,000,000 22,987,824 0.47Sanofi 1.75% EUR 10/09/2026 35,000,000 37,541,469 0.76Solvay Finance SA 4.199% FRN EUR Perpetual 6,850,000 6,472,222 0.13Solvay Finance SA 5.118% FRN EUR Perpetual 860,000 821,137 0.02Solvay Finance SA 5.425% FRN EUR Perpetual 3,140,000 2,884,247 0.06Solvay Finance SA 5.869% FRN EUR Perpetual 1,628,000 1,552,624 0.03SPCM SA 2.875% EUR 15/06/2023 3,650,000 3,396,325 0.07Suez Environnement Co FRN EUR Perpetual 14,000,000 13,154,773 0.27Total Capital International SA 2.125% EUR 15/03/2023 20,000,000 21,550,661 0.44TOTAL SA 2.25% FRN EUR Perpetual 18,000,000 16,681,770 0.34TOTAL SA 2.625% FRN EUR Perpetual 22,140,000 19,416,891 0.39Wendel SA 2.5% EUR 09/02/2027 5,600,000 5,047,000 0.10
538,935,893 10.91
GERMANYAllianz SE FRN EUR 17/10/2042 20,000,000 23,339,281 0.47Allianz SE FRN EUR 07/07/2045 20,000,000 18,615,580 0.38Allianz SE FRN EUR Perpetual 45,000,000 43,460,100 0.88BASF SE 2% EUR 05/12/2022 5,000,000 5,448,861 0.11BASF SE 2.5% EUR 22/01/2024 8,000,000 8,993,078 0.18Bayer AG FRN EUR 01/07/2074 10,000,000 9,983,007 0.20Daimler AG FRN EUR 18/09/2017 10,000,000 9,969,600 0.20Daimler AG 2.25% EUR 24/01/2022 10,000,000 10,824,993 0.22Daimler AG 2.375% EUR 12/09/2022 5,000,000 5,472,928 0.11Deutsche Bank AG FRN EUR 11/03/2016 14,500,000 14,500,508 0.29Deutsche Bank AG FRN EUR Perpetual 42,000,000 32,566,380 0.66Dresdner Bank AG FRN EUR 26/02/2021 5,000,000 4,333,850 0.09EnBW Energie Baden-Wuerttemberg AG FRN EUR 02/04/2072 21,500,000 22,309,581 0.45HSE Netz AG 6.125% EUR 23/04/2041 14,900,000 19,409,336 0.39Muenchener Rueckversicherungs-Gesellschaft AG in Muenchen FRN EUR 26/05/2042 16,000,000 19,459,543 0.40RWE AG FRN EUR 21/04/2075 6,770,000 5,490,402 0.11Unitymedia GmbH 3.75% EUR 15/01/2027 4,000,000 3,443,000 0.07Vier Gas Transport GmbH 2% EUR 12/06/2020 7,000,000 7,437,634 0.15Vier Gas Transport GmbH 2.875% EUR 12/06/2025 10,000,000 11,320,961 0.23
276,378,623 5.59
IRELANDAquarius & Investments Plc for Zurich Insurance Co Ltd FRN EUR 02/10/2043 16,000,000 16,901,792 0.34GE Capital European Funding FRN EUR 21/01/2020 5,000,000 4,980,350 0.10
21,882,142 0.44
Invesco Euro Corporate Bond Fund
Statement of Investments as at 29 February 2016
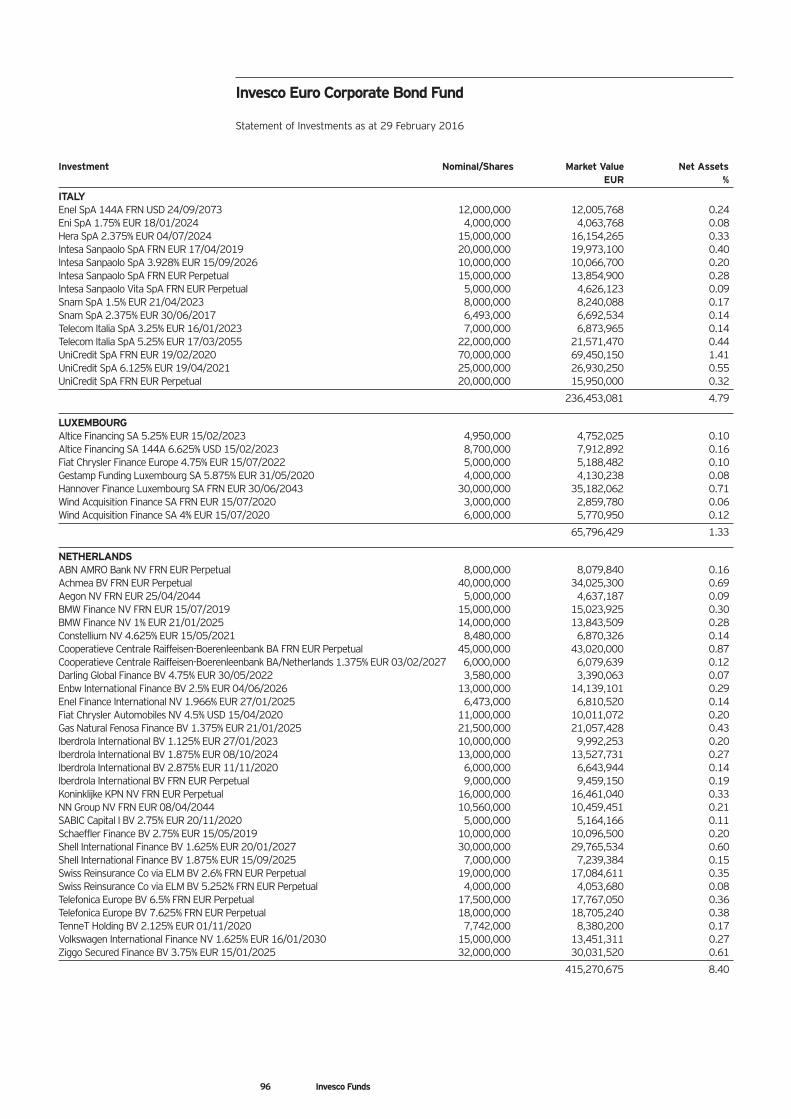
96 Invesco Funds
Investment Nominal/Shares Market Value Net AssetsEUR %
ITALYEnel SpA 144A FRN USD 24/09/2073 12,000,000 12,005,768 0.24Eni SpA 1.75% EUR 18/01/2024 4,000,000 4,063,768 0.08Hera SpA 2.375% EUR 04/07/2024 15,000,000 16,154,265 0.33Intesa Sanpaolo SpA FRN EUR 17/04/2019 20,000,000 19,973,100 0.40Intesa Sanpaolo SpA 3.928% EUR 15/09/2026 10,000,000 10,066,700 0.20Intesa Sanpaolo SpA FRN EUR Perpetual 15,000,000 13,854,900 0.28Intesa Sanpaolo Vita SpA FRN EUR Perpetual 5,000,000 4,626,123 0.09Snam SpA 1.5% EUR 21/04/2023 8,000,000 8,240,088 0.17Snam SpA 2.375% EUR 30/06/2017 6,493,000 6,692,534 0.14Telecom Italia SpA 3.25% EUR 16/01/2023 7,000,000 6,873,965 0.14Telecom Italia SpA 5.25% EUR 17/03/2055 22,000,000 21,571,470 0.44UniCredit SpA FRN EUR 19/02/2020 70,000,000 69,450,150 1.41UniCredit SpA 6.125% EUR 19/04/2021 25,000,000 26,930,250 0.55UniCredit SpA FRN EUR Perpetual 20,000,000 15,950,000 0.32
236,453,081 4.79
LUXEMBOURGAltice Financing SA 5.25% EUR 15/02/2023 4,950,000 4,752,025 0.10Altice Financing SA 144A 6.625% USD 15/02/2023 8,700,000 7,912,892 0.16Fiat Chrysler Finance Europe 4.75% EUR 15/07/2022 5,000,000 5,188,482 0.10Gestamp Funding Luxembourg SA 5.875% EUR 31/05/2020 4,000,000 4,130,238 0.08Hannover Finance Luxembourg SA FRN EUR 30/06/2043 30,000,000 35,182,062 0.71Wind Acquisition Finance SA FRN EUR 15/07/2020 3,000,000 2,859,780 0.06Wind Acquisition Finance SA 4% EUR 15/07/2020 6,000,000 5,770,950 0.12
65,796,429 1.33
NETHERLANDSABN AMRO Bank NV FRN EUR Perpetual 8,000,000 8,079,840 0.16Achmea BV FRN EUR Perpetual 40,000,000 34,025,300 0.69Aegon NV FRN EUR 25/04/2044 5,000,000 4,637,187 0.09BMW Finance NV FRN EUR 15/07/2019 15,000,000 15,023,925 0.30BMW Finance NV 1% EUR 21/01/2025 14,000,000 13,843,509 0.28Constellium NV 4.625% EUR 15/05/2021 8,480,000 6,870,326 0.14Cooperatieve Centrale Raiffeisen-Boerenleenbank BA FRN EUR Perpetual 45,000,000 43,020,000 0.87Cooperatieve Centrale Raiffeisen-Boerenleenbank BA/Netherlands 1.375% EUR 03/02/2027 6,000,000 6,079,639 0.12Darling Global Finance BV 4.75% EUR 30/05/2022 3,580,000 3,390,063 0.07Enbw International Finance BV 2.5% EUR 04/06/2026 13,000,000 14,139,101 0.29Enel Finance International NV 1.966% EUR 27/01/2025 6,473,000 6,810,520 0.14Fiat Chrysler Automobiles NV 4.5% USD 15/04/2020 11,000,000 10,011,072 0.20Gas Natural Fenosa Finance BV 1.375% EUR 21/01/2025 21,500,000 21,057,428 0.43Iberdrola International BV 1.125% EUR 27/01/2023 10,000,000 9,992,253 0.20Iberdrola International BV 1.875% EUR 08/10/2024 13,000,000 13,527,731 0.27Iberdrola International BV 2.875% EUR 11/11/2020 6,000,000 6,643,944 0.14Iberdrola International BV FRN EUR Perpetual 9,000,000 9,459,150 0.19Koninklijke KPN NV FRN EUR Perpetual 16,000,000 16,461,040 0.33NN Group NV FRN EUR 08/04/2044 10,560,000 10,459,451 0.21SABIC Capital I BV 2.75% EUR 20/11/2020 5,000,000 5,164,166 0.11Schaeffler Finance BV 2.75% EUR 15/05/2019 10,000,000 10,096,500 0.20Shell International Finance BV 1.625% EUR 20/01/2027 30,000,000 29,765,534 0.60Shell International Finance BV 1.875% EUR 15/09/2025 7,000,000 7,239,384 0.15Swiss Reinsurance Co via ELM BV 2.6% FRN EUR Perpetual 19,000,000 17,084,611 0.35Swiss Reinsurance Co via ELM BV 5.252% FRN EUR Perpetual 4,000,000 4,053,680 0.08Telefonica Europe BV 6.5% FRN EUR Perpetual 17,500,000 17,767,050 0.36Telefonica Europe BV 7.625% FRN EUR Perpetual 18,000,000 18,705,240 0.38TenneT Holding BV 2.125% EUR 01/11/2020 7,742,000 8,380,200 0.17Volkswagen International Finance NV 1.625% EUR 16/01/2030 15,000,000 13,451,311 0.27Ziggo Secured Finance BV 3.75% EUR 15/01/2025 32,000,000 30,031,520 0.61
415,270,675 8.40
Invesco Euro Corporate Bond Fund
Statement of Investments as at 29 February 2016
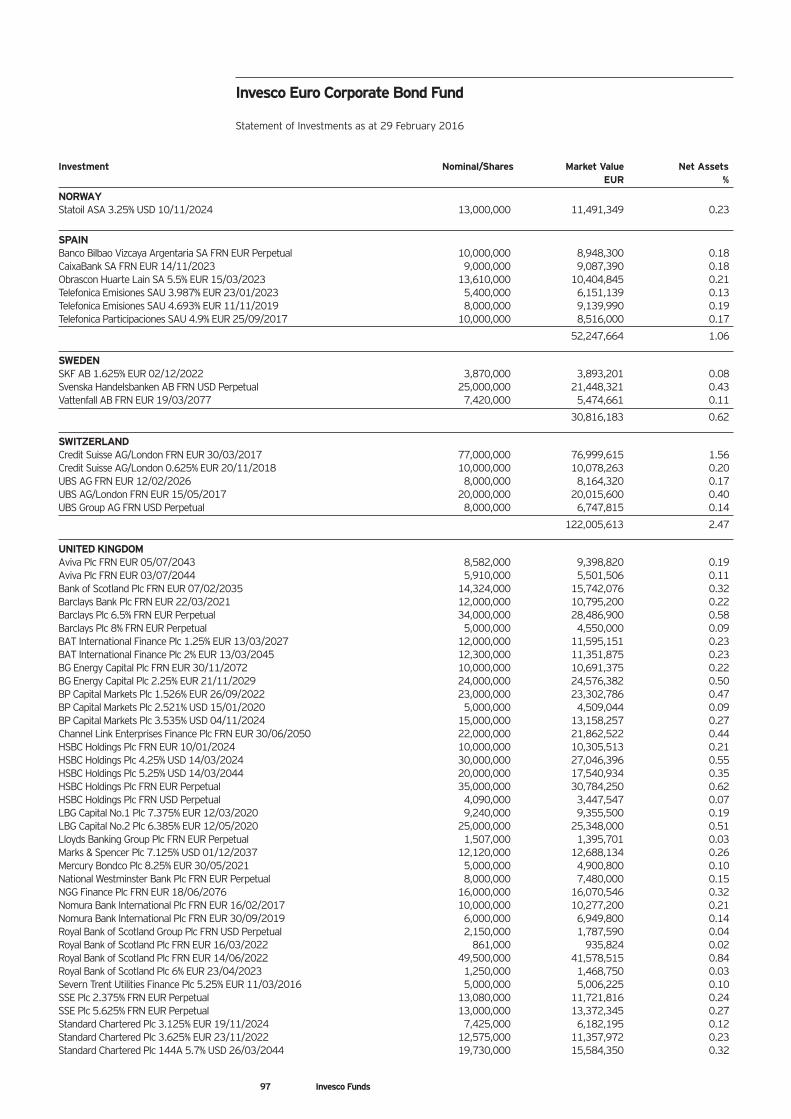
97 Invesco Funds
Investment Nominal/Shares Market Value Net AssetsEUR %
NORWAYStatoil ASA 3.25% USD 10/11/2024 13,000,000 11,491,349 0.23
SPAINBanco Bilbao Vizcaya Argentaria SA FRN EUR Perpetual 10,000,000 8,948,300 0.18CaixaBank SA FRN EUR 14/11/2023 9,000,000 9,087,390 0.18Obrascon Huarte Lain SA 5.5% EUR 15/03/2023 13,610,000 10,404,845 0.21Telefonica Emisiones SAU 3.987% EUR 23/01/2023 5,400,000 6,151,139 0.13Telefonica Emisiones SAU 4.693% EUR 11/11/2019 8,000,000 9,139,990 0.19Telefonica Participaciones SAU 4.9% EUR 25/09/2017 10,000,000 8,516,000 0.17
52,247,664 1.06
SWEDENSKF AB 1.625% EUR 02/12/2022 3,870,000 3,893,201 0.08Svenska Handelsbanken AB FRN USD Perpetual 25,000,000 21,448,321 0.43Vattenfall AB FRN EUR 19/03/2077 7,420,000 5,474,661 0.11
30,816,183 0.62
SWITZERLANDCredit Suisse AG/London FRN EUR 30/03/2017 77,000,000 76,999,615 1.56Credit Suisse AG/London 0.625% EUR 20/11/2018 10,000,000 10,078,263 0.20UBS AG FRN EUR 12/02/2026 8,000,000 8,164,320 0.17UBS AG/London FRN EUR 15/05/2017 20,000,000 20,015,600 0.40UBS Group AG FRN USD Perpetual 8,000,000 6,747,815 0.14
122,005,613 2.47
UNITED KINGDOMAviva Plc FRN EUR 05/07/2043 8,582,000 9,398,820 0.19Aviva Plc FRN EUR 03/07/2044 5,910,000 5,501,506 0.11Bank of Scotland Plc FRN EUR 07/02/2035 14,324,000 15,742,076 0.32Barclays Bank Plc FRN EUR 22/03/2021 12,000,000 10,795,200 0.22Barclays Plc 6.5% FRN EUR Perpetual 34,000,000 28,486,900 0.58Barclays Plc 8% FRN EUR Perpetual 5,000,000 4,550,000 0.09BAT International Finance Plc 1.25% EUR 13/03/2027 12,000,000 11,595,151 0.23BAT International Finance Plc 2% EUR 13/03/2045 12,300,000 11,351,875 0.23BG Energy Capital Plc FRN EUR 30/11/2072 10,000,000 10,691,375 0.22BG Energy Capital Plc 2.25% EUR 21/11/2029 24,000,000 24,576,382 0.50BP Capital Markets Plc 1.526% EUR 26/09/2022 23,000,000 23,302,786 0.47BP Capital Markets Plc 2.521% USD 15/01/2020 5,000,000 4,509,044 0.09BP Capital Markets Plc 3.535% USD 04/11/2024 15,000,000 13,158,257 0.27Channel Link Enterprises Finance Plc FRN EUR 30/06/2050 22,000,000 21,862,522 0.44HSBC Holdings Plc FRN EUR 10/01/2024 10,000,000 10,305,513 0.21HSBC Holdings Plc 4.25% USD 14/03/2024 30,000,000 27,046,396 0.55HSBC Holdings Plc 5.25% USD 14/03/2044 20,000,000 17,540,934 0.35HSBC Holdings Plc FRN EUR Perpetual 35,000,000 30,784,250 0.62HSBC Holdings Plc FRN USD Perpetual 4,090,000 3,447,547 0.07LBG Capital No.1 Plc 7.375% EUR 12/03/2020 9,240,000 9,355,500 0.19LBG Capital No.2 Plc 6.385% EUR 12/05/2020 25,000,000 25,348,000 0.51Lloyds Banking Group Plc FRN EUR Perpetual 1,507,000 1,395,701 0.03Marks & Spencer Plc 7.125% USD 01/12/2037 12,120,000 12,688,134 0.26Mercury Bondco Plc 8.25% EUR 30/05/2021 5,000,000 4,900,800 0.10National Westminster Bank Plc FRN EUR Perpetual 8,000,000 7,480,000 0.15NGG Finance Plc FRN EUR 18/06/2076 16,000,000 16,070,546 0.32Nomura Bank International Plc FRN EUR 16/02/2017 10,000,000 10,277,200 0.21Nomura Bank International Plc FRN EUR 30/09/2019 6,000,000 6,949,800 0.14Royal Bank of Scotland Group Plc FRN USD Perpetual 2,150,000 1,787,590 0.04Royal Bank of Scotland Plc FRN EUR 16/03/2022 861,000 935,824 0.02Royal Bank of Scotland Plc FRN EUR 14/06/2022 49,500,000 41,578,515 0.84Royal Bank of Scotland Plc 6% EUR 23/04/2023 1,250,000 1,468,750 0.03Severn Trent Utilities Finance Plc 5.25% EUR 11/03/2016 5,000,000 5,006,225 0.10SSE Plc 2.375% FRN EUR Perpetual 13,080,000 11,721,816 0.24SSE Plc 5.625% FRN EUR Perpetual 13,000,000 13,372,345 0.27Standard Chartered Plc 3.125% EUR 19/11/2024 7,425,000 6,182,195 0.12Standard Chartered Plc 3.625% EUR 23/11/2022 12,575,000 11,357,972 0.23Standard Chartered Plc 144A 5.7% USD 26/03/2044 19,730,000 15,584,350 0.32
Invesco Euro Corporate Bond Fund
Statement of Investments as at 29 February 2016
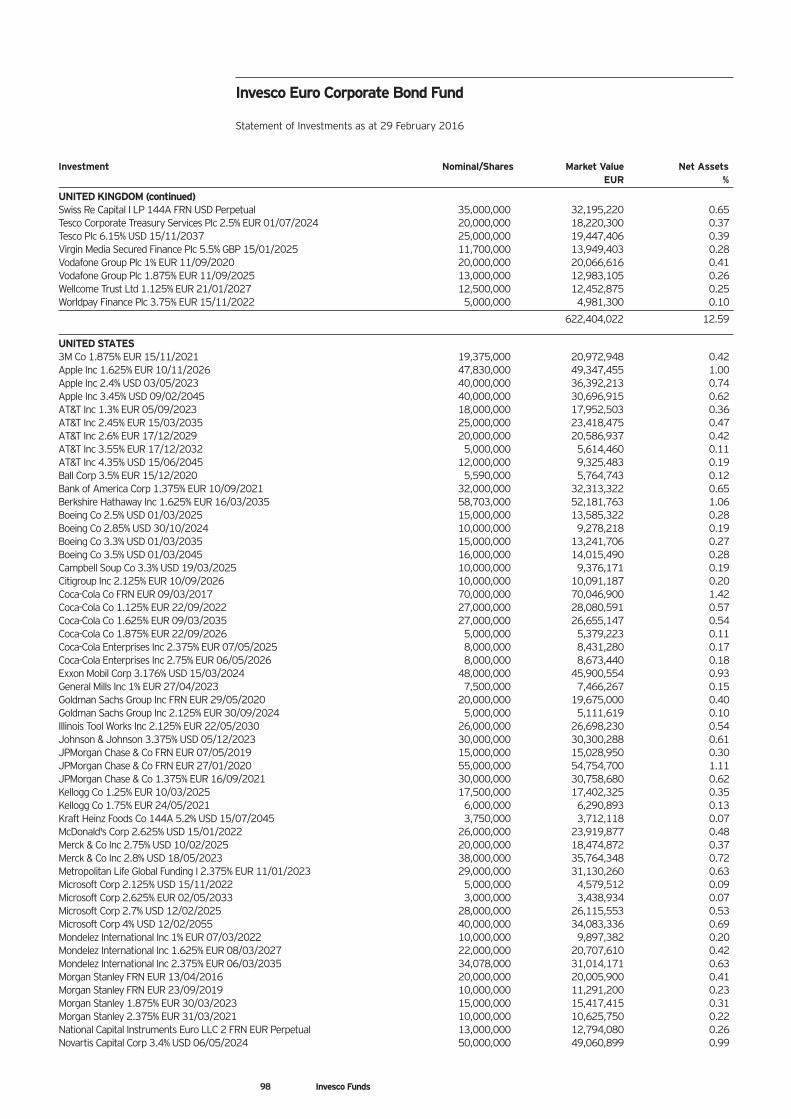
98 Invesco Funds
Investment Nominal/Shares Market Value Net AssetsEUR %
UNITED KINGDOM (continued)Swiss Re Capital I LP 144A FRN USD Perpetual 35,000,000 32,195,220 0.65Tesco Corporate Treasury Services Plc 2.5% EUR 01/07/2024 20,000,000 18,220,300 0.37Tesco Plc 6.15% USD 15/11/2037 25,000,000 19,447,406 0.39Virgin Media Secured Finance Plc 5.5% GBP 15/01/2025 11,700,000 13,949,403 0.28Vodafone Group Plc 1% EUR 11/09/2020 20,000,000 20,066,616 0.41Vodafone Group Plc 1.875% EUR 11/09/2025 13,000,000 12,983,105 0.26Wellcome Trust Ltd 1.125% EUR 21/01/2027 12,500,000 12,452,875 0.25Worldpay Finance Plc 3.75% EUR 15/11/2022 5,000,000 4,981,300 0.10
622,404,022 12.59
UNITED STATES3M Co 1.875% EUR 15/11/2021 19,375,000 20,972,948 0.42Apple Inc 1.625% EUR 10/11/2026 47,830,000 49,347,455 1.00Apple Inc 2.4% USD 03/05/2023 40,000,000 36,392,213 0.74Apple Inc 3.45% USD 09/02/2045 40,000,000 30,696,915 0.62AT&T Inc 1.3% EUR 05/09/2023 18,000,000 17,952,503 0.36AT&T Inc 2.45% EUR 15/03/2035 25,000,000 23,418,475 0.47AT&T Inc 2.6% EUR 17/12/2029 20,000,000 20,586,937 0.42AT&T Inc 3.55% EUR 17/12/2032 5,000,000 5,614,460 0.11AT&T Inc 4.35% USD 15/06/2045 12,000,000 9,325,483 0.19Ball Corp 3.5% EUR 15/12/2020 5,590,000 5,764,743 0.12Bank of America Corp 1.375% EUR 10/09/2021 32,000,000 32,313,322 0.65Berkshire Hathaway Inc 1.625% EUR 16/03/2035 58,703,000 52,181,763 1.06Boeing Co 2.5% USD 01/03/2025 15,000,000 13,585,322 0.28Boeing Co 2.85% USD 30/10/2024 10,000,000 9,278,218 0.19Boeing Co 3.3% USD 01/03/2035 15,000,000 13,241,706 0.27Boeing Co 3.5% USD 01/03/2045 16,000,000 14,015,490 0.28Campbell Soup Co 3.3% USD 19/03/2025 10,000,000 9,376,171 0.19Citigroup Inc 2.125% EUR 10/09/2026 10,000,000 10,091,187 0.20Coca-Cola Co FRN EUR 09/03/2017 70,000,000 70,046,900 1.42Coca-Cola Co 1.125% EUR 22/09/2022 27,000,000 28,080,591 0.57Coca-Cola Co 1.625% EUR 09/03/2035 27,000,000 26,655,147 0.54Coca-Cola Co 1.875% EUR 22/09/2026 5,000,000 5,379,223 0.11Coca-Cola Enterprises Inc 2.375% EUR 07/05/2025 8,000,000 8,431,280 0.17Coca-Cola Enterprises Inc 2.75% EUR 06/05/2026 8,000,000 8,673,440 0.18Exxon Mobil Corp 3.176% USD 15/03/2024 48,000,000 45,900,554 0.93General Mills Inc 1% EUR 27/04/2023 7,500,000 7,466,267 0.15Goldman Sachs Group Inc FRN EUR 29/05/2020 20,000,000 19,675,000 0.40Goldman Sachs Group Inc 2.125% EUR 30/09/2024 5,000,000 5,111,619 0.10Illinois Tool Works Inc 2.125% EUR 22/05/2030 26,000,000 26,698,230 0.54Johnson & Johnson 3.375% USD 05/12/2023 30,000,000 30,300,288 0.61JPMorgan Chase & Co FRN EUR 07/05/2019 15,000,000 15,028,950 0.30JPMorgan Chase & Co FRN EUR 27/01/2020 55,000,000 54,754,700 1.11JPMorgan Chase & Co 1.375% EUR 16/09/2021 30,000,000 30,758,680 0.62Kellogg Co 1.25% EUR 10/03/2025 17,500,000 17,402,325 0.35Kellogg Co 1.75% EUR 24/05/2021 6,000,000 6,290,893 0.13Kraft Heinz Foods Co 144A 5.2% USD 15/07/2045 3,750,000 3,712,118 0.07McDonald's Corp 2.625% USD 15/01/2022 26,000,000 23,919,877 0.48Merck & Co Inc 2.75% USD 10/02/2025 20,000,000 18,474,872 0.37Merck & Co Inc 2.8% USD 18/05/2023 38,000,000 35,764,348 0.72Metropolitan Life Global Funding I 2.375% EUR 11/01/2023 29,000,000 31,130,260 0.63Microsoft Corp 2.125% USD 15/11/2022 5,000,000 4,579,512 0.09Microsoft Corp 2.625% EUR 02/05/2033 3,000,000 3,438,934 0.07Microsoft Corp 2.7% USD 12/02/2025 28,000,000 26,115,553 0.53Microsoft Corp 4% USD 12/02/2055 40,000,000 34,083,336 0.69Mondelez International Inc 1% EUR 07/03/2022 10,000,000 9,897,382 0.20Mondelez International Inc 1.625% EUR 08/03/2027 22,000,000 20,707,610 0.42Mondelez International Inc 2.375% EUR 06/03/2035 34,078,000 31,014,171 0.63Morgan Stanley FRN EUR 13/04/2016 20,000,000 20,005,900 0.41Morgan Stanley FRN EUR 23/09/2019 10,000,000 11,291,200 0.23Morgan Stanley 1.875% EUR 30/03/2023 15,000,000 15,417,415 0.31Morgan Stanley 2.375% EUR 31/03/2021 10,000,000 10,625,750 0.22National Capital Instruments Euro LLC 2 FRN EUR Perpetual 13,000,000 12,794,080 0.26Novartis Capital Corp 3.4% USD 06/05/2024 50,000,000 49,060,899 0.99
Invesco Euro Corporate Bond Fund
Statement of Investments as at 29 February 2016
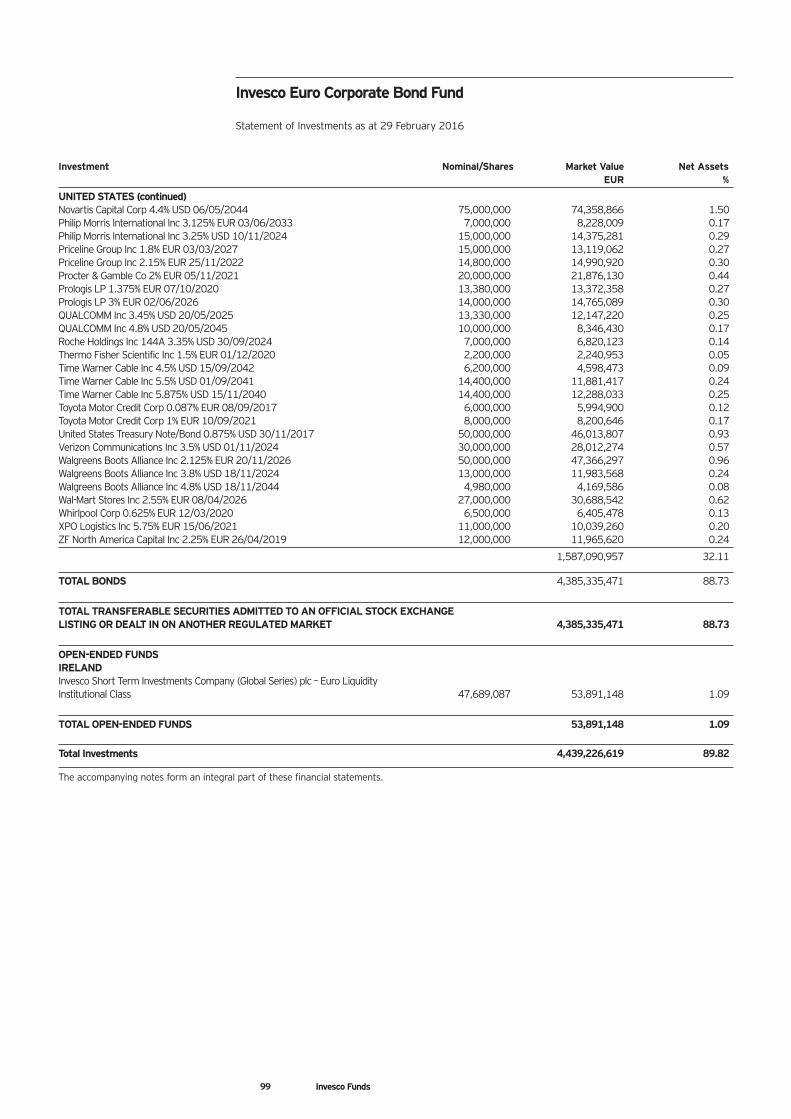
99 Invesco Funds
Investment Nominal/Shares Market Value Net AssetsEUR %
UNITED STATES (continued)Novartis Capital Corp 4.4% USD 06/05/2044 75,000,000 74,358,866 1.50Philip Morris International Inc 3.125% EUR 03/06/2033 7,000,000 8,228,009 0.17Philip Morris International Inc 3.25% USD 10/11/2024 15,000,000 14,375,281 0.29Priceline Group Inc 1.8% EUR 03/03/2027 15,000,000 13,119,062 0.27Priceline Group Inc 2.15% EUR 25/11/2022 14,800,000 14,990,920 0.30Procter & Gamble Co 2% EUR 05/11/2021 20,000,000 21,876,130 0.44Prologis LP 1.375% EUR 07/10/2020 13,380,000 13,372,358 0.27Prologis LP 3% EUR 02/06/2026 14,000,000 14,765,089 0.30QUALCOMM Inc 3.45% USD 20/05/2025 13,330,000 12,147,220 0.25QUALCOMM Inc 4.8% USD 20/05/2045 10,000,000 8,346,430 0.17Roche Holdings Inc 144A 3.35% USD 30/09/2024 7,000,000 6,820,123 0.14Thermo Fisher Scientific Inc 1.5% EUR 01/12/2020 2,200,000 2,240,953 0.05Time Warner Cable Inc 4.5% USD 15/09/2042 6,200,000 4,598,473 0.09Time Warner Cable Inc 5.5% USD 01/09/2041 14,400,000 11,881,417 0.24Time Warner Cable Inc 5.875% USD 15/11/2040 14,400,000 12,288,033 0.25Toyota Motor Credit Corp 0.087% EUR 08/09/2017 6,000,000 5,994,900 0.12Toyota Motor Credit Corp 1% EUR 10/09/2021 8,000,000 8,200,646 0.17United States Treasury Note/Bond 0.875% USD 30/11/2017 50,000,000 46,013,807 0.93Verizon Communications Inc 3.5% USD 01/11/2024 30,000,000 28,012,274 0.57Walgreens Boots Alliance Inc 2.125% EUR 20/11/2026 50,000,000 47,366,297 0.96Walgreens Boots Alliance Inc 3.8% USD 18/11/2024 13,000,000 11,983,568 0.24Walgreens Boots Alliance Inc 4.8% USD 18/11/2044 4,980,000 4,169,586 0.08Wal-Mart Stores Inc 2.55% EUR 08/04/2026 27,000,000 30,688,542 0.62Whirlpool Corp 0.625% EUR 12/03/2020 6,500,000 6,405,478 0.13XPO Logistics Inc 5.75% EUR 15/06/2021 11,000,000 10,039,260 0.20ZF North America Capital Inc 2.25% EUR 26/04/2019 12,000,000 11,965,620 0.24
1,587,090,957 32.11
TOTAL BONDS 4,385,335,471 88.73
TOTAL TRANSFERABLE SECURITIES ADMITTED TO AN OFFICIAL STOCK EXCHANGE LISTING OR DEALT IN ON ANOTHER REGULATED MARKET 4,385,335,471 88.73
OPEN-ENDED FUNDSIRELANDInvesco Short Term Investments Company (Global Series) plc – Euro Liquidity Institutional Class 47,689,087 53,891,148 1.09
TOTAL OPEN-ENDED FUNDS 53,891,148 1.09
Total Investments 4,439,226,619 89.82
The accompanying notes form an integral part of these financial statements.
Invesco Euro Corporate Bond Fund
Statement of Investments as at 29 February 2016
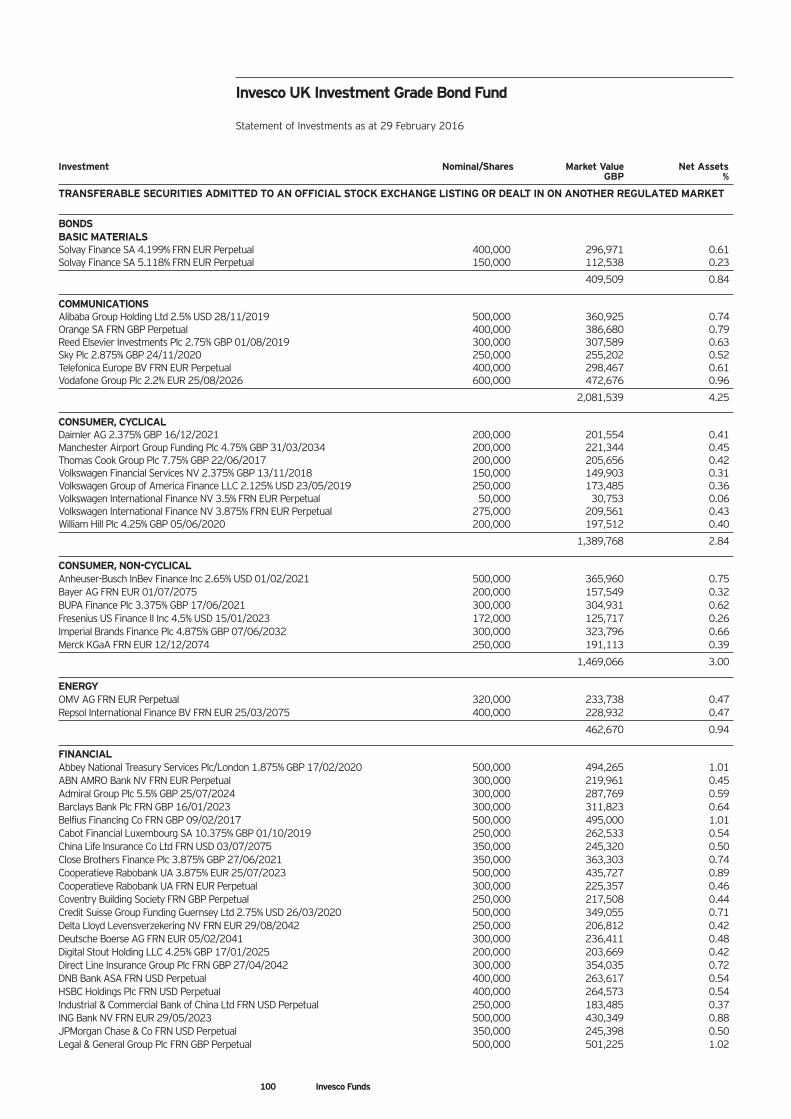
100 Invesco Funds
Investment Nominal/Shares Market Value Net AssetsGBP %
TRANSFERABLE SECURITIES ADMITTED TO AN OFFICIAL STOCK EXCHANGE LISTING OR DEALT IN ON ANOTHER REGULATED MARKET
BONDSBASIC MATERIALSSolvay Finance SA 4.199% FRN EUR Perpetual 400,000 296,971 0.61Solvay Finance SA 5.118% FRN EUR Perpetual 150,000 112,538 0.23
409,509 0.84
COMMUNICATIONSAlibaba Group Holding Ltd 2.5% USD 28/11/2019 500,000 360,925 0.74Orange SA FRN GBP Perpetual 400,000 386,680 0.79Reed Elsevier Investments Plc 2.75% GBP 01/08/2019 300,000 307,589 0.63Sky Plc 2.875% GBP 24/11/2020 250,000 255,202 0.52Telefonica Europe BV FRN EUR Perpetual 400,000 298,467 0.61Vodafone Group Plc 2.2% EUR 25/08/2026 600,000 472,676 0.96
2,081,539 4.25
CONSUMER, CYCLICALDaimler AG 2.375% GBP 16/12/2021 200,000 201,554 0.41Manchester Airport Group Funding Plc 4.75% GBP 31/03/2034 200,000 221,344 0.45Thomas Cook Group Plc 7.75% GBP 22/06/2017 200,000 205,656 0.42Volkswagen Financial Services NV 2.375% GBP 13/11/2018 150,000 149,903 0.31Volkswagen Group of America Finance LLC 2.125% USD 23/05/2019 250,000 173,485 0.36Volkswagen International Finance NV 3.5% FRN EUR Perpetual 50,000 30,753 0.06Volkswagen International Finance NV 3.875% FRN EUR Perpetual 275,000 209,561 0.43William Hill Plc 4.25% GBP 05/06/2020 200,000 197,512 0.40
1,389,768 2.84
CONSUMER, NON-CYCLICALAnheuser-Busch InBev Finance Inc 2.65% USD 01/02/2021 500,000 365,960 0.75Bayer AG FRN EUR 01/07/2075 200,000 157,549 0.32BUPA Finance Plc 3.375% GBP 17/06/2021 300,000 304,931 0.62Fresenius US Finance II Inc 4.5% USD 15/01/2023 172,000 125,717 0.26Imperial Brands Finance Plc 4.875% GBP 07/06/2032 300,000 323,796 0.66Merck KGaA FRN EUR 12/12/2074 250,000 191,113 0.39
1,469,066 3.00
ENERGYOMV AG FRN EUR Perpetual 320,000 233,738 0.47Repsol International Finance BV FRN EUR 25/03/2075 400,000 228,932 0.47
462,670 0.94
FINANCIALAbbey National Treasury Services Plc/London 1.875% GBP 17/02/2020 500,000 494,265 1.01ABN AMRO Bank NV FRN EUR Perpetual 300,000 219,961 0.45Admiral Group Plc 5.5% GBP 25/07/2024 300,000 287,769 0.59Barclays Bank Plc FRN GBP 16/01/2023 300,000 311,823 0.64Belfius Financing Co FRN GBP 09/02/2017 500,000 495,000 1.01Cabot Financial Luxembourg SA 10.375% GBP 01/10/2019 250,000 262,533 0.54China Life Insurance Co Ltd FRN USD 03/07/2075 350,000 245,320 0.50Close Brothers Finance Plc 3.875% GBP 27/06/2021 350,000 363,303 0.74Cooperatieve Rabobank UA 3.875% EUR 25/07/2023 500,000 435,727 0.89Cooperatieve Rabobank UA FRN EUR Perpetual 300,000 225,357 0.46Coventry Building Society FRN GBP Perpetual 250,000 217,508 0.44Credit Suisse Group Funding Guernsey Ltd 2.75% USD 26/03/2020 500,000 349,055 0.71Delta Lloyd Levensverzekering NV FRN EUR 29/08/2042 250,000 206,812 0.42Deutsche Boerse AG FRN EUR 05/02/2041 300,000 236,411 0.48Digital Stout Holding LLC 4.25% GBP 17/01/2025 200,000 203,669 0.42Direct Line Insurance Group Plc FRN GBP 27/04/2042 300,000 354,035 0.72DNB Bank ASA FRN USD Perpetual 400,000 263,617 0.54HSBC Holdings Plc FRN USD Perpetual 400,000 264,573 0.54Industrial & Commercial Bank of China Ltd FRN USD Perpetual 250,000 183,485 0.37ING Bank NV FRN EUR 29/05/2023 500,000 430,349 0.88JPMorgan Chase & Co FRN USD Perpetual 350,000 245,398 0.50Legal & General Group Plc FRN GBP Perpetual 500,000 501,225 1.02
Invesco UK Investment Grade Bond Fund
Statement of Investments as at 29 February 2016
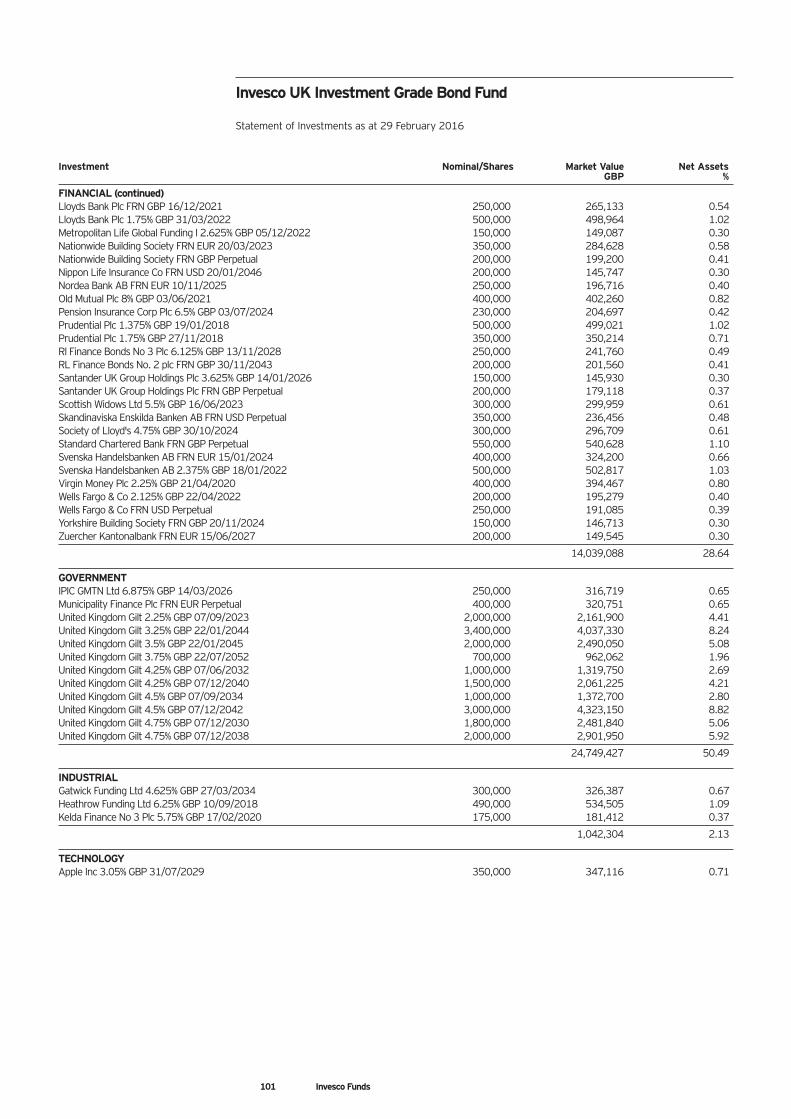
101 Invesco Funds
Investment Nominal/Shares Market Value Net AssetsGBP %
FINANCIAL (continued)Lloyds Bank Plc FRN GBP 16/12/2021 250,000 265,133 0.54Lloyds Bank Plc 1.75% GBP 31/03/2022 500,000 498,964 1.02Metropolitan Life Global Funding I 2.625% GBP 05/12/2022 150,000 149,087 0.30Nationwide Building Society FRN EUR 20/03/2023 350,000 284,628 0.58Nationwide Building Society FRN GBP Perpetual 200,000 199,200 0.41Nippon Life Insurance Co FRN USD 20/01/2046 200,000 145,747 0.30Nordea Bank AB FRN EUR 10/11/2025 250,000 196,716 0.40Old Mutual Plc 8% GBP 03/06/2021 400,000 402,260 0.82Pension Insurance Corp Plc 6.5% GBP 03/07/2024 230,000 204,697 0.42Prudential Plc 1.375% GBP 19/01/2018 500,000 499,021 1.02Prudential Plc 1.75% GBP 27/11/2018 350,000 350,214 0.71Rl Finance Bonds No 3 Plc 6.125% GBP 13/11/2028 250,000 241,760 0.49RL Finance Bonds No. 2 plc FRN GBP 30/11/2043 200,000 201,560 0.41Santander UK Group Holdings Plc 3.625% GBP 14/01/2026 150,000 145,930 0.30Santander UK Group Holdings Plc FRN GBP Perpetual 200,000 179,118 0.37Scottish Widows Ltd 5.5% GBP 16/06/2023 300,000 299,959 0.61Skandinaviska Enskilda Banken AB FRN USD Perpetual 350,000 236,456 0.48Society of Lloyd's 4.75% GBP 30/10/2024 300,000 296,709 0.61Standard Chartered Bank FRN GBP Perpetual 550,000 540,628 1.10Svenska Handelsbanken AB FRN EUR 15/01/2024 400,000 324,200 0.66Svenska Handelsbanken AB 2.375% GBP 18/01/2022 500,000 502,817 1.03Virgin Money Plc 2.25% GBP 21/04/2020 400,000 394,467 0.80Wells Fargo & Co 2.125% GBP 22/04/2022 200,000 195,279 0.40Wells Fargo & Co FRN USD Perpetual 250,000 191,085 0.39Yorkshire Building Society FRN GBP 20/11/2024 150,000 146,713 0.30Zuercher Kantonalbank FRN EUR 15/06/2027 200,000 149,545 0.30
14,039,088 28.64
GOVERNMENTIPIC GMTN Ltd 6.875% GBP 14/03/2026 250,000 316,719 0.65Municipality Finance Plc FRN EUR Perpetual 400,000 320,751 0.65United Kingdom Gilt 2.25% GBP 07/09/2023 2,000,000 2,161,900 4.41United Kingdom Gilt 3.25% GBP 22/01/2044 3,400,000 4,037,330 8.24United Kingdom Gilt 3.5% GBP 22/01/2045 2,000,000 2,490,050 5.08United Kingdom Gilt 3.75% GBP 22/07/2052 700,000 962,062 1.96United Kingdom Gilt 4.25% GBP 07/06/2032 1,000,000 1,319,750 2.69United Kingdom Gilt 4.25% GBP 07/12/2040 1,500,000 2,061,225 4.21United Kingdom Gilt 4.5% GBP 07/09/2034 1,000,000 1,372,700 2.80United Kingdom Gilt 4.5% GBP 07/12/2042 3,000,000 4,323,150 8.82United Kingdom Gilt 4.75% GBP 07/12/2030 1,800,000 2,481,840 5.06United Kingdom Gilt 4.75% GBP 07/12/2038 2,000,000 2,901,950 5.92
24,749,427 50.49
INDUSTRIALGatwick Funding Ltd 4.625% GBP 27/03/2034 300,000 326,387 0.67Heathrow Funding Ltd 6.25% GBP 10/09/2018 490,000 534,505 1.09Kelda Finance No 3 Plc 5.75% GBP 17/02/2020 175,000 181,412 0.37
1,042,304 2.13
TECHNOLOGYApple Inc 3.05% GBP 31/07/2029 350,000 347,116 0.71
Invesco UK Investment Grade Bond Fund
Statement of Investments as at 29 February 2016
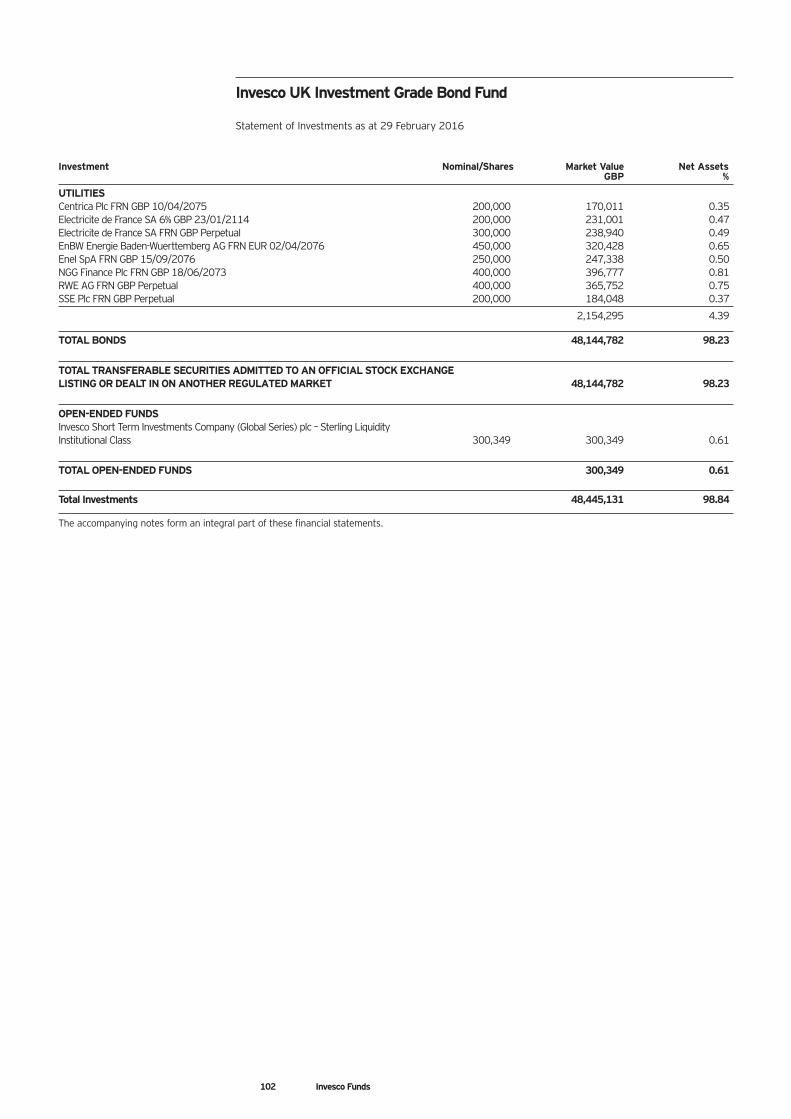
102 Invesco Funds
Investment Nominal/Shares Market Value Net AssetsGBP %
UTILITIESCentrica Plc FRN GBP 10/04/2075 200,000 170,011 0.35Electricite de France SA 6% GBP 23/01/2114 200,000 231,001 0.47Electricite de France SA FRN GBP Perpetual 300,000 238,940 0.49EnBW Energie Baden-Wuerttemberg AG FRN EUR 02/04/2076 450,000 320,428 0.65Enel SpA FRN GBP 15/09/2076 250,000 247,338 0.50NGG Finance Plc FRN GBP 18/06/2073 400,000 396,777 0.81RWE AG FRN GBP Perpetual 400,000 365,752 0.75SSE Plc FRN GBP Perpetual 200,000 184,048 0.37
2,154,295 4.39
TOTAL BONDS 48,144,782 98.23
TOTAL TRANSFERABLE SECURITIES ADMITTED TO AN OFFICIAL STOCK EXCHANGE LISTING OR DEALT IN ON ANOTHER REGULATED MARKET 48,144,782 98.23
OPEN-ENDED FUNDSInvesco Short Term Investments Company (Global Series) plc – Sterling Liquidity Institutional Class 300,349 300,349 0.61
TOTAL OPEN-ENDED FUNDS 300,349 0.61
Total Investments 48,445,131 98.84
The accompanying notes form an integral part of these financial statements.
Invesco UK Investment Grade Bond Fund
Statement of Investments as at 29 February 2016
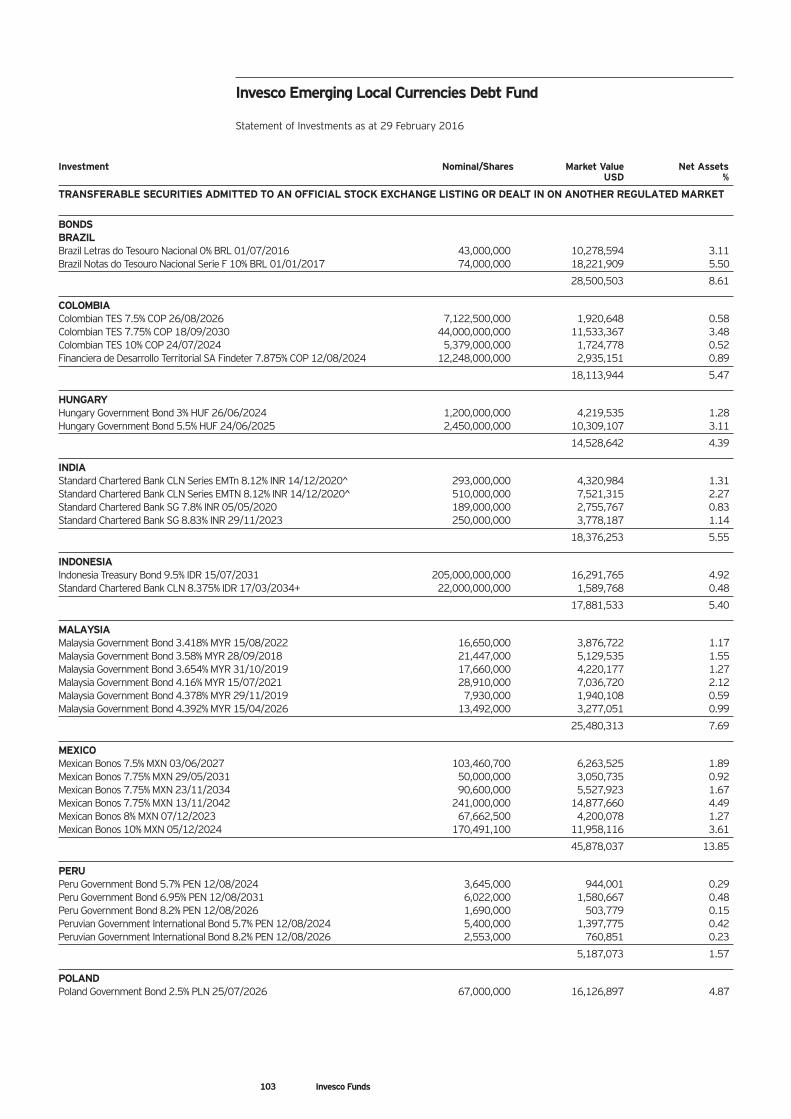
103 Invesco Funds
Investment Nominal/Shares Market Value Net AssetsUSD %
TRANSFERABLE SECURITIES ADMITTED TO AN OFFICIAL STOCK EXCHANGE LISTING OR DEALT IN ON ANOTHER REGULATED MARKET
BONDSBRAZILBrazil Letras do Tesouro Nacional 0% BRL 01/07/2016 43,000,000 10,278,594 3.11Brazil Notas do Tesouro Nacional Serie F 10% BRL 01/01/2017 74,000,000 18,221,909 5.50
28,500,503 8.61
COLOMBIAColombian TES 7.5% COP 26/08/2026 7,122,500,000 1,920,648 0.58Colombian TES 7.75% COP 18/09/2030 44,000,000,000 11,533,367 3.48Colombian TES 10% COP 24/07/2024 5,379,000,000 1,724,778 0.52Financiera de Desarrollo Territorial SA Findeter 7.875% COP 12/08/2024 12,248,000,000 2,935,151 0.89
18,113,944 5.47
HUNGARYHungary Government Bond 3% HUF 26/06/2024 1,200,000,000 4,219,535 1.28Hungary Government Bond 5.5% HUF 24/06/2025 2,450,000,000 10,309,107 3.11
14,528,642 4.39
INDIAStandard Chartered Bank CLN Series EMTn 8.12% INR 14/12/2020^ 293,000,000 4,320,984 1.31Standard Chartered Bank CLN Series EMTN 8.12% INR 14/12/2020^ 510,000,000 7,521,315 2.27Standard Chartered Bank SG 7.8% INR 05/05/2020 189,000,000 2,755,767 0.83Standard Chartered Bank SG 8.83% INR 29/11/2023 250,000,000 3,778,187 1.14
18,376,253 5.55
INDONESIAIndonesia Treasury Bond 9.5% IDR 15/07/2031 205,000,000,000 16,291,765 4.92Standard Chartered Bank CLN 8.375% IDR 17/03/2034+ 22,000,000,000 1,589,768 0.48
17,881,533 5.40
MALAYSIAMalaysia Government Bond 3.418% MYR 15/08/2022 16,650,000 3,876,722 1.17Malaysia Government Bond 3.58% MYR 28/09/2018 21,447,000 5,129,535 1.55Malaysia Government Bond 3.654% MYR 31/10/2019 17,660,000 4,220,177 1.27Malaysia Government Bond 4.16% MYR 15/07/2021 28,910,000 7,036,720 2.12Malaysia Government Bond 4.378% MYR 29/11/2019 7,930,000 1,940,108 0.59Malaysia Government Bond 4.392% MYR 15/04/2026 13,492,000 3,277,051 0.99
25,480,313 7.69
MEXICOMexican Bonos 7.5% MXN 03/06/2027 103,460,700 6,263,525 1.89Mexican Bonos 7.75% MXN 29/05/2031 50,000,000 3,050,735 0.92Mexican Bonos 7.75% MXN 23/11/2034 90,600,000 5,527,923 1.67Mexican Bonos 7.75% MXN 13/11/2042 241,000,000 14,877,660 4.49Mexican Bonos 8% MXN 07/12/2023 67,662,500 4,200,078 1.27Mexican Bonos 10% MXN 05/12/2024 170,491,100 11,958,116 3.61
45,878,037 13.85
PERUPeru Government Bond 5.7% PEN 12/08/2024 3,645,000 944,001 0.29Peru Government Bond 6.95% PEN 12/08/2031 6,022,000 1,580,667 0.48Peru Government Bond 8.2% PEN 12/08/2026 1,690,000 503,779 0.15Peruvian Government International Bond 5.7% PEN 12/08/2024 5,400,000 1,397,775 0.42Peruvian Government International Bond 8.2% PEN 12/08/2026 2,553,000 760,851 0.23
5,187,073 1.57
POLANDPoland Government Bond 2.5% PLN 25/07/2026 67,000,000 16,126,897 4.87
Invesco Emerging Local Currencies Debt Fund
Statement of Investments as at 29 February 2016
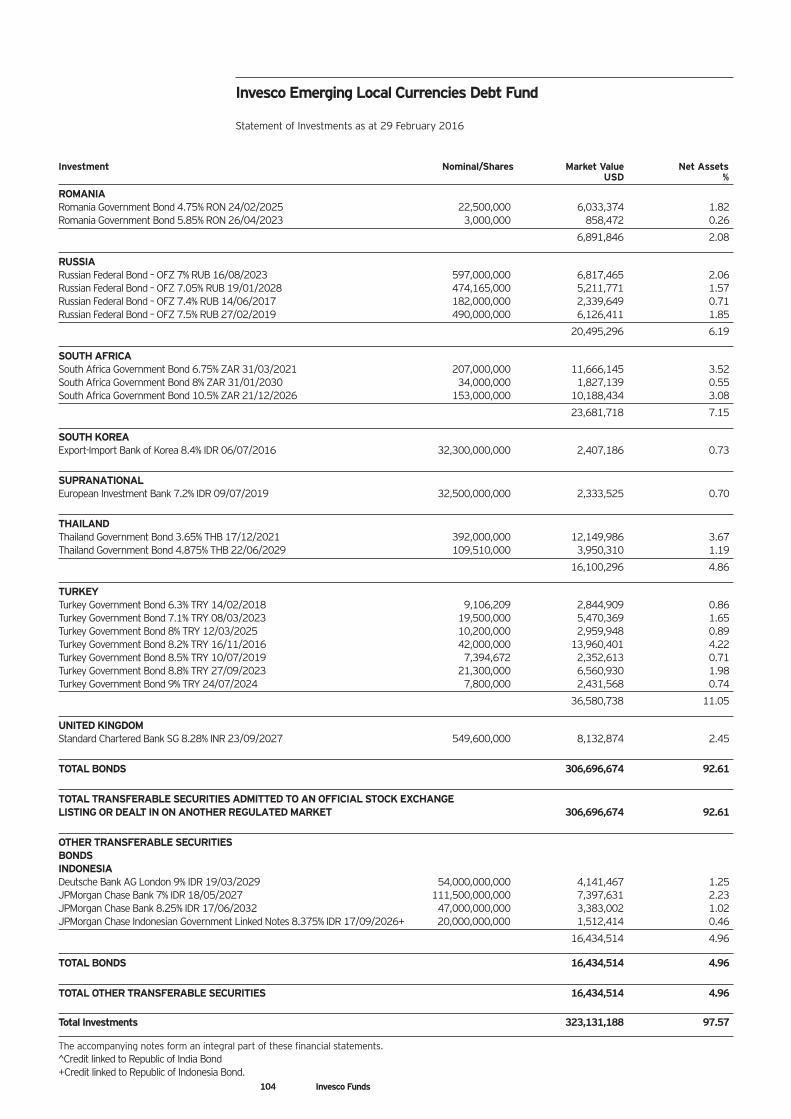
104 Invesco Funds
Investment Nominal/Shares Market Value Net AssetsUSD %
ROMANIARomania Government Bond 4.75% RON 24/02/2025 22,500,000 6,033,374 1.82Romania Government Bond 5.85% RON 26/04/2023 3,000,000 858,472 0.26
6,891,846 2.08
RUSSIARussian Federal Bond – OFZ 7% RUB 16/08/2023 597,000,000 6,817,465 2.06Russian Federal Bond – OFZ 7.05% RUB 19/01/2028 474,165,000 5,211,771 1.57Russian Federal Bond – OFZ 7.4% RUB 14/06/2017 182,000,000 2,339,649 0.71Russian Federal Bond – OFZ 7.5% RUB 27/02/2019 490,000,000 6,126,411 1.85
20,495,296 6.19
SOUTH AFRICASouth Africa Government Bond 6.75% ZAR 31/03/2021 207,000,000 11,666,145 3.52South Africa Government Bond 8% ZAR 31/01/2030 34,000,000 1,827,139 0.55South Africa Government Bond 10.5% ZAR 21/12/2026 153,000,000 10,188,434 3.08
23,681,718 7.15
SOUTH KOREAExport-Import Bank of Korea 8.4% IDR 06/07/2016 32,300,000,000 2,407,186 0.73
SUPRANATIONALEuropean Investment Bank 7.2% IDR 09/07/2019 32,500,000,000 2,333,525 0.70
THAILANDThailand Government Bond 3.65% THB 17/12/2021 392,000,000 12,149,986 3.67Thailand Government Bond 4.875% THB 22/06/2029 109,510,000 3,950,310 1.19
16,100,296 4.86
TURKEYTurkey Government Bond 6.3% TRY 14/02/2018 9,106,209 2,844,909 0.86Turkey Government Bond 7.1% TRY 08/03/2023 19,500,000 5,470,369 1.65Turkey Government Bond 8% TRY 12/03/2025 10,200,000 2,959,948 0.89Turkey Government Bond 8.2% TRY 16/11/2016 42,000,000 13,960,401 4.22Turkey Government Bond 8.5% TRY 10/07/2019 7,394,672 2,352,613 0.71Turkey Government Bond 8.8% TRY 27/09/2023 21,300,000 6,560,930 1.98Turkey Government Bond 9% TRY 24/07/2024 7,800,000 2,431,568 0.74
36,580,738 11.05
UNITED KINGDOMStandard Chartered Bank SG 8.28% INR 23/09/2027 549,600,000 8,132,874 2.45
TOTAL BONDS 306,696,674 92.61
TOTAL TRANSFERABLE SECURITIES ADMITTED TO AN OFFICIAL STOCK EXCHANGE LISTING OR DEALT IN ON ANOTHER REGULATED MARKET 306,696,674 92.61
OTHER TRANSFERABLE SECURITIESBONDSINDONESIADeutsche Bank AG London 9% IDR 19/03/2029 54,000,000,000 4,141,467 1.25JPMorgan Chase Bank 7% IDR 18/05/2027 111,500,000,000 7,397,631 2.23JPMorgan Chase Bank 8.25% IDR 17/06/2032 47,000,000,000 3,383,002 1.02JPMorgan Chase Indonesian Government Linked Notes 8.375% IDR 17/09/2026+ 20,000,000,000 1,512,414 0.46
16,434,514 4.96
TOTAL BONDS 16,434,514 4.96
TOTAL OTHER TRANSFERABLE SECURITIES 16,434,514 4.96
Total Investments 323,131,188 97.57
The accompanying notes form an integral part of these financial statements.^Credit linked to Republic of India Bond+Credit linked to Republic of Indonesia Bond.
Invesco Emerging Local Currencies Debt Fund
Statement of Investments as at 29 February 2016
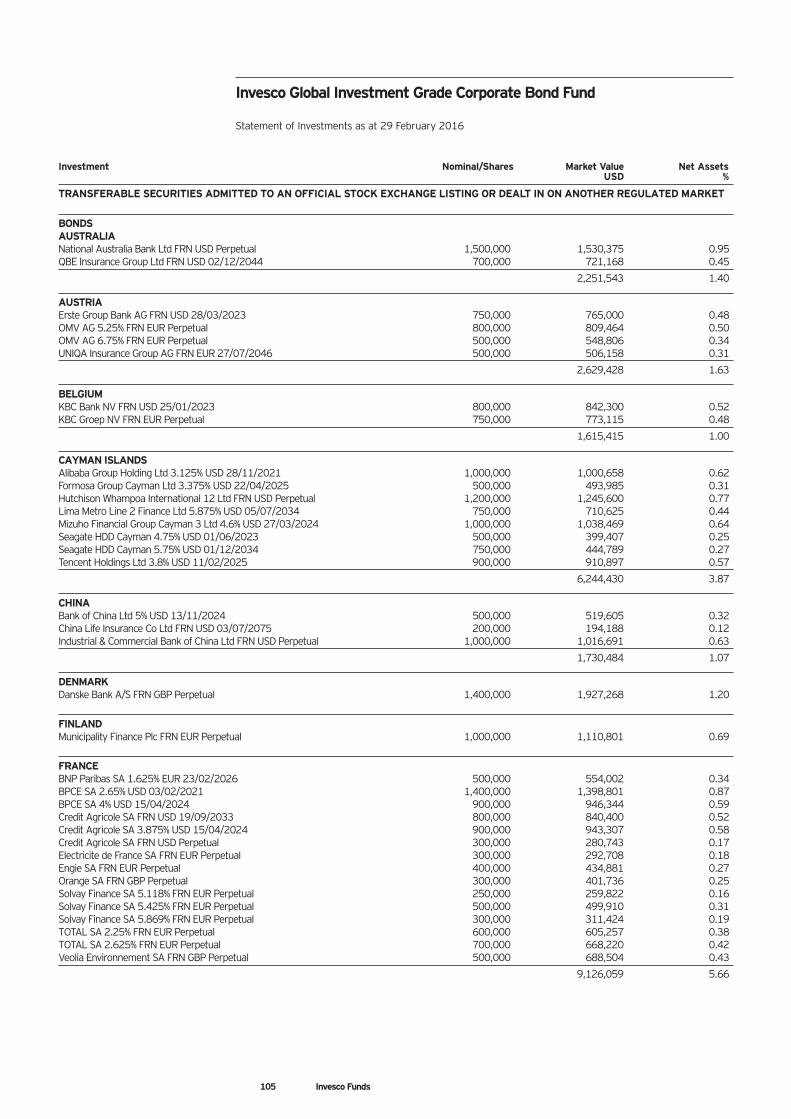
105 Invesco Funds
Investment Nominal/Shares Market Value Net AssetsUSD %
TRANSFERABLE SECURITIES ADMITTED TO AN OFFICIAL STOCK EXCHANGE LISTING OR DEALT IN ON ANOTHER REGULATED MARKET
BONDSAUSTRALIANational Australia Bank Ltd FRN USD Perpetual 1,500,000 1,530,375 0.95QBE Insurance Group Ltd FRN USD 02/12/2044 700,000 721,168 0.45
2,251,543 1.40
AUSTRIAErste Group Bank AG FRN USD 28/03/2023 750,000 765,000 0.48OMV AG 5.25% FRN EUR Perpetual 800,000 809,464 0.50OMV AG 6.75% FRN EUR Perpetual 500,000 548,806 0.34UNIQA Insurance Group AG FRN EUR 27/07/2046 500,000 506,158 0.31
2,629,428 1.63
BELGIUMKBC Bank NV FRN USD 25/01/2023 800,000 842,300 0.52KBC Groep NV FRN EUR Perpetual 750,000 773,115 0.48
1,615,415 1.00
CAYMAN ISLANDSAlibaba Group Holding Ltd 3.125% USD 28/11/2021 1,000,000 1,000,658 0.62Formosa Group Cayman Ltd 3.375% USD 22/04/2025 500,000 493,985 0.31Hutchison Whampoa International 12 Ltd FRN USD Perpetual 1,200,000 1,245,600 0.77Lima Metro Line 2 Finance Ltd 5.875% USD 05/07/2034 750,000 710,625 0.44Mizuho Financial Group Cayman 3 Ltd 4.6% USD 27/03/2024 1,000,000 1,038,469 0.64Seagate HDD Cayman 4.75% USD 01/06/2023 500,000 399,407 0.25Seagate HDD Cayman 5.75% USD 01/12/2034 750,000 444,789 0.27Tencent Holdings Ltd 3.8% USD 11/02/2025 900,000 910,897 0.57
6,244,430 3.87
CHINABank of China Ltd 5% USD 13/11/2024 500,000 519,605 0.32China Life Insurance Co Ltd FRN USD 03/07/2075 200,000 194,188 0.12Industrial & Commercial Bank of China Ltd FRN USD Perpetual 1,000,000 1,016,691 0.63
1,730,484 1.07
DENMARKDanske Bank A/S FRN GBP Perpetual 1,400,000 1,927,268 1.20
FINLANDMunicipality Finance Plc FRN EUR Perpetual 1,000,000 1,110,801 0.69
FRANCEBNP Paribas SA 1.625% EUR 23/02/2026 500,000 554,002 0.34BPCE SA 2.65% USD 03/02/2021 1,400,000 1,398,801 0.87BPCE SA 4% USD 15/04/2024 900,000 946,344 0.59Credit Agricole SA FRN USD 19/09/2033 800,000 840,400 0.52Credit Agricole SA 3.875% USD 15/04/2024 900,000 943,307 0.58Credit Agricole SA FRN USD Perpetual 300,000 280,743 0.17Electricite de France SA FRN EUR Perpetual 300,000 292,708 0.18Engie SA FRN EUR Perpetual 400,000 434,881 0.27Orange SA FRN GBP Perpetual 300,000 401,736 0.25Solvay Finance SA 5.118% FRN EUR Perpetual 250,000 259,822 0.16Solvay Finance SA 5.425% FRN EUR Perpetual 500,000 499,910 0.31Solvay Finance SA 5.869% FRN EUR Perpetual 300,000 311,424 0.19TOTAL SA 2.25% FRN EUR Perpetual 600,000 605,257 0.38TOTAL SA 2.625% FRN EUR Perpetual 700,000 668,220 0.42Veolia Environnement SA FRN GBP Perpetual 500,000 688,504 0.43
9,126,059 5.66
Invesco Global Investment Grade Corporate Bond Fund
Statement of Investments as at 29 February 2016
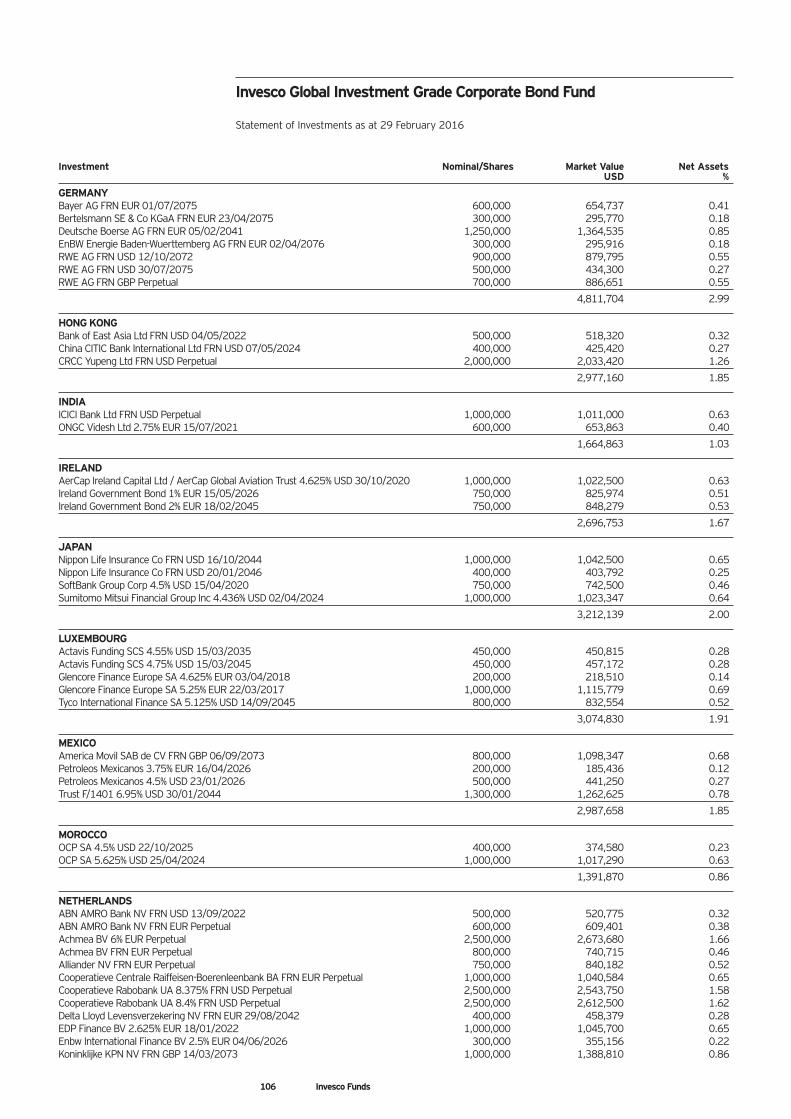
106 Invesco Funds
Investment Nominal/Shares Market Value Net AssetsUSD %
GERMANYBayer AG FRN EUR 01/07/2075 600,000 654,737 0.41Bertelsmann SE & Co KGaA FRN EUR 23/04/2075 300,000 295,770 0.18Deutsche Boerse AG FRN EUR 05/02/2041 1,250,000 1,364,535 0.85EnBW Energie Baden-Wuerttemberg AG FRN EUR 02/04/2076 300,000 295,916 0.18RWE AG FRN USD 12/10/2072 900,000 879,795 0.55RWE AG FRN USD 30/07/2075 500,000 434,300 0.27RWE AG FRN GBP Perpetual 700,000 886,651 0.55
4,811,704 2.99
HONG KONGBank of East Asia Ltd FRN USD 04/05/2022 500,000 518,320 0.32China CITIC Bank International Ltd FRN USD 07/05/2024 400,000 425,420 0.27CRCC Yupeng Ltd FRN USD Perpetual 2,000,000 2,033,420 1.26
2,977,160 1.85
INDIAICICI Bank Ltd FRN USD Perpetual 1,000,000 1,011,000 0.63ONGC Videsh Ltd 2.75% EUR 15/07/2021 600,000 653,863 0.40
1,664,863 1.03
IRELANDAerCap Ireland Capital Ltd / AerCap Global Aviation Trust 4.625% USD 30/10/2020 1,000,000 1,022,500 0.63Ireland Government Bond 1% EUR 15/05/2026 750,000 825,974 0.51Ireland Government Bond 2% EUR 18/02/2045 750,000 848,279 0.53
2,696,753 1.67
JAPANNippon Life Insurance Co FRN USD 16/10/2044 1,000,000 1,042,500 0.65Nippon Life Insurance Co FRN USD 20/01/2046 400,000 403,792 0.25SoftBank Group Corp 4.5% USD 15/04/2020 750,000 742,500 0.46Sumitomo Mitsui Financial Group Inc 4.436% USD 02/04/2024 1,000,000 1,023,347 0.64
3,212,139 2.00
LUXEMBOURGActavis Funding SCS 4.55% USD 15/03/2035 450,000 450,815 0.28Actavis Funding SCS 4.75% USD 15/03/2045 450,000 457,172 0.28Glencore Finance Europe SA 4.625% EUR 03/04/2018 200,000 218,510 0.14Glencore Finance Europe SA 5.25% EUR 22/03/2017 1,000,000 1,115,779 0.69Tyco International Finance SA 5.125% USD 14/09/2045 800,000 832,554 0.52
3,074,830 1.91
MEXICOAmerica Movil SAB de CV FRN GBP 06/09/2073 800,000 1,098,347 0.68Petroleos Mexicanos 3.75% EUR 16/04/2026 200,000 185,436 0.12Petroleos Mexicanos 4.5% USD 23/01/2026 500,000 441,250 0.27Trust F/1401 6.95% USD 30/01/2044 1,300,000 1,262,625 0.78
2,987,658 1.85
MOROCCOOCP SA 4.5% USD 22/10/2025 400,000 374,580 0.23OCP SA 5.625% USD 25/04/2024 1,000,000 1,017,290 0.63
1,391,870 0.86
NETHERLANDSABN AMRO Bank NV FRN USD 13/09/2022 500,000 520,775 0.32ABN AMRO Bank NV FRN EUR Perpetual 600,000 609,401 0.38Achmea BV 6% EUR Perpetual 2,500,000 2,673,680 1.66Achmea BV FRN EUR Perpetual 800,000 740,715 0.46Alliander NV FRN EUR Perpetual 750,000 840,182 0.52Cooperatieve Centrale Raiffeisen-Boerenleenbank BA FRN EUR Perpetual 1,000,000 1,040,584 0.65Cooperatieve Rabobank UA 8.375% FRN USD Perpetual 2,500,000 2,543,750 1.58Cooperatieve Rabobank UA 8.4% FRN USD Perpetual 2,500,000 2,612,500 1.62Delta Lloyd Levensverzekering NV FRN EUR 29/08/2042 400,000 458,379 0.28EDP Finance BV 2.625% EUR 18/01/2022 1,000,000 1,045,700 0.65Enbw International Finance BV 2.5% EUR 04/06/2026 300,000 355,156 0.22Koninklijke KPN NV FRN GBP 14/03/2073 1,000,000 1,388,810 0.86
Invesco Global Investment Grade Corporate Bond Fund
Statement of Investments as at 29 February 2016
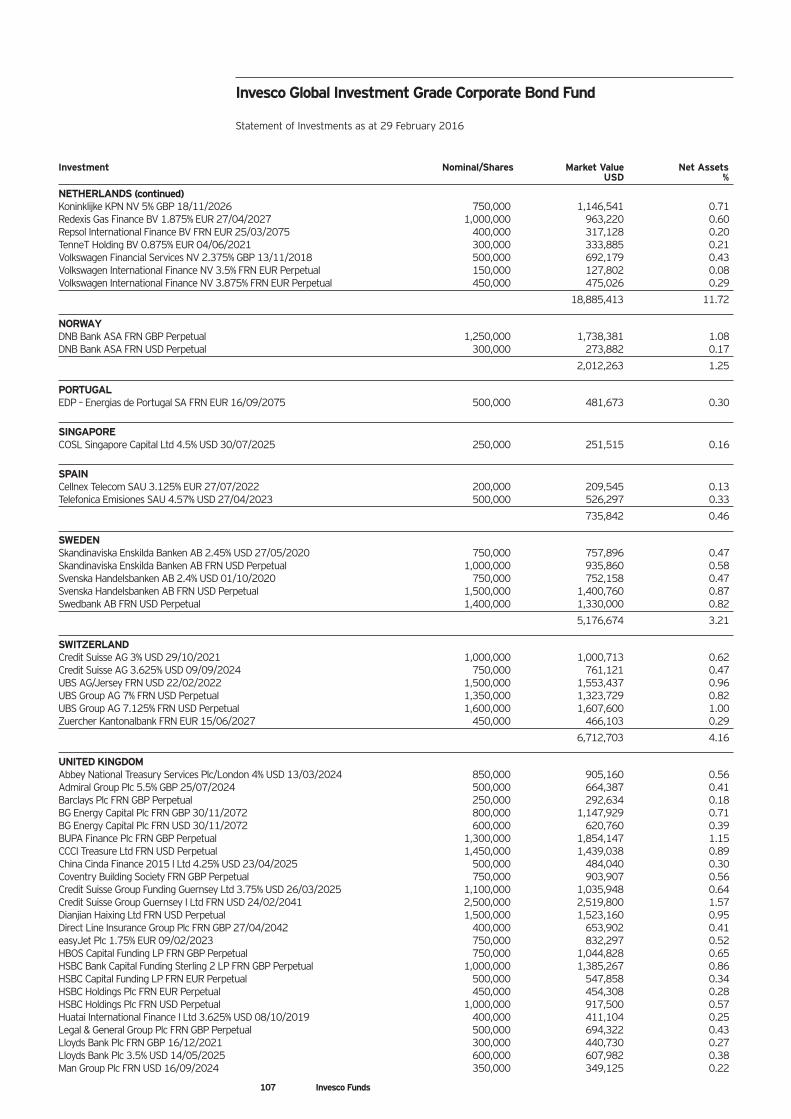
107 Invesco Funds
Investment Nominal/Shares Market Value Net AssetsUSD %
NETHERLANDS (continued)Koninklijke KPN NV 5% GBP 18/11/2026 750,000 1,146,541 0.71Redexis Gas Finance BV 1.875% EUR 27/04/2027 1,000,000 963,220 0.60Repsol International Finance BV FRN EUR 25/03/2075 400,000 317,128 0.20TenneT Holding BV 0.875% EUR 04/06/2021 300,000 333,885 0.21Volkswagen Financial Services NV 2.375% GBP 13/11/2018 500,000 692,179 0.43Volkswagen International Finance NV 3.5% FRN EUR Perpetual 150,000 127,802 0.08Volkswagen International Finance NV 3.875% FRN EUR Perpetual 450,000 475,026 0.29
18,885,413 11.72
NORWAYDNB Bank ASA FRN GBP Perpetual 1,250,000 1,738,381 1.08DNB Bank ASA FRN USD Perpetual 300,000 273,882 0.17
2,012,263 1.25
PORTUGALEDP – Energias de Portugal SA FRN EUR 16/09/2075 500,000 481,673 0.30
SINGAPORECOSL Singapore Capital Ltd 4.5% USD 30/07/2025 250,000 251,515 0.16
SPAINCellnex Telecom SAU 3.125% EUR 27/07/2022 200,000 209,545 0.13Telefonica Emisiones SAU 4.57% USD 27/04/2023 500,000 526,297 0.33
735,842 0.46
SWEDENSkandinaviska Enskilda Banken AB 2.45% USD 27/05/2020 750,000 757,896 0.47Skandinaviska Enskilda Banken AB FRN USD Perpetual 1,000,000 935,860 0.58Svenska Handelsbanken AB 2.4% USD 01/10/2020 750,000 752,158 0.47Svenska Handelsbanken AB FRN USD Perpetual 1,500,000 1,400,760 0.87Swedbank AB FRN USD Perpetual 1,400,000 1,330,000 0.82
5,176,674 3.21
SWITZERLANDCredit Suisse AG 3% USD 29/10/2021 1,000,000 1,000,713 0.62Credit Suisse AG 3.625% USD 09/09/2024 750,000 761,121 0.47UBS AG/Jersey FRN USD 22/02/2022 1,500,000 1,553,437 0.96UBS Group AG 7% FRN USD Perpetual 1,350,000 1,323,729 0.82UBS Group AG 7.125% FRN USD Perpetual 1,600,000 1,607,600 1.00Zuercher Kantonalbank FRN EUR 15/06/2027 450,000 466,103 0.29
6,712,703 4.16
UNITED KINGDOMAbbey National Treasury Services Plc/London 4% USD 13/03/2024 850,000 905,160 0.56Admiral Group Plc 5.5% GBP 25/07/2024 500,000 664,387 0.41Barclays Plc FRN GBP Perpetual 250,000 292,634 0.18BG Energy Capital Plc FRN GBP 30/11/2072 800,000 1,147,929 0.71BG Energy Capital Plc FRN USD 30/11/2072 600,000 620,760 0.39BUPA Finance Plc FRN GBP Perpetual 1,300,000 1,854,147 1.15CCCI Treasure Ltd FRN USD Perpetual 1,450,000 1,439,038 0.89China Cinda Finance 2015 I Ltd 4.25% USD 23/04/2025 500,000 484,040 0.30Coventry Building Society FRN GBP Perpetual 750,000 903,907 0.56Credit Suisse Group Funding Guernsey Ltd 3.75% USD 26/03/2025 1,100,000 1,035,948 0.64Credit Suisse Group Guernsey I Ltd FRN USD 24/02/2041 2,500,000 2,519,800 1.57Dianjian Haixing Ltd FRN USD Perpetual 1,500,000 1,523,160 0.95Direct Line Insurance Group Plc FRN GBP 27/04/2042 400,000 653,902 0.41easyJet Plc 1.75% EUR 09/02/2023 750,000 832,297 0.52HBOS Capital Funding LP FRN GBP Perpetual 750,000 1,044,828 0.65HSBC Bank Capital Funding Sterling 2 LP FRN GBP Perpetual 1,000,000 1,385,267 0.86HSBC Capital Funding LP FRN EUR Perpetual 500,000 547,858 0.34HSBC Holdings Plc FRN EUR Perpetual 450,000 454,308 0.28HSBC Holdings Plc FRN USD Perpetual 1,000,000 917,500 0.57Huatai International Finance I Ltd 3.625% USD 08/10/2019 400,000 411,104 0.25Legal & General Group Plc FRN GBP Perpetual 500,000 694,322 0.43Lloyds Bank Plc FRN GBP 16/12/2021 300,000 440,730 0.27Lloyds Bank Plc 3.5% USD 14/05/2025 600,000 607,982 0.38Man Group Plc FRN USD 16/09/2024 350,000 349,125 0.22
Invesco Global Investment Grade Corporate Bond Fund
Statement of Investments as at 29 February 2016
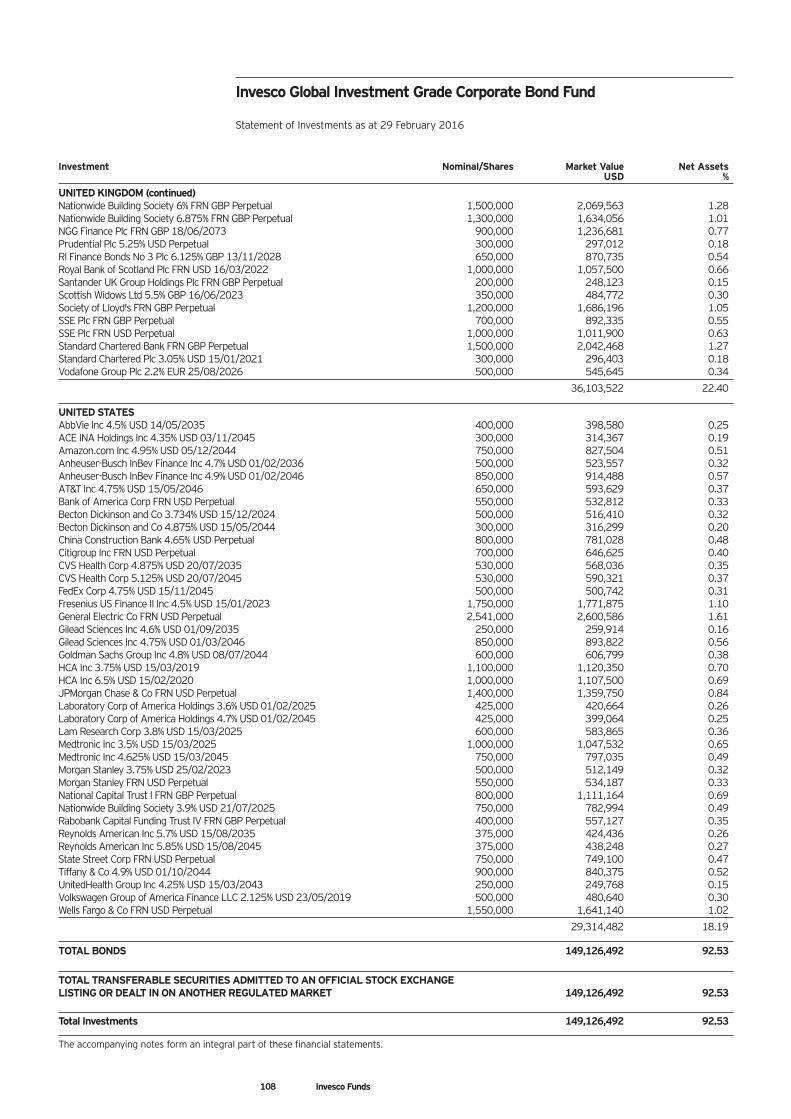
108 Invesco Funds
Investment Nominal/Shares Market Value Net AssetsUSD %
UNITED KINGDOM (continued)Nationwide Building Society 6% FRN GBP Perpetual 1,500,000 2,069,563 1.28Nationwide Building Society 6.875% FRN GBP Perpetual 1,300,000 1,634,056 1.01NGG Finance Plc FRN GBP 18/06/2073 900,000 1,236,681 0.77Prudential Plc 5.25% USD Perpetual 300,000 297,012 0.18Rl Finance Bonds No 3 Plc 6.125% GBP 13/11/2028 650,000 870,735 0.54Royal Bank of Scotland Plc FRN USD 16/03/2022 1,000,000 1,057,500 0.66Santander UK Group Holdings Plc FRN GBP Perpetual 200,000 248,123 0.15Scottish Widows Ltd 5.5% GBP 16/06/2023 350,000 484,772 0.30Society of Lloyd's FRN GBP Perpetual 1,200,000 1,686,196 1.05SSE Plc FRN GBP Perpetual 700,000 892,335 0.55SSE Plc FRN USD Perpetual 1,000,000 1,011,900 0.63Standard Chartered Bank FRN GBP Perpetual 1,500,000 2,042,468 1.27Standard Chartered Plc 3.05% USD 15/01/2021 300,000 296,403 0.18Vodafone Group Plc 2.2% EUR 25/08/2026 500,000 545,645 0.34
36,103,522 22.40
UNITED STATESAbbVie Inc 4.5% USD 14/05/2035 400,000 398,580 0.25ACE INA Holdings Inc 4.35% USD 03/11/2045 300,000 314,367 0.19Amazon.com Inc 4.95% USD 05/12/2044 750,000 827,504 0.51Anheuser-Busch InBev Finance Inc 4.7% USD 01/02/2036 500,000 523,557 0.32Anheuser-Busch InBev Finance Inc 4.9% USD 01/02/2046 850,000 914,488 0.57AT&T Inc 4.75% USD 15/05/2046 650,000 593,629 0.37Bank of America Corp FRN USD Perpetual 550,000 532,812 0.33Becton Dickinson and Co 3.734% USD 15/12/2024 500,000 516,410 0.32Becton Dickinson and Co 4.875% USD 15/05/2044 300,000 316,299 0.20China Construction Bank 4.65% USD Perpetual 800,000 781,028 0.48Citigroup Inc FRN USD Perpetual 700,000 646,625 0.40CVS Health Corp 4.875% USD 20/07/2035 530,000 568,036 0.35CVS Health Corp 5.125% USD 20/07/2045 530,000 590,321 0.37FedEx Corp 4.75% USD 15/11/2045 500,000 500,742 0.31Fresenius US Finance II Inc 4.5% USD 15/01/2023 1,750,000 1,771,875 1.10General Electric Co FRN USD Perpetual 2,541,000 2,600,586 1.61Gilead Sciences Inc 4.6% USD 01/09/2035 250,000 259,914 0.16Gilead Sciences Inc 4.75% USD 01/03/2046 850,000 893,822 0.56Goldman Sachs Group Inc 4.8% USD 08/07/2044 600,000 606,799 0.38HCA Inc 3.75% USD 15/03/2019 1,100,000 1,120,350 0.70HCA Inc 6.5% USD 15/02/2020 1,000,000 1,107,500 0.69JPMorgan Chase & Co FRN USD Perpetual 1,400,000 1,359,750 0.84Laboratory Corp of America Holdings 3.6% USD 01/02/2025 425,000 420,664 0.26Laboratory Corp of America Holdings 4.7% USD 01/02/2045 425,000 399,064 0.25Lam Research Corp 3.8% USD 15/03/2025 600,000 583,865 0.36Medtronic Inc 3.5% USD 15/03/2025 1,000,000 1,047,532 0.65Medtronic Inc 4.625% USD 15/03/2045 750,000 797,035 0.49Morgan Stanley 3.75% USD 25/02/2023 500,000 512,149 0.32Morgan Stanley FRN USD Perpetual 550,000 534,187 0.33National Capital Trust I FRN GBP Perpetual 800,000 1,111,164 0.69Nationwide Building Society 3.9% USD 21/07/2025 750,000 782,994 0.49Rabobank Capital Funding Trust IV FRN GBP Perpetual 400,000 557,127 0.35Reynolds American Inc 5.7% USD 15/08/2035 375,000 424,436 0.26Reynolds American Inc 5.85% USD 15/08/2045 375,000 438,248 0.27State Street Corp FRN USD Perpetual 750,000 749,100 0.47Tiffany & Co 4.9% USD 01/10/2044 900,000 840,375 0.52UnitedHealth Group Inc 4.25% USD 15/03/2043 250,000 249,768 0.15Volkswagen Group of America Finance LLC 2.125% USD 23/05/2019 500,000 480,640 0.30Wells Fargo & Co FRN USD Perpetual 1,550,000 1,641,140 1.02
29,314,482 18.19
TOTAL BONDS 149,126,492 92.53
TOTAL TRANSFERABLE SECURITIES ADMITTED TO AN OFFICIAL STOCK EXCHANGE LISTING OR DEALT IN ON ANOTHER REGULATED MARKET 149,126,492 92.53
Total Investments 149,126,492 92.53
The accompanying notes form an integral part of these financial statements.
Invesco Global Investment Grade Corporate Bond Fund
Statement of Investments as at 29 February 2016
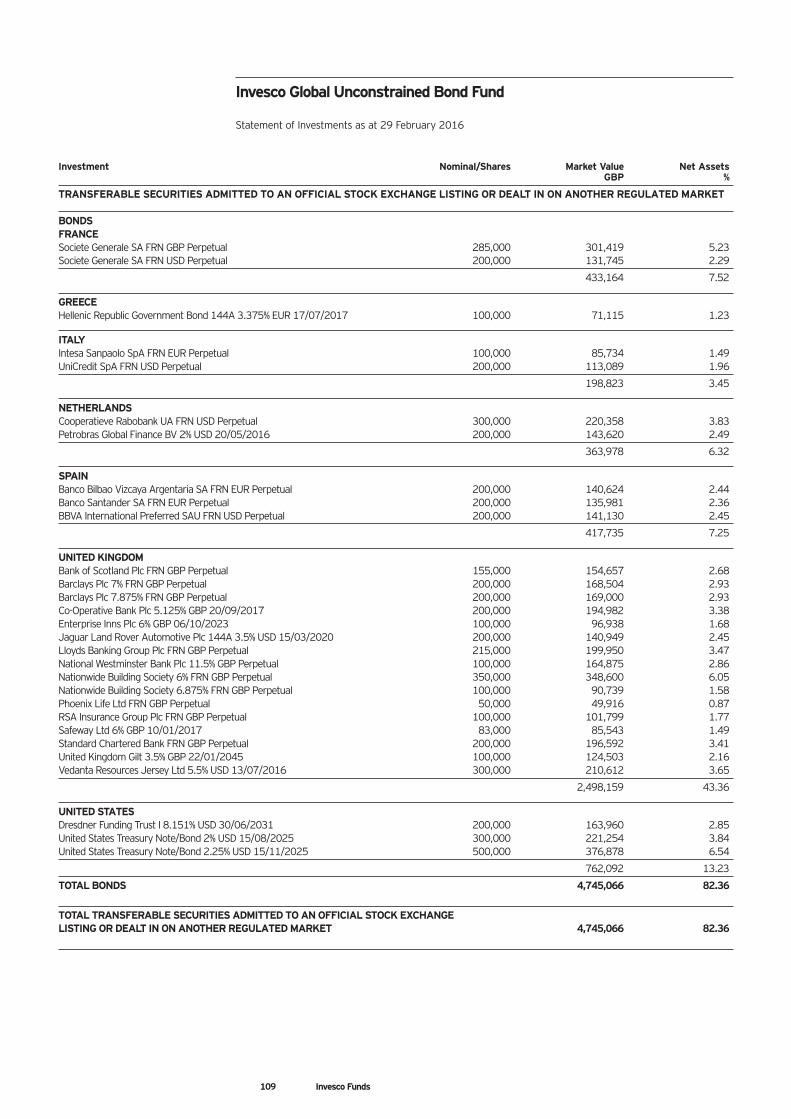
109 Invesco Funds
Investment Nominal/Shares Market Value Net AssetsGBP %
TRANSFERABLE SECURITIES ADMITTED TO AN OFFICIAL STOCK EXCHANGE LISTING OR DEALT IN ON ANOTHER REGULATED MARKET
BONDSFRANCESociete Generale SA FRN GBP Perpetual 285,000 301,419 5.23Societe Generale SA FRN USD Perpetual 200,000 131,745 2.29
433,164 7.52
GREECEHellenic Republic Government Bond 144A 3.375% EUR 17/07/2017 100,000 71,115 1.23
ITALYIntesa Sanpaolo SpA FRN EUR Perpetual 100,000 85,734 1.49UniCredit SpA FRN USD Perpetual 200,000 113,089 1.96
198,823 3.45
NETHERLANDSCooperatieve Rabobank UA FRN USD Perpetual 300,000 220,358 3.83Petrobras Global Finance BV 2% USD 20/05/2016 200,000 143,620 2.49
363,978 6.32
SPAINBanco Bilbao Vizcaya Argentaria SA FRN EUR Perpetual 200,000 140,624 2.44Banco Santander SA FRN EUR Perpetual 200,000 135,981 2.36BBVA International Preferred SAU FRN USD Perpetual 200,000 141,130 2.45
417,735 7.25
UNITED KINGDOMBank of Scotland Plc FRN GBP Perpetual 155,000 154,657 2.68Barclays Plc 7% FRN GBP Perpetual 200,000 168,504 2.93Barclays Plc 7.875% FRN GBP Perpetual 200,000 169,000 2.93Co-Operative Bank Plc 5.125% GBP 20/09/2017 200,000 194,982 3.38Enterprise Inns Plc 6% GBP 06/10/2023 100,000 96,938 1.68Jaguar Land Rover Automotive Plc 144A 3.5% USD 15/03/2020 200,000 140,949 2.45Lloyds Banking Group Plc FRN GBP Perpetual 215,000 199,950 3.47National Westminster Bank Plc 11.5% GBP Perpetual 100,000 164,875 2.86Nationwide Building Society 6% FRN GBP Perpetual 350,000 348,600 6.05Nationwide Building Society 6.875% FRN GBP Perpetual 100,000 90,739 1.58Phoenix Life Ltd FRN GBP Perpetual 50,000 49,916 0.87RSA Insurance Group Plc FRN GBP Perpetual 100,000 101,799 1.77Safeway Ltd 6% GBP 10/01/2017 83,000 85,543 1.49Standard Chartered Bank FRN GBP Perpetual 200,000 196,592 3.41United Kingdom Gilt 3.5% GBP 22/01/2045 100,000 124,503 2.16Vedanta Resources Jersey Ltd 5.5% USD 13/07/2016 300,000 210,612 3.65
2,498,159 43.36
UNITED STATESDresdner Funding Trust I 8.151% USD 30/06/2031 200,000 163,960 2.85United States Treasury Note/Bond 2% USD 15/08/2025 300,000 221,254 3.84United States Treasury Note/Bond 2.25% USD 15/11/2025 500,000 376,878 6.54
762,092 13.23
TOTAL BONDS 4,745,066 82.36
TOTAL TRANSFERABLE SECURITIES ADMITTED TO AN OFFICIAL STOCK EXCHANGE LISTING OR DEALT IN ON ANOTHER REGULATED MARKET 4,745,066 82.36
Invesco Global Unconstrained Bond Fund
Statement of Investments as at 29 February 2016
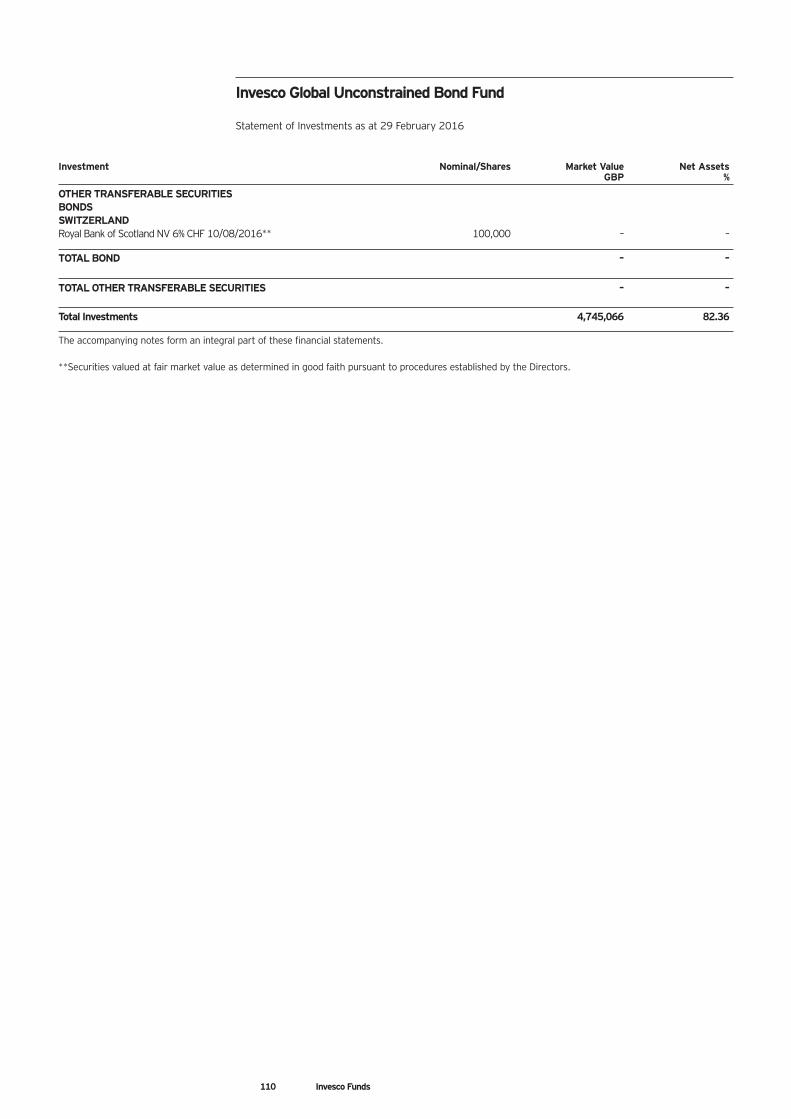
110 Invesco Funds
Invesco Global Unconstrained Bond Fund
Statement of Investments as at 29 February 2016
Investment Nominal/Shares Market Value Net AssetsGBP %
OTHER TRANSFERABLE SECURITIESBONDSSWITZERLANDRoyal Bank of Scotland NV 6% CHF 10/08/2016** 100,000 – –
TOTAL BOND – –
TOTAL OTHER TRANSFERABLE SECURITIES – –
Total Investments 4,745,066 82.36
The accompanying notes form an integral part of these financial statements.
**Securities valued at fair market value as determined in good faith pursuant to procedures established by the Directors.
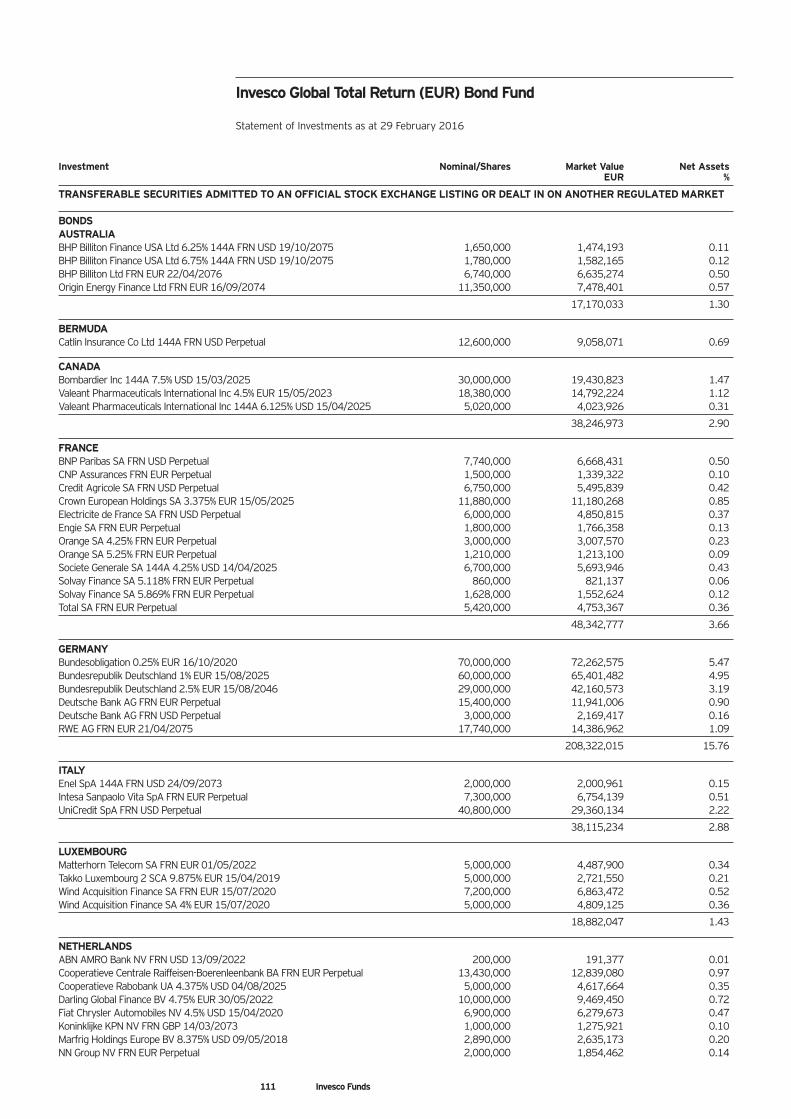
111 Invesco Funds
Invesco Global Total Return (EUR) Bond Fund
Statement of Investments as at 29 February 2016
Investment Nominal/Shares Market Value Net AssetsEUR %
TRANSFERABLE SECURITIES ADMITTED TO AN OFFICIAL STOCK EXCHANGE LISTING OR DEALT IN ON ANOTHER REGULATED MARKET
BONDSAUSTRALIABHP Billiton Finance USA Ltd 6.25% 144A FRN USD 19/10/2075 1,650,000 1,474,193 0.11BHP Billiton Finance USA Ltd 6.75% 144A FRN USD 19/10/2075 1,780,000 1,582,165 0.12BHP Billiton Ltd FRN EUR 22/04/2076 6,740,000 6,635,274 0.50Origin Energy Finance Ltd FRN EUR 16/09/2074 11,350,000 7,478,401 0.57
17,170,033 1.30
BERMUDACatlin Insurance Co Ltd 144A FRN USD Perpetual 12,600,000 9,058,071 0.69
CANADABombardier Inc 144A 7.5% USD 15/03/2025 30,000,000 19,430,823 1.47Valeant Pharmaceuticals International Inc 4.5% EUR 15/05/2023 18,380,000 14,792,224 1.12Valeant Pharmaceuticals International Inc 144A 6.125% USD 15/04/2025 5,020,000 4,023,926 0.31
38,246,973 2.90
FRANCEBNP Paribas SA FRN USD Perpetual 7,740,000 6,668,431 0.50CNP Assurances FRN EUR Perpetual 1,500,000 1,339,322 0.10Credit Agricole SA FRN USD Perpetual 6,750,000 5,495,839 0.42Crown European Holdings SA 3.375% EUR 15/05/2025 11,880,000 11,180,268 0.85Electricite de France SA FRN USD Perpetual 6,000,000 4,850,815 0.37Engie SA FRN EUR Perpetual 1,800,000 1,766,358 0.13Orange SA 4.25% FRN EUR Perpetual 3,000,000 3,007,570 0.23Orange SA 5.25% FRN EUR Perpetual 1,210,000 1,213,100 0.09Societe Generale SA 144A 4.25% USD 14/04/2025 6,700,000 5,693,946 0.43Solvay Finance SA 5.118% FRN EUR Perpetual 860,000 821,137 0.06Solvay Finance SA 5.869% FRN EUR Perpetual 1,628,000 1,552,624 0.12Total SA FRN EUR Perpetual 5,420,000 4,753,367 0.36
48,342,777 3.66
GERMANYBundesobligation 0.25% EUR 16/10/2020 70,000,000 72,262,575 5.47Bundesrepublik Deutschland 1% EUR 15/08/2025 60,000,000 65,401,482 4.95Bundesrepublik Deutschland 2.5% EUR 15/08/2046 29,000,000 42,160,573 3.19Deutsche Bank AG FRN EUR Perpetual 15,400,000 11,941,006 0.90Deutsche Bank AG FRN USD Perpetual 3,000,000 2,169,417 0.16RWE AG FRN EUR 21/04/2075 17,740,000 14,386,962 1.09
208,322,015 15.76
ITALYEnel SpA 144A FRN USD 24/09/2073 2,000,000 2,000,961 0.15Intesa Sanpaolo Vita SpA FRN EUR Perpetual 7,300,000 6,754,139 0.51UniCredit SpA FRN USD Perpetual 40,800,000 29,360,134 2.22
38,115,234 2.88
LUXEMBOURGMatterhorn Telecom SA FRN EUR 01/05/2022 5,000,000 4,487,900 0.34Takko Luxembourg 2 SCA 9.875% EUR 15/04/2019 5,000,000 2,721,550 0.21Wind Acquisition Finance SA FRN EUR 15/07/2020 7,200,000 6,863,472 0.52Wind Acquisition Finance SA 4% EUR 15/07/2020 5,000,000 4,809,125 0.36
18,882,047 1.43
NETHERLANDSABN AMRO Bank NV FRN USD 13/09/2022 200,000 191,377 0.01Cooperatieve Centrale Raiffeisen-Boerenleenbank BA FRN EUR Perpetual 13,430,000 12,839,080 0.97Cooperatieve Rabobank UA 4.375% USD 04/08/2025 5,000,000 4,617,664 0.35Darling Global Finance BV 4.75% EUR 30/05/2022 10,000,000 9,469,450 0.72Fiat Chrysler Automobiles NV 4.5% USD 15/04/2020 6,900,000 6,279,673 0.47Koninklijke KPN NV FRN GBP 14/03/2073 1,000,000 1,275,921 0.10Marfrig Holdings Europe BV 8.375% USD 09/05/2018 2,890,000 2,635,173 0.20NN Group NV FRN EUR Perpetual 2,000,000 1,854,462 0.14
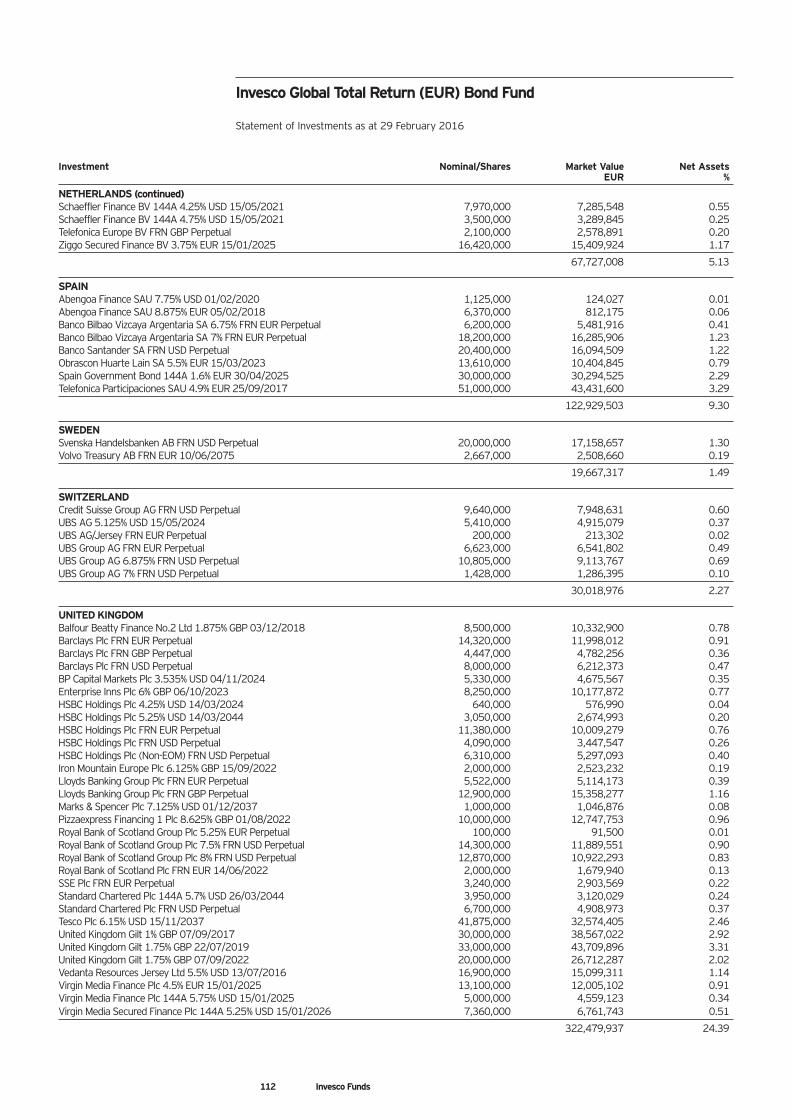
112 Invesco Funds
Investment Nominal/Shares Market Value Net AssetsEUR %
NETHERLANDS (continued)Schaeffler Finance BV 144A 4.25% USD 15/05/2021 7,970,000 7,285,548 0.55Schaeffler Finance BV 144A 4.75% USD 15/05/2021 3,500,000 3,289,845 0.25Telefonica Europe BV FRN GBP Perpetual 2,100,000 2,578,891 0.20Ziggo Secured Finance BV 3.75% EUR 15/01/2025 16,420,000 15,409,924 1.17
67,727,008 5.13
SPAINAbengoa Finance SAU 7.75% USD 01/02/2020 1,125,000 124,027 0.01Abengoa Finance SAU 8.875% EUR 05/02/2018 6,370,000 812,175 0.06Banco Bilbao Vizcaya Argentaria SA 6.75% FRN EUR Perpetual 6,200,000 5,481,916 0.41Banco Bilbao Vizcaya Argentaria SA 7% FRN EUR Perpetual 18,200,000 16,285,906 1.23Banco Santander SA FRN USD Perpetual 20,400,000 16,094,509 1.22Obrascon Huarte Lain SA 5.5% EUR 15/03/2023 13,610,000 10,404,845 0.79Spain Government Bond 144A 1.6% EUR 30/04/2025 30,000,000 30,294,525 2.29Telefonica Participaciones SAU 4.9% EUR 25/09/2017 51,000,000 43,431,600 3.29
122,929,503 9.30
SWEDENSvenska Handelsbanken AB FRN USD Perpetual 20,000,000 17,158,657 1.30Volvo Treasury AB FRN EUR 10/06/2075 2,667,000 2,508,660 0.19
19,667,317 1.49
SWITZERLANDCredit Suisse Group AG FRN USD Perpetual 9,640,000 7,948,631 0.60UBS AG 5.125% USD 15/05/2024 5,410,000 4,915,079 0.37UBS AG/Jersey FRN EUR Perpetual 200,000 213,302 0.02UBS Group AG FRN EUR Perpetual 6,623,000 6,541,802 0.49UBS Group AG 6.875% FRN USD Perpetual 10,805,000 9,113,767 0.69UBS Group AG 7% FRN USD Perpetual 1,428,000 1,286,395 0.10
30,018,976 2.27
UNITED KINGDOMBalfour Beatty Finance No.2 Ltd 1.875% GBP 03/12/2018 8,500,000 10,332,900 0.78Barclays Plc FRN EUR Perpetual 14,320,000 11,998,012 0.91Barclays Plc FRN GBP Perpetual 4,447,000 4,782,256 0.36Barclays Plc FRN USD Perpetual 8,000,000 6,212,373 0.47BP Capital Markets Plc 3.535% USD 04/11/2024 5,330,000 4,675,567 0.35Enterprise Inns Plc 6% GBP 06/10/2023 8,250,000 10,177,872 0.77HSBC Holdings Plc 4.25% USD 14/03/2024 640,000 576,990 0.04HSBC Holdings Plc 5.25% USD 14/03/2044 3,050,000 2,674,993 0.20HSBC Holdings Plc FRN EUR Perpetual 11,380,000 10,009,279 0.76HSBC Holdings Plc FRN USD Perpetual 4,090,000 3,447,547 0.26HSBC Holdings Plc (Non-EOM) FRN USD Perpetual 6,310,000 5,297,093 0.40Iron Mountain Europe Plc 6.125% GBP 15/09/2022 2,000,000 2,523,232 0.19Lloyds Banking Group Plc FRN EUR Perpetual 5,522,000 5,114,173 0.39Lloyds Banking Group Plc FRN GBP Perpetual 12,900,000 15,358,277 1.16Marks & Spencer Plc 7.125% USD 01/12/2037 1,000,000 1,046,876 0.08Pizzaexpress Financing 1 Plc 8.625% GBP 01/08/2022 10,000,000 12,747,753 0.96Royal Bank of Scotland Group Plc 5.25% EUR Perpetual 100,000 91,500 0.01Royal Bank of Scotland Group Plc 7.5% FRN USD Perpetual 14,300,000 11,889,551 0.90Royal Bank of Scotland Group Plc 8% FRN USD Perpetual 12,870,000 10,922,293 0.83Royal Bank of Scotland Plc FRN EUR 14/06/2022 2,000,000 1,679,940 0.13SSE Plc FRN EUR Perpetual 3,240,000 2,903,569 0.22Standard Chartered Plc 144A 5.7% USD 26/03/2044 3,950,000 3,120,029 0.24Standard Chartered Plc FRN USD Perpetual 6,700,000 4,908,973 0.37Tesco Plc 6.15% USD 15/11/2037 41,875,000 32,574,405 2.46United Kingdom Gilt 1% GBP 07/09/2017 30,000,000 38,567,022 2.92United Kingdom Gilt 1.75% GBP 22/07/2019 33,000,000 43,709,896 3.31United Kingdom Gilt 1.75% GBP 07/09/2022 20,000,000 26,712,287 2.02Vedanta Resources Jersey Ltd 5.5% USD 13/07/2016 16,900,000 15,099,311 1.14Virgin Media Finance Plc 4.5% EUR 15/01/2025 13,100,000 12,005,102 0.91Virgin Media Finance Plc 144A 5.75% USD 15/01/2025 5,000,000 4,559,123 0.34Virgin Media Secured Finance Plc 144A 5.25% USD 15/01/2026 7,360,000 6,761,743 0.51
322,479,937 24.39
Invesco Global Total Return (EUR) Bond Fund
Statement of Investments as at 29 February 2016
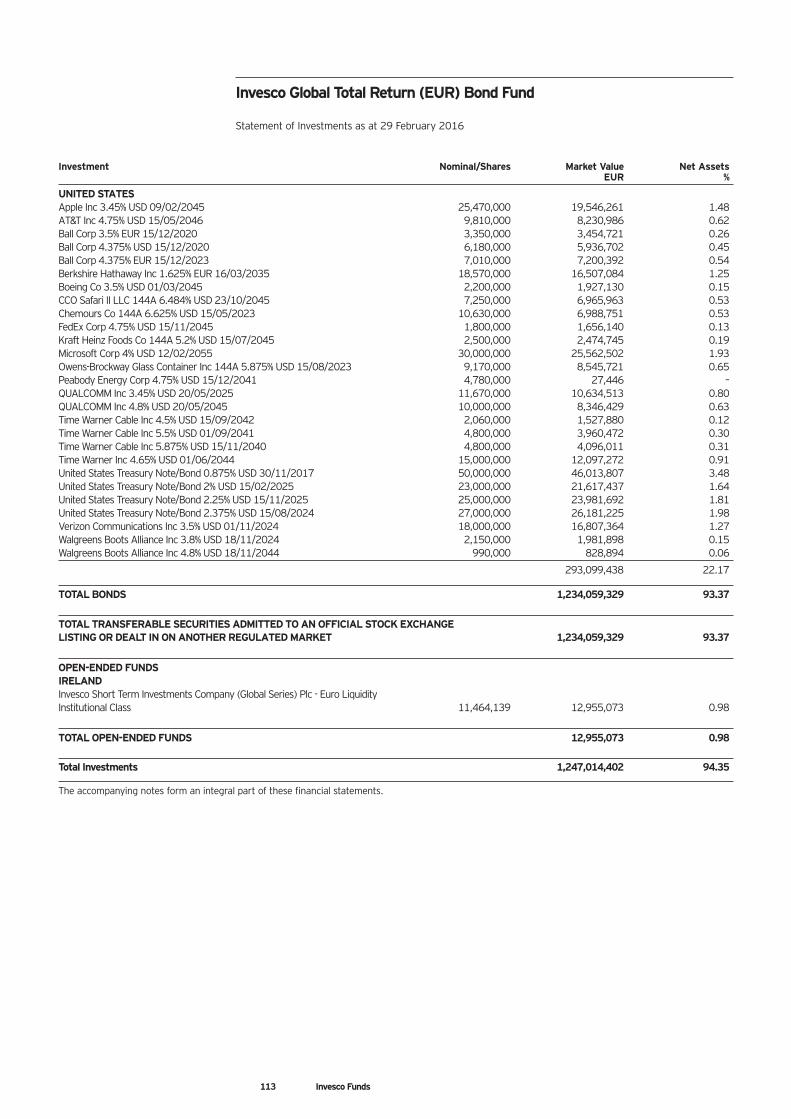
113 Invesco Funds
Investment Nominal/Shares Market Value Net AssetsEUR %
UNITED STATESApple Inc 3.45% USD 09/02/2045 25,470,000 19,546,261 1.48AT&T Inc 4.75% USD 15/05/2046 9,810,000 8,230,986 0.62Ball Corp 3.5% EUR 15/12/2020 3,350,000 3,454,721 0.26Ball Corp 4.375% USD 15/12/2020 6,180,000 5,936,702 0.45Ball Corp 4.375% EUR 15/12/2023 7,010,000 7,200,392 0.54Berkshire Hathaway Inc 1.625% EUR 16/03/2035 18,570,000 16,507,084 1.25Boeing Co 3.5% USD 01/03/2045 2,200,000 1,927,130 0.15CCO Safari II LLC 144A 6.484% USD 23/10/2045 7,250,000 6,965,963 0.53Chemours Co 144A 6.625% USD 15/05/2023 10,630,000 6,988,751 0.53FedEx Corp 4.75% USD 15/11/2045 1,800,000 1,656,140 0.13Kraft Heinz Foods Co 144A 5.2% USD 15/07/2045 2,500,000 2,474,745 0.19Microsoft Corp 4% USD 12/02/2055 30,000,000 25,562,502 1.93Owens-Brockway Glass Container Inc 144A 5.875% USD 15/08/2023 9,170,000 8,545,721 0.65Peabody Energy Corp 4.75% USD 15/12/2041 4,780,000 27,446 –QUALCOMM Inc 3.45% USD 20/05/2025 11,670,000 10,634,513 0.80QUALCOMM Inc 4.8% USD 20/05/2045 10,000,000 8,346,429 0.63Time Warner Cable Inc 4.5% USD 15/09/2042 2,060,000 1,527,880 0.12Time Warner Cable Inc 5.5% USD 01/09/2041 4,800,000 3,960,472 0.30Time Warner Cable Inc 5.875% USD 15/11/2040 4,800,000 4,096,011 0.31Time Warner Inc 4.65% USD 01/06/2044 15,000,000 12,097,272 0.91United States Treasury Note/Bond 0.875% USD 30/11/2017 50,000,000 46,013,807 3.48United States Treasury Note/Bond 2% USD 15/02/2025 23,000,000 21,617,437 1.64United States Treasury Note/Bond 2.25% USD 15/11/2025 25,000,000 23,981,692 1.81United States Treasury Note/Bond 2.375% USD 15/08/2024 27,000,000 26,181,225 1.98Verizon Communications Inc 3.5% USD 01/11/2024 18,000,000 16,807,364 1.27Walgreens Boots Alliance Inc 3.8% USD 18/11/2024 2,150,000 1,981,898 0.15Walgreens Boots Alliance Inc 4.8% USD 18/11/2044 990,000 828,894 0.06
293,099,438 22.17
TOTAL BONDS 1,234,059,329 93.37
TOTAL TRANSFERABLE SECURITIES ADMITTED TO AN OFFICIAL STOCK EXCHANGE LISTING OR DEALT IN ON ANOTHER REGULATED MARKET 1,234,059,329 93.37
OPEN-ENDED FUNDSIRELANDInvesco Short Term Investments Company (Global Series) Plc - Euro Liquidity Institutional Class 11,464,139 12,955,073 0.98
TOTAL OPEN-ENDED FUNDS 12,955,073 0.98
Total Investments 1,247,014,402 94.35
The accompanying notes form an integral part of these financial statements.
Invesco Global Total Return (EUR) Bond Fund
Statement of Investments as at 29 February 2016
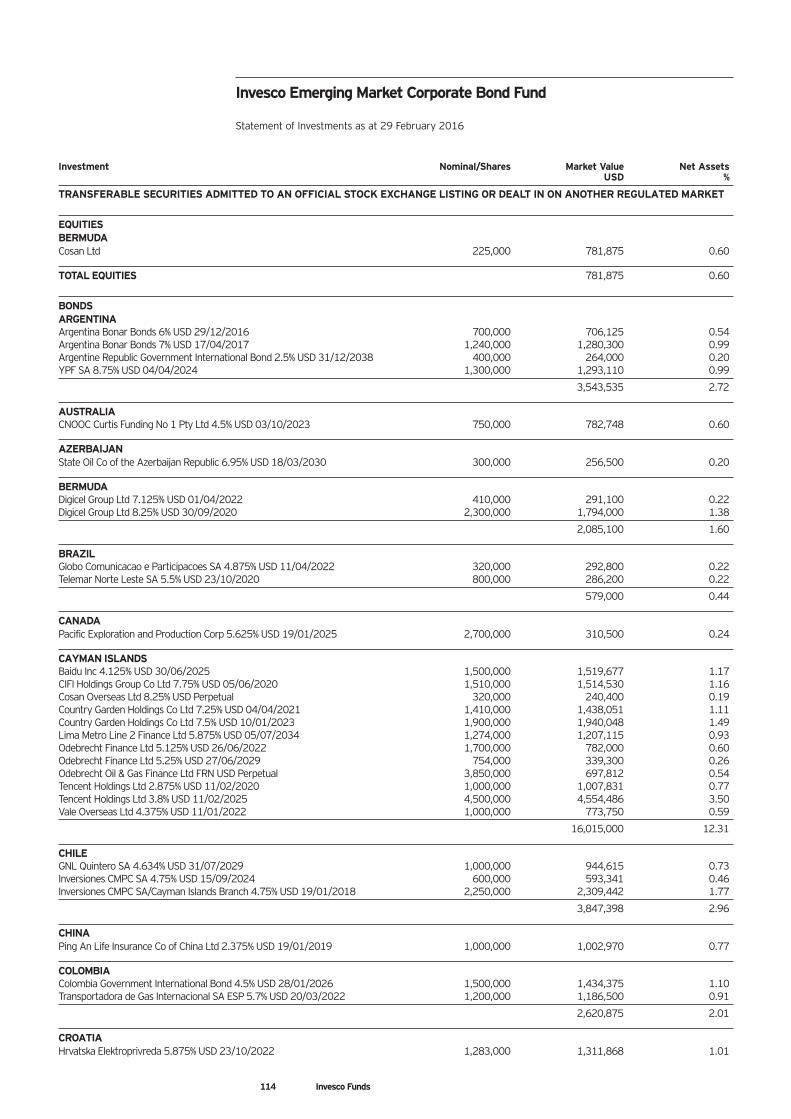
114 Invesco Funds
Investment Nominal/Shares Market Value Net AssetsUSD %
TRANSFERABLE SECURITIES ADMITTED TO AN OFFICIAL STOCK EXCHANGE LISTING OR DEALT IN ON ANOTHER REGULATED MARKET
EQUITIESBERMUDACosan Ltd 225,000 781,875 0.60
TOTAL EQUITIES 781,875 0.60
BONDSARGENTINAArgentina Bonar Bonds 6% USD 29/12/2016 700,000 706,125 0.54Argentina Bonar Bonds 7% USD 17/04/2017 1,240,000 1,280,300 0.99Argentine Republic Government International Bond 2.5% USD 31/12/2038 400,000 264,000 0.20YPF SA 8.75% USD 04/04/2024 1,300,000 1,293,110 0.99
3,543,535 2.72
AUSTRALIACNOOC Curtis Funding No 1 Pty Ltd 4.5% USD 03/10/2023 750,000 782,748 0.60
AZERBAIJANState Oil Co of the Azerbaijan Republic 6.95% USD 18/03/2030 300,000 256,500 0.20
BERMUDADigicel Group Ltd 7.125% USD 01/04/2022 410,000 291,100 0.22Digicel Group Ltd 8.25% USD 30/09/2020 2,300,000 1,794,000 1.38
2,085,100 1.60
BRAZILGlobo Comunicacao e Participacoes SA 4.875% USD 11/04/2022 320,000 292,800 0.22Telemar Norte Leste SA 5.5% USD 23/10/2020 800,000 286,200 0.22
579,000 0.44
CANADAPacific Exploration and Production Corp 5.625% USD 19/01/2025 2,700,000 310,500 0.24
CAYMAN ISLANDSBaidu Inc 4.125% USD 30/06/2025 1,500,000 1,519,677 1.17CIFI Holdings Group Co Ltd 7.75% USD 05/06/2020 1,510,000 1,514,530 1.16Cosan Overseas Ltd 8.25% USD Perpetual 320,000 240,400 0.19Country Garden Holdings Co Ltd 7.25% USD 04/04/2021 1,410,000 1,438,051 1.11Country Garden Holdings Co Ltd 7.5% USD 10/01/2023 1,900,000 1,940,048 1.49Lima Metro Line 2 Finance Ltd 5.875% USD 05/07/2034 1,274,000 1,207,115 0.93Odebrecht Finance Ltd 5.125% USD 26/06/2022 1,700,000 782,000 0.60Odebrecht Finance Ltd 5.25% USD 27/06/2029 754,000 339,300 0.26Odebrecht Oil & Gas Finance Ltd FRN USD Perpetual 3,850,000 697,812 0.54Tencent Holdings Ltd 2.875% USD 11/02/2020 1,000,000 1,007,831 0.77Tencent Holdings Ltd 3.8% USD 11/02/2025 4,500,000 4,554,486 3.50Vale Overseas Ltd 4.375% USD 11/01/2022 1,000,000 773,750 0.59
16,015,000 12.31
CHILEGNL Quintero SA 4.634% USD 31/07/2029 1,000,000 944,615 0.73Inversiones CMPC SA 4.75% USD 15/09/2024 600,000 593,341 0.46Inversiones CMPC SA/Cayman Islands Branch 4.75% USD 19/01/2018 2,250,000 2,309,442 1.77
3,847,398 2.96
CHINAPing An Life Insurance Co of China Ltd 2.375% USD 19/01/2019 1,000,000 1,002,970 0.77
COLOMBIAColombia Government International Bond 4.5% USD 28/01/2026 1,500,000 1,434,375 1.10Transportadora de Gas Internacional SA ESP 5.7% USD 20/03/2022 1,200,000 1,186,500 0.91
2,620,875 2.01
CROATIAHrvatska Elektroprivreda 5.875% USD 23/10/2022 1,283,000 1,311,868 1.01
Invesco Emerging Market Corporate Bond Fund
Statement of Investments as at 29 February 2016
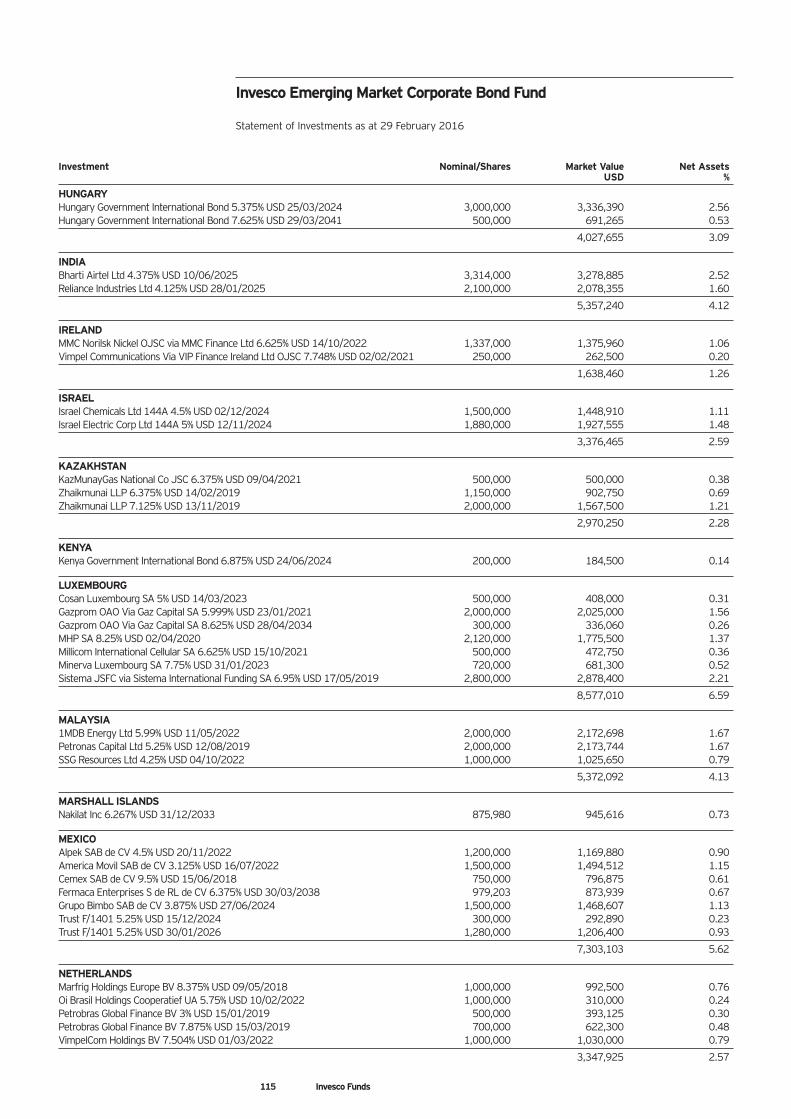
115 Invesco Funds
Invesco Emerging Market Corporate Bond Fund
Statement of Investments as at 29 February 2016
Investment Nominal/Shares Market Value Net AssetsUSD %
HUNGARYHungary Government International Bond 5.375% USD 25/03/2024 3,000,000 3,336,390 2.56Hungary Government International Bond 7.625% USD 29/03/2041 500,000 691,265 0.53
4,027,655 3.09
INDIABharti Airtel Ltd 4.375% USD 10/06/2025 3,314,000 3,278,885 2.52Reliance Industries Ltd 4.125% USD 28/01/2025 2,100,000 2,078,355 1.60
5,357,240 4.12
IRELANDMMC Norilsk Nickel OJSC via MMC Finance Ltd 6.625% USD 14/10/2022 1,337,000 1,375,960 1.06Vimpel Communications Via VIP Finance Ireland Ltd OJSC 7.748% USD 02/02/2021 250,000 262,500 0.20
1,638,460 1.26
ISRAELIsrael Chemicals Ltd 144A 4.5% USD 02/12/2024 1,500,000 1,448,910 1.11Israel Electric Corp Ltd 144A 5% USD 12/11/2024 1,880,000 1,927,555 1.48
3,376,465 2.59
KAZAKHSTANKazMunayGas National Co JSC 6.375% USD 09/04/2021 500,000 500,000 0.38Zhaikmunai LLP 6.375% USD 14/02/2019 1,150,000 902,750 0.69Zhaikmunai LLP 7.125% USD 13/11/2019 2,000,000 1,567,500 1.21
2,970,250 2.28
KENYAKenya Government International Bond 6.875% USD 24/06/2024 200,000 184,500 0.14
LUXEMBOURGCosan Luxembourg SA 5% USD 14/03/2023 500,000 408,000 0.31Gazprom OAO Via Gaz Capital SA 5.999% USD 23/01/2021 2,000,000 2,025,000 1.56Gazprom OAO Via Gaz Capital SA 8.625% USD 28/04/2034 300,000 336,060 0.26MHP SA 8.25% USD 02/04/2020 2,120,000 1,775,500 1.37Millicom International Cellular SA 6.625% USD 15/10/2021 500,000 472,750 0.36Minerva Luxembourg SA 7.75% USD 31/01/2023 720,000 681,300 0.52Sistema JSFC via Sistema International Funding SA 6.95% USD 17/05/2019 2,800,000 2,878,400 2.21
8,577,010 6.59
MALAYSIA1MDB Energy Ltd 5.99% USD 11/05/2022 2,000,000 2,172,698 1.67Petronas Capital Ltd 5.25% USD 12/08/2019 2,000,000 2,173,744 1.67SSG Resources Ltd 4.25% USD 04/10/2022 1,000,000 1,025,650 0.79
5,372,092 4.13
MARSHALL ISLANDSNakilat Inc 6.267% USD 31/12/2033 875,980 945,616 0.73
MEXICOAlpek SAB de CV 4.5% USD 20/11/2022 1,200,000 1,169,880 0.90America Movil SAB de CV 3.125% USD 16/07/2022 1,500,000 1,494,512 1.15Cemex SAB de CV 9.5% USD 15/06/2018 750,000 796,875 0.61Fermaca Enterprises S de RL de CV 6.375% USD 30/03/2038 979,203 873,939 0.67Grupo Bimbo SAB de CV 3.875% USD 27/06/2024 1,500,000 1,468,607 1.13Trust F/1401 5.25% USD 15/12/2024 300,000 292,890 0.23Trust F/1401 5.25% USD 30/01/2026 1,280,000 1,206,400 0.93
7,303,103 5.62
NETHERLANDSMarfrig Holdings Europe BV 8.375% USD 09/05/2018 1,000,000 992,500 0.76Oi Brasil Holdings Cooperatief UA 5.75% USD 10/02/2022 1,000,000 310,000 0.24Petrobras Global Finance BV 3% USD 15/01/2019 500,000 393,125 0.30Petrobras Global Finance BV 7.875% USD 15/03/2019 700,000 622,300 0.48VimpelCom Holdings BV 7.504% USD 01/03/2022 1,000,000 1,030,000 0.79
3,347,925 2.57
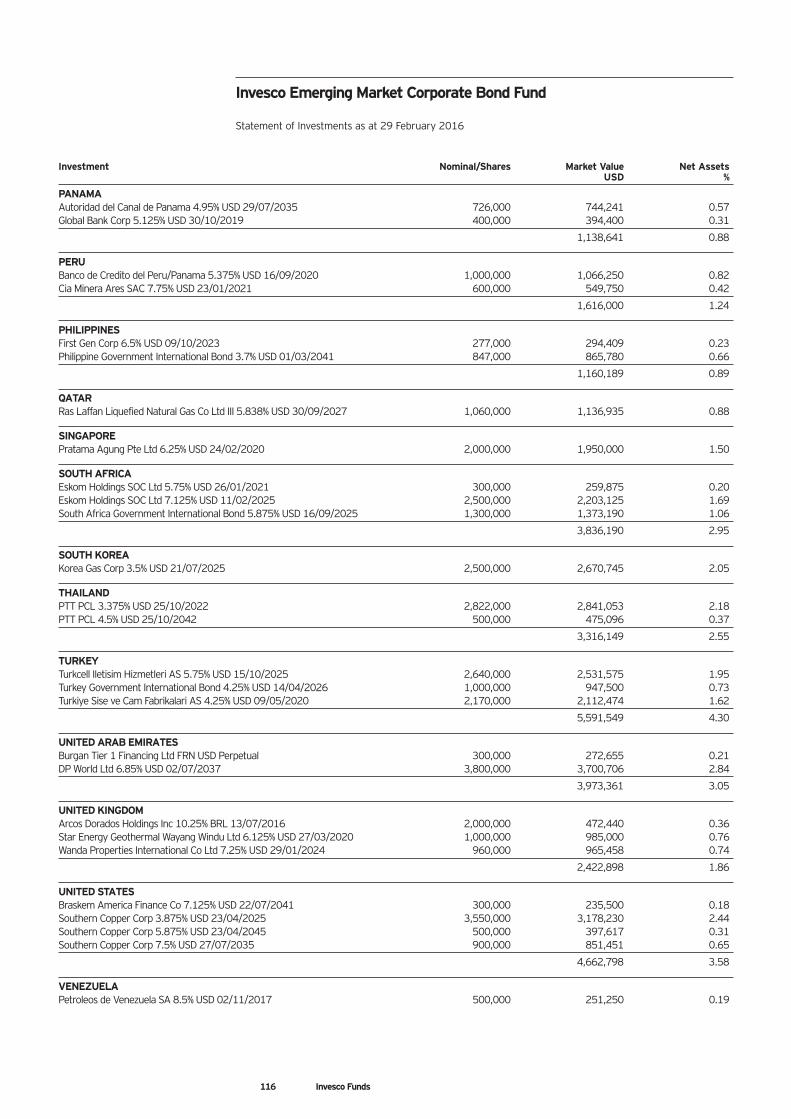
116 Invesco Funds
Invesco Emerging Market Corporate Bond Fund
Statement of Investments as at 29 February 2016
Investment Nominal/Shares Market Value Net AssetsUSD %
PANAMAAutoridad del Canal de Panama 4.95% USD 29/07/2035 726,000 744,241 0.57Global Bank Corp 5.125% USD 30/10/2019 400,000 394,400 0.31
1,138,641 0.88
PERUBanco de Credito del Peru/Panama 5.375% USD 16/09/2020 1,000,000 1,066,250 0.82Cia Minera Ares SAC 7.75% USD 23/01/2021 600,000 549,750 0.42
1,616,000 1.24
PHILIPPINESFirst Gen Corp 6.5% USD 09/10/2023 277,000 294,409 0.23Philippine Government International Bond 3.7% USD 01/03/2041 847,000 865,780 0.66
1,160,189 0.89
QATARRas Laffan Liquefied Natural Gas Co Ltd III 5.838% USD 30/09/2027 1,060,000 1,136,935 0.88
SINGAPOREPratama Agung Pte Ltd 6.25% USD 24/02/2020 2,000,000 1,950,000 1.50
SOUTH AFRICAEskom Holdings SOC Ltd 5.75% USD 26/01/2021 300,000 259,875 0.20Eskom Holdings SOC Ltd 7.125% USD 11/02/2025 2,500,000 2,203,125 1.69South Africa Government International Bond 5.875% USD 16/09/2025 1,300,000 1,373,190 1.06
3,836,190 2.95
SOUTH KOREAKorea Gas Corp 3.5% USD 21/07/2025 2,500,000 2,670,745 2.05
THAILANDPTT PCL 3.375% USD 25/10/2022 2,822,000 2,841,053 2.18PTT PCL 4.5% USD 25/10/2042 500,000 475,096 0.37
3,316,149 2.55
TURKEYTurkcell Iletisim Hizmetleri AS 5.75% USD 15/10/2025 2,640,000 2,531,575 1.95Turkey Government International Bond 4.25% USD 14/04/2026 1,000,000 947,500 0.73Turkiye Sise ve Cam Fabrikalari AS 4.25% USD 09/05/2020 2,170,000 2,112,474 1.62
5,591,549 4.30
UNITED ARAB EMIRATESBurgan Tier 1 Financing Ltd FRN USD Perpetual 300,000 272,655 0.21DP World Ltd 6.85% USD 02/07/2037 3,800,000 3,700,706 2.84
3,973,361 3.05
UNITED KINGDOMArcos Dorados Holdings Inc 10.25% BRL 13/07/2016 2,000,000 472,440 0.36Star Energy Geothermal Wayang Windu Ltd 6.125% USD 27/03/2020 1,000,000 985,000 0.76Wanda Properties International Co Ltd 7.25% USD 29/01/2024 960,000 965,458 0.74
2,422,898 1.86
UNITED STATESBraskem America Finance Co 7.125% USD 22/07/2041 300,000 235,500 0.18Southern Copper Corp 3.875% USD 23/04/2025 3,550,000 3,178,230 2.44Southern Copper Corp 5.875% USD 23/04/2045 500,000 397,617 0.31Southern Copper Corp 7.5% USD 27/07/2035 900,000 851,451 0.65
4,662,798 3.58
VENEZUELAPetroleos de Venezuela SA 8.5% USD 02/11/2017 500,000 251,250 0.19
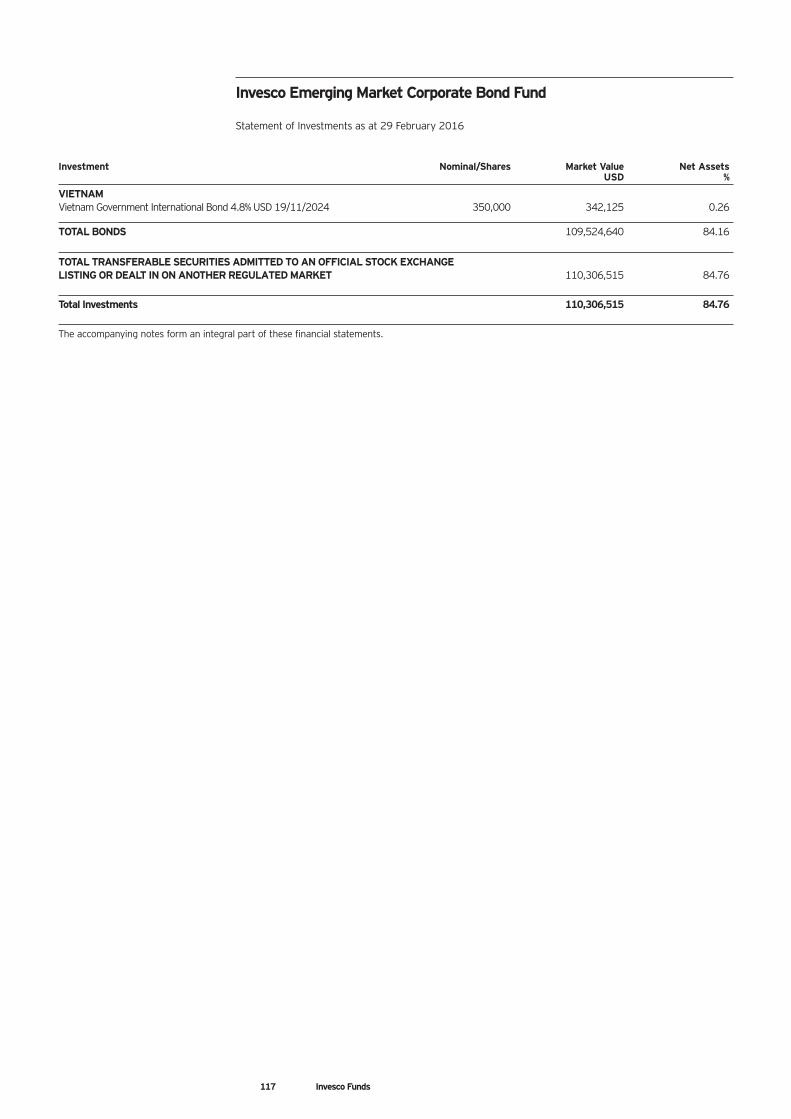
117 Invesco Funds
Invesco Emerging Market Corporate Bond Fund
Statement of Investments as at 29 February 2016
Investment Nominal/Shares Market Value Net AssetsUSD %
VIETNAMVietnam Government International Bond 4.8% USD 19/11/2024 350,000 342,125 0.26
TOTAL BONDS 109,524,640 84.16
TOTAL TRANSFERABLE SECURITIES ADMITTED TO AN OFFICIAL STOCK EXCHANGE LISTING OR DEALT IN ON ANOTHER REGULATED MARKET 110,306,515 84.76
Total Investments 110,306,515 84.76
The accompanying notes form an integral part of these financial statements.
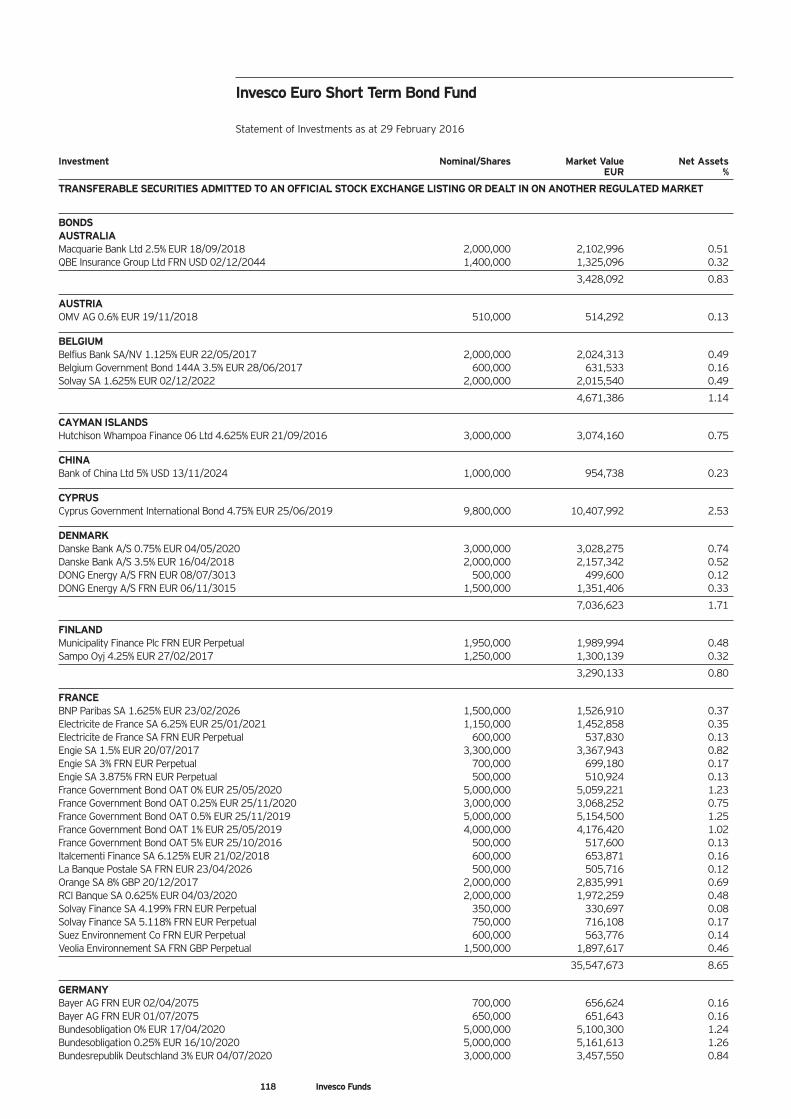
Investment Nominal/Shares Market Value Net Assets EUR %
TRANSFERABLE SECURITIES ADMITTED TO AN OFFICIAL STOCK EXCHANGE LISTING OR DEALT IN ON ANOTHER REGULATED MARKET
BONDSAUSTRALIAMacquarie Bank Ltd 2.5% EUR 18/09/2018 2,000,000 2,102,996 0.51QBE Insurance Group Ltd FRN USD 02/12/2044 1,400,000 1,325,096 0.32
3,428,092 0.83
AUSTRIAOMV AG 0.6% EUR 19/11/2018 510,000 514,292 0.13
BELGIUMBelfius Bank SA/NV 1.125% EUR 22/05/2017 2,000,000 2,024,313 0.49Belgium Government Bond 144A 3.5% EUR 28/06/2017 600,000 631,533 0.16Solvay SA 1.625% EUR 02/12/2022 2,000,000 2,015,540 0.49
4,671,386 1.14
CAYMAN ISLANDSHutchison Whampoa Finance 06 Ltd 4.625% EUR 21/09/2016 3,000,000 3,074,160 0.75
CHINABank of China Ltd 5% USD 13/11/2024 1,000,000 954,738 0.23
CYPRUSCyprus Government International Bond 4.75% EUR 25/06/2019 9,800,000 10,407,992 2.53
DENMARKDanske Bank A/S 0.75% EUR 04/05/2020 3,000,000 3,028,275 0.74Danske Bank A/S 3.5% EUR 16/04/2018 2,000,000 2,157,342 0.52DONG Energy A/S FRN EUR 08/07/3013 500,000 499,600 0.12DONG Energy A/S FRN EUR 06/11/3015 1,500,000 1,351,406 0.33
7,036,623 1.71
FINLANDMunicipality Finance Plc FRN EUR Perpetual 1,950,000 1,989,994 0.48Sampo Oyj 4.25% EUR 27/02/2017 1,250,000 1,300,139 0.32
3,290,133 0.80
FRANCEBNP Paribas SA 1.625% EUR 23/02/2026 1,500,000 1,526,910 0.37Electricite de France SA 6.25% EUR 25/01/2021 1,150,000 1,452,858 0.35Electricite de France SA FRN EUR Perpetual 600,000 537,830 0.13Engie SA 1.5% EUR 20/07/2017 3,300,000 3,367,943 0.82Engie SA 3% FRN EUR Perpetual 700,000 699,180 0.17Engie SA 3.875% FRN EUR Perpetual 500,000 510,924 0.13France Government Bond OAT 0% EUR 25/05/2020 5,000,000 5,059,221 1.23France Government Bond OAT 0.25% EUR 25/11/2020 3,000,000 3,068,252 0.75France Government Bond OAT 0.5% EUR 25/11/2019 5,000,000 5,154,500 1.25France Government Bond OAT 1% EUR 25/05/2019 4,000,000 4,176,420 1.02France Government Bond OAT 5% EUR 25/10/2016 500,000 517,600 0.13Italcementi Finance SA 6.125% EUR 21/02/2018 600,000 653,871 0.16La Banque Postale SA FRN EUR 23/04/2026 500,000 505,716 0.12Orange SA 8% GBP 20/12/2017 2,000,000 2,835,991 0.69RCI Banque SA 0.625% EUR 04/03/2020 2,000,000 1,972,259 0.48Solvay Finance SA 4.199% FRN EUR Perpetual 350,000 330,697 0.08Solvay Finance SA 5.118% FRN EUR Perpetual 750,000 716,108 0.17Suez Environnement Co FRN EUR Perpetual 600,000 563,776 0.14Veolia Environnement SA FRN GBP Perpetual 1,500,000 1,897,617 0.46
35,547,673 8.65
GERMANYBayer AG FRN EUR 02/04/2075 700,000 656,624 0.16Bayer AG FRN EUR 01/07/2075 650,000 651,643 0.16Bundesobligation 0% EUR 17/04/2020 5,000,000 5,100,300 1.24Bundesobligation 0.25% EUR 16/10/2020 5,000,000 5,161,613 1.26Bundesrepublik Deutschland 3% EUR 04/07/2020 3,000,000 3,457,550 0.84
Invesco Euro Short Term Bond Fund
Statement of Investments as at 29 February 2016
118 Invesco Funds
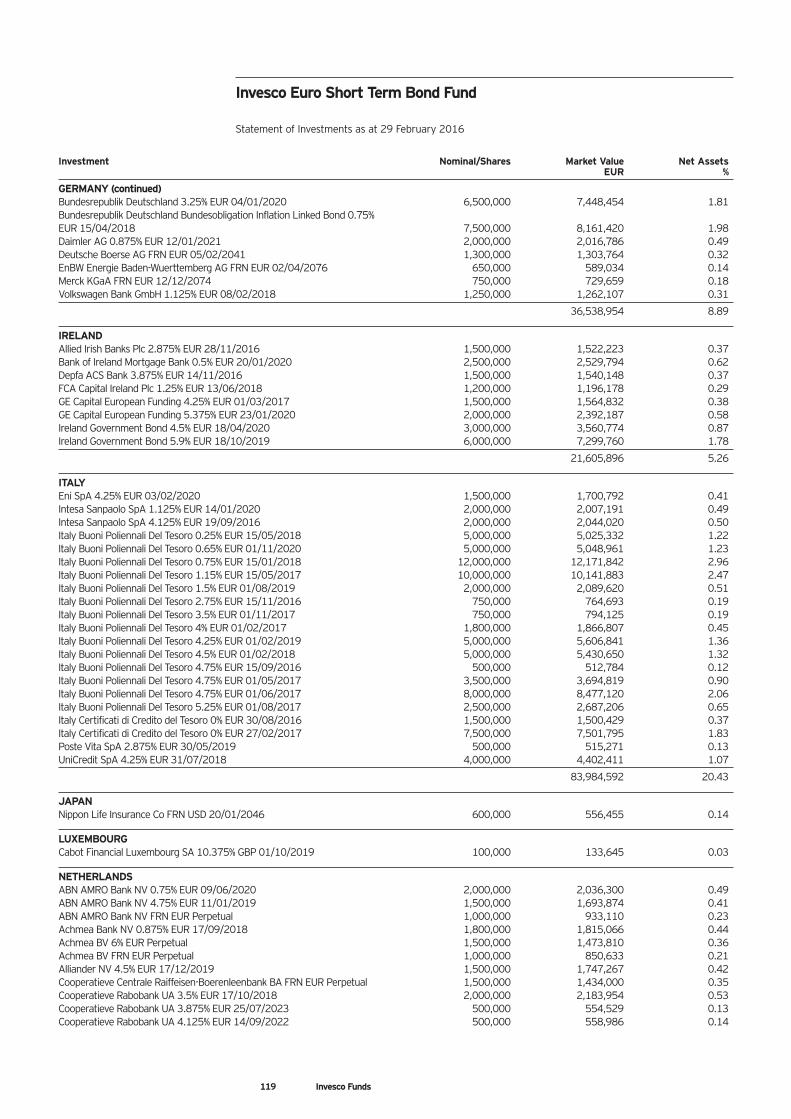
Investment Nominal/Shares Market Value Net Assets EUR %
GERMANY (continued)Bundesrepublik Deutschland 3.25% EUR 04/01/2020 6,500,000 7,448,454 1.81Bundesrepublik Deutschland Bundesobligation Inflation Linked Bond 0.75% EUR 15/04/2018 7,500,000 8,161,420 1.98Daimler AG 0.875% EUR 12/01/2021 2,000,000 2,016,786 0.49Deutsche Boerse AG FRN EUR 05/02/2041 1,300,000 1,303,764 0.32EnBW Energie Baden-Wuerttemberg AG FRN EUR 02/04/2076 650,000 589,034 0.14Merck KGaA FRN EUR 12/12/2074 750,000 729,659 0.18Volkswagen Bank GmbH 1.125% EUR 08/02/2018 1,250,000 1,262,107 0.31
36,538,954 8.89
IRELANDAllied Irish Banks Plc 2.875% EUR 28/11/2016 1,500,000 1,522,223 0.37Bank of Ireland Mortgage Bank 0.5% EUR 20/01/2020 2,500,000 2,529,794 0.62Depfa ACS Bank 3.875% EUR 14/11/2016 1,500,000 1,540,148 0.37FCA Capital Ireland Plc 1.25% EUR 13/06/2018 1,200,000 1,196,178 0.29GE Capital European Funding 4.25% EUR 01/03/2017 1,500,000 1,564,832 0.38GE Capital European Funding 5.375% EUR 23/01/2020 2,000,000 2,392,187 0.58Ireland Government Bond 4.5% EUR 18/04/2020 3,000,000 3,560,774 0.87Ireland Government Bond 5.9% EUR 18/10/2019 6,000,000 7,299,760 1.78
21,605,896 5.26
ITALYEni SpA 4.25% EUR 03/02/2020 1,500,000 1,700,792 0.41Intesa Sanpaolo SpA 1.125% EUR 14/01/2020 2,000,000 2,007,191 0.49Intesa Sanpaolo SpA 4.125% EUR 19/09/2016 2,000,000 2,044,020 0.50Italy Buoni Poliennali Del Tesoro 0.25% EUR 15/05/2018 5,000,000 5,025,332 1.22Italy Buoni Poliennali Del Tesoro 0.65% EUR 01/11/2020 5,000,000 5,048,961 1.23Italy Buoni Poliennali Del Tesoro 0.75% EUR 15/01/2018 12,000,000 12,171,842 2.96Italy Buoni Poliennali Del Tesoro 1.15% EUR 15/05/2017 10,000,000 10,141,883 2.47Italy Buoni Poliennali Del Tesoro 1.5% EUR 01/08/2019 2,000,000 2,089,620 0.51Italy Buoni Poliennali Del Tesoro 2.75% EUR 15/11/2016 750,000 764,693 0.19Italy Buoni Poliennali Del Tesoro 3.5% EUR 01/11/2017 750,000 794,125 0.19Italy Buoni Poliennali Del Tesoro 4% EUR 01/02/2017 1,800,000 1,866,807 0.45Italy Buoni Poliennali Del Tesoro 4.25% EUR 01/02/2019 5,000,000 5,606,841 1.36Italy Buoni Poliennali Del Tesoro 4.5% EUR 01/02/2018 5,000,000 5,430,650 1.32Italy Buoni Poliennali Del Tesoro 4.75% EUR 15/09/2016 500,000 512,784 0.12Italy Buoni Poliennali Del Tesoro 4.75% EUR 01/05/2017 3,500,000 3,694,819 0.90Italy Buoni Poliennali Del Tesoro 4.75% EUR 01/06/2017 8,000,000 8,477,120 2.06Italy Buoni Poliennali Del Tesoro 5.25% EUR 01/08/2017 2,500,000 2,687,206 0.65Italy Certificati di Credito del Tesoro 0% EUR 30/08/2016 1,500,000 1,500,429 0.37Italy Certificati di Credito del Tesoro 0% EUR 27/02/2017 7,500,000 7,501,795 1.83Poste Vita SpA 2.875% EUR 30/05/2019 500,000 515,271 0.13UniCredit SpA 4.25% EUR 31/07/2018 4,000,000 4,402,411 1.07
83,984,592 20.43
JAPANNippon Life Insurance Co FRN USD 20/01/2046 600,000 556,455 0.14
LUXEMBOURGCabot Financial Luxembourg SA 10.375% GBP 01/10/2019 100,000 133,645 0.03
NETHERLANDSABN AMRO Bank NV 0.75% EUR 09/06/2020 2,000,000 2,036,300 0.49ABN AMRO Bank NV 4.75% EUR 11/01/2019 1,500,000 1,693,874 0.41ABN AMRO Bank NV FRN EUR Perpetual 1,000,000 933,110 0.23Achmea Bank NV 0.875% EUR 17/09/2018 1,800,000 1,815,066 0.44Achmea BV 6% EUR Perpetual 1,500,000 1,473,810 0.36Achmea BV FRN EUR Perpetual 1,000,000 850,633 0.21Alliander NV 4.5% EUR 17/12/2019 1,500,000 1,747,267 0.42Cooperatieve Centrale Raiffeisen-Boerenleenbank BA FRN EUR Perpetual 1,500,000 1,434,000 0.35Cooperatieve Rabobank UA 3.5% EUR 17/10/2018 2,000,000 2,183,954 0.53Cooperatieve Rabobank UA 3.875% EUR 25/07/2023 500,000 554,529 0.13Cooperatieve Rabobank UA 4.125% EUR 14/09/2022 500,000 558,986 0.14
Invesco Euro Short Term Bond Fund
Statement of Investments as at 29 February 2016
119 Invesco Funds
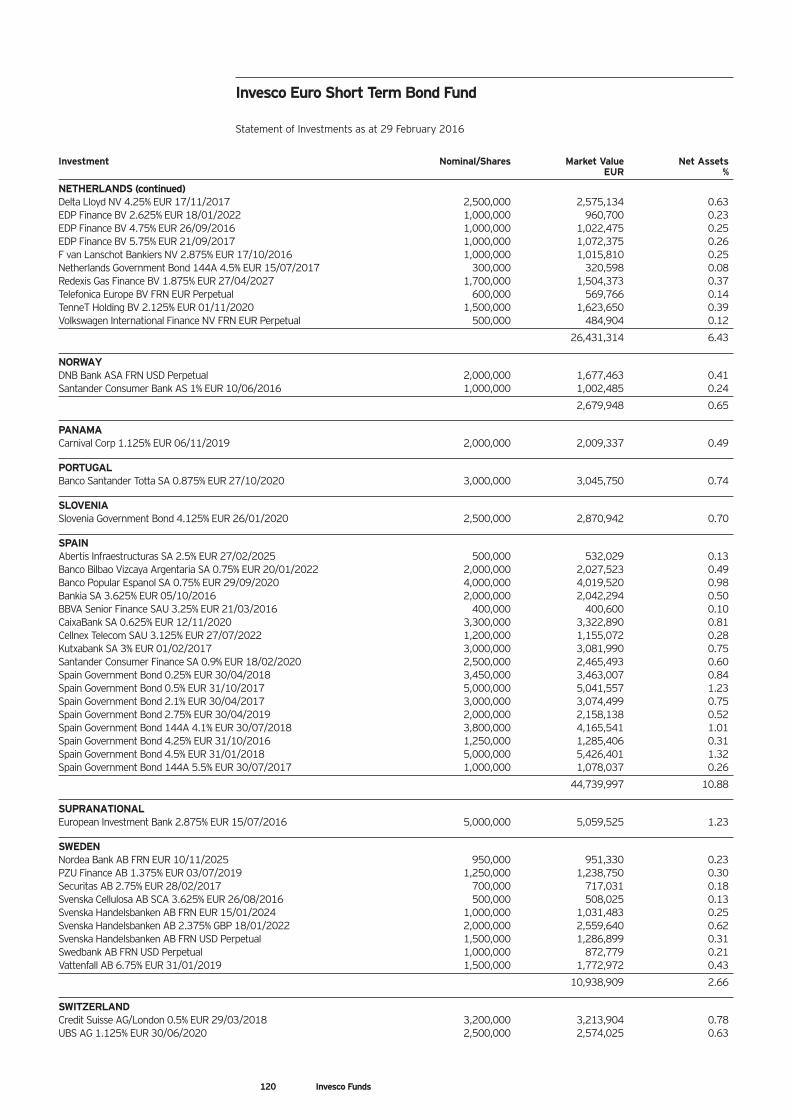
Invesco Euro Short Term Bond Fund
Statement of Investments as at 29 February 2016
Investment Nominal/Shares Market Value Net Assets EUR %
NETHERLANDS (continued)Delta Lloyd NV 4.25% EUR 17/11/2017 2,500,000 2,575,134 0.63EDP Finance BV 2.625% EUR 18/01/2022 1,000,000 960,700 0.23EDP Finance BV 4.75% EUR 26/09/2016 1,000,000 1,022,475 0.25EDP Finance BV 5.75% EUR 21/09/2017 1,000,000 1,072,375 0.26F van Lanschot Bankiers NV 2.875% EUR 17/10/2016 1,000,000 1,015,810 0.25Netherlands Government Bond 144A 4.5% EUR 15/07/2017 300,000 320,598 0.08Redexis Gas Finance BV 1.875% EUR 27/04/2027 1,700,000 1,504,373 0.37Telefonica Europe BV FRN EUR Perpetual 600,000 569,766 0.14TenneT Holding BV 2.125% EUR 01/11/2020 1,500,000 1,623,650 0.39Volkswagen International Finance NV FRN EUR Perpetual 500,000 484,904 0.12
26,431,314 6.43
NORWAYDNB Bank ASA FRN USD Perpetual 2,000,000 1,677,463 0.41Santander Consumer Bank AS 1% EUR 10/06/2016 1,000,000 1,002,485 0.24
2,679,948 0.65
PANAMACarnival Corp 1.125% EUR 06/11/2019 2,000,000 2,009,337 0.49
PORTUGALBanco Santander Totta SA 0.875% EUR 27/10/2020 3,000,000 3,045,750 0.74
SLOVENIASlovenia Government Bond 4.125% EUR 26/01/2020 2,500,000 2,870,942 0.70
SPAINAbertis Infraestructuras SA 2.5% EUR 27/02/2025 500,000 532,029 0.13Banco Bilbao Vizcaya Argentaria SA 0.75% EUR 20/01/2022 2,000,000 2,027,523 0.49Banco Popular Espanol SA 0.75% EUR 29/09/2020 4,000,000 4,019,520 0.98Bankia SA 3.625% EUR 05/10/2016 2,000,000 2,042,294 0.50BBVA Senior Finance SAU 3.25% EUR 21/03/2016 400,000 400,600 0.10CaixaBank SA 0.625% EUR 12/11/2020 3,300,000 3,322,890 0.81Cellnex Telecom SAU 3.125% EUR 27/07/2022 1,200,000 1,155,072 0.28Kutxabank SA 3% EUR 01/02/2017 3,000,000 3,081,990 0.75Santander Consumer Finance SA 0.9% EUR 18/02/2020 2,500,000 2,465,493 0.60Spain Government Bond 0.25% EUR 30/04/2018 3,450,000 3,463,007 0.84Spain Government Bond 0.5% EUR 31/10/2017 5,000,000 5,041,557 1.23Spain Government Bond 2.1% EUR 30/04/2017 3,000,000 3,074,499 0.75Spain Government Bond 2.75% EUR 30/04/2019 2,000,000 2,158,138 0.52Spain Government Bond 144A 4.1% EUR 30/07/2018 3,800,000 4,165,541 1.01Spain Government Bond 4.25% EUR 31/10/2016 1,250,000 1,285,406 0.31Spain Government Bond 4.5% EUR 31/01/2018 5,000,000 5,426,401 1.32Spain Government Bond 144A 5.5% EUR 30/07/2017 1,000,000 1,078,037 0.26
44,739,997 10.88
SUPRANATIONALEuropean Investment Bank 2.875% EUR 15/07/2016 5,000,000 5,059,525 1.23
SWEDENNordea Bank AB FRN EUR 10/11/2025 950,000 951,330 0.23PZU Finance AB 1.375% EUR 03/07/2019 1,250,000 1,238,750 0.30Securitas AB 2.75% EUR 28/02/2017 700,000 717,031 0.18Svenska Cellulosa AB SCA 3.625% EUR 26/08/2016 500,000 508,025 0.13Svenska Handelsbanken AB FRN EUR 15/01/2024 1,000,000 1,031,483 0.25Svenska Handelsbanken AB 2.375% GBP 18/01/2022 2,000,000 2,559,640 0.62Svenska Handelsbanken AB FRN USD Perpetual 1,500,000 1,286,899 0.31Swedbank AB FRN USD Perpetual 1,000,000 872,779 0.21Vattenfall AB 6.75% EUR 31/01/2019 1,500,000 1,772,972 0.43
10,938,909 2.66
SWITZERLANDCredit Suisse AG/London 0.5% EUR 29/03/2018 3,200,000 3,213,904 0.78UBS AG 1.125% EUR 30/06/2020 2,500,000 2,574,025 0.63
120 Invesco Funds
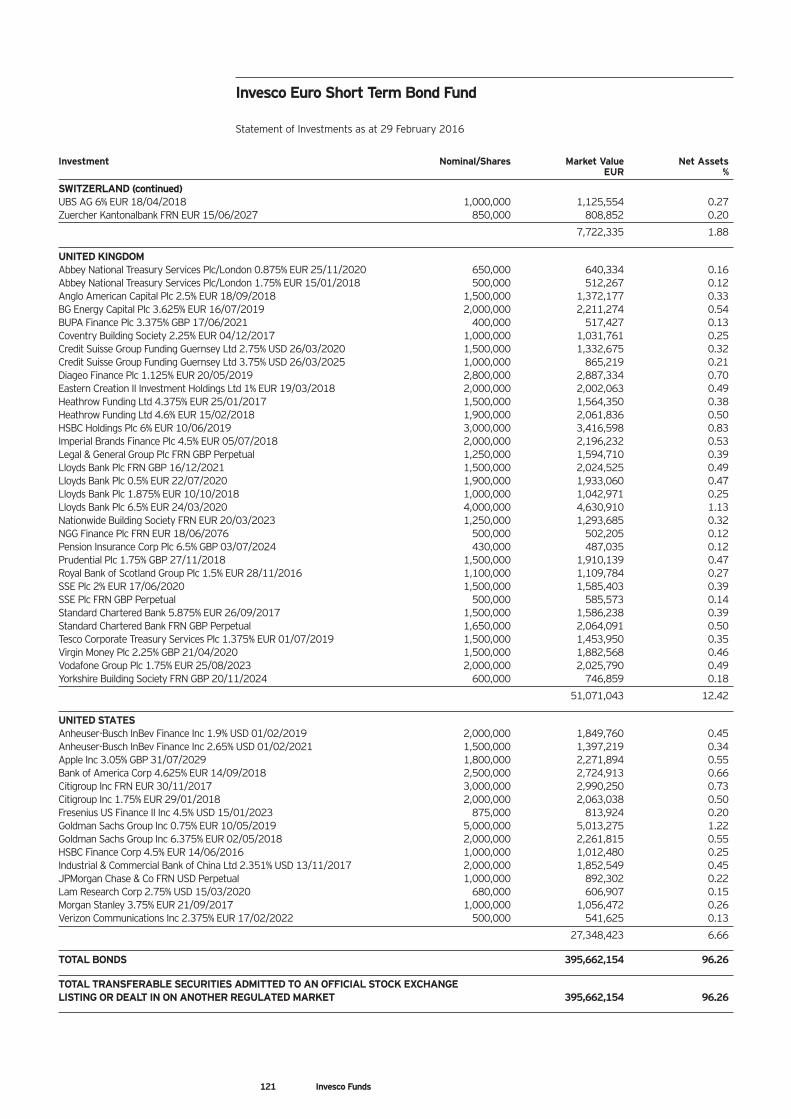
Investment Nominal/Shares Market Value Net Assets EUR %
SWITZERLAND (continued)UBS AG 6% EUR 18/04/2018 1,000,000 1,125,554 0.27Zuercher Kantonalbank FRN EUR 15/06/2027 850,000 808,852 0.20
7,722,335 1.88
UNITED KINGDOMAbbey National Treasury Services Plc/London 0.875% EUR 25/11/2020 650,000 640,334 0.16Abbey National Treasury Services Plc/London 1.75% EUR 15/01/2018 500,000 512,267 0.12Anglo American Capital Plc 2.5% EUR 18/09/2018 1,500,000 1,372,177 0.33BG Energy Capital Plc 3.625% EUR 16/07/2019 2,000,000 2,211,274 0.54BUPA Finance Plc 3.375% GBP 17/06/2021 400,000 517,427 0.13Coventry Building Society 2.25% EUR 04/12/2017 1,000,000 1,031,761 0.25Credit Suisse Group Funding Guernsey Ltd 2.75% USD 26/03/2020 1,500,000 1,332,675 0.32Credit Suisse Group Funding Guernsey Ltd 3.75% USD 26/03/2025 1,000,000 865,219 0.21Diageo Finance Plc 1.125% EUR 20/05/2019 2,800,000 2,887,334 0.70Eastern Creation II Investment Holdings Ltd 1% EUR 19/03/2018 2,000,000 2,002,063 0.49Heathrow Funding Ltd 4.375% EUR 25/01/2017 1,500,000 1,564,350 0.38Heathrow Funding Ltd 4.6% EUR 15/02/2018 1,900,000 2,061,836 0.50HSBC Holdings Plc 6% EUR 10/06/2019 3,000,000 3,416,598 0.83Imperial Brands Finance Plc 4.5% EUR 05/07/2018 2,000,000 2,196,232 0.53Legal & General Group Plc FRN GBP Perpetual 1,250,000 1,594,710 0.39Lloyds Bank Plc FRN GBP 16/12/2021 1,500,000 2,024,525 0.49Lloyds Bank Plc 0.5% EUR 22/07/2020 1,900,000 1,933,060 0.47Lloyds Bank Plc 1.875% EUR 10/10/2018 1,000,000 1,042,971 0.25Lloyds Bank Plc 6.5% EUR 24/03/2020 4,000,000 4,630,910 1.13Nationwide Building Society FRN EUR 20/03/2023 1,250,000 1,293,685 0.32NGG Finance Plc FRN EUR 18/06/2076 500,000 502,205 0.12Pension Insurance Corp Plc 6.5% GBP 03/07/2024 430,000 487,035 0.12Prudential Plc 1.75% GBP 27/11/2018 1,500,000 1,910,139 0.47Royal Bank of Scotland Group Plc 1.5% EUR 28/11/2016 1,100,000 1,109,784 0.27SSE Plc 2% EUR 17/06/2020 1,500,000 1,585,403 0.39SSE Plc FRN GBP Perpetual 500,000 585,573 0.14Standard Chartered Bank 5.875% EUR 26/09/2017 1,500,000 1,586,238 0.39Standard Chartered Bank FRN GBP Perpetual 1,650,000 2,064,091 0.50Tesco Corporate Treasury Services Plc 1.375% EUR 01/07/2019 1,500,000 1,453,950 0.35Virgin Money Plc 2.25% GBP 21/04/2020 1,500,000 1,882,568 0.46Vodafone Group Plc 1.75% EUR 25/08/2023 2,000,000 2,025,790 0.49Yorkshire Building Society FRN GBP 20/11/2024 600,000 746,859 0.18
51,071,043 12.42
UNITED STATESAnheuser-Busch InBev Finance Inc 1.9% USD 01/02/2019 2,000,000 1,849,760 0.45Anheuser-Busch InBev Finance Inc 2.65% USD 01/02/2021 1,500,000 1,397,219 0.34Apple Inc 3.05% GBP 31/07/2029 1,800,000 2,271,894 0.55Bank of America Corp 4.625% EUR 14/09/2018 2,500,000 2,724,913 0.66Citigroup Inc FRN EUR 30/11/2017 3,000,000 2,990,250 0.73Citigroup Inc 1.75% EUR 29/01/2018 2,000,000 2,063,038 0.50Fresenius US Finance II Inc 4.5% USD 15/01/2023 875,000 813,924 0.20Goldman Sachs Group Inc 0.75% EUR 10/05/2019 5,000,000 5,013,275 1.22Goldman Sachs Group Inc 6.375% EUR 02/05/2018 2,000,000 2,261,815 0.55HSBC Finance Corp 4.5% EUR 14/06/2016 1,000,000 1,012,480 0.25Industrial & Commercial Bank of China Ltd 2.351% USD 13/11/2017 2,000,000 1,852,549 0.45JPMorgan Chase & Co FRN USD Perpetual 1,000,000 892,302 0.22Lam Research Corp 2.75% USD 15/03/2020 680,000 606,907 0.15Morgan Stanley 3.75% EUR 21/09/2017 1,000,000 1,056,472 0.26Verizon Communications Inc 2.375% EUR 17/02/2022 500,000 541,625 0.13
27,348,423 6.66
TOTAL BONDS 395,662,154 96.26
TOTAL TRANSFERABLE SECURITIES ADMITTED TO AN OFFICIAL STOCK EXCHANGE LISTING OR DEALT IN ON ANOTHER REGULATED MARKET 395,662,154 96.26
Invesco Euro Short Term Bond Fund
Statement of Investments as at 29 February 2016
121 Invesco Funds
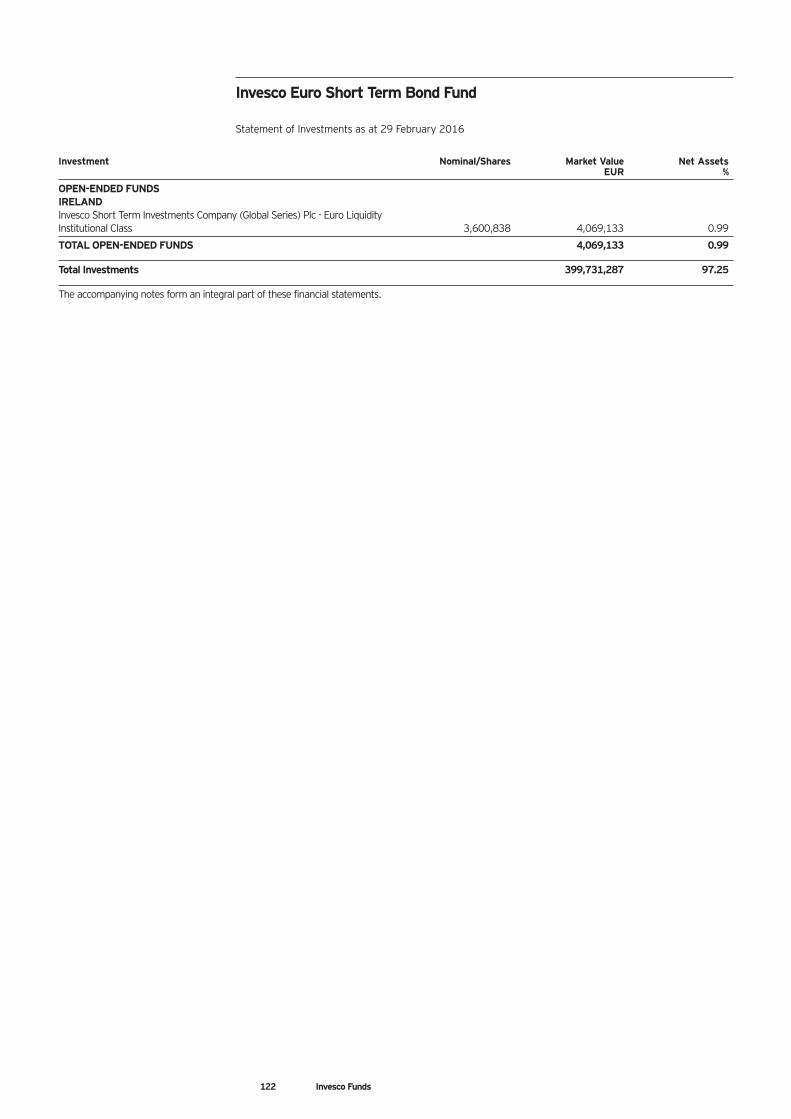
Investment Nominal/Shares Market Value Net Assets EUR %
OPEN-ENDED FUNDSIRELANDInvesco Short Term Investments Company (Global Series) Plc - Euro Liquidity Institutional Class 3,600,838 4,069,133 0.99
TOTAL OPEN-ENDED FUNDS 4,069,133 0.99
Total Investments 399,731,287 97.25
The accompanying notes form an integral part of these financial statements.
Invesco Euro Short Term Bond Fund
Statement of Investments as at 29 February 2016
122 Invesco Funds
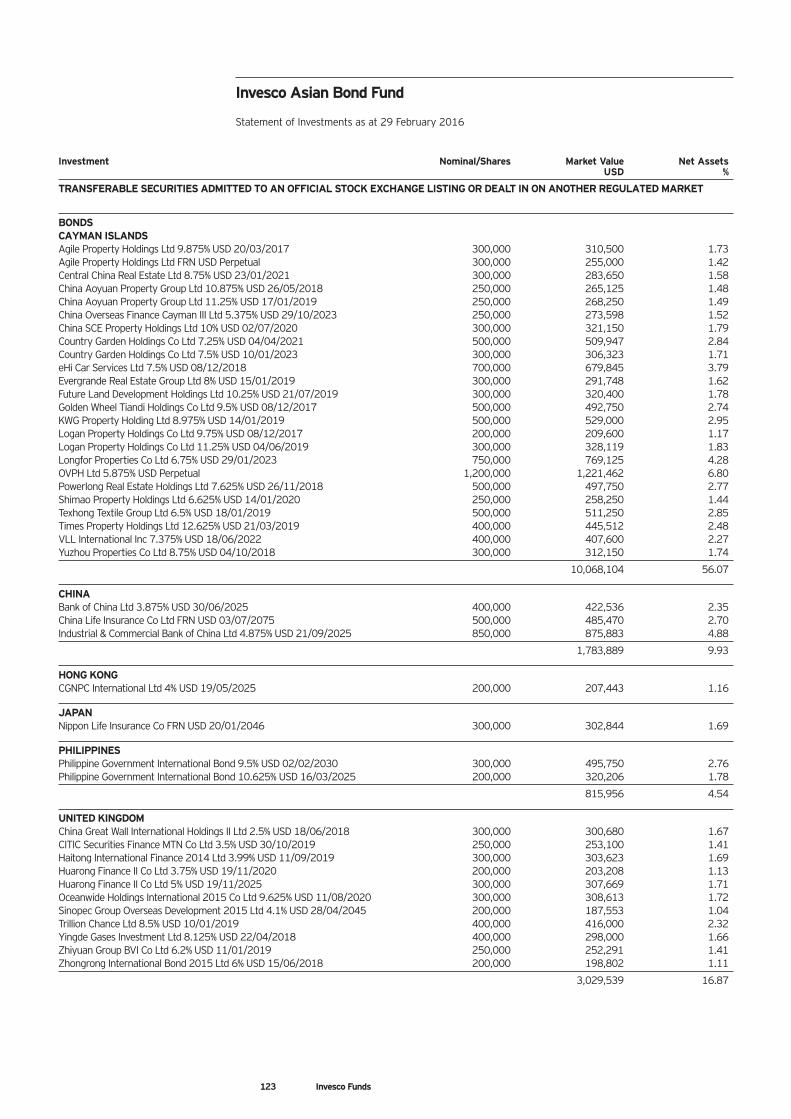
Investment Nominal/Shares Market Value Net Assets USD %
TRANSFERABLE SECURITIES ADMITTED TO AN OFFICIAL STOCK EXCHANGE LISTING OR DEALT IN ON ANOTHER REGULATED MARKET
BONDSCAYMAN ISLANDSAgile Property Holdings Ltd 9.875% USD 20/03/2017 300,000 310,500 1.73Agile Property Holdings Ltd FRN USD Perpetual 300,000 255,000 1.42Central China Real Estate Ltd 8.75% USD 23/01/2021 300,000 283,650 1.58China Aoyuan Property Group Ltd 10.875% USD 26/05/2018 250,000 265,125 1.48China Aoyuan Property Group Ltd 11.25% USD 17/01/2019 250,000 268,250 1.49China Overseas Finance Cayman III Ltd 5.375% USD 29/10/2023 250,000 273,598 1.52China SCE Property Holdings Ltd 10% USD 02/07/2020 300,000 321,150 1.79Country Garden Holdings Co Ltd 7.25% USD 04/04/2021 500,000 509,947 2.84Country Garden Holdings Co Ltd 7.5% USD 10/01/2023 300,000 306,323 1.71eHi Car Services Ltd 7.5% USD 08/12/2018 700,000 679,845 3.79Evergrande Real Estate Group Ltd 8% USD 15/01/2019 300,000 291,748 1.62Future Land Development Holdings Ltd 10.25% USD 21/07/2019 300,000 320,400 1.78Golden Wheel Tiandi Holdings Co Ltd 9.5% USD 08/12/2017 500,000 492,750 2.74KWG Property Holding Ltd 8.975% USD 14/01/2019 500,000 529,000 2.95Logan Property Holdings Co Ltd 9.75% USD 08/12/2017 200,000 209,600 1.17Logan Property Holdings Co Ltd 11.25% USD 04/06/2019 300,000 328,119 1.83Longfor Properties Co Ltd 6.75% USD 29/01/2023 750,000 769,125 4.28OVPH Ltd 5.875% USD Perpetual 1,200,000 1,221,462 6.80Powerlong Real Estate Holdings Ltd 7.625% USD 26/11/2018 500,000 497,750 2.77Shimao Property Holdings Ltd 6.625% USD 14/01/2020 250,000 258,250 1.44Texhong Textile Group Ltd 6.5% USD 18/01/2019 500,000 511,250 2.85Times Property Holdings Ltd 12.625% USD 21/03/2019 400,000 445,512 2.48VLL International Inc 7.375% USD 18/06/2022 400,000 407,600 2.27Yuzhou Properties Co Ltd 8.75% USD 04/10/2018 300,000 312,150 1.74
10,068,104 56.07
CHINABank of China Ltd 3.875% USD 30/06/2025 400,000 422,536 2.35China Life Insurance Co Ltd FRN USD 03/07/2075 500,000 485,470 2.70Industrial & Commercial Bank of China Ltd 4.875% USD 21/09/2025 850,000 875,883 4.88
1,783,889 9.93
HONG KONGCGNPC International Ltd 4% USD 19/05/2025 200,000 207,443 1.16
JAPANNippon Life Insurance Co FRN USD 20/01/2046 300,000 302,844 1.69
PHILIPPINESPhilippine Government International Bond 9.5% USD 02/02/2030 300,000 495,750 2.76Philippine Government International Bond 10.625% USD 16/03/2025 200,000 320,206 1.78
815,956 4.54
UNITED KINGDOMChina Great Wall International Holdings II Ltd 2.5% USD 18/06/2018 300,000 300,680 1.67CITIC Securities Finance MTN Co Ltd 3.5% USD 30/10/2019 250,000 253,100 1.41Haitong International Finance 2014 Ltd 3.99% USD 11/09/2019 300,000 303,623 1.69Huarong Finance II Co Ltd 3.75% USD 19/11/2020 200,000 203,208 1.13Huarong Finance II Co Ltd 5% USD 19/11/2025 300,000 307,669 1.71Oceanwide Holdings International 2015 Co Ltd 9.625% USD 11/08/2020 300,000 308,613 1.72Sinopec Group Overseas Development 2015 Ltd 4.1% USD 28/04/2045 200,000 187,553 1.04Trillion Chance Ltd 8.5% USD 10/01/2019 400,000 416,000 2.32Yingde Gases Investment Ltd 8.125% USD 22/04/2018 400,000 298,000 1.66Zhiyuan Group BVI Co Ltd 6.2% USD 11/01/2019 250,000 252,291 1.41Zhongrong International Bond 2015 Ltd 6% USD 15/06/2018 200,000 198,802 1.11
3,029,539 16.87
Invesco Asian Bond Fund
Statement of Investments as at 29 February 2016
123 Invesco Funds
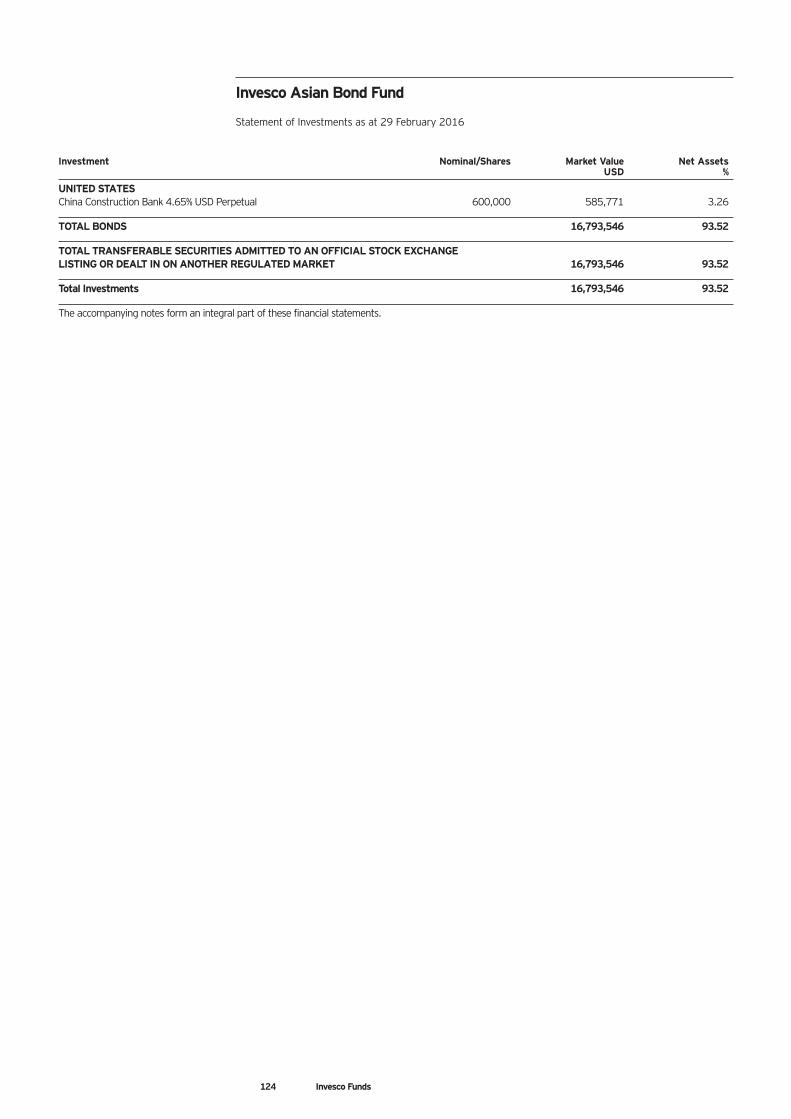
Investment Nominal/Shares Market Value Net Assets USD %
UNITED STATESChina Construction Bank 4.65% USD Perpetual 600,000 585,771 3.26
TOTAL BONDS 16,793,546 93.52
TOTAL TRANSFERABLE SECURITIES ADMITTED TO AN OFFICIAL STOCK EXCHANGE LISTING OR DEALT IN ON ANOTHER REGULATED MARKET 16,793,546 93.52
Total Investments 16,793,546 93.52
The accompanying notes form an integral part of these financial statements.
Invesco Asian Bond Fund
Statement of Investments as at 29 February 2016
124 Invesco Funds
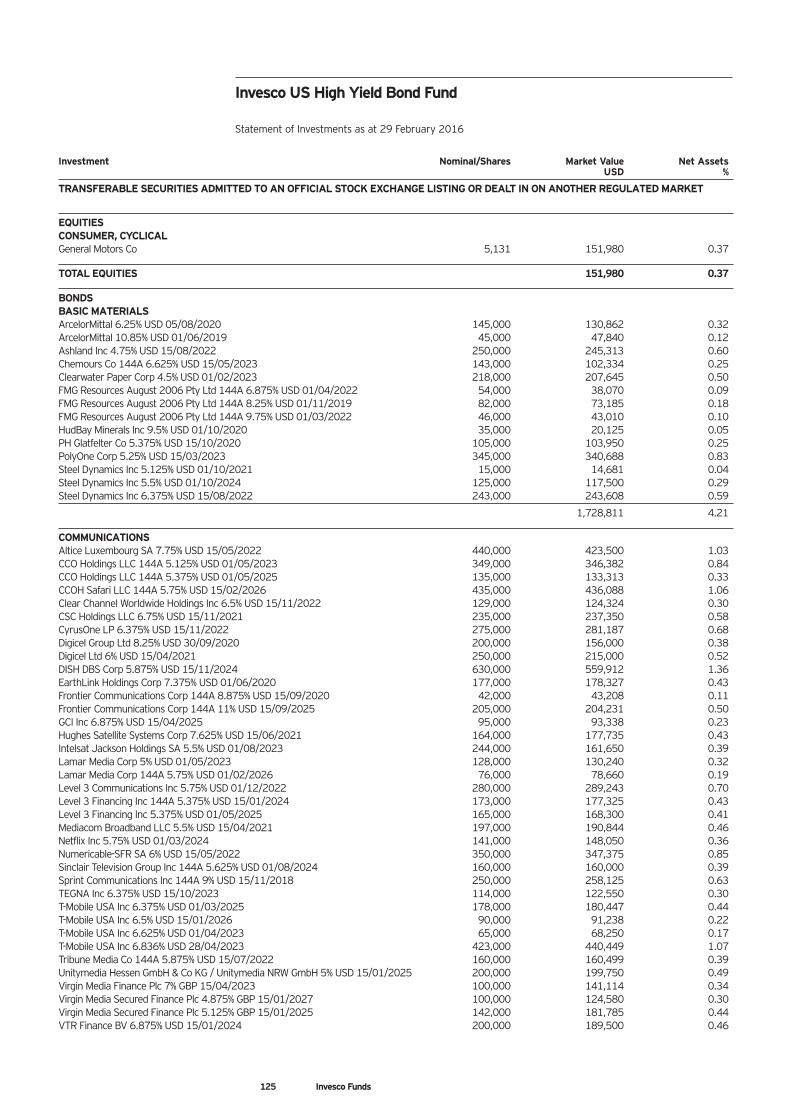
Investment Nominal/Shares Market Value Net Assets USD %
TRANSFERABLE SECURITIES ADMITTED TO AN OFFICIAL STOCK EXCHANGE LISTING OR DEALT IN ON ANOTHER REGULATED MARKET
EQUITIESCONSUMER, CYCLICALGeneral Motors Co 5,131 151,980 0.37
TOTAL EQUITIES 151,980 0.37
BONDSBASIC MATERIALSArcelorMittal 6.25% USD 05/08/2020 145,000 130,862 0.32ArcelorMittal 10.85% USD 01/06/2019 45,000 47,840 0.12Ashland Inc 4.75% USD 15/08/2022 250,000 245,313 0.60Chemours Co 144A 6.625% USD 15/05/2023 143,000 102,334 0.25Clearwater Paper Corp 4.5% USD 01/02/2023 218,000 207,645 0.50FMG Resources August 2006 Pty Ltd 144A 6.875% USD 01/04/2022 54,000 38,070 0.09FMG Resources August 2006 Pty Ltd 144A 8.25% USD 01/11/2019 82,000 73,185 0.18FMG Resources August 2006 Pty Ltd 144A 9.75% USD 01/03/2022 46,000 43,010 0.10HudBay Minerals Inc 9.5% USD 01/10/2020 35,000 20,125 0.05PH Glatfelter Co 5.375% USD 15/10/2020 105,000 103,950 0.25PolyOne Corp 5.25% USD 15/03/2023 345,000 340,688 0.83Steel Dynamics Inc 5.125% USD 01/10/2021 15,000 14,681 0.04Steel Dynamics Inc 5.5% USD 01/10/2024 125,000 117,500 0.29Steel Dynamics Inc 6.375% USD 15/08/2022 243,000 243,608 0.59
1,728,811 4.21
COMMUNICATIONSAltice Luxembourg SA 7.75% USD 15/05/2022 440,000 423,500 1.03CCO Holdings LLC 144A 5.125% USD 01/05/2023 349,000 346,382 0.84CCO Holdings LLC 144A 5.375% USD 01/05/2025 135,000 133,313 0.33CCOH Safari LLC 144A 5.75% USD 15/02/2026 435,000 436,088 1.06Clear Channel Worldwide Holdings Inc 6.5% USD 15/11/2022 129,000 124,324 0.30CSC Holdings LLC 6.75% USD 15/11/2021 235,000 237,350 0.58CyrusOne LP 6.375% USD 15/11/2022 275,000 281,187 0.68Digicel Group Ltd 8.25% USD 30/09/2020 200,000 156,000 0.38Digicel Ltd 6% USD 15/04/2021 250,000 215,000 0.52DISH DBS Corp 5.875% USD 15/11/2024 630,000 559,912 1.36EarthLink Holdings Corp 7.375% USD 01/06/2020 177,000 178,327 0.43Frontier Communications Corp 144A 8.875% USD 15/09/2020 42,000 43,208 0.11Frontier Communications Corp 144A 11% USD 15/09/2025 205,000 204,231 0.50GCI Inc 6.875% USD 15/04/2025 95,000 93,338 0.23Hughes Satellite Systems Corp 7.625% USD 15/06/2021 164,000 177,735 0.43Intelsat Jackson Holdings SA 5.5% USD 01/08/2023 244,000 161,650 0.39Lamar Media Corp 5% USD 01/05/2023 128,000 130,240 0.32Lamar Media Corp 144A 5.75% USD 01/02/2026 76,000 78,660 0.19Level 3 Communications Inc 5.75% USD 01/12/2022 280,000 289,243 0.70Level 3 Financing Inc 144A 5.375% USD 15/01/2024 173,000 177,325 0.43Level 3 Financing Inc 5.375% USD 01/05/2025 165,000 168,300 0.41Mediacom Broadband LLC 5.5% USD 15/04/2021 197,000 190,844 0.46Netflix Inc 5.75% USD 01/03/2024 141,000 148,050 0.36Numericable-SFR SA 6% USD 15/05/2022 350,000 347,375 0.85Sinclair Television Group Inc 144A 5.625% USD 01/08/2024 160,000 160,000 0.39Sprint Communications Inc 144A 9% USD 15/11/2018 250,000 258,125 0.63TEGNA Inc 6.375% USD 15/10/2023 114,000 122,550 0.30T-Mobile USA Inc 6.375% USD 01/03/2025 178,000 180,447 0.44T-Mobile USA Inc 6.5% USD 15/01/2026 90,000 91,238 0.22T-Mobile USA Inc 6.625% USD 01/04/2023 65,000 68,250 0.17T-Mobile USA Inc 6.836% USD 28/04/2023 423,000 440,449 1.07Tribune Media Co 144A 5.875% USD 15/07/2022 160,000 160,499 0.39Unitymedia Hessen GmbH & Co KG / Unitymedia NRW GmbH 5% USD 15/01/2025 200,000 199,750 0.49Virgin Media Finance Plc 7% GBP 15/04/2023 100,000 141,114 0.34Virgin Media Secured Finance Plc 4.875% GBP 15/01/2027 100,000 124,580 0.30Virgin Media Secured Finance Plc 5.125% GBP 15/01/2025 142,000 181,785 0.44VTR Finance BV 6.875% USD 15/01/2024 200,000 189,500 0.46
Invesco US High Yield Bond Fund
Statement of Investments as at 29 February 2016
125 Invesco Funds
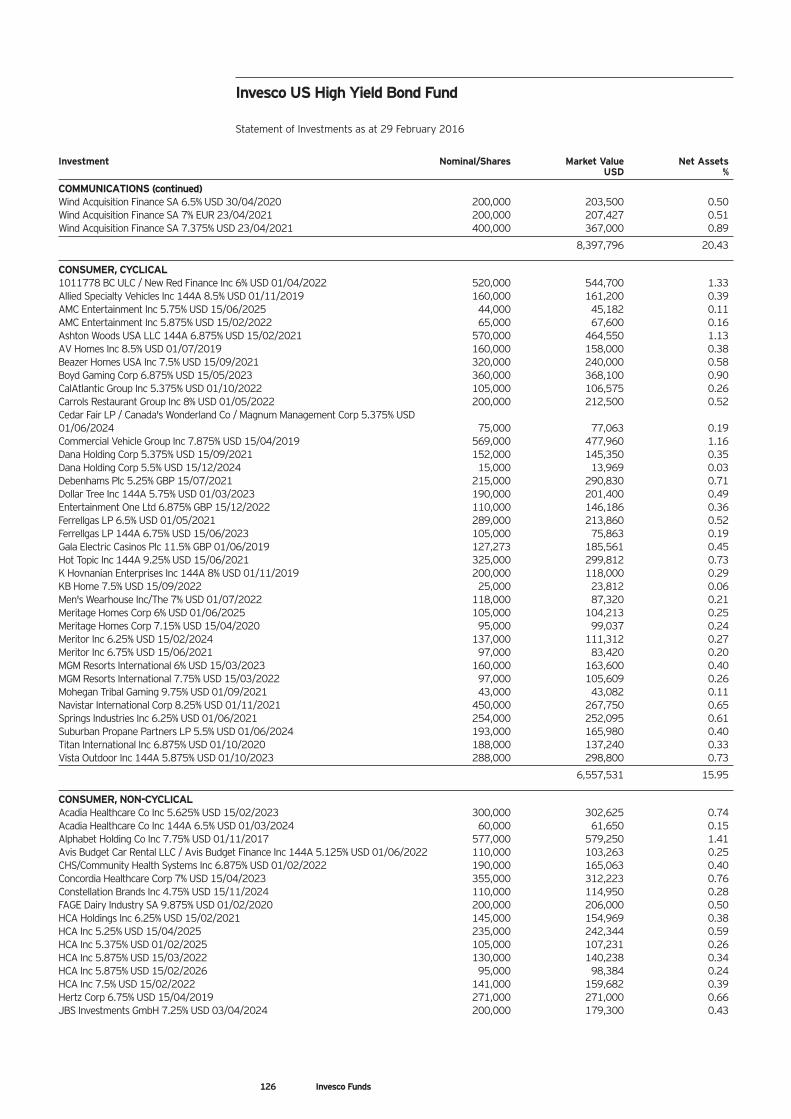
Investment Nominal/Shares Market Value Net Assets USD %
COMMUNICATIONS (continued)Wind Acquisition Finance SA 6.5% USD 30/04/2020 200,000 203,500 0.50Wind Acquisition Finance SA 7% EUR 23/04/2021 200,000 207,427 0.51Wind Acquisition Finance SA 7.375% USD 23/04/2021 400,000 367,000 0.89
8,397,796 20.43
CONSUMER, CYCLICAL1011778 BC ULC / New Red Finance Inc 6% USD 01/04/2022 520,000 544,700 1.33Allied Specialty Vehicles Inc 144A 8.5% USD 01/11/2019 160,000 161,200 0.39AMC Entertainment Inc 5.75% USD 15/06/2025 44,000 45,182 0.11AMC Entertainment Inc 5.875% USD 15/02/2022 65,000 67,600 0.16Ashton Woods USA LLC 144A 6.875% USD 15/02/2021 570,000 464,550 1.13AV Homes Inc 8.5% USD 01/07/2019 160,000 158,000 0.38Beazer Homes USA Inc 7.5% USD 15/09/2021 320,000 240,000 0.58Boyd Gaming Corp 6.875% USD 15/05/2023 360,000 368,100 0.90CalAtlantic Group Inc 5.375% USD 01/10/2022 105,000 106,575 0.26Carrols Restaurant Group Inc 8% USD 01/05/2022 200,000 212,500 0.52Cedar Fair LP / Canada's Wonderland Co / Magnum Management Corp 5.375% USD 01/06/2024 75,000 77,063 0.19Commercial Vehicle Group Inc 7.875% USD 15/04/2019 569,000 477,960 1.16Dana Holding Corp 5.375% USD 15/09/2021 152,000 145,350 0.35Dana Holding Corp 5.5% USD 15/12/2024 15,000 13,969 0.03Debenhams Plc 5.25% GBP 15/07/2021 215,000 290,830 0.71Dollar Tree Inc 144A 5.75% USD 01/03/2023 190,000 201,400 0.49Entertainment One Ltd 6.875% GBP 15/12/2022 110,000 146,186 0.36Ferrellgas LP 6.5% USD 01/05/2021 289,000 213,860 0.52Ferrellgas LP 144A 6.75% USD 15/06/2023 105,000 75,863 0.19Gala Electric Casinos Plc 11.5% GBP 01/06/2019 127,273 185,561 0.45Hot Topic Inc 144A 9.25% USD 15/06/2021 325,000 299,812 0.73K Hovnanian Enterprises Inc 144A 8% USD 01/11/2019 200,000 118,000 0.29KB Home 7.5% USD 15/09/2022 25,000 23,812 0.06Men's Wearhouse Inc/The 7% USD 01/07/2022 118,000 87,320 0.21Meritage Homes Corp 6% USD 01/06/2025 105,000 104,213 0.25Meritage Homes Corp 7.15% USD 15/04/2020 95,000 99,037 0.24Meritor Inc 6.25% USD 15/02/2024 137,000 111,312 0.27Meritor Inc 6.75% USD 15/06/2021 97,000 83,420 0.20MGM Resorts International 6% USD 15/03/2023 160,000 163,600 0.40MGM Resorts International 7.75% USD 15/03/2022 97,000 105,609 0.26Mohegan Tribal Gaming 9.75% USD 01/09/2021 43,000 43,082 0.11Navistar International Corp 8.25% USD 01/11/2021 450,000 267,750 0.65Springs Industries Inc 6.25% USD 01/06/2021 254,000 252,095 0.61Suburban Propane Partners LP 5.5% USD 01/06/2024 193,000 165,980 0.40Titan International Inc 6.875% USD 01/10/2020 188,000 137,240 0.33Vista Outdoor Inc 144A 5.875% USD 01/10/2023 288,000 298,800 0.73
6,557,531 15.95
CONSUMER, NON-CYCLICALAcadia Healthcare Co Inc 5.625% USD 15/02/2023 300,000 302,625 0.74Acadia Healthcare Co Inc 144A 6.5% USD 01/03/2024 60,000 61,650 0.15Alphabet Holding Co Inc 7.75% USD 01/11/2017 577,000 579,250 1.41Avis Budget Car Rental LLC / Avis Budget Finance Inc 144A 5.125% USD 01/06/2022 110,000 103,263 0.25CHS/Community Health Systems Inc 6.875% USD 01/02/2022 190,000 165,063 0.40Concordia Healthcare Corp 7% USD 15/04/2023 355,000 312,223 0.76Constellation Brands Inc 4.75% USD 15/11/2024 110,000 114,950 0.28FAGE Dairy Industry SA 9.875% USD 01/02/2020 200,000 206,000 0.50HCA Holdings Inc 6.25% USD 15/02/2021 145,000 154,969 0.38HCA Inc 5.25% USD 15/04/2025 235,000 242,344 0.59HCA Inc 5.375% USD 01/02/2025 105,000 107,231 0.26HCA Inc 5.875% USD 15/03/2022 130,000 140,238 0.34HCA Inc 5.875% USD 15/02/2026 95,000 98,384 0.24HCA Inc 7.5% USD 15/02/2022 141,000 159,682 0.39Hertz Corp 6.75% USD 15/04/2019 271,000 271,000 0.66JBS Investments GmbH 7.25% USD 03/04/2024 200,000 179,300 0.43
Invesco US High Yield Bond Fund
Statement of Investments as at 29 February 2016
126 Invesco Funds
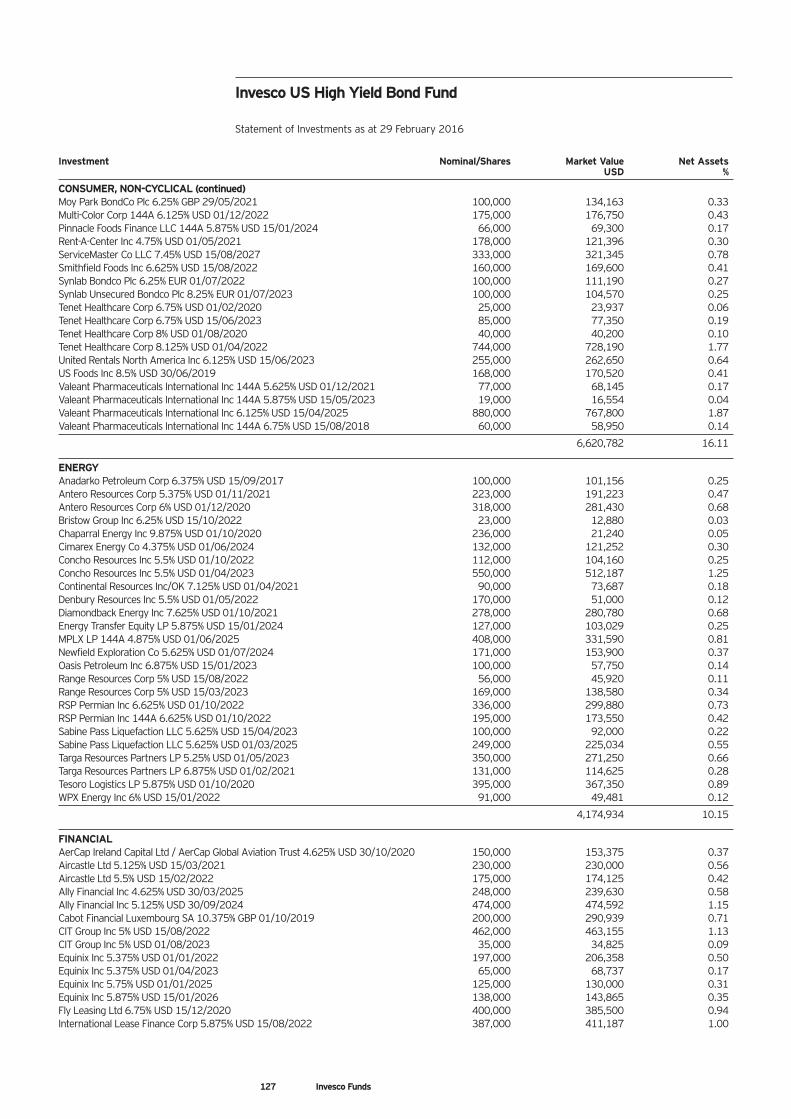
Investment Nominal/Shares Market Value Net Assets USD %
CONSUMER, NON-CYCLICAL (continued)Moy Park BondCo Plc 6.25% GBP 29/05/2021 100,000 134,163 0.33Multi-Color Corp 144A 6.125% USD 01/12/2022 175,000 176,750 0.43Pinnacle Foods Finance LLC 144A 5.875% USD 15/01/2024 66,000 69,300 0.17Rent-A-Center Inc 4.75% USD 01/05/2021 178,000 121,396 0.30ServiceMaster Co LLC 7.45% USD 15/08/2027 333,000 321,345 0.78Smithfield Foods Inc 6.625% USD 15/08/2022 160,000 169,600 0.41Synlab Bondco Plc 6.25% EUR 01/07/2022 100,000 111,190 0.27Synlab Unsecured Bondco Plc 8.25% EUR 01/07/2023 100,000 104,570 0.25Tenet Healthcare Corp 6.75% USD 01/02/2020 25,000 23,937 0.06Tenet Healthcare Corp 6.75% USD 15/06/2023 85,000 77,350 0.19Tenet Healthcare Corp 8% USD 01/08/2020 40,000 40,200 0.10Tenet Healthcare Corp 8.125% USD 01/04/2022 744,000 728,190 1.77United Rentals North America Inc 6.125% USD 15/06/2023 255,000 262,650 0.64US Foods Inc 8.5% USD 30/06/2019 168,000 170,520 0.41Valeant Pharmaceuticals International Inc 144A 5.625% USD 01/12/2021 77,000 68,145 0.17Valeant Pharmaceuticals International Inc 144A 5.875% USD 15/05/2023 19,000 16,554 0.04Valeant Pharmaceuticals International Inc 6.125% USD 15/04/2025 880,000 767,800 1.87Valeant Pharmaceuticals International Inc 144A 6.75% USD 15/08/2018 60,000 58,950 0.14
6,620,782 16.11
ENERGYAnadarko Petroleum Corp 6.375% USD 15/09/2017 100,000 101,156 0.25Antero Resources Corp 5.375% USD 01/11/2021 223,000 191,223 0.47Antero Resources Corp 6% USD 01/12/2020 318,000 281,430 0.68Bristow Group Inc 6.25% USD 15/10/2022 23,000 12,880 0.03Chaparral Energy Inc 9.875% USD 01/10/2020 236,000 21,240 0.05Cimarex Energy Co 4.375% USD 01/06/2024 132,000 121,252 0.30Concho Resources Inc 5.5% USD 01/10/2022 112,000 104,160 0.25Concho Resources Inc 5.5% USD 01/04/2023 550,000 512,187 1.25Continental Resources Inc/OK 7.125% USD 01/04/2021 90,000 73,687 0.18Denbury Resources Inc 5.5% USD 01/05/2022 170,000 51,000 0.12Diamondback Energy Inc 7.625% USD 01/10/2021 278,000 280,780 0.68Energy Transfer Equity LP 5.875% USD 15/01/2024 127,000 103,029 0.25MPLX LP 144A 4.875% USD 01/06/2025 408,000 331,590 0.81Newfield Exploration Co 5.625% USD 01/07/2024 171,000 153,900 0.37Oasis Petroleum Inc 6.875% USD 15/01/2023 100,000 57,750 0.14Range Resources Corp 5% USD 15/08/2022 56,000 45,920 0.11Range Resources Corp 5% USD 15/03/2023 169,000 138,580 0.34RSP Permian Inc 6.625% USD 01/10/2022 336,000 299,880 0.73RSP Permian Inc 144A 6.625% USD 01/10/2022 195,000 173,550 0.42Sabine Pass Liquefaction LLC 5.625% USD 15/04/2023 100,000 92,000 0.22Sabine Pass Liquefaction LLC 5.625% USD 01/03/2025 249,000 225,034 0.55Targa Resources Partners LP 5.25% USD 01/05/2023 350,000 271,250 0.66Targa Resources Partners LP 6.875% USD 01/02/2021 131,000 114,625 0.28Tesoro Logistics LP 5.875% USD 01/10/2020 395,000 367,350 0.89WPX Energy Inc 6% USD 15/01/2022 91,000 49,481 0.12
4,174,934 10.15
FINANCIALAerCap Ireland Capital Ltd / AerCap Global Aviation Trust 4.625% USD 30/10/2020 150,000 153,375 0.37Aircastle Ltd 5.125% USD 15/03/2021 230,000 230,000 0.56Aircastle Ltd 5.5% USD 15/02/2022 175,000 174,125 0.42Ally Financial Inc 4.625% USD 30/03/2025 248,000 239,630 0.58Ally Financial Inc 5.125% USD 30/09/2024 474,000 474,592 1.15Cabot Financial Luxembourg SA 10.375% GBP 01/10/2019 200,000 290,939 0.71CIT Group Inc 5% USD 15/08/2022 462,000 463,155 1.13CIT Group Inc 5% USD 01/08/2023 35,000 34,825 0.09Equinix Inc 5.375% USD 01/01/2022 197,000 206,358 0.50Equinix Inc 5.375% USD 01/04/2023 65,000 68,737 0.17Equinix Inc 5.75% USD 01/01/2025 125,000 130,000 0.31Equinix Inc 5.875% USD 15/01/2026 138,000 143,865 0.35Fly Leasing Ltd 6.75% USD 15/12/2020 400,000 385,500 0.94International Lease Finance Corp 5.875% USD 15/08/2022 387,000 411,187 1.00
Invesco US High Yield Bond Fund
Statement of Investments as at 29 February 2016
127 Invesco Funds
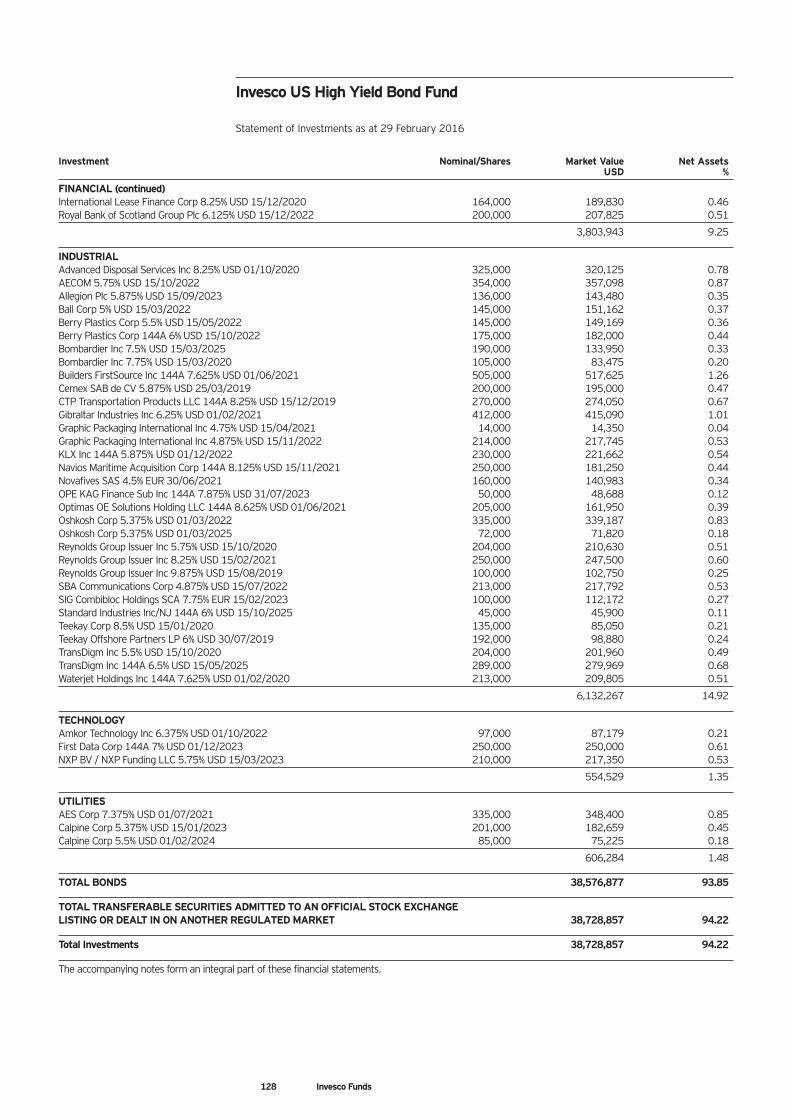
Investment Nominal/Shares Market Value Net Assets USD %
FINANCIAL (continued)International Lease Finance Corp 8.25% USD 15/12/2020 164,000 189,830 0.46Royal Bank of Scotland Group Plc 6.125% USD 15/12/2022 200,000 207,825 0.51
3,803,943 9.25
INDUSTRIALAdvanced Disposal Services Inc 8.25% USD 01/10/2020 325,000 320,125 0.78AECOM 5.75% USD 15/10/2022 354,000 357,098 0.87Allegion Plc 5.875% USD 15/09/2023 136,000 143,480 0.35Ball Corp 5% USD 15/03/2022 145,000 151,162 0.37Berry Plastics Corp 5.5% USD 15/05/2022 145,000 149,169 0.36Berry Plastics Corp 144A 6% USD 15/10/2022 175,000 182,000 0.44Bombardier Inc 7.5% USD 15/03/2025 190,000 133,950 0.33Bombardier Inc 7.75% USD 15/03/2020 105,000 83,475 0.20Builders FirstSource Inc 144A 7.625% USD 01/06/2021 505,000 517,625 1.26Cemex SAB de CV 5.875% USD 25/03/2019 200,000 195,000 0.47CTP Transportation Products LLC 144A 8.25% USD 15/12/2019 270,000 274,050 0.67Gibraltar Industries Inc 6.25% USD 01/02/2021 412,000 415,090 1.01Graphic Packaging International Inc 4.75% USD 15/04/2021 14,000 14,350 0.04Graphic Packaging International Inc 4.875% USD 15/11/2022 214,000 217,745 0.53KLX Inc 144A 5.875% USD 01/12/2022 230,000 221,662 0.54Navios Maritime Acquisition Corp 144A 8.125% USD 15/11/2021 250,000 181,250 0.44Novafives SAS 4.5% EUR 30/06/2021 160,000 140,983 0.34OPE KAG Finance Sub Inc 144A 7.875% USD 31/07/2023 50,000 48,688 0.12Optimas OE Solutions Holding LLC 144A 8.625% USD 01/06/2021 205,000 161,950 0.39Oshkosh Corp 5.375% USD 01/03/2022 335,000 339,187 0.83Oshkosh Corp 5.375% USD 01/03/2025 72,000 71,820 0.18Reynolds Group Issuer Inc 5.75% USD 15/10/2020 204,000 210,630 0.51Reynolds Group Issuer Inc 8.25% USD 15/02/2021 250,000 247,500 0.60Reynolds Group Issuer Inc 9.875% USD 15/08/2019 100,000 102,750 0.25SBA Communications Corp 4.875% USD 15/07/2022 213,000 217,792 0.53SIG Combibloc Holdings SCA 7.75% EUR 15/02/2023 100,000 112,172 0.27Standard Industries Inc/NJ 144A 6% USD 15/10/2025 45,000 45,900 0.11Teekay Corp 8.5% USD 15/01/2020 135,000 85,050 0.21Teekay Offshore Partners LP 6% USD 30/07/2019 192,000 98,880 0.24TransDigm Inc 5.5% USD 15/10/2020 204,000 201,960 0.49TransDigm Inc 144A 6.5% USD 15/05/2025 289,000 279,969 0.68Waterjet Holdings Inc 144A 7.625% USD 01/02/2020 213,000 209,805 0.51
6,132,267 14.92
TECHNOLOGYAmkor Technology Inc 6.375% USD 01/10/2022 97,000 87,179 0.21First Data Corp 144A 7% USD 01/12/2023 250,000 250,000 0.61NXP BV / NXP Funding LLC 5.75% USD 15/03/2023 210,000 217,350 0.53
554,529 1.35
UTILITIESAES Corp 7.375% USD 01/07/2021 335,000 348,400 0.85Calpine Corp 5.375% USD 15/01/2023 201,000 182,659 0.45Calpine Corp 5.5% USD 01/02/2024 85,000 75,225 0.18
606,284 1.48
TOTAL BONDS 38,576,877 93.85
TOTAL TRANSFERABLE SECURITIES ADMITTED TO AN OFFICIAL STOCK EXCHANGE LISTING OR DEALT IN ON ANOTHER REGULATED MARKET 38,728,857 94.22
Total Investments 38,728,857 94.22
The accompanying notes form an integral part of these financial statements.
Invesco US High Yield Bond Fund
Statement of Investments as at 29 February 2016
128 Invesco Funds
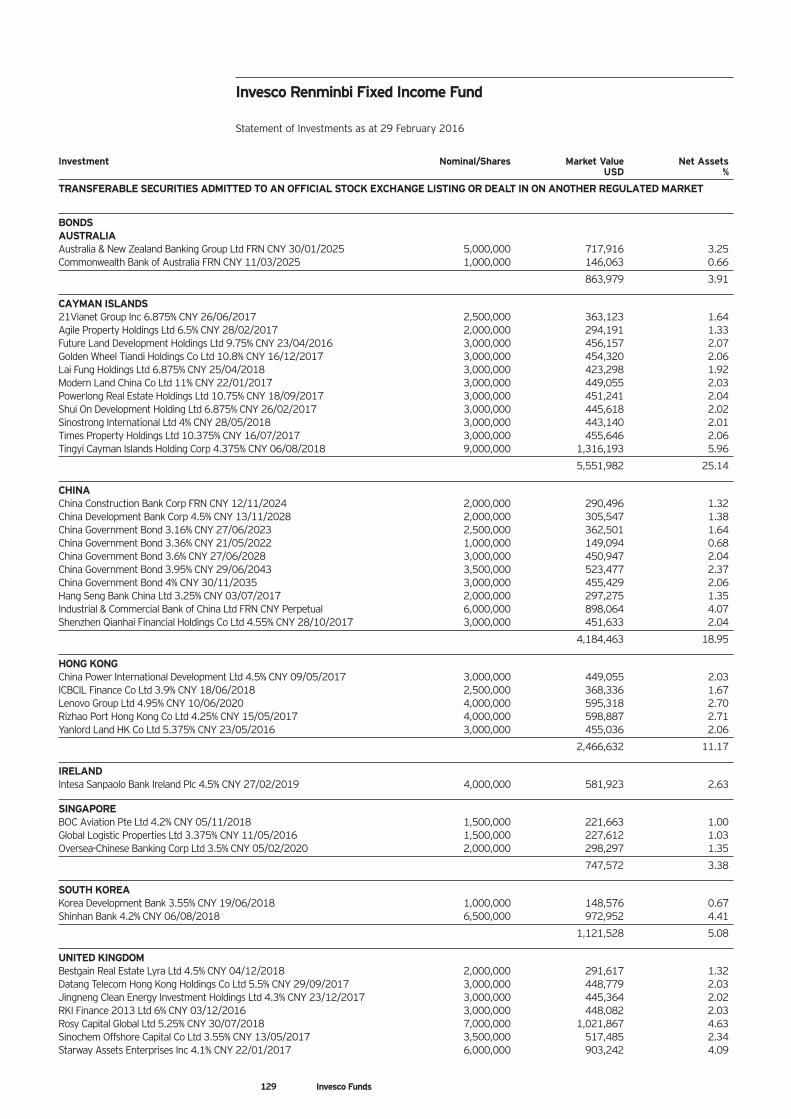
Investment Nominal/Shares Market Value Net Assets USD %
TRANSFERABLE SECURITIES ADMITTED TO AN OFFICIAL STOCK EXCHANGE LISTING OR DEALT IN ON ANOTHER REGULATED MARKET
BONDSAUSTRALIAAustralia & New Zealand Banking Group Ltd FRN CNY 30/01/2025 5,000,000 717,916 3.25Commonwealth Bank of Australia FRN CNY 11/03/2025 1,000,000 146,063 0.66
863,979 3.91
CAYMAN ISLANDS21Vianet Group Inc 6.875% CNY 26/06/2017 2,500,000 363,123 1.64Agile Property Holdings Ltd 6.5% CNY 28/02/2017 2,000,000 294,191 1.33Future Land Development Holdings Ltd 9.75% CNY 23/04/2016 3,000,000 456,157 2.07Golden Wheel Tiandi Holdings Co Ltd 10.8% CNY 16/12/2017 3,000,000 454,320 2.06Lai Fung Holdings Ltd 6.875% CNY 25/04/2018 3,000,000 423,298 1.92Modern Land China Co Ltd 11% CNY 22/01/2017 3,000,000 449,055 2.03Powerlong Real Estate Holdings Ltd 10.75% CNY 18/09/2017 3,000,000 451,241 2.04Shui On Development Holding Ltd 6.875% CNY 26/02/2017 3,000,000 445,618 2.02Sinostrong International Ltd 4% CNY 28/05/2018 3,000,000 443,140 2.01Times Property Holdings Ltd 10.375% CNY 16/07/2017 3,000,000 455,646 2.06Tingyi Cayman Islands Holding Corp 4.375% CNY 06/08/2018 9,000,000 1,316,193 5.96
5,551,982 25.14
CHINAChina Construction Bank Corp FRN CNY 12/11/2024 2,000,000 290,496 1.32China Development Bank Corp 4.5% CNY 13/11/2028 2,000,000 305,547 1.38China Government Bond 3.16% CNY 27/06/2023 2,500,000 362,501 1.64China Government Bond 3.36% CNY 21/05/2022 1,000,000 149,094 0.68China Government Bond 3.6% CNY 27/06/2028 3,000,000 450,947 2.04China Government Bond 3.95% CNY 29/06/2043 3,500,000 523,477 2.37China Government Bond 4% CNY 30/11/2035 3,000,000 455,429 2.06Hang Seng Bank China Ltd 3.25% CNY 03/07/2017 2,000,000 297,275 1.35Industrial & Commercial Bank of China Ltd FRN CNY Perpetual 6,000,000 898,064 4.07Shenzhen Qianhai Financial Holdings Co Ltd 4.55% CNY 28/10/2017 3,000,000 451,633 2.04
4,184,463 18.95
HONG KONGChina Power International Development Ltd 4.5% CNY 09/05/2017 3,000,000 449,055 2.03ICBCIL Finance Co Ltd 3.9% CNY 18/06/2018 2,500,000 368,336 1.67Lenovo Group Ltd 4.95% CNY 10/06/2020 4,000,000 595,318 2.70Rizhao Port Hong Kong Co Ltd 4.25% CNY 15/05/2017 4,000,000 598,887 2.71Yanlord Land HK Co Ltd 5.375% CNY 23/05/2016 3,000,000 455,036 2.06
2,466,632 11.17
IRELANDIntesa Sanpaolo Bank Ireland Plc 4.5% CNY 27/02/2019 4,000,000 581,923 2.63
SINGAPOREBOC Aviation Pte Ltd 4.2% CNY 05/11/2018 1,500,000 221,663 1.00Global Logistic Properties Ltd 3.375% CNY 11/05/2016 1,500,000 227,612 1.03Oversea-Chinese Banking Corp Ltd 3.5% CNY 05/02/2020 2,000,000 298,297 1.35
747,572 3.38
SOUTH KOREAKorea Development Bank 3.55% CNY 19/06/2018 1,000,000 148,576 0.67Shinhan Bank 4.2% CNY 06/08/2018 6,500,000 972,952 4.41
1,121,528 5.08
UNITED KINGDOMBestgain Real Estate Lyra Ltd 4.5% CNY 04/12/2018 2,000,000 291,617 1.32Datang Telecom Hong Kong Holdings Co Ltd 5.5% CNY 29/09/2017 3,000,000 448,779 2.03Jingneng Clean Energy Investment Holdings Ltd 4.3% CNY 23/12/2017 3,000,000 445,364 2.02RKI Finance 2013 Ltd 6% CNY 03/12/2016 3,000,000 448,082 2.03Rosy Capital Global Ltd 5.25% CNY 30/07/2018 7,000,000 1,021,867 4.63Sinochem Offshore Capital Co Ltd 3.55% CNY 13/05/2017 3,500,000 517,485 2.34Starway Assets Enterprises Inc 4.1% CNY 22/01/2017 6,000,000 903,242 4.09
Invesco Renminbi Fixed Income Fund
Statement of Investments as at 29 February 2016
129 Invesco Funds
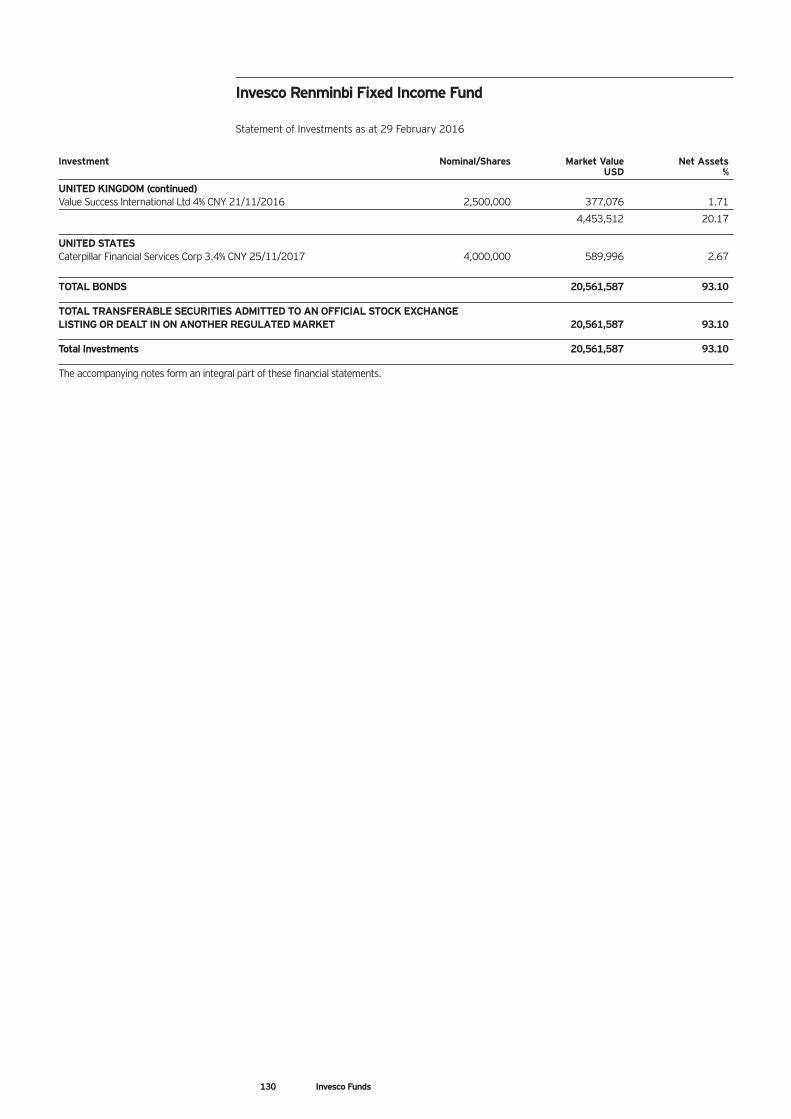
Invesco Renminbi Fixed Income Fund
Statement of Investments as at 29 February 2016
Investment Nominal/Shares Market Value Net Assets USD %
UNITED KINGDOM (continued)Value Success International Ltd 4% CNY 21/11/2016 2,500,000 377,076 1.71
4,453,512 20.17
UNITED STATESCaterpillar Financial Services Corp 3.4% CNY 25/11/2017 4,000,000 589,996 2.67
TOTAL BONDS 20,561,587 93.10
TOTAL TRANSFERABLE SECURITIES ADMITTED TO AN OFFICIAL STOCK EXCHANGE LISTING OR DEALT IN ON ANOTHER REGULATED MARKET 20,561,587 93.10
Total Investments 20,561,587 93.10
The accompanying notes form an integral part of these financial statements.
130 Invesco Funds
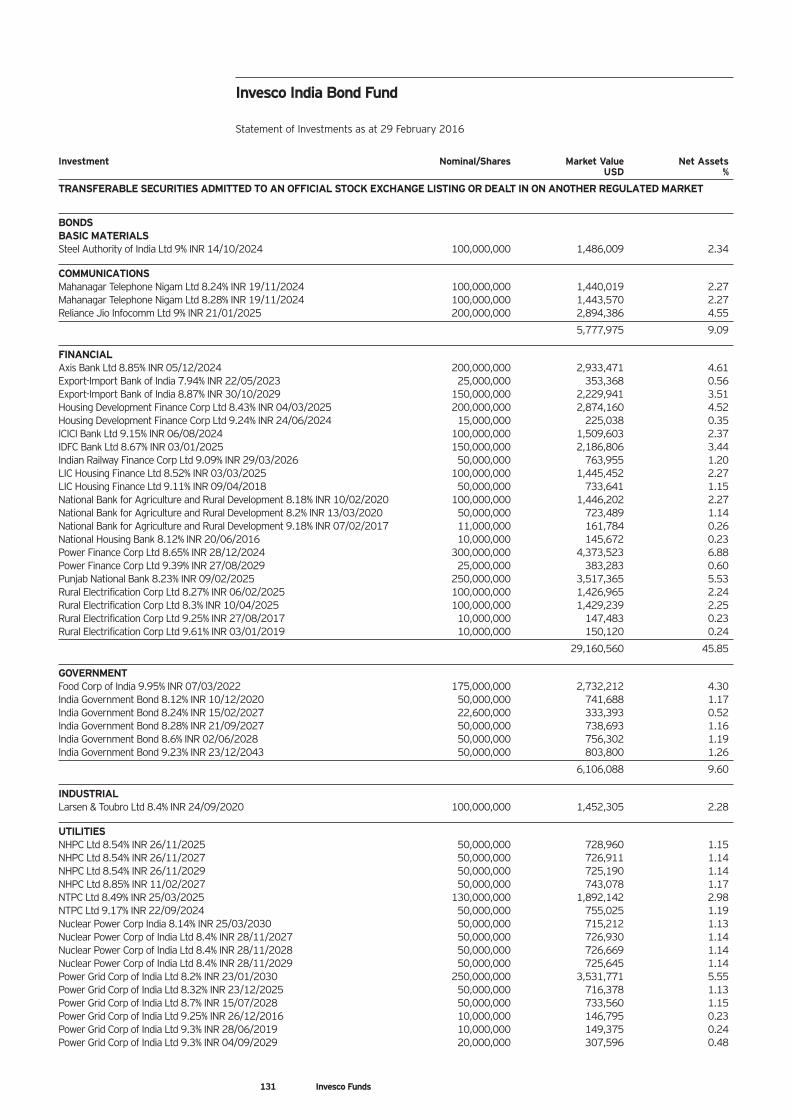
Invesco India Bond Fund
Statement of Investments as at 29 February 2016
Investment Nominal/Shares Market Value Net Assets USD %
TRANSFERABLE SECURITIES ADMITTED TO AN OFFICIAL STOCK EXCHANGE LISTING OR DEALT IN ON ANOTHER REGULATED MARKET
BONDSBASIC MATERIALSSteel Authority of India Ltd 9% INR 14/10/2024 100,000,000 1,486,009 2.34
COMMUNICATIONSMahanagar Telephone Nigam Ltd 8.24% INR 19/11/2024 100,000,000 1,440,019 2.27Mahanagar Telephone Nigam Ltd 8.28% INR 19/11/2024 100,000,000 1,443,570 2.27Reliance Jio Infocomm Ltd 9% INR 21/01/2025 200,000,000 2,894,386 4.55
5,777,975 9.09
FINANCIALAxis Bank Ltd 8.85% INR 05/12/2024 200,000,000 2,933,471 4.61Export-Import Bank of India 7.94% INR 22/05/2023 25,000,000 353,368 0.56Export-Import Bank of India 8.87% INR 30/10/2029 150,000,000 2,229,941 3.51Housing Development Finance Corp Ltd 8.43% INR 04/03/2025 200,000,000 2,874,160 4.52Housing Development Finance Corp Ltd 9.24% INR 24/06/2024 15,000,000 225,038 0.35ICICI Bank Ltd 9.15% INR 06/08/2024 100,000,000 1,509,603 2.37IDFC Bank Ltd 8.67% INR 03/01/2025 150,000,000 2,186,806 3.44Indian Railway Finance Corp Ltd 9.09% INR 29/03/2026 50,000,000 763,955 1.20LIC Housing Finance Ltd 8.52% INR 03/03/2025 100,000,000 1,445,452 2.27LIC Housing Finance Ltd 9.11% INR 09/04/2018 50,000,000 733,641 1.15National Bank for Agriculture and Rural Development 8.18% INR 10/02/2020 100,000,000 1,446,202 2.27National Bank for Agriculture and Rural Development 8.2% INR 13/03/2020 50,000,000 723,489 1.14National Bank for Agriculture and Rural Development 9.18% INR 07/02/2017 11,000,000 161,784 0.26National Housing Bank 8.12% INR 20/06/2016 10,000,000 145,672 0.23Power Finance Corp Ltd 8.65% INR 28/12/2024 300,000,000 4,373,523 6.88Power Finance Corp Ltd 9.39% INR 27/08/2029 25,000,000 383,283 0.60Punjab National Bank 8.23% INR 09/02/2025 250,000,000 3,517,365 5.53Rural Electrification Corp Ltd 8.27% INR 06/02/2025 100,000,000 1,426,965 2.24Rural Electrification Corp Ltd 8.3% INR 10/04/2025 100,000,000 1,429,239 2.25Rural Electrification Corp Ltd 9.25% INR 27/08/2017 10,000,000 147,483 0.23Rural Electrification Corp Ltd 9.61% INR 03/01/2019 10,000,000 150,120 0.24
29,160,560 45.85
GOVERNMENTFood Corp of India 9.95% INR 07/03/2022 175,000,000 2,732,212 4.30India Government Bond 8.12% INR 10/12/2020 50,000,000 741,688 1.17India Government Bond 8.24% INR 15/02/2027 22,600,000 333,393 0.52India Government Bond 8.28% INR 21/09/2027 50,000,000 738,693 1.16India Government Bond 8.6% INR 02/06/2028 50,000,000 756,302 1.19India Government Bond 9.23% INR 23/12/2043 50,000,000 803,800 1.26
6,106,088 9.60
INDUSTRIALLarsen & Toubro Ltd 8.4% INR 24/09/2020 100,000,000 1,452,305 2.28
UTILITIESNHPC Ltd 8.54% INR 26/11/2025 50,000,000 728,960 1.15NHPC Ltd 8.54% INR 26/11/2027 50,000,000 726,911 1.14NHPC Ltd 8.54% INR 26/11/2029 50,000,000 725,190 1.14NHPC Ltd 8.85% INR 11/02/2027 50,000,000 743,078 1.17NTPC Ltd 8.49% INR 25/03/2025 130,000,000 1,892,142 2.98NTPC Ltd 9.17% INR 22/09/2024 50,000,000 755,025 1.19Nuclear Power Corp India 8.14% INR 25/03/2030 50,000,000 715,212 1.13Nuclear Power Corp of India Ltd 8.4% INR 28/11/2027 50,000,000 726,930 1.14Nuclear Power Corp of India Ltd 8.4% INR 28/11/2028 50,000,000 726,669 1.14Nuclear Power Corp of India Ltd 8.4% INR 28/11/2029 50,000,000 725,645 1.14Power Grid Corp of India Ltd 8.2% INR 23/01/2030 250,000,000 3,531,771 5.55Power Grid Corp of India Ltd 8.32% INR 23/12/2025 50,000,000 716,378 1.13Power Grid Corp of India Ltd 8.7% INR 15/07/2028 50,000,000 733,560 1.15Power Grid Corp of India Ltd 9.25% INR 26/12/2016 10,000,000 146,795 0.23Power Grid Corp of India Ltd 9.3% INR 28/06/2019 10,000,000 149,375 0.24Power Grid Corp of India Ltd 9.3% INR 04/09/2029 20,000,000 307,596 0.48
131 Invesco Funds
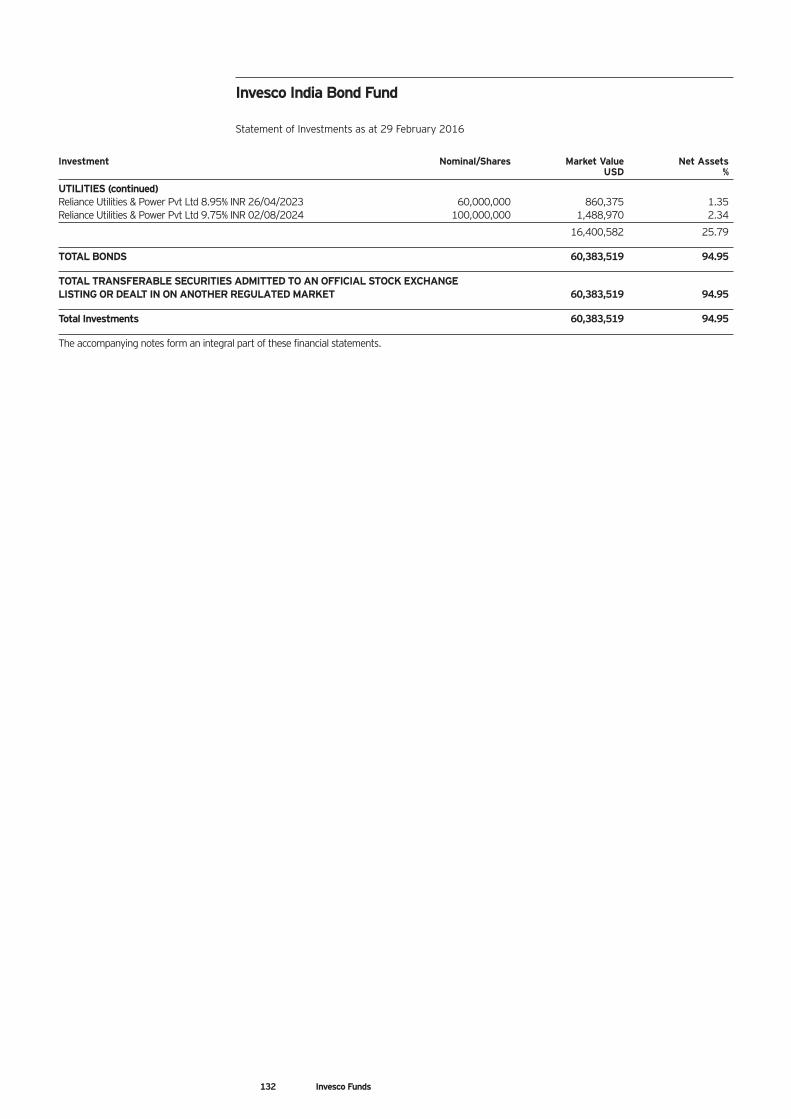
Invesco India Bond Fund
Statement of Investments as at 29 February 2016
Investment Nominal/Shares Market Value Net Assets USD %
UTILITIES (continued)Reliance Utilities & Power Pvt Ltd 8.95% INR 26/04/2023 60,000,000 860,375 1.35Reliance Utilities & Power Pvt Ltd 9.75% INR 02/08/2024 100,000,000 1,488,970 2.34
16,400,582 25.79
TOTAL BONDS 60,383,519 94.95
TOTAL TRANSFERABLE SECURITIES ADMITTED TO AN OFFICIAL STOCK EXCHANGE LISTING OR DEALT IN ON ANOTHER REGULATED MARKET 60,383,519 94.95
Total Investments 60,383,519 94.95
The accompanying notes form an integral part of these financial statements.
132 Invesco Funds
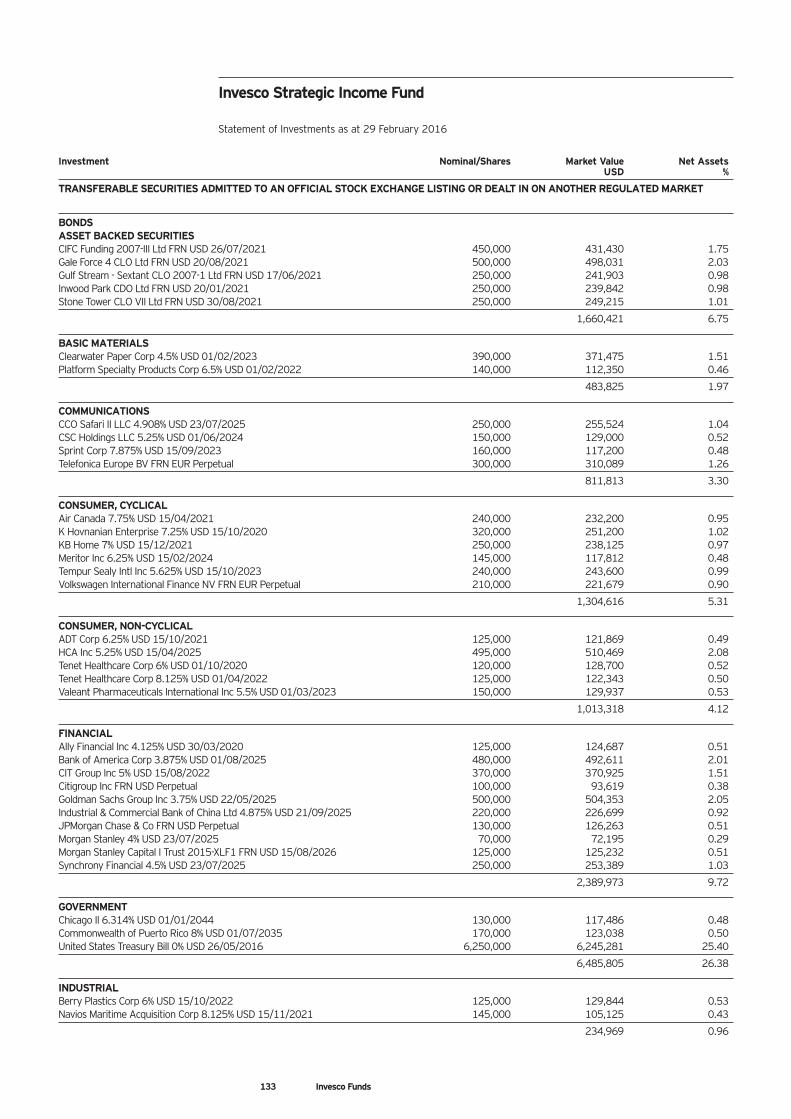
Invesco Strategic Income Fund
Statement of Investments as at 29 February 2016
Investment Nominal/Shares Market Value Net Assets USD %
TRANSFERABLE SECURITIES ADMITTED TO AN OFFICIAL STOCK EXCHANGE LISTING OR DEALT IN ON ANOTHER REGULATED MARKET
BONDSASSET BACKED SECURITIESCIFC Funding 2007-III Ltd FRN USD 26/07/2021 450,000 431,430 1.75Gale Force 4 CLO Ltd FRN USD 20/08/2021 500,000 498,031 2.03Gulf Stream - Sextant CLO 2007-1 Ltd FRN USD 17/06/2021 250,000 241,903 0.98Inwood Park CDO Ltd FRN USD 20/01/2021 250,000 239,842 0.98Stone Tower CLO VII Ltd FRN USD 30/08/2021 250,000 249,215 1.01
1,660,421 6.75
BASIC MATERIALSClearwater Paper Corp 4.5% USD 01/02/2023 390,000 371,475 1.51Platform Specialty Products Corp 6.5% USD 01/02/2022 140,000 112,350 0.46
483,825 1.97
COMMUNICATIONSCCO Safari II LLC 4.908% USD 23/07/2025 250,000 255,524 1.04CSC Holdings LLC 5.25% USD 01/06/2024 150,000 129,000 0.52Sprint Corp 7.875% USD 15/09/2023 160,000 117,200 0.48Telefonica Europe BV FRN EUR Perpetual 300,000 310,089 1.26
811,813 3.30
CONSUMER, CYCLICALAir Canada 7.75% USD 15/04/2021 240,000 232,200 0.95K Hovnanian Enterprise 7.25% USD 15/10/2020 320,000 251,200 1.02KB Home 7% USD 15/12/2021 250,000 238,125 0.97Meritor Inc 6.25% USD 15/02/2024 145,000 117,812 0.48Tempur Sealy Intl Inc 5.625% USD 15/10/2023 240,000 243,600 0.99Volkswagen International Finance NV FRN EUR Perpetual 210,000 221,679 0.90
1,304,616 5.31
CONSUMER, NON-CYCLICALADT Corp 6.25% USD 15/10/2021 125,000 121,869 0.49HCA Inc 5.25% USD 15/04/2025 495,000 510,469 2.08Tenet Healthcare Corp 6% USD 01/10/2020 120,000 128,700 0.52Tenet Healthcare Corp 8.125% USD 01/04/2022 125,000 122,343 0.50Valeant Pharmaceuticals International Inc 5.5% USD 01/03/2023 150,000 129,937 0.53
1,013,318 4.12
FINANCIALAlly Financial Inc 4.125% USD 30/03/2020 125,000 124,687 0.51Bank of America Corp 3.875% USD 01/08/2025 480,000 492,611 2.01CIT Group Inc 5% USD 15/08/2022 370,000 370,925 1.51Citigroup Inc FRN USD Perpetual 100,000 93,619 0.38Goldman Sachs Group Inc 3.75% USD 22/05/2025 500,000 504,353 2.05Industrial & Commercial Bank of China Ltd 4.875% USD 21/09/2025 220,000 226,699 0.92JPMorgan Chase & Co FRN USD Perpetual 130,000 126,263 0.51Morgan Stanley 4% USD 23/07/2025 70,000 72,195 0.29Morgan Stanley Capital I Trust 2015-XLF1 FRN USD 15/08/2026 125,000 125,232 0.51Synchrony Financial 4.5% USD 23/07/2025 250,000 253,389 1.03
2,389,973 9.72
GOVERNMENTChicago Il 6.314% USD 01/01/2044 130,000 117,486 0.48Commonwealth of Puerto Rico 8% USD 01/07/2035 170,000 123,038 0.50United States Treasury Bill 0% USD 26/05/2016 6,250,000 6,245,281 25.40
6,485,805 26.38
INDUSTRIALBerry Plastics Corp 6% USD 15/10/2022 125,000 129,844 0.53Navios Maritime Acquisition Corp 8.125% USD 15/11/2021 145,000 105,125 0.43
234,969 0.96
133 Invesco Funds
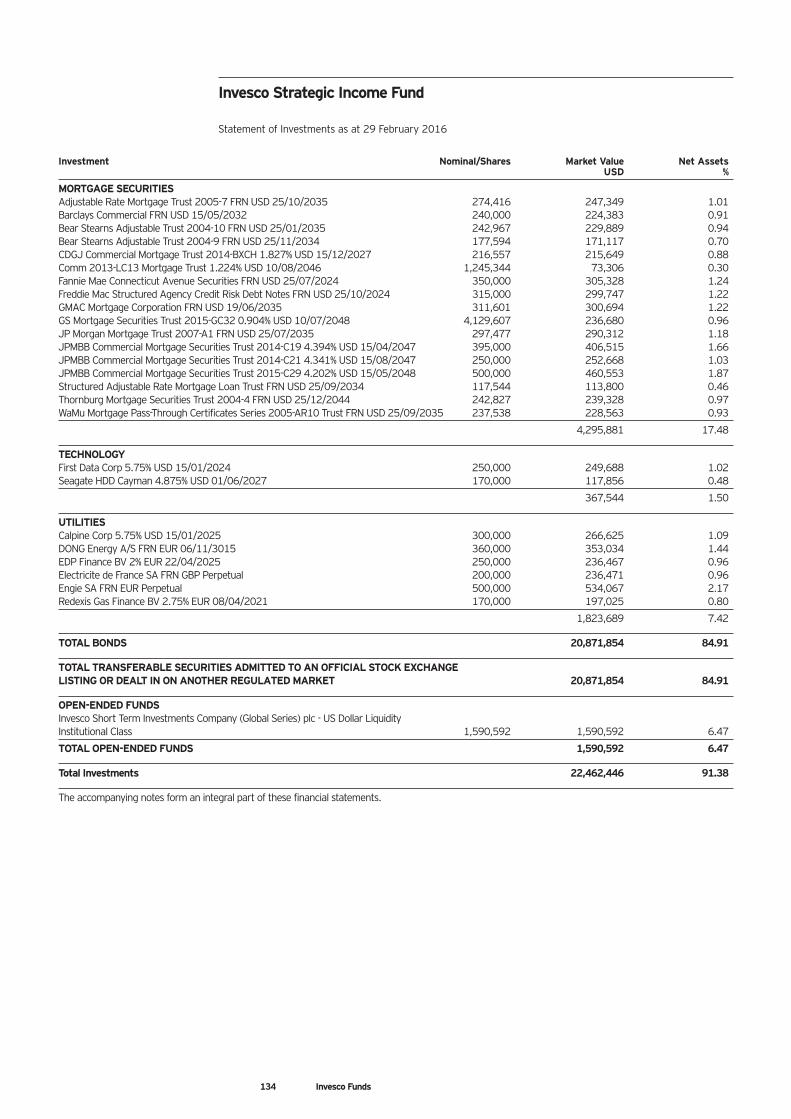
Invesco Strategic Income Fund
Statement of Investments as at 29 February 2016
Investment Nominal/Shares Market Value Net Assets USD %
MORTGAGE SECURITIESAdjustable Rate Mortgage Trust 2005-7 FRN USD 25/10/2035 274,416 247,349 1.01Barclays Commercial FRN USD 15/05/2032 240,000 224,383 0.91Bear Stearns Adjustable Trust 2004-10 FRN USD 25/01/2035 242,967 229,889 0.94Bear Stearns Adjustable Trust 2004-9 FRN USD 25/11/2034 177,594 171,117 0.70CDGJ Commercial Mortgage Trust 2014-BXCH 1.827% USD 15/12/2027 216,557 215,649 0.88Comm 2013-LC13 Mortgage Trust 1.224% USD 10/08/2046 1,245,344 73,306 0.30Fannie Mae Connecticut Avenue Securities FRN USD 25/07/2024 350,000 305,328 1.24Freddie Mac Structured Agency Credit Risk Debt Notes FRN USD 25/10/2024 315,000 299,747 1.22GMAC Mortgage Corporation FRN USD 19/06/2035 311,601 300,694 1.22GS Mortgage Securities Trust 2015-GC32 0.904% USD 10/07/2048 4,129,607 236,680 0.96JP Morgan Mortgage Trust 2007-A1 FRN USD 25/07/2035 297,477 290,312 1.18JPMBB Commercial Mortgage Securities Trust 2014-C19 4.394% USD 15/04/2047 395,000 406,515 1.66JPMBB Commercial Mortgage Securities Trust 2014-C21 4.341% USD 15/08/2047 250,000 252,668 1.03JPMBB Commercial Mortgage Securities Trust 2015-C29 4.202% USD 15/05/2048 500,000 460,553 1.87Structured Adjustable Rate Mortgage Loan Trust FRN USD 25/09/2034 117,544 113,800 0.46Thornburg Mortgage Securities Trust 2004-4 FRN USD 25/12/2044 242,827 239,328 0.97WaMu Mortgage Pass-Through Certificates Series 2005-AR10 Trust FRN USD 25/09/2035 237,538 228,563 0.93
4,295,881 17.48
TECHNOLOGYFirst Data Corp 5.75% USD 15/01/2024 250,000 249,688 1.02Seagate HDD Cayman 4.875% USD 01/06/2027 170,000 117,856 0.48
367,544 1.50
UTILITIESCalpine Corp 5.75% USD 15/01/2025 300,000 266,625 1.09DONG Energy A/S FRN EUR 06/11/3015 360,000 353,034 1.44EDP Finance BV 2% EUR 22/04/2025 250,000 236,467 0.96Electricite de France SA FRN GBP Perpetual 200,000 236,471 0.96Engie SA FRN EUR Perpetual 500,000 534,067 2.17Redexis Gas Finance BV 2.75% EUR 08/04/2021 170,000 197,025 0.80
1,823,689 7.42
TOTAL BONDS 20,871,854 84.91
TOTAL TRANSFERABLE SECURITIES ADMITTED TO AN OFFICIAL STOCK EXCHANGE LISTING OR DEALT IN ON ANOTHER REGULATED MARKET 20,871,854 84.91
OPEN-ENDED FUNDSInvesco Short Term Investments Company (Global Series) plc - US Dollar Liquidity Institutional Class 1,590,592 1,590,592 6.47
TOTAL OPEN-ENDED FUNDS 1,590,592 6.47
Total Investments 22,462,446 91.38
The accompanying notes form an integral part of these financial statements.
134 Invesco Funds
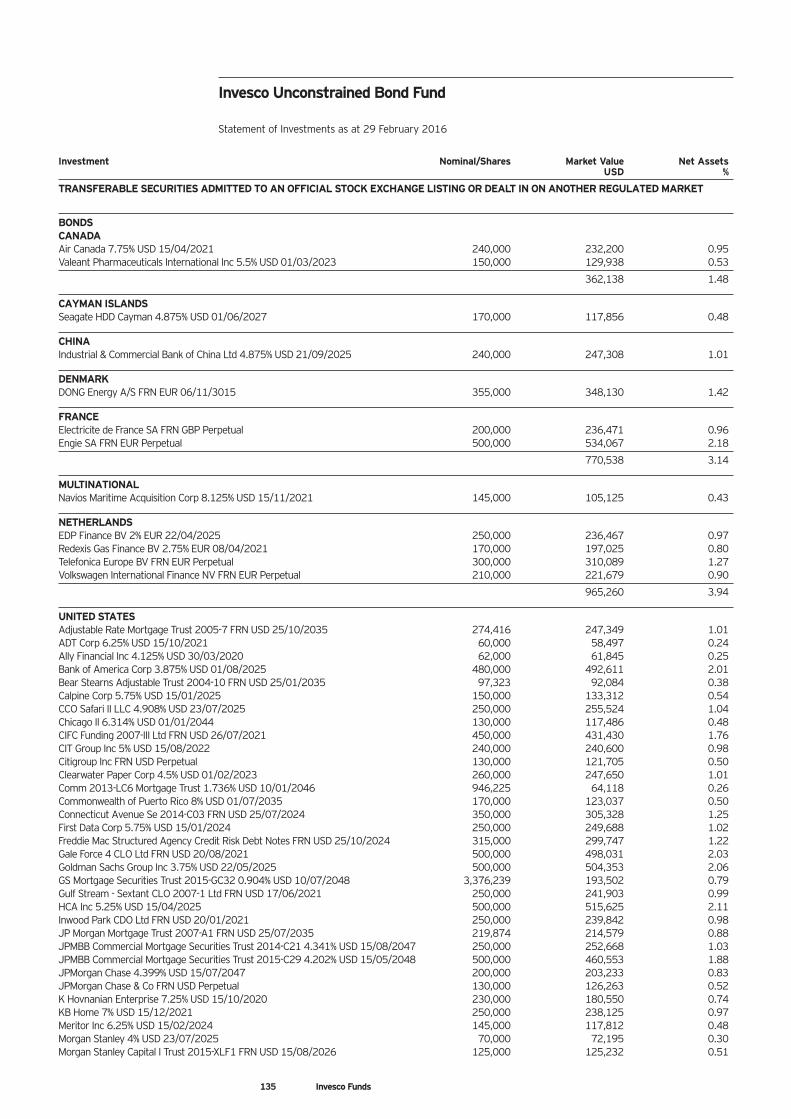
Invesco Unconstrained Bond Fund
Statement of Investments as at 29 February 2016
Investment Nominal/Shares Market Value Net Assets USD %
TRANSFERABLE SECURITIES ADMITTED TO AN OFFICIAL STOCK EXCHANGE LISTING OR DEALT IN ON ANOTHER REGULATED MARKET
BONDSCANADAAir Canada 7.75% USD 15/04/2021 240,000 232,200 0.95Valeant Pharmaceuticals International Inc 5.5% USD 01/03/2023 150,000 129,938 0.53
362,138 1.48
CAYMAN ISLANDSSeagate HDD Cayman 4.875% USD 01/06/2027 170,000 117,856 0.48
CHINAIndustrial & Commercial Bank of China Ltd 4.875% USD 21/09/2025 240,000 247,308 1.01
DENMARKDONG Energy A/S FRN EUR 06/11/3015 355,000 348,130 1.42
FRANCEElectricite de France SA FRN GBP Perpetual 200,000 236,471 0.96Engie SA FRN EUR Perpetual 500,000 534,067 2.18
770,538 3.14
MULTINATIONALNavios Maritime Acquisition Corp 8.125% USD 15/11/2021 145,000 105,125 0.43
NETHERLANDSEDP Finance BV 2% EUR 22/04/2025 250,000 236,467 0.97Redexis Gas Finance BV 2.75% EUR 08/04/2021 170,000 197,025 0.80Telefonica Europe BV FRN EUR Perpetual 300,000 310,089 1.27Volkswagen International Finance NV FRN EUR Perpetual 210,000 221,679 0.90
965,260 3.94
UNITED STATESAdjustable Rate Mortgage Trust 2005-7 FRN USD 25/10/2035 274,416 247,349 1.01ADT Corp 6.25% USD 15/10/2021 60,000 58,497 0.24Ally Financial Inc 4.125% USD 30/03/2020 62,000 61,845 0.25Bank of America Corp 3.875% USD 01/08/2025 480,000 492,611 2.01Bear Stearns Adjustable Trust 2004-10 FRN USD 25/01/2035 97,323 92,084 0.38Calpine Corp 5.75% USD 15/01/2025 150,000 133,312 0.54CCO Safari II LLC 4.908% USD 23/07/2025 250,000 255,524 1.04Chicago Il 6.314% USD 01/01/2044 130,000 117,486 0.48CIFC Funding 2007-III Ltd FRN USD 26/07/2021 450,000 431,430 1.76CIT Group Inc 5% USD 15/08/2022 240,000 240,600 0.98Citigroup Inc FRN USD Perpetual 130,000 121,705 0.50Clearwater Paper Corp 4.5% USD 01/02/2023 260,000 247,650 1.01Comm 2013-LC6 Mortgage Trust 1.736% USD 10/01/2046 946,225 64,118 0.26Commonwealth of Puerto Rico 8% USD 01/07/2035 170,000 123,037 0.50Connecticut Avenue Se 2014-C03 FRN USD 25/07/2024 350,000 305,328 1.25First Data Corp 5.75% USD 15/01/2024 250,000 249,688 1.02Freddie Mac Structured Agency Credit Risk Debt Notes FRN USD 25/10/2024 315,000 299,747 1.22Gale Force 4 CLO Ltd FRN USD 20/08/2021 500,000 498,031 2.03Goldman Sachs Group Inc 3.75% USD 22/05/2025 500,000 504,353 2.06GS Mortgage Securities Trust 2015-GC32 0.904% USD 10/07/2048 3,376,239 193,502 0.79Gulf Stream - Sextant CLO 2007-1 Ltd FRN USD 17/06/2021 250,000 241,903 0.99HCA Inc 5.25% USD 15/04/2025 500,000 515,625 2.11Inwood Park CDO Ltd FRN USD 20/01/2021 250,000 239,842 0.98JP Morgan Mortgage Trust 2007-A1 FRN USD 25/07/2035 219,874 214,579 0.88JPMBB Commercial Mortgage Securities Trust 2014-C21 4.341% USD 15/08/2047 250,000 252,668 1.03JPMBB Commercial Mortgage Securities Trust 2015-C29 4.202% USD 15/05/2048 500,000 460,553 1.88JPMorgan Chase 4.399% USD 15/07/2047 200,000 203,233 0.83JPMorgan Chase & Co FRN USD Perpetual 130,000 126,263 0.52K Hovnanian Enterprise 7.25% USD 15/10/2020 230,000 180,550 0.74KB Home 7% USD 15/12/2021 250,000 238,125 0.97Meritor Inc 6.25% USD 15/02/2024 145,000 117,812 0.48Morgan Stanley 4% USD 23/07/2025 70,000 72,195 0.30Morgan Stanley Capital I Trust 2015-XLF1 FRN USD 15/08/2026 125,000 125,232 0.51
135 Invesco Funds
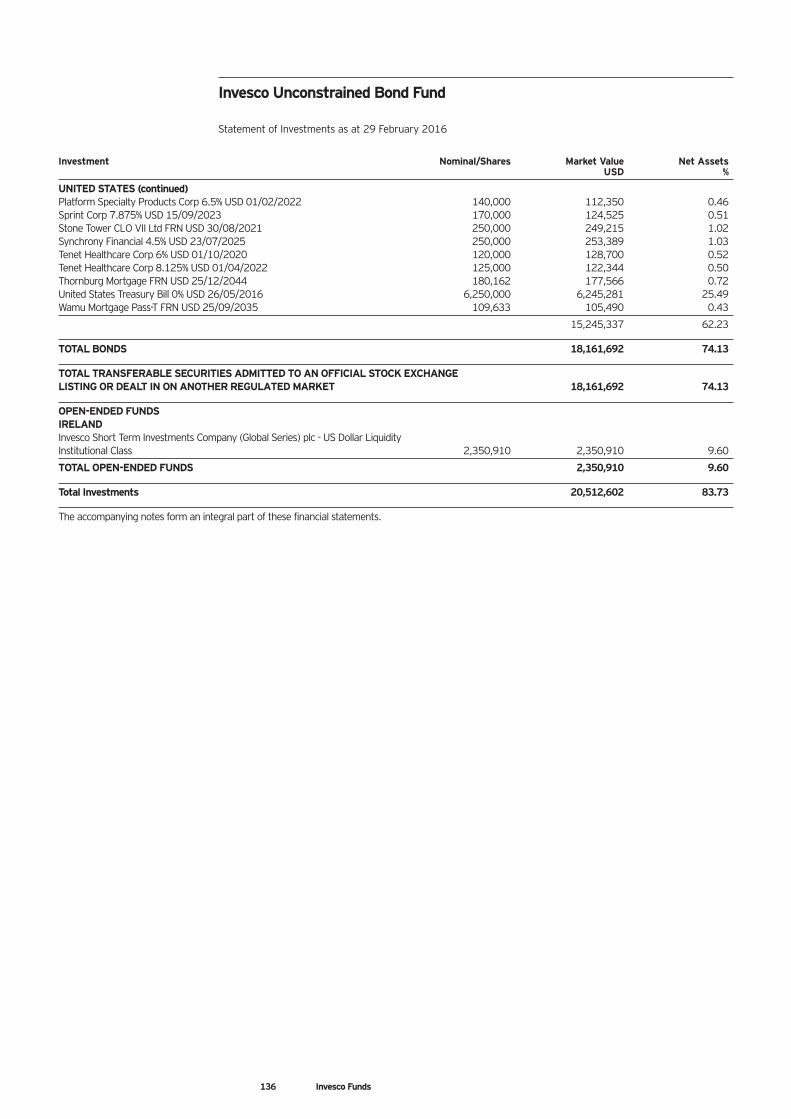
Invesco Unconstrained Bond Fund
Statement of Investments as at 29 February 2016
Investment Nominal/Shares Market Value Net Assets USD %
UNITED STATES (continued)Platform Specialty Products Corp 6.5% USD 01/02/2022 140,000 112,350 0.46Sprint Corp 7.875% USD 15/09/2023 170,000 124,525 0.51Stone Tower CLO VII Ltd FRN USD 30/08/2021 250,000 249,215 1.02Synchrony Financial 4.5% USD 23/07/2025 250,000 253,389 1.03Tenet Healthcare Corp 6% USD 01/10/2020 120,000 128,700 0.52Tenet Healthcare Corp 8.125% USD 01/04/2022 125,000 122,344 0.50Thornburg Mortgage FRN USD 25/12/2044 180,162 177,566 0.72United States Treasury Bill 0% USD 26/05/2016 6,250,000 6,245,281 25.49Wamu Mortgage Pass-T FRN USD 25/09/2035 109,633 105,490 0.43
15,245,337 62.23
TOTAL BONDS 18,161,692 74.13
TOTAL TRANSFERABLE SECURITIES ADMITTED TO AN OFFICIAL STOCK EXCHANGE LISTING OR DEALT IN ON ANOTHER REGULATED MARKET 18,161,692 74.13
OPEN-ENDED FUNDSIRELANDInvesco Short Term Investments Company (Global Series) plc - US Dollar Liquidity Institutional Class 2,350,910 2,350,910 9.60
TOTAL OPEN-ENDED FUNDS 2,350,910 9.60
Total Investments 20,512,602 83.73
The accompanying notes form an integral part of these financial statements.
136 Invesco Funds
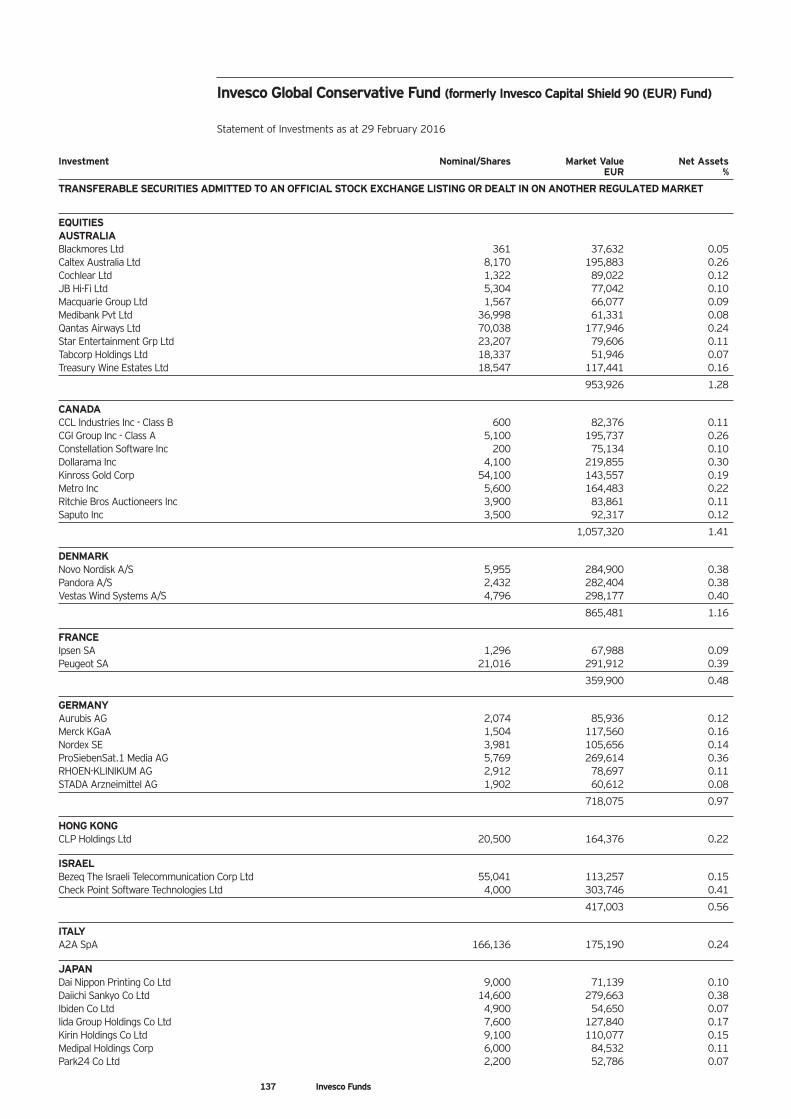
Invesco Global Conservative Fund (formerly Invesco Capital Shield 90 (EUR) Fund)
Statement of Investments as at 29 February 2016
Investment Nominal/Shares Market Value Net Assets EUR %
TRANSFERABLE SECURITIES ADMITTED TO AN OFFICIAL STOCK EXCHANGE LISTING OR DEALT IN ON ANOTHER REGULATED MARKET
EQUITIESAUSTRALIABlackmores Ltd 361 37,632 0.05Caltex Australia Ltd 8,170 195,883 0.26Cochlear Ltd 1,322 89,022 0.12JB Hi-Fi Ltd 5,304 77,042 0.10Macquarie Group Ltd 1,567 66,077 0.09Medibank Pvt Ltd 36,998 61,331 0.08Qantas Airways Ltd 70,038 177,946 0.24Star Entertainment Grp Ltd 23,207 79,606 0.11Tabcorp Holdings Ltd 18,337 51,946 0.07Treasury Wine Estates Ltd 18,547 117,441 0.16
953,926 1.28
CANADACCL Industries Inc - Class B 600 82,376 0.11CGI Group Inc - Class A 5,100 195,737 0.26Constellation Software Inc 200 75,134 0.10Dollarama Inc 4,100 219,855 0.30Kinross Gold Corp 54,100 143,557 0.19Metro Inc 5,600 164,483 0.22Ritchie Bros Auctioneers Inc 3,900 83,861 0.11Saputo Inc 3,500 92,317 0.12
1,057,320 1.41
DENMARKNovo Nordisk A/S 5,955 284,900 0.38Pandora A/S 2,432 282,404 0.38Vestas Wind Systems A/S 4,796 298,177 0.40
865,481 1.16
FRANCEIpsen SA 1,296 67,988 0.09Peugeot SA 21,016 291,912 0.39
359,900 0.48
GERMANYAurubis AG 2,074 85,936 0.12Merck KGaA 1,504 117,560 0.16Nordex SE 3,981 105,656 0.14ProSiebenSat.1 Media AG 5,769 269,614 0.36RHOEN-KLINIKUM AG 2,912 78,697 0.11STADA Arzneimittel AG 1,902 60,612 0.08
718,075 0.97
HONG KONGCLP Holdings Ltd 20,500 164,376 0.22
ISRAELBezeq The Israeli Telecommunication Corp Ltd 55,041 113,257 0.15Check Point Software Technologies Ltd 4,000 303,746 0.41
417,003 0.56
ITALYA2A SpA 166,136 175,190 0.24
JAPANDai Nippon Printing Co Ltd 9,000 71,139 0.10Daiichi Sankyo Co Ltd 14,600 279,663 0.38Ibiden Co Ltd 4,900 54,650 0.07Iida Group Holdings Co Ltd 7,600 127,840 0.17Kirin Holdings Co Ltd 9,100 110,077 0.15Medipal Holdings Corp 6,000 84,532 0.11Park24 Co Ltd 2,200 52,786 0.07
137 Invesco Funds
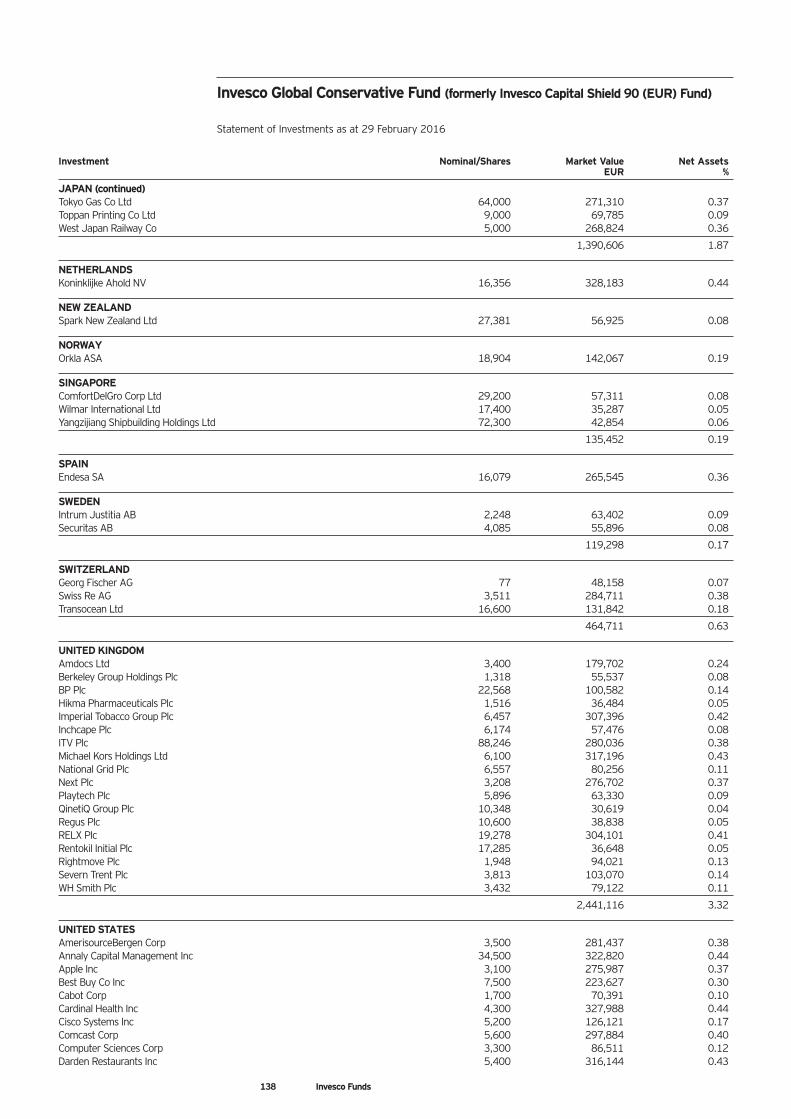
Invesco Global Conservative Fund (formerly Invesco Capital Shield 90 (EUR) Fund)
Statement of Investments as at 29 February 2016
Investment Nominal/Shares Market Value Net Assets EUR %
JAPAN (continued)Tokyo Gas Co Ltd 64,000 271,310 0.37Toppan Printing Co Ltd 9,000 69,785 0.09West Japan Railway Co 5,000 268,824 0.36
1,390,606 1.87
NETHERLANDSKoninklijke Ahold NV 16,356 328,183 0.44
NEW ZEALANDSpark New Zealand Ltd 27,381 56,925 0.08
NORWAYOrkla ASA 18,904 142,067 0.19
SINGAPOREComfortDelGro Corp Ltd 29,200 57,311 0.08Wilmar International Ltd 17,400 35,287 0.05Yangzijiang Shipbuilding Holdings Ltd 72,300 42,854 0.06
135,452 0.19
SPAINEndesa SA 16,079 265,545 0.36
SWEDENIntrum Justitia AB 2,248 63,402 0.09Securitas AB 4,085 55,896 0.08
119,298 0.17
SWITZERLANDGeorg Fischer AG 77 48,158 0.07Swiss Re AG 3,511 284,711 0.38Transocean Ltd 16,600 131,842 0.18
464,711 0.63
UNITED KINGDOMAmdocs Ltd 3,400 179,702 0.24Berkeley Group Holdings Plc 1,318 55,537 0.08BP Plc 22,568 100,582 0.14Hikma Pharmaceuticals Plc 1,516 36,484 0.05Imperial Tobacco Group Plc 6,457 307,396 0.42Inchcape Plc 6,174 57,476 0.08ITV Plc 88,246 280,036 0.38Michael Kors Holdings Ltd 6,100 317,196 0.43National Grid Plc 6,557 80,256 0.11Next Plc 3,208 276,702 0.37Playtech Plc 5,896 63,330 0.09QinetiQ Group Plc 10,348 30,619 0.04Regus Plc 10,600 38,838 0.05RELX Plc 19,278 304,101 0.41Rentokil Initial Plc 17,285 36,648 0.05Rightmove Plc 1,948 94,021 0.13Severn Trent Plc 3,813 103,070 0.14WH Smith Plc 3,432 79,122 0.11
2,441,116 3.32
UNITED STATESAmerisourceBergen Corp 3,500 281,437 0.38Annaly Capital Management Inc 34,500 322,820 0.44Apple Inc 3,100 275,987 0.37Best Buy Co Inc 7,500 223,627 0.30Cabot Corp 1,700 70,391 0.10Cardinal Health Inc 4,300 327,988 0.44Cisco Systems Inc 5,200 126,121 0.17Comcast Corp 5,600 297,884 0.40Computer Sciences Corp 3,300 86,511 0.12Darden Restaurants Inc 5,400 316,144 0.43
138 Invesco Funds
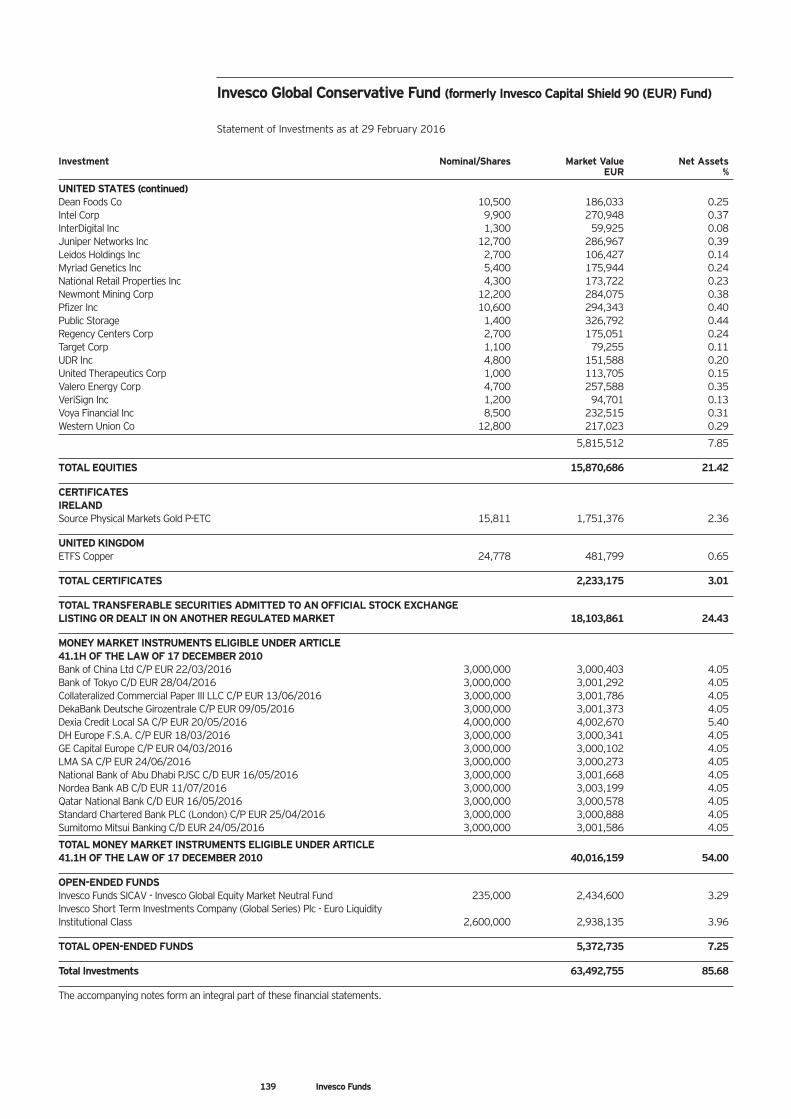
Invesco Global Conservative Fund (formerly Invesco Capital Shield 90 (EUR) Fund)
Statement of Investments as at 29 February 2016
Investment Nominal/Shares Market Value Net Assets EUR %
UNITED STATES (continued)Dean Foods Co 10,500 186,033 0.25Intel Corp 9,900 270,948 0.37InterDigital Inc 1,300 59,925 0.08Juniper Networks Inc 12,700 286,967 0.39Leidos Holdings Inc 2,700 106,427 0.14Myriad Genetics Inc 5,400 175,944 0.24National Retail Properties Inc 4,300 173,722 0.23Newmont Mining Corp 12,200 284,075 0.38Pfizer Inc 10,600 294,343 0.40Public Storage 1,400 326,792 0.44Regency Centers Corp 2,700 175,051 0.24Target Corp 1,100 79,255 0.11UDR Inc 4,800 151,588 0.20United Therapeutics Corp 1,000 113,705 0.15Valero Energy Corp 4,700 257,588 0.35VeriSign Inc 1,200 94,701 0.13Voya Financial Inc 8,500 232,515 0.31Western Union Co 12,800 217,023 0.29
5,815,512 7.85
TOTAL EQUITIES 15,870,686 21.42
CERTIFICATESIRELANDSource Physical Markets Gold P-ETC 15,811 1,751,376 2.36
UNITED KINGDOMETFS Copper 24,778 481,799 0.65
TOTAL CERTIFICATES 2,233,175 3.01
TOTAL TRANSFERABLE SECURITIES ADMITTED TO AN OFFICIAL STOCK EXCHANGE LISTING OR DEALT IN ON ANOTHER REGULATED MARKET 18,103,861 24.43
MONEY MARKET INSTRUMENTS ELIGIBLE UNDER ARTICLE 41.1H OF THE LAW OF 17 DECEMBER 2010Bank of China Ltd C/P EUR 22/03/2016 3,000,000 3,000,403 4.05Bank of Tokyo C/D EUR 28/04/2016 3,000,000 3,001,292 4.05Collateralized Commercial Paper III LLC C/P EUR 13/06/2016 3,000,000 3,001,786 4.05DekaBank Deutsche Girozentrale C/P EUR 09/05/2016 3,000,000 3,001,373 4.05Dexia Credit Local SA C/P EUR 20/05/2016 4,000,000 4,002,670 5.40DH Europe F.S.A. C/P EUR 18/03/2016 3,000,000 3,000,341 4.05GE Capital Europe C/P EUR 04/03/2016 3,000,000 3,000,102 4.05LMA SA C/P EUR 24/06/2016 3,000,000 3,000,273 4.05National Bank of Abu Dhabi PJSC C/D EUR 16/05/2016 3,000,000 3,001,668 4.05Nordea Bank AB C/D EUR 11/07/2016 3,000,000 3,003,199 4.05Qatar National Bank C/D EUR 16/05/2016 3,000,000 3,000,578 4.05Standard Chartered Bank PLC (London) C/P EUR 25/04/2016 3,000,000 3,000,888 4.05Sumitomo Mitsui Banking C/D EUR 24/05/2016 3,000,000 3,001,586 4.05
TOTAL MONEY MARKET INSTRUMENTS ELIGIBLE UNDER ARTICLE 41.1H OF THE LAW OF 17 DECEMBER 2010 40,016,159 54.00
OPEN-ENDED FUNDSInvesco Funds SICAV - Invesco Global Equity Market Neutral Fund 235,000 2,434,600 3.29Invesco Short Term Investments Company (Global Series) Plc - Euro Liquidity Institutional Class 2,600,000 2,938,135 3.96
TOTAL OPEN-ENDED FUNDS 5,372,735 7.25
Total Investments 63,492,755 85.68
The accompanying notes form an integral part of these financial statements.
139 Invesco Funds
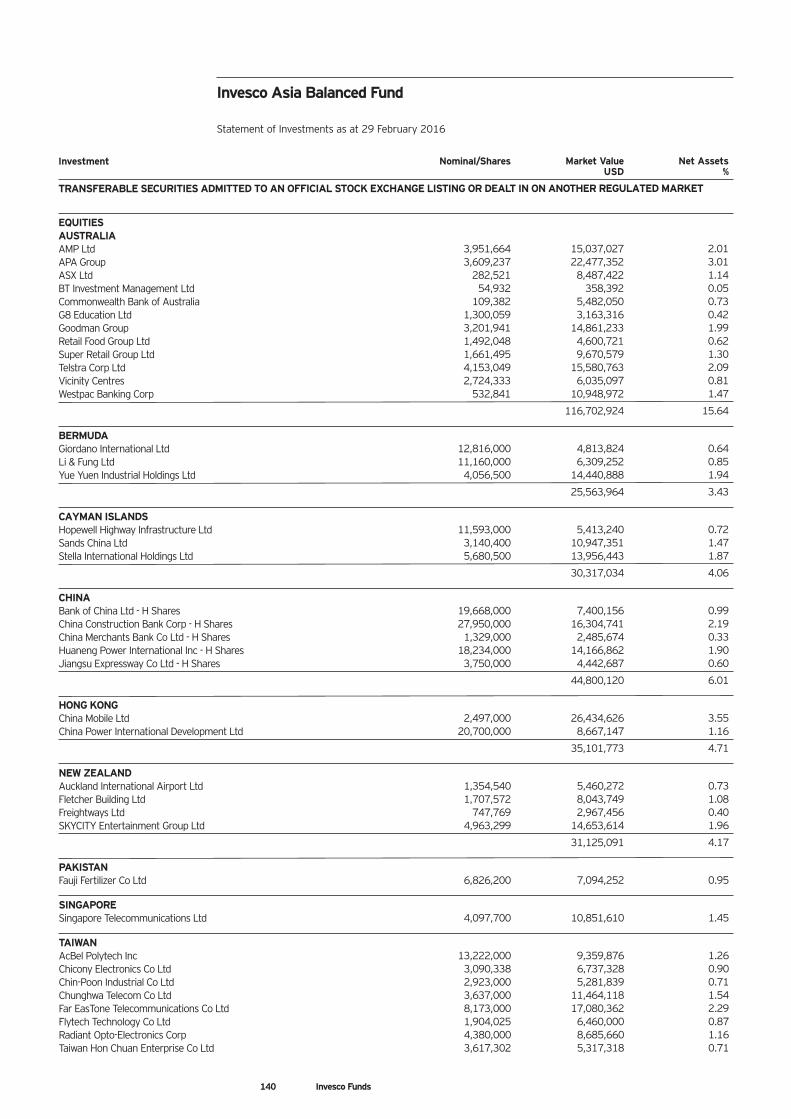
Investment Nominal/Shares Market Value Net Assets USD %
TRANSFERABLE SECURITIES ADMITTED TO AN OFFICIAL STOCK EXCHANGE LISTING OR DEALT IN ON ANOTHER REGULATED MARKET
EQUITIESAUSTRALIAAMP Ltd 3,951,664 15,037,027 2.01APA Group 3,609,237 22,477,352 3.01ASX Ltd 282,521 8,487,422 1.14BT Investment Management Ltd 54,932 358,392 0.05Commonwealth Bank of Australia 109,382 5,482,050 0.73G8 Education Ltd 1,300,059 3,163,316 0.42Goodman Group 3,201,941 14,861,233 1.99Retail Food Group Ltd 1,492,048 4,600,721 0.62Super Retail Group Ltd 1,661,495 9,670,579 1.30Telstra Corp Ltd 4,153,049 15,580,763 2.09Vicinity Centres 2,724,333 6,035,097 0.81Westpac Banking Corp 532,841 10,948,972 1.47
116,702,924 15.64
BERMUDAGiordano International Ltd 12,816,000 4,813,824 0.64Li & Fung Ltd 11,160,000 6,309,252 0.85Yue Yuen Industrial Holdings Ltd 4,056,500 14,440,888 1.94
25,563,964 3.43
CAYMAN ISLANDSHopewell Highway Infrastructure Ltd 11,593,000 5,413,240 0.72Sands China Ltd 3,140,400 10,947,351 1.47Stella International Holdings Ltd 5,680,500 13,956,443 1.87
30,317,034 4.06
CHINABank of China Ltd - H Shares 19,668,000 7,400,156 0.99China Construction Bank Corp - H Shares 27,950,000 16,304,741 2.19China Merchants Bank Co Ltd - H Shares 1,329,000 2,485,674 0.33Huaneng Power International Inc - H Shares 18,234,000 14,166,862 1.90Jiangsu Expressway Co Ltd - H Shares 3,750,000 4,442,687 0.60
44,800,120 6.01
HONG KONGChina Mobile Ltd 2,497,000 26,434,626 3.55China Power International Development Ltd 20,700,000 8,667,147 1.16
35,101,773 4.71
NEW ZEALANDAuckland International Airport Ltd 1,354,540 5,460,272 0.73Fletcher Building Ltd 1,707,572 8,043,749 1.08Freightways Ltd 747,769 2,967,456 0.40SKYCITY Entertainment Group Ltd 4,963,299 14,653,614 1.96
31,125,091 4.17
PAKISTANFauji Fertilizer Co Ltd 6,826,200 7,094,252 0.95
SINGAPORESingapore Telecommunications Ltd 4,097,700 10,851,610 1.45
TAIWANAcBel Polytech Inc 13,222,000 9,359,876 1.26Chicony Electronics Co Ltd 3,090,338 6,737,328 0.90Chin-Poon Industrial Co Ltd 2,923,000 5,281,839 0.71Chunghwa Telecom Co Ltd 3,637,000 11,464,118 1.54Far EasTone Telecommunications Co Ltd 8,173,000 17,080,362 2.29Flytech Technology Co Ltd 1,904,025 6,460,000 0.87Radiant Opto-Electronics Corp 4,380,000 8,685,660 1.16Taiwan Hon Chuan Enterprise Co Ltd 3,617,302 5,317,318 0.71
140 Invesco Funds
Invesco Asia Balanced Fund
Statement of Investments as at 29 February 2016
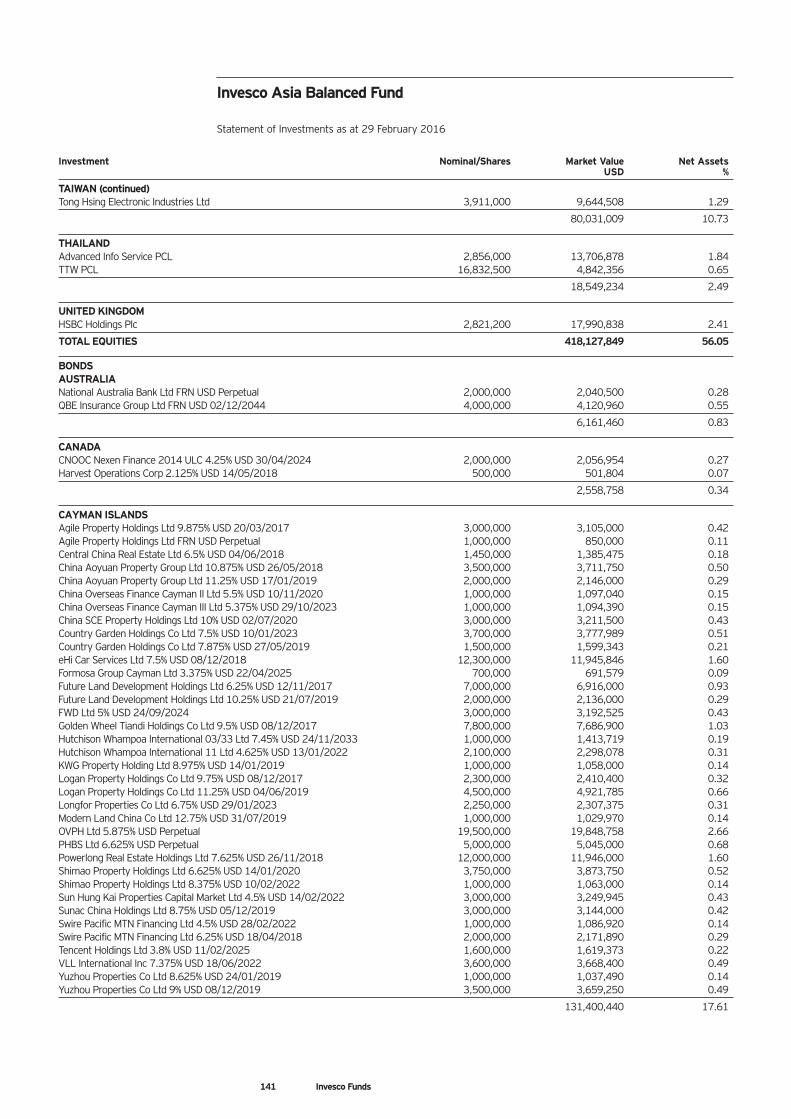
Invesco Asia Balanced Fund
Statement of Investments as at 29 February 2016
Investment Nominal/Shares Market Value Net Assets USD %
TAIWAN (continued)Tong Hsing Electronic Industries Ltd 3,911,000 9,644,508 1.29
80,031,009 10.73
THAILANDAdvanced Info Service PCL 2,856,000 13,706,878 1.84TTW PCL 16,832,500 4,842,356 0.65
18,549,234 2.49
UNITED KINGDOMHSBC Holdings Plc 2,821,200 17,990,838 2.41
TOTAL EQUITIES 418,127,849 56.05
BONDSAUSTRALIANational Australia Bank Ltd FRN USD Perpetual 2,000,000 2,040,500 0.28QBE Insurance Group Ltd FRN USD 02/12/2044 4,000,000 4,120,960 0.55
6,161,460 0.83
CANADACNOOC Nexen Finance 2014 ULC 4.25% USD 30/04/2024 2,000,000 2,056,954 0.27Harvest Operations Corp 2.125% USD 14/05/2018 500,000 501,804 0.07
2,558,758 0.34
CAYMAN ISLANDSAgile Property Holdings Ltd 9.875% USD 20/03/2017 3,000,000 3,105,000 0.42Agile Property Holdings Ltd FRN USD Perpetual 1,000,000 850,000 0.11Central China Real Estate Ltd 6.5% USD 04/06/2018 1,450,000 1,385,475 0.18China Aoyuan Property Group Ltd 10.875% USD 26/05/2018 3,500,000 3,711,750 0.50China Aoyuan Property Group Ltd 11.25% USD 17/01/2019 2,000,000 2,146,000 0.29China Overseas Finance Cayman II Ltd 5.5% USD 10/11/2020 1,000,000 1,097,040 0.15China Overseas Finance Cayman III Ltd 5.375% USD 29/10/2023 1,000,000 1,094,390 0.15China SCE Property Holdings Ltd 10% USD 02/07/2020 3,000,000 3,211,500 0.43Country Garden Holdings Co Ltd 7.5% USD 10/01/2023 3,700,000 3,777,989 0.51Country Garden Holdings Co Ltd 7.875% USD 27/05/2019 1,500,000 1,599,343 0.21eHi Car Services Ltd 7.5% USD 08/12/2018 12,300,000 11,945,846 1.60Formosa Group Cayman Ltd 3.375% USD 22/04/2025 700,000 691,579 0.09Future Land Development Holdings Ltd 6.25% USD 12/11/2017 7,000,000 6,916,000 0.93Future Land Development Holdings Ltd 10.25% USD 21/07/2019 2,000,000 2,136,000 0.29FWD Ltd 5% USD 24/09/2024 3,000,000 3,192,525 0.43Golden Wheel Tiandi Holdings Co Ltd 9.5% USD 08/12/2017 7,800,000 7,686,900 1.03Hutchison Whampoa International 03/33 Ltd 7.45% USD 24/11/2033 1,000,000 1,413,719 0.19Hutchison Whampoa International 11 Ltd 4.625% USD 13/01/2022 2,100,000 2,298,078 0.31KWG Property Holding Ltd 8.975% USD 14/01/2019 1,000,000 1,058,000 0.14Logan Property Holdings Co Ltd 9.75% USD 08/12/2017 2,300,000 2,410,400 0.32Logan Property Holdings Co Ltd 11.25% USD 04/06/2019 4,500,000 4,921,785 0.66Longfor Properties Co Ltd 6.75% USD 29/01/2023 2,250,000 2,307,375 0.31Modern Land China Co Ltd 12.75% USD 31/07/2019 1,000,000 1,029,970 0.14OVPH Ltd 5.875% USD Perpetual 19,500,000 19,848,758 2.66PHBS Ltd 6.625% USD Perpetual 5,000,000 5,045,000 0.68Powerlong Real Estate Holdings Ltd 7.625% USD 26/11/2018 12,000,000 11,946,000 1.60Shimao Property Holdings Ltd 6.625% USD 14/01/2020 3,750,000 3,873,750 0.52Shimao Property Holdings Ltd 8.375% USD 10/02/2022 1,000,000 1,063,000 0.14Sun Hung Kai Properties Capital Market Ltd 4.5% USD 14/02/2022 3,000,000 3,249,945 0.43Sunac China Holdings Ltd 8.75% USD 05/12/2019 3,000,000 3,144,000 0.42Swire Pacific MTN Financing Ltd 4.5% USD 28/02/2022 1,000,000 1,086,920 0.14Swire Pacific MTN Financing Ltd 6.25% USD 18/04/2018 2,000,000 2,171,890 0.29Tencent Holdings Ltd 3.8% USD 11/02/2025 1,600,000 1,619,373 0.22VLL International Inc 7.375% USD 18/06/2022 3,600,000 3,668,400 0.49Yuzhou Properties Co Ltd 8.625% USD 24/01/2019 1,000,000 1,037,490 0.14Yuzhou Properties Co Ltd 9% USD 08/12/2019 3,500,000 3,659,250 0.49
131,400,440 17.61
141 Invesco Funds
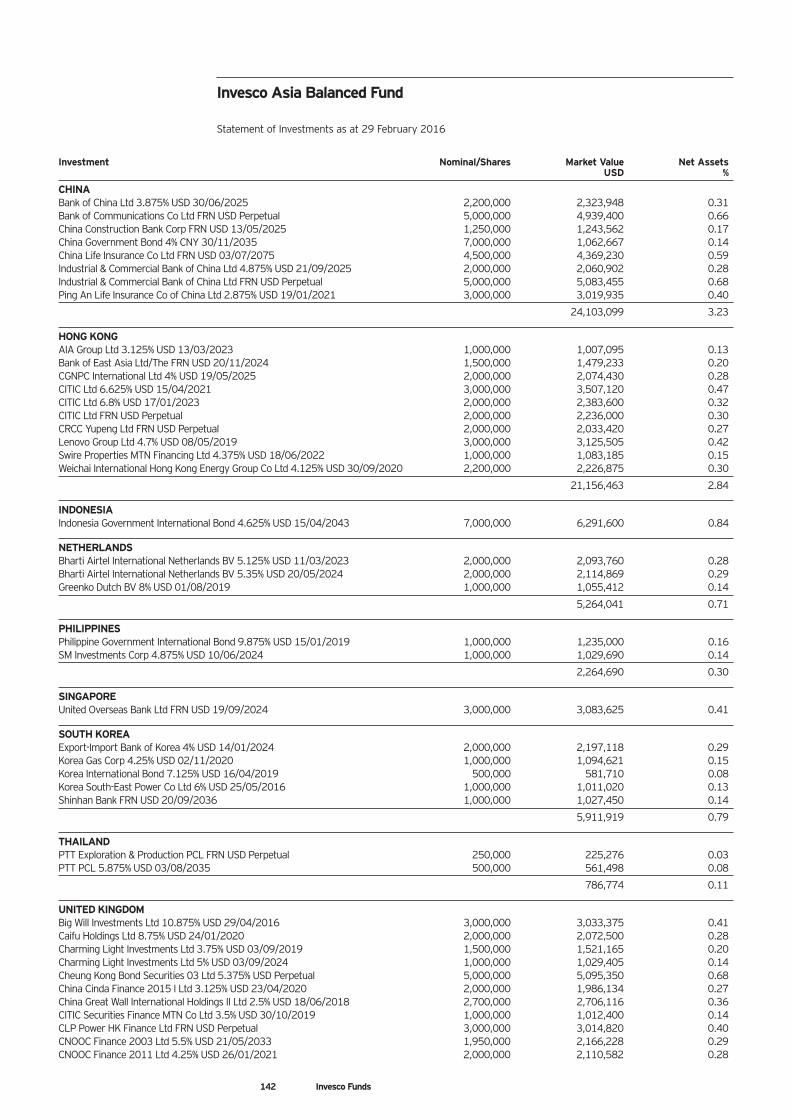
Investment Nominal/Shares Market Value Net Assets USD %
CHINABank of China Ltd 3.875% USD 30/06/2025 2,200,000 2,323,948 0.31Bank of Communications Co Ltd FRN USD Perpetual 5,000,000 4,939,400 0.66China Construction Bank Corp FRN USD 13/05/2025 1,250,000 1,243,562 0.17China Government Bond 4% CNY 30/11/2035 7,000,000 1,062,667 0.14China Life Insurance Co Ltd FRN USD 03/07/2075 4,500,000 4,369,230 0.59Industrial & Commercial Bank of China Ltd 4.875% USD 21/09/2025 2,000,000 2,060,902 0.28Industrial & Commercial Bank of China Ltd FRN USD Perpetual 5,000,000 5,083,455 0.68Ping An Life Insurance Co of China Ltd 2.875% USD 19/01/2021 3,000,000 3,019,935 0.40
24,103,099 3.23
HONG KONGAIA Group Ltd 3.125% USD 13/03/2023 1,000,000 1,007,095 0.13Bank of East Asia Ltd/The FRN USD 20/11/2024 1,500,000 1,479,233 0.20CGNPC International Ltd 4% USD 19/05/2025 2,000,000 2,074,430 0.28CITIC Ltd 6.625% USD 15/04/2021 3,000,000 3,507,120 0.47CITIC Ltd 6.8% USD 17/01/2023 2,000,000 2,383,600 0.32CITIC Ltd FRN USD Perpetual 2,000,000 2,236,000 0.30CRCC Yupeng Ltd FRN USD Perpetual 2,000,000 2,033,420 0.27Lenovo Group Ltd 4.7% USD 08/05/2019 3,000,000 3,125,505 0.42Swire Properties MTN Financing Ltd 4.375% USD 18/06/2022 1,000,000 1,083,185 0.15Weichai International Hong Kong Energy Group Co Ltd 4.125% USD 30/09/2020 2,200,000 2,226,875 0.30
21,156,463 2.84
INDONESIAIndonesia Government International Bond 4.625% USD 15/04/2043 7,000,000 6,291,600 0.84
NETHERLANDSBharti Airtel International Netherlands BV 5.125% USD 11/03/2023 2,000,000 2,093,760 0.28Bharti Airtel International Netherlands BV 5.35% USD 20/05/2024 2,000,000 2,114,869 0.29Greenko Dutch BV 8% USD 01/08/2019 1,000,000 1,055,412 0.14
5,264,041 0.71
PHILIPPINESPhilippine Government International Bond 9.875% USD 15/01/2019 1,000,000 1,235,000 0.16SM Investments Corp 4.875% USD 10/06/2024 1,000,000 1,029,690 0.14
2,264,690 0.30
SINGAPOREUnited Overseas Bank Ltd FRN USD 19/09/2024 3,000,000 3,083,625 0.41
SOUTH KOREAExport-Import Bank of Korea 4% USD 14/01/2024 2,000,000 2,197,118 0.29Korea Gas Corp 4.25% USD 02/11/2020 1,000,000 1,094,621 0.15Korea International Bond 7.125% USD 16/04/2019 500,000 581,710 0.08Korea South-East Power Co Ltd 6% USD 25/05/2016 1,000,000 1,011,020 0.13Shinhan Bank FRN USD 20/09/2036 1,000,000 1,027,450 0.14
5,911,919 0.79
THAILANDPTT Exploration & Production PCL FRN USD Perpetual 250,000 225,276 0.03PTT PCL 5.875% USD 03/08/2035 500,000 561,498 0.08
786,774 0.11
UNITED KINGDOMBig Will Investments Ltd 10.875% USD 29/04/2016 3,000,000 3,033,375 0.41Caifu Holdings Ltd 8.75% USD 24/01/2020 2,000,000 2,072,500 0.28Charming Light Investments Ltd 3.75% USD 03/09/2019 1,500,000 1,521,165 0.20Charming Light Investments Ltd 5% USD 03/09/2024 1,000,000 1,029,405 0.14Cheung Kong Bond Securities 03 Ltd 5.375% USD Perpetual 5,000,000 5,095,350 0.68China Cinda Finance 2015 I Ltd 3.125% USD 23/04/2020 2,000,000 1,986,134 0.27China Great Wall International Holdings II Ltd 2.5% USD 18/06/2018 2,700,000 2,706,116 0.36CITIC Securities Finance MTN Co Ltd 3.5% USD 30/10/2019 1,000,000 1,012,400 0.14CLP Power HK Finance Ltd FRN USD Perpetual 3,000,000 3,014,820 0.40CNOOC Finance 2003 Ltd 5.5% USD 21/05/2033 1,950,000 2,166,228 0.29CNOOC Finance 2011 Ltd 4.25% USD 26/01/2021 2,000,000 2,110,582 0.28
142 Invesco Funds
Invesco Asia Balanced Fund
Statement of Investments as at 29 February 2016
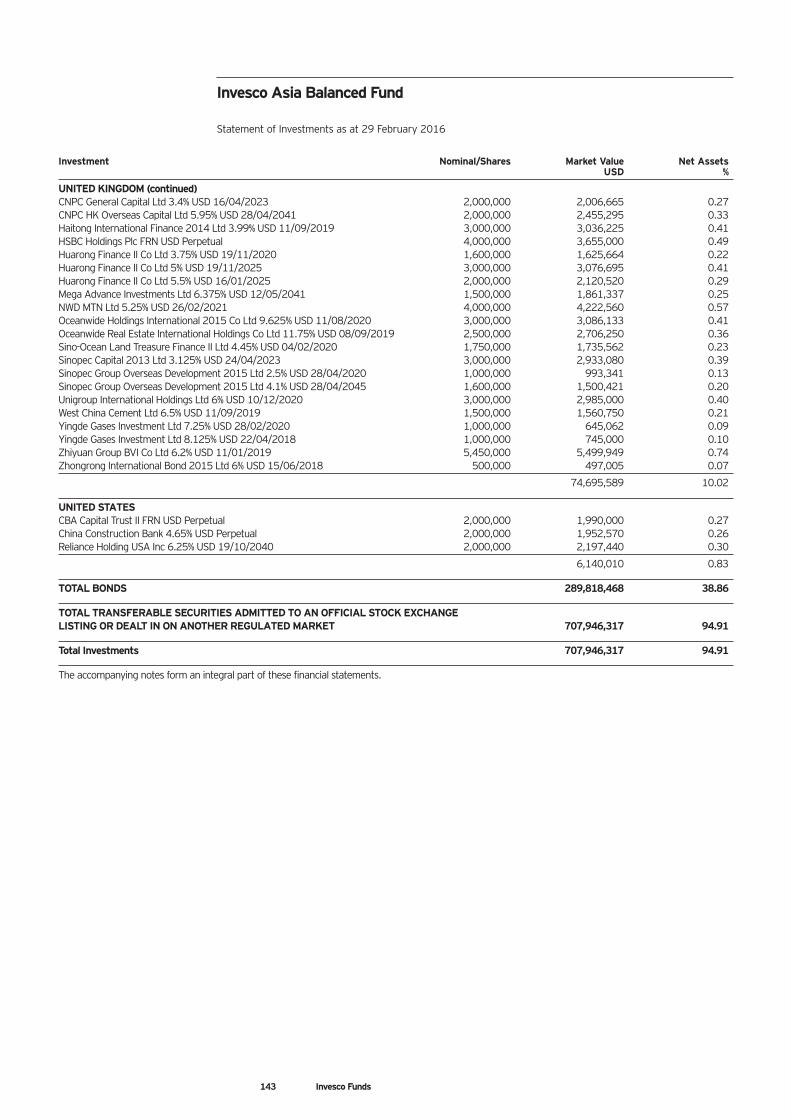
Investment Nominal/Shares Market Value Net Assets USD %
UNITED KINGDOM (continued)CNPC General Capital Ltd 3.4% USD 16/04/2023 2,000,000 2,006,665 0.27CNPC HK Overseas Capital Ltd 5.95% USD 28/04/2041 2,000,000 2,455,295 0.33Haitong International Finance 2014 Ltd 3.99% USD 11/09/2019 3,000,000 3,036,225 0.41HSBC Holdings Plc FRN USD Perpetual 4,000,000 3,655,000 0.49Huarong Finance II Co Ltd 3.75% USD 19/11/2020 1,600,000 1,625,664 0.22Huarong Finance II Co Ltd 5% USD 19/11/2025 3,000,000 3,076,695 0.41Huarong Finance II Co Ltd 5.5% USD 16/01/2025 2,000,000 2,120,520 0.29Mega Advance Investments Ltd 6.375% USD 12/05/2041 1,500,000 1,861,337 0.25NWD MTN Ltd 5.25% USD 26/02/2021 4,000,000 4,222,560 0.57Oceanwide Holdings International 2015 Co Ltd 9.625% USD 11/08/2020 3,000,000 3,086,133 0.41Oceanwide Real Estate International Holdings Co Ltd 11.75% USD 08/09/2019 2,500,000 2,706,250 0.36Sino-Ocean Land Treasure Finance II Ltd 4.45% USD 04/02/2020 1,750,000 1,735,562 0.23Sinopec Capital 2013 Ltd 3.125% USD 24/04/2023 3,000,000 2,933,080 0.39Sinopec Group Overseas Development 2015 Ltd 2.5% USD 28/04/2020 1,000,000 993,341 0.13Sinopec Group Overseas Development 2015 Ltd 4.1% USD 28/04/2045 1,600,000 1,500,421 0.20Unigroup International Holdings Ltd 6% USD 10/12/2020 3,000,000 2,985,000 0.40West China Cement Ltd 6.5% USD 11/09/2019 1,500,000 1,560,750 0.21Yingde Gases Investment Ltd 7.25% USD 28/02/2020 1,000,000 645,062 0.09Yingde Gases Investment Ltd 8.125% USD 22/04/2018 1,000,000 745,000 0.10Zhiyuan Group BVI Co Ltd 6.2% USD 11/01/2019 5,450,000 5,499,949 0.74Zhongrong International Bond 2015 Ltd 6% USD 15/06/2018 500,000 497,005 0.07
74,695,589 10.02
UNITED STATESCBA Capital Trust II FRN USD Perpetual 2,000,000 1,990,000 0.27China Construction Bank 4.65% USD Perpetual 2,000,000 1,952,570 0.26Reliance Holding USA Inc 6.25% USD 19/10/2040 2,000,000 2,197,440 0.30
6,140,010 0.83
TOTAL BONDS 289,818,468 38.86
TOTAL TRANSFERABLE SECURITIES ADMITTED TO AN OFFICIAL STOCK EXCHANGE LISTING OR DEALT IN ON ANOTHER REGULATED MARKET 707,946,317 94.91
Total Investments 707,946,317 94.91
The accompanying notes form an integral part of these financial statements.
143 Invesco Funds
Invesco Asia Balanced Fund
Statement of Investments as at 29 February 2016
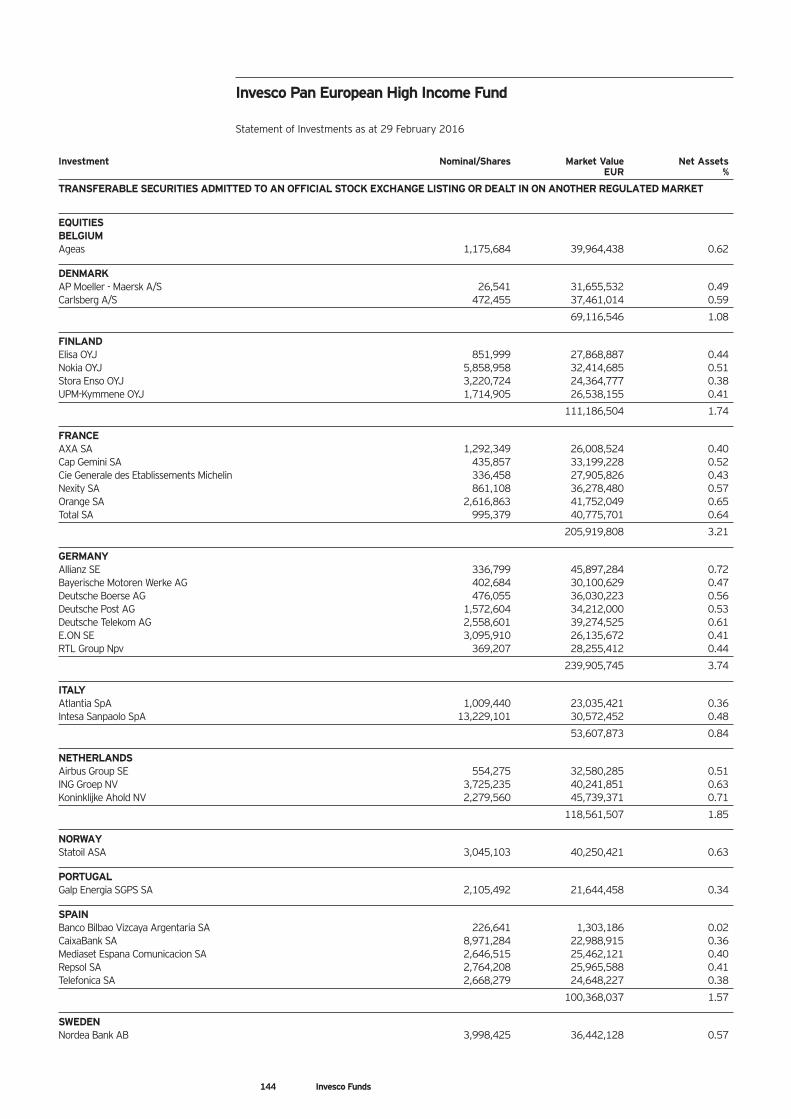
Investment Nominal/Shares Market Value Net Assets EUR %
TRANSFERABLE SECURITIES ADMITTED TO AN OFFICIAL STOCK EXCHANGE LISTING OR DEALT IN ON ANOTHER REGULATED MARKET
EQUITIESBELGIUMAgeas 1,175,684 39,964,438 0.62
DENMARKAP Moeller - Maersk A/S 26,541 31,655,532 0.49Carlsberg A/S 472,455 37,461,014 0.59
69,116,546 1.08
FINLANDElisa OYJ 851,999 27,868,887 0.44Nokia OYJ 5,858,958 32,414,685 0.51Stora Enso OYJ 3,220,724 24,364,777 0.38UPM-Kymmene OYJ 1,714,905 26,538,155 0.41
111,186,504 1.74
FRANCEAXA SA 1,292,349 26,008,524 0.40Cap Gemini SA 435,857 33,199,228 0.52Cie Generale des Etablissements Michelin 336,458 27,905,826 0.43Nexity SA 861,108 36,278,480 0.57Orange SA 2,616,863 41,752,049 0.65Total SA 995,379 40,775,701 0.64
205,919,808 3.21
GERMANYAllianz SE 336,799 45,897,284 0.72Bayerische Motoren Werke AG 402,684 30,100,629 0.47Deutsche Boerse AG 476,055 36,030,223 0.56Deutsche Post AG 1,572,604 34,212,000 0.53Deutsche Telekom AG 2,558,601 39,274,525 0.61E.ON SE 3,095,910 26,135,672 0.41RTL Group Npv 369,207 28,255,412 0.44
239,905,745 3.74
ITALYAtlantia SpA 1,009,440 23,035,421 0.36Intesa Sanpaolo SpA 13,229,101 30,572,452 0.48
53,607,873 0.84
NETHERLANDSAirbus Group SE 554,275 32,580,285 0.51ING Groep NV 3,725,235 40,241,851 0.63Koninklijke Ahold NV 2,279,560 45,739,371 0.71
118,561,507 1.85
NORWAYStatoil ASA 3,045,103 40,250,421 0.63
PORTUGALGalp Energia SGPS SA 2,105,492 21,644,458 0.34
SPAINBanco Bilbao Vizcaya Argentaria SA 226,641 1,303,186 0.02CaixaBank SA 8,971,284 22,988,915 0.36Mediaset Espana Comunicacion SA 2,646,515 25,462,121 0.40Repsol SA 2,764,208 25,965,588 0.41Telefonica SA 2,668,279 24,648,227 0.38
100,368,037 1.57
SWEDENNordea Bank AB 3,998,425 36,442,128 0.57
Invesco Pan European High Income Fund
Statement of Investments as at 29 February 2016
144 Invesco Funds
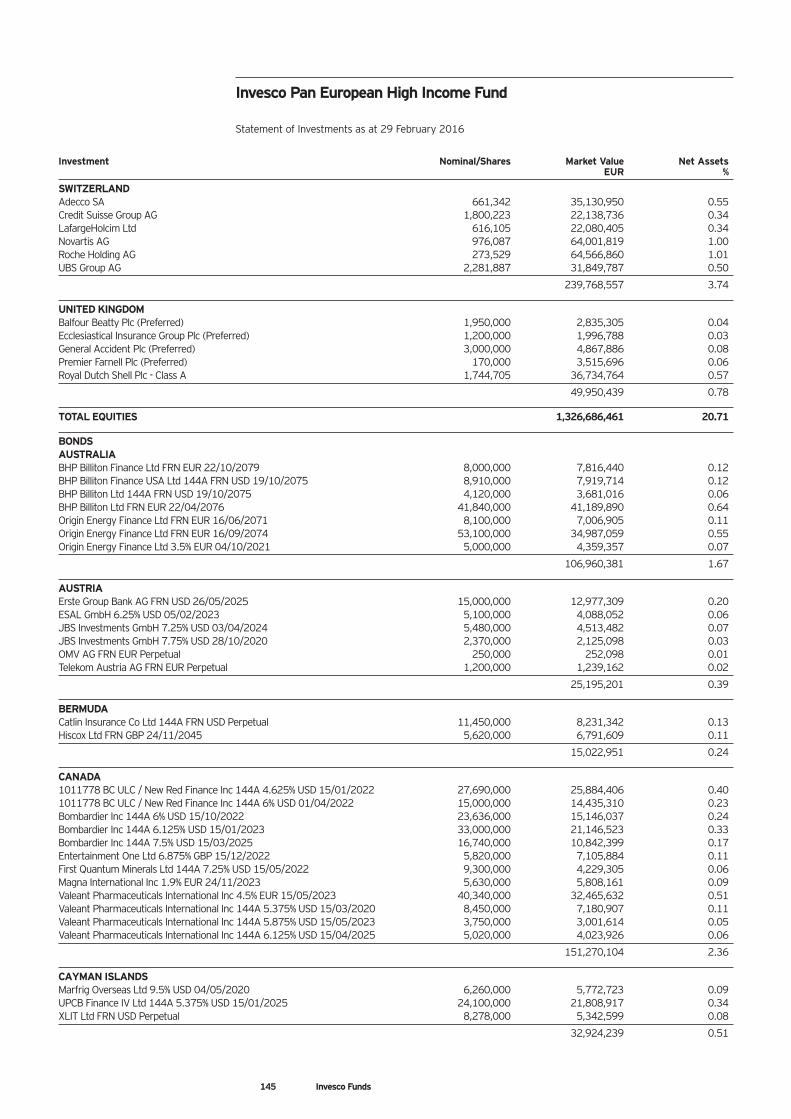
Investment Nominal/Shares Market Value Net Assets EUR %
SWITZERLANDAdecco SA 661,342 35,130,950 0.55Credit Suisse Group AG 1,800,223 22,138,736 0.34LafargeHolcim Ltd 616,105 22,080,405 0.34Novartis AG 976,087 64,001,819 1.00Roche Holding AG 273,529 64,566,860 1.01UBS Group AG 2,281,887 31,849,787 0.50
239,768,557 3.74
UNITED KINGDOMBalfour Beatty Plc (Preferred) 1,950,000 2,835,305 0.04Ecclesiastical Insurance Group Plc (Preferred) 1,200,000 1,996,788 0.03General Accident Plc (Preferred) 3,000,000 4,867,886 0.08Premier Farnell Plc (Preferred) 170,000 3,515,696 0.06Royal Dutch Shell Plc - Class A 1,744,705 36,734,764 0.57
49,950,439 0.78
TOTAL EQUITIES 1,326,686,461 20.71
BONDSAUSTRALIABHP Billiton Finance Ltd FRN EUR 22/10/2079 8,000,000 7,816,440 0.12BHP Billiton Finance USA Ltd 144A FRN USD 19/10/2075 8,910,000 7,919,714 0.12BHP Billiton Ltd 144A FRN USD 19/10/2075 4,120,000 3,681,016 0.06BHP Billiton Ltd FRN EUR 22/04/2076 41,840,000 41,189,890 0.64Origin Energy Finance Ltd FRN EUR 16/06/2071 8,100,000 7,006,905 0.11Origin Energy Finance Ltd FRN EUR 16/09/2074 53,100,000 34,987,059 0.55Origin Energy Finance Ltd 3.5% EUR 04/10/2021 5,000,000 4,359,357 0.07
106,960,381 1.67
AUSTRIAErste Group Bank AG FRN USD 26/05/2025 15,000,000 12,977,309 0.20ESAL GmbH 6.25% USD 05/02/2023 5,100,000 4,088,052 0.06JBS Investments GmbH 7.25% USD 03/04/2024 5,480,000 4,513,482 0.07JBS Investments GmbH 7.75% USD 28/10/2020 2,370,000 2,125,098 0.03OMV AG FRN EUR Perpetual 250,000 252,098 0.01Telekom Austria AG FRN EUR Perpetual 1,200,000 1,239,162 0.02
25,195,201 0.39
BERMUDACatlin Insurance Co Ltd 144A FRN USD Perpetual 11,450,000 8,231,342 0.13Hiscox Ltd FRN GBP 24/11/2045 5,620,000 6,791,609 0.11
15,022,951 0.24
CANADA1011778 BC ULC / New Red Finance Inc 144A 4.625% USD 15/01/2022 27,690,000 25,884,406 0.401011778 BC ULC / New Red Finance Inc 144A 6% USD 01/04/2022 15,000,000 14,435,310 0.23Bombardier Inc 144A 6% USD 15/10/2022 23,636,000 15,146,037 0.24Bombardier Inc 144A 6.125% USD 15/01/2023 33,000,000 21,146,523 0.33Bombardier Inc 144A 7.5% USD 15/03/2025 16,740,000 10,842,399 0.17Entertainment One Ltd 6.875% GBP 15/12/2022 5,820,000 7,105,884 0.11First Quantum Minerals Ltd 144A 7.25% USD 15/05/2022 9,300,000 4,229,305 0.06Magna International Inc 1.9% EUR 24/11/2023 5,630,000 5,808,161 0.09Valeant Pharmaceuticals International Inc 4.5% EUR 15/05/2023 40,340,000 32,465,632 0.51Valeant Pharmaceuticals International Inc 144A 5.375% USD 15/03/2020 8,450,000 7,180,907 0.11Valeant Pharmaceuticals International Inc 144A 5.875% USD 15/05/2023 3,750,000 3,001,614 0.05Valeant Pharmaceuticals International Inc 144A 6.125% USD 15/04/2025 5,020,000 4,023,926 0.06
151,270,104 2.36
CAYMAN ISLANDSMarfrig Overseas Ltd 9.5% USD 04/05/2020 6,260,000 5,772,723 0.09UPCB Finance IV Ltd 144A 5.375% USD 15/01/2025 24,100,000 21,808,917 0.34XLIT Ltd FRN USD Perpetual 8,278,000 5,342,599 0.08
32,924,239 0.51
Invesco Pan European High Income Fund
Statement of Investments as at 29 February 2016
145 Invesco Funds
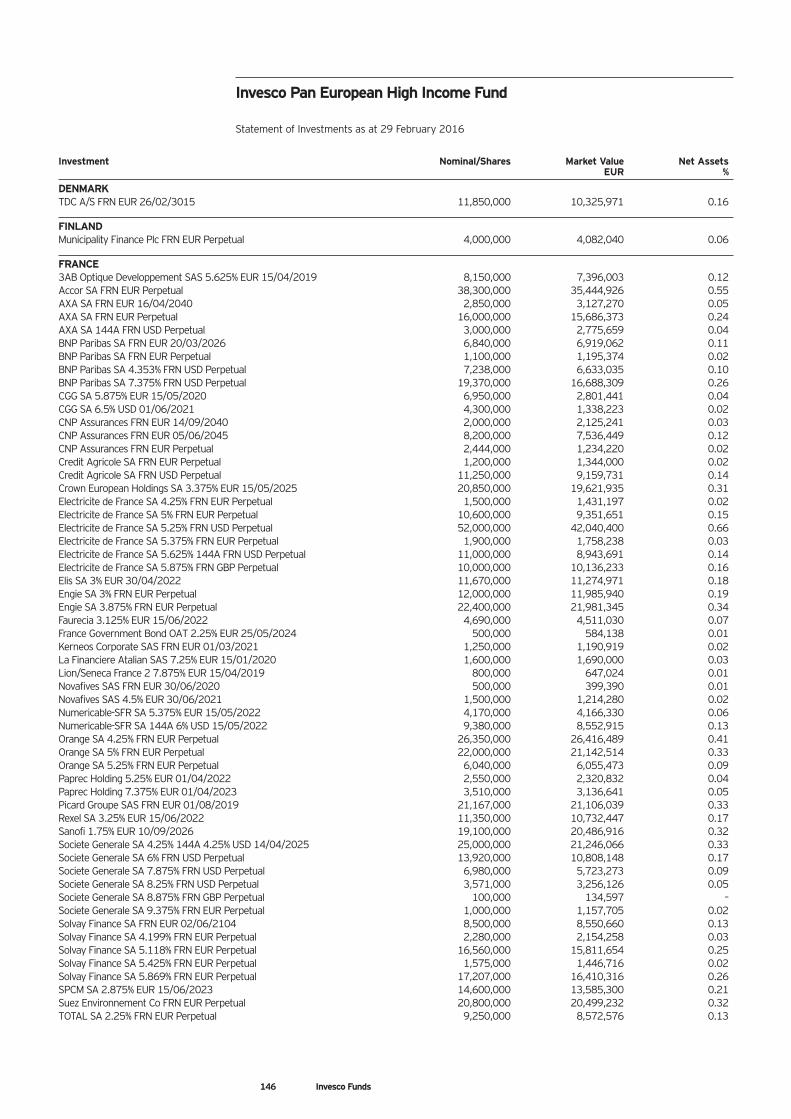
Investment Nominal/Shares Market Value Net Assets EUR %
DENMARKTDC A/S FRN EUR 26/02/3015 11,850,000 10,325,971 0.16
FINLANDMunicipality Finance Plc FRN EUR Perpetual 4,000,000 4,082,040 0.06
FRANCE3AB Optique Developpement SAS 5.625% EUR 15/04/2019 8,150,000 7,396,003 0.12Accor SA FRN EUR Perpetual 38,300,000 35,444,926 0.55AXA SA FRN EUR 16/04/2040 2,850,000 3,127,270 0.05AXA SA FRN EUR Perpetual 16,000,000 15,686,373 0.24AXA SA 144A FRN USD Perpetual 3,000,000 2,775,659 0.04BNP Paribas SA FRN EUR 20/03/2026 6,840,000 6,919,062 0.11BNP Paribas SA FRN EUR Perpetual 1,100,000 1,195,374 0.02BNP Paribas SA 4.353% FRN USD Perpetual 7,238,000 6,633,035 0.10BNP Paribas SA 7.375% FRN USD Perpetual 19,370,000 16,688,309 0.26CGG SA 5.875% EUR 15/05/2020 6,950,000 2,801,441 0.04CGG SA 6.5% USD 01/06/2021 4,300,000 1,338,223 0.02CNP Assurances FRN EUR 14/09/2040 2,000,000 2,125,241 0.03CNP Assurances FRN EUR 05/06/2045 8,200,000 7,536,449 0.12CNP Assurances FRN EUR Perpetual 2,444,000 1,234,220 0.02Credit Agricole SA FRN EUR Perpetual 1,200,000 1,344,000 0.02Credit Agricole SA FRN USD Perpetual 11,250,000 9,159,731 0.14Crown European Holdings SA 3.375% EUR 15/05/2025 20,850,000 19,621,935 0.31Electricite de France SA 4.25% FRN EUR Perpetual 1,500,000 1,431,197 0.02Electricite de France SA 5% FRN EUR Perpetual 10,600,000 9,351,651 0.15Electricite de France SA 5.25% FRN USD Perpetual 52,000,000 42,040,400 0.66Electricite de France SA 5.375% FRN EUR Perpetual 1,900,000 1,758,238 0.03Electricite de France SA 5.625% 144A FRN USD Perpetual 11,000,000 8,943,691 0.14Electricite de France SA 5.875% FRN GBP Perpetual 10,000,000 10,136,233 0.16Elis SA 3% EUR 30/04/2022 11,670,000 11,274,971 0.18Engie SA 3% FRN EUR Perpetual 12,000,000 11,985,940 0.19Engie SA 3.875% FRN EUR Perpetual 22,400,000 21,981,345 0.34Faurecia 3.125% EUR 15/06/2022 4,690,000 4,511,030 0.07France Government Bond OAT 2.25% EUR 25/05/2024 500,000 584,138 0.01Kerneos Corporate SAS FRN EUR 01/03/2021 1,250,000 1,190,919 0.02La Financiere Atalian SAS 7.25% EUR 15/01/2020 1,600,000 1,690,000 0.03Lion/Seneca France 2 7.875% EUR 15/04/2019 800,000 647,024 0.01Novafives SAS FRN EUR 30/06/2020 500,000 399,390 0.01Novafives SAS 4.5% EUR 30/06/2021 1,500,000 1,214,280 0.02Numericable-SFR SA 5.375% EUR 15/05/2022 4,170,000 4,166,330 0.06Numericable-SFR SA 144A 6% USD 15/05/2022 9,380,000 8,552,915 0.13Orange SA 4.25% FRN EUR Perpetual 26,350,000 26,416,489 0.41Orange SA 5% FRN EUR Perpetual 22,000,000 21,142,514 0.33Orange SA 5.25% FRN EUR Perpetual 6,040,000 6,055,473 0.09Paprec Holding 5.25% EUR 01/04/2022 2,550,000 2,320,832 0.04Paprec Holding 7.375% EUR 01/04/2023 3,510,000 3,136,641 0.05Picard Groupe SAS FRN EUR 01/08/2019 21,167,000 21,106,039 0.33Rexel SA 3.25% EUR 15/06/2022 11,350,000 10,732,447 0.17Sanofi 1.75% EUR 10/09/2026 19,100,000 20,486,916 0.32Societe Generale SA 4.25% 144A 4.25% USD 14/04/2025 25,000,000 21,246,066 0.33Societe Generale SA 6% FRN USD Perpetual 13,920,000 10,808,148 0.17Societe Generale SA 7.875% FRN USD Perpetual 6,980,000 5,723,273 0.09Societe Generale SA 8.25% FRN USD Perpetual 3,571,000 3,256,126 0.05Societe Generale SA 8.875% FRN GBP Perpetual 100,000 134,597 –Societe Generale SA 9.375% FRN EUR Perpetual 1,000,000 1,157,705 0.02Solvay Finance SA FRN EUR 02/06/2104 8,500,000 8,550,660 0.13Solvay Finance SA 4.199% FRN EUR Perpetual 2,280,000 2,154,258 0.03Solvay Finance SA 5.118% FRN EUR Perpetual 16,560,000 15,811,654 0.25Solvay Finance SA 5.425% FRN EUR Perpetual 1,575,000 1,446,716 0.02Solvay Finance SA 5.869% FRN EUR Perpetual 17,207,000 16,410,316 0.26SPCM SA 2.875% EUR 15/06/2023 14,600,000 13,585,300 0.21Suez Environnement Co FRN EUR Perpetual 20,800,000 20,499,232 0.32TOTAL SA 2.25% FRN EUR Perpetual 9,250,000 8,572,576 0.13
Invesco Pan European High Income Fund
Statement of Investments as at 29 February 2016
146 Invesco Funds
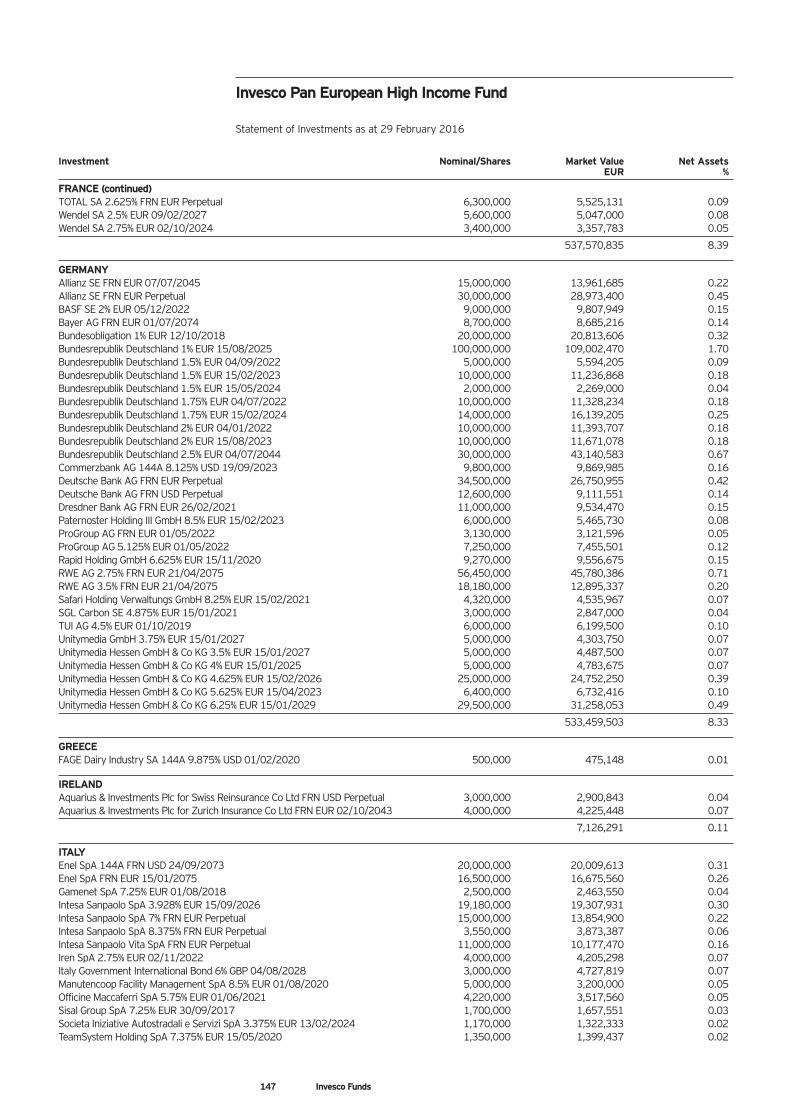
Investment Nominal/Shares Market Value Net Assets EUR %
FRANCE (continued)TOTAL SA 2.625% FRN EUR Perpetual 6,300,000 5,525,131 0.09Wendel SA 2.5% EUR 09/02/2027 5,600,000 5,047,000 0.08Wendel SA 2.75% EUR 02/10/2024 3,400,000 3,357,783 0.05
537,570,835 8.39
GERMANYAllianz SE FRN EUR 07/07/2045 15,000,000 13,961,685 0.22Allianz SE FRN EUR Perpetual 30,000,000 28,973,400 0.45BASF SE 2% EUR 05/12/2022 9,000,000 9,807,949 0.15Bayer AG FRN EUR 01/07/2074 8,700,000 8,685,216 0.14Bundesobligation 1% EUR 12/10/2018 20,000,000 20,813,606 0.32Bundesrepublik Deutschland 1% EUR 15/08/2025 100,000,000 109,002,470 1.70Bundesrepublik Deutschland 1.5% EUR 04/09/2022 5,000,000 5,594,205 0.09Bundesrepublik Deutschland 1.5% EUR 15/02/2023 10,000,000 11,236,868 0.18Bundesrepublik Deutschland 1.5% EUR 15/05/2024 2,000,000 2,269,000 0.04Bundesrepublik Deutschland 1.75% EUR 04/07/2022 10,000,000 11,328,234 0.18Bundesrepublik Deutschland 1.75% EUR 15/02/2024 14,000,000 16,139,205 0.25Bundesrepublik Deutschland 2% EUR 04/01/2022 10,000,000 11,393,707 0.18Bundesrepublik Deutschland 2% EUR 15/08/2023 10,000,000 11,671,078 0.18Bundesrepublik Deutschland 2.5% EUR 04/07/2044 30,000,000 43,140,583 0.67Commerzbank AG 144A 8.125% USD 19/09/2023 9,800,000 9,869,985 0.16Deutsche Bank AG FRN EUR Perpetual 34,500,000 26,750,955 0.42Deutsche Bank AG FRN USD Perpetual 12,600,000 9,111,551 0.14Dresdner Bank AG FRN EUR 26/02/2021 11,000,000 9,534,470 0.15Paternoster Holding III GmbH 8.5% EUR 15/02/2023 6,000,000 5,465,730 0.08ProGroup AG FRN EUR 01/05/2022 3,130,000 3,121,596 0.05ProGroup AG 5.125% EUR 01/05/2022 7,250,000 7,455,501 0.12Rapid Holding GmbH 6.625% EUR 15/11/2020 9,270,000 9,556,675 0.15RWE AG 2.75% FRN EUR 21/04/2075 56,450,000 45,780,386 0.71RWE AG 3.5% FRN EUR 21/04/2075 18,180,000 12,895,337 0.20Safari Holding Verwaltungs GmbH 8.25% EUR 15/02/2021 4,320,000 4,535,967 0.07SGL Carbon SE 4.875% EUR 15/01/2021 3,000,000 2,847,000 0.04TUI AG 4.5% EUR 01/10/2019 6,000,000 6,199,500 0.10Unitymedia GmbH 3.75% EUR 15/01/2027 5,000,000 4,303,750 0.07Unitymedia Hessen GmbH & Co KG 3.5% EUR 15/01/2027 5,000,000 4,487,500 0.07Unitymedia Hessen GmbH & Co KG 4% EUR 15/01/2025 5,000,000 4,783,675 0.07Unitymedia Hessen GmbH & Co KG 4.625% EUR 15/02/2026 25,000,000 24,752,250 0.39Unitymedia Hessen GmbH & Co KG 5.625% EUR 15/04/2023 6,400,000 6,732,416 0.10Unitymedia Hessen GmbH & Co KG 6.25% EUR 15/01/2029 29,500,000 31,258,053 0.49
533,459,503 8.33
GREECEFAGE Dairy Industry SA 144A 9.875% USD 01/02/2020 500,000 475,148 0.01
IRELANDAquarius & Investments Plc for Swiss Reinsurance Co Ltd FRN USD Perpetual 3,000,000 2,900,843 0.04Aquarius & Investments Plc for Zurich Insurance Co Ltd FRN EUR 02/10/2043 4,000,000 4,225,448 0.07
7,126,291 0.11
ITALYEnel SpA 144A FRN USD 24/09/2073 20,000,000 20,009,613 0.31Enel SpA FRN EUR 15/01/2075 16,500,000 16,675,560 0.26Gamenet SpA 7.25% EUR 01/08/2018 2,500,000 2,463,550 0.04Intesa Sanpaolo SpA 3.928% EUR 15/09/2026 19,180,000 19,307,931 0.30Intesa Sanpaolo SpA 7% FRN EUR Perpetual 15,000,000 13,854,900 0.22Intesa Sanpaolo SpA 8.375% FRN EUR Perpetual 3,550,000 3,873,387 0.06Intesa Sanpaolo Vita SpA FRN EUR Perpetual 11,000,000 10,177,470 0.16Iren SpA 2.75% EUR 02/11/2022 4,000,000 4,205,298 0.07Italy Government International Bond 6% GBP 04/08/2028 3,000,000 4,727,819 0.07Manutencoop Facility Management SpA 8.5% EUR 01/08/2020 5,000,000 3,200,000 0.05Officine Maccaferri SpA 5.75% EUR 01/06/2021 4,220,000 3,517,560 0.05Sisal Group SpA 7.25% EUR 30/09/2017 1,700,000 1,657,551 0.03Societa Iniziative Autostradali e Servizi SpA 3.375% EUR 13/02/2024 1,170,000 1,322,333 0.02TeamSystem Holding SpA 7.375% EUR 15/05/2020 1,350,000 1,399,437 0.02
Invesco Pan European High Income Fund
Statement of Investments as at 29 February 2016
147 Invesco Funds
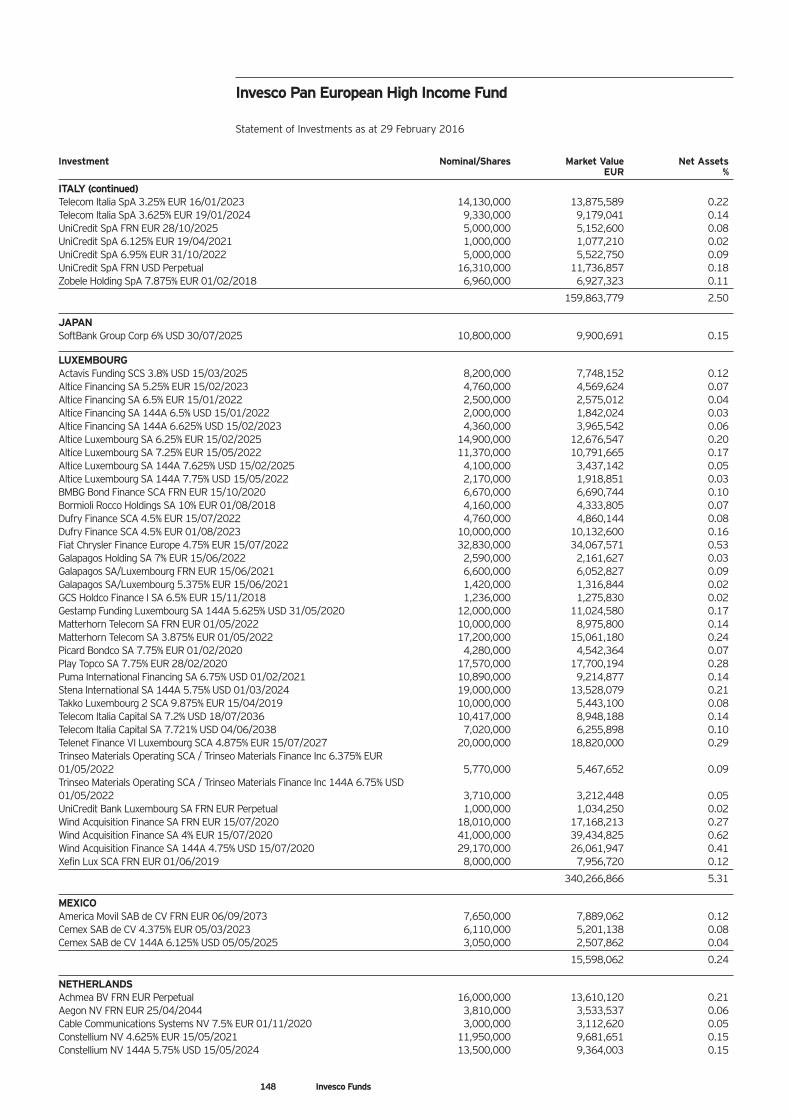
Investment Nominal/Shares Market Value Net Assets EUR %
ITALY (continued)Telecom Italia SpA 3.25% EUR 16/01/2023 14,130,000 13,875,589 0.22Telecom Italia SpA 3.625% EUR 19/01/2024 9,330,000 9,179,041 0.14UniCredit SpA FRN EUR 28/10/2025 5,000,000 5,152,600 0.08UniCredit SpA 6.125% EUR 19/04/2021 1,000,000 1,077,210 0.02UniCredit SpA 6.95% EUR 31/10/2022 5,000,000 5,522,750 0.09UniCredit SpA FRN USD Perpetual 16,310,000 11,736,857 0.18Zobele Holding SpA 7.875% EUR 01/02/2018 6,960,000 6,927,323 0.11
159,863,779 2.50
JAPANSoftBank Group Corp 6% USD 30/07/2025 10,800,000 9,900,691 0.15
LUXEMBOURGActavis Funding SCS 3.8% USD 15/03/2025 8,200,000 7,748,152 0.12Altice Financing SA 5.25% EUR 15/02/2023 4,760,000 4,569,624 0.07Altice Financing SA 6.5% EUR 15/01/2022 2,500,000 2,575,012 0.04Altice Financing SA 144A 6.5% USD 15/01/2022 2,000,000 1,842,024 0.03Altice Financing SA 144A 6.625% USD 15/02/2023 4,360,000 3,965,542 0.06Altice Luxembourg SA 6.25% EUR 15/02/2025 14,900,000 12,676,547 0.20Altice Luxembourg SA 7.25% EUR 15/05/2022 11,370,000 10,791,665 0.17Altice Luxembourg SA 144A 7.625% USD 15/02/2025 4,100,000 3,437,142 0.05Altice Luxembourg SA 144A 7.75% USD 15/05/2022 2,170,000 1,918,851 0.03BMBG Bond Finance SCA FRN EUR 15/10/2020 6,670,000 6,690,744 0.10Bormioli Rocco Holdings SA 10% EUR 01/08/2018 4,160,000 4,333,805 0.07Dufry Finance SCA 4.5% EUR 15/07/2022 4,760,000 4,860,144 0.08Dufry Finance SCA 4.5% EUR 01/08/2023 10,000,000 10,132,600 0.16Fiat Chrysler Finance Europe 4.75% EUR 15/07/2022 32,830,000 34,067,571 0.53Galapagos Holding SA 7% EUR 15/06/2022 2,590,000 2,161,627 0.03Galapagos SA/Luxembourg FRN EUR 15/06/2021 6,600,000 6,052,827 0.09Galapagos SA/Luxembourg 5.375% EUR 15/06/2021 1,420,000 1,316,844 0.02GCS Holdco Finance I SA 6.5% EUR 15/11/2018 1,236,000 1,275,830 0.02Gestamp Funding Luxembourg SA 144A 5.625% USD 31/05/2020 12,000,000 11,024,580 0.17Matterhorn Telecom SA FRN EUR 01/05/2022 10,000,000 8,975,800 0.14Matterhorn Telecom SA 3.875% EUR 01/05/2022 17,200,000 15,061,180 0.24Picard Bondco SA 7.75% EUR 01/02/2020 4,280,000 4,542,364 0.07Play Topco SA 7.75% EUR 28/02/2020 17,570,000 17,700,194 0.28Puma International Financing SA 6.75% USD 01/02/2021 10,890,000 9,214,877 0.14Stena International SA 144A 5.75% USD 01/03/2024 19,000,000 13,528,079 0.21Takko Luxembourg 2 SCA 9.875% EUR 15/04/2019 10,000,000 5,443,100 0.08Telecom Italia Capital SA 7.2% USD 18/07/2036 10,417,000 8,948,188 0.14Telecom Italia Capital SA 7.721% USD 04/06/2038 7,020,000 6,255,898 0.10Telenet Finance VI Luxembourg SCA 4.875% EUR 15/07/2027 20,000,000 18,820,000 0.29Trinseo Materials Operating SCA / Trinseo Materials Finance Inc 6.375% EUR 01/05/2022 5,770,000 5,467,652 0.09Trinseo Materials Operating SCA / Trinseo Materials Finance Inc 144A 6.75% USD 01/05/2022 3,710,000 3,212,448 0.05UniCredit Bank Luxembourg SA FRN EUR Perpetual 1,000,000 1,034,250 0.02Wind Acquisition Finance SA FRN EUR 15/07/2020 18,010,000 17,168,213 0.27Wind Acquisition Finance SA 4% EUR 15/07/2020 41,000,000 39,434,825 0.62Wind Acquisition Finance SA 144A 4.75% USD 15/07/2020 29,170,000 26,061,947 0.41Xefin Lux SCA FRN EUR 01/06/2019 8,000,000 7,956,720 0.12
340,266,866 5.31
MEXICOAmerica Movil SAB de CV FRN EUR 06/09/2073 7,650,000 7,889,062 0.12Cemex SAB de CV 4.375% EUR 05/03/2023 6,110,000 5,201,138 0.08Cemex SAB de CV 144A 6.125% USD 05/05/2025 3,050,000 2,507,862 0.04
15,598,062 0.24
NETHERLANDSAchmea BV FRN EUR Perpetual 16,000,000 13,610,120 0.21Aegon NV FRN EUR 25/04/2044 3,810,000 3,533,537 0.06Cable Communications Systems NV 7.5% EUR 01/11/2020 3,000,000 3,112,620 0.05Constellium NV 4.625% EUR 15/05/2021 11,950,000 9,681,651 0.15Constellium NV 144A 5.75% USD 15/05/2024 13,500,000 9,364,003 0.15
Invesco Pan European High Income Fund
Statement of Investments as at 29 February 2016
148 Invesco Funds
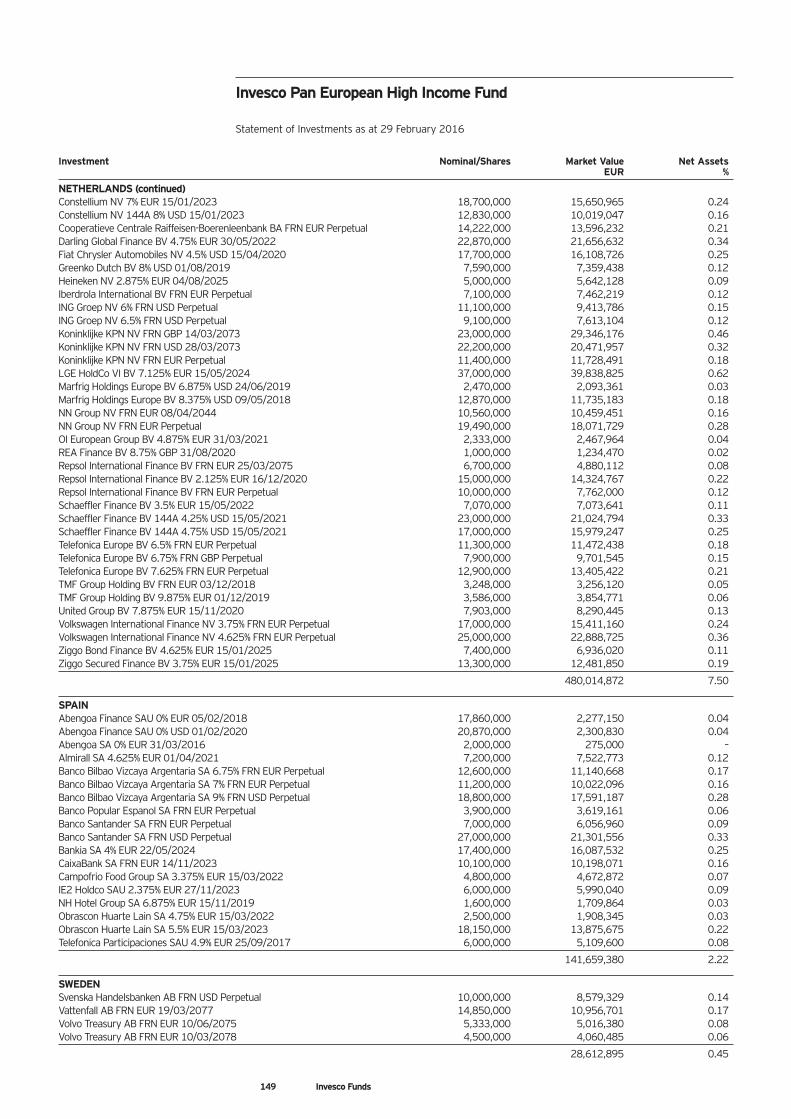
Investment Nominal/Shares Market Value Net Assets EUR %
NETHERLANDS (continued)Constellium NV 7% EUR 15/01/2023 18,700,000 15,650,965 0.24Constellium NV 144A 8% USD 15/01/2023 12,830,000 10,019,047 0.16Cooperatieve Centrale Raiffeisen-Boerenleenbank BA FRN EUR Perpetual 14,222,000 13,596,232 0.21Darling Global Finance BV 4.75% EUR 30/05/2022 22,870,000 21,656,632 0.34Fiat Chrysler Automobiles NV 4.5% USD 15/04/2020 17,700,000 16,108,726 0.25Greenko Dutch BV 8% USD 01/08/2019 7,590,000 7,359,438 0.12Heineken NV 2.875% EUR 04/08/2025 5,000,000 5,642,128 0.09Iberdrola International BV FRN EUR Perpetual 7,100,000 7,462,219 0.12ING Groep NV 6% FRN USD Perpetual 11,100,000 9,413,786 0.15ING Groep NV 6.5% FRN USD Perpetual 9,100,000 7,613,104 0.12Koninklijke KPN NV FRN GBP 14/03/2073 23,000,000 29,346,176 0.46Koninklijke KPN NV FRN USD 28/03/2073 22,200,000 20,471,957 0.32Koninklijke KPN NV FRN EUR Perpetual 11,400,000 11,728,491 0.18LGE HoldCo VI BV 7.125% EUR 15/05/2024 37,000,000 39,838,825 0.62Marfrig Holdings Europe BV 6.875% USD 24/06/2019 2,470,000 2,093,361 0.03Marfrig Holdings Europe BV 8.375% USD 09/05/2018 12,870,000 11,735,183 0.18NN Group NV FRN EUR 08/04/2044 10,560,000 10,459,451 0.16NN Group NV FRN EUR Perpetual 19,490,000 18,071,729 0.28OI European Group BV 4.875% EUR 31/03/2021 2,333,000 2,467,964 0.04REA Finance BV 8.75% GBP 31/08/2020 1,000,000 1,234,470 0.02Repsol International Finance BV FRN EUR 25/03/2075 6,700,000 4,880,112 0.08Repsol International Finance BV 2.125% EUR 16/12/2020 15,000,000 14,324,767 0.22Repsol International Finance BV FRN EUR Perpetual 10,000,000 7,762,000 0.12Schaeffler Finance BV 3.5% EUR 15/05/2022 7,070,000 7,073,641 0.11Schaeffler Finance BV 144A 4.25% USD 15/05/2021 23,000,000 21,024,794 0.33Schaeffler Finance BV 144A 4.75% USD 15/05/2021 17,000,000 15,979,247 0.25Telefonica Europe BV 6.5% FRN EUR Perpetual 11,300,000 11,472,438 0.18Telefonica Europe BV 6.75% FRN GBP Perpetual 7,900,000 9,701,545 0.15Telefonica Europe BV 7.625% FRN EUR Perpetual 12,900,000 13,405,422 0.21TMF Group Holding BV FRN EUR 03/12/2018 3,248,000 3,256,120 0.05TMF Group Holding BV 9.875% EUR 01/12/2019 3,586,000 3,854,771 0.06United Group BV 7.875% EUR 15/11/2020 7,903,000 8,290,445 0.13Volkswagen International Finance NV 3.75% FRN EUR Perpetual 17,000,000 15,411,160 0.24Volkswagen International Finance NV 4.625% FRN EUR Perpetual 25,000,000 22,888,725 0.36Ziggo Bond Finance BV 4.625% EUR 15/01/2025 7,400,000 6,936,020 0.11Ziggo Secured Finance BV 3.75% EUR 15/01/2025 13,300,000 12,481,850 0.19
480,014,872 7.50
SPAINAbengoa Finance SAU 0% EUR 05/02/2018 17,860,000 2,277,150 0.04Abengoa Finance SAU 0% USD 01/02/2020 20,870,000 2,300,830 0.04Abengoa SA 0% EUR 31/03/2016 2,000,000 275,000 –Almirall SA 4.625% EUR 01/04/2021 7,200,000 7,522,773 0.12Banco Bilbao Vizcaya Argentaria SA 6.75% FRN EUR Perpetual 12,600,000 11,140,668 0.17Banco Bilbao Vizcaya Argentaria SA 7% FRN EUR Perpetual 11,200,000 10,022,096 0.16Banco Bilbao Vizcaya Argentaria SA 9% FRN USD Perpetual 18,800,000 17,591,187 0.28Banco Popular Espanol SA FRN EUR Perpetual 3,900,000 3,619,161 0.06Banco Santander SA FRN EUR Perpetual 7,000,000 6,056,960 0.09Banco Santander SA FRN USD Perpetual 27,000,000 21,301,556 0.33Bankia SA 4% EUR 22/05/2024 17,400,000 16,087,532 0.25CaixaBank SA FRN EUR 14/11/2023 10,100,000 10,198,071 0.16Campofrio Food Group SA 3.375% EUR 15/03/2022 4,800,000 4,672,872 0.07IE2 Holdco SAU 2.375% EUR 27/11/2023 6,000,000 5,990,040 0.09NH Hotel Group SA 6.875% EUR 15/11/2019 1,600,000 1,709,864 0.03Obrascon Huarte Lain SA 4.75% EUR 15/03/2022 2,500,000 1,908,345 0.03Obrascon Huarte Lain SA 5.5% EUR 15/03/2023 18,150,000 13,875,675 0.22Telefonica Participaciones SAU 4.9% EUR 25/09/2017 6,000,000 5,109,600 0.08
141,659,380 2.22
SWEDENSvenska Handelsbanken AB FRN USD Perpetual 10,000,000 8,579,329 0.14Vattenfall AB FRN EUR 19/03/2077 14,850,000 10,956,701 0.17Volvo Treasury AB FRN EUR 10/06/2075 5,333,000 5,016,380 0.08Volvo Treasury AB FRN EUR 10/03/2078 4,500,000 4,060,485 0.06
28,612,895 0.45
Invesco Pan European High Income Fund
Statement of Investments as at 29 February 2016
149 Invesco Funds
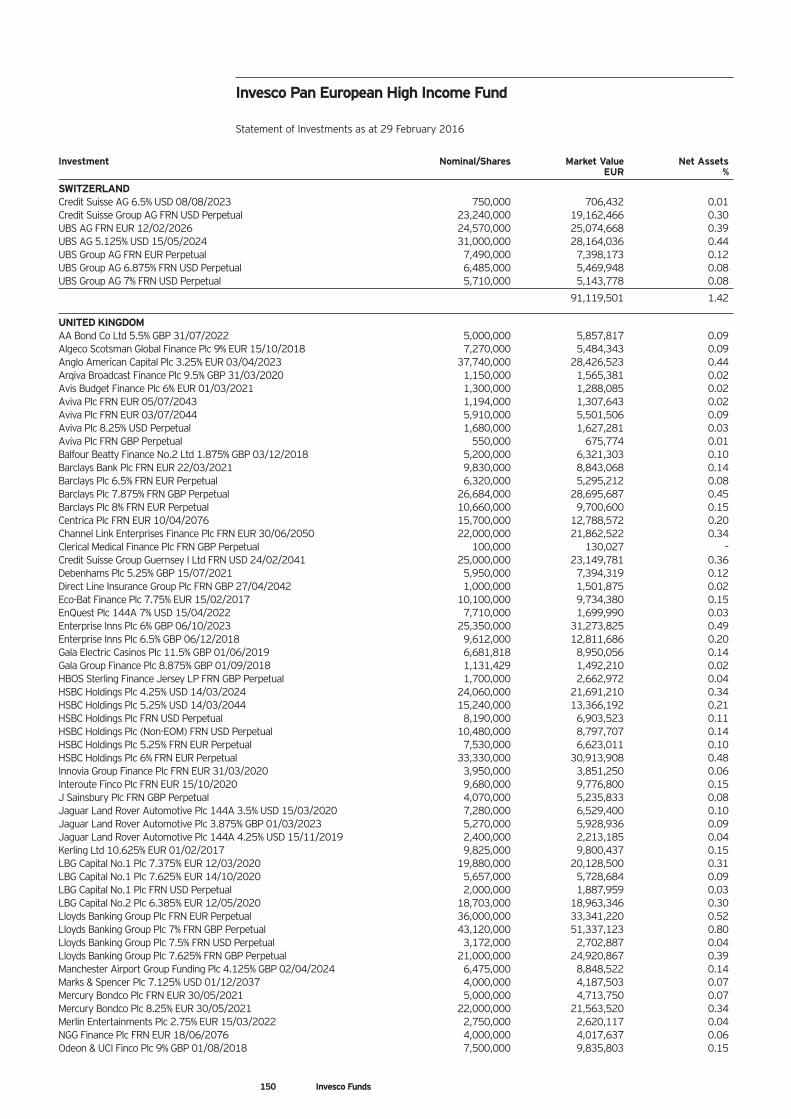
Investment Nominal/Shares Market Value Net Assets EUR %
SWITZERLANDCredit Suisse AG 6.5% USD 08/08/2023 750,000 706,432 0.01Credit Suisse Group AG FRN USD Perpetual 23,240,000 19,162,466 0.30UBS AG FRN EUR 12/02/2026 24,570,000 25,074,668 0.39UBS AG 5.125% USD 15/05/2024 31,000,000 28,164,036 0.44UBS Group AG FRN EUR Perpetual 7,490,000 7,398,173 0.12UBS Group AG 6.875% FRN USD Perpetual 6,485,000 5,469,948 0.08UBS Group AG 7% FRN USD Perpetual 5,710,000 5,143,778 0.08
91,119,501 1.42
UNITED KINGDOMAA Bond Co Ltd 5.5% GBP 31/07/2022 5,000,000 5,857,817 0.09Algeco Scotsman Global Finance Plc 9% EUR 15/10/2018 7,270,000 5,484,343 0.09Anglo American Capital Plc 3.25% EUR 03/04/2023 37,740,000 28,426,523 0.44Arqiva Broadcast Finance Plc 9.5% GBP 31/03/2020 1,150,000 1,565,381 0.02Avis Budget Finance Plc 6% EUR 01/03/2021 1,300,000 1,288,085 0.02Aviva Plc FRN EUR 05/07/2043 1,194,000 1,307,643 0.02Aviva Plc FRN EUR 03/07/2044 5,910,000 5,501,506 0.09Aviva Plc 8.25% USD Perpetual 1,680,000 1,627,281 0.03Aviva Plc FRN GBP Perpetual 550,000 675,774 0.01Balfour Beatty Finance No.2 Ltd 1.875% GBP 03/12/2018 5,200,000 6,321,303 0.10Barclays Bank Plc FRN EUR 22/03/2021 9,830,000 8,843,068 0.14Barclays Plc 6.5% FRN EUR Perpetual 6,320,000 5,295,212 0.08Barclays Plc 7.875% FRN GBP Perpetual 26,684,000 28,695,687 0.45Barclays Plc 8% FRN EUR Perpetual 10,660,000 9,700,600 0.15Centrica Plc FRN EUR 10/04/2076 15,700,000 12,788,572 0.20Channel Link Enterprises Finance Plc FRN EUR 30/06/2050 22,000,000 21,862,522 0.34Clerical Medical Finance Plc FRN GBP Perpetual 100,000 130,027 –Credit Suisse Group Guernsey I Ltd FRN USD 24/02/2041 25,000,000 23,149,781 0.36Debenhams Plc 5.25% GBP 15/07/2021 5,950,000 7,394,319 0.12Direct Line Insurance Group Plc FRN GBP 27/04/2042 1,000,000 1,501,875 0.02Eco-Bat Finance Plc 7.75% EUR 15/02/2017 10,100,000 9,734,380 0.15EnQuest Plc 144A 7% USD 15/04/2022 7,710,000 1,699,990 0.03Enterprise Inns Plc 6% GBP 06/10/2023 25,350,000 31,273,825 0.49Enterprise Inns Plc 6.5% GBP 06/12/2018 9,612,000 12,811,686 0.20Gala Electric Casinos Plc 11.5% GBP 01/06/2019 6,681,818 8,950,056 0.14Gala Group Finance Plc 8.875% GBP 01/09/2018 1,131,429 1,492,210 0.02HBOS Sterling Finance Jersey LP FRN GBP Perpetual 1,700,000 2,662,972 0.04HSBC Holdings Plc 4.25% USD 14/03/2024 24,060,000 21,691,210 0.34HSBC Holdings Plc 5.25% USD 14/03/2044 15,240,000 13,366,192 0.21HSBC Holdings Plc FRN USD Perpetual 8,190,000 6,903,523 0.11HSBC Holdings Plc (Non-EOM) FRN USD Perpetual 10,480,000 8,797,707 0.14HSBC Holdings Plc 5.25% FRN EUR Perpetual 7,530,000 6,623,011 0.10HSBC Holdings Plc 6% FRN EUR Perpetual 33,330,000 30,913,908 0.48Innovia Group Finance Plc FRN EUR 31/03/2020 3,950,000 3,851,250 0.06Interoute Finco Plc FRN EUR 15/10/2020 9,680,000 9,776,800 0.15J Sainsbury Plc FRN GBP Perpetual 4,070,000 5,235,833 0.08Jaguar Land Rover Automotive Plc 144A 3.5% USD 15/03/2020 7,280,000 6,529,400 0.10Jaguar Land Rover Automotive Plc 3.875% GBP 01/03/2023 5,270,000 5,928,936 0.09Jaguar Land Rover Automotive Plc 144A 4.25% USD 15/11/2019 2,400,000 2,213,185 0.04Kerling Ltd 10.625% EUR 01/02/2017 9,825,000 9,800,437 0.15LBG Capital No.1 Plc 7.375% EUR 12/03/2020 19,880,000 20,128,500 0.31LBG Capital No.1 Plc 7.625% EUR 14/10/2020 5,657,000 5,728,684 0.09LBG Capital No.1 Plc FRN USD Perpetual 2,000,000 1,887,959 0.03LBG Capital No.2 Plc 6.385% EUR 12/05/2020 18,703,000 18,963,346 0.30Lloyds Banking Group Plc FRN EUR Perpetual 36,000,000 33,341,220 0.52Lloyds Banking Group Plc 7% FRN GBP Perpetual 43,120,000 51,337,123 0.80Lloyds Banking Group Plc 7.5% FRN USD Perpetual 3,172,000 2,702,887 0.04Lloyds Banking Group Plc 7.625% FRN GBP Perpetual 21,000,000 24,920,867 0.39Manchester Airport Group Funding Plc 4.125% GBP 02/04/2024 6,475,000 8,848,522 0.14Marks & Spencer Plc 7.125% USD 01/12/2037 4,000,000 4,187,503 0.07Mercury Bondco Plc FRN EUR 30/05/2021 5,000,000 4,713,750 0.07Mercury Bondco Plc 8.25% EUR 30/05/2021 22,000,000 21,563,520 0.34Merlin Entertainments Plc 2.75% EUR 15/03/2022 2,750,000 2,620,117 0.04NGG Finance Plc FRN EUR 18/06/2076 4,000,000 4,017,637 0.06Odeon & UCI Finco Plc 9% GBP 01/08/2018 7,500,000 9,835,803 0.15
Invesco Pan European High Income Fund
Statement of Investments as at 29 February 2016
150 Invesco Funds
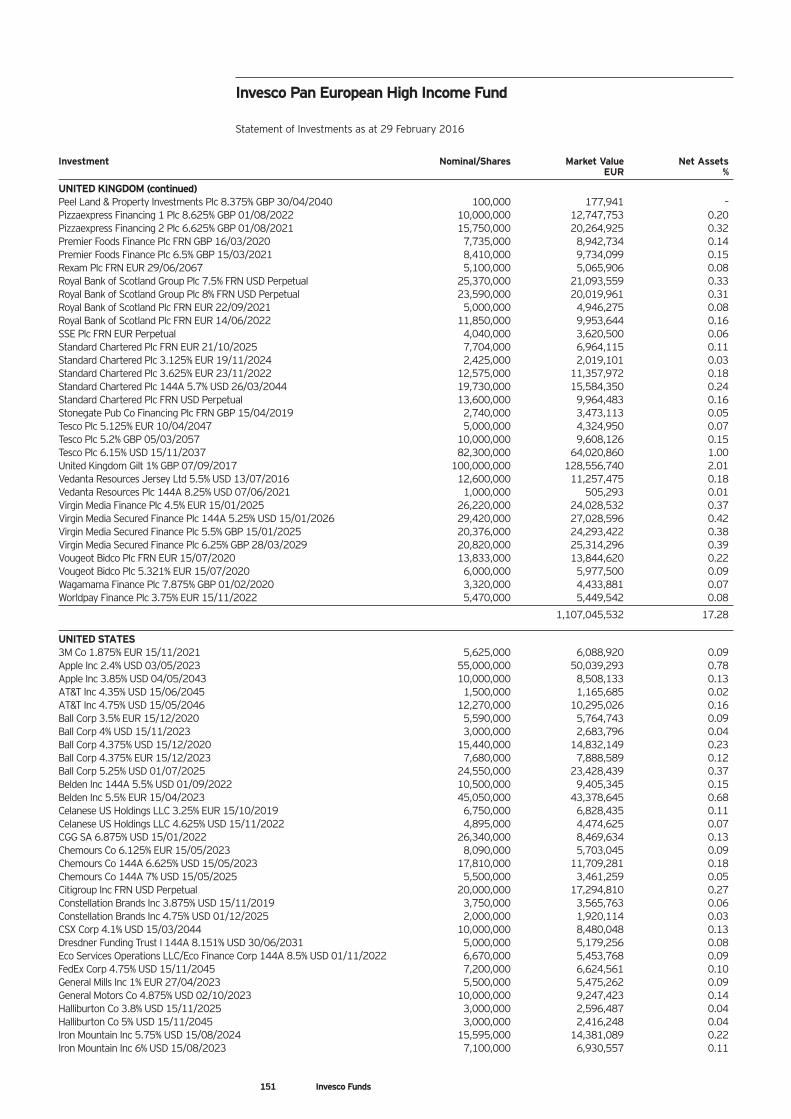
Investment Nominal/Shares Market Value Net Assets EUR %
UNITED KINGDOM (continued)Peel Land & Property Investments Plc 8.375% GBP 30/04/2040 100,000 177,941 –Pizzaexpress Financing 1 Plc 8.625% GBP 01/08/2022 10,000,000 12,747,753 0.20Pizzaexpress Financing 2 Plc 6.625% GBP 01/08/2021 15,750,000 20,264,925 0.32Premier Foods Finance Plc FRN GBP 16/03/2020 7,735,000 8,942,734 0.14Premier Foods Finance Plc 6.5% GBP 15/03/2021 8,410,000 9,734,099 0.15Rexam Plc FRN EUR 29/06/2067 5,100,000 5,065,906 0.08Royal Bank of Scotland Group Plc 7.5% FRN USD Perpetual 25,370,000 21,093,559 0.33Royal Bank of Scotland Group Plc 8% FRN USD Perpetual 23,590,000 20,019,961 0.31Royal Bank of Scotland Plc FRN EUR 22/09/2021 5,000,000 4,946,275 0.08Royal Bank of Scotland Plc FRN EUR 14/06/2022 11,850,000 9,953,644 0.16SSE Plc FRN EUR Perpetual 4,040,000 3,620,500 0.06Standard Chartered Plc FRN EUR 21/10/2025 7,704,000 6,964,115 0.11Standard Chartered Plc 3.125% EUR 19/11/2024 2,425,000 2,019,101 0.03Standard Chartered Plc 3.625% EUR 23/11/2022 12,575,000 11,357,972 0.18Standard Chartered Plc 144A 5.7% USD 26/03/2044 19,730,000 15,584,350 0.24Standard Chartered Plc FRN USD Perpetual 13,600,000 9,964,483 0.16Stonegate Pub Co Financing Plc FRN GBP 15/04/2019 2,740,000 3,473,113 0.05Tesco Plc 5.125% EUR 10/04/2047 5,000,000 4,324,950 0.07Tesco Plc 5.2% GBP 05/03/2057 10,000,000 9,608,126 0.15Tesco Plc 6.15% USD 15/11/2037 82,300,000 64,020,860 1.00United Kingdom Gilt 1% GBP 07/09/2017 100,000,000 128,556,740 2.01Vedanta Resources Jersey Ltd 5.5% USD 13/07/2016 12,600,000 11,257,475 0.18Vedanta Resources Plc 144A 8.25% USD 07/06/2021 1,000,000 505,293 0.01Virgin Media Finance Plc 4.5% EUR 15/01/2025 26,220,000 24,028,532 0.37Virgin Media Secured Finance Plc 144A 5.25% USD 15/01/2026 29,420,000 27,028,596 0.42Virgin Media Secured Finance Plc 5.5% GBP 15/01/2025 20,376,000 24,293,422 0.38Virgin Media Secured Finance Plc 6.25% GBP 28/03/2029 20,820,000 25,314,296 0.39Vougeot Bidco Plc FRN EUR 15/07/2020 13,833,000 13,844,620 0.22Vougeot Bidco Plc 5.321% EUR 15/07/2020 6,000,000 5,977,500 0.09Wagamama Finance Plc 7.875% GBP 01/02/2020 3,320,000 4,433,881 0.07Worldpay Finance Plc 3.75% EUR 15/11/2022 5,470,000 5,449,542 0.08
1,107,045,532 17.28
UNITED STATES3M Co 1.875% EUR 15/11/2021 5,625,000 6,088,920 0.09Apple Inc 2.4% USD 03/05/2023 55,000,000 50,039,293 0.78Apple Inc 3.85% USD 04/05/2043 10,000,000 8,508,133 0.13AT&T Inc 4.35% USD 15/06/2045 1,500,000 1,165,685 0.02AT&T Inc 4.75% USD 15/05/2046 12,270,000 10,295,026 0.16Ball Corp 3.5% EUR 15/12/2020 5,590,000 5,764,743 0.09Ball Corp 4% USD 15/11/2023 3,000,000 2,683,796 0.04Ball Corp 4.375% USD 15/12/2020 15,440,000 14,832,149 0.23Ball Corp 4.375% EUR 15/12/2023 7,680,000 7,888,589 0.12Ball Corp 5.25% USD 01/07/2025 24,550,000 23,428,439 0.37Belden Inc 144A 5.5% USD 01/09/2022 10,500,000 9,405,345 0.15Belden Inc 5.5% EUR 15/04/2023 45,050,000 43,378,645 0.68Celanese US Holdings LLC 3.25% EUR 15/10/2019 6,750,000 6,828,435 0.11Celanese US Holdings LLC 4.625% USD 15/11/2022 4,895,000 4,474,625 0.07CGG SA 6.875% USD 15/01/2022 26,340,000 8,469,634 0.13Chemours Co 6.125% EUR 15/05/2023 8,090,000 5,703,045 0.09Chemours Co 144A 6.625% USD 15/05/2023 17,810,000 11,709,281 0.18Chemours Co 144A 7% USD 15/05/2025 5,500,000 3,461,259 0.05Citigroup Inc FRN USD Perpetual 20,000,000 17,294,810 0.27Constellation Brands Inc 3.875% USD 15/11/2019 3,750,000 3,565,763 0.06Constellation Brands Inc 4.75% USD 01/12/2025 2,000,000 1,920,114 0.03CSX Corp 4.1% USD 15/03/2044 10,000,000 8,480,048 0.13Dresdner Funding Trust I 144A 8.151% USD 30/06/2031 5,000,000 5,179,256 0.08Eco Services Operations LLC/Eco Finance Corp 144A 8.5% USD 01/11/2022 6,670,000 5,453,768 0.09FedEx Corp 4.75% USD 15/11/2045 7,200,000 6,624,561 0.10General Mills Inc 1% EUR 27/04/2023 5,500,000 5,475,262 0.09General Motors Co 4.875% USD 02/10/2023 10,000,000 9,247,423 0.14Halliburton Co 3.8% USD 15/11/2025 3,000,000 2,596,487 0.04Halliburton Co 5% USD 15/11/2045 3,000,000 2,416,248 0.04Iron Mountain Inc 5.75% USD 15/08/2024 15,595,000 14,381,089 0.22Iron Mountain Inc 6% USD 15/08/2023 7,100,000 6,930,557 0.11
Invesco Pan European High Income Fund
Statement of Investments as at 29 February 2016
151 Invesco Funds
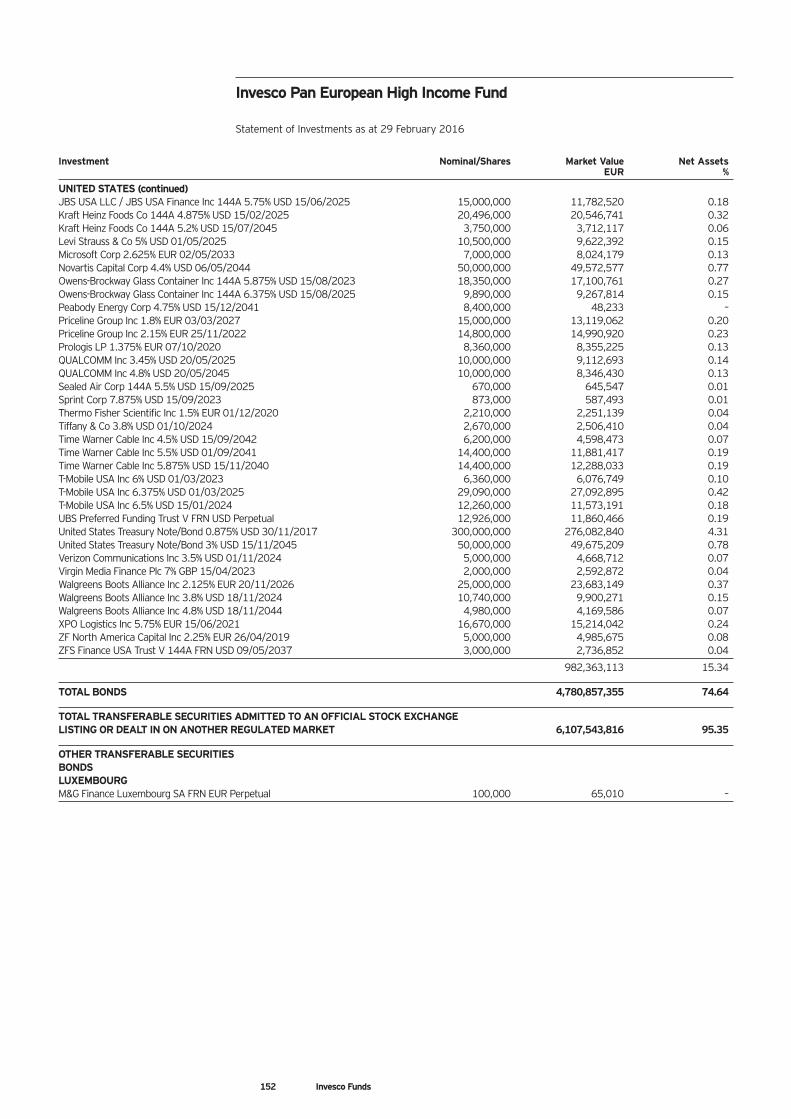
Invesco Pan European High Income Fund
Statement of Investments as at 29 February 2016
Investment Nominal/Shares Market Value Net Assets EUR %
UNITED STATES (continued)JBS USA LLC / JBS USA Finance Inc 144A 5.75% USD 15/06/2025 15,000,000 11,782,520 0.18Kraft Heinz Foods Co 144A 4.875% USD 15/02/2025 20,496,000 20,546,741 0.32Kraft Heinz Foods Co 144A 5.2% USD 15/07/2045 3,750,000 3,712,117 0.06Levi Strauss & Co 5% USD 01/05/2025 10,500,000 9,622,392 0.15Microsoft Corp 2.625% EUR 02/05/2033 7,000,000 8,024,179 0.13Novartis Capital Corp 4.4% USD 06/05/2044 50,000,000 49,572,577 0.77Owens-Brockway Glass Container Inc 144A 5.875% USD 15/08/2023 18,350,000 17,100,761 0.27Owens-Brockway Glass Container Inc 144A 6.375% USD 15/08/2025 9,890,000 9,267,814 0.15Peabody Energy Corp 4.75% USD 15/12/2041 8,400,000 48,233 –Priceline Group Inc 1.8% EUR 03/03/2027 15,000,000 13,119,062 0.20Priceline Group Inc 2.15% EUR 25/11/2022 14,800,000 14,990,920 0.23Prologis LP 1.375% EUR 07/10/2020 8,360,000 8,355,225 0.13QUALCOMM Inc 3.45% USD 20/05/2025 10,000,000 9,112,693 0.14QUALCOMM Inc 4.8% USD 20/05/2045 10,000,000 8,346,430 0.13Sealed Air Corp 144A 5.5% USD 15/09/2025 670,000 645,547 0.01Sprint Corp 7.875% USD 15/09/2023 873,000 587,493 0.01Thermo Fisher Scientific Inc 1.5% EUR 01/12/2020 2,210,000 2,251,139 0.04Tiffany & Co 3.8% USD 01/10/2024 2,670,000 2,506,410 0.04Time Warner Cable Inc 4.5% USD 15/09/2042 6,200,000 4,598,473 0.07Time Warner Cable Inc 5.5% USD 01/09/2041 14,400,000 11,881,417 0.19Time Warner Cable Inc 5.875% USD 15/11/2040 14,400,000 12,288,033 0.19T-Mobile USA Inc 6% USD 01/03/2023 6,360,000 6,076,749 0.10T-Mobile USA Inc 6.375% USD 01/03/2025 29,090,000 27,092,895 0.42T-Mobile USA Inc 6.5% USD 15/01/2024 12,260,000 11,573,191 0.18UBS Preferred Funding Trust V FRN USD Perpetual 12,926,000 11,860,466 0.19United States Treasury Note/Bond 0.875% USD 30/11/2017 300,000,000 276,082,840 4.31United States Treasury Note/Bond 3% USD 15/11/2045 50,000,000 49,675,209 0.78Verizon Communications Inc 3.5% USD 01/11/2024 5,000,000 4,668,712 0.07Virgin Media Finance Plc 7% GBP 15/04/2023 2,000,000 2,592,872 0.04Walgreens Boots Alliance Inc 2.125% EUR 20/11/2026 25,000,000 23,683,149 0.37Walgreens Boots Alliance Inc 3.8% USD 18/11/2024 10,740,000 9,900,271 0.15Walgreens Boots Alliance Inc 4.8% USD 18/11/2044 4,980,000 4,169,586 0.07XPO Logistics Inc 5.75% EUR 15/06/2021 16,670,000 15,214,042 0.24ZF North America Capital Inc 2.25% EUR 26/04/2019 5,000,000 4,985,675 0.08ZFS Finance USA Trust V 144A FRN USD 09/05/2037 3,000,000 2,736,852 0.04
982,363,113 15.34
TOTAL BONDS 4,780,857,355 74.64
TOTAL TRANSFERABLE SECURITIES ADMITTED TO AN OFFICIAL STOCK EXCHANGE LISTING OR DEALT IN ON ANOTHER REGULATED MARKET 6,107,543,816 95.35
OTHER TRANSFERABLE SECURITIESBONDSLUXEMBOURGM&G Finance Luxembourg SA FRN EUR Perpetual 100,000 65,010 –
152 Invesco Funds
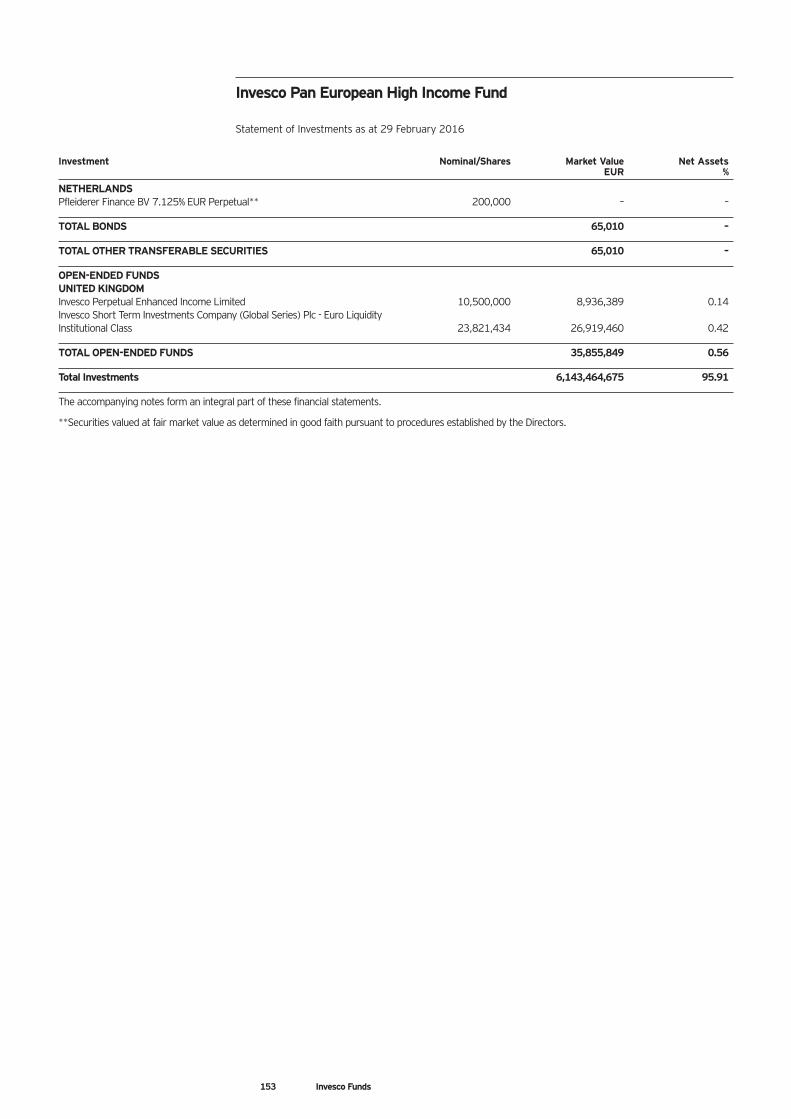
Investment Nominal/Shares Market Value Net Assets EUR %
NETHERLANDSPfleiderer Finance BV 7.125% EUR Perpetual** 200,000 – –
TOTAL BONDS 65,010 –
TOTAL OTHER TRANSFERABLE SECURITIES 65,010 –
OPEN-ENDED FUNDSUNITED KINGDOMInvesco Perpetual Enhanced Income Limited 10,500,000 8,936,389 0.14Invesco Short Term Investments Company (Global Series) Plc - Euro Liquidity Institutional Class 23,821,434 26,919,460 0.42
TOTAL OPEN-ENDED FUNDS 35,855,849 0.56
Total Investments 6,143,464,675 95.91
The accompanying notes form an integral part of these financial statements.
**Securities valued at fair market value as determined in good faith pursuant to procedures established by the Directors.
Invesco Pan European High Income Fund
Statement of Investments as at 29 February 2016
153 Invesco Funds

Investment Nominal/Shares Market Value Net Assets EUR %
OPEN-ENDED FUNDSIRELANDInvesco Short Term Investments Company (Global Series) Plc - Euro Liquidity Institutional Class 7,868,071 8,891,330 7.41
TOTAL OPEN-ENDED FUNDS 8,891,330 7.41
Total Investments 8,891,330 7.41
The accompanying notes form an integral part of these financial statements.
Invesco Global Absolute Return Fund
Statement of Investments as at 29 February 2016
154 Invesco Funds
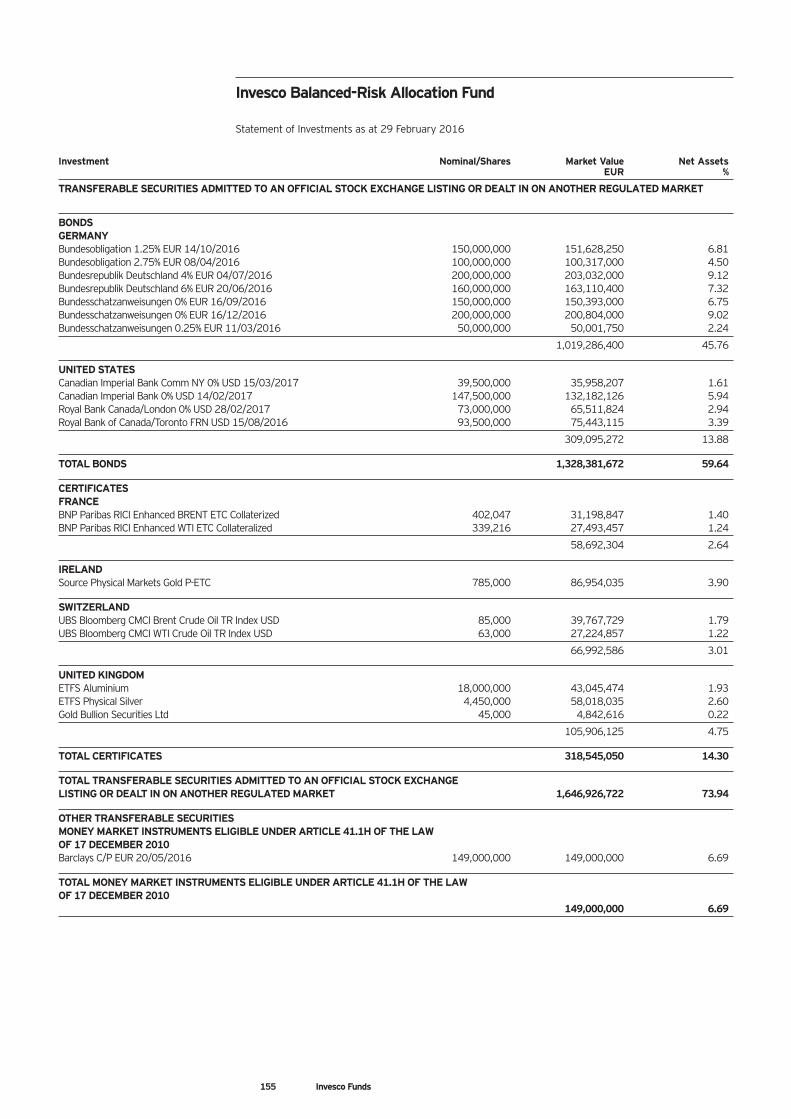
155 Invesco Funds
Investment Nominal/Shares Market Value Net Assets EUR %
TRANSFERABLE SECURITIES ADMITTED TO AN OFFICIAL STOCK EXCHANGE LISTING OR DEALT IN ON ANOTHER REGULATED MARKET
BONDSGERMANYBundesobligation 1.25% EUR 14/10/2016 150,000,000 151,628,250 6.81Bundesobligation 2.75% EUR 08/04/2016 100,000,000 100,317,000 4.50Bundesrepublik Deutschland 4% EUR 04/07/2016 200,000,000 203,032,000 9.12Bundesrepublik Deutschland 6% EUR 20/06/2016 160,000,000 163,110,400 7.32Bundesschatzanweisungen 0% EUR 16/09/2016 150,000,000 150,393,000 6.75Bundesschatzanweisungen 0% EUR 16/12/2016 200,000,000 200,804,000 9.02Bundesschatzanweisungen 0.25% EUR 11/03/2016 50,000,000 50,001,750 2.24
1,019,286,400 45.76
UNITED STATESCanadian Imperial Bank Comm NY 0% USD 15/03/2017 39,500,000 35,958,207 1.61Canadian Imperial Bank 0% USD 14/02/2017 147,500,000 132,182,126 5.94Royal Bank Canada/London 0% USD 28/02/2017 73,000,000 65,511,824 2.94Royal Bank of Canada/Toronto FRN USD 15/08/2016 93,500,000 75,443,115 3.39
309,095,272 13.88
TOTAL BONDS 1,328,381,672 59.64
CERTIFICATESFRANCEBNP Paribas RICI Enhanced BRENT ETC Collaterized 402,047 31,198,847 1.40BNP Paribas RICI Enhanced WTI ETC Collateralized 339,216 27,493,457 1.24
58,692,304 2.64
IRELANDSource Physical Markets Gold P-ETC 785,000 86,954,035 3.90
SWITZERLANDUBS Bloomberg CMCI Brent Crude Oil TR Index USD 85,000 39,767,729 1.79UBS Bloomberg CMCI WTI Crude Oil TR Index USD 63,000 27,224,857 1.22
66,992,586 3.01
UNITED KINGDOMETFS Aluminium 18,000,000 43,045,474 1.93ETFS Physical Silver 4,450,000 58,018,035 2.60Gold Bullion Securities Ltd 45,000 4,842,616 0.22
105,906,125 4.75
TOTAL CERTIFICATES 318,545,050 14.30
TOTAL TRANSFERABLE SECURITIES ADMITTED TO AN OFFICIAL STOCK EXCHANGE LISTING OR DEALT IN ON ANOTHER REGULATED MARKET 1,646,926,722 73.94
OTHER TRANSFERABLE SECURITIESMONEY MARKET INSTRUMENTS ELIGIBLE UNDER ARTICLE 41.1H OF THE LAW OF 17 DECEMBER 2010Barclays C/P EUR 20/05/2016 149,000,000 149,000,000 6.69
TOTAL MONEY MARKET INSTRUMENTS ELIGIBLE UNDER ARTICLE 41.1H OF THE LAW OF 17 DECEMBER 2010
149,000,000 6.69
Invesco Balanced-Risk Allocation Fund
Statement of Investments as at 29 February 2016
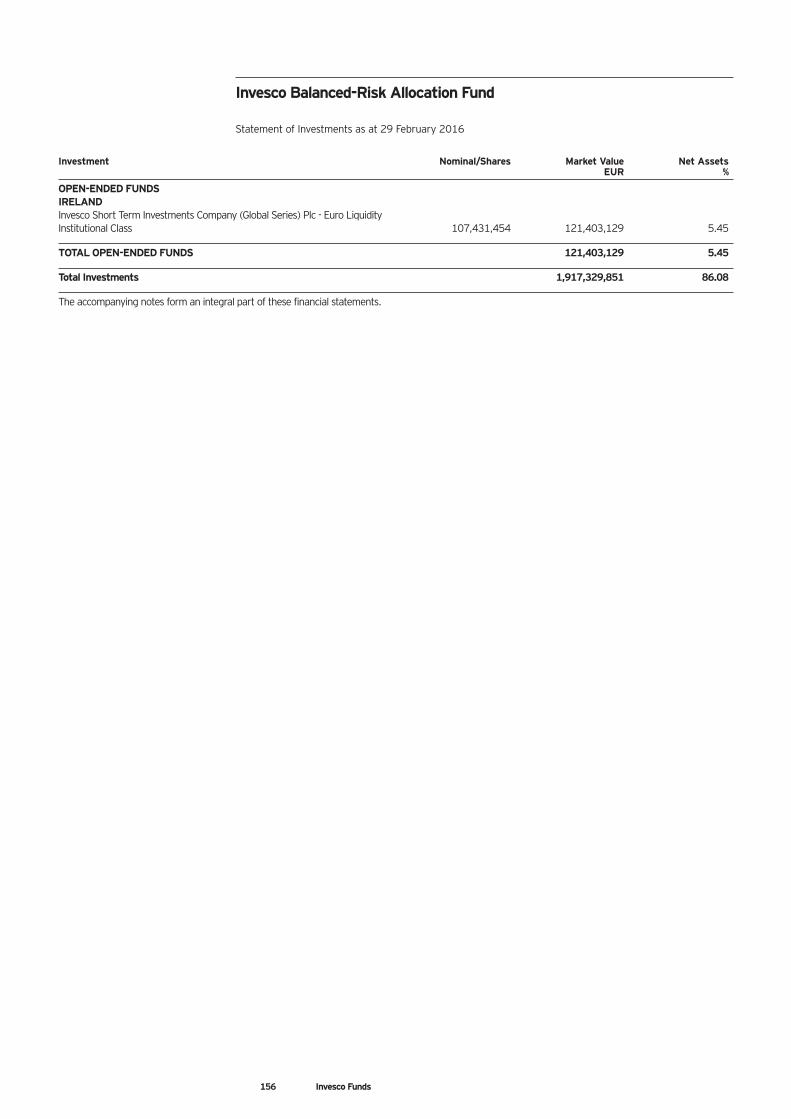
156 Invesco Funds
Investment Nominal/Shares Market Value Net Assets EUR %
OPEN-ENDED FUNDSIRELANDInvesco Short Term Investments Company (Global Series) Plc - Euro Liquidity Institutional Class 107,431,454 121,403,129 5.45
TOTAL OPEN-ENDED FUNDS 121,403,129 5.45
Total Investments 1,917,329,851 86.08
The accompanying notes form an integral part of these financial statements.
Invesco Balanced-Risk Allocation Fund
Statement of Investments as at 29 February 2016
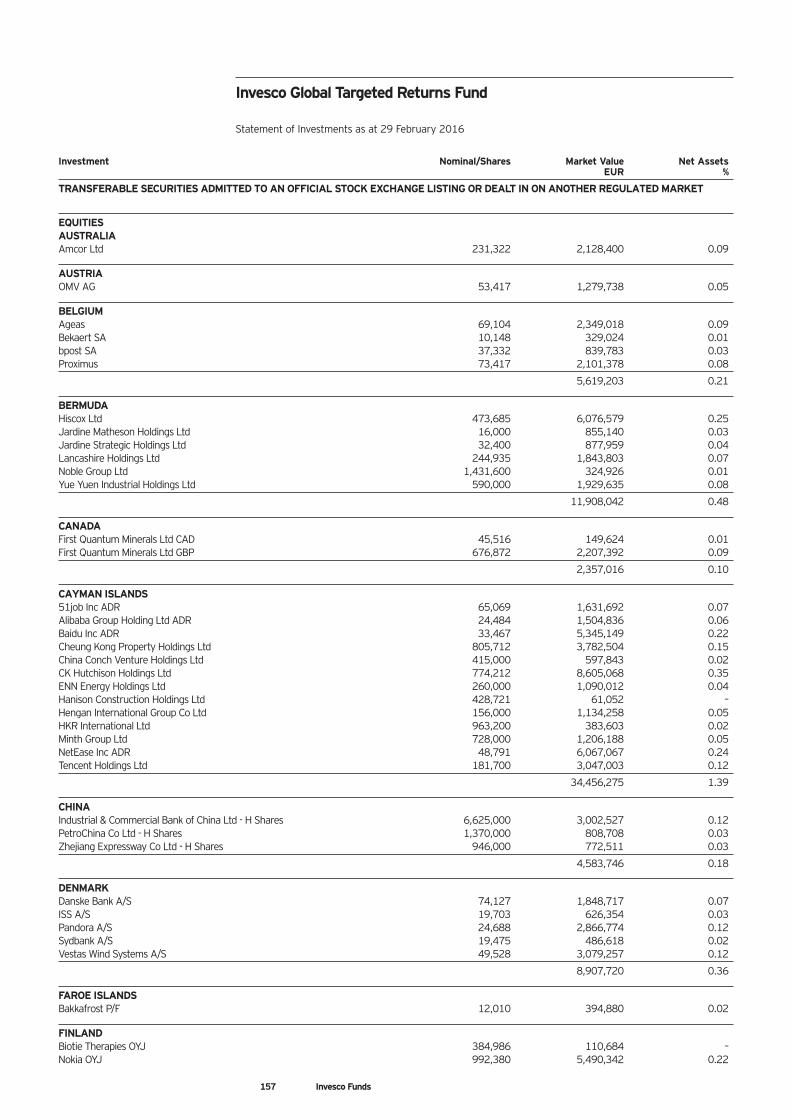
157 Invesco Funds
Investment Nominal/Shares Market Value Net Assets EUR %
TRANSFERABLE SECURITIES ADMITTED TO AN OFFICIAL STOCK EXCHANGE LISTING OR DEALT IN ON ANOTHER REGULATED MARKET
EQUITIESAUSTRALIAAmcor Ltd 231,322 2,128,400 0.09
AUSTRIAOMV AG 53,417 1,279,738 0.05
BELGIUMAgeas 69,104 2,349,018 0.09Bekaert SA 10,148 329,024 0.01bpost SA 37,332 839,783 0.03Proximus 73,417 2,101,378 0.08
5,619,203 0.21
BERMUDAHiscox Ltd 473,685 6,076,579 0.25Jardine Matheson Holdings Ltd 16,000 855,140 0.03Jardine Strategic Holdings Ltd 32,400 877,959 0.04Lancashire Holdings Ltd 244,935 1,843,803 0.07Noble Group Ltd 1,431,600 324,926 0.01Yue Yuen Industrial Holdings Ltd 590,000 1,929,635 0.08
11,908,042 0.48
CANADAFirst Quantum Minerals Ltd CAD 45,516 149,624 0.01First Quantum Minerals Ltd GBP 676,872 2,207,392 0.09
2,357,016 0.10
CAYMAN ISLANDS51job Inc ADR 65,069 1,631,692 0.07Alibaba Group Holding Ltd ADR 24,484 1,504,836 0.06Baidu Inc ADR 33,467 5,345,149 0.22Cheung Kong Property Holdings Ltd 805,712 3,782,504 0.15China Conch Venture Holdings Ltd 415,000 597,843 0.02CK Hutchison Holdings Ltd 774,212 8,605,068 0.35ENN Energy Holdings Ltd 260,000 1,090,012 0.04Hanison Construction Holdings Ltd 428,721 61,052 –Hengan International Group Co Ltd 156,000 1,134,258 0.05HKR International Ltd 963,200 383,603 0.02Minth Group Ltd 728,000 1,206,188 0.05NetEase Inc ADR 48,791 6,067,067 0.24Tencent Holdings Ltd 181,700 3,047,003 0.12
34,456,275 1.39
CHINAIndustrial & Commercial Bank of China Ltd - H Shares 6,625,000 3,002,527 0.12PetroChina Co Ltd - H Shares 1,370,000 808,708 0.03Zhejiang Expressway Co Ltd - H Shares 946,000 772,511 0.03
4,583,746 0.18
DENMARKDanske Bank A/S 74,127 1,848,717 0.07ISS A/S 19,703 626,354 0.03Pandora A/S 24,688 2,866,774 0.12Sydbank A/S 19,475 486,618 0.02Vestas Wind Systems A/S 49,528 3,079,257 0.12
8,907,720 0.36
FAROE ISLANDSBakkafrost P/F 12,010 394,880 0.02
FINLANDBiotie Therapies OYJ 384,986 110,684 –Nokia OYJ 992,380 5,490,342 0.22
Invesco Global Targeted Returns Fund
Statement of Investments as at 29 February 2016
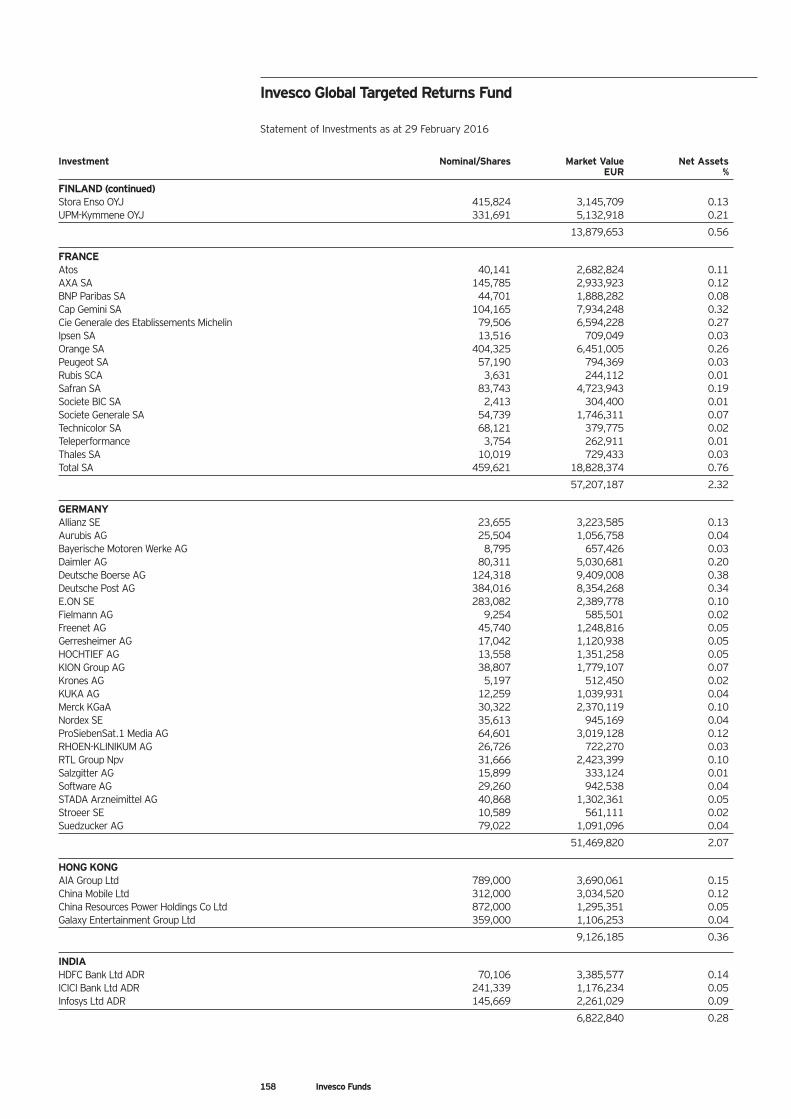
Investment Nominal/Shares Market Value Net Assets EUR %
FINLAND (continued)Stora Enso OYJ 415,824 3,145,709 0.13UPM-Kymmene OYJ 331,691 5,132,918 0.21
13,879,653 0.56
FRANCEAtos 40,141 2,682,824 0.11AXA SA 145,785 2,933,923 0.12BNP Paribas SA 44,701 1,888,282 0.08Cap Gemini SA 104,165 7,934,248 0.32Cie Generale des Etablissements Michelin 79,506 6,594,228 0.27Ipsen SA 13,516 709,049 0.03Orange SA 404,325 6,451,005 0.26Peugeot SA 57,190 794,369 0.03Rubis SCA 3,631 244,112 0.01Safran SA 83,743 4,723,943 0.19Societe BIC SA 2,413 304,400 0.01Societe Generale SA 54,739 1,746,311 0.07Technicolor SA 68,121 379,775 0.02Teleperformance 3,754 262,911 0.01Thales SA 10,019 729,433 0.03Total SA 459,621 18,828,374 0.76
57,207,187 2.32
GERMANYAllianz SE 23,655 3,223,585 0.13Aurubis AG 25,504 1,056,758 0.04Bayerische Motoren Werke AG 8,795 657,426 0.03Daimler AG 80,311 5,030,681 0.20Deutsche Boerse AG 124,318 9,409,008 0.38Deutsche Post AG 384,016 8,354,268 0.34E.ON SE 283,082 2,389,778 0.10Fielmann AG 9,254 585,501 0.02Freenet AG 45,740 1,248,816 0.05Gerresheimer AG 17,042 1,120,938 0.05HOCHTIEF AG 13,558 1,351,258 0.05KION Group AG 38,807 1,779,107 0.07Krones AG 5,197 512,450 0.02KUKA AG 12,259 1,039,931 0.04Merck KGaA 30,322 2,370,119 0.10Nordex SE 35,613 945,169 0.04ProSiebenSat.1 Media AG 64,601 3,019,128 0.12RHOEN-KLINIKUM AG 26,726 722,270 0.03RTL Group Npv 31,666 2,423,399 0.10Salzgitter AG 15,899 333,124 0.01Software AG 29,260 942,538 0.04STADA Arzneimittel AG 40,868 1,302,361 0.05Stroeer SE 10,589 561,111 0.02Suedzucker AG 79,022 1,091,096 0.04
51,469,820 2.07
HONG KONGAIA Group Ltd 789,000 3,690,061 0.15China Mobile Ltd 312,000 3,034,520 0.12China Resources Power Holdings Co Ltd 872,000 1,295,351 0.05Galaxy Entertainment Group Ltd 359,000 1,106,253 0.04
9,126,185 0.36
INDIAHDFC Bank Ltd ADR 70,106 3,385,577 0.14ICICI Bank Ltd ADR 241,339 1,176,234 0.05Infosys Ltd ADR 145,669 2,261,029 0.09
6,822,840 0.28
Invesco Global Targeted Returns Fund
Statement of Investments as at 29 February 2016
158 Invesco Funds
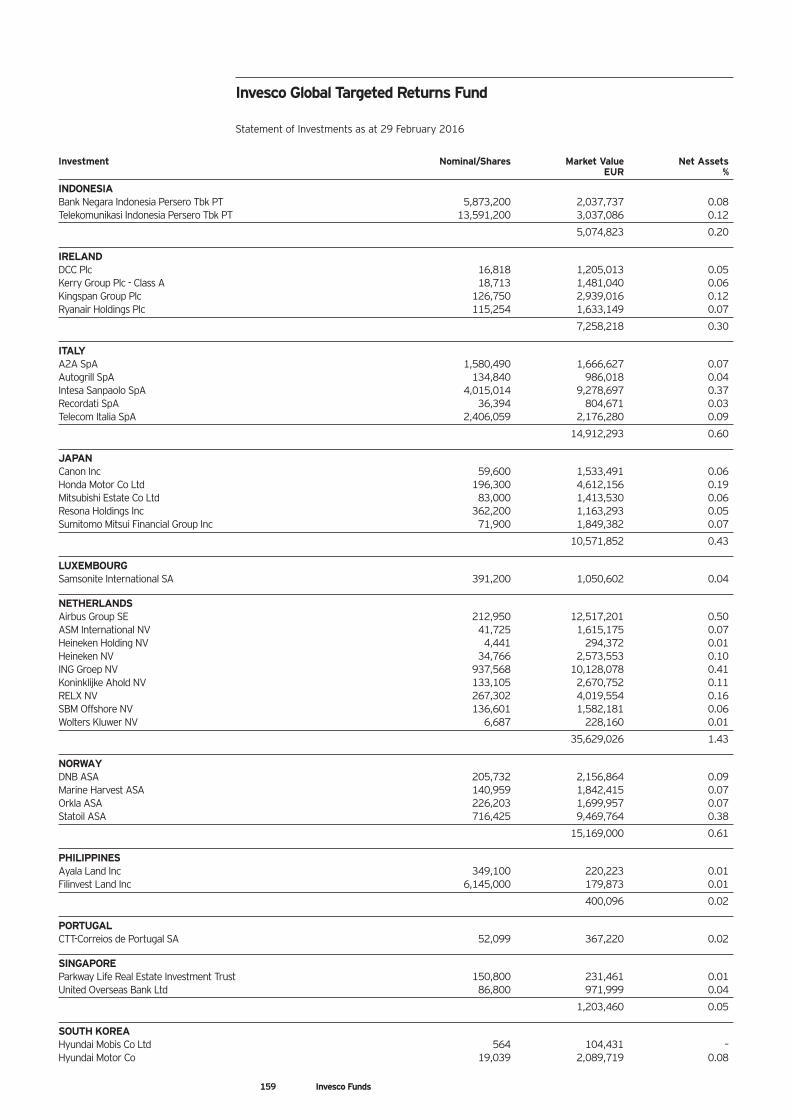
Invesco Global Targeted Returns Fund
Statement of Investments as at 29 February 2016
Investment Nominal/Shares Market Value Net Assets EUR %
INDONESIABank Negara Indonesia Persero Tbk PT 5,873,200 2,037,737 0.08Telekomunikasi Indonesia Persero Tbk PT 13,591,200 3,037,086 0.12
5,074,823 0.20
IRELANDDCC Plc 16,818 1,205,013 0.05Kerry Group Plc - Class A 18,713 1,481,040 0.06Kingspan Group Plc 126,750 2,939,016 0.12Ryanair Holdings Plc 115,254 1,633,149 0.07
7,258,218 0.30
ITALYA2A SpA 1,580,490 1,666,627 0.07Autogrill SpA 134,840 986,018 0.04Intesa Sanpaolo SpA 4,015,014 9,278,697 0.37Recordati SpA 36,394 804,671 0.03Telecom Italia SpA 2,406,059 2,176,280 0.09
14,912,293 0.60
JAPANCanon Inc 59,600 1,533,491 0.06Honda Motor Co Ltd 196,300 4,612,156 0.19Mitsubishi Estate Co Ltd 83,000 1,413,530 0.06Resona Holdings Inc 362,200 1,163,293 0.05Sumitomo Mitsui Financial Group Inc 71,900 1,849,382 0.07
10,571,852 0.43
LUXEMBOURGSamsonite International SA 391,200 1,050,602 0.04
NETHERLANDSAirbus Group SE 212,950 12,517,201 0.50ASM International NV 41,725 1,615,175 0.07Heineken Holding NV 4,441 294,372 0.01Heineken NV 34,766 2,573,553 0.10ING Groep NV 937,568 10,128,078 0.41Koninklijke Ahold NV 133,105 2,670,752 0.11RELX NV 267,302 4,019,554 0.16SBM Offshore NV 136,601 1,582,181 0.06Wolters Kluwer NV 6,687 228,160 0.01
35,629,026 1.43
NORWAYDNB ASA 205,732 2,156,864 0.09Marine Harvest ASA 140,959 1,842,415 0.07Orkla ASA 226,203 1,699,957 0.07Statoil ASA 716,425 9,469,764 0.38
15,169,000 0.61
PHILIPPINESAyala Land Inc 349,100 220,223 0.01Filinvest Land Inc 6,145,000 179,873 0.01
400,096 0.02
PORTUGALCTT-Correios de Portugal SA 52,099 367,220 0.02
SINGAPOREParkway Life Real Estate Investment Trust 150,800 231,461 0.01United Overseas Bank Ltd 86,800 971,999 0.04
1,203,460 0.05
SOUTH KOREAHyundai Mobis Co Ltd 564 104,431 –Hyundai Motor Co 19,039 2,089,719 0.08
159 Invesco Funds
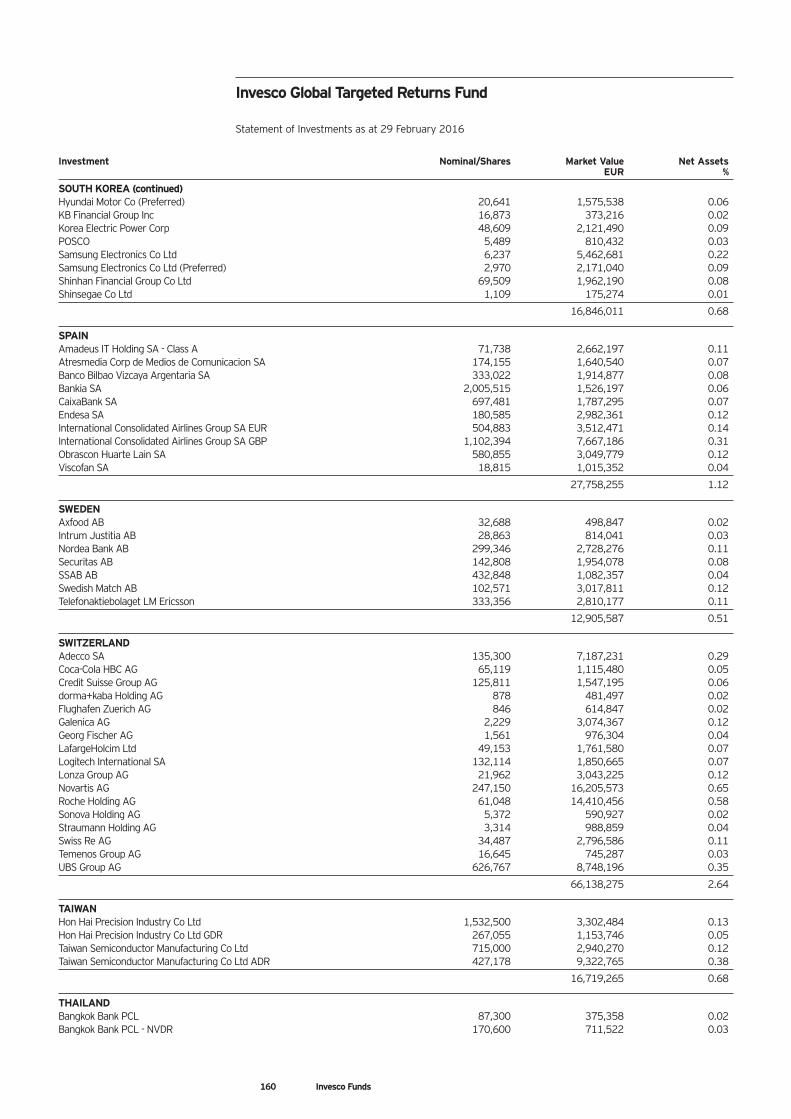
Invesco Global Targeted Returns Fund
Statement of Investments as at 29 February 2016
Investment Nominal/Shares Market Value Net Assets EUR %
SOUTH KOREA (continued)Hyundai Motor Co (Preferred) 20,641 1,575,538 0.06KB Financial Group Inc 16,873 373,216 0.02Korea Electric Power Corp 48,609 2,121,490 0.09POSCO 5,489 810,432 0.03Samsung Electronics Co Ltd 6,237 5,462,681 0.22Samsung Electronics Co Ltd (Preferred) 2,970 2,171,040 0.09Shinhan Financial Group Co Ltd 69,509 1,962,190 0.08Shinsegae Co Ltd 1,109 175,274 0.01
16,846,011 0.68
SPAINAmadeus IT Holding SA - Class A 71,738 2,662,197 0.11Atresmedia Corp de Medios de Comunicacion SA 174,155 1,640,540 0.07Banco Bilbao Vizcaya Argentaria SA 333,022 1,914,877 0.08Bankia SA 2,005,515 1,526,197 0.06CaixaBank SA 697,481 1,787,295 0.07Endesa SA 180,585 2,982,361 0.12International Consolidated Airlines Group SA EUR 504,883 3,512,471 0.14International Consolidated Airlines Group SA GBP 1,102,394 7,667,186 0.31Obrascon Huarte Lain SA 580,855 3,049,779 0.12Viscofan SA 18,815 1,015,352 0.04
27,758,255 1.12
SWEDENAxfood AB 32,688 498,847 0.02Intrum Justitia AB 28,863 814,041 0.03Nordea Bank AB 299,346 2,728,276 0.11Securitas AB 142,808 1,954,078 0.08SSAB AB 432,848 1,082,357 0.04Swedish Match AB 102,571 3,017,811 0.12Telefonaktiebolaget LM Ericsson 333,356 2,810,177 0.11
12,905,587 0.51
SWITZERLANDAdecco SA 135,300 7,187,231 0.29Coca-Cola HBC AG 65,119 1,115,480 0.05Credit Suisse Group AG 125,811 1,547,195 0.06dorma+kaba Holding AG 878 481,497 0.02Flughafen Zuerich AG 846 614,847 0.02Galenica AG 2,229 3,074,367 0.12Georg Fischer AG 1,561 976,304 0.04LafargeHolcim Ltd 49,153 1,761,580 0.07Logitech International SA 132,114 1,850,665 0.07Lonza Group AG 21,962 3,043,225 0.12Novartis AG 247,150 16,205,573 0.65Roche Holding AG 61,048 14,410,456 0.58Sonova Holding AG 5,372 590,927 0.02Straumann Holding AG 3,314 988,859 0.04Swiss Re AG 34,487 2,796,586 0.11Temenos Group AG 16,645 745,287 0.03UBS Group AG 626,767 8,748,196 0.35
66,138,275 2.64
TAIWANHon Hai Precision Industry Co Ltd 1,532,500 3,302,484 0.13Hon Hai Precision Industry Co Ltd GDR 267,055 1,153,746 0.05Taiwan Semiconductor Manufacturing Co Ltd 715,000 2,940,270 0.12Taiwan Semiconductor Manufacturing Co Ltd ADR 427,178 9,322,765 0.38
16,719,265 0.68
THAILANDBangkok Bank PCL 87,300 375,358 0.02Bangkok Bank PCL - NVDR 170,600 711,522 0.03
160 Invesco Funds
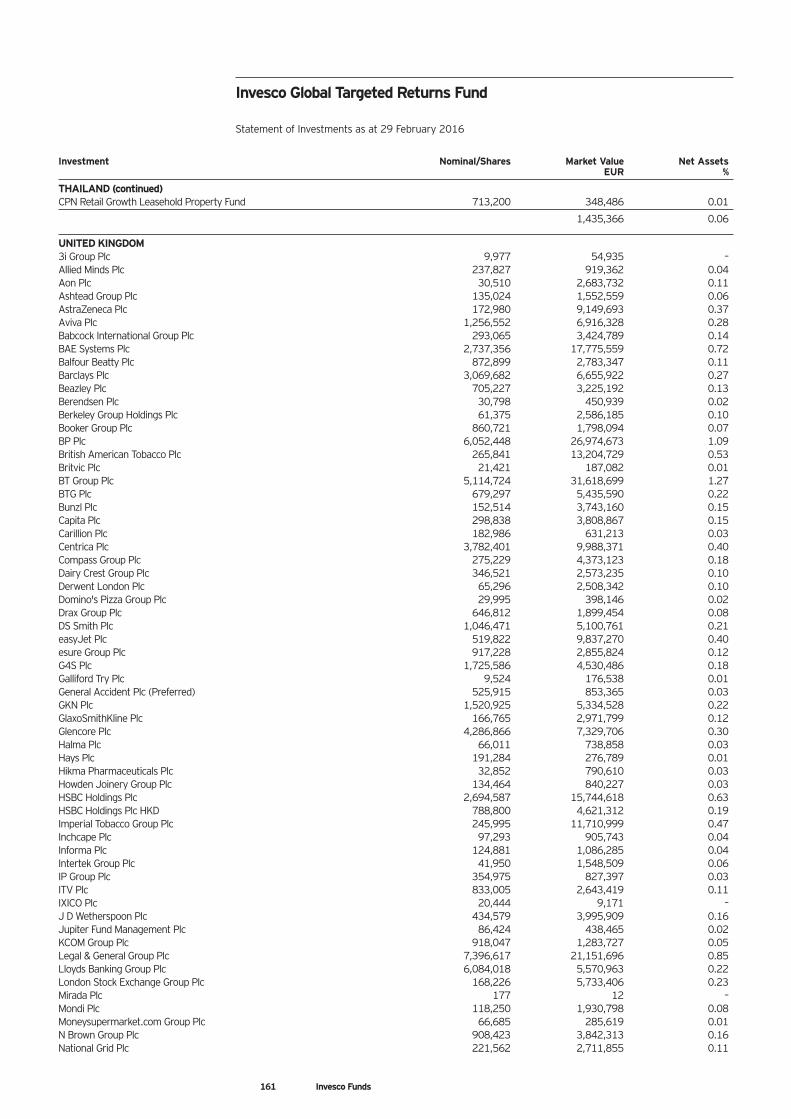
161 Invesco Funds
Investment Nominal/Shares Market Value Net Assets EUR %
THAILAND (continued)CPN Retail Growth Leasehold Property Fund 713,200 348,486 0.01
1,435,366 0.06
UNITED KINGDOM3i Group Plc 9,977 54,935 –Allied Minds Plc 237,827 919,362 0.04Aon Plc 30,510 2,683,732 0.11Ashtead Group Plc 135,024 1,552,559 0.06AstraZeneca Plc 172,980 9,149,693 0.37Aviva Plc 1,256,552 6,916,328 0.28Babcock International Group Plc 293,065 3,424,789 0.14BAE Systems Plc 2,737,356 17,775,559 0.72Balfour Beatty Plc 872,899 2,783,347 0.11Barclays Plc 3,069,682 6,655,922 0.27Beazley Plc 705,227 3,225,192 0.13Berendsen Plc 30,798 450,939 0.02Berkeley Group Holdings Plc 61,375 2,586,185 0.10Booker Group Plc 860,721 1,798,094 0.07BP Plc 6,052,448 26,974,673 1.09British American Tobacco Plc 265,841 13,204,729 0.53Britvic Plc 21,421 187,082 0.01BT Group Plc 5,114,724 31,618,699 1.27BTG Plc 679,297 5,435,590 0.22Bunzl Plc 152,514 3,743,160 0.15Capita Plc 298,838 3,808,867 0.15Carillion Plc 182,986 631,213 0.03Centrica Plc 3,782,401 9,988,371 0.40Compass Group Plc 275,229 4,373,123 0.18Dairy Crest Group Plc 346,521 2,573,235 0.10Derwent London Plc 65,296 2,508,342 0.10Domino's Pizza Group Plc 29,995 398,146 0.02Drax Group Plc 646,812 1,899,454 0.08DS Smith Plc 1,046,471 5,100,761 0.21easyJet Plc 519,822 9,837,270 0.40esure Group Plc 917,228 2,855,824 0.12G4S Plc 1,725,586 4,530,486 0.18Galliford Try Plc 9,524 176,538 0.01General Accident Plc (Preferred) 525,915 853,365 0.03GKN Plc 1,520,925 5,334,528 0.22GlaxoSmithKline Plc 166,765 2,971,799 0.12Glencore Plc 4,286,866 7,329,706 0.30Halma Plc 66,011 738,858 0.03Hays Plc 191,284 276,789 0.01Hikma Pharmaceuticals Plc 32,852 790,610 0.03Howden Joinery Group Plc 134,464 840,227 0.03HSBC Holdings Plc 2,694,587 15,744,618 0.63HSBC Holdings Plc HKD 788,800 4,621,312 0.19Imperial Tobacco Group Plc 245,995 11,710,999 0.47Inchcape Plc 97,293 905,743 0.04Informa Plc 124,881 1,086,285 0.04Intertek Group Plc 41,950 1,548,509 0.06IP Group Plc 354,975 827,397 0.03ITV Plc 833,005 2,643,419 0.11IXICO Plc 20,444 9,171 –J D Wetherspoon Plc 434,579 3,995,909 0.16Jupiter Fund Management Plc 86,424 438,465 0.02KCOM Group Plc 918,047 1,283,727 0.05Legal & General Group Plc 7,396,617 21,151,696 0.85Lloyds Banking Group Plc 6,084,018 5,570,963 0.22London Stock Exchange Group Plc 168,226 5,733,406 0.23Mirada Plc 177 12 –Mondi Plc 118,250 1,930,798 0.08Moneysupermarket.com Group Plc 66,685 285,619 0.01N Brown Group Plc 908,423 3,842,313 0.16National Grid Plc 221,562 2,711,855 0.11
Invesco Global Targeted Returns Fund
Statement of Investments as at 29 February 2016
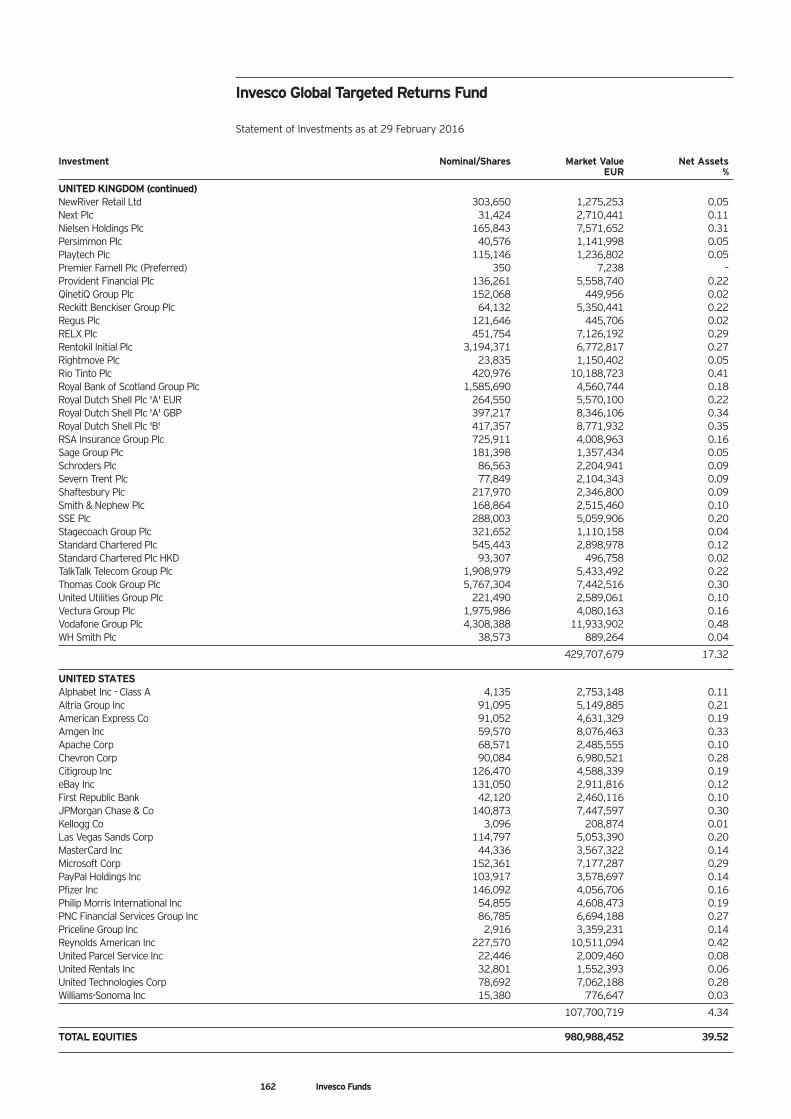
162 Invesco Funds
Invesco Global Targeted Returns Fund
Statement of Investments as at 29 February 2016
Investment Nominal/Shares Market Value Net Assets EUR %
UNITED KINGDOM (continued)NewRiver Retail Ltd 303,650 1,275,253 0.05Next Plc 31,424 2,710,441 0.11Nielsen Holdings Plc 165,843 7,571,652 0.31Persimmon Plc 40,576 1,141,998 0.05Playtech Plc 115,146 1,236,802 0.05Premier Farnell Plc (Preferred) 350 7,238 –Provident Financial Plc 136,261 5,558,740 0.22QinetiQ Group Plc 152,068 449,956 0.02Reckitt Benckiser Group Plc 64,132 5,350,441 0.22Regus Plc 121,646 445,706 0.02RELX Plc 451,754 7,126,192 0.29Rentokil Initial Plc 3,194,371 6,772,817 0.27Rightmove Plc 23,835 1,150,402 0.05Rio Tinto Plc 420,976 10,188,723 0.41Royal Bank of Scotland Group Plc 1,585,690 4,560,744 0.18Royal Dutch Shell Plc 'A' EUR 264,550 5,570,100 0.22Royal Dutch Shell Plc 'A' GBP 397,217 8,346,106 0.34Royal Dutch Shell Plc 'B' 417,357 8,771,932 0.35RSA Insurance Group Plc 725,911 4,008,963 0.16Sage Group Plc 181,398 1,357,434 0.05Schroders Plc 86,563 2,204,941 0.09Severn Trent Plc 77,849 2,104,343 0.09Shaftesbury Plc 217,970 2,346,800 0.09Smith & Nephew Plc 168,864 2,515,460 0.10SSE Plc 288,003 5,059,906 0.20Stagecoach Group Plc 321,652 1,110,158 0.04Standard Chartered Plc 545,443 2,898,978 0.12Standard Chartered Plc HKD 93,307 496,758 0.02TalkTalk Telecom Group Plc 1,908,979 5,433,492 0.22Thomas Cook Group Plc 5,767,304 7,442,516 0.30United Utilities Group Plc 221,490 2,589,061 0.10Vectura Group Plc 1,975,986 4,080,163 0.16Vodafone Group Plc 4,308,388 11,933,902 0.48WH Smith Plc 38,573 889,264 0.04
429,707,679 17.32
UNITED STATESAlphabet Inc - Class A 4,135 2,753,148 0.11Altria Group Inc 91,095 5,149,885 0.21American Express Co 91,052 4,631,329 0.19Amgen Inc 59,570 8,076,463 0.33Apache Corp 68,571 2,485,555 0.10Chevron Corp 90,084 6,980,521 0.28Citigroup Inc 126,470 4,588,339 0.19eBay Inc 131,050 2,911,816 0.12First Republic Bank 42,120 2,460,116 0.10JPMorgan Chase & Co 140,873 7,447,597 0.30Kellogg Co 3,096 208,874 0.01Las Vegas Sands Corp 114,797 5,053,390 0.20MasterCard Inc 44,336 3,567,322 0.14Microsoft Corp 152,361 7,177,287 0.29PayPal Holdings Inc 103,917 3,578,697 0.14Pfizer Inc 146,092 4,056,706 0.16Philip Morris International Inc 54,855 4,608,473 0.19PNC Financial Services Group Inc 86,785 6,694,188 0.27Priceline Group Inc 2,916 3,359,231 0.14Reynolds American Inc 227,570 10,511,094 0.42United Parcel Service Inc 22,446 2,009,460 0.08United Rentals Inc 32,801 1,552,393 0.06United Technologies Corp 78,692 7,062,188 0.28Williams-Sonoma Inc 15,380 776,647 0.03
107,700,719 4.34
TOTAL EQUITIES 980,988,452 39.52
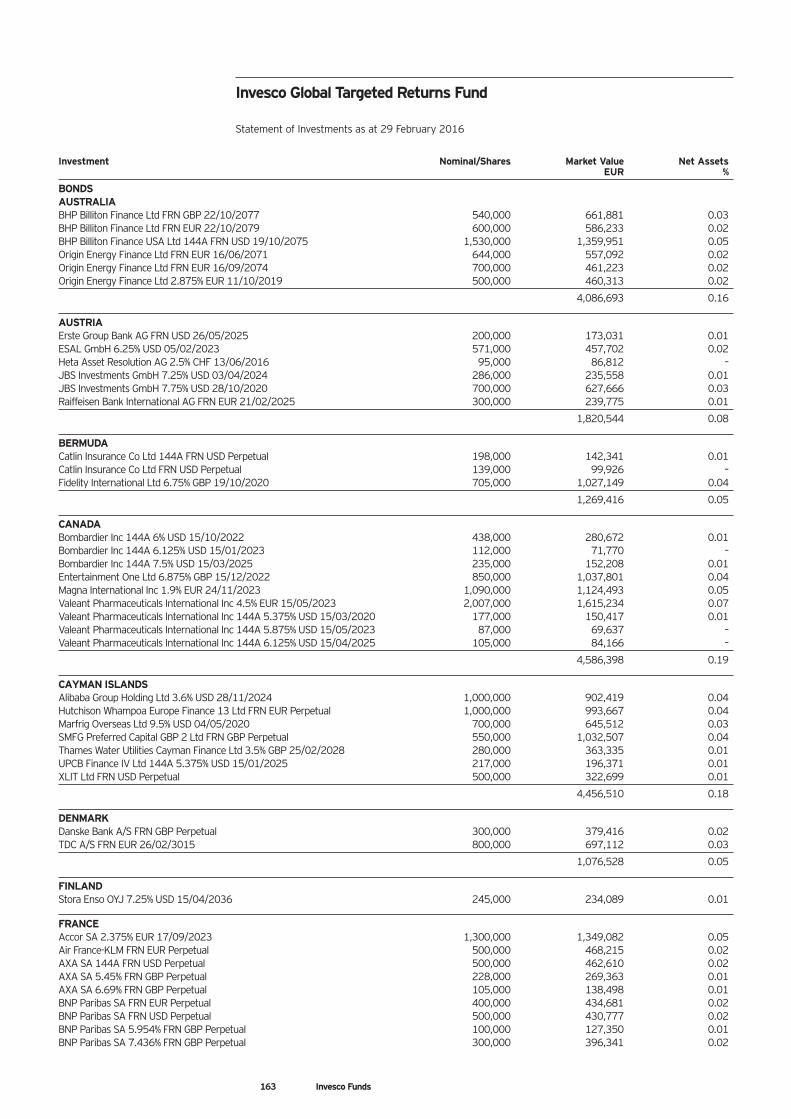
163 Invesco Funds
Investment Nominal/Shares Market Value Net Assets EUR %
BONDSAUSTRALIABHP Billiton Finance Ltd FRN GBP 22/10/2077 540,000 661,881 0.03BHP Billiton Finance Ltd FRN EUR 22/10/2079 600,000 586,233 0.02BHP Billiton Finance USA Ltd 144A FRN USD 19/10/2075 1,530,000 1,359,951 0.05Origin Energy Finance Ltd FRN EUR 16/06/2071 644,000 557,092 0.02Origin Energy Finance Ltd FRN EUR 16/09/2074 700,000 461,223 0.02Origin Energy Finance Ltd 2.875% EUR 11/10/2019 500,000 460,313 0.02
4,086,693 0.16
AUSTRIAErste Group Bank AG FRN USD 26/05/2025 200,000 173,031 0.01ESAL GmbH 6.25% USD 05/02/2023 571,000 457,702 0.02Heta Asset Resolution AG 2.5% CHF 13/06/2016 95,000 86,812 –JBS Investments GmbH 7.25% USD 03/04/2024 286,000 235,558 0.01JBS Investments GmbH 7.75% USD 28/10/2020 700,000 627,666 0.03Raiffeisen Bank International AG FRN EUR 21/02/2025 300,000 239,775 0.01
1,820,544 0.08
BERMUDACatlin Insurance Co Ltd 144A FRN USD Perpetual 198,000 142,341 0.01Catlin Insurance Co Ltd FRN USD Perpetual 139,000 99,926 –Fidelity International Ltd 6.75% GBP 19/10/2020 705,000 1,027,149 0.04
1,269,416 0.05
CANADABombardier Inc 144A 6% USD 15/10/2022 438,000 280,672 0.01Bombardier Inc 144A 6.125% USD 15/01/2023 112,000 71,770 –Bombardier Inc 144A 7.5% USD 15/03/2025 235,000 152,208 0.01Entertainment One Ltd 6.875% GBP 15/12/2022 850,000 1,037,801 0.04Magna International Inc 1.9% EUR 24/11/2023 1,090,000 1,124,493 0.05Valeant Pharmaceuticals International Inc 4.5% EUR 15/05/2023 2,007,000 1,615,234 0.07Valeant Pharmaceuticals International Inc 144A 5.375% USD 15/03/2020 177,000 150,417 0.01Valeant Pharmaceuticals International Inc 144A 5.875% USD 15/05/2023 87,000 69,637 –Valeant Pharmaceuticals International Inc 144A 6.125% USD 15/04/2025 105,000 84,166 –
4,586,398 0.19
CAYMAN ISLANDSAlibaba Group Holding Ltd 3.6% USD 28/11/2024 1,000,000 902,419 0.04Hutchison Whampoa Europe Finance 13 Ltd FRN EUR Perpetual 1,000,000 993,667 0.04Marfrig Overseas Ltd 9.5% USD 04/05/2020 700,000 645,512 0.03SMFG Preferred Capital GBP 2 Ltd FRN GBP Perpetual 550,000 1,032,507 0.04Thames Water Utilities Cayman Finance Ltd 3.5% GBP 25/02/2028 280,000 363,335 0.01UPCB Finance IV Ltd 144A 5.375% USD 15/01/2025 217,000 196,371 0.01XLIT Ltd FRN USD Perpetual 500,000 322,699 0.01
4,456,510 0.18
DENMARKDanske Bank A/S FRN GBP Perpetual 300,000 379,416 0.02TDC A/S FRN EUR 26/02/3015 800,000 697,112 0.03
1,076,528 0.05
FINLANDStora Enso OYJ 7.25% USD 15/04/2036 245,000 234,089 0.01
FRANCEAccor SA 2.375% EUR 17/09/2023 1,300,000 1,349,082 0.05Air France-KLM FRN EUR Perpetual 500,000 468,215 0.02AXA SA 144A FRN USD Perpetual 500,000 462,610 0.02AXA SA 5.45% FRN GBP Perpetual 228,000 269,363 0.01AXA SA 6.69% FRN GBP Perpetual 105,000 138,498 0.01BNP Paribas SA FRN EUR Perpetual 400,000 434,681 0.02BNP Paribas SA FRN USD Perpetual 500,000 430,777 0.02BNP Paribas SA 5.954% FRN GBP Perpetual 100,000 127,350 0.01BNP Paribas SA 7.436% FRN GBP Perpetual 300,000 396,341 0.02
Invesco Global Targeted Returns Fund
Statement of Investments as at 29 February 2016
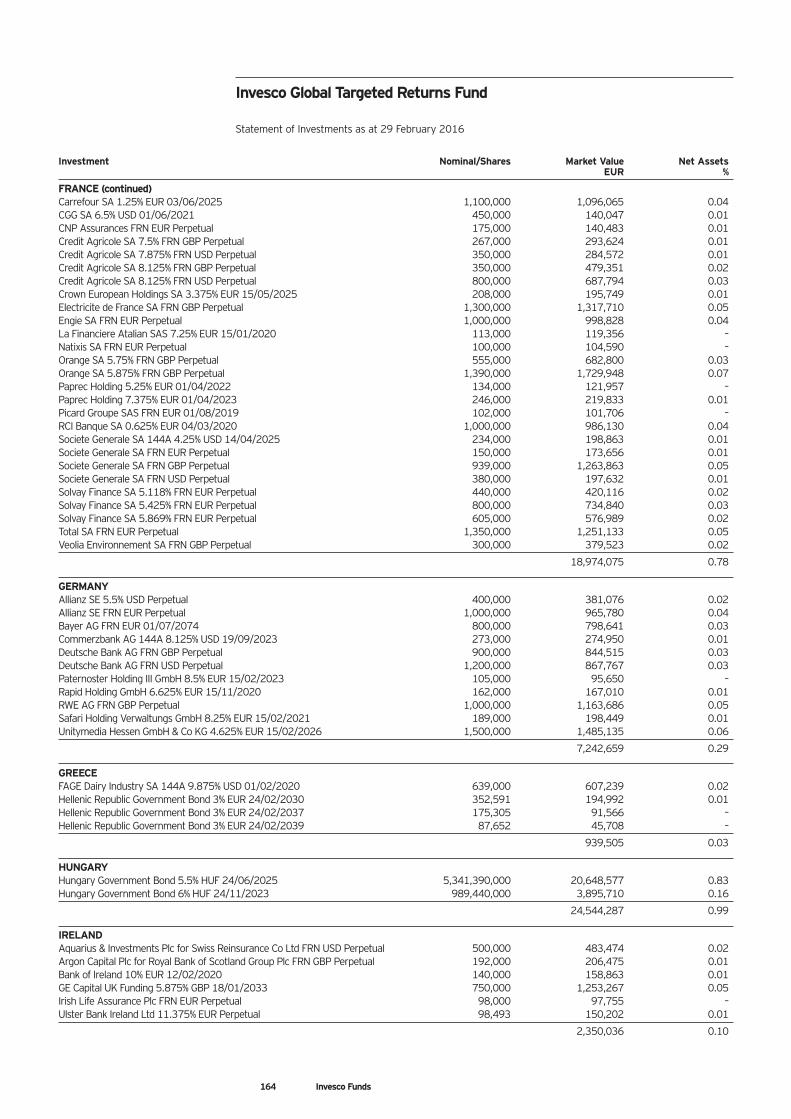
164 Invesco Funds
Investment Nominal/Shares Market Value Net Assets EUR %
FRANCE (continued)Carrefour SA 1.25% EUR 03/06/2025 1,100,000 1,096,065 0.04CGG SA 6.5% USD 01/06/2021 450,000 140,047 0.01CNP Assurances FRN EUR Perpetual 175,000 140,483 0.01Credit Agricole SA 7.5% FRN GBP Perpetual 267,000 293,624 0.01Credit Agricole SA 7.875% FRN USD Perpetual 350,000 284,572 0.01Credit Agricole SA 8.125% FRN GBP Perpetual 350,000 479,351 0.02Credit Agricole SA 8.125% FRN USD Perpetual 800,000 687,794 0.03Crown European Holdings SA 3.375% EUR 15/05/2025 208,000 195,749 0.01Electricite de France SA FRN GBP Perpetual 1,300,000 1,317,710 0.05Engie SA FRN EUR Perpetual 1,000,000 998,828 0.04La Financiere Atalian SAS 7.25% EUR 15/01/2020 113,000 119,356 –Natixis SA FRN EUR Perpetual 100,000 104,590 –Orange SA 5.75% FRN GBP Perpetual 555,000 682,800 0.03Orange SA 5.875% FRN GBP Perpetual 1,390,000 1,729,948 0.07Paprec Holding 5.25% EUR 01/04/2022 134,000 121,957 –Paprec Holding 7.375% EUR 01/04/2023 246,000 219,833 0.01Picard Groupe SAS FRN EUR 01/08/2019 102,000 101,706 –RCI Banque SA 0.625% EUR 04/03/2020 1,000,000 986,130 0.04Societe Generale SA 144A 4.25% USD 14/04/2025 234,000 198,863 0.01Societe Generale SA FRN EUR Perpetual 150,000 173,656 0.01Societe Generale SA FRN GBP Perpetual 939,000 1,263,863 0.05Societe Generale SA FRN USD Perpetual 380,000 197,632 0.01Solvay Finance SA 5.118% FRN EUR Perpetual 440,000 420,116 0.02Solvay Finance SA 5.425% FRN EUR Perpetual 800,000 734,840 0.03Solvay Finance SA 5.869% FRN EUR Perpetual 605,000 576,989 0.02Total SA FRN EUR Perpetual 1,350,000 1,251,133 0.05Veolia Environnement SA FRN GBP Perpetual 300,000 379,523 0.02
18,974,075 0.78
GERMANYAllianz SE 5.5% USD Perpetual 400,000 381,076 0.02Allianz SE FRN EUR Perpetual 1,000,000 965,780 0.04Bayer AG FRN EUR 01/07/2074 800,000 798,641 0.03Commerzbank AG 144A 8.125% USD 19/09/2023 273,000 274,950 0.01Deutsche Bank AG FRN GBP Perpetual 900,000 844,515 0.03Deutsche Bank AG FRN USD Perpetual 1,200,000 867,767 0.03Paternoster Holding III GmbH 8.5% EUR 15/02/2023 105,000 95,650 –Rapid Holding GmbH 6.625% EUR 15/11/2020 162,000 167,010 0.01RWE AG FRN GBP Perpetual 1,000,000 1,163,686 0.05Safari Holding Verwaltungs GmbH 8.25% EUR 15/02/2021 189,000 198,449 0.01Unitymedia Hessen GmbH & Co KG 4.625% EUR 15/02/2026 1,500,000 1,485,135 0.06
7,242,659 0.29
GREECEFAGE Dairy Industry SA 144A 9.875% USD 01/02/2020 639,000 607,239 0.02Hellenic Republic Government Bond 3% EUR 24/02/2030 352,591 194,992 0.01Hellenic Republic Government Bond 3% EUR 24/02/2037 175,305 91,566 –Hellenic Republic Government Bond 3% EUR 24/02/2039 87,652 45,708 –
939,505 0.03
HUNGARYHungary Government Bond 5.5% HUF 24/06/2025 5,341,390,000 20,648,577 0.83Hungary Government Bond 6% HUF 24/11/2023 989,440,000 3,895,710 0.16
24,544,287 0.99
IRELANDAquarius & Investments Plc for Swiss Reinsurance Co Ltd FRN USD Perpetual 500,000 483,474 0.02Argon Capital Plc for Royal Bank of Scotland Group Plc FRN GBP Perpetual 192,000 206,475 0.01Bank of Ireland 10% EUR 12/02/2020 140,000 158,863 0.01GE Capital UK Funding 5.875% GBP 18/01/2033 750,000 1,253,267 0.05Irish Life Assurance Plc FRN EUR Perpetual 98,000 97,755 –Ulster Bank Ireland Ltd 11.375% EUR Perpetual 98,493 150,202 0.01
2,350,036 0.10
Invesco Global Targeted Returns Fund
Statement of Investments as at 29 February 2016
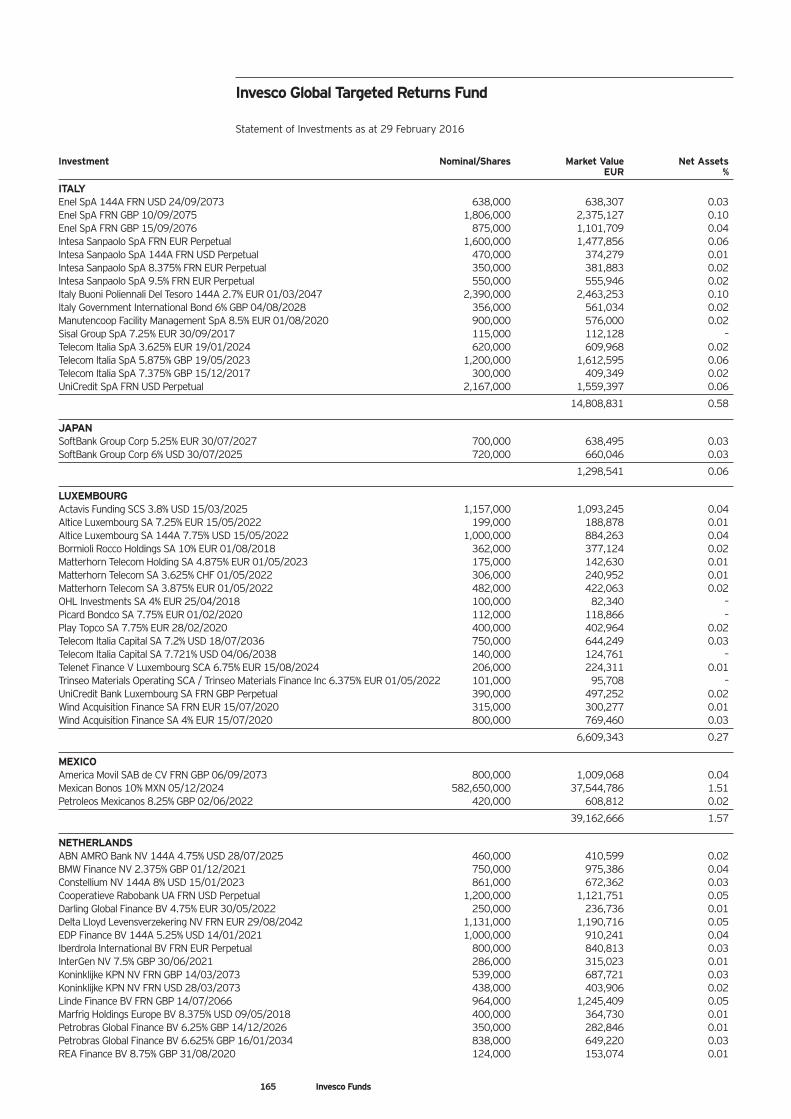
165 Invesco Funds
Investment Nominal/Shares Market Value Net Assets EUR %
ITALYEnel SpA 144A FRN USD 24/09/2073 638,000 638,307 0.03Enel SpA FRN GBP 10/09/2075 1,806,000 2,375,127 0.10Enel SpA FRN GBP 15/09/2076 875,000 1,101,709 0.04Intesa Sanpaolo SpA FRN EUR Perpetual 1,600,000 1,477,856 0.06Intesa Sanpaolo SpA 144A FRN USD Perpetual 470,000 374,279 0.01Intesa Sanpaolo SpA 8.375% FRN EUR Perpetual 350,000 381,883 0.02Intesa Sanpaolo SpA 9.5% FRN EUR Perpetual 550,000 555,946 0.02Italy Buoni Poliennali Del Tesoro 144A 2.7% EUR 01/03/2047 2,390,000 2,463,253 0.10Italy Government International Bond 6% GBP 04/08/2028 356,000 561,034 0.02Manutencoop Facility Management SpA 8.5% EUR 01/08/2020 900,000 576,000 0.02Sisal Group SpA 7.25% EUR 30/09/2017 115,000 112,128 –Telecom Italia SpA 3.625% EUR 19/01/2024 620,000 609,968 0.02Telecom Italia SpA 5.875% GBP 19/05/2023 1,200,000 1,612,595 0.06Telecom Italia SpA 7.375% GBP 15/12/2017 300,000 409,349 0.02UniCredit SpA FRN USD Perpetual 2,167,000 1,559,397 0.06
14,808,831 0.58
JAPANSoftBank Group Corp 5.25% EUR 30/07/2027 700,000 638,495 0.03SoftBank Group Corp 6% USD 30/07/2025 720,000 660,046 0.03
1,298,541 0.06
LUXEMBOURGActavis Funding SCS 3.8% USD 15/03/2025 1,157,000 1,093,245 0.04Altice Luxembourg SA 7.25% EUR 15/05/2022 199,000 188,878 0.01Altice Luxembourg SA 144A 7.75% USD 15/05/2022 1,000,000 884,263 0.04Bormioli Rocco Holdings SA 10% EUR 01/08/2018 362,000 377,124 0.02Matterhorn Telecom Holding SA 4.875% EUR 01/05/2023 175,000 142,630 0.01Matterhorn Telecom SA 3.625% CHF 01/05/2022 306,000 240,952 0.01Matterhorn Telecom SA 3.875% EUR 01/05/2022 482,000 422,063 0.02OHL Investments SA 4% EUR 25/04/2018 100,000 82,340 –Picard Bondco SA 7.75% EUR 01/02/2020 112,000 118,866 –Play Topco SA 7.75% EUR 28/02/2020 400,000 402,964 0.02Telecom Italia Capital SA 7.2% USD 18/07/2036 750,000 644,249 0.03Telecom Italia Capital SA 7.721% USD 04/06/2038 140,000 124,761 –Telenet Finance V Luxembourg SCA 6.75% EUR 15/08/2024 206,000 224,311 0.01Trinseo Materials Operating SCA / Trinseo Materials Finance Inc 6.375% EUR 01/05/2022 101,000 95,708 –UniCredit Bank Luxembourg SA FRN GBP Perpetual 390,000 497,252 0.02Wind Acquisition Finance SA FRN EUR 15/07/2020 315,000 300,277 0.01Wind Acquisition Finance SA 4% EUR 15/07/2020 800,000 769,460 0.03
6,609,343 0.27
MEXICOAmerica Movil SAB de CV FRN GBP 06/09/2073 800,000 1,009,068 0.04Mexican Bonos 10% MXN 05/12/2024 582,650,000 37,544,786 1.51Petroleos Mexicanos 8.25% GBP 02/06/2022 420,000 608,812 0.02
39,162,666 1.57
NETHERLANDSABN AMRO Bank NV 144A 4.75% USD 28/07/2025 460,000 410,599 0.02BMW Finance NV 2.375% GBP 01/12/2021 750,000 975,386 0.04Constellium NV 144A 8% USD 15/01/2023 861,000 672,362 0.03Cooperatieve Rabobank UA FRN USD Perpetual 1,200,000 1,121,751 0.05Darling Global Finance BV 4.75% EUR 30/05/2022 250,000 236,736 0.01Delta Lloyd Levensverzekering NV FRN EUR 29/08/2042 1,131,000 1,190,716 0.05EDP Finance BV 144A 5.25% USD 14/01/2021 1,000,000 910,241 0.04Iberdrola International BV FRN EUR Perpetual 800,000 840,813 0.03InterGen NV 7.5% GBP 30/06/2021 286,000 315,023 0.01Koninklijke KPN NV FRN GBP 14/03/2073 539,000 687,721 0.03Koninklijke KPN NV FRN USD 28/03/2073 438,000 403,906 0.02Linde Finance BV FRN GBP 14/07/2066 964,000 1,245,409 0.05Marfrig Holdings Europe BV 8.375% USD 09/05/2018 400,000 364,730 0.01Petrobras Global Finance BV 6.25% GBP 14/12/2026 350,000 282,846 0.01Petrobras Global Finance BV 6.625% GBP 16/01/2034 838,000 649,220 0.03REA Finance BV 8.75% GBP 31/08/2020 124,000 153,074 0.01
Invesco Global Targeted Returns Fund
Statement of Investments as at 29 February 2016
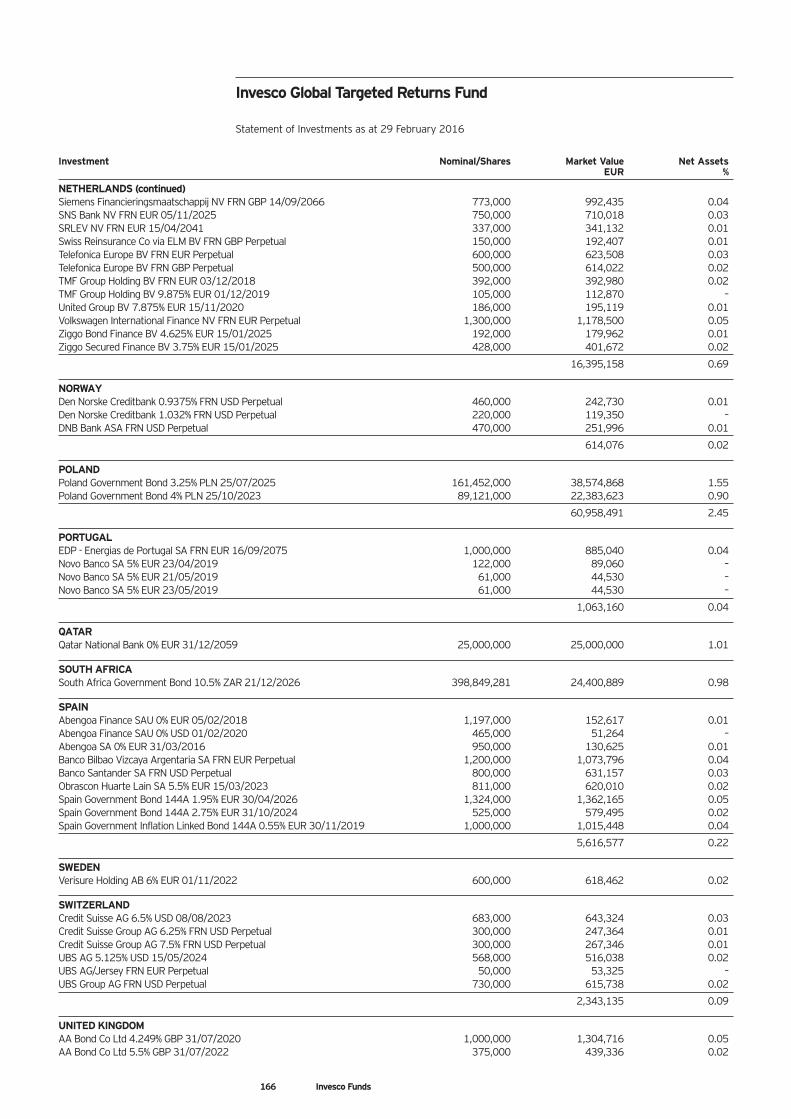
166 Invesco Funds
Investment Nominal/Shares Market Value Net Assets EUR %
NETHERLANDS (continued)Siemens Financieringsmaatschappij NV FRN GBP 14/09/2066 773,000 992,435 0.04SNS Bank NV FRN EUR 05/11/2025 750,000 710,018 0.03SRLEV NV FRN EUR 15/04/2041 337,000 341,132 0.01Swiss Reinsurance Co via ELM BV FRN GBP Perpetual 150,000 192,407 0.01Telefonica Europe BV FRN EUR Perpetual 600,000 623,508 0.03Telefonica Europe BV FRN GBP Perpetual 500,000 614,022 0.02TMF Group Holding BV FRN EUR 03/12/2018 392,000 392,980 0.02TMF Group Holding BV 9.875% EUR 01/12/2019 105,000 112,870 –United Group BV 7.875% EUR 15/11/2020 186,000 195,119 0.01Volkswagen International Finance NV FRN EUR Perpetual 1,300,000 1,178,500 0.05Ziggo Bond Finance BV 4.625% EUR 15/01/2025 192,000 179,962 0.01Ziggo Secured Finance BV 3.75% EUR 15/01/2025 428,000 401,672 0.02
16,395,158 0.69
NORWAYDen Norske Creditbank 0.9375% FRN USD Perpetual 460,000 242,730 0.01Den Norske Creditbank 1.032% FRN USD Perpetual 220,000 119,350 –DNB Bank ASA FRN USD Perpetual 470,000 251,996 0.01
614,076 0.02
POLANDPoland Government Bond 3.25% PLN 25/07/2025 161,452,000 38,574,868 1.55Poland Government Bond 4% PLN 25/10/2023 89,121,000 22,383,623 0.90
60,958,491 2.45
PORTUGALEDP - Energias de Portugal SA FRN EUR 16/09/2075 1,000,000 885,040 0.04Novo Banco SA 5% EUR 23/04/2019 122,000 89,060 –Novo Banco SA 5% EUR 21/05/2019 61,000 44,530 –Novo Banco SA 5% EUR 23/05/2019 61,000 44,530 –
1,063,160 0.04
QATARQatar National Bank 0% EUR 31/12/2059 25,000,000 25,000,000 1.01
SOUTH AFRICASouth Africa Government Bond 10.5% ZAR 21/12/2026 398,849,281 24,400,889 0.98
SPAINAbengoa Finance SAU 0% EUR 05/02/2018 1,197,000 152,617 0.01Abengoa Finance SAU 0% USD 01/02/2020 465,000 51,264 –Abengoa SA 0% EUR 31/03/2016 950,000 130,625 0.01Banco Bilbao Vizcaya Argentaria SA FRN EUR Perpetual 1,200,000 1,073,796 0.04Banco Santander SA FRN USD Perpetual 800,000 631,157 0.03Obrascon Huarte Lain SA 5.5% EUR 15/03/2023 811,000 620,010 0.02Spain Government Bond 144A 1.95% EUR 30/04/2026 1,324,000 1,362,165 0.05Spain Government Bond 144A 2.75% EUR 31/10/2024 525,000 579,495 0.02Spain Government Inflation Linked Bond 144A 0.55% EUR 30/11/2019 1,000,000 1,015,448 0.04
5,616,577 0.22
SWEDENVerisure Holding AB 6% EUR 01/11/2022 600,000 618,462 0.02
SWITZERLANDCredit Suisse AG 6.5% USD 08/08/2023 683,000 643,324 0.03Credit Suisse Group AG 6.25% FRN USD Perpetual 300,000 247,364 0.01Credit Suisse Group AG 7.5% FRN USD Perpetual 300,000 267,346 0.01UBS AG 5.125% USD 15/05/2024 568,000 516,038 0.02UBS AG/Jersey FRN EUR Perpetual 50,000 53,325 –UBS Group AG FRN USD Perpetual 730,000 615,738 0.02
2,343,135 0.09
UNITED KINGDOMAA Bond Co Ltd 4.249% GBP 31/07/2020 1,000,000 1,304,716 0.05AA Bond Co Ltd 5.5% GBP 31/07/2022 375,000 439,336 0.02
Invesco Global Targeted Returns Fund
Statement of Investments as at 29 February 2016
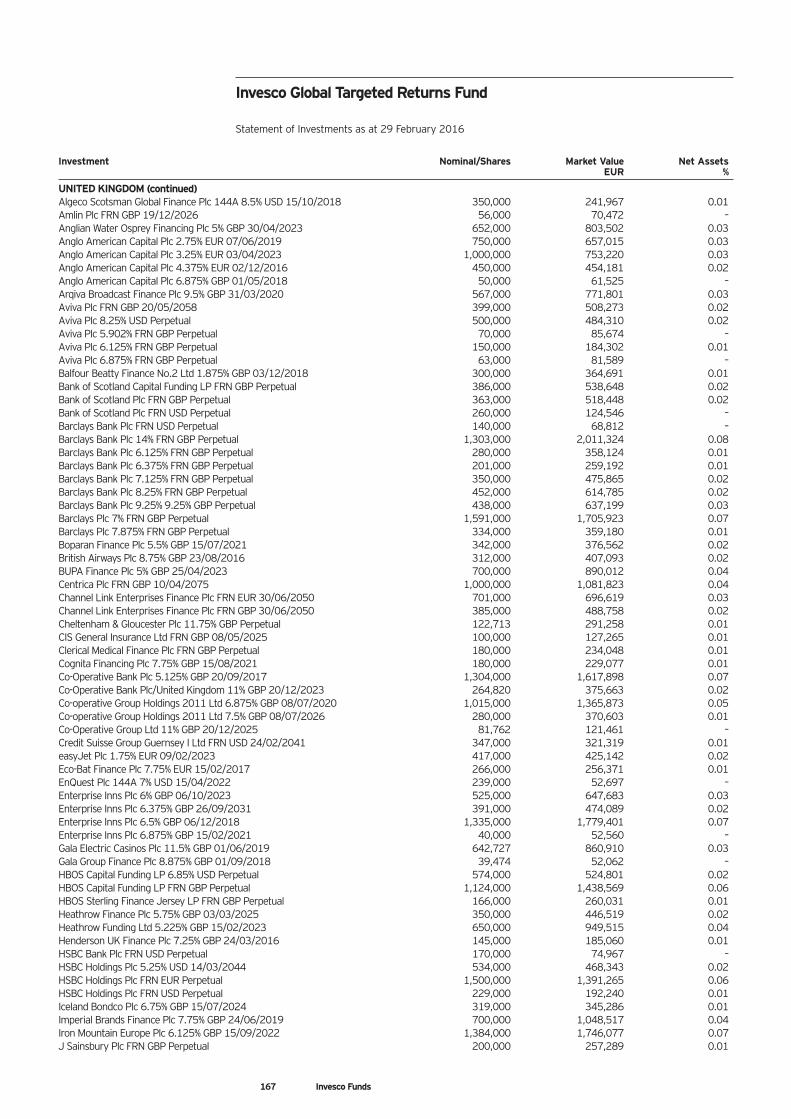
167 Invesco Funds
Investment Nominal/Shares Market Value Net Assets EUR %
UNITED KINGDOM (continued)Algeco Scotsman Global Finance Plc 144A 8.5% USD 15/10/2018 350,000 241,967 0.01Amlin Plc FRN GBP 19/12/2026 56,000 70,472 –Anglian Water Osprey Financing Plc 5% GBP 30/04/2023 652,000 803,502 0.03Anglo American Capital Plc 2.75% EUR 07/06/2019 750,000 657,015 0.03Anglo American Capital Plc 3.25% EUR 03/04/2023 1,000,000 753,220 0.03Anglo American Capital Plc 4.375% EUR 02/12/2016 450,000 454,181 0.02Anglo American Capital Plc 6.875% GBP 01/05/2018 50,000 61,525 –Arqiva Broadcast Finance Plc 9.5% GBP 31/03/2020 567,000 771,801 0.03Aviva Plc FRN GBP 20/05/2058 399,000 508,273 0.02Aviva Plc 8.25% USD Perpetual 500,000 484,310 0.02Aviva Plc 5.902% FRN GBP Perpetual 70,000 85,674 –Aviva Plc 6.125% FRN GBP Perpetual 150,000 184,302 0.01Aviva Plc 6.875% FRN GBP Perpetual 63,000 81,589 –Balfour Beatty Finance No.2 Ltd 1.875% GBP 03/12/2018 300,000 364,691 0.01Bank of Scotland Capital Funding LP FRN GBP Perpetual 386,000 538,648 0.02Bank of Scotland Plc FRN GBP Perpetual 363,000 518,448 0.02Bank of Scotland Plc FRN USD Perpetual 260,000 124,546 –Barclays Bank Plc FRN USD Perpetual 140,000 68,812 –Barclays Bank Plc 14% FRN GBP Perpetual 1,303,000 2,011,324 0.08Barclays Bank Plc 6.125% FRN GBP Perpetual 280,000 358,124 0.01Barclays Bank Plc 6.375% FRN GBP Perpetual 201,000 259,192 0.01Barclays Bank Plc 7.125% FRN GBP Perpetual 350,000 475,865 0.02Barclays Bank Plc 8.25% FRN GBP Perpetual 452,000 614,785 0.02Barclays Bank Plc 9.25% 9.25% GBP Perpetual 438,000 637,199 0.03Barclays Plc 7% FRN GBP Perpetual 1,591,000 1,705,923 0.07Barclays Plc 7.875% FRN GBP Perpetual 334,000 359,180 0.01Boparan Finance Plc 5.5% GBP 15/07/2021 342,000 376,562 0.02British Airways Plc 8.75% GBP 23/08/2016 312,000 407,093 0.02BUPA Finance Plc 5% GBP 25/04/2023 700,000 890,012 0.04Centrica Plc FRN GBP 10/04/2075 1,000,000 1,081,823 0.04Channel Link Enterprises Finance Plc FRN EUR 30/06/2050 701,000 696,619 0.03Channel Link Enterprises Finance Plc FRN GBP 30/06/2050 385,000 488,758 0.02Cheltenham & Gloucester Plc 11.75% GBP Perpetual 122,713 291,258 0.01CIS General Insurance Ltd FRN GBP 08/05/2025 100,000 127,265 0.01Clerical Medical Finance Plc FRN GBP Perpetual 180,000 234,048 0.01Cognita Financing Plc 7.75% GBP 15/08/2021 180,000 229,077 0.01Co-Operative Bank Plc 5.125% GBP 20/09/2017 1,304,000 1,617,898 0.07Co-Operative Bank Plc/United Kingdom 11% GBP 20/12/2023 264,820 375,663 0.02Co-operative Group Holdings 2011 Ltd 6.875% GBP 08/07/2020 1,015,000 1,365,873 0.05Co-operative Group Holdings 2011 Ltd 7.5% GBP 08/07/2026 280,000 370,603 0.01Co-Operative Group Ltd 11% GBP 20/12/2025 81,762 121,461 –Credit Suisse Group Guernsey I Ltd FRN USD 24/02/2041 347,000 321,319 0.01easyJet Plc 1.75% EUR 09/02/2023 417,000 425,142 0.02Eco-Bat Finance Plc 7.75% EUR 15/02/2017 266,000 256,371 0.01EnQuest Plc 144A 7% USD 15/04/2022 239,000 52,697 –Enterprise Inns Plc 6% GBP 06/10/2023 525,000 647,683 0.03Enterprise Inns Plc 6.375% GBP 26/09/2031 391,000 474,089 0.02Enterprise Inns Plc 6.5% GBP 06/12/2018 1,335,000 1,779,401 0.07Enterprise Inns Plc 6.875% GBP 15/02/2021 40,000 52,560 –Gala Electric Casinos Plc 11.5% GBP 01/06/2019 642,727 860,910 0.03Gala Group Finance Plc 8.875% GBP 01/09/2018 39,474 52,062 –HBOS Capital Funding LP 6.85% USD Perpetual 574,000 524,801 0.02HBOS Capital Funding LP FRN GBP Perpetual 1,124,000 1,438,569 0.06HBOS Sterling Finance Jersey LP FRN GBP Perpetual 166,000 260,031 0.01Heathrow Finance Plc 5.75% GBP 03/03/2025 350,000 446,519 0.02Heathrow Funding Ltd 5.225% GBP 15/02/2023 650,000 949,515 0.04Henderson UK Finance Plc 7.25% GBP 24/03/2016 145,000 185,060 0.01HSBC Bank Plc FRN USD Perpetual 170,000 74,967 –HSBC Holdings Plc 5.25% USD 14/03/2044 534,000 468,343 0.02HSBC Holdings Plc FRN EUR Perpetual 1,500,000 1,391,265 0.06HSBC Holdings Plc FRN USD Perpetual 229,000 192,240 0.01Iceland Bondco Plc 6.75% GBP 15/07/2024 319,000 345,286 0.01Imperial Brands Finance Plc 7.75% GBP 24/06/2019 700,000 1,048,517 0.04Iron Mountain Europe Plc 6.125% GBP 15/09/2022 1,384,000 1,746,077 0.07J Sainsbury Plc FRN GBP Perpetual 200,000 257,289 0.01
Invesco Global Targeted Returns Fund
Statement of Investments as at 29 February 2016
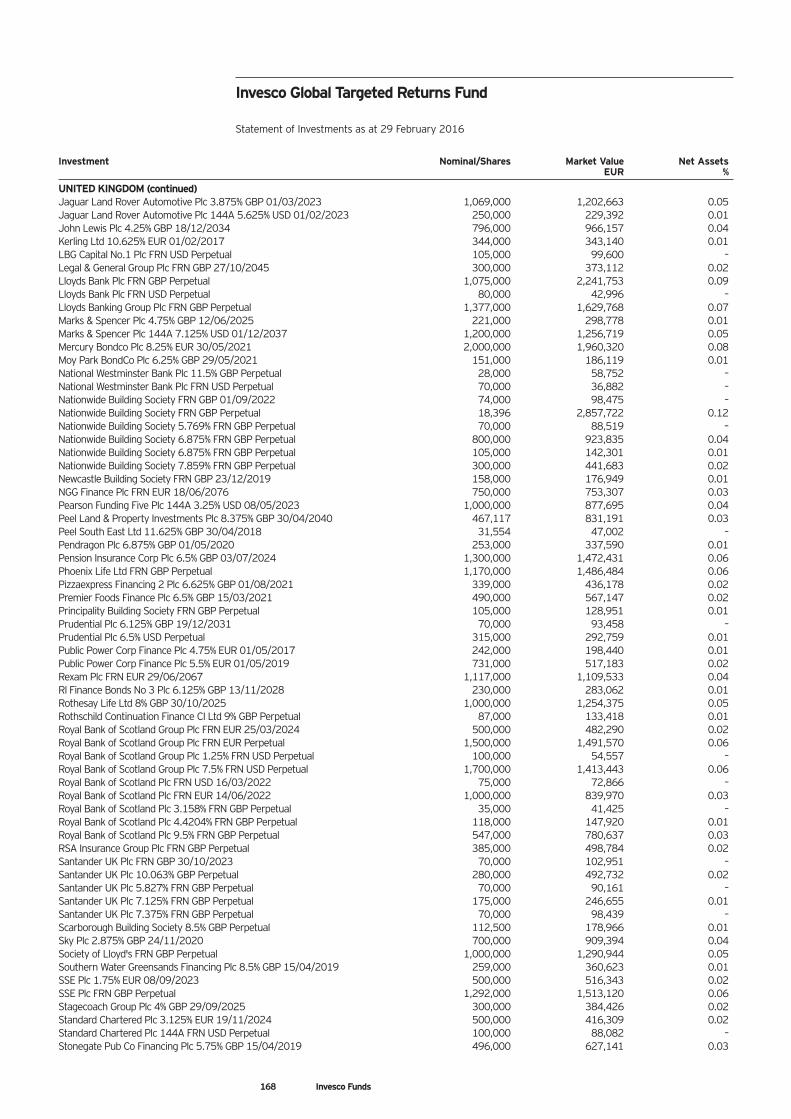
168 Invesco Funds
Investment Nominal/Shares Market Value Net Assets EUR %
UNITED KINGDOM (continued)Jaguar Land Rover Automotive Plc 3.875% GBP 01/03/2023 1,069,000 1,202,663 0.05Jaguar Land Rover Automotive Plc 144A 5.625% USD 01/02/2023 250,000 229,392 0.01John Lewis Plc 4.25% GBP 18/12/2034 796,000 966,157 0.04Kerling Ltd 10.625% EUR 01/02/2017 344,000 343,140 0.01LBG Capital No.1 Plc FRN USD Perpetual 105,000 99,600 –Legal & General Group Plc FRN GBP 27/10/2045 300,000 373,112 0.02Lloyds Bank Plc FRN GBP Perpetual 1,075,000 2,241,753 0.09Lloyds Bank Plc FRN USD Perpetual 80,000 42,996 –Lloyds Banking Group Plc FRN GBP Perpetual 1,377,000 1,629,768 0.07Marks & Spencer Plc 4.75% GBP 12/06/2025 221,000 298,778 0.01Marks & Spencer Plc 144A 7.125% USD 01/12/2037 1,200,000 1,256,719 0.05Mercury Bondco Plc 8.25% EUR 30/05/2021 2,000,000 1,960,320 0.08Moy Park BondCo Plc 6.25% GBP 29/05/2021 151,000 186,119 0.01National Westminster Bank Plc 11.5% GBP Perpetual 28,000 58,752 –National Westminster Bank Plc FRN USD Perpetual 70,000 36,882 –Nationwide Building Society FRN GBP 01/09/2022 74,000 98,475 –Nationwide Building Society FRN GBP Perpetual 18,396 2,857,722 0.12Nationwide Building Society 5.769% FRN GBP Perpetual 70,000 88,519 –Nationwide Building Society 6.875% FRN GBP Perpetual 800,000 923,835 0.04Nationwide Building Society 6.875% FRN GBP Perpetual 105,000 142,301 0.01Nationwide Building Society 7.859% FRN GBP Perpetual 300,000 441,683 0.02Newcastle Building Society FRN GBP 23/12/2019 158,000 176,949 0.01NGG Finance Plc FRN EUR 18/06/2076 750,000 753,307 0.03Pearson Funding Five Plc 144A 3.25% USD 08/05/2023 1,000,000 877,695 0.04Peel Land & Property Investments Plc 8.375% GBP 30/04/2040 467,117 831,191 0.03Peel South East Ltd 11.625% GBP 30/04/2018 31,554 47,002 –Pendragon Plc 6.875% GBP 01/05/2020 253,000 337,590 0.01Pension Insurance Corp Plc 6.5% GBP 03/07/2024 1,300,000 1,472,431 0.06Phoenix Life Ltd FRN GBP Perpetual 1,170,000 1,486,484 0.06Pizzaexpress Financing 2 Plc 6.625% GBP 01/08/2021 339,000 436,178 0.02Premier Foods Finance Plc 6.5% GBP 15/03/2021 490,000 567,147 0.02Principality Building Society FRN GBP Perpetual 105,000 128,951 0.01Prudential Plc 6.125% GBP 19/12/2031 70,000 93,458 –Prudential Plc 6.5% USD Perpetual 315,000 292,759 0.01Public Power Corp Finance Plc 4.75% EUR 01/05/2017 242,000 198,440 0.01Public Power Corp Finance Plc 5.5% EUR 01/05/2019 731,000 517,183 0.02Rexam Plc FRN EUR 29/06/2067 1,117,000 1,109,533 0.04Rl Finance Bonds No 3 Plc 6.125% GBP 13/11/2028 230,000 283,062 0.01Rothesay Life Ltd 8% GBP 30/10/2025 1,000,000 1,254,375 0.05Rothschild Continuation Finance CI Ltd 9% GBP Perpetual 87,000 133,418 0.01Royal Bank of Scotland Group Plc FRN EUR 25/03/2024 500,000 482,290 0.02Royal Bank of Scotland Group Plc FRN EUR Perpetual 1,500,000 1,491,570 0.06Royal Bank of Scotland Group Plc 1.25% FRN USD Perpetual 100,000 54,557 –Royal Bank of Scotland Group Plc 7.5% FRN USD Perpetual 1,700,000 1,413,443 0.06Royal Bank of Scotland Plc FRN USD 16/03/2022 75,000 72,866 –Royal Bank of Scotland Plc FRN EUR 14/06/2022 1,000,000 839,970 0.03Royal Bank of Scotland Plc 3.158% FRN GBP Perpetual 35,000 41,425 –Royal Bank of Scotland Plc 4.4204% FRN GBP Perpetual 118,000 147,920 0.01Royal Bank of Scotland Plc 9.5% FRN GBP Perpetual 547,000 780,637 0.03RSA Insurance Group Plc FRN GBP Perpetual 385,000 498,784 0.02Santander UK Plc FRN GBP 30/10/2023 70,000 102,951 –Santander UK Plc 10.063% GBP Perpetual 280,000 492,732 0.02Santander UK Plc 5.827% FRN GBP Perpetual 70,000 90,161 –Santander UK Plc 7.125% FRN GBP Perpetual 175,000 246,655 0.01Santander UK Plc 7.375% FRN GBP Perpetual 70,000 98,439 –Scarborough Building Society 8.5% GBP Perpetual 112,500 178,966 0.01Sky Plc 2.875% GBP 24/11/2020 700,000 909,394 0.04Society of Lloyd's FRN GBP Perpetual 1,000,000 1,290,944 0.05Southern Water Greensands Financing Plc 8.5% GBP 15/04/2019 259,000 360,623 0.01SSE Plc 1.75% EUR 08/09/2023 500,000 516,343 0.02SSE Plc FRN GBP Perpetual 1,292,000 1,513,120 0.06Stagecoach Group Plc 4% GBP 29/09/2025 300,000 384,426 0.02Standard Chartered Plc 3.125% EUR 19/11/2024 500,000 416,309 0.02Standard Chartered Plc 144A FRN USD Perpetual 100,000 88,082 –Stonegate Pub Co Financing Plc 5.75% GBP 15/04/2019 496,000 627,141 0.03
Invesco Global Targeted Returns Fund
Statement of Investments as at 29 February 2016
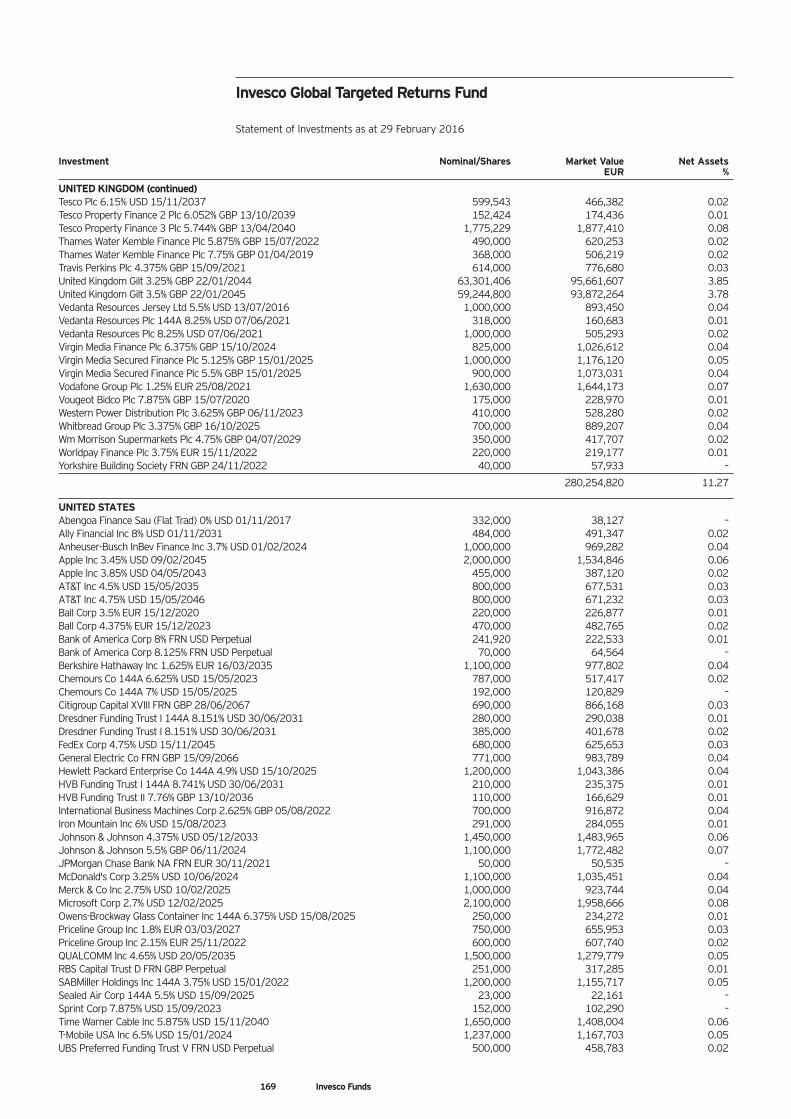
169 Invesco Funds
Investment Nominal/Shares Market Value Net Assets EUR %
UNITED KINGDOM (continued)Tesco Plc 6.15% USD 15/11/2037 599,543 466,382 0.02Tesco Property Finance 2 Plc 6.052% GBP 13/10/2039 152,424 174,436 0.01Tesco Property Finance 3 Plc 5.744% GBP 13/04/2040 1,775,229 1,877,410 0.08Thames Water Kemble Finance Plc 5.875% GBP 15/07/2022 490,000 620,253 0.02Thames Water Kemble Finance Plc 7.75% GBP 01/04/2019 368,000 506,219 0.02Travis Perkins Plc 4.375% GBP 15/09/2021 614,000 776,680 0.03United Kingdom Gilt 3.25% GBP 22/01/2044 63,301,406 95,661,607 3.85United Kingdom Gilt 3.5% GBP 22/01/2045 59,244,800 93,872,264 3.78Vedanta Resources Jersey Ltd 5.5% USD 13/07/2016 1,000,000 893,450 0.04Vedanta Resources Plc 144A 8.25% USD 07/06/2021 318,000 160,683 0.01Vedanta Resources Plc 8.25% USD 07/06/2021 1,000,000 505,293 0.02Virgin Media Finance Plc 6.375% GBP 15/10/2024 825,000 1,026,612 0.04Virgin Media Secured Finance Plc 5.125% GBP 15/01/2025 1,000,000 1,176,120 0.05Virgin Media Secured Finance Plc 5.5% GBP 15/01/2025 900,000 1,073,031 0.04Vodafone Group Plc 1.25% EUR 25/08/2021 1,630,000 1,644,173 0.07Vougeot Bidco Plc 7.875% GBP 15/07/2020 175,000 228,970 0.01Western Power Distribution Plc 3.625% GBP 06/11/2023 410,000 528,280 0.02Whitbread Group Plc 3.375% GBP 16/10/2025 700,000 889,207 0.04Wm Morrison Supermarkets Plc 4.75% GBP 04/07/2029 350,000 417,707 0.02Worldpay Finance Plc 3.75% EUR 15/11/2022 220,000 219,177 0.01Yorkshire Building Society FRN GBP 24/11/2022 40,000 57,933 –
280,254,820 11.27
UNITED STATESAbengoa Finance Sau (Flat Trad) 0% USD 01/11/2017 332,000 38,127 –Ally Financial Inc 8% USD 01/11/2031 484,000 491,347 0.02Anheuser-Busch InBev Finance Inc 3.7% USD 01/02/2024 1,000,000 969,282 0.04Apple Inc 3.45% USD 09/02/2045 2,000,000 1,534,846 0.06Apple Inc 3.85% USD 04/05/2043 455,000 387,120 0.02AT&T Inc 4.5% USD 15/05/2035 800,000 677,531 0.03AT&T Inc 4.75% USD 15/05/2046 800,000 671,232 0.03Ball Corp 3.5% EUR 15/12/2020 220,000 226,877 0.01Ball Corp 4.375% EUR 15/12/2023 470,000 482,765 0.02Bank of America Corp 8% FRN USD Perpetual 241,920 222,533 0.01Bank of America Corp 8.125% FRN USD Perpetual 70,000 64,564 –Berkshire Hathaway Inc 1.625% EUR 16/03/2035 1,100,000 977,802 0.04Chemours Co 144A 6.625% USD 15/05/2023 787,000 517,417 0.02Chemours Co 144A 7% USD 15/05/2025 192,000 120,829 –Citigroup Capital XVIII FRN GBP 28/06/2067 690,000 866,168 0.03Dresdner Funding Trust I 144A 8.151% USD 30/06/2031 280,000 290,038 0.01Dresdner Funding Trust I 8.151% USD 30/06/2031 385,000 401,678 0.02FedEx Corp 4.75% USD 15/11/2045 680,000 625,653 0.03General Electric Co FRN GBP 15/09/2066 771,000 983,789 0.04Hewlett Packard Enterprise Co 144A 4.9% USD 15/10/2025 1,200,000 1,043,386 0.04HVB Funding Trust I 144A 8.741% USD 30/06/2031 210,000 235,375 0.01HVB Funding Trust II 7.76% GBP 13/10/2036 110,000 166,629 0.01International Business Machines Corp 2.625% GBP 05/08/2022 700,000 916,872 0.04Iron Mountain Inc 6% USD 15/08/2023 291,000 284,055 0.01Johnson & Johnson 4.375% USD 05/12/2033 1,450,000 1,483,965 0.06Johnson & Johnson 5.5% GBP 06/11/2024 1,100,000 1,772,482 0.07JPMorgan Chase Bank NA FRN EUR 30/11/2021 50,000 50,535 –McDonald's Corp 3.25% USD 10/06/2024 1,100,000 1,035,451 0.04Merck & Co Inc 2.75% USD 10/02/2025 1,000,000 923,744 0.04Microsoft Corp 2.7% USD 12/02/2025 2,100,000 1,958,666 0.08Owens-Brockway Glass Container Inc 144A 6.375% USD 15/08/2025 250,000 234,272 0.01Priceline Group Inc 1.8% EUR 03/03/2027 750,000 655,953 0.03Priceline Group Inc 2.15% EUR 25/11/2022 600,000 607,740 0.02QUALCOMM Inc 4.65% USD 20/05/2035 1,500,000 1,279,779 0.05RBS Capital Trust D FRN GBP Perpetual 251,000 317,285 0.01SABMiller Holdings Inc 144A 3.75% USD 15/01/2022 1,200,000 1,155,717 0.05Sealed Air Corp 144A 5.5% USD 15/09/2025 23,000 22,161 –Sprint Corp 7.875% USD 15/09/2023 152,000 102,290 –Time Warner Cable Inc 5.875% USD 15/11/2040 1,650,000 1,408,004 0.06T-Mobile USA Inc 6.5% USD 15/01/2024 1,237,000 1,167,703 0.05UBS Preferred Funding Trust V FRN USD Perpetual 500,000 458,783 0.02
Invesco Global Targeted Returns Fund
Statement of Investments as at 29 February 2016
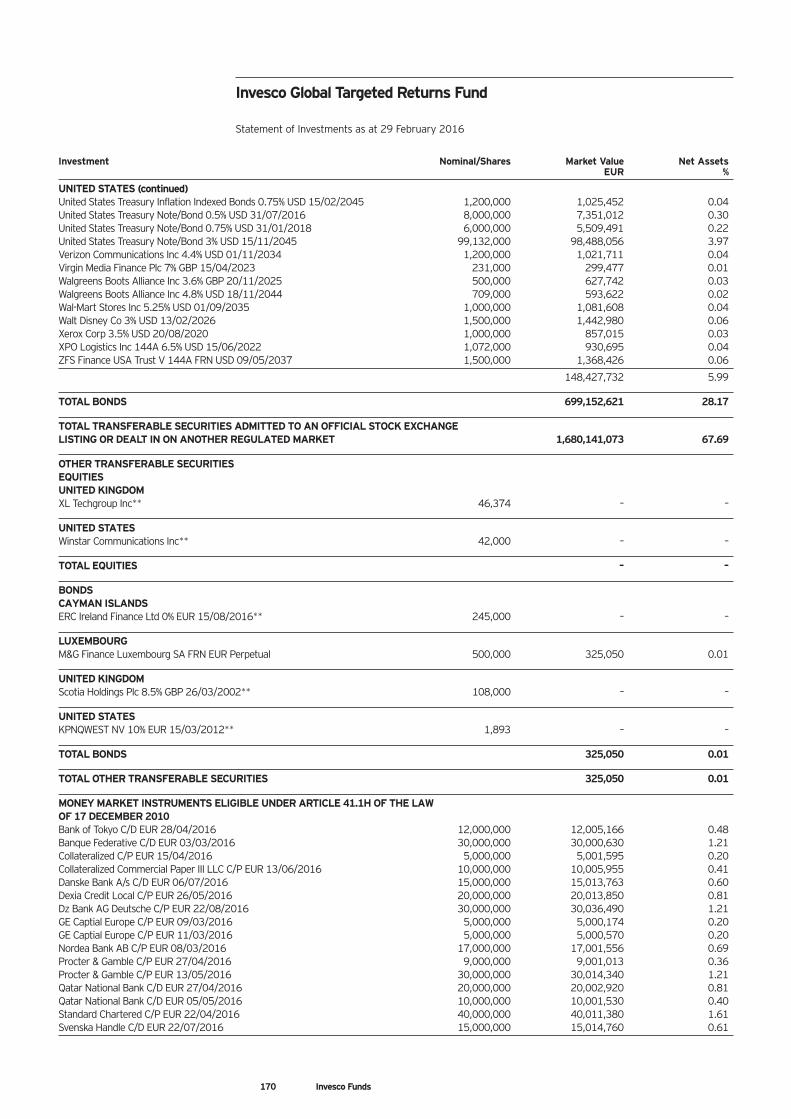
170 Invesco Funds
Investment Nominal/Shares Market Value Net Assets EUR %
UNITED STATES (continued)United States Treasury Inflation Indexed Bonds 0.75% USD 15/02/2045 1,200,000 1,025,452 0.04United States Treasury Note/Bond 0.5% USD 31/07/2016 8,000,000 7,351,012 0.30United States Treasury Note/Bond 0.75% USD 31/01/2018 6,000,000 5,509,491 0.22United States Treasury Note/Bond 3% USD 15/11/2045 99,132,000 98,488,056 3.97Verizon Communications Inc 4.4% USD 01/11/2034 1,200,000 1,021,711 0.04Virgin Media Finance Plc 7% GBP 15/04/2023 231,000 299,477 0.01Walgreens Boots Alliance Inc 3.6% GBP 20/11/2025 500,000 627,742 0.03Walgreens Boots Alliance Inc 4.8% USD 18/11/2044 709,000 593,622 0.02Wal-Mart Stores Inc 5.25% USD 01/09/2035 1,000,000 1,081,608 0.04Walt Disney Co 3% USD 13/02/2026 1,500,000 1,442,980 0.06Xerox Corp 3.5% USD 20/08/2020 1,000,000 857,015 0.03XPO Logistics Inc 144A 6.5% USD 15/06/2022 1,072,000 930,695 0.04ZFS Finance USA Trust V 144A FRN USD 09/05/2037 1,500,000 1,368,426 0.06
148,427,732 5.99
TOTAL BONDS 699,152,621 28.17
TOTAL TRANSFERABLE SECURITIES ADMITTED TO AN OFFICIAL STOCK EXCHANGE LISTING OR DEALT IN ON ANOTHER REGULATED MARKET 1,680,141,073 67.69
OTHER TRANSFERABLE SECURITIESEQUITIESUNITED KINGDOMXL Techgroup Inc** 46,374 – –
UNITED STATESWinstar Communications Inc** 42,000 – –
TOTAL EQUITIES – –
BONDSCAYMAN ISLANDSERC Ireland Finance Ltd 0% EUR 15/08/2016** 245,000 – –
LUXEMBOURGM&G Finance Luxembourg SA FRN EUR Perpetual 500,000 325,050 0.01
UNITED KINGDOMScotia Holdings Plc 8.5% GBP 26/03/2002** 108,000 – –
UNITED STATESKPNQWEST NV 10% EUR 15/03/2012** 1,893 – –
TOTAL BONDS 325,050 0.01
TOTAL OTHER TRANSFERABLE SECURITIES 325,050 0.01
MONEY MARKET INSTRUMENTS ELIGIBLE UNDER ARTICLE 41.1H OF THE LAW OF 17 DECEMBER 2010Bank of Tokyo C/D EUR 28/04/2016 12,000,000 12,005,166 0.48Banque Federative C/D EUR 03/03/2016 30,000,000 30,000,630 1.21Collateralized C/P EUR 15/04/2016 5,000,000 5,001,595 0.20Collateralized Commercial Paper III LLC C/P EUR 13/06/2016 10,000,000 10,005,955 0.41Danske Bank A/s C/D EUR 06/07/2016 15,000,000 15,013,763 0.60Dexia Credit Local C/P EUR 26/05/2016 20,000,000 20,013,850 0.81Dz Bank AG Deutsche C/P EUR 22/08/2016 30,000,000 30,036,490 1.21GE Captial Europe C/P EUR 09/03/2016 5,000,000 5,000,174 0.20GE Captial Europe C/P EUR 11/03/2016 5,000,000 5,000,570 0.20Nordea Bank AB C/P EUR 08/03/2016 17,000,000 17,001,556 0.69Procter & Gamble C/P EUR 27/04/2016 9,000,000 9,001,013 0.36Procter & Gamble C/P EUR 13/05/2016 30,000,000 30,014,340 1.21Qatar National Bank C/D EUR 27/04/2016 20,000,000 20,002,920 0.81Qatar National Bank C/D EUR 05/05/2016 10,000,000 10,001,530 0.40Standard Chartered C/P EUR 22/04/2016 40,000,000 40,011,380 1.61Svenska Handle C/D EUR 22/07/2016 15,000,000 15,014,760 0.61
Invesco Global Targeted Returns Fund
Statement of Investments as at 29 February 2016
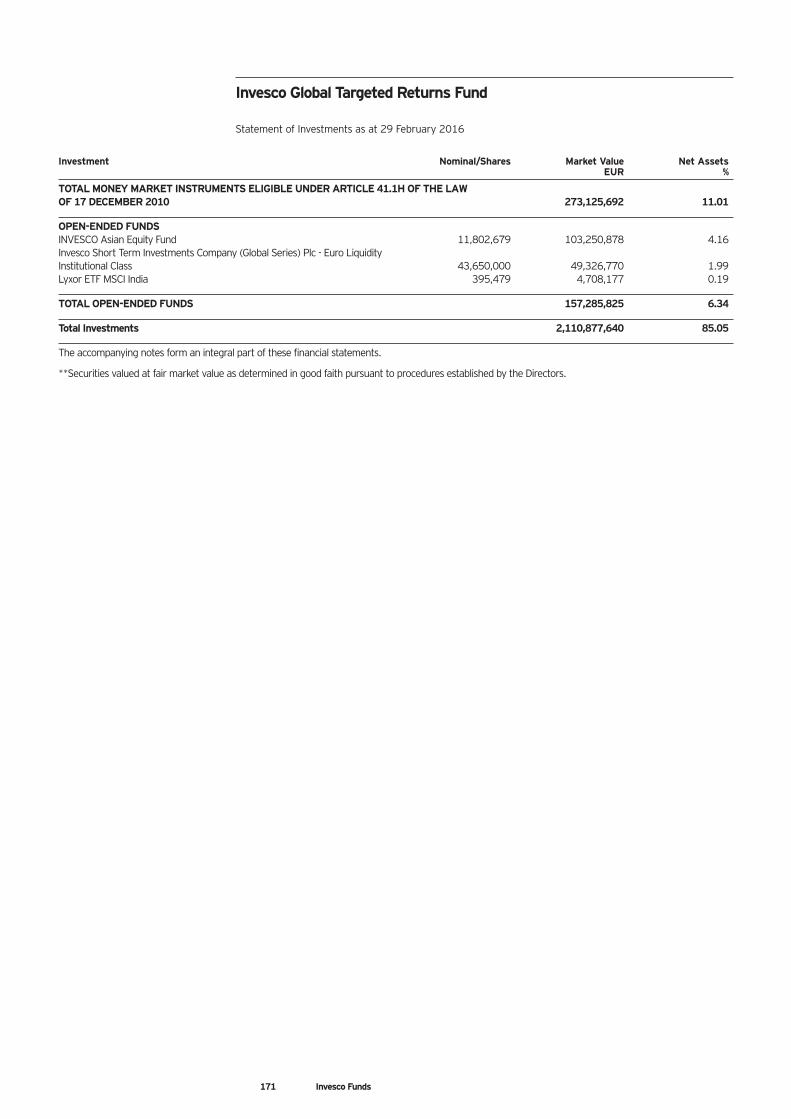
Investment Nominal/Shares Market Value Net Assets EUR %
TOTAL MONEY MARKET INSTRUMENTS ELIGIBLE UNDER ARTICLE 41.1H OF THE LAW OF 17 DECEMBER 2010 273,125,692 11.01
OPEN-ENDED FUNDSINVESCO Asian Equity Fund 11,802,679 103,250,878 4.16Invesco Short Term Investments Company (Global Series) Plc - Euro Liquidity Institutional Class 43,650,000 49,326,770 1.99Lyxor ETF MSCI India 395,479 4,708,177 0.19
TOTAL OPEN-ENDED FUNDS 157,285,825 6.34
Total Investments 2,110,877,640 85.05
The accompanying notes form an integral part of these financial statements.
**Securities valued at fair market value as determined in good faith pursuant to procedures established by the Directors.
Invesco Global Targeted Returns Fund
Statement of Investments as at 29 February 2016
171 Invesco Funds
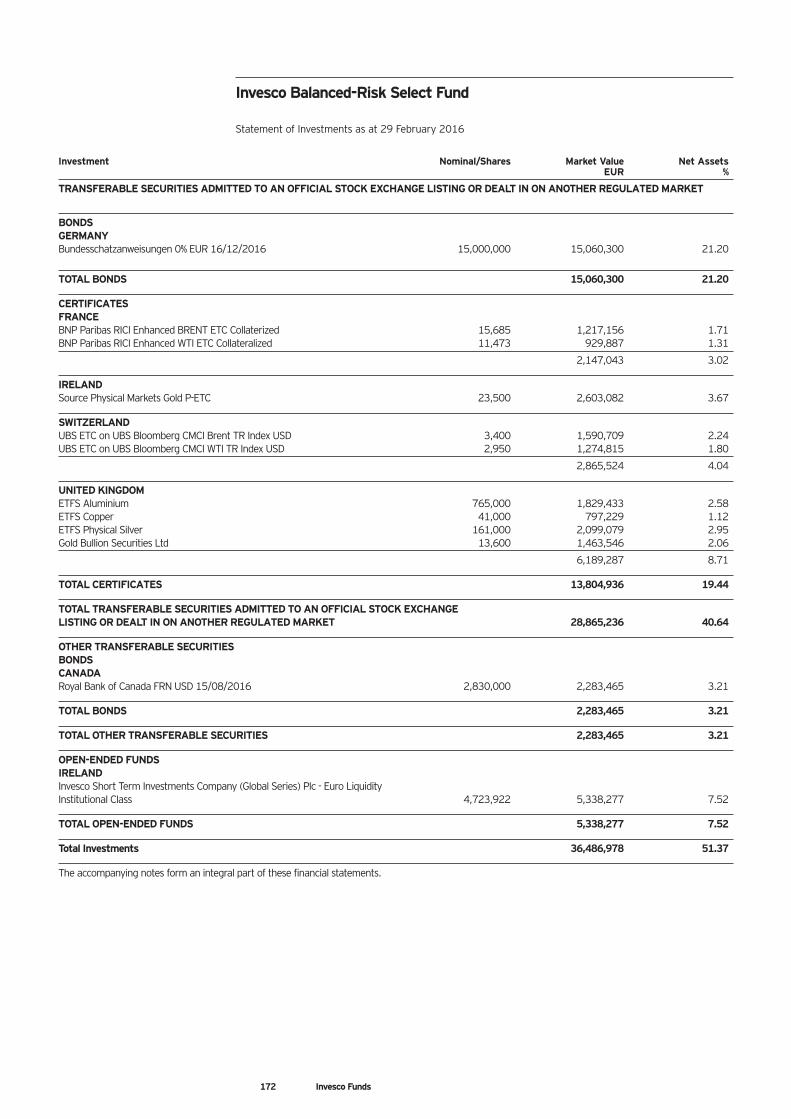
Investment Nominal/Shares Market Value Net Assets EUR %
TRANSFERABLE SECURITIES ADMITTED TO AN OFFICIAL STOCK EXCHANGE LISTING OR DEALT IN ON ANOTHER REGULATED MARKET
BONDSGERMANYBundesschatzanweisungen 0% EUR 16/12/2016 15,000,000 15,060,300 21.20
TOTAL BONDS 15,060,300 21.20
CERTIFICATESFRANCEBNP Paribas RICI Enhanced BRENT ETC Collaterized 15,685 1,217,156 1.71BNP Paribas RICI Enhanced WTI ETC Collateralized 11,473 929,887 1.31
2,147,043 3.02
IRELANDSource Physical Markets Gold P-ETC 23,500 2,603,082 3.67
SWITZERLANDUBS ETC on UBS Bloomberg CMCI Brent TR Index USD 3,400 1,590,709 2.24UBS ETC on UBS Bloomberg CMCI WTI TR Index USD 2,950 1,274,815 1.80
2,865,524 4.04
UNITED KINGDOMETFS Aluminium 765,000 1,829,433 2.58ETFS Copper 41,000 797,229 1.12ETFS Physical Silver 161,000 2,099,079 2.95Gold Bullion Securities Ltd 13,600 1,463,546 2.06
6,189,287 8.71
TOTAL CERTIFICATES 13,804,936 19.44
TOTAL TRANSFERABLE SECURITIES ADMITTED TO AN OFFICIAL STOCK EXCHANGE LISTING OR DEALT IN ON ANOTHER REGULATED MARKET 28,865,236 40.64
OTHER TRANSFERABLE SECURITIESBONDSCANADARoyal Bank of Canada FRN USD 15/08/2016 2,830,000 2,283,465 3.21
TOTAL BONDS 2,283,465 3.21
TOTAL OTHER TRANSFERABLE SECURITIES 2,283,465 3.21
OPEN-ENDED FUNDSIRELANDInvesco Short Term Investments Company (Global Series) Plc - Euro Liquidity Institutional Class 4,723,922 5,338,277 7.52
TOTAL OPEN-ENDED FUNDS 5,338,277 7.52
Total Investments 36,486,978 51.37
The accompanying notes form an integral part of these financial statements.
Invesco Balanced-Risk Select Fund
Statement of Investments as at 29 February 2016
172 Invesco Funds
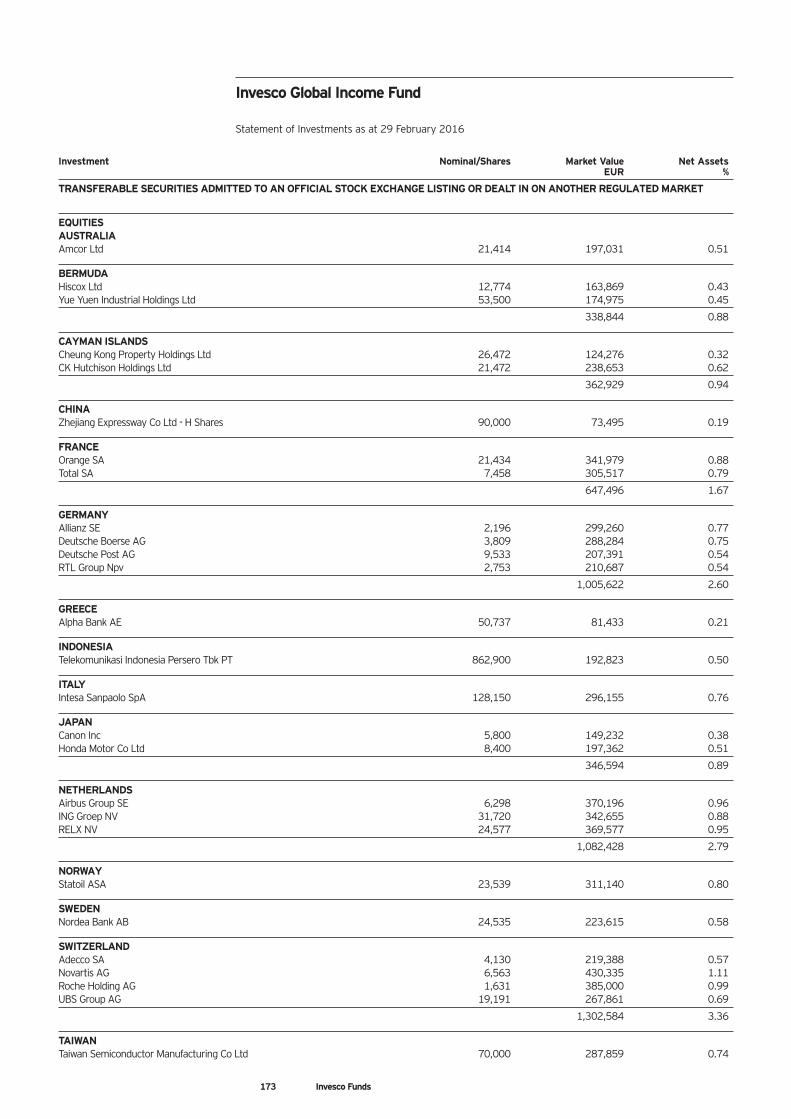
Investment Nominal/Shares Market Value Net Assets EUR %
TRANSFERABLE SECURITIES ADMITTED TO AN OFFICIAL STOCK EXCHANGE LISTING OR DEALT IN ON ANOTHER REGULATED MARKET
EQUITIESAUSTRALIAAmcor Ltd 21,414 197,031 0.51
BERMUDAHiscox Ltd 12,774 163,869 0.43Yue Yuen Industrial Holdings Ltd 53,500 174,975 0.45
338,844 0.88
CAYMAN ISLANDSCheung Kong Property Holdings Ltd 26,472 124,276 0.32CK Hutchison Holdings Ltd 21,472 238,653 0.62
362,929 0.94
CHINAZhejiang Expressway Co Ltd - H Shares 90,000 73,495 0.19
FRANCEOrange SA 21,434 341,979 0.88Total SA 7,458 305,517 0.79
647,496 1.67
GERMANYAllianz SE 2,196 299,260 0.77Deutsche Boerse AG 3,809 288,284 0.75Deutsche Post AG 9,533 207,391 0.54RTL Group Npv 2,753 210,687 0.54
1,005,622 2.60
GREECEAlpha Bank AE 50,737 81,433 0.21
INDONESIATelekomunikasi Indonesia Persero Tbk PT 862,900 192,823 0.50
ITALYIntesa Sanpaolo SpA 128,150 296,155 0.76
JAPANCanon Inc 5,800 149,232 0.38Honda Motor Co Ltd 8,400 197,362 0.51
346,594 0.89
NETHERLANDSAirbus Group SE 6,298 370,196 0.96ING Groep NV 31,720 342,655 0.88RELX NV 24,577 369,577 0.95
1,082,428 2.79
NORWAYStatoil ASA 23,539 311,140 0.80
SWEDENNordea Bank AB 24,535 223,615 0.58
SWITZERLANDAdecco SA 4,130 219,388 0.57Novartis AG 6,563 430,335 1.11Roche Holding AG 1,631 385,000 0.99UBS Group AG 19,191 267,861 0.69
1,302,584 3.36
TAIWANTaiwan Semiconductor Manufacturing Co Ltd 70,000 287,859 0.74
Invesco Global Income Fund
Statement of Investments as at 29 February 2016
173 Invesco Funds
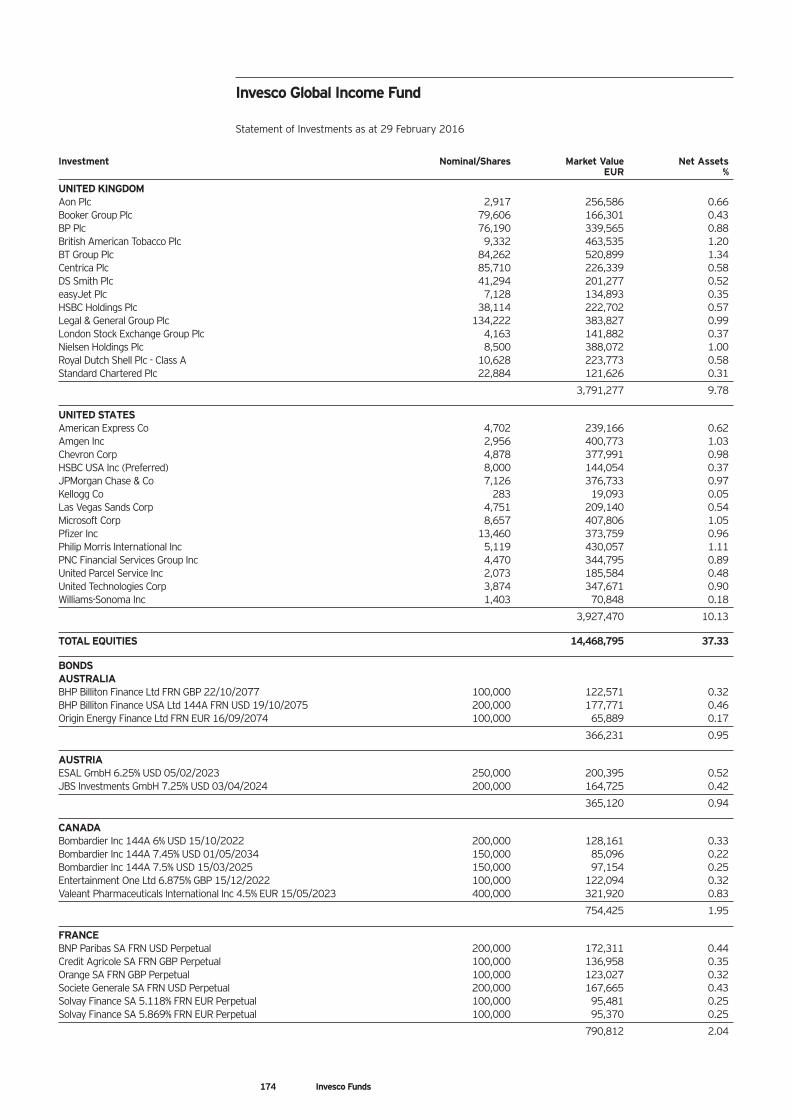
Investment Nominal/Shares Market Value Net Assets EUR %
UNITED KINGDOMAon Plc 2,917 256,586 0.66Booker Group Plc 79,606 166,301 0.43BP Plc 76,190 339,565 0.88British American Tobacco Plc 9,332 463,535 1.20BT Group Plc 84,262 520,899 1.34Centrica Plc 85,710 226,339 0.58DS Smith Plc 41,294 201,277 0.52easyJet Plc 7,128 134,893 0.35HSBC Holdings Plc 38,114 222,702 0.57Legal & General Group Plc 134,222 383,827 0.99London Stock Exchange Group Plc 4,163 141,882 0.37Nielsen Holdings Plc 8,500 388,072 1.00Royal Dutch Shell Plc - Class A 10,628 223,773 0.58Standard Chartered Plc 22,884 121,626 0.31
3,791,277 9.78
UNITED STATESAmerican Express Co 4,702 239,166 0.62Amgen Inc 2,956 400,773 1.03Chevron Corp 4,878 377,991 0.98HSBC USA Inc (Preferred) 8,000 144,054 0.37JPMorgan Chase & Co 7,126 376,733 0.97Kellogg Co 283 19,093 0.05Las Vegas Sands Corp 4,751 209,140 0.54Microsoft Corp 8,657 407,806 1.05Pfizer Inc 13,460 373,759 0.96Philip Morris International Inc 5,119 430,057 1.11PNC Financial Services Group Inc 4,470 344,795 0.89United Parcel Service Inc 2,073 185,584 0.48United Technologies Corp 3,874 347,671 0.90Williams-Sonoma Inc 1,403 70,848 0.18
3,927,470 10.13
TOTAL EQUITIES 14,468,795 37.33
BONDSAUSTRALIABHP Billiton Finance Ltd FRN GBP 22/10/2077 100,000 122,571 0.32BHP Billiton Finance USA Ltd 144A FRN USD 19/10/2075 200,000 177,771 0.46Origin Energy Finance Ltd FRN EUR 16/09/2074 100,000 65,889 0.17
366,231 0.95
AUSTRIAESAL GmbH 6.25% USD 05/02/2023 250,000 200,395 0.52JBS Investments GmbH 7.25% USD 03/04/2024 200,000 164,725 0.42
365,120 0.94
CANADABombardier Inc 144A 6% USD 15/10/2022 200,000 128,161 0.33Bombardier Inc 144A 7.45% USD 01/05/2034 150,000 85,096 0.22Bombardier Inc 144A 7.5% USD 15/03/2025 150,000 97,154 0.25Entertainment One Ltd 6.875% GBP 15/12/2022 100,000 122,094 0.32Valeant Pharmaceuticals International Inc 4.5% EUR 15/05/2023 400,000 321,920 0.83
754,425 1.95
FRANCEBNP Paribas SA FRN USD Perpetual 200,000 172,311 0.44Credit Agricole SA FRN GBP Perpetual 100,000 136,958 0.35Orange SA FRN GBP Perpetual 100,000 123,027 0.32Societe Generale SA FRN USD Perpetual 200,000 167,665 0.43Solvay Finance SA 5.118% FRN EUR Perpetual 100,000 95,481 0.25Solvay Finance SA 5.869% FRN EUR Perpetual 100,000 95,370 0.25
790,812 2.04
Invesco Global Income Fund
Statement of Investments as at 29 February 2016
174 Invesco Funds
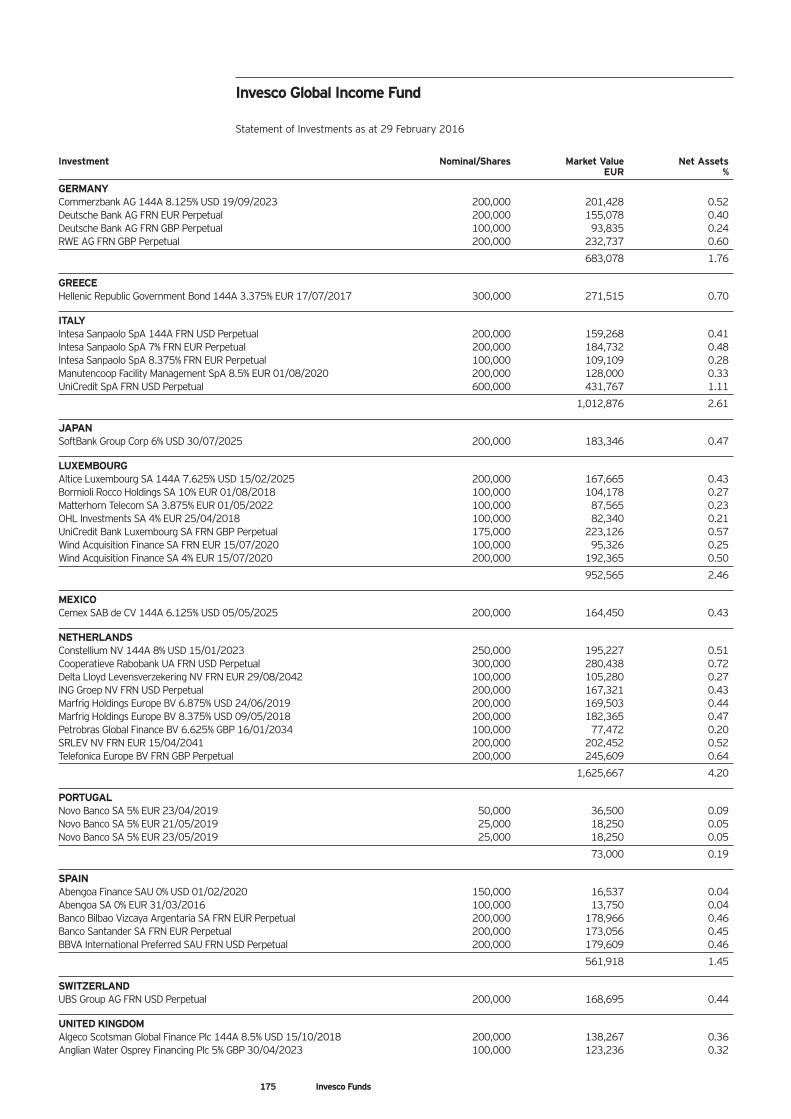
Investment Nominal/Shares Market Value Net Assets EUR %
GERMANYCommerzbank AG 144A 8.125% USD 19/09/2023 200,000 201,428 0.52Deutsche Bank AG FRN EUR Perpetual 200,000 155,078 0.40Deutsche Bank AG FRN GBP Perpetual 100,000 93,835 0.24RWE AG FRN GBP Perpetual 200,000 232,737 0.60
683,078 1.76
GREECEHellenic Republic Government Bond 144A 3.375% EUR 17/07/2017 300,000 271,515 0.70
ITALYIntesa Sanpaolo SpA 144A FRN USD Perpetual 200,000 159,268 0.41Intesa Sanpaolo SpA 7% FRN EUR Perpetual 200,000 184,732 0.48Intesa Sanpaolo SpA 8.375% FRN EUR Perpetual 100,000 109,109 0.28Manutencoop Facility Management SpA 8.5% EUR 01/08/2020 200,000 128,000 0.33UniCredit SpA FRN USD Perpetual 600,000 431,767 1.11
1,012,876 2.61
JAPANSoftBank Group Corp 6% USD 30/07/2025 200,000 183,346 0.47
LUXEMBOURGAltice Luxembourg SA 144A 7.625% USD 15/02/2025 200,000 167,665 0.43Bormioli Rocco Holdings SA 10% EUR 01/08/2018 100,000 104,178 0.27Matterhorn Telecom SA 3.875% EUR 01/05/2022 100,000 87,565 0.23OHL Investments SA 4% EUR 25/04/2018 100,000 82,340 0.21UniCredit Bank Luxembourg SA FRN GBP Perpetual 175,000 223,126 0.57Wind Acquisition Finance SA FRN EUR 15/07/2020 100,000 95,326 0.25Wind Acquisition Finance SA 4% EUR 15/07/2020 200,000 192,365 0.50
952,565 2.46
MEXICOCemex SAB de CV 144A 6.125% USD 05/05/2025 200,000 164,450 0.43
NETHERLANDSConstellium NV 144A 8% USD 15/01/2023 250,000 195,227 0.51Cooperatieve Rabobank UA FRN USD Perpetual 300,000 280,438 0.72Delta Lloyd Levensverzekering NV FRN EUR 29/08/2042 100,000 105,280 0.27ING Groep NV FRN USD Perpetual 200,000 167,321 0.43Marfrig Holdings Europe BV 6.875% USD 24/06/2019 200,000 169,503 0.44Marfrig Holdings Europe BV 8.375% USD 09/05/2018 200,000 182,365 0.47Petrobras Global Finance BV 6.625% GBP 16/01/2034 100,000 77,472 0.20SRLEV NV FRN EUR 15/04/2041 200,000 202,452 0.52Telefonica Europe BV FRN GBP Perpetual 200,000 245,609 0.64
1,625,667 4.20
PORTUGALNovo Banco SA 5% EUR 23/04/2019 50,000 36,500 0.09Novo Banco SA 5% EUR 21/05/2019 25,000 18,250 0.05Novo Banco SA 5% EUR 23/05/2019 25,000 18,250 0.05
73,000 0.19
SPAINAbengoa Finance SAU 0% USD 01/02/2020 150,000 16,537 0.04Abengoa SA 0% EUR 31/03/2016 100,000 13,750 0.04Banco Bilbao Vizcaya Argentaria SA FRN EUR Perpetual 200,000 178,966 0.46Banco Santander SA FRN EUR Perpetual 200,000 173,056 0.45BBVA International Preferred SAU FRN USD Perpetual 200,000 179,609 0.46
561,918 1.45
SWITZERLANDUBS Group AG FRN USD Perpetual 200,000 168,695 0.44
UNITED KINGDOMAlgeco Scotsman Global Finance Plc 144A 8.5% USD 15/10/2018 200,000 138,267 0.36Anglian Water Osprey Financing Plc 5% GBP 30/04/2023 100,000 123,236 0.32
Invesco Global Income Fund
Statement of Investments as at 29 February 2016
175 Invesco Funds
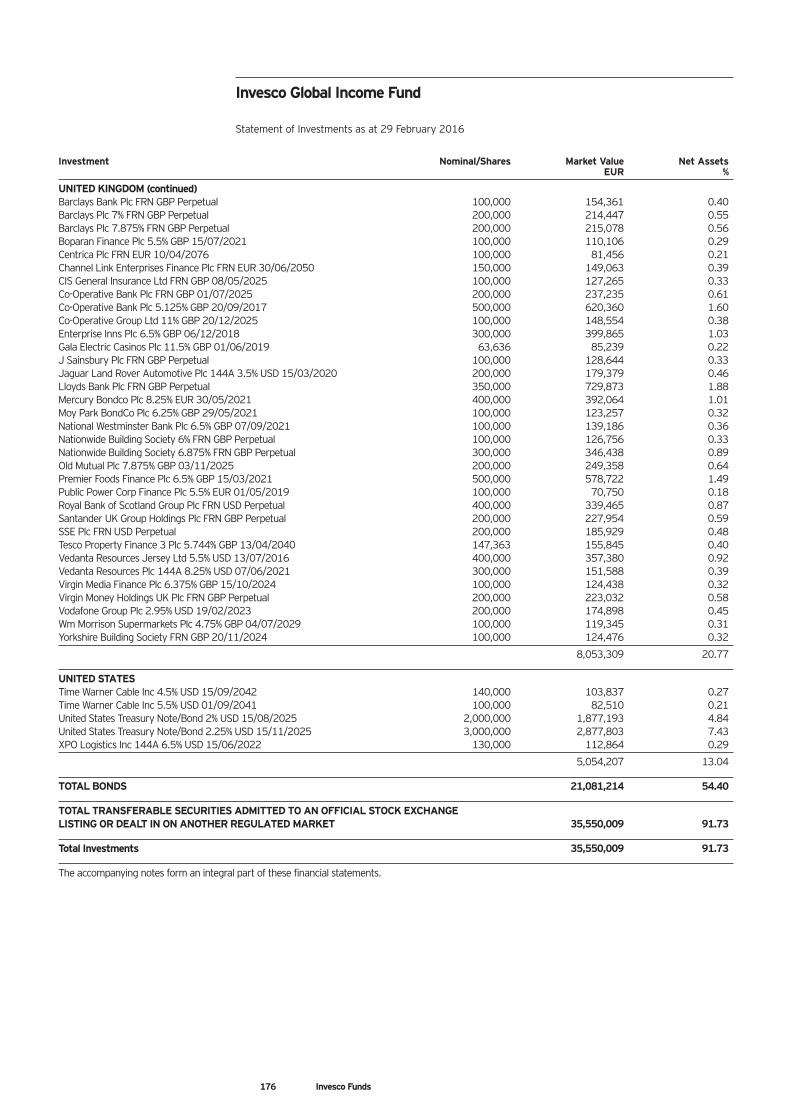
Investment Nominal/Shares Market Value Net Assets EUR %
UNITED KINGDOM (continued)Barclays Bank Plc FRN GBP Perpetual 100,000 154,361 0.40Barclays Plc 7% FRN GBP Perpetual 200,000 214,447 0.55Barclays Plc 7.875% FRN GBP Perpetual 200,000 215,078 0.56Boparan Finance Plc 5.5% GBP 15/07/2021 100,000 110,106 0.29Centrica Plc FRN EUR 10/04/2076 100,000 81,456 0.21Channel Link Enterprises Finance Plc FRN EUR 30/06/2050 150,000 149,063 0.39CIS General Insurance Ltd FRN GBP 08/05/2025 100,000 127,265 0.33Co-Operative Bank Plc FRN GBP 01/07/2025 200,000 237,235 0.61Co-Operative Bank Plc 5.125% GBP 20/09/2017 500,000 620,360 1.60Co-Operative Group Ltd 11% GBP 20/12/2025 100,000 148,554 0.38Enterprise Inns Plc 6.5% GBP 06/12/2018 300,000 399,865 1.03Gala Electric Casinos Plc 11.5% GBP 01/06/2019 63,636 85,239 0.22J Sainsbury Plc FRN GBP Perpetual 100,000 128,644 0.33Jaguar Land Rover Automotive Plc 144A 3.5% USD 15/03/2020 200,000 179,379 0.46Lloyds Bank Plc FRN GBP Perpetual 350,000 729,873 1.88Mercury Bondco Plc 8.25% EUR 30/05/2021 400,000 392,064 1.01Moy Park BondCo Plc 6.25% GBP 29/05/2021 100,000 123,257 0.32National Westminster Bank Plc 6.5% GBP 07/09/2021 100,000 139,186 0.36Nationwide Building Society 6% FRN GBP Perpetual 100,000 126,756 0.33Nationwide Building Society 6.875% FRN GBP Perpetual 300,000 346,438 0.89Old Mutual Plc 7.875% GBP 03/11/2025 200,000 249,358 0.64Premier Foods Finance Plc 6.5% GBP 15/03/2021 500,000 578,722 1.49Public Power Corp Finance Plc 5.5% EUR 01/05/2019 100,000 70,750 0.18Royal Bank of Scotland Group Plc FRN USD Perpetual 400,000 339,465 0.87Santander UK Group Holdings Plc FRN GBP Perpetual 200,000 227,954 0.59SSE Plc FRN USD Perpetual 200,000 185,929 0.48Tesco Property Finance 3 Plc 5.744% GBP 13/04/2040 147,363 155,845 0.40Vedanta Resources Jersey Ltd 5.5% USD 13/07/2016 400,000 357,380 0.92Vedanta Resources Plc 144A 8.25% USD 07/06/2021 300,000 151,588 0.39Virgin Media Finance Plc 6.375% GBP 15/10/2024 100,000 124,438 0.32Virgin Money Holdings UK Plc FRN GBP Perpetual 200,000 223,032 0.58Vodafone Group Plc 2.95% USD 19/02/2023 200,000 174,898 0.45Wm Morrison Supermarkets Plc 4.75% GBP 04/07/2029 100,000 119,345 0.31Yorkshire Building Society FRN GBP 20/11/2024 100,000 124,476 0.32
8,053,309 20.77
UNITED STATESTime Warner Cable Inc 4.5% USD 15/09/2042 140,000 103,837 0.27Time Warner Cable Inc 5.5% USD 01/09/2041 100,000 82,510 0.21United States Treasury Note/Bond 2% USD 15/08/2025 2,000,000 1,877,193 4.84United States Treasury Note/Bond 2.25% USD 15/11/2025 3,000,000 2,877,803 7.43XPO Logistics Inc 144A 6.5% USD 15/06/2022 130,000 112,864 0.29
5,054,207 13.04
TOTAL BONDS 21,081,214 54.40
TOTAL TRANSFERABLE SECURITIES ADMITTED TO AN OFFICIAL STOCK EXCHANGE LISTING OR DEALT IN ON ANOTHER REGULATED MARKET 35,550,009 91.73
Total Investments 35,550,009 91.73
The accompanying notes form an integral part of these financial statements.
Invesco Global Income Fund
Statement of Investments as at 29 February 2016
176 Invesco Funds

Investment Nominal/Shares Market Value Net Assets EUR %
OPEN-ENDED FUNDSIRELANDInvesco Short Term Investments Company (Global Series) Plc - Euro Liquidity Institutional Class 265,000 299,464 6.14
TOTAL OPEN-ENDED FUNDS 299,464 6.14
Total Investments 299,464 6.14
The accompanying notes form an integral part of these financial statements.
Invesco Global Markets Strategy Fund
Statement of Investments as at 29 February 2016
177 Invesco Funds
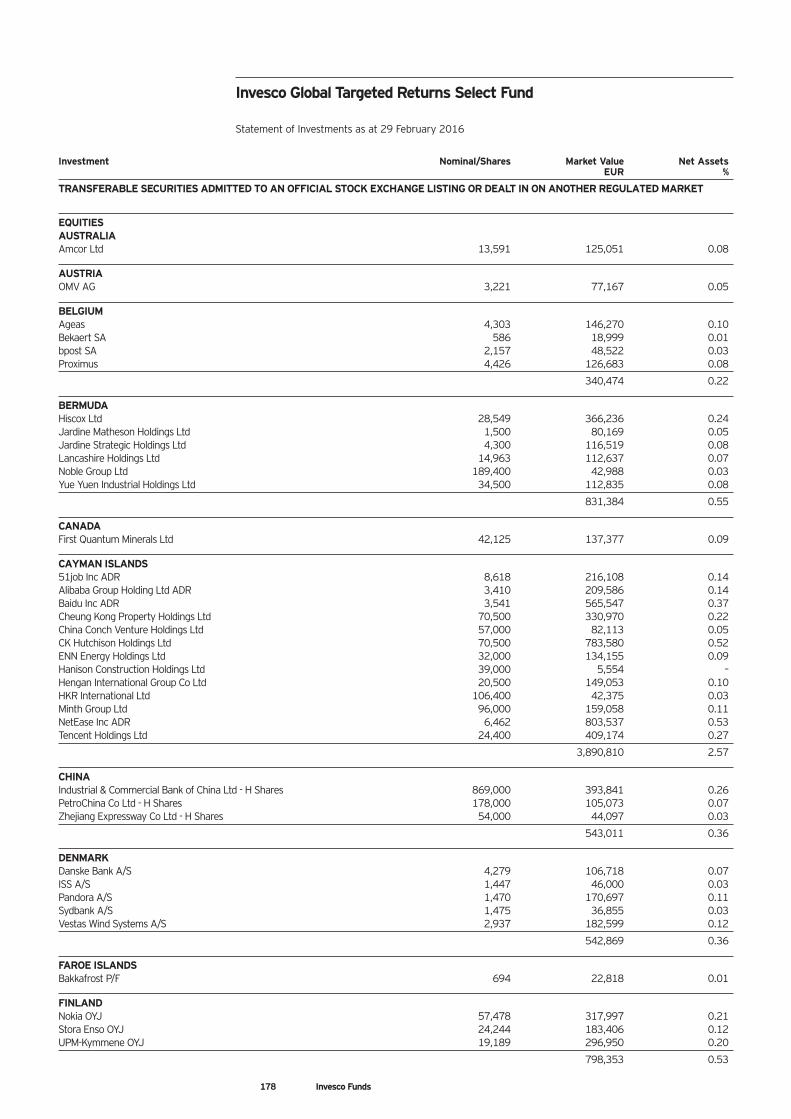
Investment Nominal/Shares Market Value Net Assets EUR %
TRANSFERABLE SECURITIES ADMITTED TO AN OFFICIAL STOCK EXCHANGE LISTING OR DEALT IN ON ANOTHER REGULATED MARKET
EQUITIESAUSTRALIAAmcor Ltd 13,591 125,051 0.08
AUSTRIAOMV AG 3,221 77,167 0.05
BELGIUMAgeas 4,303 146,270 0.10Bekaert SA 586 18,999 0.01bpost SA 2,157 48,522 0.03Proximus 4,426 126,683 0.08
340,474 0.22
BERMUDAHiscox Ltd 28,549 366,236 0.24Jardine Matheson Holdings Ltd 1,500 80,169 0.05Jardine Strategic Holdings Ltd 4,300 116,519 0.08Lancashire Holdings Ltd 14,963 112,637 0.07Noble Group Ltd 189,400 42,988 0.03Yue Yuen Industrial Holdings Ltd 34,500 112,835 0.08
831,384 0.55
CANADAFirst Quantum Minerals Ltd 42,125 137,377 0.09
CAYMAN ISLANDS51job Inc ADR 8,618 216,108 0.14Alibaba Group Holding Ltd ADR 3,410 209,586 0.14Baidu Inc ADR 3,541 565,547 0.37Cheung Kong Property Holdings Ltd 70,500 330,970 0.22China Conch Venture Holdings Ltd 57,000 82,113 0.05CK Hutchison Holdings Ltd 70,500 783,580 0.52ENN Energy Holdings Ltd 32,000 134,155 0.09Hanison Construction Holdings Ltd 39,000 5,554 –Hengan International Group Co Ltd 20,500 149,053 0.10HKR International Ltd 106,400 42,375 0.03Minth Group Ltd 96,000 159,058 0.11NetEase Inc ADR 6,462 803,537 0.53Tencent Holdings Ltd 24,400 409,174 0.27
3,890,810 2.57
CHINAIndustrial & Commercial Bank of China Ltd - H Shares 869,000 393,841 0.26PetroChina Co Ltd - H Shares 178,000 105,073 0.07Zhejiang Expressway Co Ltd - H Shares 54,000 44,097 0.03
543,011 0.36
DENMARKDanske Bank A/S 4,279 106,718 0.07ISS A/S 1,447 46,000 0.03Pandora A/S 1,470 170,697 0.11Sydbank A/S 1,475 36,855 0.03Vestas Wind Systems A/S 2,937 182,599 0.12
542,869 0.36
FAROE ISLANDSBakkafrost P/F 694 22,818 0.01
FINLANDNokia OYJ 57,478 317,997 0.21Stora Enso OYJ 24,244 183,406 0.12UPM-Kymmene OYJ 19,189 296,950 0.20
798,353 0.53
Invesco Global Targeted Returns Select Fund
Statement of Investments as at 29 February 2016
178 Invesco Funds
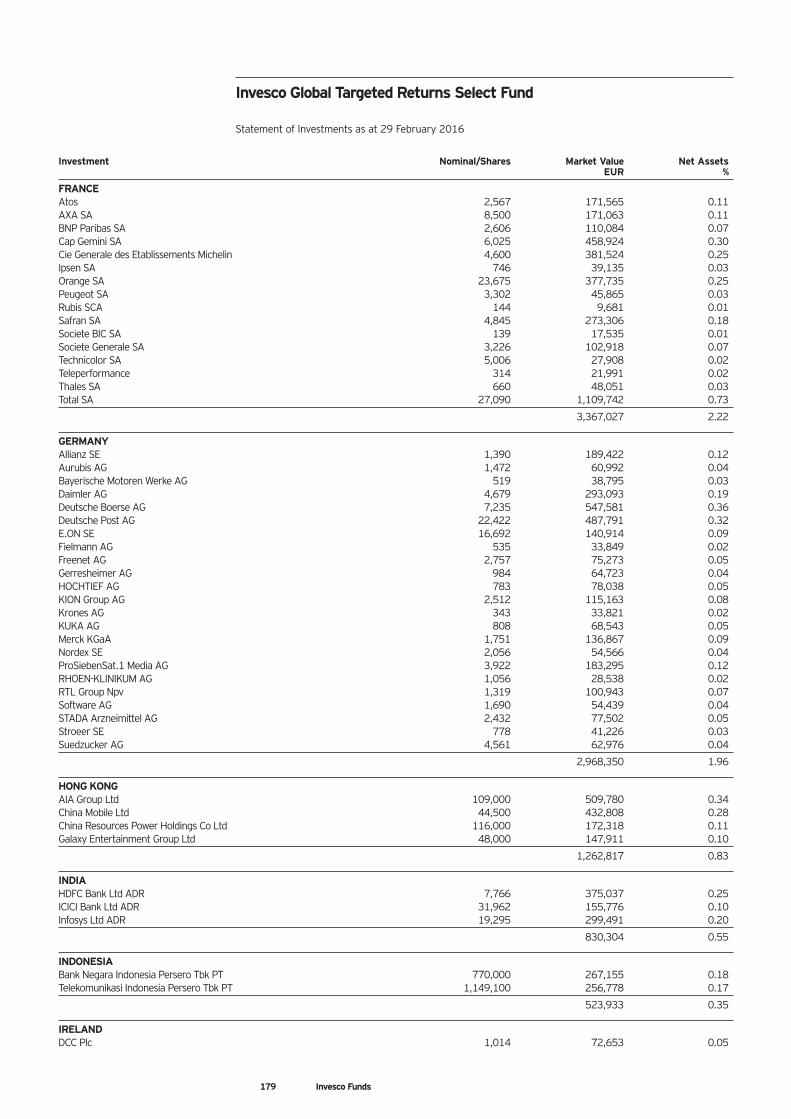
Investment Nominal/Shares Market Value Net Assets EUR %
FRANCEAtos 2,567 171,565 0.11AXA SA 8,500 171,063 0.11BNP Paribas SA 2,606 110,084 0.07Cap Gemini SA 6,025 458,924 0.30Cie Generale des Etablissements Michelin 4,600 381,524 0.25Ipsen SA 746 39,135 0.03Orange SA 23,675 377,735 0.25Peugeot SA 3,302 45,865 0.03Rubis SCA 144 9,681 0.01Safran SA 4,845 273,306 0.18Societe BIC SA 139 17,535 0.01Societe Generale SA 3,226 102,918 0.07Technicolor SA 5,006 27,908 0.02Teleperformance 314 21,991 0.02Thales SA 660 48,051 0.03Total SA 27,090 1,109,742 0.73
3,367,027 2.22
GERMANYAllianz SE 1,390 189,422 0.12Aurubis AG 1,472 60,992 0.04Bayerische Motoren Werke AG 519 38,795 0.03Daimler AG 4,679 293,093 0.19Deutsche Boerse AG 7,235 547,581 0.36Deutsche Post AG 22,422 487,791 0.32E.ON SE 16,692 140,914 0.09Fielmann AG 535 33,849 0.02Freenet AG 2,757 75,273 0.05Gerresheimer AG 984 64,723 0.04HOCHTIEF AG 783 78,038 0.05KION Group AG 2,512 115,163 0.08Krones AG 343 33,821 0.02KUKA AG 808 68,543 0.05Merck KGaA 1,751 136,867 0.09Nordex SE 2,056 54,566 0.04ProSiebenSat.1 Media AG 3,922 183,295 0.12RHOEN-KLINIKUM AG 1,056 28,538 0.02RTL Group Npv 1,319 100,943 0.07Software AG 1,690 54,439 0.04STADA Arzneimittel AG 2,432 77,502 0.05Stroeer SE 778 41,226 0.03Suedzucker AG 4,561 62,976 0.04
2,968,350 1.96
HONG KONGAIA Group Ltd 109,000 509,780 0.34China Mobile Ltd 44,500 432,808 0.28China Resources Power Holdings Co Ltd 116,000 172,318 0.11Galaxy Entertainment Group Ltd 48,000 147,911 0.10
1,262,817 0.83
INDIAHDFC Bank Ltd ADR 7,766 375,037 0.25ICICI Bank Ltd ADR 31,962 155,776 0.10Infosys Ltd ADR 19,295 299,491 0.20
830,304 0.55
INDONESIABank Negara Indonesia Persero Tbk PT 770,000 267,155 0.18Telekomunikasi Indonesia Persero Tbk PT 1,149,100 256,778 0.17
523,933 0.35
IRELANDDCC Plc 1,014 72,653 0.05
Invesco Global Targeted Returns Select Fund
Statement of Investments as at 29 February 2016
179 Invesco Funds
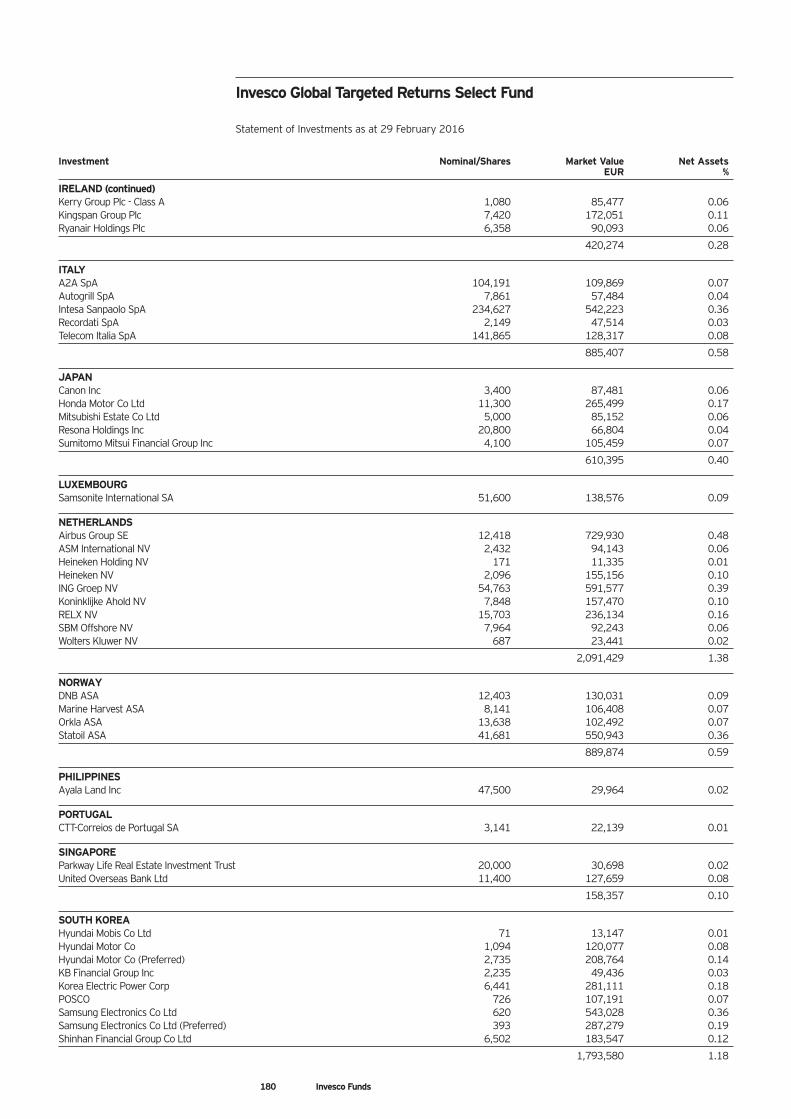
Investment Nominal/Shares Market Value Net Assets EUR %
IRELAND (continued)Kerry Group Plc - Class A 1,080 85,477 0.06Kingspan Group Plc 7,420 172,051 0.11Ryanair Holdings Plc 6,358 90,093 0.06
420,274 0.28
ITALYA2A SpA 104,191 109,869 0.07Autogrill SpA 7,861 57,484 0.04Intesa Sanpaolo SpA 234,627 542,223 0.36Recordati SpA 2,149 47,514 0.03Telecom Italia SpA 141,865 128,317 0.08
885,407 0.58
JAPANCanon Inc 3,400 87,481 0.06Honda Motor Co Ltd 11,300 265,499 0.17Mitsubishi Estate Co Ltd 5,000 85,152 0.06Resona Holdings Inc 20,800 66,804 0.04Sumitomo Mitsui Financial Group Inc 4,100 105,459 0.07
610,395 0.40
LUXEMBOURGSamsonite International SA 51,600 138,576 0.09
NETHERLANDSAirbus Group SE 12,418 729,930 0.48ASM International NV 2,432 94,143 0.06Heineken Holding NV 171 11,335 0.01Heineken NV 2,096 155,156 0.10ING Groep NV 54,763 591,577 0.39Koninklijke Ahold NV 7,848 157,470 0.10RELX NV 15,703 236,134 0.16SBM Offshore NV 7,964 92,243 0.06Wolters Kluwer NV 687 23,441 0.02
2,091,429 1.38
NORWAYDNB ASA 12,403 130,031 0.09Marine Harvest ASA 8,141 106,408 0.07Orkla ASA 13,638 102,492 0.07Statoil ASA 41,681 550,943 0.36
889,874 0.59
PHILIPPINESAyala Land Inc 47,500 29,964 0.02
PORTUGALCTT-Correios de Portugal SA 3,141 22,139 0.01
SINGAPOREParkway Life Real Estate Investment Trust 20,000 30,698 0.02United Overseas Bank Ltd 11,400 127,659 0.08
158,357 0.10
SOUTH KOREAHyundai Mobis Co Ltd 71 13,147 0.01Hyundai Motor Co 1,094 120,077 0.08Hyundai Motor Co (Preferred) 2,735 208,764 0.14KB Financial Group Inc 2,235 49,436 0.03Korea Electric Power Corp 6,441 281,111 0.18POSCO 726 107,191 0.07Samsung Electronics Co Ltd 620 543,028 0.36Samsung Electronics Co Ltd (Preferred) 393 287,279 0.19Shinhan Financial Group Co Ltd 6,502 183,547 0.12
1,793,580 1.18
Invesco Global Targeted Returns Select Fund
Statement of Investments as at 29 February 2016
180 Invesco Funds
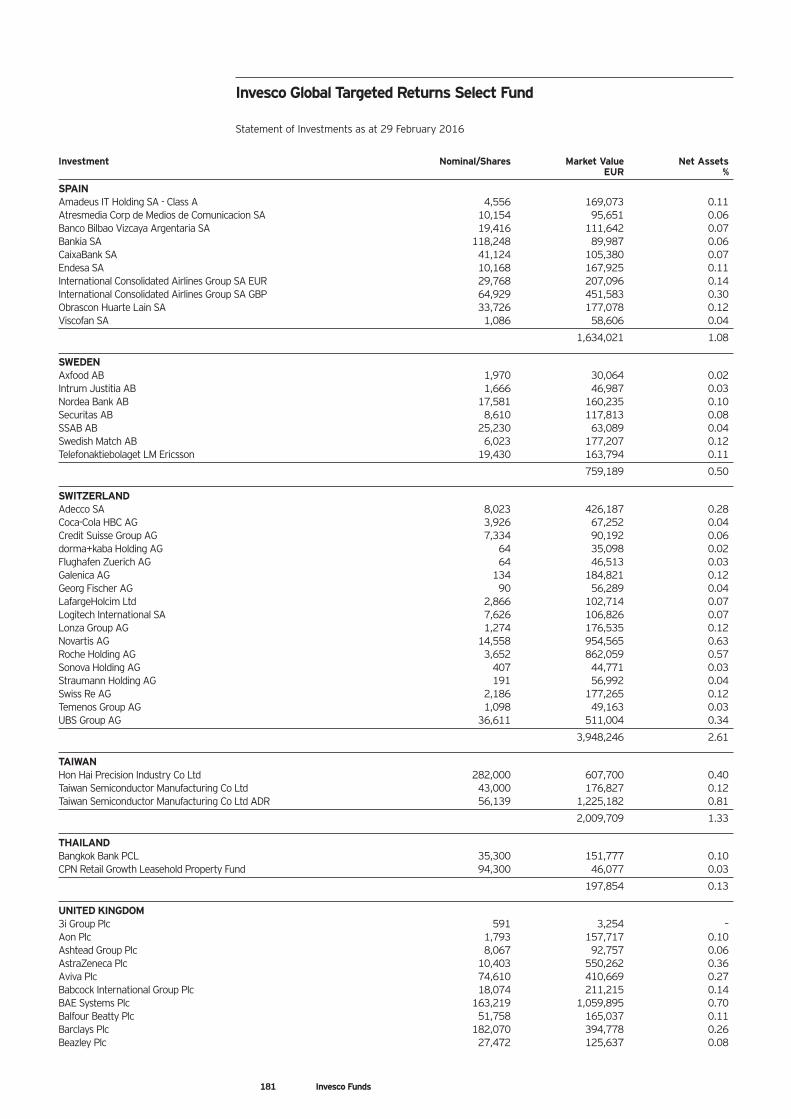
Investment Nominal/Shares Market Value Net Assets EUR %
SPAINAmadeus IT Holding SA - Class A 4,556 169,073 0.11Atresmedia Corp de Medios de Comunicacion SA 10,154 95,651 0.06Banco Bilbao Vizcaya Argentaria SA 19,416 111,642 0.07Bankia SA 118,248 89,987 0.06CaixaBank SA 41,124 105,380 0.07Endesa SA 10,168 167,925 0.11International Consolidated Airlines Group SA EUR 29,768 207,096 0.14International Consolidated Airlines Group SA GBP 64,929 451,583 0.30Obrascon Huarte Lain SA 33,726 177,078 0.12Viscofan SA 1,086 58,606 0.04
1,634,021 1.08
SWEDENAxfood AB 1,970 30,064 0.02Intrum Justitia AB 1,666 46,987 0.03Nordea Bank AB 17,581 160,235 0.10Securitas AB 8,610 117,813 0.08SSAB AB 25,230 63,089 0.04Swedish Match AB 6,023 177,207 0.12Telefonaktiebolaget LM Ericsson 19,430 163,794 0.11
759,189 0.50
SWITZERLANDAdecco SA 8,023 426,187 0.28Coca-Cola HBC AG 3,926 67,252 0.04Credit Suisse Group AG 7,334 90,192 0.06dorma+kaba Holding AG 64 35,098 0.02Flughafen Zuerich AG 64 46,513 0.03Galenica AG 134 184,821 0.12Georg Fischer AG 90 56,289 0.04LafargeHolcim Ltd 2,866 102,714 0.07Logitech International SA 7,626 106,826 0.07Lonza Group AG 1,274 176,535 0.12Novartis AG 14,558 954,565 0.63Roche Holding AG 3,652 862,059 0.57Sonova Holding AG 407 44,771 0.03Straumann Holding AG 191 56,992 0.04Swiss Re AG 2,186 177,265 0.12Temenos Group AG 1,098 49,163 0.03UBS Group AG 36,611 511,004 0.34
3,948,246 2.61
TAIWANHon Hai Precision Industry Co Ltd 282,000 607,700 0.40Taiwan Semiconductor Manufacturing Co Ltd 43,000 176,827 0.12Taiwan Semiconductor Manufacturing Co Ltd ADR 56,139 1,225,182 0.81
2,009,709 1.33
THAILANDBangkok Bank PCL 35,300 151,777 0.10CPN Retail Growth Leasehold Property Fund 94,300 46,077 0.03
197,854 0.13
UNITED KINGDOM3i Group Plc 591 3,254 –Aon Plc 1,793 157,717 0.10Ashtead Group Plc 8,067 92,757 0.06AstraZeneca Plc 10,403 550,262 0.36Aviva Plc 74,610 410,669 0.27Babcock International Group Plc 18,074 211,215 0.14BAE Systems Plc 163,219 1,059,895 0.70Balfour Beatty Plc 51,758 165,037 0.11Barclays Plc 182,070 394,778 0.26Beazley Plc 27,472 125,637 0.08
Invesco Global Targeted Returns Select Fund
Statement of Investments as at 29 February 2016
181 Invesco Funds
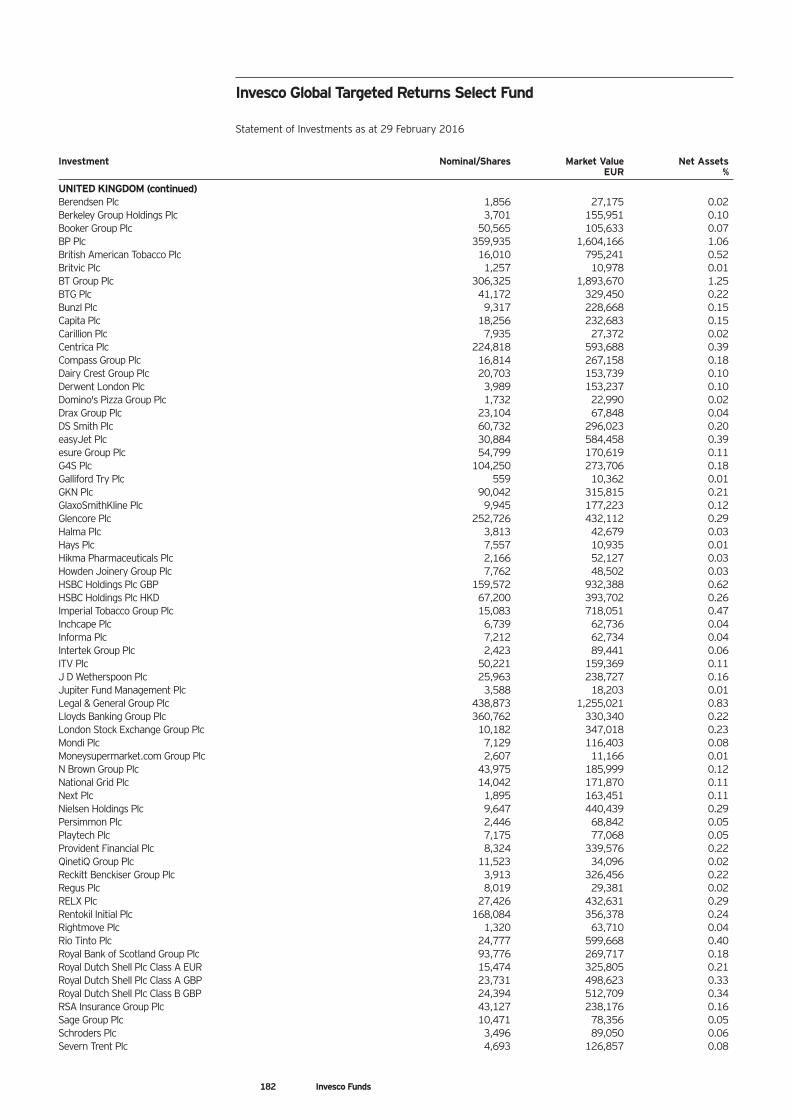
Investment Nominal/Shares Market Value Net Assets EUR %
UNITED KINGDOM (continued)Berendsen Plc 1,856 27,175 0.02Berkeley Group Holdings Plc 3,701 155,951 0.10Booker Group Plc 50,565 105,633 0.07BP Plc 359,935 1,604,166 1.06British American Tobacco Plc 16,010 795,241 0.52Britvic Plc 1,257 10,978 0.01BT Group Plc 306,325 1,893,670 1.25BTG Plc 41,172 329,450 0.22Bunzl Plc 9,317 228,668 0.15Capita Plc 18,256 232,683 0.15Carillion Plc 7,935 27,372 0.02Centrica Plc 224,818 593,688 0.39Compass Group Plc 16,814 267,158 0.18Dairy Crest Group Plc 20,703 153,739 0.10Derwent London Plc 3,989 153,237 0.10Domino's Pizza Group Plc 1,732 22,990 0.02Drax Group Plc 23,104 67,848 0.04DS Smith Plc 60,732 296,023 0.20easyJet Plc 30,884 584,458 0.39esure Group Plc 54,799 170,619 0.11G4S Plc 104,250 273,706 0.18Galliford Try Plc 559 10,362 0.01GKN Plc 90,042 315,815 0.21GlaxoSmithKline Plc 9,945 177,223 0.12Glencore Plc 252,726 432,112 0.29Halma Plc 3,813 42,679 0.03Hays Plc 7,557 10,935 0.01Hikma Pharmaceuticals Plc 2,166 52,127 0.03Howden Joinery Group Plc 7,762 48,502 0.03HSBC Holdings Plc GBP 159,572 932,388 0.62HSBC Holdings Plc HKD 67,200 393,702 0.26Imperial Tobacco Group Plc 15,083 718,051 0.47Inchcape Plc 6,739 62,736 0.04Informa Plc 7,212 62,734 0.04Intertek Group Plc 2,423 89,441 0.06ITV Plc 50,221 159,369 0.11J D Wetherspoon Plc 25,963 238,727 0.16Jupiter Fund Management Plc 3,588 18,203 0.01Legal & General Group Plc 438,873 1,255,021 0.83Lloyds Banking Group Plc 360,762 330,340 0.22London Stock Exchange Group Plc 10,182 347,018 0.23Mondi Plc 7,129 116,403 0.08Moneysupermarket.com Group Plc 2,607 11,166 0.01N Brown Group Plc 43,975 185,999 0.12National Grid Plc 14,042 171,870 0.11Next Plc 1,895 163,451 0.11Nielsen Holdings Plc 9,647 440,439 0.29Persimmon Plc 2,446 68,842 0.05Playtech Plc 7,175 77,068 0.05Provident Financial Plc 8,324 339,576 0.22QinetiQ Group Plc 11,523 34,096 0.02Reckitt Benckiser Group Plc 3,913 326,456 0.22Regus Plc 8,019 29,381 0.02RELX Plc 27,426 432,631 0.29Rentokil Initial Plc 168,084 356,378 0.24Rightmove Plc 1,320 63,710 0.04Rio Tinto Plc 24,777 599,668 0.40Royal Bank of Scotland Group Plc 93,776 269,717 0.18Royal Dutch Shell Plc Class A EUR 15,474 325,805 0.21Royal Dutch Shell Plc Class A GBP 23,731 498,623 0.33Royal Dutch Shell Plc Class B GBP 24,394 512,709 0.34RSA Insurance Group Plc 43,127 238,176 0.16Sage Group Plc 10,471 78,356 0.05Schroders Plc 3,496 89,050 0.06Severn Trent Plc 4,693 126,857 0.08
Invesco Global Targeted Returns Select Fund
Statement of Investments as at 29 February 2016
182 Invesco Funds
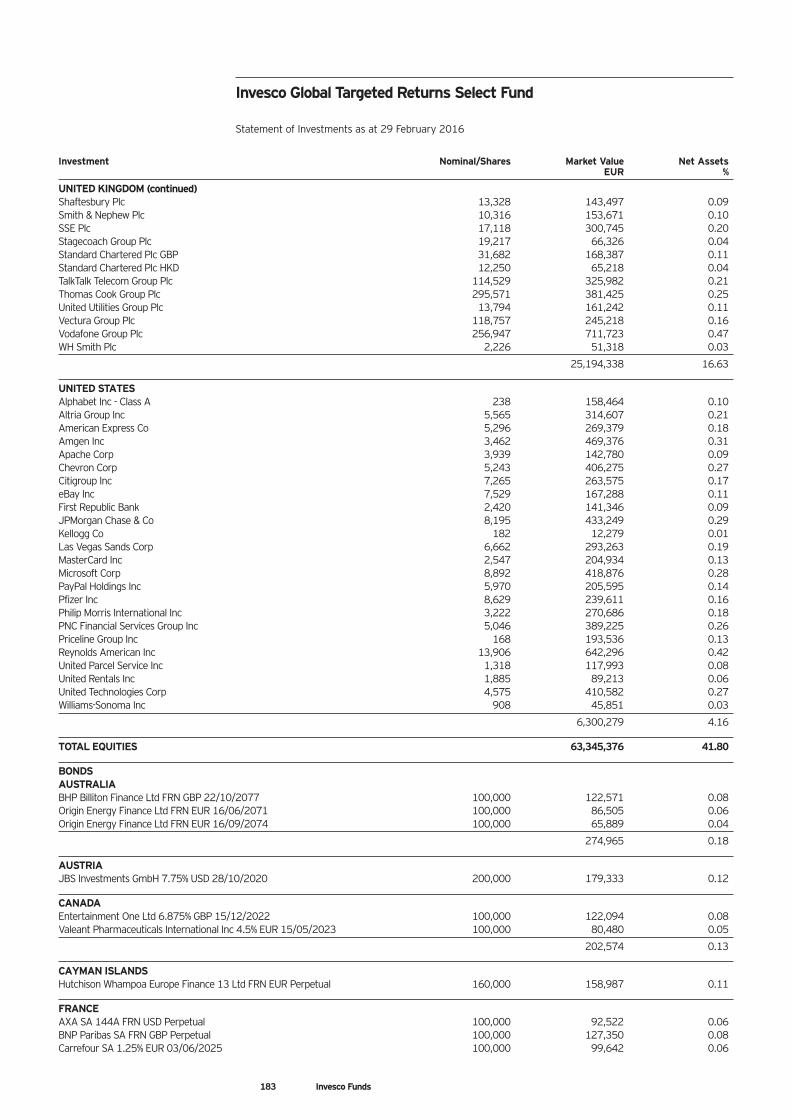
Investment Nominal/Shares Market Value Net Assets EUR %
UNITED KINGDOM (continued)Shaftesbury Plc 13,328 143,497 0.09Smith & Nephew Plc 10,316 153,671 0.10SSE Plc 17,118 300,745 0.20Stagecoach Group Plc 19,217 66,326 0.04Standard Chartered Plc GBP 31,682 168,387 0.11Standard Chartered Plc HKD 12,250 65,218 0.04TalkTalk Telecom Group Plc 114,529 325,982 0.21Thomas Cook Group Plc 295,571 381,425 0.25United Utilities Group Plc 13,794 161,242 0.11Vectura Group Plc 118,757 245,218 0.16Vodafone Group Plc 256,947 711,723 0.47WH Smith Plc 2,226 51,318 0.03
25,194,338 16.63
UNITED STATESAlphabet Inc - Class A 238 158,464 0.10Altria Group Inc 5,565 314,607 0.21American Express Co 5,296 269,379 0.18Amgen Inc 3,462 469,376 0.31Apache Corp 3,939 142,780 0.09Chevron Corp 5,243 406,275 0.27Citigroup Inc 7,265 263,575 0.17eBay Inc 7,529 167,288 0.11First Republic Bank 2,420 141,346 0.09JPMorgan Chase & Co 8,195 433,249 0.29Kellogg Co 182 12,279 0.01Las Vegas Sands Corp 6,662 293,263 0.19MasterCard Inc 2,547 204,934 0.13Microsoft Corp 8,892 418,876 0.28PayPal Holdings Inc 5,970 205,595 0.14Pfizer Inc 8,629 239,611 0.16Philip Morris International Inc 3,222 270,686 0.18PNC Financial Services Group Inc 5,046 389,225 0.26Priceline Group Inc 168 193,536 0.13Reynolds American Inc 13,906 642,296 0.42United Parcel Service Inc 1,318 117,993 0.08United Rentals Inc 1,885 89,213 0.06United Technologies Corp 4,575 410,582 0.27Williams-Sonoma Inc 908 45,851 0.03
6,300,279 4.16
TOTAL EQUITIES 63,345,376 41.80
BONDSAUSTRALIABHP Billiton Finance Ltd FRN GBP 22/10/2077 100,000 122,571 0.08Origin Energy Finance Ltd FRN EUR 16/06/2071 100,000 86,505 0.06Origin Energy Finance Ltd FRN EUR 16/09/2074 100,000 65,889 0.04
274,965 0.18
AUSTRIAJBS Investments GmbH 7.75% USD 28/10/2020 200,000 179,333 0.12
CANADAEntertainment One Ltd 6.875% GBP 15/12/2022 100,000 122,094 0.08Valeant Pharmaceuticals International Inc 4.5% EUR 15/05/2023 100,000 80,480 0.05
202,574 0.13
CAYMAN ISLANDSHutchison Whampoa Europe Finance 13 Ltd FRN EUR Perpetual 160,000 158,987 0.11
FRANCEAXA SA 144A FRN USD Perpetual 100,000 92,522 0.06BNP Paribas SA FRN GBP Perpetual 100,000 127,350 0.08Carrefour SA 1.25% EUR 03/06/2025 100,000 99,642 0.06
Invesco Global Targeted Returns Select Fund
Statement of Investments as at 29 February 2016
183 Invesco Funds
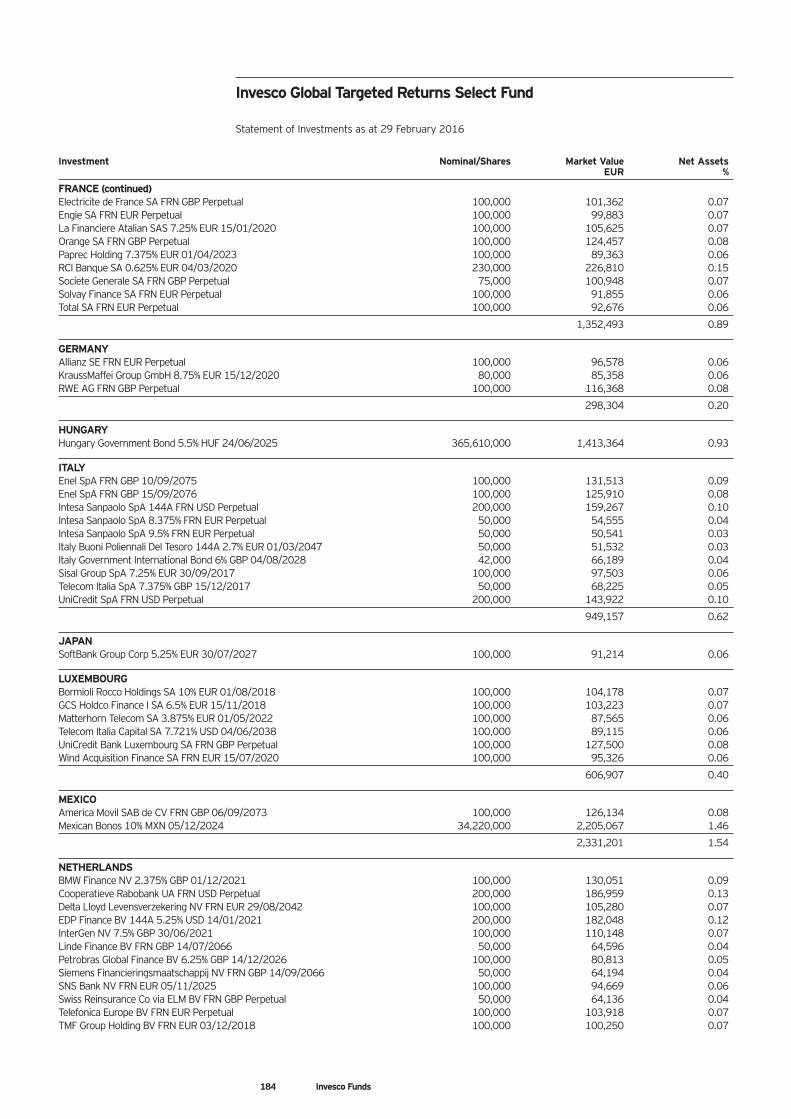
Investment Nominal/Shares Market Value Net Assets EUR %
FRANCE (continued)Electricite de France SA FRN GBP Perpetual 100,000 101,362 0.07Engie SA FRN EUR Perpetual 100,000 99,883 0.07La Financiere Atalian SAS 7.25% EUR 15/01/2020 100,000 105,625 0.07Orange SA FRN GBP Perpetual 100,000 124,457 0.08Paprec Holding 7.375% EUR 01/04/2023 100,000 89,363 0.06RCI Banque SA 0.625% EUR 04/03/2020 230,000 226,810 0.15Societe Generale SA FRN GBP Perpetual 75,000 100,948 0.07Solvay Finance SA FRN EUR Perpetual 100,000 91,855 0.06Total SA FRN EUR Perpetual 100,000 92,676 0.06
1,352,493 0.89
GERMANYAllianz SE FRN EUR Perpetual 100,000 96,578 0.06KraussMaffei Group GmbH 8.75% EUR 15/12/2020 80,000 85,358 0.06RWE AG FRN GBP Perpetual 100,000 116,368 0.08
298,304 0.20
HUNGARYHungary Government Bond 5.5% HUF 24/06/2025 365,610,000 1,413,364 0.93
ITALYEnel SpA FRN GBP 10/09/2075 100,000 131,513 0.09Enel SpA FRN GBP 15/09/2076 100,000 125,910 0.08Intesa Sanpaolo SpA 144A FRN USD Perpetual 200,000 159,267 0.10Intesa Sanpaolo SpA 8.375% FRN EUR Perpetual 50,000 54,555 0.04Intesa Sanpaolo SpA 9.5% FRN EUR Perpetual 50,000 50,541 0.03Italy Buoni Poliennali Del Tesoro 144A 2.7% EUR 01/03/2047 50,000 51,532 0.03Italy Government International Bond 6% GBP 04/08/2028 42,000 66,189 0.04Sisal Group SpA 7.25% EUR 30/09/2017 100,000 97,503 0.06Telecom Italia SpA 7.375% GBP 15/12/2017 50,000 68,225 0.05UniCredit SpA FRN USD Perpetual 200,000 143,922 0.10
949,157 0.62
JAPANSoftBank Group Corp 5.25% EUR 30/07/2027 100,000 91,214 0.06
LUXEMBOURGBormioli Rocco Holdings SA 10% EUR 01/08/2018 100,000 104,178 0.07GCS Holdco Finance I SA 6.5% EUR 15/11/2018 100,000 103,223 0.07Matterhorn Telecom SA 3.875% EUR 01/05/2022 100,000 87,565 0.06Telecom Italia Capital SA 7.721% USD 04/06/2038 100,000 89,115 0.06UniCredit Bank Luxembourg SA FRN GBP Perpetual 100,000 127,500 0.08Wind Acquisition Finance SA FRN EUR 15/07/2020 100,000 95,326 0.06
606,907 0.40
MEXICOAmerica Movil SAB de CV FRN GBP 06/09/2073 100,000 126,134 0.08Mexican Bonos 10% MXN 05/12/2024 34,220,000 2,205,067 1.46
2,331,201 1.54
NETHERLANDSBMW Finance NV 2.375% GBP 01/12/2021 100,000 130,051 0.09Cooperatieve Rabobank UA FRN USD Perpetual 200,000 186,959 0.13Delta Lloyd Levensverzekering NV FRN EUR 29/08/2042 100,000 105,280 0.07EDP Finance BV 144A 5.25% USD 14/01/2021 200,000 182,048 0.12InterGen NV 7.5% GBP 30/06/2021 100,000 110,148 0.07Linde Finance BV FRN GBP 14/07/2066 50,000 64,596 0.04Petrobras Global Finance BV 6.25% GBP 14/12/2026 100,000 80,813 0.05Siemens Financieringsmaatschappij NV FRN GBP 14/09/2066 50,000 64,194 0.04SNS Bank NV FRN EUR 05/11/2025 100,000 94,669 0.06Swiss Reinsurance Co via ELM BV FRN GBP Perpetual 50,000 64,136 0.04Telefonica Europe BV FRN EUR Perpetual 100,000 103,918 0.07TMF Group Holding BV FRN EUR 03/12/2018 100,000 100,250 0.07
Invesco Global Targeted Returns Select Fund
Statement of Investments as at 29 February 2016
184 Invesco Funds
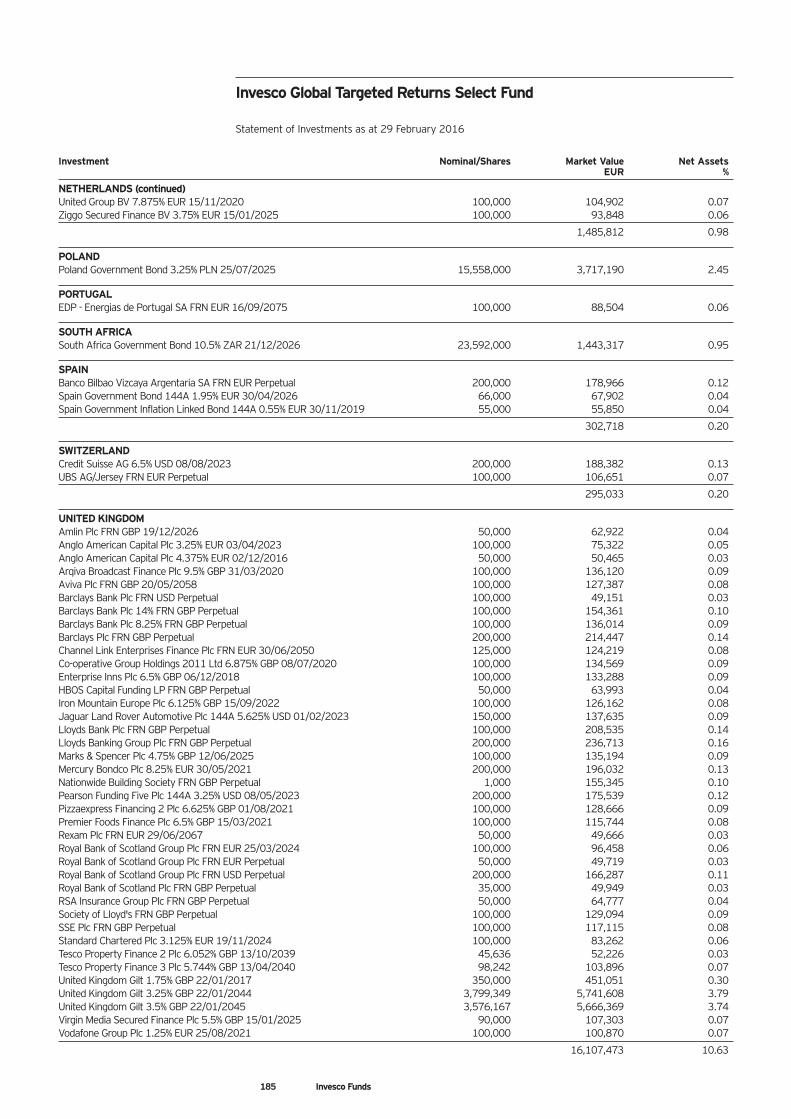
Investment Nominal/Shares Market Value Net Assets EUR %
NETHERLANDS (continued)United Group BV 7.875% EUR 15/11/2020 100,000 104,902 0.07Ziggo Secured Finance BV 3.75% EUR 15/01/2025 100,000 93,848 0.06
1,485,812 0.98
POLANDPoland Government Bond 3.25% PLN 25/07/2025 15,558,000 3,717,190 2.45
PORTUGALEDP - Energias de Portugal SA FRN EUR 16/09/2075 100,000 88,504 0.06
SOUTH AFRICASouth Africa Government Bond 10.5% ZAR 21/12/2026 23,592,000 1,443,317 0.95
SPAINBanco Bilbao Vizcaya Argentaria SA FRN EUR Perpetual 200,000 178,966 0.12Spain Government Bond 144A 1.95% EUR 30/04/2026 66,000 67,902 0.04Spain Government Inflation Linked Bond 144A 0.55% EUR 30/11/2019 55,000 55,850 0.04
302,718 0.20
SWITZERLANDCredit Suisse AG 6.5% USD 08/08/2023 200,000 188,382 0.13UBS AG/Jersey FRN EUR Perpetual 100,000 106,651 0.07
295,033 0.20
UNITED KINGDOMAmlin Plc FRN GBP 19/12/2026 50,000 62,922 0.04Anglo American Capital Plc 3.25% EUR 03/04/2023 100,000 75,322 0.05Anglo American Capital Plc 4.375% EUR 02/12/2016 50,000 50,465 0.03Arqiva Broadcast Finance Plc 9.5% GBP 31/03/2020 100,000 136,120 0.09Aviva Plc FRN GBP 20/05/2058 100,000 127,387 0.08Barclays Bank Plc FRN USD Perpetual 100,000 49,151 0.03Barclays Bank Plc 14% FRN GBP Perpetual 100,000 154,361 0.10Barclays Bank Plc 8.25% FRN GBP Perpetual 100,000 136,014 0.09Barclays Plc FRN GBP Perpetual 200,000 214,447 0.14Channel Link Enterprises Finance Plc FRN EUR 30/06/2050 125,000 124,219 0.08Co-operative Group Holdings 2011 Ltd 6.875% GBP 08/07/2020 100,000 134,569 0.09Enterprise Inns Plc 6.5% GBP 06/12/2018 100,000 133,288 0.09HBOS Capital Funding LP FRN GBP Perpetual 50,000 63,993 0.04Iron Mountain Europe Plc 6.125% GBP 15/09/2022 100,000 126,162 0.08Jaguar Land Rover Automotive Plc 144A 5.625% USD 01/02/2023 150,000 137,635 0.09Lloyds Bank Plc FRN GBP Perpetual 100,000 208,535 0.14Lloyds Banking Group Plc FRN GBP Perpetual 200,000 236,713 0.16Marks & Spencer Plc 4.75% GBP 12/06/2025 100,000 135,194 0.09Mercury Bondco Plc 8.25% EUR 30/05/2021 200,000 196,032 0.13Nationwide Building Society FRN GBP Perpetual 1,000 155,345 0.10Pearson Funding Five Plc 144A 3.25% USD 08/05/2023 200,000 175,539 0.12Pizzaexpress Financing 2 Plc 6.625% GBP 01/08/2021 100,000 128,666 0.09Premier Foods Finance Plc 6.5% GBP 15/03/2021 100,000 115,744 0.08Rexam Plc FRN EUR 29/06/2067 50,000 49,666 0.03Royal Bank of Scotland Group Plc FRN EUR 25/03/2024 100,000 96,458 0.06Royal Bank of Scotland Group Plc FRN EUR Perpetual 50,000 49,719 0.03Royal Bank of Scotland Group Plc FRN USD Perpetual 200,000 166,287 0.11Royal Bank of Scotland Plc FRN GBP Perpetual 35,000 49,949 0.03RSA Insurance Group Plc FRN GBP Perpetual 50,000 64,777 0.04Society of Lloyd's FRN GBP Perpetual 100,000 129,094 0.09SSE Plc FRN GBP Perpetual 100,000 117,115 0.08Standard Chartered Plc 3.125% EUR 19/11/2024 100,000 83,262 0.06Tesco Property Finance 2 Plc 6.052% GBP 13/10/2039 45,636 52,226 0.03Tesco Property Finance 3 Plc 5.744% GBP 13/04/2040 98,242 103,896 0.07United Kingdom Gilt 1.75% GBP 22/01/2017 350,000 451,051 0.30United Kingdom Gilt 3.25% GBP 22/01/2044 3,799,349 5,741,608 3.79United Kingdom Gilt 3.5% GBP 22/01/2045 3,576,167 5,666,369 3.74Virgin Media Secured Finance Plc 5.5% GBP 15/01/2025 90,000 107,303 0.07Vodafone Group Plc 1.25% EUR 25/08/2021 100,000 100,870 0.07
16,107,473 10.63
Invesco Global Targeted Returns Select Fund
Statement of Investments as at 29 February 2016
185 Invesco Funds
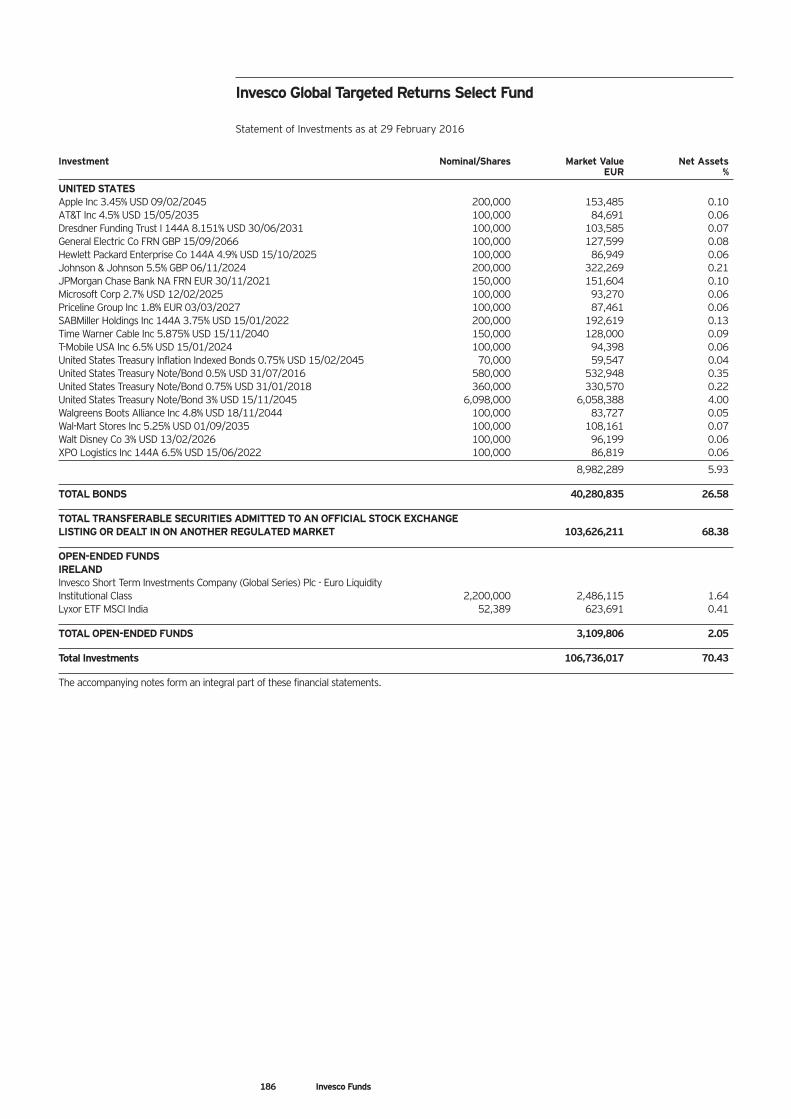
Investment Nominal/Shares Market Value Net Assets EUR %
UNITED STATESApple Inc 3.45% USD 09/02/2045 200,000 153,485 0.10AT&T Inc 4.5% USD 15/05/2035 100,000 84,691 0.06Dresdner Funding Trust I 144A 8.151% USD 30/06/2031 100,000 103,585 0.07General Electric Co FRN GBP 15/09/2066 100,000 127,599 0.08Hewlett Packard Enterprise Co 144A 4.9% USD 15/10/2025 100,000 86,949 0.06Johnson & Johnson 5.5% GBP 06/11/2024 200,000 322,269 0.21JPMorgan Chase Bank NA FRN EUR 30/11/2021 150,000 151,604 0.10Microsoft Corp 2.7% USD 12/02/2025 100,000 93,270 0.06Priceline Group Inc 1.8% EUR 03/03/2027 100,000 87,461 0.06SABMiller Holdings Inc 144A 3.75% USD 15/01/2022 200,000 192,619 0.13Time Warner Cable Inc 5.875% USD 15/11/2040 150,000 128,000 0.09T-Mobile USA Inc 6.5% USD 15/01/2024 100,000 94,398 0.06United States Treasury Inflation Indexed Bonds 0.75% USD 15/02/2045 70,000 59,547 0.04United States Treasury Note/Bond 0.5% USD 31/07/2016 580,000 532,948 0.35United States Treasury Note/Bond 0.75% USD 31/01/2018 360,000 330,570 0.22United States Treasury Note/Bond 3% USD 15/11/2045 6,098,000 6,058,388 4.00Walgreens Boots Alliance Inc 4.8% USD 18/11/2044 100,000 83,727 0.05Wal-Mart Stores Inc 5.25% USD 01/09/2035 100,000 108,161 0.07Walt Disney Co 3% USD 13/02/2026 100,000 96,199 0.06XPO Logistics Inc 144A 6.5% USD 15/06/2022 100,000 86,819 0.06
8,982,289 5.93
TOTAL BONDS 40,280,835 26.58
TOTAL TRANSFERABLE SECURITIES ADMITTED TO AN OFFICIAL STOCK EXCHANGE LISTING OR DEALT IN ON ANOTHER REGULATED MARKET 103,626,211 68.38
OPEN-ENDED FUNDSIRELANDInvesco Short Term Investments Company (Global Series) Plc - Euro Liquidity Institutional Class 2,200,000 2,486,115 1.64Lyxor ETF MSCI India 52,389 623,691 0.41
TOTAL OPEN-ENDED FUNDS 3,109,806 2.05
Total Investments 106,736,017 70.43
The accompanying notes form an integral part of these financial statements.
Invesco Global Targeted Returns Select Fund
Statement of Investments as at 29 February 2016
186 Invesco Funds
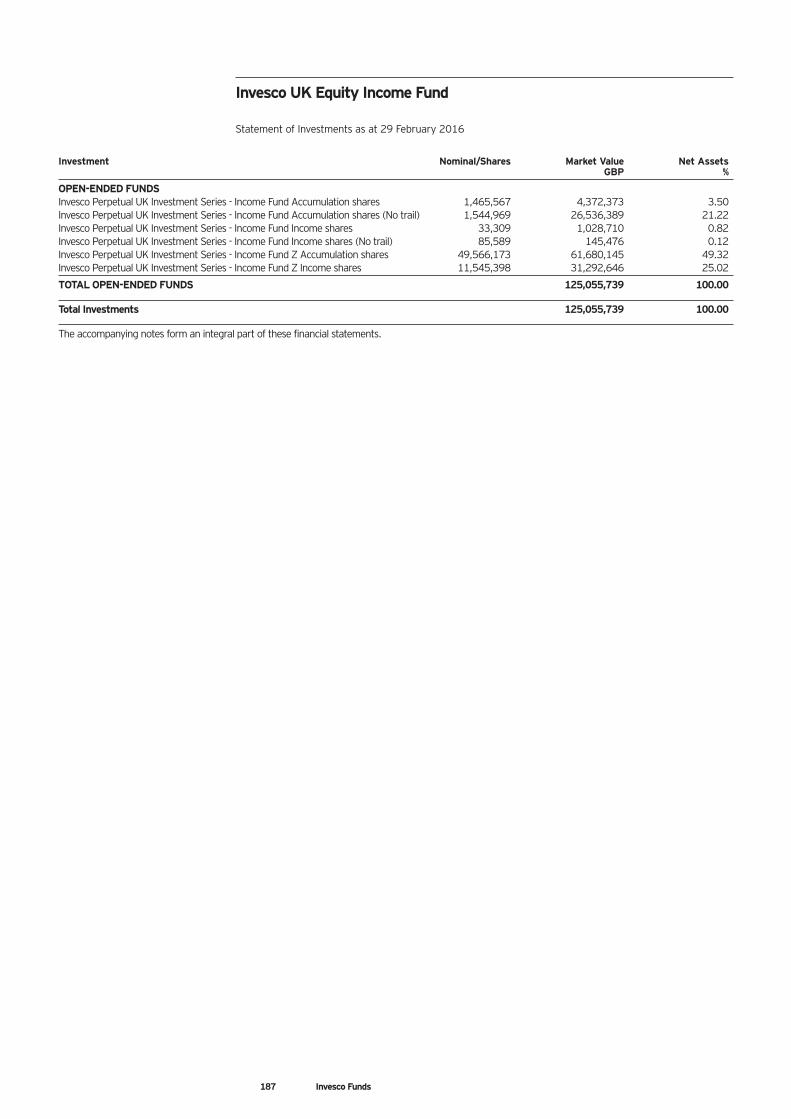
Investment Nominal/Shares Market Value Net Assets GBP %
OPEN-ENDED FUNDSInvesco Perpetual UK Investment Series - Income Fund Accumulation shares 1,465,567 4,372,373 3.50Invesco Perpetual UK Investment Series - Income Fund Accumulation shares (No trail) 1,544,969 26,536,389 21.22Invesco Perpetual UK Investment Series - Income Fund Income shares 33,309 1,028,710 0.82Invesco Perpetual UK Investment Series - Income Fund Income shares (No trail) 85,589 145,476 0.12Invesco Perpetual UK Investment Series - Income Fund Z Accumulation shares 49,566,173 61,680,145 49.32Invesco Perpetual UK Investment Series - Income Fund Z Income shares 11,545,398 31,292,646 25.02
TOTAL OPEN-ENDED FUNDS 125,055,739 100.00
Total Investments 125,055,739 100.00
The accompanying notes form an integral part of these financial statements.
Invesco UK Equity Income Fund
Statement of Investments as at 29 February 2016
187 Invesco Funds
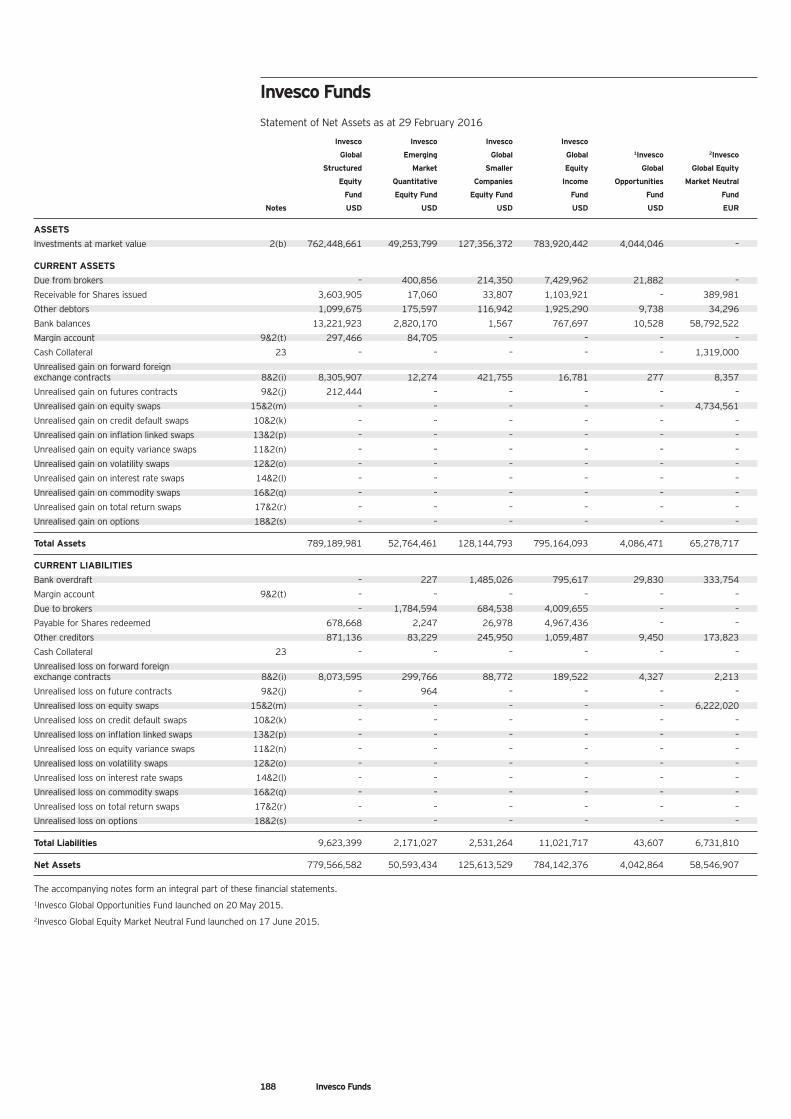
Invesco Invesco Invesco Invesco
Global Emerging Global Global 1Invesco 2Invesco
Structured Market Smaller Equity Global Global Equity
Equity Quantitative Companies Income Opportunities Market Neutral
Fund Equity Fund Equity Fund Fund Fund Fund
Notes USD USD USD USD USD EUR
ASSETS
Investments at market value 2(b) 762,448,661 49,253,799 127,356,372 783,920,442 4,044,046 –
CURRENT ASSETS
Due from brokers – 400,856 214,350 7,429,962 21,882 –
Receivable for Shares issued 3,603,905 17,060 33,807 1,103,921 – 389,981
Other debtors 1,099,675 175,597 116,942 1,925,290 9,738 34,296
Bank balances 13,221,923 2,820,170 1,567 767,697 10,528 58,792,522
Margin account 9&2(t) 297,466 84,705 – – – –
Cash Collateral 23 – – – – – 1,319,000
Unrealised gain on forward foreign exchange contracts 8&2(i) 8,305,907 12,274 421,755 16,781 277 8,357
Unrealised gain on futures contracts 9&2(j) 212,444 – – – – –
Unrealised gain on equity swaps 15&2(m) – – – – – 4,734,561
Unrealised gain on credit default swaps 10&2(k) – – – – – –
Unrealised gain on inflation linked swaps 13&2(p) – – – – – –
Unrealised gain on equity variance swaps 11&2(n) – – – – – –
Unrealised gain on volatility swaps 12&2(o) – – – – – –
Unrealised gain on interest rate swaps 14&2(l) – – – – – –
Unrealised gain on commodity swaps 16&2(q) – – – – – –
Unrealised gain on total return swaps 17&2(r) – – – – – –
Unrealised gain on options 18&2(s) – – – – – –
Total Assets 789,189,981 52,764,461 128,144,793 795,164,093 4,086,471 65,278,717
CURRENT LIABILITIES
Bank overdraft – 227 1,485,026 795,617 29,830 333,754
Margin account 9&2(t) – – – – – –
Due to brokers – 1,784,594 684,538 4,009,655 – –
Payable for Shares redeemed 678,668 2,247 26,978 4,967,436 – –
Other creditors 871,136 83,229 245,950 1,059,487 9,450 173,823
Cash Collateral 23 – – – – – –
Unrealised loss on forward foreign exchange contracts 8&2(i) 8,073,595 299,766 88,772 189,522 4,327 2,213
Unrealised loss on future contracts 9&2(j) – 964 – – – –
Unrealised loss on equity swaps 15&2(m) – – – – – 6,222,020
Unrealised loss on credit default swaps 10&2(k) – – – – – –
Unrealised loss on inflation linked swaps 13&2(p) – – – – – –
Unrealised loss on equity variance swaps 11&2(n) – – – – – –
Unrealised loss on volatility swaps 12&2(o) – – – – – –
Unrealised loss on interest rate swaps 14&2(l) – – – – – –
Unrealised loss on commodity swaps 16&2(q) – – – – – –
Unrealised loss on total return swaps 17&2(r) – – – – – –
Unrealised loss on options 18&2(s) – – – – – –
Total Liabilities 9,623,399 2,171,027 2,531,264 11,021,717 43,607 6,731,810
Net Assets 779,566,582 50,593,434 125,613,529 784,142,376 4,042,864 58,546,907
The accompanying notes form an integral part of these financial statements.1Invesco Global Opportunities Fund launched on 20 May 2015.2Invesco Global Equity Market Neutral Fund launched on 17 June 2015.
188 Invesco Funds
Invesco Funds
Statement of Net Assets as at 29 February 2016
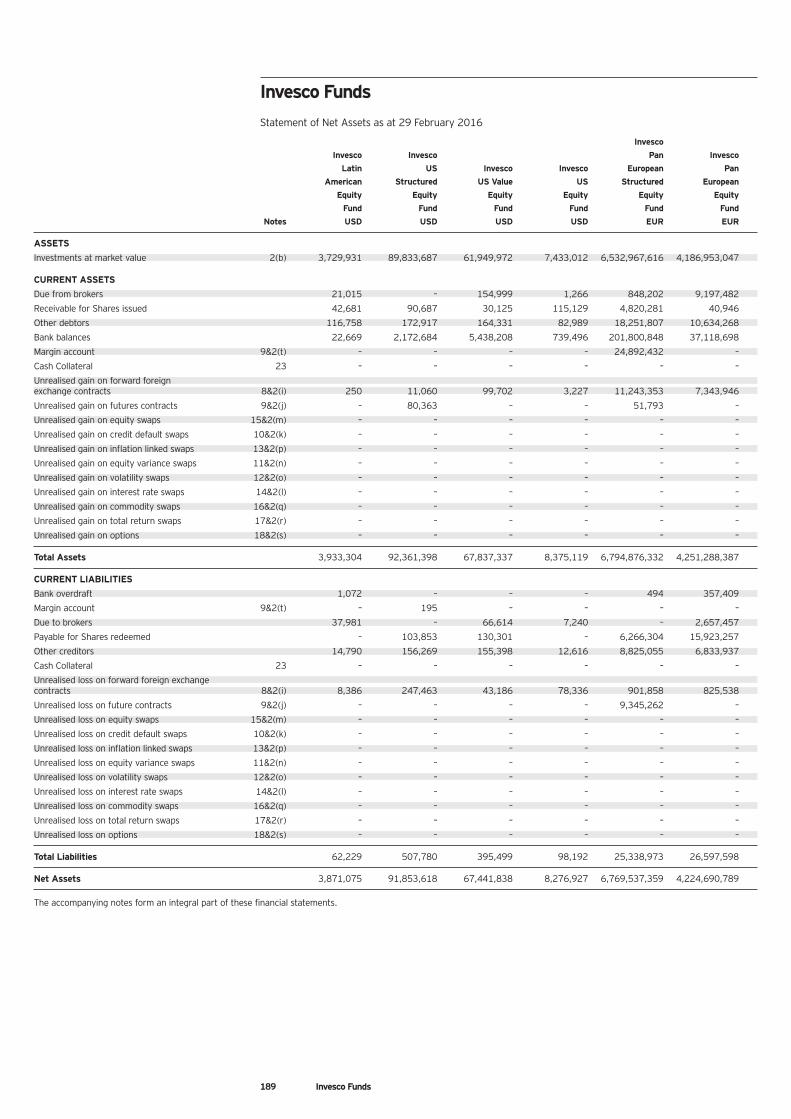
189 Invesco Funds
Invesco Funds
Statement of Net Assets as at 29 February 2016
Invesco
Invesco Invesco Pan Invesco
Latin US Invesco Invesco European Pan
American Structured US Value US Structured European
Equity Equity Equity Equity Equity Equity
Fund Fund Fund Fund Fund Fund
Notes USD USD USD USD EUR EUR
ASSETS
Investments at market value 2(b) 3,729,931 89,833,687 61,949,972 7,433,012 6,532,967,616 4,186,953,047
CURRENT ASSETS
Due from brokers 21,015 – 154,999 1,266 848,202 9,197,482
Receivable for Shares issued 42,681 90,687 30,125 115,129 4,820,281 40,946
Other debtors 116,758 172,917 164,331 82,989 18,251,807 10,634,268
Bank balances 22,669 2,172,684 5,438,208 739,496 201,800,848 37,118,698
Margin account 9&2(t) – – – – 24,892,432 –
Cash Collateral 23 – – – – – –
Unrealised gain on forward foreign exchange contracts 8&2(i) 250 11,060 99,702 3,227 11,243,353 7,343,946
Unrealised gain on futures contracts 9&2(j) – 80,363 – – 51,793 –
Unrealised gain on equity swaps 15&2(m) – – – – – –
Unrealised gain on credit default swaps 10&2(k) – – – – – –
Unrealised gain on inflation linked swaps 13&2(p) – – – – – –
Unrealised gain on equity variance swaps 11&2(n) – – – – – –
Unrealised gain on volatility swaps 12&2(o) – – – – – –
Unrealised gain on interest rate swaps 14&2(l) – – – – – –
Unrealised gain on commodity swaps 16&2(q) – – – – – –
Unrealised gain on total return swaps 17&2(r) – – – – – –
Unrealised gain on options 18&2(s) – – – – – –
Total Assets 3,933,304 92,361,398 67,837,337 8,375,119 6,794,876,332 4,251,288,387
CURRENT LIABILITIES
Bank overdraft 1,072 – – – 494 357,409
Margin account 9&2(t) – 195 – – – –
Due to brokers 37,981 – 66,614 7,240 – 2,657,457
Payable for Shares redeemed – 103,853 130,301 – 6,266,304 15,923,257
Other creditors 14,790 156,269 155,398 12,616 8,825,055 6,833,937
Cash Collateral 23 – – – – – –
Unrealised loss on forward foreign exchange contracts 8&2(i) 8,386 247,463 43,186 78,336 901,858 825,538
Unrealised loss on future contracts 9&2(j) – – – – 9,345,262 –
Unrealised loss on equity swaps 15&2(m) – – – – – –
Unrealised loss on credit default swaps 10&2(k) – – – – – –
Unrealised loss on inflation linked swaps 13&2(p) – – – – – –
Unrealised loss on equity variance swaps 11&2(n) – – – – – –
Unrealised loss on volatility swaps 12&2(o) – – – – – –
Unrealised loss on interest rate swaps 14&2(l) – – – – – –
Unrealised loss on commodity swaps 16&2(q) – – – – – –
Unrealised loss on total return swaps 17&2(r) – – – – – –
Unrealised loss on options 18&2(s) – – – – – –
Total Liabilities 62,229 507,780 395,499 98,192 25,338,973 26,597,598
Net Assets 3,871,075 91,853,618 67,441,838 8,276,927 6,769,537,359 4,224,690,789
The accompanying notes form an integral part of these financial statements.
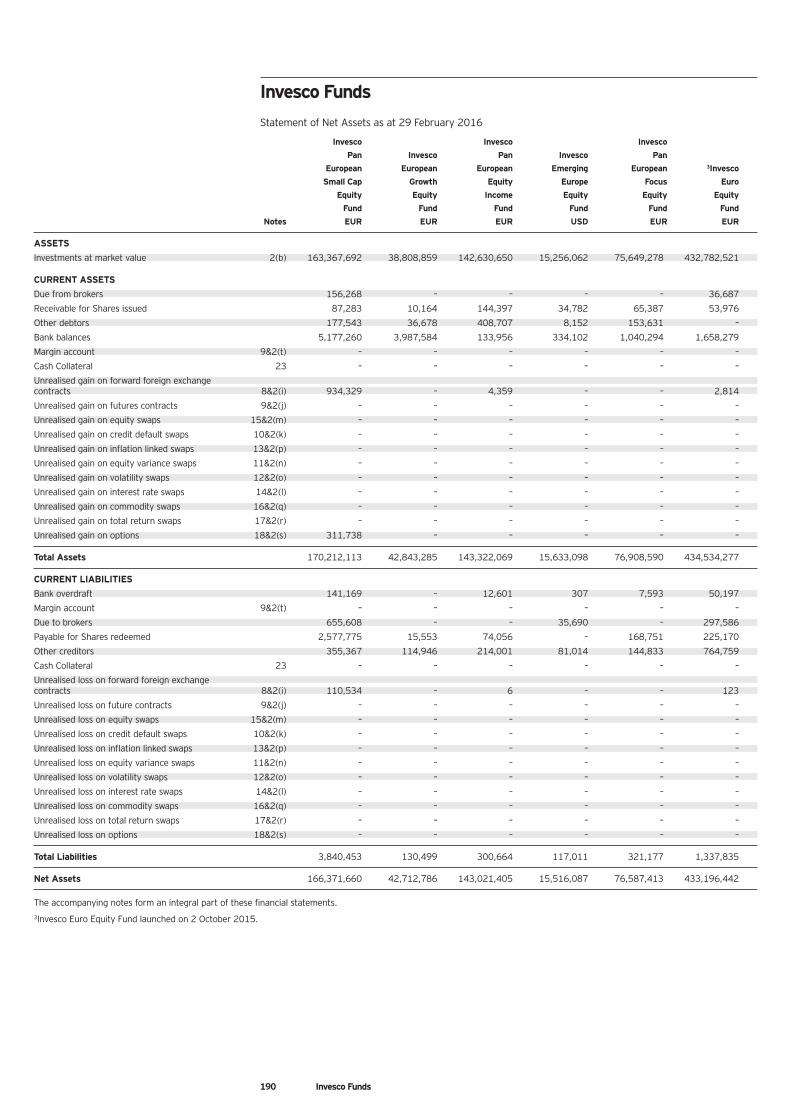
190 Invesco Funds
Invesco Funds
Statement of Net Assets as at 29 February 2016
Invesco Invesco Invesco
Pan Invesco Pan Invesco Pan
European European European Emerging European 3Invesco
Small Cap Growth Equity Europe Focus Euro
Equity Equity Income Equity Equity Equity
Fund Fund Fund Fund Fund Fund
Notes EUR EUR EUR USD EUR EUR
ASSETS
Investments at market value 2(b) 163,367,692 38,808,859 142,630,650 15,256,062 75,649,278 432,782,521
CURRENT ASSETS
Due from brokers 156,268 – – – – 36,687
Receivable for Shares issued 87,283 10,164 144,397 34,782 65,387 53,976
Other debtors 177,543 36,678 408,707 8,152 153,631 –
Bank balances 5,177,260 3,987,584 133,956 334,102 1,040,294 1,658,279
Margin account 9&2(t) – – – – – –
Cash Collateral 23 – – – – – –
Unrealised gain on forward foreign exchange contracts 8&2(i) 934,329 – 4,359 – – 2,814
Unrealised gain on futures contracts 9&2(j) – – – – – –
Unrealised gain on equity swaps 15&2(m) – – – – – –
Unrealised gain on credit default swaps 10&2(k) – – – – – –
Unrealised gain on inflation linked swaps 13&2(p) – – – – – –
Unrealised gain on equity variance swaps 11&2(n) – – – – – –
Unrealised gain on volatility swaps 12&2(o) – – – – – –
Unrealised gain on interest rate swaps 14&2(l) – – – – – –
Unrealised gain on commodity swaps 16&2(q) – – – – – –
Unrealised gain on total return swaps 17&2(r) – – – – – –
Unrealised gain on options 18&2(s) 311,738 – – – – –
Total Assets 170,212,113 42,843,285 143,322,069 15,633,098 76,908,590 434,534,277
CURRENT LIABILITIES
Bank overdraft 141,169 – 12,601 307 7,593 50,197
Margin account 9&2(t) – – – – – –
Due to brokers 655,608 – – 35,690 – 297,586
Payable for Shares redeemed 2,577,775 15,553 74,056 – 168,751 225,170
Other creditors 355,367 114,946 214,001 81,014 144,833 764,759
Cash Collateral 23 – – – – – –
Unrealised loss on forward foreign exchange contracts 8&2(i) 110,534 – 6 – – 123
Unrealised loss on future contracts 9&2(j) – – – – – –
Unrealised loss on equity swaps 15&2(m) – – – – – –
Unrealised loss on credit default swaps 10&2(k) – – – – – –
Unrealised loss on inflation linked swaps 13&2(p) – – – – – –
Unrealised loss on equity variance swaps 11&2(n) – – – – – –
Unrealised loss on volatility swaps 12&2(o) – – – – – –
Unrealised loss on interest rate swaps 14&2(l) – – – – – –
Unrealised loss on commodity swaps 16&2(q) – – – – – –
Unrealised loss on total return swaps 17&2(r) – – – – – –
Unrealised loss on options 18&2(s) – – – – – –
Total Liabilities 3,840,453 130,499 300,664 117,011 321,177 1,337,835
Net Assets 166,371,660 42,712,786 143,021,405 15,516,087 76,587,413 433,196,442
The accompanying notes form an integral part of these financial statements.3Invesco Euro Equity Fund launched on 2 October 2015.
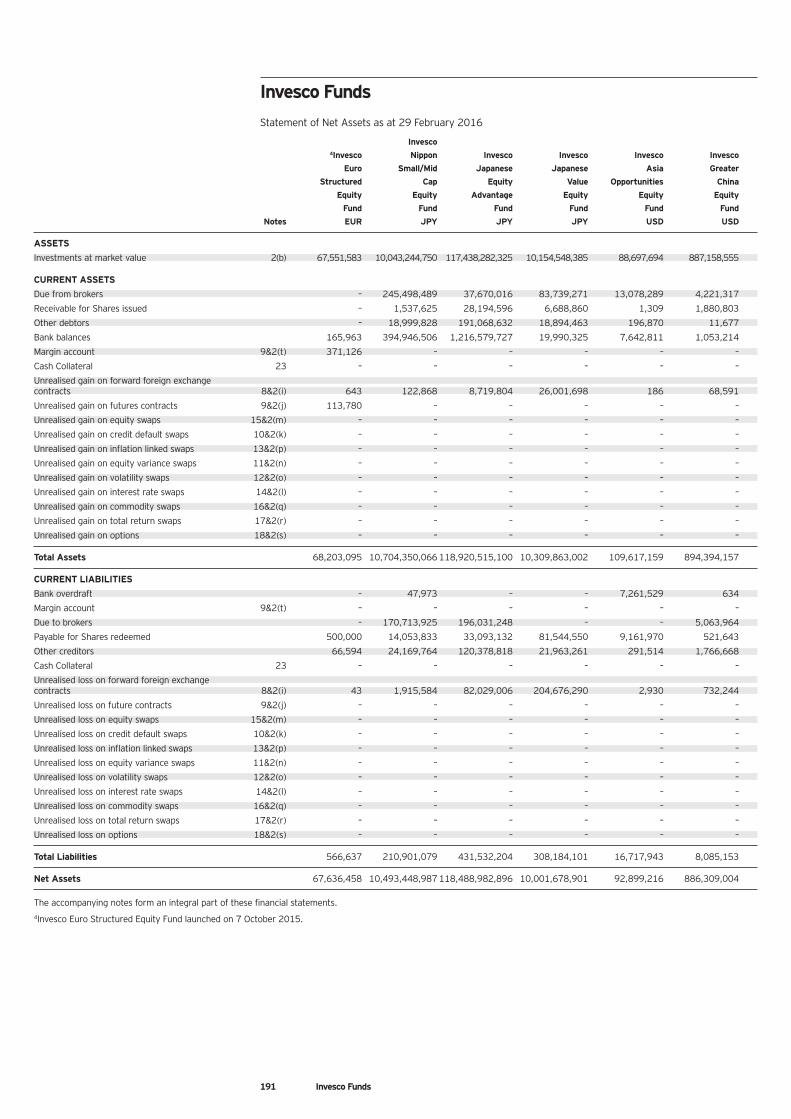
191 Invesco Funds
Invesco Funds
Statement of Net Assets as at 29 February 2016
Invesco4Invesco Nippon Invesco Invesco Invesco Invesco
Euro Small/Mid Japanese Japanese Asia Greater
Structured Cap Equity Value Opportunities China
Equity Equity Advantage Equity Equity Equity
Fund Fund Fund Fund Fund Fund
Notes EUR JPY JPY JPY USD USD
ASSETS
Investments at market value 2(b) 67,551,583 10,043,244,750 117,438,282,325 10,154,548,385 88,697,694 887,158,555
CURRENT ASSETS
Due from brokers – 245,498,489 37,670,016 83,739,271 13,078,289 4,221,317
Receivable for Shares issued – 1,537,625 28,194,596 6,688,860 1,309 1,880,803
Other debtors – 18,999,828 191,068,632 18,894,463 196,870 11,677
Bank balances 165,963 394,946,506 1,216,579,727 19,990,325 7,642,811 1,053,214
Margin account 9&2(t) 371,126 – – – – –
Cash Collateral 23 – – – – – –
Unrealised gain on forward foreign exchange contracts 8&2(i) 643 122,868 8,719,804 26,001,698 186 68,591
Unrealised gain on futures contracts 9&2(j) 113,780 – – – – –
Unrealised gain on equity swaps 15&2(m) – – – – – –
Unrealised gain on credit default swaps 10&2(k) – – – – – –
Unrealised gain on inflation linked swaps 13&2(p) – – – – – –
Unrealised gain on equity variance swaps 11&2(n) – – – – – –
Unrealised gain on volatility swaps 12&2(o) – – – – – –
Unrealised gain on interest rate swaps 14&2(l) – – – – – –
Unrealised gain on commodity swaps 16&2(q) – – – – – –
Unrealised gain on total return swaps 17&2(r) – – – – – –
Unrealised gain on options 18&2(s) – – – – – –
Total Assets 68,203,095 10,704,350,066 118,920,515,100 10,309,863,002 109,617,159 894,394,157
CURRENT LIABILITIES
Bank overdraft – 47,973 – – 7,261,529 634
Margin account 9&2(t) – – – – – –
Due to brokers – 170,713,925 196,031,248 – – 5,063,964
Payable for Shares redeemed 500,000 14,053,833 33,093,132 81,544,550 9,161,970 521,643
Other creditors 66,594 24,169,764 120,378,818 21,963,261 291,514 1,766,668
Cash Collateral 23 – – – – – –
Unrealised loss on forward foreign exchange contracts 8&2(i) 43 1,915,584 82,029,006 204,676,290 2,930 732,244
Unrealised loss on future contracts 9&2(j) – – – – – –
Unrealised loss on equity swaps 15&2(m) – – – – – –
Unrealised loss on credit default swaps 10&2(k) – – – – – –
Unrealised loss on inflation linked swaps 13&2(p) – – – – – –
Unrealised loss on equity variance swaps 11&2(n) – – – – – –
Unrealised loss on volatility swaps 12&2(o) – – – – – –
Unrealised loss on interest rate swaps 14&2(l) – – – – – –
Unrealised loss on commodity swaps 16&2(q) – – – – – –
Unrealised loss on total return swaps 17&2(r) – – – – – –
Unrealised loss on options 18&2(s) – – – – – –
Total Liabilities 566,637 210,901,079 431,532,204 308,184,101 16,717,943 8,085,153
Net Assets 67,636,458 10,493,448,987 118,488,982,896 10,001,678,901 92,899,216 886,309,004
The accompanying notes form an integral part of these financial statements.4Invesco Euro Structured Equity Fund launched on 7 October 2015.
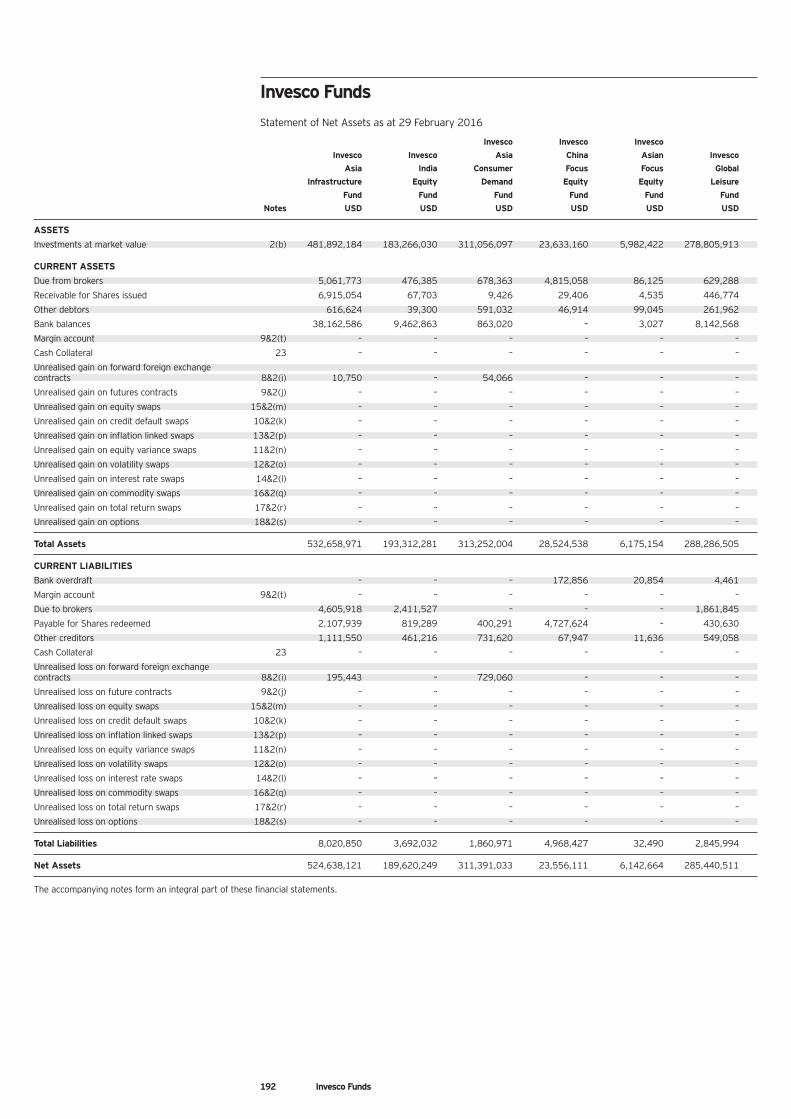
Invesco Funds
Statement of Net Assets as at 29 February 2016
192 Invesco Funds
Invesco Invesco Invesco
Invesco Invesco Asia China Asian Invesco
Asia India Consumer Focus Focus Global
Infrastructure Equity Demand Equity Equity Leisure
Fund Fund Fund Fund Fund Fund
Notes USD USD USD USD USD USD
ASSETS
Investments at market value 2(b) 481,892,184 183,266,030 311,056,097 23,633,160 5,982,422 278,805,913
CURRENT ASSETS
Due from brokers 5,061,773 476,385 678,363 4,815,058 86,125 629,288
Receivable for Shares issued 6,915,054 67,703 9,426 29,406 4,535 446,774
Other debtors 616,624 39,300 591,032 46,914 99,045 261,962
Bank balances 38,162,586 9,462,863 863,020 – 3,027 8,142,568
Margin account 9&2(t) – – – – – –
Cash Collateral 23 – – – – – –
Unrealised gain on forward foreign exchange contracts 8&2(i) 10,750 – 54,066 – – –
Unrealised gain on futures contracts 9&2(j) – – – – – –
Unrealised gain on equity swaps 15&2(m) – – – – – –
Unrealised gain on credit default swaps 10&2(k) – – – – – –
Unrealised gain on inflation linked swaps 13&2(p) – – – – – –
Unrealised gain on equity variance swaps 11&2(n) – – – – – –
Unrealised gain on volatility swaps 12&2(o) – – – – – –
Unrealised gain on interest rate swaps 14&2(l) – – – – – –
Unrealised gain on commodity swaps 16&2(q) – – – – – –
Unrealised gain on total return swaps 17&2(r) – – – – – –
Unrealised gain on options 18&2(s) – – – – – –
Total Assets 532,658,971 193,312,281 313,252,004 28,524,538 6,175,154 288,286,505
CURRENT LIABILITIES
Bank overdraft – – – 172,856 20,854 4,461
Margin account 9&2(t) – – – – – –
Due to brokers 4,605,918 2,411,527 – – – 1,861,845
Payable for Shares redeemed 2,107,939 819,289 400,291 4,727,624 – 430,630
Other creditors 1,111,550 461,216 731,620 67,947 11,636 549,058
Cash Collateral 23 – – – – – –
Unrealised loss on forward foreign exchange contracts 8&2(i) 195,443 – 729,060 – – –
Unrealised loss on future contracts 9&2(j) – – – – – –
Unrealised loss on equity swaps 15&2(m) – – – – – –
Unrealised loss on credit default swaps 10&2(k) – – – – – –
Unrealised loss on inflation linked swaps 13&2(p) – – – – – –
Unrealised loss on equity variance swaps 11&2(n) – – – – – –
Unrealised loss on volatility swaps 12&2(o) – – – – – –
Unrealised loss on interest rate swaps 14&2(l) – – – – – –
Unrealised loss on commodity swaps 16&2(q) – – – – – –
Unrealised loss on total return swaps 17&2(r) – – – – – –
Unrealised loss on options 18&2(s) – – – – – –
Total Liabilities 8,020,850 3,692,032 1,860,971 4,968,427 32,490 2,845,994
Net Assets 524,638,121 189,620,249 311,391,033 23,556,111 6,142,664 285,440,511
The accompanying notes form an integral part of these financial statements.
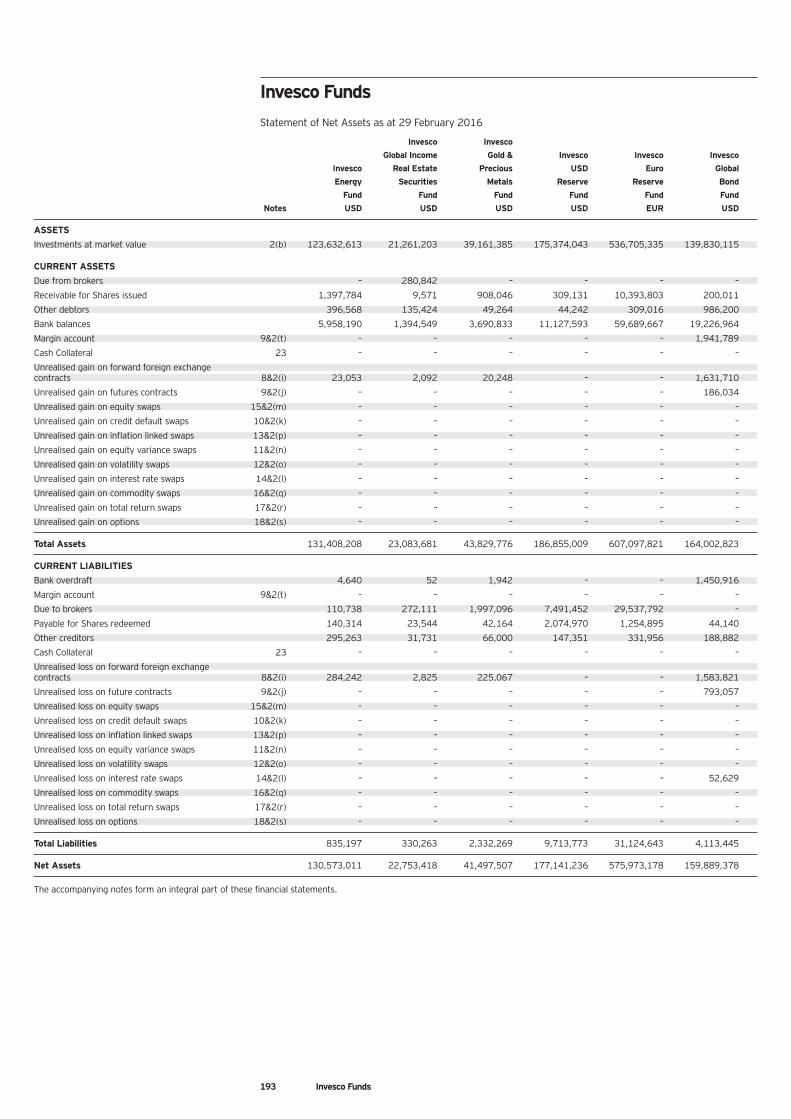
Invesco Funds
Statement of Net Assets as at 29 February 2016
193 Invesco Funds
Invesco Invesco
Global Income Gold & Invesco Invesco Invesco
Invesco Real Estate Precious USD Euro Global
Energy Securities Metals Reserve Reserve Bond
Fund Fund Fund Fund Fund Fund
Notes USD USD USD USD EUR USD
ASSETS
Investments at market value 2(b) 123,632,613 21,261,203 39,161,385 175,374,043 536,705,335 139,830,115
CURRENT ASSETS
Due from brokers – 280,842 – – – –
Receivable for Shares issued 1,397,784 9,571 908,046 309,131 10,393,803 200,011
Other debtors 396,568 135,424 49,264 44,242 309,016 986,200
Bank balances 5,958,190 1,394,549 3,690,833 11,127,593 59,689,667 19,226,964
Margin account 9&2(t) – – – – – 1,941,789
Cash Collateral 23 – – – – – –
Unrealised gain on forward foreign exchange contracts 8&2(i) 23,053 2,092 20,248 – – 1,631,710
Unrealised gain on futures contracts 9&2(j) – – – – – 186,034
Unrealised gain on equity swaps 15&2(m) – – – – – –
Unrealised gain on credit default swaps 10&2(k) – – – – – –
Unrealised gain on inflation linked swaps 13&2(p) – – – – – –
Unrealised gain on equity variance swaps 11&2(n) – – – – – –
Unrealised gain on volatility swaps 12&2(o) – – – – – –
Unrealised gain on interest rate swaps 14&2(l) – – – – – –
Unrealised gain on commodity swaps 16&2(q) – – – – – –
Unrealised gain on total return swaps 17&2(r) – – – – – –
Unrealised gain on options 18&2(s) – – – – – –
Total Assets 131,408,208 23,083,681 43,829,776 186,855,009 607,097,821 164,002,823
CURRENT LIABILITIES
Bank overdraft 4,640 52 1,942 – – 1,450,916
Margin account 9&2(t) – – – – – –
Due to brokers 110,738 272,111 1,997,096 7,491,452 29,537,792 –
Payable for Shares redeemed 140,314 23,544 42,164 2,074,970 1,254,895 44,140
Other creditors 295,263 31,731 66,000 147,351 331,956 188,882
Cash Collateral 23 – – – – – –
Unrealised loss on forward foreign exchange contracts 8&2(i) 284,242 2,825 225,067 – – 1,583,821
Unrealised loss on future contracts 9&2(j) – – – – – 793,057
Unrealised loss on equity swaps 15&2(m) – – – – – –
Unrealised loss on credit default swaps 10&2(k) – – – – – –
Unrealised loss on inflation linked swaps 13&2(p) – – – – – –
Unrealised loss on equity variance swaps 11&2(n) – – – – – –
Unrealised loss on volatility swaps 12&2(o) – – – – – –
Unrealised loss on interest rate swaps 14&2(l) – – – – – 52,629
Unrealised loss on commodity swaps 16&2(q) – – – – – –
Unrealised loss on total return swaps 17&2(r) – – – – – –
Unrealised loss on options 18&2(s) – – – – – –
Total Liabilities 835,197 330,263 2,332,269 9,713,773 31,124,643 4,113,445
Net Assets 130,573,011 22,753,418 41,497,507 177,141,236 575,973,178 159,889,378
The accompanying notes form an integral part of these financial statements.
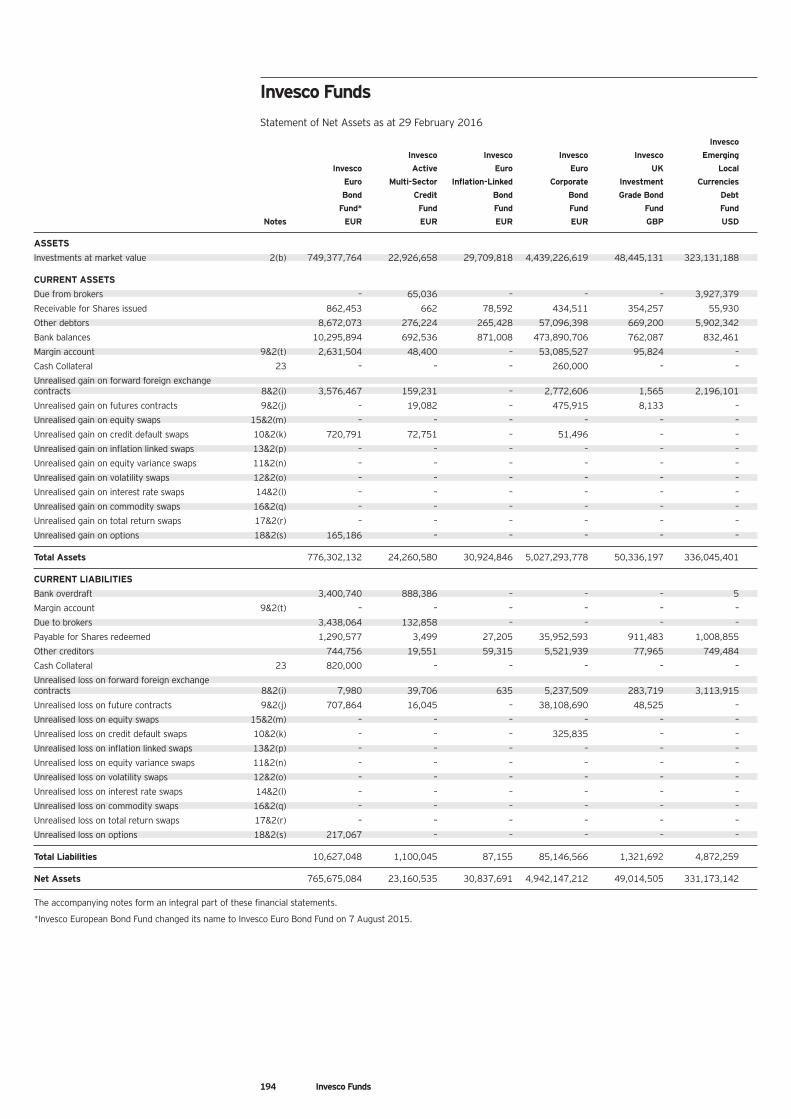
Invesco Funds
Statement of Net Assets as at 29 February 2016
Invesco
Invesco Invesco Invesco Invesco Emerging
Invesco Active Euro Euro UK Local
Euro Multi-Sector Inflation-Linked Corporate Investment Currencies
Bond Credit Bond Bond Grade Bond Debt
Fund* Fund Fund Fund Fund Fund
Notes EUR EUR EUR EUR GBP USD
ASSETS
Investments at market value 2(b) 749,377,764 22,926,658 29,709,818 4,439,226,619 48,445,131 323,131,188
CURRENT ASSETS
Due from brokers – 65,036 – – – 3,927,379
Receivable for Shares issued 862,453 662 78,592 434,511 354,257 55,930
Other debtors 8,672,073 276,224 265,428 57,096,398 669,200 5,902,342
Bank balances 10,295,894 692,536 871,008 473,890,706 762,087 832,461
Margin account 9&2(t) 2,631,504 48,400 – 53,085,527 95,824 –
Cash Collateral 23 – – – 260,000 – –
Unrealised gain on forward foreign exchange contracts 8&2(i) 3,576,467 159,231 – 2,772,606 1,565 2,196,101
Unrealised gain on futures contracts 9&2(j) – 19,082 – 475,915 8,133 –
Unrealised gain on equity swaps 15&2(m) – – – – – –
Unrealised gain on credit default swaps 10&2(k) 720,791 72,751 – 51,496 – –
Unrealised gain on inflation linked swaps 13&2(p) – – – – – –
Unrealised gain on equity variance swaps 11&2(n) – – – – – –
Unrealised gain on volatility swaps 12&2(o) – – – – – –
Unrealised gain on interest rate swaps 14&2(l) – – – – – –
Unrealised gain on commodity swaps 16&2(q) – – – – – –
Unrealised gain on total return swaps 17&2(r) – – – – – –
Unrealised gain on options 18&2(s) 165,186 – – – – –
Total Assets 776,302,132 24,260,580 30,924,846 5,027,293,778 50,336,197 336,045,401
CURRENT LIABILITIES
Bank overdraft 3,400,740 888,386 – – – 5
Margin account 9&2(t) – – – – – –
Due to brokers 3,438,064 132,858 – – – –
Payable for Shares redeemed 1,290,577 3,499 27,205 35,952,593 911,483 1,008,855
Other creditors 744,756 19,551 59,315 5,521,939 77,965 749,484
Cash Collateral 23 820,000 – – – – –
Unrealised loss on forward foreign exchange contracts 8&2(i) 7,980 39,706 635 5,237,509 283,719 3,113,915
Unrealised loss on future contracts 9&2(j) 707,864 16,045 – 38,108,690 48,525 –
Unrealised loss on equity swaps 15&2(m) – – – – – –
Unrealised loss on credit default swaps 10&2(k) – – – 325,835 – –
Unrealised loss on inflation linked swaps 13&2(p) – – – – – –
Unrealised loss on equity variance swaps 11&2(n) – – – – – –
Unrealised loss on volatility swaps 12&2(o) – – – – – –
Unrealised loss on interest rate swaps 14&2(l) – – – – – –
Unrealised loss on commodity swaps 16&2(q) – – – – – –
Unrealised loss on total return swaps 17&2(r) – – – – – –
Unrealised loss on options 18&2(s) 217,067 – – – – –
Total Liabilities 10,627,048 1,100,045 87,155 85,146,566 1,321,692 4,872,259
Net Assets 765,675,084 23,160,535 30,837,691 4,942,147,212 49,014,505 331,173,142
The accompanying notes form an integral part of these financial statements.
*Invesco European Bond Fund changed its name to Invesco Euro Bond Fund on 7 August 2015.
194 Invesco Funds
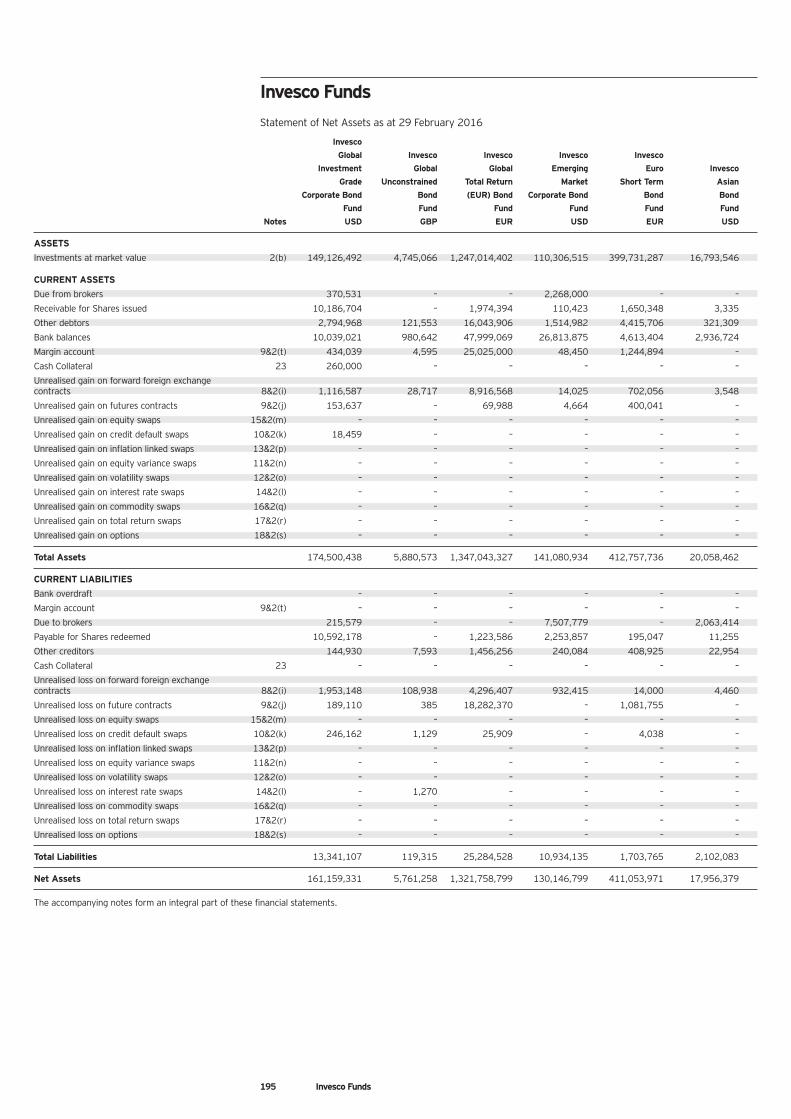
Invesco Funds
Statement of Net Assets as at 29 February 2016
Invesco
Global Invesco Invesco Invesco Invesco
Investment Global Global Emerging Euro Invesco
Grade Unconstrained Total Return Market Short Term Asian
Corporate Bond Bond (EUR) Bond Corporate Bond Bond Bond
Fund Fund Fund Fund Fund Fund
Notes USD GBP EUR USD EUR USD
ASSETS
Investments at market value 2(b) 149,126,492 4,745,066 1,247,014,402 110,306,515 399,731,287 16,793,546
CURRENT ASSETS
Due from brokers 370,531 – – 2,268,000 – –
Receivable for Shares issued 10,186,704 – 1,974,394 110,423 1,650,348 3,335
Other debtors 2,794,968 121,553 16,043,906 1,514,982 4,415,706 321,309
Bank balances 10,039,021 980,642 47,999,069 26,813,875 4,613,404 2,936,724
Margin account 9&2(t) 434,039 4,595 25,025,000 48,450 1,244,894 –
Cash Collateral 23 260,000 – – – – –
Unrealised gain on forward foreign exchange contracts 8&2(i) 1,116,587 28,717 8,916,568 14,025 702,056 3,548
Unrealised gain on futures contracts 9&2(j) 153,637 – 69,988 4,664 400,041 –
Unrealised gain on equity swaps 15&2(m) – – – – – –
Unrealised gain on credit default swaps 10&2(k) 18,459 – – – – –
Unrealised gain on inflation linked swaps 13&2(p) – – – – – –
Unrealised gain on equity variance swaps 11&2(n) – – – – – –
Unrealised gain on volatility swaps 12&2(o) – – – – – –
Unrealised gain on interest rate swaps 14&2(l) – – – – – –
Unrealised gain on commodity swaps 16&2(q) – – – – – –
Unrealised gain on total return swaps 17&2(r) – – – – – –
Unrealised gain on options 18&2(s) – – – – – –
Total Assets 174,500,438 5,880,573 1,347,043,327 141,080,934 412,757,736 20,058,462
CURRENT LIABILITIES
Bank overdraft – – – – – –
Margin account 9&2(t) – – – – – –
Due to brokers 215,579 – – 7,507,779 – 2,063,414
Payable for Shares redeemed 10,592,178 – 1,223,586 2,253,857 195,047 11,255
Other creditors 144,930 7,593 1,456,256 240,084 408,925 22,954
Cash Collateral 23 – – – – – –
Unrealised loss on forward foreign exchange contracts 8&2(i) 1,953,148 108,938 4,296,407 932,415 14,000 4,460
Unrealised loss on future contracts 9&2(j) 189,110 385 18,282,370 – 1,081,755 –
Unrealised loss on equity swaps 15&2(m) – – – – – –
Unrealised loss on credit default swaps 10&2(k) 246,162 1,129 25,909 – 4,038 –
Unrealised loss on inflation linked swaps 13&2(p) – – – – – –
Unrealised loss on equity variance swaps 11&2(n) – – – – – –
Unrealised loss on volatility swaps 12&2(o) – – – – – –
Unrealised loss on interest rate swaps 14&2(l) – 1,270 – – – –
Unrealised loss on commodity swaps 16&2(q) – – – – – –
Unrealised loss on total return swaps 17&2(r) – – – – – –
Unrealised loss on options 18&2(s) – – – – – –
Total Liabilities 13,341,107 119,315 25,284,528 10,934,135 1,703,765 2,102,083
Net Assets 161,159,331 5,761,258 1,321,758,799 130,146,799 411,053,971 17,956,379
The accompanying notes form an integral part of these financial statements.
195 Invesco Funds
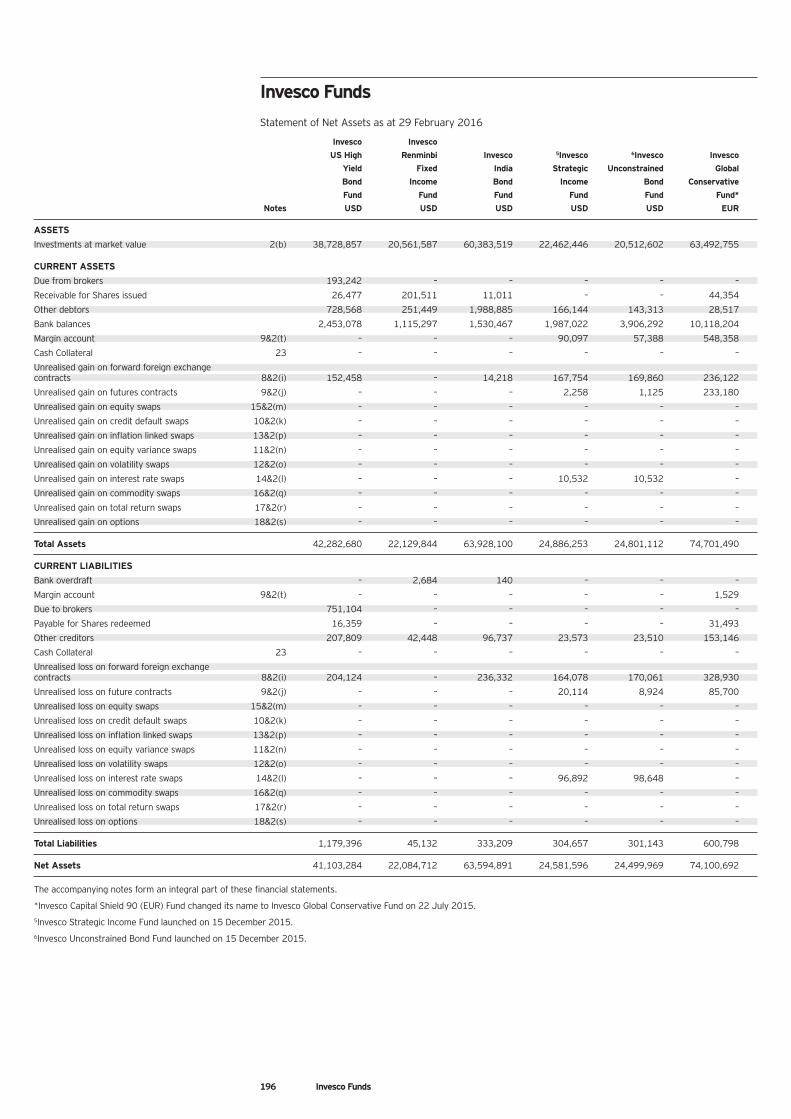
Invesco Funds
Statement of Net Assets as at 29 February 2016
Invesco Invesco
US High Renminbi Invesco 5Invesco 6Invesco Invesco
Yield Fixed India Strategic Unconstrained Global
Bond Income Bond Income Bond Conservative
Fund Fund Fund Fund Fund Fund*
Notes USD USD USD USD USD EUR
ASSETS
Investments at market value 2(b) 38,728,857 20,561,587 60,383,519 22,462,446 20,512,602 63,492,755
CURRENT ASSETS
Due from brokers 193,242 – – – – –
Receivable for Shares issued 26,477 201,511 11,011 – – 44,354
Other debtors 728,568 251,449 1,988,885 166,144 143,313 28,517
Bank balances 2,453,078 1,115,297 1,530,467 1,987,022 3,906,292 10,118,204
Margin account 9&2(t) – – – 90,097 57,388 548,358
Cash Collateral 23 – – – – – –
Unrealised gain on forward foreign exchange contracts 8&2(i) 152,458 – 14,218 167,754 169,860 236,122
Unrealised gain on futures contracts 9&2(j) – – – 2,258 1,125 233,180
Unrealised gain on equity swaps 15&2(m) – – – – – –
Unrealised gain on credit default swaps 10&2(k) – – – – – –
Unrealised gain on inflation linked swaps 13&2(p) – – – – – –
Unrealised gain on equity variance swaps 11&2(n) – – – – – –
Unrealised gain on volatility swaps 12&2(o) – – – – – –
Unrealised gain on interest rate swaps 14&2(l) – – – 10,532 10,532 –
Unrealised gain on commodity swaps 16&2(q) – – – – – –
Unrealised gain on total return swaps 17&2(r) – – – – – –
Unrealised gain on options 18&2(s) – – – – – –
Total Assets 42,282,680 22,129,844 63,928,100 24,886,253 24,801,112 74,701,490
CURRENT LIABILITIES
Bank overdraft – 2,684 140 – – –
Margin account 9&2(t) – – – – – 1,529
Due to brokers 751,104 – – – – –
Payable for Shares redeemed 16,359 – – – – 31,493
Other creditors 207,809 42,448 96,737 23,573 23,510 153,146
Cash Collateral 23 – – – – – –
Unrealised loss on forward foreign exchange contracts 8&2(i) 204,124 – 236,332 164,078 170,061 328,930
Unrealised loss on future contracts 9&2(j) – – – 20,114 8,924 85,700
Unrealised loss on equity swaps 15&2(m) – – – – – –
Unrealised loss on credit default swaps 10&2(k) – – – – – –
Unrealised loss on inflation linked swaps 13&2(p) – – – – – –
Unrealised loss on equity variance swaps 11&2(n) – – – – – –
Unrealised loss on volatility swaps 12&2(o) – – – – – –
Unrealised loss on interest rate swaps 14&2(l) – – – 96,892 98,648 –
Unrealised loss on commodity swaps 16&2(q) – – – – – –
Unrealised loss on total return swaps 17&2(r) – – – – – –
Unrealised loss on options 18&2(s) – – – – – –
Total Liabilities 1,179,396 45,132 333,209 304,657 301,143 600,798
Net Assets 41,103,284 22,084,712 63,594,891 24,581,596 24,499,969 74,100,692
The accompanying notes form an integral part of these financial statements.
*Invesco Capital Shield 90 (EUR) Fund changed its name to Invesco Global Conservative Fund on 22 July 2015.5Invesco Strategic Income Fund launched on 15 December 2015.6Invesco Unconstrained Bond Fund launched on 15 December 2015.
196 Invesco Funds
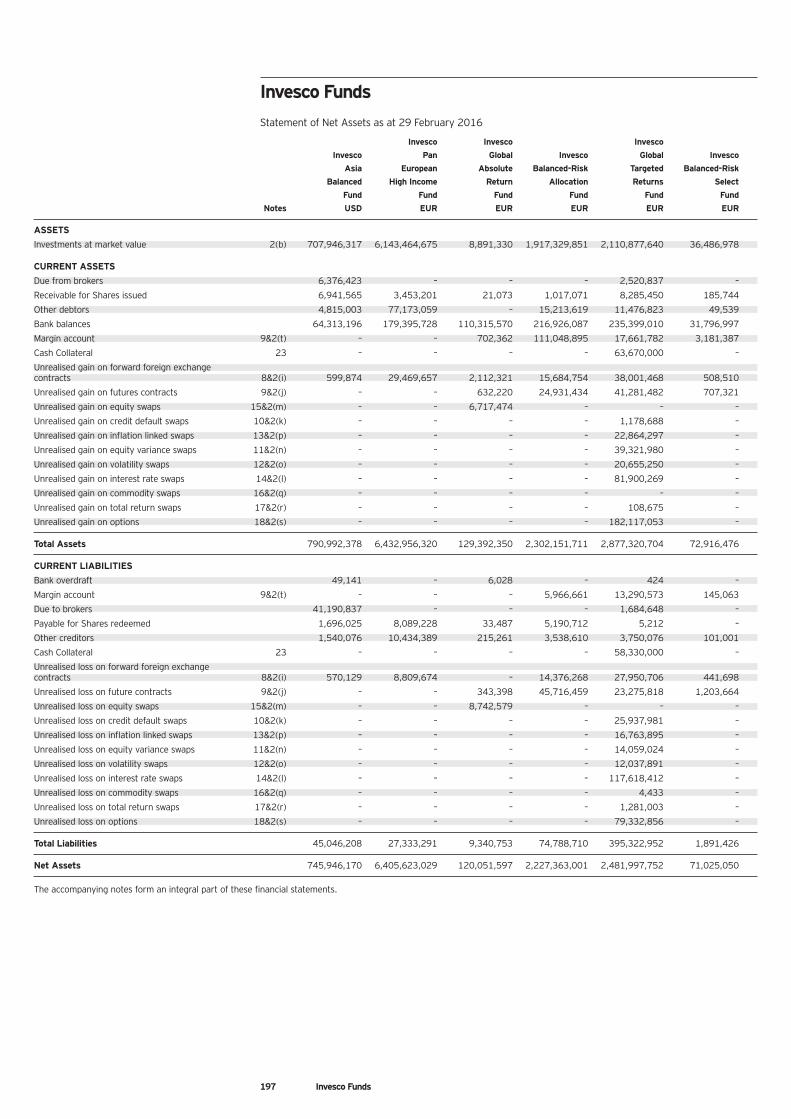
Invesco Funds
Statement of Net Assets as at 29 February 2016
Invesco Invesco Invesco
Invesco Pan Global Invesco Global Invesco
Asia European Absolute Balanced-Risk Targeted Balanced-Risk
Balanced High Income Return Allocation Returns Select
Fund Fund Fund Fund Fund Fund
Notes USD EUR EUR EUR EUR EUR
ASSETS
Investments at market value 2(b) 707,946,317 6,143,464,675 8,891,330 1,917,329,851 2,110,877,640 36,486,978
CURRENT ASSETS
Due from brokers 6,376,423 – – – 2,520,837 –
Receivable for Shares issued 6,941,565 3,453,201 21,073 1,017,071 8,285,450 185,744
Other debtors 4,815,003 77,173,059 – 15,213,619 11,476,823 49,539
Bank balances 64,313,196 179,395,728 110,315,570 216,926,087 235,399,010 31,796,997
Margin account 9&2(t) – – 702,362 111,048,895 17,661,782 3,181,387
Cash Collateral 23 – – – – 63,670,000 –
Unrealised gain on forward foreign exchange contracts 8&2(i) 599,874 29,469,657 2,112,321 15,684,754 38,001,468 508,510
Unrealised gain on futures contracts 9&2(j) – – 632,220 24,931,434 41,281,482 707,321
Unrealised gain on equity swaps 15&2(m) – – 6,717,474 – – –
Unrealised gain on credit default swaps 10&2(k) – – – – 1,178,688 –
Unrealised gain on inflation linked swaps 13&2(p) – – – – 22,864,297 –
Unrealised gain on equity variance swaps 11&2(n) – – – – 39,321,980 –
Unrealised gain on volatility swaps 12&2(o) – – – – 20,655,250 –
Unrealised gain on interest rate swaps 14&2(l) – – – – 81,900,269 –
Unrealised gain on commodity swaps 16&2(q) – – – – – –
Unrealised gain on total return swaps 17&2(r) – – – – 108,675 –
Unrealised gain on options 18&2(s) – – – – 182,117,053 –
Total Assets 790,992,378 6,432,956,320 129,392,350 2,302,151,711 2,877,320,704 72,916,476
CURRENT LIABILITIES
Bank overdraft 49,141 – 6,028 – 424 –
Margin account 9&2(t) – – – 5,966,661 13,290,573 145,063
Due to brokers 41,190,837 – – – 1,684,648 –
Payable for Shares redeemed 1,696,025 8,089,228 33,487 5,190,712 5,212 –
Other creditors 1,540,076 10,434,389 215,261 3,538,610 3,750,076 101,001
Cash Collateral 23 – – – – 58,330,000 –
Unrealised loss on forward foreign exchange contracts 8&2(i) 570,129 8,809,674 – 14,376,268 27,950,706 441,698
Unrealised loss on future contracts 9&2(j) – – 343,398 45,716,459 23,275,818 1,203,664
Unrealised loss on equity swaps 15&2(m) – – 8,742,579 – – –
Unrealised loss on credit default swaps 10&2(k) – – – – 25,937,981 –
Unrealised loss on inflation linked swaps 13&2(p) – – – – 16,763,895 –
Unrealised loss on equity variance swaps 11&2(n) – – – – 14,059,024 –
Unrealised loss on volatility swaps 12&2(o) – – – – 12,037,891 –
Unrealised loss on interest rate swaps 14&2(l) – – – – 117,618,412 –
Unrealised loss on commodity swaps 16&2(q) – – – – 4,433 –
Unrealised loss on total return swaps 17&2(r) – – – – 1,281,003 –
Unrealised loss on options 18&2(s) – – – – 79,332,856 –
Total Liabilities 45,046,208 27,333,291 9,340,753 74,788,710 395,322,952 1,891,426
Net Assets 745,946,170 6,405,623,029 120,051,597 2,227,363,001 2,481,997,752 71,025,050
The accompanying notes form an integral part of these financial statements.
197 Invesco Funds
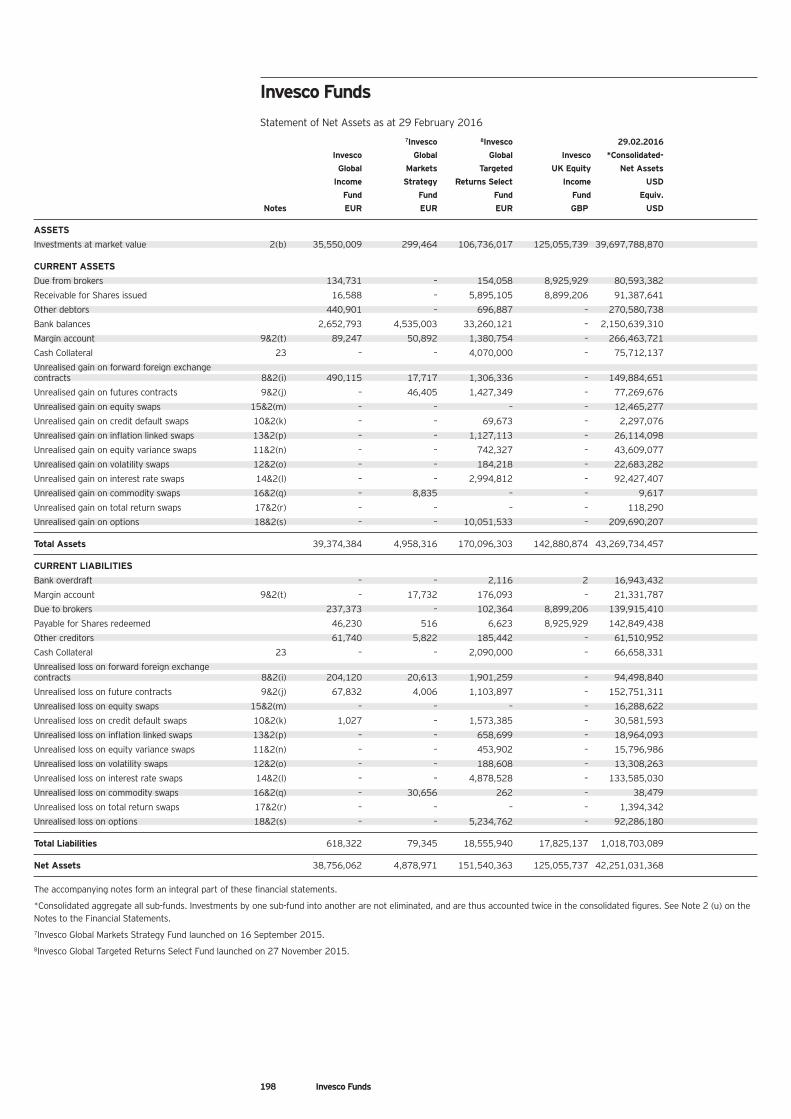
Invesco Funds
Statement of Net Assets as at 29 February 20167Invesco 8Invesco 29.02.2016
Invesco Global Global Invesco *Consolidated-
Global Markets Targeted UK Equity Net Assets
Income Strategy Returns Select Income USD
Fund Fund Fund Fund Equiv.
Notes EUR EUR EUR GBP USD
ASSETS
Investments at market value 2(b) 35,550,009 299,464 106,736,017 125,055,739 39,697,788,870
CURRENT ASSETS
Due from brokers 134,731 – 154,058 8,925,929 80,593,382
Receivable for Shares issued 16,588 – 5,895,105 8,899,206 91,387,641
Other debtors 440,901 – 696,887 – 270,580,738
Bank balances 2,652,793 4,535,003 33,260,121 – 2,150,639,310
Margin account 9&2(t) 89,247 50,892 1,380,754 – 266,463,721
Cash Collateral 23 – – 4,070,000 – 75,712,137
Unrealised gain on forward foreign exchange contracts 8&2(i) 490,115 17,717 1,306,336 – 149,884,651
Unrealised gain on futures contracts 9&2(j) – 46,405 1,427,349 – 77,269,676
Unrealised gain on equity swaps 15&2(m) – – – – 12,465,277
Unrealised gain on credit default swaps 10&2(k) – – 69,673 – 2,297,076
Unrealised gain on inflation linked swaps 13&2(p) – – 1,127,113 – 26,114,098
Unrealised gain on equity variance swaps 11&2(n) – – 742,327 – 43,609,077
Unrealised gain on volatility swaps 12&2(o) – – 184,218 – 22,683,282
Unrealised gain on interest rate swaps 14&2(l) – – 2,994,812 – 92,427,407
Unrealised gain on commodity swaps 16&2(q) – 8,835 – – 9,617
Unrealised gain on total return swaps 17&2(r) – – – – 118,290
Unrealised gain on options 18&2(s) – – 10,051,533 – 209,690,207
Total Assets 39,374,384 4,958,316 170,096,303 142,880,874 43,269,734,457
CURRENT LIABILITIES
Bank overdraft – – 2,116 2 16,943,432
Margin account 9&2(t) – 17,732 176,093 – 21,331,787
Due to brokers 237,373 – 102,364 8,899,206 139,915,410
Payable for Shares redeemed 46,230 516 6,623 8,925,929 142,849,438
Other creditors 61,740 5,822 185,442 – 61,510,952
Cash Collateral 23 – – 2,090,000 – 66,658,331
Unrealised loss on forward foreign exchange contracts 8&2(i) 204,120 20,613 1,901,259 – 94,498,840
Unrealised loss on future contracts 9&2(j) 67,832 4,006 1,103,897 – 152,751,311
Unrealised loss on equity swaps 15&2(m) – – – – 16,288,622
Unrealised loss on credit default swaps 10&2(k) 1,027 – 1,573,385 – 30,581,593
Unrealised loss on inflation linked swaps 13&2(p) – – 658,699 – 18,964,093
Unrealised loss on equity variance swaps 11&2(n) – – 453,902 – 15,796,986
Unrealised loss on volatility swaps 12&2(o) – – 188,608 – 13,308,263
Unrealised loss on interest rate swaps 14&2(l) – – 4,878,528 – 133,585,030
Unrealised loss on commodity swaps 16&2(q) – 30,656 262 – 38,479
Unrealised loss on total return swaps 17&2(r) – – – – 1,394,342
Unrealised loss on options 18&2(s) – – 5,234,762 – 92,286,180
Total Liabilities 618,322 79,345 18,555,940 17,825,137 1,018,703,089
Net Assets 38,756,062 4,878,971 151,540,363 125,055,737 42,251,031,368
The accompanying notes form an integral part of these financial statements.
*Consolidated aggregate all sub-funds. Investments by one sub-fund into another are not eliminated, and are thus accounted twice in the consolidated figures. See Note 2 (u) on theNotes to the Financial Statements.7Invesco Global Markets Strategy Fund launched on 16 September 2015.8Invesco Global Targeted Returns Select Fund launched on 27 November 2015.
198 Invesco Funds
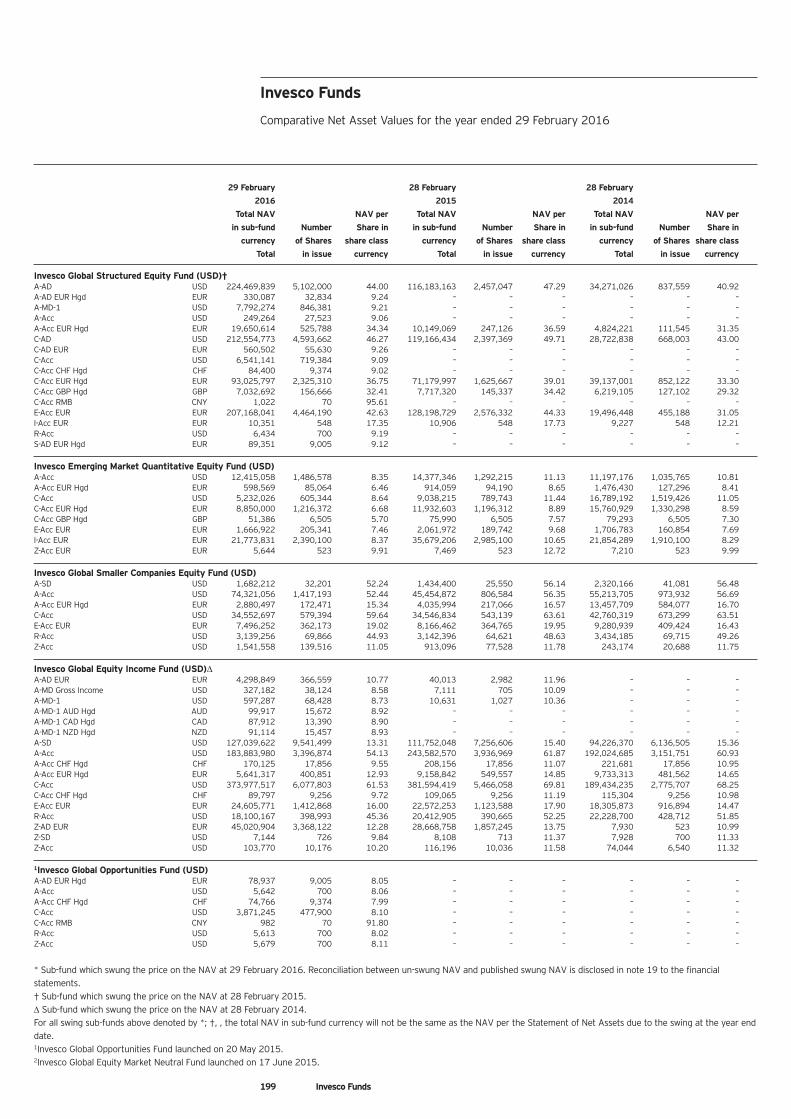
199 Invesco Funds
29 February 28 February 28 February
2016 2015 2014
Total NAV NAV per Total NAV NAV per Total NAV NAV per
in sub-fund Number Share in in sub-fund Number Share in in sub-fund Number Share in
currency of Shares share class currency of Shares share class currency of Shares share class
Total in issue currency Total in issue currency Total in issue currency
Invesco Global Structured Equity Fund (USD)†A-AD USD 224,469,839 5,102,000 44.00 116,183,163 2,457,047 47.29 34,271,026 837,559 40.92A-AD EUR Hgd EUR 330,087 32,834 9.24 – – – – – –A-MD-1 USD 7,792,274 846,381 9.21 – – – – – –A-Acc USD 249,264 27,523 9.06 – – – – – –A-Acc EUR Hgd EUR 19,650,614 525,788 34.34 10,149,069 247,126 36.59 4,824,221 111,545 31.35C-AD USD 212,554,773 4,593,662 46.27 119,166,434 2,397,369 49.71 28,722,838 668,003 43.00C-AD EUR EUR 560,502 55,630 9.26 – – – – – –C-Acc USD 6,541,141 719,384 9.09 – – – – – –C-Acc CHF Hgd CHF 84,400 9,374 9.02 – – – – – –C-Acc EUR Hgd EUR 93,025,797 2,325,310 36.75 71,179,997 1,625,667 39.01 39,137,001 852,122 33.30C-Acc GBP Hgd GBP 7,032,692 156,666 32.41 7,717,320 145,337 34.42 6,219,105 127,102 29.32C-Acc RMB CNY 1,022 70 95.61 – – – – – –E-Acc EUR EUR 207,168,041 4,464,190 42.63 128,198,729 2,576,332 44.33 19,496,448 455,188 31.05I-Acc EUR EUR 10,351 548 17.35 10,906 548 17.73 9,227 548 12.21R-Acc USD 6,434 700 9.19 – – – – – –S-AD EUR Hgd EUR 89,351 9,005 9.12 – – – – – –
Invesco Emerging Market Quantitative Equity Fund (USD)A-Acc USD 12,415,058 1,486,578 8.35 14,377,346 1,292,215 11.13 11,197,176 1,035,765 10.81A-Acc EUR Hgd EUR 598,569 85,064 6.46 914,059 94,190 8.65 1,476,430 127,296 8.41C-Acc USD 5,232,026 605,344 8.64 9,038,215 789,743 11.44 16,789,192 1,519,426 11.05C-Acc EUR Hgd EUR 8,850,000 1,216,372 6.68 11,932,603 1,196,312 8.89 15,760,929 1,330,298 8.59C-Acc GBP Hgd GBP 51,386 6,505 5.70 75,990 6,505 7.57 79,293 6,505 7.30E-Acc EUR EUR 1,666,922 205,341 7.46 2,061,972 189,742 9.68 1,706,783 160,854 7.69I-Acc EUR EUR 21,773,831 2,390,100 8.37 35,679,206 2,985,100 10.65 21,854,289 1,910,100 8.29Z-Acc EUR EUR 5,644 523 9.91 7,469 523 12.72 7,210 523 9.99
Invesco Global Smaller Companies Equity Fund (USD)A-SD USD 1,682,212 32,201 52.24 1,434,400 25,550 56.14 2,320,166 41,081 56.48A-Acc USD 74,321,056 1,417,193 52.44 45,454,872 806,584 56.35 55,213,705 973,932 56.69A-Acc EUR Hgd EUR 2,880,497 172,471 15.34 4,035,994 217,066 16.57 13,457,709 584,077 16.70C-Acc USD 34,552,697 579,394 59.64 34,546,834 543,139 63.61 42,760,319 673,299 63.51E-Acc EUR EUR 7,496,252 362,173 19.02 8,166,462 364,765 19.95 9,280,939 409,424 16.43R-Acc USD 3,139,256 69,866 44.93 3,142,396 64,621 48.63 3,434,185 69,715 49.26Z-Acc USD 1,541,558 139,516 11.05 913,096 77,528 11.78 243,174 20,688 11.75
Invesco Global Equity Income Fund (USD)ΔA-AD EUR EUR 4,298,849 366,559 10.77 40,013 2,982 11.96 – – –A-MD Gross Income USD 327,182 38,124 8.58 7,111 705 10.09 – – –A-MD-1 USD 597,287 68,428 8.73 10,631 1,027 10.36 – – –A-MD-1 AUD Hgd AUD 99,917 15,672 8.92 – – – – – –A-MD-1 CAD Hgd CAD 87,912 13,390 8.90 – – – – – –A-MD-1 NZD Hgd NZD 91,114 15,457 8.93 – – – – – –A-SD USD 127,039,622 9,541,499 13.31 111,752,048 7,256,606 15.40 94,226,370 6,136,505 15.36A-Acc USD 183,883,980 3,396,874 54.13 243,582,570 3,936,969 61.87 192,024,685 3,151,751 60.93A-Acc CHF Hgd CHF 170,125 17,856 9.55 208,156 17,856 11.07 221,681 17,856 10.95A-Acc EUR Hgd EUR 5,641,317 400,851 12.93 9,158,842 549,557 14.85 9,733,313 481,562 14.65C-Acc USD 373,977,517 6,077,803 61.53 381,594,419 5,466,058 69.81 189,434,235 2,775,707 68.25C-Acc CHF Hgd CHF 89,797 9,256 9.72 109,065 9,256 11.19 115,304 9,256 10.98E-Acc EUR EUR 24,605,771 1,412,868 16.00 22,572,253 1,123,588 17.90 18,305,873 916,894 14.47R-Acc USD 18,100,167 398,993 45.36 20,412,905 390,665 52.25 22,228,700 428,712 51.85Z-AD EUR EUR 45,020,904 3,368,122 12.28 28,668,758 1,857,245 13.75 7,930 523 10.99Z-SD USD 7,144 726 9.84 8,108 713 11.37 7,928 700 11.33Z-Acc USD 103,770 10,176 10.20 116,196 10,036 11.58 74,044 6,540 11.32
1Invesco Global Opportunities Fund (USD)A-AD EUR Hgd EUR 78,937 9,005 8.05 – – – – – –A-Acc USD 5,642 700 8.06 – – – – – –A-Acc CHF Hgd CHF 74,766 9,374 7.99 – – – – – –C-Acc USD 3,871,245 477,900 8.10 – – – – – –C-Acc RMB CNY 982 70 91.80 – – – – – –R-Acc USD 5,613 700 8.02 – – – – – –Z-Acc USD 5,679 700 8.11 – – – – – –
* Sub-fund which swung the price on the NAV at 29 February 2016. Reconciliation between un-swung NAV and published swung NAV is disclosed in note 19 to the financialstatements.† Sub-fund which swung the price on the NAV at 28 February 2015.ΔΔ Sub-fund which swung the price on the NAV at 28 February 2014.For all swing sub-funds above denoted by *; †, Δ, the total NAV in sub-fund currency will not be the same as the NAV per the Statement of Net Assets due to the swing at the year enddate.1Invesco Global Opportunities Fund launched on 20 May 2015.2Invesco Global Equity Market Neutral Fund launched on 17 June 2015.
Invesco Funds
Comparative Net Asset Values for the year ended 29 February 2016
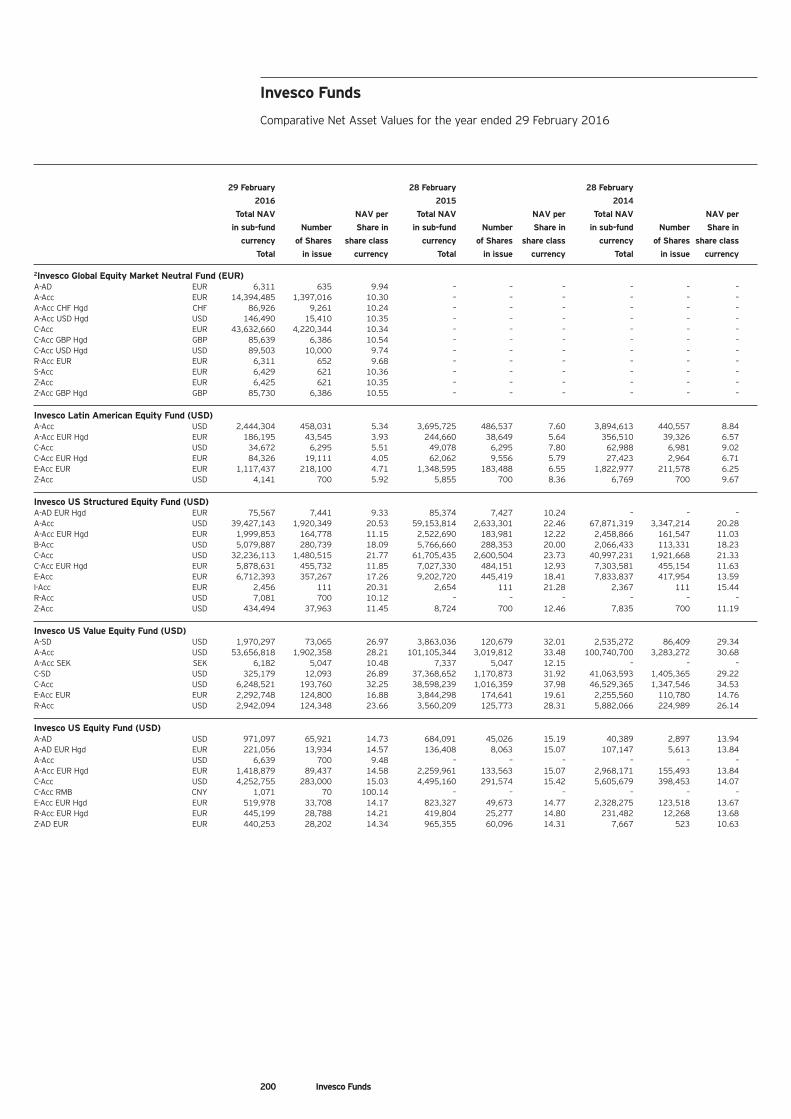
200 Invesco Funds
29 February 28 February 28 February
2016 2015 2014
Total NAV NAV per Total NAV NAV per Total NAV NAV per
in sub-fund Number Share in in sub-fund Number Share in in sub-fund Number Share in
currency of Shares share class currency of Shares share class currency of Shares share class
Total in issue currency Total in issue currency Total in issue currency
2Invesco Global Equity Market Neutral Fund (EUR)A-AD EUR 6,311 635 9.94 – – – – – –A-Acc EUR 14,394,485 1,397,016 10.30 – – – – – –A-Acc CHF Hgd CHF 86,926 9,261 10.24 – – – – – –A-Acc USD Hgd USD 146,490 15,410 10.35 – – – – – –C-Acc EUR 43,632,660 4,220,344 10.34 – – – – – –C-Acc GBP Hgd GBP 85,639 6,386 10.54 – – – – – –C-Acc USD Hgd USD 89,503 10,000 9.74 – – – – – –R-Acc EUR EUR 6,311 652 9.68 – – – – – –S-Acc EUR 6,429 621 10.36 – – – – – –Z-Acc EUR 6,425 621 10.35 – – – – – –Z-Acc GBP Hgd GBP 85,730 6,386 10.55 – – – – – –
Invesco Latin American Equity Fund (USD)A-Acc USD 2,444,304 458,031 5.34 3,695,725 486,537 7.60 3,894,613 440,557 8.84A-Acc EUR Hgd EUR 186,195 43,545 3.93 244,660 38,649 5.64 356,510 39,326 6.57C-Acc USD 34,672 6,295 5.51 49,078 6,295 7.80 62,988 6,981 9.02C-Acc EUR Hgd EUR 84,326 19,111 4.05 62,062 9,556 5.79 27,423 2,964 6.71E-Acc EUR EUR 1,117,437 218,100 4.71 1,348,595 183,488 6.55 1,822,977 211,578 6.25Z-Acc USD 4,141 700 5.92 5,855 700 8.36 6,769 700 9.67
Invesco US Structured Equity Fund (USD)A-AD EUR Hgd EUR 75,567 7,441 9.33 85,374 7,427 10.24 – – –A-Acc USD 39,427,143 1,920,349 20.53 59,153,814 2,633,301 22.46 67,871,319 3,347,214 20.28A-Acc EUR Hgd EUR 1,999,853 164,778 11.15 2,522,690 183,981 12.22 2,458,866 161,547 11.03B-Acc USD 5,079,887 280,739 18.09 5,766,660 288,353 20.00 2,066,433 113,331 18.23C-Acc USD 32,236,113 1,480,515 21.77 61,705,435 2,600,504 23.73 40,997,231 1,921,668 21.33C-Acc EUR Hgd EUR 5,878,631 455,732 11.85 7,027,330 484,151 12.93 7,303,581 455,154 11.63E-Acc EUR 6,712,393 357,267 17.26 9,202,720 445,419 18.41 7,833,837 417,954 13.59I-Acc EUR 2,456 111 20.31 2,654 111 21.28 2,367 111 15.44R-Acc USD 7,081 700 10.12 – – – – – –Z-Acc USD 434,494 37,963 11.45 8,724 700 12.46 7,835 700 11.19
Invesco US Value Equity Fund (USD)A-SD USD 1,970,297 73,065 26.97 3,863,036 120,679 32.01 2,535,272 86,409 29.34A-Acc USD 53,656,818 1,902,358 28.21 101,105,344 3,019,812 33.48 100,740,700 3,283,272 30.68A-Acc SEK SEK 6,182 5,047 10.48 7,337 5,047 12.15 – – –C-SD USD 325,179 12,093 26.89 37,368,652 1,170,873 31.92 41,063,593 1,405,365 29.22C-Acc USD 6,248,521 193,760 32.25 38,598,239 1,016,359 37.98 46,529,365 1,347,546 34.53E-Acc EUR EUR 2,292,748 124,800 16.88 3,844,298 174,641 19.61 2,255,560 110,780 14.76R-Acc USD 2,942,094 124,348 23.66 3,560,209 125,773 28.31 5,882,066 224,989 26.14
Invesco US Equity Fund (USD)A-AD USD 971,097 65,921 14.73 684,091 45,026 15.19 40,389 2,897 13.94A-AD EUR Hgd EUR 221,056 13,934 14.57 136,408 8,063 15.07 107,147 5,613 13.84A-Acc USD 6,639 700 9.48 – – – – – –A-Acc EUR Hgd EUR 1,418,879 89,437 14.58 2,259,961 133,563 15.07 2,968,171 155,493 13.84C-Acc USD 4,252,755 283,000 15.03 4,495,160 291,574 15.42 5,605,679 398,453 14.07C-Acc RMB CNY 1,071 70 100.14 – – – – – –E-Acc EUR Hgd EUR 519,978 33,708 14.17 823,327 49,673 14.77 2,328,275 123,518 13.67R-Acc EUR Hgd EUR 445,199 28,788 14.21 419,804 25,277 14.80 231,482 12,268 13.68Z-AD EUR EUR 440,253 28,202 14.34 965,355 60,096 14.31 7,667 523 10.63
Invesco Funds
Comparative Net Asset Values for the year ended 29 February 2016
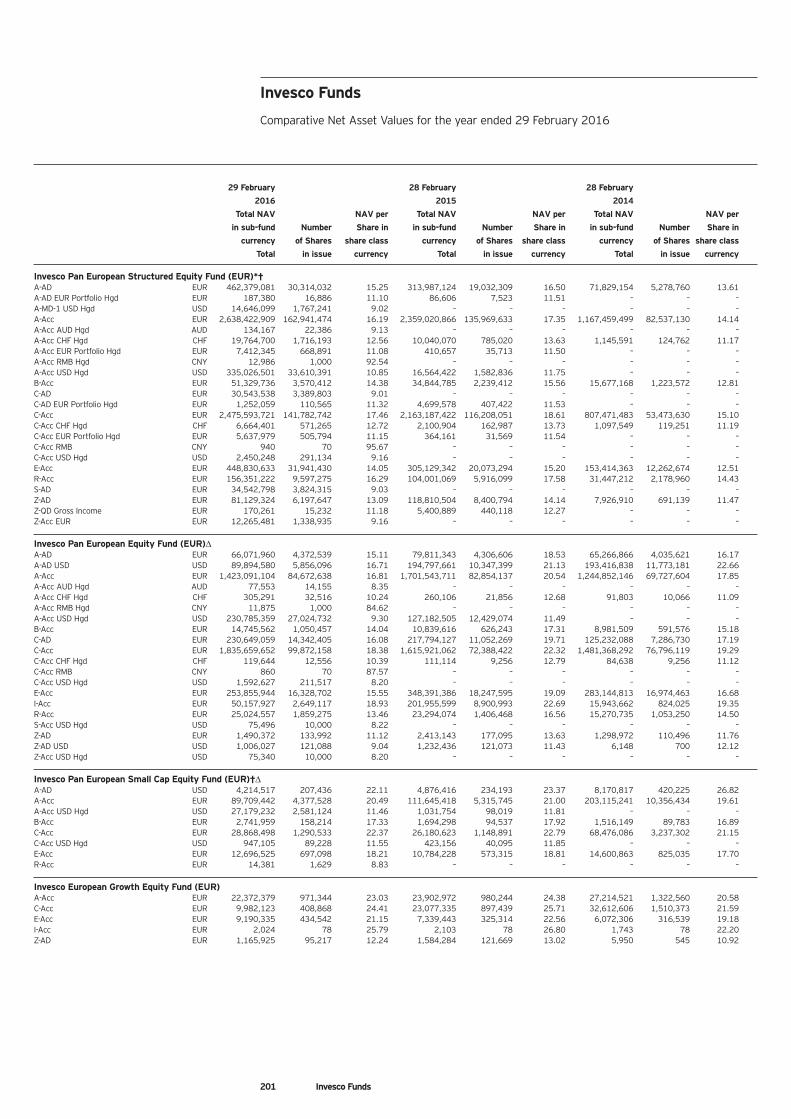
201 Invesco Funds
29 February 28 February 28 February
2016 2015 2014
Total NAV NAV per Total NAV NAV per Total NAV NAV per
in sub-fund Number Share in in sub-fund Number Share in in sub-fund Number Share in
currency of Shares share class currency of Shares share class currency of Shares share class
Total in issue currency Total in issue currency Total in issue currency
Invesco Pan European Structured Equity Fund (EUR)*†A-AD EUR 462,379,081 30,314,032 15.25 313,987,124 19,032,309 16.50 71,829,154 5,278,760 13.61A-AD EUR Portfolio Hgd EUR 187,380 16,886 11.10 86,606 7,523 11.51 – – –A-MD-1 USD Hgd USD 14,646,099 1,767,241 9.02 – – – – – –A-Acc EUR 2,638,422,909 162,941,474 16.19 2,359,020,866 135,969,633 17.35 1,167,459,499 82,537,130 14.14A-Acc AUD Hgd AUD 134,167 22,386 9.13 – – – – – –A-Acc CHF Hgd CHF 19,764,700 1,716,193 12.56 10,040,070 785,020 13.63 1,145,591 124,762 11.17A-Acc EUR Portfolio Hgd EUR 7,412,345 668,891 11.08 410,657 35,713 11.50 – – –A-Acc RMB Hgd CNY 12,986 1,000 92.54 – – – – – –A-Acc USD Hgd USD 335,026,501 33,610,391 10.85 16,564,422 1,582,836 11.75 – – –B-Acc EUR 51,329,736 3,570,412 14.38 34,844,785 2,239,412 15.56 15,677,168 1,223,572 12.81C-AD EUR 30,543,538 3,389,803 9.01 – – – – – –C-AD EUR Portfolio Hgd EUR 1,252,059 110,565 11.32 4,699,578 407,422 11.53 – – –C-Acc EUR 2,475,593,721 141,782,742 17.46 2,163,187,422 116,208,051 18.61 807,471,483 53,473,630 15.10C-Acc CHF Hgd CHF 6,664,401 571,265 12.72 2,100,904 162,987 13.73 1,097,549 119,251 11.19C-Acc EUR Portfolio Hgd EUR 5,637,979 505,794 11.15 364,161 31,569 11.54 – – –C-Acc RMB CNY 940 70 95.67 – – – – – –C-Acc USD Hgd USD 2,450,248 291,134 9.16 – – – – – –E-Acc EUR 448,830,633 31,941,430 14.05 305,129,342 20,073,294 15.20 153,414,363 12,262,674 12.51R-Acc EUR 156,351,222 9,597,275 16.29 104,001,069 5,916,099 17.58 31,447,212 2,178,960 14.43S-AD EUR 34,542,798 3,824,315 9.03 – – – – – –Z-AD EUR 81,129,324 6,197,647 13.09 118,810,504 8,400,794 14.14 7,926,910 691,139 11.47Z-QD Gross Income EUR 170,261 15,232 11.18 5,400,889 440,118 12.27 – – –Z-Acc EUR EUR 12,265,481 1,338,935 9.16 – – – – – –
Invesco Pan European Equity Fund (EUR)ΔA-AD EUR 66,071,960 4,372,539 15.11 79,811,343 4,306,606 18.53 65,266,866 4,035,621 16.17A-AD USD USD 89,894,580 5,856,096 16.71 194,797,661 10,347,399 21.13 193,416,838 11,773,181 22.66A-Acc EUR 1,423,091,104 84,672,638 16.81 1,701,543,711 82,854,137 20.54 1,244,852,146 69,727,604 17.85A-Acc AUD Hgd AUD 77,553 14,155 8.35 – – – – – –A-Acc CHF Hgd CHF 305,291 32,516 10.24 260,106 21,856 12.68 91,803 10,066 11.09A-Acc RMB Hgd CNY 11,875 1,000 84.62 – – – – – –A-Acc USD Hgd USD 230,785,359 27,024,732 9.30 127,182,505 12,429,074 11.49 – – –B-Acc EUR 14,745,562 1,050,457 14.04 10,839,616 626,243 17.31 8,981,509 591,576 15.18C-AD EUR 230,649,059 14,342,405 16.08 217,794,127 11,052,269 19.71 125,232,088 7,286,730 17.19C-Acc EUR 1,835,659,652 99,872,158 18.38 1,615,921,062 72,388,422 22.32 1,481,368,292 76,796,119 19.29C-Acc CHF Hgd CHF 119,644 12,556 10.39 111,114 9,256 12.79 84,638 9,256 11.12C-Acc RMB CNY 860 70 87.57 – – – – – –C-Acc USD Hgd USD 1,592,627 211,517 8.20 – – – – – –E-Acc EUR 253,855,944 16,328,702 15.55 348,391,386 18,247,595 19.09 283,144,813 16,974,463 16.68I-Acc EUR 50,157,927 2,649,117 18.93 201,955,599 8,900,993 22.69 15,943,662 824,025 19.35R-Acc EUR 25,024,557 1,859,275 13.46 23,294,074 1,406,468 16.56 15,270,735 1,053,250 14.50S-Acc USD Hgd USD 75,496 10,000 8.22 – – – – – –Z-AD EUR 1,490,372 133,992 11.12 2,413,143 177,095 13.63 1,298,972 110,496 11.76Z-AD USD USD 1,006,027 121,088 9.04 1,232,436 121,073 11.43 6,148 700 12.12Z-Acc USD Hgd USD 75,340 10,000 8.20 – – – – – –
Invesco Pan European Small Cap Equity Fund (EUR)†ΔA-AD USD 4,214,517 207,436 22.11 4,876,416 234,193 23.37 8,170,817 420,225 26.82A-Acc EUR 89,709,442 4,377,528 20.49 111,645,418 5,315,745 21.00 203,115,241 10,356,434 19.61A-Acc USD Hgd USD 27,179,232 2,581,124 11.46 1,031,754 98,019 11.81 – – –B-Acc EUR 2,741,959 158,214 17.33 1,694,298 94,537 17.92 1,516,149 89,783 16.89C-Acc EUR 28,868,498 1,290,533 22.37 26,180,623 1,148,891 22.79 68,476,086 3,237,302 21.15C-Acc USD Hgd USD 947,105 89,228 11.55 423,156 40,095 11.85 – – –E-Acc EUR 12,696,525 697,098 18.21 10,784,228 573,315 18.81 14,600,863 825,035 17.70R-Acc EUR 14,381 1,629 8.83 – – – – – –
Invesco European Growth Equity Fund (EUR)A-Acc EUR 22,372,379 971,344 23.03 23,902,972 980,244 24.38 27,214,521 1,322,560 20.58C-Acc EUR 9,982,123 408,868 24.41 23,077,335 897,439 25.71 32,612,606 1,510,373 21.59E-Acc EUR 9,190,335 434,542 21.15 7,339,443 325,314 22.56 6,072,306 316,539 19.18I-Acc EUR 2,024 78 25.79 2,103 78 26.80 1,743 78 22.20Z-AD EUR 1,165,925 95,217 12.24 1,584,284 121,669 13.02 5,950 545 10.92
Invesco Funds
Comparative Net Asset Values for the year ended 29 February 2016
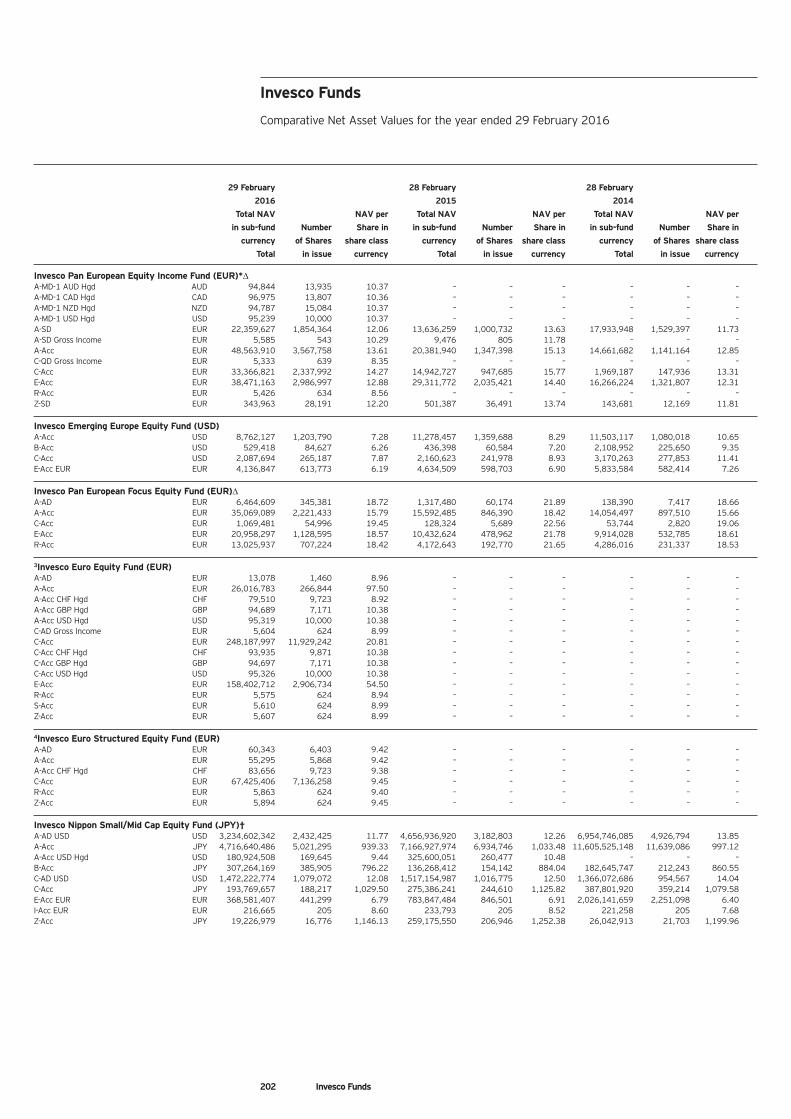
202 Invesco Funds
29 February 28 February 28 February
2016 2015 2014
Total NAV NAV per Total NAV NAV per Total NAV NAV per
in sub-fund Number Share in in sub-fund Number Share in in sub-fund Number Share in
currency of Shares share class currency of Shares share class currency of Shares share class
Total in issue currency Total in issue currency Total in issue currency
Invesco Pan European Equity Income Fund (EUR)*ΔA-MD-1 AUD Hgd AUD 94,844 13,935 10.37 – – – – – –A-MD-1 CAD Hgd CAD 96,975 13,807 10.36 – – – – – –A-MD-1 NZD Hgd NZD 94,787 15,084 10.37 – – – – – –A-MD-1 USD Hgd USD 95,239 10,000 10.37 – – – – – –A-SD EUR 22,359,627 1,854,364 12.06 13,636,259 1,000,732 13.63 17,933,948 1,529,397 11.73A-SD Gross Income EUR 5,585 543 10.29 9,476 805 11.78 – – –A-Acc EUR 48,563,910 3,567,758 13.61 20,381,940 1,347,398 15.13 14,661,682 1,141,164 12.85C-QD Gross Income EUR 5,333 639 8.35 – – – – – –C-Acc EUR 33,366,821 2,337,992 14.27 14,942,727 947,685 15.77 1,969,187 147,936 13.31E-Acc EUR 38,471,163 2,986,997 12.88 29,311,772 2,035,421 14.40 16,266,224 1,321,807 12.31R-Acc EUR 5,426 634 8.56 – – – – – –Z-SD EUR 343,963 28,191 12.20 501,387 36,491 13.74 143,681 12,169 11.81
Invesco Emerging Europe Equity Fund (USD)A-Acc USD 8,762,127 1,203,790 7.28 11,278,457 1,359,688 8.29 11,503,117 1,080,018 10.65B-Acc USD 529,418 84,627 6.26 436,398 60,584 7.20 2,108,952 225,650 9.35C-Acc USD 2,087,694 265,187 7.87 2,160,623 241,978 8.93 3,170,263 277,853 11.41E-Acc EUR EUR 4,136,847 613,773 6.19 4,634,509 598,703 6.90 5,833,584 582,414 7.26
Invesco Pan European Focus Equity Fund (EUR)ΔA-AD EUR 6,464,609 345,381 18.72 1,317,480 60,174 21.89 138,390 7,417 18.66A-Acc EUR 35,069,089 2,221,433 15.79 15,592,485 846,390 18.42 14,054,497 897,510 15.66C-Acc EUR 1,069,481 54,996 19.45 128,324 5,689 22.56 53,744 2,820 19.06E-Acc EUR 20,958,297 1,128,595 18.57 10,432,624 478,962 21.78 9,914,028 532,785 18.61R-Acc EUR 13,025,937 707,224 18.42 4,172,643 192,770 21.65 4,286,016 231,337 18.53
3Invesco Euro Equity Fund (EUR)A-AD EUR 13,078 1,460 8.96 – – – – – –A-Acc EUR 26,016,783 266,844 97.50 – – – – – –A-Acc CHF Hgd CHF 79,510 9,723 8.92 – – – – – –A-Acc GBP Hgd GBP 94,689 7,171 10.38 – – – – – –A-Acc USD Hgd USD 95,319 10,000 10.38 – – – – – –C-AD Gross Income EUR 5,604 624 8.99 – – – – – –C-Acc EUR 248,187,997 11,929,242 20.81 – – – – – –C-Acc CHF Hgd CHF 93,935 9,871 10.38 – – – – – –C-Acc GBP Hgd GBP 94,697 7,171 10.38 – – – – – –C-Acc USD Hgd USD 95,326 10,000 10.38 – – – – – –E-Acc EUR 158,402,712 2,906,734 54.50 – – – – – –R-Acc EUR 5,575 624 8.94 – – – – – –S-Acc EUR 5,610 624 8.99 – – – – – –Z-Acc EUR 5,607 624 8.99 – – – – – –
4Invesco Euro Structured Equity Fund (EUR)A-AD EUR 60,343 6,403 9.42 – – – – – –A-Acc EUR 55,295 5,868 9.42 – – – – – –A-Acc CHF Hgd CHF 83,656 9,723 9.38 – – – – – –C-Acc EUR 67,425,406 7,136,258 9.45 – – – – – –R-Acc EUR 5,863 624 9.40 – – – – – –Z-Acc EUR 5,894 624 9.45 – – – – – –
Invesco Nippon Small/Mid Cap Equity Fund (JPY)†A-AD USD USD 3,234,602,342 2,432,425 11.77 4,656,936,920 3,182,803 12.26 6,954,746,085 4,926,794 13.85A-Acc JPY 4,716,640,486 5,021,295 939.33 7,166,927,974 6,934,746 1,033.48 11,605,525,148 11,639,086 997.12A-Acc USD Hgd USD 180,924,508 169,645 9.44 325,600,051 260,477 10.48 – – –B-Acc JPY 307,264,169 385,905 796.22 136,268,412 154,142 884.04 182,645,747 212,243 860.55C-AD USD USD 1,472,222,774 1,079,072 12.08 1,517,154,987 1,016,775 12.50 1,366,072,686 954,567 14.04C-Acc JPY 193,769,657 188,217 1,029.50 275,386,241 244,610 1,125.82 387,801,920 359,214 1,079.58E-Acc EUR EUR 368,581,407 441,299 6.79 783,847,484 846,501 6.91 2,026,141,659 2,251,098 6.40I-Acc EUR EUR 216,665 205 8.60 233,793 205 8.52 221,258 205 7.68Z-Acc JPY 19,226,979 16,776 1,146.13 259,175,550 206,946 1,252.38 26,042,913 21,703 1,199.96
Invesco Funds
Comparative Net Asset Values for the year ended 29 February 2016
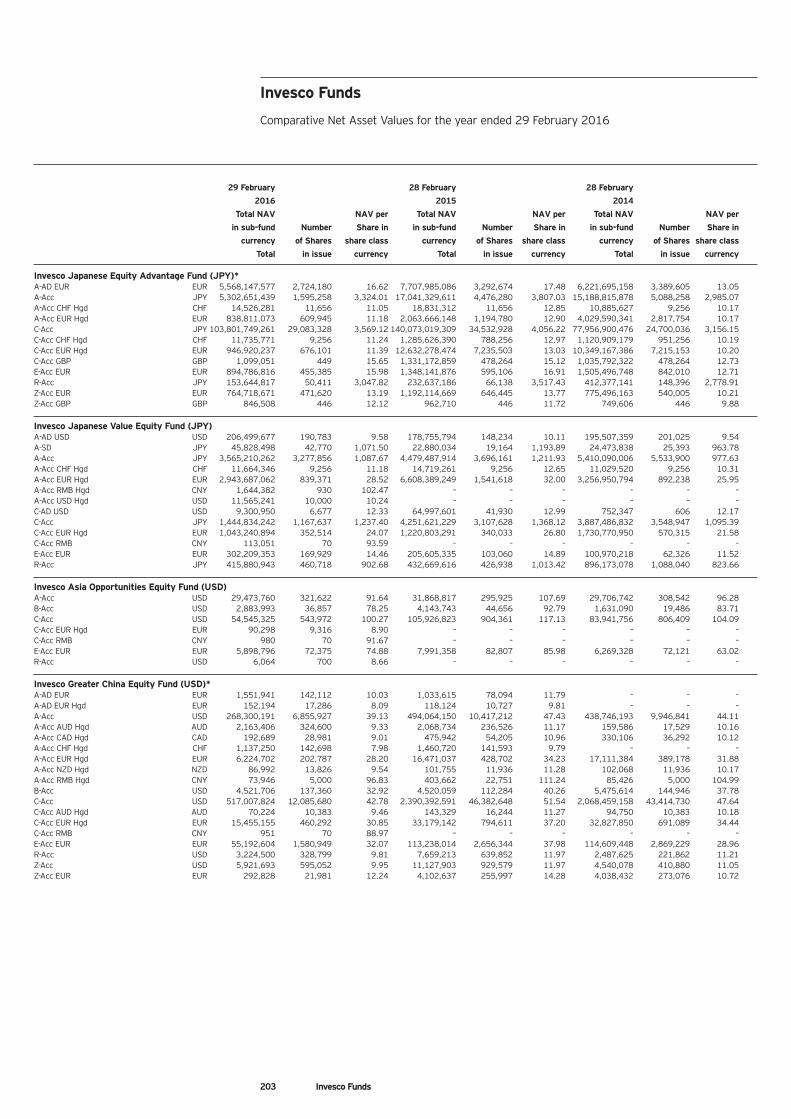
203 Invesco Funds
29 February 28 February 28 February
2016 2015 2014
Total NAV NAV per Total NAV NAV per Total NAV NAV per
in sub-fund Number Share in in sub-fund Number Share in in sub-fund Number Share in
currency of Shares share class currency of Shares share class currency of Shares share class
Total in issue currency Total in issue currency Total in issue currency
Invesco Japanese Equity Advantage Fund (JPY)*A-AD EUR EUR 5,568,147,577 2,724,180 16.62 7,707,985,086 3,292,674 17.48 6,221,695,158 3,389,605 13.05A-Acc JPY 5,302,651,439 1,595,258 3,324.01 17,041,329,611 4,476,280 3,807.03 15,188,815,878 5,088,258 2,985.07A-Acc CHF Hgd CHF 14,526,281 11,656 11.05 18,831,312 11,656 12.85 10,885,627 9,256 10.17A-Acc EUR Hgd EUR 838,811,073 609,945 11.18 2,063,666,148 1,194,780 12.90 4,029,590,341 2,817,754 10.17C-Acc JPY 103,801,749,261 29,083,328 3,569.12 140,073,019,309 34,532,928 4,056.22 77,956,900,476 24,700,036 3,156.15C-Acc CHF Hgd CHF 11,735,771 9,256 11.24 1,285,626,390 788,256 12.97 1,120,909,179 951,256 10.19C-Acc EUR Hgd EUR 946,920,237 676,101 11.39 12,632,278,474 7,235,503 13.03 10,349,167,386 7,215,153 10.20C-Acc GBP GBP 1,099,051 449 15.65 1,331,172,859 478,264 15.12 1,035,792,322 478,264 12.73E-Acc EUR EUR 894,786,816 455,385 15.98 1,348,141,876 595,106 16.91 1,505,496,748 842,010 12.71R-Acc JPY 153,644,817 50,411 3,047.82 232,637,186 66,138 3,517.43 412,377,141 148,396 2,778.91Z-Acc EUR EUR 764,718,671 471,620 13.19 1,192,114,669 646,445 13.77 775,496,163 540,005 10.21Z-Acc GBP GBP 846,508 446 12.12 962,710 446 11.72 749,606 446 9.88
Invesco Japanese Value Equity Fund (JPY)A-AD USD USD 206,499,677 190,783 9.58 178,755,794 148,234 10.11 195,507,359 201,025 9.54A-SD JPY 45,828,498 42,770 1,071.50 22,880,034 19,164 1,193.89 24,473,838 25,393 963.78A-Acc JPY 3,565,210,262 3,277,856 1,087.67 4,479,487,914 3,696,161 1,211.93 5,410,090,006 5,533,900 977.63A-Acc CHF Hgd CHF 11,664,346 9,256 11.18 14,719,261 9,256 12.65 11,029,520 9,256 10.31A-Acc EUR Hgd EUR 2,943,687,062 839,371 28.52 6,608,389,249 1,541,618 32.00 3,256,950,794 892,238 25.95A-Acc RMB Hgd CNY 1,644,382 930 102.47 – – – – – –A-Acc USD Hgd USD 11,565,241 10,000 10.24 – – – – – –C-AD USD USD 9,300,950 6,677 12.33 64,997,601 41,930 12.99 752,347 606 12.17C-Acc JPY 1,444,834,242 1,167,637 1,237.40 4,251,621,229 3,107,628 1,368.12 3,887,486,832 3,548,947 1,095.39C-Acc EUR Hgd EUR 1,043,240,894 352,514 24.07 1,220,803,291 340,033 26.80 1,730,770,950 570,315 21.58C-Acc RMB CNY 113,051 70 93.59 – – – – – –E-Acc EUR EUR 302,209,353 169,929 14.46 205,605,335 103,060 14.89 100,970,218 62,326 11.52R-Acc JPY 415,880,943 460,718 902.68 432,669,616 426,938 1,013.42 896,173,078 1,088,040 823.66
Invesco Asia Opportunities Equity Fund (USD)A-Acc USD 29,473,760 321,622 91.64 31,868,817 295,925 107.69 29,706,742 308,542 96.28B-Acc USD 2,883,993 36,857 78.25 4,143,743 44,656 92.79 1,631,090 19,486 83.71C-Acc USD 54,545,325 543,972 100.27 105,926,823 904,361 117.13 83,941,756 806,409 104.09C-Acc EUR Hgd EUR 90,298 9,316 8.90 – – – – – –C-Acc RMB CNY 980 70 91.67 – – – – – –E-Acc EUR EUR 5,898,796 72,375 74.88 7,991,358 82,807 85.98 6,269,328 72,121 63.02R-Acc USD 6,064 700 8.66 – – – – – –
Invesco Greater China Equity Fund (USD)*A-AD EUR EUR 1,551,941 142,112 10.03 1,033,615 78,094 11.79 – – –A-AD EUR Hgd EUR 152,194 17,286 8.09 118,124 10,727 9.81 – – –A-Acc USD 268,300,191 6,855,927 39.13 494,064,150 10,417,212 47.43 438,746,193 9,946,841 44.11A-Acc AUD Hgd AUD 2,163,406 324,600 9.33 2,068,734 236,526 11.17 159,586 17,529 10.16A-Acc CAD Hgd CAD 192,689 28,981 9.01 475,942 54,205 10.96 330,106 36,292 10.12A-Acc CHF Hgd CHF 1,137,250 142,698 7.98 1,460,720 141,593 9.79 – – –A-Acc EUR Hgd EUR 6,224,702 202,787 28.20 16,471,037 428,702 34.23 17,111,384 389,178 31.88A-Acc NZD Hgd NZD 86,992 13,826 9.54 101,755 11,936 11.28 102,068 11,936 10.17A-Acc RMB Hgd CNY 73,946 5,000 96.83 403,662 22,751 111.24 85,426 5,000 104.99B-Acc USD 4,521,706 137,360 32.92 4,520,059 112,284 40.26 5,475,614 144,946 37.78C-Acc USD 517,007,824 12,085,680 42.78 2,390,392,591 46,382,648 51.54 2,068,459,158 43,414,730 47.64C-Acc AUD Hgd AUD 70,224 10,383 9.46 143,329 16,244 11.27 94,750 10,383 10.18C-Acc EUR Hgd EUR 15,455,155 460,292 30.85 33,179,142 794,611 37.20 32,827,850 691,089 34.44C-Acc RMB CNY 951 70 88.97 – – – – – –E-Acc EUR EUR 55,192,604 1,580,949 32.07 113,238,014 2,656,344 37.98 114,609,448 2,869,229 28.96R-Acc USD 3,224,500 328,799 9.81 7,659,213 639,852 11.97 2,487,625 221,862 11.21Z-Acc USD 5,921,693 595,052 9.95 11,127,903 929,579 11.97 4,540,078 410,880 11.05Z-Acc EUR EUR 292,828 21,981 12.24 4,102,637 255,997 14.28 4,038,432 273,076 10.72
Invesco Funds
Comparative Net Asset Values for the year ended 29 February 2016
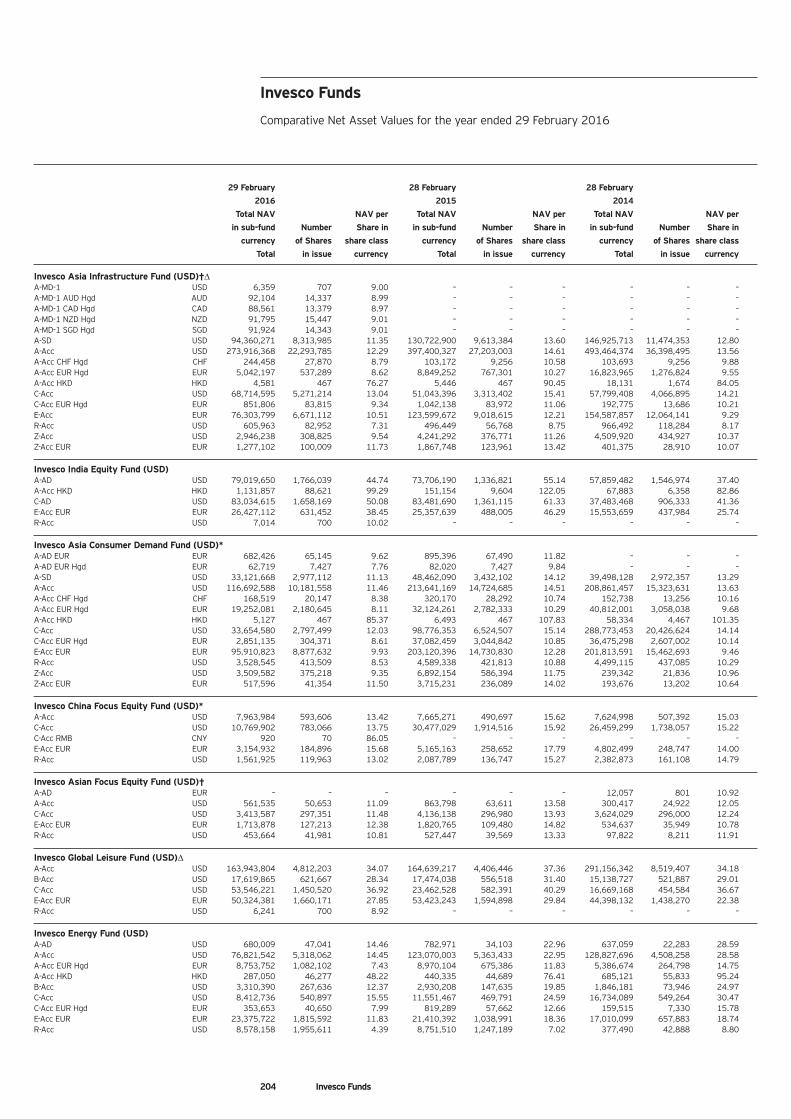
204 Invesco Funds
29 February 28 February 28 February
2016 2015 2014
Total NAV NAV per Total NAV NAV per Total NAV NAV per
in sub-fund Number Share in in sub-fund Number Share in in sub-fund Number Share in
currency of Shares share class currency of Shares share class currency of Shares share class
Total in issue currency Total in issue currency Total in issue currency
Invesco Asia Infrastructure Fund (USD)†ΔA-MD-1 USD 6,359 707 9.00 – – – – – –A-MD-1 AUD Hgd AUD 92,104 14,337 8.99 – – – – – –A-MD-1 CAD Hgd CAD 88,561 13,379 8.97 – – – – – –A-MD-1 NZD Hgd NZD 91,795 15,447 9.01 – – – – – –A-MD-1 SGD Hgd SGD 91,924 14,343 9.01 – – – – – –A-SD USD 94,360,271 8,313,985 11.35 130,722,900 9,613,384 13.60 146,925,713 11,474,353 12.80A-Acc USD 273,916,368 22,293,785 12.29 397,400,327 27,203,003 14.61 493,464,374 36,398,495 13.56A-Acc CHF Hgd CHF 244,458 27,870 8.79 103,172 9,256 10.58 103,693 9,256 9.88A-Acc EUR Hgd EUR 5,042,197 537,289 8.62 8,849,252 767,301 10.27 16,823,965 1,276,824 9.55A-Acc HKD HKD 4,581 467 76.27 5,446 467 90.45 18,131 1,674 84.05C-Acc USD 68,714,595 5,271,214 13.04 51,043,396 3,313,402 15.41 57,799,408 4,066,895 14.21C-Acc EUR Hgd EUR 851,806 83,815 9.34 1,042,138 83,972 11.06 192,775 13,686 10.21E-Acc EUR 76,303,799 6,671,112 10.51 123,599,672 9,018,615 12.21 154,587,857 12,064,141 9.29R-Acc USD 605,963 82,952 7.31 496,449 56,768 8.75 966,492 118,284 8.17Z-Acc USD 2,946,238 308,825 9.54 4,241,292 376,771 11.26 4,509,920 434,927 10.37Z-Acc EUR EUR 1,277,102 100,009 11.73 1,867,748 123,961 13.42 401,375 28,910 10.07
Invesco India Equity Fund (USD)A-AD USD 79,019,650 1,766,039 44.74 73,706,190 1,336,821 55.14 57,859,482 1,546,974 37.40A-Acc HKD HKD 1,131,857 88,621 99.29 151,154 9,604 122.05 67,883 6,358 82.86C-AD USD 83,034,615 1,658,169 50.08 83,481,690 1,361,115 61.33 37,483,468 906,333 41.36E-Acc EUR EUR 26,427,112 631,452 38.45 25,357,639 488,005 46.29 15,553,659 437,984 25.74R-Acc USD 7,014 700 10.02 – – – – – –
Invesco Asia Consumer Demand Fund (USD)*A-AD EUR EUR 682,426 65,145 9.62 895,396 67,490 11.82 – – –A-AD EUR Hgd EUR 62,719 7,427 7.76 82,020 7,427 9.84 – – –A-SD USD 33,121,668 2,977,112 11.13 48,462,090 3,432,102 14.12 39,498,128 2,972,357 13.29A-Acc USD 116,692,588 10,181,558 11.46 213,641,169 14,724,685 14.51 208,861,457 15,323,631 13.63A-Acc CHF Hgd CHF 168,519 20,147 8.38 320,170 28,292 10.74 152,738 13,256 10.16A-Acc EUR Hgd EUR 19,252,081 2,180,645 8.11 32,124,261 2,782,333 10.29 40,812,001 3,058,038 9.68A-Acc HKD HKD 5,127 467 85.37 6,493 467 107.83 58,334 4,467 101.35C-Acc USD 33,654,580 2,797,499 12.03 98,776,353 6,524,507 15.14 288,773,453 20,426,624 14.14C-Acc EUR Hgd EUR 2,851,135 304,371 8.61 37,082,459 3,044,842 10.85 36,475,298 2,607,002 10.14E-Acc EUR EUR 95,910,823 8,877,632 9.93 203,120,396 14,730,830 12.28 201,813,591 15,462,693 9.46R-Acc USD 3,528,545 413,509 8.53 4,589,338 421,813 10.88 4,499,115 437,085 10.29Z-Acc USD 3,509,582 375,218 9.35 6,892,154 586,394 11.75 239,342 21,836 10.96Z-Acc EUR EUR 517,596 41,354 11.50 3,715,231 236,089 14.02 193,676 13,202 10.64
Invesco China Focus Equity Fund (USD)*A-Acc USD 7,963,984 593,606 13.42 7,665,271 490,697 15.62 7,624,998 507,392 15.03C-Acc USD 10,769,902 783,066 13.75 30,477,029 1,914,516 15.92 26,459,299 1,738,057 15.22C-Acc RMB CNY 920 70 86.05 – – – – – –E-Acc EUR EUR 3,154,932 184,896 15.68 5,165,163 258,652 17.79 4,802,499 248,747 14.00R-Acc USD 1,561,925 119,963 13.02 2,087,789 136,747 15.27 2,382,873 161,108 14.79
Invesco Asian Focus Equity Fund (USD)†A-AD EUR – – – – – – 12,057 801 10.92A-Acc USD 561,535 50,653 11.09 863,798 63,611 13.58 300,417 24,922 12.05C-Acc USD 3,413,587 297,351 11.48 4,136,138 296,980 13.93 3,624,029 296,000 12.24E-Acc EUR EUR 1,713,878 127,213 12.38 1,820,765 109,480 14.82 534,637 35,949 10.78R-Acc USD 453,664 41,981 10.81 527,447 39,569 13.33 97,822 8,211 11.91
Invesco Global Leisure Fund (USD)ΔA-Acc USD 163,943,804 4,812,203 34.07 164,639,217 4,406,446 37.36 291,156,342 8,519,407 34.18B-Acc USD 17,619,865 621,667 28.34 17,474,038 556,518 31.40 15,138,727 521,887 29.01C-Acc USD 53,546,221 1,450,520 36.92 23,462,528 582,391 40.29 16,669,168 454,584 36.67E-Acc EUR EUR 50,324,381 1,660,171 27.85 53,423,243 1,594,898 29.84 44,398,132 1,438,270 22.38R-Acc USD 6,241 700 8.92 – – – – – –
Invesco Energy Fund (USD)A-AD USD 680,009 47,041 14.46 782,971 34,103 22.96 637,059 22,283 28.59A-Acc USD 76,821,542 5,318,062 14.45 123,070,003 5,363,433 22.95 128,827,696 4,508,258 28.58A-Acc EUR Hgd EUR 8,753,752 1,082,102 7.43 8,970,104 675,386 11.83 5,386,674 264,798 14.75A-Acc HKD HKD 287,050 46,277 48.22 440,335 44,689 76.41 685,121 55,833 95.24B-Acc USD 3,310,390 267,636 12.37 2,930,208 147,635 19.85 1,846,181 73,946 24.97C-Acc USD 8,412,736 540,897 15.55 11,551,467 469,791 24.59 16,734,089 549,264 30.47C-Acc EUR Hgd EUR 353,653 40,650 7.99 819,289 57,662 12.66 159,515 7,330 15.78E-Acc EUR EUR 23,375,722 1,815,592 11.83 21,410,392 1,038,991 18.36 17,010,099 657,883 18.74R-Acc USD 8,578,158 1,955,611 4.39 8,751,510 1,247,189 7.02 377,490 42,888 8.80
Invesco Funds
Comparative Net Asset Values for the year ended 29 February 2016
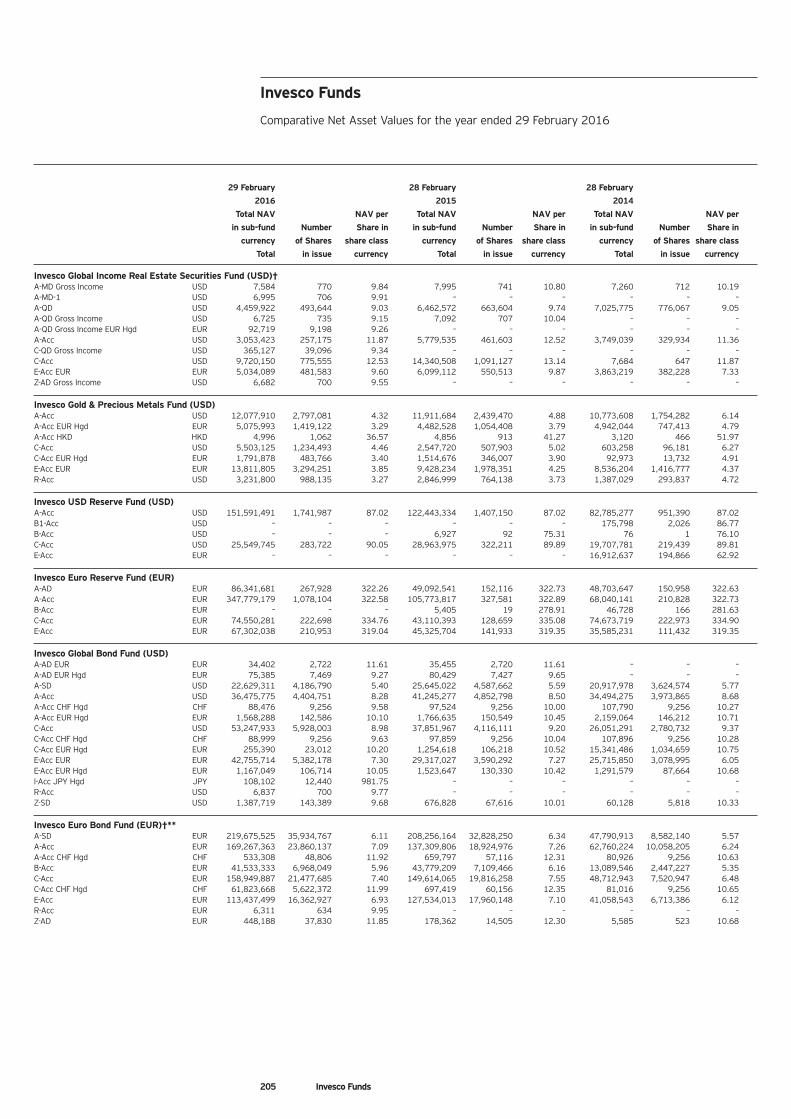
205 Invesco Funds
29 February 28 February 28 February
2016 2015 2014
Total NAV NAV per Total NAV NAV per Total NAV NAV per
in sub-fund Number Share in in sub-fund Number Share in in sub-fund Number Share in
currency of Shares share class currency of Shares share class currency of Shares share class
Total in issue currency Total in issue currency Total in issue currency
Invesco Global Income Real Estate Securities Fund (USD)†A-MD Gross Income USD 7,584 770 9.84 7,995 741 10.80 7,260 712 10.19A-MD-1 USD 6,995 706 9.91 – – – – – –A-QD USD 4,459,922 493,644 9.03 6,462,572 663,604 9.74 7,025,775 776,067 9.05A-QD Gross Income USD 6,725 735 9.15 7,092 707 10.04 – – –A-QD Gross Income EUR Hgd EUR 92,719 9,198 9.26 – – – – – –A-Acc USD 3,053,423 257,175 11.87 5,779,535 461,603 12.52 3,749,039 329,934 11.36C-QD Gross Income USD 365,127 39,096 9.34 – – – – – –C-Acc USD 9,720,150 775,555 12.53 14,340,508 1,091,127 13.14 7,684 647 11.87E-Acc EUR EUR 5,034,089 481,583 9.60 6,099,112 550,513 9.87 3,863,219 382,228 7.33Z-AD Gross Income USD 6,682 700 9.55 – – – – – –
Invesco Gold & Precious Metals Fund (USD)A-Acc USD 12,077,910 2,797,081 4.32 11,911,684 2,439,470 4.88 10,773,608 1,754,282 6.14A-Acc EUR Hgd EUR 5,075,993 1,419,122 3.29 4,482,528 1,054,408 3.79 4,942,044 747,413 4.79A-Acc HKD HKD 4,996 1,062 36.57 4,856 913 41.27 3,120 466 51.97C-Acc USD 5,503,125 1,234,493 4.46 2,547,720 507,903 5.02 603,258 96,181 6.27C-Acc EUR Hgd EUR 1,791,878 483,766 3.40 1,514,676 346,007 3.90 92,973 13,732 4.91E-Acc EUR EUR 13,811,805 3,294,251 3.85 9,428,234 1,978,351 4.25 8,536,204 1,416,777 4.37R-Acc USD 3,231,800 988,135 3.27 2,846,999 764,138 3.73 1,387,029 293,837 4.72
Invesco USD Reserve Fund (USD)A-Acc USD 151,591,491 1,741,987 87.02 122,443,334 1,407,150 87.02 82,785,277 951,390 87.02B1-Acc USD – – – – – – 175,798 2,026 86.77B-Acc USD – – – 6,927 92 75.31 76 1 76.10C-Acc USD 25,549,745 283,722 90.05 28,963,975 322,211 89.89 19,707,781 219,439 89.81E-Acc EUR – – – – – – 16,912,637 194,866 62.92
Invesco Euro Reserve Fund (EUR)A-AD EUR 86,341,681 267,928 322.26 49,092,541 152,116 322.73 48,703,647 150,958 322.63A-Acc EUR 347,779,179 1,078,104 322.58 105,773,817 327,581 322.89 68,040,141 210,828 322.73B-Acc EUR – – – 5,405 19 278.91 46,728 166 281.63C-Acc EUR 74,550,281 222,698 334.76 43,110,393 128,659 335.08 74,673,719 222,973 334.90E-Acc EUR 67,302,038 210,953 319.04 45,325,704 141,933 319.35 35,585,231 111,432 319.35
Invesco Global Bond Fund (USD)A-AD EUR EUR 34,402 2,722 11.61 35,455 2,720 11.61 – – –A-AD EUR Hgd EUR 75,385 7,469 9.27 80,429 7,427 9.65 – – –A-SD USD 22,629,311 4,186,790 5.40 25,645,022 4,587,662 5.59 20,917,978 3,624,574 5.77A-Acc USD 36,475,775 4,404,751 8.28 41,245,277 4,852,798 8.50 34,494,275 3,973,865 8.68A-Acc CHF Hgd CHF 88,476 9,256 9.58 97,524 9,256 10.00 107,790 9,256 10.27A-Acc EUR Hgd EUR 1,568,288 142,586 10.10 1,766,635 150,549 10.45 2,159,064 146,212 10.71C-Acc USD 53,247,933 5,928,003 8.98 37,851,967 4,116,111 9.20 26,051,291 2,780,732 9.37C-Acc CHF Hgd CHF 88,999 9,256 9.63 97,859 9,256 10.04 107,896 9,256 10.28C-Acc EUR Hgd EUR 255,390 23,012 10.20 1,254,618 106,218 10.52 15,341,486 1,034,659 10.75E-Acc EUR EUR 42,755,714 5,382,178 7.30 29,317,027 3,590,292 7.27 25,715,850 3,078,995 6.05E-Acc EUR Hgd EUR 1,167,049 106,714 10.05 1,523,647 130,330 10.42 1,291,579 87,664 10.68I-Acc JPY Hgd JPY 108,102 12,440 981.75 – – – – – –R-Acc USD 6,837 700 9.77 – – – – – –Z-SD USD 1,387,719 143,389 9.68 676,828 67,616 10.01 60,128 5,818 10.33
Invesco Euro Bond Fund (EUR)†**A-SD EUR 219,675,525 35,934,767 6.11 208,256,164 32,828,250 6.34 47,790,913 8,582,140 5.57A-Acc EUR 169,267,363 23,860,137 7.09 137,309,806 18,924,976 7.26 62,760,224 10,058,205 6.24A-Acc CHF Hgd CHF 533,308 48,806 11.92 659,797 57,116 12.31 80,926 9,256 10.63B-Acc EUR 41,533,333 6,968,049 5.96 43,779,209 7,109,466 6.16 13,089,546 2,447,227 5.35C-Acc EUR 158,949,887 21,477,685 7.40 149,614,065 19,816,258 7.55 48,712,943 7,520,947 6.48C-Acc CHF Hgd CHF 61,823,668 5,622,372 11.99 697,419 60,156 12.35 81,016 9,256 10.65E-Acc EUR 113,437,499 16,362,927 6.93 127,534,013 17,960,148 7.10 41,058,543 6,713,386 6.12R-Acc EUR 6,311 634 9.95 – – – – – –Z-AD EUR 448,188 37,830 11.85 178,362 14,505 12.30 5,585 523 10.68
Invesco Funds
Comparative Net Asset Values for the year ended 29 February 2016
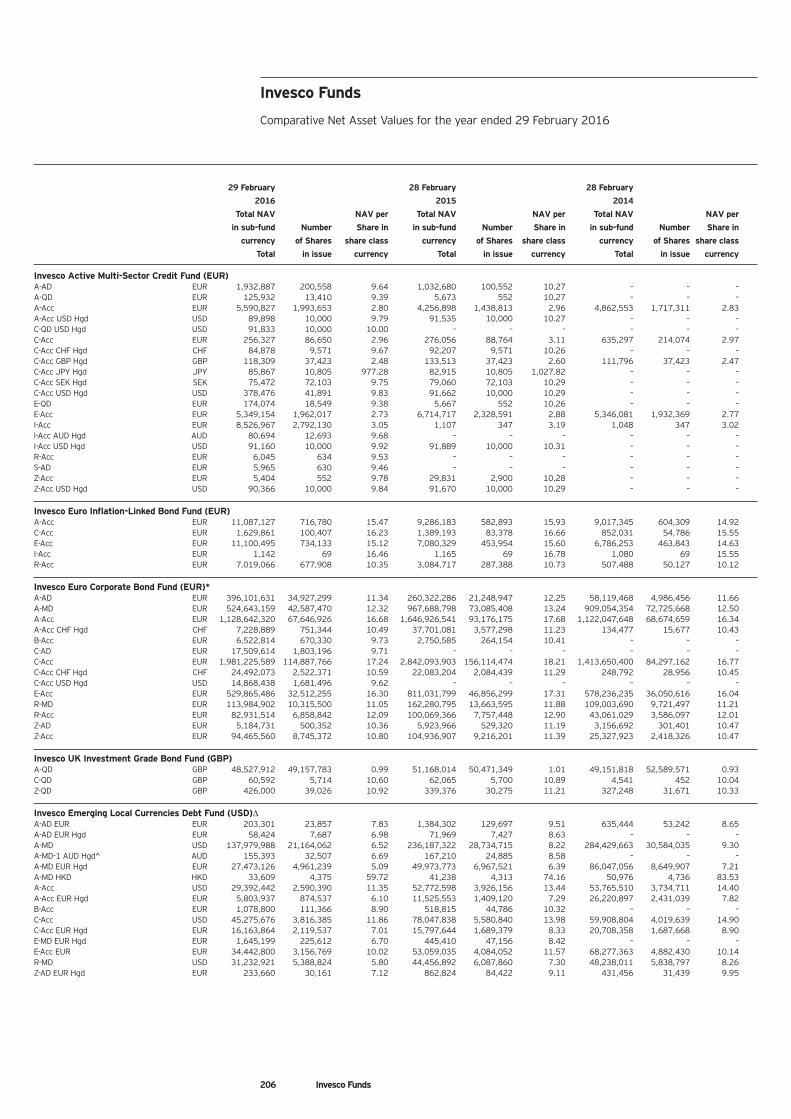
206 Invesco Funds
29 February 28 February 28 February
2016 2015 2014
Total NAV NAV per Total NAV NAV per Total NAV NAV per
in sub-fund Number Share in in sub-fund Number Share in in sub-fund Number Share in
currency of Shares share class currency of Shares share class currency of Shares share class
Total in issue currency Total in issue currency Total in issue currency
Invesco Active Multi-Sector Credit Fund (EUR)A-AD EUR 1,932,887 200,558 9.64 1,032,680 100,552 10.27 – – –A-QD EUR 125,932 13,410 9.39 5,673 552 10.27 – – –A-Acc EUR 5,590,827 1,993,653 2.80 4,256,898 1,438,813 2.96 4,862,553 1,717,311 2.83A-Acc USD Hgd USD 89,898 10,000 9.79 91,535 10,000 10.27 – – –C-QD USD Hgd USD 91,833 10,000 10.00 – – – – – –C-Acc EUR 256,327 86,650 2.96 276,056 88,764 3.11 635,297 214,074 2.97C-Acc CHF Hgd CHF 84,878 9,571 9.67 92,207 9,571 10.26 – – –C-Acc GBP Hgd GBP 118,309 37,423 2.48 133,513 37,423 2.60 111,796 37,423 2.47C-Acc JPY Hgd JPY 85,867 10,805 977.28 82,915 10,805 1,027.82 – – –C-Acc SEK Hgd SEK 75,472 72,103 9.75 79,060 72,103 10.29 – – –C-Acc USD Hgd USD 378,476 41,891 9.83 91,662 10,000 10.29 – – –E-QD EUR 174,074 18,549 9.38 5,667 552 10.26 – – –E-Acc EUR 5,349,154 1,962,017 2.73 6,714,717 2,328,591 2.88 5,346,081 1,932,369 2.77I-Acc EUR 8,526,967 2,792,130 3.05 1,107 347 3.19 1,048 347 3.02I-Acc AUD Hgd AUD 80,694 12,693 9.68 – – – – – –I-Acc USD Hgd USD 91,160 10,000 9.92 91,889 10,000 10.31 – – –R-Acc EUR 6,045 634 9.53 – – – – – –S-AD EUR 5,965 630 9.46 – – – – – –Z-Acc EUR 5,404 552 9.78 29,831 2,900 10.28 – – –Z-Acc USD Hgd USD 90,366 10,000 9.84 91,670 10,000 10.29 – – –
Invesco Euro Inflation-Linked Bond Fund (EUR)A-Acc EUR 11,087,127 716,780 15.47 9,286,183 582,893 15.93 9,017,345 604,309 14.92C-Acc EUR 1,629,861 100,407 16.23 1,389,193 83,378 16.66 852,031 54,786 15.55E-Acc EUR 11,100,495 734,133 15.12 7,080,329 453,954 15.60 6,786,253 463,843 14.63I-Acc EUR 1,142 69 16.46 1,165 69 16.78 1,080 69 15.55R-Acc EUR 7,019,066 677,908 10.35 3,084,717 287,388 10.73 507,488 50,127 10.12
Invesco Euro Corporate Bond Fund (EUR)*A-AD EUR 396,101,631 34,927,299 11.34 260,322,286 21,248,947 12.25 58,119,468 4,986,456 11.66A-MD EUR 524,643,159 42,587,470 12.32 967,688,798 73,085,408 13.24 909,054,354 72,725,668 12.50A-Acc EUR 1,128,642,320 67,646,926 16.68 1,646,926,541 93,176,175 17.68 1,122,047,648 68,674,659 16.34A-Acc CHF Hgd CHF 7,228,889 751,344 10.49 37,701,081 3,577,298 11.23 134,477 15,677 10.43B-Acc EUR 6,522,814 670,330 9.73 2,750,585 264,154 10.41 – – –C-AD EUR 17,509,614 1,803,196 9.71 – – – – – –C-Acc EUR 1,981,225,589 114,887,766 17.24 2,842,093,903 156,114,474 18.21 1,413,650,400 84,297,162 16.77C-Acc CHF Hgd CHF 24,492,073 2,522,371 10.59 22,083,204 2,084,439 11.29 248,792 28,956 10.45C-Acc USD Hgd USD 14,868,438 1,681,496 9.62 – – – – – –E-Acc EUR 529,865,486 32,512,255 16.30 811,031,799 46,856,299 17.31 578,236,235 36,050,616 16.04R-MD EUR 113,984,902 10,315,500 11.05 162,280,795 13,663,595 11.88 109,003,690 9,721,497 11.21R-Acc EUR 82,931,514 6,858,842 12.09 100,069,366 7,757,448 12.90 43,061,029 3,586,097 12.01Z-AD EUR 5,184,731 500,352 10.36 5,923,966 529,320 11.19 3,156,692 301,401 10.47Z-Acc EUR 94,465,560 8,745,372 10.80 104,936,907 9,216,201 11.39 25,327,923 2,418,326 10.47
Invesco UK Investment Grade Bond Fund (GBP)A-QD GBP 48,527,912 49,157,783 0.99 51,168,014 50,471,349 1.01 49,151,818 52,589,571 0.93C-QD GBP 60,592 5,714 10.60 62,065 5,700 10.89 4,541 452 10.04Z-QD GBP 426,000 39,026 10.92 339,376 30,275 11.21 327,248 31,671 10.33
Invesco Emerging Local Currencies Debt Fund (USD)ΔA-AD EUR EUR 203,301 23,857 7.83 1,384,302 129,697 9.51 635,444 53,242 8.65A-AD EUR Hgd EUR 58,424 7,687 6.98 71,969 7,427 8.63 – – –A-MD USD 137,979,988 21,164,062 6.52 236,187,322 28,734,715 8.22 284,429,663 30,584,035 9.30A-MD-1 AUD Hgd^ AUD 155,393 32,507 6.69 167,210 24,885 8.58 – – –A-MD EUR Hgd EUR 27,473,126 4,961,239 5.09 49,973,773 6,967,521 6.39 86,047,056 8,649,907 7.21A-MD HKD HKD 33,609 4,375 59.72 41,238 4,313 74.16 50,976 4,736 83.53A-Acc USD 29,392,442 2,590,390 11.35 52,772,598 3,926,156 13.44 53,765,510 3,734,711 14.40A-Acc EUR Hgd EUR 5,803,937 874,537 6.10 11,525,553 1,409,120 7.29 26,220,897 2,431,039 7.82B-Acc EUR 1,078,800 111,366 8.90 518,815 44,786 10.32 – – –C-Acc USD 45,275,676 3,816,385 11.86 78,047,838 5,580,840 13.98 59,908,804 4,019,639 14.90C-Acc EUR Hgd EUR 16,163,864 2,119,537 7.01 15,797,644 1,689,379 8.33 20,708,358 1,687,668 8.90E-MD EUR Hgd EUR 1,645,199 225,612 6.70 445,410 47,156 8.42 – – –E-Acc EUR EUR 34,442,800 3,156,769 10.02 53,059,035 4,084,052 11.57 68,277,363 4,882,430 10.14R-MD USD 31,232,921 5,388,824 5.80 44,456,892 6,087,860 7.30 48,238,011 5,838,797 8.26Z-AD EUR Hgd EUR 233,660 30,161 7.12 862,824 84,422 9.11 431,456 31,439 9.95
Invesco Funds
Comparative Net Asset Values for the year ended 29 February 2016
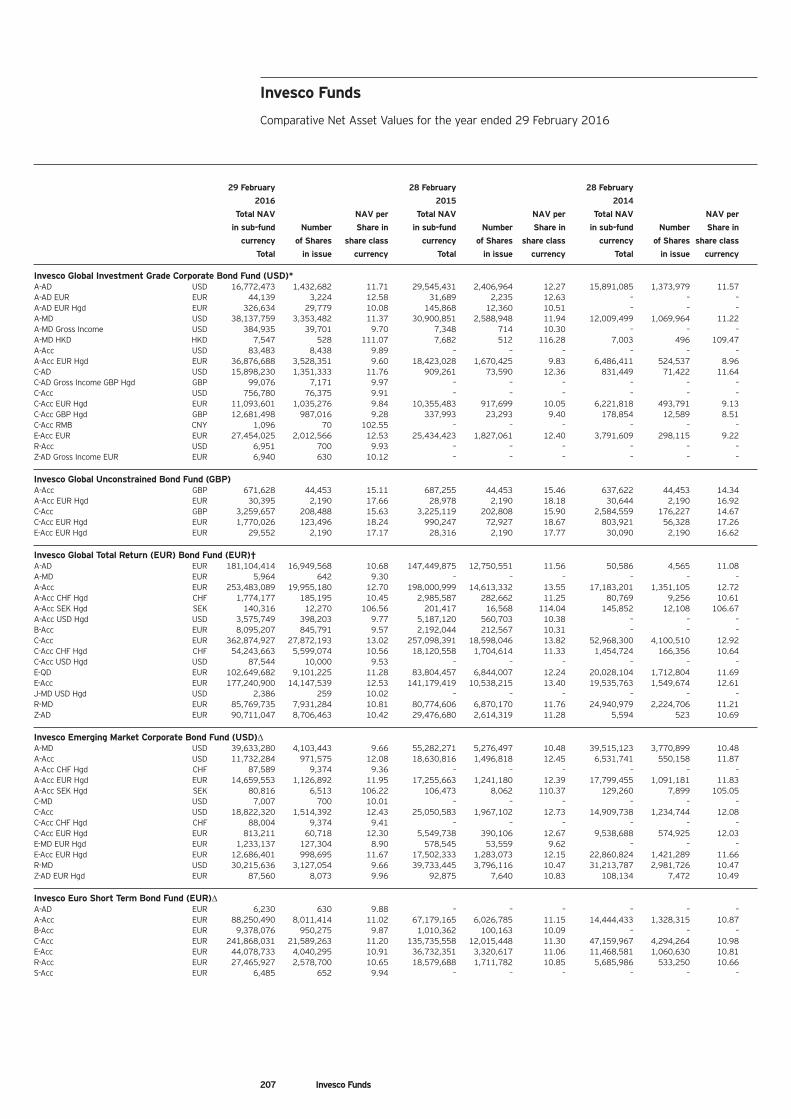
207 Invesco Funds
29 February 28 February 28 February
2016 2015 2014
Total NAV NAV per Total NAV NAV per Total NAV NAV per
in sub-fund Number Share in in sub-fund Number Share in in sub-fund Number Share in
currency of Shares share class currency of Shares share class currency of Shares share class
Total in issue currency Total in issue currency Total in issue currency
Invesco Global Investment Grade Corporate Bond Fund (USD)*A-AD USD 16,772,473 1,432,682 11.71 29,545,431 2,406,964 12.27 15,891,085 1,373,979 11.57A-AD EUR EUR 44,139 3,224 12.58 31,689 2,235 12.63 – – –A-AD EUR Hgd EUR 326,634 29,779 10.08 145,868 12,360 10.51 – – –A-MD USD 38,137,759 3,353,482 11.37 30,900,851 2,588,948 11.94 12,009,499 1,069,964 11.22A-MD Gross Income USD 384,935 39,701 9.70 7,348 714 10.30 – – –A-MD HKD HKD 7,547 528 111.07 7,682 512 116.28 7,003 496 109.47A-Acc USD 83,483 8,438 9.89 – – – – – –A-Acc EUR Hgd EUR 36,876,688 3,528,351 9.60 18,423,028 1,670,425 9.83 6,486,411 524,537 8.96C-AD USD 15,898,230 1,351,333 11.76 909,261 73,590 12.36 831,449 71,422 11.64C-AD Gross Income GBP Hgd GBP 99,076 7,171 9.97 – – – – – –C-Acc USD 756,780 76,375 9.91 – – – – – –C-Acc EUR Hgd EUR 11,093,601 1,035,276 9.84 10,355,483 917,699 10.05 6,221,818 493,791 9.13C-Acc GBP Hgd GBP 12,681,498 987,016 9.28 337,993 23,293 9.40 178,854 12,589 8.51C-Acc RMB CNY 1,096 70 102.55 – – – – – –E-Acc EUR EUR 27,454,025 2,012,566 12.53 25,434,423 1,827,061 12.40 3,791,609 298,115 9.22R-Acc USD 6,951 700 9.93 – – – – – –Z-AD Gross Income EUR EUR 6,940 630 10.12 – – – – – –
Invesco Global Unconstrained Bond Fund (GBP)A-Acc GBP 671,628 44,453 15.11 687,255 44,453 15.46 637,622 44,453 14.34A-Acc EUR Hgd EUR 30,395 2,190 17.66 28,978 2,190 18.18 30,644 2,190 16.92C-Acc GBP 3,259,657 208,488 15.63 3,225,119 202,808 15.90 2,584,559 176,227 14.67C-Acc EUR Hgd EUR 1,770,026 123,496 18.24 990,247 72,927 18.67 803,921 56,328 17.26E-Acc EUR Hgd EUR 29,552 2,190 17.17 28,316 2,190 17.77 30,090 2,190 16.62
Invesco Global Total Return (EUR) Bond Fund (EUR)†A-AD EUR 181,104,414 16,949,568 10.68 147,449,875 12,750,551 11.56 50,586 4,565 11.08A-MD EUR 5,964 642 9.30 – – – – – –A-Acc EUR 253,483,089 19,955,180 12.70 198,000,999 14,613,332 13.55 17,183,201 1,351,105 12.72A-Acc CHF Hgd CHF 1,774,177 185,195 10.45 2,985,587 282,662 11.25 80,769 9,256 10.61A-Acc SEK Hgd SEK 140,316 12,270 106.56 201,417 16,568 114.04 145,852 12,108 106.67A-Acc USD Hgd USD 3,575,749 398,203 9.77 5,187,120 560,703 10.38 – – –B-Acc EUR 8,095,207 845,791 9.57 2,192,044 212,567 10.31 – – –C-Acc EUR 362,874,927 27,872,193 13.02 257,098,391 18,598,046 13.82 52,968,300 4,100,510 12.92C-Acc CHF Hgd CHF 54,243,663 5,599,074 10.56 18,120,558 1,704,614 11.33 1,454,724 166,356 10.64C-Acc USD Hgd USD 87,544 10,000 9.53 – – – – – –E-QD EUR 102,649,682 9,101,225 11.28 83,804,457 6,844,007 12.24 20,028,104 1,712,804 11.69E-Acc EUR 177,240,900 14,147,539 12.53 141,179,419 10,538,215 13.40 19,535,763 1,549,674 12.61J-MD USD Hgd USD 2,386 259 10.02 – – – – – –R-MD EUR 85,769,735 7,931,284 10.81 80,774,606 6,870,170 11.76 24,940,979 2,224,706 11.21Z-AD EUR 90,711,047 8,706,463 10.42 29,476,680 2,614,319 11.28 5,594 523 10.69
Invesco Emerging Market Corporate Bond Fund (USD)ΔA-MD USD 39,633,280 4,103,443 9.66 55,282,271 5,276,497 10.48 39,515,123 3,770,899 10.48A-Acc USD 11,732,284 971,575 12.08 18,630,816 1,496,818 12.45 6,531,741 550,158 11.87A-Acc CHF Hgd CHF 87,589 9,374 9.36 – – – – – –A-Acc EUR Hgd EUR 14,659,553 1,126,892 11.95 17,255,663 1,241,180 12.39 17,799,455 1,091,181 11.83A-Acc SEK Hgd SEK 80,816 6,513 106.22 106,473 8,062 110.37 129,260 7,899 105.05C-MD USD 7,007 700 10.01 – – – – – –C-Acc USD 18,822,320 1,514,392 12.43 25,050,583 1,967,102 12.73 14,909,738 1,234,744 12.08C-Acc CHF Hgd CHF 88,004 9,374 9.41 – – – – – –C-Acc EUR Hgd EUR 813,211 60,718 12.30 5,549,738 390,106 12.67 9,538,688 574,925 12.03E-MD EUR Hgd EUR 1,233,137 127,304 8.90 578,545 53,559 9.62 – – –E-Acc EUR Hgd EUR 12,686,401 998,695 11.67 17,502,333 1,283,073 12.15 22,860,824 1,421,289 11.66R-MD USD 30,215,636 3,127,054 9.66 39,733,445 3,796,116 10.47 31,213,787 2,981,726 10.47Z-AD EUR Hgd EUR 87,560 8,073 9.96 92,875 7,640 10.83 108,134 7,472 10.49
Invesco Euro Short Term Bond Fund (EUR)ΔA-AD EUR 6,230 630 9.88 – – – – – –A-Acc EUR 88,250,490 8,011,414 11.02 67,179,165 6,026,785 11.15 14,444,433 1,328,315 10.87B-Acc EUR 9,378,076 950,275 9.87 1,010,362 100,163 10.09 – – –C-Acc EUR 241,868,031 21,589,263 11.20 135,735,558 12,015,448 11.30 47,159,967 4,294,264 10.98E-Acc EUR 44,078,733 4,040,295 10.91 36,732,351 3,320,617 11.06 11,468,581 1,060,630 10.81R-Acc EUR 27,465,927 2,578,700 10.65 18,579,688 1,711,782 10.85 5,685,986 533,250 10.66S-Acc EUR 6,485 652 9.94 – – – – – –
Invesco Funds
Comparative Net Asset Values for the year ended 29 February 2016
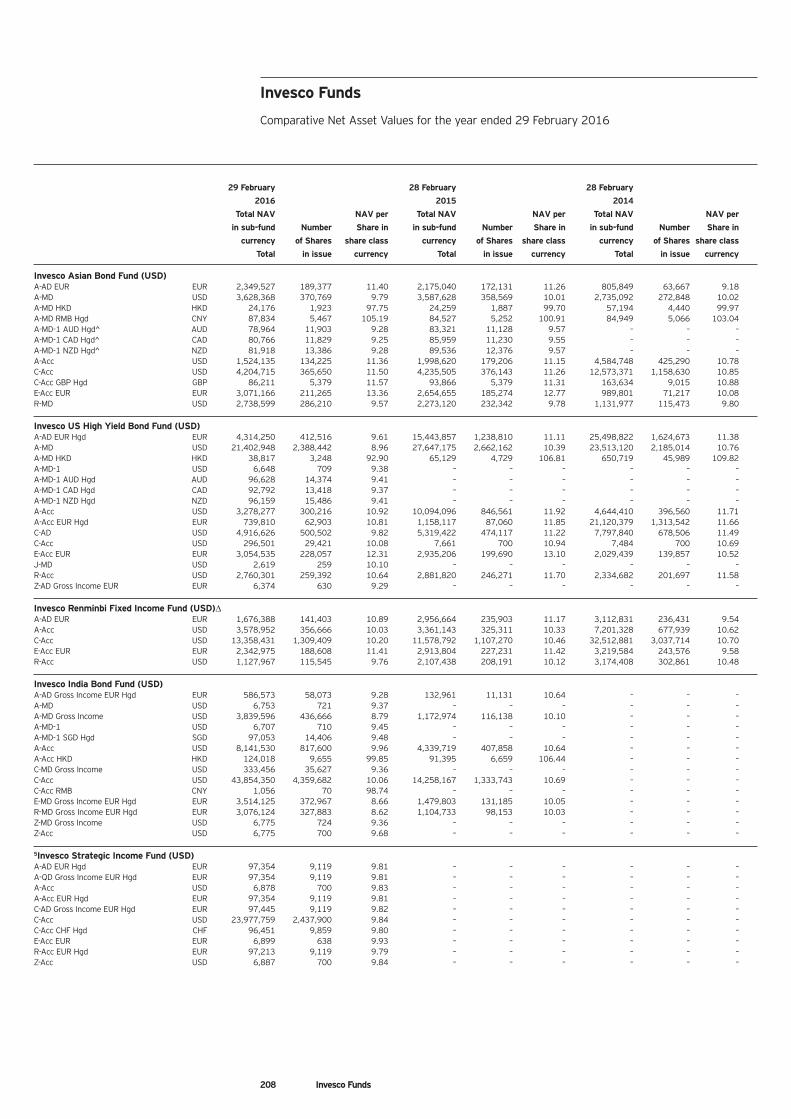
208 Invesco Funds
29 February 28 February 28 February
2016 2015 2014
Total NAV NAV per Total NAV NAV per Total NAV NAV per
in sub-fund Number Share in in sub-fund Number Share in in sub-fund Number Share in
currency of Shares share class currency of Shares share class currency of Shares share class
Total in issue currency Total in issue currency Total in issue currency
Invesco Asian Bond Fund (USD)A-AD EUR EUR 2,349,527 189,377 11.40 2,175,040 172,131 11.26 805,849 63,667 9.18A-MD USD 3,628,368 370,769 9.79 3,587,628 358,569 10.01 2,735,092 272,848 10.02A-MD HKD HKD 24,176 1,923 97.75 24,259 1,887 99.70 57,194 4,440 99.97A-MD RMB Hgd CNY 87,834 5,467 105.19 84,527 5,252 100.91 84,949 5,066 103.04A-MD-1 AUD Hgd^ AUD 78,964 11,903 9.28 83,321 11,128 9.57 – – –A-MD-1 CAD Hgd^ CAD 80,766 11,829 9.25 85,959 11,230 9.55 – – –A-MD-1 NZD Hgd^ NZD 81,918 13,386 9.28 89,536 12,376 9.57 – – –A-Acc USD 1,524,135 134,225 11.36 1,998,620 179,206 11.15 4,584,748 425,290 10.78C-Acc USD 4,204,715 365,650 11.50 4,235,505 376,143 11.26 12,573,371 1,158,630 10.85C-Acc GBP Hgd GBP 86,211 5,379 11.57 93,866 5,379 11.31 163,634 9,015 10.88E-Acc EUR EUR 3,071,166 211,265 13.36 2,654,655 185,274 12.77 989,801 71,217 10.08R-MD USD 2,738,599 286,210 9.57 2,273,120 232,342 9.78 1,131,977 115,473 9.80
Invesco US High Yield Bond Fund (USD)A-AD EUR Hgd EUR 4,314,250 412,516 9.61 15,443,857 1,238,810 11.11 25,498,822 1,624,673 11.38A-MD USD 21,402,948 2,388,442 8.96 27,647,175 2,662,162 10.39 23,513,120 2,185,014 10.76A-MD HKD HKD 38,817 3,248 92.90 65,129 4,729 106.81 650,719 45,989 109.82A-MD-1 USD 6,648 709 9.38 – – – – – –A-MD-1 AUD Hgd AUD 96,628 14,374 9.41 – – – – – –A-MD-1 CAD Hgd CAD 92,792 13,418 9.37 – – – – – –A-MD-1 NZD Hgd NZD 96,159 15,486 9.41 – – – – – –A-Acc USD 3,278,277 300,216 10.92 10,094,096 846,561 11.92 4,644,410 396,560 11.71A-Acc EUR Hgd EUR 739,810 62,903 10.81 1,158,117 87,060 11.85 21,120,379 1,313,542 11.66C-AD USD 4,916,626 500,502 9.82 5,319,422 474,117 11.22 7,797,840 678,506 11.49C-Acc USD 296,501 29,421 10.08 7,661 700 10.94 7,484 700 10.69E-Acc EUR EUR 3,054,535 228,057 12.31 2,935,206 199,690 13.10 2,029,439 139,857 10.52J-MD USD 2,619 259 10.10 – – – – – –R-Acc USD 2,760,301 259,392 10.64 2,881,820 246,271 11.70 2,334,682 201,697 11.58Z-AD Gross Income EUR EUR 6,374 630 9.29 – – – – – –
Invesco Renminbi Fixed Income Fund (USD)ΔA-AD EUR EUR 1,676,388 141,403 10.89 2,956,664 235,903 11.17 3,112,831 236,431 9.54A-Acc USD 3,578,952 356,666 10.03 3,361,143 325,311 10.33 7,201,328 677,939 10.62C-Acc USD 13,358,431 1,309,409 10.20 11,578,792 1,107,270 10.46 32,512,881 3,037,714 10.70E-Acc EUR EUR 2,342,975 188,608 11.41 2,913,804 227,231 11.42 3,219,584 243,576 9.58R-Acc USD 1,127,967 115,545 9.76 2,107,438 208,191 10.12 3,174,408 302,861 10.48
Invesco India Bond Fund (USD)A-AD Gross Income EUR Hgd EUR 586,573 58,073 9.28 132,961 11,131 10.64 – – –A-MD USD 6,753 721 9.37 – – – – – –A-MD Gross Income USD 3,839,596 436,666 8.79 1,172,974 116,138 10.10 – – –A-MD-1 USD 6,707 710 9.45 – – – – – –A-MD-1 SGD Hgd SGD 97,053 14,406 9.48 – – – – – –A-Acc USD 8,141,530 817,600 9.96 4,339,719 407,858 10.64 – – –A-Acc HKD HKD 124,018 9,655 99.85 91,395 6,659 106.44 – – –C-MD Gross Income USD 333,456 35,627 9.36 – – – – – –C-Acc USD 43,854,350 4,359,682 10.06 14,258,167 1,333,743 10.69 – – –C-Acc RMB CNY 1,056 70 98.74 – – – – – –E-MD Gross Income EUR Hgd EUR 3,514,125 372,967 8.66 1,479,803 131,185 10.05 – – –R-MD Gross Income EUR Hgd EUR 3,076,124 327,883 8.62 1,104,733 98,153 10.03 – – –Z-MD Gross Income USD 6,775 724 9.36 – – – – – –Z-Acc USD 6,775 700 9.68 – – – – – –
5Invesco Strategic Income Fund (USD)A-AD EUR Hgd EUR 97,354 9,119 9.81 – – – – – –A-QD Gross Income EUR Hgd EUR 97,354 9,119 9.81 – – – – – –A-Acc USD 6,878 700 9.83 – – – – – –A-Acc EUR Hgd EUR 97,354 9,119 9.81 – – – – – –C-AD Gross Income EUR Hgd EUR 97,445 9,119 9.82 – – – – – –C-Acc USD 23,977,759 2,437,900 9.84 – – – – – –C-Acc CHF Hgd CHF 96,451 9,859 9.80 – – – – – –E-Acc EUR EUR 6,899 638 9.93 – – – – – –R-Acc EUR Hgd EUR 97,213 9,119 9.79 – – – – – –Z-Acc USD 6,887 700 9.84 – – – – – –
Invesco Funds
Comparative Net Asset Values for the year ended 29 February 2016
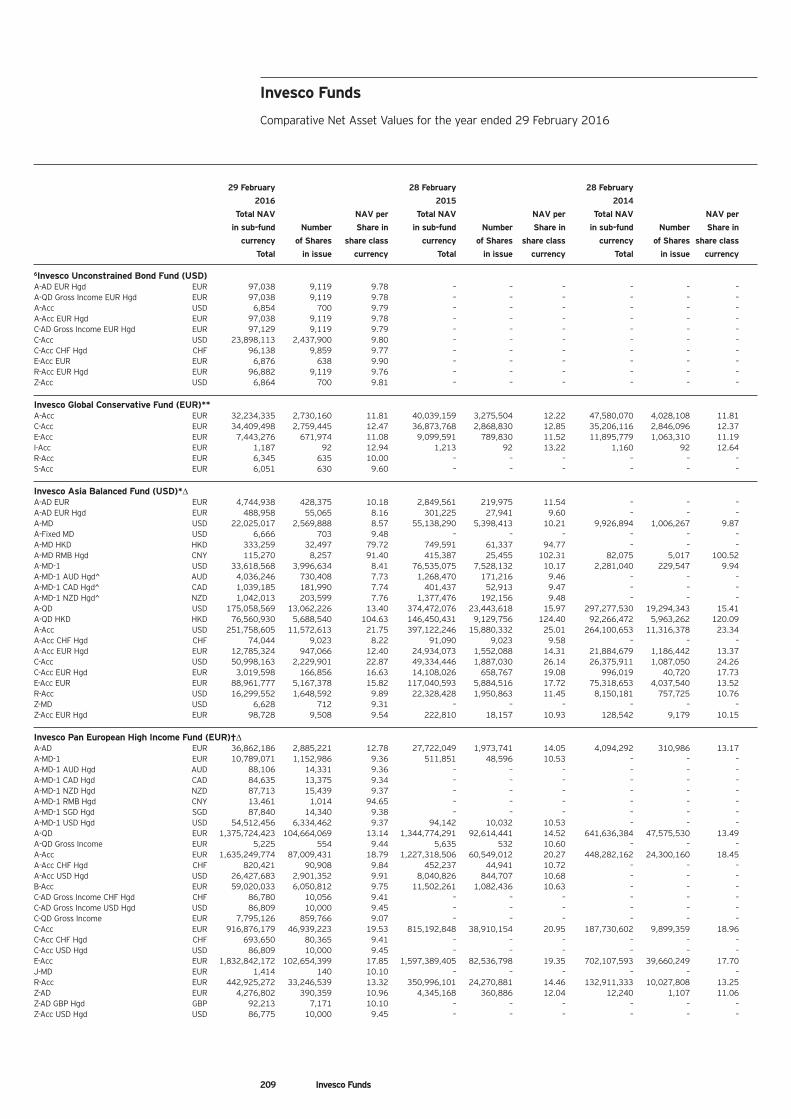
209 Invesco Funds
29 February 28 February 28 February
2016 2015 2014
Total NAV NAV per Total NAV NAV per Total NAV NAV per
in sub-fund Number Share in in sub-fund Number Share in in sub-fund Number Share in
currency of Shares share class currency of Shares share class currency of Shares share class
Total in issue currency Total in issue currency Total in issue currency
6Invesco Unconstrained Bond Fund (USD)A-AD EUR Hgd EUR 97,038 9,119 9.78 – – – – – –A-QD Gross Income EUR Hgd EUR 97,038 9,119 9.78 – – – – – –A-Acc USD 6,854 700 9.79 – – – – – –A-Acc EUR Hgd EUR 97,038 9,119 9.78 – – – – – –C-AD Gross Income EUR Hgd EUR 97,129 9,119 9.79 – – – – – –C-Acc USD 23,898,113 2,437,900 9.80 – – – – – –C-Acc CHF Hgd CHF 96,138 9,859 9.77 – – – – – –E-Acc EUR EUR 6,876 638 9.90 – – – – – –R-Acc EUR Hgd EUR 96,882 9,119 9.76 – – – – – –Z-Acc USD 6,864 700 9.81 – – – – – –
Invesco Global Conservative Fund (EUR)**A-Acc EUR 32,234,335 2,730,160 11.81 40,039,159 3,275,504 12.22 47,580,070 4,028,108 11.81C-Acc EUR 34,409,498 2,759,445 12.47 36,873,768 2,868,830 12.85 35,206,116 2,846,096 12.37E-Acc EUR 7,443,276 671,974 11.08 9,099,591 789,830 11.52 11,895,779 1,063,310 11.19I-Acc EUR 1,187 92 12.94 1,213 92 13.22 1,160 92 12.64R-Acc EUR 6,345 635 10.00 – – – – – –S-Acc EUR 6,051 630 9.60 – – – – – –
Invesco Asia Balanced Fund (USD)*ΔA-AD EUR EUR 4,744,938 428,375 10.18 2,849,561 219,975 11.54 – – –A-AD EUR Hgd EUR 488,958 55,065 8.16 301,225 27,941 9.60 – – –A-MD USD 22,025,017 2,569,888 8.57 55,138,290 5,398,413 10.21 9,926,894 1,006,267 9.87A-Fixed MD USD 6,666 703 9.48 – – – – – –A-MD HKD HKD 333,259 32,497 79.72 749,591 61,337 94.77 – – –A-MD RMB Hgd CNY 115,270 8,257 91.40 415,387 25,455 102.31 82,075 5,017 100.52A-MD-1 USD 33,618,568 3,996,634 8.41 76,535,075 7,528,132 10.17 2,281,040 229,547 9.94A-MD-1 AUD Hgd^ AUD 4,036,246 730,408 7.73 1,268,470 171,216 9.46 – – –A-MD-1 CAD Hgd^ CAD 1,039,185 181,990 7.74 401,437 52,913 9.47 – – –A-MD-1 NZD Hgd^ NZD 1,042,013 203,599 7.76 1,377,476 192,156 9.48 – – –A-QD USD 175,058,569 13,062,226 13.40 374,472,076 23,443,618 15.97 297,277,530 19,294,343 15.41A-QD HKD HKD 76,560,930 5,688,540 104.63 146,450,431 9,129,756 124.40 92,266,472 5,963,262 120.09A-Acc USD 251,758,605 11,572,613 21.75 397,122,246 15,880,332 25.01 264,100,653 11,316,378 23.34A-Acc CHF Hgd CHF 74,044 9,023 8.22 91,090 9,023 9.58 – – –A-Acc EUR Hgd EUR 12,785,324 947,066 12.40 24,934,073 1,552,088 14.31 21,884,679 1,186,442 13.37C-Acc USD 50,998,163 2,229,901 22.87 49,334,446 1,887,030 26.14 26,375,911 1,087,050 24.26C-Acc EUR Hgd EUR 3,019,598 166,856 16.63 14,108,026 658,767 19.08 996,019 40,720 17.73E-Acc EUR EUR 88,961,777 5,167,378 15.82 117,040,593 5,884,516 17.72 75,318,653 4,037,540 13.52R-Acc USD 16,299,552 1,648,592 9.89 22,328,428 1,950,863 11.45 8,150,181 757,725 10.76Z-MD USD 6,628 712 9.31 – – – – – –Z-Acc EUR Hgd EUR 98,728 9,508 9.54 222,810 18,157 10.93 128,542 9,179 10.15
Invesco Pan European High Income Fund (EUR)†ΔA-AD EUR 36,862,186 2,885,221 12.78 27,722,049 1,973,741 14.05 4,094,292 310,986 13.17A-MD-1 EUR 10,789,071 1,152,986 9.36 511,851 48,596 10.53 – – –A-MD-1 AUD Hgd AUD 88,106 14,331 9.36 – – – – – –A-MD-1 CAD Hgd CAD 84,635 13,375 9.34 – – – – – –A-MD-1 NZD Hgd NZD 87,713 15,439 9.37 – – – – – –A-MD-1 RMB Hgd CNY 13,461 1,014 94.65 – – – – – –A-MD-1 SGD Hgd SGD 87,840 14,340 9.38 – – – – – –A-MD-1 USD Hgd USD 54,512,456 6,334,462 9.37 94,142 10,032 10.53 – – –A-QD EUR 1,375,724,423 104,664,069 13.14 1,344,774,291 92,614,441 14.52 641,636,384 47,575,530 13.49A-QD Gross Income EUR 5,225 554 9.44 5,635 532 10.60 – – –A-Acc EUR 1,635,249,774 87,009,431 18.79 1,227,318,506 60,549,012 20.27 448,282,162 24,300,160 18.45A-Acc CHF Hgd CHF 820,421 90,908 9.84 452,237 44,941 10.72 – – –A-Acc USD Hgd USD 26,427,683 2,901,352 9.91 8,040,826 844,707 10.68 – – –B-Acc EUR 59,020,033 6,050,812 9.75 11,502,261 1,082,436 10.63 – – –C-AD Gross Income CHF Hgd CHF 86,780 10,056 9.41 – – – – – –C-AD Gross Income USD Hgd USD 86,809 10,000 9.45 – – – – – –C-QD Gross Income EUR 7,795,126 859,766 9.07 – – – – – –C-Acc EUR 916,876,179 46,939,223 19.53 815,192,848 38,910,154 20.95 187,730,602 9,899,359 18.96C-Acc CHF Hgd CHF 693,650 80,365 9.41 – – – – – –C-Acc USD Hgd USD 86,809 10,000 9.45 – – – – – –E-Acc EUR 1,832,842,172 102,654,399 17.85 1,597,389,405 82,536,798 19.35 702,107,593 39,660,249 17.70J-MD EUR 1,414 140 10.10 – – – – – –R-Acc EUR 442,925,272 33,246,539 13.32 350,996,101 24,270,881 14.46 132,911,333 10,027,808 13.25Z-AD EUR 4,276,802 390,359 10.96 4,345,168 360,886 12.04 12,240 1,107 11.06Z-AD GBP Hgd GBP 92,213 7,171 10.10 – – – – – –Z-Acc USD Hgd USD 86,775 10,000 9.45 – – – – – –
Invesco Funds
Comparative Net Asset Values for the year ended 29 February 2016
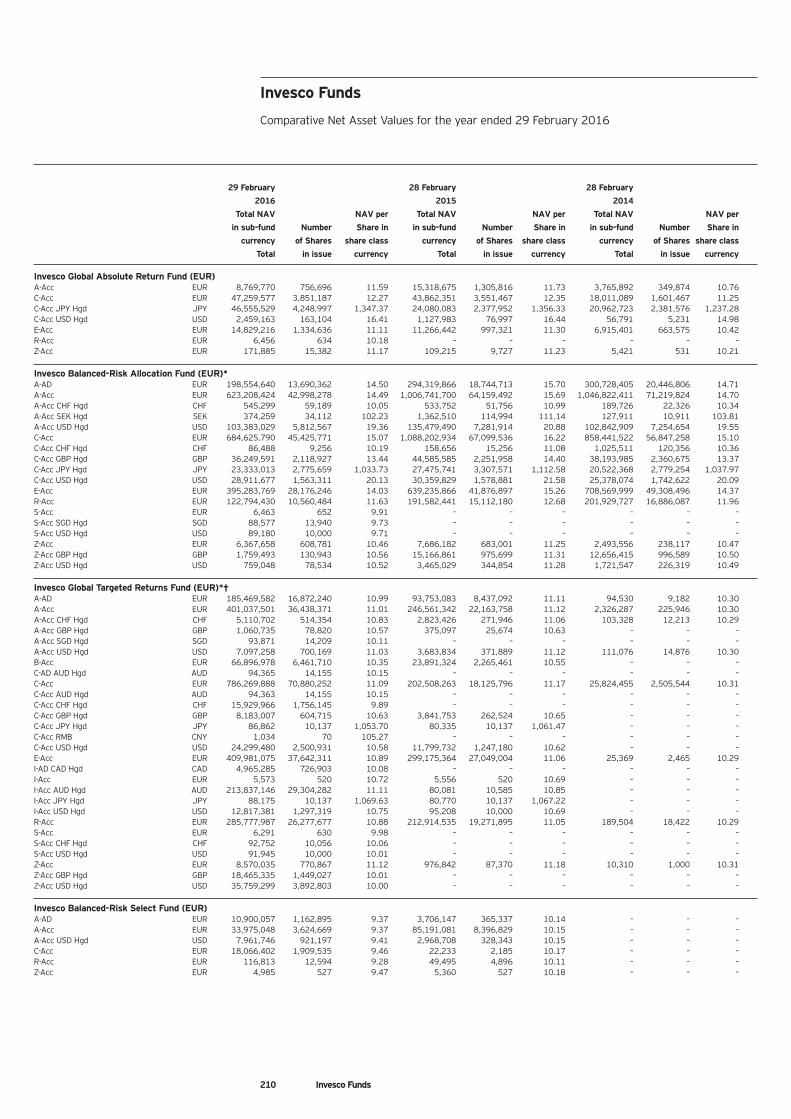
210 Invesco Funds
29 February 28 February 28 February
2016 2015 2014
Total NAV NAV per Total NAV NAV per Total NAV NAV per
in sub-fund Number Share in in sub-fund Number Share in in sub-fund Number Share in
currency of Shares share class currency of Shares share class currency of Shares share class
Total in issue currency Total in issue currency Total in issue currency
Invesco Global Absolute Return Fund (EUR)A-Acc EUR 8,769,770 756,696 11.59 15,318,675 1,305,816 11.73 3,765,892 349,874 10.76C-Acc EUR 47,259,577 3,851,187 12.27 43,862,351 3,551,467 12.35 18,011,089 1,601,467 11.25C-Acc JPY Hgd JPY 46,555,529 4,248,997 1,347.37 24,080,083 2,377,952 1,356.33 20,962,723 2,381,576 1,237.28C-Acc USD Hgd USD 2,459,163 163,104 16.41 1,127,983 76,997 16.44 56,791 5,231 14.98E-Acc EUR 14,829,216 1,334,636 11.11 11,266,442 997,321 11.30 6,915,401 663,575 10.42R-Acc EUR 6,456 634 10.18 – – – – – –Z-Acc EUR 171,885 15,382 11.17 109,215 9,727 11.23 5,421 531 10.21
Invesco Balanced-Risk Allocation Fund (EUR)*A-AD EUR 198,554,640 13,690,362 14.50 294,319,866 18,744,713 15.70 300,728,405 20,446,806 14.71A-Acc EUR 623,208,424 42,998,278 14.49 1,006,741,700 64,159,492 15.69 1,046,822,411 71,219,824 14.70A-Acc CHF Hgd CHF 545,299 59,189 10.05 533,752 51,756 10.99 189,726 22,326 10.34A-Acc SEK Hgd SEK 374,259 34,112 102.23 1,362,510 114,994 111.14 127,911 10,911 103.81A-Acc USD Hgd USD 103,383,029 5,812,567 19.36 135,479,490 7,281,914 20.88 102,842,909 7,254,654 19.55C-Acc EUR 684,625,790 45,425,771 15.07 1,088,202,934 67,099,536 16.22 858,441,522 56,847,258 15.10C-Acc CHF Hgd CHF 86,488 9,256 10.19 158,656 15,256 11.08 1,025,511 120,356 10.36C-Acc GBP Hgd GBP 36,249,591 2,118,927 13.44 44,585,585 2,251,958 14.40 38,193,985 2,360,675 13.37C-Acc JPY Hgd JPY 23,333,013 2,775,659 1,033.73 27,475,741 3,307,571 1,112.58 20,522,368 2,779,254 1,037.97C-Acc USD Hgd USD 28,911,677 1,563,311 20.13 30,359,829 1,578,881 21.58 25,378,074 1,742,622 20.09E-Acc EUR 395,283,769 28,176,246 14.03 639,235,866 41,876,897 15.26 708,569,999 49,308,496 14.37R-Acc EUR 122,794,430 10,560,484 11.63 191,582,441 15,112,180 12.68 201,929,727 16,886,087 11.96S-Acc EUR 6,463 652 9.91 – – – – – –S-Acc SGD Hgd SGD 88,577 13,940 9.73 – – – – – –S-Acc USD Hgd USD 89,180 10,000 9.71 – – – – – –Z-Acc EUR 6,367,658 608,781 10.46 7,686,182 683,001 11.25 2,493,556 238,117 10.47Z-Acc GBP Hgd GBP 1,759,493 130,943 10.56 15,166,861 975,699 11.31 12,656,415 996,589 10.50Z-Acc USD Hgd USD 759,048 78,534 10.52 3,465,029 344,854 11.28 1,721,547 226,319 10.49
Invesco Global Targeted Returns Fund (EUR)*†A-AD EUR 185,469,582 16,872,240 10.99 93,753,083 8,437,092 11.11 94,530 9,182 10.30A-Acc EUR 401,037,501 36,438,371 11.01 246,561,342 22,163,758 11.12 2,326,287 225,946 10.30A-Acc CHF Hgd CHF 5,110,702 514,354 10.83 2,823,426 271,946 11.06 103,328 12,213 10.29A-Acc GBP Hgd GBP 1,060,735 78,820 10.57 375,097 25,674 10.63 – – –A-Acc SGD Hgd SGD 93,871 14,209 10.11 – – – – – –A-Acc USD Hgd USD 7,097,258 700,169 11.03 3,683,834 371,889 11.12 111,076 14,876 10.30B-Acc EUR 66,896,978 6,461,710 10.35 23,891,324 2,265,461 10.55 – – –C-AD AUD Hgd AUD 94,365 14,155 10.15 – – – – – –C-Acc EUR 786,269,888 70,880,252 11.09 202,508,263 18,125,796 11.17 25,824,455 2,505,544 10.31C-Acc AUD Hgd AUD 94,363 14,155 10.15 – – – – – –C-Acc CHF Hgd CHF 15,929,966 1,756,145 9.89 – – – – – –C-Acc GBP Hgd GBP 8,183,007 604,715 10.63 3,841,753 262,524 10.65 – – –C-Acc JPY Hgd JPY 86,862 10,137 1,053.70 80,335 10,137 1,061.47 – – –C-Acc RMB CNY 1,034 70 105.27 – – – – – –C-Acc USD Hgd USD 24,299,480 2,500,931 10.58 11,799,732 1,247,180 10.62 – – –E-Acc EUR 409,981,075 37,642,311 10.89 299,175,364 27,049,004 11.06 25,369 2,465 10.29I-AD CAD Hgd CAD 4,965,285 726,903 10.08 – – – – – –I-Acc EUR 5,573 520 10.72 5,556 520 10.69 – – –I-Acc AUD Hgd AUD 213,837,146 29,304,282 11.11 80,081 10,585 10.85 – – –I-Acc JPY Hgd JPY 88,175 10,137 1,069.63 80,770 10,137 1,067.22 – – –I-Acc USD Hgd USD 12,817,381 1,297,319 10.75 95,208 10,000 10.69 – – –R-Acc EUR 285,777,987 26,277,677 10.88 212,914,535 19,271,895 11.05 189,504 18,422 10.29S-Acc EUR 6,291 630 9.98 – – – – – –S-Acc CHF Hgd CHF 92,752 10,056 10.06 – – – – – –S-Acc USD Hgd USD 91,945 10,000 10.01 – – – – – –Z-Acc EUR 8,570,035 770,867 11.12 976,842 87,370 11.18 10,310 1,000 10.31Z-Acc GBP Hgd GBP 18,465,335 1,449,027 10.01 – – – – – –Z-Acc USD Hgd USD 35,759,299 3,892,803 10.00 – – – – – –
Invesco Balanced-Risk Select Fund (EUR)A-AD EUR 10,900,057 1,162,895 9.37 3,706,147 365,337 10.14 – – –A-Acc EUR 33,975,048 3,624,669 9.37 85,191,081 8,396,829 10.15 – – –A-Acc USD Hgd USD 7,961,746 921,197 9.41 2,968,708 328,343 10.15 – – –C-Acc EUR 18,066,402 1,909,535 9.46 22,233 2,185 10.17 – – –R-Acc EUR 116,813 12,594 9.28 49,495 4,896 10.11 – – –Z-Acc EUR 4,985 527 9.47 5,360 527 10.18 – – –
Invesco Funds
Comparative Net Asset Values for the year ended 29 February 2016
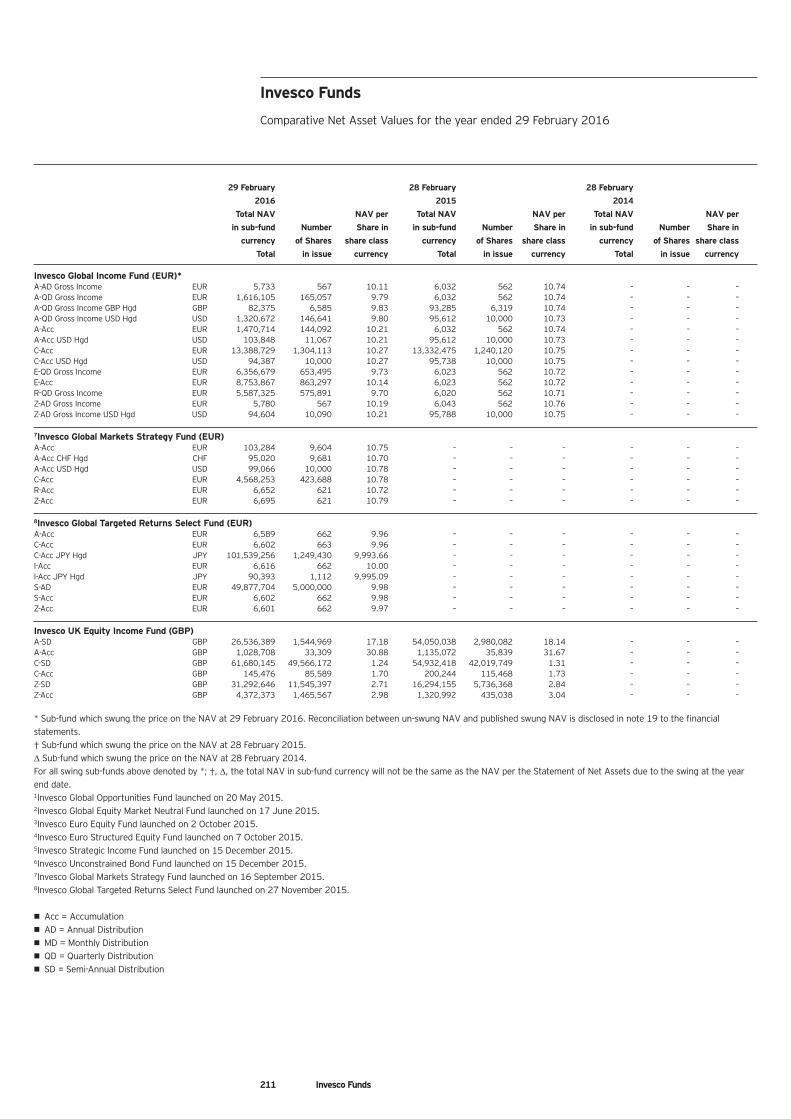
211 Invesco Funds
29 February 28 February 28 February
2016 2015 2014
Total NAV NAV per Total NAV NAV per Total NAV NAV per
in sub-fund Number Share in in sub-fund Number Share in in sub-fund Number Share in
currency of Shares share class currency of Shares share class currency of Shares share class
Total in issue currency Total in issue currency Total in issue currency
Invesco Global Income Fund (EUR)*A-AD Gross Income EUR 5,733 567 10.11 6,032 562 10.74 – – –A-QD Gross Income EUR 1,616,105 165,057 9.79 6,032 562 10.74 – – –A-QD Gross Income GBP Hgd GBP 82,375 6,585 9.83 93,285 6,319 10.74 – – –A-QD Gross Income USD Hgd USD 1,320,672 146,641 9.80 95,612 10,000 10.73 – – –A-Acc EUR 1,470,714 144,092 10.21 6,032 562 10.74 – – –A-Acc USD Hgd USD 103,848 11,067 10.21 95,612 10,000 10.73 – – –C-Acc EUR 13,388,729 1,304,113 10.27 13,332,475 1,240,120 10.75 – – –C-Acc USD Hgd USD 94,387 10,000 10.27 95,738 10,000 10.75 – – –E-QD Gross Income EUR 6,356,679 653,495 9.73 6,023 562 10.72 – – –E-Acc EUR 8,753,867 863,297 10.14 6,023 562 10.72 – – –R-QD Gross Income EUR 5,587,325 575,891 9.70 6,020 562 10.71 – – –Z-AD Gross Income EUR 5,780 567 10.19 6,043 562 10.76 – – –Z-AD Gross Income USD Hgd USD 94,604 10,090 10.21 95,788 10,000 10.75 – – –
7Invesco Global Markets Strategy Fund (EUR)A-Acc EUR 103,284 9,604 10.75 – – – – – –A-Acc CHF Hgd CHF 95,020 9,681 10.70 – – – – – –A-Acc USD Hgd USD 99,066 10,000 10.78 – – – – – –C-Acc EUR 4,568,253 423,688 10.78 – – – – – –R-Acc EUR 6,652 621 10.72 – – – – – –Z-Acc EUR 6,695 621 10.79 – – – – – –
8Invesco Global Targeted Returns Select Fund (EUR)A-Acc EUR 6,589 662 9.96 – – – – – –C-Acc EUR 6,602 663 9.96 – – – – – –C-Acc JPY Hgd JPY 101,539,256 1,249,430 9,993.66 – – – – – –I-Acc EUR 6,616 662 10.00 – – – – – –I-Acc JPY Hgd JPY 90,393 1,112 9,995.09 – – – – – –S-AD EUR 49,877,704 5,000,000 9.98 – – – – – –S-Acc EUR 6,602 662 9.98 – – – – – –Z-Acc EUR 6,601 662 9.97 – – – – – –
Invesco UK Equity Income Fund (GBP)A-SD GBP 26,536,389 1,544,969 17.18 54,050,038 2,980,082 18.14 – – –A-Acc GBP 1,028,708 33,309 30.88 1,135,072 35,839 31.67 – – –C-SD GBP 61,680,145 49,566,172 1.24 54,932,418 42,019,749 1.31 – – –C-Acc GBP 145,476 85,589 1.70 200,244 115,468 1.73 – – –Z-SD GBP 31,292,646 11,545,397 2.71 16,294,155 5,736,368 2.84 – – –Z-Acc GBP 4,372,373 1,465,567 2.98 1,320,992 435,038 3.04 – – –
* Sub-fund which swung the price on the NAV at 29 February 2016. Reconciliation between un-swung NAV and published swung NAV is disclosed in note 19 to the financialstatements.† Sub-fund which swung the price on the NAV at 28 February 2015.Δ Sub-fund which swung the price on the NAV at 28 February 2014.For all swing sub-funds above denoted by *; †, Δ, the total NAV in sub-fund currency will not be the same as the NAV per the Statement of Net Assets due to the swing at the yearend date.1Invesco Global Opportunities Fund launched on 20 May 2015.2Invesco Global Equity Market Neutral Fund launched on 17 June 2015.3Invesco Euro Equity Fund launched on 2 October 2015.4Invesco Euro Structured Equity Fund launched on 7 October 2015.5Invesco Strategic Income Fund launched on 15 December 2015.6Invesco Unconstrained Bond Fund launched on 15 December 2015.7Invesco Global Markets Strategy Fund launched on 16 September 2015.8Invesco Global Targeted Returns Select Fund launched on 27 November 2015.
• Acc = Accumulation• AD = Annual Distribution• MD = Monthly Distribution• QD = Quarterly Distribution• SD = Semi-Annual Distribution
Invesco Funds
Comparative Net Asset Values for the year ended 29 February 2016
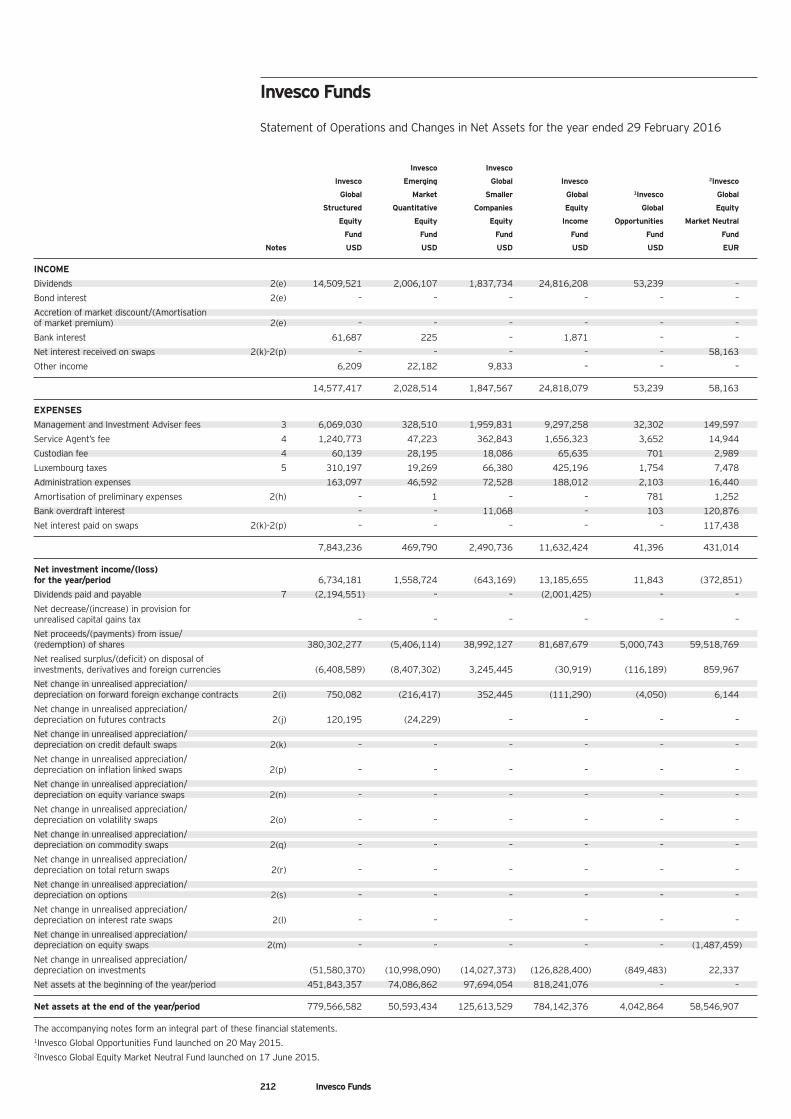
212 Invesco Funds
Invesco Invesco
Invesco Emerging Global Invesco 2Invesco
Global Market Smaller Global 1Invesco Global
Structured Quantitative Companies Equity Global Equity
Equity Equity Equity Income Opportunities Market Neutral
Fund Fund Fund Fund Fund Fund
Notes USD USD USD USD USD EUR
INCOME
Dividends 2(e) 14,509,521 2,006,107 1,837,734 24,816,208 53,239 –
Bond interest 2(e) – – – – – –
Accretion of market discount/(Amortisation of market premium) 2(e) – – – – – –
Bank interest 61,687 225 – 1,871 – –
Net interest received on swaps 2(k)-2(p) – – – – – 58,163
Other income 6,209 22,182 9,833 – – –
14,577,417 2,028,514 1,847,567 24,818,079 53,239 58,163
EXPENSES
Management and Investment Adviser fees 3 6,069,030 328,510 1,959,831 9,297,258 32,302 149,597
Service Agent’s fee 4 1,240,773 47,223 362,843 1,656,323 3,652 14,944
Custodian fee 4 60,139 28,195 18,086 65,635 701 2,989
Luxembourg taxes 5 310,197 19,269 66,380 425,196 1,754 7,478
Administration expenses 163,097 46,592 72,528 188,012 2,103 16,440
Amortisation of preliminary expenses 2(h) – 1 – – 781 1,252
Bank overdraft interest – – 11,068 – 103 120,876
Net interest paid on swaps 2(k)-2(p) – – – – – 117,438
7,843,236 469,790 2,490,736 11,632,424 41,396 431,014
Net investment income/(loss) for the year/period 6,734,181 1,558,724 (643,169) 13,185,655 11,843 (372,851)
Dividends paid and payable 7 (2,194,551) – – (2,001,425) – –
Net decrease/(increase) in provision for unrealised capital gains tax – – – – – –
Net proceeds/(payments) from issue/(redemption) of shares 380,302,277 (5,406,114) 38,992,127 81,687,679 5,000,743 59,518,769
Net realised surplus/(deficit) on disposal of investments, derivatives and foreign currencies (6,408,589) (8,407,302) 3,245,445 (30,919) (116,189) 859,967
Net change in unrealised appreciation/depreciation on forward foreign exchange contracts 2(i) 750,082 (216,417) 352,445 (111,290) (4,050) 6,144
Net change in unrealised appreciation/depreciation on futures contracts 2(j) 120,195 (24,229) – – – –
Net change in unrealised appreciation/depreciation on credit default swaps 2(k) – – – – – –
Net change in unrealised appreciation/depreciation on inflation linked swaps 2(p) – – – – – –
Net change in unrealised appreciation/depreciation on equity variance swaps 2(n) – – – – – –
Net change in unrealised appreciation/depreciation on volatility swaps 2(o) – – – – – –
Net change in unrealised appreciation/depreciation on commodity swaps 2(q) – – – – – –
Net change in unrealised appreciation/depreciation on total return swaps 2(r) – – – – – –
Net change in unrealised appreciation/depreciation on options 2(s) – – – – – –
Net change in unrealised appreciation/depreciation on interest rate swaps 2(l) – – – – – –
Net change in unrealised appreciation/depreciation on equity swaps 2(m) – – – – – (1,487,459)
Net change in unrealised appreciation/depreciation on investments (51,580,370) (10,998,090) (14,027,373) (126,828,400) (849,483) 22,337
Net assets at the beginning of the year/period 451,843,357 74,086,862 97,694,054 818,241,076 – –
Net assets at the end of the year/period 779,566,582 50,593,434 125,613,529 784,142,376 4,042,864 58,546,907
The accompanying notes form an integral part of these financial statements.1Invesco Global Opportunities Fund launched on 20 May 2015.2Invesco Global Equity Market Neutral Fund launched on 17 June 2015.
Invesco Funds
Statement of Operations and Changes in Net Assets for the year ended 29 February 2016
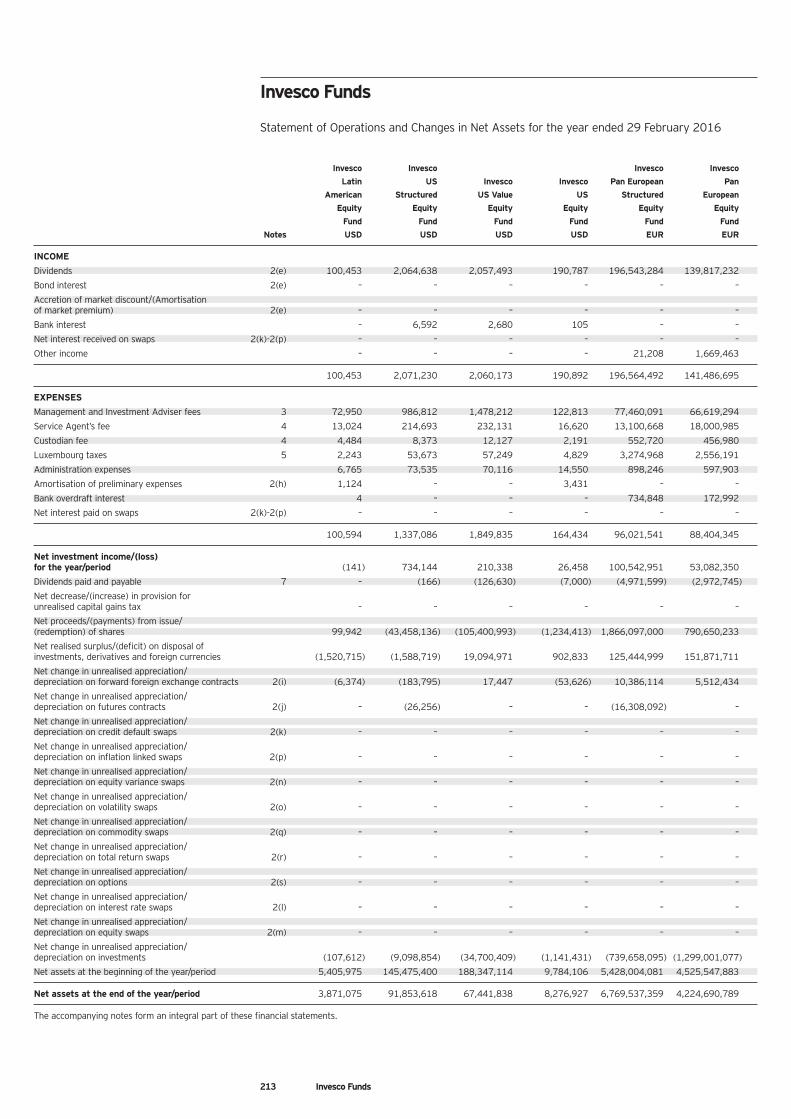
213 Invesco Funds
Invesco Invesco Invesco Invesco
Latin US Invesco Invesco Pan European Pan
American Structured US Value US Structured European
Equity Equity Equity Equity Equity Equity
Fund Fund Fund Fund Fund Fund
Notes USD USD USD USD EUR EUR
INCOME
Dividends 2(e) 100,453 2,064,638 2,057,493 190,787 196,543,284 139,817,232
Bond interest 2(e) – – – – – –
Accretion of market discount/(Amortisation of market premium) 2(e) – – – – – –
Bank interest – 6,592 2,680 105 – –
Net interest received on swaps 2(k)-2(p) – – – – – –
Other income – – – – 21,208 1,669,463
100,453 2,071,230 2,060,173 190,892 196,564,492 141,486,695
EXPENSES
Management and Investment Adviser fees 3 72,950 986,812 1,478,212 122,813 77,460,091 66,619,294
Service Agent’s fee 4 13,024 214,693 232,131 16,620 13,100,668 18,000,985
Custodian fee 4 4,484 8,373 12,127 2,191 552,720 456,980
Luxembourg taxes 5 2,243 53,673 57,249 4,829 3,274,968 2,556,191
Administration expenses 6,765 73,535 70,116 14,550 898,246 597,903
Amortisation of preliminary expenses 2(h) 1,124 – – 3,431 – –
Bank overdraft interest 4 – – – 734,848 172,992
Net interest paid on swaps 2(k)-2(p) – – – – – –
100,594 1,337,086 1,849,835 164,434 96,021,541 88,404,345
Net investment income/(loss) for the year/period (141) 734,144 210,338 26,458 100,542,951 53,082,350
Dividends paid and payable 7 – (166) (126,630) (7,000) (4,971,599) (2,972,745)
Net decrease/(increase) in provision for unrealised capital gains tax – – – – – –
Net proceeds/(payments) from issue/(redemption) of shares 99,942 (43,458,136) (105,400,993) (1,234,413) 1,866,097,000 790,650,233
Net realised surplus/(deficit) on disposal of investments, derivatives and foreign currencies (1,520,715) (1,588,719) 19,094,971 902,833 125,444,999 151,871,711
Net change in unrealised appreciation/depreciation on forward foreign exchange contracts 2(i) (6,374) (183,795) 17,447 (53,626) 10,386,114 5,512,434
Net change in unrealised appreciation/depreciation on futures contracts 2(j) – (26,256) – – (16,308,092) –
Net change in unrealised appreciation/depreciation on credit default swaps 2(k) – – – – – –
Net change in unrealised appreciation/depreciation on inflation linked swaps 2(p) – – – – – –
Net change in unrealised appreciation/depreciation on equity variance swaps 2(n) – – – – – –
Net change in unrealised appreciation/depreciation on volatility swaps 2(o) – – – – – –
Net change in unrealised appreciation/depreciation on commodity swaps 2(q) – – – – – –
Net change in unrealised appreciation/depreciation on total return swaps 2(r) – – – – – –
Net change in unrealised appreciation/depreciation on options 2(s) – – – – – –
Net change in unrealised appreciation/depreciation on interest rate swaps 2(l) – – – – – –
Net change in unrealised appreciation/depreciation on equity swaps 2(m) – – – – – –
Net change in unrealised appreciation/depreciation on investments (107,612) (9,098,854) (34,700,409) (1,141,431) (739,658,095) (1,299,001,077)
Net assets at the beginning of the year/period 5,405,975 145,475,400 188,347,114 9,784,106 5,428,004,081 4,525,547,883
Net assets at the end of the year/period 3,871,075 91,853,618 67,441,838 8,276,927 6,769,537,359 4,224,690,789
The accompanying notes form an integral part of these financial statements.
Invesco Funds
Statement of Operations and Changes in Net Assets for the year ended 29 February 2016
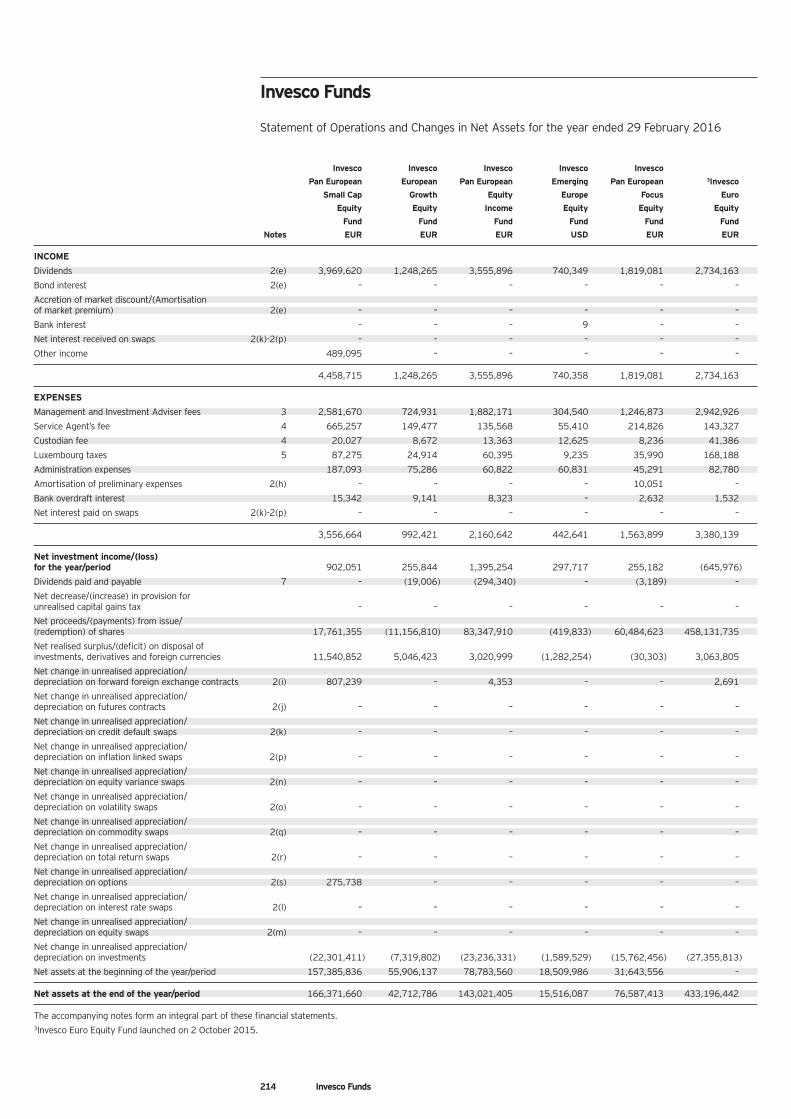
214 Invesco Funds
Invesco Invesco Invesco Invesco Invesco
Pan European European Pan European Emerging Pan European 3Invesco
Small Cap Growth Equity Europe Focus Euro
Equity Equity Income Equity Equity Equity
Fund Fund Fund Fund Fund Fund
Notes EUR EUR EUR USD EUR EUR
INCOME
Dividends 2(e) 3,969,620 1,248,265 3,555,896 740,349 1,819,081 2,734,163
Bond interest 2(e) – – – – – –
Accretion of market discount/(Amortisation of market premium) 2(e) – – – – – –
Bank interest – – – 9 – –
Net interest received on swaps 2(k)-2(p) – – – – – –
Other income 489,095 – – – – –
4,458,715 1,248,265 3,555,896 740,358 1,819,081 2,734,163
EXPENSES
Management and Investment Adviser fees 3 2,581,670 724,931 1,882,171 304,540 1,246,873 2,942,926
Service Agent’s fee 4 665,257 149,477 135,568 55,410 214,826 143,327
Custodian fee 4 20,027 8,672 13,363 12,625 8,236 41,386
Luxembourg taxes 5 87,275 24,914 60,395 9,235 35,990 168,188
Administration expenses 187,093 75,286 60,822 60,831 45,291 82,780
Amortisation of preliminary expenses 2(h) – – – – 10,051 –
Bank overdraft interest 15,342 9,141 8,323 – 2,632 1,532
Net interest paid on swaps 2(k)-2(p) – – – – – –
3,556,664 992,421 2,160,642 442,641 1,563,899 3,380,139
Net investment income/(loss) for the year/period 902,051 255,844 1,395,254 297,717 255,182 (645,976)
Dividends paid and payable 7 – (19,006) (294,340) – (3,189) –
Net decrease/(increase) in provision for unrealised capital gains tax – – – – – –
Net proceeds/(payments) from issue/(redemption) of shares 17,761,355 (11,156,810) 83,347,910 (419,833) 60,484,623 458,131,735
Net realised surplus/(deficit) on disposal of investments, derivatives and foreign currencies 11,540,852 5,046,423 3,020,999 (1,282,254) (30,303) 3,063,805
Net change in unrealised appreciation/depreciation on forward foreign exchange contracts 2(i) 807,239 – 4,353 – – 2,691
Net change in unrealised appreciation/depreciation on futures contracts 2(j) – – – – – –
Net change in unrealised appreciation/depreciation on credit default swaps 2(k) – – – – – –
Net change in unrealised appreciation/depreciation on inflation linked swaps 2(p) – – – – – –
Net change in unrealised appreciation/depreciation on equity variance swaps 2(n) – – – – – –
Net change in unrealised appreciation/depreciation on volatility swaps 2(o) – – – – – –
Net change in unrealised appreciation/depreciation on commodity swaps 2(q) – – – – – –
Net change in unrealised appreciation/depreciation on total return swaps 2(r) – – – – – –
Net change in unrealised appreciation/depreciation on options 2(s) 275,738 – – – – –
Net change in unrealised appreciation/depreciation on interest rate swaps 2(l) – – – – – –
Net change in unrealised appreciation/depreciation on equity swaps 2(m) – – – – – –
Net change in unrealised appreciation/depreciation on investments (22,301,411) (7,319,802) (23,236,331) (1,589,529) (15,762,456) (27,355,813)
Net assets at the beginning of the year/period 157,385,836 55,906,137 78,783,560 18,509,986 31,643,556 –
Net assets at the end of the year/period 166,371,660 42,712,786 143,021,405 15,516,087 76,587,413 433,196,442
The accompanying notes form an integral part of these financial statements.3Invesco Euro Equity Fund launched on 2 October 2015.
Invesco Funds
Statement of Operations and Changes in Net Assets for the year ended 29 February 2016

215 Invesco Funds
Invesco4Invesco Nippon Invesco Invesco Invesco Invesco
Euro Small/Mid Japanese Japanese Asia Greater
Structured Cap Equity Value Opportunities China
Equity Equity Advantage Equity Equity Equity
Fund Fund Fund Fund Fund Fund
Notes EUR JPY JPY JPY USD USD
INCOME
Dividends 2(e) 98,386 121,970,877 2,598,049,231 269,340,515 3,019,033 55,487,409
Bond interest 2(e) – – – – – –
Accretion of market discount/(Amortisation of market premium) 2(e) – – – – – –
Bank interest – 3,793 – – 2,348 –
Net interest received on swaps 2(k)-2(p) – – – – – –
Other income – 20,635,259 – – – –
98,386 142,609,929 2,598,049,231 269,340,515 3,021,381 55,487,409
EXPENSES
Management and Investment Adviser fees 3 104,041 183,429,078 1,344,384,062 218,460,438 1,793,427 21,418,184
Service Agent’s fee 4 25,932 47,778,934 219,360,850 33,731,526 482,265 5,982,086
Custodian fee 4 1,296 3,617,171 19,889,166 4,533,094 76,088 655,819
Luxembourg taxes 5 10,641 6,231,206 79,849,695 8,690,590 74,001 916,528
Administration expenses 10,373 10,361,388 14,319,568 10,922,303 79,723 228,582
Amortisation of preliminary expenses 2(h) – – – – – –
Bank overdraft interest 696 – 2,855 7,779 – 17,371
Net interest paid on swaps 2(k)-2(p) – – – – – –
152,979 251,417,777 1,677,806,196 276,345,730 2,505,504 29,218,570
Net investment income/(loss) for the year/period (54,593) (108,807,848) 920,243,035 (7,005,215) 515,877 26,268,839
Dividends paid and payable 7 – – – (419,146) – –
Net decrease/(increase) in provision for unrealised capital gains tax – – – – 572,921 –
Net proceeds/(payments) from issue/(redemption) of shares 70,052,896 (3,605,258,232) (51,301,069,870) (5,229,867,147) (35,389,598) (1,996,391,724)
Net realised surplus/(deficit) on disposal of investments, derivatives and foreign currencies (590,866) 1,000,085,530 18,359,122,640 1,888,356,772 (7,009,982) 204,541,586
Net change in unrealised appreciation/depreciation on forward foreign exchange contracts 2(i) 600 (6,317,567) (162,232,104) (266,227,467) (2,744) (418,277)
Net change in unrealised appreciation/depreciation on futures contracts 2(j) 113,780 – – – – –
Net change in unrealised appreciation/depreciation on credit default swaps 2(k) – – – – – –
Net change in unrealised appreciation/depreciation on inflation linked swaps 2(p) – – – – – –
Net change in unrealised appreciation/depreciation on equity variance swaps 2(n) – – – – – –
Net change in unrealised appreciation/depreciation on volatility swaps 2(o) – – – – – –
Net change in unrealised appreciation/depreciation on commodity swaps 2(q) – – – – – –
Net change in unrealised appreciation/depreciation on total return swaps 2(r) – – – – – –
Net change in unrealised appreciation/depreciation on options 2(s) – – – – – –
Net change in unrealised appreciation/depreciation on interest rate swaps 2(l) – – – – – –
Net change in unrealised appreciation/depreciation on equity swaps 2(m) – – – – – –
Net change in unrealised appreciation/depreciation on investments (1,885,359) (1,959,403,366) (34,254,846,436) (3,863,088,221) (15,717,999) (428,252,045)
Net assets at the beginning of the year/period – 15,173,150,470 184,927,765,631 17,479,929,325 149,930,741 3,080,560,625
Net assets at the end of the year/period 67,636,458 10,493,448,987 118,488,982,896 10,001,678,901 92,899,216 886,309,004
The accompanying notes form an integral part of these financial statements.4Invesco Euro Structured Equity Fund launched on 7 October 2015.
Invesco Funds
Statement of Operations and Changes in Net Assets for the year ended 29 February 2016
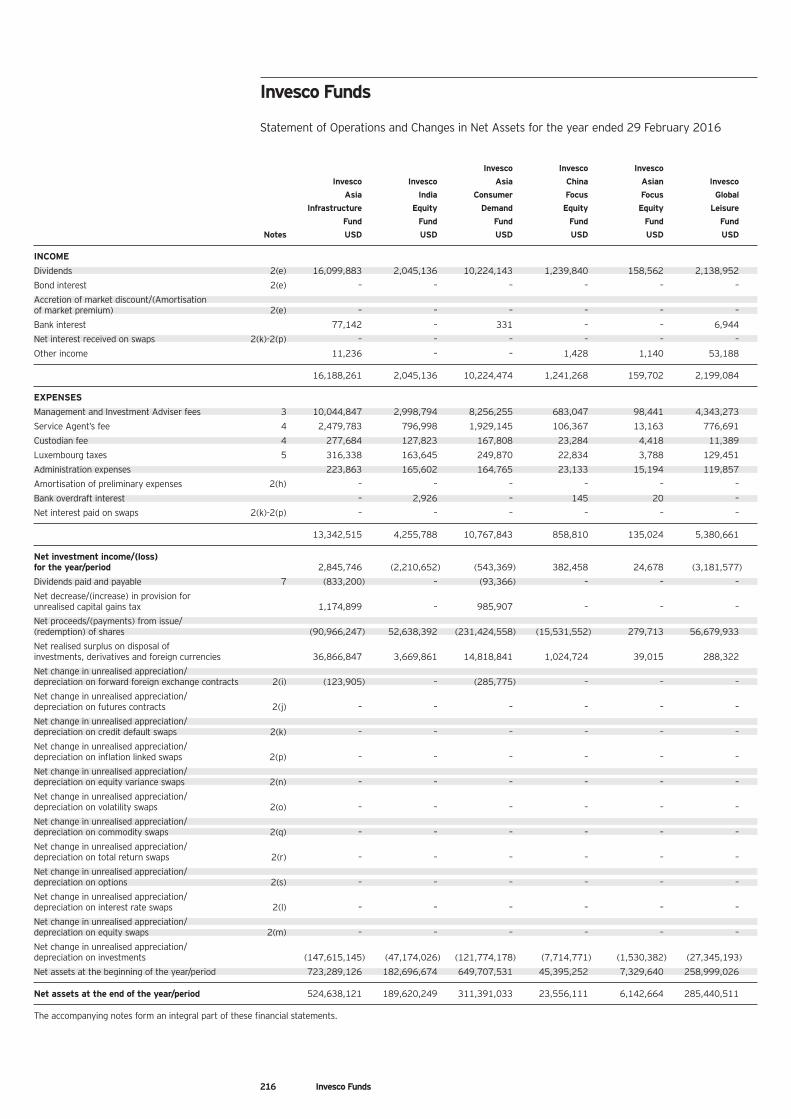
216 Invesco Funds
Invesco Invesco Invesco
Invesco Invesco Asia China Asian Invesco
Asia India Consumer Focus Focus Global
Infrastructure Equity Demand Equity Equity Leisure
Fund Fund Fund Fund Fund Fund
Notes USD USD USD USD USD USD
INCOME
Dividends 2(e) 16,099,883 2,045,136 10,224,143 1,239,840 158,562 2,138,952
Bond interest 2(e) – – – – – –
Accretion of market discount/(Amortisation of market premium) 2(e) – – – – – –
Bank interest 77,142 – 331 – – 6,944
Net interest received on swaps 2(k)-2(p) – – – – – –
Other income 11,236 – – 1,428 1,140 53,188
16,188,261 2,045,136 10,224,474 1,241,268 159,702 2,199,084
EXPENSES
Management and Investment Adviser fees 3 10,044,847 2,998,794 8,256,255 683,047 98,441 4,343,273
Service Agent’s fee 4 2,479,783 796,998 1,929,145 106,367 13,163 776,691
Custodian fee 4 277,684 127,823 167,808 23,284 4,418 11,389
Luxembourg taxes 5 316,338 163,645 249,870 22,834 3,788 129,451
Administration expenses 223,863 165,602 164,765 23,133 15,194 119,857
Amortisation of preliminary expenses 2(h) – – – – – –
Bank overdraft interest – 2,926 – 145 20 –
Net interest paid on swaps 2(k)-2(p) – – – – – –
13,342,515 4,255,788 10,767,843 858,810 135,024 5,380,661
Net investment income/(loss)for the year/period 2,845,746 (2,210,652) (543,369) 382,458 24,678 (3,181,577)
Dividends paid and payable 7 (833,200) – (93,366) – – –
Net decrease/(increase) in provision for unrealised capital gains tax 1,174,899 – 985,907 – – –
Net proceeds/(payments) from issue/(redemption) of shares (90,966,247) 52,638,392 (231,424,558) (15,531,552) 279,713 56,679,933
Net realised surplus on disposal of investments, derivatives and foreign currencies 36,866,847 3,669,861 14,818,841 1,024,724 39,015 288,322
Net change in unrealised appreciation/depreciation on forward foreign exchange contracts 2(i) (123,905) – (285,775) – – –
Net change in unrealised appreciation/depreciation on futures contracts 2(j) – – – – – –
Net change in unrealised appreciation/depreciation on credit default swaps 2(k) – – – – – –
Net change in unrealised appreciation/depreciation on inflation linked swaps 2(p) – – – – – –
Net change in unrealised appreciation/depreciation on equity variance swaps 2(n) – – – – – –
Net change in unrealised appreciation/depreciation on volatility swaps 2(o) – – – – – –
Net change in unrealised appreciation/depreciation on commodity swaps 2(q) – – – – – –
Net change in unrealised appreciation/depreciation on total return swaps 2(r) – – – – – –
Net change in unrealised appreciation/depreciation on options 2(s) – – – – – –
Net change in unrealised appreciation/depreciation on interest rate swaps 2(l) – – – – – –
Net change in unrealised appreciation/depreciation on equity swaps 2(m) – – – – – –
Net change in unrealised appreciation/depreciation on investments (147,615,145) (47,174,026) (121,774,178) (7,714,771) (1,530,382) (27,345,193)
Net assets at the beginning of the year/period 723,289,126 182,696,674 649,707,531 45,395,252 7,329,640 258,999,026
Net assets at the end of the year/period 524,638,121 189,620,249 311,391,033 23,556,111 6,142,664 285,440,511
The accompanying notes form an integral part of these financial statements.
Invesco Funds
Statement of Operations and Changes in Net Assets for the year ended 29 February 2016
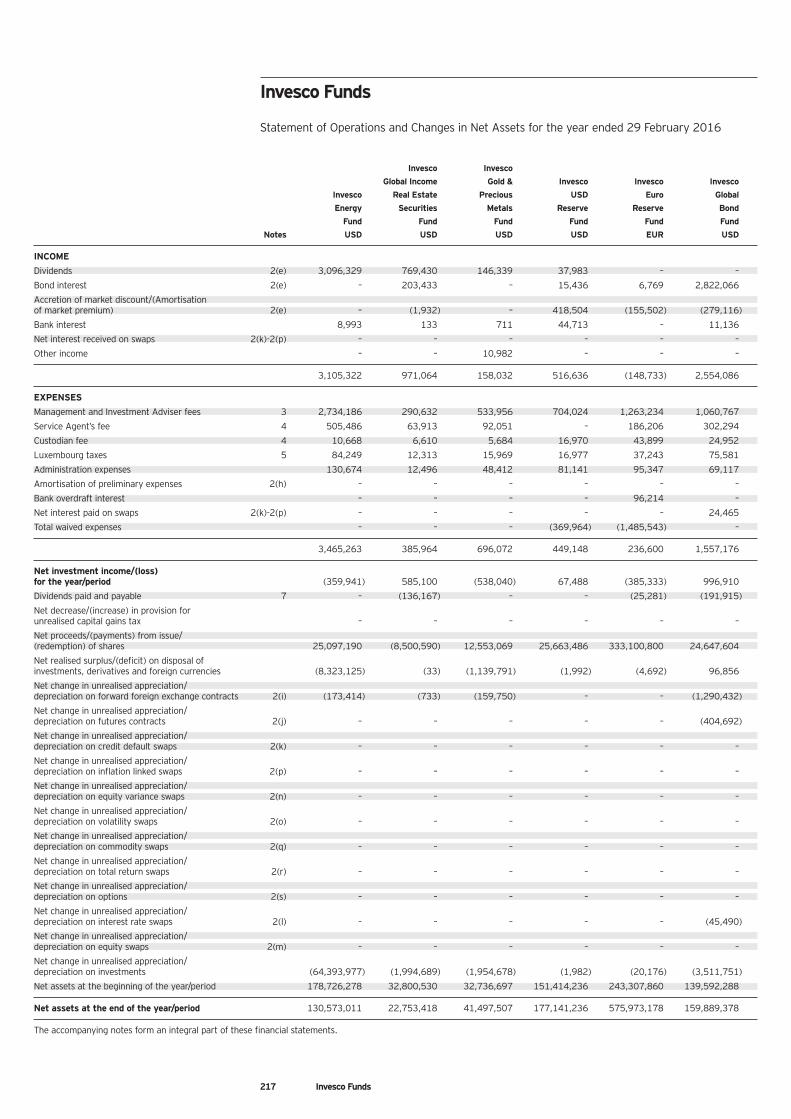
217 Invesco Funds
Invesco Invesco
Global Income Gold & Invesco Invesco Invesco
Invesco Real Estate Precious USD Euro Global
Energy Securities Metals Reserve Reserve Bond
Fund Fund Fund Fund Fund Fund
Notes USD USD USD USD EUR USD
INCOME
Dividends 2(e) 3,096,329 769,430 146,339 37,983 – –
Bond interest 2(e) – 203,433 – 15,436 6,769 2,822,066
Accretion of market discount/(Amortisation of market premium) 2(e) – (1,932) – 418,504 (155,502) (279,116)
Bank interest 8,993 133 711 44,713 – 11,136
Net interest received on swaps 2(k)-2(p) – – – – – –
Other income – – 10,982 – – –
3,105,322 971,064 158,032 516,636 (148,733) 2,554,086
EXPENSES
Management and Investment Adviser fees 3 2,734,186 290,632 533,956 704,024 1,263,234 1,060,767
Service Agent’s fee 4 505,486 63,913 92,051 – 186,206 302,294
Custodian fee 4 10,668 6,610 5,684 16,970 43,899 24,952
Luxembourg taxes 5 84,249 12,313 15,969 16,977 37,243 75,581
Administration expenses 130,674 12,496 48,412 81,141 95,347 69,117
Amortisation of preliminary expenses 2(h) – – – – – –
Bank overdraft interest – – – – 96,214 –
Net interest paid on swaps 2(k)-2(p) – – – – – 24,465
Total waived expenses – – – (369,964) (1,485,543) –
3,465,263 385,964 696,072 449,148 236,600 1,557,176
Net investment income/(loss)for the year/period (359,941) 585,100 (538,040) 67,488 (385,333) 996,910
Dividends paid and payable 7 – (136,167) – – (25,281) (191,915)
Net decrease/(increase) in provision for unrealised capital gains tax – – – – – –
Net proceeds/(payments) from issue/(redemption) of shares 25,097,190 (8,500,590) 12,553,069 25,663,486 333,100,800 24,647,604
Net realised surplus/(deficit) on disposal of investments, derivatives and foreign currencies (8,323,125) (33) (1,139,791) (1,992) (4,692) 96,856
Net change in unrealised appreciation/depreciation on forward foreign exchange contracts 2(i) (173,414) (733) (159,750) – – (1,290,432)
Net change in unrealised appreciation/depreciation on futures contracts 2(j) – – – – – (404,692)
Net change in unrealised appreciation/depreciation on credit default swaps 2(k) – – – – – –
Net change in unrealised appreciation/depreciation on inflation linked swaps 2(p) – – – – – –
Net change in unrealised appreciation/depreciation on equity variance swaps 2(n) – – – – – –
Net change in unrealised appreciation/depreciation on volatility swaps 2(o) – – – – – –
Net change in unrealised appreciation/depreciation on commodity swaps 2(q) – – – – – –
Net change in unrealised appreciation/depreciation on total return swaps 2(r) – – – – – –
Net change in unrealised appreciation/depreciation on options 2(s) – – – – – –
Net change in unrealised appreciation/depreciation on interest rate swaps 2(l) – – – – – (45,490)
Net change in unrealised appreciation/depreciation on equity swaps 2(m) – – – – – –
Net change in unrealised appreciation/depreciation on investments (64,393,977) (1,994,689) (1,954,678) (1,982) (20,176) (3,511,751)
Net assets at the beginning of the year/period 178,726,278 32,800,530 32,736,697 151,414,236 243,307,860 139,592,288
Net assets at the end of the year/period 130,573,011 22,753,418 41,497,507 177,141,236 575,973,178 159,889,378
The accompanying notes form an integral part of these financial statements.
Invesco Funds
Statement of Operations and Changes in Net Assets for the year ended 29 February 2016
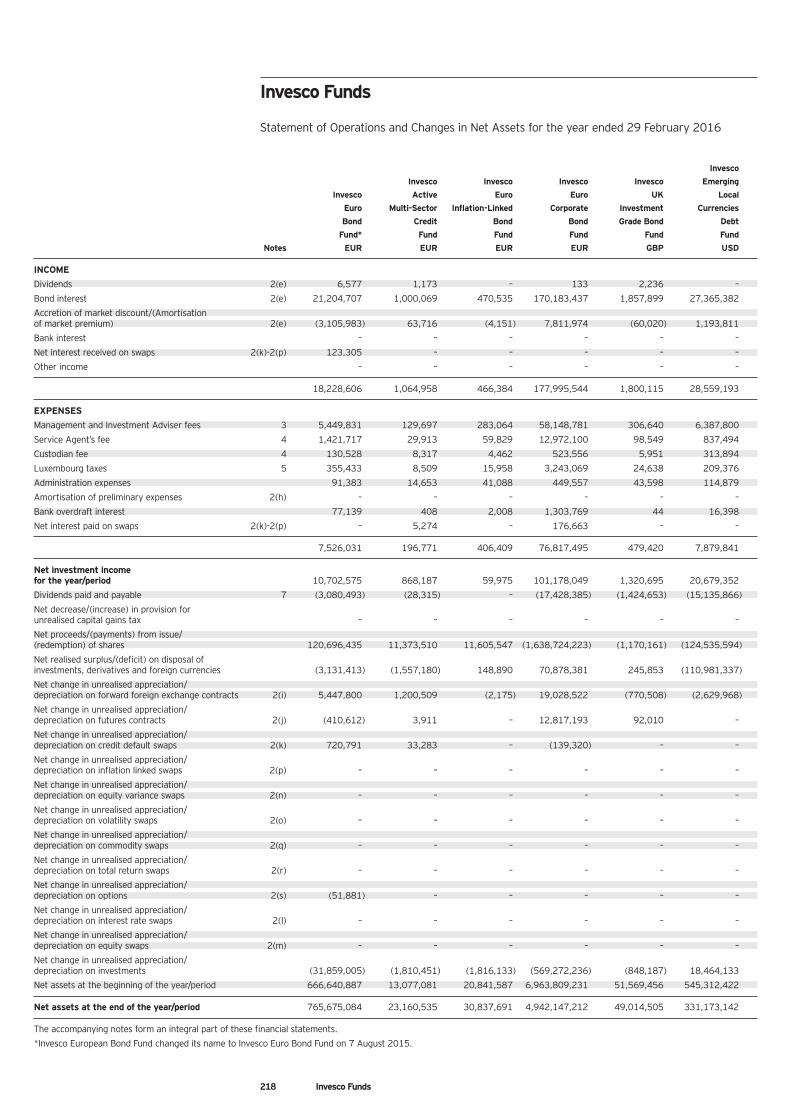
218 Invesco Funds
Invesco
Invesco Invesco Invesco Invesco Emerging
Invesco Active Euro Euro UK Local
Euro Multi-Sector Inflation-Linked Corporate Investment Currencies
Bond Credit Bond Bond Grade Bond Debt
Fund* Fund Fund Fund Fund Fund
Notes EUR EUR EUR EUR GBP USD
INCOME
Dividends 2(e) 6,577 1,173 – 133 2,236 –
Bond interest 2(e) 21,204,707 1,000,069 470,535 170,183,437 1,857,899 27,365,382
Accretion of market discount/(Amortisation of market premium) 2(e) (3,105,983) 63,716 (4,151) 7,811,974 (60,020) 1,193,811
Bank interest – – – – – –
Net interest received on swaps 2(k)-2(p) 123,305 – – – – –
Other income – – – – – –
18,228,606 1,064,958 466,384 177,995,544 1,800,115 28,559,193
EXPENSES
Management and Investment Adviser fees 3 5,449,831 129,697 283,064 58,148,781 306,640 6,387,800
Service Agent’s fee 4 1,421,717 29,913 59,829 12,972,100 98,549 837,494
Custodian fee 4 130,528 8,317 4,462 523,556 5,951 313,894
Luxembourg taxes 5 355,433 8,509 15,958 3,243,069 24,638 209,376
Administration expenses 91,383 14,653 41,088 449,557 43,598 114,879
Amortisation of preliminary expenses 2(h) – – – – – –
Bank overdraft interest 77,139 408 2,008 1,303,769 44 16,398
Net interest paid on swaps 2(k)-2(p) – 5,274 – 176,663 – –
7,526,031 196,771 406,409 76,817,495 479,420 7,879,841
Net investment income for the year/period 10,702,575 868,187 59,975 101,178,049 1,320,695 20,679,352
Dividends paid and payable 7 (3,080,493) (28,315) – (17,428,385) (1,424,653) (15,135,866)
Net decrease/(increase) in provision for unrealised capital gains tax – – – – – –
Net proceeds/(payments) from issue/(redemption) of shares 120,696,435 11,373,510 11,605,547 (1,638,724,223) (1,170,161) (124,535,594)
Net realised surplus/(deficit) on disposal of investments, derivatives and foreign currencies (3,131,413) (1,557,180) 148,890 70,878,381 245,853 (110,981,337)
Net change in unrealised appreciation/depreciation on forward foreign exchange contracts 2(i) 5,447,800 1,200,509 (2,175) 19,028,522 (770,508) (2,629,968)
Net change in unrealised appreciation/depreciation on futures contracts 2(j) (410,612) 3,911 – 12,817,193 92,010 –
Net change in unrealised appreciation/depreciation on credit default swaps 2(k) 720,791 33,283 – (139,320) – –
Net change in unrealised appreciation/depreciation on inflation linked swaps 2(p) – – – – – –
Net change in unrealised appreciation/depreciation on equity variance swaps 2(n) – – – – – –
Net change in unrealised appreciation/depreciation on volatility swaps 2(o) – – – – – –
Net change in unrealised appreciation/depreciation on commodity swaps 2(q) – – – – – –
Net change in unrealised appreciation/depreciation on total return swaps 2(r) – – – – – –
Net change in unrealised appreciation/depreciation on options 2(s) (51,881) – – – – –
Net change in unrealised appreciation/depreciation on interest rate swaps 2(l) – – – – – –
Net change in unrealised appreciation/depreciation on equity swaps 2(m) – – – – – –
Net change in unrealised appreciation/depreciation on investments (31,859,005) (1,810,451) (1,816,133) (569,272,236) (848,187) 18,464,133
Net assets at the beginning of the year/period 666,640,887 13,077,081 20,841,587 6,963,809,231 51,569,456 545,312,422
Net assets at the end of the year/period 765,675,084 23,160,535 30,837,691 4,942,147,212 49,014,505 331,173,142
The accompanying notes form an integral part of these financial statements.
*Invesco European Bond Fund changed its name to Invesco Euro Bond Fund on 7 August 2015.
Invesco Funds
Statement of Operations and Changes in Net Assets for the year ended 29 February 2016
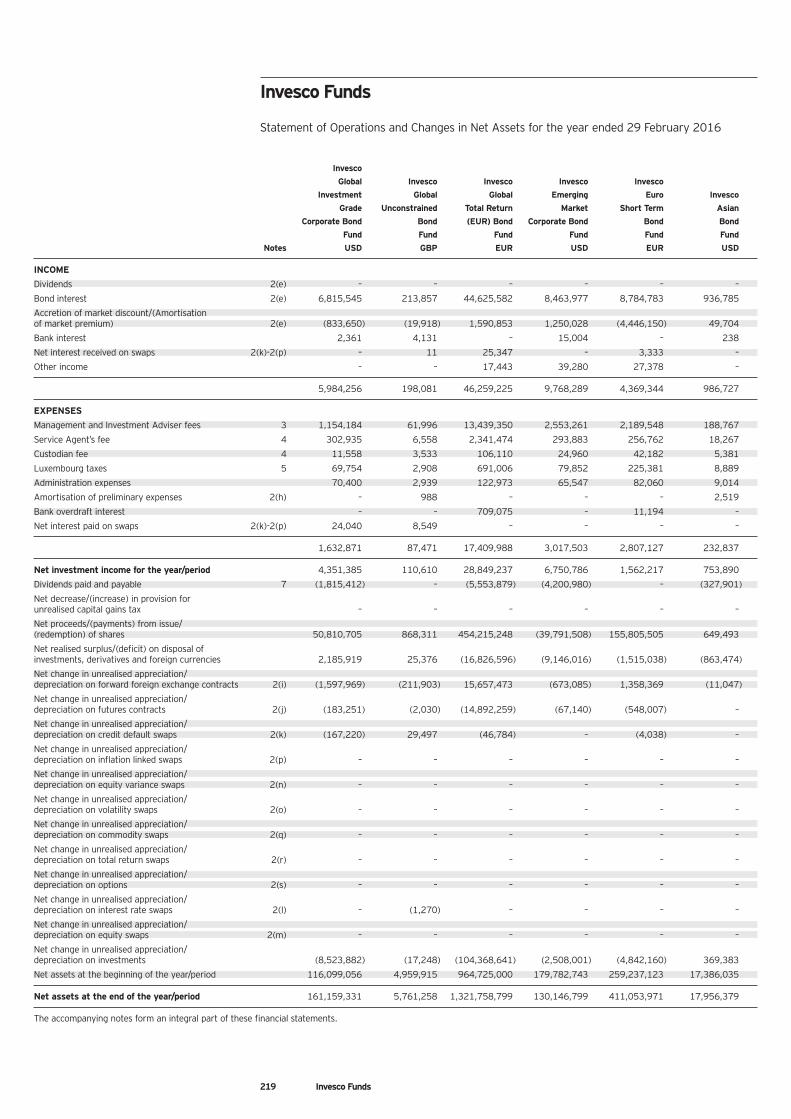
219 Invesco Funds
Invesco
Global Invesco Invesco Invesco Invesco
Investment Global Global Emerging Euro Invesco
Grade Unconstrained Total Return Market Short Term Asian
Corporate Bond Bond (EUR) Bond Corporate Bond Bond Bond
Fund Fund Fund Fund Fund Fund
Notes USD GBP EUR USD EUR USD
INCOME
Dividends 2(e) – – – – – –
Bond interest 2(e) 6,815,545 213,857 44,625,582 8,463,977 8,784,783 936,785
Accretion of market discount/(Amortisation of market premium) 2(e) (833,650) (19,918) 1,590,853 1,250,028 (4,446,150) 49,704
Bank interest 2,361 4,131 – 15,004 – 238
Net interest received on swaps 2(k)-2(p) – 11 25,347 – 3,333 –
Other income – – 17,443 39,280 27,378 –
5,984,256 198,081 46,259,225 9,768,289 4,369,344 986,727
EXPENSES
Management and Investment Adviser fees 3 1,154,184 61,996 13,439,350 2,553,261 2,189,548 188,767
Service Agent’s fee 4 302,935 6,558 2,341,474 293,883 256,762 18,267
Custodian fee 4 11,558 3,533 106,110 24,960 42,182 5,381
Luxembourg taxes 5 69,754 2,908 691,006 79,852 225,381 8,889
Administration expenses 70,400 2,939 122,973 65,547 82,060 9,014
Amortisation of preliminary expenses 2(h) – 988 – – – 2,519
Bank overdraft interest – – 709,075 – 11,194 –
Net interest paid on swaps 2(k)-2(p) 24,040 8,549 – – – –
1,632,871 87,471 17,409,988 3,017,503 2,807,127 232,837
Net investment income for the year/period 4,351,385 110,610 28,849,237 6,750,786 1,562,217 753,890
Dividends paid and payable 7 (1,815,412) – (5,553,879) (4,200,980) – (327,901)
Net decrease/(increase) in provision for unrealised capital gains tax – – – – – –
Net proceeds/(payments) from issue/(redemption) of shares 50,810,705 868,311 454,215,248 (39,791,508) 155,805,505 649,493
Net realised surplus/(deficit) on disposal of investments, derivatives and foreign currencies 2,185,919 25,376 (16,826,596) (9,146,016) (1,515,038) (863,474)
Net change in unrealised appreciation/depreciation on forward foreign exchange contracts 2(i) (1,597,969) (211,903) 15,657,473 (673,085) 1,358,369 (11,047)
Net change in unrealised appreciation/depreciation on futures contracts 2(j) (183,251) (2,030) (14,892,259) (67,140) (548,007) –
Net change in unrealised appreciation/depreciation on credit default swaps 2(k) (167,220) 29,497 (46,784) – (4,038) –
Net change in unrealised appreciation/depreciation on inflation linked swaps 2(p) – – – – – –
Net change in unrealised appreciation/depreciation on equity variance swaps 2(n) – – – – – –
Net change in unrealised appreciation/depreciation on volatility swaps 2(o) – – – – – –
Net change in unrealised appreciation/depreciation on commodity swaps 2(q) – – – – – –
Net change in unrealised appreciation/depreciation on total return swaps 2(r) – – – – – –
Net change in unrealised appreciation/depreciation on options 2(s) – – – – – –
Net change in unrealised appreciation/depreciation on interest rate swaps 2(l) – (1,270) – – – –
Net change in unrealised appreciation/depreciation on equity swaps 2(m) – – – – – –
Net change in unrealised appreciation/depreciation on investments (8,523,882) (17,248) (104,368,641) (2,508,001) (4,842,160) 369,383
Net assets at the beginning of the year/period 116,099,056 4,959,915 964,725,000 179,782,743 259,237,123 17,386,035
Net assets at the end of the year/period 161,159,331 5,761,258 1,321,758,799 130,146,799 411,053,971 17,956,379
The accompanying notes form an integral part of these financial statements.
Invesco Funds
Statement of Operations and Changes in Net Assets for the year ended 29 February 2016
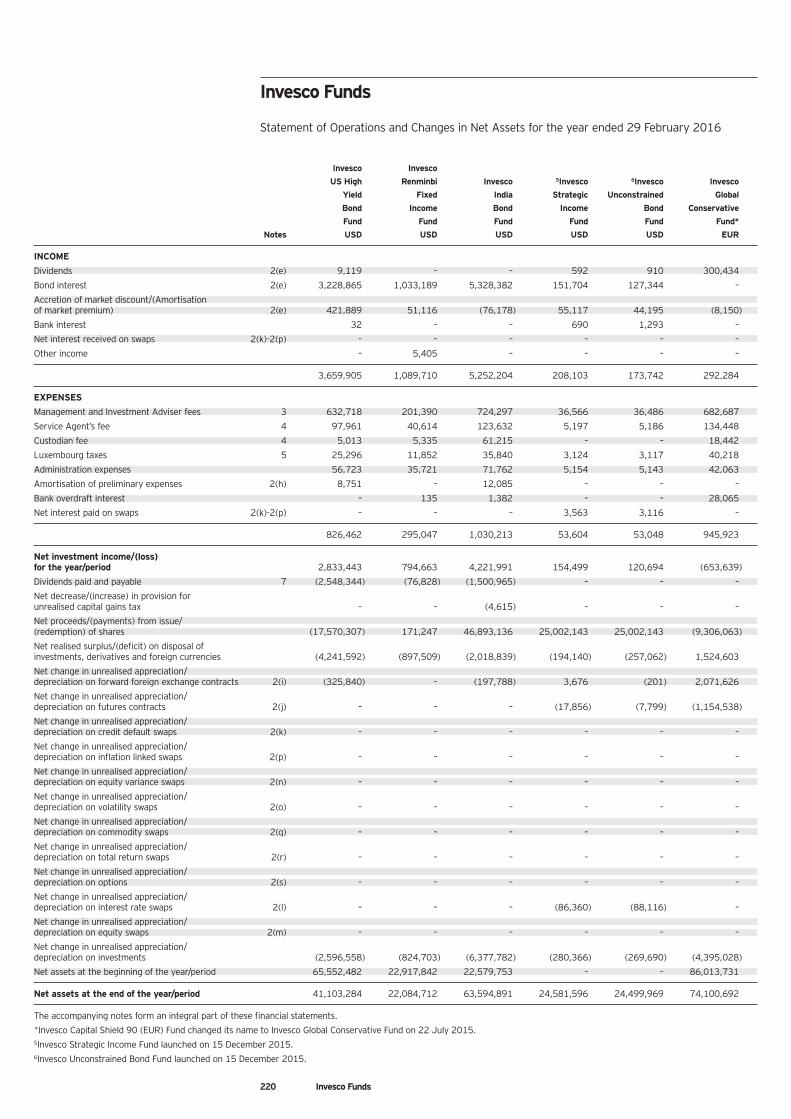
220 Invesco Funds
Invesco Invesco
US High Renminbi Invesco 5Invesco 6Invesco Invesco
Yield Fixed India Strategic Unconstrained Global
Bond Income Bond Income Bond Conservative
Fund Fund Fund Fund Fund Fund*
Notes USD USD USD USD USD EUR
INCOME
Dividends 2(e) 9,119 – – 592 910 300,434
Bond interest 2(e) 3,228,865 1,033,189 5,328,382 151,704 127,344 –
Accretion of market discount/(Amortisation of market premium) 2(e) 421,889 51,116 (76,178) 55,117 44,195 (8,150)
Bank interest 32 – – 690 1,293 –
Net interest received on swaps 2(k)-2(p) – – – – – –
Other income – 5,405 – – – –
3,659,905 1,089,710 5,252,204 208,103 173,742 292,284
EXPENSES
Management and Investment Adviser fees 3 632,718 201,390 724,297 36,566 36,486 682,687
Service Agent’s fee 4 97,961 40,614 123,632 5,197 5,186 134,448
Custodian fee 4 5,013 5,335 61,215 – – 18,442
Luxembourg taxes 5 25,296 11,852 35,840 3,124 3,117 40,218
Administration expenses 56,723 35,721 71,762 5,154 5,143 42,063
Amortisation of preliminary expenses 2(h) 8,751 – 12,085 – – –
Bank overdraft interest – 135 1,382 – – 28,065
Net interest paid on swaps 2(k)-2(p) – – – 3,563 3,116 –
826,462 295,047 1,030,213 53,604 53,048 945,923
Net investment income/(loss) for the year/period 2,833,443 794,663 4,221,991 154,499 120,694 (653,639)
Dividends paid and payable 7 (2,548,344) (76,828) (1,500,965) – – –
Net decrease/(increase) in provision for unrealised capital gains tax – – (4,615) – – –
Net proceeds/(payments) from issue/(redemption) of shares (17,570,307) 171,247 46,893,136 25,002,143 25,002,143 (9,306,063)
Net realised surplus/(deficit) on disposal of investments, derivatives and foreign currencies (4,241,592) (897,509) (2,018,839) (194,140) (257,062) 1,524,603
Net change in unrealised appreciation/depreciation on forward foreign exchange contracts 2(i) (325,840) – (197,788) 3,676 (201) 2,071,626
Net change in unrealised appreciation/depreciation on futures contracts 2(j) – – – (17,856) (7,799) (1,154,538)
Net change in unrealised appreciation/depreciation on credit default swaps 2(k) – – – – – –
Net change in unrealised appreciation/depreciation on inflation linked swaps 2(p) – – – – – –
Net change in unrealised appreciation/depreciation on equity variance swaps 2(n) – – – – – –
Net change in unrealised appreciation/depreciation on volatility swaps 2(o) – – – – – –
Net change in unrealised appreciation/depreciation on commodity swaps 2(q) – – – – – –
Net change in unrealised appreciation/depreciation on total return swaps 2(r) – – – – – –
Net change in unrealised appreciation/depreciation on options 2(s) – – – – – –
Net change in unrealised appreciation/depreciation on interest rate swaps 2(l) – – – (86,360) (88,116) –
Net change in unrealised appreciation/depreciation on equity swaps 2(m) – – – – – –
Net change in unrealised appreciation/depreciation on investments (2,596,558) (824,703) (6,377,782) (280,366) (269,690) (4,395,028)
Net assets at the beginning of the year/period 65,552,482 22,917,842 22,579,753 – – 86,013,731
Net assets at the end of the year/period 41,103,284 22,084,712 63,594,891 24,581,596 24,499,969 74,100,692
The accompanying notes form an integral part of these financial statements.
*Invesco Capital Shield 90 (EUR) Fund changed its name to Invesco Global Conservative Fund on 22 July 2015.5Invesco Strategic Income Fund launched on 15 December 2015.6Invesco Unconstrained Bond Fund launched on 15 December 2015.
Invesco Funds
Statement of Operations and Changes in Net Assets for the year ended 29 February 2016
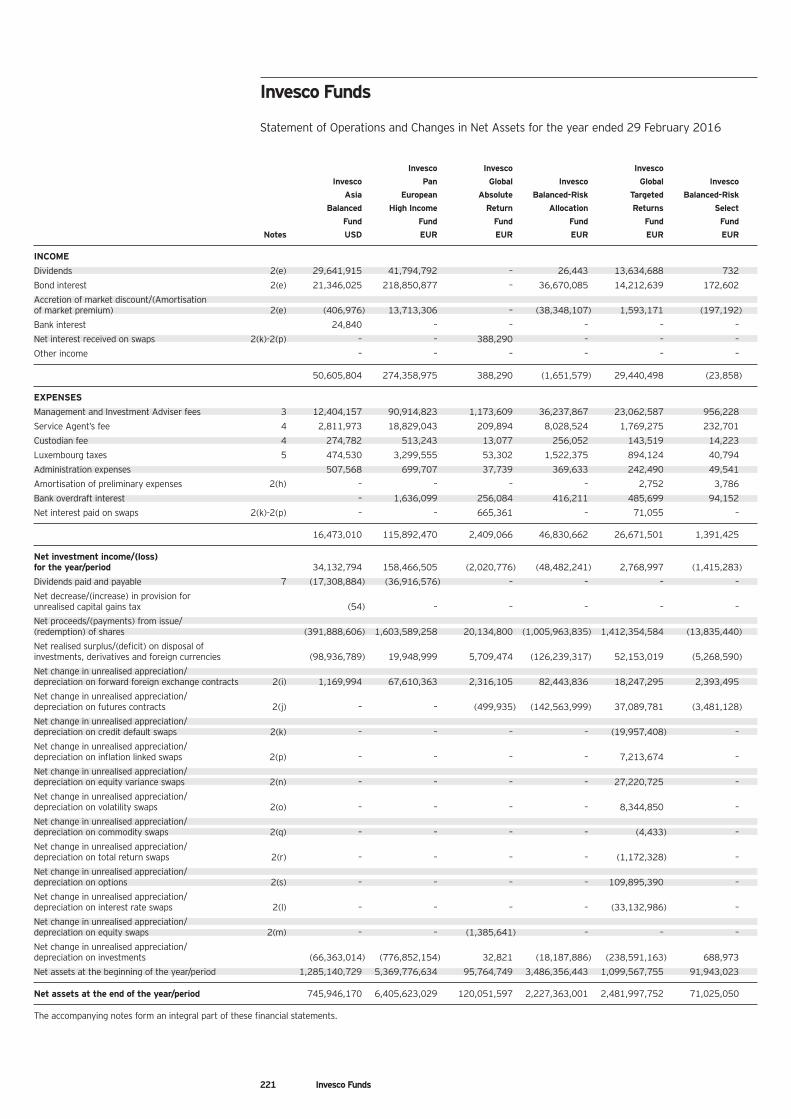
221 Invesco Funds
Invesco Invesco Invesco
Invesco Pan Global Invesco Global Invesco
Asia European Absolute Balanced-Risk Targeted Balanced-Risk
Balanced High Income Return Allocation Returns Select
Fund Fund Fund Fund Fund Fund
Notes USD EUR EUR EUR EUR EUR
INCOME
Dividends 2(e) 29,641,915 41,794,792 – 26,443 13,634,688 732
Bond interest 2(e) 21,346,025 218,850,877 – 36,670,085 14,212,639 172,602
Accretion of market discount/(Amortisation of market premium) 2(e) (406,976) 13,713,306 – (38,348,107) 1,593,171 (197,192)
Bank interest 24,840 – – – – –
Net interest received on swaps 2(k)-2(p) – – 388,290 – – –
Other income – – – – – –
50,605,804 274,358,975 388,290 (1,651,579) 29,440,498 (23,858)
EXPENSES
Management and Investment Adviser fees 3 12,404,157 90,914,823 1,173,609 36,237,867 23,062,587 956,228
Service Agent’s fee 4 2,811,973 18,829,043 209,894 8,028,524 1,769,275 232,701
Custodian fee 4 274,782 513,243 13,077 256,052 143,519 14,223
Luxembourg taxes 5 474,530 3,299,555 53,302 1,522,375 894,124 40,794
Administration expenses 507,568 699,707 37,739 369,633 242,490 49,541
Amortisation of preliminary expenses 2(h) – – – – 2,752 3,786
Bank overdraft interest – 1,636,099 256,084 416,211 485,699 94,152
Net interest paid on swaps 2(k)-2(p) – – 665,361 – 71,055 –
16,473,010 115,892,470 2,409,066 46,830,662 26,671,501 1,391,425
Net investment income/(loss) for the year/period 34,132,794 158,466,505 (2,020,776) (48,482,241) 2,768,997 (1,415,283)
Dividends paid and payable 7 (17,308,884) (36,916,576) – – – –
Net decrease/(increase) in provision for unrealised capital gains tax (54) – – – – –
Net proceeds/(payments) from issue/(redemption) of shares (391,888,606) 1,603,589,258 20,134,800 (1,005,963,835) 1,412,354,584 (13,835,440)
Net realised surplus/(deficit) on disposal of investments, derivatives and foreign currencies (98,936,789) 19,948,999 5,709,474 (126,239,317) 52,153,019 (5,268,590)
Net change in unrealised appreciation/depreciation on forward foreign exchange contracts 2(i) 1,169,994 67,610,363 2,316,105 82,443,836 18,247,295 2,393,495
Net change in unrealised appreciation/depreciation on futures contracts 2(j) – – (499,935) (142,563,999) 37,089,781 (3,481,128)
Net change in unrealised appreciation/depreciation on credit default swaps 2(k) – – – – (19,957,408) –
Net change in unrealised appreciation/depreciation on inflation linked swaps 2(p) – – – – 7,213,674 –
Net change in unrealised appreciation/depreciation on equity variance swaps 2(n) – – – – 27,220,725 –
Net change in unrealised appreciation/depreciation on volatility swaps 2(o) – – – – 8,344,850 –
Net change in unrealised appreciation/depreciation on commodity swaps 2(q) – – – – (4,433) –
Net change in unrealised appreciation/depreciation on total return swaps 2(r) – – – – (1,172,328) –
Net change in unrealised appreciation/depreciation on options 2(s) – – – – 109,895,390 –
Net change in unrealised appreciation/depreciation on interest rate swaps 2(l) – – – – (33,132,986) –
Net change in unrealised appreciation/depreciation on equity swaps 2(m) – – (1,385,641) – – –
Net change in unrealised appreciation/depreciation on investments (66,363,014) (776,852,154) 32,821 (18,187,886) (238,591,163) 688,973
Net assets at the beginning of the year/period 1,285,140,729 5,369,776,634 95,764,749 3,486,356,443 1,099,567,755 91,943,023
Net assets at the end of the year/period 745,946,170 6,405,623,029 120,051,597 2,227,363,001 2,481,997,752 71,025,050
The accompanying notes form an integral part of these financial statements.
Invesco Funds
Statement of Operations and Changes in Net Assets for the year ended 29 February 2016
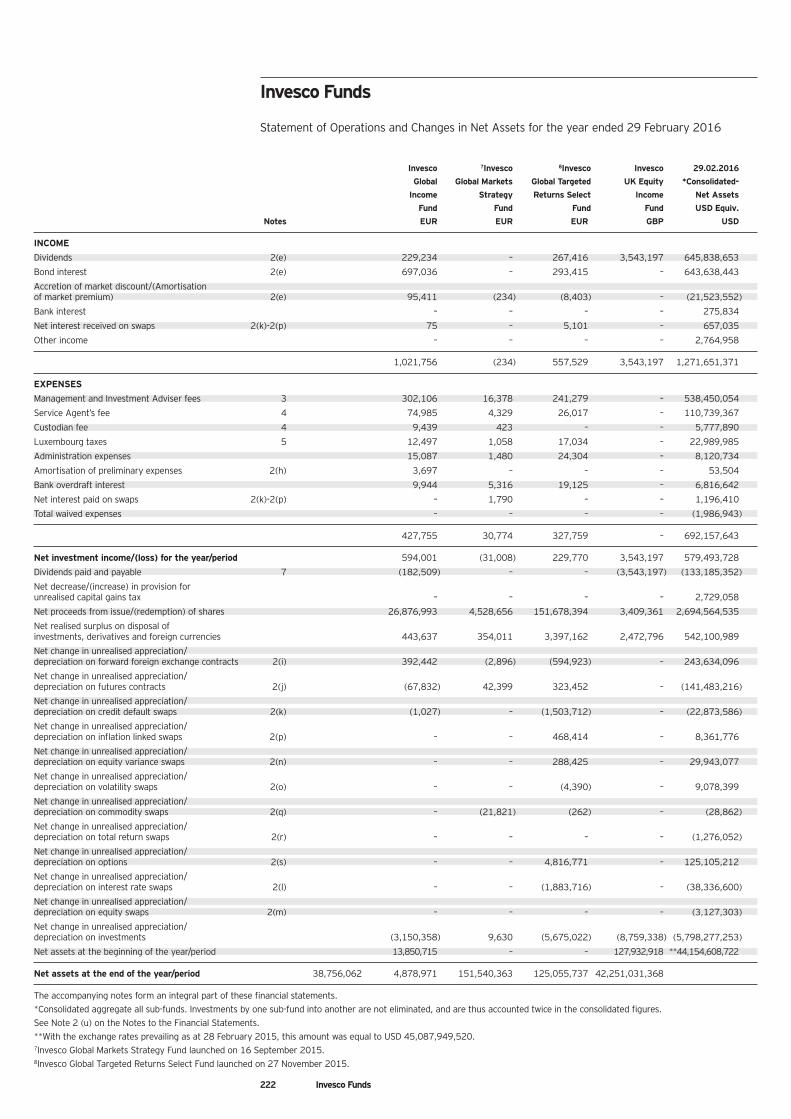
222 Invesco Funds
Invesco 7Invesco 8Invesco Invesco 29.02.2016
Global Global Markets Global Targeted UK Equity *Consolidated-
Income Strategy Returns Select Income Net Assets
Fund Fund Fund Fund USD Equiv.
Notes EUR EUR EUR GBP USD
INCOME
Dividends 2(e) 229,234 – 267,416 3,543,197 645,838,653
Bond interest 2(e) 697,036 – 293,415 – 643,638,443
Accretion of market discount/(Amortisation of market premium) 2(e) 95,411 (234) (8,403) – (21,523,552)
Bank interest – – – – 275,834
Net interest received on swaps 2(k)-2(p) 75 – 5,101 – 657,035
Other income – – – – 2,764,958
1,021,756 (234) 557,529 3,543,197 1,271,651,371
EXPENSES
Management and Investment Adviser fees 3 302,106 16,378 241,279 – 538,450,054
Service Agent’s fee 4 74,985 4,329 26,017 – 110,739,367
Custodian fee 4 9,439 423 – – 5,777,890
Luxembourg taxes 5 12,497 1,058 17,034 – 22,989,985
Administration expenses 15,087 1,480 24,304 – 8,120,734
Amortisation of preliminary expenses 2(h) 3,697 – – – 53,504
Bank overdraft interest 9,944 5,316 19,125 – 6,816,642
Net interest paid on swaps 2(k)-2(p) – 1,790 – – 1,196,410
Total waived expenses – – – – (1,986,943)
427,755 30,774 327,759 – 692,157,643
Net investment income/(loss) for the year/period 594,001 (31,008) 229,770 3,543,197 579,493,728
Dividends paid and payable 7 (182,509) – – (3,543,197) (133,185,352)
Net decrease/(increase) in provision for unrealised capital gains tax – – – – 2,729,058
Net proceeds from issue/(redemption) of shares 26,876,993 4,528,656 151,678,394 3,409,361 2,694,564,535
Net realised surplus on disposal of investments, derivatives and foreign currencies 443,637 354,011 3,397,162 2,472,796 542,100,989
Net change in unrealised appreciation/depreciation on forward foreign exchange contracts 2(i) 392,442 (2,896) (594,923) – 243,634,096
Net change in unrealised appreciation/depreciation on futures contracts 2(j) (67,832) 42,399 323,452 – (141,483,216)
Net change in unrealised appreciation/depreciation on credit default swaps 2(k) (1,027) – (1,503,712) – (22,873,586)
Net change in unrealised appreciation/depreciation on inflation linked swaps 2(p) – – 468,414 – 8,361,776
Net change in unrealised appreciation/depreciation on equity variance swaps 2(n) – – 288,425 – 29,943,077
Net change in unrealised appreciation/depreciation on volatility swaps 2(o) – – (4,390) – 9,078,399
Net change in unrealised appreciation/depreciation on commodity swaps 2(q) – (21,821) (262) – (28,862)
Net change in unrealised appreciation/depreciation on total return swaps 2(r) – – – – (1,276,052)
Net change in unrealised appreciation/depreciation on options 2(s) – – 4,816,771 – 125,105,212
Net change in unrealised appreciation/depreciation on interest rate swaps 2(l) – – (1,883,716) – (38,336,600)
Net change in unrealised appreciation/depreciation on equity swaps 2(m) – – – – (3,127,303)
Net change in unrealised appreciation/depreciation on investments (3,150,358) 9,630 (5,675,022) (8,759,338) (5,798,277,253)
Net assets at the beginning of the year/period 13,850,715 – – 127,932,918 **44,154,608,722
Net assets at the end of the year/period 38,756,062 4,878,971 151,540,363 125,055,737 42,251,031,368
The accompanying notes form an integral part of these financial statements.*Consolidated aggregate all sub-funds. Investments by one sub-fund into another are not eliminated, and are thus accounted twice in the consolidated figures.See Note 2 (u) on the Notes to the Financial Statements.**With the exchange rates prevailing as at 28 February 2015, this amount was equal to USD 45,087,949,520.7Invesco Global Markets Strategy Fund launched on 16 September 2015.8Invesco Global Targeted Returns Select Fund launched on 27 November 2015.
Invesco Funds
Statement of Operations and Changes in Net Assets for the year ended 29 February 2016
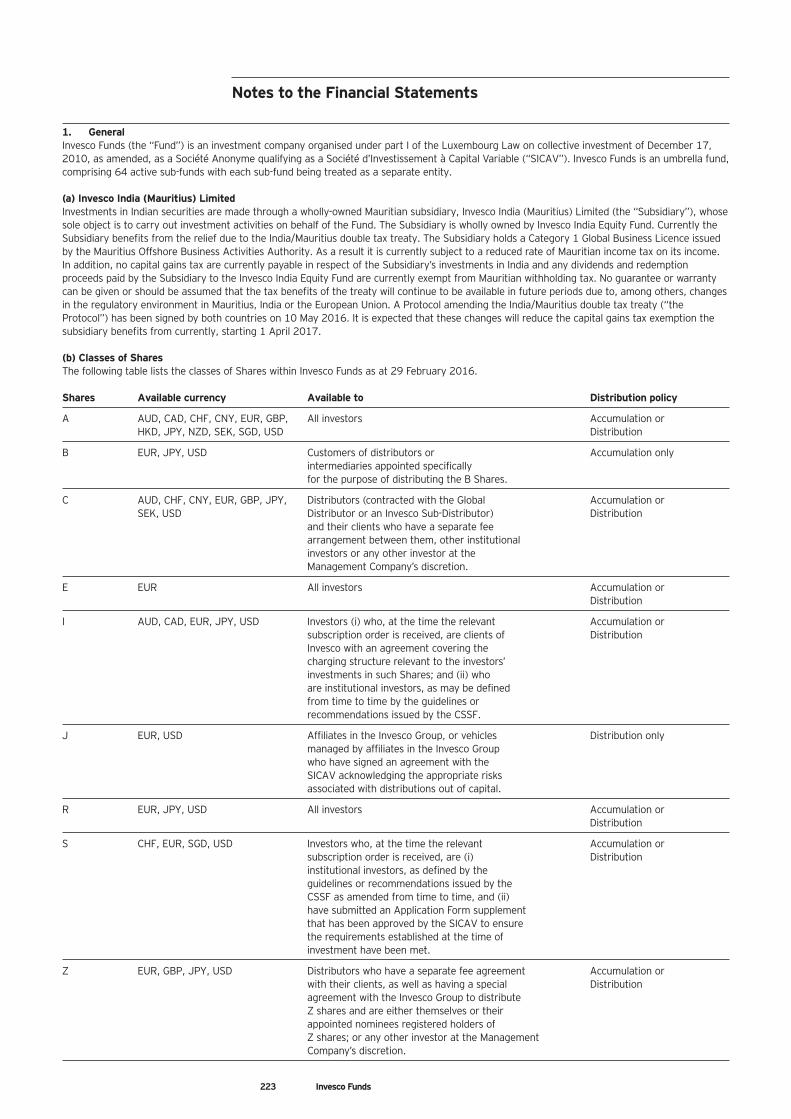
223 Invesco Funds
Notes to the Financial Statements
1. GeneralInvesco Funds (the “Fund”) is an investment company organised under part I of the Luxembourg Law on collective investment of December 17,2010, as amended, as a Société Anonyme qualifying as a Société d’Investissement à Capital Variable (“SICAV”). Invesco Funds is an umbrella fund,comprising 64 active sub-funds with each sub-fund being treated as a separate entity.
(a) Invesco India (Mauritius) LimitedInvestments in Indian securities are made through a wholly-owned Mauritian subsidiary, Invesco India (Mauritius) Limited (the “Subsidiary”), whosesole object is to carry out investment activities on behalf of the Fund. The Subsidiary is wholly owned by Invesco India Equity Fund. Currently theSubsidiary benefits from the relief due to the India/Mauritius double tax treaty. The Subsidiary holds a Category 1 Global Business Licence issuedby the Mauritius Offshore Business Activities Authority. As a result it is currently subject to a reduced rate of Mauritian income tax on its income.In addition, no capital gains tax are currently payable in respect of the Subsidiary’s investments in India and any dividends and redemptionproceeds paid by the Subsidiary to the Invesco India Equity Fund are currently exempt from Mauritian withholding tax. No guarantee or warrantycan be given or should be assumed that the tax benefits of the treaty will continue to be available in future periods due to, among others, changesin the regulatory environment in Mauritius, India or the European Union. A Protocol amending the India/Mauritius double tax treaty (“theProtocol”) has been signed by both countries on 10 May 2016. It is expected that these changes will reduce the capital gains tax exemption thesubsidiary benefits from currently, starting 1 April 2017.
(b) Classes of SharesThe following table lists the classes of Shares within Invesco Funds as at 29 February 2016.
Shares Available currency Available to Distribution policy
A AUD, CAD, CHF, CNY, EUR, GBP, All investors Accumulation orHKD, JPY, NZD, SEK, SGD, USD Distribution
B EUR, JPY, USD Customers of distributors or Accumulation onlyintermediaries appointed specificallyfor the purpose of distributing the B Shares.
C AUD, CHF, CNY, EUR, GBP, JPY, Distributors (contracted with the Global Accumulation orSEK, USD Distributor or an Invesco Sub-Distributor) Distribution
and their clients who have a separate feearrangement between them, other institutionalinvestors or any other investor at theManagement Company’s discretion.
E EUR All investors Accumulation orDistribution
I AUD, CAD, EUR, JPY, USD Investors (i) who, at the time the relevant Accumulation orsubscription order is received, are clients of DistributionInvesco with an agreement covering the charging structure relevant to the investors’ investments in such Shares; and (ii) who are institutional investors, as may be defined from time to time by the guidelines or recommendations issued by the CSSF.
J EUR, USD Affiliates in the Invesco Group, or vehicles Distribution onlymanaged by affiliates in the Invesco Groupwho have signed an agreement with theSICAV acknowledging the appropriate risksassociated with distributions out of capital.
R EUR, JPY, USD All investors Accumulation orDistribution
S CHF, EUR, SGD, USD Investors who, at the time the relevant Accumulation orsubscription order is received, are (i) Distributioninstitutional investors, as defined by theguidelines or recommendations issued by theCSSF as amended from time to time, and (ii) have submitted an Application Form supplement that has been approved by the SICAV to ensure the requirements established at the time of investment have been met.
Z EUR, GBP, JPY, USD Distributors who have a separate fee agreement Accumulation orwith their clients, as well as having a special Distributionagreement with the Invesco Group to distribute Z shares and are either themselves or their appointed nominees registered holders of Z shares; or any other investor at the Management Company’s discretion.
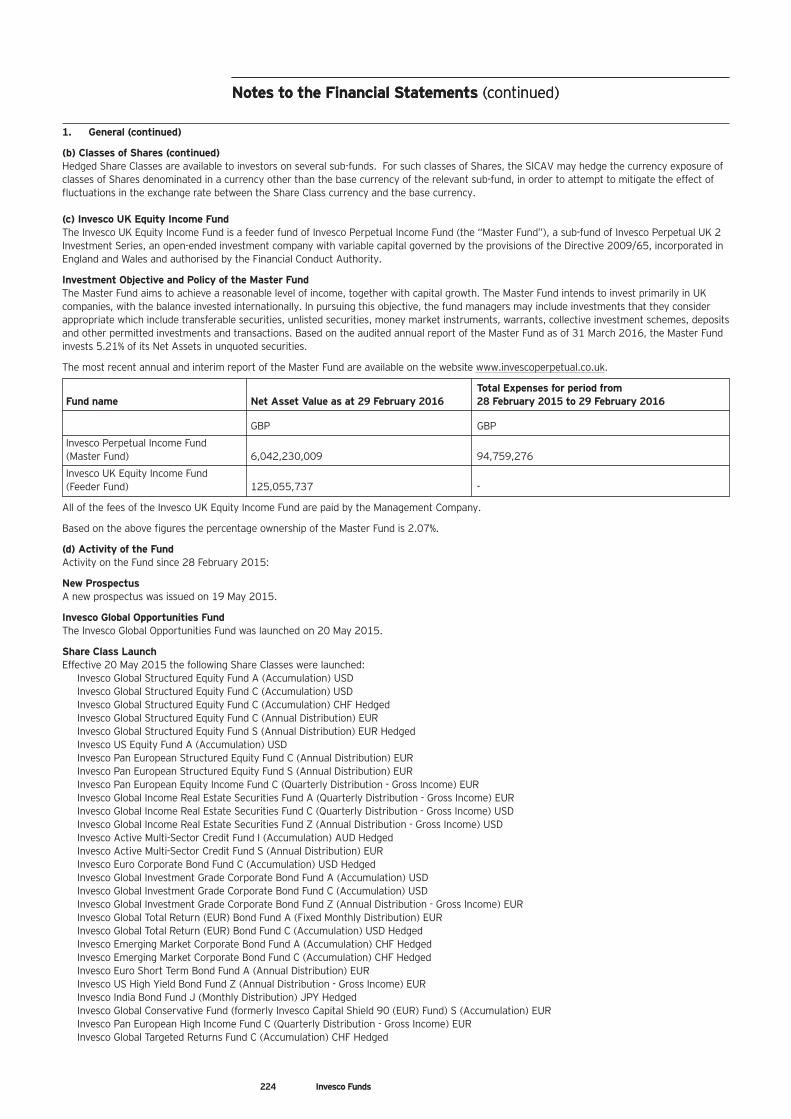
224 Invesco Funds
1. General (continued)
(b) Classes of Shares (continued)Hedged Share Classes are available to investors on several sub-funds. For such classes of Shares, the SICAV may hedge the currency exposure ofclasses of Shares denominated in a currency other than the base currency of the relevant sub-fund, in order to attempt to mitigate the effect offluctuations in the exchange rate between the Share Class currency and the base currency.
(c) Invesco UK Equity Income FundThe Invesco UK Equity Income Fund is a feeder fund of Invesco Perpetual Income Fund (the “Master Fund”), a sub-fund of Invesco Perpetual UK 2Investment Series, an open-ended investment company with variable capital governed by the provisions of the Directive 2009/65, incorporated inEngland and Wales and authorised by the Financial Conduct Authority.
Investment Objective and Policy of the Master Fund The Master Fund aims to achieve a reasonable level of income, together with capital growth. The Master Fund intends to invest primarily in UKcompanies, with the balance invested internationally. In pursuing this objective, the fund managers may include investments that they considerappropriate which include transferable securities, unlisted securities, money market instruments, warrants, collective investment schemes, depositsand other permitted investments and transactions. Based on the audited annual report of the Master Fund as of 31 March 2016, the Master Fundinvests 5.21% of its Net Assets in unquoted securities.
The most recent annual and interim report of the Master Fund are available on the website www.invescoperpetual.co.uk.
Total Expenses for period from Fund name Net Asset Value as at 29 February 2016 28 February 2015 to 29 February 2016
GBP GBP
Invesco Perpetual Income Fund(Master Fund) 6,042,230,009 94,759,276
Invesco UK Equity Income Fund (Feeder Fund) 125,055,737 -
All of the fees of the Invesco UK Equity Income Fund are paid by the Management Company.
Based on the above figures the percentage ownership of the Master Fund is 2.07%.
(d) Activity of the FundActivity on the Fund since 28 February 2015:
New ProspectusA new prospectus was issued on 19 May 2015.
Invesco Global Opportunities FundThe Invesco Global Opportunities Fund was launched on 20 May 2015.
Share Class LaunchEffective 20 May 2015 the following Share Classes were launched:
Invesco Global Structured Equity Fund A (Accumulation) USDInvesco Global Structured Equity Fund C (Accumulation) USDInvesco Global Structured Equity Fund C (Accumulation) CHF HedgedInvesco Global Structured Equity Fund C (Annual Distribution) EURInvesco Global Structured Equity Fund S (Annual Distribution) EUR HedgedInvesco US Equity Fund A (Accumulation) USDInvesco Pan European Structured Equity Fund C (Annual Distribution) EURInvesco Pan European Structured Equity Fund S (Annual Distribution) EURInvesco Pan European Equity Income Fund C (Quarterly Distribution - Gross Income) EURInvesco Global Income Real Estate Securities Fund A (Quarterly Distribution - Gross Income) EURInvesco Global Income Real Estate Securities Fund C (Quarterly Distribution - Gross Income) USDInvesco Global Income Real Estate Securities Fund Z (Annual Distribution - Gross Income) USDInvesco Active Multi-Sector Credit Fund I (Accumulation) AUD HedgedInvesco Active Multi-Sector Credit Fund S (Annual Distribution) EURInvesco Euro Corporate Bond Fund C (Accumulation) USD HedgedInvesco Global Investment Grade Corporate Bond Fund A (Accumulation) USDInvesco Global Investment Grade Corporate Bond Fund C (Accumulation) USDInvesco Global Investment Grade Corporate Bond Fund Z (Annual Distribution - Gross Income) EURInvesco Global Total Return (EUR) Bond Fund A (Fixed Monthly Distribution) EURInvesco Global Total Return (EUR) Bond Fund C (Accumulation) USD HedgedInvesco Emerging Market Corporate Bond Fund A (Accumulation) CHF HedgedInvesco Emerging Market Corporate Bond Fund C (Accumulation) CHF HedgedInvesco Euro Short Term Bond Fund A (Annual Distribution) EURInvesco US High Yield Bond Fund Z (Annual Distribution - Gross Income) EURInvesco India Bond Fund J (Monthly Distribution) JPY HedgedInvesco Global Conservative Fund (formerly Invesco Capital Shield 90 (EUR) Fund) S (Accumulation) EURInvesco Pan European High Income Fund C (Quarterly Distribution - Gross Income) EURInvesco Global Targeted Returns Fund C (Accumulation) CHF Hedged
Notes to the Financial Statements (continued)Notes to the Financial Statements (continued)
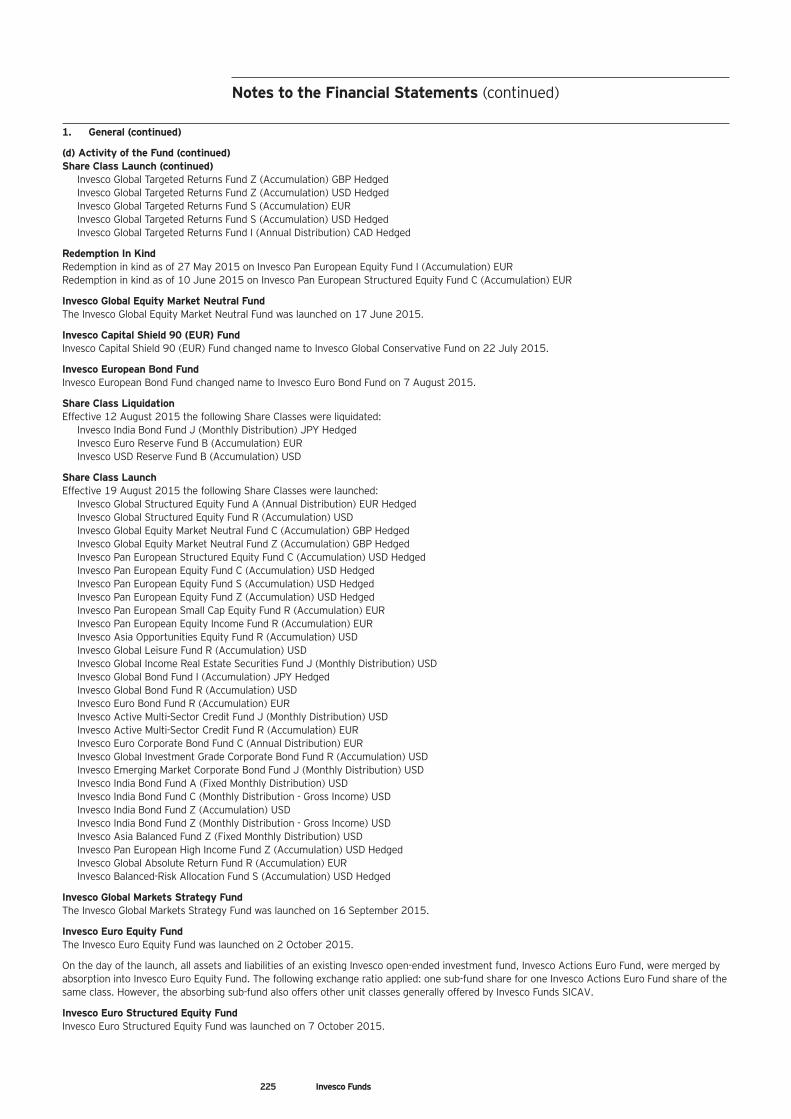
225 Invesco Funds
1. General (continued)
(d) Activity of the Fund (continued)Share Class Launch (continued)
Invesco Global Targeted Returns Fund Z (Accumulation) GBP HedgedInvesco Global Targeted Returns Fund Z (Accumulation) USD HedgedInvesco Global Targeted Returns Fund S (Accumulation) EURInvesco Global Targeted Returns Fund S (Accumulation) USD HedgedInvesco Global Targeted Returns Fund I (Annual Distribution) CAD Hedged
Redemption In KindRedemption in kind as of 27 May 2015 on Invesco Pan European Equity Fund I (Accumulation) EURRedemption in kind as of 10 June 2015 on Invesco Pan European Structured Equity Fund C (Accumulation) EUR
Invesco Global Equity Market Neutral FundThe Invesco Global Equity Market Neutral Fund was launched on 17 June 2015.
Invesco Capital Shield 90 (EUR) FundInvesco Capital Shield 90 (EUR) Fund changed name to Invesco Global Conservative Fund on 22 July 2015.
Invesco European Bond FundInvesco European Bond Fund changed name to Invesco Euro Bond Fund on 7 August 2015.
Share Class LiquidationEffective 12 August 2015 the following Share Classes were liquidated:
Invesco India Bond Fund J (Monthly Distribution) JPY HedgedInvesco Euro Reserve Fund B (Accumulation) EURInvesco USD Reserve Fund B (Accumulation) USD
Share Class Launch Effective 19 August 2015 the following Share Classes were launched:
Invesco Global Structured Equity Fund A (Annual Distribution) EUR HedgedInvesco Global Structured Equity Fund R (Accumulation) USDInvesco Global Equity Market Neutral Fund C (Accumulation) GBP HedgedInvesco Global Equity Market Neutral Fund Z (Accumulation) GBP HedgedInvesco Pan European Structured Equity Fund C (Accumulation) USD HedgedInvesco Pan European Equity Fund C (Accumulation) USD HedgedInvesco Pan European Equity Fund S (Accumulation) USD HedgedInvesco Pan European Equity Fund Z (Accumulation) USD HedgedInvesco Pan European Small Cap Equity Fund R (Accumulation) EURInvesco Pan European Equity Income Fund R (Accumulation) EURInvesco Asia Opportunities Equity Fund R (Accumulation) USDInvesco Global Leisure Fund R (Accumulation) USDInvesco Global Income Real Estate Securities Fund J (Monthly Distribution) USDInvesco Global Bond Fund I (Accumulation) JPY HedgedInvesco Global Bond Fund R (Accumulation) USDInvesco Euro Bond Fund R (Accumulation) EURInvesco Active Multi-Sector Credit Fund J (Monthly Distribution) USDInvesco Active Multi-Sector Credit Fund R (Accumulation) EURInvesco Euro Corporate Bond Fund C (Annual Distribution) EURInvesco Global Investment Grade Corporate Bond Fund R (Accumulation) USDInvesco Emerging Market Corporate Bond Fund J (Monthly Distribution) USDInvesco India Bond Fund A (Fixed Monthly Distribution) USDInvesco India Bond Fund C (Monthly Distribution - Gross Income) USDInvesco India Bond Fund Z (Accumulation) USDInvesco India Bond Fund Z (Monthly Distribution - Gross Income) USDInvesco Asia Balanced Fund Z (Fixed Monthly Distribution) USDInvesco Pan European High Income Fund Z (Accumulation) USD HedgedInvesco Global Absolute Return Fund R (Accumulation) EURInvesco Balanced-Risk Allocation Fund S (Accumulation) USD Hedged
Invesco Global Markets Strategy FundThe Invesco Global Markets Strategy Fund was launched on 16 September 2015.
Invesco Euro Equity FundThe Invesco Euro Equity Fund was launched on 2 October 2015.
On the day of the launch, all assets and liabilities of an existing Invesco open-ended investment fund, Invesco Actions Euro Fund, were merged byabsorption into Invesco Euro Equity Fund. The following exchange ratio applied: one sub-fund share for one Invesco Actions Euro Fund share of thesame class. However, the absorbing sub-fund also offers other unit classes generally offered by Invesco Funds SICAV.
Invesco Euro Structured Equity FundInvesco Euro Structured Equity Fund was launched on 7 October 2015.
Notes to the Financial Statements (continued)

226 Invesco Funds
1. General (continued)
(d) Activity of the Fund (continued)Invesco Euro Equity FundEffective 7 October 2015 the following Share Class names and distribution policy was amended;
Invesco Euro Equity Fund A (Annual Distribution) EURInvesco Euro Equity Fund A (Accumulation) CHF HedgedInvesco Euro Equity Fund C (Annual Distribution - Gross Income) EURInvesco Euro Equity Fund R (Accumulation) EURInvesco Euro Equity Fund S (Accumulation) EURInvesco Euro Equity Fund Z (Accumulation) EUR
Invesco Emerging Local Currencies Debt FundEffective 7 October 2015 the following Share Class names and distribution policy was amended:
A (Monthly Distribution - Gross Income) AUD Hedged Plus changed to A (Monthly Distribution - 1) AUD Hedged
Invesco Asian Bond FundEffective 7 October 2015 the following Share Class names and distribution policy was amended:
A (Monthly Distribution - Gross Income) AUD Hedged Plus changed to A (Monthly Distribution - 1) AUD HedgedA (Monthly Distribution - Gross Income) CAD Hedged Plus changed to A (Monthly Distribution - 1) CAD HedgedA (Monthly Distribution - Gross Income) NZD Hedged Plus changed to A (Monthly Distribution - 1) NZD Hedged
Invesco Asia Balanced fundEffective 7 October 2015 the following Share Class names and distribution policy was amended:
A (Monthly Distribution - Gross Income) AUD Hedged Plus changed to A (Monthly Distribution - 1) AUD HedgedA (Monthly Distribution - Gross Income) CAD Hedged Plus changed to A (Monthly Distribution - 1) CAD HedgedA (Monthly Distribution - Gross Income) NZD Hedged Plus changed to A (Monthly Distribution - 1) NZD Hedged
New ProspectusA new prospectus was issued on 7 October 2015.
Share Class LaunchEffective 23 October 2015 the following Share Class was launched:
Invesco Balanced-Risk Allocation Fund S (Accumulation) SGD Hedged
Share Class Launch Effective 11 November 2015 the following Share Classes were launched:
Invesco Global Structured Equity Fund C (Accumulation) RMBInvesco Global Structured Equity Fund A (Monthly Distribution-1) USDInvesco Global Equity Income Fund A (Monthly Distribution-1) AUD HedgedInvesco Global Equity Income Fund A (Monthly Distribution-1) CAD HedgedInvesco Global Equity Income Fund A (Monthly Distribution-1) NZD HedgedInvesco Global Opportunities Fund C (Accumulation) RMBInvesco Global Equity Market Neutral Fund C (Accumulation) USD HedgedInvesco Global Equity Market Neutral Fund R (Accumulation) EURInvesco US Equity Fund J (Monthly Distribution) USDInvesco US Equity Fund C (Accumulation) RMBInvesco Pan European Structured Equity Fund A (Accumulation) AUD HedgedInvesco Pan European Structured Equity Fund A (Accumulation) RMB HedgedInvesco Pan European Structured Equity Fund A (Monthly Distribution-1) USD HedgedInvesco Pan European Structured Equity Fund C (Accumulation) RMBInvesco Pan European Structured Equity Fund Z (Accumulation) EURInvesco Pan European Equity Fund A (Accumulation) AUD HedgedInvesco Pan European Equity Fund A (Accumulation) RMB HedgedInvesco Pan European Equity Fund C (Accumulation) RMBInvesco Japanese Value Equity Fund C (Accumulation) RMBInvesco Asia Opportunities Equity Fund C (Accumulation) EUR HedgedInvesco Asia Opportunities Equity Fund C (Accumulation) RMBInvesco Greater China Equity Fund C (Accumulation) RMBInvesco Asia Infrastructure Fund A (Monthly Distribution-1) AUD HedgedInvesco Asia Infrastructure Fund A (Monthly Distribution-1) CAD HedgedInvesco Asia Infrastructure Fund A (Monthly Distribution-1) NZD HedgedInvesco Asia Infrastructure Fund A (Monthly Distribution-1) SGD HedgedInvesco Asia Infrastructure Fund A (Monthly Distribution-1) USDInvesco China Focus Equity Fund C (Accumulation) RMBInvesco Global Income Real Estate Securities Fund A (Monthly Distribution-1) USDInvesco Global Investment Grade Corporate Bond Fund C (Accumulation) RMBInvesco Euro Short Term Bond Fund S (Accumulation) EURInvesco US High Yield Bond Fund A (Monthly Distribution-1) AUD HedgedInvesco US High Yield Bond Fund A (Monthly Distribution-1) CAD HedgedInvesco US High Yield Bond Fund A (Monthly Distribution-1) NZD HedgedInvesco US High Yield Bond Fund A (Monthly Distribution-1) USDInvesco India Bond Fund A (Monthly Distribution-1) SGD Hedged
Notes to the Financial Statements (continued)Notes to the Financial Statements (continued)
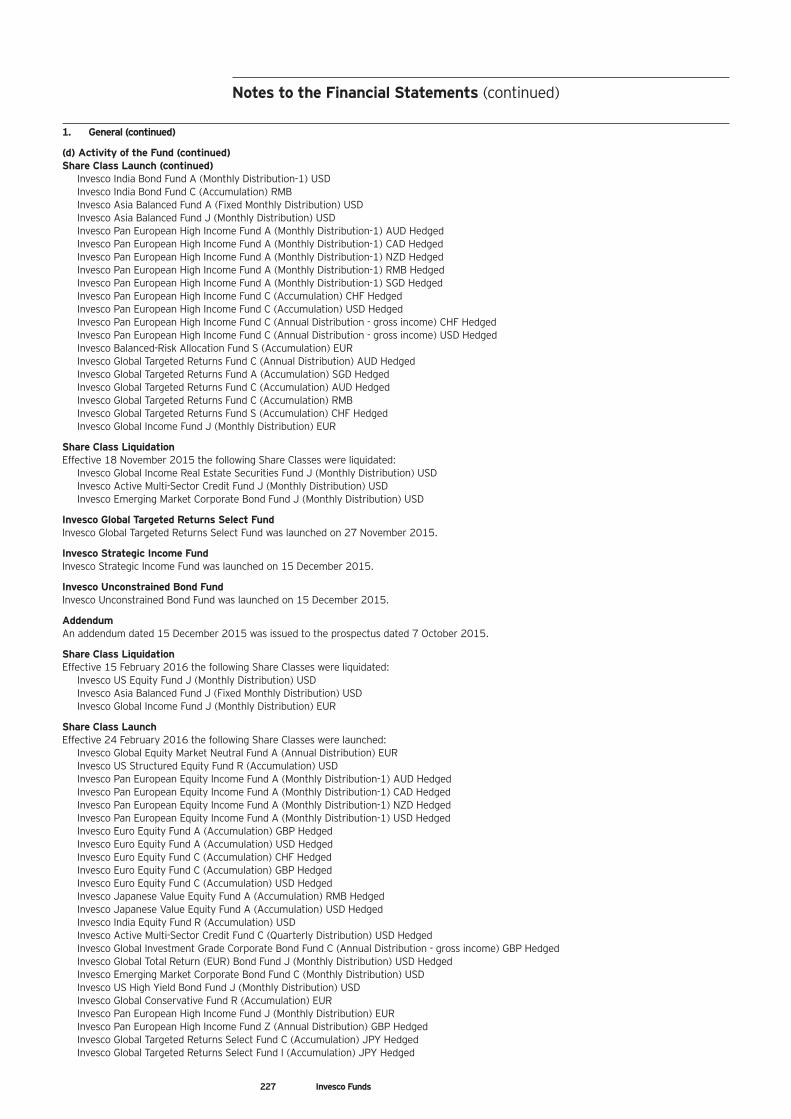
227 Invesco Funds
1. General (continued)
(d) Activity of the Fund (continued)Share Class Launch (continued)
Invesco India Bond Fund A (Monthly Distribution-1) USDInvesco India Bond Fund C (Accumulation) RMBInvesco Asia Balanced Fund A (Fixed Monthly Distribution) USDInvesco Asia Balanced Fund J (Monthly Distribution) USDInvesco Pan European High Income Fund A (Monthly Distribution-1) AUD HedgedInvesco Pan European High Income Fund A (Monthly Distribution-1) CAD HedgedInvesco Pan European High Income Fund A (Monthly Distribution-1) NZD HedgedInvesco Pan European High Income Fund A (Monthly Distribution-1) RMB HedgedInvesco Pan European High Income Fund A (Monthly Distribution-1) SGD HedgedInvesco Pan European High Income Fund C (Accumulation) CHF HedgedInvesco Pan European High Income Fund C (Accumulation) USD HedgedInvesco Pan European High Income Fund C (Annual Distribution - gross income) CHF HedgedInvesco Pan European High Income Fund C (Annual Distribution - gross income) USD HedgedInvesco Balanced-Risk Allocation Fund S (Accumulation) EURInvesco Global Targeted Returns Fund C (Annual Distribution) AUD HedgedInvesco Global Targeted Returns Fund A (Accumulation) SGD HedgedInvesco Global Targeted Returns Fund C (Accumulation) AUD HedgedInvesco Global Targeted Returns Fund C (Accumulation) RMBInvesco Global Targeted Returns Fund S (Accumulation) CHF HedgedInvesco Global Income Fund J (Monthly Distribution) EUR
Share Class LiquidationEffective 18 November 2015 the following Share Classes were liquidated:
Invesco Global Income Real Estate Securities Fund J (Monthly Distribution) USDInvesco Active Multi-Sector Credit Fund J (Monthly Distribution) USDInvesco Emerging Market Corporate Bond Fund J (Monthly Distribution) USD
Invesco Global Targeted Returns Select FundInvesco Global Targeted Returns Select Fund was launched on 27 November 2015.
Invesco Strategic Income FundInvesco Strategic Income Fund was launched on 15 December 2015.
Invesco Unconstrained Bond FundInvesco Unconstrained Bond Fund was launched on 15 December 2015.
AddendumAn addendum dated 15 December 2015 was issued to the prospectus dated 7 October 2015.
Share Class LiquidationEffective 15 February 2016 the following Share Classes were liquidated:
Invesco US Equity Fund J (Monthly Distribution) USDInvesco Asia Balanced Fund J (Fixed Monthly Distribution) USDInvesco Global Income Fund J (Monthly Distribution) EUR
Share Class Launch Effective 24 February 2016 the following Share Classes were launched:
Invesco Global Equity Market Neutral Fund A (Annual Distribution) EURInvesco US Structured Equity Fund R (Accumulation) USDInvesco Pan European Equity Income Fund A (Monthly Distribution-1) AUD HedgedInvesco Pan European Equity Income Fund A (Monthly Distribution-1) CAD HedgedInvesco Pan European Equity Income Fund A (Monthly Distribution-1) NZD HedgedInvesco Pan European Equity Income Fund A (Monthly Distribution-1) USD HedgedInvesco Euro Equity Fund A (Accumulation) GBP HedgedInvesco Euro Equity Fund A (Accumulation) USD HedgedInvesco Euro Equity Fund C (Accumulation) CHF HedgedInvesco Euro Equity Fund C (Accumulation) GBP HedgedInvesco Euro Equity Fund C (Accumulation) USD HedgedInvesco Japanese Value Equity Fund A (Accumulation) RMB HedgedInvesco Japanese Value Equity Fund A (Accumulation) USD HedgedInvesco India Equity Fund R (Accumulation) USDInvesco Active Multi-Sector Credit Fund C (Quarterly Distribution) USD HedgedInvesco Global Investment Grade Corporate Bond Fund C (Annual Distribution - gross income) GBP HedgedInvesco Global Total Return (EUR) Bond Fund J (Monthly Distribution) USD HedgedInvesco Emerging Market Corporate Bond Fund C (Monthly Distribution) USDInvesco US High Yield Bond Fund J (Monthly Distribution) USDInvesco Global Conservative Fund R (Accumulation) EURInvesco Pan European High Income Fund J (Monthly Distribution) EURInvesco Pan European High Income Fund Z (Annual Distribution) GBP HedgedInvesco Global Targeted Returns Select Fund C (Accumulation) JPY HedgedInvesco Global Targeted Returns Select Fund I (Accumulation) JPY Hedged
Notes to the Financial Statements (continued)
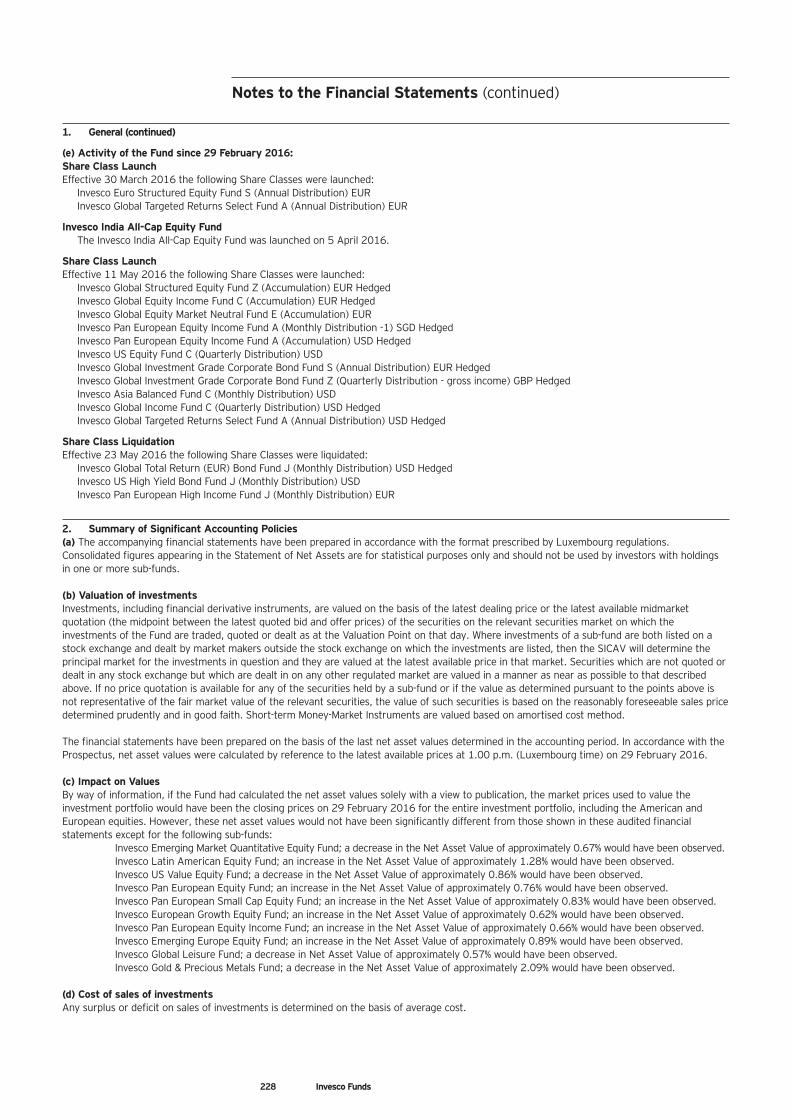
228 Invesco Funds
1. General (continued)
(e) Activity of the Fund since 29 February 2016:Share Class Launch Effective 30 March 2016 the following Share Classes were launched:
Invesco Euro Structured Equity Fund S (Annual Distribution) EURInvesco Global Targeted Returns Select Fund A (Annual Distribution) EUR
Invesco India All-Cap Equity FundThe Invesco India All-Cap Equity Fund was launched on 5 April 2016.
Share Class Launch Effective 11 May 2016 the following Share Classes were launched:
Invesco Global Structured Equity Fund Z (Accumulation) EUR HedgedInvesco Global Equity Income Fund C (Accumulation) EUR HedgedInvesco Global Equity Market Neutral Fund E (Accumulation) EURInvesco Pan European Equity Income Fund A (Monthly Distribution -1) SGD HedgedInvesco Pan European Equity Income Fund A (Accumulation) USD HedgedInvesco US Equity Fund C (Quarterly Distribution) USDInvesco Global Investment Grade Corporate Bond Fund S (Annual Distribution) EUR HedgedInvesco Global Investment Grade Corporate Bond Fund Z (Quarterly Distribution - gross income) GBP HedgedInvesco Asia Balanced Fund C (Monthly Distribution) USDInvesco Global Income Fund C (Quarterly Distribution) USD HedgedInvesco Global Targeted Returns Select Fund A (Annual Distribution) USD Hedged
Share Class LiquidationEffective 23 May 2016 the following Share Classes were liquidated:
Invesco Global Total Return (EUR) Bond Fund J (Monthly Distribution) USD HedgedInvesco US High Yield Bond Fund J (Monthly Distribution) USDInvesco Pan European High Income Fund J (Monthly Distribution) EUR
2. Summary of Significant Accounting Policies(a) The accompanying financial statements have been prepared in accordance with the format prescribed by Luxembourg regulations.Consolidated figures appearing in the Statement of Net Assets are for statistical purposes only and should not be used by investors with holdingsin one or more sub-funds.
(b) Valuation of investmentsInvestments, including financial derivative instruments, are valued on the basis of the latest dealing price or the latest available midmarketquotation (the midpoint between the latest quoted bid and offer prices) of the securities on the relevant securities market on which theinvestments of the Fund are traded, quoted or dealt as at the Valuation Point on that day. Where investments of a sub-fund are both listed on astock exchange and dealt by market makers outside the stock exchange on which the investments are listed, then the SICAV will determine theprincipal market for the investments in question and they are valued at the latest available price in that market. Securities which are not quoted ordealt in any stock exchange but which are dealt in on any other regulated market are valued in a manner as near as possible to that describedabove. If no price quotation is available for any of the securities held by a sub-fund or if the value as determined pursuant to the points above isnot representative of the fair market value of the relevant securities, the value of such securities is based on the reasonably foreseeable sales pricedetermined prudently and in good faith. Short-term Money-Market Instruments are valued based on amortised cost method.
The financial statements have been prepared on the basis of the last net asset values determined in the accounting period. In accordance with theProspectus, net asset values were calculated by reference to the latest available prices at 1.00 p.m. (Luxembourg time) on 29 February 2016.
(c) Impact on ValuesBy way of information, if the Fund had calculated the net asset values solely with a view to publication, the market prices used to value theinvestment portfolio would have been the closing prices on 29 February 2016 for the entire investment portfolio, including the American andEuropean equities. However, these net asset values would not have been significantly different from those shown in these audited financialstatements except for the following sub-funds:
Invesco Emerging Market Quantitative Equity Fund; a decrease in the Net Asset Value of approximately 0.67% would have been observed.Invesco Latin American Equity Fund; an increase in the Net Asset Value of approximately 1.28% would have been observed.Invesco US Value Equity Fund; a decrease in the Net Asset Value of approximately 0.86% would have been observed.Invesco Pan European Equity Fund; an increase in the Net Asset Value of approximately 0.76% would have been observed.Invesco Pan European Small Cap Equity Fund; an increase in the Net Asset Value of approximately 0.83% would have been observed.Invesco European Growth Equity Fund; an increase in the Net Asset Value of approximately 0.62% would have been observed.Invesco Pan European Equity Income Fund; an increase in the Net Asset Value of approximately 0.66% would have been observed.Invesco Emerging Europe Equity Fund; an increase in the Net Asset Value of approximately 0.89% would have been observed.Invesco Global Leisure Fund; a decrease in Net Asset Value of approximately 0.57% would have been observed.Invesco Gold & Precious Metals Fund; a decrease in the Net Asset Value of approximately 2.09% would have been observed.
(d) Cost of sales of investmentsAny surplus or deficit on sales of investments is determined on the basis of average cost.
Notes to the Financial Statements (continued)
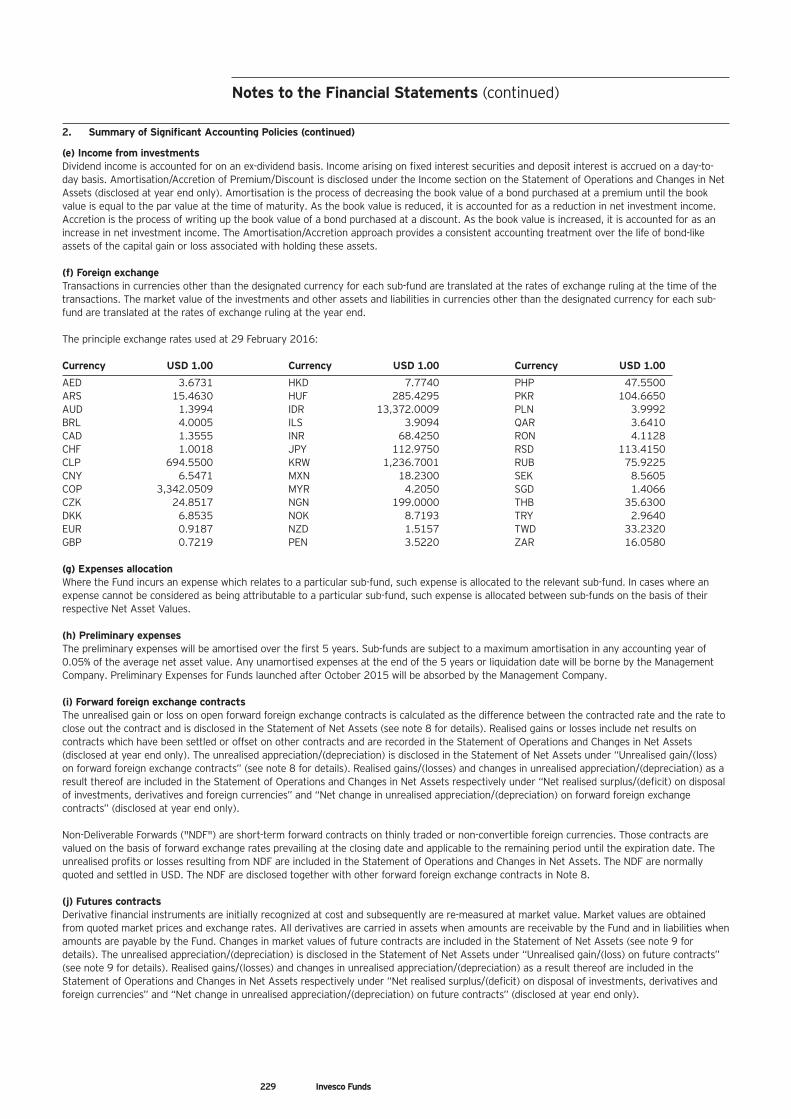
229 Invesco Funds
2. Summary of Significant Accounting Policies (continued)
(e) Income from investmentsDividend income is accounted for on an ex-dividend basis. Income arising on fixed interest securities and deposit interest is accrued on a day-to-day basis. Amortisation/Accretion of Premium/Discount is disclosed under the Income section on the Statement of Operations and Changes in NetAssets (disclosed at year end only). Amortisation is the process of decreasing the book value of a bond purchased at a premium until the bookvalue is equal to the par value at the time of maturity. As the book value is reduced, it is accounted for as a reduction in net investment income.Accretion is the process of writing up the book value of a bond purchased at a discount. As the book value is increased, it is accounted for as anincrease in net investment income. The Amortisation/Accretion approach provides a consistent accounting treatment over the life of bond-likeassets of the capital gain or loss associated with holding these assets.
(f) Foreign exchangeTransactions in currencies other than the designated currency for each sub-fund are translated at the rates of exchange ruling at the time of thetransactions. The market value of the investments and other assets and liabilities in currencies other than the designated currency for each sub-fund are translated at the rates of exchange ruling at the year end.
The principle exchange rates used at 29 February 2016:
Currency USD 1.00 Currency USD 1.00 Currency USD 1.00
AED 3.6731 HKD 7.7740 PHP 47.5500ARS 15.4630 HUF 285.4295 PKR 104.6650AUD 1.3994 IDR 13,372.0009 PLN 3.9992BRL 4.0005 ILS 3.9094 QAR 3.6410CAD 1.3555 INR 68.4250 RON 4.1128CHF 1.0018 JPY 112.9750 RSD 113.4150CLP 694.5500 KRW 1,236.7001 RUB 75.9225CNY 6.5471 MXN 18.2300 SEK 8.5605COP 3,342.0509 MYR 4.2050 SGD 1.4066CZK 24.8517 NGN 199.0000 THB 35.6300DKK 6.8535 NOK 8.7193 TRY 2.9640EUR 0.9187 NZD 1.5157 TWD 33.2320GBP 0.7219 PEN 3.5220 ZAR 16.0580
(g) Expenses allocationWhere the Fund incurs an expense which relates to a particular sub-fund, such expense is allocated to the relevant sub-fund. In cases where anexpense cannot be considered as being attributable to a particular sub-fund, such expense is allocated between sub-funds on the basis of theirrespective Net Asset Values.
(h) Preliminary expensesThe preliminary expenses will be amortised over the first 5 years. Sub-funds are subject to a maximum amortisation in any accounting year of0.05% of the average net asset value. Any unamortised expenses at the end of the 5 years or liquidation date will be borne by the ManagementCompany. Preliminary Expenses for Funds launched after October 2015 will be absorbed by the Management Company.
(i) Forward foreign exchange contractsThe unrealised gain or loss on open forward foreign exchange contracts is calculated as the difference between the contracted rate and the rate toclose out the contract and is disclosed in the Statement of Net Assets (see note 8 for details). Realised gains or losses include net results oncontracts which have been settled or offset on other contracts and are recorded in the Statement of Operations and Changes in Net Assets(disclosed at year end only). The unrealised appreciation/(depreciation) is disclosed in the Statement of Net Assets under “Unrealised gain/(loss)on forward foreign exchange contracts” (see note 8 for details). Realised gains/(losses) and changes in unrealised appreciation/(depreciation) as aresult thereof are included in the Statement of Operations and Changes in Net Assets respectively under “Net realised surplus/(deficit) on disposalof investments, derivatives and foreign currencies” and “Net change in unrealised appreciation/(depreciation) on forward foreign exchangecontracts” (disclosed at year end only).
Non-Deliverable Forwards ("NDF") are short-term forward contracts on thinly traded or non-convertible foreign currencies. Those contracts arevalued on the basis of forward exchange rates prevailing at the closing date and applicable to the remaining period until the expiration date. Theunrealised profits or losses resulting from NDF are included in the Statement of Operations and Changes in Net Assets. The NDF are normallyquoted and settled in USD. The NDF are disclosed together with other forward foreign exchange contracts in Note 8.
(j) Futures contractsDerivative financial instruments are initially recognized at cost and subsequently are re-measured at market value. Market values are obtainedfrom quoted market prices and exchange rates. All derivatives are carried in assets when amounts are receivable by the Fund and in liabilities whenamounts are payable by the Fund. Changes in market values of future contracts are included in the Statement of Net Assets (see note 9 fordetails). The unrealised appreciation/(depreciation) is disclosed in the Statement of Net Assets under “Unrealised gain/(loss) on future contracts”(see note 9 for details). Realised gains/(losses) and changes in unrealised appreciation/(depreciation) as a result thereof are included in theStatement of Operations and Changes in Net Assets respectively under “Net realised surplus/(deficit) on disposal of investments, derivatives andforeign currencies” and “Net change in unrealised appreciation/(depreciation) on future contracts” (disclosed at year end only).
Notes to the Financial Statements (continued)
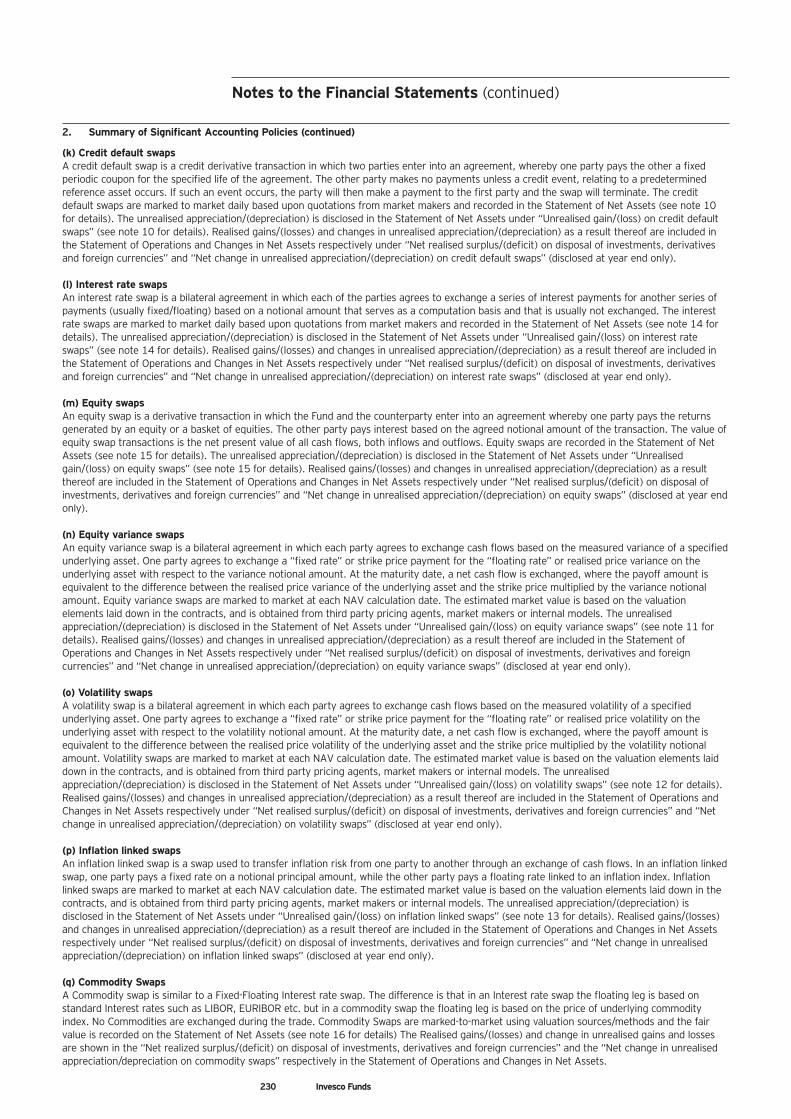
230 Invesco Funds
2. Summary of Significant Accounting Policies (continued)
(k) Credit default swapsA credit default swap is a credit derivative transaction in which two parties enter into an agreement, whereby one party pays the other a fixedperiodic coupon for the specified life of the agreement. The other party makes no payments unless a credit event, relating to a predeterminedreference asset occurs. If such an event occurs, the party will then make a payment to the first party and the swap will terminate. The creditdefault swaps are marked to market daily based upon quotations from market makers and recorded in the Statement of Net Assets (see note 10for details). The unrealised appreciation/(depreciation) is disclosed in the Statement of Net Assets under “Unrealised gain/(loss) on credit defaultswaps” (see note 10 for details). Realised gains/(losses) and changes in unrealised appreciation/(depreciation) as a result thereof are included inthe Statement of Operations and Changes in Net Assets respectively under “Net realised surplus/(deficit) on disposal of investments, derivativesand foreign currencies” and “Net change in unrealised appreciation/(depreciation) on credit default swaps” (disclosed at year end only).
(l) Interest rate swapsAn interest rate swap is a bilateral agreement in which each of the parties agrees to exchange a series of interest payments for another series ofpayments (usually fixed/floating) based on a notional amount that serves as a computation basis and that is usually not exchanged. The interestrate swaps are marked to market daily based upon quotations from market makers and recorded in the Statement of Net Assets (see note 14 fordetails). The unrealised appreciation/(depreciation) is disclosed in the Statement of Net Assets under “Unrealised gain/(loss) on interest rateswaps” (see note 14 for details). Realised gains/(losses) and changes in unrealised appreciation/(depreciation) as a result thereof are included inthe Statement of Operations and Changes in Net Assets respectively under “Net realised surplus/(deficit) on disposal of investments, derivativesand foreign currencies” and “Net change in unrealised appreciation/(depreciation) on interest rate swaps” (disclosed at year end only).
(m) Equity swapsAn equity swap is a derivative transaction in which the Fund and the counterparty enter into an agreement whereby one party pays the returnsgenerated by an equity or a basket of equities. The other party pays interest based on the agreed notional amount of the transaction. The value ofequity swap transactions is the net present value of all cash flows, both inflows and outflows. Equity swaps are recorded in the Statement of NetAssets (see note 15 for details). The unrealised appreciation/(depreciation) is disclosed in the Statement of Net Assets under “Unrealisedgain/(loss) on equity swaps” (see note 15 for details). Realised gains/(losses) and changes in unrealised appreciation/(depreciation) as a resultthereof are included in the Statement of Operations and Changes in Net Assets respectively under “Net realised surplus/(deficit) on disposal ofinvestments, derivatives and foreign currencies” and “Net change in unrealised appreciation/(depreciation) on equity swaps” (disclosed at year endonly).
(n) Equity variance swaps An equity variance swap is a bilateral agreement in which each party agrees to exchange cash flows based on the measured variance of a specifiedunderlying asset. One party agrees to exchange a “fixed rate” or strike price payment for the “floating rate” or realised price variance on theunderlying asset with respect to the variance notional amount. At the maturity date, a net cash flow is exchanged, where the payoff amount isequivalent to the difference between the realised price variance of the underlying asset and the strike price multiplied by the variance notionalamount. Equity variance swaps are marked to market at each NAV calculation date. The estimated market value is based on the valuationelements laid down in the contracts, and is obtained from third party pricing agents, market makers or internal models. The unrealisedappreciation/(depreciation) is disclosed in the Statement of Net Assets under “Unrealised gain/(loss) on equity variance swaps” (see note 11 fordetails). Realised gains/(losses) and changes in unrealised appreciation/(depreciation) as a result thereof are included in the Statement ofOperations and Changes in Net Assets respectively under “Net realised surplus/(deficit) on disposal of investments, derivatives and foreigncurrencies” and “Net change in unrealised appreciation/(depreciation) on equity variance swaps” (disclosed at year end only).
(o) Volatility swaps A volatility swap is a bilateral agreement in which each party agrees to exchange cash flows based on the measured volatility of a specifiedunderlying asset. One party agrees to exchange a “fixed rate” or strike price payment for the “floating rate” or realised price volatility on theunderlying asset with respect to the volatility notional amount. At the maturity date, a net cash flow is exchanged, where the payoff amount isequivalent to the difference between the realised price volatility of the underlying asset and the strike price multiplied by the volatility notionalamount. Volatility swaps are marked to market at each NAV calculation date. The estimated market value is based on the valuation elements laiddown in the contracts, and is obtained from third party pricing agents, market makers or internal models. The unrealisedappreciation/(depreciation) is disclosed in the Statement of Net Assets under “Unrealised gain/(loss) on volatility swaps” (see note 12 for details).Realised gains/(losses) and changes in unrealised appreciation/(depreciation) as a result thereof are included in the Statement of Operations andChanges in Net Assets respectively under “Net realised surplus/(deficit) on disposal of investments, derivatives and foreign currencies” and “Netchange in unrealised appreciation/(depreciation) on volatility swaps” (disclosed at year end only).
(p) Inflation linked swaps An inflation linked swap is a swap used to transfer inflation risk from one party to another through an exchange of cash flows. In an inflation linkedswap, one party pays a fixed rate on a notional principal amount, while the other party pays a floating rate linked to an inflation index. Inflationlinked swaps are marked to market at each NAV calculation date. The estimated market value is based on the valuation elements laid down in thecontracts, and is obtained from third party pricing agents, market makers or internal models. The unrealised appreciation/(depreciation) isdisclosed in the Statement of Net Assets under “Unrealised gain/(loss) on inflation linked swaps” (see note 13 for details). Realised gains/(losses)and changes in unrealised appreciation/(depreciation) as a result thereof are included in the Statement of Operations and Changes in Net Assetsrespectively under “Net realised surplus/(deficit) on disposal of investments, derivatives and foreign currencies” and “Net change in unrealisedappreciation/(depreciation) on inflation linked swaps” (disclosed at year end only).
(q) Commodity SwapsA Commodity swap is similar to a Fixed-Floating Interest rate swap. The difference is that in an Interest rate swap the floating leg is based onstandard Interest rates such as LIBOR, EURIBOR etc. but in a commodity swap the floating leg is based on the price of underlying commodityindex. No Commodities are exchanged during the trade. Commodity Swaps are marked-to-market using valuation sources/methods and the fairvalue is recorded on the Statement of Net Assets (see note 16 for details) The Realised gains/(losses) and change in unrealised gains and lossesare shown in the “Net realized surplus/(deficit) on disposal of investments, derivatives and foreign currencies” and the “Net change in unrealisedappreciation/depreciation on commodity swaps” respectively in the Statement of Operations and Changes in Net Assets.
Notes to the Financial Statements (continued)
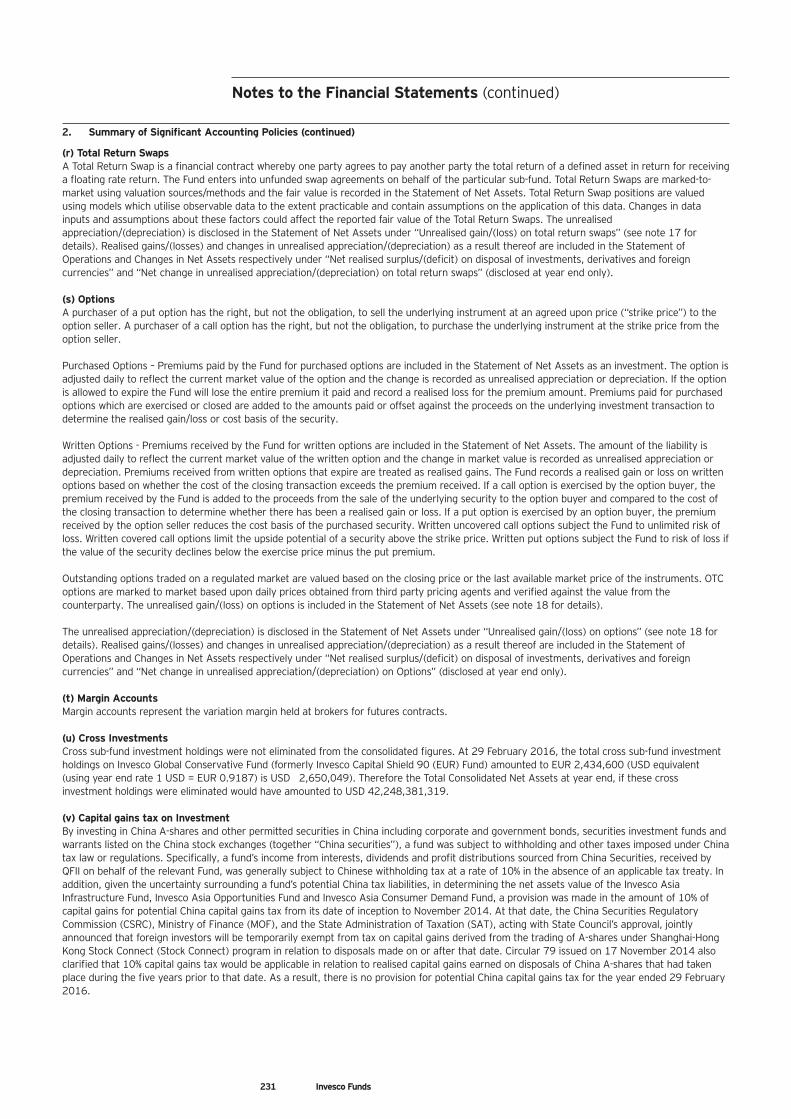
231 Invesco Funds
2. Summary of Significant Accounting Policies (continued)
(r) Total Return SwapsA Total Return Swap is a financial contract whereby one party agrees to pay another party the total return of a defined asset in return for receivinga floating rate return. The Fund enters into unfunded swap agreements on behalf of the particular sub-fund. Total Return Swaps are marked-to-market using valuation sources/methods and the fair value is recorded in the Statement of Net Assets. Total Return Swap positions are valuedusing models which utilise observable data to the extent practicable and contain assumptions on the application of this data. Changes in datainputs and assumptions about these factors could affect the reported fair value of the Total Return Swaps. The unrealisedappreciation/(depreciation) is disclosed in the Statement of Net Assets under “Unrealised gain/(loss) on total return swaps” (see note 17 fordetails). Realised gains/(losses) and changes in unrealised appreciation/(depreciation) as a result thereof are included in the Statement ofOperations and Changes in Net Assets respectively under “Net realised surplus/(deficit) on disposal of investments, derivatives and foreigncurrencies” and “Net change in unrealised appreciation/(depreciation) on total return swaps” (disclosed at year end only).
(s) OptionsA purchaser of a put option has the right, but not the obligation, to sell the underlying instrument at an agreed upon price (“strike price”) to theoption seller. A purchaser of a call option has the right, but not the obligation, to purchase the underlying instrument at the strike price from theoption seller.
Purchased Options – Premiums paid by the Fund for purchased options are included in the Statement of Net Assets as an investment. The option isadjusted daily to reflect the current market value of the option and the change is recorded as unrealised appreciation or depreciation. If the optionis allowed to expire the Fund will lose the entire premium it paid and record a realised loss for the premium amount. Premiums paid for purchasedoptions which are exercised or closed are added to the amounts paid or offset against the proceeds on the underlying investment transaction todetermine the realised gain/loss or cost basis of the security.
Written Options - Premiums received by the Fund for written options are included in the Statement of Net Assets. The amount of the liability isadjusted daily to reflect the current market value of the written option and the change in market value is recorded as unrealised appreciation ordepreciation. Premiums received from written options that expire are treated as realised gains. The Fund records a realised gain or loss on writtenoptions based on whether the cost of the closing transaction exceeds the premium received. If a call option is exercised by the option buyer, thepremium received by the Fund is added to the proceeds from the sale of the underlying security to the option buyer and compared to the cost ofthe closing transaction to determine whether there has been a realised gain or loss. If a put option is exercised by an option buyer, the premiumreceived by the option seller reduces the cost basis of the purchased security. Written uncovered call options subject the Fund to unlimited risk ofloss. Written covered call options limit the upside potential of a security above the strike price. Written put options subject the Fund to risk of loss ifthe value of the security declines below the exercise price minus the put premium.
Outstanding options traded on a regulated market are valued based on the closing price or the last available market price of the instruments. OTCoptions are marked to market based upon daily prices obtained from third party pricing agents and verified against the value from thecounterparty. The unrealised gain/(loss) on options is included in the Statement of Net Assets (see note 18 for details).
The unrealised appreciation/(depreciation) is disclosed in the Statement of Net Assets under “Unrealised gain/(loss) on options” (see note 18 fordetails). Realised gains/(losses) and changes in unrealised appreciation/(depreciation) as a result thereof are included in the Statement ofOperations and Changes in Net Assets respectively under “Net realised surplus/(deficit) on disposal of investments, derivatives and foreigncurrencies” and “Net change in unrealised appreciation/(depreciation) on Options” (disclosed at year end only).
(t) Margin AccountsMargin accounts represent the variation margin held at brokers for futures contracts.
(u) Cross InvestmentsCross sub-fund investment holdings were not eliminated from the consolidated figures. At 29 February 2016, the total cross sub-fund investmentholdings on Invesco Global Conservative Fund (formerly Invesco Capital Shield 90 (EUR) Fund) amounted to EUR 2,434,600 (USD equivalent(using year end rate 1 USD = EUR 0.9187) is USD 2,650,049). Therefore the Total Consolidated Net Assets at year end, if these crossinvestment holdings were eliminated would have amounted to USD 42,248,381,319.
(v) Capital gains tax on InvestmentBy investing in China A-shares and other permitted securities in China including corporate and government bonds, securities investment funds andwarrants listed on the China stock exchanges (together “China securities”), a fund was subject to withholding and other taxes imposed under Chinatax law or regulations. Specifically, a fund’s income from interests, dividends and profit distributions sourced from China Securities, received byQFII on behalf of the relevant Fund, was generally subject to Chinese withholding tax at a rate of 10% in the absence of an applicable tax treaty. Inaddition, given the uncertainty surrounding a fund’s potential China tax liabilities, in determining the net assets value of the Invesco AsiaInfrastructure Fund, Invesco Asia Opportunities Fund and Invesco Asia Consumer Demand Fund, a provision was made in the amount of 10% ofcapital gains for potential China capital gains tax from its date of inception to November 2014. At that date, the China Securities RegulatoryCommission (CSRC), Ministry of Finance (MOF), and the State Administration of Taxation (SAT), acting with State Council’s approval, jointlyannounced that foreign investors will be temporarily exempt from tax on capital gains derived from the trading of A-shares under Shanghai-HongKong Stock Connect (Stock Connect) program in relation to disposals made on or after that date. Circular 79 issued on 17 November 2014 alsoclarified that 10% capital gains tax would be applicable in relation to realised capital gains earned on disposals of China A-shares that had takenplace during the five years prior to that date. As a result, there is no provision for potential China capital gains tax for the year ended 29 February2016.
Notes to the Financial Statements (continued)
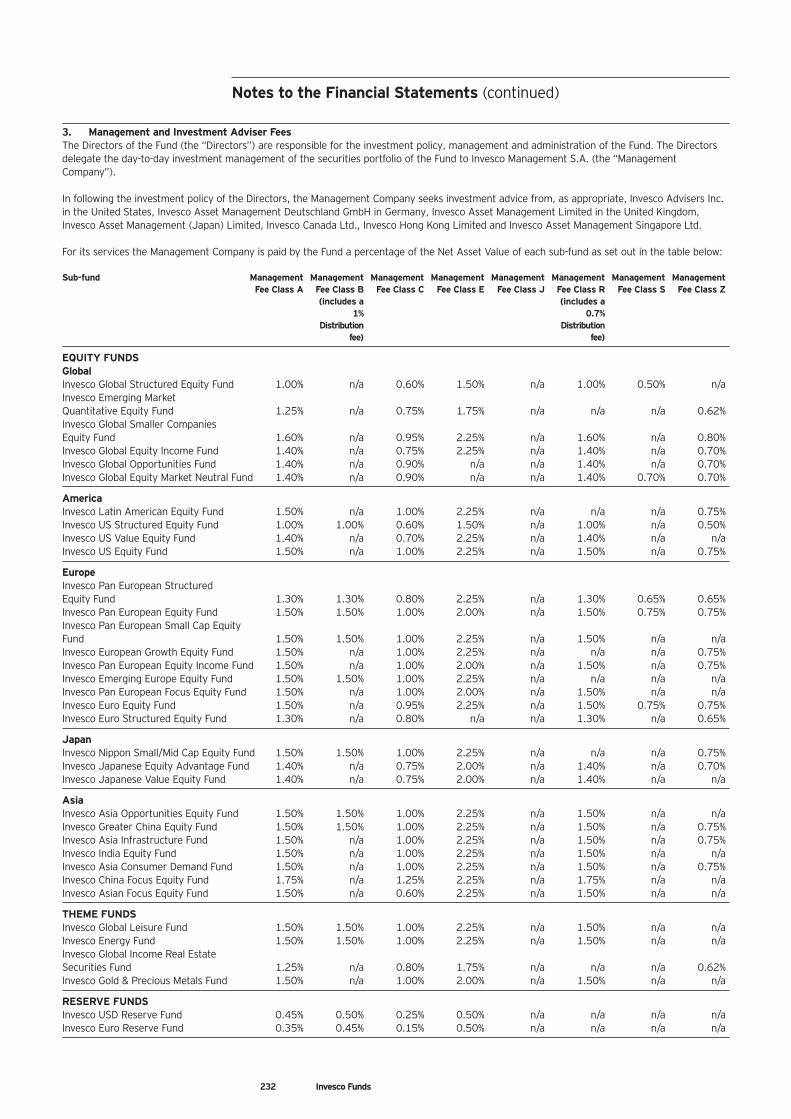
232 Invesco Funds
3. Management and Investment Adviser FeesThe Directors of the Fund (the “Directors”) are responsible for the investment policy, management and administration of the Fund. The Directorsdelegate the day-to-day investment management of the securities portfolio of the Fund to Invesco Management S.A. (the “ManagementCompany”).
In following the investment policy of the Directors, the Management Company seeks investment advice from, as appropriate, Invesco Advisers Inc.in the United States, Invesco Asset Management Deutschland GmbH in Germany, Invesco Asset Management Limited in the United Kingdom,Invesco Asset Management (Japan) Limited, Invesco Canada Ltd., Invesco Hong Kong Limited and Invesco Asset Management Singapore Ltd.
For its services the Management Company is paid by the Fund a percentage of the Net Asset Value of each sub-fund as set out in the table below:
Sub-fund Management Management Management Management Management Management Management Management Fee Class A Fee Class B Fee Class C Fee Class E Fee Class J Fee Class R Fee Class S Fee Class Z (includes a (includes a 1% 0.7% Distribution Distribution fee) fee)
EQUITY FUNDSGlobalInvesco Global Structured Equity Fund 1.00% n/a 0.60% 1.50% n/a 1.00% 0.50% n/aInvesco Emerging Market Quantitative Equity Fund 1.25% n/a 0.75% 1.75% n/a n/a n/a 0.62%Invesco Global Smaller Companies Equity Fund 1.60% n/a 0.95% 2.25% n/a 1.60% n/a 0.80%Invesco Global Equity Income Fund 1.40% n/a 0.75% 2.25% n/a 1.40% n/a 0.70%Invesco Global Opportunities Fund 1.40% n/a 0.90% n/a n/a 1.40% n/a 0.70%Invesco Global Equity Market Neutral Fund 1.40% n/a 0.90% n/a n/a 1.40% 0.70% 0.70%
AmericaInvesco Latin American Equity Fund 1.50% n/a 1.00% 2.25% n/a n/a n/a 0.75%Invesco US Structured Equity Fund 1.00% 1.00% 0.60% 1.50% n/a 1.00% n/a 0.50%Invesco US Value Equity Fund 1.40% n/a 0.70% 2.25% n/a 1.40% n/a n/aInvesco US Equity Fund 1.50% n/a 1.00% 2.25% n/a 1.50% n/a 0.75%
EuropeInvesco Pan European Structured Equity Fund 1.30% 1.30% 0.80% 2.25% n/a 1.30% 0.65% 0.65%Invesco Pan European Equity Fund 1.50% 1.50% 1.00% 2.00% n/a 1.50% 0.75% 0.75%Invesco Pan European Small Cap Equity Fund 1.50% 1.50% 1.00% 2.25% n/a 1.50% n/a n/aInvesco European Growth Equity Fund 1.50% n/a 1.00% 2.25% n/a n/a n/a 0.75%Invesco Pan European Equity Income Fund 1.50% n/a 1.00% 2.00% n/a 1.50% n/a 0.75%Invesco Emerging Europe Equity Fund 1.50% 1.50% 1.00% 2.25% n/a n/a n/a n/aInvesco Pan European Focus Equity Fund 1.50% n/a 1.00% 2.00% n/a 1.50% n/a n/aInvesco Euro Equity Fund 1.50% n/a 0.95% 2.25% n/a 1.50% 0.75% 0.75%Invesco Euro Structured Equity Fund 1.30% n/a 0.80% n/a n/a 1.30% n/a 0.65%
JapanInvesco Nippon Small/Mid Cap Equity Fund 1.50% 1.50% 1.00% 2.25% n/a n/a n/a 0.75%Invesco Japanese Equity Advantage Fund 1.40% n/a 0.75% 2.00% n/a 1.40% n/a 0.70%Invesco Japanese Value Equity Fund 1.40% n/a 0.75% 2.00% n/a 1.40% n/a n/a
AsiaInvesco Asia Opportunities Equity Fund 1.50% 1.50% 1.00% 2.25% n/a 1.50% n/a n/aInvesco Greater China Equity Fund 1.50% 1.50% 1.00% 2.25% n/a 1.50% n/a 0.75%Invesco Asia Infrastructure Fund 1.50% n/a 1.00% 2.25% n/a 1.50% n/a 0.75%Invesco India Equity Fund 1.50% n/a 1.00% 2.25% n/a 1.50% n/a n/aInvesco Asia Consumer Demand Fund 1.50% n/a 1.00% 2.25% n/a 1.50% n/a 0.75%Invesco China Focus Equity Fund 1.75% n/a 1.25% 2.25% n/a 1.75% n/a n/aInvesco Asian Focus Equity Fund 1.50% n/a 0.60% 2.25% n/a 1.50% n/a n/a
THEME FUNDSInvesco Global Leisure Fund 1.50% 1.50% 1.00% 2.25% n/a 1.50% n/a n/aInvesco Energy Fund 1.50% 1.50% 1.00% 2.25% n/a 1.50% n/a n/aInvesco Global Income Real Estate Securities Fund 1.25% n/a 0.80% 1.75% n/a n/a n/a 0.62%Invesco Gold & Precious Metals Fund 1.50% n/a 1.00% 2.00% n/a 1.50% n/a n/a
RESERVE FUNDSInvesco USD Reserve Fund 0.45% 0.50% 0.25% 0.50% n/a n/a n/a n/aInvesco Euro Reserve Fund 0.35% 0.45% 0.15% 0.50% n/a n/a n/a n/a
Notes to the Financial Statements (continued)
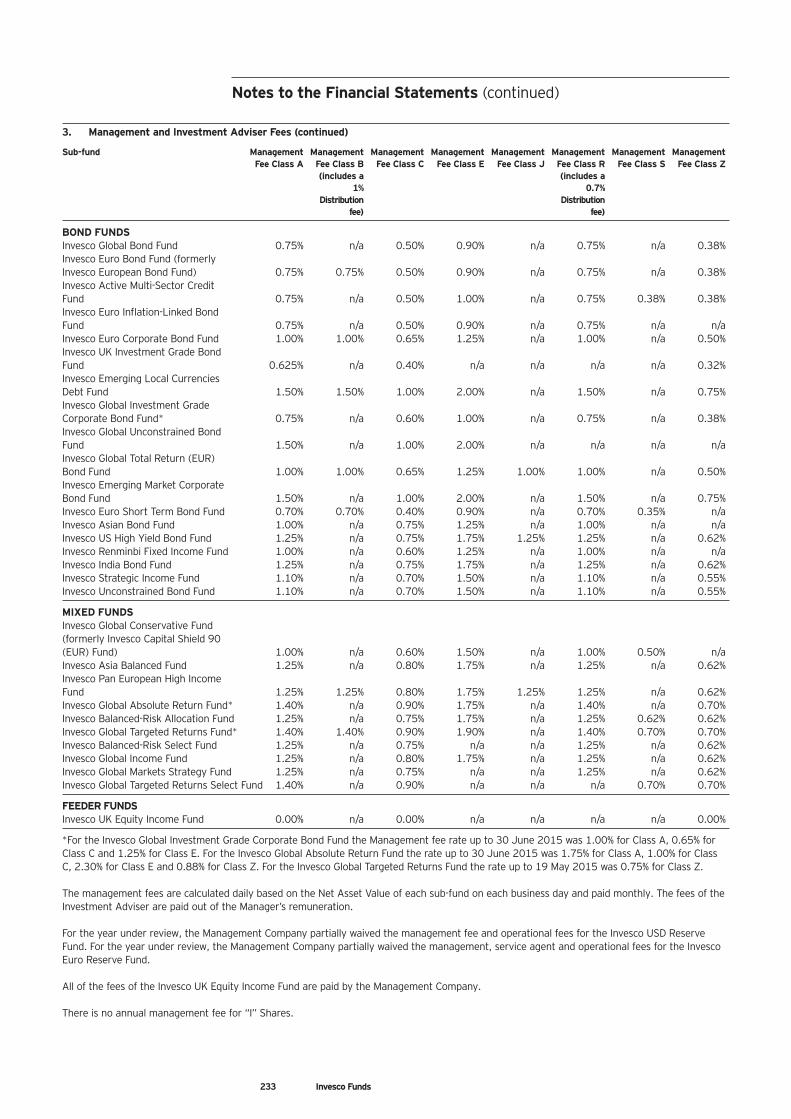
233 Invesco Funds
3. Management and Investment Adviser Fees (continued)
Sub-fund Management Management Management Management Management Management Management Management Fee Class A Fee Class B Fee Class C Fee Class E Fee Class J Fee Class R Fee Class S Fee Class Z (includes a (includes a 1% 0.7% Distribution Distribution fee) fee)
BOND FUNDSInvesco Global Bond Fund 0.75% n/a 0.50% 0.90% n/a 0.75% n/a 0.38%Invesco Euro Bond Fund (formerly Invesco European Bond Fund) 0.75% 0.75% 0.50% 0.90% n/a 0.75% n/a 0.38%Invesco Active Multi-Sector Credit Fund 0.75% n/a 0.50% 1.00% n/a 0.75% 0.38% 0.38%Invesco Euro Inflation-Linked Bond Fund 0.75% n/a 0.50% 0.90% n/a 0.75% n/a n/aInvesco Euro Corporate Bond Fund 1.00% 1.00% 0.65% 1.25% n/a 1.00% n/a 0.50%Invesco UK Investment Grade Bond Fund 0.625% n/a 0.40% n/a n/a n/a n/a 0.32%Invesco Emerging Local Currencies Debt Fund 1.50% 1.50% 1.00% 2.00% n/a 1.50% n/a 0.75%Invesco Global Investment Grade Corporate Bond Fund* 0.75% n/a 0.60% 1.00% n/a 0.75% n/a 0.38%Invesco Global Unconstrained Bond Fund 1.50% n/a 1.00% 2.00% n/a n/a n/a n/aInvesco Global Total Return (EUR) Bond Fund 1.00% 1.00% 0.65% 1.25% 1.00% 1.00% n/a 0.50%Invesco Emerging Market Corporate Bond Fund 1.50% n/a 1.00% 2.00% n/a 1.50% n/a 0.75%Invesco Euro Short Term Bond Fund 0.70% 0.70% 0.40% 0.90% n/a 0.70% 0.35% n/aInvesco Asian Bond Fund 1.00% n/a 0.75% 1.25% n/a 1.00% n/a n/aInvesco US High Yield Bond Fund 1.25% n/a 0.75% 1.75% 1.25% 1.25% n/a 0.62%Invesco Renminbi Fixed Income Fund 1.00% n/a 0.60% 1.25% n/a 1.00% n/a n/aInvesco India Bond Fund 1.25% n/a 0.75% 1.75% n/a 1.25% n/a 0.62%Invesco Strategic Income Fund 1.10% n/a 0.70% 1.50% n/a 1.10% n/a 0.55%Invesco Unconstrained Bond Fund 1.10% n/a 0.70% 1.50% n/a 1.10% n/a 0.55%
MIXED FUNDS Invesco Global Conservative Fund (formerly Invesco Capital Shield 90 (EUR) Fund) 1.00% n/a 0.60% 1.50% n/a 1.00% 0.50% n/aInvesco Asia Balanced Fund 1.25% n/a 0.80% 1.75% n/a 1.25% n/a 0.62%Invesco Pan European High Income Fund 1.25% 1.25% 0.80% 1.75% 1.25% 1.25% n/a 0.62%Invesco Global Absolute Return Fund* 1.40% n/a 0.90% 1.75% n/a 1.40% n/a 0.70%Invesco Balanced-Risk Allocation Fund 1.25% n/a 0.75% 1.75% n/a 1.25% 0.62% 0.62%Invesco Global Targeted Returns Fund* 1.40% 1.40% 0.90% 1.90% n/a 1.40% 0.70% 0.70%Invesco Balanced-Risk Select Fund 1.25% n/a 0.75% n/a n/a 1.25% n/a 0.62%Invesco Global Income Fund 1.25% n/a 0.80% 1.75% n/a 1.25% n/a 0.62%Invesco Global Markets Strategy Fund 1.25% n/a 0.75% n/a n/a 1.25% n/a 0.62%Invesco Global Targeted Returns Select Fund 1.40% n/a 0.90% n/a n/a n/a 0.70% 0.70%
FEEDER FUNDS Invesco UK Equity Income Fund 0.00% n/a 0.00% n/a n/a n/a n/a 0.00%
*For the Invesco Global Investment Grade Corporate Bond Fund the Management fee rate up to 30 June 2015 was 1.00% for Class A, 0.65% forClass C and 1.25% for Class E. For the Invesco Global Absolute Return Fund the rate up to 30 June 2015 was 1.75% for Class A, 1.00% for ClassC, 2.30% for Class E and 0.88% for Class Z. For the Invesco Global Targeted Returns Fund the rate up to 19 May 2015 was 0.75% for Class Z.
The management fees are calculated daily based on the Net Asset Value of each sub-fund on each business day and paid monthly. The fees of theInvestment Adviser are paid out of the Manager’s remuneration.
For the year under review, the Management Company partially waived the management fee and operational fees for the Invesco USD ReserveFund. For the year under review, the Management Company partially waived the management, service agent and operational fees for the InvescoEuro Reserve Fund.
All of the fees of the Invesco UK Equity Income Fund are paid by the Management Company.
There is no annual management fee for “I” Shares.
Notes to the Financial Statements (continued)
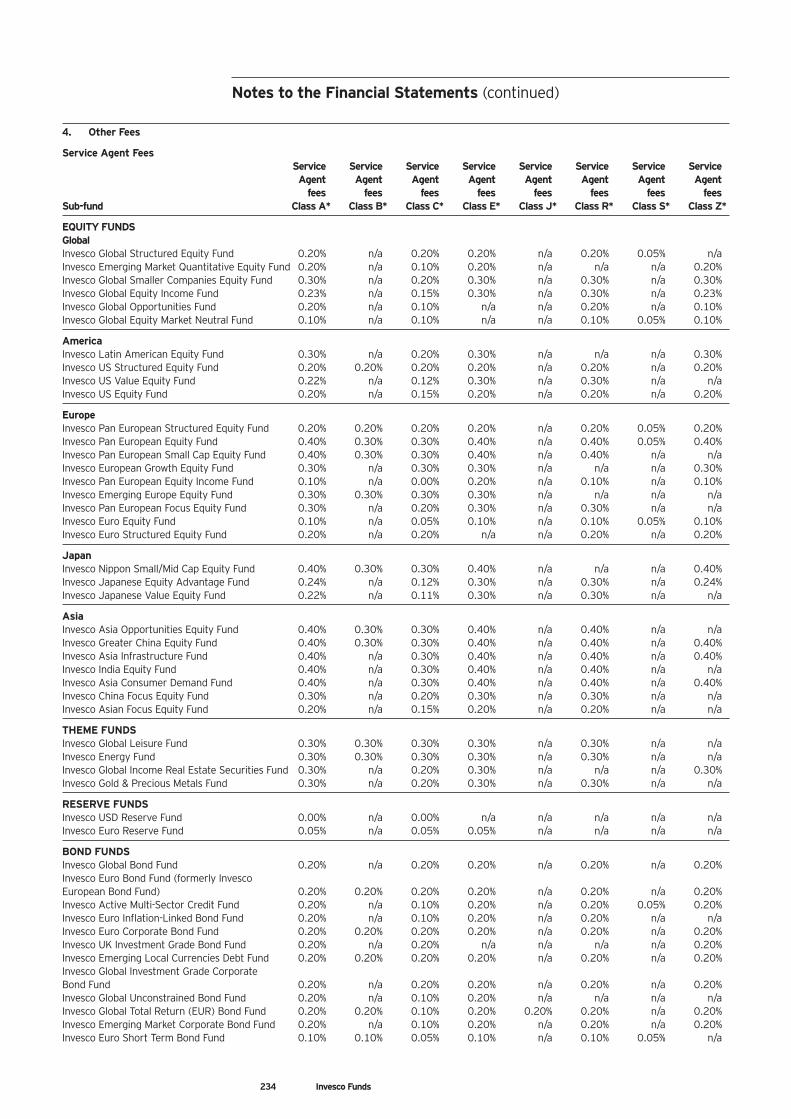
234 Invesco Funds
4. Other Fees
Service Agent FeesService Service Service Service Service Service Service ServiceAgent Agent Agent Agent Agent Agent Agent Agent
fees fees fees fees fees fees fees feesSub-fund Class A* Class B* Class C* Class E* Class J* Class R* Class S* Class Z*
EQUITY FUNDSGlobalInvesco Global Structured Equity Fund 0.20% n/a 0.20% 0.20% n/a 0.20% 0.05% n/aInvesco Emerging Market Quantitative Equity Fund 0.20% n/a 0.10% 0.20% n/a n/a n/a 0.20%Invesco Global Smaller Companies Equity Fund 0.30% n/a 0.20% 0.30% n/a 0.30% n/a 0.30%Invesco Global Equity Income Fund 0.23% n/a 0.15% 0.30% n/a 0.30% n/a 0.23%Invesco Global Opportunities Fund 0.20% n/a 0.10% n/a n/a 0.20% n/a 0.10%Invesco Global Equity Market Neutral Fund 0.10% n/a 0.10% n/a n/a 0.10% 0.05% 0.10%
AmericaInvesco Latin American Equity Fund 0.30% n/a 0.20% 0.30% n/a n/a n/a 0.30%Invesco US Structured Equity Fund 0.20% 0.20% 0.20% 0.20% n/a 0.20% n/a 0.20%Invesco US Value Equity Fund 0.22% n/a 0.12% 0.30% n/a 0.30% n/a n/aInvesco US Equity Fund 0.20% n/a 0.15% 0.20% n/a 0.20% n/a 0.20%
EuropeInvesco Pan European Structured Equity Fund 0.20% 0.20% 0.20% 0.20% n/a 0.20% 0.05% 0.20%Invesco Pan European Equity Fund 0.40% 0.30% 0.30% 0.40% n/a 0.40% 0.05% 0.40%Invesco Pan European Small Cap Equity Fund 0.40% 0.30% 0.30% 0.40% n/a 0.40% n/a n/aInvesco European Growth Equity Fund 0.30% n/a 0.30% 0.30% n/a n/a n/a 0.30%Invesco Pan European Equity Income Fund 0.10% n/a 0.00% 0.20% n/a 0.10% n/a 0.10%Invesco Emerging Europe Equity Fund 0.30% 0.30% 0.30% 0.30% n/a n/a n/a n/aInvesco Pan European Focus Equity Fund 0.30% n/a 0.20% 0.30% n/a 0.30% n/a n/aInvesco Euro Equity Fund 0.10% n/a 0.05% 0.10% n/a 0.10% 0.05% 0.10%Invesco Euro Structured Equity Fund 0.20% n/a 0.20% n/a n/a 0.20% n/a 0.20%
JapanInvesco Nippon Small/Mid Cap Equity Fund 0.40% 0.30% 0.30% 0.40% n/a n/a n/a 0.40%Invesco Japanese Equity Advantage Fund 0.24% n/a 0.12% 0.30% n/a 0.30% n/a 0.24%Invesco Japanese Value Equity Fund 0.22% n/a 0.11% 0.30% n/a 0.30% n/a n/a
AsiaInvesco Asia Opportunities Equity Fund 0.40% 0.30% 0.30% 0.40% n/a 0.40% n/a n/aInvesco Greater China Equity Fund 0.40% 0.30% 0.30% 0.40% n/a 0.40% n/a 0.40%Invesco Asia Infrastructure Fund 0.40% n/a 0.30% 0.40% n/a 0.40% n/a 0.40%Invesco India Equity Fund 0.40% n/a 0.30% 0.40% n/a 0.40% n/a n/aInvesco Asia Consumer Demand Fund 0.40% n/a 0.30% 0.40% n/a 0.40% n/a 0.40%Invesco China Focus Equity Fund 0.30% n/a 0.20% 0.30% n/a 0.30% n/a n/aInvesco Asian Focus Equity Fund 0.20% n/a 0.15% 0.20% n/a 0.20% n/a n/a
THEME FUNDSInvesco Global Leisure Fund 0.30% 0.30% 0.30% 0.30% n/a 0.30% n/a n/aInvesco Energy Fund 0.30% 0.30% 0.30% 0.30% n/a 0.30% n/a n/aInvesco Global Income Real Estate Securities Fund 0.30% n/a 0.20% 0.30% n/a n/a n/a 0.30%Invesco Gold & Precious Metals Fund 0.30% n/a 0.20% 0.30% n/a 0.30% n/a n/a
RESERVE FUNDSInvesco USD Reserve Fund 0.00% n/a 0.00% n/a n/a n/a n/a n/aInvesco Euro Reserve Fund 0.05% n/a 0.05% 0.05% n/a n/a n/a n/a
BOND FUNDSInvesco Global Bond Fund 0.20% n/a 0.20% 0.20% n/a 0.20% n/a 0.20%Invesco Euro Bond Fund (formerly Invesco European Bond Fund) 0.20% 0.20% 0.20% 0.20% n/a 0.20% n/a 0.20%Invesco Active Multi-Sector Credit Fund 0.20% n/a 0.10% 0.20% n/a 0.20% 0.05% 0.20%Invesco Euro Inflation-Linked Bond Fund 0.20% n/a 0.10% 0.20% n/a 0.20% n/a n/aInvesco Euro Corporate Bond Fund 0.20% 0.20% 0.20% 0.20% n/a 0.20% n/a 0.20%Invesco UK Investment Grade Bond Fund 0.20% n/a 0.20% n/a n/a n/a n/a 0.20%Invesco Emerging Local Currencies Debt Fund 0.20% 0.20% 0.20% 0.20% n/a 0.20% n/a 0.20%Invesco Global Investment Grade Corporate Bond Fund 0.20% n/a 0.20% 0.20% n/a 0.20% n/a 0.20%Invesco Global Unconstrained Bond Fund 0.20% n/a 0.10% 0.20% n/a n/a n/a n/aInvesco Global Total Return (EUR) Bond Fund 0.20% 0.20% 0.10% 0.20% 0.20% 0.20% n/a 0.20%Invesco Emerging Market Corporate Bond Fund 0.20% n/a 0.10% 0.20% n/a 0.20% n/a 0.20%Invesco Euro Short Term Bond Fund 0.10% 0.10% 0.05% 0.10% n/a 0.10% 0.05% n/a
Notes to the Financial Statements (continued)
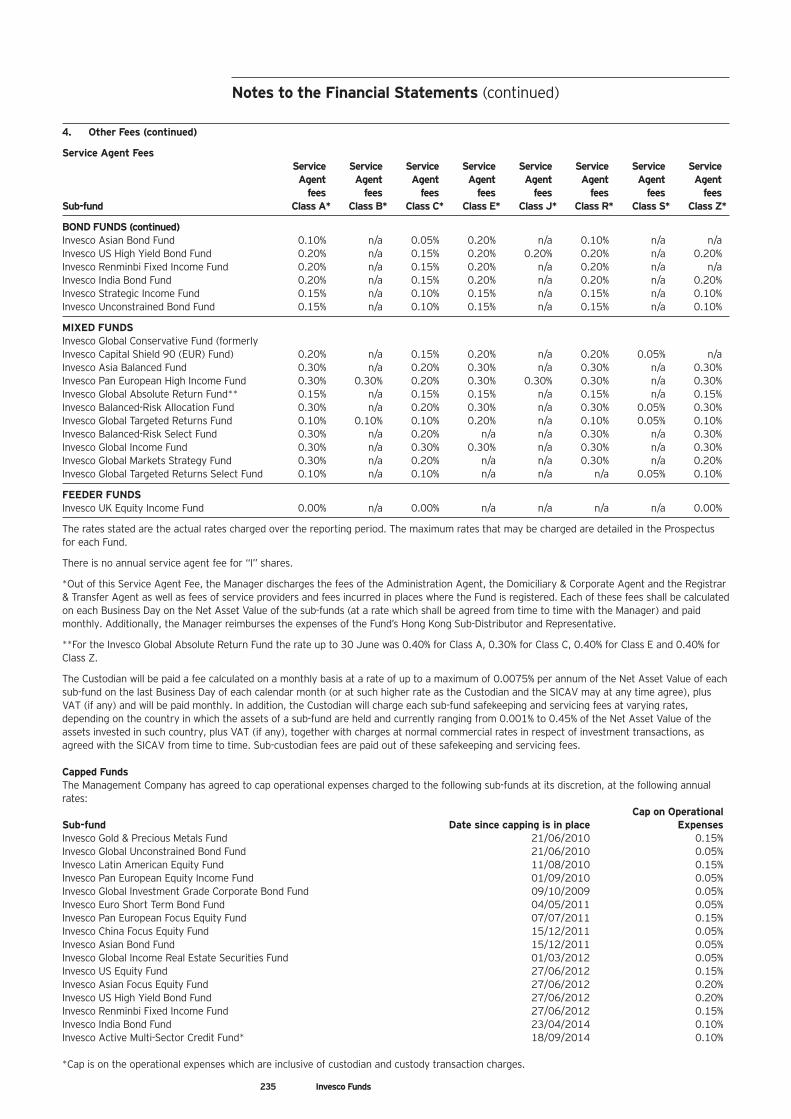
235 Invesco Funds
4. Other Fees (continued)
Service Agent FeesService Service Service Service Service Service Service ServiceAgent Agent Agent Agent Agent Agent Agent Agent
fees fees fees fees fees fees fees feesSub-fund Class A* Class B* Class C* Class E* Class J* Class R* Class S* Class Z*
BOND FUNDS (continued)Invesco Asian Bond Fund 0.10% n/a 0.05% 0.20% n/a 0.10% n/a n/aInvesco US High Yield Bond Fund 0.20% n/a 0.15% 0.20% 0.20% 0.20% n/a 0.20%Invesco Renminbi Fixed Income Fund 0.20% n/a 0.15% 0.20% n/a 0.20% n/a n/aInvesco India Bond Fund 0.20% n/a 0.15% 0.20% n/a 0.20% n/a 0.20%Invesco Strategic Income Fund 0.15% n/a 0.10% 0.15% n/a 0.15% n/a 0.10%Invesco Unconstrained Bond Fund 0.15% n/a 0.10% 0.15% n/a 0.15% n/a 0.10%
MIXED FUNDSInvesco Global Conservative Fund (formerly Invesco Capital Shield 90 (EUR) Fund) 0.20% n/a 0.15% 0.20% n/a 0.20% 0.05% n/aInvesco Asia Balanced Fund 0.30% n/a 0.20% 0.30% n/a 0.30% n/a 0.30%Invesco Pan European High Income Fund 0.30% 0.30% 0.20% 0.30% 0.30% 0.30% n/a 0.30%Invesco Global Absolute Return Fund** 0.15% n/a 0.15% 0.15% n/a 0.15% n/a 0.15%Invesco Balanced-Risk Allocation Fund 0.30% n/a 0.20% 0.30% n/a 0.30% 0.05% 0.30%Invesco Global Targeted Returns Fund 0.10% 0.10% 0.10% 0.20% n/a 0.10% 0.05% 0.10%Invesco Balanced-Risk Select Fund 0.30% n/a 0.20% n/a n/a 0.30% n/a 0.30%Invesco Global Income Fund 0.30% n/a 0.30% 0.30% n/a 0.30% n/a 0.30%Invesco Global Markets Strategy Fund 0.30% n/a 0.20% n/a n/a 0.30% n/a 0.20%Invesco Global Targeted Returns Select Fund 0.10% n/a 0.10% n/a n/a n/a 0.05% 0.10%
FEEDER FUNDSInvesco UK Equity Income Fund 0.00% n/a 0.00% n/a n/a n/a n/a 0.00%
The rates stated are the actual rates charged over the reporting period. The maximum rates that may be charged are detailed in the Prospectusfor each Fund.
There is no annual service agent fee for “I” shares.
*Out of this Service Agent Fee, the Manager discharges the fees of the Administration Agent, the Domiciliary & Corporate Agent and the Registrar& Transfer Agent as well as fees of service providers and fees incurred in places where the Fund is registered. Each of these fees shall be calculatedon each Business Day on the Net Asset Value of the sub-funds (at a rate which shall be agreed from time to time with the Manager) and paidmonthly. Additionally, the Manager reimburses the expenses of the Fund’s Hong Kong Sub-Distributor and Representative.
**For the Invesco Global Absolute Return Fund the rate up to 30 June was 0.40% for Class A, 0.30% for Class C, 0.40% for Class E and 0.40% forClass Z.
The Custodian will be paid a fee calculated on a monthly basis at a rate of up to a maximum of 0.0075% per annum of the Net Asset Value of eachsub-fund on the last Business Day of each calendar month (or at such higher rate as the Custodian and the SICAV may at any time agree), plusVAT (if any) and will be paid monthly. In addition, the Custodian will charge each sub-fund safekeeping and servicing fees at varying rates,depending on the country in which the assets of a sub-fund are held and currently ranging from 0.001% to 0.45% of the Net Asset Value of theassets invested in such country, plus VAT (if any), together with charges at normal commercial rates in respect of investment transactions, asagreed with the SICAV from time to time. Sub-custodian fees are paid out of these safekeeping and servicing fees.
Capped FundsThe Management Company has agreed to cap operational expenses charged to the following sub-funds at its discretion, at the following annualrates: Cap on OperationalSub-fund Date since capping is in place ExpensesInvesco Gold & Precious Metals Fund 21/06/2010 0.15%Invesco Global Unconstrained Bond Fund 21/06/2010 0.05%Invesco Latin American Equity Fund 11/08/2010 0.15%Invesco Pan European Equity Income Fund 01/09/2010 0.05%Invesco Global Investment Grade Corporate Bond Fund 09/10/2009 0.05%Invesco Euro Short Term Bond Fund 04/05/2011 0.05%Invesco Pan European Focus Equity Fund 07/07/2011 0.15%Invesco China Focus Equity Fund 15/12/2011 0.05%Invesco Asian Bond Fund 15/12/2011 0.05%Invesco Global Income Real Estate Securities Fund 01/03/2012 0.05%Invesco US Equity Fund 27/06/2012 0.15%Invesco Asian Focus Equity Fund 27/06/2012 0.20%Invesco US High Yield Bond Fund 27/06/2012 0.20%Invesco Renminbi Fixed Income Fund 27/06/2012 0.15%Invesco India Bond Fund 23/04/2014 0.10%Invesco Active Multi-Sector Credit Fund* 18/09/2014 0.10%
*Cap is on the operational expenses which are inclusive of custodian and custody transaction charges.
Notes to the Financial Statements (continued)
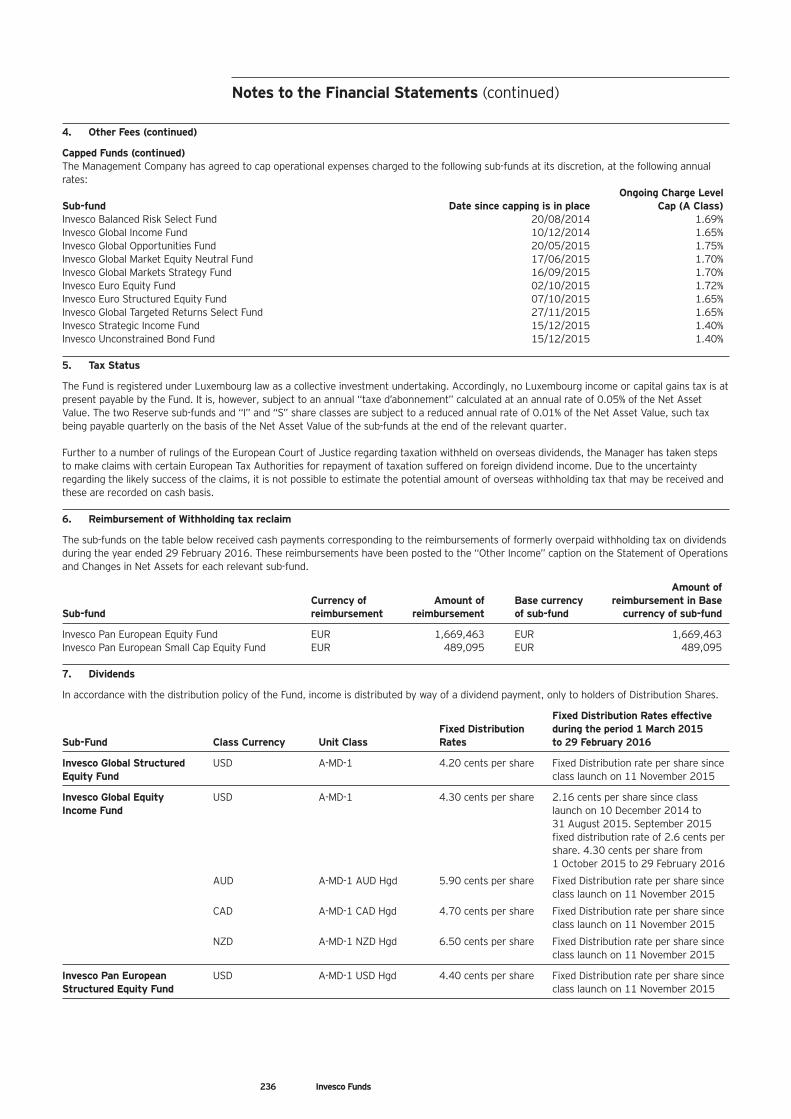
236 Invesco Funds
4. Other Fees (continued)
Capped Funds (continued)The Management Company has agreed to cap operational expenses charged to the following sub-funds at its discretion, at the following annualrates: Ongoing Charge LevelSub-fund Date since capping is in place Cap (A Class)Invesco Balanced Risk Select Fund 20/08/2014 1.69%Invesco Global Income Fund 10/12/2014 1.65%Invesco Global Opportunities Fund 20/05/2015 1.75%Invesco Global Market Equity Neutral Fund 17/06/2015 1.70%Invesco Global Markets Strategy Fund 16/09/2015 1.70%Invesco Euro Equity Fund 02/10/2015 1.72%Invesco Euro Structured Equity Fund 07/10/2015 1.65%Invesco Global Targeted Returns Select Fund 27/11/2015 1.65%Invesco Strategic Income Fund 15/12/2015 1.40%Invesco Unconstrained Bond Fund 15/12/2015 1.40%
5. Tax Status
The Fund is registered under Luxembourg law as a collective investment undertaking. Accordingly, no Luxembourg income or capital gains tax is atpresent payable by the Fund. It is, however, subject to an annual “taxe d’abonnement” calculated at an annual rate of 0.05% of the Net AssetValue. The two Reserve sub-funds and “I” and “S” share classes are subject to a reduced annual rate of 0.01% of the Net Asset Value, such taxbeing payable quarterly on the basis of the Net Asset Value of the sub-funds at the end of the relevant quarter.
Further to a number of rulings of the European Court of Justice regarding taxation withheld on overseas dividends, the Manager has taken stepsto make claims with certain European Tax Authorities for repayment of taxation suffered on foreign dividend income. Due to the uncertaintyregarding the likely success of the claims, it is not possible to estimate the potential amount of overseas withholding tax that may be received andthese are recorded on cash basis.
6. Reimbursement of Withholding tax reclaim
The sub-funds on the table below received cash payments corresponding to the reimbursements of formerly overpaid withholding tax on dividendsduring the year ended 29 February 2016. These reimbursements have been posted to the “Other Income” caption on the Statement of Operationsand Changes in Net Assets for each relevant sub-fund.
Amount of Currency of Amount of Base currency reimbursement in Base Sub-fund reimbursement reimbursement of sub-fund currency of sub-fund
Invesco Pan European Equity Fund EUR 1,669,463 EUR 1,669,463Invesco Pan European Small Cap Equity Fund EUR 489,095 EUR 489,095
7. Dividends
In accordance with the distribution policy of the Fund, income is distributed by way of a dividend payment, only to holders of Distribution Shares.
Fixed Distribution Rates effective Fixed Distribution during the period 1 March 2015
Sub-Fund Class Currency Unit Class Rates to 29 February 2016
Invesco Global Structured USD A-MD-1 4.20 cents per share Fixed Distribution rate per share sinceEquity Fund class launch on 11 November 2015
Invesco Global Equity USD A-MD-1 4.30 cents per share 2.16 cents per share since class Income Fund launch on 10 December 2014 to
31 August 2015. September 2015fixed distribution rate of 2.6 cents pershare. 4.30 cents per share from1 October 2015 to 29 February 2016
AUD A-MD-1 AUD Hgd 5.90 cents per share Fixed Distribution rate per share sinceclass launch on 11 November 2015
CAD A-MD-1 CAD Hgd 4.70 cents per share Fixed Distribution rate per share sinceclass launch on 11 November 2015
NZD A-MD-1 NZD Hgd 6.50 cents per share Fixed Distribution rate per share sinceclass launch on 11 November 2015
Invesco Pan European USD A-MD-1 USD Hgd 4.40 cents per share Fixed Distribution rate per share sinceStructured Equity Fund class launch on 11 November 2015
Notes to the Financial Statements (continued)
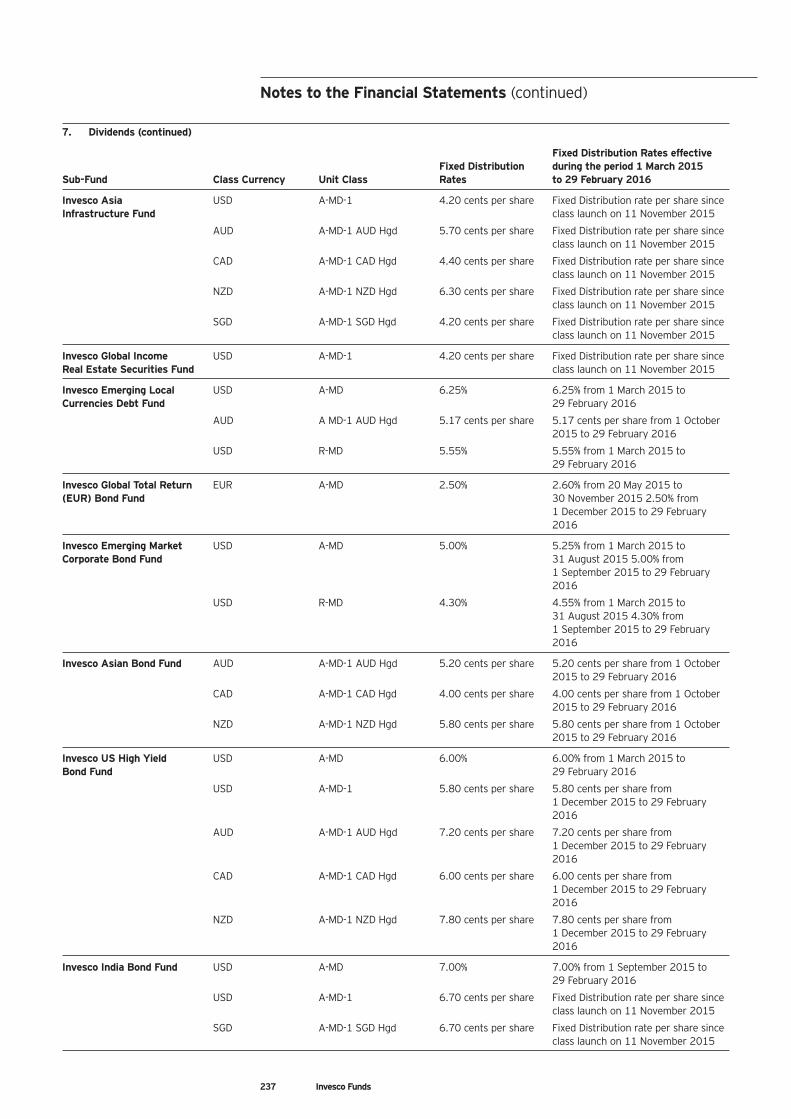
237 Invesco Funds
7. Dividends (continued)
Fixed Distribution Rates effective Fixed Distribution during the period 1 March 2015
Sub-Fund Class Currency Unit Class Rates to 29 February 2016
Invesco Asia USD A-MD-1 4.20 cents per share Fixed Distribution rate per share sinceInfrastructure Fund class launch on 11 November 2015
AUD A-MD-1 AUD Hgd 5.70 cents per share Fixed Distribution rate per share sinceclass launch on 11 November 2015
CAD A-MD-1 CAD Hgd 4.40 cents per share Fixed Distribution rate per share sinceclass launch on 11 November 2015
NZD A-MD-1 NZD Hgd 6.30 cents per share Fixed Distribution rate per share sinceclass launch on 11 November 2015
SGD A-MD-1 SGD Hgd 4.20 cents per share Fixed Distribution rate per share sinceclass launch on 11 November 2015
Invesco Global Income USD A-MD-1 4.20 cents per share Fixed Distribution rate per share sinceReal Estate Securities Fund class launch on 11 November 2015
Invesco Emerging Local USD A-MD 6.25% 6.25% from 1 March 2015 to Currencies Debt Fund 29 February 2016
AUD A MD-1 AUD Hgd 5.17 cents per share 5.17 cents per share from 1 October2015 to 29 February 2016
USD R-MD 5.55% 5.55% from 1 March 2015 to29 February 2016
Invesco Global Total Return EUR A-MD 2.50% 2.60% from 20 May 2015 to (EUR) Bond Fund 30 November 2015 2.50% from
1 December 2015 to 29 February2016
Invesco Emerging Market USD A-MD 5.00% 5.25% from 1 March 2015 to Corporate Bond Fund 31 August 2015 5.00% from
1 September 2015 to 29 February2016
USD R-MD 4.30% 4.55% from 1 March 2015 to31 August 2015 4.30% from1 September 2015 to 29 February2016
Invesco Asian Bond Fund AUD A-MD-1 AUD Hgd 5.20 cents per share 5.20 cents per share from 1 October2015 to 29 February 2016
CAD A-MD-1 CAD Hgd 4.00 cents per share 4.00 cents per share from 1 October2015 to 29 February 2016
NZD A-MD-1 NZD Hgd 5.80 cents per share 5.80 cents per share from 1 October2015 to 29 February 2016
Invesco US High Yield USD A-MD 6.00% 6.00% from 1 March 2015 to Bond Fund 29 February 2016
USD A-MD-1 5.80 cents per share 5.80 cents per share from1 December 2015 to 29 February2016
AUD A-MD-1 AUD Hgd 7.20 cents per share 7.20 cents per share from1 December 2015 to 29 February2016
CAD A-MD-1 CAD Hgd 6.00 cents per share 6.00 cents per share from1 December 2015 to 29 February2016
NZD A-MD-1 NZD Hgd 7.80 cents per share 7.80 cents per share from1 December 2015 to 29 February2016
Invesco India Bond Fund USD A-MD 7.00% 7.00% from 1 September 2015 to29 February 2016
USD A-MD-1 6.70 cents per share Fixed Distribution rate per share sinceclass launch on 11 November 2015
SGD A-MD-1 SGD Hgd 6.70 cents per share Fixed Distribution rate per share sinceclass launch on 11 November 2015
Notes to the Financial Statements (continued)
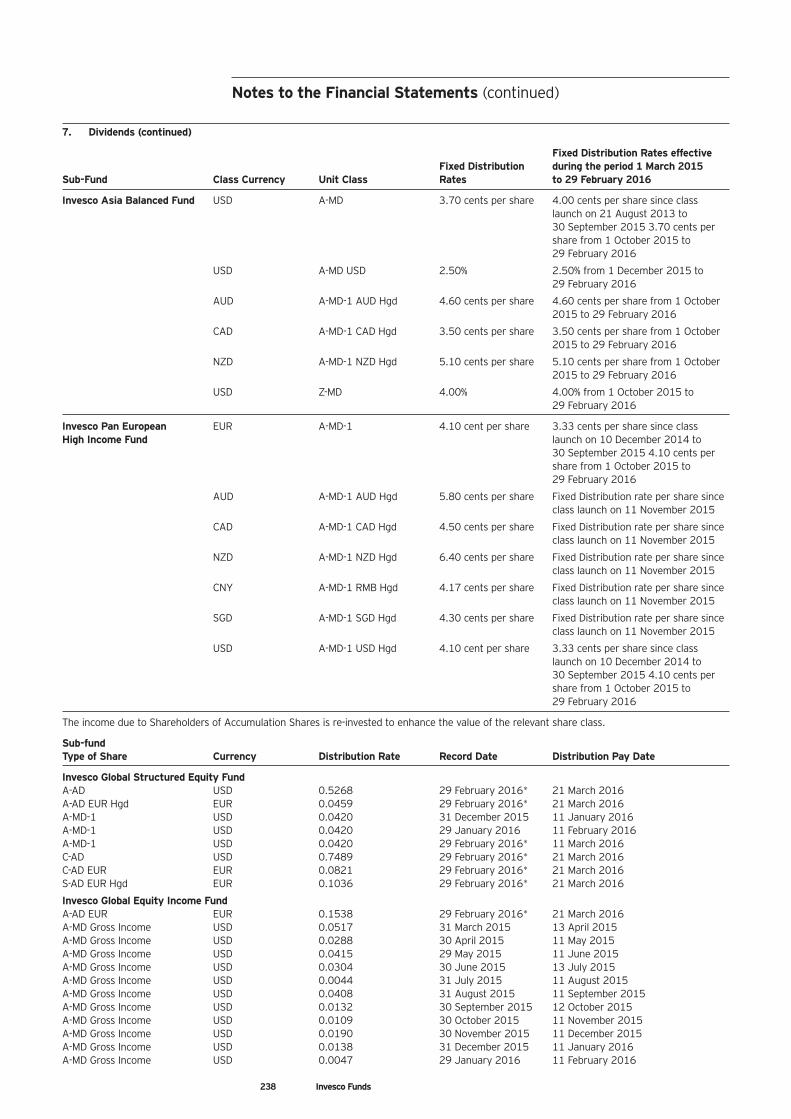
238 Invesco Funds
7. Dividends (continued)
Fixed Distribution Rates effective Fixed Distribution during the period 1 March 2015
Sub-Fund Class Currency Unit Class Rates to 29 February 2016
Invesco Asia Balanced Fund USD A-MD 3.70 cents per share 4.00 cents per share since classlaunch on 21 August 2013 to30 September 2015 3.70 cents pershare from 1 October 2015 to29 February 2016
USD A-MD USD 2.50% 2.50% from 1 December 2015 to29 February 2016
AUD A-MD-1 AUD Hgd 4.60 cents per share 4.60 cents per share from 1 October2015 to 29 February 2016
CAD A-MD-1 CAD Hgd 3.50 cents per share 3.50 cents per share from 1 October2015 to 29 February 2016
NZD A-MD-1 NZD Hgd 5.10 cents per share 5.10 cents per share from 1 October2015 to 29 February 2016
USD Z-MD 4.00% 4.00% from 1 October 2015 to29 February 2016
Invesco Pan European EUR A-MD-1 4.10 cent per share 3.33 cents per share since class High Income Fund launch on 10 December 2014 to
30 September 2015 4.10 cents pershare from 1 October 2015 to29 February 2016
AUD A-MD-1 AUD Hgd 5.80 cents per share Fixed Distribution rate per share sinceclass launch on 11 November 2015
CAD A-MD-1 CAD Hgd 4.50 cents per share Fixed Distribution rate per share sinceclass launch on 11 November 2015
NZD A-MD-1 NZD Hgd 6.40 cents per share Fixed Distribution rate per share sinceclass launch on 11 November 2015
CNY A-MD-1 RMB Hgd 4.17 cents per share Fixed Distribution rate per share sinceclass launch on 11 November 2015
SGD A-MD-1 SGD Hgd 4.30 cents per share Fixed Distribution rate per share sinceclass launch on 11 November 2015
USD A-MD-1 USD Hgd 4.10 cent per share 3.33 cents per share since classlaunch on 10 December 2014 to30 September 2015 4.10 cents pershare from 1 October 2015 to29 February 2016
The income due to Shareholders of Accumulation Shares is re-invested to enhance the value of the relevant share class.
Sub-fundType of Share Currency Distribution Rate Record Date Distribution Pay Date
Invesco Global Structured Equity Fund A-AD USD 0.5268 29 February 2016* 21 March 2016A-AD EUR Hgd EUR 0.0459 29 February 2016* 21 March 2016A-MD-1 USD 0.0420 31 December 2015 11 January 2016A-MD-1 USD 0.0420 29 January 2016 11 February 2016A-MD-1 USD 0.0420 29 February 2016* 11 March 2016C-AD USD 0.7489 29 February 2016* 21 March 2016C-AD EUR EUR 0.0821 29 February 2016* 21 March 2016S-AD EUR Hgd EUR 0.1036 29 February 2016* 21 March 2016
Invesco Global Equity Income Fund A-AD EUR EUR 0.1538 29 February 2016* 21 March 2016A-MD Gross Income USD 0.0517 31 March 2015 13 April 2015A-MD Gross Income USD 0.0288 30 April 2015 11 May 2015A-MD Gross Income USD 0.0415 29 May 2015 11 June 2015A-MD Gross Income USD 0.0304 30 June 2015 13 July 2015A-MD Gross Income USD 0.0044 31 July 2015 11 August 2015A-MD Gross Income USD 0.0408 31 August 2015 11 September 2015A-MD Gross Income USD 0.0132 30 September 2015 12 October 2015A-MD Gross Income USD 0.0109 30 October 2015 11 November 2015A-MD Gross Income USD 0.0190 30 November 2015 11 December 2015A-MD Gross Income USD 0.0138 31 December 2015 11 January 2016A-MD Gross Income USD 0.0047 29 January 2016 11 February 2016
Notes to the Financial Statements (continued)
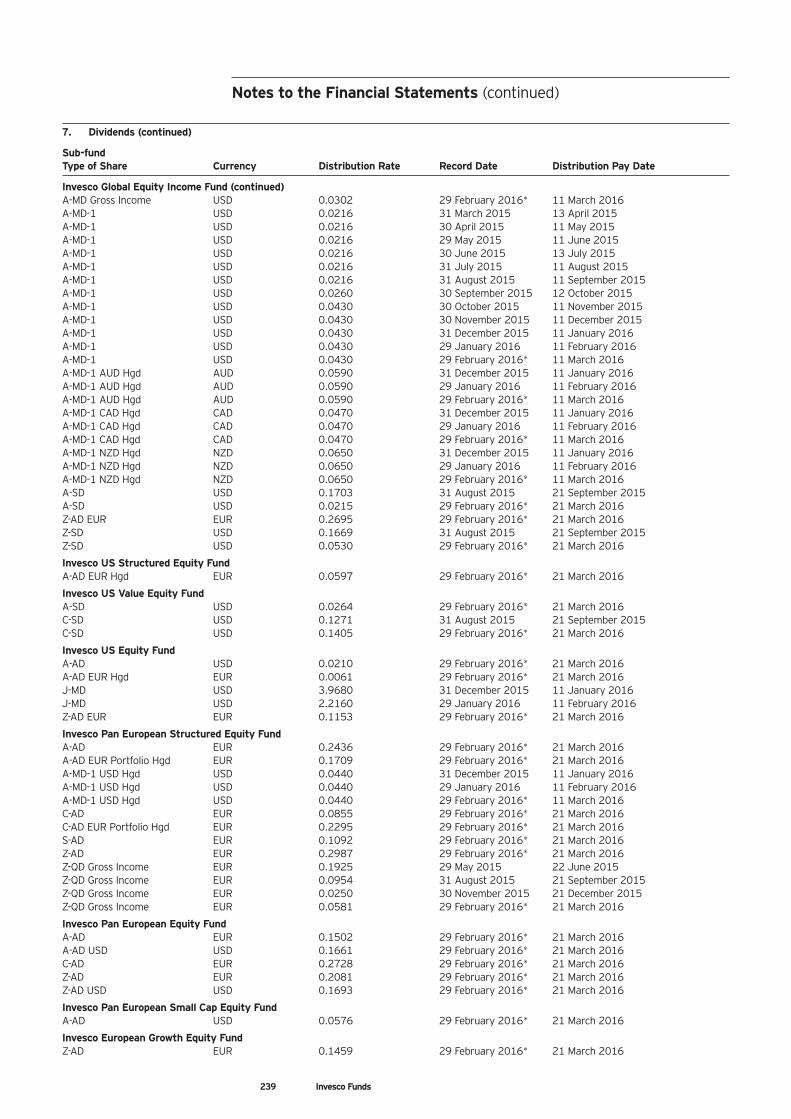
239 Invesco Funds
7. Dividends (continued)
Sub-fundType of Share Currency Distribution Rate Record Date Distribution Pay Date
Invesco Global Equity Income Fund (continued)A-MD Gross Income USD 0.0302 29 February 2016* 11 March 2016A-MD-1 USD 0.0216 31 March 2015 13 April 2015A-MD-1 USD 0.0216 30 April 2015 11 May 2015A-MD-1 USD 0.0216 29 May 2015 11 June 2015A-MD-1 USD 0.0216 30 June 2015 13 July 2015A-MD-1 USD 0.0216 31 July 2015 11 August 2015A-MD-1 USD 0.0216 31 August 2015 11 September 2015A-MD-1 USD 0.0260 30 September 2015 12 October 2015A-MD-1 USD 0.0430 30 October 2015 11 November 2015A-MD-1 USD 0.0430 30 November 2015 11 December 2015A-MD-1 USD 0.0430 31 December 2015 11 January 2016A-MD-1 USD 0.0430 29 January 2016 11 February 2016A-MD-1 USD 0.0430 29 February 2016* 11 March 2016A-MD-1 AUD Hgd AUD 0.0590 31 December 2015 11 January 2016A-MD-1 AUD Hgd AUD 0.0590 29 January 2016 11 February 2016A-MD-1 AUD Hgd AUD 0.0590 29 February 2016* 11 March 2016A-MD-1 CAD Hgd CAD 0.0470 31 December 2015 11 January 2016A-MD-1 CAD Hgd CAD 0.0470 29 January 2016 11 February 2016A-MD-1 CAD Hgd CAD 0.0470 29 February 2016* 11 March 2016A-MD-1 NZD Hgd NZD 0.0650 31 December 2015 11 January 2016A-MD-1 NZD Hgd NZD 0.0650 29 January 2016 11 February 2016A-MD-1 NZD Hgd NZD 0.0650 29 February 2016* 11 March 2016A-SD USD 0.1703 31 August 2015 21 September 2015A-SD USD 0.0215 29 February 2016* 21 March 2016Z-AD EUR EUR 0.2695 29 February 2016* 21 March 2016Z-SD USD 0.1669 31 August 2015 21 September 2015Z-SD USD 0.0530 29 February 2016* 21 March 2016
Invesco US Structured Equity Fund A-AD EUR Hgd EUR 0.0597 29 February 2016* 21 March 2016
Invesco US Value Equity Fund A-SD USD 0.0264 29 February 2016* 21 March 2016C-SD USD 0.1271 31 August 2015 21 September 2015C-SD USD 0.1405 29 February 2016* 21 March 2016
Invesco US Equity FundA-AD USD 0.0210 29 February 2016* 21 March 2016A-AD EUR Hgd EUR 0.0061 29 February 2016* 21 March 2016J-MD USD 3.9680 31 December 2015 11 January 2016J-MD USD 2.2160 29 January 2016 11 February 2016Z-AD EUR EUR 0.1153 29 February 2016* 21 March 2016
Invesco Pan European Structured Equity Fund A-AD EUR 0.2436 29 February 2016* 21 March 2016A-AD EUR Portfolio Hgd EUR 0.1709 29 February 2016* 21 March 2016A-MD-1 USD Hgd USD 0.0440 31 December 2015 11 January 2016A-MD-1 USD Hgd USD 0.0440 29 January 2016 11 February 2016A-MD-1 USD Hgd USD 0.0440 29 February 2016* 11 March 2016C-AD EUR 0.0855 29 February 2016* 21 March 2016C-AD EUR Portfolio Hgd EUR 0.2295 29 February 2016* 21 March 2016S-AD EUR 0.1092 29 February 2016* 21 March 2016Z-AD EUR 0.2987 29 February 2016* 21 March 2016Z-QD Gross Income EUR 0.1925 29 May 2015 22 June 2015Z-QD Gross Income EUR 0.0954 31 August 2015 21 September 2015Z-QD Gross Income EUR 0.0250 30 November 2015 21 December 2015Z-QD Gross Income EUR 0.0581 29 February 2016* 21 March 2016
Invesco Pan European Equity Fund A-AD EUR 0.1502 29 February 2016* 21 March 2016A-AD USD USD 0.1661 29 February 2016* 21 March 2016C-AD EUR 0.2728 29 February 2016* 21 March 2016Z-AD EUR 0.2081 29 February 2016* 21 March 2016Z-AD USD USD 0.1693 29 February 2016* 21 March 2016
Invesco Pan European Small Cap Equity FundA-AD USD 0.0576 29 February 2016* 21 March 2016
Invesco European Growth Equity Fund Z-AD EUR 0.1459 29 February 2016* 21 March 2016
Notes to the Financial Statements (continued)
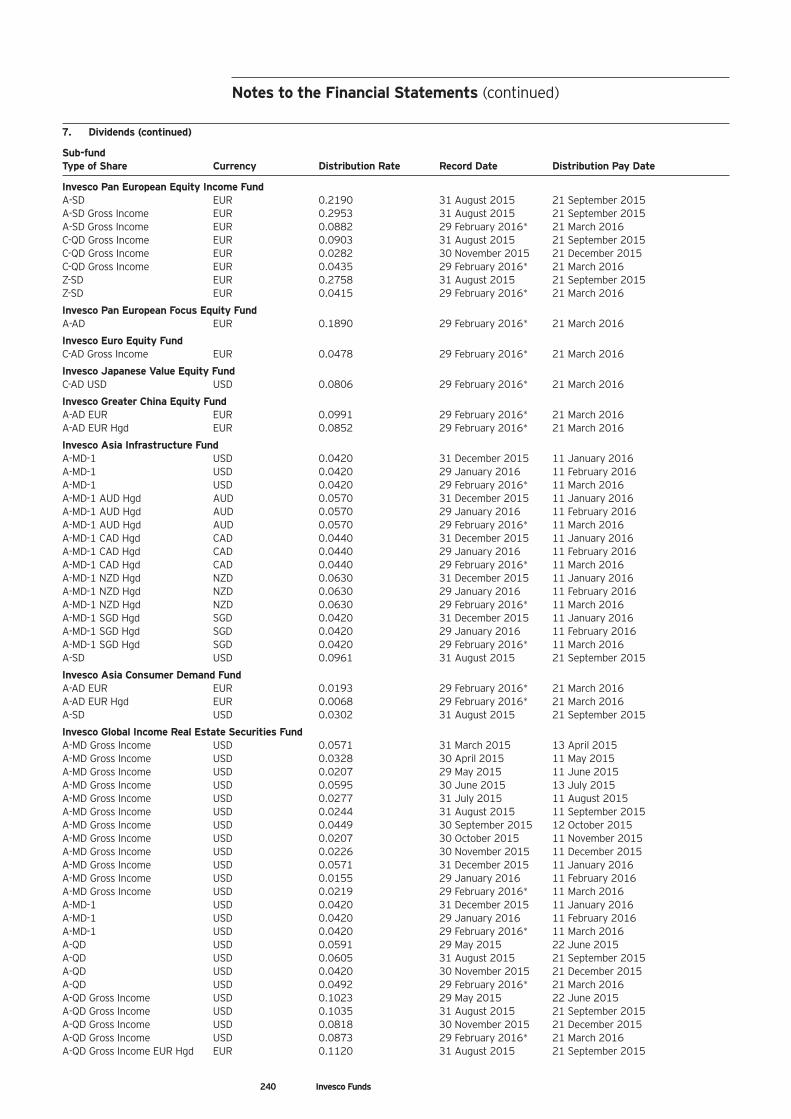
240 Invesco Funds
7. Dividends (continued)
Sub-fundType of Share Currency Distribution Rate Record Date Distribution Pay Date
Invesco Pan European Equity Income FundA-SD EUR 0.2190 31 August 2015 21 September 2015A-SD Gross Income EUR 0.2953 31 August 2015 21 September 2015A-SD Gross Income EUR 0.0882 29 February 2016* 21 March 2016C-QD Gross Income EUR 0.0903 31 August 2015 21 September 2015C-QD Gross Income EUR 0.0282 30 November 2015 21 December 2015C-QD Gross Income EUR 0.0435 29 February 2016* 21 March 2016Z-SD EUR 0.2758 31 August 2015 21 September 2015Z-SD EUR 0.0415 29 February 2016* 21 March 2016
Invesco Pan European Focus Equity Fund A-AD EUR 0.1890 29 February 2016* 21 March 2016
Invesco Euro Equity FundC-AD Gross Income EUR 0.0478 29 February 2016* 21 March 2016
Invesco Japanese Value Equity Fund C-AD USD USD 0.0806 29 February 2016* 21 March 2016
Invesco Greater China Equity Fund A-AD EUR EUR 0.0991 29 February 2016* 21 March 2016A-AD EUR Hgd EUR 0.0852 29 February 2016* 21 March 2016
Invesco Asia Infrastructure FundA-MD-1 USD 0.0420 31 December 2015 11 January 2016A-MD-1 USD 0.0420 29 January 2016 11 February 2016A-MD-1 USD 0.0420 29 February 2016* 11 March 2016A-MD-1 AUD Hgd AUD 0.0570 31 December 2015 11 January 2016A-MD-1 AUD Hgd AUD 0.0570 29 January 2016 11 February 2016A-MD-1 AUD Hgd AUD 0.0570 29 February 2016* 11 March 2016A-MD-1 CAD Hgd CAD 0.0440 31 December 2015 11 January 2016A-MD-1 CAD Hgd CAD 0.0440 29 January 2016 11 February 2016A-MD-1 CAD Hgd CAD 0.0440 29 February 2016* 11 March 2016A-MD-1 NZD Hgd NZD 0.0630 31 December 2015 11 January 2016A-MD-1 NZD Hgd NZD 0.0630 29 January 2016 11 February 2016A-MD-1 NZD Hgd NZD 0.0630 29 February 2016* 11 March 2016A-MD-1 SGD Hgd SGD 0.0420 31 December 2015 11 January 2016A-MD-1 SGD Hgd SGD 0.0420 29 January 2016 11 February 2016A-MD-1 SGD Hgd SGD 0.0420 29 February 2016* 11 March 2016A-SD USD 0.0961 31 August 2015 21 September 2015
Invesco Asia Consumer Demand Fund A-AD EUR EUR 0.0193 29 February 2016* 21 March 2016A-AD EUR Hgd EUR 0.0068 29 February 2016* 21 March 2016A-SD USD 0.0302 31 August 2015 21 September 2015
Invesco Global Income Real Estate Securities FundA-MD Gross Income USD 0.0571 31 March 2015 13 April 2015A-MD Gross Income USD 0.0328 30 April 2015 11 May 2015A-MD Gross Income USD 0.0207 29 May 2015 11 June 2015A-MD Gross Income USD 0.0595 30 June 2015 13 July 2015A-MD Gross Income USD 0.0277 31 July 2015 11 August 2015A-MD Gross Income USD 0.0244 31 August 2015 11 September 2015A-MD Gross Income USD 0.0449 30 September 2015 12 October 2015A-MD Gross Income USD 0.0207 30 October 2015 11 November 2015A-MD Gross Income USD 0.0226 30 November 2015 11 December 2015A-MD Gross Income USD 0.0571 31 December 2015 11 January 2016A-MD Gross Income USD 0.0155 29 January 2016 11 February 2016A-MD Gross Income USD 0.0219 29 February 2016* 11 March 2016A-MD-1 USD 0.0420 31 December 2015 11 January 2016A-MD-1 USD 0.0420 29 January 2016 11 February 2016A-MD-1 USD 0.0420 29 February 2016* 11 March 2016A-QD USD 0.0591 29 May 2015 22 June 2015A-QD USD 0.0605 31 August 2015 21 September 2015A-QD USD 0.0420 30 November 2015 21 December 2015A-QD USD 0.0492 29 February 2016* 21 March 2016A-QD Gross Income USD 0.1023 29 May 2015 22 June 2015A-QD Gross Income USD 0.1035 31 August 2015 21 September 2015A-QD Gross Income USD 0.0818 30 November 2015 21 December 2015A-QD Gross Income USD 0.0873 29 February 2016* 21 March 2016A-QD Gross Income EUR Hgd EUR 0.1120 31 August 2015 21 September 2015
Notes to the Financial Statements (continued)
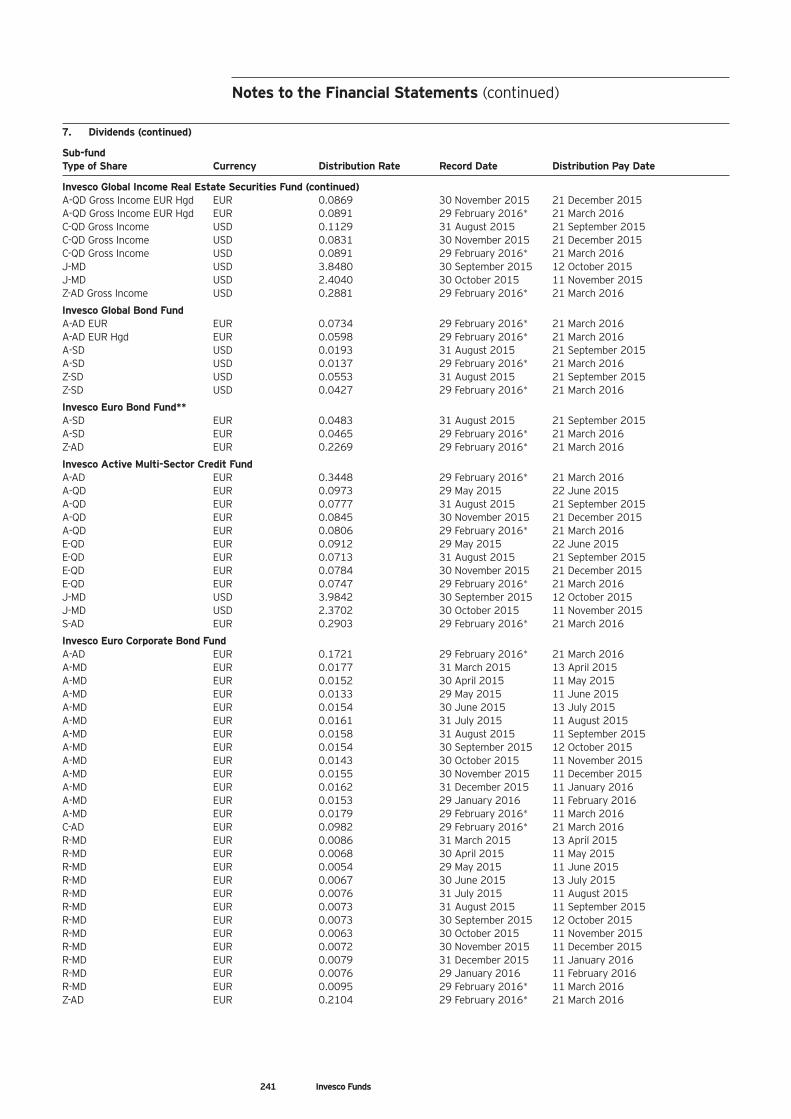
241 Invesco Funds
7. Dividends (continued)
Sub-fundType of Share Currency Distribution Rate Record Date Distribution Pay Date
Invesco Global Income Real Estate Securities Fund (continued)A-QD Gross Income EUR Hgd EUR 0.0869 30 November 2015 21 December 2015A-QD Gross Income EUR Hgd EUR 0.0891 29 February 2016* 21 March 2016C-QD Gross Income USD 0.1129 31 August 2015 21 September 2015C-QD Gross Income USD 0.0831 30 November 2015 21 December 2015C-QD Gross Income USD 0.0891 29 February 2016* 21 March 2016J-MD USD 3.8480 30 September 2015 12 October 2015J-MD USD 2.4040 30 October 2015 11 November 2015Z-AD Gross Income USD 0.2881 29 February 2016* 21 March 2016
Invesco Global Bond Fund A-AD EUR EUR 0.0734 29 February 2016* 21 March 2016A-AD EUR Hgd EUR 0.0598 29 February 2016* 21 March 2016A-SD USD 0.0193 31 August 2015 21 September 2015A-SD USD 0.0137 29 February 2016* 21 March 2016Z-SD USD 0.0553 31 August 2015 21 September 2015Z-SD USD 0.0427 29 February 2016* 21 March 2016
Invesco Euro Bond Fund** A-SD EUR 0.0483 31 August 2015 21 September 2015A-SD EUR 0.0465 29 February 2016* 21 March 2016Z-AD EUR 0.2269 29 February 2016* 21 March 2016
Invesco Active Multi-Sector Credit FundA-AD EUR 0.3448 29 February 2016* 21 March 2016A-QD EUR 0.0973 29 May 2015 22 June 2015A-QD EUR 0.0777 31 August 2015 21 September 2015A-QD EUR 0.0845 30 November 2015 21 December 2015A-QD EUR 0.0806 29 February 2016* 21 March 2016E-QD EUR 0.0912 29 May 2015 22 June 2015E-QD EUR 0.0713 31 August 2015 21 September 2015E-QD EUR 0.0784 30 November 2015 21 December 2015E-QD EUR 0.0747 29 February 2016* 21 March 2016J-MD USD 3.9842 30 September 2015 12 October 2015J-MD USD 2.3702 30 October 2015 11 November 2015S-AD EUR 0.2903 29 February 2016* 21 March 2016
Invesco Euro Corporate Bond FundA-AD EUR 0.1721 29 February 2016* 21 March 2016A-MD EUR 0.0177 31 March 2015 13 April 2015A-MD EUR 0.0152 30 April 2015 11 May 2015A-MD EUR 0.0133 29 May 2015 11 June 2015A-MD EUR 0.0154 30 June 2015 13 July 2015A-MD EUR 0.0161 31 July 2015 11 August 2015A-MD EUR 0.0158 31 August 2015 11 September 2015A-MD EUR 0.0154 30 September 2015 12 October 2015A-MD EUR 0.0143 30 October 2015 11 November 2015A-MD EUR 0.0155 30 November 2015 11 December 2015A-MD EUR 0.0162 31 December 2015 11 January 2016A-MD EUR 0.0153 29 January 2016 11 February 2016A-MD EUR 0.0179 29 February 2016* 11 March 2016C-AD EUR 0.0982 29 February 2016* 21 March 2016R-MD EUR 0.0086 31 March 2015 13 April 2015R-MD EUR 0.0068 30 April 2015 11 May 2015R-MD EUR 0.0054 29 May 2015 11 June 2015R-MD EUR 0.0067 30 June 2015 13 July 2015R-MD EUR 0.0076 31 July 2015 11 August 2015R-MD EUR 0.0073 31 August 2015 11 September 2015R-MD EUR 0.0073 30 September 2015 12 October 2015R-MD EUR 0.0063 30 October 2015 11 November 2015R-MD EUR 0.0072 30 November 2015 11 December 2015R-MD EUR 0.0079 31 December 2015 11 January 2016R-MD EUR 0.0076 29 January 2016 11 February 2016R-MD EUR 0.0095 29 February 2016* 11 March 2016Z-AD EUR 0.2104 29 February 2016* 21 March 2016
Notes to the Financial Statements (continued)
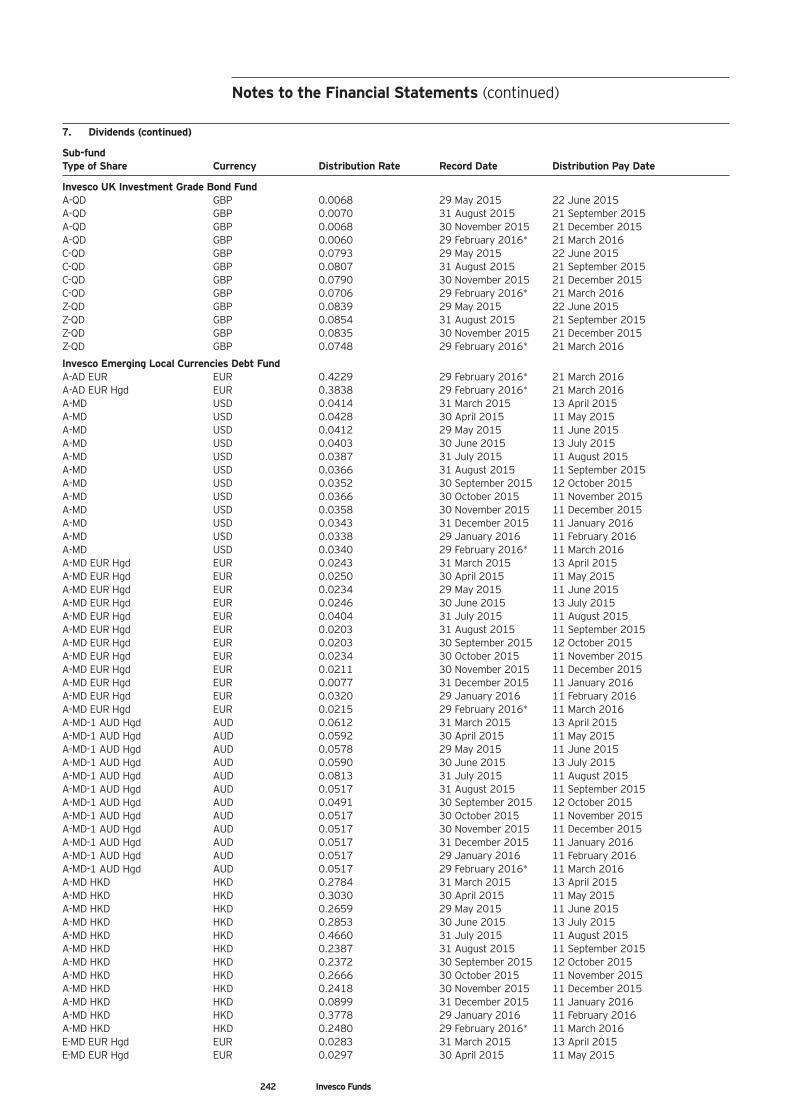
242 Invesco Funds
7. Dividends (continued)
Sub-fundType of Share Currency Distribution Rate Record Date Distribution Pay Date
Invesco UK Investment Grade Bond FundA-QD GBP 0.0068 29 May 2015 22 June 2015A-QD GBP 0.0070 31 August 2015 21 September 2015A-QD GBP 0.0068 30 November 2015 21 December 2015A-QD GBP 0.0060 29 February 2016* 21 March 2016C-QD GBP 0.0793 29 May 2015 22 June 2015C-QD GBP 0.0807 31 August 2015 21 September 2015C-QD GBP 0.0790 30 November 2015 21 December 2015C-QD GBP 0.0706 29 February 2016* 21 March 2016Z-QD GBP 0.0839 29 May 2015 22 June 2015Z-QD GBP 0.0854 31 August 2015 21 September 2015Z-QD GBP 0.0835 30 November 2015 21 December 2015Z-QD GBP 0.0748 29 February 2016* 21 March 2016
Invesco Emerging Local Currencies Debt FundA-AD EUR EUR 0.4229 29 February 2016* 21 March 2016A-AD EUR Hgd EUR 0.3838 29 February 2016* 21 March 2016A-MD USD 0.0414 31 March 2015 13 April 2015A-MD USD 0.0428 30 April 2015 11 May 2015A-MD USD 0.0412 29 May 2015 11 June 2015A-MD USD 0.0403 30 June 2015 13 July 2015A-MD USD 0.0387 31 July 2015 11 August 2015A-MD USD 0.0366 31 August 2015 11 September 2015A-MD USD 0.0352 30 September 2015 12 October 2015A-MD USD 0.0366 30 October 2015 11 November 2015A-MD USD 0.0358 30 November 2015 11 December 2015A-MD USD 0.0343 31 December 2015 11 January 2016A-MD USD 0.0338 29 January 2016 11 February 2016A-MD USD 0.0340 29 February 2016* 11 March 2016A-MD EUR Hgd EUR 0.0243 31 March 2015 13 April 2015A-MD EUR Hgd EUR 0.0250 30 April 2015 11 May 2015A-MD EUR Hgd EUR 0.0234 29 May 2015 11 June 2015A-MD EUR Hgd EUR 0.0246 30 June 2015 13 July 2015A-MD EUR Hgd EUR 0.0404 31 July 2015 11 August 2015A-MD EUR Hgd EUR 0.0203 31 August 2015 11 September 2015A-MD EUR Hgd EUR 0.0203 30 September 2015 12 October 2015A-MD EUR Hgd EUR 0.0234 30 October 2015 11 November 2015A-MD EUR Hgd EUR 0.0211 30 November 2015 11 December 2015A-MD EUR Hgd EUR 0.0077 31 December 2015 11 January 2016A-MD EUR Hgd EUR 0.0320 29 January 2016 11 February 2016A-MD EUR Hgd EUR 0.0215 29 February 2016* 11 March 2016A-MD-1 AUD Hgd AUD 0.0612 31 March 2015 13 April 2015A-MD-1 AUD Hgd AUD 0.0592 30 April 2015 11 May 2015A-MD-1 AUD Hgd AUD 0.0578 29 May 2015 11 June 2015A-MD-1 AUD Hgd AUD 0.0590 30 June 2015 13 July 2015A-MD-1 AUD Hgd AUD 0.0813 31 July 2015 11 August 2015A-MD-1 AUD Hgd AUD 0.0517 31 August 2015 11 September 2015A-MD-1 AUD Hgd AUD 0.0491 30 September 2015 12 October 2015A-MD-1 AUD Hgd AUD 0.0517 30 October 2015 11 November 2015A-MD-1 AUD Hgd AUD 0.0517 30 November 2015 11 December 2015A-MD-1 AUD Hgd AUD 0.0517 31 December 2015 11 January 2016A-MD-1 AUD Hgd AUD 0.0517 29 January 2016 11 February 2016A-MD-1 AUD Hgd AUD 0.0517 29 February 2016* 11 March 2016A-MD HKD HKD 0.2784 31 March 2015 13 April 2015A-MD HKD HKD 0.3030 30 April 2015 11 May 2015A-MD HKD HKD 0.2659 29 May 2015 11 June 2015A-MD HKD HKD 0.2853 30 June 2015 13 July 2015A-MD HKD HKD 0.4660 31 July 2015 11 August 2015A-MD HKD HKD 0.2387 31 August 2015 11 September 2015A-MD HKD HKD 0.2372 30 September 2015 12 October 2015A-MD HKD HKD 0.2666 30 October 2015 11 November 2015A-MD HKD HKD 0.2418 30 November 2015 11 December 2015A-MD HKD HKD 0.0899 31 December 2015 11 January 2016A-MD HKD HKD 0.3778 29 January 2016 11 February 2016A-MD HKD HKD 0.2480 29 February 2016* 11 March 2016E-MD EUR Hgd EUR 0.0283 31 March 2015 13 April 2015E-MD EUR Hgd EUR 0.0297 30 April 2015 11 May 2015
Notes to the Financial Statements (continued)
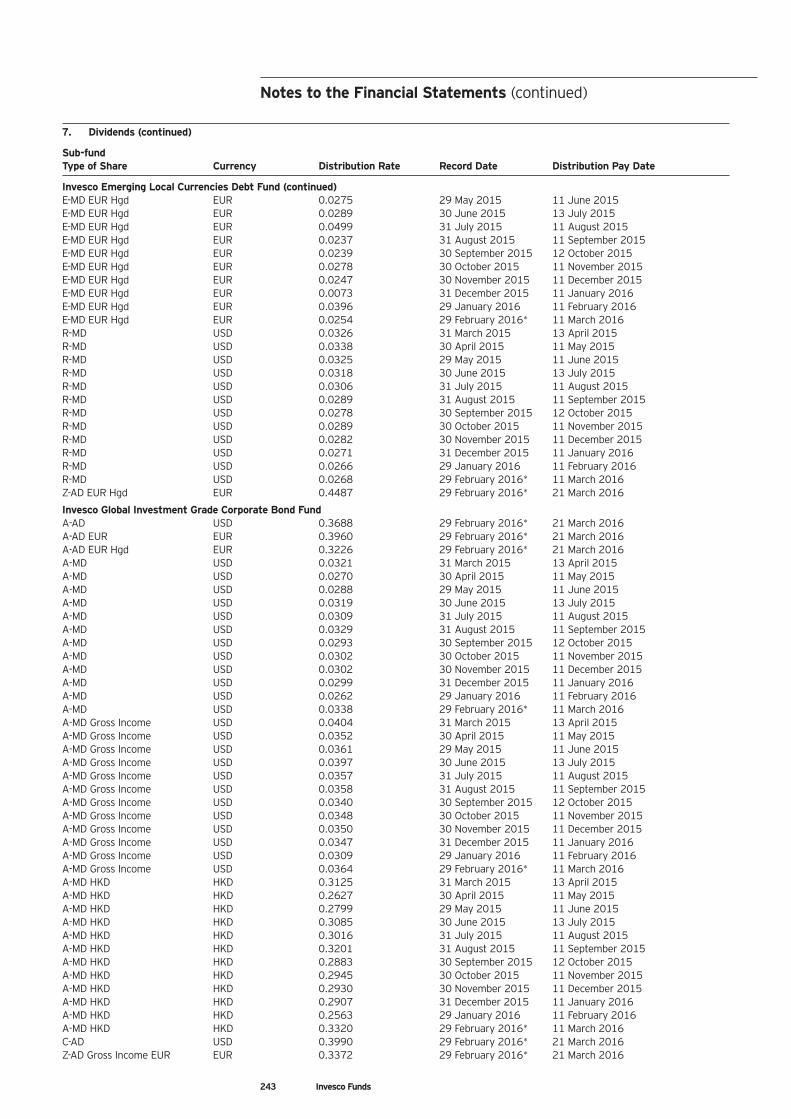
243 Invesco Funds
7. Dividends (continued)
Sub-fundType of Share Currency Distribution Rate Record Date Distribution Pay Date
Invesco Emerging Local Currencies Debt Fund (continued)E-MD EUR Hgd EUR 0.0275 29 May 2015 11 June 2015E-MD EUR Hgd EUR 0.0289 30 June 2015 13 July 2015E-MD EUR Hgd EUR 0.0499 31 July 2015 11 August 2015E-MD EUR Hgd EUR 0.0237 31 August 2015 11 September 2015E-MD EUR Hgd EUR 0.0239 30 September 2015 12 October 2015E-MD EUR Hgd EUR 0.0278 30 October 2015 11 November 2015E-MD EUR Hgd EUR 0.0247 30 November 2015 11 December 2015E-MD EUR Hgd EUR 0.0073 31 December 2015 11 January 2016E-MD EUR Hgd EUR 0.0396 29 January 2016 11 February 2016E-MD EUR Hgd EUR 0.0254 29 February 2016* 11 March 2016R-MD USD 0.0326 31 March 2015 13 April 2015R-MD USD 0.0338 30 April 2015 11 May 2015R-MD USD 0.0325 29 May 2015 11 June 2015R-MD USD 0.0318 30 June 2015 13 July 2015R-MD USD 0.0306 31 July 2015 11 August 2015R-MD USD 0.0289 31 August 2015 11 September 2015R-MD USD 0.0278 30 September 2015 12 October 2015R-MD USD 0.0289 30 October 2015 11 November 2015R-MD USD 0.0282 30 November 2015 11 December 2015R-MD USD 0.0271 31 December 2015 11 January 2016R-MD USD 0.0266 29 January 2016 11 February 2016R-MD USD 0.0268 29 February 2016* 11 March 2016Z-AD EUR Hgd EUR 0.4487 29 February 2016* 21 March 2016
Invesco Global Investment Grade Corporate Bond Fund A-AD USD 0.3688 29 February 2016* 21 March 2016A-AD EUR EUR 0.3960 29 February 2016* 21 March 2016A-AD EUR Hgd EUR 0.3226 29 February 2016* 21 March 2016A-MD USD 0.0321 31 March 2015 13 April 2015A-MD USD 0.0270 30 April 2015 11 May 2015A-MD USD 0.0288 29 May 2015 11 June 2015A-MD USD 0.0319 30 June 2015 13 July 2015A-MD USD 0.0309 31 July 2015 11 August 2015A-MD USD 0.0329 31 August 2015 11 September 2015A-MD USD 0.0293 30 September 2015 12 October 2015A-MD USD 0.0302 30 October 2015 11 November 2015A-MD USD 0.0302 30 November 2015 11 December 2015A-MD USD 0.0299 31 December 2015 11 January 2016A-MD USD 0.0262 29 January 2016 11 February 2016A-MD USD 0.0338 29 February 2016* 11 March 2016A-MD Gross Income USD 0.0404 31 March 2015 13 April 2015A-MD Gross Income USD 0.0352 30 April 2015 11 May 2015A-MD Gross Income USD 0.0361 29 May 2015 11 June 2015A-MD Gross Income USD 0.0397 30 June 2015 13 July 2015A-MD Gross Income USD 0.0357 31 July 2015 11 August 2015A-MD Gross Income USD 0.0358 31 August 2015 11 September 2015A-MD Gross Income USD 0.0340 30 September 2015 12 October 2015A-MD Gross Income USD 0.0348 30 October 2015 11 November 2015A-MD Gross Income USD 0.0350 30 November 2015 11 December 2015A-MD Gross Income USD 0.0347 31 December 2015 11 January 2016A-MD Gross Income USD 0.0309 29 January 2016 11 February 2016A-MD Gross Income USD 0.0364 29 February 2016* 11 March 2016A-MD HKD HKD 0.3125 31 March 2015 13 April 2015A-MD HKD HKD 0.2627 30 April 2015 11 May 2015A-MD HKD HKD 0.2799 29 May 2015 11 June 2015A-MD HKD HKD 0.3085 30 June 2015 13 July 2015A-MD HKD HKD 0.3016 31 July 2015 11 August 2015A-MD HKD HKD 0.3201 31 August 2015 11 September 2015A-MD HKD HKD 0.2883 30 September 2015 12 October 2015A-MD HKD HKD 0.2945 30 October 2015 11 November 2015A-MD HKD HKD 0.2930 30 November 2015 11 December 2015A-MD HKD HKD 0.2907 31 December 2015 11 January 2016A-MD HKD HKD 0.2563 29 January 2016 11 February 2016A-MD HKD HKD 0.3320 29 February 2016* 11 March 2016C-AD USD 0.3990 29 February 2016* 21 March 2016Z-AD Gross Income EUR EUR 0.3372 29 February 2016* 21 March 2016
Notes to the Financial Statements (continued)
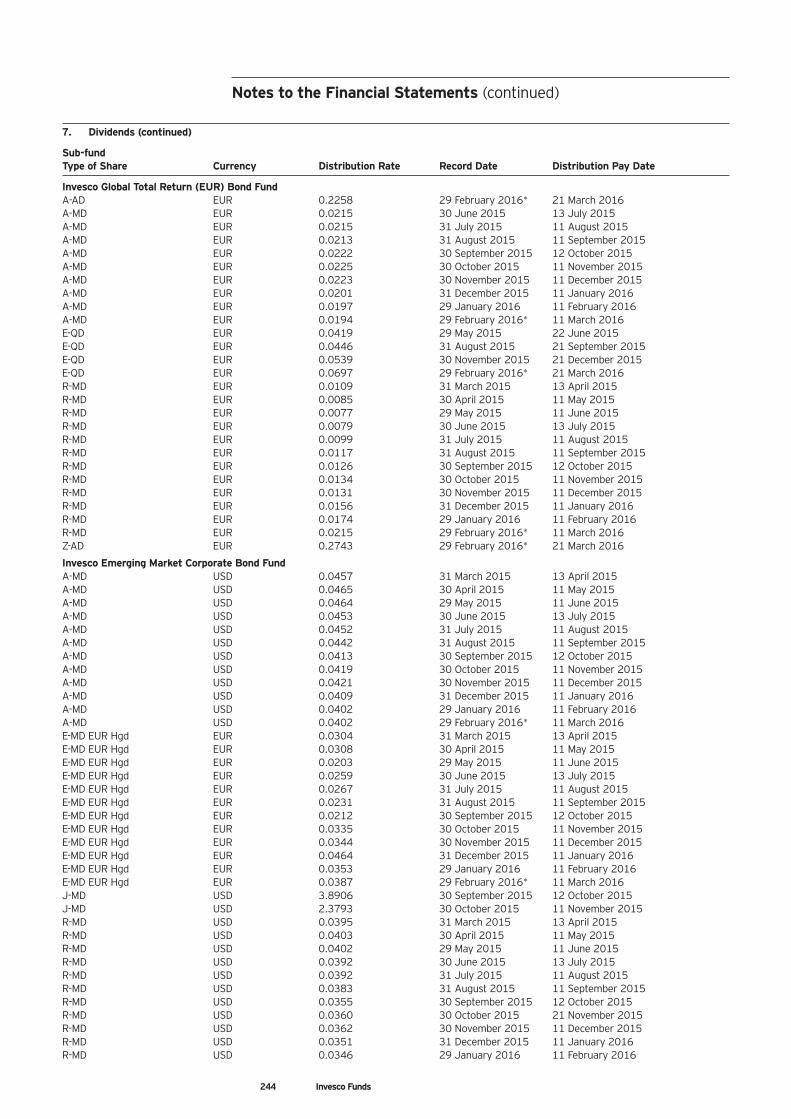
Notes to the Financial Statements (continued)
7. Dividends (continued)
Sub-fundType of Share Currency Distribution Rate Record Date Distribution Pay Date
Invesco Global Total Return (EUR) Bond Fund A-AD EUR 0.2258 29 February 2016* 21 March 2016A-MD EUR 0.0215 30 June 2015 13 July 2015A-MD EUR 0.0215 31 July 2015 11 August 2015A-MD EUR 0.0213 31 August 2015 11 September 2015A-MD EUR 0.0222 30 September 2015 12 October 2015A-MD EUR 0.0225 30 October 2015 11 November 2015A-MD EUR 0.0223 30 November 2015 11 December 2015A-MD EUR 0.0201 31 December 2015 11 January 2016A-MD EUR 0.0197 29 January 2016 11 February 2016A-MD EUR 0.0194 29 February 2016* 11 March 2016E-QD EUR 0.0419 29 May 2015 22 June 2015E-QD EUR 0.0446 31 August 2015 21 September 2015E-QD EUR 0.0539 30 November 2015 21 December 2015E-QD EUR 0.0697 29 February 2016* 21 March 2016R-MD EUR 0.0109 31 March 2015 13 April 2015R-MD EUR 0.0085 30 April 2015 11 May 2015R-MD EUR 0.0077 29 May 2015 11 June 2015R-MD EUR 0.0079 30 June 2015 13 July 2015R-MD EUR 0.0099 31 July 2015 11 August 2015R-MD EUR 0.0117 31 August 2015 11 September 2015R-MD EUR 0.0126 30 September 2015 12 October 2015R-MD EUR 0.0134 30 October 2015 11 November 2015R-MD EUR 0.0131 30 November 2015 11 December 2015R-MD EUR 0.0156 31 December 2015 11 January 2016R-MD EUR 0.0174 29 January 2016 11 February 2016R-MD EUR 0.0215 29 February 2016* 11 March 2016Z-AD EUR 0.2743 29 February 2016* 21 March 2016
Invesco Emerging Market Corporate Bond FundA-MD USD 0.0457 31 March 2015 13 April 2015A-MD USD 0.0465 30 April 2015 11 May 2015A-MD USD 0.0464 29 May 2015 11 June 2015A-MD USD 0.0453 30 June 2015 13 July 2015A-MD USD 0.0452 31 July 2015 11 August 2015A-MD USD 0.0442 31 August 2015 11 September 2015A-MD USD 0.0413 30 September 2015 12 October 2015A-MD USD 0.0419 30 October 2015 11 November 2015A-MD USD 0.0421 30 November 2015 11 December 2015A-MD USD 0.0409 31 December 2015 11 January 2016A-MD USD 0.0402 29 January 2016 11 February 2016A-MD USD 0.0402 29 February 2016* 11 March 2016E-MD EUR Hgd EUR 0.0304 31 March 2015 13 April 2015E-MD EUR Hgd EUR 0.0308 30 April 2015 11 May 2015E-MD EUR Hgd EUR 0.0203 29 May 2015 11 June 2015E-MD EUR Hgd EUR 0.0259 30 June 2015 13 July 2015E-MD EUR Hgd EUR 0.0267 31 July 2015 11 August 2015E-MD EUR Hgd EUR 0.0231 31 August 2015 11 September 2015E-MD EUR Hgd EUR 0.0212 30 September 2015 12 October 2015E-MD EUR Hgd EUR 0.0335 30 October 2015 11 November 2015E-MD EUR Hgd EUR 0.0344 30 November 2015 11 December 2015E-MD EUR Hgd EUR 0.0464 31 December 2015 11 January 2016E-MD EUR Hgd EUR 0.0353 29 January 2016 11 February 2016E-MD EUR Hgd EUR 0.0387 29 February 2016* 11 March 2016J-MD USD 3.8906 30 September 2015 12 October 2015J-MD USD 2.3793 30 October 2015 11 November 2015R-MD USD 0.0395 31 March 2015 13 April 2015R-MD USD 0.0403 30 April 2015 11 May 2015R-MD USD 0.0402 29 May 2015 11 June 2015R-MD USD 0.0392 30 June 2015 13 July 2015R-MD USD 0.0392 31 July 2015 11 August 2015R-MD USD 0.0383 31 August 2015 11 September 2015R-MD USD 0.0355 30 September 2015 12 October 2015R-MD USD 0.0360 30 October 2015 21 November 2015R-MD USD 0.0362 30 November 2015 11 December 2015R-MD USD 0.0351 31 December 2015 11 January 2016R-MD USD 0.0346 29 January 2016 11 February 2016
244 Invesco Funds
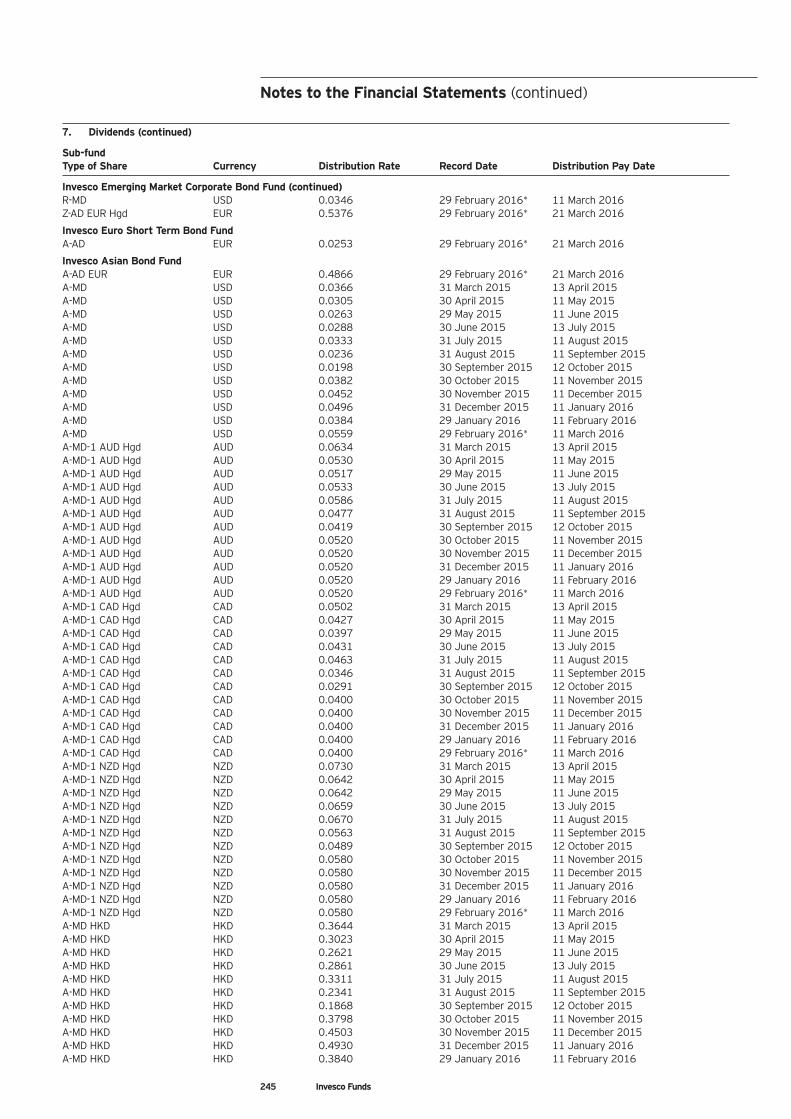
Notes to the Financial Statements (continued)
7. Dividends (continued)
Sub-fundType of Share Currency Distribution Rate Record Date Distribution Pay Date
Invesco Emerging Market Corporate Bond Fund (continued)R-MD USD 0.0346 29 February 2016* 11 March 2016Z-AD EUR Hgd EUR 0.5376 29 February 2016* 21 March 2016
Invesco Euro Short Term Bond FundA-AD EUR 0.0253 29 February 2016* 21 March 2016
Invesco Asian Bond FundA-AD EUR EUR 0.4866 29 February 2016* 21 March 2016A-MD USD 0.0366 31 March 2015 13 April 2015A-MD USD 0.0305 30 April 2015 11 May 2015A-MD USD 0.0263 29 May 2015 11 June 2015A-MD USD 0.0288 30 June 2015 13 July 2015A-MD USD 0.0333 31 July 2015 11 August 2015A-MD USD 0.0236 31 August 2015 11 September 2015A-MD USD 0.0198 30 September 2015 12 October 2015A-MD USD 0.0382 30 October 2015 11 November 2015A-MD USD 0.0452 30 November 2015 11 December 2015A-MD USD 0.0496 31 December 2015 11 January 2016A-MD USD 0.0384 29 January 2016 11 February 2016A-MD USD 0.0559 29 February 2016* 11 March 2016A-MD-1 AUD Hgd AUD 0.0634 31 March 2015 13 April 2015A-MD-1 AUD Hgd AUD 0.0530 30 April 2015 11 May 2015A-MD-1 AUD Hgd AUD 0.0517 29 May 2015 11 June 2015A-MD-1 AUD Hgd AUD 0.0533 30 June 2015 13 July 2015A-MD-1 AUD Hgd AUD 0.0586 31 July 2015 11 August 2015A-MD-1 AUD Hgd AUD 0.0477 31 August 2015 11 September 2015A-MD-1 AUD Hgd AUD 0.0419 30 September 2015 12 October 2015A-MD-1 AUD Hgd AUD 0.0520 30 October 2015 11 November 2015A-MD-1 AUD Hgd AUD 0.0520 30 November 2015 11 December 2015A-MD-1 AUD Hgd AUD 0.0520 31 December 2015 11 January 2016A-MD-1 AUD Hgd AUD 0.0520 29 January 2016 11 February 2016A-MD-1 AUD Hgd AUD 0.0520 29 February 2016* 11 March 2016A-MD-1 CAD Hgd CAD 0.0502 31 March 2015 13 April 2015A-MD-1 CAD Hgd CAD 0.0427 30 April 2015 11 May 2015A-MD-1 CAD Hgd CAD 0.0397 29 May 2015 11 June 2015A-MD-1 CAD Hgd CAD 0.0431 30 June 2015 13 July 2015A-MD-1 CAD Hgd CAD 0.0463 31 July 2015 11 August 2015A-MD-1 CAD Hgd CAD 0.0346 31 August 2015 11 September 2015A-MD-1 CAD Hgd CAD 0.0291 30 September 2015 12 October 2015A-MD-1 CAD Hgd CAD 0.0400 30 October 2015 11 November 2015A-MD-1 CAD Hgd CAD 0.0400 30 November 2015 11 December 2015A-MD-1 CAD Hgd CAD 0.0400 31 December 2015 11 January 2016A-MD-1 CAD Hgd CAD 0.0400 29 January 2016 11 February 2016A-MD-1 CAD Hgd CAD 0.0400 29 February 2016* 11 March 2016A-MD-1 NZD Hgd NZD 0.0730 31 March 2015 13 April 2015A-MD-1 NZD Hgd NZD 0.0642 30 April 2015 11 May 2015A-MD-1 NZD Hgd NZD 0.0642 29 May 2015 11 June 2015A-MD-1 NZD Hgd NZD 0.0659 30 June 2015 13 July 2015A-MD-1 NZD Hgd NZD 0.0670 31 July 2015 11 August 2015A-MD-1 NZD Hgd NZD 0.0563 31 August 2015 11 September 2015A-MD-1 NZD Hgd NZD 0.0489 30 September 2015 12 October 2015A-MD-1 NZD Hgd NZD 0.0580 30 October 2015 11 November 2015A-MD-1 NZD Hgd NZD 0.0580 30 November 2015 11 December 2015A-MD-1 NZD Hgd NZD 0.0580 31 December 2015 11 January 2016A-MD-1 NZD Hgd NZD 0.0580 29 January 2016 11 February 2016A-MD-1 NZD Hgd NZD 0.0580 29 February 2016* 11 March 2016A-MD HKD HKD 0.3644 31 March 2015 13 April 2015A-MD HKD HKD 0.3023 30 April 2015 11 May 2015A-MD HKD HKD 0.2621 29 May 2015 11 June 2015A-MD HKD HKD 0.2861 30 June 2015 13 July 2015A-MD HKD HKD 0.3311 31 July 2015 11 August 2015A-MD HKD HKD 0.2341 31 August 2015 11 September 2015A-MD HKD HKD 0.1868 30 September 2015 12 October 2015A-MD HKD HKD 0.3798 30 October 2015 11 November 2015A-MD HKD HKD 0.4503 30 November 2015 11 December 2015A-MD HKD HKD 0.4930 31 December 2015 11 January 2016A-MD HKD HKD 0.3840 29 January 2016 11 February 2016
245 Invesco Funds
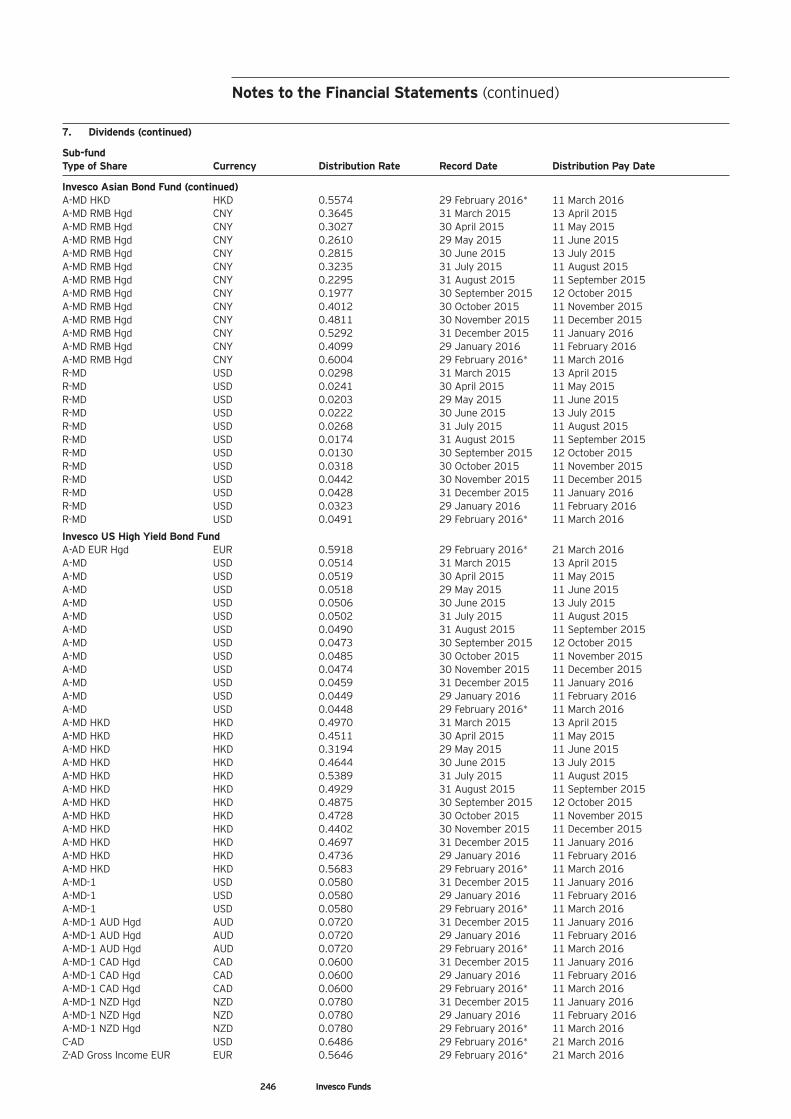
Notes to the Financial Statements (continued)
7. Dividends (continued)
Sub-fundType of Share Currency Distribution Rate Record Date Distribution Pay Date
Invesco Asian Bond Fund (continued)A-MD HKD HKD 0.5574 29 February 2016* 11 March 2016A-MD RMB Hgd CNY 0.3645 31 March 2015 13 April 2015A-MD RMB Hgd CNY 0.3027 30 April 2015 11 May 2015A-MD RMB Hgd CNY 0.2610 29 May 2015 11 June 2015A-MD RMB Hgd CNY 0.2815 30 June 2015 13 July 2015A-MD RMB Hgd CNY 0.3235 31 July 2015 11 August 2015A-MD RMB Hgd CNY 0.2295 31 August 2015 11 September 2015A-MD RMB Hgd CNY 0.1977 30 September 2015 12 October 2015A-MD RMB Hgd CNY 0.4012 30 October 2015 11 November 2015A-MD RMB Hgd CNY 0.4811 30 November 2015 11 December 2015A-MD RMB Hgd CNY 0.5292 31 December 2015 11 January 2016A-MD RMB Hgd CNY 0.4099 29 January 2016 11 February 2016A-MD RMB Hgd CNY 0.6004 29 February 2016* 11 March 2016R-MD USD 0.0298 31 March 2015 13 April 2015R-MD USD 0.0241 30 April 2015 11 May 2015R-MD USD 0.0203 29 May 2015 11 June 2015R-MD USD 0.0222 30 June 2015 13 July 2015R-MD USD 0.0268 31 July 2015 11 August 2015R-MD USD 0.0174 31 August 2015 11 September 2015R-MD USD 0.0130 30 September 2015 12 October 2015R-MD USD 0.0318 30 October 2015 11 November 2015R-MD USD 0.0442 30 November 2015 11 December 2015R-MD USD 0.0428 31 December 2015 11 January 2016R-MD USD 0.0323 29 January 2016 11 February 2016R-MD USD 0.0491 29 February 2016* 11 March 2016
Invesco US High Yield Bond FundA-AD EUR Hgd EUR 0.5918 29 February 2016* 21 March 2016A-MD USD 0.0514 31 March 2015 13 April 2015A-MD USD 0.0519 30 April 2015 11 May 2015A-MD USD 0.0518 29 May 2015 11 June 2015A-MD USD 0.0506 30 June 2015 13 July 2015A-MD USD 0.0502 31 July 2015 11 August 2015A-MD USD 0.0490 31 August 2015 11 September 2015A-MD USD 0.0473 30 September 2015 12 October 2015A-MD USD 0.0485 30 October 2015 11 November 2015A-MD USD 0.0474 30 November 2015 11 December 2015A-MD USD 0.0459 31 December 2015 11 January 2016A-MD USD 0.0449 29 January 2016 11 February 2016A-MD USD 0.0448 29 February 2016* 11 March 2016A-MD HKD HKD 0.4970 31 March 2015 13 April 2015A-MD HKD HKD 0.4511 30 April 2015 11 May 2015A-MD HKD HKD 0.3194 29 May 2015 11 June 2015A-MD HKD HKD 0.4644 30 June 2015 13 July 2015A-MD HKD HKD 0.5389 31 July 2015 11 August 2015A-MD HKD HKD 0.4929 31 August 2015 11 September 2015A-MD HKD HKD 0.4875 30 September 2015 12 October 2015A-MD HKD HKD 0.4728 30 October 2015 11 November 2015A-MD HKD HKD 0.4402 30 November 2015 11 December 2015A-MD HKD HKD 0.4697 31 December 2015 11 January 2016A-MD HKD HKD 0.4736 29 January 2016 11 February 2016A-MD HKD HKD 0.5683 29 February 2016* 11 March 2016A-MD-1 USD 0.0580 31 December 2015 11 January 2016A-MD-1 USD 0.0580 29 January 2016 11 February 2016A-MD-1 USD 0.0580 29 February 2016* 11 March 2016A-MD-1 AUD Hgd AUD 0.0720 31 December 2015 11 January 2016A-MD-1 AUD Hgd AUD 0.0720 29 January 2016 11 February 2016A-MD-1 AUD Hgd AUD 0.0720 29 February 2016* 11 March 2016A-MD-1 CAD Hgd CAD 0.0600 31 December 2015 11 January 2016A-MD-1 CAD Hgd CAD 0.0600 29 January 2016 11 February 2016A-MD-1 CAD Hgd CAD 0.0600 29 February 2016* 11 March 2016A-MD-1 NZD Hgd NZD 0.0780 31 December 2015 11 January 2016A-MD-1 NZD Hgd NZD 0.0780 29 January 2016 11 February 2016A-MD-1 NZD Hgd NZD 0.0780 29 February 2016* 11 March 2016C-AD USD 0.6486 29 February 2016* 21 March 2016Z-AD Gross Income EUR EUR 0.5646 29 February 2016* 21 March 2016
246 Invesco Funds
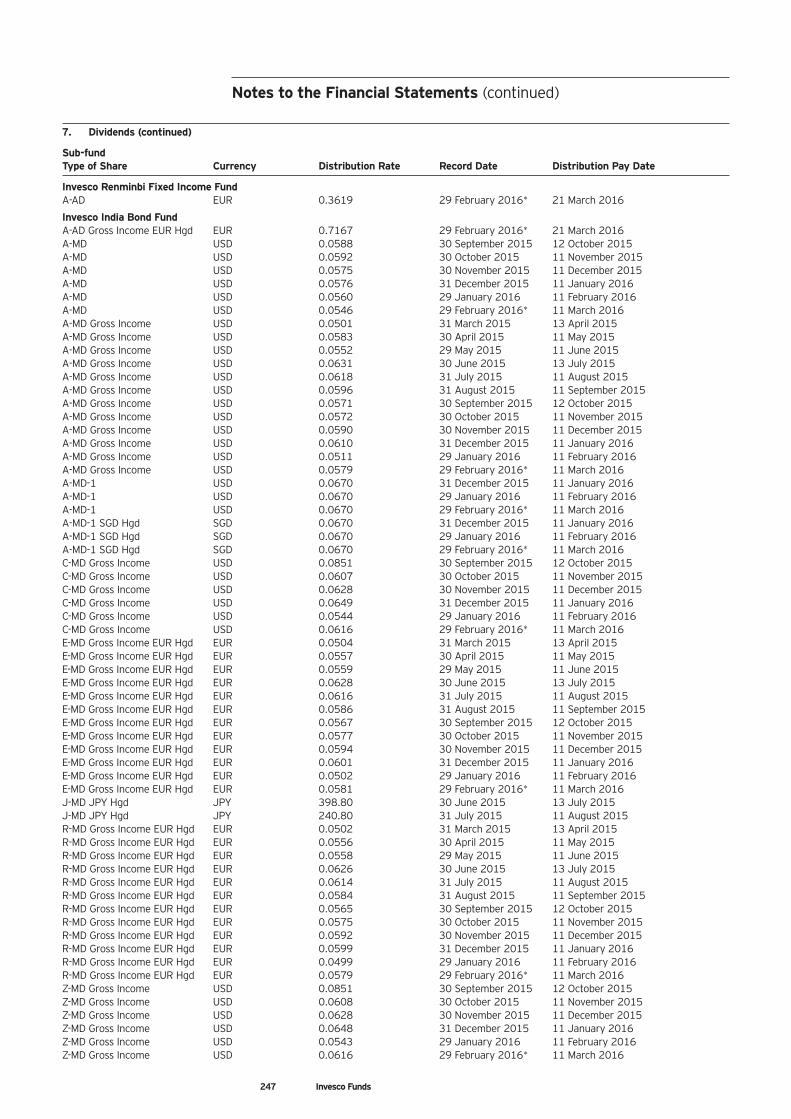
Notes to the Financial Statements (continued)
7. Dividends (continued)
Sub-fundType of Share Currency Distribution Rate Record Date Distribution Pay Date
Invesco Renminbi Fixed Income FundA-AD EUR 0.3619 29 February 2016* 21 March 2016
Invesco India Bond FundA-AD Gross Income EUR Hgd EUR 0.7167 29 February 2016* 21 March 2016A-MD USD 0.0588 30 September 2015 12 October 2015A-MD USD 0.0592 30 October 2015 11 November 2015A-MD USD 0.0575 30 November 2015 11 December 2015A-MD USD 0.0576 31 December 2015 11 January 2016A-MD USD 0.0560 29 January 2016 11 February 2016A-MD USD 0.0546 29 February 2016* 11 March 2016A-MD Gross Income USD 0.0501 31 March 2015 13 April 2015A-MD Gross Income USD 0.0583 30 April 2015 11 May 2015A-MD Gross Income USD 0.0552 29 May 2015 11 June 2015A-MD Gross Income USD 0.0631 30 June 2015 13 July 2015A-MD Gross Income USD 0.0618 31 July 2015 11 August 2015A-MD Gross Income USD 0.0596 31 August 2015 11 September 2015A-MD Gross Income USD 0.0571 30 September 2015 12 October 2015A-MD Gross Income USD 0.0572 30 October 2015 11 November 2015A-MD Gross Income USD 0.0590 30 November 2015 11 December 2015A-MD Gross Income USD 0.0610 31 December 2015 11 January 2016A-MD Gross Income USD 0.0511 29 January 2016 11 February 2016A-MD Gross Income USD 0.0579 29 February 2016* 11 March 2016A-MD-1 USD 0.0670 31 December 2015 11 January 2016A-MD-1 USD 0.0670 29 January 2016 11 February 2016A-MD-1 USD 0.0670 29 February 2016* 11 March 2016A-MD-1 SGD Hgd SGD 0.0670 31 December 2015 11 January 2016A-MD-1 SGD Hgd SGD 0.0670 29 January 2016 11 February 2016A-MD-1 SGD Hgd SGD 0.0670 29 February 2016* 11 March 2016C-MD Gross Income USD 0.0851 30 September 2015 12 October 2015C-MD Gross Income USD 0.0607 30 October 2015 11 November 2015C-MD Gross Income USD 0.0628 30 November 2015 11 December 2015C-MD Gross Income USD 0.0649 31 December 2015 11 January 2016C-MD Gross Income USD 0.0544 29 January 2016 11 February 2016C-MD Gross Income USD 0.0616 29 February 2016* 11 March 2016E-MD Gross Income EUR Hgd EUR 0.0504 31 March 2015 13 April 2015E-MD Gross Income EUR Hgd EUR 0.0557 30 April 2015 11 May 2015E-MD Gross Income EUR Hgd EUR 0.0559 29 May 2015 11 June 2015E-MD Gross Income EUR Hgd EUR 0.0628 30 June 2015 13 July 2015E-MD Gross Income EUR Hgd EUR 0.0616 31 July 2015 11 August 2015E-MD Gross Income EUR Hgd EUR 0.0586 31 August 2015 11 September 2015E-MD Gross Income EUR Hgd EUR 0.0567 30 September 2015 12 October 2015E-MD Gross Income EUR Hgd EUR 0.0577 30 October 2015 11 November 2015E-MD Gross Income EUR Hgd EUR 0.0594 30 November 2015 11 December 2015E-MD Gross Income EUR Hgd EUR 0.0601 31 December 2015 11 January 2016E-MD Gross Income EUR Hgd EUR 0.0502 29 January 2016 11 February 2016E-MD Gross Income EUR Hgd EUR 0.0581 29 February 2016* 11 March 2016J-MD JPY Hgd JPY 398.80 30 June 2015 13 July 2015J-MD JPY Hgd JPY 240.80 31 July 2015 11 August 2015R-MD Gross Income EUR Hgd EUR 0.0502 31 March 2015 13 April 2015R-MD Gross Income EUR Hgd EUR 0.0556 30 April 2015 11 May 2015R-MD Gross Income EUR Hgd EUR 0.0558 29 May 2015 11 June 2015R-MD Gross Income EUR Hgd EUR 0.0626 30 June 2015 13 July 2015R-MD Gross Income EUR Hgd EUR 0.0614 31 July 2015 11 August 2015R-MD Gross Income EUR Hgd EUR 0.0584 31 August 2015 11 September 2015R-MD Gross Income EUR Hgd EUR 0.0565 30 September 2015 12 October 2015R-MD Gross Income EUR Hgd EUR 0.0575 30 October 2015 11 November 2015R-MD Gross Income EUR Hgd EUR 0.0592 30 November 2015 11 December 2015R-MD Gross Income EUR Hgd EUR 0.0599 31 December 2015 11 January 2016R-MD Gross Income EUR Hgd EUR 0.0499 29 January 2016 11 February 2016R-MD Gross Income EUR Hgd EUR 0.0579 29 February 2016* 11 March 2016Z-MD Gross Income USD 0.0851 30 September 2015 12 October 2015Z-MD Gross Income USD 0.0608 30 October 2015 11 November 2015Z-MD Gross Income USD 0.0628 30 November 2015 11 December 2015Z-MD Gross Income USD 0.0648 31 December 2015 11 January 2016Z-MD Gross Income USD 0.0543 29 January 2016 11 February 2016Z-MD Gross Income USD 0.0616 29 February 2016* 11 March 2016
247 Invesco Funds
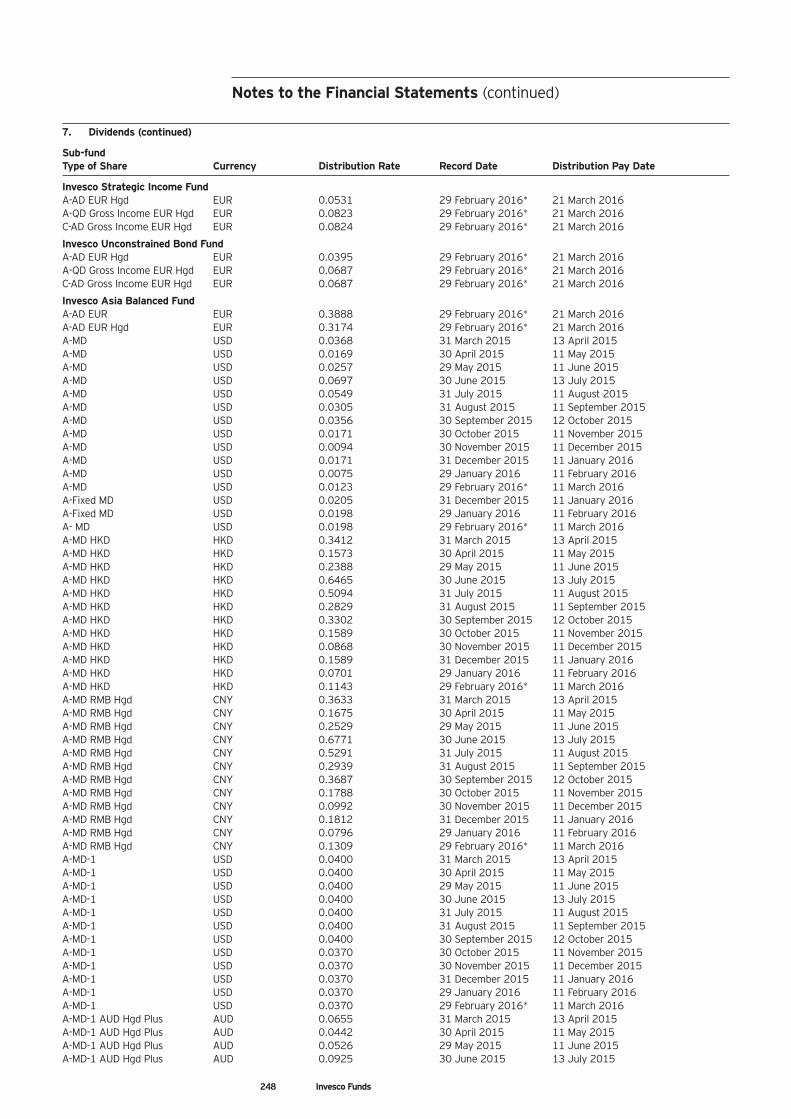
Notes to the Financial Statements (continued)
7. Dividends (continued)
Sub-fundType of Share Currency Distribution Rate Record Date Distribution Pay Date
Invesco Strategic Income FundA-AD EUR Hgd EUR 0.0531 29 February 2016* 21 March 2016A-QD Gross Income EUR Hgd EUR 0.0823 29 February 2016* 21 March 2016C-AD Gross Income EUR Hgd EUR 0.0824 29 February 2016* 21 March 2016
Invesco Unconstrained Bond Fund A-AD EUR Hgd EUR 0.0395 29 February 2016* 21 March 2016A-QD Gross Income EUR Hgd EUR 0.0687 29 February 2016* 21 March 2016C-AD Gross Income EUR Hgd EUR 0.0687 29 February 2016* 21 March 2016
Invesco Asia Balanced FundA-AD EUR EUR 0.3888 29 February 2016* 21 March 2016A-AD EUR Hgd EUR 0.3174 29 February 2016* 21 March 2016A-MD USD 0.0368 31 March 2015 13 April 2015A-MD USD 0.0169 30 April 2015 11 May 2015A-MD USD 0.0257 29 May 2015 11 June 2015A-MD USD 0.0697 30 June 2015 13 July 2015A-MD USD 0.0549 31 July 2015 11 August 2015A-MD USD 0.0305 31 August 2015 11 September 2015A-MD USD 0.0356 30 September 2015 12 October 2015A-MD USD 0.0171 30 October 2015 11 November 2015A-MD USD 0.0094 30 November 2015 11 December 2015A-MD USD 0.0171 31 December 2015 11 January 2016A-MD USD 0.0075 29 January 2016 11 February 2016A-MD USD 0.0123 29 February 2016* 11 March 2016A-Fixed MD USD 0.0205 31 December 2015 11 January 2016A-Fixed MD USD 0.0198 29 January 2016 11 February 2016A- MD USD 0.0198 29 February 2016* 11 March 2016A-MD HKD HKD 0.3412 31 March 2015 13 April 2015A-MD HKD HKD 0.1573 30 April 2015 11 May 2015A-MD HKD HKD 0.2388 29 May 2015 11 June 2015A-MD HKD HKD 0.6465 30 June 2015 13 July 2015A-MD HKD HKD 0.5094 31 July 2015 11 August 2015A-MD HKD HKD 0.2829 31 August 2015 11 September 2015A-MD HKD HKD 0.3302 30 September 2015 12 October 2015A-MD HKD HKD 0.1589 30 October 2015 11 November 2015A-MD HKD HKD 0.0868 30 November 2015 11 December 2015A-MD HKD HKD 0.1589 31 December 2015 11 January 2016A-MD HKD HKD 0.0701 29 January 2016 11 February 2016A-MD HKD HKD 0.1143 29 February 2016* 11 March 2016A-MD RMB Hgd CNY 0.3633 31 March 2015 13 April 2015A-MD RMB Hgd CNY 0.1675 30 April 2015 11 May 2015A-MD RMB Hgd CNY 0.2529 29 May 2015 11 June 2015A-MD RMB Hgd CNY 0.6771 30 June 2015 13 July 2015A-MD RMB Hgd CNY 0.5291 31 July 2015 11 August 2015A-MD RMB Hgd CNY 0.2939 31 August 2015 11 September 2015A-MD RMB Hgd CNY 0.3687 30 September 2015 12 October 2015A-MD RMB Hgd CNY 0.1788 30 October 2015 11 November 2015A-MD RMB Hgd CNY 0.0992 30 November 2015 11 December 2015A-MD RMB Hgd CNY 0.1812 31 December 2015 11 January 2016A-MD RMB Hgd CNY 0.0796 29 January 2016 11 February 2016A-MD RMB Hgd CNY 0.1309 29 February 2016* 11 March 2016A-MD-1 USD 0.0400 31 March 2015 13 April 2015A-MD-1 USD 0.0400 30 April 2015 11 May 2015A-MD-1 USD 0.0400 29 May 2015 11 June 2015A-MD-1 USD 0.0400 30 June 2015 13 July 2015A-MD-1 USD 0.0400 31 July 2015 11 August 2015A-MD-1 USD 0.0400 31 August 2015 11 September 2015A-MD-1 USD 0.0400 30 September 2015 12 October 2015A-MD-1 USD 0.0370 30 October 2015 11 November 2015A-MD-1 USD 0.0370 30 November 2015 11 December 2015A-MD-1 USD 0.0370 31 December 2015 11 January 2016A-MD-1 USD 0.0370 29 January 2016 11 February 2016A-MD-1 USD 0.0370 29 February 2016* 11 March 2016A-MD-1 AUD Hgd Plus AUD 0.0655 31 March 2015 13 April 2015A-MD-1 AUD Hgd Plus AUD 0.0442 30 April 2015 11 May 2015A-MD-1 AUD Hgd Plus AUD 0.0526 29 May 2015 11 June 2015A-MD-1 AUD Hgd Plus AUD 0.0925 30 June 2015 13 July 2015
248 Invesco Funds
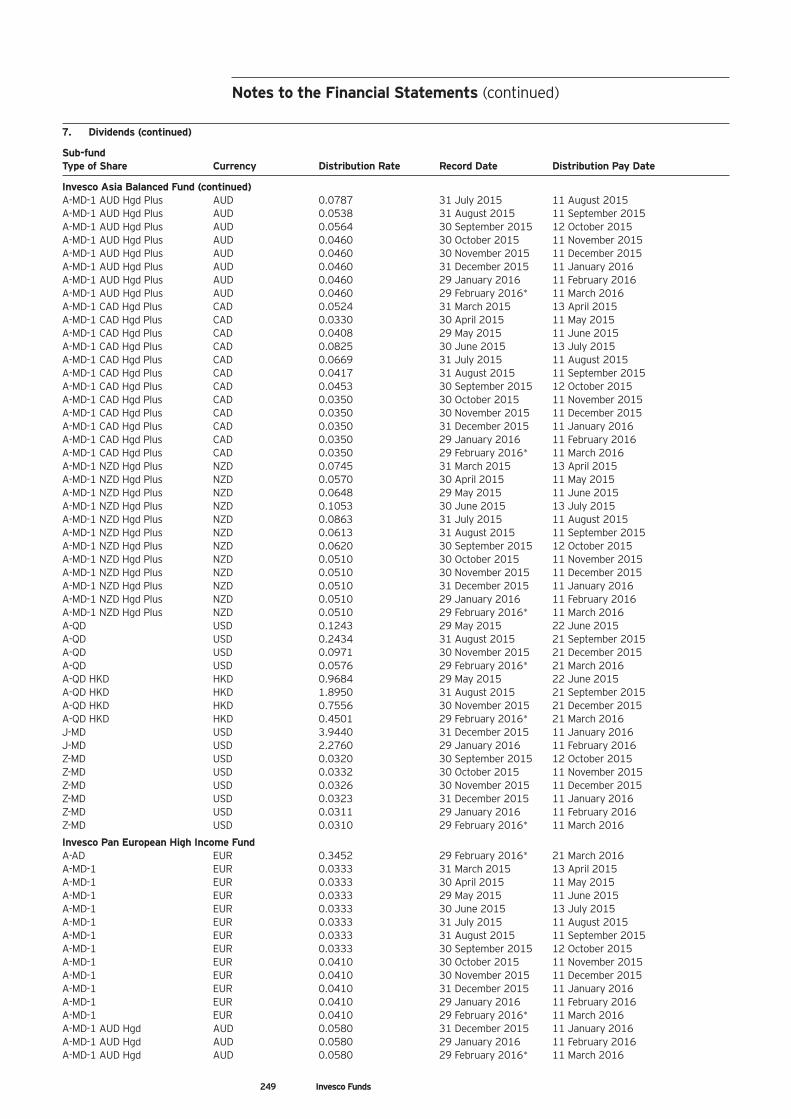
Notes to the Financial Statements (continued)
249 Invesco Funds
7. Dividends (continued)
Sub-fundType of Share Currency Distribution Rate Record Date Distribution Pay Date
Invesco Asia Balanced Fund (continued)A-MD-1 AUD Hgd Plus AUD 0.0787 31 July 2015 11 August 2015A-MD-1 AUD Hgd Plus AUD 0.0538 31 August 2015 11 September 2015A-MD-1 AUD Hgd Plus AUD 0.0564 30 September 2015 12 October 2015A-MD-1 AUD Hgd Plus AUD 0.0460 30 October 2015 11 November 2015A-MD-1 AUD Hgd Plus AUD 0.0460 30 November 2015 11 December 2015A-MD-1 AUD Hgd Plus AUD 0.0460 31 December 2015 11 January 2016A-MD-1 AUD Hgd Plus AUD 0.0460 29 January 2016 11 February 2016A-MD-1 AUD Hgd Plus AUD 0.0460 29 February 2016* 11 March 2016A-MD-1 CAD Hgd Plus CAD 0.0524 31 March 2015 13 April 2015A-MD-1 CAD Hgd Plus CAD 0.0330 30 April 2015 11 May 2015A-MD-1 CAD Hgd Plus CAD 0.0408 29 May 2015 11 June 2015A-MD-1 CAD Hgd Plus CAD 0.0825 30 June 2015 13 July 2015A-MD-1 CAD Hgd Plus CAD 0.0669 31 July 2015 11 August 2015A-MD-1 CAD Hgd Plus CAD 0.0417 31 August 2015 11 September 2015A-MD-1 CAD Hgd Plus CAD 0.0453 30 September 2015 12 October 2015A-MD-1 CAD Hgd Plus CAD 0.0350 30 October 2015 11 November 2015A-MD-1 CAD Hgd Plus CAD 0.0350 30 November 2015 11 December 2015A-MD-1 CAD Hgd Plus CAD 0.0350 31 December 2015 11 January 2016A-MD-1 CAD Hgd Plus CAD 0.0350 29 January 2016 11 February 2016A-MD-1 CAD Hgd Plus CAD 0.0350 29 February 2016* 11 March 2016A-MD-1 NZD Hgd Plus NZD 0.0745 31 March 2015 13 April 2015A-MD-1 NZD Hgd Plus NZD 0.0570 30 April 2015 11 May 2015A-MD-1 NZD Hgd Plus NZD 0.0648 29 May 2015 11 June 2015A-MD-1 NZD Hgd Plus NZD 0.1053 30 June 2015 13 July 2015A-MD-1 NZD Hgd Plus NZD 0.0863 31 July 2015 11 August 2015A-MD-1 NZD Hgd Plus NZD 0.0613 31 August 2015 11 September 2015A-MD-1 NZD Hgd Plus NZD 0.0620 30 September 2015 12 October 2015A-MD-1 NZD Hgd Plus NZD 0.0510 30 October 2015 11 November 2015A-MD-1 NZD Hgd Plus NZD 0.0510 30 November 2015 11 December 2015A-MD-1 NZD Hgd Plus NZD 0.0510 31 December 2015 11 January 2016A-MD-1 NZD Hgd Plus NZD 0.0510 29 January 2016 11 February 2016A-MD-1 NZD Hgd Plus NZD 0.0510 29 February 2016* 11 March 2016A-QD USD 0.1243 29 May 2015 22 June 2015A-QD USD 0.2434 31 August 2015 21 September 2015A-QD USD 0.0971 30 November 2015 21 December 2015A-QD USD 0.0576 29 February 2016* 21 March 2016A-QD HKD HKD 0.9684 29 May 2015 22 June 2015A-QD HKD HKD 1.8950 31 August 2015 21 September 2015A-QD HKD HKD 0.7556 30 November 2015 21 December 2015A-QD HKD HKD 0.4501 29 February 2016* 21 March 2016J-MD USD 3.9440 31 December 2015 11 January 2016J-MD USD 2.2760 29 January 2016 11 February 2016Z-MD USD 0.0320 30 September 2015 12 October 2015Z-MD USD 0.0332 30 October 2015 11 November 2015Z-MD USD 0.0326 30 November 2015 11 December 2015Z-MD USD 0.0323 31 December 2015 11 January 2016Z-MD USD 0.0311 29 January 2016 11 February 2016Z-MD USD 0.0310 29 February 2016* 11 March 2016
Invesco Pan European High Income FundA-AD EUR 0.3452 29 February 2016* 21 March 2016A-MD-1 EUR 0.0333 31 March 2015 13 April 2015A-MD-1 EUR 0.0333 30 April 2015 11 May 2015A-MD-1 EUR 0.0333 29 May 2015 11 June 2015A-MD-1 EUR 0.0333 30 June 2015 13 July 2015A-MD-1 EUR 0.0333 31 July 2015 11 August 2015A-MD-1 EUR 0.0333 31 August 2015 11 September 2015A-MD-1 EUR 0.0333 30 September 2015 12 October 2015A-MD-1 EUR 0.0410 30 October 2015 11 November 2015A-MD-1 EUR 0.0410 30 November 2015 11 December 2015A-MD-1 EUR 0.0410 31 December 2015 11 January 2016A-MD-1 EUR 0.0410 29 January 2016 11 February 2016A-MD-1 EUR 0.0410 29 February 2016* 11 March 2016A-MD-1 AUD Hgd AUD 0.0580 31 December 2015 11 January 2016A-MD-1 AUD Hgd AUD 0.0580 29 January 2016 11 February 2016A-MD-1 AUD Hgd AUD 0.0580 29 February 2016* 11 March 2016
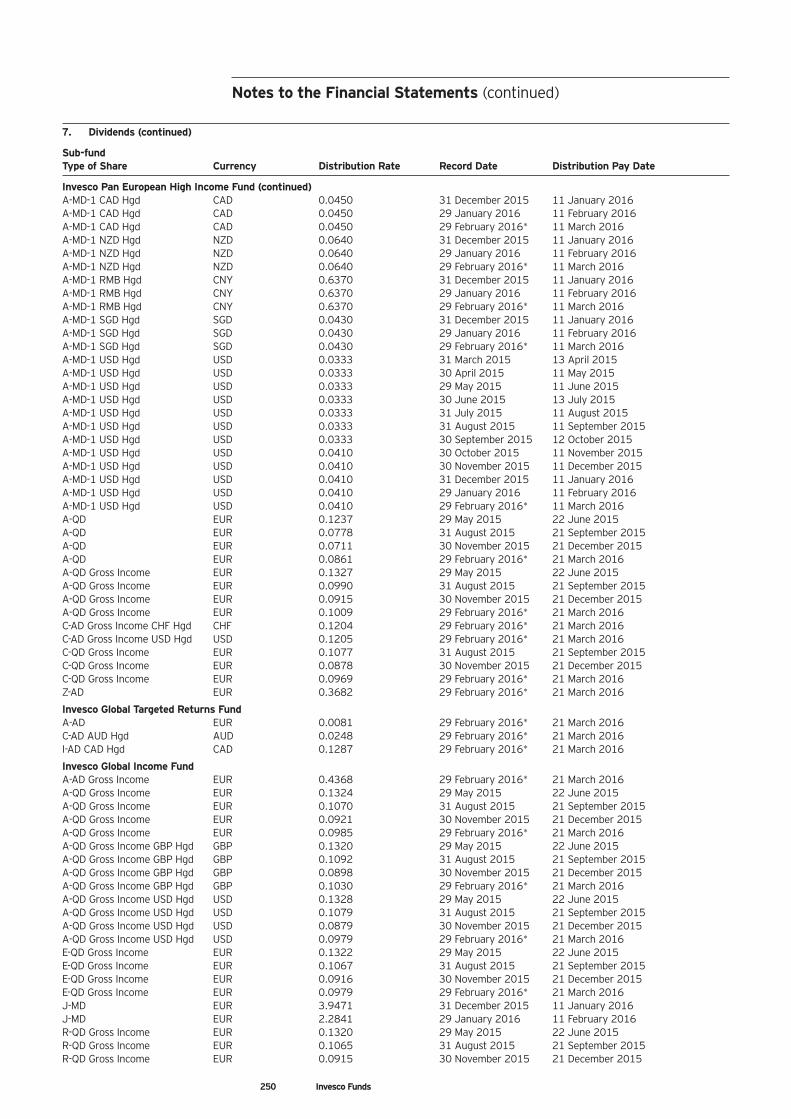
Notes to the Financial Statements (continued)
250 Invesco Funds
7. Dividends (continued)
Sub-fundType of Share Currency Distribution Rate Record Date Distribution Pay Date
Invesco Pan European High Income Fund (continued)A-MD-1 CAD Hgd CAD 0.0450 31 December 2015 11 January 2016A-MD-1 CAD Hgd CAD 0.0450 29 January 2016 11 February 2016A-MD-1 CAD Hgd CAD 0.0450 29 February 2016* 11 March 2016A-MD-1 NZD Hgd NZD 0.0640 31 December 2015 11 January 2016A-MD-1 NZD Hgd NZD 0.0640 29 January 2016 11 February 2016A-MD-1 NZD Hgd NZD 0.0640 29 February 2016* 11 March 2016A-MD-1 RMB Hgd CNY 0.6370 31 December 2015 11 January 2016A-MD-1 RMB Hgd CNY 0.6370 29 January 2016 11 February 2016A-MD-1 RMB Hgd CNY 0.6370 29 February 2016* 11 March 2016A-MD-1 SGD Hgd SGD 0.0430 31 December 2015 11 January 2016A-MD-1 SGD Hgd SGD 0.0430 29 January 2016 11 February 2016A-MD-1 SGD Hgd SGD 0.0430 29 February 2016* 11 March 2016A-MD-1 USD Hgd USD 0.0333 31 March 2015 13 April 2015A-MD-1 USD Hgd USD 0.0333 30 April 2015 11 May 2015A-MD-1 USD Hgd USD 0.0333 29 May 2015 11 June 2015A-MD-1 USD Hgd USD 0.0333 30 June 2015 13 July 2015A-MD-1 USD Hgd USD 0.0333 31 July 2015 11 August 2015A-MD-1 USD Hgd USD 0.0333 31 August 2015 11 September 2015A-MD-1 USD Hgd USD 0.0333 30 September 2015 12 October 2015A-MD-1 USD Hgd USD 0.0410 30 October 2015 11 November 2015A-MD-1 USD Hgd USD 0.0410 30 November 2015 11 December 2015A-MD-1 USD Hgd USD 0.0410 31 December 2015 11 January 2016A-MD-1 USD Hgd USD 0.0410 29 January 2016 11 February 2016A-MD-1 USD Hgd USD 0.0410 29 February 2016* 11 March 2016A-QD EUR 0.1237 29 May 2015 22 June 2015A-QD EUR 0.0778 31 August 2015 21 September 2015A-QD EUR 0.0711 30 November 2015 21 December 2015A-QD EUR 0.0861 29 February 2016* 21 March 2016A-QD Gross Income EUR 0.1327 29 May 2015 22 June 2015A-QD Gross Income EUR 0.0990 31 August 2015 21 September 2015A-QD Gross Income EUR 0.0915 30 November 2015 21 December 2015A-QD Gross Income EUR 0.1009 29 February 2016* 21 March 2016C-AD Gross Income CHF Hgd CHF 0.1204 29 February 2016* 21 March 2016C-AD Gross Income USD Hgd USD 0.1205 29 February 2016* 21 March 2016C-QD Gross Income EUR 0.1077 31 August 2015 21 September 2015C-QD Gross Income EUR 0.0878 30 November 2015 21 December 2015C-QD Gross Income EUR 0.0969 29 February 2016* 21 March 2016Z-AD EUR 0.3682 29 February 2016* 21 March 2016
Invesco Global Targeted Returns Fund A-AD EUR 0.0081 29 February 2016* 21 March 2016C-AD AUD Hgd AUD 0.0248 29 February 2016* 21 March 2016I-AD CAD Hgd CAD 0.1287 29 February 2016* 21 March 2016
Invesco Global Income FundA-AD Gross Income EUR 0.4368 29 February 2016* 21 March 2016A-QD Gross Income EUR 0.1324 29 May 2015 22 June 2015A-QD Gross Income EUR 0.1070 31 August 2015 21 September 2015A-QD Gross Income EUR 0.0921 30 November 2015 21 December 2015A-QD Gross Income EUR 0.0985 29 February 2016* 21 March 2016A-QD Gross Income GBP Hgd GBP 0.1320 29 May 2015 22 June 2015A-QD Gross Income GBP Hgd GBP 0.1092 31 August 2015 21 September 2015A-QD Gross Income GBP Hgd GBP 0.0898 30 November 2015 21 December 2015A-QD Gross Income GBP Hgd GBP 0.1030 29 February 2016* 21 March 2016A-QD Gross Income USD Hgd USD 0.1328 29 May 2015 22 June 2015A-QD Gross Income USD Hgd USD 0.1079 31 August 2015 21 September 2015A-QD Gross Income USD Hgd USD 0.0879 30 November 2015 21 December 2015A-QD Gross Income USD Hgd USD 0.0979 29 February 2016* 21 March 2016E-QD Gross Income EUR 0.1322 29 May 2015 22 June 2015E-QD Gross Income EUR 0.1067 31 August 2015 21 September 2015E-QD Gross Income EUR 0.0916 30 November 2015 21 December 2015E-QD Gross Income EUR 0.0979 29 February 2016* 21 March 2016J-MD EUR 3.9471 31 December 2015 11 January 2016J-MD EUR 2.2841 29 January 2016 11 February 2016R-QD Gross Income EUR 0.1320 29 May 2015 22 June 2015R-QD Gross Income EUR 0.1065 31 August 2015 21 September 2015R-QD Gross Income EUR 0.0915 30 November 2015 21 December 2015
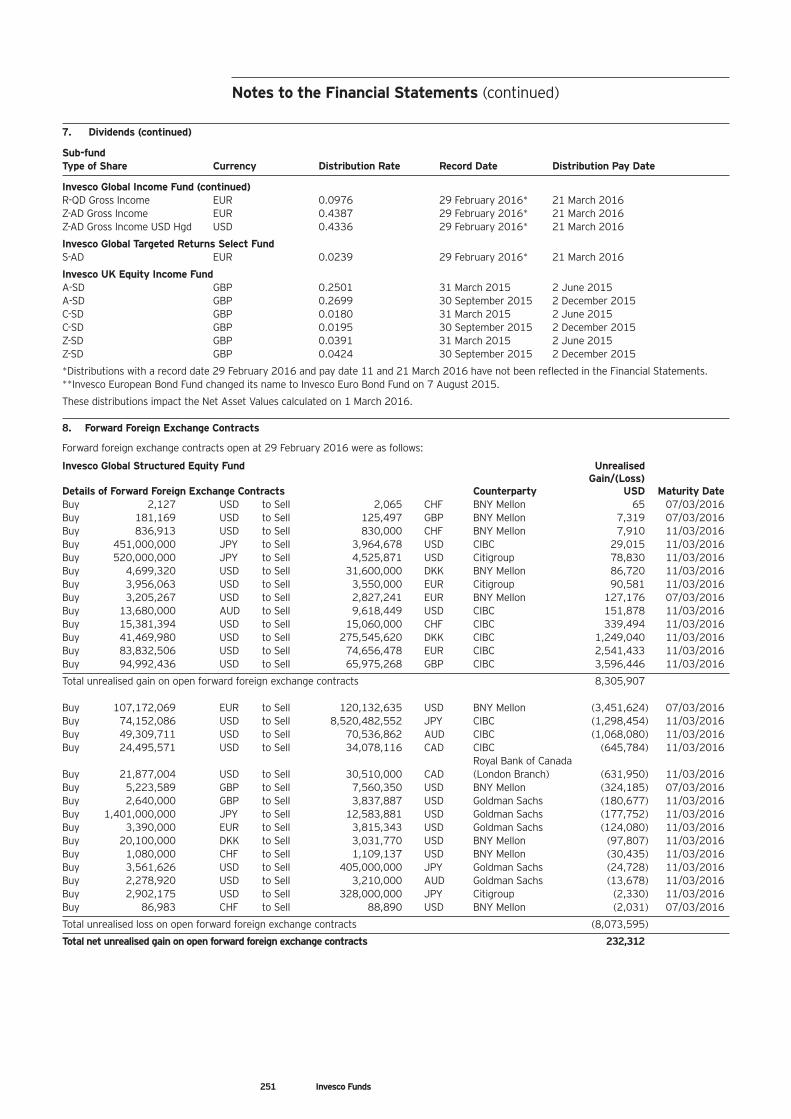
Notes to the Financial Statements (continued)
251 Invesco Funds
7. Dividends (continued)
Sub-fundType of Share Currency Distribution Rate Record Date Distribution Pay Date
Invesco Global Income Fund (continued)R-QD Gross Income EUR 0.0976 29 February 2016* 21 March 2016Z-AD Gross Income EUR 0.4387 29 February 2016* 21 March 2016Z-AD Gross Income USD Hgd USD 0.4336 29 February 2016* 21 March 2016
Invesco Global Targeted Returns Select Fund S-AD EUR 0.0239 29 February 2016* 21 March 2016
Invesco UK Equity Income FundA-SD GBP 0.2501 31 March 2015 2 June 2015A-SD GBP 0.2699 30 September 2015 2 December 2015C-SD GBP 0.0180 31 March 2015 2 June 2015C-SD GBP 0.0195 30 September 2015 2 December 2015Z-SD GBP 0.0391 31 March 2015 2 June 2015Z-SD GBP 0.0424 30 September 2015 2 December 2015
*Distributions with a record date 29 February 2016 and pay date 11 and 21 March 2016 have not been reflected in the Financial Statements.**Invesco European Bond Fund changed its name to Invesco Euro Bond Fund on 7 August 2015.
These distributions impact the Net Asset Values calculated on 1 March 2016.
8. Forward Foreign Exchange Contracts
Forward foreign exchange contracts open at 29 February 2016 were as follows:
Invesco Global Structured Equity Fund Unrealised Gain/(Loss) Details of Forward Foreign Exchange Contracts Counterparty USD Maturity DateBuy 2,127 USD to Sell 2,065 CHF BNY Mellon 65 07/03/2016Buy 181,169 USD to Sell 125,497 GBP BNY Mellon 7,319 07/03/2016Buy 836,913 USD to Sell 830,000 CHF BNY Mellon 7,910 11/03/2016Buy 451,000,000 JPY to Sell 3,964,678 USD CIBC 29,015 11/03/2016Buy 520,000,000 JPY to Sell 4,525,871 USD Citigroup 78,830 11/03/2016Buy 4,699,320 USD to Sell 31,600,000 DKK BNY Mellon 86,720 11/03/2016Buy 3,956,063 USD to Sell 3,550,000 EUR Citigroup 90,581 11/03/2016Buy 3,205,267 USD to Sell 2,827,241 EUR BNY Mellon 127,176 07/03/2016Buy 13,680,000 AUD to Sell 9,618,449 USD CIBC 151,878 11/03/2016Buy 15,381,394 USD to Sell 15,060,000 CHF CIBC 339,494 11/03/2016Buy 41,469,980 USD to Sell 275,545,620 DKK CIBC 1,249,040 11/03/2016Buy 83,832,506 USD to Sell 74,656,478 EUR CIBC 2,541,433 11/03/2016Buy 94,992,436 USD to Sell 65,975,268 GBP CIBC 3,596,446 11/03/2016
Total unrealised gain on open forward foreign exchange contracts 8,305,907
Buy 107,172,069 EUR to Sell 120,132,635 USD BNY Mellon (3,451,624) 07/03/2016Buy 74,152,086 USD to Sell 8,520,482,552 JPY CIBC (1,298,454) 11/03/2016Buy 49,309,711 USD to Sell 70,536,862 AUD CIBC (1,068,080) 11/03/2016Buy 24,495,571 USD to Sell 34,078,116 CAD CIBC (645,784) 11/03/2016 Royal Bank of Canada Buy 21,877,004 USD to Sell 30,510,000 CAD (London Branch) (631,950) 11/03/2016Buy 5,223,589 GBP to Sell 7,560,350 USD BNY Mellon (324,185) 07/03/2016Buy 2,640,000 GBP to Sell 3,837,887 USD Goldman Sachs (180,677) 11/03/2016Buy 1,401,000,000 JPY to Sell 12,583,881 USD Goldman Sachs (177,752) 11/03/2016Buy 3,390,000 EUR to Sell 3,815,343 USD Goldman Sachs (124,080) 11/03/2016Buy 20,100,000 DKK to Sell 3,031,770 USD BNY Mellon (97,807) 11/03/2016Buy 1,080,000 CHF to Sell 1,109,137 USD BNY Mellon (30,435) 11/03/2016Buy 3,561,626 USD to Sell 405,000,000 JPY Goldman Sachs (24,728) 11/03/2016Buy 2,278,920 USD to Sell 3,210,000 AUD Goldman Sachs (13,678) 11/03/2016Buy 2,902,175 USD to Sell 328,000,000 JPY Citigroup (2,330) 11/03/2016Buy 86,983 CHF to Sell 88,890 USD BNY Mellon (2,031) 07/03/2016
Total unrealised loss on open forward foreign exchange contracts (8,073,595)
Total net unrealised gain on open forward foreign exchange contracts 232,312
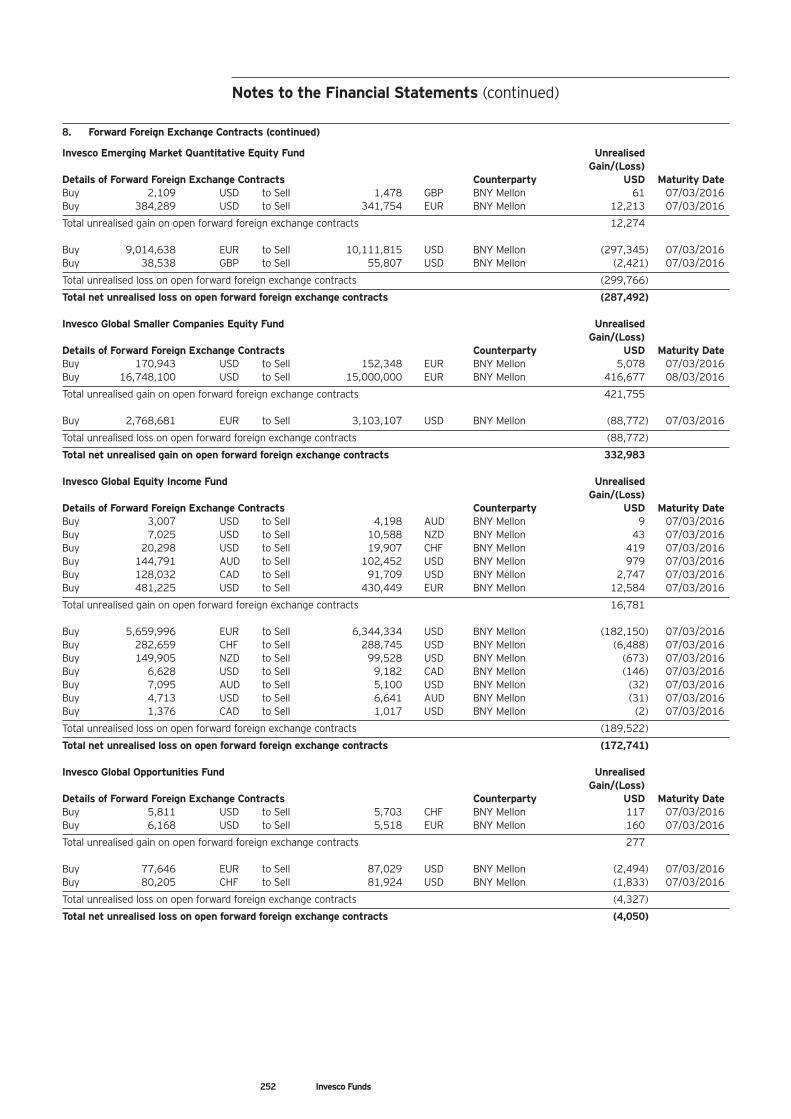
Notes to the Financial Statements (continued)
252 Invesco Funds
8. Forward Foreign Exchange Contracts (continued)
Invesco Emerging Market Quantitative Equity Fund Unrealised Gain/(Loss) Details of Forward Foreign Exchange Contracts Counterparty USD Maturity DateBuy 2,109 USD to Sell 1,478 GBP BNY Mellon 61 07/03/2016Buy 384,289 USD to Sell 341,754 EUR BNY Mellon 12,213 07/03/2016
Total unrealised gain on open forward foreign exchange contracts 12,274
Buy 9,014,638 EUR to Sell 10,111,815 USD BNY Mellon (297,345) 07/03/2016Buy 38,538 GBP to Sell 55,807 USD BNY Mellon (2,421) 07/03/2016
Total unrealised loss on open forward foreign exchange contracts (299,766)
Total net unrealised loss on open forward foreign exchange contracts (287,492)
Invesco Global Smaller Companies Equity Fund Unrealised Gain/(Loss) Details of Forward Foreign Exchange Contracts Counterparty USD Maturity DateBuy 170,943 USD to Sell 152,348 EUR BNY Mellon 5,078 07/03/2016Buy 16,748,100 USD to Sell 15,000,000 EUR BNY Mellon 416,677 08/03/2016
Total unrealised gain on open forward foreign exchange contracts 421,755
Buy 2,768,681 EUR to Sell 3,103,107 USD BNY Mellon (88,772) 07/03/2016
Total unrealised loss on open forward foreign exchange contracts (88,772)
Total net unrealised gain on open forward foreign exchange contracts 332,983
Invesco Global Equity Income Fund Unrealised Gain/(Loss) Details of Forward Foreign Exchange Contracts Counterparty USD Maturity DateBuy 3,007 USD to Sell 4,198 AUD BNY Mellon 9 07/03/2016Buy 7,025 USD to Sell 10,588 NZD BNY Mellon 43 07/03/2016Buy 20,298 USD to Sell 19,907 CHF BNY Mellon 419 07/03/2016Buy 144,791 AUD to Sell 102,452 USD BNY Mellon 979 07/03/2016Buy 128,032 CAD to Sell 91,709 USD BNY Mellon 2,747 07/03/2016Buy 481,225 USD to Sell 430,449 EUR BNY Mellon 12,584 07/03/2016
Total unrealised gain on open forward foreign exchange contracts 16,781
Buy 5,659,996 EUR to Sell 6,344,334 USD BNY Mellon (182,150) 07/03/2016Buy 282,659 CHF to Sell 288,745 USD BNY Mellon (6,488) 07/03/2016Buy 149,905 NZD to Sell 99,528 USD BNY Mellon (673) 07/03/2016Buy 6,628 USD to Sell 9,182 CAD BNY Mellon (146) 07/03/2016Buy 7,095 AUD to Sell 5,100 USD BNY Mellon (32) 07/03/2016Buy 4,713 USD to Sell 6,641 AUD BNY Mellon (31) 07/03/2016Buy 1,376 CAD to Sell 1,017 USD BNY Mellon (2) 07/03/2016
Total unrealised loss on open forward foreign exchange contracts (189,522)
Total net unrealised loss on open forward foreign exchange contracts (172,741)
Invesco Global Opportunities Fund Unrealised Gain/(Loss) Details of Forward Foreign Exchange Contracts Counterparty USD Maturity DateBuy 5,811 USD to Sell 5,703 CHF BNY Mellon 117 07/03/2016Buy 6,168 USD to Sell 5,518 EUR BNY Mellon 160 07/03/2016
Total unrealised gain on open forward foreign exchange contracts 277
Buy 77,646 EUR to Sell 87,029 USD BNY Mellon (2,494) 07/03/2016Buy 80,205 CHF to Sell 81,924 USD BNY Mellon (1,833) 07/03/2016
Total unrealised loss on open forward foreign exchange contracts (4,327)
Total net unrealised loss on open forward foreign exchange contracts (4,050)
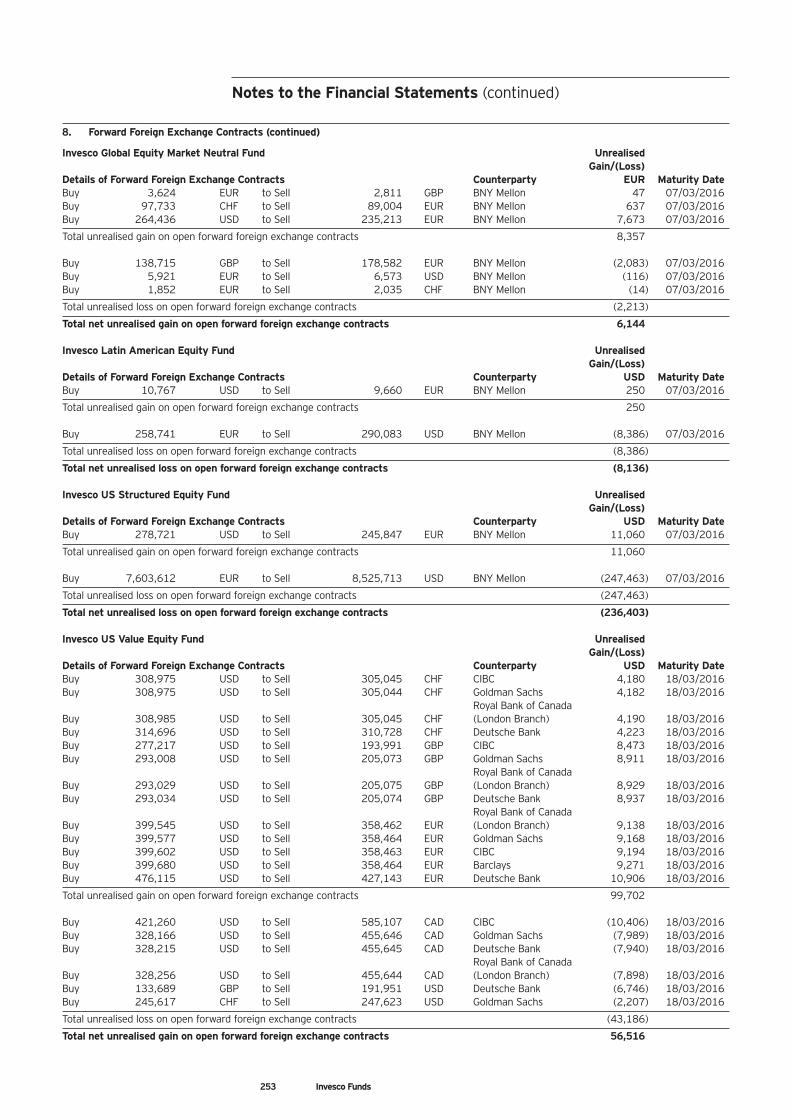
253 Invesco Funds
Notes to the Financial Statements (continued)
8. Forward Foreign Exchange Contracts (continued)
Invesco Global Equity Market Neutral Fund Unrealised Gain/(Loss) Details of Forward Foreign Exchange Contracts Counterparty EUR Maturity DateBuy 3,624 EUR to Sell 2,811 GBP BNY Mellon 47 07/03/2016Buy 97,733 CHF to Sell 89,004 EUR BNY Mellon 637 07/03/2016Buy 264,436 USD to Sell 235,213 EUR BNY Mellon 7,673 07/03/2016
Total unrealised gain on open forward foreign exchange contracts 8,357
Buy 138,715 GBP to Sell 178,582 EUR BNY Mellon (2,083) 07/03/2016Buy 5,921 EUR to Sell 6,573 USD BNY Mellon (116) 07/03/2016Buy 1,852 EUR to Sell 2,035 CHF BNY Mellon (14) 07/03/2016
Total unrealised loss on open forward foreign exchange contracts (2,213)
Total net unrealised gain on open forward foreign exchange contracts 6,144
Invesco Latin American Equity Fund Unrealised Gain/(Loss) Details of Forward Foreign Exchange Contracts Counterparty USD Maturity DateBuy 10,767 USD to Sell 9,660 EUR BNY Mellon 250 07/03/2016
Total unrealised gain on open forward foreign exchange contracts 250
Buy 258,741 EUR to Sell 290,083 USD BNY Mellon (8,386) 07/03/2016
Total unrealised loss on open forward foreign exchange contracts (8,386)
Total net unrealised loss on open forward foreign exchange contracts (8,136)
Invesco US Structured Equity Fund Unrealised Gain/(Loss) Details of Forward Foreign Exchange Contracts Counterparty USD Maturity DateBuy 278,721 USD to Sell 245,847 EUR BNY Mellon 11,060 07/03/2016
Total unrealised gain on open forward foreign exchange contracts 11,060
Buy 7,603,612 EUR to Sell 8,525,713 USD BNY Mellon (247,463) 07/03/2016
Total unrealised loss on open forward foreign exchange contracts (247,463)
Total net unrealised loss on open forward foreign exchange contracts (236,403)
Invesco US Value Equity Fund Unrealised Gain/(Loss) Details of Forward Foreign Exchange Contracts Counterparty USD Maturity DateBuy 308,975 USD to Sell 305,045 CHF CIBC 4,180 18/03/2016Buy 308,975 USD to Sell 305,044 CHF Goldman Sachs 4,182 18/03/2016 Royal Bank of Canada Buy 308,985 USD to Sell 305,045 CHF (London Branch) 4,190 18/03/2016Buy 314,696 USD to Sell 310,728 CHF Deutsche Bank 4,223 18/03/2016Buy 277,217 USD to Sell 193,991 GBP CIBC 8,473 18/03/2016Buy 293,008 USD to Sell 205,073 GBP Goldman Sachs 8,911 18/03/2016 Royal Bank of Canada Buy 293,029 USD to Sell 205,075 GBP (London Branch) 8,929 18/03/2016Buy 293,034 USD to Sell 205,074 GBP Deutsche Bank 8,937 18/03/2016 Royal Bank of Canada Buy 399,545 USD to Sell 358,462 EUR (London Branch) 9,138 18/03/2016Buy 399,577 USD to Sell 358,464 EUR Goldman Sachs 9,168 18/03/2016Buy 399,602 USD to Sell 358,463 EUR CIBC 9,194 18/03/2016Buy 399,680 USD to Sell 358,464 EUR Barclays 9,271 18/03/2016Buy 476,115 USD to Sell 427,143 EUR Deutsche Bank 10,906 18/03/2016
Total unrealised gain on open forward foreign exchange contracts 99,702
Buy 421,260 USD to Sell 585,107 CAD CIBC (10,406) 18/03/2016Buy 328,166 USD to Sell 455,646 CAD Goldman Sachs (7,989) 18/03/2016Buy 328,215 USD to Sell 455,645 CAD Deutsche Bank (7,940) 18/03/2016 Royal Bank of Canada Buy 328,256 USD to Sell 455,644 CAD (London Branch) (7,898) 18/03/2016Buy 133,689 GBP to Sell 191,951 USD Deutsche Bank (6,746) 18/03/2016Buy 245,617 CHF to Sell 247,623 USD Goldman Sachs (2,207) 18/03/2016
Total unrealised loss on open forward foreign exchange contracts (43,186)
Total net unrealised gain on open forward foreign exchange contracts 56,516
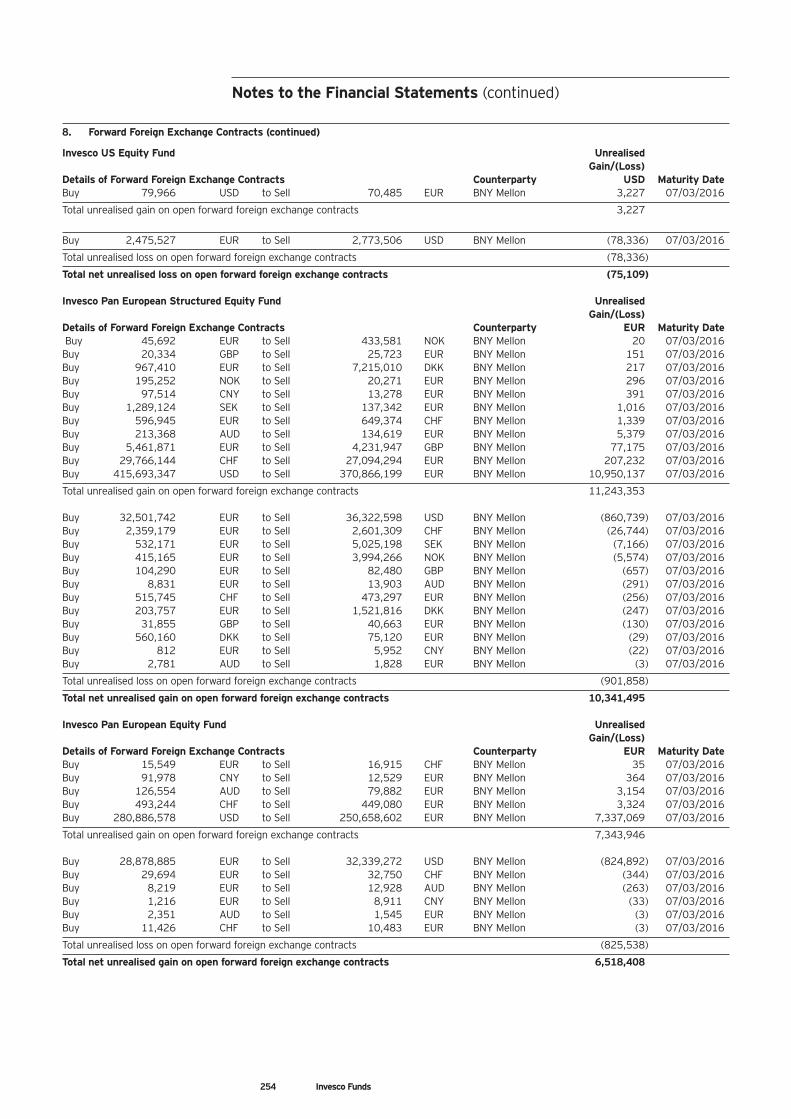
Notes to the Financial Statements (continued)
254 Invesco Funds
8. Forward Foreign Exchange Contracts (continued)
Invesco US Equity Fund Unrealised Gain/(Loss) Details of Forward Foreign Exchange Contracts Counterparty USD Maturity DateBuy 79,966 USD to Sell 70,485 EUR BNY Mellon 3,227 07/03/2016
Total unrealised gain on open forward foreign exchange contracts 3,227
Buy 2,475,527 EUR to Sell 2,773,506 USD BNY Mellon (78,336) 07/03/2016
Total unrealised loss on open forward foreign exchange contracts (78,336)
Total net unrealised loss on open forward foreign exchange contracts (75,109)
Invesco Pan European Structured Equity Fund Unrealised Gain/(Loss) Details of Forward Foreign Exchange Contracts Counterparty EUR Maturity DateBuy 45,692 EUR to Sell 433,581 NOK BNY Mellon 20 07/03/2016
Buy 20,334 GBP to Sell 25,723 EUR BNY Mellon 151 07/03/2016Buy 967,410 EUR to Sell 7,215,010 DKK BNY Mellon 217 07/03/2016Buy 195,252 NOK to Sell 20,271 EUR BNY Mellon 296 07/03/2016Buy 97,514 CNY to Sell 13,278 EUR BNY Mellon 391 07/03/2016Buy 1,289,124 SEK to Sell 137,342 EUR BNY Mellon 1,016 07/03/2016Buy 596,945 EUR to Sell 649,374 CHF BNY Mellon 1,339 07/03/2016Buy 213,368 AUD to Sell 134,619 EUR BNY Mellon 5,379 07/03/2016Buy 5,461,871 EUR to Sell 4,231,947 GBP BNY Mellon 77,175 07/03/2016Buy 29,766,144 CHF to Sell 27,094,294 EUR BNY Mellon 207,232 07/03/2016Buy 415,693,347 USD to Sell 370,866,199 EUR BNY Mellon 10,950,137 07/03/2016
Total unrealised gain on open forward foreign exchange contracts 11,243,353
Buy 32,501,742 EUR to Sell 36,322,598 USD BNY Mellon (860,739) 07/03/2016Buy 2,359,179 EUR to Sell 2,601,309 CHF BNY Mellon (26,744) 07/03/2016Buy 532,171 EUR to Sell 5,025,198 SEK BNY Mellon (7,166) 07/03/2016Buy 415,165 EUR to Sell 3,994,266 NOK BNY Mellon (5,574) 07/03/2016Buy 104,290 EUR to Sell 82,480 GBP BNY Mellon (657) 07/03/2016Buy 8,831 EUR to Sell 13,903 AUD BNY Mellon (291) 07/03/2016Buy 515,745 CHF to Sell 473,297 EUR BNY Mellon (256) 07/03/2016Buy 203,757 EUR to Sell 1,521,816 DKK BNY Mellon (247) 07/03/2016Buy 31,855 GBP to Sell 40,663 EUR BNY Mellon (130) 07/03/2016Buy 560,160 DKK to Sell 75,120 EUR BNY Mellon (29) 07/03/2016Buy 812 EUR to Sell 5,952 CNY BNY Mellon (22) 07/03/2016Buy 2,781 AUD to Sell 1,828 EUR BNY Mellon (3) 07/03/2016
Total unrealised loss on open forward foreign exchange contracts (901,858)
Total net unrealised gain on open forward foreign exchange contracts 10,341,495
Invesco Pan European Equity Fund Unrealised Gain/(Loss) Details of Forward Foreign Exchange Contracts Counterparty EUR Maturity DateBuy 15,549 EUR to Sell 16,915 CHF BNY Mellon 35 07/03/2016Buy 91,978 CNY to Sell 12,529 EUR BNY Mellon 364 07/03/2016Buy 126,554 AUD to Sell 79,882 EUR BNY Mellon 3,154 07/03/2016Buy 493,244 CHF to Sell 449,080 EUR BNY Mellon 3,324 07/03/2016Buy 280,886,578 USD to Sell 250,658,602 EUR BNY Mellon 7,337,069 07/03/2016
Total unrealised gain on open forward foreign exchange contracts 7,343,946
Buy 28,878,885 EUR to Sell 32,339,272 USD BNY Mellon (824,892) 07/03/2016Buy 29,694 EUR to Sell 32,750 CHF BNY Mellon (344) 07/03/2016Buy 8,219 EUR to Sell 12,928 AUD BNY Mellon (263) 07/03/2016Buy 1,216 EUR to Sell 8,911 CNY BNY Mellon (33) 07/03/2016Buy 2,351 AUD to Sell 1,545 EUR BNY Mellon (3) 07/03/2016Buy 11,426 CHF to Sell 10,483 EUR BNY Mellon (3) 07/03/2016
Total unrealised loss on open forward foreign exchange contracts (825,538)
Total net unrealised gain on open forward foreign exchange contracts 6,518,408
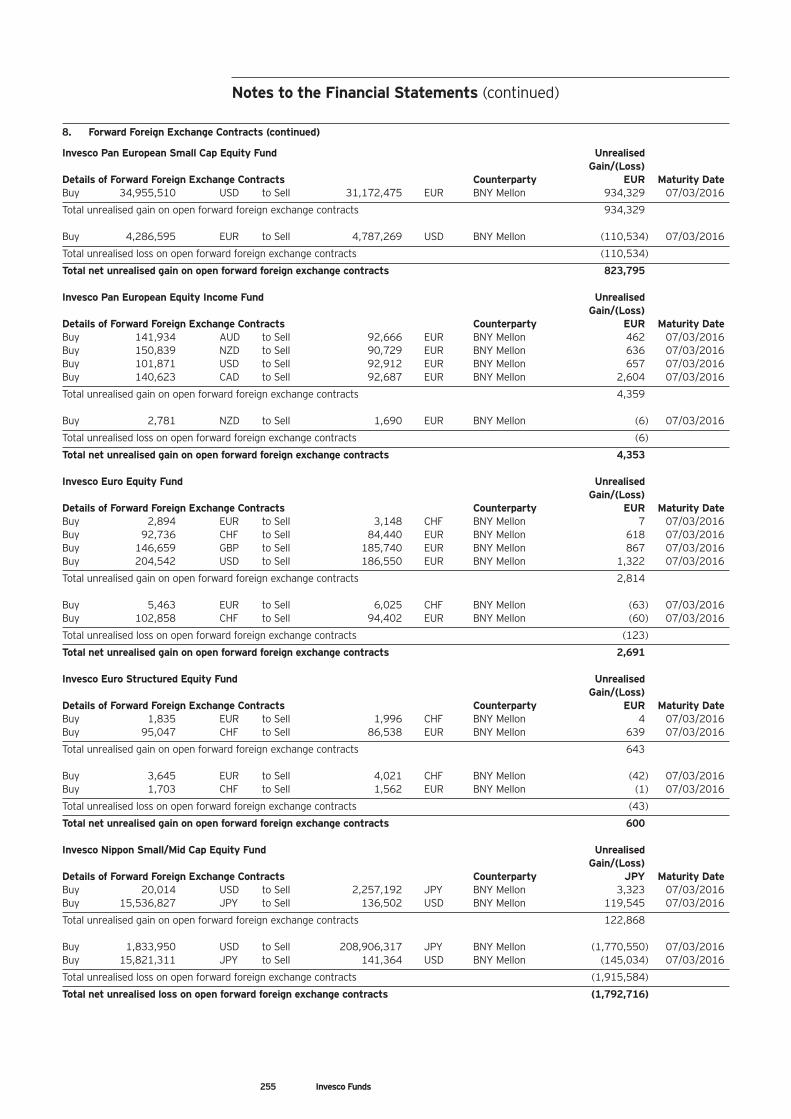
255 Invesco Funds
Notes to the Financial Statements (continued)
8. Forward Foreign Exchange Contracts (continued)
Invesco Pan European Small Cap Equity Fund Unrealised Gain/(Loss) Details of Forward Foreign Exchange Contracts Counterparty EUR Maturity DateBuy 34,955,510 USD to Sell 31,172,475 EUR BNY Mellon 934,329 07/03/2016
Total unrealised gain on open forward foreign exchange contracts 934,329
Buy 4,286,595 EUR to Sell 4,787,269 USD BNY Mellon (110,534) 07/03/2016
Total unrealised loss on open forward foreign exchange contracts (110,534)
Total net unrealised gain on open forward foreign exchange contracts 823,795
Invesco Pan European Equity Income Fund Unrealised Gain/(Loss) Details of Forward Foreign Exchange Contracts Counterparty EUR Maturity DateBuy 141,934 AUD to Sell 92,666 EUR BNY Mellon 462 07/03/2016Buy 150,839 NZD to Sell 90,729 EUR BNY Mellon 636 07/03/2016Buy 101,871 USD to Sell 92,912 EUR BNY Mellon 657 07/03/2016Buy 140,623 CAD to Sell 92,687 EUR BNY Mellon 2,604 07/03/2016
Total unrealised gain on open forward foreign exchange contracts 4,359
Buy 2,781 NZD to Sell 1,690 EUR BNY Mellon (6) 07/03/2016
Total unrealised loss on open forward foreign exchange contracts (6)
Total net unrealised gain on open forward foreign exchange contracts 4,353
Invesco Euro Equity Fund Unrealised Gain/(Loss) Details of Forward Foreign Exchange Contracts Counterparty EUR Maturity DateBuy 2,894 EUR to Sell 3,148 CHF BNY Mellon 7 07/03/2016Buy 92,736 CHF to Sell 84,440 EUR BNY Mellon 618 07/03/2016Buy 146,659 GBP to Sell 185,740 EUR BNY Mellon 867 07/03/2016Buy 204,542 USD to Sell 186,550 EUR BNY Mellon 1,322 07/03/2016
Total unrealised gain on open forward foreign exchange contracts 2,814
Buy 5,463 EUR to Sell 6,025 CHF BNY Mellon (63) 07/03/2016Buy 102,858 CHF to Sell 94,402 EUR BNY Mellon (60) 07/03/2016
Total unrealised loss on open forward foreign exchange contracts (123)
Total net unrealised gain on open forward foreign exchange contracts 2,691
Invesco Euro Structured Equity Fund Unrealised Gain/(Loss) Details of Forward Foreign Exchange Contracts Counterparty EUR Maturity DateBuy 1,835 EUR to Sell 1,996 CHF BNY Mellon 4 07/03/2016Buy 95,047 CHF to Sell 86,538 EUR BNY Mellon 639 07/03/2016
Total unrealised gain on open forward foreign exchange contracts 643
Buy 3,645 EUR to Sell 4,021 CHF BNY Mellon (42) 07/03/2016Buy 1,703 CHF to Sell 1,562 EUR BNY Mellon (1) 07/03/2016
Total unrealised loss on open forward foreign exchange contracts (43)
Total net unrealised gain on open forward foreign exchange contracts 600
Invesco Nippon Small/Mid Cap Equity Fund Unrealised Gain/(Loss) Details of Forward Foreign Exchange Contracts Counterparty JPY Maturity DateBuy 20,014 USD to Sell 2,257,192 JPY BNY Mellon 3,323 07/03/2016Buy 15,536,827 JPY to Sell 136,502 USD BNY Mellon 119,545 07/03/2016
Total unrealised gain on open forward foreign exchange contracts 122,868
Buy 1,833,950 USD to Sell 208,906,317 JPY BNY Mellon (1,770,550) 07/03/2016Buy 15,821,311 JPY to Sell 141,364 USD BNY Mellon (145,034) 07/03/2016
Total unrealised loss on open forward foreign exchange contracts (1,915,584)
Total net unrealised loss on open forward foreign exchange contracts (1,792,716)
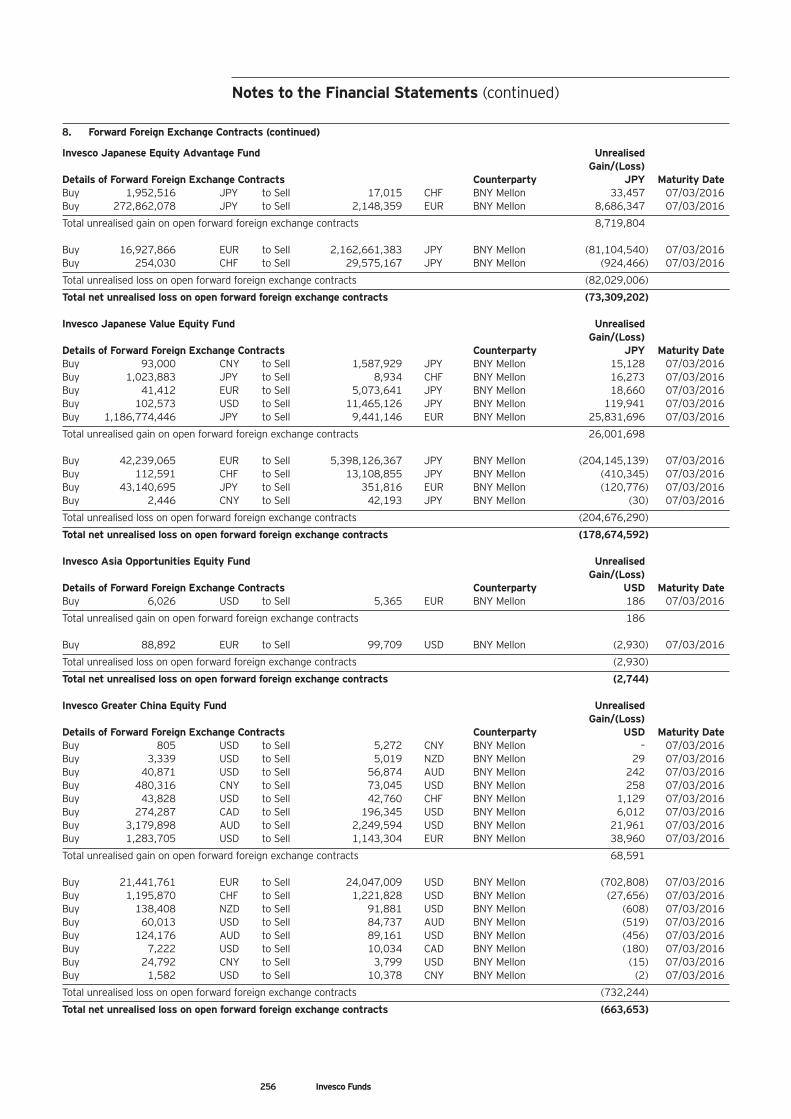
Notes to the Financial Statements (continued)
256 Invesco Funds
8. Forward Foreign Exchange Contracts (continued)
Invesco Japanese Equity Advantage Fund Unrealised Gain/(Loss) Details of Forward Foreign Exchange Contracts Counterparty JPY Maturity DateBuy 1,952,516 JPY to Sell 17,015 CHF BNY Mellon 33,457 07/03/2016Buy 272,862,078 JPY to Sell 2,148,359 EUR BNY Mellon 8,686,347 07/03/2016
Total unrealised gain on open forward foreign exchange contracts 8,719,804
Buy 16,927,866 EUR to Sell 2,162,661,383 JPY BNY Mellon (81,104,540) 07/03/2016Buy 254,030 CHF to Sell 29,575,167 JPY BNY Mellon (924,466) 07/03/2016
Total unrealised loss on open forward foreign exchange contracts (82,029,006)
Total net unrealised loss on open forward foreign exchange contracts (73,309,202)
Invesco Japanese Value Equity Fund Unrealised Gain/(Loss) Details of Forward Foreign Exchange Contracts Counterparty JPY Maturity DateBuy 93,000 CNY to Sell 1,587,929 JPY BNY Mellon 15,128 07/03/2016Buy 1,023,883 JPY to Sell 8,934 CHF BNY Mellon 16,273 07/03/2016Buy 41,412 EUR to Sell 5,073,641 JPY BNY Mellon 18,660 07/03/2016Buy 102,573 USD to Sell 11,465,126 JPY BNY Mellon 119,941 07/03/2016Buy 1,186,774,446 JPY to Sell 9,441,146 EUR BNY Mellon 25,831,696 07/03/2016
Total unrealised gain on open forward foreign exchange contracts 26,001,698
Buy 42,239,065 EUR to Sell 5,398,126,367 JPY BNY Mellon (204,145,139) 07/03/2016Buy 112,591 CHF to Sell 13,108,855 JPY BNY Mellon (410,345) 07/03/2016Buy 43,140,695 JPY to Sell 351,816 EUR BNY Mellon (120,776) 07/03/2016Buy 2,446 CNY to Sell 42,193 JPY BNY Mellon (30) 07/03/2016
Total unrealised loss on open forward foreign exchange contracts (204,676,290)
Total net unrealised loss on open forward foreign exchange contracts (178,674,592)
Invesco Asia Opportunities Equity Fund Unrealised Gain/(Loss) Details of Forward Foreign Exchange Contracts Counterparty USD Maturity DateBuy 6,026 USD to Sell 5,365 EUR BNY Mellon 186 07/03/2016
Total unrealised gain on open forward foreign exchange contracts 186
Buy 88,892 EUR to Sell 99,709 USD BNY Mellon (2,930) 07/03/2016
Total unrealised loss on open forward foreign exchange contracts (2,930)
Total net unrealised loss on open forward foreign exchange contracts (2,744)
Invesco Greater China Equity Fund Unrealised Gain/(Loss) Details of Forward Foreign Exchange Contracts Counterparty USD Maturity DateBuy 805 USD to Sell 5,272 CNY BNY Mellon – 07/03/2016Buy 3,339 USD to Sell 5,019 NZD BNY Mellon 29 07/03/2016Buy 40,871 USD to Sell 56,874 AUD BNY Mellon 242 07/03/2016Buy 480,316 CNY to Sell 73,045 USD BNY Mellon 258 07/03/2016Buy 43,828 USD to Sell 42,760 CHF BNY Mellon 1,129 07/03/2016Buy 274,287 CAD to Sell 196,345 USD BNY Mellon 6,012 07/03/2016Buy 3,179,898 AUD to Sell 2,249,594 USD BNY Mellon 21,961 07/03/2016Buy 1,283,705 USD to Sell 1,143,304 EUR BNY Mellon 38,960 07/03/2016
Total unrealised gain on open forward foreign exchange contracts 68,591
Buy 21,441,761 EUR to Sell 24,047,009 USD BNY Mellon (702,808) 07/03/2016Buy 1,195,870 CHF to Sell 1,221,828 USD BNY Mellon (27,656) 07/03/2016Buy 138,408 NZD to Sell 91,881 USD BNY Mellon (608) 07/03/2016Buy 60,013 USD to Sell 84,737 AUD BNY Mellon (519) 07/03/2016Buy 124,176 AUD to Sell 89,161 USD BNY Mellon (456) 07/03/2016Buy 7,222 USD to Sell 10,034 CAD BNY Mellon (180) 07/03/2016Buy 24,792 CNY to Sell 3,799 USD BNY Mellon (15) 07/03/2016Buy 1,582 USD to Sell 10,378 CNY BNY Mellon (2) 07/03/2016
Total unrealised loss on open forward foreign exchange contracts (732,244)
Total net unrealised loss on open forward foreign exchange contracts (663,653)
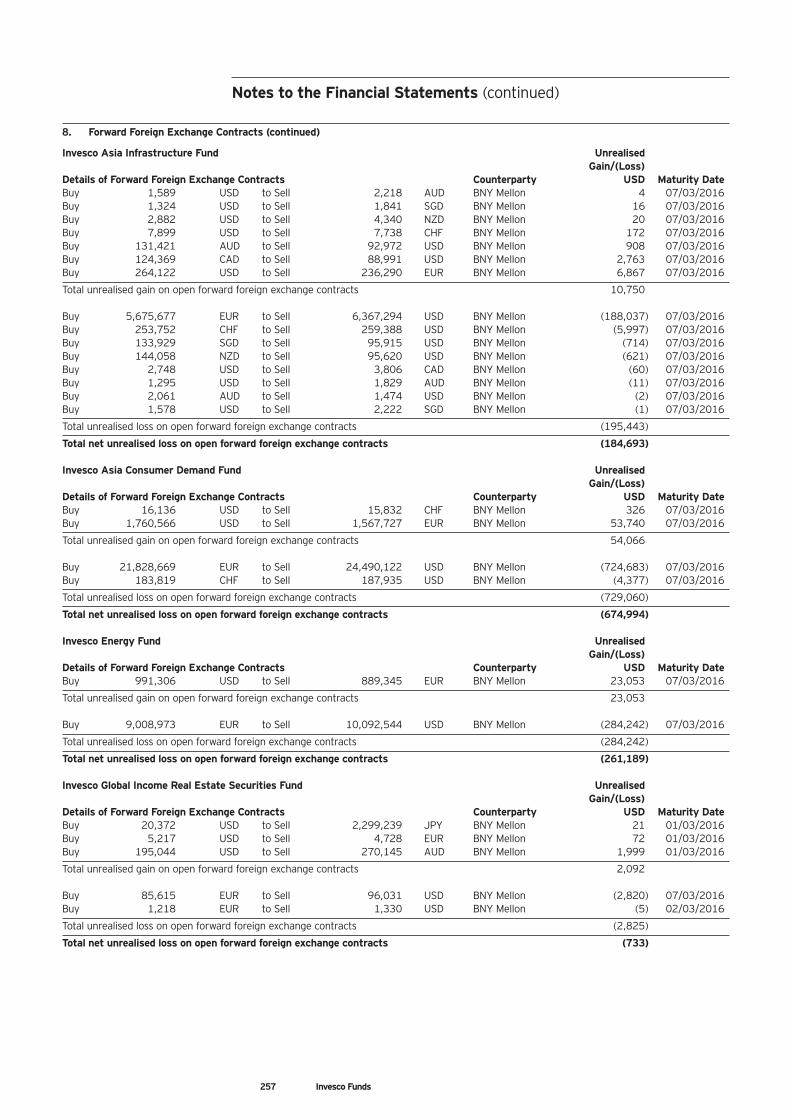
257 Invesco Funds
Notes to the Financial Statements (continued)
8. Forward Foreign Exchange Contracts (continued)
Invesco Asia Infrastructure Fund Unrealised Gain/(Loss) Details of Forward Foreign Exchange Contracts Counterparty USD Maturity DateBuy 1,589 USD to Sell 2,218 AUD BNY Mellon 4 07/03/2016Buy 1,324 USD to Sell 1,841 SGD BNY Mellon 16 07/03/2016Buy 2,882 USD to Sell 4,340 NZD BNY Mellon 20 07/03/2016Buy 7,899 USD to Sell 7,738 CHF BNY Mellon 172 07/03/2016Buy 131,421 AUD to Sell 92,972 USD BNY Mellon 908 07/03/2016Buy 124,369 CAD to Sell 88,991 USD BNY Mellon 2,763 07/03/2016Buy 264,122 USD to Sell 236,290 EUR BNY Mellon 6,867 07/03/2016
Total unrealised gain on open forward foreign exchange contracts 10,750
Buy 5,675,677 EUR to Sell 6,367,294 USD BNY Mellon (188,037) 07/03/2016Buy 253,752 CHF to Sell 259,388 USD BNY Mellon (5,997) 07/03/2016Buy 133,929 SGD to Sell 95,915 USD BNY Mellon (714) 07/03/2016Buy 144,058 NZD to Sell 95,620 USD BNY Mellon (621) 07/03/2016Buy 2,748 USD to Sell 3,806 CAD BNY Mellon (60) 07/03/2016Buy 1,295 USD to Sell 1,829 AUD BNY Mellon (11) 07/03/2016Buy 2,061 AUD to Sell 1,474 USD BNY Mellon (2) 07/03/2016Buy 1,578 USD to Sell 2,222 SGD BNY Mellon (1) 07/03/2016
Total unrealised loss on open forward foreign exchange contracts (195,443)
Total net unrealised loss on open forward foreign exchange contracts (184,693)
Invesco Asia Consumer Demand Fund Unrealised Gain/(Loss) Details of Forward Foreign Exchange Contracts Counterparty USD Maturity DateBuy 16,136 USD to Sell 15,832 CHF BNY Mellon 326 07/03/2016Buy 1,760,566 USD to Sell 1,567,727 EUR BNY Mellon 53,740 07/03/2016
Total unrealised gain on open forward foreign exchange contracts 54,066
Buy 21,828,669 EUR to Sell 24,490,122 USD BNY Mellon (724,683) 07/03/2016Buy 183,819 CHF to Sell 187,935 USD BNY Mellon (4,377) 07/03/2016
Total unrealised loss on open forward foreign exchange contracts (729,060)
Total net unrealised loss on open forward foreign exchange contracts (674,994)
Invesco Energy Fund Unrealised Gain/(Loss) Details of Forward Foreign Exchange Contracts Counterparty USD Maturity DateBuy 991,306 USD to Sell 889,345 EUR BNY Mellon 23,053 07/03/2016
Total unrealised gain on open forward foreign exchange contracts 23,053
Buy 9,008,973 EUR to Sell 10,092,544 USD BNY Mellon (284,242) 07/03/2016
Total unrealised loss on open forward foreign exchange contracts (284,242)
Total net unrealised loss on open forward foreign exchange contracts (261,189)
Invesco Global Income Real Estate Securities Fund Unrealised Gain/(Loss) Details of Forward Foreign Exchange Contracts Counterparty USD Maturity DateBuy 20,372 USD to Sell 2,299,239 JPY BNY Mellon 21 01/03/2016Buy 5,217 USD to Sell 4,728 EUR BNY Mellon 72 01/03/2016Buy 195,044 USD to Sell 270,145 AUD BNY Mellon 1,999 01/03/2016
Total unrealised gain on open forward foreign exchange contracts 2,092
Buy 85,615 EUR to Sell 96,031 USD BNY Mellon (2,820) 07/03/2016Buy 1,218 EUR to Sell 1,330 USD BNY Mellon (5) 02/03/2016
Total unrealised loss on open forward foreign exchange contracts (2,825)
Total net unrealised loss on open forward foreign exchange contracts (733)
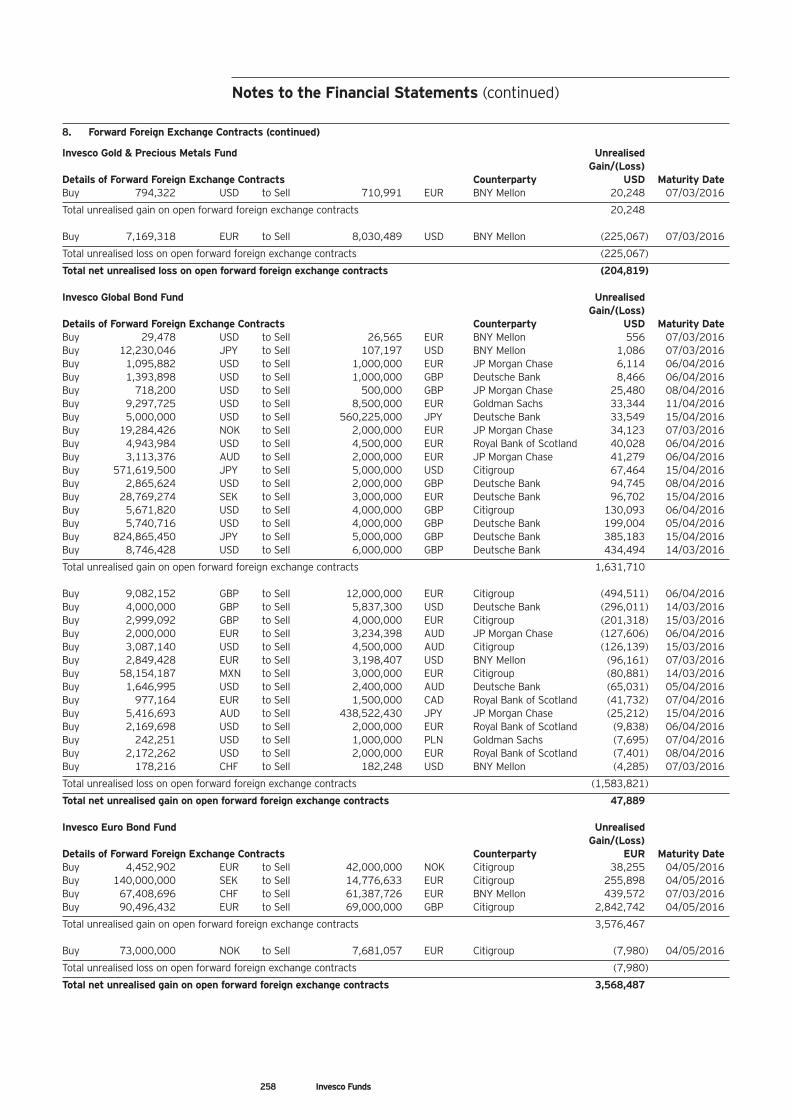
Notes to the Financial Statements (continued)
258 Invesco Funds
8. Forward Foreign Exchange Contracts (continued)
Invesco Gold & Precious Metals Fund Unrealised Gain/(Loss) Details of Forward Foreign Exchange Contracts Counterparty USD Maturity DateBuy 794,322 USD to Sell 710,991 EUR BNY Mellon 20,248 07/03/2016
Total unrealised gain on open forward foreign exchange contracts 20,248
Buy 7,169,318 EUR to Sell 8,030,489 USD BNY Mellon (225,067) 07/03/2016
Total unrealised loss on open forward foreign exchange contracts (225,067)
Total net unrealised loss on open forward foreign exchange contracts (204,819)
Invesco Global Bond Fund Unrealised Gain/(Loss) Details of Forward Foreign Exchange Contracts Counterparty USD Maturity DateBuy 29,478 USD to Sell 26,565 EUR BNY Mellon 556 07/03/2016Buy 12,230,046 JPY to Sell 107,197 USD BNY Mellon 1,086 07/03/2016Buy 1,095,882 USD to Sell 1,000,000 EUR JP Morgan Chase 6,114 06/04/2016Buy 1,393,898 USD to Sell 1,000,000 GBP Deutsche Bank 8,466 06/04/2016Buy 718,200 USD to Sell 500,000 GBP JP Morgan Chase 25,480 08/04/2016Buy 9,297,725 USD to Sell 8,500,000 EUR Goldman Sachs 33,344 11/04/2016Buy 5,000,000 USD to Sell 560,225,000 JPY Deutsche Bank 33,549 15/04/2016Buy 19,284,426 NOK to Sell 2,000,000 EUR JP Morgan Chase 34,123 07/03/2016Buy 4,943,984 USD to Sell 4,500,000 EUR Royal Bank of Scotland 40,028 06/04/2016Buy 3,113,376 AUD to Sell 2,000,000 EUR JP Morgan Chase 41,279 06/04/2016Buy 571,619,500 JPY to Sell 5,000,000 USD Citigroup 67,464 15/04/2016Buy 2,865,624 USD to Sell 2,000,000 GBP Deutsche Bank 94,745 08/04/2016Buy 28,769,274 SEK to Sell 3,000,000 EUR Deutsche Bank 96,702 15/04/2016Buy 5,671,820 USD to Sell 4,000,000 GBP Citigroup 130,093 06/04/2016Buy 5,740,716 USD to Sell 4,000,000 GBP Deutsche Bank 199,004 05/04/2016Buy 824,865,450 JPY to Sell 5,000,000 GBP Deutsche Bank 385,183 15/04/2016Buy 8,746,428 USD to Sell 6,000,000 GBP Deutsche Bank 434,494 14/03/2016
Total unrealised gain on open forward foreign exchange contracts 1,631,710
Buy 9,082,152 GBP to Sell 12,000,000 EUR Citigroup (494,511) 06/04/2016Buy 4,000,000 GBP to Sell 5,837,300 USD Deutsche Bank (296,011) 14/03/2016Buy 2,999,092 GBP to Sell 4,000,000 EUR Citigroup (201,318) 15/03/2016Buy 2,000,000 EUR to Sell 3,234,398 AUD JP Morgan Chase (127,606) 06/04/2016Buy 3,087,140 USD to Sell 4,500,000 AUD Citigroup (126,139) 15/03/2016Buy 2,849,428 EUR to Sell 3,198,407 USD BNY Mellon (96,161) 07/03/2016Buy 58,154,187 MXN to Sell 3,000,000 EUR Citigroup (80,881) 14/03/2016Buy 1,646,995 USD to Sell 2,400,000 AUD Deutsche Bank (65,031) 05/04/2016Buy 977,164 EUR to Sell 1,500,000 CAD Royal Bank of Scotland (41,732) 07/04/2016Buy 5,416,693 AUD to Sell 438,522,430 JPY JP Morgan Chase (25,212) 15/04/2016Buy 2,169,698 USD to Sell 2,000,000 EUR Royal Bank of Scotland (9,838) 06/04/2016Buy 242,251 USD to Sell 1,000,000 PLN Goldman Sachs (7,695) 07/04/2016Buy 2,172,262 USD to Sell 2,000,000 EUR Royal Bank of Scotland (7,401) 08/04/2016Buy 178,216 CHF to Sell 182,248 USD BNY Mellon (4,285) 07/03/2016
Total unrealised loss on open forward foreign exchange contracts (1,583,821)
Total net unrealised gain on open forward foreign exchange contracts 47,889
Invesco Euro Bond Fund Unrealised Gain/(Loss) Details of Forward Foreign Exchange Contracts Counterparty EUR Maturity DateBuy 4,452,902 EUR to Sell 42,000,000 NOK Citigroup 38,255 04/05/2016Buy 140,000,000 SEK to Sell 14,776,633 EUR Citigroup 255,898 04/05/2016Buy 67,408,696 CHF to Sell 61,387,726 EUR BNY Mellon 439,572 07/03/2016Buy 90,496,432 EUR to Sell 69,000,000 GBP Citigroup 2,842,742 04/05/2016
Total unrealised gain on open forward foreign exchange contracts 3,576,467
Buy 73,000,000 NOK to Sell 7,681,057 EUR Citigroup (7,980) 04/05/2016
Total unrealised loss on open forward foreign exchange contracts (7,980)
Total net unrealised gain on open forward foreign exchange contracts 3,568,487
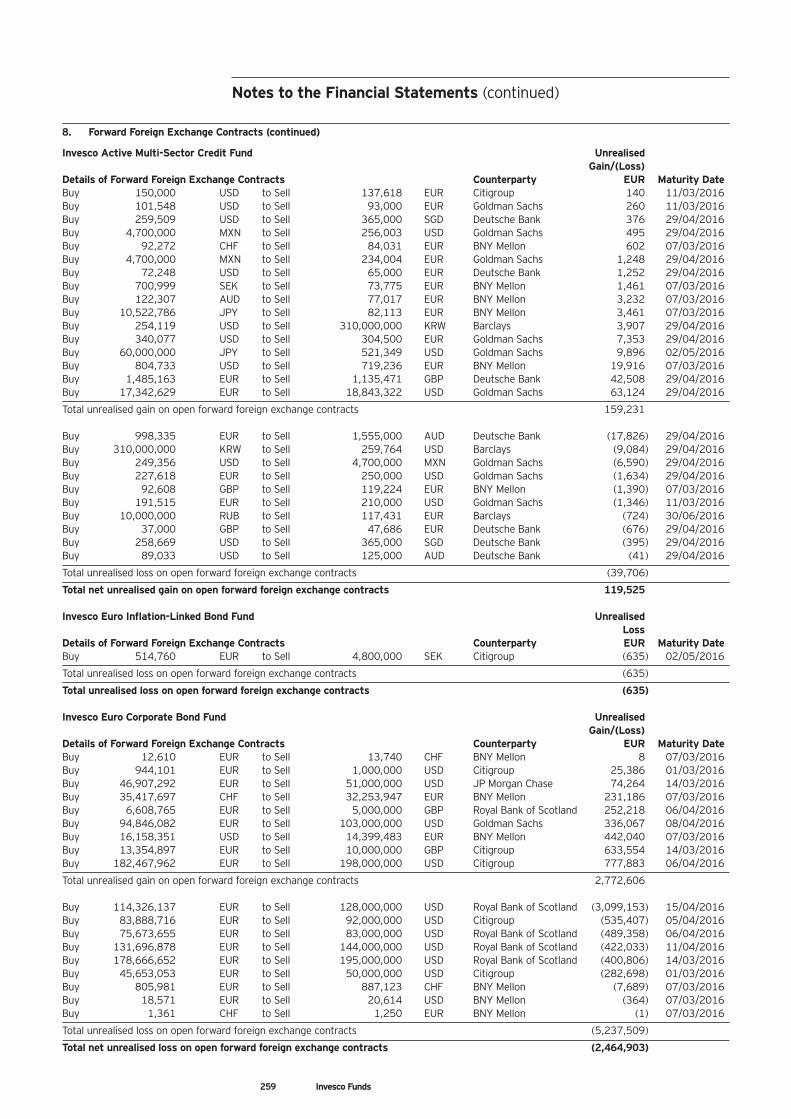
259 Invesco Funds
Notes to the Financial Statements (continued)
8. Forward Foreign Exchange Contracts (continued)
Invesco Active Multi-Sector Credit Fund Unrealised Gain/(Loss) Details of Forward Foreign Exchange Contracts Counterparty EUR Maturity DateBuy 150,000 USD to Sell 137,618 EUR Citigroup 140 11/03/2016Buy 101,548 USD to Sell 93,000 EUR Goldman Sachs 260 11/03/2016Buy 259,509 USD to Sell 365,000 SGD Deutsche Bank 376 29/04/2016Buy 4,700,000 MXN to Sell 256,003 USD Goldman Sachs 495 29/04/2016Buy 92,272 CHF to Sell 84,031 EUR BNY Mellon 602 07/03/2016Buy 4,700,000 MXN to Sell 234,004 EUR Goldman Sachs 1,248 29/04/2016Buy 72,248 USD to Sell 65,000 EUR Deutsche Bank 1,252 29/04/2016Buy 700,999 SEK to Sell 73,775 EUR BNY Mellon 1,461 07/03/2016Buy 122,307 AUD to Sell 77,017 EUR BNY Mellon 3,232 07/03/2016Buy 10,522,786 JPY to Sell 82,113 EUR BNY Mellon 3,461 07/03/2016Buy 254,119 USD to Sell 310,000,000 KRW Barclays 3,907 29/04/2016Buy 340,077 USD to Sell 304,500 EUR Goldman Sachs 7,353 29/04/2016Buy 60,000,000 JPY to Sell 521,349 USD Goldman Sachs 9,896 02/05/2016Buy 804,733 USD to Sell 719,236 EUR BNY Mellon 19,916 07/03/2016Buy 1,485,163 EUR to Sell 1,135,471 GBP Deutsche Bank 42,508 29/04/2016Buy 17,342,629 EUR to Sell 18,843,322 USD Goldman Sachs 63,124 29/04/2016
Total unrealised gain on open forward foreign exchange contracts 159,231
Buy 998,335 EUR to Sell 1,555,000 AUD Deutsche Bank (17,826) 29/04/2016Buy 310,000,000 KRW to Sell 259,764 USD Barclays (9,084) 29/04/2016Buy 249,356 USD to Sell 4,700,000 MXN Goldman Sachs (6,590) 29/04/2016Buy 227,618 EUR to Sell 250,000 USD Goldman Sachs (1,634) 29/04/2016Buy 92,608 GBP to Sell 119,224 EUR BNY Mellon (1,390) 07/03/2016Buy 191,515 EUR to Sell 210,000 USD Goldman Sachs (1,346) 11/03/2016Buy 10,000,000 RUB to Sell 117,431 EUR Barclays (724) 30/06/2016Buy 37,000 GBP to Sell 47,686 EUR Deutsche Bank (676) 29/04/2016Buy 258,669 USD to Sell 365,000 SGD Deutsche Bank (395) 29/04/2016Buy 89,033 USD to Sell 125,000 AUD Deutsche Bank (41) 29/04/2016
Total unrealised loss on open forward foreign exchange contracts (39,706)
Total net unrealised gain on open forward foreign exchange contracts 119,525
Invesco Euro Inflation-Linked Bond Fund Unrealised Loss Details of Forward Foreign Exchange Contracts Counterparty EUR Maturity DateBuy 514,760 EUR to Sell 4,800,000 SEK Citigroup (635) 02/05/2016
Total unrealised loss on open forward foreign exchange contracts (635)
Total unrealised loss on open forward foreign exchange contracts (635)
Invesco Euro Corporate Bond Fund Unrealised Gain/(Loss) Details of Forward Foreign Exchange Contracts Counterparty EUR Maturity DateBuy 12,610 EUR to Sell 13,740 CHF BNY Mellon 8 07/03/2016Buy 944,101 EUR to Sell 1,000,000 USD Citigroup 25,386 01/03/2016Buy 46,907,292 EUR to Sell 51,000,000 USD JP Morgan Chase 74,264 14/03/2016Buy 35,417,697 CHF to Sell 32,253,947 EUR BNY Mellon 231,186 07/03/2016Buy 6,608,765 EUR to Sell 5,000,000 GBP Royal Bank of Scotland 252,218 06/04/2016Buy 94,846,082 EUR to Sell 103,000,000 USD Goldman Sachs 336,067 08/04/2016Buy 16,158,351 USD to Sell 14,399,483 EUR BNY Mellon 442,040 07/03/2016Buy 13,354,897 EUR to Sell 10,000,000 GBP Citigroup 633,554 14/03/2016Buy 182,467,962 EUR to Sell 198,000,000 USD Citigroup 777,883 06/04/2016
Total unrealised gain on open forward foreign exchange contracts 2,772,606
Buy 114,326,137 EUR to Sell 128,000,000 USD Royal Bank of Scotland (3,099,153) 15/04/2016Buy 83,888,716 EUR to Sell 92,000,000 USD Citigroup (535,407) 05/04/2016Buy 75,673,655 EUR to Sell 83,000,000 USD Royal Bank of Scotland (489,358) 06/04/2016Buy 131,696,878 EUR to Sell 144,000,000 USD Royal Bank of Scotland (422,033) 11/04/2016Buy 178,666,652 EUR to Sell 195,000,000 USD Royal Bank of Scotland (400,806) 14/03/2016Buy 45,653,053 EUR to Sell 50,000,000 USD Citigroup (282,698) 01/03/2016Buy 805,981 EUR to Sell 887,123 CHF BNY Mellon (7,689) 07/03/2016Buy 18,571 EUR to Sell 20,614 USD BNY Mellon (364) 07/03/2016Buy 1,361 CHF to Sell 1,250 EUR BNY Mellon (1) 07/03/2016
Total unrealised loss on open forward foreign exchange contracts (5,237,509)
Total net unrealised loss on open forward foreign exchange contracts (2,464,903)
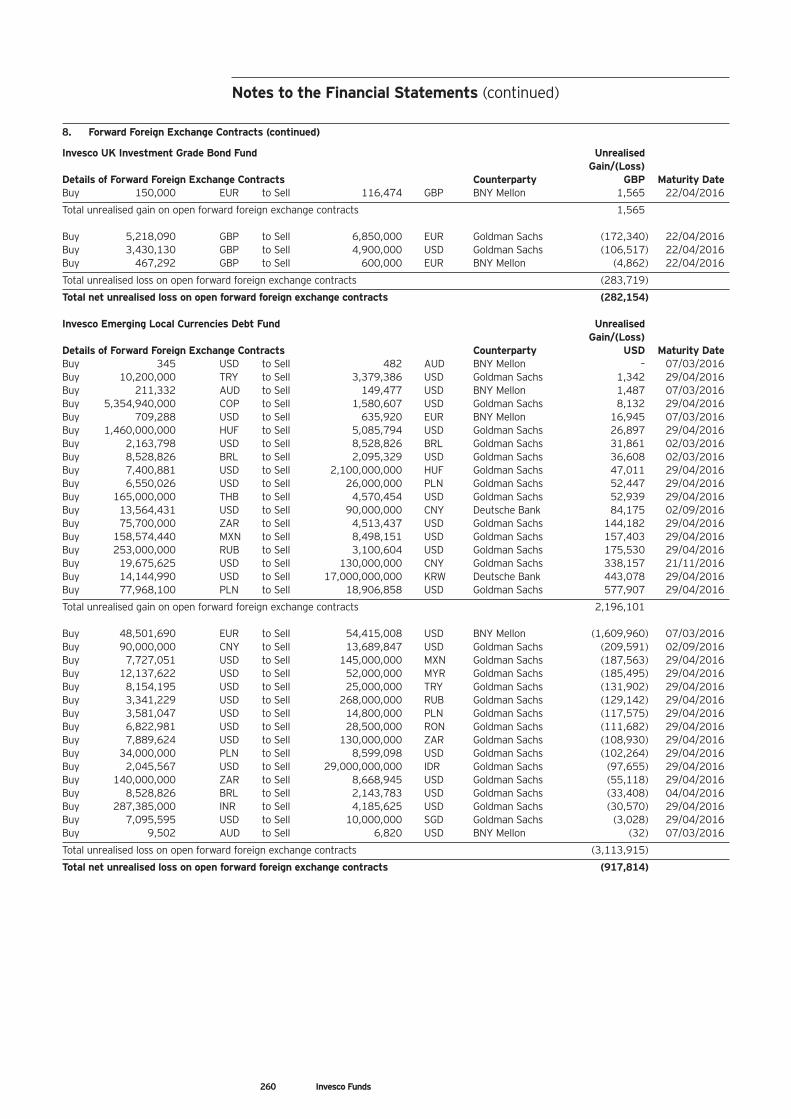
Notes to the Financial Statements (continued)
260 Invesco Funds
8. Forward Foreign Exchange Contracts (continued)
Invesco UK Investment Grade Bond Fund Unrealised Gain/(Loss) Details of Forward Foreign Exchange Contracts Counterparty GBP Maturity DateBuy 150,000 EUR to Sell 116,474 GBP BNY Mellon 1,565 22/04/2016
Total unrealised gain on open forward foreign exchange contracts 1,565
Buy 5,218,090 GBP to Sell 6,850,000 EUR Goldman Sachs (172,340) 22/04/2016Buy 3,430,130 GBP to Sell 4,900,000 USD Goldman Sachs (106,517) 22/04/2016Buy 467,292 GBP to Sell 600,000 EUR BNY Mellon (4,862) 22/04/2016
Total unrealised loss on open forward foreign exchange contracts (283,719)
Total net unrealised loss on open forward foreign exchange contracts (282,154)
Invesco Emerging Local Currencies Debt Fund Unrealised Gain/(Loss) Details of Forward Foreign Exchange Contracts Counterparty USD Maturity DateBuy 345 USD to Sell 482 AUD BNY Mellon – 07/03/2016Buy 10,200,000 TRY to Sell 3,379,386 USD Goldman Sachs 1,342 29/04/2016Buy 211,332 AUD to Sell 149,477 USD BNY Mellon 1,487 07/03/2016Buy 5,354,940,000 COP to Sell 1,580,607 USD Goldman Sachs 8,132 29/04/2016Buy 709,288 USD to Sell 635,920 EUR BNY Mellon 16,945 07/03/2016Buy 1,460,000,000 HUF to Sell 5,085,794 USD Goldman Sachs 26,897 29/04/2016Buy 2,163,798 USD to Sell 8,528,826 BRL Goldman Sachs 31,861 02/03/2016Buy 8,528,826 BRL to Sell 2,095,329 USD Goldman Sachs 36,608 02/03/2016Buy 7,400,881 USD to Sell 2,100,000,000 HUF Goldman Sachs 47,011 29/04/2016Buy 6,550,026 USD to Sell 26,000,000 PLN Goldman Sachs 52,447 29/04/2016Buy 165,000,000 THB to Sell 4,570,454 USD Goldman Sachs 52,939 29/04/2016Buy 13,564,431 USD to Sell 90,000,000 CNY Deutsche Bank 84,175 02/09/2016Buy 75,700,000 ZAR to Sell 4,513,437 USD Goldman Sachs 144,182 29/04/2016Buy 158,574,440 MXN to Sell 8,498,151 USD Goldman Sachs 157,403 29/04/2016Buy 253,000,000 RUB to Sell 3,100,604 USD Goldman Sachs 175,530 29/04/2016Buy 19,675,625 USD to Sell 130,000,000 CNY Goldman Sachs 338,157 21/11/2016Buy 14,144,990 USD to Sell 17,000,000,000 KRW Deutsche Bank 443,078 29/04/2016Buy 77,968,100 PLN to Sell 18,906,858 USD Goldman Sachs 577,907 29/04/2016
Total unrealised gain on open forward foreign exchange contracts 2,196,101
Buy 48,501,690 EUR to Sell 54,415,008 USD BNY Mellon (1,609,960) 07/03/2016Buy 90,000,000 CNY to Sell 13,689,847 USD Goldman Sachs (209,591) 02/09/2016Buy 7,727,051 USD to Sell 145,000,000 MXN Goldman Sachs (187,563) 29/04/2016Buy 12,137,622 USD to Sell 52,000,000 MYR Goldman Sachs (185,495) 29/04/2016Buy 8,154,195 USD to Sell 25,000,000 TRY Goldman Sachs (131,902) 29/04/2016Buy 3,341,229 USD to Sell 268,000,000 RUB Goldman Sachs (129,142) 29/04/2016Buy 3,581,047 USD to Sell 14,800,000 PLN Goldman Sachs (117,575) 29/04/2016Buy 6,822,981 USD to Sell 28,500,000 RON Goldman Sachs (111,682) 29/04/2016Buy 7,889,624 USD to Sell 130,000,000 ZAR Goldman Sachs (108,930) 29/04/2016Buy 34,000,000 PLN to Sell 8,599,098 USD Goldman Sachs (102,264) 29/04/2016Buy 2,045,567 USD to Sell 29,000,000,000 IDR Goldman Sachs (97,655) 29/04/2016Buy 140,000,000 ZAR to Sell 8,668,945 USD Goldman Sachs (55,118) 29/04/2016Buy 8,528,826 BRL to Sell 2,143,783 USD Goldman Sachs (33,408) 04/04/2016Buy 287,385,000 INR to Sell 4,185,625 USD Goldman Sachs (30,570) 29/04/2016Buy 7,095,595 USD to Sell 10,000,000 SGD Goldman Sachs (3,028) 29/04/2016Buy 9,502 AUD to Sell 6,820 USD BNY Mellon (32) 07/03/2016
Total unrealised loss on open forward foreign exchange contracts (3,113,915)
Total net unrealised loss on open forward foreign exchange contracts (917,814)
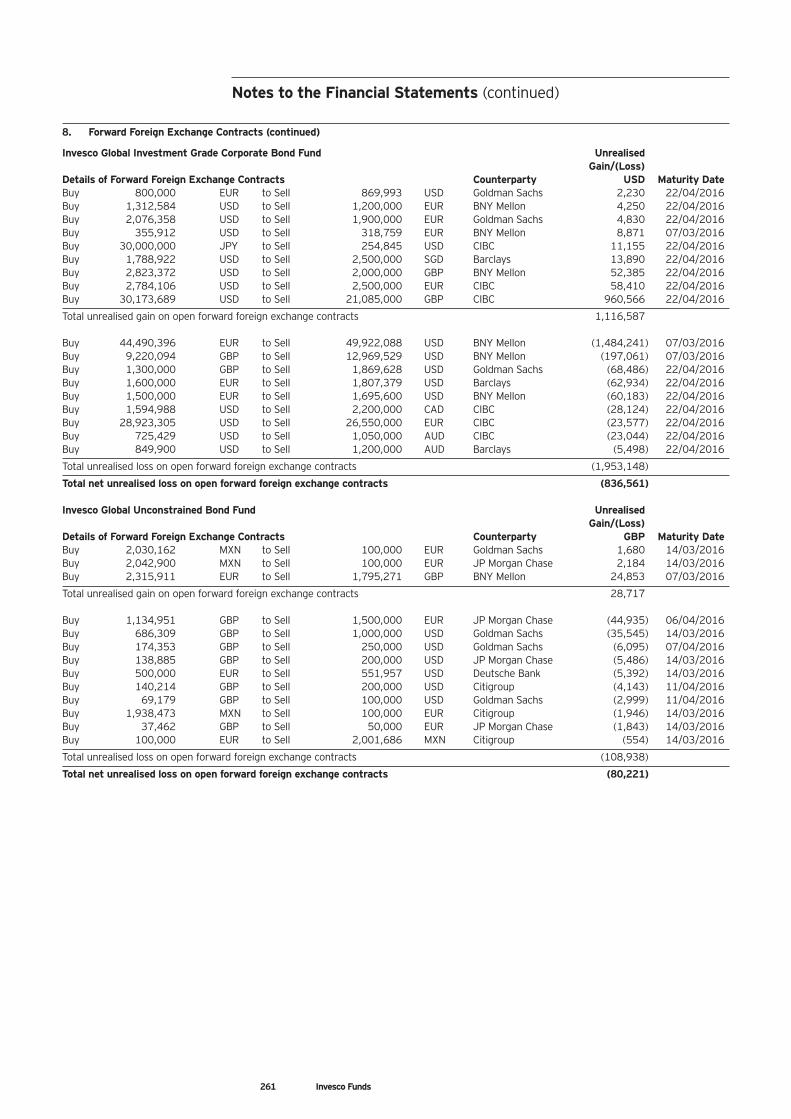
261 Invesco Funds
Notes to the Financial Statements (continued)
8. Forward Foreign Exchange Contracts (continued)
Invesco Global Investment Grade Corporate Bond Fund Unrealised Gain/(Loss) Details of Forward Foreign Exchange Contracts Counterparty USD Maturity DateBuy 800,000 EUR to Sell 869,993 USD Goldman Sachs 2,230 22/04/2016Buy 1,312,584 USD to Sell 1,200,000 EUR BNY Mellon 4,250 22/04/2016Buy 2,076,358 USD to Sell 1,900,000 EUR Goldman Sachs 4,830 22/04/2016Buy 355,912 USD to Sell 318,759 EUR BNY Mellon 8,871 07/03/2016Buy 30,000,000 JPY to Sell 254,845 USD CIBC 11,155 22/04/2016Buy 1,788,922 USD to Sell 2,500,000 SGD Barclays 13,890 22/04/2016Buy 2,823,372 USD to Sell 2,000,000 GBP BNY Mellon 52,385 22/04/2016Buy 2,784,106 USD to Sell 2,500,000 EUR CIBC 58,410 22/04/2016Buy 30,173,689 USD to Sell 21,085,000 GBP CIBC 960,566 22/04/2016
Total unrealised gain on open forward foreign exchange contracts 1,116,587
Buy 44,490,396 EUR to Sell 49,922,088 USD BNY Mellon (1,484,241) 07/03/2016Buy 9,220,094 GBP to Sell 12,969,529 USD BNY Mellon (197,061) 07/03/2016Buy 1,300,000 GBP to Sell 1,869,628 USD Goldman Sachs (68,486) 22/04/2016Buy 1,600,000 EUR to Sell 1,807,379 USD Barclays (62,934) 22/04/2016Buy 1,500,000 EUR to Sell 1,695,600 USD BNY Mellon (60,183) 22/04/2016Buy 1,594,988 USD to Sell 2,200,000 CAD CIBC (28,124) 22/04/2016Buy 28,923,305 USD to Sell 26,550,000 EUR CIBC (23,577) 22/04/2016Buy 725,429 USD to Sell 1,050,000 AUD CIBC (23,044) 22/04/2016Buy 849,900 USD to Sell 1,200,000 AUD Barclays (5,498) 22/04/2016
Total unrealised loss on open forward foreign exchange contracts (1,953,148)
Total net unrealised loss on open forward foreign exchange contracts (836,561)
Invesco Global Unconstrained Bond Fund Unrealised Gain/(Loss) Details of Forward Foreign Exchange Contracts Counterparty GBP Maturity DateBuy 2,030,162 MXN to Sell 100,000 EUR Goldman Sachs 1,680 14/03/2016Buy 2,042,900 MXN to Sell 100,000 EUR JP Morgan Chase 2,184 14/03/2016Buy 2,315,911 EUR to Sell 1,795,271 GBP BNY Mellon 24,853 07/03/2016
Total unrealised gain on open forward foreign exchange contracts 28,717
Buy 1,134,951 GBP to Sell 1,500,000 EUR JP Morgan Chase (44,935) 06/04/2016Buy 686,309 GBP to Sell 1,000,000 USD Goldman Sachs (35,545) 14/03/2016Buy 174,353 GBP to Sell 250,000 USD Goldman Sachs (6,095) 07/04/2016Buy 138,885 GBP to Sell 200,000 USD JP Morgan Chase (5,486) 14/03/2016Buy 500,000 EUR to Sell 551,957 USD Deutsche Bank (5,392) 14/03/2016Buy 140,214 GBP to Sell 200,000 USD Citigroup (4,143) 11/04/2016Buy 69,179 GBP to Sell 100,000 USD Goldman Sachs (2,999) 11/04/2016Buy 1,938,473 MXN to Sell 100,000 EUR Citigroup (1,946) 14/03/2016Buy 37,462 GBP to Sell 50,000 EUR JP Morgan Chase (1,843) 14/03/2016Buy 100,000 EUR to Sell 2,001,686 MXN Citigroup (554) 14/03/2016
Total unrealised loss on open forward foreign exchange contracts (108,938)
Total net unrealised loss on open forward foreign exchange contracts (80,221)
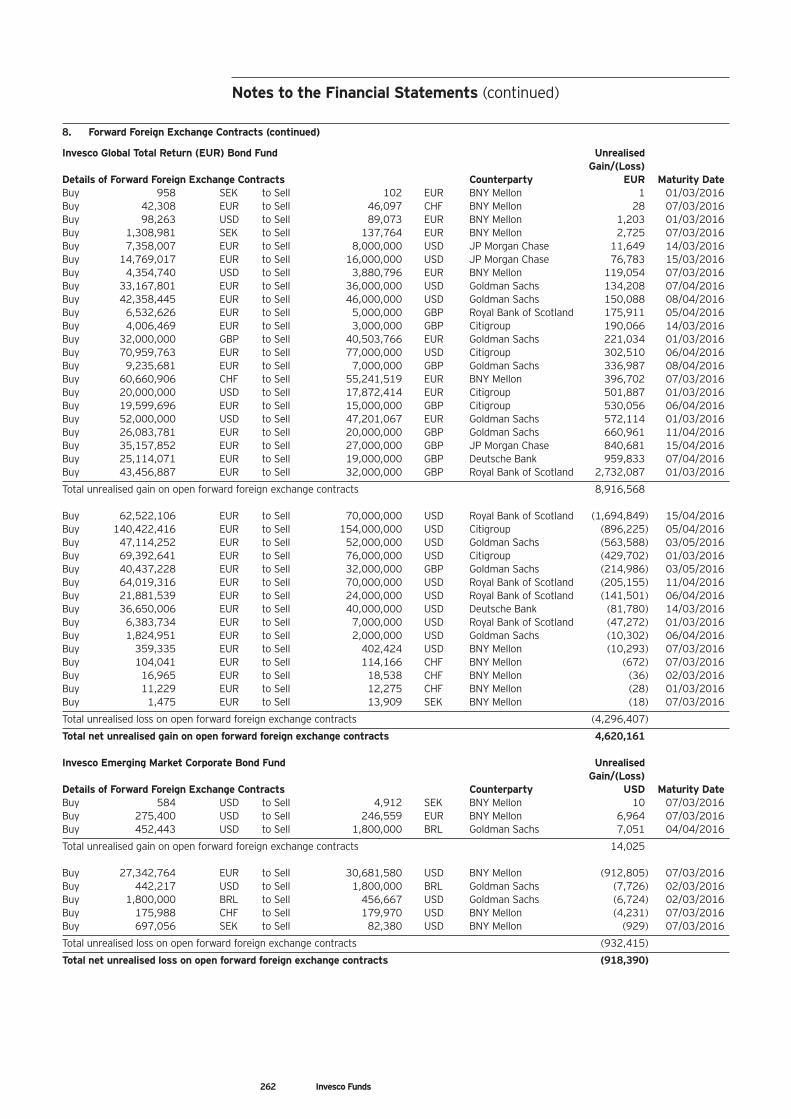
Notes to the Financial Statements (continued)
262 Invesco Funds
8. Forward Foreign Exchange Contracts (continued)
Invesco Global Total Return (EUR) Bond Fund Unrealised Gain/(Loss) Details of Forward Foreign Exchange Contracts Counterparty EUR Maturity DateBuy 958 SEK to Sell 102 EUR BNY Mellon 1 01/03/2016Buy 42,308 EUR to Sell 46,097 CHF BNY Mellon 28 07/03/2016Buy 98,263 USD to Sell 89,073 EUR BNY Mellon 1,203 01/03/2016Buy 1,308,981 SEK to Sell 137,764 EUR BNY Mellon 2,725 07/03/2016Buy 7,358,007 EUR to Sell 8,000,000 USD JP Morgan Chase 11,649 14/03/2016Buy 14,769,017 EUR to Sell 16,000,000 USD JP Morgan Chase 76,783 15/03/2016Buy 4,354,740 USD to Sell 3,880,796 EUR BNY Mellon 119,054 07/03/2016Buy 33,167,801 EUR to Sell 36,000,000 USD Goldman Sachs 134,208 07/04/2016Buy 42,358,445 EUR to Sell 46,000,000 USD Goldman Sachs 150,088 08/04/2016Buy 6,532,626 EUR to Sell 5,000,000 GBP Royal Bank of Scotland 175,911 05/04/2016Buy 4,006,469 EUR to Sell 3,000,000 GBP Citigroup 190,066 14/03/2016Buy 32,000,000 GBP to Sell 40,503,766 EUR Goldman Sachs 221,034 01/03/2016Buy 70,959,763 EUR to Sell 77,000,000 USD Citigroup 302,510 06/04/2016Buy 9,235,681 EUR to Sell 7,000,000 GBP Goldman Sachs 336,987 08/04/2016Buy 60,660,906 CHF to Sell 55,241,519 EUR BNY Mellon 396,702 07/03/2016Buy 20,000,000 USD to Sell 17,872,414 EUR Citigroup 501,887 01/03/2016Buy 19,599,696 EUR to Sell 15,000,000 GBP Citigroup 530,056 06/04/2016Buy 52,000,000 USD to Sell 47,201,067 EUR Goldman Sachs 572,114 01/03/2016Buy 26,083,781 EUR to Sell 20,000,000 GBP Goldman Sachs 660,961 11/04/2016Buy 35,157,852 EUR to Sell 27,000,000 GBP JP Morgan Chase 840,681 15/04/2016Buy 25,114,071 EUR to Sell 19,000,000 GBP Deutsche Bank 959,833 07/04/2016Buy 43,456,887 EUR to Sell 32,000,000 GBP Royal Bank of Scotland 2,732,087 01/03/2016
Total unrealised gain on open forward foreign exchange contracts 8,916,568
Buy 62,522,106 EUR to Sell 70,000,000 USD Royal Bank of Scotland (1,694,849) 15/04/2016Buy 140,422,416 EUR to Sell 154,000,000 USD Citigroup (896,225) 05/04/2016Buy 47,114,252 EUR to Sell 52,000,000 USD Goldman Sachs (563,588) 03/05/2016Buy 69,392,641 EUR to Sell 76,000,000 USD Citigroup (429,702) 01/03/2016Buy 40,437,228 EUR to Sell 32,000,000 GBP Goldman Sachs (214,986) 03/05/2016Buy 64,019,316 EUR to Sell 70,000,000 USD Royal Bank of Scotland (205,155) 11/04/2016Buy 21,881,539 EUR to Sell 24,000,000 USD Royal Bank of Scotland (141,501) 06/04/2016Buy 36,650,006 EUR to Sell 40,000,000 USD Deutsche Bank (81,780) 14/03/2016Buy 6,383,734 EUR to Sell 7,000,000 USD Royal Bank of Scotland (47,272) 01/03/2016Buy 1,824,951 EUR to Sell 2,000,000 USD Goldman Sachs (10,302) 06/04/2016Buy 359,335 EUR to Sell 402,424 USD BNY Mellon (10,293) 07/03/2016Buy 104,041 EUR to Sell 114,166 CHF BNY Mellon (672) 07/03/2016Buy 16,965 EUR to Sell 18,538 CHF BNY Mellon (36) 02/03/2016Buy 11,229 EUR to Sell 12,275 CHF BNY Mellon (28) 01/03/2016Buy 1,475 EUR to Sell 13,909 SEK BNY Mellon (18) 07/03/2016
Total unrealised loss on open forward foreign exchange contracts (4,296,407)
Total net unrealised gain on open forward foreign exchange contracts 4,620,161
Invesco Emerging Market Corporate Bond Fund Unrealised Gain/(Loss) Details of Forward Foreign Exchange Contracts Counterparty USD Maturity DateBuy 584 USD to Sell 4,912 SEK BNY Mellon 10 07/03/2016Buy 275,400 USD to Sell 246,559 EUR BNY Mellon 6,964 07/03/2016Buy 452,443 USD to Sell 1,800,000 BRL Goldman Sachs 7,051 04/04/2016
Total unrealised gain on open forward foreign exchange contracts 14,025
Buy 27,342,764 EUR to Sell 30,681,580 USD BNY Mellon (912,805) 07/03/2016Buy 442,217 USD to Sell 1,800,000 BRL Goldman Sachs (7,726) 02/03/2016Buy 1,800,000 BRL to Sell 456,667 USD Goldman Sachs (6,724) 02/03/2016Buy 175,988 CHF to Sell 179,970 USD BNY Mellon (4,231) 07/03/2016Buy 697,056 SEK to Sell 82,380 USD BNY Mellon (929) 07/03/2016
Total unrealised loss on open forward foreign exchange contracts (932,415)
Total net unrealised loss on open forward foreign exchange contracts (918,390)
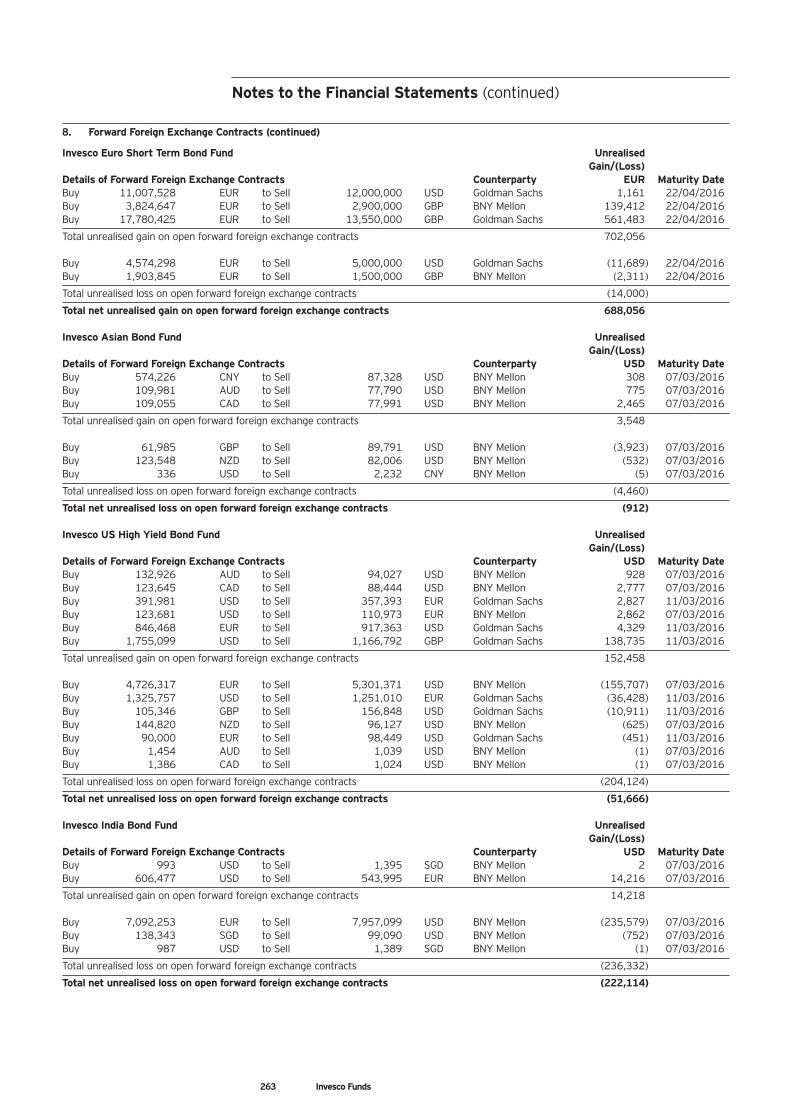
263 Invesco Funds
Notes to the Financial Statements (continued)
8. Forward Foreign Exchange Contracts (continued)
Invesco Euro Short Term Bond Fund Unrealised Gain/(Loss) Details of Forward Foreign Exchange Contracts Counterparty EUR Maturity DateBuy 11,007,528 EUR to Sell 12,000,000 USD Goldman Sachs 1,161 22/04/2016Buy 3,824,647 EUR to Sell 2,900,000 GBP BNY Mellon 139,412 22/04/2016Buy 17,780,425 EUR to Sell 13,550,000 GBP Goldman Sachs 561,483 22/04/2016
Total unrealised gain on open forward foreign exchange contracts 702,056
Buy 4,574,298 EUR to Sell 5,000,000 USD Goldman Sachs (11,689) 22/04/2016Buy 1,903,845 EUR to Sell 1,500,000 GBP BNY Mellon (2,311) 22/04/2016
Total unrealised loss on open forward foreign exchange contracts (14,000)
Total net unrealised gain on open forward foreign exchange contracts 688,056
Invesco Asian Bond Fund Unrealised Gain/(Loss) Details of Forward Foreign Exchange Contracts Counterparty USD Maturity DateBuy 574,226 CNY to Sell 87,328 USD BNY Mellon 308 07/03/2016Buy 109,981 AUD to Sell 77,790 USD BNY Mellon 775 07/03/2016Buy 109,055 CAD to Sell 77,991 USD BNY Mellon 2,465 07/03/2016
Total unrealised gain on open forward foreign exchange contracts 3,548
Buy 61,985 GBP to Sell 89,791 USD BNY Mellon (3,923) 07/03/2016Buy 123,548 NZD to Sell 82,006 USD BNY Mellon (532) 07/03/2016Buy 336 USD to Sell 2,232 CNY BNY Mellon (5) 07/03/2016
Total unrealised loss on open forward foreign exchange contracts (4,460)
Total net unrealised loss on open forward foreign exchange contracts (912)
Invesco US High Yield Bond Fund Unrealised Gain/(Loss) Details of Forward Foreign Exchange Contracts Counterparty USD Maturity DateBuy 132,926 AUD to Sell 94,027 USD BNY Mellon 928 07/03/2016Buy 123,645 CAD to Sell 88,444 USD BNY Mellon 2,777 07/03/2016Buy 391,981 USD to Sell 357,393 EUR Goldman Sachs 2,827 11/03/2016Buy 123,681 USD to Sell 110,973 EUR BNY Mellon 2,862 07/03/2016Buy 846,468 EUR to Sell 917,363 USD Goldman Sachs 4,329 11/03/2016Buy 1,755,099 USD to Sell 1,166,792 GBP Goldman Sachs 138,735 11/03/2016
Total unrealised gain on open forward foreign exchange contracts 152,458
Buy 4,726,317 EUR to Sell 5,301,371 USD BNY Mellon (155,707) 07/03/2016Buy 1,325,757 USD to Sell 1,251,010 EUR Goldman Sachs (36,428) 11/03/2016Buy 105,346 GBP to Sell 156,848 USD Goldman Sachs (10,911) 11/03/2016Buy 144,820 NZD to Sell 96,127 USD BNY Mellon (625) 07/03/2016Buy 90,000 EUR to Sell 98,449 USD Goldman Sachs (451) 11/03/2016Buy 1,454 AUD to Sell 1,039 USD BNY Mellon (1) 07/03/2016Buy 1,386 CAD to Sell 1,024 USD BNY Mellon (1) 07/03/2016
Total unrealised loss on open forward foreign exchange contracts (204,124)
Total net unrealised loss on open forward foreign exchange contracts (51,666)
Invesco India Bond Fund Unrealised Gain/(Loss) Details of Forward Foreign Exchange Contracts Counterparty USD Maturity DateBuy 993 USD to Sell 1,395 SGD BNY Mellon 2 07/03/2016Buy 606,477 USD to Sell 543,995 EUR BNY Mellon 14,216 07/03/2016
Total unrealised gain on open forward foreign exchange contracts 14,218
Buy 7,092,253 EUR to Sell 7,957,099 USD BNY Mellon (235,579) 07/03/2016Buy 138,343 SGD to Sell 99,090 USD BNY Mellon (752) 07/03/2016Buy 987 USD to Sell 1,389 SGD BNY Mellon (1) 07/03/2016
Total unrealised loss on open forward foreign exchange contracts (236,332)
Total net unrealised loss on open forward foreign exchange contracts (222,114)
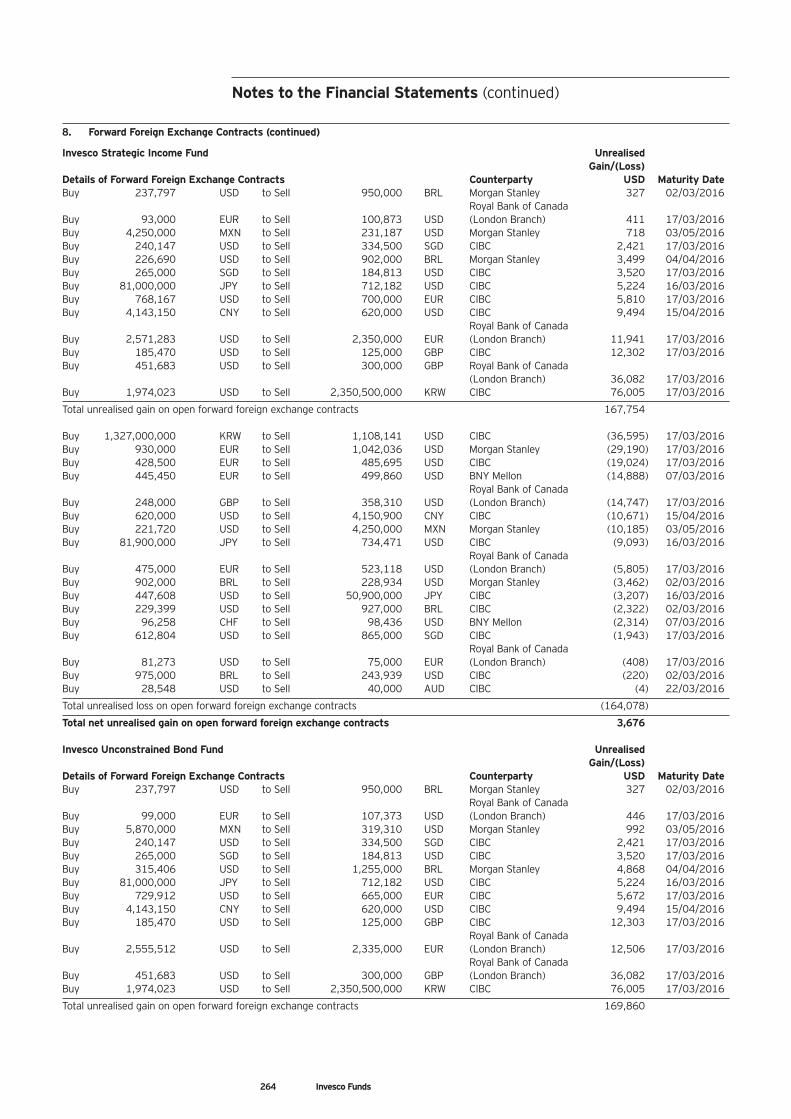
8. Forward Foreign Exchange Contracts (continued)
Invesco Strategic Income Fund Unrealised Gain/(Loss) Details of Forward Foreign Exchange Contracts Counterparty USD Maturity DateBuy 237,797 USD to Sell 950,000 BRL Morgan Stanley 327 02/03/2016 Royal Bank of Canada Buy 93,000 EUR to Sell 100,873 USD (London Branch) 411 17/03/2016Buy 4,250,000 MXN to Sell 231,187 USD Morgan Stanley 718 03/05/2016Buy 240,147 USD to Sell 334,500 SGD CIBC 2,421 17/03/2016Buy 226,690 USD to Sell 902,000 BRL Morgan Stanley 3,499 04/04/2016Buy 265,000 SGD to Sell 184,813 USD CIBC 3,520 17/03/2016Buy 81,000,000 JPY to Sell 712,182 USD CIBC 5,224 16/03/2016Buy 768,167 USD to Sell 700,000 EUR CIBC 5,810 17/03/2016Buy 4,143,150 CNY to Sell 620,000 USD CIBC 9,494 15/04/2016 Royal Bank of Canada Buy 2,571,283 USD to Sell 2,350,000 EUR (London Branch) 11,941 17/03/2016Buy 185,470 USD to Sell 125,000 GBP CIBC 12,302 17/03/2016Buy 451,683 USD to Sell 300,000 GBP Royal Bank of Canada (London Branch) 36,082 17/03/2016Buy 1,974,023 USD to Sell 2,350,500,000 KRW CIBC 76,005 17/03/2016
Total unrealised gain on open forward foreign exchange contracts 167,754
Buy 1,327,000,000 KRW to Sell 1,108,141 USD CIBC (36,595) 17/03/2016Buy 930,000 EUR to Sell 1,042,036 USD Morgan Stanley (29,190) 17/03/2016Buy 428,500 EUR to Sell 485,695 USD CIBC (19,024) 17/03/2016Buy 445,450 EUR to Sell 499,860 USD BNY Mellon (14,888) 07/03/2016 Royal Bank of Canada Buy 248,000 GBP to Sell 358,310 USD (London Branch) (14,747) 17/03/2016Buy 620,000 USD to Sell 4,150,900 CNY CIBC (10,671) 15/04/2016Buy 221,720 USD to Sell 4,250,000 MXN Morgan Stanley (10,185) 03/05/2016Buy 81,900,000 JPY to Sell 734,471 USD CIBC (9,093) 16/03/2016 Royal Bank of Canada Buy 475,000 EUR to Sell 523,118 USD (London Branch) (5,805) 17/03/2016Buy 902,000 BRL to Sell 228,934 USD Morgan Stanley (3,462) 02/03/2016Buy 447,608 USD to Sell 50,900,000 JPY CIBC (3,207) 16/03/2016Buy 229,399 USD to Sell 927,000 BRL CIBC (2,322) 02/03/2016Buy 96,258 CHF to Sell 98,436 USD BNY Mellon (2,314) 07/03/2016Buy 612,804 USD to Sell 865,000 SGD CIBC (1,943) 17/03/2016 Royal Bank of Canada Buy 81,273 USD to Sell 75,000 EUR (London Branch) (408) 17/03/2016Buy 975,000 BRL to Sell 243,939 USD CIBC (220) 02/03/2016Buy 28,548 USD to Sell 40,000 AUD CIBC (4) 22/03/2016
Total unrealised loss on open forward foreign exchange contracts (164,078)
Total net unrealised gain on open forward foreign exchange contracts 3,676
Invesco Unconstrained Bond Fund Unrealised Gain/(Loss) Details of Forward Foreign Exchange Contracts Counterparty USD Maturity DateBuy 237,797 USD to Sell 950,000 BRL Morgan Stanley 327 02/03/2016 Royal Bank of Canada Buy 99,000 EUR to Sell 107,373 USD (London Branch) 446 17/03/2016Buy 5,870,000 MXN to Sell 319,310 USD Morgan Stanley 992 03/05/2016Buy 240,147 USD to Sell 334,500 SGD CIBC 2,421 17/03/2016Buy 265,000 SGD to Sell 184,813 USD CIBC 3,520 17/03/2016Buy 315,406 USD to Sell 1,255,000 BRL Morgan Stanley 4,868 04/04/2016Buy 81,000,000 JPY to Sell 712,182 USD CIBC 5,224 16/03/2016Buy 729,912 USD to Sell 665,000 EUR CIBC 5,672 17/03/2016Buy 4,143,150 CNY to Sell 620,000 USD CIBC 9,494 15/04/2016Buy 185,470 USD to Sell 125,000 GBP CIBC 12,303 17/03/2016 Royal Bank of Canada Buy 2,555,512 USD to Sell 2,335,000 EUR (London Branch) 12,506 17/03/2016 Royal Bank of Canada Buy 451,683 USD to Sell 300,000 GBP (London Branch) 36,082 17/03/2016Buy 1,974,023 USD to Sell 2,350,500,000 KRW CIBC 76,005 17/03/2016
Total unrealised gain on open forward foreign exchange contracts 169,860
264 Invesco Funds
Notes to the Financial Statements (continued)
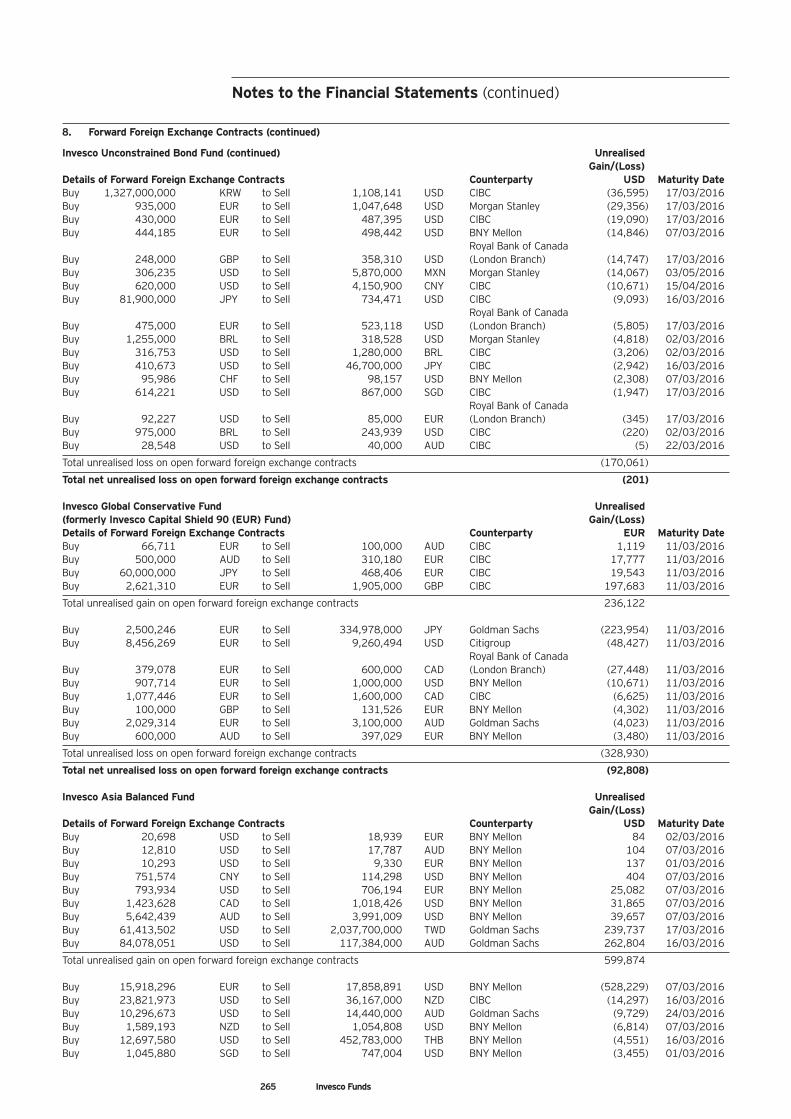
Notes to the Financial Statements (continued)
8. Forward Foreign Exchange Contracts (continued)
Invesco Unconstrained Bond Fund (continued) Unrealised Gain/(Loss) Details of Forward Foreign Exchange Contracts Counterparty USD Maturity DateBuy 1,327,000,000 KRW to Sell 1,108,141 USD CIBC (36,595) 17/03/2016Buy 935,000 EUR to Sell 1,047,648 USD Morgan Stanley (29,356) 17/03/2016Buy 430,000 EUR to Sell 487,395 USD CIBC (19,090) 17/03/2016Buy 444,185 EUR to Sell 498,442 USD BNY Mellon (14,846) 07/03/2016 Royal Bank of Canada Buy 248,000 GBP to Sell 358,310 USD (London Branch) (14,747) 17/03/2016Buy 306,235 USD to Sell 5,870,000 MXN Morgan Stanley (14,067) 03/05/2016Buy 620,000 USD to Sell 4,150,900 CNY CIBC (10,671) 15/04/2016Buy 81,900,000 JPY to Sell 734,471 USD CIBC (9,093) 16/03/2016 Royal Bank of Canada Buy 475,000 EUR to Sell 523,118 USD (London Branch) (5,805) 17/03/2016Buy 1,255,000 BRL to Sell 318,528 USD Morgan Stanley (4,818) 02/03/2016Buy 316,753 USD to Sell 1,280,000 BRL CIBC (3,206) 02/03/2016Buy 410,673 USD to Sell 46,700,000 JPY CIBC (2,942) 16/03/2016Buy 95,986 CHF to Sell 98,157 USD BNY Mellon (2,308) 07/03/2016Buy 614,221 USD to Sell 867,000 SGD CIBC (1,947) 17/03/2016 Royal Bank of Canada Buy 92,227 USD to Sell 85,000 EUR (London Branch) (345) 17/03/2016Buy 975,000 BRL to Sell 243,939 USD CIBC (220) 02/03/2016Buy 28,548 USD to Sell 40,000 AUD CIBC (5) 22/03/2016
Total unrealised loss on open forward foreign exchange contracts (170,061)
Total net unrealised loss on open forward foreign exchange contracts (201)
Invesco Global Conservative Fund Unrealised (formerly Invesco Capital Shield 90 (EUR) Fund) Gain/(Loss) Details of Forward Foreign Exchange Contracts Counterparty EUR Maturity DateBuy 66,711 EUR to Sell 100,000 AUD CIBC 1,119 11/03/2016Buy 500,000 AUD to Sell 310,180 EUR CIBC 17,777 11/03/2016Buy 60,000,000 JPY to Sell 468,406 EUR CIBC 19,543 11/03/2016Buy 2,621,310 EUR to Sell 1,905,000 GBP CIBC 197,683 11/03/2016
Total unrealised gain on open forward foreign exchange contracts 236,122
Buy 2,500,246 EUR to Sell 334,978,000 JPY Goldman Sachs (223,954) 11/03/2016Buy 8,456,269 EUR to Sell 9,260,494 USD Citigroup (48,427) 11/03/2016 Royal Bank of Canada Buy 379,078 EUR to Sell 600,000 CAD (London Branch) (27,448) 11/03/2016Buy 907,714 EUR to Sell 1,000,000 USD BNY Mellon (10,671) 11/03/2016Buy 1,077,446 EUR to Sell 1,600,000 CAD CIBC (6,625) 11/03/2016Buy 100,000 GBP to Sell 131,526 EUR BNY Mellon (4,302) 11/03/2016Buy 2,029,314 EUR to Sell 3,100,000 AUD Goldman Sachs (4,023) 11/03/2016Buy 600,000 AUD to Sell 397,029 EUR BNY Mellon (3,480) 11/03/2016
Total unrealised loss on open forward foreign exchange contracts (328,930)
Total net unrealised loss on open forward foreign exchange contracts (92,808)
Invesco Asia Balanced Fund Unrealised Gain/(Loss) Details of Forward Foreign Exchange Contracts Counterparty USD Maturity DateBuy 20,698 USD to Sell 18,939 EUR BNY Mellon 84 02/03/2016Buy 12,810 USD to Sell 17,787 AUD BNY Mellon 104 07/03/2016Buy 10,293 USD to Sell 9,330 EUR BNY Mellon 137 01/03/2016Buy 751,574 CNY to Sell 114,298 USD BNY Mellon 404 07/03/2016Buy 793,934 USD to Sell 706,194 EUR BNY Mellon 25,082 07/03/2016Buy 1,423,628 CAD to Sell 1,018,426 USD BNY Mellon 31,865 07/03/2016Buy 5,642,439 AUD to Sell 3,991,009 USD BNY Mellon 39,657 07/03/2016Buy 61,413,502 USD to Sell 2,037,700,000 TWD Goldman Sachs 239,737 17/03/2016Buy 84,078,051 USD to Sell 117,384,000 AUD Goldman Sachs 262,804 16/03/2016
Total unrealised gain on open forward foreign exchange contracts 599,874
Buy 15,918,296 EUR to Sell 17,858,891 USD BNY Mellon (528,229) 07/03/2016Buy 23,821,973 USD to Sell 36,167,000 NZD CIBC (14,297) 16/03/2016Buy 10,296,673 USD to Sell 14,440,000 AUD Goldman Sachs (9,729) 24/03/2016Buy 1,589,193 NZD to Sell 1,054,808 USD BNY Mellon (6,814) 07/03/2016Buy 12,697,580 USD to Sell 452,783,000 THB BNY Mellon (4,551) 16/03/2016Buy 1,045,880 SGD to Sell 747,004 USD BNY Mellon (3,455) 01/03/2016
265 Invesco Funds
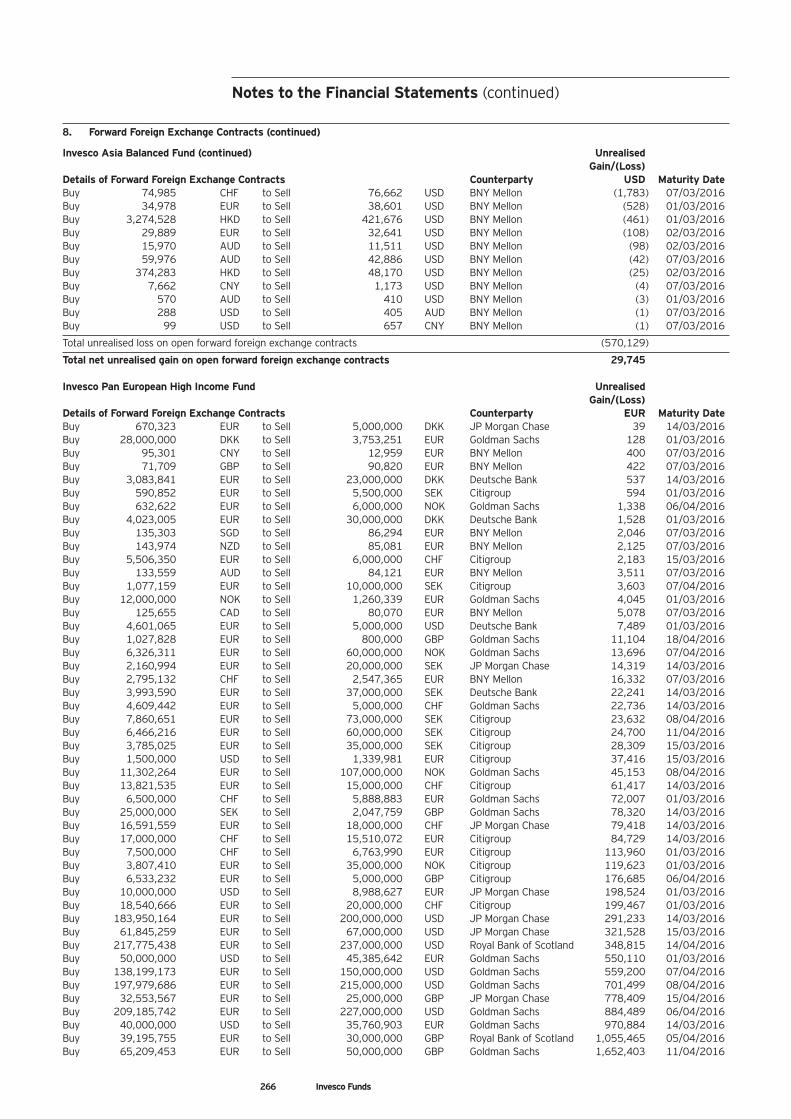
8. Forward Foreign Exchange Contracts (continued)
Invesco Asia Balanced Fund (continued) Unrealised Gain/(Loss) Details of Forward Foreign Exchange Contracts Counterparty USD Maturity DateBuy 74,985 CHF to Sell 76,662 USD BNY Mellon (1,783) 07/03/2016Buy 34,978 EUR to Sell 38,601 USD BNY Mellon (528) 01/03/2016Buy 3,274,528 HKD to Sell 421,676 USD BNY Mellon (461) 01/03/2016Buy 29,889 EUR to Sell 32,641 USD BNY Mellon (108) 02/03/2016Buy 15,970 AUD to Sell 11,511 USD BNY Mellon (98) 02/03/2016Buy 59,976 AUD to Sell 42,886 USD BNY Mellon (42) 07/03/2016Buy 374,283 HKD to Sell 48,170 USD BNY Mellon (25) 02/03/2016Buy 7,662 CNY to Sell 1,173 USD BNY Mellon (4) 07/03/2016Buy 570 AUD to Sell 410 USD BNY Mellon (3) 01/03/2016Buy 288 USD to Sell 405 AUD BNY Mellon (1) 07/03/2016Buy 99 USD to Sell 657 CNY BNY Mellon (1) 07/03/2016
Total unrealised loss on open forward foreign exchange contracts (570,129)
Total net unrealised gain on open forward foreign exchange contracts 29,745
Invesco Pan European High Income Fund Unrealised Gain/(Loss) Details of Forward Foreign Exchange Contracts Counterparty EUR Maturity DateBuy 670,323 EUR to Sell 5,000,000 DKK JP Morgan Chase 39 14/03/2016Buy 28,000,000 DKK to Sell 3,753,251 EUR Goldman Sachs 128 01/03/2016Buy 95,301 CNY to Sell 12,959 EUR BNY Mellon 400 07/03/2016Buy 71,709 GBP to Sell 90,820 EUR BNY Mellon 422 07/03/2016Buy 3,083,841 EUR to Sell 23,000,000 DKK Deutsche Bank 537 14/03/2016Buy 590,852 EUR to Sell 5,500,000 SEK Citigroup 594 01/03/2016Buy 632,622 EUR to Sell 6,000,000 NOK Goldman Sachs 1,338 06/04/2016Buy 4,023,005 EUR to Sell 30,000,000 DKK Deutsche Bank 1,528 01/03/2016Buy 135,303 SGD to Sell 86,294 EUR BNY Mellon 2,046 07/03/2016Buy 143,974 NZD to Sell 85,081 EUR BNY Mellon 2,125 07/03/2016Buy 5,506,350 EUR to Sell 6,000,000 CHF Citigroup 2,183 15/03/2016Buy 133,559 AUD to Sell 84,121 EUR BNY Mellon 3,511 07/03/2016Buy 1,077,159 EUR to Sell 10,000,000 SEK Citigroup 3,603 07/04/2016Buy 12,000,000 NOK to Sell 1,260,339 EUR Goldman Sachs 4,045 01/03/2016Buy 125,655 CAD to Sell 80,070 EUR BNY Mellon 5,078 07/03/2016Buy 4,601,065 EUR to Sell 5,000,000 USD Deutsche Bank 7,489 01/03/2016Buy 1,027,828 EUR to Sell 800,000 GBP Goldman Sachs 11,104 18/04/2016Buy 6,326,311 EUR to Sell 60,000,000 NOK Goldman Sachs 13,696 07/04/2016Buy 2,160,994 EUR to Sell 20,000,000 SEK JP Morgan Chase 14,319 14/03/2016Buy 2,795,132 CHF to Sell 2,547,365 EUR BNY Mellon 16,332 07/03/2016Buy 3,993,590 EUR to Sell 37,000,000 SEK Deutsche Bank 22,241 14/03/2016Buy 4,609,442 EUR to Sell 5,000,000 CHF Goldman Sachs 22,736 14/03/2016Buy 7,860,651 EUR to Sell 73,000,000 SEK Citigroup 23,632 08/04/2016Buy 6,466,216 EUR to Sell 60,000,000 SEK Citigroup 24,700 11/04/2016Buy 3,785,025 EUR to Sell 35,000,000 SEK Citigroup 28,309 15/03/2016Buy 1,500,000 USD to Sell 1,339,981 EUR Citigroup 37,416 15/03/2016Buy 11,302,264 EUR to Sell 107,000,000 NOK Goldman Sachs 45,153 08/04/2016Buy 13,821,535 EUR to Sell 15,000,000 CHF Citigroup 61,417 14/03/2016Buy 6,500,000 CHF to Sell 5,888,883 EUR Goldman Sachs 72,007 01/03/2016Buy 25,000,000 SEK to Sell 2,047,759 GBP Goldman Sachs 78,320 14/03/2016Buy 16,591,559 EUR to Sell 18,000,000 CHF JP Morgan Chase 79,418 14/03/2016Buy 17,000,000 CHF to Sell 15,510,072 EUR Citigroup 84,729 14/03/2016Buy 7,500,000 CHF to Sell 6,763,990 EUR Citigroup 113,960 01/03/2016Buy 3,807,410 EUR to Sell 35,000,000 NOK Citigroup 119,623 01/03/2016Buy 6,533,232 EUR to Sell 5,000,000 GBP Citigroup 176,685 06/04/2016Buy 10,000,000 USD to Sell 8,988,627 EUR JP Morgan Chase 198,524 01/03/2016Buy 18,540,666 EUR to Sell 20,000,000 CHF Citigroup 199,467 01/03/2016Buy 183,950,164 EUR to Sell 200,000,000 USD JP Morgan Chase 291,233 14/03/2016Buy 61,845,259 EUR to Sell 67,000,000 USD JP Morgan Chase 321,528 15/03/2016Buy 217,775,438 EUR to Sell 237,000,000 USD Royal Bank of Scotland 348,815 14/04/2016Buy 50,000,000 USD to Sell 45,385,642 EUR Goldman Sachs 550,110 01/03/2016Buy 138,199,173 EUR to Sell 150,000,000 USD Goldman Sachs 559,200 07/04/2016Buy 197,979,686 EUR to Sell 215,000,000 USD Goldman Sachs 701,499 08/04/2016Buy 32,553,567 EUR to Sell 25,000,000 GBP JP Morgan Chase 778,409 15/04/2016Buy 209,185,742 EUR to Sell 227,000,000 USD Goldman Sachs 884,489 06/04/2016Buy 40,000,000 USD to Sell 35,760,903 EUR Goldman Sachs 970,884 14/03/2016Buy 39,195,755 EUR to Sell 30,000,000 GBP Royal Bank of Scotland 1,055,465 05/04/2016Buy 65,209,453 EUR to Sell 50,000,000 GBP Goldman Sachs 1,652,403 11/04/2016
Notes to the Financial Statements (continued)
266 Invesco Funds
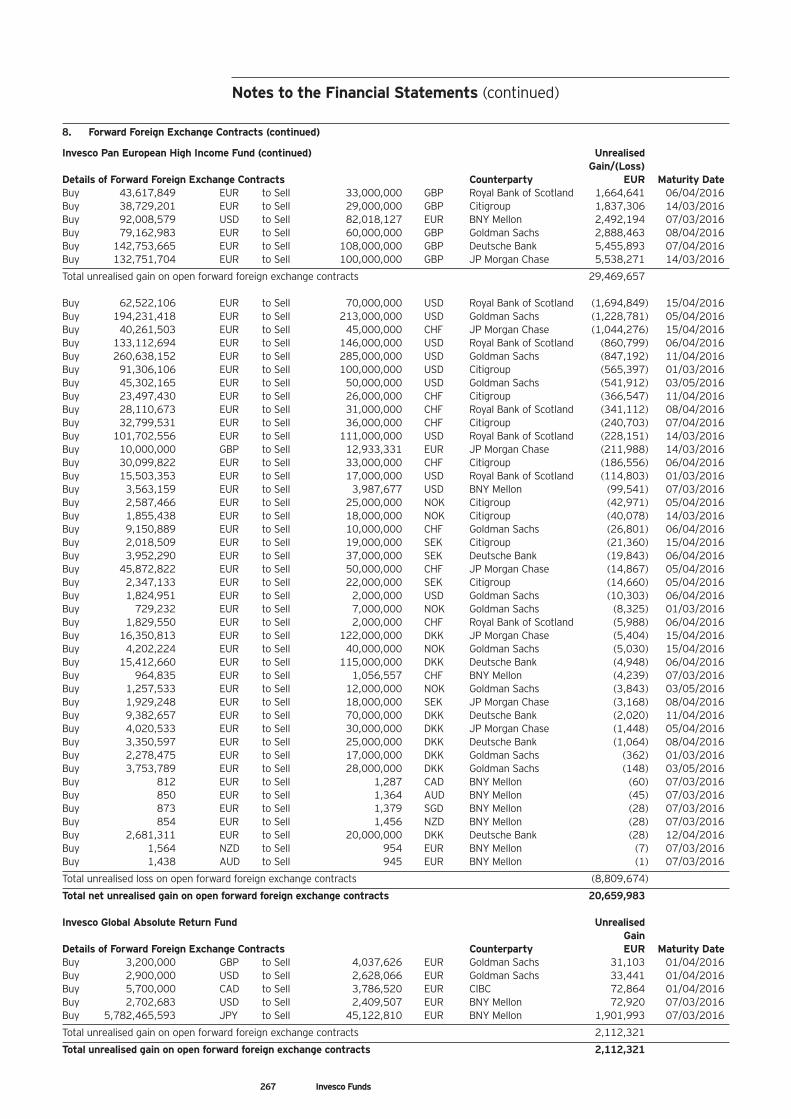
8. Forward Foreign Exchange Contracts (continued)
Invesco Pan European High Income Fund (continued) Unrealised Gain/(Loss) Details of Forward Foreign Exchange Contracts Counterparty EUR Maturity DateBuy 43,617,849 EUR to Sell 33,000,000 GBP Royal Bank of Scotland 1,664,641 06/04/2016Buy 38,729,201 EUR to Sell 29,000,000 GBP Citigroup 1,837,306 14/03/2016Buy 92,008,579 USD to Sell 82,018,127 EUR BNY Mellon 2,492,194 07/03/2016Buy 79,162,983 EUR to Sell 60,000,000 GBP Goldman Sachs 2,888,463 08/04/2016Buy 142,753,665 EUR to Sell 108,000,000 GBP Deutsche Bank 5,455,893 07/04/2016Buy 132,751,704 EUR to Sell 100,000,000 GBP JP Morgan Chase 5,538,271 14/03/2016
Total unrealised gain on open forward foreign exchange contracts 29,469,657
Buy 62,522,106 EUR to Sell 70,000,000 USD Royal Bank of Scotland (1,694,849) 15/04/2016Buy 194,231,418 EUR to Sell 213,000,000 USD Goldman Sachs (1,228,781) 05/04/2016Buy 40,261,503 EUR to Sell 45,000,000 CHF JP Morgan Chase (1,044,276) 15/04/2016Buy 133,112,694 EUR to Sell 146,000,000 USD Royal Bank of Scotland (860,799) 06/04/2016Buy 260,638,152 EUR to Sell 285,000,000 USD Goldman Sachs (847,192) 11/04/2016Buy 91,306,106 EUR to Sell 100,000,000 USD Citigroup (565,397) 01/03/2016Buy 45,302,165 EUR to Sell 50,000,000 USD Goldman Sachs (541,912) 03/05/2016Buy 23,497,430 EUR to Sell 26,000,000 CHF Citigroup (366,547) 11/04/2016Buy 28,110,673 EUR to Sell 31,000,000 CHF Royal Bank of Scotland (341,112) 08/04/2016Buy 32,799,531 EUR to Sell 36,000,000 CHF Citigroup (240,703) 07/04/2016Buy 101,702,556 EUR to Sell 111,000,000 USD Royal Bank of Scotland (228,151) 14/03/2016Buy 10,000,000 GBP to Sell 12,933,331 EUR JP Morgan Chase (211,988) 14/03/2016Buy 30,099,822 EUR to Sell 33,000,000 CHF Citigroup (186,556) 06/04/2016Buy 15,503,353 EUR to Sell 17,000,000 USD Royal Bank of Scotland (114,803) 01/03/2016Buy 3,563,159 EUR to Sell 3,987,677 USD BNY Mellon (99,541) 07/03/2016Buy 2,587,466 EUR to Sell 25,000,000 NOK Citigroup (42,971) 05/04/2016Buy 1,855,438 EUR to Sell 18,000,000 NOK Citigroup (40,078) 14/03/2016Buy 9,150,889 EUR to Sell 10,000,000 CHF Goldman Sachs (26,801) 06/04/2016Buy 2,018,509 EUR to Sell 19,000,000 SEK Citigroup (21,360) 15/04/2016Buy 3,952,290 EUR to Sell 37,000,000 SEK Deutsche Bank (19,843) 06/04/2016Buy 45,872,822 EUR to Sell 50,000,000 CHF JP Morgan Chase (14,867) 05/04/2016Buy 2,347,133 EUR to Sell 22,000,000 SEK Citigroup (14,660) 05/04/2016Buy 1,824,951 EUR to Sell 2,000,000 USD Goldman Sachs (10,303) 06/04/2016Buy 729,232 EUR to Sell 7,000,000 NOK Goldman Sachs (8,325) 01/03/2016Buy 1,829,550 EUR to Sell 2,000,000 CHF Royal Bank of Scotland (5,988) 06/04/2016Buy 16,350,813 EUR to Sell 122,000,000 DKK JP Morgan Chase (5,404) 15/04/2016Buy 4,202,224 EUR to Sell 40,000,000 NOK Goldman Sachs (5,030) 15/04/2016Buy 15,412,660 EUR to Sell 115,000,000 DKK Deutsche Bank (4,948) 06/04/2016Buy 964,835 EUR to Sell 1,056,557 CHF BNY Mellon (4,239) 07/03/2016Buy 1,257,533 EUR to Sell 12,000,000 NOK Goldman Sachs (3,843) 03/05/2016Buy 1,929,248 EUR to Sell 18,000,000 SEK JP Morgan Chase (3,168) 08/04/2016Buy 9,382,657 EUR to Sell 70,000,000 DKK Deutsche Bank (2,020) 11/04/2016Buy 4,020,533 EUR to Sell 30,000,000 DKK JP Morgan Chase (1,448) 05/04/2016Buy 3,350,597 EUR to Sell 25,000,000 DKK Deutsche Bank (1,064) 08/04/2016Buy 2,278,475 EUR to Sell 17,000,000 DKK Goldman Sachs (362) 01/03/2016Buy 3,753,789 EUR to Sell 28,000,000 DKK Goldman Sachs (148) 03/05/2016Buy 812 EUR to Sell 1,287 CAD BNY Mellon (60) 07/03/2016Buy 850 EUR to Sell 1,364 AUD BNY Mellon (45) 07/03/2016Buy 873 EUR to Sell 1,379 SGD BNY Mellon (28) 07/03/2016Buy 854 EUR to Sell 1,456 NZD BNY Mellon (28) 07/03/2016Buy 2,681,311 EUR to Sell 20,000,000 DKK Deutsche Bank (28) 12/04/2016Buy 1,564 NZD to Sell 954 EUR BNY Mellon (7) 07/03/2016Buy 1,438 AUD to Sell 945 EUR BNY Mellon (1) 07/03/2016
Total unrealised loss on open forward foreign exchange contracts (8,809,674)
Total net unrealised gain on open forward foreign exchange contracts 20,659,983
Invesco Global Absolute Return Fund Unrealised Gain Details of Forward Foreign Exchange Contracts Counterparty EUR Maturity DateBuy 3,200,000 GBP to Sell 4,037,626 EUR Goldman Sachs 31,103 01/04/2016Buy 2,900,000 USD to Sell 2,628,066 EUR Goldman Sachs 33,441 01/04/2016Buy 5,700,000 CAD to Sell 3,786,520 EUR CIBC 72,864 01/04/2016Buy 2,702,683 USD to Sell 2,409,507 EUR BNY Mellon 72,920 07/03/2016Buy 5,782,465,593 JPY to Sell 45,122,810 EUR BNY Mellon 1,901,993 07/03/2016
Total unrealised gain on open forward foreign exchange contracts 2,112,321
Total unrealised gain on open forward foreign exchange contracts 2,112,321
Notes to the Financial Statements (continued)
267 Invesco Funds
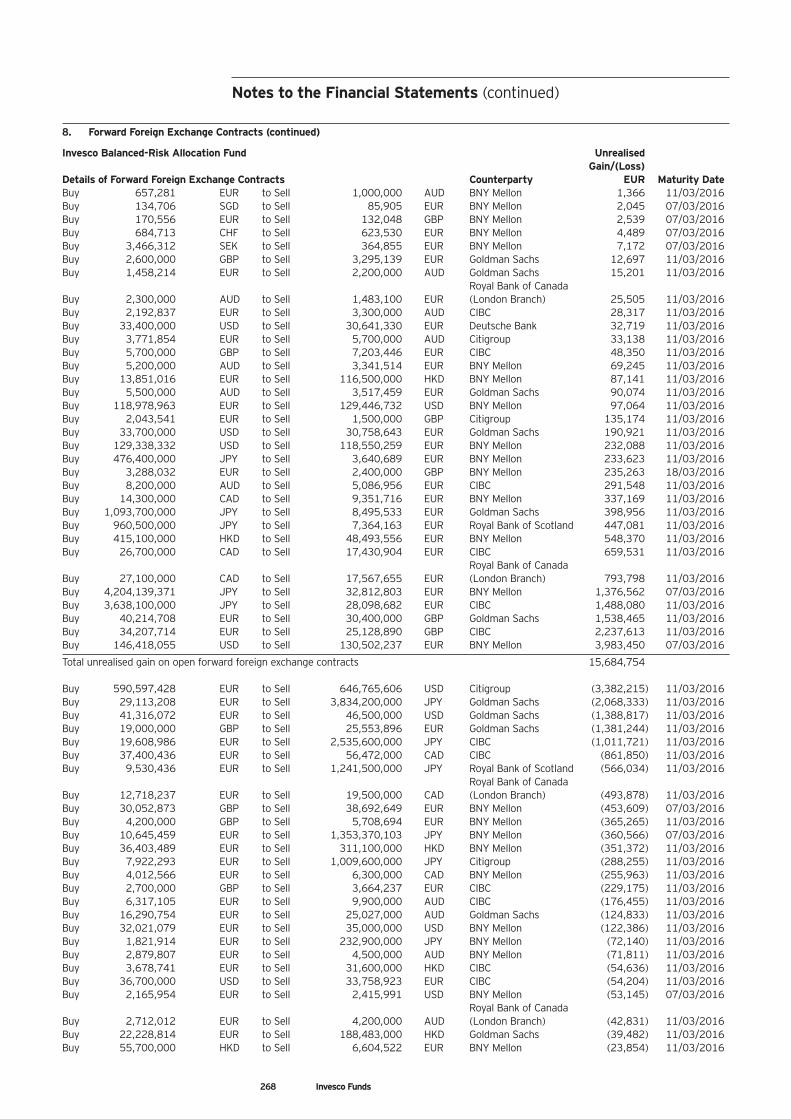
8. Forward Foreign Exchange Contracts (continued)
Invesco Balanced-Risk Allocation Fund Unrealised Gain/(Loss) Details of Forward Foreign Exchange Contracts Counterparty EUR Maturity DateBuy 657,281 EUR to Sell 1,000,000 AUD BNY Mellon 1,366 11/03/2016Buy 134,706 SGD to Sell 85,905 EUR BNY Mellon 2,045 07/03/2016Buy 170,556 EUR to Sell 132,048 GBP BNY Mellon 2,539 07/03/2016Buy 684,713 CHF to Sell 623,530 EUR BNY Mellon 4,489 07/03/2016Buy 3,466,312 SEK to Sell 364,855 EUR BNY Mellon 7,172 07/03/2016Buy 2,600,000 GBP to Sell 3,295,139 EUR Goldman Sachs 12,697 11/03/2016Buy 1,458,214 EUR to Sell 2,200,000 AUD Goldman Sachs 15,201 11/03/2016 Royal Bank of Canada Buy 2,300,000 AUD to Sell 1,483,100 EUR (London Branch) 25,505 11/03/2016Buy 2,192,837 EUR to Sell 3,300,000 AUD CIBC 28,317 11/03/2016Buy 33,400,000 USD to Sell 30,641,330 EUR Deutsche Bank 32,719 11/03/2016Buy 3,771,854 EUR to Sell 5,700,000 AUD Citigroup 33,138 11/03/2016Buy 5,700,000 GBP to Sell 7,203,446 EUR CIBC 48,350 11/03/2016Buy 5,200,000 AUD to Sell 3,341,514 EUR BNY Mellon 69,245 11/03/2016Buy 13,851,016 EUR to Sell 116,500,000 HKD BNY Mellon 87,141 11/03/2016Buy 5,500,000 AUD to Sell 3,517,459 EUR Goldman Sachs 90,074 11/03/2016Buy 118,978,963 EUR to Sell 129,446,732 USD BNY Mellon 97,064 11/03/2016Buy 2,043,541 EUR to Sell 1,500,000 GBP Citigroup 135,174 11/03/2016Buy 33,700,000 USD to Sell 30,758,643 EUR Goldman Sachs 190,921 11/03/2016Buy 129,338,332 USD to Sell 118,550,259 EUR BNY Mellon 232,088 11/03/2016Buy 476,400,000 JPY to Sell 3,640,689 EUR BNY Mellon 233,623 11/03/2016Buy 3,288,032 EUR to Sell 2,400,000 GBP BNY Mellon 235,263 18/03/2016Buy 8,200,000 AUD to Sell 5,086,956 EUR CIBC 291,548 11/03/2016Buy 14,300,000 CAD to Sell 9,351,716 EUR BNY Mellon 337,169 11/03/2016Buy 1,093,700,000 JPY to Sell 8,495,533 EUR Goldman Sachs 398,956 11/03/2016Buy 960,500,000 JPY to Sell 7,364,163 EUR Royal Bank of Scotland 447,081 11/03/2016Buy 415,100,000 HKD to Sell 48,493,556 EUR BNY Mellon 548,370 11/03/2016Buy 26,700,000 CAD to Sell 17,430,904 EUR CIBC 659,531 11/03/2016 Royal Bank of Canada Buy 27,100,000 CAD to Sell 17,567,655 EUR (London Branch) 793,798 11/03/2016Buy 4,204,139,371 JPY to Sell 32,812,803 EUR BNY Mellon 1,376,562 07/03/2016Buy 3,638,100,000 JPY to Sell 28,098,682 EUR CIBC 1,488,080 11/03/2016Buy 40,214,708 EUR to Sell 30,400,000 GBP Goldman Sachs 1,538,465 11/03/2016Buy 34,207,714 EUR to Sell 25,128,890 GBP CIBC 2,237,613 11/03/2016Buy 146,418,055 USD to Sell 130,502,237 EUR BNY Mellon 3,983,450 07/03/2016
Total unrealised gain on open forward foreign exchange contracts 15,684,754
Buy 590,597,428 EUR to Sell 646,765,606 USD Citigroup (3,382,215) 11/03/2016Buy 29,113,208 EUR to Sell 3,834,200,000 JPY Goldman Sachs (2,068,333) 11/03/2016Buy 41,316,072 EUR to Sell 46,500,000 USD Goldman Sachs (1,388,817) 11/03/2016Buy 19,000,000 GBP to Sell 25,553,896 EUR Goldman Sachs (1,381,244) 11/03/2016Buy 19,608,986 EUR to Sell 2,535,600,000 JPY CIBC (1,011,721) 11/03/2016Buy 37,400,436 EUR to Sell 56,472,000 CAD CIBC (861,850) 11/03/2016Buy 9,530,436 EUR to Sell 1,241,500,000 JPY Royal Bank of Scotland (566,034) 11/03/2016 Royal Bank of Canada Buy 12,718,237 EUR to Sell 19,500,000 CAD (London Branch) (493,878) 11/03/2016Buy 30,052,873 GBP to Sell 38,692,649 EUR BNY Mellon (453,609) 07/03/2016Buy 4,200,000 GBP to Sell 5,708,694 EUR BNY Mellon (365,265) 11/03/2016Buy 10,645,459 EUR to Sell 1,353,370,103 JPY BNY Mellon (360,566) 07/03/2016Buy 36,403,489 EUR to Sell 311,100,000 HKD BNY Mellon (351,372) 11/03/2016Buy 7,922,293 EUR to Sell 1,009,600,000 JPY Citigroup (288,255) 11/03/2016Buy 4,012,566 EUR to Sell 6,300,000 CAD BNY Mellon (255,963) 11/03/2016Buy 2,700,000 GBP to Sell 3,664,237 EUR CIBC (229,175) 11/03/2016Buy 6,317,105 EUR to Sell 9,900,000 AUD CIBC (176,455) 11/03/2016Buy 16,290,754 EUR to Sell 25,027,000 AUD Goldman Sachs (124,833) 11/03/2016Buy 32,021,079 EUR to Sell 35,000,000 USD BNY Mellon (122,386) 11/03/2016Buy 1,821,914 EUR to Sell 232,900,000 JPY BNY Mellon (72,140) 11/03/2016Buy 2,879,807 EUR to Sell 4,500,000 AUD BNY Mellon (71,811) 11/03/2016Buy 3,678,741 EUR to Sell 31,600,000 HKD CIBC (54,636) 11/03/2016Buy 36,700,000 USD to Sell 33,758,923 EUR CIBC (54,204) 11/03/2016Buy 2,165,954 EUR to Sell 2,415,991 USD BNY Mellon (53,145) 07/03/2016 Royal Bank of Canada Buy 2,712,012 EUR to Sell 4,200,000 AUD (London Branch) (42,831) 11/03/2016Buy 22,228,814 EUR to Sell 188,483,000 HKD Goldman Sachs (39,482) 11/03/2016Buy 55,700,000 HKD to Sell 6,604,522 EUR BNY Mellon (23,854) 11/03/2016
Notes to the Financial Statements (continued)
268 Invesco Funds
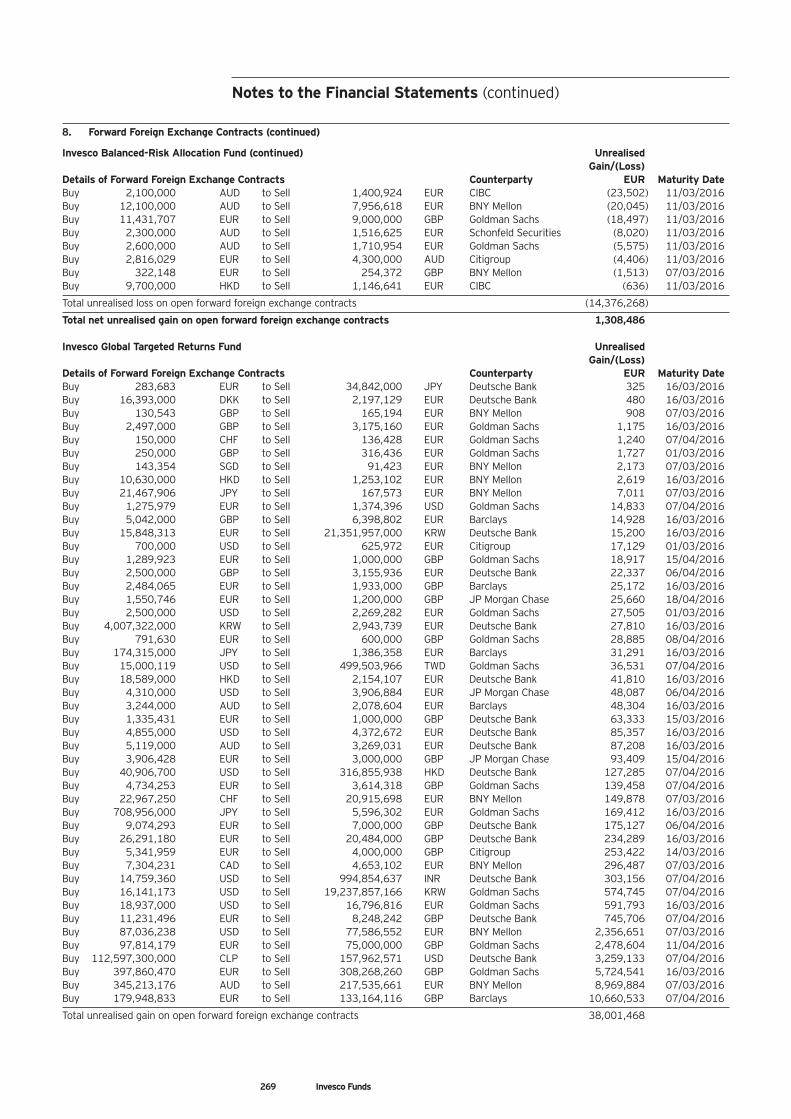
Notes to the Financial Statements (continued)
8. Forward Foreign Exchange Contracts (continued)
Invesco Balanced-Risk Allocation Fund (continued) Unrealised Gain/(Loss) Details of Forward Foreign Exchange Contracts Counterparty EUR Maturity DateBuy 2,100,000 AUD to Sell 1,400,924 EUR CIBC (23,502) 11/03/2016Buy 12,100,000 AUD to Sell 7,956,618 EUR BNY Mellon (20,045) 11/03/2016Buy 11,431,707 EUR to Sell 9,000,000 GBP Goldman Sachs (18,497) 11/03/2016Buy 2,300,000 AUD to Sell 1,516,625 EUR Schonfeld Securities (8,020) 11/03/2016Buy 2,600,000 AUD to Sell 1,710,954 EUR Goldman Sachs (5,575) 11/03/2016Buy 2,816,029 EUR to Sell 4,300,000 AUD Citigroup (4,406) 11/03/2016Buy 322,148 EUR to Sell 254,372 GBP BNY Mellon (1,513) 07/03/2016Buy 9,700,000 HKD to Sell 1,146,641 EUR CIBC (636) 11/03/2016
Total unrealised loss on open forward foreign exchange contracts (14,376,268)
Total net unrealised gain on open forward foreign exchange contracts 1,308,486
Invesco Global Targeted Returns Fund Unrealised Gain/(Loss) Details of Forward Foreign Exchange Contracts Counterparty EUR Maturity DateBuy 283,683 EUR to Sell 34,842,000 JPY Deutsche Bank 325 16/03/2016Buy 16,393,000 DKK to Sell 2,197,129 EUR Deutsche Bank 480 16/03/2016Buy 130,543 GBP to Sell 165,194 EUR BNY Mellon 908 07/03/2016Buy 2,497,000 GBP to Sell 3,175,160 EUR Goldman Sachs 1,175 16/03/2016Buy 150,000 CHF to Sell 136,428 EUR Goldman Sachs 1,240 07/04/2016Buy 250,000 GBP to Sell 316,436 EUR Goldman Sachs 1,727 01/03/2016Buy 143,354 SGD to Sell 91,423 EUR BNY Mellon 2,173 07/03/2016Buy 10,630,000 HKD to Sell 1,253,102 EUR BNY Mellon 2,619 16/03/2016Buy 21,467,906 JPY to Sell 167,573 EUR BNY Mellon 7,011 07/03/2016Buy 1,275,979 EUR to Sell 1,374,396 USD Goldman Sachs 14,833 07/04/2016Buy 5,042,000 GBP to Sell 6,398,802 EUR Barclays 14,928 16/03/2016Buy 15,848,313 EUR to Sell 21,351,957,000 KRW Deutsche Bank 15,200 16/03/2016Buy 700,000 USD to Sell 625,972 EUR Citigroup 17,129 01/03/2016Buy 1,289,923 EUR to Sell 1,000,000 GBP Goldman Sachs 18,917 15/04/2016Buy 2,500,000 GBP to Sell 3,155,936 EUR Deutsche Bank 22,337 06/04/2016Buy 2,484,065 EUR to Sell 1,933,000 GBP Barclays 25,172 16/03/2016Buy 1,550,746 EUR to Sell 1,200,000 GBP JP Morgan Chase 25,660 18/04/2016Buy 2,500,000 USD to Sell 2,269,282 EUR Goldman Sachs 27,505 01/03/2016Buy 4,007,322,000 KRW to Sell 2,943,739 EUR Deutsche Bank 27,810 16/03/2016Buy 791,630 EUR to Sell 600,000 GBP Goldman Sachs 28,885 08/04/2016Buy 174,315,000 JPY to Sell 1,386,358 EUR Barclays 31,291 16/03/2016Buy 15,000,119 USD to Sell 499,503,966 TWD Goldman Sachs 36,531 07/04/2016Buy 18,589,000 HKD to Sell 2,154,107 EUR Deutsche Bank 41,810 16/03/2016Buy 4,310,000 USD to Sell 3,906,884 EUR JP Morgan Chase 48,087 06/04/2016Buy 3,244,000 AUD to Sell 2,078,604 EUR Barclays 48,304 16/03/2016Buy 1,335,431 EUR to Sell 1,000,000 GBP Deutsche Bank 63,333 15/03/2016Buy 4,855,000 USD to Sell 4,372,672 EUR Deutsche Bank 85,357 16/03/2016Buy 5,119,000 AUD to Sell 3,269,031 EUR Deutsche Bank 87,208 16/03/2016Buy 3,906,428 EUR to Sell 3,000,000 GBP JP Morgan Chase 93,409 15/04/2016Buy 40,906,700 USD to Sell 316,855,938 HKD Deutsche Bank 127,285 07/04/2016Buy 4,734,253 EUR to Sell 3,614,318 GBP Goldman Sachs 139,458 07/04/2016Buy 22,967,250 CHF to Sell 20,915,698 EUR BNY Mellon 149,878 07/03/2016Buy 708,956,000 JPY to Sell 5,596,302 EUR Goldman Sachs 169,412 16/03/2016Buy 9,074,293 EUR to Sell 7,000,000 GBP Deutsche Bank 175,127 06/04/2016Buy 26,291,180 EUR to Sell 20,484,000 GBP Deutsche Bank 234,289 16/03/2016Buy 5,341,959 EUR to Sell 4,000,000 GBP Citigroup 253,422 14/03/2016Buy 7,304,231 CAD to Sell 4,653,102 EUR BNY Mellon 296,487 07/03/2016Buy 14,759,360 USD to Sell 994,854,637 INR Deutsche Bank 303,156 07/04/2016Buy 16,141,173 USD to Sell 19,237,857,166 KRW Goldman Sachs 574,745 07/04/2016Buy 18,937,000 USD to Sell 16,796,816 EUR Goldman Sachs 591,793 16/03/2016Buy 11,231,496 EUR to Sell 8,248,242 GBP Deutsche Bank 745,706 07/04/2016Buy 87,036,238 USD to Sell 77,586,552 EUR BNY Mellon 2,356,651 07/03/2016Buy 97,814,179 EUR to Sell 75,000,000 GBP Goldman Sachs 2,478,604 11/04/2016Buy 112,597,300,000 CLP to Sell 157,962,571 USD Deutsche Bank 3,259,133 07/04/2016Buy 397,860,470 EUR to Sell 308,268,260 GBP Goldman Sachs 5,724,541 16/03/2016Buy 345,213,176 AUD to Sell 217,535,661 EUR BNY Mellon 8,969,884 07/03/2016Buy 179,948,833 EUR to Sell 133,164,116 GBP Barclays 10,660,533 07/04/2016
Total unrealised gain on open forward foreign exchange contracts 38,001,468
269 Invesco Funds
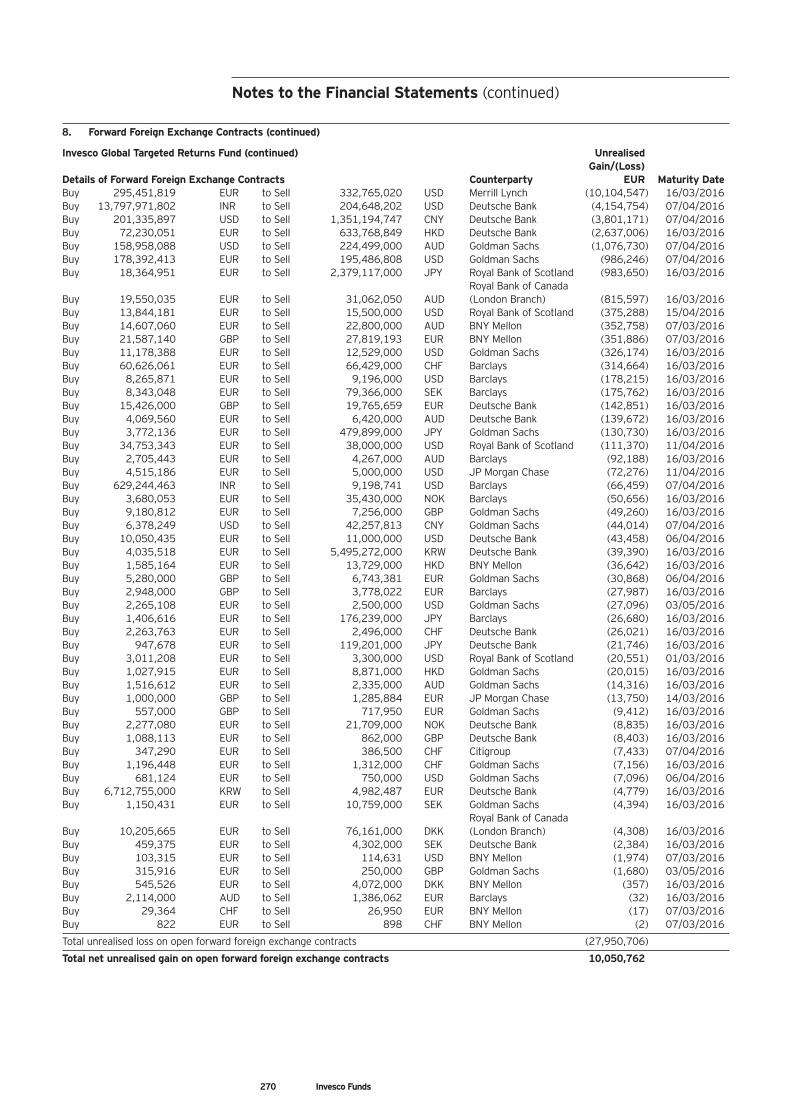
8. Forward Foreign Exchange Contracts (continued)
Invesco Global Targeted Returns Fund (continued) Unrealised Gain/(Loss) Details of Forward Foreign Exchange Contracts Counterparty EUR Maturity DateBuy 295,451,819 EUR to Sell 332,765,020 USD Merrill Lynch (10,104,547) 16/03/2016Buy 13,797,971,802 INR to Sell 204,648,202 USD Deutsche Bank (4,154,754) 07/04/2016Buy 201,335,897 USD to Sell 1,351,194,747 CNY Deutsche Bank (3,801,171) 07/04/2016Buy 72,230,051 EUR to Sell 633,768,849 HKD Deutsche Bank (2,637,006) 16/03/2016Buy 158,958,088 USD to Sell 224,499,000 AUD Goldman Sachs (1,076,730) 07/04/2016Buy 178,392,413 EUR to Sell 195,486,808 USD Goldman Sachs (986,246) 07/04/2016Buy 18,364,951 EUR to Sell 2,379,117,000 JPY Royal Bank of Scotland (983,650) 16/03/2016 Royal Bank of Canada Buy 19,550,035 EUR to Sell 31,062,050 AUD (London Branch) (815,597) 16/03/2016Buy 13,844,181 EUR to Sell 15,500,000 USD Royal Bank of Scotland (375,288) 15/04/2016Buy 14,607,060 EUR to Sell 22,800,000 AUD BNY Mellon (352,758) 07/03/2016Buy 21,587,140 GBP to Sell 27,819,193 EUR BNY Mellon (351,886) 07/03/2016Buy 11,178,388 EUR to Sell 12,529,000 USD Goldman Sachs (326,174) 16/03/2016Buy 60,626,061 EUR to Sell 66,429,000 CHF Barclays (314,664) 16/03/2016Buy 8,265,871 EUR to Sell 9,196,000 USD Barclays (178,215) 16/03/2016Buy 8,343,048 EUR to Sell 79,366,000 SEK Barclays (175,762) 16/03/2016Buy 15,426,000 GBP to Sell 19,765,659 EUR Deutsche Bank (142,851) 16/03/2016Buy 4,069,560 EUR to Sell 6,420,000 AUD Deutsche Bank (139,672) 16/03/2016Buy 3,772,136 EUR to Sell 479,899,000 JPY Goldman Sachs (130,730) 16/03/2016Buy 34,753,343 EUR to Sell 38,000,000 USD Royal Bank of Scotland (111,370) 11/04/2016Buy 2,705,443 EUR to Sell 4,267,000 AUD Barclays (92,188) 16/03/2016Buy 4,515,186 EUR to Sell 5,000,000 USD JP Morgan Chase (72,276) 11/04/2016Buy 629,244,463 INR to Sell 9,198,741 USD Barclays (66,459) 07/04/2016Buy 3,680,053 EUR to Sell 35,430,000 NOK Barclays (50,656) 16/03/2016Buy 9,180,812 EUR to Sell 7,256,000 GBP Goldman Sachs (49,260) 16/03/2016Buy 6,378,249 USD to Sell 42,257,813 CNY Goldman Sachs (44,014) 07/04/2016Buy 10,050,435 EUR to Sell 11,000,000 USD Deutsche Bank (43,458) 06/04/2016Buy 4,035,518 EUR to Sell 5,495,272,000 KRW Deutsche Bank (39,390) 16/03/2016Buy 1,585,164 EUR to Sell 13,729,000 HKD BNY Mellon (36,642) 16/03/2016Buy 5,280,000 GBP to Sell 6,743,381 EUR Goldman Sachs (30,868) 06/04/2016Buy 2,948,000 GBP to Sell 3,778,022 EUR Barclays (27,987) 16/03/2016Buy 2,265,108 EUR to Sell 2,500,000 USD Goldman Sachs (27,096) 03/05/2016Buy 1,406,616 EUR to Sell 176,239,000 JPY Barclays (26,680) 16/03/2016Buy 2,263,763 EUR to Sell 2,496,000 CHF Deutsche Bank (26,021) 16/03/2016Buy 947,678 EUR to Sell 119,201,000 JPY Deutsche Bank (21,746) 16/03/2016Buy 3,011,208 EUR to Sell 3,300,000 USD Royal Bank of Scotland (20,551) 01/03/2016Buy 1,027,915 EUR to Sell 8,871,000 HKD Goldman Sachs (20,015) 16/03/2016Buy 1,516,612 EUR to Sell 2,335,000 AUD Goldman Sachs (14,316) 16/03/2016Buy 1,000,000 GBP to Sell 1,285,884 EUR JP Morgan Chase (13,750) 14/03/2016Buy 557,000 GBP to Sell 717,950 EUR Goldman Sachs (9,412) 16/03/2016Buy 2,277,080 EUR to Sell 21,709,000 NOK Deutsche Bank (8,835) 16/03/2016Buy 1,088,113 EUR to Sell 862,000 GBP Deutsche Bank (8,403) 16/03/2016Buy 347,290 EUR to Sell 386,500 CHF Citigroup (7,433) 07/04/2016Buy 1,196,448 EUR to Sell 1,312,000 CHF Goldman Sachs (7,156) 16/03/2016Buy 681,124 EUR to Sell 750,000 USD Goldman Sachs (7,096) 06/04/2016Buy 6,712,755,000 KRW to Sell 4,982,487 EUR Deutsche Bank (4,779) 16/03/2016Buy 1,150,431 EUR to Sell 10,759,000 SEK Goldman Sachs (4,394) 16/03/2016 Royal Bank of Canada Buy 10,205,665 EUR to Sell 76,161,000 DKK (London Branch) (4,308) 16/03/2016Buy 459,375 EUR to Sell 4,302,000 SEK Deutsche Bank (2,384) 16/03/2016Buy 103,315 EUR to Sell 114,631 USD BNY Mellon (1,974) 07/03/2016Buy 315,916 EUR to Sell 250,000 GBP Goldman Sachs (1,680) 03/05/2016Buy 545,526 EUR to Sell 4,072,000 DKK BNY Mellon (357) 16/03/2016Buy 2,114,000 AUD to Sell 1,386,062 EUR Barclays (32) 16/03/2016Buy 29,364 CHF to Sell 26,950 EUR BNY Mellon (17) 07/03/2016Buy 822 EUR to Sell 898 CHF BNY Mellon (2) 07/03/2016
Total unrealised loss on open forward foreign exchange contracts (27,950,706)
Total net unrealised gain on open forward foreign exchange contracts 10,050,762
270 Invesco Funds
Notes to the Financial Statements (continued)
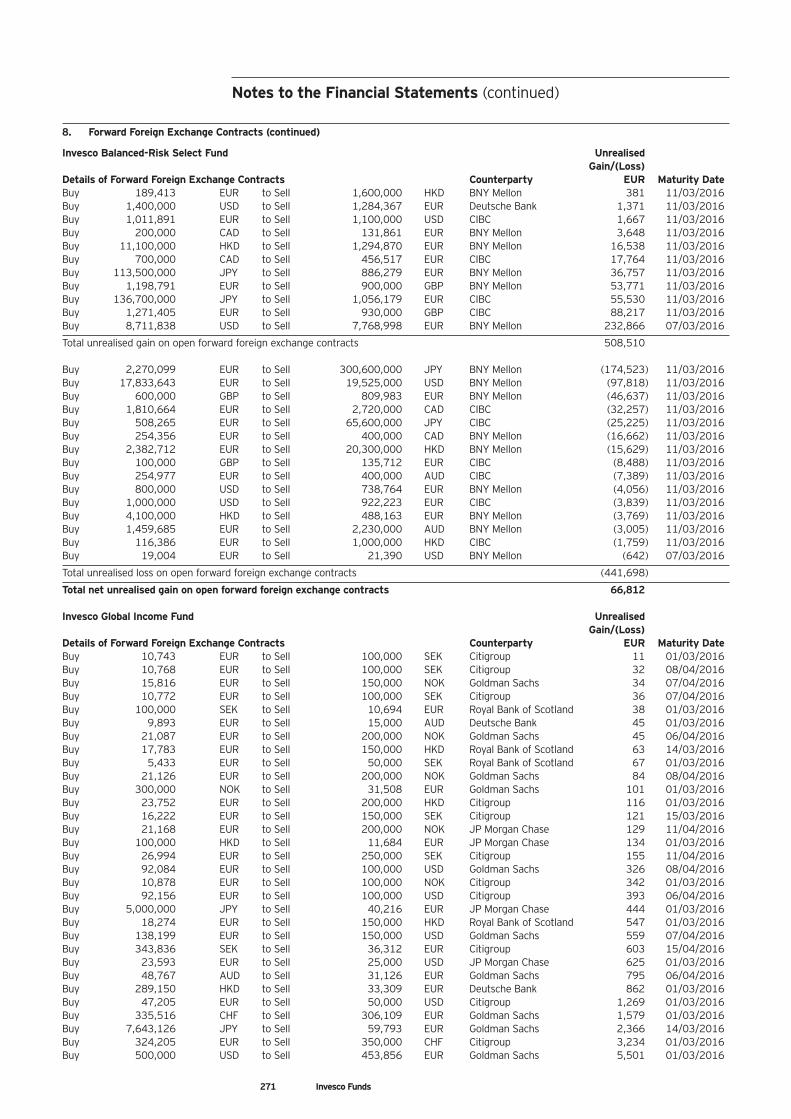
8. Forward Foreign Exchange Contracts (continued)
Invesco Balanced-Risk Select Fund Unrealised Gain/(Loss) Details of Forward Foreign Exchange Contracts Counterparty EUR Maturity DateBuy 189,413 EUR to Sell 1,600,000 HKD BNY Mellon 381 11/03/2016Buy 1,400,000 USD to Sell 1,284,367 EUR Deutsche Bank 1,371 11/03/2016Buy 1,011,891 EUR to Sell 1,100,000 USD CIBC 1,667 11/03/2016Buy 200,000 CAD to Sell 131,861 EUR BNY Mellon 3,648 11/03/2016Buy 11,100,000 HKD to Sell 1,294,870 EUR BNY Mellon 16,538 11/03/2016Buy 700,000 CAD to Sell 456,517 EUR CIBC 17,764 11/03/2016Buy 113,500,000 JPY to Sell 886,279 EUR BNY Mellon 36,757 11/03/2016Buy 1,198,791 EUR to Sell 900,000 GBP BNY Mellon 53,771 11/03/2016Buy 136,700,000 JPY to Sell 1,056,179 EUR CIBC 55,530 11/03/2016Buy 1,271,405 EUR to Sell 930,000 GBP CIBC 88,217 11/03/2016Buy 8,711,838 USD to Sell 7,768,998 EUR BNY Mellon 232,866 07/03/2016
Total unrealised gain on open forward foreign exchange contracts 508,510
Buy 2,270,099 EUR to Sell 300,600,000 JPY BNY Mellon (174,523) 11/03/2016Buy 17,833,643 EUR to Sell 19,525,000 USD BNY Mellon (97,818) 11/03/2016Buy 600,000 GBP to Sell 809,983 EUR BNY Mellon (46,637) 11/03/2016Buy 1,810,664 EUR to Sell 2,720,000 CAD CIBC (32,257) 11/03/2016Buy 508,265 EUR to Sell 65,600,000 JPY CIBC (25,225) 11/03/2016Buy 254,356 EUR to Sell 400,000 CAD BNY Mellon (16,662) 11/03/2016Buy 2,382,712 EUR to Sell 20,300,000 HKD BNY Mellon (15,629) 11/03/2016Buy 100,000 GBP to Sell 135,712 EUR CIBC (8,488) 11/03/2016Buy 254,977 EUR to Sell 400,000 AUD CIBC (7,389) 11/03/2016Buy 800,000 USD to Sell 738,764 EUR BNY Mellon (4,056) 11/03/2016Buy 1,000,000 USD to Sell 922,223 EUR CIBC (3,839) 11/03/2016Buy 4,100,000 HKD to Sell 488,163 EUR BNY Mellon (3,769) 11/03/2016Buy 1,459,685 EUR to Sell 2,230,000 AUD BNY Mellon (3,005) 11/03/2016Buy 116,386 EUR to Sell 1,000,000 HKD CIBC (1,759) 11/03/2016Buy 19,004 EUR to Sell 21,390 USD BNY Mellon (642) 07/03/2016
Total unrealised loss on open forward foreign exchange contracts (441,698)
Total net unrealised gain on open forward foreign exchange contracts 66,812
Invesco Global Income Fund Unrealised Gain/(Loss) Details of Forward Foreign Exchange Contracts Counterparty EUR Maturity DateBuy 10,743 EUR to Sell 100,000 SEK Citigroup 11 01/03/2016Buy 10,768 EUR to Sell 100,000 SEK Citigroup 32 08/04/2016Buy 15,816 EUR to Sell 150,000 NOK Goldman Sachs 34 07/04/2016Buy 10,772 EUR to Sell 100,000 SEK Citigroup 36 07/04/2016Buy 100,000 SEK to Sell 10,694 EUR Royal Bank of Scotland 38 01/03/2016Buy 9,893 EUR to Sell 15,000 AUD Deutsche Bank 45 01/03/2016Buy 21,087 EUR to Sell 200,000 NOK Goldman Sachs 45 06/04/2016Buy 17,783 EUR to Sell 150,000 HKD Royal Bank of Scotland 63 14/03/2016Buy 5,433 EUR to Sell 50,000 SEK Royal Bank of Scotland 67 01/03/2016Buy 21,126 EUR to Sell 200,000 NOK Goldman Sachs 84 08/04/2016Buy 300,000 NOK to Sell 31,508 EUR Goldman Sachs 101 01/03/2016Buy 23,752 EUR to Sell 200,000 HKD Citigroup 116 01/03/2016Buy 16,222 EUR to Sell 150,000 SEK Citigroup 121 15/03/2016Buy 21,168 EUR to Sell 200,000 NOK JP Morgan Chase 129 11/04/2016Buy 100,000 HKD to Sell 11,684 EUR JP Morgan Chase 134 01/03/2016Buy 26,994 EUR to Sell 250,000 SEK Citigroup 155 11/04/2016Buy 92,084 EUR to Sell 100,000 USD Goldman Sachs 326 08/04/2016Buy 10,878 EUR to Sell 100,000 NOK Citigroup 342 01/03/2016Buy 92,156 EUR to Sell 100,000 USD Citigroup 393 06/04/2016Buy 5,000,000 JPY to Sell 40,216 EUR JP Morgan Chase 444 01/03/2016Buy 18,274 EUR to Sell 150,000 HKD Royal Bank of Scotland 547 01/03/2016Buy 138,199 EUR to Sell 150,000 USD Goldman Sachs 559 07/04/2016Buy 343,836 SEK to Sell 36,312 EUR Citigroup 603 15/04/2016Buy 23,593 EUR to Sell 25,000 USD JP Morgan Chase 625 01/03/2016Buy 48,767 AUD to Sell 31,126 EUR Goldman Sachs 795 06/04/2016Buy 289,150 HKD to Sell 33,309 EUR Deutsche Bank 862 01/03/2016Buy 47,205 EUR to Sell 50,000 USD Citigroup 1,269 01/03/2016Buy 335,516 CHF to Sell 306,109 EUR Goldman Sachs 1,579 01/03/2016Buy 7,643,126 JPY to Sell 59,793 EUR Goldman Sachs 2,366 14/03/2016Buy 324,205 EUR to Sell 350,000 CHF Citigroup 3,234 01/03/2016Buy 500,000 USD to Sell 453,856 EUR Goldman Sachs 5,501 01/03/2016
271 Invesco Funds
Notes to the Financial Statements (continued)
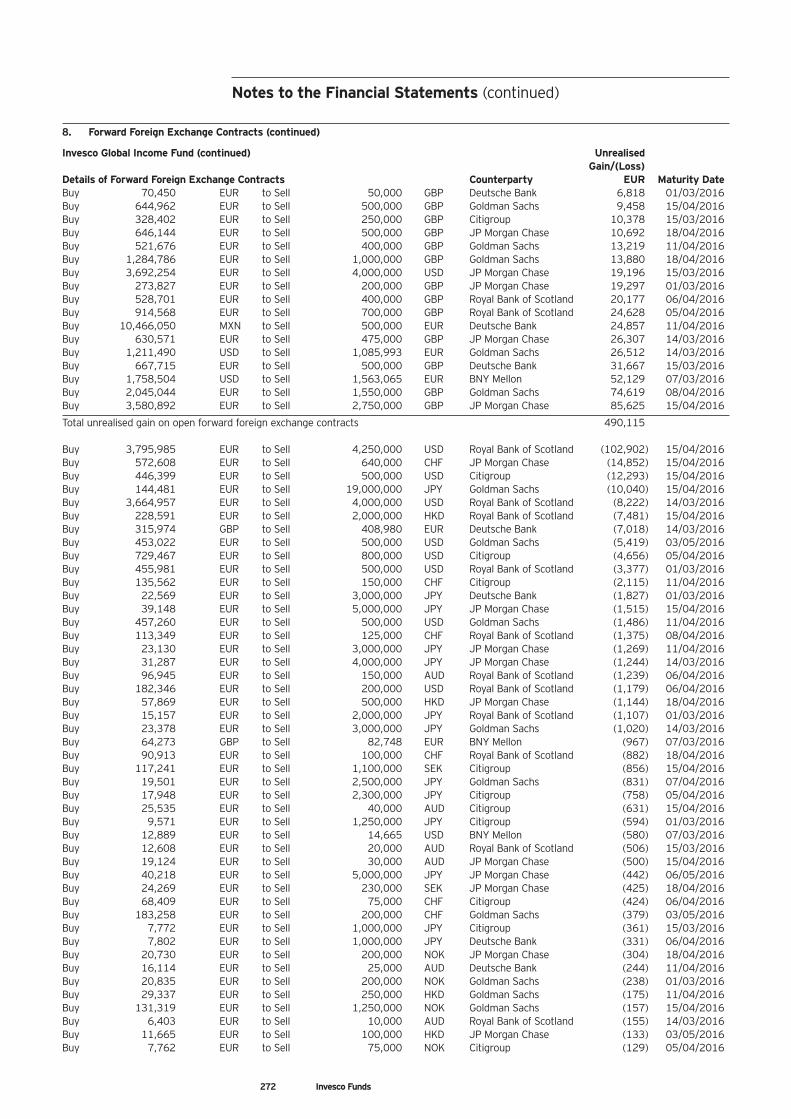
8. Forward Foreign Exchange Contracts (continued)
Invesco Global Income Fund (continued) Unrealised Gain/(Loss) Details of Forward Foreign Exchange Contracts Counterparty EUR Maturity DateBuy 70,450 EUR to Sell 50,000 GBP Deutsche Bank 6,818 01/03/2016Buy 644,962 EUR to Sell 500,000 GBP Goldman Sachs 9,458 15/04/2016Buy 328,402 EUR to Sell 250,000 GBP Citigroup 10,378 15/03/2016Buy 646,144 EUR to Sell 500,000 GBP JP Morgan Chase 10,692 18/04/2016Buy 521,676 EUR to Sell 400,000 GBP Goldman Sachs 13,219 11/04/2016Buy 1,284,786 EUR to Sell 1,000,000 GBP Goldman Sachs 13,880 18/04/2016Buy 3,692,254 EUR to Sell 4,000,000 USD JP Morgan Chase 19,196 15/03/2016Buy 273,827 EUR to Sell 200,000 GBP JP Morgan Chase 19,297 01/03/2016Buy 528,701 EUR to Sell 400,000 GBP Royal Bank of Scotland 20,177 06/04/2016Buy 914,568 EUR to Sell 700,000 GBP Royal Bank of Scotland 24,628 05/04/2016Buy 10,466,050 MXN to Sell 500,000 EUR Deutsche Bank 24,857 11/04/2016Buy 630,571 EUR to Sell 475,000 GBP JP Morgan Chase 26,307 14/03/2016Buy 1,211,490 USD to Sell 1,085,993 EUR Goldman Sachs 26,512 14/03/2016Buy 667,715 EUR to Sell 500,000 GBP Deutsche Bank 31,667 15/03/2016Buy 1,758,504 USD to Sell 1,563,065 EUR BNY Mellon 52,129 07/03/2016Buy 2,045,044 EUR to Sell 1,550,000 GBP Goldman Sachs 74,619 08/04/2016Buy 3,580,892 EUR to Sell 2,750,000 GBP JP Morgan Chase 85,625 15/04/2016
Total unrealised gain on open forward foreign exchange contracts 490,115
Buy 3,795,985 EUR to Sell 4,250,000 USD Royal Bank of Scotland (102,902) 15/04/2016Buy 572,608 EUR to Sell 640,000 CHF JP Morgan Chase (14,852) 15/04/2016Buy 446,399 EUR to Sell 500,000 USD Citigroup (12,293) 15/04/2016Buy 144,481 EUR to Sell 19,000,000 JPY Goldman Sachs (10,040) 15/04/2016Buy 3,664,957 EUR to Sell 4,000,000 USD Royal Bank of Scotland (8,222) 14/03/2016Buy 228,591 EUR to Sell 2,000,000 HKD Royal Bank of Scotland (7,481) 15/04/2016Buy 315,974 GBP to Sell 408,980 EUR Deutsche Bank (7,018) 14/03/2016Buy 453,022 EUR to Sell 500,000 USD Goldman Sachs (5,419) 03/05/2016Buy 729,467 EUR to Sell 800,000 USD Citigroup (4,656) 05/04/2016Buy 455,981 EUR to Sell 500,000 USD Royal Bank of Scotland (3,377) 01/03/2016Buy 135,562 EUR to Sell 150,000 CHF Citigroup (2,115) 11/04/2016Buy 22,569 EUR to Sell 3,000,000 JPY Deutsche Bank (1,827) 01/03/2016Buy 39,148 EUR to Sell 5,000,000 JPY JP Morgan Chase (1,515) 15/04/2016Buy 457,260 EUR to Sell 500,000 USD Goldman Sachs (1,486) 11/04/2016Buy 113,349 EUR to Sell 125,000 CHF Royal Bank of Scotland (1,375) 08/04/2016Buy 23,130 EUR to Sell 3,000,000 JPY JP Morgan Chase (1,269) 11/04/2016Buy 31,287 EUR to Sell 4,000,000 JPY JP Morgan Chase (1,244) 14/03/2016Buy 96,945 EUR to Sell 150,000 AUD Royal Bank of Scotland (1,239) 06/04/2016Buy 182,346 EUR to Sell 200,000 USD Royal Bank of Scotland (1,179) 06/04/2016Buy 57,869 EUR to Sell 500,000 HKD JP Morgan Chase (1,144) 18/04/2016Buy 15,157 EUR to Sell 2,000,000 JPY Royal Bank of Scotland (1,107) 01/03/2016Buy 23,378 EUR to Sell 3,000,000 JPY Goldman Sachs (1,020) 14/03/2016Buy 64,273 GBP to Sell 82,748 EUR BNY Mellon (967) 07/03/2016Buy 90,913 EUR to Sell 100,000 CHF Royal Bank of Scotland (882) 18/04/2016Buy 117,241 EUR to Sell 1,100,000 SEK Citigroup (856) 15/04/2016Buy 19,501 EUR to Sell 2,500,000 JPY Goldman Sachs (831) 07/04/2016Buy 17,948 EUR to Sell 2,300,000 JPY Citigroup (758) 05/04/2016Buy 25,535 EUR to Sell 40,000 AUD Citigroup (631) 15/04/2016Buy 9,571 EUR to Sell 1,250,000 JPY Citigroup (594) 01/03/2016Buy 12,889 EUR to Sell 14,665 USD BNY Mellon (580) 07/03/2016Buy 12,608 EUR to Sell 20,000 AUD Royal Bank of Scotland (506) 15/03/2016Buy 19,124 EUR to Sell 30,000 AUD JP Morgan Chase (500) 15/04/2016Buy 40,218 EUR to Sell 5,000,000 JPY JP Morgan Chase (442) 06/05/2016Buy 24,269 EUR to Sell 230,000 SEK JP Morgan Chase (425) 18/04/2016Buy 68,409 EUR to Sell 75,000 CHF Citigroup (424) 06/04/2016Buy 183,258 EUR to Sell 200,000 CHF Goldman Sachs (379) 03/05/2016Buy 7,772 EUR to Sell 1,000,000 JPY Citigroup (361) 15/03/2016Buy 7,802 EUR to Sell 1,000,000 JPY Deutsche Bank (331) 06/04/2016Buy 20,730 EUR to Sell 200,000 NOK JP Morgan Chase (304) 18/04/2016Buy 16,114 EUR to Sell 25,000 AUD Deutsche Bank (244) 11/04/2016Buy 20,835 EUR to Sell 200,000 NOK Goldman Sachs (238) 01/03/2016Buy 29,337 EUR to Sell 250,000 HKD Goldman Sachs (175) 11/04/2016Buy 131,319 EUR to Sell 1,250,000 NOK Goldman Sachs (157) 15/04/2016Buy 6,403 EUR to Sell 10,000 AUD Royal Bank of Scotland (155) 14/03/2016Buy 11,665 EUR to Sell 100,000 HKD JP Morgan Chase (133) 03/05/2016Buy 7,762 EUR to Sell 75,000 NOK Citigroup (129) 05/04/2016
272 Invesco Funds
Notes to the Financial Statements (continued)
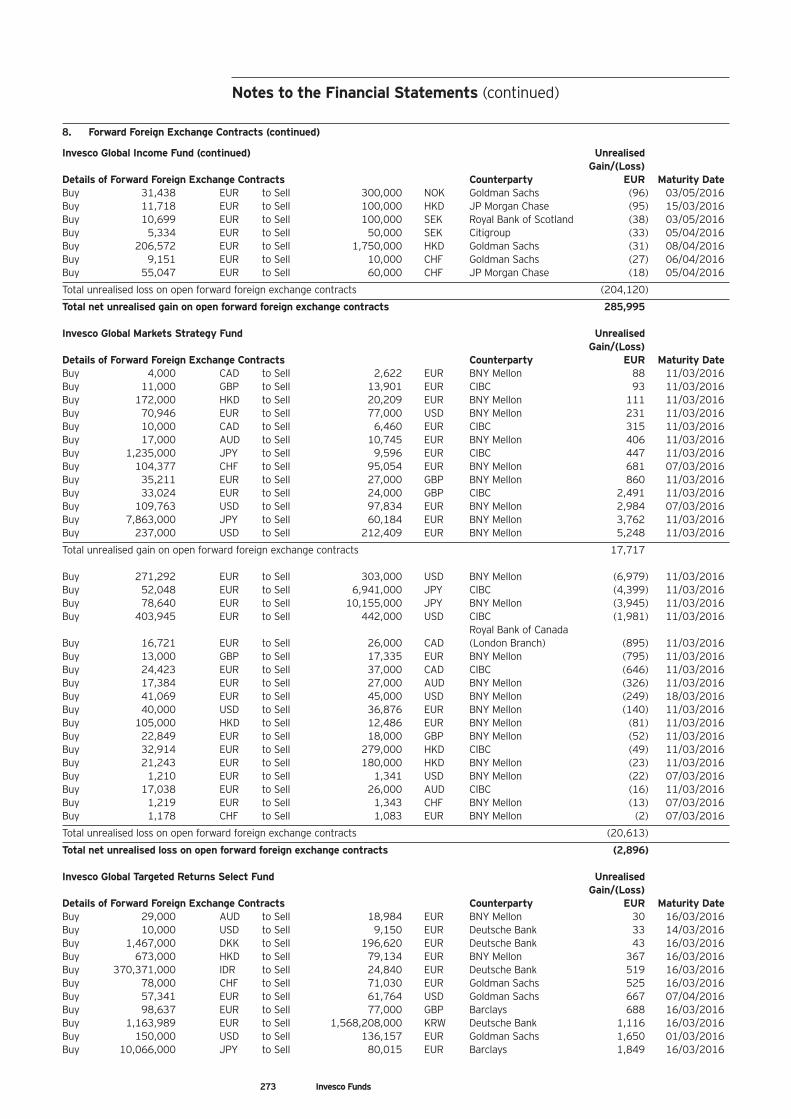
273 Invesco Funds
8. Forward Foreign Exchange Contracts (continued)
Invesco Global Income Fund (continued) Unrealised Gain/(Loss) Details of Forward Foreign Exchange Contracts Counterparty EUR Maturity DateBuy 31,438 EUR to Sell 300,000 NOK Goldman Sachs (96) 03/05/2016Buy 11,718 EUR to Sell 100,000 HKD JP Morgan Chase (95) 15/03/2016Buy 10,699 EUR to Sell 100,000 SEK Royal Bank of Scotland (38) 03/05/2016Buy 5,334 EUR to Sell 50,000 SEK Citigroup (33) 05/04/2016Buy 206,572 EUR to Sell 1,750,000 HKD Goldman Sachs (31) 08/04/2016Buy 9,151 EUR to Sell 10,000 CHF Goldman Sachs (27) 06/04/2016Buy 55,047 EUR to Sell 60,000 CHF JP Morgan Chase (18) 05/04/2016
Total unrealised loss on open forward foreign exchange contracts (204,120)
Total net unrealised gain on open forward foreign exchange contracts 285,995
Invesco Global Markets Strategy Fund Unrealised Gain/(Loss) Details of Forward Foreign Exchange Contracts Counterparty EUR Maturity DateBuy 4,000 CAD to Sell 2,622 EUR BNY Mellon 88 11/03/2016Buy 11,000 GBP to Sell 13,901 EUR CIBC 93 11/03/2016Buy 172,000 HKD to Sell 20,209 EUR BNY Mellon 111 11/03/2016Buy 70,946 EUR to Sell 77,000 USD BNY Mellon 231 11/03/2016Buy 10,000 CAD to Sell 6,460 EUR CIBC 315 11/03/2016Buy 17,000 AUD to Sell 10,745 EUR BNY Mellon 406 11/03/2016Buy 1,235,000 JPY to Sell 9,596 EUR CIBC 447 11/03/2016Buy 104,377 CHF to Sell 95,054 EUR BNY Mellon 681 07/03/2016Buy 35,211 EUR to Sell 27,000 GBP BNY Mellon 860 11/03/2016Buy 33,024 EUR to Sell 24,000 GBP CIBC 2,491 11/03/2016Buy 109,763 USD to Sell 97,834 EUR BNY Mellon 2,984 07/03/2016Buy 7,863,000 JPY to Sell 60,184 EUR BNY Mellon 3,762 11/03/2016Buy 237,000 USD to Sell 212,409 EUR BNY Mellon 5,248 11/03/2016
Total unrealised gain on open forward foreign exchange contracts 17,717
Buy 271,292 EUR to Sell 303,000 USD BNY Mellon (6,979) 11/03/2016Buy 52,048 EUR to Sell 6,941,000 JPY CIBC (4,399) 11/03/2016Buy 78,640 EUR to Sell 10,155,000 JPY BNY Mellon (3,945) 11/03/2016Buy 403,945 EUR to Sell 442,000 USD CIBC (1,981) 11/03/2016 Royal Bank of Canada Buy 16,721 EUR to Sell 26,000 CAD (London Branch) (895) 11/03/2016Buy 13,000 GBP to Sell 17,335 EUR BNY Mellon (795) 11/03/2016Buy 24,423 EUR to Sell 37,000 CAD CIBC (646) 11/03/2016Buy 17,384 EUR to Sell 27,000 AUD BNY Mellon (326) 11/03/2016Buy 41,069 EUR to Sell 45,000 USD BNY Mellon (249) 18/03/2016Buy 40,000 USD to Sell 36,876 EUR BNY Mellon (140) 11/03/2016Buy 105,000 HKD to Sell 12,486 EUR BNY Mellon (81) 11/03/2016Buy 22,849 EUR to Sell 18,000 GBP BNY Mellon (52) 11/03/2016Buy 32,914 EUR to Sell 279,000 HKD CIBC (49) 11/03/2016Buy 21,243 EUR to Sell 180,000 HKD BNY Mellon (23) 11/03/2016Buy 1,210 EUR to Sell 1,341 USD BNY Mellon (22) 07/03/2016Buy 17,038 EUR to Sell 26,000 AUD CIBC (16) 11/03/2016Buy 1,219 EUR to Sell 1,343 CHF BNY Mellon (13) 07/03/2016Buy 1,178 CHF to Sell 1,083 EUR BNY Mellon (2) 07/03/2016
Total unrealised loss on open forward foreign exchange contracts (20,613)
Total net unrealised loss on open forward foreign exchange contracts (2,896)
Invesco Global Targeted Returns Select Fund Unrealised Gain/(Loss) Details of Forward Foreign Exchange Contracts Counterparty EUR Maturity DateBuy 29,000 AUD to Sell 18,984 EUR BNY Mellon 30 16/03/2016Buy 10,000 USD to Sell 9,150 EUR Deutsche Bank 33 14/03/2016Buy 1,467,000 DKK to Sell 196,620 EUR Deutsche Bank 43 16/03/2016Buy 673,000 HKD to Sell 79,134 EUR BNY Mellon 367 16/03/2016Buy 370,371,000 IDR to Sell 24,840 EUR Deutsche Bank 519 16/03/2016Buy 78,000 CHF to Sell 71,030 EUR Goldman Sachs 525 16/03/2016Buy 57,341 EUR to Sell 61,764 USD Goldman Sachs 667 07/04/2016Buy 98,637 EUR to Sell 77,000 GBP Barclays 688 16/03/2016Buy 1,163,989 EUR to Sell 1,568,208,000 KRW Deutsche Bank 1,116 16/03/2016Buy 150,000 USD to Sell 136,157 EUR Goldman Sachs 1,650 01/03/2016Buy 10,066,000 JPY to Sell 80,015 EUR Barclays 1,849 16/03/2016
Notes to the Financial Statements (continued)
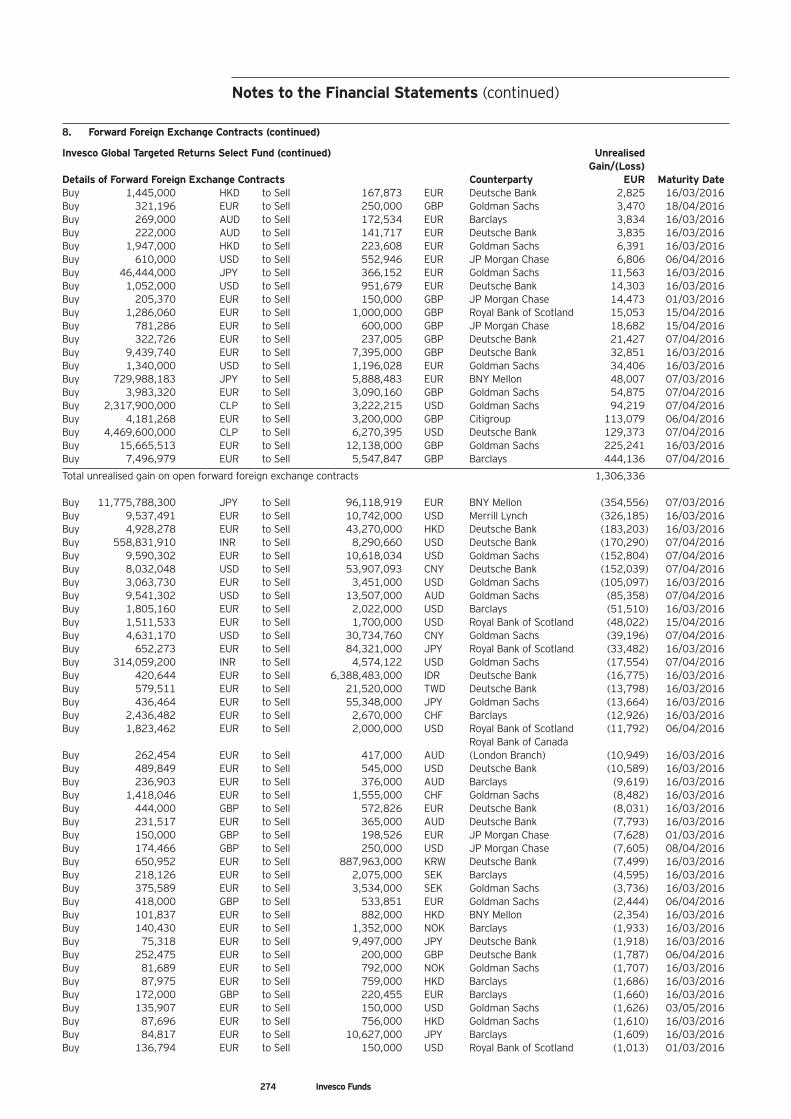
8. Forward Foreign Exchange Contracts (continued)
Invesco Global Targeted Returns Select Fund (continued) Unrealised Gain/(Loss) Details of Forward Foreign Exchange Contracts Counterparty EUR Maturity DateBuy 1,445,000 HKD to Sell 167,873 EUR Deutsche Bank 2,825 16/03/2016Buy 321,196 EUR to Sell 250,000 GBP Goldman Sachs 3,470 18/04/2016Buy 269,000 AUD to Sell 172,534 EUR Barclays 3,834 16/03/2016Buy 222,000 AUD to Sell 141,717 EUR Deutsche Bank 3,835 16/03/2016Buy 1,947,000 HKD to Sell 223,608 EUR Goldman Sachs 6,391 16/03/2016Buy 610,000 USD to Sell 552,946 EUR JP Morgan Chase 6,806 06/04/2016Buy 46,444,000 JPY to Sell 366,152 EUR Goldman Sachs 11,563 16/03/2016Buy 1,052,000 USD to Sell 951,679 EUR Deutsche Bank 14,303 16/03/2016Buy 205,370 EUR to Sell 150,000 GBP JP Morgan Chase 14,473 01/03/2016Buy 1,286,060 EUR to Sell 1,000,000 GBP Royal Bank of Scotland 15,053 15/04/2016Buy 781,286 EUR to Sell 600,000 GBP JP Morgan Chase 18,682 15/04/2016Buy 322,726 EUR to Sell 237,005 GBP Deutsche Bank 21,427 07/04/2016Buy 9,439,740 EUR to Sell 7,395,000 GBP Deutsche Bank 32,851 16/03/2016Buy 1,340,000 USD to Sell 1,196,028 EUR Goldman Sachs 34,406 16/03/2016Buy 729,988,183 JPY to Sell 5,888,483 EUR BNY Mellon 48,007 07/03/2016Buy 3,983,320 EUR to Sell 3,090,160 GBP Goldman Sachs 54,875 07/04/2016Buy 2,317,900,000 CLP to Sell 3,222,215 USD Goldman Sachs 94,219 07/04/2016Buy 4,181,268 EUR to Sell 3,200,000 GBP Citigroup 113,079 06/04/2016Buy 4,469,600,000 CLP to Sell 6,270,395 USD Deutsche Bank 129,373 07/04/2016Buy 15,665,513 EUR to Sell 12,138,000 GBP Goldman Sachs 225,241 16/03/2016Buy 7,496,979 EUR to Sell 5,547,847 GBP Barclays 444,136 07/04/2016
Total unrealised gain on open forward foreign exchange contracts 1,306,336
Buy 11,775,788,300 JPY to Sell 96,118,919 EUR BNY Mellon (354,556) 07/03/2016Buy 9,537,491 EUR to Sell 10,742,000 USD Merrill Lynch (326,185) 16/03/2016Buy 4,928,278 EUR to Sell 43,270,000 HKD Deutsche Bank (183,203) 16/03/2016Buy 558,831,910 INR to Sell 8,290,660 USD Deutsche Bank (170,290) 07/04/2016Buy 9,590,302 EUR to Sell 10,618,034 USD Goldman Sachs (152,804) 07/04/2016Buy 8,032,048 USD to Sell 53,907,093 CNY Deutsche Bank (152,039) 07/04/2016Buy 3,063,730 EUR to Sell 3,451,000 USD Goldman Sachs (105,097) 16/03/2016Buy 9,541,302 USD to Sell 13,507,000 AUD Goldman Sachs (85,358) 07/04/2016Buy 1,805,160 EUR to Sell 2,022,000 USD Barclays (51,510) 16/03/2016Buy 1,511,533 EUR to Sell 1,700,000 USD Royal Bank of Scotland (48,022) 15/04/2016Buy 4,631,170 USD to Sell 30,734,760 CNY Goldman Sachs (39,196) 07/04/2016Buy 652,273 EUR to Sell 84,321,000 JPY Royal Bank of Scotland (33,482) 16/03/2016Buy 314,059,200 INR to Sell 4,574,122 USD Goldman Sachs (17,554) 07/04/2016Buy 420,644 EUR to Sell 6,388,483,000 IDR Deutsche Bank (16,775) 16/03/2016Buy 579,511 EUR to Sell 21,520,000 TWD Deutsche Bank (13,798) 16/03/2016Buy 436,464 EUR to Sell 55,348,000 JPY Goldman Sachs (13,664) 16/03/2016Buy 2,436,482 EUR to Sell 2,670,000 CHF Barclays (12,926) 16/03/2016Buy 1,823,462 EUR to Sell 2,000,000 USD Royal Bank of Scotland (11,792) 06/04/2016 Royal Bank of Canada Buy 262,454 EUR to Sell 417,000 AUD (London Branch) (10,949) 16/03/2016Buy 489,849 EUR to Sell 545,000 USD Deutsche Bank (10,589) 16/03/2016Buy 236,903 EUR to Sell 376,000 AUD Barclays (9,619) 16/03/2016Buy 1,418,046 EUR to Sell 1,555,000 CHF Goldman Sachs (8,482) 16/03/2016Buy 444,000 GBP to Sell 572,826 EUR Deutsche Bank (8,031) 16/03/2016Buy 231,517 EUR to Sell 365,000 AUD Deutsche Bank (7,793) 16/03/2016Buy 150,000 GBP to Sell 198,526 EUR JP Morgan Chase (7,628) 01/03/2016Buy 174,466 GBP to Sell 250,000 USD JP Morgan Chase (7,605) 08/04/2016Buy 650,952 EUR to Sell 887,963,000 KRW Deutsche Bank (7,499) 16/03/2016Buy 218,126 EUR to Sell 2,075,000 SEK Barclays (4,595) 16/03/2016Buy 375,589 EUR to Sell 3,534,000 SEK Goldman Sachs (3,736) 16/03/2016Buy 418,000 GBP to Sell 533,851 EUR Goldman Sachs (2,444) 06/04/2016Buy 101,837 EUR to Sell 882,000 HKD BNY Mellon (2,354) 16/03/2016Buy 140,430 EUR to Sell 1,352,000 NOK Barclays (1,933) 16/03/2016Buy 75,318 EUR to Sell 9,497,000 JPY Deutsche Bank (1,918) 16/03/2016Buy 252,475 EUR to Sell 200,000 GBP Deutsche Bank (1,787) 06/04/2016Buy 81,689 EUR to Sell 792,000 NOK Goldman Sachs (1,707) 16/03/2016Buy 87,975 EUR to Sell 759,000 HKD Barclays (1,686) 16/03/2016Buy 172,000 GBP to Sell 220,455 EUR Barclays (1,660) 16/03/2016Buy 135,907 EUR to Sell 150,000 USD Goldman Sachs (1,626) 03/05/2016Buy 87,696 EUR to Sell 756,000 HKD Goldman Sachs (1,610) 16/03/2016Buy 84,817 EUR to Sell 10,627,000 JPY Barclays (1,609) 16/03/2016Buy 136,794 EUR to Sell 150,000 USD Royal Bank of Scotland (1,013) 01/03/2016
274 Invesco Funds
Notes to the Financial Statements (continued)
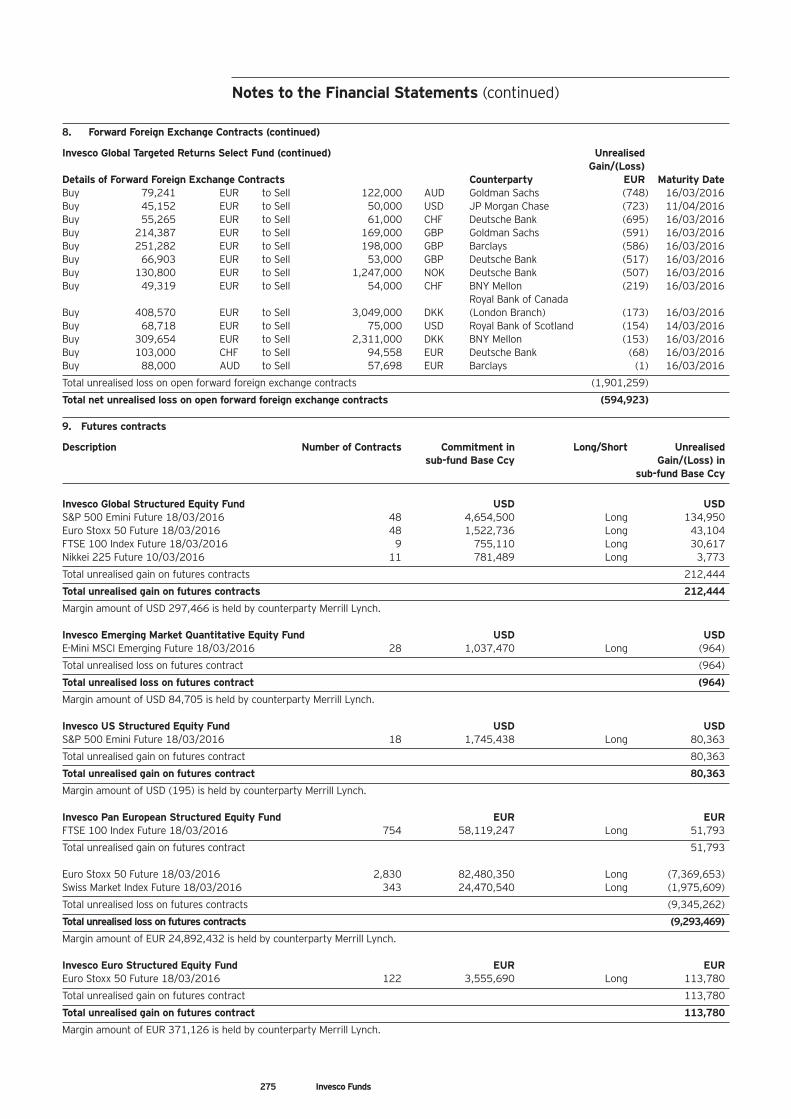
275 Invesco Funds
8. Forward Foreign Exchange Contracts (continued)
Invesco Global Targeted Returns Select Fund (continued) Unrealised Gain/(Loss) Details of Forward Foreign Exchange Contracts Counterparty EUR Maturity DateBuy 79,241 EUR to Sell 122,000 AUD Goldman Sachs (748) 16/03/2016Buy 45,152 EUR to Sell 50,000 USD JP Morgan Chase (723) 11/04/2016Buy 55,265 EUR to Sell 61,000 CHF Deutsche Bank (695) 16/03/2016Buy 214,387 EUR to Sell 169,000 GBP Goldman Sachs (591) 16/03/2016Buy 251,282 EUR to Sell 198,000 GBP Barclays (586) 16/03/2016Buy 66,903 EUR to Sell 53,000 GBP Deutsche Bank (517) 16/03/2016Buy 130,800 EUR to Sell 1,247,000 NOK Deutsche Bank (507) 16/03/2016Buy 49,319 EUR to Sell 54,000 CHF BNY Mellon (219) 16/03/2016 Royal Bank of Canada Buy 408,570 EUR to Sell 3,049,000 DKK (London Branch) (173) 16/03/2016Buy 68,718 EUR to Sell 75,000 USD Royal Bank of Scotland (154) 14/03/2016Buy 309,654 EUR to Sell 2,311,000 DKK BNY Mellon (153) 16/03/2016Buy 103,000 CHF to Sell 94,558 EUR Deutsche Bank (68) 16/03/2016Buy 88,000 AUD to Sell 57,698 EUR Barclays (1) 16/03/2016
Total unrealised loss on open forward foreign exchange contracts (1,901,259)
Total net unrealised loss on open forward foreign exchange contracts (594,923)
9. Futures contracts
Description Number of Contracts Commitment in Long/Short Unrealised sub-fund Base Ccy Gain/(Loss) in sub-fund Base Ccy
Invesco Global Structured Equity Fund USD USDS&P 500 Emini Future 18/03/2016 48 4,654,500 Long 134,950Euro Stoxx 50 Future 18/03/2016 48 1,522,736 Long 43,104FTSE 100 Index Future 18/03/2016 9 755,110 Long 30,617Nikkei 225 Future 10/03/2016 11 781,489 Long 3,773
Total unrealised gain on futures contracts 212,444
Total unrealised gain on futures contracts 212,444
Margin amount of USD 297,466 is held by counterparty Merrill Lynch.
Invesco Emerging Market Quantitative Equity Fund USD USDE-Mini MSCI Emerging Future 18/03/2016 28 1,037,470 Long (964)
Total unrealised loss on futures contract (964)
Total unrealised loss on futures contract (964)
Margin amount of USD 84,705 is held by counterparty Merrill Lynch.
Invesco US Structured Equity Fund USD USDS&P 500 Emini Future 18/03/2016 18 1,745,438 Long 80,363
Total unrealised gain on futures contract 80,363
Total unrealised gain on futures contract 80,363
Margin amount of USD (195) is held by counterparty Merrill Lynch.
Invesco Pan European Structured Equity Fund EUR EURFTSE 100 Index Future 18/03/2016 754 58,119,247 Long 51,793
Total unrealised gain on futures contract 51,793
Euro Stoxx 50 Future 18/03/2016 2,830 82,480,350 Long (7,369,653)Swiss Market Index Future 18/03/2016 343 24,470,540 Long (1,975,609)
Total unrealised loss on futures contracts (9,345,262)
Total unrealised loss on futures contracts (9,293,469)
Margin amount of EUR 24,892,432 is held by counterparty Merrill Lynch.
Invesco Euro Structured Equity Fund EUR EUREuro Stoxx 50 Future 18/03/2016 122 3,555,690 Long 113,780
Total unrealised gain on futures contract 113,780
Total unrealised gain on futures contract 113,780
Margin amount of EUR 371,126 is held by counterparty Merrill Lynch.
Notes to the Financial Statements (continued)
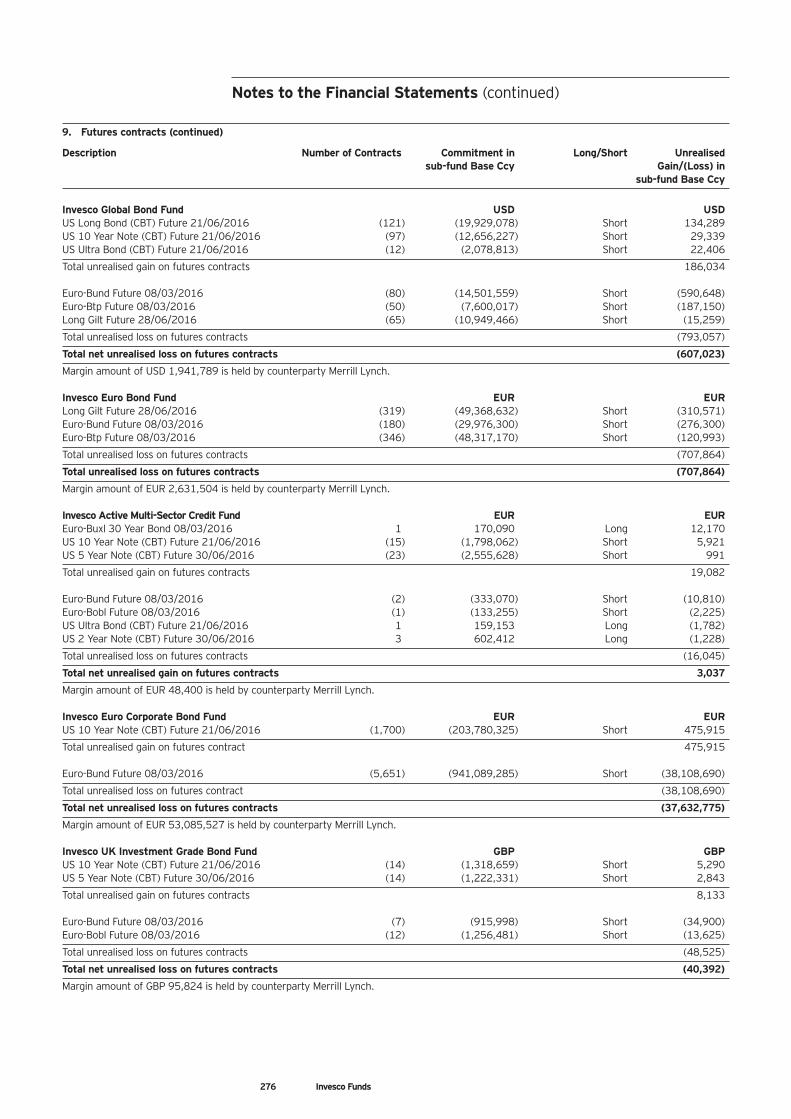
9. Futures contracts (continued)
Description Number of Contracts Commitment in Long/Short Unrealised sub-fund Base Ccy Gain/(Loss) in sub-fund Base Ccy
Invesco Global Bond Fund USD USDUS Long Bond (CBT) Future 21/06/2016 (121) (19,929,078) Short 134,289US 10 Year Note (CBT) Future 21/06/2016 (97) (12,656,227) Short 29,339US Ultra Bond (CBT) Future 21/06/2016 (12) (2,078,813) Short 22,406
Total unrealised gain on futures contracts 186,034
Euro-Bund Future 08/03/2016 (80) (14,501,559) Short (590,648)Euro-Btp Future 08/03/2016 (50) (7,600,017) Short (187,150)Long Gilt Future 28/06/2016 (65) (10,949,466) Short (15,259)
Total unrealised loss on futures contracts (793,057)
Total net unrealised loss on futures contracts (607,023)
Margin amount of USD 1,941,789 is held by counterparty Merrill Lynch.
Invesco Euro Bond Fund EUR EURLong Gilt Future 28/06/2016 (319) (49,368,632) Short (310,571)Euro-Bund Future 08/03/2016 (180) (29,976,300) Short (276,300)Euro-Btp Future 08/03/2016 (346) (48,317,170) Short (120,993)
Total unrealised loss on futures contracts (707,864)
Total unrealised loss on futures contracts (707,864)
Margin amount of EUR 2,631,504 is held by counterparty Merrill Lynch.
Invesco Active Multi-Sector Credit Fund EUR EUREuro-Buxl 30 Year Bond 08/03/2016 1 170,090 Long 12,170US 10 Year Note (CBT) Future 21/06/2016 (15) (1,798,062) Short 5,921US 5 Year Note (CBT) Future 30/06/2016 (23) (2,555,628) Short 991
Total unrealised gain on futures contracts 19,082
Euro-Bund Future 08/03/2016 (2) (333,070) Short (10,810)Euro-Bobl Future 08/03/2016 (1) (133,255) Short (2,225)US Ultra Bond (CBT) Future 21/06/2016 1 159,153 Long (1,782)US 2 Year Note (CBT) Future 30/06/2016 3 602,412 Long (1,228)
Total unrealised loss on futures contracts (16,045)
Total net unrealised gain on futures contracts 3,037
Margin amount of EUR 48,400 is held by counterparty Merrill Lynch.
Invesco Euro Corporate Bond Fund EUR EURUS 10 Year Note (CBT) Future 21/06/2016 (1,700) (203,780,325) Short 475,915
Total unrealised gain on futures contract 475,915
Euro-Bund Future 08/03/2016 (5,651) (941,089,285) Short (38,108,690)
Total unrealised loss on futures contract (38,108,690)
Total net unrealised loss on futures contracts (37,632,775)
Margin amount of EUR 53,085,527 is held by counterparty Merrill Lynch.
Invesco UK Investment Grade Bond Fund GBP GBPUS 10 Year Note (CBT) Future 21/06/2016 (14) (1,318,659) Short 5,290US 5 Year Note (CBT) Future 30/06/2016 (14) (1,222,331) Short 2,843
Total unrealised gain on futures contracts 8,133
Euro-Bund Future 08/03/2016 (7) (915,998) Short (34,900)Euro-Bobl Future 08/03/2016 (12) (1,256,481) Short (13,625)
Total unrealised loss on futures contracts (48,525)
Total net unrealised loss on futures contracts (40,392)
Margin amount of GBP 95,824 is held by counterparty Merrill Lynch.
276 Invesco Funds
Notes to the Financial Statements (continued)
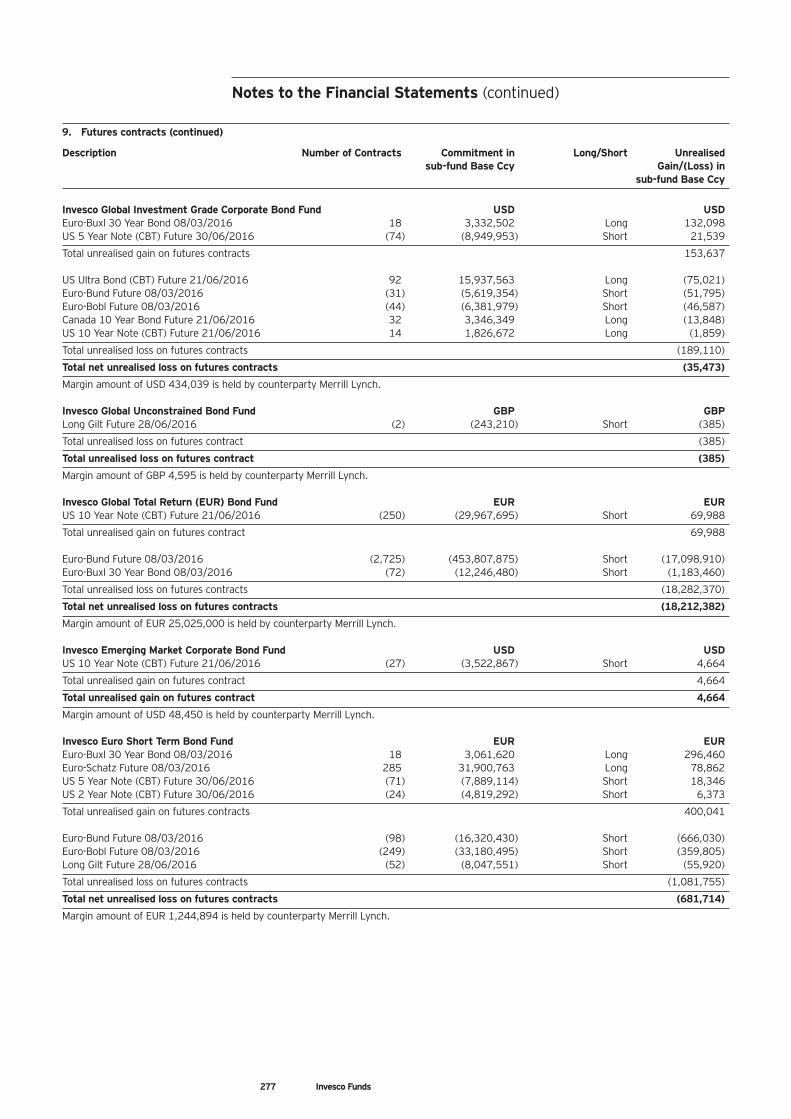
277 Invesco Funds
9. Futures contracts (continued)
Description Number of Contracts Commitment in Long/Short Unrealised sub-fund Base Ccy Gain/(Loss) in sub-fund Base Ccy
Invesco Global Investment Grade Corporate Bond Fund USD USDEuro-Buxl 30 Year Bond 08/03/2016 18 3,332,502 Long 132,098US 5 Year Note (CBT) Future 30/06/2016 (74) (8,949,953) Short 21,539
Total unrealised gain on futures contracts 153,637
US Ultra Bond (CBT) Future 21/06/2016 92 15,937,563 Long (75,021)Euro-Bund Future 08/03/2016 (31) (5,619,354) Short (51,795)Euro-Bobl Future 08/03/2016 (44) (6,381,979) Short (46,587)Canada 10 Year Bond Future 21/06/2016 32 3,346,349 Long (13,848)US 10 Year Note (CBT) Future 21/06/2016 14 1,826,672 Long (1,859)
Total unrealised loss on futures contracts (189,110)
Total net unrealised loss on futures contracts (35,473)
Margin amount of USD 434,039 is held by counterparty Merrill Lynch.
Invesco Global Unconstrained Bond Fund GBP GBPLong Gilt Future 28/06/2016 (2) (243,210) Short (385)
Total unrealised loss on futures contract (385)
Total unrealised loss on futures contract (385)
Margin amount of GBP 4,595 is held by counterparty Merrill Lynch.
Invesco Global Total Return (EUR) Bond Fund EUR EURUS 10 Year Note (CBT) Future 21/06/2016 (250) (29,967,695) Short 69,988
Total unrealised gain on futures contract 69,988
Euro-Bund Future 08/03/2016 (2,725) (453,807,875) Short (17,098,910)Euro-Buxl 30 Year Bond 08/03/2016 (72) (12,246,480) Short (1,183,460)
Total unrealised loss on futures contracts (18,282,370)
Total net unrealised loss on futures contracts (18,212,382)
Margin amount of EUR 25,025,000 is held by counterparty Merrill Lynch.
Invesco Emerging Market Corporate Bond Fund USD USDUS 10 Year Note (CBT) Future 21/06/2016 (27) (3,522,867) Short 4,664
Total unrealised gain on futures contract 4,664
Total unrealised gain on futures contract 4,664
Margin amount of USD 48,450 is held by counterparty Merrill Lynch.
Invesco Euro Short Term Bond Fund EUR EUREuro-Buxl 30 Year Bond 08/03/2016 18 3,061,620 Long 296,460Euro-Schatz Future 08/03/2016 285 31,900,763 Long 78,862US 5 Year Note (CBT) Future 30/06/2016 (71) (7,889,114) Short 18,346US 2 Year Note (CBT) Future 30/06/2016 (24) (4,819,292) Short 6,373
Total unrealised gain on futures contracts 400,041
Euro-Bund Future 08/03/2016 (98) (16,320,430) Short (666,030)Euro-Bobl Future 08/03/2016 (249) (33,180,495) Short (359,805)Long Gilt Future 28/06/2016 (52) (8,047,551) Short (55,920)
Total unrealised loss on futures contracts (1,081,755)
Total net unrealised loss on futures contracts (681,714)
Margin amount of EUR 1,244,894 is held by counterparty Merrill Lynch.
Notes to the Financial Statements (continued)
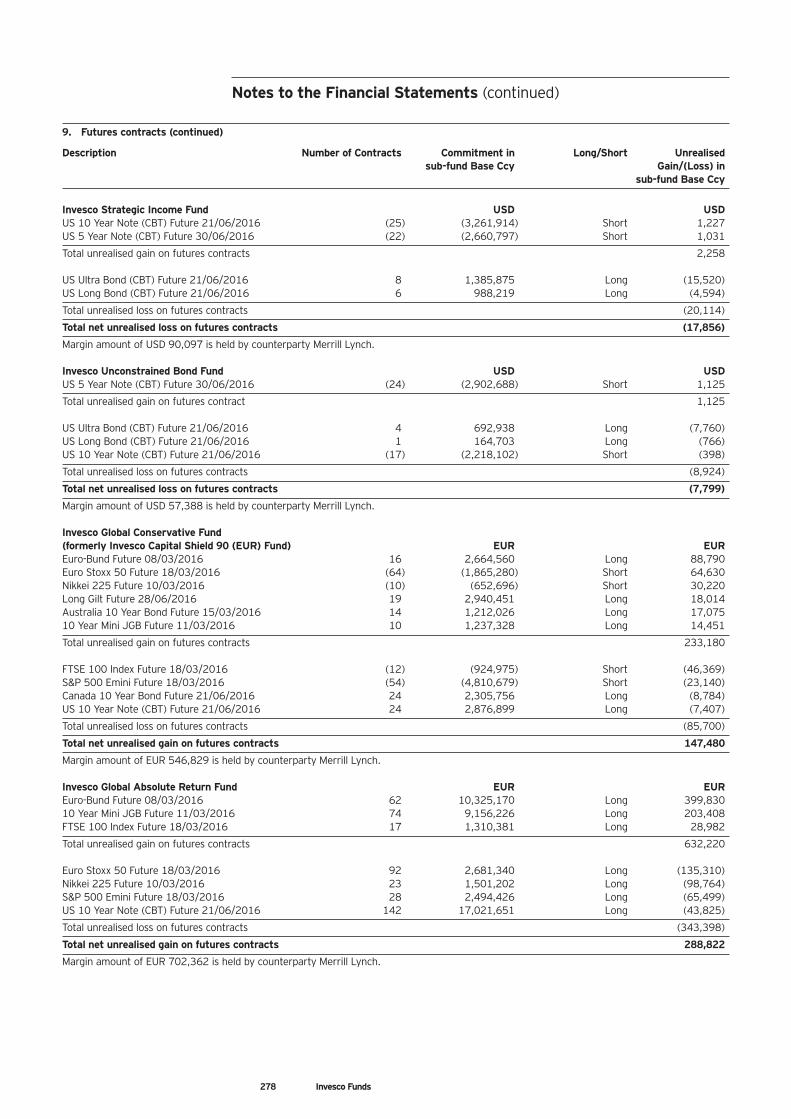
9. Futures contracts (continued)
Description Number of Contracts Commitment in Long/Short Unrealised sub-fund Base Ccy Gain/(Loss) in sub-fund Base Ccy
Invesco Strategic Income Fund USD USDUS 10 Year Note (CBT) Future 21/06/2016 (25) (3,261,914) Short 1,227US 5 Year Note (CBT) Future 30/06/2016 (22) (2,660,797) Short 1,031
Total unrealised gain on futures contracts 2,258
US Ultra Bond (CBT) Future 21/06/2016 8 1,385,875 Long (15,520)US Long Bond (CBT) Future 21/06/2016 6 988,219 Long (4,594)
Total unrealised loss on futures contracts (20,114)
Total net unrealised loss on futures contracts (17,856)
Margin amount of USD 90,097 is held by counterparty Merrill Lynch.
Invesco Unconstrained Bond Fund USD USDUS 5 Year Note (CBT) Future 30/06/2016 (24) (2,902,688) Short 1,125
Total unrealised gain on futures contract 1,125
US Ultra Bond (CBT) Future 21/06/2016 4 692,938 Long (7,760)US Long Bond (CBT) Future 21/06/2016 1 164,703 Long (766)US 10 Year Note (CBT) Future 21/06/2016 (17) (2,218,102) Short (398)
Total unrealised loss on futures contracts (8,924)
Total net unrealised loss on futures contracts (7,799)
Margin amount of USD 57,388 is held by counterparty Merrill Lynch.
Invesco Global Conservative Fund(formerly Invesco Capital Shield 90 (EUR) Fund) EUR EUREuro-Bund Future 08/03/2016 16 2,664,560 Long 88,790Euro Stoxx 50 Future 18/03/2016 (64) (1,865,280) Short 64,630Nikkei 225 Future 10/03/2016 (10) (652,696) Short 30,220Long Gilt Future 28/06/2016 19 2,940,451 Long 18,014Australia 10 Year Bond Future 15/03/2016 14 1,212,026 Long 17,07510 Year Mini JGB Future 11/03/2016 10 1,237,328 Long 14,451
Total unrealised gain on futures contracts 233,180
FTSE 100 Index Future 18/03/2016 (12) (924,975) Short (46,369)S&P 500 Emini Future 18/03/2016 (54) (4,810,679) Short (23,140)Canada 10 Year Bond Future 21/06/2016 24 2,305,756 Long (8,784)US 10 Year Note (CBT) Future 21/06/2016 24 2,876,899 Long (7,407)
Total unrealised loss on futures contracts (85,700)
Total net unrealised gain on futures contracts 147,480
Margin amount of EUR 546,829 is held by counterparty Merrill Lynch.
Invesco Global Absolute Return Fund EUR EUREuro-Bund Future 08/03/2016 62 10,325,170 Long 399,83010 Year Mini JGB Future 11/03/2016 74 9,156,226 Long 203,408FTSE 100 Index Future 18/03/2016 17 1,310,381 Long 28,982
Total unrealised gain on futures contracts 632,220
Euro Stoxx 50 Future 18/03/2016 92 2,681,340 Long (135,310)Nikkei 225 Future 10/03/2016 23 1,501,202 Long (98,764)S&P 500 Emini Future 18/03/2016 28 2,494,426 Long (65,499)US 10 Year Note (CBT) Future 21/06/2016 142 17,021,651 Long (43,825)
Total unrealised loss on futures contracts (343,398)
Total net unrealised gain on futures contracts 288,822
Margin amount of EUR 702,362 is held by counterparty Merrill Lynch.
278 Invesco Funds
Notes to the Financial Statements (continued)
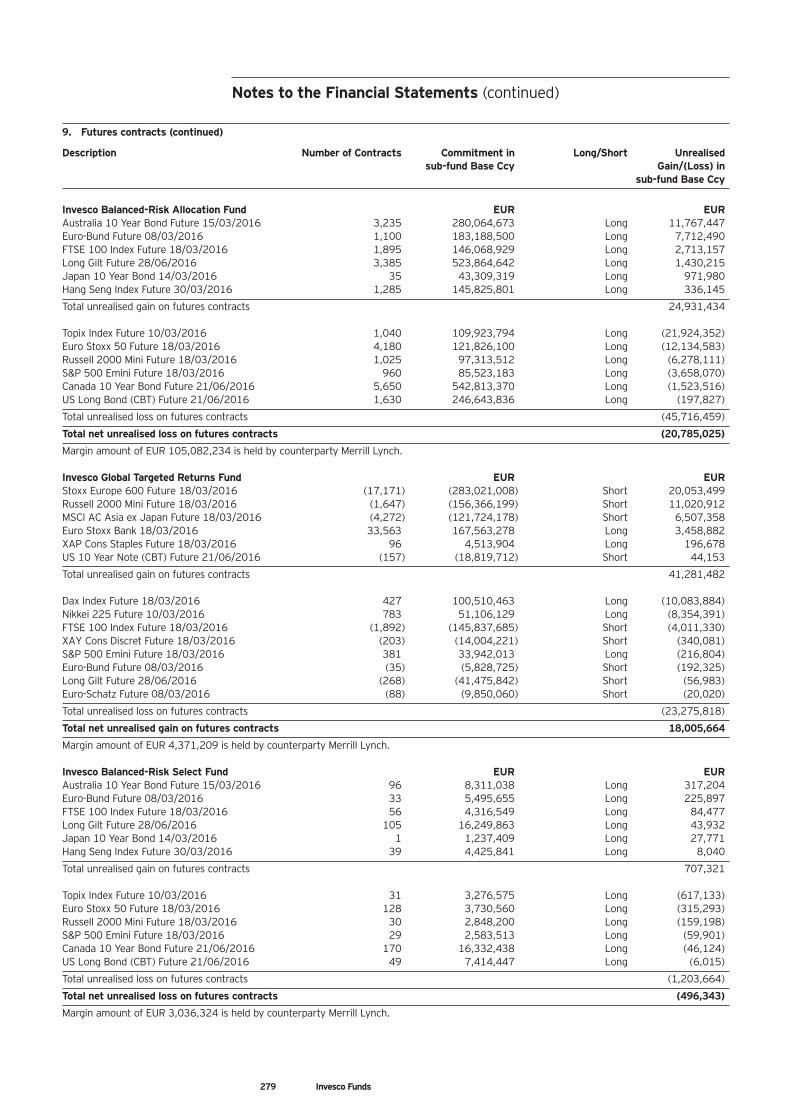
279 Invesco Funds
9. Futures contracts (continued)
Description Number of Contracts Commitment in Long/Short Unrealised sub-fund Base Ccy Gain/(Loss) in sub-fund Base Ccy
Invesco Balanced-Risk Allocation Fund EUR EURAustralia 10 Year Bond Future 15/03/2016 3,235 280,064,673 Long 11,767,447Euro-Bund Future 08/03/2016 1,100 183,188,500 Long 7,712,490FTSE 100 Index Future 18/03/2016 1,895 146,068,929 Long 2,713,157Long Gilt Future 28/06/2016 3,385 523,864,642 Long 1,430,215Japan 10 Year Bond 14/03/2016 35 43,309,319 Long 971,980Hang Seng Index Future 30/03/2016 1,285 145,825,801 Long 336,145
Total unrealised gain on futures contracts 24,931,434
Topix Index Future 10/03/2016 1,040 109,923,794 Long (21,924,352)Euro Stoxx 50 Future 18/03/2016 4,180 121,826,100 Long (12,134,583)Russell 2000 Mini Future 18/03/2016 1,025 97,313,512 Long (6,278,111)S&P 500 Emini Future 18/03/2016 960 85,523,183 Long (3,658,070)Canada 10 Year Bond Future 21/06/2016 5,650 542,813,370 Long (1,523,516)US Long Bond (CBT) Future 21/06/2016 1,630 246,643,836 Long (197,827)
Total unrealised loss on futures contracts (45,716,459)
Total net unrealised loss on futures contracts (20,785,025)
Margin amount of EUR 105,082,234 is held by counterparty Merrill Lynch.
Invesco Global Targeted Returns Fund EUR EURStoxx Europe 600 Future 18/03/2016 (17,171) (283,021,008) Short 20,053,499Russell 2000 Mini Future 18/03/2016 (1,647) (156,366,199) Short 11,020,912MSCI AC Asia ex Japan Future 18/03/2016 (4,272) (121,724,178) Short 6,507,358Euro Stoxx Bank 18/03/2016 33,563 167,563,278 Long 3,458,882XAP Cons Staples Future 18/03/2016 96 4,513,904 Long 196,678US 10 Year Note (CBT) Future 21/06/2016 (157) (18,819,712) Short 44,153
Total unrealised gain on futures contracts 41,281,482
Dax Index Future 18/03/2016 427 100,510,463 Long (10,083,884)Nikkei 225 Future 10/03/2016 783 51,106,129 Long (8,354,391)FTSE 100 Index Future 18/03/2016 (1,892) (145,837,685) Short (4,011,330)XAY Cons Discret Future 18/03/2016 (203) (14,004,221) Short (340,081)S&P 500 Emini Future 18/03/2016 381 33,942,013 Long (216,804)Euro-Bund Future 08/03/2016 (35) (5,828,725) Short (192,325)Long Gilt Future 28/06/2016 (268) (41,475,842) Short (56,983)Euro-Schatz Future 08/03/2016 (88) (9,850,060) Short (20,020)
Total unrealised loss on futures contracts (23,275,818)
Total net unrealised gain on futures contracts 18,005,664
Margin amount of EUR 4,371,209 is held by counterparty Merrill Lynch.
Invesco Balanced-Risk Select Fund EUR EURAustralia 10 Year Bond Future 15/03/2016 96 8,311,038 Long 317,204Euro-Bund Future 08/03/2016 33 5,495,655 Long 225,897FTSE 100 Index Future 18/03/2016 56 4,316,549 Long 84,477Long Gilt Future 28/06/2016 105 16,249,863 Long 43,932Japan 10 Year Bond 14/03/2016 1 1,237,409 Long 27,771Hang Seng Index Future 30/03/2016 39 4,425,841 Long 8,040
Total unrealised gain on futures contracts 707,321
Topix Index Future 10/03/2016 31 3,276,575 Long (617,133)Euro Stoxx 50 Future 18/03/2016 128 3,730,560 Long (315,293)Russell 2000 Mini Future 18/03/2016 30 2,848,200 Long (159,198)S&P 500 Emini Future 18/03/2016 29 2,583,513 Long (59,901)Canada 10 Year Bond Future 21/06/2016 170 16,332,438 Long (46,124)US Long Bond (CBT) Future 21/06/2016 49 7,414,447 Long (6,015)
Total unrealised loss on futures contracts (1,203,664)
Total net unrealised loss on futures contracts (496,343)
Margin amount of EUR 3,036,324 is held by counterparty Merrill Lynch.
Notes to the Financial Statements (continued)
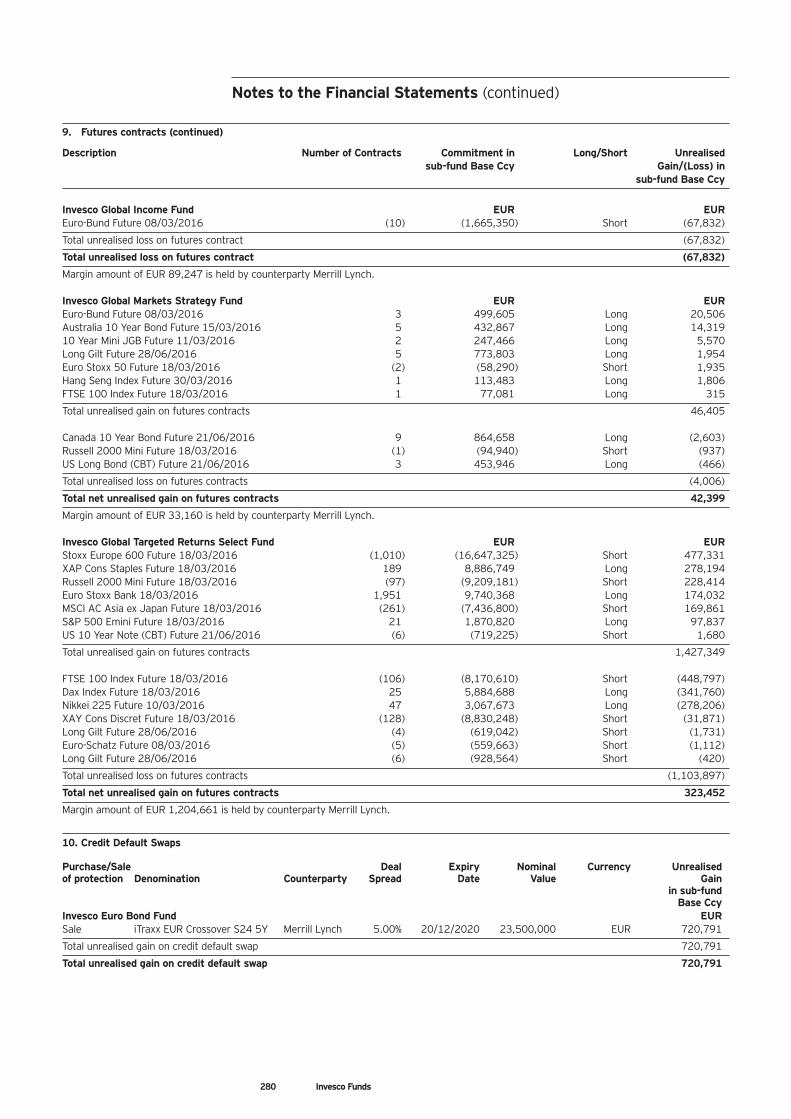
9. Futures contracts (continued)
Description Number of Contracts Commitment in Long/Short Unrealised sub-fund Base Ccy Gain/(Loss) in sub-fund Base Ccy
Invesco Global Income Fund EUR EUREuro-Bund Future 08/03/2016 (10) (1,665,350) Short (67,832)
Total unrealised loss on futures contract (67,832)
Total unrealised loss on futures contract (67,832)
Margin amount of EUR 89,247 is held by counterparty Merrill Lynch.
Invesco Global Markets Strategy Fund EUR EUREuro-Bund Future 08/03/2016 3 499,605 Long 20,506Australia 10 Year Bond Future 15/03/2016 5 432,867 Long 14,31910 Year Mini JGB Future 11/03/2016 2 247,466 Long 5,570Long Gilt Future 28/06/2016 5 773,803 Long 1,954Euro Stoxx 50 Future 18/03/2016 (2) (58,290) Short 1,935Hang Seng Index Future 30/03/2016 1 113,483 Long 1,806FTSE 100 Index Future 18/03/2016 1 77,081 Long 315
Total unrealised gain on futures contracts 46,405
Canada 10 Year Bond Future 21/06/2016 9 864,658 Long (2,603)Russell 2000 Mini Future 18/03/2016 (1) (94,940) Short (937)US Long Bond (CBT) Future 21/06/2016 3 453,946 Long (466)
Total unrealised loss on futures contracts (4,006)
Total net unrealised gain on futures contracts 42,399
Margin amount of EUR 33,160 is held by counterparty Merrill Lynch.
Invesco Global Targeted Returns Select Fund EUR EURStoxx Europe 600 Future 18/03/2016 (1,010) (16,647,325) Short 477,331XAP Cons Staples Future 18/03/2016 189 8,886,749 Long 278,194Russell 2000 Mini Future 18/03/2016 (97) (9,209,181) Short 228,414Euro Stoxx Bank 18/03/2016 1,951 9,740,368 Long 174,032MSCI AC Asia ex Japan Future 18/03/2016 (261) (7,436,800) Short 169,861S&P 500 Emini Future 18/03/2016 21 1,870,820 Long 97,837US 10 Year Note (CBT) Future 21/06/2016 (6) (719,225) Short 1,680
Total unrealised gain on futures contracts 1,427,349
FTSE 100 Index Future 18/03/2016 (106) (8,170,610) Short (448,797)Dax Index Future 18/03/2016 25 5,884,688 Long (341,760)Nikkei 225 Future 10/03/2016 47 3,067,673 Long (278,206)XAY Cons Discret Future 18/03/2016 (128) (8,830,248) Short (31,871)Long Gilt Future 28/06/2016 (4) (619,042) Short (1,731)Euro-Schatz Future 08/03/2016 (5) (559,663) Short (1,112)Long Gilt Future 28/06/2016 (6) (928,564) Short (420)
Total unrealised loss on futures contracts (1,103,897)
Total net unrealised gain on futures contracts 323,452
Margin amount of EUR 1,204,661 is held by counterparty Merrill Lynch.
10. Credit Default Swaps
Purchase/Sale Deal Expiry Nominal Currency Unrealisedof protection Denomination Counterparty Spread Date Value Gain in sub-fund Base CcyInvesco Euro Bond Fund EURSale iTraxx EUR Crossover S24 5Y Merrill Lynch 5.00% 20/12/2020 23,500,000 EUR 720,791
Total unrealised gain on credit default swap 720,791
Total unrealised gain on credit default swap 720,791
280 Invesco Funds
Notes to the Financial Statements (continued)
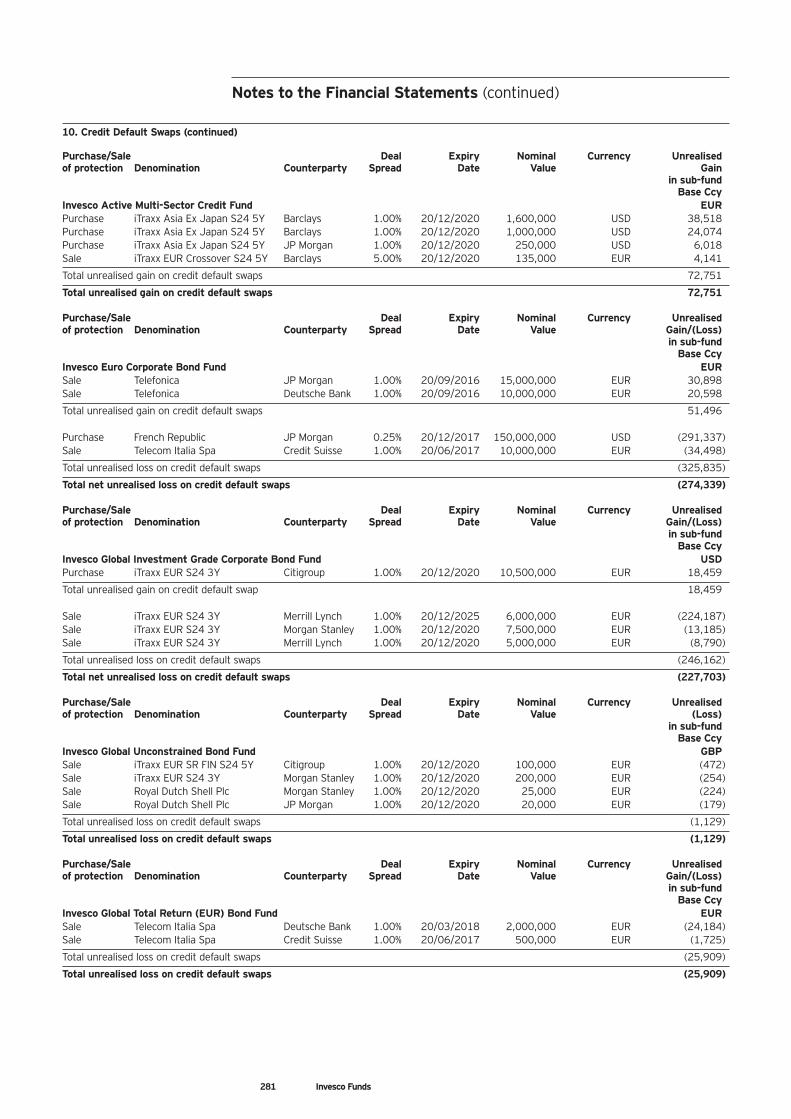
281 Invesco Funds
10. Credit Default Swaps (continued)
Purchase/Sale Deal Expiry Nominal Currency Unrealisedof protection Denomination Counterparty Spread Date Value Gain in sub-fund Base CcyInvesco Active Multi-Sector Credit Fund EURPurchase iTraxx Asia Ex Japan S24 5Y Barclays 1.00% 20/12/2020 1,600,000 USD 38,518Purchase iTraxx Asia Ex Japan S24 5Y Barclays 1.00% 20/12/2020 1,000,000 USD 24,074Purchase iTraxx Asia Ex Japan S24 5Y JP Morgan 1.00% 20/12/2020 250,000 USD 6,018Sale iTraxx EUR Crossover S24 5Y Barclays 5.00% 20/12/2020 135,000 EUR 4,141
Total unrealised gain on credit default swaps 72,751
Total unrealised gain on credit default swaps 72,751
Purchase/Sale Deal Expiry Nominal Currency Unrealisedof protection Denomination Counterparty Spread Date Value Gain/(Loss) in sub-fund Base CcyInvesco Euro Corporate Bond Fund EURSale Telefonica JP Morgan 1.00% 20/09/2016 15,000,000 EUR 30,898Sale Telefonica Deutsche Bank 1.00% 20/09/2016 10,000,000 EUR 20,598
Total unrealised gain on credit default swaps 51,496
Purchase French Republic JP Morgan 0.25% 20/12/2017 150,000,000 USD (291,337)Sale Telecom Italia Spa Credit Suisse 1.00% 20/06/2017 10,000,000 EUR (34,498)
Total unrealised loss on credit default swaps (325,835)
Total net unrealised loss on credit default swaps (274,339)
Purchase/Sale Deal Expiry Nominal Currency Unrealisedof protection Denomination Counterparty Spread Date Value Gain/(Loss) in sub-fund Base CcyInvesco Global Investment Grade Corporate Bond Fund USDPurchase iTraxx EUR S24 3Y Citigroup 1.00% 20/12/2020 10,500,000 EUR 18,459
Total unrealised gain on credit default swap 18,459
Sale iTraxx EUR S24 3Y Merrill Lynch 1.00% 20/12/2025 6,000,000 EUR (224,187)Sale iTraxx EUR S24 3Y Morgan Stanley 1.00% 20/12/2020 7,500,000 EUR (13,185)Sale iTraxx EUR S24 3Y Merrill Lynch 1.00% 20/12/2020 5,000,000 EUR (8,790)
Total unrealised loss on credit default swaps (246,162)
Total net unrealised loss on credit default swaps (227,703)
Purchase/Sale Deal Expiry Nominal Currency Unrealisedof protection Denomination Counterparty Spread Date Value (Loss) in sub-fund Base CcyInvesco Global Unconstrained Bond Fund GBPSale iTraxx EUR SR FIN S24 5Y Citigroup 1.00% 20/12/2020 100,000 EUR (472)Sale iTraxx EUR S24 3Y Morgan Stanley 1.00% 20/12/2020 200,000 EUR (254)Sale Royal Dutch Shell Plc Morgan Stanley 1.00% 20/12/2020 25,000 EUR (224)Sale Royal Dutch Shell Plc JP Morgan 1.00% 20/12/2020 20,000 EUR (179)
Total unrealised loss on credit default swaps (1,129)
Total unrealised loss on credit default swaps (1,129)
Purchase/Sale Deal Expiry Nominal Currency Unrealisedof protection Denomination Counterparty Spread Date Value Gain/(Loss) in sub-fund Base CcyInvesco Global Total Return (EUR) Bond Fund EURSale Telecom Italia Spa Deutsche Bank 1.00% 20/03/2018 2,000,000 EUR (24,184)Sale Telecom Italia Spa Credit Suisse 1.00% 20/06/2017 500,000 EUR (1,725)
Total unrealised loss on credit default swaps (25,909)
Total unrealised loss on credit default swaps (25,909)
Notes to the Financial Statements (continued)
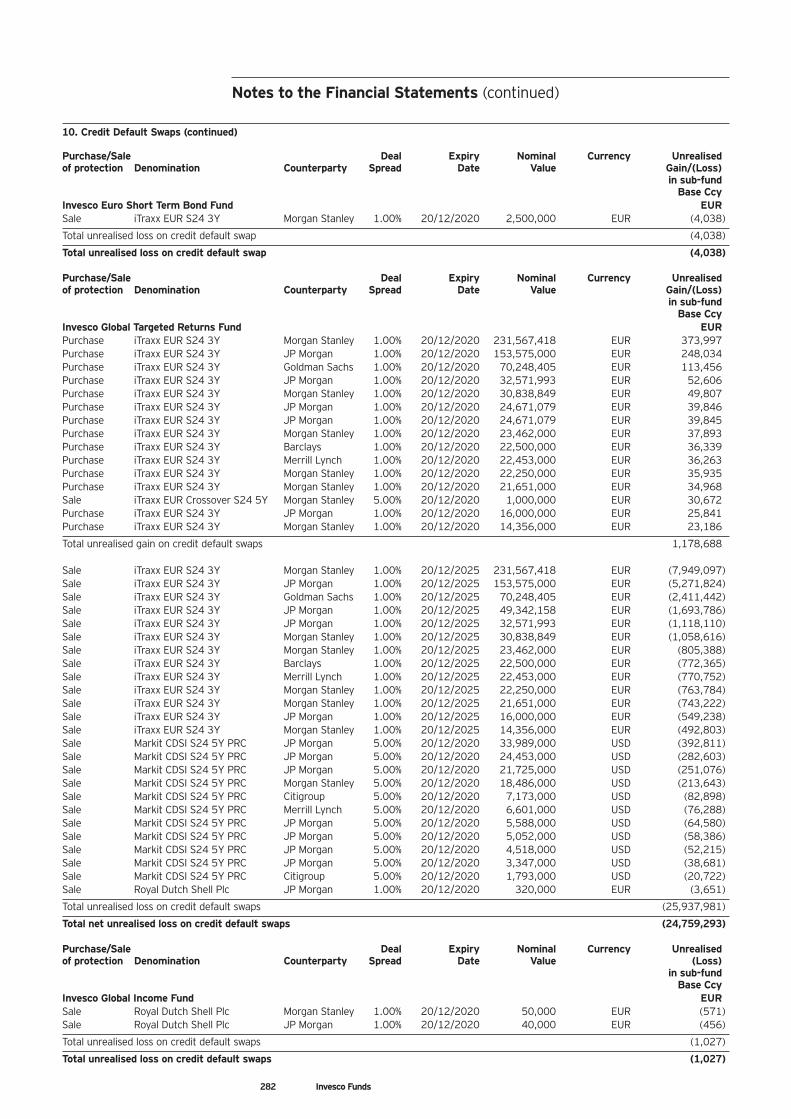
10. Credit Default Swaps (continued)
Purchase/Sale Deal Expiry Nominal Currency Unrealisedof protection Denomination Counterparty Spread Date Value Gain/(Loss) in sub-fund Base CcyInvesco Euro Short Term Bond Fund EURSale iTraxx EUR S24 3Y Morgan Stanley 1.00% 20/12/2020 2,500,000 EUR (4,038)
Total unrealised loss on credit default swap (4,038)
Total unrealised loss on credit default swap (4,038)
Purchase/Sale Deal Expiry Nominal Currency Unrealisedof protection Denomination Counterparty Spread Date Value Gain/(Loss) in sub-fund Base CcyInvesco Global Targeted Returns Fund EURPurchase iTraxx EUR S24 3Y Morgan Stanley 1.00% 20/12/2020 231,567,418 EUR 373,997Purchase iTraxx EUR S24 3Y JP Morgan 1.00% 20/12/2020 153,575,000 EUR 248,034Purchase iTraxx EUR S24 3Y Goldman Sachs 1.00% 20/12/2020 70,248,405 EUR 113,456Purchase iTraxx EUR S24 3Y JP Morgan 1.00% 20/12/2020 32,571,993 EUR 52,606Purchase iTraxx EUR S24 3Y Morgan Stanley 1.00% 20/12/2020 30,838,849 EUR 49,807Purchase iTraxx EUR S24 3Y JP Morgan 1.00% 20/12/2020 24,671,079 EUR 39,846Purchase iTraxx EUR S24 3Y JP Morgan 1.00% 20/12/2020 24,671,079 EUR 39,845Purchase iTraxx EUR S24 3Y Morgan Stanley 1.00% 20/12/2020 23,462,000 EUR 37,893Purchase iTraxx EUR S24 3Y Barclays 1.00% 20/12/2020 22,500,000 EUR 36,339Purchase iTraxx EUR S24 3Y Merrill Lynch 1.00% 20/12/2020 22,453,000 EUR 36,263Purchase iTraxx EUR S24 3Y Morgan Stanley 1.00% 20/12/2020 22,250,000 EUR 35,935Purchase iTraxx EUR S24 3Y Morgan Stanley 1.00% 20/12/2020 21,651,000 EUR 34,968Sale iTraxx EUR Crossover S24 5Y Morgan Stanley 5.00% 20/12/2020 1,000,000 EUR 30,672Purchase iTraxx EUR S24 3Y JP Morgan 1.00% 20/12/2020 16,000,000 EUR 25,841Purchase iTraxx EUR S24 3Y Morgan Stanley 1.00% 20/12/2020 14,356,000 EUR 23,186
Total unrealised gain on credit default swaps 1,178,688
Sale iTraxx EUR S24 3Y Morgan Stanley 1.00% 20/12/2025 231,567,418 EUR (7,949,097)Sale iTraxx EUR S24 3Y JP Morgan 1.00% 20/12/2025 153,575,000 EUR (5,271,824)Sale iTraxx EUR S24 3Y Goldman Sachs 1.00% 20/12/2025 70,248,405 EUR (2,411,442)Sale iTraxx EUR S24 3Y JP Morgan 1.00% 20/12/2025 49,342,158 EUR (1,693,786)Sale iTraxx EUR S24 3Y JP Morgan 1.00% 20/12/2025 32,571,993 EUR (1,118,110)Sale iTraxx EUR S24 3Y Morgan Stanley 1.00% 20/12/2025 30,838,849 EUR (1,058,616)Sale iTraxx EUR S24 3Y Morgan Stanley 1.00% 20/12/2025 23,462,000 EUR (805,388)Sale iTraxx EUR S24 3Y Barclays 1.00% 20/12/2025 22,500,000 EUR (772,365)Sale iTraxx EUR S24 3Y Merrill Lynch 1.00% 20/12/2025 22,453,000 EUR (770,752)Sale iTraxx EUR S24 3Y Morgan Stanley 1.00% 20/12/2025 22,250,000 EUR (763,784)Sale iTraxx EUR S24 3Y Morgan Stanley 1.00% 20/12/2025 21,651,000 EUR (743,222)Sale iTraxx EUR S24 3Y JP Morgan 1.00% 20/12/2025 16,000,000 EUR (549,238)Sale iTraxx EUR S24 3Y Morgan Stanley 1.00% 20/12/2025 14,356,000 EUR (492,803)Sale Markit CDSI S24 5Y PRC JP Morgan 5.00% 20/12/2020 33,989,000 USD (392,811)Sale Markit CDSI S24 5Y PRC JP Morgan 5.00% 20/12/2020 24,453,000 USD (282,603)Sale Markit CDSI S24 5Y PRC JP Morgan 5.00% 20/12/2020 21,725,000 USD (251,076)Sale Markit CDSI S24 5Y PRC Morgan Stanley 5.00% 20/12/2020 18,486,000 USD (213,643)Sale Markit CDSI S24 5Y PRC Citigroup 5.00% 20/12/2020 7,173,000 USD (82,898)Sale Markit CDSI S24 5Y PRC Merrill Lynch 5.00% 20/12/2020 6,601,000 USD (76,288)Sale Markit CDSI S24 5Y PRC JP Morgan 5.00% 20/12/2020 5,588,000 USD (64,580)Sale Markit CDSI S24 5Y PRC JP Morgan 5.00% 20/12/2020 5,052,000 USD (58,386)Sale Markit CDSI S24 5Y PRC JP Morgan 5.00% 20/12/2020 4,518,000 USD (52,215)Sale Markit CDSI S24 5Y PRC JP Morgan 5.00% 20/12/2020 3,347,000 USD (38,681)Sale Markit CDSI S24 5Y PRC Citigroup 5.00% 20/12/2020 1,793,000 USD (20,722)Sale Royal Dutch Shell Plc JP Morgan 1.00% 20/12/2020 320,000 EUR (3,651)
Total unrealised loss on credit default swaps (25,937,981)
Total net unrealised loss on credit default swaps (24,759,293)
Purchase/Sale Deal Expiry Nominal Currency Unrealisedof protection Denomination Counterparty Spread Date Value (Loss) in sub-fund Base CcyInvesco Global Income Fund EURSale Royal Dutch Shell Plc Morgan Stanley 1.00% 20/12/2020 50,000 EUR (571)Sale Royal Dutch Shell Plc JP Morgan 1.00% 20/12/2020 40,000 EUR (456)
Total unrealised loss on credit default swaps (1,027)
Total unrealised loss on credit default swaps (1,027)
282 Invesco Funds
Notes to the Financial Statements (continued)
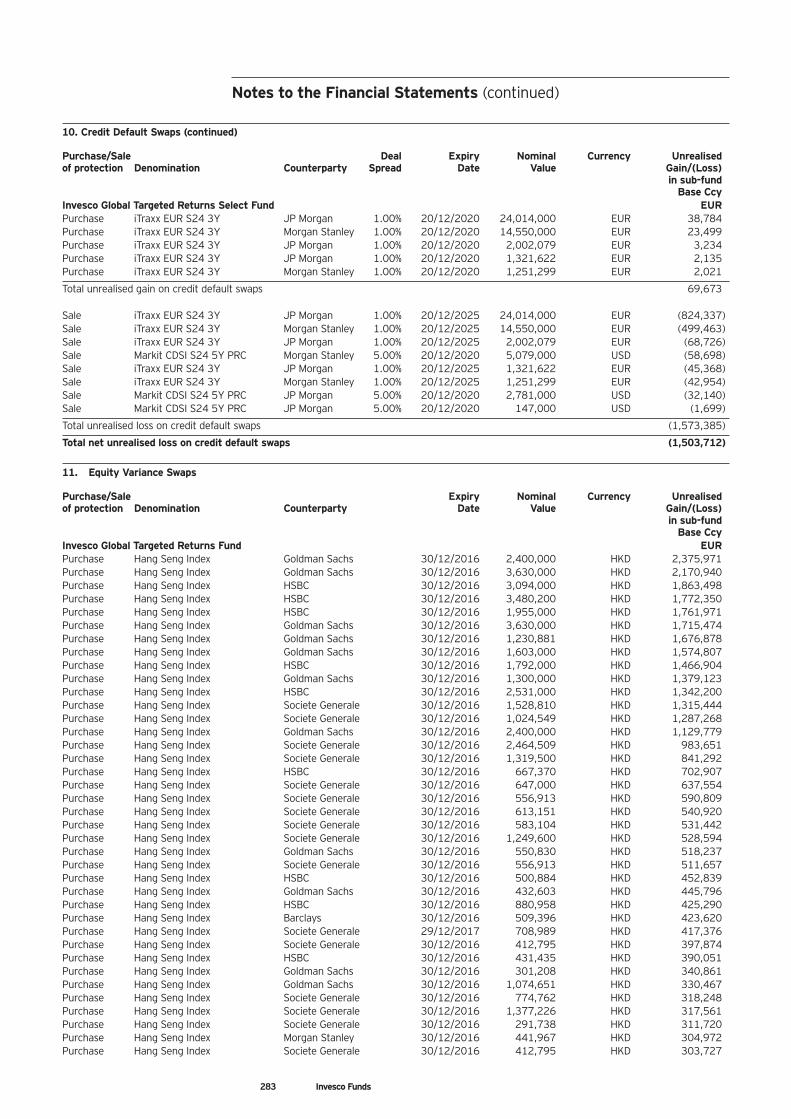
283 Invesco Funds
10. Credit Default Swaps (continued)
Purchase/Sale Deal Expiry Nominal Currency Unrealisedof protection Denomination Counterparty Spread Date Value Gain/(Loss) in sub-fund Base CcyInvesco Global Targeted Returns Select Fund EURPurchase iTraxx EUR S24 3Y JP Morgan 1.00% 20/12/2020 24,014,000 EUR 38,784Purchase iTraxx EUR S24 3Y Morgan Stanley 1.00% 20/12/2020 14,550,000 EUR 23,499Purchase iTraxx EUR S24 3Y JP Morgan 1.00% 20/12/2020 2,002,079 EUR 3,234Purchase iTraxx EUR S24 3Y JP Morgan 1.00% 20/12/2020 1,321,622 EUR 2,135Purchase iTraxx EUR S24 3Y Morgan Stanley 1.00% 20/12/2020 1,251,299 EUR 2,021
Total unrealised gain on credit default swaps 69,673
Sale iTraxx EUR S24 3Y JP Morgan 1.00% 20/12/2025 24,014,000 EUR (824,337)Sale iTraxx EUR S24 3Y Morgan Stanley 1.00% 20/12/2025 14,550,000 EUR (499,463)Sale iTraxx EUR S24 3Y JP Morgan 1.00% 20/12/2025 2,002,079 EUR (68,726)Sale Markit CDSI S24 5Y PRC Morgan Stanley 5.00% 20/12/2020 5,079,000 USD (58,698)Sale iTraxx EUR S24 3Y JP Morgan 1.00% 20/12/2025 1,321,622 EUR (45,368)Sale iTraxx EUR S24 3Y Morgan Stanley 1.00% 20/12/2025 1,251,299 EUR (42,954)Sale Markit CDSI S24 5Y PRC JP Morgan 5.00% 20/12/2020 2,781,000 USD (32,140)Sale Markit CDSI S24 5Y PRC JP Morgan 5.00% 20/12/2020 147,000 USD (1,699)
Total unrealised loss on credit default swaps (1,573,385)
Total net unrealised loss on credit default swaps (1,503,712)
11. Equity Variance Swaps
Purchase/Sale Expiry Nominal Currency Unrealisedof protection Denomination Counterparty Date Value Gain/(Loss) in sub-fund Base CcyInvesco Global Targeted Returns Fund EURPurchase Hang Seng Index Goldman Sachs 30/12/2016 2,400,000 HKD 2,375,971Purchase Hang Seng Index Goldman Sachs 30/12/2016 3,630,000 HKD 2,170,940Purchase Hang Seng Index HSBC 30/12/2016 3,094,000 HKD 1,863,498Purchase Hang Seng Index HSBC 30/12/2016 3,480,200 HKD 1,772,350Purchase Hang Seng Index HSBC 30/12/2016 1,955,000 HKD 1,761,971Purchase Hang Seng Index Goldman Sachs 30/12/2016 3,630,000 HKD 1,715,474Purchase Hang Seng Index Goldman Sachs 30/12/2016 1,230,881 HKD 1,676,878Purchase Hang Seng Index Goldman Sachs 30/12/2016 1,603,000 HKD 1,574,807Purchase Hang Seng Index HSBC 30/12/2016 1,792,000 HKD 1,466,904Purchase Hang Seng Index Goldman Sachs 30/12/2016 1,300,000 HKD 1,379,123Purchase Hang Seng Index HSBC 30/12/2016 2,531,000 HKD 1,342,200Purchase Hang Seng Index Societe Generale 30/12/2016 1,528,810 HKD 1,315,444Purchase Hang Seng Index Societe Generale 30/12/2016 1,024,549 HKD 1,287,268Purchase Hang Seng Index Goldman Sachs 30/12/2016 2,400,000 HKD 1,129,779Purchase Hang Seng Index Societe Generale 30/12/2016 2,464,509 HKD 983,651Purchase Hang Seng Index Societe Generale 30/12/2016 1,319,500 HKD 841,292Purchase Hang Seng Index HSBC 30/12/2016 667,370 HKD 702,907Purchase Hang Seng Index Societe Generale 30/12/2016 647,000 HKD 637,554Purchase Hang Seng Index Societe Generale 30/12/2016 556,913 HKD 590,809Purchase Hang Seng Index Societe Generale 30/12/2016 613,151 HKD 540,920Purchase Hang Seng Index Societe Generale 30/12/2016 583,104 HKD 531,442Purchase Hang Seng Index Societe Generale 30/12/2016 1,249,600 HKD 528,594Purchase Hang Seng Index Goldman Sachs 30/12/2016 550,830 HKD 518,237Purchase Hang Seng Index Societe Generale 30/12/2016 556,913 HKD 511,657Purchase Hang Seng Index HSBC 30/12/2016 500,884 HKD 452,839Purchase Hang Seng Index Goldman Sachs 30/12/2016 432,603 HKD 445,796Purchase Hang Seng Index HSBC 30/12/2016 880,958 HKD 425,290Purchase Hang Seng Index Barclays 30/12/2016 509,396 HKD 423,620Purchase Hang Seng Index Societe Generale 29/12/2017 708,989 HKD 417,376Purchase Hang Seng Index Societe Generale 30/12/2016 412,795 HKD 397,874Purchase Hang Seng Index HSBC 30/12/2016 431,435 HKD 390,051Purchase Hang Seng Index Goldman Sachs 30/12/2016 301,208 HKD 340,861Purchase Hang Seng Index Goldman Sachs 30/12/2016 1,074,651 HKD 330,467Purchase Hang Seng Index Societe Generale 30/12/2016 774,762 HKD 318,248Purchase Hang Seng Index Societe Generale 30/12/2016 1,377,226 HKD 317,561Purchase Hang Seng Index Societe Generale 30/12/2016 291,738 HKD 311,720Purchase Hang Seng Index Morgan Stanley 30/12/2016 441,967 HKD 304,972Purchase Hang Seng Index Societe Generale 30/12/2016 412,795 HKD 303,727
Notes to the Financial Statements (continued)
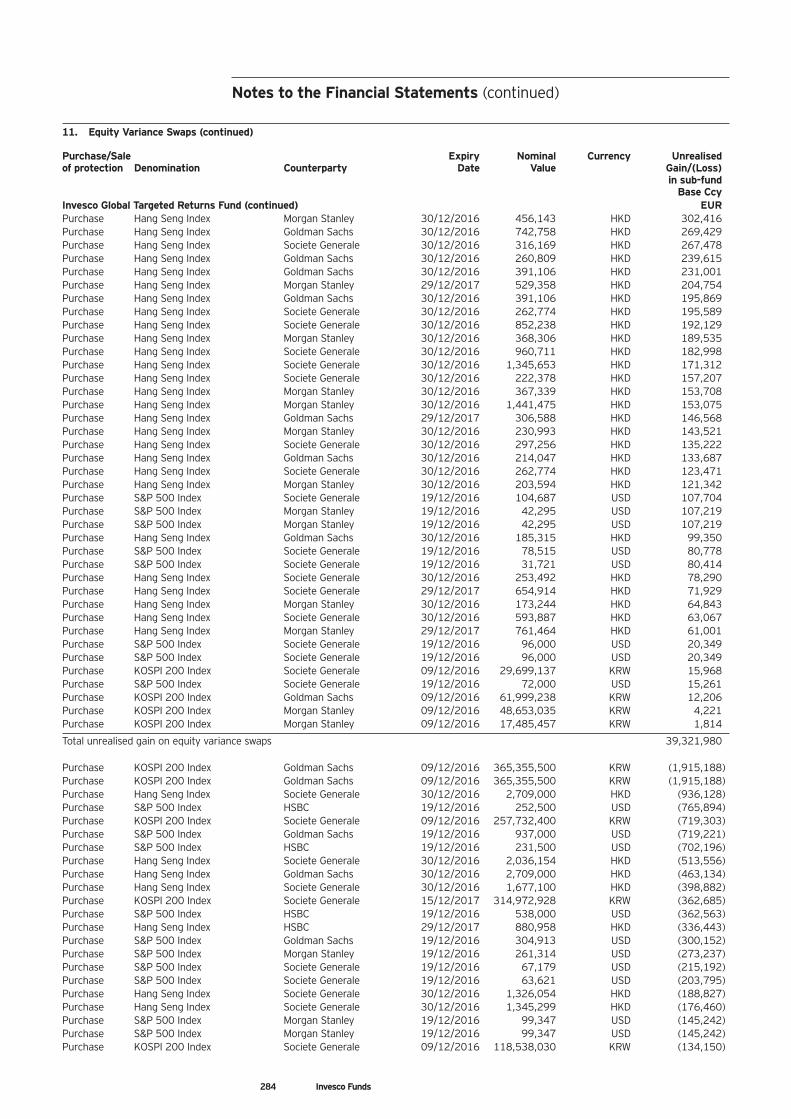
11. Equity Variance Swaps (continued)
Purchase/Sale Expiry Nominal Currency Unrealisedof protection Denomination Counterparty Date Value Gain/(Loss) in sub-fund Base CcyInvesco Global Targeted Returns Fund (continued) EURPurchase Hang Seng Index Morgan Stanley 30/12/2016 456,143 HKD 302,416Purchase Hang Seng Index Goldman Sachs 30/12/2016 742,758 HKD 269,429Purchase Hang Seng Index Societe Generale 30/12/2016 316,169 HKD 267,478Purchase Hang Seng Index Goldman Sachs 30/12/2016 260,809 HKD 239,615Purchase Hang Seng Index Goldman Sachs 30/12/2016 391,106 HKD 231,001Purchase Hang Seng Index Morgan Stanley 29/12/2017 529,358 HKD 204,754Purchase Hang Seng Index Goldman Sachs 30/12/2016 391,106 HKD 195,869Purchase Hang Seng Index Societe Generale 30/12/2016 262,774 HKD 195,589Purchase Hang Seng Index Societe Generale 30/12/2016 852,238 HKD 192,129Purchase Hang Seng Index Morgan Stanley 30/12/2016 368,306 HKD 189,535Purchase Hang Seng Index Societe Generale 30/12/2016 960,711 HKD 182,998Purchase Hang Seng Index Societe Generale 30/12/2016 1,345,653 HKD 171,312Purchase Hang Seng Index Societe Generale 30/12/2016 222,378 HKD 157,207Purchase Hang Seng Index Morgan Stanley 30/12/2016 367,339 HKD 153,708Purchase Hang Seng Index Morgan Stanley 30/12/2016 1,441,475 HKD 153,075Purchase Hang Seng Index Goldman Sachs 29/12/2017 306,588 HKD 146,568Purchase Hang Seng Index Morgan Stanley 30/12/2016 230,993 HKD 143,521Purchase Hang Seng Index Societe Generale 30/12/2016 297,256 HKD 135,222Purchase Hang Seng Index Goldman Sachs 30/12/2016 214,047 HKD 133,687Purchase Hang Seng Index Societe Generale 30/12/2016 262,774 HKD 123,471Purchase Hang Seng Index Morgan Stanley 30/12/2016 203,594 HKD 121,342Purchase S&P 500 Index Societe Generale 19/12/2016 104,687 USD 107,704Purchase S&P 500 Index Morgan Stanley 19/12/2016 42,295 USD 107,219Purchase S&P 500 Index Morgan Stanley 19/12/2016 42,295 USD 107,219Purchase Hang Seng Index Goldman Sachs 30/12/2016 185,315 HKD 99,350Purchase S&P 500 Index Societe Generale 19/12/2016 78,515 USD 80,778Purchase S&P 500 Index Societe Generale 19/12/2016 31,721 USD 80,414Purchase Hang Seng Index Societe Generale 30/12/2016 253,492 HKD 78,290Purchase Hang Seng Index Societe Generale 29/12/2017 654,914 HKD 71,929Purchase Hang Seng Index Morgan Stanley 30/12/2016 173,244 HKD 64,843Purchase Hang Seng Index Societe Generale 30/12/2016 593,887 HKD 63,067Purchase Hang Seng Index Morgan Stanley 29/12/2017 761,464 HKD 61,001Purchase S&P 500 Index Societe Generale 19/12/2016 96,000 USD 20,349Purchase S&P 500 Index Societe Generale 19/12/2016 96,000 USD 20,349Purchase KOSPI 200 Index Societe Generale 09/12/2016 29,699,137 KRW 15,968Purchase S&P 500 Index Societe Generale 19/12/2016 72,000 USD 15,261Purchase KOSPI 200 Index Goldman Sachs 09/12/2016 61,999,238 KRW 12,206Purchase KOSPI 200 Index Morgan Stanley 09/12/2016 48,653,035 KRW 4,221Purchase KOSPI 200 Index Morgan Stanley 09/12/2016 17,485,457 KRW 1,814
Total unrealised gain on equity variance swaps 39,321,980
Purchase KOSPI 200 Index Goldman Sachs 09/12/2016 365,355,500 KRW (1,915,188)Purchase KOSPI 200 Index Goldman Sachs 09/12/2016 365,355,500 KRW (1,915,188)Purchase Hang Seng Index Societe Generale 30/12/2016 2,709,000 HKD (936,128)Purchase S&P 500 Index HSBC 19/12/2016 252,500 USD (765,894)Purchase KOSPI 200 Index Societe Generale 09/12/2016 257,732,400 KRW (719,303)Purchase S&P 500 Index Goldman Sachs 19/12/2016 937,000 USD (719,221)Purchase S&P 500 Index HSBC 19/12/2016 231,500 USD (702,196)Purchase Hang Seng Index Societe Generale 30/12/2016 2,036,154 HKD (513,556)Purchase Hang Seng Index Goldman Sachs 30/12/2016 2,709,000 HKD (463,134)Purchase Hang Seng Index Societe Generale 30/12/2016 1,677,100 HKD (398,882)Purchase KOSPI 200 Index Societe Generale 15/12/2017 314,972,928 KRW (362,685)Purchase S&P 500 Index HSBC 19/12/2016 538,000 USD (362,563)Purchase Hang Seng Index HSBC 29/12/2017 880,958 HKD (336,443)Purchase S&P 500 Index Goldman Sachs 19/12/2016 304,913 USD (300,152)Purchase S&P 500 Index Morgan Stanley 19/12/2016 261,314 USD (273,237)Purchase S&P 500 Index Societe Generale 19/12/2016 67,179 USD (215,192)Purchase S&P 500 Index Societe Generale 19/12/2016 63,621 USD (203,795)Purchase Hang Seng Index Societe Generale 30/12/2016 1,326,054 HKD (188,827)Purchase Hang Seng Index Societe Generale 30/12/2016 1,345,299 HKD (176,460)Purchase S&P 500 Index Morgan Stanley 19/12/2016 99,347 USD (145,242)Purchase S&P 500 Index Morgan Stanley 19/12/2016 99,347 USD (145,242)Purchase KOSPI 200 Index Societe Generale 09/12/2016 118,538,030 KRW (134,150)
284 Invesco Funds
Notes to the Financial Statements (continued)
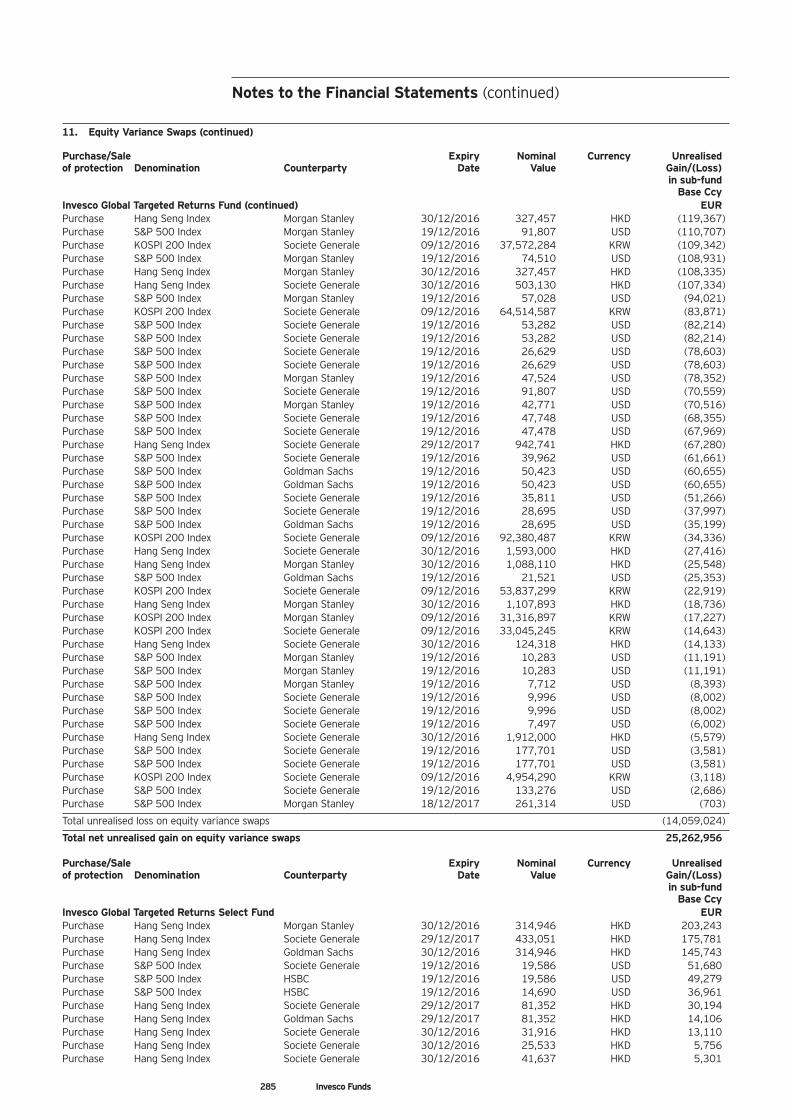
285 Invesco Funds
11. Equity Variance Swaps (continued)
Purchase/Sale Expiry Nominal Currency Unrealisedof protection Denomination Counterparty Date Value Gain/(Loss) in sub-fund Base CcyInvesco Global Targeted Returns Fund (continued) EURPurchase Hang Seng Index Morgan Stanley 30/12/2016 327,457 HKD (119,367)Purchase S&P 500 Index Morgan Stanley 19/12/2016 91,807 USD (110,707)Purchase KOSPI 200 Index Societe Generale 09/12/2016 37,572,284 KRW (109,342)Purchase S&P 500 Index Morgan Stanley 19/12/2016 74,510 USD (108,931)Purchase Hang Seng Index Morgan Stanley 30/12/2016 327,457 HKD (108,335)Purchase Hang Seng Index Societe Generale 30/12/2016 503,130 HKD (107,334)Purchase S&P 500 Index Morgan Stanley 19/12/2016 57,028 USD (94,021)Purchase KOSPI 200 Index Societe Generale 09/12/2016 64,514,587 KRW (83,871)Purchase S&P 500 Index Societe Generale 19/12/2016 53,282 USD (82,214)Purchase S&P 500 Index Societe Generale 19/12/2016 53,282 USD (82,214)Purchase S&P 500 Index Societe Generale 19/12/2016 26,629 USD (78,603)Purchase S&P 500 Index Societe Generale 19/12/2016 26,629 USD (78,603)Purchase S&P 500 Index Morgan Stanley 19/12/2016 47,524 USD (78,352)Purchase S&P 500 Index Societe Generale 19/12/2016 91,807 USD (70,559)Purchase S&P 500 Index Morgan Stanley 19/12/2016 42,771 USD (70,516)Purchase S&P 500 Index Societe Generale 19/12/2016 47,748 USD (68,355)Purchase S&P 500 Index Societe Generale 19/12/2016 47,478 USD (67,969)Purchase Hang Seng Index Societe Generale 29/12/2017 942,741 HKD (67,280)Purchase S&P 500 Index Societe Generale 19/12/2016 39,962 USD (61,661)Purchase S&P 500 Index Goldman Sachs 19/12/2016 50,423 USD (60,655)Purchase S&P 500 Index Goldman Sachs 19/12/2016 50,423 USD (60,655)Purchase S&P 500 Index Societe Generale 19/12/2016 35,811 USD (51,266)Purchase S&P 500 Index Societe Generale 19/12/2016 28,695 USD (37,997)Purchase S&P 500 Index Goldman Sachs 19/12/2016 28,695 USD (35,199)Purchase KOSPI 200 Index Societe Generale 09/12/2016 92,380,487 KRW (34,336)Purchase Hang Seng Index Societe Generale 30/12/2016 1,593,000 HKD (27,416)Purchase Hang Seng Index Morgan Stanley 30/12/2016 1,088,110 HKD (25,548)Purchase S&P 500 Index Goldman Sachs 19/12/2016 21,521 USD (25,353)Purchase KOSPI 200 Index Societe Generale 09/12/2016 53,837,299 KRW (22,919)Purchase Hang Seng Index Morgan Stanley 30/12/2016 1,107,893 HKD (18,736)Purchase KOSPI 200 Index Morgan Stanley 09/12/2016 31,316,897 KRW (17,227)Purchase KOSPI 200 Index Societe Generale 09/12/2016 33,045,245 KRW (14,643)Purchase Hang Seng Index Societe Generale 30/12/2016 124,318 HKD (14,133)Purchase S&P 500 Index Morgan Stanley 19/12/2016 10,283 USD (11,191)Purchase S&P 500 Index Morgan Stanley 19/12/2016 10,283 USD (11,191)Purchase S&P 500 Index Morgan Stanley 19/12/2016 7,712 USD (8,393)Purchase S&P 500 Index Societe Generale 19/12/2016 9,996 USD (8,002)Purchase S&P 500 Index Societe Generale 19/12/2016 9,996 USD (8,002)Purchase S&P 500 Index Societe Generale 19/12/2016 7,497 USD (6,002)Purchase Hang Seng Index Societe Generale 30/12/2016 1,912,000 HKD (5,579)Purchase S&P 500 Index Societe Generale 19/12/2016 177,701 USD (3,581)Purchase S&P 500 Index Societe Generale 19/12/2016 177,701 USD (3,581)Purchase KOSPI 200 Index Societe Generale 09/12/2016 4,954,290 KRW (3,118)Purchase S&P 500 Index Societe Generale 19/12/2016 133,276 USD (2,686)Purchase S&P 500 Index Morgan Stanley 18/12/2017 261,314 USD (703)
Total unrealised loss on equity variance swaps (14,059,024)
Total net unrealised gain on equity variance swaps 25,262,956
Purchase/Sale Expiry Nominal Currency Unrealisedof protection Denomination Counterparty Date Value Gain/(Loss) in sub-fund Base CcyInvesco Global Targeted Returns Select Fund EURPurchase Hang Seng Index Morgan Stanley 30/12/2016 314,946 HKD 203,243Purchase Hang Seng Index Societe Generale 29/12/2017 433,051 HKD 175,781Purchase Hang Seng Index Goldman Sachs 30/12/2016 314,946 HKD 145,743Purchase S&P 500 Index Societe Generale 19/12/2016 19,586 USD 51,680Purchase S&P 500 Index HSBC 19/12/2016 19,586 USD 49,279Purchase S&P 500 Index HSBC 19/12/2016 14,690 USD 36,961Purchase Hang Seng Index Societe Generale 29/12/2017 81,352 HKD 30,194Purchase Hang Seng Index Goldman Sachs 29/12/2017 81,352 HKD 14,106Purchase Hang Seng Index Societe Generale 30/12/2016 31,916 HKD 13,110Purchase Hang Seng Index Societe Generale 30/12/2016 25,533 HKD 5,756Purchase Hang Seng Index Societe Generale 30/12/2016 41,637 HKD 5,301
Notes to the Financial Statements (continued)
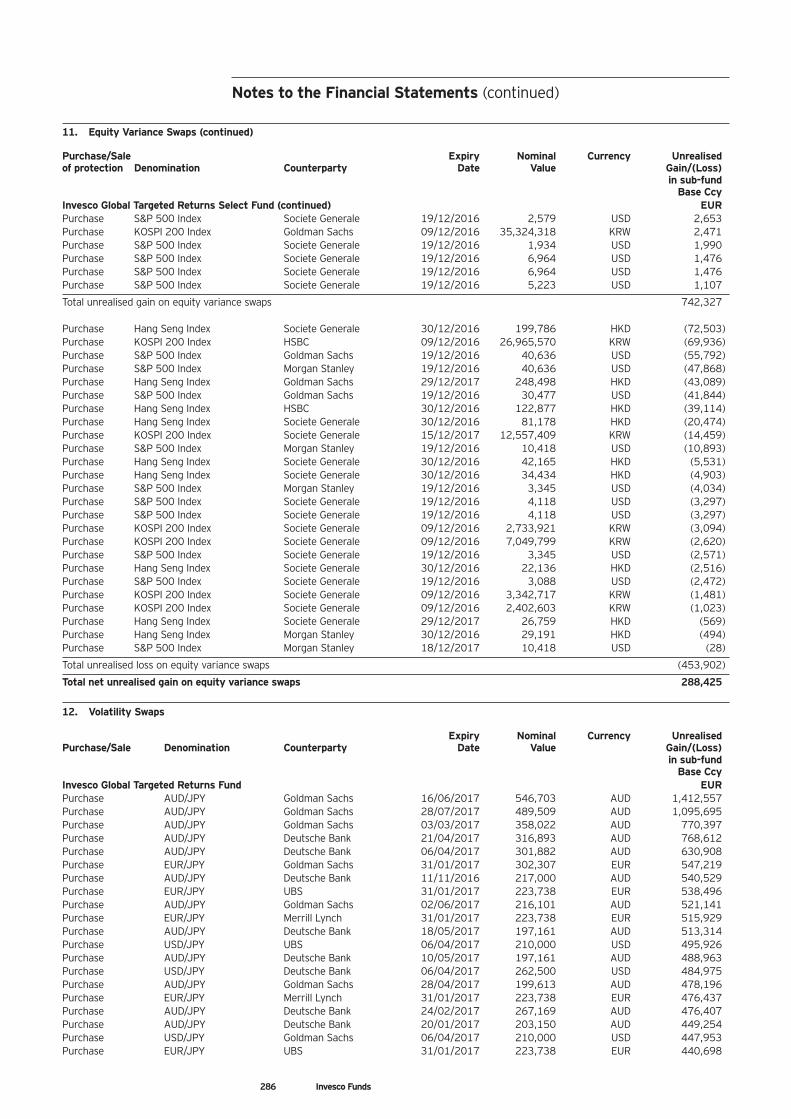
11. Equity Variance Swaps (continued)
Purchase/Sale Expiry Nominal Currency Unrealisedof protection Denomination Counterparty Date Value Gain/(Loss) in sub-fund Base CcyInvesco Global Targeted Returns Select Fund (continued) EURPurchase S&P 500 Index Societe Generale 19/12/2016 2,579 USD 2,653Purchase KOSPI 200 Index Goldman Sachs 09/12/2016 35,324,318 KRW 2,471Purchase S&P 500 Index Societe Generale 19/12/2016 1,934 USD 1,990Purchase S&P 500 Index Societe Generale 19/12/2016 6,964 USD 1,476Purchase S&P 500 Index Societe Generale 19/12/2016 6,964 USD 1,476Purchase S&P 500 Index Societe Generale 19/12/2016 5,223 USD 1,107
Total unrealised gain on equity variance swaps 742,327
Purchase Hang Seng Index Societe Generale 30/12/2016 199,786 HKD (72,503)Purchase KOSPI 200 Index HSBC 09/12/2016 26,965,570 KRW (69,936)Purchase S&P 500 Index Goldman Sachs 19/12/2016 40,636 USD (55,792)Purchase S&P 500 Index Morgan Stanley 19/12/2016 40,636 USD (47,868)Purchase Hang Seng Index Goldman Sachs 29/12/2017 248,498 HKD (43,089)Purchase S&P 500 Index Goldman Sachs 19/12/2016 30,477 USD (41,844)Purchase Hang Seng Index HSBC 30/12/2016 122,877 HKD (39,114)Purchase Hang Seng Index Societe Generale 30/12/2016 81,178 HKD (20,474)Purchase KOSPI 200 Index Societe Generale 15/12/2017 12,557,409 KRW (14,459)Purchase S&P 500 Index Morgan Stanley 19/12/2016 10,418 USD (10,893)Purchase Hang Seng Index Societe Generale 30/12/2016 42,165 HKD (5,531)Purchase Hang Seng Index Societe Generale 30/12/2016 34,434 HKD (4,903)Purchase S&P 500 Index Morgan Stanley 19/12/2016 3,345 USD (4,034)Purchase S&P 500 Index Societe Generale 19/12/2016 4,118 USD (3,297)Purchase S&P 500 Index Societe Generale 19/12/2016 4,118 USD (3,297)Purchase KOSPI 200 Index Societe Generale 09/12/2016 2,733,921 KRW (3,094)Purchase KOSPI 200 Index Societe Generale 09/12/2016 7,049,799 KRW (2,620)Purchase S&P 500 Index Societe Generale 19/12/2016 3,345 USD (2,571)Purchase Hang Seng Index Societe Generale 30/12/2016 22,136 HKD (2,516)Purchase S&P 500 Index Societe Generale 19/12/2016 3,088 USD (2,472)Purchase KOSPI 200 Index Societe Generale 09/12/2016 3,342,717 KRW (1,481)Purchase KOSPI 200 Index Societe Generale 09/12/2016 2,402,603 KRW (1,023)Purchase Hang Seng Index Societe Generale 29/12/2017 26,759 HKD (569)Purchase Hang Seng Index Morgan Stanley 30/12/2016 29,191 HKD (494)Purchase S&P 500 Index Morgan Stanley 18/12/2017 10,418 USD (28)
Total unrealised loss on equity variance swaps (453,902)
Total net unrealised gain on equity variance swaps 288,425
12. Volatility Swaps
Expiry Nominal Currency UnrealisedPurchase/Sale Denomination Counterparty Date Value Gain/(Loss) in sub-fund Base CcyInvesco Global Targeted Returns Fund EURPurchase AUD/JPY Goldman Sachs 16/06/2017 546,703 AUD 1,412,557Purchase AUD/JPY Goldman Sachs 28/07/2017 489,509 AUD 1,095,695Purchase AUD/JPY Goldman Sachs 03/03/2017 358,022 AUD 770,397Purchase AUD/JPY Deutsche Bank 21/04/2017 316,893 AUD 768,612Purchase AUD/JPY Deutsche Bank 06/04/2017 301,882 AUD 630,908Purchase EUR/JPY Goldman Sachs 31/01/2017 302,307 EUR 547,219Purchase AUD/JPY Deutsche Bank 11/11/2016 217,000 AUD 540,529Purchase EUR/JPY UBS 31/01/2017 223,738 EUR 538,496Purchase AUD/JPY Goldman Sachs 02/06/2017 216,101 AUD 521,141Purchase EUR/JPY Merrill Lynch 31/01/2017 223,738 EUR 515,929Purchase AUD/JPY Deutsche Bank 18/05/2017 197,161 AUD 513,314Purchase USD/JPY UBS 06/04/2017 210,000 USD 495,926Purchase AUD/JPY Deutsche Bank 10/05/2017 197,161 AUD 488,963Purchase USD/JPY Deutsche Bank 06/04/2017 262,500 USD 484,975Purchase AUD/JPY Goldman Sachs 28/04/2017 199,613 AUD 478,196Purchase EUR/JPY Merrill Lynch 31/01/2017 223,738 EUR 476,437Purchase AUD/JPY Deutsche Bank 24/02/2017 267,169 AUD 476,407Purchase AUD/JPY Deutsche Bank 20/01/2017 203,150 AUD 449,254Purchase USD/JPY Goldman Sachs 06/04/2017 210,000 USD 447,953Purchase EUR/JPY UBS 31/01/2017 223,738 EUR 440,698
286 Invesco Funds
Notes to the Financial Statements (continued)
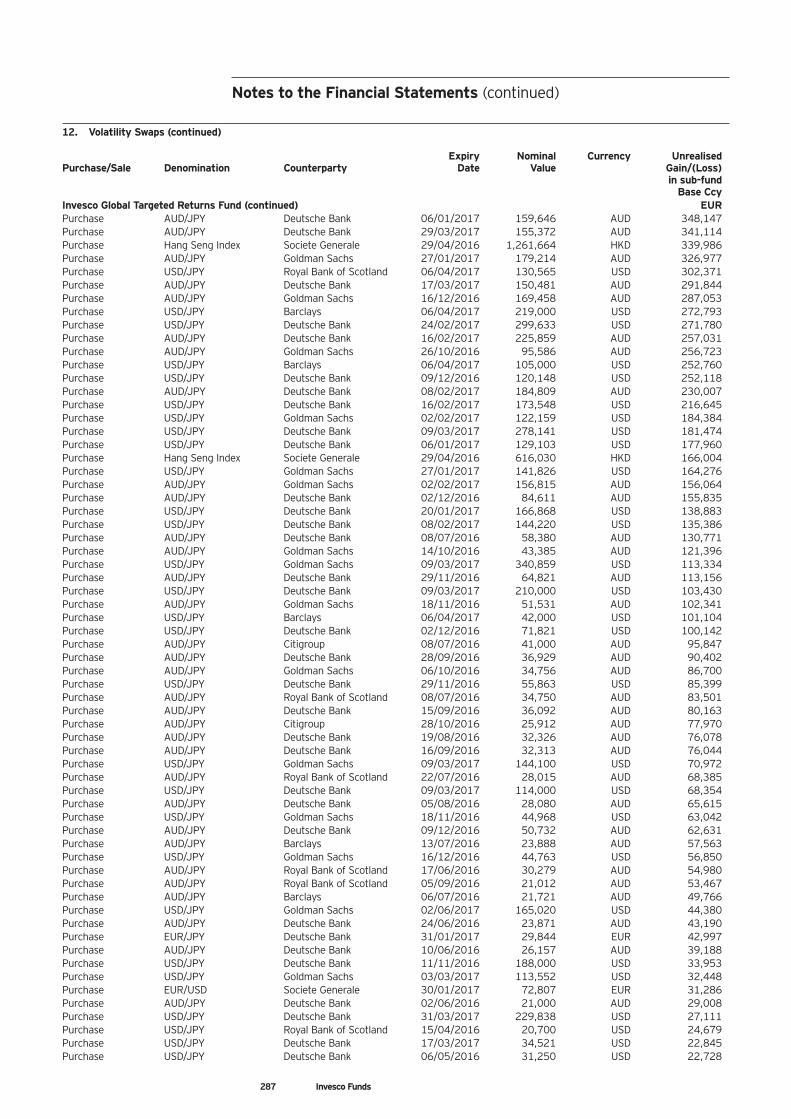
287 Invesco Funds
12. Volatility Swaps (continued)
Expiry Nominal Currency UnrealisedPurchase/Sale Denomination Counterparty Date Value Gain/(Loss) in sub-fund Base CcyInvesco Global Targeted Returns Fund (continued) EURPurchase AUD/JPY Deutsche Bank 06/01/2017 159,646 AUD 348,147Purchase AUD/JPY Deutsche Bank 29/03/2017 155,372 AUD 341,114Purchase Hang Seng Index Societe Generale 29/04/2016 1,261,664 HKD 339,986Purchase AUD/JPY Goldman Sachs 27/01/2017 179,214 AUD 326,977Purchase USD/JPY Royal Bank of Scotland 06/04/2017 130,565 USD 302,371Purchase AUD/JPY Deutsche Bank 17/03/2017 150,481 AUD 291,844Purchase AUD/JPY Goldman Sachs 16/12/2016 169,458 AUD 287,053Purchase USD/JPY Barclays 06/04/2017 219,000 USD 272,793Purchase USD/JPY Deutsche Bank 24/02/2017 299,633 USD 271,780Purchase AUD/JPY Deutsche Bank 16/02/2017 225,859 AUD 257,031Purchase AUD/JPY Goldman Sachs 26/10/2016 95,586 AUD 256,723Purchase USD/JPY Barclays 06/04/2017 105,000 USD 252,760Purchase USD/JPY Deutsche Bank 09/12/2016 120,148 USD 252,118Purchase AUD/JPY Deutsche Bank 08/02/2017 184,809 AUD 230,007Purchase USD/JPY Deutsche Bank 16/02/2017 173,548 USD 216,645Purchase USD/JPY Goldman Sachs 02/02/2017 122,159 USD 184,384Purchase USD/JPY Deutsche Bank 09/03/2017 278,141 USD 181,474Purchase USD/JPY Deutsche Bank 06/01/2017 129,103 USD 177,960Purchase Hang Seng Index Societe Generale 29/04/2016 616,030 HKD 166,004Purchase USD/JPY Goldman Sachs 27/01/2017 141,826 USD 164,276Purchase AUD/JPY Goldman Sachs 02/02/2017 156,815 AUD 156,064Purchase AUD/JPY Deutsche Bank 02/12/2016 84,611 AUD 155,835Purchase USD/JPY Deutsche Bank 20/01/2017 166,868 USD 138,883Purchase USD/JPY Deutsche Bank 08/02/2017 144,220 USD 135,386Purchase AUD/JPY Deutsche Bank 08/07/2016 58,380 AUD 130,771Purchase AUD/JPY Goldman Sachs 14/10/2016 43,385 AUD 121,396Purchase USD/JPY Goldman Sachs 09/03/2017 340,859 USD 113,334Purchase AUD/JPY Deutsche Bank 29/11/2016 64,821 AUD 113,156Purchase USD/JPY Deutsche Bank 09/03/2017 210,000 USD 103,430Purchase AUD/JPY Goldman Sachs 18/11/2016 51,531 AUD 102,341Purchase USD/JPY Barclays 06/04/2017 42,000 USD 101,104Purchase USD/JPY Deutsche Bank 02/12/2016 71,821 USD 100,142Purchase AUD/JPY Citigroup 08/07/2016 41,000 AUD 95,847Purchase AUD/JPY Deutsche Bank 28/09/2016 36,929 AUD 90,402Purchase AUD/JPY Goldman Sachs 06/10/2016 34,756 AUD 86,700Purchase USD/JPY Deutsche Bank 29/11/2016 55,863 USD 85,399Purchase AUD/JPY Royal Bank of Scotland 08/07/2016 34,750 AUD 83,501Purchase AUD/JPY Deutsche Bank 15/09/2016 36,092 AUD 80,163Purchase AUD/JPY Citigroup 28/10/2016 25,912 AUD 77,970Purchase AUD/JPY Deutsche Bank 19/08/2016 32,326 AUD 76,078Purchase AUD/JPY Deutsche Bank 16/09/2016 32,313 AUD 76,044Purchase USD/JPY Goldman Sachs 09/03/2017 144,100 USD 70,972Purchase AUD/JPY Royal Bank of Scotland 22/07/2016 28,015 AUD 68,385Purchase USD/JPY Deutsche Bank 09/03/2017 114,000 USD 68,354Purchase AUD/JPY Deutsche Bank 05/08/2016 28,080 AUD 65,615Purchase USD/JPY Goldman Sachs 18/11/2016 44,968 USD 63,042Purchase AUD/JPY Deutsche Bank 09/12/2016 50,732 AUD 62,631Purchase AUD/JPY Barclays 13/07/2016 23,888 AUD 57,563Purchase USD/JPY Goldman Sachs 16/12/2016 44,763 USD 56,850Purchase AUD/JPY Royal Bank of Scotland 17/06/2016 30,279 AUD 54,980Purchase AUD/JPY Royal Bank of Scotland 05/09/2016 21,012 AUD 53,467Purchase AUD/JPY Barclays 06/07/2016 21,721 AUD 49,766Purchase USD/JPY Goldman Sachs 02/06/2017 165,020 USD 44,380Purchase AUD/JPY Deutsche Bank 24/06/2016 23,871 AUD 43,190Purchase EUR/JPY Deutsche Bank 31/01/2017 29,844 EUR 42,997Purchase AUD/JPY Deutsche Bank 10/06/2016 26,157 AUD 39,188Purchase USD/JPY Deutsche Bank 11/11/2016 188,000 USD 33,953Purchase USD/JPY Goldman Sachs 03/03/2017 113,552 USD 32,448Purchase EUR/USD Societe Generale 30/01/2017 72,807 EUR 31,286Purchase AUD/JPY Deutsche Bank 02/06/2016 21,000 AUD 29,008Purchase USD/JPY Deutsche Bank 31/03/2017 229,838 USD 27,111Purchase USD/JPY Royal Bank of Scotland 15/04/2016 20,700 USD 24,679Purchase USD/JPY Deutsche Bank 17/03/2017 34,521 USD 22,845Purchase USD/JPY Deutsche Bank 06/05/2016 31,250 USD 22,728
Notes to the Financial Statements (continued)
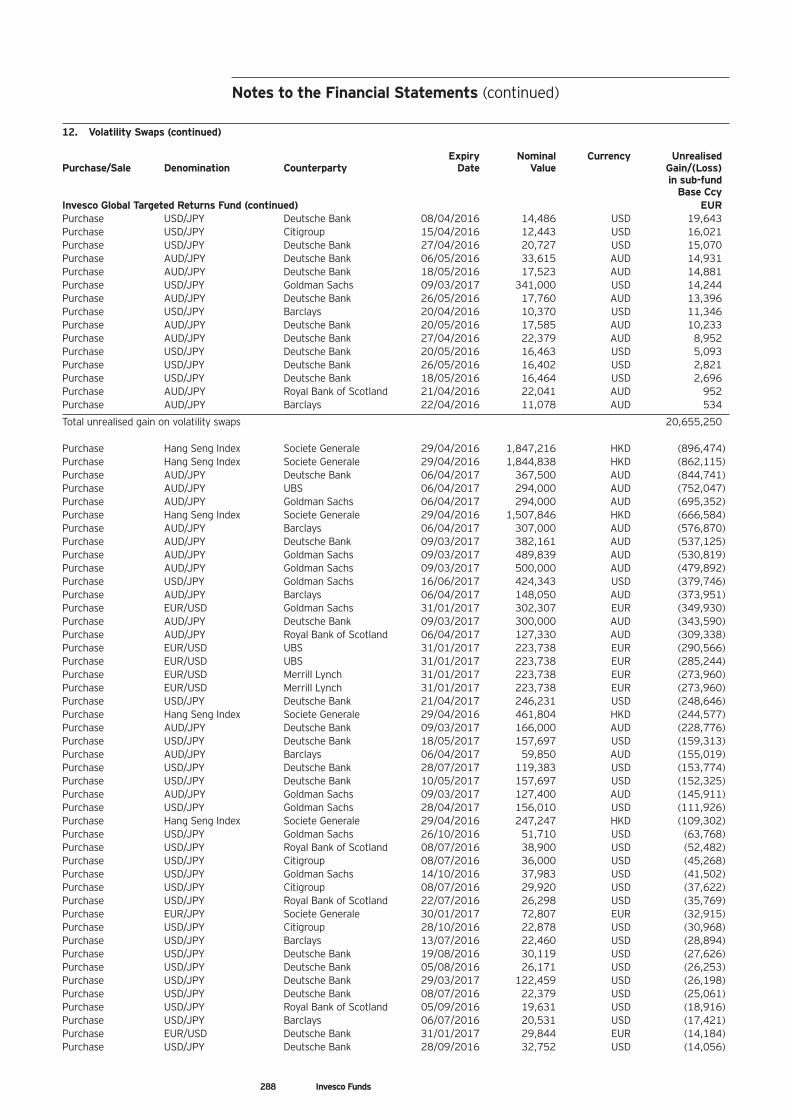
12. Volatility Swaps (continued)
Expiry Nominal Currency UnrealisedPurchase/Sale Denomination Counterparty Date Value Gain/(Loss) in sub-fund Base CcyInvesco Global Targeted Returns Fund (continued) EURPurchase USD/JPY Deutsche Bank 08/04/2016 14,486 USD 19,643Purchase USD/JPY Citigroup 15/04/2016 12,443 USD 16,021Purchase USD/JPY Deutsche Bank 27/04/2016 20,727 USD 15,070Purchase AUD/JPY Deutsche Bank 06/05/2016 33,615 AUD 14,931Purchase AUD/JPY Deutsche Bank 18/05/2016 17,523 AUD 14,881Purchase USD/JPY Goldman Sachs 09/03/2017 341,000 USD 14,244Purchase AUD/JPY Deutsche Bank 26/05/2016 17,760 AUD 13,396Purchase USD/JPY Barclays 20/04/2016 10,370 USD 11,346Purchase AUD/JPY Deutsche Bank 20/05/2016 17,585 AUD 10,233Purchase AUD/JPY Deutsche Bank 27/04/2016 22,379 AUD 8,952Purchase USD/JPY Deutsche Bank 20/05/2016 16,463 USD 5,093Purchase USD/JPY Deutsche Bank 26/05/2016 16,402 USD 2,821Purchase USD/JPY Deutsche Bank 18/05/2016 16,464 USD 2,696Purchase AUD/JPY Royal Bank of Scotland 21/04/2016 22,041 AUD 952Purchase AUD/JPY Barclays 22/04/2016 11,078 AUD 534
Total unrealised gain on volatility swaps 20,655,250
Purchase Hang Seng Index Societe Generale 29/04/2016 1,847,216 HKD (896,474)Purchase Hang Seng Index Societe Generale 29/04/2016 1,844,838 HKD (862,115)Purchase AUD/JPY Deutsche Bank 06/04/2017 367,500 AUD (844,741)Purchase AUD/JPY UBS 06/04/2017 294,000 AUD (752,047)Purchase AUD/JPY Goldman Sachs 06/04/2017 294,000 AUD (695,352)Purchase Hang Seng Index Societe Generale 29/04/2016 1,507,846 HKD (666,584)Purchase AUD/JPY Barclays 06/04/2017 307,000 AUD (576,870)Purchase AUD/JPY Deutsche Bank 09/03/2017 382,161 AUD (537,125)Purchase AUD/JPY Goldman Sachs 09/03/2017 489,839 AUD (530,819)Purchase AUD/JPY Goldman Sachs 09/03/2017 500,000 AUD (479,892)Purchase USD/JPY Goldman Sachs 16/06/2017 424,343 USD (379,746)Purchase AUD/JPY Barclays 06/04/2017 148,050 AUD (373,951)Purchase EUR/USD Goldman Sachs 31/01/2017 302,307 EUR (349,930)Purchase AUD/JPY Deutsche Bank 09/03/2017 300,000 AUD (343,590)Purchase AUD/JPY Royal Bank of Scotland 06/04/2017 127,330 AUD (309,338)Purchase EUR/USD UBS 31/01/2017 223,738 EUR (290,566)Purchase EUR/USD UBS 31/01/2017 223,738 EUR (285,244)Purchase EUR/USD Merrill Lynch 31/01/2017 223,738 EUR (273,960)Purchase EUR/USD Merrill Lynch 31/01/2017 223,738 EUR (273,960)Purchase USD/JPY Deutsche Bank 21/04/2017 246,231 USD (248,646)Purchase Hang Seng Index Societe Generale 29/04/2016 461,804 HKD (244,577)Purchase AUD/JPY Deutsche Bank 09/03/2017 166,000 AUD (228,776)Purchase USD/JPY Deutsche Bank 18/05/2017 157,697 USD (159,313)Purchase AUD/JPY Barclays 06/04/2017 59,850 AUD (155,019)Purchase USD/JPY Deutsche Bank 28/07/2017 119,383 USD (153,774)Purchase USD/JPY Deutsche Bank 10/05/2017 157,697 USD (152,325)Purchase AUD/JPY Goldman Sachs 09/03/2017 127,400 AUD (145,911)Purchase USD/JPY Goldman Sachs 28/04/2017 156,010 USD (111,926)Purchase Hang Seng Index Societe Generale 29/04/2016 247,247 HKD (109,302)Purchase USD/JPY Goldman Sachs 26/10/2016 51,710 USD (63,768)Purchase USD/JPY Royal Bank of Scotland 08/07/2016 38,900 USD (52,482)Purchase USD/JPY Citigroup 08/07/2016 36,000 USD (45,268)Purchase USD/JPY Goldman Sachs 14/10/2016 37,983 USD (41,502)Purchase USD/JPY Citigroup 08/07/2016 29,920 USD (37,622)Purchase USD/JPY Royal Bank of Scotland 22/07/2016 26,298 USD (35,769)Purchase EUR/JPY Societe Generale 30/01/2017 72,807 EUR (32,915)Purchase USD/JPY Citigroup 28/10/2016 22,878 USD (30,968)Purchase USD/JPY Barclays 13/07/2016 22,460 USD (28,894)Purchase USD/JPY Deutsche Bank 19/08/2016 30,119 USD (27,626)Purchase USD/JPY Deutsche Bank 05/08/2016 26,171 USD (26,253)Purchase USD/JPY Deutsche Bank 29/03/2017 122,459 USD (26,198)Purchase USD/JPY Deutsche Bank 08/07/2016 22,379 USD (25,061)Purchase USD/JPY Royal Bank of Scotland 05/09/2016 19,631 USD (18,916)Purchase USD/JPY Barclays 06/07/2016 20,531 USD (17,421)Purchase EUR/USD Deutsche Bank 31/01/2017 29,844 EUR (14,184)Purchase USD/JPY Deutsche Bank 28/09/2016 32,752 USD (14,056)
288 Invesco Funds
Notes to the Financial Statements (continued)
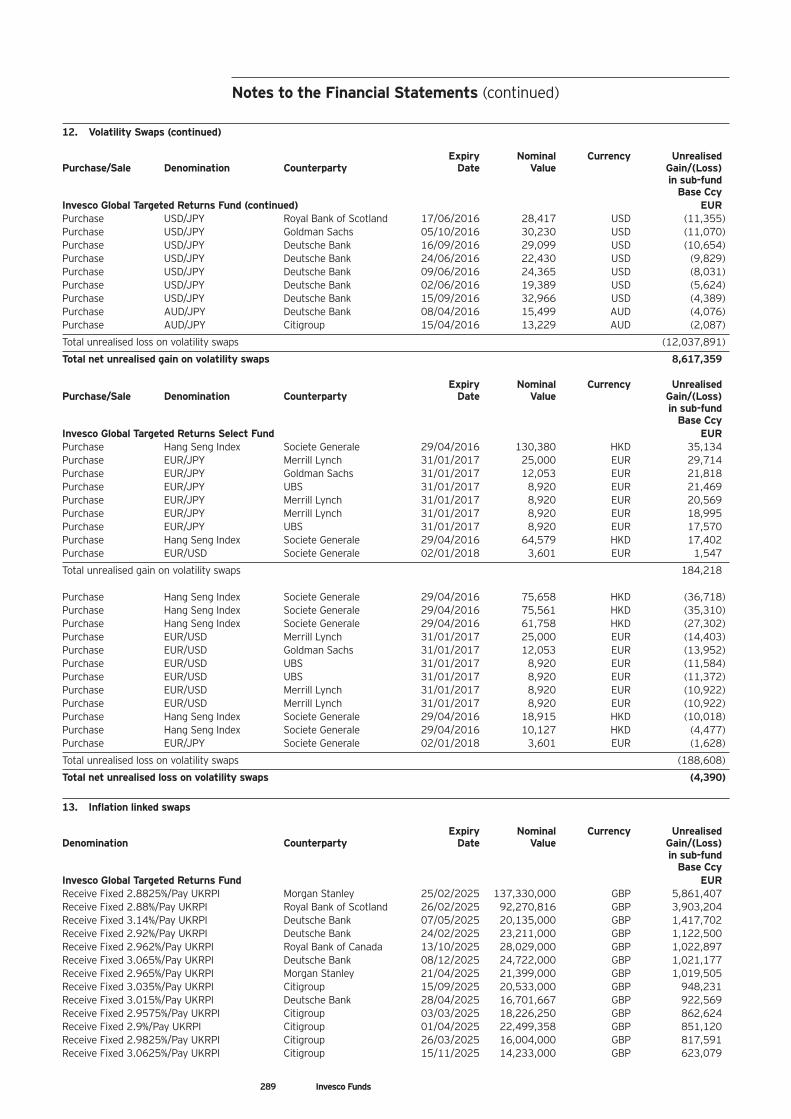
289 Invesco Funds
12. Volatility Swaps (continued)
Expiry Nominal Currency UnrealisedPurchase/Sale Denomination Counterparty Date Value Gain/(Loss) in sub-fund Base CcyInvesco Global Targeted Returns Fund (continued) EURPurchase USD/JPY Royal Bank of Scotland 17/06/2016 28,417 USD (11,355)Purchase USD/JPY Goldman Sachs 05/10/2016 30,230 USD (11,070)Purchase USD/JPY Deutsche Bank 16/09/2016 29,099 USD (10,654)Purchase USD/JPY Deutsche Bank 24/06/2016 22,430 USD (9,829)Purchase USD/JPY Deutsche Bank 09/06/2016 24,365 USD (8,031)Purchase USD/JPY Deutsche Bank 02/06/2016 19,389 USD (5,624)Purchase USD/JPY Deutsche Bank 15/09/2016 32,966 USD (4,389)Purchase AUD/JPY Deutsche Bank 08/04/2016 15,499 AUD (4,076)Purchase AUD/JPY Citigroup 15/04/2016 13,229 AUD (2,087)
Total unrealised loss on volatility swaps (12,037,891)
Total net unrealised gain on volatility swaps 8,617,359
Expiry Nominal Currency UnrealisedPurchase/Sale Denomination Counterparty Date Value Gain/(Loss) in sub-fund Base CcyInvesco Global Targeted Returns Select Fund EURPurchase Hang Seng Index Societe Generale 29/04/2016 130,380 HKD 35,134Purchase EUR/JPY Merrill Lynch 31/01/2017 25,000 EUR 29,714Purchase EUR/JPY Goldman Sachs 31/01/2017 12,053 EUR 21,818Purchase EUR/JPY UBS 31/01/2017 8,920 EUR 21,469Purchase EUR/JPY Merrill Lynch 31/01/2017 8,920 EUR 20,569Purchase EUR/JPY Merrill Lynch 31/01/2017 8,920 EUR 18,995Purchase EUR/JPY UBS 31/01/2017 8,920 EUR 17,570Purchase Hang Seng Index Societe Generale 29/04/2016 64,579 HKD 17,402Purchase EUR/USD Societe Generale 02/01/2018 3,601 EUR 1,547
Total unrealised gain on volatility swaps 184,218
Purchase Hang Seng Index Societe Generale 29/04/2016 75,658 HKD (36,718)Purchase Hang Seng Index Societe Generale 29/04/2016 75,561 HKD (35,310)Purchase Hang Seng Index Societe Generale 29/04/2016 61,758 HKD (27,302)Purchase EUR/USD Merrill Lynch 31/01/2017 25,000 EUR (14,403)Purchase EUR/USD Goldman Sachs 31/01/2017 12,053 EUR (13,952)Purchase EUR/USD UBS 31/01/2017 8,920 EUR (11,584)Purchase EUR/USD UBS 31/01/2017 8,920 EUR (11,372)Purchase EUR/USD Merrill Lynch 31/01/2017 8,920 EUR (10,922)Purchase EUR/USD Merrill Lynch 31/01/2017 8,920 EUR (10,922)Purchase Hang Seng Index Societe Generale 29/04/2016 18,915 HKD (10,018)Purchase Hang Seng Index Societe Generale 29/04/2016 10,127 HKD (4,477)Purchase EUR/JPY Societe Generale 02/01/2018 3,601 EUR (1,628)
Total unrealised loss on volatility swaps (188,608)
Total net unrealised loss on volatility swaps (4,390)
13. Inflation linked swaps
Expiry Nominal Currency UnrealisedDenomination Counterparty Date Value Gain/(Loss) in sub-fund Base CcyInvesco Global Targeted Returns Fund EURReceive Fixed 2.8825%/Pay UKRPI Morgan Stanley 25/02/2025 137,330,000 GBP 5,861,407Receive Fixed 2.88%/Pay UKRPI Royal Bank of Scotland 26/02/2025 92,270,816 GBP 3,903,204Receive Fixed 3.14%/Pay UKRPI Deutsche Bank 07/05/2025 20,135,000 GBP 1,417,702Receive Fixed 2.92%/Pay UKRPI Deutsche Bank 24/02/2025 23,211,000 GBP 1,122,500Receive Fixed 2.962%/Pay UKRPI Royal Bank of Canada 13/10/2025 28,029,000 GBP 1,022,897Receive Fixed 3.065%/Pay UKRPI Deutsche Bank 08/12/2025 24,722,000 GBP 1,021,177Receive Fixed 2.965%/Pay UKRPI Morgan Stanley 21/04/2025 21,399,000 GBP 1,019,505Receive Fixed 3.035%/Pay UKRPI Citigroup 15/09/2025 20,533,000 GBP 948,231Receive Fixed 3.015%/Pay UKRPI Deutsche Bank 28/04/2025 16,701,667 GBP 922,569Receive Fixed 2.9575%/Pay UKRPI Citigroup 03/03/2025 18,226,250 GBP 862,624Receive Fixed 2.9%/Pay UKRPI Citigroup 01/04/2025 22,499,358 GBP 851,120Receive Fixed 2.9825%/Pay UKRPI Citigroup 26/03/2025 16,004,000 GBP 817,591Receive Fixed 3.0625%/Pay UKRPI Citigroup 15/11/2025 14,233,000 GBP 623,079
Notes to the Financial Statements (continued)
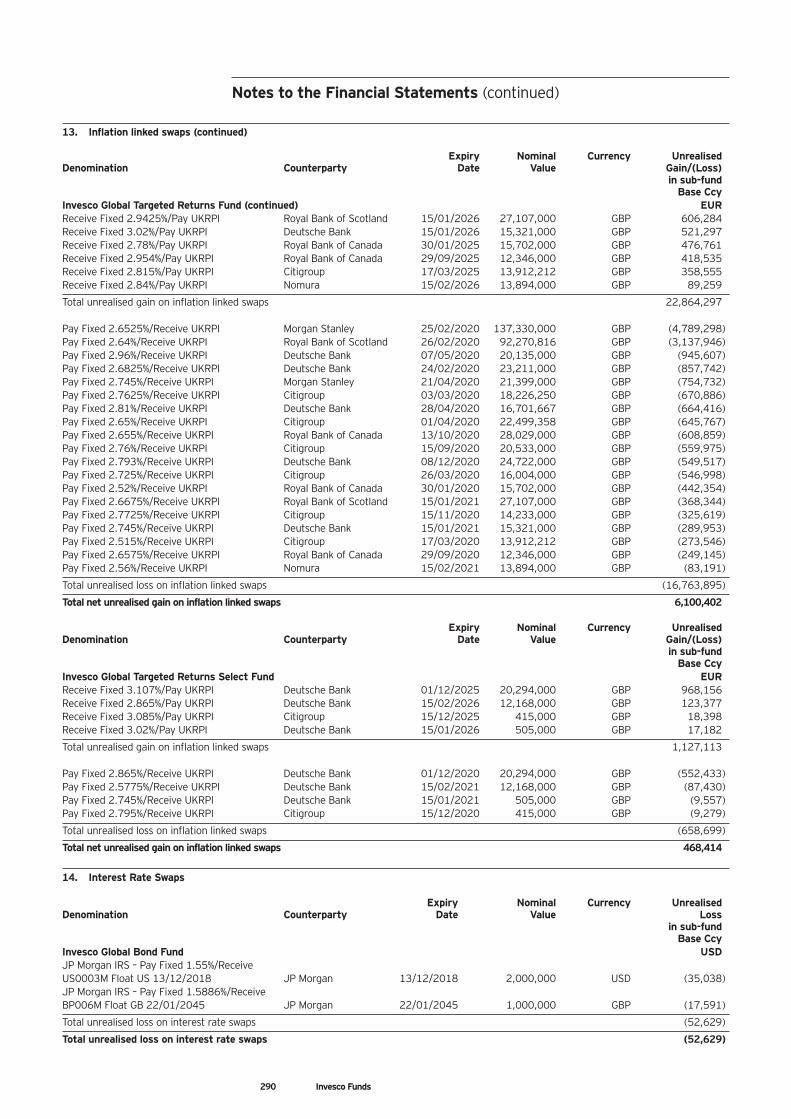
13. Inflation linked swaps (continued)
Expiry Nominal Currency UnrealisedDenomination Counterparty Date Value Gain/(Loss) in sub-fund Base CcyInvesco Global Targeted Returns Fund (continued) EURReceive Fixed 2.9425%/Pay UKRPI Royal Bank of Scotland 15/01/2026 27,107,000 GBP 606,284Receive Fixed 3.02%/Pay UKRPI Deutsche Bank 15/01/2026 15,321,000 GBP 521,297Receive Fixed 2.78%/Pay UKRPI Royal Bank of Canada 30/01/2025 15,702,000 GBP 476,761Receive Fixed 2.954%/Pay UKRPI Royal Bank of Canada 29/09/2025 12,346,000 GBP 418,535Receive Fixed 2.815%/Pay UKRPI Citigroup 17/03/2025 13,912,212 GBP 358,555Receive Fixed 2.84%/Pay UKRPI Nomura 15/02/2026 13,894,000 GBP 89,259
Total unrealised gain on inflation linked swaps 22,864,297
Pay Fixed 2.6525%/Receive UKRPI Morgan Stanley 25/02/2020 137,330,000 GBP (4,789,298)Pay Fixed 2.64%/Receive UKRPI Royal Bank of Scotland 26/02/2020 92,270,816 GBP (3,137,946)Pay Fixed 2.96%/Receive UKRPI Deutsche Bank 07/05/2020 20,135,000 GBP (945,607)Pay Fixed 2.6825%/Receive UKRPI Deutsche Bank 24/02/2020 23,211,000 GBP (857,742)Pay Fixed 2.745%/Receive UKRPI Morgan Stanley 21/04/2020 21,399,000 GBP (754,732)Pay Fixed 2.7625%/Receive UKRPI Citigroup 03/03/2020 18,226,250 GBP (670,886)Pay Fixed 2.81%/Receive UKRPI Deutsche Bank 28/04/2020 16,701,667 GBP (664,416)Pay Fixed 2.65%/Receive UKRPI Citigroup 01/04/2020 22,499,358 GBP (645,767)Pay Fixed 2.655%/Receive UKRPI Royal Bank of Canada 13/10/2020 28,029,000 GBP (608,859)Pay Fixed 2.76%/Receive UKRPI Citigroup 15/09/2020 20,533,000 GBP (559,975)Pay Fixed 2.793%/Receive UKRPI Deutsche Bank 08/12/2020 24,722,000 GBP (549,517)Pay Fixed 2.725%/Receive UKRPI Citigroup 26/03/2020 16,004,000 GBP (546,998)Pay Fixed 2.52%/Receive UKRPI Royal Bank of Canada 30/01/2020 15,702,000 GBP (442,354)Pay Fixed 2.6675%/Receive UKRPI Royal Bank of Scotland 15/01/2021 27,107,000 GBP (368,344)Pay Fixed 2.7725%/Receive UKRPI Citigroup 15/11/2020 14,233,000 GBP (325,619)Pay Fixed 2.745%/Receive UKRPI Deutsche Bank 15/01/2021 15,321,000 GBP (289,953)Pay Fixed 2.515%/Receive UKRPI Citigroup 17/03/2020 13,912,212 GBP (273,546)Pay Fixed 2.6575%/Receive UKRPI Royal Bank of Canada 29/09/2020 12,346,000 GBP (249,145)Pay Fixed 2.56%/Receive UKRPI Nomura 15/02/2021 13,894,000 GBP (83,191)
Total unrealised loss on inflation linked swaps (16,763,895)
Total net unrealised gain on inflation linked swaps 6,100,402
Expiry Nominal Currency UnrealisedDenomination Counterparty Date Value Gain/(Loss) in sub-fund Base CcyInvesco Global Targeted Returns Select Fund EURReceive Fixed 3.107%/Pay UKRPI Deutsche Bank 01/12/2025 20,294,000 GBP 968,156Receive Fixed 2.865%/Pay UKRPI Deutsche Bank 15/02/2026 12,168,000 GBP 123,377Receive Fixed 3.085%/Pay UKRPI Citigroup 15/12/2025 415,000 GBP 18,398Receive Fixed 3.02%/Pay UKRPI Deutsche Bank 15/01/2026 505,000 GBP 17,182
Total unrealised gain on inflation linked swaps 1,127,113
Pay Fixed 2.865%/Receive UKRPI Deutsche Bank 01/12/2020 20,294,000 GBP (552,433)Pay Fixed 2.5775%/Receive UKRPI Deutsche Bank 15/02/2021 12,168,000 GBP (87,430)Pay Fixed 2.745%/Receive UKRPI Deutsche Bank 15/01/2021 505,000 GBP (9,557)Pay Fixed 2.795%/Receive UKRPI Citigroup 15/12/2020 415,000 GBP (9,279)
Total unrealised loss on inflation linked swaps (658,699)
Total net unrealised gain on inflation linked swaps 468,414
14. Interest Rate Swaps
Expiry Nominal Currency UnrealisedDenomination Counterparty Date Value Loss in sub-fund Base CcyInvesco Global Bond Fund USDJP Morgan IRS – Pay Fixed 1.55%/Receive US0003M Float US 13/12/2018 JP Morgan 13/12/2018 2,000,000 USD (35,038)JP Morgan IRS – Pay Fixed 1.5886%/Receive BP006M Float GB 22/01/2045 JP Morgan 22/01/2045 1,000,000 GBP (17,591)
Total unrealised loss on interest rate swaps (52,629)
Total unrealised loss on interest rate swaps (52,629)
290 Invesco Funds
Notes to the Financial Statements (continued)
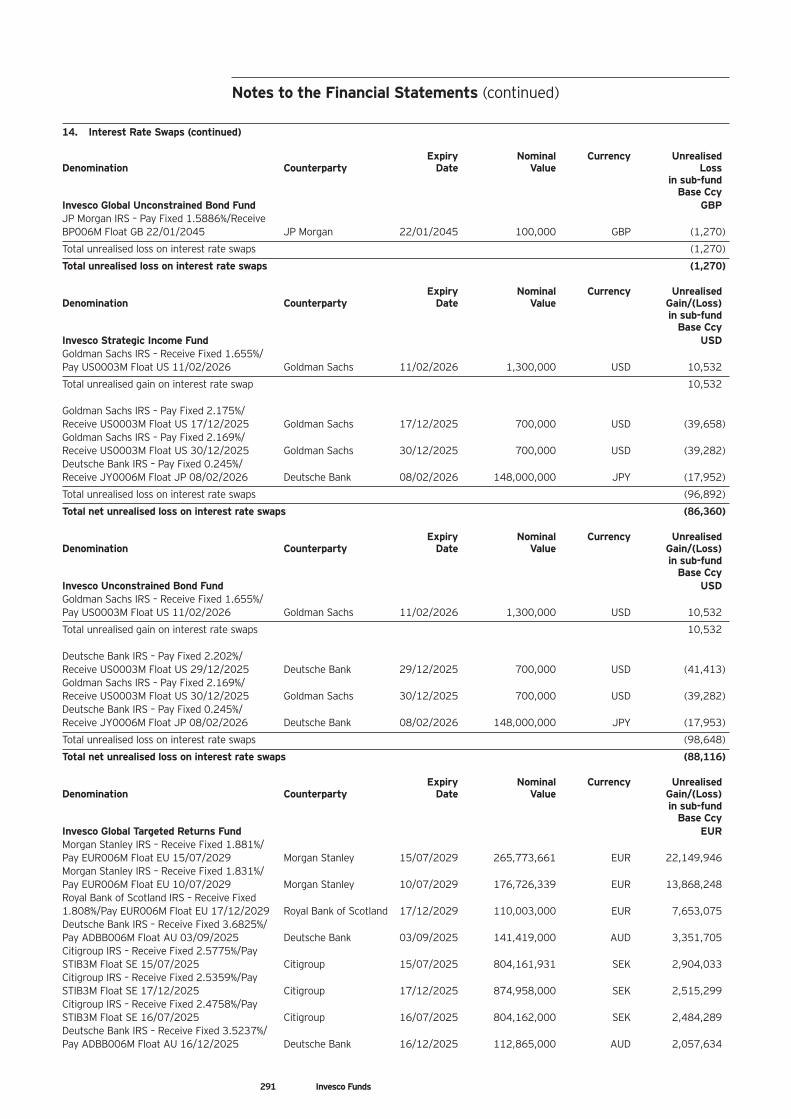
291 Invesco Funds
14. Interest Rate Swaps (continued)
Expiry Nominal Currency UnrealisedDenomination Counterparty Date Value Loss in sub-fund Base CcyInvesco Global Unconstrained Bond Fund GBPJP Morgan IRS – Pay Fixed 1.5886%/Receive BP006M Float GB 22/01/2045 JP Morgan 22/01/2045 100,000 GBP (1,270)
Total unrealised loss on interest rate swaps (1,270)
Total unrealised loss on interest rate swaps (1,270)
Expiry Nominal Currency UnrealisedDenomination Counterparty Date Value Gain/(Loss) in sub-fund Base CcyInvesco Strategic Income Fund USDGoldman Sachs IRS – Receive Fixed 1.655%/Pay US0003M Float US 11/02/2026 Goldman Sachs 11/02/2026 1,300,000 USD 10,532
Total unrealised gain on interest rate swap 10,532
Goldman Sachs IRS – Pay Fixed 2.175%/Receive US0003M Float US 17/12/2025 Goldman Sachs 17/12/2025 700,000 USD (39,658)Goldman Sachs IRS – Pay Fixed 2.169%/Receive US0003M Float US 30/12/2025 Goldman Sachs 30/12/2025 700,000 USD (39,282)Deutsche Bank IRS – Pay Fixed 0.245%/Receive JY0006M Float JP 08/02/2026 Deutsche Bank 08/02/2026 148,000,000 JPY (17,952)
Total unrealised loss on interest rate swaps (96,892)
Total net unrealised loss on interest rate swaps (86,360)
Expiry Nominal Currency UnrealisedDenomination Counterparty Date Value Gain/(Loss) in sub-fund Base CcyInvesco Unconstrained Bond Fund USDGoldman Sachs IRS – Receive Fixed 1.655%/Pay US0003M Float US 11/02/2026 Goldman Sachs 11/02/2026 1,300,000 USD 10,532
Total unrealised gain on interest rate swaps 10,532
Deutsche Bank IRS – Pay Fixed 2.202%/Receive US0003M Float US 29/12/2025 Deutsche Bank 29/12/2025 700,000 USD (41,413)Goldman Sachs IRS – Pay Fixed 2.169%/Receive US0003M Float US 30/12/2025 Goldman Sachs 30/12/2025 700,000 USD (39,282)Deutsche Bank IRS – Pay Fixed 0.245%/Receive JY0006M Float JP 08/02/2026 Deutsche Bank 08/02/2026 148,000,000 JPY (17,953)
Total unrealised loss on interest rate swaps (98,648)
Total net unrealised loss on interest rate swaps (88,116)
Expiry Nominal Currency UnrealisedDenomination Counterparty Date Value Gain/(Loss) in sub-fund Base CcyInvesco Global Targeted Returns Fund EURMorgan Stanley IRS – Receive Fixed 1.881%/Pay EUR006M Float EU 15/07/2029 Morgan Stanley 15/07/2029 265,773,661 EUR 22,149,946Morgan Stanley IRS – Receive Fixed 1.831%/Pay EUR006M Float EU 10/07/2029 Morgan Stanley 10/07/2029 176,726,339 EUR 13,868,248Royal Bank of Scotland IRS – Receive Fixed 1.808%/Pay EUR006M Float EU 17/12/2029 Royal Bank of Scotland 17/12/2029 110,003,000 EUR 7,653,075Deutsche Bank IRS – Receive Fixed 3.6825%/Pay ADBB006M Float AU 03/09/2025 Deutsche Bank 03/09/2025 141,419,000 AUD 3,351,705Citigroup IRS – Receive Fixed 2.5775%/Pay STIB3M Float SE 15/07/2025 Citigroup 15/07/2025 804,161,931 SEK 2,904,033Citigroup IRS – Receive Fixed 2.5359%/Pay STIB3M Float SE 17/12/2025 Citigroup 17/12/2025 874,958,000 SEK 2,515,299Citigroup IRS – Receive Fixed 2.4758%/Pay STIB3M Float SE 16/07/2025 Citigroup 16/07/2025 804,162,000 SEK 2,484,289Deutsche Bank IRS – Receive Fixed 3.5237%/Pay ADBB006M Float AU 16/12/2025 Deutsche Bank 16/12/2025 112,865,000 AUD 2,057,634
Notes to the Financial Statements (continued)
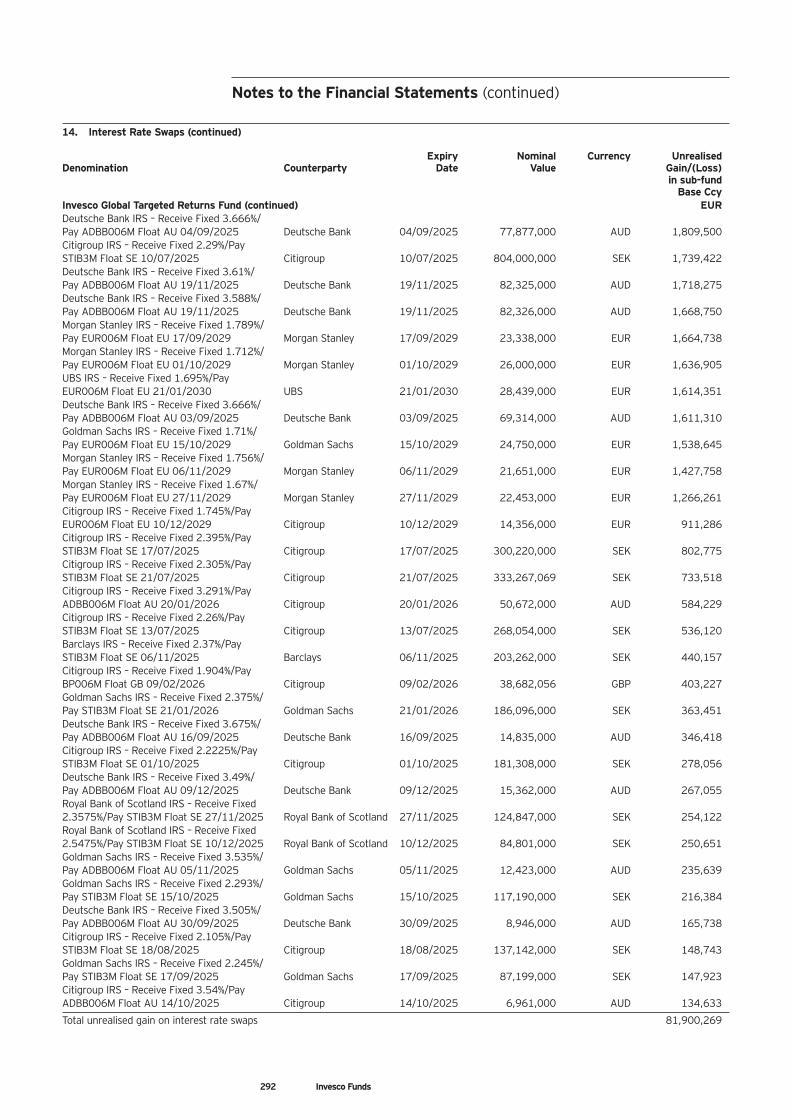
14. Interest Rate Swaps (continued)
Expiry Nominal Currency UnrealisedDenomination Counterparty Date Value Gain/(Loss) in sub-fund Base CcyInvesco Global Targeted Returns Fund (continued) EURDeutsche Bank IRS – Receive Fixed 3.666%/Pay ADBB006M Float AU 04/09/2025 Deutsche Bank 04/09/2025 77,877,000 AUD 1,809,500Citigroup IRS – Receive Fixed 2.29%/Pay STIB3M Float SE 10/07/2025 Citigroup 10/07/2025 804,000,000 SEK 1,739,422Deutsche Bank IRS – Receive Fixed 3.61%/Pay ADBB006M Float AU 19/11/2025 Deutsche Bank 19/11/2025 82,325,000 AUD 1,718,275Deutsche Bank IRS – Receive Fixed 3.588%/Pay ADBB006M Float AU 19/11/2025 Deutsche Bank 19/11/2025 82,326,000 AUD 1,668,750Morgan Stanley IRS – Receive Fixed 1.789%/Pay EUR006M Float EU 17/09/2029 Morgan Stanley 17/09/2029 23,338,000 EUR 1,664,738Morgan Stanley IRS – Receive Fixed 1.712%/Pay EUR006M Float EU 01/10/2029 Morgan Stanley 01/10/2029 26,000,000 EUR 1,636,905UBS IRS – Receive Fixed 1.695%/Pay EUR006M Float EU 21/01/2030 UBS 21/01/2030 28,439,000 EUR 1,614,351Deutsche Bank IRS – Receive Fixed 3.666%/Pay ADBB006M Float AU 03/09/2025 Deutsche Bank 03/09/2025 69,314,000 AUD 1,611,310Goldman Sachs IRS – Receive Fixed 1.71%/Pay EUR006M Float EU 15/10/2029 Goldman Sachs 15/10/2029 24,750,000 EUR 1,538,645Morgan Stanley IRS – Receive Fixed 1.756%/Pay EUR006M Float EU 06/11/2029 Morgan Stanley 06/11/2029 21,651,000 EUR 1,427,758Morgan Stanley IRS – Receive Fixed 1.67%/Pay EUR006M Float EU 27/11/2029 Morgan Stanley 27/11/2029 22,453,000 EUR 1,266,261Citigroup IRS – Receive Fixed 1.745%/Pay EUR006M Float EU 10/12/2029 Citigroup 10/12/2029 14,356,000 EUR 911,286Citigroup IRS – Receive Fixed 2.395%/Pay STIB3M Float SE 17/07/2025 Citigroup 17/07/2025 300,220,000 SEK 802,775Citigroup IRS – Receive Fixed 2.305%/Pay STIB3M Float SE 21/07/2025 Citigroup 21/07/2025 333,267,069 SEK 733,518Citigroup IRS – Receive Fixed 3.291%/Pay ADBB006M Float AU 20/01/2026 Citigroup 20/01/2026 50,672,000 AUD 584,229Citigroup IRS – Receive Fixed 2.26%/Pay STIB3M Float SE 13/07/2025 Citigroup 13/07/2025 268,054,000 SEK 536,120Barclays IRS – Receive Fixed 2.37%/Pay STIB3M Float SE 06/11/2025 Barclays 06/11/2025 203,262,000 SEK 440,157Citigroup IRS – Receive Fixed 1.904%/Pay BP006M Float GB 09/02/2026 Citigroup 09/02/2026 38,682,056 GBP 403,227Goldman Sachs IRS – Receive Fixed 2.375%/Pay STIB3M Float SE 21/01/2026 Goldman Sachs 21/01/2026 186,096,000 SEK 363,451Deutsche Bank IRS – Receive Fixed 3.675%/Pay ADBB006M Float AU 16/09/2025 Deutsche Bank 16/09/2025 14,835,000 AUD 346,418Citigroup IRS – Receive Fixed 2.2225%/Pay STIB3M Float SE 01/10/2025 Citigroup 01/10/2025 181,308,000 SEK 278,056Deutsche Bank IRS – Receive Fixed 3.49%/Pay ADBB006M Float AU 09/12/2025 Deutsche Bank 09/12/2025 15,362,000 AUD 267,055Royal Bank of Scotland IRS – Receive Fixed 2.3575%/Pay STIB3M Float SE 27/11/2025 Royal Bank of Scotland 27/11/2025 124,847,000 SEK 254,122Royal Bank of Scotland IRS – Receive Fixed 2.5475%/Pay STIB3M Float SE 10/12/2025 Royal Bank of Scotland 10/12/2025 84,801,000 SEK 250,651Goldman Sachs IRS – Receive Fixed 3.535%/Pay ADBB006M Float AU 05/11/2025 Goldman Sachs 05/11/2025 12,423,000 AUD 235,639Goldman Sachs IRS – Receive Fixed 2.293%/Pay STIB3M Float SE 15/10/2025 Goldman Sachs 15/10/2025 117,190,000 SEK 216,384Deutsche Bank IRS – Receive Fixed 3.505%/Pay ADBB006M Float AU 30/09/2025 Deutsche Bank 30/09/2025 8,946,000 AUD 165,738Citigroup IRS – Receive Fixed 2.105%/Pay STIB3M Float SE 18/08/2025 Citigroup 18/08/2025 137,142,000 SEK 148,743Goldman Sachs IRS – Receive Fixed 2.245%/Pay STIB3M Float SE 17/09/2025 Goldman Sachs 17/09/2025 87,199,000 SEK 147,923Citigroup IRS – Receive Fixed 3.54%/Pay ADBB006M Float AU 14/10/2025 Citigroup 14/10/2025 6,961,000 AUD 134,633
Total unrealised gain on interest rate swaps 81,900,269
292 Invesco Funds
Notes to the Financial Statements (continued)
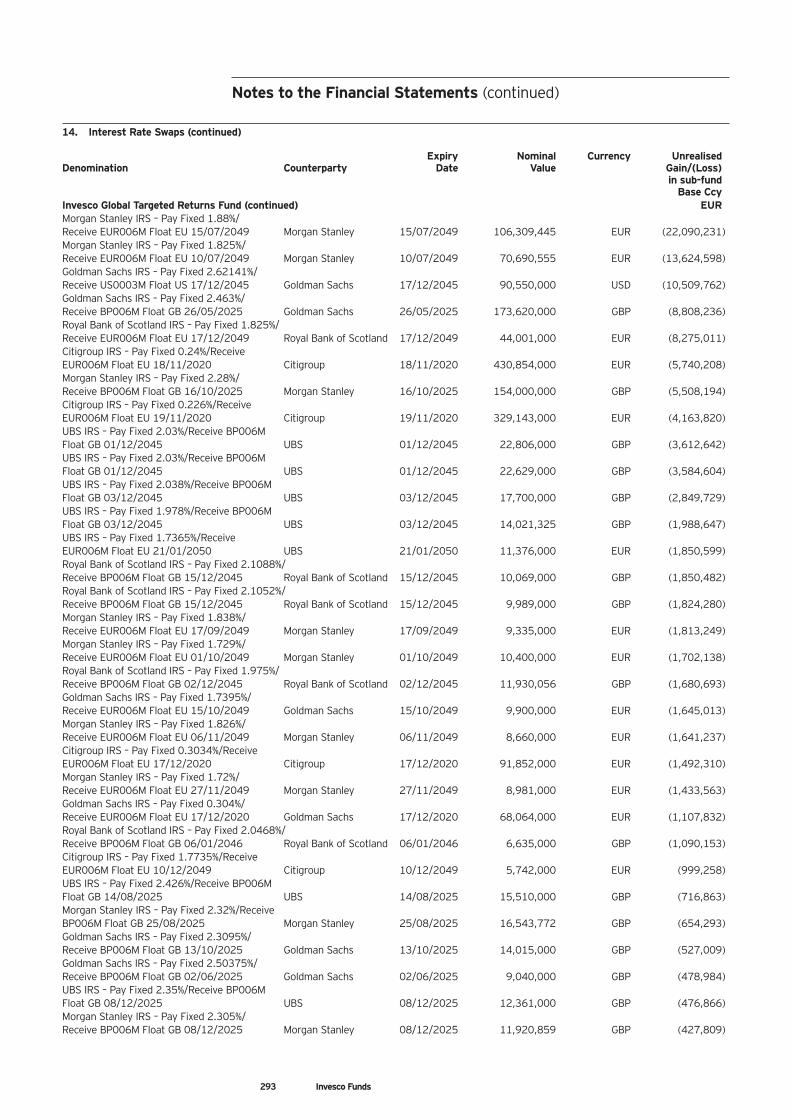
293 Invesco Funds
14. Interest Rate Swaps (continued)
Expiry Nominal Currency UnrealisedDenomination Counterparty Date Value Gain/(Loss) in sub-fund Base CcyInvesco Global Targeted Returns Fund (continued) EURMorgan Stanley IRS – Pay Fixed 1.88%/Receive EUR006M Float EU 15/07/2049 Morgan Stanley 15/07/2049 106,309,445 EUR (22,090,231)Morgan Stanley IRS – Pay Fixed 1.825%/Receive EUR006M Float EU 10/07/2049 Morgan Stanley 10/07/2049 70,690,555 EUR (13,624,598)Goldman Sachs IRS – Pay Fixed 2.62141%/Receive US0003M Float US 17/12/2045 Goldman Sachs 17/12/2045 90,550,000 USD (10,509,762)Goldman Sachs IRS – Pay Fixed 2.463%/Receive BP006M Float GB 26/05/2025 Goldman Sachs 26/05/2025 173,620,000 GBP (8,808,236)Royal Bank of Scotland IRS – Pay Fixed 1.825%/Receive EUR006M Float EU 17/12/2049 Royal Bank of Scotland 17/12/2049 44,001,000 EUR (8,275,011)Citigroup IRS – Pay Fixed 0.24%/Receive EUR006M Float EU 18/11/2020 Citigroup 18/11/2020 430,854,000 EUR (5,740,208)Morgan Stanley IRS – Pay Fixed 2.28%/Receive BP006M Float GB 16/10/2025 Morgan Stanley 16/10/2025 154,000,000 GBP (5,508,194)Citigroup IRS – Pay Fixed 0.226%/Receive EUR006M Float EU 19/11/2020 Citigroup 19/11/2020 329,143,000 EUR (4,163,820)UBS IRS – Pay Fixed 2.03%/Receive BP006M Float GB 01/12/2045 UBS 01/12/2045 22,806,000 GBP (3,612,642)UBS IRS – Pay Fixed 2.03%/Receive BP006M Float GB 01/12/2045 UBS 01/12/2045 22,629,000 GBP (3,584,604)UBS IRS – Pay Fixed 2.038%/Receive BP006M Float GB 03/12/2045 UBS 03/12/2045 17,700,000 GBP (2,849,729)UBS IRS – Pay Fixed 1.978%/Receive BP006M Float GB 03/12/2045 UBS 03/12/2045 14,021,325 GBP (1,988,647)UBS IRS – Pay Fixed 1.7365%/Receive EUR006M Float EU 21/01/2050 UBS 21/01/2050 11,376,000 EUR (1,850,599)Royal Bank of Scotland IRS – Pay Fixed 2.1088%/Receive BP006M Float GB 15/12/2045 Royal Bank of Scotland 15/12/2045 10,069,000 GBP (1,850,482)Royal Bank of Scotland IRS – Pay Fixed 2.1052%/Receive BP006M Float GB 15/12/2045 Royal Bank of Scotland 15/12/2045 9,989,000 GBP (1,824,280)Morgan Stanley IRS – Pay Fixed 1.838%/Receive EUR006M Float EU 17/09/2049 Morgan Stanley 17/09/2049 9,335,000 EUR (1,813,249)Morgan Stanley IRS – Pay Fixed 1.729%/Receive EUR006M Float EU 01/10/2049 Morgan Stanley 01/10/2049 10,400,000 EUR (1,702,138)Royal Bank of Scotland IRS – Pay Fixed 1.975%/Receive BP006M Float GB 02/12/2045 Royal Bank of Scotland 02/12/2045 11,930,056 GBP (1,680,693)Goldman Sachs IRS – Pay Fixed 1.7395%/Receive EUR006M Float EU 15/10/2049 Goldman Sachs 15/10/2049 9,900,000 EUR (1,645,013)Morgan Stanley IRS – Pay Fixed 1.826%/Receive EUR006M Float EU 06/11/2049 Morgan Stanley 06/11/2049 8,660,000 EUR (1,641,237)Citigroup IRS – Pay Fixed 0.3034%/Receive EUR006M Float EU 17/12/2020 Citigroup 17/12/2020 91,852,000 EUR (1,492,310)Morgan Stanley IRS – Pay Fixed 1.72%/Receive EUR006M Float EU 27/11/2049 Morgan Stanley 27/11/2049 8,981,000 EUR (1,433,563)Goldman Sachs IRS – Pay Fixed 0.304%/Receive EUR006M Float EU 17/12/2020 Goldman Sachs 17/12/2020 68,064,000 EUR (1,107,832)Royal Bank of Scotland IRS – Pay Fixed 2.0468%/Receive BP006M Float GB 06/01/2046 Royal Bank of Scotland 06/01/2046 6,635,000 GBP (1,090,153)Citigroup IRS – Pay Fixed 1.7735%/Receive EUR006M Float EU 10/12/2049 Citigroup 10/12/2049 5,742,000 EUR (999,258)UBS IRS – Pay Fixed 2.426%/Receive BP006M Float GB 14/08/2025 UBS 14/08/2025 15,510,000 GBP (716,863)Morgan Stanley IRS – Pay Fixed 2.32%/ReceiveBP006M Float GB 25/08/2025 Morgan Stanley 25/08/2025 16,543,772 GBP (654,293)Goldman Sachs IRS – Pay Fixed 2.3095%/Receive BP006M Float GB 13/10/2025 Goldman Sachs 13/10/2025 14,015,000 GBP (527,009)Goldman Sachs IRS – Pay Fixed 2.50375%/Receive BP006M Float GB 02/06/2025 Goldman Sachs 02/06/2025 9,040,000 GBP (478,984)UBS IRS – Pay Fixed 2.35%/Receive BP006M Float GB 08/12/2025 UBS 08/12/2025 12,361,000 GBP (476,866)Morgan Stanley IRS – Pay Fixed 2.305%/Receive BP006M Float GB 08/12/2025 Morgan Stanley 08/12/2025 11,920,859 GBP (427,809)
Notes to the Financial Statements (continued)
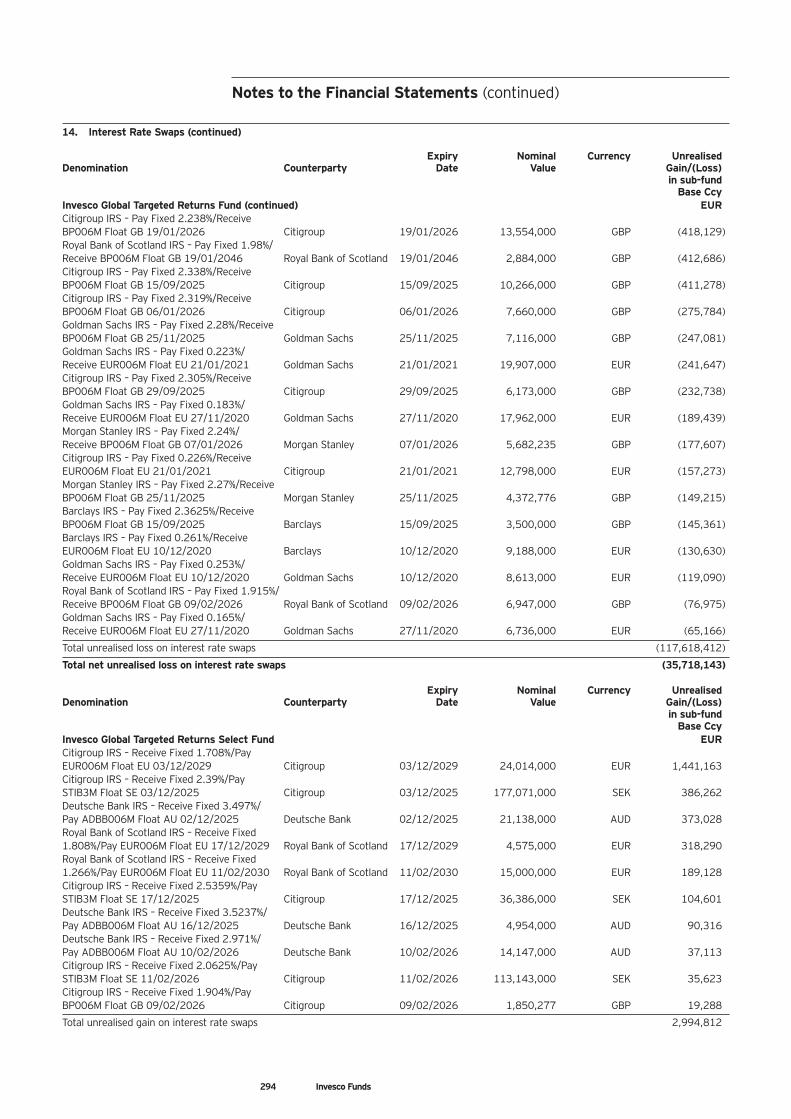
14. Interest Rate Swaps (continued)
Expiry Nominal Currency UnrealisedDenomination Counterparty Date Value Gain/(Loss) in sub-fund Base CcyInvesco Global Targeted Returns Fund (continued) EURCitigroup IRS – Pay Fixed 2.238%/Receive BP006M Float GB 19/01/2026 Citigroup 19/01/2026 13,554,000 GBP (418,129)Royal Bank of Scotland IRS – Pay Fixed 1.98%/Receive BP006M Float GB 19/01/2046 Royal Bank of Scotland 19/01/2046 2,884,000 GBP (412,686)Citigroup IRS – Pay Fixed 2.338%/Receive BP006M Float GB 15/09/2025 Citigroup 15/09/2025 10,266,000 GBP (411,278)Citigroup IRS – Pay Fixed 2.319%/Receive BP006M Float GB 06/01/2026 Citigroup 06/01/2026 7,660,000 GBP (275,784)Goldman Sachs IRS – Pay Fixed 2.28%/ReceiveBP006M Float GB 25/11/2025 Goldman Sachs 25/11/2025 7,116,000 GBP (247,081)Goldman Sachs IRS – Pay Fixed 0.223%/Receive EUR006M Float EU 21/01/2021 Goldman Sachs 21/01/2021 19,907,000 EUR (241,647)Citigroup IRS – Pay Fixed 2.305%/Receive BP006M Float GB 29/09/2025 Citigroup 29/09/2025 6,173,000 GBP (232,738)Goldman Sachs IRS – Pay Fixed 0.183%/Receive EUR006M Float EU 27/11/2020 Goldman Sachs 27/11/2020 17,962,000 EUR (189,439)Morgan Stanley IRS – Pay Fixed 2.24%/Receive BP006M Float GB 07/01/2026 Morgan Stanley 07/01/2026 5,682,235 GBP (177,607)Citigroup IRS – Pay Fixed 0.226%/Receive EUR006M Float EU 21/01/2021 Citigroup 21/01/2021 12,798,000 EUR (157,273)Morgan Stanley IRS – Pay Fixed 2.27%/ReceiveBP006M Float GB 25/11/2025 Morgan Stanley 25/11/2025 4,372,776 GBP (149,215)Barclays IRS – Pay Fixed 2.3625%/Receive BP006M Float GB 15/09/2025 Barclays 15/09/2025 3,500,000 GBP (145,361)Barclays IRS – Pay Fixed 0.261%/Receive EUR006M Float EU 10/12/2020 Barclays 10/12/2020 9,188,000 EUR (130,630)Goldman Sachs IRS – Pay Fixed 0.253%/Receive EUR006M Float EU 10/12/2020 Goldman Sachs 10/12/2020 8,613,000 EUR (119,090)Royal Bank of Scotland IRS – Pay Fixed 1.915%/Receive BP006M Float GB 09/02/2026 Royal Bank of Scotland 09/02/2026 6,947,000 GBP (76,975)Goldman Sachs IRS – Pay Fixed 0.165%/Receive EUR006M Float EU 27/11/2020 Goldman Sachs 27/11/2020 6,736,000 EUR (65,166)
Total unrealised loss on interest rate swaps (117,618,412)
Total net unrealised loss on interest rate swaps (35,718,143)
Expiry Nominal Currency UnrealisedDenomination Counterparty Date Value Gain/(Loss) in sub-fund Base CcyInvesco Global Targeted Returns Select Fund EURCitigroup IRS – Receive Fixed 1.708%/Pay EUR006M Float EU 03/12/2029 Citigroup 03/12/2029 24,014,000 EUR 1,441,163Citigroup IRS – Receive Fixed 2.39%/Pay STIB3M Float SE 03/12/2025 Citigroup 03/12/2025 177,071,000 SEK 386,262Deutsche Bank IRS – Receive Fixed 3.497%/Pay ADBB006M Float AU 02/12/2025 Deutsche Bank 02/12/2025 21,138,000 AUD 373,028Royal Bank of Scotland IRS – Receive Fixed 1.808%/Pay EUR006M Float EU 17/12/2029 Royal Bank of Scotland 17/12/2029 4,575,000 EUR 318,290Royal Bank of Scotland IRS – Receive Fixed 1.266%/Pay EUR006M Float EU 11/02/2030 Royal Bank of Scotland 11/02/2030 15,000,000 EUR 189,128Citigroup IRS – Receive Fixed 2.5359%/Pay STIB3M Float SE 17/12/2025 Citigroup 17/12/2025 36,386,000 SEK 104,601Deutsche Bank IRS – Receive Fixed 3.5237%/Pay ADBB006M Float AU 16/12/2025 Deutsche Bank 16/12/2025 4,954,000 AUD 90,316Deutsche Bank IRS – Receive Fixed 2.971%/Pay ADBB006M Float AU 10/02/2026 Deutsche Bank 10/02/2026 14,147,000 AUD 37,113Citigroup IRS – Receive Fixed 2.0625%/Pay STIB3M Float SE 11/02/2026 Citigroup 11/02/2026 113,143,000 SEK 35,623Citigroup IRS – Receive Fixed 1.904%/Pay BP006M Float GB 09/02/2026 Citigroup 09/02/2026 1,850,277 GBP 19,288
Total unrealised gain on interest rate swaps 2,994,812
294 Invesco Funds
Notes to the Financial Statements (continued)
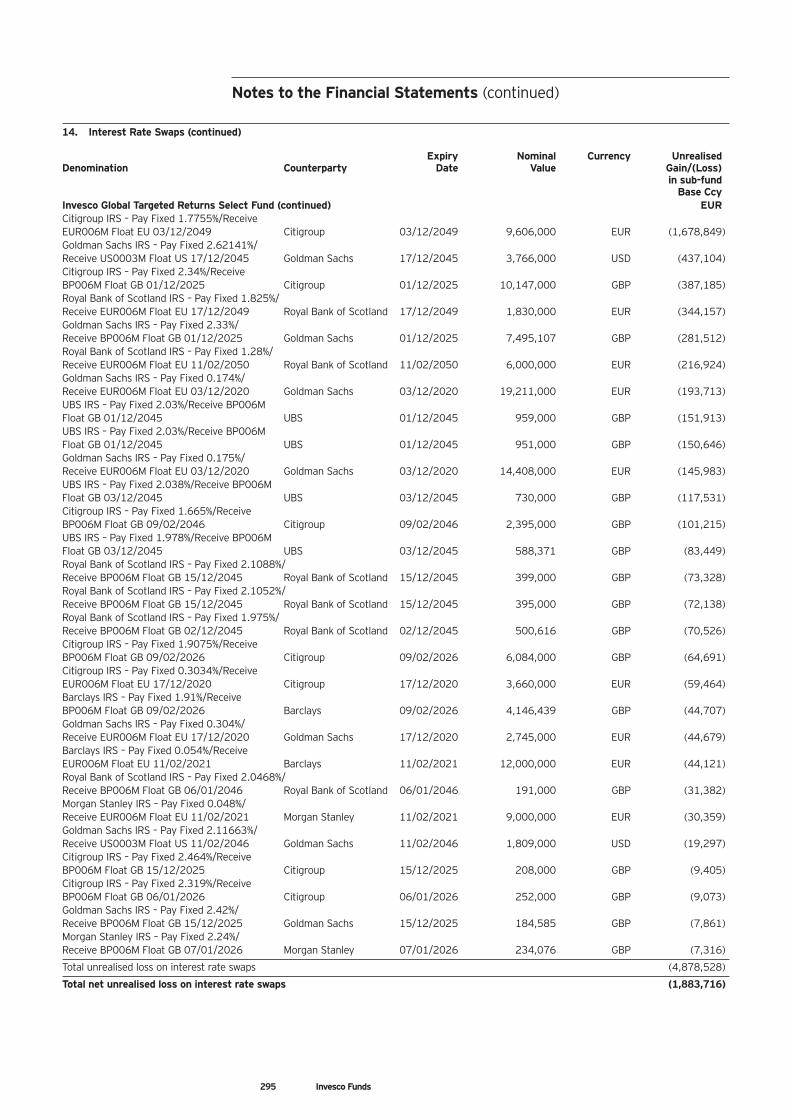
14. Interest Rate Swaps (continued)
Expiry Nominal Currency UnrealisedDenomination Counterparty Date Value Gain/(Loss) in sub-fund Base CcyInvesco Global Targeted Returns Select Fund (continued) EURCitigroup IRS – Pay Fixed 1.7755%/Receive EUR006M Float EU 03/12/2049 Citigroup 03/12/2049 9,606,000 EUR (1,678,849)Goldman Sachs IRS – Pay Fixed 2.62141%/Receive US0003M Float US 17/12/2045 Goldman Sachs 17/12/2045 3,766,000 USD (437,104)Citigroup IRS – Pay Fixed 2.34%/Receive BP006M Float GB 01/12/2025 Citigroup 01/12/2025 10,147,000 GBP (387,185)Royal Bank of Scotland IRS – Pay Fixed 1.825%/Receive EUR006M Float EU 17/12/2049 Royal Bank of Scotland 17/12/2049 1,830,000 EUR (344,157)Goldman Sachs IRS – Pay Fixed 2.33%/Receive BP006M Float GB 01/12/2025 Goldman Sachs 01/12/2025 7,495,107 GBP (281,512)Royal Bank of Scotland IRS – Pay Fixed 1.28%/Receive EUR006M Float EU 11/02/2050 Royal Bank of Scotland 11/02/2050 6,000,000 EUR (216,924)Goldman Sachs IRS – Pay Fixed 0.174%/Receive EUR006M Float EU 03/12/2020 Goldman Sachs 03/12/2020 19,211,000 EUR (193,713)UBS IRS – Pay Fixed 2.03%/Receive BP006M Float GB 01/12/2045 UBS 01/12/2045 959,000 GBP (151,913)UBS IRS – Pay Fixed 2.03%/Receive BP006M Float GB 01/12/2045 UBS 01/12/2045 951,000 GBP (150,646)Goldman Sachs IRS – Pay Fixed 0.175%/Receive EUR006M Float EU 03/12/2020 Goldman Sachs 03/12/2020 14,408,000 EUR (145,983)UBS IRS – Pay Fixed 2.038%/Receive BP006M Float GB 03/12/2045 UBS 03/12/2045 730,000 GBP (117,531)Citigroup IRS – Pay Fixed 1.665%/Receive BP006M Float GB 09/02/2046 Citigroup 09/02/2046 2,395,000 GBP (101,215)UBS IRS – Pay Fixed 1.978%/Receive BP006M Float GB 03/12/2045 UBS 03/12/2045 588,371 GBP (83,449)Royal Bank of Scotland IRS – Pay Fixed 2.1088%/Receive BP006M Float GB 15/12/2045 Royal Bank of Scotland 15/12/2045 399,000 GBP (73,328)Royal Bank of Scotland IRS – Pay Fixed 2.1052%/Receive BP006M Float GB 15/12/2045 Royal Bank of Scotland 15/12/2045 395,000 GBP (72,138)Royal Bank of Scotland IRS – Pay Fixed 1.975%/Receive BP006M Float GB 02/12/2045 Royal Bank of Scotland 02/12/2045 500,616 GBP (70,526)Citigroup IRS – Pay Fixed 1.9075%/Receive BP006M Float GB 09/02/2026 Citigroup 09/02/2026 6,084,000 GBP (64,691)Citigroup IRS – Pay Fixed 0.3034%/Receive EUR006M Float EU 17/12/2020 Citigroup 17/12/2020 3,660,000 EUR (59,464)Barclays IRS – Pay Fixed 1.91%/Receive BP006M Float GB 09/02/2026 Barclays 09/02/2026 4,146,439 GBP (44,707)Goldman Sachs IRS – Pay Fixed 0.304%/Receive EUR006M Float EU 17/12/2020 Goldman Sachs 17/12/2020 2,745,000 EUR (44,679)Barclays IRS – Pay Fixed 0.054%/Receive EUR006M Float EU 11/02/2021 Barclays 11/02/2021 12,000,000 EUR (44,121)Royal Bank of Scotland IRS – Pay Fixed 2.0468%/Receive BP006M Float GB 06/01/2046 Royal Bank of Scotland 06/01/2046 191,000 GBP (31,382)Morgan Stanley IRS – Pay Fixed 0.048%/Receive EUR006M Float EU 11/02/2021 Morgan Stanley 11/02/2021 9,000,000 EUR (30,359)Goldman Sachs IRS – Pay Fixed 2.11663%/Receive US0003M Float US 11/02/2046 Goldman Sachs 11/02/2046 1,809,000 USD (19,297)Citigroup IRS – Pay Fixed 2.464%/Receive BP006M Float GB 15/12/2025 Citigroup 15/12/2025 208,000 GBP (9,405)Citigroup IRS – Pay Fixed 2.319%/Receive BP006M Float GB 06/01/2026 Citigroup 06/01/2026 252,000 GBP (9,073)Goldman Sachs IRS – Pay Fixed 2.42%/Receive BP006M Float GB 15/12/2025 Goldman Sachs 15/12/2025 184,585 GBP (7,861)Morgan Stanley IRS – Pay Fixed 2.24%/Receive BP006M Float GB 07/01/2026 Morgan Stanley 07/01/2026 234,076 GBP (7,316)
Total unrealised loss on interest rate swaps (4,878,528)
Total net unrealised loss on interest rate swaps (1,883,716)
295 Invesco Funds
Notes to the Financial Statements (continued)
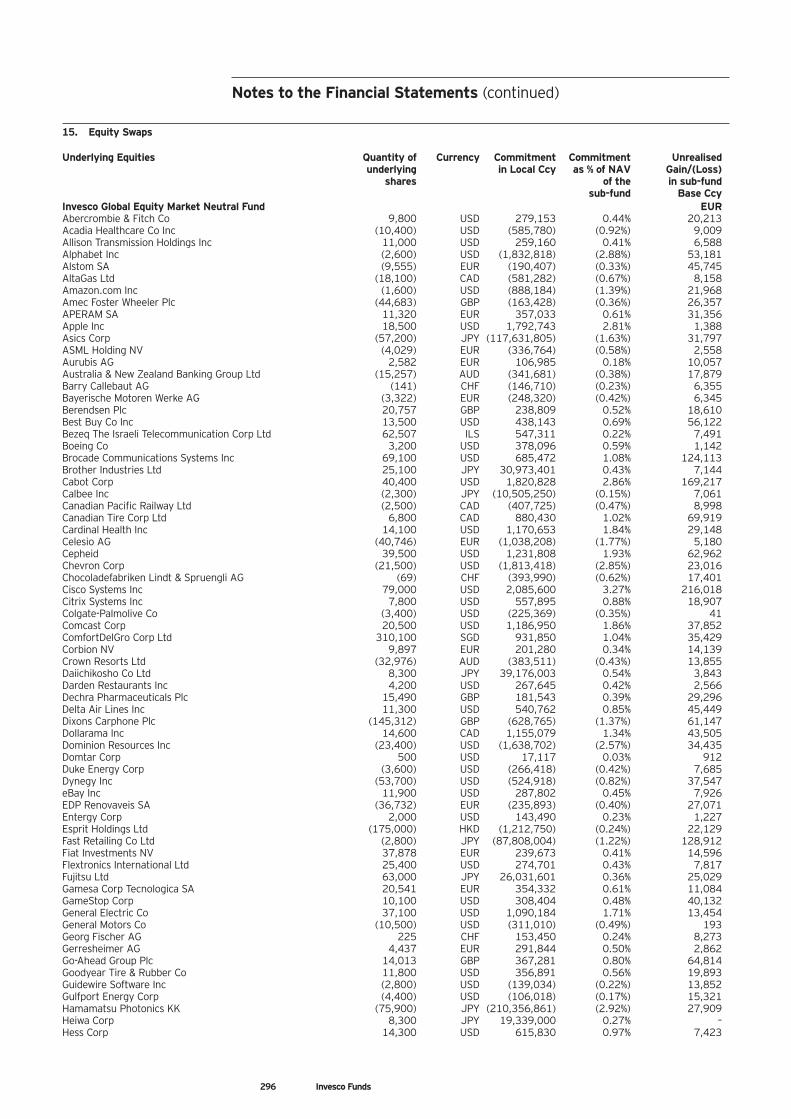
296 Invesco Funds
Notes to the Financial Statements (continued)
15. Equity Swaps
Underlying Equities Quantity of Currency Commitment Commitment Unrealised underlying in Local Ccy as % of NAV Gain/(Loss) shares of the in sub-fund sub-fund Base CcyInvesco Global Equity Market Neutral Fund EURAbercrombie & Fitch Co 9,800 USD 279,153 0.44% 20,213Acadia Healthcare Co Inc (10,400) USD (585,780) (0.92%) 9,009Allison Transmission Holdings Inc 11,000 USD 259,160 0.41% 6,588Alphabet Inc (2,600) USD (1,832,818) (2.88%) 53,181Alstom SA (9,555) EUR (190,407) (0.33%) 45,745AltaGas Ltd (18,100) CAD (581,282) (0.67%) 8,158Amazon.com Inc (1,600) USD (888,184) (1.39%) 21,968Amec Foster Wheeler Plc (44,683) GBP (163,428) (0.36%) 26,357APERAM SA 11,320 EUR 357,033 0.61% 31,356Apple Inc 18,500 USD 1,792,743 2.81% 1,388Asics Corp (57,200) JPY (117,631,805) (1.63%) 31,797ASML Holding NV (4,029) EUR (336,764) (0.58%) 2,558Aurubis AG 2,582 EUR 106,985 0.18% 10,057Australia & New Zealand Banking Group Ltd (15,257) AUD (341,681) (0.38%) 17,879Barry Callebaut AG (141) CHF (146,710) (0.23%) 6,355Bayerische Motoren Werke AG (3,322) EUR (248,320) (0.42%) 6,345Berendsen Plc 20,757 GBP 238,809 0.52% 18,610Best Buy Co Inc 13,500 USD 438,143 0.69% 56,122Bezeq The Israeli Telecommunication Corp Ltd 62,507 ILS 547,311 0.22% 7,491Boeing Co 3,200 USD 378,096 0.59% 1,142Brocade Communications Systems Inc 69,100 USD 685,472 1.08% 124,113Brother Industries Ltd 25,100 JPY 30,973,401 0.43% 7,144Cabot Corp 40,400 USD 1,820,828 2.86% 169,217Calbee Inc (2,300) JPY (10,505,250) (0.15%) 7,061Canadian Pacific Railway Ltd (2,500) CAD (407,725) (0.47%) 8,998Canadian Tire Corp Ltd 6,800 CAD 880,430 1.02% 69,919Cardinal Health Inc 14,100 USD 1,170,653 1.84% 29,148Celesio AG (40,746) EUR (1,038,208) (1.77%) 5,180Cepheid 39,500 USD 1,231,808 1.93% 62,962Chevron Corp (21,500) USD (1,813,418) (2.85%) 23,016Chocoladefabriken Lindt & Spruengli AG (69) CHF (393,990) (0.62%) 17,401Cisco Systems Inc 79,000 USD 2,085,600 3.27% 216,018Citrix Systems Inc 7,800 USD 557,895 0.88% 18,907Colgate-Palmolive Co (3,400) USD (225,369) (0.35%) 41Comcast Corp 20,500 USD 1,186,950 1.86% 37,852ComfortDelGro Corp Ltd 310,100 SGD 931,850 1.04% 35,429Corbion NV 9,897 EUR 201,280 0.34% 14,139Crown Resorts Ltd (32,976) AUD (383,511) (0.43%) 13,855Daiichikosho Co Ltd 8,300 JPY 39,176,003 0.54% 3,843Darden Restaurants Inc 4,200 USD 267,645 0.42% 2,566Dechra Pharmaceuticals Plc 15,490 GBP 181,543 0.39% 29,296Delta Air Lines Inc 11,300 USD 540,762 0.85% 45,449Dixons Carphone Plc (145,312) GBP (628,765) (1.37%) 61,147Dollarama Inc 14,600 CAD 1,155,079 1.34% 43,505Dominion Resources Inc (23,400) USD (1,638,702) (2.57%) 34,435Domtar Corp 500 USD 17,117 0.03% 912Duke Energy Corp (3,600) USD (266,418) (0.42%) 7,685Dynegy Inc (53,700) USD (524,918) (0.82%) 37,547eBay Inc 11,900 USD 287,802 0.45% 7,926EDP Renovaveis SA (36,732) EUR (235,893) (0.40%) 27,071Entergy Corp 2,000 USD 143,490 0.23% 1,227Esprit Holdings Ltd (175,000) HKD (1,212,750) (0.24%) 22,129Fast Retailing Co Ltd (2,800) JPY (87,808,004) (1.22%) 128,912Fiat Investments NV 37,878 EUR 239,673 0.41% 14,596Flextronics International Ltd 25,400 USD 274,701 0.43% 7,817Fujitsu Ltd 63,000 JPY 26,031,601 0.36% 25,029Gamesa Corp Tecnologica SA 20,541 EUR 354,332 0.61% 11,084GameStop Corp 10,100 USD 308,404 0.48% 40,132General Electric Co 37,100 USD 1,090,184 1.71% 13,454General Motors Co (10,500) USD (311,010) (0.49%) 193Georg Fischer AG 225 CHF 153,450 0.24% 8,273Gerresheimer AG 4,437 EUR 291,844 0.50% 2,862Go-Ahead Group Plc 14,013 GBP 367,281 0.80% 64,814Goodyear Tire & Rubber Co 11,800 USD 356,891 0.56% 19,893Guidewire Software Inc (2,800) USD (139,034) (0.22%) 13,852Gulfport Energy Corp (4,400) USD (106,018) (0.17%) 15,321Hamamatsu Photonics KK (75,900) JPY (210,356,861) (2.92%) 27,909Heiwa Corp 8,300 JPY 19,339,000 0.27% –Hess Corp 14,300 USD 615,830 0.97% 7,423
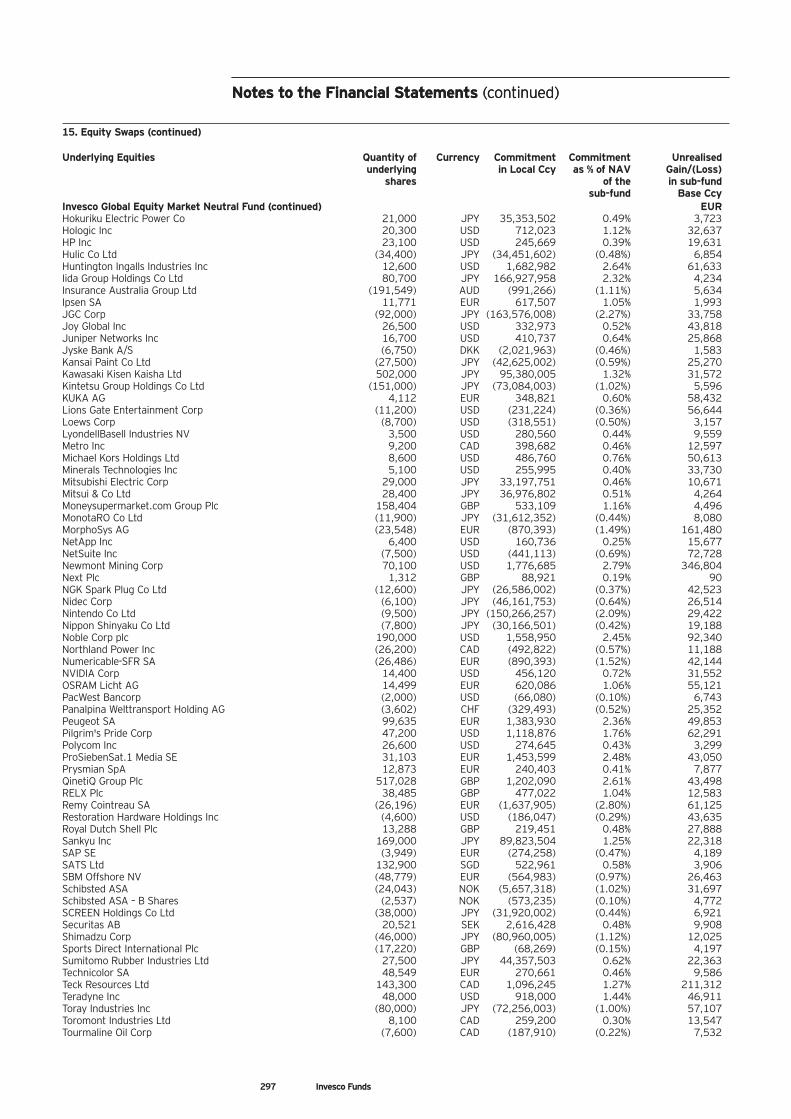
297 Invesco Funds
15. Equity Swaps (continued)
Underlying Equities Quantity of Currency Commitment Commitment Unrealised underlying in Local Ccy as % of NAV Gain/(Loss) shares of the in sub-fund sub-fund Base CcyInvesco Global Equity Market Neutral Fund (continued) EURHokuriku Electric Power Co 21,000 JPY 35,353,502 0.49% 3,723Hologic Inc 20,300 USD 712,023 1.12% 32,637HP Inc 23,100 USD 245,669 0.39% 19,631Hulic Co Ltd (34,400) JPY (34,451,602) (0.48%) 6,854Huntington Ingalls Industries Inc 12,600 USD 1,682,982 2.64% 61,633Iida Group Holdings Co Ltd 80,700 JPY 166,927,958 2.32% 4,234Insurance Australia Group Ltd (191,549) AUD (991,266) (1.11%) 5,634Ipsen SA 11,771 EUR 617,507 1.05% 1,993JGC Corp (92,000) JPY (163,576,008) (2.27%) 33,758Joy Global Inc 26,500 USD 332,973 0.52% 43,818Juniper Networks Inc 16,700 USD 410,737 0.64% 25,868Jyske Bank A/S (6,750) DKK (2,021,963) (0.46%) 1,583Kansai Paint Co Ltd (27,500) JPY (42,625,002) (0.59%) 25,270Kawasaki Kisen Kaisha Ltd 502,000 JPY 95,380,005 1.32% 31,572Kintetsu Group Holdings Co Ltd (151,000) JPY (73,084,003) (1.02%) 5,596KUKA AG 4,112 EUR 348,821 0.60% 58,432Lions Gate Entertainment Corp (11,200) USD (231,224) (0.36%) 56,644Loews Corp (8,700) USD (318,551) (0.50%) 3,157LyondellBasell Industries NV 3,500 USD 280,560 0.44% 9,559Metro Inc 9,200 CAD 398,682 0.46% 12,597Michael Kors Holdings Ltd 8,600 USD 486,760 0.76% 50,613Minerals Technologies Inc 5,100 USD 255,995 0.40% 33,730Mitsubishi Electric Corp 29,000 JPY 33,197,751 0.46% 10,671Mitsui & Co Ltd 28,400 JPY 36,976,802 0.51% 4,264Moneysupermarket.com Group Plc 158,404 GBP 533,109 1.16% 4,496MonotaRO Co Ltd (11,900) JPY (31,612,352) (0.44%) 8,080MorphoSys AG (23,548) EUR (870,393) (1.49%) 161,480NetApp Inc 6,400 USD 160,736 0.25% 15,677NetSuite Inc (7,500) USD (441,113) (0.69%) 72,728Newmont Mining Corp 70,100 USD 1,776,685 2.79% 346,804Next Plc 1,312 GBP 88,921 0.19% 90NGK Spark Plug Co Ltd (12,600) JPY (26,586,002) (0.37%) 42,523Nidec Corp (6,100) JPY (46,161,753) (0.64%) 26,514Nintendo Co Ltd (9,500) JPY (150,266,257) (2.09%) 29,422Nippon Shinyaku Co Ltd (7,800) JPY (30,166,501) (0.42%) 19,188Noble Corp plc 190,000 USD 1,558,950 2.45% 92,340Northland Power Inc (26,200) CAD (492,822) (0.57%) 11,188Numericable-SFR SA (26,486) EUR (890,393) (1.52%) 42,144NVIDIA Corp 14,400 USD 456,120 0.72% 31,552OSRAM Licht AG 14,499 EUR 620,086 1.06% 55,121PacWest Bancorp (2,000) USD (66,080) (0.10%) 6,743Panalpina Welttransport Holding AG (3,602) CHF (329,493) (0.52%) 25,352Peugeot SA 99,635 EUR 1,383,930 2.36% 49,853Pilgrim's Pride Corp 47,200 USD 1,118,876 1.76% 62,291Polycom Inc 26,600 USD 274,645 0.43% 3,299ProSiebenSat.1 Media SE 31,103 EUR 1,453,599 2.48% 43,050Prysmian SpA 12,873 EUR 240,403 0.41% 7,877QinetiQ Group Plc 517,028 GBP 1,202,090 2.61% 43,498RELX Plc 38,485 GBP 477,022 1.04% 12,583Remy Cointreau SA (26,196) EUR (1,637,905) (2.80%) 61,125Restoration Hardware Holdings Inc (4,600) USD (186,047) (0.29%) 43,635Royal Dutch Shell Plc 13,288 GBP 219,451 0.48% 27,888Sankyu Inc 169,000 JPY 89,823,504 1.25% 22,318SAP SE (3,949) EUR (274,258) (0.47%) 4,189SATS Ltd 132,900 SGD 522,961 0.58% 3,906SBM Offshore NV (48,779) EUR (564,983) (0.97%) 26,463Schibsted ASA (24,043) NOK (5,657,318) (1.02%) 31,697Schibsted ASA – B Shares (2,537) NOK (573,235) (0.10%) 4,772SCREEN Holdings Co Ltd (38,000) JPY (31,920,002) (0.44%) 6,921Securitas AB 20,521 SEK 2,616,428 0.48% 9,908Shimadzu Corp (46,000) JPY (80,960,005) (1.12%) 12,025Sports Direct International Plc (17,220) GBP (68,269) (0.15%) 4,197Sumitomo Rubber Industries Ltd 27,500 JPY 44,357,503 0.62% 22,363Technicolor SA 48,549 EUR 270,661 0.46% 9,586Teck Resources Ltd 143,300 CAD 1,096,245 1.27% 211,312Teradyne Inc 48,000 USD 918,000 1.44% 46,911Toray Industries Inc (80,000) JPY (72,256,003) (1.00%) 57,107Toromont Industries Ltd 8,100 CAD 259,200 0.30% 13,547Tourmaline Oil Corp (7,600) CAD (187,910) (0.22%) 7,532
Notes to the Financial Statements (continued)Notes to the Financial Statements (continued)
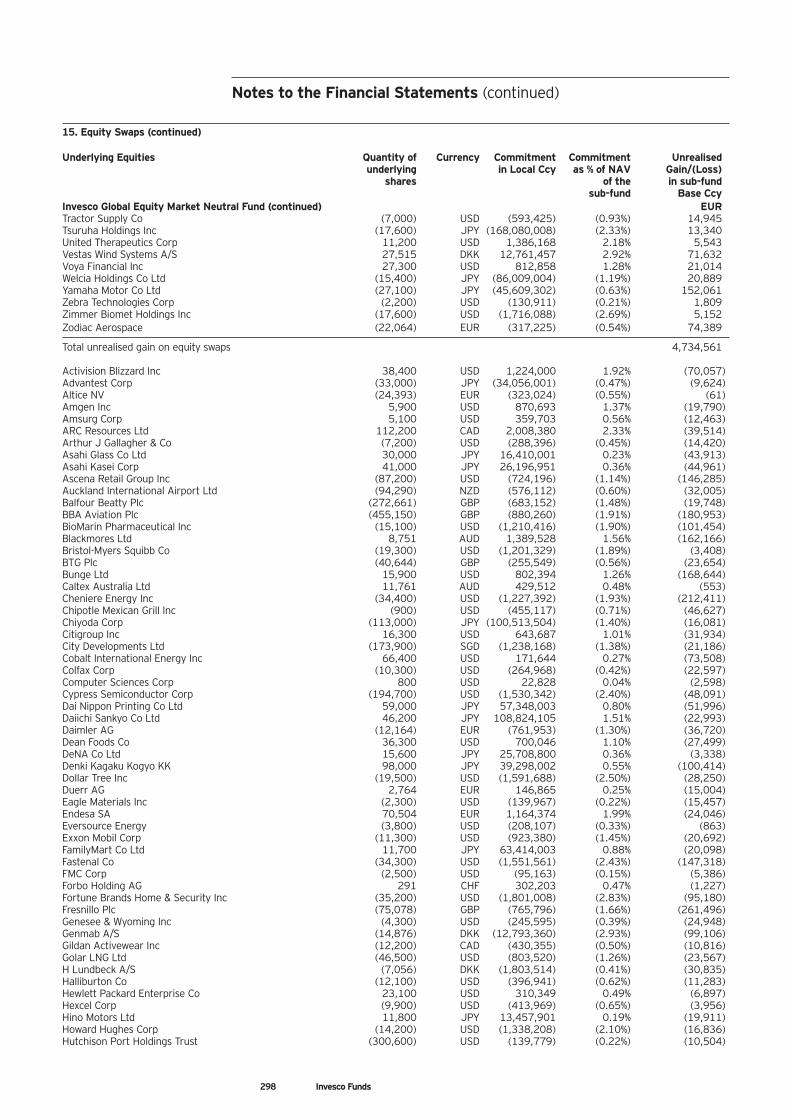
298 Invesco Funds
15. Equity Swaps (continued)
Underlying Equities Quantity of Currency Commitment Commitment Unrealised underlying in Local Ccy as % of NAV Gain/(Loss) shares of the in sub-fund sub-fund Base CcyInvesco Global Equity Market Neutral Fund (continued) EURTractor Supply Co (7,000) USD (593,425) (0.93%) 14,945Tsuruha Holdings Inc (17,600) JPY (168,080,008) (2.33%) 13,340United Therapeutics Corp 11,200 USD 1,386,168 2.18% 5,543Vestas Wind Systems A/S 27,515 DKK 12,761,457 2.92% 71,632Voya Financial Inc 27,300 USD 812,858 1.28% 21,014Welcia Holdings Co Ltd (15,400) JPY (86,009,004) (1.19%) 20,889Yamaha Motor Co Ltd (27,100) JPY (45,609,302) (0.63%) 152,061Zebra Technologies Corp (2,200) USD (130,911) (0.21%) 1,809Zimmer Biomet Holdings Inc (17,600) USD (1,716,088) (2.69%) 5,152Zodiac Aerospace (22,064) EUR (317,225) (0.54%) 74,389
Total unrealised gain on equity swaps 4,734,561
Activision Blizzard Inc 38,400 USD 1,224,000 1.92% (70,057)Advantest Corp (33,000) JPY (34,056,001) (0.47%) (9,624)Altice NV (24,393) EUR (323,024) (0.55%) (61)Amgen Inc 5,900 USD 870,693 1.37% (19,790)Amsurg Corp 5,100 USD 359,703 0.56% (12,463)ARC Resources Ltd 112,200 CAD 2,008,380 2.33% (39,514)Arthur J Gallagher & Co (7,200) USD (288,396) (0.45%) (14,420)Asahi Glass Co Ltd 30,000 JPY 16,410,001 0.23% (43,913)Asahi Kasei Corp 41,000 JPY 26,196,951 0.36% (44,961)Ascena Retail Group Inc (87,200) USD (724,196) (1.14%) (146,285)Auckland International Airport Ltd (94,290) NZD (576,112) (0.60%) (32,005)Balfour Beatty Plc (272,661) GBP (683,152) (1.48%) (19,748)BBA Aviation Plc (455,150) GBP (880,260) (1.91%) (180,953)BioMarin Pharmaceutical Inc (15,100) USD (1,210,416) (1.90%) (101,454)Blackmores Ltd 8,751 AUD 1,389,528 1.56% (162,166)Bristol-Myers Squibb Co (19,300) USD (1,201,329) (1.89%) (3,408)BTG Plc (40,644) GBP (255,549) (0.56%) (23,654)Bunge Ltd 15,900 USD 802,394 1.26% (168,644)Caltex Australia Ltd 11,761 AUD 429,512 0.48% (553)Cheniere Energy Inc (34,400) USD (1,227,392) (1.93%) (212,411)Chipotle Mexican Grill Inc (900) USD (455,117) (0.71%) (46,627)Chiyoda Corp (113,000) JPY (100,513,504) (1.40%) (16,081)Citigroup Inc 16,300 USD 643,687 1.01% (31,934)City Developments Ltd (173,900) SGD (1,238,168) (1.38%) (21,186)Cobalt International Energy Inc 66,400 USD 171,644 0.27% (73,508)Colfax Corp (10,300) USD (264,968) (0.42%) (22,597)Computer Sciences Corp 800 USD 22,828 0.04% (2,598)Cypress Semiconductor Corp (194,700) USD (1,530,342) (2.40%) (48,091)Dai Nippon Printing Co Ltd 59,000 JPY 57,348,003 0.80% (51,996)Daiichi Sankyo Co Ltd 46,200 JPY 108,824,105 1.51% (22,993)Daimler AG (12,164) EUR (761,953) (1.30%) (36,720)Dean Foods Co 36,300 USD 700,046 1.10% (27,499)DeNA Co Ltd 15,600 JPY 25,708,800 0.36% (3,338)Denki Kagaku Kogyo KK 98,000 JPY 39,298,002 0.55% (100,414)Dollar Tree Inc (19,500) USD (1,591,688) (2.50%) (28,250)Duerr AG 2,764 EUR 146,865 0.25% (15,004)Eagle Materials Inc (2,300) USD (139,967) (0.22%) (15,457)Endesa SA 70,504 EUR 1,164,374 1.99% (24,046)Eversource Energy (3,800) USD (208,107) (0.33%) (863)Exxon Mobil Corp (11,300) USD (923,380) (1.45%) (20,692)FamilyMart Co Ltd 11,700 JPY 63,414,003 0.88% (20,098)Fastenal Co (34,300) USD (1,551,561) (2.43%) (147,318)FMC Corp (2,500) USD (95,163) (0.15%) (5,386)Forbo Holding AG 291 CHF 302,203 0.47% (1,227)Fortune Brands Home & Security Inc (35,200) USD (1,801,008) (2.83%) (95,180)Fresnillo Plc (75,078) GBP (765,796) (1.66%) (261,496)Genesee & Wyoming Inc (4,300) USD (245,595) (0.39%) (24,948)Genmab A/S (14,876) DKK (12,793,360) (2.93%) (99,106)Gildan Activewear Inc (12,200) CAD (430,355) (0.50%) (10,816)Golar LNG Ltd (46,500) USD (803,520) (1.26%) (23,567)H Lundbeck A/S (7,056) DKK (1,803,514) (0.41%) (30,835)Halliburton Co (12,100) USD (396,941) (0.62%) (11,283)Hewlett Packard Enterprise Co 23,100 USD 310,349 0.49% (6,897)Hexcel Corp (9,900) USD (413,969) (0.65%) (3,956)Hino Motors Ltd 11,800 JPY 13,457,901 0.19% (19,911)Howard Hughes Corp (14,200) USD (1,338,208) (2.10%) (16,836)Hutchison Port Holdings Trust (300,600) USD (139,779) (0.22%) (10,504)
Notes to the Financial Statements (continued)
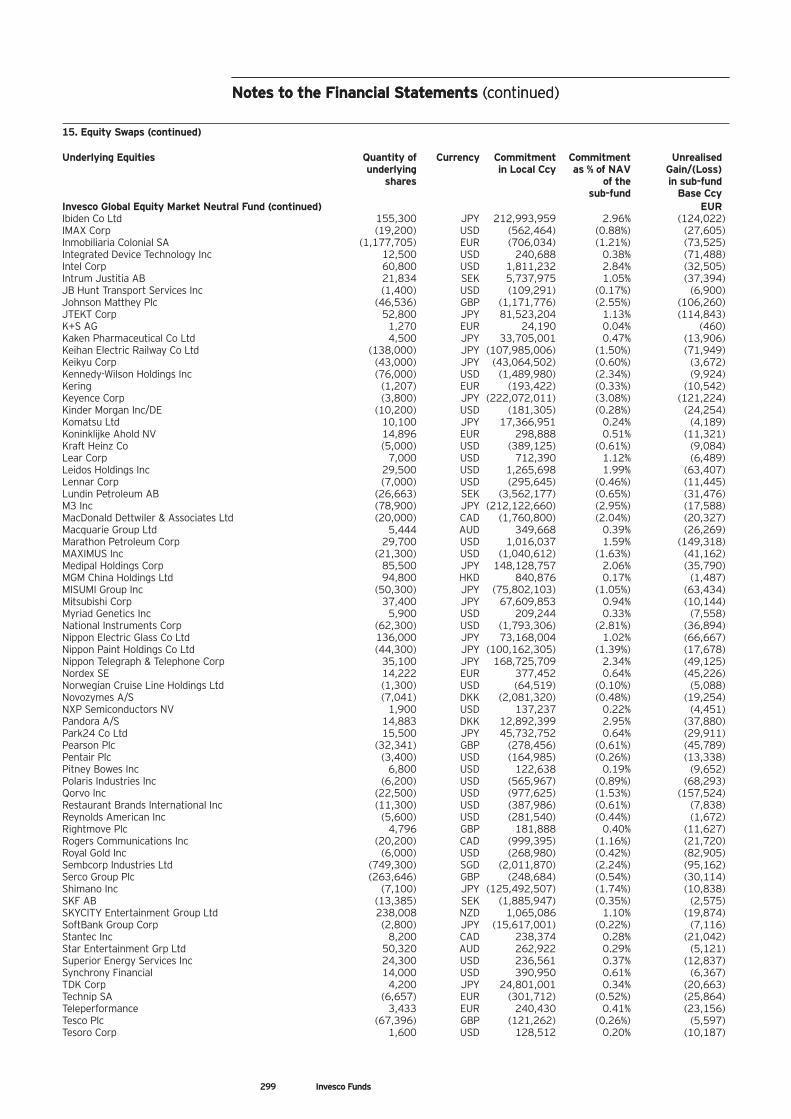
299 Invesco Funds
15. Equity Swaps (continued)
Underlying Equities Quantity of Currency Commitment Commitment Unrealised underlying in Local Ccy as % of NAV Gain/(Loss) shares of the in sub-fund sub-fund Base CcyInvesco Global Equity Market Neutral Fund (continued) EURIbiden Co Ltd 155,300 JPY 212,993,959 2.96% (124,022)IMAX Corp (19,200) USD (562,464) (0.88%) (27,605)Inmobiliaria Colonial SA (1,177,705) EUR (706,034) (1.21%) (73,525)Integrated Device Technology Inc 12,500 USD 240,688 0.38% (71,488)Intel Corp 60,800 USD 1,811,232 2.84% (32,505)Intrum Justitia AB 21,834 SEK 5,737,975 1.05% (37,394)JB Hunt Transport Services Inc (1,400) USD (109,291) (0.17%) (6,900)Johnson Matthey Plc (46,536) GBP (1,171,776) (2.55%) (106,260)JTEKT Corp 52,800 JPY 81,523,204 1.13% (114,843)K+S AG 1,270 EUR 24,190 0.04% (460)Kaken Pharmaceutical Co Ltd 4,500 JPY 33,705,001 0.47% (13,906)Keihan Electric Railway Co Ltd (138,000) JPY (107,985,006) (1.50%) (71,949)Keikyu Corp (43,000) JPY (43,064,502) (0.60%) (3,672)Kennedy-Wilson Holdings Inc (76,000) USD (1,489,980) (2.34%) (9,924)Kering (1,207) EUR (193,422) (0.33%) (10,542)Keyence Corp (3,800) JPY (222,072,011) (3.08%) (121,224)Kinder Morgan Inc/DE (10,200) USD (181,305) (0.28%) (24,254)Komatsu Ltd 10,100 JPY 17,366,951 0.24% (4,189)Koninklijke Ahold NV 14,896 EUR 298,888 0.51% (11,321)Kraft Heinz Co (5,000) USD (389,125) (0.61%) (9,084)Lear Corp 7,000 USD 712,390 1.12% (6,489)Leidos Holdings Inc 29,500 USD 1,265,698 1.99% (63,407)Lennar Corp (7,000) USD (295,645) (0.46%) (11,445)Lundin Petroleum AB (26,663) SEK (3,562,177) (0.65%) (31,476)M3 Inc (78,900) JPY (212,122,660) (2.95%) (17,588)MacDonald Dettwiler & Associates Ltd (20,000) CAD (1,760,800) (2.04%) (20,327)Macquarie Group Ltd 5,444 AUD 349,668 0.39% (26,269)Marathon Petroleum Corp 29,700 USD 1,016,037 1.59% (149,318)MAXIMUS Inc (21,300) USD (1,040,612) (1.63%) (41,162)Medipal Holdings Corp 85,500 JPY 148,128,757 2.06% (35,790)MGM China Holdings Ltd 94,800 HKD 840,876 0.17% (1,487)MISUMI Group Inc (50,300) JPY (75,802,103) (1.05%) (63,434)Mitsubishi Corp 37,400 JPY 67,609,853 0.94% (10,144)Myriad Genetics Inc 5,900 USD 209,244 0.33% (7,558)National Instruments Corp (62,300) USD (1,793,306) (2.81%) (36,894)Nippon Electric Glass Co Ltd 136,000 JPY 73,168,004 1.02% (66,667)Nippon Paint Holdings Co Ltd (44,300) JPY (100,162,305) (1.39%) (17,678)Nippon Telegraph & Telephone Corp 35,100 JPY 168,725,709 2.34% (49,125)Nordex SE 14,222 EUR 377,452 0.64% (45,226)Norwegian Cruise Line Holdings Ltd (1,300) USD (64,519) (0.10%) (5,088)Novozymes A/S (7,041) DKK (2,081,320) (0.48%) (19,254)NXP Semiconductors NV 1,900 USD 137,237 0.22% (4,451)Pandora A/S 14,883 DKK 12,892,399 2.95% (37,880)Park24 Co Ltd 15,500 JPY 45,732,752 0.64% (29,911)Pearson Plc (32,341) GBP (278,456) (0.61%) (45,789)Pentair Plc (3,400) USD (164,985) (0.26%) (13,338)Pitney Bowes Inc 6,800 USD 122,638 0.19% (9,652)Polaris Industries Inc (6,200) USD (565,967) (0.89%) (68,293)Qorvo Inc (22,500) USD (977,625) (1.53%) (157,524)Restaurant Brands International Inc (11,300) USD (387,986) (0.61%) (7,838)Reynolds American Inc (5,600) USD (281,540) (0.44%) (1,672)Rightmove Plc 4,796 GBP 181,888 0.40% (11,627)Rogers Communications Inc (20,200) CAD (999,395) (1.16%) (21,720)Royal Gold Inc (6,000) USD (268,980) (0.42%) (82,905)Sembcorp Industries Ltd (749,300) SGD (2,011,870) (2.24%) (95,162)Serco Group Plc (263,646) GBP (248,684) (0.54%) (30,114)Shimano Inc (7,100) JPY (125,492,507) (1.74%) (10,838)SKF AB (13,385) SEK (1,885,947) (0.35%) (2,575)SKYCITY Entertainment Group Ltd 238,008 NZD 1,065,086 1.10% (19,874)SoftBank Group Corp (2,800) JPY (15,617,001) (0.22%) (7,116)Stantec Inc 8,200 CAD 238,374 0.28% (21,042)Star Entertainment Grp Ltd 50,320 AUD 262,922 0.29% (5,121)Superior Energy Services Inc 24,300 USD 236,561 0.37% (12,837)Synchrony Financial 14,000 USD 390,950 0.61% (6,367)TDK Corp 4,200 JPY 24,801,001 0.34% (20,663)Technip SA (6,657) EUR (301,712) (0.52%) (25,864)Teleperformance 3,433 EUR 240,430 0.41% (23,156)Tesco Plc (67,396) GBP (121,262) (0.26%) (5,597)Tesoro Corp 1,600 USD 128,512 0.20% (10,187)
Notes to the Financial Statements (continued)Notes to the Financial Statements (continued)
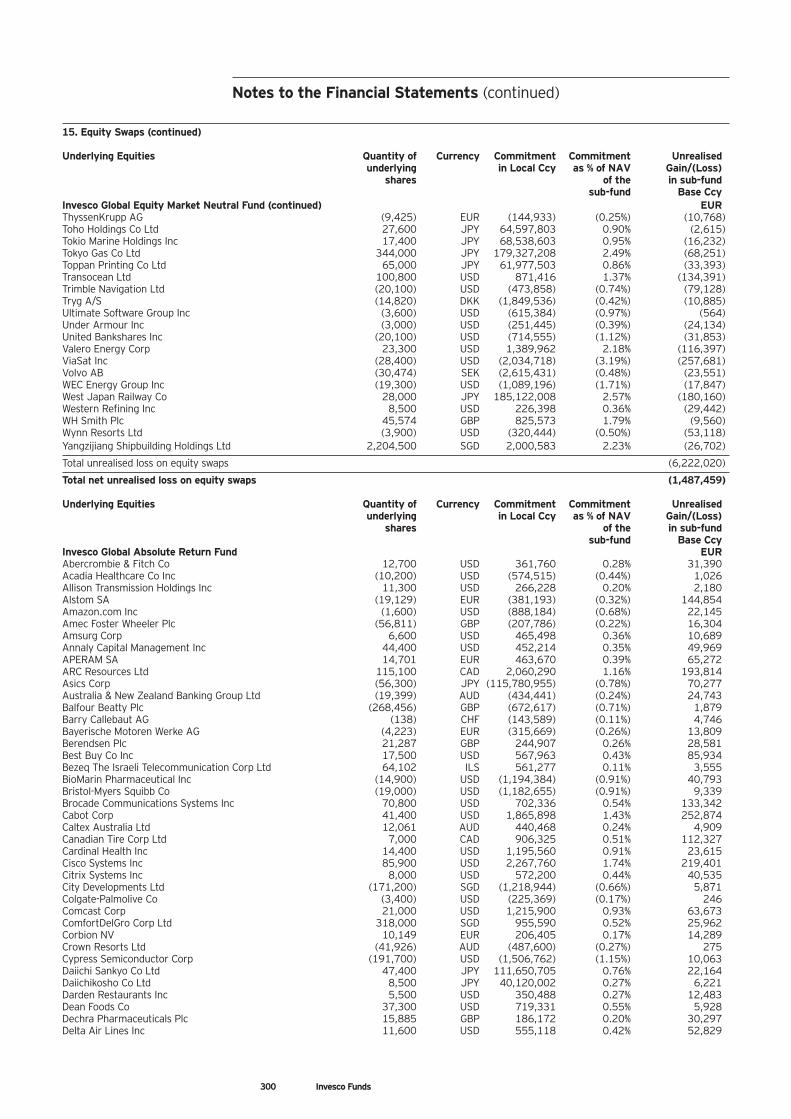
300 Invesco Funds
15. Equity Swaps (continued)
Underlying Equities Quantity of Currency Commitment Commitment Unrealised underlying in Local Ccy as % of NAV Gain/(Loss) shares of the in sub-fund sub-fund Base CcyInvesco Global Equity Market Neutral Fund (continued) EURThyssenKrupp AG (9,425) EUR (144,933) (0.25%) (10,768)Toho Holdings Co Ltd 27,600 JPY 64,597,803 0.90% (2,615)Tokio Marine Holdings Inc 17,400 JPY 68,538,603 0.95% (16,232)Tokyo Gas Co Ltd 344,000 JPY 179,327,208 2.49% (68,251)Toppan Printing Co Ltd 65,000 JPY 61,977,503 0.86% (33,393)Transocean Ltd 100,800 USD 871,416 1.37% (134,391)Trimble Navigation Ltd (20,100) USD (473,858) (0.74%) (79,128)Tryg A/S (14,820) DKK (1,849,536) (0.42%) (10,885)Ultimate Software Group Inc (3,600) USD (615,384) (0.97%) (564)Under Armour Inc (3,000) USD (251,445) (0.39%) (24,134)United Bankshares Inc (20,100) USD (714,555) (1.12%) (31,853)Valero Energy Corp 23,300 USD 1,389,962 2.18% (116,397)ViaSat Inc (28,400) USD (2,034,718) (3.19%) (257,681)Volvo AB (30,474) SEK (2,615,431) (0.48%) (23,551)WEC Energy Group Inc (19,300) USD (1,089,196) (1.71%) (17,847)West Japan Railway Co 28,000 JPY 185,122,008 2.57% (180,160)Western Refining Inc 8,500 USD 226,398 0.36% (29,442)WH Smith Plc 45,574 GBP 825,573 1.79% (9,560)Wynn Resorts Ltd (3,900) USD (320,444) (0.50%) (53,118)Yangzijiang Shipbuilding Holdings Ltd 2,204,500 SGD 2,000,583 2.23% (26,702)
Total unrealised loss on equity swaps (6,222,020)
Total net unrealised loss on equity swaps (1,487,459)
Underlying Equities Quantity of Currency Commitment Commitment Unrealised underlying in Local Ccy as % of NAV Gain/(Loss) shares of the in sub-fund sub-fund Base CcyInvesco Global Absolute Return Fund EURAbercrombie & Fitch Co 12,700 USD 361,760 0.28% 31,390Acadia Healthcare Co Inc (10,200) USD (574,515) (0.44%) 1,026Allison Transmission Holdings Inc 11,300 USD 266,228 0.20% 2,180Alstom SA (19,129) EUR (381,193) (0.32%) 144,854Amazon.com Inc (1,600) USD (888,184) (0.68%) 22,145Amec Foster Wheeler Plc (56,811) GBP (207,786) (0.22%) 16,304Amsurg Corp 6,600 USD 465,498 0.36% 10,689Annaly Capital Management Inc 44,400 USD 452,214 0.35% 49,969APERAM SA 14,701 EUR 463,670 0.39% 65,272ARC Resources Ltd 115,100 CAD 2,060,290 1.16% 193,814Asics Corp (56,300) JPY (115,780,955) (0.78%) 70,277Australia & New Zealand Banking Group Ltd (19,399) AUD (434,441) (0.24%) 24,743Balfour Beatty Plc (268,456) GBP (672,617) (0.71%) 1,879Barry Callebaut AG (138) CHF (143,589) (0.11%) 4,746Bayerische Motoren Werke AG (4,223) EUR (315,669) (0.26%) 13,809Berendsen Plc 21,287 GBP 244,907 0.26% 28,581Best Buy Co Inc 17,500 USD 567,963 0.43% 85,934Bezeq The Israeli Telecommunication Corp Ltd 64,102 ILS 561,277 0.11% 3,555BioMarin Pharmaceutical Inc (14,900) USD (1,194,384) (0.91%) 40,793Bristol-Myers Squibb Co (19,000) USD (1,182,655) (0.91%) 9,339Brocade Communications Systems Inc 70,800 USD 702,336 0.54% 133,342Cabot Corp 41,400 USD 1,865,898 1.43% 252,874Caltex Australia Ltd 12,061 AUD 440,468 0.24% 4,909Canadian Tire Corp Ltd 7,000 CAD 906,325 0.51% 112,327Cardinal Health Inc 14,400 USD 1,195,560 0.91% 23,615Cisco Systems Inc 85,900 USD 2,267,760 1.74% 219,401Citrix Systems Inc 8,000 USD 572,200 0.44% 40,535City Developments Ltd (171,200) SGD (1,218,944) (0.66%) 5,871Colgate-Palmolive Co (3,400) USD (225,369) (0.17%) 246Comcast Corp 21,000 USD 1,215,900 0.93% 63,673ComfortDelGro Corp Ltd 318,000 SGD 955,590 0.52% 25,962Corbion NV 10,149 EUR 206,405 0.17% 14,289Crown Resorts Ltd (41,926) AUD (487,600) (0.27%) 275Cypress Semiconductor Corp (191,700) USD (1,506,762) (1.15%) 10,063Daiichi Sankyo Co Ltd 47,400 JPY 111,650,705 0.76% 22,164Daiichikosho Co Ltd 8,500 JPY 40,120,002 0.27% 6,221Darden Restaurants Inc 5,500 USD 350,488 0.27% 12,483Dean Foods Co 37,300 USD 719,331 0.55% 5,928Dechra Pharmaceuticals Plc 15,885 GBP 186,172 0.20% 30,297Delta Air Lines Inc 11,600 USD 555,118 0.42% 52,829
Notes to the Financial Statements (continued)
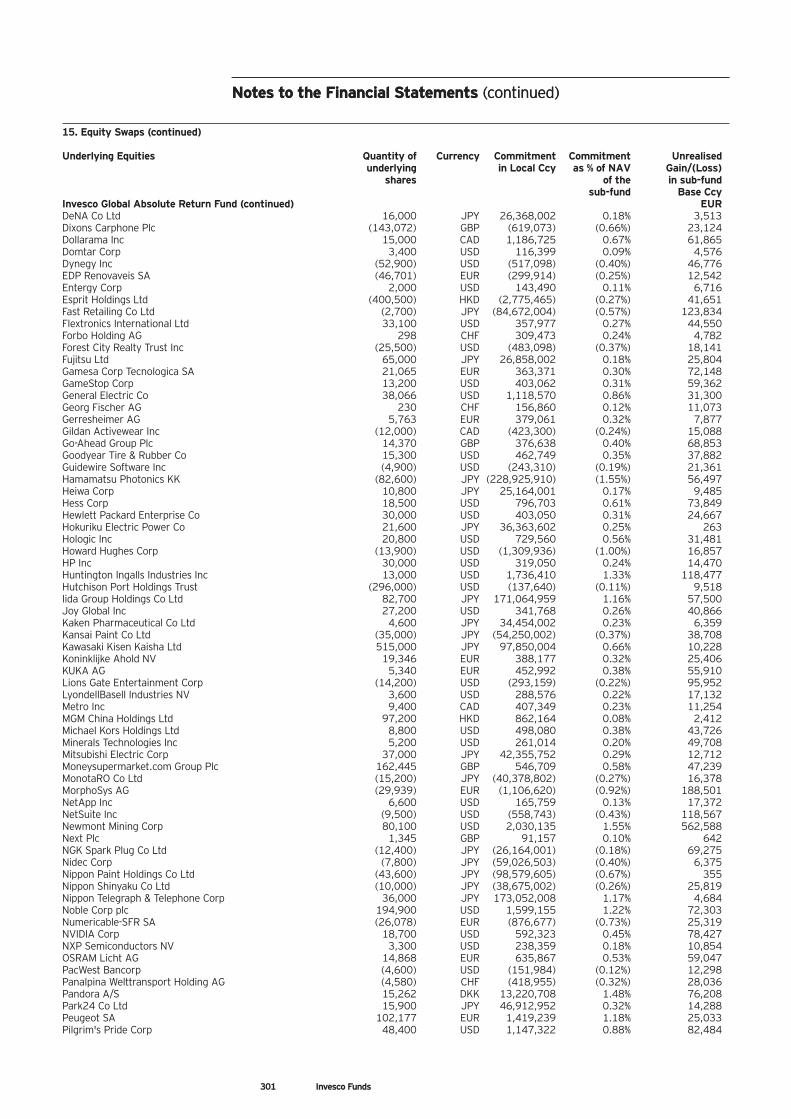
301 Invesco Funds
15. Equity Swaps (continued)
Underlying Equities Quantity of Currency Commitment Commitment Unrealised underlying in Local Ccy as % of NAV Gain/(Loss) shares of the in sub-fund sub-fund Base CcyInvesco Global Absolute Return Fund (continued) EURDeNA Co Ltd 16,000 JPY 26,368,002 0.18% 3,513Dixons Carphone Plc (143,072) GBP (619,073) (0.66%) 23,124Dollarama Inc 15,000 CAD 1,186,725 0.67% 61,865Domtar Corp 3,400 USD 116,399 0.09% 4,576Dynegy Inc (52,900) USD (517,098) (0.40%) 46,776EDP Renovaveis SA (46,701) EUR (299,914) (0.25%) 12,542Entergy Corp 2,000 USD 143,490 0.11% 6,716Esprit Holdings Ltd (400,500) HKD (2,775,465) (0.27%) 41,651Fast Retailing Co Ltd (2,700) JPY (84,672,004) (0.57%) 123,834Flextronics International Ltd 33,100 USD 357,977 0.27% 44,550Forbo Holding AG 298 CHF 309,473 0.24% 4,782Forest City Realty Trust Inc (25,500) USD (483,098) (0.37%) 18,141Fujitsu Ltd 65,000 JPY 26,858,002 0.18% 25,804Gamesa Corp Tecnologica SA 21,065 EUR 363,371 0.30% 72,148GameStop Corp 13,200 USD 403,062 0.31% 59,362General Electric Co 38,066 USD 1,118,570 0.86% 31,300Georg Fischer AG 230 CHF 156,860 0.12% 11,073Gerresheimer AG 5,763 EUR 379,061 0.32% 7,877Gildan Activewear Inc (12,000) CAD (423,300) (0.24%) 15,088Go-Ahead Group Plc 14,370 GBP 376,638 0.40% 68,853Goodyear Tire & Rubber Co 15,300 USD 462,749 0.35% 37,882Guidewire Software Inc (4,900) USD (243,310) (0.19%) 21,361Hamamatsu Photonics KK (82,600) JPY (228,925,910) (1.55%) 56,497Heiwa Corp 10,800 JPY 25,164,001 0.17% 9,485Hess Corp 18,500 USD 796,703 0.61% 73,849Hewlett Packard Enterprise Co 30,000 USD 403,050 0.31% 24,667Hokuriku Electric Power Co 21,600 JPY 36,363,602 0.25% 263Hologic Inc 20,800 USD 729,560 0.56% 31,481Howard Hughes Corp (13,900) USD (1,309,936) (1.00%) 16,857HP Inc 30,000 USD 319,050 0.24% 14,470Huntington Ingalls Industries Inc 13,000 USD 1,736,410 1.33% 118,477Hutchison Port Holdings Trust (296,000) USD (137,640) (0.11%) 9,518Iida Group Holdings Co Ltd 82,700 JPY 171,064,959 1.16% 57,500Joy Global Inc 27,200 USD 341,768 0.26% 40,866Kaken Pharmaceutical Co Ltd 4,600 JPY 34,454,002 0.23% 6,359Kansai Paint Co Ltd (35,000) JPY (54,250,002) (0.37%) 38,708Kawasaki Kisen Kaisha Ltd 515,000 JPY 97,850,004 0.66% 10,228Koninklijke Ahold NV 19,346 EUR 388,177 0.32% 25,406KUKA AG 5,340 EUR 452,992 0.38% 55,910Lions Gate Entertainment Corp (14,200) USD (293,159) (0.22%) 95,952LyondellBasell Industries NV 3,600 USD 288,576 0.22% 17,132Metro Inc 9,400 CAD 407,349 0.23% 11,254MGM China Holdings Ltd 97,200 HKD 862,164 0.08% 2,412Michael Kors Holdings Ltd 8,800 USD 498,080 0.38% 43,726Minerals Technologies Inc 5,200 USD 261,014 0.20% 49,708Mitsubishi Electric Corp 37,000 JPY 42,355,752 0.29% 12,712Moneysupermarket.com Group Plc 162,445 GBP 546,709 0.58% 47,239MonotaRO Co Ltd (15,200) JPY (40,378,802) (0.27%) 16,378MorphoSys AG (29,939) EUR (1,106,620) (0.92%) 188,501NetApp Inc 6,600 USD 165,759 0.13% 17,372NetSuite Inc (9,500) USD (558,743) (0.43%) 118,567Newmont Mining Corp 80,100 USD 2,030,135 1.55% 562,588Next Plc 1,345 GBP 91,157 0.10% 642NGK Spark Plug Co Ltd (12,400) JPY (26,164,001) (0.18%) 69,275Nidec Corp (7,800) JPY (59,026,503) (0.40%) 6,375Nippon Paint Holdings Co Ltd (43,600) JPY (98,579,605) (0.67%) 355Nippon Shinyaku Co Ltd (10,000) JPY (38,675,002) (0.26%) 25,819Nippon Telegraph & Telephone Corp 36,000 JPY 173,052,008 1.17% 4,684Noble Corp plc 194,900 USD 1,599,155 1.22% 72,303Numericable-SFR SA (26,078) EUR (876,677) (0.73%) 25,319NVIDIA Corp 18,700 USD 592,323 0.45% 78,427NXP Semiconductors NV 3,300 USD 238,359 0.18% 10,854OSRAM Licht AG 14,868 EUR 635,867 0.53% 59,047PacWest Bancorp (4,600) USD (151,984) (0.12%) 12,298Panalpina Welttransport Holding AG (4,580) CHF (418,955) (0.32%) 28,036Pandora A/S 15,262 DKK 13,220,708 1.48% 76,208Park24 Co Ltd 15,900 JPY 46,912,952 0.32% 14,288Peugeot SA 102,177 EUR 1,419,239 1.18% 25,033Pilgrim's Pride Corp 48,400 USD 1,147,322 0.88% 82,484
Notes to the Financial Statements (continued)Notes to the Financial Statements (continued)
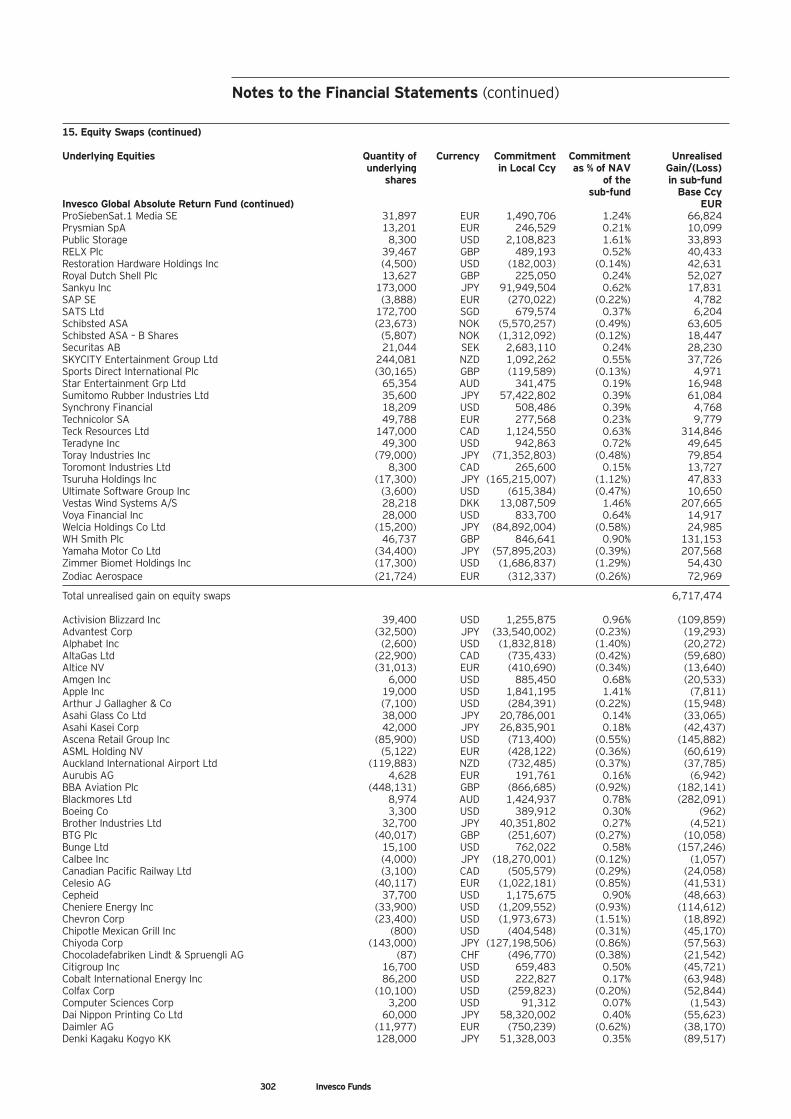
302 Invesco Funds
15. Equity Swaps (continued)
Underlying Equities Quantity of Currency Commitment Commitment Unrealised underlying in Local Ccy as % of NAV Gain/(Loss) shares of the in sub-fund sub-fund Base CcyInvesco Global Absolute Return Fund (continued) EURProSiebenSat.1 Media SE 31,897 EUR 1,490,706 1.24% 66,824Prysmian SpA 13,201 EUR 246,529 0.21% 10,099Public Storage 8,300 USD 2,108,823 1.61% 33,893RELX Plc 39,467 GBP 489,193 0.52% 40,433Restoration Hardware Holdings Inc (4,500) USD (182,003) (0.14%) 42,631Royal Dutch Shell Plc 13,627 GBP 225,050 0.24% 52,027Sankyu Inc 173,000 JPY 91,949,504 0.62% 17,831SAP SE (3,888) EUR (270,022) (0.22%) 4,782SATS Ltd 172,700 SGD 679,574 0.37% 6,204Schibsted ASA (23,673) NOK (5,570,257) (0.49%) 63,605Schibsted ASA – B Shares (5,807) NOK (1,312,092) (0.12%) 18,447Securitas AB 21,044 SEK 2,683,110 0.24% 28,230SKYCITY Entertainment Group Ltd 244,081 NZD 1,092,262 0.55% 37,726Sports Direct International Plc (30,165) GBP (119,589) (0.13%) 4,971Star Entertainment Grp Ltd 65,354 AUD 341,475 0.19% 16,948Sumitomo Rubber Industries Ltd 35,600 JPY 57,422,802 0.39% 61,084Synchrony Financial 18,209 USD 508,486 0.39% 4,768Technicolor SA 49,788 EUR 277,568 0.23% 9,779Teck Resources Ltd 147,000 CAD 1,124,550 0.63% 314,846Teradyne Inc 49,300 USD 942,863 0.72% 49,645Toray Industries Inc (79,000) JPY (71,352,803) (0.48%) 79,854Toromont Industries Ltd 8,300 CAD 265,600 0.15% 13,727Tsuruha Holdings Inc (17,300) JPY (165,215,007) (1.12%) 47,833Ultimate Software Group Inc (3,600) USD (615,384) (0.47%) 10,650Vestas Wind Systems A/S 28,218 DKK 13,087,509 1.46% 207,665Voya Financial Inc 28,000 USD 833,700 0.64% 14,917Welcia Holdings Co Ltd (15,200) JPY (84,892,004) (0.58%) 24,985WH Smith Plc 46,737 GBP 846,641 0.90% 131,153Yamaha Motor Co Ltd (34,400) JPY (57,895,203) (0.39%) 207,568Zimmer Biomet Holdings Inc (17,300) USD (1,686,837) (1.29%) 54,430Zodiac Aerospace (21,724) EUR (312,337) (0.26%) 72,969
Total unrealised gain on equity swaps 6,717,474
Activision Blizzard Inc 39,400 USD 1,255,875 0.96% (109,859)Advantest Corp (32,500) JPY (33,540,002) (0.23%) (19,293)Alphabet Inc (2,600) USD (1,832,818) (1.40%) (20,272)AltaGas Ltd (22,900) CAD (735,433) (0.42%) (59,680)Altice NV (31,013) EUR (410,690) (0.34%) (13,640)Amgen Inc 6,000 USD 885,450 0.68% (20,533)Apple Inc 19,000 USD 1,841,195 1.41% (7,811)Arthur J Gallagher & Co (7,100) USD (284,391) (0.22%) (15,948)Asahi Glass Co Ltd 38,000 JPY 20,786,001 0.14% (33,065)Asahi Kasei Corp 42,000 JPY 26,835,901 0.18% (42,437)Ascena Retail Group Inc (85,900) USD (713,400) (0.55%) (145,882)ASML Holding NV (5,122) EUR (428,122) (0.36%) (60,619)Auckland International Airport Ltd (119,883) NZD (732,485) (0.37%) (37,785)Aurubis AG 4,628 EUR 191,761 0.16% (6,942)BBA Aviation Plc (448,131) GBP (866,685) (0.92%) (182,141)Blackmores Ltd 8,974 AUD 1,424,937 0.78% (282,091)Boeing Co 3,300 USD 389,912 0.30% (962)Brother Industries Ltd 32,700 JPY 40,351,802 0.27% (4,521)BTG Plc (40,017) GBP (251,607) (0.27%) (10,058)Bunge Ltd 15,100 USD 762,022 0.58% (157,246)Calbee Inc (4,000) JPY (18,270,001) (0.12%) (1,057)Canadian Pacific Railway Ltd (3,100) CAD (505,579) (0.29%) (24,058)Celesio AG (40,117) EUR (1,022,181) (0.85%) (41,531)Cepheid 37,700 USD 1,175,675 0.90% (48,663)Cheniere Energy Inc (33,900) USD (1,209,552) (0.93%) (114,612)Chevron Corp (23,400) USD (1,973,673) (1.51%) (18,892)Chipotle Mexican Grill Inc (800) USD (404,548) (0.31%) (45,170)Chiyoda Corp (143,000) JPY (127,198,506) (0.86%) (57,563)Chocoladefabriken Lindt & Spruengli AG (87) CHF (496,770) (0.38%) (21,542)Citigroup Inc 16,700 USD 659,483 0.50% (45,721)Cobalt International Energy Inc 86,200 USD 222,827 0.17% (63,948)Colfax Corp (10,100) USD (259,823) (0.20%) (52,844)Computer Sciences Corp 3,200 USD 91,312 0.07% (1,543)Dai Nippon Printing Co Ltd 60,000 JPY 58,320,002 0.40% (55,623)Daimler AG (11,977) EUR (750,239) (0.62%) (38,170)Denki Kagaku Kogyo KK 128,000 JPY 51,328,003 0.35% (89,517)
Notes to the Financial Statements (continued)
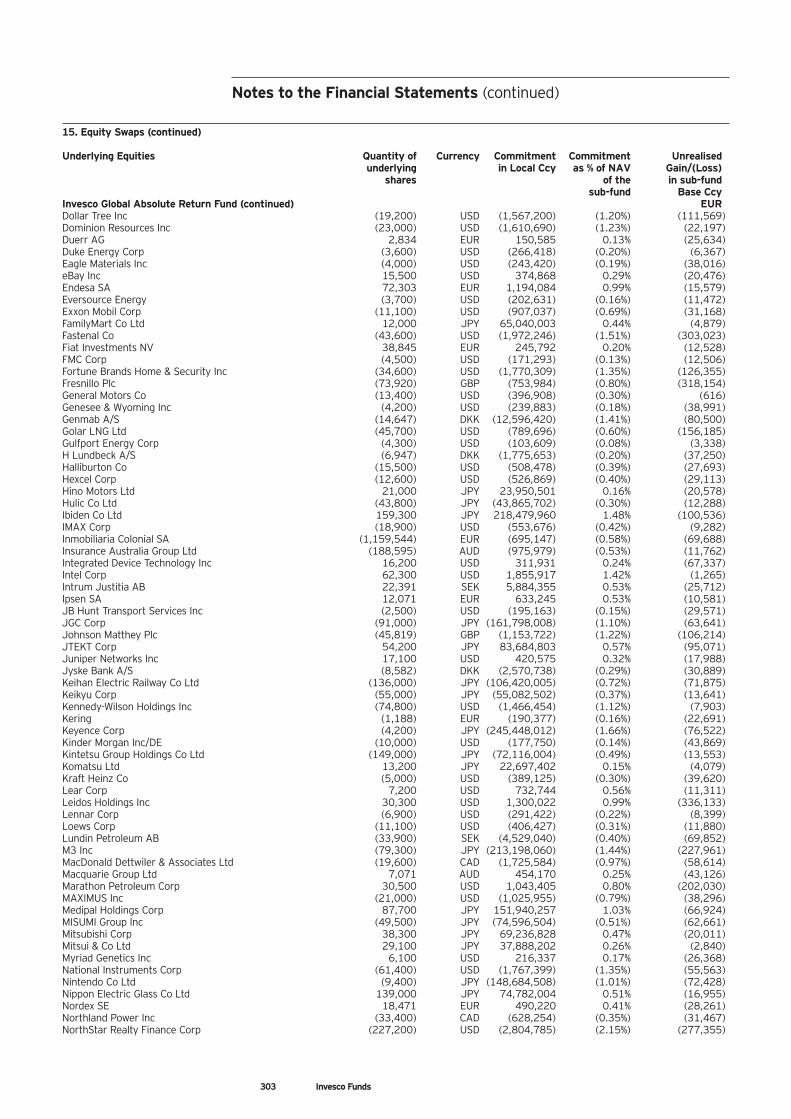
303 Invesco Funds
15. Equity Swaps (continued)
Underlying Equities Quantity of Currency Commitment Commitment Unrealised underlying in Local Ccy as % of NAV Gain/(Loss) shares of the in sub-fund sub-fund Base CcyInvesco Global Absolute Return Fund (continued) EURDollar Tree Inc (19,200) USD (1,567,200) (1.20%) (111,569)Dominion Resources Inc (23,000) USD (1,610,690) (1.23%) (22,197)Duerr AG 2,834 EUR 150,585 0.13% (25,634)Duke Energy Corp (3,600) USD (266,418) (0.20%) (6,367)Eagle Materials Inc (4,000) USD (243,420) (0.19%) (38,016)eBay Inc 15,500 USD 374,868 0.29% (20,476)Endesa SA 72,303 EUR 1,194,084 0.99% (15,579)Eversource Energy (3,700) USD (202,631) (0.16%) (11,472)Exxon Mobil Corp (11,100) USD (907,037) (0.69%) (31,168)FamilyMart Co Ltd 12,000 JPY 65,040,003 0.44% (4,879)Fastenal Co (43,600) USD (1,972,246) (1.51%) (303,023)Fiat Investments NV 38,845 EUR 245,792 0.20% (12,528)FMC Corp (4,500) USD (171,293) (0.13%) (12,506)Fortune Brands Home & Security Inc (34,600) USD (1,770,309) (1.35%) (126,355)Fresnillo Plc (73,920) GBP (753,984) (0.80%) (318,154)General Motors Co (13,400) USD (396,908) (0.30%) (616)Genesee & Wyoming Inc (4,200) USD (239,883) (0.18%) (38,991)Genmab A/S (14,647) DKK (12,596,420) (1.41%) (80,500)Golar LNG Ltd (45,700) USD (789,696) (0.60%) (156,185)Gulfport Energy Corp (4,300) USD (103,609) (0.08%) (3,338)H Lundbeck A/S (6,947) DKK (1,775,653) (0.20%) (37,250)Halliburton Co (15,500) USD (508,478) (0.39%) (27,693)Hexcel Corp (12,600) USD (526,869) (0.40%) (29,113)Hino Motors Ltd 21,000 JPY 23,950,501 0.16% (20,578)Hulic Co Ltd (43,800) JPY (43,865,702) (0.30%) (12,288)Ibiden Co Ltd 159,300 JPY 218,479,960 1.48% (100,536)IMAX Corp (18,900) USD (553,676) (0.42%) (9,282)Inmobiliaria Colonial SA (1,159,544) EUR (695,147) (0.58%) (69,688)Insurance Australia Group Ltd (188,595) AUD (975,979) (0.53%) (11,762)Integrated Device Technology Inc 16,200 USD 311,931 0.24% (67,337)Intel Corp 62,300 USD 1,855,917 1.42% (1,265)Intrum Justitia AB 22,391 SEK 5,884,355 0.53% (25,712)Ipsen SA 12,071 EUR 633,245 0.53% (10,581)JB Hunt Transport Services Inc (2,500) USD (195,163) (0.15%) (29,571)JGC Corp (91,000) JPY (161,798,008) (1.10%) (63,641)Johnson Matthey Plc (45,819) GBP (1,153,722) (1.22%) (106,214)JTEKT Corp 54,200 JPY 83,684,803 0.57% (95,071)Juniper Networks Inc 17,100 USD 420,575 0.32% (17,988)Jyske Bank A/S (8,582) DKK (2,570,738) (0.29%) (30,889)Keihan Electric Railway Co Ltd (136,000) JPY (106,420,005) (0.72%) (71,875)Keikyu Corp (55,000) JPY (55,082,502) (0.37%) (13,641)Kennedy-Wilson Holdings Inc (74,800) USD (1,466,454) (1.12%) (7,903)Kering (1,188) EUR (190,377) (0.16%) (22,691)Keyence Corp (4,200) JPY (245,448,012) (1.66%) (76,522)Kinder Morgan Inc/DE (10,000) USD (177,750) (0.14%) (43,869)Kintetsu Group Holdings Co Ltd (149,000) JPY (72,116,004) (0.49%) (13,553)Komatsu Ltd 13,200 JPY 22,697,402 0.15% (4,079)Kraft Heinz Co (5,000) USD (389,125) (0.30%) (39,620)Lear Corp 7,200 USD 732,744 0.56% (11,311)Leidos Holdings Inc 30,300 USD 1,300,022 0.99% (336,133)Lennar Corp (6,900) USD (291,422) (0.22%) (8,399)Loews Corp (11,100) USD (406,427) (0.31%) (11,880)Lundin Petroleum AB (33,900) SEK (4,529,040) (0.40%) (69,852)M3 Inc (79,300) JPY (213,198,060) (1.44%) (227,961)MacDonald Dettwiler & Associates Ltd (19,600) CAD (1,725,584) (0.97%) (58,614)Macquarie Group Ltd 7,071 AUD 454,170 0.25% (43,126)Marathon Petroleum Corp 30,500 USD 1,043,405 0.80% (202,030)MAXIMUS Inc (21,000) USD (1,025,955) (0.79%) (38,296)Medipal Holdings Corp 87,700 JPY 151,940,257 1.03% (66,924)MISUMI Group Inc (49,500) JPY (74,596,504) (0.51%) (62,661)Mitsubishi Corp 38,300 JPY 69,236,828 0.47% (20,011)Mitsui & Co Ltd 29,100 JPY 37,888,202 0.26% (2,840)Myriad Genetics Inc 6,100 USD 216,337 0.17% (26,368)National Instruments Corp (61,400) USD (1,767,399) (1.35%) (55,563)Nintendo Co Ltd (9,400) JPY (148,684,508) (1.01%) (72,428)Nippon Electric Glass Co Ltd 139,000 JPY 74,782,004 0.51% (16,955)Nordex SE 18,471 EUR 490,220 0.41% (28,261)Northland Power Inc (33,400) CAD (628,254) (0.35%) (31,467)NorthStar Realty Finance Corp (227,200) USD (2,804,785) (2.15%) (277,355)
Notes to the Financial Statements (continued)
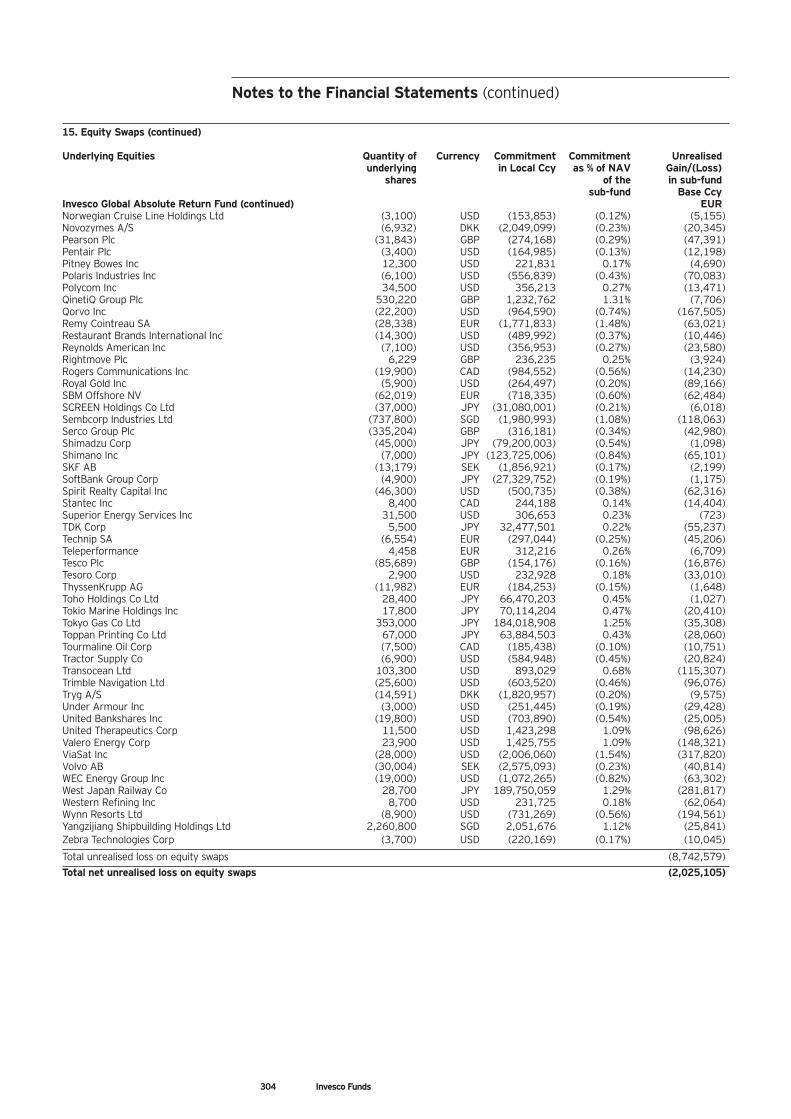
304 Invesco Funds
15. Equity Swaps (continued)
Underlying Equities Quantity of Currency Commitment Commitment Unrealised underlying in Local Ccy as % of NAV Gain/(Loss) shares of the in sub-fund sub-fund Base CcyInvesco Global Absolute Return Fund (continued) EURNorwegian Cruise Line Holdings Ltd (3,100) USD (153,853) (0.12%) (5,155)Novozymes A/S (6,932) DKK (2,049,099) (0.23%) (20,345)Pearson Plc (31,843) GBP (274,168) (0.29%) (47,391)Pentair Plc (3,400) USD (164,985) (0.13%) (12,198)Pitney Bowes Inc 12,300 USD 221,831 0.17% (4,690)Polaris Industries Inc (6,100) USD (556,839) (0.43%) (70,083)Polycom Inc 34,500 USD 356,213 0.27% (13,471)QinetiQ Group Plc 530,220 GBP 1,232,762 1.31% (7,706)Qorvo Inc (22,200) USD (964,590) (0.74%) (167,505)Remy Cointreau SA (28,338) EUR (1,771,833) (1.48%) (63,021)Restaurant Brands International Inc (14,300) USD (489,992) (0.37%) (10,446)Reynolds American Inc (7,100) USD (356,953) (0.27%) (23,580)Rightmove Plc 6,229 GBP 236,235 0.25% (3,924)Rogers Communications Inc (19,900) CAD (984,552) (0.56%) (14,230)Royal Gold Inc (5,900) USD (264,497) (0.20%) (89,166)SBM Offshore NV (62,019) EUR (718,335) (0.60%) (62,484)SCREEN Holdings Co Ltd (37,000) JPY (31,080,001) (0.21%) (6,018)Sembcorp Industries Ltd (737,800) SGD (1,980,993) (1.08%) (118,063)Serco Group Plc (335,204) GBP (316,181) (0.34%) (42,980)Shimadzu Corp (45,000) JPY (79,200,003) (0.54%) (1,098)Shimano Inc (7,000) JPY (123,725,006) (0.84%) (65,101)SKF AB (13,179) SEK (1,856,921) (0.17%) (2,199)SoftBank Group Corp (4,900) JPY (27,329,752) (0.19%) (1,175)Spirit Realty Capital Inc (46,300) USD (500,735) (0.38%) (62,316)Stantec Inc 8,400 CAD 244,188 0.14% (14,404)Superior Energy Services Inc 31,500 USD 306,653 0.23% (723)TDK Corp 5,500 JPY 32,477,501 0.22% (55,237)Technip SA (6,554) EUR (297,044) (0.25%) (45,206)Teleperformance 4,458 EUR 312,216 0.26% (6,709)Tesco Plc (85,689) GBP (154,176) (0.16%) (16,876)Tesoro Corp 2,900 USD 232,928 0.18% (33,010)ThyssenKrupp AG (11,982) EUR (184,253) (0.15%) (1,648)Toho Holdings Co Ltd 28,400 JPY 66,470,203 0.45% (1,027)Tokio Marine Holdings Inc 17,800 JPY 70,114,204 0.47% (20,410)Tokyo Gas Co Ltd 353,000 JPY 184,018,908 1.25% (35,308)Toppan Printing Co Ltd 67,000 JPY 63,884,503 0.43% (28,060)Tourmaline Oil Corp (7,500) CAD (185,438) (0.10%) (10,751)Tractor Supply Co (6,900) USD (584,948) (0.45%) (20,824)Transocean Ltd 103,300 USD 893,029 0.68% (115,307)Trimble Navigation Ltd (25,600) USD (603,520) (0.46%) (96,076)Tryg A/S (14,591) DKK (1,820,957) (0.20%) (9,575)Under Armour Inc (3,000) USD (251,445) (0.19%) (29,428)United Bankshares Inc (19,800) USD (703,890) (0.54%) (25,005)United Therapeutics Corp 11,500 USD 1,423,298 1.09% (98,626)Valero Energy Corp 23,900 USD 1,425,755 1.09% (148,321)ViaSat Inc (28,000) USD (2,006,060) (1.54%) (317,820)Volvo AB (30,004) SEK (2,575,093) (0.23%) (40,814)WEC Energy Group Inc (19,000) USD (1,072,265) (0.82%) (63,302)West Japan Railway Co 28,700 JPY 189,750,059 1.29% (281,817)Western Refining Inc 8,700 USD 231,725 0.18% (62,064)Wynn Resorts Ltd (8,900) USD (731,269) (0.56%) (194,561)Yangzijiang Shipbuilding Holdings Ltd 2,260,800 SGD 2,051,676 1.12% (25,841)Zebra Technologies Corp (3,700) USD (220,169) (0.17%) (10,045)
Total unrealised loss on equity swaps (8,742,579)Total net unrealised loss on equity swaps (2,025,105)
Notes to the Financial Statements (continued)
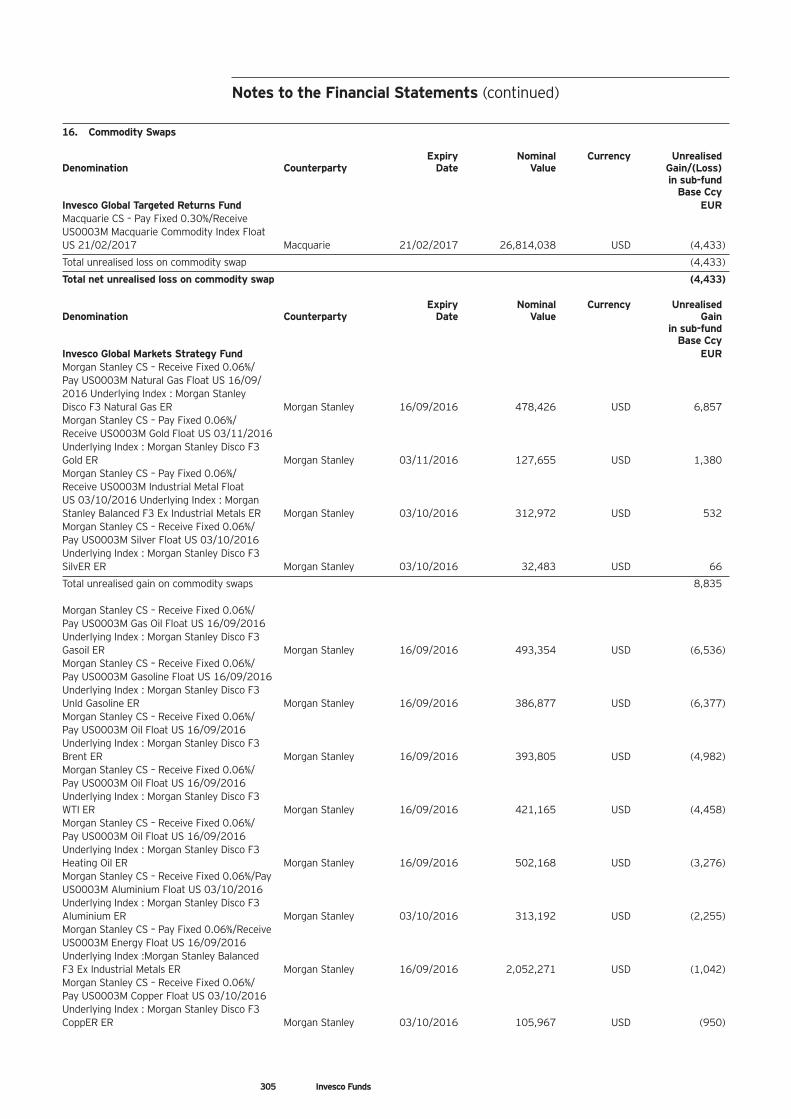
305 Invesco Funds
16. Commodity Swaps
Expiry Nominal Currency UnrealisedDenomination Counterparty Date Value Gain/(Loss) in sub-fund Base CcyInvesco Global Targeted Returns Fund EURMacquarie CS – Pay Fixed 0.30%/Receive US0003M Macquarie Commodity Index Float US 21/02/2017 Macquarie 21/02/2017 26,814,038 USD (4,433)
Total unrealised loss on commodity swap (4,433)
Total net unrealised loss on commodity swap (4,433)
Expiry Nominal Currency UnrealisedDenomination Counterparty Date Value Gain in sub-fund Base CcyInvesco Global Markets Strategy Fund EURMorgan Stanley CS – Receive Fixed 0.06%/Pay US0003M Natural Gas Float US 16/09/2016 Underlying Index : Morgan Stanley Disco F3 Natural Gas ER Morgan Stanley 16/09/2016 478,426 USD 6,857Morgan Stanley CS – Pay Fixed 0.06%/Receive US0003M Gold Float US 03/11/2016 Underlying Index : Morgan Stanley Disco F3 Gold ER Morgan Stanley 03/11/2016 127,655 USD 1,380Morgan Stanley CS – Pay Fixed 0.06%/Receive US0003M Industrial Metal Float US 03/10/2016 Underlying Index : Morgan Stanley Balanced F3 Ex Industrial Metals ER Morgan Stanley 03/10/2016 312,972 USD 532Morgan Stanley CS – Receive Fixed 0.06%/Pay US0003M Silver Float US 03/10/2016 Underlying Index : Morgan Stanley Disco F3 SilvER ER Morgan Stanley 03/10/2016 32,483 USD 66
Total unrealised gain on commodity swaps 8,835
Morgan Stanley CS – Receive Fixed 0.06%/Pay US0003M Gas Oil Float US 16/09/2016 Underlying Index : Morgan Stanley Disco F3 Gasoil ER Morgan Stanley 16/09/2016 493,354 USD (6,536)Morgan Stanley CS – Receive Fixed 0.06%/Pay US0003M Gasoline Float US 16/09/2016 Underlying Index : Morgan Stanley Disco F3 Unld Gasoline ER Morgan Stanley 16/09/2016 386,877 USD (6,377)Morgan Stanley CS – Receive Fixed 0.06%/Pay US0003M Oil Float US 16/09/2016 Underlying Index : Morgan Stanley Disco F3 Brent ER Morgan Stanley 16/09/2016 393,805 USD (4,982)Morgan Stanley CS – Receive Fixed 0.06%/Pay US0003M Oil Float US 16/09/2016 Underlying Index : Morgan Stanley Disco F3 WTI ER Morgan Stanley 16/09/2016 421,165 USD (4,458)Morgan Stanley CS – Receive Fixed 0.06%/Pay US0003M Oil Float US 16/09/2016 Underlying Index : Morgan Stanley Disco F3 Heating Oil ER Morgan Stanley 16/09/2016 502,168 USD (3,276)Morgan Stanley CS – Receive Fixed 0.06%/Pay US0003M Aluminium Float US 03/10/2016 Underlying Index : Morgan Stanley Disco F3 Aluminium ER Morgan Stanley 03/10/2016 313,192 USD (2,255)Morgan Stanley CS – Pay Fixed 0.06%/Receive US0003M Energy Float US 16/09/2016 Underlying Index :Morgan Stanley Balanced F3 Ex Industrial Metals ER Morgan Stanley 16/09/2016 2,052,271 USD (1,042)Morgan Stanley CS – Receive Fixed 0.06%/Pay US0003M Copper Float US 03/10/2016 Underlying Index : Morgan Stanley Disco F3 CoppER ER Morgan Stanley 03/10/2016 105,967 USD (950)
Notes to the Financial Statements (continued)
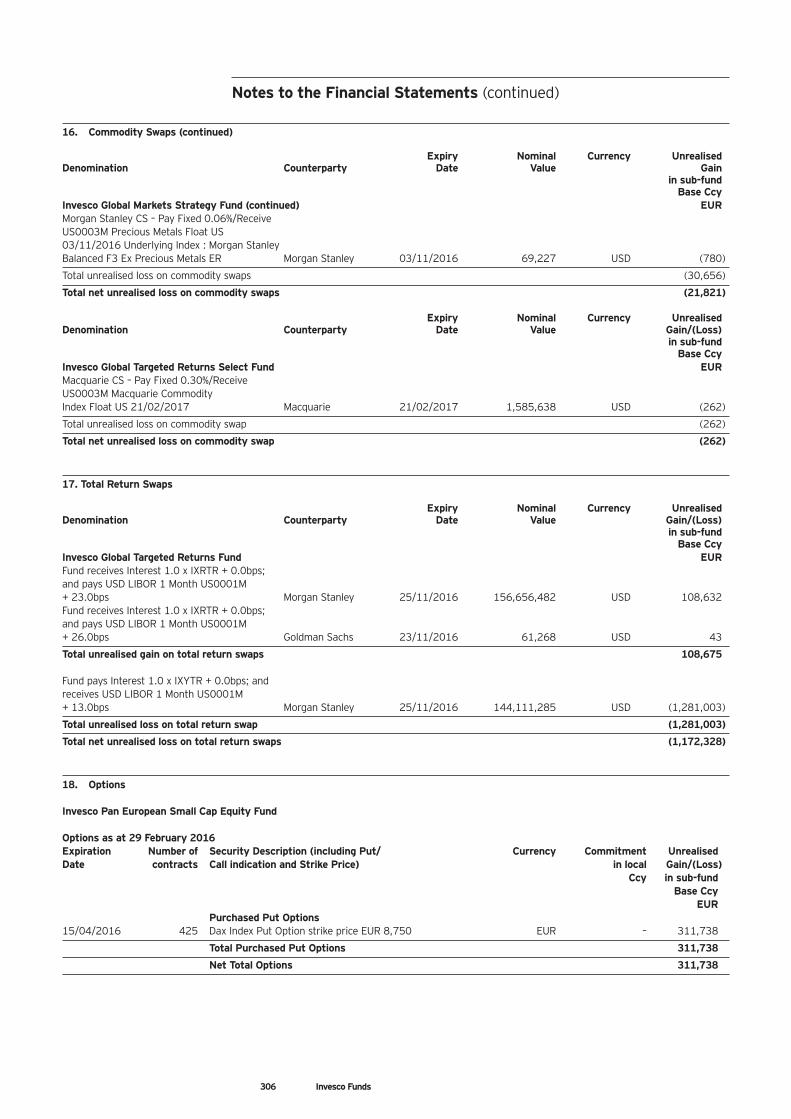
306 Invesco Funds
16. Commodity Swaps (continued)
Expiry Nominal Currency UnrealisedDenomination Counterparty Date Value Gain in sub-fund Base CcyInvesco Global Markets Strategy Fund (continued) EURMorgan Stanley CS – Pay Fixed 0.06%/Receive US0003M Precious Metals Float US 03/11/2016 Underlying Index : Morgan Stanley Balanced F3 Ex Precious Metals ER Morgan Stanley 03/11/2016 69,227 USD (780)
Total unrealised loss on commodity swaps (30,656)
Total net unrealised loss on commodity swaps (21,821)
Expiry Nominal Currency UnrealisedDenomination Counterparty Date Value Gain/(Loss) in sub-fund Base CcyInvesco Global Targeted Returns Select Fund EURMacquarie CS – Pay Fixed 0.30%/Receive US0003M Macquarie Commodity Index Float US 21/02/2017 Macquarie 21/02/2017 1,585,638 USD (262)
Total unrealised loss on commodity swap (262)
Total net unrealised loss on commodity swap (262)
17. Total Return Swaps
Expiry Nominal Currency UnrealisedDenomination Counterparty Date Value Gain/(Loss) in sub-fund Base CcyInvesco Global Targeted Returns Fund EURFund receives Interest 1.0 x IXRTR + 0.0bps; and pays USD LIBOR 1 Month US0001M + 23.0bps Morgan Stanley 25/11/2016 156,656,482 USD 108,632Fund receives Interest 1.0 x IXRTR + 0.0bps; and pays USD LIBOR 1 Month US0001M + 26.0bps Goldman Sachs 23/11/2016 61,268 USD 43
Total unrealised gain on total return swaps 108,675
Fund pays Interest 1.0 x IXYTR + 0.0bps; and receives USD LIBOR 1 Month US0001M + 13.0bps Morgan Stanley 25/11/2016 144,111,285 USD (1,281,003)
Total unrealised loss on total return swap (1,281,003)
Total net unrealised loss on total return swaps (1,172,328)
18. Options
Invesco Pan European Small Cap Equity Fund
Options as at 29 February 2016Expiration Number of Security Description (including Put/ Currency Commitment UnrealisedDate contracts Call indication and Strike Price) in local Gain/(Loss)
Ccy in sub-fundBase Ccy
EURPurchased Put Options
15/04/2016 425 Dax Index Put Option strike price EUR 8,750 EUR – 311,738
Total Purchased Put Options 311,738
Net Total Options 311,738
Notes to the Financial Statements (continued)
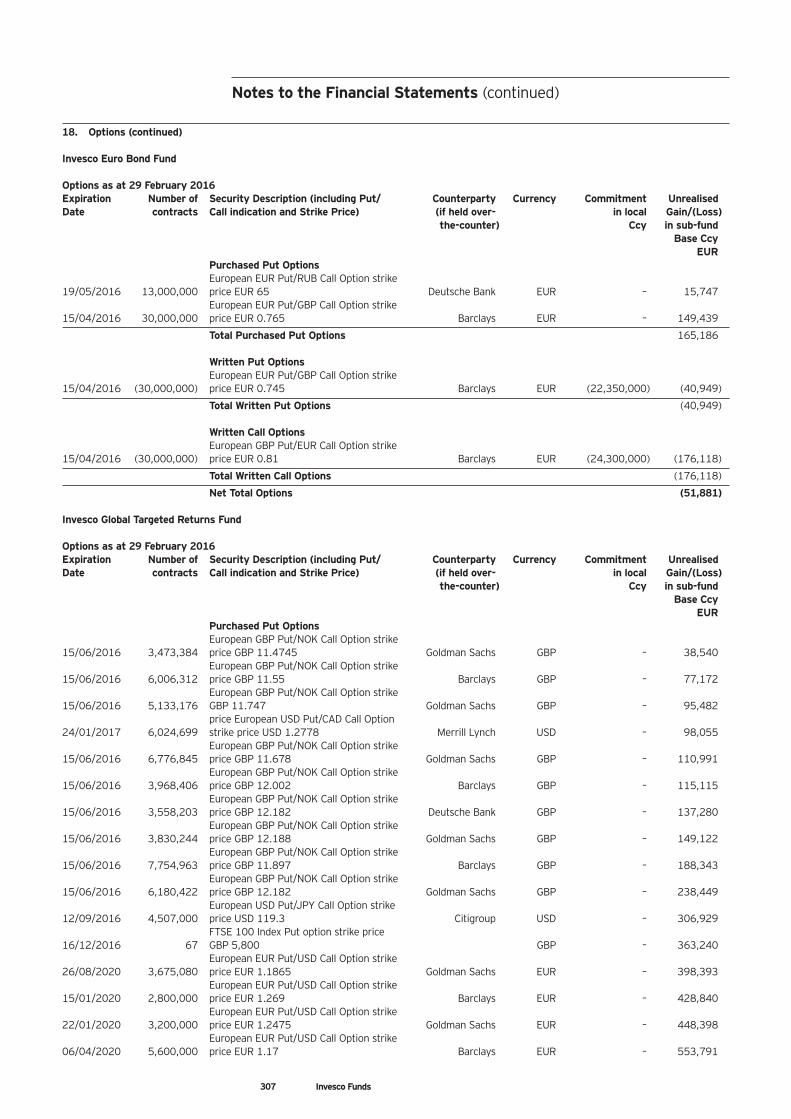
307 Invesco Funds
18. Options (continued)
Invesco Euro Bond Fund
Options as at 29 February 2016Expiration Number of Security Description (including Put/ Counterparty Currency Commitment UnrealisedDate contracts Call indication and Strike Price) (if held over- in local Gain/(Loss)
the-counter) Ccy in sub-fundBase Ccy
EURPurchased Put OptionsEuropean EUR Put/RUB Call Option strike
19/05/2016 13,000,000 price EUR 65 Deutsche Bank EUR – 15,747European EUR Put/GBP Call Option strike
15/04/2016 30,000,000 price EUR 0.765 Barclays EUR – 149,439
Total Purchased Put Options 165,186
Written Put OptionsEuropean EUR Put/GBP Call Option strike
15/04/2016 (30,000,000) price EUR 0.745 Barclays EUR (22,350,000) (40,949)
Total Written Put Options (40,949)
Written Call OptionsEuropean GBP Put/EUR Call Option strike
15/04/2016 (30,000,000) price EUR 0.81 Barclays EUR (24,300,000) (176,118)
Total Written Call Options (176,118)
Net Total Options (51,881)
Invesco Global Targeted Returns Fund
Options as at 29 February 2016Expiration Number of Security Description (including Put/ Counterparty Currency Commitment UnrealisedDate contracts Call indication and Strike Price) (if held over- in local Gain/(Loss)
the-counter) Ccy in sub-fundBase Ccy
EURPurchased Put OptionsEuropean GBP Put/NOK Call Option strike
15/06/2016 3,473,384 price GBP 11.4745 Goldman Sachs GBP – 38,540European GBP Put/NOK Call Option strike
15/06/2016 6,006,312 price GBP 11.55 Barclays GBP – 77,172European GBP Put/NOK Call Option strike
15/06/2016 5,133,176 GBP 11.747 Goldman Sachs GBP – 95,482price European USD Put/CAD Call Option
24/01/2017 6,024,699 strike price USD 1.2778 Merrill Lynch USD – 98,055European GBP Put/NOK Call Option strike
15/06/2016 6,776,845 price GBP 11.678 Goldman Sachs GBP – 110,991European GBP Put/NOK Call Option strike
15/06/2016 3,968,406 price GBP 12.002 Barclays GBP – 115,115European GBP Put/NOK Call Option strike
15/06/2016 3,558,203 price GBP 12.182 Deutsche Bank GBP – 137,280European GBP Put/NOK Call Option strike
15/06/2016 3,830,244 price GBP 12.188 Goldman Sachs GBP – 149,122European GBP Put/NOK Call Option strike
15/06/2016 7,754,963 price GBP 11.897 Barclays GBP – 188,343European GBP Put/NOK Call Option strike
15/06/2016 6,180,422 price GBP 12.182 Goldman Sachs GBP – 238,449European USD Put/JPY Call Option strike
12/09/2016 4,507,000 price USD 119.3 Citigroup USD – 306,929FTSE 100 Index Put option strike price
16/12/2016 67 GBP 5,800 GBP – 363,240European EUR Put/USD Call Option strike
26/08/2020 3,675,080 price EUR 1.1865 Goldman Sachs EUR – 398,393European EUR Put/USD Call Option strike
15/01/2020 2,800,000 price EUR 1.269 Barclays EUR – 428,840European EUR Put/USD Call Option strike
22/01/2020 3,200,000 price EUR 1.2475 Goldman Sachs EUR – 448,398European EUR Put/USD Call Option strike
06/04/2020 5,600,000 price EUR 1.17 Barclays EUR – 553,791
Notes to the Financial Statements (continued)
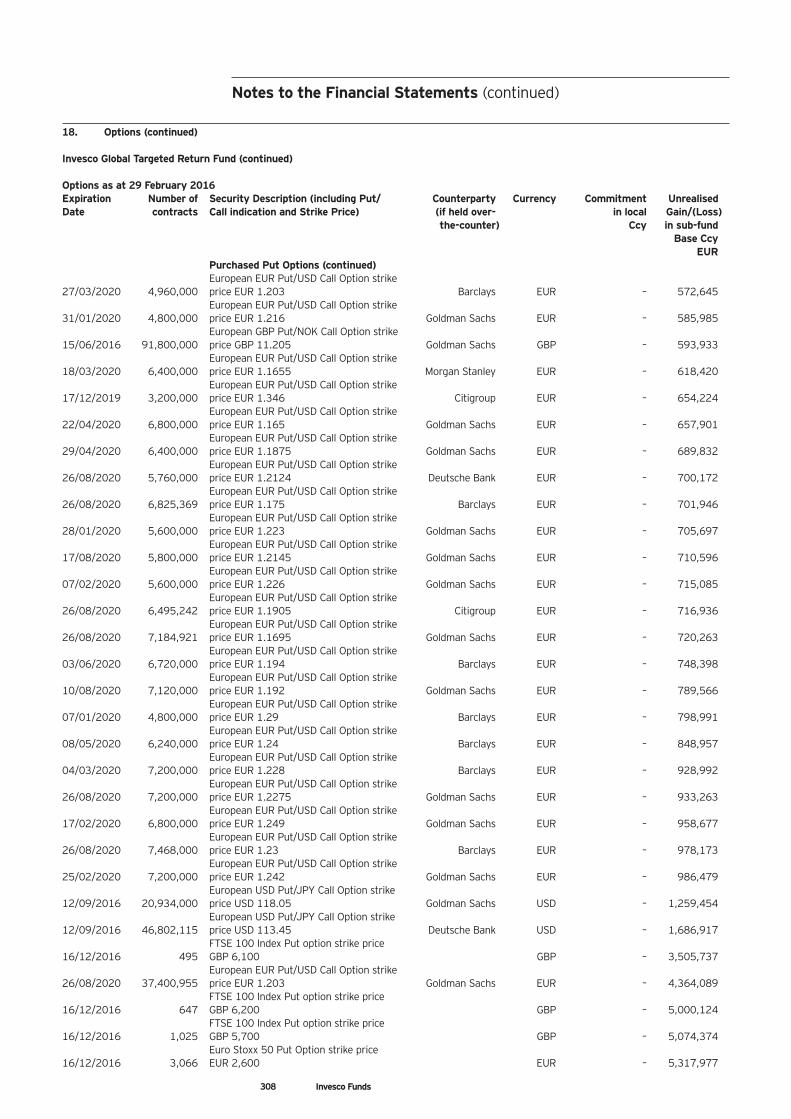
308 Invesco Funds
18. Options (continued)
Invesco Global Targeted Return Fund (continued)
Options as at 29 February 2016Expiration Number of Security Description (including Put/ Counterparty Currency Commitment UnrealisedDate contracts Call indication and Strike Price) (if held over- in local Gain/(Loss)
the-counter) Ccy in sub-fundBase Ccy
EURPurchased Put Options (continued)European EUR Put/USD Call Option strike
27/03/2020 4,960,000 price EUR 1.203 Barclays EUR – 572,645European EUR Put/USD Call Option strike
31/01/2020 4,800,000 price EUR 1.216 Goldman Sachs EUR – 585,985European GBP Put/NOK Call Option strike
15/06/2016 91,800,000 price GBP 11.205 Goldman Sachs GBP – 593,933European EUR Put/USD Call Option strike
18/03/2020 6,400,000 price EUR 1.1655 Morgan Stanley EUR – 618,420European EUR Put/USD Call Option strike
17/12/2019 3,200,000 price EUR 1.346 Citigroup EUR – 654,224European EUR Put/USD Call Option strike
22/04/2020 6,800,000 price EUR 1.165 Goldman Sachs EUR – 657,901European EUR Put/USD Call Option strike
29/04/2020 6,400,000 price EUR 1.1875 Goldman Sachs EUR – 689,832European EUR Put/USD Call Option strike
26/08/2020 5,760,000 price EUR 1.2124 Deutsche Bank EUR – 700,172European EUR Put/USD Call Option strike
26/08/2020 6,825,369 price EUR 1.175 Barclays EUR – 701,946European EUR Put/USD Call Option strike
28/01/2020 5,600,000 price EUR 1.223 Goldman Sachs EUR – 705,697European EUR Put/USD Call Option strike
17/08/2020 5,800,000 price EUR 1.2145 Goldman Sachs EUR – 710,596European EUR Put/USD Call Option strike
07/02/2020 5,600,000 price EUR 1.226 Goldman Sachs EUR – 715,085European EUR Put/USD Call Option strike
26/08/2020 6,495,242 price EUR 1.1905 Citigroup EUR – 716,936European EUR Put/USD Call Option strike
26/08/2020 7,184,921 price EUR 1.1695 Goldman Sachs EUR – 720,263European EUR Put/USD Call Option strike
03/06/2020 6,720,000 price EUR 1.194 Barclays EUR – 748,398European EUR Put/USD Call Option strike
10/08/2020 7,120,000 price EUR 1.192 Goldman Sachs EUR – 789,566European EUR Put/USD Call Option strike
07/01/2020 4,800,000 price EUR 1.29 Barclays EUR – 798,991European EUR Put/USD Call Option strike
08/05/2020 6,240,000 price EUR 1.24 Barclays EUR – 848,957European EUR Put/USD Call Option strike
04/03/2020 7,200,000 price EUR 1.228 Barclays EUR – 928,992European EUR Put/USD Call Option strike
26/08/2020 7,200,000 price EUR 1.2275 Goldman Sachs EUR – 933,263European EUR Put/USD Call Option strike
17/02/2020 6,800,000 price EUR 1.249 Goldman Sachs EUR – 958,677European EUR Put/USD Call Option strike
26/08/2020 7,468,000 price EUR 1.23 Barclays EUR – 978,173European EUR Put/USD Call Option strike
25/02/2020 7,200,000 price EUR 1.242 Goldman Sachs EUR – 986,479European USD Put/JPY Call Option strike
12/09/2016 20,934,000 price USD 118.05 Goldman Sachs USD – 1,259,454European USD Put/JPY Call Option strike
12/09/2016 46,802,115 price USD 113.45 Deutsche Bank USD – 1,686,917FTSE 100 Index Put option strike price
16/12/2016 495 GBP 6,100 GBP – 3,505,737European EUR Put/USD Call Option strike
26/08/2020 37,400,955 price EUR 1.203 Goldman Sachs EUR – 4,364,089FTSE 100 Index Put option strike price
16/12/2016 647 GBP 6,200 GBP – 5,000,124FTSE 100 Index Put option strike price
16/12/2016 1,025 GBP 5,700 GBP – 5,074,374Euro Stoxx 50 Put Option strike price
16/12/2016 3,066 EUR 2,600 EUR – 5,317,977
Notes to the Financial Statements (continued)
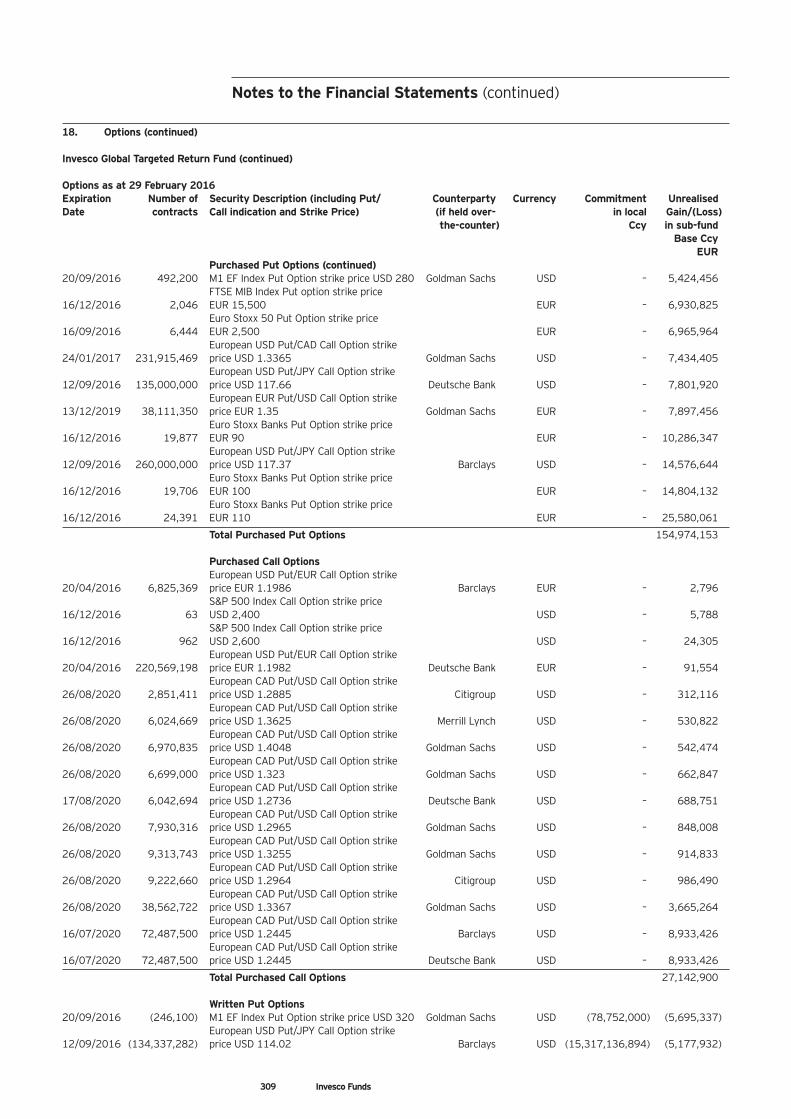
309 Invesco Funds
18. Options (continued)
Invesco Global Targeted Return Fund (continued)
Options as at 29 February 2016Expiration Number of Security Description (including Put/ Counterparty Currency Commitment UnrealisedDate contracts Call indication and Strike Price) (if held over- in local Gain/(Loss)
the-counter) Ccy in sub-fundBase Ccy
EURPurchased Put Options (continued)
20/09/2016 492,200 M1 EF Index Put Option strike price USD 280 Goldman Sachs USD – 5,424,456FTSE MIB Index Put option strike price
16/12/2016 2,046 EUR 15,500 EUR – 6,930,825Euro Stoxx 50 Put Option strike price
16/09/2016 6,444 EUR 2,500 EUR – 6,965,964European USD Put/CAD Call Option strike
24/01/2017 231,915,469 price USD 1.3365 Goldman Sachs USD – 7,434,405European USD Put/JPY Call Option strike
12/09/2016 135,000,000 price USD 117.66 Deutsche Bank USD – 7,801,920European EUR Put/USD Call Option strike
13/12/2019 38,111,350 price EUR 1.35 Goldman Sachs EUR – 7,897,456Euro Stoxx Banks Put Option strike price
16/12/2016 19,877 EUR 90 EUR – 10,286,347European USD Put/JPY Call Option strike
12/09/2016 260,000,000 price USD 117.37 Barclays USD – 14,576,644Euro Stoxx Banks Put Option strike price
16/12/2016 19,706 EUR 100 EUR – 14,804,132Euro Stoxx Banks Put Option strike price
16/12/2016 24,391 EUR 110 EUR – 25,580,061
Total Purchased Put Options 154,974,153
Purchased Call OptionsEuropean USD Put/EUR Call Option strike
20/04/2016 6,825,369 price EUR 1.1986 Barclays EUR – 2,796S&P 500 Index Call Option strike price
16/12/2016 63 USD 2,400 USD – 5,788S&P 500 Index Call Option strike price
16/12/2016 962 USD 2,600 USD – 24,305European USD Put/EUR Call Option strike
20/04/2016 220,569,198 price EUR 1.1982 Deutsche Bank EUR – 91,554European CAD Put/USD Call Option strike
26/08/2020 2,851,411 price USD 1.2885 Citigroup USD – 312,116European CAD Put/USD Call Option strike
26/08/2020 6,024,669 price USD 1.3625 Merrill Lynch USD – 530,822European CAD Put/USD Call Option strike
26/08/2020 6,970,835 price USD 1.4048 Goldman Sachs USD – 542,474European CAD Put/USD Call Option strike
26/08/2020 6,699,000 price USD 1.323 Goldman Sachs USD – 662,847European CAD Put/USD Call Option strike
17/08/2020 6,042,694 price USD 1.2736 Deutsche Bank USD – 688,751European CAD Put/USD Call Option strike
26/08/2020 7,930,316 price USD 1.2965 Goldman Sachs USD – 848,008European CAD Put/USD Call Option strike
26/08/2020 9,313,743 price USD 1.3255 Goldman Sachs USD – 914,833European CAD Put/USD Call Option strike
26/08/2020 9,222,660 price USD 1.2964 Citigroup USD – 986,490European CAD Put/USD Call Option strike
26/08/2020 38,562,722 price USD 1.3367 Goldman Sachs USD – 3,665,264European CAD Put/USD Call Option strike
16/07/2020 72,487,500 price USD 1.2445 Barclays USD – 8,933,426European CAD Put/USD Call Option strike
16/07/2020 72,487,500 price USD 1.2445 Deutsche Bank USD – 8,933,426
Total Purchased Call Options 27,142,900
Written Put Options20/09/2016 (246,100) M1 EF Index Put Option strike price USD 320 Goldman Sachs USD (78,752,000) (5,695,337)
European USD Put/JPY Call Option strike 12/09/2016 (134,337,282) price USD 114.02 Barclays USD (15,317,136,894) (5,177,932)
Notes to the Financial Statements (continued)
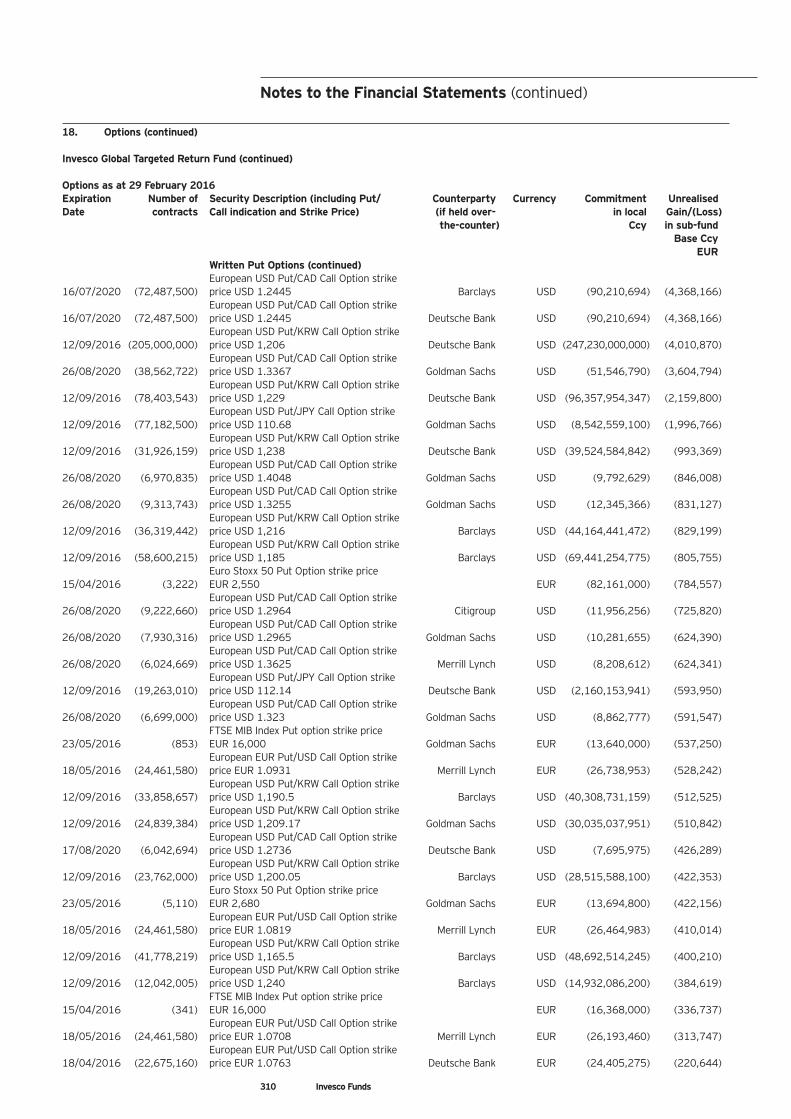
310 Invesco Funds
18. Options (continued)
Invesco Global Targeted Return Fund (continued)
Options as at 29 February 2016Expiration Number of Security Description (including Put/ Counterparty Currency Commitment UnrealisedDate contracts Call indication and Strike Price) (if held over- in local Gain/(Loss)
the-counter) Ccy in sub-fundBase Ccy
EURWritten Put Options (continued)European USD Put/CAD Call Option strike
16/07/2020 (72,487,500) price USD 1.2445 Barclays USD (90,210,694) (4,368,166)European USD Put/CAD Call Option strike
16/07/2020 (72,487,500) price USD 1.2445 Deutsche Bank USD (90,210,694) (4,368,166)European USD Put/KRW Call Option strike
12/09/2016 (205,000,000) price USD 1,206 Deutsche Bank USD (247,230,000,000) (4,010,870)European USD Put/CAD Call Option strike
26/08/2020 (38,562,722) price USD 1.3367 Goldman Sachs USD (51,546,790) (3,604,794)European USD Put/KRW Call Option strike
12/09/2016 (78,403,543) price USD 1,229 Deutsche Bank USD (96,357,954,347) (2,159,800)European USD Put/JPY Call Option strike
12/09/2016 (77,182,500) price USD 110.68 Goldman Sachs USD (8,542,559,100) (1,996,766)European USD Put/KRW Call Option strike
12/09/2016 (31,926,159) price USD 1,238 Deutsche Bank USD (39,524,584,842) (993,369)European USD Put/CAD Call Option strike
26/08/2020 (6,970,835) price USD 1.4048 Goldman Sachs USD (9,792,629) (846,008)European USD Put/CAD Call Option strike
26/08/2020 (9,313,743) price USD 1.3255 Goldman Sachs USD (12,345,366) (831,127)European USD Put/KRW Call Option strike
12/09/2016 (36,319,442) price USD 1,216 Barclays USD (44,164,441,472) (829,199)European USD Put/KRW Call Option strike
12/09/2016 (58,600,215) price USD 1,185 Barclays USD (69,441,254,775) (805,755)Euro Stoxx 50 Put Option strike price
15/04/2016 (3,222) EUR 2,550 EUR (82,161,000) (784,557)European USD Put/CAD Call Option strike
26/08/2020 (9,222,660) price USD 1.2964 Citigroup USD (11,956,256) (725,820)European USD Put/CAD Call Option strike
26/08/2020 (7,930,316) price USD 1.2965 Goldman Sachs USD (10,281,655) (624,390)European USD Put/CAD Call Option strike
26/08/2020 (6,024,669) price USD 1.3625 Merrill Lynch USD (8,208,612) (624,341)European USD Put/JPY Call Option strike
12/09/2016 (19,263,010) price USD 112.14 Deutsche Bank USD (2,160,153,941) (593,950)European USD Put/CAD Call Option strike
26/08/2020 (6,699,000) price USD 1.323 Goldman Sachs USD (8,862,777) (591,547)FTSE MIB Index Put option strike price
23/05/2016 (853) EUR 16,000 Goldman Sachs EUR (13,640,000) (537,250)European EUR Put/USD Call Option strike
18/05/2016 (24,461,580) price EUR 1.0931 Merrill Lynch EUR (26,738,953) (528,242)European USD Put/KRW Call Option strike
12/09/2016 (33,858,657) price USD 1,190.5 Barclays USD (40,308,731,159) (512,525)European USD Put/KRW Call Option strike
12/09/2016 (24,839,384) price USD 1,209.17 Goldman Sachs USD (30,035,037,951) (510,842)European USD Put/CAD Call Option strike
17/08/2020 (6,042,694) price USD 1.2736 Deutsche Bank USD (7,695,975) (426,289)European USD Put/KRW Call Option strike
12/09/2016 (23,762,000) price USD 1,200.05 Barclays USD (28,515,588,100) (422,353)Euro Stoxx 50 Put Option strike price
23/05/2016 (5,110) EUR 2,680 Goldman Sachs EUR (13,694,800) (422,156)European EUR Put/USD Call Option strike
18/05/2016 (24,461,580) price EUR 1.0819 Merrill Lynch EUR (26,464,983) (410,014)European USD Put/KRW Call Option strike
12/09/2016 (41,778,219) price USD 1,165.5 Barclays USD (48,692,514,245) (400,210)European USD Put/KRW Call Option strike
12/09/2016 (12,042,005) price USD 1,240 Barclays USD (14,932,086,200) (384,619)FTSE MIB Index Put option strike price
15/04/2016 (341) EUR 16,000 EUR (16,368,000) (336,737)European EUR Put/USD Call Option strike
18/05/2016 (24,461,580) price EUR 1.0708 Merrill Lynch EUR (26,193,460) (313,747)European EUR Put/USD Call Option strike
18/04/2016 (22,675,160) price EUR 1.0763 Deutsche Bank EUR (24,405,275) (220,644)
Notes to the Financial Statements (continued)
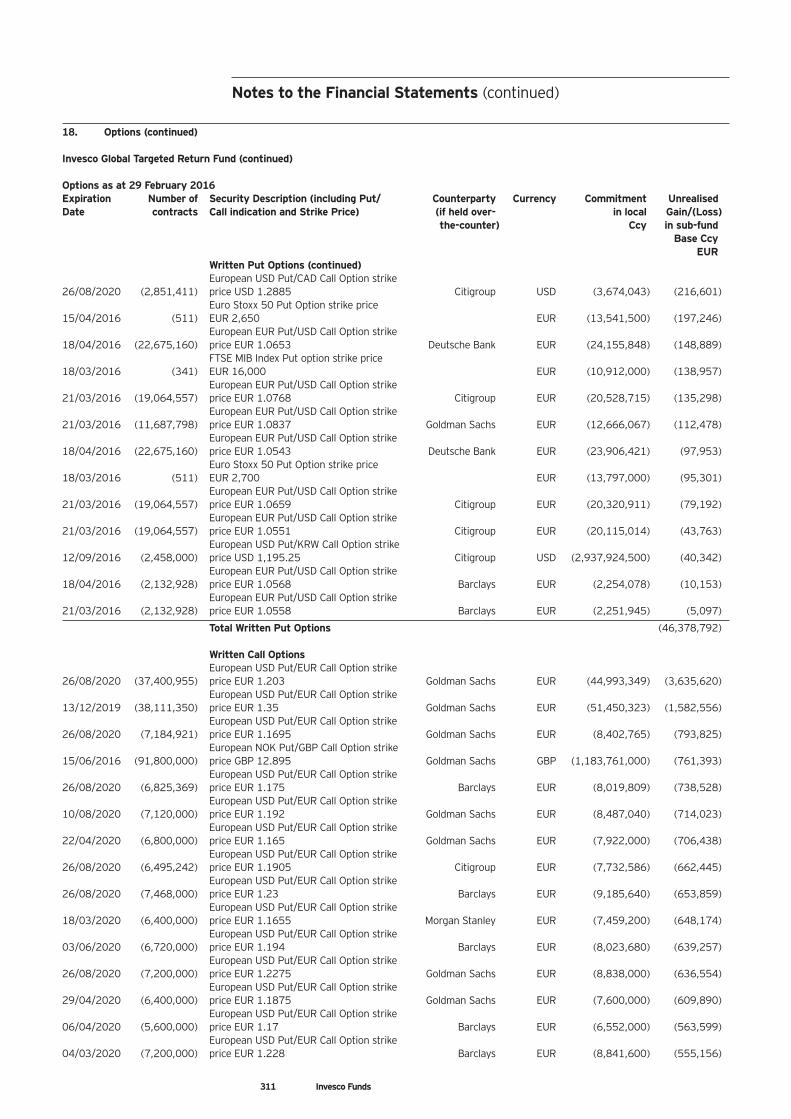
311 Invesco Funds
18. Options (continued)
Invesco Global Targeted Return Fund (continued)
Options as at 29 February 2016Expiration Number of Security Description (including Put/ Counterparty Currency Commitment UnrealisedDate contracts Call indication and Strike Price) (if held over- in local Gain/(Loss)
the-counter) Ccy in sub-fundBase Ccy
EURWritten Put Options (continued)European USD Put/CAD Call Option strike
26/08/2020 (2,851,411) price USD 1.2885 Citigroup USD (3,674,043) (216,601)Euro Stoxx 50 Put Option strike price
15/04/2016 (511) EUR 2,650 EUR (13,541,500) (197,246)European EUR Put/USD Call Option strike
18/04/2016 (22,675,160) price EUR 1.0653 Deutsche Bank EUR (24,155,848) (148,889)FTSE MIB Index Put option strike price
18/03/2016 (341) EUR 16,000 EUR (10,912,000) (138,957)European EUR Put/USD Call Option strike
21/03/2016 (19,064,557) price EUR 1.0768 Citigroup EUR (20,528,715) (135,298)European EUR Put/USD Call Option strike
21/03/2016 (11,687,798) price EUR 1.0837 Goldman Sachs EUR (12,666,067) (112,478)European EUR Put/USD Call Option strike
18/04/2016 (22,675,160) price EUR 1.0543 Deutsche Bank EUR (23,906,421) (97,953)Euro Stoxx 50 Put Option strike price
18/03/2016 (511) EUR 2,700 EUR (13,797,000) (95,301)European EUR Put/USD Call Option strike
21/03/2016 (19,064,557) price EUR 1.0659 Citigroup EUR (20,320,911) (79,192)European EUR Put/USD Call Option strike
21/03/2016 (19,064,557) price EUR 1.0551 Citigroup EUR (20,115,014) (43,763)European USD Put/KRW Call Option strike
12/09/2016 (2,458,000) price USD 1,195.25 Citigroup USD (2,937,924,500) (40,342)European EUR Put/USD Call Option strike
18/04/2016 (2,132,928) price EUR 1.0568 Barclays EUR (2,254,078) (10,153)European EUR Put/USD Call Option strike
21/03/2016 (2,132,928) price EUR 1.0558 Barclays EUR (2,251,945) (5,097)
Total Written Put Options (46,378,792)
Written Call OptionsEuropean USD Put/EUR Call Option strike
26/08/2020 (37,400,955) price EUR 1.203 Goldman Sachs EUR (44,993,349) (3,635,620)European USD Put/EUR Call Option strike
13/12/2019 (38,111,350) price EUR 1.35 Goldman Sachs EUR (51,450,323) (1,582,556)European USD Put/EUR Call Option strike
26/08/2020 (7,184,921) price EUR 1.1695 Goldman Sachs EUR (8,402,765) (793,825)European NOK Put/GBP Call Option strike
15/06/2016 (91,800,000) price GBP 12.895 Goldman Sachs GBP (1,183,761,000) (761,393)European USD Put/EUR Call Option strike
26/08/2020 (6,825,369) price EUR 1.175 Barclays EUR (8,019,809) (738,528)European USD Put/EUR Call Option strike
10/08/2020 (7,120,000) price EUR 1.192 Goldman Sachs EUR (8,487,040) (714,023)European USD Put/EUR Call Option strike
22/04/2020 (6,800,000) price EUR 1.165 Goldman Sachs EUR (7,922,000) (706,438)European USD Put/EUR Call Option strike
26/08/2020 (6,495,242) price EUR 1.1905 Citigroup EUR (7,732,586) (662,445)European USD Put/EUR Call Option strike
26/08/2020 (7,468,000) price EUR 1.23 Barclays EUR (9,185,640) (653,859)European USD Put/EUR Call Option strike
18/03/2020 (6,400,000) price EUR 1.1655 Morgan Stanley EUR (7,459,200) (648,174)European USD Put/EUR Call Option strike
03/06/2020 (6,720,000) price EUR 1.194 Barclays EUR (8,023,680) (639,257)European USD Put/EUR Call Option strike
26/08/2020 (7,200,000) price EUR 1.2275 Goldman Sachs EUR (8,838,000) (636,554)European USD Put/EUR Call Option strike
29/04/2020 (6,400,000) price EUR 1.1875 Goldman Sachs EUR (7,600,000) (609,890)European USD Put/EUR Call Option strike
06/04/2020 (5,600,000) price EUR 1.17 Barclays EUR (6,552,000) (563,599)European USD Put/EUR Call Option strike
04/03/2020 (7,200,000) price EUR 1.228 Barclays EUR (8,841,600) (555,156)
Notes to the Financial Statements (continued)
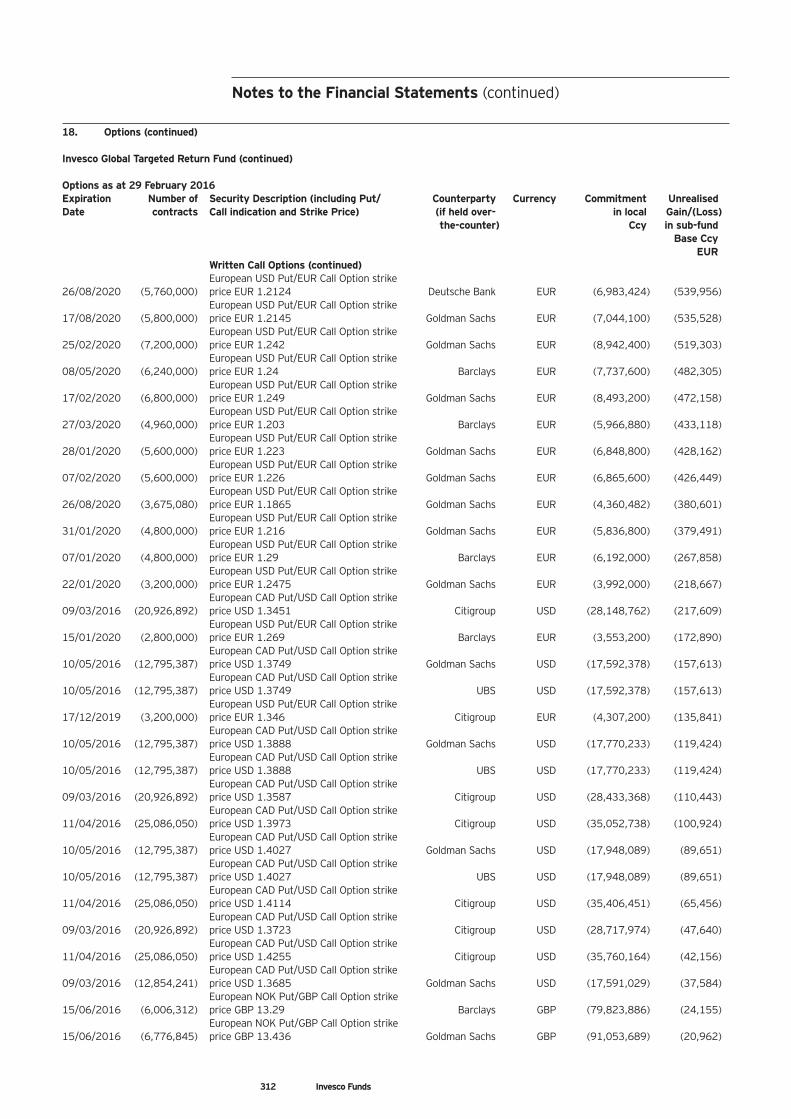
312 Invesco Funds
18. Options (continued)
Invesco Global Targeted Return Fund (continued)
Options as at 29 February 2016Expiration Number of Security Description (including Put/ Counterparty Currency Commitment UnrealisedDate contracts Call indication and Strike Price) (if held over- in local Gain/(Loss)
the-counter) Ccy in sub-fundBase Ccy
EURWritten Call Options (continued)European USD Put/EUR Call Option strike
26/08/2020 (5,760,000) price EUR 1.2124 Deutsche Bank EUR (6,983,424) (539,956)European USD Put/EUR Call Option strike
17/08/2020 (5,800,000) price EUR 1.2145 Goldman Sachs EUR (7,044,100) (535,528)European USD Put/EUR Call Option strike
25/02/2020 (7,200,000) price EUR 1.242 Goldman Sachs EUR (8,942,400) (519,303)European USD Put/EUR Call Option strike
08/05/2020 (6,240,000) price EUR 1.24 Barclays EUR (7,737,600) (482,305)European USD Put/EUR Call Option strike
17/02/2020 (6,800,000) price EUR 1.249 Goldman Sachs EUR (8,493,200) (472,158)European USD Put/EUR Call Option strike
27/03/2020 (4,960,000) price EUR 1.203 Barclays EUR (5,966,880) (433,118)European USD Put/EUR Call Option strike
28/01/2020 (5,600,000) price EUR 1.223 Goldman Sachs EUR (6,848,800) (428,162)European USD Put/EUR Call Option strike
07/02/2020 (5,600,000) price EUR 1.226 Goldman Sachs EUR (6,865,600) (426,449)European USD Put/EUR Call Option strike
26/08/2020 (3,675,080) price EUR 1.1865 Goldman Sachs EUR (4,360,482) (380,601)European USD Put/EUR Call Option strike
31/01/2020 (4,800,000) price EUR 1.216 Goldman Sachs EUR (5,836,800) (379,491)European USD Put/EUR Call Option strike
07/01/2020 (4,800,000) price EUR 1.29 Barclays EUR (6,192,000) (267,858)European USD Put/EUR Call Option strike
22/01/2020 (3,200,000) price EUR 1.2475 Goldman Sachs EUR (3,992,000) (218,667)European CAD Put/USD Call Option strike
09/03/2016 (20,926,892) price USD 1.3451 Citigroup USD (28,148,762) (217,609)European USD Put/EUR Call Option strike
15/01/2020 (2,800,000) price EUR 1.269 Barclays EUR (3,553,200) (172,890)European CAD Put/USD Call Option strike
10/05/2016 (12,795,387) price USD 1.3749 Goldman Sachs USD (17,592,378) (157,613)European CAD Put/USD Call Option strike
10/05/2016 (12,795,387) price USD 1.3749 UBS USD (17,592,378) (157,613)European USD Put/EUR Call Option strike
17/12/2019 (3,200,000) price EUR 1.346 Citigroup EUR (4,307,200) (135,841)European CAD Put/USD Call Option strike
10/05/2016 (12,795,387) price USD 1.3888 Goldman Sachs USD (17,770,233) (119,424)European CAD Put/USD Call Option strike
10/05/2016 (12,795,387) price USD 1.3888 UBS USD (17,770,233) (119,424)European CAD Put/USD Call Option strike
09/03/2016 (20,926,892) price USD 1.3587 Citigroup USD (28,433,368) (110,443)European CAD Put/USD Call Option strike
11/04/2016 (25,086,050) price USD 1.3973 Citigroup USD (35,052,738) (100,924)European CAD Put/USD Call Option strike
10/05/2016 (12,795,387) price USD 1.4027 Goldman Sachs USD (17,948,089) (89,651)European CAD Put/USD Call Option strike
10/05/2016 (12,795,387) price USD 1.4027 UBS USD (17,948,089) (89,651)European CAD Put/USD Call Option strike
11/04/2016 (25,086,050) price USD 1.4114 Citigroup USD (35,406,451) (65,456)European CAD Put/USD Call Option strike
09/03/2016 (20,926,892) price USD 1.3723 Citigroup USD (28,717,974) (47,640)European CAD Put/USD Call Option strike
11/04/2016 (25,086,050) price USD 1.4255 Citigroup USD (35,760,164) (42,156)European CAD Put/USD Call Option strike
09/03/2016 (12,854,241) price USD 1.3685 Goldman Sachs USD (17,591,029) (37,584)European NOK Put/GBP Call Option strike
15/06/2016 (6,006,312) price GBP 13.29 Barclays GBP (79,823,886) (24,155)European NOK Put/GBP Call Option strike
15/06/2016 (6,776,845) price GBP 13.436 Goldman Sachs GBP (91,053,689) (20,962)
Notes to the Financial Statements (continued)
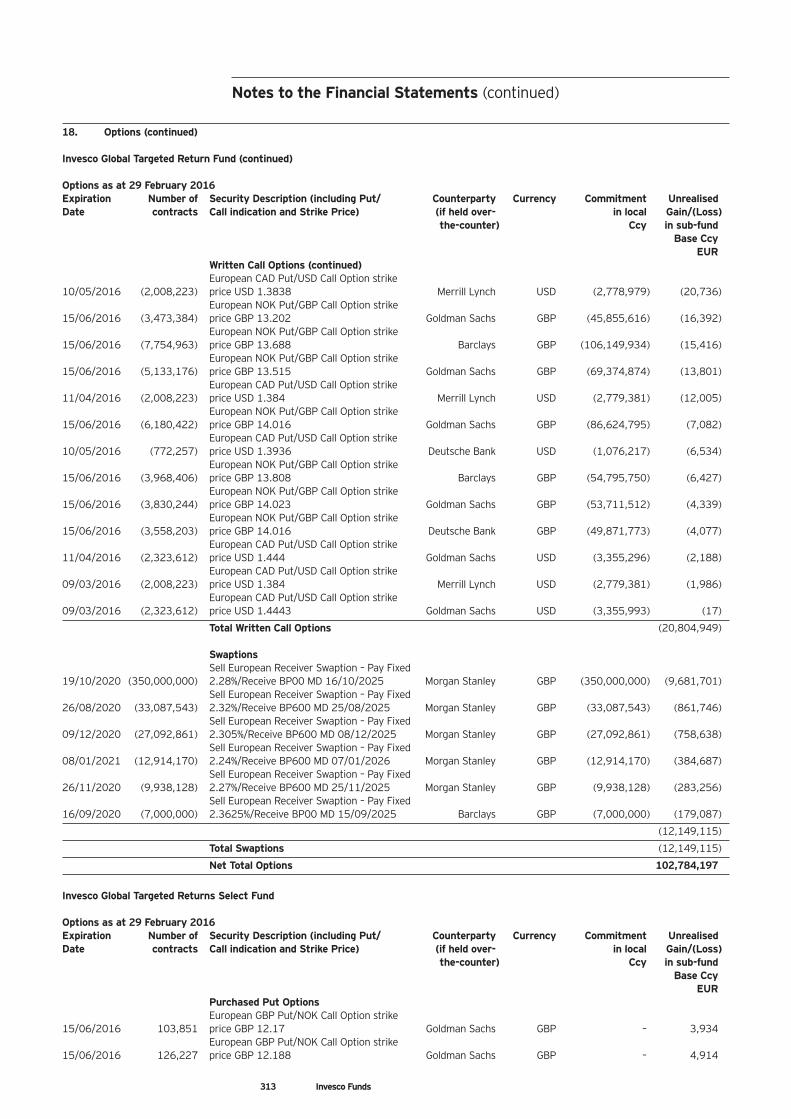
313 Invesco Funds
18. Options (continued)
Invesco Global Targeted Return Fund (continued)
Options as at 29 February 2016Expiration Number of Security Description (including Put/ Counterparty Currency Commitment UnrealisedDate contracts Call indication and Strike Price) (if held over- in local Gain/(Loss)
the-counter) Ccy in sub-fundBase Ccy
EURWritten Call Options (continued)European CAD Put/USD Call Option strike
10/05/2016 (2,008,223) price USD 1.3838 Merrill Lynch USD (2,778,979) (20,736)European NOK Put/GBP Call Option strike
15/06/2016 (3,473,384) price GBP 13.202 Goldman Sachs GBP (45,855,616) (16,392)European NOK Put/GBP Call Option strike
15/06/2016 (7,754,963) price GBP 13.688 Barclays GBP (106,149,934) (15,416)European NOK Put/GBP Call Option strike
15/06/2016 (5,133,176) price GBP 13.515 Goldman Sachs GBP (69,374,874) (13,801)European CAD Put/USD Call Option strike
11/04/2016 (2,008,223) price USD 1.384 Merrill Lynch USD (2,779,381) (12,005)European NOK Put/GBP Call Option strike
15/06/2016 (6,180,422) price GBP 14.016 Goldman Sachs GBP (86,624,795) (7,082)European CAD Put/USD Call Option strike
10/05/2016 (772,257) price USD 1.3936 Deutsche Bank USD (1,076,217) (6,534)European NOK Put/GBP Call Option strike
15/06/2016 (3,968,406) price GBP 13.808 Barclays GBP (54,795,750) (6,427)European NOK Put/GBP Call Option strike
15/06/2016 (3,830,244) price GBP 14.023 Goldman Sachs GBP (53,711,512) (4,339)European NOK Put/GBP Call Option strike
15/06/2016 (3,558,203) price GBP 14.016 Deutsche Bank GBP (49,871,773) (4,077)European CAD Put/USD Call Option strike
11/04/2016 (2,323,612) price USD 1.444 Goldman Sachs USD (3,355,296) (2,188)European CAD Put/USD Call Option strike
09/03/2016 (2,008,223) price USD 1.384 Merrill Lynch USD (2,779,381) (1,986)European CAD Put/USD Call Option strike
09/03/2016 (2,323,612) price USD 1.4443 Goldman Sachs USD (3,355,993) (17)
Total Written Call Options (20,804,949)
SwaptionsSell European Receiver Swaption – Pay Fixed
19/10/2020 (350,000,000) 2.28%/Receive BP00 MD 16/10/2025 Morgan Stanley GBP (350,000,000) (9,681,701)Sell European Receiver Swaption – Pay Fixed
26/08/2020 (33,087,543) 2.32%/Receive BP600 MD 25/08/2025 Morgan Stanley GBP (33,087,543) (861,746)Sell European Receiver Swaption – Pay Fixed
09/12/2020 (27,092,861) 2.305%/Receive BP600 MD 08/12/2025 Morgan Stanley GBP (27,092,861) (758,638)Sell European Receiver Swaption – Pay Fixed
08/01/2021 (12,914,170) 2.24%/Receive BP600 MD 07/01/2026 Morgan Stanley GBP (12,914,170) (384,687)Sell European Receiver Swaption – Pay Fixed
26/11/2020 (9,938,128) 2.27%/Receive BP600 MD 25/11/2025 Morgan Stanley GBP (9,938,128) (283,256)Sell European Receiver Swaption – Pay Fixed
16/09/2020 (7,000,000) 2.3625%/Receive BP00 MD 15/09/2025 Barclays GBP (7,000,000) (179,087)
(12,149,115)
Total Swaptions (12,149,115)
Net Total Options 102,784,197
Invesco Global Targeted Returns Select Fund
Options as at 29 February 2016Expiration Number of Security Description (including Put/ Counterparty Currency Commitment UnrealisedDate contracts Call indication and Strike Price) (if held over- in local Gain/(Loss)
the-counter) Ccy in sub-fundBase Ccy
EURPurchased Put OptionsEuropean GBP Put/NOK Call Option strike
15/06/2016 103,851 price GBP 12.17 Goldman Sachs GBP – 3,934European GBP Put/NOK Call Option strike
15/06/2016 126,227 price GBP 12.188 Goldman Sachs GBP – 4,914
Notes to the Financial Statements (continued)
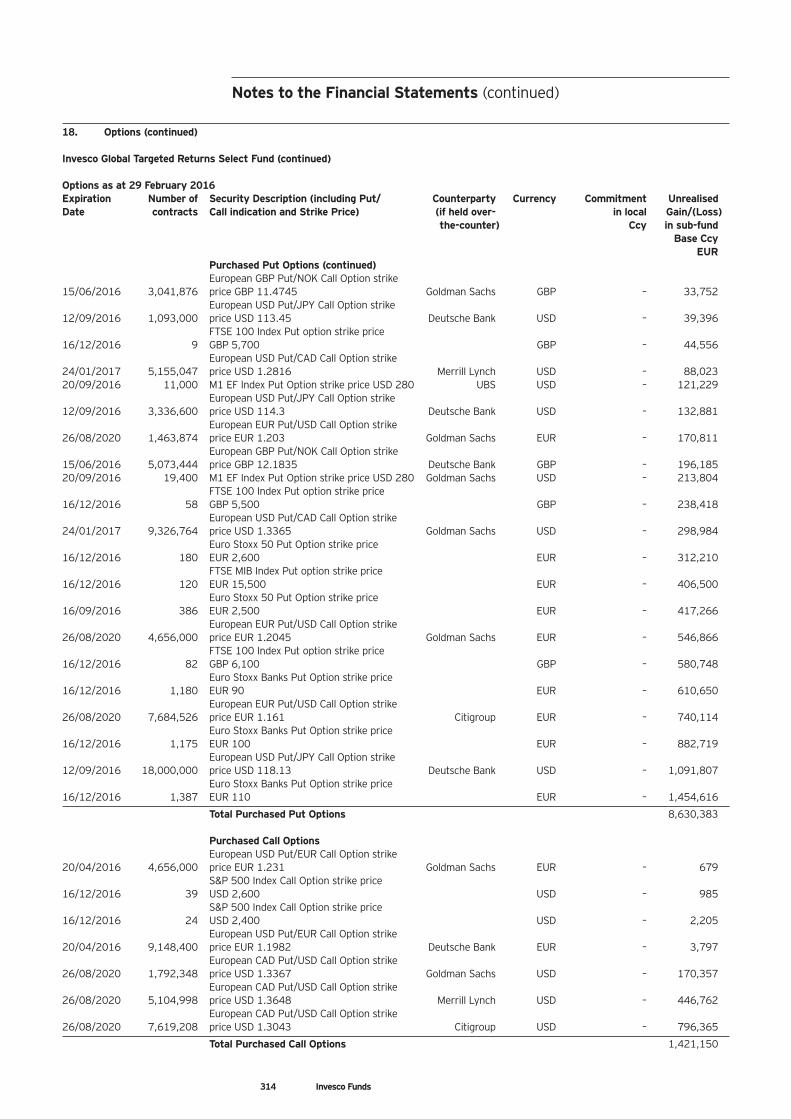
314 Invesco Funds
18. Options (continued)
Invesco Global Targeted Returns Select Fund (continued)
Options as at 29 February 2016Expiration Number of Security Description (including Put/ Counterparty Currency Commitment UnrealisedDate contracts Call indication and Strike Price) (if held over- in local Gain/(Loss)
the-counter) Ccy in sub-fundBase Ccy
EURPurchased Put Options (continued)European GBP Put/NOK Call Option strike
15/06/2016 3,041,876 price GBP 11.4745 Goldman Sachs GBP – 33,752European USD Put/JPY Call Option strike
12/09/2016 1,093,000 price USD 113.45 Deutsche Bank USD – 39,396FTSE 100 Index Put option strike price
16/12/2016 9 GBP 5,700 GBP – 44,556European USD Put/CAD Call Option strike
24/01/2017 5,155,047 price USD 1.2816 Merrill Lynch USD – 88,02320/09/2016 11,000 M1 EF Index Put Option strike price USD 280 UBS USD – 121,229
European USD Put/JPY Call Option strike 12/09/2016 3,336,600 price USD 114.3 Deutsche Bank USD – 132,881
European EUR Put/USD Call Option strike 26/08/2020 1,463,874 price EUR 1.203 Goldman Sachs EUR – 170,811
European GBP Put/NOK Call Option strike 15/06/2016 5,073,444 price GBP 12.1835 Deutsche Bank GBP – 196,18520/09/2016 19,400 M1 EF Index Put Option strike price USD 280 Goldman Sachs USD – 213,804
FTSE 100 Index Put option strike price 16/12/2016 58 GBP 5,500 GBP – 238,418
European USD Put/CAD Call Option strike 24/01/2017 9,326,764 price USD 1.3365 Goldman Sachs USD – 298,984
Euro Stoxx 50 Put Option strike price 16/12/2016 180 EUR 2,600 EUR – 312,210
FTSE MIB Index Put option strike price 16/12/2016 120 EUR 15,500 EUR – 406,500
Euro Stoxx 50 Put Option strike price 16/09/2016 386 EUR 2,500 EUR – 417,266
European EUR Put/USD Call Option strike 26/08/2020 4,656,000 price EUR 1.2045 Goldman Sachs EUR – 546,866
FTSE 100 Index Put option strike price 16/12/2016 82 GBP 6,100 GBP – 580,748
Euro Stoxx Banks Put Option strike price 16/12/2016 1,180 EUR 90 EUR – 610,650
European EUR Put/USD Call Option strike 26/08/2020 7,684,526 price EUR 1.161 Citigroup EUR – 740,114
Euro Stoxx Banks Put Option strike price 16/12/2016 1,175 EUR 100 EUR – 882,719
European USD Put/JPY Call Option strike 12/09/2016 18,000,000 price USD 118.13 Deutsche Bank USD – 1,091,807
Euro Stoxx Banks Put Option strike price 16/12/2016 1,387 EUR 110 EUR – 1,454,616
Total Purchased Put Options 8,630,383
Purchased Call OptionsEuropean USD Put/EUR Call Option strike
20/04/2016 4,656,000 price EUR 1.231 Goldman Sachs EUR – 679S&P 500 Index Call Option strike price
16/12/2016 39 USD 2,600 USD – 985S&P 500 Index Call Option strike price
16/12/2016 24 USD 2,400 USD – 2,205European USD Put/EUR Call Option strike
20/04/2016 9,148,400 price EUR 1.1982 Deutsche Bank EUR – 3,797European CAD Put/USD Call Option strike
26/08/2020 1,792,348 price USD 1.3367 Goldman Sachs USD – 170,357European CAD Put/USD Call Option strike
26/08/2020 5,104,998 price USD 1.3648 Merrill Lynch USD – 446,762European CAD Put/USD Call Option strike
26/08/2020 7,619,208 price USD 1.3043 Citigroup USD – 796,365
Total Purchased Call Options 1,421,150
Notes to the Financial Statements (continued)
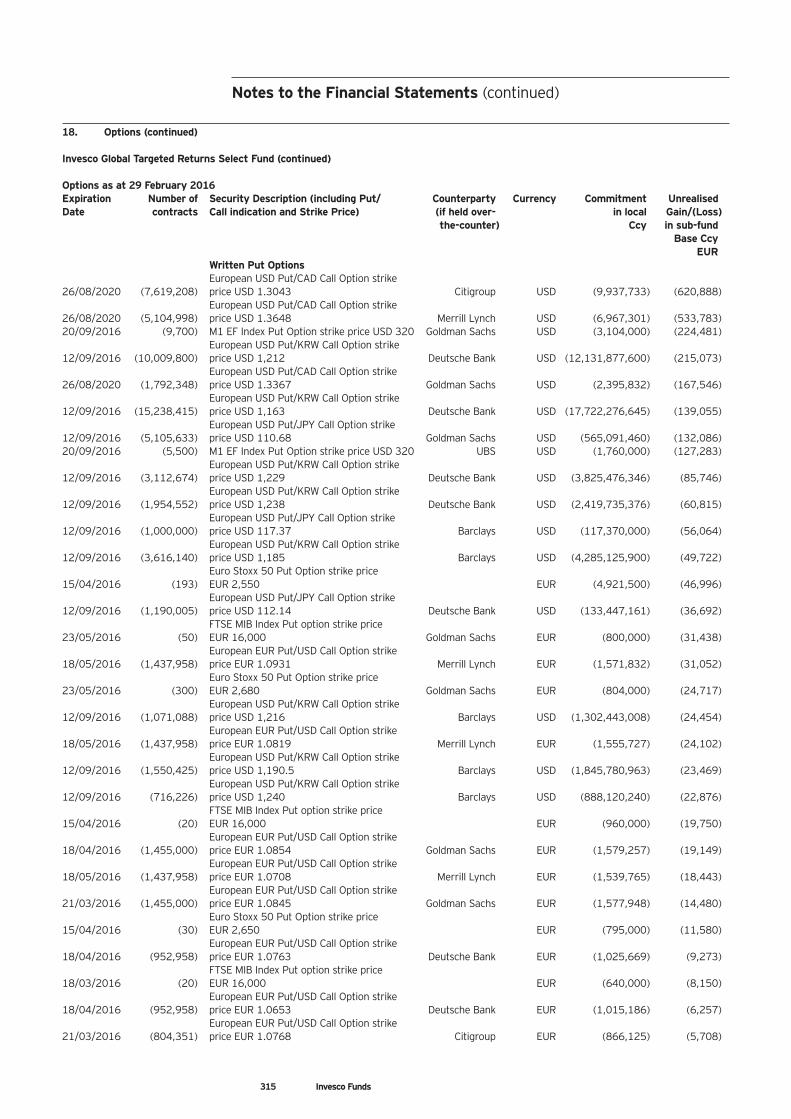
315 Invesco Funds
18. Options (continued)
Invesco Global Targeted Returns Select Fund (continued)
Options as at 29 February 2016Expiration Number of Security Description (including Put/ Counterparty Currency Commitment UnrealisedDate contracts Call indication and Strike Price) (if held over- in local Gain/(Loss)
the-counter) Ccy in sub-fundBase Ccy
EURWritten Put OptionsEuropean USD Put/CAD Call Option strike
26/08/2020 (7,619,208) price USD 1.3043 Citigroup USD (9,937,733) (620,888)European USD Put/CAD Call Option strike
26/08/2020 (5,104,998) price USD 1.3648 Merrill Lynch USD (6,967,301) (533,783)20/09/2016 (9,700) M1 EF Index Put Option strike price USD 320 Goldman Sachs USD (3,104,000) (224,481)
European USD Put/KRW Call Option strike 12/09/2016 (10,009,800) price USD 1,212 Deutsche Bank USD (12,131,877,600) (215,073)
European USD Put/CAD Call Option strike 26/08/2020 (1,792,348) price USD 1.3367 Goldman Sachs USD (2,395,832) (167,546)
European USD Put/KRW Call Option strike 12/09/2016 (15,238,415) price USD 1,163 Deutsche Bank USD (17,722,276,645) (139,055)
European USD Put/JPY Call Option strike 12/09/2016 (5,105,633) price USD 110.68 Goldman Sachs USD (565,091,460) (132,086)20/09/2016 (5,500) M1 EF Index Put Option strike price USD 320 UBS USD (1,760,000) (127,283)
European USD Put/KRW Call Option strike 12/09/2016 (3,112,674) price USD 1,229 Deutsche Bank USD (3,825,476,346) (85,746)
European USD Put/KRW Call Option strike 12/09/2016 (1,954,552) price USD 1,238 Deutsche Bank USD (2,419,735,376) (60,815)
European USD Put/JPY Call Option strike 12/09/2016 (1,000,000) price USD 117.37 Barclays USD (117,370,000) (56,064)
European USD Put/KRW Call Option strike 12/09/2016 (3,616,140) price USD 1,185 Barclays USD (4,285,125,900) (49,722)
Euro Stoxx 50 Put Option strike price 15/04/2016 (193) EUR 2,550 EUR (4,921,500) (46,996)
European USD Put/JPY Call Option strike 12/09/2016 (1,190,005) price USD 112.14 Deutsche Bank USD (133,447,161) (36,692)
FTSE MIB Index Put option strike price 23/05/2016 (50) EUR 16,000 Goldman Sachs EUR (800,000) (31,438)
European EUR Put/USD Call Option strike 18/05/2016 (1,437,958) price EUR 1.0931 Merrill Lynch EUR (1,571,832) (31,052)
Euro Stoxx 50 Put Option strike price 23/05/2016 (300) EUR 2,680 Goldman Sachs EUR (804,000) (24,717)
European USD Put/KRW Call Option strike 12/09/2016 (1,071,088) price USD 1,216 Barclays USD (1,302,443,008) (24,454)
European EUR Put/USD Call Option strike 18/05/2016 (1,437,958) price EUR 1.0819 Merrill Lynch EUR (1,555,727) (24,102)
European USD Put/KRW Call Option strike 12/09/2016 (1,550,425) price USD 1,190.5 Barclays USD (1,845,780,963) (23,469)
European USD Put/KRW Call Option strike 12/09/2016 (716,226) price USD 1,240 Barclays USD (888,120,240) (22,876)
FTSE MIB Index Put option strike price 15/04/2016 (20) EUR 16,000 EUR (960,000) (19,750)
European EUR Put/USD Call Option strike 18/04/2016 (1,455,000) price EUR 1.0854 Goldman Sachs EUR (1,579,257) (19,149)
European EUR Put/USD Call Option strike 18/05/2016 (1,437,958) price EUR 1.0708 Merrill Lynch EUR (1,539,765) (18,443)
European EUR Put/USD Call Option strike 21/03/2016 (1,455,000) price EUR 1.0845 Goldman Sachs EUR (1,577,948) (14,480)
Euro Stoxx 50 Put Option strike price 15/04/2016 (30) EUR 2,650 EUR (795,000) (11,580)
European EUR Put/USD Call Option strike 18/04/2016 (952,958) price EUR 1.0763 Deutsche Bank EUR (1,025,669) (9,273)
FTSE MIB Index Put option strike price 18/03/2016 (20) EUR 16,000 EUR (640,000) (8,150)
European EUR Put/USD Call Option strike 18/04/2016 (952,958) price EUR 1.0653 Deutsche Bank EUR (1,015,186) (6,257)
European EUR Put/USD Call Option strike 21/03/2016 (804,351) price EUR 1.0768 Citigroup EUR (866,125) (5,708)
Notes to the Financial Statements (continued)
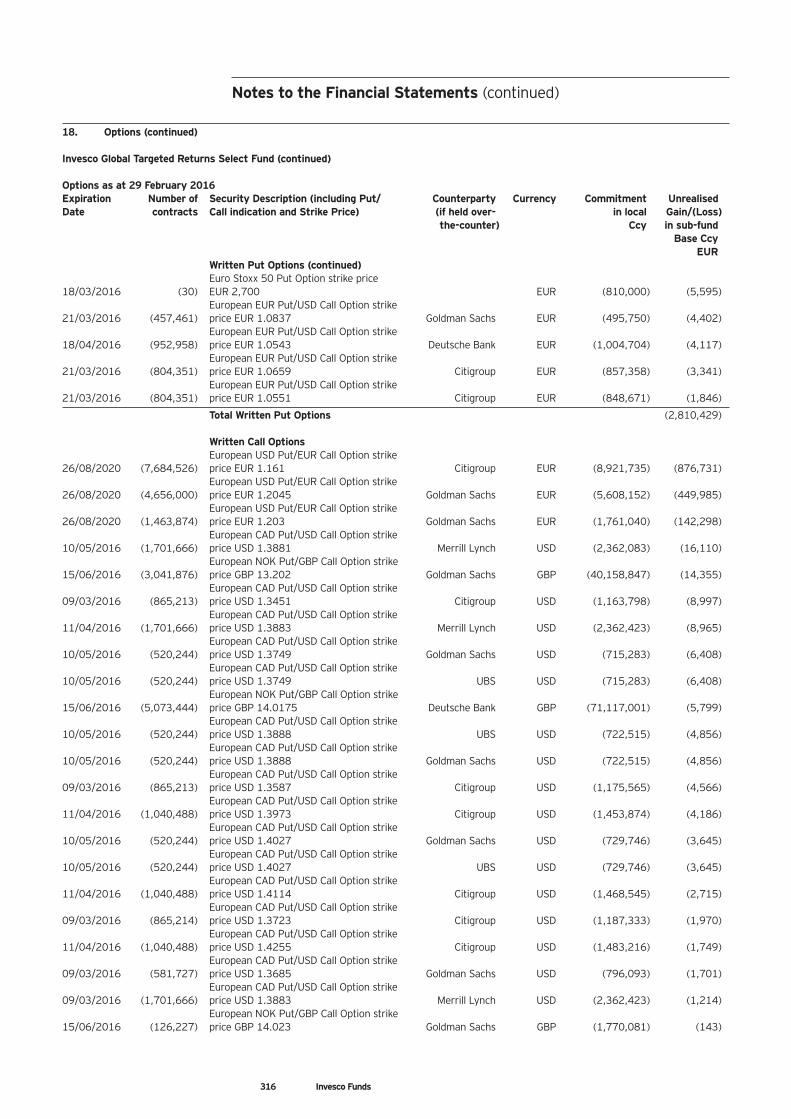
316 Invesco Funds
18. Options (continued)
Invesco Global Targeted Returns Select Fund (continued)
Options as at 29 February 2016Expiration Number of Security Description (including Put/ Counterparty Currency Commitment UnrealisedDate contracts Call indication and Strike Price) (if held over- in local Gain/(Loss)
the-counter) Ccy in sub-fundBase Ccy
EURWritten Put Options (continued)Euro Stoxx 50 Put Option strike price
18/03/2016 (30) EUR 2,700 EUR (810,000) (5,595)European EUR Put/USD Call Option strike
21/03/2016 (457,461) price EUR 1.0837 Goldman Sachs EUR (495,750) (4,402)European EUR Put/USD Call Option strike
18/04/2016 (952,958) price EUR 1.0543 Deutsche Bank EUR (1,004,704) (4,117)European EUR Put/USD Call Option strike
21/03/2016 (804,351) price EUR 1.0659 Citigroup EUR (857,358) (3,341)European EUR Put/USD Call Option strike
21/03/2016 (804,351) price EUR 1.0551 Citigroup EUR (848,671) (1,846)
Total Written Put Options (2,810,429)
Written Call OptionsEuropean USD Put/EUR Call Option strike
26/08/2020 (7,684,526) price EUR 1.161 Citigroup EUR (8,921,735) (876,731)European USD Put/EUR Call Option strike
26/08/2020 (4,656,000) price EUR 1.2045 Goldman Sachs EUR (5,608,152) (449,985)European USD Put/EUR Call Option strike
26/08/2020 (1,463,874) price EUR 1.203 Goldman Sachs EUR (1,761,040) (142,298)European CAD Put/USD Call Option strike
10/05/2016 (1,701,666) price USD 1.3881 Merrill Lynch USD (2,362,083) (16,110)European NOK Put/GBP Call Option strike
15/06/2016 (3,041,876) price GBP 13.202 Goldman Sachs GBP (40,158,847) (14,355)European CAD Put/USD Call Option strike
09/03/2016 (865,213) price USD 1.3451 Citigroup USD (1,163,798) (8,997)European CAD Put/USD Call Option strike
11/04/2016 (1,701,666) price USD 1.3883 Merrill Lynch USD (2,362,423) (8,965)European CAD Put/USD Call Option strike
10/05/2016 (520,244) price USD 1.3749 Goldman Sachs USD (715,283) (6,408)European CAD Put/USD Call Option strike
10/05/2016 (520,244) price USD 1.3749 UBS USD (715,283) (6,408)European NOK Put/GBP Call Option strike
15/06/2016 (5,073,444) price GBP 14.0175 Deutsche Bank GBP (71,117,001) (5,799)European CAD Put/USD Call Option strike
10/05/2016 (520,244) price USD 1.3888 UBS USD (722,515) (4,856)European CAD Put/USD Call Option strike
10/05/2016 (520,244) price USD 1.3888 Goldman Sachs USD (722,515) (4,856)European CAD Put/USD Call Option strike
09/03/2016 (865,213) price USD 1.3587 Citigroup USD (1,175,565) (4,566)European CAD Put/USD Call Option strike
11/04/2016 (1,040,488) price USD 1.3973 Citigroup USD (1,453,874) (4,186)European CAD Put/USD Call Option strike
10/05/2016 (520,244) price USD 1.4027 Goldman Sachs USD (729,746) (3,645)European CAD Put/USD Call Option strike
10/05/2016 (520,244) price USD 1.4027 UBS USD (729,746) (3,645)European CAD Put/USD Call Option strike
11/04/2016 (1,040,488) price USD 1.4114 Citigroup USD (1,468,545) (2,715)European CAD Put/USD Call Option strike
09/03/2016 (865,214) price USD 1.3723 Citigroup USD (1,187,333) (1,970)European CAD Put/USD Call Option strike
11/04/2016 (1,040,488) price USD 1.4255 Citigroup USD (1,483,216) (1,749)European CAD Put/USD Call Option strike
09/03/2016 (581,727) price USD 1.3685 Goldman Sachs USD (796,093) (1,701)European CAD Put/USD Call Option strike
09/03/2016 (1,701,666) price USD 1.3883 Merrill Lynch USD (2,362,423) (1,214)European NOK Put/GBP Call Option strike
15/06/2016 (126,227) price GBP 14.023 Goldman Sachs GBP (1,770,081) (143)
Notes to the Financial Statements (continued)
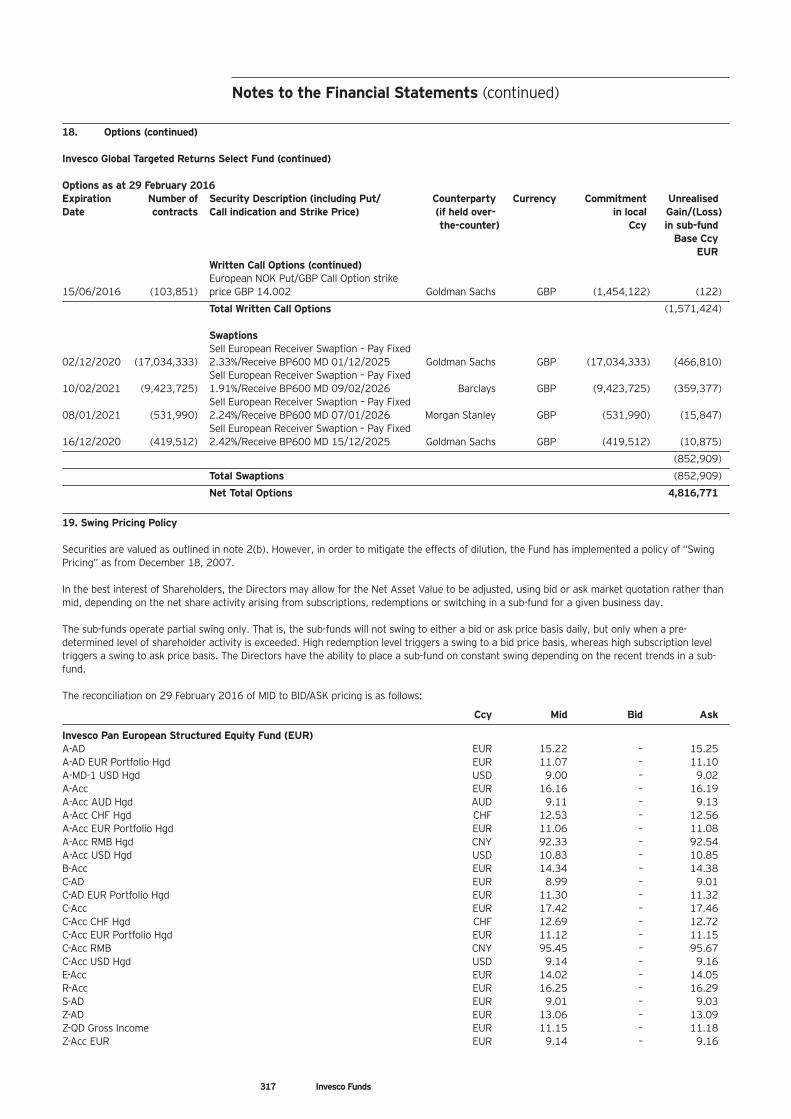
Notes to the Financial Statements (continued)
18. Options (continued)
Invesco Global Targeted Returns Select Fund (continued)
Options as at 29 February 2016Expiration Number of Security Description (including Put/ Counterparty Currency Commitment UnrealisedDate contracts Call indication and Strike Price) (if held over- in local Gain/(Loss)
the-counter) Ccy in sub-fundBase Ccy
EURWritten Call Options (continued)European NOK Put/GBP Call Option strike
15/06/2016 (103,851) price GBP 14.002 Goldman Sachs GBP (1,454,122) (122)
Total Written Call Options (1,571,424)
SwaptionsSell European Receiver Swaption – Pay Fixed
02/12/2020 (17,034,333) 2.33%/Receive BP600 MD 01/12/2025 Goldman Sachs GBP (17,034,333) (466,810)Sell European Receiver Swaption – Pay Fixed
10/02/2021 (9,423,725) 1.91%/Receive BP600 MD 09/02/2026 Barclays GBP (9,423,725) (359,377)Sell European Receiver Swaption – Pay Fixed
08/01/2021 (531,990) 2.24%/Receive BP600 MD 07/01/2026 Morgan Stanley GBP (531,990) (15,847)Sell European Receiver Swaption – Pay Fixed
16/12/2020 (419,512) 2.42%/Receive BP600 MD 15/12/2025 Goldman Sachs GBP (419,512) (10,875)
(852,909)
Total Swaptions (852,909)
Net Total Options 4,816,771
19. Swing Pricing Policy
Securities are valued as outlined in note 2(b). However, in order to mitigate the effects of dilution, the Fund has implemented a policy of “SwingPricing” as from December 18, 2007.
In the best interest of Shareholders, the Directors may allow for the Net Asset Value to be adjusted, using bid or ask market quotation rather thanmid, depending on the net share activity arising from subscriptions, redemptions or switching in a sub-fund for a given business day.
The sub-funds operate partial swing only. That is, the sub-funds will not swing to either a bid or ask price basis daily, but only when a pre-determined level of shareholder activity is exceeded. High redemption level triggers a swing to a bid price basis, whereas high subscription leveltriggers a swing to ask price basis. The Directors have the ability to place a sub-fund on constant swing depending on the recent trends in a sub-fund.
The reconciliation on 29 February 2016 of MID to BID/ASK pricing is as follows:
Ccy Mid Bid Ask
Invesco Pan European Structured Equity Fund (EUR)A-AD EUR 15.22 – 15.25A-AD EUR Portfolio Hgd EUR 11.07 – 11.10A-MD-1 USD Hgd USD 9.00 – 9.02A-Acc EUR 16.16 – 16.19A-Acc AUD Hgd AUD 9.11 – 9.13A-Acc CHF Hgd CHF 12.53 – 12.56A-Acc EUR Portfolio Hgd EUR 11.06 – 11.08A-Acc RMB Hgd CNY 92.33 – 92.54A-Acc USD Hgd USD 10.83 – 10.85B-Acc EUR 14.34 – 14.38C-AD EUR 8.99 – 9.01C-AD EUR Portfolio Hgd EUR 11.30 – 11.32C-Acc EUR 17.42 – 17.46C-Acc CHF Hgd CHF 12.69 – 12.72C-Acc EUR Portfolio Hgd EUR 11.12 – 11.15C-Acc RMB CNY 95.45 – 95.67C-Acc USD Hgd USD 9.14 – 9.16E-Acc EUR 14.02 – 14.05R-Acc EUR 16.25 – 16.29S-AD EUR 9.01 – 9.03Z-AD EUR 13.06 – 13.09Z-QD Gross Income EUR 11.15 – 11.18Z-Acc EUR EUR 9.14 – 9.16
317 Invesco Funds
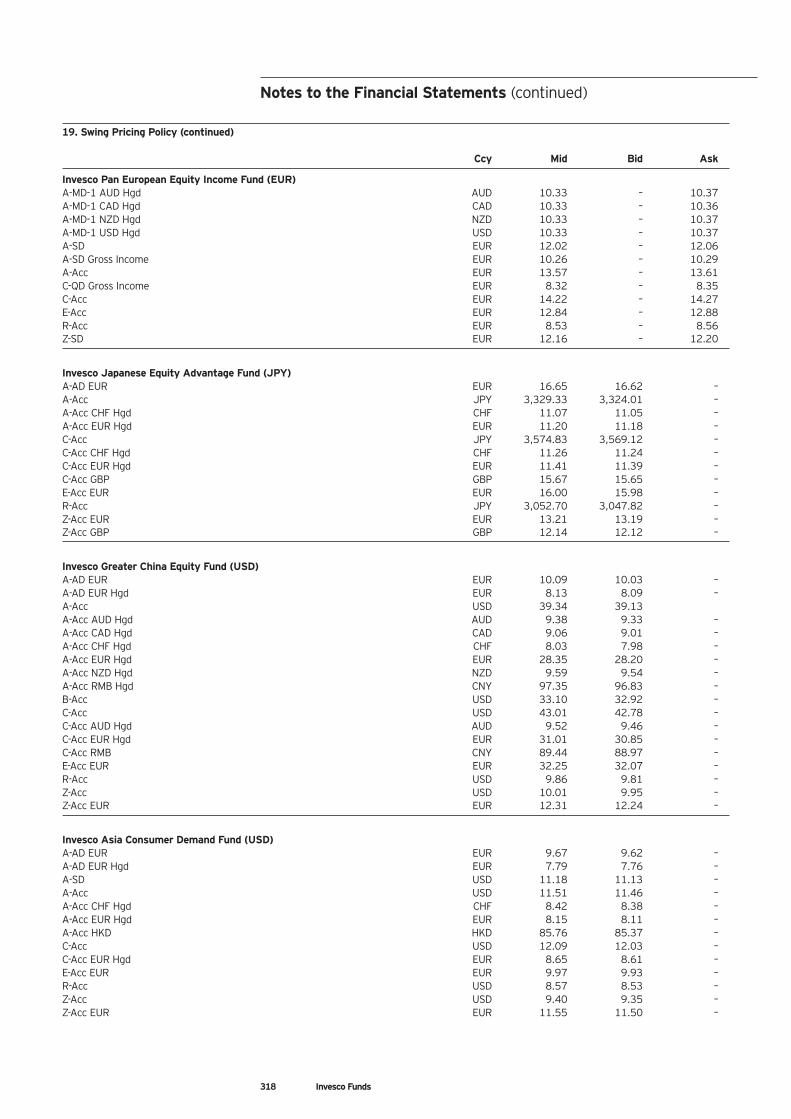
Notes to the Financial Statements (continued)
19. Swing Pricing Policy (continued)
Ccy Mid Bid Ask
Invesco Pan European Equity Income Fund (EUR)A-MD-1 AUD Hgd AUD 10.33 – 10.37A-MD-1 CAD Hgd CAD 10.33 – 10.36A-MD-1 NZD Hgd NZD 10.33 – 10.37A-MD-1 USD Hgd USD 10.33 – 10.37A-SD EUR 12.02 – 12.06A-SD Gross Income EUR 10.26 – 10.29A-Acc EUR 13.57 – 13.61C-QD Gross Income EUR 8.32 – 8.35C-Acc EUR 14.22 – 14.27E-Acc EUR 12.84 – 12.88R-Acc EUR 8.53 – 8.56Z-SD EUR 12.16 – 12.20
Invesco Japanese Equity Advantage Fund (JPY)A-AD EUR EUR 16.65 16.62 –A-Acc JPY 3,329.33 3,324.01 –A-Acc CHF Hgd CHF 11.07 11.05 –A-Acc EUR Hgd EUR 11.20 11.18 –C-Acc JPY 3,574.83 3,569.12 –C-Acc CHF Hgd CHF 11.26 11.24 –C-Acc EUR Hgd EUR 11.41 11.39 –C-Acc GBP GBP 15.67 15.65 –E-Acc EUR EUR 16.00 15.98 –R-Acc JPY 3,052.70 3,047.82 –Z-Acc EUR EUR 13.21 13.19 –Z-Acc GBP GBP 12.14 12.12 –
Invesco Greater China Equity Fund (USD)A-AD EUR EUR 10.09 10.03 –A-AD EUR Hgd EUR 8.13 8.09 –A-Acc USD 39.34 39.13A-Acc AUD Hgd AUD 9.38 9.33 –A-Acc CAD Hgd CAD 9.06 9.01 –A-Acc CHF Hgd CHF 8.03 7.98 –A-Acc EUR Hgd EUR 28.35 28.20 –A-Acc NZD Hgd NZD 9.59 9.54 –A-Acc RMB Hgd CNY 97.35 96.83 –B-Acc USD 33.10 32.92 –C-Acc USD 43.01 42.78 –C-Acc AUD Hgd AUD 9.52 9.46 –C-Acc EUR Hgd EUR 31.01 30.85 –C-Acc RMB CNY 89.44 88.97 –E-Acc EUR EUR 32.25 32.07 –R-Acc USD 9.86 9.81 –Z-Acc USD 10.01 9.95 –Z-Acc EUR EUR 12.31 12.24 –
Invesco Asia Consumer Demand Fund (USD)A-AD EUR EUR 9.67 9.62 –A-AD EUR Hgd EUR 7.79 7.76 –A-SD USD 11.18 11.13 –A-Acc USD 11.51 11.46 –A-Acc CHF Hgd CHF 8.42 8.38 –A-Acc EUR Hgd EUR 8.15 8.11 –A-Acc HKD HKD 85.76 85.37 –C-Acc USD 12.09 12.03 –C-Acc EUR Hgd EUR 8.65 8.61 –E-Acc EUR EUR 9.97 9.93 –R-Acc USD 8.57 8.53 –Z-Acc USD 9.40 9.35 –Z-Acc EUR EUR 11.55 11.50 –
318 Invesco Funds
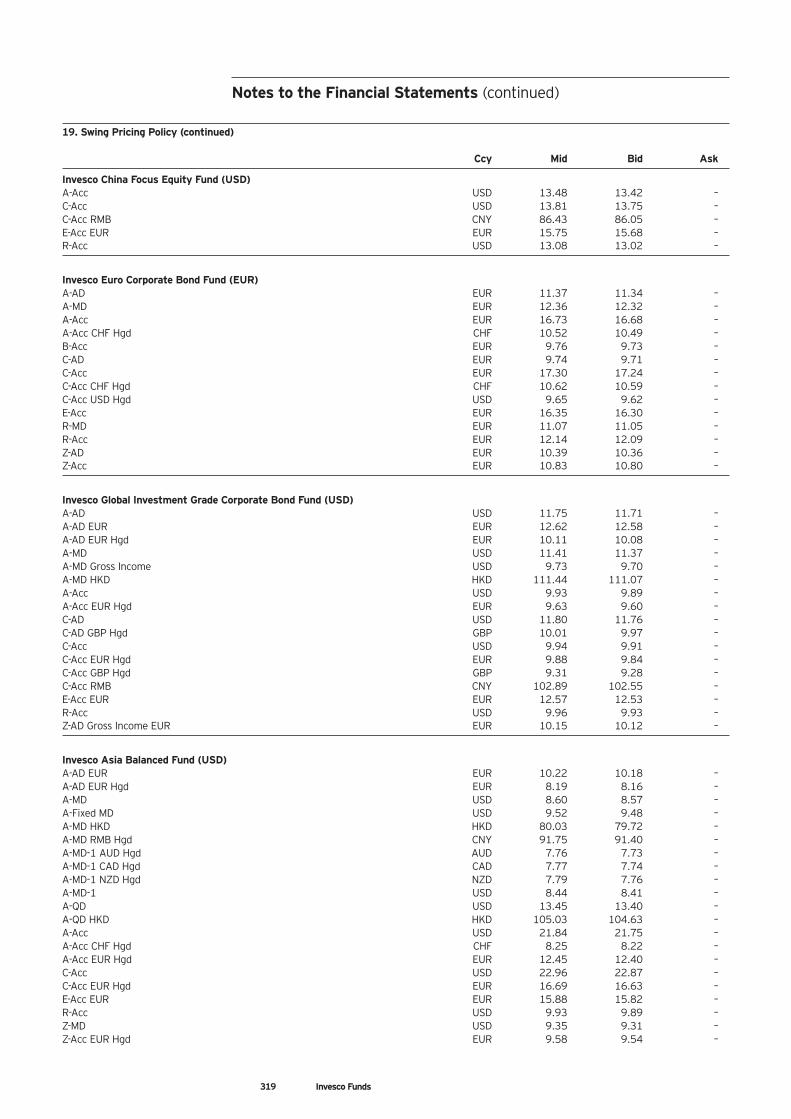
Notes to the Financial Statements (continued)
19. Swing Pricing Policy (continued)
Ccy Mid Bid Ask
Invesco China Focus Equity Fund (USD)A-Acc USD 13.48 13.42 –C-Acc USD 13.81 13.75 –C-Acc RMB CNY 86.43 86.05 –E-Acc EUR EUR 15.75 15.68 –R-Acc USD 13.08 13.02 –
Invesco Euro Corporate Bond Fund (EUR)A-AD EUR 11.37 11.34 –A-MD EUR 12.36 12.32 –A-Acc EUR 16.73 16.68 –A-Acc CHF Hgd CHF 10.52 10.49 –B-Acc EUR 9.76 9.73 –C-AD EUR 9.74 9.71 –C-Acc EUR 17.30 17.24 –C-Acc CHF Hgd CHF 10.62 10.59 –C-Acc USD Hgd USD 9.65 9.62 –E-Acc EUR 16.35 16.30 –R-MD EUR 11.07 11.05 –R-Acc EUR 12.14 12.09 –Z-AD EUR 10.39 10.36 –Z-Acc EUR 10.83 10.80 –
Invesco Global Investment Grade Corporate Bond Fund (USD)A-AD USD 11.75 11.71 –A-AD EUR EUR 12.62 12.58 –A-AD EUR Hgd EUR 10.11 10.08 –A-MD USD 11.41 11.37 –A-MD Gross Income USD 9.73 9.70 –A-MD HKD HKD 111.44 111.07 –A-Acc USD 9.93 9.89 –A-Acc EUR Hgd EUR 9.63 9.60 –C-AD USD 11.80 11.76 –C-AD GBP Hgd GBP 10.01 9.97 –C-Acc USD 9.94 9.91 –C-Acc EUR Hgd EUR 9.88 9.84 –C-Acc GBP Hgd GBP 9.31 9.28 –C-Acc RMB CNY 102.89 102.55 –E-Acc EUR EUR 12.57 12.53 –R-Acc USD 9.96 9.93 –Z-AD Gross Income EUR EUR 10.15 10.12 –
Invesco Asia Balanced Fund (USD)A-AD EUR EUR 10.22 10.18 –A-AD EUR Hgd EUR 8.19 8.16 –A-MD USD 8.60 8.57 –A-Fixed MD USD 9.52 9.48 –A-MD HKD HKD 80.03 79.72 –A-MD RMB Hgd CNY 91.75 91.40 –A-MD-1 AUD Hgd AUD 7.76 7.73 –A-MD-1 CAD Hgd CAD 7.77 7.74 –A-MD-1 NZD Hgd NZD 7.79 7.76 –A-MD-1 USD 8.44 8.41 –A-QD USD 13.45 13.40 –A-QD HKD HKD 105.03 104.63 –A-Acc USD 21.84 21.75 –A-Acc CHF Hgd CHF 8.25 8.22 –A-Acc EUR Hgd EUR 12.45 12.40 –C-Acc USD 22.96 22.87 –C-Acc EUR Hgd EUR 16.69 16.63 –E-Acc EUR EUR 15.88 15.82 –R-Acc USD 9.93 9.89 –Z-MD USD 9.35 9.31 –Z-Acc EUR Hgd EUR 9.58 9.54 –
319 Invesco Funds
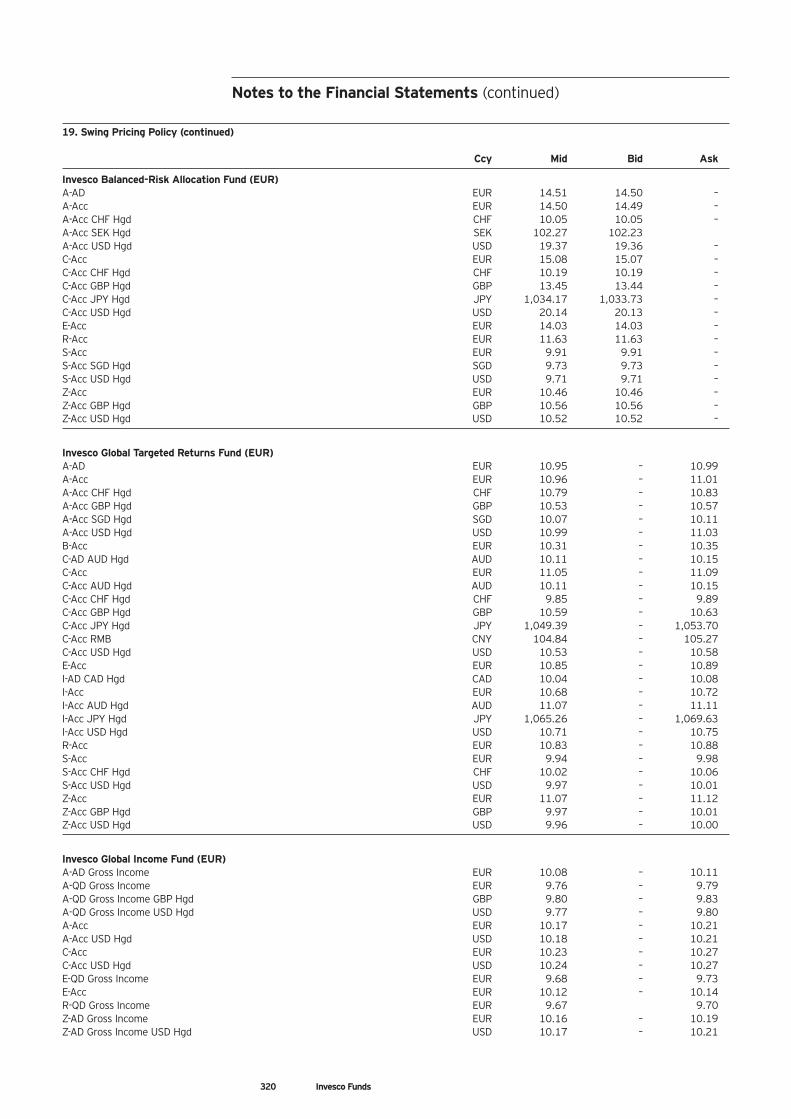
Notes to the Financial Statements (continued)
19. Swing Pricing Policy (continued)
Ccy Mid Bid Ask
Invesco Balanced-Risk Allocation Fund (EUR)A-AD EUR 14.51 14.50 –A-Acc EUR 14.50 14.49 –A-Acc CHF Hgd CHF 10.05 10.05 –A-Acc SEK Hgd SEK 102.27 102.23A-Acc USD Hgd USD 19.37 19.36 –C-Acc EUR 15.08 15.07 –C-Acc CHF Hgd CHF 10.19 10.19 –C-Acc GBP Hgd GBP 13.45 13.44 –C-Acc JPY Hgd JPY 1,034.17 1,033.73 –C-Acc USD Hgd USD 20.14 20.13 –E-Acc EUR 14.03 14.03 –R-Acc EUR 11.63 11.63 –S-Acc EUR 9.91 9.91 –S-Acc SGD Hgd SGD 9.73 9.73 –S-Acc USD Hgd USD 9.71 9.71 –Z-Acc EUR 10.46 10.46 –Z-Acc GBP Hgd GBP 10.56 10.56 –Z-Acc USD Hgd USD 10.52 10.52 –
Invesco Global Targeted Returns Fund (EUR)A-AD EUR 10.95 – 10.99A-Acc EUR 10.96 – 11.01A-Acc CHF Hgd CHF 10.79 – 10.83A-Acc GBP Hgd GBP 10.53 – 10.57A-Acc SGD Hgd SGD 10.07 – 10.11A-Acc USD Hgd USD 10.99 – 11.03B-Acc EUR 10.31 – 10.35C-AD AUD Hgd AUD 10.11 – 10.15C-Acc EUR 11.05 – 11.09C-Acc AUD Hgd AUD 10.11 – 10.15C-Acc CHF Hgd CHF 9.85 – 9.89C-Acc GBP Hgd GBP 10.59 – 10.63C-Acc JPY Hgd JPY 1,049.39 – 1,053.70C-Acc RMB CNY 104.84 – 105.27C-Acc USD Hgd USD 10.53 – 10.58E-Acc EUR 10.85 – 10.89I-AD CAD Hgd CAD 10.04 – 10.08I-Acc EUR 10.68 – 10.72I-Acc AUD Hgd AUD 11.07 – 11.11I-Acc JPY Hgd JPY 1,065.26 – 1,069.63I-Acc USD Hgd USD 10.71 – 10.75R-Acc EUR 10.83 – 10.88S-Acc EUR 9.94 – 9.98S-Acc CHF Hgd CHF 10.02 – 10.06S-Acc USD Hgd USD 9.97 – 10.01Z-Acc EUR 11.07 – 11.12Z-Acc GBP Hgd GBP 9.97 – 10.01Z-Acc USD Hgd USD 9.96 – 10.00
Invesco Global Income Fund (EUR)A-AD Gross Income EUR 10.08 – 10.11A-QD Gross Income EUR 9.76 – 9.79A-QD Gross Income GBP Hgd GBP 9.80 – 9.83A-QD Gross Income USD Hgd USD 9.77 – 9.80A-Acc EUR 10.17 – 10.21A-Acc USD Hgd USD 10.18 – 10.21C-Acc EUR 10.23 – 10.27C-Acc USD Hgd USD 10.24 – 10.27E-QD Gross Income EUR 9.68 – 9.73E-Acc EUR 10.12 – 10.14R-QD Gross Income EUR 9.67 9.70Z-AD Gross Income EUR 10.16 – 10.19Z-AD Gross Income USD Hgd USD 10.17 – 10.21
320 Invesco Funds
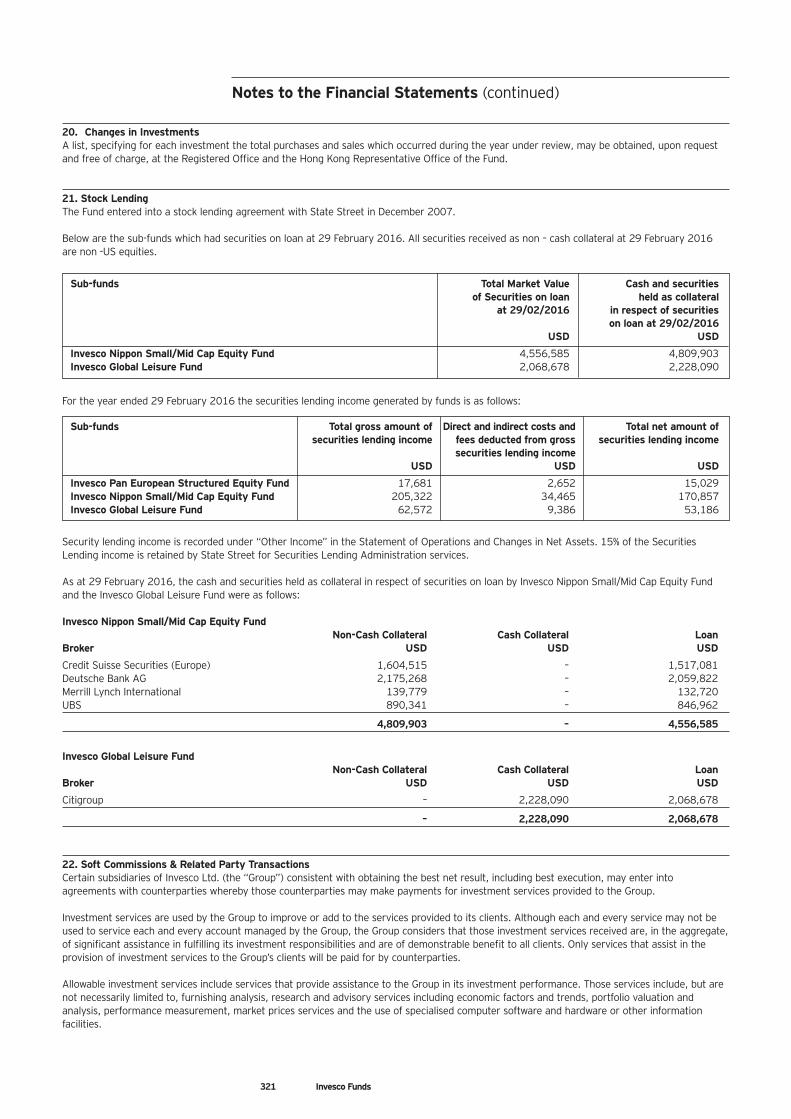
Notes to the Financial Statements (continued)
20. Changes in InvestmentsA list, specifying for each investment the total purchases and sales which occurred during the year under review, may be obtained, upon requestand free of charge, at the Registered Office and the Hong Kong Representative Office of the Fund.
21. Stock LendingThe Fund entered into a stock lending agreement with State Street in December 2007.
Below are the sub-funds which had securities on loan at 29 February 2016. All securities received as non – cash collateral at 29 February 2016are non -US equities.
For the year ended 29 February 2016 the securities lending income generated by funds is as follows:
Security lending income is recorded under “Other Income” in the Statement of Operations and Changes in Net Assets. 15% of the SecuritiesLending income is retained by State Street for Securities Lending Administration services.
As at 29 February 2016, the cash and securities held as collateral in respect of securities on loan by Invesco Nippon Small/Mid Cap Equity Fundand the Invesco Global Leisure Fund were as follows:
Invesco Nippon Small/Mid Cap Equity Fund Non-Cash Collateral Cash Collateral LoanBroker USD USD USD
Credit Suisse Securities (Europe) 1,604,515 – 1,517,081Deutsche Bank AG 2,175,268 – 2,059,822Merrill Lynch International 139,779 – 132,720UBS 890,341 – 846,962
4,809,903 – 4,556,585
Invesco Global Leisure Fund Non-Cash Collateral Cash Collateral LoanBroker USD USD USD
Citigroup – 2,228,090 2,068,678
– 2,228,090 2,068,678
22. Soft Commissions & Related Party TransactionsCertain subsidiaries of Invesco Ltd. (the “Group”) consistent with obtaining the best net result, including best execution, may enter intoagreements with counterparties whereby those counterparties may make payments for investment services provided to the Group.
Investment services are used by the Group to improve or add to the services provided to its clients. Although each and every service may not beused to service each and every account managed by the Group, the Group considers that those investment services received are, in the aggregate,of significant assistance in fulfilling its investment responsibilities and are of demonstrable benefit to all clients. Only services that assist in theprovision of investment services to the Group’s clients will be paid for by counterparties.
Allowable investment services include services that provide assistance to the Group in its investment performance. Those services include, but arenot necessarily limited to, furnishing analysis, research and advisory services including economic factors and trends, portfolio valuation andanalysis, performance measurement, market prices services and the use of specialised computer software and hardware or other informationfacilities.
Sub-funds Total Market Value Cash and securities of Securities on loan held as collateral at 29/02/2016 in respect of securities on loan at 29/02/2016 USD USD
Invesco Nippon Small/Mid Cap Equity Fund 4,556,585 4,809,903Invesco Global Leisure Fund 2,068,678 2,228,090
Sub-funds Total gross amount of Direct and indirect costs and Total net amount of securities lending income fees deducted from gross securities lending income securities lending income USD USD USD
Invesco Pan European Structured Equity Fund 17,681 2,652 15,029Invesco Nippon Small/Mid Cap Equity Fund 205,322 34,465 170,857Invesco Global Leisure Fund 62,572 9,386 53,186
321 Invesco Funds
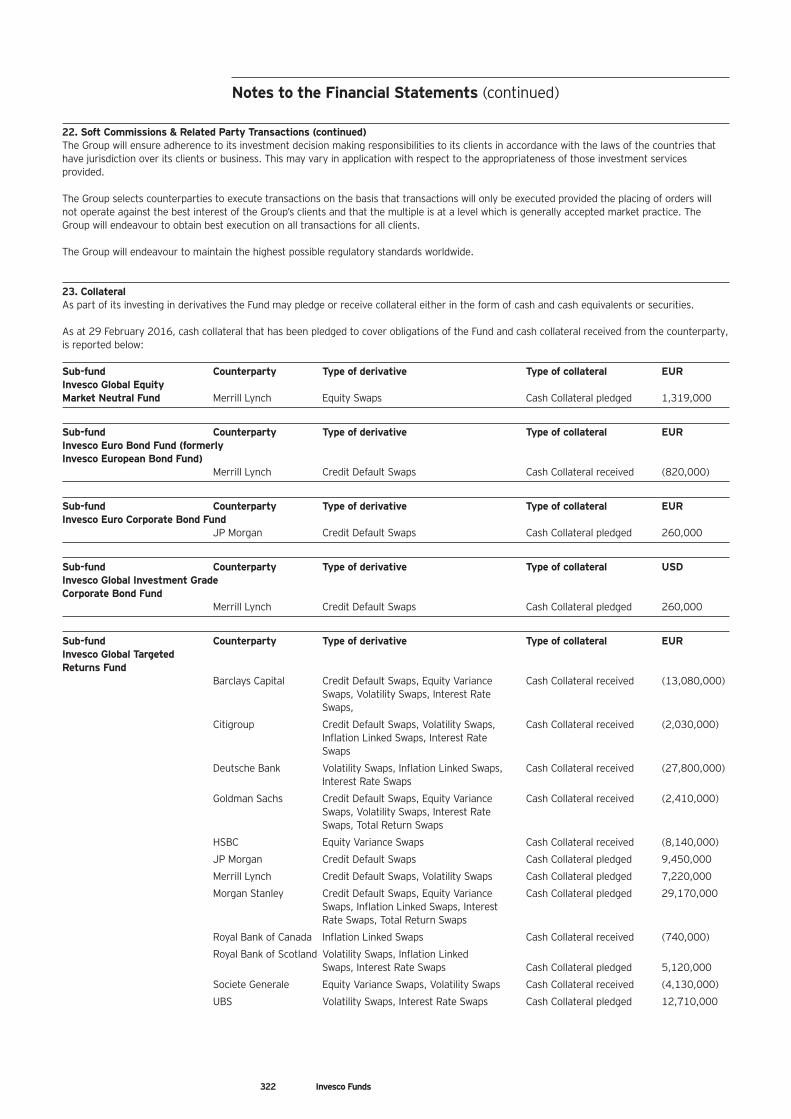
Notes to the Financial Statements (continued)
322 Invesco Funds
22. Soft Commissions & Related Party Transactions (continued)The Group will ensure adherence to its investment decision making responsibilities to its clients in accordance with the laws of the countries thathave jurisdiction over its clients or business. This may vary in application with respect to the appropriateness of those investment servicesprovided.
The Group selects counterparties to execute transactions on the basis that transactions will only be executed provided the placing of orders willnot operate against the best interest of the Group’s clients and that the multiple is at a level which is generally accepted market practice. TheGroup will endeavour to obtain best execution on all transactions for all clients.
The Group will endeavour to maintain the highest possible regulatory standards worldwide.
23. CollateralAs part of its investing in derivatives the Fund may pledge or receive collateral either in the form of cash and cash equivalents or securities.
As at 29 February 2016, cash collateral that has been pledged to cover obligations of the Fund and cash collateral received from the counterparty,is reported below:
Sub-fund Counterparty Type of derivative Type of collateral EURInvesco Global EquityMarket Neutral Fund Merrill Lynch Equity Swaps Cash Collateral pledged 1,319,000
Sub-fund Counterparty Type of derivative Type of collateral EURInvesco Euro Bond Fund (formerly Invesco European Bond Fund)
Merrill Lynch Credit Default Swaps Cash Collateral received (820,000)
Sub-fund Counterparty Type of derivative Type of collateral EURInvesco Euro Corporate Bond Fund
JP Morgan Credit Default Swaps Cash Collateral pledged 260,000
Sub-fund Counterparty Type of derivative Type of collateral USDInvesco Global Investment Grade Corporate Bond Fund
Merrill Lynch Credit Default Swaps Cash Collateral pledged 260,000
Sub-fund Counterparty Type of derivative Type of collateral EURInvesco Global Targeted Returns Fund
Barclays Capital Credit Default Swaps, Equity Variance Cash Collateral received (13,080,000)Swaps, Volatility Swaps, Interest Rate Swaps,
Citigroup Credit Default Swaps, Volatility Swaps, Cash Collateral received (2,030,000)Inflation Linked Swaps, Interest Rate Swaps
Deutsche Bank Volatility Swaps, Inflation Linked Swaps, Cash Collateral received (27,800,000)Interest Rate Swaps
Goldman Sachs Credit Default Swaps, Equity Variance Cash Collateral received (2,410,000)Swaps, Volatility Swaps, Interest Rate Swaps, Total Return Swaps
HSBC Equity Variance Swaps Cash Collateral received (8,140,000)
JP Morgan Credit Default Swaps Cash Collateral pledged 9,450,000
Merrill Lynch Credit Default Swaps, Volatility Swaps Cash Collateral pledged 7,220,000
Morgan Stanley Credit Default Swaps, Equity Variance Cash Collateral pledged 29,170,000Swaps, Inflation Linked Swaps, Interest Rate Swaps, Total Return Swaps
Royal Bank of Canada Inflation Linked Swaps Cash Collateral received (740,000)
Royal Bank of Scotland Volatility Swaps, Inflation Linked Swaps, Interest Rate Swaps Cash Collateral pledged 5,120,000
Societe Generale Equity Variance Swaps, Volatility Swaps Cash Collateral received (4,130,000)
UBS Volatility Swaps, Interest Rate Swaps Cash Collateral pledged 12,710,000
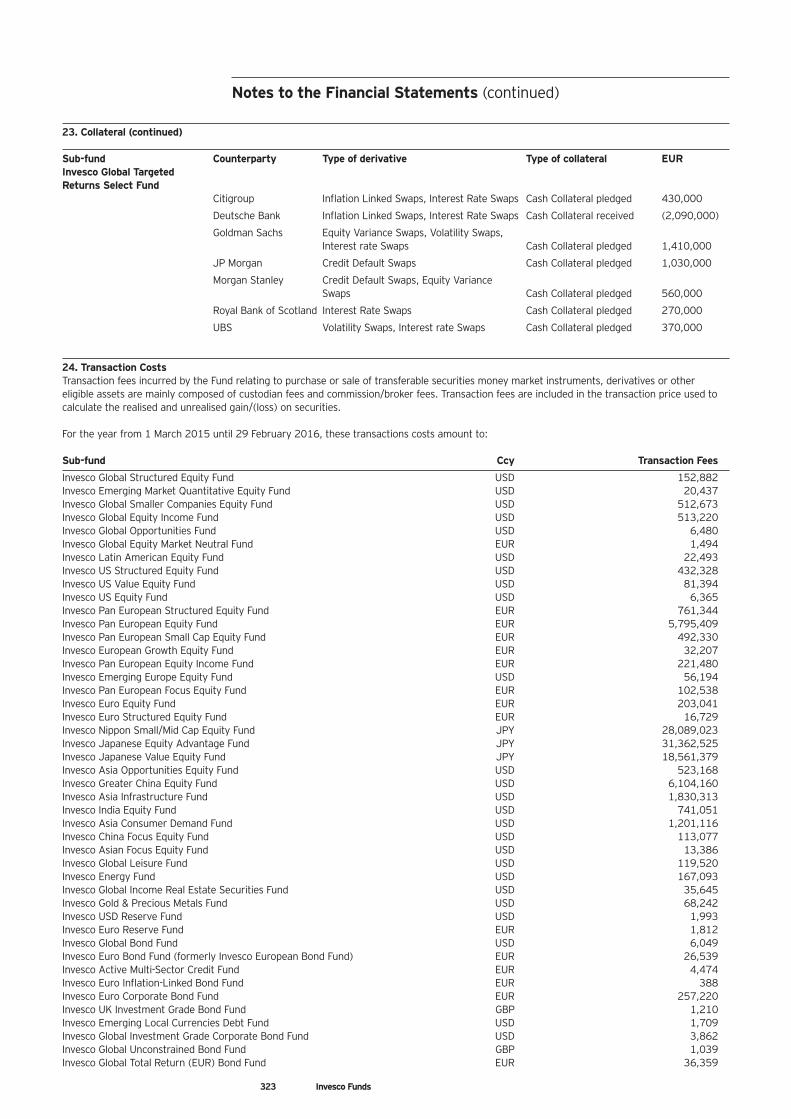
Notes to the Financial Statements (continued)
323 Invesco Funds
23. Collateral (continued)
Sub-fund Counterparty Type of derivative Type of collateral EURInvesco Global Targeted Returns Select Fund
Citigroup Inflation Linked Swaps, Interest Rate Swaps Cash Collateral pledged 430,000
Deutsche Bank Inflation Linked Swaps, Interest Rate Swaps Cash Collateral received (2,090,000)
Goldman Sachs Equity Variance Swaps, Volatility Swaps, Interest rate Swaps Cash Collateral pledged 1,410,000
JP Morgan Credit Default Swaps Cash Collateral pledged 1,030,000
Morgan Stanley Credit Default Swaps, Equity Variance Swaps Cash Collateral pledged 560,000
Royal Bank of Scotland Interest Rate Swaps Cash Collateral pledged 270,000
UBS Volatility Swaps, Interest rate Swaps Cash Collateral pledged 370,000
24. Transaction CostsTransaction fees incurred by the Fund relating to purchase or sale of transferable securities money market instruments, derivatives or othereligible assets are mainly composed of custodian fees and commission/broker fees. Transaction fees are included in the transaction price used tocalculate the realised and unrealised gain/(loss) on securities.
For the year from 1 March 2015 until 29 February 2016, these transactions costs amount to:
Sub-fund Ccy Transaction Fees
Invesco Global Structured Equity Fund USD 152,882Invesco Emerging Market Quantitative Equity Fund USD 20,437Invesco Global Smaller Companies Equity Fund USD 512,673Invesco Global Equity Income Fund USD 513,220Invesco Global Opportunities Fund USD 6,480Invesco Global Equity Market Neutral Fund EUR 1,494Invesco Latin American Equity Fund USD 22,493Invesco US Structured Equity Fund USD 432,328Invesco US Value Equity Fund USD 81,394Invesco US Equity Fund USD 6,365Invesco Pan European Structured Equity Fund EUR 761,344Invesco Pan European Equity Fund EUR 5,795,409Invesco Pan European Small Cap Equity Fund EUR 492,330Invesco European Growth Equity Fund EUR 32,207Invesco Pan European Equity Income Fund EUR 221,480Invesco Emerging Europe Equity Fund USD 56,194Invesco Pan European Focus Equity Fund EUR 102,538Invesco Euro Equity Fund EUR 203,041Invesco Euro Structured Equity Fund EUR 16,729Invesco Nippon Small/Mid Cap Equity Fund JPY 28,089,023Invesco Japanese Equity Advantage Fund JPY 31,362,525Invesco Japanese Value Equity Fund JPY 18,561,379Invesco Asia Opportunities Equity Fund USD 523,168Invesco Greater China Equity Fund USD 6,104,160Invesco Asia Infrastructure Fund USD 1,830,313Invesco India Equity Fund USD 741,051Invesco Asia Consumer Demand Fund USD 1,201,116Invesco China Focus Equity Fund USD 113,077Invesco Asian Focus Equity Fund USD 13,386Invesco Global Leisure Fund USD 119,520Invesco Energy Fund USD 167,093Invesco Global Income Real Estate Securities Fund USD 35,645Invesco Gold & Precious Metals Fund USD 68,242Invesco USD Reserve Fund USD 1,993Invesco Euro Reserve Fund EUR 1,812Invesco Global Bond Fund USD 6,049Invesco Euro Bond Fund (formerly Invesco European Bond Fund) EUR 26,539Invesco Active Multi-Sector Credit Fund EUR 4,474Invesco Euro Inflation-Linked Bond Fund EUR 388Invesco Euro Corporate Bond Fund EUR 257,220Invesco UK Investment Grade Bond Fund GBP 1,210Invesco Emerging Local Currencies Debt Fund USD 1,709Invesco Global Investment Grade Corporate Bond Fund USD 3,862Invesco Global Unconstrained Bond Fund GBP 1,039Invesco Global Total Return (EUR) Bond Fund EUR 36,359
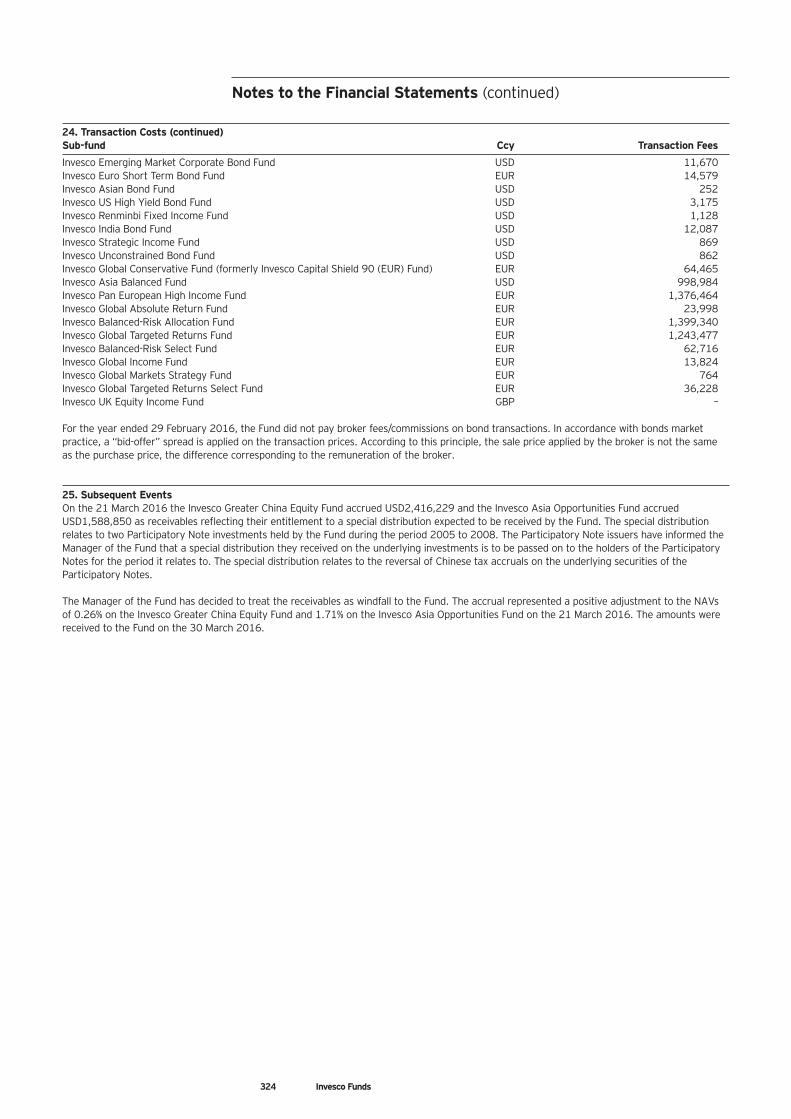
Notes to the Financial Statements (continued)
324 Invesco Funds
24. Transaction Costs (continued)Sub-fund Ccy Transaction Fees
Invesco Emerging Market Corporate Bond Fund USD 11,670Invesco Euro Short Term Bond Fund EUR 14,579Invesco Asian Bond Fund USD 252Invesco US High Yield Bond Fund USD 3,175Invesco Renminbi Fixed Income Fund USD 1,128Invesco India Bond Fund USD 12,087Invesco Strategic Income Fund USD 869Invesco Unconstrained Bond Fund USD 862Invesco Global Conservative Fund (formerly Invesco Capital Shield 90 (EUR) Fund) EUR 64,465Invesco Asia Balanced Fund USD 998,984Invesco Pan European High Income Fund EUR 1,376,464Invesco Global Absolute Return Fund EUR 23,998Invesco Balanced-Risk Allocation Fund EUR 1,399,340Invesco Global Targeted Returns Fund EUR 1,243,477Invesco Balanced-Risk Select Fund EUR 62,716Invesco Global Income Fund EUR 13,824Invesco Global Markets Strategy Fund EUR 764Invesco Global Targeted Returns Select Fund EUR 36,228Invesco UK Equity Income Fund GBP –
For the year ended 29 February 2016, the Fund did not pay broker fees/commissions on bond transactions. In accordance with bonds marketpractice, a “bid-offer” spread is applied on the transaction prices. According to this principle, the sale price applied by the broker is not the sameas the purchase price, the difference corresponding to the remuneration of the broker.
25. Subsequent EventsOn the 21 March 2016 the Invesco Greater China Equity Fund accrued USD2,416,229 and the Invesco Asia Opportunities Fund accruedUSD1,588,850 as receivables reflecting their entitlement to a special distribution expected to be received by the Fund. The special distributionrelates to two Participatory Note investments held by the Fund during the period 2005 to 2008. The Participatory Note issuers have informed theManager of the Fund that a special distribution they received on the underlying investments is to be passed on to the holders of the ParticipatoryNotes for the period it relates to. The special distribution relates to the reversal of Chinese tax accruals on the underlying securities of theParticipatory Notes.
The Manager of the Fund has decided to treat the receivables as windfall to the Fund. The accrual represented a positive adjustment to the NAVsof 0.26% on the Invesco Greater China Equity Fund and 1.71% on the Invesco Asia Opportunities Fund on the 21 March 2016. The amounts werereceived to the Fund on the 30 March 2016.
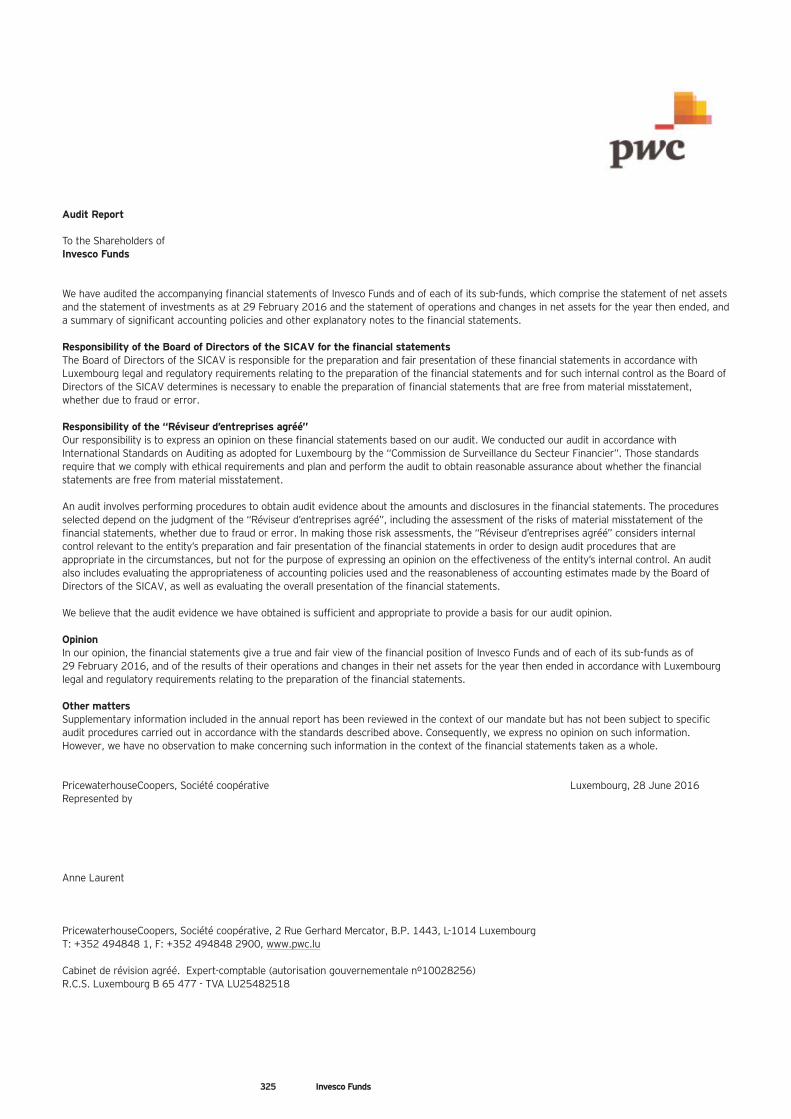
325 Invesco Funds
Audit Report
To the Shareholders ofInvesco Funds
We have audited the accompanying financial statements of Invesco Funds and of each of its sub-funds, which comprise the statement of net assetsand the statement of investments as at 29 February 2016 and the statement of operations and changes in net assets for the year then ended, anda summary of significant accounting policies and other explanatory notes to the financial statements.
Responsibility of the Board of Directors of the SICAV for the financial statementsThe Board of Directors of the SICAV is responsible for the preparation and fair presentation of these financial statements in accordance withLuxembourg legal and regulatory requirements relating to the preparation of the financial statements and for such internal control as the Board ofDirectors of the SICAV determines is necessary to enable the preparation of financial statements that are free from material misstatement,whether due to fraud or error.
Responsibility of the “Réviseur d’entreprises agréé”Our responsibility is to express an opinion on these financial statements based on our audit. We conducted our audit in accordance withInternational Standards on Auditing as adopted for Luxembourg by the “Commission de Surveillance du Secteur Financier”. Those standardsrequire that we comply with ethical requirements and plan and perform the audit to obtain reasonable assurance about whether the financialstatements are free from material misstatement.
An audit involves performing procedures to obtain audit evidence about the amounts and disclosures in the financial statements. The proceduresselected depend on the judgment of the “Réviseur d’entreprises agréé”, including the assessment of the risks of material misstatement of thefinancial statements, whether due to fraud or error. In making those risk assessments, the “Réviseur d’entreprises agréé” considers internalcontrol relevant to the entity’s preparation and fair presentation of the financial statements in order to design audit procedures that areappropriate in the circumstances, but not for the purpose of expressing an opinion on the effectiveness of the entity’s internal control. An auditalso includes evaluating the appropriateness of accounting policies used and the reasonableness of accounting estimates made by the Board ofDirectors of the SICAV, as well as evaluating the overall presentation of the financial statements.
We believe that the audit evidence we have obtained is sufficient and appropriate to provide a basis for our audit opinion.
OpinionIn our opinion, the financial statements give a true and fair view of the financial position of Invesco Funds and of each of its sub-funds as of29 February 2016, and of the results of their operations and changes in their net assets for the year then ended in accordance with Luxembourglegal and regulatory requirements relating to the preparation of the financial statements.
Other mattersSupplementary information included in the annual report has been reviewed in the context of our mandate but has not been subject to specificaudit procedures carried out in accordance with the standards described above. Consequently, we express no opinion on such information.However, we have no observation to make concerning such information in the context of the financial statements taken as a whole.
PricewaterhouseCoopers, Société coopérative Luxembourg, 28 June 2016Represented by
Anne Laurent
PricewaterhouseCoopers, Société coopérative, 2 Rue Gerhard Mercator, B.P. 1443, L-1014 LuxembourgT: +352 494848 1, F: +352 494848 2900, www.pwc.lu
Cabinet de révision agréé. Expert-comptable (autorisation gouvernementale nº10028256)R.C.S. Luxembourg B 65 477 - TVA LU25482518
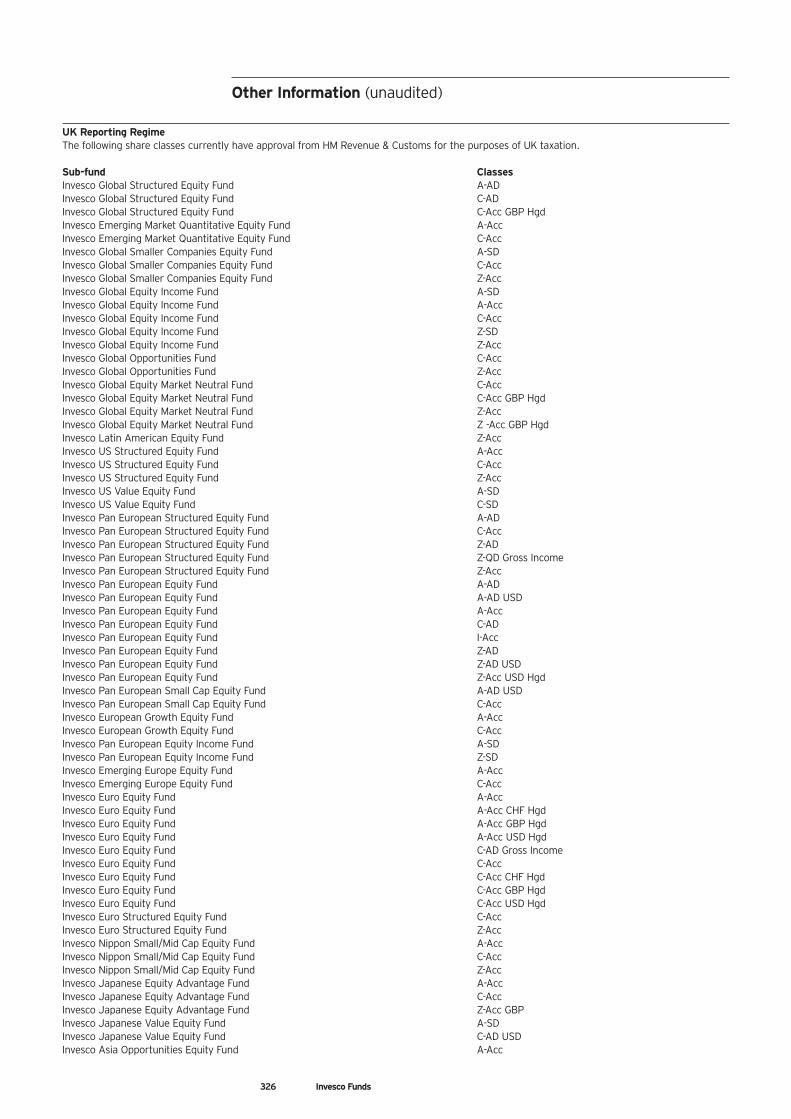
326 Invesco Funds
UK Reporting RegimeThe following share classes currently have approval from HM Revenue & Customs for the purposes of UK taxation.
Sub-fund ClassesInvesco Global Structured Equity Fund A-ADInvesco Global Structured Equity Fund C-ADInvesco Global Structured Equity Fund C-Acc GBP HgdInvesco Emerging Market Quantitative Equity Fund A-AccInvesco Emerging Market Quantitative Equity Fund C-AccInvesco Global Smaller Companies Equity Fund A-SDInvesco Global Smaller Companies Equity Fund C-AccInvesco Global Smaller Companies Equity Fund Z-AccInvesco Global Equity Income Fund A-SDInvesco Global Equity Income Fund A-AccInvesco Global Equity Income Fund C-AccInvesco Global Equity Income Fund Z-SDInvesco Global Equity Income Fund Z-AccInvesco Global Opportunities Fund C-AccInvesco Global Opportunities Fund Z-AccInvesco Global Equity Market Neutral Fund C-AccInvesco Global Equity Market Neutral Fund C-Acc GBP HgdInvesco Global Equity Market Neutral Fund Z-AccInvesco Global Equity Market Neutral Fund Z -Acc GBP HgdInvesco Latin American Equity Fund Z-AccInvesco US Structured Equity Fund A-AccInvesco US Structured Equity Fund C-AccInvesco US Structured Equity Fund Z-AccInvesco US Value Equity Fund A-SDInvesco US Value Equity Fund C-SDInvesco Pan European Structured Equity Fund A-ADInvesco Pan European Structured Equity Fund C-AccInvesco Pan European Structured Equity Fund Z-ADInvesco Pan European Structured Equity Fund Z-QD Gross IncomeInvesco Pan European Structured Equity Fund Z-AccInvesco Pan European Equity Fund A-ADInvesco Pan European Equity Fund A-AD USDInvesco Pan European Equity Fund A-AccInvesco Pan European Equity Fund C-ADInvesco Pan European Equity Fund I-AccInvesco Pan European Equity Fund Z-ADInvesco Pan European Equity Fund Z-AD USDInvesco Pan European Equity Fund Z-Acc USD HgdInvesco Pan European Small Cap Equity Fund A-AD USDInvesco Pan European Small Cap Equity Fund C-AccInvesco European Growth Equity Fund A-AccInvesco European Growth Equity Fund C-AccInvesco Pan European Equity Income Fund A-SDInvesco Pan European Equity Income Fund Z-SDInvesco Emerging Europe Equity Fund A-AccInvesco Emerging Europe Equity Fund C-AccInvesco Euro Equity Fund A-AccInvesco Euro Equity Fund A-Acc CHF HgdInvesco Euro Equity Fund A-Acc GBP HgdInvesco Euro Equity Fund A-Acc USD HgdInvesco Euro Equity Fund C-AD Gross IncomeInvesco Euro Equity Fund C-AccInvesco Euro Equity Fund C-Acc CHF HgdInvesco Euro Equity Fund C-Acc GBP HgdInvesco Euro Equity Fund C-Acc USD HgdInvesco Euro Structured Equity Fund C-AccInvesco Euro Structured Equity Fund Z-AccInvesco Nippon Small/Mid Cap Equity Fund A-AccInvesco Nippon Small/Mid Cap Equity Fund C-AccInvesco Nippon Small/Mid Cap Equity Fund Z-AccInvesco Japanese Equity Advantage Fund A-AccInvesco Japanese Equity Advantage Fund C-AccInvesco Japanese Equity Advantage Fund Z-Acc GBPInvesco Japanese Value Equity Fund A-SDInvesco Japanese Value Equity Fund C-AD USDInvesco Asia Opportunities Equity Fund A-Acc
Other Information (unaudited)
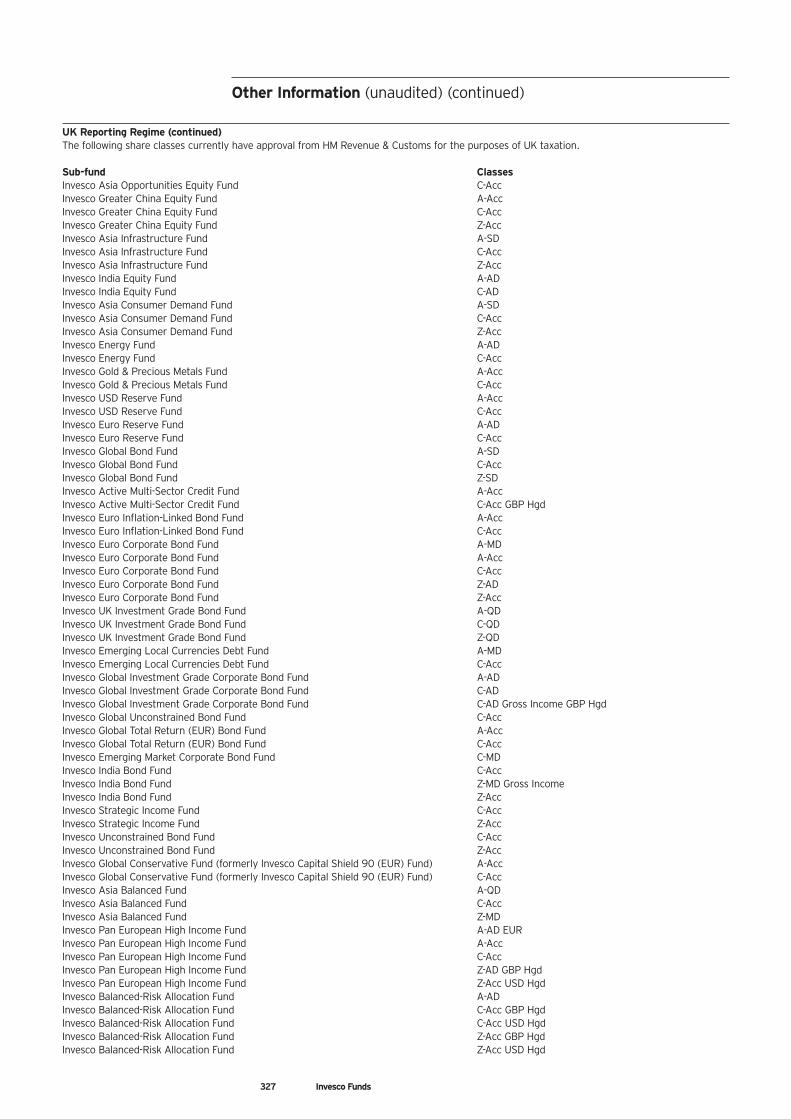
UK Reporting Regime (continued)The following share classes currently have approval from HM Revenue & Customs for the purposes of UK taxation.
Sub-fund ClassesInvesco Asia Opportunities Equity Fund C-AccInvesco Greater China Equity Fund A-AccInvesco Greater China Equity Fund C-AccInvesco Greater China Equity Fund Z-AccInvesco Asia Infrastructure Fund A-SDInvesco Asia Infrastructure Fund C-AccInvesco Asia Infrastructure Fund Z-AccInvesco India Equity Fund A-ADInvesco India Equity Fund C-ADInvesco Asia Consumer Demand Fund A-SDInvesco Asia Consumer Demand Fund C-AccInvesco Asia Consumer Demand Fund Z-AccInvesco Energy Fund A-ADInvesco Energy Fund C-AccInvesco Gold & Precious Metals Fund A-AccInvesco Gold & Precious Metals Fund C-AccInvesco USD Reserve Fund A-AccInvesco USD Reserve Fund C-AccInvesco Euro Reserve Fund A-ADInvesco Euro Reserve Fund C-AccInvesco Global Bond Fund A-SDInvesco Global Bond Fund C-AccInvesco Global Bond Fund Z-SDInvesco Active Multi-Sector Credit Fund A-AccInvesco Active Multi-Sector Credit Fund C-Acc GBP HgdInvesco Euro Inflation-Linked Bond Fund A-AccInvesco Euro Inflation-Linked Bond Fund C-AccInvesco Euro Corporate Bond Fund A-MDInvesco Euro Corporate Bond Fund A-AccInvesco Euro Corporate Bond Fund C-AccInvesco Euro Corporate Bond Fund Z-ADInvesco Euro Corporate Bond Fund Z-AccInvesco UK Investment Grade Bond Fund A-QDInvesco UK Investment Grade Bond Fund C-QDInvesco UK Investment Grade Bond Fund Z-QDInvesco Emerging Local Currencies Debt Fund A-MDInvesco Emerging Local Currencies Debt Fund C-AccInvesco Global Investment Grade Corporate Bond Fund A-ADInvesco Global Investment Grade Corporate Bond Fund C-ADInvesco Global Investment Grade Corporate Bond Fund C-AD Gross Income GBP HgdInvesco Global Unconstrained Bond Fund C-AccInvesco Global Total Return (EUR) Bond Fund A-AccInvesco Global Total Return (EUR) Bond Fund C-AccInvesco Emerging Market Corporate Bond Fund C-MDInvesco India Bond Fund C-AccInvesco India Bond Fund Z-MD Gross IncomeInvesco India Bond Fund Z-AccInvesco Strategic Income Fund C-AccInvesco Strategic Income Fund Z-AccInvesco Unconstrained Bond Fund C-AccInvesco Unconstrained Bond Fund Z-AccInvesco Global Conservative Fund (formerly Invesco Capital Shield 90 (EUR) Fund) A-AccInvesco Global Conservative Fund (formerly Invesco Capital Shield 90 (EUR) Fund) C-AccInvesco Asia Balanced Fund A-QDInvesco Asia Balanced Fund C-AccInvesco Asia Balanced Fund Z-MDInvesco Pan European High Income Fund A-AD EURInvesco Pan European High Income Fund A-AccInvesco Pan European High Income Fund C-AccInvesco Pan European High Income Fund Z-AD GBP HgdInvesco Pan European High Income Fund Z-Acc USD HgdInvesco Balanced-Risk Allocation Fund A-ADInvesco Balanced-Risk Allocation Fund C-Acc GBP HgdInvesco Balanced-Risk Allocation Fund C-Acc USD HgdInvesco Balanced-Risk Allocation Fund Z-Acc GBP HgdInvesco Balanced-Risk Allocation Fund Z-Acc USD Hgd
Other Information (unaudited) (continued)
327 Invesco Funds
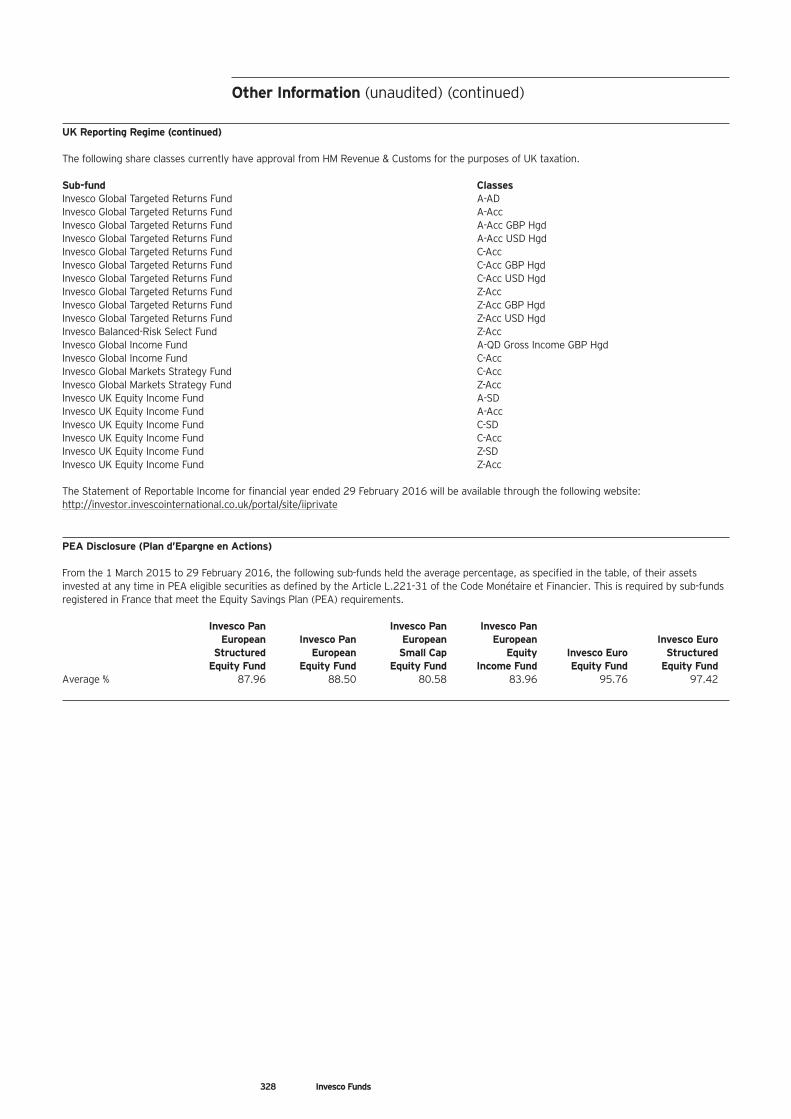
328 Invesco Funds
UK Reporting Regime (continued)
The following share classes currently have approval from HM Revenue & Customs for the purposes of UK taxation.
Sub-fund ClassesInvesco Global Targeted Returns Fund A-ADInvesco Global Targeted Returns Fund A-AccInvesco Global Targeted Returns Fund A-Acc GBP HgdInvesco Global Targeted Returns Fund A-Acc USD HgdInvesco Global Targeted Returns Fund C-AccInvesco Global Targeted Returns Fund C-Acc GBP HgdInvesco Global Targeted Returns Fund C-Acc USD HgdInvesco Global Targeted Returns Fund Z-AccInvesco Global Targeted Returns Fund Z-Acc GBP HgdInvesco Global Targeted Returns Fund Z-Acc USD HgdInvesco Balanced-Risk Select Fund Z-AccInvesco Global Income Fund A-QD Gross Income GBP HgdInvesco Global Income Fund C-AccInvesco Global Markets Strategy Fund C-AccInvesco Global Markets Strategy Fund Z-AccInvesco UK Equity Income Fund A-SDInvesco UK Equity Income Fund A-AccInvesco UK Equity Income Fund C-SDInvesco UK Equity Income Fund C-AccInvesco UK Equity Income Fund Z-SDInvesco UK Equity Income Fund Z-Acc
The Statement of Reportable Income for financial year ended 29 February 2016 will be available through the following website:http://investor.invescointernational.co.uk/portal/site/iiprivate
PEA Disclosure (Plan d’Epargne en Actions)
From the 1 March 2015 to 29 February 2016, the following sub-funds held the average percentage, as specified in the table, of their assetsinvested at any time in PEA eligible securities as defined by the Article L.221-31 of the Code Monétaire et Financier. This is required by sub-fundsregistered in France that meet the Equity Savings Plan (PEA) requirements.
Invesco Pan Invesco Pan Invesco PanEuropean Invesco Pan European European Invesco Euro
Structured European Small Cap Equity Invesco Euro StructuredEquity Fund Equity Fund Equity Fund Income Fund Equity Fund Equity Fund
Average % 87.96 88.50 80.58 83.96 95.76 97.42
Other Information (unaudited) (continued)
329 Invesco Funds
Calculation Methods of the Risk ExposureFollowing the assessment of the investment policy of each sub-fund of Invesco Funds (the sub-fund), Invesco Management S.A. has decided to use(Value-at-Risk) (VaR) for the assessment of the global exposure of each sub-fund.
Value-at-Risk (VaR) is a statistical measurement. It intends to measure the maximum potential loss at a given confidence level (probability) over aspecific time period under normal market conditions. All of the positions within the portfolio are taken into account for the VaR calculation, notjust derivatives.
Absolute and Relative VaR are calculated daily using a VaR risk model based on a two years historical simulation methodology. This method forcalculating VaR contains no standard distribution assumption and assumes that history repeats itself.
The calculation standards used for the VaR model are in compliance with the provisions in box 15 of ESMA Guidelines on Risk Measurement andthe calculation of Global Exposure and Counterparty Risk for UCITS (Ref:10-788) (“ESMA Guidelines”).
The Absolute VaR of a UCITS cannot be greater than 20% of its NAV. The Relative VaR of a UCITS cannot be more than 2 times the VaR of thereference portfolio. Invesco Management SA monitors that the VaR of the UCITS/2* VaR of the reference portfolio is not greater than 100%.
The calculation of the Absolute and Relative VaR is carried out in accordance with the following parameters:
• one-tailed confidence interval of 99%;• holding period equivalent to 1 month (i.e. 20 business days);• effective observation period (history) of risk factors of 500 business days (ESMA Guidelines require at least 250 business days); • daily calculation.
In line with box 25 of ESMA Guidelines, as the sub-funds use the VaR approach to monitor the global exposure, Invesco Management SA calculatesthe leverage for each sub-fund on a daily basis, as the sum of the absolute value of the notionals of the derivatives used. With respect to financialderivative instruments which do not have a notional value attached to them, the calculation of the value is based upon the market value of theequivalent position of the underlying asset that is attached to the financial derivative instrument and applied consistently and appropriately.
The average level of leverage figures provided below does not take into account any netting and hedging arrangements that the sub-funds mayhave in place at any time even though these netting and hedging arrangements are used for risk reduction purpose.
The below table details the VaR approach for each sub-fund and for those sub-funds utilising the relative VaR methodology, it details the referenceportfolio. The table also details the minimum, maximum and average daily VaR utilisation that occurred during the one year period ending29 February 2016, as well as the daily average level of leverage for each sub-fund during the one year period ending 29 February 2016.
Other Information (unaudited) (continued)
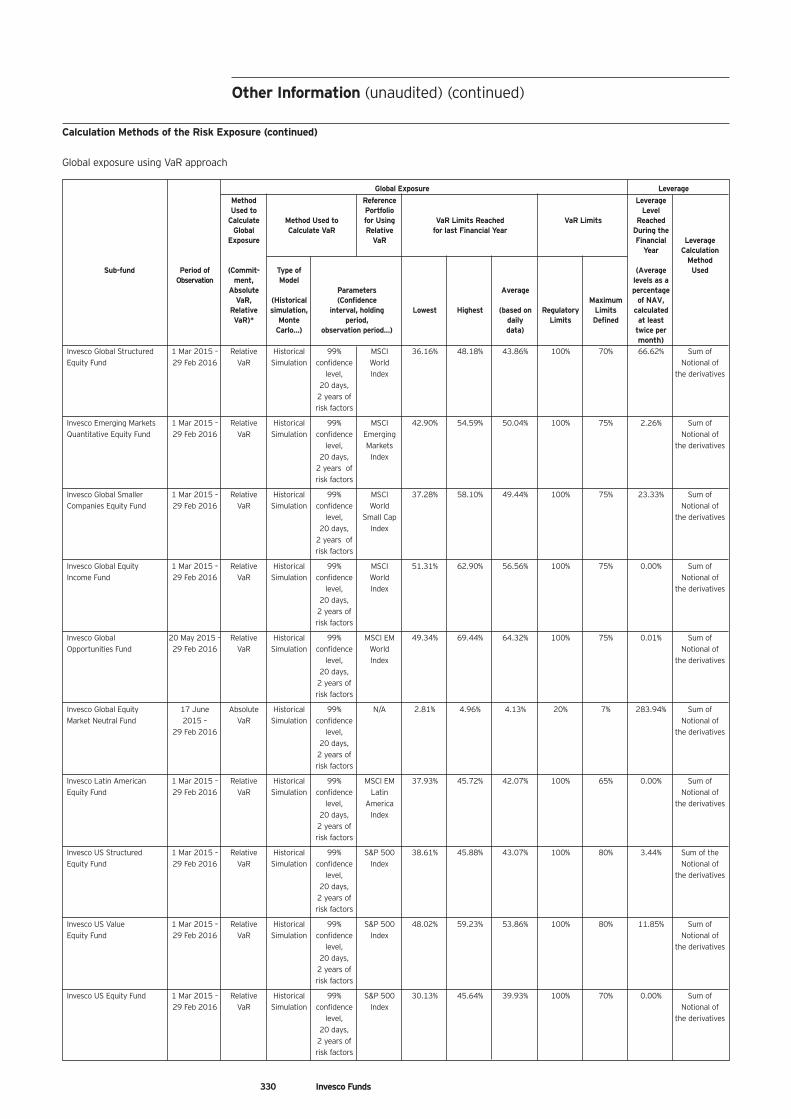
Global Exposure LeverageMethod Reference LeverageUsed to Portfolio Level
Calculate Method Used to for Using VaR Limits Reached VaR Limits ReachedGlobal Calculate VaR Relative for last Financial Year During the
Exposure VaR Financial LeverageYear Calculation
MethodSub-fund Period of (Commit- Type of (Average Used
Observation ment, Model levels as aAbsolute Parameters Average percentage
VaR, (Historical (Confidence Maximum of NAV, Relative simulation, interval, holding Lowest Highest (based on Regulatory Limits calculated VaR)* Monte period, daily Limits Defined at least Carlo…) observation period…) data) twice per month)Invesco Global Structured 1 Mar 2015 – Relative Historical 99% MSCI 36.16% 48.18% 43.86% 100% 70% 66.62% Sum of Equity Fund 29 Feb 2016 VaR Simulation confidence World Notional of
level, Index the derivatives 20 days, 2 years of risk factors
Invesco Emerging Markets 1 Mar 2015 – Relative Historical 99% MSCI 42.90% 54.59% 50.04% 100% 75% 2.26% Sum of Quantitative Equity Fund 29 Feb 2016 VaR Simulation confidence Emerging Notional of
level, Markets the derivatives 20 days, Index 2 years of risk factors
Invesco Global Smaller 1 Mar 2015 – Relative Historical 99% MSCI 37.28% 58.10% 49.44% 100% 75% 23.33% Sum of Companies Equity Fund 29 Feb 2016 VaR Simulation confidence World Notional of
level, Small Cap the derivatives 20 days, Index 2 years of risk factors
Invesco Global Equity 1 Mar 2015 – Relative Historical 99% MSCI 51.31% 62.90% 56.56% 100% 75% 0.00% Sum of Income Fund 29 Feb 2016 VaR Simulation confidence World Notional of
level, Index the derivatives 20 days, 2 years of risk factors
Invesco Global 20 May 2015 – Relative Historical 99% MSCI EM 49.34% 69.44% 64.32% 100% 75% 0.01% Sum of Opportunities Fund 29 Feb 2016 VaR Simulation confidence World Notional of
level, Index the derivatives 20 days, 2 years of risk factors
Invesco Global Equity 17 June Absolute Historical 99% N/A 2.81% 4.96% 4.13% 20% 7% 283.94% Sum of Market Neutral Fund 2015 – VaR Simulation confidence Notional of
29 Feb 2016 level, the derivatives 20 days, 2 years of risk factors
Invesco Latin American 1 Mar 2015 – Relative Historical 99% MSCI EM 37.93% 45.72% 42.07% 100% 65% 0.00% Sum of Equity Fund 29 Feb 2016 VaR Simulation confidence Latin Notional of
level, America the derivatives 20 days, Index 2 years of risk factors
Invesco US Structured 1 Mar 2015 – Relative Historical 99% S&P 500 38.61% 45.88% 43.07% 100% 80% 3.44% Sum of the Equity Fund 29 Feb 2016 VaR Simulation confidence Index Notional of
level, the derivatives 20 days, 2 years of risk factors
Invesco US Value 1 Mar 2015 – Relative Historical 99% S&P 500 48.02% 59.23% 53.86% 100% 80% 11.85% Sum of Equity Fund 29 Feb 2016 VaR Simulation confidence Index Notional of
level, the derivatives 20 days, 2 years of risk factors
Invesco US Equity Fund 1 Mar 2015 – Relative Historical 99% S&P 500 30.13% 45.64% 39.93% 100% 70% 0.00% Sum of 29 Feb 2016 VaR Simulation confidence Index Notional of
level, the derivatives 20 days, 2 years of risk factors
330 Invesco Funds
Other Information (unaudited) (continued)
Calculation Methods of the Risk Exposure (continued)
Global exposure using VaR approach
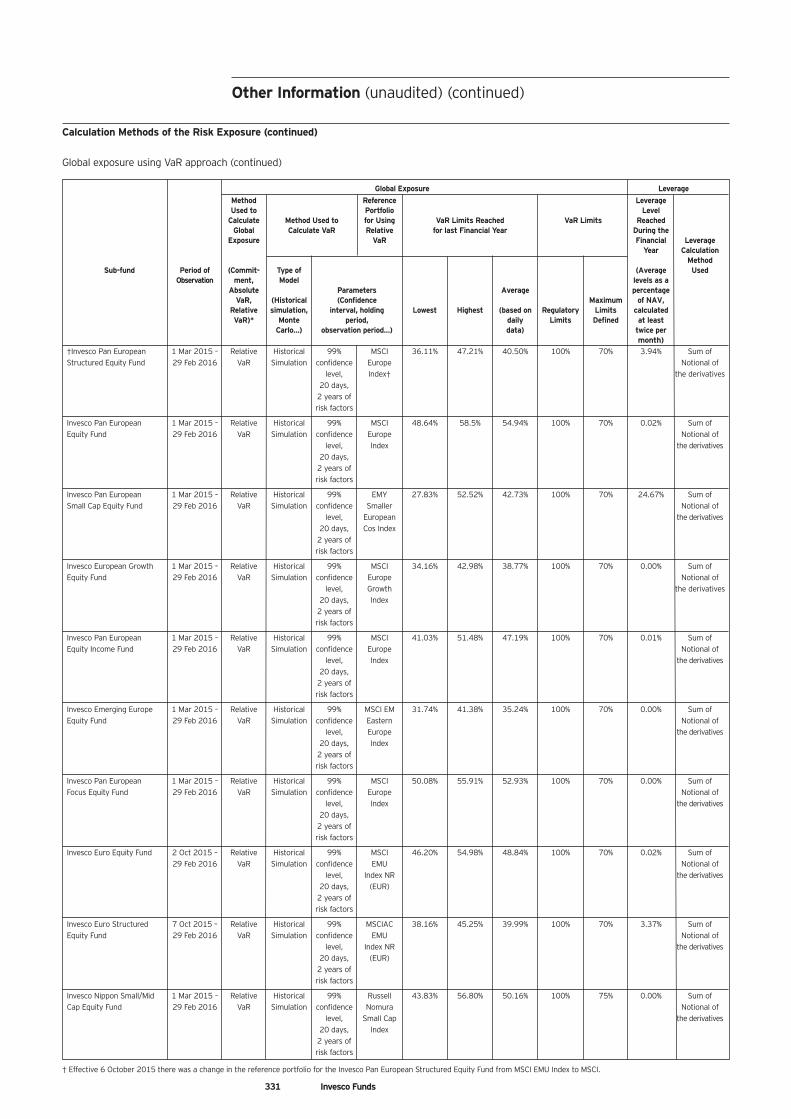
Global Exposure LeverageMethod Reference LeverageUsed to Portfolio Level
Calculate Method Used to for Using VaR Limits Reached VaR Limits ReachedGlobal Calculate VaR Relative for last Financial Year During the
Exposure VaR Financial LeverageYear Calculation
MethodSub-fund Period of (Commit- Type of (Average Used
Observation ment, Model levels as aAbsolute Parameters Average percentage
VaR, (Historical (Confidence Maximum of NAV, Relative simulation, interval, holding Lowest Highest (based on Regulatory Limits calculated VaR)* Monte period, daily Limits Defined at least Carlo…) observation period…) data) twice per month)†Invesco Pan European 1 Mar 2015 – Relative Historical 99% MSCI 36.11% 47.21% 40.50% 100% 70% 3.94% Sum of Structured Equity Fund 29 Feb 2016 VaR Simulation confidence Europe Notional of
level, Index† the derivatives 20 days, 2 years of risk factors
Invesco Pan European 1 Mar 2015 – Relative Historical 99% MSCI 48.64% 58.5% 54.94% 100% 70% 0.02% Sum of Equity Fund 29 Feb 2016 VaR Simulation confidence Europe Notional of
level, Index the derivatives 20 days, 2 years of risk factors
Invesco Pan European 1 Mar 2015 – Relative Historical 99% EMY 27.83% 52.52% 42.73% 100% 70% 24.67% Sum of Small Cap Equity Fund 29 Feb 2016 VaR Simulation confidence Smaller Notional of
level, European the derivatives 20 days, Cos Index 2 years of risk factors
Invesco European Growth 1 Mar 2015 – Relative Historical 99% MSCI 34.16% 42.98% 38.77% 100% 70% 0.00% Sum of Equity Fund 29 Feb 2016 VaR Simulation confidence Europe Notional of
level, Growth the derivatives 20 days, Index 2 years of risk factors
Invesco Pan European 1 Mar 2015 – Relative Historical 99% MSCI 41.03% 51.48% 47.19% 100% 70% 0.01% Sum of Equity Income Fund 29 Feb 2016 VaR Simulation confidence Europe Notional of
level, Index the derivatives 20 days, 2 years of risk factors
Invesco Emerging Europe 1 Mar 2015 – Relative Historical 99% MSCI EM 31.74% 41.38% 35.24% 100% 70% 0.00% Sum of Equity Fund 29 Feb 2016 VaR Simulation confidence Eastern Notional of
level, Europe the derivatives 20 days, Index 2 years of risk factors
Invesco Pan European 1 Mar 2015 – Relative Historical 99% MSCI 50.08% 55.91% 52.93% 100% 70% 0.00% Sum of Focus Equity Fund 29 Feb 2016 VaR Simulation confidence Europe Notional of
level, Index the derivatives 20 days, 2 years of risk factors
Invesco Euro Equity Fund 2 Oct 2015 – Relative Historical 99% MSCI 46.20% 54.98% 48.84% 100% 70% 0.02% Sum of 29 Feb 2016 VaR Simulation confidence EMU Notional of
level, Index NR the derivatives 20 days, (EUR) 2 years of risk factors
Invesco Euro Structured 7 Oct 2015 – Relative Historical 99% MSCIAC 38.16% 45.25% 39.99% 100% 70% 3.37% Sum of Equity Fund 29 Feb 2016 VaR Simulation confidence EMU Notional of
level, Index NR the derivatives 20 days, (EUR) 2 years of risk factors
Invesco Nippon Small/Mid 1 Mar 2015 – Relative Historical 99% Russell 43.83% 56.80% 50.16% 100% 75% 0.00% Sum of Cap Equity Fund 29 Feb 2016 VaR Simulation confidence Nomura Notional of
level, Small Cap the derivatives 20 days, Index 2 years of risk factors
331 Invesco Funds
Other Information (unaudited) (continued)
Calculation Methods of the Risk Exposure (continued)
Global exposure using VaR approach (continued)
† Effective 6 October 2015 there was a change in the reference portfolio for the Invesco Pan European Structured Equity Fund from MSCI EMU Index to MSCI.
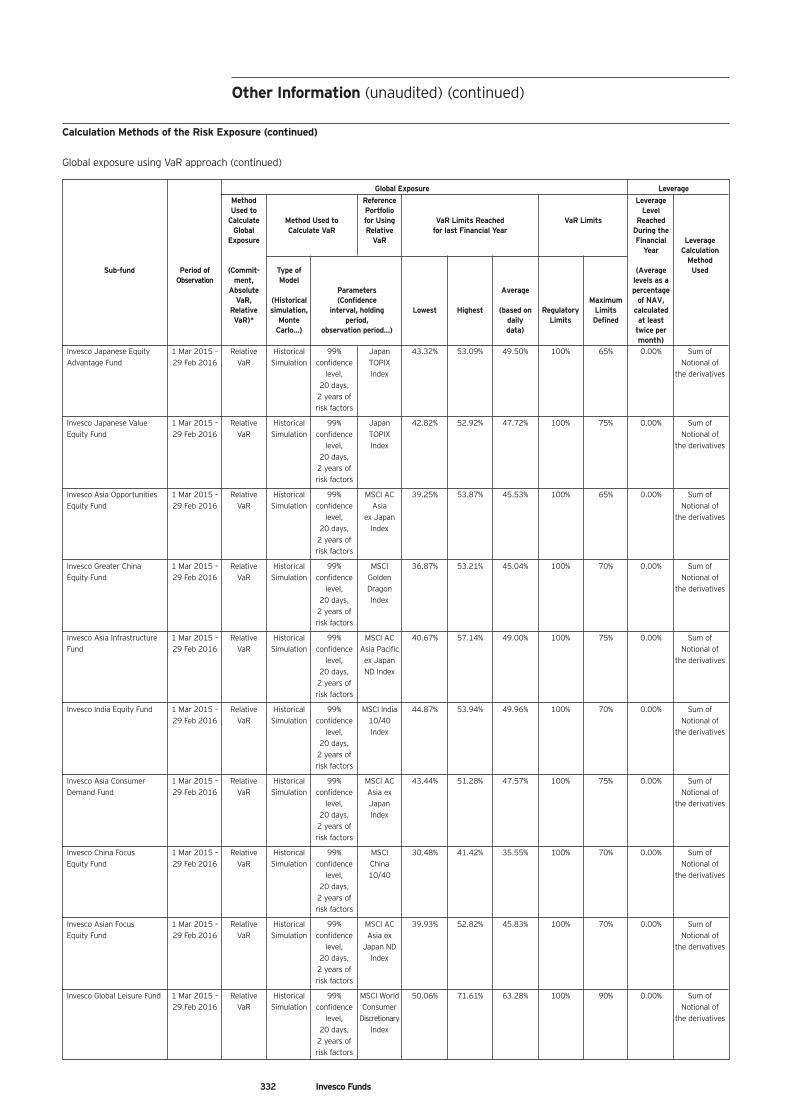
332 Invesco Funds
Global Exposure LeverageMethod Reference LeverageUsed to Portfolio Level
Calculate Method Used to for Using VaR Limits Reached VaR Limits ReachedGlobal Calculate VaR Relative for last Financial Year During the
Exposure VaR Financial LeverageYear Calculation
MethodSub-fund Period of (Commit- Type of (Average Used
Observation ment, Model levels as aAbsolute Parameters Average percentage
VaR, (Historical (Confidence Maximum of NAV, Relative simulation, interval, holding Lowest Highest (based on Regulatory Limits calculated VaR)* Monte period, daily Limits Defined at least Carlo…) observation period…) data) twice per month)Invesco Japanese Equity 1 Mar 2015 – Relative Historical 99% Japan 43.32% 53.09% 49.50% 100% 65% 0.00% Sum of Advantage Fund 29 Feb 2016 VaR Simulation confidence TOPIX Notional of
level, Index the derivatives 20 days, 2 years of risk factors
Invesco Japanese Value 1 Mar 2015 – Relative Historical 99% Japan 42.82% 52.92% 47.72% 100% 75% 0.00% Sum of Equity Fund 29 Feb 2016 VaR Simulation confidence TOPIX Notional of
level, Index the derivatives 20 days, 2 years of risk factors
Invesco Asia Opportunities 1 Mar 2015 – Relative Historical 99% MSCI AC 39.25% 53.87% 45.53% 100% 65% 0.00% Sum of Equity Fund 29 Feb 2016 VaR Simulation confidence Asia Notional of
level, ex Japan the derivatives 20 days, Index 2 years of risk factors
Invesco Greater China 1 Mar 2015 – Relative Historical 99% MSCI 36.87% 53.21% 45.04% 100% 70% 0.00% Sum of Equity Fund 29 Feb 2016 VaR Simulation confidence Golden Notional of
level, Dragon the derivatives 20 days, Index 2 years of risk factors
Invesco Asia Infrastructure 1 Mar 2015 – Relative Historical 99% MSCI AC 40.67% 57.14% 49.00% 100% 75% 0.00% Sum of Fund 29 Feb 2016 VaR Simulation confidence Asia Pacific Notional of
level, ex Japan the derivatives 20 days, ND Index 2 years of risk factors
Invesco India Equity Fund 1 Mar 2015 – Relative Historical 99% MSCI India 44.87% 53.94% 49.96% 100% 70% 0.00% Sum of 29 Feb 2016 VaR Simulation confidence 10/40 Notional of
level, Index the derivatives 20 days, 2 years of risk factors
Invesco Asia Consumer 1 Mar 2015 – Relative Historical 99% MSCI AC 43.44% 51.28% 47.57% 100% 75% 0.00% Sum of Demand Fund 29 Feb 2016 VaR Simulation confidence Asia ex Notional of
level, Japan the derivatives 20 days, Index 2 years of risk factors
Invesco China Focus 1 Mar 2015 – Relative Historical 99% MSCI 30.48% 41.42% 35.55% 100% 70% 0.00% Sum of Equity Fund 29 Feb 2016 VaR Simulation confidence China Notional of
level, 10/40 the derivatives 20 days, 2 years of risk factors
Invesco Asian Focus 1 Mar 2015 – Relative Historical 99% MSCI AC 39.93% 52.82% 45.83% 100% 70% 0.00% Sum of Equity Fund 29 Feb 2016 VaR Simulation confidence Asia ex Notional of
level, Japan ND the derivatives 20 days, Index 2 years of risk factors
Invesco Global Leisure Fund 1 Mar 2015 – Relative Historical 99% MSCI World 50.06% 71.61% 63.28% 100% 90% 0.00% Sum of 29 Feb 2016 VaR Simulation confidence Consumer Notional of
level, Discretionary the derivatives 20 days, Index 2 years of risk factors
Other Information (unaudited) (continued)
Calculation Methods of the Risk Exposure (continued)
Global exposure using VaR approach (continued)
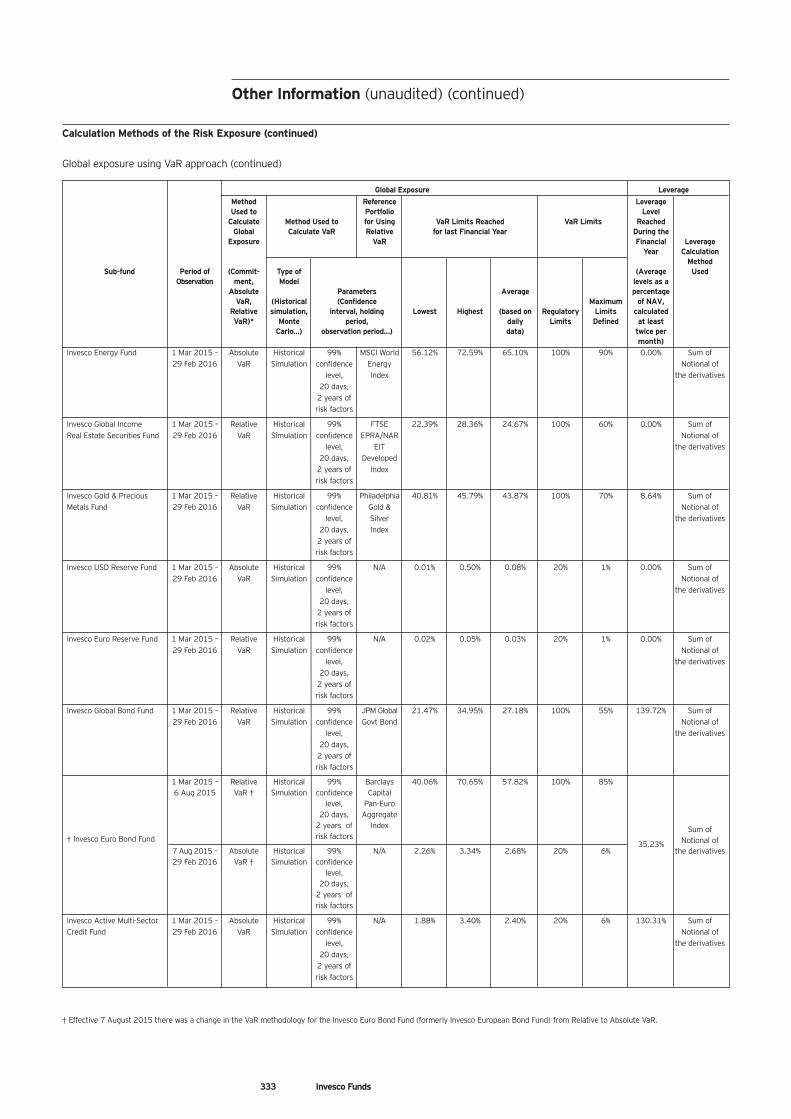
Global Exposure LeverageMethod Reference LeverageUsed to Portfolio Level
Calculate Method Used to for Using VaR Limits Reached VaR Limits ReachedGlobal Calculate VaR Relative for last Financial Year During the
Exposure VaR Financial LeverageYear Calculation
MethodSub-fund Period of (Commit- Type of (Average Used
Observation ment, Model levels as aAbsolute Parameters Average percentage
VaR, (Historical (Confidence Maximum of NAV, Relative simulation, interval, holding Lowest Highest (based on Regulatory Limits calculated VaR)* Monte period, daily Limits Defined at least Carlo…) observation period…) data) twice per month)Invesco Energy Fund 1 Mar 2015 – Absolute Historical 99% MSCI World 56.12% 72.59% 65.10% 100% 90% 0.00% Sum of 29 Feb 2016 VaR Simulation confidence Energy Notional of
level, Index the derivatives 20 days, 2 years of risk factors
Invesco Global Income 1 Mar 2015 –≠ Relative Historical 99% FTSE 22.39% 28.36% 24.67% 100% 60% 0.00% Sum of Real Estate Securities Fund 29 Feb 2016 VaR Simulation confidence EPRA/NAR Notional of
level, EIT the derivatives 20 days, Developed 2 years of Index risk factors
Invesco Gold & Precious 1 Mar 2015 – Relative Historical 99% Philadelphia 40.81% 45.79% 43.87% 100% 70% 8.64% Sum of Metals Fund 29 Feb 2016 VaR Simulation confidence Gold & Notional of
level, Silver the derivatives 20 days, Index 2 years of risk factors
Invesco USD Reserve Fund 1 Mar 2015 – Absolute Historical 99% N/A 0.01% 0.50% 0.08% 20% 1% 0.00% Sum of 29 Feb 2016 VaR Simulation confidence Notional of
level, the derivatives 20 days, 2 years of risk factors
Invesco Euro Reserve Fund 1 Mar 2015 – Relative Historical 99% N/A 0.02% 0.05% 0.03% 20% 1% 0.00% Sum of 29 Feb 2016 VaR Simulation confidence Notional of
level, the derivatives 20 days, 2 years of risk factors
Invesco Global Bond Fund 1 Mar 2015 – Relative Historical 99% JPM Global 21.47% 34.95% 27.18% 100% 55% 139.72% Sum of 29 Feb 2016 VaR Simulation confidence Govt Bond Notional of
level, the derivatives 20 days, 2 years of risk factors
1 Mar 2015 – Relative Historical 99% Barclays 40.06% 70.65% 57.82% 100% 85% 6 Aug 2015 VaR † Simulation confidence Capital
level, Pan-Euro 20 days, Aggregate 2 years of Index Sum of† Invesco Euro Bond Fund risk factors
35.23% Notional of
7 Aug 2015 – Absolute Historical 99% N/A 2.26% 3.34% 2.68% 20% 6% the derivatives 29 Feb 2016 VaR † Simulation confidence
level, 20 days, 2 years of risk factors
Invesco Active Multi-Sector 1 Mar 2015 – Absolute Historical 99% N/A 1.88% 3.40% 2.40% 20% 6% 130.31% Sum of Credit Fund 29 Feb 2016 VaR Simulation confidence Notional of
level, the derivatives 20 days, 2 years of risk factors
333 Invesco Funds
Other Information (unaudited) (continued)
Calculation Methods of the Risk Exposure (continued)
Global exposure using VaR approach (continued)
† Effective 7 August 2015 there was a change in the VaR methodology for the Invesco Euro Bond Fund (formerly Invesco European Bond Fund) from Relative to Absolute VaR.
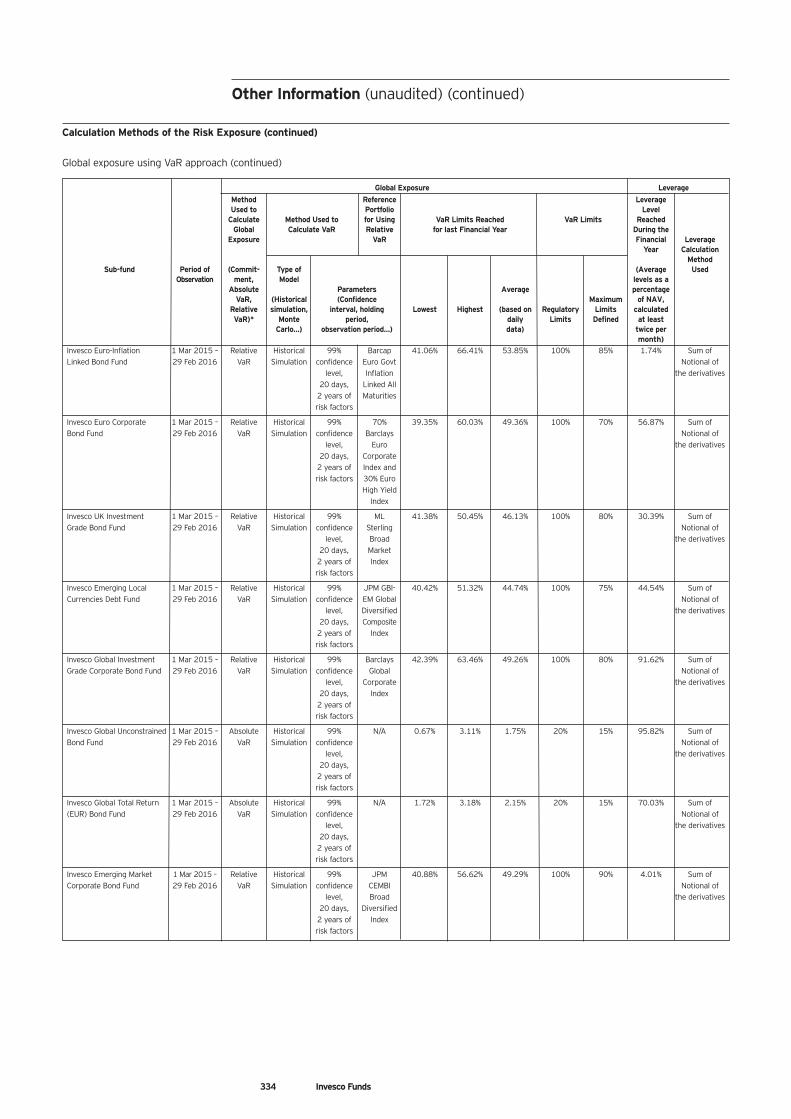
Global Exposure LeverageMethod Reference LeverageUsed to Portfolio Level
Calculate Method Used to for Using VaR Limits Reached VaR Limits ReachedGlobal Calculate VaR Relative for last Financial Year During the
Exposure VaR Financial LeverageYear Calculation
MethodSub-fund Period of (Commit- Type of (Average Used
Observation ment, Model levels as aAbsolute Parameters Average percentage
VaR, (Historical (Confidence Maximum of NAV, Relative simulation, interval, holding Lowest Highest (based on Regulatory Limits calculated VaR)* Monte period, daily Limits Defined at least Carlo…) observation period…) data) twice per month)Invesco Euro-Inflation 1 Mar 2015 – Relative Historical 99% Barcap 41.06% 66.41% 53.85% 100% 85% 1.74% Sum of Linked Bond Fund 29 Feb 2016 VaR Simulation confidence Euro Govt Notional of
level, Inflation the derivatives 20 days, Linked All 2 years of Maturities risk factors
Invesco Euro Corporate 1 Mar 2015 – Relative Historical 99% 70% 39.35% 60.03% 49.36% 100% 70% 56.87% Sum of Bond Fund 29 Feb 2016 VaR Simulation confidence Barclays Notional of
level, Euro the derivatives 20 days, Corporate 2 years of Index and risk factors 30% Euro High Yield Index
Invesco UK Investment 1 Mar 2015 – Relative Historical 99% ML 41.38% 50.45% 46.13% 100% 80% 30.39% Sum of Grade Bond Fund 29 Feb 2016 VaR Simulation confidence Sterling Notional of
level, Broad the derivatives 20 days, Market 2 years of Index risk factors
Invesco Emerging Local 1 Mar 2015 – Relative Historical 99% JPM GBI- 40.42% 51.32% 44.74% 100% 75% 44.54% Sum of Currencies Debt Fund 29 Feb 2016 VaR Simulation confidence EM Global Notional of
level, Diversified the derivatives 20 days, Composite 2 years of Index risk factors
Invesco Global Investment 1 Mar 2015 – Relative Historical 99% Barclays 42.39% 63.46% 49.26% 100% 80% 91.62% Sum of Grade Corporate Bond Fund 29 Feb 2016 VaR Simulation confidence Global Notional of
level, Corporate the derivatives 20 days, Index 2 years of risk factors
Invesco Global Unconstrained 1 Mar 2015 – Absolute Historical 99% N/A 0.67% 3.11% 1.75% 20% 15% 95.82% Sum of Bond Fund 29 Feb 2016 VaR Simulation confidence Notional of
level, the derivatives 20 days, 2 years of risk factors
Invesco Global Total Return 1 Mar 2015 – Absolute Historical 99% N/A 1.72% 3.18% 2.15% 20% 15% 70.03% Sum of (EUR) Bond Fund 29 Feb 2016 VaR Simulation confidence Notional of
level, the derivatives 20 days, 2 years of risk factors
Invesco Emerging Market 1 Mar 2015 – Relative Historical 99% JPM 40.88% 56.62% 49.29% 100% 90% 4.01% Sum of Corporate Bond Fund 29 Feb 2016 VaR Simulation confidence CEMBI Notional of
level, Broad the derivatives 20 days, Diversified 2 years of Index risk factors
334 Invesco Funds
Calculation Methods of the Risk Exposure (continued)
Global exposure using VaR approach (continued)
Other Information (unaudited) (continued)
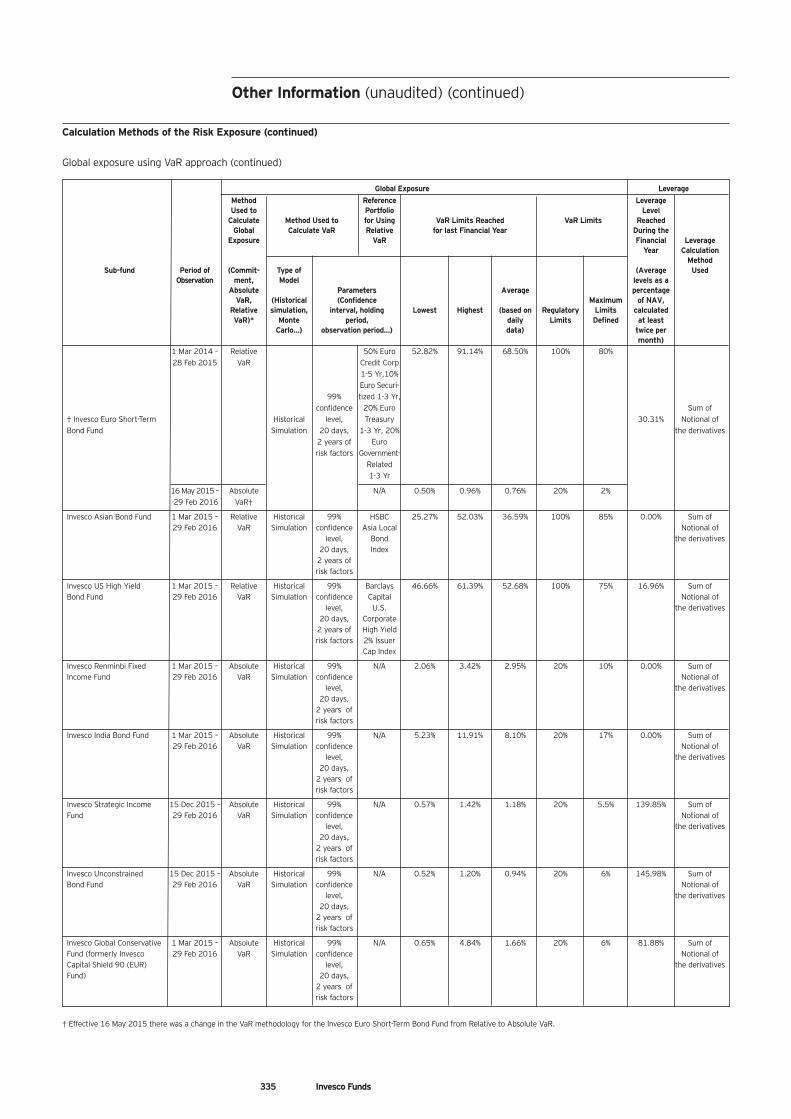
Global Exposure LeverageMethod Reference LeverageUsed to Portfolio Level
Calculate Method Used to for Using VaR Limits Reached VaR Limits ReachedGlobal Calculate VaR Relative for last Financial Year During the
Exposure VaR Financial LeverageYear Calculation
MethodSub-fund Period of (Commit- Type of (Average Used
Observation ment, Model levels as aAbsolute Parameters Average percentage
VaR, (Historical (Confidence Maximum of NAV, Relative simulation, interval, holding Lowest Highest (based on Regulatory Limits calculated VaR)* Monte period, daily Limits Defined at least Carlo…) observation period…) data) twice per month) 1 Mar 2014 – Relative 50% Euro 52.82% 91.14% 68.50% 100% 80% 28 Feb 2015 VaR Credit Corp 1-5 Yr,10% Euro Securi- 99% tized 1-3 Yr, confidence 20% Euro Sum of † Invesco Euro Short-Term Historical level, Treasury 30.31% Notional ofBond Fund Simulation 20 days, 1-3 Yr, 20% the derivatives 2 years of Euro risk factors Government- Related 1-3 Yr
16 May 2015 – Absolute N/A 0.50% 0.96% 0.76% 20% 2% 29 Feb 2016 VaR†
Invesco Asian Bond Fund 1 Mar 2015 – Relative Historical 99% HSBC 25.27% 52.03% 36.59% 100% 85% 0.00% Sum of 29 Feb 2016 VaR Simulation confidence Asia Local Notional of
level, Bond the derivatives 20 days, Index 2 years of risk factors
Invesco US High Yield 1 Mar 2015 – Relative Historical 99% Barclays 46.66% 61.39% 52.68% 100% 75% 16.96% Sum of Bond Fund 29 Feb 2016 VaR Simulation confidence Capital Notional of
level, U.S. the derivatives 20 days, Corporate 2 years of High Yield risk factors 2% Issuer Cap Index
Invesco Renminbi Fixed 1 Mar 2015 – Absolute Historical 99% N/A 2.06% 3.42% 2.95% 20% 10% 0.00% Sum of Income Fund 29 Feb 2016 VaR Simulation confidence Notional of
level, the derivatives 20 days, 2 years of risk factors
Invesco India Bond Fund 1 Mar 2015 – Absolute Historical 99% N/A 5.23% 11.91% 8.10% 20% 17% 0.00% Sum of 29 Feb 2016 VaR Simulation confidence Notional of
level, the derivatives 20 days, 2 years of risk factors
Invesco Strategic Income 15 Dec 2015 – Absolute Historical 99% N/A 0.57% 1.42% 1.18% 20% 5.5% 139.85% Sum of Fund 29 Feb 2016 VaR Simulation confidence Notional of
level, the derivatives 20 days, 2 years of risk factors
Invesco Unconstrained 15 Dec 2015 – Absolute Historical 99% N/A 0.52% 1.20% 0.94% 20% 6% 145.98% Sum of Bond Fund 29 Feb 2016 VaR Simulation confidence Notional of
level, the derivatives 20 days, 2 years of risk factors
Invesco Global Conservative 1 Mar 2015 – Absolute Historical 99% N/A 0.65% 4.84% 1.66% 20% 6% 81.88% Sum of Fund (formerly Invesco 29 Feb 2016 VaR Simulation confidence Notional ofCapital Shield 90 (EUR) level, the derivativesFund) 20 days,
2 years of risk factors
Calculation Methods of the Risk Exposure (continued)
Global exposure using VaR approach (continued)
Other Information (unaudited) (continued)
335 Invesco Funds
† Effective 16 May 2015 there was a change in the VaR methodology for the Invesco Euro Short-Term Bond Fund from Relative to Absolute VaR.
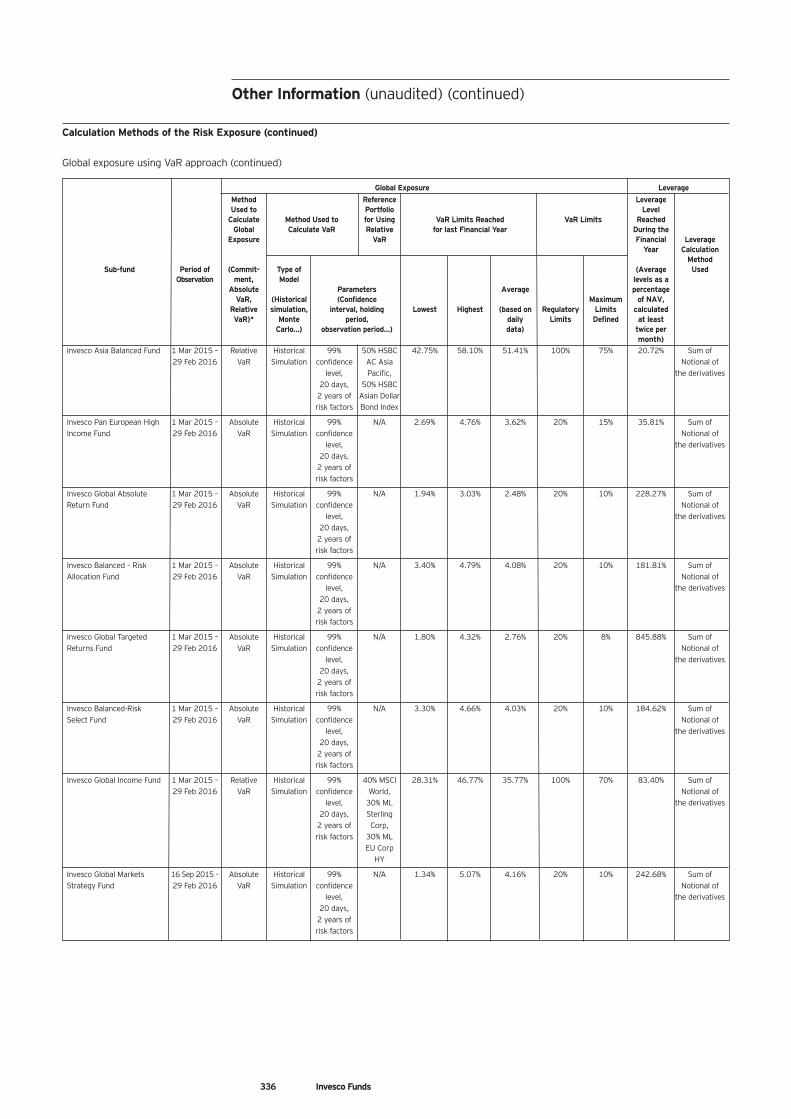
Global Exposure LeverageMethod Reference LeverageUsed to Portfolio Level
Calculate Method Used to for Using VaR Limits Reached VaR Limits ReachedGlobal Calculate VaR Relative for last Financial Year During the
Exposure VaR Financial LeverageYear Calculation
MethodSub-fund Period of (Commit- Type of (Average Used
Observation ment, Model levels as aAbsolute Parameters Average percentage
VaR, (Historical (Confidence Maximum of NAV, Relative simulation, interval, holding Lowest Highest (based on Regulatory Limits calculated VaR)* Monte period, daily Limits Defined at least Carlo…) observation period…) data) twice per month)Invesco Asia Balanced Fund 1 Mar 2015 – Relative Historical 99% 50% HSBC 42.75% 58.10% 51.41% 100% 75% 20.72% Sum of 29 Feb 2016 VaR Simulation confidence AC Asia Notional of
level, Pacific, the derivatives 20 days, 50% HSBC 2 years of Asian Dollar risk factors Bond Index
Invesco Pan European High 1 Mar 2015 – Absolute Historical 99% N/A 2.69% 4.76% 3.62% 20% 15% 35.81% Sum of Income Fund 29 Feb 2016 VaR Simulation confidence Notional of
level, the derivatives 20 days, 2 years of risk factors
Invesco Global Absolute 1 Mar 2015 – Absolute Historical 99% N/A 1.94% 3.03% 2.48% 20% 10% 228.27% Sum of Return Fund 29 Feb 2016 VaR Simulation confidence Notional of
level, the derivatives 20 days, 2 years of risk factors
Invesco Balanced – Risk 1 Mar 2015 – Absolute Historical 99% N/A 3.40% 4.79% 4.08% 20% 10% 181.81% Sum of Allocation Fund 29 Feb 2016 VaR Simulation confidence Notional of
level, the derivatives 20 days, 2 years of risk factors
Invesco Global Targeted 1 Mar 2015 – Absolute Historical 99% N/A 1.80% 4.32% 2.76% 20% 8% 845.88% Sum of Returns Fund 29 Feb 2016 VaR Simulation confidence Notional of
level, the derivatives 20 days, 2 years of risk factors
Invesco Balanced-Risk 1 Mar 2015 – Absolute Historical 99% N/A 3.30% 4.66% 4.03% 20% 10% 184.62% Sum of Select Fund 29 Feb 2016 VaR Simulation confidence Notional of
level, the derivatives 20 days, 2 years of risk factors
Invesco Global Income Fund 1 Mar 2015 – Relative Historical 99% 40% MSCI 28.31% 46.77% 35.77% 100% 70% 83.40% Sum of 29 Feb 2016 VaR Simulation confidence World, Notional of
level, 30% ML the derivatives 20 days, Sterling 2 years of Corp, risk factors 30% ML EU Corp HY
Invesco Global Markets 16 Sep 2015 – Absolute Historical 99% N/A 1.34% 5.07% 4.16% 20% 10% 242.68% Sum of Strategy Fund 29 Feb 2016 VaR Simulation confidence Notional of
level, the derivatives 20 days, 2 years of risk factors
336 Invesco Funds
Calculation Methods of the Risk Exposure (continued)
Global exposure using VaR approach (continued)
Other Information (unaudited) (continued)
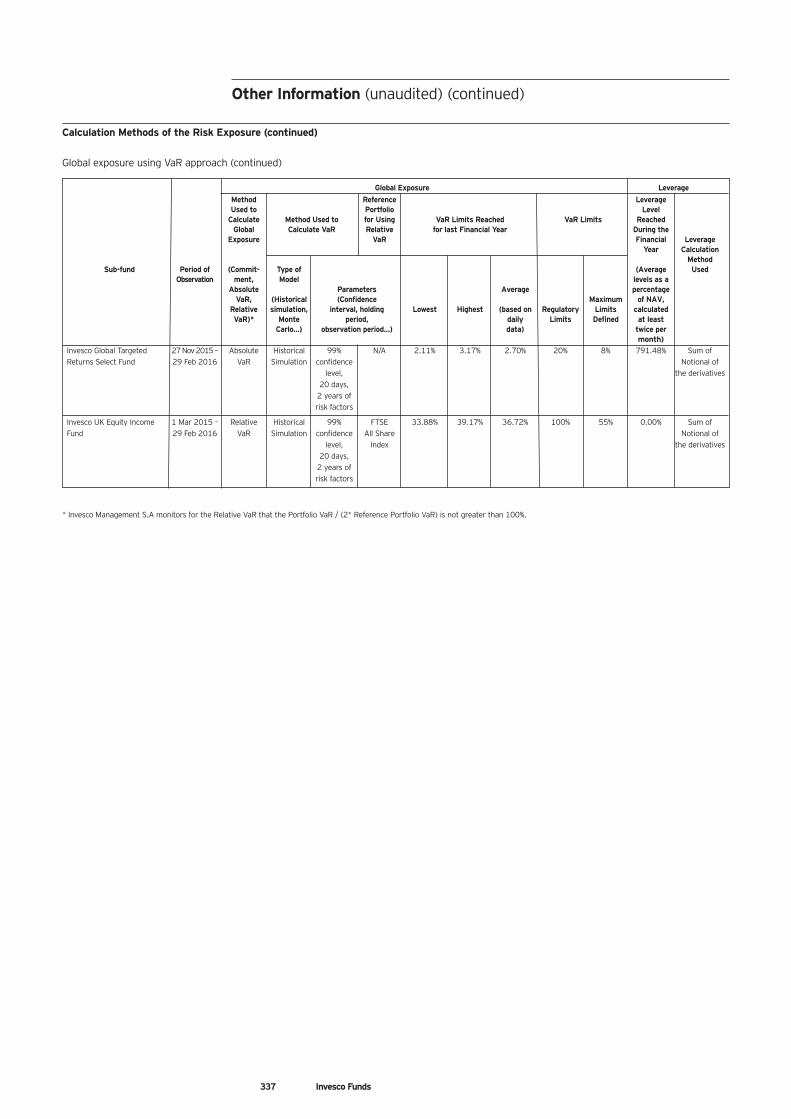
Global Exposure LeverageMethod Reference LeverageUsed to Portfolio Level
Calculate Method Used to for Using VaR Limits Reached VaR Limits ReachedGlobal Calculate VaR Relative for last Financial Year During the
Exposure VaR Financial LeverageYear Calculation
MethodSub-fund Period of (Commit- Type of (Average Used
Observation ment, Model levels as aAbsolute Parameters Average percentage
VaR, (Historical (Confidence Maximum of NAV, Relative simulation, interval, holding Lowest Highest (based on Regulatory Limits calculated VaR)* Monte period, daily Limits Defined at least Carlo…) observation period…) data) twice per month)Invesco Global Targeted 27 Nov 2015 – Absolute Historical 99% N/A 2.11% 3.17% 2.70% 20% 8% 791.48% Sum of Returns Select Fund 29 Feb 2016 VaR Simulation confidence Notional of
level, the derivatives 20 days, 2 years of risk factors
Invesco UK Equity Income 1 Mar 2015 – Relative Historical 99% FTSE 33.88% 39.17% 36.72% 100% 55% 0.00% Sum of Fund 29 Feb 2016 VaR Simulation confidence All Share Notional of
level, Index the derivatives 20 days, 2 years of risk factors
337 Invesco Funds
Calculation Methods of the Risk Exposure (continued)
Global exposure using VaR approach (continued)
Other Information (unaudited) (continued)
* Invesco Management S.A monitors for the Relative VaR that the Portfolio VaR / (2* Reference Portfolio VaR) is not greater than 100%.
ORGANISATION
Leslie Schmldt(Chairperson)(until 15 July 2015)11 Greenway PlazaSuite 2500Houston,USAPresident and ChiefExecutive Officer ofInvesco Trust Company,Invesco, USA
Brian Collins (resigned 30 June 2015)Independent Director,Ireland
John Rowland (resigned 2 March 2015)Perpetual ParkPerpetual Park DriveHenley-on-ThamesOxfordshireRG9 1HHUnited KingdomGlobal Head ofInvestment Operations
Timothy Caverly (appointed 15 July 2015)Independent Director,Luxembourg
Cormac O’Sullivan(resigned 15 July 2015)Central QuayRiverside IV Sir John Rogersons QuayDublin 2IrelandHead of the ProgramManagement Office(Europe), Invesco,Ireland
Karen Dunn Kelley1555 PeachtreeStreetN.E. Suite 1800Atlanta, Georgia30309, USASenior Managing Director,Invesco, USA
Peter Carroll (appointed 15 July 2015)37A Avenue J.F. Kennedy L-1855 Luxembourg Grand Duchy of Luxembourg Head of EMEA DelegationOversight, Invesco,Luxembourg
Douglas J. Sharp(Chairperson)(from 15 July 2015)Perpetual ParkHenley, UKHead of EMEA Retail,Invesco, UK
Invesco Funds(Registered Office)Vertigo Building – Polaris2-4 rue Eugène RuppertL-2453 LuxembourgGrand Duchy of Luxembourg
Management CompanyInvesco Management S.A.37A Avenue J.F. KennedyL-1855 LuxembourgGrand Duchy of Luxembourg
Investment AdvisersInvesco Advisers Inc.1555 Peachtree Street, N.E.Atlanta, GeorgiaGA 30309USA
Invesco Asset ManagementDeutschland GmbHAn der Welle 5D-60322 Frankfurt am MainGermany
Invesco Asset Management LimitedRegistered Office Perpetual ParkPerpetual Park DriveHenley-on-ThamesOxfordshire RG9 1HHUnited Kingdom
Invesco Asset Management (Japan)LimitedRegistered OfficeRoppongi Hills Mori Tower 14FP.O. Box 11510-1, Roppongi 6-chomeMinato-kuTokyo 106-6114Japan
Invesco Canada Ltd.5140 Yonge StreetSuite 800TorontoOntario MN2 6X7Canada
Invesco Hong Kong Limited41/F Citibank Tower3 Garden Road Central Hong Kong
Invesco Asset Management Singapore Ltd9 Raffles Place# 18-01 Republic PlazaSingapore 048619
Administration Agent, Domiciliaryand Corporate & Paying Agent inLuxembourgThe Bank of New York Mellon(International) Limited,Luxembourg BranchVertigo Building - Polaris2-4 rue Eugène RuppertL-2453 LuxembourgGrand Duchy of Luxembourg
Registrar & Transfer AgentInternational Financial Data Services(Luxembourg) S.A.47, Avenue J.F. KennedyL-1855 LuxembourgGrand Duchy of Luxembourg
Primary Dealing Desk
Hong Kong – Macau
Hong Kong Sub-Distributor &RepresentativeInvesco Asset Management AsiaLimited41/F, Citibank Tower3 Garden Road,Central Hong KongTel: +852 3128 6000Fax: +852 3128 6001
German Sub-Distributor andInformation AgentInvesco Asset ManagementDeutschland GmbHAn der Welle 5D-60322 Frankfurt am MainGermanyTel: +49 69 29807 0Fax: +49 69 29807 159
Ireland Global DistributorInvesco Global Asset ManagementDAC*Central QuayRiverside IV Sir John Rogersons QuayDublin 2IrelandTel: +353 1 439 8000Fax: +353 1 439 8400
AuditorPricewaterhouseCoopers, Sociétécoopérative2, rue Gerhard MercatorL-2182 LuxembourgGrand Duchy of Luxembourg
Lending AgentState Street Global Markets20 Churchill PlaceCanary WharfLondon E14 5HJUnited Kingdom
Legal Advisers to the SICAVArendt & Medernach S.A.14 rue ErasmeL-2082 LuxembourgGrand Duchy of Luxembourg
German Paying AgentBNP Paribas Securities ServicesS.C.A.Zweigniederlassung Frankfurt amMainEuropa-Allee 12D-60327 Frankfurt am MainGermany
Austrian DistributorInvesco Asset ManagementÖsterreich GmbHRotenturmstrasse 16 -18A-1010 ViennaAustriaTel: +43 1 316 20 00Fax: +43 1 316 20 20
Austrian Paying AgentErste Bank der oesterreichischenSparkassen AGGraben 21A-1010 ViennaAustria
Invesco Limited RepresentativeOfficesAustriaInvesco Asset ManagementÖsterreich GmbHRotenturmstrasse 16 -18A-1010 ViennaAustriaTel: +43 1 316 20 00Fax: +43 1 316 20 20
BelgiumInvesco Asset Management S.A.Belgian BranchThe Blue Tower235 Avenue LouiseB-1050, BrusselsBelgiumTel: +322 641 0170Fax: +322 641 0175
FranceInvesco Asset Management S.A.18 rue de Londres75009 ParisFranceTel: +33 1 56 62 43 00Fax: +33 1 56 62 43 83/ 43 20
GermanyInvesco Asset ManagementDeutschland GmbHAn der Welle 5D-60322 Frankfurt am MainGermanyTel: +49 69 29807 0Fax: +49 69 29807 159
Hong KongInvesco Asset Management AsiaLimited41/F, Citibank Tower3 Garden Road,Central Hong KongTel: +852 3128 6000Fax: +852 3128 6001
IrelandInvesco Global Asset ManagementDAC*Central QuayRiverside IV Sir John Rogersons QuayDublin 2IrelandTel: +353 1 439 8000Fax: +353 1 439 8400
ItalyInvesco Asset Management S.A.Piazza del Duomo,22 – Galleria Pattari 220122 MilanoItalyTel: +39 02 88074 1Fax: +39 02 88074 391
NetherlandsInvesco Asset Management S.A.Dutch BranchJ.C. Geesinkweg 9991096 AZ AmsterdamNetherlandsTel: +31 205 61 62 61Fax: +31 205 61 68 88
SpainInvesco Asset Management, S.A. Sucursal en España C/ Recoletos, 15 28001 Madrid, SpainTel: + 34 91 781 3020 Fax: + 34 91 576 0520
SwedenInvesco Asset Management S.A.(France)Swedish Filial Stureplan 4c4th Floor, Stockholm 11435SwedenTel:+46 8 463 11 06Fax: +32 2 641 01 75
SwitzerlandInvesco Asset Management(Switzerland) LimitedTalacker 34CH-8001 ZurichSwitzerlandTel: +41 44 287 90 00Fax: +41 44 287 90 10
Board of Directors
*Effective 12 May 2016 Invesco Global Asset Management Limited converted to Invesco Global Asset Management DAC (Designated Activity Company) pursuant to the CompaniesAct 2014.
338 Invesco Funds

Perivan Financial Print 241182
Registered Office: 2-4 rue Eugène Ruppert, L-2453 Luxembourg
No subscription can be accepted on the basis of financial reports alone. Subscriptions, in order to be valid, must be made on the basis of the currentProspectus supplemented by a copy of the latest available Audited Annual Report and a copy of the latest Unaudited Semi-Annual Report, if later than suchAudited Annual Report.
Copies of the Prospectus, Audited Annual Report and Unaudited Interim Report may be obtained at the Registered Office of the Company (Invesco Funds),2-4 rue Eugène Ruppert, L-2453 Luxembourg, as well as from the offices of the Global Distributor in Dublin. Notices of all General Meetings will be published inthe Luxemburger Wort and, to the extent required by law, in the Mémorial, Recueil des Sociétés et Associations (“Mémorial”) and will be sent to holders ofregistered Shares at their address in the Register of Shareholders by post at least 8 days prior to meetings. In the event of any discrepancy betweentranslations from English text into foreign languages, please note that the English text will prevail.
Equalisation is calculated for tax reporting purposes and is not disclosed in the Audited Annual or Interim Report.
241182 Invesco SICAV English cover spread 28/06/2016 23:48 Page 2

Invesco Funds Audited Annual ReportSociété d’Investissement à Capital Variable
For the year ended 29 February 2016
(R.C.S. Luxembourg B34457)
Contact us
Invesco Global Asset Management DACCentral Quay, Riverside IVSir John Rogersons Quay, Dublin 2, IrelandTelephone: +353 1 439 8000Website: www.invesco.com
241182 Invesco SICAV English cover spread 28/06/2016 23:48 Page 1