Annual Report and Audited Accounts BlackRock Global Index Funds ...
144
31 March 2017 Annual Report and Audited Accounts BlackRock Global Index Funds (BGIF) R.C.S. Luxembourg: B 171278
-
Upload
khangminh22 -
Category
Documents
-
view
0 -
download
0
Transcript of Annual Report and Audited Accounts BlackRock Global Index Funds ...

31 March 2017
Annual Report and Audited AccountsBlackRock Global Index Funds (BGIF)R.C.S. Luxembourg: B 171278


Annual Report and Audited Accounts 1
Subscriptions can only be made on the basis of the current Prospectus, the Key Investor Information Document (“KIID”) supplemented by the most recent annual report and audited accounts
and unaudited interim report and accounts, if published after such annual report and audited accounts. Copies are available at the registered office of the company, from the Local Investor
Servicing team, the Transfer Agent, the Management Company or any of the Distributors.
Contents
Chairman’s Letter to Shareholders 2
Investment Advisers’ Report 4
Directors’ Report 9
Report on Remuneration 13
General Information 16
Statement of Net Assets 18
Three Year Summary of Net Asset Values 19
Statement of Operations and Changes in Net Assets 21
Statement of Changes in Shares Outstanding 24
Portfolio of Investments
BlackRock Emerging Markets Equity Index Fund 26
BlackRock Emerging Markets Government Bond
Index Fund 33
BlackRock Europe Equity Index Fund 46
BlackRock Euro Aggregate Bond Index Fund 51
BlackRock Euro Government Bond Index Fund 75
BlackRock Global Government Bond Index Fund 80
BlackRock Japan Equity Index Fund 93
BlackRock North America Equity Index Fund 97
BlackRock Pacific ex Japan Equity Index Fund 104
BlackRock World Equity Index Fund 107
Notes to the Financial Statements 122
Report of the Réviseur d’entreprises agréé 129
Supplementary Information (Unaudited) 130

2 BlackRock Global Index Funds (BGIF)
Chairman’s Letter to ShareholdersMarch 2017
The information stated in this report is historical and not necessarily indicative of future performance.
Dear Shareholder,
I am writing to update you on the activities of BlackRock Global Index Funds (the “Company” or “BGIF”) over the twelve months to 31 March 2017. The BGIF range comprised of ten funds (each a “Fund”, together the “Funds”) as at 31 March 2017.
The Funds’ performance is covered in more detail in the separate Investment Adviser’s Report. The period under review saw equity markets move significantly higher, driven by improving economic growth and expectations of fiscal stimulus from a number of the world’s major economies.
In contrast, greater volatility was seen in bond markets than in the previous year. Yields for developed market government bonds rose consistently in the last six months of the year as the prospect of deflation ebbed and the prospect of higher interest rates loomed. However, the sell-off eased in the first quarter of 2017, and bond yields started to fall again.
Politics dominated headlines, but, in the end, did not derail markets. The election of Donald Trump as US President may have appeared to be a catalyst for stronger equity markets and weaker bond markets, but the trend was already well-established. Global economic growth indicators had been moving higher for some time and inflationary pressures – stabilising commodity prices, higher wages – had started to emerge.
Nevertheless, the promise of fiscal stimulus under the new administration accelerated this process. By the end of the period, the lack of any concrete plans for tax cuts or infrastructure spending had started to derail investor optimism, and saw markets move to a narrower trading range.
The US Federal Reserve (“the Fed”) responded to improving growth and employment figures, with quarter point rises in the Fed Funds’ rate in December and March, bringing it to 1%. Markets are still expecting one or two further rate rises this year. However, if the weaker retail sales and jobs growth seen in March continue, it may temper the enthusiasm for rate rises.
Stock markets saw a significant rotation during the period as investors moved away from more defensive companies, with stable, predictable earnings, cashflow and dividends, and towards more economically-sensitive areas, such as financials or resources, which looked likely to benefit from an inflationary environment.
The US stock market was strong for most of the period under review, particularly for international investors who participated in the rising US Dollar. US markets benefited from the strength of the economic recovery and the promise of greater fiscal spending.
Elsewhere, Japanese markets were buoyed by government action, with domestically-focused companies showing particular strength. To date, Japan is the only government to have committed to significant fiscal stimulus, with a Yen 28 trillion (USD 276 billion) package aimed at boosting Japan’s sluggish economic growth and reversing the impact of the decision to raise consumption tax in 2014.
European markets continued to be mixed. Economic growth seemed to be improving, particularly in the largest economies, and the region seems finally to have slayed the deflationary dragon. However, politics loomed large: At the start of the year the region faced considerable uncertainty, with general elections in the Netherlands, France and Germany. As it transpired populism did not prove as potent a force as people believed. Continental Europe and the UK must also try to navigate Brexit with limited damage to both sides.
Emerging markets were among the top-performers over the period. However, that was not without some volatility in-between. In particular, there was a sell-off in the immediate aftermath of Donald Trump’s election as investors worried about the impact of increased protectionism by developed market economies. This hit Mexico and Asia particularly hard, but most markets had recovered their footing by the end of the period. Latin America and Emerging Europe were the strongest regions.
Bond markets took a tumble in the second half of 2016, appearing to bring to an end a near-three decade long bull market. Yields were responding to a new environment, where deflation no longer appeared a significant threat and interest rates look set to rise. However, yields had started to move lower once again in the early months of 2017 as the US administration’s much-anticipated fiscal stimulus seemed slow to materialize and there remains significant deflationary forces at work – high debt, an ageing population, low business investment.
Regulatory change continued throughout Europe and a number of these future changes could have implications for investors. Key changes included:
} Revisions to the Markets in Financial Instruments Directive (“MiFID II”) and the new Markets in Financial Instruments Regulation (“MiFIR”): the revised Directive and new Regulation have been finalised and are due to come into effect at the beginning of 2018. Requirements being introduced include restrictions on how financial advisers may be remunerated which could result in advisers amending their services.

Annual Report and Audited Accounts 3
The information stated in this report is historical and not necessarily indicative of future performance.
Chairman’s Letter to ShareholdersMarch 2017 continued
} European Market Infrastructure Regulation (“EMIR”): the Joint Committee of the European Supervisory Authorities published the final draft of the Regulatory Technical Standards in March 2016, which provide the framework for EMIR. This aims to increase the transparency and reduce the risk relating to over-the-counter derivatives.
} Packaged Retail Investment and Insurance-based Investment Products (“PRIIPs”): The European Commission has finalised a revamped version of its PRIIPs regulation following the rejection of last year's proposals by the European Parliament. The rules are set to come into force in January 2018.
} UCITS V came into effect in March 2016. UCITS V aims to increase the level of protection already offered to investors in UCITS and to improve investor confidence in UCITS. It aims to do so by enhancing the rules on the responsibilities of depositaries and by introducing remuneration policy requirements for UCITS fund managers. It also aims to ensure that all EU regulators responsible for the supervision of UCITS funds and their managers have a common minimum set of powers available to investigate infringements.
} The Common Reporting Standard (“CRS”) came into effect in January 2016. CRS introduces a global standard for the automatic exchange of information (“AEol”), developed by the Organisation for Economic Co-operation and Development (“OECD”).
} Securities Financing Transactions Regulation (Regulation (EU) 2015/2365) (“SFTR”) came into force on 12 January 2016 and, amongst other requirements, introduces new disclosure requirements in UCITS funds, UCITS Management companies and AIFM annual and half-yearly reports published after 13 January 2017 detailing the Funds use of securities financing transactions and total return swaps (“TRS”). As a result, additional disclosures have been included in the Supplementary Information section to the Annual Report and Audited Accounts.
There were no new fund launches or closures during the twelve month period. Over the twelve month period, the assets under management in the BGIF range increased by 23.1%. They now stand at USD 6.2bn, up from USD 5.0bn at the start of the period. The strongest inflows were seen into the BlackRock Emerging Markets Government Bond Index Fund, which saw assets rise 72.3% to USD 1.9bn. The BlackRock World Equity Index Fund was also strong, with assets up 59.9% to USD 1.1bn. The BlackRock Euro Government Bond Index Fund was the only fund to see assets fall, dropping 44.6% to EUR 436.5m.
The other two bond funds in the range – the BlackRock Euro Aggregate Bond Index Fund and the BlackRock Global Government Bond Index Fund also saw assets under management rise, by 25.4% and 16.7% to EUR 462.2m and USD 95.0m respectively.
Flows into the BlackRock North America Equity Index Fund reflected the strength of the US markets, rising 28.5% to USD 783.9m. The BlackRock Emerging Markets Equity Index Fund and the BlackRock Europe Equity Index Fund saw net assets rise 8.8% and 13.2% respectively to USD 436.8m and EUR 428.4m. The total net assets for the BlackRock Pacific ex Japan Equity Index Fund rose 17.5% to USD 309.2m, while assets in the BlackRock Japan Equity Index Fund rose 11.6% to USD 150.8m.
Should you have any questions on any of this material, please contact us via our website: www.blackrockinternational.com
Yours faithfully,
Paul FreemanChairman

4 BlackRock Global Index Funds (BGIF)
(1) The local BlackRock Group companies or branches or their administrators.
Investment Advisers’ Report Performance Overview1 April 2016 to 31 March 2017
Disclosed in the table below are the performance returns for the primary share class for each Fund, which has been selected as a representative share class. The primary share class for each Fund is the A class non-distributing share. Performance figures for any other share class can be made available upon request.
Past performance is not a guide to future performance and should not be the sole factor of consideration when selecting a product. All financial investments involve an element of risk. Therefore, the value of your investment and the income from it will vary and your initial investment amount cannot be guaranteed. The Funds invest a large portion of assets which are denominated in other currencies; hence changes in the relevant exchange rates will affect the value of the investment. The performance figures do not consider charges and fees that may be levied at the time of subscription or redemption of shares. Levels and bases of taxation may change from time to time. Subscriptions can only be made on the basis of the current Prospectus, the Key Investor Information Document (“KIID”), supplemented by the most recent annual report and audited accounts and unaudited interim report and accounts, if published after such annual report and audited accounts. Copies are available from Local Investor Servicing team(1), the Transfer Agent, the Management Company or any of the Representatives or Distributors and at the registered office of the Company. BGIF is only available for investment by non-US citizens who are not residents of the US. The Funds are not offered for sale or sold in the US, its territories or possessions.
Financial Year Performance
to 31 March 2017 Calendar Year Performance
1 year 2016 2015 2014 Launch Date
BlackRock Emerging Markets Equity Index Fund 'A' Non Dist (USD) 16.97% 10.60% (15.41)% (2.31)% 16 November 2012
MSCI Emerging Markets Index (USD) 17.17% 11.26% (15.12)% (1.99)%
BlackRock Emerging Markets Government Bond Index Fund 'A' Non Dist (USD) 8.56% 9.65% 0.82% 7.22% 28 May 2013
J.P. Morgan Emerging Markets Bond Index Global Diversified Index (USD) 8.92% 10.15% 1.18% 7.43%
BlackRock Europe Equity Index Fund 'A' Non Dist (EUR) 16.37% 1.73% 8.79% 6.66% 23 October 2012
MSCI Europe Index (Euro) 16.61% 2.36% 8.41% 6.82%
BlackRock Euro Aggregate Bond Index Fund 'A' Non Dist (EUR) (1.00)% 2.89% 0.44% 10.61% 28 May 2013
Bloomberg Barclays Euro Aggregate Bond Index (Euro) (0.56)% 3.32% 1.00% 11.10%
BlackRock Euro Government Bond Index Fund 'A' Non Dist (EUR) (2.13)% 2.81% 1.05% 12.77% 23 October 2012
Citi EMU Government Bond Index (Euro) (1.73)% 3.20% 1.65% 13.18%
BlackRock Global Government Bond Index Fund 'A' Non Dist (USD) (4.36)% 0.90% (4.34)% (0.58)% 23 October 2012
Citi World Government Bond Index (USD) (3.65)% 1.60% (3.57)% (0.48)%
BlackRock Japan Equity Index Fund 'A' Non Dist (USD) 13.38% 2.01% 7.86% (3.22)% 23 October 2012
MSCI Japan Index (USD) 14.06% 2.29% 9.20% (3.87)%
BlackRock North America Equity Index Fund 'A' Non Dist (USD) 15.87% 10.79% (2.00)% 12.58% 23 October 2012
MSCI North America Index (USD) 16.58% 11.37% (1.46)% 13.26%
BlackRock Pacific ex Japan Equity Index Fund 'A' Non Dist (USD) 17.79% 6.56% (9.07)% 0.31% 24 October 2012
MSCI Pacific ex Japan Index (USD) 18.41% 7.32% (8.06)% (0.54)%
BlackRock World Equity Index Fund 'A' Non Dist (USD) 14.04% 6.80% (1.71)% 5.45% 23 October 2012
MSCI World Index (USD) 14.60% 7.27% (1.21)% 5.80%
Fund performance returns are based on dealing prices with net dividends (after deduction of witholding tax) reinvested and are shown net of fees. Index Sources: Info Research & Datastream

Annual Report and Audited Accounts 5
Investment Advisers’ ReportPerformance Overview1 April 2016 to 31 March 2017 continued
Investment ObjectiveThe investment objective of each Fund is to match the performance of the benchmark index of that Fund.
Market ReviewAsset class performance over the past twelve months has been dominated by rising expectations of inflation. A decreased likelihood of deflation, and the prospect of interest rate rises have favoured stock markets over bond markets and more economically-sensitive sectors and markets.
After a lacklustre performance over the summer months, markets started to break out of a narrow trading range following the election of Donald Trump in November. They continued this rise until February, when investor confidence started to wane. Stock markets traded sideways on fears that the much-promised fiscal stimulus would not be forthcoming from the US administration.
The US stock market led for most of the period, particularly for non-US investors who have received an additional boost from the stronger US Dollar. Emerging markets, Asian and European equities were also strong, while the UK and Japan lagged.
More stark than the difference between regions has been the difference between sectors. Within the majority of developed stock markets, there has been a notable change in leadership, away from defensive, stable companies, and towards those areas with more exposure to economic growth such as banks and resource companies. There has also been greater stock dispersion. Gold has been a laggard as investors predict better times ahead.
Bond prices briefly appeared to have finally turned a corner after a lengthy bull run. The prospect of both higher inflation and, by consequence, higher interest rates, saw prices fall and yields rise. Nevertheless, this started to reverse in February and March of 2017, as US fiscal stimulus proved elusive and geopolitical tensions rose.
There are parts of the bond market that continue to attract support. Emerging market debt and, in particular, high yield has been reasonably strong. Higher quality corporate bonds have also survived the rout in many cases.
Equity Fund PerformanceThe BlackRock Pacific ex Japan Equity Index Fund was the strongest over the period, rising 17.8%. Japanese equities were also strong, with the BlackRock Japan Equity Index Fund rising 13.4%. The BlackRock North America Equity Index Fund rose 15.9% over the period. The BlackRock World Equity Index Fund also held up well, rising 14.0%. The BlackRock Emerging Markets Equity Index Fund rose 17.0% over the period, while the BlackRock Europe Equity Index Fund rose 16.4% over the period.
Fixed Income Fund PerformanceGlobal bond markets weakened as the prospect of deflation receded in spite of ongoing loose monetary policy in many places around the globe. In general, it paid to take a risk on lower quality bonds over the period. Within the BlackRock funds, the weakest performance came from the BlackRock Global Government Bond Index Fund, which produced a negative return of -4.4%. The BlackRock Euro Aggregate Bond Index Fund (which invests more broadly in fixed income assets) decreased by 1.0%. The BlackRock Emerging Markets Government Bond Index Fund rose 8.6%. The BlackRock Euro Government Bond Index Fund decreased by 2.1%.
Tracking DifferenceThe investment objective of the Funds is to match the performance of the benchmark indices listed in the table below:
Fund Benchmark Index Investment Management Approach
BlackRock Emerging Markets Equity Index Fund
MSCI Emerging Markets Index
Optimising
BlackRock Emerging Markets Government Bond Index Fund
J.P. Morgan Emerging Markets Bond Index Global Diversified
Optimising
BlackRock Europe Equity Index Fund
MSCI Europe Index Replicating
BlackRock Euro Aggregate Bond Index Fund
Bloomberg Barclays Euro Aggregate Bond Index
Optimising
BlackRock Euro Government Bond Index Fund
Citi EMU Government Bond Index
Optimising
BlackRock Global Government Bond Index Fund
Citi World Government Bond Index
Optimising
BlackRock Japan Equity Index Fund
MSCI Japan Index Replicating
BlackRock North America Equity Index Fund
MSCI North America Index
Replicating
BlackRock Pacific ex Japan Equity Index Fund
MSCI Pacific ex Japan Index
Replicating
BlackRock World Equity Index Fund
MSCI World Index Replicating
Tracking difference is defined as the difference in returns between a Fund and its benchmark index. Tracking difference is based on the NAV calculated in accordance with the prospectus. For physically replicating funds, the investment

6 BlackRock Global Index Funds (BGIF)
Investment Advisers’ ReportPerformance Overview1 April 2016 to 31 March 2017 continued
management approach is to buy a portfolio of securities that as far as practicable consist of the securities that make up the benchmark index, in similar proportion to the weights represented in the benchmark index.
For optimising funds, the investment management approach aims to match the performance of a benchmark index by investing in a portfolio that is primarily made up of securities that represent the benchmark index. The objective is to generate the total return as close as reasonably possible to that of the index, net of transaction costs and gross of fees.
Cash management, efficient portfolio management techniques including securities lending, transaction costs from rebalancing and currency hedging can have an impact on tracking
difference. Importantly, these impacts can be either positive or negative depending on the underlying circumstances.
In addition to the above, the Funds may also have a tracking difference due to withholding tax suffered by the Funds on any income received from its investments. The level and quantum of tracking difference arising due to withholding taxes depends on various factors such as any reclaims filed on behalf of the Funds with various tax authorities, any benefits obtained by the Funds under a tax treaty or any securities lending activities carried out by the Funds.
The table below compares the realised Fund performance against the performance of the relevant benchmark index during the twelve months ended 31 March 2017. An explanation for the difference is provided.
Fund Tracking performance of Fund*
Performance of benchmark index
Tracking difference
Explanation of the tracking difference
BlackRock Emerging Markets Equity Index Fund
16.97% 17.17% (0.20)% Before costs, the Fund outperformed the benchmark index due to security sampling techniques employed and certain markets being closed at the Fund’s valuation point.
BlackRock Emerging Markets Government Bond Index Fund
8.56% 8.92% (0.36)% Before costs, the Fund performed in line with the benchmark index.
BlackRock Europe Equity Index Fund 16.37% 16.61% (0.24)% Before costs, the Fund outperformed the benchmark index primarily due to a lower tax rate from that used for the benchmark index total return.
BlackRock Euro Aggregate Bond Index Fund (1.00)% (0.56)% (0.44)% Before costs, the Fund performed in line with the benchmark index.
BlackRock Euro Government Bond Index Fund
(2.13)% (1.73)% (0.40)% Before costs, the Fund performed in line with the benchmark index.
BlackRock Global Government Bond Index Fund
(4.36)% (3.65)% (0.71)% Before costs and after adjusting for the difference in valuation point of the Fund and the pricing point of the benchmark index, the Fund performed in line with the benchmark index.
BlackRock Japan Equity Index Fund 13.38% 14.06% (0.68)% Before costs, the Fund performed in line with the benchmark index.
BlackRock North America Equity Index Fund 15.87% 16.58% (0.71)% Before costs, the Fund performed in line with the benchmark index.
BlackRock Pacific ex Japan Equity Index Fund 17.79% 18.41% (0.62)% Before costs, the Fund performed in line with the benchmark index.
BlackRock World Equity Index Fund 14.04% 14.60% (0.56)% Before costs, the Fund performed in line with the benchmark index.
* Performance is reported for each Funds’ A class non-distributing shares.

Annual Report and Audited Accounts 7
Investment Advisers’ ReportPerformance Overview1 April 2016 to 31 March 2017 continued
Fund Anticipated tracking error
Realised tracking error of Fund
Explanation
BlackRock Emerging Markets Equity Index Fund Up to 1.00% 1.65% The tracking error of the Fund is primarily due to valuation timing differences between the Fund and the benchmark when there are public holidays in Luxembourg and in underlying markets in which the Fund invests and also due to sampling techniques employed.
BlackRock Emerging Markets Government Bond Index Fund
Up to 1.20% 0.63% The Fund has tracked its benchmark index within its anticipated tracking error.
Tracking ErrorRealised tracking error is the annualised standard deviation of the difference in monthly returns between a Fund and its benchmark index. Tracking error shows the consistency of the returns relative to the benchmark index over a defined period of time. Tracking error is based on the NAV calculated in accordance with the prospectus.
Anticipated tracking error is based on the expected volatility of differences between the returns of a Fund and the returns of its benchmark index. For physically replicating funds, the investment management approach is to buy a portfolio of securities that, as far as practicable, consist of the securities that make up the benchmark index, in similar proportion to the weights represented in the benchmark index.
For optimising Funds, the investment management approach aims to match the main risk characteristics of the benchmark index by investing in a portfolio that is primarily made up of securities that represent the benchmark index. The objective is to generate a total return as close as reasonably possible to that of the index, net of transaction costs and gross of fees.
Cash management, efficient portfolio management techniques (including securities lending), transaction costs from rebalancing and currency hedging collectively can have an impact on tracking error, as well as the return differential between a Fund and its benchmark index. Importantly, these impacts can be either positive or negative, depending on the underlying circumstances.
Explanation of Divergence Between Anticipated and Realised Tracking Error
The Funds may have a tracking error due to a number of sources.
Funds may have a tracking error due to withholding tax suffered by the Funds on any income received from its investments. The level and quantum of tracking error arising due to withholding taxes depends on various factors, such as any reclaims filed by the Funds with various tax authorities, any benefits obtained by the Funds under a tax treaty or any securities lending activities carried out by the Funds.
A Fund’s tracking error may be affected if the times at which a Fund and its Benchmark Index are priced are different. Where the Benchmark Index is valued at the time the relevant markets close for business and a Fund is valued at an earlier time, the tracking error of that Fund may appear to be higher than if the Fund and the Benchmark Index were priced at the same time. This is particularly relevant for the fixed income Funds, although, less so for the equity Funds for which the relevant index provider issues a price of the relevant Benchmark Index at the same time as the equity Fund’s valuation point.
In addition, as the Net Asset Value of a Fund taken at its valuation point includes the effect of any swing pricing, the tracking error figures set out below may be impacted depending on the significance of any adjustment in the Net Asset Value in order to reduce the effect of “dilution” on that Fund resulting from the sale or purchase of shares in the Fund.
A Fund’s tracking error figures set out below may also be affected by non-dealing days, which occur at times when the local stock exchanges or regulated markets in respect of a particular Fund are closed for trading and settlement due to public holidays. During such times, the relevant Funds will not be able to obtain access to such market(s) directly and will, for example, either hold the cash received from any subscriptions until the relevant market(s) are open or will obtain exposure to the relevant market(s) indirectly using proxy instruments. Both approaches may increase a Fund’s tracking error. Alternatively, the tracking error of a Fund may be affected if there is a public holiday in Luxembourg, as the Net Asset Value of the Funds will remain the same, despite movements in the underlying markets.
The table below compares the anticipated tracking error of the Funds (disclosed in the prospectus on an ex ante basis) against the actual realised tracking error of the Funds as at 31 March 2017. The realised tracking error is annualised and calculated using data from the preceding 36 month observation period. Where a Fund has not been trading for 36 months, the annualised tracking error since inception has been presented.

8 BlackRock Global Index Funds (BGIF)
Investment Advisers’ ReportPerformance Overview1 April 2016 to 31 March 2017 continued
Fund Anticipated tracking error
Realised tracking error of Fund
Explanation
BlackRock Europe Equity Index Fund Up to 0.60% 0.46% The Fund has tracked its benchmark index within its anticipated tracking error.
BlackRock Euro Aggregate Bond Index Fund Up to 0.60% 0.07% The Fund has tracked its benchmark index within its anticipated tracking error.
BlackRock Euro Government Bond Index Fund Up to 0.25% 0.06% The Fund has tracked its benchmark index within its anticipated tracking error.
BlackRock Global Government Bond Index Fund Up to 0.45% 0.20% The Fund has tracked its benchmark index within its anticipated tracking error.
BlackRock Japan Equity Index Fund Up to 1.50% 1.12% The Fund has tracked its benchmark index within its anticipated tracking error.
BlackRock North America Equity Index Fund Up to 0.45% 0.21% The Fund has tracked its benchmark index within its anticipated tracking error.
BlackRock Pacific ex Japan Equity Index Fund Up to 2.00% 1.62% The Fund has tracked its benchmark index within its anticipated tracking error.
BlackRock World Equity Index Fund Up to 0.45% 0.14% The Fund has tracked its benchmark index within its anticipated tracking error.
April 2017

Annual Report and Audited Accounts 9
Corporate Governance Statement
IntroductionBlackRock Global Index Funds (the “Company”) is a public limited company (société anonyme) established under the laws of the Grand Duchy of Luxembourg as an open ended variable capital investment company (société d’investissement à capital variable). The Company has been authorised by the Commission de Surveillance du Secteur Financier (the “CSSF”) as an undertaking for collective investment in transferable securities (“UCITS”) pursuant to the provisions of Part I of the law of 17 December 2010, as amended from time to time and is regulated pursuant to such law. The Company complies with the principles set out in the Association of the Luxembourg Fund Industry (“ALFI”) Code of Conduct Revision 2013 (the “Code”) issued by ALFI in June 2013.
The Board of Directors of the Company (the “Board”) is committed to maintaining the highest standards of corporate governance and is accountable to shareholders for the governance of the Company’s affairs. The Board has considered the principles and recommendations of the Code and has put in place a framework for corporate governance which it believes is appropriate for adherence to the principals of the Code given the nature of its structure as an Investment Company. This statement summarises the corporate governance structure and processes in place for the Company for the period under review from 1 April 2016 to 31 March 2017.
Board Composition The Board consists of six non-executive Directors, (including one independent Director) as of 31 March 2017. The Board is committed to maintaining an appropriate balance of skills, experience, independence and knowledge amongst its members.
The Directors’ biographies, on pages 11 and 12, collectively demonstrate a breadth of investment knowledge and experience, business and financial skills and legal and regulatory familiarity which enables them to provide effective strategic leadership, oversight and proper governance of the Company. BlackRock considers the current compositions to be a suitable and appropriate balance for the Board.
Article 13 of the Company’s Articles of Incorporation in accordance with Luxembourg law, provides that Directors shall be elected by the shareholders at their annual general meeting for a period ending at the next annual general meeting and until their successors are elected. Any Director who resigns his/her position is obliged to confirm to the Board and the CSSF that the resignation is not connected with any issues with or claims against the Company.
The Board supports a planned and progressive renewal of the Board. BlackRock is committed to ensuring that Directors put forward for election by the shareholders possess the skills needed to maintain this balance. The Board is committed to carrying out an annual review of its performance and activities.
The Directors have a continuing obligation to ensure they have sufficient time to discharge their duties. The details of each Director’s (including the Chairman), other appointments and commitments are made available to the Board and BlackRock Investment Management (UK) Limited (“BIM UK”) for inspection. All new appointments or significant commitments require the prior approval of BIM UK.
Before a new Director is proposed to the shareholders for appointment he or she will receive a full induction incorporating relevant information regarding the Company and his or her duties and responsibilities as a Director. In addition, a new Director is required to spend some time with representatives of BIM UK so that the new Director will become familiar with the various processes which are considered necessary for the proper performance of his or her duties and responsibilities to the Company.
The Company’s policy is to encourage Directors to keep up to date with developments relevant to the Company. The Directors have attended and will continue to attend updates and briefings run by BIM UK and affiliated entities in the U.S. and elsewhere. The Directors also receive regular briefings from, amongst others, the auditors, investment strategists, risk specialists, Management Company and legal advisers regarding any proposed product developments or changes in laws or regulations that could affect the Company.
Board’s ResponsibilitiesThe Board meets at least quarterly and also on an ad hoc basis as required. The Board is supplied with information in a timely manner and in a form and of a quality appropriate to enable it to discharge its duties. The Board is responsible for the long-term success of the Company and recognises its responsibility to provide leadership, direction and control to the Company within a framework of prudent and effective controls which enables risk to be assessed and managed. The Board reserves to itself decisions relating to the determination of investment policy and objectives, any change in investment strategy and entering into any material contracts. The Board also approves the prospectus and any addenda to it, circulars to shareholders, financial statements and other relevant legal documentation.
The Chairman's main responsibility is to lead and manage the Board, encourage critical discussions and promote effective communication within the Board. In addition, he is responsible for promoting best practice corporate governance and effective communication with shareholders.
The Directors have access to the advice and services of external counsel and the resources of BIM UK and BlackRock (Luxembourg) S.A. (the “Management Company”) should they be needed. Where necessary, in the furtherance of their duties, the Board and individual Directors may seek independent professional advice. The Board has responsibility for ensuring that the Company keeps proper accounting records which disclose with reasonable accuracy at any time the financial position of the Company and which enable
Directors’ Report

10 BlackRock Global Index Funds (BGIF)
Directors’ Report continued
it to ensure that the financial statements comply with relevant accounting standards. It is the Board’s responsibility to present a balanced and understandable assessment of the Company’s financial position, which extends to interim financial statements and other reports made available to shareholders and the public. The Board is responsible for taking reasonable steps for safeguarding the assets of the Company and for taking reasonable steps in the prevention and detection of fraud and other irregularities.
InsuranceThe Company maintains appropriate Directors’ and Officers’ liability insurance cover.
Delegation of Responsibilities As an open ended variable capital investment company most of the Company’s day-to-day management and administration is delegated to BlackRock group companies such as the Management Company which employs dedicated compliance and risk professionals, the Investment Advisers and other third party service providers. The Board has delegated the following areas of responsibility:
Management and Administration
The Board has delegated the investment management, distribution and administration of the Company and its Funds to the Management Company. The Management Company has delegated the management of the investment portfolio to the Investment Advisers. The Investment Advisers operate under guidelines determined by the Board and as detailed in the Company’s prospectus relating to the Company’s Funds. The relevant Investment Advisers have direct responsibility for the decisions relating to the day-to-day running of the Company’s Funds and are accountable to both the Management Company and the Company for the investment performance of the Funds. The Board has also delegated the exercise of voting rights attaching to the securities held in the portfolio to the respective Investment Advisers who may in turn delegate to BIM UK. Voting on behalf of shareholders is done in a manner which is believed to be in the best economic interest of shareholders as long-term investors.
The Management Company has delegated its responsibilities for administrative services of the Company and its Funds to State Street Bank Luxembourg S.C.A (the “Fund Accountant”). The Fund Accountant has the responsibility for the administration of the Company’s affairs including the calculation of the net asset value and preparation of the financial statements of the Company, subject to the overall supervision of the Directors and the Management Company. The Fund Accountant is a subsidiary of State Street Bank & Trust Co. The Company has appointed State Street Bank Luxembourg S.C.A. as Depositary of its assets, which has responsibility for safe-keeping of such assets, pursuant to the regulations. The Depositary is a subsidiary of State Street Bank & Trust Co. The Management Company has delegated transfer agent, listing agent and share registration services to J.P. Morgan Bank Luxembourg S.A.
The Management Company reports to the Board on a quarterly basis and by exception where necessary. Reporting is in place to ensure that the Board can effectively oversee the actions of its delegates.
The Management Company is responsible for the risk management and internal controls of the Company and for reviewing their effectiveness, for ensuring that financial information published or used within the business is reliable, and for regularly monitoring compliance with regulations governing the operation of the Company. The Management Company reviews the effectiveness of the internal control and risk management systems on an ongoing basis to identify, evaluate and manage the Company’s significant risks. As part of that process, there are procedures designed to capture and evaluate any failings or weaknesses. Should a case be categorised by the Board as significant, procedures exist to ensure that necessary action is taken to remedy the failings.
The Board is also responsible for establishing and maintaining adequate internal control and risk management systems of the Company in relation to the financial reporting process. Such systems are designed to manage rather than eliminate the risk of failure to achieve the Company’s financial reporting objectives. The Company has procedures in place to ensure all relevant accounting records are properly maintained and are readily available, including production of annual and half-yearly financial statements. These procedures include appointing the Fund Accountant to maintain the accounting records of the Company independently of the Investment Advisers and the Depositary. The financial statements are prepared in accordance with applicable law and Generally Accepted Accounting Principles (“GAAP”) in Luxembourg and are approved by the Board of Directors of the Company. The accounting information given in the annual report and audited accounts is required to be audited and the report of the réviseur d'entreprises agréé, including any qualifications, is reproduced in full in the annual report and audited accounts of the Company.
The control processes over the risks identified, covering financial, operational, compliance and risk management, is embedded in the operations of the Management Company, BIM UK and other parties including the Fund Accountant and the Depositary. There is a monitoring and reporting process to review these controls, which has been in place throughout the period under review and up to the date of this report, carried out by BIM UK’s corporate audit department.
BIM UK’s internal audit and operational risk units report to the Board through the Management Company on a quarterly basis. The Management Company also receives a report from the Fund Accountant and the Depositary on the internal controls of the administrative and custodial operations of the Company. The Board recognises that these control systems can only be designed to manage rather than eliminate the risk of failure to achieve fund objectives, and to provide reasonable, but not absolute, assurance against material
Annual Report and Audited Accounts 11
Directors’ Report continued
misstatement or loss, and relies on the operating controls established by the service providers.
Financial Reporting The Company prepares its financial statements under Luxembourg GAAP and on a going concern basis.
RemunerationThe Company is an investment company and has no employees or executive Directors. No Director (past or present) has any entitlement to a pension from the Company, and the Company has not awarded any share options or long-term performance incentives. No element of Directors’ remuneration is performance-related. Those Directors who are also employees of the BlackRock group are not entitled to receive a Director’s fee. All other Directors are paid fees which are submitted for approval by the shareholders at the annual general meeting and are disclosed on page 16. The Board believes that the level of remuneration for those Directors who take a fee properly reflects the time commitment and responsibilities of their roles. The maximum amount of remuneration payable to the Directors is approved by the Board.
Communication with ShareholdersThe Board is responsible for convening the annual general meeting and all other general meetings of the Company. Shareholders have the opportunity to, and are encouraged to attend and vote at general meetings. Notice of general meetings is issued in accordance with the Articles of Incorporation of the Company and notice of the annual general meeting is sent out at least 8 days in advance of the meeting. All substantive matters put before a general meeting are dealt with by way of separate resolution. Proxy voting figures are noted by the chairman of the general meeting.
The proceedings of general meetings are governed by the Articles of Incorporation of the Company.
The Board has reporting procedures in place such that client communication with BIM UK is reported to the Board, including shareholder complaints. In addition to this BlackRock Investment Management (UK) Limited has been appointed as Principal Distributor and is tasked with actively managing the relationship between the Company and its shareholders.
Directors’ Biographies
Nicholas C.D. Hall (ex-Chairman, resigned 31 May 2017) (British): Mr Hall was, until he retired in May 2009, General Counsel of BlackRock International (previously known as Merrill Lynch Investment Managers International) based in London which position he held from his appointment in August 1998. He joined the Group in 1983. He was educated at St. Catharine's College, Cambridge graduating with a MA (Law) degree in 1975. He qualified as a solicitor in England and Wales in 1978 and in Hong Kong in 1987. Up until 31 May 2017 he was a non-executive director of BlackRock Investment Management (UK) Limited, BlackRock Advisors (UK) Limited, BlackRock Group Limited, Chairman
of BlackRock Life Limited, BlackRock Global Funds and BlackRock Strategic Funds and served on the Boards of a number of other BlackRock entities and sponsored funds. Mr Hall chaired the BlackRock Group Limited EMEA Conflicts Management Committee and was a member of the BlackRock Group Limited EMEA Audit Committee, Nominations Committee and Risk Committee.
Francine Keiser (Luxembourger): Ms Keiser is a former Partner of Linklaters LLP and is now a consultant to the firm. She has been a member of the Luxembourg Bar since 1989. Ms Keiser is an experienced investment funds lawyer with wide expertise in all legal aspects of investment management, in particular in the UCITS area. She serves as a Director on the Boards of flagship funds of several major fund promoters, including BlackRock Global Funds and BlackRock Strategic Funds.
Alexander C. Hoctor-Duncan (British) (resigned 24 October 2016): Mr Hoctor-Duncan is a Managing Director of BlackRock and is Head of BlackRock’s Europe, Middle East and Africa Retail business. He is a member of the Global Client Group Executive Committee, Leadership Committee, and European Executive Committee, and also serves as a Director on the Boards of BlackRock Strategic Funds and BlackRock Global Index Funds. Mr. Hoctor-Duncan is based in London. Prior to moving to his current role, Mr. Hoctor-Duncan was Head of Retail Sales in the EMEA region. Mr. Hoctor-Duncan’s service with the firm dates back to 1997, including his years with Mercury Asset Management and Merrill Lynch Investment Management (“MLIM”), which merged with BlackRock in 2006. At MLIM, he was head of the UK Retail business and Head of Sales in the UK retail market.
Frank Le Feuvre (British nationality, Jersey resident): Mr Le Feuvre is the Country Manager for the Channel Islands and a member of BlackRock's Global Client Group. He is also the Managing Director of BlackRock (Channel Islands) Limited. Mr Le Feuvre’s service with the firm dates back to 1972, including his years with MLIM, which merged with BlackRock in 2006. At MLIM, he was Head of the Jersey business and Managing Director of Merrill Lynch Investment Management (Channel Islands) Limited. Mr Le Feuvre also serves as Director on the Boards of BlackRock Global Funds and BlackRock Strategic Funds.
Geoffrey D. Radcliffe (British nationality, Luxembourg resident): Mr Radcliffe is a Managing Director of BlackRock and is based in Luxembourg. He is a member of the BlackRock Business Operations Global Fund Services team and heads Fund Administration for EMEA, with responsibilities extending into Asia Pacific. Mr Radcliffe is a Fellow of The Institute of Chartered Accountants in England and Wales and an Associate of The Chartered Institute of Bankers. He has 30 years of banking, accounting and fund experience in the Isle of Man, London, Bermuda and Luxembourg. Mr Radcliffe joined the BlackRock Group in 1998. He serves as a Director on the Board of the Management Company and also on the Boards of a number of BlackRock funds including BlackRock Global Funds and BlackRock Global Index Funds.
12 BlackRock Global Index Funds (BGIF)
Directors’ Report continued
Bruno Rovelli (Italian) (resigned 24 October 2016): Mr Rovelli is Head of Investment Advisory for BlackRock in Italy. Before joining Blackrock in 2011 Mr Rovelli worked for over 11 years at Eurizon Capital, the largest asset manager in Italy. At Eurizon Capital Mr Rovelli served in various roles including Chief Strategist, Chief Investment Officer of the institutional business, Head of Quantitative Strategies and, from 2005 onwards, Chief Investment Officer for the mutual funds business. Prior to joining Eurizon Capital, Mr Rovelli served as an economist and fixed income strategist for Citigroup, Bank of America and Unicredit. Mr Rovelli is a graduate in economics (First Class Honours) from Luigi Bocconi University in Milan. Mr Rovelli also serves as a Director on the Board of BlackRock Strategic Funds and BlackRock Global Index Funds.
Barry O’Dwyer (Irish) (appointed 21 November 2016): Mr O’Dwyer is a Managing Director at BlackRock. He is the Head of Fund Governance for BlackRock’s European open-ended fund ranges and is the Chief Operating Officer for BlackRock’s Irish business. He serves as a director on the boards of a number of BlackRock corporate, fund, and management companies domiciled in Ireland, Luxembourg, Switzerland and Germany and on the board of BlackRock’s UK Life company. He was the chairman of the Irish Funds Industry Association 2014-2015, is a board director of Financial Services Ireland and is a member of An Taoiseach’s Financial Services Industry Advisory Committee. He joined BlackRock Advisors (UK) Limited in 1999 as head of risk management and moved to his present role in 2006. Prior to joining BlackRock Advisors (UK) Limited, Mr O’Dwyer worked as risk manager at Gartmore Investment Management and at HypoVereinsbank and National Westminster Bank. Mr O’Dwyer graduated from Trinity College Dublin with a degree in Business Studies and Economics in 1991. He holds a Chartered Association of Certified Accountants qualification and an MBA from London City University Business School.
Robert Hayes (British) (appointed 21 November 2016): Mr Hayes is a Managing Director of BlackRock and is Head of Investment Oversight for the BlackRock EMEA Retail business. The team is responsible for establishing and reviewing investment expectations for all BlackRock’s Retail Funds in the EMEA region and is also responsible for BlackRock’s relationships with mutual fund rating agencies. He also chairs the Investment Committee and serves as a Director of BlackRock Life Limited. Mr Hayes’ service with the firm dates back to 2001, including his years with MLIM, which merged with BlackRock in 2006. At MLIM he was Head of Strategic Advice and immediately before his current role he was Head of Client Strategy in BlackRock’s Client Solutions business. Prior to joining the firm, Mr Hayes was a Partner with Watson Wyatt Partners, as an investment consultant for large pension funds and institutional investors. Earlier in his career, Mr Hayes was a UK Equity Investment Manager at ICI Pension Fund and Head of Institutional Investment at M&G Investment Management. Mr Hayes earned a BSc degree in Mathematics from Southampton University in 1983.
Paul Freeman (Chairman, appointed 17 July 2017) (British): Mr Freeman currently serves as a director on the boards of a number of BlackRock Group companies and investment funds. He was until December 2015 a Managing Director of BlackRock, which he had joined in August 2005 (which then was Merrill Lynch Investment Managers). Up until July 2011 Mr Freeman was the Head of Product Development and Range Management for the EMEA region with responsibility for the development and ongoing product management of all funds domiciled in EMEA and distributed on a cross-border basis by BlackRock. Between July 2011 and December 2015 Mr Freeman worked closely with BlackRock’s Government affairs team and served on various internal governance committees and on the boards of a number of group subsidiaries and managed funds. Mr Freeman has worked in the financial services industry for over 35 years and, prior to BlackRock, has held senior management positions at Schroders, Rothschild Asset Management, Henderson Investors and GT Management (now part of Invesco). Mr Freeman is a Chartered Accountant.
Annual Report and Audited Accounts 13
Report on Remuneration
The below disclosures are made in respect of the remuneration policies of the BlackRock group (“BlackRock”), as they apply to BlackRock (Luxembourg) S.A. (the “Management Company”). The disclosures are made in accordance with the Directive 2009/65/EC on the coordination of laws, regulations and administrative provisions relating to undertakings for collective investment in transferable securities (“UCITS”), as amended, including in particular by Directive 2014/91/EU of the European Parliament and of the council of 23 July 2014, (the “Directive”), and the “Guidelines on sound remuneration policies under the UCITS Directive and AIFMD” issued by the European Securities and Markets Authority. The Law of 10 May 2016 (2016 Law) transposed the Directive as regards to depositary functions, remuneration policies and sanctions, thereby amending the 2010 Law and the AIFM Law. The 2016 Law came into force on 1 June 2016.
BlackRock’s UCITS Remuneration Policy (the “UCITS Remuneration Policy”) will apply to the European Economic Area (“EEA”) entities within the BlackRock group authorised as a manager of UCITS funds in accordance with the Directive, and will ensure compliance with the requirements of Article 14b of the Directive.
The Management Company has adopted the UCITS Remuneration Policy, a summary of which is set out below.
Role of the Compensation Committees Remuneration governance is a tiered structure including the Management Development and Compensation Committee (“MDCC”) of BlackRock, Inc.’s board of directors (the “BlackRock, Inc. Board”) (BlackRock Inc.’s independent remuneration committee), complemented by the EMEA Compensation Committee (the “Committee”) and the board of directors of the Management Company (the “Manager’s Board”). These bodies are responsible for the determination of the remuneration policies of the Management Company.
(a) MDCC The MDCC’s primary purposes include:
} to provide oversight of:} BlackRock’s executive compensation programmes;} BlackRock’s employee benefit plans; } such other compensation plans as may be established
by BlackRock from time to time for which the MDCC is deemed as administrator; and
} review and discuss the compensation discussion and analysis included in the BlackRock, Inc. annual proxy statement with management and approval of the MDCC report for inclusion in the proxy statement.
The MDCC directly retains its own independent compensation consultant, Semler Brossy Consulting Group LLC, who has no relationship with BlackRock, Inc. or the BlackRock, Inc. Board that would interfere with its ability to provide independent advice to the MDCC on compensation matters.
The MDCC is currently composed of Messrs. Gerber (Chairman), Komansky, Grosfeld, Maughan, Mills and Nixon. The BlackRock, Inc. Board has determined that all of the members of the MDCC are “independent” within the meaning of the listing standards of the New York Stock Exchange (NYSE), which requires each meet a “non-employee director” standard.
The MDCC held 8 meetings during 2016. The MDCC charter is available on BlackRock, Inc.’s website (www.blackrock.com).
(b) EMEA Compensation Committee The Committee is established for the purpose of reviewing compensation policies, practices, and principles as required by local/regional rules set by regulatory bodies. Specifically, the Committee’s primary purposes are to review and make recommendations concerning:
} executive compensation programmes;
} employee benefit plans;
} such other compensation plans as may be established from time to time; and
} other local/regional compensation policies, practices, and principles as required to comply with local/regional rules as set by regulators.
The Committee consists of a minimum of three members and is constituted in a way that enables it to exercise its judgment and demonstrate its ability to make decisions which are consistent with the current and future financial status of the business. The current members are: David Blumer, Head of the EMEA Region; Dan Dunay, Global Head of Reward; and Karen Dennehy, EMEA Head of Human Resources. Only members of the Committee have the right to attend Committee meetings and the Committee may request the attendance of any executive or other person as deemed appropriate to facilitate the review of remuneration recommendations and policy design to ensure that the remuneration practices are consistent with effective risk management and do not encourage excessive risk taking.
Examples of additional attendees may include individuals from the Operational Risk and Regulatory Compliance functions.
Decision-making processCompensation decisions for employees are made once annually in January following the end of the performance year. This timing allows full-year financial results to be considered along with other non-financial goals and objectives. Although the framework for compensation decision-making is tied to financial performance, significant discretion is used to determine individual compensation based on achievement of strategic and operating results and other considerations such as management and leadership capabilities.
No set formulas are established and no fixed benchmarks are used in determining annual incentive awards. In determining

14 BlackRock Global Index Funds (BGIF)
Report on Remuneration continued
specific individual compensation amounts, a number of factors are considered including non-financial goals and objectives and overall financial and investment performance. These results are viewed in the aggregate without any specific weighting, and there is no direct correlation between any particular performance measure and the resulting annual incentive award.
Annual incentive awards are generated from a bonus pool.
The size of the projected bonus pool, including cash and equity awards, is reviewed throughout the year by the MDCC and the final total bonus pool is approved after year-end. As part of this review, the MDCC receives actual and projected financial information over the course of the year as well as final year-end information. The financial information that the MDCC receives and considers includes the current year projected income statement and other financial measures compared with prior year results and the current year budget. The MDCC additionally reviews other metrics of Blackrock’s financial performance (e.g., net inflows of AUM and investment performance) as well as information regarding market conditions and competitive compensation levels.
The MDCC regularly considers management’s recommendation as to the percentage of pre-incentive operating income that will be accrued and reflected as a compensation expense throughout the year for the cash portion of the total annual bonus pool (the “accrual rate”). The accrual rate of the cash portion of the total annual bonus pool may be modified by the MDCC during the year based on its review of the financial information described above. The MDCC does not apply any particular weighting or formula to the information it considers when determining the size of the total bonus pool or the accruals made for the cash portion of the total bonus pool.
Following the end of the performance year, the MDCC approves the final bonus pool amount.
As part of the year-end review process the Operational Risk and Regulatory Compliance departments report to the Committee on any activities, incidents or events that warrant consideration in making compensation decisions.
Individuals are not involved in setting their own remuneration.
Control functionsEach of the control functions (Operational Risk, Legal & Compliance, and Internal Audit) has its own organisational structure which is independent of the business units. The head of each control function is either a member of the Global Executive Committee, BlackRock’s global management committee, or has a reporting obligation to the Manager’s Board.
Functional bonus pools are determined with reference to the performance of each individual function. The remuneration of the senior members of control functions is directly overseen by the Committee.
Link between pay and performanceThere is a clear and well defined pay-for-performance philosophy and compensation programmes which are designed to meet five key objectives as detailed below:
} attracting, retaining and motivating employees capable of making significant contributions to the long-term success of the business;
} aligning the interests of senior employees with those of shareholders by awarding BlackRock, Inc. stock as a significant part of both annual and long-term incentive awards;
} controlling fixed costs by ensuring that compensation expense varies with profitability;
} linking a significant portion of an employee’s total compensation to the financial and operational performance of the business as well as its common stock performance; and
} discouraging excessive risk-taking.
Driving a high-performance culture is dependent on the ability to measure performance against objectives, values and behaviours in a clear and consistent way. Managers use a 5-point rating scale to provide an overall assessment of an employee’s performance, and employees also provide a self-evaluation. The overall, final rating is reconciled during each employee’s performance appraisal. Employees are assessed on the manner in which performance is attained as well as the absolute performance itself.
In keeping with the pay-for-performance philosophy, ratings are used to differentiate and reward individual performance – but don’t pre-determine compensation outcomes. Compensation decisions remain discretionary and are made as part of the year-end compensation process.
When setting remuneration levels other factors are considered, as well as individual performance, which may include:
} the performance of the Management Company, the Funds managed by the Management Company and/or the relevant functional department;
} factors relevant to an employee individually (e.g. relevant working arrangements (including part-time status if applicable); relationships with clients and colleagues; teamwork; skills; any conduct issues; and, subject to any applicable policy, the impact that any relevant leave of absence may have on contribution to the business);
} the management of risk within the risk profiles appropriate for BlackRock's clients;
} strategic business needs, including intentions regarding retention;

Annual Report and Audited Accounts 15
Report on Remuneration continued
} market intelligence; and
} criticality to business.
A primary product tool is risk management and, while employees are compensated for strong performance in their management of client assets, they are required to manage risk within the risk profiles appropriate for their clients. Therefore, employees are not rewarded for engaging in high-risk transactions outside of established parameters. Compensation practices do not provide undue incentives for short-term planning or short-term financial rewards, do not reward unreasonable risk and provide a reasonable balance between the many and substantial risks inherent within the business of investment management, risk management and advisory services.
The compensation model includes a basic salary, which is contractual, and a discretionary bonus scheme. Although all employees are eligible to be considered for a bonus, there is no contractual obligation to make any award to an employee under its discretionary bonus scheme. In exercising discretion to award a discretionary bonus, the factors listed above (under the heading “Link between pay and performance”) may be taken into account in addition to any other matters which become relevant to the exercise of discretion in the course of the performance year.
Discretionary bonus awards for all employees, including executive officers, are subject to a guideline that determines the portion paid in cash and the portion paid in stock and subject to additional vesting/clawback conditions. As annual compensation increases, a greater portion is paid in stock. The MDCC adopted this approach in 2006 to substantially increase the retention value and shareholder alignment of the compensation package for eligible employees, including the executive officers. The portion deferred into stock vests in equal instalments over the three years following grant.
Supplementary to the annual discretionary bonus as described above, equity awards from the “Partner Plan” and “Enterprise Leadership Acceleration at BlackRock Plan” are made to select senior leaders to provide greater linkage with future business results. These long-term incentive awards have been established individually to provide meaningful incentives for continued performance over a multi-year period recognizing the scope of the individual’s role, business expertise and leadership skills. These awards usually vest fully three years after they are granted.
Selected senior leaders are eligible to receive performance-adjusted equity-based awards from the “BlackRock Performance Incentive Plan” (“BPIP”). Awards made from the BPIP have a three-year performance period based on a measurement of As Adjusted Operating Margin1 and Organic
Revenue Growth2 . Determination of pay-out will be made based on BlackRock’s achievement relative to target financial results at the conclusion of the performance period. The maximum number of shares that can be earned is 165% of the award in those situations where both metrics achieve pre-determined financial targets. No shares will be earned where BlackRock’s financial performance in both of the above metrics is below a pre-determined performance threshold. These metrics have been selected as key measures of shareholder value which endure across market cycles.
A limited number of investment professionals have a portion of their annual discretionary bonus (as described above) awarded as deferred cash that notionally tracks investment in selected products managed by the relevant employee. The intention of these awards is to align investment professionals with the investment returns of the products they manage through the deferral of compensation into those products. Clients and external evaluators have increasingly viewed more favourably those products where key investors have “skin in the game” through significant personal investments. These awards vest in equal instalments over the three years following grant.
Identified StaffThe UCITS Remuneration Policy sets out the process that will be applied to identify staff as Identified Staff, being categories of staff of the Management Company, including senior management, risk takers, control functions and any employee receiving total remuneration that takes them into the same remuneration bracket as senior management and risk takers, whose professional activities have a material impact on the risk profiles of the Management Company or of the funds it manages.
The list of Identified Staff will be subject to regular review, being formally reviewed in the event of, but not limited to:
} Organisational changes} New business initiatives} Changes in significant influence function lists} Changes in role responsibilities} Revised regulatory direction
Quantitative Remuneration DisclosureAppropriate disclosures will be made in due course in accordance with Article 69(3) of the Directive once a full performance year has been completed.
1 As Adjusted Operating Margin: As reported in BlackRock, Inc.’s external filings, reflects adjusted Operating Income divided by Total Revenue net of distribution and servicing expenses and
amortisation of deferred sales commission.2 Organic Revenue Growth: Equal to net new base fees plus net new Aladdin revenue generated in the year (in dollars).

16 BlackRock Global Index Funds (BGIF)
General Information
Board of Directors Paul Freeman, Chairman (appointed effective 17 July 2017) Nicholas C. D. Hall, Chairman (resigned effective 31 May 2017)Geoffrey D. RadcliffeFrank Le FeuvreFrancine KeiserRobert Hayes (appointed effective 21 November 2016)Barry O’Dwyer (appointed effective 21 November 2016)Bruno Rovelli (resigned effective 24 October 2016)Alexander C. Hoctor-Duncan (resigned effective 24 October 2016)
All Directors are non-executive.
Frank Le Feuvre, Robert Hayes, Geoffrey D. Radcliffe and Barry O’Dwyer are employees of
the BlackRock Group (the BlackRock group of companies, the ultimate holding company
of which is BlackRock, Inc., of which the Management Company and Investment Advisers
are part of), and Nicholas C. D. Hall is a former employee of the BlackRock Group. Francine
Keiser is an independent Director.
Management CompanyBlackRock (Luxembourg) S.A.35A avenue J.F. Kennedy,L-1855 Luxembourg,Grand Duchy of Luxembourg
Investment Advisers BlackRock Investment Management (UK) Limited12 Throgmorton Avenue,London EC2N 2DL,United Kingdom
BlackRock Institutional Trust Company N.A.400 Howard Street,San Francisco CA 94105USA
Principal DistributorBlackRock Investment Management (UK) Limited12 Throgmorton Avenue,London EC2N 2DL,United Kingdom
Depositary and Fund Accountant State Street Bank Luxembourg S.C.A.49 avenue J.F. Kennedy,L-1855 Luxembourg,Grand Duchy of Luxembourg
Listing Agent, Registrar and Transfer AgentJ.P. Morgan Bank Luxembourg S.A.6, route de Trèves, Building C L-2633 SenningerbergGrand Duchy of Luxembourg
Cabinet de Révision AgrééDeloitte Audit, Société à responsabilité limitée560 rue de Neudorf,L-2220 Luxembourg,Grand Duchy of Luxembourg
Legal AdvisersLinklaters LLP35 avenue J.F. Kennedy,L-1855 Luxembourg,Grand Duchy of Luxembourg
Securities Lending AgentBlackRock Advisors (UK) Limited12 Throgmorton Avenue,London EC2N 2DL,United Kingdom
Paying AgentsAustria:Raiffeisen Bank International AGAm Stadtpark 91030 ViennaAustria
Denmark:BlackRock Copenhagen BranchHarbour HouseSundkrogsgade 21CopenhagenDK- 2100Denmark
France:CACEIS Bank France1-3 Place Valhubert,75013 ParisFrance
Germany: J.P. Morgan AGCIB / Investor Services – Trustee & FiduciaryTaunustor 1 (TaunusTurm)60310 Frankfurt am MainGermany
Luxembourg: (Central Paying Agent) J.P. Morgan Bank Luxembourg S.A.6, route de Trèves, Building CL-2633 SenningerbergGrand Duchy of Luxembourg
Sweden:BlackRock Investment Management (UK) Limited-Stockholm Branch Norrlandsgatan 16111 43 Stockholm Sweden

Annual Report and Audited Accounts 17
Switzerland:State Street Bank International GmbH Munich,Zurich BranchBeethovenstrasse 19CH-8027 ZurichSwitzerland
United Kingdom:J.P. Morgan Europe Limited,UK Paying Agency3 Lochside ViewEdinburgh EH12 9DHUnited Kingdom
Registered Office49 avenue J.F. Kennedy,L-1855 Luxembourg,Grand Duchy of Luxembourg
EnquiriesIn the absence of other arrangements, enquiries regardingthe Company should be addressed as follows:Written Enquiries:BlackRock Investment Management (UK) Limited, c/o BlackRock (Luxembourg) S.A.P.O. Box 1058,L-1010 Luxembourg,Grand Duchy of Luxembourg
All other enquiries: Telephone: + 44 207 743 3300, Fax: + 44 207 743 1143.Email: [email protected]
General Information continued
Current ProspectusThe Company’s Prospectus dated 6 February 2017, and the relevant KIID along with copies of the Application Form may be obtained from the Local Investor Servicing team, the Management Company or any of the Representatives or Distributors. Copies of the Company’s Articles of Association, the Annual Report and Audited Accounts and Unaudited Interim Report and Accounts may also be obtained free of charge from any of these offices and from the Paying Agents. All these documents are also available from www.blackrockinternational.com.
RepresentativesThe representative in Switzerland is BlackRock Asset Management Switzerland Limited, Bahnhofstrasse 39, 8001 Zürich, Switzerland.
The representative in Denmark is BlackRock Copenhagen Branch, subsidiary of BlackRock Investment Management (UK) Limited, England, Harbour House, Sundkrogsgade 21, Copenhagen, DK 2100, Denmark.
Portfolio of InvestmentsEquities are primarily classified by the country of incorporation of the entity in which the Fund holds shares.
Corporate and government fixed and variable income securities are primarily classified by the country of incorporation of the issuer.
Purchases and Sales A detailed list of investments purchased and sold for any Fund during the year is available upon request, free of charge, from the Registered Office, or the offices of the Representatives as mentioned above.
Authorised StatusThe Company is a UCITS under the part I of Luxembourg Law of 17 December 2010, as amended. Regulatory consents have been obtained or appropriate notifications have been made for the distribution of shares of all the Company’s Funds in the umbrella in the following countries:
Austria, Chile, Denmark, Finland, France, Germany, Ireland, Italy, Jersey, Luxembourg, Netherlands, Norway, South Africa, Spain, Sweden, Switzerland and United Kingdom.
The Company is duly registered with the Comision Nacional de Mercado de Valores in Spain under number 1239.

18
Bla
ckRo
ck G
lob
al In
dex
Fun
ds
(BG
IF)
The
note
s o
n p
ages
122
to 1
28 fo
rm a
n in
teg
ral p
art o
f the
se fi
nanc
ial s
tate
men
ts.
Stat
emen
t of N
et A
sset
s as
at 3
1 M
arch
201
7
No
te
Blac
kRoc
k Gl
obal
In
dex
Fund
s Co
mbi
ned
Blac
kRoc
k Em
ergi
ng M
arke
ts
Equi
ty In
dex
Fund
Blac
kRoc
k Em
ergi
ng M
arke
ts
Gove
rnm
ent B
ond
Inde
x Fu
ndBl
ackR
ock
Euro
pe
Equi
ty In
dex
Fund
Blac
kRoc
k Eu
ro
Aggr
egat
e Bo
nd
Inde
x Fu
nd
Blac
kRoc
k Eu
ro
Gove
rnm
ent B
ond
Inde
x Fu
nd
Blac
kRoc
k Gl
obal
Go
vern
men
t Bon
d In
dex
Fund
Blac
kRoc
k Ja
pan
Equi
ty In
dex
Fund
Blac
kRoc
k No
rth
Amer
ica E
quity
In
dex
Fund
Blac
kRoc
k Pa
cific
ex J
apan
Equ
ity
Inde
x Fu
ndBl
ackR
ock
Wor
ld
Equi
ty In
dex
Fund
USD
USD
USD
EUR
EUR
EUR
USD
USD
USD
USD
USD
Ass
ets
Secu
ritie
s p
ort
folio
at c
ost
5,66
8,87
8,11
539
6,22
0,61
6 1,
797,
981,
431
363,
121,
640
435,
839,
308
415,
978,
534
97,2
24,3
71
134,
302,
227
624,
745,
371
295,
780,
822
1,02
4,47
2,31
8 U
nrea
lised
ap
pre
ciat
ion/
(dep
reci
atio
n)42
6,66
8,30
488
1,23
2 36
,016
,480
57
,293
,528
20
,005
,865
14
,499
,973
(3
,375
,274
) 13
,423
,076
15
5,46
7,50
4 10
,022
,607
11
6,14
5,95
4
Secu
ritie
s p
ort
folio
at m
arke
t val
ue2(
a)6,
095,
546,
419
397,
101,
848
1,83
3,99
7,91
1 42
0,41
5,16
8 45
5,84
5,17
3 43
0,47
8,50
7 93
,849
,097
14
7,72
5,30
3 78
0,21
2,87
5 30
5,80
3,42
9 1,
140,
618,
272
Cas
h at
ban
k2(
a)64
,410
,328
35,8
09,4
78
9,21
5,76
15,
853,
503
2,35
0,25
9 1,
688,
994
657,
277
1,90
6,82
5 3,
087,
027
1,83
9,33
8 1,
324,
309
Due
fro
m b
roke
r12
1,14
5,62
114
,610
–
390,
606
– –
– 12
8,89
1 17
2,73
9 12
6,04
1 28
5,98
1 In
tere
st a
nd d
ivid
end
s re
ceiv
able
2(a)
,2(d
)45
,780
,423
1,23
8,28
4 25
,601
,919
1,
971,
090
4,60
9,70
9 4,
877,
767
609,
648
1,15
8,04
4 66
9,43
4 1,
471,
968
2,78
7,76
0 Re
ceiv
able
for
inve
stm
ents
so
ld2(
a),2
(d)
14,5
58,7
3638
6,33
6 –
43,7
10
– –
– –
13,8
96,6
98
– 22
8,99
8 Re
ceiv
able
for
Fund
sha
res
sub
scrib
ed2(
a)25
,028
,401
1,55
1,11
0 13
,831
,281
32
7,84
4 2,
164,
602
783,
196
43,7
76
205,
012
619,
711
355,
022
4,92
2,49
8 U
nrea
lised
ap
pre
ciat
ion
on:
Fu
ture
s co
ntra
cts
2(d)
756,
040
662,
517
– 45
,267
–
– –
– 4,
856
30,5
72
9,72
8 O
pen
forw
ard
fore
ign
exch
ang
e tr
ansa
ctio
ns2(
d)4,
969,
649
818,
918
4,14
1,56
3 –
– –
9,16
8 –
– –
– O
ther
ass
ets
156,
349
10,5
06
52,9
28
6,75
9 32
,627
4,
407
110
1,02
4 2,
654
3,45
2 38
,883
Tota
l ass
ets
6,25
2,35
1,96
643
7,59
3,60
7 1,
886,
841,
363
429,
053,
947
465,
002,
370
437,
832,
871
95,1
69,0
76
151,
125,
099
798,
665,
994
309,
629,
822
1,15
0,21
6,42
9
Liab
ilitie
s
Inco
me
dis
trib
utio
n p
ayab
le2(
a)4,
850,
824
103,
290
935,
615
250,
743
1,22
7,47
4 27
,736
12
,879
37
,408
23
8,59
2 36
,687
1,
877,
257
Paya
ble
for
inve
stm
ents
pur
chas
ed2(
a)
10,2
38,8
6615
2,01
1 9,
304,
578
– 54
8,58
3 12
6,83
8 –
60,5
96
– –
– Pa
yab
le fo
r Fu
nd s
hare
s re
dee
med
2(a)
17,8
07,4
8727
,747
88
6,01
5 14
0,96
3 87
1,58
5 98
1,91
0 44
,183
7,
923
14,1
80,3
31
115,
699
414,
530
Unr
ealis
ed d
epre
ciat
ion
on:
Fu
ture
s co
ntra
cts
2(d)
61,0
56–
– –
– –
– 61
,056
–
– –
Acc
rued
exp
ense
s an
d o
ther
liab
ilitie
s4,
5,6
3,06
1,16
348
9,44
5 47
7,12
2 27
0,48
3 14
5,49
4 22
8,10
7 98
,857
11
5,48
0 29
7,43
1 28
4,18
4 61
0,44
7
Tota
l lia
bili
ties
36,0
19,3
9677
2,49
3 11
,603
,330
662,
189
2,79
3,13
6 1,
364,
591
155,
919
282,
463
14,7
16,3
54
436,
570
2,90
2,23
4
Tota
l net
ass
ets
6,21
6,33
2,57
043
6,82
1,11
4 1,
875,
238,
033
428,
391,
758
462,
209,
234
436,
468,
280
95,0
13,1
57
150,
842,
636
783,
949,
640
309,
193,
252
1,14
7,31
4,19
5
Appr
oved
on
beha
lf o
f the
Boa
rd o
f Dir
ecto
rs o
f the
Com
pany
Geo
ffre
y D
. Rad
cliff
e Pa
ul F
reem
an
Dir
ecto
r D
irec
tor
Dat
e 19
Jul
y 20
17
Dat
e 19
Jul
y 20
17

Annual Report and Audited Accounts 19
The notes on pages 122 to 128 form an integral part of these financial statements.
Three Year Summary of Net Asset Valuesas at 31 March 2017
Currency 31 March 2017 31 March 2016 31 March 2015
BlackRock Emerging Markets Equity Index FundTotal net assets USD 436,821,114 401,552,214 419,849,026Net asset value per:
A Class non-distributing share USD 107.00 91.48 103.75F Class non-distributing share EUR 103.41 82.58 99.25F Class non-distributing share USD 110.47 94.17 106.48N Class distributing share EUR 118.49 96.34 118.47N Class distributing share USD 128.45 111.46 128.95N Class non-distributing share USD 108.59 92.54 104.60X Class non-distributing share EUR 102.39 81.58 97.82X Class non-distributing share USD 109.62 93.23 105.16
BlackRock Emerging Markets Government Bond Index FundTotal net assets USD 1,875,238,033 1,088,653,643 356,462,342Net asset value per:
A Class non-distributing share USD 118.31 108.98 105.09A Class non-distributing share EUR hedged(1) EUR 105.83 – –I Class distributing share USD 106.91 103.59 –I Class non-distributing share USD 116.87 107.35 103.23I Class non-distributing share EUR hedged(1) EUR 106.07 – –I Class non-distributing share GBP hedged(1) GBP 106.17 – –N Class distributing share EUR 119.65 108.64 116.87X Class non-distributing share(1) EUR 111.58 – –X Class non-distributing share USD 120.53 110.49 106.04X Class non-distributing share EUR hedged(1) EUR 106.34 – –X Class non-distributing share SEK hedged(1) SEK 995.17 – –
BlackRock Europe Equity Index FundTotal net assets EUR 428,391,758 378,459,527 424,740,869Net asset value per:
A Class non-distributing share EUR 154.43 132.71 154.17D Class non-distributing share EUR 146.64 125.64 145.52F Class non-distributing share EUR 156.63 134.20 155.43N Class distributing share EUR 139.17 122.72 146.23N Class distributing share USD 151.04 142.17 159.43N Class non-distributing share EUR 156.84 134.33 155.55X Class non-distributing share EUR 157.92 135.06 156.15X Class non-distributing share(1) USD 105.80 – –
BlackRock Euro Aggregate Bond Index FundTotal net assets EUR 462,209,234 368,577,325 334,786,492Net asset value per:
A Class non-distributing share EUR 113.28 114.42 114.16N Class distributing share EUR 108.21 110.29 111.28X Class non-distributing share EUR 115.40 116.01 115.18
BlackRock Euro Government Bond Index FundTotal net assets EUR 436,468,280 788,111,812 920,751,302Net asset value per:
A Class non-distributing share EUR 120.41 123.03 122.61D Class non-distributing share EUR 119.09 121.32 120.54F Class non-distributing share EUR 122.01 124.29 123.49N Class distributing share EUR 114.15 117.40 118.00N Class non-distributing share EUR 122.19 124.43 123.59X Class non-distributing share EUR 123.03 125.10 124.07
(1) New share class launch, see Note 1 for further details.

The notes on pages 122 to 128 form an integral part of these financial statements.
20 BlackRock Global Index Funds (BGIF)
Three Year Summary of Net Asset Values as at 31 March 2017 continued
Currency 31 March 2017 31 March 2016 31 March 2015
BlackRock Global Government Bond Index FundTotal net assets USD 95,013,157 81,444,953 97,511,041Net asset value per:
A Class non-distributing share USD 91.96 96.15 91.07D Class non-distributing share EUR 117.16 114.46 114.94F Class non-distributing share USD 93.23 97.19 91.78N Class distributing share EUR 105.34 103.74 105.27N Class non-distributing share EUR 87.29 85.23 85.51N Class non-distributing share USD 93.36 97.30 91.89X Class non-distributing share(1) EUR 100.26 – –X Class non-distributing share USD 93.94 97.75 92.15
BlackRock Japan Equity Index FundTotal net assets USD 150,842,636 135,168,420 124,923,080Net asset value per:
A Class non-distributing share USD 146.01 128.78 139.22F Class non-distributing share USD 148.09 130.22 140.35N Class distributing share EUR 167.89 140.55 163.53N Class distributing share USD 179.49 160.37 175.58N Class non-distributing share USD 148.28 130.35 140.45X Class non-distributing share EUR 139.60 114.81 131.27X Class non-distributing share USD 149.25 131.01 140.95
BlackRock North America Equity Index FundTotal net assets USD 783,949,640 609,949,244 594,023,966Net asset value per:
A Class non-distributing share USD 167.85 144.86 146.43F Class non-distributing share USD 170.23 146.47 147.62N Class distributing share EUR 195.39 159.54 173.23N Class distributing share USD 209.97 182.94 186.90N Class non-distributing share USD 170.47 146.63 147.74X Class non-distributing share EUR 160.47 129.14 138.06X Class non-distributing share USD 171.59 147.38 148.26
BlackRock Pacific ex Japan Equity Index FundTotal net assets USD 309,193,252 263,071,813 211,221,231Net asset value per:
A Class non-distributing UK reporting fund share USD 117.32 99.60 110.49F Class non-distributing UK reporting fund share USD 119.03 100.74 111.43N Class distributing share EUR 120.84 99.44 121.64N Class distributing share USD 130.50 114.58 131.85N Class non-distributing share USD 119.16 100.83 111.48X Class non-distributing share EUR 112.18 88.80 104.19X Class non-distributing share USD 119.94 101.34 111.88
BlackRock World Equity Index FundTotal net assets USD 1,147,314,195 717,392,136 702,336,739Net asset value per:
A Class non-distributing share USD 151.55 132.89 138.31D Class non-distributing share EUR 179.59 147.12 162.27F Class non-distributing share EUR 143.86 117.86 129.95F Class non-distributing share(1) GBP 123.27 – –F Class non-distributing share USD 153.68 134.35 139.42N Class distributing share EUR 169.37 141.23 158.77N Class non-distributing share EUR 183.21 150.00 165.38N Class non-distributing share USD 153.94 134.52 139.56X Class non-distributing share EUR 144.92 118.49 130.43X Class non-distributing share USD 154.96 135.22 140.08
(1) New share class launch, see Note 1 for further details.
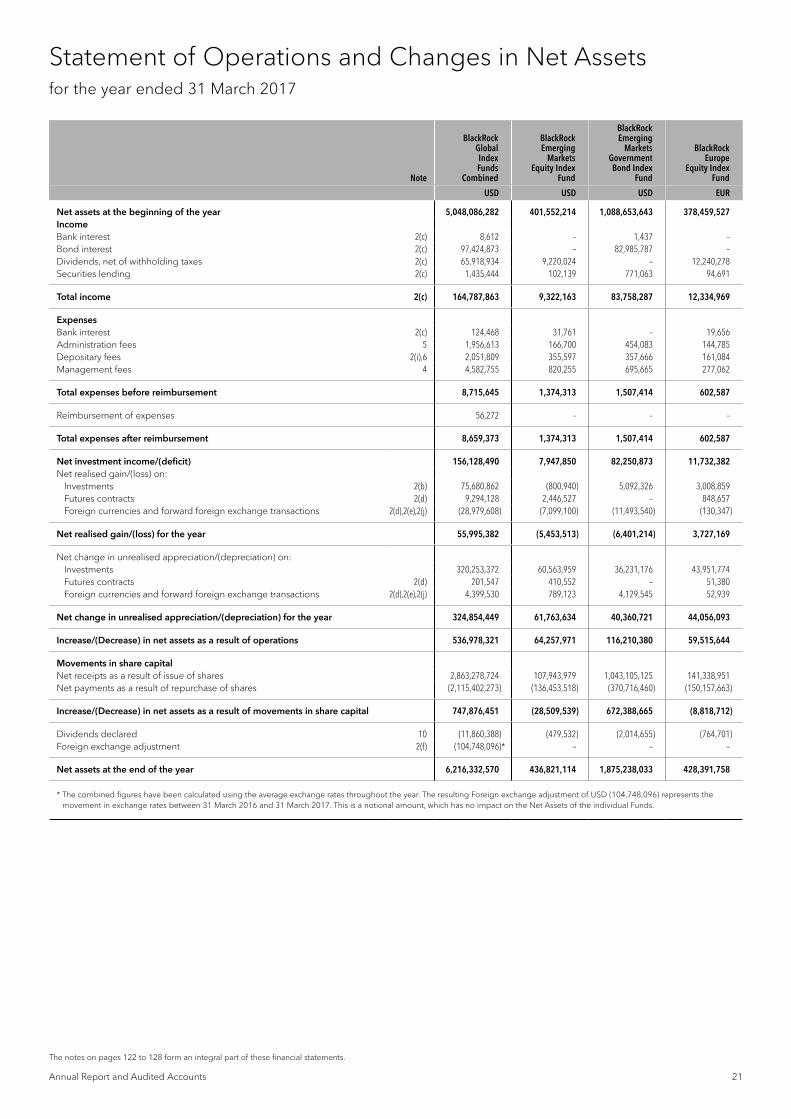
Annual Report and Audited Accounts 21
The notes on pages 122 to 128 form an integral part of these financial statements.
Statement of Operations and Changes in Net Assetsfor the year ended 31 March 2017
Note
BlackRock Global Index Funds
Combined
BlackRock Emerging
Markets Equity Index
Fund
BlackRock Emerging
Markets Government Bond Index
Fund
BlackRock Europe
Equity Index Fund
USD USD USD EUR
Net assets at the beginning of the year 5,048,086,282 401,552,214 1,088,653,643 378,459,527 Income Bank interest 2(c) 8,612 – 1,437 – Bond interest 2(c) 97,424,873 – 82,985,787 – Dividends, net of withholding taxes 2(c) 65,918,934 9,220,024 – 12,240,278 Securities lending 2(c) 1,435,444 102,139 771,063 94,691
Total income 2(c) 164,787,863 9,322,163 83,758,287 12,334,969
Expenses Bank interest 2(c) 124,468 31,761 – 19,656 Administration fees 5 1,956,613 166,700 454,083 144,785 Depositary fees 2(i),6 2,051,809 355,597 357,666 161,084 Management fees 4 4,582,755 820,255 695,665 277,062
Total expenses before reimbursement 8,715,645 1,374,313 1,507,414 602,587
Reimbursement of expenses 56,272 – – –
Total expenses after reimbursement 8,659,373 1,374,313 1,507,414 602,587
Net investment income/(deficit) 156,128,490 7,947,850 82,250,873 11,732,382 Net realised gain/(loss) on:
Investments 2(b) 75,680,862 (800,940) 5,092,326 3,008,859 Futures contracts 2(d) 9,294,128 2,446,527 – 848,657 Foreign currencies and forward foreign exchange transactions 2(d),2(e),2(j) (28,979,608) (7,099,100) (11,493,540) (130,347)
Net realised gain/(loss) for the year 55,995,382 (5,453,513) (6,401,214) 3,727,169
Net change in unrealised appreciation/(depreciation) on: Investments 320,253,372 60,563,959 36,231,176 43,951,774 Futures contracts 2(d) 201,547 410,552 – 51,380 Foreign currencies and forward foreign exchange transactions 2(d),2(e),2(j) 4,399,530 789,123 4,129,545 52,939
Net change in unrealised appreciation/(depreciation) for the year 324,854,449 61,763,634 40,360,721 44,056,093
Increase/(Decrease) in net assets as a result of operations 536,978,321 64,257,971 116,210,380 59,515,644
Movements in share capital Net receipts as a result of issue of shares 2,863,278,724 107,943,979 1,043,105,125 141,338,951 Net payments as a result of repurchase of shares (2,115,402,273) (136,453,518) (370,716,460) (150,157,663)
Increase/(Decrease) in net assets as a result of movements in share capital 747,876,451 (28,509,539) 672,388,665 (8,818,712)
Dividends declared 10 (11,860,388) (479,532) (2,014,655) (764,701) Foreign exchange adjustment 2(f) (104,748,096)* – – –
Net assets at the end of the year 6,216,332,570 436,821,114 1,875,238,033 428,391,758
* The combined figures have been calculated using the average exchange rates throughout the year. The resulting Foreign exchange adjustment of USD (104,748,096) represents the movement in exchange rates between 31 March 2016 and 31 March 2017. This is a notional amount, which has no impact on the Net Assets of the individual Funds.

The notes on pages 122 to 128 form an integral part of these financial statements.
22 BlackRock Global Index Funds (BGIF)
Statement of Operations and Changes in Net Assets for the year ended 31 March 2017 continued
Note
BlackRock Euro
Aggregate Bond Index
Fund
BlackRock Euro
Government Bond Index
Fund
BlackRock Global
Government Bond Index
Fund
BlackRock Japan
Equity Index Fund
EUR EUR USD USD
Net assets at the beginning of the year 368,577,325 788,111,812 81,444,953 135,168,420 Income Bank interest 2(c) – – – – Bond interest 2(c) 5,833,963 6,341,008 1,090,040 – Dividends, net of withholding taxes 2(c) – – – 2,689,123 Securities lending 2(c) 19,526 91,629 796 32,044
Total income 2(c) 5,853,489 6,432,637 1,090,836 2,721,167
Expenses Bank interest 2(c) 7,572 6,625 16,132 4,593 Administration fees 5 122,262 190,165 38,432 52,435 Depositary fees 2(i),6 125,278 167,396 91,342 78,370 Management fees 4 71,256 554,122 73,580 94,009
Total expenses before reimbursement 326,368 918,308 219,486 229,407
Reimbursement of expenses 29,523 – – –
Total expenses after reimbursement 296,845 918,308 219,486 229,407
Net investment income/(deficit) 5,556,644 5,514,329 871,350 2,491,760 Net realised gain/(loss) on:
Investments 2(b) 190,716 36,853,183 1,445,374 1,531,705 Futures contracts 2(d) – – – 277,742 Foreign currencies and forward foreign exchange transactions 2(d),2(e),2(j) (851) (18,774) (1,557,366) (691,913)
Net realised gain/(loss) for the year 189,865 36,834,409 (111,992) 1,117,534
Net change in unrealised appreciation/(depreciation) on: Investments (8,858,127) (43,897,101) (4,909,342) 14,021,457 Futures contracts 2(d) – – – (46,131) Foreign currencies and forward foreign exchange transactions 2(d),2(e),2(j) 340 21,427 (21,990) (67,049)
Net change in unrealised appreciation/(depreciation) for the year (8,857,787) (43,875,674) (4,931,332) 13,908,277
Increase/(Decrease) in net assets as a result of operations (3,111,278) (1,526,936) (4,171,974) 17,517,571
Movements in share capital Net receipts as a result of issue of shares 172,261,620 203,642,070 86,906,291 44,016,582 Net payments as a result of repurchase of shares (73,430,053) (553,597,938) (69,139,717) (45,784,261)
Increase/(Decrease) in net assets as a result of movements in share capital 98,831,567 (349,955,868) 17,766,574 (1,767,679)
Dividends declared 10 (2,088,380) (160,728) (26,396) (75,676) Foreign exchange adjustment 2(f) – – – –
Net assets at the end of the year 462,209,234 436,468,280 95,013,157 150,842,636

Annual Report and Audited Accounts 23
The notes on pages 122 to 128 form an integral part of these financial statements.
Statement of Operations and Changes in Net Assets for the year ended 31 March 2017 continued
Note
BlackRock North
America Equity Index
Fund
BlackRock Pacific ex
Japan Equity Index Fund
BlackRock World Equity
Index Fund
USD USD USD
Net assets at the beginning of the year 609,949,244 263,071,813 717,392,136 Income Bank interest 2(c) – 7,175 – Bond interest 2(c) – – – Dividends, net of withholding taxes 2(c) 10,870,359 11,312,150 18,406,627 Securities lending 2(c) 47,069 75,876 180,760
Total income 2(c) 10,917,428 11,395,201 18,587,387
Expenses Bank interest 2(c) 436 – 34,428 Administration fees 5 294,436 144,625 304,599 Depositary fees 2(i),6 171,231 186,587 313,501 Management fees 4 544,663 666,630 698,488
Total expenses before reimbursement 1,010,766 997,842 1,351,016
Reimbursement of expenses – – 23,902
Total expenses after reimbursement 1,010,766 997,842 1,327,114
Net investment income/(deficit) 9,906,662 10,397,359 17,260,273 Net realised gain/(loss) on:
Investments 2(b) 9,563,273 (437,633) 15,371,571 Futures contracts 2(d) 2,306,871 628,101 2,704,391 Foreign currencies and forward foreign exchange transactions 2(d),2(e),2(j) (202,139) (2,464,216) (5,306,900)
Net realised gain/(loss) for the year 11,668,005 (2,273,748) 12,769,062
Net change in unrealised appreciation/(depreciation) on: Investments 87,030,043 36,708,081 100,260,400 Futures contracts 2(d) (73,254) 23,227 (169,182) Foreign currencies and forward foreign exchange transactions 2(d),2(e),2(j) (68,406) (208,883) (234,720)
Net change in unrealised appreciation/(depreciation) for the year 86,888,383 36,522,425 99,856,498
Increase/(Decrease) in net assets as a result of operations 108,463,050 44,646,036 129,885,833
Movements in share capitalNet receipts as a result of issue of shares 291,116,652 97,537,640 625,530,285 Net payments as a result of repurchase of shares (225,117,658) (95,948,123) (320,110,133)
Increase/(Decrease) in net assets as a result of movements in share capital 65,998,994 1,589,517 305,420,152
Dividends declared 10 (461,648) (114,114) (5,383,926) Foreign exchange adjustment 2(f) – – –
Net assets at the end of the year 783,949,640 309,193,252 1,147,314,195

The notes on pages 122 to 128 form an integral part of these financial statements.
24 BlackRock Global Index Funds (BGIF)
Statement of Changes in Shares Outstandingfor the year ended 31 March 2017
Shares outstanding at the beginning
of the yearShares issued
Shares repurchased
Shares outstanding at the end
of the year
BlackRock Emerging Markets Equity Index FundA Class non-distributing share USD 1,018,623 698,995 538,646 1,178,972F Class non-distributing share EUR 24,202 28,199 8,756 43,645F Class non-distributing share USD 243,212 137,312 118,499 262,025N Class distributing share EUR 235,757 38,122 87,896 185,983N Class distributing share USD 39 – – 39N Class non-distributing share USD 930,559 126,618 331,586 725,591X Class non-distributing share EUR 1,715,073 56,956 207,360 1,564,669X Class non-distributing share USD 124,282 3,084 96,416 30,950
BlackRock Emerging Markets Government Bond Index FundA Class non-distributing share USD 156,274 274,644 328,867 102,051A Class non-distributing share EUR hedged(1) – 149,302 13,087 136,215I Class distributing share USD 50 160,384 60,962 99,472I Class non-distributing share USD 854,525 1,049,383 245,632 1,658,276I Class non-distributing share EUR hedged(1) – 2,620,915 168,868 2,452,047I Class non-distributing share GBP hedged(1) – 36,569 8,476 28,093N Class distributing share EUR 169,087 92,312 60,666 200,733X Class non-distributing share EUR(1) – 829,086 – 829,086X Class non-distributing share USD 8,678,655 2,943,619 2,304,344 9,317,930X Class non-distributing share EUR hedged(1) – 45 – 45X Class non-distributing share SEK hedged(1) – 1,024,211 – 1,024,211
BlackRock Europe Equity Index FundA Class non-distributing share EUR 217,327 195,477 192,590 220,214D Class non-distributing share EUR 117,564 10,212 7,428 120,348F Class non-distributing share EUR 635,230 173,245 354,276 454,199N Class distributing share EUR 202,429 49,570 54,375 197,624N Class distributing share USD 33 – – 33N Class non-distributing share EUR 59,179 206,430 102,041 163,568X Class non-distributing share EUR 1,605,301 160,748 332,744 1,433,305X Class non-distributing share USD(1) – 327,989 64,583 263,406
BlackRock Euro Aggregate Bond Index FundA Class non-distributing share EUR 990 8,213 1,146 8,057N Class distributing share EUR 798,078 990,675 55,734 1,733,019X Class non-distributing share EUR 2,417,510 530,165 575,342 2,372,333
BlackRock Euro Government Bond Index FundA Class non-distributing share EUR 519,927 60,285 195,961 384,251D Class non-distributing share EUR 433,946 358,668 739,675 52,939F Class non-distributing share EUR 153,753 20,683 80,767 93,669N Class distributing share EUR 1,665,124 55,857 1,671,260 49,721N Class non-distributing share EUR 1,427,041 749,829 1,267,584 909,286X Class non-distributing share EUR 2,232,924 398,508 553,103 2,078,329
BlackRock Global Government Bond Index FundA Class non-distributing share USD 3,958 9,481 9,785 3,654D Class non-distributing share EUR 25,560 137,101 105,554 57,107F Class non-distributing share USD 161,207 352,512 178,053 335,666N Class distributing share EUR 19,965 12,976 4,987 27,954N Class non-distributing share EUR 201,672 152,893 279,201 75,364N Class non-distributing share USD 50 – – 50X Class non-distributing share EUR(1) – 46 – 46X Class non-distributing share USD 410,115 178,826 98,745 490,196
BlackRock Japan Equity Index FundA Class non-distributing share USD 52,760 71,724 24,011 100,473F Class non-distributing share USD 253,146 61,100 110,820 203,426N Class distributing share EUR 28,776 2,957 6,307 25,426N Class distributing share USD 30 – – 30N Class non-distributing share USD 50,019 4,174 11,712 42,481X Class non-distributing share EUR 629,079 98,471 171,574 555,976X Class non-distributing share USD 14,533 71,264 3,681 82,116
(1) New share class launch, see Note 1 for further details.

Annual Report and Audited Accounts 25
The notes on pages 122 to 128 form an integral part of these financial statements.
Statement of Changes in Shares Outstandingfor the year ended 31 March 2017 continued
Shares outstanding at the beginning
of the yearShares issued
Shares repurchased
Shares outstanding at the end
of the year
BlackRock North America Equity Index FundA Class non-distributing share USD 65,291 50,645 55,386 60,550F Class non-distributing share USD 1,417,135 999,628 615,402 1,801,361N Class distributing share EUR 110,377 155,691 89,119 176,949N Class distributing share USD 4,156 – – 4,156N Class non-distributing share USD 281,978 56,940 67,879 271,039X Class non-distributing share EUR 2,126,862 42,740 506,396 1,663,206X Class non-distributing share USD 118,746 522,727 70,643 570,830
BlackRock Pacific ex Japan Equity Index FundA Class non-distributing UK reporting fund share USD 1,086,350 403,886 397,211 1,093,025F Class non-distributing UK reporting fund share USD 903,785 305,013 343,026 865,772N Class distributing share EUR 31,892 7,909 21,375 18,426N Class distributing share USD 38 – – 38N Class non-distributing share USD 77,748 24,227 11,982 89,993X Class non-distributing share EUR 505,999 66,945 131,399 441,545X Class non-distributing share USD 10,999 90,127 2,110 99,016
BlackRock World Equity Index FundA Class non-distributing share USD 34,101 73,515 59,410 48,206D Class non-distributing share EUR 17,977 9,694 9,250 18,421F Class non-distributing share EUR 39 1,320 1,053 306F Class non-distributing share GBP(1) – 154,135 32,083 122,052F Class non-distributing share USD 511,319 125,648 36,461 600,506N Class distributing share EUR 1,381,132 861,770 905,447 1,337,455N Class non-distributing share EUR 20,046 5,932 3,687 22,291N Class non-distributing share USD 527,671 68,357 149,333 446,695X Class non-distributing share EUR 745,534 66,067 100,527 711,074X Class non-distributing share USD 1,800,924 2,815,678 743,860 3,872,742
(1) New share class launch, see Note 1 for further details.

Transferable Securities and Money Market Instruments Admitted to an Official Stock Exchange Listing or Dealt in on Another Regulated Market
Transferable Securities and Money Market Instruments Admitted to an Official Stock Exchange Listing or Dealt in on Another Regulated Market
Holding Description
Market Value
USD
% of Net
Assets Holding Description
Market Value
USD
% of Net
Assets
* All or a portion of this security represents a security on loan.
Portfolio of InvestmentsUSD
26 BlackRock Global Index Funds (BGIF)
The notes on pages 122 to 128 form an integral part of these financial statements.
BlackRock Emerging Markets Equity Index Fund
COMMON / PREFERRED STOCKS (SHARES) & RIGHTS
Bermuda 382,000 Alibaba Health Information
Technology Ltd 172,067 0.04 1,120,000 Alibaba Pictures Group Ltd 203,237 0.05 496,000 Beijing Enterprises Water
Group Ltd * 367,679 0.08 354,000 Brilliance China Automotive
Holdings Ltd 592,259 0.13 178,000 China Gas Holdings Ltd * 286,807 0.06 86,000 China Resources Gas Group Ltd * 304,366 0.07 198,000 COSCO SHIPPING Ports Ltd 218,634 0.05 5,568 Credicorp Ltd 913,096 0.21 1,798,000 GOME Electrical Appliances
Holding Ltd 245,279 0.06 126,000 Haier Electronics Group Co Ltd 288,639 0.07 388,000 Kunlun Energy Co Ltd * 359,525 0.08 157,000 Nine Dragons Paper Holdings Ltd 168,714 0.04
4,120,302 0.94
Brazil 432,520 Ambev SA 2,492,749 0.57 81,972 Banco Bradesco SA 828,240 0.19 263,071 Banco Bradesco SA (Pref) 2,692,908 0.62 82,565 Banco do Brasil SA 884,760 0.20 43,114 Banco Santander Brasil SA (Unit) 378,228 0.09 66,914 BB Seguridade Participacoes SA 620,158 0.14 188,823 BM&FBovespa SA - Bolsa de
Valores Mercadorias e Futuros 1,146,024 0.26 56,476 BR Malls Participacoes SA 252,624 0.06 60,544 BRF SA 735,493 0.17 97,700 CCR SA 555,987 0.13 16,492 Centrais Eletricas Brasileiras SA 89,898 0.02 14,925 Centrais Eletricas Brasileiras SA
(Pref) 'B' 102,449 0.02 17,805 Cia Brasileira de Distribuicao (Pref) 342,951 0.08 44,300 Cia de Saneamento Basico do
Estado de Sao Paulo 456,828 0.11 79,141 Cia Energetica de Minas
Gerais (Pref) 257,142 0.06 40,056 Cia Siderurgica Nacional SA 115,238 0.03 97,388 Cielo SA 860,503 0.20 21,370 CPFL Energia SA 174,058 0.04 73,800 Embraer SA 409,735 0.09 24,500 Engie Brasil Energia SA 274,133 0.06 21,000 Equatorial Energia SA 385,347 0.09 34,900 Fibria Celulose SA 315,636 0.07 96,711 Gerdau SA (Pref) 327,043 0.08 34,544 Hypermarcas SA 316,667 0.07 300,607 Itau Unibanco Holding SA (Pref) 3,645,158 0.83 5,644 Itausa - Investimentos Itau SA 17,181 0.00 344,491 Itausa - Investimentos Itau SA (Pref) 1,048,671 0.24 79,100 JBS SA 259,504 0.06 53,303 Klabin SA (Unit) 254,909 0.06 143,971 Kroton Educacional SA 594,496 0.14 17,700 Localiza Rent a Car SA 233,837 0.05 71,850 Lojas Americanas SA (Pref) 368,537 0.08 70,900 Lojas Renner SA 610,133 0.14 4,600 M Dias Branco SA 184,795 0.04 20,300 Natura Cosmeticos SA 182,569 0.04 27,671 Odontoprev SA 98,462 0.02 285,933 Petroleo Brasileiro SA 1,370,112 0.31 408,335 Petroleo Brasileiro SA (Pref) 1,875,478 0.43 25,900 Raia Drogasil SA 477,386 0.11 22,722 Sul America SA (Unit) 120,059 0.03 62,500 Suzano Papel e Celulose SA
'A' (Pref) 257,685 0.06 45,441 Telefonica Brasil SA (Pref) 668,703 0.15
111,700 Tim Participacoes SA 357,293 0.08 30,735 Ultrapar Participacoes SA 696,229 0.16 110,227 Vale SA 1,029,233 0.24 184,967 Vale SA (Pref) 1,638,420 0.38 69,940 WEG SA 380,803 0.09
31,384,452 7.19
Cayman Islands 6,882 58.com Inc ADR 242,384 0.06 79,500 AAC Technologies Holdings Inc 930,540 0.21 107,234 Alibaba Group Holding Ltd ADR * 11,650,974 2.67 96,000 ANTA Sports Products Ltd 265,628 0.06 25,912 Baidu Inc ADR 4,452,977 1.02 576,000 Belle International Holdings Ltd 374,351 0.09 101,878 Chailease Holding Co Ltd 238,054 0.05 159,000 China Conch Venture Holdings Ltd 312,260 0.07 461,000 China Evergrande Group 427,168 0.10 444,000 China Huishan Dairy Holdings
Co Ltd * 23,999 0.01 81,000 China Medical System Holdings Ltd 143,648 0.03 298,000 China Mengniu Dairy Co Ltd 617,458 0.14 288,483 China Resources Land Ltd 779,659 0.18 230,000 China State Construction
International Holdings Ltd 411,441 0.09 659,200 Country Garden Holdings Co Ltd * 593,006 0.14 34,829 Ctrip.com International Ltd ADR 1,722,642 0.39 82,000 ENN Energy Holdings Ltd 461,697 0.11 435,000 Fullshare Holdings Ltd * 192,581 0.04 1,337,000 GCL-Poly Energy Holdings Ltd * 177,229 0.04 555,000 Geely Automobile Holdings Ltd 849,973 0.19 25,000 Haitian International Holdings Ltd 58,171 0.01 75,500 Hengan International Group Co Ltd 561,616 0.13 62,065 JD.com Inc ADR 1,945,117 0.45 103,000 Kingsoft Corp Ltd 283,672 0.06 139,000 Longfor Properties Co Ltd 228,618 0.05 7,975 NetEase Inc ADR 2,239,779 0.51 11,861 New Oriental Education &
Technology Group Inc ADR 706,678 0.16 280,100 Semiconductor Manufacturing
International Corp 346,779 0.08 58,000 Shenzhou International
Group Holdings Ltd * 366,127 0.08 179,500 Shimao Property Holdings Ltd 285,065 0.07 4,171 SINA Corp 300,312 0.07 397,000 Sino Biopharmaceutical Ltd 326,991 0.08 176,000 SOHO China Ltd 94,226 0.02 265,000 Sunac China Holdings Ltd 343,773 0.08 54,000 Sunny Optical Technology
Group Co Ltd * 394,736 0.09 3,779 TAL Education Group ADR 391,731 0.09 542,079 Tencent Holdings Ltd 15,543,284 3.56 224,000 Tingyi Cayman Islands
Holding Corp 281,360 0.06 36,367 Vipshop Holdings Ltd ADR 486,227 0.11 546,000 Want Want China Holdings Ltd 378,042 0.09 1,697 YY Inc ADR 78,571 0.02
50,508,544 11.56
Chile 6,872 Banco de Chile ADR 501,381 0.11 22,100 Banco Santander Chile ADR * 552,721 0.13 49,960 Cencosud SA ADR 464,628 0.11 16,530 Cia Cervecerias Unidas SA ADR * 418,374 0.09 43,697 Empresas COPEC SA 465,721 0.11 90,955 Enel Americas SA ADR * 945,023 0.22 63,049 Enel Chile SA ADR 342,987 0.08 16,611 Enel Generacion Chile SA ADR 372,253 0.08
Portfolio of Investments as at 31 March 2017
Brazil continued

Transferable Securities and Money Market Instruments Admitted to an Official Stock Exchange Listing or Dealt in on Another Regulated Market
Transferable Securities and Money Market Instruments Admitted to an Official Stock Exchange Listing or Dealt in on Another Regulated Market
Holding Description
Market Value
USD
% of Net
Assets Holding Description
Market Value
USD
% of Net
Assets
* All or a portion of this security represents a security on loan. ** Security subject to a fair value adjustment as detailed in Note 2(a).
Annual Report and Audited Accounts 27
The notes on pages 122 to 128 form an integral part of these financial statements.
BlackRock Emerging Markets Equity Index Fund continued
62,292 SACI Falabella 515,206 0.12 23,007 Sociedad Quimica y Minera
de Chile SA ADR 790,060 0.18
5,368,354 1.23
China 2,362,000 Agricultural Bank of China Ltd 'H' * 1,088,248 0.25 222,000 Air China Ltd 'H' 179,708 0.04 378,000 Aluminum Corp of China Ltd 'H' 184,859 0.04 105,000 Anhui Conch Cement Co Ltd 'H' * 356,745 0.08 337,000 AviChina Industry &
Technology Co Ltd 'H' 233,767 0.05 7,428,000 Bank of China Ltd 'H' 3,689,982 0.85 790,000 Bank of Communications Co Ltd 'H' 614,086 0.14 186,000 Beijing Capital International
Airport Co Ltd 'H' 222,618 0.05 66,500 Byd Co Ltd 'H' * 368,862 0.08 1,117,000 CGN Power Co Ltd 'H' '144A' 345,008 0.08 989,000 China Cinda Asset
Management Co Ltd 'H' 384,387 0.09 961,000 China CITIC Bank Corp Ltd 'H' 636,936 0.15 336,000 China Coal Energy Co Ltd 'H' 169,508 0.04 371,000 China Communications
Construction Co Ltd 'H' 523,298 0.12 7,979,000 China Construction Bank Corp 'H' 6,417,908 1.47 327,000 China Everbright Bank Co Ltd 'H' 159,918 0.04 191,000 China Galaxy Securities Co Ltd 'H' 176,245 0.04 411,000 China Huarong Asset Management
Co Ltd 'H' '144A' * 168,203 0.04 695,000 China Life Insurance Co Ltd 'H' 2,133,233 0.49 378,000 China Longyuan Power
Group Corp Ltd 'H' 293,828 0.07 354,292 China Merchants Bank Co Ltd 'H' 936,997 0.21 616,500 China Minsheng Banking
Corp Ltd 'H' 658,531 0.15 426,000 China National Building
Material Co Ltd 'H' 274,122 0.06 230,000 China Oilfield Services Ltd 'H' * 220,817 0.05 274,600 China Pacific Insurance
Group Co Ltd 'H' 991,285 0.23 2,451,200 China Petroleum &
Chemical Corp 'H' 1,987,395 0.46 189,500 China Railway
Construction Corp Ltd 'H' 268,755 0.06 384,000 China Railway Group Ltd 'H' * 343,464 0.08 364,000 China Shenhua Energy Co Ltd 'H' 845,090 0.19 195,722 China Southern Airlines Co Ltd 'H' 135,515 0.03 1,254,000 China Telecom Corp Ltd 'H' 611,648 0.14 118,200 China Vanke Co Ltd 'H' 319,449 0.07 64,300 Chongqing Changan
Automobile Co Ltd 'B' 89,372 0.02 302,000 Chongqing Rural Commercial
Bank Co Ltd 'H' 204,047 0.05 206,000 CITIC Securities Co Ltd 'H' 424,182 0.10 434,250 CRRC Corp Ltd 'H' * 421,941 0.10 310,000 Dongfeng Motor Group Co Ltd 'H' 348,290 0.08 105,400 GF Securities Co Ltd 'H' 220,831 0.05 301,500 Great Wall Motor Co Ltd 'H' * 343,396 0.08 234,000 Guangzhou Automobile
Group Co Ltd 'H' 374,629 0.09 131,200 Guangzhou R&F
Properties Co Ltd 'H' 204,983 0.05 291,600 Haitong Securities Co Ltd 'H' 493,115 0.11 446,000 Huaneng Power International Inc 'H' 297,898 0.07 95,400 Huatai Securities Co Ltd 'H' '144A' 185,637 0.04 6,963,000 Industrial & Commercial Bank of
China Ltd 'H' 4,552,240 1.04 138,000 Jiangsu Expressway Co Ltd 'H' 198,202 0.05 89,000 Jiangxi Copper Co Ltd 'H' 138,593 0.03
69,500 New China Life Insurance Co Ltd 'H' 330,942 0.08 758,000 People's Insurance Co Group of
China Ltd/The 'H' 314,116 0.07 1,912,000 PetroChina Co Ltd 'H' 1,400,120 0.32 405,872 PICC Property & Casualty Co Ltd 'H' 625,764 0.14 486,000 Ping An Insurance Group Co of
China Ltd 'H' * 2,720,762 0.62 264,000 Shandong Weigao Group Medical
Polymer Co Ltd 'H' 188,905 0.04 360,000 Shanghai Electric
Group Co Ltd 'H' * 178,373 0.04 63,000 Shanghai Fosun Pharmaceutical
Group Co Ltd 'H' * 231,884 0.05 101,700 Shanghai Pharmaceuticals
Holding Co Ltd 'H' 266,349 0.06 146,000 Sinopec Engineering
Group Co Ltd 'H' 149,941 0.03 90,000 Sinopec Shanghai
Petrochemical Co Ltd 'H' 49,921 0.01 134,400 Sinopharm Group Co Ltd 'H' 623,547 0.14 101,000 Sinotrans Ltd 'H' 47,184 0.01 59,000 TravelSky Technology Ltd 'H' 139,409 0.03 50,000 Tsingtao Brewery Co Ltd 'H' * 230,366 0.05 156,000 Zhejiang Expressway Co Ltd 'H' 203,978 0.05 45,500 Zhuzhou CRRC Times
Electric Co Ltd 241,839 0.06 722,000 Zijin Mining Group Co Ltd 'H' 267,605 0.06 88,800 ZTE Corp 'H' 162,966 0.04
42,811,742 9.80
Colombia 25,413 Bancolombia SA (Pref) 255,187 0.06 6,379 Bancolombia SA ADR 256,308 0.06 66,106 Ecopetrol SA ADR 614,786 0.14 37,749 Grupo Aval Acciones
y Valores SA ADR 306,522 0.07
1,432,803 0.33
Czech Republic 12,278 CEZ AS 211,889 0.05 8,520 Komercni banka AS 317,043 0.07 56,577 Moneta Money Bank AS '144A' * 191,922 0.05
720,854 0.17
Egypt 96,587 Commercial International Bank
Egypt SAE GDR Reg 420,154 0.10 45,859 Global Telecom Holding SAE GDR ** 85,112 0.02
505,266 0.12
Greece 104,201 Alpha Bank AE 188,154 0.04 71,671 Eurobank Ergasias SA 43,496 0.01 8,203 FF Group 157,761 0.04 23,427 Hellenic Telecommunications
Organization SA 222,021 0.05 10,685 JUMBO SA 167,022 0.04 414,788 National Bank of Greece SA 106,363 0.02 23,356 OPAP SA 218,603 0.05
1,103,420 0.25
Hong Kong 58,500 Beijing Enterprises Holdings Ltd * 302,654 0.07 277,000 China Everbright International Ltd * 372,886 0.09 70,000 China Everbright Ltd 141,257 0.03 110,561 China Merchants Port
Holdings Co Ltd 323,704 0.07
Portfolio of Investments as at 31 March 2017
China continued Chile continued

Transferable Securities and Money Market Instruments Admitted to an Official Stock Exchange Listing or Dealt in on Another Regulated Market
Transferable Securities and Money Market Instruments Admitted to an Official Stock Exchange Listing or Dealt in on Another Regulated Market
Holding Description
Market Value
USD
% of Net
Assets Holding Description
Market Value
USD
% of Net
Assets
* All or a portion of this security represents a security on loan.
28 BlackRock Global Index Funds (BGIF)
The notes on pages 122 to 128 form an integral part of these financial statements.
BlackRock Emerging Markets Equity Index Fund continued
586,000 China Mobile Ltd 6,414,118 1.47 336,000 China Overseas Land &
Investment Ltd 959,969 0.22 279,000 China Power International
Development Ltd 103,769 0.02 140,174 China Resources Beer
Holdings Co Ltd * 318,944 0.07 207,146 China Resources Power
Holdings Co Ltd 373,757 0.09 189,000 China Taiping Insurance
Holdings Co Ltd * 457,769 0.11 570,000 China Unicom Hong Kong Ltd * 762,910 0.17 419,000 CITIC Ltd 597,474 0.14 1,655,000 CNOOC Ltd 1,976,565 0.45 404,000 CSPC Pharmaceutical Group Ltd 529,291 0.12 169,000 Far East Horizon Ltd 158,772 0.04 219,620 Fosun International Ltd 330,126 0.08 220,000 Guangdong Investment Ltd 313,709 0.07 824,000 Lenovo Group Ltd 542,953 0.12 47,000 Shanghai Industrial Holdings Ltd 138,213 0.03 422,000 Sino-Ocean Group Holding Ltd 198,230 0.05 229,000 Sun Art Retail Group Ltd 214,552 0.05
15,531,622 3.56
Hungary 3,987 MOL Hungarian Oil & Gas Plc * 273,657 0.06 19,726 OTP Bank Plc 555,126 0.13 15,477 Richter Gedeon Nyrt 355,282 0.08
1,184,065 0.27
India 14,726 Axis Bank Ltd GDR RegS * 558,115 0.13 25,200 Dr Reddy's Laboratories Ltd ADR 1,026,396 0.23 21,898 GAIL India Ltd GDR RegS * 1,006,213 0.23 57,846 ICICI Bank Ltd ADR 492,559 0.11 188,006 Infosys Ltd ADR * 2,950,754 0.68 40,077 Larsen & Toubro Ltd GDR RegS * 969,863 0.22 69,628 Mahindra & Mahindra Ltd GDR * 1,389,079 0.32 74,771 Reliance Industries Ltd GDR '144A' 3,013,271 0.69 23,896 State Bank of India GDR RegS 1,071,736 0.25 30,985 Tata Motors Ltd ADR 1,100,277 0.25 100,993 Tata Steel Ltd GDR RegS * 739,269 0.17 83,648 Vedanta Ltd ADR 1,416,161 0.32 94,130 Wipro Ltd ADR 969,539 0.22
16,703,232 3.82
Indonesia 2,535,300 Astra International Tbk PT 1,640,986 0.38 1,105,500 Bank Central Asia Tbk PT 1,373,009 0.31 892,200 Bank Mandiri Persero Tbk PT 783,366 0.18 777,000 Bank Negara Indonesia
Persero Tbk PT 377,552 0.09 1,168,400 Bank Rakyat Indonesia
Persero Tbk PT 1,137,668 0.26 823,200 Charoen Pokphand
Indonesia Tbk PT 197,684 0.05 57,300 Gudang Garam Tbk PT 281,759 0.06 405,000 Hanjaya Mandala
Sampoerna Tbk PT 118,532 0.03 214,300 Indocement Tunggal
Prakarsa Tbk PT 266,960 0.06 459,200 Indofood Sukses Makmur Tbk PT 275,682 0.06 3,938,100 Kalbe Farma Tbk PT 455,118 0.10 2,839,300 Lippo Karawaci Tbk PT 154,478 0.04 232,800 Matahari Department Store Tbk PT 230,171 0.05 668,200 Media Nusantara Citra Tbk PT 92,767 0.02 1,372,400 Perusahaan Gas Negara
Persero Tbk 260,566 0.06
308,882 Semen Indonesia Persero Tbk PT 208,618 0.05 5,004,000 Telekomunikasi Indonesia
Persero Tbk PT 1,550,900 0.36 167,700 Unilever Indonesia Tbk PT 545,241 0.12 191,300 United Tractors Tbk PT 380,432 0.09
10,331,489 2.37
Malaysia 222,200 AMMB Holdings Bhd 233,472 0.05 223,000 Astro Malaysia Holdings Bhd 138,068 0.03 317,973 Axiata Group Bhd 363,562 0.08 14,300 British American Tobacco
Malaysia Bhd 147,346 0.03 338,089 CIMB Group Holdings Bhd 425,524 0.10 486,032 Dialog Group Bhd 194,391 0.05 384,500 DiGi.Com Bhd 445,709 0.10 128,500 Felda Global Ventures
Holdings Bhd 60,686 0.01 185,800 Gamuda Bhd 217,477 0.05 253,592 Genting Bhd 549,531 0.13 329,800 Genting Malaysia Bhd 406,149 0.09 62,500 Hong Leong Bank Bhd 194,328 0.05 316,300 IHH Healthcare Bhd 428,833 0.10 357,300 IJM Corp Bhd 274,505 0.06 217,200 IOI Corp Bhd 228,218 0.05 448,727 IOI Properties Group Bhd 209,889 0.05 57,200 Kuala Lumpur Kepong Bhd 318,991 0.07 311,846 Malayan Banking Bhd 628,554 0.14 206,300 Maxis Bhd 300,208 0.07 116,700 MISC Bhd 193,028 0.05 259,900 Petronas Chemicals Group Bhd 452,204 0.10 18,700 Petronas Dagangan Bhd 101,412 0.02 82,500 Petronas Gas Bhd 368,365 0.09 40,700 PPB Group Bhd 153,953 0.04 281,700 Public Bank Bhd 1,266,711 0.29 15,337 RHB Capital Bhd 17,917 0.01 442,600 Sapura Energy Bhd 182,021 0.04 254,486 Sime Darby Bhd 533,641 0.12 109,206 Telekom Malaysia Bhd 158,423 0.04 325,200 Tenaga Nasional Bhd 1,008,190 0.23 3,500 UMW Holdings Bhd 4,745 0.00 666,000 YTL Corp Bhd 224,232 0.05
10,430,283 2.39
Malta 30,747 Brait SE 180,499 0.04
180,499 0.04
Mexico 324,800 Alfa SAB de CV 'A' 472,969 0.11 2,952,844 America Movil SAB de CV 'L' 2,109,793 0.48 49,200 Arca Continental SAB de CV 337,365 0.08 1,265,519 Cemex SAB de CV (Unit) 1,124,861 0.26 54,700 Coca-Cola Femsa SAB de CV 'L' 395,087 0.09 21,100 El Puerto de Liverpool
SAB de CV 'C1' 165,587 0.04 274,550 Fibra Uno Administracion SA
de CV (Reit) 466,403 0.11 166,218 Fomento Economico
Mexicano SAB de CV (Unit) 1,488,956 0.34 81,307 Gentera SAB de CV 135,869 0.03 24,300 Gruma SAB de CV 'B' 346,999 0.08 34,300 Grupo Aeroportuario del Pacifico
SAB de CV 'B' 332,914 0.08 23,000 Grupo Aeroportuario del Sureste
SAB de CV 'B' 410,234 0.09 160,268 Grupo Bimbo SAB de CV 'A' 398,480 0.09 61,100 Grupo Carso SAB de CV 'A1' 287,932 0.07
Portfolio of Investments as at 31 March 2017
Hong Kong continued Indonesia continued

Transferable Securities and Money Market Instruments Admitted to an Official Stock Exchange Listing or Dealt in on Another Regulated Market
Transferable Securities and Money Market Instruments Admitted to an Official Stock Exchange Listing or Dealt in on Another Regulated Market
Holding Description
Market Value
USD
% of Net
Assets Holding Description
Market Value
USD
% of Net
Assets
* All or a portion of this security represents a security on loan.
Annual Report and Audited Accounts 29
The notes on pages 122 to 128 form an integral part of these financial statements.
BlackRock Emerging Markets Equity Index Fund continued
239,770 Grupo Financiero Banorte SAB de CV 'O' 1,384,707 0.32
225,100 Grupo Financiero Inbursa SAB de CV 'O' 369,315 0.08
198,300 Grupo Financiero Santander Mexico SAB de CV 'B' 358,440 0.08
375,577 Grupo Mexico SAB de CV 'B' 1,151,093 0.26 250,874 Grupo Televisa SAB 'CPO' (Unit) 1,296,607 0.30 15,540 Industrias Penoles SAB de CV 393,925 0.09 38,702 Infraestructura Energetica Nova
SAB de CV 182,134 0.04 153,952 Kimberly-Clark de Mexico
SAB de CV 'A' 332,292 0.08 118,593 Mexichem SAB de CV 324,393 0.07 86,800 OHL Mexico SAB de CV 122,139 0.03 27,200 Promotora y Operadora de
Infraestructura SAB de CV 295,923 0.07 546,189 Wal-Mart de Mexico SAB de CV 1,242,391 0.28
15,926,808 3.65
Netherlands 300,531 Steinhoff International
Holdings NV * 1,452,796 0.33
1,452,796 0.33
Peru 7,012 Cia de Minas
Buenaventura SAA ADR 83,443 0.02
83,443 0.02
Philippines 214,070 Aboitiz Equity Ventures Inc 317,638 0.07 235,700 Aboitiz Power Corp 196,123 0.04 25,040 Ayala Corp 421,700 0.10 762,500 Ayala Land Inc 502,255 0.11 92,266 Bank of the Philippine Islands 186,095 0.04 222,303 BDO Unibank Inc 521,033 0.12 713,700 Energy Development Corp 85,630 0.02 2,785 Globe Telecom Inc 112,788 0.03 8,225 GT Capital Holdings Inc 187,695 0.04 340,540 JG Summit Holdings Inc 552,126 0.13 43,000 Jollibee Foods Corp 169,258 0.04 1,346,000 Megaworld Corp 90,672 0.02 1,468,000 Metro Pacific Investments Corp 176,131 0.04 11,455 PLDT Inc 375,783 0.09 24,967 SM Investments Corp 346,826 0.08 971,400 SM Prime Holdings Inc 547,895 0.13 109,340 Universal Robina Corp 356,295 0.08
5,145,943 1.18
Poland 15,373 Bank Pekao SA 513,429 0.12 3,899 Bank Zachodni WBK SA * 339,200 0.08 25,268 Cyfrowy Polsat SA 152,712 0.03 9,217 Eurocash SA * 73,731 0.02 1,793 Grupa Azoty SA 31,464 0.01 16,695 KGHM Polska Miedz SA 492,070 0.11 157 LPP SA 267,127 0.06 2,520 mBank SA 239,612 0.05 72,655 Orange Polska SA 84,704 0.02 93,163 PGE Polska Grupa Energetyczna SA 265,656 0.06 26,489 Polski Koncern Naftowy ORLEN SA * 695,179 0.16 223,399 Polskie Gornictwo Naftowe i
Gazownictwo SA * 335,426 0.08 83,642 Powszechna Kasa Oszczednosci
Bank Polski SA 678,795 0.16 53,654 Powszechny Zaklad Ubezpieczen SA * 473,609 0.11
229,973 Tauron Polska Energia SA * 194,410 0.04
4,837,124 1.11
Qatar 16,558 Barwa Real Estate Co 162,574 0.04 22,177 Commercial Bank QSC/The 206,781 0.05 93,926 Ezdan Holding Group QSC 407,577 0.09 15,362 Industries Qatar QSC 465,362 0.11 35,298 Masraf Al Rayan QSC 408,616 0.09 10,465 Ooredoo QSC 277,641 0.06 2,850 Qatar Electricity & Water Co QSC 172,201 0.04 12,479 Qatar Insurance Co SAQ 240,936 0.06 7,215 Qatar Islamic Bank SAQ 202,712 0.05 22,072 Qatar National Bank QPSC 885,644 0.20
3,430,044 0.79
Russia 564,731 Gazprom PJSC ADR 2,527,171 0.58 41,026 Lukoil PJSC ADR 2,178,481 0.50 28,025 Magnit PJSC GDR RegS 1,075,599 0.25 66,510 MMC Norilsk Nickel PJSC ADR 1,045,870 0.24 57,201 Mobile TeleSystems PJSC ADR 637,505 0.14 9,121 Novatek PJSC GDR RegS 1,141,037 0.26 136,924 Rosneft Oil Co PJSC GDR RegS 781,151 0.18 23,151 Rostelecom PJSC ADR 189,607 0.04 129,871 RusHydro PJSC ADR 211,690 0.05 278,954 Sberbank of Russia PJSC ADR 3,228,893 0.74 35,517 Severstal PJSC GDR RegS 512,155 0.12 18,699 Sistema PJSC GDR RegS 168,104 0.04 72,380 Surgutneftegas OJSC ADR
(traded in United Kingdom) 369,138 0.08 62,735 Surgutneftegas OJSC ADR
(traded in United States) 319,948 0.07 24,788 Tatneft PJSC ADR 921,618 0.21 303,447 VTB Bank PJSC GDR RegS 694,590 0.16
16,002,557 3.66
South Africa 5,823 Anglo American Platinum Ltd 131,928 0.03 45,922 AngloGold Ashanti Ltd * 487,317 0.11 37,897 Aspen Pharmacare Holdings Ltd 783,684 0.18 42,805 Barclays Africa Group Ltd * 451,935 0.10 35,588 Bid Corp Ltd 691,656 0.16 35,588 Bidvest Group Ltd/The 406,925 0.09 4,073 Capitec Bank Holdings Ltd 233,640 0.05 13,577 Coronation Fund Managers Ltd 64,171 0.02 26,772 Discovery Ltd * 258,176 0.06 341,236 FirstRand Ltd * 1,180,851 0.27 80,520 Fortress Income Fund Ltd 201,815 0.05 49,000 Fortress Income Fund Ltd 'A' * 61,150 0.01 25,172 Foschini Group Ltd/The 293,095 0.07 105,034 Gold Fields Ltd 368,105 0.08 200,699 Growthpoint Properties Ltd (Reit) 391,231 0.09 30,910 Hyprop Investments Ltd (Reit) 283,590 0.07 56,828 Impala Platinum Holdings Ltd * 193,084 0.04 9,095 Imperial Holdings Ltd 112,217 0.03 16,136 Investec Ltd 110,169 0.03 110,547 Life Healthcare Group
Holdings Ltd 238,556 0.05 37,825 Life Healthcare Group
Holdings Ltd (Right) 12,897 0.00 140,820 MMI Holdings Ltd * 243,760 0.06 13,100 Mondi Ltd 314,890 0.07 23,090 Mr Price Group Ltd * 276,830 0.06 152,837 MTN Group Ltd * 1,404,632 0.32 41,642 Naspers Ltd 'N' * 7,231,284 1.66 19,233 Nedbank Group Ltd * 349,491 0.08 112,832 Netcare Ltd * 215,983 0.05
Portfolio of Investments as at 31 March 2017
Mexico continued Poland continued

Transferable Securities and Money Market Instruments Admitted to an Official Stock Exchange Listing or Dealt in on Another Regulated Market
Transferable Securities and Money Market Instruments Admitted to an Official Stock Exchange Listing or Dealt in on Another Regulated Market
Holding Description
Market Value
USD
% of Net
Assets Holding Description
Market Value
USD
% of Net
Assets
* All or a portion of this security represents a security on loan.
30 BlackRock Global Index Funds (BGIF)
The notes on pages 122 to 128 form an integral part of these financial statements.
BlackRock Emerging Markets Equity Index Fund continued
18,468 Pick n Pay Stores Ltd 92,521 0.02 16,203 Pioneer Foods Group Ltd 215,269 0.05 13,631 PSG Group Ltd * 253,270 0.06 69,305 Rand Merchant Investment
Holdings Ltd * 214,490 0.05 492,118 Redefine Properties Ltd (Reit) 406,978 0.09 53,686 Remgro Ltd 834,569 0.19 35,686 Resilient Ltd (Reit) 311,531 0.07 73,159 RMB Holdings Ltd * 322,805 0.07 142,049 Sanlam Ltd * 716,844 0.16 43,842 Sappi Ltd 299,760 0.07 51,367 Sasol Ltd * 1,508,084 0.35 32,474 Shoprite Holdings Ltd 466,552 0.11 59,733 Sibanye Gold Ltd 128,097 0.03 18,226 SPAR Group Ltd/The 237,062 0.05 117,459 Standard Bank Group Ltd * 1,267,710 0.29 26,256 Telkom SA SOC Ltd 147,793 0.03 18,077 Tiger Brands Ltd 543,118 0.12 45,315 Truworths International Ltd * 293,804 0.07 41,188 Vodacom Group Ltd 471,666 0.11 112,759 Woolworths Holdings Ltd * 589,943 0.14
26,314,928 6.02
South Korea 3,088 Amorepacific Corp 774,554 0.18 942 Amorepacific Corp (Pref) 140,672 0.03 2,924 Amorepacific Group 312,455 0.07 1,508 BGF retail Co Ltd 141,590 0.03 22,635 BNK Financial Group Inc 185,808 0.04 7,951 Celltrion Inc 640,602 0.15 9,474 Cheil Worldwide Inc 160,964 0.04 924 CJ CheilJedang Corp 291,668 0.07 1,337 CJ Corp 208,028 0.05 561 CJ Korea Express Corp 83,525 0.02 6,293 Coway Co Ltd 541,345 0.12 3,247 Daelim Industrial Co Ltd 234,894 0.05 4,987 Dongbu Insurance Co Ltd 285,405 0.07 2,457 E-Mart Inc 451,501 0.10 7,875 GS Engineering &
Construction Corp 216,187 0.05 3,232 GS Holdings Corp 170,805 0.04 25,880 Hana Financial Group Inc 855,107 0.20 8,742 Hankook Tire Co Ltd 426,039 0.10 725 Hanmi Pharm Co Ltd 193,843 0.04 1,800 Hanmi Science Co Ltd 94,000 0.02 22,250 Hanon Systems 184,637 0.04 1,086 Hanssem Co Ltd 213,646 0.05 11,720 Hanwha Chemical Corp 276,677 0.06 23,568 Hanwha Life Insurance Co Ltd 127,292 0.03 3,803 Hotel Shilla Co Ltd 153,371 0.04 2,720 Hyosung Corp 329,572 0.08 1,651 Hyundai Department Store Co Ltd 149,111 0.03 6,442 Hyundai Development
Co-Engineering & Construction 234,165 0.05 8,251 Hyundai Engineering &
Construction Co Ltd 365,219 0.08 2,218 Hyundai Glovis Co Ltd 291,555 0.07 4,354 Hyundai Heavy Industries Co Ltd 642,413 0.15 6,290 Hyundai Marine & Fire
Insurance Co Ltd 196,861 0.05 6,112 Hyundai Mobis Co Ltd 1,314,438 0.30 14,932 Hyundai Motor Co 2,103,005 0.48 4,481 Hyundai Motor Co (2nd Pref) 414,722 0.10 1,784 Hyundai Motor Co (Pref) 158,411 0.04 8,800 Hyundai Steel Co 460,342 0.11 1,702 Hyundai Wia Corp 103,341 0.02 32,866 Industrial Bank of Korea 358,549 0.08 3,659 Kakao Corp 271,897 0.06 12,279 Kangwon Land Inc 419,438 0.10
38,015 KB Financial Group Inc 1,665,684 0.38 724 KCC Corp 229,184 0.05 2,706 KEPCO Plant Service &
Engineering Co Ltd 150,992 0.03 27,032 Kia Motors Corp 895,588 0.21 6,258 Korea Aerospace Industries Ltd 322,329 0.07 25,971 Korea Electric Power Corp 1,078,738 0.25 803 Korea Gas Corp 32,276 0.01 4,240 Korea Investment Holdings Co Ltd 178,578 0.04 979 Korea Zinc Co Ltd 378,188 0.09 12,095 KT&G Corp 1,054,514 0.24 4,063 LG Chem Ltd 1,068,159 0.24 771 LG Chem Ltd (Pref) 131,338 0.03 7,227 LG Corp 453,667 0.10 21,762 LG Display Co Ltd 588,662 0.13 8,780 LG Electronics Inc 533,097 0.12 976 LG Household & Health Care Ltd 707,803 0.16 1,801 LG Innotek Co Ltd 219,831 0.05 20,548 LG Uplus Corp 262,753 0.06 1,474 Lotte Chemical Corp 488,346 0.11 1,021 Lotte Shopping Co Ltd 198,576 0.05 53,537 Mirae Asset Daewoo Co Ltd 432,777 0.10 2,564 NAVER Corp 1,960,315 0.45 1,722 NCSoft Corp 469,650 0.11 12,036 NH Investment & Securities Co Ltd 135,073 0.03 1,443 OCI Co Ltd 109,293 0.03 382 Orion Corp 228,865 0.05 7,437 POSCO 1,935,229 0.44 2,404 S-1 Corp 192,827 0.04 3,950 S-Oil Corp 354,981 0.08 7,288 Samsung C&T Corp 830,922 0.19 5,884 Samsung Card Co Ltd 206,253 0.05 7,030 Samsung Electro-
Mechanics Co Ltd 436,900 0.10 9,453 Samsung Electronics Co Ltd 17,413,199 3.99 1,641 Samsung Electronics Co Ltd (Pref) 2,352,252 0.54 3,458 Samsung Fire & Marine
Insurance Co Ltd 828,708 0.19 25,892 Samsung Heavy Industries Co Ltd 259,314 0.06 7,086 Samsung Life Insurance Co Ltd 687,500 0.16 5,284 Samsung SDI Co Ltd 652,054 0.15 3,997 Samsung SDS Co Ltd 477,152 0.11 7,881 Samsung Securities Co Ltd 237,142 0.05 38,977 Shinhan Financial Group Co Ltd 1,624,187 0.37 856 Shinsegae Inc 146,200 0.03 4,443 SK Holdings Co Ltd 967,424 0.22 53,207 SK Hynix Inc 2,402,713 0.55 6,762 SK Innovation Co Ltd 1,006,772 0.23 986 SK Telecom Co Ltd 222,187 0.05 22,578 Woori Bank 262,464 0.06 663 Yuhan Corp 131,912 0.03
62,780,222 14.37
Taiwan 630,083 Advanced Semiconductor
Engineering Inc 804,670 0.18 39,579 Advantech Co Ltd 331,320 0.08 174,689 Asia Cement Corp 176,171 0.04 59,000 Asustek Computer Inc 583,340 0.13 1,040,000 AU Optronics Corp 406,163 0.09 63,000 Catcher Technology Co Ltd 622,889 0.14 836,611 Cathay Financial Holding Co Ltd 1,342,768 0.31 402,005 Chang Hwa Commercial Bank Ltd 245,105 0.06 210,600 Cheng Shin Rubber Industry Co Ltd 435,186 0.10 487,423 China Airlines Ltd 169,476 0.04 1,247,000 China Development Financial
Holding Corp 342,342 0.08 334,108 China Life Insurance Co Ltd 330,337 0.08 1,190,973 China Steel Corp 993,050 0.23
Portfolio of Investments as at 31 March 2017
South Africa continued South Korea continued
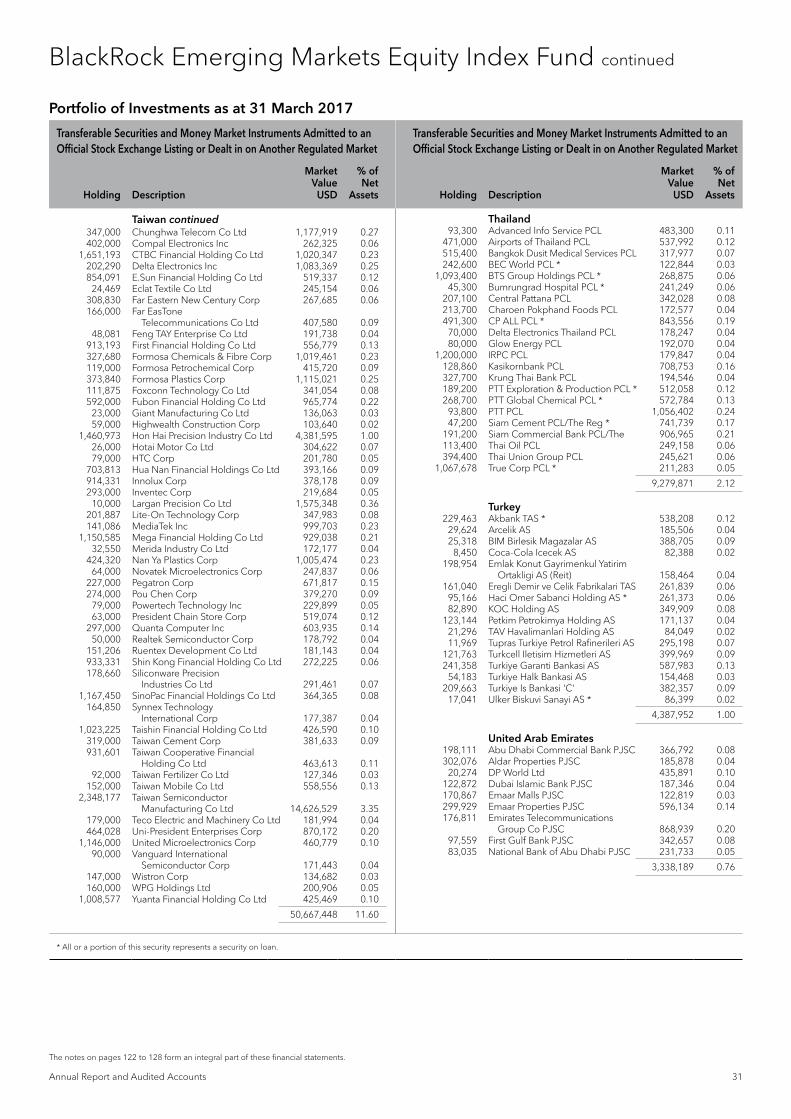
Transferable Securities and Money Market Instruments Admitted to an Official Stock Exchange Listing or Dealt in on Another Regulated Market
Transferable Securities and Money Market Instruments Admitted to an Official Stock Exchange Listing or Dealt in on Another Regulated Market
Holding Description
Market Value
USD
% of Net
Assets Holding Description
Market Value
USD
% of Net
Assets
* All or a portion of this security represents a security on loan.
Annual Report and Audited Accounts 31
The notes on pages 122 to 128 form an integral part of these financial statements.
BlackRock Emerging Markets Equity Index Fund continued
347,000 Chunghwa Telecom Co Ltd 1,177,919 0.27 402,000 Compal Electronics Inc 262,325 0.06 1,651,193 CTBC Financial Holding Co Ltd 1,020,347 0.23 202,290 Delta Electronics Inc 1,083,369 0.25 854,091 E.Sun Financial Holding Co Ltd 519,337 0.12 24,469 Eclat Textile Co Ltd 245,154 0.06 308,830 Far Eastern New Century Corp 267,685 0.06 166,000 Far EasTone
Telecommunications Co Ltd 407,580 0.09 48,081 Feng TAY Enterprise Co Ltd 191,738 0.04 913,193 First Financial Holding Co Ltd 556,779 0.13 327,680 Formosa Chemicals & Fibre Corp 1,019,461 0.23 119,000 Formosa Petrochemical Corp 415,720 0.09 373,840 Formosa Plastics Corp 1,115,021 0.25 111,875 Foxconn Technology Co Ltd 341,054 0.08 592,000 Fubon Financial Holding Co Ltd 965,774 0.22 23,000 Giant Manufacturing Co Ltd 136,063 0.03 59,000 Highwealth Construction Corp 103,640 0.02 1,460,973 Hon Hai Precision Industry Co Ltd 4,381,595 1.00 26,000 Hotai Motor Co Ltd 304,622 0.07 79,000 HTC Corp 201,780 0.05 703,813 Hua Nan Financial Holdings Co Ltd 393,166 0.09 914,331 Innolux Corp 378,178 0.09 293,000 Inventec Corp 219,684 0.05 10,000 Largan Precision Co Ltd 1,575,348 0.36 201,887 Lite-On Technology Corp 347,983 0.08 141,086 MediaTek Inc 999,703 0.23 1,150,585 Mega Financial Holding Co Ltd 929,038 0.21 32,550 Merida Industry Co Ltd 172,177 0.04 424,320 Nan Ya Plastics Corp 1,005,474 0.23 64,000 Novatek Microelectronics Corp 247,837 0.06 227,000 Pegatron Corp 671,817 0.15 274,000 Pou Chen Corp 379,270 0.09 79,000 Powertech Technology Inc 229,899 0.05 63,000 President Chain Store Corp 519,074 0.12 297,000 Quanta Computer Inc 603,935 0.14 50,000 Realtek Semiconductor Corp 178,792 0.04 151,206 Ruentex Development Co Ltd 181,143 0.04 933,331 Shin Kong Financial Holding Co Ltd 272,225 0.06 178,660 Siliconware Precision
Industries Co Ltd 291,461 0.07 1,167,450 SinoPac Financial Holdings Co Ltd 364,365 0.08 164,850 Synnex Technology
International Corp 177,387 0.04 1,023,225 Taishin Financial Holding Co Ltd 426,590 0.10 319,000 Taiwan Cement Corp 381,633 0.09 931,601 Taiwan Cooperative Financial
Holding Co Ltd 463,613 0.11 92,000 Taiwan Fertilizer Co Ltd 127,346 0.03 152,000 Taiwan Mobile Co Ltd 558,556 0.13 2,348,177 Taiwan Semiconductor
Manufacturing Co Ltd 14,626,529 3.35 179,000 Teco Electric and Machinery Co Ltd 181,994 0.04 464,028 Uni-President Enterprises Corp 870,172 0.20 1,146,000 United Microelectronics Corp 460,779 0.10 90,000 Vanguard International
Semiconductor Corp 171,443 0.04 147,000 Wistron Corp 134,682 0.03 160,000 WPG Holdings Ltd 200,906 0.05 1,008,577 Yuanta Financial Holding Co Ltd 425,469 0.10
50,667,448 11.60
Thailand 93,300 Advanced Info Service PCL 483,300 0.11 471,000 Airports of Thailand PCL 537,992 0.12 515,400 Bangkok Dusit Medical Services PCL 317,977 0.07 242,600 BEC World PCL * 122,844 0.03 1,093,400 BTS Group Holdings PCL * 268,875 0.06 45,300 Bumrungrad Hospital PCL * 241,249 0.06 207,100 Central Pattana PCL 342,028 0.08 213,700 Charoen Pokphand Foods PCL 172,577 0.04 491,300 CP ALL PCL * 843,556 0.19 70,000 Delta Electronics Thailand PCL 178,247 0.04 80,000 Glow Energy PCL 192,070 0.04 1,200,000 IRPC PCL 179,847 0.04 128,860 Kasikornbank PCL 708,753 0.16 327,700 Krung Thai Bank PCL 194,546 0.04 189,200 PTT Exploration & Production PCL * 512,058 0.12 268,700 PTT Global Chemical PCL * 572,784 0.13 93,800 PTT PCL 1,056,402 0.24 47,200 Siam Cement PCL/The Reg * 741,739 0.17 191,200 Siam Commercial Bank PCL/The 906,965 0.21 113,400 Thai Oil PCL 249,158 0.06 394,400 Thai Union Group PCL 245,621 0.06 1,067,678 True Corp PCL * 211,283 0.05
9,279,871 2.12
Turkey 229,463 Akbank TAS * 538,208 0.12 29,624 Arcelik AS 185,506 0.04 25,318 BIM Birlesik Magazalar AS 388,705 0.09 8,450 Coca-Cola Icecek AS 82,388 0.02 198,954 Emlak Konut Gayrimenkul Yatirim
Ortakligi AS (Reit) 158,464 0.04 161,040 Eregli Demir ve Celik Fabrikalari TAS 261,839 0.06 95,166 Haci Omer Sabanci Holding AS * 261,373 0.06 82,890 KOC Holding AS 349,909 0.08 123,144 Petkim Petrokimya Holding AS 171,137 0.04 21,296 TAV Havalimanlari Holding AS 84,049 0.02 11,969 Tupras Turkiye Petrol Rafinerileri AS 295,198 0.07 121,763 Turkcell Iletisim Hizmetleri AS 399,969 0.09 241,358 Turkiye Garanti Bankasi AS 587,983 0.13 54,183 Turkiye Halk Bankasi AS 154,468 0.03 209,663 Turkiye Is Bankasi 'C' 382,357 0.09 17,041 Ulker Biskuvi Sanayi AS * 86,399 0.02
4,387,952 1.00
United Arab Emirates 198,111 Abu Dhabi Commercial Bank PJSC 366,792 0.08 302,076 Aldar Properties PJSC 185,878 0.04 20,274 DP World Ltd 435,891 0.10 122,872 Dubai Islamic Bank PJSC 187,346 0.04 170,867 Emaar Malls PJSC 122,819 0.03 299,929 Emaar Properties PJSC 596,134 0.14 176,811 Emirates Telecommunications
Group Co PJSC 868,939 0.20 97,559 First Gulf Bank PJSC 342,657 0.08 83,035 National Bank of Abu Dhabi PJSC 231,733 0.05
3,338,189 0.76
Portfolio of Investments as at 31 March 2017
Taiwan continued

Transferable Securities and Money Market Instruments Admitted to an Official Stock Exchange Listing or Dealt in on Another Regulated Market Other Transferable Securities and Money Market Instruments
Holding Description
Market Value
USD
% of Net
Assets Holding Description
Market Value
USD
% of Net
Assets
** Security subject to a fair value adjustment as detailed in Note 2(a).
32 BlackRock Global Index Funds (BGIF)
The notes on pages 122 to 128 form an integral part of these financial statements.
BlackRock Emerging Markets Equity Index Fund continued
Futures contracts as at 31 March 2017
Number of contracts
Currency of contract
Contract/ Description
Expiration date
Gross underlying
exposure USD
Unrealised appreciation/
(depreciation) USD
414 USD Mini MSCI Emerging Market Index June 2017 19,915,470 519,355 1,089 USD SGX CNX Nifty April 2017 20,033,244 143,162
Total 39,948,714 662,517
Sector Breakdown as at 31 March 2017
% of Net Assets
Financial 23.68Communications 16.46Technology 12.01Consumer, Non-cyclical 7.97Consumer, Cyclical 7.61Energy 7.24Industrial 5.91Basic Materials 5.85Utilities 2.70Diversified 1.48
Securities portfolio at market value 90.91Other Net Assets 9.09
100.00
Open forward foreign exchange transactions as at 31 March 2017
Currency
Purchases Currency
Sales Counterparty
Maturity date
Unrealised appreciation/
(depreciation) USD
INR 1,296,228,771 USD 19,136,945 UBS 28/4/2017 818,918
Total (Gross underlying exposure - USD 19,955,863) 818,918
United States 9,074 Southern Copper Corp 325,847 0.07 30,632 Yum China Holdings Inc 811,748 0.19
1,137,595 0.26
Total Common / Preferred Stocks (Shares) & Rights 397,101,847 90.91
Total Transferable Securities and Money Market Instruments Admitted to an Official Stock Exchange Listing or Dealt in on Another Regulated Market 397,101,847 90.91
COMMON STOCKS (SHARES)
Bermuda 790,000 Hanergy Thin Film
Power Group Ltd ** 1 0.00
1 0.00
Total Common Stocks (Shares) 1 0.00Total Other Transferable Securities and Money Market Instruments 1 0.00
Securities portfolio at market value 397,101,848 90.91
Other Net Assets 39,719,266 9.09
Total Net Assets (USD) 436,821,114 100.00
Portfolio of Investments as at 31 March 2017

Transferable Securities and Money Market Instruments Admitted to an Official Stock Exchange Listing or Dealt in on Another Regulated Market
Transferable Securities and Money Market Instruments Admitted to an Official Stock Exchange Listing or Dealt in on Another Regulated Market
Holding Description
Market Value
USD
% of Net
Assets Holding Description
Market Value
USD
% of Net
Assets
* All or a portion of this security represents a security on loan.
USD
Annual Report and Audited Accounts 33
The notes on pages 122 to 128 form an integral part of these financial statements.
BlackRock Emerging Markets Government Bond Index Fund
BONDS
Angola USD 5,950,000 Angolan Government International
Bond RegS 9.50% 12/11/2025 6,151,229 0.33
6,151,229 0.33
Argentina USD 1,847,000 Argentine Republic Government
International Bond '144A' 6.875% 22/4/2021 1,982,939 0.11
USD 3,385,922 Argentine Republic Government International Bond 8.28% 31/12/2033 (traded in Argentina) 3,563,276 0.19
USD 7,318,639 Argentine Republic Government International Bond 8.28% 31/12/2033 (traded in United States) 7,856,193 0.42
USD 207,463 Argentine Republic Government International Bond (Step-up coupon) 2.50% 31/12/2038 (traded in Luxembourg) 130,811 0.01
USD 8,157,537 Argentine Republic Government International Bond (Step-up coupon) 2.50% 31/12/2038 (traded in United States) 5,143,572 0.27
USD 5,250,000 Argentine Republic Government International Bond RegS 6.25% 22/4/2019 * 5,557,939 0.30
USD 6,753,000 Argentine Republic Government International Bond RegS 6.875% 22/4/2021 7,253,127 0.39
USD 3,200,000 Argentine Republic Government International Bond RegS 5.625% 26/1/2022 3,275,024 0.17
USD 11,895,000 Argentine Republic Government International Bond RegS 7.50% 22/4/2026 * 12,661,752 0.67
USD 4,250,000 Argentine Republic Government International Bond RegS 6.875% 26/1/2027 * 4,313,920 0.23
USD 1,750,000 Argentine Republic Government International Bond RegS 6.625% 6/7/2028 1,716,260 0.09
USD 2,719,000 Argentine Republic Government International Bond RegS 7.125% 6/7/2036 2,635,119 0.14
USD 4,443,000 Argentine Republic Government International Bond RegS 7.625% 22/4/2046 * 4,520,752 0.24
60,610,684 3.23
Armenia USD 2,250,000 Republic of Armenia International
Bond RegS 7.15% 26/3/2025 2,415,015 0.13 USD 1,450,000 Republic of Armenia International
Bond RegS 6.00% 30/9/2020 * 1,522,790 0.08
3,937,805 0.21
Australia USD 950,000 Baosteel Financing 2015 Pty Ltd
RegS 3.875% 28/1/2020 971,793 0.05 USD 2,000,000 CNOOC Curtis Funding No 1 Pty
Ltd RegS 4.50% 3/10/2023 2,128,060 0.12
3,099,853 0.17
Azerbaijan USD 4,500,000 Republic of Azerbaijan International
Bond RegS 4.75% 18/3/2024 (traded in Ireland) 4,539,172 0.24
USD 600,000 Republic of Azerbaijan International Bond RegS 4.75% 18/3/2024 (traded in United States) 605,223 0.03
USD 5,400,000 Southern Gas Corridor CJSC RegS 6.875% 24/3/2026 * 5,946,750 0.32
USD 3,900,000 State Oil Co of the Azerbaijan Republic RegS 4.75% 13/3/2023 3,795,324 0.21
USD 2,700,000 State Oil Co of the Azerbaijan Republic RegS 6.95% 18/3/2030 2,854,440 0.15
17,740,909 0.95
Belize USD 1,950,000 Belize Government International
Bond RegS (Step-up coupon) 4.938% 20/2/2034 1,244,344 0.07
1,244,344 0.07
Bolivia USD 1,500,000 Bolivian Government International
Bond '144A' 4.50% 20/3/2028 1,473,727 0.08 USD 1,450,000 Bolivian Government International
Bond RegS 4.875% 29/10/2022 * 1,570,053 0.08 USD 1,650,000 Bolivian Government International
Bond RegS 5.95% 22/8/2023 * 1,884,597 0.10
4,928,377 0.26
Brazil USD 750,000 Banco Nacional de Desenvolvimento
Economico e Social RegS 6.369% 16/6/2018 (traded in Luxembourg) 783,840 0.04
USD 1,000,000 Banco Nacional de Desenvolvimento Economico e Social RegS 6.369% 16/6/2018 (traded in United States)* 1,045,120 0.06
USD 1,250,000 Banco Nacional de Desenvolvimento Economico e Social RegS 4.00% 14/4/2019 1,275,719 0.07
USD 1,400,000 Banco Nacional de Desenvolvimento Economico e Social RegS 6.50% 10/6/2019 1,500,828 0.08
USD 1,150,000 Banco Nacional de Desenvolvimento Economico e Social RegS 5.50% 12/7/2020 1,219,109 0.07
USD 2,350,000 Banco Nacional de Desenvolvimento Economico e Social RegS 5.75% 26/9/2023 2,482,187 0.13
USD 3,350,000 Brazilian Government International Bond 5.875% 15/1/2019 * 3,584,500 0.19
USD 700,000 Brazilian Government International Bond 8.875% 14/10/2019 814,398 0.04
USD 5,200,000 Brazilian Government International Bond 4.875% 22/1/2021 5,470,400 0.29
USD 3,350,000 Brazilian Government International Bond 2.625% 5/1/2023 3,097,410 0.17
USD 1,950,000 Brazilian Government International Bond 8.875% 15/4/2024 2,470,601 0.13
USD 7,500,000 Brazilian Government International Bond 4.25% 7/1/2025 7,357,500 0.39
USD 1,475,000 Brazilian Government International Bond 8.75% 4/2/2025 1,879,408 0.10
USD 4,900,000 Brazilian Government International Bond 6.00% 7/4/2026 5,311,355 0.28
USD 600,000 Brazilian Government International Bond 10.125% 15/5/2027 857,628 0.05
USD 2,400,000 Brazilian Government International Bond 8.25% 20/1/2034 2,985,000 0.16
Portfolio of Investments as at 31 March 2017
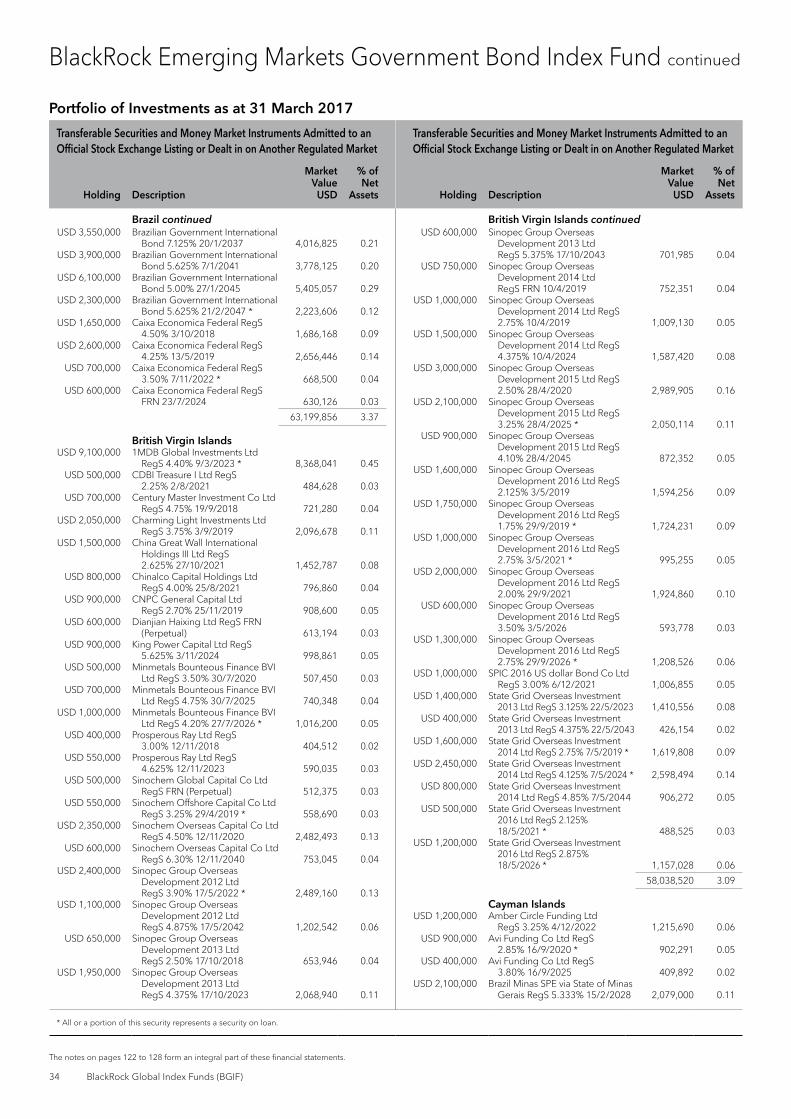
Transferable Securities and Money Market Instruments Admitted to an Official Stock Exchange Listing or Dealt in on Another Regulated Market
Transferable Securities and Money Market Instruments Admitted to an Official Stock Exchange Listing or Dealt in on Another Regulated Market
Holding Description
Market Value
USD
% of Net
Assets Holding Description
Market Value
USD
% of Net
Assets
* All or a portion of this security represents a security on loan.
34 BlackRock Global Index Funds (BGIF)
The notes on pages 122 to 128 form an integral part of these financial statements.
BlackRock Emerging Markets Government Bond Index Fund continued
USD 3,550,000 Brazilian Government International Bond 7.125% 20/1/2037 4,016,825 0.21
USD 3,900,000 Brazilian Government International Bond 5.625% 7/1/2041 3,778,125 0.20
USD 6,100,000 Brazilian Government International Bond 5.00% 27/1/2045 5,405,057 0.29
USD 2,300,000 Brazilian Government International Bond 5.625% 21/2/2047 * 2,223,606 0.12
USD 1,650,000 Caixa Economica Federal RegS 4.50% 3/10/2018 1,686,168 0.09
USD 2,600,000 Caixa Economica Federal RegS 4.25% 13/5/2019 2,656,446 0.14
USD 700,000 Caixa Economica Federal RegS 3.50% 7/11/2022 * 668,500 0.04
USD 600,000 Caixa Economica Federal RegS FRN 23/7/2024 630,126 0.03
63,199,856 3.37
British Virgin Islands USD 9,100,000 1MDB Global Investments Ltd
RegS 4.40% 9/3/2023 * 8,368,041 0.45 USD 500,000 CDBI Treasure I Ltd RegS
2.25% 2/8/2021 484,628 0.03 USD 700,000 Century Master Investment Co Ltd
RegS 4.75% 19/9/2018 721,280 0.04 USD 2,050,000 Charming Light Investments Ltd
RegS 3.75% 3/9/2019 2,096,678 0.11 USD 1,500,000 China Great Wall International
Holdings III Ltd RegS 2.625% 27/10/2021 1,452,787 0.08
USD 800,000 Chinalco Capital Holdings Ltd RegS 4.00% 25/8/2021 796,860 0.04
USD 900,000 CNPC General Capital Ltd RegS 2.70% 25/11/2019 908,600 0.05
USD 600,000 Dianjian Haixing Ltd RegS FRN (Perpetual) 613,194 0.03
USD 900,000 King Power Capital Ltd RegS 5.625% 3/11/2024 998,861 0.05
USD 500,000 Minmetals Bounteous Finance BVI Ltd RegS 3.50% 30/7/2020 507,450 0.03
USD 700,000 Minmetals Bounteous Finance BVI Ltd RegS 4.75% 30/7/2025 740,348 0.04
USD 1,000,000 Minmetals Bounteous Finance BVI Ltd RegS 4.20% 27/7/2026 * 1,016,200 0.05
USD 400,000 Prosperous Ray Ltd RegS 3.00% 12/11/2018 404,512 0.02
USD 550,000 Prosperous Ray Ltd RegS 4.625% 12/11/2023 590,035 0.03
USD 500,000 Sinochem Global Capital Co Ltd RegS FRN (Perpetual) 512,375 0.03
USD 550,000 Sinochem Offshore Capital Co Ltd RegS 3.25% 29/4/2019 * 558,690 0.03
USD 2,350,000 Sinochem Overseas Capital Co Ltd RegS 4.50% 12/11/2020 2,482,493 0.13
USD 600,000 Sinochem Overseas Capital Co Ltd RegS 6.30% 12/11/2040 753,045 0.04
USD 2,400,000 Sinopec Group Overseas Development 2012 Ltd RegS 3.90% 17/5/2022 * 2,489,160 0.13
USD 1,100,000 Sinopec Group Overseas Development 2012 Ltd RegS 4.875% 17/5/2042 1,202,542 0.06
USD 650,000 Sinopec Group Overseas Development 2013 Ltd RegS 2.50% 17/10/2018 653,946 0.04
USD 1,950,000 Sinopec Group Overseas Development 2013 Ltd RegS 4.375% 17/10/2023 2,068,940 0.11
USD 600,000 Sinopec Group Overseas Development 2013 Ltd RegS 5.375% 17/10/2043 701,985 0.04
USD 750,000 Sinopec Group Overseas Development 2014 Ltd RegS FRN 10/4/2019 752,351 0.04
USD 1,000,000 Sinopec Group Overseas Development 2014 Ltd RegS 2.75% 10/4/2019 1,009,130 0.05
USD 1,500,000 Sinopec Group Overseas Development 2014 Ltd RegS 4.375% 10/4/2024 1,587,420 0.08
USD 3,000,000 Sinopec Group Overseas Development 2015 Ltd RegS 2.50% 28/4/2020 2,989,905 0.16
USD 2,100,000 Sinopec Group Overseas Development 2015 Ltd RegS 3.25% 28/4/2025 * 2,050,114 0.11
USD 900,000 Sinopec Group Overseas Development 2015 Ltd RegS 4.10% 28/4/2045 872,352 0.05
USD 1,600,000 Sinopec Group Overseas Development 2016 Ltd RegS 2.125% 3/5/2019 1,594,256 0.09
USD 1,750,000 Sinopec Group Overseas Development 2016 Ltd RegS 1.75% 29/9/2019 * 1,724,231 0.09
USD 1,000,000 Sinopec Group Overseas Development 2016 Ltd RegS 2.75% 3/5/2021 * 995,255 0.05
USD 2,000,000 Sinopec Group Overseas Development 2016 Ltd RegS 2.00% 29/9/2021 1,924,860 0.10
USD 600,000 Sinopec Group Overseas Development 2016 Ltd RegS 3.50% 3/5/2026 593,778 0.03
USD 1,300,000 Sinopec Group Overseas Development 2016 Ltd RegS 2.75% 29/9/2026 * 1,208,526 0.06
USD 1,000,000 SPIC 2016 US dollar Bond Co Ltd RegS 3.00% 6/12/2021 1,006,855 0.05
USD 1,400,000 State Grid Overseas Investment 2013 Ltd RegS 3.125% 22/5/2023 1,410,556 0.08
USD 400,000 State Grid Overseas Investment 2013 Ltd RegS 4.375% 22/5/2043 426,154 0.02
USD 1,600,000 State Grid Overseas Investment 2014 Ltd RegS 2.75% 7/5/2019 * 1,619,808 0.09
USD 2,450,000 State Grid Overseas Investment 2014 Ltd RegS 4.125% 7/5/2024 * 2,598,494 0.14
USD 800,000 State Grid Overseas Investment 2014 Ltd RegS 4.85% 7/5/2044 906,272 0.05
USD 500,000 State Grid Overseas Investment 2016 Ltd RegS 2.125% 18/5/2021 * 488,525 0.03
USD 1,200,000 State Grid Overseas Investment 2016 Ltd RegS 2.875% 18/5/2026 * 1,157,028 0.06
58,038,520 3.09
Cayman Islands USD 1,200,000 Amber Circle Funding Ltd
RegS 3.25% 4/12/2022 1,215,690 0.06 USD 900,000 Avi Funding Co Ltd RegS
2.85% 16/9/2020 * 902,291 0.05 USD 400,000 Avi Funding Co Ltd RegS
3.80% 16/9/2025 409,892 0.02 USD 2,100,000 Brazil Minas SPE via State of Minas
Gerais RegS 5.333% 15/2/2028 2,079,000 0.11
Portfolio of Investments as at 31 March 2017
Brazil continued British Virgin Islands continued

Transferable Securities and Money Market Instruments Admitted to an Official Stock Exchange Listing or Dealt in on Another Regulated Market
Transferable Securities and Money Market Instruments Admitted to an Official Stock Exchange Listing or Dealt in on Another Regulated Market
Holding Description
Market Value
USD
% of Net
Assets Holding Description
Market Value
USD
% of Net
Assets
* All or a portion of this security represents a security on loan.
Annual Report and Audited Accounts 35
The notes on pages 122 to 128 form an integral part of these financial statements.
BlackRock Emerging Markets Government Bond Index Fund continued
USD 1,657,895 EP PetroEcuador Via Noble Sovereign Funding I Ltd RegS FRN 24/9/2019 1,659,967 0.09
USD 4,100,000 Lamar Funding Ltd RegS 3.958% 7/5/2025 * 3,909,924 0.21
USD 500,000 Three Gorges Finance I Cayman Islands Ltd RegS 2.30% 2/6/2021 490,585 0.03
USD 800,000 Three Gorges Finance I Cayman Islands Ltd RegS 3.70% 10/6/2025 815,616 0.04
USD 1,300,000 Three Gorges Finance I Cayman Islands Ltd RegS 3.15% 2/6/2026 * 1,259,986 0.07
12,742,951 0.68
Chile USD 1,000,000 Banco del Estado de Chile
RegS 4.125% 7/10/2020 1,056,620 0.06 USD 1,750,000 Banco del Estado de Chile
RegS 3.875% 8/2/2022 * 1,817,069 0.10 USD 1,550,000 Chile Government International
Bond 3.875% 5/8/2020 1,637,544 0.09 USD 1,975,000 Chile Government International
Bond 2.25% 30/10/2022 1,941,622 0.10 USD 700,000 Chile Government International
Bond 3.125% 27/3/2025 710,185 0.04 USD 7,446,000 Chile Government International
Bond 3.125% 21/1/2026 * 7,536,097 0.40 USD 1,500,000 Chile Government International
Bond 3.625% 30/10/2042 * 1,475,670 0.08 USD 800,000 Corp Nacional del Cobre de Chile
RegS 7.50% 15/1/2019 * 877,952 0.05 USD 1,000,000 Corp Nacional del Cobre de Chile
RegS 3.75% 4/11/2020 (traded in Chile) 1,045,550 0.06
USD 1,750,000 Corp Nacional del Cobre de Chile RegS 3.75% 4/11/2020 (traded in United States) 1,829,713 0.10
USD 3,950,000 Corp Nacional del Cobre de Chile RegS 3.875% 3/11/2021 4,142,266 0.22
USD 3,450,000 Corp Nacional del Cobre de Chile RegS 3.00% 17/7/2022 * 3,472,425 0.18
USD 1,800,000 Corp Nacional del Cobre de Chile RegS 4.50% 13/8/2023 1,930,104 0.10
USD 6,300,000 Corp Nacional del Cobre de Chile RegS 4.50% 16/9/2025 6,655,509 0.35
USD 850,000 Corp Nacional del Cobre de Chile RegS 5.625% 21/9/2035 * 945,506 0.05
USD 850,000 Corp Nacional del Cobre de Chile RegS 6.15% 24/10/2036 994,271 0.05
USD 2,150,000 Corp Nacional del Cobre de Chile RegS 4.25% 17/7/2042 1,998,962 0.11
USD 2,550,000 Corp Nacional del Cobre de Chile RegS 5.625% 18/10/2043 2,846,922 0.15
USD 2,900,000 Corp Nacional del Cobre de Chile RegS 4.875% 4/11/2044 * 2,964,728 0.16
USD 1,100,000 Empresa de Transporte de Pasajeros Metro SA RegS 4.75% 4/2/2024 * 1,186,438 0.06
USD 1,500,000 Empresa de Transporte de Pasajeros Metro SA RegS 5.00% 25/1/2047 * 1,578,000 0.08
USD 1,400,000 Empresa Nacional del Petroleo RegS 4.375% 30/10/2024 * 1,438,990 0.08
USD 2,400,000 Empresa Nacional del Petroleo RegS 3.75% 5/8/2026 2,334,792 0.12
52,416,935 2.79
China USD 1,000,000 China Development Bank Corp
RegS 1.625% 22/6/2019 987,780 0.05
USD 2,450,000 China Development Bank Corp RegS 2.50% 9/10/2020 * 2,447,378 0.13
USD 1,750,000 China Development Bank Corp RegS 2.125% 1/6/2021 * 1,712,445 0.09
USD 1,000,000 China Development Bank Corp RegS 2.625% 24/1/2022 992,790 0.05
USD 500,000 China Development Bank Corp RegS 3.00% 1/6/2026 * 484,958 0.03
USD 600,000 China Development Bank Corp RegS 3.375% 24/1/2027 595,641 0.03
USD 600,000 China Development Bank Corp RegS 4.00% 24/1/2037 608,679 0.03
USD 1,200,000 Export-Import Bank of China/ The RegS 2.50% 31/7/2019 1,211,796 0.06
USD 1,500,000 Export-Import Bank of China/ The RegS 2.00% 26/4/2021 1,462,853 0.08
USD 2,300,000 Export-Import Bank of China/ The RegS 3.625% 31/7/2024 2,376,555 0.13
USD 2,100,000 Export-Import Bank of China/ The RegS 2.875% 26/4/2026 2,018,383 0.11
14,899,258 0.79
Colombia USD 4,700,000 Colombia Government International
Bond 7.375% 18/3/2019 5,191,267 0.28 USD 1,450,000 Colombia Government International
Bond 11.75% 25/2/2020 1,829,574 0.10 USD 5,100,000 Colombia Government International
Bond 4.375% 12/7/2021 5,417,730 0.29 USD 2,400,000 Colombia Government International
Bond 2.625% 15/3/2023 * 2,314,320 0.12 USD 4,550,000 Colombia Government International
Bond 4.00% 26/2/2024 4,691,733 0.25 USD 2,625,000 Colombia Government International
Bond 8.125% 21/5/2024 3,333,881 0.18 USD 3,550,000 Colombia Government International
Bond 4.50% 28/1/2026 3,757,675 0.20 USD 2,000,000 Colombia Government International
Bond 3.875% 25/4/2027 * 2,000,000 0.11 USD 4,800,000 Colombia Government International
Bond 7.375% 18/9/2037 * 6,145,920 0.33 USD 5,900,000 Colombia Government International
Bond 6.125% 18/1/2041 6,755,677 0.36 USD 5,950,000 Colombia Government International
Bond 5.625% 26/2/2044 * 6,491,450 0.34 USD 9,600,000 Colombia Government International
Bond 5.00% 15/6/2045 * 9,660,912 0.51
57,590,139 3.07
Costa Rica USD 1,300,000 Banco de Costa Rica RegS
5.25% 12/8/2018 1,324,609 0.07 USD 1,200,000 Banco Nacional de Costa Rica
RegS 4.875% 1/11/2018 1,220,664 0.07 USD 2,500,000 Banco Nacional de Costa Rica
RegS 5.875% 25/4/2021 * 2,558,700 0.14 USD 1,900,000 Banco Nacional de Costa Rica
RegS 6.25% 1/11/2023 * 1,957,741 0.10 USD 3,750,000 Costa Rica Government International
Bond RegS 4.25% 26/1/2023 3,640,668 0.19 USD 2,650,000 Costa Rica Government International
Bond RegS 4.375% 30/4/2025 2,502,647 0.13 USD 1,800,000 Costa Rica Government International
Bond RegS 5.625% 30/4/2043 1,586,106 0.09 USD 3,800,000 Costa Rica Government International
Bond RegS 7.00% 4/4/2044 3,860,401 0.21 USD 3,900,000 Costa Rica Government International
Bond RegS 7.158% 12/3/2045 3,999,021 0.21
Portfolio of Investments as at 31 March 2017
Cayman Islands continued China continued
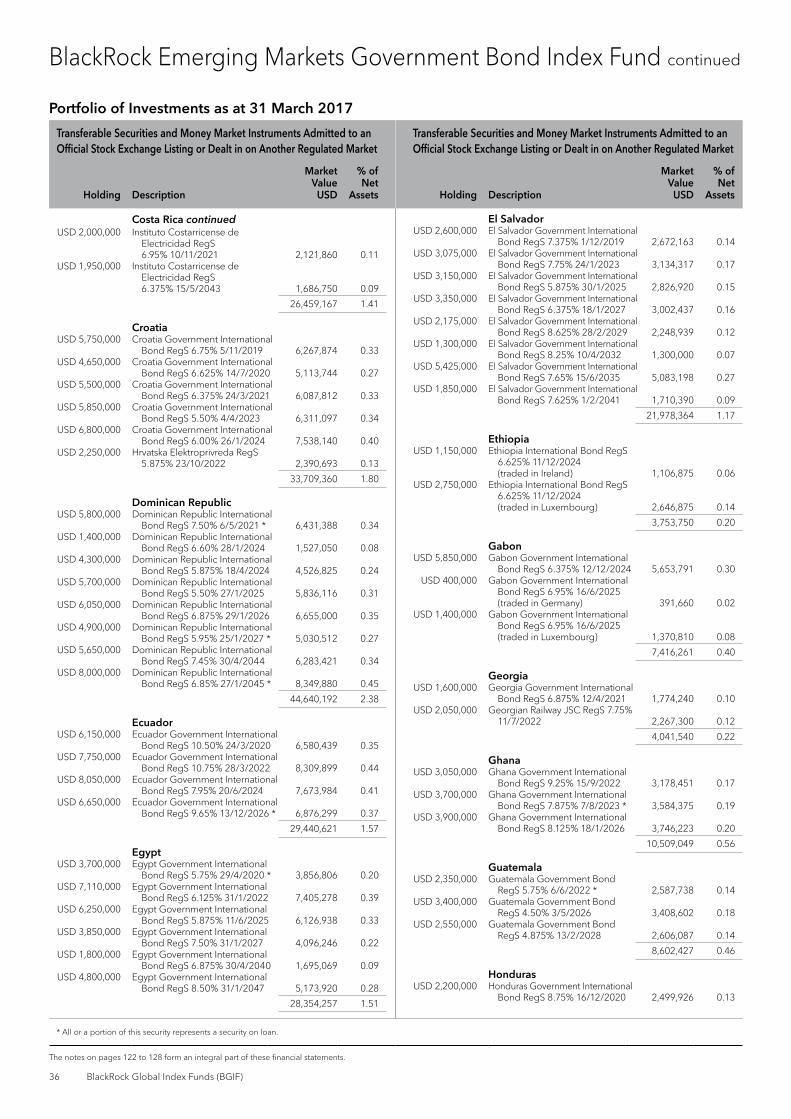
Transferable Securities and Money Market Instruments Admitted to an Official Stock Exchange Listing or Dealt in on Another Regulated Market
Transferable Securities and Money Market Instruments Admitted to an Official Stock Exchange Listing or Dealt in on Another Regulated Market
Holding Description
Market Value
USD
% of Net
Assets Holding Description
Market Value
USD
% of Net
Assets
* All or a portion of this security represents a security on loan.
36 BlackRock Global Index Funds (BGIF)
The notes on pages 122 to 128 form an integral part of these financial statements.
USD 2,000,000 Instituto Costarricense de Electricidad RegS 6.95% 10/11/2021 2,121,860 0.11
USD 1,950,000 Instituto Costarricense de Electricidad RegS 6.375% 15/5/2043 1,686,750 0.09
26,459,167 1.41
Croatia USD 5,750,000 Croatia Government International
Bond RegS 6.75% 5/11/2019 6,267,874 0.33 USD 4,650,000 Croatia Government International
Bond RegS 6.625% 14/7/2020 5,113,744 0.27 USD 5,500,000 Croatia Government International
Bond RegS 6.375% 24/3/2021 6,087,812 0.33 USD 5,850,000 Croatia Government International
Bond RegS 5.50% 4/4/2023 6,311,097 0.34 USD 6,800,000 Croatia Government International
Bond RegS 6.00% 26/1/2024 7,538,140 0.40 USD 2,250,000 Hrvatska Elektroprivreda RegS
5.875% 23/10/2022 2,390,693 0.13
33,709,360 1.80
Dominican Republic USD 5,800,000 Dominican Republic International
Bond RegS 7.50% 6/5/2021 * 6,431,388 0.34 USD 1,400,000 Dominican Republic International
Bond RegS 6.60% 28/1/2024 1,527,050 0.08 USD 4,300,000 Dominican Republic International
Bond RegS 5.875% 18/4/2024 4,526,825 0.24 USD 5,700,000 Dominican Republic International
Bond RegS 5.50% 27/1/2025 5,836,116 0.31 USD 6,050,000 Dominican Republic International
Bond RegS 6.875% 29/1/2026 6,655,000 0.35 USD 4,900,000 Dominican Republic International
Bond RegS 5.95% 25/1/2027 * 5,030,512 0.27 USD 5,650,000 Dominican Republic International
Bond RegS 7.45% 30/4/2044 6,283,421 0.34 USD 8,000,000 Dominican Republic International
Bond RegS 6.85% 27/1/2045 * 8,349,880 0.45
44,640,192 2.38
Ecuador USD 6,150,000 Ecuador Government International
Bond RegS 10.50% 24/3/2020 6,580,439 0.35 USD 7,750,000 Ecuador Government International
Bond RegS 10.75% 28/3/2022 8,309,899 0.44 USD 8,050,000 Ecuador Government International
Bond RegS 7.95% 20/6/2024 7,673,984 0.41 USD 6,650,000 Ecuador Government International
Bond RegS 9.65% 13/12/2026 * 6,876,299 0.37
29,440,621 1.57
Egypt USD 3,700,000 Egypt Government International
Bond RegS 5.75% 29/4/2020 * 3,856,806 0.20 USD 7,110,000 Egypt Government International
Bond RegS 6.125% 31/1/2022 7,405,278 0.39 USD 6,250,000 Egypt Government International
Bond RegS 5.875% 11/6/2025 6,126,938 0.33 USD 3,850,000 Egypt Government International
Bond RegS 7.50% 31/1/2027 4,096,246 0.22 USD 1,800,000 Egypt Government International
Bond RegS 6.875% 30/4/2040 1,695,069 0.09 USD 4,800,000 Egypt Government International
Bond RegS 8.50% 31/1/2047 5,173,920 0.28
28,354,257 1.51
El Salvador USD 2,600,000 El Salvador Government International
Bond RegS 7.375% 1/12/2019 2,672,163 0.14 USD 3,075,000 El Salvador Government International
Bond RegS 7.75% 24/1/2023 3,134,317 0.17 USD 3,150,000 El Salvador Government International
Bond RegS 5.875% 30/1/2025 2,826,920 0.15 USD 3,350,000 El Salvador Government International
Bond RegS 6.375% 18/1/2027 3,002,437 0.16 USD 2,175,000 El Salvador Government International
Bond RegS 8.625% 28/2/2029 2,248,939 0.12 USD 1,300,000 El Salvador Government International
Bond RegS 8.25% 10/4/2032 1,300,000 0.07 USD 5,425,000 El Salvador Government International
Bond RegS 7.65% 15/6/2035 5,083,198 0.27 USD 1,850,000 El Salvador Government International
Bond RegS 7.625% 1/2/2041 1,710,390 0.09
21,978,364 1.17
Ethiopia USD 1,150,000 Ethiopia International Bond RegS
6.625% 11/12/2024 (traded in Ireland) 1,106,875 0.06
USD 2,750,000 Ethiopia International Bond RegS 6.625% 11/12/2024 (traded in Luxembourg) 2,646,875 0.14
3,753,750 0.20
Gabon USD 5,850,000 Gabon Government International
Bond RegS 6.375% 12/12/2024 5,653,791 0.30 USD 400,000 Gabon Government International
Bond RegS 6.95% 16/6/2025 (traded in Germany) 391,660 0.02
USD 1,400,000 Gabon Government International Bond RegS 6.95% 16/6/2025 (traded in Luxembourg) 1,370,810 0.08
7,416,261 0.40
Georgia USD 1,600,000 Georgia Government International
Bond RegS 6.875% 12/4/2021 1,774,240 0.10 USD 2,050,000 Georgian Railway JSC RegS 7.75%
11/7/2022 2,267,300 0.12
4,041,540 0.22
Ghana USD 3,050,000 Ghana Government International
Bond RegS 9.25% 15/9/2022 3,178,451 0.17 USD 3,700,000 Ghana Government International
Bond RegS 7.875% 7/8/2023 * 3,584,375 0.19 USD 3,900,000 Ghana Government International
Bond RegS 8.125% 18/1/2026 3,746,223 0.20
10,509,049 0.56
Guatemala USD 2,350,000 Guatemala Government Bond
RegS 5.75% 6/6/2022 * 2,587,738 0.14 USD 3,400,000 Guatemala Government Bond
RegS 4.50% 3/5/2026 3,408,602 0.18 USD 2,550,000 Guatemala Government Bond
RegS 4.875% 13/2/2028 2,606,087 0.14
8,602,427 0.46
Honduras USD 2,200,000 Honduras Government International
Bond RegS 8.75% 16/12/2020 2,499,926 0.13
BlackRock Emerging Markets Government Bond Index Fund continued
Portfolio of Investments as at 31 March 2017
Costa Rica continued

Transferable Securities and Money Market Instruments Admitted to an Official Stock Exchange Listing or Dealt in on Another Regulated Market
Transferable Securities and Money Market Instruments Admitted to an Official Stock Exchange Listing or Dealt in on Another Regulated Market
Holding Description
Market Value
USD
% of Net
Assets Holding Description
Market Value
USD
% of Net
Assets
* All or a portion of this security represents a security on loan.
Annual Report and Audited Accounts 37
The notes on pages 122 to 128 form an integral part of these financial statements.
USD 1,650,000 Honduras Government International Bond RegS 7.50% 15/3/2024 * 1,821,188 0.10
USD 3,000,000 Honduras Government International Bond RegS 6.25% 19/1/2027 3,048,270 0.16
7,369,384 0.39
Hungary USD 2,350,000 Hungary Government International
Bond 4.00% 25/3/2019 * 2,440,475 0.13 USD 6,900,000 Hungary Government International
Bond 6.25% 29/1/2020 7,570,266 0.40 USD 10,900,000 Hungary Government International
Bond 6.375% 29/3/2021 * 12,300,813 0.66 USD 6,600,000 Hungary Government International
Bond 5.375% 21/2/2023 7,281,285 0.39 USD 7,050,000 Hungary Government International
Bond 5.75% 22/11/2023 7,983,455 0.42 USD 6,750,000 Hungary Government International
Bond 5.375% 25/3/2024 7,510,050 0.40 USD 250,000 Hungary Government International
Bond 7.625% 29/3/2041 (traded in United Kingdom) 363,583 0.02
USD 3,950,000 Hungary Government International Bond 7.625% 29/3/2041 (traded in United States) 5,744,604 0.31
USD 1,450,000 Magyar Export-Import Bank Zrt RegS 4.00% 30/1/2020 * 1,486,134 0.08
USD 1,900,000 MFB Magyar Fejlesztesi Bank Zrt RegS 6.25% 21/10/2020 2,095,719 0.11
54,776,384 2.92
India USD 1,650,000 Export-Import Bank of India
RegS 3.875% 2/10/2019 1,702,280 0.09 USD 1,700,000 Export-Import Bank of India
RegS 2.75% 1/4/2020 1,698,394 0.09 USD 1,600,000 Export-Import Bank of India
RegS 2.75% 12/8/2020 1,598,624 0.09 USD 2,000,000 Export-Import Bank of India
RegS 3.125% 20/7/2021 * 2,016,120 0.11 USD 2,550,000 Export-Import Bank of India
RegS 4.00% 14/1/2023 2,640,576 0.14 USD 4,700,000 Export-Import Bank of India
RegS 3.375% 5/8/2026 * 4,505,843 0.24 USD 1,650,000 Indian Railway Finance Corp Ltd
RegS 3.917% 26/2/2019 1,696,365 0.09
15,858,202 0.85
Indonesia USD 750,000 Indonesia Government International
Bond RegS 11.625% 4/3/2019 (traded in Singapore) 886,864 0.05
USD 1,800,000 Indonesia Government International Bond RegS 11.625% 4/3/2019 (traded in United States) 2,128,473 0.11
USD 2,350,000 Indonesia Government International Bond RegS 5.875% 13/3/2020 2,572,004 0.14
USD 3,400,000 Indonesia Government International Bond RegS 4.875% 5/5/2021 3,640,618 0.20
USD 750,000 Indonesia Government International Bond RegS 3.70% 8/1/2022 766,511 0.04
USD 2,400,000 Indonesia Government International Bond RegS 3.75% 25/4/2022 2,452,800 0.13
USD 2,300,000 Indonesia Government International Bond RegS 3.375% 15/4/2023 2,302,116 0.12
USD 1,200,000 Indonesia Government International Bond RegS 5.375% 17/10/2023 1,330,488 0.07
USD 2,400,000 Indonesia Government International Bond RegS 5.875% 15/1/2024 * 2,730,000 0.15
USD 2,250,000 Indonesia Government International Bond RegS 4.125% 15/1/2025 2,311,065 0.12
USD 3,200,000 Indonesia Government International Bond RegS 4.75% 8/1/2026 3,416,208 0.18
USD 1,750,000 Indonesia Government International Bond RegS 4.35% 8/1/2027 1,816,281 0.10
USD 2,300,000 Indonesia Government International Bond RegS 8.50% 12/10/2035 3,326,651 0.18
USD 600,000 Indonesia Government International Bond RegS 6.625% 17/2/2037 (traded in United Kingdom) 739,986 0.04
USD 950,000 Indonesia Government International Bond RegS 6.625% 17/2/2037 (traded in United States) 1,171,645 0.06
USD 1,100,000 Indonesia Government International Bond RegS 7.75% 17/1/2038 (traded in Singapore) 1,523,643 0.08
USD 1,400,000 Indonesia Government International Bond RegS 7.75% 17/1/2038 (traded in United States) 1,939,182 0.10
USD 1,400,000 Indonesia Government International Bond RegS 5.25% 17/1/2042 (traded in Singapore) 1,508,178 0.08
USD 1,550,000 Indonesia Government International Bond RegS 5.25% 17/1/2042 (traded in United States) 1,669,768 0.09
USD 1,650,000 Indonesia Government International Bond RegS 4.625% 15/4/2043 * 1,668,332 0.09
USD 2,950,000 Indonesia Government International Bond RegS 6.75% 15/1/2044 3,805,500 0.20
USD 2,800,000 Indonesia Government International Bond RegS 5.125% 15/1/2045 2,982,000 0.16
USD 1,150,000 Indonesia Government International Bond RegS 5.95% 8/1/2046 1,354,125 0.07
USD 2,050,000 Indonesia Government International Bond RegS 5.25% 8/1/2047 2,204,098 0.12
USD 1,350,000 Pelabuhan Indonesia II PT RegS 4.25% 5/5/2025 * 1,347,300 0.07
USD 650,000 Pelabuhan Indonesia II PT RegS 5.375% 5/5/2045 637,936 0.03
USD 400,000 Pelabuhan Indonesia III Persero PT RegS 4.875% 1/10/2024 420,000 0.02
USD 1,100,000 Pertamina Persero PT RegS 5.25% 23/5/2021 1,180,157 0.06
USD 1,400,000 Pertamina Persero PT RegS 4.875% 3/5/2022 * 1,485,750 0.08
USD 2,400,000 Pertamina Persero PT RegS 4.30% 20/5/2023 2,475,000 0.13
USD 450,000 Pertamina Persero PT RegS 6.50% 27/5/2041 * 507,281 0.03
USD 1,700,000 Pertamina Persero PT RegS 6.00% 3/5/2042 1,808,375 0.10
USD 1,850,000 Pertamina Persero PT RegS 5.625% 20/5/2043 1,905,500 0.10
USD 2,200,000 Pertamina Persero PT RegS 6.45% 30/5/2044 2,483,096 0.13
USD 1,300,000 Perusahaan Listrik Negara PT RegS 5.50% 22/11/2021 1,414,283 0.08
USD 1,100,000 Perusahaan Listrik Negara PT RegS 5.25% 24/10/2042 1,095,952 0.06
USD 900,000 Perusahaan Penerbit SBSN Indonesia III RegS 3.40% 29/3/2021 909,477 0.05
USD 1,000,000 Perusahaan Penerbit SBSN Indonesia III RegS 3.30% 21/11/2022 1,002,225 0.05
USD 1,900,000 Perusahaan Penerbit SBSN Indonesia III RegS 4.35% 10/9/2024 * 1,970,851 0.11
BlackRock Emerging Markets Government Bond Index Fund continued
Portfolio of Investments as at 31 March 2017
Honduras continued Indonesia continued

Transferable Securities and Money Market Instruments Admitted to an Official Stock Exchange Listing or Dealt in on Another Regulated Market
Transferable Securities and Money Market Instruments Admitted to an Official Stock Exchange Listing or Dealt in on Another Regulated Market
Holding Description
Market Value
USD
% of Net
Assets Holding Description
Market Value
USD
% of Net
Assets
* All or a portion of this security represents a security on loan.
38 BlackRock Global Index Funds (BGIF)
The notes on pages 122 to 128 form an integral part of these financial statements.
USD 2,750,000 Perusahaan Penerbit SBSN Indonesia III RegS 4.325% 28/5/2025 2,829,021 0.15
USD 2,000,000 Perusahaan Penerbit SBSN Indonesia III RegS 4.55% 29/3/2026 2,079,740 0.11
75,798,480 4.04
Iraq USD 10,375,000 Iraq International Bond RegS
5.80% 15/1/2028 9,184,884 0.49
9,184,884 0.49
Ireland USD 700,000 GTLK Europe DAC RegS
5.95% 19/7/2021 735,088 0.04 USD 1,000,000 Russian Railways Via RZD Capital
Plc RegS 3.45% 6/10/2020 1,005,800 0.05 USD 2,000,000 Russian Railways Via RZD
Capital Plc RegS 5.70% 5/4/2022 2,153,780 0.11 USD 1,100,000 SCF Capital Ltd RegS
5.375% 16/6/2023 1,139,017 0.06 USD 650,000 Vnesheconombank Via VEB Finance
Plc RegS 4.224% 21/11/2018 665,525 0.04 USD 2,650,000 Vnesheconombank Via VEB Finance
Plc RegS 6.902% 9/7/2020 2,914,536 0.16 USD 1,200,000 Vnesheconombank Via VEB Finance
Plc RegS 6.025% 5/7/2022 1,289,700 0.07 USD 1,600,000 Vnesheconombank Via VEB Finance
Plc RegS 5.942% 21/11/2023 1,716,576 0.09 USD 1,400,000 Vnesheconombank Via VEB Finance
Plc RegS 6.80% 22/11/2025 1,566,138 0.08
13,186,160 0.70
Ivory Coast USD 2,350,000 Ivory Coast Government International
Bond RegS 5.375% 23/7/2024 2,240,572 0.12 USD 4,200,000 Ivory Coast Government International
Bond RegS 6.375% 3/3/2028 4,114,698 0.22 USD 10,045,000 Ivory Coast Government International
Bond RegS (Step-up coupon) 5.75% 31/12/2032 9,366,661 0.50
15,721,931 0.84
Jamaica USD 2,550,000 Jamaica Government International
Bond 7.625% 9/7/2025 2,980,313 0.16 USD 5,850,000 Jamaica Government International
Bond 6.75% 28/4/2028 6,523,715 0.35 USD 5,069,000 Jamaica Government International
Bond 8.00% 15/3/2039 5,830,186 0.31 USD 2,250,000 Jamaica Government International
Bond 7.875% 28/7/2045 * 2,584,688 0.14
17,918,902 0.96
Jordan USD 1,800,000 Jordan Government International
Bond RegS 6.125% 29/1/2026 1,846,071 0.10 USD 4,150,000 Jordan Government International
Bond RegS 5.75% 31/1/2027 4,069,407 0.22
5,915,478 0.32
Kazakhstan USD 4,100,000 Development Bank of Kazakhstan
JSC RegS 4.125% 10/12/2022 4,069,455 0.22 USD 2,700,000 KazAgro National Management
Holding JSC RegS 4.625% 24/5/2023 2,650,725 0.14
USD 5,150,000 Kazakhstan Government International Bond RegS 3.875% 14/10/2024 * 5,201,809 0.28
USD 8,350,000 Kazakhstan Government International Bond RegS 5.125% 21/7/2025 * 9,080,625 0.48
USD 3,300,000 Kazakhstan Government International Bond RegS 4.875% 14/10/2044 * 3,250,467 0.17
USD 4,750,000 Kazakhstan Government International Bond RegS 6.50% 21/7/2045 * 5,640,245 0.30
USD 2,050,000 Kazakhstan Temir Zholy National Co JSC RegS 6.375% 6/10/2020 2,222,221 0.12
USD 4,050,000 KazMunayGas National Co JSC RegS 9.125% 2/7/2018 4,369,545 0.23
USD 4,500,000 KazMunayGas National Co JSC RegS 7.00% 5/5/2020 4,959,495 0.27
USD 4,150,000 KazMunayGas National Co JSC RegS 6.375% 9/4/2021 4,568,693 0.24
USD 1,800,000 KazMunayGas National Co JSC RegS 5.75% 30/4/2043 1,778,634 0.10
47,791,914 2.55
Kenya USD 2,450,000 Kenya Government International
Bond RegS 5.875% 24/6/2019 2,544,080 0.14 USD 7,950,000 Kenya Government International
Bond RegS 6.875% 24/6/2024 7,938,870 0.42
10,482,950 0.56
Latvia USD 2,350,000 Latvia Government International
Bond RegS 2.75% 12/1/2020 * 2,384,639 0.13
2,384,639 0.13
Lebanon USD 4,200,000 Lebanon Government International
Bond 6.375% 9/3/2020 4,378,605 0.23 USD 2,400,000 Lebanon Government International
Bond RegS 5.15% 12/11/2018 2,437,260 0.13 USD 1,350,000 Lebanon Government International
Bond RegS 6.00% 20/5/2019 * 1,388,232 0.07 USD 4,350,000 Lebanon Government International
Bond RegS 5.45% 28/11/2019 4,439,458 0.24 USD 5,400,000 Lebanon Government International
Bond RegS 8.25% 12/4/2021 5,991,354 0.32 USD 5,300,000 Lebanon Government International
Bond RegS 6.10% 4/10/2022 * 5,425,292 0.29 USD 3,225,000 Lebanon Government International
Bond RegS 6.00% 27/1/2023 3,275,681 0.17 USD 2,100,000 Lebanon Government International
Bond RegS 6.65% 22/4/2024 2,158,065 0.12 USD 1,550,000 Lebanon Government International
Bond RegS 6.25% 4/11/2024 * 1,550,364 0.08 USD 2,000,000 Lebanon Government International
Bond RegS 6.20% 26/2/2025 1,987,050 0.11 USD 5,700,000 Lebanon Government International
Bond RegS 6.60% 27/11/2026 5,783,220 0.31 USD 3,800,000 Lebanon Government International
Bond RegS 6.75% 29/11/2027 * 3,839,976 0.21 USD 2,100,000 Lebanon Government International
Bond RegS 6.65% 3/11/2028 2,085,573 0.11 USD 4,750,000 Lebanon Government International
Bond RegS 6.65% 26/2/2030 * 4,711,952 0.25 USD 1,300,000 Lebanon Government International
Bond RegS 7.05% 2/11/2035 1,300,735 0.07
50,752,817 2.71
BlackRock Emerging Markets Government Bond Index Fund continued
Portfolio of Investments as at 31 March 2017
Indonesia continued Kazakhstan continued

Transferable Securities and Money Market Instruments Admitted to an Official Stock Exchange Listing or Dealt in on Another Regulated Market
Transferable Securities and Money Market Instruments Admitted to an Official Stock Exchange Listing or Dealt in on Another Regulated Market
Holding Description
Market Value
USD
% of Net
Assets Holding Description
Market Value
USD
% of Net
Assets
* All or a portion of this security represents a security on loan.
Annual Report and Audited Accounts 39
The notes on pages 122 to 128 form an integral part of these financial statements.
Lithuania USD 7,500,000 Lithuania Government International
Bond RegS 7.375% 11/2/2020 * 8,542,500 0.45 USD 5,650,000 Lithuania Government International
Bond RegS 6.125% 9/3/2021 6,387,636 0.34 USD 5,550,000 Lithuania Government International
Bond RegS 6.625% 1/2/2022 6,514,534 0.35
21,444,670 1.14
Luxembourg USD 650,000 Russian Agricultural Bank OJSC
Via RSHB Capital SA RegS 7.75% 29/5/2018 688,877 0.04
USD 2,450,000 Russian Agricultural Bank OJSC Via RSHB Capital SA RegS 5.10% 25/7/2018 2,527,787 0.13
USD 600,000 Russian Agricultural Bank OJSC Via RSHB Capital SA RegS 8.50% 16/10/2023 682,248 0.04
3,898,912 0.21
Malaysia USD 1,500,000 Export-Import Bank of Malaysia
Bhd RegS 2.48% 20/10/2021 1,473,180 0.08 USD 2,500,000 Malaysia Sovereign Sukuk Bhd
RegS 3.043% 22/4/2025 * 2,473,875 0.13 USD 1,500,000 Malaysia Sovereign Sukuk Bhd
RegS 4.236% 22/4/2045 1,557,750 0.08 USD 3,150,000 Malaysia Sukuk Global Bhd
RegS 3.179% 27/4/2026 * 3,139,447 0.17 USD 1,200,000 Malaysia Sukuk Global Bhd
RegS 4.08% 27/4/2046 1,210,104 0.06 USD 800,000 Petroliam Nasional Bhd RegS
7.625% 15/10/2026 (traded in Luxembourg) 1,072,608 0.06
USD 700,000 Petroliam Nasional Bhd RegS 7.625% 15/10/2026 (traded in United States) * 938,532 0.05
USD 8,950,000 Petronas Capital Ltd RegS 5.25% 12/8/2019 9,545,712 0.51
USD 2,700,000 Petronas Capital Ltd RegS 3.125% 18/3/2022 * 2,726,001 0.15
USD 250,000 Petronas Capital Ltd RegS 7.875% 22/5/2022 (traded in Malaysia) 307,440 0.02
USD 2,450,000 Petronas Capital Ltd RegS 7.875% 22/5/2022 (traded in United States) * 3,012,912 0.16
USD 4,300,000 Petronas Capital Ltd RegS 3.50% 18/3/2025 * 4,378,819 0.23
USD 4,750,000 Petronas Capital Ltd RegS 4.50% 18/3/2045 * 5,014,670 0.27
USD 3,500,000 Petronas Global Sukuk Ltd RegS 2.707% 18/3/2020 3,529,750 0.19
USD 3,000,000 Wakala Global Sukuk Bhd RegS 4.646% 6/7/2021 3,247,440 0.17
43,628,240 2.33
Mexico USD 850,000 Banco Nacional de Comercio
Exterior SNC RegS 4.375% 14/10/2025 862,695 0.05
USD 650,000 Banco Nacional de Comercio Exterior SNC RegS FRN 11/8/2026 639,714 0.03
USD 900,000 Comision Federal de Electricidad RegS 4.875% 26/5/2021 946,899 0.05
USD 1,250,000 Comision Federal de Electricidad RegS 4.875% 15/1/2024 1,293,713 0.07
USD 1,450,000 Comision Federal de Electricidad RegS 4.75% 23/2/2027 1,457,721 0.08
USD 600,000 Comision Federal de Electricidad RegS 5.75% 14/2/2042 598,788 0.03
USD 450,000 Comision Federal de Electricidad RegS 6.125% 16/6/2045 465,921 0.02
USD 1,000,000 Mexico City Airport Trust RegS 5.50% 31/10/2046 983,340 0.05
USD 1,000,000 Mexico City Airport Trust RegS 4.25% 31/10/2026 1,014,470 0.05
USD 1,850,000 Mexico Government International Bond 5.95% 19/3/2019 1,997,796 0.11
USD 2,950,000 Mexico Government International Bond 5.125% 15/1/2020 * 3,193,965 0.17
USD 1,200,000 Mexico Government International Bond 3.50% 21/1/2021 1,244,640 0.07
USD 3,100,000 Mexico Government International Bond 3.625% 15/3/2022 3,196,487 0.17
USD 4,100,000 Mexico Government International Bond 4.00% 2/10/2023 4,233,762 0.23
USD 3,350,000 Mexico Government International Bond 3.60% 30/1/2025 3,350,084 0.18
USD 3,000,000 Mexico Government International Bond 4.125% 21/1/2026 * 3,088,725 0.16
USD 1,000,000 Mexico Government International Bond 8.30% 15/8/2031 1,463,220 0.08
USD 840,000 Mexico Government International Bond 7.50% 8/4/2033 1,104,369 0.06
USD 1,550,000 Mexico Government International Bond 6.75% 27/9/2034 1,937,190 0.10
USD 3,200,000 Mexico Government International Bond 6.05% 11/1/2040 3,672,160 0.20
USD 4,400,000 Mexico Government International Bond 4.75% 8/3/2044 4,302,100 0.23
USD 2,950,000 Mexico Government International Bond 5.55% 21/1/2045 3,204,378 0.17
USD 3,000,000 Mexico Government International Bond 4.60% 23/1/2046 2,890,005 0.15
USD 1,850,000 Mexico Government International Bond 4.35% 15/1/2047 1,712,637 0.09
USD 2,600,000 Mexico Government International Bond 5.75% 12/10/2110 2,593,500 0.14
USD 250,000 Nacional Financiera SNC RegS 3.375% 5/11/2020 255,420 0.01
USD 300,000 Petroleos Mexicanos 5.75% 1/3/2018 309,843 0.02
USD 150,000 Petroleos Mexicanos FRN 18/7/2018 152,432 0.01
USD 200,000 Petroleos Mexicanos 3.125% 23/1/2019 201,686 0.01
USD 1,267,000 Petroleos Mexicanos 5.50% 4/2/2019 1,329,602 0.07
USD 2,450,000 Petroleos Mexicanos 8.00% 3/5/2019 2,709,528 0.14
USD 700,000 Petroleos Mexicanos 6.00% 5/3/2020 * 752,934 0.04
USD 1,350,000 Petroleos Mexicanos 3.50% 23/7/2020 1,365,701 0.07
USD 2,900,000 Petroleos Mexicanos 5.50% 21/1/2021 3,072,057 0.16
USD 1,000,000 Petroleos Mexicanos 6.375% 4/2/2021 1,087,135 0.06
USD 2,100,000 Petroleos Mexicanos 4.875% 24/1/2022 2,161,824 0.12
USD 1,650,000 Petroleos Mexicanos 3.50% 30/1/2023 1,573,688 0.08
USD 1,000,000 Petroleos Mexicanos 4.625% 21/9/2023 * 1,006,820 0.05
BlackRock Emerging Markets Government Bond Index Fund continued
Portfolio of Investments as at 31 March 2017
Mexico continued
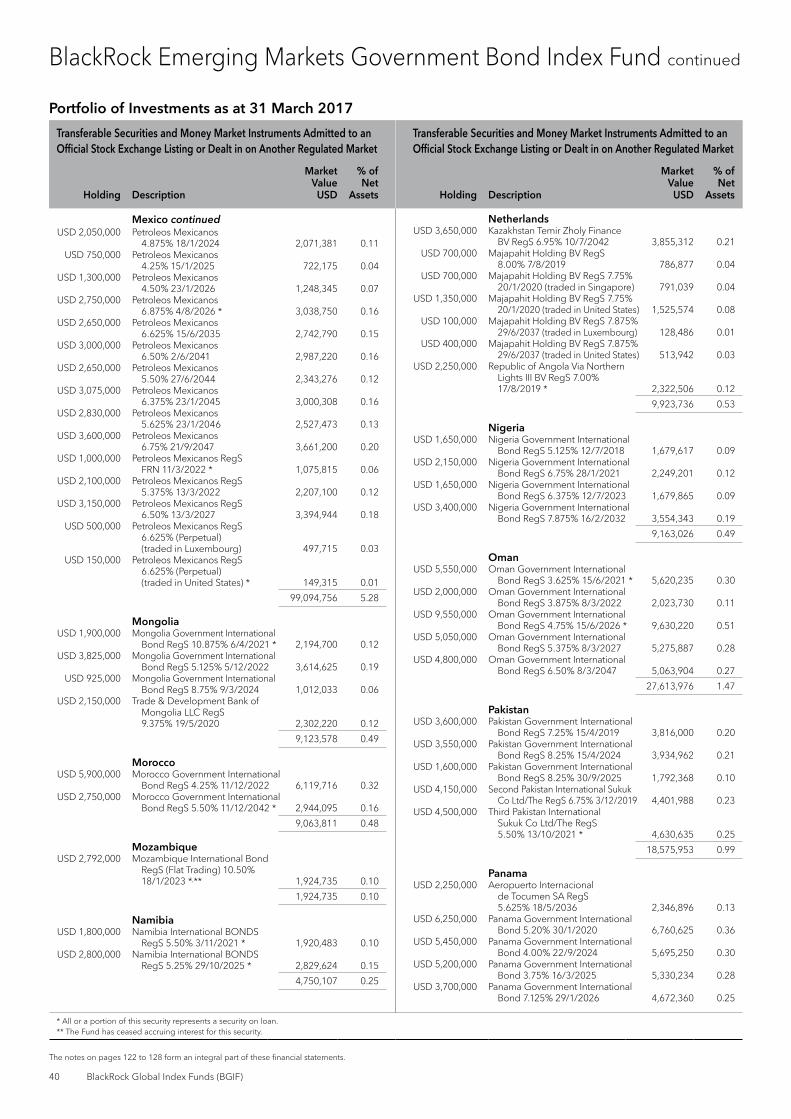
Transferable Securities and Money Market Instruments Admitted to an Official Stock Exchange Listing or Dealt in on Another Regulated Market
Transferable Securities and Money Market Instruments Admitted to an Official Stock Exchange Listing or Dealt in on Another Regulated Market
Holding Description
Market Value
USD
% of Net
Assets Holding Description
Market Value
USD
% of Net
Assets
* All or a portion of this security represents a security on loan. ** The Fund has ceased accruing interest for this security.
40 BlackRock Global Index Funds (BGIF)
The notes on pages 122 to 128 form an integral part of these financial statements.
USD 2,050,000 Petroleos Mexicanos 4.875% 18/1/2024 2,071,381 0.11
USD 750,000 Petroleos Mexicanos 4.25% 15/1/2025 722,175 0.04
USD 1,300,000 Petroleos Mexicanos 4.50% 23/1/2026 1,248,345 0.07
USD 2,750,000 Petroleos Mexicanos 6.875% 4/8/2026 * 3,038,750 0.16
USD 2,650,000 Petroleos Mexicanos 6.625% 15/6/2035 2,742,790 0.15
USD 3,000,000 Petroleos Mexicanos 6.50% 2/6/2041 2,987,220 0.16
USD 2,650,000 Petroleos Mexicanos 5.50% 27/6/2044 2,343,276 0.12
USD 3,075,000 Petroleos Mexicanos 6.375% 23/1/2045 3,000,308 0.16
USD 2,830,000 Petroleos Mexicanos 5.625% 23/1/2046 2,527,473 0.13
USD 3,600,000 Petroleos Mexicanos 6.75% 21/9/2047 3,661,200 0.20
USD 1,000,000 Petroleos Mexicanos RegS FRN 11/3/2022 * 1,075,815 0.06
USD 2,100,000 Petroleos Mexicanos RegS 5.375% 13/3/2022 2,207,100 0.12
USD 3,150,000 Petroleos Mexicanos RegS 6.50% 13/3/2027 3,394,944 0.18
USD 500,000 Petroleos Mexicanos RegS 6.625% (Perpetual) (traded in Luxembourg) 497,715 0.03
USD 150,000 Petroleos Mexicanos RegS 6.625% (Perpetual) (traded in United States) * 149,315 0.01
99,094,756 5.28
Mongolia USD 1,900,000 Mongolia Government International
Bond RegS 10.875% 6/4/2021 * 2,194,700 0.12 USD 3,825,000 Mongolia Government International
Bond RegS 5.125% 5/12/2022 3,614,625 0.19 USD 925,000 Mongolia Government International
Bond RegS 8.75% 9/3/2024 1,012,033 0.06 USD 2,150,000 Trade & Development Bank of
Mongolia LLC RegS 9.375% 19/5/2020 2,302,220 0.12
9,123,578 0.49
Morocco USD 5,900,000 Morocco Government International
Bond RegS 4.25% 11/12/2022 6,119,716 0.32 USD 2,750,000 Morocco Government International
Bond RegS 5.50% 11/12/2042 * 2,944,095 0.16
9,063,811 0.48
Mozambique USD 2,792,000 Mozambique International Bond
RegS (Flat Trading) 10.50% 18/1/2023 *,** 1,924,735 0.10
1,924,735 0.10
Namibia USD 1,800,000 Namibia International BONDS
RegS 5.50% 3/11/2021 * 1,920,483 0.10 USD 2,800,000 Namibia International BONDS
RegS 5.25% 29/10/2025 * 2,829,624 0.15
4,750,107 0.25
Netherlands USD 3,650,000 Kazakhstan Temir Zholy Finance
BV RegS 6.95% 10/7/2042 3,855,312 0.21 USD 700,000 Majapahit Holding BV RegS
8.00% 7/8/2019 786,877 0.04 USD 700,000 Majapahit Holding BV RegS 7.75%
20/1/2020 (traded in Singapore) 791,039 0.04 USD 1,350,000 Majapahit Holding BV RegS 7.75%
20/1/2020 (traded in United States) 1,525,574 0.08 USD 100,000 Majapahit Holding BV RegS 7.875%
29/6/2037 (traded in Luxembourg) 128,486 0.01 USD 400,000 Majapahit Holding BV RegS 7.875%
29/6/2037 (traded in United States) 513,942 0.03 USD 2,250,000 Republic of Angola Via Northern
Lights III BV RegS 7.00% 17/8/2019 * 2,322,506 0.12
9,923,736 0.53
Nigeria USD 1,650,000 Nigeria Government International
Bond RegS 5.125% 12/7/2018 1,679,617 0.09 USD 2,150,000 Nigeria Government International
Bond RegS 6.75% 28/1/2021 2,249,201 0.12 USD 1,650,000 Nigeria Government International
Bond RegS 6.375% 12/7/2023 1,679,865 0.09 USD 3,400,000 Nigeria Government International
Bond RegS 7.875% 16/2/2032 3,554,343 0.19
9,163,026 0.49
Oman USD 5,550,000 Oman Government International
Bond RegS 3.625% 15/6/2021 * 5,620,235 0.30 USD 2,000,000 Oman Government International
Bond RegS 3.875% 8/3/2022 2,023,730 0.11 USD 9,550,000 Oman Government International
Bond RegS 4.75% 15/6/2026 * 9,630,220 0.51 USD 5,050,000 Oman Government International
Bond RegS 5.375% 8/3/2027 5,275,887 0.28 USD 4,800,000 Oman Government International
Bond RegS 6.50% 8/3/2047 5,063,904 0.27
27,613,976 1.47
Pakistan USD 3,600,000 Pakistan Government International
Bond RegS 7.25% 15/4/2019 3,816,000 0.20 USD 3,550,000 Pakistan Government International
Bond RegS 8.25% 15/4/2024 3,934,962 0.21 USD 1,600,000 Pakistan Government International
Bond RegS 8.25% 30/9/2025 1,792,368 0.10 USD 4,150,000 Second Pakistan International Sukuk
Co Ltd/The RegS 6.75% 3/12/2019 4,401,988 0.23 USD 4,500,000 Third Pakistan International
Sukuk Co Ltd/The RegS 5.50% 13/10/2021 * 4,630,635 0.25
18,575,953 0.99
Panama USD 2,250,000 Aeropuerto Internacional
de Tocumen SA RegS 5.625% 18/5/2036 2,346,896 0.13
USD 6,250,000 Panama Government International Bond 5.20% 30/1/2020 6,760,625 0.36
USD 5,450,000 Panama Government International Bond 4.00% 22/9/2024 5,695,250 0.30
USD 5,200,000 Panama Government International Bond 3.75% 16/3/2025 5,330,234 0.28
USD 3,700,000 Panama Government International Bond 7.125% 29/1/2026 4,672,360 0.25
BlackRock Emerging Markets Government Bond Index Fund continued
Portfolio of Investments as at 31 March 2017
Mexico continued

Transferable Securities and Money Market Instruments Admitted to an Official Stock Exchange Listing or Dealt in on Another Regulated Market
Transferable Securities and Money Market Instruments Admitted to an Official Stock Exchange Listing or Dealt in on Another Regulated Market
Holding Description
Market Value
USD
% of Net
Assets Holding Description
Market Value
USD
% of Net
Assets
* All or a portion of this security represents a security on loan.
Annual Report and Audited Accounts 41
The notes on pages 122 to 128 form an integral part of these financial statements.
USD 3,250,000 Panama Government International Bond 8.875% 30/9/2027 4,576,877 0.24
USD 3,950,000 Panama Government International Bond 3.875% 17/3/2028 4,022,384 0.22
USD 3,050,000 Panama Government International Bond 9.375% 1/4/2029 4,474,045 0.24
USD 8,400,000 Panama Government International Bond 6.70% 26/1/2036 10,655,610 0.57
USD 3,000,000 Panama Government International Bond 4.30% 29/4/2053 2,882,640 0.15
51,416,921 2.74
Paraguay USD 700,000 Paraguay Government International
Bond '144A' 4.625% 25/1/2023 * 730,093 0.04 USD 3,300,000 Paraguay Government International
Bond RegS 4.625% 25/1/2023 * 3,440,250 0.18 USD 2,100,000 Paraguay Government International
Bond RegS 5.00% 15/4/2026 2,195,907 0.12 USD 3,850,000 Paraguay Government International
Bond RegS 6.10% 11/8/2044 4,115,284 0.22
10,481,534 0.56
Peru USD 1,900,000 Corp Financiera de Desarrollo SA
RegS 3.25% 15/7/2019 1,936,185 0.10 USD 2,000,000 Corp Financiera de Desarrollo SA
RegS 4.75% 8/2/2022 2,126,170 0.11 USD 2,050,000 Corp Financiera de Desarrollo SA
RegS 4.75% 15/7/2025 2,175,890 0.12 USD 1,850,000 Fondo MIVIVIENDA SA RegS
3.50% 31/1/2023 * 1,860,212 0.10 USD 350,000 Fondo MIVIVIENDA SA RegS
3.50% 31/1/2023 351,915 0.02 USD 7,150,000 Peruvian Government International
Bond 7.35% 21/7/2025 9,286,420 0.50 USD 4,750,000 Peruvian Government International
Bond 4.125% 25/8/2027 * 5,122,519 0.27 USD 8,320,000 Peruvian Government International
Bond 8.75% 21/11/2033 12,620,442 0.67 USD 4,850,000 Peruvian Government International
Bond 6.55% 14/3/2037 6,287,540 0.34 USD 9,900,000 Peruvian Government International
Bond 5.625% 18/11/2050 11,838,172 0.63
53,605,465 2.86
Philippines USD 200,000 Philippine Government International
Bond 9.875% 15/1/2019 228,555 0.01 USD 2,300,000 Philippine Government International
Bond 8.375% 17/6/2019 2,626,117 0.14 USD 700,000 Philippine Government International
Bond 6.50% 20/1/2020 785,152 0.04 USD 4,600,000 Philippine Government International
Bond 4.00% 15/1/2021 * 4,899,000 0.26 USD 4,050,000 Philippine Government International
Bond 4.20% 21/1/2024 * 4,389,430 0.23 USD 4,150,000 Philippine Government International
Bond 10.625% 16/3/2025 6,323,853 0.34 USD 2,450,000 Philippine Government International
Bond 5.50% 30/3/2026 2,895,569 0.15 USD 4,650,000 Philippine Government International
Bond 9.50% 2/2/2030 7,366,483 0.39 USD 2,400,000 Philippine Government International
Bond 7.75% 14/1/2031 (traded in Luxembourg) 3,427,200 0.18
USD 1,800,000 Philippine Government International Bond 7.75% 14/1/2031 (traded in United States) 2,570,400 0.14
USD 2,200,000 Philippine Government International Bond 6.375% 15/1/2032 2,843,500 0.15
USD 4,950,000 Philippine Government International Bond 6.375% 23/10/2034 * 6,583,500 0.35
USD 2,850,000 Philippine Government International Bond 5.00% 13/1/2037 3,330,938 0.18
USD 4,200,000 Philippine Government International Bond 3.95% 20/1/2040 4,327,869 0.23
USD 4,450,000 Philippine Government International Bond 3.70% 1/3/2041 * 4,412,553 0.24
USD 3,515,000 Philippine Government International Bond 3.70% 2/2/2042 * 3,478,233 0.19
USD 2,650,000 Power Sector Assets & Liabilities Management Corp RegS 7.25% 27/5/2019 * 2,942,004 0.16
USD 2,320,000 Power Sector Assets & Liabilities Management Corp RegS 7.39% 2/12/2024 * 2,969,484 0.16
66,399,840 3.54
Poland USD 11,450,000 Republic of Poland Government
International Bond 6.375% 15/7/2019 12,574,962 0.67
USD 6,100,000 Republic of Poland Government International Bond 5.125% 21/4/2021 6,689,230 0.36
USD 9,700,000 Republic of Poland Government International Bond 5.00% 23/3/2022 10,668,060 0.57
USD 7,200,000 Republic of Poland Government International Bond 3.00% 17/3/2023 * 7,209,000 0.39
USD 400,000 Republic of Poland Government International Bond 4.00% 22/1/2024 (traded in Luxembourg) 420,250 0.02
USD 6,500,000 Republic of Poland Government International Bond 4.00% 22/1/2024 (traded in United States) * 6,829,062 0.36
USD 6,050,000 Republic of Poland Government International Bond 3.25% 6/4/2026 * 6,007,348 0.32
50,397,912 2.69
Republic of Cameroon USD 2,750,000 Republic of Cameroon International
Bond RegS 9.50% 19/11/2025 * 3,121,250 0.17
3,121,250 0.17
Romania USD 8,450,000 Romanian Government International
Bond RegS 6.75% 7/2/2022 9,804,112 0.53 USD 5,900,000 Romanian Government International
Bond RegS 4.375% 22/8/2023 6,233,940 0.33 USD 3,650,000 Romanian Government International
Bond RegS 4.875% 22/1/2024 3,967,915 0.21 USD 3,950,000 Romanian Government International
Bond RegS 6.125% 22/1/2044 * 4,862,253 0.26
24,868,220 1.33
BlackRock Emerging Markets Government Bond Index Fund continued
Portfolio of Investments as at 31 March 2017
Panama continued Philippines continued

Transferable Securities and Money Market Instruments Admitted to an Official Stock Exchange Listing or Dealt in on Another Regulated Market
Transferable Securities and Money Market Instruments Admitted to an Official Stock Exchange Listing or Dealt in on Another Regulated Market
Holding Description
Market Value
USD
% of Net
Assets Holding Description
Market Value
USD
% of Net
Assets
* All or a portion of this security represents a security on loan.
42 BlackRock Global Index Funds (BGIF)
The notes on pages 122 to 128 form an integral part of these financial statements.
Russia USD 4,450,000 Russian Foreign Bond - Eurobond
RegS 11.00% 24/7/2018 5,003,580 0.27 USD 2,200,000 Russian Foreign Bond - Eurobond
RegS 3.50% 16/1/2019 2,261,193 0.12 USD 4,800,000 Russian Foreign Bond - Eurobond
RegS 5.00% 29/4/2020 5,129,424 0.27 USD 3,000,000 Russian Foreign Bond - Eurobond
RegS 4.50% 4/4/2022 3,188,760 0.17 USD 4,600,000 Russian Foreign Bond - Eurobond
RegS 4.875% 16/9/2023 4,938,100 0.26 USD 4,800,000 Russian Foreign Bond - Eurobond
RegS 4.75% 27/5/2026 5,016,120 0.27 USD 3,100,000 Russian Foreign Bond - Eurobond
RegS 12.75% 24/6/2028 5,471,423 0.29 USD 4,400,000 Russian Foreign Bond - Eurobond
RegS 5.625% 4/4/2042 4,846,380 0.26 USD 800,000 Russian Foreign Bond - Eurobond
RegS 5.875% 16/9/2043 (traded in Germany) 912,000 0.05
USD 1,400,000 Russian Foreign Bond - Eurobond RegS 5.875% 16/9/2043 (traded in United Kingdom) 1,596,000 0.08
USD 16,448,000 Russian Foreign Bond - Eurobond RegS (Step-up coupon) 7.50% 31/3/2030 19,828,475 1.06
58,191,455 3.10
Senegal USD 500,000 Senegal Government International
Bond RegS 8.75% 13/5/2021 (traded in Luxembourg) 568,782 0.03
USD 1,350,000 Senegal Government International Bond RegS 8.75% 13/5/2021 (traded in Senegal) 1,535,713 0.08
USD 2,000,000 Senegal Government International Bond RegS 6.25% 30/7/2024 * 2,019,660 0.11
4,124,155 0.22
Serbia USD 3,900,000 Serbia International Bond RegS
5.875% 3/12/2018 4,106,427 0.22 USD 5,600,000 Serbia International Bond RegS
4.875% 25/2/2020 5,813,276 0.31 USD 7,800,000 Serbia International Bond RegS
7.25% 28/9/2021 8,914,737 0.47
18,834,440 1.00
Slovakia USD 5,450,000 Slovakia Government International
Bond RegS 4.375% 21/5/2022 5,942,190 0.32
5,942,190 0.32
South Africa USD 4,850,000 Eskom Holdings SOC Ltd RegS
5.75% 26/1/2021 4,883,611 0.26 USD 2,750,000 Eskom Holdings SOC Ltd RegS
6.75% 6/8/2023 2,779,961 0.15 USD 3,200,000 Eskom Holdings SOC Ltd RegS
7.125% 11/2/2025 3,237,024 0.17 USD 3,500,000 Republic of South Africa Government
International Bond 6.875% 27/5/2019 3,807,423 0.20
USD 3,100,000 Republic of South Africa Government International Bond 5.50% 9/3/2020 (traded in Luxembourg) 3,302,740 0.18
USD 2,000,000 Republic of South Africa Government International Bond 5.50% 9/3/2020 (traded in United States) 2,130,800 0.11
USD 2,300,000 Republic of South Africa Government International Bond 5.875% 30/5/2022 2,515,096 0.13
USD 4,250,000 Republic of South Africa Government International Bond 4.665% 17/1/2024 4,305,760 0.23
USD 5,150,000 Republic of South Africa Government International Bond 5.875% 16/9/2025 5,544,232 0.30
USD 3,100,000 Republic of South Africa Government International Bond 4.875% 14/4/2026 * 3,122,475 0.17
USD 5,550,000 Republic of South Africa Government International Bond 4.30% 12/10/2028 5,217,777 0.28
USD 2,200,000 Republic of South Africa Government International Bond 6.25% 8/3/2041 * 2,410,903 0.13
USD 2,600,000 Republic of South Africa Government International Bond 5.375% 24/7/2044 * 2,553,980 0.14
USD 2,800,000 Republic of South Africa Government International Bond 5.00% 12/10/2046 2,600,108 0.14
USD 2,550,000 Transnet SOC Ltd RegS 4.00% 26/7/2022 2,450,703 0.13
USD 1,000,000 ZAR Sovereign Capital Fund Propriety Ltd RegS 3.903% 24/6/2020 1,021,480 0.05
51,884,073 2.77
Sri Lanka USD 1,500,000 Bank of Ceylon RegS
5.325% 16/4/2018 * 1,520,055 0.08 USD 2,250,000 National Savings Bank RegS
8.875% 18/9/2018 2,411,723 0.13 USD 4,300,000 Sri Lanka Government International
Bond RegS 6.00% 14/1/2019 4,461,250 0.24 USD 1,200,000 Sri Lanka Government International
Bond RegS 5.125% 11/4/2019 1,231,500 0.07 USD 4,800,000 Sri Lanka Government International
Bond RegS 6.25% 4/10/2020 * 5,069,328 0.27 USD 4,100,000 Sri Lanka Government International
Bond RegS 6.25% 27/7/2021 * 4,330,174 0.23 USD 1,500,000 Sri Lanka Government International
Bond RegS 5.75% 18/1/2022 * 1,542,765 0.08 USD 3,950,000 Sri Lanka Government International
Bond RegS 5.875% 25/7/2022 4,065,577 0.22 USD 2,250,000 Sri Lanka Government International
Bond RegS 6.125% 3/6/2025 2,256,008 0.12 USD 6,250,000 Sri Lanka Government International
Bond RegS 6.85% 3/11/2025 6,480,625 0.34 USD 1,600,000 Sri Lanka Government International
Bond RegS 6.825% 18/7/2026 (traded in Singapore) 1,656,000 0.09
USD 2,350,000 Sri Lanka Government International Bond RegS 6.825% 18/7/2026 (traded in United States) 2,432,250 0.13
37,457,255 2.00
Suriname USD 2,150,000 Republic of Suriname RegS
9.25% 26/10/2026 2,150,108 0.11
2,150,108 0.11
BlackRock Emerging Markets Government Bond Index Fund continued
Portfolio of Investments as at 31 March 2017
South Africa continued
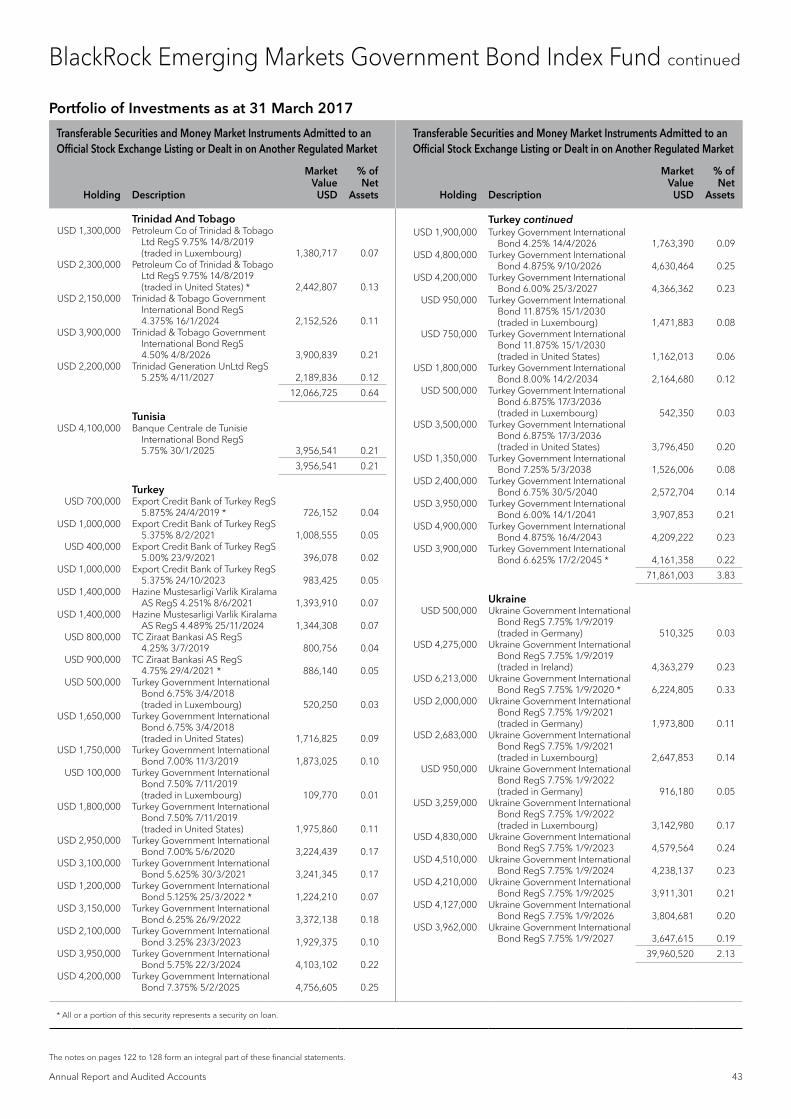
Transferable Securities and Money Market Instruments Admitted to an Official Stock Exchange Listing or Dealt in on Another Regulated Market
Transferable Securities and Money Market Instruments Admitted to an Official Stock Exchange Listing or Dealt in on Another Regulated Market
Holding Description
Market Value
USD
% of Net
Assets Holding Description
Market Value
USD
% of Net
Assets
* All or a portion of this security represents a security on loan.
Annual Report and Audited Accounts 43
The notes on pages 122 to 128 form an integral part of these financial statements.
Trinidad And Tobago USD 1,300,000 Petroleum Co of Trinidad & Tobago
Ltd RegS 9.75% 14/8/2019 (traded in Luxembourg) 1,380,717 0.07
USD 2,300,000 Petroleum Co of Trinidad & Tobago Ltd RegS 9.75% 14/8/2019 (traded in United States) * 2,442,807 0.13
USD 2,150,000 Trinidad & Tobago Government International Bond RegS 4.375% 16/1/2024 2,152,526 0.11
USD 3,900,000 Trinidad & Tobago Government International Bond RegS 4.50% 4/8/2026 3,900,839 0.21
USD 2,200,000 Trinidad Generation UnLtd RegS 5.25% 4/11/2027 2,189,836 0.12
12,066,725 0.64
Tunisia USD 4,100,000 Banque Centrale de Tunisie
International Bond RegS 5.75% 30/1/2025 3,956,541 0.21
3,956,541 0.21
Turkey USD 700,000 Export Credit Bank of Turkey RegS
5.875% 24/4/2019 * 726,152 0.04 USD 1,000,000 Export Credit Bank of Turkey RegS
5.375% 8/2/2021 1,008,555 0.05 USD 400,000 Export Credit Bank of Turkey RegS
5.00% 23/9/2021 396,078 0.02 USD 1,000,000 Export Credit Bank of Turkey RegS
5.375% 24/10/2023 983,425 0.05 USD 1,400,000 Hazine Mustesarligi Varlik Kiralama
AS RegS 4.251% 8/6/2021 1,393,910 0.07 USD 1,400,000 Hazine Mustesarligi Varlik Kiralama
AS RegS 4.489% 25/11/2024 1,344,308 0.07 USD 800,000 TC Ziraat Bankasi AS RegS
4.25% 3/7/2019 800,756 0.04 USD 900,000 TC Ziraat Bankasi AS RegS
4.75% 29/4/2021 * 886,140 0.05 USD 500,000 Turkey Government International
Bond 6.75% 3/4/2018 (traded in Luxembourg) 520,250 0.03
USD 1,650,000 Turkey Government International Bond 6.75% 3/4/2018 (traded in United States) 1,716,825 0.09
USD 1,750,000 Turkey Government International Bond 7.00% 11/3/2019 1,873,025 0.10
USD 100,000 Turkey Government International Bond 7.50% 7/11/2019 (traded in Luxembourg) 109,770 0.01
USD 1,800,000 Turkey Government International Bond 7.50% 7/11/2019 (traded in United States) 1,975,860 0.11
USD 2,950,000 Turkey Government International Bond 7.00% 5/6/2020 3,224,439 0.17
USD 3,100,000 Turkey Government International Bond 5.625% 30/3/2021 3,241,345 0.17
USD 1,200,000 Turkey Government International Bond 5.125% 25/3/2022 * 1,224,210 0.07
USD 3,150,000 Turkey Government International Bond 6.25% 26/9/2022 3,372,138 0.18
USD 2,100,000 Turkey Government International Bond 3.25% 23/3/2023 1,929,375 0.10
USD 3,950,000 Turkey Government International Bond 5.75% 22/3/2024 4,103,102 0.22
USD 4,200,000 Turkey Government International Bond 7.375% 5/2/2025 4,756,605 0.25
USD 1,900,000 Turkey Government International Bond 4.25% 14/4/2026 1,763,390 0.09
USD 4,800,000 Turkey Government International Bond 4.875% 9/10/2026 4,630,464 0.25
USD 4,200,000 Turkey Government International Bond 6.00% 25/3/2027 4,366,362 0.23
USD 950,000 Turkey Government International Bond 11.875% 15/1/2030 (traded in Luxembourg) 1,471,883 0.08
USD 750,000 Turkey Government International Bond 11.875% 15/1/2030 (traded in United States) 1,162,013 0.06
USD 1,800,000 Turkey Government International Bond 8.00% 14/2/2034 2,164,680 0.12
USD 500,000 Turkey Government International Bond 6.875% 17/3/2036 (traded in Luxembourg) 542,350 0.03
USD 3,500,000 Turkey Government International Bond 6.875% 17/3/2036 (traded in United States) 3,796,450 0.20
USD 1,350,000 Turkey Government International Bond 7.25% 5/3/2038 1,526,006 0.08
USD 2,400,000 Turkey Government International Bond 6.75% 30/5/2040 2,572,704 0.14
USD 3,950,000 Turkey Government International Bond 6.00% 14/1/2041 3,907,853 0.21
USD 4,900,000 Turkey Government International Bond 4.875% 16/4/2043 4,209,222 0.23
USD 3,900,000 Turkey Government International Bond 6.625% 17/2/2045 * 4,161,358 0.22
71,861,003 3.83
Ukraine USD 500,000 Ukraine Government International
Bond RegS 7.75% 1/9/2019 (traded in Germany) 510,325 0.03
USD 4,275,000 Ukraine Government International Bond RegS 7.75% 1/9/2019 (traded in Ireland) 4,363,279 0.23
USD 6,213,000 Ukraine Government International Bond RegS 7.75% 1/9/2020 * 6,224,805 0.33
USD 2,000,000 Ukraine Government International Bond RegS 7.75% 1/9/2021 (traded in Germany) 1,973,800 0.11
USD 2,683,000 Ukraine Government International Bond RegS 7.75% 1/9/2021 (traded in Luxembourg) 2,647,853 0.14
USD 950,000 Ukraine Government International Bond RegS 7.75% 1/9/2022 (traded in Germany) 916,180 0.05
USD 3,259,000 Ukraine Government International Bond RegS 7.75% 1/9/2022 (traded in Luxembourg) 3,142,980 0.17
USD 4,830,000 Ukraine Government International Bond RegS 7.75% 1/9/2023 4,579,564 0.24
USD 4,510,000 Ukraine Government International Bond RegS 7.75% 1/9/2024 4,238,137 0.23
USD 4,210,000 Ukraine Government International Bond RegS 7.75% 1/9/2025 3,911,301 0.21
USD 4,127,000 Ukraine Government International Bond RegS 7.75% 1/9/2026 3,804,681 0.20
USD 3,962,000 Ukraine Government International Bond RegS 7.75% 1/9/2027 3,647,615 0.19
39,960,520 2.13
BlackRock Emerging Markets Government Bond Index Fund continued
Portfolio of Investments as at 31 March 2017
Turkey continued

Transferable Securities and Money Market Instruments Admitted to an Official Stock Exchange Listing or Dealt in on Another Regulated Market
Transferable Securities and Money Market Instruments Admitted to an Official Stock Exchange Listing or Dealt in on Another Regulated Market
Holding Description
Market Value
USD
% of Net
Assets Holding Description
Market Value
USD
% of Net
Assets
* All or a portion of this security represents a security on loan.
44 BlackRock Global Index Funds (BGIF)
The notes on pages 122 to 128 form an integral part of these financial statements.
United Kingdom USD 2,100,000 Oschadbank Via SSB #1 Plc RegS
(Step-up coupon) 9.375% 10/3/2023 2,115,540 0.11
USD 550,000 Oschadbank Via SSB #1 Plc RegS (Step-up coupon) 9.625% 20/3/2025 (traded in Luxembourg) 537,441 0.03
USD 1,100,000 Oschadbank Via SSB #1 Plc RegS (Step-up coupon) 9.625% 20/3/2025 (traded in United States) 1,074,882 0.06
USD 600,000 Ukreximbank Via Biz Finance Plc '144A' 9.75% 22/1/2025 587,055 0.03
USD 1,750,000 Ukreximbank Via Biz Finance Plc RegS 9.625% 27/4/2022 1,763,536 0.09
USD 1,700,000 Ukreximbank Via Biz Finance Plc RegS 9.75% 22/1/2025 1,661,835 0.09
7,740,289 0.41
United States USD 568,141 Brazil Loan Trust 1 RegS
5.477% 24/7/2023 579,504 0.03
579,504 0.03
Uruguay USD 600,000 Uruguay Government International
Bond 8.00% 18/11/2022 732,090 0.04 USD 7,375,000 Uruguay Government International
Bond 4.50% 14/8/2024 7,866,728 0.42 USD 8,850,000 Uruguay Government International
Bond 4.375% 27/10/2027 9,254,887 0.49 USD 2,425,000 Uruguay Government International
Bond 7.875% 15/1/2033 3,182,146 0.17 USD 4,700,000 Uruguay Government International
Bond 7.625% 21/3/2036 6,127,390 0.33 USD 2,780,000 Uruguay Government International
Bond 4.125% 20/11/2045 2,453,003 0.13 USD 15,519,190 Uruguay Government International
Bond 5.10% 18/6/2050 * 14,995,417 0.80
44,611,661 2.38
Venezuela USD 650,000 CA La Electricidad de Caracas
RegS 8.50% 10/4/2018 491,338 0.03 USD 4,082,000 Petroleos de Venezuela SA RegS
8.50% 27/10/2020 3,024,354 0.16 USD 3,000,000 Petroleos de Venezuela SA RegS
9.00% 17/11/2021 1,445,280 0.08 USD 3,750,000 Petroleos de Venezuela SA RegS
12.75% 17/2/2022 * 2,135,100 0.11 USD 6,600,000 Petroleos de Venezuela SA RegS
6.00% 16/5/2024 2,372,964 0.13 USD 5,700,000 Petroleos de Venezuela SA RegS
6.00% 15/11/2026 1,965,018 0.10 USD 3,950,000 Petroleos de Venezuela SA RegS
5.375% 12/4/2027 1,335,515 0.07 USD 3,755,000 Petroleos de Venezuela SA RegS
9.75% 17/5/2035 1,570,491 0.08 USD 1,900,000 Petroleos de Venezuela SA RegS
5.50% 12/4/2037 629,071 0.03 USD 750,000 Venezuela Government International
Bond 13.625% 15/8/2018 * 639,019 0.03 USD 4,450,000 Venezuela Government International
Bond 9.25% 15/9/2027 * 2,065,601 0.11
USD 1,900,000 Venezuela Government International Bond 9.375% 13/1/2034 * 848,350 0.05
USD 1,050,000 Venezuela Government International Bond RegS 7.00% 1/12/2018 735,000 0.04
USD 100,000 Venezuela Government International Bond RegS 7.75% 13/10/2019 (traded in Germany) 57,700 0.00
USD 2,950,000 Venezuela Government International Bond RegS 7.75% 13/10/2019 (traded in United States) 1,702,150 0.09
USD 2,025,000 Venezuela Government International Bond RegS 6.00% 9/12/2020 1,034,066 0.05
USD 3,700,000 Venezuela Government International Bond RegS 12.75% 23/8/2022 * 2,239,147 0.12
USD 200,000 Venezuela Government International Bond RegS 9.00% 7/5/2023 (traded in Germany) 95,740 0.01
USD 2,350,000 Venezuela Government International Bond RegS 9.00% 7/5/2023 (traded in United States) 1,124,945 0.06
USD 1,400,000 Venezuela Government International Bond RegS 8.25% 13/10/2024 (traded in Germany) 616,000 0.03
USD 1,700,000 Venezuela Government International Bond RegS 8.25% 13/10/2024 (traded in United States) * 748,000 0.04
USD 2,250,000 Venezuela Government International Bond RegS 7.65% 21/4/2025 973,125 0.05
USD 4,325,000 Venezuela Government International Bond RegS 11.75% 21/10/2026 2,292,250 0.12
USD 2,350,000 Venezuela Government International Bond RegS 9.25% 7/5/2028 * 1,057,500 0.06
USD 5,750,000 Venezuela Government International Bond RegS 11.95% 5/8/2031 3,099,250 0.17
USD 1,650,000 Venezuela Government International Bond RegS 7.00% 31/3/2038 657,938 0.04
34,954,912 1.86
Vietnam USD 2,225,000 Vietnam Government International
Bond RegS 6.75% 29/1/2020 2,437,076 0.13 USD 4,372,000 Vietnam Government International
Bond RegS 4.80% 19/11/2024 4,461,058 0.24
6,898,134 0.37
Zambia USD 2,400,000 Zambia Government International
Bond RegS 5.375% 20/9/2022 2,196,624 0.12 USD 4,550,000 Zambia Government International
Bond RegS 8.50% 14/4/2024 4,688,957 0.25 USD 4,550,000 Zambia Government International
Bond RegS 8.97% 30/7/2027 4,754,750 0.25
11,640,331 0.62
Total Bonds 1,833,997,911 97.80
Total Transferable Securities and Money Market Instruments Admitted to an Official Stock Exchange Listing or Dealt in on Another Regulated Market 1,833,997,911 97.80
Securities portfolio at market value 1,833,997,911 97.80
Other Net Assets 41,240,122 2.20
Total Net Assets (USD) 1,875,238,033 100.00
BlackRock Emerging Markets Government Bond Index Fund continued
Portfolio of Investments as at 31 March 2017
Venezuela continued

Annual Report and Audited Accounts 45
The notes on pages 122 to 128 form an integral part of these financial statements.
BlackRock Emerging Markets Government Bond Index Fund continued
Open forward foreign exchange transactions as at 31 March 2017
Currency
Purchases Currency
Sales Counterparty
Maturity date
Unrealised appreciation/
(depreciation) USD
EUR Hedged Share Class
EUR 281,065,709 USD 297,706,386 State Street Bank & Trust Company 12/4/2017 2,701,959 USD 5,566,437 EUR 5,244,511 State Street Bank & Trust Company 12/4/2017 (38,995)
2,662,964
GBP Hedged Share Class
GBP 4,056,127 USD 4,936,803 State Street Bank & Trust Company 12/4/2017 120,697 USD 1,317,463 GBP 1,059,074 State Street Bank & Trust Company 12/4/2017 (3,074)
117,623
SEK Hedged Share Class
SEK 1,053,239,024 USD 116,609,589 State Street Bank & Trust Company 12/4/2017 1,390,114 USD 3,232,482 SEK 29,112,485 State Street Bank & Trust Company 12/4/2017 (29,138)
1,360,976
Total (Gross underlying exposure - USD 433,653,136) 4,141,563
Sector Breakdown as at 31 March 2017
% of Net Assets
Government 78.29Energy 9.03Financial 4.72Utilities 2.32Basic Materials 1.85Industrial 1.32Diversified 0.17Consumer, Cyclical 0.05Consumer, Non-cyclical 0.05
Securities portfolio at market value 97.80Other Net Assets 2.20
100.00
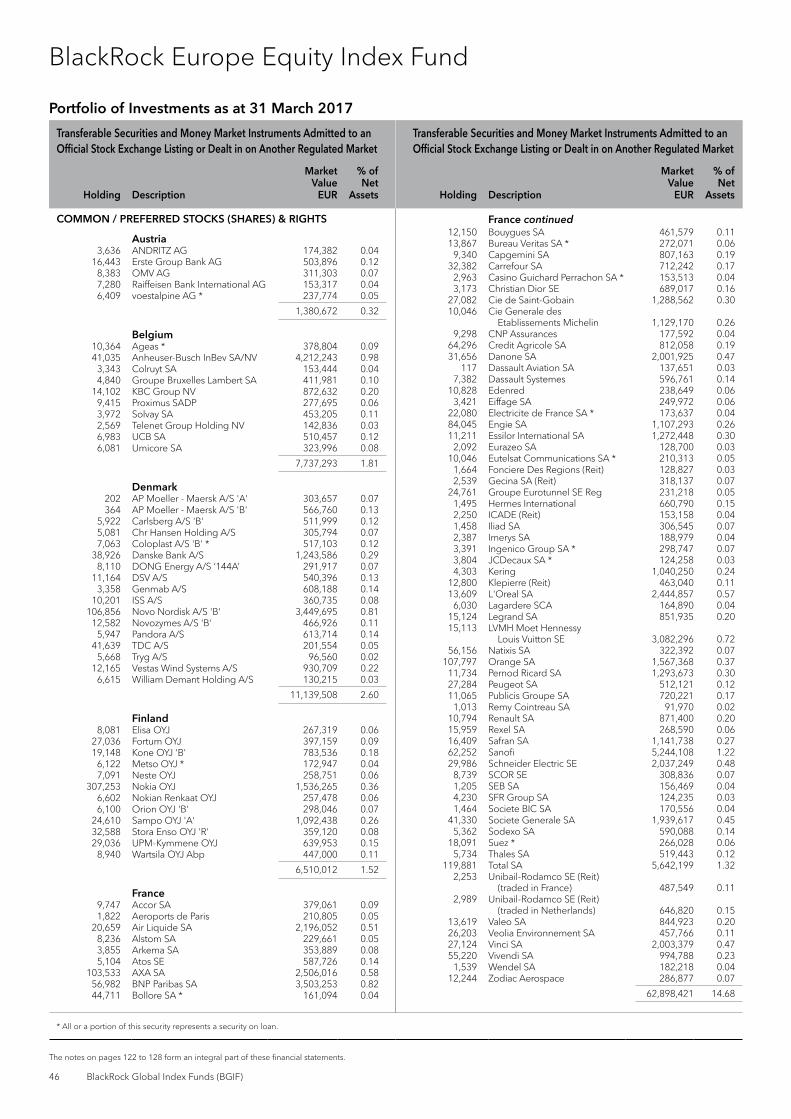
Transferable Securities and Money Market Instruments Admitted to an Official Stock Exchange Listing or Dealt in on Another Regulated Market
Transferable Securities and Money Market Instruments Admitted to an Official Stock Exchange Listing or Dealt in on Another Regulated Market
Holding Description
Market Value
EUR
% of Net
Assets Holding Description
Market Value
EUR
% of Net
Assets
* All or a portion of this security represents a security on loan.
EUR
46 BlackRock Global Index Funds (BGIF)
The notes on pages 122 to 128 form an integral part of these financial statements.
BlackRock Europe Equity Index Fund
COMMON / PREFERRED STOCKS (SHARES) & RIGHTS
Austria 3,636 ANDRITZ AG 174,382 0.04 16,443 Erste Group Bank AG 503,896 0.12 8,383 OMV AG 311,303 0.07 7,280 Raiffeisen Bank International AG 153,317 0.04 6,409 voestalpine AG * 237,774 0.05
1,380,672 0.32
Belgium 10,364 Ageas * 378,804 0.09 41,035 Anheuser-Busch InBev SA/NV 4,212,243 0.98 3,343 Colruyt SA 153,444 0.04 4,840 Groupe Bruxelles Lambert SA 411,981 0.10 14,102 KBC Group NV 872,632 0.20 9,415 Proximus SADP 277,695 0.06 3,972 Solvay SA 453,205 0.11 2,569 Telenet Group Holding NV 142,836 0.03 6,983 UCB SA 510,457 0.12 6,081 Umicore SA 323,996 0.08
7,737,293 1.81
Denmark 202 AP Moeller - Maersk A/S 'A' 303,657 0.07 364 AP Moeller - Maersk A/S 'B' 566,760 0.13 5,922 Carlsberg A/S 'B' 511,999 0.12 5,081 Chr Hansen Holding A/S 305,794 0.07 7,063 Coloplast A/S 'B' * 517,103 0.12 38,926 Danske Bank A/S 1,243,586 0.29 8,110 DONG Energy A/S ‘144A’ 291,917 0.07 11,164 DSV A/S 540,396 0.13 3,358 Genmab A/S 608,188 0.14 10,201 ISS A/S 360,735 0.08 106,856 Novo Nordisk A/S 'B' 3,449,695 0.81 12,582 Novozymes A/S 'B' 466,926 0.11 5,947 Pandora A/S 613,714 0.14 41,639 TDC A/S 201,554 0.05 5,668 Tryg A/S 96,560 0.02 12,165 Vestas Wind Systems A/S 930,709 0.22 6,615 William Demant Holding A/S 130,215 0.03
11,139,508 2.60
Finland 8,081 Elisa OYJ 267,319 0.06 27,036 Fortum OYJ 397,159 0.09 19,148 Kone OYJ 'B' 783,536 0.18 6,122 Metso OYJ * 172,947 0.04 7,091 Neste OYJ 258,751 0.06 307,253 Nokia OYJ 1,536,265 0.36 6,602 Nokian Renkaat OYJ 257,478 0.06 6,100 Orion OYJ 'B' 298,046 0.07 24,610 Sampo OYJ 'A' 1,092,438 0.26 32,588 Stora Enso OYJ 'R' 359,120 0.08 29,036 UPM-Kymmene OYJ 639,953 0.15 8,940 Wartsila OYJ Abp 447,000 0.11
6,510,012 1.52
France 9,747 Accor SA 379,061 0.09 1,822 Aeroports de Paris 210,805 0.05 20,659 Air Liquide SA 2,196,052 0.51 8,236 Alstom SA 229,661 0.05 3,855 Arkema SA 353,889 0.08 5,104 Atos SE 587,726 0.14 103,533 AXA SA 2,506,016 0.58 56,982 BNP Paribas SA 3,503,253 0.82 44,711 Bollore SA * 161,094 0.04
12,150 Bouygues SA 461,579 0.11 13,867 Bureau Veritas SA * 272,071 0.06 9,340 Capgemini SA 807,163 0.19 32,382 Carrefour SA 712,242 0.17 2,963 Casino Guichard Perrachon SA * 153,513 0.04 3,173 Christian Dior SE 689,017 0.16 27,082 Cie de Saint-Gobain 1,288,562 0.30 10,046 Cie Generale des
Etablissements Michelin 1,129,170 0.26 9,298 CNP Assurances 177,592 0.04 64,296 Credit Agricole SA 812,058 0.19 31,656 Danone SA 2,001,925 0.47 117 Dassault Aviation SA 137,651 0.03 7,382 Dassault Systemes 596,761 0.14 10,828 Edenred 238,649 0.06 3,421 Eiffage SA 249,972 0.06 22,080 Electricite de France SA * 173,637 0.04 84,045 Engie SA 1,107,293 0.26 11,211 Essilor International SA 1,272,448 0.30 2,092 Eurazeo SA 128,700 0.03 10,046 Eutelsat Communications SA * 210,313 0.05 1,664 Fonciere Des Regions (Reit) 128,827 0.03 2,539 Gecina SA (Reit) 318,137 0.07 24,761 Groupe Eurotunnel SE Reg 231,218 0.05 1,495 Hermes International 660,790 0.15 2,250 ICADE (Reit) 153,158 0.04 1,458 Iliad SA 306,545 0.07 2,387 Imerys SA 188,979 0.04 3,391 Ingenico Group SA * 298,747 0.07 3,804 JCDecaux SA * 124,258 0.03 4,303 Kering 1,040,250 0.24 12,800 Klepierre (Reit) 463,040 0.11 13,609 L'Oreal SA 2,444,857 0.57 6,030 Lagardere SCA 164,890 0.04 15,124 Legrand SA 851,935 0.20 15,113 LVMH Moet Hennessy
Louis Vuitton SE 3,082,296 0.72 56,156 Natixis SA 322,392 0.07 107,797 Orange SA 1,567,368 0.37 11,734 Pernod Ricard SA 1,293,673 0.30 27,284 Peugeot SA 512,121 0.12 11,065 Publicis Groupe SA 720,221 0.17 1,013 Remy Cointreau SA 91,970 0.02 10,794 Renault SA 871,400 0.20 15,959 Rexel SA 268,590 0.06 16,409 Safran SA 1,141,738 0.27 62,252 Sanofi 5,244,108 1.22 29,986 Schneider Electric SE 2,037,249 0.48 8,739 SCOR SE 308,836 0.07 1,205 SEB SA 156,469 0.04 4,230 SFR Group SA 124,235 0.03 1,464 Societe BIC SA 170,556 0.04 41,330 Societe Generale SA 1,939,617 0.45 5,362 Sodexo SA 590,088 0.14 18,091 Suez * 266,028 0.06 5,734 Thales SA 519,443 0.12 119,881 Total SA 5,642,199 1.32 2,253 Unibail-Rodamco SE (Reit)
(traded in France) 487,549 0.11 2,989 Unibail-Rodamco SE (Reit)
(traded in Netherlands) 646,820 0.15 13,619 Valeo SA 844,923 0.20 26,203 Veolia Environnement SA 457,766 0.11 27,124 Vinci SA 2,003,379 0.47 55,220 Vivendi SA 994,788 0.23 1,539 Wendel SA 182,218 0.04 12,244 Zodiac Aerospace 286,877 0.07
62,898,421 14.68
Portfolio of Investments as at 31 March 2017
France continued
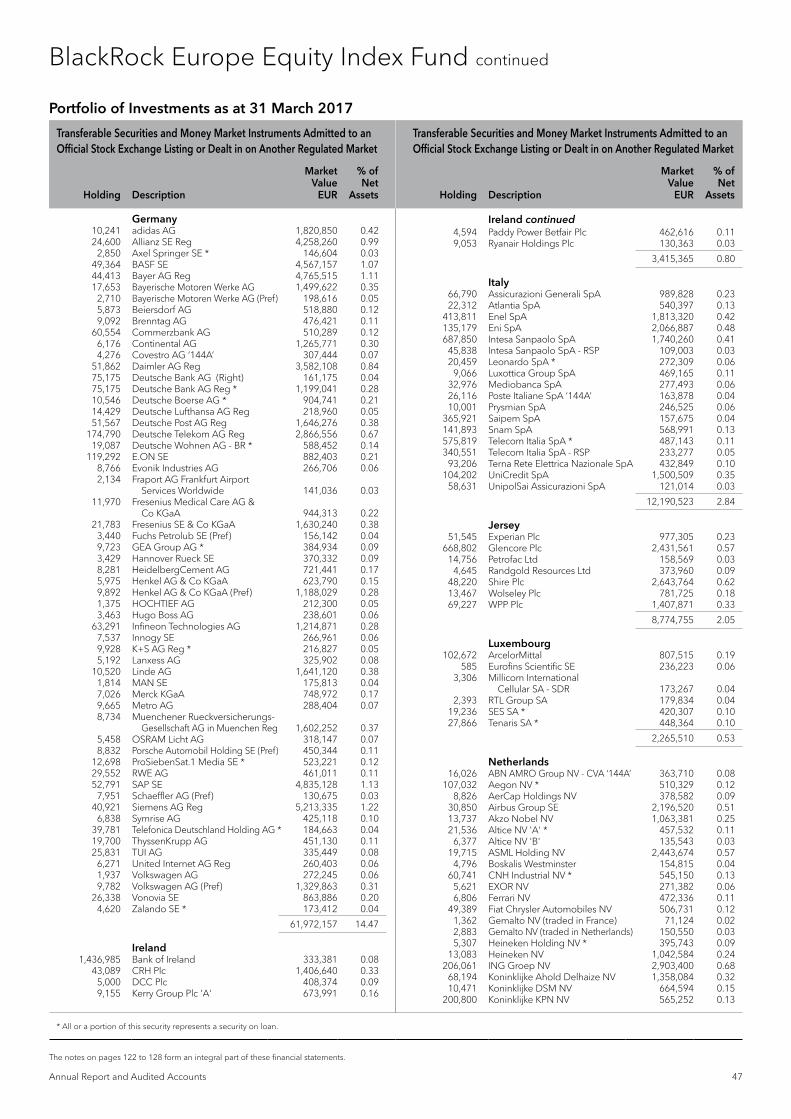
Transferable Securities and Money Market Instruments Admitted to an Official Stock Exchange Listing or Dealt in on Another Regulated Market
Transferable Securities and Money Market Instruments Admitted to an Official Stock Exchange Listing or Dealt in on Another Regulated Market
Holding Description
Market Value
EUR
% of Net
Assets Holding Description
Market Value
EUR
% of Net
Assets
* All or a portion of this security represents a security on loan.
Annual Report and Audited Accounts 47
The notes on pages 122 to 128 form an integral part of these financial statements.
BlackRock Europe Equity Index Fund continued
Germany 10,241 adidas AG 1,820,850 0.42 24,600 Allianz SE Reg 4,258,260 0.99 2,850 Axel Springer SE * 146,604 0.03 49,364 BASF SE 4,567,157 1.07 44,413 Bayer AG Reg 4,765,515 1.11 17,653 Bayerische Motoren Werke AG 1,499,622 0.35 2,710 Bayerische Motoren Werke AG (Pref) 198,616 0.05 5,873 Beiersdorf AG 518,880 0.12 9,092 Brenntag AG 476,421 0.11 60,554 Commerzbank AG 510,289 0.12 6,176 Continental AG 1,265,771 0.30 4,276 Covestro AG ‘144A’ 307,444 0.07 51,862 Daimler AG Reg 3,582,108 0.84 75,175 Deutsche Bank AG (Right) 161,175 0.04 75,175 Deutsche Bank AG Reg * 1,199,041 0.28 10,546 Deutsche Boerse AG * 904,741 0.21 14,429 Deutsche Lufthansa AG Reg 218,960 0.05 51,567 Deutsche Post AG Reg 1,646,276 0.38 174,790 Deutsche Telekom AG Reg 2,866,556 0.67 19,087 Deutsche Wohnen AG - BR * 588,452 0.14 119,292 E.ON SE 882,403 0.21 8,766 Evonik Industries AG 266,706 0.06 2,134 Fraport AG Frankfurt Airport
Services Worldwide 141,036 0.03 11,970 Fresenius Medical Care AG &
Co KGaA 944,313 0.22 21,783 Fresenius SE & Co KGaA 1,630,240 0.38 3,440 Fuchs Petrolub SE (Pref) 156,142 0.04 9,723 GEA Group AG * 384,934 0.09 3,429 Hannover Rueck SE 370,332 0.09 8,281 HeidelbergCement AG 721,441 0.17 5,975 Henkel AG & Co KGaA 623,790 0.15 9,892 Henkel AG & Co KGaA (Pref) 1,188,029 0.28 1,375 HOCHTIEF AG 212,300 0.05 3,463 Hugo Boss AG 238,601 0.06 63,291 Infineon Technologies AG 1,214,871 0.28 7,537 Innogy SE 266,961 0.06 9,928 K+S AG Reg * 216,827 0.05 5,192 Lanxess AG 325,902 0.08 10,520 Linde AG 1,641,120 0.38 1,814 MAN SE 175,813 0.04 7,026 Merck KGaA 748,972 0.17 9,665 Metro AG 288,404 0.07 8,734 Muenchener Rueckversicherungs-
Gesellschaft AG in Muenchen Reg 1,602,252 0.37 5,458 OSRAM Licht AG 318,147 0.07 8,832 Porsche Automobil Holding SE (Pref) 450,344 0.11 12,698 ProSiebenSat.1 Media SE * 523,221 0.12 29,552 RWE AG 461,011 0.11 52,791 SAP SE 4,835,128 1.13 7,951 Schaeffler AG (Pref) 130,675 0.03 40,921 Siemens AG Reg 5,213,335 1.22 6,838 Symrise AG 425,118 0.10 39,781 Telefonica Deutschland Holding AG * 184,663 0.04 19,700 ThyssenKrupp AG 451,130 0.11 25,831 TUI AG 335,449 0.08 6,271 United Internet AG Reg 260,403 0.06 1,937 Volkswagen AG 272,245 0.06 9,782 Volkswagen AG (Pref) 1,329,863 0.31 26,338 Vonovia SE 863,886 0.20 4,620 Zalando SE * 173,412 0.04
61,972,157 14.47
Ireland 1,436,985 Bank of Ireland 333,381 0.08 43,089 CRH Plc 1,406,640 0.33 5,000 DCC Plc 408,374 0.09 9,155 Kerry Group Plc 'A' 673,991 0.16
4,594 Paddy Power Betfair Plc 462,616 0.11 9,053 Ryanair Holdings Plc 130,363 0.03
3,415,365 0.80
Italy 66,790 Assicurazioni Generali SpA 989,828 0.23 22,312 Atlantia SpA 540,397 0.13 413,811 Enel SpA 1,813,320 0.42 135,179 Eni SpA 2,066,887 0.48 687,850 Intesa Sanpaolo SpA 1,740,260 0.41 45,838 Intesa Sanpaolo SpA - RSP 109,003 0.03 20,459 Leonardo SpA * 272,309 0.06 9,066 Luxottica Group SpA 469,165 0.11 32,976 Mediobanca SpA 277,493 0.06 26,116 Poste Italiane SpA ‘144A’ 163,878 0.04 10,001 Prysmian SpA 246,525 0.06 365,921 Saipem SpA 157,675 0.04 141,893 Snam SpA 568,991 0.13 575,819 Telecom Italia SpA * 487,143 0.11 340,551 Telecom Italia SpA - RSP 233,277 0.05 93,206 Terna Rete Elettrica Nazionale SpA 432,849 0.10 104,202 UniCredit SpA 1,500,509 0.35 58,631 UnipolSai Assicurazioni SpA 121,014 0.03
12,190,523 2.84
Jersey 51,545 Experian Plc 977,305 0.23 668,802 Glencore Plc 2,431,561 0.57 14,756 Petrofac Ltd 158,569 0.03 4,645 Randgold Resources Ltd 373,960 0.09 48,220 Shire Plc 2,643,764 0.62 13,467 Wolseley Plc 781,725 0.18 69,227 WPP Plc 1,407,871 0.33
8,774,755 2.05
Luxembourg 102,672 ArcelorMittal 807,515 0.19 585 Eurofins Scientific SE 236,223 0.06 3,306 Millicom International
Cellular SA - SDR 173,267 0.04 2,393 RTL Group SA 179,834 0.04 19,236 SES SA * 420,307 0.10 27,866 Tenaris SA * 448,364 0.10
2,265,510 0.53
Netherlands 16,026 ABN AMRO Group NV - CVA ‘144A’ 363,710 0.08 107,032 Aegon NV * 510,329 0.12 8,826 AerCap Holdings NV 378,582 0.09 30,850 Airbus Group SE 2,196,520 0.51 13,737 Akzo Nobel NV 1,063,381 0.25 21,536 Altice NV 'A' * 457,532 0.11 6,377 Altice NV 'B' 135,543 0.03 19,715 ASML Holding NV 2,443,674 0.57 4,796 Boskalis Westminster 154,815 0.04 60,741 CNH Industrial NV * 545,150 0.13 5,621 EXOR NV 271,382 0.06 6,806 Ferrari NV 472,336 0.11 49,389 Fiat Chrysler Automobiles NV 506,731 0.12 1,362 Gemalto NV (traded in France) 71,124 0.02 2,883 Gemalto NV (traded in Netherlands) 150,550 0.03 5,307 Heineken Holding NV * 395,743 0.09 13,083 Heineken NV 1,042,584 0.24 206,061 ING Groep NV 2,903,400 0.68 68,194 Koninklijke Ahold Delhaize NV 1,358,084 0.32 10,471 Koninklijke DSM NV 664,594 0.15 200,800 Koninklijke KPN NV 565,252 0.13
Portfolio of Investments as at 31 March 2017
Ireland continued

Transferable Securities and Money Market Instruments Admitted to an Official Stock Exchange Listing or Dealt in on Another Regulated Market
Transferable Securities and Money Market Instruments Admitted to an Official Stock Exchange Listing or Dealt in on Another Regulated Market
Holding Description
Market Value
EUR
% of Net
Assets Holding Description
Market Value
EUR
% of Net
Assets
* All or a portion of this security represents a security on loan.
48 BlackRock Global Index Funds (BGIF)
The notes on pages 122 to 128 form an integral part of these financial statements.
49,781 Koninklijke Philips NV 1,491,937 0.35 4,019 Koninklijke Vopak NV 164,196 0.04 17,605 NN Group NV 537,481 0.13 16,697 NXP Semiconductors NV 1,624,146 0.38 11,778 QIAGEN NV 319,596 0.07 7,123 Randstad Holding NV 384,428 0.09 55,943 RELX NV 968,653 0.23 34,194 STMicroelectronics NV 491,197 0.11 86,626 Unilever NV - CVA 4,021,612 0.94 17,401 Wolters Kluwer NV 674,550 0.16
27,328,812 6.38
Norway 53,643 DNB ASA 795,294 0.19 10,315 Gjensidige Forsikring ASA 148,545 0.03 23,375 Marine Harvest ASA 332,546 0.08 72,411 Norsk Hydro ASA * 395,183 0.09 47,663 Orkla ASA 397,191 0.09 4,050 Schibsted ASA 'A' 97,103 0.02 4,750 Schibsted ASA 'B' 101,674 0.02 63,870 Statoil ASA 1,023,449 0.24 39,917 Telenor ASA 622,669 0.15 10,425 Yara International ASA 377,480 0.09
4,291,134 1.00
Portugal 131,210 EDP - Energias de Portugal SA 416,460 0.10 24,280 Galp Energia SGPS SA 344,048 0.08 15,771 Jeronimo Martins SGPS SA 262,114 0.06
1,022,622 0.24
Spain 37,370 Abertis Infraestructuras SA 564,287 0.13 11,784 ACS Actividades de Construccion
y Servicios SA 372,964 0.09 4,004 Aena SA ‘144A’ 586,786 0.14 24,451 Amadeus IT Group SA 1,159,833 0.27 352,623 Banco Bilbao Vizcaya Argentaria SA 2,545,585 0.59 313,284 Banco de Sabadell SA 534,776 0.12 187,229 Banco Popular Espanol SA * 170,004 0.04 785,616 Banco Santander SA 4,467,013 1.04 278,225 Bankia SA 293,806 0.07 39,237 Bankinter SA 306,794 0.07 197,835 CaixaBank SA 794,110 0.19 35,255 Distribuidora Internacional de
Alimentacion SA * 189,848 0.04 5,868 Enagas SA 142,064 0.03 16,889 Endesa SA 370,207 0.09 29,174 Ferrovial SA 543,657 0.13 20,299 Gas Natural SDG SA 414,506 0.10 18,264 Grifols SA 418,428 0.10 289,804 Iberdrola SA 1,931,254 0.45 58,818 Industria de Diseno Textil SA 1,919,820 0.45 44,187 International Consolidated
Airlines Group SA 272,059 0.06 56,907 Mapfre SA 182,159 0.04 15,012 Red Electrica Corp SA 270,066 0.06 64,244 Repsol SA 929,289 0.22 248,482 Telefonica SA 2,595,394 0.61 10,756 Zardoya Otis SA 93,470 0.02
22,068,179 5.15
Sweden 16,117 Alfa Laval AB * 283,985 0.07 56,444 Assa Abloy AB 'B' * 1,083,301 0.25 37,298 Atlas Copco AB 'A' 1,227,994 0.29 21,216 Atlas Copco AB 'B' 628,906 0.15
14,510 Boliden AB 407,154 0.09 14,301 Electrolux AB 'B' 373,408 0.09 11,907 Getinge AB 'B' 195,326 0.05 53,533 Hennes & Mauritz AB 'B' * 1,276,574 0.30 14,058 Hexagon AB 'B' 530,627 0.12 21,057 Husqvarna AB 'B' 173,485 0.04 5,012 ICA Gruppen AB * 160,496 0.04 9,043 Industrivarden AB 'C' 183,416 0.04 25,501 Investor AB 'B' 1,004,783 0.23 13,070 Kinnevik AB 'B' 327,839 0.08 2,028 L E Lundbergforetagen AB 'B' 128,289 0.03 9,750 Lundin Petroleum AB 184,674 0.04 170,224 Nordea Bank AB 1,827,105 0.43 61,366 Sandvik AB 854,861 0.20 16,504 Securitas AB 'B' 242,019 0.06 83,303 Skandinaviska Enskilda Banken AB 'A' 867,940 0.20 18,304 Skanska AB 'B' 401,951 0.09 23,627 SKF AB 'B' 435,630 0.10 34,663 Svenska Cellulosa AB SCA 'B' 1,051,132 0.25 86,089 Svenska Handelsbanken AB 'A' 1,103,613 0.26 50,194 Swedbank AB 'A' 1,091,198 0.25 10,036 Swedish Match AB 305,808 0.07 19,255 Tele2 AB 'B' 171,959 0.04 173,198 Telefonaktiebolaget LM Ericsson 'B' 1,079,289 0.25 149,352 Telia Co AB 587,690 0.14 84,733 Volvo AB 'B' 1,164,389 0.27
19,354,841 4.52
Switzerland 102,903 ABB Ltd Reg 2,244,390 0.52 5,277 Actelion Ltd 1,394,271 0.33 8,900 Adecco Group AG Reg 590,171 0.14 4,406 Aryzta AG * 132,032 0.03 3,009 Baloise Holding AG Reg * 385,272 0.09 120 Barry Callebaut AG Reg 147,138 0.03 57 Chocoladefabriken Lindt &
Spruengli AG - PC 303,073 0.07 6 Chocoladefabriken Lindt &
Spruengli AG Reg 372,924 0.09 28,501 Cie Financiere Richemont SA Reg 2,101,859 0.49 9,395 Coca-Cola HBC AG - CDI 225,925 0.05 107,478 Credit Suisse Group AG Reg 1,495,768 0.35 2,453 Dufry AG Reg 350,790 0.08 428 EMS-Chemie Holding AG Reg 232,774 0.05 209 Galenica AG Reg 206,420 0.05 2,076 Geberit AG Reg * 833,547 0.20 522 Givaudan SA Reg * 879,766 0.21 12,577 Julius Baer Group Ltd 589,327 0.14 2,995 Kuehne + Nagel International AG Reg 396,085 0.09 25,320 LafargeHolcim Ltd Reg 1,397,197 0.33 3,204 Lonza Group AG Reg 567,563 0.13 171,146 Nestle SA Reg 12,309,343 2.87 122,448 Novartis AG Reg 8,543,431 1.99 1,779 Pargesa Holding SA - BR 117,885 0.03 1,028 Partners Group Holding AG 519,193 0.12 38,636 Roche Holding AG 9,261,526 2.16 2,392 Schindler Holding AG - Part Cert 433,791 0.10 1,085 Schindler Holding AG Reg 193,011 0.05 294 SGS SA Reg * 587,341 0.14 116 Sika AG - BR 648,243 0.15 3,147 Sonova Holding AG Reg 405,002 0.09 1,620 Swatch Group AG/The - BR 541,819 0.13 2,672 Swatch Group AG/The Reg * 174,560 0.04 1,705 Swiss Life Holding AG Reg 514,116 0.12 3,675 Swiss Prime Site AG Reg 300,751 0.07 18,110 Swiss Re AG 1,521,873 0.36 1,429 Swisscom AG Reg * 615,065 0.14 5,091 Syngenta AG Reg 2,105,065 0.49
BlackRock Europe Equity Index Fund continued
Portfolio of Investments as at 31 March 2017
Netherlands continued Sweden continued

Transferable Securities and Money Market Instruments Admitted to an Official Stock Exchange Listing or Dealt in on Another Regulated Market
Transferable Securities and Money Market Instruments Admitted to an Official Stock Exchange Listing or Dealt in on Another Regulated Market
Holding Description
Market Value
EUR
% of Net
Assets Holding Description
Market Value
EUR
% of Net
Assets
* All or a portion of this security represents a security on loan.
Annual Report and Audited Accounts 49
The notes on pages 122 to 128 form an integral part of these financial statements.
BlackRock Europe Equity Index Fund continued
201,575 UBS Group AG Reg 3,012,695 0.70 8,199 Zurich Insurance Group AG * 2,048,987 0.48
58,699,989 13.70
United Kingdom 55,799 3i Group Plc 487,964 0.11 46,794 Aberdeen Asset Management Plc 144,413 0.03 10,822 Admiral Group Plc 250,897 0.06 75,860 Anglo American Plc 1,078,963 0.25 19,557 Antofagasta Plc 188,027 0.04 28,378 Ashtead Group Plc 548,649 0.13 19,059 Associated British Foods Plc 582,406 0.14 69,044 AstraZeneca Plc 3,968,354 0.93 52,489 Auto Trader Group Plc ‘144A’ 238,420 0.06 218,973 Aviva Plc 1,368,170 0.32 12,415 Babcock International Group Plc 128,053 0.03 177,000 BAE Systems Plc 1,334,852 0.31 924,399 Barclays Plc 2,438,934 0.57 51,681 Barratt Developments Plc 329,024 0.08 6,862 Berkeley Group Holdings Plc 256,207 0.06 116,306 BHP Billiton Plc 1,677,300 0.39 1,025,099 BP Plc 5,509,090 1.29 101,782 British American Tobacco Plc 6,276,334 1.47 50,794 British Land Co Plc/The (Reit) * 358,640 0.08 462,306 BT Group Plc 1,727,733 0.40 19,262 Bunzl Plc 520,062 0.12 25,448 Burberry Group Plc 513,974 0.12 35,058 Capita Plc 229,989 0.05 10,005 Carnival Plc 536,989 0.13 294,864 Centrica Plc 749,668 0.17 90,483 Cobham Plc 142,525 0.03 12,904 Coca-Cola European Partners Plc * 453,317 0.11 88,457 Compass Group Plc 1,559,505 0.36 6,791 Croda International Plc 282,794 0.07 137,463 Diageo Plc 3,668,108 0.86 70,898 Direct Line Insurance Group Plc 288,040 0.07 51,463 Dixons Carphone Plc 190,046 0.04 7,487 easyJet Plc 89,803 0.02 12,574 Fresnillo Plc 225,642 0.05 80,190 G4S Plc 285,184 0.07 99,208 GKN Plc 421,693 0.10 266,152 GlaxoSmithKline Plc 5,198,467 1.21 42,508 Hammerson Plc (Reit) 281,714 0.07 14,349 Hargreaves Lansdown Plc * 217,983 0.05 8,525 Hikma Pharmaceuticals Plc * 198,141 0.05 1,079,855 HSBC Holdings Plc 8,241,476 1.92 14,111 IMI Plc 197,574 0.05 52,486 Imperial Brands Plc 2,382,074 0.56 24,126 Inmarsat Plc * 238,851 0.06 10,722 InterContinental Hotels Group Plc 489,276 0.11 9,177 Intertek Group Plc 419,415 0.10 48,313 Intu Properties Plc (Reit) 156,824 0.04 33,445 Investec Plc 213,601 0.05 211,211 ITV Plc 522,694 0.12 89,757 J Sainsbury Plc 277,107 0.06 11,141 Johnson Matthey Plc 401,023 0.09 117,886 Kingfisher Plc 449,711 0.10 41,710 Land Securities Group Plc (Reit) 510,025 0.12 325,722 Legal & General Group Plc 942,516 0.22
3,507,229 Lloyds Banking Group Plc 2,717,204 0.63 17,949 London Stock Exchange Group Plc 657,597 0.15 85,657 Marks & Spencer Group Plc 336,808 0.08 18,519 Mediclinic International Plc 155,359 0.04 40,371 Meggitt Plc 211,309 0.05 35,597 Merlin Entertainments Plc ‘144A’ 197,536 0.05 19,854 Mondi Plc 447,322 0.10 207,689 National Grid Plc 2,462,052 0.57 7,606 Next Plc 383,274 0.09 273,688 Old Mutual Plc 645,056 0.15 42,878 Pearson Plc * 338,949 0.08 15,965 Persimmon Plc 389,691 0.09 7,861 Provident Financial Plc * 271,952 0.06 140,801 Prudential Plc 2,769,832 0.65 34,239 Reckitt Benckiser Group Plc 2,922,305 0.68 59,238 RELX Plc 1,080,313 0.25 67,575 Rio Tinto Plc 2,520,292 0.59 98,206 Rolls-Royce Holdings Plc 871,420 0.20 194,091 Royal Bank of Scotland Group Plc * 548,718 0.13 238,470 Royal Dutch Shell Plc 'A' 5,863,966 1.37 204,482 Royal Dutch Shell Plc 'B' 5,260,490 1.23 46,609 Royal Mail Plc 230,854 0.05 57,624 RSA Insurance Group Plc 394,332 0.09 62,580 Sage Group Plc/The 462,564 0.11 7,367 Schroders Plc 261,223 0.06 59,283 Segro Plc (Reit) * 314,518 0.07 12,342 Severn Trent Plc 343,882 0.08 57,715 Sky Plc 658,257 0.15 47,235 Smith & Nephew Plc 669,623 0.16 22,846 Smiths Group Plc 429,700 0.10 56,333 SSE Plc * 969,165 0.23 28,326 St James's Place Plc 350,994 0.08 181,843 Standard Chartered Plc 1,619,716 0.38 110,138 Standard Life Plc * 456,457 0.11 27,601 Tate & Lyle Plc 248,135 0.06 192,320 Taylor Wimpey Plc 433,084 0.10 582 TechnipFMC Plc 17,867 0.00 444,933 Tesco Plc 967,937 0.23 15,516 Travis Perkins Plc * 272,281 0.06 70,169 Unilever Plc 3,233,944 0.75 38,761 United Utilities Group Plc 450,900 0.11 1,452,702 Vodafone Group Plc 3,539,135 0.83 11,307 Weir Group Plc/The 252,906 0.06 10,536 Whitbread Plc 485,002 0.11 47,861 William Hill Plc 161,611 0.04 133,253 WM Morrison Supermarkets Plc 372,990 0.09 95,698 Worldpay Group Plc ‘144A’ 328,612 0.08
109,365,375 25.53
Total Common / Preferred Stocks (Shares) & Rights 420,415,168 98.14
Total Transferable Securities and Money Market Instruments Admitted to an Official Stock Exchange Listing or Dealt in on Another Regulated Market 420,415,168 98.14
Securities portfolio at market value 420,415,168 98.14
Other Net Assets 7,976,590 1.86
Total Net Assets (EUR) 428,391,758 100.00
Portfolio of Investments as at 31 March 2017
United Kingdom continued Switzerland continued

50 BlackRock Global Index Funds (BGIF)
The notes on pages 122 to 128 form an integral part of these financial statements.
BlackRock Europe Equity Index Fund continued
Futures contracts as at 31 March 2017
Number of contracts
Currency of contract
Contract/ Description
Expiration date
Gross underlying
exposure EUR
Unrealised appreciation/
(depreciation) EUR
117 EUR EURO STOXX 50 Index June 2017 3,987,360 60,776 26 GBP FTSE 100 Index June 2017 2,205,301 (18,034) 10 CHF Swiss Market Index June 2017 798,075 2,525
Total 6,990,736 45,267
Sector Breakdown as at 31 March 2017
% of Net Assets
Consumer, Non-cyclical 28.64Financial 21.29Industrial 10.61Consumer, Cyclical 9.71Basic Materials 7.22Energy 6.88Communications 6.64Utilities 3.59Technology 3.44Diversified 0.12
Securities portfolio at market value 98.14Other Net Assets 1.86
100.00
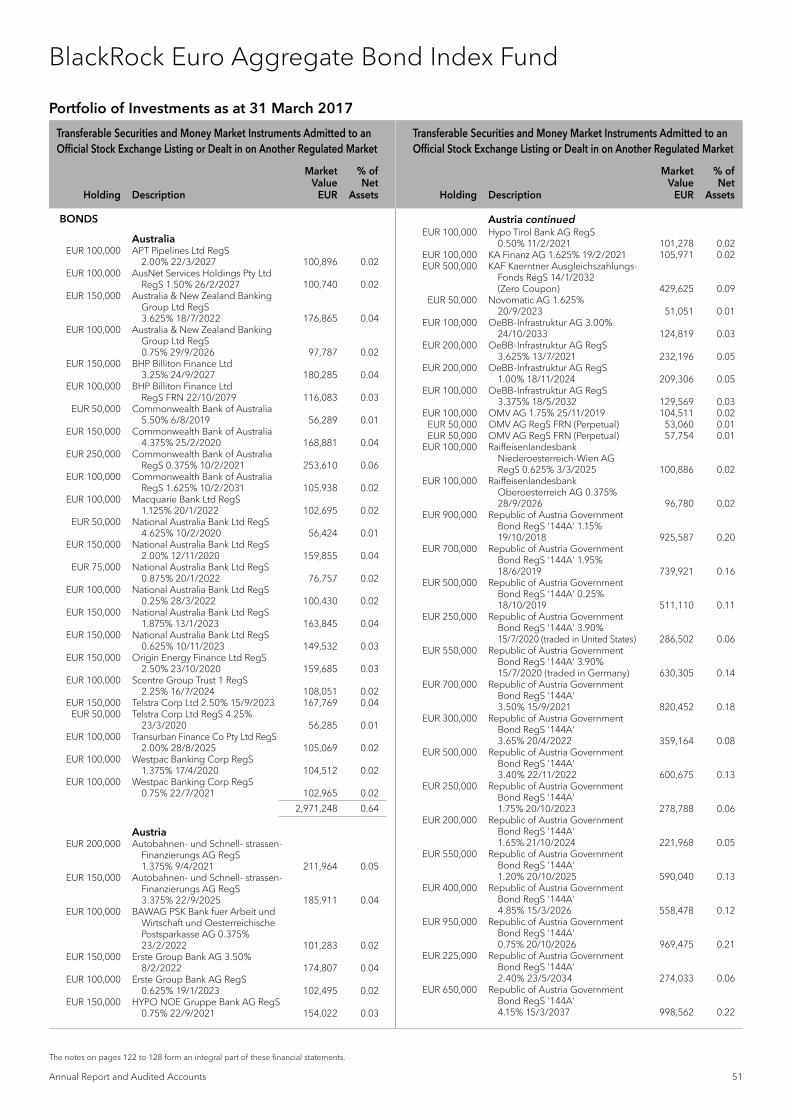
Transferable Securities and Money Market Instruments Admitted to an Official Stock Exchange Listing or Dealt in on Another Regulated Market
Transferable Securities and Money Market Instruments Admitted to an Official Stock Exchange Listing or Dealt in on Another Regulated Market
Holding Description
Market Value
EUR
% of Net
Assets Holding Description
Market Value
EUR
% of Net
Assets
EUR
Annual Report and Audited Accounts 51
The notes on pages 122 to 128 form an integral part of these financial statements.
BlackRock Euro Aggregate Bond Index Fund
BONDS
Australia EUR 100,000 APT Pipelines Ltd RegS
2.00% 22/3/2027 100,896 0.02 EUR 100,000 AusNet Services Holdings Pty Ltd
RegS 1.50% 26/2/2027 100,740 0.02 EUR 150,000 Australia & New Zealand Banking
Group Ltd RegS 3.625% 18/7/2022 176,865 0.04
EUR 100,000 Australia & New Zealand Banking Group Ltd RegS 0.75% 29/9/2026 97,787 0.02
EUR 150,000 BHP Billiton Finance Ltd 3.25% 24/9/2027 180,285 0.04
EUR 100,000 BHP Billiton Finance Ltd RegS FRN 22/10/2079 116,083 0.03
EUR 50,000 Commonwealth Bank of Australia 5.50% 6/8/2019 56,289 0.01
EUR 150,000 Commonwealth Bank of Australia 4.375% 25/2/2020 168,881 0.04
EUR 250,000 Commonwealth Bank of Australia RegS 0.375% 10/2/2021 253,610 0.06
EUR 100,000 Commonwealth Bank of Australia RegS 1.625% 10/2/2031 105,938 0.02
EUR 100,000 Macquarie Bank Ltd RegS 1.125% 20/1/2022 102,695 0.02
EUR 50,000 National Australia Bank Ltd RegS 4.625% 10/2/2020 56,424 0.01
EUR 150,000 National Australia Bank Ltd RegS 2.00% 12/11/2020 159,855 0.04
EUR 75,000 National Australia Bank Ltd RegS 0.875% 20/1/2022 76,757 0.02
EUR 100,000 National Australia Bank Ltd RegS 0.25% 28/3/2022 100,430 0.02
EUR 150,000 National Australia Bank Ltd RegS 1.875% 13/1/2023 163,845 0.04
EUR 150,000 National Australia Bank Ltd RegS 0.625% 10/11/2023 149,532 0.03
EUR 150,000 Origin Energy Finance Ltd RegS 2.50% 23/10/2020 159,685 0.03
EUR 100,000 Scentre Group Trust 1 RegS 2.25% 16/7/2024 108,051 0.02
EUR 150,000 Telstra Corp Ltd 2.50% 15/9/2023 167,769 0.04 EUR 50,000 Telstra Corp Ltd RegS 4.25%
23/3/2020 56,285 0.01 EUR 100,000 Transurban Finance Co Pty Ltd RegS
2.00% 28/8/2025 105,069 0.02 EUR 100,000 Westpac Banking Corp RegS
1.375% 17/4/2020 104,512 0.02 EUR 100,000 Westpac Banking Corp RegS
0.75% 22/7/2021 102,965 0.02
2,971,248 0.64
Austria EUR 200,000 Autobahnen- und Schnell- strassen-
Finanzierungs AG RegS 1.375% 9/4/2021 211,964 0.05
EUR 150,000 Autobahnen- und Schnell- strassen-Finanzierungs AG RegS 3.375% 22/9/2025 185,911 0.04
EUR 100,000 BAWAG PSK Bank fuer Arbeit und Wirtschaft und Oesterreichische Postsparkasse AG 0.375% 23/2/2022 101,283 0.02
EUR 150,000 Erste Group Bank AG 3.50% 8/2/2022 174,807 0.04
EUR 100,000 Erste Group Bank AG RegS 0.625% 19/1/2023 102,495 0.02
EUR 150,000 HYPO NOE Gruppe Bank AG RegS 0.75% 22/9/2021 154,022 0.03
EUR 100,000 Hypo Tirol Bank AG RegS 0.50% 11/2/2021 101,278 0.02
EUR 100,000 KA Finanz AG 1.625% 19/2/2021 105,971 0.02 EUR 500,000 KAF Kaerntner Ausgleichszahlungs-
Fonds RegS 14/1/2032 (Zero Coupon) 429,625 0.09
EUR 50,000 Novomatic AG 1.625% 20/9/2023 51,051 0.01
EUR 100,000 OeBB-Infrastruktur AG 3.00% 24/10/2033 124,819 0.03
EUR 200,000 OeBB-Infrastruktur AG RegS 3.625% 13/7/2021 232,196 0.05
EUR 200,000 OeBB-Infrastruktur AG RegS 1.00% 18/11/2024 209,306 0.05
EUR 100,000 OeBB-Infrastruktur AG RegS 3.375% 18/5/2032 129,569 0.03
EUR 100,000 OMV AG 1.75% 25/11/2019 104,511 0.02 EUR 50,000 OMV AG RegS FRN (Perpetual) 53,060 0.01 EUR 50,000 OMV AG RegS FRN (Perpetual) 57,754 0.01 EUR 100,000 Raiffeisenlandesbank
Niederoesterreich-Wien AG RegS 0.625% 3/3/2025 100,886 0.02
EUR 100,000 Raiffeisenlandesbank Oberoesterreich AG 0.375% 28/9/2026 96,780 0.02
EUR 900,000 Republic of Austria Government Bond RegS '144A' 1.15% 19/10/2018 925,587 0.20
EUR 700,000 Republic of Austria Government Bond RegS '144A' 1.95% 18/6/2019 739,921 0.16
EUR 500,000 Republic of Austria Government Bond RegS '144A' 0.25% 18/10/2019 511,110 0.11
EUR 250,000 Republic of Austria Government Bond RegS '144A' 3.90% 15/7/2020 (traded in United States) 286,502 0.06
EUR 550,000 Republic of Austria Government Bond RegS '144A' 3.90% 15/7/2020 (traded in Germany) 630,305 0.14
EUR 700,000 Republic of Austria Government Bond RegS '144A' 3.50% 15/9/2021 820,452 0.18
EUR 300,000 Republic of Austria Government Bond RegS '144A' 3.65% 20/4/2022 359,164 0.08
EUR 500,000 Republic of Austria Government Bond RegS '144A' 3.40% 22/11/2022 600,675 0.13
EUR 250,000 Republic of Austria Government Bond RegS '144A' 1.75% 20/10/2023 278,788 0.06
EUR 200,000 Republic of Austria Government Bond RegS '144A' 1.65% 21/10/2024 221,968 0.05
EUR 550,000 Republic of Austria Government Bond RegS '144A' 1.20% 20/10/2025 590,040 0.13
EUR 400,000 Republic of Austria Government Bond RegS '144A' 4.85% 15/3/2026 558,478 0.12
EUR 950,000 Republic of Austria Government Bond RegS '144A' 0.75% 20/10/2026 969,475 0.21
EUR 225,000 Republic of Austria Government Bond RegS '144A' 2.40% 23/5/2034 274,033 0.06
EUR 650,000 Republic of Austria Government Bond RegS '144A' 4.15% 15/3/2037 998,562 0.22
Portfolio of Investments as at 31 March 2017
Austria continued

Transferable Securities and Money Market Instruments Admitted to an Official Stock Exchange Listing or Dealt in on Another Regulated Market
Transferable Securities and Money Market Instruments Admitted to an Official Stock Exchange Listing or Dealt in on Another Regulated Market
Holding Description
Market Value
EUR
% of Net
Assets Holding Description
Market Value
EUR
% of Net
Assets
52 BlackRock Global Index Funds (BGIF)
The notes on pages 122 to 128 form an integral part of these financial statements.
BlackRock Euro Aggregate Bond Index Fund continued
EUR 275,000 Republic of Austria Government Bond RegS '144A' 3.15% 20/6/2044 387,612 0.08
EUR 300,000 Republic of Austria Government Bond RegS '144A' 1.50% 20/2/2047 304,221 0.07
EUR 150,000 Republic of Austria Government Bond RegS '144A' 3.80% 26/1/2062 256,958 0.06
EUR 50,000 Republic of Austria Government Bond RegS '144A' 1.50% 2/11/2086 44,374 0.01
EUR 100,000 Telekom Finanzmanagement GmbH RegS 3.50% 4/7/2023 116,477 0.03
EUR 100,000 UniCredit Bank Austria AG 1.875% 29/10/2020 106,845 0.02
EUR 100,000 UniCredit Bank Austria AG RegS 1.25% 30/7/2018 102,038 0.02
EUR 100,000 UniCredit Bank Austria AG RegS 0.75% 25/2/2025 101,757 0.02
EUR 100,000 Verbund AG RegS 1.50% 20/11/2024 104,268 0.02
13,016,898 2.82
Belgium EUR 50,000 Anheuser-Busch InBev SA/NV/old
RegS 2.00% 16/12/2019 52,689 0.01 EUR 150,000 Anheuser-Busch InBev SA/NV/old
RegS 0.625% 17/3/2020 152,441 0.03 EUR 400,000 Anheuser-Busch InBev SA/NV/old
RegS 0.875% 17/3/2022 410,114 0.09 EUR 100,000 Anheuser-Busch InBev SA/NV/old
RegS 2.70% 31/3/2026 112,732 0.02 EUR 150,000 Anheuser-Busch InBev SA/NV/old
RegS 2.00% 17/3/2028 157,071 0.03 EUR 150,000 Anheuser-Busch InBev SA/NV/old
RegS 2.75% 17/3/2036 161,295 0.04 EUR 100,000 Belfius Bank SA/NV RegS
0.375% 27/11/2019 101,509 0.02 EUR 100,000 Belfius Bank SA/NV RegS
1.75% 24/6/2024 109,683 0.02 EUR 100,000 Belfius Bank SA/NV RegS
3.125% 11/5/2026 102,528 0.02 EUR 100,000 BNP Paribas Fortis SA RegS
0.50% 23/9/2024 100,503 0.02 EUR 100,000 Eandis System Operator SCRL
RegS 2.875% 9/10/2023 114,803 0.03 EUR 100,000 Elia System Operator SA/NV
RegS 3.00% 7/4/2029 116,255 0.03 EUR 100,000 Flemish Community/The RegS
1.00% 13/10/2036 90,368 0.02 EUR 100,000 KBC Bank NV RegS
1.25% 28/5/2020 104,398 0.02 EUR 100,000 KBC Bank NV RegS
0.125% 28/4/2021 100,660 0.02 EUR 100,000 KBC Group NV RegS
1.00% 26/4/2021 101,819 0.02 EUR 100,000 KBC Group NV RegS FRN
25/11/2024 104,096 0.02 EUR 500,000 Kingdom of Belgium Government
Bond 4.00% 28/3/2019 545,680 0.12 EUR 600,000 Kingdom of Belgium Government
Bond 4.00% 28/3/2022 726,168 0.16 EUR 200,000 Kingdom of Belgium Government
Bond 5.50% 28/3/2028 299,332 0.07 EUR 550,000 Kingdom of Belgium Government
Bond RegS '144A' 4.00% 28/3/2018 574,948 0.12
EUR 650,000 Kingdom of Belgium Government Bond RegS 1.25% 22/6/2018 664,475 0.14
EUR 400,000 Kingdom of Belgium Government Bond RegS 3.00% 28/9/2019 435,416 0.09
EUR 400,000 Kingdom of Belgium Government Bond RegS '144A' 3.75% 28/9/2020 (traded in Belgium) 458,972 0.10
EUR 550,000 Kingdom of Belgium Government Bond RegS '144A' 3.75% 28/9/2020 (traded in Germany) 631,086 0.14
EUR 750,000 Kingdom of Belgium Government Bond RegS '144A' 4.25% 28/9/2021 904,462 0.20
EUR 200,000 Kingdom of Belgium Government Bond RegS 4.25% 28/9/2022 (traded in Belgium) 247,870 0.05
EUR 500,000 Kingdom of Belgium Government Bond RegS 4.25% 28/9/2022 (traded in Germany) 619,675 0.13
EUR 550,000 Kingdom of Belgium Government Bond RegS 2.25% 22/6/2023 625,515 0.14
EUR 750,000 Kingdom of Belgium Government Bond RegS '144A' 0.20% 22/10/2023 753,180 0.16
EUR 600,000 Kingdom of Belgium Government Bond RegS '144A' 2.60% 22/6/2024 699,264 0.15
EUR 1,000,000 Kingdom of Belgium Government Bond RegS '144A' 0.80% 22/6/2025 1,024,410 0.22
EUR 500,000 Kingdom of Belgium Government Bond RegS '144A' 4.50% 28/3/2026 673,295 0.15
EUR 1,050,000 Kingdom of Belgium Government Bond RegS '144A' 1.00% 22/6/2026 1,082,424 0.23
EUR 300,000 Kingdom of Belgium Government Bond RegS '144A' 0.80% 22/6/2027 299,103 0.07
EUR 1,050,000 Kingdom of Belgium Government Bond RegS '144A' 1.00% 22/6/2031 1,022,101 0.22
EUR 350,000 Kingdom of Belgium Government Bond RegS 4.00% 28/3/2032 485,506 0.11
EUR 350,000 Kingdom of Belgium Government Bond RegS '144A' 3.00% 22/6/2034 441,948 0.10
EUR 600,000 Kingdom of Belgium Government Bond RegS '144A' 5.00% 28/3/2035 956,670 0.21
EUR 500,000 Kingdom of Belgium Government Bond RegS '144A' 1.90% 22/6/2038 532,180 0.12
EUR 750,000 Kingdom of Belgium Government Bond RegS '144A' 4.25% 28/3/2041 1,147,222 0.25
EUR 375,000 Kingdom of Belgium Government Bond RegS 3.75% 22/6/2045 541,678 0.12
EUR 200,000 Kingdom of Belgium Government Bond RegS '144A' 1.60% 22/6/2047 188,934 0.04
EUR 100,000 Kingdom of Belgium Government Bond RegS '144A' 2.25% 22/6/2057 104,681 0.02
EUR 150,000 Kingdom of Belgium Government Bond RegS '144A' 2.15% 22/6/2066 149,483 0.03
EUR 100,000 Proximus SADP RegS 1.875% 1/10/2025 107,649 0.02
EUR 100,000 Solvay SA RegS 2.75% 2/12/2027 112,066 0.02
19,248,357 4.16
Portfolio of Investments as at 31 March 2017
Austria continued Belgium continued

Transferable Securities and Money Market Instruments Admitted to an Official Stock Exchange Listing or Dealt in on Another Regulated Market
Transferable Securities and Money Market Instruments Admitted to an Official Stock Exchange Listing or Dealt in on Another Regulated Market
Holding Description
Market Value
EUR
% of Net
Assets Holding Description
Market Value
EUR
% of Net
Assets
* All or a portion of this security represents a security on loan.
Annual Report and Audited Accounts 53
The notes on pages 122 to 128 form an integral part of these financial statements.
Brazil EUR 100,000 Vale SA 3.75% 10/1/2023 108,928 0.02
108,928 0.02
British Virgin Islands EUR 100,000 Sinopec Group Overseas
Development 2015 Ltd RegS 1.00% 28/4/2022 101,093 0.02
101,093 0.02
Bulgaria EUR 100,000 Bulgaria Government International
Bond RegS 2.95% 3/9/2024 110,625 0.03 EUR 100,000 Bulgaria Government International
Bond RegS 2.625% 26/3/2027 105,854 0.02 EUR 100,000 Bulgaria Government International
Bond RegS 3.00% 21/3/2028 108,634 0.02
325,113 0.07
Canada EUR 100,000 Alimentation Couche-Tard Inc
RegS 1.875% 6/5/2026 102,075 0.02 EUR 150,000 Bank of Montreal RegS 0.25%
22/1/2020 * 151,868 0.03 EUR 100,000 Bank of Montreal RegS 0.125%
19/4/2021 100,520 0.02 EUR 300,000 Bank of Montreal RegS 0.10%
20/10/2023 295,041 0.07 EUR 100,000 Bank of Nova Scotia/The RegS
0.50% 23/7/2020 101,982 0.02 EUR 150,000 Bank of Nova Scotia/The RegS
0.75% 17/9/2021 154,732 0.03 EUR 100,000 Caisse Centrale Desjardins RegS
1.125% 11/3/2019 102,690 0.02 EUR 150,000 Canadian Imperial Bank of
Commerce RegS 1.25% 7/8/2018 153,247 0.03 EUR 200,000 National Bank of Canada RegS
0.50% 26/1/2022 203,869 0.05 EUR 100,000 Province of British Columbia Canada
RegS 0.875% 8/10/2025 102,382 0.02 EUR 50,000 Province of Ontario Canada 4.00%
3/12/2019 55,686 0.01 EUR 150,000 Province of Ontario Canada 3.00%
28/9/2020 166,435 0.04 EUR 100,000 Province of Ontario Canada RegS
0.875% 21/1/2025 102,522 0.02 EUR 50,000 Province of Quebec Canada
4.75% 29/4/2018 52,787 0.01 EUR 150,000 Province of Quebec Canada RegS
5.00% 29/4/2019 166,622 0.04 EUR 100,000 Province of Quebec Canada RegS
0.875% 15/1/2025 102,514 0.02 EUR 100,000 Province of Quebec Canada RegS
1.125% 28/10/2025 103,996 0.02 EUR 100,000 Royal Bank of Canada RegS
1.25% 29/10/2018 102,498 0.02 EUR 100,000 Royal Bank of Canada RegS
1.625% 4/8/2020 105,722 0.02 EUR 200,000 Royal Bank of Canada RegS
0.125% 11/3/2021 201,078 0.05 EUR 100,000 Toronto-Dominion Bank/
The RegS 0.625% 29/7/2019 102,032 0.02 EUR 100,000 Toronto-Dominion Bank/
The RegS 0.50% 15/6/2020 102,015 0.02 EUR 100,000 Toronto-Dominion Bank/
The RegS 0.375% 12/1/2021 101,593 0.02 EUR 200,000 Toronto-Dominion Bank/
The RegS 0.50% 3/4/2024 201,095 0.05
EUR 200,000 Total Capital Canada Ltd RegS 1.125% 18/3/2022 207,822 0.05
3,342,823 0.72
Cayman Islands EUR 100,000 China Overseas Land International
Cayman Ltd RegS 1.75% 15/7/2019 102,785 0.02 EUR 100,000 Hutchison Whampoa Europe Finance
13 Ltd RegS FRN (Perpetual) 102,800 0.02 EUR 200,000 Hutchison Whampoa Finance 14 Ltd
RegS 1.375% 31/10/2021 206,638 0.05 EUR 100,000 IPIC GMTN Ltd RegS 5.875%
14/3/2021 121,164 0.03 EUR 100,000 Three Gorges Finance II Cayman
Islands Ltd RegS 1.70% 10/6/2022 103,616 0.02
637,003 0.14
Chile EUR 100,000 Chile Government International
Bond 1.625% 30/1/2025 105,679 0.02
105,679 0.02
China EUR 100,000 China Development Bank Corp
RegS 0.50% 1/6/2021 100,343 0.02 EUR 300,000 China Development Bank Corp
RegS 0.875% 24/1/2024 295,590 0.06 EUR 300,000 Export-Import Bank of China/
The RegS 0.625% 2/12/2021 300,507 0.07
696,440 0.15
Colombia EUR 100,000 Colombia Government International
Bond 3.875% 22/3/2026 114,868 0.02
114,868 0.02
Czech Republic EUR 50,000 CEZ AS RegS 5.00% 19/10/2021 60,345 0.01 EUR 100,000 CEZ AS RegS 4.875% 16/4/2025 128,116 0.03 EUR 200,000 Czech Republic International
RegS 5.00% 11/6/2018 212,750 0.05 EUR 200,000 Czech Republic International
RegS 3.875% 24/5/2022 237,994 0.05 EUR 100,000 EP Energy AS RegS 5.875%
1/11/2019 112,994 0.02
752,199 0.16
Denmark EUR 200,000 AP Moller - Maersk A/S RegS
1.75% 18/3/2021 208,460 0.05 EUR 200,000 BRFkredit A/S RegS 0.25%
1/4/2021 201,564 0.05 EUR 150,000 Carlsberg Breweries A/S RegS
2.625% 3/7/2019 158,635 0.04 EUR 100,000 Danfoss A/S RegS 1.375%
23/2/2022 103,750 0.02 EUR 100,000 Danske Bank A/S 4.125%
26/11/2019 111,471 0.03 EUR 100,000 Danske Bank A/S 1.625%
28/2/2020 105,207 0.02 EUR 150,000 Danske Bank A/S RegS
0.375% 26/8/2019 152,215 0.03 EUR 200,000 Danske Bank A/S RegS
0.75% 2/6/2023 203,046 0.05 EUR 100,000 Danske Bank A/S RegS FRN
19/5/2026 106,597 0.02
BlackRock Euro Aggregate Bond Index Fund continued
Portfolio of Investments as at 31 March 2017
Canada continued

Transferable Securities and Money Market Instruments Admitted to an Official Stock Exchange Listing or Dealt in on Another Regulated Market
Transferable Securities and Money Market Instruments Admitted to an Official Stock Exchange Listing or Dealt in on Another Regulated Market
Holding Description
Market Value
EUR
% of Net
Assets Holding Description
Market Value
EUR
% of Net
Assets
54 BlackRock Global Index Funds (BGIF)
The notes on pages 122 to 128 form an integral part of these financial statements.
BlackRock Euro Aggregate Bond Index Fund continued
EUR 50,000 DONG Energy A/S RegS 4.875% 16/12/2021 60,669 0.01
EUR 50,000 DONG Energy A/S RegS FRN 26/6/3013 58,291 0.01
EUR 100,000 ISS Global A/S RegS 1.125% 9/1/2020 102,329 0.02
EUR 100,000 Kommunekredit RegS 0.25% 29/3/2023 100,238 0.02
EUR 100,000 Nykredit Realkredit A/S RegS 0.75% 14/7/2021 100,652 0.02
EUR 100,000 Nykredit Realkredit A/S RegS FRN 17/11/2027 104,008 0.02
EUR 150,000 TDC A/S RegS 1.75% 27/2/2027 148,095 0.03
2,025,227 0.44
Finland EUR 100,000 Aktia Bank Plc RegS 0.25%
31/3/2022 100,732 0.02 EUR 100,000 Citycon OYJ RegS 3.75%
24/6/2020 110,676 0.02 EUR 150,000 Danske Bank OYJ RegS 1.625%
27/9/2019 156,994 0.04 EUR 150,000 Elisa OYJ RegS 0.875% 17/3/2024 148,621 0.03 EUR 200,000 Finland Government Bond RegS
'144A' 1.125% 15/9/2018 205,384 0.05 EUR 400,000 Finland Government Bond RegS
'144A' 4.375% 4/7/2019 445,164 0.10 EUR 150,000 Finland Government Bond RegS
'144A' 0.375% 15/9/2020 154,246 0.03 EUR 350,000 Finland Government Bond RegS
'144A' 3.50% 15/4/2021 405,079 0.09 EUR 200,000 Finland Government Bond RegS
'144A' 1.625% 15/9/2022 219,096 0.05 EUR 400,000 Finland Government Bond RegS
'144A' 1.50% 15/4/2023 437,078 0.10 EUR 250,000 Finland Government Bond RegS
'144A' 15/9/2023 (Zero Coupon) 248,832 0.05 EUR 150,000 Finland Government Bond RegS
'144A' 2.00% 15/4/2024 169,612 0.04 EUR 150,000 Finland Government Bond RegS
'144A' 4.00% 4/7/2025 195,898 0.04 EUR 250,000 Finland Government Bond RegS
'144A' 0.875% 15/9/2025 260,845 0.06 EUR 400,000 Finland Government Bond RegS
'144A' 0.50% 15/4/2026 402,276 0.09 EUR 200,000 Finland Government Bond RegS
'144A' 2.75% 4/7/2028 246,642 0.05 EUR 100,000 Finland Government Bond RegS
'144A' 0.75% 15/4/2031 99,042 0.02 EUR 200,000 Finland Government Bond RegS
'144A' 2.625% 4/7/2042 266,354 0.06 EUR 100,000 Finland Government Bond RegS
'144A' 1.375% 15/4/2047 103,121 0.02 EUR 150,000 Finnvera OYJ RegS 0.50% 13/4/2026 149,043 0.03 EUR 100,000 Fortum OYJ RegS 4.00% 24/5/2021 114,696 0.03 EUR 100,000 Municipality Finance Plc RegS
0.10% 15/10/2021 100,566 0.02 EUR 100,000 Municipality Finance Plc RegS
0.625% 26/11/2026 99,466 0.02 EUR 150,000 Nordea Mortgage Bank Plc RegS
2.25% 3/5/2019 157,969 0.04 EUR 400,000 Nordea Mortgage Bank Plc RegS
0.125% 17/6/2020 403,652 0.09 EUR 100,000 Nordea Mortgage Bank Plc RegS
0.025% 24/1/2022 99,861 0.02 EUR 100,000 Nordea Mortgage Bank Plc RegS
1.00% 5/11/2024 104,601 0.02 EUR 200,000 OP Corporate Bank Plc RegS
1.25% 14/5/2018 203,078 0.04
EUR 100,000 OP Corporate Bank Plc RegS 2.00% 3/3/2021 107,128 0.02
EUR 150,000 OP Mortgage Bank 0.25% 13/3/2024 149,064 0.03
EUR 100,000 OP Mortgage Bank RegS 1.50% 17/3/2021 106,184 0.02
EUR 125,000 OP Mortgage Bank RegS 0.25% 11/5/2023 125,241 0.03
EUR 100,000 Sampo OYJ RegS 1.50% 16/9/2021 104,271 0.02 EUR 100,000 Tyottomyysvakuutusrahasto
0.375% 23/9/2019 101,487 0.02
6,501,999 1.41
France EUR 100,000 Accor SA RegS 2.375% 17/9/2023 107,207 0.02 EUR 100,000 Aeroports de Paris
3.875% 15/2/2022 116,733 0.03 EUR 250,000 Agence Francaise de
Developpement RegS 3.625% 21/4/2020 278,707 0.06
EUR 300,000 Agence Francaise de Developpement RegS 0.125% 30/4/2022 298,179 0.07
EUR 100,000 Agence Francaise de Developpement RegS 3.125% 4/1/2024 117,455 0.03
EUR 200,000 Agence Francaise de Developpement RegS 1.375% 17/9/2024 210,712 0.05
EUR 100,000 Agence Francaise de Developpement RegS 0.875% 25/5/2031 92,657 0.02
EUR 100,000 Air Liquide Finance SA 3.889% 9/6/2020 112,268 0.03
EUR 100,000 Air Liquide Finance SA RegS 1.25% 3/6/2025 102,705 0.02
EUR 100,000 Air Liquide Finance SA RegS 1.25% 13/6/2028 100,083 0.02
EUR 200,000 APRR SA RegS 1.125% 15/1/2021 206,322 0.05 EUR 100,000 APRR SA RegS 1.875% 6/1/2031 102,049 0.02 EUR 100,000 Arkea Home Loans SFH SA
RegS 2.375% 11/7/2023 112,974 0.03 EUR 100,000 Arkema SA 3.85% 30/4/2020 111,232 0.03 EUR 50,000 Auchan Holding SA RegS
2.875% 15/11/2017 50,936 0.01 EUR 100,000 Auchan Holding SA RegS
2.375% 12/12/2022 109,185 0.02 EUR 100,000 Autoroutes du Sud de la France SA
RegS 7.375% 20/3/2019 114,443 0.03 EUR 100,000 Autoroutes du Sud de la France SA
RegS 2.875% 18/1/2023 112,818 0.03 EUR 100,000 AXA Bank Europe SCF RegS
0.375% 23/3/2023 100,525 0.02 EUR 100,000 AXA SA RegS FRN 16/4/2040 111,515 0.03 EUR 100,000 AXA SA RegS FRN 6/7/2047 103,673 0.02 EUR 100,000 AXA SA RegS FRN (Perpetual) 104,812 0.02 EUR 350,000 Banque Federative du Credit
Mutuel SA 4.125% 20/7/2020 395,524 0.09 EUR 100,000 Banque Federative du Credit Mutuel
SA RegS 2.625% 24/2/2021 108,914 0.02 EUR 100,000 Banque Federative du Credit Mutuel
SA RegS 2.625% 18/3/2024 111,856 0.03 EUR 100,000 Banque Federative du Credit Mutuel
SA RegS 3.00% 21/5/2024 107,030 0.02 EUR 100,000 Banque Federative du Credit Mutuel
SA RegS 2.375% 24/3/2026 100,429 0.02 EUR 100,000 Banque Federative du Credit Mutuel
SA RegS 1.875% 4/11/2026 95,697 0.02 EUR 100,000 BNP Paribas Cardif SA RegS FRN
(Perpetual) 100,539 0.02
Portfolio of Investments as at 31 March 2017
Denmark continued Finland continued

Transferable Securities and Money Market Instruments Admitted to an Official Stock Exchange Listing or Dealt in on Another Regulated Market
Transferable Securities and Money Market Instruments Admitted to an Official Stock Exchange Listing or Dealt in on Another Regulated Market
Holding Description
Market Value
EUR
% of Net
Assets Holding Description
Market Value
EUR
% of Net
Assets
* All or a portion of this security represents a security on loan.
Annual Report and Audited Accounts 55
The notes on pages 122 to 128 form an integral part of these financial statements.
EUR 300,000 BNP Paribas Home Loan SFH SA RegS 1.375% 17/6/2020 315,067 0.07
EUR 100,000 BNP Paribas Home Loan SFH SA RegS 0.375% 7/5/2025 99,049 0.02
EUR 50,000 BNP Paribas SA 5.431% 7/9/2017 51,133 0.01 EUR 100,000 BNP Paribas SA RegS 2.875%
27/11/2017 102,027 0.02 EUR 100,000 BNP Paribas SA RegS 2.50%
23/8/2019 105,812 0.02 EUR 100,000 BNP Paribas SA RegS 2.875%
24/10/2022 112,225 0.03 EUR 225,000 BNP Paribas SA RegS 0.75%
11/11/2022 226,248 0.05 EUR 100,000 BNP Paribas SA RegS 1.125%
15/1/2023 102,376 0.02 EUR 125,000 BNP Paribas SA RegS 1.125%
10/10/2023 124,311 0.03 EUR 100,000 BNP Paribas SA RegS 2.375%
17/2/2025 101,643 0.02 EUR 150,000 BNP Paribas SA RegS FRN
20/3/2026 156,139 0.03 EUR 50,000 Bouygues SA RegS 3.641%
29/10/2019 54,579 0.01 EUR 100,000 Bouygues SA RegS 4.50%
9/2/2022 119,054 0.03 EUR 50,000 BPCE SA 3.75% 21/7/2017 50,592 0.01 EUR 100,000 BPCE SA RegS 0.625% 20/4/2020 101,311 0.02 EUR 100,000 BPCE SA RegS 4.50% 10/2/2022 119,949 0.03 EUR 100,000 BPCE SA RegS 1.125% 18/1/2023 99,727 0.02 EUR 100,000 BPCE SA RegS 4.625% 18/7/2023 116,566 0.03 EUR 100,000 BPCE SA RegS 2.875% 22/4/2026 102,501 0.02 EUR 300,000 BPCE SFH SA RegS 3.75%
13/9/2021 348,852 0.08 EUR 200,000 BPCE SFH SA RegS 1.00%
24/2/2025 206,586 0.05 EUR 100,000 Bpifrance Financement SA RegS
2.00% 25/7/2017 100,769 0.02 EUR 100,000 Bpifrance Financement SA RegS
0.10% 19/2/2021 100,235 0.02 EUR 300,000 Bpifrance Financement SA RegS
0.75% 25/10/2021 308,440 0.07 EUR 100,000 Bpifrance Financement SA RegS
2.75% 25/10/2025 116,049 0.03 EUR 200,000 Bpifrance Financement SA RegS
0.875% 25/11/2026 196,722 0.04 EUR 200,000 Caisse Centrale du Credit Immobilier
de France SA 1.125% 22/4/2019 205,375 0.05 EUR 200,000 Caisse d'Amortissement de la Dette
Sociale 2.50% 25/10/2022 224,628 0.05 EUR 500,000 Caisse d'Amortissement de la Dette
Sociale RegS 1.00% 25/5/2018 507,837 0.11 EUR 700,000 Caisse d'Amortissement de la Dette
Sociale RegS 4.25% 25/4/2020 796,075 0.17 EUR 200,000 Caisse d'Amortissement de la Dette
Sociale RegS 0.05% 25/11/2020 201,090 0.04 EUR 300,000 Caisse d'Amortissement de la Dette
Sociale RegS 4.375% 25/10/2021 359,392 0.08 EUR 300,000 Caisse d'Amortissement de la Dette
Sociale RegS 0.125% 25/11/2022 * 297,324 0.07 EUR 200,000 Caisse d'Amortissement de la Dette
Sociale RegS 0.50% 25/5/2023 201,502 0.04 EUR 200,000 Caisse d'Amortissement de la Dette
Sociale RegS 2.375% 25/1/2024 225,324 0.05 EUR 300,000 Caisse d'Amortissement de la Dette
Sociale RegS 1.375% 25/11/2024 316,420 0.07 EUR 350,000 Caisse d'Amortissement de la Dette
Sociale RegS 4.00% 15/12/2025 443,628 0.10
EUR 300,000 Caisse de Refinancement de l'Habitat SA 3.75% 19/2/2020 334,357 0.07
EUR 250,000 Caisse de Refinancement de l'Habitat SA 3.60% 13/9/2021 290,235 0.06
EUR 350,000 Caisse de Refinancement de l'Habitat SA 4.00% 10/1/2022 416,514 0.09
EUR 300,000 Caisse de Refinancement de l'Habitat SA 4.00% 17/6/2022 361,281 0.08
EUR 150,000 Caisse de Refinancement de l'Habitat SA 3.60% 8/3/2024 183,543 0.04
EUR 150,000 Caisse des Depots et Consignations 4.125% 20/2/2019 162,601 0.04
EUR 400,000 Caisse Francaise de Financement Local 3.50% 24/9/2020 450,394 0.10
EUR 100,000 Caisse Francaise de Financement Local 4.25% 26/1/2021 116,482 0.03
EUR 100,000 Caisse Francaise de Financement Local 5.375% 8/7/2024 135,047 0.03
EUR 200,000 Caisse Francaise de Financement Local RegS 0.375% 16/9/2019 203,076 0.04
EUR 100,000 Caisse Francaise de Financement Local RegS 0.50% 13/4/2022 101,900 0.02
EUR 100,000 Caisse Francaise de Financement Local RegS 0.20% 27/4/2023 99,421 0.02
EUR 100,000 Caisse Francaise de Financement Local RegS 0.625% 13/4/2026 99,213 0.02
EUR 100,000 Caisse Francaise de Financement Local RegS 1.50% 13/1/2031 103,247 0.02
EUR 100,000 Caisse Francaise de Financement Local RegS 1.25% 22/1/2035 96,280 0.02
EUR 100,000 Capgemini SA RegS 2.50% 1/7/2023 109,127 0.02 EUR 100,000 Carmila SAS RegS 2.375% 16/9/2024 105,083 0.02 EUR 200,000 Carrefour SA RegS 1.75% 22/5/2019 207,235 0.05 EUR 50,000 Carrefour SA RegS 3.875% 25/4/2021 57,131 0.01 EUR 100,000 Carrefour SA RegS 1.75% 15/7/2022 105,713 0.02 EUR 200,000 Cie de Financement Foncier SA
4.625% 23/9/2017 204,765 0.05 EUR 300,000 Cie de Financement Foncier SA
0.375% 17/9/2019 304,441 0.07 EUR 300,000 Cie de Financement Foncier SA
4.875% 25/5/2021 359,925 0.08 EUR 200,000 Cie de Financement Foncier SA
4.25% 19/1/2022 239,411 0.05 EUR 150,000 Cie de Financement Foncier SA
4.00% 24/10/2025 190,875 0.04 EUR 200,000 Cie de Financement Foncier SA
RegS 0.325% 12/9/2023 198,882 0.04 EUR 100,000 Cie de Financement Foncier SA
RegS 0.50% 4/9/2024 99,525 0.02 EUR 150,000 Cie de Financement Foncier SA
RegS 1.00% 2/2/2026 152,852 0.03 EUR 100,000 Cie de Financement Foncier SA R
egS 0.225% 14/9/2026 93,777 0.02 EUR 50,000 Cie de Saint-Gobain 4.75% 11/4/2017 50,047 0.01 EUR 150,000 Cie de Saint-Gobain RegS 4.50%
30/9/2019 166,425 0.04 EUR 100,000 Cie de Saint-Gobain RegS 1.00%
17/3/2025 99,333 0.02 EUR 50,000 Cie Financiere et Industrielle des
Autoroutes SA RegS 5.00% 24/5/2021 59,669 0.01
EUR 100,000 Cie Financiere et Industrielle des Autoroutes SA RegS 0.375% 7/2/2025 95,490 0.02
EUR 100,000 Cie Financiere et Industrielle des Autoroutes SA RegS 0.75% 9/9/2028 93,078 0.02
Portfolio of Investments as at 31 March 2017
BlackRock Euro Aggregate Bond Index Fund continued
France continued France continued

Transferable Securities and Money Market Instruments Admitted to an Official Stock Exchange Listing or Dealt in on Another Regulated Market
Transferable Securities and Money Market Instruments Admitted to an Official Stock Exchange Listing or Dealt in on Another Regulated Market
Holding Description
Market Value
EUR
% of Net
Assets Holding Description
Market Value
EUR
% of Net
Assets
* All or a portion of this security represents a security on loan.
56 BlackRock Global Index Funds (BGIF)
The notes on pages 122 to 128 form an integral part of these financial statements.
EUR 100,000 CIF Euromortgage SA 3.75% 23/10/2019 110,067 0.02
EUR 50,000 CNP Assurances RegS FRN 14/9/2040 56,938 0.01
EUR 100,000 CNP Assurances RegS FRN 10/6/2047 104,921 0.02
EUR 100,000 Coface SA RegS 4.125% 27/3/2024 109,175 0.02 EUR 100,000 Credit Agricole Assurances SA
RegS FRN (Perpetual) 101,483 0.02 EUR 300,000 Credit Agricole Home Loan SFH SA
RegS 1.625% 11/3/2020 316,170 0.07 EUR 100,000 Credit Agricole Home Loan SFH SA
RegS 0.375% 24/3/2023 100,664 0.02 EUR 200,000 Credit Agricole Home Loan SFH SA
RegS 0.25% 23/2/2024 197,530 0.04 EUR 200,000 Credit Agricole Home Loan SFH SA
RegS 0.50% 3/4/2025 199,075 0.04 EUR 100,000 Credit Agricole Home Loan SFH SA
RegS 4.00% 16/7/2025 127,828 0.03 EUR 100,000 Credit Agricole Home Loan SFH SA
RegS 1.25% 24/3/2031 100,724 0.02 EUR 150,000 Credit Agricole Public Sector SCF SA
0.25% 31/10/2026 142,350 0.03 EUR 50,000 Credit Agricole SA RegS 3.90%
19/4/2021 56,563 0.01 EUR 100,000 Credit Agricole SA RegS 2.625%
17/3/2027 101,849 0.02 EUR 100,000 Credit Agricole SA/London
5.125% 18/4/2023 127,079 0.03 EUR 100,000 Credit Agricole SA/London RegS
2.375% 27/11/2020 107,846 0.02 EUR 300,000 Credit Agricole SA/London RegS
0.75% 1/12/2022 301,860 0.07 EUR 100,000 Credit Agricole SA/London RegS
2.375% 20/5/2024 110,114 0.02 EUR 100,000 Credit Agricole SA/London RegS
1.25% 14/4/2026 100,415 0.02 EUR 100,000 Credit Agricole SA/London RegS
1.875% 20/12/2026 99,752 0.02 EUR 200,000 Credit Mutuel - CIC Home Loan
SFH SA RegS 1.125% 6/2/2019 205,400 0.05 EUR 100,000 Credit Mutuel - CIC Home Loan
SFH SA RegS 1.375% 22/4/2020 104,777 0.02 EUR 50,000 Credit Mutuel - CIC Home Loan
SFH SA RegS 3.125% 9/9/2020 55,642 0.01 EUR 100,000 Credit Mutuel - CIC Home Loan
SFH SA RegS 4.375% 17/3/2021 117,507 0.03 EUR 200,000 Credit Mutuel - CIC Home Loan
SFH SA RegS 1.75% 19/6/2024 218,941 0.05 EUR 200,000 Credit Mutuel - CIC Home Loan
SFH SA RegS 0.625% 10/2/2025 200,802 0.04 EUR 100,000 Credit Mutuel Arkea SA RegS
1.00% 26/1/2023 101,250 0.02 EUR 100,000 Danone SA RegS 0.424% 3/11/2022 99,259 0.02 EUR 100,000 Danone SA RegS 2.60% 28/6/2023 111,613 0.03 EUR 100,000 Danone SA RegS 1.125% 14/1/2025 100,928 0.02 EUR 100,000 Danone SA RegS 1.208% 3/11/2028 97,851 0.02 EUR 100,000 Dexia Credit Local SA RegS
1.625% 29/10/2018 102,856 0.02 EUR 150,000 Dexia Credit Local SA RegS
1.375% 18/9/2019 155,407 0.03 EUR 200,000 Dexia Credit Local SA RegS
0.25% 19/3/2020 201,508 0.04 EUR 150,000 Dexia Credit Local SA RegS
2.00% 22/1/2021 160,317 0.04 EUR 150,000 Dexia Credit Local SA RegS
0.625% 21/1/2022 152,341 0.03 EUR 200,000 Dexia Credit Local SA RegS
0.625% 3/2/2024 199,030 0.04
EUR 100,000 Edenred RegS 1.375% 10/3/2025 99,160 0.02 EUR 50,000 Electricite de France SA
5.00% 5/2/2018 52,131 0.01 EUR 150,000 Electricite de France SA
6.25% 25/1/2021 184,074 0.04 EUR 150,000 Electricite de France SA
4.625% 11/9/2024 186,934 0.04 EUR 200,000 Electricite de France SA
RegS 3.875% 18/1/2022 232,250 0.05 EUR 100,000 Electricite de France SA
RegS 4.00% 12/11/2025 121,957 0.03 EUR 50,000 Electricite de France SA
RegS 5.625% 21/2/2033 71,256 0.02 EUR 100,000 Electricite de France SA
RegS 1.875% 13/10/2036 89,617 0.02 EUR 50,000 Electricite de France SA
RegS 4.50% 12/11/2040 64,111 0.01 EUR 100,000 Electricite de France SA
RegS FRN (Perpetual) 100,470 0.02 EUR 100,000 Electricite de France SA
RegS FRN (Perpetual) 101,023 0.02 EUR 100,000 Engie SA 3.125% 21/1/2020 108,676 0.02 EUR 50,000 Engie SA 3.50% 18/10/2022 58,285 0.01 EUR 100,000 Engie SA RegS 0.875% 27/3/2024 100,139 0.02 EUR 200,000 Engie SA RegS 2.375% 19/5/2026 220,780 0.05 EUR 100,000 Engie SA RegS FRN (Perpetual) 110,375 0.02 EUR 100,000 Essilor International SA RegS
1.75% 9/4/2021 106,096 0.02 EUR 100,000 Fonciere Des Regions RegS
1.75% 10/9/2021 103,846 0.02 EUR 900,000 French Republic Government Bond
OAT RegS 25/2/2018 (Zero Coupon) 904,149 0.20
EUR 550,000 French Republic Government Bond OAT RegS 4.00% 25/4/2018 576,240 0.13
EUR 1,600,000 French Republic Government Bond OAT RegS 1.00% 25/5/2018 1,627,472 0.35
EUR 900,000 French Republic Government Bond OAT RegS 4.25% 25/10/2018 966,699 0.21
EUR 900,000 French Republic Government Bond OAT RegS 1.00% 25/11/2018 921,942 0.20
EUR 1,600,000 French Republic Government Bond OAT RegS 25/2/2019 (Zero Coupon) 1,614,624 0.35
EUR 1,300,000 French Republic Government Bond OAT RegS 4.25% 25/4/2019 1,426,490 0.31
EUR 900,000 French Republic Government Bond OAT RegS 1.00% 25/5/2019 * 927,504 0.20
EUR 1,700,000 French Republic Government Bond OAT RegS 3.75% 25/10/2019 1,880,710 0.41
EUR 300,000 French Republic Government Bond OAT RegS 8.50% 25/10/2019 368,574 0.08
EUR 1,000,000 French Republic Government Bond OAT RegS 0.50% 25/11/2019 * 1,022,735 0.22
EUR 2,000,000 French Republic Government Bond OAT RegS 3.50% 25/4/2020 2,233,720 0.48
EUR 1,500,000 French Republic Government Bond OAT RegS 25/5/2020 (Zero Coupon) * 1,514,070 0.33
EUR 1,850,000 French Republic Government Bond OAT RegS 2.50% 25/10/2020 2,029,376 0.44
EUR 900,000 French Republic Government Bond OAT RegS 0.25% 25/11/2020 914,940 0.20
EUR 1,200,000 French Republic Government Bond OAT RegS 3.75% 25/4/2021 1,389,504 0.30
EUR 1,400,000 French Republic Government Bond OAT RegS 25/5/2021 (Zero Coupon) 1,406,475 0.31
Portfolio of Investments as at 31 March 2017
BlackRock Euro Aggregate Bond Index Fund continued
France continued France continued
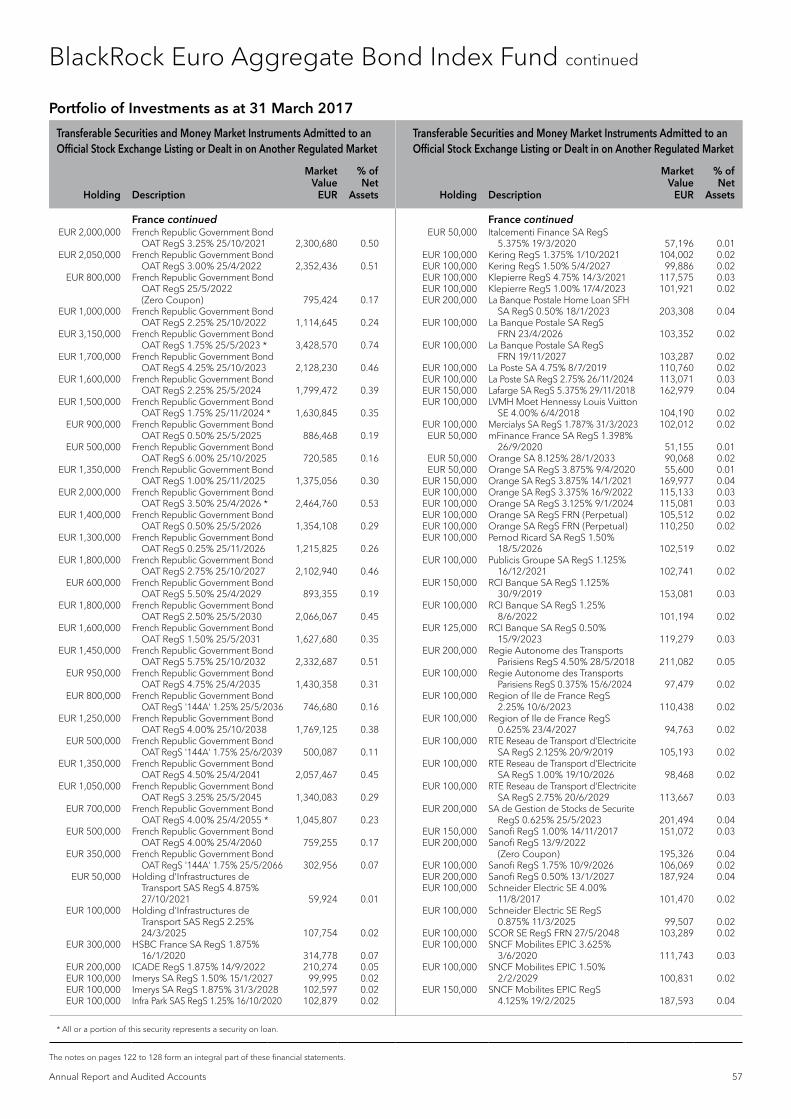
Transferable Securities and Money Market Instruments Admitted to an Official Stock Exchange Listing or Dealt in on Another Regulated Market
Transferable Securities and Money Market Instruments Admitted to an Official Stock Exchange Listing or Dealt in on Another Regulated Market
Holding Description
Market Value
EUR
% of Net
Assets Holding Description
Market Value
EUR
% of Net
Assets
* All or a portion of this security represents a security on loan.
Annual Report and Audited Accounts 57
The notes on pages 122 to 128 form an integral part of these financial statements.
EUR 2,000,000 French Republic Government Bond OAT RegS 3.25% 25/10/2021 2,300,680 0.50
EUR 2,050,000 French Republic Government Bond OAT RegS 3.00% 25/4/2022 2,352,436 0.51
EUR 800,000 French Republic Government Bond OAT RegS 25/5/2022 (Zero Coupon) 795,424 0.17
EUR 1,000,000 French Republic Government Bond OAT RegS 2.25% 25/10/2022 1,114,645 0.24
EUR 3,150,000 French Republic Government Bond OAT RegS 1.75% 25/5/2023 * 3,428,570 0.74
EUR 1,700,000 French Republic Government Bond OAT RegS 4.25% 25/10/2023 2,128,230 0.46
EUR 1,600,000 French Republic Government Bond OAT RegS 2.25% 25/5/2024 1,799,472 0.39
EUR 1,500,000 French Republic Government Bond OAT RegS 1.75% 25/11/2024 * 1,630,845 0.35
EUR 900,000 French Republic Government Bond OAT RegS 0.50% 25/5/2025 886,468 0.19
EUR 500,000 French Republic Government Bond OAT RegS 6.00% 25/10/2025 720,585 0.16
EUR 1,350,000 French Republic Government Bond OAT RegS 1.00% 25/11/2025 1,375,056 0.30
EUR 2,000,000 French Republic Government Bond OAT RegS 3.50% 25/4/2026 * 2,464,760 0.53
EUR 1,400,000 French Republic Government Bond OAT RegS 0.50% 25/5/2026 1,354,108 0.29
EUR 1,300,000 French Republic Government Bond OAT RegS 0.25% 25/11/2026 1,215,825 0.26
EUR 1,800,000 French Republic Government Bond OAT RegS 2.75% 25/10/2027 2,102,940 0.46
EUR 600,000 French Republic Government Bond OAT RegS 5.50% 25/4/2029 893,355 0.19
EUR 1,800,000 French Republic Government Bond OAT RegS 2.50% 25/5/2030 2,066,067 0.45
EUR 1,600,000 French Republic Government Bond OAT RegS 1.50% 25/5/2031 1,627,680 0.35
EUR 1,450,000 French Republic Government Bond OAT RegS 5.75% 25/10/2032 2,332,687 0.51
EUR 950,000 French Republic Government Bond OAT RegS 4.75% 25/4/2035 1,430,358 0.31
EUR 800,000 French Republic Government Bond OAT RegS '144A' 1.25% 25/5/2036 746,680 0.16
EUR 1,250,000 French Republic Government Bond OAT RegS 4.00% 25/10/2038 1,769,125 0.38
EUR 500,000 French Republic Government Bond OAT RegS '144A' 1.75% 25/6/2039 500,087 0.11
EUR 1,350,000 French Republic Government Bond OAT RegS 4.50% 25/4/2041 2,057,467 0.45
EUR 1,050,000 French Republic Government Bond OAT RegS 3.25% 25/5/2045 1,340,083 0.29
EUR 700,000 French Republic Government Bond OAT RegS 4.00% 25/4/2055 * 1,045,807 0.23
EUR 500,000 French Republic Government Bond OAT RegS 4.00% 25/4/2060 759,255 0.17
EUR 350,000 French Republic Government Bond OAT RegS '144A' 1.75% 25/5/2066 302,956 0.07
EUR 50,000 Holding d'Infrastructures de Transport SAS RegS 4.875% 27/10/2021 59,924 0.01
EUR 100,000 Holding d'Infrastructures de Transport SAS RegS 2.25% 24/3/2025 107,754 0.02
EUR 300,000 HSBC France SA RegS 1.875% 16/1/2020 314,778 0.07
EUR 200,000 ICADE RegS 1.875% 14/9/2022 210,274 0.05 EUR 100,000 Imerys SA RegS 1.50% 15/1/2027 99,995 0.02 EUR 100,000 Imerys SA RegS 1.875% 31/3/2028 102,597 0.02 EUR 100,000 Infra Park SAS RegS 1.25% 16/10/2020 102,879 0.02
EUR 50,000 Italcementi Finance SA RegS 5.375% 19/3/2020 57,196 0.01
EUR 100,000 Kering RegS 1.375% 1/10/2021 104,002 0.02 EUR 100,000 Kering RegS 1.50% 5/4/2027 99,886 0.02 EUR 100,000 Klepierre RegS 4.75% 14/3/2021 117,575 0.03 EUR 100,000 Klepierre RegS 1.00% 17/4/2023 101,921 0.02 EUR 200,000 La Banque Postale Home Loan SFH
SA RegS 0.50% 18/1/2023 203,308 0.04 EUR 100,000 La Banque Postale SA RegS
FRN 23/4/2026 103,352 0.02 EUR 100,000 La Banque Postale SA RegS
FRN 19/11/2027 103,287 0.02 EUR 100,000 La Poste SA 4.75% 8/7/2019 110,760 0.02 EUR 100,000 La Poste SA RegS 2.75% 26/11/2024 113,071 0.03 EUR 150,000 Lafarge SA RegS 5.375% 29/11/2018 162,979 0.04 EUR 100,000 LVMH Moet Hennessy Louis Vuitton
SE 4.00% 6/4/2018 104,190 0.02 EUR 100,000 Mercialys SA RegS 1.787% 31/3/2023 102,012 0.02 EUR 50,000 mFinance France SA RegS 1.398%
26/9/2020 51,155 0.01 EUR 50,000 Orange SA 8.125% 28/1/2033 90,068 0.02 EUR 50,000 Orange SA RegS 3.875% 9/4/2020 55,600 0.01 EUR 150,000 Orange SA RegS 3.875% 14/1/2021 169,977 0.04 EUR 100,000 Orange SA RegS 3.375% 16/9/2022 115,133 0.03 EUR 100,000 Orange SA RegS 3.125% 9/1/2024 115,081 0.03 EUR 100,000 Orange SA RegS FRN (Perpetual) 105,512 0.02 EUR 100,000 Orange SA RegS FRN (Perpetual) 110,250 0.02 EUR 100,000 Pernod Ricard SA RegS 1.50%
18/5/2026 102,519 0.02 EUR 100,000 Publicis Groupe SA RegS 1.125%
16/12/2021 102,741 0.02 EUR 150,000 RCI Banque SA RegS 1.125%
30/9/2019 153,081 0.03 EUR 100,000 RCI Banque SA RegS 1.25%
8/6/2022 101,194 0.02 EUR 125,000 RCI Banque SA RegS 0.50%
15/9/2023 119,279 0.03 EUR 200,000 Regie Autonome des Transports
Parisiens RegS 4.50% 28/5/2018 211,082 0.05 EUR 100,000 Regie Autonome des Transports
Parisiens RegS 0.375% 15/6/2024 97,479 0.02 EUR 100,000 Region of Ile de France RegS
2.25% 10/6/2023 110,438 0.02 EUR 100,000 Region of Ile de France RegS
0.625% 23/4/2027 94,763 0.02 EUR 100,000 RTE Reseau de Transport d'Electricite
SA RegS 2.125% 20/9/2019 105,193 0.02 EUR 100,000 RTE Reseau de Transport d'Electricite
SA RegS 1.00% 19/10/2026 98,468 0.02 EUR 100,000 RTE Reseau de Transport d'Electricite
SA RegS 2.75% 20/6/2029 113,667 0.03 EUR 200,000 SA de Gestion de Stocks de Securite
RegS 0.625% 25/5/2023 201,494 0.04 EUR 150,000 Sanofi RegS 1.00% 14/11/2017 151,072 0.03 EUR 200,000 Sanofi RegS 13/9/2022
(Zero Coupon) 195,326 0.04 EUR 100,000 Sanofi RegS 1.75% 10/9/2026 106,069 0.02 EUR 200,000 Sanofi RegS 0.50% 13/1/2027 187,924 0.04 EUR 100,000 Schneider Electric SE 4.00%
11/8/2017 101,470 0.02 EUR 100,000 Schneider Electric SE RegS
0.875% 11/3/2025 99,507 0.02 EUR 100,000 SCOR SE RegS FRN 27/5/2048 103,289 0.02 EUR 100,000 SNCF Mobilites EPIC 3.625%
3/6/2020 111,743 0.03 EUR 100,000 SNCF Mobilites EPIC 1.50%
2/2/2029 100,831 0.02 EUR 150,000 SNCF Mobilites EPIC RegS
4.125% 19/2/2025 187,593 0.04
Portfolio of Investments as at 31 March 2017
BlackRock Euro Aggregate Bond Index Fund continued
France continued France continued

Transferable Securities and Money Market Instruments Admitted to an Official Stock Exchange Listing or Dealt in on Another Regulated Market
Transferable Securities and Money Market Instruments Admitted to an Official Stock Exchange Listing or Dealt in on Another Regulated Market
Holding Description
Market Value
EUR
% of Net
Assets Holding Description
Market Value
EUR
% of Net
Assets
* All or a portion of this security represents a security on loan.
58 BlackRock Global Index Funds (BGIF)
The notes on pages 122 to 128 form an integral part of these financial statements.
EUR 100,000 SNCF Reseau 4.375% 2/6/2022 120,997 0.03 EUR 200,000 SNCF Reseau 3.125% 25/10/2028 239,006 0.05 EUR 200,000 SNCF Reseau 5.00% 10/10/2033 296,095 0.07 EUR 200,000 SNCF Reseau RegS 0.10%
27/5/2021 199,858 0.04 EUR 250,000 SNCF Reseau RegS 4.50%
30/1/2024 314,830 0.07 EUR 200,000 SNCF Reseau RegS 2.625%
29/12/2025 227,567 0.05 EUR 100,000 SNCF Reseau RegS 1.00%
9/11/2031 92,152 0.02 EUR 100,000 Societe Fonciere Lyonnaise SA
RegS 1.875% 26/11/2021 104,653 0.02 EUR 50,000 Societe Generale SA 3.125%
21/9/2017 50,789 0.01 EUR 50,000 Societe Generale SA 6.125%
20/8/2018 54,101 0.01 EUR 100,000 Societe Generale SA RegS 0.75%
25/11/2020 102,011 0.02 EUR 100,000 Societe Generale SA RegS 4.75%
2/3/2021 117,230 0.03 EUR 100,000 Societe Generale SA RegS 1.00%
1/4/2022 100,090 0.02 EUR 100,000 Societe Generale SA RegS 4.00%
7/6/2023 113,806 0.03 EUR 150,000 Societe Generale SCF SA 4.125%
15/2/2022 179,614 0.04 EUR 100,000 Societe Generale SCF SA RegS
4.25% 3/2/2023 123,470 0.03 EUR 200,000 Societe Generale SFH SA 1.75%
5/3/2020 211,514 0.05 EUR 200,000 Societe Generale SFH SA RegS
0.125% 27/2/2020 201,934 0.04 EUR 100,000 Sodexo SA RegS 0.75% 14/4/2027 95,665 0.02 EUR 50,000 Suez 4.125% 24/6/2022 59,537 0.01 EUR 100,000 Suez 5.50% 22/7/2024 133,032 0.03 EUR 100,000 Suez RegS 1.00% 3/4/2025 100,100 0.02 EUR 100,000 TDF Infrastructure SAS RegS
2.50% 7/4/2026 103,433 0.02 EUR 100,000 Teleperformance RegS 1.50%
3/4/2024 99,762 0.02 EUR 100,000 Total Capital International SA
RegS 0.25% 12/7/2023 98,359 0.02 EUR 100,000 Total Capital International SA
RegS 1.375% 19/3/2025 104,388 0.02 EUR 200,000 Total Capital International SA
RegS 2.875% 19/11/2025 233,010 0.05 EUR 200,000 Total SA RegS FRN (Perpetual) 200,460 0.04 EUR 100,000 Total SA RegS FRN (Perpetual) 99,017 0.02 EUR 150,000 Total SA RegS FRN (Perpetual) 159,428 0.04 EUR 100,000 Transport et Infrastructures Gaz
France SA RegS 4.339% 7/7/2021 115,281 0.03
EUR 200,000 UNEDIC ASSEO 1.25% 29/5/2020 208,986 0.05
EUR 500,000 UNEDIC ASSEO RegS 1.50% 16/4/2021 530,507 0.12
EUR 200,000 UNEDIC ASSEO RegS 0.125% 25/5/2022 198,594 0.04
EUR 200,000 UNEDIC ASSEO RegS 0.25% 24/11/2023 197,126 0.04
EUR 200,000 UNEDIC ASSEO RegS 0.625% 17/2/2025 198,748 0.04
EUR 200,000 UNEDIC ASSEO RegS 1.25% 28/3/2027 203,660 0.05
EUR 100,000 Unibail-Rodamco SE RegS 0.875% 21/2/2025 98,613 0.02
EUR 100,000 Unibail-Rodamco SE RegS 2.50% 4/6/2026 110,801 0.02
EUR 100,000 Unibail-Rodamco SE RegS 1.50% 22/2/2028 100,203 0.02
EUR 100,000 Unibail-Rodamco SE RegS 2.00% 28/4/2036 100,780 0.02
EUR 50,000 Veolia Environnement SA 4.375% 11/12/2020 57,585 0.01
EUR 100,000 Veolia Environnement SA 5.125% 24/5/2022 122,884 0.03
EUR 100,000 Veolia Environnement SA RegS 1.496% 30/11/2026 101,482 0.02
EUR 100,000 Veolia Environnement SA RegS 1.59% 10/1/2028 101,328 0.02
EUR 50,000 Vivendi SA 4.00% 31/3/2017 50,006 0.01 EUR 100,000 Vivendi SA RegS 1.125%
24/11/2023 100,398 0.02 EUR 100,000 WPP Finance SA RegS
2.25% 22/9/2026 108,537 0.02
102,188,163 22.11
Germany EUR 150,000 Aareal Bank AG 1.00% 28/6/2018 152,505 0.03 EUR 200,000 Allianz SE RegS FRN 7/7/2045 199,166 0.04 EUR 100,000 Allianz SE RegS FRN (Perpetual) 104,750 0.02 EUR 100,000 Alstria office AG RegS (Reit)
2.25% 24/3/2021 105,708 0.02 EUR 100,000 BASF SE RegS 2.50% 22/1/2024 112,900 0.03 EUR 150,000 Bayer AG RegS 1.125% 24/1/2018 151,087 0.03 EUR 125,000 Bayer AG RegS FRN 1/7/2074 130,130 0.03 EUR 100,000 Bayerische Landesbank 1.00%
9/7/2021 104,547 0.02 EUR 50,000 Bayerische Landesbank
1.625% 18/4/2023 54,481 0.01 EUR 100,000 Bayerische Landesbodenkreditanstalt
1.75% 24/4/2024 109,786 0.02 EUR 150,000 Bayerische Landesbodenkreditanstalt
0.625% 23/11/2026 149,590 0.03 EUR 150,000 Berlin Hyp AG 1.375% 30/5/2017 150,413 0.03 EUR 50,000 Berlin Hyp AG 1.125% 5/2/2018 50,632 0.01 EUR 75,000 Berlin Hyp AG 0.25% 22/2/2023 75,504 0.02 EUR 100,000 Berlin Hyp AG 0.375% 21/2/2025 99,785 0.02 EUR 100,000 Bertelsmann SE & Co KGaA RegS
FRN 23/4/2075 97,173 0.02 EUR 500,000 Bundesobligation RegS 0.50%
23/2/2018 505,662 0.11 EUR 1,000,000 Bundesobligation RegS 1.00%
12/10/2018 1,027,300 0.22 EUR 300,000 Bundesobligation RegS 1.00%
22/2/2019 310,095 0.07 EUR 950,000 Bundesobligation RegS 0.50%
12/4/2019 974,291 0.21 EUR 1,900,000 Bundesobligation RegS 0.25%
11/10/2019 1,946,778 0.42 EUR 600,000 Bundesobligation RegS
17/4/2020 (Zero Coupon) 612,126 0.13 EUR 750,000 Bundesobligation RegS 0.25%
16/10/2020 772,747 0.17 EUR 1,350,000 Bundesobligation RegS
9/4/2021 (Zero Coupon) 1,379,497 0.30 EUR 1,400,000 Bundesobligation RegS
8/10/2021 (Zero Coupon) 1,430,618 0.31 EUR 600,000 Bundesobligation RegS
8/4/2022 (Zero Coupon) 611,718 0.13 EUR 600,000 Bundesrepublik Deutschland
RegS 4.00% 4/1/2018 * 621,594 0.14 EUR 1,250,000 Bundesrepublik Deutschland
RegS 4.25% 4/7/2018 1,328,656 0.29 EUR 1,050,000 Bundesrepublik Deutschland
RegS 3.75% 4/1/2019 1,134,063 0.25
Portfolio of Investments as at 31 March 2017
BlackRock Euro Aggregate Bond Index Fund continued
France continued France continued

Transferable Securities and Money Market Instruments Admitted to an Official Stock Exchange Listing or Dealt in on Another Regulated Market
Transferable Securities and Money Market Instruments Admitted to an Official Stock Exchange Listing or Dealt in on Another Regulated Market
Holding Description
Market Value
EUR
% of Net
Assets Holding Description
Market Value
EUR
% of Net
Assets
* All or a portion of this security represents a security on loan.
Annual Report and Audited Accounts 59
The notes on pages 122 to 128 form an integral part of these financial statements.
EUR 800,000 Bundesrepublik Deutschland RegS 3.50% 4/7/2019 877,160 0.19
EUR 1,250,000 Bundesrepublik Deutschland RegS 3.25% 4/1/2020 * 1,388,350 0.30
EUR 900,000 Bundesrepublik Deutschland RegS 3.00% 4/7/2020 1,007,910 0.22
EUR 800,000 Bundesrepublik Deutschland RegS 2.25% 4/9/2020 879,696 0.19
EUR 1,000,000 Bundesrepublik Deutschland RegS 2.50% 4/1/2021 1,117,270 0.24
EUR 600,000 Bundesrepublik Deutschland RegS 3.25% 4/7/2021 697,392 0.15
EUR 300,000 Bundesrepublik Deutschland RegS 2.25% 4/9/2021 336,828 0.07
EUR 1,500,000 Bundesrepublik Deutschland RegS 2.00% 4/1/2022 1,677,210 0.36
EUR 800,000 Bundesrepublik Deutschland RegS 1.75% 4/7/2022 889,912 0.19
EUR 650,000 Bundesrepublik Deutschland RegS 1.50% 4/9/2022 715,689 0.16
EUR 400,000 Bundesrepublik Deutschland RegS 1.50% 15/2/2023 442,260 0.10
EUR 800,000 Bundesrepublik Deutschland RegS 1.50% 15/5/2023 886,736 0.19
EUR 1,250,000 Bundesrepublik Deutschland RegS 2.00% 15/8/2023 * 1,429,287 0.31
EUR 450,000 Bundesrepublik Deutschland RegS 6.25% 4/1/2024 646,605 0.14
EUR 1,100,000 Bundesrepublik Deutschland RegS 1.75% 15/2/2024 * 1,244,914 0.27
EUR 400,000 Bundesrepublik Deutschland RegS 1.50% 15/5/2024 446,060 0.10
EUR 550,000 Bundesrepublik Deutschland RegS 1.00% 15/8/2024 593,618 0.13
EUR 1,000,000 Bundesrepublik Deutschland RegS 0.50% 15/2/2025 * 1,039,220 0.23
EUR 700,000 Bundesrepublik Deutschland RegS 1.00% 15/8/2025 754,495 0.16
EUR 1,900,000 Bundesrepublik Deutschland RegS 0.50% 15/2/2026 * 1,957,798 0.42
EUR 1,100,000 Bundesrepublik Deutschland RegS 15/8/2026 (Zero Coupon) 1,074,502 0.23
EUR 600,000 Bundesrepublik Deutschland RegS 0.25% 15/2/2027 * 595,818 0.13
EUR 400,000 Bundesrepublik Deutschland RegS 6.50% 4/7/2027 649,980 0.14
EUR 500,000 Bundesrepublik Deutschland RegS 5.625% 4/1/2028 778,225 0.17
EUR 400,000 Bundesrepublik Deutschland RegS 6.25% 4/1/2030 685,772 0.15
EUR 1,400,000 Bundesrepublik Deutschland RegS 5.50% 4/1/2031 2,319,128 0.50
EUR 850,000 Bundesrepublik Deutschland RegS 4.75% 4/7/2034 1,407,931 0.31
EUR 1,250,000 Bundesrepublik Deutschland RegS 4.00% 4/1/2037 1,970,975 0.43
EUR 550,000 Bundesrepublik Deutschland RegS 4.25% 4/7/2039 920,793 0.20
EUR 550,000 Bundesrepublik Deutschland RegS 4.75% 4/7/2040 (traded in Germany) 989,527 0.22
EUR 300,000 Bundesrepublik Deutschland RegS 4.75% 4/7/2040 (traded in United States) 539,742 0.12
EUR 750,000 Bundesrepublik Deutschland RegS 3.25% 4/7/2042 1,123,976 0.24
EUR 625,000 Bundesrepublik Deutschland RegS 2.50% 4/7/2044 835,519 0.18
EUR 1,050,000 Bundesrepublik Deutschland RegS 2.50% 15/8/2046 1,417,316 0.31
EUR 700,000 Bundesschatzanweisungen RegS 14/12/2018 (Zero Coupon) 709,240 0.15
EUR 150,000 Commerzbank AG 3.625% 10/7/2017 151,516 0.03 EUR 100,000 Commerzbank AG 4.375% 2/7/2019 110,392 0.03 EUR 100,000 Commerzbank AG 7.75% 16/3/2021 122,481 0.03 EUR 125,000 Commerzbank AG 0.50% 9/6/2026 124,359 0.03 EUR 200,000 Commerzbank AG RegS
0.25% 26/1/2022 202,193 0.04 EUR 200,000 Commerzbank AG RegS
0.50% 13/9/2023 191,730 0.04 EUR 50,000 Commerzbank AG RegS
4.00% 23/3/2026 53,033 0.01 EUR 50,000 Continental AG RegS
3.00% 16/7/2018 51,918 0.01 EUR 150,000 Covestro AG RegS 1.75% 25/9/2024 158,353 0.04 EUR 200,000 CRH Finance Germany GmbH
RegS 1.75% 16/7/2021 210,829 0.05 EUR 200,000 Daimler AG RegS 0.50% 9/9/2019 202,357 0.04 EUR 300,000 Daimler AG RegS 0.625% 5/3/2020 304,587 0.07 EUR 100,000 Daimler AG RegS 2.25% 24/1/2022 109,303 0.02 EUR 50,000 Daimler AG RegS 2.375% 8/3/2023 55,413 0.01 EUR 100,000 Daimler AG RegS 1.875% 8/7/2024 107,957 0.02 EUR 125,000 Daimler AG RegS 1.375% 11/5/2028 * 125,881 0.03 EUR 200,000 Deutsche Bank AG RegS
1.25% 8/9/2021 202,498 0.05 EUR 200,000 Deutsche Bank AG RegS
2.375% 11/1/2023 212,596 0.05 EUR 100,000 Deutsche Bank AG RegS
0.25% 8/3/2024 99,441 0.02 EUR 100,000 Deutsche Bank AG RegS
1.125% 17/3/2025 96,302 0.02 EUR 100,000 Deutsche Boerse AG RegS
FRN 5/2/2041 105,720 0.02 EUR 100,000 Deutsche Genossenschafts-
Hypothekenbank AG 0.125% 30/9/2022 100,120 0.02
EUR 100,000 Deutsche Genossenschafts-Hypothekenbank AG RegS 0.25% 21/1/2021 101,338 0.02
EUR 150,000 Deutsche Hypothekenbank AG 0.875% 24/1/2018 151,514 0.03
EUR 100,000 Deutsche Kreditbank AG RegS 0.50% 19/3/2027 98,007 0.02
EUR 50,000 Deutsche Pfandbriefbank AG 1.50% 18/3/2020 52,481 0.01
EUR 100,000 Deutsche Pfandbriefbank AG 2.375% 29/5/2028 115,584 0.03
EUR 300,000 Deutsche Pfandbriefbank AG RegS 0.50% 19/1/2023 305,395 0.07
EUR 50,000 Deutsche Post AG RegS 0.375% 1/4/2021 50,470 0.01
EUR 50,000 Dexia Kommunalbank Deutschland AG 4.75% 23/5/2018 52,830 0.01
EUR 100,000 Dexia Kommunalbank Deutschland AG 0.375% 3/3/2022 100,947 0.02
EUR 100,000 DVB Bank SE 2.375% 2/12/2020 106,937 0.02 EUR 100,000 DVB Bank SE RegS 1.00%
25/4/2022 100,468 0.02 EUR 50,000 ENTEGA Netz AG 6.125%
23/4/2041 66,900 0.02 EUR 100,000 Eurogrid GmbH RegS 1.625%
3/11/2023 105,618 0.02 EUR 200,000 FMS Wertmanagement AoeR
3.375% 17/6/2021 230,154 0.05 EUR 300,000 FMS Wertmanagement AoeR
RegS 3.00% 3/8/2018 314,257 0.07
Portfolio of Investments as at 31 March 2017
BlackRock Euro Aggregate Bond Index Fund continued
Germany continued Germany continued

Transferable Securities and Money Market Instruments Admitted to an Official Stock Exchange Listing or Dealt in on Another Regulated Market
Transferable Securities and Money Market Instruments Admitted to an Official Stock Exchange Listing or Dealt in on Another Regulated Market
Holding Description
Market Value
EUR
% of Net
Assets Holding Description
Market Value
EUR
% of Net
Assets
* All or a portion of this security represents a security on loan.
60 BlackRock Global Index Funds (BGIF)
The notes on pages 122 to 128 form an integral part of these financial statements.
EUR 200,000 FMS Wertmanagement AoeR RegS 26/2/2019 (Zero Coupon) 201,876 0.04
EUR 300,000 FMS Wertmanagement AoeR RegS 1.375% 15/1/2020 314,679 0.07
EUR 200,000 FMS Wertmanagement AoeR RegS 20/10/2020 (Zero Coupon) 201,982 0.04
EUR 200,000 Free and Hanseatic City of Hamburg RegS 1.50% 4/9/2020 211,843 0.05
EUR 100,000 Free and Hanseatic City of Hamburg RegS 0.375% 1/4/2025 99,998 0.02
EUR 50,000 Free State of Bavaria RegS 1.875% 7/2/2019 52,155 0.01
EUR 100,000 Gemeinsame Deutsche Bundeslaender 2.375% 21/9/2018 104,144 0.02
EUR 100,000 Gemeinsame Deutsche Bundeslaender 1.50% 29/1/2021 106,417 0.02
EUR 200,000 Gemeinsame Deutsche Bundeslaender 1.75% 13/6/2022 218,140 0.05
EUR 100,000 Gemeinsame Deutsche Bundeslaender 2.25% 23/10/2023 113,427 0.03
EUR 100,000 Gemeinsame Deutsche Bundeslaender RegS 4.25% 13/4/2017 100,117 0.02
EUR 150,000 Gemeinsame Deutsche Bundeslaender RegS 0.375% 23/6/2020 153,056 0.03
EUR 100,000 Gemeinsame Deutsche Bundeslaender RegS 0.125% 14/4/2023 100,031 0.02
EUR 100,000 Gemeinsame Deutsche Bundeslaender RegS 0.50% 5/2/2025 101,163 0.02
EUR 100,000 HeidelbergCement AG RegS 2.25% 3/6/2024 106,715 0.02
EUR 50,000 HeidelbergCement AG RegS 1.50% 7/2/2025 50,633 0.01
EUR 75,000 Henkel AG & Co KGaA RegS 13/9/2021 (Zero Coupon) 74,667 0.02
EUR 100,000 HSH Nordbank AG RegS 1.375% 2/10/2018 102,281 0.02
EUR 100,000 HSH Nordbank AG RegS 0.75% 7/10/2021 102,369 0.02
EUR 50,000 Knorr-Bremse AG RegS 0.50% 8/12/2021 50,519 0.01
EUR 250,000 Kreditanstalt fuer Wiederaufbau 0.05% 30/11/2017 251,221 0.06
EUR 550,000 Kreditanstalt fuer Wiederaufbau 0.875% 25/6/2018 560,653 0.12
EUR 200,000 Kreditanstalt fuer Wiederaufbau 1.125% 16/10/2018 205,540 0.05
EUR 650,000 Kreditanstalt fuer Wiederaufbau 1.875% 20/3/2019 * 682,094 0.15
EUR 500,000 Kreditanstalt fuer Wiederaufbau 3.625% 20/1/2020 558,625 0.12
EUR 250,000 Kreditanstalt fuer Wiederaufbau 0.125% 1/6/2020 254,682 0.06
EUR 250,000 Kreditanstalt fuer Wiederaufbau 3.375% 18/1/2021 286,212 0.06
EUR 250,000 Kreditanstalt fuer Wiederaufbau 30/6/2021 (Zero Coupon) 253,436 0.06
EUR 400,000 Kreditanstalt fuer Wiederaufbau 3.50% 4/7/2021 465,610 0.10
EUR 150,000 Kreditanstalt fuer Wiederaufbau 2.50% 17/1/2022 170,164 0.04
EUR 100,000 Kreditanstalt fuer Wiederaufbau 0.625% 4/7/2022 104,206 0.02
EUR 200,000 Kreditanstalt fuer Wiederaufbau 4.625% 4/1/2023 255,165 0.06
EUR 150,000 Kreditanstalt fuer Wiederaufbau 0.375% 15/3/2023 153,803 0.03
EUR 300,000 Kreditanstalt fuer Wiederaufbau 15/9/2023 (Zero Coupon) 299,454 0.07
EUR 300,000 Kreditanstalt fuer Wiederaufbau 0.05% 30/5/2024 298,465 0.07
EUR 250,000 Kreditanstalt fuer Wiederaufbau 1.50% 11/6/2024 274,566 0.06
EUR 150,000 Kreditanstalt fuer Wiederaufbau 0.625% 15/1/2025 154,650 0.03
EUR 150,000 Kreditanstalt fuer Wiederaufbau 0.375% 9/3/2026 150,019 0.03
EUR 200,000 Kreditanstalt fuer Wiederaufbau RegS 0.625% 12/2/2018 202,301 0.04
EUR 250,000 Kreditanstalt fuer Wiederaufbau RegS 0.375% 22/7/2019 255,472 0.06
EUR 400,000 Kreditanstalt fuer Wiederaufbau RegS 0.125% 27/10/2020 407,940 0.09
EUR 200,000 Kreditanstalt fuer Wiederaufbau RegS 0.375% 23/4/2030 188,107 0.04
EUR 50,000 Kreditanstalt fuer Wiederaufbau RegS 1.25% 4/7/2036 50,820 0.01
EUR 200,000 Kreditanstalt fuer Wiederaufbau RegS 1.125% 15/6/2037 197,539 0.04
EUR 100,000 Land Thueringen RegS 0.50% 12/5/2025 100,890 0.02
EUR 75,000 Landesbank Baden-Wuerttemberg RegS 0.25% 21/7/2020 76,098 0.02
EUR 100,000 Landesbank Baden-Wuerttemberg RegS 0.25% 26/10/2021 101,269 0.02
EUR 100,000 Landesbank Baden-Wuerttemberg RegS 0.20% 10/1/2024 100,059 0.02
EUR 100,000 Landesbank Baden-Wuerttemberg RegS 0.375% 27/2/2025 100,196 0.02
EUR 100,000 Landesbank Baden-Wuerttemberg RegS FRN 27/5/2026 103,156 0.02
EUR 50,000 Landesbank Hessen-Thueringen Girozentrale 2.875% 21/4/2017 50,078 0.01
EUR 300,000 Landesbank Hessen-Thueringen Girozentrale 2.00% 26/4/2019 314,170 0.07
EUR 200,000 Landesbank Hessen-Thueringen Girozentrale RegS 0.125% 27/11/2018 201,648 0.04
EUR 200,000 Landesbank Hessen-Thueringen Girozentrale RegS 1.875% 26/6/2023 221,091 0.05
EUR 150,000 Landeskreditbank Baden-Wuerttemberg Foerderbank RegS 0.125% 5/11/2020 151,675 0.03
EUR 150,000 Landeskreditbank Baden-Wuerttemberg Foerderbank RegS 0.375% 13/4/2026 148,611 0.03
EUR 100,000 Landwirtschaftliche Rentenbank 4.375% 27/11/2017 103,250 0.02
EUR 300,000 Landwirtschaftliche Rentenbank RegS 1.375% 19/11/2020 318,541 0.07
EUR 200,000 Landwirtschaftliche Rentenbank RegS 0.25% 15/7/2024 200,987 0.04
EUR 100,000 Landwirtschaftliche Rentenbank RegS 0.375% 16/3/2026 99,525 0.02
EUR 200,000 Lanxess AG RegS 0.25% 7/10/2021 198,986 0.04 EUR 150,000 Linde AG 1.75% 17/9/2020 158,896 0.04 EUR 100,000 Merck Financial Services GmbH
RegS 1.375% 1/9/2022 105,252 0.02 EUR 75,000 Merck KGaA RegS FRN 12/12/2074 78,034 0.02 EUR 100,000 Muenchener Hypothekenbank eG
0.375% 10/11/2021 101,836 0.02
Portfolio of Investments as at 31 March 2017
BlackRock Euro Aggregate Bond Index Fund continued
Germany continued Germany continued

Transferable Securities and Money Market Instruments Admitted to an Official Stock Exchange Listing or Dealt in on Another Regulated Market
Transferable Securities and Money Market Instruments Admitted to an Official Stock Exchange Listing or Dealt in on Another Regulated Market
Holding Description
Market Value
EUR
% of Net
Assets Holding Description
Market Value
EUR
% of Net
Assets
Annual Report and Audited Accounts 61
The notes on pages 122 to 128 form an integral part of these financial statements.
EUR 100,000 Muenchener Hypothekenbank eG 0.50% 7/6/2023 102,113 0.02
EUR 100,000 Muenchener Hypothekenbank eG 0.50% 22/4/2026 99,861 0.02
EUR 100,000 Muenchener Hypothekenbank eG 2.50% 4/7/2028 117,887 0.03
EUR 100,000 Muenchener Rueckversicherungs-Gesellschaft AG in Muenchen RegS FRN 26/5/2041 118,975 0.03
EUR 150,000 Norddeutsche Landesbank Girozentrale 1.625% 17/7/2017 150,826 0.03
EUR 150,000 Norddeutsche Landesbank Girozentrale 0.25% 28/10/2026 144,765 0.03
EUR 100,000 Norddeutsche Landesbank Girozentrale RegS 0.625% 24/9/2018 100,767 0.02
EUR 100,000 Norddeutsche Landesbank Girozentrale RegS 0.025% 31/1/2019 100,597 0.02
EUR 300,000 NRW Bank 1/2/2022 (Zero Coupon) 300,795 0.07 EUR 200,000 NRW Bank RegS 0.50% 23/7/2018 202,399 0.04 EUR 200,000 NRW Bank RegS 4.25% 29/4/2019 219,120 0.05 EUR 200,000 NRW Bank RegS 0.50% 11/5/2026 199,886 0.04 EUR 100,000 Robert Bosch GmbH RegS
1.75% 8/7/2024 108,432 0.02 EUR 50,000 SAP SE RegS 1.125% 20/2/2023 52,469 0.01 EUR 50,000 SAP SE RegS 1.75% 22/2/2027 54,392 0.01 EUR 100,000 Sparkasse KoelnBonn RegS
1.125% 14/10/2024 105,658 0.02 EUR 100,000 State of Baden-Wurttemberg
RegS 1.00% 18/7/2022 105,238 0.02 EUR 100,000 State of Baden-Wurttemberg R
egS 2.00% 13/11/2023 111,749 0.03 EUR 150,000 State of Baden-Wurttemberg
RegS 0.625% 9/2/2027 150,622 0.03 EUR 100,000 State of Berlin RegS
3.50% 22/6/2017 100,864 0.02 EUR 200,000 State of Berlin RegS
0.25% 15/7/2020 203,298 0.05 EUR 200,000 State of Berlin RegS
1.625% 3/6/2024 219,199 0.05 EUR 150,000 State of Berlin RegS
0.50% 10/2/2025 151,637 0.03 EUR 100,000 State of Berlin RegS
1.00% 19/5/2032 97,586 0.02 EUR 100,000 State of Berlin RegS
0.625% 25/8/2036 88,350 0.02 EUR 300,000 State of Brandenburg RegS
0.25% 19/10/2026 291,618 0.06 EUR 100,000 State of Bremen RegS
1.125% 30/10/2024 105,898 0.02 EUR 100,000 State of Bremen RegS
0.50% 3/3/2025 100,730 0.02 EUR 100,000 State of Hesse RegS
1.00% 27/4/2018 101,563 0.02 EUR 300,000 State of Hesse RegS
1.375% 5/2/2020 314,359 0.07 EUR 200,000 State of Hesse RegS
1.75% 20/1/2023 219,249 0.05 EUR 150,000 State of Hesse RegS
0.375% 10/3/2023 152,491 0.03 EUR 150,000 State of Hesse RegS
1.375% 10/6/2024 161,830 0.04 EUR 100,000 State of Hesse RegS
0.50% 17/2/2025 101,115 0.02 EUR 50,000 State of Lower Saxony RegS
1.375% 26/9/2019 52,134 0.01 EUR 100,000 State of Lower Saxony RegS
2.125% 11/10/2023 112,474 0.03 EUR 100,000 State of Lower Saxony RegS
2.125% 16/1/2024 112,744 0.03
EUR 450,000 State of Lower Saxony RegS 2/8/2024 (Zero Coupon) 440,368 0.10
EUR 50,000 State of Lower Saxony RegS 0.625% 20/1/2025 50,990 0.01
EUR 200,000 State of Lower Saxony RegS 0.50% 8/6/2026 199,726 0.04
EUR 150,000 State of North Rhine-Westphalia Germany RegS 2.375% 23/8/2017 151,669 0.03
EUR 200,000 State of North Rhine-Westphalia Germany RegS 0.875% 4/12/2017 201,860 0.04
EUR 400,000 State of North Rhine-Westphalia Germany RegS 1.75% 17/5/2019 418,176 0.09
EUR 200,000 State of North Rhine-Westphalia Germany RegS 0.875% 16/12/2019 206,521 0.05
EUR 300,000 State of North Rhine-Westphalia Germany RegS 1.875% 15/9/2022 330,103 0.07
EUR 100,000 State of North Rhine-Westphalia Germany RegS 0.375% 16/2/2023 101,724 0.02
EUR 200,000 State of North Rhine-Westphalia Germany RegS 0.20% 17/4/2023 200,994 0.04
EUR 250,000 State of North Rhine-Westphalia Germany RegS 0.20% 16/2/2024 249,285 0.06
EUR 150,000 State of North Rhine-Westphalia Germany RegS 1.25% 14/3/2025 160,299 0.04
EUR 100,000 State of North Rhine-Westphalia Germany RegS 2.00% 15/10/2025 113,040 0.03
EUR 100,000 State of North Rhine-Westphalia Germany RegS 0.625% 21/7/2031 93,344 0.02
EUR 100,000 State of North Rhine-Westphalia Germany RegS 1.25% 12/5/2036 98,451 0.02
EUR 100,000 State of North Rhine-Westphalia Germany RegS 0.75% 16/8/2041 84,393 0.02
EUR 150,000 State of Rhineland-Palatinate 0.125% 1/3/2023 150,355 0.03
EUR 200,000 State of Rhineland-Palatinate RegS 16/9/2019 (Zero Coupon) 201,612 0.04
EUR 250,000 State of Rhineland-Palatinate RegS 2.375% 23/2/2022 279,640 0.06
EUR 100,000 State of Rhineland-Palatinate RegS 0.50% 21/1/2025 101,083 0.02
EUR 150,000 State of Saxony-Anhalt RegS 4.50% 11/9/2017 153,285 0.03
EUR 100,000 Talanx AG 3.125% 13/2/2023 115,675 0.03 EUR 200,000 UniCredit Bank AG
2.625% 31/5/2017 200,956 0.04 EUR 150,000 UniCredit Bank AG
0.125% 1/3/2022 150,711 0.03 EUR 100,000 Vier Gas Transport GmbH RegS
2.00% 12/6/2020 106,217 0.02 EUR 100,000 Volkswagen Leasing GmbH
3.25% 10/5/2018 103,448 0.02 EUR 100,000 Wirtschafts- und Infrastrukturbank
Hessen 1.75% 15/4/2024 109,501 0.02 EUR 100,000 WL BANK AG Westfaelische
Landschaft Bodenkreditbank 0.50% 29/7/2022 102,325 0.02
EUR 200,000 WL BANK AG Westfaelische Landschaft Bodenkreditbank RegS 1.125% 18/9/2024 211,903 0.05
77,204,583 16.70
Hungary EUR 200,000 Hungary Government International
Bond RegS 6.00% 11/1/2019 221,900 0.05
221,900 0.05
Iceland EUR 100,000 Arion Banki HF RegS 3.125%
12/3/2018 102,690 0.02
102,690 0.02
Portfolio of Investments as at 31 March 2017
BlackRock Euro Aggregate Bond Index Fund continued
Germany continued Germany continued

Transferable Securities and Money Market Instruments Admitted to an Official Stock Exchange Listing or Dealt in on Another Regulated Market
Transferable Securities and Money Market Instruments Admitted to an Official Stock Exchange Listing or Dealt in on Another Regulated Market
Holding Description
Market Value
EUR
% of Net
Assets Holding Description
Market Value
EUR
% of Net
Assets
* All or a portion of this security represents a security on loan.
62 BlackRock Global Index Funds (BGIF)
The notes on pages 122 to 128 form an integral part of these financial statements.
Indonesia EUR 200,000 Indonesia Government International
Bond RegS 2.625% 14/6/2023 209,828 0.05 EUR 100,000 Indonesia Government International
Bond RegS 3.375% 30/7/2025 106,945 0.02
316,773 0.07
Ireland EUR 150,000 AIB Mortgage Bank
3.125% 10/9/2018 157,327 0.04 EUR 100,000 Bank of Ireland Mortgage Bank
RegS 3.625% 2/10/2020 112,756 0.03 EUR 100,000 Bank of Ireland RegS 1.25% 9/4/2020 102,846 0.02 EUR 50,000 Cloverie Plc for Zurich Insurance
Co Ltd FRN 24/7/2039 57,792 0.01 EUR 100,000 CRH Finance DAC RegS
3.125% 3/4/2023 113,712 0.03 EUR 100,000 ESB Finance DAC RegS
6.25% 11/9/2017 102,786 0.02 EUR 100,000 ESB Finance DAC RegS
1.75% 7/2/2029 103,721 0.02 EUR 150,000 FCA Bank SpA/Ireland RegS
2.00% 23/10/2019 155,487 0.03 EUR 100,000 Fresenius Finance Ireland Plc RegS
1.50% 30/1/2024 101,945 0.02 EUR 100,000 Fresenius Finance Ireland Plc RegS
3.00% 30/1/2032 107,017 0.02 EUR 150,000 GE Capital European Funding
Unlimited Co 4.35% 3/11/2021 178,185 0.04 EUR 100,000 GE Capital European Funding
Unlimited Co 4.625% 22/2/2027 132,486 0.03 EUR 200,000 GE Capital European Funding
Unlimited Co RegS 1.00% 2/5/2017 200,211 0.04
EUR 200,000 German Postal Pensions Securitisation Plc 3.75% 18/1/2021 227,896 0.05
EUR 200,000 Ireland Government Bond 4.50% 18/10/2018 * 215,092 0.05
EUR 550,000 Ireland Government Bond 4.40% 18/6/2019 607,931 0.13
EUR 300,000 Ireland Government Bond 5.90% 18/10/2019 347,865 0.08
EUR 500,000 Ireland Government Bond 4.50% 18/4/2020 572,100 0.12
EUR 150,000 Ireland Government Bond 5.00% 18/10/2020 177,745 0.04
EUR 500,000 Ireland Government Bond 5.40% 13/3/2025 680,035 0.15
EUR 200,000 Ireland Government Bond RegS 0.80% 15/3/2022 207,618 0.05
EUR 450,000 Ireland Government Bond RegS 3.90% 20/3/2023 546,937 0.12
EUR 250,000 Ireland Government Bond RegS 3.40% 18/3/2024 299,670 0.07
EUR 200,000 Ireland Government Bond RegS 1.00% 15/5/2026 200,478 0.04
EUR 500,000 Ireland Government Bond RegS 2.40% 15/5/2030 558,845 0.12
EUR 300,000 Ireland Government Bond RegS 1.70% 15/5/2037 292,992 0.06
EUR 200,000 Ireland Government Bond RegS 2.00% 18/2/2045 197,736 0.04
EUR 100,000 Johnson Controls International Plc 1.00% 15/9/2023 99,703 0.02
EUR 100,000 Kerry Group Financial Services RegS 2.375% 10/9/2025 109,190 0.02
EUR 100,000 Lunar Funding V for Swisscom AG RegS 2.00% 30/9/2020 106,455 0.02
EUR 100,000 Ryanair DAC RegS 125% 10/3/2023 100,584 0.02
7,175,143 1.55
Israel EUR 100,000 Israel Government International
Bond RegS 2.875% 29/1/2024 113,110 0.03 EUR 100,000 Israel Government International
Bond RegS 2.375% 18/1/2037 99,864 0.02
212,974 0.05
Italy EUR 100,000 A2A SpA RegS 1.75% 25/2/2025 102,712 0.02 EUR 100,000 ACEA SpA RegS 2.625% 15/7/2024 109,447 0.02 EUR 100,000 Assicurazioni Generali SpA RegS
2.875% 14/1/2020 107,424 0.02 EUR 100,000 Assicurazioni Generali SpA RegS
4.125% 4/5/2026 106,265 0.02 EUR 100,000 Assicurazioni Generali SpA
RegS FRN 10/7/2042 131,749 0.03 EUR 100,000 Assicurazioni Generali SpA
RegS FRN 12/12/2042 121,032 0.03 EUR 100,000 Atlantia SpA RegS
1.625% 3/2/2025 100,720 0.02 EUR 100,000 Autostrade per l'Italia SpA
RegS 4.375% 16/3/2020 112,392 0.02 EUR 100,000 Autostrade per l'Italia SpA
RegS 1.875% 4/11/2025 103,883 0.02 EUR 200,000 Banca Monte dei Paschi di Siena
SpA RegS 2.875% 16/7/2024 216,296 0.05 EUR 100,000 Banca Popolare di Milano Scarl
RegS 0.875% 14/9/2022 101,061 0.02 EUR 100,000 Banca Popolare di Sondrio SCPA
RegS 1.375% 5/8/2019 103,247 0.02 EUR 150,000 BPER Banca RegS 0.50% 22/7/2020 152,362 0.03 EUR 100,000 BPER Banca RegS 0.875% 22/1/2022 102,234 0.02 EUR 200,000 Cassa Depositi e Prestiti SpA RegS
1.00% 26/1/2018 201,757 0.04 EUR 100,000 CDP Reti SpA RegS
1.875% 29/5/2022 102,379 0.02 EUR 100,000 Credit Agricole Cariparma SpA
RegS 0.875% 31/1/2022 101,816 0.02 EUR 100,000 Credit Agricole Cariparma SpA
RegS 0.875% 16/6/2023 101,102 0.02 EUR 100,000 Credit Agricole Cariparma SpA
RegS 0.25% 30/9/2024 95,205 0.02 EUR 100,000 Credito Emiliano SpA RegS
0.875% 5/11/2021 102,484 0.02 EUR 8,000 Enel SpA RegS 5.25% 20/6/2017 8,090 0.00 EUR 150,000 Eni SpA RegS 4.75% 14/11/2017 154,511 0.03 EUR 150,000 Eni SpA RegS 4.125% 16/9/2019 164,742 0.04 EUR 100,000 Eni SpA RegS 3.25% 10/7/2023 114,488 0.03 EUR 100,000 Eni SpA RegS 1.50% 2/2/2026 100,808 0.02 EUR 100,000 Eni SpA RegS 1.50% 17/1/2027 99,577 0.02 EUR 100,000 Eni SpA RegS 1.625% 17/5/2028 99,273 0.02 EUR 100,000 Ferrovie dello Stato Italiane SpA
RegS 4.00% 22/7/2020 111,306 0.02 EUR 100,000 Hera SpA RegS 5.20% 29/1/2028 134,338 0.03 EUR 200,000 Intesa Sanpaolo SpA RegS
3.75% 25/9/2019 219,109 0.05 EUR 100,000 Intesa Sanpaolo SpA RegS
4.375% 15/10/2019 109,939 0.02 EUR 100,000 Intesa Sanpaolo SpA RegS
1.125% 14/1/2020 101,595 0.02 EUR 50,000 Intesa Sanpaolo SpA RegS
4.125% 14/4/2020 55,244 0.01
Portfolio of Investments as at 31 March 2017
BlackRock Euro Aggregate Bond Index Fund continued
Ireland continued
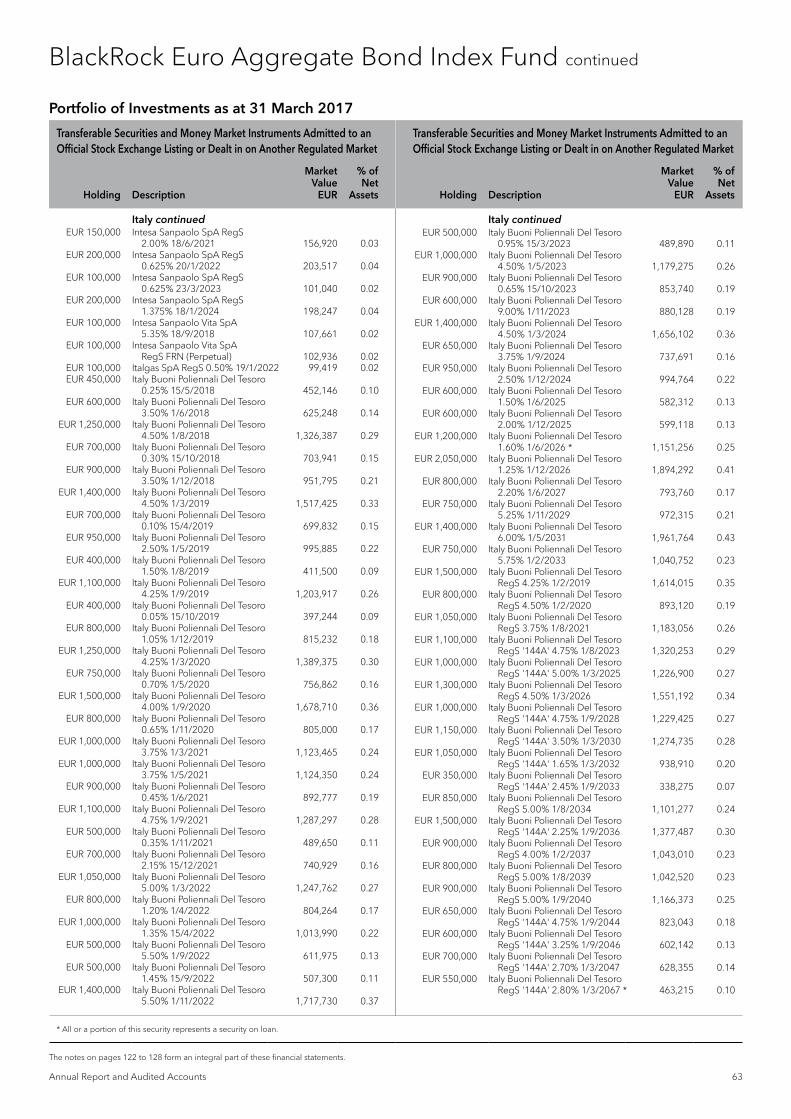
Transferable Securities and Money Market Instruments Admitted to an Official Stock Exchange Listing or Dealt in on Another Regulated Market
Transferable Securities and Money Market Instruments Admitted to an Official Stock Exchange Listing or Dealt in on Another Regulated Market
Holding Description
Market Value
EUR
% of Net
Assets Holding Description
Market Value
EUR
% of Net
Assets
* All or a portion of this security represents a security on loan.
Annual Report and Audited Accounts 63
The notes on pages 122 to 128 form an integral part of these financial statements.
EUR 150,000 Intesa Sanpaolo SpA RegS 2.00% 18/6/2021 156,920 0.03
EUR 200,000 Intesa Sanpaolo SpA RegS 0.625% 20/1/2022 203,517 0.04
EUR 100,000 Intesa Sanpaolo SpA RegS 0.625% 23/3/2023 101,040 0.02
EUR 200,000 Intesa Sanpaolo SpA RegS 1.375% 18/1/2024 198,247 0.04
EUR 100,000 Intesa Sanpaolo Vita SpA 5.35% 18/9/2018 107,661 0.02
EUR 100,000 Intesa Sanpaolo Vita SpA RegS FRN (Perpetual) 102,936 0.02
EUR 100,000 Italgas SpA RegS 0.50% 19/1/2022 99,419 0.02 EUR 450,000 Italy Buoni Poliennali Del Tesoro
0.25% 15/5/2018 452,146 0.10 EUR 600,000 Italy Buoni Poliennali Del Tesoro
3.50% 1/6/2018 625,248 0.14 EUR 1,250,000 Italy Buoni Poliennali Del Tesoro
4.50% 1/8/2018 1,326,387 0.29 EUR 700,000 Italy Buoni Poliennali Del Tesoro
0.30% 15/10/2018 703,941 0.15 EUR 900,000 Italy Buoni Poliennali Del Tesoro
3.50% 1/12/2018 951,795 0.21 EUR 1,400,000 Italy Buoni Poliennali Del Tesoro
4.50% 1/3/2019 1,517,425 0.33 EUR 700,000 Italy Buoni Poliennali Del Tesoro
0.10% 15/4/2019 699,832 0.15 EUR 950,000 Italy Buoni Poliennali Del Tesoro
2.50% 1/5/2019 995,885 0.22 EUR 400,000 Italy Buoni Poliennali Del Tesoro
1.50% 1/8/2019 411,500 0.09 EUR 1,100,000 Italy Buoni Poliennali Del Tesoro
4.25% 1/9/2019 1,203,917 0.26 EUR 400,000 Italy Buoni Poliennali Del Tesoro
0.05% 15/10/2019 397,244 0.09 EUR 800,000 Italy Buoni Poliennali Del Tesoro
1.05% 1/12/2019 815,232 0.18 EUR 1,250,000 Italy Buoni Poliennali Del Tesoro
4.25% 1/3/2020 1,389,375 0.30 EUR 750,000 Italy Buoni Poliennali Del Tesoro
0.70% 1/5/2020 756,862 0.16 EUR 1,500,000 Italy Buoni Poliennali Del Tesoro
4.00% 1/9/2020 1,678,710 0.36 EUR 800,000 Italy Buoni Poliennali Del Tesoro
0.65% 1/11/2020 805,000 0.17 EUR 1,000,000 Italy Buoni Poliennali Del Tesoro
3.75% 1/3/2021 1,123,465 0.24 EUR 1,000,000 Italy Buoni Poliennali Del Tesoro
3.75% 1/5/2021 1,124,350 0.24 EUR 900,000 Italy Buoni Poliennali Del Tesoro
0.45% 1/6/2021 892,777 0.19 EUR 1,100,000 Italy Buoni Poliennali Del Tesoro
4.75% 1/9/2021 1,287,297 0.28 EUR 500,000 Italy Buoni Poliennali Del Tesoro
0.35% 1/11/2021 489,650 0.11 EUR 700,000 Italy Buoni Poliennali Del Tesoro
2.15% 15/12/2021 740,929 0.16 EUR 1,050,000 Italy Buoni Poliennali Del Tesoro
5.00% 1/3/2022 1,247,762 0.27 EUR 800,000 Italy Buoni Poliennali Del Tesoro
1.20% 1/4/2022 804,264 0.17 EUR 1,000,000 Italy Buoni Poliennali Del Tesoro
1.35% 15/4/2022 1,013,990 0.22 EUR 500,000 Italy Buoni Poliennali Del Tesoro
5.50% 1/9/2022 611,975 0.13 EUR 500,000 Italy Buoni Poliennali Del Tesoro
1.45% 15/9/2022 507,300 0.11 EUR 1,400,000 Italy Buoni Poliennali Del Tesoro
5.50% 1/11/2022 1,717,730 0.37
EUR 500,000 Italy Buoni Poliennali Del Tesoro 0.95% 15/3/2023 489,890 0.11
EUR 1,000,000 Italy Buoni Poliennali Del Tesoro 4.50% 1/5/2023 1,179,275 0.26
EUR 900,000 Italy Buoni Poliennali Del Tesoro 0.65% 15/10/2023 853,740 0.19
EUR 600,000 Italy Buoni Poliennali Del Tesoro 9.00% 1/11/2023 880,128 0.19
EUR 1,400,000 Italy Buoni Poliennali Del Tesoro 4.50% 1/3/2024 1,656,102 0.36
EUR 650,000 Italy Buoni Poliennali Del Tesoro 3.75% 1/9/2024 737,691 0.16
EUR 950,000 Italy Buoni Poliennali Del Tesoro 2.50% 1/12/2024 994,764 0.22
EUR 600,000 Italy Buoni Poliennali Del Tesoro 1.50% 1/6/2025 582,312 0.13
EUR 600,000 Italy Buoni Poliennali Del Tesoro 2.00% 1/12/2025 599,118 0.13
EUR 1,200,000 Italy Buoni Poliennali Del Tesoro 1.60% 1/6/2026 * 1,151,256 0.25
EUR 2,050,000 Italy Buoni Poliennali Del Tesoro 1.25% 1/12/2026 1,894,292 0.41
EUR 800,000 Italy Buoni Poliennali Del Tesoro 2.20% 1/6/2027 793,760 0.17
EUR 750,000 Italy Buoni Poliennali Del Tesoro 5.25% 1/11/2029 972,315 0.21
EUR 1,400,000 Italy Buoni Poliennali Del Tesoro 6.00% 1/5/2031 1,961,764 0.43
EUR 750,000 Italy Buoni Poliennali Del Tesoro 5.75% 1/2/2033 1,040,752 0.23
EUR 1,500,000 Italy Buoni Poliennali Del Tesoro RegS 4.25% 1/2/2019 1,614,015 0.35
EUR 800,000 Italy Buoni Poliennali Del Tesoro RegS 4.50% 1/2/2020 893,120 0.19
EUR 1,050,000 Italy Buoni Poliennali Del Tesoro RegS 3.75% 1/8/2021 1,183,056 0.26
EUR 1,100,000 Italy Buoni Poliennali Del Tesoro RegS '144A' 4.75% 1/8/2023 1,320,253 0.29
EUR 1,000,000 Italy Buoni Poliennali Del Tesoro RegS '144A' 5.00% 1/3/2025 1,226,900 0.27
EUR 1,300,000 Italy Buoni Poliennali Del Tesoro RegS 4.50% 1/3/2026 1,551,192 0.34
EUR 1,000,000 Italy Buoni Poliennali Del Tesoro RegS '144A' 4.75% 1/9/2028 1,229,425 0.27
EUR 1,150,000 Italy Buoni Poliennali Del Tesoro RegS '144A' 3.50% 1/3/2030 1,274,735 0.28
EUR 1,050,000 Italy Buoni Poliennali Del Tesoro RegS '144A' 1.65% 1/3/2032 938,910 0.20
EUR 350,000 Italy Buoni Poliennali Del Tesoro RegS '144A' 2.45% 1/9/2033 338,275 0.07
EUR 850,000 Italy Buoni Poliennali Del Tesoro RegS 5.00% 1/8/2034 1,101,277 0.24
EUR 1,500,000 Italy Buoni Poliennali Del Tesoro RegS '144A' 2.25% 1/9/2036 1,377,487 0.30
EUR 900,000 Italy Buoni Poliennali Del Tesoro RegS 4.00% 1/2/2037 1,043,010 0.23
EUR 800,000 Italy Buoni Poliennali Del Tesoro RegS 5.00% 1/8/2039 1,042,520 0.23
EUR 900,000 Italy Buoni Poliennali Del Tesoro RegS 5.00% 1/9/2040 1,166,373 0.25
EUR 650,000 Italy Buoni Poliennali Del Tesoro RegS '144A' 4.75% 1/9/2044 823,043 0.18
EUR 600,000 Italy Buoni Poliennali Del Tesoro RegS '144A' 3.25% 1/9/2046 602,142 0.13
EUR 700,000 Italy Buoni Poliennali Del Tesoro RegS '144A' 2.70% 1/3/2047 628,355 0.14
EUR 550,000 Italy Buoni Poliennali Del Tesoro RegS '144A' 2.80% 1/3/2067 * 463,215 0.10
Portfolio of Investments as at 31 March 2017
BlackRock Euro Aggregate Bond Index Fund continued
Italy continued Italy continued
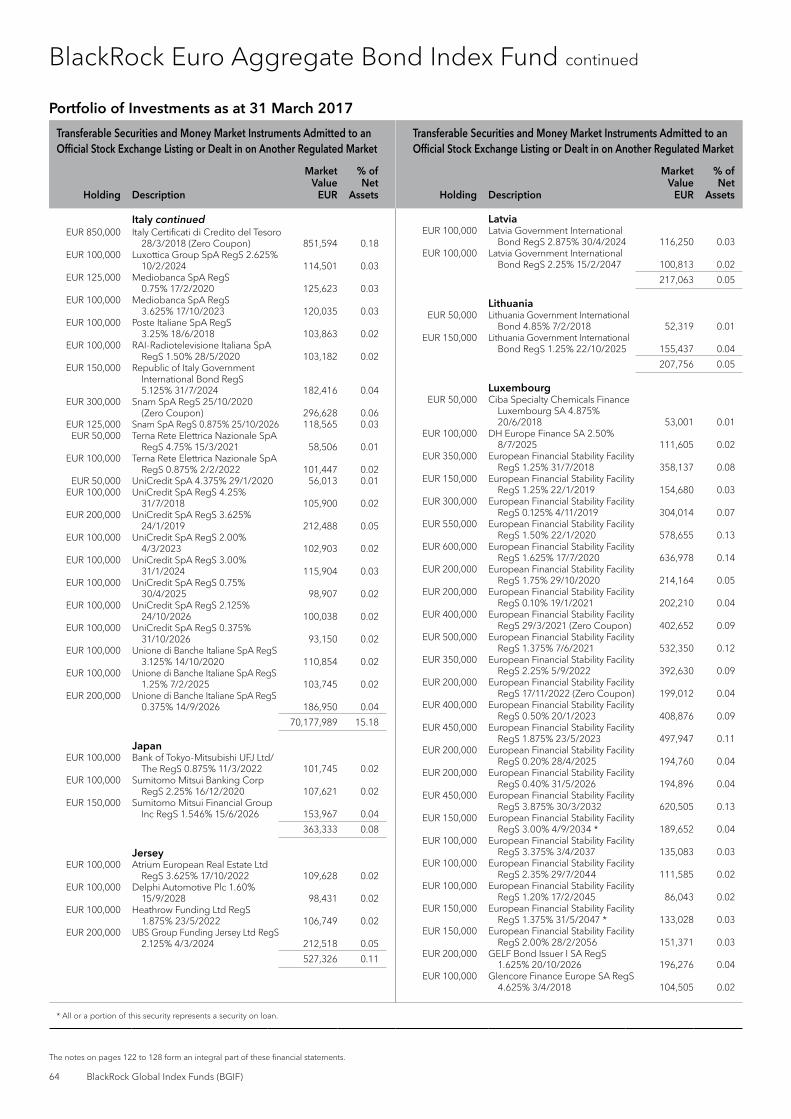
Transferable Securities and Money Market Instruments Admitted to an Official Stock Exchange Listing or Dealt in on Another Regulated Market
Transferable Securities and Money Market Instruments Admitted to an Official Stock Exchange Listing or Dealt in on Another Regulated Market
Holding Description
Market Value
EUR
% of Net
Assets Holding Description
Market Value
EUR
% of Net
Assets
* All or a portion of this security represents a security on loan.
64 BlackRock Global Index Funds (BGIF)
The notes on pages 122 to 128 form an integral part of these financial statements.
EUR 850,000 Italy Certificati di Credito del Tesoro 28/3/2018 (Zero Coupon) 851,594 0.18
EUR 100,000 Luxottica Group SpA RegS 2.625% 10/2/2024 114,501 0.03
EUR 125,000 Mediobanca SpA RegS 0.75% 17/2/2020 125,623 0.03
EUR 100,000 Mediobanca SpA RegS 3.625% 17/10/2023 120,035 0.03
EUR 100,000 Poste Italiane SpA RegS 3.25% 18/6/2018 103,863 0.02
EUR 100,000 RAI-Radiotelevisione Italiana SpA RegS 1.50% 28/5/2020 103,182 0.02
EUR 150,000 Republic of Italy Government International Bond RegS 5.125% 31/7/2024 182,416 0.04
EUR 300,000 Snam SpA RegS 25/10/2020 (Zero Coupon) 296,628 0.06
EUR 125,000 Snam SpA RegS 0.875% 25/10/2026 118,565 0.03 EUR 50,000 Terna Rete Elettrica Nazionale SpA
RegS 4.75% 15/3/2021 58,506 0.01 EUR 100,000 Terna Rete Elettrica Nazionale SpA
RegS 0.875% 2/2/2022 101,447 0.02 EUR 50,000 UniCredit SpA 4.375% 29/1/2020 56,013 0.01 EUR 100,000 UniCredit SpA RegS 4.25%
31/7/2018 105,900 0.02 EUR 200,000 UniCredit SpA RegS 3.625%
24/1/2019 212,488 0.05 EUR 100,000 UniCredit SpA RegS 2.00%
4/3/2023 102,903 0.02 EUR 100,000 UniCredit SpA RegS 3.00%
31/1/2024 115,904 0.03 EUR 100,000 UniCredit SpA RegS 0.75%
30/4/2025 98,907 0.02 EUR 100,000 UniCredit SpA RegS 2.125%
24/10/2026 100,038 0.02 EUR 100,000 UniCredit SpA RegS 0.375%
31/10/2026 93,150 0.02 EUR 100,000 Unione di Banche Italiane SpA RegS
3.125% 14/10/2020 110,854 0.02 EUR 100,000 Unione di Banche Italiane SpA RegS
1.25% 7/2/2025 103,745 0.02 EUR 200,000 Unione di Banche Italiane SpA RegS
0.375% 14/9/2026 186,950 0.04
70,177,989 15.18
Japan EUR 100,000 Bank of Tokyo-Mitsubishi UFJ Ltd/
The RegS 0.875% 11/3/2022 101,745 0.02 EUR 100,000 Sumitomo Mitsui Banking Corp
RegS 2.25% 16/12/2020 107,621 0.02 EUR 150,000 Sumitomo Mitsui Financial Group
Inc RegS 1.546% 15/6/2026 153,967 0.04
363,333 0.08
Jersey EUR 100,000 Atrium European Real Estate Ltd
RegS 3.625% 17/10/2022 109,628 0.02 EUR 100,000 Delphi Automotive Plc 1.60%
15/9/2028 98,431 0.02 EUR 100,000 Heathrow Funding Ltd RegS
1.875% 23/5/2022 106,749 0.02 EUR 200,000 UBS Group Funding Jersey Ltd RegS
2.125% 4/3/2024 212,518 0.05
527,326 0.11
Latvia EUR 100,000 Latvia Government International
Bond RegS 2.875% 30/4/2024 116,250 0.03 EUR 100,000 Latvia Government International
Bond RegS 2.25% 15/2/2047 100,813 0.02
217,063 0.05
Lithuania EUR 50,000 Lithuania Government International
Bond 4.85% 7/2/2018 52,319 0.01 EUR 150,000 Lithuania Government International
Bond RegS 1.25% 22/10/2025 155,437 0.04
207,756 0.05
Luxembourg EUR 50,000 Ciba Specialty Chemicals Finance
Luxembourg SA 4.875% 20/6/2018 53,001 0.01
EUR 100,000 DH Europe Finance SA 2.50% 8/7/2025 111,605 0.02
EUR 350,000 European Financial Stability Facility RegS 1.25% 31/7/2018 358,137 0.08
EUR 150,000 European Financial Stability Facility RegS 1.25% 22/1/2019 154,680 0.03
EUR 300,000 European Financial Stability Facility RegS 0.125% 4/11/2019 304,014 0.07
EUR 550,000 European Financial Stability Facility RegS 1.50% 22/1/2020 578,655 0.13
EUR 600,000 European Financial Stability Facility RegS 1.625% 17/7/2020 636,978 0.14
EUR 200,000 European Financial Stability Facility RegS 1.75% 29/10/2020 214,164 0.05
EUR 200,000 European Financial Stability Facility RegS 0.10% 19/1/2021 202,210 0.04
EUR 400,000 European Financial Stability Facility RegS 29/3/2021 (Zero Coupon) 402,652 0.09
EUR 500,000 European Financial Stability Facility RegS 1.375% 7/6/2021 532,350 0.12
EUR 350,000 European Financial Stability Facility RegS 2.25% 5/9/2022 392,630 0.09
EUR 200,000 European Financial Stability Facility RegS 17/11/2022 (Zero Coupon) 199,012 0.04
EUR 400,000 European Financial Stability Facility RegS 0.50% 20/1/2023 408,876 0.09
EUR 450,000 European Financial Stability Facility RegS 1.875% 23/5/2023 497,947 0.11
EUR 200,000 European Financial Stability Facility RegS 0.20% 28/4/2025 194,760 0.04
EUR 200,000 European Financial Stability Facility RegS 0.40% 31/5/2026 194,896 0.04
EUR 450,000 European Financial Stability Facility RegS 3.875% 30/3/2032 620,505 0.13
EUR 150,000 European Financial Stability Facility RegS 3.00% 4/9/2034 * 189,652 0.04
EUR 100,000 European Financial Stability Facility RegS 3.375% 3/4/2037 135,083 0.03
EUR 100,000 European Financial Stability Facility RegS 2.35% 29/7/2044 111,585 0.02
EUR 100,000 European Financial Stability Facility RegS 1.20% 17/2/2045 86,043 0.02
EUR 150,000 European Financial Stability Facility RegS 1.375% 31/5/2047 * 133,028 0.03
EUR 150,000 European Financial Stability Facility RegS 2.00% 28/2/2056 151,371 0.03
EUR 200,000 GELF Bond Issuer I SA RegS 1.625% 20/10/2026 196,276 0.04
EUR 100,000 Glencore Finance Europe SA RegS 4.625% 3/4/2018 104,505 0.02
Portfolio of Investments as at 31 March 2017
BlackRock Euro Aggregate Bond Index Fund continued
Italy continued

Transferable Securities and Money Market Instruments Admitted to an Official Stock Exchange Listing or Dealt in on Another Regulated Market
Transferable Securities and Money Market Instruments Admitted to an Official Stock Exchange Listing or Dealt in on Another Regulated Market
Holding Description
Market Value
EUR
% of Net
Assets Holding Description
Market Value
EUR
% of Net
Assets
* All or a portion of this security represents a security on loan.
Annual Report and Audited Accounts 65
The notes on pages 122 to 128 form an integral part of these financial statements.
BlackRock Euro Aggregate Bond Index Fund continued
EUR 150,000 Glencore Finance Europe SA RegS 1.25% 17/3/2021 152,271 0.03
EUR 100,000 Glencore Finance Europe SA RegS 1.875% 13/9/2023 101,834 0.02
EUR 100,000 Grand City Properties SA RegS 1.50% 17/4/2025 99,588 0.02
EUR 50,000 Hannover Finance Luxembourg SA FRN 14/9/2040 57,657 0.01
EUR 100,000 Harman Finance International SCA 2.00% 27/5/2022 105,848 0.02
EUR 100,000 HeidelbergCement Finance Luxembourg SA RegS 8.50% 31/10/2019 121,441 0.03
EUR 50,000 HeidelbergCement Finance Luxembourg SA RegS 1.625% 7/4/2026 50,198 0.01
EUR 100,000 Holcim Finance Luxembourg SA RegS 1.375% 26/5/2023 102,549 0.02
EUR 150,000 Luxembourg Government Bond RegS 2.25% 21/3/2022 167,935 0.04
EUR 250,000 Luxembourg Government Bond RegS 0.625% 1/2/2027 252,282 0.06
EUR 200,000 Nestle Finance International Ltd RegS 1.25% 4/5/2020 208,710 0.05
EUR 250,000 Novartis Finance SA RegS 0.125% 20/9/2023 245,274 0.05
EUR 100,000 SES SA RegS 4.625% 9/3/2020 112,717 0.02
8,942,919 1.93
Mexico EUR 100,000 America Movil SAB de CV
3.00% 12/7/2021 109,687 0.03 EUR 100,000 America Movil SAB de CV
1.50% 10/3/2024 101,125 0.02 EUR 100,000 America Movil SAB de CV RegS
FRN 6/9/2073 105,211 0.02 EUR 100,000 Fomento Economico Mexicano SAB
de CV RegS 1.75% 20/3/2023 101,909 0.02 EUR 200,000 Mexico Government International
Bond 2.75% 22/4/2023 214,000 0.05 EUR 100,000 Mexico Government International
Bond 1.625% 6/3/2024 99,345 0.02 EUR 100,000 Mexico Government International
Bond 3.375% 23/2/2031 104,083 0.02 EUR 100,000 Mexico Government International
Bond 4.00% 15/3/2115 87,369 0.02 EUR 200,000 Petroleos Mexicanos RegS
3.75% 15/3/2019 * 210,022 0.05 EUR 100,000 Petroleos Mexicanos RegS
1.875% 21/4/2022 97,136 0.02 EUR 100,000 Petroleos Mexicanos RegS
3.75% 21/2/2024 101,988 0.02 EUR 50,000 Petroleos Mexicanos RegS
5.50% 24/2/2025 56,475 0.01 EUR 100,000 Petroleos Mexicanos RegS
2.75% 21/4/2027 88,875 0.02
1,477,225 0.32
Morocco EUR 100,000 Morocco Government International
Bond RegS 4.50% 5/10/2020 111,957 0.02
111,957 0.02
Netherlands EUR 100,000 ABB Finance BV RegS
0.625% 3/5/2023 101,057 0.02
EUR 50,000 ABN AMRO Bank NV 3.625% 22/6/2020 56,123 0.01
EUR 150,000 ABN AMRO Bank NV RegS 1.875% 31/7/2019 157,544 0.04
EUR 100,000 ABN AMRO Bank NV RegS 6.375% 27/4/2021 121,968 0.03
EUR 50,000 ABN AMRO Bank NV RegS 4.125% 28/3/2022 59,338 0.01
EUR 150,000 ABN AMRO Bank NV RegS 0.625% 31/5/2022 152,197 0.03
EUR 150,000 ABN AMRO Bank NV RegS 1.00% 16/4/2025 153,067 0.03
EUR 100,000 ABN AMRO Bank NV RegS 0.875% 14/1/2026 102,954 0.02
EUR 100,000 ABN AMRO Bank NV RegS FRN 18/1/2028 106,508 0.02
EUR 200,000 ABN AMRO Bank NV RegS 1.50% 30/9/2030 210,133 0.05
EUR 100,000 ABN AMRO Bank NV RegS 1.00% 13/4/2031 97,970 0.02
EUR 100,000 ABN AMRO Bank NV RegS 1.125% 12/1/2032 98,637 0.02
EUR 150,000 Achmea Bank NV 2.00% 23/1/2018 152,510 0.03 EUR 100,000 Achmea BV RegS FRN (Perpetual) 95,920 0.02 EUR 100,000 Adecco International Financial
Services BV RegS 1.50% 22/11/2022 104,770 0.02
EUR 100,000 Airbus Group Finance BV RegS 2.375% 2/4/2024 111,494 0.02
EUR 100,000 Airbus Group Finance BV RegS 1.375% 13/5/2031 99,046 0.02
EUR 150,000 Alliander NV RegS 2.25% 14/11/2022 166,720 0.04 EUR 100,000 Allianz Finance II BV FRN 8/7/2041 117,410 0.03 EUR 100,000 Allianz Finance II BV RegS
3.00% 13/3/2028 118,678 0.03 EUR 125,000 ASML Holding NV RegS
1.625% 28/5/2027 125,753 0.03 EUR 100,000 ATF Netherlands BV RegS
1.50% 3/5/2022 100,223 0.02 EUR 100,000 ATF Netherlands BV RegS
2.125% 13/3/2023 101,550 0.02 EUR 150,000 Bank Nederlandse Gemeenten
NV 3.875% 26/5/2023 183,825 0.04 EUR 300,000 Bank Nederlandse Gemeenten
NV RegS 0.75% 21/5/2018 304,290 0.07 EUR 200,000 Bank Nederlandse Gemeenten
NV RegS 1.50% 15/4/2020 210,772 0.05 EUR 100,000 Bank Nederlandse Gemeenten
NV RegS 2.625% 1/9/2020 109,785 0.02 EUR 200,000 Bank Nederlandse Gemeenten
NV RegS 0.50% 26/8/2022 204,602 0.05 EUR 100,000 Bank Nederlandse Gemeenten
NV RegS 2.25% 17/7/2023 112,888 0.03 EUR 200,000 Bank Nederlandse Gemeenten
NV RegS 0.25% 7/6/2024 198,785 0.04 EUR 250,000 Bank Nederlandse Gemeenten
NV RegS 1.00% 12/1/2026 259,011 0.06 EUR 200,000 BASF Finance Europe NV RegS
10/11/2020 (Zero Coupon) 199,433 0.04 EUR 100,000 Bharti Airtel International Netherlands
BV RegS 3.375% 20/5/2021 108,710 0.02 EUR 100,000 BMW Finance NV 3.25% 14/1/2019 105,889 0.02 EUR 250,000 BMW Finance NV RegS 0.125%
12/1/2021 249,540 0.05 EUR 150,000 BMW Finance NV RegS 1.00%
15/2/2022 154,958 0.03 EUR 75,000 BMW Finance NV RegS 1.25%
5/9/2022 78,328 0.02
Portfolio of Investments as at 31 March 2017
Luxembourg continued Netherlands continued

Transferable Securities and Money Market Instruments Admitted to an Official Stock Exchange Listing or Dealt in on Another Regulated Market
Transferable Securities and Money Market Instruments Admitted to an Official Stock Exchange Listing or Dealt in on Another Regulated Market
Holding Description
Market Value
EUR
% of Net
Assets Holding Description
Market Value
EUR
% of Net
Assets
66 BlackRock Global Index Funds (BGIF)
The notes on pages 122 to 128 form an integral part of these financial statements.
BlackRock Euro Aggregate Bond Index Fund continued
EUR 100,000 BMW Finance NV RegS 1.00% 21/1/2025 101,731 0.02
EUR 100,000 Bunge Finance Europe BV 1.85% 16/6/2023 103,882 0.02
EUR 100,000 Cooperatieve Rabobank UA 4.75% 15/1/2018 103,923 0.02
EUR 100,000 Cooperatieve Rabobank UA 5.875% 20/5/2019 112,205 0.03
EUR 300,000 Cooperatieve Rabobank UA 4.125% 14/1/2020 334,284 0.07
EUR 75,000 Cooperatieve Rabobank UA 3.75% 9/11/2020 84,012 0.02
EUR 50,000 Cooperatieve Rabobank UA 4.125% 14/7/2025 62,885 0.01
EUR 250,000 Cooperatieve Rabobank UA RegS 4.125% 12/1/2021 287,577 0.06
EUR 100,000 Cooperatieve Rabobank UA RegS 2.375% 22/5/2023 111,493 0.02
EUR 100,000 Cooperatieve Rabobank UA RegS 3.875% 25/7/2023 115,937 0.03
EUR 300,000 Cooperatieve Rabobank UA RegS 1.25% 23/3/2026 305,808 0.07
EUR 150,000 de Volksbank NV 2.125% 30/8/2017 151,528 0.03 EUR 100,000 de Volksbank NV RegS 0.75%
24/10/2031 93,537 0.02 EUR 100,000 Delta Lloyd Levensverzekering
NV RegS FRN 29/8/2042 129,121 0.03 EUR 100,000 Demeter Investments BV for Zurich
Insurance Co Ltd RegS FRN 1/10/2046 107,028 0.02
EUR 100,000 Deutsche Bahn Finance BV 4.75% 14/3/2018 104,771 0.02
EUR 100,000 Deutsche Bahn Finance BV RegS 3.00% 8/3/2024 118,479 0.03
EUR 50,000 Deutsche Bahn Finance BV RegS 3.75% 9/7/2025 63,081 0.01
EUR 100,000 Deutsche Bahn Finance BV RegS 0.625% 26/9/2028 96,333 0.02
EUR 50,000 Deutsche Bahn Finance BV RegS 0.875% 11/7/2031 46,945 0.01
EUR 100,000 Deutsche Post Finance BV RegS 2.95% 27/6/2022 113,620 0.03
EUR 150,000 Deutsche Telekom International Finance BV 4.25% 16/3/2020 168,591 0.04
EUR 100,000 Deutsche Telekom International Finance BV RegS 6.625% 29/3/2018 106,630 0.02
EUR 200,000 Deutsche Telekom International Finance BV RegS 0.375% 30/10/2021 200,818 0.04
EUR 50,000 Deutsche Telekom International Finance BV RegS 2.75% 24/10/2024 56,881 0.01
EUR 225,000 Deutsche Telekom International Finance BV RegS 1.50% 3/4/2028 224,260 0.05
EUR 150,000 E.ON International Finance BV 6.375% 29/5/2017 151,563 0.03
EUR 50,000 E.ON International Finance BV 5.75% 7/5/2020 58,752 0.01
EUR 200,000 EDP Finance BV RegS 2.625% 18/1/2022 214,358 0.05
EUR 125,000 EDP Finance BV RegS 1.125% 12/2/2024 119,854 0.03
EUR 100,000 ELM BV for Swiss Life Insurance & Pension Group RegS FRN (Perpetual) 105,753 0.02
EUR 50,000 EnBW International Finance BV 6.125% 7/7/2039 80,930 0.02
EUR 100,000 EnBW International Finance BV RegS 2.50% 4/6/2026 113,546 0.03
EUR 300,000 Enel Finance International NV 1.966% 27/1/2025 314,766 0.07
EUR 50,000 Enel Finance International NV RegS 5.00% 14/9/2022 61,751 0.01
EUR 130,000 Enel Finance International NV RegS 1.375% 1/6/2026 128,519 0.03
EUR 100,000 Enexis Holding NV RegS 0.875% 28/4/2026 99,058 0.02
EUR 200,000 Evonik Finance BV RegS 8/3/2021 (Zero Coupon) 197,900 0.04
EUR 100,000 Evonik Finance BV RegS 0.75% 7/9/2028 91,491 0.02
EUR 150,000 EXOR NV RegS 2.125% 2/12/2022 158,465 0.04
EUR 100,000 F van Lanschot Bankiers NV RegS 0.275% 28/4/2022 100,366 0.02
EUR 100,000 Gas Natural Fenosa Finance BV RegS 2.875% 11/3/2024 112,380 0.03
EUR 100,000 Gas Natural Fenosa Finance BV RegS 1.375% 19/1/2027 98,942 0.02
EUR 100,000 Heineken NV RegS 3.50% 19/3/2024 118,328 0.03 EUR 100,000 Heineken NV RegS 1.00% 4/5/2026 98,306 0.02 EUR 100,000 Iberdrola International BV RegS
4.25% 11/10/2018 106,535 0.02 EUR 100,000 Iberdrola International BV RegS
1.75% 17/9/2023 105,889 0.02 EUR 100,000 Iberdrola International BV
RegS 0.375% 15/9/2025 93,714 0.02 EUR 150,000 ING Bank NV 4.00% 17/1/2020 167,758 0.04 EUR 150,000 ING Bank NV RegS
3.375% 11/1/2018 154,424 0.03 EUR 200,000 ING Bank NV RegS
1.875% 27/2/2018 203,697 0.05 EUR 100,000 ING Bank NV RegS
1.25% 13/12/2019 103,306 0.02 EUR 100,000 ING Bank NV RegS
2.00% 28/8/2020 107,310 0.02 EUR 200,000 ING Bank NV RegS
3.375% 10/1/2022 232,184 0.05 EUR 150,000 ING Bank NV RegS
4.50% 21/2/2022 180,487 0.04 EUR 100,000 ING Bank NV RegS FRN 25/2/2026 108,774 0.02 EUR 100,000 ING Bank NV RegS FRN 11/4/2028 105,790 0.02 EUR 150,000 innogy Finance BV RegS
6.625% 31/1/2019 168,111 0.04 EUR 50,000 innogy Finance BV RegS
6.50% 10/8/2021 63,463 0.01 EUR 50,000 innogy Finance II BV
5.75% 14/2/2033 73,809 0.02 EUR 100,000 JAB Holdings BV RegS
1.50% 24/11/2021 104,180 0.02 EUR 150,000 Koninklijke DSM NV RegS
1.375% 26/9/2022 158,239 0.04 EUR 200,000 Koninklijke KPN NV RegS
7.50% 4/2/2019 227,616 0.05 EUR 100,000 Koninklijke KPN NV RegS
1.125% 11/9/2028 93,991 0.02 EUR 100,000 LeasePlan Corp NV RegS
1.375% 24/9/2018 101,896 0.02 EUR 50,000 Linde Finance BV
4.75% 24/4/2017 50,140 0.01 EUR 100,000 Mylan NV RegS
1.25% 23/11/2020 102,336 0.02 EUR 100,000 Mylan NV RegS
2.25% 22/11/2024 102,818 0.02 EUR 150,000 Nederlandse Gasunie NV
RegS 3.625% 13/10/2021 173,363 0.04 EUR 200,000 Nederlandse Waterschapsbank
NV RegS 1.125% 28/1/2019 205,596 0.05 EUR 250,000 Nederlandse Waterschapsbank
NV RegS 1.625% 23/8/2019 261,701 0.06
Portfolio of Investments as at 31 March 2017
Netherlands continued Netherlands continued

Transferable Securities and Money Market Instruments Admitted to an Official Stock Exchange Listing or Dealt in on Another Regulated Market
Transferable Securities and Money Market Instruments Admitted to an Official Stock Exchange Listing or Dealt in on Another Regulated Market
Holding Description
Market Value
EUR
% of Net
Assets Holding Description
Market Value
EUR
% of Net
Assets
* All or a portion of this security represents a security on loan.
Annual Report and Audited Accounts 67
The notes on pages 122 to 128 form an integral part of these financial statements.
EUR 100,000 Nederlandse Waterschapsbank NV RegS 3.00% 28/3/2022 114,762 0.03
EUR 200,000 Nederlandse Waterschapsbank NV RegS 0.50% 19/1/2023 204,173 0.05
EUR 100,000 Nederlandse Waterschapsbank NV RegS 0.50% 29/4/2030 93,155 0.02
EUR 100,000 Nederlandse Waterschapsbank NV RegS 1.25% 27/5/2036 97,376 0.02
EUR 850,000 Netherlands Government Bond 0.25% 15/1/2020 870,918 0.19
EUR 450,000 Netherlands Government Bond 3.75% 15/1/2023 553,126 0.12
EUR 600,000 Netherlands Government Bond 5.50% 15/1/2028 912,444 0.20
EUR 500,000 Netherlands Government Bond RegS '144A' 1.25% 15/1/2018 * 507,795 0.11
EUR 500,000 Netherlands Government Bond RegS '144A' 15/4/2018 (Zero Coupon) 503,675 0.11
EUR 600,000 Netherlands Government Bond RegS '144A' 4.00% 15/7/2018 636,486 0.14
EUR 800,000 Netherlands Government Bond RegS '144A' 1.25% 15/1/2019 827,768 0.18
EUR 350,000 Netherlands Government Bond RegS '144A' 4.00% 15/7/2019 387,464 0.08
EUR 600,000 Netherlands Government Bond RegS '144A' 3.50% 15/7/2020 681,024 0.15
EUR 800,000 Netherlands Government Bond RegS '144A' 3.25% 15/7/2021 927,368 0.20
EUR 500,000 Netherlands Government Bond RegS '144A' 15/1/2022 (Zero Coupon) 506,690 0.11
EUR 800,000 Netherlands Government Bond R egS '144A' 2.25% 15/7/2022 906,520 0.20
EUR 600,000 Netherlands Government Bond RegS '144A' 1.75% 15/7/2023 668,952 0.15
EUR 950,000 Netherlands Government Bond RegS '144A' 2.00% 15/7/2024 1,081,622 0.23
EUR 550,000 Netherlands Government Bond RegS '144A' 0.25% 15/7/2025 * 548,295 0.12
EUR 600,000 Netherlands Government Bond RegS '144A' 0.50% 15/7/2026 604,392 0.13
EUR 400,000 Netherlands Government Bond RegS '144A' 0.75% 15/7/2027 407,084 0.09
EUR 550,000 Netherlands Government Bond RegS '144A' 2.50% 15/1/2033 686,631 0.15
EUR 650,000 Netherlands Government Bond RegS '144A' 4.00% 15/1/2037 1,010,834 0.22
EUR 680,000 Netherlands Government Bond RegS '144A' 3.75% 15/1/2042 1,077,752 0.23
EUR 575,000 Netherlands Government Bond RegS '144A' 2.75% 15/1/2047 800,434 0.17
EUR 100,000 NIBC Bank NV RegS 0.25% 22/4/2022 100,284 0.02
EUR 100,000 NN Group NV RegS 0.875% 13/1/2023 100,218 0.02
EUR 100,000 NN Group NV RegS FRN 8/4/2044 107,516 0.02 EUR 150,000 Nomura Europe Finance NV
RegS 1.125% 3/6/2020 153,472 0.03 EUR 100,000 RELX Finance BV RegS
1.00% 22/3/2024 100,547 0.02 EUR 100,000 RELX Finance BV RegS
1.375% 12/5/2026 101,294 0.02 EUR 100,000 Repsol International Finance BV
RegS 2.625% 28/5/2020 107,549 0.02 EUR 100,000 Repsol International Finance BV
RegS 2.25% 10/12/2026 106,596 0.02 EUR 50,000 Roche Finance Europe BV RegS
2.00% 25/6/2018 51,330 0.01
EUR 150,000 Roche Finance Europe BV RegS 0.875% 25/2/2025 153,444 0.03
EUR 50,000 Shell International Finance BV 4.375% 14/5/2018 52,484 0.01
EUR 100,000 Shell International Finance BV 2.50% 24/3/2026 113,511 0.03
EUR 200,000 Shell International Finance BV RegS 1.625% 24/3/2021 211,685 0.05
EUR 200,000 Shell International Finance BV RegS 1.00% 6/4/2022 207,034 0.05
EUR 150,000 Shell International Finance BV RegS 0.75% 15/8/2028 141,724 0.03
EUR 200,000 Siemens Financieringsmaatschappij NV RegS 1.50% 10/3/2020 209,653 0.05
EUR 100,000 Syngenta Finance NV RegS 1.25% 10/9/2027 96,991 0.02
EUR 100,000 TenneT Holding BV RegS 4.50% 9/2/2022 120,569 0.03
EUR 100,000 TenneT Holding BV RegS 1.875% 13/6/2036 101,444 0.02
EUR 100,000 Teva Pharmaceutical Finance Netherlands II BV RegS 1.125% 15/10/2024 94,934 0.02
EUR 100,000 Teva Pharmaceutical Finance Netherlands II BV RegS 1.875% 31/3/2027 95,912 0.02
EUR 150,000 Unilever NV RegS 1.00% 3/6/2023 153,957 0.03 EUR 100,000 Urenco Finance NV RegS
2.25% 5/8/2022 107,530 0.02 EUR 250,000 Volkswagen International Finance
NV RegS 2.00% 14/1/2020 262,784 0.06 EUR 100,000 Volkswagen International Finance
NV RegS 0.50% 30/3/2021 100,096 0.02 EUR 100,000 Volkswagen International Finance
NV RegS 1.875% 30/3/2027 100,926 0.02 EUR 150,000 Volkswagen International Finance
NV RegS 1.625% 16/1/2030 142,738 0.03 EUR 150,000 Volkswagen International Finance
NV RegS FRN (Perpetual) 157,200 0.03 EUR 100,000 Volkswagen International Finance
NV RegS FRN (Perpetual) 103,833 0.02 EUR 100,000 Volkswagen International Finance
NV RegS FRN (Perpetual) 94,697 0.02 EUR 100,000 Vonovia Finance BV RegS
3.125% 25/7/2019 107,003 0.02 EUR 200,000 Vonovia Finance BV RegS
1.75% 25/1/2027 * 204,443 0.05 EUR 100,000 Vonovia Finance BV RegS
FRN (Perpetual) 105,420 0.02 EUR 100,000 Wolters Kluwer NV RegS
1.50% 22/3/2027 101,119 0.02 EUR 150,000 Wuerth Finance International BV
RegS 1.00% 19/5/2022 155,101 0.03
34,721,679 7.51
New Zealand EUR 100,000 ASB Finance Ltd/London RegS
0.25% 14/4/2021 100,640 0.02 EUR 150,000 Westpac Securities NZ Ltd/London
RegS 0.875% 24/6/2019 153,539 0.04
254,179 0.06
Norway EUR 150,000 DNB Bank ASA RegS
3.875% 29/6/2020 168,716 0.04 EUR 150,000 DNB Bank ASA RegS
4.375% 24/2/2021 174,577 0.04
BlackRock Euro Aggregate Bond Index Fund continued
Portfolio of Investments as at 31 March 2017
Netherlands continued Netherlands continued

Transferable Securities and Money Market Instruments Admitted to an Official Stock Exchange Listing or Dealt in on Another Regulated Market
Transferable Securities and Money Market Instruments Admitted to an Official Stock Exchange Listing or Dealt in on Another Regulated Market
Holding Description
Market Value
EUR
% of Net
Assets Holding Description
Market Value
EUR
% of Net
Assets
* All or a portion of this security represents a security on loan.
68 BlackRock Global Index Funds (BGIF)
The notes on pages 122 to 128 form an integral part of these financial statements.
BlackRock Euro Aggregate Bond Index Fund continued
EUR 200,000 DNB Boligkreditt AS 2.375% 31/8/2017 202,305 0.04
EUR 100,000 DNB Boligkreditt AS 2.75% 21/3/2022 113,175 0.02
EUR 150,000 DNB Boligkreditt AS RegS 2.375% 11/4/2017 150,085 0.03
EUR 100,000 DNB Boligkreditt AS RegS 1.875% 18/6/2019 104,736 0.02
EUR 200,000 DNB Boligkreditt AS RegS 1.875% 21/11/2022 219,148 0.05
EUR 200,000 DNB Boligkreditt AS RegS 0.25% 18/4/2023 200,084 0.04
EUR 150,000 Eika Boligkreditt AS 2.125% 30/1/2023 166,104 0.04
EUR 300,000 SpareBank 1 Boligkreditt AS RegS 1.50% 20/1/2020 314,148 0.07
EUR 200,000 SpareBank 1 Boligkreditt AS RegS 1.50% 12/6/2020 210,438 0.05
EUR 100,000 SpareBank 1 Boligkreditt AS RegS 0.25% 30/8/2026 95,856 0.02
EUR 125,000 SpareBank 1 SMN RegS 0.75% 8/6/2021 126,813 0.03
EUR 150,000 SpareBank 1 SR-Bank ASA RegS 2.125% 14/4/2021 160,374 0.04
EUR 100,000 Sparebanken Soer Boligkreditt AS RegS 0.25% 22/3/2021 100,720 0.02
EUR 100,000 Sparebanken Vest Boligkreditt AS RegS 0.375% 22/9/2020 101,507 0.02
EUR 100,000 Sparebanken Vest Boligkreditt AS RegS 0.25% 29/4/2022 100,503 0.02
EUR 100,000 Statkraft AS RegS 1.50% 21/9/2023 104,984 0.02 EUR 100,000 Statoil ASA RegS 2.00% 10/9/2020 106,541 0.02 EUR 150,000 Statoil ASA RegS 1.625% 17/2/2035 146,833 0.03 EUR 150,000 Telenor ASA RegS 2.50% 22/5/2025 170,066 0.04
3,237,713 0.70
Panama EUR 125,000 Carnival Corp 1.875% 7/11/2022 132,059 0.03
132,059 0.03
Peru EUR 100,000 Peruvian Government International
Bond 3.75% 1/3/2030 115,500 0.03
115,500 0.03
Poland EUR 200,000 PKO Bank Hipoteczny SA RegS
0.125% 24/6/2022 196,560 0.04 EUR 300,000 Republic of Poland Government
International Bond 4.20% 15/4/2020 337,605 0.07
EUR 500,000 Republic of Poland Government International Bond 4.00% 23/3/2021 575,000 0.13
EUR 150,000 Republic of Poland Government International Bond RegS 1.625% 15/1/2019 154,763 0.03
EUR 150,000 Republic of Poland Government International Bond RegS 3.375% 9/7/2024 175,515 0.04
EUR 100,000 Republic of Poland Government International Bond RegS 1.50% 19/1/2026 103,750 0.02
EUR 100,000 Republic of Poland Government International Bond RegS 1.00% 25/10/2028 94,875 0.02
EUR 150,000 Republic of Poland Government International Bond RegS 2.375% 18/1/2036 * 156,187 0.04
1,794,255 0.39
Portugal EUR 200,000 Banco Santander Totta SA RegS
1.625% 11/6/2019 207,228 0.05 EUR 100,000 Brisa Concessao Rodoviaria SA
RegS 2.00% 22/3/2023 103,265 0.02 EUR 100,000 Caixa Geral de Depositos SA
RegS 3.75% 18/1/2018 103,052 0.02 EUR 100,000 Galp Gas Natural Distribuicao SA
RegS 1.375% 19/9/2023 98,924 0.02
512,469 0.11
Romania EUR 75,000 Romanian Government International
Bond RegS 4.875% 7/11/2019 84,141 0.02 EUR 100,000 Romanian Government International
Bond RegS 4.625% 18/9/2020 114,937 0.03 EUR 100,000 Romanian Government International
Bond RegS 3.625% 24/4/2024 112,500 0.03 EUR 100,000 Romanian Government International
Bond RegS 2.75% 29/10/2025 105,875 0.02 EUR 150,000 Romanian Government International
Bond RegS 2.875% 26/5/2028 154,312 0.03 EUR 50,000 Romanian Government International
Bond RegS 3.875% 29/10/2035 52,892 0.01
624,657 0.14
Singapore EUR 100,000 United Overseas Bank Ltd RegS
0.125% 2/3/2022 99,608 0.02
99,608 0.02
Slovakia EUR 350,000 Slovakia Government Bond
13/11/2023 (Zero Coupon) 340,165 0.07 EUR 300,000 Slovakia Government Bond RegS
4.00% 27/4/2020 341,025 0.08 EUR 50,000 Slovakia Government Bond RegS
3.00% 28/2/2023 59,119 0.01 EUR 250,000 Slovakia Government Bond RegS
3.375% 15/11/2024 303,987 0.07 EUR 100,000 Slovakia Government Bond RegS
4.35% 14/10/2025 133,658 0.03 EUR 100,000 Slovakia Government Bond RegS
3.625% 16/1/2029 125,615 0.03 EUR 100,000 Slovakia Government Bond RegS
1.625% 21/1/2031 103,360 0.02 EUR 100,000 Slovakia Government Bond RegS
1.875% 9/3/2037 100,213 0.02
1,507,142 0.33
Slovenia EUR 15,000 Slovenia Government Bond
RegS 4.125% 26/1/2020 (traded in Germany) 16,856 0.00
EUR 285,000 Slovenia Government Bond RegS 4.125% 26/1/2020 (traded in Slovenia) 320,269 0.07
EUR 150,000 Slovenia Government Bond RegS 3.00% 8/4/2021 168,664 0.04
Portfolio of Investments as at 31 March 2017
Norway continued Poland continued
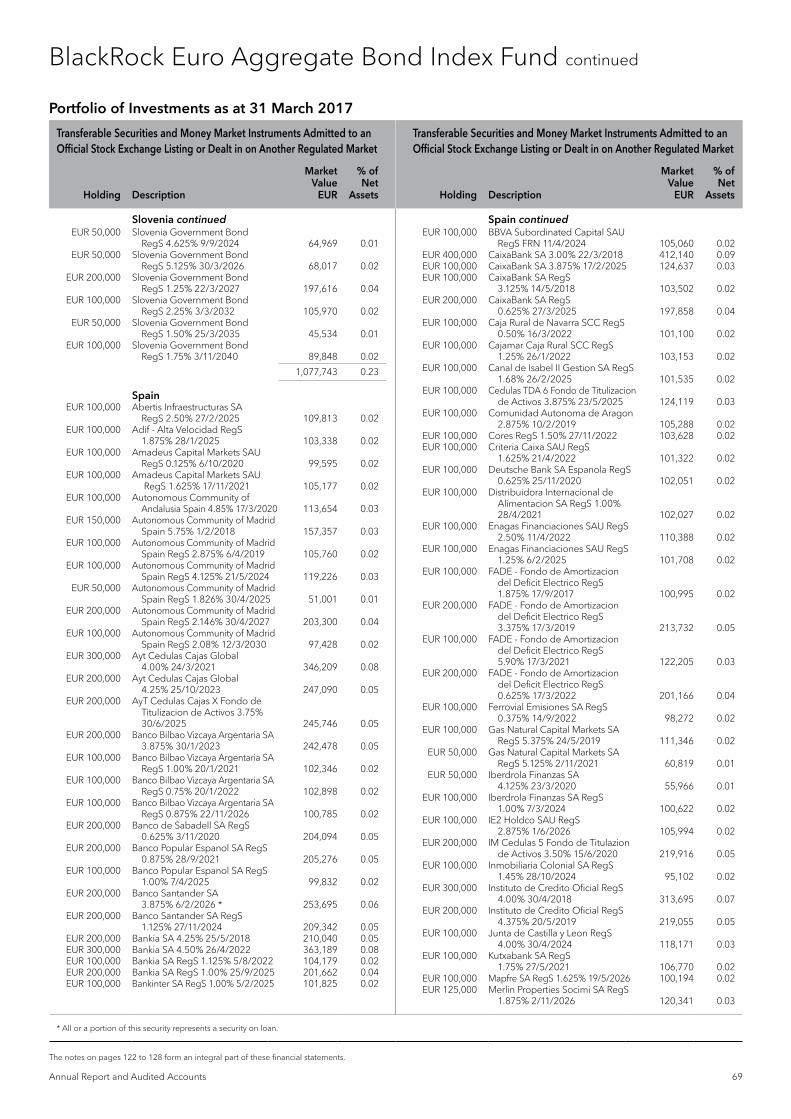
Transferable Securities and Money Market Instruments Admitted to an Official Stock Exchange Listing or Dealt in on Another Regulated Market
Transferable Securities and Money Market Instruments Admitted to an Official Stock Exchange Listing or Dealt in on Another Regulated Market
Holding Description
Market Value
EUR
% of Net
Assets Holding Description
Market Value
EUR
% of Net
Assets
* All or a portion of this security represents a security on loan.
Annual Report and Audited Accounts 69
The notes on pages 122 to 128 form an integral part of these financial statements.
EUR 50,000 Slovenia Government Bond RegS 4.625% 9/9/2024 64,969 0.01
EUR 50,000 Slovenia Government Bond RegS 5.125% 30/3/2026 68,017 0.02
EUR 200,000 Slovenia Government Bond RegS 1.25% 22/3/2027 197,616 0.04
EUR 100,000 Slovenia Government Bond RegS 2.25% 3/3/2032 105,970 0.02
EUR 50,000 Slovenia Government Bond RegS 1.50% 25/3/2035 45,534 0.01
EUR 100,000 Slovenia Government Bond RegS 1.75% 3/11/2040 89,848 0.02
1,077,743 0.23
Spain EUR 100,000 Abertis Infraestructuras SA
RegS 2.50% 27/2/2025 109,813 0.02 EUR 100,000 Adif - Alta Velocidad RegS
1.875% 28/1/2025 103,338 0.02 EUR 100,000 Amadeus Capital Markets SAU
RegS 0.125% 6/10/2020 99,595 0.02 EUR 100,000 Amadeus Capital Markets SAU
RegS 1.625% 17/11/2021 105,177 0.02 EUR 100,000 Autonomous Community of
Andalusia Spain 4.85% 17/3/2020 113,654 0.03 EUR 150,000 Autonomous Community of Madrid
Spain 5.75% 1/2/2018 157,357 0.03 EUR 100,000 Autonomous Community of Madrid
Spain RegS 2.875% 6/4/2019 105,760 0.02 EUR 100,000 Autonomous Community of Madrid
Spain RegS 4.125% 21/5/2024 119,226 0.03 EUR 50,000 Autonomous Community of Madrid
Spain RegS 1.826% 30/4/2025 51,001 0.01 EUR 200,000 Autonomous Community of Madrid
Spain RegS 2.146% 30/4/2027 203,300 0.04 EUR 100,000 Autonomous Community of Madrid
Spain RegS 2.08% 12/3/2030 97,428 0.02 EUR 300,000 Ayt Cedulas Cajas Global
4.00% 24/3/2021 346,209 0.08 EUR 200,000 Ayt Cedulas Cajas Global
4.25% 25/10/2023 247,090 0.05 EUR 200,000 AyT Cedulas Cajas X Fondo de
Titulizacion de Activos 3.75% 30/6/2025 245,746 0.05
EUR 200,000 Banco Bilbao Vizcaya Argentaria SA 3.875% 30/1/2023 242,478 0.05
EUR 100,000 Banco Bilbao Vizcaya Argentaria SA RegS 1.00% 20/1/2021 102,346 0.02
EUR 100,000 Banco Bilbao Vizcaya Argentaria SA RegS 0.75% 20/1/2022 102,898 0.02
EUR 100,000 Banco Bilbao Vizcaya Argentaria SA RegS 0.875% 22/11/2026 100,785 0.02
EUR 200,000 Banco de Sabadell SA RegS 0.625% 3/11/2020 204,094 0.05
EUR 200,000 Banco Popular Espanol SA RegS 0.875% 28/9/2021 205,276 0.05
EUR 100,000 Banco Popular Espanol SA RegS 1.00% 7/4/2025 99,832 0.02
EUR 200,000 Banco Santander SA 3.875% 6/2/2026 * 253,695 0.06
EUR 200,000 Banco Santander SA RegS 1.125% 27/11/2024 209,342 0.05
EUR 200,000 Bankia SA 4.25% 25/5/2018 210,040 0.05 EUR 300,000 Bankia SA 4.50% 26/4/2022 363,189 0.08 EUR 100,000 Bankia SA RegS 1.125% 5/8/2022 104,179 0.02 EUR 200,000 Bankia SA RegS 1.00% 25/9/2025 201,662 0.04 EUR 100,000 Bankinter SA RegS 1.00% 5/2/2025 101,825 0.02
EUR 100,000 BBVA Subordinated Capital SAU RegS FRN 11/4/2024 105,060 0.02
EUR 400,000 CaixaBank SA 3.00% 22/3/2018 412,140 0.09 EUR 100,000 CaixaBank SA 3.875% 17/2/2025 124,637 0.03 EUR 100,000 CaixaBank SA RegS
3.125% 14/5/2018 103,502 0.02 EUR 200,000 CaixaBank SA RegS
0.625% 27/3/2025 197,858 0.04 EUR 100,000 Caja Rural de Navarra SCC RegS
0.50% 16/3/2022 101,100 0.02 EUR 100,000 Cajamar Caja Rural SCC RegS
1.25% 26/1/2022 103,153 0.02 EUR 100,000 Canal de Isabel II Gestion SA RegS
1.68% 26/2/2025 101,535 0.02 EUR 100,000 Cedulas TDA 6 Fondo de Titulizacion
de Activos 3.875% 23/5/2025 124,119 0.03 EUR 100,000 Comunidad Autonoma de Aragon
2.875% 10/2/2019 105,288 0.02 EUR 100,000 Cores RegS 1.50% 27/11/2022 103,628 0.02 EUR 100,000 Criteria Caixa SAU RegS
1.625% 21/4/2022 101,322 0.02 EUR 100,000 Deutsche Bank SA Espanola RegS
0.625% 25/11/2020 102,051 0.02 EUR 100,000 Distribuidora Internacional de
Alimentacion SA RegS 1.00% 28/4/2021 102,027 0.02
EUR 100,000 Enagas Financiaciones SAU RegS 2.50% 11/4/2022 110,388 0.02
EUR 100,000 Enagas Financiaciones SAU RegS 1.25% 6/2/2025 101,708 0.02
EUR 100,000 FADE - Fondo de Amortizacion del Deficit Electrico RegS 1.875% 17/9/2017 100,995 0.02
EUR 200,000 FADE - Fondo de Amortizacion del Deficit Electrico RegS 3.375% 17/3/2019 213,732 0.05
EUR 100,000 FADE - Fondo de Amortizacion del Deficit Electrico RegS 5.90% 17/3/2021 122,205 0.03
EUR 200,000 FADE - Fondo de Amortizacion del Deficit Electrico RegS 0.625% 17/3/2022 201,166 0.04
EUR 100,000 Ferrovial Emisiones SA RegS 0.375% 14/9/2022 98,272 0.02
EUR 100,000 Gas Natural Capital Markets SA RegS 5.375% 24/5/2019 111,346 0.02
EUR 50,000 Gas Natural Capital Markets SA RegS 5.125% 2/11/2021 60,819 0.01
EUR 50,000 Iberdrola Finanzas SA 4.125% 23/3/2020 55,966 0.01
EUR 100,000 Iberdrola Finanzas SA RegS 1.00% 7/3/2024 100,622 0.02
EUR 100,000 IE2 Holdco SAU RegS 2.875% 1/6/2026 105,994 0.02
EUR 200,000 IM Cedulas 5 Fondo de Titulazion de Activos 3.50% 15/6/2020 219,916 0.05
EUR 100,000 Inmobiliaria Colonial SA RegS 1.45% 28/10/2024 95,102 0.02
EUR 300,000 Instituto de Credito Oficial RegS 4.00% 30/4/2018 313,695 0.07
EUR 200,000 Instituto de Credito Oficial RegS 4.375% 20/5/2019 219,055 0.05
EUR 100,000 Junta de Castilla y Leon RegS 4.00% 30/4/2024 118,171 0.03
EUR 100,000 Kutxabank SA RegS 1.75% 27/5/2021 106,770 0.02
EUR 100,000 Mapfre SA RegS 1.625% 19/5/2026 100,194 0.02 EUR 125,000 Merlin Properties Socimi SA RegS
1.875% 2/11/2026 120,341 0.03
BlackRock Euro Aggregate Bond Index Fund continued
Portfolio of Investments as at 31 March 2017
Slovenia continued Spain continued

Transferable Securities and Money Market Instruments Admitted to an Official Stock Exchange Listing or Dealt in on Another Regulated Market
Transferable Securities and Money Market Instruments Admitted to an Official Stock Exchange Listing or Dealt in on Another Regulated Market
Holding Description
Market Value
EUR
% of Net
Assets Holding Description
Market Value
EUR
% of Net
Assets
* All or a portion of this security represents a security on loan.
70 BlackRock Global Index Funds (BGIF)
The notes on pages 122 to 128 form an integral part of these financial statements.
BlackRock Euro Aggregate Bond Index Fund continued
EUR 200,000 Programa Cedulas TDA Fondo de Titulizacion de Activos 4.125% 10/4/2021 232,114 0.05
EUR 100,000 Programa Cedulas TDA Fondo de Titulizacion de Activos 4.25% 28/3/2027 128,030 0.03
EUR 100,000 Programa Cedulas TDA Fondo de Titulizacion de Activos 4.25% 10/4/2031 130,343 0.03
EUR 100,000 Red Electrica Financiaciones SAU RegS 4.875% 29/4/2020 114,569 0.03
EUR 200,000 Santander Consumer Finance SA RegS 0.90% 18/2/2020 203,606 0.05
EUR 200,000 Santander International Debt SAU RegS 1.375% 14/12/2022 207,334 0.05
EUR 100,000 Santander Issuances SAU RegS 3.25% 4/4/2026 104,375 0.02
EUR 100,000 Spain Government Bond 4.50% 31/1/2018 103,995 0.02
EUR 1,000,000 Spain Government Bond 0.25% 30/4/2018 1,005,990 0.22
EUR 1,150,000 Spain Government Bond 3.75% 31/10/2018 1,223,669 0.27
EUR 800,000 Spain Government Bond 0.25% 31/1/2019 806,064 0.18
EUR 800,000 Spain Government Bond 2.75% 30/4/2019 848,888 0.18
EUR 1,000,000 Spain Government Bond 1.40% 31/1/2020 1,042,290 0.23
EUR 900,000 Spain Government Bond 1.15% 30/7/2020 934,344 0.20
EUR 165,000 Spain Government Bond 0.75% 30/7/2021 (traded in Germany) 168,732 0.04
EUR 1,135,000 Spain Government Bond 0.75% 30/7/2021 (traded in Spain) 1,160,674 0.25
EUR 500,000 Spain Government Bond 0.40% 30/4/2022 498,120 0.11
EUR 650,000 Spain Government Bond 6.00% 31/1/2029 939,191 0.20
EUR 1,000,000 Spain Government Bond 5.75% 30/7/2032 1,473,550 0.32
EUR 550,000 Spain Government Bond RegS '144A' 4.10% 30/7/2018 581,713 0.13
EUR 550,000 Spain Government Bond RegS '144A' 4.60% 30/7/2019 610,508 0.13
EUR 700,000 Spain Government Bond RegS '144A' 4.30% 31/10/2019 779,327 0.17
EUR 750,000 Spain Government Bond RegS '144A' 4.00% 30/4/2020 842,400 0.18
EUR 950,000 Spain Government Bond RegS '144A' 4.85% 31/10/2020 1,112,849 0.24
EUR 1,750,000 Spain Government Bond RegS '144A' 5.50% 30/4/2021 2,131,526 0.46
EUR 850,000 Spain Government Bond RegS '144A' 5.85% 31/1/2022 1,072,169 0.23
EUR 200,000 Spain Government Bond RegS '144A' 5.40% 31/1/2023 253,847 0.06
EUR 1,000,000 Spain Government Bond RegS '144A' 4.40% 31/10/2023 1,224,400 0.27
EUR 900,000 Spain Government Bond RegS '144A' 4.80% 31/1/2024 1,128,352 0.25
EUR 1,850,000 Spain Government Bond RegS '144A' 3.80% 30/4/2024 2,198,679 0.48
EUR 750,000 Spain Government Bond RegS '144A' 2.75% 31/10/2024 835,699 0.18
EUR 1,000,000 Spain Government Bond RegS '144A' 1.60% 30/4/2025 1,024,930 0.22
EUR 950,000 Spain Government Bond RegS '144A' 4.65% 30/7/2025 1,196,268 0.26
EUR 100,000 Spain Government Bond RegS '144A' 2.15% 31/10/2025 (traded in Germany) 105,962 0.02
EUR 550,000 Spain Government Bond RegS '144A' 2.15% 31/10/2025 (traded in Spain) 582,791 0.13
EUR 900,000 Spain Government Bond RegS '144A' 1.95% 30/4/2026 935,784 0.20
EUR 1,100,000 Spain Government Bond RegS '144A' 5.90% 30/7/2026 1,519,518 0.33
EUR 800,000 Spain Government Bond RegS '144A' 1.30% 31/10/2026 * 783,820 0.17
EUR 500,000 Spain Government Bond RegS '144A' 1.50% 30/4/2027 493,697 0.11
EUR 850,000 Spain Government Bond RegS '144A' 5.15% 31/10/2028 1,147,232 0.25
EUR 1,300,000 Spain Government Bond RegS '144A' 1.95% 30/7/2030 1,290,893 0.28
EUR 750,000 Spain Government Bond RegS '144A' 4.20% 31/1/2037 952,372 0.21
EUR 700,000 Spain Government Bond RegS '144A' 4.90% 30/7/2040 973,980 0.21
EUR 650,000 Spain Government Bond RegS '144A' 4.70% 30/7/2041 884,611 0.19
EUR 550,000 Spain Government Bond RegS '144A' 5.15% 31/10/2044 795,803 0.17
EUR 600,000 Spain Government Bond RegS '144A' 2.90% 31/10/2046 603,450 0.13
EUR 100,000 Spain Government Bond RegS '144A' 3.45% 30/7/2066 106,288 0.02
EUR 50,000 Telefonica Emisiones SAU RegS 3.661% 18/9/2017 50,867 0.01
EUR 200,000 Telefonica Emisiones SAU RegS 2.736% 29/5/2019 211,567 0.05
EUR 50,000 Telefonica Emisiones SAU RegS 4.693% 11/11/2019 55,914 0.01
EUR 100,000 Telefonica Emisiones SAU RegS 0.75% 13/4/2022 100,373 0.02
EUR 100,000 Telefonica Emisiones SAU RegS 2.242% 27/5/2022 107,813 0.02
EUR 100,000 Telefonica Emisiones SAU RegS 1.46% 13/4/2026 98,664 0.02
EUR 100,000 Telefonica Emisiones SAU RegS 2.318% 17/10/2028 101,703 0.02
EUR 100,000 Telefonica Emisiones SAU RegS 2.932% 17/10/2029 107,279 0.02
47,499,138 10.28
Supranational EUR 150,000 Council Of Europe Development
Bank RegS 1.125% 22/10/2018 153,782 0.03 EUR 150,000 Council Of Europe Development
Bank RegS 0.75% 9/6/2025 154,557 0.03 EUR 200,000 EUROFIMA RegS 0.25% 25/4/2023 199,274 0.04 EUR 900,000 European Investment Bank
4.75% 15/10/2017 925,767 0.20 EUR 200,000 European Investment Bank
2.50% 15/10/2018 209,350 0.05 EUR 300,000 European Investment Bank
15/1/2019 (Zero Coupon) 302,808 0.07 EUR 500,000 European Investment Bank
2.50% 16/9/2019 536,550 0.12 EUR 300,000 European Investment Bank
4.625% 15/4/2020 346,161 0.08 EUR 250,000 European Investment Bank
1.50% 15/7/2020 265,687 0.06 EUR 250,000 European Investment Bank
0.25% 15/10/2020 255,455 0.06
Portfolio of Investments as at 31 March 2017
Spain continued Spain continued

Transferable Securities and Money Market Instruments Admitted to an Official Stock Exchange Listing or Dealt in on Another Regulated Market
Transferable Securities and Money Market Instruments Admitted to an Official Stock Exchange Listing or Dealt in on Another Regulated Market
Holding Description
Market Value
EUR
% of Net
Assets Holding Description
Market Value
EUR
% of Net
Assets
* All or a portion of this security represents a security on loan.
Annual Report and Audited Accounts 71
The notes on pages 122 to 128 form an integral part of these financial statements.
EUR 300,000 European Investment Bank 1.50% 15/4/2021 321,274 0.07
EUR 200,000 European Investment Bank 2.75% 15/9/2021 226,590 0.05
EUR 100,000 European Investment Bank 3.00% 28/9/2022 116,878 0.03
EUR 100,000 European Investment Bank 1.625% 15/3/2023 109,360 0.02
EUR 1,000,000 European Investment Bank 2.00% 14/4/2023 1,123,760 0.24
EUR 300,000 European Investment Bank 16/10/2023 (Zero Coupon) 297,546 0.06
EUR 200,000 European Investment Bank 15/3/2024 (Zero Coupon) 197,187 0.04
EUR 700,000 European Investment Bank 0.125% 15/4/2025 * 688,541 0.15
EUR 200,000 European Investment Bank 4.50% 15/10/2025 270,456 0.06
EUR 200,000 European Investment Bank 0.50% 15/1/2027 198,678 0.04
EUR 100,000 European Investment Bank 4.00% 15/4/2030 138,693 0.03
EUR 400,000 European Investment Bank 4.00% 15/10/2037 605,232 0.13
EUR 150,000 European Investment Bank 0.875% 13/9/2047 124,396 0.03
EUR 250,000 European Investment Bank RegS 2.50% 15/3/2019 264,671 0.06
EUR 300,000 European Investment Bank RegS 3.625% 15/1/2021 344,994 0.08
EUR 400,000 European Investment Bank RegS 0.375% 14/4/2026 395,236 0.09
EUR 100,000 European Investment Bank RegS 1.25% 13/11/2026 107,224 0.02
EUR 350,000 European Investment Bank RegS 3.50% 15/4/2027 451,255 0.10
EUR 300,000 European Investment Bank RegS 1.00% 14/4/2032 296,658 0.06
EUR 350,000 European Investment Bank RegS 3.00% 14/10/2033 450,051 0.10
EUR 100,000 European Investment Bank RegS 2.75% 15/3/2040 128,470 0.03
EUR 100,000 European Investment Bank RegS 3.625% 14/3/2042 147,060 0.03
EUR 100,000 European Investment Bank RegS 1.75% 15/9/2045 105,100 0.02
EUR 250,000 European Stability Mechanism RegS 17/10/2017 (Zero Coupon) 250,832 0.05
EUR 200,000 European Stability Mechanism RegS 1.25% 15/10/2018 205,518 0.05
EUR 95,000 European Stability Mechanism RegS 0.05% 17/12/2018 95,883 0.02
EUR 600,000 European Stability Mechanism RegS 0.875% 15/10/2019 621,009 0.13
EUR 200,000 European Stability Mechanism RegS 1.375% 4/3/2021 213,254 0.05
EUR 200,000 European Stability Mechanism RegS 18/10/2022 (Zero Coupon) 200,259 0.04
EUR 200,000 European Stability Mechanism RegS 2.125% 20/11/2023 227,332 0.05
EUR 400,000 European Stability Mechanism RegS 0.125% 22/4/2024 396,884 0.09
EUR 250,000 European Stability Mechanism RegS 0.50% 2/3/2026 249,227 0.05
EUR 150,000 European Stability Mechanism RegS 1.125% 3/5/2032 * 150,527 0.03
EUR 300,000 European Stability Mechanism RegS 0.875% 18/7/2042 * 257,610 0.06
EUR 200,000 European Stability Mechanism RegS 1.75% 20/10/2045 * 204,515 0.04
EUR 200,000 European Stability Mechanism RegS 1.80% 2/11/2046 205,482 0.05
EUR 50,000 European Stability Mechanism RegS 1.85% 1/12/2055 50,623 0.01
EUR 150,000 European Union 2.375% 4/10/2018 156,524 0.03 EUR 250,000 European Union 3.50% 4/6/2021 288,931 0.06 EUR 100,000 European Union 2.875% 4/4/2028 124,474 0.03 EUR 100,000 European Union RegS
3.25% 4/4/2018 103,823 0.02 EUR 250,000 European Union RegS
2.75% 4/4/2022 286,494 0.06 EUR 300,000 European Union RegS
0.625% 4/11/2023 310,743 0.07 EUR 100,000 European Union RegS
1.875% 4/4/2024 112,588 0.02 EUR 200,000 European Union RegS
3.00% 4/9/2026 247,624 0.05 EUR 350,000 European Union RegS
2.50% 4/11/2027 418,292 0.09 EUR 200,000 European Union RegS
0.75% 4/4/2031 194,602 0.04 EUR 100,000 European Union RegS
3.375% 4/4/2032 134,075 0.03 EUR 150,000 European Union RegS
1.50% 4/10/2035 159,241 0.04 EUR 100,000 European Union RegS
3.75% 4/4/2042 150,252 0.03 EUR 100,000 International Bank for Reconstruction
& Development 3.875% 20/5/2019 109,260 0.02 EUR 100,000 International Bank for Reconstruction
& Development 0.625% 12/1/2033 93,620 0.02 EUR 150,000 Nordic Investment Bank RegS
0.375% 19/9/2022 153,198 0.03
16,831,397 3.64
Sweden EUR 100,000 Akelius Residential Property AB
RegS 1.50% 23/1/2022 101,536 0.02 EUR 100,000 Akzo Nobel Sweden Finance AB
RegS 2.625% 27/7/2022 110,182 0.03 EUR 100,000 Lansforsakringar Hypotek AB
RegS 0.25% 22/4/2022 100,592 0.02 EUR 300,000 Nordea Bank AB RegS
4.00% 11/7/2019 327,730 0.07 EUR 125,000 Nordea Bank AB RegS
2.00% 17/2/2021 133,691 0.03 EUR 100,000 Nordea Bank AB RegS
4.00% 29/3/2021 114,262 0.03 EUR 100,000 Nordea Bank AB RegS
1.125% 12/2/2025 103,870 0.02 EUR 150,000 SBAB Bank AB RegS
1.375% 2/5/2018 152,355 0.03 EUR 200,000 SCA Hygiene AB RegS
0.625% 28/3/2022 200,351 0.05 EUR 150,000 Securitas AB RegS 1.125% 20/2/2024 149,147 0.03 EUR 150,000 Skandinaviska Enskilda Banken AB
1.50% 25/2/2020 157,357 0.04 EUR 150,000 Skandinaviska Enskilda Banken AB
RegS 1.875% 14/11/2019 157,367 0.04 EUR 100,000 Skandinaviska Enskilda Banken AB
RegS 0.15% 11/2/2021 100,876 0.02 EUR 150,000 Skandinaviska Enskilda Banken AB
RegS 0.625% 30/1/2023 153,844 0.04 EUR 100,000 Skandinaviska Enskilda Banken AB
RegS FRN 28/5/2026 105,484 0.02 EUR 100,000 SKF AB RegS 2.375% 29/10/2020 106,770 0.02
BlackRock Euro Aggregate Bond Index Fund continued
Portfolio of Investments as at 31 March 2017
Supranational continued Supranational continued

Transferable Securities and Money Market Instruments Admitted to an Official Stock Exchange Listing or Dealt in on Another Regulated Market
Transferable Securities and Money Market Instruments Admitted to an Official Stock Exchange Listing or Dealt in on Another Regulated Market
Holding Description
Market Value
EUR
% of Net
Assets Holding Description
Market Value
EUR
% of Net
Assets
72 BlackRock Global Index Funds (BGIF)
The notes on pages 122 to 128 form an integral part of these financial statements.
BlackRock Euro Aggregate Bond Index Fund continued
EUR 200,000 Stadshypotek AB RegS 1.625% 30/10/2020 212,490 0.05
EUR 100,000 Stadshypotek AB RegS 0.05% 20/6/2022 99,734 0.02
EUR 100,000 Stockholms Lans Landsting RegS 0.75% 26/2/2025 101,795 0.02
EUR 100,000 Svenska Handelsbanken AB RegS 2.25% 27/8/2020 107,221 0.02
EUR 100,000 Svenska Handelsbanken AB RegS 2.625% 23/8/2022 111,894 0.03
EUR 350,000 Svenska Handelsbanken AB RegS FRN 15/1/2024 364,180 0.08
EUR 100,000 Sveriges Sakerstallda Obligationer AB RegS 0.75% 17/6/2022 103,370 0.02
EUR 100,000 Sveriges Sakerstallda Obligationer AB RegS 0.875% 29/3/2027 100,899 0.02
EUR 100,000 Swedbank AB RegS 1.00% 1/6/2022 103,440 0.02 EUR 100,000 Swedbank AB RegS FRN 26/2/2024 103,776 0.02 EUR 100,000 Swedbank Hypotek AB 1.125%
21/5/2021 104,880 0.02 EUR 100,000 Swedbank Hypotek AB RegS
0.375% 29/9/2020 101,712 0.02 EUR 100,000 Sweden Government International
Bond RegS 0.75% 2/5/2019 102,387 0.02 EUR 150,000 Sweden Government International
Bond RegS 0.05% 12/2/2020 151,572 0.03 EUR 100,000 Telefonaktiebolaget LM Ericsson
RegS 1.875% 1/3/2024 99,895 0.02 EUR 50,000 Telia Co AB 4.75% 16/11/2021 60,216 0.01 EUR 150,000 Telia Co AB RegS 4.25% 18/2/2020 168,229 0.04 EUR 100,000 Telia Co AB RegS 3.00% 7/9/2027 114,861 0.03 EUR 150,000 Vattenfall AB RegS
5.375% 29/4/2024 198,417 0.04 EUR 100,000 Volvo Treasury AB RegS
2.375% 26/11/2019 106,010 0.02
4,892,392 1.06
Switzerland EUR 150,000 Credit Suisse AG/Guernsey
RegS 1.75% 15/1/2021 159,832 0.04 EUR 50,000 Credit Suisse AG/London
5.125% 18/9/2017 51,240 0.01 EUR 100,000 Credit Suisse AG/London
RegS 0.625% 20/11/2018 101,124 0.02 EUR 150,000 Credit Suisse AG/London
RegS 4.75% 5/8/2019 166,384 0.04 EUR 100,000 Credit Suisse AG/London RegS
1.125% 15/9/2020 103,142 0.02 EUR 100,000 Credit Suisse AG/London RegS
1.375% 31/1/2022 104,548 0.02 EUR 150,000 Credit Suisse AG/London RegS
1.50% 10/4/2026 156,816 0.04 EUR 50,000 UBS AG/London RegS
6.00% 18/4/2018 53,184 0.01 EUR 300,000 UBS AG/London RegS
1.375% 16/4/2021 316,063 0.07 EUR 100,000 UBS AG/London RegS
1.25% 3/9/2021 104,391 0.02
1,316,724 0.29
United Arab Emirates EUR 150,000 Emirates Telecommunications Group
Co PJSC RegS 1.75% 18/6/2021 157,428 0.03
157,428 0.03
United Kingdom EUR 50,000 Aviva Plc RegS FRN 22/5/2038 53,763 0.01 EUR 100,000 Aviva Plc RegS FRN 4/12/2045 100,959 0.02 EUR 100,000 Babcock International Group Plc
RegS 1.75% 6/10/2022 103,874 0.02
EUR 50,000 Barclays Bank Plc 6.00% 23/1/2018 52,350 0.01 EUR 50,000 Barclays Bank Plc 4.00% 7/10/2019 55,271 0.01 EUR 100,000 Barclays Bank Plc RegS 4.00%
12/1/2021 115,150 0.03 EUR 150,000 Barclays Plc RegS 1.875% 23/3/2021 155,748 0.03 EUR 200,000 Barclays Plc RegS 1.50% 1/4/2022 204,006 0.05 EUR 150,000 BAT International Finance Plc
4.875% 24/2/2021 176,064 0.04 EUR 100,000 BAT International Finance Plc
RegS 1.00% 23/5/2022 101,643 0.02 EUR 150,000 BAT International Finance Plc
RegS 1.25% 13/3/2027 146,401 0.03 EUR 150,000 BG Energy Capital Plc RegS
3.00% 16/11/2018 157,408 0.04 EUR 100,000 BG Energy Capital Plc RegS
1.25% 21/11/2022 104,226 0.02 EUR 50,000 BP Capital Markets Plc RegS
3.83% 6/10/2017 51,012 0.01 EUR 150,000 BP Capital Markets Plc RegS
2.994% 18/2/2019 158,687 0.04 EUR 100,000 BP Capital Markets Plc RegS
0.83% 19/9/2024 99,015 0.02 EUR 150,000 BP Capital Markets Plc RegS
2.972% 27/2/2026 172,680 0.04 EUR 100,000 BP Capital Markets Plc RegS
1.573% 16/2/2027 102,454 0.02 EUR 250,000 British Telecommunications Plc
RegS 1.125% 10/3/2023 253,564 0.06 EUR 100,000 Coca-Cola European Partners Plc
RegS 0.75% 24/2/2022 101,122 0.02 EUR 200,000 Coca-Cola European Partners Plc
RegS 1.125% 26/5/2024 203,180 0.04 EUR 100,000 Coventry Building Society RegS
0.625% 3/11/2021 102,132 0.02 EUR 100,000 Diageo Finance Plc RegS
1.75% 23/9/2024 107,356 0.02 EUR 100,000 DS Smith Plc RegS
2.25% 16/9/2022 106,274 0.02 EUR 100,000 FCE Bank Plc RegS
2.875% 3/10/2017 101,474 0.02 EUR 100,000 FCE Bank Plc RegS
1.134% 10/2/2022 100,902 0.02 EUR 150,000 GlaxoSmithKline Capital Plc
RegS 1.375% 2/12/2024 156,711 0.03 EUR 50,000 HSBC Bank Plc RegS
4.00% 15/1/2021 57,385 0.01 EUR 150,000 HSBC Holdings Plc 6.25% 19/3/2018 158,886 0.04 EUR 200,000 HSBC Holdings Plc 3.125% 7/6/2028 212,772 0.05 EUR 200,000 HSBC Holdings Plc RegS
6.00% 10/6/2019 225,238 0.05 EUR 150,000 Imperial Brands Finance Plc RegS
2.25% 26/2/2021 159,911 0.04 EUR 100,000 ITV Plc RegS 2.00% 1/12/2023 102,164 0.02 EUR 100,000 Leeds Building Society RegS
1.375% 5/5/2022 100,466 0.02 EUR 100,000 Lloyds Bank Plc RegS
5.375% 3/9/2019 113,097 0.03 EUR 200,000 Lloyds Bank Plc RegS
6.50% 24/3/2020 234,375 0.05 EUR 200,000 Lloyds Bank Plc RegS
4.00% 29/9/2020 228,171 0.05 EUR 200,000 Lloyds Bank Plc RegS
0.375% 18/1/2021 202,868 0.04 EUR 200,000 Lloyds Bank Plc RegS
0.625% 14/9/2022 204,114 0.05 EUR 100,000 Lloyds Bank Plc RegS
0.50% 11/4/2023 100,960 0.02 EUR 211,000 Lloyds Banking Group Plc RegS
1.00% 9/11/2023 208,124 0.05 EUR 100,000 Motability Operations Group Plc
RegS 0.875% 14/3/2025 99,519 0.02
Portfolio of Investments as at 31 March 2017
Sweden continued United Kingdom continued

Transferable Securities and Money Market Instruments Admitted to an Official Stock Exchange Listing or Dealt in on Another Regulated Market
Transferable Securities and Money Market Instruments Admitted to an Official Stock Exchange Listing or Dealt in on Another Regulated Market
Holding Description
Market Value
EUR
% of Net
Assets Holding Description
Market Value
EUR
% of Net
Assets
* All or a portion of this security represents a security on loan.
Annual Report and Audited Accounts 73
The notes on pages 122 to 128 form an integral part of these financial statements.
EUR 100,000 National Grid Plc 4.375% 10/3/2020 112,164 0.03 EUR 150,000 Nationwide Building Society
4.375% 28/2/2022 180,925 0.04 EUR 50,000 Nationwide Building Society RegS
6.75% 22/7/2020 59,844 0.01 EUR 100,000 Nationwide Building Society RegS
0.75% 29/10/2021 102,900 0.02 EUR 100,000 Nationwide Building Society RegS
1.125% 3/6/2022 103,120 0.02 EUR 100,000 Nationwide Building Society RegS
0.75% 26/10/2022 102,767 0.02 EUR 125,000 Nationwide Building Society RegS
0.50% 23/2/2024 125,279 0.03 EUR 100,000 Nationwide Building Society RegS
1.25% 3/3/2025 102,027 0.02 EUR 100,000 Royal Bank of Scotland Group Plc
RegS 2.50% 22/3/2023 103,626 0.02 EUR 100,000 Royal Bank of Scotland Plc/The
3.875% 19/10/2020 113,752 0.03 EUR 150,000 Royal Bank of Scotland Plc/The RegS
5.375% 30/9/2019 169,042 0.04 EUR 300,000 Santander UK Group Holdings Plc
RegS 1.125% 8/9/2023 299,430 0.07 EUR 200,000 Santander UK Plc 0.25% 9/8/2021 201,480 0.04 EUR 150,000 Santander UK Plc RegS 2.00%
14/1/2019 155,175 0.03 EUR 100,000 Sky Plc RegS 2.50% 15/9/2026 107,650 0.02 EUR 200,000 SSE Plc RegS 2.00% 17/6/2020 211,969 0.05 EUR 100,000 Standard Chartered Bank RegS
5.875% 26/9/2017 102,818 0.02 EUR 200,000 Standard Chartered Plc RegS
1.625% 13/6/2021 207,878 0.05 EUR 100,000 State Grid Europe Development
2014 Plc RegS 1.50% 26/1/2022 103,102 0.02 EUR 150,000 Vodafone Group Plc 4.65%
20/1/2022 179,321 0.04 EUR 100,000 Vodafone Group Plc RegS 0.875%
17/11/2020 101,885 0.02 EUR 150,000 Vodafone Group Plc RegS 0.375%
22/11/2021 148,824 0.03 EUR 100,000 Vodafone Group Plc RegS 0.50%
30/1/2024 96,438 0.02 EUR 100,000 Vodafone Group Plc RegS 1.60%
29/7/2031 93,890 0.02 EUR 100,000 Yorkshire Building Society RegS
1.25% 11/6/2021 104,749 0.02
9,141,531 1.98
United States EUR 100,000 3M Co 1.50% 2/6/2031 103,048 0.02 EUR 100,000 3M Co RegS 1.875% 15/11/2021 107,883 0.02 EUR 100,000 AbbVie Inc 1.375% 17/5/2024 101,395 0.02 EUR 100,000 American Honda Finance Corp
RegS 1.875% 4/9/2019 104,542 0.02 EUR 100,000 Amgen Inc 1.25% 25/2/2022 103,113 0.02 EUR 100,000 Amgen Inc 2.00% 25/2/2026 106,676 0.02 EUR 100,000 Apple Inc 1.375% 17/1/2024 105,439 0.02 EUR 100,000 Apple Inc 1.625% 10/11/2026 106,400 0.02 EUR 200,000 AT&T Inc 1.45% 1/6/2022 207,032 0.05 EUR 100,000 AT&T Inc 2.50% 15/3/2023 108,646 0.03 EUR 150,000 AT&T Inc 3.50% 17/12/2025 175,180 0.04 EUR 100,000 AT&T Inc 2.45% 15/3/2035 96,590 0.02 EUR 50,000 Bank of America Corp RegS
4.625% 7/8/2017 50,826 0.01 EUR 50,000 Bank of America Corp RegS
4.625% 14/9/2018 53,304 0.01 EUR 100,000 Bank of America Corp RegS
2.50% 27/7/2020 107,222 0.02
EUR 125,000 Bank of America Corp RegS FRN 7/2/2022 125,246 0.03
EUR 100,000 Bank of America Corp RegS 2.375% 19/6/2024 108,546 0.03
EUR 150,000 Bank of America Corp RegS 1.375% 26/3/2025 * 152,200 0.03
EUR 200,000 Berkshire Hathaway Inc 0.25% 17/1/2021 200,590 0.04
EUR 100,000 Berkshire Hathaway Inc 0.75% 16/3/2023 100,935 0.02
EUR 100,000 Berkshire Hathaway Inc 1.125% 16/3/2027 98,302 0.02
EUR 200,000 BMW US Capital LLC RegS 1.00% 18/7/2017 200,735 0.05
EUR 100,000 Bristol-Myers Squibb Co 1.00% 15/5/2025 101,144 0.02
EUR 100,000 Citigroup Inc 1.75% 28/1/2025 103,676 0.02 EUR 150,000 Citigroup Inc RegS
1.75% 29/1/2018 152,311 0.03 EUR 100,000 Citigroup Inc RegS
1.375% 27/10/2021 104,057 0.02 EUR 200,000 Citigroup Inc RegS
0.75% 26/10/2023 197,160 0.04 EUR 100,000 Citigroup Inc RegS
1.50% 26/10/2028 97,293 0.02 EUR 100,000 Coca-Cola Co/The
0.50% 8/3/2024 98,896 0.02 EUR 100,000 Coca-Cola Co/The
1.875% 22/9/2026 108,055 0.02 EUR 100,000 Coca-Cola Co/The
1.625% 9/3/2035 99,964 0.02 EUR 50,000 Continental Rubber of America Corp
0.50% 19/2/2019 50,444 0.01 EUR 100,000 Digital Euro Finco LLC RegS
2.625% 15/4/2024 104,446 0.02 EUR 87,000 Eli Lilly & Co 1.00% 2/6/2022
(traded in Germany) 89,831 0.02 EUR 113,000 Eli Lilly & Co 1.00% 2/6/2022
(traded in United States) 116,676 0.03 EUR 100,000 Expedia Inc 2.50% 3/6/2022 105,742 0.02 EUR 100,000 FedEx Corp 1.625% 11/1/2027 101,094 0.02 EUR 100,000 General Electric Co 1.25% 26/5/2023 104,375 0.02 EUR 50,000 General Electric Co RegS
4.125% 19/9/2035 68,623 0.02 EUR 100,000 General Motors Financial Co Inc
RegS 0.955% 7/9/2023 98,223 0.02 EUR 50,000 Goldman Sachs Group Inc/
The RegS 5.125% 23/10/2019 56,403 0.01 EUR 50,000 Goldman Sachs Group Inc/
The RegS 2.00% 27/7/2023 53,021 0.01 EUR 275,000 Goldman Sachs Group Inc/
The RegS 1.25% 1/5/2025 272,427 0.06 EUR 150,000 Goldman Sachs Group Inc/
The RegS 2.875% 3/6/2026 166,983 0.04 EUR 75,000 Goldman Sachs Group Inc/
The RegS 1.625% 27/7/2026 74,925 0.02 EUR 100,000 Honeywell International Inc
0.65% 21/2/2020 101,551 0.02 EUR 100,000 Honeywell International Inc
2.25% 22/2/2028 110,349 0.03 EUR 100,000 Illinois Tool Works Inc
1.75% 20/5/2022 106,924 0.02 EUR 100,000 International Business Machines
Corp 1.875% 6/11/2020 106,471 0.02 EUR 100,000 International Business Machines
Corp 1.125% 6/9/2024 102,962 0.02 EUR 100,000 International Business Machines
Corp 2.875% 7/11/2025 117,245 0.03 EUR 100,000 Johnson & Johnson 0.25% 20/1/2022 100,247 0.02
BlackRock Euro Aggregate Bond Index Fund continued
Portfolio of Investments as at 31 March 2017
United Kingdom continued United States continued

Transferable Securities and Money Market Instruments Admitted to an Official Stock Exchange Listing or Dealt in on Another Regulated Market
Transferable Securities and Money Market Instruments Admitted to an Official Stock Exchange Listing or Dealt in on Another Regulated Market
Holding Description
Market Value
EUR
% of Net
Assets Holding Description
Market Value
EUR
% of Net
Assets
74 BlackRock Global Index Funds (BGIF)
The notes on pages 122 to 128 form an integral part of these financial statements.
BlackRock Euro Aggregate Bond Index Fund continued
EUR 100,000 Johnson & Johnson 1.65% 20/5/2035 103,606 0.02 EUR 200,000 JPMorgan Chase & Co RegS
3.875% 23/9/2020 225,496 0.05 EUR 100,000 JPMorgan Chase & Co RegS
1.375% 16/9/2021 104,282 0.02 EUR 100,000 JPMorgan Chase & Co RegS
2.75% 24/8/2022 111,299 0.03 EUR 150,000 JPMorgan Chase & Co RegS
2.75% 1/2/2023 167,636 0.04 EUR 200,000 JPMorgan Chase & Co RegS
1.50% 29/10/2026 203,689 0.05 EUR 150,000 Kinder Morgan Inc/DE
1.50% 16/3/2022 153,345 0.03 EUR 100,000 Kraft Heinz Foods Co RegS
2.25% 25/5/2028 100,471 0.02 EUR 150,000 MasterCard Inc 1.10% 1/12/2022 155,085 0.04 EUR 100,000 McDonald's Corp
2.625% 11/6/2029 112,194 0.03 EUR 100,000 McDonald's Corp RegS
1.75% 3/5/2028 102,842 0.02 EUR 100,000 Merck & Co Inc 1.875% 15/10/2026 108,122 0.02 EUR 150,000 Metropolitan Life Global Funding I
RegS 1.25% 17/9/2021 156,096 0.04 EUR 100,000 Microsoft Corp 3.125% 6/12/2028 121,255 0.03 EUR 100,000 Molson Coors Brewing Co
1.25% 15/7/2024 100,110 0.02 EUR 100,000 Mondelez International Inc
1.625% 8/3/2027 99,251 0.02 EUR 50,000 Morgan Stanley 5.50% 2/10/2017 51,414 0.01 EUR 200,000 Morgan Stanley 5.375% 10/8/2020 233,818 0.05 EUR 100,000 Morgan Stanley 2.375% 31/3/2021 107,589 0.02 EUR 200,000 Morgan Stanley 1.75% 11/3/2024 208,139 0.05 EUR 100,000 Nasdaq Inc 3.875% 7/6/2021 113,869 0.03 EUR 100,000 Oracle Corp 3.125% 10/7/2025 118,310 0.03 EUR 100,000 PepsiCo Inc 1.75% 28/4/2021 106,128 0.02 EUR 100,000 Pfizer Inc 0.25% 6/3/2022 99,421 0.02 EUR 50,000 Pfizer Inc RegS 5.75% 3/6/2021 61,422 0.01 EUR 200,000 Philip Morris International Inc
2.75% 19/3/2025 227,642 0.05 EUR 200,000 PPG Industries Inc 0.875% 3/11/2025 193,704 0.04 EUR 100,000 Praxair Inc 1.625% 1/12/2025 105,752 0.02 EUR 100,000 Priceline Group Inc/The
1.80% 3/3/2027 99,055 0.02 EUR 50,000 Procter & Gamble Co/The
4.125% 7/12/2020 57,529 0.01 EUR 200,000 Procter & Gamble Co/The
2.00% 5/11/2021 216,673 0.05
EUR 100,000 Prologis LP 3.00% 2/6/2026 113,486 0.03 EUR 200,000 Southern Power Co 1.00% 20/6/2022 199,087 0.04 EUR 100,000 Thermo Fisher Scientific Inc
0.75% 12/9/2024 97,394 0.02 EUR 100,000 Thermo Fisher Scientific Inc
2.00% 15/4/2025 106,094 0.02 EUR 125,000 Thermo Fisher Scientific Inc
1.375% 12/9/2028 121,645 0.03 EUR 100,000 Toyota Motor Credit Corp
RegS 1.25% 1/8/2017 100,465 0.02 EUR 150,000 Toyota Motor Credit Corp
RegS 2.375% 1/2/2023 166,642 0.04 EUR 100,000 United Parcel Service Inc
1.00% 15/11/2028 97,937 0.02 EUR 100,000 United Technologies Corp
1.125% 15/12/2021 103,573 0.02 EUR 100,000 Verizon Communications Inc
2.375% 17/2/2022 108,387 0.02 EUR 150,000 Verizon Communications Inc
1.375% 2/11/2028 144,074 0.03 EUR 100,000 Verizon Communications Inc
2.625% 1/12/2031 105,699 0.02 EUR 100,000 VF Corp 0.625% 20/9/2023 98,481 0.02 EUR 50,000 Wal-Mart Stores Inc
4.875% 21/9/2029 70,381 0.02 EUR 350,000 Wells Fargo & Co RegS
1.125% 29/10/2021 361,237 0.08 EUR 150,000 Wells Fargo & Co RegS
2.25% 2/5/2023 163,051 0.04 EUR 150,000 Wells Fargo & Co RegS
2.00% 27/4/2026 158,741 0.04 EUR 100,000 Wells Fargo & Co RegS
1.00% 2/2/2027 95,812 0.02 EUR 100,000 Whirlpool Corp 0.625% 12/3/2020 101,092 0.02
12,533,890 2.71
Total Bonds 455,845,173 98.62
Total Transferable Securities and Money Market Instruments Admitted to an Official Stock Exchange Listing or Dealt in on Another Regulated Market 455,845,173 98.62
Securities portfolio at market value 455,845,173 98.62
Other Net Assets 6,364,061 1.38
Total Net Assets (EUR) 462,209,234 100.00
Portfolio of Investments as at 31 March 2017
Sector Breakdown as at 31 March 2017
% of Net Assets
Government 69.01Financial 17.83Consumer, Non-cyclical 2.88Utilities 2.13Communications 1.70Industrial 1.48Consumer, Cyclical 1.28Energy 1.19Basic Materials 0.73Technology 0.30Diversified 0.09
Securities portfolio at market value 98.62Other Net Assets 1.38
100.00
United States continued United States continued

Transferable Securities and Money Market Instruments Admitted to an Official Stock Exchange Listing or Dealt in on Another Regulated Market
Transferable Securities and Money Market Instruments Admitted to an Official Stock Exchange Listing or Dealt in on Another Regulated Market
Holding Description
Market Value
EUR
% of Net
Assets Holding Description
Market Value
EUR
% of Net
Assets
* All or a portion of this security represents a security on loan.
EUR
Annual Report and Audited Accounts 75
The notes on pages 122 to 128 form an integral part of these financial statements.
BONDS
Austria EUR 550,000 Republic of Austria Government
Bond 6.25% 15/7/2027 867,941 0.20 EUR 720,000 Republic of Austria Government
Bond RegS '144A' 1.15% 19/10/2018 740,470 0.17
EUR 1,298,000 Republic of Austria Government Bond RegS '144A' 4.35% 15/3/2019 1,424,743 0.33
EUR 470,000 Republic of Austria Government Bond RegS '144A' 1.95% 18/6/2019 496,804 0.11
EUR 850,000 Republic of Austria Government Bond RegS '144A' 0.25% 18/10/2019 868,887 0.20
EUR 200,000 Republic of Austria Government Bond RegS '144A' 3.90% 15/7/2020 229,202 0.05
EUR 1,975,000 Republic of Austria Government Bond RegS '144A' 3.50% 15/9/2021 2,314,848 0.53
EUR 1,143,000 Republic of Austria Government Bond RegS '144A' 3.40% 22/11/2022 1,373,143 0.31
EUR 530,000 Republic of Austria Government Bond RegS '144A' 1.75% 20/10/2023 591,030 0.14
EUR 925,000 Republic of Austria Government Bond RegS '144A' 1.65% 21/10/2024 1,026,602 0.23
EUR 1,340,000 Republic of Austria Government Bond RegS '144A' 1.20% 20/10/2025 1,437,552 0.33
EUR 395,000 Republic of Austria Government Bond RegS '144A' 4.85% 15/3/2026 551,497 0.13
EUR 720,000 Republic of Austria Government Bond RegS '144A' 0.75% 20/10/2026 734,760 0.17
EUR 465,000 Republic of Austria Government Bond RegS '144A' 2.40% 23/5/2034 566,335 0.13
EUR 953,000 Republic of Austria Government Bond RegS '144A' 4.15% 15/3/2037 1,464,046 0.33
EUR 475,000 Republic of Austria Government Bond RegS '144A' 3.15% 20/6/2044 669,512 0.15
EUR 240,000 Republic of Austria Government Bond RegS '144A' 1.50% 20/2/2047 243,377 0.06
EUR 274,000 Republic of Austria Government Bond RegS '144A' 3.80% 26/1/2062 469,376 0.11
16,070,125 3.68
Belgium EUR 1,470,000 Kingdom of Belgium Government
Bond 4.00% 28/3/2019 1,604,299 0.37 EUR 1,255,000 Kingdom of Belgium Government
Bond 4.00% 28/3/2022 1,518,901 0.35 EUR 1,613,000 Kingdom of Belgium Government
Bond 5.50% 28/3/2028 2,414,113 0.55 EUR 1,265,000 Kingdom of Belgium Government
Bond RegS 1.25% 22/6/2018 1,293,172 0.30 EUR 1,150,000 Kingdom of Belgium Government
Bond RegS 3.00% 28/9/2019 1,251,821 0.29
EUR 1,240,000 Kingdom of Belgium Government Bond RegS '144A' 3.75% 28/9/2020 1,422,813 0.33
EUR 1,725,000 Kingdom of Belgium Government Bond RegS '144A' 4.25% 28/9/2021 2,080,264 0.48
EUR 690,000 Kingdom of Belgium Government Bond RegS 4.25% 28/9/2022 855,151 0.20
EUR 780,000 Kingdom of Belgium Government Bond RegS 2.25% 22/6/2023 * 887,094 0.20
EUR 600,000 Kingdom of Belgium Government Bond RegS '144A' 0.20% 22/10/2023 602,544 0.14
EUR 1,650,000 Kingdom of Belgium Government Bond RegS '144A' 2.60% 22/6/2024 1,922,976 0.44
EUR 450,000 Kingdom of Belgium Government Bond RegS '144A' 0.50% 22/10/2024 454,833 0.10
EUR 660,000 Kingdom of Belgium Government Bond RegS '144A' 0.80% 22/6/2025 676,111 0.15
EUR 250,000 Kingdom of Belgium Government Bond RegS '144A' 4.50% 28/3/2026 336,648 0.08
EUR 1,230,000 Kingdom of Belgium Government Bond RegS '144A' 1.00% 22/6/2026 1,267,982 0.29
EUR 650,000 Kingdom of Belgium Government Bond RegS '144A' 0.80% 22/6/2027 648,056 0.15
EUR 550,000 Kingdom of Belgium Government Bond RegS '144A' 1.00% 22/6/2031 535,387 0.12
EUR 707,000 Kingdom of Belgium Government Bond RegS 4.00% 28/3/2032 980,722 0.22
EUR 430,000 Kingdom of Belgium Government Bond RegS '144A' 3.00% 22/6/2034 542,965 0.12
EUR 1,582,000 Kingdom of Belgium Government Bond RegS '144A' 5.00% 28/3/2035 2,522,420 0.58
EUR 280,000 Kingdom of Belgium Government Bond RegS '144A' 1.90% 22/6/2038 298,021 0.07
EUR 1,265,000 Kingdom of Belgium Government Bond RegS '144A' 4.25% 28/3/2041 1,934,982 0.44
EUR 685,000 Kingdom of Belgium Government Bond RegS 3.75% 22/6/2045 989,465 0.23
EUR 460,000 Kingdom of Belgium Government Bond RegS '144A' 1.60% 22/6/2047 434,548 0.10
EUR 270,000 Kingdom of Belgium Government Bond RegS '144A' 2.25% 22/6/2057 282,639 0.06
EUR 210,000 Kingdom of Belgium Government Bond RegS '144A' 2.15% 22/6/2066 209,276 0.05
27,967,203 6.41
Finland EUR 615,000 Finland Government Bond RegS
'144A' 1.125% 15/9/2018 631,556 0.14 EUR 500,000 Finland Government Bond RegS
'144A' 4.375% 4/7/2019 556,455 0.13 EUR 580,000 Finland Government Bond RegS
'144A' 0.375% 15/9/2020 596,420 0.14
BlackRock Euro Government Bond Index Fund
Portfolio of Investments as at 31 March 2017
Belgium continued

Transferable Securities and Money Market Instruments Admitted to an Official Stock Exchange Listing or Dealt in on Another Regulated Market
Transferable Securities and Money Market Instruments Admitted to an Official Stock Exchange Listing or Dealt in on Another Regulated Market
Holding Description
Market Value
EUR
% of Net
Assets Holding Description
Market Value
EUR
% of Net
Assets
* All or a portion of this security represents a security on loan.
76 BlackRock Global Index Funds (BGIF)
The notes on pages 122 to 128 form an integral part of these financial statements.
BlackRock Euro Government Bond Index Fund continued
EUR 770,000 Finland Government Bond RegS '144A' 3.50% 15/4/2021 891,175 0.20
EUR 410,000 Finland Government Bond RegS '144A' 15/4/2022 (Zero Coupon) 413,583 0.09
EUR 395,000 Finland Government Bond RegS '144A' 1.625% 15/9/2022 432,715 0.10
EUR 570,000 Finland Government Bond RegS '144A' 2.00% 15/4/2024 644,527 0.15
EUR 543,000 Finland Government Bond RegS '144A' 4.00% 4/7/2025 709,152 0.16
EUR 450,000 Finland Government Bond RegS '144A' 0.875% 15/9/2025 469,521 0.11
EUR 500,000 Finland Government Bond RegS '144A' 0.50% 15/4/2026 502,845 0.11
EUR 60,000 Finland Government Bond RegS '144A' 2.75% 4/7/2028 73,993 0.02
EUR 490,000 Finland Government Bond RegS '144A' 0.75% 15/4/2031 485,306 0.11
EUR 350,000 Finland Government Bond RegS '144A' 2.625% 4/7/2042 466,119 0.11
6,873,367 1.57
France EUR 1,744,000 French Republic Government Bond
OAT RegS 4.00% 25/4/2018 * 1,827,206 0.42 EUR 3,765,000 French Republic Government Bond
OAT RegS 1.00% 25/5/2018 3,829,645 0.88 EUR 2,365,000 French Republic Government Bond
OAT RegS 1.00% 25/11/2018 2,422,659 0.56 EUR 2,530,000 French Republic Government Bond
OAT RegS 25/2/2019 (Zero Coupon) 2,553,124 0.58
EUR 850,000 French Republic Government Bond OAT RegS 4.25% 25/4/2019 932,705 0.21
EUR 2,690,000 French Republic Government Bond OAT RegS 1.00% 25/5/2019 * 2,772,206 0.64
EUR 1,660,000 French Republic Government Bond OAT RegS 3.75% 25/10/2019 1,836,458 0.42
EUR 1,130,000 French Republic Government Bond OAT RegS 8.50% 25/10/2019 1,388,295 0.32
EUR 1,360,000 French Republic Government Bond OAT RegS 0.50% 25/11/2019 * 1,390,920 0.32
EUR 4,617,000 French Republic Government Bond OAT RegS 3.50% 25/4/2020 * 5,156,543 1.18
EUR 2,390,000 French Republic Government Bond OAT RegS 25/5/2020 (Zero Coupon)* 2,412,418 0.55
EUR 1,585,000 French Republic Government Bond OAT RegS 2.50% 25/10/2020 1,738,682 0.40
EUR 1,250,000 French Republic Government Bond OAT RegS 0.25% 25/11/2020 * 1,270,750 0.29
EUR 3,263,000 French Republic Government Bond OAT RegS 3.75% 25/4/2021 3,778,293 0.87
EUR 2,660,000 French Republic Government Bond OAT RegS 25/5/2021 (Zero Coupon) 2,672,302 0.61
EUR 3,315,000 French Republic Government Bond OAT RegS 3.25% 25/10/2021 3,813,377 0.87
EUR 3,539,000 French Republic Government Bond OAT RegS 3.00% 25/4/2022 * 4,061,109 0.93
EUR 250,000 French Republic Government Bond OAT RegS 25/5/2022 (Zero Coupon) 248,570 0.06
EUR 2,818,000 French Republic Government Bond OAT RegS 2.25% 25/10/2022 3,141,070 0.72
EUR 3,430,000 French Republic Government Bond OAT RegS 1.75% 25/5/2023 3,733,332 0.86
EUR 2,670,000 French Republic Government Bond OAT RegS 4.25% 25/10/2023 3,342,573 0.77
EUR 2,845,000 French Republic Government Bond OAT RegS 2.25% 25/5/2024 3,199,686 0.73
EUR 2,195,000 French Republic Government Bond OAT RegS 1.75% 25/11/2024 * 2,386,470 0.55
EUR 3,200,000 French Republic Government Bond OAT RegS 0.50% 25/5/2025 * 3,151,888 0.72
EUR 2,190,000 French Republic Government Bond OAT RegS 6.00% 25/10/2025 3,156,162 0.72
EUR 1,500,000 French Republic Government Bond OAT RegS 1.00% 25/11/2025 (traded in France) 1,527,840 0.35
EUR 140,000 French Republic Government Bond OAT RegS 1.00% 25/11/2025 (traded in Germany) 142,598 0.03
EUR 2,230,000 French Republic Government Bond OAT RegS 3.50% 25/4/2026 2,748,207 0.63
EUR 1,780,000 French Republic Government Bond OAT RegS 0.50% 25/5/2026 1,721,652 0.39
EUR 2,280,000 French Republic Government Bond OAT RegS 0.25% 25/11/2026 2,132,370 0.49
EUR 2,620,000 French Republic Government Bond OAT RegS 2.75% 25/10/2027 3,060,946 0.70
EUR 2,230,000 French Republic Government Bond OAT RegS 5.50% 25/4/2029 3,320,303 0.76
EUR 2,625,000 French Republic Government Bond OAT RegS 2.50% 25/5/2030 3,013,014 0.69
EUR 2,060,000 French Republic Government Bond OAT RegS 1.50% 25/5/2031 2,095,638 0.48
EUR 2,300,000 French Republic Government Bond OAT RegS 5.75% 25/10/2032 3,700,125 0.85
EUR 2,005,000 French Republic Government Bond OAT RegS 4.75% 25/4/2035 3,018,808 0.69
EUR 1,010,000 French Republic Government Bond OAT RegS '144A' 1.25% 25/5/2036 942,684 0.22
EUR 2,265,000 French Republic Government Bond OAT RegS 4.00% 25/10/2038 3,205,654 0.73
EUR 625,000 French Republic Government Bond OAT RegS '144A' 1.75% 25/6/2039 625,109 0.14
EUR 2,222,000 French Republic Government Bond OAT RegS 4.50% 25/4/2041 3,386,439 0.78
EUR 1,870,000 French Republic Government Bond OAT RegS 3.25% 25/5/2045 2,386,625 0.55
EUR 1,160,000 French Republic Government Bond OAT RegS 4.00% 25/4/2055 * 1,733,052 0.40
EUR 845,000 French Republic Government Bond OAT RegS 4.00% 25/4/2060 1,283,141 0.29
EUR 450,000 French Republic Government Bond OAT RegS '144A' 1.75% 25/5/2066 389,516 0.09
106,650,164 24.44
Germany EUR 1,370,000 Bundesobligation RegS
1.00% 22/2/2019 * 1,416,101 0.32 EUR 550,000 Bundesobligation RegS
0.50% 12/4/2019 564,064 0.13 EUR 1,525,000 Bundesobligation RegS
0.25% 11/10/2019 1,562,545 0.36 EUR 1,025,000 Bundesobligation RegS 17/4/2020
(Zero Coupon) 1,045,715 0.24 EUR 2,050,000 Bundesobligation RegS
0.25% 16/10/2020 2,112,176 0.48 EUR 750,000 Bundesobligation RegS
9/4/2021 (Zero Coupon) 766,388 0.18 EUR 2,315,000 Bundesobligation RegS
8/10/2021 (Zero Coupon) 2,365,629 0.54
Portfolio of Investments as at 31 March 2017
Finland continued France continued

Transferable Securities and Money Market Instruments Admitted to an Official Stock Exchange Listing or Dealt in on Another Regulated Market
Transferable Securities and Money Market Instruments Admitted to an Official Stock Exchange Listing or Dealt in on Another Regulated Market
Holding Description
Market Value
EUR
% of Net
Assets Holding Description
Market Value
EUR
% of Net
Assets
* All or a portion of this security represents a security on loan.
Annual Report and Audited Accounts 77
The notes on pages 122 to 128 form an integral part of these financial statements.
BlackRock Euro Government Bond Index Fund continued
EUR 495,000 Bundesobligation RegS 8/4/2022 (Zero Coupon) 504,667 0.12
EUR 2,610,000 Bundesrepublik Deutschland RegS 4.25% 4/7/2018 2,774,234 0.64
EUR 3,745,000 Bundesrepublik Deutschland RegS 3.75% 4/1/2019 4,044,825 0.93
EUR 1,940,000 Bundesrepublik Deutschland RegS 3.50% 4/7/2019 2,127,113 0.49
EUR 2,127,000 Bundesrepublik Deutschland RegS 3.00% 4/7/2020 * 2,382,027 0.55
EUR 1,820,000 Bundesrepublik Deutschland RegS 2.25% 4/9/2020 2,001,308 0.46
EUR 2,045,000 Bundesrepublik Deutschland RegS 2.50% 4/1/2021 2,284,817 0.52
EUR 1,420,000 Bundesrepublik Deutschland RegS 3.25% 4/7/2021 1,650,494 0.38
EUR 1,960,000 Bundesrepublik Deutschland RegS 2.25% 4/9/2021 2,200,610 0.50
EUR 1,275,000 Bundesrepublik Deutschland RegS 2.00% 4/1/2022 1,425,629 0.33
EUR 1,135,000 Bundesrepublik Deutschland RegS 1.75% 4/7/2022 1,262,563 0.29
EUR 702,000 Bundesrepublik Deutschland RegS 1.50% 4/9/2022 772,944 0.18
EUR 1,285,000 Bundesrepublik Deutschland RegS 1.50% 15/2/2023 1,420,760 0.32
EUR 2,020,000 Bundesrepublik Deutschland RegS 1.50% 15/5/2023 2,239,008 0.51
EUR 595,000 Bundesrepublik Deutschland RegS 2.00% 15/8/2023 680,341 0.16
EUR 465,000 Bundesrepublik Deutschland RegS 6.25% 4/1/2024 668,159 0.15
EUR 1,505,000 Bundesrepublik Deutschland RegS 1.75% 15/2/2024 1,703,269 0.39
EUR 1,240,000 Bundesrepublik Deutschland RegS 1.50% 15/5/2024 1,382,786 0.32
EUR 1,670,000 Bundesrepublik Deutschland RegS 1.00% 15/8/2024 * 1,802,439 0.41
EUR 2,050,000 Bundesrepublik Deutschland RegS 0.50% 15/2/2025 * 2,130,401 0.49
EUR 2,080,000 Bundesrepublik Deutschland RegS 1.00% 15/8/2025 * 2,241,928 0.51
EUR 2,210,000 Bundesrepublik Deutschland RegS 0.50% 15/2/2026 2,277,228 0.52
EUR 1,550,000 Bundesrepublik Deutschland RegS 15/8/2026 (Zero Coupon) 1,514,071 0.35
EUR 930,000 Bundesrepublik Deutschland RegS 0.25% 15/2/2027 * 923,518 0.21
EUR 835,000 Bundesrepublik Deutschland RegS 6.50% 4/7/2027 1,356,833 0.31
EUR 1,000,000 Bundesrepublik Deutschland RegS 5.625% 4/1/2028 1,556,450 0.36
EUR 420,000 Bundesrepublik Deutschland RegS 4.75% 4/7/2028 621,041 0.14
EUR 574,000 Bundesrepublik Deutschland RegS 6.25% 4/1/2030 984,083 0.22
EUR 1,505,000 Bundesrepublik Deutschland RegS 5.50% 4/1/2031 2,493,063 0.57
EUR 1,400,000 Bundesrepublik Deutschland RegS 4.75% 4/7/2034 * 2,318,946 0.53
EUR 1,896,000 Bundesrepublik Deutschland RegS 4.00% 4/1/2037 2,989,575 0.68
EUR 1,140,000 Bundesrepublik Deutschland RegS 4.25% 4/7/2039 1,908,554 0.44
EUR 1,050,000 Bundesrepublik Deutschland RegS 4.75% 4/7/2040 1,889,097 0.43
EUR 1,165,000 Bundesrepublik Deutschland RegS 3.25% 4/7/2042 1,745,910 0.40
EUR 1,650,000 Bundesrepublik Deutschland RegS 2.50% 4/7/2044 2,205,769 0.50
EUR 1,475,000 Bundesrepublik Deutschland RegS 2.50% 15/8/2046 1,990,992 0.46
EUR 1,600,000 Bundesschatzanweisungen RegS 16/3/2018 (Zero Coupon) 1,611,520 0.37
EUR 2,060,000 Bundesschatzanweisungen RegS 15/6/2018 (Zero Coupon) 2,078,499 0.48
77,998,089 17.87
Ireland EUR 715,000 Ireland Government Bond
4.50% 18/10/2018 * 768,954 0.18 EUR 435,000 Ireland Government Bond
4.40% 18/6/2019 480,819 0.11 EUR 1,215,000 Ireland Government Bond
5.90% 18/10/2019 1,408,853 0.32 EUR 815,000 Ireland Government Bond
4.50% 18/4/2020 932,523 0.21 EUR 875,000 Ireland Government Bond
5.40% 13/3/2025 1,190,061 0.27 EUR 650,000 Ireland Government Bond RegS
0.80% 15/3/2022 674,758 0.16 EUR 375,000 Ireland Government Bond RegS
3.90% 20/3/2023 455,781 0.11 EUR 675,000 Ireland Government Bond RegS
3.40% 18/3/2024 809,109 0.19 EUR 540,000 Ireland Government Bond RegS
1.00% 15/5/2026 541,291 0.12 EUR 650,000 Ireland Government Bond RegS
2.40% 15/5/2030 726,498 0.17 EUR 280,000 Ireland Government Bond RegS
1.70% 15/5/2037 273,459 0.06 EUR 460,000 Ireland Government Bond RegS
2.00% 18/2/2045 454,793 0.10
8,716,899 2.00
Italy EUR 2,100,000 Italy Buoni Poliennali Del Tesoro
0.25% 15/5/2018 * 2,110,017 0.48 EUR 900,000 Italy Buoni Poliennali Del Tesoro
3.50% 1/6/2018 937,872 0.21 EUR 754,000 Italy Buoni Poliennali Del Tesoro
4.50% 1/8/2018 800,077 0.18 EUR 850,000 Italy Buoni Poliennali Del Tesoro
0.30% 15/10/2018 854,786 0.20 EUR 1,515,000 Italy Buoni Poliennali Del Tesoro
3.50% 1/12/2018 1,602,188 0.37 EUR 2,255,000 Italy Buoni Poliennali Del Tesoro
4.50% 1/3/2019 2,444,138 0.56 EUR 700,000 Italy Buoni Poliennali Del Tesoro
0.10% 15/4/2019 699,832 0.16 EUR 1,135,000 Italy Buoni Poliennali Del Tesoro
2.50% 1/5/2019 1,189,821 0.27 EUR 1,760,000 Italy Buoni Poliennali Del Tesoro
1.50% 1/8/2019 1,810,600 0.41 EUR 2,070,000 Italy Buoni Poliennali Del Tesoro
4.25% 1/9/2019 2,265,553 0.52 EUR 200,000 Italy Buoni Poliennali Del Tesoro
0.05% 15/10/2019 198,622 0.05 EUR 3,610,000 Italy Buoni Poliennali Del Tesoro
1.05% 1/12/2019 * 3,678,734 0.84 EUR 3,525,000 Italy Buoni Poliennali Del Tesoro
4.25% 1/3/2020 3,918,037 0.90 EUR 2,696,000 Italy Buoni Poliennali Del Tesoro
0.70% 1/5/2020 2,720,668 0.62 EUR 815,000 Italy Buoni Poliennali Del Tesoro
4.00% 1/9/2020 912,099 0.21
Portfolio of Investments as at 31 March 2017
Germany continued Germany continued
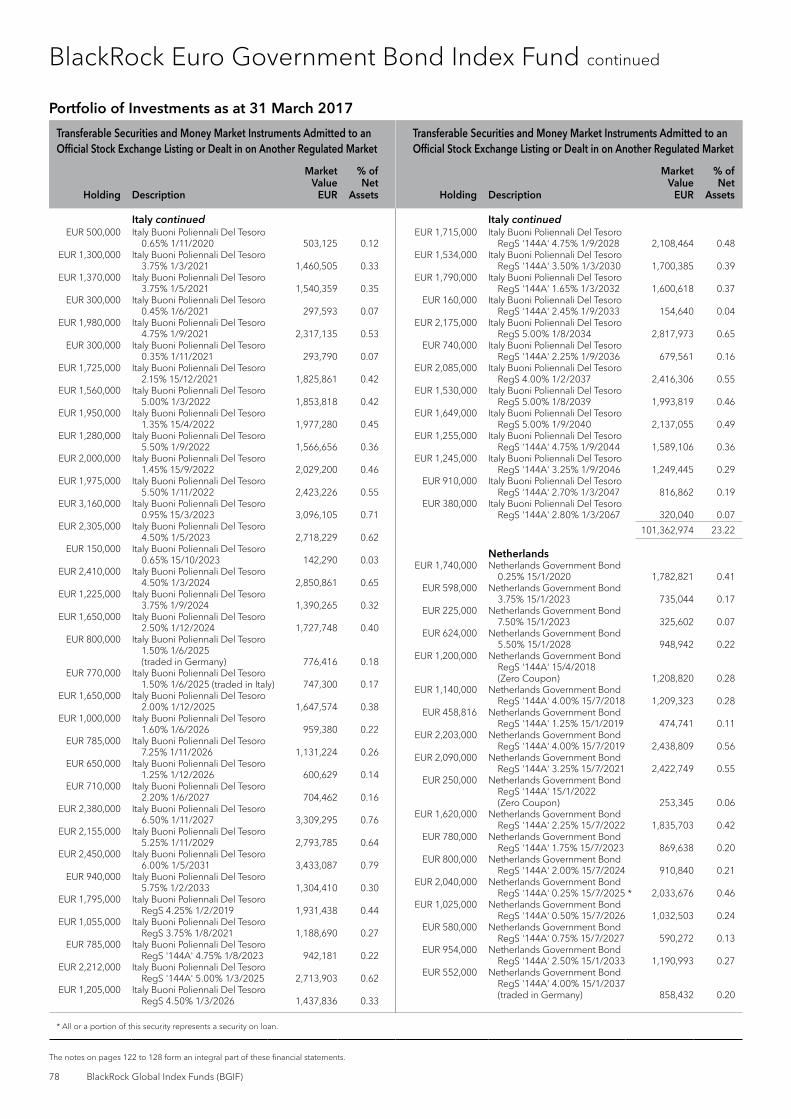
Transferable Securities and Money Market Instruments Admitted to an Official Stock Exchange Listing or Dealt in on Another Regulated Market
Transferable Securities and Money Market Instruments Admitted to an Official Stock Exchange Listing or Dealt in on Another Regulated Market
Holding Description
Market Value
EUR
% of Net
Assets Holding Description
Market Value
EUR
% of Net
Assets
* All or a portion of this security represents a security on loan.
78 BlackRock Global Index Funds (BGIF)
The notes on pages 122 to 128 form an integral part of these financial statements.
BlackRock Euro Government Bond Index Fund continued
EUR 500,000 Italy Buoni Poliennali Del Tesoro 0.65% 1/11/2020 503,125 0.12
EUR 1,300,000 Italy Buoni Poliennali Del Tesoro 3.75% 1/3/2021 1,460,505 0.33
EUR 1,370,000 Italy Buoni Poliennali Del Tesoro 3.75% 1/5/2021 1,540,359 0.35
EUR 300,000 Italy Buoni Poliennali Del Tesoro 0.45% 1/6/2021 297,593 0.07
EUR 1,980,000 Italy Buoni Poliennali Del Tesoro 4.75% 1/9/2021 2,317,135 0.53
EUR 300,000 Italy Buoni Poliennali Del Tesoro 0.35% 1/11/2021 293,790 0.07
EUR 1,725,000 Italy Buoni Poliennali Del Tesoro 2.15% 15/12/2021 1,825,861 0.42
EUR 1,560,000 Italy Buoni Poliennali Del Tesoro 5.00% 1/3/2022 1,853,818 0.42
EUR 1,950,000 Italy Buoni Poliennali Del Tesoro 1.35% 15/4/2022 1,977,280 0.45
EUR 1,280,000 Italy Buoni Poliennali Del Tesoro 5.50% 1/9/2022 1,566,656 0.36
EUR 2,000,000 Italy Buoni Poliennali Del Tesoro 1.45% 15/9/2022 2,029,200 0.46
EUR 1,975,000 Italy Buoni Poliennali Del Tesoro 5.50% 1/11/2022 2,423,226 0.55
EUR 3,160,000 Italy Buoni Poliennali Del Tesoro 0.95% 15/3/2023 3,096,105 0.71
EUR 2,305,000 Italy Buoni Poliennali Del Tesoro 4.50% 1/5/2023 2,718,229 0.62
EUR 150,000 Italy Buoni Poliennali Del Tesoro 0.65% 15/10/2023 142,290 0.03
EUR 2,410,000 Italy Buoni Poliennali Del Tesoro 4.50% 1/3/2024 2,850,861 0.65
EUR 1,225,000 Italy Buoni Poliennali Del Tesoro 3.75% 1/9/2024 1,390,265 0.32
EUR 1,650,000 Italy Buoni Poliennali Del Tesoro 2.50% 1/12/2024 1,727,748 0.40
EUR 800,000 Italy Buoni Poliennali Del Tesoro 1.50% 1/6/2025 (traded in Germany) 776,416 0.18
EUR 770,000 Italy Buoni Poliennali Del Tesoro 1.50% 1/6/2025 (traded in Italy) 747,300 0.17
EUR 1,650,000 Italy Buoni Poliennali Del Tesoro 2.00% 1/12/2025 1,647,574 0.38
EUR 1,000,000 Italy Buoni Poliennali Del Tesoro 1.60% 1/6/2026 959,380 0.22
EUR 785,000 Italy Buoni Poliennali Del Tesoro 7.25% 1/11/2026 1,131,224 0.26
EUR 650,000 Italy Buoni Poliennali Del Tesoro 1.25% 1/12/2026 600,629 0.14
EUR 710,000 Italy Buoni Poliennali Del Tesoro 2.20% 1/6/2027 704,462 0.16
EUR 2,380,000 Italy Buoni Poliennali Del Tesoro 6.50% 1/11/2027 3,309,295 0.76
EUR 2,155,000 Italy Buoni Poliennali Del Tesoro 5.25% 1/11/2029 2,793,785 0.64
EUR 2,450,000 Italy Buoni Poliennali Del Tesoro 6.00% 1/5/2031 3,433,087 0.79
EUR 940,000 Italy Buoni Poliennali Del Tesoro 5.75% 1/2/2033 1,304,410 0.30
EUR 1,795,000 Italy Buoni Poliennali Del Tesoro RegS 4.25% 1/2/2019 1,931,438 0.44
EUR 1,055,000 Italy Buoni Poliennali Del Tesoro RegS 3.75% 1/8/2021 1,188,690 0.27
EUR 785,000 Italy Buoni Poliennali Del Tesoro RegS '144A' 4.75% 1/8/2023 942,181 0.22
EUR 2,212,000 Italy Buoni Poliennali Del Tesoro RegS '144A' 5.00% 1/3/2025 2,713,903 0.62
EUR 1,205,000 Italy Buoni Poliennali Del Tesoro RegS 4.50% 1/3/2026 1,437,836 0.33
EUR 1,715,000 Italy Buoni Poliennali Del Tesoro RegS '144A' 4.75% 1/9/2028 2,108,464 0.48
EUR 1,534,000 Italy Buoni Poliennali Del Tesoro RegS '144A' 3.50% 1/3/2030 1,700,385 0.39
EUR 1,790,000 Italy Buoni Poliennali Del Tesoro RegS '144A' 1.65% 1/3/2032 1,600,618 0.37
EUR 160,000 Italy Buoni Poliennali Del Tesoro RegS '144A' 2.45% 1/9/2033 154,640 0.04
EUR 2,175,000 Italy Buoni Poliennali Del Tesoro RegS 5.00% 1/8/2034 2,817,973 0.65
EUR 740,000 Italy Buoni Poliennali Del Tesoro RegS '144A' 2.25% 1/9/2036 679,561 0.16
EUR 2,085,000 Italy Buoni Poliennali Del Tesoro RegS 4.00% 1/2/2037 2,416,306 0.55
EUR 1,530,000 Italy Buoni Poliennali Del Tesoro RegS 5.00% 1/8/2039 1,993,819 0.46
EUR 1,649,000 Italy Buoni Poliennali Del Tesoro RegS 5.00% 1/9/2040 2,137,055 0.49
EUR 1,255,000 Italy Buoni Poliennali Del Tesoro RegS '144A' 4.75% 1/9/2044 1,589,106 0.36
EUR 1,245,000 Italy Buoni Poliennali Del Tesoro RegS '144A' 3.25% 1/9/2046 1,249,445 0.29
EUR 910,000 Italy Buoni Poliennali Del Tesoro RegS '144A' 2.70% 1/3/2047 816,862 0.19
EUR 380,000 Italy Buoni Poliennali Del Tesoro RegS '144A' 2.80% 1/3/2067 320,040 0.07
101,362,974 23.22
Netherlands EUR 1,740,000 Netherlands Government Bond
0.25% 15/1/2020 1,782,821 0.41 EUR 598,000 Netherlands Government Bond
3.75% 15/1/2023 735,044 0.17 EUR 225,000 Netherlands Government Bond
7.50% 15/1/2023 325,602 0.07 EUR 624,000 Netherlands Government Bond
5.50% 15/1/2028 948,942 0.22 EUR 1,200,000 Netherlands Government Bond
RegS '144A' 15/4/2018 (Zero Coupon) 1,208,820 0.28
EUR 1,140,000 Netherlands Government Bond RegS '144A' 4.00% 15/7/2018 1,209,323 0.28
EUR 458,816 Netherlands Government Bond RegS '144A' 1.25% 15/1/2019 474,741 0.11
EUR 2,203,000 Netherlands Government Bond RegS '144A' 4.00% 15/7/2019 2,438,809 0.56
EUR 2,090,000 Netherlands Government Bond RegS '144A' 3.25% 15/7/2021 2,422,749 0.55
EUR 250,000 Netherlands Government Bond RegS '144A' 15/1/2022 (Zero Coupon) 253,345 0.06
EUR 1,620,000 Netherlands Government Bond RegS '144A' 2.25% 15/7/2022 1,835,703 0.42
EUR 780,000 Netherlands Government Bond RegS '144A' 1.75% 15/7/2023 869,638 0.20
EUR 800,000 Netherlands Government Bond RegS '144A' 2.00% 15/7/2024 910,840 0.21
EUR 2,040,000 Netherlands Government Bond RegS '144A' 0.25% 15/7/2025 * 2,033,676 0.46
EUR 1,025,000 Netherlands Government Bond RegS '144A' 0.50% 15/7/2026 1,032,503 0.24
EUR 580,000 Netherlands Government Bond RegS '144A' 0.75% 15/7/2027 590,272 0.13
EUR 954,000 Netherlands Government Bond RegS '144A' 2.50% 15/1/2033 1,190,993 0.27
EUR 552,000 Netherlands Government Bond RegS '144A' 4.00% 15/1/2037 (traded in Germany) 858,432 0.20
Portfolio of Investments as at 31 March 2017
Italy continued Italy continued

Transferable Securities and Money Market Instruments Admitted to an Official Stock Exchange Listing or Dealt in on Another Regulated Market
Transferable Securities and Money Market Instruments Admitted to an Official Stock Exchange Listing or Dealt in on Another Regulated Market
Holding Description
Market Value
EUR
% of Net
Assets Holding Description
Market Value
EUR
% of Net
Assets
* All or a portion of this security represents a security on loan.
Annual Report and Audited Accounts 79
The notes on pages 122 to 128 form an integral part of these financial statements.
BlackRock Euro Government Bond Index Fund continued
EUR 570,000 Netherlands Government Bond RegS '144A' 4.00% 15/1/2037 (traded in Netherlands) 886,424 0.20
EUR 1,150,000 Netherlands Government Bond RegS '144A' 3.75% 15/1/2042 1,822,669 0.42
EUR 910,000 Netherlands Government Bond RegS '144A' 2.75% 15/1/2047 1,266,775 0.29
25,098,121 5.75
Spain EUR 1,100,000 Spain Government Bond
0.25% 30/4/2018 * 1,106,589 0.25 EUR 3,855,000 Spain Government Bond
3.75% 31/10/2018 4,101,951 0.94 EUR 500,000 Spain Government Bond
0.25% 31/1/2019 503,790 0.12 EUR 1,250,000 Spain Government Bond
2.75% 30/4/2019 1,326,388 0.30 EUR 2,635,000 Spain Government Bond
1.40% 31/1/2020 * 2,746,434 0.63 EUR 1,000,000 Spain Government Bond
1.15% 30/7/2020 1,038,160 0.24 EUR 1,900,000 Spain Government Bond
0.75% 30/7/2021 1,942,978 0.45 EUR 250,000 Spain Government Bond
0.40% 30/4/2022 249,060 0.06 EUR 1,550,000 Spain Government Bond
6.00% 31/1/2029 2,239,610 0.51 EUR 1,850,000 Spain Government Bond
5.75% 30/7/2032 2,726,067 0.62 EUR 1,110,000 Spain Government Bond RegS
'144A' 4.10% 30/7/2018 1,174,003 0.27 EUR 1,355,000 Spain Government Bond RegS
'144A' 4.60% 30/7/2019 1,504,070 0.34 EUR 558,000 Spain Government Bond RegS
'144A' 4.30% 31/10/2019 621,235 0.14 EUR 2,535,000 Spain Government Bond RegS
'144A' 4.00% 30/4/2020 2,847,312 0.65 EUR 2,435,000 Spain Government Bond RegS
'144A' 5.50% 30/4/2021 * 2,965,867 0.68 EUR 1,520,000 Spain Government Bond RegS
'144A' 5.85% 31/1/2022 1,917,290 0.44 EUR 1,960,000 Spain Government Bond RegS
'144A' 5.40% 31/1/2023 2,487,701 0.57 EUR 1,425,000 Spain Government Bond RegS
'144A' 4.40% 31/10/2023 1,744,770 0.40 EUR 1,300,000 Spain Government Bond RegS
'144A' 4.80% 31/1/2024 1,629,843 0.37
EUR 1,580,000 Spain Government Bond RegS '144A' 3.80% 30/4/2024 1,877,790 0.43
EUR 1,480,000 Spain Government Bond RegS '144A' 2.75% 31/10/2024 1,649,112 0.38
EUR 1,560,000 Spain Government Bond RegS '144A' 1.60% 30/4/2025 1,598,891 0.37
EUR 1,710,000 Spain Government Bond RegS '144A' 4.65% 30/7/2025 2,153,283 0.49
EUR 1,960,000 Spain Government Bond RegS '144A' 2.15% 31/10/2025 2,076,855 0.48
EUR 1,810,000 Spain Government Bond RegS '144A' 1.95% 30/4/2026 1,881,966 0.43
EUR 1,100,000 Spain Government Bond RegS '144A' 5.90% 30/7/2026 * 1,519,518 0.35
EUR 1,200,000 Spain Government Bond RegS '144A' 1.30% 31/10/2026 1,175,730 0.27
EUR 1,070,000 Spain Government Bond RegS '144A' 1.50% 30/4/2027 1,056,513 0.24
EUR 1,000,000 Spain Government Bond RegS '144A' 5.15% 31/10/2028 1,349,685 0.31
EUR 1,160,000 Spain Government Bond RegS '144A' 1.95% 30/7/2030 1,151,874 0.26
EUR 1,470,000 Spain Government Bond RegS '144A' 4.20% 31/1/2037 1,866,650 0.43
EUR 1,085,000 Spain Government Bond RegS '144A' 4.90% 30/7/2040 1,509,669 0.35
EUR 1,234,000 Spain Government Bond RegS '144A' 4.70% 30/7/2041 1,679,400 0.39
EUR 900,000 Spain Government Bond RegS '144A' 5.15% 31/10/2044 1,302,224 0.30
EUR 670,000 Spain Government Bond RegS '144A' 2.90% 31/10/2046 673,853 0.15
EUR 325,000 Spain Government Bond RegS '144A' 3.45% 30/7/2066 345,434 0.08
59,741,565 13.69
Total Bonds 430,478,507 98.63
Total Transferable Securities and Money Market Instruments Admitted to an Official Stock Exchange Listing or Dealt in on Another Regulated Market 430,478,507 98.63
Securities portfolio at market value 430,478,507 98.63
Other Net Assets 5,989,773 1.37
Total Net Assets (EUR) 436,468,280 100.00
Portfolio of Investments as at 31 March 2017
Sector Breakdown as at 31 March 2017
% of Net Assets
Government 98.63
Securities portfolio at market value 98.63Other Net Assets 1.37
100.00
Netherlands continued Spain continued

Transferable Securities and Money Market Instruments Admitted to an Official Stock Exchange Listing or Dealt in on Another Regulated Market
Transferable Securities and Money Market Instruments Admitted to an Official Stock Exchange Listing or Dealt in on Another Regulated Market
Holding Description
Market Value
USD
% of Net
Assets Holding Description
Market Value
USD
% of Net
Assets
USD
80 BlackRock Global Index Funds (BGIF)
The notes on pages 122 to 128 form an integral part of these financial statements.
BlackRock Global Government Bond Index Fund
BONDS
Australia AUD 110,000 Australia Government Bond RegS
3.25% 21/10/2018 86,043 0.09 AUD 110,000 Australia Government Bond RegS
2.75% 21/10/2019 85,919 0.09 AUD 150,000 Australia Government Bond RegS
4.50% 15/4/2020 123,266 0.13 AUD 115,000 Australia Government Bond RegS
1.75% 21/11/2020 86,990 0.09 AUD 180,000 Australia Government Bond RegS
5.75% 15/5/2021 157,256 0.17 AUD 90,000 Australia Government Bond RegS
2.00% 21/12/2021 68,187 0.07 AUD 120,000 Australia Government Bond RegS
5.50% 21/4/2023 107,898 0.11 AUD 135,000 Australia Government Bond RegS
2.75% 21/4/2024 104,881 0.11 AUD 20,000 Australia Government Bond RegS
3.25% 21/4/2025 (traded in Australia) 16,023 0.02
AUD 100,000 Australia Government Bond RegS 3.25% 21/4/2025 (traded in Germany) 80,117 0.08
AUD 135,000 Australia Government Bond RegS 4.25% 21/4/2026 116,398 0.12
AUD 161,000 Australia Government Bond RegS 4.75% 21/4/2027 145,136 0.15
AUD 120,000 Australia Government Bond RegS 2.75% 21/11/2027 91,579 0.10
AUD 50,000 Australia Government Bond RegS 2.25% 21/5/2028 36,198 0.04
AUD 30,000 Australia Government Bond RegS 3.25% 21/4/2029 23,836 0.03
AUD 75,000 Australia Government Bond RegS 4.50% 21/4/2033 67,563 0.07
AUD 30,000 Australia Government Bond RegS 2.75% 21/6/2035 21,426 0.02
AUD 45,000 Australia Government Bond RegS 3.75% 21/4/2037 36,613 0.04
AUD 30,000 Australia Government Bond RegS 3.25% 21/6/2039 22,398 0.02
AUD 40,000 Australia Government Bond RegS 3.00% 21/3/2047 27,214 0.03
1,504,941 1.58
Austria EUR 70,000 Republic of Austria Government
Bond 6.25% 15/7/2027 118,027 0.12 EUR 20,000 Republic of Austria Government
Bond RegS '144A' 1.15% 19/10/2018 21,976 0.02
EUR 15,000 Republic of Austria Government Bond RegS '144A' 4.35% 15/3/2019 17,592 0.02
EUR 35,000 Republic of Austria Government Bond RegS '144A' 1.95% 18/6/2019 39,528 0.04
EUR 50,000 Republic of Austria Government Bond RegS '144A' 0.25% 18/10/2019 54,610 0.06
EUR 60,000 Republic of Austria Government Bond RegS '144A' 3.90% 15/7/2020 73,467 0.08
EUR 90,000 Republic of Austria Government Bond RegS '144A' 3.50% 15/9/2021 112,707 0.12
EUR 40,000 Republic of Austria Government Bond RegS '144A' 3.65% 20/4/2022 51,167 0.05
EUR 35,000 Republic of Austria Government Bond RegS '144A' 3.40% 22/11/2022 44,925 0.05
EUR 60,000 Republic of Austria Government Bond RegS '144A' 1.75% 20/10/2023 71,489 0.08
EUR 75,000 Republic of Austria Government Bond RegS '144A' 1.65% 21/10/2024 88,936 0.09
EUR 15,000 Republic of Austria Government Bond RegS '144A' 1.20% 20/10/2025 17,193 0.02
EUR 30,000 Republic of Austria Government Bond RegS '144A' 4.85% 15/3/2026 44,753 0.05
EUR 30,000 Republic of Austria Government Bond RegS '144A' 0.75% 20/10/2026 32,711 0.04
EUR 25,000 Republic of Austria Government Bond RegS '144A' 2.40% 23/5/2034 32,532 0.03
EUR 66,000 Republic of Austria Government Bond RegS '144A' 4.15% 15/3/2037 108,333 0.11
EUR 35,000 Republic of Austria Government Bond RegS '144A' 3.15% 20/6/2044 52,709 0.06
EUR 20,000 Republic of Austria Government Bond RegS '144A' 1.50% 20/2/2047 21,670 0.02
EUR 15,000 Republic of Austria Government Bond RegS '144A' 3.80% 26/1/2062 27,455 0.03
1,031,780 1.09
Belgium EUR 120,000 Kingdom of Belgium Government
Bond 4.00% 28/3/2019 139,928 0.15 EUR 70,000 Kingdom of Belgium Government
Bond 4.00% 28/3/2022 90,519 0.10 EUR 50,000 Kingdom of Belgium Government
Bond 5.50% 28/3/2028 79,955 0.08 EUR 60,000 Kingdom of Belgium Government
Bond RegS 3.00% 28/9/2019 69,783 0.07 EUR 85,000 Kingdom of Belgium Government
Bond RegS '144A' 3.75% 28/9/2020 104,208 0.11
EUR 100,000 Kingdom of Belgium Government Bond RegS '144A' 4.25% 28/9/2021 128,850 0.14
EUR 60,000 Kingdom of Belgium Government Bond RegS 4.25% 28/9/2022 79,451 0.08
EUR 95,000 Kingdom of Belgium Government Bond RegS 2.25% 22/6/2023 115,439 0.12
EUR 85,000 Kingdom of Belgium Government Bond RegS '144A' 2.60% 22/6/2024 105,843 0.11
EUR 55,000 Kingdom of Belgium Government Bond RegS '144A' 0.80% 22/6/2025 60,199 0.06
EUR 60,000 Kingdom of Belgium Government Bond RegS '144A' 4.50% 28/3/2026 86,326 0.09
EUR 110,000 Kingdom of Belgium Government Bond RegS '144A' 1.00% 22/6/2026 121,159 0.13
EUR 40,000 Kingdom of Belgium Government Bond RegS '144A' 0.80% 22/6/2027 42,610 0.04
Portfolio of Investments as at 31 March 2017
Austria continued
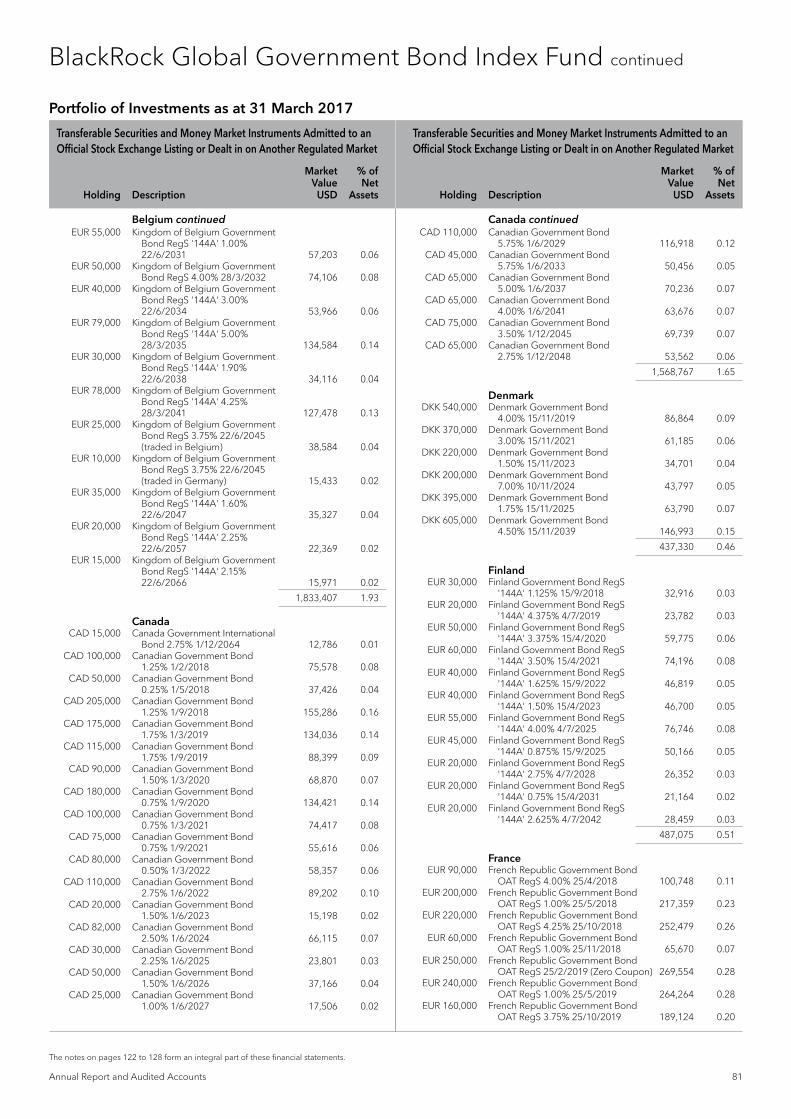
Transferable Securities and Money Market Instruments Admitted to an Official Stock Exchange Listing or Dealt in on Another Regulated Market
Transferable Securities and Money Market Instruments Admitted to an Official Stock Exchange Listing or Dealt in on Another Regulated Market
Holding Description
Market Value
USD
% of Net
Assets Holding Description
Market Value
USD
% of Net
Assets
Annual Report and Audited Accounts 81
The notes on pages 122 to 128 form an integral part of these financial statements.
BlackRock Global Government Bond Index Fund continued
EUR 55,000 Kingdom of Belgium Government Bond RegS '144A' 1.00% 22/6/2031 57,203 0.06
EUR 50,000 Kingdom of Belgium Government Bond RegS 4.00% 28/3/2032 74,106 0.08
EUR 40,000 Kingdom of Belgium Government Bond RegS '144A' 3.00% 22/6/2034 53,966 0.06
EUR 79,000 Kingdom of Belgium Government Bond RegS '144A' 5.00% 28/3/2035 134,584 0.14
EUR 30,000 Kingdom of Belgium Government Bond RegS '144A' 1.90% 22/6/2038 34,116 0.04
EUR 78,000 Kingdom of Belgium Government Bond RegS '144A' 4.25% 28/3/2041 127,478 0.13
EUR 25,000 Kingdom of Belgium Government Bond RegS 3.75% 22/6/2045 (traded in Belgium) 38,584 0.04
EUR 10,000 Kingdom of Belgium Government Bond RegS 3.75% 22/6/2045 (traded in Germany) 15,433 0.02
EUR 35,000 Kingdom of Belgium Government Bond RegS '144A' 1.60% 22/6/2047 35,327 0.04
EUR 20,000 Kingdom of Belgium Government Bond RegS '144A' 2.25% 22/6/2057 22,369 0.02
EUR 15,000 Kingdom of Belgium Government Bond RegS '144A' 2.15% 22/6/2066 15,971 0.02
1,833,407 1.93
Canada CAD 15,000 Canada Government International
Bond 2.75% 1/12/2064 12,786 0.01 CAD 100,000 Canadian Government Bond
1.25% 1/2/2018 75,578 0.08 CAD 50,000 Canadian Government Bond
0.25% 1/5/2018 37,426 0.04 CAD 205,000 Canadian Government Bond
1.25% 1/9/2018 155,286 0.16 CAD 175,000 Canadian Government Bond
1.75% 1/3/2019 134,036 0.14 CAD 115,000 Canadian Government Bond
1.75% 1/9/2019 88,399 0.09 CAD 90,000 Canadian Government Bond
1.50% 1/3/2020 68,870 0.07 CAD 180,000 Canadian Government Bond
0.75% 1/9/2020 134,421 0.14 CAD 100,000 Canadian Government Bond
0.75% 1/3/2021 74,417 0.08 CAD 75,000 Canadian Government Bond
0.75% 1/9/2021 55,616 0.06 CAD 80,000 Canadian Government Bond
0.50% 1/3/2022 58,357 0.06 CAD 110,000 Canadian Government Bond
2.75% 1/6/2022 89,202 0.10 CAD 20,000 Canadian Government Bond
1.50% 1/6/2023 15,198 0.02 CAD 82,000 Canadian Government Bond
2.50% 1/6/2024 66,115 0.07 CAD 30,000 Canadian Government Bond
2.25% 1/6/2025 23,801 0.03 CAD 50,000 Canadian Government Bond
1.50% 1/6/2026 37,166 0.04 CAD 25,000 Canadian Government Bond
1.00% 1/6/2027 17,506 0.02
CAD 110,000 Canadian Government Bond 5.75% 1/6/2029 116,918 0.12
CAD 45,000 Canadian Government Bond 5.75% 1/6/2033 50,456 0.05
CAD 65,000 Canadian Government Bond 5.00% 1/6/2037 70,236 0.07
CAD 65,000 Canadian Government Bond 4.00% 1/6/2041 63,676 0.07
CAD 75,000 Canadian Government Bond 3.50% 1/12/2045 69,739 0.07
CAD 65,000 Canadian Government Bond 2.75% 1/12/2048 53,562 0.06
1,568,767 1.65
Denmark DKK 540,000 Denmark Government Bond
4.00% 15/11/2019 86,864 0.09 DKK 370,000 Denmark Government Bond
3.00% 15/11/2021 61,185 0.06 DKK 220,000 Denmark Government Bond
1.50% 15/11/2023 34,701 0.04 DKK 200,000 Denmark Government Bond
7.00% 10/11/2024 43,797 0.05 DKK 395,000 Denmark Government Bond
1.75% 15/11/2025 63,790 0.07 DKK 605,000 Denmark Government Bond
4.50% 15/11/2039 146,993 0.15
437,330 0.46
Finland EUR 30,000 Finland Government Bond RegS
'144A' 1.125% 15/9/2018 32,916 0.03 EUR 20,000 Finland Government Bond RegS
'144A' 4.375% 4/7/2019 23,782 0.03 EUR 50,000 Finland Government Bond RegS
'144A' 3.375% 15/4/2020 59,775 0.06 EUR 60,000 Finland Government Bond RegS
'144A' 3.50% 15/4/2021 74,196 0.08 EUR 40,000 Finland Government Bond RegS
'144A' 1.625% 15/9/2022 46,819 0.05 EUR 40,000 Finland Government Bond RegS
'144A' 1.50% 15/4/2023 46,700 0.05 EUR 55,000 Finland Government Bond RegS
'144A' 4.00% 4/7/2025 76,746 0.08 EUR 45,000 Finland Government Bond RegS
'144A' 0.875% 15/9/2025 50,166 0.05 EUR 20,000 Finland Government Bond RegS
'144A' 2.75% 4/7/2028 26,352 0.03 EUR 20,000 Finland Government Bond RegS
'144A' 0.75% 15/4/2031 21,164 0.02 EUR 20,000 Finland Government Bond RegS
'144A' 2.625% 4/7/2042 28,459 0.03
487,075 0.51
France EUR 90,000 French Republic Government Bond
OAT RegS 4.00% 25/4/2018 100,748 0.11 EUR 200,000 French Republic Government Bond
OAT RegS 1.00% 25/5/2018 217,359 0.23 EUR 220,000 French Republic Government Bond
OAT RegS 4.25% 25/10/2018 252,479 0.26 EUR 60,000 French Republic Government Bond
OAT RegS 1.00% 25/11/2018 65,670 0.07 EUR 250,000 French Republic Government Bond
OAT RegS 25/2/2019 (Zero Coupon) 269,554 0.28 EUR 240,000 French Republic Government Bond
OAT RegS 1.00% 25/5/2019 264,264 0.28 EUR 160,000 French Republic Government Bond
OAT RegS 3.75% 25/10/2019 189,124 0.20
Portfolio of Investments as at 31 March 2017
Belgium continued Canada continued

Transferable Securities and Money Market Instruments Admitted to an Official Stock Exchange Listing or Dealt in on Another Regulated Market
Transferable Securities and Money Market Instruments Admitted to an Official Stock Exchange Listing or Dealt in on Another Regulated Market
Holding Description
Market Value
USD
% of Net
Assets Holding Description
Market Value
USD
% of Net
Assets
82 BlackRock Global Index Funds (BGIF)
The notes on pages 122 to 128 form an integral part of these financial statements.
BlackRock Global Government Bond Index Fund continued
Portfolio of Investments as at 31 March 2017
EUR 100,000 French Republic Government Bond OAT RegS 0.50% 25/11/2019 (traded in France) 109,274 0.11
EUR 130,000 French Republic Government Bond OAT RegS 0.50% 25/11/2019 (traded in Germany) 142,056 0.15
EUR 230,000 French Republic Government Bond OAT RegS 3.50% 25/4/2020 274,461 0.29
EUR 220,000 French Republic Government Bond OAT RegS 25/5/2020 (Zero Coupon) 237,264 0.25
EUR 45,000 French Republic Government Bond OAT RegS 0.25% 25/11/2020 48,878 0.05
EUR 220,000 French Republic Government Bond OAT RegS 3.75% 25/4/2021 272,180 0.29
EUR 50,000 French Republic Government Bond OAT RegS 25/5/2021 (Zero Coupon)(traded in France) 53,670 0.06
EUR 50,000 French Republic Government Bond OAT RegS 25/5/2021 (Zero Coupon)(traded in Germany) 53,670 0.06
EUR 340,000 French Republic Government Bond OAT RegS 3.25% 25/10/2021 417,888 0.44
EUR 200,000 French Republic Government Bond OAT RegS 3.00% 25/4/2022 245,216 0.26
EUR 50,000 French Republic Government Bond OAT RegS 25/5/2022 (Zero Coupon) 53,117 0.06
EUR 160,000 French Republic Government Bond OAT RegS 2.25% 25/10/2022 190,551 0.20
EUR 145,000 French Republic Government Bond OAT RegS 1.75% 25/5/2023 168,626 0.18
EUR 290,000 French Republic Government Bond OAT RegS 4.25% 25/10/2023 387,902 0.41
EUR 220,000 French Republic Government Bond OAT RegS 2.25% 25/5/2024 264,364 0.28
EUR 65,000 French Republic Government Bond OAT RegS 1.75% 25/11/2024 75,507 0.08
EUR 80,000 French Republic Government Bond OAT RegS 0.50% 25/5/2025 84,191 0.09
EUR 90,000 French Republic Government Bond OAT RegS 6.00% 25/10/2025 138,584 0.14
EUR 145,000 French Republic Government Bond OAT RegS 1.00% 25/11/2025 157,801 0.17
EUR 250,000 French Republic Government Bond OAT RegS 3.50% 25/4/2026 329,184 0.35
EUR 122,000 French Republic Government Bond OAT RegS 0.50% 25/5/2026 126,078 0.13
EUR 30,000 French Republic Government Bond OAT RegS 0.25% 25/11/2026 29,978 0.03
EUR 170,000 French Republic Government Bond OAT RegS 2.75% 25/10/2027 212,206 0.22
EUR 250,000 French Republic Government Bond OAT RegS 5.50% 25/4/2029 397,711 0.42
EUR 179,000 French Republic Government Bond OAT RegS 2.50% 25/5/2030 219,523 0.23
EUR 90,000 French Republic Government Bond OAT RegS 1.50% 25/5/2031 97,824 0.10
EUR 115,000 French Republic Government Bond OAT RegS 5.75% 25/10/2032 197,670 0.21
EUR 143,000 French Republic Government Bond OAT RegS 4.75% 25/4/2035 230,044 0.24
EUR 35,000 French Republic Government Bond OAT RegS '144A' 1.25% 25/5/2036 34,903 0.04
EUR 115,000 French Republic Government Bond OAT RegS 4.00% 25/10/2038 173,900 0.18
EUR 50,000 French Republic Government Bond OAT RegS '144A' 1.75% 25/6/2039 53,432 0.06
EUR 153,000 French Republic Government Bond OAT RegS 4.50% 25/4/2041 249,141 0.26
EUR 128,000 French Republic Government Bond OAT RegS 3.25% 25/5/2045 174,545 0.18
EUR 70,000 French Republic Government Bond OAT RegS 4.00% 25/4/2055 111,739 0.12
EUR 55,000 French Republic Government Bond OAT RegS 4.00% 25/4/2060 89,235 0.09
EUR 35,000 French Republic Government Bond OAT RegS '144A' 1.75% 25/5/2066 32,369 0.03
7,493,880 7.89
Germany EUR 70,000 Bundesobligation RegS 1.00%
12/10/2018 76,833 0.08 EUR 45,000 Bundesobligation RegS 1.00%
22/2/2019 49,698 0.05 EUR 70,000 Bundesobligation RegS 0.50%
12/4/2019 76,704 0.08 EUR 200,000 Bundesobligation RegS 0.25%
11/10/2019 218,951 0.23 EUR 100,000 Bundesobligation RegS 17/4/2020
(Zero Coupon) 109,004 0.11 EUR 240,000 Bundesobligation RegS 0.25%
16/10/2020 264,206 0.28 EUR 50,000 Bundesobligation RegS 8/10/2021
(Zero Coupon) 54,591 0.06 EUR 90,000 Bundesrepublik Deutschland RegS
4.25% 4/7/2018 102,211 0.11 EUR 100,000 Bundesrepublik Deutschland RegS
3.75% 4/1/2019 115,399 0.12 EUR 30,000 Bundesrepublik Deutschland RegS
3.50% 4/7/2019 35,145 0.04 EUR 90,000 Bundesrepublik Deutschland RegS
3.25% 4/1/2020 106,804 0.11 EUR 105,000 Bundesrepublik Deutschland RegS
3.00% 4/7/2020 125,639 0.13 EUR 97,000 Bundesrepublik Deutschland RegS
2.50% 4/1/2021 115,793 0.12 EUR 150,000 Bundesrepublik Deutschland RegS
3.25% 4/7/2021 186,282 0.20 EUR 120,000 Bundesrepublik Deutschland RegS
2.25% 4/9/2021 143,954 0.15 EUR 40,000 Bundesrepublik Deutschland RegS
2.00% 4/1/2022 47,787 0.05 EUR 65,000 Bundesrepublik Deutschland RegS
1.75% 4/7/2022 77,255 0.08 EUR 120,000 Bundesrepublik Deutschland RegS
1.50% 4/9/2022 141,171 0.15 EUR 210,000 Bundesrepublik Deutschland RegS
1.50% 15/2/2023 248,080 0.26 EUR 70,000 Bundesrepublik Deutschland RegS
1.50% 15/5/2023 82,900 0.09 EUR 160,000 Bundesrepublik Deutschland RegS
2.00% 15/8/2023 195,472 0.21 EUR 70,000 Bundesrepublik Deutschland RegS
6.25% 4/1/2024 107,468 0.11 EUR 90,000 Bundesrepublik Deutschland RegS
1.75% 15/2/2024 108,829 0.11 EUR 75,000 Bundesrepublik Deutschland RegS
1.00% 15/8/2024 86,489 0.09 EUR 110,000 Bundesrepublik Deutschland RegS
0.50% 15/2/2025 122,139 0.13 EUR 130,000 Bundesrepublik Deutschland RegS
1.00% 15/8/2025 149,712 0.16 EUR 140,000 Bundesrepublik Deutschland RegS
0.50% 15/2/2026 154,133 0.16 EUR 145,000 Bundesrepublik Deutschland RegS
15/8/2026 (Zero Coupon) 151,334 0.16 EUR 35,000 Bundesrepublik Deutschland RegS
0.25% 15/2/2027 37,135 0.04 EUR 60,000 Bundesrepublik Deutschland RegS
6.50% 4/7/2027 104,171 0.11
France continued France continued

Transferable Securities and Money Market Instruments Admitted to an Official Stock Exchange Listing or Dealt in on Another Regulated Market
Transferable Securities and Money Market Instruments Admitted to an Official Stock Exchange Listing or Dealt in on Another Regulated Market
Holding Description
Market Value
USD
% of Net
Assets Holding Description
Market Value
USD
% of Net
Assets
* All or a portion of this security represents a security on loan.
Annual Report and Audited Accounts 83
The notes on pages 122 to 128 form an integral part of these financial statements.
BlackRock Global Government Bond Index Fund continued
Portfolio of Investments as at 31 March 2017
EUR 60,000 Bundesrepublik Deutschland RegS 5.625% 4/1/2028 99,779 0.10
EUR 50,000 Bundesrepublik Deutschland RegS 4.75% 4/7/2028 78,994 0.08
EUR 50,000 Bundesrepublik Deutschland RegS 6.25% 4/1/2030 91,589 0.10
EUR 73,000 Bundesrepublik Deutschland RegS 5.50% 4/1/2031 129,203 0.14
EUR 110,000 Bundesrepublik Deutschland RegS 4.75% 4/7/2034 194,675 0.20
EUR 82,000 Bundesrepublik Deutschland RegS 4.00% 4/1/2037 138,146 0.14
EUR 100,000 Bundesrepublik Deutschland RegS 4.25% 4/7/2039 178,877 0.19
EUR 64,000 Bundesrepublik Deutschland RegS 4.75% 4/7/2040 123,027 0.13
EUR 100,000 Bundesrepublik Deutschland RegS 3.25% 4/7/2042 160,122 0.17
EUR 37,000 Bundesrepublik Deutschland RegS 2.50% 4/7/2044 52,848 0.06
EUR 104,000 Bundesrepublik Deutschland RegS 2.50% 15/8/2046 149,991 0.16
EUR 150,000 Bundesschatzanweisungen RegS 14/9/2018 (Zero Coupon) 162,046 0.17
EUR 140,000 Bundesschatzanweisungen RegS 14/12/2018 (Zero Coupon) 151,558 0.16
5,306,144 5.58
Ireland EUR 80,000 Ireland Government Bond
4.50% 18/10/2018 * 91,926 0.10 EUR 50,000 Ireland Government Bond
4.40% 18/6/2019 59,049 0.06 EUR 40,000 Ireland Government Bond
5.90% 18/10/2019 49,557 0.05 EUR 40,000 Ireland Government Bond
4.50% 18/4/2020 48,901 0.05 EUR 29,000 Ireland Government Bond
5.40% 13/3/2025 42,142 0.04 EUR 55,000 Ireland Government Bond RegS
0.80% 15/3/2022 61,003 0.06 EUR 11,000 Ireland Government Bond RegS
3.90% 20/3/2023 14,285 0.02 EUR 60,000 Ireland Government Bond RegS
3.40% 18/3/2024 76,844 0.08 EUR 30,000 Ireland Government Bond RegS
1.00% 15/5/2026 32,130 0.03 EUR 45,000 Ireland Government Bond RegS
2.40% 15/5/2030 53,739 0.06 EUR 25,000 Ireland Government Bond RegS
1.70% 15/5/2037 26,087 0.03 EUR 35,000 Ireland Government Bond RegS
2.00% 18/2/2045 36,972 0.04
592,635 0.62
Italy EUR 100,000 Italy Buoni Poliennali Del Tesoro
3.50% 1/6/2018 111,341 0.12 EUR 180,000 Italy Buoni Poliennali Del Tesoro
4.50% 1/8/2018 204,074 0.21 EUR 85,000 Italy Buoni Poliennali Del Tesoro
0.30% 15/10/2018 91,330 0.10 EUR 90,000 Italy Buoni Poliennali Del Tesoro
3.50% 1/12/2018 101,695 0.11 EUR 75,000 Italy Buoni Poliennali Del Tesoro
4.50% 1/3/2019 86,855 0.09 EUR 155,000 Italy Buoni Poliennali Del Tesoro
2.50% 1/5/2019 173,609 0.18
EUR 80,000 Italy Buoni Poliennali Del Tesoro 1.50% 1/8/2019 87,933 0.09
EUR 120,000 Italy Buoni Poliennali Del Tesoro 4.25% 1/9/2019 140,326 0.15
EUR 140,000 Italy Buoni Poliennali Del Tesoro 0.05% 15/10/2019 148,552 0.16
EUR 60,000 Italy Buoni Poliennali Del Tesoro 1.05% 1/12/2019 65,328 0.07
EUR 250,000 Italy Buoni Poliennali Del Tesoro 4.25% 1/3/2020 296,896 0.31
EUR 60,000 Italy Buoni Poliennali Del Tesoro 0.70% 1/5/2020 64,694 0.07
EUR 85,000 Italy Buoni Poliennali Del Tesoro 4.00% 1/9/2020 101,638 0.11
EUR 80,000 Italy Buoni Poliennali Del Tesoro 0.65% 1/11/2020 86,010 0.09
EUR 130,000 Italy Buoni Poliennali Del Tesoro 3.75% 1/3/2021 156,048 0.16
EUR 135,000 Italy Buoni Poliennali Del Tesoro 3.75% 1/5/2021 162,177 0.17
EUR 60,000 Italy Buoni Poliennali Del Tesoro 0.45% 1/6/2021 63,593 0.07
EUR 80,000 Italy Buoni Poliennali Del Tesoro 4.75% 1/9/2021 100,030 0.11
EUR 90,000 Italy Buoni Poliennali Del Tesoro 2.15% 15/12/2021 101,783 0.11
EUR 80,000 Italy Buoni Poliennali Del Tesoro 5.00% 1/3/2022 101,575 0.11
EUR 95,000 Italy Buoni Poliennali Del Tesoro 1.35% 15/4/2022 102,923 0.11
EUR 80,000 Italy Buoni Poliennali Del Tesoro 5.50% 1/9/2022 104,618 0.11
EUR 190,000 Italy Buoni Poliennali Del Tesoro 1.45% 15/9/2022 205,969 0.22
EUR 102,000 Italy Buoni Poliennali Del Tesoro 5.50% 1/11/2022 133,715 0.14
EUR 150,000 Italy Buoni Poliennali Del Tesoro 0.95% 15/3/2023 157,027 0.16
EUR 110,000 Italy Buoni Poliennali Del Tesoro 4.50% 1/5/2023 (traded in Italy) 138,600 0.15
EUR 60,000 Italy Buoni Poliennali Del Tesoro 4.50% 1/5/2023 (traded in Switzerland) 75,600 0.08
EUR 40,000 Italy Buoni Poliennali Del Tesoro 9.00% 1/11/2023 62,692 0.07
EUR 80,000 Italy Buoni Poliennali Del Tesoro 4.50% 1/3/2024 101,112 0.11
EUR 90,000 Italy Buoni Poliennali Del Tesoro 3.75% 1/9/2024 109,134 0.11
EUR 80,000 Italy Buoni Poliennali Del Tesoro 2.50% 1/12/2024 89,504 0.09
EUR 175,000 Italy Buoni Poliennali Del Tesoro 1.50% 1/6/2025 181,467 0.19
EUR 20,000 Italy Buoni Poliennali Del Tesoro 2.00% 1/12/2025 21,338 0.02
EUR 80,000 Italy Buoni Poliennali Del Tesoro 1.60% 1/6/2026 82,004 0.09
EUR 80,000 Italy Buoni Poliennali Del Tesoro 7.25% 1/11/2026 123,175 0.13
EUR 50,000 Italy Buoni Poliennali Del Tesoro 1.25% 1/12/2026 49,365 0.05
EUR 30,000 Italy Buoni Poliennali Del Tesoro 2.20% 1/6/2027 31,803 0.03
EUR 154,000 Italy Buoni Poliennali Del Tesoro 6.50% 1/11/2027 228,788 0.24
EUR 170,000 Italy Buoni Poliennali Del Tesoro 5.25% 1/11/2029 235,477 0.25
EUR 130,000 Italy Buoni Poliennali Del Tesoro 6.00% 1/5/2031 194,633 0.20
Germany continued Italy continued

Transferable Securities and Money Market Instruments Admitted to an Official Stock Exchange Listing or Dealt in on Another Regulated Market
Transferable Securities and Money Market Instruments Admitted to an Official Stock Exchange Listing or Dealt in on Another Regulated Market
Holding Description
Market Value
USD
% of Net
Assets Holding Description
Market Value
USD
% of Net
Assets
84 BlackRock Global Index Funds (BGIF)
The notes on pages 122 to 128 form an integral part of these financial statements.
Portfolio of Investments as at 31 March 2017
EUR 84,000 Italy Buoni Poliennali Del Tesoro 5.75% 1/2/2033 124,543 0.13
EUR 103,000 Italy Buoni Poliennali Del Tesoro RegS 4.25% 1/2/2019 118,415 0.12
EUR 50,000 Italy Buoni Poliennali Del Tesoro RegS 3.75% 1/8/2021 60,192 0.06
EUR 140,000 Italy Buoni Poliennali Del Tesoro RegS '144A' 4.75% 1/8/2023 179,534 0.19
EUR 100,000 Italy Buoni Poliennali Del Tesoro RegS '144A' 5.00% 1/3/2025 131,088 0.14
EUR 90,000 Italy Buoni Poliennali Del Tesoro RegS 4.50% 1/3/2026 114,741 0.12
EUR 85,000 Italy Buoni Poliennali Del Tesoro RegS '144A' 4.75% 1/9/2028 111,654 0.12
EUR 80,000 Italy Buoni Poliennali Del Tesoro RegS '144A' 3.50% 1/3/2030 94,747 0.10
EUR 115,000 Italy Buoni Poliennali Del Tesoro RegS '144A' 1.65% 1/3/2032 109,872 0.12
EUR 130,000 Italy Buoni Poliennali Del Tesoro RegS 5.00% 1/8/2034 179,960 0.19
EUR 53,000 Italy Buoni Poliennali Del Tesoro RegS '144A' 2.25% 1/9/2036 52,003 0.05
EUR 125,000 Italy Buoni Poliennali Del Tesoro RegS 4.00% 1/2/2037 154,778 0.16
EUR 122,000 Italy Buoni Poliennali Del Tesoro RegS 5.00% 1/8/2039 169,867 0.18
EUR 75,000 Italy Buoni Poliennali Del Tesoro RegS 5.00% 1/9/2040 103,851 0.11
EUR 73,000 Italy Buoni Poliennali Del Tesoro RegS '144A' 4.75% 1/9/2044 98,761 0.10
EUR 55,000 Italy Buoni Poliennali Del Tesoro RegS '144A' 3.25% 1/9/2046 58,975 0.06
EUR 85,000 Italy Buoni Poliennali Del Tesoro RegS '144A' 2.70% 1/3/2047 81,523 0.09
EUR 25,000 Italy Buoni Poliennali Del Tesoro RegS '144A' 2.80% 1/3/2067 22,496 0.02
6,841,431 7.20
Japan JPY 7,500,000 Japan Government 2 Year Bond
0.10% 15/7/2018 67,504 0.07 JPY 18,000,000 Japan Government 2 Year Bond
0.10% 15/9/2018 162,116 0.17 JPY 11,000,000 Japan Government 2 Year Bond
0.10% 15/11/2018 99,112 0.10 JPY 25,000,000 Japan Government 2 Year Bond
0.10% 15/12/2018 225,362 0.24 JPY 15,000,000 Japan Government 2 Year Bond
0.10% 15/1/2019 135,262 0.14 JPY 27,000,000 Japan Government 5 Year Bond
0.10% 20/3/2018 242,802 0.26 JPY 44,700,000 Japan Government 5 Year Bond
0.30% 20/6/2018 403,209 0.42 JPY 32,000,000 Japan Government 5 Year Bond
0.40% 20/6/2018 288,999 0.30 JPY 20,000,000 Japan Government 5 Year Bond
0.20% 20/9/2018 180,389 0.19 JPY 20,000,000 Japan Government 5 Year Bond
0.20% 20/12/2018 180,564 0.19 JPY 22,000,000 Japan Government 5 Year Bond
0.20% 20/3/2019 198,750 0.21 JPY 5,000,000 Japan Government 5 Year Bond
0.10% 20/6/2019 45,102 0.05 JPY 11,000,000 Japan Government 5 Year Bond
0.20% 20/6/2019 99,444 0.10 JPY 9,000,000 Japan Government 5 Year Bond
0.10% 20/9/2019 81,229 0.09 JPY 14,500,000 Japan Government 5 Year Bond
0.10% 20/12/2019 130,937 0.14
JPY 15,000,000 Japan Government 5 Year Bond 0.10% 20/3/2020 135,535 0.14
JPY 27,000,000 Japan Government 5 Year Bond 0.10% 20/6/2020 244,076 0.26
JPY 37,000,000 Japan Government 5 Year Bond 0.10% 20/12/2020 334,839 0.35
JPY 30,400,000 Japan Government 5 Year Bond 0.10% 20/6/2021 275,322 0.29
JPY 10,000,000 Japan Government 5 Year Bond 0.10% 20/9/2021 90,608 0.10
JPY 22,000,000 Japan Government 10 Year Bond 1.50% 20/9/2018 202,094 0.21
JPY 9,000,000 Japan Government 10 Year Bond 1.30% 20/12/2018 82,761 0.09
JPY 23,000,000 Japan Government 10 Year Bond 1.30% 20/3/2019 212,125 0.22
JPY 16,000,000 Japan Government 10 Year Bond 1.50% 20/3/2019 148,203 0.16
JPY 14,000,000 Japan Government 10 Year Bond 1.50% 20/6/2019 130,165 0.14
JPY 15,000,000 Japan Government 10 Year Bond 1.30% 20/9/2019 139,283 0.15
JPY 17,000,000 Japan Government 10 Year Bond 1.40% 20/9/2019 158,329 0.17
JPY 2,800,000 Japan Government 10 Year Bond 1.30% 20/12/2019 26,108 0.03
JPY 15,100,000 Japan Government 10 Year Bond 1.30% 20/3/2020 141,182 0.15
JPY 7,000,000 Japan Government 10 Year Bond 1.40% 20/3/2020 65,655 0.07
JPY 14,500,000 Japan Government 10 Year Bond 1.10% 20/6/2020 135,151 0.14
JPY 9,300,000 Japan Government 10 Year Bond 1.30% 20/6/2020 87,236 0.09
JPY 32,000,000 Japan Government 10 Year Bond 0.80% 20/9/2020 296,127 0.31
JPY 26,000,000 Japan Government 10 Year Bond 1.00% 20/9/2020 242,424 0.25
JPY 27,000,000 Japan Government 10 Year Bond 1.20% 20/12/2020 254,228 0.27
JPY 9,000,000 Japan Government 10 Year Bond 1.10% 20/3/2021 84,682 0.09
JPY 16,000,000 Japan Government 10 Year Bond 1.30% 20/3/2021 151,536 0.16
JPY 14,400,000 Japan Government 10 Year Bond 1.20% 20/6/2021 136,353 0.14
JPY 5,000,000 Japan Government 10 Year Bond 1.10% 20/9/2021 47,305 0.05
JPY 21,000,000 Japan Government 10 Year Bond 1.00% 20/12/2021 198,291 0.21
JPY 17,000,000 Japan Government 10 Year Bond 1.10% 20/12/2021 161,243 0.17
JPY 15,500,000 Japan Government 10 Year Bond 0.90% 20/3/2022 145,990 0.15
JPY 35,900,000 Japan Government 10 Year Bond 1.00% 20/3/2022 339,735 0.36
JPY 30,100,000 Japan Government 10 Year Bond 0.80% 20/6/2022 282,729 0.30
JPY 8,500,000 Japan Government 10 Year Bond 0.90% 20/6/2022 80,244 0.08
JPY 13,500,000 Japan Government 10 Year Bond 0.80% 20/9/2022 126,946 0.13
JPY 29,000,000 Japan Government 10 Year Bond 0.70% 20/12/2022 271,912 0.29
JPY 16,000,000 Japan Government 10 Year Bond 0.80% 20/12/2022 150,697 0.16
JPY 22,650,000 Japan Government 10 Year Bond 0.60% 20/3/2023 211,330 0.22
JPY 8,300,000 Japan Government 10 Year Bond 0.80% 20/6/2023 78,492 0.08
BlackRock Global Government Bond Index Fund continued
Italy continued Japan continued

Transferable Securities and Money Market Instruments Admitted to an Official Stock Exchange Listing or Dealt in on Another Regulated Market
Transferable Securities and Money Market Instruments Admitted to an Official Stock Exchange Listing or Dealt in on Another Regulated Market
Holding Description
Market Value
USD
% of Net
Assets Holding Description
Market Value
USD
% of Net
Assets
Annual Report and Audited Accounts 85
The notes on pages 122 to 128 form an integral part of these financial statements.
Portfolio of Investments as at 31 March 2017
JPY 21,000,000 Japan Government 10 Year Bond 0.60% 20/12/2023 196,724 0.21
JPY 4,000,000 Japan Government 10 Year Bond 0.60% 20/3/2024 37,506 0.04
JPY 7,500,000 Japan Government 10 Year Bond 0.60% 20/6/2024 70,337 0.07
JPY 12,200,000 Japan Government 10 Year Bond 0.50% 20/9/2024 113,589 0.12
JPY 7,000,000 Japan Government 10 Year Bond 0.30% 20/12/2024 64,274 0.07
JPY 6,200,000 Japan Government 10 Year Bond 0.50% 20/12/2024 57,786 0.06
JPY 4,200,000 Japan Government 10 Year Bond 0.40% 20/3/2025 38,847 0.04
JPY 22,000,000 Japan Government 10 Year Bond 0.40% 20/6/2025 203,363 0.21
JPY 13,000,000 Japan Government 10 Year Bond 0.40% 20/9/2025 120,253 0.13
JPY 6,000,000 Japan Government 10 Year Bond 0.30% 20/12/2025 55,077 0.06
JPY 16,600,000 Japan Government 10 Year Bond 0.10% 20/3/2026 149,560 0.16
JPY 16,000,000 Japan Government 10 Year Bond 0.10% 20/6/2026 144,098 0.15
JPY 18,000,000 Japan Government 10 Year Bond 0.10% 20/9/2026 162,005 0.17
JPY 18,500,000 Japan Government 10 Year Bond 0.10% 20/12/2026 166,434 0.18
JPY 24,500,000 Japan Government 20 Year Bond 1.90% 20/9/2022 243,552 0.26
JPY 3,000,000 Japan Government 20 Year Bond 1.90% 20/9/2023 30,292 0.03
JPY 7,000,000 Japan Government 20 Year Bond 1.90% 20/3/2024 71,288 0.07
JPY 4,000,000 Japan Government 20 Year Bond 2.10% 20/3/2024 41,263 0.04
JPY 10,000,000 Japan Government 20 Year Bond 2.40% 20/6/2024 105,446 0.11
JPY 6,000,000 Japan Government 20 Year Bond 2.10% 20/9/2024 62,302 0.07
JPY 11,100,000 Japan Government 20 Year Bond 1.90% 20/3/2025 114,546 0.12
JPY 10,000,000 Japan Government 20 Year Bond 1.90% 20/6/2025 103,546 0.11
JPY 5,500,000 Japan Government 20 Year Bond 2.00% 20/6/2025 57,304 0.06
JPY 12,000,000 Japan Government 20 Year Bond 2.10% 20/6/2025 126,067 0.13
JPY 6,000,000 Japan Government 20 Year Bond 2.00% 20/9/2025 62,784 0.07
JPY 8,500,000 Japan Government 20 Year Bond 2.00% 20/12/2025 89,287 0.09
JPY 6,000,000 Japan Government 20 Year Bond 2.10% 20/3/2026 63,675 0.07
JPY 7,000,000 Japan Government 20 Year Bond 2.20% 20/6/2026 75,204 0.08
JPY 13,700,000 Japan Government 20 Year Bond 2.30% 20/6/2026 148,311 0.16
JPY 11,000,000 Japan Government 20 Year Bond 2.20% 20/9/2026 118,601 0.12
JPY 3,000,000 Japan Government 20 Year Bond 2.30% 20/9/2026 32,580 0.03
JPY 24,000,000 Japan Government 20 Year Bond 2.10% 20/12/2026 257,427 0.27
JPY 8,200,000 Japan Government 20 Year Bond 2.10% 20/3/2027 88,291 0.09
JPY 2,500,000 Japan Government 20 Year Bond 2.10% 20/6/2027 26,998 0.03
JPY 10,000,000 Japan Government 20 Year Bond 2.30% 20/6/2027 109,816 0.12
JPY 7,000,000 Japan Government 20 Year Bond 2.10% 20/12/2027 76,081 0.08
JPY 4,000,000 Japan Government 20 Year Bond 2.10% 20/6/2028 43,731 0.05
JPY 6,000,000 Japan Government 20 Year Bond 2.40% 20/6/2028 67,381 0.07
JPY 8,300,000 Japan Government 20 Year Bond 2.10% 20/9/2028 90,939 0.10
JPY 18,000,000 Japan Government 20 Year Bond 1.90% 20/12/2028 193,912 0.20
JPY 16,000,000 Japan Government 20 Year Bond 1.90% 20/3/2029 172,807 0.18
JPY 15,000,000 Japan Government 20 Year Bond 2.10% 20/9/2029 165,933 0.17
JPY 14,150,000 Japan Government 20 Year Bond 1.60% 20/6/2030 149,248 0.16
JPY 5,000,000 Japan Government 20 Year Bond 1.80% 20/9/2030 53,979 0.06
JPY 11,500,000 Japan Government 20 Year Bond 1.90% 20/9/2030 125,464 0.13
JPY 15,500,000 Japan Government 20 Year Bond 2.10% 20/12/2030 173,178 0.18
JPY 8,200,000 Japan Government 20 Year Bond 2.00% 20/3/2031 90,757 0.10
JPY 7,300,000 Japan Government 20 Year Bond 2.20% 20/3/2031 82,615 0.09
JPY 11,000,000 Japan Government 20 Year Bond 1.90% 20/6/2031 120,553 0.13
JPY 7,000,000 Japan Government 20 Year Bond 1.70% 20/9/2031 75,063 0.08
JPY 12,000,000 Japan Government 20 Year Bond 1.80% 20/9/2031 130,173 0.14
JPY 12,000,000 Japan Government 20 Year Bond 1.80% 20/12/2031 130,273 0.14
JPY 4,000,000 Japan Government 20 Year Bond 1.70% 20/3/2032 42,946 0.05
JPY 9,000,000 Japan Government 20 Year Bond 1.80% 20/3/2032 97,769 0.10
JPY 7,000,000 Japan Government 20 Year Bond 1.50% 20/6/2032 73,366 0.08
JPY 4,000,000 Japan Government 20 Year Bond 1.60% 20/6/2032 42,443 0.04
JPY 5,000,000 Japan Government 20 Year Bond 1.70% 20/6/2032 53,741 0.06
JPY 17,000,000 Japan Government 20 Year Bond 1.70% 20/9/2032 182,661 0.19
JPY 21,500,000 Japan Government 20 Year Bond 1.70% 20/12/2032 231,260 0.24
JPY 18,000,000 Japan Government 20 Year Bond 1.80% 20/12/2032 196,042 0.21
JPY 11,300,000 Japan Government 20 Year Bond 1.50% 20/3/2033 118,450 0.12
JPY 10,900,000 Japan Government 20 Year Bond 1.60% 20/3/2033 115,815 0.12
JPY 13,000,000 Japan Government 20 Year Bond 1.70% 20/6/2033 139,912 0.15
JPY 13,700,000 Japan Government 20 Year Bond 1.70% 20/9/2033 147,477 0.16
JPY 14,850,000 Japan Government 20 Year Bond 1.60% 20/12/2033 157,795 0.17
JPY 4,000,000 Japan Government 20 Year Bond 1.50% 20/3/2034 41,921 0.04
JPY 7,350,000 Japan Government 20 Year Bond 1.50% 20/6/2034 76,919 0.08
JPY 15,200,000 Japan Government 20 Year Bond 1.40% 20/9/2034 156,913 0.17
JPY 13,300,000 Japan Government 20 Year Bond 1.20% 20/12/2034 133,068 0.14
JPY 11,700,000 Japan Government 20 Year Bond 1.20% 20/3/2035 116,928 0.12
BlackRock Global Government Bond Index Fund continued
Japan continued Japan continued

Transferable Securities and Money Market Instruments Admitted to an Official Stock Exchange Listing or Dealt in on Another Regulated Market
Transferable Securities and Money Market Instruments Admitted to an Official Stock Exchange Listing or Dealt in on Another Regulated Market
Holding Description
Market Value
USD
% of Net
Assets Holding Description
Market Value
USD
% of Net
Assets
86 BlackRock Global Index Funds (BGIF)
The notes on pages 122 to 128 form an integral part of these financial statements.
Portfolio of Investments as at 31 March 2017
JPY 10,000,000 Japan Government 20 Year Bond 1.30% 20/6/2035 101,345 0.11
JPY 13,000,000 Japan Government 20 Year Bond 1.20% 20/9/2035 129,523 0.14
JPY 13,800,000 Japan Government 20 Year Bond 1.00% 20/12/2035 133,024 0.14
JPY 11,600,000 Japan Government 20 Year Bond 0.40% 20/3/2036 100,556 0.11
JPY 17,600,000 Japan Government 20 Year Bond 0.20% 20/6/2036 146,135 0.15
JPY 16,100,000 Japan Government 20 Year Bond 0.50% 20/9/2036 141,186 0.15
JPY 8,000,000 Japan Government 20 Year Bond 0.60% 20/12/2036 71,283 0.07
JPY 10,000,000 Japan Government 30 Year Bond 1.10% 20/3/2033 99,200 0.10
JPY 11,000,000 Japan Government 30 Year Bond 2.40% 20/3/2034 129,712 0.14
JPY 7,700,000 Japan Government 30 Year Bond 2.50% 20/9/2034 92,100 0.10
JPY 6,600,000 Japan Government 30 Year Bond 2.30% 20/3/2035 77,123 0.08
JPY 5,000,000 Japan Government 30 Year Bond 2.30% 20/6/2035 58,425 0.06
JPY 6,000,000 Japan Government 30 Year Bond 2.50% 20/9/2035 72,019 0.08
JPY 3,500,000 Japan Government 30 Year Bond 2.30% 20/12/2035 40,963 0.04
JPY 2,500,000 Japan Government 30 Year Bond 2.50% 20/3/2036 30,065 0.03
JPY 4,400,000 Japan Government 30 Year Bond 2.50% 20/6/2036 52,985 0.06
JPY 6,000,000 Japan Government 30 Year Bond 2.50% 20/9/2036 72,236 0.08
JPY 2,400,000 Japan Government 30 Year Bond 2.30% 20/12/2036 28,158 0.03
JPY 5,000,000 Japan Government 30 Year Bond 2.40% 20/3/2037 59,574 0.06
JPY 7,300,000 Japan Government 30 Year Bond 2.50% 20/9/2037 88,507 0.09
JPY 900,000 Japan Government 30 Year Bond 2.50% 20/3/2038 10,952 0.01
JPY 10,000,000 Japan Government 30 Year Bond 2.40% 20/9/2038 120,330 0.13
JPY 7,250,000 Japan Government 30 Year Bond 2.30% 20/3/2039 86,279 0.09
JPY 15,450,000 Japan Government 30 Year Bond 2.20% 20/9/2039 181,466 0.19
JPY 9,000,000 Japan Government 30 Year Bond 2.30% 20/3/2040 107,839 0.11
JPY 15,150,000 Japan Government 30 Year Bond 2.00% 20/9/2040 173,141 0.18
JPY 12,500,000 Japan Government 30 Year Bond 2.20% 20/3/2041 148,135 0.16
JPY 14,800,000 Japan Government 30 Year Bond 2.00% 20/9/2041 170,275 0.18
JPY 14,200,000 Japan Government 30 Year Bond 2.00% 20/3/2042 163,621 0.17
JPY 16,200,000 Japan Government 30 Year Bond 1.90% 20/9/2042 183,497 0.19
JPY 12,000,000 Japan Government 30 Year Bond 1.80% 20/3/2043 133,966 0.14
JPY 8,700,000 Japan Government 30 Year Bond 1.90% 20/6/2043 99,020 0.10
JPY 7,000,000 Japan Government 30 Year Bond 1.80% 20/9/2043 78,246 0.08
JPY 7,000,000 Japan Government 30 Year Bond 1.70% 20/12/2043 76,783 0.08
JPY 9,500,000 Japan Government 30 Year Bond 1.70% 20/3/2044 104,236 0.11
JPY 6,000,000 Japan Government 30 Year Bond 1.70% 20/6/2044 65,853 0.07
JPY 6,600,000 Japan Government 30 Year Bond 1.70% 20/9/2044 72,458 0.08
JPY 6,800,000 Japan Government 30 Year Bond 1.50% 20/3/2045 71,546 0.08
JPY 4,500,000 Japan Government 30 Year Bond 1.60% 20/6/2045 48,505 0.05
JPY 5,000,000 Japan Government 30 Year Bond 1.40% 20/9/2045 51,491 0.05
JPY 5,000,000 Japan Government 30 Year Bond 1.40% 20/12/2045 51,596 0.05
JPY 6,000,000 Japan Government 30 Year Bond 0.80% 20/3/2046 53,636 0.06
JPY 7,400,000 Japan Government 30 Year Bond 0.30% 20/6/2046 57,517 0.06
JPY 8,600,000 Japan Government 30 Year Bond 0.50% 20/9/2046 70,805 0.07
JPY 3,300,000 Japan Government 30 Year Bond 0.60% 20/12/2046 27,889 0.03
JPY 5,000,000 Japan Government 40 Year Bond 2.40% 20/3/2048 63,906 0.07
JPY 3,900,000 Japan Government 40 Year Bond 2.20% 20/3/2049 48,172 0.05
JPY 9,400,000 Japan Government 40 Year Bond 2.20% 20/3/2050 116,601 0.12
JPY 8,400,000 Japan Government 40 Year Bond 2.20% 20/3/2051 104,643 0.11
JPY 8,300,000 Japan Government 40 Year Bond 2.00% 20/3/2052 99,412 0.10
JPY 4,100,000 Japan Government 40 Year Bond 1.90% 20/3/2053 47,771 0.05
JPY 5,500,000 Japan Government 40 Year Bond 1.70% 20/3/2054 61,091 0.06
JPY 4,800,000 Japan Government 40 Year Bond 1.40% 20/3/2055 49,676 0.05
JPY 6,350,000 Japan Government 40 Year Bond 0.40% 20/3/2056 46,669 0.05
20,856,805 21.95
Malaysia MYR 80,000 Malaysia Government Bond
3.58% 28/9/2018 18,117 0.02 MYR 350,000 Malaysia Government Bond
3.889% 31/7/2020 79,474 0.09 MYR 130,000 Malaysia Government Bond
4.16% 15/7/2021 29,737 0.03 MYR 130,000 Malaysia Government Bond
3.80% 17/8/2023 28,998 0.03 MYR 305,000 Malaysia Government Bond
4.181% 15/7/2024 69,035 0.07 MYR 100,000 Malaysia Government Bond
3.90% 30/11/2026 22,169 0.02 MYR 150,000 Malaysia Government Bond
3.733% 15/6/2028 31,752 0.03 MYR 150,000 Malaysia Government Bond
4.127% 15/4/2032 32,021 0.04
311,303 0.33
Mexico MXN 1,900,000 Mexican Bonos 4.75% 14/6/2018 99,145 0.10 MXN 1,250,000 Mexican Bonos 5.00% 11/12/2019 63,802 0.07 MXN 500,000 Mexican Bonos 8.00% 11/6/2020 27,565 0.03 MXN 250,000 Mexican Bonos 6.50% 10/6/2021 13,152 0.01 MXN 1,200,000 Mexican Bonos 6.50% 9/6/2022 62,881 0.07 MXN 1,450,000 Mexican Bonos 10.00% 5/12/2024 91,149 0.10 MXN 1,000,000 Mexican Bonos 5.75% 5/3/2026 48,873 0.05 MXN 400,000 Mexican Bonos 7.50% 3/6/2027 21,963 0.02 MXN 300,000 Mexican Bonos 8.50% 31/5/2029 17,689 0.02
BlackRock Global Government Bond Index Fund continued
Japan continued Japan continued

Transferable Securities and Money Market Instruments Admitted to an Official Stock Exchange Listing or Dealt in on Another Regulated Market
Transferable Securities and Money Market Instruments Admitted to an Official Stock Exchange Listing or Dealt in on Another Regulated Market
Holding Description
Market Value
USD
% of Net
Assets Holding Description
Market Value
USD
% of Net
Assets
Annual Report and Audited Accounts 87
The notes on pages 122 to 128 form an integral part of these financial statements.
Portfolio of Investments as at 31 March 2017
MXN 350,000 Mexican Bonos 7.75% 29/5/2031 19,427 0.02 MXN 1,500,000 Mexican Bonos 7.75% 23/11/2034 82,832 0.09 MXN 1,000,000 Mexican Bonos 7.75% 13/11/2042 55,246 0.06
603,724 0.64
Netherlands EUR 80,000 Netherlands Government Bond
0.25% 15/1/2020 87,579 0.09 EUR 30,000 Netherlands Government Bond
3.75% 15/1/2023 39,399 0.04 EUR 55,000 Netherlands Government Bond
5.50% 15/1/2028 89,366 0.09 EUR 100,000 Netherlands Government Bond
RegS '144A' 4.00% 15/7/2018 113,342 0.12 EUR 69,000 Netherlands Government Bond
RegS '144A' 1.25% 15/1/2019 76,282 0.08 EUR 40,000 Netherlands Government Bond
RegS '144A' 4.00% 15/7/2019 47,313 0.05 EUR 80,000 Netherlands Government Bond
RegS '144A' 3.50% 15/7/2020 97,019 0.10 EUR 170,000 Netherlands Government Bond
RegS '144A' 3.25% 15/7/2021 210,555 0.22 EUR 25,000 Netherlands Government Bond
RegS '144A' 15/1/2022 (Zero Coupon) 27,069 0.03
EUR 45,000 Netherlands Government Bond RegS '144A' 2.25% 15/7/2022 54,482 0.06
EUR 104,000 Netherlands Government Bond RegS '144A' 1.75% 15/7/2023 123,889 0.13
EUR 40,000 Netherlands Government Bond RegS '144A' 2.00% 15/7/2024 48,659 0.05
EUR 130,000 Netherlands Government Bond RegS '144A' 0.25% 15/7/2025 138,468 0.15
EUR 45,000 Netherlands Government Bond RegS '144A' 0.50% 15/7/2026 48,432 0.05
EUR 35,000 Netherlands Government Bond RegS '144A' 0.75% 15/7/2027 38,058 0.04
EUR 67,000 Netherlands Government Bond RegS '144A' 2.50% 15/1/2033 89,370 0.09
EUR 28,000 Netherlands Government Bond RegS '144A' 4.00% 15/1/2037 (traded in Germany) 46,524 0.05
EUR 45,000 Netherlands Government Bond RegS '144A' 4.00% 15/1/2037 (traded in Netherlands) 74,771 0.08
EUR 66,000 Netherlands Government Bond RegS '144A' 3.75% 15/1/2042 111,766 0.12
EUR 11,000 Netherlands Government Bond RegS '144A' 2.75% 15/1/2047 (traded in Germany) 16,361 0.02
EUR 52,000 Netherlands Government Bond RegS '144A' 2.75% 15/1/2047 (traded in Netherlands) 77,342 0.08
1,656,046 1.74
Norway NOK 300,000 Norway Government Bond RegS
'144A' 4.50% 22/5/2019 37,794 0.04 NOK 440,000 Norway Government Bond RegS
'144A' 3.75% 25/5/2021 57,067 0.06 NOK 150,000 Norway Government Bond RegS
'144A' 2.00% 24/5/2023 18,311 0.02 NOK 160,000 Norway Government Bond RegS
'144A' 3.00% 14/3/2024 20,740 0.02 NOK 400,000 Norway Government Bond RegS
'144A' 1.75% 13/3/2025 47,823 0.05 NOK 60,000 Norway Government Bond RegS
'144A' 1.50% 19/2/2026 6,980 0.01
188,715 0.20
Singapore SGD 60,000 Singapore Government Bond
0.50% 1/4/2018 42,731 0.05 SGD 90,000 Singapore Government Bond
2.25% 1/6/2021 66,001 0.07 SGD 70,000 Singapore Government Bond
1.25% 1/10/2021 49,288 0.05 SGD 90,000 Singapore Government Bond
2.75% 1/7/2023 67,511 0.07 SGD 25,000 Singapore Government Bond
3.50% 1/3/2027 19,904 0.02 SGD 10,000 Singapore Government Bond
2.875% 1/7/2029 7,582 0.01 SGD 30,000 Singapore Government Bond
3.375% 1/9/2033 24,261 0.03 SGD 30,000 Singapore Government Bond
2.75% 1/4/2042 22,744 0.02
300,022 0.32
South Africa ZAR 795,000 Republic of South Africa Government
Bond 7.75% 28/2/2023 57,959 0.06 ZAR 800,000 Republic of South Africa Government
Bond 10.50% 21/12/2026 66,047 0.07 ZAR 750,000 Republic of South Africa Government
Bond 8.00% 31/1/2030 50,805 0.05 ZAR 450,000 Republic of South Africa Government
Bond 7.00% 28/2/2031 27,657 0.03 ZAR 400,000 Republic of South Africa Government
Bond 8.25% 31/3/2032 27,105 0.03 ZAR 700,000 Republic of South Africa Government
Bond 6.25% 31/3/2036 37,169 0.04 ZAR 510,000 Republic of South Africa Government
Bond 8.50% 31/1/2037 34,186 0.04 ZAR 550,000 Republic of South Africa Government
Bond 6.50% 28/2/2041 29,044 0.03 ZAR 1,050,000 Republic of South Africa Government
Bond 8.75% 28/2/2048 71,023 0.07
400,995 0.42
Spain EUR 60,000 Spain Government Bond
0.25% 30/4/2018 64,491 0.07 EUR 210,000 Spain Government Bond
3.75% 31/10/2018 238,748 0.25 EUR 75,000 Spain Government Bond
2.75% 30/4/2019 85,031 0.09 EUR 125,000 Spain Government Bond
1.40% 31/1/2020 139,204 0.15 EUR 100,000 Spain Government Bond
1.15% 30/7/2020 110,922 0.12 EUR 40,000 Spain Government Bond
0.75% 30/7/2021 43,705 0.05 EUR 105,000 Spain Government Bond
6.00% 31/1/2029 162,101 0.17 EUR 108,000 Spain Government Bond
5.75% 30/7/2032 170,037 0.18 EUR 165,000 Spain Government Bond RegS
'144A' 4.10% 30/7/2018 186,459 0.20 EUR 100,000 Spain Government Bond RegS
'144A' 4.60% 30/7/2019 118,600 0.12 EUR 110,000 Spain Government Bond RegS
'144A' 4.30% 31/10/2019 130,849 0.14 EUR 90,000 Spain Government Bond RegS
'144A' 4.00% 30/4/2020 108,007 0.11 EUR 100,000 Spain Government Bond RegS
'144A' 4.85% 31/10/2020 125,160 0.13 EUR 180,000 Spain Government Bond RegS
'144A' 5.50% 30/4/2021 234,250 0.25 EUR 80,000 Spain Government Bond RegS
'144A' 5.85% 31/1/2022 107,817 0.11
BlackRock Global Government Bond Index Fund continued
Mexico continued

Transferable Securities and Money Market Instruments Admitted to an Official Stock Exchange Listing or Dealt in on Another Regulated Market
Transferable Securities and Money Market Instruments Admitted to an Official Stock Exchange Listing or Dealt in on Another Regulated Market
Holding Description
Market Value
USD
% of Net
Assets Holding Description
Market Value
USD
% of Net
Assets
88 BlackRock Global Index Funds (BGIF)
The notes on pages 122 to 128 form an integral part of these financial statements.
Portfolio of Investments as at 31 March 2017
EUR 150,000 Spain Government Bond RegS '144A' 5.40% 31/1/2023 203,417 0.21
EUR 140,000 Spain Government Bond RegS '144A' 4.40% 31/10/2023 183,149 0.19
EUR 180,000 Spain Government Bond RegS '144A' 3.80% 30/4/2024 228,569 0.24
EUR 125,000 Spain Government Bond RegS '144A' 2.75% 31/10/2024 148,817 0.16
EUR 110,000 Spain Government Bond RegS '144A' 4.65% 30/7/2025 147,997 0.16
EUR 70,000 Spain Government Bond RegS '144A' 2.15% 31/10/2025 79,251 0.08
EUR 110,000 Spain Government Bond RegS '144A' 1.95% 30/4/2026 122,202 0.13
EUR 70,000 Spain Government Bond RegS '144A' 5.90% 30/7/2026 103,315 0.11
EUR 160,000 Spain Government Bond RegS '144A' 1.30% 31/10/2026 167,495 0.18
EUR 80,000 Spain Government Bond RegS '144A' 1.50% 30/4/2027 84,399 0.09
EUR 35,000 Spain Government Bond RegS '144A' 5.15% 31/10/2028 50,472 0.05
EUR 70,000 Spain Government Bond RegS '144A' 1.95% 30/7/2030 74,268 0.08
EUR 80,000 Spain Government Bond RegS '144A' 4.20% 31/1/2037 108,540 0.11
EUR 75,000 Spain Government Bond RegS '144A' 4.90% 30/7/2040 111,498 0.12
EUR 75,000 Spain Government Bond RegS '144A' 4.70% 30/7/2041 109,057 0.11
EUR 58,000 Spain Government Bond RegS '144A' 5.15% 31/10/2044 89,665 0.09
EUR 38,000 Spain Government Bond RegS '144A' 2.90% 31/10/2046 40,835 0.04
EUR 25,000 Spain Government Bond RegS '144A' 3.45% 30/7/2066 28,391 0.03
4,106,718 4.32
Sweden SEK 595,000 Sweden Government Bond 5.00%
1/12/2020 (traded in Sweden) 79,669 0.08 SEK 250,000 Sweden Government Bond 5.00%
1/12/2020 (traded in Switzerland) 33,474 0.04 SEK 390,000 Sweden Government Bond 3.50%
1/6/2022 51,709 0.05 SEK 370,000 Sweden Government Bond 1.50%
13/11/2023 45,007 0.05 SEK 150,000 Sweden Government Bond 2.50%
12/5/2025 (traded in Germany) 19,633 0.02 SEK 200,000 Sweden Government Bond 2.50%
12/5/2025 (traded in Sweden) 26,177 0.03 SEK 470,000 Sweden Government Bond
1.00% 12/11/2026 54,624 0.06 SEK 190,000 Sweden Government Bond
3.50% 30/3/2039 29,049 0.03
339,342 0.36
United Kingdom GBP 120,000 United Kingdom Gilt RegS
5.00% 7/3/2018 156,392 0.16 GBP 105,000 United Kingdom Gilt RegS
1.25% 22/7/2018 132,858 0.14 GBP 85,000 United Kingdom Gilt RegS
4.50% 7/3/2019 114,999 0.12 GBP 80,000 United Kingdom Gilt RegS
1.75% 22/7/2019 103,536 0.11 GBP 62,000 United Kingdom Gilt RegS
3.75% 7/9/2019 84,143 0.09 GBP 60,000 United Kingdom Gilt RegS
4.75% 7/3/2020 84,907 0.09
GBP 205,000 United Kingdom Gilt RegS 2.00% 22/7/2020 270,609 0.29
GBP 115,000 United Kingdom Gilt RegS 3.75% 7/9/2020 160,899 0.17
GBP 90,000 United Kingdom Gilt RegS 1.50% 22/1/2021 117,326 0.12
GBP 50,000 United Kingdom Gilt RegS 8.00% 7/6/2021 82,447 0.09
GBP 85,000 United Kingdom Gilt RegS 4.00% 7/3/2022 124,710 0.13
GBP 70,000 United Kingdom Gilt RegS 0.50% 22/7/2022 87,112 0.09
GBP 150,000 United Kingdom Gilt RegS 1.75% 7/9/2022 199,552 0.21
GBP 100,000 United Kingdom Gilt RegS 2.25% 7/9/2023 137,366 0.14
GBP 65,000 United Kingdom Gilt RegS 2.75% 7/9/2024 92,583 0.10
GBP 80,000 United Kingdom Gilt RegS 5.00% 7/3/2025 131,765 0.14
GBP 85,000 United Kingdom Gilt RegS 2.00% 7/9/2025 115,383 0.12
GBP 110,000 United Kingdom Gilt RegS 1.50% 22/7/2026 142,661 0.15
GBP 90,000 United Kingdom Gilt RegS 4.25% 7/12/2027 147,551 0.16
GBP 25,000 United Kingdom Gilt RegS 6.00% 7/12/2028 47,568 0.05
GBP 55,000 United Kingdom Gilt RegS 4.75% 7/12/2030 97,760 0.10
GBP 90,000 United Kingdom Gilt RegS 4.25% 7/6/2032 154,643 0.16
GBP 110,000 United Kingdom Gilt RegS 4.50% 7/9/2034 198,237 0.21
GBP 95,000 United Kingdom Gilt RegS 4.25% 7/3/2036 169,013 0.18
GBP 20,000 United Kingdom Gilt RegS 1.75% 7/9/2037 25,110 0.03
GBP 62,000 United Kingdom Gilt RegS 4.75% 7/12/2038 120,414 0.13
GBP 90,000 United Kingdom Gilt RegS 4.25% 7/9/2039 165,139 0.17
GBP 74,000 United Kingdom Gilt RegS 4.25% 7/12/2040 137,535 0.14
GBP 90,000 United Kingdom Gilt RegS 4.50% 7/12/2042 176,713 0.19
GBP 108,000 United Kingdom Gilt RegS 3.25% 22/1/2044 177,571 0.19
GBP 133,000 United Kingdom Gilt RegS 3.50% 22/1/2045 229,735 0.24
GBP 57,000 United Kingdom Gilt RegS 4.25% 7/12/2046 112,772 0.12
GBP 35,000 United Kingdom Gilt RegS 1.50% 22/7/2047 41,644 0.04
GBP 80,000 United Kingdom Gilt RegS 4.25% 7/12/2049 164,522 0.17
GBP 96,000 United Kingdom Gilt RegS 3.75% 22/7/2052 187,943 0.20
GBP 80,000 United Kingdom Gilt RegS 4.25% 7/12/2055 176,690 0.19
GBP 10,000 United Kingdom Gilt RegS 1.75% 22/7/2057 13,134 0.01
GBP 75,000 United Kingdom Gilt RegS 4.00% 22/1/2060 165,026 0.17
GBP 45,000 United Kingdom Gilt RegS 2.50% 22/7/2065 74,186 0.08
GBP 93,000 United Kingdom Gilt RegS 3.50% 22/7/2068 195,952 0.21
5,318,106 5.60
BlackRock Global Government Bond Index Fund continued
Spain continued United Kingdom continued
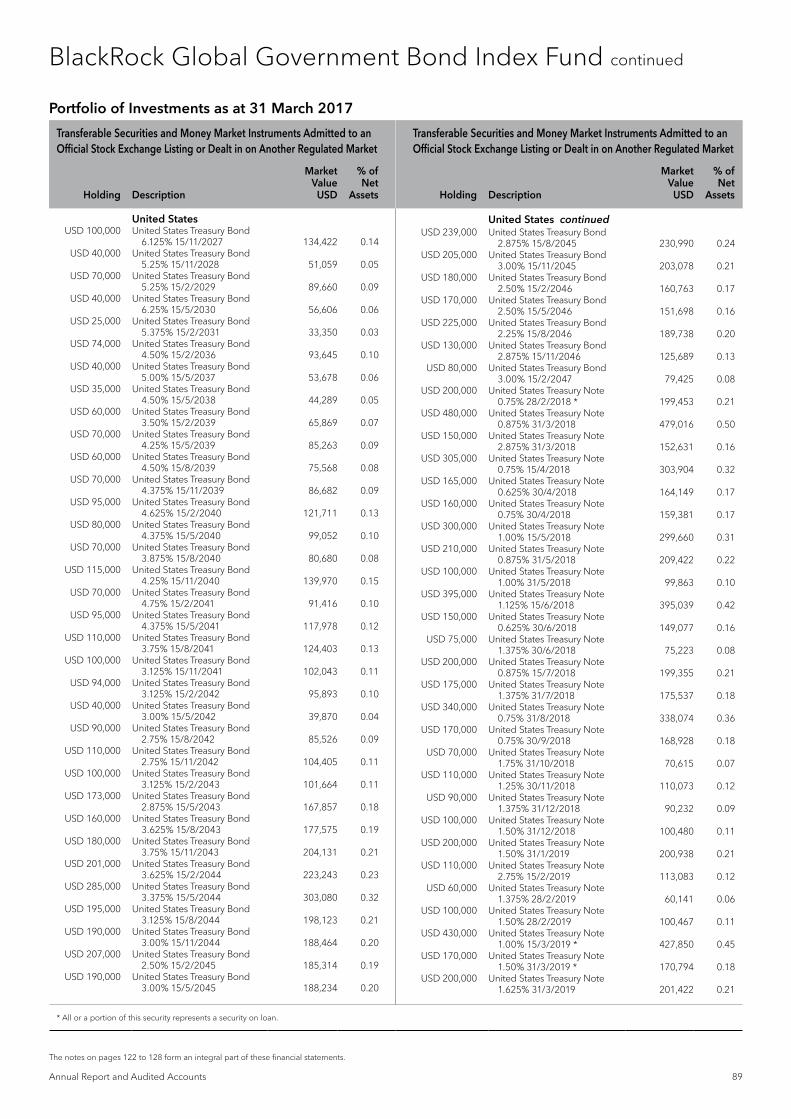
Transferable Securities and Money Market Instruments Admitted to an Official Stock Exchange Listing or Dealt in on Another Regulated Market
Transferable Securities and Money Market Instruments Admitted to an Official Stock Exchange Listing or Dealt in on Another Regulated Market
Holding Description
Market Value
USD
% of Net
Assets Holding Description
Market Value
USD
% of Net
Assets
* All or a portion of this security represents a security on loan.
Annual Report and Audited Accounts 89
The notes on pages 122 to 128 form an integral part of these financial statements.
Portfolio of Investments as at 31 March 2017
United States USD 100,000 United States Treasury Bond
6.125% 15/11/2027 134,422 0.14 USD 40,000 United States Treasury Bond
5.25% 15/11/2028 51,059 0.05 USD 70,000 United States Treasury Bond
5.25% 15/2/2029 89,660 0.09 USD 40,000 United States Treasury Bond
6.25% 15/5/2030 56,606 0.06 USD 25,000 United States Treasury Bond
5.375% 15/2/2031 33,350 0.03 USD 74,000 United States Treasury Bond
4.50% 15/2/2036 93,645 0.10 USD 40,000 United States Treasury Bond
5.00% 15/5/2037 53,678 0.06 USD 35,000 United States Treasury Bond
4.50% 15/5/2038 44,289 0.05 USD 60,000 United States Treasury Bond
3.50% 15/2/2039 65,869 0.07 USD 70,000 United States Treasury Bond
4.25% 15/5/2039 85,263 0.09 USD 60,000 United States Treasury Bond
4.50% 15/8/2039 75,568 0.08 USD 70,000 United States Treasury Bond
4.375% 15/11/2039 86,682 0.09 USD 95,000 United States Treasury Bond
4.625% 15/2/2040 121,711 0.13 USD 80,000 United States Treasury Bond
4.375% 15/5/2040 99,052 0.10 USD 70,000 United States Treasury Bond
3.875% 15/8/2040 80,680 0.08 USD 115,000 United States Treasury Bond
4.25% 15/11/2040 139,970 0.15 USD 70,000 United States Treasury Bond
4.75% 15/2/2041 91,416 0.10 USD 95,000 United States Treasury Bond
4.375% 15/5/2041 117,978 0.12 USD 110,000 United States Treasury Bond
3.75% 15/8/2041 124,403 0.13 USD 100,000 United States Treasury Bond
3.125% 15/11/2041 102,043 0.11 USD 94,000 United States Treasury Bond
3.125% 15/2/2042 95,893 0.10 USD 40,000 United States Treasury Bond
3.00% 15/5/2042 39,870 0.04 USD 90,000 United States Treasury Bond
2.75% 15/8/2042 85,526 0.09 USD 110,000 United States Treasury Bond
2.75% 15/11/2042 104,405 0.11 USD 100,000 United States Treasury Bond
3.125% 15/2/2043 101,664 0.11 USD 173,000 United States Treasury Bond
2.875% 15/5/2043 167,857 0.18 USD 160,000 United States Treasury Bond
3.625% 15/8/2043 177,575 0.19 USD 180,000 United States Treasury Bond
3.75% 15/11/2043 204,131 0.21 USD 201,000 United States Treasury Bond
3.625% 15/2/2044 223,243 0.23 USD 285,000 United States Treasury Bond
3.375% 15/5/2044 303,080 0.32 USD 195,000 United States Treasury Bond
3.125% 15/8/2044 198,123 0.21 USD 190,000 United States Treasury Bond
3.00% 15/11/2044 188,464 0.20 USD 207,000 United States Treasury Bond
2.50% 15/2/2045 185,314 0.19 USD 190,000 United States Treasury Bond
3.00% 15/5/2045 188,234 0.20
USD 239,000 United States Treasury Bond 2.875% 15/8/2045 230,990 0.24
USD 205,000 United States Treasury Bond 3.00% 15/11/2045 203,078 0.21
USD 180,000 United States Treasury Bond 2.50% 15/2/2046 160,763 0.17
USD 170,000 United States Treasury Bond 2.50% 15/5/2046 151,698 0.16
USD 225,000 United States Treasury Bond 2.25% 15/8/2046 189,738 0.20
USD 130,000 United States Treasury Bond 2.875% 15/11/2046 125,689 0.13
USD 80,000 United States Treasury Bond 3.00% 15/2/2047 79,425 0.08
USD 200,000 United States Treasury Note 0.75% 28/2/2018 * 199,453 0.21
USD 480,000 United States Treasury Note 0.875% 31/3/2018 479,016 0.50
USD 150,000 United States Treasury Note 2.875% 31/3/2018 152,631 0.16
USD 305,000 United States Treasury Note 0.75% 15/4/2018 303,904 0.32
USD 165,000 United States Treasury Note 0.625% 30/4/2018 164,149 0.17
USD 160,000 United States Treasury Note 0.75% 30/4/2018 159,381 0.17
USD 300,000 United States Treasury Note 1.00% 15/5/2018 299,660 0.31
USD 210,000 United States Treasury Note 0.875% 31/5/2018 209,422 0.22
USD 100,000 United States Treasury Note 1.00% 31/5/2018 99,863 0.10
USD 395,000 United States Treasury Note 1.125% 15/6/2018 395,039 0.42
USD 150,000 United States Treasury Note 0.625% 30/6/2018 149,077 0.16
USD 75,000 United States Treasury Note 1.375% 30/6/2018 75,223 0.08
USD 200,000 United States Treasury Note 0.875% 15/7/2018 199,355 0.21
USD 175,000 United States Treasury Note 1.375% 31/7/2018 175,537 0.18
USD 340,000 United States Treasury Note 0.75% 31/8/2018 338,074 0.36
USD 170,000 United States Treasury Note 0.75% 30/9/2018 168,928 0.18
USD 70,000 United States Treasury Note 1.75% 31/10/2018 70,615 0.07
USD 110,000 United States Treasury Note 1.25% 30/11/2018 110,073 0.12
USD 90,000 United States Treasury Note 1.375% 31/12/2018 90,232 0.09
USD 100,000 United States Treasury Note 1.50% 31/12/2018 100,480 0.11
USD 200,000 United States Treasury Note 1.50% 31/1/2019 200,938 0.21
USD 110,000 United States Treasury Note 2.75% 15/2/2019 113,083 0.12
USD 60,000 United States Treasury Note 1.375% 28/2/2019 60,141 0.06
USD 100,000 United States Treasury Note 1.50% 28/2/2019 100,467 0.11
USD 430,000 United States Treasury Note 1.00% 15/3/2019 * 427,850 0.45
USD 170,000 United States Treasury Note 1.50% 31/3/2019 * 170,794 0.18
USD 200,000 United States Treasury Note 1.625% 31/3/2019 201,422 0.21
BlackRock Global Government Bond Index Fund continued
United States continued

Transferable Securities and Money Market Instruments Admitted to an Official Stock Exchange Listing or Dealt in on Another Regulated Market
Transferable Securities and Money Market Instruments Admitted to an Official Stock Exchange Listing or Dealt in on Another Regulated Market
Holding Description
Market Value
USD
% of Net
Assets Holding Description
Market Value
USD
% of Net
Assets
* All or a portion of this security represents a security on loan.
90 BlackRock Global Index Funds (BGIF)
The notes on pages 122 to 128 form an integral part of these financial statements.
Portfolio of Investments as at 31 March 2017
USD 520,000 United States Treasury Note 0.875% 15/4/2019 515,816 0.54
USD 150,000 United States Treasury Note 1.25% 30/4/2019 149,900 0.16
USD 300,000 United States Treasury Note 1.625% 30/4/2019 * 302,086 0.32
USD 350,000 United States Treasury Note 0.875% 15/5/2019 346,951 0.36
USD 350,000 United States Treasury Note 1.125% 31/5/2019 348,708 0.37
USD 290,000 United States Treasury Note 1.50% 31/5/2019 291,252 0.31
USD 100,000 United States Treasury Note 0.875% 15/6/2019 99,039 0.10
USD 100,000 United States Treasury Note 1.00% 30/6/2019 99,293 0.10
USD 195,000 United States Treasury Note 1.625% 30/6/2019 196,310 0.21
USD 60,000 United States Treasury Note 0.75% 15/7/2019 59,210 0.06
USD 200,000 United States Treasury Note 0.875% 31/7/2019 197,859 0.21
USD 130,000 United States Treasury Note 1.625% 31/7/2019 130,843 0.14
USD 495,000 United States Treasury Note 0.75% 15/8/2019 488,058 0.51
USD 100,000 United States Treasury Note 1.00% 31/8/2019 99,133 0.10
USD 200,000 United States Treasury Note 1.625% 31/8/2019 201,211 0.21
USD 33,000 United States Treasury Note 1.00% 30/9/2019 32,685 0.03
USD 150,000 United States Treasury Note 1.75% 30/9/2019 151,342 0.16
USD 200,000 United States Treasury Note 1.00% 15/10/2019 198,008 0.21
USD 190,000 United States Treasury Note 1.25% 31/10/2019 189,243 0.20
USD 100,000 United States Treasury Note 1.50% 31/10/2019 100,227 0.11
USD 100,000 United States Treasury Note 1.00% 15/11/2019 98,922 0.10
USD 187,000 United States Treasury Note 3.375% 15/11/2019 196,482 0.21
USD 150,000 United States Treasury Note 1.00% 30/11/2019 148,371 0.16
USD 140,000 United States Treasury Note 1.50% 30/11/2019 140,241 0.15
USD 225,000 United States Treasury Note 1.375% 15/12/2019 224,596 0.24
USD 200,000 United States Treasury Note 1.375% 15/1/2020 199,543 0.21
USD 118,000 United States Treasury Note 1.375% 31/1/2020 117,668 0.12
USD 100,000 United States Treasury Note 1.25% 29/2/2020 99,281 0.10
USD 400,000 United States Treasury Note 1.375% 31/3/2020 398,313 0.42
USD 127,000 United States Treasury Note 1.125% 30/4/2020 125,413 0.13
USD 200,000 United States Treasury Note 1.375% 30/4/2020 198,965 0.21
USD 170,000 United States Treasury Note 1.375% 31/5/2020 168,938 0.18
USD 290,000 United States Treasury Note 1.625% 30/6/2020 290,249 0.31
USD 200,000 United States Treasury Note 1.625% 31/7/2020 200,016 0.21
USD 100,000 United States Treasury Note 2.00% 31/7/2020 101,250 0.11
USD 130,000 United States Treasury Note 1.375% 31/8/2020 128,832 0.14
USD 155,000 United States Treasury Note 2.125% 31/8/2020 157,434 0.17
USD 200,000 United States Treasury Note 1.375% 30/9/2020 197,984 0.21
USD 200,000 United States Treasury Note 2.00% 30/9/2020 202,250 0.21
USD 150,000 United States Treasury Note 1.375% 31/10/2020 * 148,348 0.16
USD 120,000 United States Treasury Note 1.75% 31/10/2020 120,255 0.13
USD 300,000 United States Treasury Note 2.625% 15/11/2020 309,656 0.33
USD 130,000 United States Treasury Note 1.625% 30/11/2020 129,584 0.14
USD 70,000 United States Treasury Note 2.00% 30/11/2020 70,714 0.07
USD 100,000 United States Treasury Note 1.75% 31/12/2020 100,055 0.10
USD 165,000 United States Treasury Note 2.375% 31/12/2020 168,893 0.18
USD 95,000 United States Treasury Note 1.375% 31/1/2021 93,659 0.10
USD 450,000 United States Treasury Note 2.125% 31/1/2021 456,188 0.48
USD 80,000 United States Treasury Note 3.625% 15/2/2021 85,644 0.09
USD 620,000 United States Treasury Note 1.125% 28/2/2021 604,839 0.64
USD 125,000 United States Treasury Note 2.00% 28/2/2021 126,113 0.13
USD 280,000 United States Treasury Note 1.25% 31/3/2021 274,181 0.29
USD 200,000 United States Treasury Note 2.25% 31/3/2021 203,547 0.21
USD 310,000 United States Treasury Note 1.375% 30/4/2021 304,781 0.32
USD 75,000 United States Treasury Note 2.25% 30/4/2021 76,313 0.08
USD 65,000 United States Treasury Note 3.125% 15/5/2021 68,372 0.07
USD 125,000 United States Treasury Note 1.375% 31/5/2021 122,783 0.13
USD 180,000 United States Treasury Note 2.00% 31/5/2021 181,346 0.19
USD 115,000 United States Treasury Note 1.125% 30/6/2021 111,667 0.12
USD 139,000 United States Treasury Note 2.125% 30/6/2021 140,672 0.15
USD 150,000 United States Treasury Note 1.125% 31/7/2021 145,465 0.15
USD 185,000 United States Treasury Note 2.25% 31/7/2021 188,024 0.20
USD 210,000 United States Treasury Note 2.125% 15/8/2021 212,477 0.22
USD 170,000 United States Treasury Note 1.125% 31/8/2021 164,701 0.17
USD 150,000 United States Treasury Note 2.00% 31/8/2021 150,832 0.16
USD 100,000 United States Treasury Note 1.125% 30/9/2021 96,742 0.10
USD 200,000 United States Treasury Note 2.125% 30/9/2021 202,094 0.21
USD 250,000 United States Treasury Note 1.25% 31/10/2021 242,988 0.26
BlackRock Global Government Bond Index Fund continued
United States continued United States continued

Transferable Securities and Money Market Instruments Admitted to an Official Stock Exchange Listing or Dealt in on Another Regulated Market
Transferable Securities and Money Market Instruments Admitted to an Official Stock Exchange Listing or Dealt in on Another Regulated Market
Holding Description
Market Value
USD
% of Net
Assets Holding Description
Market Value
USD
% of Net
Assets
* All or a portion of this security represents a security on loan.
Annual Report and Audited Accounts 91
The notes on pages 122 to 128 form an integral part of these financial statements.
USD 40,000 United States Treasury Note 2.00% 31/10/2021 40,178 0.04
USD 100,000 United States Treasury Note 2.00% 15/11/2021 100,453 0.11
USD 250,000 United States Treasury Note 1.75% 30/11/2021 248,379 0.26
USD 150,000 United States Treasury Note 1.875% 30/11/2021 149,836 0.16
USD 200,000 United States Treasury Note 2.00% 31/12/2021 200,766 0.21
USD 150,000 United States Treasury Note 2.125% 31/12/2021 151,430 0.16
USD 330,000 United States Treasury Note 1.875% 31/1/2022 329,252 0.35
USD 160,000 United States Treasury Note 2.00% 15/2/2022 160,650 0.17
USD 30,000 United States Treasury Note 1.75% 28/2/2022 29,730 0.03
USD 50,000 United States Treasury Note 1.75% 31/3/2022 49,516 0.05
USD 150,000 United States Treasury Note 1.75% 15/5/2022 148,336 0.16
USD 150,000 United States Treasury Note 1.875% 31/5/2022 149,273 0.16
USD 130,000 United States Treasury Note 2.125% 30/6/2022 130,876 0.14
USD 110,000 United States Treasury Note 1.625% 15/8/2022 107,705 0.11
USD 140,000 United States Treasury Note 1.875% 31/8/2022 138,895 0.15
USD 298,000 United States Treasury Note 1.75% 30/9/2022 293,390 0.31
USD 100,000 United States Treasury Note 1.875% 31/10/2022 99,016 0.10
USD 380,000 United States Treasury Note 1.625% 15/11/2022 371,153 0.39
USD 50,000 United States Treasury Note 2.00% 30/11/2022 49,803 0.05
USD 70,000 United States Treasury Note 2.125% 31/12/2022 70,150 0.07
USD 220,000 United States Treasury Note 1.75% 31/1/2023 215,806 0.23
USD 230,000 United States Treasury Note 2.00% 15/2/2023 228,697 0.24
USD 285,000 United States Treasury Note 1.50% 28/2/2023 275,381 0.29
USD 145,000 United States Treasury Note 1.50% 31/3/2023 139,942 0.15
USD 120,000 United States Treasury Note 1.625% 30/4/2023 116,543 0.12
USD 220,000 United States Treasury Note 1.75% 15/5/2023 215,136 0.23
USD 200,000 United States Treasury Note 1.625% 31/5/2023 194,078 0.20
USD 50,000 United States Treasury Note 1.375% 30/6/2023 47,738 0.05
USD 120,000 United States Treasury Note 1.25% 31/7/2023 113,531 0.12
USD 285,000 United States Treasury Note 2.50% 15/8/2023 * 290,689 0.31
USD 140,000 United States Treasury Note 1.375% 31/8/2023 133,334 0.14
USD 260,000 United States Treasury Note 2.75% 15/11/2023 269,120 0.28
USD 140,000 United States Treasury Note 2.25% 31/12/2023 140,448 0.15
USD 120,000 United States Treasury Note 2.25% 31/1/2024 120,309 0.13
USD 260,000 United States Treasury Note 2.75% 15/2/2024 268,927 0.28
USD 400,000 United States Treasury Note 2.50% 15/5/2024 406,938 0.43
USD 475,000 United States Treasury Note 2.375% 15/8/2024 * 478,544 0.50
USD 435,000 United States Treasury Note 2.25% 15/11/2024 433,743 0.46
USD 210,000 United States Treasury Note 2.00% 15/2/2025 205,259 0.22
USD 170,000 United States Treasury Note 2.125% 15/5/2025 167,330 0.18
USD 280,000 United States Treasury Note 2.00% 15/8/2025 272,442 0.29
USD 410,000 United States Treasury Note 2.25% 15/11/2025 406,140 0.43
USD 310,000 United States Treasury Note 1.625% 15/2/2026 291,182 0.31
USD 340,000 United States Treasury Note 1.625% 15/5/2026 * 318,644 0.33
USD 305,000 United States Treasury Note 1.50% 15/8/2026 281,911 0.30
USD 250,000 United States Treasury Note 2.00% 15/11/2026 * 241,230 0.25
USD 120,000 United States Treasury Note 2.25% 15/2/2027 118,336 0.12
32,669,931 34.38
Total Bonds 93,849,097 98.77
Total Transferable Securities and Money Market Instruments Admitted to an Official Stock Exchange Listing or Dealt in on Another Regulated Market 93,849,097 98.77
Securities portfolio at market value 93,849,097 98.77
Other Net Assets 1,164,060 1.23
Total Net Assets (USD) 95,013,157 100.00
BlackRock Global Government Bond Index Fund continued
Portfolio of Investments as at 31 March 2017
United States continued United States continued

92 BlackRock Global Index Funds (BGIF)
The notes on pages 122 to 128 form an integral part of these financial statements.
BlackRock Global Government Bond Index Fund continued
Open forward foreign exchange transactions as at 31 March 2017
Currency
Purchases Currency
Sales Counterparty
Maturity date
Unrealised appreciation/
(depreciation) USD
CHF 145,000 USD 143,559 Toronto Dominion Bank 16/6/2017 1,962 PLN 160,000 USD 39,329 Bank of America NA 16/6/2017 1,021 PLN 1,908,000 USD 467,849 Toronto Dominion Bank 16/6/2017 13,320 USD 647,061 EUR 610,000 Nomura International Plc 16/6/2017 (6,928)USD 27,533 PLN 110,000 Bank of America NA 16/6/2017 (207)
Total (Gross underlying exposure - USD 1,348,766) 9,168
Sector Breakdown as at 31 March 2017
% of Net Assets
Government 98.77
Securities portfolio at market value 98.77Other Net Assets 1.23
100.00
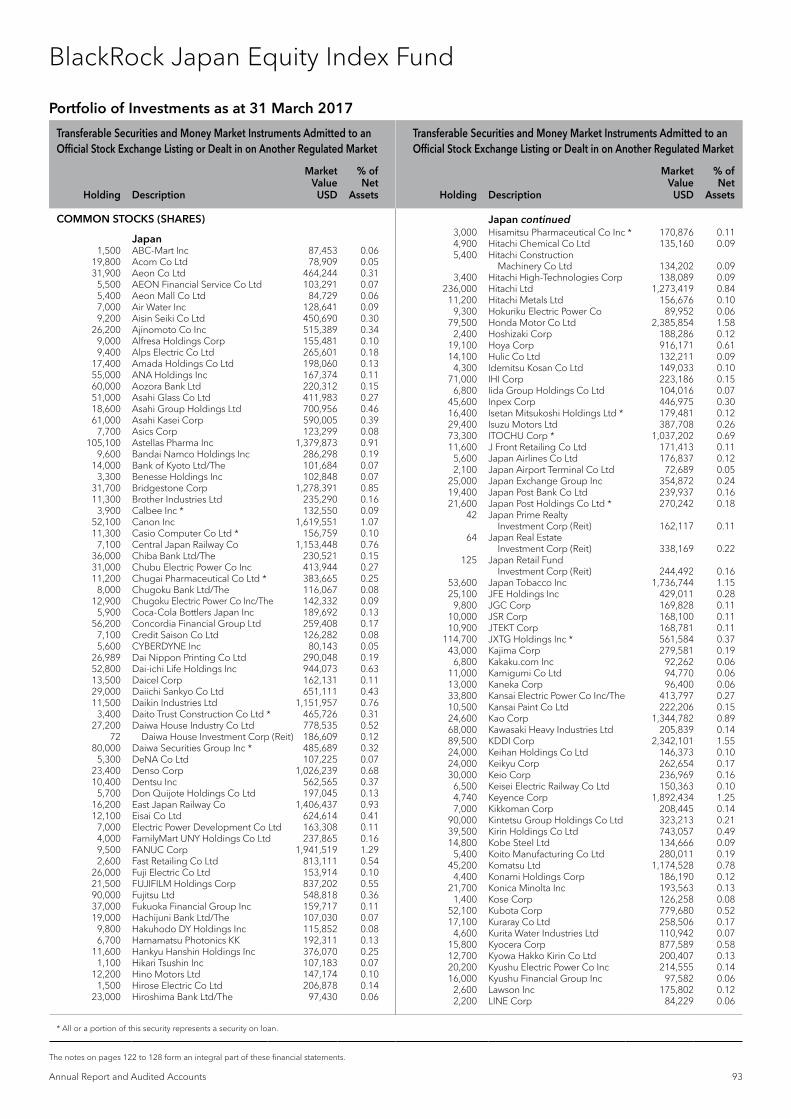
Transferable Securities and Money Market Instruments Admitted to an Official Stock Exchange Listing or Dealt in on Another Regulated Market
Transferable Securities and Money Market Instruments Admitted to an Official Stock Exchange Listing or Dealt in on Another Regulated Market
Holding Description
Market Value
USD
% of Net
Assets Holding Description
Market Value
USD
% of Net
Assets
* All or a portion of this security represents a security on loan.
USD
Annual Report and Audited Accounts 93
The notes on pages 122 to 128 form an integral part of these financial statements.
BlackRock Japan Equity Index Fund
COMMON STOCKS (SHARES)
Japan 1,500 ABC-Mart Inc 87,453 0.06 19,800 Acom Co Ltd 78,909 0.05 31,900 Aeon Co Ltd 464,244 0.31 5,500 AEON Financial Service Co Ltd 103,291 0.07 5,400 Aeon Mall Co Ltd 84,729 0.06 7,000 Air Water Inc 128,641 0.09 9,200 Aisin Seiki Co Ltd 450,690 0.30 26,200 Ajinomoto Co Inc 515,389 0.34 9,000 Alfresa Holdings Corp 155,481 0.10 9,400 Alps Electric Co Ltd 265,601 0.18 17,400 Amada Holdings Co Ltd 198,060 0.13 55,000 ANA Holdings Inc 167,374 0.11 60,000 Aozora Bank Ltd 220,312 0.15 51,000 Asahi Glass Co Ltd 411,983 0.27 18,600 Asahi Group Holdings Ltd 700,956 0.46 61,000 Asahi Kasei Corp 590,005 0.39 7,700 Asics Corp 123,299 0.08 105,100 Astellas Pharma Inc 1,379,873 0.91 9,600 Bandai Namco Holdings Inc 286,298 0.19 14,000 Bank of Kyoto Ltd/The 101,684 0.07 3,300 Benesse Holdings Inc 102,848 0.07 31,700 Bridgestone Corp 1,278,391 0.85 11,300 Brother Industries Ltd 235,290 0.16 3,900 Calbee Inc * 132,550 0.09 52,100 Canon Inc 1,619,551 1.07 11,300 Casio Computer Co Ltd * 156,759 0.10 7,100 Central Japan Railway Co 1,153,448 0.76 36,000 Chiba Bank Ltd/The 230,521 0.15 31,000 Chubu Electric Power Co Inc 413,944 0.27 11,200 Chugai Pharmaceutical Co Ltd * 383,665 0.25 8,000 Chugoku Bank Ltd/The 116,067 0.08 12,900 Chugoku Electric Power Co Inc/The 142,332 0.09 5,900 Coca-Cola Bottlers Japan Inc 189,692 0.13 56,200 Concordia Financial Group Ltd 259,408 0.17 7,100 Credit Saison Co Ltd 126,282 0.08 5,600 CYBERDYNE Inc 80,143 0.05 26,989 Dai Nippon Printing Co Ltd 290,048 0.19 52,800 Dai-ichi Life Holdings Inc 944,073 0.63 13,500 Daicel Corp 162,131 0.11 29,000 Daiichi Sankyo Co Ltd 651,111 0.43 11,500 Daikin Industries Ltd 1,151,957 0.76 3,400 Daito Trust Construction Co Ltd * 465,726 0.31 27,200 Daiwa House Industry Co Ltd 778,535 0.52 72 Daiwa House Investment Corp (Reit) 186,609 0.12 80,000 Daiwa Securities Group Inc * 485,689 0.32 5,300 DeNA Co Ltd 107,225 0.07 23,400 Denso Corp 1,026,239 0.68 10,400 Dentsu Inc 562,565 0.37 5,700 Don Quijote Holdings Co Ltd 197,045 0.13 16,200 East Japan Railway Co 1,406,437 0.93 12,100 Eisai Co Ltd 624,614 0.41 7,000 Electric Power Development Co Ltd 163,308 0.11 4,000 FamilyMart UNY Holdings Co Ltd 237,865 0.16 9,500 FANUC Corp 1,941,519 1.29 2,600 Fast Retailing Co Ltd 813,111 0.54 26,000 Fuji Electric Co Ltd 153,914 0.10 21,500 FUJIFILM Holdings Corp 837,202 0.55 90,000 Fujitsu Ltd 548,818 0.36 37,000 Fukuoka Financial Group Inc 159,717 0.11 19,000 Hachijuni Bank Ltd/The 107,030 0.07 9,800 Hakuhodo DY Holdings Inc 115,852 0.08 6,700 Hamamatsu Photonics KK 192,311 0.13 11,600 Hankyu Hanshin Holdings Inc 376,070 0.25 1,100 Hikari Tsushin Inc 107,183 0.07 12,200 Hino Motors Ltd 147,174 0.10 1,500 Hirose Electric Co Ltd 206,878 0.14 23,000 Hiroshima Bank Ltd/The 97,430 0.06
3,000 Hisamitsu Pharmaceutical Co Inc * 170,876 0.11 4,900 Hitachi Chemical Co Ltd 135,160 0.09 5,400 Hitachi Construction
Machinery Co Ltd 134,202 0.09 3,400 Hitachi High-Technologies Corp 138,089 0.09 236,000 Hitachi Ltd 1,273,419 0.84 11,200 Hitachi Metals Ltd 156,676 0.10 9,300 Hokuriku Electric Power Co 89,952 0.06 79,500 Honda Motor Co Ltd 2,385,854 1.58 2,400 Hoshizaki Corp 188,286 0.12 19,100 Hoya Corp 916,171 0.61 14,100 Hulic Co Ltd 132,211 0.09 4,300 Idemitsu Kosan Co Ltd 149,033 0.10 71,000 IHI Corp 223,186 0.15 6,800 Iida Group Holdings Co Ltd 104,016 0.07 45,600 Inpex Corp 446,975 0.30 16,400 Isetan Mitsukoshi Holdings Ltd * 179,481 0.12 29,400 Isuzu Motors Ltd 387,708 0.26 73,300 ITOCHU Corp * 1,037,202 0.69 11,600 J Front Retailing Co Ltd 171,413 0.11 5,600 Japan Airlines Co Ltd 176,837 0.12 2,100 Japan Airport Terminal Co Ltd 72,689 0.05 25,000 Japan Exchange Group Inc 354,872 0.24 19,400 Japan Post Bank Co Ltd 239,937 0.16 21,600 Japan Post Holdings Co Ltd * 270,242 0.18 42 Japan Prime Realty
Investment Corp (Reit) 162,117 0.11 64 Japan Real Estate
Investment Corp (Reit) 338,169 0.22 125 Japan Retail Fund
Investment Corp (Reit) 244,492 0.16 53,600 Japan Tobacco Inc 1,736,744 1.15 25,100 JFE Holdings Inc 429,011 0.28 9,800 JGC Corp 169,828 0.11 10,000 JSR Corp 168,100 0.11 10,900 JTEKT Corp 168,781 0.11 114,700 JXTG Holdings Inc * 561,584 0.37 43,000 Kajima Corp 279,581 0.19 6,800 Kakaku.com Inc 92,262 0.06 11,000 Kamigumi Co Ltd 94,770 0.06 13,000 Kaneka Corp 96,400 0.06 33,800 Kansai Electric Power Co Inc/The 413,797 0.27 10,500 Kansai Paint Co Ltd 222,206 0.15 24,600 Kao Corp 1,344,782 0.89 68,000 Kawasaki Heavy Industries Ltd 205,839 0.14 89,500 KDDI Corp 2,342,101 1.55 24,000 Keihan Holdings Co Ltd 146,373 0.10 24,000 Keikyu Corp 262,654 0.17 30,000 Keio Corp 236,969 0.16 6,500 Keisei Electric Railway Co Ltd 150,363 0.10 4,740 Keyence Corp 1,892,434 1.25 7,000 Kikkoman Corp 208,445 0.14 90,000 Kintetsu Group Holdings Co Ltd 323,213 0.21 39,500 Kirin Holdings Co Ltd 743,057 0.49 14,800 Kobe Steel Ltd 134,666 0.09 5,400 Koito Manufacturing Co Ltd 280,011 0.19 45,200 Komatsu Ltd 1,174,528 0.78 4,400 Konami Holdings Corp 186,190 0.12 21,700 Konica Minolta Inc 193,563 0.13 1,400 Kose Corp 126,258 0.08 52,100 Kubota Corp 779,680 0.52 17,100 Kuraray Co Ltd 258,506 0.17 4,600 Kurita Water Industries Ltd 110,942 0.07 15,800 Kyocera Corp 877,589 0.58 12,700 Kyowa Hakko Kirin Co Ltd 200,407 0.13 20,200 Kyushu Electric Power Co Inc 214,555 0.14 16,000 Kyushu Financial Group Inc 97,582 0.06 2,600 Lawson Inc 175,802 0.12 2,200 LINE Corp 84,229 0.06
Portfolio of Investments as at 31 March 2017
Japan continued

Transferable Securities and Money Market Instruments Admitted to an Official Stock Exchange Listing or Dealt in on Another Regulated Market
Transferable Securities and Money Market Instruments Admitted to an Official Stock Exchange Listing or Dealt in on Another Regulated Market
Holding Description
Market Value
USD
% of Net
Assets Holding Description
Market Value
USD
% of Net
Assets
* All or a portion of this security represents a security on loan.
94 BlackRock Global Index Funds (BGIF)
The notes on pages 122 to 128 form an integral part of these financial statements.
BlackRock Japan Equity Index Fund continued
Portfolio of Investments as at 31 March 2017
12,000 Lion Corp 215,153 0.14 12,600 LIXIL Group Corp 318,780 0.21 9,200 M3 Inc 227,652 0.15 2,500 Mabuchi Motor Co Ltd 140,382 0.09 10,800 Makita Corp 377,217 0.25 79,200 Marubeni Corp * 486,222 0.32 9,700 Marui Group Co Ltd 131,436 0.09 2,700 Maruichi Steel Tube Ltd 76,531 0.05 28,000 Mazda Motor Corp 401,970 0.27 3,100 McDonald's Holdings Co Japan Ltd 90,229 0.06 45,330 Mebuki Financial Group Inc 180,654 0.12 7,900 Medipal Holdings Corp 123,530 0.08 5,500 MEIJI Holdings Co Ltd 456,609 0.30 19,100 MINEBEA MITSUMI Inc 254,017 0.17 2,800 Miraca Holdings Inc 128,390 0.08 13,200 MISUMI Group Inc 237,851 0.16 66,100 Mitsubishi Chemical Holdings Corp 509,928 0.34 73,700 Mitsubishi Corp * 1,587,725 1.05 94,200 Mitsubishi Electric Corp 1,347,281 0.89 61,000 Mitsubishi Estate Co Ltd 1,108,992 0.74 8,700 Mitsubishi Gas Chemical Co Inc 180,140 0.12 154,000 Mitsubishi Heavy Industries Ltd 615,945 0.41 5,442 Mitsubishi Logistics Corp 74,763 0.05 5,800 Mitsubishi Materials Corp 175,049 0.12 32,200 Mitsubishi Motors Corp 192,923 0.13 10,800 Mitsubishi Tanabe Pharma Corp 224,202 0.15 621,200 Mitsubishi UFJ Financial Group Inc 3,892,653 2.58 20,800 Mitsubishi UFJ Lease &
Finance Co Ltd 103,385 0.07 83,300 Mitsui & Co Ltd * 1,202,949 0.80 44,000 Mitsui Chemicals Inc 216,729 0.14 44,000 Mitsui Fudosan Co Ltd 935,483 0.62 54,000 Mitsui OSK Lines Ltd 169,264 0.11 2,100 Mixi Inc 100,806 0.07 1,175,638 Mizuho Financial Group Inc * 2,147,861 1.42 24,900 MS&AD Insurance Group
Holdings Inc 789,414 0.52 9,400 Murata Manufacturing Co Ltd 1,333,056 0.88 5,900 Nabtesco Corp 155,875 0.10 47,000 Nagoya Railroad Co Ltd 210,881 0.14 131,000 NEC Corp * 314,419 0.21 8,100 Nexon Co Ltd 128,326 0.08 12,600 NGK Insulators Ltd 284,363 0.19 8,600 NGK Spark Plug Co Ltd 195,938 0.13 9,000 NH Foods Ltd 240,919 0.16 11,700 Nidec Corp 1,110,169 0.74 16,200 Nikon Corp 234,164 0.16 5,500 Nintendo Co Ltd 1,272,546 0.84 69 Nippon Building Fund Inc (Reit) 376,330 0.25 21,000 Nippon Electric Glass Co Ltd 126,572 0.08 39,000 Nippon Express Co Ltd 199,785 0.13 7,800 Nippon Paint Holdings Co Ltd 270,688 0.18 71 Nippon Prologis REIT Inc (Reit) 153,433 0.10 39,600 Nippon Steel & Sumitomo
Metal Corp 909,672 0.60 33,300 Nippon Telegraph &
Telephone Corp 1,417,174 0.94 77,000 Nippon Yusen KK 162,054 0.11 5,900 Nissan Chemical Industries Ltd 171,198 0.11 116,100 Nissan Motor Co Ltd * 1,116,186 0.74 9,200 Nisshin Seifun Group Inc 136,855 0.09 3,100 Nissin Foods Holdings Co Ltd 171,297 0.11 3,900 Nitori Holdings Co Ltd 491,429 0.33 8,200 Nitto Denko Corp 631,707 0.42 4,400 NOK Corp 101,823 0.07 177,200 Nomura Holdings Inc * 1,098,018 0.73 6,000 Nomura Real Estate Holdings Inc 95,325 0.06 193 Nomura Real Estate Master
Fund Inc (Reit) 298,678 0.20
6,340 Nomura Research Institute Ltd 232,796 0.15 21,200 NSK Ltd 302,260 0.20 6,100 NTT Data Corp 288,447 0.19 67,600 NTT DOCOMO Inc * 1,569,524 1.04 32,200 Obayashi Corp 300,199 0.20 3,000 Obic Co Ltd 142,397 0.09 14,200 Odakyu Electric Railway Co Ltd 275,454 0.18 39,000 Oji Holdings Corp 181,972 0.12 14,000 Olympus Corp 536,629 0.36 9,200 Omron Corp 402,490 0.27 20,200 Ono Pharmaceutical Co Ltd 416,899 0.28 2,000 Oracle Corp Japan 113,917 0.08 10,500 Oriental Land Co Ltd 600,228 0.40 64,800 ORIX Corp 956,099 0.63 94,000 Osaka Gas Co Ltd 356,099 0.24 2,500 Otsuka Corp 135,232 0.09 19,100 Otsuka Holdings Co Ltd 859,038 0.57 107,800 Panasonic Corp 1,214,512 0.81 4,700 Park24 Co Ltd 122,656 0.08 4,400 Pola Orbis Holdings Inc * 105,882 0.07 44,700 Rakuten Inc 446,359 0.30 18,000 Recruit Holdings Co Ltd 915,637 0.61 106,100 Resona Holdings Inc * 568,128 0.38 32,300 Ricoh Co Ltd 264,972 0.18 1,600 Rinnai Corp 126,957 0.08 4,200 Rohm Co Ltd 278,345 0.18 1,200 Ryohin Keikaku Co Ltd 262,117 0.17 2,100 Sankyo Co Ltd 69,962 0.05 17,900 Santen Pharmaceutical Co Ltd 258,417 0.17 10,500 SBI Holdings Inc 145,943 0.10 10,100 Secom Co Ltd 720,821 0.48 9,100 Sega Sammy Holdings Inc 121,594 0.08 7,900 Seibu Holdings Inc 129,969 0.09 13,300 Seiko Epson Corp 279,198 0.18 20,500 Sekisui Chemical Co Ltd 343,503 0.23 28,900 Sekisui House Ltd 473,902 0.31 36,700 Seven & i Holdings Co Ltd 1,433,686 0.95 27,500 Seven Bank Ltd * 89,647 0.06 71,000 Sharp Corp * 298,854 0.20 12,200 Shimadzu Corp 193,281 0.13 1,100 Shimamura Co Ltd 144,913 0.10 3,600 Shimano Inc 523,912 0.35 26,000 Shimizu Corp 232,384 0.15 19,000 Shin-Etsu Chemical Co Ltd 1,641,017 1.09 84,000 Shinsei Bank Ltd 154,218 0.10 14,400 Shionogi & Co Ltd 741,279 0.49 18,300 Shiseido Co Ltd 480,199 0.32 25,000 Shizuoka Bank Ltd/The 202,848 0.13 9,300 Showa Shell Sekiyu KK 93,866 0.06 2,800 SMC Corp 825,506 0.55 40,300 SoftBank Group Corp 2,837,530 1.88 3,300 Sohgo Security Services Co Ltd 122,797 0.08 17,400 Sompo Holdings Inc 635,631 0.42 61,600 Sony Corp 2,077,607 1.38 8,100 Sony Financial Holdings Inc 129,777 0.09 7,200 Stanley Electric Co Ltd 204,729 0.14 8,700 Start Today Co Ltd 191,905 0.13 30,100 Subaru Corp * 1,100,648 0.73 76,000 Sumitomo Chemical Co Ltd 423,357 0.28 58,500 Sumitomo Corp * 784,558 0.52 8,400 Sumitomo Dainippon
Pharma Co Ltd 138,270 0.09 36,200 Sumitomo Electric Industries Ltd 598,470 0.40 26,000 Sumitomo Heavy Industries Ltd 180,691 0.12 24,000 Sumitomo Metal Mining Co Ltd 340,355 0.23 65,400 Sumitomo Mitsui Financial
Group Inc * 2,369,183 1.57 16,400 Sumitomo Mitsui Trust Holdings Inc 566,935 0.38
Japan continued Japan continued
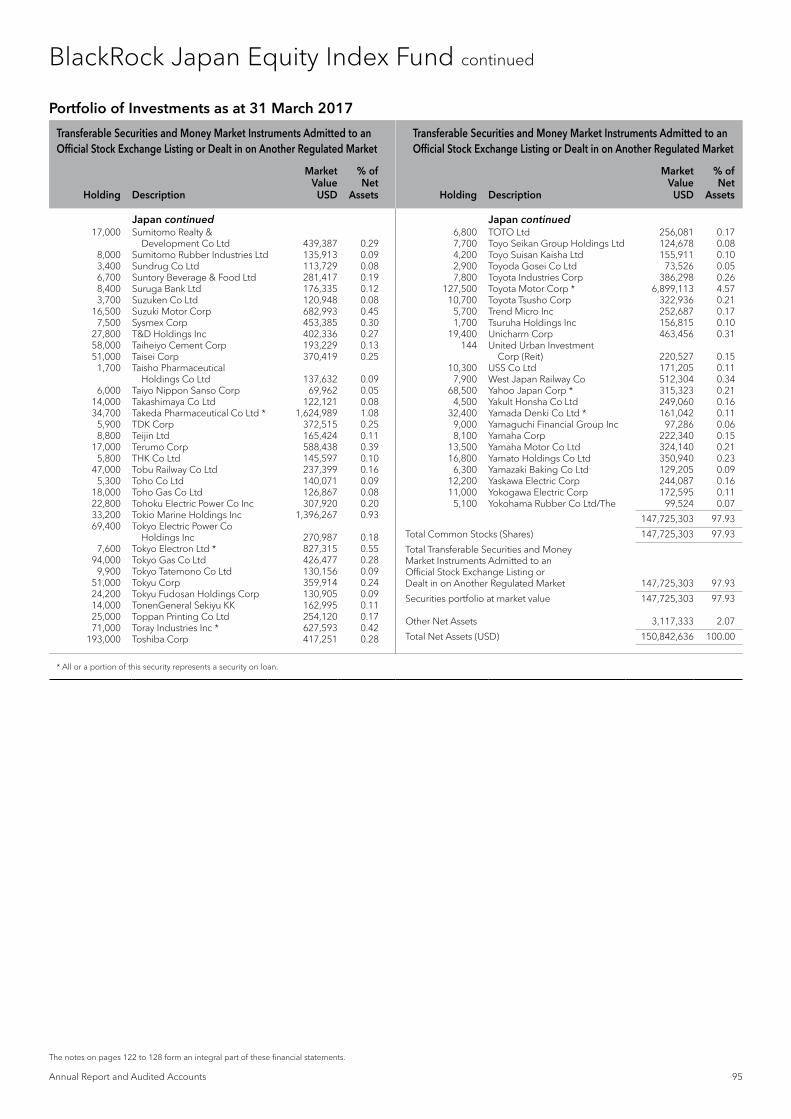
Transferable Securities and Money Market Instruments Admitted to an Official Stock Exchange Listing or Dealt in on Another Regulated Market
Transferable Securities and Money Market Instruments Admitted to an Official Stock Exchange Listing or Dealt in on Another Regulated Market
Holding Description
Market Value
USD
% of Net
Assets Holding Description
Market Value
USD
% of Net
Assets
* All or a portion of this security represents a security on loan.
Annual Report and Audited Accounts 95
The notes on pages 122 to 128 form an integral part of these financial statements.
BlackRock Japan Equity Index Fund continued
Portfolio of Investments as at 31 March 2017
17,000 Sumitomo Realty & Development Co Ltd 439,387 0.29
8,000 Sumitomo Rubber Industries Ltd 135,913 0.09 3,400 Sundrug Co Ltd 113,729 0.08 6,700 Suntory Beverage & Food Ltd 281,417 0.19 8,400 Suruga Bank Ltd 176,335 0.12 3,700 Suzuken Co Ltd 120,948 0.08 16,500 Suzuki Motor Corp 682,993 0.45 7,500 Sysmex Corp 453,385 0.30 27,800 T&D Holdings Inc 402,336 0.27 58,000 Taiheiyo Cement Corp 193,229 0.13 51,000 Taisei Corp 370,419 0.25 1,700 Taisho Pharmaceutical
Holdings Co Ltd 137,632 0.09 6,000 Taiyo Nippon Sanso Corp 69,962 0.05 14,000 Takashimaya Co Ltd 122,121 0.08 34,700 Takeda Pharmaceutical Co Ltd * 1,624,989 1.08 5,900 TDK Corp 372,515 0.25 8,800 Teijin Ltd 165,424 0.11 17,000 Terumo Corp 588,438 0.39 5,800 THK Co Ltd 145,597 0.10 47,000 Tobu Railway Co Ltd 237,399 0.16 5,300 Toho Co Ltd 140,071 0.09 18,000 Toho Gas Co Ltd 126,867 0.08 22,800 Tohoku Electric Power Co Inc 307,920 0.20 33,200 Tokio Marine Holdings Inc 1,396,267 0.93 69,400 Tokyo Electric Power Co
Holdings Inc 270,987 0.18 7,600 Tokyo Electron Ltd * 827,315 0.55 94,000 Tokyo Gas Co Ltd 426,477 0.28 9,900 Tokyo Tatemono Co Ltd 130,156 0.09 51,000 Tokyu Corp 359,914 0.24 24,200 Tokyu Fudosan Holdings Corp 130,905 0.09 14,000 TonenGeneral Sekiyu KK 162,995 0.11 25,000 Toppan Printing Co Ltd 254,120 0.17 71,000 Toray Industries Inc * 627,593 0.42 193,000 Toshiba Corp 417,251 0.28
6,800 TOTO Ltd 256,081 0.17 7,700 Toyo Seikan Group Holdings Ltd 124,678 0.08 4,200 Toyo Suisan Kaisha Ltd 155,911 0.10 2,900 Toyoda Gosei Co Ltd 73,526 0.05 7,800 Toyota Industries Corp 386,298 0.26 127,500 Toyota Motor Corp * 6,899,113 4.57 10,700 Toyota Tsusho Corp 322,936 0.21 5,700 Trend Micro Inc 252,687 0.17 1,700 Tsuruha Holdings Inc 156,815 0.10 19,400 Unicharm Corp 463,456 0.31 144 United Urban Investment
Corp (Reit) 220,527 0.15 10,300 USS Co Ltd 171,205 0.11 7,900 West Japan Railway Co 512,304 0.34 68,500 Yahoo Japan Corp * 315,323 0.21 4,500 Yakult Honsha Co Ltd 249,060 0.16 32,400 Yamada Denki Co Ltd * 161,042 0.11 9,000 Yamaguchi Financial Group Inc 97,286 0.06 8,100 Yamaha Corp 222,340 0.15 13,500 Yamaha Motor Co Ltd 324,140 0.21 16,800 Yamato Holdings Co Ltd 350,940 0.23 6,300 Yamazaki Baking Co Ltd 129,205 0.09 12,200 Yaskawa Electric Corp 244,087 0.16 11,000 Yokogawa Electric Corp 172,595 0.11 5,100 Yokohama Rubber Co Ltd/The 99,524 0.07
147,725,303 97.93
Total Common Stocks (Shares) 147,725,303 97.93
Total Transferable Securities and Money Market Instruments Admitted to an Official Stock Exchange Listing or Dealt in on Another Regulated Market 147,725,303 97.93
Securities portfolio at market value 147,725,303 97.93
Other Net Assets 3,117,333 2.07
Total Net Assets (USD) 150,842,636 100.00
Japan continued Japan continued

96 BlackRock Global Index Funds (BGIF)
The notes on pages 122 to 128 form an integral part of these financial statements.
BlackRock Japan Equity Index Fund continued
Futures contracts as at 31 March 2017
Number of contracts
Currency of contract
Contract/ Description
Expiration date
Gross underlying
exposure USD
Unrealised appreciation/
(depreciation) USD
234 JPY Mini TOPIX Index June 2017 3,169,667 (61,056)
Total 3,169,667 (61,056)
Sector Breakdown as at 31 March 2017
% of Net Assets
Consumer, Cyclical 25.08Industrial 21.13Financial 16.89Consumer, Non-cyclical 15.17Communications 7.18Basic Materials 5.97Technology 3.65Utilities 1.92Energy 0.94
Securities portfolio at market value 97.93Other Net Assets 2.07
100.00
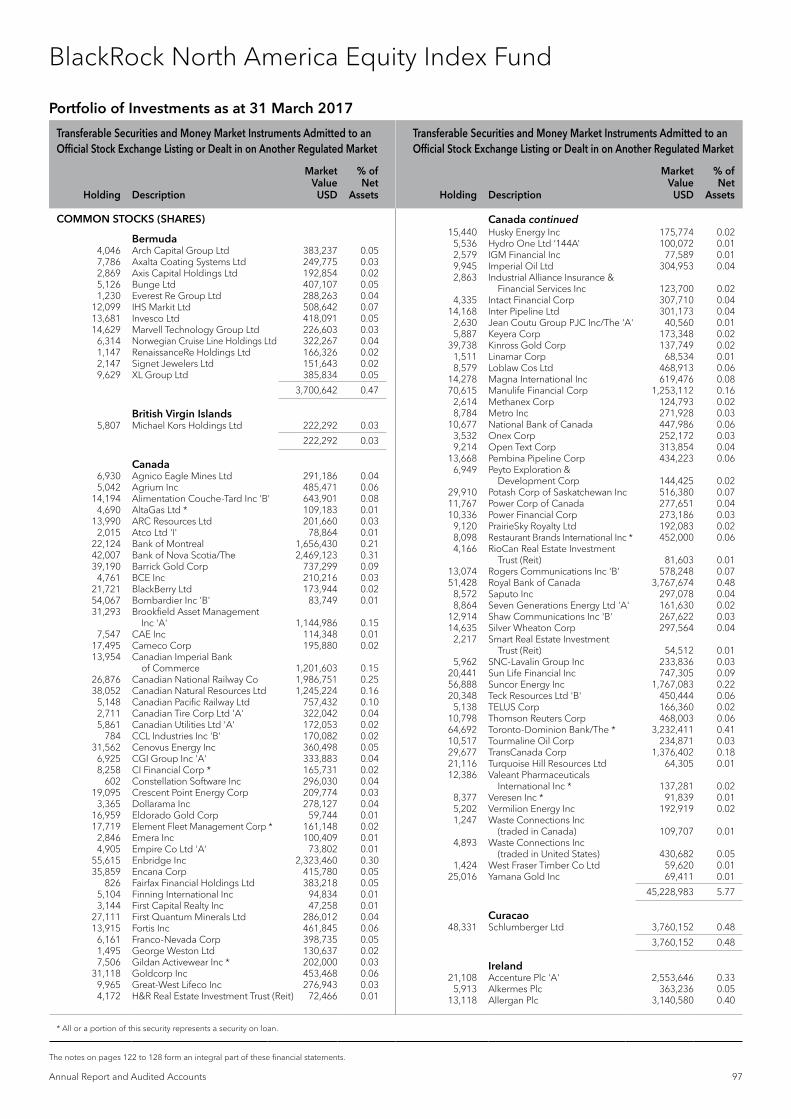
Transferable Securities and Money Market Instruments Admitted to an Official Stock Exchange Listing or Dealt in on Another Regulated Market
Transferable Securities and Money Market Instruments Admitted to an Official Stock Exchange Listing or Dealt in on Another Regulated Market
Holding Description
Market Value
USD
% of Net
Assets Holding Description
Market Value
USD
% of Net
Assets
* All or a portion of this security represents a security on loan.
USD
Annual Report and Audited Accounts 97
The notes on pages 122 to 128 form an integral part of these financial statements.
BlackRock North America Equity Index Fund
Portfolio of Investments as at 31 March 2017
COMMON STOCKS (SHARES)
Bermuda 4,046 Arch Capital Group Ltd 383,237 0.05 7,786 Axalta Coating Systems Ltd 249,775 0.03 2,869 Axis Capital Holdings Ltd 192,854 0.02 5,126 Bunge Ltd 407,107 0.05 1,230 Everest Re Group Ltd 288,263 0.04 12,099 IHS Markit Ltd 508,642 0.07 13,681 Invesco Ltd 418,091 0.05 14,629 Marvell Technology Group Ltd 226,603 0.03 6,314 Norwegian Cruise Line Holdings Ltd 322,267 0.04 1,147 RenaissanceRe Holdings Ltd 166,326 0.02 2,147 Signet Jewelers Ltd 151,643 0.02 9,629 XL Group Ltd 385,834 0.05
3,700,642 0.47
British Virgin Islands 5,807 Michael Kors Holdings Ltd 222,292 0.03
222,292 0.03
Canada 6,930 Agnico Eagle Mines Ltd 291,186 0.04 5,042 Agrium Inc 485,471 0.06 14,194 Alimentation Couche-Tard Inc 'B' 643,901 0.08 4,690 AltaGas Ltd * 109,183 0.01 13,990 ARC Resources Ltd 201,660 0.03 2,015 Atco Ltd 'I' 78,864 0.01 22,124 Bank of Montreal 1,656,430 0.21 42,007 Bank of Nova Scotia/The 2,469,123 0.31 39,190 Barrick Gold Corp 737,299 0.09 4,761 BCE Inc 210,216 0.03 21,721 BlackBerry Ltd 173,944 0.02 54,067 Bombardier Inc 'B' 83,749 0.01 31,293 Brookfield Asset Management
Inc 'A' 1,144,986 0.15 7,547 CAE Inc 114,348 0.01 17,495 Cameco Corp 195,880 0.02 13,954 Canadian Imperial Bank
of Commerce 1,201,603 0.15 26,876 Canadian National Railway Co 1,986,751 0.25 38,052 Canadian Natural Resources Ltd 1,245,224 0.16 5,148 Canadian Pacific Railway Ltd 757,432 0.10 2,711 Canadian Tire Corp Ltd 'A' 322,042 0.04 5,861 Canadian Utilities Ltd 'A' 172,053 0.02 784 CCL Industries Inc 'B' 170,082 0.02 31,562 Cenovus Energy Inc 360,498 0.05 6,925 CGI Group Inc 'A' 333,883 0.04 8,258 CI Financial Corp * 165,731 0.02 602 Constellation Software Inc 296,030 0.04 19,095 Crescent Point Energy Corp 209,774 0.03 3,365 Dollarama Inc 278,127 0.04 16,959 Eldorado Gold Corp 59,744 0.01 17,719 Element Fleet Management Corp * 161,148 0.02 2,846 Emera Inc 100,409 0.01 4,905 Empire Co Ltd 'A' 73,802 0.01 55,615 Enbridge Inc 2,323,460 0.30 35,859 Encana Corp 415,780 0.05 826 Fairfax Financial Holdings Ltd 383,218 0.05 5,104 Finning International Inc 94,834 0.01 3,144 First Capital Realty Inc 47,258 0.01 27,111 First Quantum Minerals Ltd 286,012 0.04 13,915 Fortis Inc 461,845 0.06 6,161 Franco-Nevada Corp 398,735 0.05 1,495 George Weston Ltd 130,637 0.02 7,506 Gildan Activewear Inc * 202,000 0.03 31,118 Goldcorp Inc 453,468 0.06 9,965 Great-West Lifeco Inc 276,943 0.03 4,172 H&R Real Estate Investment Trust (Reit) 72,466 0.01
15,440 Husky Energy Inc 175,774 0.02 5,536 Hydro One Ltd ‘144A’ 100,072 0.01 2,579 IGM Financial Inc 77,589 0.01 9,945 Imperial Oil Ltd 304,953 0.04 2,863 Industrial Alliance Insurance &
Financial Services Inc 123,700 0.02 4,335 Intact Financial Corp 307,710 0.04 14,168 Inter Pipeline Ltd 301,173 0.04 2,630 Jean Coutu Group PJC Inc/The 'A' 40,560 0.01 5,887 Keyera Corp 173,348 0.02 39,738 Kinross Gold Corp 137,749 0.02 1,511 Linamar Corp 68,534 0.01 8,579 Loblaw Cos Ltd 468,913 0.06 14,278 Magna International Inc 619,476 0.08 70,615 Manulife Financial Corp 1,253,112 0.16 2,614 Methanex Corp 124,793 0.02 8,784 Metro Inc 271,928 0.03 10,677 National Bank of Canada 447,986 0.06 3,532 Onex Corp 252,172 0.03 9,214 Open Text Corp 313,854 0.04 13,668 Pembina Pipeline Corp 434,223 0.06 6,949 Peyto Exploration &
Development Corp 144,425 0.02 29,910 Potash Corp of Saskatchewan Inc 516,380 0.07 11,767 Power Corp of Canada 277,651 0.04 10,336 Power Financial Corp 273,186 0.03 9,120 PrairieSky Royalty Ltd 192,083 0.02 8,098 Restaurant Brands International Inc * 452,000 0.06 4,166 RioCan Real Estate Investment
Trust (Reit) 81,603 0.01 13,074 Rogers Communications Inc 'B' 578,248 0.07 51,428 Royal Bank of Canada 3,767,674 0.48 8,572 Saputo Inc 297,078 0.04 8,864 Seven Generations Energy Ltd 'A' 161,630 0.02 12,914 Shaw Communications Inc 'B' 267,622 0.03 14,635 Silver Wheaton Corp 297,564 0.04 2,217 Smart Real Estate Investment
Trust (Reit) 54,512 0.01 5,962 SNC-Lavalin Group Inc 233,836 0.03 20,441 Sun Life Financial Inc 747,305 0.09 56,888 Suncor Energy Inc 1,767,083 0.22 20,348 Teck Resources Ltd 'B' 450,444 0.06 5,138 TELUS Corp 166,360 0.02 10,798 Thomson Reuters Corp 468,003 0.06 64,692 Toronto-Dominion Bank/The * 3,232,411 0.41 10,517 Tourmaline Oil Corp 234,871 0.03 29,677 TransCanada Corp 1,376,402 0.18 21,116 Turquoise Hill Resources Ltd 64,305 0.01 12,386 Valeant Pharmaceuticals
International Inc * 137,281 0.02 8,377 Veresen Inc * 91,839 0.01 5,202 Vermilion Energy Inc 192,919 0.02 1,247 Waste Connections Inc
(traded in Canada) 109,707 0.01 4,893 Waste Connections Inc
(traded in United States) 430,682 0.05 1,424 West Fraser Timber Co Ltd 59,620 0.01 25,016 Yamana Gold Inc 69,411 0.01
45,228,983 5.77
Curacao 48,331 Schlumberger Ltd 3,760,152 0.48
3,760,152 0.48
Ireland 21,108 Accenture Plc 'A' 2,553,646 0.33 5,913 Alkermes Plc 363,236 0.05 13,118 Allergan Plc 3,140,580 0.40
Canada continued

Transferable Securities and Money Market Instruments Admitted to an Official Stock Exchange Listing or Dealt in on Another Regulated Market
Transferable Securities and Money Market Instruments Admitted to an Official Stock Exchange Listing or Dealt in on Another Regulated Market
Holding Description
Market Value
USD
% of Net
Assets Holding Description
Market Value
USD
% of Net
Assets
* All or a portion of this security represents a security on loan.
98 BlackRock Global Index Funds (BGIF)
The notes on pages 122 to 128 form an integral part of these financial statements.
16,174 Eaton Corp Plc 1,199,464 0.15 9,360 Ingersoll-Rand Plc 756,569 0.10 1,895 Jazz Pharmaceuticals Plc 276,367 0.03 32,196 Johnson Controls International Plc 1,361,247 0.17 4,233 Mallinckrodt Plc 193,660 0.02 48,413 Medtronic Plc 3,904,508 0.50 5,537 Pentair Plc 346,782 0.04 5,388 Perrigo Co Plc 363,367 0.05 9,749 Seagate Technology Plc 453,718 0.06 26,499 Weatherford International Plc 177,543 0.02 4,817 Willis Towers Watson Plc 629,100 0.08
15,719,787 2.00
Jersey 9,921 Delphi Automotive Plc 802,907 0.10
802,907 0.10
Liberia 5,543 Royal Caribbean Cruises Ltd 549,810 0.07
549,810 0.07
Netherlands 1,294 Core Laboratories NV * 148,590 0.02 12,313 LyondellBasell Industries NV 'A' 1,122,207 0.14 15,270 Mylan NV 605,150 0.08 6,863 Sensata Technologies Holding NV 300,874 0.04
2,176,821 0.28
Panama 12,783 Carnival Corp 755,859 0.10
755,859 0.10
Singapore 13,782 Broadcom Ltd 3,018,258 0.38 16,844 Flex Ltd 281,800 0.04
3,300,058 0.42
Switzerland 16,342 Chubb Ltd 2,228,885 0.28 4,481 Garmin Ltd 229,114 0.03 12,611 TE Connectivity Ltd 942,168 0.12
3,400,167 0.43
United Kingdom 9,552 Aon Plc 1,128,569 0.14 7,686 Liberty Global Plc 'A' 274,390 0.04 21,791 Liberty Global Plc 'C' 762,031 0.10 4,592 Liberty Global Plc LiLAC 'C' 105,570 0.01 12,179 Nielsen Holdings Plc 500,557 0.06 15,931 TechnipFMC Plc 522,696 0.07
3,293,813 0.42
United States 21,146 3M Co 4,054,745 0.52 59,089 Abbott Laboratories 2,632,710 0.34 56,239 AbbVie Inc 3,680,280 0.47 19,864 Activision Blizzard Inc 988,830 0.13 1,420 Acuity Brands Inc 292,037 0.04 17,567 Adobe Systems Inc 2,279,670 0.29 2,771 Advance Auto Parts Inc 412,685 0.05 28,954 Advanced Micro Devices Inc 414,332 0.05 23,845 AES Corp/VA 266,349 0.03 12,200 Aetna Inc 1,547,814 0.20 2,076 Affiliated Managers Group Inc 339,073 0.04 14,815 Aflac Inc 1,071,421 0.14
2,111 AGCO Corp 127,124 0.02 12,151 Agilent Technologies Inc 646,433 0.08 10,342 AGNC Investment Corp (Reit) 206,116 0.03 7,428 Air Products & Chemicals Inc 1,007,608 0.13 6,686 Akamai Technologies Inc 404,369 0.05 4,090 Albemarle Corp 431,209 0.06 2,978 Alexandria Real Estate
Equities Inc (Reit) 328,086 0.04 8,102 Alexion Pharmaceuticals Inc 972,888 0.12 2,556 Align Technology Inc 293,045 0.04 408 Alleghany Corp 251,022 0.03 1,838 Alliance Data Systems Corp 456,210 0.06 7,170 Alliant Energy Corp 284,219 0.04 12,436 Allstate Corp/The 1,012,166 0.13 14,359 Ally Financial Inc 293,067 0.04 10,285 Alphabet Inc 'A' 8,728,777 1.11 10,792 Alphabet Inc 'C' 8,954,986 1.14 67,245 Altria Group Inc 4,842,985 0.62 14,032 Amazon.com Inc 12,403,586 1.58 215 AMERCO 81,971 0.01 8,173 Ameren Corp 448,207 0.06 4,801 American Airlines Group Inc 204,667 0.03 17,543 American Electric Power Co Inc 1,180,819 0.15 26,708 American Express Co 2,106,994 0.27 35,954 American International Group Inc 2,239,575 0.29 14,631 American Tower Corp (Reit) 1,767,571 0.23 6,082 American Water Works Co Inc 472,328 0.06 5,574 Ameriprise Financial Inc 721,666 0.09 5,458 AmerisourceBergen Corp 489,091 0.06 7,631 AMETEK Inc 412,684 0.05 25,618 Amgen Inc 4,218,260 0.54 10,806 Amphenol Corp 'A' 773,385 0.10 18,904 Anadarko Petroleum Corp 1,184,336 0.15 13,004 Analog Devices Inc 1,064,898 0.14 33,476 Annaly Capital
Management Inc (Reit) 371,751 0.05 3,430 ANSYS Inc 365,158 0.05 5,217 Antero Resources Corp 119,782 0.02 9,166 Anthem Inc 1,523,389 0.19 5,928 AO Smith Corp 302,328 0.04 13,050 Apache Corp 679,775 0.09 185,251 Apple Inc 26,648,356 3.40 37,410 Applied Materials Inc 1,446,645 0.18 9,421 Aramark 348,954 0.04 19,350 Archer-Daniels-Midland Co 891,261 0.11 14,156 Arconic Inc 372,020 0.05 2,700 Arrow Electronics Inc 199,422 0.03 5,731 Arthur J Gallagher & Co 324,489 0.04 2,489 Ashland Global Holdings Inc 308,238 0.04 2,116 Assurant Inc 201,888 0.03 213,328 AT&T Inc 8,921,377 1.14 3,205 Atmos Energy Corp 253,035 0.03 7,404 Autodesk Inc 633,338 0.08 2,656 Autoliv Inc 270,832 0.03 15,843 Automatic Data Processing Inc 1,618,046 0.21 2,019 AutoNation Inc 86,413 0.01 967 AutoZone Inc 701,075 0.09 4,939 AvalonBay Communities Inc (Reit) 904,232 0.12 2,671 Avery Dennison Corp 214,615 0.03 4,617 Avnet Inc 210,997 0.03 3,049 B/E Aerospace Inc 196,203 0.03 13,591 Baker Hughes Inc 815,596 0.10 5,364 Ball Corp 395,059 0.05 351,047 Bank of America Corp 8,361,940 1.07 37,012 Bank of New York Mellon Corp/The 1,752,148 0.22 16,695 Baxter International Inc 865,803 0.11 28,613 BB&T Corp 1,286,154 0.16 7,410 Becton Dickinson and Co 1,354,993 0.17 5,300 Bed Bath & Beyond Inc 211,735 0.03
Portfolio of Investments as at 31 March 2017
BlackRock North America Equity Index Fund continued
Ireland continued United States continued
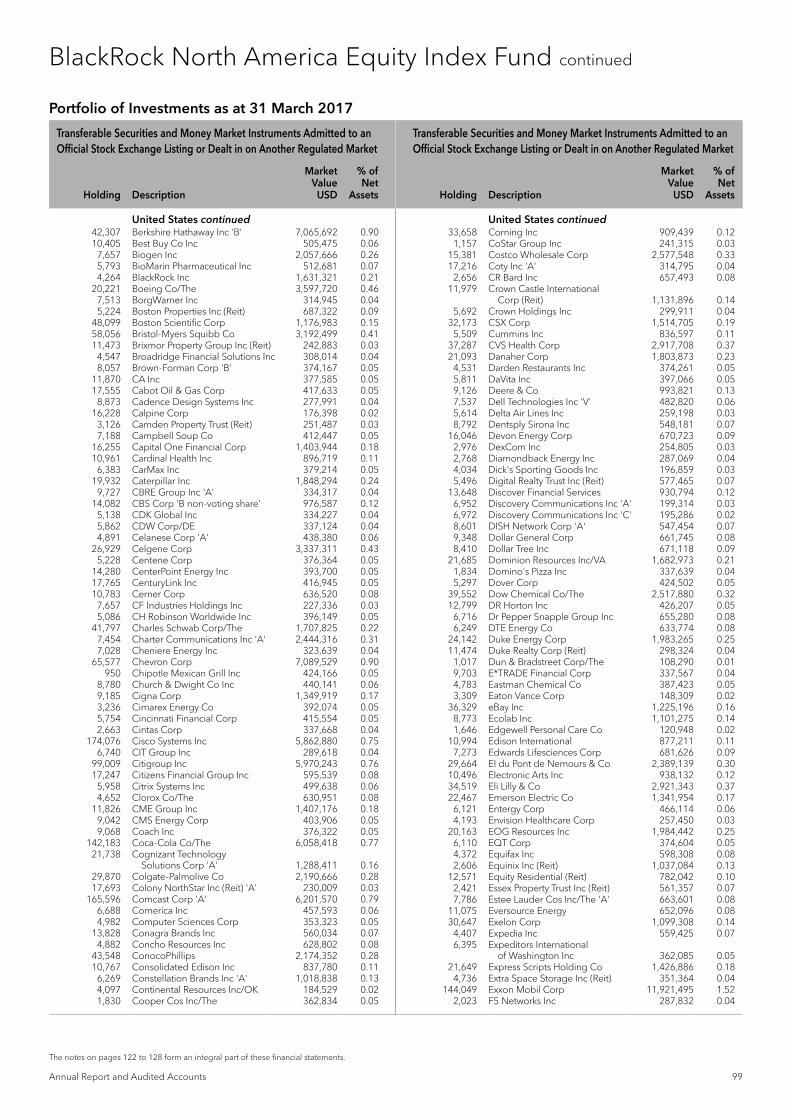
Transferable Securities and Money Market Instruments Admitted to an Official Stock Exchange Listing or Dealt in on Another Regulated Market
Transferable Securities and Money Market Instruments Admitted to an Official Stock Exchange Listing or Dealt in on Another Regulated Market
Holding Description
Market Value
USD
% of Net
Assets Holding Description
Market Value
USD
% of Net
Assets
Annual Report and Audited Accounts 99
The notes on pages 122 to 128 form an integral part of these financial statements.
42,307 Berkshire Hathaway Inc 'B' 7,065,692 0.90 10,405 Best Buy Co Inc 505,475 0.06 7,657 Biogen Inc 2,057,666 0.26 5,793 BioMarin Pharmaceutical Inc 512,681 0.07 4,264 BlackRock Inc 1,631,321 0.21 20,221 Boeing Co/The 3,597,720 0.46 7,513 BorgWarner Inc 314,945 0.04 5,224 Boston Properties Inc (Reit) 687,322 0.09 48,099 Boston Scientific Corp 1,176,983 0.15 58,056 Bristol-Myers Squibb Co 3,192,499 0.41 11,473 Brixmor Property Group Inc (Reit) 242,883 0.03 4,547 Broadridge Financial Solutions Inc 308,014 0.04 8,057 Brown-Forman Corp 'B' 374,167 0.05 11,870 CA Inc 377,585 0.05 17,555 Cabot Oil & Gas Corp 417,633 0.05 8,873 Cadence Design Systems Inc 277,991 0.04 16,228 Calpine Corp 176,398 0.02 3,126 Camden Property Trust (Reit) 251,487 0.03 7,188 Campbell Soup Co 412,447 0.05 16,255 Capital One Financial Corp 1,403,944 0.18 10,961 Cardinal Health Inc 896,719 0.11 6,383 CarMax Inc 379,214 0.05 19,932 Caterpillar Inc 1,848,294 0.24 9,727 CBRE Group Inc 'A' 334,317 0.04 14,082 CBS Corp 'B non-voting share' 976,587 0.12 5,138 CDK Global Inc 334,227 0.04 5,862 CDW Corp/DE 337,124 0.04 4,891 Celanese Corp 'A' 438,380 0.06 26,929 Celgene Corp 3,337,311 0.43 5,228 Centene Corp 376,364 0.05 14,280 CenterPoint Energy Inc 393,700 0.05 17,765 CenturyLink Inc 416,945 0.05 10,783 Cerner Corp 636,520 0.08 7,657 CF Industries Holdings Inc 227,336 0.03 5,086 CH Robinson Worldwide Inc 396,149 0.05 41,797 Charles Schwab Corp/The 1,707,825 0.22 7,454 Charter Communications Inc 'A' 2,444,316 0.31 7,028 Cheniere Energy Inc 323,639 0.04 65,577 Chevron Corp 7,089,529 0.90 950 Chipotle Mexican Grill Inc 424,166 0.05 8,780 Church & Dwight Co Inc 440,141 0.06 9,185 Cigna Corp 1,349,919 0.17 3,236 Cimarex Energy Co 392,074 0.05 5,754 Cincinnati Financial Corp 415,554 0.05 2,663 Cintas Corp 337,668 0.04 174,076 Cisco Systems Inc 5,862,880 0.75 6,740 CIT Group Inc 289,618 0.04 99,009 Citigroup Inc 5,970,243 0.76 17,247 Citizens Financial Group Inc 595,539 0.08 5,958 Citrix Systems Inc 499,638 0.06 4,652 Clorox Co/The 630,951 0.08 11,826 CME Group Inc 1,407,176 0.18 9,042 CMS Energy Corp 403,906 0.05 9,068 Coach Inc 376,322 0.05 142,183 Coca-Cola Co/The 6,058,418 0.77 21,738 Cognizant Technology
Solutions Corp 'A' 1,288,411 0.16 29,870 Colgate-Palmolive Co 2,190,666 0.28 17,693 Colony NorthStar Inc (Reit) 'A' 230,009 0.03 165,596 Comcast Corp 'A' 6,201,570 0.79 6,688 Comerica Inc 457,593 0.06 4,982 Computer Sciences Corp 353,323 0.05 13,828 Conagra Brands Inc 560,034 0.07 4,882 Concho Resources Inc 628,802 0.08 43,548 ConocoPhillips 2,174,352 0.28 10,767 Consolidated Edison Inc 837,780 0.11 6,269 Constellation Brands Inc 'A' 1,018,838 0.13 4,097 Continental Resources Inc/OK 184,529 0.02 1,830 Cooper Cos Inc/The 362,834 0.05
33,658 Corning Inc 909,439 0.12 1,157 CoStar Group Inc 241,315 0.03 15,381 Costco Wholesale Corp 2,577,548 0.33 17,216 Coty Inc 'A' 314,795 0.04 2,656 CR Bard Inc 657,493 0.08 11,979 Crown Castle International
Corp (Reit) 1,131,896 0.14 5,692 Crown Holdings Inc 299,911 0.04 32,173 CSX Corp 1,514,705 0.19 5,509 Cummins Inc 836,597 0.11 37,287 CVS Health Corp 2,917,708 0.37 21,093 Danaher Corp 1,803,873 0.23 4,531 Darden Restaurants Inc 374,261 0.05 5,811 DaVita Inc 397,066 0.05 9,126 Deere & Co 993,821 0.13 7,537 Dell Technologies Inc 'V' 482,820 0.06 5,614 Delta Air Lines Inc 259,198 0.03 8,792 Dentsply Sirona Inc 548,181 0.07 16,046 Devon Energy Corp 670,723 0.09 2,976 DexCom Inc 254,805 0.03 2,768 Diamondback Energy Inc 287,069 0.04 4,034 Dick's Sporting Goods Inc 196,859 0.03 5,496 Digital Realty Trust Inc (Reit) 577,465 0.07 13,648 Discover Financial Services 930,794 0.12 6,952 Discovery Communications Inc 'A' 199,314 0.03 6,972 Discovery Communications Inc 'C' 195,286 0.02 8,601 DISH Network Corp 'A' 547,454 0.07 9,348 Dollar General Corp 661,745 0.08 8,410 Dollar Tree Inc 671,118 0.09 21,685 Dominion Resources Inc/VA 1,682,973 0.21 1,834 Domino's Pizza Inc 337,639 0.04 5,297 Dover Corp 424,502 0.05 39,552 Dow Chemical Co/The 2,517,880 0.32 12,799 DR Horton Inc 426,207 0.05 6,716 Dr Pepper Snapple Group Inc 655,280 0.08 6,249 DTE Energy Co 633,774 0.08 24,142 Duke Energy Corp 1,983,265 0.25 11,474 Duke Realty Corp (Reit) 298,324 0.04 1,017 Dun & Bradstreet Corp/The 108,290 0.01 9,703 E*TRADE Financial Corp 337,567 0.04 4,783 Eastman Chemical Co 387,423 0.05 3,309 Eaton Vance Corp 148,309 0.02 36,329 eBay Inc 1,225,196 0.16 8,773 Ecolab Inc 1,101,275 0.14 1,646 Edgewell Personal Care Co 120,948 0.02 10,994 Edison International 877,211 0.11 7,273 Edwards Lifesciences Corp 681,626 0.09 29,664 EI du Pont de Nemours & Co 2,389,139 0.30 10,496 Electronic Arts Inc 938,132 0.12 34,519 Eli Lilly & Co 2,921,343 0.37 22,467 Emerson Electric Co 1,341,954 0.17 6,121 Entergy Corp 466,114 0.06 4,193 Envision Healthcare Corp 257,450 0.03 20,163 EOG Resources Inc 1,984,442 0.25 6,110 EQT Corp 374,604 0.05 4,372 Equifax Inc 598,308 0.08 2,606 Equinix Inc (Reit) 1,037,084 0.13 12,571 Equity Residential (Reit) 782,042 0.10 2,421 Essex Property Trust Inc (Reit) 561,357 0.07 7,786 Estee Lauder Cos Inc/The 'A' 663,601 0.08 11,075 Eversource Energy 652,096 0.08 30,647 Exelon Corp 1,099,308 0.14 4,407 Expedia Inc 559,425 0.07 6,395 Expeditors International
of Washington Inc 362,085 0.05 21,649 Express Scripts Holding Co 1,426,886 0.18 4,736 Extra Space Storage Inc (Reit) 351,364 0.04 144,049 Exxon Mobil Corp 11,921,495 1.52 2,023 F5 Networks Inc 287,832 0.04
Portfolio of Investments as at 31 March 2017
BlackRock North America Equity Index Fund continued
United States continued United States continued

Transferable Securities and Money Market Instruments Admitted to an Official Stock Exchange Listing or Dealt in on Another Regulated Market
Transferable Securities and Money Market Instruments Admitted to an Official Stock Exchange Listing or Dealt in on Another Regulated Market
Holding Description
Market Value
USD
% of Net
Assets Holding Description
Market Value
USD
% of Net
Assets
* All or a portion of this security represents a security on loan.
100 BlackRock Global Index Funds (BGIF)
The notes on pages 122 to 128 form an integral part of these financial statements.
81,314 Facebook Inc 'A' 11,560,411 1.47 10,542 Fastenal Co 542,175 0.07 2,776 Federal Realty Investment Trust (Reit) 371,373 0.05 9,025 FedEx Corp 1,755,994 0.22 10,488 Fidelity National Information
Services Inc 839,145 0.11 25,440 Fifth Third Bancorp 648,974 0.08 10,902 First Data Corp 'A' 169,308 0.02 5,472 First Republic Bank/CA 514,094 0.07 15,963 FirstEnergy Corp 505,389 0.06 7,443 Fiserv Inc 860,262 0.11 3,347 FleetCor Technologies Inc 503,054 0.06 4,036 FLIR Systems Inc 147,072 0.02 5,331 Flowserve Corp 256,581 0.03 5,740 Fluor Corp 302,670 0.04 3,984 FMC Corp 282,864 0.04 9,245 FNF Group 360,185 0.05 4,089 Foot Locker Inc 308,024 0.04 126,533 Ford Motor Co 1,476,007 0.19 3,903 Fortinet Inc 147,963 0.02 11,083 Fortive Corp 662,874 0.08 5,224 Fortune Brands Home & Security Inc 317,567 0.04 12,506 Franklin Resources Inc 526,378 0.07 48,375 Freeport-McMoRan Inc 649,676 0.08 32,686 Frontier Communications Corp 70,111 0.01 9,956 Gap Inc/The 244,718 0.03 2,560 Gartner Inc 276,250 0.04 307,331 General Electric Co 9,207,637 1.17 20,377 General Mills Inc 1,205,911 0.15 47,886 General Motors Co 1,692,291 0.22 5,458 Genuine Parts Co 504,865 0.06 19,991 GGP Inc (Reit) 464,391 0.06 45,225 Gilead Sciences Inc 3,065,803 0.39 5,238 Global Payments Inc 423,178 0.05 12,430 Goldman Sachs Group Inc/The 2,843,487 0.36 10,460 Goodyear Tire & Rubber Co/The 375,200 0.05 7,438 H&R Block Inc 173,082 0.02 29,864 Halliburton Co 1,473,788 0.19 12,270 Hanesbrands Inc 254,480 0.03 5,894 Harley-Davidson Inc 359,888 0.05 4,189 Harris Corp 467,032 0.06 13,166 Hartford Financial Services
Group Inc/The 627,623 0.08 4,153 Hasbro Inc 416,131 0.05 10,491 HCA Holdings Inc 934,958 0.12 16,307 HCP Inc (Reit) 507,800 0.06 4,042 Helmerich & Payne Inc * 269,844 0.03 2,624 Henry Schein Inc 446,920 0.06 5,359 Hershey Co/The 583,863 0.07 10,334 Hess Corp 508,743 0.06 57,614 Hewlett Packard Enterprise Co 1,373,806 0.18 7,554 Hilton Worldwide Holdings Inc 445,988 0.06 5,400 HollyFrontier Corp 152,550 0.02 8,931 Hologic Inc 379,478 0.05 42,282 Home Depot Inc/The 6,209,535 0.79 25,145 Honeywell International Inc 3,150,668 0.40 11,218 Hormel Foods Corp 384,890 0.05 23,782 Host Hotels & Resorts Inc (Reit) 443,534 0.06 56,968 HP Inc 1,010,612 0.13 5,002 Humana Inc 1,037,815 0.13 39,541 Huntington Bancshares Inc/OH 530,245 0.07 1,660 Huntington Ingalls Industries Inc 334,341 0.04 3,341 IDEXX Laboratories Inc 514,748 0.07 10,785 Illinois Tool Works Inc 1,426,640 0.18 4,905 Illumina Inc 848,565 0.11 5,927 Incyte Corp 801,627 0.10 2,701 Ingredion Inc 326,200 0.04 164,627 Intel Corp 5,913,402 0.75 20,940 Intercontinental Exchange Inc 1,256,819 0.16
31,388 International Business Machines Corp 5,458,059 0.70 2,917 International Flavors & Fragrances Inc 386,911 0.05 14,020 International Paper Co 715,020 0.09 14,733 Interpublic Group of Cos Inc/The 363,021 0.05 8,586 Intuit Inc 994,602 0.13 1,372 Intuitive Surgical Inc 1,050,431 0.13 8,880 Iron Mountain Inc (Reit) 315,506 0.04 4,986 Jacobs Engineering Group Inc 276,623 0.04 2,662 JB Hunt Transport Services Inc 244,451 0.03 3,997 JM Smucker Co/The 526,085 0.07 94,508 Johnson & Johnson 11,772,862 1.50 1,905 Jones Lang LaSalle Inc 208,578 0.03 124,304 JPMorgan Chase & Co 10,990,960 1.40 10,716 Juniper Networks Inc 297,423 0.04 3,940 Kansas City Southern 341,322 0.04 9,022 Kellogg Co 656,441 0.08 37,552 KeyCorp 668,801 0.09 12,482 Kimberly-Clark Corp 1,652,866 0.21 16,081 Kimco Realty Corp (Reit) 354,506 0.05 65,599 Kinder Morgan Inc/DE 1,422,514 0.18 5,619 KLA-Tencor Corp 535,378 0.07 6,134 Kohl's Corp * 249,470 0.03 21,332 Kraft Heinz Co/The 1,941,425 0.25 30,208 Kroger Co/The 897,782 0.11 8,617 L Brands Inc 410,600 0.05 3,809 Laboratory Corp of America
Holdings 548,306 0.07 5,934 Lam Research Corp 764,062 0.10 15,097 Las Vegas Sands Corp 859,925 0.11 2,199 Lear Corp 312,324 0.04 3,941 Leggett & Platt Inc 198,705 0.03 5,644 Lennar Corp 'A' 288,747 0.04 11,503 Leucadia National Corp 300,113 0.04 10,852 Level 3 Communications Inc 619,866 0.08 3,600 Liberty Broadband Corp 'C' 311,868 0.04 14,188 Liberty Interactive Corp QVC
Group 'A' 281,632 0.04 2,499 Liberty Media Corp-Liberty
SiriusXM 'A' 97,561 0.01 5,945 Liberty Media Corp-Liberty
SiriusXM 'C' 231,201 0.03 5,906 Liberty Property Trust (Reit) 226,849 0.03 7,759 Lincoln National Corp 505,887 0.06 9,769 LKQ Corp 287,697 0.04 10,231 Loews Corp 478,811 0.06 30,604 Lowe's Cos Inc 2,515,649 0.32 4,188 Lululemon Athletica Inc 214,007 0.03 5,110 M&T Bank Corp 794,656 0.10 4,289 Macerich Co/The (Reit) 277,455 0.04 2,748 Macquarie Infrastructure Corp 221,434 0.03 10,192 Macy's Inc 304,435 0.04 2,158 ManpowerGroup Inc 221,950 0.03 31,793 Marathon Oil Corp 508,052 0.06 18,188 Marathon Petroleum Corp 916,311 0.12 534 Markel Corp 518,834 0.07 11,517 Marriott International Inc/MD 'A' 1,091,236 0.14 18,192 Marsh & McLennan Cos Inc 1,345,298 0.17 2,322 Martin Marietta Materials Inc 503,967 0.06 10,487 Masco Corp 354,356 0.05 33,787 Mastercard Inc 'A' 3,808,471 0.49 11,088 Mattel Inc 284,075 0.04 9,517 Maxim Integrated Products Inc 426,362 0.05 3,726 McCormick & Co Inc/MD
'non-voting share' 364,254 0.05 28,850 McDonald's Corp 3,743,287 0.48 7,891 McKesson Corp 1,175,601 0.15 6,439 Mead Johnson Nutrition Co 573,586 0.07 3,202 MEDNAX Inc 221,995 0.03 1,410 MercadoLibre Inc 300,415 0.04
Portfolio of Investments as at 31 March 2017
BlackRock North America Equity Index Fund continued
United States continued United States continued
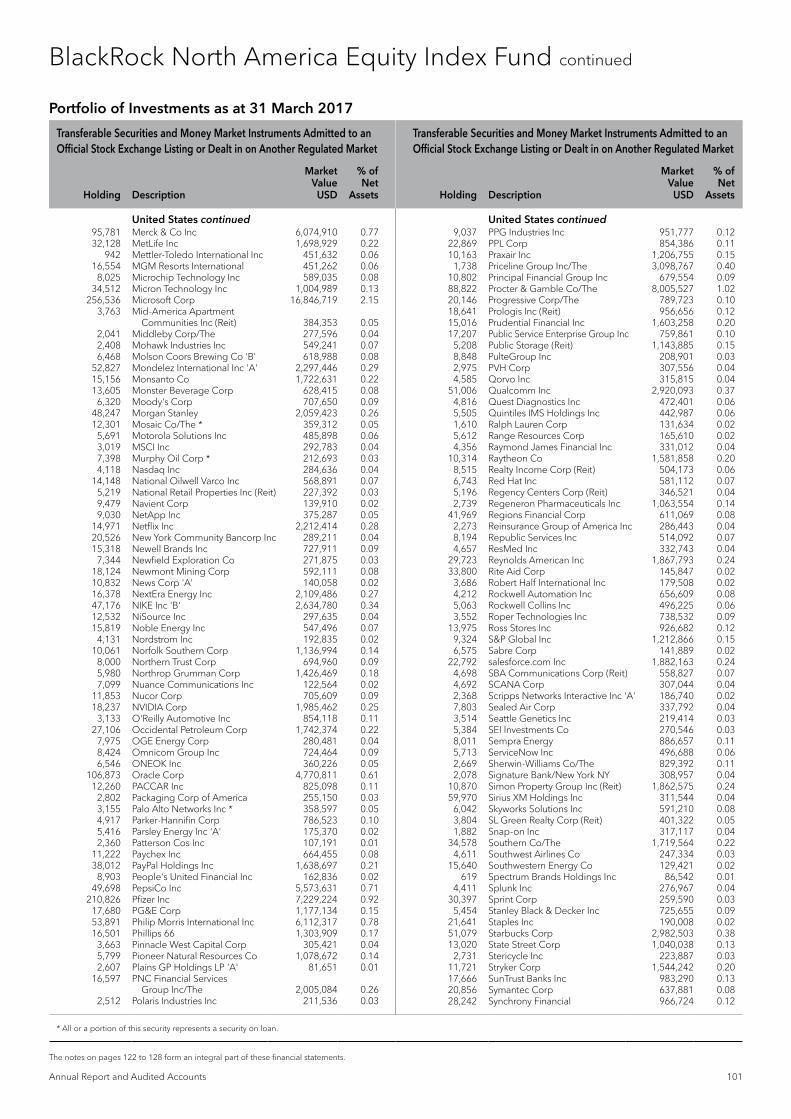
Transferable Securities and Money Market Instruments Admitted to an Official Stock Exchange Listing or Dealt in on Another Regulated Market
Transferable Securities and Money Market Instruments Admitted to an Official Stock Exchange Listing or Dealt in on Another Regulated Market
Holding Description
Market Value
USD
% of Net
Assets Holding Description
Market Value
USD
% of Net
Assets
* All or a portion of this security represents a security on loan.
Annual Report and Audited Accounts 101
The notes on pages 122 to 128 form an integral part of these financial statements.
95,781 Merck & Co Inc 6,074,910 0.77 32,128 MetLife Inc 1,698,929 0.22 942 Mettler-Toledo International Inc 451,632 0.06 16,554 MGM Resorts International 451,262 0.06 8,025 Microchip Technology Inc 589,035 0.08 34,512 Micron Technology Inc 1,004,989 0.13 256,536 Microsoft Corp 16,846,719 2.15 3,763 Mid-America Apartment
Communities Inc (Reit) 384,353 0.05 2,041 Middleby Corp/The 277,596 0.04 2,408 Mohawk Industries Inc 549,241 0.07 6,468 Molson Coors Brewing Co 'B' 618,988 0.08 52,827 Mondelez International Inc 'A' 2,297,446 0.29 15,156 Monsanto Co 1,722,631 0.22 13,605 Monster Beverage Corp 628,415 0.08 6,320 Moody's Corp 707,650 0.09 48,247 Morgan Stanley 2,059,423 0.26 12,301 Mosaic Co/The * 359,312 0.05 5,691 Motorola Solutions Inc 485,898 0.06 3,019 MSCI Inc 292,783 0.04 7,398 Murphy Oil Corp * 212,693 0.03 4,118 Nasdaq Inc 284,636 0.04 14,148 National Oilwell Varco Inc 568,891 0.07 5,219 National Retail Properties Inc (Reit) 227,392 0.03 9,479 Navient Corp 139,910 0.02 9,030 NetApp Inc 375,287 0.05 14,971 Netflix Inc 2,212,414 0.28 20,526 New York Community Bancorp Inc 289,211 0.04 15,318 Newell Brands Inc 727,911 0.09 7,344 Newfield Exploration Co 271,875 0.03 18,124 Newmont Mining Corp 592,111 0.08 10,832 News Corp 'A' 140,058 0.02 16,378 NextEra Energy Inc 2,109,486 0.27 47,176 NIKE Inc 'B' 2,634,780 0.34 12,532 NiSource Inc 297,635 0.04 15,819 Noble Energy Inc 547,496 0.07 4,131 Nordstrom Inc 192,835 0.02 10,061 Norfolk Southern Corp 1,136,994 0.14 8,000 Northern Trust Corp 694,960 0.09 5,980 Northrop Grumman Corp 1,426,469 0.18 7,099 Nuance Communications Inc 122,564 0.02 11,853 Nucor Corp 705,609 0.09 18,237 NVIDIA Corp 1,985,462 0.25 3,133 O'Reilly Automotive Inc 854,118 0.11 27,106 Occidental Petroleum Corp 1,742,374 0.22 7,975 OGE Energy Corp 280,481 0.04 8,424 Omnicom Group Inc 724,464 0.09 6,546 ONEOK Inc 360,226 0.05 106,873 Oracle Corp 4,770,811 0.61 12,260 PACCAR Inc 825,098 0.11 2,802 Packaging Corp of America 255,150 0.03 3,155 Palo Alto Networks Inc * 358,597 0.05 4,917 Parker-Hannifin Corp 786,523 0.10 5,416 Parsley Energy Inc 'A' 175,370 0.02 2,360 Patterson Cos Inc 107,191 0.01 11,222 Paychex Inc 664,455 0.08 38,012 PayPal Holdings Inc 1,638,697 0.21 8,903 People's United Financial Inc 162,836 0.02 49,698 PepsiCo Inc 5,573,631 0.71 210,826 Pfizer Inc 7,229,224 0.92 17,680 PG&E Corp 1,177,134 0.15 53,891 Philip Morris International Inc 6,112,317 0.78 16,501 Phillips 66 1,303,909 0.17 3,663 Pinnacle West Capital Corp 305,421 0.04 5,799 Pioneer Natural Resources Co 1,078,672 0.14 2,607 Plains GP Holdings LP 'A' 81,651 0.01 16,597 PNC Financial Services
Group Inc/The 2,005,084 0.26 2,512 Polaris Industries Inc 211,536 0.03
9,037 PPG Industries Inc 951,777 0.12 22,869 PPL Corp 854,386 0.11 10,163 Praxair Inc 1,206,755 0.15 1,738 Priceline Group Inc/The 3,098,767 0.40 10,802 Principal Financial Group Inc 679,554 0.09 88,822 Procter & Gamble Co/The 8,005,527 1.02 20,146 Progressive Corp/The 789,723 0.10 18,641 Prologis Inc (Reit) 956,656 0.12 15,016 Prudential Financial Inc 1,603,258 0.20 17,207 Public Service Enterprise Group Inc 759,861 0.10 5,208 Public Storage (Reit) 1,143,885 0.15 8,848 PulteGroup Inc 208,901 0.03 2,975 PVH Corp 307,556 0.04 4,585 Qorvo Inc 315,815 0.04 51,006 Qualcomm Inc 2,920,093 0.37 4,816 Quest Diagnostics Inc 472,401 0.06 5,505 Quintiles IMS Holdings Inc 442,987 0.06 1,610 Ralph Lauren Corp 131,634 0.02 5,612 Range Resources Corp 165,610 0.02 4,356 Raymond James Financial Inc 331,012 0.04 10,314 Raytheon Co 1,581,858 0.20 8,515 Realty Income Corp (Reit) 504,173 0.06 6,743 Red Hat Inc 581,112 0.07 5,196 Regency Centers Corp (Reit) 346,521 0.04 2,739 Regeneron Pharmaceuticals Inc 1,063,554 0.14 41,969 Regions Financial Corp 611,069 0.08 2,273 Reinsurance Group of America Inc 286,443 0.04 8,194 Republic Services Inc 514,092 0.07 4,657 ResMed Inc 332,743 0.04 29,723 Reynolds American Inc 1,867,793 0.24 33,800 Rite Aid Corp 145,847 0.02 3,686 Robert Half International Inc 179,508 0.02 4,212 Rockwell Automation Inc 656,609 0.08 5,063 Rockwell Collins Inc 496,225 0.06 3,552 Roper Technologies Inc 738,532 0.09 13,975 Ross Stores Inc 926,682 0.12 9,324 S&P Global Inc 1,212,866 0.15 6,575 Sabre Corp 141,889 0.02 22,792 salesforce.com Inc 1,882,163 0.24 4,698 SBA Communications Corp (Reit) 558,827 0.07 4,692 SCANA Corp 307,044 0.04 2,368 Scripps Networks Interactive Inc 'A' 186,740 0.02 7,803 Sealed Air Corp 337,792 0.04 3,514 Seattle Genetics Inc 219,414 0.03 5,384 SEI Investments Co 270,546 0.03 8,011 Sempra Energy 886,657 0.11 5,713 ServiceNow Inc 496,688 0.06 2,669 Sherwin-Williams Co/The 829,392 0.11 2,078 Signature Bank/New York NY 308,957 0.04 10,870 Simon Property Group Inc (Reit) 1,862,575 0.24 59,970 Sirius XM Holdings Inc 311,544 0.04 6,042 Skyworks Solutions Inc 591,210 0.08 3,804 SL Green Realty Corp (Reit) 401,322 0.05 1,882 Snap-on Inc 317,117 0.04 34,578 Southern Co/The 1,719,564 0.22 4,611 Southwest Airlines Co 247,334 0.03 15,640 Southwestern Energy Co 129,421 0.02 619 Spectrum Brands Holdings Inc 86,542 0.01 4,411 Splunk Inc 276,967 0.04 30,397 Sprint Corp 259,590 0.03 5,454 Stanley Black & Decker Inc 725,655 0.09 21,641 Staples Inc 190,008 0.02 51,079 Starbucks Corp 2,982,503 0.38 13,020 State Street Corp 1,040,038 0.13 2,731 Stericycle Inc 223,887 0.03 11,721 Stryker Corp 1,544,242 0.20 17,666 SunTrust Banks Inc 983,290 0.13 20,856 Symantec Corp 637,881 0.08 28,242 Synchrony Financial 966,724 0.12
Portfolio of Investments as at 31 March 2017
BlackRock North America Equity Index Fund continued
United States continued United States continued
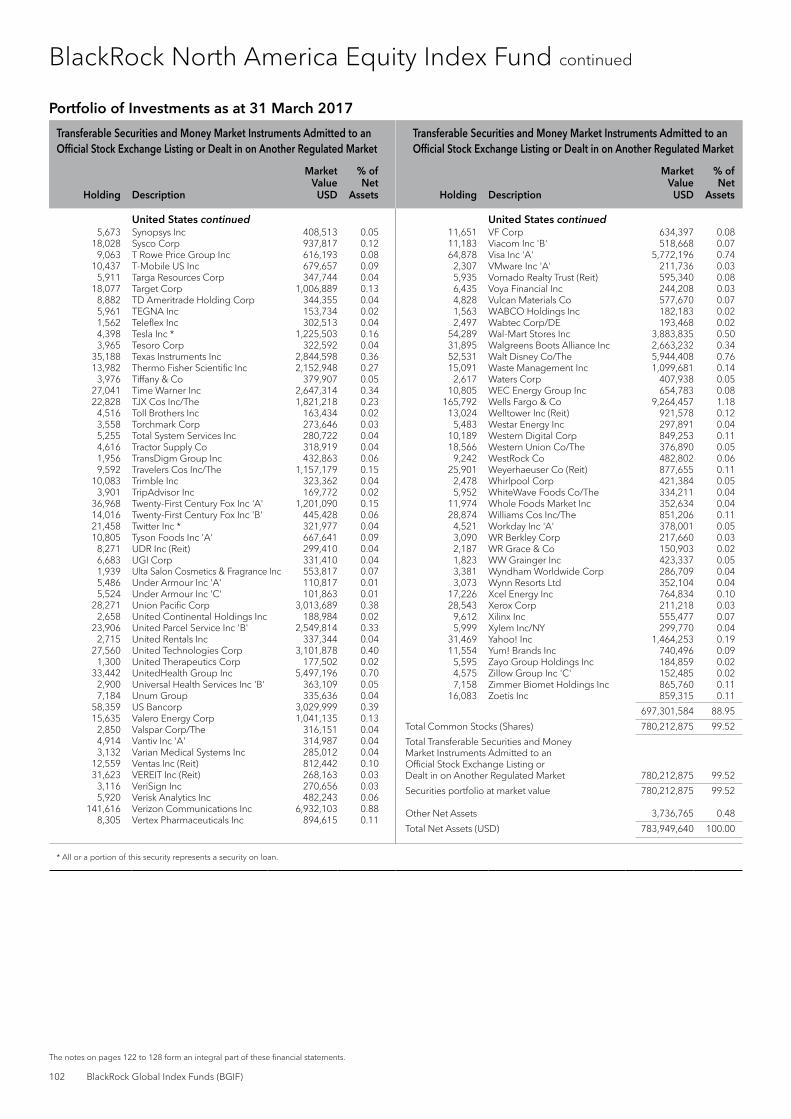
Transferable Securities and Money Market Instruments Admitted to an Official Stock Exchange Listing or Dealt in on Another Regulated Market
Transferable Securities and Money Market Instruments Admitted to an Official Stock Exchange Listing or Dealt in on Another Regulated Market
Holding Description
Market Value
USD
% of Net
Assets Holding Description
Market Value
USD
% of Net
Assets
* All or a portion of this security represents a security on loan.
102 BlackRock Global Index Funds (BGIF)
The notes on pages 122 to 128 form an integral part of these financial statements.
5,673 Synopsys Inc 408,513 0.05 18,028 Sysco Corp 937,817 0.12 9,063 T Rowe Price Group Inc 616,193 0.08 10,437 T-Mobile US Inc 679,657 0.09 5,911 Targa Resources Corp 347,744 0.04 18,077 Target Corp 1,006,889 0.13 8,882 TD Ameritrade Holding Corp 344,355 0.04 5,961 TEGNA Inc 153,734 0.02 1,562 Teleflex Inc 302,513 0.04 4,398 Tesla Inc * 1,225,503 0.16 3,965 Tesoro Corp 322,592 0.04 35,188 Texas Instruments Inc 2,844,598 0.36 13,982 Thermo Fisher Scientific Inc 2,152,948 0.27 3,976 Tiffany & Co 379,907 0.05 27,041 Time Warner Inc 2,647,314 0.34 22,828 TJX Cos Inc/The 1,821,218 0.23 4,516 Toll Brothers Inc 163,434 0.02 3,558 Torchmark Corp 273,646 0.03 5,255 Total System Services Inc 280,722 0.04 4,616 Tractor Supply Co 318,919 0.04 1,956 TransDigm Group Inc 432,863 0.06 9,592 Travelers Cos Inc/The 1,157,179 0.15 10,083 Trimble Inc 323,362 0.04 3,901 TripAdvisor Inc 169,772 0.02 36,968 Twenty-First Century Fox Inc 'A' 1,201,090 0.15 14,016 Twenty-First Century Fox Inc 'B' 445,428 0.06 21,458 Twitter Inc * 321,977 0.04 10,805 Tyson Foods Inc 'A' 667,641 0.09 8,271 UDR Inc (Reit) 299,410 0.04 6,683 UGI Corp 331,410 0.04 1,939 Ulta Salon Cosmetics & Fragrance Inc 553,817 0.07 5,486 Under Armour Inc 'A' 110,817 0.01 5,524 Under Armour Inc 'C' 101,863 0.01 28,271 Union Pacific Corp 3,013,689 0.38 2,658 United Continental Holdings Inc 188,984 0.02 23,906 United Parcel Service Inc 'B' 2,549,814 0.33 2,715 United Rentals Inc 337,344 0.04 27,560 United Technologies Corp 3,101,878 0.40 1,300 United Therapeutics Corp 177,502 0.02 33,442 UnitedHealth Group Inc 5,497,196 0.70 2,900 Universal Health Services Inc 'B' 363,109 0.05 7,184 Unum Group 335,636 0.04 58,359 US Bancorp 3,029,999 0.39 15,635 Valero Energy Corp 1,041,135 0.13 2,850 Valspar Corp/The 316,151 0.04 4,914 Vantiv Inc 'A' 314,987 0.04 3,132 Varian Medical Systems Inc 285,012 0.04 12,559 Ventas Inc (Reit) 812,442 0.10 31,623 VEREIT Inc (Reit) 268,163 0.03 3,116 VeriSign Inc 270,656 0.03 5,920 Verisk Analytics Inc 482,243 0.06 141,616 Verizon Communications Inc 6,932,103 0.88 8,305 Vertex Pharmaceuticals Inc 894,615 0.11
11,651 VF Corp 634,397 0.08 11,183 Viacom Inc 'B' 518,668 0.07 64,878 Visa Inc 'A' 5,772,196 0.74 2,307 VMware Inc 'A' 211,736 0.03 5,935 Vornado Realty Trust (Reit) 595,340 0.08 6,435 Voya Financial Inc 244,208 0.03 4,828 Vulcan Materials Co 577,670 0.07 1,563 WABCO Holdings Inc 182,183 0.02 2,497 Wabtec Corp/DE 193,468 0.02 54,289 Wal-Mart Stores Inc 3,883,835 0.50 31,895 Walgreens Boots Alliance Inc 2,663,232 0.34 52,531 Walt Disney Co/The 5,944,408 0.76 15,091 Waste Management Inc 1,099,681 0.14 2,617 Waters Corp 407,938 0.05 10,805 WEC Energy Group Inc 654,783 0.08 165,792 Wells Fargo & Co 9,264,457 1.18 13,024 Welltower Inc (Reit) 921,578 0.12 5,483 Westar Energy Inc 297,891 0.04 10,189 Western Digital Corp 849,253 0.11 18,566 Western Union Co/The 376,890 0.05 9,242 WestRock Co 482,802 0.06 25,901 Weyerhaeuser Co (Reit) 877,655 0.11 2,478 Whirlpool Corp 421,384 0.05 5,952 WhiteWave Foods Co/The 334,211 0.04 11,974 Whole Foods Market Inc 352,634 0.04 28,874 Williams Cos Inc/The 851,206 0.11 4,521 Workday Inc 'A' 378,001 0.05 3,090 WR Berkley Corp 217,660 0.03 2,187 WR Grace & Co 150,903 0.02 1,823 WW Grainger Inc 423,337 0.05 3,381 Wyndham Worldwide Corp 286,709 0.04 3,073 Wynn Resorts Ltd 352,104 0.04 17,226 Xcel Energy Inc 764,834 0.10 28,543 Xerox Corp 211,218 0.03 9,612 Xilinx Inc 555,477 0.07 5,999 Xylem Inc/NY 299,770 0.04 31,469 Yahoo! Inc 1,464,253 0.19 11,554 Yum! Brands Inc 740,496 0.09 5,595 Zayo Group Holdings Inc 184,859 0.02 4,575 Zillow Group Inc 'C' 152,485 0.02 7,158 Zimmer Biomet Holdings Inc 865,760 0.11 16,083 Zoetis Inc 859,315 0.11
697,301,584 88.95
Total Common Stocks (Shares) 780,212,875 99.52
Total Transferable Securities and Money Market Instruments Admitted to an Official Stock Exchange Listing or Dealt in on Another Regulated Market 780,212,875 99.52
Securities portfolio at market value 780,212,875 99.52
Other Net Assets 3,736,765 0.48
Total Net Assets (USD) 783,949,640 100.00
Portfolio of Investments as at 31 March 2017
BlackRock North America Equity Index Fund continued
United States continued United States continued

Annual Report and Audited Accounts 103
The notes on pages 122 to 128 form an integral part of these financial statements.
BlackRock North America Equity Index Fund continued
Futures contracts as at 31 March 2017
Number of contracts
Currency of contract
Contract/ Description
Expiration date
Gross underlying
exposure USD
Unrealised appreciation/
(depreciation) USD
31 USD E-Mini S&P 500 Index June 2017 3,662,185 3,483 2 CAD S&P/TSX 60 Index June 2017 274,727 1,373
Total 3,936,912 4,856
Sector Breakdown as at 31 March 2017
% of Net Assets
Consumer, Non-cyclical 21.75Financial 19.56Technology 13.40Communications 13.31Industrial 9.17Consumer, Cyclical 8.82Energy 7.48Utilities 3.08Basic Materials 2.91Diversified 0.04
Securities portfolio at market value 99.52Other Net Assets 0.48
100.00
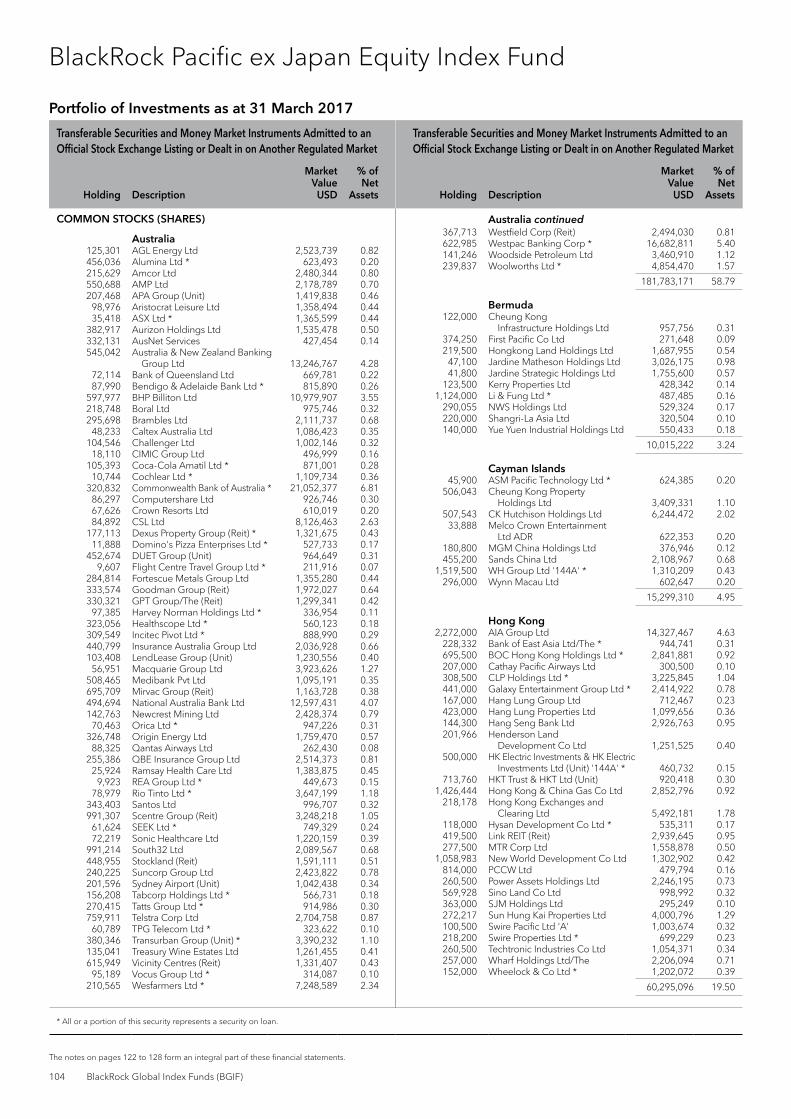
Transferable Securities and Money Market Instruments Admitted to an Official Stock Exchange Listing or Dealt in on Another Regulated Market
Transferable Securities and Money Market Instruments Admitted to an Official Stock Exchange Listing or Dealt in on Another Regulated Market
Holding Description
Market Value
USD
% of Net
Assets Holding Description
Market Value
USD
% of Net
Assets
* All or a portion of this security represents a security on loan.
USD
104 BlackRock Global Index Funds (BGIF)
The notes on pages 122 to 128 form an integral part of these financial statements.
COMMON STOCKS (SHARES)
Australia 125,301 AGL Energy Ltd 2,523,739 0.82 456,036 Alumina Ltd * 623,493 0.20 215,629 Amcor Ltd 2,480,344 0.80 550,688 AMP Ltd 2,178,789 0.70 207,468 APA Group (Unit) 1,419,838 0.46 98,976 Aristocrat Leisure Ltd 1,358,494 0.44 35,418 ASX Ltd * 1,365,599 0.44 382,917 Aurizon Holdings Ltd 1,535,478 0.50 332,131 AusNet Services 427,454 0.14 545,042 Australia & New Zealand Banking
Group Ltd 13,246,767 4.28 72,114 Bank of Queensland Ltd 669,781 0.22 87,990 Bendigo & Adelaide Bank Ltd * 815,890 0.26 597,977 BHP Billiton Ltd 10,979,907 3.55 218,748 Boral Ltd 975,746 0.32 295,698 Brambles Ltd 2,111,737 0.68 48,233 Caltex Australia Ltd 1,086,423 0.35 104,546 Challenger Ltd 1,002,146 0.32 18,110 CIMIC Group Ltd 496,999 0.16 105,393 Coca-Cola Amatil Ltd * 871,001 0.28 10,744 Cochlear Ltd * 1,109,734 0.36 320,832 Commonwealth Bank of Australia * 21,052,377 6.81 86,297 Computershare Ltd 926,746 0.30 67,626 Crown Resorts Ltd 610,019 0.20 84,892 CSL Ltd 8,126,463 2.63 177,113 Dexus Property Group (Reit) * 1,321,675 0.43 11,888 Domino's Pizza Enterprises Ltd * 527,733 0.17 452,674 DUET Group (Unit) 964,649 0.31 9,607 Flight Centre Travel Group Ltd * 211,916 0.07 284,814 Fortescue Metals Group Ltd 1,355,280 0.44 333,574 Goodman Group (Reit) 1,972,027 0.64 330,321 GPT Group/The (Reit) 1,299,341 0.42 97,385 Harvey Norman Holdings Ltd * 336,954 0.11 323,056 Healthscope Ltd * 560,123 0.18 309,549 Incitec Pivot Ltd * 888,990 0.29 440,799 Insurance Australia Group Ltd 2,036,928 0.66 103,408 LendLease Group (Unit) 1,230,556 0.40 56,951 Macquarie Group Ltd 3,923,626 1.27 508,465 Medibank Pvt Ltd 1,095,191 0.35 695,709 Mirvac Group (Reit) 1,163,728 0.38 494,694 National Australia Bank Ltd 12,597,431 4.07 142,763 Newcrest Mining Ltd 2,428,374 0.79 70,463 Orica Ltd * 947,226 0.31 326,748 Origin Energy Ltd 1,759,470 0.57 88,325 Qantas Airways Ltd 262,430 0.08 255,386 QBE Insurance Group Ltd 2,514,373 0.81 25,924 Ramsay Health Care Ltd 1,383,875 0.45 9,923 REA Group Ltd * 449,673 0.15 78,979 Rio Tinto Ltd * 3,647,199 1.18 343,403 Santos Ltd 996,707 0.32 991,307 Scentre Group (Reit) 3,248,218 1.05 61,624 SEEK Ltd * 749,329 0.24 72,219 Sonic Healthcare Ltd 1,220,159 0.39 991,214 South32 Ltd 2,089,567 0.68 448,955 Stockland (Reit) 1,591,111 0.51 240,225 Suncorp Group Ltd 2,423,822 0.78 201,596 Sydney Airport (Unit) 1,042,438 0.34 156,208 Tabcorp Holdings Ltd * 566,731 0.18 270,415 Tatts Group Ltd * 914,986 0.30 759,911 Telstra Corp Ltd 2,704,758 0.87 60,789 TPG Telecom Ltd * 323,622 0.10 380,346 Transurban Group (Unit) * 3,390,232 1.10 135,041 Treasury Wine Estates Ltd 1,261,455 0.41 615,949 Vicinity Centres (Reit) 1,331,407 0.43 95,189 Vocus Group Ltd * 314,087 0.10 210,565 Wesfarmers Ltd * 7,248,589 2.34
367,713 Westfield Corp (Reit) 2,494,030 0.81 622,985 Westpac Banking Corp * 16,682,811 5.40 141,246 Woodside Petroleum Ltd 3,460,910 1.12 239,837 Woolworths Ltd * 4,854,470 1.57
181,783,171 58.79
Bermuda 122,000 Cheung Kong
Infrastructure Holdings Ltd 957,756 0.31 374,250 First Pacific Co Ltd 271,648 0.09 219,500 Hongkong Land Holdings Ltd 1,687,955 0.54 47,100 Jardine Matheson Holdings Ltd 3,026,175 0.98 41,800 Jardine Strategic Holdings Ltd 1,755,600 0.57 123,500 Kerry Properties Ltd 428,342 0.14 1,124,000 Li & Fung Ltd * 487,485 0.16 290,055 NWS Holdings Ltd 529,324 0.17 220,000 Shangri-La Asia Ltd 320,504 0.10 140,000 Yue Yuen Industrial Holdings Ltd 550,433 0.18
10,015,222 3.24
Cayman Islands 45,900 ASM Pacific Technology Ltd * 624,385 0.20 506,043 Cheung Kong Property
Holdings Ltd 3,409,331 1.10 507,543 CK Hutchison Holdings Ltd 6,244,472 2.02 33,888 Melco Crown Entertainment
Ltd ADR 622,353 0.20 180,800 MGM China Holdings Ltd 376,946 0.12 455,200 Sands China Ltd 2,108,967 0.68 1,519,500 WH Group Ltd '144A' * 1,310,209 0.43 296,000 Wynn Macau Ltd 602,647 0.20
15,299,310 4.95
Hong Kong 2,272,000 AIA Group Ltd 14,327,467 4.63 228,332 Bank of East Asia Ltd/The * 944,741 0.31 695,500 BOC Hong Kong Holdings Ltd * 2,841,881 0.92 207,000 Cathay Pacific Airways Ltd 300,500 0.10 308,500 CLP Holdings Ltd * 3,225,845 1.04 441,000 Galaxy Entertainment Group Ltd * 2,414,922 0.78 167,000 Hang Lung Group Ltd 712,467 0.23 423,000 Hang Lung Properties Ltd 1,099,656 0.36 144,300 Hang Seng Bank Ltd 2,926,763 0.95 201,966 Henderson Land
Development Co Ltd 1,251,525 0.40 500,000 HK Electric Investments & HK Electric
Investments Ltd (Unit) '144A' * 460,732 0.15 713,760 HKT Trust & HKT Ltd (Unit) 920,418 0.30 1,426,444 Hong Kong & China Gas Co Ltd 2,852,796 0.92 218,178 Hong Kong Exchanges and
Clearing Ltd 5,492,181 1.78 118,000 Hysan Development Co Ltd * 535,311 0.17 419,500 Link REIT (Reit) 2,939,645 0.95 277,500 MTR Corp Ltd 1,558,878 0.50 1,058,983 New World Development Co Ltd 1,302,902 0.42 814,000 PCCW Ltd 479,794 0.16 260,500 Power Assets Holdings Ltd 2,246,195 0.73 569,928 Sino Land Co Ltd 998,992 0.32 363,000 SJM Holdings Ltd 295,249 0.10 272,217 Sun Hung Kai Properties Ltd 4,000,796 1.29 100,500 Swire Pacific Ltd 'A' 1,003,674 0.32 218,200 Swire Properties Ltd * 699,229 0.23 260,500 Techtronic Industries Co Ltd 1,054,371 0.34 257,000 Wharf Holdings Ltd/The 2,206,094 0.71 152,000 Wheelock & Co Ltd * 1,202,072 0.39
60,295,096 19.50
Portfolio of Investments as at 31 March 2017
BlackRock Pacific ex Japan Equity Index Fund
Australia continued

Transferable Securities and Money Market Instruments Admitted to an Official Stock Exchange Listing or Dealt in on Another Regulated Market
Transferable Securities and Money Market Instruments Admitted to an Official Stock Exchange Listing or Dealt in on Another Regulated Market
Holding Description
Market Value
USD
% of Net
Assets Holding Description
Market Value
USD
% of Net
Assets
* All or a portion of this security represents a security on loan.
Annual Report and Audited Accounts 105
The notes on pages 122 to 128 form an integral part of these financial statements.
BlackRock Pacific ex Japan Equity Index Fund continued
Ireland 82,029 James Hardie Industries Plc - CDI 1,288,788 0.42
1,288,788 0.42
Isle of Man 1,114,500 Genting Singapore Plc 813,911 0.26
813,911 0.26
Mauritius 1,272,500 Golden Agri-Resources Ltd 350,764 0.11
350,764 0.11
New Zealand 176,876 Auckland International Airport Ltd * 835,542 0.27 135,713 Contact Energy Ltd * 479,871 0.16 128,219 Fletcher Building Ltd 745,467 0.24 135,099 Mercury NZ Ltd 297,383 0.10 244,975 Meridian Energy Ltd 479,328 0.15 73,859 Ryman Healthcare Ltd 434,063 0.14 340,847 Spark New Zealand Ltd 833,643 0.27
4,105,297 1.33
Papua New Guinea 251,440 Oil Search Ltd 1,386,600 0.45
1,386,600 0.45
Singapore 463,000 Ascendas Real Estate Investment
Trust (Reit) 835,369 0.27 376,200 CapitaLand Commercial Trust
Ltd (Reit) 416,144 0.13 469,400 CapitaLand Ltd * 1,219,963 0.39 454,900 CapitaLand Mall Trust (Reit) 641,622 0.21 75,500 City Developments Ltd 551,371 0.18
395,000 ComfortDelGro Corp Ltd 723,992 0.23 325,335 DBS Group Holdings Ltd 4,518,865 1.46 497,600 Global Logistic Properties Ltd 990,426 0.32 954,500 Hutchison Port Holdings Trust (Unit) 396,117 0.13 19,311 Jardine Cycle & Carriage Ltd 606,415 0.20 272,900 Keppel Corp Ltd 1,356,001 0.44 578,540 Oversea-Chinese Banking Corp Ltd 4,026,211 1.30 134,800 SATS Ltd 470,984 0.15 178,800 Sembcorp Industries Ltd 407,091 0.13 98,800 Singapore Airlines Ltd 712,333 0.23 143,031 Singapore Exchange Ltd 788,529 0.26 215,400 Singapore Press Holdings Ltd 547,483 0.18 262,800 Singapore Technologies
Engineering Ltd * 701,829 0.23 1,500,700 Singapore Telecommunications Ltd * 4,211,888 1.36 109,100 StarHub Ltd 224,965 0.07 445,600 Suntec Real Estate Investment
Trust (Reit) 571,078 0.18 243,246 United Overseas Bank Ltd 3,850,626 1.25 96,057 UOL Group Ltd 479,357 0.16 359,600 Wilmar International Ltd 908,848 0.29 380,400 Yangzijiang Shipbuilding
Holdings Ltd 307,763 0.10
30,465,270 9.85
Total Common Stocks (Shares) 305,803,429 98.90
Total Transferable Securities and Money Market Instruments Admitted to an Official Stock Exchange Listing or Dealt in on Another Regulated Market 305,803,429 98.90
Securities portfolio at market value 305,803,429 98.90
Other Net Assets 3,389,823 1.10
Total Net Assets (USD) 309,193,252 100.00
Portfolio of Investments as at 31 March 2017
Singapore continued
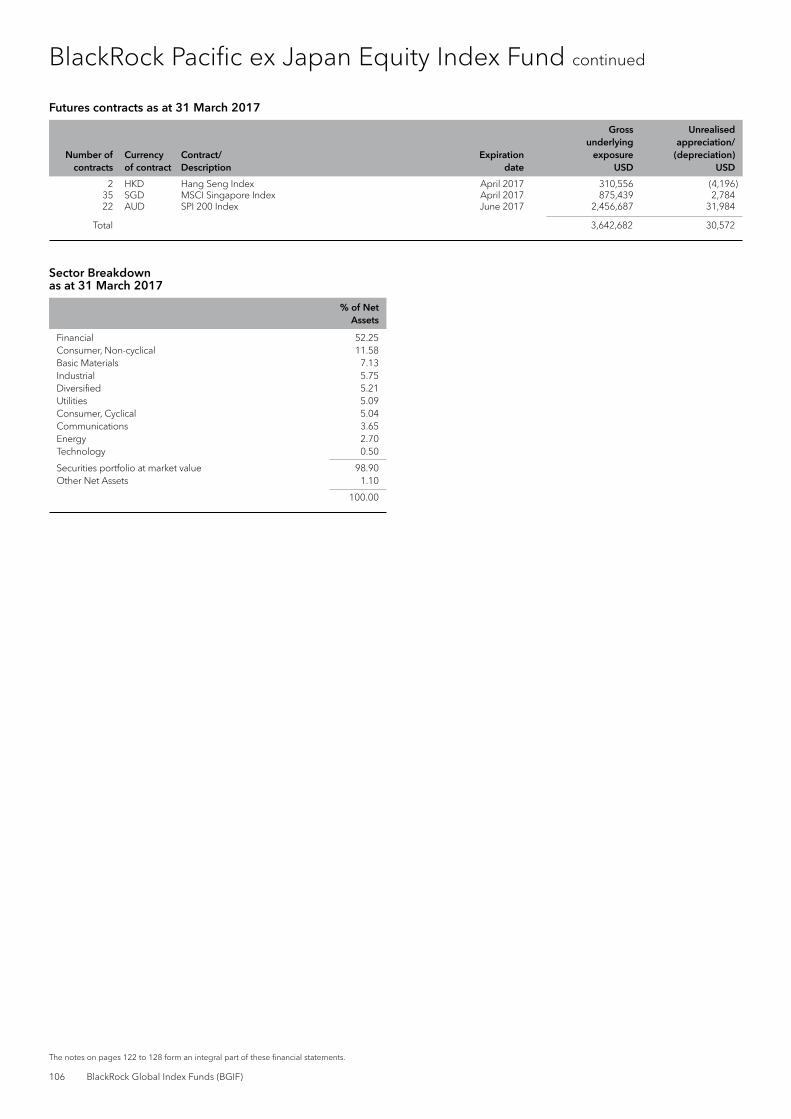
106 BlackRock Global Index Funds (BGIF)
The notes on pages 122 to 128 form an integral part of these financial statements.
BlackRock Pacific ex Japan Equity Index Fund continued
Futures contracts as at 31 March 2017
Number of contracts
Currency of contract
Contract/ Description
Expiration date
Gross underlying
exposure USD
Unrealised appreciation/
(depreciation) USD
2 HKD Hang Seng Index April 2017 310,556 (4,196) 35 SGD MSCI Singapore Index April 2017 875,439 2,784 22 AUD SPI 200 Index June 2017 2,456,687 31,984
Total 3,642,682 30,572
Sector Breakdown as at 31 March 2017
% of Net Assets
Financial 52.25Consumer, Non-cyclical 11.58Basic Materials 7.13Industrial 5.75Diversified 5.21Utilities 5.09Consumer, Cyclical 5.04Communications 3.65Energy 2.70Technology 0.50
Securities portfolio at market value 98.90Other Net Assets 1.10
100.00

Transferable Securities and Money Market Instruments Admitted to an Official Stock Exchange Listing or Dealt in on Another Regulated Market
Transferable Securities and Money Market Instruments Admitted to an Official Stock Exchange Listing or Dealt in on Another Regulated Market
Holding Description
Market Value
USD
% of Net
Assets Holding Description
Market Value
USD
% of Net
Assets
* All or a portion of this security represents a security on loan.
USD
Annual Report and Audited Accounts 107
The notes on pages 122 to 128 form an integral part of these financial statements.
BlackRock World Equity Index Fund
COMMON / PREFERRED STOCKS (SHARES) & RIGHTS
Australia 23,758 AGL Energy Ltd 478,520 0.04 83,606 Alumina Ltd 114,306 0.01 40,387 Amcor Ltd 464,565 0.04 78,528 AMP Ltd 310,695 0.03 39,493 APA Group (Unit) 270,276 0.02 13,060 Aristocrat Leisure Ltd 179,255 0.02 6,795 ASX Ltd 261,992 0.02 71,596 Aurizon Holdings Ltd 287,096 0.03 63,147 AusNet Services 81,270 0.01 96,204 Australia & New Zealand Banking
Group Ltd 2,338,154 0.20 13,093 Bank of Queensland Ltd 121,605 0.01 15,766 Bendigo & Adelaide Bank Ltd 146,191 0.01 104,992 BHP Billiton Ltd 1,927,837 0.17 37,623 Boral Ltd 167,821 0.02 55,170 Brambles Ltd 393,998 0.03 9,174 Caltex Australia Ltd 206,639 0.02 20,093 Challenger Ltd 192,605 0.02 3,282 CIMIC Group Ltd 90,069 0.01 19,673 Coca-Cola Amatil Ltd 162,584 0.01 474 Cochlear Ltd 48,959 0.00 54,565 Commonwealth Bank of Australia 3,580,450 0.31 15,958 Computershare Ltd 171,373 0.02 14,663 Crown Resorts Ltd 132,267 0.01 13,847 CSL Ltd 1,325,533 0.12 33,799 Dexus Property Group (Reit) 252,219 0.02 2,342 Domino's Pizza Enterprises Ltd 103,966 0.01 83,970 DUET Group (Unit) 178,940 0.02 2,470 Flight Centre Travel Group Ltd * 54,485 0.01 54,772 Fortescue Metals Group Ltd 260,631 0.02 63,798 Goodman Group (Reit) 377,162 0.03 63,313 GPT Group/The (Reit) 249,046 0.02 13,398 Harvey Norman Holdings Ltd 46,357 0.00 53,207 Healthscope Ltd * 92,252 0.01 58,411 Incitec Pivot Ltd 167,750 0.02 85,500 Insurance Australia Group Ltd 395,095 0.03 19,376 LendLease Group (Unit) 230,575 0.02 8,322 Macquarie Group Ltd 573,342 0.05 95,371 Medibank Pvt Ltd 205,421 0.02 130,423 Mirvac Group (Reit) 218,162 0.02 86,805 National Australia Bank Ltd 2,210,498 0.19 22,077 Newcrest Mining Ltd 375,526 0.03 12,984 Orica Ltd 174,542 0.02 60,845 Origin Energy Ltd 327,638 0.03 9,326 Qantas Airways Ltd 27,709 0.00 39,863 QBE Insurance Group Ltd 392,467 0.03 4,937 Ramsay Health Care Ltd 263,547 0.02 1,966 REA Group Ltd 89,092 0.01 15,044 Rio Tinto Ltd 694,722 0.06 55,267 Santos Ltd 160,409 0.01 188,211 Scentre Group (Reit) 616,711 0.05 11,522 SEEK Ltd 140,104 0.01 13,948 Sonic Healthcare Ltd 235,655 0.02 126,487 South32 Ltd 266,646 0.02 64,758 Stockland (Reit) 229,505 0.02 29,643 Suncorp Group Ltd 299,092 0.03 38,247 Sydney Airport (Unit) 197,772 0.02 31,164 Tabcorp Holdings Ltd 113,065 0.01 50,035 Tatts Group Ltd 169,300 0.02 149,561 Telstra Corp Ltd 532,334 0.05 7,137 TPG Telecom Ltd 37,995 0.00 73,242 Transurban Group (Unit) * 652,846 0.06 25,969 Treasury Wine Estates Ltd 242,584 0.02 117,780 Vicinity Centres (Reit) 254,588 0.02 10,918 Vocus Group Ltd * 36,025 0.00 34,507 Wesfarmers Ltd 1,187,885 0.10
66,523 Westfield Corp (Reit) 451,195 0.04 106,492 Westpac Banking Corp 2,851,732 0.25 27,313 Woodside Petroleum Ltd 669,243 0.06 36,268 Woolworths Ltd * 734,090 0.06
31,493,980 2.74
Austria 2,501 ANDRITZ AG 128,158 0.01 8,066 Erste Group Bank AG 264,102 0.02 5,061 OMV AG 200,805 0.02 3,997 Raiffeisen Bank International AG 89,939 0.01 3,402 voestalpine AG 134,854 0.01
817,858 0.07
Belgium 6,845 Ageas 267,310 0.02 24,657 Anheuser-Busch InBev SA/NV 2,704,291 0.24 2,331 Colruyt SA 114,317 0.01 2,798 Groupe Bruxelles Lambert SA * 254,468 0.02 9,013 KBC Group NV 595,901 0.05 5,286 Proximus SADP * 166,583 0.01 2,565 Solvay SA 312,700 0.03 1,741 Telenet Group Holding NV 103,425 0.01 2,515 UCB SA 196,431 0.02 3,304 Umicore SA 188,087 0.02
4,903,513 0.43
Bermuda 4,365 Arch Capital Group Ltd 413,453 0.04 3,928 Axalta Coating Systems Ltd 126,010 0.01 3,164 Axis Capital Holdings Ltd 212,684 0.02 4,813 Bunge Ltd 382,248 0.03 5,000 Cheung Kong Infrastructure
Holdings Ltd 39,252 0.00 991 Everest Re Group Ltd 232,251 0.02 35,500 First Pacific Co Ltd 25,767 0.00 41,700 Hongkong Land Holdings Ltd 320,673 0.03 9,863 IHS Markit Ltd 414,641 0.04 9,805 Invesco Ltd 299,641 0.03 8,900 Jardine Matheson Holdings Ltd 571,825 0.05 7,200 Jardine Strategic Holdings Ltd * 302,400 0.03 25,500 Kerry Properties Ltd 88,443 0.01 132,000 Li & Fung Ltd 57,249 0.00 15,573 Marvell Technology Group Ltd 241,226 0.02 5,624 Norwegian Cruise Line
Holdings Ltd 287,049 0.02 54,020 NWS Holdings Ltd 98,582 0.01 901 RenaissanceRe Holdings Ltd 130,654 0.01 34,000 Shangri-La Asia Ltd 49,532 0.00 2,497 Signet Jewelers Ltd 176,363 0.02 9,662 XL Group Ltd 387,156 0.03 25,000 Yue Yuen Industrial Holdings Ltd 98,292 0.01
4,955,391 0.43
British Virgin Islands 5,973 Michael Kors Holdings Ltd 228,646 0.02
228,646 0.02
Canada 7,865 Agnico Eagle Mines Ltd * 330,473 0.03 3,759 Agrium Inc 361,937 0.03 14,822 Alimentation Couche-Tard Inc 'B' * 672,390 0.06 1,464 AltaGas Ltd 34,082 0.00 13,195 ARC Resources Ltd * 190,201 0.02 3,266 Atco Ltd 'I' 127,826 0.01
Portfolio of Investments as at 31 March 2017
Australia continued

Transferable Securities and Money Market Instruments Admitted to an Official Stock Exchange Listing or Dealt in on Another Regulated Market
Transferable Securities and Money Market Instruments Admitted to an Official Stock Exchange Listing or Dealt in on Another Regulated Market
Holding Description
Market Value
USD
% of Net
Assets Holding Description
Market Value
USD
% of Net
Assets
* All or a portion of this security represents a security on loan.
108 BlackRock Global Index Funds (BGIF)
The notes on pages 122 to 128 form an integral part of these financial statements.
BlackRock World Equity Index Fund continued
20,838 Bank of Montreal 1,560,147 0.14 39,536 Bank of Nova Scotia/The 2,323,881 0.20 31,407 Barrick Gold Corp 590,874 0.05 5,176 BCE Inc 228,539 0.02 17,446 BlackBerry Ltd 139,710 0.01 26,188 Bombardier Inc 'B' 40,565 0.00 25,754 Brookfield Asset Management Inc 'A' 942,319 0.08 9,249 CAE Inc 140,136 0.01 13,895 Cameco Corp * 155,573 0.01 12,927 Canadian Imperial Bank of
Commerce 1,113,166 0.10 25,356 Canadian National Railway Co 1,874,388 0.16 35,645 Canadian Natural Resources Ltd 1,166,456 0.10 3,883 Canadian Pacific Railway Ltd 571,311 0.05 2,442 Canadian Tire Corp Ltd 'A' 290,087 0.03 4,355 Canadian Utilities Ltd 'A' 127,844 0.01 969 CCL Industries Inc 'B' 210,216 0.02 27,626 Cenovus Energy Inc 315,542 0.03 7,201 CGI Group Inc 'A' 347,190 0.03 8,581 CI Financial Corp * 172,214 0.02 676 Constellation Software Inc * 332,419 0.03 19,210 Crescent Point Energy Corp 211,037 0.02 2,466 Dollarama Inc 203,822 0.02 16,187 Eldorado Gold Corp 57,024 0.00 13,653 Element Fleet Management Corp * 124,169 0.01 1,780 Emera Inc 62,800 0.01 3,630 Empire Co Ltd 'A' 54,618 0.00 49,844 Enbridge Inc 2,082,361 0.18 27,495 Encana Corp 318,801 0.03 831 Fairfax Financial Holdings Ltd 385,538 0.03 5,734 Finning International Inc 106,540 0.01 4,471 First Capital Realty Inc 67,204 0.01 24,589 First Quantum Minerals Ltd 259,406 0.02 11,358 Fortis Inc 376,977 0.03 4,977 Franco-Nevada Corp 322,107 0.03 1,775 George Weston Ltd 155,104 0.01 7,843 Gildan Activewear Inc 211,069 0.02 28,280 Goldcorp Inc 412,111 0.04 10,496 Great-West Lifeco Inc 291,700 0.03 4,926 H&R Real Estate Investment
Trust (Reit) 85,563 0.01 12,271 Husky Energy Inc 139,697 0.01 6,145 Hydro One Ltd 111,080 0.01 3,846 IGM Financial Inc * 115,707 0.01 10,526 Imperial Oil Ltd 322,769 0.03 3,541 Industrial Alliance Insurance &
Financial Services Inc 152,993 0.01 2,984 Intact Financial Corp 211,813 0.02 12,573 Inter Pipeline Ltd 267,267 0.02 2,082 Jean Coutu Group PJC Inc/The 'A' 32,109 0.00 6,454 Keyera Corp 190,043 0.02 48,856 Kinross Gold Corp 169,356 0.01 1,320 Linamar Corp 59,871 0.01 8,074 Loblaw Cos Ltd 441,311 0.04 10,346 Magna International Inc 448,879 0.04 61,336 Manulife Financial Corp 1,088,450 0.09 3,154 Methanex Corp 150,573 0.01 8,249 Metro Inc 255,366 0.02 11,986 National Bank of Canada 502,909 0.04 2,878 Onex Corp 205,479 0.02 8,560 Open Text Corp 291,577 0.03 13,833 Pembina Pipeline Corp 439,465 0.04 5,731 Peyto Exploration &
Development Corp * 119,110 0.01 29,586 Potash Corp of Saskatchewan Inc * 510,786 0.04 13,346 Power Corp of Canada 314,909 0.03 8,670 Power Financial Corp 229,153 0.02 7,783 PrairieSky Royalty Ltd * 163,923 0.01
4,991 Restaurant Brands International Inc 278,579 0.02 4,055 RioCan Real Estate Investment
Trust (Reit) 79,429 0.01 12,713 Rogers Communications Inc 'B' 562,282 0.05 47,548 Royal Bank of Canada 3,483,421 0.30 9,021 Saputo Inc 312,638 0.03 8,380 Seven Generations Energy Ltd 'A' 152,805 0.01 10,851 Shaw Communications Inc 'B' 224,869 0.02 15,497 Silver Wheaton Corp 315,090 0.03 2,362 Smart Real Estate Investment
Trust (Reit) 58,078 0.01 5,376 SNC-Lavalin Group Inc 210,852 0.02 21,638 Sun Life Financial Inc 791,067 0.07 54,441 Suncor Energy Inc 1,691,073 0.15 19,968 Teck Resources Ltd 'B' 442,032 0.04 7,337 TELUS Corp 237,560 0.02 11,783 Thomson Reuters Corp 510,694 0.04 58,790 Toronto-Dominion Bank/The * 2,937,511 0.26 7,352 Tourmaline Oil Corp 164,189 0.01 26,919 TransCanada Corp * 1,248,488 0.11 33,803 Turquoise Hill Resources Ltd 102,942 0.01 11,573 Valeant Pharmaceuticals
International Inc * 128,270 0.01 10,499 Veresen Inc * 115,103 0.01 4,101 Vermilion Energy Inc * 152,088 0.01 6,216 Waste Connections Inc 547,132 0.05 2,531 West Fraser Timber Co Ltd 105,967 0.01 37,141 Yamana Gold Inc 103,053 0.01
42,037,244 3.66
Cayman Islands 8,900 ASM Pacific Technology Ltd 121,068 0.01 96,096 Cheung Kong Property
Holdings Ltd 647,421 0.06 80,596 CK Hutchison Holdings Ltd 991,600 0.09 6,531 Melco Crown
Entertainment Ltd ADR 119,942 0.01 38,800 MGM China Holdings Ltd 80,893 0.01 84,400 Sands China Ltd 391,030 0.03 278,500 WH Group Ltd ‘144A’ 240,140 0.02 58,400 Wynn Macau Ltd 118,901 0.01
2,710,995 0.24
Curacao 45,527 Schlumberger Ltd 3,542,001 0.31
3,542,001 0.31
Denmark 104 AP Moeller - Maersk A/S 'A' 167,039 0.01 229 AP Moeller - Maersk A/S 'B' 380,968 0.03 3,719 Carlsberg A/S 'B' 343,543 0.03 3,423 Chr Hansen Holding A/S 220,111 0.02 3,873 Coloplast A/S 'B' * 302,963 0.03 21,745 Danske Bank A/S 742,249 0.06 2,161 DONG Energy A/S ‘144A’ 83,109 0.01 6,687 DSV A/S 345,842 0.03 2,018 Genmab A/S 390,510 0.03 1,780 ISS A/S 67,254 0.01 62,834 Novo Nordisk A/S 'B' 2,167,359 0.19 8,068 Novozymes A/S 'B' 319,903 0.03 3,974 Pandora A/S 438,178 0.04 19,302 TDC A/S 99,827 0.01 4,463 Tryg A/S 81,236 0.01 7,729 Vestas Wind Systems A/S 631,800 0.05 4,284 William Demant Holding A/S 90,102 0.01
6,871,993 0.60
Portfolio of Investments as at 31 March 2017
Canada continued Canada continued

Transferable Securities and Money Market Instruments Admitted to an Official Stock Exchange Listing or Dealt in on Another Regulated Market
Transferable Securities and Money Market Instruments Admitted to an Official Stock Exchange Listing or Dealt in on Another Regulated Market
Holding Description
Market Value
USD
% of Net
Assets Holding Description
Market Value
USD
% of Net
Assets
* All or a portion of this security represents a security on loan.
Annual Report and Audited Accounts 109
The notes on pages 122 to 128 form an integral part of these financial statements.
BlackRock World Equity Index Fund continued
Finland 4,958 Elisa OYJ 175,237 0.02 15,444 Fortum OYJ * 242,402 0.02 11,818 Kone OYJ 'B' 516,695 0.04 3,898 Metso OYJ * 117,656 0.01 4,429 Neste OYJ 172,677 0.01 199,258 Nokia OYJ 1,064,486 0.09 4,274 Nokian Renkaat OYJ 178,096 0.02 3,580 Orion OYJ 'B' * 186,892 0.02 15,679 Sampo OYJ 'A' * 743,632 0.06 18,884 Stora Enso OYJ 'R' 222,346 0.02 14,968 UPM-Kymmene OYJ 352,476 0.03 3,648 Wartsila OYJ Abp 194,885 0.02
4,167,480 0.36
France 6,011 Accor SA 249,769 0.02 1,147 Aeroports de Paris 141,792 0.01 12,346 Air Liquide SA 1,402,213 0.12 4,271 Alstom SA 127,249 0.01 2,356 Arkema SA 231,085 0.02 2,365 Atos SE 290,971 0.02 63,615 AXA SA 1,645,201 0.14 33,795 BNP Paribas SA 2,219,937 0.19 34,735 Bollore SA * 133,717 0.01 4,575 Bouygues SA 185,701 0.02 9,242 Bureau Veritas SA * 193,740 0.02 5,713 Capgemini SA 527,513 0.05 19,739 Carrefour SA 463,878 0.04 1,466 Casino Guichard Perrachon SA 81,152 0.01 1,489 Christian Dior SE 345,469 0.03 16,894 Cie de Saint-Gobain 858,838 0.07 5,990 Cie Generale des
Etablissements Michelin 719,362 0.06 5,938 CNP Assurances 121,179 0.01 36,930 Credit Agricole SA 498,353 0.04 20,120 Danone SA 1,359,484 0.12 49 Dassault Aviation SA 61,595 0.01 2,690 Dassault Systemes SE 232,345 0.02 7,268 Edenred 171,151 0.01 1,678 Eiffage SA 131,004 0.01 13,443 Electricite de France SA * 112,952 0.01 49,883 Engie SA 702,195 0.06 7,136 Essilor International SA 865,376 0.07 1,592 Eurazeo SA 104,644 0.01 6,419 Eutelsat Communications SA 143,580 0.01 1,244 Fonciere Des Regions (Reit) 102,903 0.01 1,521 Gecina SA (Reit) 203,627 0.02 16,350 Groupe Eurotunnel SE Reg 163,127 0.01 925 Hermes International 436,836 0.04 1,362 ICADE (Reit) 99,057 0.01 925 Iliad SA 207,793 0.02 1,213 Imerys SA 102,607 0.01 1,940 Ingenico Group SA 182,613 0.02 2,142 JCDecaux SA * 74,758 0.01 1,967 Kering 508,072 0.04 7,725 Klepierre (Reit) 298,580 0.03 7,663 L'Oreal SA * 1,470,890 0.13 3,198 Lagardere SCA 93,435 0.01 9,600 Legrand SA 577,784 0.05 8,711 LVMH Moet Hennessy
Louis Vuitton SE 1,898,218 0.16 32,949 Natixis SA * 202,108 0.02 62,333 Orange SA 968,360 0.08 5,908 Pernod Ricard SA 695,943 0.06 16,965 Peugeot SA 340,230 0.03 4,464 Publicis Groupe SA 310,451 0.03 865 Remy Cointreau SA 83,909 0.01 6,731 Renault SA 580,589 0.05
10,447 Rexel SA 187,858 0.02 10,829 Safran SA 805,058 0.07 36,734 Sanofi 3,306,290 0.29 19,174 Schneider Electric SE 1,391,850 0.12 2,097 SCOR SE 79,181 0.01 798 SEB SA 110,713 0.01 1,899 SFR Group SA 59,591 0.01 989 Societe BIC SA 123,105 0.01 26,134 Societe Generale SA 1,310,421 0.11 3,280 Sodexo SA 385,672 0.03 5,274 Suez 82,863 0.01 3,695 Thales SA 357,642 0.03 72,142 Total SA 3,627,777 0.32 1,844 Unibail-Rodamco SE (Reit)
(traded in France) 426,356 0.04 1,554 Unibail-Rodamco SE (Reit)
(traded in Netherlands) 359,304 0.03 8,365 Valeo SA 554,488 0.05 16,711 Veolia Environnement SA 311,925 0.03 17,208 Vinci SA 1,357,982 0.12 35,679 Vivendi SA 686,754 0.06 978 Wendel SA 123,721 0.01 7,086 Zodiac Aerospace 177,389 0.01
39,749,275 3.46
Germany 6,420 adidas AG 1,219,610 0.11 14,393 Allianz SE Reg 2,661,967 0.23 1,608 Axel Springer SE * 88,377 0.01 29,656 BASF SE 2,931,585 0.26 26,307 Bayer AG Reg 3,015,958 0.26 11,353 Bayerische Motoren Werke AG 1,030,453 0.09 1,111 Bayerische Motoren Werke AG (Pref) 86,999 0.01 3,514 Beiersdorf AG 331,713 0.03 4,108 Brenntag AG 229,994 0.02 36,992 Commerzbank AG 333,070 0.03 3,408 Continental AG 746,280 0.07 2,678 Covestro AG ‘144A’ 205,728 0.02 30,761 Daimler AG Reg 2,270,096 0.20 47,504 Deutsche Bank AG (Right) 108,820 0.01 42,109 Deutsche Bank AG Reg 717,612 0.06 6,885 Deutsche Boerse AG * 631,095 0.06 7,313 Deutsche Lufthansa AG Reg 118,571 0.01 33,207 Deutsche Post AG Reg 1,132,700 0.10 107,404 Deutsche Telekom AG Reg 1,881,996 0.16 11,802 Deutsche Wohnen AG * 388,762 0.03 64,532 E.ON SE 510,017 0.04 5,671 Evonik Industries AG 184,351 0.02 1,405 Fraport AG Frankfurt Airport
Services Worldwide 99,213 0.01 5,688 Fresenius Medical Care AG &
Co KGaA 479,442 0.04 12,725 Fresenius SE & Co KGaA 1,017,527 0.09 2,389 Fuchs Petrolub SE (Pref) 115,859 0.01 6,433 GEA Group AG * 272,116 0.02 2,114 Hannover Rueck SE 243,940 0.02 5,172 HeidelbergCement AG 481,427 0.04 3,644 Henkel AG & Co KGaA 406,474 0.04 5,643 Henkel AG & Co KGaA (Pref) 724,115 0.06 2,304 Hugo Boss AG 169,612 0.01 30,577 Infineon Technologies AG 627,101 0.05 5,026 Innogy SE 190,206 0.02 6,677 K+S AG Reg * 155,807 0.01 3,182 Lanxess AG 213,406 0.02 5,572 Linde AG 928,731 0.08 1,211 MAN SE 125,404 0.01 4,553 Merck KGaA 518,572 0.05 6,227 Metro AG 198,533 0.02
Portfolio of Investments as at 31 March 2017
France continued

Transferable Securities and Money Market Instruments Admitted to an Official Stock Exchange Listing or Dealt in on Another Regulated Market
Transferable Securities and Money Market Instruments Admitted to an Official Stock Exchange Listing or Dealt in on Another Regulated Market
Holding Description
Market Value
USD
% of Net
Assets Holding Description
Market Value
USD
% of Net
Assets
* All or a portion of this security represents a security on loan.
110 BlackRock Global Index Funds (BGIF)
The notes on pages 122 to 128 form an integral part of these financial statements.
BlackRock World Equity Index Fund continued
5,535 Muenchener Rueckversicherungs-Gesellschaft AG in Muenchen Reg 1,084,900 0.09
3,067 OSRAM Licht AG 191,013 0.02 5,080 Porsche Automobil Holding SE (Pref) 276,760 0.02 4,532 ProSiebenSat.1 Media SE 199,524 0.02 17,030 RWE AG 283,853 0.02 31,245 SAP SE 3,057,616 0.27 24,788 Siemens AG Reg 3,374,157 0.29 4,161 Symrise AG 276,397 0.02 25,429 Telefonica Deutschland Holding AG 126,121 0.01 13,300 ThyssenKrupp AG 325,418 0.03 17,465 TUI AG 242,331 0.02 4,272 United Internet AG Reg 189,538 0.02 1,137 Volkswagen AG 170,744 0.02 6,380 Volkswagen AG (Pref) 926,732 0.08 16,326 Vonovia SE 572,147 0.05 3,062 Zalando SE * 122,799 0.01
39,213,289 3.42
Hong Kong 396,000 AIA Group Ltd 2,497,217 0.22 42,545 Bank of East Asia Ltd/The 176,033 0.01 88,000 BOC Hong Kong Holdings Ltd 359,577 0.03 50,000 Cathay Pacific Airways Ltd 72,584 0.01 59,000 CLP Holdings Ltd 616,936 0.05 83,000 Galaxy Entertainment Group Ltd 454,509 0.04 31,000 Hang Lung Group Ltd 132,254 0.01 24,000 Hang Lung Properties Ltd 62,392 0.01 26,800 Hang Seng Bank Ltd * 543,571 0.05 37,615 Henderson Land
Development Co Ltd 233,089 0.02 112,500 HK Electric Investments & HK Electric
Investments Ltd (Unit) ‘144A’ 103,665 0.01 93,860 HKT Trust & HKT Ltd (Unit) 121,036 0.01 177,824 Hong Kong & China Gas Co Ltd 355,637 0.03 40,827 Hong Kong Exchanges and
Clearing Ltd 1,027,735 0.09 22,000 Hysan Development Co Ltd 99,804 0.01 81,000 Link REIT (Reit) 567,607 0.05 52,000 MTR Corp Ltd * 292,114 0.02 202,074 New World Development Co Ltd 248,618 0.02 127,000 PCCW Ltd 74,857 0.01 39,500 Power Assets Holdings Ltd 340,594 0.03 109,448 Sino Land Co Ltd 191,845 0.02 35,000 SJM Holdings Ltd 28,468 0.00 45,000 Sun Hung Kai Properties Ltd 661,369 0.06 18,500 Swire Pacific Ltd 'A' 184,756 0.02 40,400 Swire Properties Ltd 129,463 0.01 47,500 Techtronic Industries Co Ltd 192,256 0.02 48,000 Wharf Holdings Ltd/The 412,033 0.03 29,000 Wheelock & Co Ltd * 229,343 0.02
10,409,362 0.91
Ireland 20,380 Accenture Plc 'A' 2,465,572 0.22 3,798 Alkermes Plc 233,311 0.02 12,155 Allergan Plc 2,910,029 0.25 960,721 Bank of Ireland 238,144 0.02 28,152 CRH Plc 981,929 0.09 3,150 DCC Plc 274,886 0.02 13,650 Eaton Corp Plc 1,012,284 0.09 8,031 Ingersoll-Rand Plc 649,146 0.06 15,321 James Hardie Industries Plc - CDI 240,714 0.02 2,127 Jazz Pharmaceuticals Plc 310,202 0.03 29,248 Johnson Controls International Plc 1,236,605 0.11 5,474 Kerry Group Plc 'A' 430,581 0.04 3,747 Mallinckrodt Plc 171,425 0.01 45,622 Medtronic Plc 3,679,414 0.32
2,835 Paddy Power Betfair Plc 305,026 0.03 6,035 Pentair Plc 377,972 0.03 4,029 Perrigo Co Plc 271,716 0.02 10,699 Seagate Technology Plc 497,932 0.04 32,339 Weatherford International Plc 216,671 0.02 4,585 Willis Towers Watson Plc 598,801 0.05
17,102,360 1.49
Isle of Man 209,300 Genting Singapore Plc 152,850 0.01
152,850 0.01
Israel 1,401 Azrieli Group Ltd 74,109 0.01 37,138 Bank Hapoalim BM 225,683 0.02 49,905 Bank Leumi Le-Israel BM 219,758 0.02 72,482 Bezeq The Israeli
Telecommunication Corp Ltd 129,865 0.01 4,583 Check Point Software
Technologies Ltd * 469,987 0.04 436 Elbit Systems Ltd 49,750 0.00 481 Frutarom Industries Ltd 26,807 0.00 12,618 Israel Chemicals Ltd 53,480 0.01 4,160 Mizrahi Tefahot Bank Ltd 70,344 0.01 2,091 Nice Ltd 140,073 0.01 32,108 Teva Pharmaceutical
Industries Ltd ADR * 1,045,758 0.09
2,505,614 0.22
Italy 31,188 Assicurazioni Generali SpA 493,844 0.04 11,092 Atlantia SpA 287,037 0.03 241,776 Enel SpA 1,131,983 0.10 86,674 Eni SpA 1,415,959 0.12 432,708 Intesa Sanpaolo SpA 1,169,687 0.10 35,478 Intesa Sanpaolo SpA - RSP 90,142 0.01 8,198 Leonardo SpA 116,584 0.01 5,887 Luxottica Group SpA 325,506 0.03 20,889 Mediobanca SpA 187,813 0.02 17,490 Poste Italiane SpA ‘144A’ 117,262 0.01 6,760 Prysmian SpA 178,040 0.02 36,078 Saipem SpA 16,610 0.00 64,884 Snam SpA 277,995 0.02 357,072 Telecom Italia SpA * 322,761 0.03 208,119 Telecom Italia SpA - RSP 152,320 0.01 53,091 Terna Rete Elettrica Nazionale SpA * 263,431 0.02 67,069 UniCredit SpA 1,031,902 0.09 50,008 UnipolSai Assicurazioni SpA * 110,282 0.01
7,689,158 0.67
Japan 800 ABC-Mart Inc 46,642 0.00 15,800 Acom Co Ltd 62,968 0.01 12,700 Aeon Co Ltd 184,824 0.02 2,100 AEON Financial Service Co Ltd 39,438 0.00 2,300 Aeon Mall Co Ltd 36,088 0.00 5,700 Air Water Inc 104,750 0.01 6,500 Aisin Seiki Co Ltd 318,422 0.03 18,700 Ajinomoto Co Inc 367,854 0.03 4,400 Alfresa Holdings Corp 76,013 0.01 6,400 Alps Electric Co Ltd 180,835 0.02 9,300 Amada Holdings Co Ltd 105,860 0.01 31,000 ANA Holdings Inc 94,338 0.01 33,000 Aozora Bank Ltd 121,171 0.01 21,000 Asahi Glass Co Ltd 169,640 0.01 13,100 Asahi Group Holdings Ltd 493,684 0.04 44,000 Asahi Kasei Corp 425,578 0.04
Portfolio of Investments as at 31 March 2017
Germany continued Ireland continued
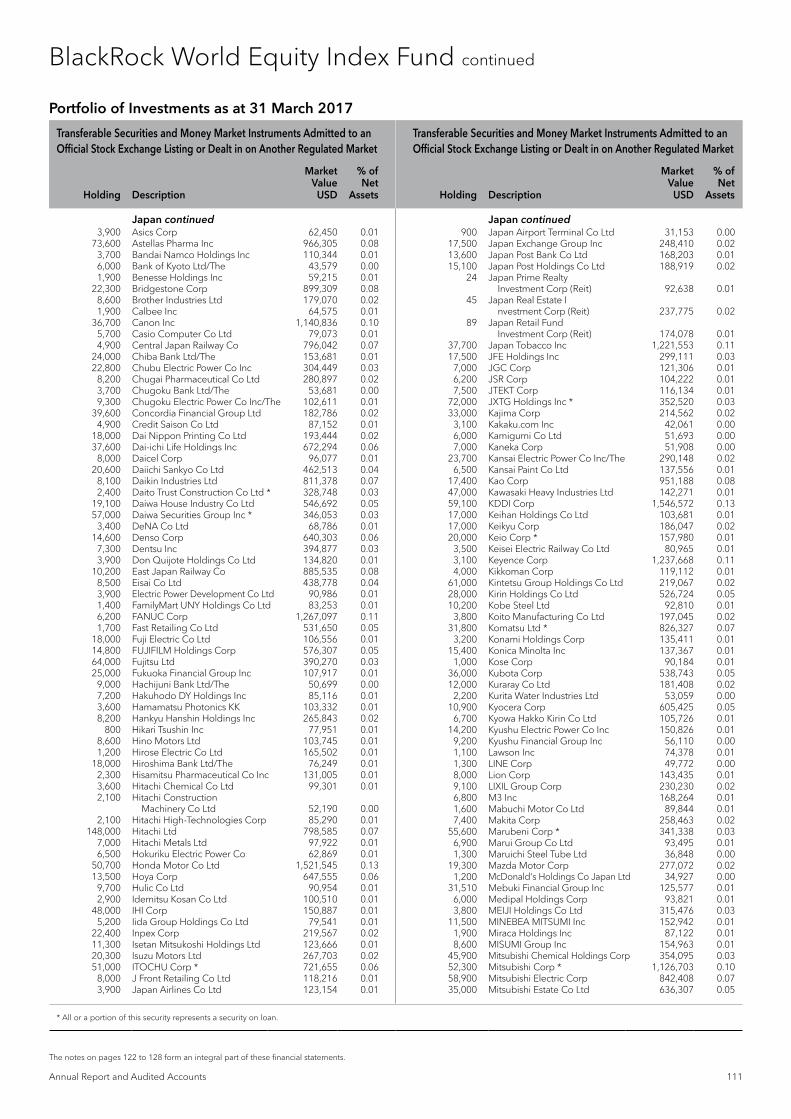
Transferable Securities and Money Market Instruments Admitted to an Official Stock Exchange Listing or Dealt in on Another Regulated Market
Transferable Securities and Money Market Instruments Admitted to an Official Stock Exchange Listing or Dealt in on Another Regulated Market
Holding Description
Market Value
USD
% of Net
Assets Holding Description
Market Value
USD
% of Net
Assets
* All or a portion of this security represents a security on loan.
Annual Report and Audited Accounts 111
The notes on pages 122 to 128 form an integral part of these financial statements.
BlackRock World Equity Index Fund continued
3,900 Asics Corp 62,450 0.01 73,600 Astellas Pharma Inc 966,305 0.08 3,700 Bandai Namco Holdings Inc 110,344 0.01 6,000 Bank of Kyoto Ltd/The 43,579 0.00 1,900 Benesse Holdings Inc 59,215 0.01 22,300 Bridgestone Corp 899,309 0.08 8,600 Brother Industries Ltd 179,070 0.02 1,900 Calbee Inc 64,575 0.01 36,700 Canon Inc 1,140,836 0.10 5,700 Casio Computer Co Ltd 79,073 0.01 4,900 Central Japan Railway Co 796,042 0.07 24,000 Chiba Bank Ltd/The 153,681 0.01 22,800 Chubu Electric Power Co Inc 304,449 0.03 8,200 Chugai Pharmaceutical Co Ltd 280,897 0.02 3,700 Chugoku Bank Ltd/The 53,681 0.00 9,300 Chugoku Electric Power Co Inc/The 102,611 0.01 39,600 Concordia Financial Group Ltd 182,786 0.02 4,900 Credit Saison Co Ltd 87,152 0.01 18,000 Dai Nippon Printing Co Ltd 193,444 0.02 37,600 Dai-ichi Life Holdings Inc 672,294 0.06 8,000 Daicel Corp 96,077 0.01 20,600 Daiichi Sankyo Co Ltd 462,513 0.04 8,100 Daikin Industries Ltd 811,378 0.07 2,400 Daito Trust Construction Co Ltd * 328,748 0.03 19,100 Daiwa House Industry Co Ltd 546,692 0.05 57,000 Daiwa Securities Group Inc * 346,053 0.03 3,400 DeNA Co Ltd 68,786 0.01 14,600 Denso Corp 640,303 0.06 7,300 Dentsu Inc 394,877 0.03 3,900 Don Quijote Holdings Co Ltd 134,820 0.01 10,200 East Japan Railway Co 885,535 0.08 8,500 Eisai Co Ltd 438,778 0.04 3,900 Electric Power Development Co Ltd 90,986 0.01 1,400 FamilyMart UNY Holdings Co Ltd 83,253 0.01 6,200 FANUC Corp 1,267,097 0.11 1,700 Fast Retailing Co Ltd 531,650 0.05 18,000 Fuji Electric Co Ltd 106,556 0.01 14,800 FUJIFILM Holdings Corp 576,307 0.05 64,000 Fujitsu Ltd 390,270 0.03 25,000 Fukuoka Financial Group Inc 107,917 0.01 9,000 Hachijuni Bank Ltd/The 50,699 0.00 7,200 Hakuhodo DY Holdings Inc 85,116 0.01 3,600 Hamamatsu Photonics KK 103,332 0.01 8,200 Hankyu Hanshin Holdings Inc 265,843 0.02 800 Hikari Tsushin Inc 77,951 0.01 8,600 Hino Motors Ltd 103,745 0.01 1,200 Hirose Electric Co Ltd 165,502 0.01 18,000 Hiroshima Bank Ltd/The 76,249 0.01 2,300 Hisamitsu Pharmaceutical Co Inc 131,005 0.01 3,600 Hitachi Chemical Co Ltd 99,301 0.01 2,100 Hitachi Construction
Machinery Co Ltd 52,190 0.00 2,100 Hitachi High-Technologies Corp 85,290 0.01 148,000 Hitachi Ltd 798,585 0.07 7,000 Hitachi Metals Ltd 97,922 0.01 6,500 Hokuriku Electric Power Co 62,869 0.01 50,700 Honda Motor Co Ltd 1,521,545 0.13 13,500 Hoya Corp 647,555 0.06 9,700 Hulic Co Ltd 90,954 0.01 2,900 Idemitsu Kosan Co Ltd 100,510 0.01 48,000 IHI Corp 150,887 0.01 5,200 Iida Group Holdings Co Ltd 79,541 0.01 22,400 Inpex Corp 219,567 0.02 11,300 Isetan Mitsukoshi Holdings Ltd 123,666 0.01 20,300 Isuzu Motors Ltd 267,703 0.02 51,000 ITOCHU Corp * 721,655 0.06 8,000 J Front Retailing Co Ltd 118,216 0.01 3,900 Japan Airlines Co Ltd 123,154 0.01
900 Japan Airport Terminal Co Ltd 31,153 0.00 17,500 Japan Exchange Group Inc 248,410 0.02 13,600 Japan Post Bank Co Ltd 168,203 0.01 15,100 Japan Post Holdings Co Ltd 188,919 0.02 24 Japan Prime Realty
Investment Corp (Reit) 92,638 0.01 45 Japan Real Estate I
nvestment Corp (Reit) 237,775 0.02 89 Japan Retail Fund
Investment Corp (Reit) 174,078 0.01 37,700 Japan Tobacco Inc 1,221,553 0.11 17,500 JFE Holdings Inc 299,111 0.03 7,000 JGC Corp 121,306 0.01 6,200 JSR Corp 104,222 0.01 7,500 JTEKT Corp 116,134 0.01 72,000 JXTG Holdings Inc * 352,520 0.03 33,000 Kajima Corp 214,562 0.02 3,100 Kakaku.com Inc 42,061 0.00 6,000 Kamigumi Co Ltd 51,693 0.00 7,000 Kaneka Corp 51,908 0.00 23,700 Kansai Electric Power Co Inc/The 290,148 0.02 6,500 Kansai Paint Co Ltd 137,556 0.01 17,400 Kao Corp 951,188 0.08 47,000 Kawasaki Heavy Industries Ltd 142,271 0.01 59,100 KDDI Corp 1,546,572 0.13 17,000 Keihan Holdings Co Ltd 103,681 0.01 17,000 Keikyu Corp 186,047 0.02 20,000 Keio Corp * 157,980 0.01 3,500 Keisei Electric Railway Co Ltd 80,965 0.01 3,100 Keyence Corp 1,237,668 0.11 4,000 Kikkoman Corp 119,112 0.01 61,000 Kintetsu Group Holdings Co Ltd 219,067 0.02 28,000 Kirin Holdings Co Ltd 526,724 0.05 10,200 Kobe Steel Ltd 92,810 0.01 3,800 Koito Manufacturing Co Ltd 197,045 0.02 31,800 Komatsu Ltd * 826,327 0.07 3,200 Konami Holdings Corp 135,411 0.01 15,400 Konica Minolta Inc 137,367 0.01 1,000 Kose Corp 90,184 0.01 36,000 Kubota Corp 538,743 0.05 12,000 Kuraray Co Ltd 181,408 0.02 2,200 Kurita Water Industries Ltd 53,059 0.00 10,900 Kyocera Corp 605,425 0.05 6,700 Kyowa Hakko Kirin Co Ltd 105,726 0.01 14,200 Kyushu Electric Power Co Inc 150,826 0.01 9,200 Kyushu Financial Group Inc 56,110 0.00 1,100 Lawson Inc 74,378 0.01 1,300 LINE Corp 49,772 0.00 8,000 Lion Corp 143,435 0.01 9,100 LIXIL Group Corp 230,230 0.02 6,800 M3 Inc 168,264 0.01 1,600 Mabuchi Motor Co Ltd 89,844 0.01 7,400 Makita Corp 258,463 0.02 55,600 Marubeni Corp * 341,338 0.03 6,900 Marui Group Co Ltd 93,495 0.01 1,300 Maruichi Steel Tube Ltd 36,848 0.00 19,300 Mazda Motor Corp 277,072 0.02 1,200 McDonald's Holdings Co Japan Ltd 34,927 0.00 31,510 Mebuki Financial Group Inc 125,577 0.01 6,000 Medipal Holdings Corp 93,821 0.01 3,800 MEIJI Holdings Co Ltd 315,476 0.03 11,500 MINEBEA MITSUMI Inc 152,942 0.01 1,900 Miraca Holdings Inc 87,122 0.01 8,600 MISUMI Group Inc 154,963 0.01 45,900 Mitsubishi Chemical Holdings Corp 354,095 0.03 52,300 Mitsubishi Corp * 1,126,703 0.10 58,900 Mitsubishi Electric Corp 842,408 0.07 35,000 Mitsubishi Estate Co Ltd 636,307 0.05
Portfolio of Investments as at 31 March 2017
Japan continued Japan continued

Transferable Securities and Money Market Instruments Admitted to an Official Stock Exchange Listing or Dealt in on Another Regulated Market
Transferable Securities and Money Market Instruments Admitted to an Official Stock Exchange Listing or Dealt in on Another Regulated Market
Holding Description
Market Value
USD
% of Net
Assets Holding Description
Market Value
USD
% of Net
Assets
* All or a portion of this security represents a security on loan.
112 BlackRock Global Index Funds (BGIF)
The notes on pages 122 to 128 form an integral part of these financial statements.
BlackRock World Equity Index Fund continued
5,500 Mitsubishi Gas Chemical Co Inc 113,881 0.01 88,000 Mitsubishi Heavy Industries Ltd 351,968 0.03 7,000 Mitsubishi Logistics Corp 96,167 0.01 4,200 Mitsubishi Materials Corp 126,760 0.01 22,200 Mitsubishi Motors Corp 133,009 0.01 7,400 Mitsubishi Tanabe Pharma Corp 153,620 0.01 410,100 Mitsubishi UFJ Financial Group Inc 2,569,828 0.22 12,200 Mitsubishi UFJ Lease &
Finance Co Ltd 60,639 0.01 59,200 Mitsui & Co Ltd * 854,917 0.07 34,000 Mitsui Chemicals Inc 167,473 0.01 25,000 Mitsui Fudosan Co Ltd 531,524 0.05 42,000 Mitsui OSK Lines Ltd 131,650 0.01 1,000 Mixi Inc 48,003 0.00 776,300 Mizuho Financial Group Inc * 1,418,280 0.12 17,100 MS&AD Insurance Group
Holdings Inc 542,128 0.05 5,400 Murata Manufacturing Co Ltd 765,798 0.07 3,900 Nabtesco Corp 103,036 0.01 32,000 Nagoya Railroad Co Ltd * 143,579 0.01 89,000 NEC Corp * 213,613 0.02 7,200 Nexon Co Ltd 114,068 0.01 8,900 NGK Insulators Ltd 200,860 0.02 5,900 NGK Spark Plug Co Ltd 134,422 0.01 2,000 NH Foods Ltd 53,538 0.00 8,200 Nidec Corp 778,067 0.07 11,300 Nikon Corp 163,337 0.01 3,900 Nintendo Co Ltd 902,351 0.08 50 Nippon Building Fund Inc (Reit) 272,703 0.02 14,000 Nippon Electric Glass Co Ltd 84,381 0.01 27,000 Nippon Express Co Ltd 138,313 0.01 1,000 Nippon Paint Holdings Co Ltd 34,704 0.00 20 Nippon Prologis REIT Inc (Reit) 43,220 0.00 27,800 Nippon Steel & Sumitomo
Metal Corp 638,608 0.06 22,900 Nippon Telegraph &
Telephone Corp 974,573 0.08 54,000 Nippon Yusen KK 113,649 0.01 4,000 Nissan Chemical Industries Ltd 116,067 0.01 82,500 Nissan Motor Co Ltd * 793,156 0.07 6,100 Nisshin Seifun Group Inc 90,741 0.01 1,800 Nissin Foods Holdings Co Ltd 99,463 0.01 2,700 Nitori Holdings Co Ltd 340,220 0.03 3,800 Nitto Denko Corp 292,742 0.03 2,700 NOK Corp 62,483 0.01 126,000 Nomura Holdings Inc * 780,758 0.07 4,200 Nomura Real Estate Holdings Inc 66,728 0.01 76 Nomura Real Estate
Master Fund Inc (Reit) 117,614 0.01 4,290 Nomura Research Institute Ltd 157,523 0.01 15,000 NSK Ltd 213,864 0.02 4,400 NTT Data Corp 208,060 0.02 47,400 NTT DOCOMO Inc * 1,100,524 0.10 21,900 Obayashi Corp 204,172 0.02 2,500 Obic Co Ltd 118,664 0.01 10,000 Odakyu Electric Railway Co Ltd 193,982 0.02 27,000 Oji Holdings Corp 125,981 0.01 9,900 Olympus Corp 379,473 0.03 6,600 Omron Corp 288,743 0.02 13,800 Ono Pharmaceutical Co Ltd 284,812 0.02 1,300 Oracle Corp Japan 74,046 0.01 7,400 Oriental Land Co Ltd 423,018 0.04 45,600 ORIX Corp 672,810 0.06 64,000 Osaka Gas Co Ltd 242,450 0.02 1,900 Otsuka Corp 102,776 0.01 13,200 Otsuka Holdings Co Ltd 593,681 0.05 76,500 Panasonic Corp 861,875 0.07 3,000 Park24 Co Ltd 78,291 0.01
1,200 Pola Orbis Holdings Inc 28,877 0.00 31,700 Rakuten Inc 316,546 0.03 11,700 Recruit Holdings Co Ltd 595,164 0.05 75,100 Resona Holdings Inc * 402,134 0.03 22,700 Ricoh Co Ltd 186,219 0.02 1,000 Rinnai Corp 79,348 0.01 2,900 Rohm Co Ltd 192,191 0.02 200 Ryohin Keikaku Co Ltd 43,686 0.00 600 Sankyo Co Ltd 19,989 0.00 12,500 Santen Pharmaceutical Co Ltd 180,459 0.02 7,100 SBI Holdings Inc 98,685 0.01 7,000 Secom Co Ltd 499,579 0.04 6,200 Sega Sammy Holdings Inc 82,844 0.01 5,600 Seibu Holdings Inc 92,130 0.01 9,700 Seiko Epson Corp 203,625 0.02 8,500 Sekisui Chemical Co Ltd 142,428 0.01 21,400 Sekisui House Ltd 350,917 0.03 25,900 Seven & i Holdings Co Ltd 1,011,784 0.09 19,100 Seven Bank Ltd * 62,264 0.01 49,000 Sharp Corp 206,251 0.02 3,100 Shimadzu Corp 49,112 0.00 900 Shimamura Co Ltd 118,565 0.01 2,500 Shimano Inc 363,828 0.03 19,000 Shimizu Corp 169,819 0.01 11,300 Shin-Etsu Chemical Co Ltd 975,973 0.08 59,000 Shinsei Bank Ltd 108,320 0.01 10,400 Shionogi & Co Ltd 535,368 0.05 13,000 Shiseido Co Ltd 341,125 0.03 18,000 Shizuoka Bank Ltd/The 146,051 0.01 3,500 Showa Shell Sekiyu KK 35,326 0.00 1,600 SMC Corp 471,718 0.04 26,700 SoftBank Group Corp 1,879,952 0.16 2,500 Sohgo Security Services Co Ltd 93,028 0.01 10,000 Sompo Holdings Inc 365,305 0.03 43,100 Sony Corp 1,453,650 0.13 6,300 Sony Financial Holdings Inc 100,938 0.01 4,900 Stanley Electric Co Ltd 139,329 0.01 7,200 Start Today Co Ltd 158,818 0.01 21,200 Subaru Corp * 775,207 0.07 54,000 Sumitomo Chemical Co Ltd 300,806 0.03 41,400 Sumitomo Corp * 555,226 0.05 5,300 Sumitomo Dainippon
Pharma Co Ltd 87,242 0.01 25,700 Sumitomo Electric Industries Ltd 424,881 0.04 19,000 Sumitomo Heavy Industries Ltd 132,044 0.01 18,000 Sumitomo Metal Mining Co Ltd 255,266 0.02 43,500 Sumitomo Mitsui Financial Group Inc 1,575,833 0.14 11,200 Sumitomo Mitsui Trust Holdings Inc 387,175 0.03 7,000 Sumitomo Realty &
Development Co Ltd 180,924 0.02 6,100 Sumitomo Rubber Industries Ltd 103,633 0.01 2,800 Sundrug Co Ltd 93,659 0.01 4,600 Suntory Beverage & Food Ltd 193,212 0.02 5,800 Suruga Bank Ltd 121,755 0.01 2,700 Suzuken Co Ltd 88,259 0.01 11,600 Suzuki Motor Corp 480,165 0.04 5,600 Sysmex Corp 338,528 0.03 19,500 T&D Holdings Inc 282,214 0.02 41,000 Taiheiyo Cement Corp 136,593 0.01 36,000 Taisei Corp 261,472 0.02 1,300 Taisho Pharmaceutical
Holdings Co Ltd 105,248 0.01 2,000 Taiyo Nippon Sanso Corp 23,321 0.00 11,000 Takashimaya Co Ltd 95,952 0.01 24,400 Takeda Pharmaceutical Co Ltd * 1,142,644 0.10 4,300 TDK Corp 271,494 0.02 5,000 Teijin Ltd 93,991 0.01 11,900 Terumo Corp 411,907 0.04
Portfolio of Investments as at 31 March 2017
Japan continued Japan continued

Transferable Securities and Money Market Instruments Admitted to an Official Stock Exchange Listing or Dealt in on Another Regulated Market
Transferable Securities and Money Market Instruments Admitted to an Official Stock Exchange Listing or Dealt in on Another Regulated Market
Holding Description
Market Value
USD
% of Net
Assets Holding Description
Market Value
USD
% of Net
Assets
* All or a portion of this security represents a security on loan.
Annual Report and Audited Accounts 113
The notes on pages 122 to 128 form an integral part of these financial statements.
BlackRock World Equity Index Fund continued
4,100 THK Co Ltd 102,922 0.01 31,000 Tobu Railway Co Ltd 156,582 0.01 4,000 Toho Co Ltd 105,714 0.01 16,000 Toho Gas Co Ltd 112,771 0.01 15,200 Tohoku Electric Power Co Inc 205,280 0.02 23,400 Tokio Marine Holdings Inc 984,116 0.09 48,800 Tokyo Electric Power
Co Holdings Inc 190,550 0.02 5,500 Tokyo Electron Ltd * 598,715 0.05 66,000 Tokyo Gas Co Ltd 299,441 0.03 5,000 Tokyo Tatemono Co Ltd 65,735 0.01 35,000 Tokyu Corp 247,000 0.02 11,600 Tokyu Fudosan Holdings Corp 62,748 0.01 8,000 TonenGeneral Sekiyu KK 93,140 0.01 15,000 Toppan Printing Co Ltd 152,472 0.01 50,000 Toray Industries Inc 441,967 0.04 142,000 Toshiba Corp 306,993 0.03 5,100 TOTO Ltd 192,061 0.02 4,800 Toyo Seikan Group Holdings Ltd 77,722 0.01 2,500 Toyo Suisan Kaisha Ltd 92,804 0.01 2,700 Toyoda Gosei Co Ltd 68,455 0.01 5,600 Toyota Industries Corp 277,342 0.02 83,800 Toyota Motor Corp * 4,534,476 0.39 7,100 Toyota Tsusho Corp 214,284 0.02 4,100 Trend Micro Inc 181,757 0.02 1,100 Tsuruha Holdings Inc 101,469 0.01 13,700 Unicharm Corp 327,286 0.03 17 United Urban
Investment Corp (Reit) 26,034 0.00 6,500 USS Co Ltd 108,042 0.01 3,500 West Japan Railway Co 226,970 0.02 49,300 Yahoo Japan Corp * 226,941 0.02 2,800 Yakult Honsha Co Ltd 154,970 0.01 21,000 Yamada Denki Co Ltd * 104,379 0.01 9,000 Yamaguchi Financial Group Inc 97,286 0.01 5,900 Yamaha Corp 161,951 0.01 9,500 Yamaha Motor Co Ltd 228,099 0.02 11,200 Yamato Holdings Co Ltd 233,960 0.02 4,300 Yamazaki Baking Co Ltd 88,187 0.01 2,000 Yaskawa Electric Corp 40,014 0.00 7,600 Yokogawa Electric Corp 119,248 0.01 3,500 Yokohama Rubber Co Ltd/The 68,301 0.01
97,817,756 8.53
Jersey 8,477 Delphi Automotive Plc 686,044 0.06 33,961 Experian Plc 687,984 0.06 384,297 Glencore Plc 1,492,825 0.13 8,875 Petrofac Ltd 101,899 0.01 3,273 Randgold Resources Ltd * 281,540 0.02 29,036 Shire Plc 1,700,931 0.15 8,994 Wolseley Plc 557,815 0.05 37,747 WPP Plc 820,208 0.07
6,329,246 0.55
Liberia 6,193 Royal Caribbean Cruises Ltd 614,284 0.05
614,284 0.05
Luxembourg 65,643 ArcelorMittal 551,622 0.05 387 Eurofins Scientific SE 166,967 0.01 2,640 Millicom International
Cellular SA - SDR 147,833 0.01 1,455 RTL Group SA 116,828 0.01
12,744 SES SA * 297,517 0.03 16,518 Tenaris SA * 283,967 0.03
1,564,734 0.14
Netherlands 9,900 ABN AMRO Group NV - CVA ‘144A’ 240,060 0.02 64,220 Aegon NV * 327,161 0.03 5,310 AerCap Holdings NV 243,357 0.02 18,587 Airbus Group SE 1,413,981 0.12 8,743 Akzo Nobel NV 723,123 0.06 12,913 Altice NV 'A' * 293,115 0.03 4,178 Altice NV 'B' 94,882 0.01 12,083 ASML Holding NV 1,600,205 0.14 3,490 Boskalis Westminster 120,369 0.01 35,466 CNH Industrial NV * 340,096 0.03 1,561 Core Laboratories NV * 179,250 0.02 3,448 EXOR NV 177,864 0.02 3,120 Ferrari NV 231,349 0.02 29,653 Fiat Chrysler Automobiles NV 325,065 0.03 2,788 Gemalto NV * 155,555 0.01 3,444 Heineken Holding NV * 274,398 0.02 8,155 Heineken NV 694,356 0.06 125,077 ING Groep NV 1,882,967 0.16 43,957 Koninklijke Ahold Delhaize NV 935,325 0.08 4,759 Koninklijke DSM NV 322,729 0.03 69,536 Koninklijke KPN NV 209,143 0.02 32,184 Koninklijke Philips NV 1,030,579 0.09 2,836 Koninklijke Vopak NV 123,796 0.01 10,708 LyondellBasell Industries NV 'A' 975,927 0.09 6,158 Mobileye NV 376,069 0.03 16,033 Mylan NV 635,388 0.06 7,072 NN Group NV 230,687 0.02 8,715 NXP Semiconductors NV 905,750 0.08 4,580 QIAGEN NV 132,785 0.01 4,164 Randstad Holding NV 240,114 0.02 35,764 RELX NV 661,642 0.06 6,079 Sensata Technologies Holding NV 266,503 0.02 12,416 STMicroelectronics NV 190,564 0.02 51,786 Unilever NV - CVA 2,568,731 0.22 6,180 Wolters Kluwer NV * 255,966 0.02
19,378,851 1.69
New Zealand 33,302 Auckland International Airport Ltd 157,315 0.01 22,467 Contact Energy Ltd 79,442 0.01 23,709 Fletcher Building Ltd 137,845 0.01 32,732 Mercury NZ Ltd 72,050 0.01 38,302 Meridian Energy Ltd 74,943 0.01 13,575 Ryman Healthcare Ltd 79,779 0.01 17,051 Spark New Zealand Ltd 41,703 0.00
643,077 0.06
Norway 34,334 DNB ASA 543,868 0.05 7,338 Gjensidige Forsikring ASA 112,907 0.01 14,261 Marine Harvest ASA 216,772 0.02 47,296 Norsk Hydro ASA 275,786 0.02 28,592 Orkla ASA 254,576 0.02 1,869 Schibsted ASA 'A' 47,879 0.01 1,981 Schibsted ASA 'B' 45,306 0.00 39,551 Statoil ASA 677,144 0.06 16,254 Telenor ASA 270,903 0.02 6,151 Yara International ASA 237,967 0.02
2,683,108 0.23
Portfolio of Investments as at 31 March 2017
Japan continued Luxembourg continued

Transferable Securities and Money Market Instruments Admitted to an Official Stock Exchange Listing or Dealt in on Another Regulated Market
Transferable Securities and Money Market Instruments Admitted to an Official Stock Exchange Listing or Dealt in on Another Regulated Market
Holding Description
Market Value
USD
% of Net
Assets Holding Description
Market Value
USD
% of Net
Assets
* All or a portion of this security represents a security on loan.
114 BlackRock Global Index Funds (BGIF)
The notes on pages 122 to 128 form an integral part of these financial statements.
BlackRock World Equity Index Fund continued
Panama 11,089 Carnival Corp 655,693 0.06
655,693 0.06
Papua New Guinea 47,852 Oil Search Ltd 263,886 0.02
263,886 0.02
Portugal 81,760 EDP - Energias de Portugal SA 277,270 0.02 7,289 Galp Energia SGPS SA 110,355 0.01 10,810 Jeronimo Martins SGPS SA 191,960 0.02
579,585 0.05
Singapore 86,500 Ascendas Real Estate
Investment Trust (Reit) 156,068 0.01 12,948 Broadcom Ltd 2,835,612 0.25 84,100 CapitaLand Commercial Trust (Reit) 93,030 0.01 66,500 CapitaLand Ltd 172,832 0.02 86,000 CapitaLand Mall Trust (Reit) 121,300 0.01 17,100 City Developments Ltd 124,880 0.01 74,700 ComfortDelGro Corp Ltd 136,917 0.01 62,867 DBS Group Holdings Ltd 873,215 0.08 19,146 Flex Ltd 320,313 0.03 95,900 Global Logistic Properties Ltd 190,880 0.02 156,700 Hutchison Port Holdings Trust (Unit) 65,030 0.01 3,922 Jardine Cycle & Carriage Ltd 123,161 0.01 50,900 Keppel Corp Ltd 252,915 0.02 111,530 Oversea-Chinese Banking Corp Ltd 776,166 0.07 11,900 SATS Ltd 41,578 0.00 41,300 Sembcorp Industries Ltd 94,032 0.01 2,800 Singapore Airlines Ltd 20,188 0.00 20,500 Singapore Exchange Ltd 113,016 0.01 18,000 Singapore Press Holdings Ltd 45,751 0.00 54,400 Singapore Technologies
Engineering Ltd 145,280 0.01 220,100 Singapore Telecommunications Ltd 617,736 0.05 14,000 StarHub Ltd 28,868 0.00 82,600 Suntec Real Estate
Investment Trust (Reit) 105,859 0.01 45,474 United Overseas Bank Ltd 719,861 0.06 17,925 UOL Group Ltd 89,452 0.01 66,400 Wilmar International Ltd 167,818 0.02 32,000 Yangzijiang Shipbuilding
Holdings Ltd 25,890 0.00
8,457,648 0.74
Spain 13,350 Abertis Infraestructuras SA 215,384 0.02 2,898 ACS Actividades de Construccion
y Servicios SA 98,000 0.01 1,485 Aena SA ‘144A’ 232,523 0.02 15,670 Amadeus IT Group SA 794,186 0.07 224,519 Banco Bilbao Vizcaya Argentaria SA 1,731,747 0.15 184,029 Banco de Sabadell SA 335,640 0.03 119,159 Banco Popular Espanol SA * 115,602 0.01 462,398 Banco Santander SA 2,809,164 0.25 161,389 Bankia SA 182,093 0.02 25,617 Bankinter SA 214,010 0.02 109,266 CaixaBank SA 468,616 0.04 23,527 Distribuidora Internacional de
Alimentacion SA 135,365 0.01 1,744 Enagas SA 45,112 0.00 11,199 Endesa SA 262,285 0.02 17,509 Ferrovial SA 348,614 0.03 12,426 Gas Natural SDG SA 271,107 0.02 9,649 Grifols SA 236,190 0.02
188,410 Iberdrola SA 1,341,508 0.12 33,594 Industria de Diseno Textil SA 1,171,564 0.10 29,248 International Consolidated Airlines
Group SA - CDI 192,407 0.02 37,169 Mapfre SA 127,122 0.01 4,081 Red Electrica Corp SA 78,443 0.01 39,333 Repsol SA 607,897 0.05 159,028 Telefonica SA 1,774,747 0.15 8,380 Zardoya Otis SA 77,807 0.01
13,867,133 1.21
Sweden 11,194 Alfa Laval AB 210,742 0.02 35,134 Assa Abloy AB 'B' 720,465 0.06 23,552 Atlas Copco AB 'A' 828,501 0.07 14,174 Atlas Copco AB 'B' 448,920 0.04 8,070 Boliden AB 241,946 0.02 8,345 Electrolux AB 'B' 232,808 0.02 7,220 Getinge AB 'B' 126,546 0.01 27,337 Hennes & Mauritz AB 'B' * 696,513 0.06 9,104 Hexagon AB 'B' 367,158 0.03 14,382 Husqvarna AB 'B' 126,601 0.01 2,876 ICA Gruppen AB * 98,400 0.01 6,196 Industrivarden AB 'C' 134,273 0.01 16,234 Investor AB 'B' 683,432 0.06 8,197 Kinnevik AB 'B' 219,682 0.02 1,227 L E Lundbergforetagen AB 'B' 82,931 0.01 7,491 Lundin Petroleum AB 151,599 0.01 93,086 Nordea Bank AB 1,067,533 0.09 24,726 Sandvik AB 368,024 0.03 10,870 Securitas AB 'B' 170,312 0.02 53,035 Skandinaviska Enskilda
Banken AB 'A' 590,400 0.05 12,050 Skanska AB 'B' 282,728 0.03 12,961 SKF AB 'B' 255,330 0.02 18,787 Svenska Cellulosa AB SCA 'B' 608,700 0.05 46,011 Svenska Handelsbanken AB 'A' 630,210 0.06 25,617 Swedbank AB 'A' 595,024 0.05 6,647 Swedish Match AB 216,405 0.02 13,195 Tele2 AB 'B' 125,906 0.01 108,871 Telefonaktiebolaget LM Ericsson 'B' 724,872 0.07 90,724 Telia Co AB 381,429 0.04 41,217 Volvo AB 'B' 605,168 0.05
11,992,558 1.05
Switzerland 59,049 ABB Ltd Reg 1,376,059 0.12 2,707 Actelion Ltd 764,193 0.07 3,404 Adecco Group AG Reg 241,175 0.02 3,093 Aryzta AG * 99,030 0.01 1,730 Baloise Holding AG Reg 236,671 0.02 85 Barry Callebaut AG Reg 111,357 0.01 36 Chocoladefabriken Lindt &
Spruengli AG - PC 204,517 0.02 1 Chocoladefabriken Lindt &
Spruengli AG Reg 66,408 0.01 15,178 Chubb Ltd 2,070,127 0.18 15,967 Cie Financiere Richemont SA Reg 1,258,117 0.11 5,290 Coca-Cola HBC AG - CDI 135,918 0.01 58,924 Credit Suisse Group AG Reg 876,176 0.08 1,597 Dufry AG Reg 244,010 0.02 301 EMS-Chemie Holding AG Reg 174,909 0.01 134 Galenica AG Reg 141,405 0.01 4,000 Garmin Ltd 204,520 0.02 1,293 Geberit AG Reg * 554,697 0.05 328 Givaudan SA Reg * 590,643 0.05 7,840 Julius Baer Group Ltd 392,509 0.03
Portfolio of Investments as at 31 March 2017
Spain continued

Transferable Securities and Money Market Instruments Admitted to an Official Stock Exchange Listing or Dealt in on Another Regulated Market
Transferable Securities and Money Market Instruments Admitted to an Official Stock Exchange Listing or Dealt in on Another Regulated Market
Holding Description
Market Value
USD
% of Net
Assets Holding Description
Market Value
USD
% of Net
Assets
* All or a portion of this security represents a security on loan.
Annual Report and Audited Accounts 115
The notes on pages 122 to 128 form an integral part of these financial statements.
BlackRock World Equity Index Fund continued
1,889 Kuehne + Nagel International AG Reg 266,918 0.02
15,858 LafargeHolcim Ltd Reg * 934,968 0.08 1,859 Lonza Group AG Reg 351,848 0.03 99,402 Nestle SA Reg 7,638,667 0.67 71,441 Novartis AG Reg 5,325,771 0.46 1,210 Pargesa Holding SA 85,669 0.01 606 Partners Group Holding AG 327,011 0.03 22,503 Roche Holding AG 5,763,484 0.50 1,438 Schindler Holding AG 278,633 0.02 640 Schindler Holding AG Reg 121,643 0.01 195 SGS SA Reg * 416,229 0.04 60 Sika AG 358,249 0.03 1,870 Sonova Holding AG Reg 257,132 0.02 1,077 Swatch Group AG/The 384,866 0.03 1,724 Swatch Group AG/The Reg 120,337 0.01 1,119 Swiss Life Holding AG Reg 360,513 0.03 2,424 Swiss Prime Site AG Reg 211,952 0.02 9,779 Swiss Re AG 878,029 0.08 927 Swisscom AG Reg 426,307 0.04 3,016 Syngenta AG Reg 1,332,441 0.12 11,245 TE Connectivity Ltd 840,114 0.07 119,243 UBS Group AG Reg 1,904,170 0.17 4,839 Zurich Insurance Group AG * 1,292,076 0.11
39,619,468 3.45
United Kingdom 34,006 3i Group Plc 317,740 0.03 31,879 Aberdeen Asset Management Plc 105,117 0.01 7,672 Admiral Group Plc 190,043 0.02 44,582 Anglo American Plc * 677,497 0.06 13,689 Antofagasta Plc 140,619 0.01 7,917 Aon Plc 935,394 0.08 17,519 Ashtead Group Plc 361,890 0.03 9,865 Associated British Foods Plc * 322,090 0.03 41,314 AstraZeneca Plc 2,537,091 0.22 35,434 Auto Trader Group Plc ‘144A’ 171,969 0.02 115,971 Aviva Plc 774,200 0.07 8,716 Babcock International Group Plc 96,054 0.01 103,695 BAE Systems Plc 835,549 0.07 538,115 Barclays Plc 1,516,946 0.13 34,815 Barratt Developments Plc 236,819 0.02 4,509 Berkeley Group Holdings Plc 179,877 0.02 68,044 BHP Billiton Plc 1,048,462 0.09 613,580 BP Plc 3,523,218 0.31 59,464 British American Tobacco Plc * 3,917,811 0.34 33,757 British Land Co Plc/The (Reit) 254,662 0.02 263,110 BT Group Plc 1,050,603 0.09 6,413 Bunzl Plc 184,999 0.02 11,673 Burberry Group Plc 251,898 0.02 23,257 Capita Plc 163,015 0.01 6,622 Carnival Plc 379,744 0.03 194,008 Centrica Plc 527,013 0.05 43,350 Cobham Plc 72,957 0.01 7,621 Coca-Cola European Partners Plc 286,052 0.02 48,479 Compass Group Plc * 913,193 0.08 4,736 Croda International Plc 210,718 0.02 79,104 Diageo Plc 2,255,324 0.20 48,018 Direct Line Insurance Group Plc 208,438 0.02 34,335 Dixons Carphone Plc 135,474 0.01 6,259 easyJet Plc 80,213 0.01 8,250 Fresnillo Plc 158,181 0.01 53,819 G4S Plc 204,501 0.02 33,381 GKN Plc 151,601 0.01 154,936 GlaxoSmithKline Plc 3,233,346 0.28 27,344 Hammerson Plc (Reit) 193,622 0.02 8,962 Hargreaves Lansdown Plc 145,466 0.01
3,651 Hikma Pharmaceuticals Plc 90,666 0.01 639,558 HSBC Holdings Plc 5,215,234 0.45 6,803 IMI Plc 101,771 0.01 30,137 Imperial Brands Plc 1,461,390 0.13 13,438 Inmarsat Plc * 142,145 0.01 6,481 InterContinental Hotels Group Plc 315,991 0.03 5,775 Intertek Group Plc 282,001 0.02 32,554 Intu Properties Plc (Reit) 112,903 0.01 4,748 Investec Plc 32,399 0.00 126,540 ITV Plc 334,590 0.03 25,668 J Sainsbury Plc * 84,669 0.01 6,740 Johnson Matthey Plc 259,215 0.02 79,731 Kingfisher Plc 324,977 0.03 27,415 Land Securities Group Plc (Reit) 358,174 0.03 206,750 Legal & General Group Plc 639,207 0.06 9,015 Liberty Global Plc 'A' 321,835 0.03 19,286 Liberty Global Plc 'C' 674,431 0.06 3,734 Liberty Global Plc LiLAC 'C' 85,845 0.01 2,067,854 Lloyds Banking Group Plc 1,711,719 0.15 6,821 London Stock Exchange Group Plc 267,007 0.02 56,692 Marks & Spencer Group Plc * 238,175 0.02 13,705 Mediclinic International Plc * 122,844 0.01 27,255 Meggitt Plc 152,423 0.01 24,750 Merlin Entertainments Plc ‘144A’ 146,744 0.01 12,880 Mondi Plc 310,058 0.03 121,926 National Grid Plc 1,544,310 0.13 4,893 Next Plc 263,441 0.02 12,654 Nielsen Holdings Plc 520,079 0.05 140,551 Old Mutual Plc 353,940 0.03 13,960 Pearson Plc 117,907 0.01 10,773 Persimmon Plc 280,959 0.02 5,124 Provident Financial Plc * 189,399 0.02 83,085 Prudential Plc 1,746,323 0.15 20,374 Reckitt Benckiser Group Plc 1,857,954 0.16 38,467 RELX Plc 749,535 0.07 39,447 Rio Tinto Plc 1,571,930 0.14 65,192 Rolls-Royce Holdings Plc 618,070 0.05 122,287 Royal Bank of Scotland Group Plc * 369,384 0.03 140,309 Royal Dutch Shell Plc 'A' 3,686,358 0.32 122,359 Royal Dutch Shell Plc 'B' 3,363,267 0.29 31,364 Royal Mail Plc 165,979 0.01 35,517 RSA Insurance Group Plc 259,686 0.02 37,802 Sage Group Plc/The 298,542 0.03 4,702 Schroders Plc 178,138 0.02 8,618 Segro Plc (Reit) 48,851 0.00 8,136 Severn Trent Plc 242,209 0.02 25,694 Sky Plc 313,107 0.03 31,486 Smith & Nephew Plc 476,912 0.04 13,864 Smiths Group Plc 278,611 0.02 36,362 SSE Plc * 668,401 0.06 10,773 St James's Place Plc 142,628 0.01 95,855 Standard Chartered Plc * 912,245 0.08 71,331 Standard Life Plc 315,861 0.03 16,014 Tate & Lyle Plc 153,821 0.01 113,874 Taylor Wimpey Plc 273,985 0.02 15,701 TechnipFMC Plc 515,150 0.05 284,674 Tesco Plc 661,690 0.06 8,719 Travis Perkins Plc 163,478 0.01 41,252 Unilever Plc 2,031,358 0.18 23,737 United Utilities Group Plc 295,029 0.03 869,255 Vodafone Group Plc 2,262,675 0.20 7,589 Weir Group Plc/The 181,364 0.02 6,361 Whitbread Plc 312,858 0.03 29,791 William Hill Plc 107,480 0.01 76,956 WM Morrison Supermarkets Plc 230,153 0.02 56,612 Worldpay Group Plc ‘144A’ 207,703 0.02
71,666,589 6.25
Portfolio of Investments as at 31 March 2017
Switzerland continued United Kingdom continued

Transferable Securities and Money Market Instruments Admitted to an Official Stock Exchange Listing or Dealt in on Another Regulated Market
Transferable Securities and Money Market Instruments Admitted to an Official Stock Exchange Listing or Dealt in on Another Regulated Market
Holding Description
Market Value
USD
% of Net
Assets Holding Description
Market Value
USD
% of Net
Assets
* All or a portion of this security represents a security on loan.
116 BlackRock Global Index Funds (BGIF)
The notes on pages 122 to 128 form an integral part of these financial statements.
BlackRock World Equity Index Fund continued
Portfolio of Investments as at 31 March 2017
United States 19,288 3M Co 3,698,474 0.32 56,343 Abbott Laboratories 2,510,362 0.22 51,922 AbbVie Inc 3,397,776 0.30 18,748 Activision Blizzard Inc 933,275 0.08 1,533 Acuity Brands Inc 315,277 0.03 16,002 Adobe Systems Inc 2,076,580 0.18 2,110 Advance Auto Parts Inc 314,242 0.03 25,546 Advanced Micro Devices Inc 365,563 0.03 12,162 AES Corp/VA 135,850 0.01 10,998 Aetna Inc 1,395,316 0.12 1,883 Affiliated Managers Group Inc 307,550 0.03 12,093 Aflac Inc 874,566 0.08 2,365 AGCO Corp 142,420 0.01 11,426 Agilent Technologies Inc 607,863 0.05 11,622 AGNC Investment Corp (Reit) 231,626 0.02 6,096 Air Products & Chemicals Inc 826,922 0.07 6,114 Akamai Technologies Inc 369,775 0.03 3,957 Albemarle Corp 417,187 0.04 2,779 Alexandria Real Estate
Equities Inc (Reit) 306,162 0.03 6,608 Alexion Pharmaceuticals Inc 793,489 0.07 2,568 Align Technology Inc 294,421 0.03 378 Alleghany Corp 232,565 0.02 1,674 Alliance Data Systems Corp 415,504 0.04 7,987 Alliant Energy Corp 316,605 0.03 10,940 Allstate Corp/The 890,407 0.08 11,734 Ally Financial Inc 239,491 0.02 9,530 Alphabet Inc 'A' 8,088,016 0.70 10,000 Alphabet Inc 'C' 8,297,800 0.72 62,714 Altria Group Inc 4,516,662 0.39 13,055 Amazon.com Inc 11,539,967 1.01 302 AMERCO 115,141 0.01 8,522 Ameren Corp 467,346 0.04 4,582 American Airlines Group Inc 195,331 0.02 14,663 American Electric Power Co Inc 986,967 0.09 25,707 American Express Co 2,028,025 0.18 33,260 American International Group Inc 2,071,765 0.18 13,510 American Tower Corp (Reit) 1,632,143 0.14 6,250 American Water Works Co Inc 485,375 0.04 4,930 Ameriprise Financial Inc 638,287 0.06 5,335 AmerisourceBergen Corp 478,069 0.04 6,470 AMETEK Inc 349,898 0.03 23,890 Amgen Inc 3,933,727 0.34 9,706 Amphenol Corp 'A' 694,658 0.06 17,223 Anadarko Petroleum Corp 1,079,021 0.09 11,760 Analog Devices Inc 963,026 0.08 34,856 Annaly Capital Management Inc (Reit) 387,076 0.03 3,099 ANSYS Inc 329,920 0.03 5,314 Antero Resources Corp 122,009 0.01 8,576 Anthem Inc 1,425,331 0.12 5,483 AO Smith Corp 279,633 0.02 10,789 Apache Corp 561,999 0.05 171,776 Apple Inc 24,709,978 2.15 33,217 Applied Materials Inc 1,284,501 0.11 8,228 Aramark 304,765 0.03 16,987 Archer-Daniels-Midland Co 782,421 0.07 15,332 Arconic Inc 402,925 0.03 3,169 Arrow Electronics Inc 234,062 0.02 6,191 Arthur J Gallagher & Co 350,534 0.03 2,261 Ashland Global Holdings Inc 280,002 0.02 2,241 Assurant Inc 213,814 0.02 199,235 AT&T Inc 8,332,008 0.73 3,677 Atmos Energy Corp 290,299 0.03 7,020 Autodesk Inc 600,491 0.05 3,100 Autoliv Inc 316,107 0.03 14,578 Automatic Data Processing Inc 1,488,851 0.13 2,593 AutoNation Inc 110,980 0.01 832 AutoZone Inc 603,200 0.05 3,907 AvalonBay Communities Inc (Reit) 715,294 0.06
1,612 Avery Dennison Corp 129,524 0.01 4,541 Avnet Inc 207,524 0.02 3,554 B/E Aerospace Inc 228,700 0.02 12,004 Baker Hughes Inc 720,360 0.06 3,775 Ball Corp 278,029 0.02 325,262 Bank of America Corp 7,747,741 0.67 34,515 Bank of New York Mellon Corp/The 1,633,940 0.14 15,453 Baxter International Inc 801,393 0.07 25,199 BB&T Corp 1,132,695 0.10 6,541 Becton Dickinson and Co 1,196,087 0.10 5,388 Bed Bath & Beyond Inc 215,251 0.02 39,256 Berkshire Hathaway Inc 'B' 6,556,145 0.57 9,933 Best Buy Co Inc 482,545 0.04 7,174 Biogen Inc 1,927,869 0.17 6,015 BioMarin Pharmaceutical Inc 532,328 0.05 3,882 BlackRock Inc 1,485,176 0.13 18,885 Boeing Co/The 3,360,019 0.29 7,458 BorgWarner Inc 312,639 0.03 5,439 Boston Properties Inc (Reit) 715,609 0.06 40,475 Boston Scientific Corp 990,423 0.09 54,699 Bristol-Myers Squibb Co 3,007,898 0.26 11,189 Brixmor Property Group Inc (Reit) 236,871 0.02 4,233 Broadridge Financial Solutions Inc 286,743 0.02 7,424 Brown-Forman Corp 'B' 344,771 0.03 11,498 CA Inc 365,751 0.03 16,629 Cabot Oil & Gas Corp 395,604 0.03 10,502 Cadence Design Systems Inc 329,028 0.03 11,832 Calpine Corp 128,614 0.01 3,088 Camden Property Trust (Reit) 248,430 0.02 5,706 Campbell Soup Co 327,410 0.03 16,035 Capital One Financial Corp 1,384,943 0.12 9,145 Cardinal Health Inc 748,152 0.06 5,416 CarMax Inc 321,765 0.03 19,126 Caterpillar Inc 1,773,554 0.15 10,508 CBRE Group Inc 'A' 361,160 0.03 11,968 CBS Corp 'B non-voting share' 829,981 0.07 4,522 CDK Global Inc 294,156 0.03 5,192 CDW Corp/DE 298,592 0.03 5,110 Celanese Corp 'A' 458,009 0.04 25,375 Celgene Corp 3,144,724 0.27 6,103 Centene Corp 439,355 0.04 8,373 CenterPoint Energy Inc 230,844 0.02 18,996 CenturyLink Inc 445,836 0.04 10,809 Cerner Corp 638,055 0.06 8,082 CF Industries Holdings Inc * 239,955 0.02 4,983 CH Robinson Worldwide Inc 388,126 0.03 38,006 Charles Schwab Corp/The 1,552,925 0.14 7,095 Charter Communications Inc 'A' 2,326,592 0.20 7,051 Cheniere Energy Inc 324,699 0.03 60,933 Chevron Corp 6,587,467 0.57 833 Chipotle Mexican Grill Inc 371,926 0.03 7,229 Church & Dwight Co Inc 362,390 0.03 8,391 Cigna Corp 1,233,225 0.11 3,405 Cimarex Energy Co 412,550 0.04 3,549 Cincinnati Financial Corp 256,309 0.02 2,923 Cintas Corp 370,636 0.03 161,957 Cisco Systems Inc 5,454,712 0.48 6,697 CIT Group Inc 287,770 0.02 90,939 Citigroup Inc 5,483,622 0.48 18,399 Citizens Financial Group Inc 635,317 0.06 4,482 Citrix Systems Inc 375,861 0.03 4,604 Clorox Co/The 624,441 0.05 10,576 CME Group Inc 1,258,438 0.11 10,015 CMS Energy Corp 447,370 0.04 10,001 Coach Inc 415,042 0.04 131,753 Coca-Cola Co/The 5,613,995 0.49 18,507 Cognizant Technology
Solutions Corp 'A' 1,096,910 0.10 27,432 Colgate-Palmolive Co 2,011,863 0.18
United States continued

Transferable Securities and Money Market Instruments Admitted to an Official Stock Exchange Listing or Dealt in on Another Regulated Market
Transferable Securities and Money Market Instruments Admitted to an Official Stock Exchange Listing or Dealt in on Another Regulated Market
Holding Description
Market Value
USD
% of Net
Assets Holding Description
Market Value
USD
% of Net
Assets
* All or a portion of this security represents a security on loan.
Annual Report and Audited Accounts 117
The notes on pages 122 to 128 form an integral part of these financial statements.
BlackRock World Equity Index Fund continued
17,390 Colony NorthStar Inc (Reit) 'A' * 226,070 0.02 154,868 Comcast Corp 'A' 5,799,807 0.51 4,027 Comerica Inc 275,527 0.02 5,007 Computer Sciences Corp 355,096 0.03 14,870 Conagra Brands Inc 602,235 0.05 4,966 Concho Resources Inc * 639,621 0.06 40,545 ConocoPhillips 2,024,412 0.18 9,607 Consolidated Edison Inc 747,521 0.06 5,210 Constellation Brands Inc 'A' 846,729 0.07 1,002 Continental Resources Inc/OK 45,130 0.00 1,696 Cooper Cos Inc/The 336,266 0.03 29,688 Corning Inc 802,170 0.07 1,163 CoStar Group Inc 242,567 0.02 14,341 Costco Wholesale Corp 2,403,265 0.21 17,162 Coty Inc 'A' 313,807 0.03 2,569 CR Bard Inc 635,956 0.06 9,953 Crown Castle
International Corp (Reit) 940,459 0.08 5,196 Crown Holdings Inc 273,777 0.02 30,826 CSX Corp 1,451,288 0.13 5,021 Cummins Inc 762,489 0.07 34,904 CVS Health Corp 2,731,238 0.24 19,853 Danaher Corp 1,697,829 0.15 4,255 Darden Restaurants Inc 351,463 0.03 5,822 DaVita Inc 397,817 0.03 7,838 Deere & Co 853,558 0.07 7,867 Dell Technologies Inc 'V' 503,960 0.04 6,370 Delta Air Lines Inc 294,103 0.03 8,138 Dentsply Sirona Inc 507,404 0.04 15,420 Devon Energy Corp 644,556 0.06 2,979 DexCom Inc 255,062 0.02 2,782 Diamondback Energy Inc 288,521 0.02 3,079 Dick's Sporting Goods Inc 150,255 0.01 5,582 Digital Realty Trust Inc (Reit) 586,501 0.05 12,140 Discover Financial Services 827,948 0.07 5,847 Discovery Communications Inc 'A' 167,633 0.01 8,039 Discovery Communications Inc 'C' 225,172 0.02 6,522 DISH Network Corp 'A' 415,125 0.04 8,517 Dollar General Corp 602,918 0.05 8,310 Dollar Tree Inc 663,138 0.06 20,011 Dominion Resources Inc/VA 1,553,054 0.14 1,797 Domino's Pizza Inc 330,828 0.03 3,690 Dover Corp 295,717 0.03 36,890 Dow Chemical Co/The 2,348,417 0.20 12,612 DR Horton Inc 419,980 0.04 6,579 Dr Pepper Snapple Group Inc 641,913 0.06 6,410 DTE Energy Co 650,102 0.06 22,263 Duke Energy Corp 1,828,905 0.16 12,314 Duke Realty Corp (Reit) 320,164 0.03 1,247 Dun & Bradstreet Corp/The 132,781 0.01 9,681 E*TRADE Financial Corp 336,802 0.03 5,138 Eastman Chemical Co 416,178 0.04 3,914 Eaton Vance Corp 175,425 0.02 34,425 eBay Inc 1,160,983 0.10 7,847 Ecolab Inc 985,034 0.09 2,061 Edgewell Personal Care Co 151,442 0.01 9,205 Edison International 734,467 0.06 7,524 Edwards Lifesciences Corp 705,149 0.06 28,623 EI du Pont de Nemours & Co 2,305,296 0.20 8,583 Electronic Arts Inc 767,149 0.07 32,525 Eli Lilly & Co 2,752,591 0.24 19,703 Emerson Electric Co 1,176,860 0.10 4,163 Entergy Corp 317,012 0.03 3,322 Envision Healthcare Corp 203,971 0.02 18,742 EOG Resources Inc 1,844,588 0.16 6,171 EQT Corp 378,344 0.03 4,156 Equifax Inc 568,749 0.05
2,038 Equinix Inc (Reit) 811,042 0.07 12,902 Equity Residential (Reit) 802,633 0.07 2,296 Essex Property Trust Inc (Reit) 532,374 0.05 7,831 Estee Lauder Cos Inc/The 'A' 667,436 0.06 11,282 Eversource Energy 664,284 0.06 29,348 Exelon Corp 1,052,713 0.09 4,310 Expedia Inc 547,111 0.05 6,342 Expeditors International
of Washington Inc 359,084 0.03 19,922 Express Scripts Holding Co 1,313,059 0.11 4,507 Extra Space Storage Inc (Reit) 334,374 0.03 133,576 Exxon Mobil Corp 11,054,750 0.96 1,335 F5 Networks Inc 189,944 0.02 75,352 Facebook Inc 'A' 10,712,794 0.93 10,307 Fastenal Co 530,089 0.05 2,564 Federal Realty Investment Trust (Reit) 343,012 0.03 8,068 FedEx Corp 1,569,791 0.14 9,520 Fidelity National
Information Services Inc 761,695 0.07 26,802 Fifth Third Bancorp 683,719 0.06 10,914 First Data Corp 'A' 169,494 0.01 5,288 First Republic Bank/CA 496,808 0.04 15,089 FirstEnergy Corp 477,718 0.04 6,289 Fiserv Inc 726,883 0.06 2,701 FleetCor Technologies Inc 405,960 0.04 4,807 FLIR Systems Inc 175,167 0.02 4,519 Flowserve Corp 217,499 0.02 4,852 Fluor Corp 255,846 0.02 4,671 FMC Corp 331,641 0.03 8,721 FNF Group 339,770 0.03 4,739 Foot Locker Inc 356,989 0.03 119,018 Ford Motor Co 1,388,345 0.12 5,142 Fortinet Inc 194,933 0.02 11,037 Fortive Corp 660,123 0.06 5,402 Fortune Brands Home & Security Inc 328,388 0.03 13,340 Franklin Resources Inc 561,481 0.05 34,415 Freeport-McMoRan Inc 462,193 0.04 40,578 Frontier Communications Corp 87,040 0.01 8,256 Gap Inc/The 202,932 0.02 2,905 Gartner Inc 313,479 0.03 286,447 General Electric Co 8,581,952 0.75 18,579 General Mills Inc 1,099,505 0.10 45,068 General Motors Co 1,592,703 0.14 5,184 Genuine Parts Co * 479,520 0.04 20,009 GGP Inc (Reit) 464,809 0.04 41,853 Gilead Sciences Inc 2,837,215 0.25 5,512 Global Payments Inc 445,314 0.04 11,582 Goldman Sachs Group Inc/The 2,649,498 0.23 9,141 Goodyear Tire & Rubber Co/The 327,888 0.03 7,064 H&R Block Inc 164,379 0.01 27,563 Halliburton Co 1,360,234 0.12 13,211 Hanesbrands Inc 273,996 0.02 6,283 Harley-Davidson Inc 383,640 0.03 4,357 Harris Corp 485,762 0.04 13,542 Hartford Financial Services
Group Inc/The 645,547 0.06 3,970 Hasbro Inc 397,794 0.03 8,651 HCA Holdings Inc 770,977 0.07 16,604 HCP Inc (Reit) 517,049 0.04 3,791 Helmerich & Payne Inc * 253,087 0.02 2,386 Henry Schein Inc 406,384 0.04 5,081 Hershey Co/The 553,575 0.05 10,149 Hess Corp 499,635 0.04 52,115 Hewlett Packard Enterprise Co 1,242,682 0.11 7,058 Hilton Worldwide Holdings Inc 416,704 0.04 5,863 HollyFrontier Corp 165,630 0.01 8,428 Hologic Inc 358,106 0.03
Portfolio of Investments as at 31 March 2017
United States continued United States continued

Transferable Securities and Money Market Instruments Admitted to an Official Stock Exchange Listing or Dealt in on Another Regulated Market
Transferable Securities and Money Market Instruments Admitted to an Official Stock Exchange Listing or Dealt in on Another Regulated Market
Holding Description
Market Value
USD
% of Net
Assets Holding Description
Market Value
USD
% of Net
Assets
* All or a portion of this security represents a security on loan.
118 BlackRock Global Index Funds (BGIF)
The notes on pages 122 to 128 form an integral part of these financial statements.
BlackRock World Equity Index Fund continued
Portfolio of Investments as at 31 March 2017
39,181 Home Depot Inc/The 5,754,122 0.50 22,926 Honeywell International Inc 2,872,628 0.25 10,177 Hormel Foods Corp 349,173 0.03 25,964 Host Hotels & Resorts Inc (Reit) 484,229 0.04 49,917 HP Inc 885,528 0.08 4,467 Humana Inc 926,813 0.08 36,456 Huntington Bancshares Inc/OH 488,875 0.04 1,668 Huntington Ingalls Industries Inc 335,952 0.03 3,193 IDEXX Laboratories Inc 491,946 0.04 9,976 Illinois Tool Works Inc 1,319,625 0.11 4,633 Illumina Inc * 801,509 0.07 5,305 Incyte Corp 717,501 0.06 2,561 Ingredion Inc 309,292 0.03 151,707 Intel Corp 5,449,315 0.47 19,031 Intercontinental Exchange Inc 1,142,241 0.10 29,163 International Business
Machines Corp 5,071,154 0.44 2,776 International Flavors &
Fragrances Inc 368,209 0.03 13,681 International Paper Co 697,731 0.06 14,054 Interpublic Group of Cos Inc/The 346,291 0.03 7,182 Intuit Inc 831,963 0.07 1,105 Intuitive Surgical Inc 846,010 0.07 6,353 Iron Mountain Inc (Reit) 225,722 0.02 4,235 Jacobs Engineering Group Inc 234,958 0.02 3,170 JB Hunt Transport Services Inc 291,101 0.03 3,554 JM Smucker Co/The 467,777 0.04 87,682 Johnson & Johnson 10,922,547 0.95 1,590 Jones Lang LaSalle Inc 174,089 0.01 114,919 JPMorgan Chase & Co 10,161,138 0.89 12,084 Juniper Networks Inc 335,391 0.03 3,775 Kansas City Southern 327,028 0.03 9,317 Kellogg Co 677,905 0.06 29,761 KeyCorp 530,043 0.05 11,295 Kimberly-Clark Corp 1,495,684 0.13 15,138 Kimco Realty Corp (Reit) 333,717 0.03 59,628 Kinder Morgan Inc/DE 1,293,033 0.11 4,525 KLA-Tencor Corp 431,142 0.04 6,420 Kohl's Corp * 261,101 0.02 19,664 Kraft Heinz Co/The 1,789,621 0.16 26,739 Kroger Co/The 794,683 0.07 7,151 L Brands Inc 340,745 0.03 2,822 Laboratory Corp of
America Holdings 406,227 0.04 5,717 Lam Research Corp 736,121 0.06 12,487 Las Vegas Sands Corp 711,260 0.06 2,544 Lear Corp 361,324 0.03 4,680 Leggett & Platt Inc 235,966 0.02 5,945 Lennar Corp 'A' 304,146 0.03 11,301 Leucadia National Corp 294,843 0.03 10,698 Level 3 Communications Inc 611,070 0.05 3,812 Liberty Broadband Corp 'C' 330,234 0.03 15,000 Liberty Interactive Corp
QVC Group 'A' 297,750 0.03 3,780 Liberty Media Corp-Liberty
SiriusXM 'A' * 147,571 0.01 7,006 Liberty Media Corp-Liberty
SiriusXM 'C' 272,463 0.02 5,212 Liberty Property Trust (Reit) 200,193 0.02 8,116 Lincoln National Corp 529,163 0.05 10,722 LKQ Corp 315,763 0.03 10,169 Loews Corp 475,909 0.04 27,735 Lowe's Cos Inc 2,279,817 0.20 3,863 Lululemon Athletica Inc 197,399 0.02 3,963 M&T Bank Corp 616,286 0.05 4,296 Macerich Co/The (Reit) 277,908 0.02 2,762 Macquarie Infrastructure Corp 222,562 0.02
10,841 Macy's Inc 323,821 0.03 2,399 ManpowerGroup Inc 246,737 0.02 29,687 Marathon Oil Corp 474,398 0.04 15,513 Marathon Petroleum Corp 781,545 0.07 495 Markel Corp 480,942 0.04 9,629 Marriott International Inc/MD 'A' 912,348 0.08 16,912 Marsh & McLennan Cos Inc 1,250,642 0.11 2,106 Martin Marietta Materials Inc 457,086 0.04 11,600 Masco Corp 391,964 0.03 30,933 Mastercard Inc 'A' 3,486,768 0.30 11,865 Mattel Inc 303,981 0.03 10,064 Maxim Integrated Products Inc 450,867 0.04 4,120 McCormick & Co Inc/MD
'non-voting share' 402,771 0.03 26,521 McDonald's Corp 3,441,100 0.30 7,153 McKesson Corp 1,065,654 0.09 6,438 Mead Johnson Nutrition Co 573,497 0.05 3,280 MEDNAX Inc * 227,402 0.02 1,416 MercadoLibre Inc 301,693 0.03 89,131 Merck & Co Inc 5,653,134 0.49 30,556 MetLife Inc 1,615,801 0.14 932 Mettler-Toledo International Inc 446,838 0.04 10,686 MGM Resorts International 291,300 0.03 7,697 Microchip Technology Inc * 564,960 0.05 29,363 Micron Technology Inc 855,051 0.07 237,701 Microsoft Corp 15,609,825 1.36 4,018 Mid-America Apartment
Communities Inc (Reit) 410,399 0.04 2,053 Middleby Corp/The 279,229 0.02 1,450 Mohawk Industries Inc 330,731 0.03 6,682 Molson Coors Brewing Co 'B' 639,467 0.06 50,925 Mondelez International Inc 'A' 2,214,728 0.19 13,934 Monsanto Co 1,583,738 0.14 13,960 Monster Beverage Corp 644,812 0.06 5,343 Moody's Corp 598,256 0.05 44,970 Morgan Stanley 1,919,544 0.17 11,805 Mosaic Co/The 344,824 0.03 3,457 Motorola Solutions Inc 295,159 0.03 3,218 MSCI Inc 312,082 0.03 5,670 Murphy Oil Corp 163,013 0.01 4,056 Nasdaq Inc 280,351 0.02 13,181 National Oilwell Varco Inc 530,008 0.05 5,245 National Retail Properties Inc (Reit) 228,525 0.02 11,178 Navient Corp 164,987 0.01 9,790 NetApp Inc 406,872 0.04 13,959 Netflix Inc 2,062,861 0.18 9,492 New York Community Bancorp Inc 133,742 0.01 11,935 Newell Brands Inc 567,151 0.05 7,017 Newfield Exploration Co 259,769 0.02 18,574 Newmont Mining Corp 606,813 0.05 13,140 News Corp 'A' 169,900 0.01 14,953 NextEra Energy Inc 1,925,946 0.17 42,524 NIKE Inc 'B' 2,374,965 0.21 11,410 NiSource Inc 270,988 0.02 15,025 Noble Energy Inc 520,015 0.04 4,601 Nordstrom Inc 214,775 0.02 9,566 Norfolk Southern Corp 1,081,054 0.09 7,639 Northern Trust Corp 663,600 0.06 5,262 Northrop Grumman Corp 1,255,197 0.11 9,447 Nuance Communications Inc 163,102 0.01 11,305 Nucor Corp 672,987 0.06 17,261 NVIDIA Corp 1,879,205 0.16 2,763 O'Reilly Automotive Inc 753,249 0.07 24,725 Occidental Petroleum Corp 1,589,323 0.14 7,075 OGE Energy Corp 248,828 0.02 8,398 Omnicom Group Inc 722,228 0.06 7,556 ONEOK Inc 415,807 0.04
United States continued United States continued

Transferable Securities and Money Market Instruments Admitted to an Official Stock Exchange Listing or Dealt in on Another Regulated Market
Transferable Securities and Money Market Instruments Admitted to an Official Stock Exchange Listing or Dealt in on Another Regulated Market
Holding Description
Market Value
USD
% of Net
Assets Holding Description
Market Value
USD
% of Net
Assets
* All or a portion of this security represents a security on loan.
Annual Report and Audited Accounts 119
The notes on pages 122 to 128 form an integral part of these financial statements.
BlackRock World Equity Index Fund continued
99,107 Oracle Corp 4,424,136 0.39 9,978 PACCAR Inc 671,519 0.06 2,493 Packaging Corp of America 227,013 0.02 2,586 Palo Alto Networks Inc 293,925 0.03 3,616 Parker-Hannifin Corp 578,415 0.05 5,422 Parsley Energy Inc 'A' 175,564 0.02 2,919 Patterson Cos Inc 132,581 0.01 8,903 Paychex Inc 527,147 0.05 34,499 PayPal Holdings Inc 1,487,252 0.13 11,044 People's United Financial Inc * 201,995 0.02 46,156 PepsiCo Inc 5,176,395 0.45 195,859 Pfizer Inc 6,716,005 0.59 15,020 PG&E Corp 1,000,032 0.09 49,690 Philip Morris International Inc 5,635,840 0.49 14,812 Phillips 66 1,170,444 0.10 3,899 Pinnacle West Capital Corp 325,099 0.03 5,074 Pioneer Natural Resources Co 943,815 0.08 2,879 Plains GP Holdings LP 'A' 90,170 0.01 15,960 PNC Financial Services
Group Inc/The 1,928,128 0.17 2,147 Polaris Industries Inc 180,799 0.02 7,660 PPG Industries Inc 806,751 0.07 21,443 PPL Corp 801,110 0.07 9,069 Praxair Inc 1,076,853 0.09 1,566 Priceline Group Inc/The 2,792,100 0.24 10,348 Principal Financial Group Inc 650,993 0.06 82,419 Procter & Gamble Co/The 7,428,424 0.65 20,372 Progressive Corp/The 798,582 0.07 15,672 Prologis Inc (Reit) 804,287 0.07 13,823 Prudential Financial Inc 1,475,882 0.13 17,885 Public Service Enterprise Group Inc 789,802 0.07 4,783 Public Storage (Reit) 1,050,538 0.09 10,684 PulteGroup Inc 252,249 0.02 2,817 PVH Corp 291,221 0.03 4,465 Qorvo Inc 307,549 0.03 48,242 Qualcomm Inc 2,761,854 0.24 4,834 Quest Diagnostics Inc 474,167 0.04 5,210 Quintiles IMS Holdings Inc 419,249 0.04 1,981 Ralph Lauren Corp 161,967 0.01 6,434 Range Resources Corp 189,867 0.02 4,564 Raymond James Financial Inc 346,818 0.03 9,340 Raytheon Co 1,432,476 0.12 9,040 Realty Income Corp (Reit) 535,258 0.05 5,274 Red Hat Inc 454,513 0.04 3,690 Regency Centers Corp (Reit) 246,086 0.02 2,301 Regeneron Pharmaceuticals Inc 893,478 0.08 34,819 Regions Financial Corp 506,965 0.04 2,283 Reinsurance Group of America Inc 287,704 0.02 8,154 Republic Services Inc 511,582 0.04 4,946 ResMed Inc 353,392 0.03 28,040 Reynolds American Inc 1,762,034 0.15 36,680 Rite Aid Corp 158,274 0.01 4,485 Robert Half International Inc 218,420 0.02 3,462 Rockwell Automation Inc 539,691 0.05 4,547 Rockwell Collins Inc 445,651 0.04 3,103 Roper Technologies Inc 645,176 0.06 11,762 Ross Stores Inc 779,938 0.07 7,814 S&P Global Inc 1,016,445 0.09 8,199 Sabre Corp 176,934 0.02 20,539 salesforce.com Inc 1,696,111 0.15 3,603 SBA Communications Corp (Reit) 428,577 0.04 4,747 SCANA Corp 310,644 0.03 2,781 Scripps Networks Interactive Inc 'A' 219,310 0.02 6,915 Sealed Air Corp 299,350 0.03 3,532 Seattle Genetics Inc 220,538 0.02 4,797 SEI Investments Co * 241,049 0.02 6,750 Sempra Energy 747,090 0.06 4,808 ServiceNow Inc 418,008 0.04
2,198 Sherwin-Williams Co/The 683,029 0.06 1,907 Signature Bank/New York NY 283,533 0.02 10,240 Simon Property Group Inc (Reit) 1,754,624 0.15 45,832 Sirius XM Holdings Inc 238,097 0.02 5,799 Skyworks Solutions Inc 567,432 0.05 2,163 SL Green Realty Corp (Reit) 228,197 0.02 2,042 Snap-on Inc 344,077 0.03 31,128 Southern Co/The 1,547,995 0.13 5,338 Southwest Airlines Co 286,330 0.02 16,014 Southwestern Energy Co 132,516 0.01 949 Spectrum Brands Holdings Inc 132,680 0.01 4,713 Splunk Inc 295,929 0.03 25,589 Sprint Corp 218,530 0.02 5,334 Stanley Black & Decker Inc 709,689 0.06 22,644 Staples Inc 198,814 0.02 46,366 Starbucks Corp 2,707,311 0.24 12,737 State Street Corp 1,017,432 0.09 2,941 Stericycle Inc 241,103 0.02 10,491 Stryker Corp 1,382,189 0.12 14,600 SunTrust Banks Inc 812,636 0.07 21,567 Symantec Corp 659,627 0.06 25,298 Synchrony Financial * 865,951 0.08 5,342 Synopsys Inc 384,677 0.03 15,539 Sysco Corp 808,339 0.07 8,827 T Rowe Price Group Inc 600,148 0.05 8,594 T-Mobile US Inc 559,641 0.05 5,942 Targa Resources Corp 349,568 0.03 17,025 Target Corp 948,292 0.08 7,103 TD Ameritrade Holding Corp 275,383 0.02 7,009 TEGNA Inc 180,762 0.02 1,571 Teleflex Inc 304,256 0.03 3,845 Tesla Inc * 1,071,409 0.09 4,215 Tesoro Corp 342,932 0.03 32,842 Texas Instruments Inc 2,654,947 0.23 12,815 Thermo Fisher Scientific Inc 1,973,254 0.17 4,367 Tiffany & Co 417,267 0.04 25,465 Time Warner Inc 2,493,023 0.22 21,027 TJX Cos Inc/The 1,677,534 0.15 5,680 Toll Brothers Inc 205,559 0.02 3,973 Torchmark Corp 305,563 0.03 3,031 Total System Services Inc 161,916 0.01 4,803 Tractor Supply Co 331,839 0.03 1,255 TransDigm Group Inc 277,732 0.02 8,819 Travelers Cos Inc/The 1,063,924 0.09 4,471 Trimble Inc 143,385 0.01 4,080 TripAdvisor Inc * 177,562 0.02 34,053 Twenty-First Century Fox Inc 'A' 1,106,382 0.10 15,329 Twenty-First Century Fox Inc 'B' 487,156 0.04 20,466 Twitter Inc * 307,092 0.03 8,921 Tyson Foods Inc 'A' 551,229 0.05 9,309 UDR Inc (Reit) 336,986 0.03 6,195 UGI Corp 307,210 0.03 2,072 Ulta Salon Cosmetics
& Fragrance Inc 591,805 0.05 6,415 Under Armour Inc 'A' * 129,583 0.01 6,521 Under Armour Inc 'C' 120,247 0.01 25,984 Union Pacific Corp 2,769,894 0.24 2,768 United Continental Holdings Inc 196,805 0.02 22,630 United Parcel Service Inc 'B' 2,413,716 0.21 3,033 United Rentals Inc 376,856 0.03 25,219 United Technologies Corp 2,838,398 0.25 1,529 United Therapeutics Corp 208,770 0.02 30,546 UnitedHealth Group Inc 5,021,151 0.44 3,155 Universal Health Services Inc 'B' 395,038 0.03 4,960 Unum Group 231,731 0.02 54,393 US Bancorp 2,824,085 0.25 14,044 Valero Energy Corp 935,190 0.08 2,688 Valspar Corp/The 298,180 0.03
Portfolio of Investments as at 31 March 2017
United States continued United States continued

Transferable Securities and Money Market Instruments Admitted to an Official Stock Exchange Listing or Dealt in on Another Regulated Market
Transferable Securities and Money Market Instruments Admitted to an Official Stock Exchange Listing or Dealt in on Another Regulated Market
Holding Description
Market Value
USD
% of Net
Assets Holding Description
Market Value
USD
% of Net
Assets
120 BlackRock Global Index Funds (BGIF)
The notes on pages 122 to 128 form an integral part of these financial statements.
BlackRock World Equity Index Fund continued
3,209 Vantiv Inc 'A' 205,697 0.02 3,278 Varian Medical Systems Inc 298,298 0.03 12,299 Ventas Inc (Reit) 795,622 0.07 34,818 VEREIT Inc (Reit) 295,257 0.03 3,395 VeriSign Inc 294,890 0.03 4,537 Verisk Analytics Inc 369,584 0.03 131,592 Verizon Communications Inc 6,441,428 0.56 7,492 Vertex Pharmaceuticals Inc 807,038 0.07 11,773 VF Corp 641,040 0.06 12,379 Viacom Inc 'B' 574,138 0.05 60,707 Visa Inc 'A' 5,401,102 0.47 2,649 VMware Inc 'A' 243,125 0.02 6,042 Vornado Realty Trust (Reit) 606,073 0.05 7,045 Voya Financial Inc 267,358 0.02 4,725 Vulcan Materials Co 565,346 0.05 1,887 WABCO Holdings Inc 219,949 0.02 3,192 Wabtec Corp/DE 247,316 0.02 50,637 Wal-Mart Stores Inc 3,622,571 0.32 30,125 Walgreens Boots Alliance Inc 2,515,437 0.22 49,160 Walt Disney Co/The 5,562,946 0.48 13,289 Waste Management Inc 968,369 0.08 2,211 Waters Corp 344,651 0.03 11,267 WEC Energy Group Inc 682,780 0.06 153,666 Wells Fargo & Co 8,586,856 0.75 10,139 Welltower Inc (Reit) 717,436 0.06 5,067 Westar Energy Inc 275,290 0.02 9,938 Western Digital Corp 828,332 0.07 17,070 Western Union Co/The 346,521 0.03 8,849 WestRock Co 462,272 0.04 21,174 Weyerhaeuser Co (Reit) 717,481 0.06 1,893 Whirlpool Corp 321,905 0.03
4,037 WhiteWave Foods Co/The 226,682 0.02 11,128 Whole Foods Market Inc 327,720 0.03 20,022 Williams Cos Inc/The 590,249 0.05 4,298 Workday Inc 'A' 359,356 0.03 3,434 WR Berkley Corp 241,891 0.02 2,471 WR Grace & Co 170,499 0.01 1,903 WW Grainger Inc 441,915 0.04 3,864 Wyndham Worldwide Corp 327,667 0.03 2,817 Wynn Resorts Ltd 322,772 0.03 15,942 Xcel Energy Inc 707,825 0.06 30,355 Xerox Corp 224,627 0.02 9,087 Xilinx Inc 525,138 0.05 6,323 Xylem Inc/NY 315,960 0.03 27,904 Yahoo! Inc 1,298,373 0.11 10,658 Yum! Brands Inc 683,071 0.06 5,602 Zayo Group Holdings Inc 185,090 0.02 640 Zillow Group Inc 'C' 21,331 0.00 6,281 Zimmer Biomet Holdings Inc 759,687 0.07 13,530 Zoetis Inc 722,908 0.06
645,933,647 56.30
Total Common / Preferred Stocks (Shares) & Rights 1,140,618,272 99.42
Total Transferable Securities and Money Market Instruments Admitted to an Official Stock Exchange Listing or Dealt in on Another Regulated Market 1,140,618,272 99.42
Securities portfolio at market value 1,140,618,272 99.42
Other Net Assets 6,695,923 0.58
Total Net Assets (USD) 1,147,314,195 100.00
Portfolio of Investments as at 31 March 2017
United States continued United States continued

Annual Report and Audited Accounts 121
The notes on pages 122 to 128 form an integral part of these financial statements.
Futures contracts as at 31 March 2017
Number of contracts
Currency of contract
Contract/ Description
Expiration date
Gross underlying
exposure USD
Unrealised appreciation/
(depreciation) USD
43 USD E-Mini S&P 500 Index June 2017 5,079,805 8,800 33 EUR EURO STOXX 50 Index June 2017 1,201,622 12,020 9 GBP FTSE 100 Index June 2017 815,627 (1,621) 5 CHF Swiss Market Index June 2017 426,351 1,739 5 JPY Topix Index June 2017 677,279 (11,210)
Total 8,200,684 9,728
Sector Breakdown as at 31 March 2017
% of Net Assets
Consumer, Non-cyclical 22.44Financial 21.33Communications 10.85Consumer, Cyclical 10.40Industrial 10.31Technology 9.68Energy 6.54Basic Materials 4.36Utilities 3.20Diversified 0.31
Securities portfolio at market value 99.42Other Net Assets 0.58
100.00
BlackRock World Equity Index Fund continued

122 BlackRock Global Index Funds (BGIF)
Notes to the Financial Statements
1. OrganisationBlackRock Global Index Funds is a public limited company (société anonyme) established under the laws of the Grand Duchy of Luxembourg as an open ended variable capital investment company (société d’investissement à capital variable). The Company was established on 30 August 2012 and was authorised by the Commission de Surveillance du Secteur Financier (the “CSSF”) as an UCITS pursuant to the provisions of Part I of the law of 17 December 2010, as amended from time to time and is regulated pursuant to such law (the “2010 Law”).
The Company has appointed BlackRock (Luxembourg) S.A. as its Management Company.
As at 31 March 2017, the Company offered shares in 10 Funds (each a “Fund”, together the “Funds”). The Company is an umbrella structure comprising separate Funds with segregated liability. Each Fund shall have segregated liability from the other Funds and the Company shall not be liable as a whole to third parties for the liabilities of each Fund. Each Fund shall be made up of a separate portfolio of investments maintained and invested in accordance with the investment objectives applicable to such Fund. Each Fund is a separate pool of assets and is represented by separate shares of each Fund which are divided into share classes as follows:
A Class
A Class non-distributing share EUR
A Class non-distributing share EUR hedged
A Class non-distributing share USD
A Class non-distributing UK reporting fund share USD
D Class
D Class non-distributing share EUR
F Class
F Class non-distributing share EUR
F Class non-distributing share GBP
F Class non-distributing share USD
F Class non-distributing UK reporting fund share USD
I Class1
I Class distributing share USD
I Class non-distributing share EUR hedged
I Class non-distributing share GBP hedged
I Class non-distributing share USD
N Class
N Class distributing share EUR
N Class distributing share USD
N Class non-distributing share EUR
Share Classes LaunchedThe date disclosed is the launch date but the class may have been seeded at a later date.
Effective date Type Fund
13 April 2016 A Class non-distributing share EUR hedged BlackRock Emerging Markets Government Bond Index Fund
13 April 2016 I Class non-distributing share EUR hedged BlackRock Emerging Markets Government Bond Index Fund
13 April 2016 X Class non-distributing share EUR hedged BlackRock Emerging Markets Government Bond Index Fund
20 April 2016 F Class non-distributing share GBP BlackRock World Equity Index Fund
N Class continued
N Class non-distributing share USD
X Class1
X Class non-distributing share EUR
X Class non-distributing share EUR hedged
X Class non-distributing share SEK hedged
X Class non-distributing share USD
1 available to institutional investors.
The classes of shares have equivalent rights in the Company but carry different features and charging structures which are more fully described in the Company’s Prospectus.
Significant events during the yearIn a UK referendum held on 23 June 2016, the electorate of the UK resolved to leave the European Union. For further details on the impact of the results of the referendum please refer to the Investment Adviser’s Report.
Effective 24 October 2016, Bruno Rovelli and Alexander C. Hoctor-Duncan resigned from the Board of Directors of the Company.
Effective 21 November 2016, Barry O’Dwyer and Robert Hayes were appointed as Directors of the Board of the Company.
A new Prospectus was issued on 6 February 2017.
In a letter to shareholders dated 6 February 2017, the Board of Directors of the Company advised shareholders that any costs relating to withholding tax reclaims (plus any taxes or interest thereon) will be paid by the Company and will be allocated between the relevant Funds on a fair and equitable basis. As there is a good degree of success with withholding tax reclaims, the Directors have determined that any costs associated with withholding tax reclaims will no longer be paid out of the Administration Fee and will now be paid by the Company.
Securities Financing Transactions Regulation (Regulation (EU) 2015/2365) came into force on 12 January 2016 and, amongst other requirements, introduces new disclosure requirements in UCITS funds, UCITS Management companies and AIFM annual and half-yearly reports published after 13 January 2017 detailing the Funds use of securities financing transactions and total return swaps. As a result, additional disclosures have been included in the Supplementary Information section to the Annual Report and Audited Accounts.
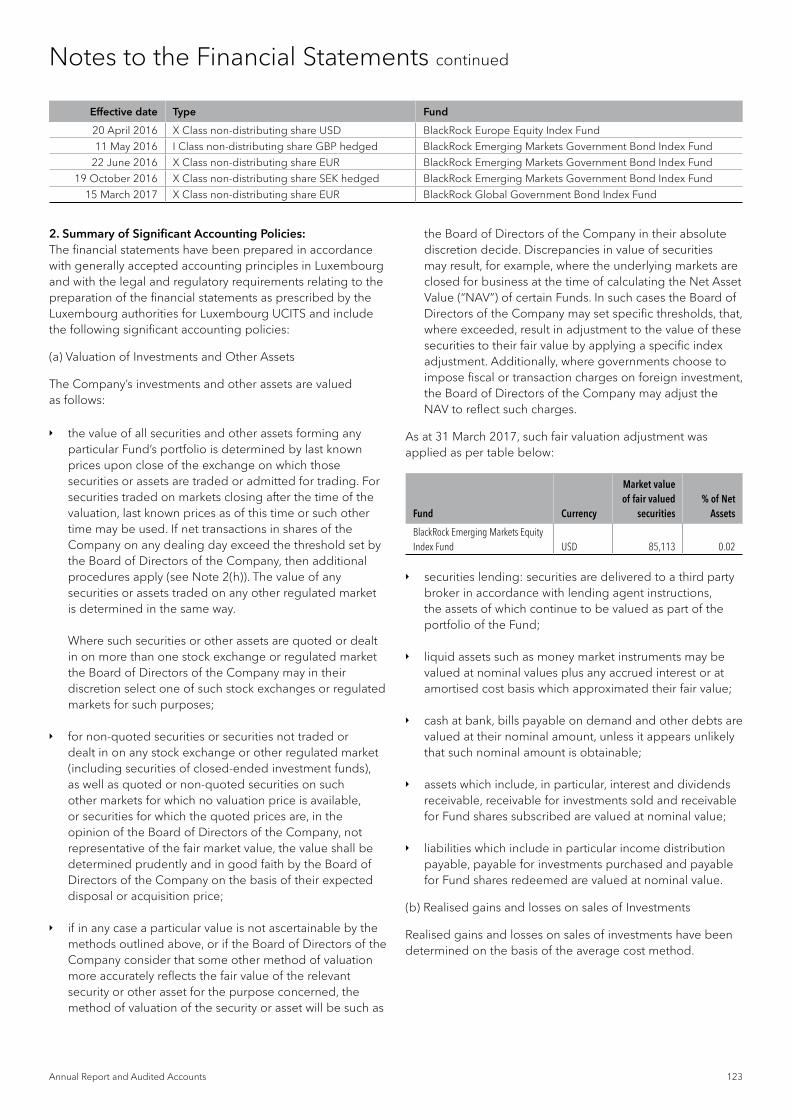
Annual Report and Audited Accounts 123
Notes to the Financial Statements continued
Effective date Type Fund
20 April 2016 X Class non-distributing share USD BlackRock Europe Equity Index Fund
11 May 2016 I Class non-distributing share GBP hedged BlackRock Emerging Markets Government Bond Index Fund
22 June 2016 X Class non-distributing share EUR BlackRock Emerging Markets Government Bond Index Fund
19 October 2016 X Class non-distributing share SEK hedged BlackRock Emerging Markets Government Bond Index Fund
15 March 2017 X Class non-distributing share EUR BlackRock Global Government Bond Index Fund
2. Summary of Significant Accounting Policies:The financial statements have been prepared in accordance with generally accepted accounting principles in Luxembourg and with the legal and regulatory requirements relating to the preparation of the financial statements as prescribed by the Luxembourg authorities for Luxembourg UCITS and include the following significant accounting policies:
(a) Valuation of Investments and Other Assets
The Company’s investments and other assets are valued as follows:
the value of all securities and other assets forming any particular Fund’s portfolio is determined by last known prices upon close of the exchange on which those securities or assets are traded or admitted for trading. For securities traded on markets closing after the time of the valuation, last known prices as of this time or such other time may be used. If net transactions in shares of the Company on any dealing day exceed the threshold set by the Board of Directors of the Company, then additional procedures apply (see Note 2(h)). The value of any securities or assets traded on any other regulated market is determined in the same way.
Where such securities or other assets are quoted or dealt in on more than one stock exchange or regulated market the Board of Directors of the Company may in their discretion select one of such stock exchanges or regulated markets for such purposes;
for non-quoted securities or securities not traded or dealt in on any stock exchange or other regulated market (including securities of closed-ended investment funds), as well as quoted or non-quoted securities on such other markets for which no valuation price is available, or securities for which the quoted prices are, in the opinion of the Board of Directors of the Company, not representative of the fair market value, the value shall be determined prudently and in good faith by the Board of Directors of the Company on the basis of their expected disposal or acquisition price;
if in any case a particular value is not ascertainable by the methods outlined above, or if the Board of Directors of the Company consider that some other method of valuation more accurately reflects the fair value of the relevant security or other asset for the purpose concerned, the method of valuation of the security or asset will be such as
the Board of Directors of the Company in their absolute discretion decide. Discrepancies in value of securities may result, for example, where the underlying markets are closed for business at the time of calculating the Net Asset Value (“NAV”) of certain Funds. In such cases the Board of Directors of the Company may set specific thresholds, that, where exceeded, result in adjustment to the value of these securities to their fair value by applying a specific index adjustment. Additionally, where governments choose to impose fiscal or transaction charges on foreign investment, the Board of Directors of the Company may adjust the NAV to reflect such charges.
As at 31 March 2017, such fair valuation adjustment was applied as per table below:
Fund Currency
Market value of fair valued
securities % of Net
Assets
BlackRock Emerging Markets Equity Index Fund USD 85,113 0.02
securities lending: securities are delivered to a third party broker in accordance with lending agent instructions, the assets of which continue to be valued as part of the portfolio of the Fund;
liquid assets such as money market instruments may be valued at nominal values plus any accrued interest or at amortised cost basis which approximated their fair value;
cash at bank, bills payable on demand and other debts are valued at their nominal amount, unless it appears unlikely that such nominal amount is obtainable;
assets which include, in particular, interest and dividends receivable, receivable for investments sold and receivable for Fund shares subscribed are valued at nominal value;
liabilities which include in particular income distribution payable, payable for investments purchased and payable for Fund shares redeemed are valued at nominal value.
(b) Realised gains and losses on sales of Investments
Realised gains and losses on sales of investments have been determined on the basis of the average cost method.

124 BlackRock Global Index Funds (BGIF)
Notes to the Financial Statements continued
(c) Income/Expense from Investments
The Company takes credit for income from its investments on the following basis:
interest income is accrued daily and includes the amortisation on a straight line basis of premiums and accretion of discounts;
bank interest income is recognised on an accrual basis;
dividend income is accrued on the ex-dividend date and is shown net of withholding taxes;
securities lending income is accrued on a weekly basis;
negative yield expense on financial assets relating to interest from a negative effective interest rate on assets held is accreted daily and is recognised within bank interest in the Statement of Operations and Changes in Net Assets over the life of the underlying instrument;
when a bond has been identified as being in default, the interest accrual on the defaulted security is stopped. On confirmation of default from relevant parties, the amount receivable is written off.
(d) Financial Derivative Instruments
During the year, the Funds have entered into a number of forward foreign exchange transactions and futures contracts. Open forward foreign exchange transactions and futures contracts are valued at the fair market value to close the contracts on the valuation date. Surpluses/deficits arising from these and unsettled contracts are taken to unrealised appreciation/depreciation and are included under assets or liabilities (as appropriate) in the Statement of Net Assets. The net change in unrealised appreciation or depreciation and the realised gains or losses on settlement or closing transactions of forward foreign exchange transactions and futures contracts are presented in the Statement of Operations and Changes in Net Assets.
(e) Foreign Exchange
The cost of investments in currencies other than the currency of denomination of the respective Fund has been translated at the rates of exchange ruling at the time of purchase. Investments and other assets in currencies other than the currency of denomination of the respective Fund have been translated at the exchange rate prevailing at the Fund’s valuation point in Luxembourg on 31 March 2017. The net change in unrealised appreciation or depreciation and the realised gains or losses on disposal or settlement of other assets or liabilities in currencies other than the currency of denomination of the respective Fund are presented in the Statement of Operations and Changes in Net Assets.
Income and expenses in currencies other than the currency of denomination of the respective Fund have been translated at the rates of exchange prevailing on the transaction date.
The following exchange rates were used to translate the investments and other assets and other liabilities denominated in currencies for all Funds other than the base currency of the Fund at the respective Funds’ valuation point at 31 March 2017:
All Funds
CCY EUR USD
AED 0.2548 0.2723
AUD 0.7149 0.7638
BRL 0.2952 0.3155
CAD 0.7038 0.7519
CHF 0.9353 0.9993
CLP 0.0014 0.0015
COP 0.0003 0.0003
CZK 0.0370 0.0395
DKK 0.1345 0.1437
EUR 1.0000 1.0685
GBP 1.1668 1.2466
HKD 0.1205 0.1287
HUF 0.0032 0.0035
IDR 0.0001 0.0001
ILS 0.2576 0.2752
INR 0.0144 0.0154
JPY 0.0084 0.0090
KRW 0.0008 0.0009
MXN 0.0499 0.0533
MYR 0.2115 0.2260
NOK 0.1089 0.1164
NZD 0.6540 0.6988
PHP 0.0187 0.0199
PLN 0.2362 0.2523
QAR 0.2570 0.2746
SEK 0.1048 0.1120
SGD 0.6701 0.7160
THB 0.0272 0.0291
TRY 0.2571 0.2746
TWD 0.0308 0.0330
USD 0.9359 1.0000
ZAR 0.0700 0.0748
(f) Combined Financial Statements
The accounts of each Fund are expressed in the Funds’ base currency.
The combined figures of the Company are expressed in USD and include the total of the financial statements of the different Funds, translated if necessary. For the translation of the Statement of Net Assets, the following exchange rate prevailing at the Fund’s valuation point in Luxembourg as at 31 March 2017 for all Funds expressed in Euros, has been applied:
EURUSD 0.9359
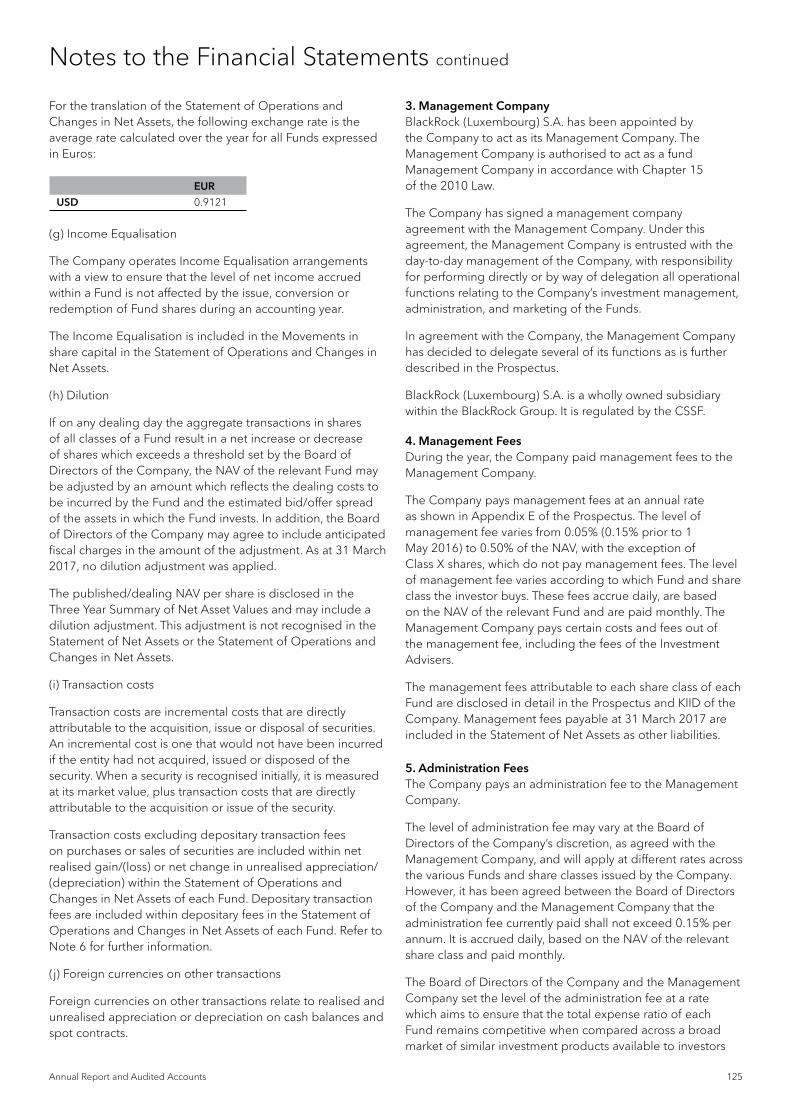
Annual Report and Audited Accounts 125
Notes to the Financial Statements continued
For the translation of the Statement of Operations and Changes in Net Assets, the following exchange rate is the average rate calculated over the year for all Funds expressed in Euros:
EURUSD 0.9121
(g) Income Equalisation
The Company operates Income Equalisation arrangements with a view to ensure that the level of net income accrued within a Fund is not affected by the issue, conversion or redemption of Fund shares during an accounting year.
The Income Equalisation is included in the Movements in share capital in the Statement of Operations and Changes in Net Assets.
(h) Dilution
If on any dealing day the aggregate transactions in shares of all classes of a Fund result in a net increase or decrease of shares which exceeds a threshold set by the Board of Directors of the Company, the NAV of the relevant Fund may be adjusted by an amount which reflects the dealing costs to be incurred by the Fund and the estimated bid/offer spread of the assets in which the Fund invests. In addition, the Board of Directors of the Company may agree to include anticipated fiscal charges in the amount of the adjustment. As at 31 March 2017, no dilution adjustment was applied.
The published/dealing NAV per share is disclosed in the Three Year Summary of Net Asset Values and may include a dilution adjustment. This adjustment is not recognised in the Statement of Net Assets or the Statement of Operations and Changes in Net Assets.
(i) Transaction costs
Transaction costs are incremental costs that are directly attributable to the acquisition, issue or disposal of securities. An incremental cost is one that would not have been incurred if the entity had not acquired, issued or disposed of the security. When a security is recognised initially, it is measured at its market value, plus transaction costs that are directly attributable to the acquisition or issue of the security.
Transaction costs excluding depositary transaction fees on purchases or sales of securities are included within net realised gain/(loss) or net change in unrealised appreciation/ (depreciation) within the Statement of Operations and Changes in Net Assets of each Fund. Depositary transaction fees are included within depositary fees in the Statement of Operations and Changes in Net Assets of each Fund. Refer to Note 6 for further information.
(j) Foreign currencies on other transactions
Foreign currencies on other transactions relate to realised and unrealised appreciation or depreciation on cash balances and spot contracts.
3. Management CompanyBlackRock (Luxembourg) S.A. has been appointed by the Company to act as its Management Company. The Management Company is authorised to act as a fund Management Company in accordance with Chapter 15 of the 2010 Law.
The Company has signed a management company agreement with the Management Company. Under this agreement, the Management Company is entrusted with the day-to-day management of the Company, with responsibility for performing directly or by way of delegation all operational functions relating to the Company’s investment management, administration, and marketing of the Funds.
In agreement with the Company, the Management Company has decided to delegate several of its functions as is further described in the Prospectus.
BlackRock (Luxembourg) S.A. is a wholly owned subsidiary within the BlackRock Group. It is regulated by the CSSF.
4. Management FeesDuring the year, the Company paid management fees to the Management Company.
The Company pays management fees at an annual rate as shown in Appendix E of the Prospectus. The level of management fee varies from 0.05% (0.15% prior to 1 May 2016) to 0.50% of the NAV, with the exception of Class X shares, which do not pay management fees. The level of management fee varies according to which Fund and share class the investor buys. These fees accrue daily, are based on the NAV of the relevant Fund and are paid monthly. The Management Company pays certain costs and fees out of the management fee, including the fees of the Investment Advisers.
The management fees attributable to each share class of each Fund are disclosed in detail in the Prospectus and KIID of the Company. Management fees payable at 31 March 2017 are included in the Statement of Net Assets as other liabilities.
5. Administration FeesThe Company pays an administration fee to the Management Company.
The level of administration fee may vary at the Board of Directors of the Company’s discretion, as agreed with the Management Company, and will apply at different rates across the various Funds and share classes issued by the Company. However, it has been agreed between the Board of Directors of the Company and the Management Company that the administration fee currently paid shall not exceed 0.15% per annum. It is accrued daily, based on the NAV of the relevant share class and paid monthly.
The Board of Directors of the Company and the Management Company set the level of the administration fee at a rate which aims to ensure that the total expense ratio of each Fund remains competitive when compared across a broad market of similar investment products available to investors

126 BlackRock Global Index Funds (BGIF)
Notes to the Financial Statements continued
in the Funds, taking into account a number of criteria such as the market sector of each Fund and the Fund’s performance relative to its peer group.
The administration fee is used by the Management Company to meet all fixed and variable operating and administrative costs and expenses incurred by the Company, with the exception of the Depositary fees, plus any taxes thereon and any taxes at an investment or Company level.
These operating and administrative expenses include all third party expenses and other recoverable costs incurred by or on behalf of the Company from time to time, including but not limited to, fund accounting fees, transfer agency fees (including sub-transfer agency and associated platform dealing charges), all professional costs, such as consultancy, legal, tax advisory and audit fees, Directors’ fees (for those Directors who are not employees of the BlackRock Group), travel expenses, reasonable out-of-pocket expenses, printing, publication, translation and all other costs relating to shareholder reporting, regulatory filing and licence fees, correspondent and other banking charges, software support and maintenance, operational costs and expenses attributed to the Investor Servicing teams and other global administration services provided by various BlackRock Group companies.
The Management Company bears the financial risk of ensuring that the Fund’s total expense ratio remains competitive. Accordingly the Management Company is entitled to retain any amount of the administration fee paid to it which is in excess of the actual expenses incurred by the Company during any year whereas any costs and expenses incurred by the Company in any period which exceed the amount of administration fee that is paid to the Management Company, shall be borne by the Management Company or another BlackRock Group company.
From 8 March 2017, any costs relating to withholding tax reclaims (plus any taxes or interest thereon) will no longer be paid by the Management Company and will be allocated between the relevant Funds on a fair and equitable basis.
Directors of the Company who are not employees of the BlackRock Group receive a fee of EUR 30,000 per annum gross of taxation in return for their duties performed during the year ended 31 March 2017. The Chairman receives a fee of EUR 33,500 per annum gross of taxation. Directors who are employees of the BlackRock Group are not entitled to receive a Directors fee.
Detailed below are the fees paid to Deloitte Audit Société à responsabilité limitée for the year ended 31 March 2017.
31 March 2017 USD
Audit and audit related services (excluding VAT) 70,172
Non-audit services –-
6. Depositary FeesThe Depositary receives a fee in respect of each Fund. These fees are to remunerate the Depositary for safekeeping and transaction costs applicable to each Fund. These fees will vary in respect of each Fund depending on the value of assets under management and the volume of trading in that Fund.
The Depositary receives annual fees, based on the value of securities, which accrue daily, plus transaction fees. The annual custody safekeeping fees range from 0.005% to 0.40% of the NAV per annum and the transaction fees range from USD 5 to USD 75 per transaction. The rates for both categories of fees will vary according to the country of investment and, in some cases, according to asset class. Investments in bonds and developed equity markets will be at the lower end of these ranges, while some investments in emerging or developing markets will be at the upper end. Thus the custody cost to each Fund will depend on its asset allocation at any time.
7. Taxes
LuxembourgThe Company is registered under Luxembourg law as an investment company. Accordingly, no Luxembourg income or capital gains tax is at present payable by the Company. The Funds are exempt from the subscription tax (“taxe d’abonnement”) because the sole objective of each Fund is to match / replicate the performance of its Benchmark Index and all share classes of the Company are listed on the Luxembourg Stock Exchange. Therefore, in accordance with the 2010 Law, which provides an exemption from “taxe d’abonnement” to funds and classes structured in this manner, it is expected that the share classes should be exempt from this annual subscription tax.
United KingdomReporting FundsThe UK Reporting Funds regime applies to the Company. Under this regime, investors in UK Reporting Funds are subject to tax on the share of the UK Reporting Funds income attributable to their holdings in the Fund, whether or not distributed, but any gains on disposal of their holdings are subject to capital gains tax. A list of the Funds which currently have UK Reporting Fund status is available at: https://www.gov.uk/government/publications/offshore-funds-list-of-reporting-funds.
Other transaction taxesOther jurisdictions may impose taxes, Financial Transactions Taxes (“FTT”) or other transaction taxes on certain assets held by the Funds (for example UK stamp duty, French FTT).
Withholding taxDividends and interest received by the Company on its investments may be subject to withholding taxes in the countries of origin which are generally irrecoverable as the Company itself is exempt from income tax. Recent European Union case law may, however, reduce the amount of such irrecoverable tax. Investors should inform themselves of, and when appropriate consult their professional advisers on,

Annual Report and Audited Accounts 127
Notes to the Financial Statements continued
the possible tax consequences of subscribing for, buying, holding, redeeming, converting or selling Shares under the laws of their country of citizenship, residence or domicile. Investors should note that the levels and bases of, and reliefs from, taxation can change. The potential of withholding tax charges is further described in the Prospectus.
8. Investment AdvisersThe Management Company, BlackRock (Luxembourg) S.A., has delegated some management and provision of investment advice to the Investment Advisers: BlackRock Investment Management (UK) Limited (“BIM UK”) and BlackRock Institutional Trust Company N.A., as described in the Prospectus. The Investment Advisers provides advice and management in the areas of stock and sector selection and strategic allocation. Notwithstanding the appointment of the Investment Advisers, the Management Company accepts full responsibility to the Company for all investment transactions.
9. Transactions with Connected PersonsThe ultimate holding company of the Management Company, the Principal Distributor and the Investment Advisers is BlackRock, Inc., a company incorporated in Delaware, USA. PNC Financial Services Group Inc. ("PNC Group") is a substantial shareholder in BlackRock, Inc.. When arranging transactions in securities for the Company, companies in the PNC Group may have provided securities, brokerage, foreign exchange, banking and other services or may have acted as principal on their usual terms and may benefit therefrom. Commission has been paid to brokers and agents in accordance with the relevant market practice and the benefit of any bulk or other commission discounts or cash commission rebates provided by brokers or agents have been passed on to the Company. The services of PNC Group companies could have been used by the Investment Advisers where it was considered appropriate to do so provided that their commissions and other terms of business are generally comparable with those available from unassociated brokers and agents in the markets concerned, and that this is consistent with the above policy of obtaining best results.
During the year, there have been no significant transactions which were outside the ordinary course of business or which were not on normal commercial terms. There were no transactions of the Company effected through BlackRock companies.
The securities lending agent appointed pursuant to the securities lending agreement is BlackRock Advisors (UK) Limited which is a related party to the Company. BlackRock Advisors (UK) Limited bears all operational costs directly related to securities loan transactions.
The Funds benefit from a borrower default indemnity provided by BlackRock, Inc.. The indemnity allows for full replacement of securities on loan. BlackRock, Inc. bears the cost of indemnification against borrower default.
10. DividendsDistributions will not be made to the shareholders of the Non-Distributing Classes. The investment income and other profits will be accumulated and reinvested on behalf of these shareholders.
For the distributing share classes the policy is to distribute substantially all the investment income for the year after deduction of expenses. The Board of Directors of the Company may also determine if and to what extent dividends may include distribution, from both net realised and net unrealised capital gains. Where distributing share classes pay dividends that include net realised capital gains or net unrealised capital gains, dividends may include initially subscribed capital.
The Board of Directors of the Company intend to declare dividends on the distributing share classes out of the net revenue of the relevant Fund (i.e. all interest, dividends and other income less the Fund’s accrued expenses) for that financial year.
Where a Fund has UK Reporting Fund status and reported income exceeds distributions made then the surplus shall be treated as a deemed dividend and will be taxed as income, subject to the tax status of the investor.
Dividends will normally be declared with a view to being paid semi-annually (March and September).
11. Transaction CostsIn order to achieve its investment objective, a Fund will incur transactions costs in relation to trading activity on its portfolio. Disclosed in the table below are separately identifiable transaction costs incurred by each Fund for the year ended 31 March 2017. These include commission costs, settlement fees and broker fees.
Fund CCYTransaction
Costs
BlackRock Emerging Markets Equity Index Fund USD 96,263
BlackRock Emerging Markets Government Bond Index Fund USD 120
BlackRock Europe Equity Index Fund EUR 164,667
BlackRock Euro Aggregate Bond Index Fund EUR 725
BlackRock Euro Government Bond Index Fund EUR 250
BlackRock Global Government Bond Index Fund USD 107
BlackRock Japan Equity Index Fund USD 10,266
BlackRock North America Equity Index Fund USD 21,400
BlackRock Pacific ex Japan Equity Index Fund USD 39,743
BlackRock World Equity Index Fund USD 119,668
Not all transaction costs are separately identifiable. For fixed income investments, forward foreign exchange transactions and other derivative contracts, transaction costs are included in the purchase and sales price of the investment. While not separately identifiable these transaction costs are captured within the performance of each Fund.

128 BlackRock Global Index Funds (BGIF)
Notes to the Financial Statements continued
12. Due from/to BrokersDue from/to brokers on the Statement of Net Assets consists of margin paid/received from Fund’s clearing brokers and various counterparties.
13. Global Market Risk ExposureThe Management Company adopted the Commitment Approach as the global exposure methodology of the Funds.
The Commitment Approach is a methodology that aggregates the underlying market or notional values of financial derivative instruments to determine the degree of global exposure of a Fund to financial derivative instruments.
Pursuant to the 2010 Law, the global exposure for a Fund under the Commitment Approach must not exceed 100% of that Fund’s NAV. As at 31 March 2017 the global exposure of each Fund did not exceed 100% of its NAV.
14. Total Expense RatioTotal Expense Ratio (“TER”) is calculated as the total of all expenses (excluding bank interest, negative yield expense on financial assets and including expense reimbursements), divided by the average net assets of the Company, expressed as a percentage. All data is annualised.
The Management Fee may be used in part to pay remuneration for distribution activities concerning the Company. Reimbursement may be made to institutional investors which from a commercial perspective hold shares of the Company for third parties.
The TER for the year from 1 April 2016 to 31 March 2017 is as follows:
Fund Name TER
BlackRock Emerging Markets Equity Index Fund Class A 0.626%
Class F 0.325%
Class N 0.294%
Class X 0.095%
BlackRock Emerging Markets Government Bond Index Fund Class A 0.528%
Class I 0.249%
Class N 0.247%
Class X 0.047%
BlackRock Europe Equity Index Fund Class A 0.536%
Class D 0.227%
Class F 0.226%
Class N 0.198%
Class X 0.047%
BlackRock Euro Aggregate Bond Index Fund Class A 0.536%
Class N 0.108%
Class X 0.049%
BlackRock Euro Government Bond Index Fund Class A 0.527%
Class D 0.230%
Class F 0.227%
Class N 0.197%
Class X 0.047%
Fund Name TER
BlackRock Global Government Bond Index Fund Class A 0.525%
Class D 0.238%
Class F 0.225%
Class N 0.195%
Class X 0.046%
BlackRock Japan Equity Index Fund Class A 0.534%
Class F 0.225%
Class N 0.195%
Class X 0.045%
BlackRock North America Equity Index Fund Class A 0.522%
Class F 0.223%
Class N 0.192%
Class X 0.041%
BlackRock Pacific ex Japan Equity Index Fund Class A 0.538%
Class F 0.238%
Class N 0.208%
Class X 0.059%
BlackRock World Equity Index Fund Class A 0.528%
Class D 0.229%
Class F 0.227%
Class N 0.197%
Class X 0.050%
15. Subsequent EventsEffective 31 May 2017 Nicholas C.D. Hall resigned as Chairman of the Board of the Directors.
Effective 17 July 2017 Paul Freeman was appointed as Chairman of the Board of the Directors.

To the Shareholders of BlackRock Global Index Funds
REPORT OF THE RÉVISEUR D’ENTREPRISES AGRÉÉ
Following our appointment by the annual general meeting of the Shareholders of the Company dated 18 October 2016, we have audited the accompanying financial statements of BlackRock Global Index Funds (the “Company”) and of each of its sub-funds, which comprise the statement of net assets, the portfolio of investments as at 31 March 2017 and the statement of operations and changes in net assets for the year then ended, and a summary of significant accounting policies and other explanatory notes to the financial statements.
Responsibility of the Board of Directors of the Company for the financial statementsThe Board of Directors of the Company is responsible for the preparation and fair presentation of these financial statements in accordance with Luxembourg legal and regulatory requirements relating to the preparation of the financial statements and for such internal control as the Board of Directors of the Company determines is necessary to enable the preparation of financial statements that are free from material misstatement, whether due to fraud or error.
Responsibility of the réviseur d’entreprises agrééOur responsibility is to express an opinion on these financial statements based on our audit. We conducted our audit in accordance with International Standards on Auditing as adopted for Luxembourg by the Commission de Surveillance du Secteur Financier. Those standards require that we comply with ethical requirements and plan and perform the audit to obtain reasonable assurance whether the financial statements are free from material misstatement.
An audit involves performing procedures to obtain audit evidence about the amounts and disclosures in the financial statements. The procedures selected depend on the réviseur d’entreprises agréé’s judgement, including the assessment of the risks of material misstatement of the financial statements, whether due to fraud or error. In making those risk assessments, the réviseur d’entreprises agréé considers internal control relevant to the entity’s preparation and fair presentation of the financial statements in order to design audit procedures that are appropriate in the circumstances, but not for the purpose of expressing an opinion on the effectiveness of the entity’s internal control. An audit also includes evaluating the appropriateness of accounting policies used and the reasonableness of accounting estimates made by the Board of Directors of the Company, as well as evaluating the overall presentation of the financial statements.
We believe that the audit evidence we have obtained is sufficient and appropriate to provide a basis for our audit opinion.
OpinionIn our opinion, the financial statements give a true and fair view of the financial position of BlackRock Global Index Funds and of each of its sub-funds as at 31 March 2017, and of the results of their operations and changes in their net assets for the year then ended in accordance with Luxembourg legal and regulatory requirements relating to the preparation of the financial statements.
Other informationThe Board of Directors is responsible for the other information. The other information comprises the information included in the annual report but does not include the financial statements and our report of Réviseur d’Entreprises Agréé thereon.
Our opinion on the financial statements does not cover the other information and we do not express any form of assurance conclusion thereon.
In connection with our audit of the financial statements, our responsibility is to read the other information and, in doing so, consider whether the other information is materially inconsistent with the financial statements or our knowledge obtained in the audit or otherwise appears to be materially misstated. If, based on the work we have performed, we conclude that there is a material misstatement of this other information, we are required to report this fact. We have nothing to report in this regard.
For Deloitte Audit, Cabinet de révision agréé
Christian van Dartel, Réviseur d’entreprises agrééPartner
Luxembourg, XX XXXX 2017
Société à responsabilité limitée au capital de 35.000 EURRCS Luxembourg B 67.895N° d’autorisation d’établissement 10022179
42 BlackRock Global Investment Series
Report of the Réviseur d’entreprises agréé
To the Unitholders of BlackRock Global Investment Series (FCP)Following our appointment by the Board of Directors of the Management Company dated June 26, 2015, we have audited the accompanying financial statements of BlackRock Global Investment Series (FCP) and of each of its sub-funds which comprise the statement of net assets and the portfolio of investments as at 31 January 2016, and the statements of operations and changes in net assets for the year then ended, and a summary of significant accounting policies and other explanatory notes to the financial statements.
Responsibility of the Board of Directors of the Management Company for the financial statementsThe Board of Directors of the Management Company is responsible for the preparation and fair presentation of these financial statements in accordance with Luxembourg legal and regulatory requirements relating to the preparation of the financial statements and for such internal control as the Board of Directors of the Management Company determines is necessary to enable the preparation of financial statements that are free from material misstatement, whether due to fraud or error.
Responsibility of the réviseur d’entreprises agrééOur responsibility is to express an opinion on these financial statements based on our audit. We conducted our audit in accordance with International Standards on Auditing as adopted for Luxembourg by the Commission de Surveillance du Secteur Financier. Those standards require that we comply with ethical requirements and plan and perform the audit to obtain reasonable assurance about whether the financial statements are free from material misstatement.
An audit involves performing procedures to obtain audit evidence about the amounts and disclosures in the financial statements. The procedures selected depend on the réviseur d’entreprises agréé’s judgement, including the assessment of the risks of material misstatement of the financial statements, whether due to fraud or error. In making those risk assessments, the réviseur d’entreprises agréé considers internal control relevant to the entity’s preparation and fair presentation of the financial statements in order to design audit procedures that are appropriate in the circumstances, but not for the purpose of expressing an opinion on the effectiveness of the entity’s internal control. An audit also includes evaluating the appropriateness of accounting policies used and the reasonableness of accounting estimates made by the Board of Directors of the Management Company, as well as evaluating the overall presentation of the financial statements.
We believe that the audit evidence we have obtained is sufficient and appropriate to provide a basis for our audit opinion.
OpinionIn our opinion, the financial statements give a true and fair view of the financial position of BlackRock Global Investment Series (FCP) and of each of its sub-funds as at 31 January 2016, and of the results of their operations and changes in their net assets for the year then ended in accordance with Luxembourg legal and regulatory requirements relating to the preparation of the financial statements.
Other matterSupplementary information included in the annual report has been reviewed in the context of our mandate but has not been subject to specific audit procedures carried out in accordance with the standards described above. Consequently, we express no opinion on such information. However, we have no observation to make concerning such information in the context of the financial statements taken as a whole.
For Deloitte Audit, Cabinet de révision agréé
Justin Griffiths, Réviseur d’entreprises agrééPartner
Luxembourg, 12 May 2016
Société à responsabilité limitée au capital de 35.000 € RCS Luxembourg B 67.895Autorisation d’établissement 10022179
Deloitte AuditSociété à responsabilité limitée
560, rue de NeudorfL-2220 LuxembourgB.P. 1173L-1011 Luxembourg
Tel: +352 451 451Fax: +352 451 452 992www.deloitte.lu
Report of the Réviseur d’entreprises agréé
Deloitte AuditSociété à responsabilité limitée
560, rue de NeudorfL-2220 Luxembourg
B.P. 1173L-1011 Luxembourg
Tel: +352 451 451Fax: +352 451 452 992
www.deloitte.lu
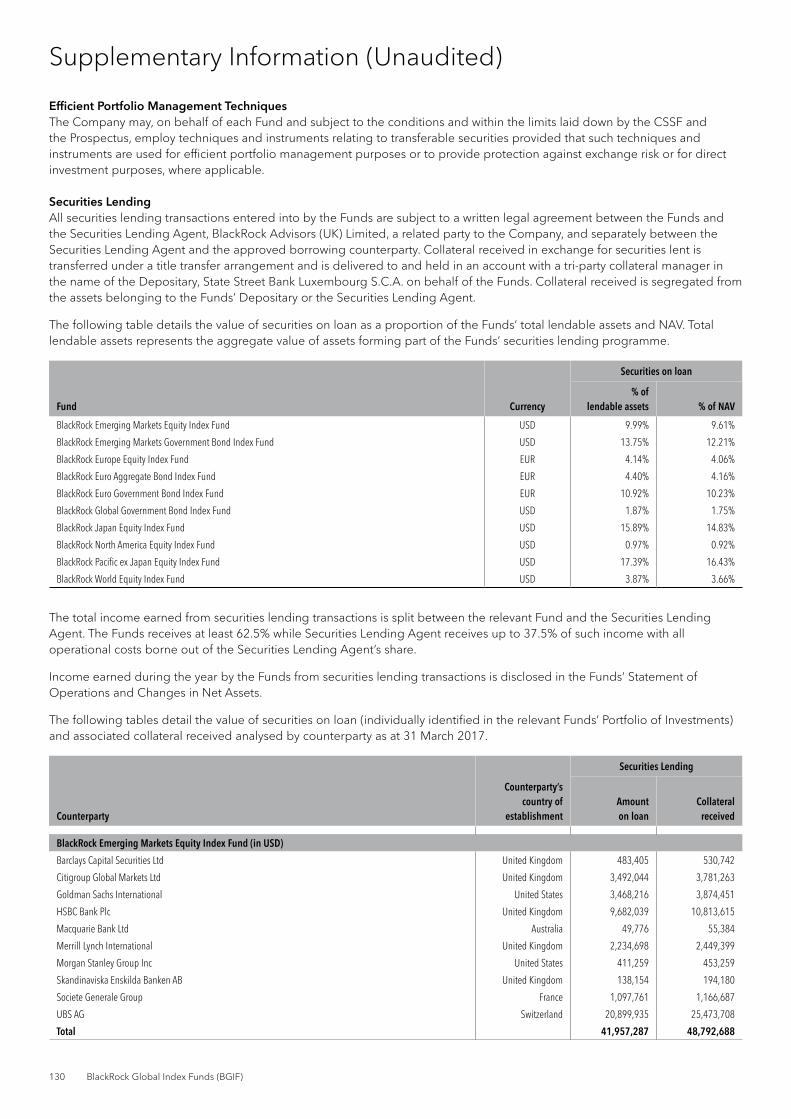
130 BlackRock Global Index Funds (BGIF)
Supplementary Information (Unaudited)
Supplementary Information (Unaudited)
Efficient Portfolio Management Techniques The Company may, on behalf of each Fund and subject to the conditions and within the limits laid down by the CSSF and the Prospectus, employ techniques and instruments relating to transferable securities provided that such techniques and instruments are used for efficient portfolio management purposes or to provide protection against exchange risk or for direct investment purposes, where applicable.
Securities LendingAll securities lending transactions entered into by the Funds are subject to a written legal agreement between the Funds and the Securities Lending Agent, BlackRock Advisors (UK) Limited, a related party to the Company, and separately between the Securities Lending Agent and the approved borrowing counterparty. Collateral received in exchange for securities lent is transferred under a title transfer arrangement and is delivered to and held in an account with a tri-party collateral manager in the name of the Depositary, State Street Bank Luxembourg S.C.A. on behalf of the Funds. Collateral received is segregated from the assets belonging to the Funds’ Depositary or the Securities Lending Agent.
The following table details the value of securities on loan as a proportion of the Funds’ total lendable assets and NAV. Total lendable assets represents the aggregate value of assets forming part of the Funds’ securities lending programme.
Securities on loan
Fund Currency% of
lendable assets % of NAV
BlackRock Emerging Markets Equity Index Fund USD 9.99% 9.61%
BlackRock Emerging Markets Government Bond Index Fund USD 13.75% 12.21%
BlackRock Europe Equity Index Fund EUR 4.14% 4.06%
BlackRock Euro Aggregate Bond Index Fund EUR 4.40% 4.16%
BlackRock Euro Government Bond Index Fund EUR 10.92% 10.23%
BlackRock Global Government Bond Index Fund USD 1.87% 1.75%
BlackRock Japan Equity Index Fund USD 15.89% 14.83%
BlackRock North America Equity Index Fund USD 0.97% 0.92%
BlackRock Pacific ex Japan Equity Index Fund USD 17.39% 16.43%
BlackRock World Equity Index Fund USD 3.87% 3.66%
The total income earned from securities lending transactions is split between the relevant Fund and the Securities Lending Agent. The Funds receives at least 62.5% while Securities Lending Agent receives up to 37.5% of such income with all operational costs borne out of the Securities Lending Agent’s share.
Income earned during the year by the Funds from securities lending transactions is disclosed in the Funds’ Statement of Operations and Changes in Net Assets.
The following tables detail the value of securities on loan (individually identified in the relevant Funds’ Portfolio of Investments) and associated collateral received analysed by counterparty as at 31 March 2017.
Securities Lending
Counterparty
Counterparty’s country of
establishmentAmount on loan
Collateral received
BlackRock Emerging Markets Equity Index Fund (in USD)
Barclays Capital Securities Ltd United Kingdom 483,405 530,742
Citigroup Global Markets Ltd United Kingdom 3,492,044 3,781,263
Goldman Sachs International United States 3,468,216 3,874,451
HSBC Bank Plc United Kingdom 9,682,039 10,813,615
Macquarie Bank Ltd Australia 49,776 55,384
Merrill Lynch International United Kingdom 2,234,698 2,449,399
Morgan Stanley Group Inc United States 411,259 453,259
Skandinaviska Enskilda Banken AB United Kingdom 138,154 194,180
Societe Generale Group France 1,097,761 1,166,687
UBS AG Switzerland 20,899,935 25,473,708
Total 41,957,287 48,792,688

Annual Report and Audited Accounts 131
Supplementary Information (Unaudited) continued
Securities Lending
Counterparty
Counterparty’s country of
establishmentAmount on loan
Collateral received
BlackRock Emerging Markets Government Bond Index Fund (in USD)
Barclays Bank Plc United Kingdom 42,798,430 46,508,269
BNP Paribas SA France 16,602,636 19,058,780
Citigroup Global Markets Ltd United Kingdom 17,903,319 18,668,218
Credit Suisse Securities Ltd United Kingdom 26,648,910 34,041,633
JP Morgan Securities Plc United Kingdom 57,341,108 63,684,701
Morgan Stanley Group Inc United States 15,476,093 16,116,111
Nomura International Plc United Kingdom 40,118,439 43,907,019
Royal Bank of Scotland Plc United Kingdom 4,283,288 4,537,805
Societe Generale SA France 293,654 326,617
UBS AG Switzerland 7,517,723 8,367,435
Total 228,983,600 255,216,588
BlackRock Europe Equity Index Fund (in EUR)
Barclays Capital Securities Ltd United Kingdom 3,596,795 3,949,012
BNP Paribas Arbitrage SNC France 601,999 661,067
Citigroup Global Markets Ltd United Kingdom 1,923,290 2,082,580
Credit Suisse Securities Limited United Kingdom 229,083 245,024
Goldman Sachs International United States 174,065 194,453
HSBC Bank Plc United Kingdom 1,975,218 2,206,069
Macquarie Bank Ltd Australia 126,325 140,558
Merrill Lynch International United Kingdom 2,262,715 2,480,106
Morgan Stanley Group Inc United States 1,066,756 1,175,697
Nomura International Plc United Kingdom 1,299,947 1,461,402
Societe Generale SA France 1,233,249 1,310,681
The Bank of Nova Scotia Canada 75,624 83,849
UBS AG Switzerland 2,841,352 3,463,158
Total 17,406,418 19,453,656
BlackRock Euro Aggregate Bond Index Fund (in EUR)
Barclays Bank Plc United Kingdom 366,557 398,330
Citigroup Global Markets Ltd United Kingdom 176,003 183,522
HSBC Bank Plc United Kingdom 2,612,159 2,922,555
JP Morgan Securities Plc United Kingdom 294,187 328,160
Morgan Stanley Group Inc United States 197,717 205,894
Nomura International Plc United Kingdom 1,640,366 1,799,653
Societe Generale SA France 7,286,701 8,084,409
The Bank of Nova Scotia Canada 4,941,850 5,518,883
UBS AG Switzerland 1,720,657 1,929,674
Total 19,236,197 21,371,080
BlackRock Euro Government Bond Index Fund (in EUR)
BNP Paribas Arbitrage SNC France 3,885,274 4,070,600
HSBC Bank Plc United Kingdom 7,757,788 8,635,613
Macquarie Bank Ltd Australia 2,019,938 2,310,232
Nomura International Plc United Kingdom 4,125,235 4,529,620
Societe Generale SA France 24,315,728 26,970,427
UBS AG Switzerland 2,559,769 2,870,718
Total 44,663,732 49,387,210

132 BlackRock Global Index Funds (BGIF)
Supplementary Information (Unaudited) continued
Securities Lending
Counterparty
Counterparty’s country of
establishmentAmount on loan
Collateral received
BlackRock Global Government Bond Index Fund (in USD)
Barclays Capital Securities Ltd United Kingdom 130,878 274,268
HSBC Bank Plc United Kingdom 1,240,670 1,371,319
Societe Generale SA France 198,392 274,280
UBS AG Switzerland 88,882 99,679
Total 1,658,822 2,019,546
BlackRock Japan Equity Index Fund (in USD)
Barclays Capital Securities Ltd United Kingdom 17,507,679 19,222,115
BNP Paribas Arbitrage SNC France 1,988,707 2,183,838
Goldman Sachs International United States 813,425 908,702
Merrill Lynch International United Kingdom 700,642 767,956
Morgan Stanley Group Inc United States 249,574 275,062
UBS AG Switzerland 1,115,926 1,360,137
Total 22,375,953 24,717,810
BlackRock North America Equity Index Fund (in USD)
Citigroup Global Markets Ltd United Kingdom 429,013 464,545
Goldman Sachs International United States 4,428,868 4,947,622
Morgan Stanley Group Inc United States 437,591 482,279
Societe Generale SA France 1,295,233 1,376,557
UBS AG Switzerland 589,933 719,035
Total 7,180,638 7,990,038
BlackRock Pacific ex Japan Equity Index Fund (in USD)
Barclays Capital Securities Ltd United Kingdom 398,148 437,136
Citigroup Global Markets Ltd United Kingdom 1,089,356 1,179,578
HSBC Bank Plc United Kingdom 4,296,246 4,798,366
Macquarie Bank Ltd Australia 9,901,223 11,016,783
Merrill Lynch International United Kingdom 12,014,774 13,169,100
Morgan Stanley Group Inc United States 201,147 221,689
Societe Generale SA France 20,255,193 21,526,956
UBS AG Switzerland 2,639,041 3,216,572
Total 50,795,128 55,566,180
BlackRock World Equity Index Fund (in USD)
Barclays Capital Securities Ltd United Kingdom 15,362,852 16,867,258
BNP Paribas Arbitrage SNC France 1,613,955 1,772,315
Citigroup Global Markets Ltd United Kingdom 3,190,277 3,454,501
Goldman Sachs International United States 4,729,129 5,283,053
HSBC Bank Plc United Kingdom 877,676 980,254
Macquarie Bank Ltd Australia 882,886 982,359
Merrill Lynch International United Kingdom 2,237,295 2,452,244
Morgan Stanley Group Inc United States 648,660 714,903
Nomura International Plc United Kingdom 431,552 485,151
Skandinaviska Enskilda Banken AB United Kingdom 144,953 203,736
Societe Generale SA France 6,702,244 7,123,058
The Bank of Nova Scotia Canada 166,559 184,675
UBS AG Switzerland 4,999,940 6,094,134
Total 41,987,978 46,597,641

Annual Report and Audited Accounts 133
Supplementary Information (Unaudited) continued
All securities on loan have an open maturity tenor as they are recallable or terminable on a daily basis.
Collateral The Funds engage in activities which may require collateral to be provided to a counterparty (“collateral posted”) or may hold collateral received (“collateral received”) from a counterparty.
The following table provides an analysis by currency of the cash and underlying non-cash collateral received/posted by way of title transfer collateral arrangement by the Funds, in respect of securities lending transactions, as at 31 March 2017.
Currency
Non-cash collateral received
BlackRock Emerging Markets Equity Index Fund (in USD)
Securities lending transactions
AUD 505,129
CAD 433,717
CHF 80,928
DKK 48,245
EUR 18,921,393
GBP 14,705,447
JPY 1,283,987
NOK 2
SEK 27,935
USD 12,785,905
Total 48,792,688
BlackRock Emerging Markets Government Bond Index Fund (in USD)
Securities lending transactions
AUD 59,398
CAD 892,062
CHF 1,348,294
DKK 5,993,288
EUR 162,307,226
GBP 27,103,021
JPY 2,334,410
NOK 5,785,245
SEK 1,418,748
USD 47,974,893
Total 255,216,585
BlackRock Europe Equity Index Fund (in EUR)
Securities lending transactions
AUD 611,602
CAD 134,258
CHF 514,530
DKK 358,973
EUR 6,841,114
GBP 3,482,131
JPY 284,368
NOK 1
SEK 15,386
USD 7,211,293
Total 19,453,656
Currency
Non-cash collateral received
BlackRock Euro Aggregate Bond Index Fund (in EUR)
Securities lending transactions
AUD 91,606
CAD 9,377
CHF 1,035,980
DKK 62,350
EUR 6,674,744
GBP 6,610,289
JPY 173,967
NOK 60,186
SEK 660,913
USD 5,991,668
Total 21,371,080
BlackRock Euro Government Bond Index Fund (in EUR)
Securities lending transactions
AUD 431,300
CHF 3,430,261
EUR 18,222,746
GBP 4,064,820
JPY 418,248
SEK 2,387,920
USD 20,431,915
Total 49,387,210
BlackRock Global Government Bond Index Fund (in USD)
Securities lending transactions
CHF 131,326
EUR 745,319
GBP 437,600
JPY 126,139
NOK 24,856
SEK 124,647
USD 429,659
Total 2,019,546
BlackRock Japan Equity Index Fund (in USD)
Securities lending transactions
AUD 1,813,984
CHF 2,137,711
DKK 1,747,328
EUR 6,477,951
GBP 4,421,756
JPY 213,928
USD 7,905,152
Total 24,717,810

134 BlackRock Global Index Funds (BGIF)
Supplementary Information (Unaudited) continued
Currency
Non-cash collateral received
BlackRock North America Equity Index Fund (in USD)
Securities lending transactions
AUD 548,803
EUR 4,060,761
GBP 717,653
JPY 1,315,770
SEK 3,432
USD 1,343,619
Total 7,990,038
BlackRock Pacific ex Japan Equity Index Fund (in USD)
Securities lending transactions
AUD 5,959,414
CAD 192,455
CHF 2,935,412
DKK 39,737
EUR 14,263,060
GBP 4,072,770
JPY 3,398,245
NOK 1
SEK 8,715
USD 24,696,371
Total 55,566,180
Currency
Non-cash collateral received
BlackRock World Equity Index Fund (in USD)
Securities lending transactions
AUD 3,152,881
CAD 39,316
CHF 2,127,150
DKK 1,533,266
EUR 15,911,352
GBP 7,561,476
JPY 2,340,497
NOK 2
SEK 25,521
USD 13,906,180
Total 46,597,641
Non-cash collateral received by way of title transfer collateral arrangement in relation to securities lending transactions, cannot be sold, re-invested or pledged.
The following table provides an analysis of the type, quality and maturity tenor of non-cash collateral received by the Funds by way of title transfer collateral arrangement in respect of securities lending transactions, as at 31 March 2017.
Collateral type and quality
Maturity Tenor
Total2 – 7 days 8 – 30 days 31 – 90 days 91 – 365 daysMore than
365 days
Open
BlackRock Emerging Markets Equity Index FundCollateral received – securities lendingFixed IncomeInvestment grade – – – 59 9,269,713 – 9,269,772
EquitiesRecognised equity index – – – – – 39,522,916 39,522,916
Total – – – 59 9,269,713 39,522,916 48,792,688BlackRock Emerging Markets Government Bond Index FundCollateral received – securities lendingFixed IncomeInvestment grade 43,324 – 57,453 5,579,901 172,779,288 – 178,459,966
EquitiesRecognised equity index – – – – – 76,756,622 76,756,622
Total 43,324 – 57,453 5,579,901 172,779,288 76,756,622 255,216,588
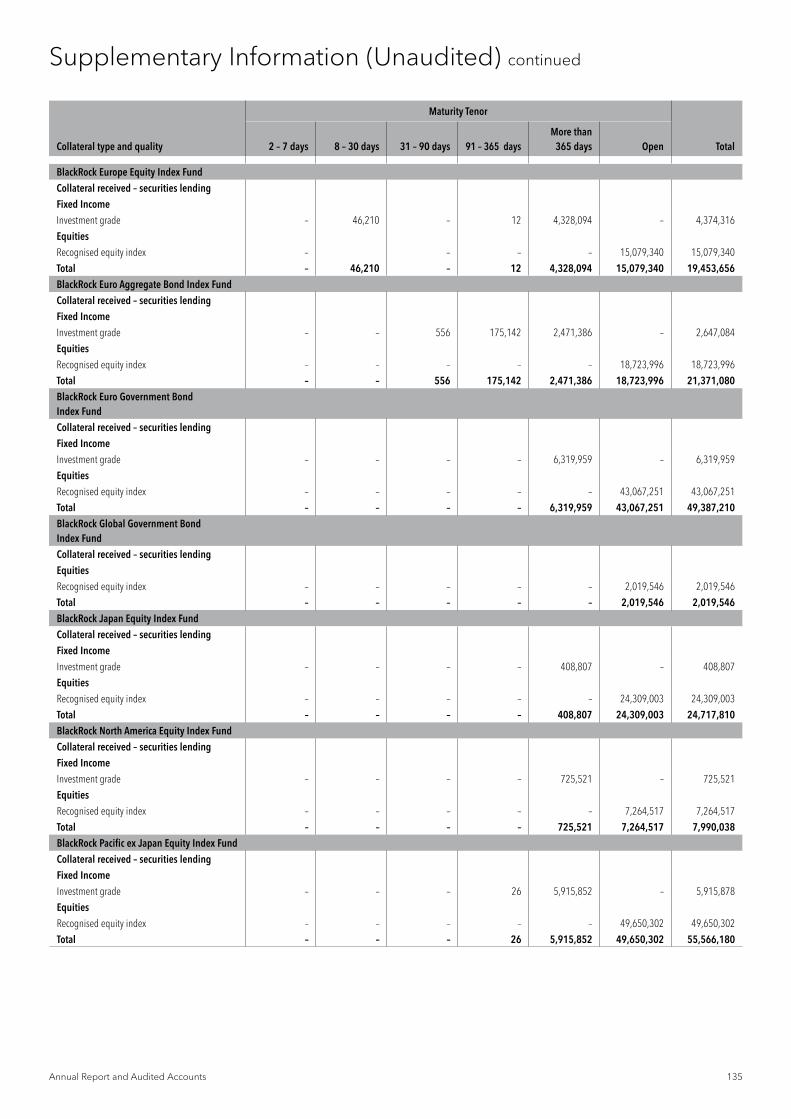
Annual Report and Audited Accounts 135
Supplementary Information (Unaudited) continued
Collateral type and quality
Maturity Tenor
Total2 – 7 days 8 – 30 days 31 – 90 days 91 – 365 daysMore than
365 days
Open
BlackRock Europe Equity Index FundCollateral received – securities lendingFixed IncomeInvestment grade – 46,210 – 12 4,328,094 – 4,374,316
EquitiesRecognised equity index – – – – 15,079,340 15,079,340
Total – 46,210 – 12 4,328,094 15,079,340 19,453,656BlackRock Euro Aggregate Bond Index FundCollateral received – securities lendingFixed IncomeInvestment grade – – 556 175,142 2,471,386 – 2,647,084
EquitiesRecognised equity index – – – – – 18,723,996 18,723,996
Total – – 556 175,142 2,471,386 18,723,996 21,371,080BlackRock Euro Government Bond Index FundCollateral received – securities lendingFixed IncomeInvestment grade – – – – 6,319,959 – 6,319,959
EquitiesRecognised equity index – – – – – 43,067,251 43,067,251
Total – – – – 6,319,959 43,067,251 49,387,210BlackRock Global Government Bond Index FundCollateral received – securities lendingEquitiesRecognised equity index – – – – – 2,019,546 2,019,546
Total – – – – – 2,019,546 2,019,546BlackRock Japan Equity Index FundCollateral received – securities lendingFixed IncomeInvestment grade – – – – 408,807 – 408,807
EquitiesRecognised equity index – – – – – 24,309,003 24,309,003
Total – – – – 408,807 24,309,003 24,717,810BlackRock North America Equity Index FundCollateral received – securities lendingFixed IncomeInvestment grade – – – – 725,521 – 725,521
EquitiesRecognised equity index – – – – – 7,264,517 7,264,517
Total – – – – 725,521 7,264,517 7,990,038BlackRock Pacific ex Japan Equity Index FundCollateral received – securities lendingFixed IncomeInvestment grade – – – 26 5,915,852 – 5,915,878
EquitiesRecognised equity index – – – – – 49,650,302 49,650,302
Total – – – 26 5,915,852 49,650,302 55,566,180

136 BlackRock Global Index Funds (BGIF)
Supplementary Information (Unaudited) continued
Collateral type and quality
Maturity Tenor
Total2 – 7 days 8 – 30 days 31 – 90 days 91 – 365 daysMore than
365 days
Open
BlackRock World Equity Index FundCollateral received – securities lendingFixed IncomeInvestment grade – – – 5 3,744,872 – 3,744,877
EquitiesRecognised equity index – – – – – 42,852,764 42,852,764
Total – – – 5 3,744,872 42,852,764 46,597,641
Investment grade securities are those issued by an entity with a minimum investment grade credit rating from at least one globally recognised credit rating agency; Standard & Poor’s, Moody’s or Fitch.
A recognised equity index contains at least 20 equities where no single equity represents more than 20% of the total index and no five equities combined represent more than 60% of the total index.
The maturity tenor analysis for fixed income securities received or posted as collateral is based on the respective contractual maturity date, while for equity securities, ETFs and money market funds received or posted as collateral are presented as open transactions as they are not subject to a contractual maturity date.
The following table provides an analysis of the amounts of non-cash collateral received by the Funds in respect of securities lending transactions and held by the Funds’ Depositary (or through its delegates) or through a securities settlement system, as at 31 March 2017.
Non-cash collateral received
DepositarySecurities
lending
BlackRock Emerging Markets Equity Index FundState Street Bank Luxembourg S.C.A. (or its delegates) 48,792,688
BlackRock Emerging Markets Government Bond Index FundDepositary (Ireland) Limited (or its delegates) 100,531,640
Euroclear SA/NV 154,684,948
Total 255,216,588BlackRock Europe Equity Index FundState Street Bank Luxembourg S.C.A. (or its delegates) 19,453,656
BlackRock Euro Aggregate Bond Index FundState Street Bank Luxembourg S.C.A. (or its delegates) 19,674,650
Euroclear SA/NV 1,696,430
Total 21,371,080BlackRock Euro Government Bond Index FundState Street Bank Luxembourg S.C.A. (or its delegates) 49,387,210
BlackRock Global Government Bond Index FundState Street Bank Luxembourg S.C.A. (or its delegates) 2,019,546
BlackRock Japan Equity Index FundState Street Bank Luxembourg S.C.A. (or its delegates) 24,717,810
BlackRock North America Equity Index FundState Street Bank Luxembourg S.C.A. (or its delegates) 7,990,038
BlackRock Pacific ex Japan Equity Index FundState Street Bank Luxembourg S.C.A. (or its delegates) 55,566,180
BlackRock World Equity Index FundState Street Bank Luxembourg S.C.A. (or its delegates) 46,597,641
The following table lists the ten largest issuers by value of non-cash collateral received by the Funds by way of title transfer collateral arrangement across securities lending transactions as at 31 March 2017.
Issuers
Value
% of the Fund’s NAV
BlackRock Emerging Markets Equity Index FundUnited States Treasury 2,741,014 0.63%
United Kingdom Gilt 2,635,338 0.60%
Haemonetics Corp 2,586,651 0.59%
UniCredit SpA 2,540,461 0.58%
Enel SpA 2,540,460 0.58%
Belgium Government Bond 1,795,818 0.41%
Mediobanca SpA 1,472,852 0.34%
Vesuvius Plc 1,339,693 0.31%
PennyMac Mortgage Investment Trust 1,282,451 0.29%
UBM Plc 1,223,922 0.28%
Other issuers 28,634,028 6.56%
Total 48,792,688 11.17%BlackRock Emerging Markets Government Bond Index FundFrench Republic Government Bond OAT 33,572,416 1.79%
Belgium Government Bond 23,567,423 1.26%
Netherlands Government Bond 21,966,090 1.17%
Finland Government Bond 21,958,839 1.17%
Republic of Austria Government Bond 19,834,518 1.06%
United Kingdom Gilt 16,825,601 0.90%
Kreditanstalt fuer Wiederaufbau 11,267,796 0.60%
United States Treasury 9,607,601 0.51%
Bundesobligation 6,690,218 0.36%
Denmark Government Bond 5,993,288 0.32%
Other issuers 83,932,798 4.48%
Total 255,216,588 13.61%

Annual Report and Audited Accounts 137
Supplementary Information (Unaudited) continued
Issuers
Value
% of the Fund’s NAV
BlackRock Europe Equity Index FundUnited States Treasury 1,444,752 0.34%
United Kingdom Gilt 904,784 0.21%
Republic of Austria Government Bond 581,299 0.14%
French Republic Government Bond OAT 455,434 0.11%
Just Eat Plc 426,189 0.10%
MarketAxess Holdings Inc 360,424 0.08%
Belgium Government Bond 359,292 0.08%
LINE Corp 359,000 0.08%
Aurizon Holdings Ltd 358,994 0.08%
Dell Technologies Inc 'V' 358,983 0.08%
Other issuers 13,844,505 3.23%
Total 19,453,656 4.54%BlackRock Euro Aggregate Bond Index FundBelgium Government Bond 2,515,111 0.54%
Koninklijke KPN NV 794,083 0.17%
International Consolidated Airlines Group SA - CDI 686,748 0.15%
Experian Plc 663,453 0.14%
Marsh & McLennan Cos Inc 663,447 0.14%
Merck & Co Inc 663,446 0.14%
Novartis AG Reg 663,445 0.14%
McDonald's Corp 663,387 0.14%
FirstEnergy Corp 632,461 0.14%
French Republic Government Bond OAT 612,244 0.13%
Other issuers 12,813,255 2.77%
Total 21,371,080 4.62%BlackRock Euro Government Bond Index FundExperian Plc 2,451,855 0.56%
International Consolidated Airlines Group SA - CDI
2,451,840 0.56%
Marsh & McLennan Cos Inc 2,451,831 0.56%
Merck & Co Inc 2,451,827 0.56%
Novartis AG Reg 2,451,825 0.56%
McDonald's Corp 2,451,610 0.56%
Atlas Copco AB 'A' 2,387,920 0.55%
FirstEnergy Corp 2,337,321 0.54%
Rockwell Automation Inc 2,065,284 0.47%
Whirlpool Corp 2,001,298 0.46%
Other issuers 25,884,599 5.93%
Total 49,387,210 11.32%BlackRock Global Government Bond Index FundLloyds Banking Group Plc 149,531 0.16%
Total SA 149,474 0.16%
Anheuser-Busch InBev SA/NV 149,402 0.16%
Nordea Bank AB 124,647 0.13%
WPP Plc 124,643 0.13%
New York Community Bancorp Inc 124,627 0.13%
3M Co 124,626 0.13%
Diageo Plc 124,613 0.13%
LafargeHolcim Ltd Reg 124,593 0.13%
Hoshizaki Corp 124,588 0.13%
Other issuers 698,802 0.74%
Total 2,019,546 2.13%
Issuers
Value
% of the Fund’s NAV
BlackRock Japan Equity Index FundJust Eat Plc 1,773,852 1.18%
MarketAxess Holdings Inc 1,748,012 1.16%
LINE Corp 1,747,462 1.16%
Aurizon Holdings Ltd 1,747,430 1.16%
Dell Technologies Inc 'V' 1,747,376 1.16%
Pandora A/S 1,747,328 1.16%
Syngenta AG Reg 1,742,822 1.16%
Ipsen SA 1,422,058 0.94%
Moneysupermarket.com Group Plc 1,399,433 0.93%
Amundi SA 1,086,299 0.72%
Other issuers 8,555,738 5.67%
Total 24,717,810 16.39%BlackRock North America Equity Index FundKH Neochem Co Ltd 449,780 0.06%
Marathon Petroleum Corp 449,736 0.06%
Japan Tobacco Inc 449,489 0.06%
CIE Automotive SA 368,642 0.05%
Incitec Pivot Ltd 361,623 0.05%
TLG Immobilien AG 251,800 0.03%
Grupo Catalana Occidente SA 210,737 0.03%
Codere SA/Spain 197,977 0.03%
Tele Columbus Ag 192,654 0.02%
Republic of Austria Government Bond 169,463 0.02%
Other issuers 4,888,137 0.62%
Total 7,990,038 1.02%BlackRock Pacific ex Japan Equity Index FundUnited States Treasury 3,239,569 1.05%
Groupe Eurotunnel SE Reg 2,050,185 0.66%
BHP Billiton Ltd 2,050,183 0.66%
Gas Natural SDG SA 2,050,179 0.66%
Finisar Corp 2,050,175 0.66%
Melia Hotels International SA 2,050,154 0.66%
Electricite de France SA 2,050,146 0.66%
Otsuka Corp 1,789,547 0.58%
Societe BIC SA 1,763,792 0.57%
Macquarie Infrastructure Corp 1,460,706 0.47%
Other issuers 35,011,544 11.32%
Total 55,566,180 17.97%BlackRock World Equity Index FundJust Eat Plc 1,651,618 0.14%
MarketAxess Holdings Inc 1,535,884 0.13%
LINE Corp 1,533,384 0.13%
Aurizon Holdings Ltd 1,533,357 0.13%
Dell Technologies Inc 'V' 1,533,309 0.13%
Pandora A/S 1,533,266 0.13%
Syngenta AG Reg 1,529,313 0.13%
Moneysupermarket.com Group Plc 1,337,698 0.12%
United States Treasury 1,281,466 0.11%
Ipsen SA 1,247,845 0.11%
Other issuers 31,880,501 2.78%
Total 46,597,641 4.06%

138 BlackRock Global Index Funds (BGIF)
Supplementary Information (Unaudited) continued
No securities collateral received from a single issuer, in relation to efficient portfolio management has exceeded 20% of any of the respective Funds’ NAV at the year end date.
None of the Funds have been fully collateralised in securities issued or guaranteed by an EU member state at the year end date.


31 March 2017
© 2017 BlackRock, Inc. All Rights reserved. BLACKROCK, BLACKROCK SOLUTIONS, iSHARES, SO WHAT DO I DO WITH MY MONEY, INVESTING FOR A NEW WORLD, and BUILT FOR THESE TIMES are registered and unregistered trademarks of BlackRock, Inc. or its subsidiaries in the United States and elsewhere. All other trademarks are those of their respective owners.
Want to know more? +44 (0)20 7743 3000 www.blackrockinternational.com