INTERNATIONAL OPPORTUNITIES FUNDS
164
19 AOUT 20021 INTERNATIONAL OPPORTUNITIES FUNDS Sociiti d'lnvestissement h Capital Variable Luxembourg UNAUDITED SEMI-ANNUAL REPORT AS AT JUNE 30, 2008 No subscription an be received on the bask of this hcial W~K. Subscriptions are only did if made on the basis of the cuttent prospectus accompanied by the latest annual report and the most recent semi-annual report, if published theder.
-
Upload
khangminh22 -
Category
Documents
-
view
3 -
download
0
Transcript of INTERNATIONAL OPPORTUNITIES FUNDS

1 9 AOUT 20021
INTERNATIONAL OPPORTUNITIES FUNDS Sociiti d'lnvestissement h Capital Variable
Luxembourg
UNAUDITED SEMI-ANNUAL REPORT
AS AT JUNE 30, 2008
No subscription a n be received on the bask of this h c i a l W ~ K . Subscriptions are only d i d if made on the basis of the
cuttent prospectus accompanied by the latest annual report and the most recent semi-annual report, if published t h e d e r .
INTERNATIONAL OPPORTWNITIES FUNDS
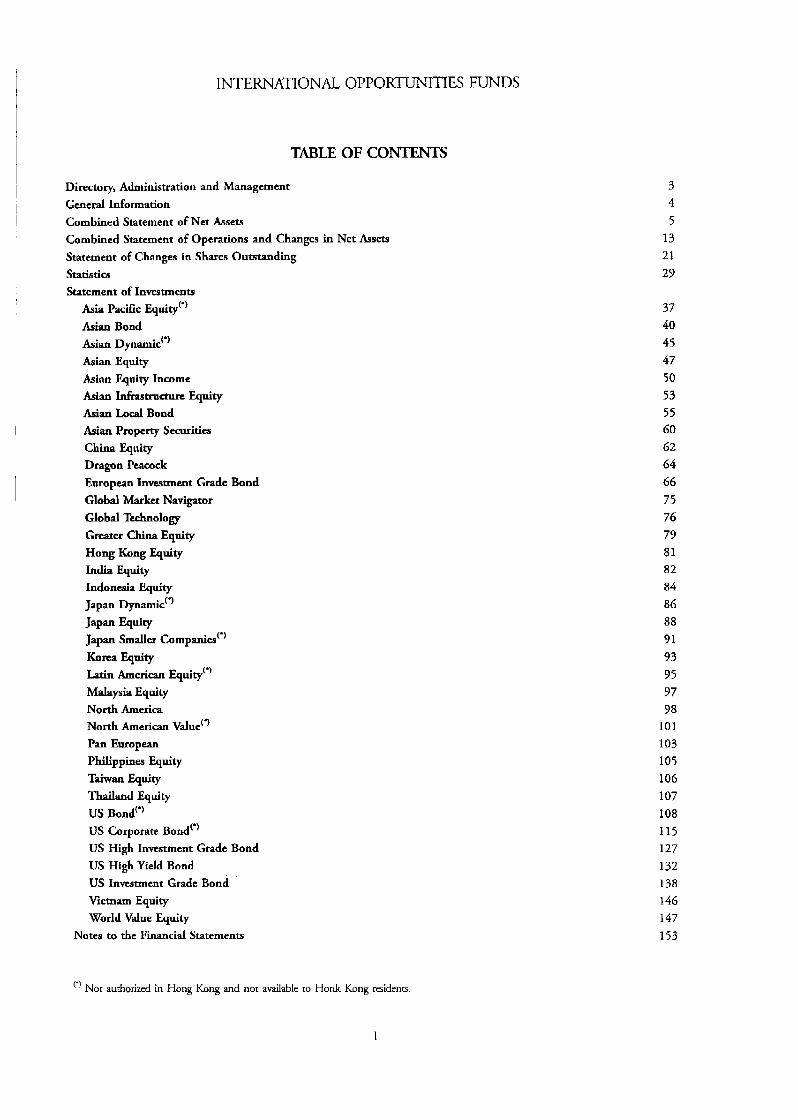
TABLE OF CONTENTS
Directory, Administration and Management General Information Combined Statement of Net Assets Combined Statement of Operations and Changes in Net Assets Statement of Changes in Shares Outstanding StatiStiCS
Statement of Investments Asia Pacific ~quity'' Asian Bond hian Dynamic('' Asian Equity Asian Equity Income Asian Infrastructure Equity Asian Local Bond Asian Property Securities China Equity Dragon P e d European Investment Grade Bond Global Market Navigator
Global Technology Greater China Equity Hong Kong Equity India Equity Indonesia Equity Japan Dynamic'*'
Japan Smaller Companies'*' Korea 4uity ati in American Equity"' Malaysia Equity North America ~ o r t h American Wue"' Pan European Philippines Equity Taiwan Equity Thailand Equity US Bond"' US Corporate Bond"' US High Investment Grade Bond US High Yield Bond US Investment Grade Bond Vietnam Equity World Value Equity
Japan Equity
Notes to the Financial Statements
') N o t authorized in Hong Kong and not available to Honk Kong residents.
3 4 5
13 21 29
37 40 45 47 50 53 55 60 62 64 66 75 76 79 81 82 84 86 88 91
93 95 97 98
101 103 105 106 107 108 115 127 132 138 146 147 153
INTERNATIONAL OPPORTUNITIES FUNDS
DIRECTORY, A D M I N I m O N AND MANAGEMENT
Board of Directors and Okers
Chairman
Directors
Day-to-day Managers
Mr. Stephen Paul BICKELL Regional Risk Director Prudential Corporation Asia, Hong Kong
Mr. Suraj MISHRA Chicf Executive Officer Prudential Asset Management (Singapore) Limited
Mr. Peter Martin LLOYD Chief Actuary, Asia Prudential Corporation Asia, Hong Kong
Mt. Guy STRAPP Regional Head of lnvtstment Management (Asia) and Chief Executive Officer Prudential Asset Management (Hong Kong) Limited
Mr. Kevin GIBSON Chief Investment OWcer, Japanese Equities Prudential Asset Management (Hong Kong) Limited
Mr. Manuel HAUSER Independent day-to-day Manager Luxembourg
Mr. Balasubramanian SWAMINATHAN Regional Chief Operating Officer - Funds Prudential Fund Services Private Limited Singapore
2
INTERNATIONAL OPPORTUNITIES FUNDS
DIRECTORY, ADMLNISTRATION AND MANAGEMENT (continued)
Admmstmtion and Management . .
Registered Office
Investment Manager
Investment Sub-Managers
Aetogolf Center lA, Hoehenhof L-1736 Scnningerberg Grand Duchy of Luxembourg
Prudential Asset Management (Singapore) Limited 30 Cecil Street, #20-01 Prudential Tower Singapore 049712
For the European Investment Grade Bond, the Global Technology, the Pan European and the World Value Equity Sub-Funds, M&G Investment Management Limited Laurence Pountncy Hill London EC4R O H H United Kingdom
For the Asian Dynamic, the Asian Equity, the Asian Infrastructure Equity, the China Equity, the Greater China Equity, the Hong Kong Equity, the Japan Equity and the Korea Equiry Sub-Funds, Prudentid Asset Management (Hong Kong) Limited Suite 1701, Two Exchange Square, Central, Hong Kong
For the North America, the North American Value, the US Bond, the US Corporate Bond, the US High Investment Grade Bond, the US Investment Grade Bond and the US High Yield Bond Sub-Funds, PPM America, Inc. 225 West Wacker Drive, Suite 1200 Chicago, Illinois 60606 United States of America
Custodian, Central Administration, Registrar and Transfer Agent and Domiciliary and Corporate A p t
The Bank of New York (Luxembourg) S.A. Aerogolf Center 1A, Hoehenhof L-1736 Senningerberg Grand Duchy of Luxembourg
Auditor
Legal Adviser
KPMG Audit S.i r.1. 31, A k Scheffer L-2520 Luxembourg Grand Duchy of Luxembourg
Kremer k o c i t s & Clifford Chance 4, Place de Paris L-1011 Luxembourg Grand Duchy of Luxembourg
3
INTERNATIONAL OPPORTUNITIES FUNDS
GFNERAL INFORMATION
Current Prospectus
The SICAV‘s Prospecnu and simplified Prospeaus dated June 2008 may be obrained kom h e Registered Office of the SICAV. Copies of the Company’s Arricles of Association may also be obrained, free of charge, from the Fkgutered Office of the SICAV.
During the y a , the Prospectus has been amended in line with CSSF approval. Please refer to the Prospecrus dated June 2008 to have the current applicable terms and conditions.
Authorised status
T h e Company is governed by the Luxembourg Law dated December 20, 2002 (the “2002 Lw’’). The Company fulf~I~ the provisions of article 27 applicable to rht investment mmpanies which have not designated a management mmpany i t . self managed investment companies. Thus, the Company complies with the provisions of directives 2001/107/EC and 2001/108/EC of the European Parliament and of the Council of January 21,2002 amending the Council Directive 85/61 1/EEC on the mordinauon of laws, regulations and administrative provisions relating to undertaking for collective investment in transkrable &ties (UClTS) with a view to regdaring management companies and simplified prospectuses respecrively with regards to i n v m e n r s of UCITS.
AnnUalGeneralhktiq
The annual general meming of Shareholders of &e SICAV will be held at the RcgLstcred Office of the SICAV or at such other place in Luxembourg on the semnd Friday of April in each y a r at 1 1 am., or if any such day is not a Business Day in Luxunbourg, on the next following Business Day in Luxembourg.
Notices of all general meetings will be sent to rhe holders of registered Sham by post at last 8 days prior IO the meehg at their addresses in the tegister of Shareholders.
The notices of all general meetings of Shareholders may be published in any newspapers as the Board of D i m e may &de.
~ r t a n d h u n t s
The i inand yearend of the SICAV will be the last day of December of each y w .
Audited annual reports will be published withii 4 monrhs &r the financial yew-end and unaudited semiannual r e p m will be published within 2 months after the end of the relevant period Such reports will be mailed to cach registered Shareholder at their i q i s t d address and will be madc available at the Registered Office of the SICAV during normal business hours.
Publication of Ern
Prim will be made available at the registered office of the SICAV on a daily basis and on Bloomberg and Rcuters’ Lipper Hindsit. The SlCAV will further arrange for regular publicadon of h e prim in the Financial Xmes, or in such other newspapers as the Board of Directon may decide on.
Purchases and Sales
A demiled list of investments purchased and sold for any Sub-Fund during the period is available upon q u a t , frae of charge. from the Rcgisrcrcd Office of the SICAV.
4
INTERNATIONAL OPPORTUNITIES FUNDS
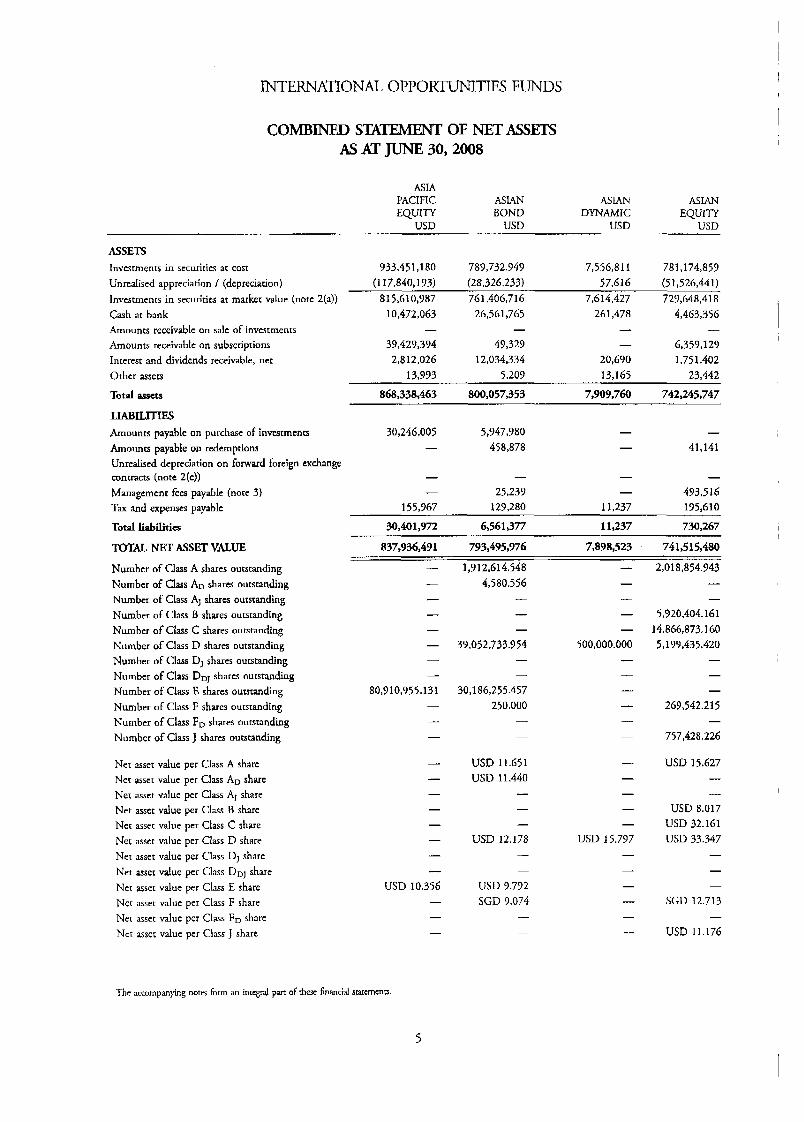
COMJ3INED STATEMENT OF NETASSETS As AT JUNE 30,2008
ASIA PACIFIC ASIAN ASIAN ASIAN EQUITY BOND DYNAMIC EQUITY
USD USD WSD USD
ASSETS Investments in securities at cost 733,451,180 789,732,949 7,556,811 781,174,857 Unrealised appreciation / (depreciation) (1 17,840,193) (28,326,233) 5 7 6 1 6 (5 1,52644 1)
Investments in securities at marker value (notc 2(a)) 81 5,610,987 761,406,716 7,614,427 727,648,418
Cash at bank 10,472,063 26,561,765 26 1,478 4,463,356 Amounts receivable on sale of investments - - I I
Amounts receivable on subscriptions 39,429,394 49,329 - 6,359,129 Interest and dividends receivable, net 2,812,026 12,034,334 20,690 1,75 1,402 Othcr assets 13,933 5,209 13,165 23,442
Total assets 868,338,463 800,057,353 7,909,760 742,245,747
LIABILITIES 5,947,980 - - Amounts payable on purchase of investments 30,246,005
Amounts payable on redemptions - 458,878 - 41,141 Unrealiscd depreciation on forward foreign exchange contracts (note 2(c)) - - - - Management fees payable (nore 3) - 25,239 - 493,5 16 Tax and expenses payable 155,967 129,280 1 1,237 135,610
Total liabilities 30,401,972 6,561,377 11,237 730,267
TOTAL NET ASSET VALUE 837,936,491 793,495,376 7,898,523 . 741,515,480
Number of Class A shares outstanding I 1,9 12,614.548 - Number of Class AD shares outstanding Number of Class A1 shares outstanding
Number of Class B shares outstanding Number of Class C shares outstanding Number of Class D shares outstanding Number of Class DJ shares outstanding Number of Class DDj s h a m outstanding Number of Class E shares outstanding
Number of Class F shares outstanding Number of Class FD shares outstanding Number of Class J shares outstanding
Net asset value per Class A share Net asset value per Class AD share Net asset value per Class A] share Net asset value per Class B share Net asset value per Class C share Net asset value per Class D share Net asset value per Class D, share Net asset value per Class DDJ share
Net asset value per Class E share Net asset value per Class F share Net asset value per Class FD share
Nct asset value per Class J share
4,580.556 - - -
39,052,733.9 54 -
- 30,186,255.457
250.000 - -
USD 11.651 USD 11.440
I
- -
USD 12.178 - -
USD 7.772 SGD 7.074 I
-
2,018,854.943 - -
5,920,404.161 14,866,873.160 5.1 99,435.420
- - -
269,542.215
757,428.226
USD 15.627
-
- -
USD 8.017 USD 32.161
USD 33.347 -
- -
SGD 12.713 -
USD 11.176
The xmmpanying noto form an inrcgnJ pan of these financial staternena.
5
INTERNATIONAL OPPORTUNITIES FUNDS
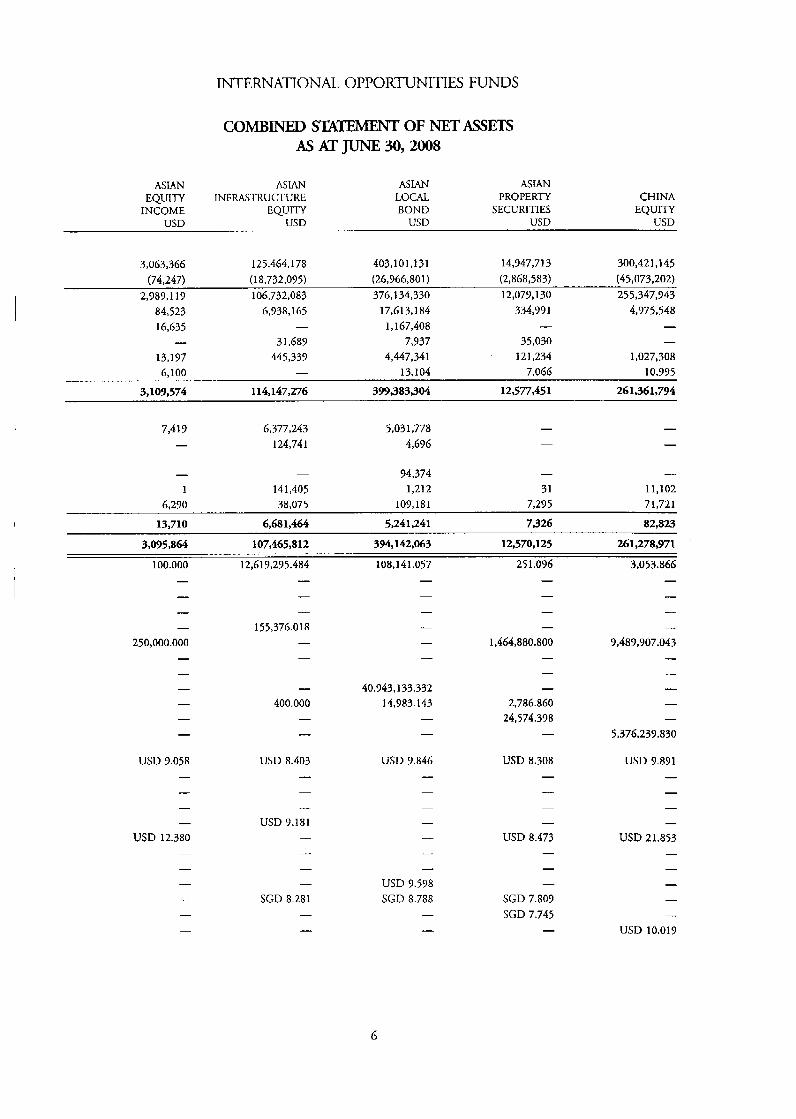
COMBINED SmTFMFNT OF NETASSEXS ASATJUNE30,2008
ASIAN ASIAN ASIAN EQUITY INFRASTRUCTURE LOCAL PROPER= CHINA
INCOME EQUITY BOND SECURITIES EQUITY USD USD USD USD USD
3,063,366 125,464,178 (74,247) (1 8,732,095)
2,987,119 106,732,083 84,523 6,938,165 16,635 - I 3 1,687
13,177 445,339 6,100 -
403,101,131 (26.966.80 1) 376,134,330
17,613.1 84 1,167,408
7,937 4,447,341
13,104
14,947,713 (2,868,583) 12,079,130
334,991
35,030 121,234
7,066
-
300.42 1,145 (45,073,202) 255,347,943
4,975,548
- 1,027,308
10,995
3,109,574 114,147,276 399383,304 12,577,451 26 1,36 1,794
7,419 6,377,243 5,031,778 - 124,741 4,696
- - 94,374 - - 1 141,405 1,212 31 11,102
6,290 38,075 109,181 7,295 71,721
13,710 6,681,464 5,241,241 7,326 82,823
3,095,8&4 107,465,812 394,142,063 12,570,125 261,278,971
100.000 12,619,295.484 108,141.057 251.096 3,053.866
- 250,000.000
I
155,376.018 I
- 1,464,880.800
- 9,489,907.043
I
400.000 -
-
40,943,133.332 14,983.143
-
-
- -
2,786.860 24,574.398
-
- I
I
- 5,376,239.830
USD 9.058 USD 8.403 USD 9.846 USD 8.308 USD 9.891
- -
USD 12.380
- USD 9.181 -
USD 8.473
- -
USD 21.853
-
SGD 8.281 - I
USD 9.578 SGD 8.788
- SGD 7.809 SGD 7.745
-
- I
- USD 10.019
6
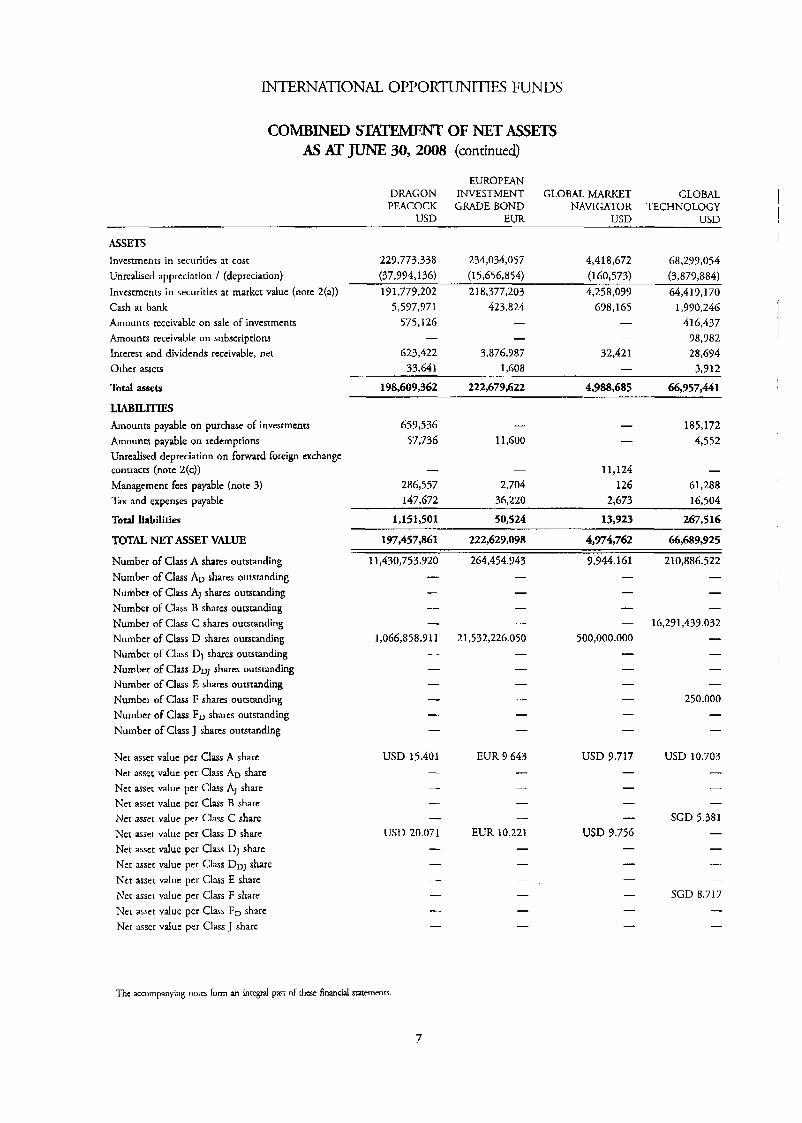
INTERNATIONAL OPPORTUNITIES FUNDS
COMBINED SEX- OF NET ASSETS AS AT JUNE 30,2008 (conrinued)
EUROPFAN DRAGON INVESTMENT GLOBAL MARKET GLOBAL PEACOCK GRADE BOND NAVIGATOR TECHNOLOGY
USD EUR USD USD
ASSETS InVeStIIIehtS in securities at cost 229,773,338 234,034,057 4,418,672 68,299,054 Unrealised appreciation / (depreciation) (37,994,136) (15,656,854) (160,573) (3,879,884) lnvcstments in securities at market value (note 2(a)) 191,779,202 218,377,203 4,258,099 6441 9,170 Cash at bank Amounts receivable on sale of investments Amounts receivable on subscriptions Interest and dividends receivable, net Other assets
Total assets
LMILITIES Amounts payable on purchase of investments Amounts payable on redemptions
5,597,971 423,824 678,165 1,990,246 575,126 - - 416,437
- - 98,982 623,422 3,876,987 32,421 28,694
33.641 1.608 - 3.912
-
198,609,362 222,679,622 4,988,685 66,957,441
659,536 I
57,736 1 1 ,GOO - 185,172 - 4,552
Unrealised depreciation on forward foreign exchange contracts (note 2(c)) - - 11,124 - Management fees payable (note 3) 286,557 2,704 126 61,288 Tax and expenses payable 147,672 36,220 2,673 16,504
Total liabilities 1,151,501 50,524 13,923 267,516
TOTAL NET ASSET VALUE
Number of Class A shares outstanding Number of Class AD shares outsranding Number of Class AJ shares outstanding Number of Class B shares outstanding Number of Class C shares outstanding Number o f Class D shares outstanding Number of Class D] shares outstanding Number of Class DDJ shares outstanding Number of Class E shares outstanding Number of Class F shares outstanding Number of Class FD shares outstanding Number of Class J shares outstanding
Net asset value per Class A share Net asset value per Class AD share Net asset value per Class AJ share
Net asset value per Class B share Net z s c t value per Class C share Net asset value per Class D share Net assct value per Class DJ share Net assct value per Class DDJ share Net asset value per Class E share Net asset value per Class F share Net asset value per Class FD share Nct asset vduc per Class J share
197,457,861 222,629,098 4,974,762 66,689,925
11,430,753.920 264,454.943 9,944.161 210,886.522
I - - I
- - - 16,291,439.032 1,066,858.91 1 21,532,226.050 500,000.000 -
USD 9.717 - - - I
USD 9.756 -
USD 10.703 - - -
SGD 5.381 - - - -
SGD 8.717 I
-
I
The accompanying nor- form an integral part of t h e financial statements.
7
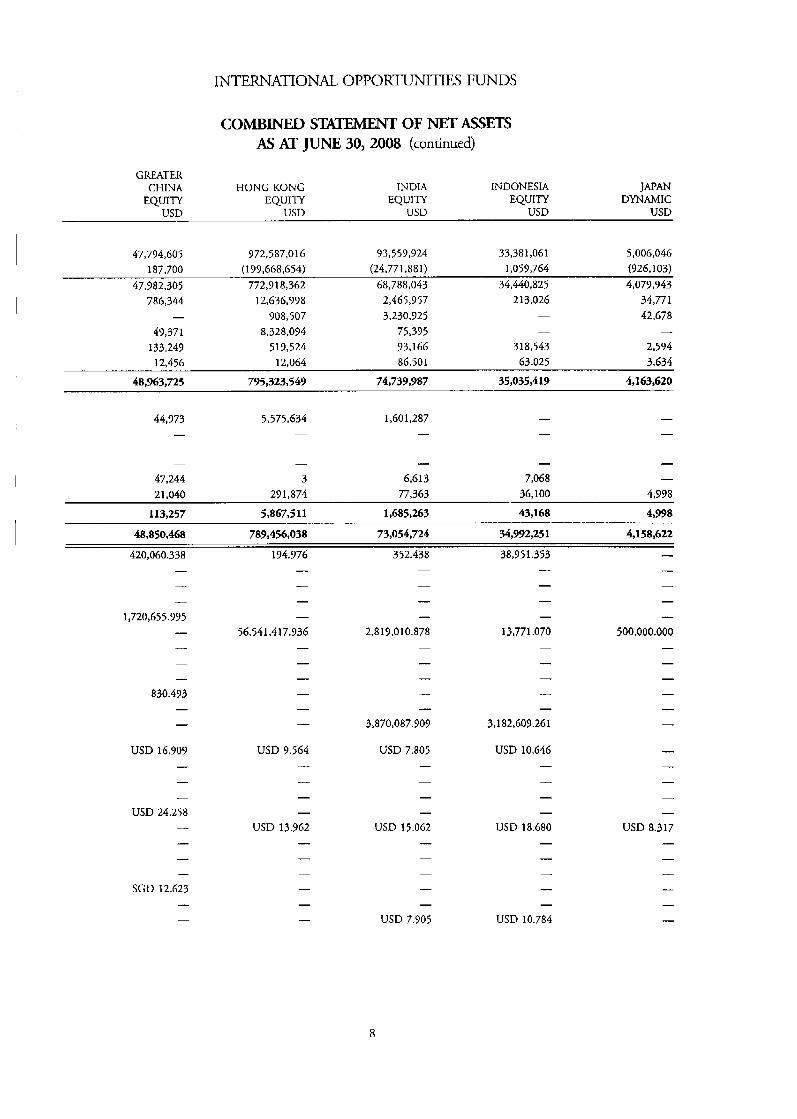
INTERNATIONAL OPPORTUNITIES FUNDS
COMBXNEO S n OF NETASSETS As AT JUNE 30, 2008 (continued)
GREATER CHINA HONG KONG INDIA INDONESIA JAPAN EQUITY EQUITY EQUITY EQUITY DYNAMIC
USD USD USD USD USD
47,794,605 972,587,O 16 93,559,924 33,38 1,061 5,006,046 187,700 (199,668,654) (24,771,881) 1,059,764 (926,103)
47,982,305 772,918,362 68,788,043 34,440,825 4,079,943 7 8 6,3 4 4 12,636,978 2,465,957 2 13,026 34,771
- 908,507 3,230,725 - 42,678
49,371 133,249
12.456
8,328,094 5 17,524
12.064
75,395 93,166 86,501
-
318,543 63,025
- 2,594 3,634
48,763,725 795,323,549 74,739,987 35,035,419 4,163,620
44,973 I
5,575,634 -
1,601,287 -
-
47,244 21,040
-
3 291,874
- 6 6 1 3
77,363
- 7,068
36,100 -
4,938
113,257 5,847,511 1,685,263 43,168 4,998
48,850,468 789,456,038 73,054,724 34,772,251 4,158,622
420,060.338 194.976 352.438 38,951.353
- 1,720,655.995
I
-
56,541,417.936 -
- 2,819,010.878
-
- 13,771.070
-
I
500,000.000 -
- 830.493
- I
3,870,087.909
- 3,182,609.261
USD 16.909 - - -
USD 24.258 - I
- -
SGD 12.623 I
USD 9.564 I
- - -
USD 13.962 - - -
USD 7.805 -
USD 10.646 - - - -
USD 18.680 - - - I
- USD 10.784
- USD 7.905
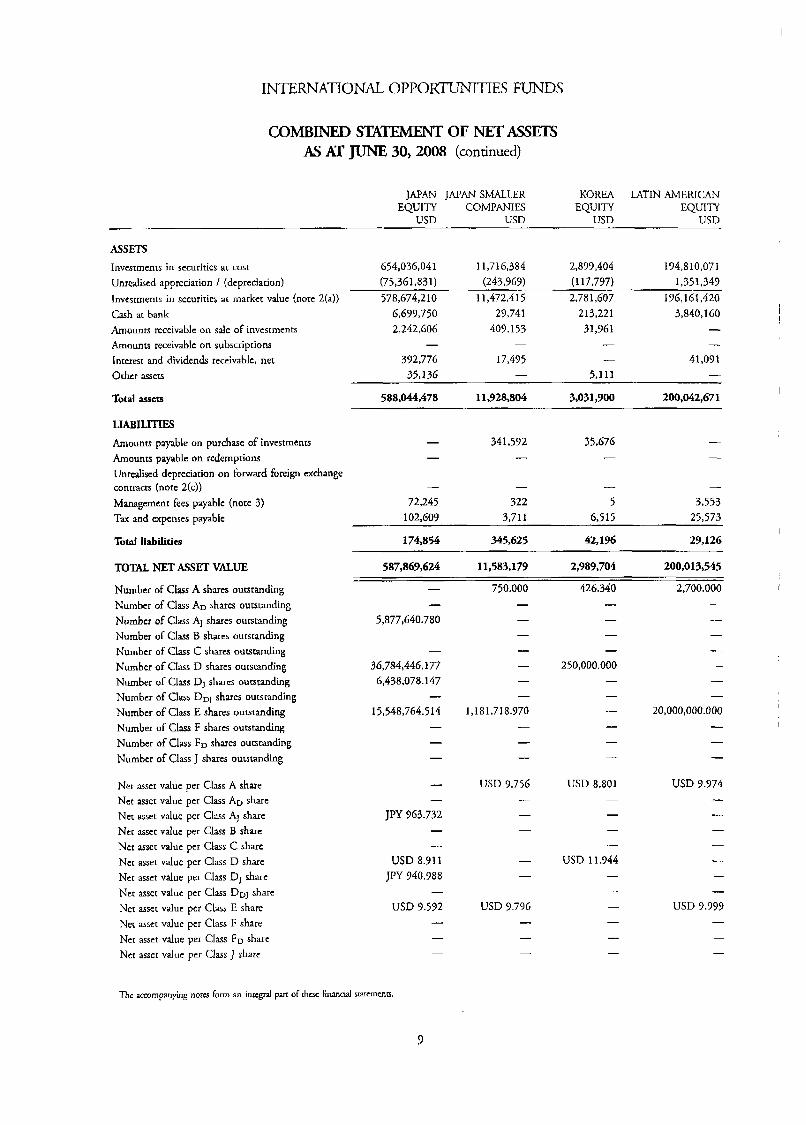
INTERNATIONAL OPPORTUNITIES FUNDS
COMBINED S m m OF NET ASSETS AS AT JUNE, 30,2008 (continued)
JAPAN JAPAN SMALLER KOREA LATIN AMERICAN EQUITY COMPANIES EQUITY EQUITY
USD USD USD USD
ASSETS Investmenis in securities ar cost
Unrealised appreciation I (depreciation) lnvesrments in securities at market vduc (note 2(4) Cash at bank Amounts receivable on sale of investments Amounts receivable on subscriptions Interest and dividends receivable, net Othcr assets
Total assets
LIABILITIES Amounts payable on purchase of investments Amounts payable on redemptions Unrealised depreciation on forward foreign exchange contracts (note 2(c)) Management fees payable (note 3) Tax and expenses payable
Total liabilities
TOTAL NET ASSET VALUE
Number of Class A shares outstanding Number of Class AD shares outstanding Number of Class A1 sharcs outstanding Number of Class B shares oursranding Number of Class C shares outstanding Number of Class D shares outstanding Number of Class DJ sharcs outstanding Number of Class DDJ shares outstanding Number of Class E shares outstanding Number of Class F shares outstanding Number of Class FD shares outstanding Number of Class J shares ourstanding
Net asset value per Class A share Net asset value per Class AI, share Net asset value per Class AJ share Net asset value per Class B share Net asset value per Class C share Net asset value per Class D share Ncr asset value per Class ID, share Net asset value per Class DDJ share Net asset valuc pcr Class E share Net asset value per Class F share Nct asset value per Class F, share Net asset value per Class J sharc
654,036,041 11,716,384 2,899,404 194,810,071 (75,361,831) (243,767) (117,797) 1,351,349 578,674,210 11,472,415 2,781,607 196,161,420
6,699,750 27,741 213,221 3,840,160 2,242,606 407,153 31,961 -
392,776 17,495 - 41,091 35, I36 - 5,111 -
588,044,478 11,928,804 3,031,900 200,042,671
- - - -
I
- 341,592 35,676 -
- - - -
72,245 322 5 3,553 102,609 3,711 6,515 25,573
174,854 345,625 42.1% 29,126
587,869,624 11,583,179 2,989,704 200,013,545
750.000 426.340 2.700.000 - -
5,877,640.780 -
-
36,784,446.177 6,438,078.147
15,548,764.514 I
- - -
I
- JPY 963.732
- -
USD 8.911 JPY 740.988
USD 9.592 -
I
-
-
USD 9.974 I
- USD 9.737
-
T h c armrnpanying nom form an integral pan of [hac financial smcmenc;.
9

INTERNATIONAL OPPORTUNITIES FUNDS
COMBINED S n OF NET ASSETS AS AT JUNE 30,2008 (continued)
NORTH MALAYSIA NORTH AMERICAN PAN PHILIPPINES
EQUITY AMERICA VALUE EUROPEAN EQUITY USD usn USD USD USD
832,483,002 666,745,461 145,526,662 15,556,103 36,718,653 (4,987,400) 31,731,253
1.1 15,729
( 1 06,306,357) (139,093,078) 52,138 (5,420,9 17) 726,176,645 527,652,363 145,578,800 10,135,186
4,027,640 - -
802,470 14,805
1,558,855
20,843,678 617,121
-
7,93s,s4a -
287,875 194,231 2 1,743
295,580 95,726
9,933 - -
139,413 -
32,986,395 731,021,560 550,672,017 154,018,197 10,536,425
I
22,000 19,315,374
-
- 20,385
66,198 -
-
7,374 30,135
-
9,959 114,856
- 21
59,842
I
72,281 63,163
I
2,507 8,902
37,509 146,815 19,375,237 155,829 77,607
32,948,886 730,874,745 531,296,780 153,862,368 10,458,8 18
100.000 743,415.128 1,611.770 1,158,931.563 12,520.000
- - - - - - - 5,569,889.390 - 71,945,4a2.725 71,080,535.470 4,740,456.456
-
541.712 -
- 250.000
- - 3,697,081.218
USD 8.804 -
- 1,657,227.665
USD 6.195 -
USD 7.797 -
USD 7.378 -
USD 14.813 -
-
SGD 13.925 USD 16.811 I
- USD 7.474
-
-
SGD 7.825 -
- SGD 12.064
- - USD 8.912
- USD 6.264
10

INTERNATIONAL OPPORTUNITIES FUNDS
COMBTNFD SIXEMENT OF NET ASSETS AS AT JUNE 30,2008 (continued)
TAIWAN THAILAND US US CORPORATE EQUITY EQUITY BOND BOND
USD USD USD USD
ASSETS Investments in Securities at cost
Unrealised appreciation I (dcpreciation) Investments in securities at marker value (note 2(a)) Cash at bank Amounts receivablc on sale of investments Amounts receivable on subscriptions Interest and dividends receivable, net Orher assets
Total assets
LIABILITIES Amounts payable on purchase of invesrrnents Amounts payable on redemptions Unrcalised depreciation on forward foreign exchange contracts (note 2(c)) Management fees payable (note 3) Tax and expenses payable
Total liabilities
TOTAL NET ASSET VALUE
Number of Class A shares outstanding Number of Class AD shares outsranding Number of Class A1 shares outstanding Number of Class B shares outstanding Number of Class C shares outstanding Number of Class D shares outsranding Number of Class D] shares outstanding Number of Class D , shares outstanding Number of Class E shares outstanding Number of Class F shares ourstanding Number of Class FD shares ourstanding Number of Class J shares outstanding
Net asset value pcr Class A share Net asset valuc per Class AD share Net asset value per Class AI sharc Net asset value per Class B share Net asset value per Class C share Net asscr value per Class D share Net asset value per Class D, share Net asset value per Class D, share Net asset value per Class E sharc Net asset value per Class F share Net asse[ value per Class FD share Net asset value per Class J share
5,371,007 34,334,848 608,434,387 749,566,3 12 (177,764) (1,576,081) (1 1,521,380) (17,773,566)
596,913,007 731,792,746 5,193,243 32,758,767 105,092 1,086,572 26,377,371 876,4 18
- 4,887,280 - - 437,398 -
1,899 I 3,842,663 8,497,264 13.641; 18,096 - -
5,313,880 33,863,435 632,457,739 741,166,428
-
-
- - 31,017,227 -
- - - -
2,767 8,911 22,444 - 10,506 21,778 55,817 97,362
13,273 30,689 31,095,488 97,362
5,300,607 33,832,746 601,362,251 741,069,066
23 1,271.1 53 I
-
I
I
250,000.000 - - - - I
-
197,826.089 - - - -
17,450.789 -
- I
-
- 3,068,009.753
USD 10.162 - I
- -
USD 13.948 - -
- - -
USD 10.293
2,062,972.662 - - -
31,145.8 17 57,494,543.168
I
- 116,746.272
457.350 - -
USD 9.799 - - -
USD 9.987 USD 10.075
I
- USD 10.058
SGD 9.419 -
-
I
I
I
The accompanying nom furm an intcgn_l part of these financial sratemena.
INTERNATIONAL OPPORTUNITIES FUNDS
COMEHNED STATEMENT OF NET ASSEX'S AS AT JUNE 30, 2008 (continued)
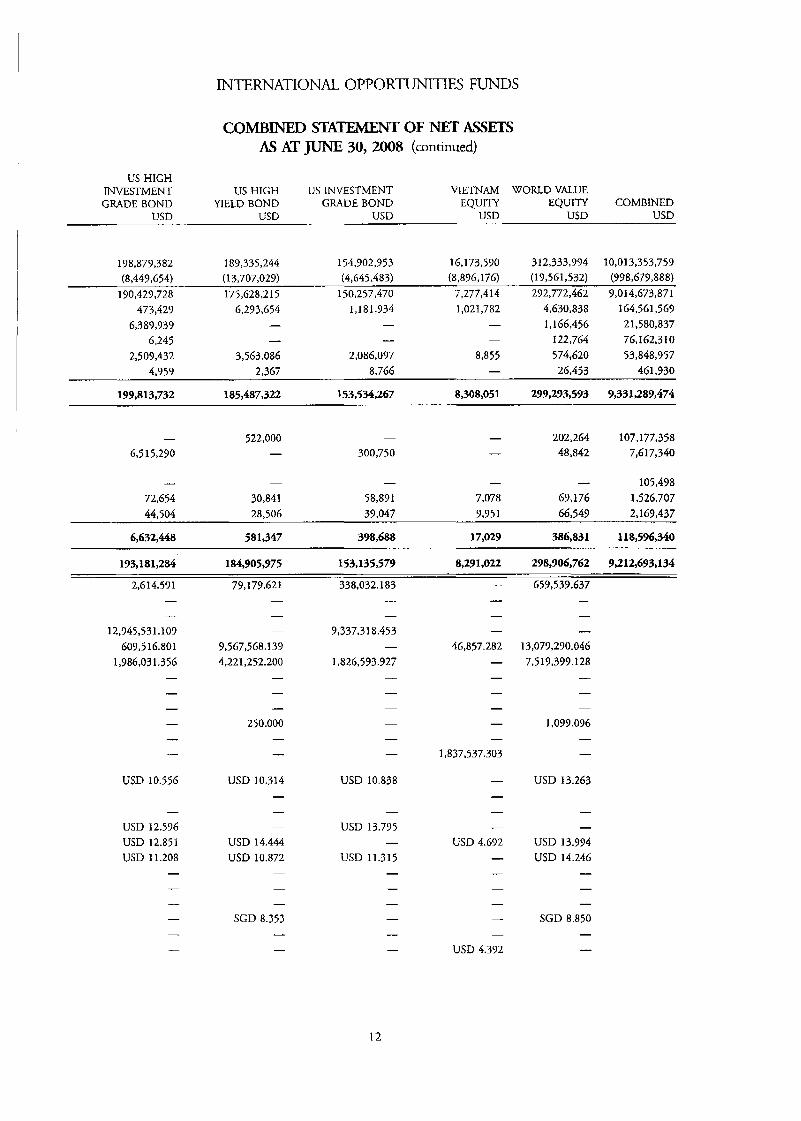
US HIGH INVESTMENI' US HIGH US INVESTMENT VIETNAM WOWD VALUE GRADE BOND YIELD BOND GRAD€ BOND EQUITY EQUITY COMBINED
USD USD USD USD USD WSD
312,333,994 10,013,353,759 198,877,382 189,335,244 154,902,953 16.1 73,590 (8,449,654) (13,707,029) (4,645,483) (8,896,176) (19,561,532) (998,679,888)
190,429,728 175,628.21 5 150,257,470 7,277,414 292,772,462 9,014,673,871 4,630,838 164,561,569
I - - 2 1,580,837 1,166,456 6,389,939 6,245 - I - 122,764 76,162,3 I O
2,509,432 3,563,086 2,086,097 8,855 574,620 53,848,957 4,959 2,367 8,766 - 26,453 461,930
199,813,732 185,487,322 153,534,267 8,308,051 299,293,593 9,331,289,474
473,429 6,293,654 1 , I 81.934 1,021,782
- 522,000 -
6,515,290 - 300,750 202,264 107,177,358
- 48,842 7,617,340 -
I - - - - 105,498 72,654 30,841 58,891 7,078 69,176 1,526,707 44,504 28,506 39,047 9,951 66,549 2,169,437
6,632,448 58 1,347 398,688 17,029 386,831 118,596,340
193,181,284 184,905,975 153,135,579 8,291,022 298,906,762 9,2 12,693, I34
79,179.621 338,032.183 I 659,539.637 2.61 4.57 1 I
I
12,945,531.109 609,516.801
1,986,031.356 - - - - - I
USD 10.556 -
- USD 12.596 USD 12.851 USD 11.208
- - I
-
- -
-
-
-
9,567,568.139 4,221,252.200
- - I
250.000 - -
USD 10.314 - I
-
USD 14.444 USD 10.872
-
-
-
SGD 8.353 - -
- -
9,337,318.453
1,826,593.927
-
- -
-
-
-
-
USD 10.838 -
- USD 13.795
- USD 11.315
- - - -
- -
- I
- 13,079,290.046 7,519,399.128
- -
-
1,099.096 -
-
USD 13.263 -
- -
USD 13.994 USD 14.246
- - -
SGD 8.850 - I
12
INTERNATIONAL OPPORTUNITIES FUNDS
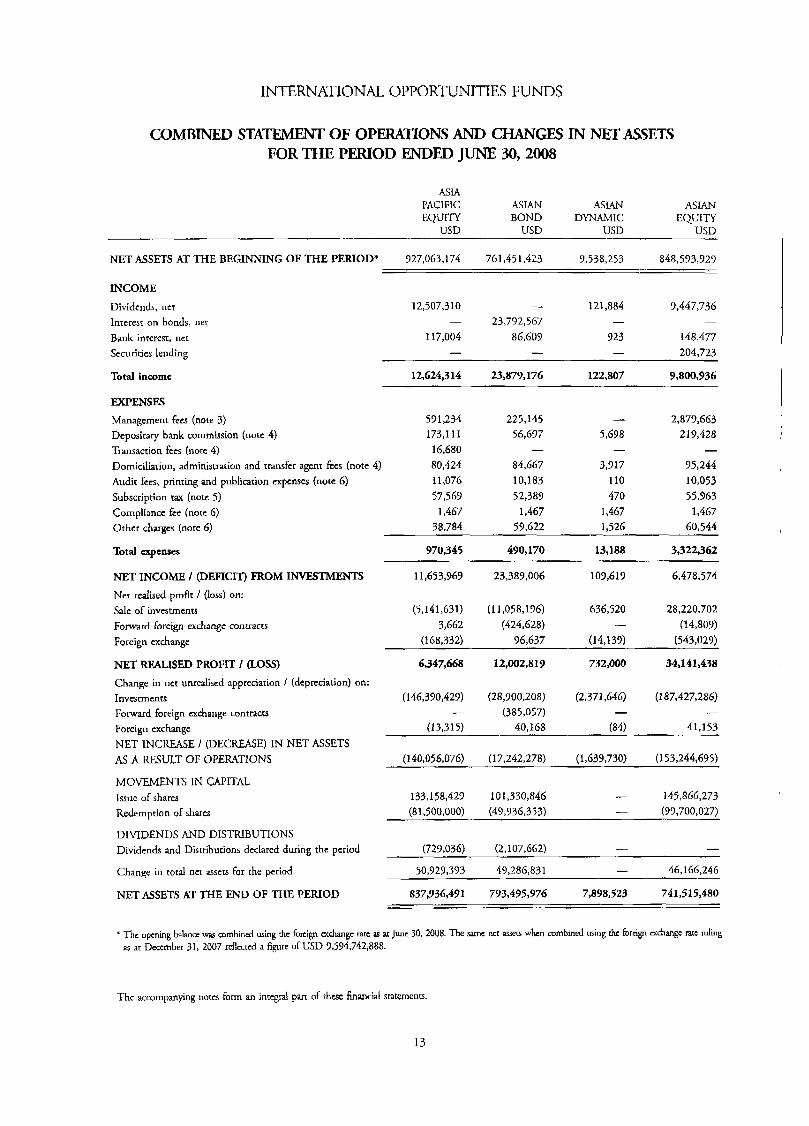
COMBINED STATEMIBIT OF OPERA’ITONS AND CHANGES IN NETASSETS FOR THE PERIOD ENDED JUNE 30,2008
ASIA PACIFIC ASIAN ASIAN ASIAN EQUITY BOND DYNAMIC EQWITY
USD USD USD USD ~. ~ ~ ~
NET ASSETS AT THE BEGINNING OF THE P m O D * 927,063,174 761,451,423 9,538,253 848,593,927
INCOME Dividends, ncc 12,507.3 10 - 121,884 9,447,736 Interest on bonds, net - 23,792,567 - -
Bank interest, net 117,004 86,609 923 148,477 Securities lending - - - 204,723
Total income 12,624,314 23,879,176 122,807 9,800,936
EXPENSES Management fees (note 3) 591,234 225,145 I 2,877,663 Depositary bank commission (notc 4) 173,111 56,697 5,698 2 19,428 Transaction fecs (note 4) 16,680 - - - Domiciliation, administration and transfer agent fees (note 4 ) 80,424 84,GGY 3,917 95,244 Audit fees, printing and publication expenses (note 6) Subscription tax (note 5 ) Compliance ftc (note 6) Other charges (note 6)
Total expenses
NET INCOME / (DWICIn FROM INVESTMENTS Net rcalised profit / (loss) on: Sale of investments Forward foreign exchange contracts Foreign exchange
NET W I S E D PROFIT I (LOSS) Change in ncr unrealiscd appreciation I (depreciation) on: Invcstrnents Forward foreign crchange contracts Foreign cxchangc NET INCREASE I (DECREASE) IN NET ASSETS AS A RESULT OF OPERATIONS
MOVEMENTS IN CAPITAL Issue of shares Redemption of shares
DIVIDENDS AND DISTRIBUTIONS Dividends and Distributions declared during the period
Change in coral net assets for the period
NET ASSETS AT THE END OF THE PERIOD
11,076 10,183 110 10,053 57,569 52,389 470 55,963
1,467 1,467 1,467 1,467 38.784 59.622 1.526 60.544
970,345 490,170 13,188 3,322,362
11,653,969 23,387,006 109,619 6,478,574
(5,141,631) (1 1,058,196) 636,520 28,220,702 3,662 (424,628) I (14,809)
(168,332) 96,637 (14,139) (543,029)
6,347,668 12,002,819 732,000 34,141,438
(146,390,429) (28,900,208) (2,371,646) (187,427,286) - (385,057) - -
(13,315) 40,168 (84) 41,153
1140,056,076) (17,242,278) (1,639,730) (153,244,695)
133,158,429 101,330,846 - 145,866,273 (81,500,000) (49,936,353) - (97,700,027)
(729.036) (2.107.662) - - ~. ~ ~ ~ ~
50,929,393 49,286,831 - 46,166,246
837,936,491 793,495,976 7,898,523 741,515,480
- T h e opening balance war combined using rhc forcign acchangc rate z at June 30,2008. The same nct assers when mmbmed using thc foreign ctchange m e ruling as at Dcccmber 31, 2007 reffccrrd a figure of USD 9,594,742,888.
Thc accompanying notes form an integral parr of thesc financial statements.
13
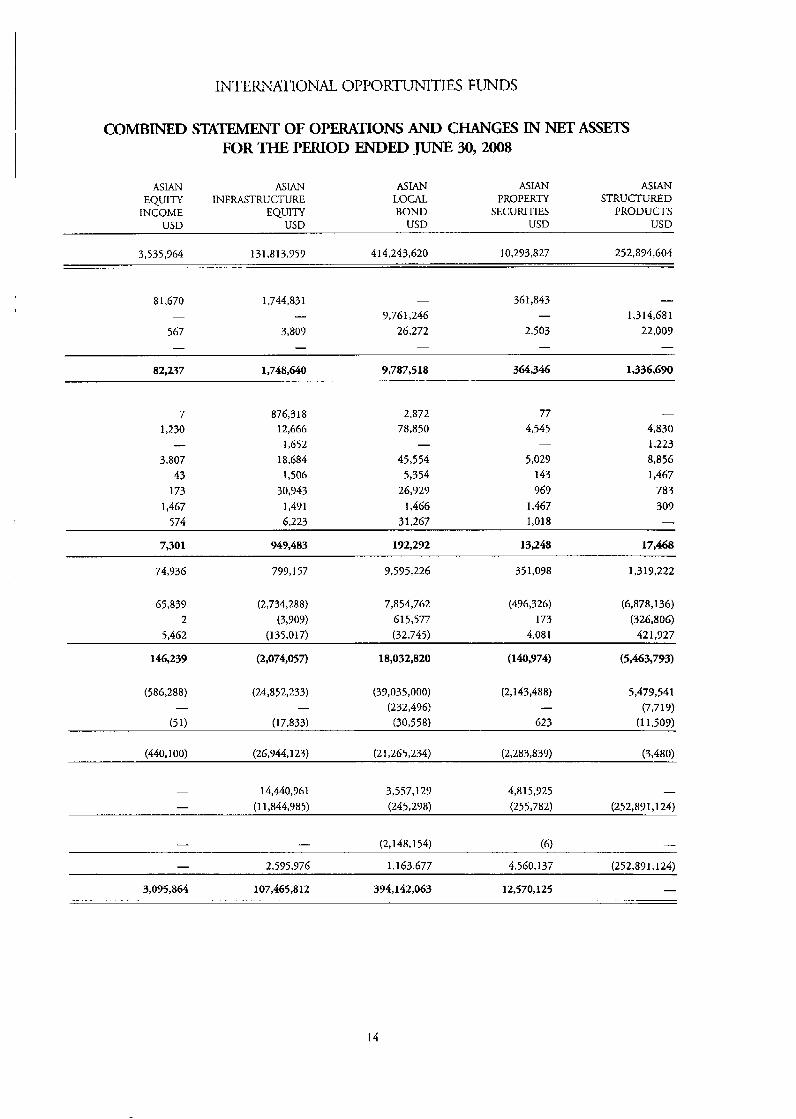
INTERNATIONAL OPPORTUNITIES FUNDS
COMBINED S m m OF OPERATIONS AND CHANGES IN NET ASSETS FOR THE PERIOD ENDED JUNE 30,2008
ASIAN ASIAN EQUITY INFRASTRUCTURE
INCOME EQUITY USD USD
ASIAN ASIAN ASIAN LOCAL PROPERTY STRUCTURED BOND SECUWTIES PRODUCTS
USD USD USD
3,535,964 131,813,959 414,243,620 10,293,827 252,894,604
8 1,670
567
-
-
1,744,831
3,809 I
-
-
7,761,246 26,272
361,843
2,503 -
-
- 1,314,681
22,009
82,237 1,748,640 9,787,518 364,346 1,336,690
7 1,230
3,807 43
-
876,318 12,666
1,652 18,684
1 ,SO6
2,872 78,850
45,554 5,354
-
77 4,545
5,029 143
-
- 4,830 1,223 8,856 1,467
173 30,943 26,929 969 783 1,467 1,491 1,466 1,467 309
574 6,223 3 1,267 1,018 -
7,301 949,483 192,292 13,248 17,468
74,736
65,839 2
5,462
799,157 9,595,226 351,098 1,319,222
(2,734,288) 7,854,762 (496,326) (6,878,136) (3,909) 615,577 173 (326,806)
(1 35,017) (32,745) 4,081. 421,927
146,239 (2,074,057) 18,032,820 (140,974 (5,463,793)
(586,288) (24,852,233) (39,035,000) (2,143,488) 5,479,541 - - (232,496) I (7,719)
(51) (17,833) (30,558) 623 (1 1,509)
(440,100) (26,944,123) (21,265,234) (2,283,839) (3,480)
- 14,440,961 3,557,129 4,815,925 - - (1 1,844,985) (245,298) (255,782) (252,891,124)
- 2.595.976 1.163.677 4.560.137 (252.891 . I 24) -
- 107,465,812 334,142,063 12,570,125 3,095,864
14
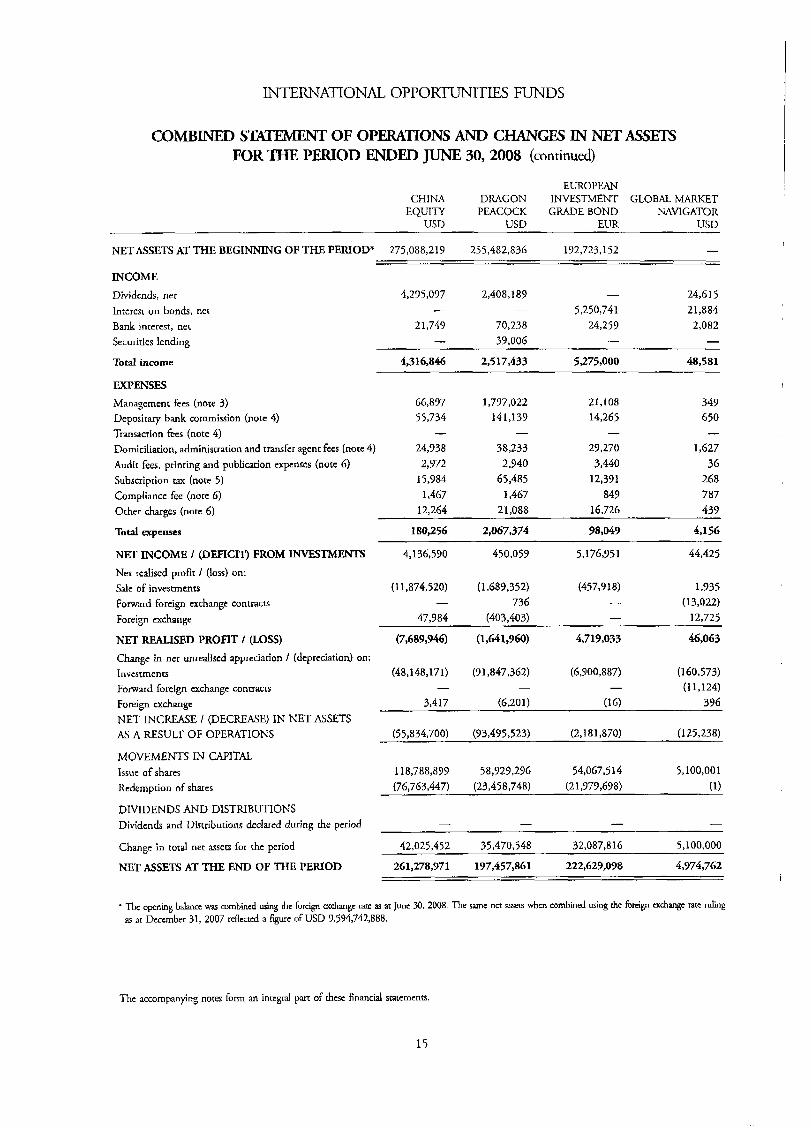
INTERNATIONAL OPPORmITIES FUNDS
COMBINED STATEMENT OF OPERATIONS AND CHANGFS IN NET ASSETS FOR THE PERIOD W E D JUNE 30,2008 (continued)
EUROPEAN CHINA DRAGON INVESTMENT GLOBAL MARKET
EQUITY PEACOCK GRADE BOND NAVIGATOR USD USD EUR USD
NET ASSETS AT THE BEGINNING OF THE PERIOD* 275,088,219 255,482,836 192,723,152 -
INCOME Dividends, net 4,295,077 2,408,189 - 24,615 Interest on bonds, net - - 5,250,741 21,884 Bank interest, net 21,749 70,238 24,259 2.082 Securities lending - 39,006 I - Total income 4,316,846 2,517,433 5,275,000 48,581
EXPENSES Managemcnt fees (note 3) 66,897 1,797,022 21,108 349 Depositary bank commission (note 4) 55,734 141,139 14,265 650 Transaction fees (note 4) - - - Domiciliation, administration and transfer agent fccs (note 4) 24,938 38,233 27,270 1,627 Audit fees, prinring and publication expenses (note 6) 2,372 2,940 3.440 36 Subscription tax (note 5) 15,984 65,485 12,391 268 Compliance fee (note 6) 1,467 1,467 849 787
Total menses 180,256 2,067,374 98,049 4.156
-
Other charges (note 6) 12,264 21,088 16,726 439
NET INCOME I (DEFICIT) FROM INVESTMENTS 4,136,590 450,057 5,17695 1 44,425
Net rcalised profit I (loss) on: Sale of investments Forward foreign cxchangc contracts Foreign exchange
NET RFALISED PROFIT I (LOSS)
(457.9 18) 1,935 - 736 - (13,022)
47,984 (403,403) - 12,725
(1 1,874,520) (1,689,352)
(7,689,946) (1,641,960) 4,713,033 46,063 Change in net unrealiscd appreciation / (depreciation) on: Investments (48,148,171) (71,847,362) (6,900,887) (160,573) Forward foreign exchange contracts - - - (1 1,124) Foreign exchange 3,417 (6,201) (16) 396 NET INCREASE I (DECREASE) IN NET ASSETS AS A RESULT OF OPERATIONS (55,834,700) (93,495,523) (2,18 1,870) (125,238)
MOVEMENTS IN CAPITAL. Issue of shares 118,788,899 58,927,296 54,067,514 5,100,001 Redemption of shares (76,763,447) (23,458,748) (2 1,779,698) (1)
Dividends and Distributions declared during the period - - I - DIVIDENDS AND DISTRIBUTIONS
Change in total net assets for the period 42,025,452 35,470,548 32,087,816 5,100,000
NET ASSETS AT THE END OF THE PERIOD 261,278,371 137,457,861 222,629,098 4,974,762
Thc opening balance was mmbined using rhe forcipn exchange rate as at June 30,2008. The same ncr assers whcn combined using rhe foreign exchange rate ruling s a1 December 31, 2007 reflcctcd a figure of USD 9,594,742,888.
I
I
The accompanying nora form an intcgral pan of thcsc financial statements.
15
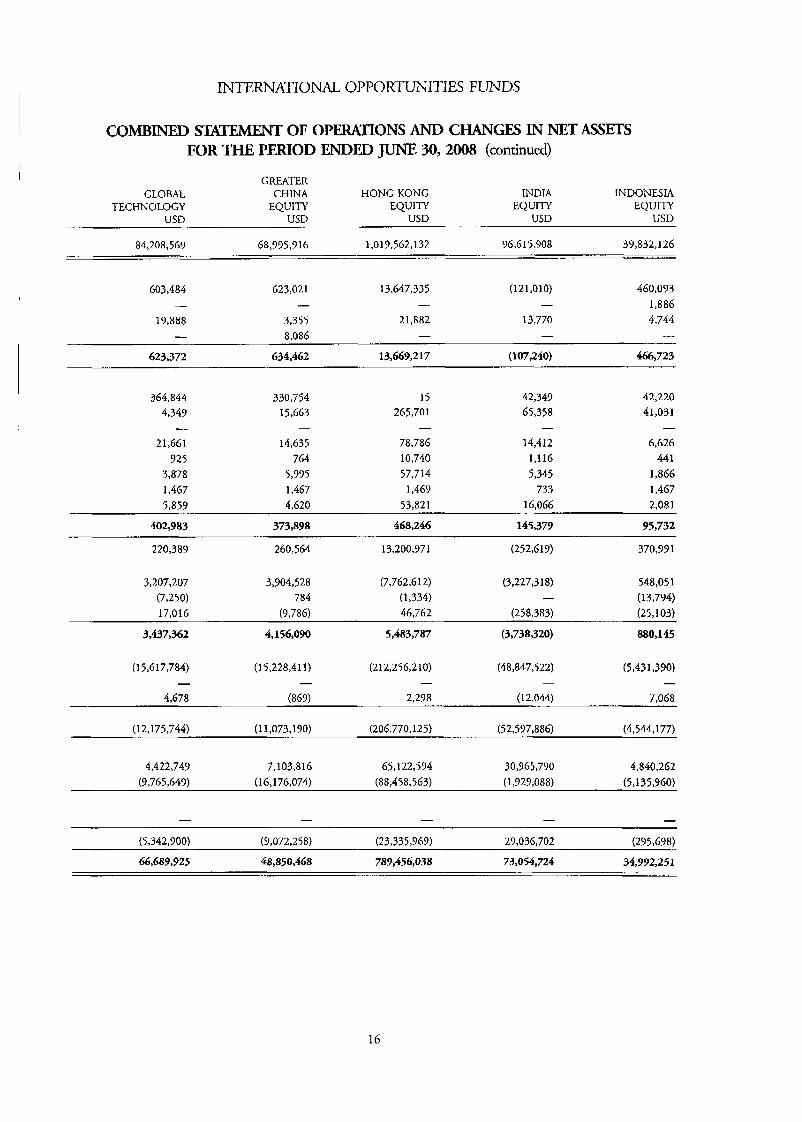
INTERNATIONAL OPPORTUNITIES FUNDS
COMBINED STATEMENT OF OPERATIONS AND CHANGES IN JWT ASSETS FOR THE PERIOD ENDED JUNE 30,2008 (continued)
GREATER GLOBAL CHINA HONG KONG INDIA INDONESIA
TECHNOLOGY EQWITY EQUITY EQUlTY EQUITY USD USD USD USD USD
84,208,567 68,775,716 1,017,562,132 76.615,908 37,832,126
603,484 -
623,021 13,647,335 (121,010) 460,093 - - - 1,886
19,888 3,355 21,882 13,770 4,744
623,372 634,462 13,669,217 (107,240) 466,723
- - - - 8,086
364,844 4,349
21,661 925
3,878 1,467 5,859
- 330,754
15,663
14,635 764
5,775 1,467 4,620
-
402,983 373,898
15 42,349 42,220 265,701 65,358 41,031
78,786 14,412 6,626 10,740 1,116 44 1 57,714 5,345 1,866
1,467 733 1,467 53,821 16,066 2,081
468,246 145,379 95,732
- - -
220,389 260,564 13,200,971 (252,619) 370,991
3,207,207 3,904,528 (7,762612) (3.227,3 18) 548,051 (7,250) 784 (1,334) - (1 3,794) 17,016 (9,786) 46,762 (258,383) (25,103)
3,437,362 4,156,090 5,483,787 (3,738,320) 880,145
(1 5,6 17,784) (15,228,41 I ) (212,256,210) (48,847,522) (5,431,390)
4,678 (869) 2,278 (1 2,044) 7,068
(1 2,175,744) (1 1,073,190) (206,770,125) (52,577,886) (4,544,177)
- - - - -
4,422,749 7,103,816 65,122,594 30,965,790 4,840,262 (9,765,649) ( I 6,176,074) (88,458,563) (1,729,088) (5,135,760)
(5,342,700) (9,072,258) (23,335,969) 27,036,702 (295,698)
66,689,925 48,850,468 789,456,038 73,054,724 34,992,251
16
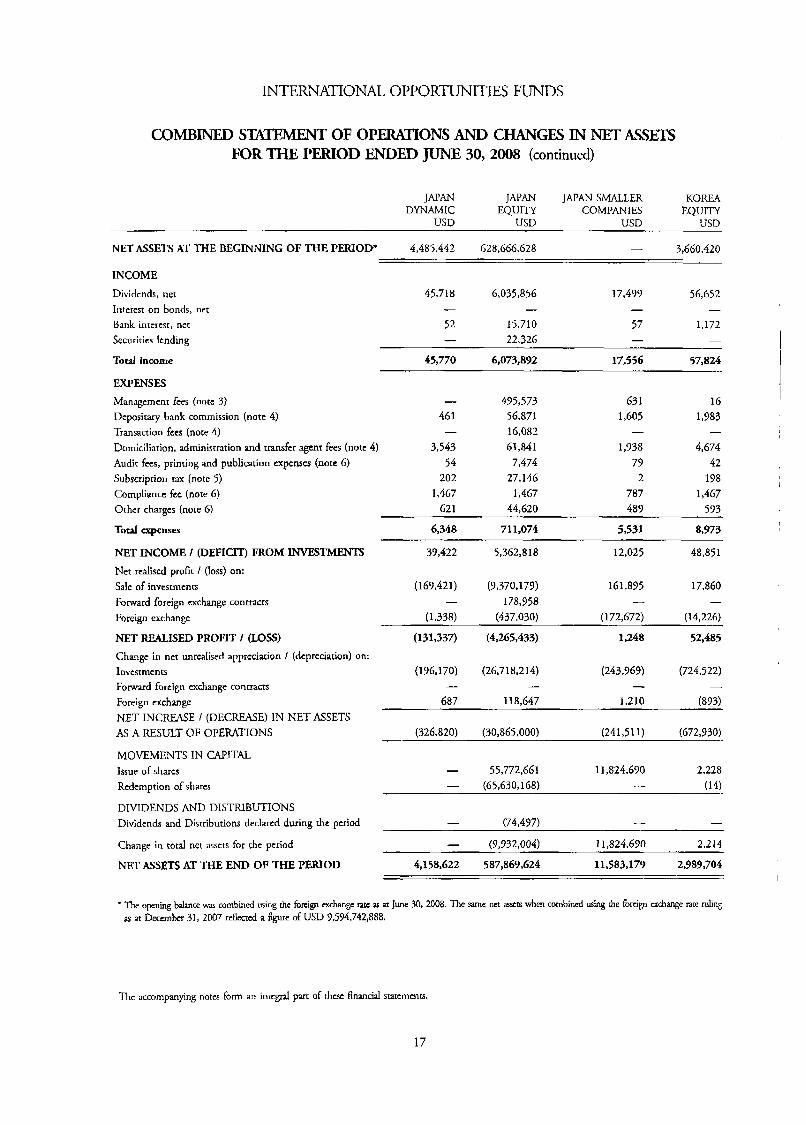
INTERNATONAL OPPORTUNITIES FUNDS
COMBINED S- OF OPERATIONS AND CHANGES IN NET ASSETS FOR THE PERIOD ENDED JUNE 30, 2008 (continued)
JAPAN JAPAN SMALLER KOREA DYNAMIC IAFAN EQUITY COMPANIES EQUITY
USD USD USD USD
NET ASSETS AT THE BEGINNING OF THE PERIOD* 4,485,442 628,666,628 - 3,660,420
INCOME
Dividcnds, net 45,718 6,035,856 17,499 56,652 Interest on bonds, net
Bank intcrcst, net Securities lending
Total income
- - 52 15.710 - 22,326
45,770 6,073,892 17,556 57,824
EXPENSES Management fces (note 3) I 495,573 63 I 16 Depositary bank commission (note 4) 461 56.871 1,605 1,983
Domiciliation, administration and transfer agent fees (note 4) 3.543 61,841 1,938 4,674 Audit fees, printing and publication expenses (note 6) 54 7,474 77 42 Subscription tax (note 5) 202 27,146 2 198 Compliance fec (note G) 1,467 1,467 787 1,467
Transaction fees (note 4) - 16,082 - -
Other charges (note 6) 62 1 44,620 489 593
Total expenses 6,348 711,074 5,531 8,973
NET INCOME I (DEFICIT) FROM I N V € ! S T M ~ 39,422 5,362,818 12,025 48,851
Net realised profit / (loss) on: Sale of invesuncnrs Forward foreign cxchange contracts Foreign exchange
NET W I S E D PROFIT I (LOSS)
(169,421) (9,370,179) 161,895 17,860 - 178,958 - -
(1,338) (437,030) (172,672) (1 4,226)
(131,337) (4,265,433) 1,248 52,485
Change in net unrcalised appreciation / (depreciation) on: Investments (196,170) (26,718,214) (243,969) (724,522) Forward foreign exchange contracts I I - -
Foreign exchange 687 118,647 1,210 (893) NET INCREASE / (DECREASE) IN NET ASSETS AS A RESULT OF OPERATIONS (326,820) (30,865,000) (241,511) (672,Y 30)
MOVEMENTS IN CAPITAL Issue of shares - 55,772,661 11,824,690 2,228
(14) Redemption of shares - (65,630,168) -
Dividends and Distributions declared during the period I (74,497) - - DIVIDENDS AND DISTRIBUTIONS
Change in total net assets for the period - (7,732,004) I 1,824,690 2,214
NET ASSETS AT THE END OF THE PERIOD 4,158,622 587,869,624 11,583,179 2,383,704
= The opening balance was combined using rhe brig mchange rate as at June 30, 2008. The same nct wen when combined using the forcip uchange race ruling as at Decembcr 31, 2007 reflected a figure of USD 9,594,742,888.
Thc accompanying notes form an intcgral parr of thcsc financial smtcmeno;.
17
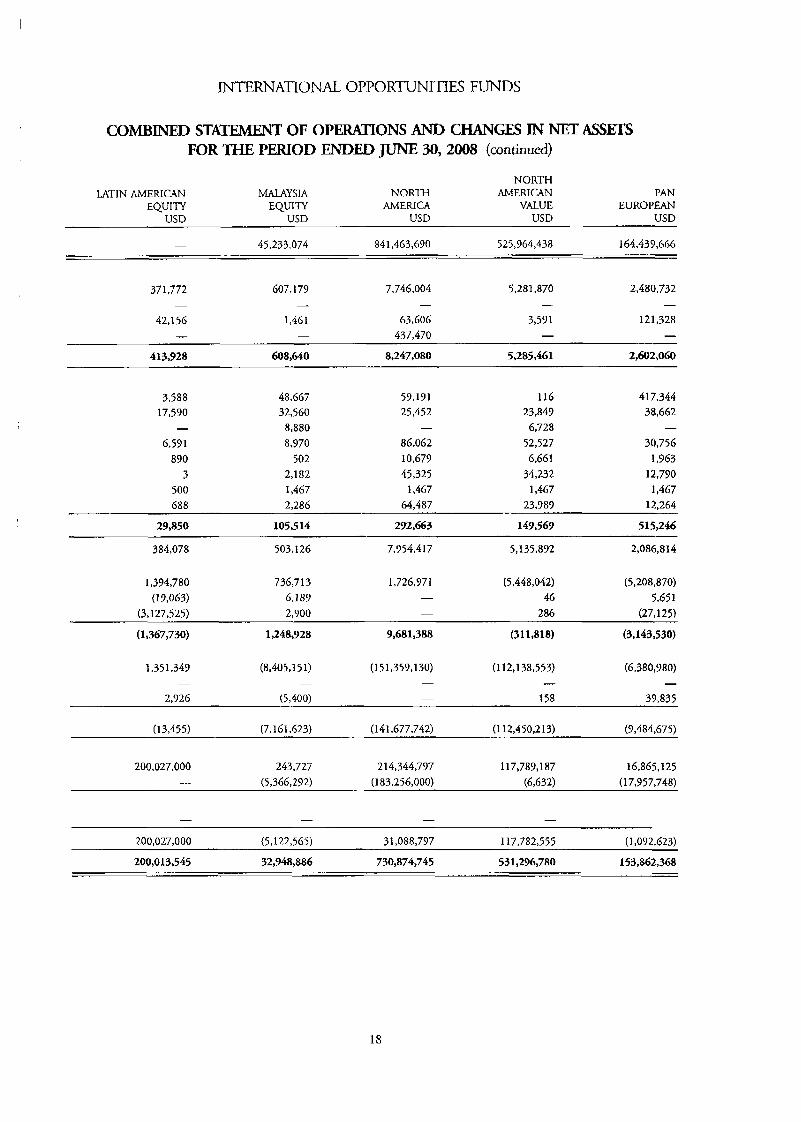
INTERNATIONAL OPPORTUNITIES FUNDS
COMBINED STATEMENT OF OPERATIONS ANJJ CHANGES IN NET ASSETS FOR TmLE PERIOD FNDED JUNE 30,2008 (continued)
NORTH LATIN AMERICAN MALAYSIA NOR?-H AMEMCAN PAN
EQWITY EQUITY AMERICA VALUE EUROPEAN USD USD USD USD USD
45,233,074 841,463,630 525,964,438 164,439,666 -
371,772 607,179 7,746,004 5,281,870 2,480,732
42,156 1,461 63,606 3,591 121,328 I - 437,470 - -
413,928 608,640 8,247,080 5,285,461 2,602,060
- - - - -
3.588 48,667 59,191 116 417,344 17,590 32,560 25,452 23,849 38,662 - 8,880 - 6,728 -
6,591 8,970 86,062 52,527 30,756 890 502 10,679 6661 1,963
3 2,182 45,325 34,232 12,790 500 1,467 1,467 1,467 1,467 688 2,286 64,487 23,989 12,264
29,850 105,514 292,663 149,569 51 5,246
384,078 503,126 7,954,417 5,135,892 2,086,814
I
I
1,394,780 736,713 1,726,371 (5,448,042) (5,208,870) (19,063) 6,189 - 46 S,65 1
(3,127,525) 2,900 - 286 (27,125)
(1,3679730) 1,248,928 9,681,388 (31 1,818) (3,143,530)
1,351,349 (8,405,151) (1 51,359,130) (1 12,138,553) (6,380,980) - - - - -
2,926 (5,400) - 158 39,835
(13,455) (7,161,623) ( I 4 I ,677,742) (1 12,450,213) (9,484,675)
200,027,000 243,727 2 14,344,797 117,789,187 16,865,125 (5,366,292) (183,256,000) (6,632) (17,957,748) -
200,027,000 (5.1 22,565) 31,088,797 117,782,555 (1,092,623)
200,013,545 32,948,886 730,874,745 531,296,780 153,862,368
18
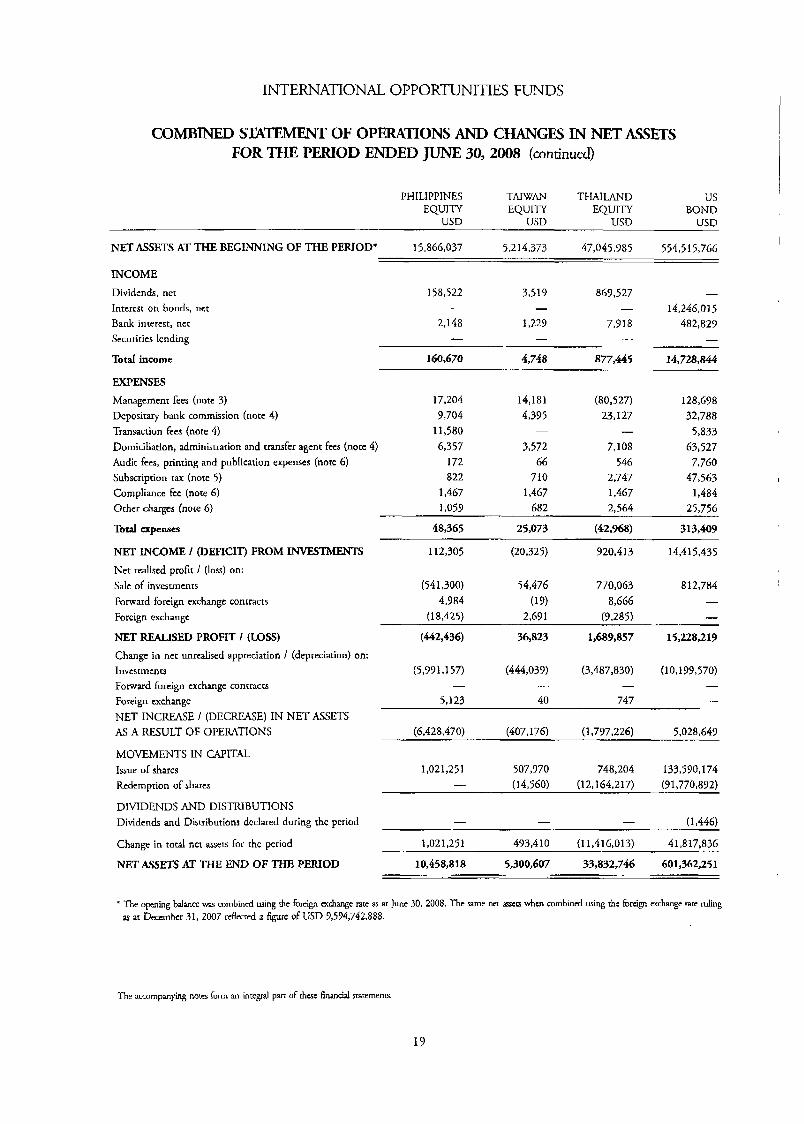
INTERNATIONAL OPPORTUNITIES FUNDS
COMBINED STATEMENT OF OPFRATIONS AND CHANGES IN NET ASSETS FOR THE PERIOD ENDED JUNE 30, 2008 (continued)
PHILIPPINES TAIWAN THAILAND us EQUITY EQUITY EQUITY BOND
USD USD USD USD
NET ASSETS AT THE BEGINNING OF THE PERIOD* 15,866,037 5,214,373 47,045,985 554,515,766
INCOME Dividends, net 158,522 3,519 867,527 I
Intercsr on bonds, nct - - - 14,246,015 Bank interest, net 2,148 1,229 7,918 482,829
- I - Securities lending I
Total income 160,670 4,748 877,445 14,728,844
EXPENSES Management fees (note 3) Depositary bank commission (note 4) Transaction fees (note 4) Domiciliation, administration and transfer agent fees (note 4) Audit fees, printing and publication expenses (nore 6) Subscription tax (note 5) Compliance fec (note 6) Orher charges (nore 6)
T o 4 eXpeMC!4
-
17,204 9,704
11,580 6,357
I72 822
1,467 1,059
14,181 4,395
3,572 66
710 1,467
682
-
(80,5 27) 23,127
7,108 54B
2,747 1,467 2.564
48,365 25,073 (42,968)
128,698 32,788
5,833 63,527 7,760
47,563 1,484
25,756
313,409
NET INCOME I (DEFICIT) FROM INVESTMENTS 112,305 (20,325) 920,413 14,415,435
Net realiscd profit / (loss) on: Sale of investmenrs Forward foreign exchange contracts
(541,300) 54,476 770,063 8 12,784 4,984 (19) 8,666 -
Foreign exchange (18,425) 2,691 (9,285) - NET W S E D PROFIT I (LOSS) (442,436) 36,823 1,689,857 15,228,213 Change in net unrcalised appreciation I (depreciation) on: lnvcstmenrs (5,99 1.1 57) (444,039) (3,487,830) (10,199,570) Forward foreign exchange contracts - - - -
Foreign exchange 5,123 40 747 I
NET INCREASE I (DECREASE) IN NET ASSETS AS A RESULT OF OPERATIONS (6,428,4701 (407,176) (1,797,226) 5,028,649
MOVEMENTS IN CAPITAL Issue of shares Redemption of shares
DlVIDENDS AND DISTRlBUTIONS
1,021,251 507,970 748,204 133,590,174 (1 4,560) (1 2,164,217) (91,770,892) -
Dividends and Distributions declared during the period - I - (1,446)
Change in total net assets for the period 1,021,251 493,410 (11,416,013) 41,817,836
NET ASSETS AT T H E END OF THE P W O D 10,458,aia 5,300,607 33,832,746 601,362,251
* The opening baance was mrnbincd using rhc foreign exchange rate a at June 30, 2008. Thc m e net assets whcn cornbincd using the foreign cxchange rate ruling as at December 3 1 , 2007 d m e d a figure of USD 9,594,742,888.
The accompanying nom form an integral pan of these financial statements.
I9
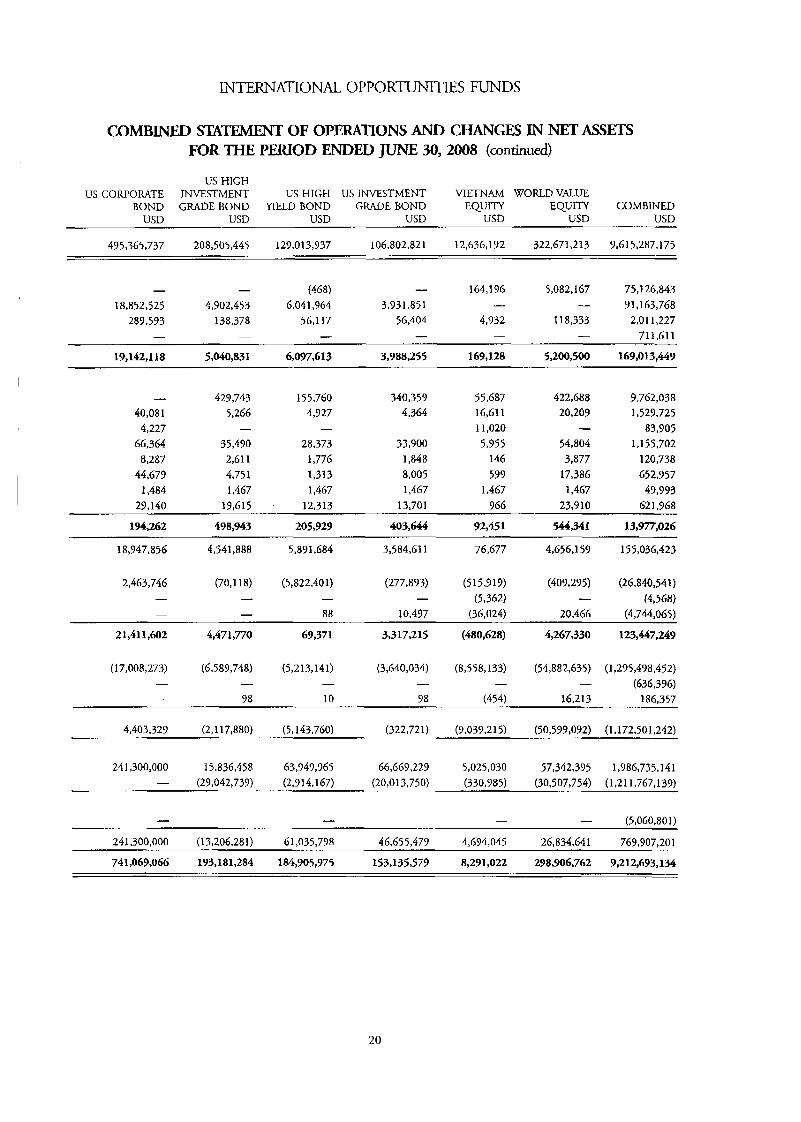
INTERNATIONAL OPPORTUNITIES FUNDS
COMB= STAIEMBT OF OPERATIONS AND CHANGES IISI NET ASSETS FOR THE PRIOD ENDED JUNE 30,208 (continued)
US HIGH US CORPORATE INVESTMENT US HIGH US INVESTMENT VIETNAM WORLD VALUE
BOND GRADE BOND YIELD BOND GRADE BOND EQUITY EQUITY COMBINED USD USD USD USD USD USD USD
495,365,737 208,505,445 129,013,937 106,802,821 12,636,192 322,671,213 9,615,287,175
- - (468) I 164,196 5,082,167 75.1 26,843 18,852,525 4,902,453 6,041,964 3,931,851 I I 91,163,768
289,593 138,378 56,117 56,404 4,932 118,333 2,011,227 - - - - I - 711,611
3,988,255 169,128 5,200,500 169,O 13,449 17,142,118 5,040,831 6,077,613
- 40,081
4,227 66,364
8,287 44,679
1,484 29,140
429,743 5,266
35,490 2,611 4,751 1,467
19,615
-
155,760 4,927
28.373 1,776 1,313 1,467
12,313
-
340,359 4,364
33,900 1,848 8,005 1,467
13,701
-
55,687 16,611 1 1,020 5,955
146 599
1,467 966
422,688 20,209
54,804 3,877
17,386 1,467
23,910
- 9,762,038 1,529,725
83,905 1,155,702
120,738 652,957
49,993 621,968
194,262 498,943 205,929 403,644 92,451 544,341 13,977,026
4,541,888 5,871,684 3,584,611 76,677 4,656,159 155,036,423 18,947,856
2,463,746 (70,118) (5,822,401) (277,893) (51 5,919) (409,275) (26,840,541) - - (5,362) - (4,568)
- - 88 10,497 (36,024) 20,466 (4,744,065)
21,411,602 4,471,770 67,371 3,317,215 (480,628) 4,267,330 123,447,247
- -
( I 7,008,273) (6,589,748) (5,213,14 1) (3,640,034) (8,558,133) (54,882,635) (1,295,498,452)
- 98 10 98 (454) 16,213 186,357
- - I - - - (636,396)
4,403,329 (2.1 17,880) (5,143,760) (322,721) (9,039,215) (50,599,092) (1,172,501,242)
241,300,000 15,836.458 63,949,965 66,669,229 5,025,030 57,342,395 1,986,735,141 - (29,042,7391 (231 4,167) (20,013,750) (330,985) (30,507,7541 (1,211,767,139)
241,300,000 (13,206,281) 61,035,738 46.655,479 4,694,045 26,834,641 769,907,201
74 1,069,066 193,18 1,284 184,905,975 1 5 3 ~ 35,579 8,291,022 298,906,762 9,2 12,693,134
20
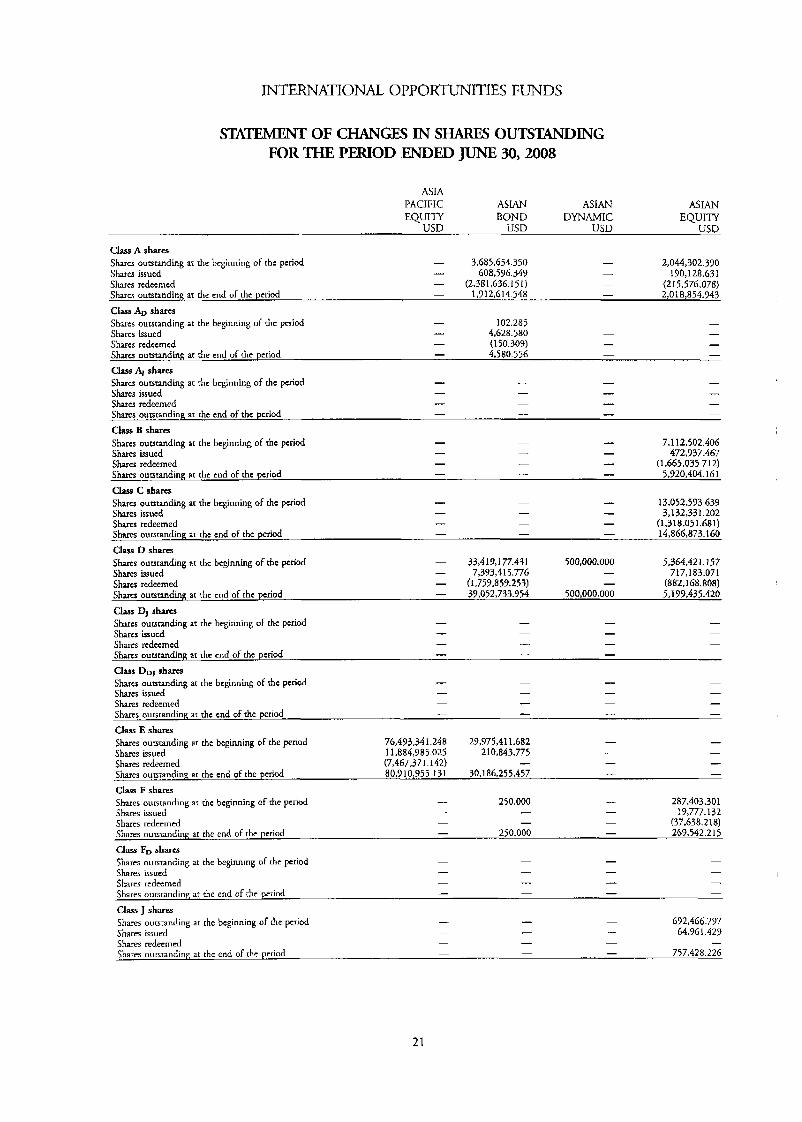
INTERNATIONAL OPPORTUNITIES FUNDS
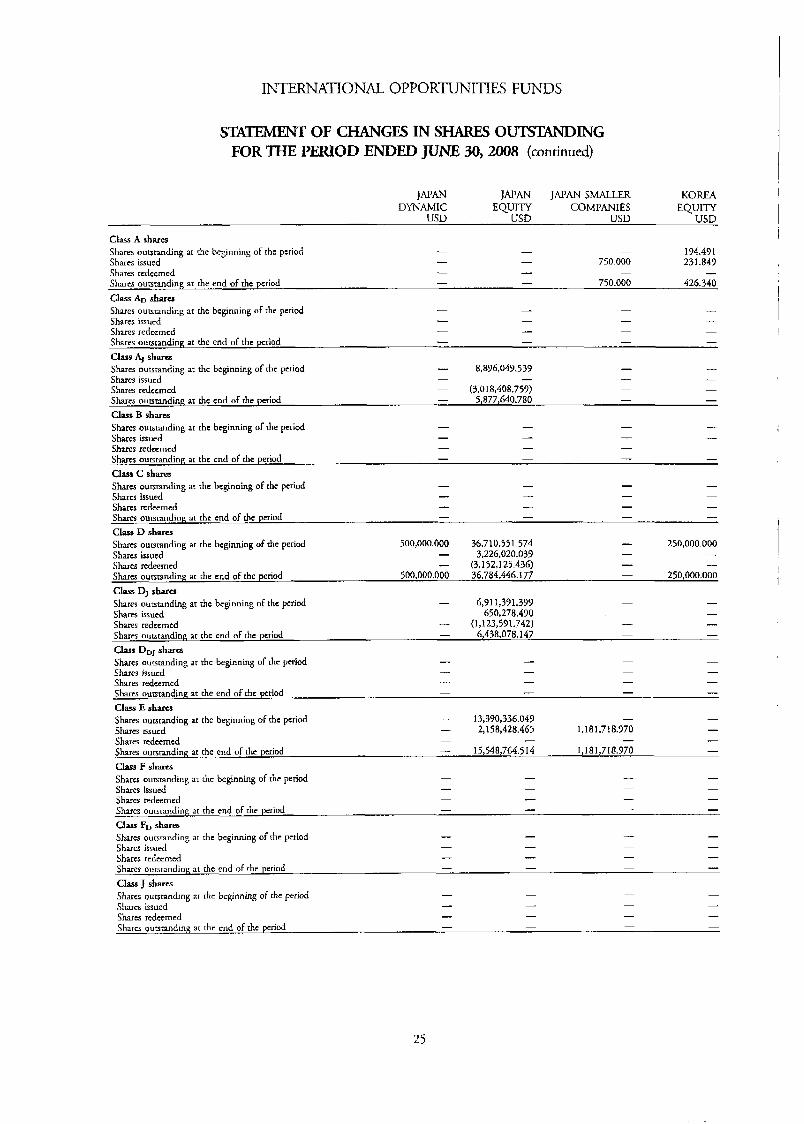
S n OF CHANGES IN SHARES OUTSTANDING FOR THE PERIOD ENDED JUNE 30,2008
ASIA PACIFIC ASIAN ASIAN ASIAN EQUIIY BOND DYNAMIC EQUITY
USD USD USD USD
Class A shar- 2,044,302.390
190,128.63 1 Shares issued I 608,596.349 - Shares redeemed - (2,381,636.1 51) - (2 1 5,5 76.078) Shares outstanding ar rhe end of the period - 1,912,614.548 - 2,018,854343
Class AD shares
Shares outsranding at the bcginning of the period - 3,685,654.350 -
Shares outstanding at the beginning of thc pcriod - 102.285 - - Sharcs issued I 4,628.580 - - Shares redcerncd - (150.305)) - - Shares outstanding at the end of the period - 4,580.556 - -
clnss 14 shures Sham ourstanding ar the bcginning of rhe period - - - - Shares issued - Shares redeemed - - Shares outstanding at the end of thc pcriod - I - -
Class B shares 7,112,502.406 Shares ouutanding ar rhe beginning of the period - - -
Shares issued - - - 472,937.467 Sharcs redeemed - - - (1,665,035.712)
5,920,404.161 Shares outstanding at the end of the period
C k C shares 13,052,593.639 Shares outstanding at the bcginning of the period - - I
3,132,331.202 Shares issued -
(1,318,051.681) Shares rcdeemed - - - 14,866,873.160 Shares outstanding ar the end of the period I - -
Clam D shares Shares outs.;randing at thc beginning of thc period - 33,4 19.1 77.431 500,000.000 5,364,421.157 Shares issued - 7,393,4 15.776 - 717J 83.071
(882,168.808) 39,052,733.954 500,000.000 5,199,435.420
- I - I -
- - -
- -
Shares tedccmed - (1,759,859,253) - Sham outstandinE at thc cnd of rhe period
Shares outsranding at the beginning of the period - - - I
Shares ouuztandinR ar rhc cnd of the period - - - -
Shares outstanding ar the bcginning of the period - - - -
Shares outstanding ar the end of rhe period - - - -
Shares outstanding at rhe beginning of the period 76,493,341,248 29,975,411.682 - - Shares issucd 11,884,985.025 210,843.775 - - Shares redeemed (7,467,371.142) - - - Shares ouatanding at rhe end of the period 80,910,955.13 1 30.1 86,255.457 - -
Class F shves 287,403.301 Shares outstanding at the beginning of the period - 250.000 -
19,777.132 Shares issued - - - Sham rcdccrned - - - (37,638.21 8)
267,542.215 Shares ountanding at the end of the period - 250.000 -
Shares oursranding at the beginning of the period - - - -
Shares outstanding at the end of rhc pcriod - - - -
-
Class DJ s h m
- - - - Shares Lsucd Shares redeemed - - - -
Clm D ~ J shares
- I - - Shares issued Shares redeemed
Uaas E shares
- - - -
C k FD share
.- - - - Shares issued Shares redeemed
Class J shares Shares outstanding at rhe beginning of [he pcriod - I - 692,466.797 Sharer issued - - - 64,961,429 Shares redeemed Shares oursranding at thc end of the pcriod - - - 757,428.226
- - I -
- I - I
21
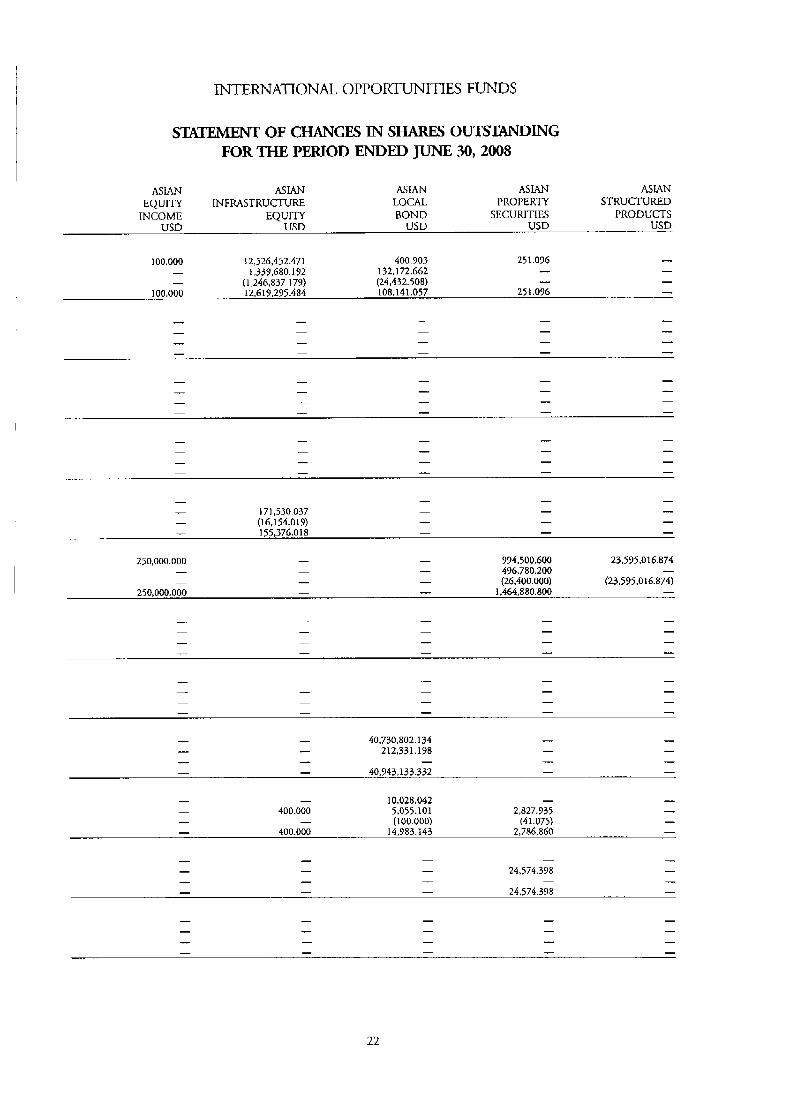
INTERNATIONAL OPPORTUNITIES FUNDS
STATEWNT OF CJUNGES IN SHARES OUT!XANDING FOR THE PERIOD ENDED JUNE 30,2008
ASIAN ASIAN ASIAN ASLAN ASLAN EQUITY INFRASTRUCTURE LOCAL PROPERTY STRUCTURED
INCOME EQUITY BOND SECURITIES PRODUCTS USD USD USD USD USD
100.000 12,526,452.471 400.703 251.096 -
100.000 12,619,275,484 108,141.057 251.096 - - 132.172.662 -
I - - 1,337680.192 - (1,246,837- 179) (24,432.508)
I
-
171,530.037 (16.1 54.019)
250,000.000 - - 994,500.600 23,535,016.874 - - - 496,780.200 - - - - (26,400.000) (23,575,016.874)
- - 1,464,880.800 - 250,000.000
- 40,730,802.1 34 - 212,331,198 I - - 40,743,133.332
- - 10,028.042 - I
- 400.000 5.055.101 2.827.935 - - - (l00.000) (4 1.075) - - 400.000 14,983.143 2,786.860 -
22
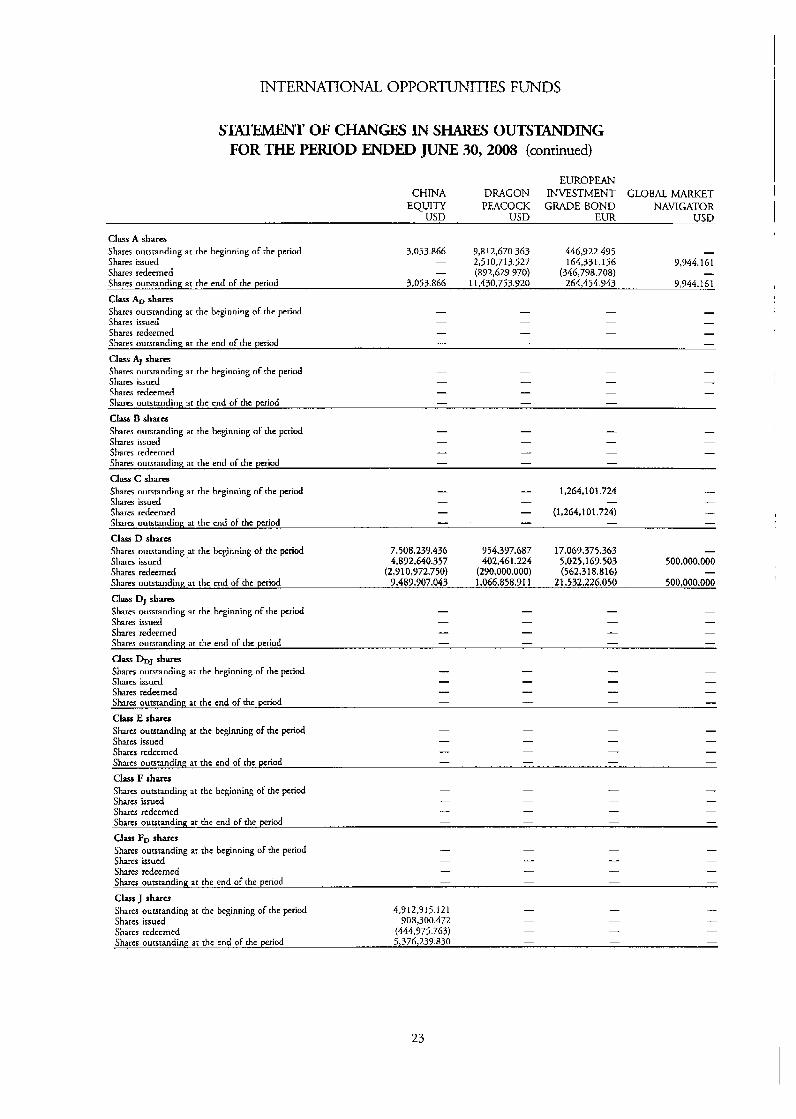
INTERNATIONAL OPPORTUNITIES FUNDS
S m w OF CHANGES IN SHARES OUTSTANDING FOR THE PERIOD ENDED JUNE 30,2008 (continued)
EUROPEAN CHINA DRAGON INVESTMENT GLOBAL MARKET
PEACOCK GRADE BOND NAVIGATOR USD USD EUR USB
Shares outstanding at rhc bcginning uf rhe period 3.053.866 9,812,670.363 446,922.495 - Shares redeemed - (892,629.970) (346,798.708) -
EQUITY
Class A shares
Shares issued - 2,5 10-71 3.527 164,331.156 9,944.161
Sharcs outstanding at thc cnd of rhc period 3,053.866 11.430.753.920 264,454.943 9,944.161 Class AD shares Shares oursranding ar rhc bcginning of thc period - - - Shares issued - - - Shares redeemed - I - Shares oursranding, ar the end of the period I - -
Clpr~ AJ sh- Shares outstanding at thc bcginning of the period - - - Shares issued - Shates redeemed - - - Shares outstanding at the cnd of rhc period - -
C l w B shares Shares oursranding ar rhe beginning of the pcriod - - I - Shares issued - - Shares rcdccrned - - - Shares oursranding a1 [he end of the period - - -
Class C shares Sharcs outstanding at thc bcginning of [he period I I
Shares issued - Shares rcdccmcd - - (1,264,101.724) - Sharcs outstanding at thc cnd of rhe period I I -
Shares ourstanding at the bcginning of rhe period 7,508,239.436 754.377.687 17,069,375.363 - Shares redmrncd (2,710,972.750) (290,000.000) (562.318.816) -
Class DJ s h m
- - - -
- - - -
- - -
- - -
-
I 1,264.101.724 - - - -
Claps D shvcr
Sham issucd 4,892,640.357 402,461.224 5,025,169.503 500,000.000
Shares outstandinn at thc cnd of rhc period 9,489,907.043 1,066,858.91 1 21,532,226.050 500,000.000
Shares outstanding at rhc beginning of [he period - - - -
Shares issued Shares redeemed Shares oursranding ar the end of the period - - - UW D ~ J shares Shares outstanding at the beginning of rhc period - - - - Shares issucd - - - -
Shares redeemed Shares outsranding ar rhc end of thc pcriod - - -
Class E shares Shares oursranding ar the beginning of the pcricd - - -
Shares issued Shares rcdccrncd - - - Shares oursranding ar the end of the pcriod - - - -
Class F shares Shares outstanding at the beginning of the period - - Shares issued - Shares rcdeemed I - - - Shares outstanding at thc cnd of the period - - -
Class Fn shares Shares outstanding at rhe bcginning of rhe period Shares issucd Shares redeemed Shares outstanding ar the end of [he period - - - -
Class J shares Shares oursranding at [he beginning of thc pcriod 4,712,915.121 - - - Shares issued 908,300.472 - - Sharcs rcdccrncd (444,775.763) - - - Shares ouaranding at rhc cnd of rhc period 5,376,239.830 - - -
- - - - - - - -
-
I - I - -
- - - - -
-
- - - - -
-
- - - - - I I - - - - -
-
23

INTERNATIONAL OPPORTUNITIES FUNDS
STATEMENT OF CHANGE IN SHARlEs OUTSTANDING FOR THE PERIOD ENDED JUNE 30,2008 (continued)
GREATER GLOBAL CHINA HONG KONG INDIA INDONESIA
TECHNOLOGY EQUITY EQUITY EQUITY EQUITY USD USD USD USD USD
1,177,720.57 1 194.976 352.438 38,951.353 - I
243.667.039 107,445.706
210,886.522 420.060.338 194.976 352.438 38,95 1.353
- - - (140,226.223) (757,660.233) - -
- - - 17,5 19,709.746 1,531,209.373
779,098.215 266,616.61 3 - (2,007,368.929) (77,167.79 1) 16,29 1,439.032 1,720,655.995 -
- - -
- - 57,777,966.902 . 1,958,093.442 13,771.070 I - 4,425,386.200 9G7,918.043 - - - (5,681,935.166) (107,000.607) - - - 56,541,417.936 2,819,010.878 13,77 1.070
- - - 2,981,524.263 3,142,429.497 - - - a8as63.646 473,097.920 - - - I (432,920.1 56)
3,870,087.907 3.1 82,609.261 - -_ -
24
INTERNATIONAL OPPORmITIES FUNDS
STATEMENT OF CHANGES IN SHARES OUTSTANDING FOR TKE PERIOD ENDED JUNE 30,2008 (continued)
JAPAN JAPAN SMALLER KOREA COMPANIES EQUITY
USD USD DYNAMIC EQUITY
USD USD
Class A shares - - 174.491
Shares issued - - 750.000 231.849 Shares redccmcd Shares oursranding at thc end of the pcriod - - 750.000 426.340 Class & shares Shares oursranding at rhe beginning of the period - - - Shares issucd - - Shares redccmcd - I - - Shares ouwandinp, at the end of the pcriod - -
CIH AJ s h m Sharcs ouwanding at thc bcginning of rhc period I 8,896,049.539 - I
Shares issucd - - I - Shares redccmcd - (3,018,408.759) - - Shares oumanding at the cnd of the period - 5,877,640.780 - -
Shares outstanding at rhe beginning of the period - - I I
Sharcs omtanding ar the cnd of thc period - -
Shares outstanding at rhc bcginning of the period - - - -
Shares oursranding at the end of the period - - - I
Shares ourstanding at the beginning of rhe period 500,000.000 36,710,551.574 - 250,000.000
Shares redeemed - (3,152,125.436) I -
Shares outstanding ar rhc bcginning of the period - 6,911,391.399 - - 650,278.490 Sharcs issued
Shares redeemed I (1,123,591.742) - - Shares outstanding ar rhc end of rhe period - 6,438,078.147 Class DDJ shwa Shares outstanding a t thc bcginning of rhc period - - - -
Shares oursrandinR at the end of thc period - - - -
Shares outstanding ar rhe beginning of the period -
I - I -
- I I
- -
Class B sharcs
Sham issued Shares redccrncd
Class C shares
Sharcs issued Shares rcdecmed - - - -
Class D sharcs
Shares issucd - 3,226,020.039
Shares ourstanding at the end of the period 500,000.000 36,784,446.177 - 250,000.000
- - - - - - I -
- -
I I - -
- -
C k DJ s h m
- - -
- -
- - - - Shares issucd Shares redccrncd
Class E sharcs
I - - -
Shares oursranding at rhe beginning of rhe period - 13,390,336.049 - - 1,181.718.970 - 1,181,718.970 -
Shares issucd - 2,158,428.465 Shares redeemed Shares oursranding at the end of the period - 15,548,7G4.514
- - I -
Class F shams Shares outstanding ar thc beginning of the period - - I -
Shares issucd Shares redeemed - - Shares ouaranding ar the cnd of the period - I - - Class F, shares Shares outstanding ar the bcginning of rhc pctiod - - I - Shares issued Shares rcdcemed Shares oursranding at rhe end of the period I - - - Class J shares Shares outstanding ar rhc brginning of thc period - - - -
Shares issued Shares redccmcd Shares uucrtanding ar thc end of rhc pcriod
I - - - - -
- - - - - - - -
- - - - I - - - - - - -
25

INTERNATIONAL OPPORTUNITIES FUNDS
S n OF CHANGES IN SHARES O U T m I N G FOR THE PERIOD ENDED JUNE 30,2008 (continued)
NORTH LATIN MERICAN MALAYSLA NORTH AMERICAN PAN
EQUITY EQUITY AMERICA VALUE EUROPEAN USD USD USD USD USD
- 100.000 684.31 7.487 1,000.000 1,460,841.725 2,700.000 - 114,175.636 61 1.770 281,334.327
- - (55,079.995) (583,244.487) 2,700.000 100.000 743.4 1 5.128 1,611.770 1,158,931.563
- - - - 5,270,408.523 I - - - 586,653.708 - - - - (287,172.84 1 ) - - - - 5,567,889.390
- - 68.837,137.627 56,617.437.646 4,706,583.843 - - 19,205,793.726 14,463,097.824 377,836.795 - - (16,099,450.628) - (365,964.182) - - 7 1,945,482.725 71,080,535.470 4,740,456.456
- - - 1,000.000 250.000 I - - 541.712 - - - - (1,000.000) -
- 541.712 250.000 - -
- - - 4.1 93,064.576 -
- 24,870.107 - -
- (520,853.465) -
- 3,677,081.21 8 - -
- - -
-
26
INTERNATIONAL OPPORTUNITIES FUNDS
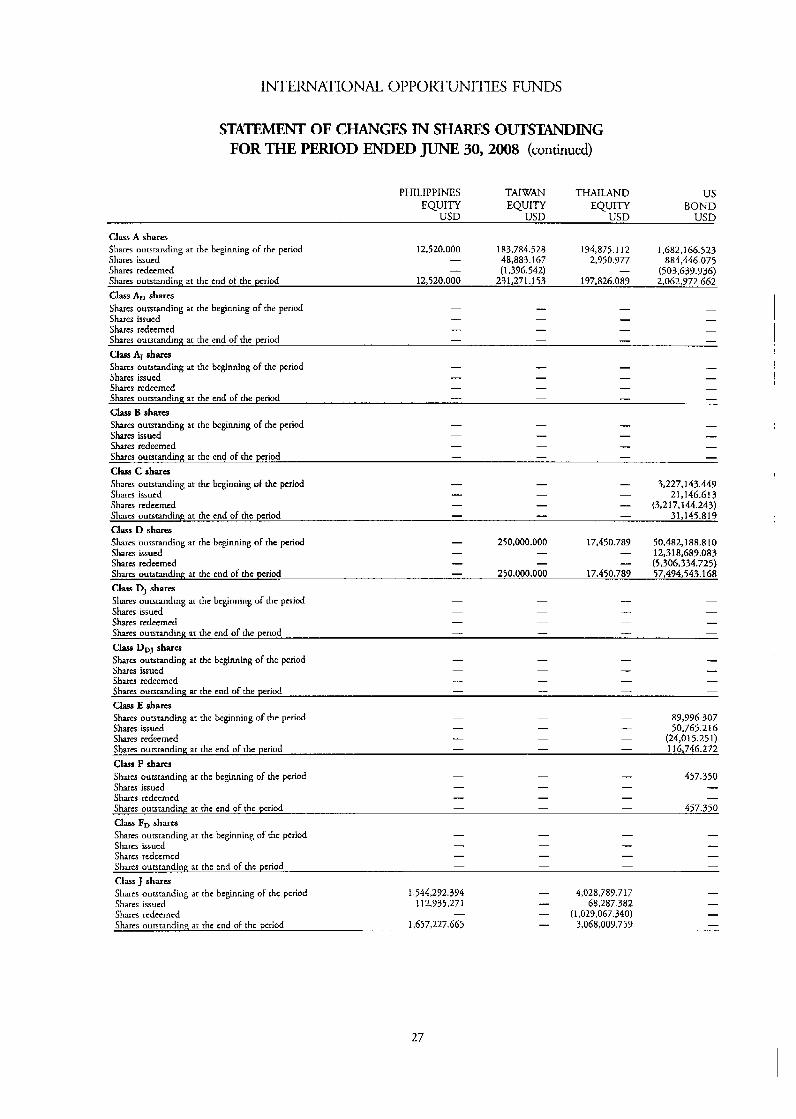
S n OF CHANGES IN SHARES OUTSTANDING FOR THE PERIOD ENDED JUNE 30, 2008 (continued)
PHILIPPINES TAIWAN THAILAND us EQUITY EQUITY EQUITY BOND
USD USD USD USD
Class A shares Sharcs outstanding at the beginning of the period 12.520.000 183,784.528 194,875.1 12 1,682,166.523 Shares issucd - 48,883.167 2,950.977 884,446.075 Shares redeemed I (1.396.542) - (503,639.736) Shares outstanding at thc end of chc period 12,520.000 231.271.153 197,826,089 2,062,972.662
Class AD S h x a Shares outstanding at thc beginning of the period Shares issucd - - Shares rcdccrncd - I - Shares oursranding ar rhe end of the period - -
C~ZISS Aj shares Shares outstanding at the beginning of the period Shares issued - - - Shares redeemed - - - Shares outstanding at the end of the period - -
Class B shares Shates oursranding at rhe beginning of the period - - Shares issucd - Shares redeemed - - Shares oursranding ar rhe end of the period - - I - Class C shams Shares ouaranding at thc bcginning of the period - - - 3,227,143,441)
- - 21,146.61 3 Sham issued I
Sham rcdccmcd - - - (3,217,144.243) - - 3 1,145.81 9 Sharcs outstanding at the end of the period
Clam D shares Shares outstanding at thc beginning of the period - 250,000.000 17,450.789 50.482,388.810 Shares issued - - - 12,318,689.083 Shares redeemed - - I (5,306,334.725) Sham outstanding at the end of the period - 250,000.000 17,450.789 57,474,543.1 68 clars D, shares Shares oursranding ar the bcginning of thc period - - Shares issued - - Shares rcdccrncd - - - Sham oursranding ar the end of the period - - I -
Clar~ DDj shares Shares outstanding at the bcginning of the period - - -
Shares issued Shares redeemed - - - -
Shares outstanding at thc cnd of the period - I - -
Class E shares Shares oursranding ar rhe beginning of tht pcriod - - - 89,996.307 Shares issucd - - - 50,765.216 Shares redeemed I - - (24,015.251)
11 6,746.272 Sharcs ourztanding at the end of the period I - - Class F sham
- 457.350 Shares outstanding ar rhe beginning of the pcriod - -
Shares issued Sham redeemed I - - -
- 457.350 Shares oursrandinE at the end of thc pcriod - -
Class F, shares Shares oursranding ar rhe beginning of thc period - - - - Shares issucd - - - Shares rcdccmcd Shares ourstanding ar the end of the period - - - -
Class J shares Shares ourstanding ar the beginning of rhc pcriod 1.544.272.394 - 4,028,787.717 - Shares issued 112,935.271 I 68,287.382 - Shares redeemrd - - (1.029.067.340) - Shares oursranding ar rhc end of thc period 1,657,227.665 - 3,068,009.759 -
- - - -
- - -
- -
- - - - - -
- -
- - - - -
- -
-
- - - -
-
- - I - -
- - - -
- - - - -
27
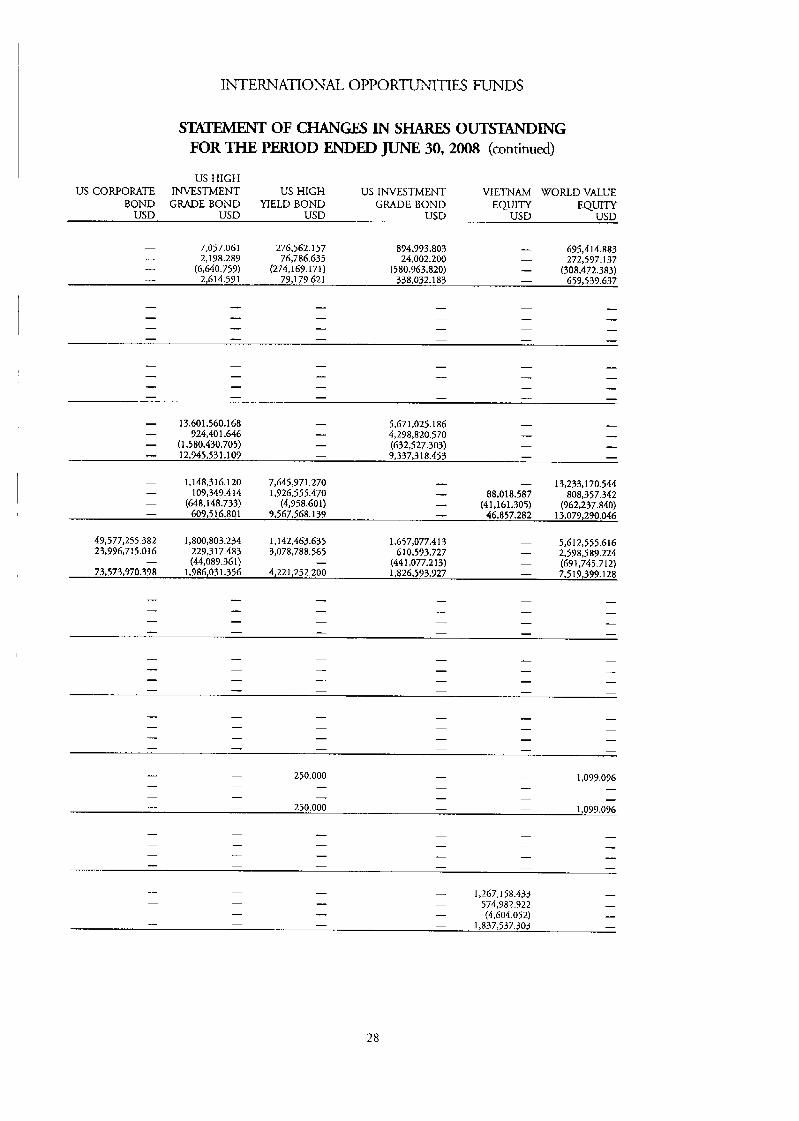
INTERNATIONAL OPPORTUNITIES FUNDS
STATEMENT OF CHANGES IN SHARES OUTSTIANDING FOR THE PERIOD ENIDFD JUNE 30,2008 (continued)
US HIGH US CORPORATE INVESTMENT US HIGH US INVESTMENT VIETNAM WORLD VALUE
BOND GRADE BOND YIELD BOND GRADE BOND EQUITY EQUITY USD USD USD USD USD USD
7,057.061 276,562.157 874.993.803 I 695,414.883 - 2,198.289 76,786.635 24,002.200 - 272,597.1 37 I (6,640.759) (274,169.171) (580,963.820) - (308.472.383) I 2,614.591 79,179.621 338,032.183 - 659,539.637
-
- - 13,601,560.1 B8 - 5.671.025.186 - - 924,401.646 - 4,29a,820.570 - - - (1,580,430.705) - (632,527.303) - - 12,945,531 .IO9 - 7,337,318,453 - -
-
1.148,316.120 7,645,971.270 I - 13,233,170.544 109,349.4 14 1.726.555.470 - 88,018.587 808,357.342
- (648,148.733) (4,958.601) I (41,161.305) (962,237.840) - 609,516.801 9,567,568.139 - 46,857.282 13,079,290.046
- -
49,577,255.382 1,800,803.234 1.142,463.635 1.657,077.413 - 5,612,555.616 23,396,715.016 229,317.483 3,078,788.565 610,593.727 - 2,598,589.224
(44,089.361) - (44 1,077.213) - (69 1,745.71 2) 73,573,970.398 1,986,03 1.356 4,221,252.200 1,826,593.927 - 7.51 9,399.128
-
,
- - 1,267.1 58.433 - - - 574,982.922 - - - (4.604.052) I
- - - - - -
- 1,837,537303 - - I -
28

INTERNATIONAL OPPORTUNITIES FUNDS
STATISTICS
ASIA PACIFIC ASIAN ASIAN ASIAN EQUITY BOND DYNAMIC EQUITY
USD USD USD USD ..
TOTAL NET ASSETS VALUE - Junc 30, 2008 - Dcccrnbcr 3 I , 2007 - Dcccrnbcr 3 I , 2006 - Dccembcr 31, 2005 Nct a c t value per Class A share ar ar
- Junc 30, 2008 - December 31, 2007 - Decernbcr 31, 2006 - Dcccrnbcr 31, 2005 Net asset value per Class AD share as at
- June 30, 2008 - Decernbcr 31, 2007 - Dcccrnbcr 31. 2006 - December 31, 2005 Ncr asset value per Class A, sharc as at
-June 30, 2008 - December 3 I , 2007 - December 31, 2006 - Decernbcr 31, 2005 Net asset valuc pcr Class B sharc as at -June 30, 2008 - Deccmbcr 31, 2007 - December 31, 2006 - December 31, 2005 Net asset valuc per Class C &arc as at
- Junc 30, 2008 - Dcccrnbcr 31, 2007 - Dcccrnbcr 31, 2006 - Dcccrnbet 31, 2005 Net asset valuc pcr Class D share as at
-June 30, 2008 - December 31, 2007 - December 31, 2006 - Dcccrnbcr 31, 2005 Nct assct valuc per Class DJ share a at
-June 30, 2008 - December 31, 2007 - Dcccrnbcr 31. 2006 - Dccetnber 31, 2005 Net assct vduc pcr Class DDJ share as a1
-June 30, 2008 - Dccembet 3 I , 2007 - December 31, 2006 - December 31, 2005 Ner assct value per Class E share as a t
- Junc 30, 2008 - Dcccrnbet 31, 2007 - Dcccmber 31, 2006 - December 31, 2005 Net asset valuc pcr Class F share as a t
- Junc 30, 2008 - December 31, 2007 - neccrnbcr 3 I , 2006 - Dcccrnber 31. 2005 Nct assct value per Class F, sharc as at - Junc 30, 2008 - Dccrrnbrr 3 I , 2007 - Dcccrnbcr 31. 2006 - Decernbei 31, 2005 Nct asr t value per Class J sharc as at
- Junc 30, 2008 - DrLernber 31, 2007 - Deccrnbcr 31, 2006 - Dcccrnbcr 31, 2005
837,936,491 $)27,063,174
- -
793,475,976 761,451,423 597,447,103 282,G46,959
741,515,480 848,593,929 428,022,538 211,510,251
USD 11.651 USD 11.990 USD 11.636 USD 10.747
USD 15.627 USD 19.076 USD 14.264 USD 10.925
USD 11.440 USD 11.997 -
USD 8.017 USD 9.727 -
-
USD 32.161 USD 39.153 USD 29.117 USD 22.193
- USD 13.839 USD 12.682
USD 12.178 USD 12.435 USD 11.913 USD 10.864
USD 15.797 USD 19.077 USD 12.656
USD 33.347 USD 40.395 USD 29.740 USD 22.443
USD 9.792 USD 10.064
- -
USD 10.356 USD 12.120
-
SGD 7.074 SGD 9.844
SGD 10.179 SGD 10.202
SGD 12.713 SGD 16.394 SGD 13.068 SGD 10.867
USD 11.176 USD 13.560
I
The accompanying notes form an integral part uf these financial staicrncntz.
29

INTERNATIONAL OPPOR?ZsNITIES FUNDS
smsTIcs
ASIAN ASIAN AslAN ASIAN ASIAN EQUITY INFRASTRUCTURE LOCAL PROPERTY STRUCTURED
INCOME EQUITY BOND SECURITIES PRODUCTS USD USD USD USD USD
3,095.8M 3,535,964 3,013,041 -
107,465,812 131,813,959
- -
394,142,063 4 14,243,620 386,123,574
12,570,125 10,273,827
- -
I
252,894&04 169,506,780 -
USD 7.058 USD 10.427 -
-
USD 8.403 USD 10.523
- -
USD 9.846 USD 10.443
USD 8.308 USD 10.228
- -
USD 9.181 - - -
USD 12.380 USD 14.140 USD 12.052
-
USD 8.473 USD 10.348 I
-
- USD 10.718 USD 10.465 I
- USD 10.633
USD 9.598 USD 10.168 -
-
SGD 8.281 - - -
SGD 8.788 SGD 9.847
SGD 7.809 - - -
SGD 7.745 - - I
30
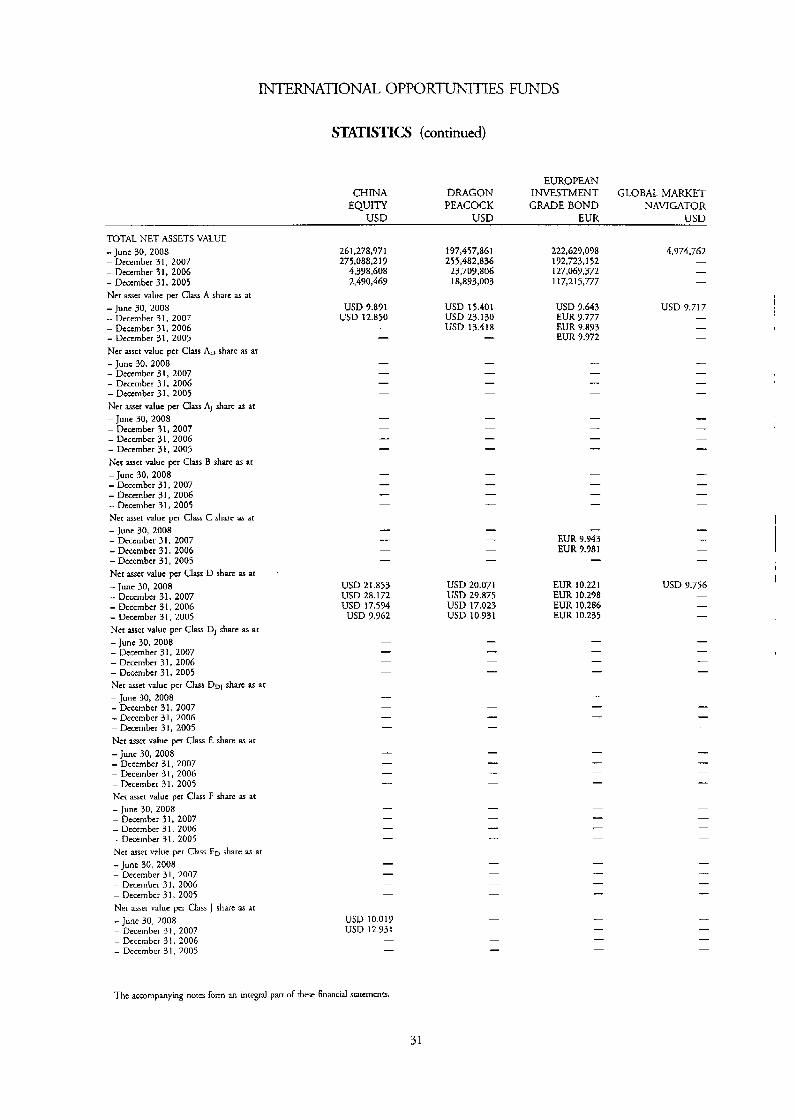
INTERNATIONAL OPPORTUNITIES FUNDS
!jTATIISTICS (continued)
EUROPEAN CHINA DRAGON INVESTMENT GLOBAL MARKET
EQUITY PEACOCK GRADE BOND NAVIGATOR USD USD EUR USD
TOTAL NET ASSETS VALUE - Junc 30, 2008 - December 31, 2007 - December 31, 2006 - December 31, 2005 Ncr asset value per Clas A sharc as at
- Junc 30, 2008 - December 3 I , 2007 - December 31, 2006 - Dcccmbcr 31, 2005 Net assct valuc per Class AD share as at
- Junc 30, 2008 - December 31, 2007 - Dcccmbcr 31, 2006 - December 31, 2005 Net met value per Class A, sharc as ar - June 30, 2008 - December 31, 2007 - Dcccmbcr 3 I , 2006 - Dcccmbcr 31, 2005 Net aact Vauc pcr Class B share as at
- Junc 30, 2008 - Dcccmbcr 31. 2007 - Dccember 31, 2006 - December 31, 2005 Ner asset value pcr Class C sharc as at
- Junc 30, 2008 - Dcccmbcr 3 I , 2007 - Dccembcr 31, 2006 - December 31, 2005 Ncr asser value per Class D sharc as at
- Junc 30, 2008 - Dcccmber 31, 2007 - Dcccmbcr 3 I , 2006 - Dnember 3 I , 2005 Net m e r value per Class D, sharc as at
-June 30, 2008 - Deccmbcr 31, 2007 - Dcccmbcr 3 I , 2006 - Dcccmber 31, 2005 Net asset valuc pcr Class Diq share as ar
-June 30, 2008 - Dccember 31, 2007 - December 31, 2006 - December 3 1, 2005 Ner asset valuc pcr Class E share as at
- Junc 30, 2008 - Dcccmber 3 I , 2007 - December 3 1 , 2006 - Decembcr 31, 2005 Nct a a c t value per Class F sharc as at
- June 30, 2008 - December 31, 2007 - Dcccmbcr 3 1 , 2006 - Dccember 31, 2005 Ncr m e t value pcr Class F D sharc as ar - J u n e 30, 2008 - December 3 I , 2007 - Decembcr 31, 2006 - Deccmbcr 31. 2005 Net asset valuc pcr Class J sliare as ,IC
-June 30, 2008 - December 31, 2007 - Dcccmbcr 3 I , 2006 - Dcccmber 31. 2005
261,278,971 275,088,219
4,398,608 2,490,469
197,457,a~i 255,482,836
23,709,806 18,833,003
222,1529,098 192,723,152 127,069.372 117,215,777
4,974,762 - - -
USD 9.891 USD 12.850 -
-
USD 15.401 USD 23.130 USD 13.418 -
USD 9.643 EUR 9.777 EUR 9.893 EUR 9.972
- EUR 9.943 EUR 9.981 -
USD 21.853 USD 28.172 USD 17.594
USD 9.962
USD 20.071 USD 29.875 USD 17.023 USD 10.931
EUR 10.221 EUR 10.238 EUR 10.286 EUR 10.235
USD 9.756 - - -
USD 10.019 USD 12.931
-
The acmrnpanying notch forrn an inregnl part of thcsc financial statcmcnts.
31
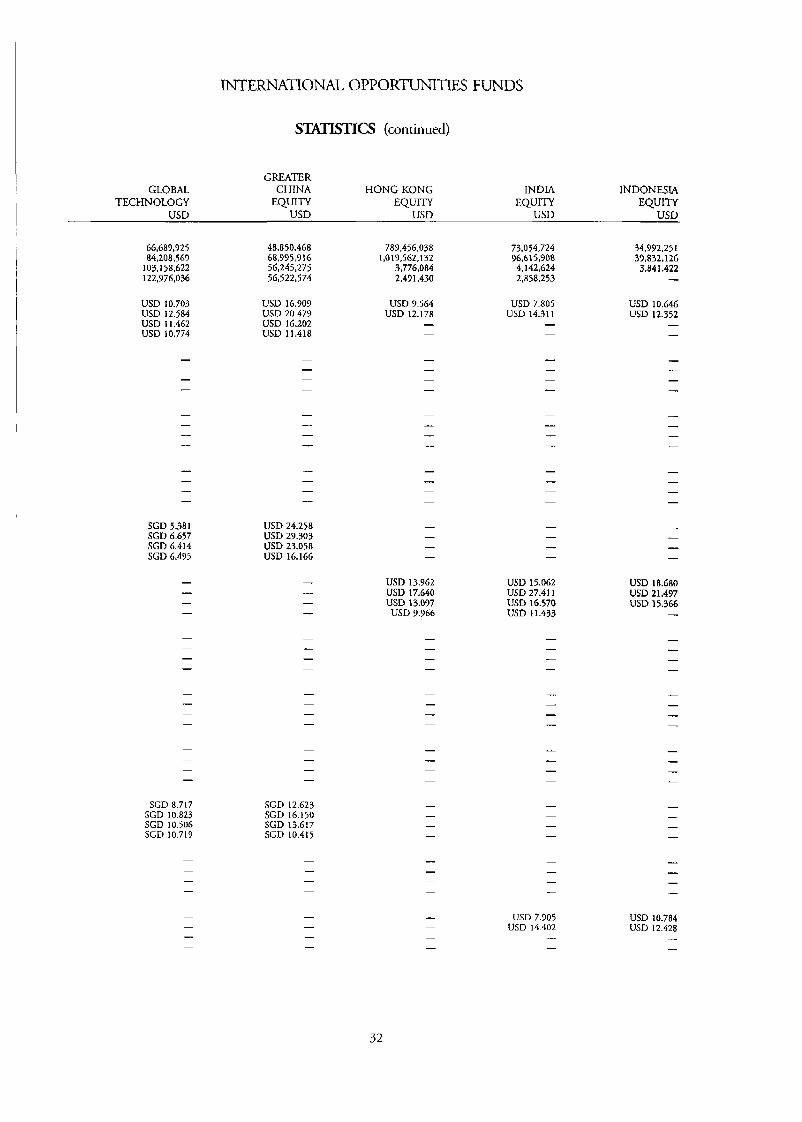
INTERNATIONAL OPPORTUNI'TIFS FUNDS
STATETICS (continued)
GREATER GLOBAL CHINA
TECHNOLOGY EQUITY USD USD
HONG KONG INDIA INDONESM EQUITY EQUITY EQUITY
USD USD USD
66,689,925 84,208,569
103,158,622 122,976,036
789,456,038 1,0l9,562,I 32
3,776,084 2,491,430
73,054,724 96,615,908 4,142,624 2,858,253
34,992,251 39,832,126 3,841,422 -
USD 9.564 USD 12.178 -
-
USD 7.805 USD 14.31 1 -
-
USD 10.646 USD 12.352 -
-
SGD 5.381 SGD 6.657 SGD 6.414 SGD 6.495
USD 24.258 USD 29.303 USD 23.058 USD 16.166
USD 13.962 USD 17.640 USD 13.097
USD 9.966
USD 15.062 USD 27.41 1 USD 16.570 USD 11.433
USD 18.680 USD 21.497 USD 15.366 -
SGD 8.717 SGD 10.823 SGD 10.506 SGD 10.719
SGD 12.623 SGD 16.150 SGD 13.617 SGD 10.415
USD 7.905 USD 14.402 -
USD 10.784 USD 12.428 -
-
32
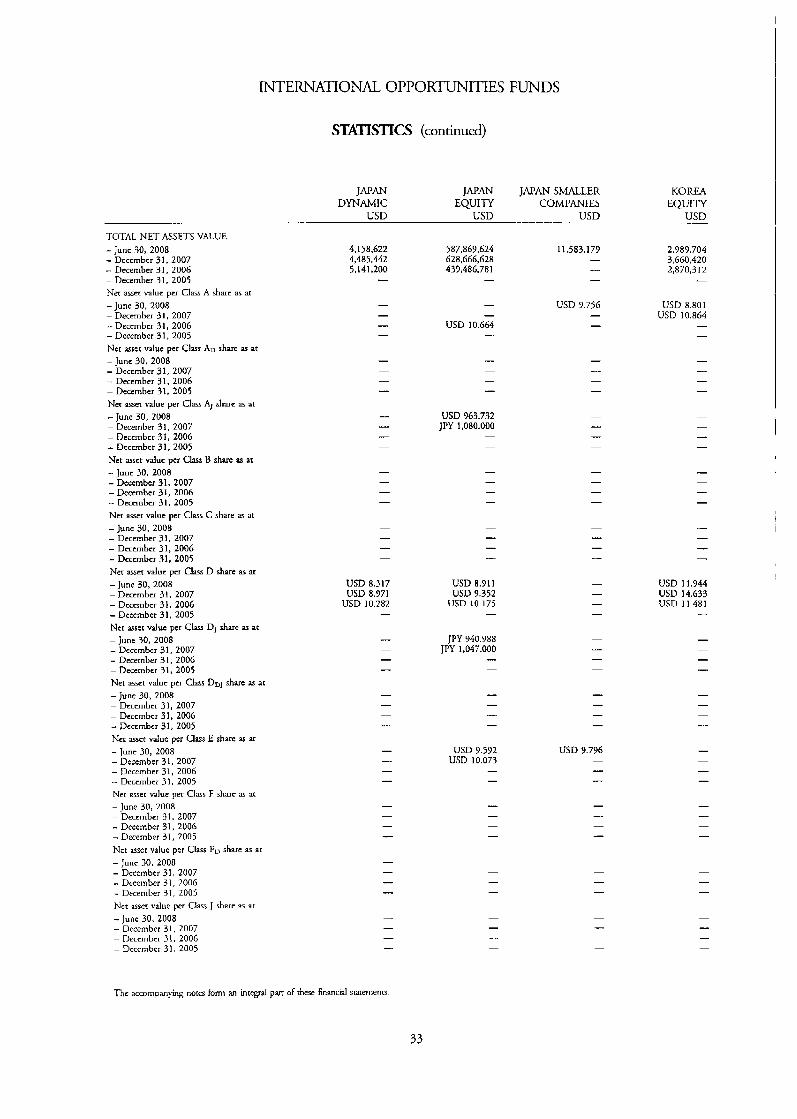
INTERNATIONAL OPPORTUNITIES FUNDS
S m S T I C S (continued)
JNM JAPAN JAPAN SMALLER KOREA DYNAMIC EQUITY COMPANIES EQUITY
USD USD USD USD
TOTAL NET ASSETS VALUE - Junc 30, 2008 - Dcccmbcr 31. 2007 - December 31, 2006 - December 31, 2005 Net asset value per Class A sharc as at
-June 30, 2008 - December 3 1, 2007 - Deccmbcr 31, 2006 - December 31, 2005 Ner arser value per Class AD sharc as at
-June 30, 2008 - Dcccmbcr 3 I , 2007 - Dcccmbcr 31. 2006 - December 31, 2005 Net asset value per Class A, share as at
-June 30, 2008 - December 31, 2007 - Deccmbcr 31, 2006 - Dcccmbcr 31, 2005 Net assct valuc per Class B share ar at
- Junc 30, 2008 - December 31, 2007 - December 31, 2006 - Dcccrnbcr 31, 2005 Nct assct value per Class C share as at - Junc 30, 2008 - Dcccmbcr 31. 2007 - Dncmbcr 31, 2006 - Dcccmbcr 31, 2005 Ner asset valur pcr Class D share as ar -June 30, 2008 - Dcccmbcr 31, 2007 - Dcccmbcr 31, 2006 - Dccember 31, 2005 Ncr user value per Class D, sharc as at
-June 30, 2008 - Dcccmbcr 31, 2007 - December 31, 2006 - December 31, 2005 Net assct valuc pcr Class D ~ J shut as ar
-June 30, 2008 - Dcccmbcr 31, 2007 - Weccrnbcr 3 1, 2006 - Dcccmbcr 31, 2005 Nct assct value per Class E share as at
- Junc 30, 2008 - December 31, 2007 - Decembcr 31, 2006 - Dcccmbcr 31, 2005 Nct asset value per Class F sharc as at
-June 30, 2008 - Deccmbcr 3 I , 2007 - December 31, 2006 - December 31, 2005 Nct asset value per Class F , sharc as at
- Junc 30, 2008 - Dccernber 31, 2007 -. Drcember 31, 2006 - December 31, 2005 Nct asser V~lue per Class J sharc as at
-June 30, 2008 - December 31, 2007 - Decembcr 31. 2006 - Dcccmber 3 I , 2005
4,158,622 4,485,442 5,14 1,200 -
587,869,624 628,666,628 439,486,781
-
11,583,179 - - -
2,989,704 3,660.420 2,870,3 I 2 -
USD 9.756 - - -
USD 8.801 USD 10.864 -
USD 10.664 -
USD 963.732 JPY 1,080.000
-
USD 8.317 USD 8.971
USD 10.282
USD 8.911 USD 9.352
USD 10.175 -
USD 11.944 USD 14.633 USD 11.481
JPY 940.988 JPY 1,047.000 -
-
USD 9.592 USD 10.073
- -
USD 9.796 - I
-
The accnmpanying notes form an i n r p l pan OF rhcsc finmncid srarernenn.
33
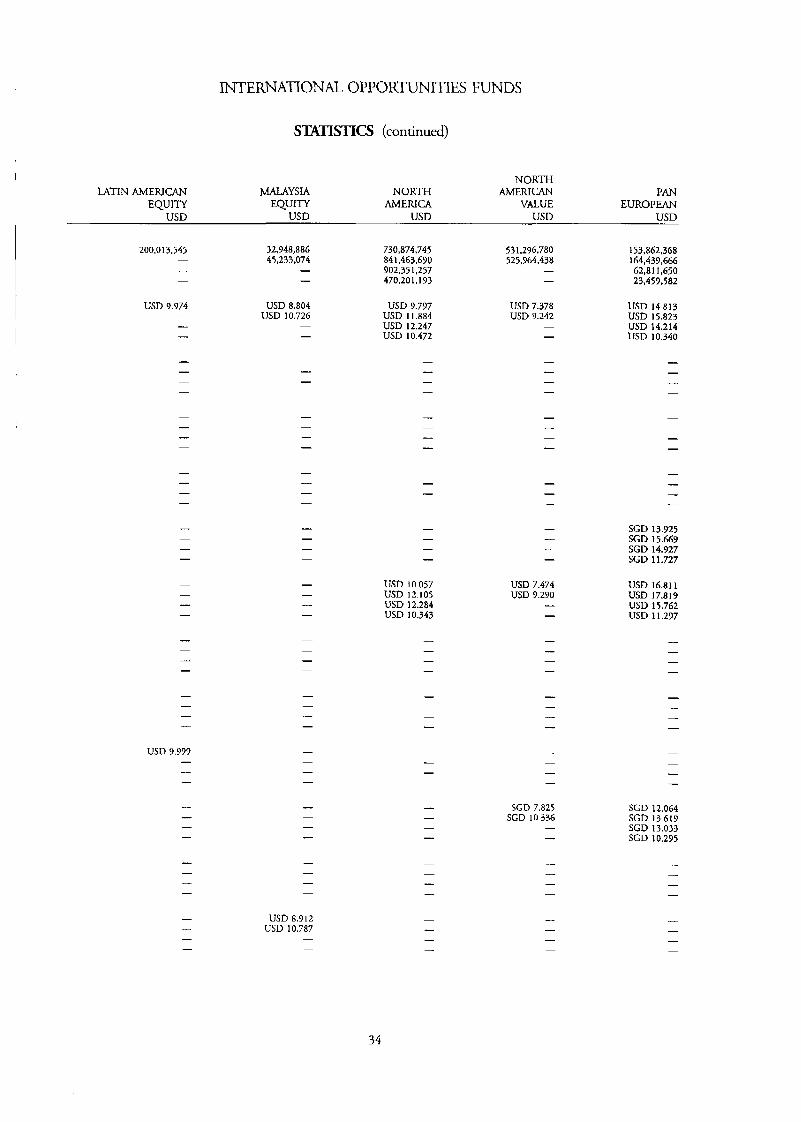
INTERNATIONAL OPPORTUNITIES FUNDS
STATISIICS (continued)
NORTH LATIN AMERICAN MALAYSIA NORTH AMERICAN PAN
EQUITY EQUITY AMERICA VALUE EUROPEAN USD USD USD USD WSD
200.0 13,545 - - -
32,948,886 45,233,074 -
-
730,874.745 841,463,690 902,351,257 470.20 1 , I93
153,862,368 164,439,666 6281 1,650 23,459,582
USD 14.813 USD 15.823 USD 14.214 USD 10.340
USD 9.974 - I
-
USD 8.804 USD 10.726
USD 9.797 USD 1 1.884 USD 12.247 USD 10.472
USD 7.378 USD 9.242
- -
SGD 13.925 SGD 15.669 SGD 14.927 SGD 11.727
USD 10.057 USD 12.105
USD 10.343 USD 12.284
USD 7.474 USD 9.290 I
USD 16.811 USD 17.819 USD 15.762 USD 11.297
USD 7.999 - I
-
SGD 7.825 SGD 10.336 -
-
SGD 12.064 SGD 13.619 SGD 13.033 SGD 10.295
USD 8.912 USD 10.787
34
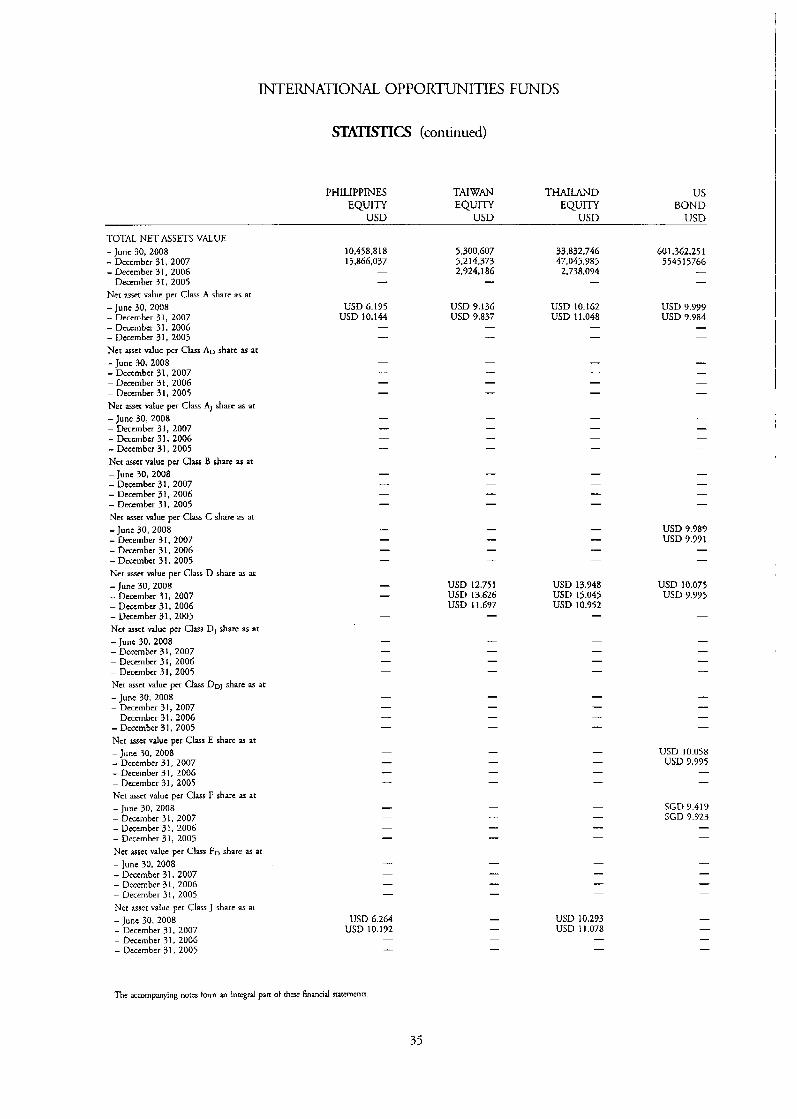
INTERNATIONAL O P P O R ~ I T I l 3 FUNDS
SnTISTICS (conrinued)
PHILIPPINES TAIWAN THAILAND us EQUITY EQUITY EQUITY BOND
USD USD USD USD
TOTAL NET ASSETS VALUE - Junc 30, 2008 - Dcccrnbcr 31. 2007 - Deccmber 31, 2006 - December 31, 2005 Net asset value per Class A sharc as at -June 30, 2008 - Deccmbcr 31, 2007 - Dncmbcr 31, 2006 - Decernbcr 31, 2005 Net asset valuc pcr Class AD sharc as at - Junc 30, 2008 - Dcccmber 31, 2007 - December 31, 2006 - December 31, 2005 Net asset value per Class A, sharc as at
-June 30, 2008 - December 31, 2007 - Dnembcr 31, 2006 - Dccember 31, 2005 Nct asscr value per Class B share as at
-June 30, 2008 - December 31, 2007 - Dcccmbcr 3 1, 2006 - Dnembcr 31, 2005 Nct asset value per Class C share as at
- Junc 30. 2008 - December 31. 2007 - Dccernbcr 3 1, 2006 - Dccember 31, 2005 Nct asset value per Class D share as at
-June 30,2008 - December 31, 2007 - December 31, 2006 - December 31, 2005 Nct asstt value pct Class DJ share as at
-June 30, 2008 - December 31, 2007 - Decernbcr 31, 2006 - Decembcr 31, 2005 Ncr assct valuc pcr Class DDJ share as at
-June 30, 2008 - Decembcr 31, 2007 - Dcccrnbcr 31, 2006 - Dcccmber 3 I , 2005 Nct asset value per Class E sharc as at -June 30, 2008 - Dcccmbcr 31, 2007 - December 31, 2006 - Decembcr 31, 2005 Nct mct value per Class F share as at
- Junc 30, 2008 - December 31, 2007 - December 31, 2006 - Decernbcr 31, 2005 Ner asset value per Class FD sharc as at -June 30, 2008 - December 31, 2007 - December 3 I , 2006 - December 31, 2005 Net asset value pcr Class J sharc a\ at
-June 30, 2008 - neccrnbcr 31, 2007 - December 3 I , 2006 - Decernbcr 31, 2005
10,458,818 15,866.037
5,300.607 5,214,373 2,9241 86 -
33,832,746 47,045,985
2,738,094 -
601.362.25 1 554515766
USD 6.195 USD 10.144
-
USD 9.136 USD 9.837
-
USD 10.1C.2 USD 11.048
-
USD 9.999 USD 7.984 -
-
USD 9.985, USD 9.991 -
-
USD 12.751 USD 13.626 USD 11.697 -
USD 13.948 USD 15.045 USD 10.952 -
USD 10.075 USD 9.995
-
USD 10.058 USD 7.995
- -
SGD 7.419 SGD 9.923 -
USD 10.293 USD 11.078 -
-
USD 6.264 USD 10.192
-
The accompanying notes form an inrLgt’d1 parr of rhw financial suternenrs.
35
INTERNATIONAL OPPORTUNITIES FUNDS
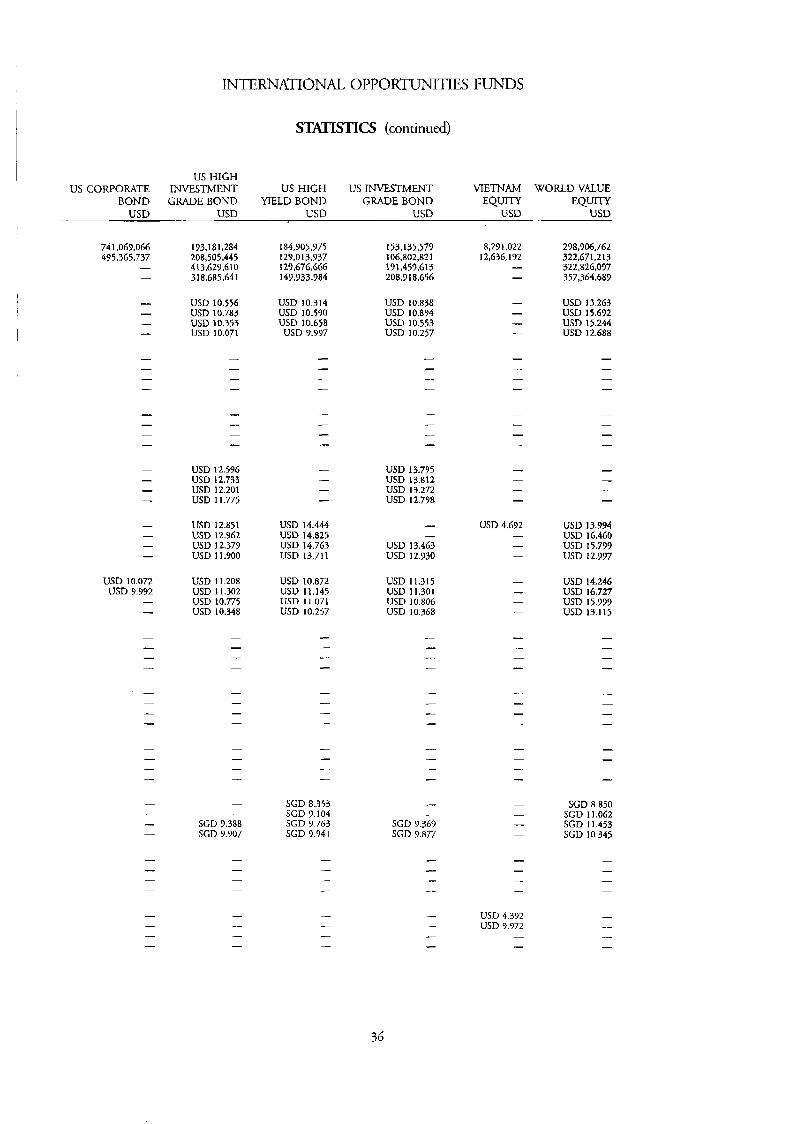
SUI'ISTICS (continued)
US HIGH US CORPORATE INVESTMENT US HIGH US INVESTMENT VIETNAM WORLD VALUE
BOND GRADE BOND YIELD BOND GRADE BOND EQUITY EQUITY USD USD USD USD USD USD
741,069,066 495,365,737
-
193,181,284 208,505,445 413,629,610 318,685.641
184,905,975 129,013,937 129 LJ6,G66 149,933,984
153,135,579 106,802,821 19 1,459.61 3 208,9 18,656
8,291,022 12,636,172
298,906,762 322,671,213 322,826,097 357,364,689
USD 10.556 USD 10.783 USD 10.353 USD 10.071
USD 10.314 USD 10.590 USD 10.658
USD 7.997
USD 10.838 USD 10.894 USD 10.553 USB 10.257
USD 13.263 USD 15.692 USD 15.244 USD 12.688
USD 13.795 USD 13.812 USD 13.272 USD 12.798
USD 12.596 USD 12.733 USD 12.201 USD 11.775
USD 12.851 USD 12.962 USD 12.379 USD 11.900
USD 14.444 USD 14.825 USD 14.763 USD 13.711
USD 4.692 - - -
USD 13.994 USD 16.460 USD 15.799 USD 12.997
USD 13.463 USD 12.930
USD 10.072 USD 9.992
USD 11.208 USD 11.302 USD 10.775 USD 10.348
USD 10.872 USD 11.145 USD 11.071 USD 10.257
USD 11.315 USD 11.301 USD 10.806 USD 10.368
USD 14.246 USD 16.727 USD 15.999 USD 13.115
SGD 8.353 SGD 9.104 SGD 9.763 SGD 9.94 1
SGD SGD 1 8.850 1.062
SGD 11.453 SGD 10.345
SGD 9.388 SGD 9.907
SGD 9.369 SGD 9.877
USD 4.392 USD 9.972
36

I
INTERNATIONAL O P P O R ~ I T T E S FUNDS - ASIA PACIFIC EQUI'IY -
S n OF INVESTMFNTS As AT JUNE 30,2008 (expressed in USD)
- -. ~~
Aquisition % net Evaluation assets Description Quantity Currency cost
TRANSFERABLE SECURITIES ADMITTED TO AN OFFICIAL STOCK EXCHANGE LISTING OR DEALT IN ON ANOTHER REGULATFD MARKET
SHARES
AUSTRALIA AMP Lrd Aristocrar Leisure Ltd Australia & New Zealand Banking Group Ltd BHP Billiton Lrd Foster's Group Ltd Macquarie Group Ltd Metash Lrd Origin Energy Ltd KO Tinto Lrd Suncorp-Metway Ltd Telstra Corp., Ltd
BERMUDA ARA Asset Management Lrd
CAYMAN ISL4NDS AAC Acoustic Technologies Holdings, Inc. Shui On Land Ltd
CHINA Bank of China Ltd "H" BYD Electronic International Co., Ltd China Coal Energy Co. "H" China COSCO Holdings Co., Ltd "H" China Petroleum & Chemical Corp. "H" China Shipping Development Co., Ltd "H" Guangzhou R&F Properties Co., Ltd "H"
HONG KONG BOC Hong Kong Holdings Ltd China Mobile Ltd China Netcom Group Corporation Hong Kong Lrd CNOOC Ltd Huabao lnternational Holdings Ltd Kowloon Developrncnr Co., Lrd Wharf Holdings Ltd
2,034,722 2,048,841 1,290,913 1,206,708 4,439,047
361,231 4,660,026 2,026,479
183,936 749,792
2,878,380
7,885,000
AUD 17,531,087 13,130,906 1.57 AUD 19,942,756 12,687,150 1.51
AUD 30,392,159 23,308,993 2.78 AUD 43,782,447 50,863,288 6.07 AUD 23,833,278 21,707,944 2.59 AUD 23,834,835 16,947,256 2.02 AUD 17,712,654 16,630,713 1.98 AUD 16,391,206 31,508,516 3.76 AUD 21,445,853 24,039,578 2.87 AUD 11,218,191 9,430,577 1 . I 3
AUD 11,549,467 11,771,581 1.41
237,633,933 232,026,528 27.69
SGD 5,438,414 4.1 14,296 0.50
12,283,000 HKD 15,533,551 10,266,998 1.23 8,161,000 HKD 7,445,846 6,790,152 0.81
24,979,397 17,057,150 2.04
36,714,000 HKD 19,017,198 16,332,498 1.95 4,209,500 HKD 5,700,862 2,478,636 0.30 7,002,000 HKD 17,152,812 15,741,453 1.88 3,287,500 HKD 7,455,144 8,029,476 0.76 8,584,000 HKD 11,740,566 8,033,486 0.76
6,777,713 7,823,749 0.73 2,608,000 HKD 3,047,600 HKD 7,486,699 5,680,857 0.67
79,530,994 64,140,175 7.65
4,105,500 HKD 10,596,628 10,868,699 1.30 1,167,686 HKD 19,027,327 15,715,276 1.87
5,298,500 HKD 15,985,425 14,434,552 1.72 10,473,000 HKD 17,535,728 18,018,352 2.15 11,445,000 HKD 11,312,616 10,857,728 1.30 3,701,000 HKD 8,764,046 6,775,457 0.81 4,645,000 HKD 25,344,966 19,442,863 2.32
108,566,736 76,112.935 11.47
37
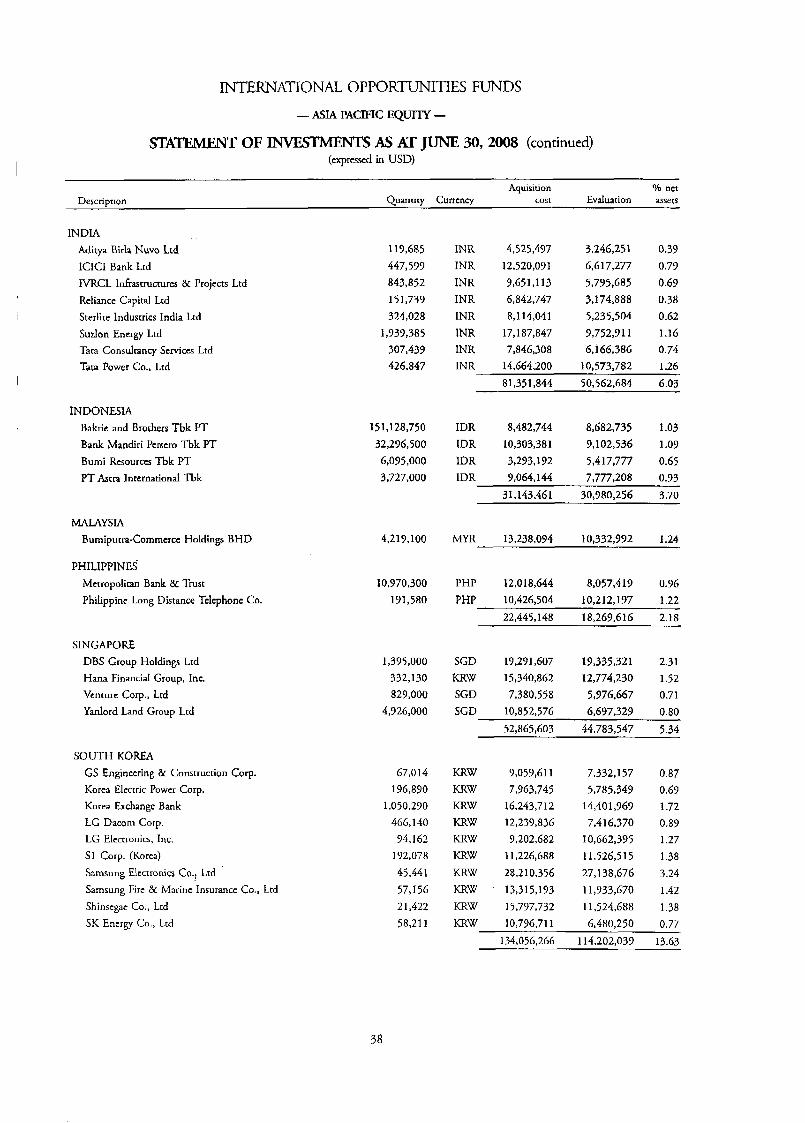
INTERNATIONAL OPPORTUNITIES FUNDS
- ASIA PACIFIC EQUITY -
STATEMnVT OF -S As AT JUNE 30,2008 (continued) (expressed in USD)
Aquisition o/b net Description Quanriry Curtcncy cost Evaluation assets
INDIA Aditya Birla Nuvo Ltd lCICI Bank Ltd IVRCL Infrastructures & Projects Ltd Reliance Capital Ltd Sterlire lndusrries India Ltd Suzlon Energy Ltd Tara Consulrancy Services Ltd Tata Power Co., Ltd
119,685 447,599 843,852 151,739 324,028
1,939,385 307,439 426,847
INR INR INR INR INR INR INR INR
4,525,437 12,520,091 9,651 ,I 13 6,842,747 8,114,041
17,187,847 7,846,308
14.664.200
3,246,251 6,6 17,277 5,795,685 3,174,888 5,235,504 3,752,Y 1 1 6,166,386
10.573.782
0.39 0.79 0.69 0.38 0.62 1.16
0.74 1.26
81,351,844 50,562,684 6.03
INDONESIA Bakrie and Brothers Tbk IT Bank Mandiri Pcrscro Tbk PT Burni Resourccs Tbk PT PT ktra International Tbk
151,128,750 32,296,500 6,095,000 3,727,000
IDR 8,482,744 8,682,735 1.03 IDR 10,303,381 9,102,536 1.09 IDR 3,293,192 5,417,777 0.65 IDR 9,064,144 7,777,208 0.93
MALAYSIA Bumipurra-Commerce Holdings BHD
PHILIPPINES Mctropolitan Bank & Trust
Philippine Long Distance Tclcphonc CO.
SINGAPORE DBS Group Holdings Ltd Hana Financial Group, Inc. Venture Corp., Ltd Yanlord Land Group Ltd
SOUTH KOREA GS Engineering & Construction Corp. Korea Electric Power Corp. Korea Exchange Bank LG Dacorn Corp. LG Elcctronics, Inc. SI Corp. (Korea) Samsung Elcctronics Co., Lrd Sarnsung Fire & Marine Insurance Co., Ltd Shinscgac Co., Ltd SK Encrgy Co., Lrd
31,143,461 30,980,256 3.70
4,217,100 MYR 13,238,094 10,332,992 1.24
10,970,300 191,580
PHP 12,018,644 8,057,419 0.96 PHP 10,426,504 10,212,197 1.22
1,395,000 332,130 829,000
4,926,000
67,014 196,890
1,050.290 466, I40
74,162 192,078 45,441 57,156 2 1,422 58,21 I
SGD 19,291,607 19,335,321 2.31 KRW 15,340,862 12,774,230 1.52 SGD 7,380,558 5,976,667 0.71 SGD 10,852,576 6,697,329 0.80
52,865,603 44,783,547 5.34
KRW 9,059,611 7,332,157 0.87 KRW 7,963,745 5,785,349 0.69 KRW 16,243,712 14,401,969 1.72 KRW 12,239,836 7,416,370 0.89 KRW 9,202,682 10,662,395 1.27 KRW I 1,226,688 1 1,526,5 15 I .38 KRW 28,210,356 27,138,676 3.24 KRW . 13,315,193 11,933,670 1.42 KRW 15,797,732 11,524,688 1.38 KRW 10,796,711 6,480,250 0.77
134,056,266 114,202,037 13.63
38
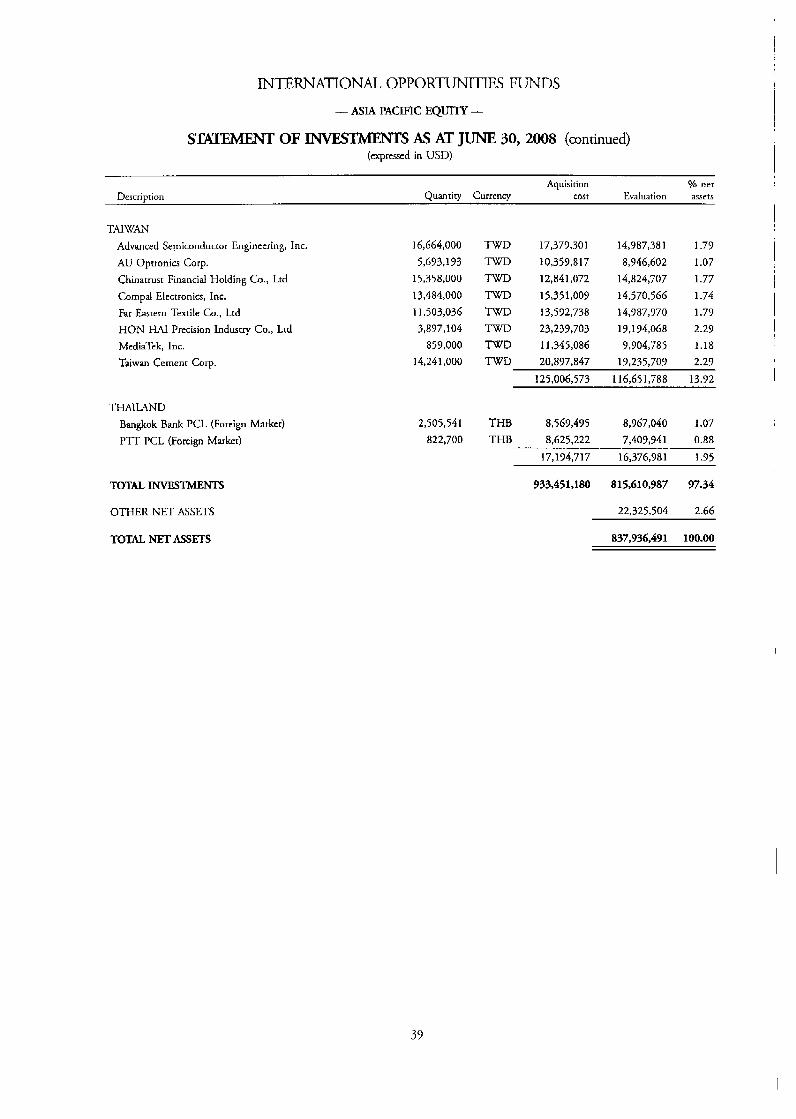
INTERNATONAL O P P O R m I T I E S FUNDS
- ASIA PACIFIC EQUITY -
STATEMENT OF -S AS AT JUNE 30, 2008 (continued) (expressed in USD)
Aquisition Yo net Description Quantity Currency cost Evaluation assets
TAIWAN Advanced Semiconductor Engineering, Inc. AU Optronics Corp. Chinatrust Financial Holding Co., Ltd Cornpal Electronics, Inc. Far Eastern Textile Co., Ltd HON HAI Precision Industry Co., Lrd MediaTek, Inc.
Taiwan Cement COT.
THAILAND Bangkok Bank PCL (Foreign Market) PTT PCL (Foreign Market)
16,664,000
5,693,193 15,358,000 13,484,000 11,503,036 3,897,104
859,000 14,241,000
2,505,541 822,700
TWD TWD TWD TWD TWD TWD TWD TWD
17,379,301 10,359,817 12,841,072 1535 1,009 13,592,738 23,239,703 11,345,086 20,897,847
14,987,381 8,946,602
14,824,707 14,570,566 14,987,970 19,174,068
9,904,785 19,235,709
I .79 1.07
1.77 1.74 1.79 2.29 1.18 2.29
125,006,573 116,651,788 13.92
8,967,040 1.07 8,625,222 7,409,941 0.88
17.194.717 115.376.981 1.95
THB 8,569,495 THB
TOTAL INVESTMENTS
OTHER NET ASSETS
733,451,180 815,610,987 97.34
22.325.504 2.66
TOTAL NET ASSETS
39
837,936,491 100.00

INTEFCNAnONAL O P P O R ~ I T I E S FUNDS
- ASIAN BOND -
STATEMENT OF l N V E S w AS AT JUNE 30,2008 (expressed in USD)
Aquisition % net Description Quantity Currency cost Evaluation assets
TRANSFERABLE SECURITIES A13MIlTF.D TO AN OFFICIAL STOCK EXCHANGE LISTING OR DEALT IN ON ANOTHER REGULATED hlARKET
BONDS
BERMUDA Hang Fung Gold Technology Lrd 9.25% 17/10/2014 Li & Fung Ltd 5.5% 16/5/2017 Nine Dragons Paper Holdings Ltd 7.875% 29/4/2013 (Reg)
BRITISH VIRGIN ISLANDS Ciric Resources Finance Ltd 6.75% 15/5/2014 (Reg) CMHI Finance BVI Co., Ltd 6.125% 18/6/2013 CNOOC Finance 2002 Ltd 5.5% 21/5/2033 (Reg) CNOOC Finance 2002 Ltd 6.375% 8/3/2012 (Rcg) Gain Silver Finance Ltd 6.375% 25/8/2016 Hutchison Whampoa Intcrnational 0111 1 Ltd 7% 16/2/20 1 1 (Reg) PCCW-HKT Capita Lrd 89'0 15/11/2011 (Reg) PCCW-HKT Capita No 2 Ltd 6% 15/7/2013 (Reg) PCCW-HKT Capital No 3 Ltd 5.25% 20/7/2015 (Reg) Wharf Finance Ltd 6.125% 6/11/2017 "EMTN"
CANADA Sino-Forest Corp. 9.125% 17/8/2011 (Reg)
CAYMAN ISLANDS Agile Properry Holdings Lrd 9% 22/9/2013 (Reg) Equus Cayman Finance Ltd 5.5% 12/9/2008 (Reg) Greentown China Holdings Ltd 7% 8/11/2013 (Rcg) Hutchison Whampoa Finance CI Ltd 7.45% 1/8/2017 (Reg) Hurchison Whampoa Finance CI Ltd 7.5% 1/8/2027 (Reg) l-lurchison Whampoa International 0311 3 Ltd 6.5% 13/2/2013 (Reg) Hutchison Whampoa International 03/33 Lrd 6.25% 24/1/2014 (Reg) Hutchison Whampoa International 03/33 Lrd 7.45% 2411 112033 (Reg) Lai Fung Holdings Lrd 9.125% 4/4/2014 MGTI Finance Co., Ltd (Cayman) 8.375% 15/9/2010 Parkson Rerail Group Lrd 7.125% 30/5/2012 Parkson Retail Group Lrd 7.875% 1411 11201 I Start CLO Ltd FRN 7161201 1 "2006-3X D" Start CLO Ltd FRN 26/12/2011 "2007-4X D" Sun Hung Kai Properties Capital Marker 1.td 5.375% 8/3/2017 "EMTN"
2.000.000 3,200.000 8,000,000
8,000,000 6,000,000 8,615,000
830,000 10,900,000
6,900,000 12,000,000
1,000,000 4,000,000
11,300,000
5,000,000
8,000,000 3,000,000
10,500,000 6,000,000 2,000,000
16,400,000
4,000,000
1 1,400,000
4,000,000 14,700,000
1,000,000 6,000,000 4,250,000 2,700,000
17,000,000
USD 2,000,000 1,682,500 0.21 USD 3,182,359 3,026,768 0.38 USD 7,960,903 7,459,680 0.94
13,143,262 12,168,948 1.53
USD 7,946,895 7,480,000 0.94 USD 5,971,573 5,900,526 0.74 USD 7,826,524 7,459,507 0.94 USD 870,546 872,645 0.11
USD 10,84731 1 10,478,042 1.32
USD 7,089,501 7,202,540 0.91 USD 13,298,470 12,782,490 1.61 USD 1,020,828 985,857 0.13 USD 3,755,288 3,573,575 0.45 USD 11,288,870 10,961,000 1.38
67,916,306 67,696,182 8.53
USD 5,056,584 5,075,000 0.64
USD USD USD USD USD
USD
USD
USD
USD USD USD USD USD USD
USD
7,477,433 3,006,348 8,951,294 6,635,429 2,178,771
16,709,143
4,138,173
12,418,903
3,994,125 15,175,908 1,000,000 6,085,414 4,250,000 2,700,000
36,226,873
6,760,000 3,002,160 7,245,000 6,383,704 2,008,985
1 6 , 6 0 5 ~ 75
3,993,902
11,354,137 3,360,000
15,060,026 962,760
5,970,000 3,907,875 2,401,380
16,116,766
0.85 0.38 0.92 0.81 0.25
2.09
0.50
1.43
0.42 I .70 0.12 0.75 0.49 0.30
2.03
40

INTERNATIONAL OPPORTCTNITIES FUNDS - ASIAN BOND -
SlI4- OF -S As AT JUNE 30, 2008 (continued) (expressed in USD)
Aquisition Yo net Description Quantity Currency cost Evaluation assets
Swire Pacific MTN Financing Ltd 6.25% 18/4/2018 "EMTN" Towngas China Co., Lrd 8.25% 23/9/20] 1 UOB Cayman Ltd FRN Pcrpctual (Reg)
HONG KONG Bank of East Asia Ltd FRN 13/12/2015 Chong Hing Bank Ltd FRN 16/12/2016 Dah Sing Bank FRN 6/5/20] 5 "EMTN" Dah Sing Bank FRN 18/8/2017 Hong Kong Govcrnrnent Bond 3.73% 5/6/2013 "1306" Wing Hang Bank Ltd FRN Pcrpctual "EMTN"
INDIA ICICI Bank Ltd FRN Perpetual (Fkg) State Bank of India Ltd FRN Perpetual "EMTN"
INDONESIA Bank Danamon Indonesia Tbk PT FRN 30/3/2014 (Fkg) Bank Internasionat lndonesia Tbk PT 7.75 28/4/2015 (Step-up Coupon 10.275% 28/4/2015) Bank Niaga Tbk PT 7.75% 14/7/2010 (Step-up Coupon 10.01 6Yo 14/7/2015) Indonesia Government lntcrnational Bond 6.625% 17/2/2037 (Reg) Indonesia Governmcnt International Bond 6.875% 9/3/2017 (Reg) Indonesia Government International Bond 6.875% 17/1/2018 (Reg) Indonesia Government International Bond 7.75% 17/1/2038 (Rcg) Indonesia Treasury Bond 9.5% 15/6/20] 5 "FR27" Lippo Karawaci Finance BV 8.875% 9/3/2011 PT Bank 1.ippo Tbk (Cayman Islands) FRN 22/11/2016 "EMTN"
MALAYSLA CIMB Invcstmcnt Bank BHD 5% 15/4/2007 (Step-up Coupon 8.7% 15/4/2014) Eon Bank BHD FRN 21/1/2014 Malaysia Government Bond 3.9 17% 30/9/2008 "4/03" Penerbangan Malaysia BHD 5.625% 15/3/2016 (Reg) Perronas Capital l.rd 7% 22/5/2012 (Reg) Pctrorias Capital Lrd 7.875% 22/5/2022 (Reg) Public Bank BHD 5% 201612012 (Srep-up Coupon 6.604% 20/7/2017)
4,000,000
8,000,000 10,800,000
2,000,000 6,000,000
900,000 7,000,000
200,000,000 7,300,000
1,000,000 2,000,000
13,000,000
2,500,000
6,500,000
6,000,000
6,000,000
8,000,000
4,625,000 17,000,000,000
7,000,000
9,400,000
3,000,000 800,000
8,500,000 10,000,000
14,450,000 2,000,000
7,000,000
41
USD 3,764,778 3,992,315 0.50 WSD 8,5 10,108 8,521,600 1 .OS USD 10,341,874 10,031,740 1.27
133,764,574 127,677,745 16.07
1,794,037 1,974,845 0.25 USD
USD 6,000,000 5,385,228 0.75 USD 898,231 857,558 0.11 USD 6,857,224 6,751,640 0.85 HKD 26,370,188 26,203,004 3.30 USD 9,238,395 8,137,135 1.03
51,380,075 47.907.410 6.29
USD 979,987 836,675 0.11 USD 2,000,000 1,723,687 0.22
2,979,987 2,560,364 0.33
USD
USD
USD
USD
USD
USD
USD IDR USD
13,027,452
2,503,905
6,564,463
5,600,839
6,212,760
7,875,117
4,626,444
1,770,593 6,752,774
13,008,970
2,581,250
6,5 13,370
4,975,000
5,685,000
7,540,000
4,364,844
1,531,382 6,706,553
USD 9,496,650 7,776,000 64,451,017 62,702,389 7.90
1.64
0.33
0.82
0.63
0.72
0.75
0.55 0.19 0.84
1.23
USD 2,955,103 2,993,847 0.38 USD 795,866 799,682 0.10 MYR 2,717,791 2,601,933 0.33 USD 10,552,431 10,197,294 1.29 USD 15,475,555 15,467,785 1.95 USD 2,412,585 2,380,202 0.30
US11 6,767,924 6,776,380 0.86
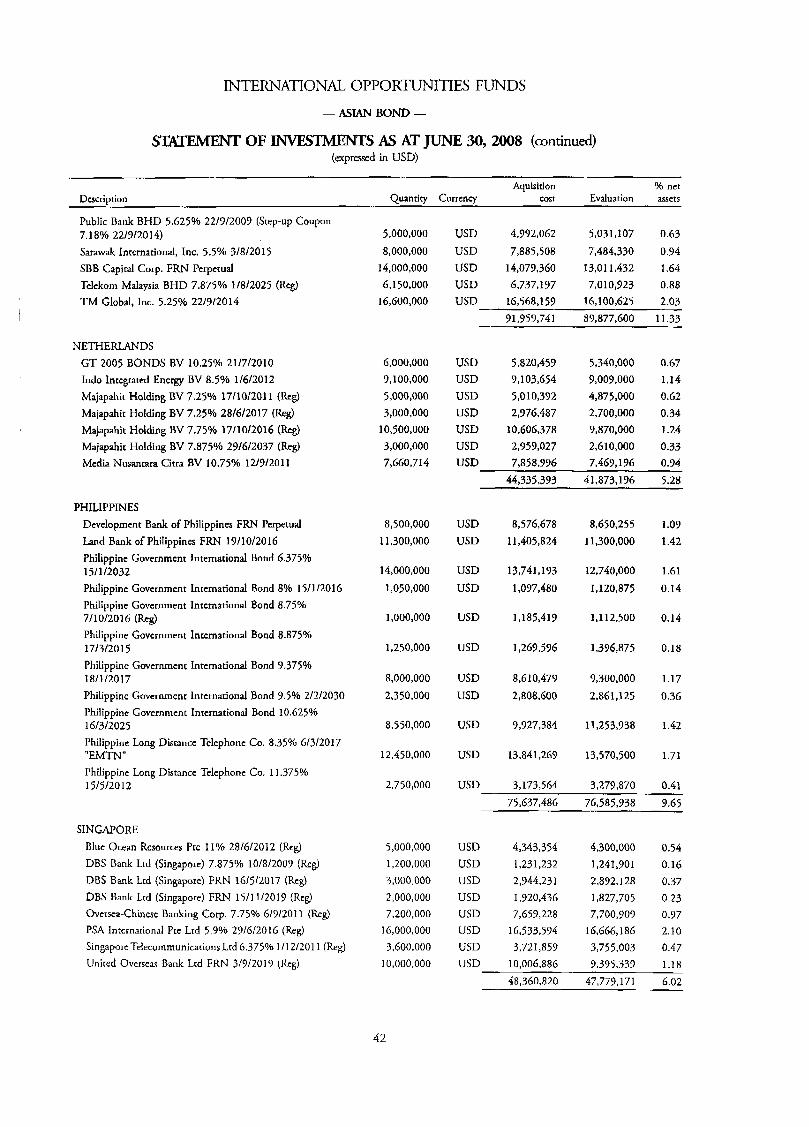
INTERNATIONAL OPPORTUNITIES FUNDS
- ASTAN BOND -
~ X E M E N T OF m S AS AT JUNE 30,2008 (continued) (expressed in USD)
Aquisirion 46 net Evaluation assets Dcscrivtion Quantiw Currency cost
Public Bank BHD 5.625Yo 22/7/2009 (Step-up Coupon 7.18% 22/9/2014) Sarawak International, Inc. 5.5% 3/8/2015 SBB Capital Corp. FRN Perpetual Telekom Malaysia BHD 7.875% 1/8/2025 (Reg) TM Global, Inc. 5.25% 22/7/2014
N E T H E W D S GT 2005 BONDS BV 10.25% 21/7/2010 Indo Integrated Energy BV 8.5% 1/6/2012 Majapahit Holding BV 7.25% 17/10/2011 (Pug) Majapahit Holding BV 7.25% 28/6/2017 (Reg) Majapahit Holding BV 7.75% 17/10/2016 (kg) Majapahit Holding BV 7.875% 29/6/2037 (Reg) Media Nusantara Citra BV 10.75% 12/7/2011
PHILIPPINES Development Bank of Philippines FRN Perpetual Land Bank of Philippines FRN 19/10/2016 Philippine Government International Bond 6.375% 15/1/2032 Philippine Government Intcrnational Bond 8% 15/1/2016 Philippine Government International Bond 8.750/0 7/10/2016 (Reg) Philippine Government International Bond 8.875% 17/3/20 15 Philippine Government International Bond 9.375% 18/1/2017 Philippine Government Intcrnational Bond 9.5% 2/2/2030 Philippine Government International Bond 10.625% 16/3/2025 Philippine Long Distance Telephone Co. 8.35% 6/3/2017 ”EMTN” Philippine Long Distance Telephone Co. 11.375% 15/5/2012
SINGAPORE Blue Ocean Resources Pte 11% 28/6/2012 (Reg) DES Bank Ltd (Singaporc) 7.875% 10/8/2009 (Reg) DES Bank Lcd (Singapore) FRN 16/5/2017 (Reg) DBS Bank Lrd (Singapore) FRN 1511 1/2019 (Rcg) Oversea-Chinese Banking Cop. 7.75% 6171201 1 (Reg) PSA Intcrnational Ptc Ltd 5.90/0 29/6/2016 (Reg) Singaporc Telecommunications Lrd 6.375% 1 / I 21201 1 (Reg) United Overseas Bank Ltd F R N 3/7/2019 (Reg)
5,000,000 8,000,000
14,000,000 6,150,000
16,600,000
6,000,000 7,100,000 5,000,000
3,000,000 10,500,000 3,000,000 7,660,714
8,500,000 1 1,300,000
14,000,000 1,050,000
1,000,000
1,250,000
8,000,000
2,350,000
8,550,000
12,450,000
2,750,000
5,000,000 1,200,000 3,000,000 2,000,000 7,200,000
16,000,000 3,600,000
10,000,000
USD 4,992,062 5,031,107 0.63 USD 7,885,508 7,484,330 0.94 USD 14,079,360 13,011,432 1.64 USD 6,737,197 7,010,723 0.88 USD 16,568,157 16,100,625 2.03
91,757,741 89,877,600 11.33
USD USD USD USB USD USD USD -
5,820,459 7,103,654 5,010,392 2,976,487
10,606,378 2,957,027 7,858,996
44.335.393
5,340,000 9,009,000 4,875,000 2,700,000 9,870,000 2,610,000 7,469,196
41 A73.176
0.67 1.14 0.62 0.34 1.24 0.33 0.94 5.28 -
USD USD
USD USD
USD
USD
USD USD
USD
USD
USD
8,576,678 11,405,824
13,741,193 1,097,480
1,185,417
1,267,596
8,610,477 2,808,600
9,927,384
13,84 1,269
3,173,564
8,650,255 11,300,000
12,740,000
1,120,875
1,112,500
1,396,875
9,300,000 2,861,125
11,253,738
13,570,500
3,279,870
1.09 1.42
1.61 0.14
0.14
0.18
1.17 0.36
1.42
1.71
0.41
USR USD USD USD USD USD USD USD
75,637,486
4,343,354 1,231,232 2,944,231 1,720,436 7,657,228
16,533,574 3,721,857
30,006,886
76,585,738 9.65
4,300,000 1,241,901 2,892.128 1,827,705 7,700,909
16,666,186 3,755,003 9,395,339
0.54 0.16 0.37 0.23 0.97 2.10 0.47 1.18
48,360,820 47,773,171 6.02
42
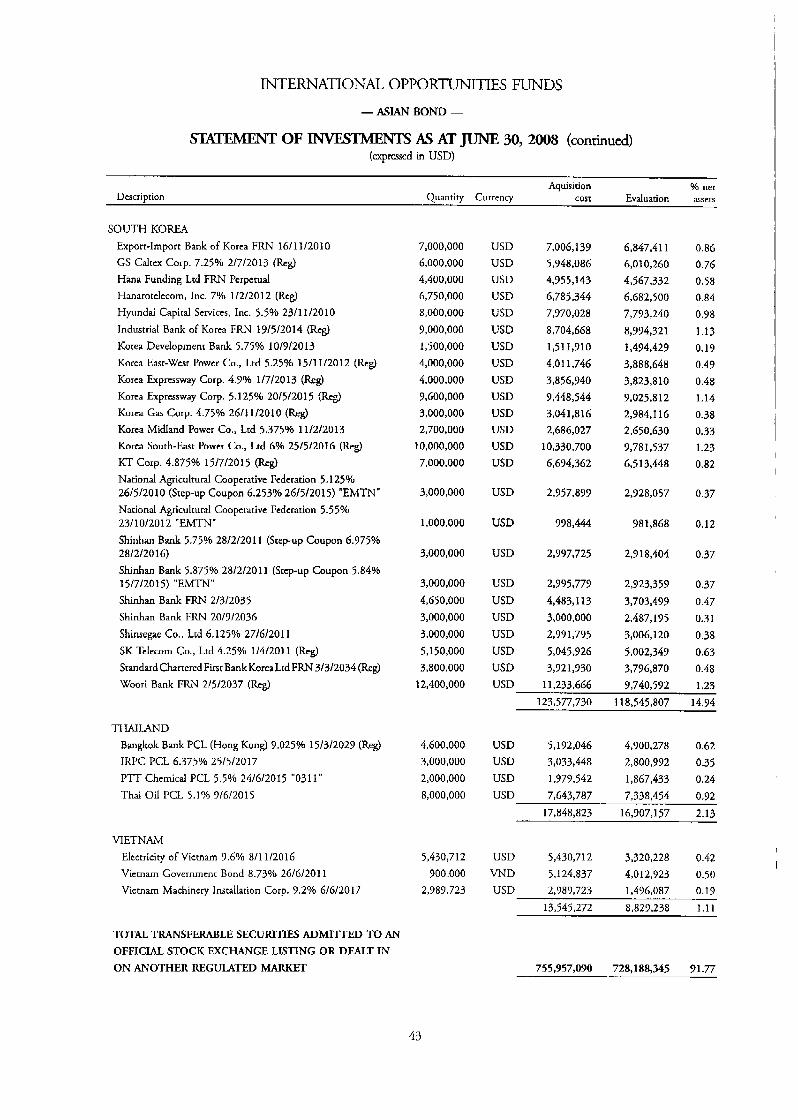
INTERNATIONAL OPPORTUNIlTES FUNDS
- ASIAN BOND -
STATEMENT OF -S AS AT JUNE 30, 2008 (continued) (expressed in USD)
Aquisition Yo net Evaluation assets Description Quantity Currency cosr
SOUTH KOREA Export-Import Bank of Korea FRN 16/11/2010 GS Caltcx Corp. 7.25% 2/7/2013 (Reg) Hana Funding Lrd FRN Pcrpetual Hanarotelecom, Inc. 70/0 1/2/2012 (Reg) Hyundai Capital Scrviccs, Inc. 5.5D/o 2311 112010 Industrial Bank of Korea FRN 19/5/2014 (Reg) Korea Developmenr Bank 5.75% 10/9/2013 Korea East-West Power Co., Ltd 5.25% 15/11/2012 (Reg) Korea Expressway Corp. 4.9% 1/7/2013 (Reg) Korea Expressway Corp. 5.125% 20/5/2015 (Reg) Korea Gas Corp. 4.75% 26/11/2010 (Reg) Korea Midland Power Co., Ltd 5.375% 11/2/2013 Korea South-East Power Co., Ltd 6% 25/5/2016 (Reg) KT Corp. 4.875% 15/7/2015 (hg) National Agricultural Cooperative Federation 5.125% 21/5/2010 (Step-up Coupon 6.253% 26/5/2015) "EMTN" National Agricultural Coopcrative Federation 5.55% 23/10/2012 "EMTN" Shinhan Bank 5.75% 28/2/2011 (Step-up Coupon 6.975% 28/2/2016) Shinhan Bank 5.875% 28/2/2011 (Step-up Coupon 5.84% 15/7/20 15) "EMTN" Shinhan Bank FRN 2/3/2035 Shinhan Bank FRN 20/9/2036 Shinsegae Co., Ltd 6.125% 27/6/2011 SK Telecorn Co., Ltd 4.25% 1/4/2011 (Rcg) StandardCharceredFirst BankKoreaLtdFFKN 3/3/2034 (Reg) Woori Bank FRN 2/5/2037 (Reg)
THAILAND Bangkok Bank PCL (Hong Kong) 9.025% 15/3/2029 (Reg) IRPC PCL 6.375% 25/5/2017 PTT Chemical PCL 5.5% 24/6/2015 "0311" Thai Oil PCL 5.1% 9/6/2015
VIETNAM Elcctricity of Vietnam 9.6% 8/11/2016 Vietnam Governrncnt Bond 8.73% 26/6/2011 Victnam Machincry Installation Corp. 9.2% 6/6/2017
TOTAL TRANSFERABLE SECURITIES ADMITTED TO AN
OFFICIAL STOCK EXCHANGE LISTING OR DEALT IN
ON ANOTHER REGULATED hlARKET
7,000,000 6,000,000 4,400,000 6,750,000 a,ooo,ooo 9,000,000 1,500,000 4,000,000 4,000,000 9,600,000 3,000,000 2,700,000
10,000,000 7,000,000
3,000,000
1,000,000
3,000,000
3,000,000 4,650,000 3,000,000 3,000,000
5,150,000 3,800,000
12,400,000
4,600,000 3,000,000 2,000,000 8,000,000
5,430,712 900,000
2,389,723
USD USD USD USD USD USD USD USD USD USD USD USD USD USD
USD
USD
USD
USD USD USD USD USD USD USD
7,006,139 5,948,086 4,355,143 6,785,344 7,970,028 8,704,668 131 1,910 4,011,746 3,856,940 9,448,544 3,041,816 2,686,027
10,330,700 6,694,362
2,357,899
998,444
2,997,725
2,995,779 4,483,113 3,000,000
2,991,795 5,045,926 3,921,930
11.233.666
6,847,411 6,010,260 4,567,332 6,682,300 7,793,240 8,994,321 1,494,429 3,888,648 3,823,810 9,025,812 2,984.1 16 2650.630 9,781,537 6,513,448
2,928,057
981,868
2.91 8,404
2,923,359 3,703,499 2,487,195 3,006,120
5,002,349 3,796,870 9.740.592
0.86 0.76 0.58
0.84 0.98 1.13 0.19 0.49 0.48 1.14 0.38 0.33 1.23 0.82
0.37
0.12
0.37
0.37 0.47 0.31 0.38 0.63 0.48
. . . ,- - 1.23 123,577,730 118,545,807 14.94
USD 5,192,046 4,900,278 0.62 USD 3,033,448 2,800,992 0.35 USD 1,979,542 1,867,433 0.24 USD 7,643,787 7,338,454 0.92
17,848,823 16,907,157 2.13
USD 5,430,712 3,320,228 0.42 5,124,837 4,012,923 0.50 VND
USD 2,989,723 1,496,087 0.19 13,545,272 8,829,238 1.1 1
755,957,090 728,188,345 71.77
43
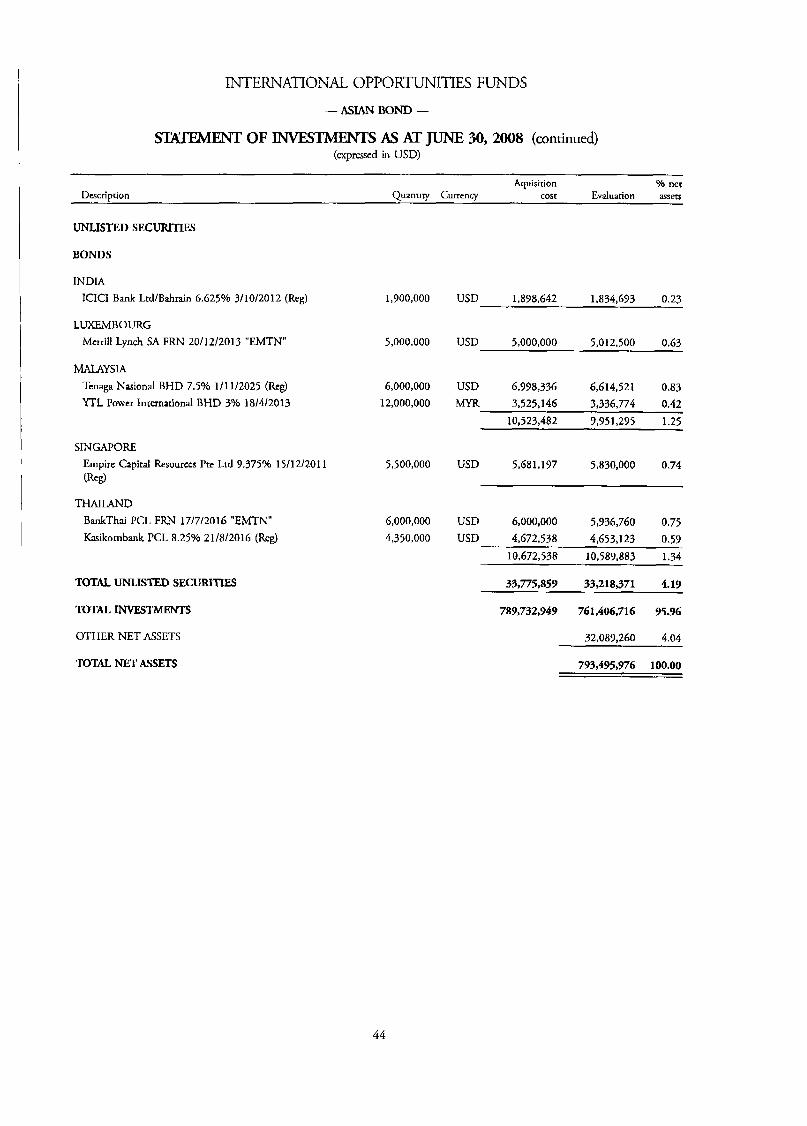
INTERNATIONAL OPPORTUNITIES FUNDS
STA- OF m S As AT JUNE 30,2008 (continued) (expressed in USD)
~
Aquisirion % net Evaluation assets Description Quantiry Currency cost
UNLISTED SECURITlES
BONDS
INDIA lCICI Bank LtdIBahtain 6.G25% 3/10/2012 (Reg)
LUXEMBOURG Mctrill Lynch SA FRN 20/12/2013 "EMTN"
MALAYSIA Tenaga Nasional BHD 7.5% 111 112025 (Reg) YTL Power International BI-ID 3% 18/4/2013
SINGAPORE Empire Capital Resources Pte Ltd 9.375% 15/12/2011 (W
THAILAND BankThai PCL FRN 17/7/2016 "EMTN" Kasikornbank PCL 8.25% 21/8/2016 (Reg)
TOTAL UNLISTED SECUFUTIES
TOTAL INVESTMENTS
OTHER NET ASSETS
1,700,000 USD 1,898,642 1,834,693 0.23
5,000,000 USD 5,000,000 5,012,500 0.63
6,000,000 USD 6,798,336 6,614,521 0.83 12,000,000 MYR 3,525,146 3,336,774 0.42
10,523,482 7,951,295 1.25
5,500,000 USD 5,681,177 5,830,000 0.74
6,000,000 USD 6,000,000 5,936,760 0.75 4,350,000 USD 4,672,538 4,653,123 0.59
10,672,538 10,587,883 1.34
33,775,859 33,218,371 4.19
789,732,949 761,406,716 95.96
32,089,260 4.04
TOTAL NET ASSETS 793,495,976 100.00
44
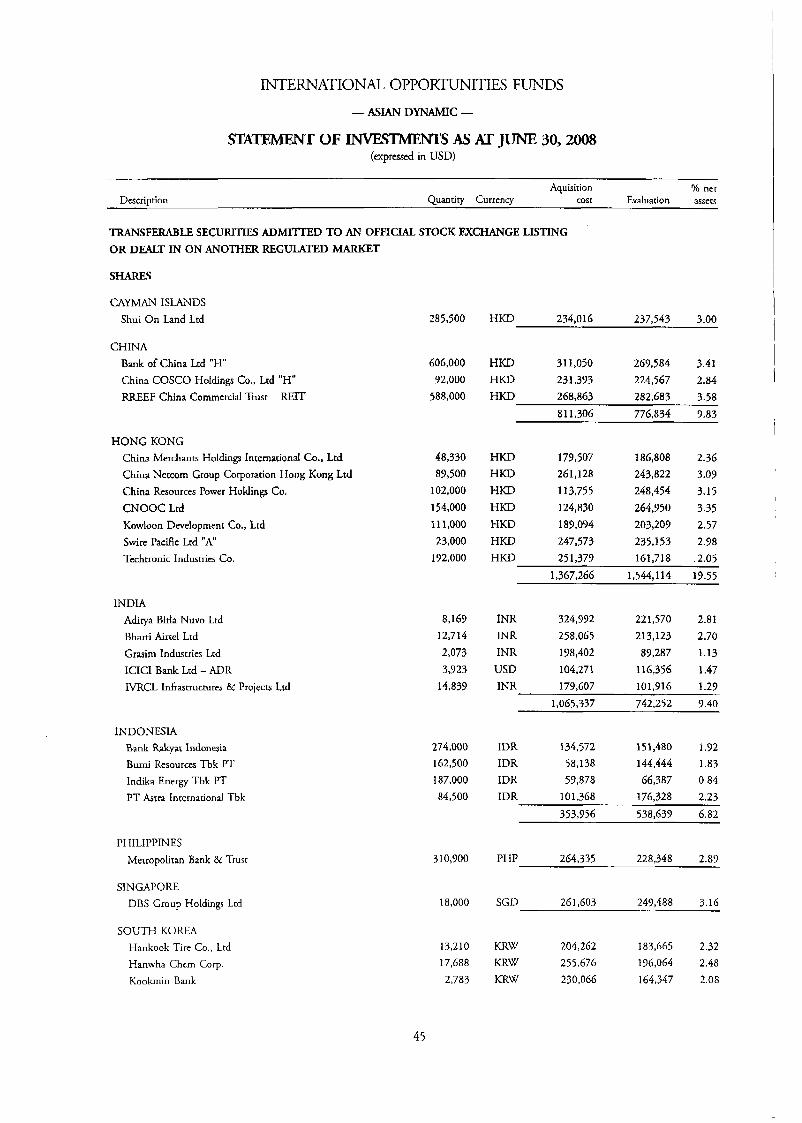
INTERNATIONAL OPPORmITIES FUNDS
-&IAN DYNAMIC -
STATEMENT OF -S As AT JUNE 30,2008 (expressed in USD)
Aquisition Yo net Description Quantity Currency cosr Evaluation assets
TRANSFERABLE SECURITIES A D M I n E D TO AN OFFICM STOCK EXCHANGE LISTING OR DEALT IN ON ANOTHER REGULATED MARKET
SHARES
CAYMAN ISLANDS Shui On Land Ltd
CHINA Bank of China Ltd "H" China COSCO Holdings Co., Lrd "H" RREEF China Commercial Trust - REIT
HONG KONG China Merchants Holdings International Co., Ltd China Netcom Group Corporation Hong Kong Ltd China Resources Power Holdings Co. CNOOC Ltd Kowloon Development Co., Ltd Swirc Pacific Lrd "A" Techtronic Industries Co.
lNDIA Adirya Birla Nuvo Ltd Bharci Airtel Ltd Grasim Industries Lrd ICICI Bank Ltd - ADR IVRCL Infrastructures & Projects Ltd
INDONESIA Bank Rakyat Indonesia Bumi Resources Tbk PT Indika Energy Tbk PT PT Asrra International Tbk
PHILIPPINES Metropolitan Bank & Trusr
SINGAPORE DBS Group Holdings Lrd
SOUTH KOREA Hankook Tire Co.. Ltd Hanwha Chcm Curp. Kookrnin Bank
1 i 285,500 HKD 234,016 237,543 3.00
606,000 HKD 311,050 269,584 3.41 I 92,000 HKD 231,393 224,567 2.84 I
282,683 3.58 268,863 811,306 776,834 9.83
588,000 HKD
48,330 HKD 179,507 186,808 89,500 HKD 261,128 243,822
102,000 HKD 113,755 248,454 264,950 154,000 HKD 124,830
111,000 HKD 189,034 203,209 23,000 HKD 247,573 235,153
192,000 HKD 251,379 161,718 1,367,266 1,544,114
2.36 3.09 3.15 3.35 2.57 2.98 2.05
19.55 -
8,167 INR 324,772 221,570 2.81 12,714 INR 258.065 213,123 2.70
89,287 1.13 2,073 INR 198,402 3,923 USD 10427 1 116,356 1.47
14,839 INR 179,607 101,916 1.29 1,065,337 742,252 9.40
274,000 IDR 134,572 151,480 1.92 162,500 IDR 58,138 144,444 1.83 187,000 IDR 59,878 66,387 0.84 84,500 IDR 101,368 176.328 2.23
353,956 538,637 6.82
310,900 PHP 264,335 228,348 2.89
249,488 3.16 261,603 18,000 SGD
13,210 KRW 204,262 183,665 2.32 196,064 2.48 255,676 17,688 KRw 164,347 2.08 2,783 KRW 230,066
45
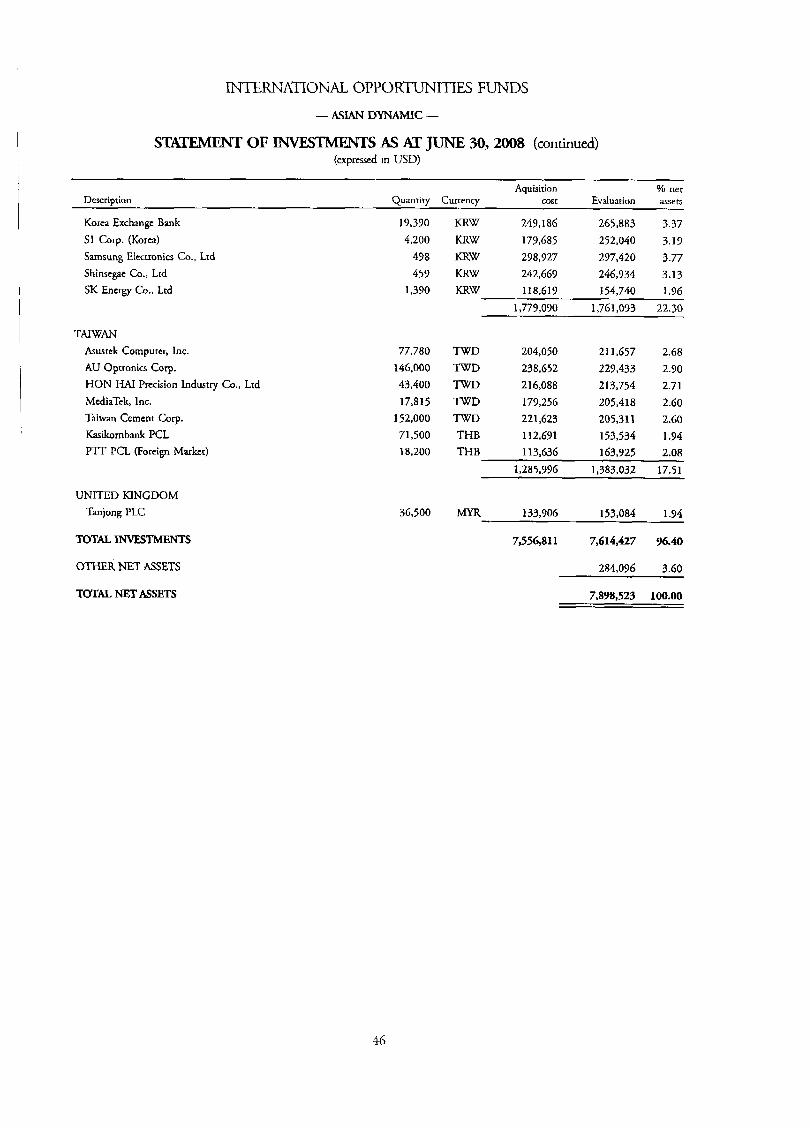
INTERNATIONAL OPPORTUNITIES FUNDS
- ASIAN DYNAMIC -
STp,TEMENT OF -S AS 4T JUNE 30,2008 (continued) (expressed in USD)
Aquisition % net Quantity Currency cost Evaluation assets I
Description
Korea Exchange Bank S1 Corp. (Korea) Samsung Elearonics Co., Ltd Shinsegae Co., Lrd SK Encrgy Co., Ltd
TAWAN Asustek Computer, Inc.
AU Oprronics Corp. HON HAI Precision Industry Co., Ltd McdiaTek, lnc. Taiwan Cement Corp. Kasikornbank PCL MT PCL (Foreign Market)
I
UNITED KINGDOM Tanjong PLC
TOTAL INVESTMENTS
OTHER NET ASSETS
19,390 4,200
498 459
1,390
77,780 146.000 43,400
17,815 152,000 71,500 18,200
36,500
KRW 249,186 265,883 3.37 KRW 173,685 252,040 3.19 KRW 298,927 297,420 3.77 KRW 242,669 246,934 3.13 KRW 1189619 154.740 1.36
~
1,779,090 1,761,073 22.30
TWD 204,050 TWD 238,652 TWD 2 16,088 TWD 179,256 TWD 221,623 THE 112,691 THB 113,636
1,285,996
211,657 2.68 229,433 2.90 213,754 2.71 205,418 2.60 205,311 2.60 153,534 1.94 163,925 2.08
1,383.032 17.51 ~ . -
MYR 133,906 153,084 1.94
7,556,811 7,614,427 96.40
284,096 3.60
TOTAL NET ASSETS 7,898,523 100.00
46
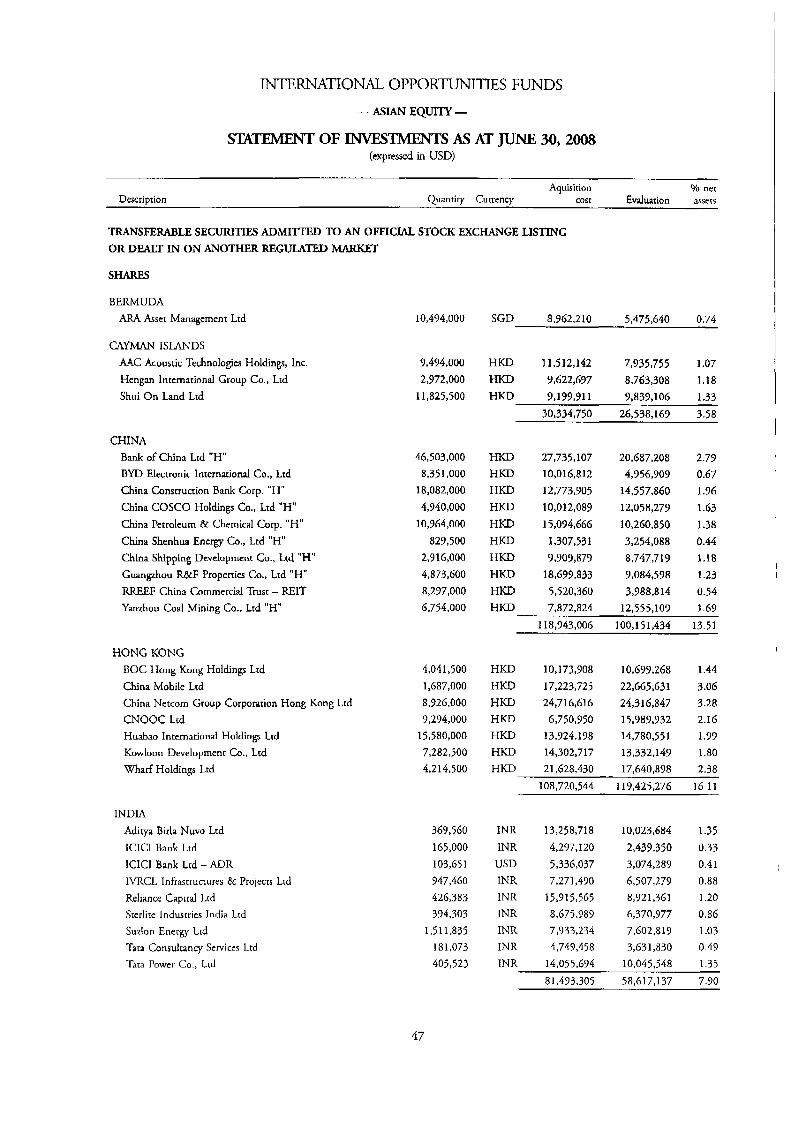
INTERNATIONAL OPPORTUNITIES FUNDS
- ASIAN EQurrY -
SIX- OF INVESTMENTS AS AT JUNE 30,2008 (acpressed in USD)
Aquisirion % net Description Quantity Currency cost Evduarion assets
TRANSFERABLE SECURITIES ADMITIED TO AN OFFICIAL STOCK EXCHANGE LISTING OR DEALT IN ON ANOTHER REGULATED MARKET
SHARES
BERMUDA ARA Asset Management Ltd
CAYMAN ISLANDS AAC Acoustic Technologies Holdings, Inc. Hengan Inrernarional Group Co., Ltd Shui On Land Ltd
CHINA Bank of China Lrd "H" BYD Electronic International Co., Lrd China Construction Bank Corp. "H" China COSCO Holdings Co., Ltd "H" China Petroleum & Chemical Corp. "H" China Shenhua Energy Co., Ltd "H" China Shipping Development Co., Ltd "H" Guangzhou R&F Properties Co., Lrd "H" RREEF China Commercial Trusr - E l T Yanzhou Coal Mining Co., Lrd "H"
HONG KONG BOC Hong Kong Holdings Ltd China Mobile Ltd China Netcorn Group Corporarion Hong Kong Lrd CNOOC Lrd Huabao International Holdings Ltd Kowloon Development Co., Ltd Wharf Holdings Ltd
INDIA Aditya Birla Nuvo Ltd ICICI Bank Ltd lClCl Bank Lrd - ADR IVRCL Infrasrrucrures & Projects Lrd Reliance Capital Lrd Srerlire Indusrries India Lrd Suzlon Energy Ltd 'rata Consulrancy Services Ltd Tara Power Co., Lrd
10,494,000
9,494,000 2,972,000
11,825,500
46,503,000 8,351,000
18,082,000 4,940,000
10,964,000
829,500 2,9 16,000 4,873,600 8,297,000 6,754,000
4,041,500 1,687,000 8,926,000 9,294,000
15,580,000 7,282,500 4,214,500
369,560 165,000 103,651 947,460 426,383 394,303
1,511,835 181,073 405,523
SGD 8,962,230 5,475,640 0.74
HKD 11,512,142 7,935,755 1.07 HKD 9,622,697 8,763,308 1.18 HKD 9,199,911 9,839,106 1.33
30,334.750 26.538.169 3.58
HKD HKD HKD HKD HKD HKD HKD I-IKD HKD HKD
27,735,107 10,016,812 12,773,905 10,012,089 15,094,666
1,307,531 9,909,879
18,699,833 5,520,360 7.872.824
~
20,687,208 4,956,909
14,557,860 12,058,279 10,260,850 3,254,088 8,747,7 19 9,084,598 3,988,814
12,555.107
~
2.77 0.67 1.96 1.63 1.38 0.44 1.18 1.23 0.54 I .69
~ ~~
118,943,006 100,151,434 13.51
HKD 10,173,908
HKD 17,223,725 I-IKD 24,716,616 HKD 6,750,950 HKD 13,924,198 HKD 14,302,717 HKD 21 -628.430
108,720,544
10,693,268 22,665,631 24,316,847 15,989,932 14,780,551 13,332,149 17,640,898
119,425,276
1.44 3.06 3.28 2.16
1.99 1 .80 2.38
16.11 -
INR INR USD INR INR INR INR INR INR -
13,258,718 4,297,120 5,336,037 7,271,490
15,915,565 8,675,983 7,933,234 4,749,458
14,055,694 81.493.305
10,023,684 1.35
2,439,350 0.33 3,074,289 0.41 6,507,279 0.88 8,921,361 1.20 6,370,977 0.86 7,602,819 1.03 3,631,830 0.49
10,045,548 1.35
58,617,137 7.90
47
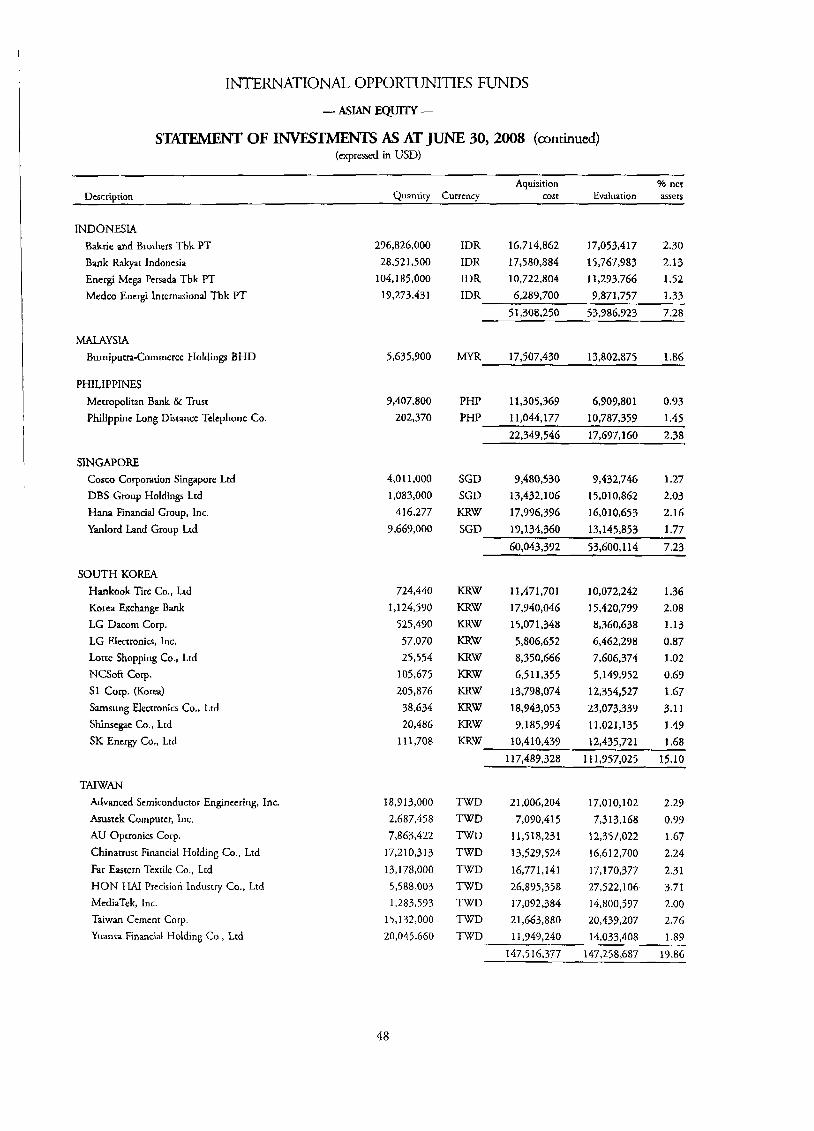
INTERNATIONAL OPPORTUNITIES FUNDS
- ASIAN EQUITY -
STATEMFNT OF INvEs Ih lENTS AS AT JUNE 30,2008 (continued) ( e x p n d in USD)
Aquisition Yo ner Description Quantity Currency cost Evaluation assets
INDONESIA Bakrie and Brothers Tbk PT Bank Rakyat Indonesia Energi Mega Persada Tbk PT Medco Energi lnrernasional Tbk PT
MALAYSLA Bumiputra-Commerce Holdings BHD
PHILIPPINES Metropolitan Bank gL Trust Philippine Long Distance Telephone Co.
SINGAPORE Cosco Corporarion Singapore Ltd DBS Group Holdings Ltd Hana Financial Group, Inc. Yanlord Land Group Lcd
SOUTH KOREA Hankook Tire Co., Lrd Korea Lrchangc Bank LG Dacorn Corp. LG Electronics, Inc. Lome Shopping Co., Ltd NCSofi Cotp. SI Corp. (Korea) Samsung Elecrronics Co., Ltd Shinsegae Co., Ltd SK Energy Co., Ltd
TAIWAN Advanccd Semiconductor Engineering, Inc. husrck Computer, Inc. AW Optronics Corp. Chinatrusr Financial Holding Co., Ltd Far Eastern Textile Co., Ltd HON HAI Precision Industry Co., Ltd McdiaTek, Inc.
Taiwan Cement Corp. Yuanta Financial Holding Co., Lrd
296,826,000 28,521,500
104,185,000 17,273.43 1
5,635,900
9,407,800 202,370
4,O 11,000 1,083,000
416,277 9,669,OQO
724,440 1,124,590
525,490 57,070 25,554
105,675 205,876
38,634 20,486
111,708
18,913,000 2,687,458 7,863,422
17,210,313 13,178,000 5,588,003 1,283,593
15,132,000 20,045.660
IDR 16,714,862 17,053,417 2.30 IDR 17,580,884 15,767,983 2.13 IDR 10,722,804 1 1,293,766 1.52 IDR 6,289,700 9,871,757 1.33
51,308,250 53,786,923 7.28
PHP 11,305,369 6,909,801 0.93 PHP 11,044,177 10,787,359 1.45
22,349,546 17,697,160 2.38
SGD 9,480,530 9,432,746 1.27 SGD 13,432,106 15,010,862 2.03 mw 17,996,336 16,010,653 2.16 SGD 19,134,360 13,145,853 1.77
60.043.392 53,600,114 7.23
KRW KRW KRW KRW KRW KRW KRW KRW KRW KRW -
11,471,701 17,940,046 15,071,348 5,806,652 8,350,666 6,511,355
13,798,074 18,943,053 9,185,994
10,410,439 117,489,328
10,072,242 15,420,799 8,360,638 6,462,298 7,606,374 5,149,952
12,354,527 23,073,339 11,021,135 12,435,721
11 1,957.025
1.36 2.08 1.13
0.87 1.02 0.69 1.67 3.1 1 1.49 1.68
15.10 -
TWD TWD TWD TWD TWD TWD TWD TWD TWD
21,006,204 7,090,415
11,518,231 13,529,524 16,771,14 1
26,895,358 17,092,384 21,663,880 1 1,949,240
17,010,102 7,3 13,168
12,357,022 16,612,700 17,170,377 27,522,106 14,800,597 20,439,207 14,033,408
2.29 0.93 1.67 2.24 2.31 3.71 2.00 2.76 1.89 II
147,516,377 147,258,687 19.86
48
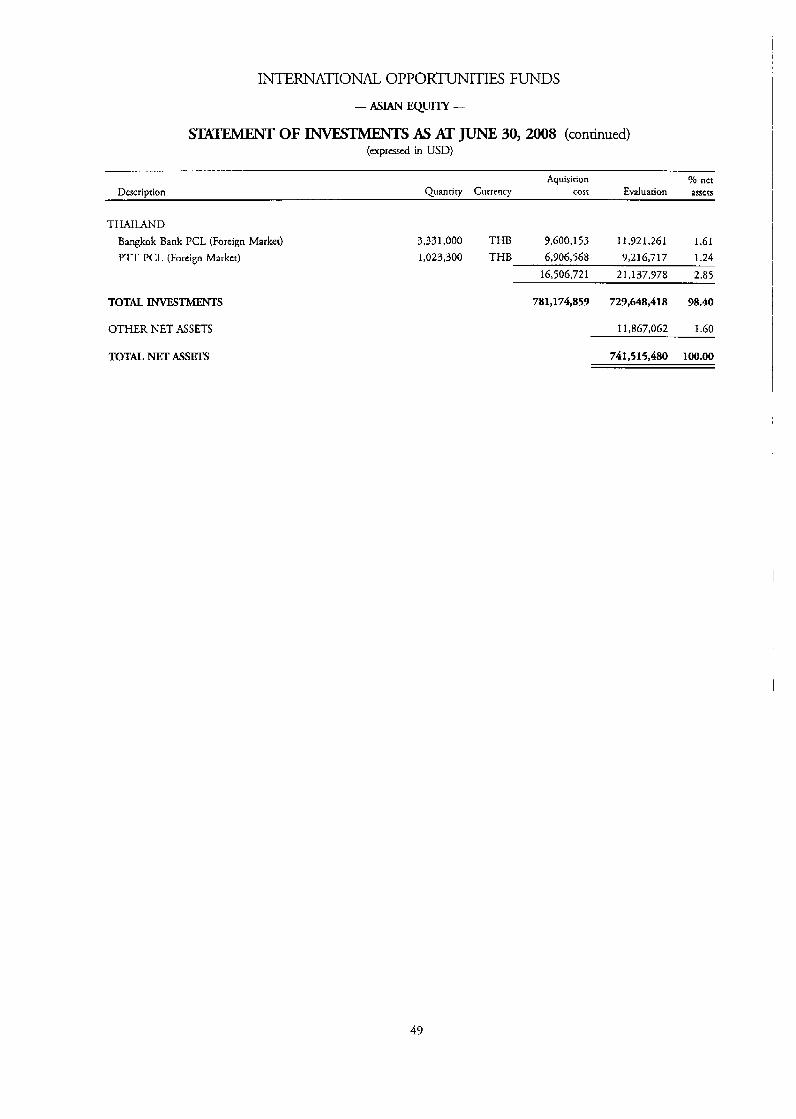
INTERNATIONAL OPPORTUNITIES FUNDS
- ASIAN E Q m -
STATEMENT OF INVESTMENTS AS AT JUNE 30, 2008 (continued) (expressed in USD)
Descriorion Aquisirion % nct
Ouantiw Currency cost Evaluation assets
THAILAND Bangkok Bank PCL (Foreign Market) PTT PCL (Foreign Market)
3,331,000 THB 9,600,153 11,921,261 1.61
6,906,568 9,216,717 1.24 1,023,300 THB 16,506,721 21,137,978 2.85
TOTAL INVESTMENTS
OTHER NET ASSETS
781,174,859 727,648,418 98.40
1 1,867,062 1.60
TOTAL NET ASSETS 741,515,480 100.00
49
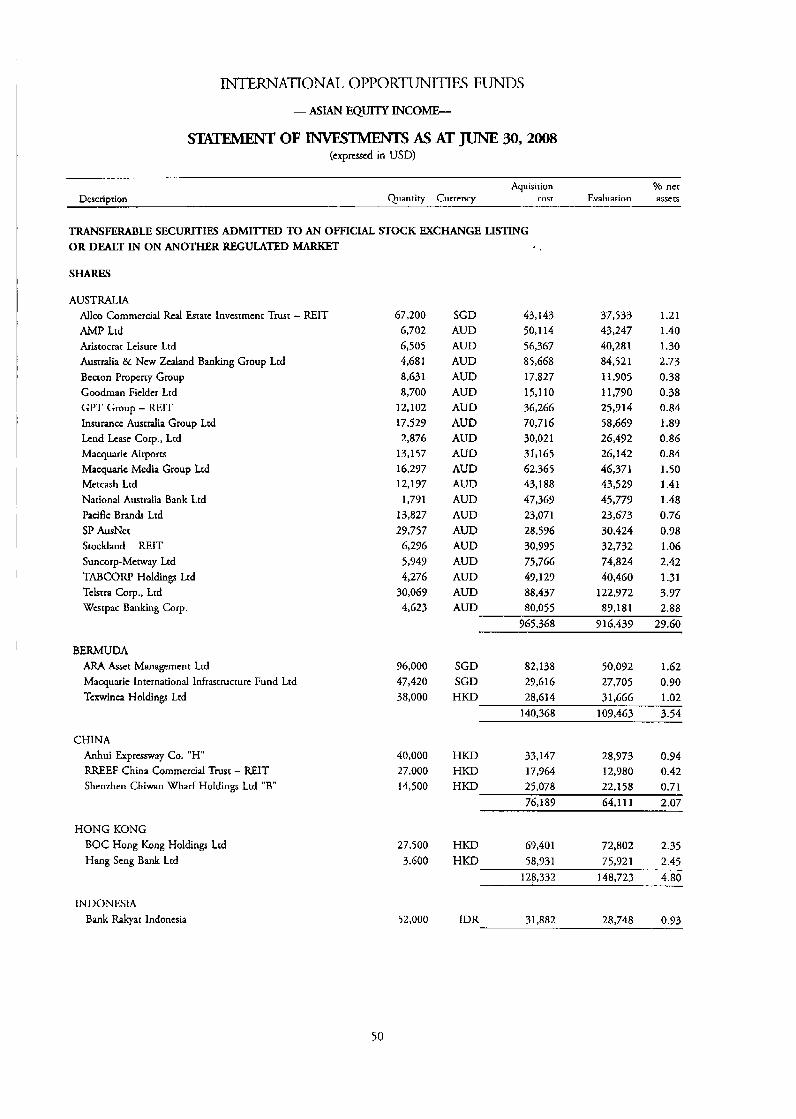
INTERNATIONAL OPPORmITIES FUNDS
- ASIAN SQUllY INCOME- - OF INVFS'llGNTS As AT JUNE 30,208 (expressed in USD)
Aquisirion Yo nct Evaluation asscrs Description Quantity Currency cost
TRANSFERABLE SECURITIES ADMIlTFD TO AN OFFICIAL STOCK EXCHANGE LISTING OR DEALT IN ON ANOTHER REGULATED hL4RKET
SHARES
AUSTRALLA
AMP Ltd Aristocrat Leisure Ltd Australia & New Zedand Banking Group Ltd Becron ProPercy Group Goodman Ficldcr Lrd GPT Group - REIT Insurancc Australia Group Lrd Lcnd Lcarc Corp., Lrd Macquarie Airports Macquaric Media Group Ltd Metcash Ltd Narional Australia Bank Ltd Pacific Bran& Lrd SP AusNet Stockland - REIT Suncorp-Memy Ltd TABCORP Holdings Lrd Telstra C o p , Ltd Wesrpac Banking Corp.
Allco Commercial Real Estate Investment Trust - REIT
BERMUDA ARA Asset Management Ltd Macquarie International Infrastrucrurc Fund Ltd Tcxwinca Holdings Lrd
CHINA Anhui Expressway Co. "H" RREEF China Commercial Trust - E l T Shenzhen Chiwan Wharf Holdings Ltd "B"
HONG KONG BOC Hong Kong Holdings Ltd Hang Seng Bank Ltd
INDONESIA Bank Rakyar Indonesia
67,200 6,702 6,505 4,681 8,631 8,700
12,102 17,529 2,876
13,157 16,297 12,197
1,771 13,827 29,757
6,296 5,949 4,276
30,069 4,623
96,000 47,420 38,000
40,000 27,000 14,500
27,500 3,600
52.000
SGD 43,143 AUD 50,114 AUD 56,367 AUD 85,668 AUD 17,827 AUD 15,110 AUD 36,266 AUD 70,716 AUD 30,021
AUD 62,365 AUD 43,188 AUD 47,369 AUD 23,071 AUD 28,596 AUD 30,995 AUD 75,766 AUD 49,129 AUD 88,437 AUD 80.055
AUD 31,165
37,533 43,247 40,281 84,521 11.905 11,790 25,914 58,669 26,492 26,142 46,371 43,529 45,779 23,673 30,424 32,732
40,460 122,972 87.181
74,824
1.21 1.40 1.30 2.73 0.38 0.38 0.84 I .89 0.86 0.84 1 .so 1.41 I .48 0.76 0.98 I .06 2.42 1.31 3.97 2.88
965,368 9 16,439 29.60
SGD 82,138 50,092 1.62 SGD 29,616 27,705 0.90 HKD 28.614 31.666 1.02
140,368 109,463 3.54
HKD 33,147 28,973 0.94 HKD 17,964 12,980 0.42 HKD 25.078 22.158 0.71
76,189 64,111 2.07
HKD 69,401 72,802 2.35 75,921 2.45
128,332 148,723 4.80 HKD 58,931
31,882 28,748 0.93 IDR
50

INTERNATIONAL OPPORmITIES FUNDS
- ASIAN EQUITY INCOME,
SlNXMENT OF W S AS AT JUNE 30, 2008 (continued) (expressed in USD)
Aquisition % net Description Quantity Currency cost Evaluation assets
MALAYSIA Malayan Banking BHD Public Bank BHD (Foreign Market)
PHILIPPINES Philippinc Long Distance Telephone Co.
SINGAPORE Ascendas Real Estate Investment Trust - WIT CapitaCommercial Trust - REIT DBS Group Holdings Ltd First Ship Lase Trust - Unit Lippo-Mapletree Indonesia Retail Trust - REIT MobilcOnc Ltd Pacific Shipping Trust - Unit Parkway Life Real Estate Investment Trust - REIT Singapore Post Lrd Singapore Press Holdings Ltd Singapore Technologies Engineering Lrd StarHub Lrd
SOUTH KOFEA Kookmin Bank Korea Exchange Bank Macquarie Korea Infrastructure Fund - GDR S-Oil Corp.
TAIWAN Acer, Inc. Chunghwa Tclccom Co., Ltd Compal Electronics, Inc. Far EasTone Tclemmmunications Co., Ltd Siliconware Precision Industries Co. Taiwan Mobile Co., Ltd Taiwan Semiconductor Manufacturing Co., Ltd
THAILAND Advanced Info Service PCL (Foreign Market) Bangkok Expressway PCL (Foreign Market) Electriciry Generating PCL (Foreign Market) Kasikornbank PCL (Foreign Shares) Land and Houses PCL (Foreign Marker) Siam Cement PCL (Foreign Marker) Siam Ciry Bank PCL (Foreign Marker) Siani City Cement PCL (Foreign Marker)
26,375 16,500
1,410
39,000 28,600 5,000
32,000 56,000 16,000 77,000 4,000
27,000 15,000 15,000 3 1,000
1,100 5,000 2,547 1,042
16,564 13,000 47,000 36,357 28,000 41,000 72,620
36,300 88,200 8,200
18,200 171,800 10,000
123,500 4,000
MYR 82,368 56,924 1.84 MYR 30,048 53,543 1.73
112,416 110,467 3.57
PHP 66,117 75,160 2.43
SGD SGD SGD SGD SGD SGD USD SGD SGD SGD SGD
58,942 30,010 60,313 31,674 30,889 22,370 42,088
3,441 19,857 46,885 27,807
63,342 40,145 69,302 28,691 22,430 22,106 38,800 3,322
21,827 46,851 30.3 15
2.05 1.30 2.24 0.93 0.72 0.71 1.25 0.1 1 0.70 1.51 0.98
SGD 63,231 64,930 2.10 437,527 452,061 14.60
KRW 84,839 64,759 2.10 KRW 66,346 68,562 2.21 USD 18,318 13,881 0.45 KRW 80,356 66,911 2.16
249,859 214,313 6.92
TWD TWD TWD TWD TWD TWD TWD
25,821 32,633 33,510 33,620 51,412 50,787 52,092 57,772 46,770 41,280 78,861 76,3 16
138,136 155,508 426,602 447,736
1.05 1.09 1.64 1.87 1.33 2.47 5.02
14.47 -
THB THB THE THB THB THB THB THB
77,276 100,142 57,732 42,877 17,314 20,665 31,415 39,081 30,205 37,716 70,246 57,350 60,810 55,786 24,194 23,740
387,372 377,757
3.23 1.37 0.67 1.26 1.22 1.72 1.81 0.77
12.27 -
51
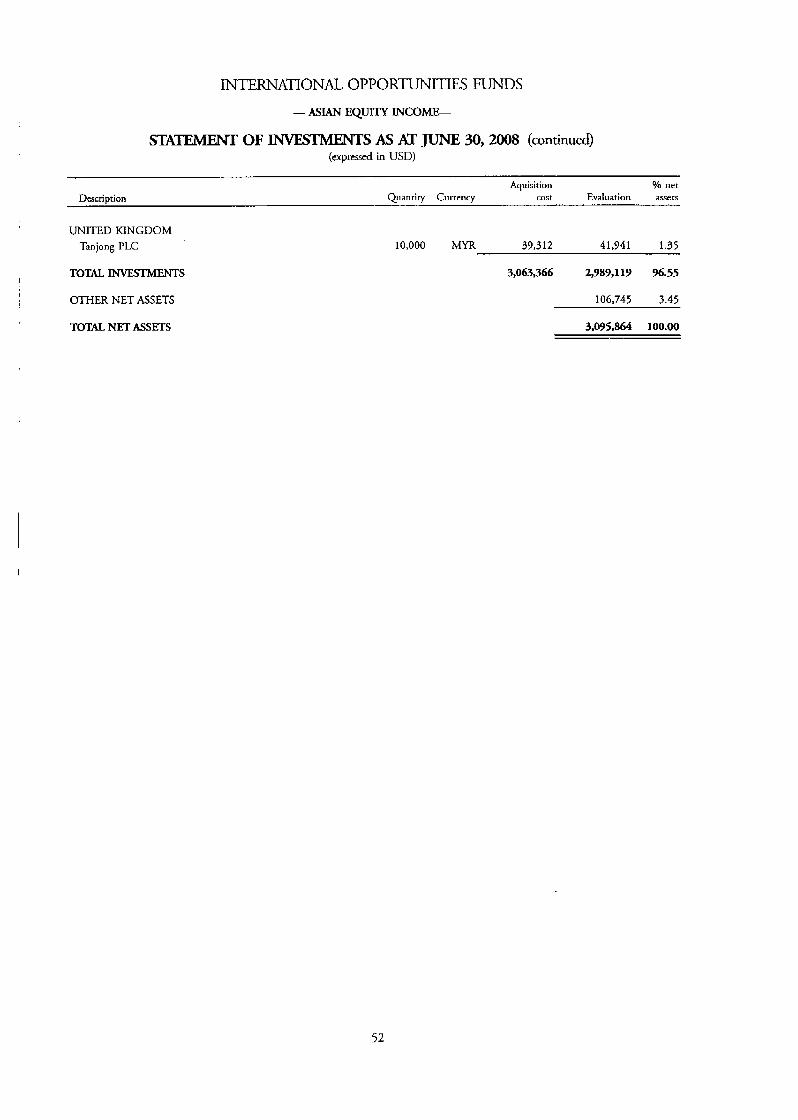
INTERNATIONAL. OPPORTUNITIES FUNDS
- ASIAN EQUI'Y I N C O W
SXUEMENT OF -S AS AT JUNE 30,2008 (continued) (exprcssed in USD)
Aquisition Yo net Description Quanriry Currency cost Evaluation assets
UNITED KINGDOM Tanjong PLC 10,000 MYR 39,312 41,941 1.35
TOTAL TNVESTMENTS 3,063,366 2,989,117 96.55
OTHER NET ASSETS 106,745 3.45
TOTAL NET ASSETS 3,095,864 100.00
I
52

INTERNATIONAL OPPORTUNITIES FUNDS
- ASIAN INFRASTRU- EQUITY - S n OF INVESTMENTS AS AT JUNE 30,2008
(expressed in USD)
Aquisirion Yo net Description Quantity Currency cost Evaluation assets
TRANSFERABLE SECURITIES ADMITTED TO AN OFFICIAL STOCK EXCHANGE LISTING OR DEALT IN ON ANOTHER REGULATED MARKET
SHARES
BERMUDA NWS Holdings Ltd
CHINA China Petroleum & Chemical Corp. "H" China Railway Group Ltd "H" China Shenhua Energy Co., Ltd "H" Jiangsu Expressway Co., Ltd "H"
HONG KONG Chcung Kong Infrastructute Holdings Ltd China Netcom Group Corporation Hong Kong Ltd China Resources Power Holdings Co. CNOOC Ltd Guangdong Investmcnr Ltd Hong Kong & China Gas Co., Ltd MTR Corp. Sinorruk Hong Kong Lrd Wasion Meters Group Lrd
INDIA Bharat Heavy Elccrricals Ltd Bharti Airccl Ltd Larsen & Toubro Lrd - GDR NTPC Ltd Reliance Industries Ltd
INDONESIA Bakrie and Brothers Tbk PT PT Awa International Tbk
MALAYSLA PLUS Expressways BHD Tenaga Nasional BHD
PHlLIPPINES Manila Watcr Co., Inc.
PNOC Energy Dcveloprnent Corp.
1,351,625
3,296,000 4,668,000
618,500 4,354,000
710,000 620,500
1,190,000 2,168,000 5,724,000 1,894,900
695,373 2,005,000 2,118,000
41,001 208,029
17,650 515,967 64,525
28,876,000 1,094,000
2,643,600 889,400
6,736,600 14,734,000
53
3,594,305 3,526,242 3.29 H W
HKD 3,855,771 3,084,619 2.87 HKD 3,970,443 3,476,750 3.23 HKD 3,850,534 2,426,345 2.26 HKD 4,747,204 3,566,816 3.32
16,423,952 12,554,730 11.68
HKD HKD HKD HKD HKD HKD HKD HKD HKD
2,871,341 1,723,739 3,854,893 3,701,567 3,599,969 4,493,737 2,175,050 2,264,985 1,353,406
3,003,750 1,690,410 2,898,625 3,729,952 2,318,879 4,503,887 2,188,572 1,93a,104
814,589
2.79 1.57 2.70 3.47 2.16 4.19 2.04 1 .so 0.76
26,038,687 23,086,768 21.48
INR 2,335,311 1,311,016 1.22 INR 4,175,376 3,487,168 3.24 USD 1,354,759 898,385 0.84 INR 2,702,416 1,829,525 1.70 INR 4,150,574 3,133.710 2.92
14,718,436 10,659,804 9.92
IDR 1,626,106 1,659,000 1.54 IDR 2,484,376 2,282,872 2.13
4.1 10,482 3,941,872 3.67
MYR 2,575,864 2,096,099 1.95 MYR 2,439,974 2,219,070 2.07
5,015,838 4,315,169 4.02
PHP 2,318,995 2,736,322 2.54 PHP 2,228,731 1,705,248 1-59
4,547,726 4,441,570 4.13
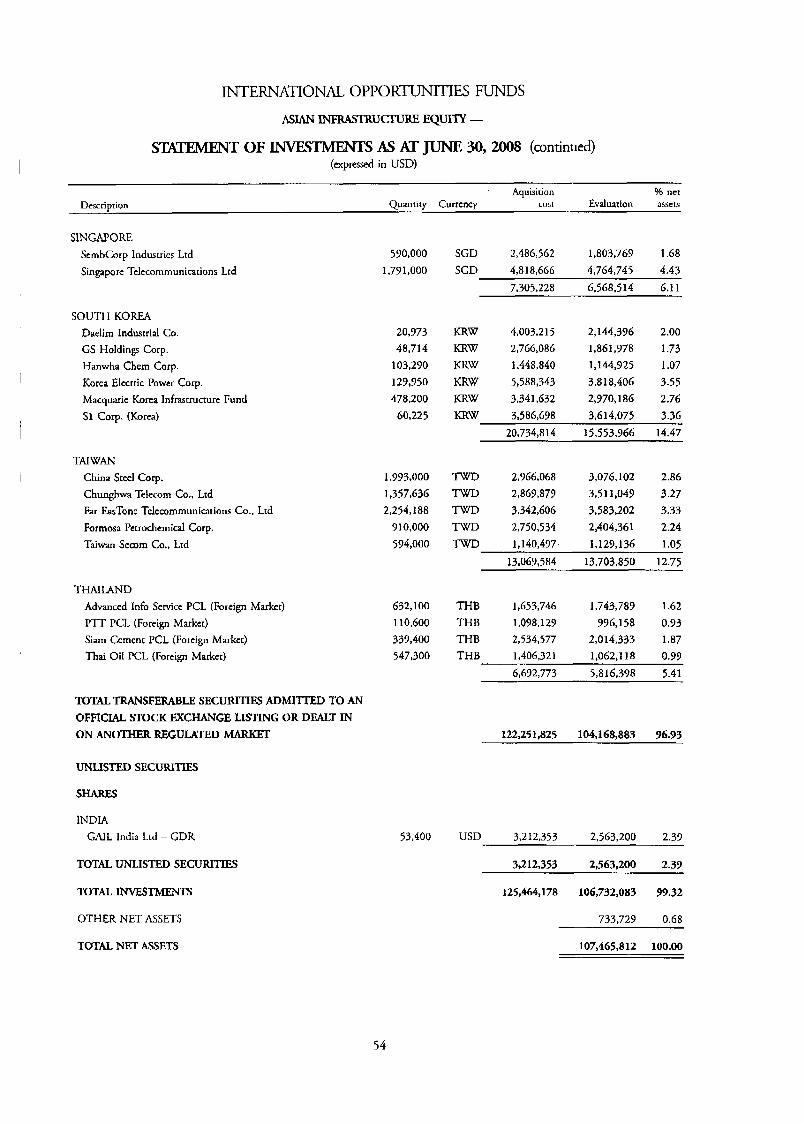
INTERNATIONAL OPPORTCTNITIES FUNDS
- ASIAN XNFRASTRUCTLTRE EQUlTY -
STATEMENT OF INVESTMENTS AS AT JUNE 30,2008 (continued) (expressed in USD)
Aquisition % net Description Quantity Currency cost Evaluation assets
SINGAPORE ScmbCorp Industries Ltd Singapore Telecommunications Ltd
SOUTH KOREA
I Daelim Industrial Co. GS Holdings Corp. Hanwha Chem Corp.
Macquaric Korea Infrastructure Fund SI COT. (Korea)
I Korea Electric Power Corp.
I
TAIWAN I China Steel Corp.
Chunghwa Telecom Co., Ltd Far EasTone Telecommunications Co., Ltd Formosa Petrochemical Corp. Taiwan Secom Co., Ltd
TKAlLAND Advanced Info Service PCL (Foreign Market) PTT PCL (Foreign Market) Siam Cement PCL (Foreign Market) Thai Oil PCL (Foreign Market)
TOTAL TRANSFERABLE SECURITIES ADMITTJD TO AN
OFFICIAL STOCK EXCHANGE LISTING OR DEALT IN ON ANOTHER REGULATED MARKET
UNLISTED SECURITIES
SHARES
INDIA GAIL India Ltd - GDR
590,000 1.79 1.000
20,973 48,714
103,290 129,950 478,200
60.225
1,993,000 1,357,636 2,254,188
9 10,000 594,000
632,100 110,600 339,400 547,300
SGD 2,486,562 1,803,769 1.68 SGD 4.818.666 4,764,745 4.43
~
7,305,228 6,568,514 6.1 1
KRW 4,003,215 2,144,376 2.00 KRW 2,766,086 1,861,778 1.73
1,144,925 1.07 KRW 1,448,840 KRW 5,588,343 3,818,406 3.55 KRW 3,341,632 2,970,186 2.76 mw 3,586,638 3,614,075 3.36
20,734,814 15,553,966 14.47
TWD 2,966,068 3,076,102 2.86 TWD 2,869,879 351 1,049 3.27 TWD 3,342,606 3,583,202 3.33 TWD 2,750,534 2,404,361 2.24 TWD 1,140,497- 1,129,136 1.05
13,069,584 13,703,850 12.75
THB 1,653,746 1,743,789 1.62 THB 1,098,127 996,158 0.93 THB 2,534,577 2,014,333 1.87 THB 1.406.321 1.062.1 18 0.99
6,692,773 5,816,398 5.41
122,251,825 104,168,883 96.93
2,563,200 2.39 53,400 USD 3,212,353
TOTAL UNLISTED SECURITIES 3,212,353 2,563,200 2.39
TOTAL INVESTMENTS 125,464,178 106,732,083 37.32
OTHER NET ASSETS 733,729 0.68
TOTAL NET ASSETS 107,465,812 100.00
54
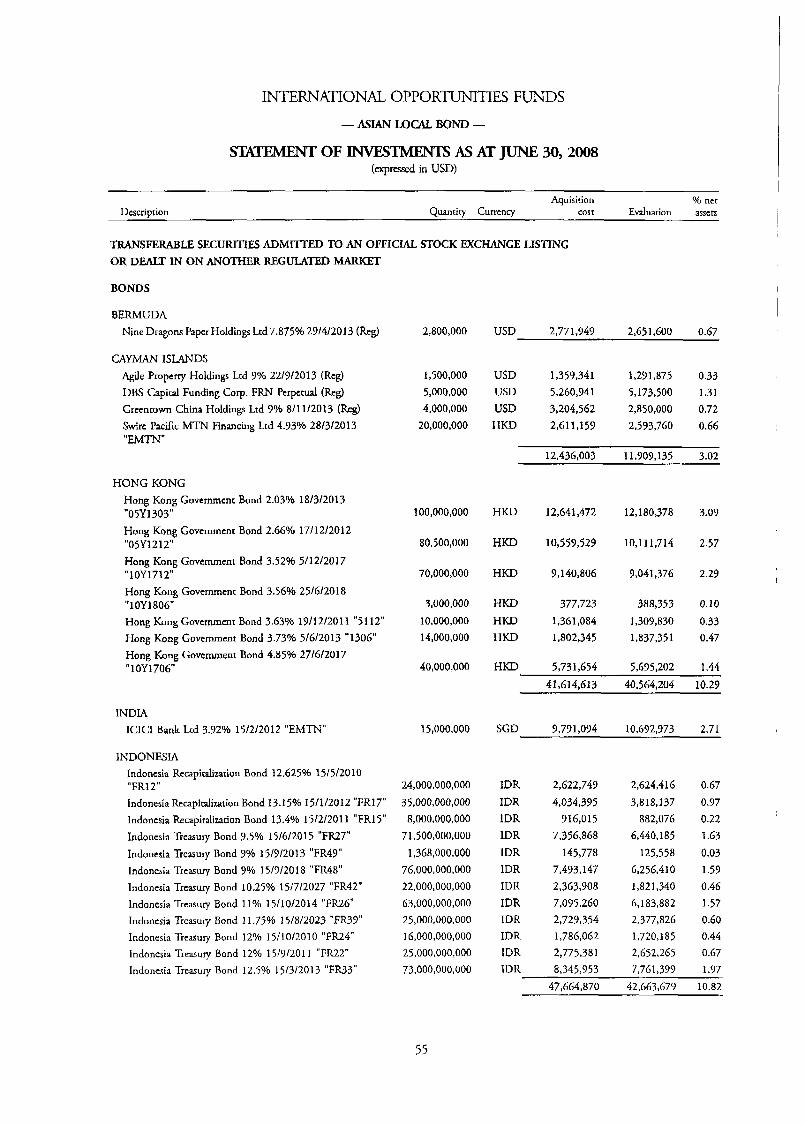
INTERNATIONAL OPPORTUNITIES FUNDS
- ASIAN LOCAL BOND - OF I N V E S m AS AT JUNE 30,2008
(expressed in USD)
Aquisition Yo net Evaluation assets Description Quantity Currency cosr
TRANSFERABLE SECURITIES ADMITrJT) TO AN OFFICIAL STOCK EXCHANGE LISTING OR DEALT IN ON ANOTHER REGULATED MARKET
BONDS
BERMUDA Nine Dragons Paper Holdings Ltd 7.875% 29/4/2013 (Reg)
CAYh4AN ISLANDS Agile Properry Holdings Ltd 9% 22/9/2013 (Reg) DES Capital Funding Corp. FRN Perpetual (Reg) Grecnrown China Holdings Ltd 9% 811 112013 (Reg) Swirc Pacific MTN Financing Ltd 4.93% 28/3/2013 "EMTN"
HONG KONG Hong Kong Govcrnmcnt Bond 2.03% 18/3/2013 "05Y1303" Hong Kong Govcrnmcnt Bond 2.66% 17/12/2012 "05Y 12 12" Hong Kong Govemmcnt Bond 3.52% 5/12/2017 "1 OY 17 12" Hong Kong Government Bond 3.56% 25/6/2018 "1 OY 1 806" Hong Kong Govcrnrnent Bond 3.63% 19/12/2011 "5112" Hong Kong Government Bond 3.73% 5/6/2013 "1306" Hong Kong Government Bond 4.85% 27/6/2017 "1 OY 1706"
INDIA ICICI Bank Ltd 3.92% 15/2/2012 "EMTN"
INDONESIA Indonesia Recapitdizarion Bond 12.625% 15/5/2010 "FR12" Indonesia Rccapiralization Bond 13.15% 15/1/2012 "FR17" lndoncsia Recapitalization Bond 13.4% 15/2/2011 "FR15" Indonesia Treasury Bond 9.5% 15/6/2015 "FR27" Indonesia Treasury Bond 9% 15/9/2013 "FR49" Indonesia Treasury Bond 9% 15/9/2018 "FR48" Indonesia Treasury Bond 1025% 15/7/2027 "FR42" Indonesia Treasury Bond 11% 15/10/2014 "FlUi26" Indonesia Treasury Bond 11.75% 15/8/2023 "FR39" Indonesia Treasury Bond 12% 15/10/2010 "FR24" Indonesia Treasury Bond 12% 15/9/2011 "FR22" Indonesia Treasury Bond 12.50/0 15/3/2013 "FR33"
2,800,000
1,500,000 5,000,000 4,000,000
20,000,000
100,000,000
80,500,000
70,000,000
3,000,000 10,000,000 14,000,000
40,000,000
15,000,000
24,000,000,000 35,000,000,000
8,000,000,000 71,500,000,000
1,368,000,000 76,000,000,000 22,000,000,000 63,000,000,000 25,000,000,000 16,000,000,000 25,000,000,000 73,000,000,000
2,771,949 2,651,600 0.67 USD
I ,29 1,875 0.33 USD 1,359,341 USD 5,260,741 5,173,500 1.31 USD 3,204,562 2,850,000 0.72 HKD 2,611,159 2,573,760 0.66
12,436,003 11,909,135 3.02
HKD 12,641,472 12,180,378 3.09
HKD 10,559,529 10,111,714 2.57
HKD 9,140,806 9,041,376 2.29
HKD 377,723 388,353 0.10 HKD 1,361,084 1,309,830 0.33 HKD 1,802,345 1,837,351 0.47
HKD 5,731.654 5,695,202 1.44 ~
41,614,613 40.564.204 10.29
SGD 9,791,094 30,692,973 2.71
IDR 2,622,749
IDR 4,034,395 IDR 916,015 IDR 7,356,868 IDR 145,778 IDR 7,493,147 IDR 2,363,908 IDR 7,095,260 IDR 2,729,354 IDR 1,786,062 IDR 2,775,381 IDR 8,345,953
47.664.870
2,624,416 0.67 3,818,137 0.77
882,076 0.22 6,440,185 1.63
125,558 0.03 6,256,410 1.59 1,821,340 0.46 6,183,882 1.57 2,377,826 0.60 1,720,185 0.44 2,652,265 0.67 7,761,399 1.77
42,663.679 10.82
55
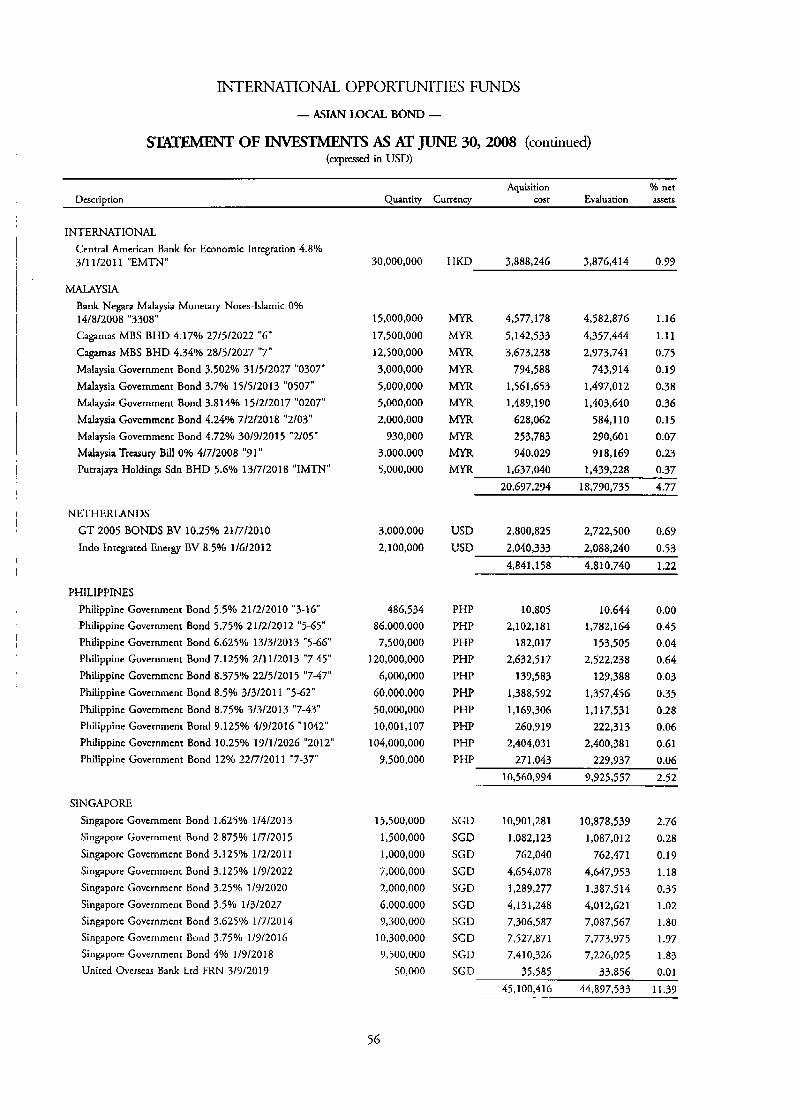
INTERNATIONAL OPPORTUNITIES FUNDS - ASIAN LOCAL BOND -
STAlFMWT OF INVESTMENTS AS AT JUNE 30,2008 (continued) (expressed in USD)
Aquisition Yo net Description Quantity Currency cost Evaluation assets
INTERNATIONAL Central American Bank for Economic Integration 4.8% 3/13/2011 "EMTN"
MALAYSIA Bank Negara Malaysia Monetary Notes-Islamic 0% 14/8/2008 "3308" Cagamas MBS BHD 4.17% 27/5/2022 "6" Cagamas MBS BHD 4.34% 28/5/2027 "7" Malaysia Government Bond 3.502% 31/5/2027 "0307" Malaysia Government Bond 3.7% 15/5/2013 "0507" Malaysia Government Bond 3.814% 15/2/2017 "0207" Malaysia Government Bond 4.2446 7/2/2018 "2/03" Malaysia Government Bond 4.72% 30/9/2015 "2105" Malaysia Treasury Bill 0% 4/7/2008 "91 " Putrajaya Holdings Sdn BHD 5.6% 13/7/2018 "IMTN"
NETHERLANDS G T 2005 BONDS BV 10.25% 21/7/2010 Indo Integrated Energy BV 8.5% 1/6/2012
PHILIPPINES Philippine Government Bond 5.5% 21/2/2010 "3-16" Philippine Government Bond 5.75% 21/2/2012 "5-65" Philippine Government Bond 6.625% 13/3/2013 "546" Philippine Government Bond 7.125% 211 112013 "745" Philippine Government Bond 8.375% 22/5/2015 "747" Philippine Government Bond 8.5% 3/3/2011 "5-62" Philippine Government Bond 8.75% 3/3/20] 3 "7-43" Philippine Government Bond 9.125% 4/9/2016 "1042" Philippine Government Bond 10.25% 19/1/2026 "2012" Philippine Government Bond 12% 22/7/20] 1 "7-37"
SINGAPORE Singapore Government Bond 1.625% 1/4/2013 Singapore Government Bond 2.875% 1/7/20] 5 Singapore Government Bond 3.125% 1/2/2011 Singapore Governmenr Bond 3.125% 1/7/2022 Singapore Government Bond 3.25% 1/7/2020 Singapore Govcrnmcnt Bond 3.5% 1/3/2027 Singapore Government Bond 3.625% 1/7/2014 Singapore Government Bond 3.75% 1/7/2016 Singapore Governmenr Bond 4% 1/7/2018 United Overseas Bank Lrd FRN 3/7/2017
30,000,000
15,000,000 17,500,000 12,500,000 3,000,000 5,000,000 5,000,000 2,000,000
930,000 3,000,000 5,000,000
3,000,000 2,100,000
486,534 86,000,000 7,500,000
120,000,000 6,000,000
60,000,000 50,000,000 10,001,107
104,000,000 9,500,000
15,500,000 1,500,000 1,000,000 7,000,000 2,000,000 6,000,000 9,300,000
10,300,000 7,500,000
50,000
HKD 3,888,246 3,876,414 0.99
m MYR
m MYR MYFi
MYR MYR MYR MYR MYR
4,577,178 5,142,533 3,673,238
794,588 1,561,653 1,489,190
628,062 253,783 940,029
1,637,040
4,582,876 4,357,444 2,973,741
743,714 1,477,012 1,403,640
584,110 290,601 918,169
1,439,228
1.16 1.11 0.75 0.19 0.38 0.36 0.15 0.07 0.23 0.37
20,697,294 18,790,735 4.77
USD 2,800,825 2,722,500 0.69 USD 2,040,333 2,088,240 0.53
4,841,158 4,810,740 1.22
PHP PHP PHP PHP PHP PHP PHP PHP PHP PHP
10,805 2,102.1 81
182,O 17 2,632,517
139,583 1,388,592 1,169,306
260,919 2,404,031
27 1,043
10,644 1,782,164
153,505 2,522,238
129,388 1,357,456 1,117,531
222,3 I 3 2,400,381
229,937
0.00 0.45 0.04 0.64 0.03
0.35 0.28 0.06 0.61 0.06
SGD SGD SGD SGD SGD SGD SGD SGD SGD SGD
10,560,994 9,925,557
10,901,281 1,082,123
762,040
4,654,078 1,289,277 4,131,248 7,306,587 7,527,871 7,410,326
35,585
10,878,539 1,087,012
762,47 1 4,647,953 1,387,514 4,012,621 7,087,567 7,773,975 7,226,025
33,856
2.52
2.76 0.28 0.19 1.18 0.35 1.02 1.80 1.97 1.83 0.01
45,100,416 44,897,533 11.39
56
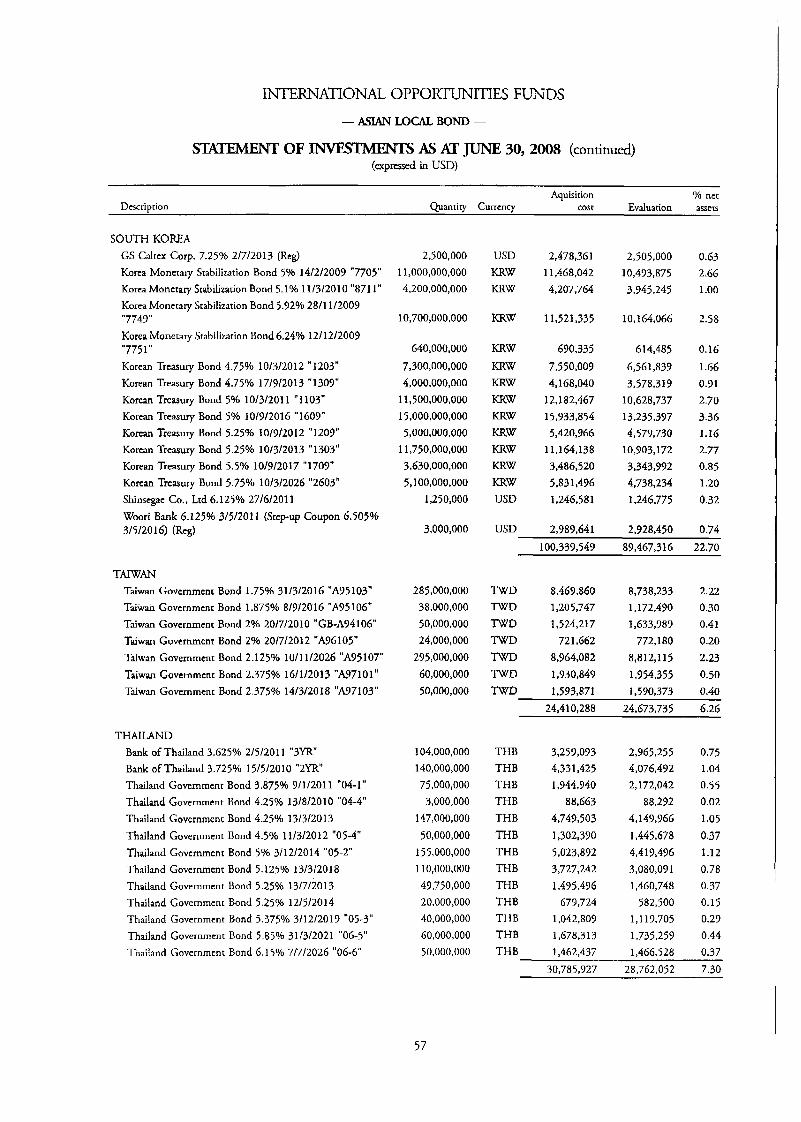
INTERNATIONAL OPPORTUNITIES FUNDS
- ASIAN LOW BOND -
TEMENT OF INVESTMENTS AS AT JUNE 30, 2008 (continued) (expressed in USD)
Aquisition Yo net Description Quantity Currency cost Evaluation assets
SOUTH KORJ3 GS Caltcx Corp. 7.25Yo 2/7/2013 (Reg) Korea Monetary Srabilization Bond 5% 14/2/2009 "7705" Korea Monetary Srabilization Bond 5.1% 11/3/2010 "871 1" Korea Monerary Stabilization Bond 5.92% 28/11/2009 "7749" Korea Monetary Stabilization Bond 6.24% 1211 212009 "775 1
Korean Treasury Bond 4.75Yo 10/3/2012 "1203" Korean Treasury Bond 4.75% 17/9/2013 "1309" Korean Treasury Bond 5% 10/3/2011 " 1 103" Korean Treasury Bond 54/0 10/9/2016 "1607" Korean Treasury Bond 5.25% 10/9/2012 "1209" Korean Treasury Bond 5.254/0 10/3/2013 "1303" Korean Treasury Bond 5.5% 10/9/2017 "1709" Korean Treasury Bond 5.75% 10/3/2026 "2603" Shinsegae Co., Ltd 6.125% 27/6/2011 Woori Bank 6.125% 3/5/20] 1 (Step-up Coupon 6.505% 3/5/2016) (Reg)
TAIWAN Taiwan Govcrnment Bond 1.75% 31/3/2016 "A95103" Taiwan Government Bond 1.875% 8/9/2016 "A75106" Taiwan Government Bond 2% 20/7/2010 "GB-A74106" Taiwan Government Bond 2% 20/7/2012 "A96105" Taiwan Government Bond 2.125% 1011 112026 "A95107" Taiwan Govetnmenr Bond 2.375% 16/1/2013 "A97101" Taiwan Government Bond 2.375% 14/3/2018 "A97103"
THAILAND Bank of Thailand 3.625% 2/5/201 I "3YR" Bank of Thailand 3.725% 15/5/2010 "2YR" Thailand Government Bond 3.875% 7/1/2011 "04-1" Thailand Government Bond 4.25% 13/8/2010 "04-4" Thailand Government Bond 4.25% 13/3/2013 Thailand Government Bond 4.5% 11/3/2012 "05-4" Thailand Govcrnmenr Bond 5% 3/12/2014 "05-2" Thailand Governmcnt Bond 5.125% 13/3/2018 Thailand Government Bond 5.25% 13/7/2013 Thailand Government Bond 5.25% 12/5/2014 Thailand Governmcnt Bond 5.375% 3/12/2019 "05-3" Thailand Government Bond 5.85% 31/3/2021 "06-5" Thailand Government Bond 6.1 50/0 7/7/2026 "06-6"
2,500,000 I1,000,000,000 4,200,000,000
10,700,000,000
640,000,000
7,300,000,000 4,000,000,000
11,500,000,000 15,000,000,000 5,000,000,000
1 1,750,000,000 3,630,000,000 5,100,000,000
1,250,000
3,000,000
2a5,ooo.ooo 38,000,000 50,000,000 24,000,000
295,000,000 60,000,000 50,000,000
104,000,000 140,000,000 75,000,000
3,000,000 147,000,000 50,000,000
155,000,000 110,000,000 49,750,000 20.000,000 40,000,000 60,000,000 50,000,000
USD KRW KRW
KRW
KRW KRW KRW KRW KRW KRW KRW KRW KRW USD
USD
0.63 2.66 1 .oo
2.58
0.16 1.66 0.91 2.70 3.36 1.16 2.77 0.85 1.20 0.32
0.74
w a , m ii,46a,o42 4,207,764
11,521,335
690,335
7,550,009 4,168,040
12.1 82,467 15,733,854 5,420,966
1 1.1 64,138 3,486,520 5,831,496 1,246,581
2,505,000 10,473,875 3,945,245
10,164,066
614,485 6,561,839 3,578,317
10,628,737 13,235,397 4,579,730
10,703,172 3,343,992 4,738,234 1,246,775
2,989,641 2,928,450 100,339,549 89,467,316 22.70
TWD 8,467,860 8,738,233 2.22 TWD 1,205,747 1,172,490 0.30 TWD 1,524,217 1,633,989 0.41 TWD 72 1,662 772,180 0.20 TWD 8,964,082 8,812,115 2.23 TWD 1,930,847 1,954,355 0.50 TWD 1,573,871 1,570,373 0.40
THB THB THB THB THB THB THB THB THB THB THB THB THB
24,410,288 24,673,735 6.26
3,259,093 4,331,425 1,944,740
88,663 4,749,503 1,302,390 5,023,a92 3,727,242 1,475,496
679,724 1,042,809 1,678,313 1,462,437
2,765,255 4,076,492 2,172,042
88,292 4,149,966 1,445,678 4,419,496
1,460,748 582,500
1,119,705 1,735,259 1.466.528
3,oao,o9i
0.75 1.04 0.55 0.02 1.05 0.37 1.12
.0.78 0.37 0.15 0.29 0.44 0.37
30,785,727 28,762,052 7.30
57
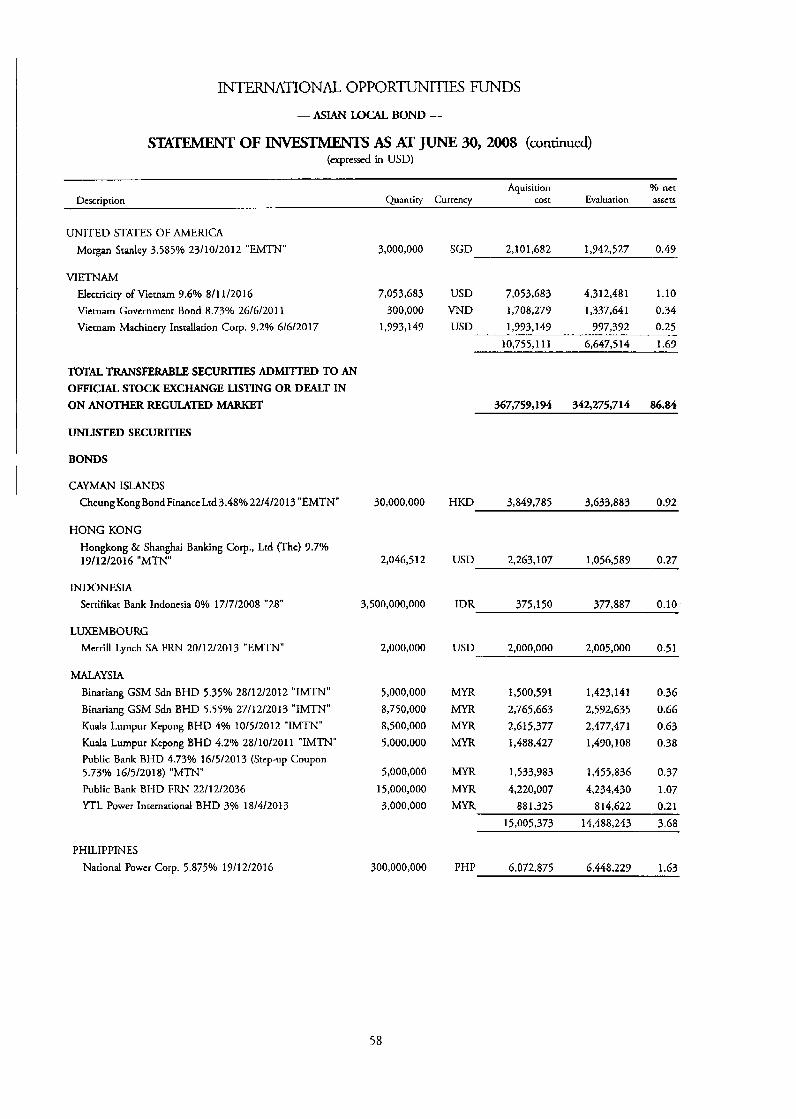
INTERNATIONAL OPPORTUNITIES FUNDS
- ASIAN IDCAL BOND -
OF W S As AT JUNE 30,2008 (continued) (expressed in USD)
Aquisition % nct Description Quantiry Currency cost Evaluation assets
UNITED STATES OF AMERICA Morgan Sranley 3.585% 23/10/2012 "EMTN" 3,000,000 SGD 2,101,682 1,942,527 0.49
VIETNAM Electricity of Vietnam 9.69'0 8/11/2016 Vietnam Govcrnmcnt Bond 8.73% 26/6/20] 1 Vietnam Machinery Insrallarion Corp. 9.2% 6/6/2017
7,053,683 300,000
1 , 9 9 3 ~ 49
USD 7,053,683 4,312,481 1.10 VND 1,708,279 1,337,641 0.34 USD 1.993.149 997.392 0.25
TOTAL TRANSlFERABLE SECURITIES ADMI'ITED TO AN OFFICIAL STOCK EXCHANGE LISTING OR DEALT IN ON ANOTHER REGULATED MARKET
UNLISTED SECURITIES
BONDS
CAYMAN ISLANDS Cheung Kong Bond Finance Ltd 3.48% 22/4/2013 "EMTN"
HONG KONG Hongkong & ShanghaJ Banking Corp., Ltd (The) 9.7% 19/12/2016 "MTN"
INDONESIA Scrtifikat Bank Indonesia 0% 17/7/2008 "28"
LUXEMBOURG Mcrrill Lynch SA FRN 20/12/2013 "EMTN"
h4ALAYSL4 Binariang GSM Sdn BHD 5.35% 28/12/2012 "IMTN" Binariang GSM Sdn BHD 5.55% 27/12/2013 "IMTN" Kuda Lurnpur Kepong BHD 4% 10/5/2012 "IMTN" Kuda Lurnpur Kepong BHD 4.2% 2811012011 "IMTN" Public Bank BHD 4.73% 16/5/2013 (Step-up Coupon 5.73% 16/5/2018) "MTN" Public Bank BHD F R N 22/12/2036 YTL Power International BHD 3% 18/4/2013
PHILIPPINES National Power Corp. 5.875% 19/12/2016
30,000,000
2,046,512
3,500,000,000
2,000,000
5,000,000 8,750,000 8,500,000 5,000,000
5,000,000 15,000,000 3,000,000
300,000,000
10,755,111 6,647.5 14 1.69
367,759,194 342,275,714 86.84
HKD 3,849,785 3,633,883 0.92
USD 2,263,107 1,056,589 0.27
377.887 0.10 IDR 375,150
USD 2,000,000 2,005,000 0.51
MYR 1,500,591 1,423,141 0.36 MYR 2,765,663 2,592,635 0.66 MYR 2,615,377 2,477,471 0.63 MYR 1,488.427 1,490,108 0.38
MYR 1,533,983 1,455,836 0.37 MYR 4,220,007 4,234,430 1.07 MYR 881,325 814,622 0.21
15,005,373 14,488,243 3.68
PHP 6,072,875 6,448,223 1.63
58

INTERNATIONAL OPPORTUNITIES FUNDS
- ASIAN LOCAL BOND -
OF AS AT JUNE 30,2008 (continued) (expressed in USD)
Aquisition % net Evaluation assets Description Quantity Currency cost
SINGAPORE Ascott Capital Pre Ltd 4.7% 7/7/2011 "MTN" CMT MTN Pre Ltd 3.25% 1/4/2010 "MTN" Horel Propertics Ltd 3.3% 7/3/2011 "MTN"
1,467,825 0.37 4,000,000 SGD 2,895,550 2,937,649 0.75 2,000,000 SGD 1,416,727 1,437,31 I 0.36
5,848,785 I .48 5,775,647
2,000,000 SGD I ,463,370
TOTAL UNLISTED SECURI'XIE
TOTAL INVESTMENTS
OTHER NET ASSETS
TOTAZ. NET ASSETS
35,341,937 33,858,616 8.59
403,lO 1,13 1 376,134,330 95.43
18,007,733 4.57
394.142.063 100.00
59
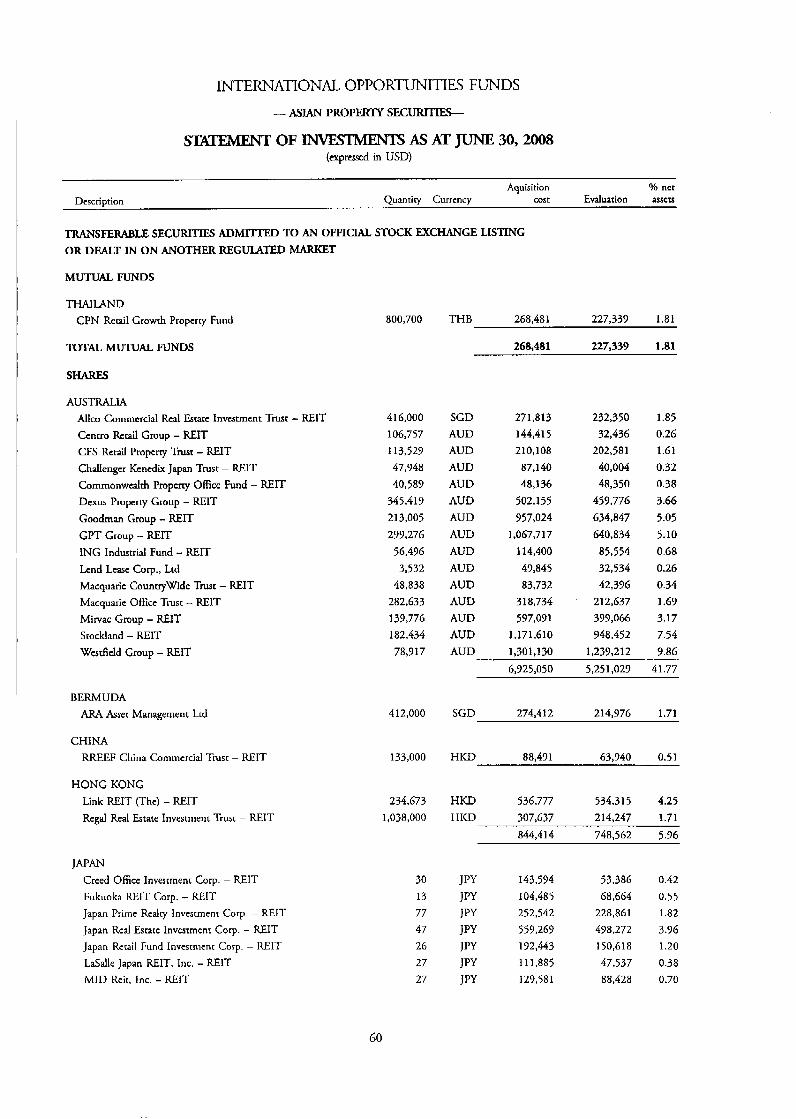
INTERNATIONAL OPPORTUNITIES FUNDS
I MUTUAL FUNDS
- ASJAN PROPERTY SECURlTLES
OF INVESTMENTS As AT JUNE 30,2008 (expressed in USD)
Aquisition 9'0 nct Description Quanriry Currency cost Evaluation asscts
TRfiNSFERABLE SECURITIES ADMITTED TO AN OFFICIAL STOCK EXCHANGE LISTING OR DEALT IN ON ANOTHER REGUL4TED MARKET
THAILAND CPN Retail Growth Propcrry Fund
TOTAL MUTUAL FUNDS
SHARES
AUSTRALIA Allco Commcrcial Rtal Estate Investment Trust - FEIT Ccntro Rctail Group - REIT CFS Retail Propcrry Trust - REIT Challenger Kenedix Japan Trust - REIT Commonwealth Propcrry Office Fund - REIT Dcxus Property Group - FEIT Goodman Group - REIT GPT Group - REIT ING Industrial Fund - REIT Lend Lcasc Corp., Ltd Macquaric Countrywide Trust - REIT Macquarie Ofice Trust - REIT Mirvac Group - REIT Stoddand - REIT Wcstfeld Group - REIT
80o.700 THB 268,481 227,339 1.81
268,481 227,339 1.81
4 16,000 106,757 113,529 47,948 40,583
345,413 213,005 299,276
56,496 3,532
48,838 282,633 133,776 182,434 78,917
SGD AUD AUD AUD AUD AUD AUD AUD AUD AUD AUD AUD AUD AUD AUD
271,813 144,415 210,108
87,140
48,136 502,155 957,024
1,067,717 114,400 49,845 83,732
3 18,734 597,091
I , 171,610 1.301 .I30
232,350 32,436
202,581 40,004 48,350
459,776 634,847 640,834
85,554 32,534 42,396
212,637 399,066 948,452
1.239.212
1.85 0.26 1.61 0.32 0.38 3.66 5.05 5.10 0.68 0.26 0.34 1.69 3.17 7.54 9.86
6.925.050 5.251.029 41.77
I BERMUDA ARA Asset Management Ltd
CHINA RREEF China Commcrcial Trust - E I T
HONG KONG Link REIT (The) - REIT Rcgal Rcal Estate Investment Trust - REIT
412,000 SGD 274,4 12 214,976 1.71
133,000 HKD 88,491 63,940 0.51
234,673 HKD 536,777 534,315 4.25 1,038,000 HKD 307,637 214,247 1.71
844.414 748.562 5.96
Creed Officc Investment Corp. - REIT Fukuoka REIT Corp. - RElT Japan Prime Redry Invcstment Corp. - RElT Japan Real Esrare Investment Corp. - WIT Japan Retail Fund Investment Corp. - RElT LaSalle Japan REIT, Inc. - RElT MID Reit, Inc. - REIT
30 JPY 143,594 53,386 0.42 13 JPY 104,485 68,664 0.55 77 JPY 252,542 228,861 1.82 47 JPY 559,269 490,272 3.96 26 JPY 192,443 150,618 1.20 27 JPY 111,885 47,537 0.38 27 JPY 129,581 88,428 0.70
60
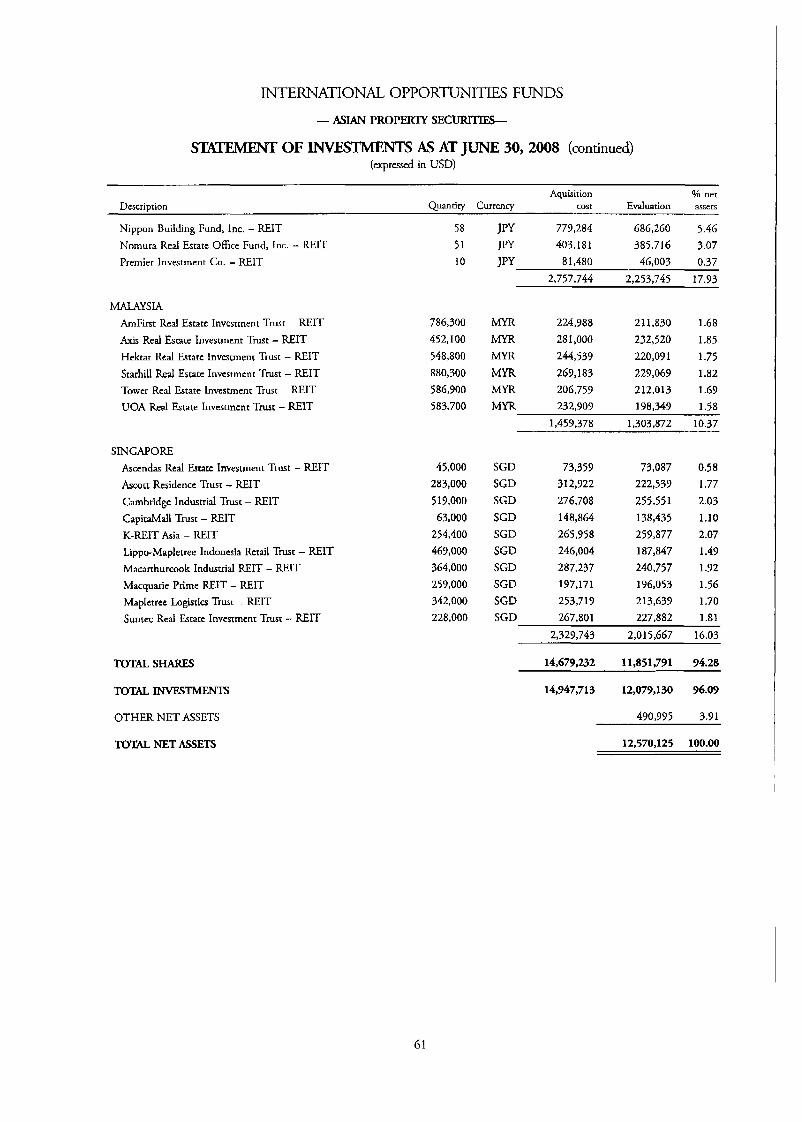
INTERNATIONAL OPPORmITIES FUNDS
- ASIAN PROPEEm SECIJRWDS-
S n OF INvEsxhlENTS AS AT JUNE 30,2008 (continued) (expressed in USD)
Aquisition % net Description Quantity Currency cost Evaluation assets
Nippon Building Fund, Inc. - REIT Nomura Real Estate Ofice Fund, Inc. - REIT Premier Investment Co. - FEIT
MALAYSIA AmFirst Real Estate Investment Trust - REIT Axis Real Estate Investment Trust - REIT Hektar Real Estate Investment Trust - REIT Starhill Real Estate Investmcnr Trust - REIT Tower Real Estate Investment Trust - REIT UOA Real Estate Investment Trust - W I T
SINGAPORE Ascendas Real Estate Investment Trust - REIT Ascott Residence Trust - REIT Cambridge Industrial Trust - REIT CapitaMall Trust - REIT K-REIT Asia - REIT Lippo-Mapletree Indonesia Retail Trust - REIT Macarrhurcook Industrial FEIT - REIT Macquatie Prime REIT - REIT Mapletree Logistics Trust - REIT Suntcc Real Estate Investment Trust - REIT
TOTAL SHARES
TOTAL INVESTMENTS
58 51 10
786,300 452,100 548,800 880,300 586,900 583,700
45,000 283,000 5 19,000 63,000
254,400 469,000 364,000 259,000 342,000 228,000
JPY 779,284 686,260 5.46 JPY 403,181 385.716 3.07 JPY 81,480 46,003 0.37
2,757,744 2,253,745 17.93
MYR 224,988 211,830 1.68 MYR 28 1,000 232,520 1.85 MYR 244,539 220,091 1.75 MYR 269,383 229,069 1.82 MYR 206,759 212,013 1.69 MYR 232.909 198.349 1.58
1,459,378 1,303,872 10.37
SGD SGD SGD SGD SGD SGD SGD SGD SGD SGD
73,359 312,922 276,708 148,864 265,958 246,004 287,237 197,17 1 253,719 267,801
73,087 222,539 255,551 138,435 259,877 187,847 240,757 196,053 213,639 227,882
0.58 1.77 2.03 1.10 2.07 I .49 1.92 1.56 1.70 1.81
2,329,743 2,015,667 16.03
14,679,232 11,851,791 74.28
14,947,713 12,079,130 96.09
OTHER NET ASSETS
TOTAL NET ASSETS
490,995 3.91
12.570.125 100.00
61
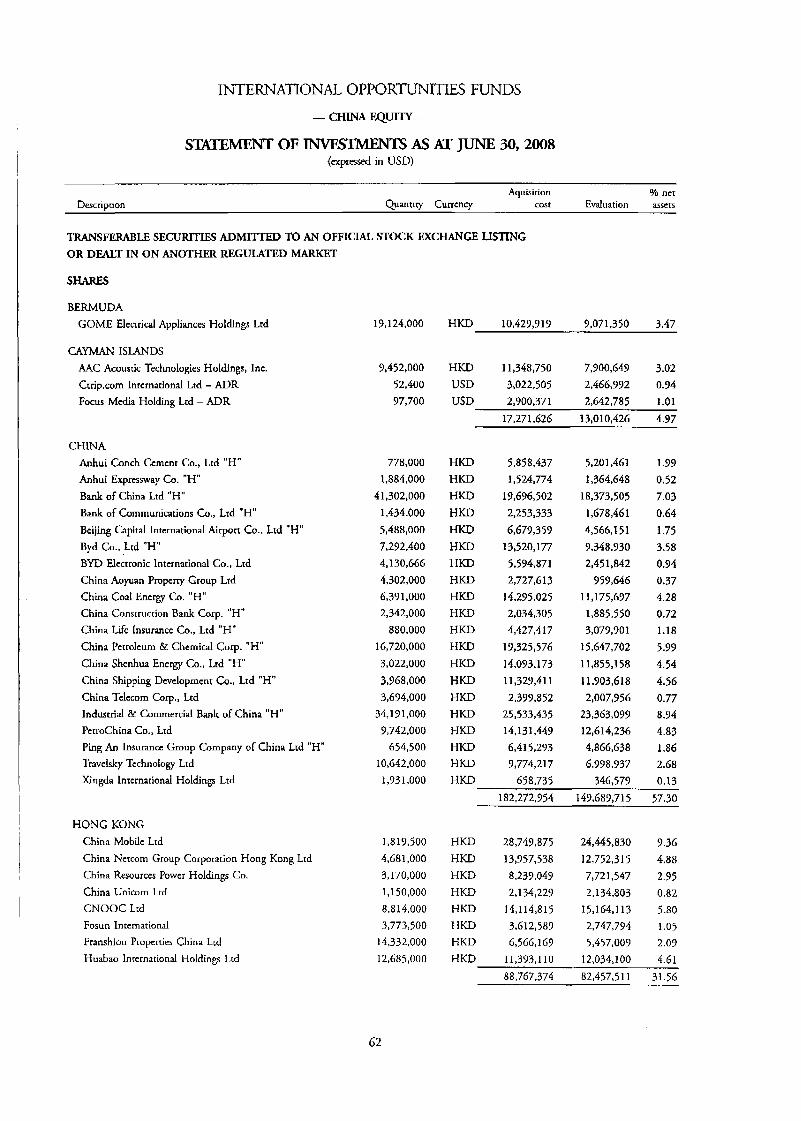
INTERNATIONAL OPPORTZTNITIES FUNDS
- CHINA E Q W -
STATEMENT OF AS AT JUNE 30,2008 (expressed in USD)
Aquisirion Yo net Description Quantity Currency cost Evaluation assets
TRANSFERABLE SECUlUTIES ADMITTED TO AN OFFICIAL STOCK MCHANGE LISTING OR DEALT IN ON ANOTHER REGULATED MARKET
BERMUDA GOME Electrical Appliances Holdings Lrd
CAYMAN ISLANDS AAC Acoustic Technologies Holdings, Inc. Ctrip.com Inrcrnarional Ltd - ADR Focus Media Holding Lrd - ADR
CHINA Anhui Conch Grncnt Co., Lrd "H" Anhui Exprcssway Co. "H" Bank of China Ltd "H" Bank o f Communications Co., Lrd "H" Bcijing Capital International Airport Co., Ltd "H" Byd Co., Ltd "H" BYD Electronic lnternational Co., Lrd China Aoyuan Propcrry Group Ltd China Coal Energy Co. "H" China Construction Bank Corp. "H" China Life Insurance Co., Lrd "H" China Perrolcum & Chemical Corp. "H" China Shenhua Energy Co., Lrd "H" China Shipping Dcvelopmcnt Co., Ltd "H" China Telccorn Corp., Ltd Industrial & Commercial Bank of China "H" PctroChina Co., Ltd Ping An Insurance Group Company of China Lrd "H" Travelsky Tcchnology Ltd Xingda Inrcrnarional Holdings Ltd
HONG KONG China Mobile Ltd China Nercorn Group Corporation Hong Kong Ltd China Resources Power Holdings Co.
China Unicorn Ltd CNOOC Ltd Fosun International Franshion Properties China Lrd Huabao International Holdings Lrd
19,124,000
9,452,000 52,400 97,700
778,000 1,884,000
41,302,000 1,434,000 5,488,000 7,292,400 4,130,666 4,302,000 6,391,000 2,342,000
880,000 16,720,000 3,022,000 3,968,000 3,694,000
34,19 1,000 9,742,000
654,500 10,642,000 1,93 1,000
1,819,500 4,681,000 3,170,000 1,150,000 8,814,000 3,773,500
14,332,000 12,685,000
HKD 10,429,919 9,071,350 3.47
HK.D 11,348,750 7,900,647 3.02 USD 3,022,505 2,466,992 0.94 USD 2.900.371 2,642,785 1.01
~~
17,271,626 13,010,426 4.97
HKD HKD HKD HKD HKD HKD HKD HKD HKD HKD HKD HKD HKD HKD HKD HKD HKD HKD HKD
5,858,437 1,524,774
19,696,502 2,253,333 6,679,359
13,520,177 5,594,871 2,727,613
14,295,025 2,034,305 4,427,417
19,325,576 14,093,173 1 1,329.4 1 1
2,399,852 25,533,435 14,131,449 6,415,293 9,774,217
5,201,461 1,364,648
18,373,505 1,678,461 4,566,151 3,348.930 2,45 1,842
959,646 11,175,697 1,885,550 3,079,901
15,647,702 11,855,158 11,903,618 2,007,956
23,363,099 12,614,236 4,866,638 6,998,937
1.99 0.52 7.03 0.64 1.75 3.58 0.94 0.37 4.28 0.72 1.18 5.99 4.54 4.56 0.77 8.94 4.83 1.86 2.68
HKD 658,735 346,579 0.13 182,272,954 149,689,715 57.30
HKD HKD HKD HKD HKD HKD HKD HKD -
28,749,875 13,957,538 8,239,049 2,134,229
14,114,815 3,612,589 6,566,169
1 1 , 3 9 3 ~ 10 88.767.374
24,445,830 12,752,315 7,721,547 2,134,803
15,164.1 13 2,747,794 5,457,009
12,034,100 82,457,511
9.36 4.88 2.95 0.82 5.80 1.05 2.09 4.61
31.56
62

INTERNATIONAL OPPORTUNITIES FUNDS
- CHINA E Q m -
S- OF l[NvEsTMENTS AS AT JUNE 30,2008 (continued) (expressed in USD)
Aquisition Yo net Description Quantity Currency cost Evaluation assets
SINGAPORE Yanlord Land Group Ltd 823,000 SGD 1,679,272 1,118,941 0.43
TOTAL INVESTMENTS 300,421,145 255,347,943 97.73
OTHER NET ASSETS 5,931,028 2.27
TOTAL NET ASSETS 261,278,971 100.00
63
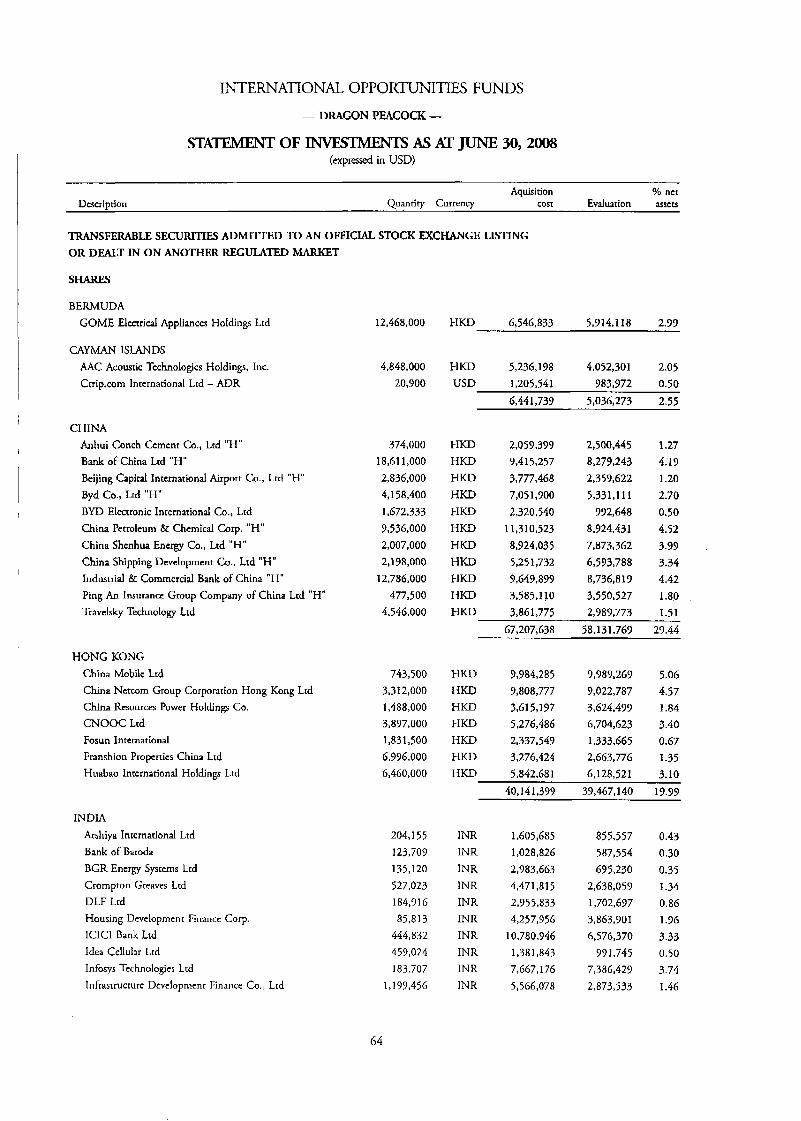
INTERNATIONAL OPPORTUNITIES FUNDS
- DRAGON PJZACOCK -
S- OF INVFS- As AT JUNE 30,2008 (expressed in USD)
- - -~ ~~~~ ~
Aquisition % nct Evaluation assets Dcscriprion Quantity Currency cost
TRANSFERABLE SECURITIES ADMI'ITED TO AN OFFICIAL STOCK EXCHANGE LISTING OR DEALT IN ON ANOTHER REGULATED MARKET
SHARES
BERMUDA GOME Electrical Appliances Holdings Ltd
CAYMAN ISLANDS AAC Acoustic Technologies Holdings, Inc. Ctrip.com International Lrd - ADR
12,468,000 HKD 6,546,833 5,914,118 2.97
4,848,000 HKD 5,236,198 4,052,301 2.05 20,900 USD 1,205,541 983,972 0.50
6,441,739 5,036,273 2.55
CHINA Anhui Conch Gmcnt Co., Ltd "H" Bank of China Ltd "H" Beijing Capital International Airport Co., Ltd "H" Byd Co., Ltd "H" BYD Electronic International Co., Lrd China Petroleum & Chemical Corp. "H" China Shcnhua Energy Co., Ltd "H" China Shipping Development Co., Ltd "H" Industrial & Commercia Bank of China "H" Ping An Insurance Group Company of China Ltd "H" Travelsky Technology Ltd
I
I
374,000 18,611,000 2,836,000 4,158,400 1,672,333 9,536,000 2,007,000 2,198,000
12,786,000 477,500
4,546,000
HKD HKD HKD HKD HKD HKD HKD HKD HKD HKD HKD
2,059,399 9-41 5,257 3,777,468 7,051,700 2,320,540
11,310,523 8,924,035 5,251,732 9.G49.899 3,585,110 3,861,775
2,500,445 8,279,243 2,359,622 5,331,111
992,648 8,724,431 7,873,362 6,593,788 8,736,8 17 3,550,527 2,989,773
1.27 4.19 1.20 2.70 0.50 4.52 3.99 3.34 4.42 1.80 1.51
HONG KONG China Mobile Ltd China Netcom Group Corporation Hong Kong Ltd China %sources Power Holding Co. CNOOC Ltd Fosun International Franshion Properties China Ltd Huabao International Holdings Ltd
743,500 HKD 3,312,000 HKD 1,488,000 HKD 3,897,000 HKD 1,831,500 HKD 6,796,000 HKD 6,460,000 HKD
INDIA Arshiya Inrernational Ltd Bank of Baroda BGR Energy Systems Lrd Crornpton Greaves Lrd DLF Ltd Housing Development Finance Corp. ICICI Bank Ltd Idea Cellular Ltd lnfosys Technologics Ltd lnfrasrrucrurc Dcvcloprnenr Finance Co., Ltd
67,207,638
9,984,285 9,808,777 3.61 5,177 5,276,486 2,337,549 3,276,424 5,842,681
58,131,769 27.44
7,989,269 5.06 9,022,787 4.57 3,624,499 1 .a4 6,704,623 3.40 1,333,665 0.67 2,663,776 1.35 6,128,521 3.10
~~ ~
40,141,399 39,467,340 17.99
204,155 123,709 135,120 527,023 1843 16 85,813
444,832 459,024 183,707
1,199,456
INR 1,605,685 INR 1,028,826 INR 2,783,663 INR 4,471,815 INR 2,955,833 INR 4,257,956 INR 10,780,946 INR 1,381,843 INR 7,667,176 INR 5,566,078
855,557 587,554 695,230
2,638,059 1,702,697 3,863,901 6,576,370
991,745 7,386,429 2,873,533
0.43 0.30 0.35 I .34 0.86 1.76 3.33 0.50 3.74 I .46
64
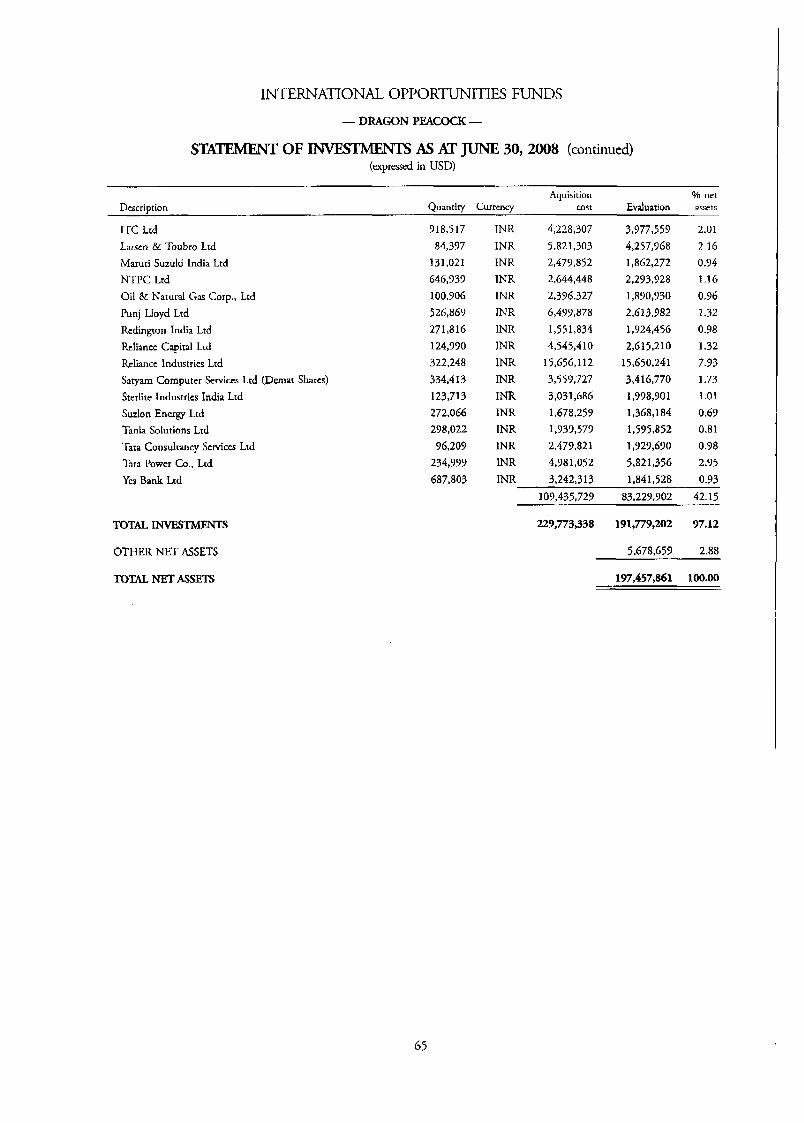
INTERNATIONAL OPPORmITIES FUNDS
- DRAGON PEACOCK -
STATEMENT OF -S AS AT JUNE 30, 2008 (continued) (expressed in USD)
Aquisition Yo net Description Quanriry Currency cast Evaluation assets
ITC Ltd Larscn & Toubro Ltd Maruti Suzuki India Ltd NTPC Lrd Oil & Natural Gas Corp., Ltd Punj Lloyd Ltd Redington India Ltd Reliance Capital Ltd I L l i c c Industries Ltd Satyam Computer Services Ltd (Demat Shares) Sterlite Industries India Ltd Suzlon Energy Ltd Tanla Solutions Lrd Tara Consultancy Services Ltd Tata Power Co., Ltd Yes Bank Lrd
918,517 84,397
131,021 646,939 100,706 526,867 271,s 16 124,990 322,248 334,4 13 123,713 272,066 298,022 96,209
234,999 687,803
INR 4,228,307 INR 5,82 1,303 INR 2,477,852 INR 2,644,448 INR 2,396,327 INR 6,499,878 INR 1,551,834 INR 4,545,410 INR 15,656,112 INR 3,559,727 INR 3,031,686 INR 1,678,259 INR 1,937,579 INR 2,479,821 INR 4,981,052 INR 3,242,313
3,977,559 4,257,968 1,862,272 2,293,928 1,890,930 2,613,982 1,924,456 2,615.2 10
15,650,241 3,416,770 1,998,901 1,368,184 1,575,852 1,929,690 5,821,356 1,841,528
2.01
2.16 0.94 1.16
0.96 1.32 0.98 1.32 7.93 1.73 1.01
0.69 0.81 0.78 2.95 0.93
TOTAL INVESTMENTS
OTHER NET ASSETS
103,435,729 83,229,902 42.15
229,773,338 191,779,202 77.12
5,678,659 2.88
TOTAL NET ASSETS 197,457,861 100.00
65
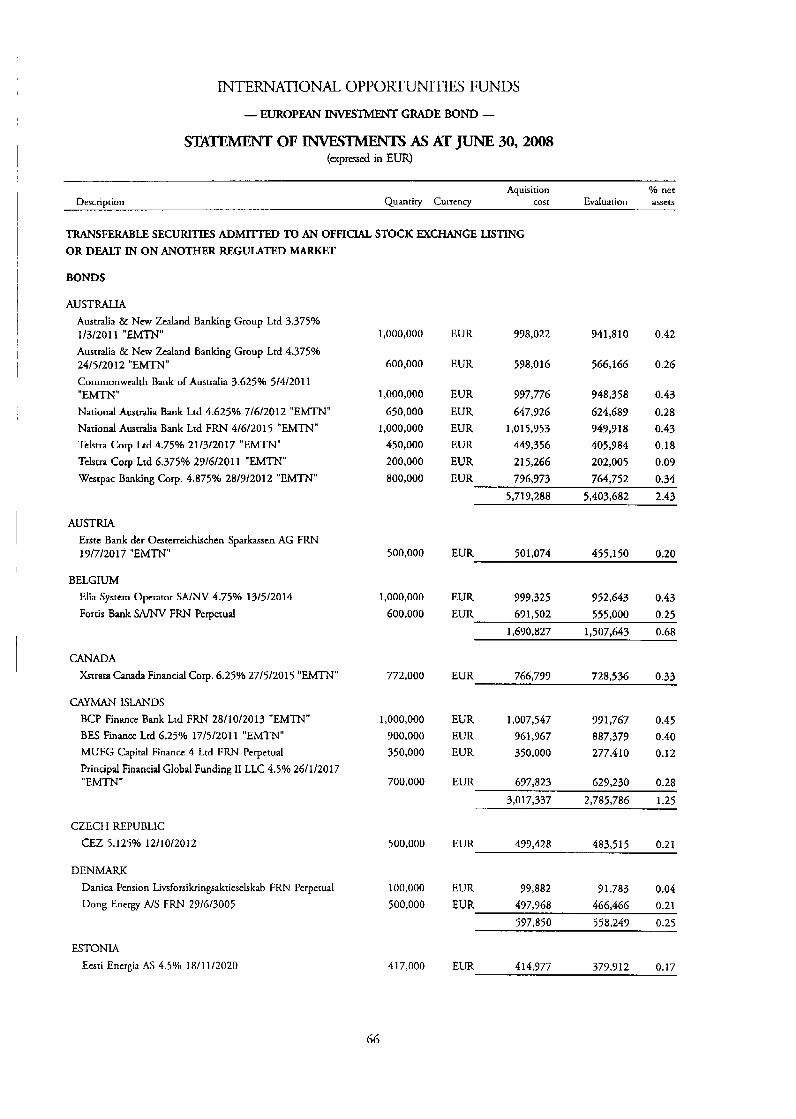
INTERNATIONAL OPPORTUNITIES FUNDS
- EUROPEAN WWXMFNT GRADE BOND -
S ' I M T M W T OF INVESTMENTS AS AT JUNE 30,2008 (acpressed in EUR)
Descrimion Aquisition % net
Quantin, Currency cost Evaluation assets
TRANSFERABLE SECURITIES ADMllTF.D TO AN OFFIClAL STOCK EXCHANGE LISTING OR DEALT IN ON ANOTHER REGULATED MARKET
BONDS
AUSTRALLA Australia & New Zealand Banking Group Ltd 3.375% 1/3/2011 "EMTN" Australia & New Zealand Banking Group Ltd 4.375% 24/5/2012 "EMTN" Commonwealth Bank of Australia 3.625% 5/4/2011 "EMTN" National Australia Bank Ltd 4.I525% 7/15/2012 "EMTN" National Australia Bank Ltd FRN 4/6/2015 "EMTN" TeLtra Corp Ltd 4.75% 21/3/2017 "EMTN" TcLtra Corp Ltd 6.375% 27/6/2011 "EMTN" Westpac Banking Corp. 4.875% 28/9/2012 "EMTN"
AUSTRIA Erste Bank der Oesterreichischen Sparkassen AG FRN 19/7/2017 "EMTN"
BELGIUM Elia System Operator SA/NV 4.75% 13/5/2014 Fortis Bank W N V FRN Perpetual
CANADA Xstrata Canada Financial Corp. 6.25% 27/5/2015 "EMTN"
CAYMAN ISLANDS BCP Finance Bank Lrd FRN 28/10/2013 "EMTN" BES Finance Ltd 6.25% 17/5/2011 "EMTN" MUFG Capital Finance 4 Ltd FRN Perpetual Principal Financial Global Funding 11 LLC 4.5% 26/1/2017 "EMTN"
CZECH REPUBLIC CEZ 5.125% 12/10/2012
DENMARK Danica Pension Livsforsikringsakrieselskab FRN Perperual Dong Energy A/S FRN 29/6/3005
ESTONIA Eesri Energia AS 4.5% 18/11/2020
1,000,000
600,000
1,000,000 650,000
1,000,000 450,000 200,000 800,000
500,000
1,000,000 600,000
772,000
1,000,000 900,000 350,000
700,000
500,000
100,000 500,000
417,000
EUR 998,022
EUR 598,016
EUR 997,776 EUR 647,926 EUR 1,015,753 EUR 447,356 EUR 215,266 EUR 796,973
741,810
566,166
948,358 624,689 949,918 405,984 202,005 764,752
0.42
0.26
0.43 0.28 0.43 0.18 0.09 0.34
5,719,288 5,403,682 2.43
EUR 501,074 455,150 0.20
EUR 999,325 952,643 0.43 EUR 691,502 555,000 0.25
1,670,827 1,507,643 0.68
EUR 766,799 728,536 0.33
EUR 1,007,547 991,767 0.45 EUR 761,767 887,379 0.40 EUR 350,000 277,410 0.12
EUR 697,823 629,230 0.28 3,017,337 2,785,786 1.25
497,428 483,515 0.21 EUR
EUR 99,882 91,783 0.04 EUR 4 9 7,9 6 8 466,466 0.21
597,850 558,249 0.25
EUR 414,977 373,712 0.17
66
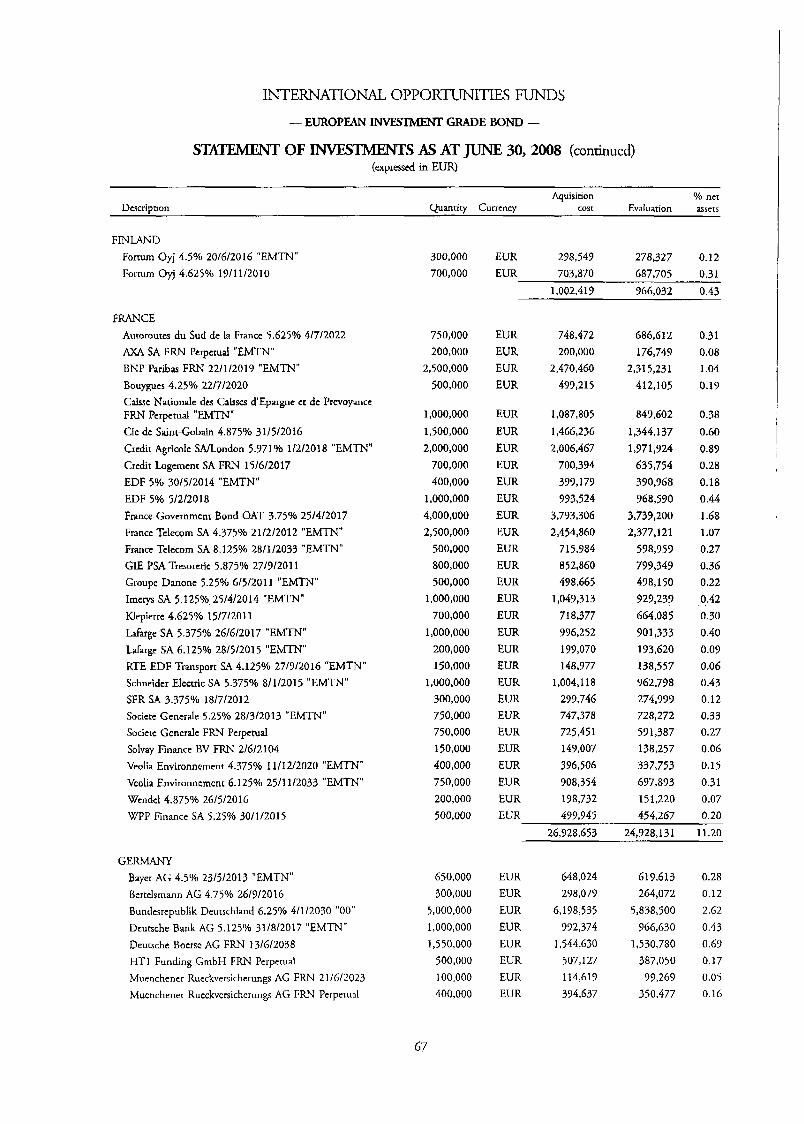
INTERNATIONAL OPPORTUNITIES FUNDS
- EUROPFAN GRADE BOND -
STA- OF INVESTMENTS As AT JUNE 30,2008 (continued) (expressed in EUR)
~~ ~ ~~
Aquisition Yo net Description Quantity Currency cost Evaluation asscts
FINLAND Fortum Oyj 4.5% 20/6/2016 "EMTN" Fortum Oyj 4.625% 19/11/2010
FKANCE Autoroutes du Sud de la France 5.625% 4/7/2022 AXA SA F R N Perpctual "EMTN" BNP Paribas FRN 22/1/2019 "EMTN" Bouygucs 4.25% 22/7/2020 Caissc Nationale des Caisses dEpargne ct de Prewyance FRN Perpetual "EMTN" Cie dc Saint-Gobain 4.875% 31/5/2016 Credit Agricole WLondon 5.971% 1/2/2018 "EMTN" Credit Logemcnr SA F R N 15/6/2017 EDF 5% 30/5/2014 "EMTN" EDF 5% 5/2/2018 France Government Bond OAT 3.75% 25/4/2017 France Tclecom SA 4.375% 21/2/2012 "EMTN" France Telecom SA 8.125% 28/1/2033 "EMTN" GIE PSA Tresoreric 5.875% 27/9/2011 Groupe Danonc 5.25% 6/5/2011 "EMTN" Imcrys SA 5.125% 25/4/2014 "EMTN" Klepierre 4.625% 15/7/2011 Lafarge SA 5.375% 26/6/2017 "EMTN" Lafarge SA 6.125% 28/5/2015 "EMTN" RTE EDF Transport SA 4.125% 27/9/2016 "EMTN" Schneidcr Elccrric SA 5.375940 8/1/2015 "EMTN" SFR SA 3.375% 18/7/2012 Socictc Gcncrale 5.25% 28/3/2013 "EMTN" Socicrc Generale FRN Perpetual Solvay Finance BV FRN 2/6/2104 Veolia Environnernent 4.375% 11/12/2020 "EMTN" Veolia Environnemenr 6.125% 25/11/2033 "EMTN" Wcndcl 4.875% 26/5/2016 WPP Finance SA 5.25% 30/1/2015
GERMANY Bayer AG 4.5% 23/5/2013 "EMTN" Bertelsmann AG 4.75% 26/9/2016 Bundesrepublik Deurschland 6.25% 411 /2030 "00" Dcutsche Bank AG 5.125% 31/8/2017 "EMTN" Deutsche Bocrse AG FRN 13/6/2038 HTI Funding GmbH FRN Perpetual Muenchencr Rucckversichcrungs AG FRN 21/6/2023 Muenchener Rucckversicherungs AG FRN Perpetual
300,000 700,000
750,000 200,000
2,500,000 500,000
1,000,000 1,500,000
2,000,000 700,000 400,000
1,000,000
4,000,000 2,500,000
500,000 800,000 500,000
1,000,000
700,000 1,000,000
200,000 150,000
1,000,000 300,000 750,000 750,000 150,000 400,000
750,000 200,000 500,000
650,000 300,000
5,000,000
1,000,000 1,550,000
500,000 100,000 400,000
67
298,549 278,327 0.12 687,705 0.31
1,002,419 966.032 0.43
EUR EUR 703,870
EUR EUR EUR EUR
EUR EUR EUR EUR EUR EUR EUR EUR EUR EUR EUR EUR EUR EUR EUR EUR EUR EUR EUR EUR EUR EUR EUR EUR
748,472 200,000
2,470,460 439,215
1,087,805 1,466,236 2,006,467
700,394 399,179 993,524
3,793,306 2,454,860
715,984 852,860 498,665
1,047,3 13 718,377 996,252 199,070 148,977
1,004,118 299,746 747,378 725,45 1 149,007 396,506 908,354 198,732
68661 2
176,749 2,315,231
41 2,105
849,602
1,344,137 1,771,924
635,754 390,968 968,590
3,739,200 2,377,121
5 9 8,9 5 9 799,349 498,150 929,239 664,085 901,333 193,620 138,557 962,798 274,999 728,272 591,387 138,257 337,753 697,893 151,220
0.31 0.08 1.04 0.17
0.38 0.60 0.89 0.28 0.18 0.44 1.68 1.07 0.27 0.36 0.22 0.42 0.30 0.40 0.09 0.06 0.43 0.12 0.33 0.27 0.06 0.15
0.31 0.07
499,945 454,267 0.20
26,928,653 24,928,131 11.20
EUR
EUR EUR EUR EUR EUR EUR EUR EUR
648,024 298,079
6,138,535 792,374
1,544,630 507,127 114,619 394,637
619,613 264,072
5,838,500 966,630
1,530,780 387,050 99,269
350,477
0.28 0.12 2.62 0.43 0.69 0.17
0.05
0.16
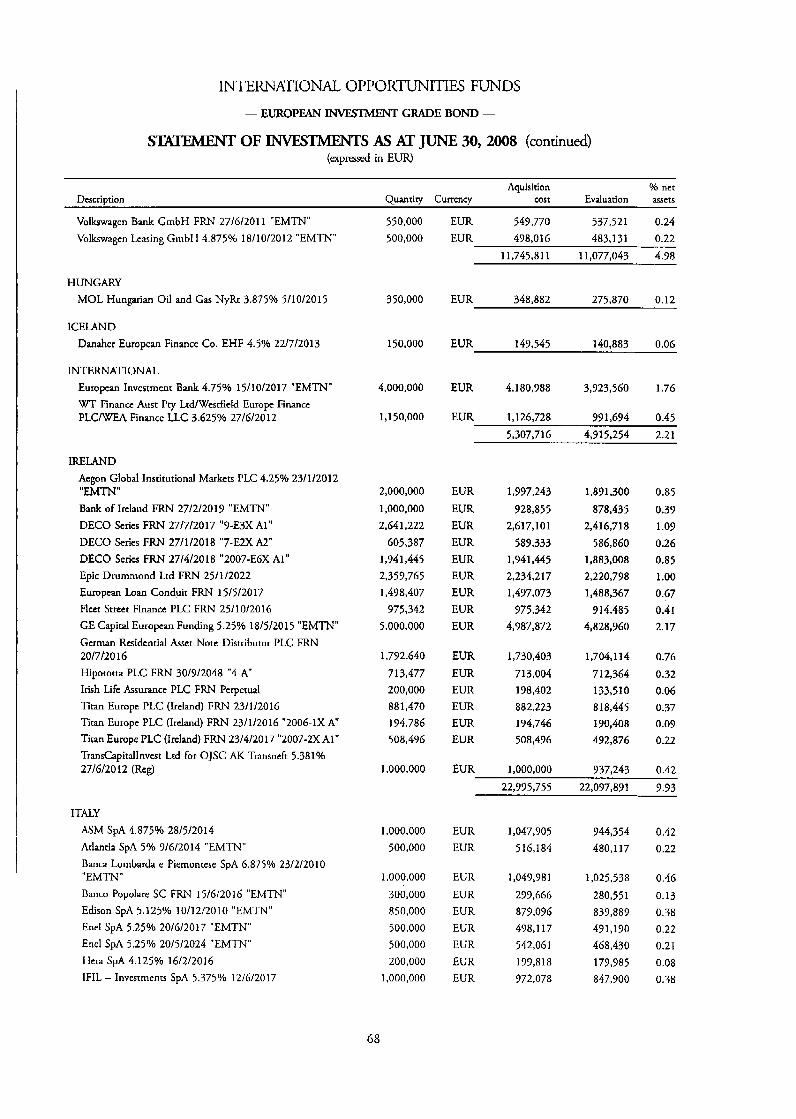
INTERNATIONAL OPPORmITIES FUNDS - EUROPEAN INVESTMENT GRADE BOND -
OF INVESTMENTS As AT JUNE 30,2008 (continued) (expressed in EUR)
Descrimion Aquisition % net
Ouanrin Currencv cost Evaluation assets
Volkswagen Bank GmbH FRN 27/6/2011 "EMTN" V o h a g e n Leasing GmbH 4.875% 18/10/2012 "EMTN"
HUNGARY MOL Hungarian Oil and Gas NyRt 3.875% 5/10/2015
ICELAND Danaher European Finance Co. EHF 4.5% 22/7/2013
INTERNATIONAL European Investment Bank 4.75% 15/10/2017 "EMTN" WT Finance Aust Pty LtdWesrfield Europe Finance PLClwEA Finance LLC 3.625% 27/6/2012
IRELAND Acpn Global Institutional Markets PLC 4.2596 23/1/2012 "EMTN" Bank of Ireland FRN 27/2/2019 "EMTN" DECO Series FRN 27/7/2017 "9-E3X Al" DECO Series FRN 27/1/2018 "7-E2X A2" DECO Serics FRN 27/4/2018 "2007-E6X AI" Epic Drummond Ltd FRN 25/1/2022 Europcan Loan Conduit FRN 15/5/2017 Flcet Street Finance PLC FRN 25/10/2016 GE Capital European Funding 5.25% 18/5/2015 "EMTN" German Rcsidcnrial Asset Note Distributor PLC FRN 20/7/2016 Hipototta PLC FRN 30/9/2048 "4 A" Irish Life Assurance PLC FRN Perpetual Titan Europe PLC (Ireland) FRN 23/1/2016 Tiran Europe PLC (Ireland) FRN 23/1/2016 "2006-1X A"
Titan Europe PLC (Ireland) FRN 23/4/2017 "2007-2XAl" TransCapitalInvest Lrd for OJSC AK Transneft 5.381% 27/6/2012 (Reg)
ITALY ASM SPA 4.875% 28/5/2014 Arlantia SPA 5% 9/6/2014 "EMTN" Banca Lombarda e Piemonrcse SPA 6.875% 23/2/2010 "EMTN" Banco Popolare SC F R N 15/6/2016 "EMTN" Edison SPA 5.125% 10/12/2010 "EMTN" Enel SPA 5.25% 20/6/2017 "EMTN" Enel SPA 5.25% 20/5/2024 "EMTN" Hera SPA 4.125% 16/2/2016 IFIL - Investments SpA 5.375% 12/6/2017
550,000 500,000
350,000
150,000
4,000,000
1,150,000
2,000,000 1,000,000 2,641,222
605,387 1.94 1,445 2,359,765 1,498,407
975,342 5,000,000
1,792,640 713,477 200,000 881,470 194,786 508,496
1,000,000
1,000,000 500,000
1,000,000
300,000 850,000 500,000 500,000 200,000
1,000,000
GS
EUR 549,770 537,521 0.24 EUR 49 8.01 6 483,131 0.22
11.745.811 11.077.043 4.98
EUR 348,882 275,870 0.12
EUR 149,545 140,883 0.06
EUR 4,180,988 3,323,560 1.76
EUR 1,126,728 991,694 0.45 5,307,716 4,915,254 2.21
EWR EUR EUR EUR EUR EUR EUR EUR EUR
1,997,243 928,855
2,617,101
589,333 1,941,445 2,234,217 1,497,073
975,342 4,987 ,a72
1,891,300 878,435
2,416,718 586,860
1,883,008 2,220,738 1,488,367
914,485 4,828,960
0.85 0.39 1.09 0.26 0.85 1 .oo 0.67 0.41 2.17
EUR 1,730,403 1,704,114 0.76 EUR 713,004 712,364 0.32 EUR 198,402 133,510 0.06 EUR 882,223 818,445 0.37 EUR 194,746 190,408 0.09 EUR 508,496 492,876 0.22
EUR 1,000,000 937,243 0.42 22,995,755 22,097,89 1 9.93
EUR 1,047,905 EUR 5 16,184
EUR 1,049,981
EUR 299,666 EUR 8 7 9,O 9 6 EUR 498,117 EUR 542,061 EUR 199,818 EUR 972,078
944,354 480,117
1,025,538
280,551 839,889 491,190 468,430 179.985 847,900
0.42 0.22
0.46 0.13 0.38 0.22 0.21 0.08 0.38
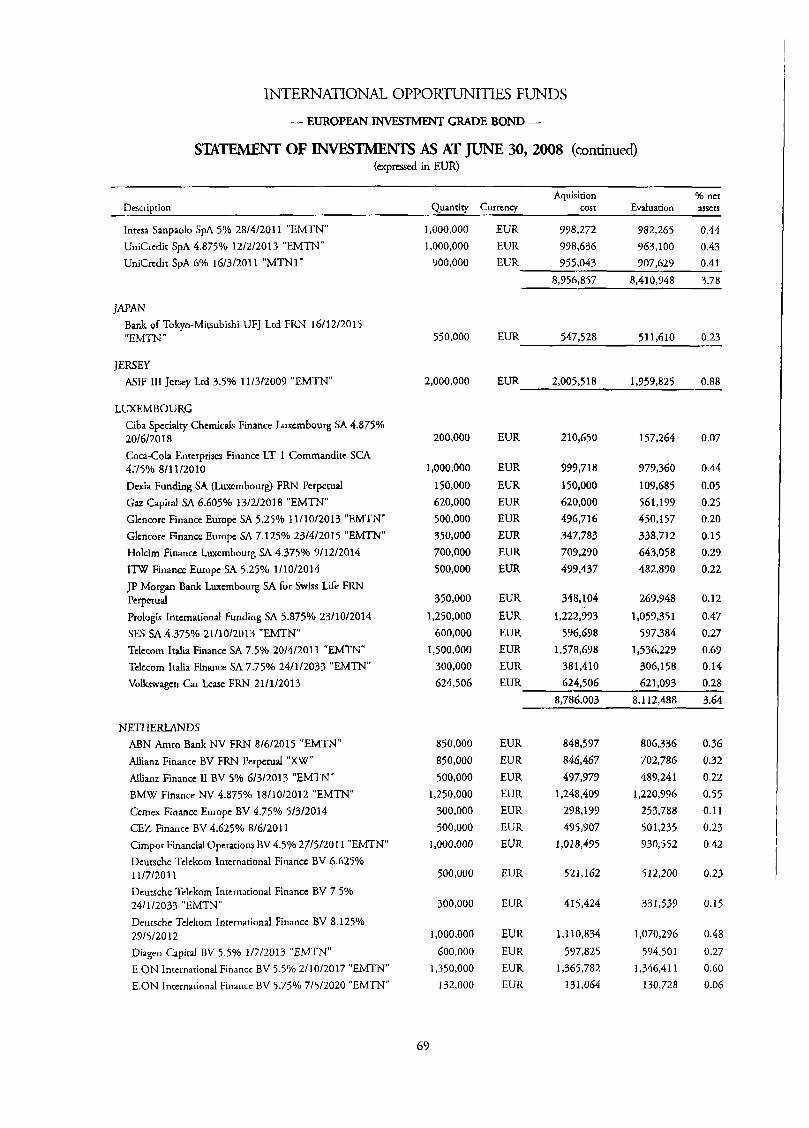
INTERNATIONAL OPPORTUNITIES FUNDS
- EUROPEAN GRADE BOND -
STATEMENT OF -S AS AT JUNE 30,2008 (continued) (Bcprtssed in EUR)
Aquisition % net Description Quantity Currency cost Evaluation assets
Intcsa Sanpaolo SPA 5% 28/4/20] 1 "EMTN" UniCrcdir SPA 4.875% 12/2/20] 3 "EMTN" UniCredir SPA 6% 16/3/2011 "MTN 1 "
JAPAN Bank of Tokyo-Mitsubishi UFJ Ltd FRN 16/12/2015 "EMTN"
JERSEY ASIF 111 Jersey Lrd 3.54/0 11/3/2007 "EMTN"
LUXEMBOURG Ciba Specialty Chtmicds Finance Luxcmbourg SA 4.875% 20/6/2018 Coca-Cola Enterprises Finance LT 1 Commandite SCA 4.75% 811 112010 Dexia Funding SA (Luxembourg) FRN Perpetual Gaz Capital SA 6.605% 13/2/2018 "EMTN" Glencore Finance Europe SA 5.25% 11/10/2013 "EMTN" Glcncore Finance Europe SA 7.125% 23141201 5 "EMTN" Holdm Finance Luxembourg SA 4.375% 9/12/2014 ITW Finance Eumpc SA 5.25% 1/10/2014 JP Morgan Bank Luxembourg SA for Swiss Life FRN Perpetual Prologis Inrcrnational Funding SA 5.875% 23/10/2014 SES SA 4.375% 2111012013 "EMTN" Tcltcom ltalia Finance SA 7.5% 20/4/2011 "EMTN" Tclccom Italia Finance SA 7.75% 24/1/2033 "EMTN" Vokswagcn Car Lase FRN 21/1/2013
NETHERLANDS ABN Amro Bank NV FRN 8/6/2015 "EMTN" Allianz Finance BV FRN Perpetual "XW"
Allianz Finance I1 BV 5% 6/3/2013 "EMTN" BMW Finance NV 4.875% 18/10/2012 "EMTN" Cernex Finance Europe BV 4.75% 5/3/2014 CEZ Financc BV 4.625% 8/6/20] 1 Cimpor Financial Opcrarions BV4.5% 27/5/20 1 I "EMTN" Dcursche Tclckorn International Finance BV 6.625Yo 11/7/2011 Dcutsche Telekom International Finance BV 7.5% 24/1/2033 "EMTN" Deursche Tclekom Inrernational Finance 6V 8.125% 29/5/2012 Diageo Capital BV 5.5% 1/7/2013 "EMTN" E.ON lntcrnational Financc BV 5.5% 2/10/2017 "EMTN" E.ON International Financc BV 5.75% 7/5/2020 "EMTN"
1,000,000
1,000,000 900,000
550,000
2,000,000
200,000
1,000,000 150,000 620,000 500,000 350,000 700,000 500,000
350,000 1,250,000
600,000 1,500,000
300,000 624,506
850,000 850,000 500,000
1,250,000 300,000 500,000
I,000.000
500,000
300,000
1,000,000 600,000
1,350,000 132,000
67
EUR 998,272 982,265 0.44 EUR 798,636 763,100 0.43 EUR 955,043 707.629 0.41
8,756,857 8,410,948 3.78
EUR 547.528 511.610 0.23
EUR 2,005,518 1,959,825 0.88
EUR
EUR EUR EUR EUR EUR EUR EUR
EUR EUR EUR EUR EUR
210,650
999,718 150,000 620,000 496,716 347,783 709,290 49 9,437
348,104
1,222,993 596,678
1,578,698 38 1,410
157,264
979,360 109,685 561,197 450,157 338,712 643,058 482,890
269,948
1,059,351 597,384
1,536,227 306,158
0.07
0.44 0.05 0.25 0.20 0.15 0.29 0.22
0.12
0.47 0.27 0.69 0.14
EUR 624,506 621,093 0.28 8,786.003 8.112.488 3.64
EUR EUR EUR EUR EUR EUR EUR
EUR
EUR
EUR EUR EUR EUR
848,577 846,467 497,379
1,248,409 298,199 495,707
1,018,495
52 1,162
415,424
1,110,834 597,825
1,365,782 1 3 I ,064
806,336 702,786 489,241
1,220,796 253,788 501,235 930,552
512,200
33 1,539
1,070,296 594,501
1,346,411 130,728
0.36 0.32 0.22 0.55 0.11 0.23 0.42
0.23
0.15
0.48 0.27
0.60 0.06
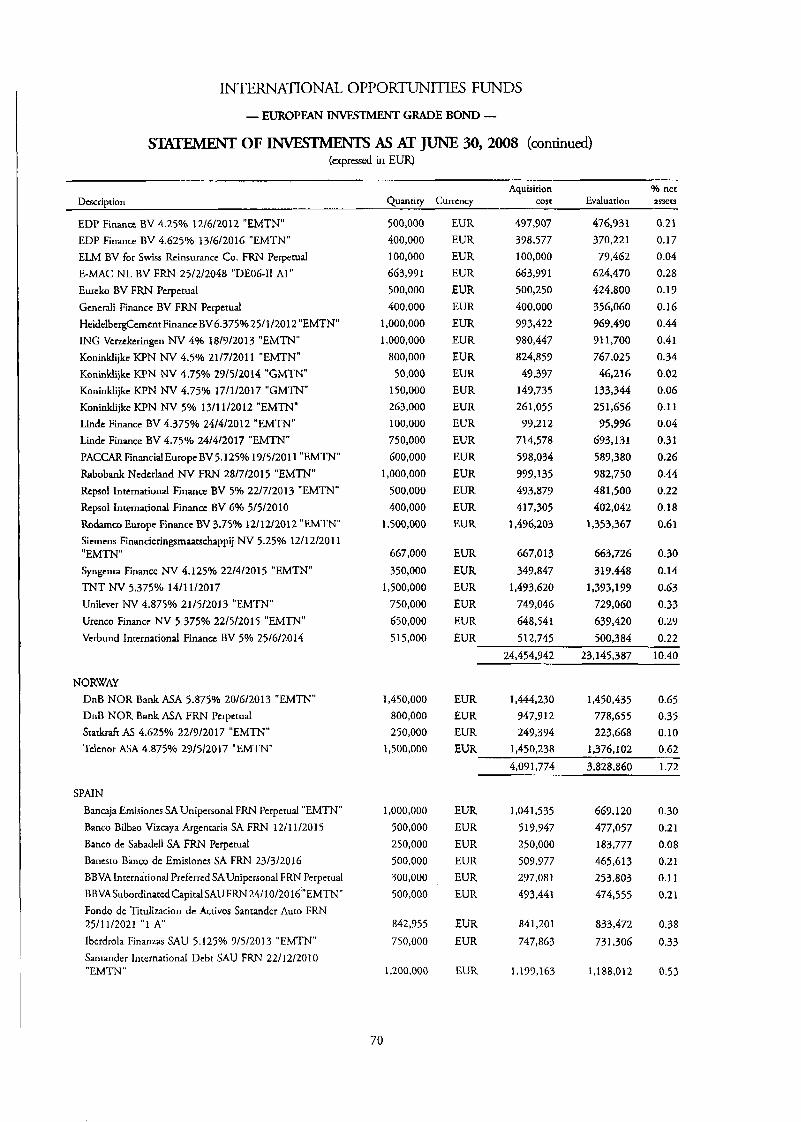
INTERNATIONAL 0PPORTUNITTE.S FUNDS
- EUROPEAN GRADE BOND -
OF -S As AT JUNE 30,2008 (continued) (expressed in EUR)
Aquisition Yo net Description Quantity Currency cost Evaluation assets
EDP Finance BV 4.25% 12/6/2012 "EMTN" EDP Finance BV 4.625% 13/6/2016 "EMTN" ELM BV for Swiss Reinsurance Co. F R N Perpetual E-MAC NL BV FRN 25/2/2048 "DE06-I1 AI" Eureko BV FRN Perpetual Generali Finance BV FRN Perpetual HeidelbcrgCcment FinanccBV6.375%25/1/2012 "EMTN" ING Vcrzekeringen NV 4% 18/9/2013 "EMTN" Koninklijke KPN NV 4.5% 21/7/20] 1 "EMTN" Koninklijkc KPN NV 4.75% 29/5/2014 "GMTN" Koninklijke KPN NV 4.75% 17/1/2017 "GMTN" Koninklijke KPN NV 5% 13/11/2012 "EMTN" Linde Finance BV 4.375% 24/4/2012 "EMTN" Linde Finance BV 4.75% 24/4/2017 "EMTN" PACCAR Financial Europe BV 5.125% 19/5/20 1 1 "EMTN" Rabobank Ncdcrland NV FRN 28/7/2015 "EMTN" Rcpsol International Finance BV 5% 22/7/2013 "EMTN" Repsol International Finance BV 6% 5/5/2010 Rodamu, Europe Finance BV 3.75% 12/12/2012 "EMTN" Siemens Financieringsrnaacschappij NV 5.25% 12/12/2011 "EMTN" Syngenta Finance NV 4.125'3'0 22/4/2015 "EMTN" TNT NV 5.375% 14/11/2017 Unilwer W 4.875Yo 21/5/2013 "EMTN" Urenco Finance NV 5.375% 22/5/2015 "F.MTN" Vcrbund International Finance BV 5% 25/6/2014
NORWAY DnB NOR Bank ASA 5.875% 20/6/2013 "EMTN" DnB NOR Bank ASA FRN Pcrpctual Staduaft AS 4.625% 22/9/2017 "EMTN" Telcnor M A 4.875% 29/5/2017 "EMTN"
SPAIN Bancaja Ernisioncs SA Unipersonal FRN Perpetual "EMTN" Banco Bilbao Vizcaya Argentaria SA FRN 12/11/2015 Banco de Sabadell SA FRN Pcrpetual Banesto Banco de Emisioncs SA FRN 23/3/2016 BBVA International Prcfcrrcd SAUnipersonal F R N Perperual BBVASubordinarcdCapitalSAU FRN 2411 0/20 16 "EMTN" Fondo de Titulizacion de Activos Santander Auto FRN 25/11/2021 " 1 A Ibcrdrola Finanzas SAU 5.125% 9/5/20] 3 "EMTN" Santander International Dcbt SAU F R N 22/12/2010 " EMTN "
500,000 400,000 I00,000 663,991 500,000 400,000
1,000,000 I,000,000
800,000 50,000
150,000 263,000 100,000 750,000 600,000
1,000,000 500,000 400,000
1,500,000
667,000 350,000
1,500,000 750,000 650,000 5 15,000
1,450,000 800,000 250,000
1,500,000
1,000,000 500,000 250,000 500,000 300,000 500,000
842,955 750,000
1,200,000
EUR EUR EUR EUR EUR EUR EUR EUR EUR EUR EUR EUR EUR EUR EUR EUR EUR EUR EUR
EUR EUR EUR EUR EUR EUR
497,907 398,577 100,000 663,991 500,250 400,000 993,422 980,447 824,859
49,397 149,735 261,055
99,212 714.578 598,034 999,135 493,879 417,305
1,496,203
667,013 349,847
1,493,620 749,046 648,541 512,745
476,931 370,221 79,462
624,470 424,800 356,060 969,490 911,700 767,025
46,216 133,344 251,656 95,996
693,131 589,380 782,750 481,500 402,042
1,353,367
663,726 319,448
1,393,199 729,060 639,420 500,384
0.21 0.17 0.04 0.28 0.19 0.16 0.44 0.4 1 0.34 0.02 0.06 0.1 1
0.04 0.31 0.26 0.44 0.22 0.18 0.61
0.30 0.14 0.63 0.33 0.29 0.22
24,454,942 23,145,387 10.40
1,450,435 0.65 EUR 1,444,230 EUR 947,912 778,655 0.35 EUR 249,394 223,668 0.10 EUR 1,450,238 1,376,102 0.62
3.828.860 1.72 4,091,774
EUR EUR EUR EUR EUR EUR
EUR EUR
EUR
1,041,535 5 19,947 250,000 509,977 297,081 49 3,44 1
841,201
747,863
1,199,163
669,120 477,057 183,777 465,613 253,803 474,555
833,472
731,306
1 , I 88,012
~
0.30 0.21 0.08 0.21 0.1 I 0.21
0.38 0.33
0.53
70
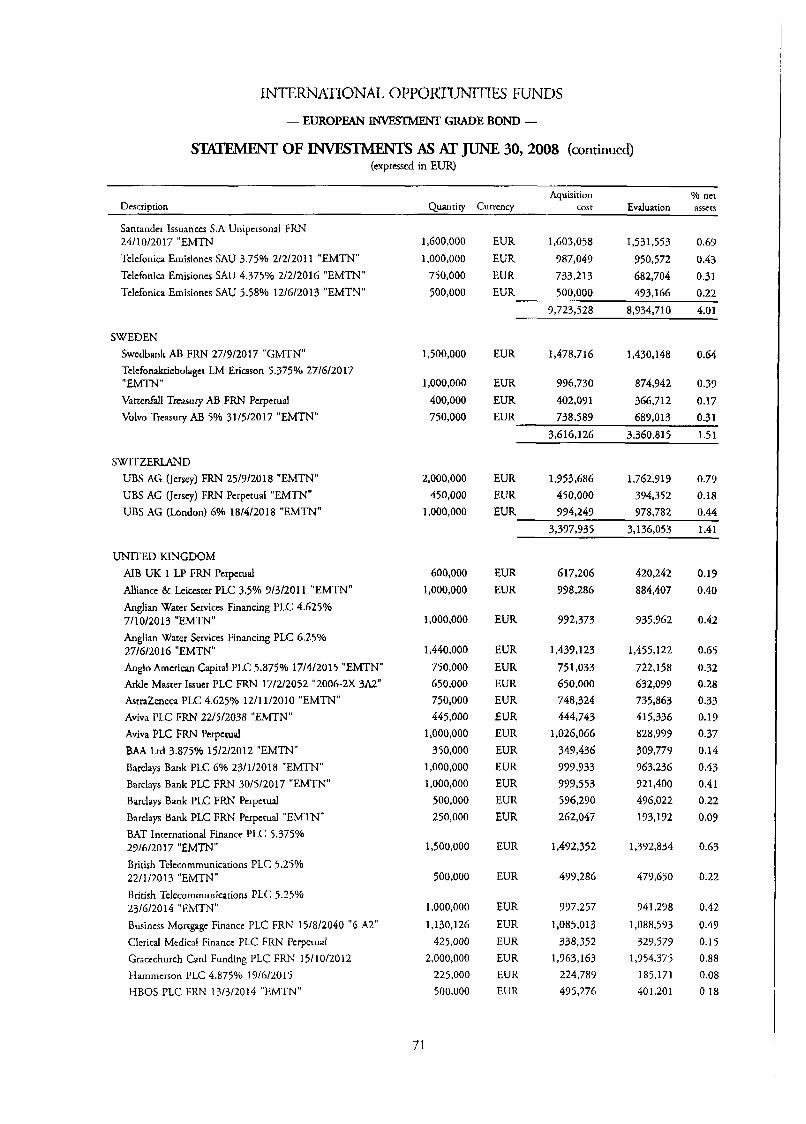
INTERNATIONAL OPPORmITIES FUNDS
- EUROPEAN GFti4.DE BOND -
OF -S As AT JUNE 30,2008 (continued) (expressed in EUR)
Aquisition Yo net Evaluation assets Description Quantiry Currency cost
Santander Issuances S.A Unipcrsonai FRN 24/10/2017 "EMTN Telefonica Ernisiones SAU 3.75% 2/2/20] 1 "EMTN" Telcfonica Emisiones SAU 4.375% 2/2/2016 "EMTN" Telefonica Emisiones SAU 5.58% 12/6/2013 "EMTN"
SWEDEN Swedbank AB FRN 27/9/2017 "GMTN" Telefonaktiebolaget LM Ericsson 5.375% 27/6/2017 "EMTN" Vattenfall Treasury AB F R N Perpetual Volvo Treasuy AB 5% 31/5/2017 "EMTN"
SWITZERLAND UBS AG (Jersey) FRN 25/3/20] 8 "EMTN" UBS AG (Jersey) F R N Perpetual "EMTN" UBS AG (London) 6% 18/4/2018 "EMTN"
UNITED KINGDOM AIB UK 1 LP FRN Perpetual Alliance & Leicester PLC 3.5% 9/3/20] 1 "EMTN" Anglian Water Services Financing PLC 4.625% 7/10/2013 "EMTN" Anglian Water Services Financing PLC 6.25% 27/6/2016 "EMTN" Anglo Amcrian Capital PLC 5.875% 17/4/2015 "EMTN" Ar!& Master Issuer PLC FRN 17/2/2052 "2006-2X 3A2" AsrraZeneca PLC 4.625% 1211 112010 "EMTN" Aviva PLC FRN 22/5/2038 "EMTN" Aviva P K F R N Perpetual BAA Ltd 3.875% 15/2/2012 "EMTN" Barclays Bank PLC 6% 23/1/2018 "EMTN" Barclays Bank PLC FRN 30/5/2017 "EMTN" Barclays Bank PLC FRN Perpetual Barclays Bank PLC FRN Perpetual "EMTN" BAT lnrernational Finance PLC 5.375% 29/6/2017 "EMTN" British Telecommunications PLC 5.25% 22/1/2013 "EMTN" British Telecornmunicarions PLC 5.25% 23/6/2014 "EMTN" Business Mortgage Finance PLC FRN 15/8/204 Clerical Medical Finance PLC FRN Perperual Graccchurch Card Funding PLC FRN 1511012012 kiarnrncrson PLC 4.875% 19/6/2015 HBOS PLC FRN 13/3/2014 "EMTN"
"6 A2"
1,600,000 1,000,000
750,000 500,000
1,500,000
1,000,000 400,000 750,000
2,000,000 450,000
1,000,000
600,000 1,000,000
1,000,000
1,440,000 750,000 650,000 750,000 445,000
1,000,000 350,000
1,000,000 1,000,000
500,000 250,000
1,500,000
500,000
1,000,000 1,130,126
425,000 2,000,000
225,000 500,000
71
EUR 1,603,058 1,531,553 0.67 EUR 987,049 950,572 0.43 EUR 733,213 682,704 0.31
493,166 0.22 EUR 500,000 9,723,528 8,934,710 4.01
EUR 1,478,716 1,430,148 0.64
EUR 996,730 874,942 0.39 EUR 402,091 366,712 0.17 EUR 738,589 689,013 0.31
3,616,126 3,360,815 1.51
EUR 1,953,686 1,762,919 0.79 EUR 450,000 394,352 0.18 EUR 994,249 978,782 0.44
3,397,935 3,136,053 1.41
EUR EUR
EUR
EUR EUR EUR EUR EUR EWR EUR EUR EUR EUR EUR
EUR
EUR
EUR EUR EUR EUR EUR EU R
617,206 998,286
992,373
1,439, I23 751,033 650,000 748,324 444,743
1,026,066 349,436 999,933 999,553 5 9 6,2 9 0 262,047
1,492,352
479,286
997,257 1,085,013
338,352 1,963,163
224,789 495,276
420,242 884,407
935,962
1,455,122 722,158 632,099 735,863 41 5,336 828,999 309,779 963,236 921,400 496,022 193,192
1,372,834
479,650
941,298
1,088,593 327,579
1,954,375 185,171 401,201
0.19 0.40
0.42
0.65 0.32 0.28 0.33 0.19 0.37 0.14 0.43 0.41 0.22 0.09
0.63
0.22
0.42 0.49 0.15 0.88 0.08 0.18

INTERNATIONAL OPPORTUNITIES FUNDS
- EUROPEAN GRADE BOND -
OF INVESTMENTS As AT JUNE 30,2008 (continued) ( B c p r d in EUR)
Aquisirion Yo net Description Quantity Currency cost Evaluation assets
HBOS PLC F R N 30/10/2019 "EMTN" Holmes Mater Issuer PLC FRN 15/7/2040 "2007-1 3A2" HSBC Bank PLC FRN 18/3/2016 "EMTN" HSBC Bank PLC F R N 30/3/2020 "EMTN" Imperial Tobacco Finance PLC 4.375% 22/11/2013 "EMTN" Lloyds TSB Bank PLC FRN 5/3/2018 "EMTN" Lloyds TSB Bank PLC FRN Perpetual National Grid Gas PLC 5.125% 14/5/2013 "EMTN" National Grid PLC 4.375% 10/3/2020 "EMTN" Nationwide Building Society 3.125% 26/1/2010 "EMTN" Old Mutual PLC FRN 18/1/2017 "EMTN" OTE PLC 5.375% 14/2/2011 "GMTN" Permanent Financing PLC FRN 10/9/2032 P i a r Funding PLC FRN 1511 112012 "2005-1 A" Rcnrokil Initial PLC 4.625% 27/3/2014 "EMTN" Ruam PLC 4.375% 15/3/2013 "EMTN" Royal Bank of Scotland Group PLC F R N Perpetual Royal BankofScotland PLC (The) F R N 28/1/2016 "EMTN" Srvern Trent Utilities Finance PLC 5.25% 11/3/2016 "EMTN" Sherwood Castle Funding PLC FRN 15/8/2010 "2003-1 A SL Finance PLC FRN Perpetual Standard Chartered Bank 5.875% 26/3/2017 "EMTN" Standard,Chanered PLC 4.875Yo 11/3/2011 United Utilities Water PLC 4.25% 24/1/2020 "EMTN" Vodafonc Group PLC FRN 6/6/2014 "EMTN" WPP Group PLC 4.375% 5/12/2013 WPP Group PLC 6.625% 12/5/2016 "EMTN"
UNITED STATES OF AMERICA 3M co . 5% 14/7/2014 Air Products & Chemicals, Inc. 4.2S% 10/4/2012 American International Group, Inc. FRN 15/3/2067 "A3" AT&T, Inc. 4.375% 15/3/2013 ATBrT, Inc. 6.125% 2/4/2015 "GLOB" BA Credit Card Trust 4.15% 19/4/2010 "03A5"
Bank of America Corp. FRN 23/5/2017 "EMTN" BMW US Capital LLC 5% 28/5/2015 "EMTN" Bristol-Mycrs Squibb Co. 4.375% 15/11/2016 Cargill, Inc. 6.25% 24/7/20] 5 "EMTN" Cirigroup, Inc. 3.35% 10/10/2013 "EMTN" Citigroup, Inc. FRN 30/11/2017 "EMTN"
1,000,000 600,000
1,500,000 500,000
150,000 1,250,000
500,000 1,000,000
850,000 1,500,000
800,000 1,250,000 2,000,000 2,000,000
200,000 600,000 100,000
1,000,000
1,800,000 420,000 500,000 750,000
1,000,000 1,000,000
750,000 200,000 270,000
1,250,000 200,000 500,000
1,200,000 550,000
2,000,000 2,000,000
650,000 200,000 500,000
2,000,000 750,000
EUR EUR EUR EUR
EUR EUR EUR EUR EUR EUR EUR EUR EUR EUR EUR EUR EUR EUR
EUR
EUR EUR EUR EUR EUR EUR EUR
967,880 600,000
1,476,651 487,363
149,333 1,253,204
410,198 999,873 839,259
1,496,947 784,180
1,250,443 1,969,737 1,997,732
197,012 605,870 100,000 994,839
1,792,495 420,286 505,537 708.055 998,950 965,914 750,000 199,544
830,786 582,450
1,42 1,877 432,500
134,256
1,210,510 391,821 974,983 719,436
1,394,159 708,950
1,228,888 1,952,100 1,924,080
171,280 537,072 86,839
949,200
1,741,795 417,765 408,082 698,326 970,266 835,984 710,925 177,741
EUR 269,438 257,484 41,160,641 38,558,073 17.32
0.37 0.26 0.64 0.19
0.06 0.54 0.18 0.44 0.32 0.63 0.32 0.55 0.88 0.86 0.08 0.24 0.04 0.43
0.78 0.19 0.18 0.31 0.44 0.38 0.32 0.08 0.12
EUR EUR EUR EUR EUR EUR EUR EUR EUR EUR EUR EUR
1,245.01 3 204,287 499,013
1,179,682 549,475
2,028,705 1,983,918
646,446 200,004 498,013
1,937,133 749,501
1,221,339 189,295 368,441
1,125,655 5 5 2,773
1,938,600 1,826,376
621,872 179,909 494,024
1,794,486 644,117
0.55 0.09 0.17 0.51 0.25 0.87 0.82 0.28 0.08 0.22 0.80 0.29
72
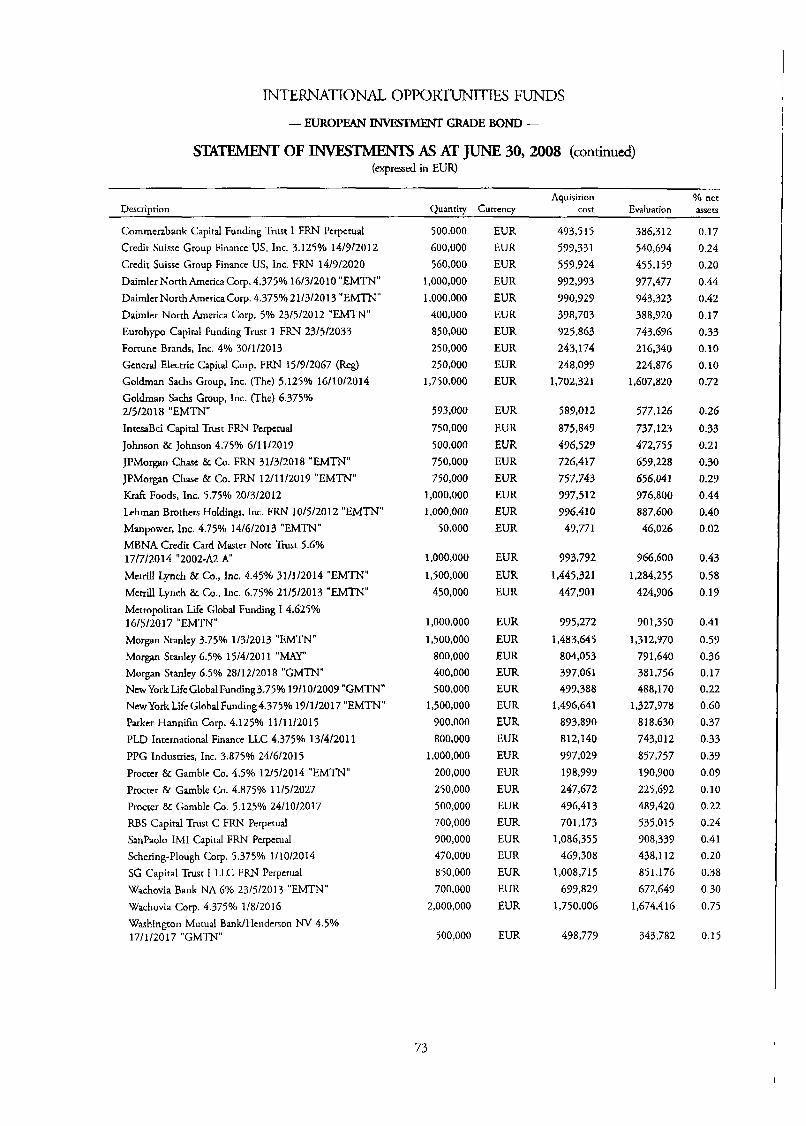
INTERNATIONAL OPPORTUNITIES FUNDS
- EUROPEAN GRADE BOND -
STKEMENT OF INVESTMIENTS AS AT JUNE 30,2008 (continued) (expressed ih EUR)
Descrivtion Aquisirion 94 net
Ouanriw Currency cost Evaluation assets
Cornmcrzbank Capital Funding Tmsr 1 FRN Pctpcrual Credit Suisse Group Finance US, Inc. 3.125% 14/9/2012 Credit Suissc Group Finance US, Inc. FRN 14/9/2020 Daimlcr North America Corp. 4.375% 16/3/2010 "EMTN" Daimler North America Corp. 4.375% 21/3/2013 "EMTN" Dairnler North America Corp. 5% 23/5/2012 "EMTN" Eurohypo Capital Funding Trust 1 FRN 23/5/2033 Fortune Brands, Inc. 4% 30/1/2013 General Electric Capital Corp. FRN 15/9/2067 (Reg) Goldman Sa& Group, Inc. (The) 5.125% 16/10/2014 Goldman Sachs Group, Inc. (The) 6.375'3'0 2/5/2018 "EMTN" IntesaBci Capital Trust F W Perpetual Johnson 8r Johnson 4.75% 611 112019 JPMorgan Chase & Co. FRN 31/3/2018 "EMTN" JPMotgan Chase & Co. FRN 12/11/2019 "EMTN" Kraft Foods, Inc. 5.75% 2013/2012 Lehman Brothers Holdings, Inc. FRN 10/5/2012 "EMTN" Manpowcr. Inc. 4.75% 14/6/2013 "EMTN" MBNA Credit Card Master Note Trust 5.6% 17/7/2014 "2002-A2 A" Mctrill Lynch & Co., Inc. 4.45% 31/1/2014 "EMTN" Merrill Lynch & Co., Inc. 6.75% 21/5/2013 "EMTN" Metropolitan Life Global Funding 14.625% 16/5/2017 "EMTN" Morgan Stanley 3.75% 1/3/2013 "EMTN" Morgan Stanley 6.5% 15/4/2011 "MAY" Morgan Stanley 6.5% 28/12/2018 "GMTN" NcwYorkLife GlobalFunding3.7596 19/10/2009 "GMTN" NewYorkLifeGlobal Funding4.375% 19/1/2017 "EMTN" Parker Hannifin Corp. 4.125% 11/11/2015 PLD International Finance LLC 4.375% 13/4/2011 PPG Industries, Inc. 3.875% 24/6/2015 Procter & Gamble Co. 4.5% 12/5/2014 "EMTN" Procter & Gamble Co. 4.875% 11/5/2027 Ptocter & Gamble Co. 5.125% 24/10/2017 RBS Capital Trust C FRN Perpetual SanPaolo IMI Capital FRN Perpetual Schering-Plough Corp. 5.375% 1/10/2014 SG Capital Trust 1 LLC FRN Perpetual Wachovia Bank NA 6% 23/5/2013 "EMTN" Wachovia Corp. 4.375% 1/8/2016 Washington Mutual Bank/Henderson NV 4.5% 17/ 1 /20 I7 "GMTN"
500,000 600,000 560,000
1,000,000 1,000,000
400,000 850,000 250,000 250,000
1,750,000
593,000 750,000 500,000 750,000 750,000
1,000,000 1,000,000
50,000
1,000,000 1,500,000
450,000
1,000,000 1,500,000
800,000 400,000 500,000
1,500,000 900,000 800,000
1,000,000 200,000 250,000 500,000 700,000 900,000 470,000 850,000 700,000
2,000,000
500,000
EUR EUR EUR EUR EUR EUR EUR EUR EUR EUR
EUR EUR EUR EUR EUR EUR EUR EUR
EUR
EUR EUR
EUR EUR EUR EUR EUR EUR EUR EUR EUR EUR EUR EUR EUR EUR EUR EUR EUR EUR
EUR
493,515 599,331 559,924 992,993 9 9 0,P 2 9 398,703 925,863 243,174 248,099
1,702,321
589,012 875,849 496,529 726,417 757,743 '397,512 996,410 49,771
993,792 1,445,321
447,901
995,272 1,483,645
804,053 397,061 439,388
1,496,641 8 9 3,8 9 0 812,140 997,029 198,999 247,672 496,413 701,173
1,086,355 469,308
1,008,715 699,829
1,750,006
498,779
386,312 540,634 455,159 977,477 943,323 388,920 743,696 216,340 224,876
1,607,820
577,126 737,123 472,755 659,228 656,041 976,800 887,600 46,026
966,600
1,284,255 424,906
901,350 1,312,970
791,640 381,756 488,170
1,327,978 818,630 743,O 12 857,757 190,900 225,692 489,420 535,015 908,339 438,112 851,176 672,649
1,674,4 16
343.782
0.17 0.24 0.20 0.44 0.42 0.17 0.33 0.10 0.10 0.72
0.26 0.33 0.2 1 0.30 0.29 0.44 0.40 0.02
0.43 0.58 0.17
0.41
0.59 0.36 0.17 0.22 0.60 0.37 0.33 0.39 0.09 0.10 0.22 0.24 0.41 0.20 0.38 0.30 0.75
0.15
73
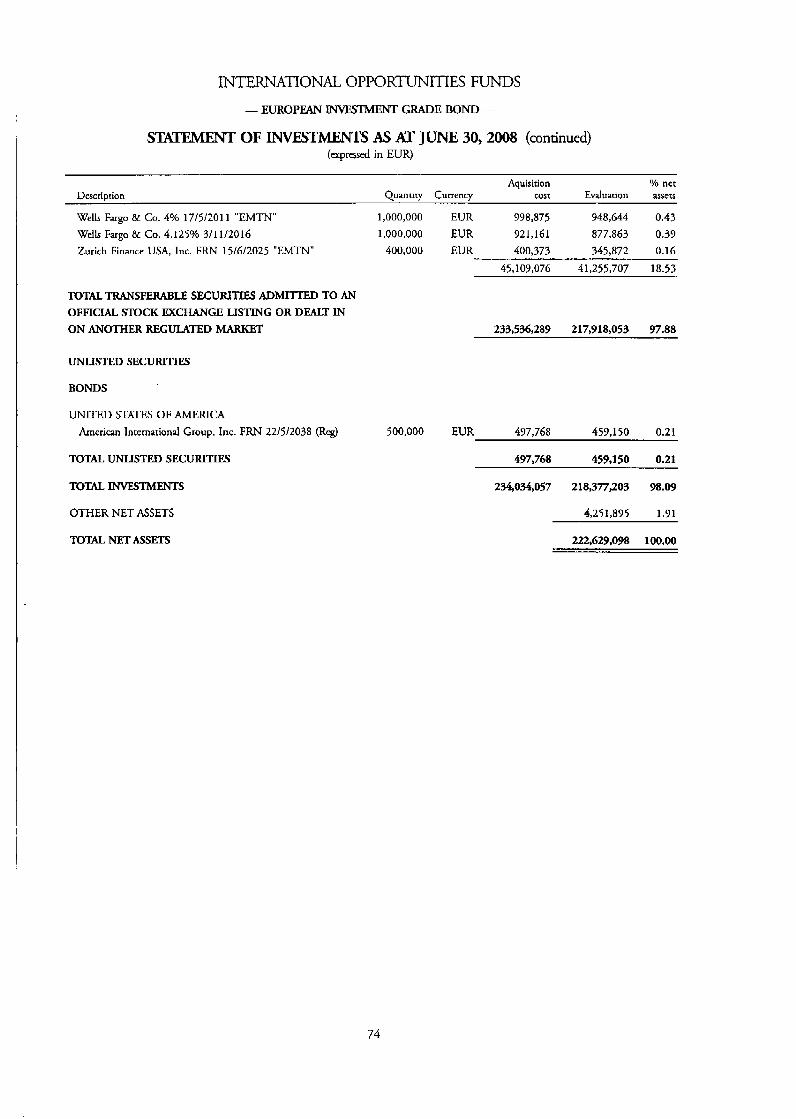
INTERNATIONAL OPPORTUNITIES FUNDS
- EUROPEAN GRADE BOND -
STGTEMENT OF -S AS AT JUNE 30, 2008 (continued) (expressed in EUR)
.- . . ..
Aquisition Yo nct Evaluation assets Descriprion Quantity Currency cost
Wells Fargo & Co. 4% 17/5/2011 "EMTN" Wells Fargo & Co. 4.125Yo 3/11/2016 Zurich Finance USA, Inc. FRN 15/6/2025 "EMTN"
1,000,000 EUR 998,875 948,644 0.43 1,000,000 EUR 921,161 877,863 0.39
400,000 EWR 400,373 345,872 0.16
45.109.076 41.255.707 18.53
TOTAL TRANSFERABLE SECUM'TES ADMIITED TO AN OFFICIAL STOCK EXCHANGE LISTING OR DEALT IN ON ANOTHER REGULATED MARKET
UNLISTED SECUIUTIES
BONDS
UNITED STATES OF AMERICA
American International Group, Inc. FRN 22/5/2038 (Reg)
TOTAL UNLISTED SECURITIES
TOTAL INVESTMENTS
OTHER NET ASSETS
233,536,289 217,918,053 97.88
500,000 EUR 497,768 459,150 0.21
497,768 459,150 0.21
234,034,057 218,377,203 98.09
4.251.875 1.91
TOTAL NET ASSETS
74
222,629,098 100.00
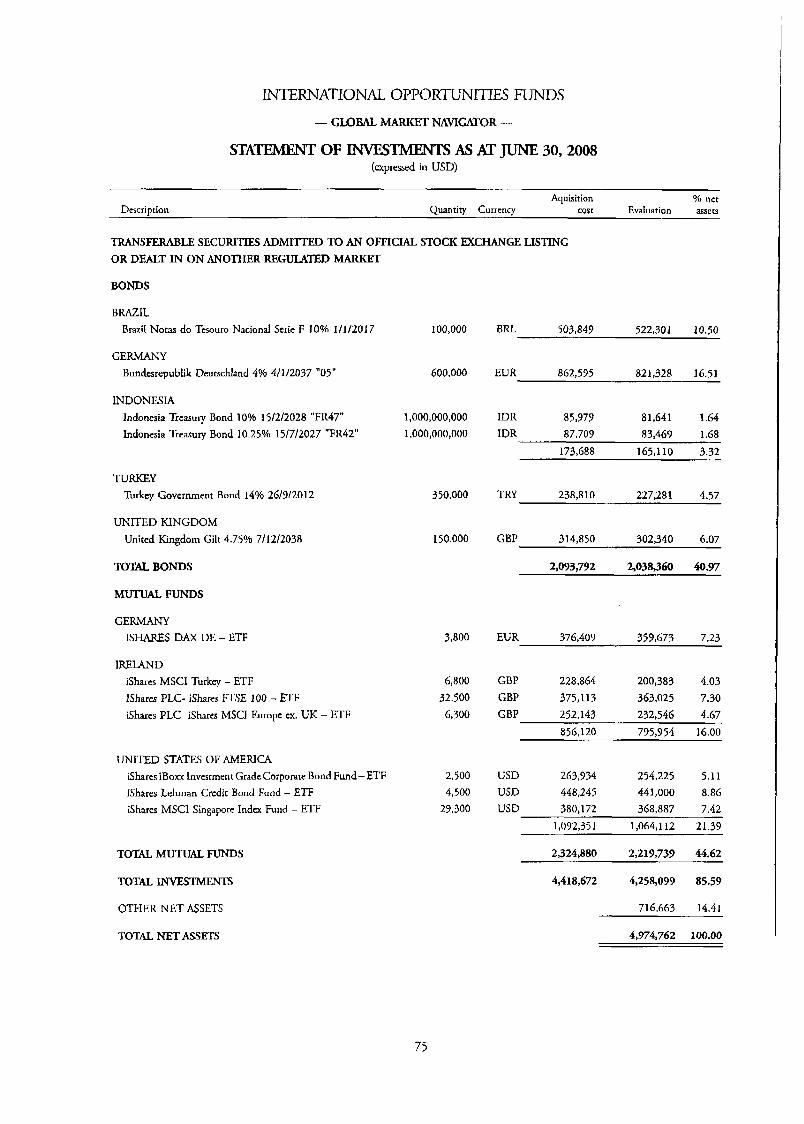
INTERNATIONAL OPPORTUNITIES FUNDS
- GLOBAL MARKET NAWGATOR -
S- OF lNWSTMENTS As AT JUNE 30,2008 (expressed in USD)
Aquisition Yo ncr Evaluation assets Description Quantity Currency cost
TRANSFERABLE SECURITIES ADMI’XTED TO AN OFFICIAL STOCK EXCHANGE LISTING OR D W T IN ON ANOTHER REGULATW) MARKET
BONDS
BRAZIL Brazil Notas do Tcsouro Naciond Seric F 10% 1/1/2017
GERMANY Bundcsrepublik Deutschland 4% 4/1/2037 ”05”
INDONESIA Indonesia Treasury Bond 10% 15/2/2028 “FR47” Indonesia Treasury Bond 10.25% 15/7/2027 “FR42”
TURKEY Turkey Government Bond 14% 26/9/2012
UNITED KINGDOM United Kingdom Gilt 4.75% 7/12/2038
TOTAL BONDS
MUTUAL FUNDS
GERMANY ISHARES DAX DE - ETF
IRELAND ishares MSCI Turkey - ETF IShares PLC- ishares FTSE 100 - ETF ishares PLC- iSharcs MSCI Europe cx. UK - ETF
UNITED STATES OF AMERICA ishares iBoxx Investment Grade Corporate Bond Fund - ETF ishares Lehman Crcdit Bond Fund - ETF ishares MSCI Singapore Indcx Fund - ETF
100,000
600,000
1,000,000,000 1,000,000,000
350,000
150,000
3,800
6,800 32,500 6,300
2,500 4,500
27,300
BRL 503,847 522,301 10.50
EUR 862,535 821,328 16.51
IDR 85,979 81,641 1.64 IDR 87,709 83,469 1.68
173,688 165,110 3.32
TRY 238,810 227,281 4.57
302,340 6.07
2,038,360 40.97
GBP 314,850
2,093.792 ~
EUR 376,409 359,673 7.23
228,864 200,383 4.03 GBP GBP 375,113 363,025 7.30 GBP 252.143 232.546 4.67
856,120 795,954 16.00
USD 263,934 254,225 5.11 USD 448,245 441,000 8.86 USD 380,172 368,887 7.42
1,092,35 1 1,064,112 21.39
TOTAL MUTUAL FUNDS
TOTAL INVESTMENTS
OTHER NET ASSETS
2,324,880 2,213,733 44.62
4,418,672 4,258,099 85.59
716,663 14.41
TOTAL NET ASSETS 4,974,762 100.00
75

INTERNATIONAL OPPORTUNITIES FUNDS - GLOBAL TECHNOLOGY -
-OF I N W S M N T S As ATJUNE 30,2008 (expressed in USD)
Aquisition Yo net Description Quanriv Currency cost Evaluation assets
TRANSFERABLE SECURITIES ADMITTED TO AN OFFICIAL STOCK EXCHANGE LISTING OR DEALT IN ON ANOTHER REGULATED MARKET
SHARES
BELGIUM Barco NV 18,000 EUR 1,483,678 1,159,321 1.74
BERMUDA Bio-Treat Tcchnology Ltd Marvel1 Tcchnology Group Ltd
CANADA h t r a Technologies Lrd Excapsa Software, Inc. MacDonald Derrwiler & Associates Ltd Neo Material Technologies, Inc.
722,635 SGD 434,934 148,701 0.22 61,500 USD 745,974 1,087,320 1.63
1,180,908 1,236,021 1.85
29,000 CAD 91 0,177 665,877 1.00 1,140,000 GBP 1,052.723 258,393 0.39
31,500 CAD 901,357 1,243,792 1.86 203,000 CAD 72 1,229 891,959 1.34
3,585,486 3,060,021 4.59
FRANCE lpsen
GERMANY Hcidelberger Druckmaschinen AG K W S Saat AG Siemens AG
19,500 EUR 84 1,474 1,002,034 1.50
34,000 EUR 1,460,463 703,797 1.06 5,200 EUR 777,605 1,189,211 1.78 9,750 EUR 708,640 1,070,746 I .61
GREECE Intralot SA-Integrated Lottery Systems & Scrviccs
2,746,708 2,963,754 4.45
69,000 EUR 518,537 1,149,177 1.72
GUERNSEY Amdou Ltd 3 1.000 USD 95 1,898 911,710 1.37
JMW Astellas Pharma, Inc. Canon, Inc. Hitachi High-Technologies Corp. Sony Corp.
N E T H E U N DS ASM International NV Koninklijkc Philips Electronics NV STMicroelcctronics NV
27,800 32,700 55,900 26,600
28,566 51,000 71,000
JPY 1,190,899 1,184,154 1.78 JPY 1,114,894 1,670,018 2.53 JPY 1,471,177 1,301,661 1.95 JPY 752,261 1,168,290 1.75
4,749,231 5,344,123 8.01
EUR 666,433 875,686 1.31 EUR 1,497,253 1,735,853 2.60 EUR 1,508,182 957,663 1.44
3,671,868 3,569,202 5.35
NORWAY Kongsbcrg Gruppen AS 9,500 NOK 433,487 703,059 1.06
76

INTERNAXONAL OPPORmITIES FUNDS
- GLOBAL TECHNOLOGY - STATEMENT OF -S As AT JUNE 30, 2008 (continued)
(expressed in USD)
Aquisition Yo net Evaluation assets Description Quantity Cutrcncy cost
SOUTH KOREA LG Electronics, Inc. LG Life Sciences Lrd Samsung Electronics Co., Ltd
SWEDEN Telefonaktiebolagccr LM Ericsson
TAIWAN Cornpal Electronics, Inc.
UNITED KINGDOM Alizymc PLC ARM Holdings PLC BTG PLC IP Group PLC QinetiQ PLC Sportingbct PLC Victr: PLC xaar PLC
UNITED STATES OF AMERICA 3M Co. Albany international Corp. "A"
Amgen, Inc. Bio-Rad Laboratories, Inc. "A"
Cabot Microelectronics Corp. Cadence Dcsign Systems. Inc.
Cybcrsourcc Corp. E1 Du Pont de Nernours & Co. Electronics for Imaging, Inc. Eli Lilly & Co. Foundry Networks, Inc.
Johnson & Johnson L-3 Communications Holdings, Inc. Live Nation, Inc. Martek Biosciences Corp. Microsoft Corp. Modine Manufacruring Co. Motorola, Inc. Myriad Generics, Inc.
Nanosphcrc, Inc. Nuance Comniunicarions, Inc.
Nvidia Corp. oprionsXpress Holdings, Inc.
10,000 16,000 2,210
51,000
745.000
415,000 612,000 330,000 330,000 306,726 260,000
76,000 220,000
13.500 38,000 19,000 11,500 42,000 68,000 60,000 17,500 60,000 21,000 78,000 31,500 12,500 37,527 34,000 30,000 60,000 5 1,000 27,000 37,47 1 63,000 43,000 43,000
77
KRW 689,419 1,132,346 1.70 KRW 983,758 804,205 1.20 KRW 753,648 1,319,876 1.98
2.426.825 3.256.427 4.88
SEK 954,181 519,743 0.78
TWD 863,731 805,034 1.21
GBP GBP GBP GBP GBP GBP GBP GBP
1,042,210 1,363,999
G76,683 913,837
1,133,864 1,293,589
545,138 1,013,707
1 82,166 1,056,245 1,228,800
737,444 1,217,400
178,092 1,131,227
886,689
0.27 1.58 1.84 1.11 1.83 0.27 1.70 1.33
7,983,029 6,620,063 9.93
USD USD USD WSB USD USD USD USD USD USD USD USD USD USD USD USD USD USD USD USD USD USD USD
1,048,066 1,462,987 1.45 1,705
698,119 1,708,953
928,390 981,755 871,129
1,506,577 1,221,331
707,780 2,010,723
775,610 664,940 848,004 821,360
1,543,247 1,008,283
578,467 524,594 157,504 463,090 788,324
938,385 1,103,140
881,030 920,000
1,417,920 689,520
1,029,000 747,075 894,600 957,810 946,920
2,002,455 1,137,375
393,658 1,153,960
828,900 780,000
374.850 1,294,110
276,536 1.01 2,4 10
829,040 978,680
1.41 1.65 1.32 1.38 2.13 1.03 1.54 1.12 1.34 1.44 1.42 3.00 1.71 0.59 1.73 1.24 1.17 0.56 1.94 0.41 1.52 1.24 1.47
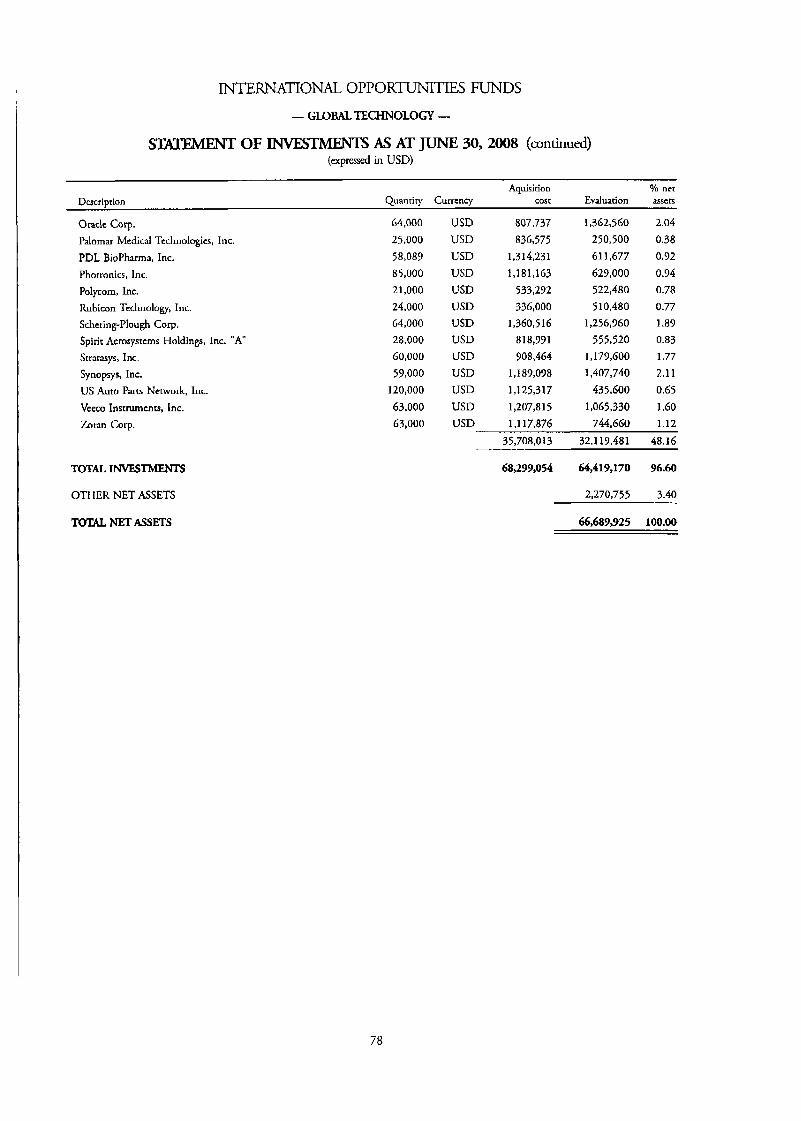
INTERNATIONAL OPPORTUNITIES FUNDS
- GLOBALTECHNOLOcfy -
STGIX’IEMENT OF -S AS AT JUNE 30,2008 (continued) (expressed in USD)
Aquisition Oh net Description Quantiry Currency cost Evaluation assets
Ora& Corp. Palomar Medical Tcchnologics, Inc.
PDL BioPharrna, Jnc. Phorronics, Inc. Polycom, Inc.
Schering-Plough COT. Spirit Aerosysrcms Holdings, Inc. “A” Srrarasys, Inc. Synopsys, Inc. US Auto Parts Network, Inc. Vceco Instrmcnts, Inc. Zoran Corp.
Rubicon Technology, Inc.
64,000 25,000 58,089 85,000 21,000 24,000 64,000 28,000 60,000 59,000
120,000
63,000 63,000
USD USD USD
USD USD USD USD USD USD USD USD USD USD
807,737
836,575 1,314,231 1,181,163
533,292 336,000
1,360,516 818,991 908,464
1,189,098 1,125,317 1,207,8 15 1,117,876
1,362,560 250,500 G11,677 629,000 522,480 510,480
1,256,960 555,520
1,179,GOO 1,407,740
435,600 1,065,330
744,660
2.04 0.38 0.72 0.94
0.78 0.77 1.87 0.83
1.77 2.1 1 0.65
1.60 1.12
TOTAL INVESTh4ENTS
OTHER NET ASSETS
TOTAL NET ASSETS
35,708,013 32,119,481 48.16
68,299,054 64,419,170 96.60
2,270,755 3.40
66,689,925 100.00
78
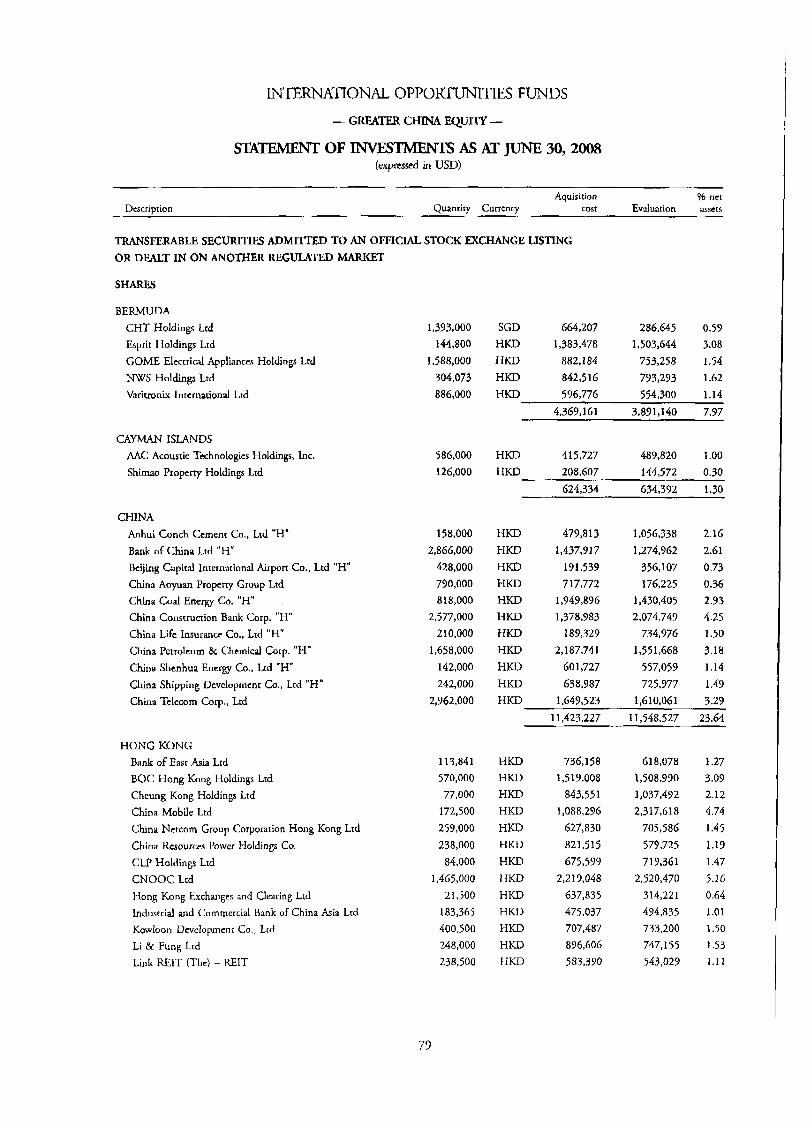
INTERNATIONAL OPPORTUNITIES FUNDS
- GREATER CHINA EQUXTY -
STATEMENT OF INvEsTMENT]Ts AS AT JUNE 30,2008 (expressed in USD)
Aquisition % net Description Quantity Currency cost Evaluation assets
TRANSFERABLE SECURITIES ADMITTED TO AN OFFICIAL STOCK EXCHANGE LISTING OR DEALT IN ON ANOTHER REGULATED MARKET
SHARES
BERMUDA CHT Holdings Lrd Esprit Holdings Lrd GOME Electrical Appliances Holdings Lrd NWS Holdings Ltd Varitronix International Ltd
CAYMAN ISLANDS AAC Acoustic Technologies Holdings, Inc. Shimao Propeny Holdings Ltd
CHINA Anhui Conch Cement Co., Lrd "H" Bank of China Ltd "H" Bcijing Capital International Airport Co., Ltd "H" China Aoyuan Property Group Ltd China Coal Energy Co. "H" China Construction Bank Corp. "H" China Life Insurance Co., Lrd "H" China Petroleum & Chemical Corp. "H" China Shenhua Encrgy Co., Ltd "H" China Shipping Development Co., Ltd "H" China Telecom Corp., Ltd
HONG KONG Bank of East Asia Lrd BOC Hong Kong Holdings Lrd Cheung Kong Holdings Ltd China Mobile Ltd China Netcom Group Corporation Hong Kong Lrd China Rcsources Power Holdings Co. CLP Holdings Ltd CNOOC Ltd Hong Kong Exchanges and Clearing Ltd Industrial and Commercial Bank of China Asia Lrd Kowloon Developmenr Co., Lrd Li & Fung Ltd Link REIT (Thc) - KElT
1,393,000 144,800
1,588,000 304,073 886,000
586,000 126,000
158,000 2,866,000
428,000 790,000 8 18,000
2,577,000 2 10,000
1,658,000 142,000 242,000
2,962,000
113,841 570,000 77,000
172,500 259,000 238,000
84,000 1,465,000
21,500 183,365 4 0 0,5 0 0 248,000 238,500
SGD 664,207 286,645 0.59 HKD 1,383,478 1,503,644 3.08 HKD 882,184 753,258 1.54 HKD 842,516 793,293 1.62 HKD 596,776 554,300 1.14
4,369, I6 I 3,891,140 7.77
HKD 415,727 489,820 1.00 HKD 208,607 144,572 0.30
624,334 634,392 1.30
HKD 479,813 1,056,338 2.16 HKD 1,437,917 1,274,962 2.61 HKD 191,537 356,107 0.73 HKD 717,772 176,225 0.36 HKD 1,949,896 1,430,405 2.93 HKD 1,378,983 2,074,749 4.25 HKD 189,329 734,976 1.50 HKD 2,187,741 1,551,668 3.18 HKD 601,727 557,059 1.14 HKD 638,987 725,977 1.43 HKD 1,649,523 1,610,061 3.29
11,423,227 11,548,527 23.64
HKD nKD HKD HKD HKD HKD HKD HKD HKD HKD HKD HKD HKD
736,158 1,519,008
843,551 1,088,296
627,830 8 2 1 S 5 675,599
2,219,048 637,835 475,037 707,487 89G.606 583,370
618,078 1,508,990 1,037,492 2,317,618
705,586 579,725 719,361
2,520,470 3 14.22 1 494,835 733,200 747,155 543,029
1.27 3.09 2.12 4.74 1.45 1.19 1.47 5.16 0.64 1.01 1.50
1.53 1.11
79
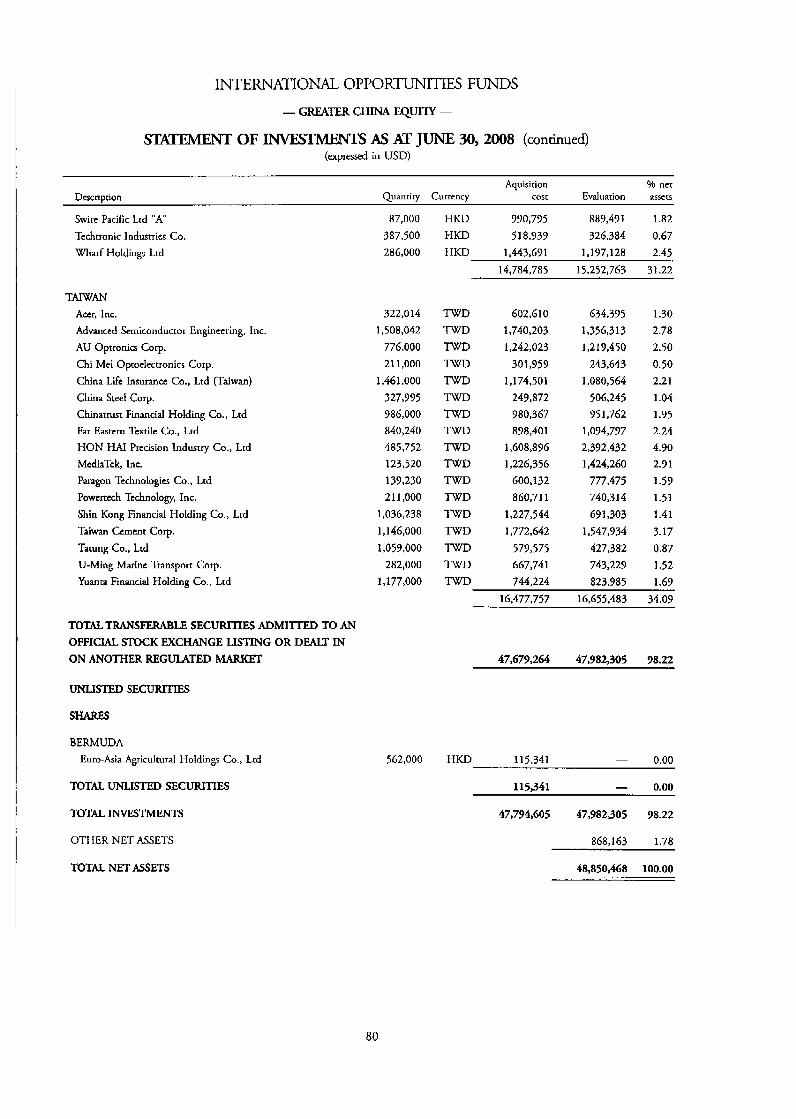
INTERNATIONAL OPPORTUNITIES FUNDS
- GREATER CHINA EQUITY -
OF As AT JUNE 30,2008 (continued) (expressed in USD)
Aquisirion % ncr Description Quantity Currency COST Evaluation assets
Swire Pacific Lrd "A" Techtronic Industries Co. Wharf Holdings Ltd
TAIWAN Accr, Inc.
Advanced Semiconductor Engineering, Inc. AU Optroniw Corp. Chi Mei Oproclectronics Corp. China Life Insurance Co., Ltd (Taiwan) China Steel COT. Chinatrust Financial Holding Co., Ltd Far Eastern Textile Co., Ltd HON HAl Precision Industry Co., Ltd McdiaTck, Inc. Paragon Technologies Co., Lrd Powertech Technology, Inc.
Shin Kong Financial Holding Co., Lrd Taiwan Cement Corp. Tatung Co., Ltd U-Ming Marine Transport Corp. Yuanta Financial Holding Co., Ltd
TOTAL TRANSFERABLE SECURITIES ADMIlTED TO AN OFFICIAL STOCK EXCHANGE LISTING OR DEALT IN ON ANOTHER REGULATED MARKET
UNLISTED SECURITIES
SHARES
BERMUDA Euro-Asia Agricultural Holdings Co., Lrd
TOTAL UNLISTED SECURITIES
TOTAL INVESTMENTS
87,000 387,500 286,000
322,014 1,508,042
776,000 21 1,000
1,461,000 327,995 986,000 840,240 485,752 123,520 139,230 21 1,000
1,036,238 1,146,000 1,059,000
282,000 1,177,000
HKD 990,795 889,491 1.82 5 18.9 39 326,384 0.67 HKD
HKD 1,443,691 1,197,128 2.45 14,784,785 15,252,763 31.22
TWD TWD TWD TWD TWD TWD TWD TWD TWD TWD TWD TWD TWD TWD TWD TWD TWD
602,610 1,740,203 1,242,023
301,957 1,174,501
249,872 980,367 898,401
1,608,896 1,226,356
600,132 860,711
1,227,544 1,772,642
579,575 667,741 744,224
634,395 1,356,313 1,219,450
243,643 1,080,564
506,245 95 1,762
1,094,797 2,392,432 1,424,260
777,475 740,314 691,303
1,547,934 427,382 743,223 823,985
I .30 2.78 2.50 0.50 2.21 1.04 1.95 2.24 4.90 2.91 1.59 1.51 1.41 3.17 0.87 1.52 1.69
16,477,757 36,655,483 34.09
47,673,264 47,982,305 98.22
- 562,000 HKD 115,341 0.00
115.341 - 0.00 . .~
47,794,605 47,982,305 98.22
OTHER NET ASSETS 868,163 1.78
TOTAL NET ASSETS 48,850,468 100.00
80

INTERNATIONAL OPPORTUNITIES FUNDS - HONG KONG EQUlTY -
OF INVESTMENTS AS AT JUNE 30,2008 (expressed in WSD)
~ ~
Aquisirion % net Description Quantity Currency cost Evaluation assecs
TRANSFERABLE SECURITIES ADMITTED TO AN OFFICLAL STOCK EXCHANGE LISTING OR DJ?.ALT IN ON ANOTHER REGULATED MAFNET
SHARES
BERMUDA CHT Holdings Lrd Esprit Holdings Ltd GOME Electrical Appliances Holdings Ltd Hongkong Land Holdings Lrd Kerry Propcrrics Lrd NWS Holdings Ltd Yue Yucn Industrial Holdings Ltd
CAYMAN ISLANDS AAC Acoustic Technologics Holdings, Inc. Kingboard Chemical Holdings Ltd
HONG KONG Bank of East Asia Lrd BOC Hong Kong Holdings Ltd Cheung Kong Holdings Ltd China Ncrcom Group Corporation Hong Kong Ltd China Resources Power Holdings Co. CLP Holdings Ltd Hang Lung Propcrrics Lrd Hang Scng Bank Ltd Henderson Land Developmenr Co., Ltd Hong Kong & China Gas Co., Ltd Hong Kong Exchanges and Clearing Ltd Hutchison Whampoa Ltd Industrial and Commercial Bank of China Asia Ltd Kowloon Development Co., Ltd Li & Fung Ltd Link REIT (The) - RElT MTR Corp. New World Development Ltd Shun Tak Holdings Lrd Sun Hung Kai Propcrrier Ltd Swire Pacific Lrd " A Techtronic Industries Co. Wharf Holdings Lrd
TOTAL INVESTMENTS
OTHER NET ASSETS
TOTAL NET ASSETS
97,000 2,913,200
16,772,000 1,965,000 4,159,667 6357,373 2,772,500
9,391,000 2,174,500
7,073,307 15,590,000 4,726,000 4,671,000 4,426,000 4,009,500 2,812,000 2,855,300 3.5 18,000
13,150,483 2,745,500 7,134,137 2,145,788 7,617,000 7,571,400 8,585,000 2,600,948 7,306,000 3,630,000 4,081,340 3,444,500 5,023,500 7,850,250
SGD 45,903 17,760 0.00 HKD 42,447,615 30,251,490 3.83 HKD 9.21 5,665 7,955,693 1.01 USD 10,025,588 8,331,600 1.06 HKD 34,132,872 21,837,550 2.77 HKD 20,018,728 16,585,690 2.10 HKD 8,836,820 6,582,699 0.83
124,723,191 91,564,682 11.60
HKD 12,080,692 7,849,661 1.00 HKD 11,880,292 10.035.831 1.27
~ ~
23,960,984 17,885,492 2.27
HKD HKD HKD HKD HKD HKD HKD HKD HKD HKD HKD HKD HKD HKD HKD HKD HKD HKD HKD HKD HKD HKD HKD
43,520,376 40,711,774 88,517,717
7,942,653 29,111,243 12,576,528 54,348,296 30,723,100 35,262,234 82,879,538 84,381,922 5,559,055
17,943,505 38,013,773 20,627,254
8,822,035 18,563,717 14,587,056
45,347,525 4,229,777
43,227,335
13,996,81 a
82,789,170
38,403,196 41,272,200 63,677,775 12,725,072 10,780,336 34,336,666
9,012,531 60,215,610 21,919,142 31,256,682 40,125,247 71,887,840
5,770,690 13,744,521 28,835,984 13,546,756 8,186,054
14,873,789 9,012,403
55,357,736 35,216,673
4,23 1,197 32,859,286
4.86 5.23 8.07 1.61 1.36 4.35 1.14 7.63 2.78 3.96 5.08 9.1 1 0.73 1.77 3.65 2.48 1.04 1.88 1.14 7.01 4.46 0.54 4.16
823,902,841 663,468,188 84.04
372,587,016 772,918,362 77.71
16,537,676 2.07
787,456,038 100.00
81
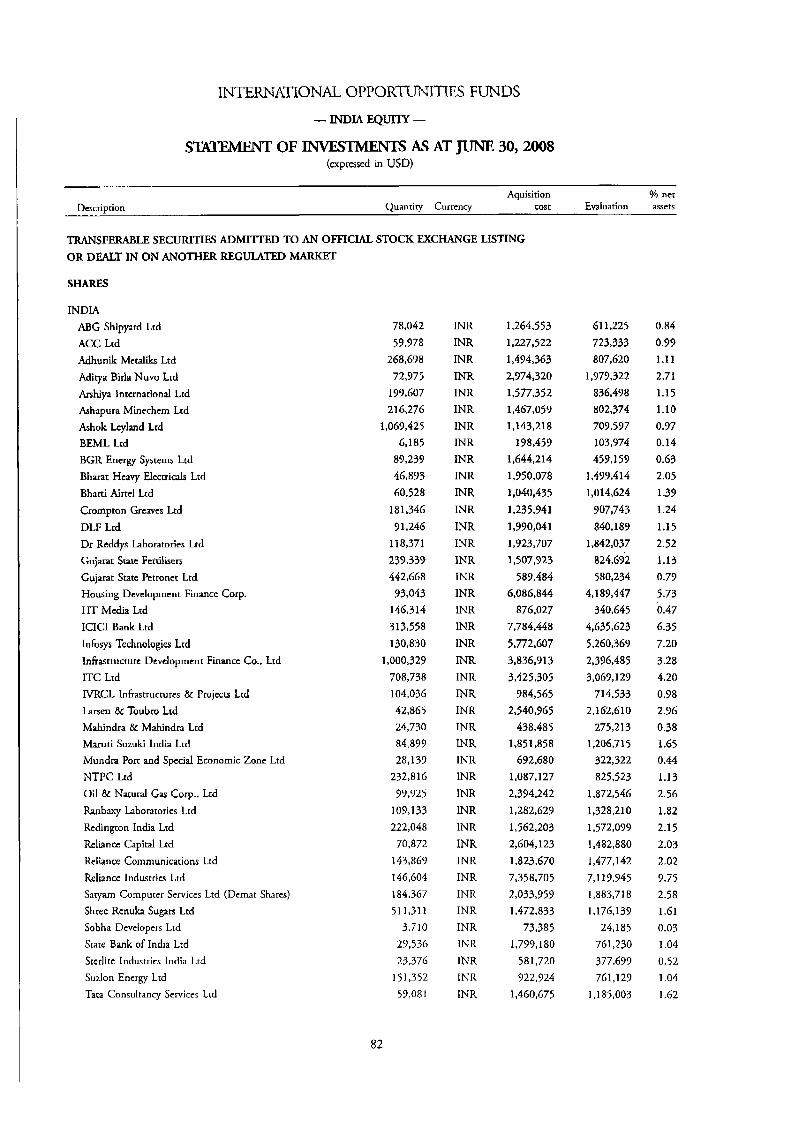
INTERNATIONAL. OPPORTUNITIES FUNDS - INDL4 E Q m -
S W I E M E N T OF INVESTMENTS AS AT JUNE 30,2008 (expressed in USD)
Aquisition % net Dcscriotion Quanriw Currcnw cost Evaluation assets
TRANSFERABLE SECURITIES ADMI'ITFD TO AN OFFIClAL STOCK EXCHANGE LISTING OR DEALT IN ON ANOTHER REGULATED MARKET
SHARES
INDlA ABG Shipyard Ltd ACC Ltd Adhunik Mctaliks Ltd Aditya Birla Nuvo Lrd Arshiya InrcrnationaI Lrd Ashapura Minechem Lrd Ashok Leyland Lrd BEML Ltd BGR Energy Systems Ltd Bharat Hcavy Electrids Ltd Bharti Ai~tcl Lrd Crompton Greaves Ltd DLF Ltd Dr Reddys Laboratories Ltd Gujarat State Fcrtilisers
Gujarat State Petronet Ltd Housing Dwclopmcnt Finance Corp. HT Media Ltd ICICI Bank Ltd Infosys Technologies Lrd Infrastructure Development Finance Co., Ltd ITC Ltd IVRCL Infrastructures & Projects Lrd Lmen & Toubro Ltd Mahindra & Mahindra Lrd Maruti Suzuki India Ltd Mundra Port and Special Economic Zone Ltd NTPC Ltd Oil & Natural Gas Corp., Ltd Ranbaxy Laboratories Lrd Redington India Ltd Reliance Capita Ltd Reliance Cornrnunicarions Lrd Reliance Industries Ltd Sagam Computcr Scrvices Ltd (Dcrnat Shares) Shree Rcnuka Sugars Ltd Sobha Developers Ltd Srate Bank of India Ltd Stcrlirc Industrics India Ltd Sutlon Energy Ltd Tata Consultancy Services Lrd
78,042 59,978
268,678 72,975
199,607 216,276
1,069,425 6,185
89,239 46,893 60,528
181,346 91,246
11 8,371 239,339 442,668
93,043 146,314 313,558 130,830
1,000,329 708,738 104,036 42,865 24,730 84,879 28,139
232,816 97,925
109,133 222,048
70,872 143,869 146,604 184.367 51 1,311
3,710 29,536 23,376
151,352 59,081
INR INR INK INR INR INR INR INR INR INR INR INR INR INR INR INR INR INR INR INR INR INR INR INR INR INR INR INR INR INR INR INK INR INR INR INR INR INR INR INR INR
1,264,553 1,227,522 1,494,363 2,974,320 1,577,352 1,467,059 1,143,218
198,459 1,644,214 1,950,078 1,040,435 1,235,941 1,990,041 1,923,707 1,507,923
589,484 6,086,844
876,027 7,784,448 5,772,607 3,836,913 3,425,305
984,565 2,540,965
438,485 1,851,858
692,680 1,087,127 2,394,242 1,282,629 1,562,203 2,604,123 1,823,670 7,358,705 2,033,959 1,472,833
73,385 1 , 7 9 9 ~ 80
58 1,720 722,924
1,460,675
61 1,225 723,333 807,620
1,979,322 836,498 802,374 709,597 103,974 459,159
1,499,414 1,014,624
907,743 840,189
1,842,037 824,692 580,234
4,189,447 340,645
4,635,623 5,260,369 2,396,485 3,069,129
714,533 2,162,610
275,213 1,206,715
322,322 825,523
1,872,546 1,328,210 1,572,099 1,482,880 1,477,142 7,119,945 1,883,718 1,176,139
24,185 761,230 377,699 761,129
1,185,003
0.84 0.99 1.11
2.71 1.15 1.10 0.97 0.14 0.63 2.05 1.39 1.24 1.15 2.52 1.13 0.73 5.73 0.47 6.35 7.20 3.28 4.20 0.98 2.96 0.38 1.65 0.44 1.13 2.56 1.82 2.15 2.03 2.02 9.75 2.58 1.61 0.03 1.04 0.52 1.04 1.62
82
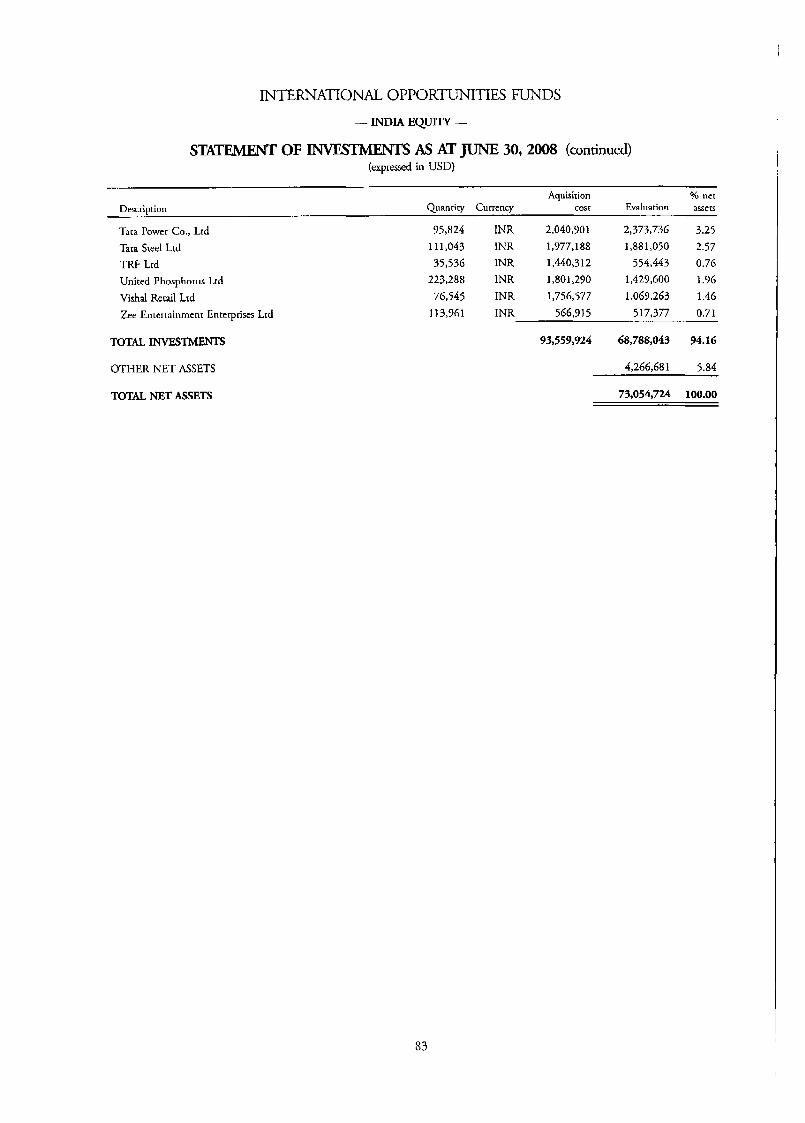
INTERNATIONAL OPPORTUNITIES FUNDS - INDIA E Q U I Y -
S- OF INVESTMENTS As AT JUNE 30,2008 (continued) (expressed in USD)
Aquisition Yo net Description Quantity Currency cosr Evaluation assecj
Tara Power Co., Ltd 95,824 INR 2,040,301 2,373,736 3.25 Tara Steel Ltd 111,043 INR 1,977,188 1,881,050 2.57 TRF Lid 35,536 INR 1,440,312 554,443 0.76 United Phosphorus Ltd 223,288 INR 1,801,290 1,429,600 I .96 Vishal Retail Ltd 76,545 INR 1,756,577 1,069,263 1.46 Zee Entertainment Entcrpriscs Lrd 113,961 INR 566,Y 15 517,377 0.71
TOTAL INVESTMENTS 93,559,924 68,788,043 94.16
OTHER NET ASSETS 4,266,681 5.84
TOTAL NET ASSETS 73,054,724 100.00
83
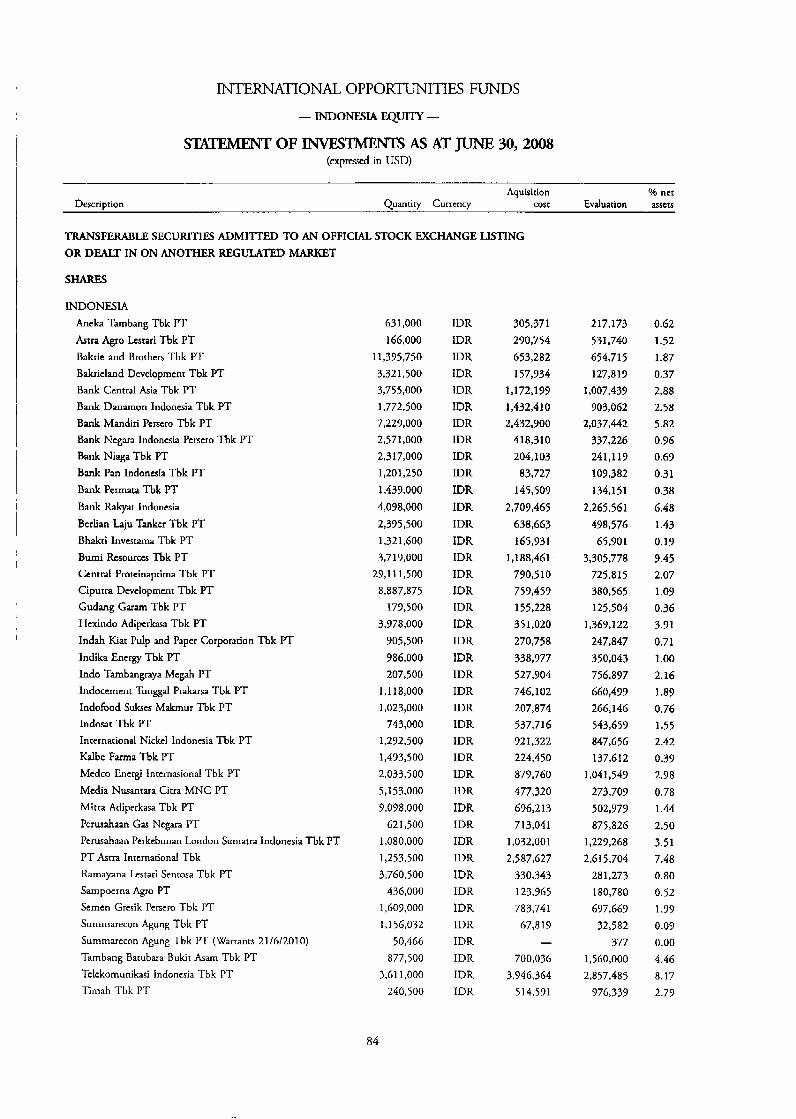
INTERNATIONAL OPPORTUNITIES FUNDS
- INDONESIA E Q W -
S m OF INWSTMENTS AS AT JIJNJ? 30,2008 (expressed in USD)
Description Aquisirion % net
Quantity Currency cost Evaluation assets
TRANSFERABLE SECURITIES ADMIlTFD TO AN OFFICIAL STOCK EXCHANGE LISTING OR DEALT IN ON ANOTHER REGULATED MARKET
SHARES
INDONESIA Aneka Tambang Tbk IT h t r a Agro Lcsrari Tbk PT Baktie and Brothers Tbk PT Bakrieland Development Tbk M Bank Central Asia Tbk IT Bank Danamon Indonesia Tbk PT Bank Mandiri Persero Tbk PT Bank Negara Indonesia Pcrscro Tbk PT Bank Niaga Tbk PT Bank Pan Indonesia Tbk PT Bank Pcrmata Tbk PT Bank Rakyat Indonesia Berlian Laju Tanker Tbk PT Bhakti Invesrama Tbk PT Bumi Resources Tbk PT Central Proteinaprima Tbk PT Cipurra Dwclopment Tbk PT Gudang Garam Tbk PT Hcxindo Adipcrkasa Tbk PT Indah Kat Pulp and Paper Corporation Tbk PT Indika Energy Tbk PT Indo Tambangrap Megah PT Indocement Tunggd Prakarsa Tbk PT Indofood Sukses Makmur Tbk PT Indosar Tbk IT International Nickcl Indonesia Tbk PT Kalbe Farma Tbk PT Medco Encrgi Inrcrnasional Tbk PT Media Nusantara Citra MNC PT Mitra Adiperkasa Tbk PT Perusahaan Gas Negara PT Pcrusahaan Perkebunan London Sumatra Indonesia Tbk PT PT Astra International Tbk Ramayana Lestari Senrosa Tbk PT Sampoerna Agro PT Semen Gresik Persero Tbk PT Summarecon Agung Tbk PT Summarecon Agung Tbk PT (Warrants 21/6/2010) Tambang Barubara Bukit Asam Tbk PT Telekomunikasi Indoncsia Tbk PT Timah Tbk PT
63 1.000
166,000 11,395,750 3,321,500 3,755,000 1,772,500 7,229,000 2,571,000 2,317,000 1,201,250 1,433,000 4,098,000 2,395,500 1,321,600 3.71 9,000
27.11 1,500 8,887,875
179,500 3,978,000
905,500 986,000 207,500
1,118,000 1,023,000
743,000 1,272,500 1,473,500 2,033,500 5,153,000 3,098,000
621,500 1,080,000 1,253,500 3,760,500
436,000 1,609,000 1,156,032
50,466 877,500
3.61 1,000 240,500
a4
IDR IDR IDR IDR IDR IDR IDR IDR IDR IDR IDR IDR IDR IDR IDR IDR 1DR IDR IDR IDR IDR IDR IDR IDR IDR IDR IDR IDR IDR IDR IDR IDR IDR IDR IDR IDR IDR IDR IDR IDR IDR
305,371 290,754 653,282 157,934
1,172,199 1,432,410 2,432,900
418,310 204,103
83,727 145,509
2,703,465 638,663 165,931
I ,I 88,461 790,510 759,453 155,228 351,020 270,758 338,977 527,904 746,102 207,874 537,716 921,322 224,450 879,760 477,320 696,213 713,041
1,032,001 2,587,627
330,343 123,965 783,741
67.8 19 -
700,036 3.946.364
514,591
2 17,173 531,740 654,715 127,819
1,007,439 903,062
2,037,442 337,226 241,119 109,382 134.1 51
2,265,561 498,576 65,901
3,305,778
380,565 125,504
1,369,122 247,847 350,043 756,897 660,499 266,146 543,659 847,656 137.61 2
1,041,549 273,709 502,979 875,826
1,229,268 2,615,704
281,273 180,780 677,669
32,582 377
1,560,000 2,857,485
776,339
725,815
0.62 1.52 1.87 0.37 2.88 2.58 5.82 0.96 0.69 0.31 0.38 6.48 1.43 0.19 9.45 2.07 1.09 0.36 3.91 0.71 1 .oo 2.16 1.87 0.76 1.55 2.42 0.39 2.98 0.78 1.44 2.50 3.51 7.48 0.80 0.52 1.99 0.07 0.00 4.46 8.17 2.77
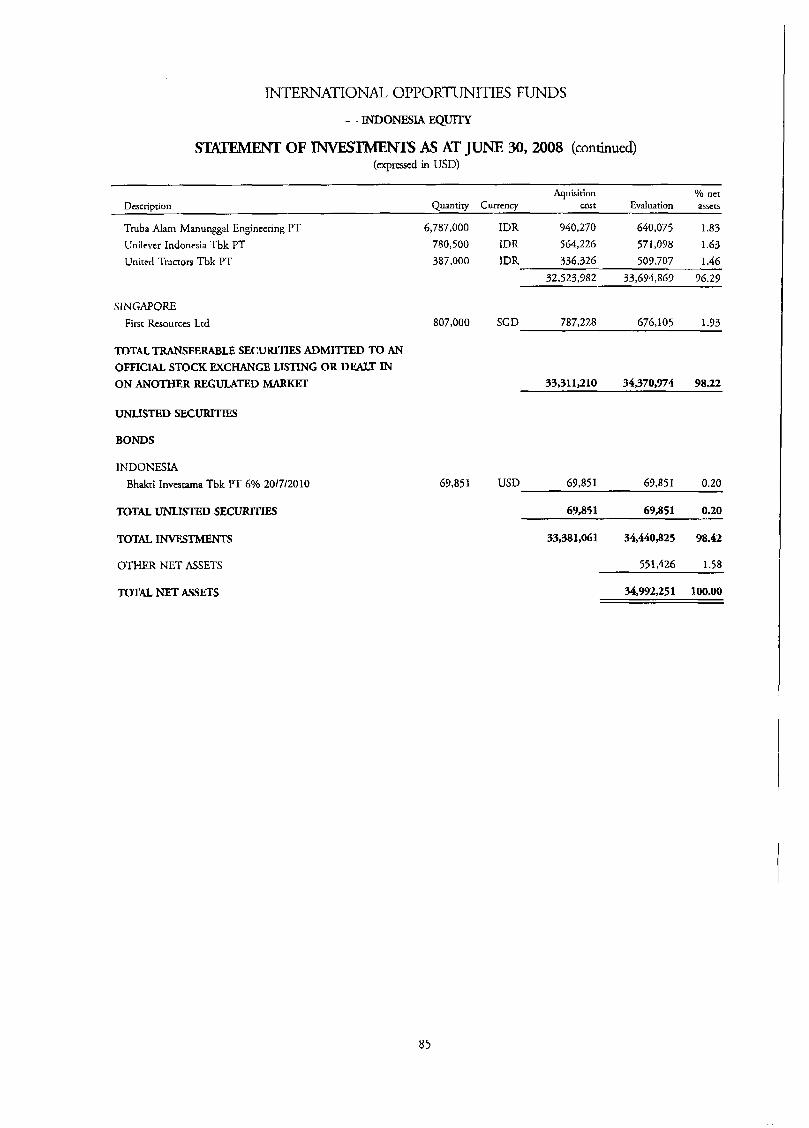
INTERNATIONAL OPPORTUNITIES FUNDS
-INDONESIA E Q m -
STATEMENT OF XNVESTMENTS As AT JUNE 30, 2008 (continued) (arpresscd in USD)
Aquisition % net Evaluation assets Description Quantiry Currency cost
Truba Alam Manunggal Engineering PT Unilcver Indonesia Tbk PT United Tractors Tbk PT
SINGAPORE First Resourccs Ltd
TOTAL W S F E R A B L E SECURITIES ADMIlTED TO AN OFFICIAL STOCK EXCHANGE LISTING OR D U T IN ON ANOTHER REGULATED MARKEX
UNLISTED SECURITIES
BONDS
INDONESIA Bh&ti Investama Tbk PT 6% 2017/2010
TOTAL UNLISTED SECURITIES
6,787,000 IDR 940,270 640,075 1.83 780,500 1DR 564,226 571,078 1.63 387,000 IDR 336,326 509,707 1.46
32,523,982 33,694,863 76.29
676,105 1.93 807,000 SGD 787,228
33,311,210 34,370,974 98.22
69,851 USD 69,851 69,851 0.20
69,851 69,851 0.20
TOTAL INVESTMENTS
OTHER NET ASSETS
33,381,061 34,440,825 98.42
551,426 1.58
TOTAL NET ASSETS 34,992,251 100.00
8 5
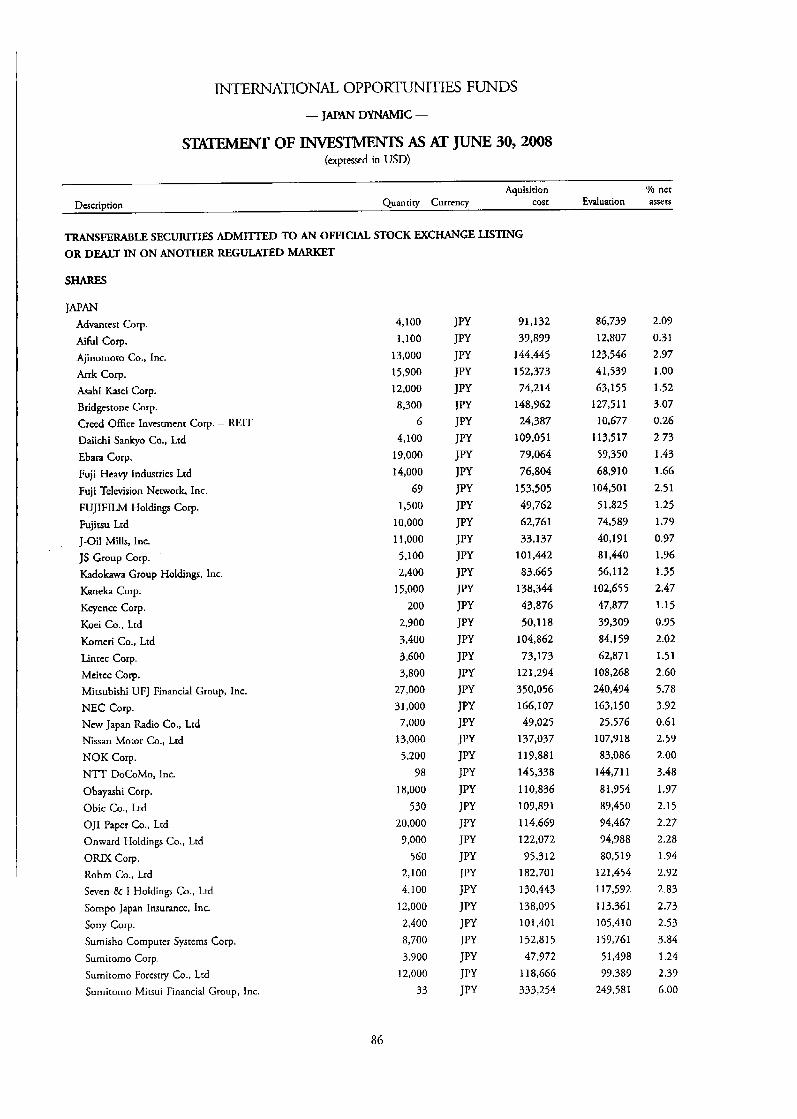
INTERNAmONAL OPPORTUNITIES FUNDS -JAPAN DYNAMIC -
STATEMENT OF INVESTMENTS AS ATJUNE 30,2008 (expressed in USD)
Aquisirion Yo nct Description Quantiry Currency cost Evaluation assets
TRANSFERABLE SECURITIB ADMI'ITED TO AN OFFICIAL STOCK EXCHANGE LISTING OR DEALT IN ON ANOTHER REGULATED MARKET
SHARES
JAPAN Advantest Corp. Aiful corp. Ajinomoto Co., Inc. Arrk Corp. Asahi Kasei Corp. Bridgestone Corp. Creed Office Invcstmcnr C o p - REIT Daiichi Sankyo Co., Ltd Ebara Corp. Fuji Heavy Industries Ltd Fuji Television Network, Inc. FUJIFILM Holdings Corp. Fujiau Ltd J-Oil Mills, Inc. JS Group Corp. Kadokawa Group Holdings, Inc. Kaneka Corp. Keyence Corp. Koei Co., Ltd Korneri Co., Ltd Lintcc Corp. Mcitcc Corp. Mitsubishi UFJ Financial Group, Inc. NEC Corp. New Japan Radio Co., Lrd Nissan Motor Co., Ltd NOK Corp. NlT DoCoMo, Inc. Obayashi Corp. Obic Co., Ltd OJI Paper Co., Ltd Onward Holdings Co., Ltd ORIX Corp. Rohm Co., Lrd Seven & I Holdings Co., Ltd Sompo Japan Insurance, Inc. Sony Corp. Surnisho Computer Systems Corp.
Sumitomo Corp.
Sumitomo Forcsrry Co., Ltd Sumitomo Mitsui Financial Group, Inc.
4,100 1,100
13,000 15,900 12,000 8,300
6 4,100
19,000 14,000
69 1,500
10,000 1 1.000 5.100 2,400
15,000 200
2,900 3,400 3,600 3,800
27,000 31,000 7,000
13,000 5,200
98 18,000
530 20,000 9,000
560 2,100
4,100 12,000 2,400 8,700 3,900
12,000 33
91,132 39,899
144,445 152,373 74,214
148,962 24,387
109,05 1 79,064 76,804
153,505 49,762 62,761 33,137
101,442 83,665
138,344 43,876 50,118
104,862 73,173
121,294 350,056 166,107 49,025
137,037 119,881 145,338 110,836 109,891 1 14,669 122,072 95,312
182,701 130,443 138,095 101,401 152,815 47,972
1 18,666 333,254
86,739 12,807
123,546 41,539 63,155
1273 1 1 10,677
113,517 59,350 68,910
104,501 5 1,825 74.589 40,191 81,440 56,112
102,655 47,877 39,309 84,159 62,871
108,268 240,494 163,150 25.57G
1073 18 83,086
144,711
81,954 89,450 94,467 94,988 80.5 19
121,454 117,592 113,361 1 05,410 159,761
5 1,498 99,389
249,581
2.09 0.31 2.97 I .oo 1.52 3.07 0.26 2.73 1.43 1.66 2.51 1.25 1.79 0.97 1.96 1.35 2.47 1.15 0.95 2.02 1.51 2.60 5.78 3.92 0.61 2.59 2.00 3.48 1.97 2.15 2.27 2.28 1.94 2.92 2.83 2.73 2.53 3.84 I .24 2.39 6.00
86

INTERNATIONAL OPPORTUNITIES FUNDS
-JAPAN DYNAMIC -
STATEWWT OF INVESTMENTS AS AT JUNFL 30,2008 (continued) (expressed in USD)
Aquisition % net Evaluation assets
Sumitorno Trust 8r Banking Co., Ltd (The) 11,000 JPY 74,020 77,259 1.86 Takeda Pharmaceutical Co., Lrd . 800 JPY 40,725 40,892 0.98 Thine Electronics, Inc. 23 JPY 45,014 22,424 0.54 Toppan Forms Co., Ltd 8,800 JPY 115,123 106,038 2.55 Toyota Motor Corp. 1,000 JPY 49,323 47,423 1.14
TOTAL INVESTMENTS 5,006,046 4,079,943 98.11
Description Quantity Currency cost
OTHER NET ASSETS 78,679 1.89
TOTAL NET ASSETS 4,158,622 100.00
87

INTERNATIONAL OPPORTUNITIES FUNDS
- JAPAN EQWIY -
OF INVESTMENTS As AT JUNE 30,2oO8 (expressed in USD)
Aquisition % nct Description Quantity Currency cost Evaluation assets
TRANSFERABLE SECUFUTIES ADMIlTED TO AN OFFIClAL STOCK EXCHANGE LISTING OR DEALT IN ON ANOTHER REGULATED MARKET
JAPAN Advantest Corp. Aeon Co., Lrd Aiful COT. Ajinomoto Co., Inc. Asahi Glass Co., Lrd Asahi Kasci Corp. krcllas Pharrna, Inc.
Bank of Yokohama Ltd (Thc) Bridgestone Corp. Canon, Inc. Central Glass Co., Ltd Dai Nippon Prinring Co., Ltd Daiichi Sankyo Co., Ltd Daiwa House Industry Co., Ltd Denso Corp. East Japan Railway Co. Ebara Corp. Fuji Television Network, Inc. FUJXFILM Holdings Corp. Fujirsu Ltd Hitachi Ltd Honda Motor Co., Ltd HOYA Corp.
IT Holdings Corp. JFE Holdings, Inc. JS Group Cop. Kaneka Corp. Kansai Electric Power Co., Inc. (The) Kao Corp. Keycnce Corp. Kobe Stcel Ltd Kubota Corp.
Kyocera Corp. Marubeni Corp. Matsushita Electric lndusrrial Co., Ltd Meitec Corp. Mirsubishi Cotp. Mirsubishi Estate Co., Lrd Mitsubishi Heavy lndustries Ltd
117,000
197,200 58,050
417,000 174,000 997,000 75,800
395,000 518,500 330,600 471,000 322,000 453,700 145,000 144.900
235 528,000
2,277 220,700
1,020,000
947,000 458,100 125,300 180,600 32,100
318,000 486,000 126,000
94,000 7,400
844,000 282,000
50,400 235,000
320,000
82,700 401,600 229,000 71 1,000
2,650,544 3,805,029 1,567,958 4,712,040 2,327,374 6,466,541
3,255,940 2,698,705
10,575,277 16,605,384
2,437,867 4,722,690
12,910,145 1,942,373 4,808,035 1,743,818
2,249,541 471 3,604
8,813,91 I 7.8 14,5 18 6,203,558
1 5,436,4 1 1 4,118,303 3,986,446 1,584,476 5471.72 1 4,172,132
3,012,871
2,667,319 2,201,493 3,027,884 1,704,648 4,441,198
1,584,152 6,537,173 3,627,089 9,887,171 5,774,476 4,504,679
2,475,223 2,447,150
675,863 3,962,970 2,114,78 1
5,247,120 3,228,738 2,744,380
7,965,597 17,086,241 1,930,456 4,770,03 1
12,561,621 1,367,776 5,006,247 1,924,133 1,649,297 3,448,530 7,6251 12 7,608,121 6,866,411
15,653,754 2,911,747 3,649,780 1,625,586 5,078,006 3,326,026
2,963,794 2,478.01 6 2,250,234 2,428,662 2,036,689 4,770,694
1,771,070 6,936,438 2,356,259
13,304,935 5,267,357 4,363,343
0.42
0.42 0.12 0.67 0.36 0.89 0.55 0.47 1.36 2.91
0.33 0.81 2.14 0.23
0.85 0.33 0.28 0.59 1.30 1.29 1.17 2.66 0.50 0.62 0.28 0.86 0.57 0.50 0.42 0.38 0.41
0.35 0.81 0.34 1.18
0.40 2.26 0.90 0.74
88
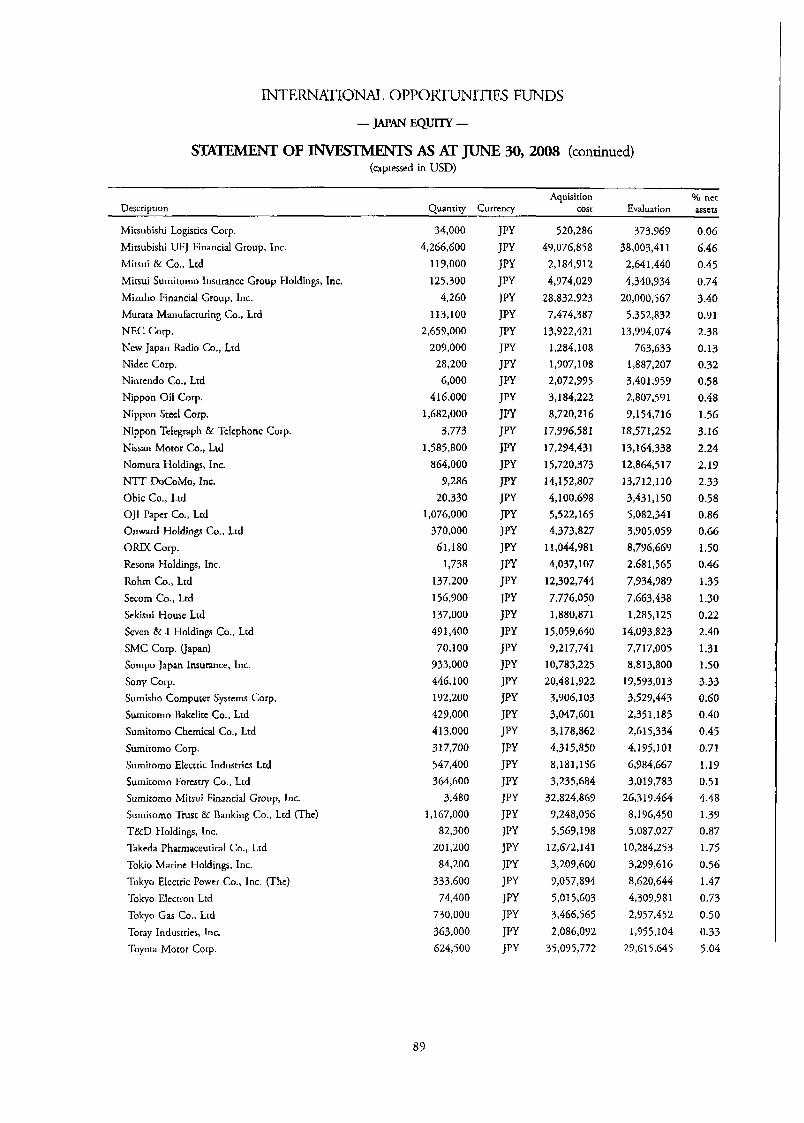
INTERNAnONAL OPPORTUNITIES FUNDS
- JAPAN EQUITY -
S- OF JNVESTMENTS AS AT JUNE 30, 2008 (continued) (expressed in USD)
Aquisition % net Evaluation assets Description Quantity Currency cost
Mitsubishi Logistics Corp. Mitsubishi UFJ Financial Group, Inc. Mitsui & Co., Lrd Mirsui Sumitorno Insurance Group Holdings, Inc. Mizuho Financial Group, Inc. Murata Manufacturing Co., Ltd NEC Corp. New Japan Radio Co., Ltd Nidec Corp. Nintcndo Co., Ltd Nippon Oil Corp. Nippon Steel Corp. Nippon Telegraph & Tclcphone Corp. Nissan Motor Co., Ltd Nornura Holdings, Inc. NTT DoCoMo, Inc. Obic Co., Ltd OJI Paper Co., Ltd Onward Holdings Co., Ltd ORIX Corp. Rcsona Holdings, Inc. Rohm Co., Ltd Sccom Co., Ltd Sckisui House Ltd Swen & .I Holdings Co., Ltd SMC Corp. (Japan) Sornpo Japan Insurance, Inc. Sony COT. Surnisho Computer Systems Corp. Sumitorno Bakclire Co., Ltd Sumitorno Chemical Co., Ltd Sumitorno Corp. Sumitomo Electric Industrics Ltd Sumitomo Forestry Co., Ltd Sumitorno Mitsui Financial Group, Inc.
Sumitorno Trust Br Banking Co., Ltd (The) T&D Holdings, Inc.
Takcda Pharmaceutical Co., Lrd Tokio Marine Holdings, Inc. Tokyo Electric Power Co., Inc. (Thc) Tokyo Electron Ltd
Tokyo Gas Co., Lrd Toray Industries, Inc.
Toyota Motor Corp.
34,000 4,266,600
119,000 125,300
4,260 113,100
2,659,000 209,000
28,200 6,000
416,000 1,682,000
3,773 1,585,800
aci4,ooo 9,286
20,330 1,076,000
370,000 61,180
1,738 137,200 156,900 137,000 491,400 70,100
933,000 446,100 192,200 429,000 4 13,000 3 17,700 547,400 364,600
3,480 1,167,000
201,200 84,200
333,600 74,400
730,000 363,000 624,500
82,300
520,286 49,076,858
2,184,912 4,974,029
28,832,923 7,474,387
13,922,421 1,284,108 1,907,108 2,072,995 3,184,222 8,720,216
17,996,58 I 17,294,431 15,720,373 14.1 52,807 4,100,698 5,522,165 4,373,827
11,044,981 4,037,107
12,302,744 7,776,050 1,880,871
15,059,640 9,217,741
10,783,225 20,481,922 3,906, I03 3,047.60 1 3,178,862 4.31 5,850 8,181,156
32,824,869 9,248,056
3,235,684
5,569,198 12,672,14 1 3,209,600 9,057,894 5,015,603 3,466,565 2,086,092
35,095,772
373,969 38,003,411
2,641,440
4,340,934 20,000,567
5,352,832 13,994,074
763,633 1,887,207 3,401,959 2,807,591 9,154,716
18,571,252 13,164,338 12,864,517 13,712,110 3,431,150 5,082,341 3,905,059 8,796,669 2,681,565 7,934,989 7,663,438 1,285,125
14,093,823 7,717,005 8.81 3,800
19,593,013 3,529,443 2,351,185 2,615,334 4,195,101 6.9 84,667 3,019,783
26.31 9,464 8,196,450 5,087,027
10,284,253 3,299,616 8,620,644 4,309,981 2,957:452 1,955,104
29,615,645
0.06 6.46 0.45 0.74 3.40 0.71 2.38 0.13 0.32 0.58 0.48 1.56 3.16 2.24 2.19 2.33 0.58 0.86 0.66 1.50 0.46 I .35 1.30 0.22 2.40 1.31 1.50 3.33 0.60 0.40 0.45 0.71 1.13 0.51 4.48 1.37 0.87 1.75 0.56 1.47 0.73 0.50 0.33 5.04
89

INTERNAnONAL OPPORWITIES FUNDS - JAPAN E Q m -
OF INVESTMENTS AS AT JUNE 30, 2008 (continued) (expressed in WSD)
Aquisition 016 ner Description Quantiry Currency cost Evaluation assets
West Japan Railway Co. 2,001 JPY 9,OS 1,453 7,868,152 1.68
Yamato Holdings Co., Lrd 403,000 JPY 6,247,288 5,653,329 0.96
TOTAL INVESTMENTS 654,036,041 578,674,210 98.44
Yahoo! Japan Corp. 4,383 JPY 1,757,512 I ,631,859 0.29
OTHER NET ASSETS 7,175,414 1.56
TOTAL NET ASSETS
90
587,869,624 100.00

INTERNATIONAL O P P O R ~ I T I E S FUNDS
-JAPAN ShWLLER COMPANIES -
S w OF lNVFSTMF,NTS As AT JUNE 30,2008 (expressed in USD)
Dcscriotion Aquisirion Yo net
Quantio. Currency cost Evaluation assets
TRANSFERABLE SECURITIES A D M I T I I D TO AN OFFICIAL STOCK EXCHANGE LISTING OR DEALT IN ON ANOTHER REGULATED MARKET
SHARES
JAPAN Ai Holdings Corp. Ando Corp. Arrk Corp. h e l l Corp. Bank of Okinawa Lrd (The) Bunka Shutter Co., Ltd Creed Corp. Creed Ofice Invesrrnent Corp. - REIT Daiichikosho Co., Ltd Ebata Corp. Future hchitect, Inc.
Geo Corp.
Hikati Tsushin, Inc. Iriso Electronics Co., Ltd Jaccs Co., Ltd J-Oil Mills, Inc. Kadokawa Group Holdings, Inc. Koa Corp. Koei Co., Lrd Komcri GI., Lrd Lintcc Corp. Macda Corp. MEC Co., Lrd (Japan) Mcitec Corp. Miraial Co., Ltd Miyachi Corp. Nissan Chemical Industries Ltd Pal Co., Ltd Pocket Card Co., Ltd Saro Corp. Sumisho Computer Systems Corp. Surnitomo Bakelite Co., Ltd Sumitorno Forestry Co., Lrd Thine Electronics, Inc. Tokyo Tomin Bank Ltd (The) Toppan Forms Co., Ltd Toyo Tire & Rubber Co., Ltd Tsurnura & Co.
60,100 200,000 103,000
100 1 1,600 76,000
100 112
33,100 57,000
592 202
6,800 20,500
103,000 29,000 1 1,400
25,700 13,700 12,500 17,400 56,000 3 1,300 10,100 7,700
19,100 17,000 20,900
120,600 25,300 18,900 36,000 46,700
298 20,600 28,500 89.000 14,200
310,241 302,708 341,985 352,112 422,924 244,415 132,135 328,811 300,904 180,325 348,796 167,983 210,691 271,056 352,374
87,601 275,232 195,336 230,498 308,033 245,367 153,833 262,762 312,978 298,757 185,344 186,371 324,827 337,558 307,997 356,001 171,417 317,997 350,355 434,045 287,638 278,418 332,637
317,437 425,755 269,090 358,749 4 17,246 306,460 84,055
197,309 334,932 178,047 360,316 170,365 225,283 277,486 21 1,567 105,959 266,534 186,567 188,412 309,409 303,876 193,478 235,242 287,766 230,001 222,377 21 0,157 257,182 301,372 2 8 6,4 2 0
347,068 197,302 386,791 290,539 400,710 343,419 284,746 367,618
2.74 3.68 2.32 3.10 3.60 2.65 0.73 1.72 2.89 1.54
1.47 1.75 2.40 1.83 0.92 2.30 1.61 1.63 2.67 2.62 1.67 2.03 2.48 1.99 1.92 1.81 2.22 2.60 2.47 3.00 1.70 3.34 2.51
3.46 2.96 2.46 3.17
3.11
91

INTERNATIONAL OPPORTUNITIES FUNDS
-JAPAN SMALLER COMPAMES -
OF -S AS AT JUNE 30,2008 (continued) (expressed in USD)
Aquisition % net Description Quantity Currency cost Evaluation assets
United Arrows Ltd 48,100 JPY 307,217 317,798 2.74 USJ Co., Lrd 289 JPY 201,645 184,651 1.59 Wood One Co., Ltd 35,000 JPY 217,727 200,435 1.73 Work Applications Co., Lrd 95 JPY 135.088 120,498 1.04 Zukcn, Inc. 32,500 JPY 323,825 309,787 2.67
TOTAL. INVJ3TMENTS 11,716,384 11,472,415 99.04
OTHER NET ASSETS 110,764 0.96
TOTAL NET ASSETS 11.583.179 100.00
92

JNTERNATIONAL OPPORTUNITIES FUNDS
- KOREA EQUITY -
S n OF INVESTMENTS AS AT JUNE 30,2008 (expressed in USD)
~- Aquisition % net
Description Quantiry Currency cost Evaluation assets
TRANSFERABLE SECURITIES ADMIlTED TO AN OFFICIAL STOCK EXCHANGE USTING
OR D W T IN ON ANOTHER REGULATED MARKET
SINGAPORE Hana Financial Group, Inc. Hitc Brewery Co., Ltd
SOUTH KOREA Amorepacific Corp. Cheil Industries, Inc. Daeduck Electronics Co. Daelim Industrial Co. Dong-A Pharmaceutical Co., Ltd GS Engineering & Consrruction Corp. GS Holdings Corp. GS Home Shopping, Inc. Halla Climate Control Handsome Co., Ltd Hankook Tire Co., Ltd Hanwha Chem Corp. Hanwha Corp. Hynix Semiconductor, Inc. Hyundai Heavy Industtics Hyundai Motor Co. Hyundai Motor Co. (Prefl Industrial Bank of Korea
KCC Corp. Kookmin Bank Korea Electric Power Corp. Korea Exchange Bank KT Corp. - ADR KT&G Corp. LG Chem Ltd LG Corp. LG Display Co., Ltd LG Electronics, Inc.
LG Household & Health Care Lrd LG Tclecom Lrd Lotte Shopping Co., Lrd Macquarie Korea Infrasrruccure Fund - GDR NCSoft Corp. Nong Shim Co., Lrd POSCO Pusan Bank
2,296 554
86 550
5,450 348 435 41 8
1,176 490
1,180 1,524 4,040 4,884
309 650 322 345 490 530 34
2,091 3,890
1 1,740 1,900
849 29 1 158
1,650 922 61
4,881 165
5,575 320 254 268
1,670
KRW 108,474 88,308 2.75 KRW 66,647 62,203 2.08
175,121 150,511 5.03
KRW KRW KRW KRW KRW KRW KRW KRW KRW KRW KXW KRW KRW KRW KRW KRW KRW KRW KRW KRW KRW KRW USD KRW KRW KRW KRW KRW KRW KRW KRW USD KRW KRW KRW KRW
56,358 22,141 47,910 37,401 36,274 32,285 42,239 32,368 14,018 26,278 63,672 65,856 14,475 23,275 58,104 27,097 20,648
7,762 9,549
173,839 167,048 163,585 48,989 59,482 18,394 14,712 71,597 71,979 13,069 45,084 56,240 42,134 22,692 51,728
102,280 23,657
53,252 25,490 19,581 35,581 44,269 45,734 45,714 3 1,746 1 1,727 17,039 56,170 54,137 10,925 15,528 99,692 23,407 13,371 8.078
14,149 123,482 1 14,302 160,983 40,394 73,015 27,807 10,252 61,806
104,402 11,949 36,986 49,114 30,384 15,595 54,247
139,314 22,609
1.78 0.85 0.66 1.19 1.48 1.53 1.53 1.06
0.39 0.57 1.88 1.81 0.37 0.52 3.33 0.78 0.45 0.27 0.47 4.13 3.82 5.39 1.35 2.44 0.93 0.34 2.07 3.49 0.40 1.24 1.64 1.02 0.52 1.81 4.66 0.76
93

INTERNATIONAL OPPORTUNITIES FUNDS - KOREA EQUITY -
OF -S As AT JUNE 30,2008 (continued) (scpressed in USD)
Aquisition % net Dcscription Quantity Currency cost Evaluation assets
S1 Corp. (Korea)
Samsung Electronics Co., Lrd Samsung Fire & Marine Insurance Co., Ltd
Samsung SDI Co., Ltd Shinhan Financial Group Co., Lcd Shinsegac Co., Ltd SK Energy Co., Ltd SK Holding Co., Ltd SK Telecom Co., Ltd SK Telecom Co., Ltd - ADR $-Oil Corp. Woori Finance Holdings Co., Ltd Woori Investment & Securities Co., Ltd
1,335 456 628 174
1,629 289 270 110 86
2,700 821
820 1,180
KRW 61,398 80,113 2.68 KRW 294,178 272,336 9.1 1 KRW 99,222 131,121 4.39 KRW 12,899 13,900 0.47 KRW 80,045 73,628 2.46 KRW 162,010 155,477 5.20 KRW 17,807 30,057 1.01 KRW 8,236 13,559 0.45 KRW 16,768 15,655 0.52 USD 68,341 55,807 1.87
KRW 68,532 52,720 1.76 KRW 18,434 13,046 0.44 KRW 27,994 21,424 0.72
2,724.283 2.631.096 88.01
OTHER NET ASSETS
2,899,404 2,781,607 93.04
208,097 6.96
IDTAL NET ASSETS 2,989,704 100.00
94
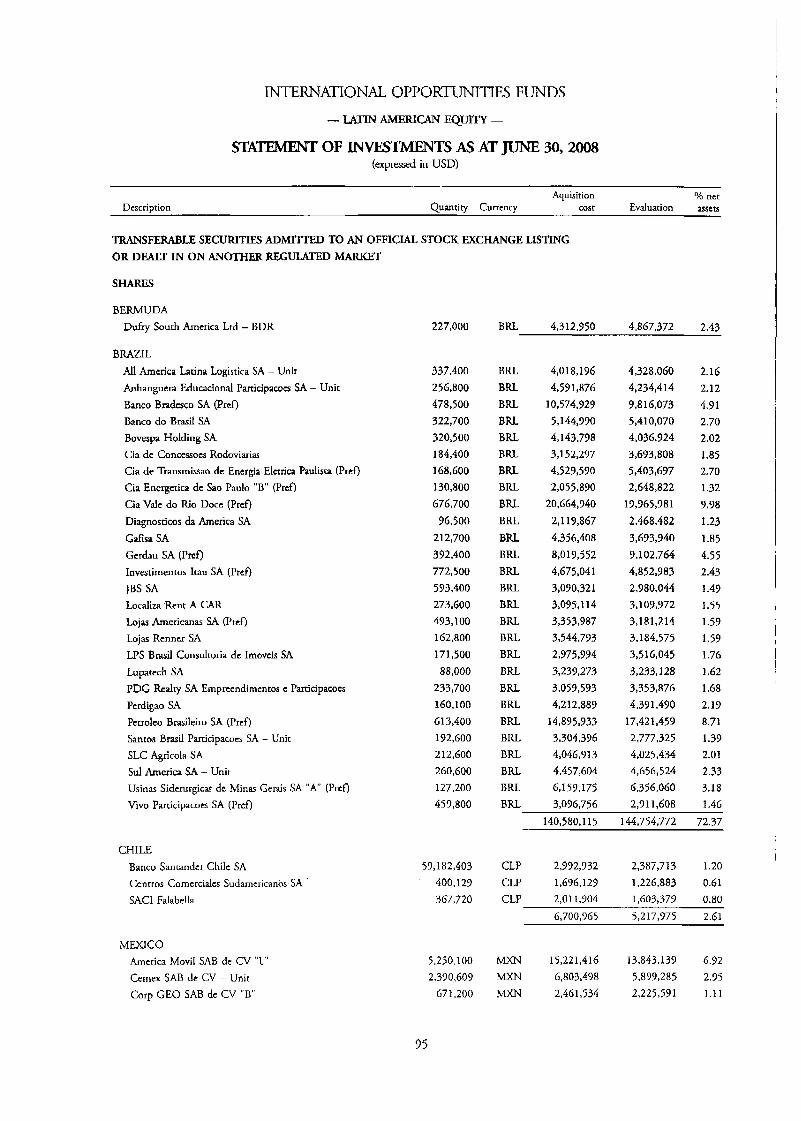
INTERNAmONAL OPPORTUNITIES FUNDS
-LATIN AMERICAN E Q W -
STATEMENT OF XNVEsTMlENTS As AT JUNE 30,2008 (expressed in USD)
Aquisition Yo net Description Quantity Currency cost Evaluation assets
TRANSFERABLE SECURITIES ADMI'ITED TO AN OFFICIAL STOCK MCHANGE LISTING OR DEALT IN ON ANOTHER REGULATED MARKET
SHARES
BERMUDA Dufry South America Ltd - BDR
BRAZIL All America Latina Logistica SA - Unit Anhanguera Educacional PartiCipaCOuj SA - Unit Banco Bradesco SA (Pref) Banco do Brasil SA Bovespa Holding SA Cia de Concessocs Rodoviarias Cia de Transmissao de Energia Elcrrica Paulista (Prcf) Cia Energctica de Sao Paulo "B" (Pref) Cia Vale do Rio Docc (Prcf)
Diagnosricos da America SA Gafsa SA
Gerdau SA (Prcf) Investimentos Itau SA (Prefj JBS SA Localiza Rent A CAR
Lojas Americanas SA (Prcf) Lojas Rcnncr SA LPS Brasil Consultoria de Imovcis SA Lupatech SA PDG Realty SA Emprcendirnentos c Panicipacocs Perdigao SA Petrolco Brasileiro SA (Pref)
Sanros Brasil Participacocs SA - Unit SLC Agricola SA SUI America SA - Unit Usinas Siderurgicas de Minas Gerais SA " A (Prcfl Vivo Panicipacoes SA (Prcf)
CHILE Banco Santander Chile SA Cenrros Cornercialcs Sudamcricanos SA SAC1 Falabella
MEXICO America Movil SAB dc CV "L" Cernex SAB de CV - Unit Corp GEO SAB dc CV "B"
227,000
337,400 256,800 478,500 322,700 320,500 184,400 168,600 130,800 676,700
96,500 212,700 392,400 772,500 593,400 273,600 493,100 162,800 171,500 88,000
233,700 160,100 613,400 192,600 212,600 260,600 127,200 459,800
59,182,403 400,129 367,720
5,250,100 2,390,609
671,200
95
BRL 4,312,950 4,867,372 2.43
BRL BRL BRL BIU BRL BRL BRL BRL BRL BRL BRL BRL BRL BRL BRL BRL BRL BRL BRL BRL BRL BRL BRL BRL BRL BRL BRL
4,018,196 4,591,876
10,574,929 5,144,990 4,143,798 3,152,297 4,5 2 9,5 9 0 2,055,830
20,664,940
2,119,867 4,356,408 8,019,552 4,675,041 3,09 0,321 3,095,114 3,353,987 3,544,793 2,975,994 3,239,273 3,059,593 4,212,887
14,895,933 3,304,396 4,046,913 4,457,604 6,159,175 3,096,756
4,328,060 4,234,414 9,816,073 5 4 1 0,070 4,036,924 3,693,808 5,403,697 2,648,822
19,965,981 2,468,482 3,693,940 9,102,764
4,852,983 2,980,044 3.1 09,972 3,181,214 3,184,575 3,516,045 3,233,128 3,353,876 4,391,490
17,421,459 2,777,325 4,025,434 4,656,524 6,356,060 2,711,608
2.16 2.12 4.91 2.70 2.02 1.85 2.70 1.32 9.98 I .23 1.85 4.55 2.43 1.49 1.55 1.59 I .59 I .76 I .62 1.68 2.19 8.71 I .39 2.01 2.33 3.18 1.46
140,580,115 144,754,772 72.37
CLP 2,992,932 2,387,713 1.20 CLP 1,636,129 1,226,883 0.61 CLP 2,011,704 1,603,379 0.80
6,7 0 0,7 6 5 5,217,975 2.61
MXN 15,221,416 13,843,139 6.92 MXN 6,s 0 3.4 9 8 5,899,285 2.75 MXN 2,461,534 2,225,591 1.11
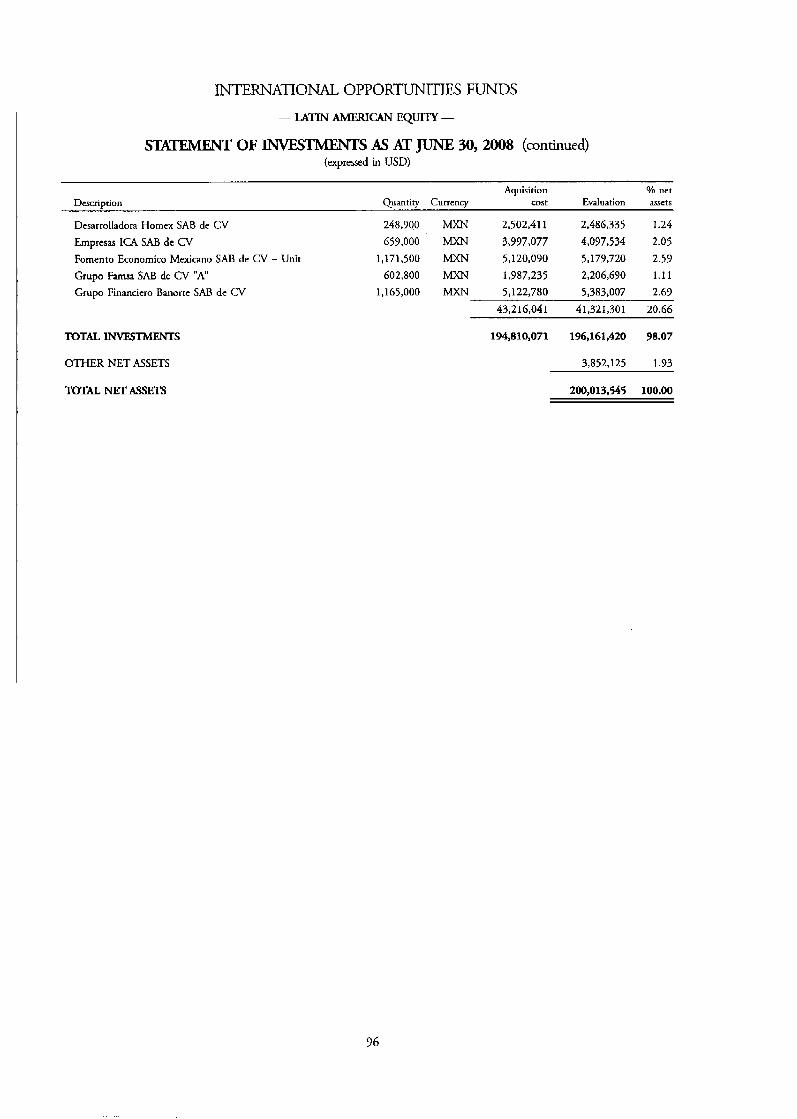
INTERNATIONAL OPPORTUNITIES FUNDS - LATIN AhCERICAN EQUlTY-
XKEMENT OF -S AS AT JUNE 30,2008 (continued) (expressed in USD)
Description Quantity
Desarrolladora Homex SAB de CV 248,900 Empresas ICA SAl3 de CV 659,000 Fomento Economico Mexican0 SAB de CV - Unit 1,171,500 Grupo Famsa SAB de CV "A" 602,800 Grupo Financicro Banorrc SAB de CV 1,165,000
Aquisition Oh net Currencv cost Evaluation assets
MXN 2,502,411 2,486,335 1.24 m 3,997,077 4,097,534 2.05 MXN 5,120,090 5,179,720 2.59 MXN 1,987,235 2,206,690 1.11 MXN 5,122,780 5,383,007 2.69
43,216,041 41,321,301 20.66
TOTAL INVESTMENTS 194,810,071 196,161,420 98.07
OTHER NET ASSETS
TOTAL NIT ASSETS
3,852,125 1.73
200,013,545 100.00
96
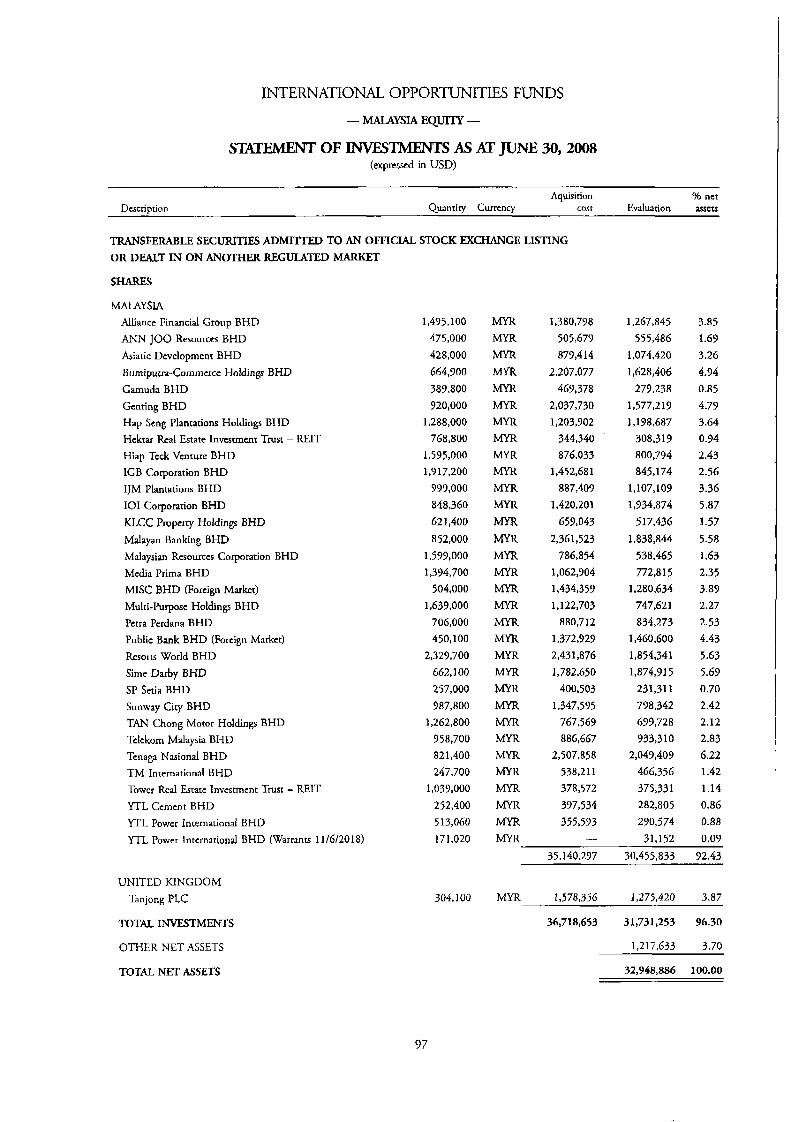
INTERNATIONAL O P P O R W I T I E FUNDS - MALp;ysIA EQUITY -
OF INVESTMENTS As AT JUNE 30,20O8 (expressed in USD)
Aquisition 46 net Description Quantity Currency cost Evaluation asscts
TRANSFERABLE SECURITIES ADMI'MED TO AN OFFICIAL STOCK EXCHANGE LISTING OR D W T IN ON ANOTHER REGULATED MARKET
SHARES
MALAYSLA Alliance Financial Group BHD ANN JOO Resources BHD Asiatic Dcveloprnent BHD Bumiputra-Commcrce Holdings BHD Gamuda BHD Genting BHD Hap Seng Plantations Holdings BHD Hcktar Rcal Estate Inmstmenr Trust - REIT Hiap Tcck Venture BHD IGB Corporation BHD IJM Plantations BHD IO1 Corporation BHD KLCC Pmperry Holding BHD Malayan Banking BHD Malaysian Rcsourccs Corporation BHD Mcdia Prima BHD MISC BHD (Foreign Market) Multi-Purposc Holdings BHD Petra Perdana 3HD Public Bank BHD (Foreign Market) Resorts World BHD Sirne Darby BHD SP Setia BHD Sunway City BHD TAN Chong Motor Holdings BHD Tclckorn Malaysia BHD Tenaga Nasional BHD TM International BHD Tower Real Estate Investment Trust - REIT YTL Cement BHD YTL Powcr International BHD YTL Power Intcrnarional BHD (Warrants 11/6/2018)
UNITED KINGDOM Tanjong PLC
TOTAL INVESTMENTS
OTHER NET ASSETS
1,495,100 475,000 428,000 664,900 389,800 920,000
1,288,000 768,800
1,595,000 1,917,200
999,000 848,360 62 1,400
852,000 1,599,000 1,394,700
504,000 1,639,000
706,000 450,100
2,329,700 662, IO0 257,000 987,800
1,262,800 958,700 821,400 247,700
1,039,000 252,400 513,060 171,020
304, I00
MYR MYR MYR MYR MYR MYR MYR MYR MYR MYR Mm MYR MYR MYR MYR MYR MYR MYR MYR MYR MYR MYR MYR MYR MYR MYR MYR m MYR MYR MYR MYR
I ,380,798 505,679 879,414
2,207,077 469,378
2,037,730 1,203,902
344,340 876,033
1,452,681 887,409
1,420,201 659,043
2,361,523 786,854
1,062,904 1,434,359 1,122,703
880,712 1,372,929 2,43 1,876 1,782,650
400,503 1,347,595
767,569 886,667
2,507,858 538,211
397,534 3 5 5 I5 9 3
378,572
I
1,267,845 555,486
1,074,420 1,628,406
279,238 1,577,219 I ,198,687
308,319 800,794 845,174
1,107,109 1,934,874
517,436 1,838,844
538,465 772.8 1 5
1,280,634 74762 1 834,273
1,460,600 1,854,341 1,87431 5
231,311 798,342 699,728 933,3 10
2,049,409 466,356 375,331 2 8 2,s 0 5 290,574
3.85 I .69 3.26 4.94 0.85 4.79 3.64 0.94 2.43 2.56 3.36 5.87 1.57 5.58 1.63 2.35 3.89 2.27 2.53 4.43
5.63 5.69 0.70 2.42 2.12 2.83 6.22 1.42 1.14 0.86 0.88
31,152 0.09 35,140,297 30,455,833 92.43
1,275,420 3.87
34,718,653 31,731,253 96-30
MYR I ,578,356
1,217,633 3.70
TOTAL NET ASSETS 32,948,886 100.00
97

INTERNATIONAL OPPORTLTNITXES FUNDS
- NORTH AMERICA - S- OF IN"FS7JMENTS AS AT JUNE 30,2008
(expressed in USD)
Aquisition Yo net Description Quantity Currency cost Evaluation assets
TRANSFERABLE SECURITIES ADMITTED TO AN OFFICIAL STOCK EXCHANGE LISTING OR DEALT IN ON ANOTHER REGUUTED MARKET
SHARES
BERMUDA Tyco Electronics Lrd Tyco International Ltd
UNITED STATES OF AMERICA 3M Co. Abbotr Laboratories Abercrornbie & Fit& Co. " A Alcoa, Inc. Allegheny Technologies, Inc. Allstare Corp. (The) Atria Group, Inc. American Express Co. American International Group, Inc. Amgcn, Inc. Anadarko Petroleum COT.
Anheuser-Bus& Cos., Inc. Apache Corp. Applied Materials, Inc. Archer-Daniels-Midland Co. AT&T, Inc. Automatic Data Processing, Inc. Avnct, Inc. Bank of America Corp. Baxtcr International, Inc. Boeing Co. Brisrol-Myers Squibb Co. Burlington Northern Santa Fc Corp Cardinal Health, Inc. Caterpillar, Inc. CBS Corp. "B" Chevron Corp. Cigna Corp. Cisco Systems, Inc. Cirigtoup, Inc. Coca-Cola Co. (The) Colgarc-Palmolive Co. Corncasr Corp. "A"
Computer Sciences Corp. ConocoPhillips Corning, Inc.
37,675 38,475
55,300 109,000 65,900 63,800 94,800
188,800 407,500
40,800 353,300
84,100 31,200 48,900 75,600
108,400 123,900 511,337 42,900
16 1,300 490,050
50,200 54,600
154,400 20,800 28,500
147,200 55,550
197,600 176,500 404,100 584,200 133,300 34,300
530,100 176,700 146,400 105,200
98
USD 397,397 1,429,490 0.20 USD 442,0(;4 1,542,078 0.21
839,461 2,971,568 0.41
USD USD USD USD USD USD USD USD USD USD USD USD USD USD USD USD USD USD USD USD USD USD USD USD USD USD USD USD USD USD USD USD USD USD USD USD
4,175,404 5,343,310 4,985,340 1,789,697 7,100,622
10,425,257 8,214,500 2,060,213
20,442,122 3,875,990 1. ,591,321 2,268,722 6,136,234 1,972,630 4,578,383
14,611,689 1,792,534 5,301,337
21,886,659 2,259,836 3,989,183 3,713,848 1,488,718 1,748,592 9,994,835 1,701,775
13,675,662 7,013,413 8,786,071
22,694,033 6,592,540 2,217,626
10,987,871 8,342,522 9,761,376 2,815,431
3,843,903 5,777,000 4,224,190 2,257,244 5,725,920 8,782,976 8,292,625 1,552,032 9,804,075 3,897,717 2,320,032 3,044,5 14
10,364,760 2,091,036 4,078,788
16,751,400 1,786,356 4,44331 5
12,050,330 3,158,082 3,653,832 3,134,320 2,025,720 1,442,955
10,856,000 1,097,668
19,325,280 6,301,050 9,540,801
10,077,450 69 10,272 2,337,603 7,875,763 8,287,765
13,416,096 2,466,940
0.53 0.79 0.58 0.31 0.78 1.20 1.13 0.21 1.34 0.53 0.32 0.42 1.42 0.27 0.56 2.29 0.24 0.61 1.65 0.43 0.50 0.43 0.28 0.20 1.48 0.15 2.64 0.86 1.31 1.38 0.95 0.32 1.35 1.13 1-84 0.34

INTERNATIONAL OPPORTUNITIES FUNDS
- NO- AMERICA -
T'EMENT OF INVESTMENTS AS AT JUNE 30,2008 (continued) (expressed in USD)
ST
___~
Aquisirion % ncr Description Quantity Currency cost Evaluation assets
Covidien Ltd DcU, Inc. Dominion Resources, Inc.lVA Dow Chemical Co. (The) E1 Du Pont de Ncmours & Co. Electronic Data Systems Corp. Eli Lilly & Co. Emerson Electric Co. Enon Mobil Corp.
Federal National Mortgage Association Ford Motor Co. Fortune Brands, Inc. General Electric Co. General Motors Corp. Goldman Sachs Group, Inc. (The) Goodrich Corp. Hartford Financial Scrviccs Group, Inc. Hewlctt-Packard Co. Home Depot, Inc. HoneyweU International, Inc. Jngram Micro, Inc. "A" Intel Cop. International Business Machines C o p Johnson &Johnson JPMorgan Chase & Co. Kimberly-Clark Corp.
Kraft Foods, Inc. " A Lincoln National Corp. Liz Claiborne, Inc. Macy's, Inc. Masco Corp.
Medtronic, Inc. Merck & Co., Inc. Merrill Lynch & Co., Inc. Microsoft Corp. Morgan Stanley Mororola, Inc. Newell Rubbermaid, Inc. Newfield Exploration Co. Nucor Corp. Occidental Petroleum Corp. Oracle Corp. PcpsiCo, Inc. Pfizer, Inc. Philip Morris Intcrnational, lnc. PPG Industries. Inc Procrer & Gamble Co.
38,575 152,800 38,000
237,700 186,600 40,500 65,900 55.600
363,400 460,200 960,993 113,300 680,800 543,200
16,900 166,900 146,800 255,700 379,800
51,400
275,200 570,200 139,600 193,100 373,900
32,100 103,534 140,700 266,100 371,000 535,900 75,800
253,400 299,600 542,100 34,300
166,200 363,800 139,300 140,200 1 1 5,100 270,700 105,900 780,600 142,300 117,000 209,600
99
USD USD USD USD USD USD USD USD USD USD USD USD USD USD USD USD USD USD USD USD USD USD USD USD USD USD USD USD USD USD USD USD USD USD USD USD USD USD USD USD USD USD USD USD USD USD USD
452,392 4,592,555 1,469,252 9,379,148 8,257,489
853,541 3,591,245 2,282,155
24,582,564 20,955,508
7,095,482 8,382,796
24,126,396 13,832,067 2,530,669 8,477,557
11,780,271 8,565,349
13,639.1 12 2,246,897 4,713,009
12,506,661 12,522,190 12,234,186 15,443,088 2,037,981 2,822,906 7,515,383 7,966,783
1 1,258,822 14,124,423 3,750,633 9,890,301
17,497,962 15,060,402
543,434 2,448,697 8,2 14,140 6,318,691 7,114,394 6,228,583 4,345,210 6,537,089
19,252,068 5,910,630 7,507,352
12,683,045
1,828,069 3,399,800 1,755,600 8,279,091 7,965,954
995,085 3,005,693 2,678,252
31,452,270 9,572,160 4,785,745 7,066,521
17,877,808 6,273,960 2,950,064 8,066,277 9,835,600
1 1,399,106 9,122,796 2,530,422 4,901,312
12,253,598 16,758,980 12,275,367 13,105,195 1,921,827 2,Y 39,330 6,5 17,224 3,893,043 7,245,630 8,531,528 3,883,992 9,370,732 9,796,920
14,978,223 1,259,153 1,221,570 6,177,324 9,014,103
10,498,176 10,180,595 5,763,203 6,770,187
13,488,768 7,090,803 6,686,550
12,678,704
0.25 0.46 0.24 1.13 1.07 0.14 0.41 0.37 4.30 1.31 0.65 0.97 2.45 0.86 0.40 1.10 1.35 I .56 1.25 0.35 0.67 1.68 2.29 1.68 1.79 0.26 0.40 0.89 0.53 0.99 1.17 0.53 1.28 1.34 2.05 0.17 0.17 0.84 1.23 1.44 1.39 0.79 0.93 1.85 0.97 0.91 1.73
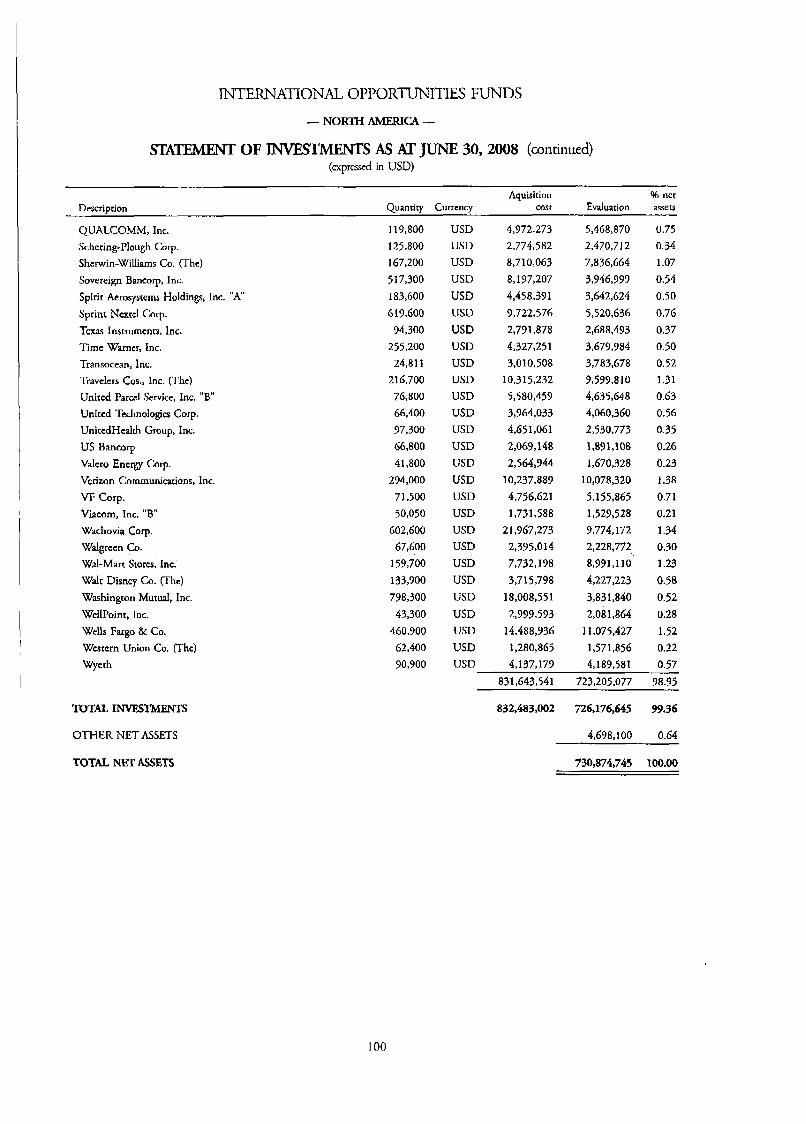
INTERNATIONAL OPPORTUNITIES FUNDS
- NORTH AMERICA -
OF m S As AT JUNE 30,2008 (continued) (expressed in USD)
Aquisition % net Description Quantiry Currency cost Evaluation assets
QUALCOMM, Inc.
Schering-Plough COT.
Sherwin-Williams Co. (The) Sovereign BUICOI~, Inc. Spirit Aerosystems Holdings, Inc. "A" Sprint Ncxtel Corp. Texas Instruments, Inc. Time Warner, Inc. Transocean, Inc. Travelers Cos., Inc. (The) United Parcel Service, Inc. "B" United Technologies Corp. UnircdHealth Group, Inc. US Bancorp Vdcro Energy Corp. Verizon Communications, Inc. VF Corp. Viacom, Inc. "B" Wachovia Corp. Walgreen CQ. Wal-Mart Stores, Inc. Walt Disney Co. (The) Washington Mutua, Inc. WellPoint, Inc. Wells Fargo & Co. Wcstcrn Union Co. (The) wycth
miu LNyEE'xhlENTs
OTHER NET ASSETS
119,800 125,800 167,200 517,300 183,600 6 19,600
94,300 255,200
216,700 76,800 66,400 97,300 66,800 41,800
294,000 71,500 50,050
602,600 67,600
159,700 133,900 798,300
43,300 460,900
62,400 90,900
24,811
USD USD USD USD USD USD USD USD USD USD USD USD USD USD USD WSD USD USD USD USD USD us13 USD USD USD USD
4,972,273 2,774,582 8,710,063 8,137,207 4,458,37 1
9,722,576 2,791,878 4,327,251 3,010,508
10.31 5,232 5,580,459 3,964,033 4,651,061 2,069,148 2,564,944
10,237,889 4,756,121 1,731,588
21,967,273 2,395,014 7,732,198 3,715,798
18,008,551 2,733,593
14,488,936 1,280,865
5,468,870 2,470,712 7,836,664 3,946,999 3,642,624 5,520,636 2,688,493 3,679,984 3,783,678 9,597,810 4,635,648 4,060,360 2,530,773 1,891,106 1,670,328
10,078,320 5,155,865 1,529,528 9,774,172 2,228,772 8,991,110 4,227,223 3,831,840 2,081,864
1 1,075,427 1,571,856
0.75 0.34 1.07 0.54 0.50 0.76 0.37 0.50 0.52 1.31 0.63 0.56 0.35 0.26 0.23 1.38 0.71 0.21 1.34 0.30 1.23 0.58 0.52 0.28 1.52 0.22
USD 4,137,179 4,189,581 0.57 831,643,541 723,205,077 98.95
832,483,002 726,176,645 99.36
4,698,100 0.64
no,a74,745 1oo.00 TOTAL, NET ASSETS
100
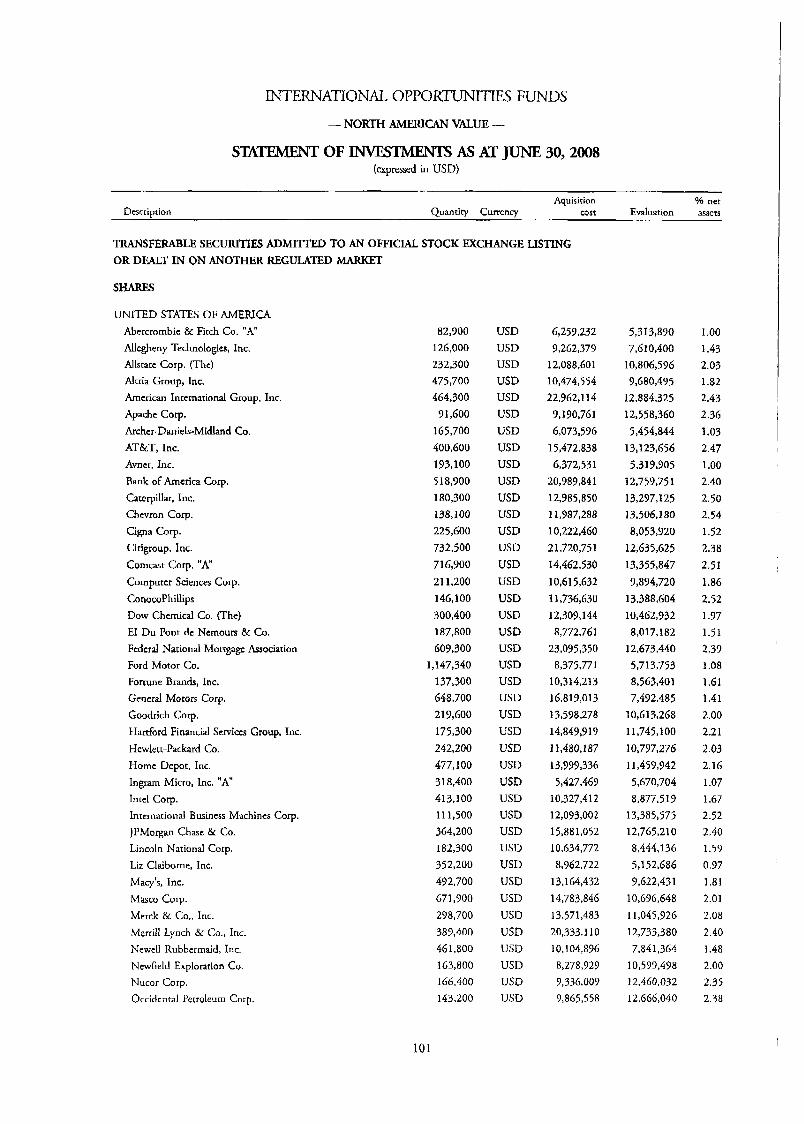
INTERNATIONAL OPPORTUNITIES FUNDS
- N o m AMERICAN VALUE -
SIX- OF INVESTMENTS As AT JUNE 30,2008 (expressed in USD)
Dcscriotion
~
Ya net Aquisition Ouantitv Currencv cost Evaluation assets
TRANSFERABLE SECURITIES ADMI'ITED TO AN OFFICIAL STOCK FXCHANGE LISTING OR DEALT IN ON ANOTHER REGULATED MARKET
UNITED STATES OF AMERICA Abercrombie & Fitch Co. "A" Allegheny Technologies, Inc. Allstarc Corp. (The) Altria Group, Inc. American International Group, Inc. Apache Cotp. Archer-Daniels-Midland Co. AT&T, Inc. Avnet, Inc. Bank of America Corp. Caterpillar, Inc. Chevron Corp. Cigna Corp. Cidgroup, Inc. Corncast Corp. " A Computer Sciences Corp. ConocoPhiUips Dow Chemical Co. (The) E1 Du Pont de Nemours & Co. Federal National Mortgage Association Ford Motor Co. Fortune Brands, Inc. General Motors Corp. Goodrich Corp. Hartford Financial Services Group, Inc. Hewlett-Packard Co. Home Depot, Inc. Ingram Micro, Inc. "A" Intel Corp. International Business Machines Corp. JPMorgan Chase & Co. Lincoln National Corp. Liz Claiborne, Inc.
Macy's, Inc. Masco Corp. Merck & Co., Inc.
Merrill Lynch & Co., Inc.
Newell Rubbermaid, Inc. Ncwfield Exploration Co. Nucor Corp. Occidcntal Petroleum Corp.
82,900 126,000 232,300 475,700 464,300
91,600 165,700 400,600 193,100 518,900 180,300 138,100 225,600 732,500 716,300 21 1,200 146,100 300,400 187,800 609,300
1,147,340 137,300 648,700 2 19,600 175,300 242,200 477,100 31 8,400 413,100 11 1,500 364,200 182,300 352,200 492,700 671,900 298,700 383,400 461,800 163,800 166,400 143,200
USD USD USD USD USD USD USD USD USD USD USD USD USD USD USD USD USD USD USD USD USD USD USD USD USD USD USD USD USD USD USD USD USD USD USD USD USD USD USD USD USD
6,253,232 9,262,379
12,088,601 10,474,554 22,962,114
9,190,761 6,073,596
15,472,838 6,372,531
20,989,841 12,985,850 11,987,288 10,222,460 2 1,720,75 1 14,462,530 10,615,632 11,736,630 12,309,144 8,772,761
23,095,350 8,375.77 1
10,314,213 16,819,013 13,598,278 14,849,Y 19 1 1,480, I87 13,993,336 5,427,469
10,327,412 12,093,002 15,881,052 10,634,772 8,962,722
13,164,432 14,783,846 13,571,483 20,333,110 10,104,896 8,278,929 7,331;,009 9,865,558
5,313,890 7,610,400
10,806,596 9,680,495
12,884,325 12,558,360 5,454,844
13,123,656 5,319,905
12,753,75 1 13,297,125 13,506,180 8,053,920
12,635,625 13,355,847 9,894,720
13,388,604 10,462,932 8,017,182
12,673,440 5,713,753 8,563,401 7,412,485
10,613,268 1 1,745,100 10,737,276 1 1,459,942 5,670,704 8,877,519
13,385,575 12,765,210 8 , 4 4 4 ~ 36 5,152,686 9,622,431
10,696,648 11,045,926 12,733,380 7,841,364
10,599,498 12,460.032 12,666,040
I .oo 1.43 2.03 I .a2 2.43 2.36 1.03 2.47 1 .oo 2.40 2.50 2.54 1.52 2.38 2.51 1.86 2.52 1.97 1.51 2.39 1 .08 1 .61 1.41 2.00 2.21 2.03 2.16 1.07 1.67 2.52 2.40 1.53 0.97 1.81 2.01 2.08 2.40 1.48 2.00 2.35 2.38
I
101
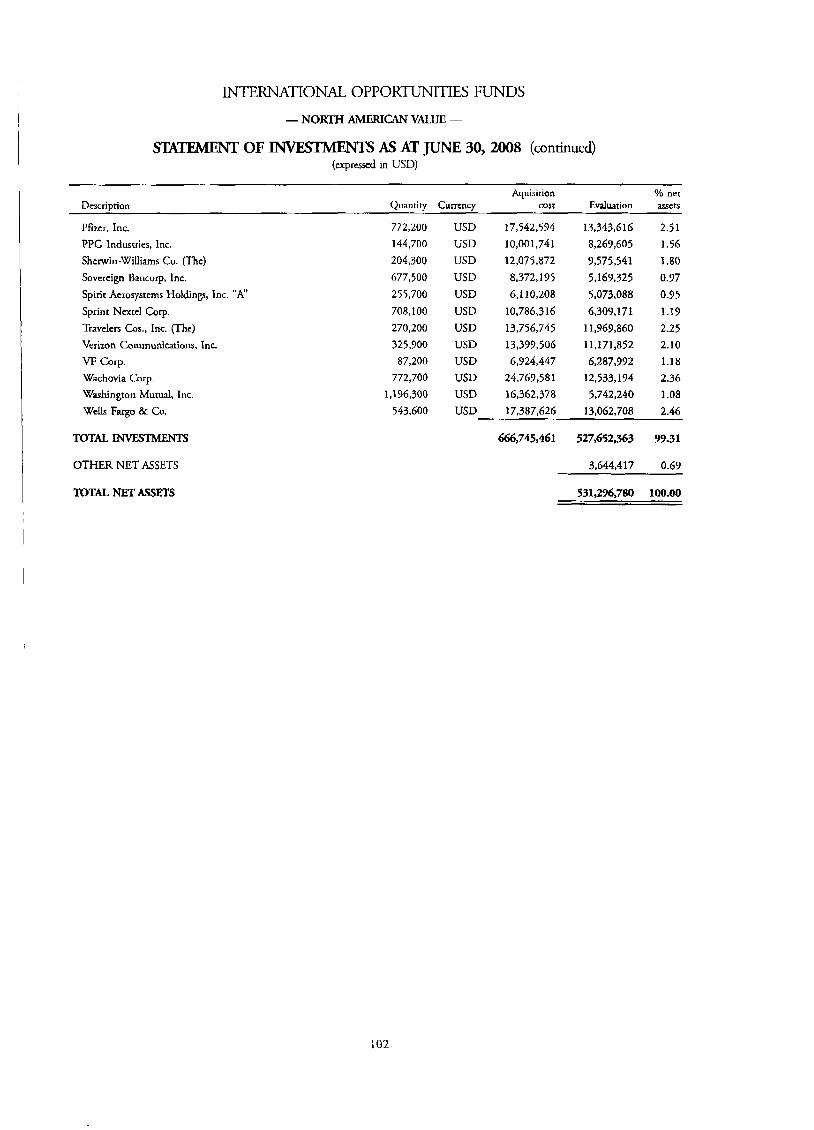
INTERNATIONAL OPPORTUNITIES FUNDS
- N0KII-I AMERICAN VALUE -
OF N E X M F N T S AS AT JUNE 30,2008 (continued) (expressed in USD)
Dcscriotion Aquisition Yo net
Ouantitv Currcncv COST Evaluation assets ~ ~ ~
Pfizcr, Inc.
PPG Industries, Inc.
Shcnnrin-Williams Co. (The) Sovcrcign Bancorp, Inc. Spirit Acrosysterns Holding, Inc. "A" Sprint Nextcl Corp.
Travelers Cos., Inc. (The) Verizon Communications, Inc. VF Corp. Wachovia Corp. Washington M u d , Inc. Wells Fargo & Co.
772,200 144,700 204,300 677,500
255,700 708,100 270,200
325,300 87,200
772,700 1,196,300
543,600
USD USD USD USD USD USD USD USD USD USD USD USD
17,542,594 10,001,741 12,075,872 8,372,195 6,110,208
10,786.316
13,756,745 13,399,506 6,924,447
24,767,581 16,362,378 17,387,626
13,343,616 8,269,605
9,575,541 5,169,325 5,073,088 6 , 3 0 9 ~ 7 I
11,969,860 11,171,852
6,287,992 12,533,194 5,742,240
13,062,708
2.51 1.56 1 .BO
0.97 0.95 1.19 2.25 2.10 1.18 2.36 1.08 2.46
TOTAL INVESTMENTS 666,745,461 527,652,363 99.31
OTHER NET ASSETS 3.644.417 0.69
TOTAL NET ASSETS 531,296,780 100.00
102
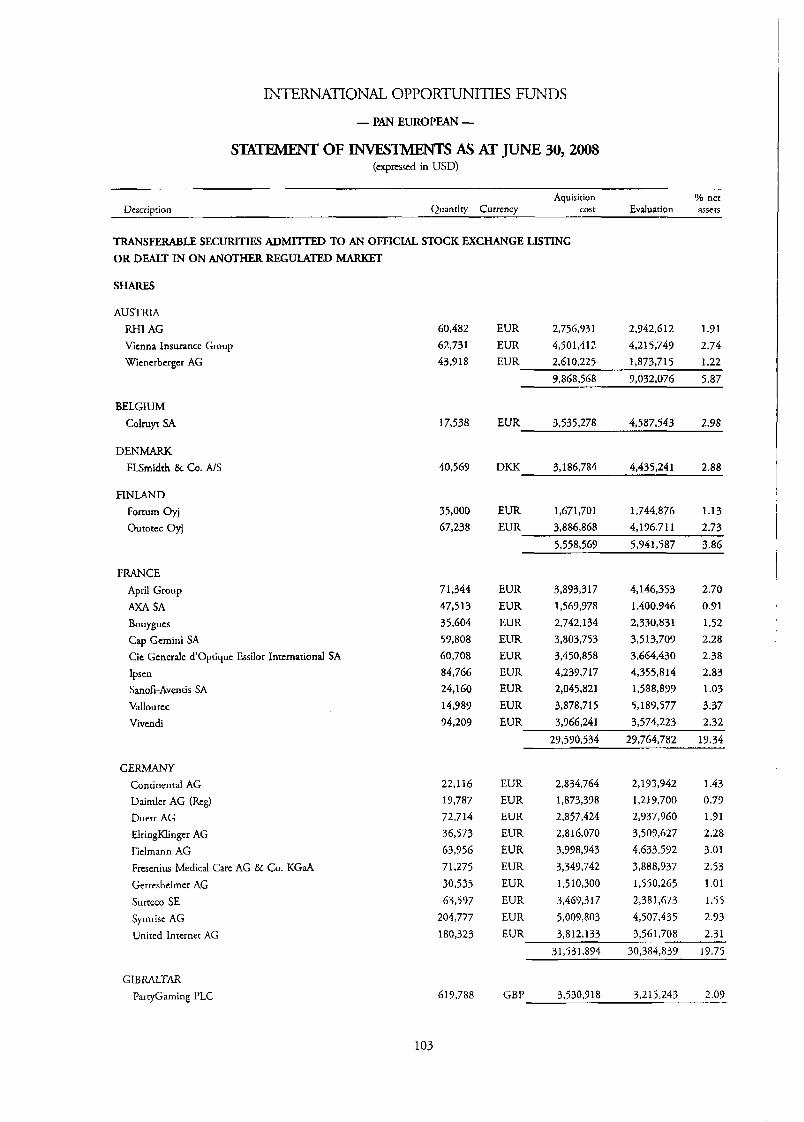
INTERNATIONAL OPPORTUNITIES FUNDS
- PAN EUROPEAN -
STATEMENT OF l l W 3 w AS AT JUNE 30,2008 (expressed in USD)
Descriution Aquisirion Yo net
Evaluarion assets Quanriry Currency cost
TRANSFFJWBLE SECURITIES ADMITTED TO AN OFFICIAL STOCK EXCHANGE LISTING OR DEALT IN ON ANOTHER REGULATED MARKET
SHARES
AUSTRIA RHI AG Vienna Insurance Group Wienerberger AG
BELGIUM Colruyt SA
DENMARK FLSmidrh & Co. A I S
FINLAND Fonurn Oyj Outotec Oyj
FRANCE April Group AXA SA Bouygucs Cap Gemini SA Cic Gcnerale dOptiquc Essilor International SA lpscn Sanofi-Aventis SA Vallourcc Vivendi
GERMANY Continental AG Daimler AG (Reg) Duerr AG ElringKlingcr AG Fielmann AG Frescnius Medical Care AG & Co. KGaA Gerrcsheirncr AG Surreco SE Symrise AG United Internet AG
GIB MLTAR PartyGaming PLC
60,482 62,731 43,918
17,538
40,569
35,000 67,238
71,344 47,513 35,604 59,808 60,708 84,766 24,160 14,989 94,209
22,116 19,787 72,714 36,573 63,956 71,275 30,535 63,597
204,777 180,323
617,788
103
EUR 2,756,931 2,742,612 1.91 EUR 4,501,412 4,215,749 2.74 EUR 2,610,225 1,873,715 1.22
9,868,568 9,032,076 5.87
EUR 3,535,278 4,587,543 2.98
EUR 1,671,701 1,744,876 1.13 EUR 3,886,868 4,196,711 2.73
5,558,569 5,941,587 3.86
EUR EUR EUR EUR EUR EUR EUR EUR EUR
3,893,317 1,569,978 2,742,134 3,803,753 3,450,858 4,239,717 2,045,821 3,878,715 3,966,24 1
4,146353 1,400,946 2,330,831 3,513,707 3,664,430 4,355,814 1,588,899 5,189,577 3,574,223
2.70 0.91 1.52 2.28 2.38 2.83 1.03 3.37 2.32
EUR EUR EUR EUR EUR EUR EUR EUR EUR EUR
2,834,764 1,873,398 2,857,424 2,s 16,070 3,998,943 3,349,742 1,510,300 3,469,317 5,009,803 3,812,133
2,193,942 1,219,700 2,937,960 3,509,627 4,633,592 3,888,937 1,550,265 2,381,673 4,507,435 3,561,708
1.43 0.77 1.91 2.28 3.01 2.53 1.01 1.55 2.73 2.31
31,531,894 30,384,839 19.75
GBP 3,530,918 3,215,243 2.09
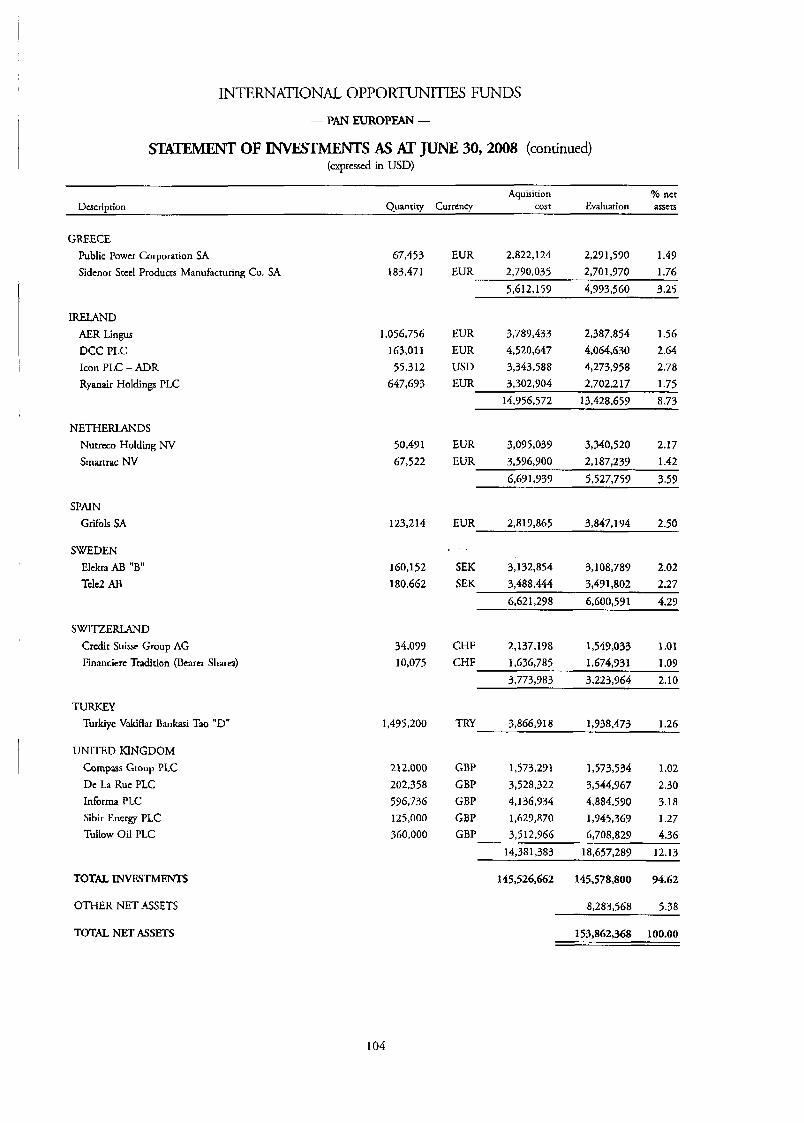
INTERNATIONAL OPPORTUNITIES FUNDS
- PAN EUROPIXN -
STGTEMENT OF IMrEsTMENTS As AT JUNE 30,2008 (continued) (expressed in USD)
Aquisition % net Description Quantity Currency cost Evaluation assets
GREECE Public Power Corporation SA Sidenor Steel Products Manufacturing Co. SA
IRELAND AER Lingus DCC PLC Icon PLC - ADR Ryanair Holdings PLC
NETHERLANDS Nutrcco Holding NV Smartrac NV
SPAIN Grifols SA
SWEDEN Elekra AB “E” Telc2 AB
SWITZERLAND Credit Suissc Group AG Financierc Tradition (Bearer Shares)
TURKEY Turkiye Valciflar Bankasi Tao “D”
UNITED KINGDOM Compass Group PLC Dc La Ruc PLC Infotrna PLC Sibir Energy PLC Tullow Oil PLC
TOTAL INVESTMFNTS
OTHER NET ASSETS
67,453 183,471
1,056,756 163,011 55,312
647,GY 3
50,471 67,522
123,214
160,152 180,662
34,099 10,075
1,495,200
212,000 202,358 596,736 125,000 360,000
EUR 2,822,124 2,29 1,590 1.49 EUR 2,790,035 2,701,970 1.76
5,612,159 4,993,560 3.25
EUR 3,789,433 2,387,854 1.56 EUR 4,520,647 4,064,630 2.64 USD 3,343,588 4,273,958 2.78 EUR 3,302,904 2,702,217 1.75
14,956,572 13,428,659 8.73
EUR 3,095,039 3,340,520 2.17 EUR 3,596,900 2,187,239 1.42
6,691,939 5,527,753 3.59
EUR 2,819,865 3,847,194 2.50
SEK 3,132,854 3,108,789 2.02 SEK 3,488,444 3,491,802 2.27
6,621,298 6,600,591 4.29
CHF 2,137,198 1,549,033 1.01 CHF 1,636,785 1,674,731 1.09
3,773,983 3,223,964 2.10
TRY 3,86631 a 1,938,473 1.26
1,573,534 1.02 GBP 1,573,291 GBP 3,528,322 3,544,967 2.30 GBP 4,136,934 4,884,590 3.18
1,629,870 1,945,369 1.27 GBP GBP 3,512,966 6,708,829 4.36
14,381,383 18.657.289 12.13
145,526,662 145,578,800 34.62
8,283,568 5.38
153,862,368 100.00 TOTAL NET ASSETS
104
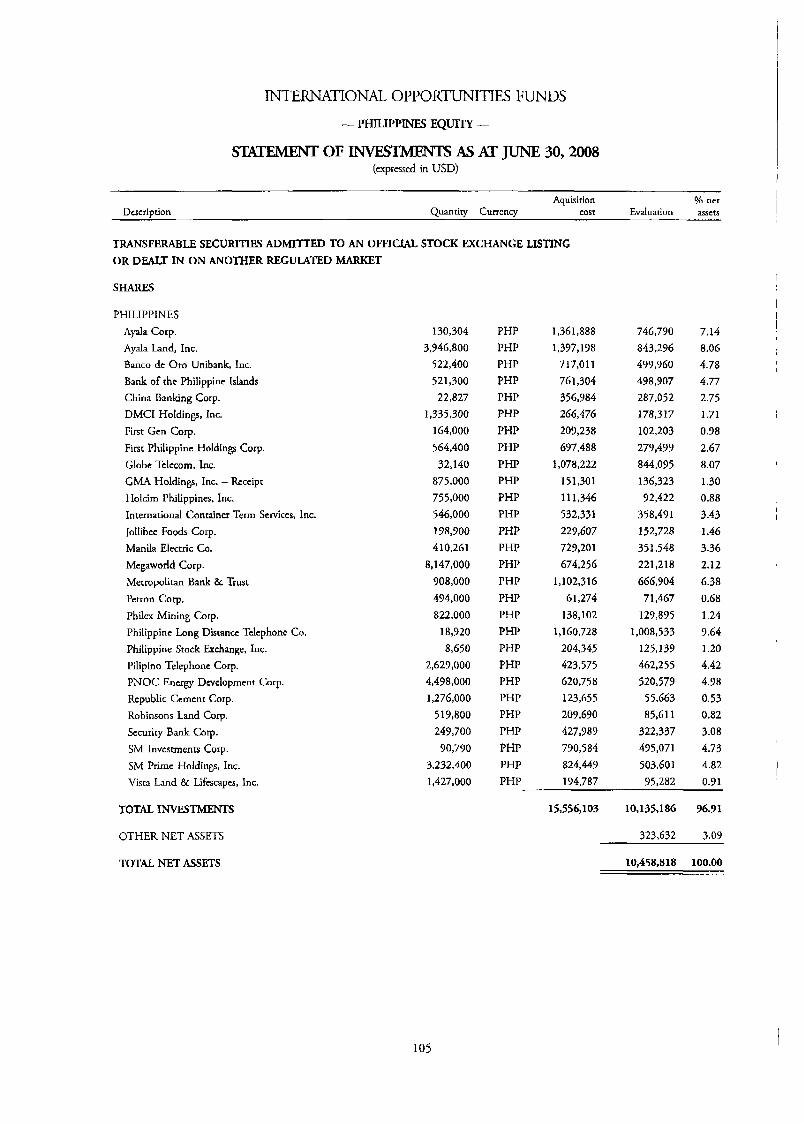
INTERNATIONAL OPPORTUNITIES FUNDS
- PHTLIPPINFS E Q W -
OF INVESTMENTS AS AT JUNE 30,2008 (expressed in USD)
Aquisirion Yo net Description Quantity Currency cost Evaluation assets
TRANSFERABLE SECURITIES ADMITTED TO AN OFFIClAL STOCK MCHANGE LISTING OR DEALT IN ON ANOTHER REGULATED W T
SHARES
PHILIPPINES Ayah Corp. Ayah Land, Inc. Banco dc Oro Unibank, Inc. Bank of rhc Philippine Islands China Banking Corp. DMCI Holdings, Inc. First Gcn Corp. First Philippine Holdings Corp. Globe Tclccorn, Inc. GMA Holdings, Inc. - Receipt Holcirn Philippines, Inc. International Container Term Services, Inc. Jollibee Foods Corp.
Manila Electric Co. Megaworld Corp. Metropohtm Bank & Trust Petron Corp. Philex Mining Corp. Philippine Long Distance Telephone Co. Philippine Stock Exchange, Inc. Pilipino Telephone Corp. PNOC Energy Development Corp. Republic Cemcnr Corp. Robinsons Land Corp. Security Bank Corp. SM Invcsrments Corp. SM Prime Holdings, Inc. Vista Land & Lifescapes, Inc.
TOTAL INVESTMENTS
130,304 3.9 4 6,8 0 0
522,400 521,300 22,827
1,335,300 164,000 564,400 32,140
875,000 755,000 546,000 I 98,900 410,261
8,147,000 908,000 494,000 822,000
18,920 8,650
2,629,000 4,498,000 1,276,000
519,800 249,700
90,790 3,232,400 1,427,000
PHP PHP PHP PHP PHP PHP PHP PHP PHP PHP PHP PHP PHP PHP PHI? PHP PHP PHP PHP PHP PHP PHP PHP PHP PHP PHP PHP PHP
1,361,888 1,397,198
717,011 761,304 356,984 266,471 209,238 697,488
1,078,222 151,301 11 1,346 532,331 229,607 729,201 674,256
1,102,316 61,274
138,102 1,160,728
204,345 423,575 620,758 123,655 207,690 427,989 790,584 824,449 174.787
746,770 843,276 477,760 478,707 287,052 I 78,3 17 102,203 279,499 844,095 136,323 92,422
358,491 152,728 351,548 221,218 666,904 71,467
129,895 1,008,533
125,139 462,255 520,579
55,663 85,611
322,337 495,071 503,601 95.282
!
I
I I I 7.14
8.06 4.78 I
4.77 2.75 1.71 ; 0.98 2.67 8.07 1.30 0.88 3.43 1.46 3.36 2.12 6.38 0.68 1.24 9.64 1.20
4.42 4.98 0.53 0.82 3.08 4.73
I I
4.82 0.91 _ _ .
15,556,103 10,135,186 36.91
OTHER NET ASSETS
TOTAL NET ASSETS
323,632 3.07
10,458,818 100.00
105
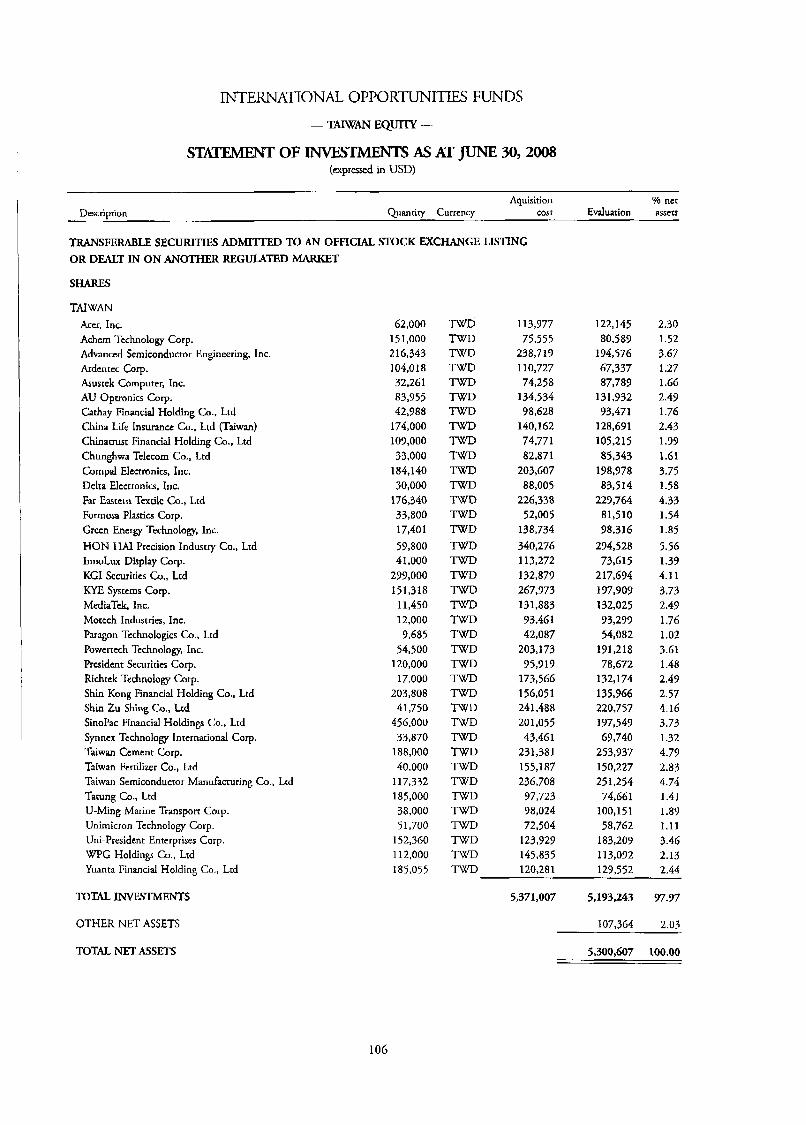
INTERNATIONAL OPPORmITIES FUNDS
- TAIWAN E Q W -
STATNWXT OF avvEsTMENTs As AT JUNE 30,2008 (expressed in USD)
Aquisition Yo net Evaluation assets Description Quantity Currency cost
TRANSFERABLE SECURITIES ADMI- TO AN OFFICIAL STOCK EXCHANGE LISTING OR DEALT IN ON ANOTHER REGULATED MARKET
SHARES
TAIWAN Acer, Inc. Achern Technology Corp. Advanced Semiconductor Engineering, Inc. Ardentec Corp. Asusrek Computer, Inc. AU Optronics Corp Cathay Financial Holding Co., Ltd China Life Insurance Co., Ltd (Taiwan) Chinatrust Financial Holding Co., Ltd Chunghwa Telecom Co., Ltd Cornpal Electronics, Inc. Delta Electronics, Inc. Far Eascctn Textile Co., Ltd Formosa Plastics Corp. Green Energy Technology, Inc. HON HAI Precision Industry Co., Ltd InnoLux Display COT. KGI Securidcs Co., Ltd KYE Systems COT. MediaTek, lnc. Motech Industries, Inc. Paragon Technologies Co., Ltd Powertech Technology, Inc. President Securities COT. Richrek Technology Corp. Shin Kong Financial Holding Co., Ltd Shin Zu Shing Co., Ltd SinoPac Financial Holdings Co., Ltd Synnex Technology International Corp. Taiwan Cement Corp. Taiwan Fertilizer Co., Ltd Taiwan Semiconductor Manufacturing Co., Ltd Tatung Co., Ltd U-Ming Marine Transport Corp. Unimicron Technology Corp. Uni-President Enterprises Corp. WPG Holdings Co., Ltd Yuanta Financial Holding Co., Ltd
TOTAL INVESTMENTS
OTHER NET ASSETS
62,000 15 1,000 216,343 104,018 32,261 83,955 42,988
174,000 109,000 33,000
184,140 30,000
176,340 33,800 17,401 59,800 41,000
293,000 151,318
11,450 12,000 9,685
54,500 120,000
17,000 203,808
41,750 456,000 33,870
188,000 40,000
117,332 185,000 38,000 5 1,700
152,360 112,000 185,055
TWD TWD TWD TWD TWD TWD TWD
TWD TWD rn TWD TWD TWD TWD TWD TWD TWD TWD TWD TWD TWD TWD TWD TWD TWD TWD TWD TWD TWD TWD TWD TWD TWD TWD TWD TWD TWD
w n
113,977 75,555
238,719 110,727 74,258
134,534 98,628
140,162 74,771 82,871
203,607 88,005
226,338 52,005
138,734 340,276 113,272 132,879 267,973 131,883 93,461 42,087
203,173 95,919
173,566 156,051 241,488 201,055 43,461
231,381 155,187 236,708
97,723 98,024 72,504
123,929 145,835 120.281
122,145 80,589
194,576 67,337 87,783
131,932 93,471
128,691 105,215 85,343
83,514 229,764
81,510 98,311
294,528 73,615
217,694 197,909 132,025 93,299 54,082
191,218 78,1572
132,174 135,366 220,757 177,549 69,740
253,937 150,227 251,254
74,661 100,151 58,762
183,209 113,092
198,978
2.30 1.52 3.67 1.27 1.66 2.49 1.76 2.43 1.99 1.61 3.75 1.58 4.33 1.54 1.85 5.56 1.39 4.11 3.73 2.49 1.76 1.02 3.61 1.48 2.49 2.57 4.16 3.73 1.32 4.79 2.83 4.74 1.41 1.89 1.11 3.46 2.13
129.552 . ,. . 2.44
5,371,007 5,193,243 97.97
107,364 2.03
TOTAL. NET ASSETS 5,300,607 100.00
106
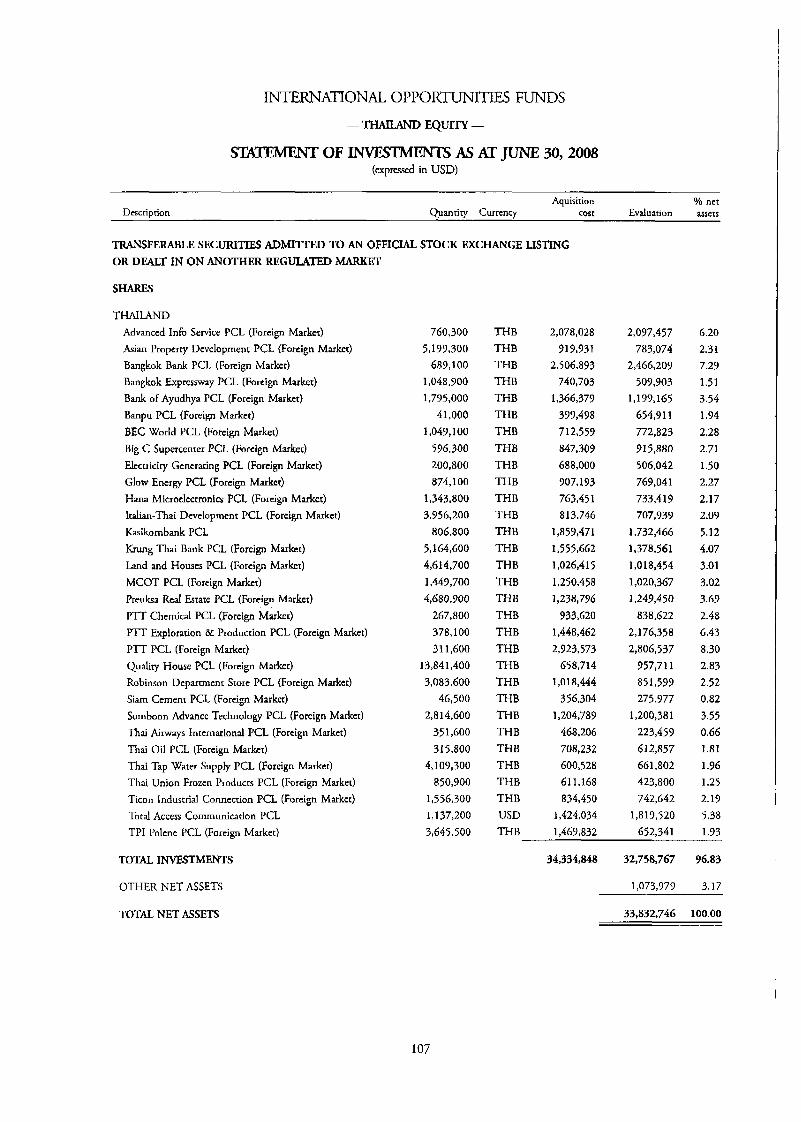
INTERNATIONAL OPPORTUNITIES FUNDS -TWJLANDEQlJlT!l-
S U m OF INVESTMENTS AS AT JUNE 30,2008 (expressed in USD)
Aquisition Yo net Description Quantity Currency cost Evaluation mcts
TRANSFERABLE SECURITIES ADMITTED TO AN OFFICIAL STOCK MCHANGE LISTING OR DEALT IN ON ANOTHER REGULAITD MARKET
SHARES
THAILAND Advanced Info Service PCL (Foreign Markcr) Asian Property Development PCL (Foreign Market) Bangkok Bank PCL (Foreign Marker) Bangkok Expressway PCL (Foreign Market) Bank of Ayudhya PCL (Foreign Market) Banpu PCL (Foreign Market) BEC World PCL (Foreign Market) Big C Supercenter PCL (Foreign Market) Electricity Generating PCL (Foreign Market) Glow Energy PCL (Foreign Market) Hana Microclecrronics PCL (Foreign Market) Italian-Thai Dcvelopment PCL (Forcign Markt) Kasikornbank PCL Krung Thai Bank PCL (Foreign Market) Land and Houses PCL (Foreign Market) MCOT PCL (Foreign Market) Preuksa Real &tare PCL (Foreign Markcr) PTT Chemical PCL (Foreign Market) PTT Exploration & Production PCL (Foreign Market) PTT PCL (Foreign Market) Quality House PCL (Foreign Market) Robinson Department Store PCL (Foreign Market) Siam Cement PCL (Foreign Market) Somboon Advance Technology PCL (Foreign Market) Thai Airways Intcrnarional PCL (Foreign Market) Thai Oil PCL (Foreign Marker) Thai Tap Water Supply PCL (Foreign Market) Thai Union Frozen Products PCL (Foreign Market) Ticon Industrial Connection PCL (Foreign Marker) Total Access Communication PCL TPI Polcne PCL (Foreign Market)
760,300 5,199,300
689,100 1,048,900 1.79 5,000
41,000 1,049,100
596,300 200,800 874,100
1,343,800 3,956,200
806,800 5,164,600 4,614,700 1,449,700 4,680,900
267,800 378,100 31 1,600
13,841,400 3,083,600
46,500 2,814,600 35 1,600
315,800 4,109,300
850,900 1,556,300 1,137,200 3,645,500
THB THB THB THB THB THB THB THB THB THB TI-IB THB THB THB THB THB THB THB THB THB THB THB THB THB THB THB THB THB THB USD THB
2,078,028 919,931
2,506,893 740,703
1,366,379 399,498 712,559 847,309 688,000 907,193 763,451 813,746
1,859,471 1,555,662 1,026,415
1,250,458 1,238,736
933,620 1,448,462 2,923,573
658,714 1,018.444
356,304 1,204,789
468,206 708,232 600,528 61 1,168 834,450
1,424,034 1,469,832
2,097,457 783,074
2,466,209 509,903
1,199,165 654,911 772,823 91 5,880 506,042 769,041 733,419 707.939
1,732,466 1,378,561 1,018,454 1,020,367 1,249,450
838,622 2,176,358 2,806,537
957,711 851,599 275,977
1,200,381 223,459 612,857 661,802 423,800 742,642
1,819,520 652,341
6.20 2.31 7.29 1.51 3.54 1.94 2.28 2.71 1.50 2.27 2.17 2.09 5.12 4.07 3.01 3.02 3.69 2.48 6.43 8.30 2.83 2.52 0.82 3.55 0.66 1.81 1.96 1.25 2.19 5.38 1.93
TOTAL INVESTMENTS
OTHER NET ASSETS
34,334,848 32,758,767 36.83
1,073,979 3.17
TOTAL NET ASSETS
107
33,832,746 100.00
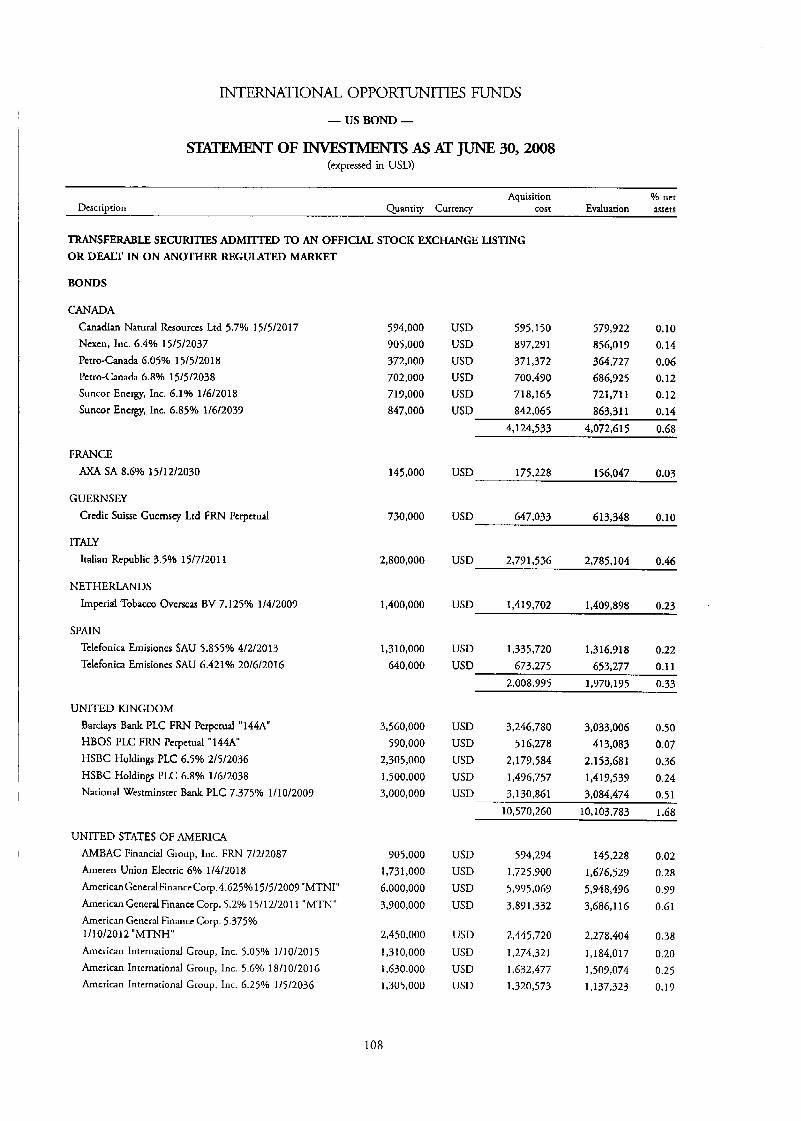
INTERNATIONAL OPPORTUNITIES FUNDS -USBOND-
OF INVESTMENTS As AT JUNE 30,2008 (expressed in USD)
Dcscription Aquisition Yo net
Evaluation assets Quantitv Curtcncv cost
TRANSFERABLE SECURITIES ADMI'ITFD TO AN OFFICIAL STOCK EXCHANGE EXSTING OR DEALT IN ON ANOTHER REGULATED MARKET
BONDS
CANADA Canadian Natural Resources Ltd 5.7% 15/5/2017 Ncxcn, Inc. 6.4% 15/5/2037 Pctro-Canada 6.05% 15/5/20] 8 Pcrro-Canada 6.8% 15/5/2038 Suncor Energy, Inc. 6.1% 1/6/2018 Suncor Encrgy, Inc. 6.85% 1/6/2037
FRANCE AXA SA 8.6% 15/12/2030
GUERNSEY Credit Suisse Guernscy Lrd F R N Pcrpctual
ITALY Italian Republic 3.5% 15/7/20] 1
NETHERLANDS Imperial Tobacco Overseas BV 7.125% 1/4/2009
SPAIN Tclefonica Ernisiones SAU 5.855% 4/2/2013 Telefonica Emisiones SAU 6.421% 20/6/2016
UNITED KINGDOM Bardays Bank PLC FRN Perpetual "144A" HBOS PLC FRN Perpetual "144A" HSBC Holdings PLC 6.5% 2/5/2036 HSBC Holdings PLC 6.8% 1\6/2038 National Westminster Bank PLC 7.375% 1/10/2007
UNITED STATES OF AMERICA AMBAC Financial Group, Inc. FRN 7/2/2087 Amcren Union Elccrric 6% 1/4/20 18 American GcncralFinance Corp.4.625% 15/5/2007 "MTNI" American General Finance Corp. 5.2% 15/12/2011 "MTN" American General Financc Corp. 5.375% 1/10/2012 "MTNH" American International Group, Inc. 5.05% 1 / I 01201 5 American lncernarional Group, Inc. 5.6% lS/l0/2016 American International Group, Inc. 6.25% 1 /5/2036
594,000 705,000 372,000 702,000 719,000 847,000
145,000
730,000
2,800,000
1,400,000
1,310,000 640,000
3,560,000 590,000
2,305,000 1,500,000 3,000,000
905,000 1.73 1.000 6,000,000 3,900,000
2,450,000
1.3 10,000 1,630,000 1,305,000
108
USD 595,150 579,922 0.10 USD 897,291 856,019 0.14 USD 371,372 364,727 0.06 USD 700,490 686,925 0.12 USD 718,165 721,711 0.12
USD 842,065 863,311 0.14
4,124,533 4,072,615 0.68
USD 175,228 156,047 0.03
647,033 613.348 0.10 USD
USD 2.79 1,536 2.785.104 0.46
USD 1,417,702 1,409,898 0.23
USD 1,335,720 1,316,918 0.22 USD 673,275 653,277 0.11
2,008,995 1.970.195 0.33
USD 3,246,780 3,033,006 0.50 USD 5 16,278 413,083 0.07
USD 2,179,584 2,153,681 0.36 USD 1,496,757 1,419,539 0.24 USD 3,130,861 3,084,474 0.51
10,570,260 10,103,783 1.68
USD 594,294 145,228 0.02 USD 1,725,900 1,676,529 0.28 USD 5,995,067 5,748,496 0.99 USD 3,89 1,332 3,686,116 0.61
USD 2,445,720 2,278,404 0.38 USD 1,274,321 1,184,017 0.20 USD 1,632,477 1,507,074 0.25 USD 1,320,573 1,137,323 0.19
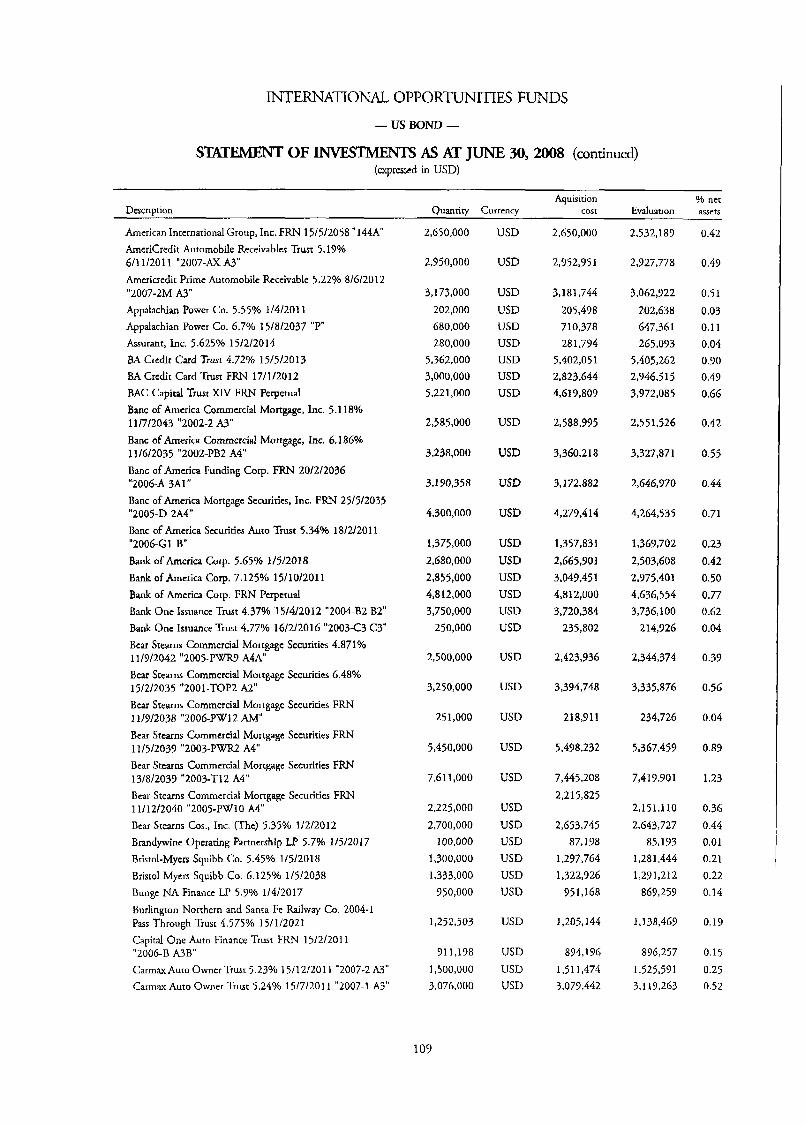
INTERNATIONAL OPPORmITIES FUNDS
- U S BOND -
STATEMENT OF INVESTMENTS As AT JUNE 30,2008 (continued) (expressed in USD)
Aquisition Yo net Evaluation assets Description Quantity Currency cost
American International Group, Inc. FRN 15/5/2058 "144A" AmcriCredit Automobile Receivables Trust 5.19% 6/11/201 I "2007-AX A3" Americredit Prime Automobile Receivable 5.22% 8/6/2012 "2007-2M A3" Appalachian Power Co. 5.55% 1/4/2011 Appalachian Power Co. 6.7% 15/8/2037 "P" Assurant, Inc. 5.625% 15/2/2014 BA Credit Card Trust 4.72% 15/5/2013 BA Credit Card Trust FRN 17/1/2012 BAC Capital Trust XIV FRN Perpetual Banc of America Commercial Mortgage, Inc. 5.118% 11/7/2043 "2002-2 A3" Banc of America Commercial Mortgage, Inc. 6.186%
Banc of America Funding Corp. FIU\I 20/2/2036 "2006-A 3A1" Banc of America Mortgage Securities, Inc. FRN 25/5/2035 "2005-D 2A4" Banc of America Securities Auto Trust 5.34% 18/2/20] 1 "2006-G1 E" Bank of America COT. 5.65% 1/5/2018 Bank of America C o p 7.1259'0 15/10/2011 Bank of America COT. FRN Perpetual Bank One Issuance Trust 4.37% 15/4/2012 "2004-B2 B2" Bank One Issuance Trust 4.77% 16/2/2016 "2003-C3 C3" Bear Stearns Commercid Mortgage Securities 4.871% 11/9/2042 "2005-PWRY A4A" Bear Stearns Commercial Mortgage Securities 6.48% 15/2/2035 "2001-TOP2 A2" Bear Stearns Commercial Mortgage Securities FRN 11/9/2038 "2006-PW12 AM" Bear Stearns Commercial Mortgage Securities FRN 11/5/2035, "2003-PWR2 A4" Bear Stearns Commercial Mortgage Securities FRN 13/8/2039 "2003-Tl2 A4" Bear Stearns Commcrcial Mortgage Securities FRN 11/12/2040 "2005-PW10 A4" Bear Stearns Cos., Inc. (The) 5.35% 1/2/2012 Brandywine Operating Partnership LP 5.7% 1/5/2017 Bristol-Myers Squibb Co. 5.45% 1/5/2018 Bristol-Myers Squibb Co. 6.125% 1/5/2038 Bunge NA Finance LP 5.7% 1/4/2017 Burlington Northern and Sanra Fe Railway Co. 2004-1 Pass Through Trust 4.575% 15/1/2021 Capital One Auto Finance Trust FRN 15/2/2011 "2006-8 M B " Carmax Auto Owncr Trust 5.23% 15/12/2011 "2007-2 A3" Carmax Auto Owner Trust 5.24% 15/7/2011 "2007-1 A3"
11/6/2035 "2002-PB2 A4"
2,650,000
2,950,000
3,173,000 202,000
280,000 5,362,000 3,000,000 5,221,000
2,585,000
3,238,000
3,190,358
4,300,000
1,375,000 2,680,000 2,855,000 4,812,000 3,750,000
250,000
2,500,000
3,250,000
251,000
5,450,000
7.61 1,000
6a0,ooo
2,225,000 2,700,000
100,000 1,300,000 1,333,000
950,000
1,252,503
711,198 1,500,000 3,076,000
103
USD
USD
USD USD USD USD USD USD USD
USD
USD
USD
USD
USD
USD USD USD USD USD
USD
USD
USD
US D
USD
USD USD USD US D USD USD
USD
USD USD USD
2,650,000
2,952,951
3,181,744 205,498 710,378 28 1,794
5,402,051 2,823,644 4,619,809
2,588,995
3,360,218
3,172,882
4,279,414
1,357,831 2,665,901 3,049,451 4,812,000 3,720,384
235,802
2,423,Y 36
3,394,748
218,911
5,498,232
7,445,208 2,215,825
2,653,745 87, I98
1,297,764 1,322,926
951,168
1,205,144
894,196 1.51 1,474 3,079,442
2,532,189
2.927,778
3,062,922 202,638 647,361 265,093
5,405,262 2,94651 5 3,972,085
2,551,526
3,327,871
2,646,970
4,264,535
1,369,702 2,503,608 2,975,401 4,636,554 3,736, IO0
214,926
2,344,374
3,335,876
234,726
5,367,453
7,419,901
2,151,110 2,643,727
85, I93 1,28 1,444 1,29 1,212
869,259
1,138,469
896,257 1,525,591 3,119,263
0.42
0.49
0.51 0.03 0.1 I 0.04 0.90 0.49 0.66
0.42
0.55
0.44
0.71
0.23 0.42 0.50 0.77 0.62 0.04
0.39
0.56
0.04
0.89
1.23
0.315 0.44 0.01 0.21 0.22 0.14
0.19
0.15 0.25 0.52
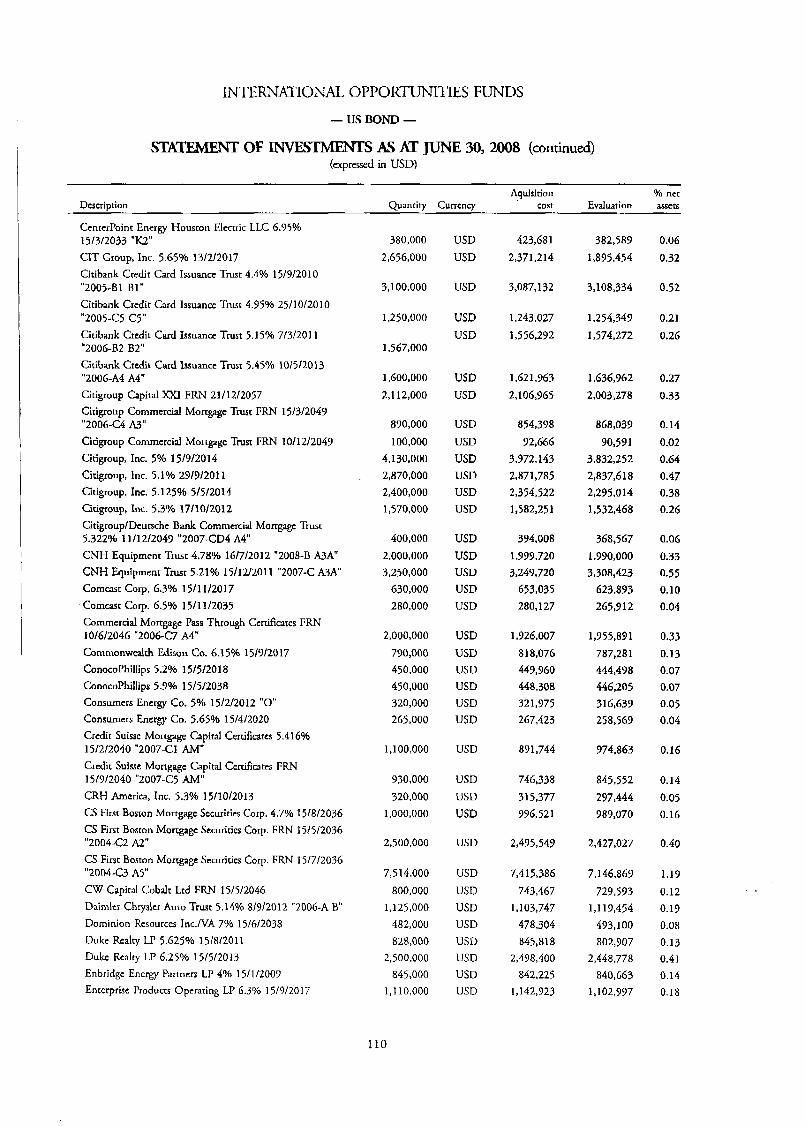
INTERNATIONAL OPPORTUNITIES FUNDS
- US BOND -
S W E M E N T OF -S As AT JUNE 30,2008 (continued) (expressed in WSD)
~
Aquisition % nct Description Quantity Currency cost Evaluation assets
Ccntcrl'oint Energy Houston Electric LLC 6.75% 15/3/2033 "K2" CIT Group, Inc. 5.65% 13/2/2017 Citibank Credit Card Issuance Trust 4.4% 15/9/2010 "2005-81 B1" Citibank Crcdit Card Issuance Trust 4.95% 25/10/2010 "2005-C5 C5" Citibank Credit Card Issuance TNSt 5.15% 7/3/2011 "2006-B2 B2" Citibank Credit Card Issuance Trust 5.45% 10/5/2013 "2006-A4 A4" Citigroup Capital W FRN 21/12/2057 Citigroup Commercial Mortgage Trust FRN 15/3/2047 "2006-C4 &" Citigroup Commercial Mortgage Trust FRN 1011 2/2049 Citigroup, Inc. 5% 15/9/2014 Citigroup, Inc. 5.1% 29/9/2011 Citigroup, Inc. 5.125% 5/5/2014 Citigroup, Inc. 5.3Oh 17/10/2012 CitigrouplDcutschc Bank Commercial Mortgage Trust 5.322% 11/12/2049 "2007-CD4 A4" CNH Equipment Trust 4.78% 16/7/2012 "2008-B & A CNH Equipment Trust 5.21% 15/12/2011 "2007-C & A Commt COT. 6.3% 1511 112017 Comcast Cop. 6.5% 15/11/2035 Commercial Mortgage Pass Through Certificates FRN 30/6/2046 "2006-C7 A4" Commonwealth Edison Co. 6.15% 15/9/2017 ConocoPhiUips 5.20/, 15/5/2018 ConocoPhillips S.9% 15/5/2038 Consumers Energy Co. 5% 15/2/2012 "0" Consumers Energy Co. 5.65% 15/4/2020 Credit Suisse Mortgage Capital Certificates 5.416%
Credit Suisse Mortgage Capital Certificates FRN 15/7/2040 "2007-C5 AM" CRH America, Inc. 5.3% 15/10/2013 CS First Boston Mortgage Securities Corp. 4.7% 15/8/2036 CS First Boston Mortgage Securities Corp. FRN 15/5/2036
CS First Boston Mortgage Securities COT. FRN 15/7/2036
CW Capital Cobalt Ltd FRN 15/5/2046 Daimlcr Chrysler Auto Trust 5.149'0 8/9/2012 "2006-A B" Dominion Resources Inc.NA 7% 15/6/2038 Duke Realty LP 5.625% 15/8/2011 Duke Realty LP 6.25% 15/5/2013 Enbridgc Energy Partners LP 4% 15/1/2009 Enterprise Products Operating LP 6.3% 15/9/2017
15/2/2040 "2007-C1 AM"
"2004-C2 A2"
"2004-C3 A5"
380,000 2,656,000
3,100,000
1,250,000
1,567,000
1,600,000 2,112,000
890,000
100,000 4,130,000 2,870,000 2,400,000 1,570,000
400,000 2,000,000 3,250,000
630,000 280,000
2,000,000
790,000 450,000 450,000 320,000 265,000
1,100,000
930,000 320,000
1,000,000
2,500,000
7,514,000 800,000
1,125,000 482,000 828,000
2,500,000 845,000
1,110,000
110
USD USD
USD
USB USD
USD USD
USD USD USD USD USD USD
USD USD USD USD USD
USD USD USD USD USD USD
USD
USD USD USD
USD
USD USD USD USD USD USD USD USD
423,681 2,371,214
3,087,132
1,243,027
1,556,292
1,621,963 2,106,965
854,398 92,666
3,972,143 2,871,785 2,354,522 1,582,251
394,008 1,779,720 3,249,720
653,035 280,127
1,926,007 818,076 449,960 448,308 321,975 267,423
871,744
746,338 315,377 976,521
2,495,549
7,415,386 743,467
1,103,747 478,304 845,818
2,478,400 842,225
1,142,923
382,587 1,895,454
3,108,334
1,254,349 1,574,272
1,636,962 2,003,278
868,039
70,591 3,832,252 2,837,618 2,275,014 1,532,468
368,567 1,990,000 3,308,423
623,893 265,912
1,755,891 787,281 444,498 446,205 316,639 258,569
974,863
845,552 297,444 989,070
2,427,027
7,146,869 729,593
1.1 17,454 493,100 802,907
2,448,778 840,663
1,102,777
0.06 0.32
0.52
0.21
0.26
0.27
0.33
0.14 0.02 0.64 0.47 0.38 0.26
0.06 0.33 0.55 0.10 0.04
0.33 0.13 0.07 0.07 0.05 0.04
0.16
0.14
0.05 0.16
0.40
1.19 0.12 0.19 0.08 0.13 0.41 0.14 0.18
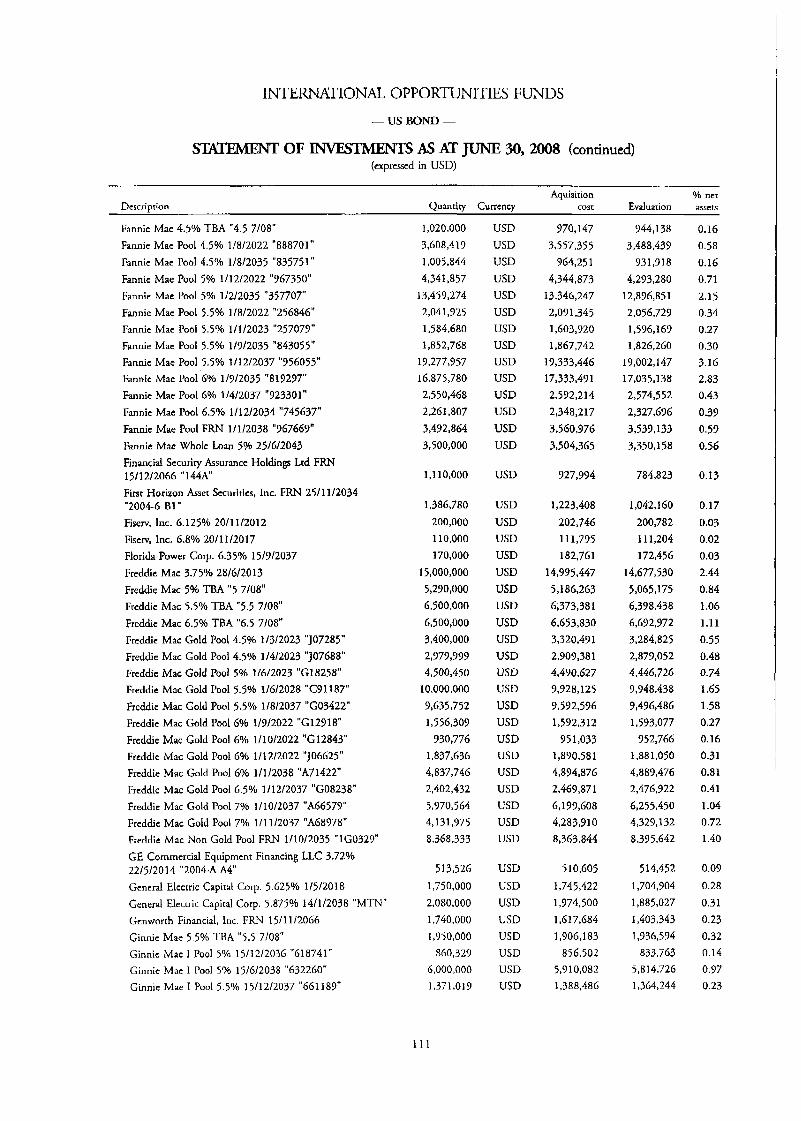
INTERNATIONAL OPPOR?ZTNITIES FUNDS
-USBOND-
S T i X m OF TNVESTMENTS As AT JUNE 30,2008 (continued) (expressed in USD)
Aquisition Yo net Description Quantity Currency cost Evaluation assets
Fannie Mae 4.5Oh TBA "4.5 7/08" Fannie Mac Pool 4.50/0 1/8/2022 "888701" Fannie Mae Pool 4.5% 1/8/2035 "835751" Fannic Mae Pool 5% 1/12/2022 "967350" Fannie Mae Pool 5% 1/2/2035 "357707" Fannie Mae Pool 5.5% 1/8/2022 "256846" Fannie Mae Pool 5.5% 1/1/2023 "257079" Fannie Mae Pool 5.5% 1/9/2035 "843055" Fannie Mac Pool 5.5% 1/12/2037 "956055" Fannic Mae Pool 6% 1/9/2035 "819297" Fannic Mae Pool 6% 1/4/2037 "923301" Fannie Mac Pool 6.5% 1/12/2034 "745637" Fannie Mae Pool FRN 1/1/2038 "967669" Fannie Mac Whole Loan 5% 25/6/2043 Financial Security Assurance Holdings Ltd FRN 15/12/2066 "144A" Firsr Horizon Asset Sccuritics, Inc. FRN 25/11/2034 "2004-6 B1" Fiserv, lnc. 6.125% 20/11/2012 Fiserv, Inc. 6.8% 20/11/2017 Florida Power Corp. 6.35% 15/9/2037 Freddie Mac 3.75% 28/6/2013 Freddie Mac 5% TBA "5 7/08" Freddie Mac 5.5% TBA "5.5 7/08" Freddie Mac 6.5% TBA "6.5 7/08" Freddie Mac Gold Pool 4.5'30 1\3/2023 "J07285" Freddie Mac Gold Pool 4.5% 11412023 "J07688" Freddie Mac Gold Pool 5% 1/6/2023 "G18258" Freddie Mac Gold Pool 5.5% 1/6/2028 "C91187" Freddie Mac Gold Pool 5.59'0 1/8/2037 "G03422" Freddie Mac Gold Pool 6% 1/9/2022 "G12918" Freddie Mac Gold Pool 69'0 1/10/2022 "G12843" Freddie Mac Gold Pool 6% 1/12/2022 "J06625" Freddie Mac Gold Pool 6% 1/1/2038 "A71422" Freddie Mac Gold Pool 6.5% 1/12/2037 "G08238" Freddie Mac Gold Pool 7% 111012037 "A66579" Freddie Mac Gold Pool 7% 1/11/2037 "A68978" Freddie Mac Non Gold Pool FRN 111012035 "1G0329" GE Commercial Equipment Financing LLC 3.72%
General Electric Capital Corp. 5.625% 1/5/2018 General Electric Capital Corp. 5.875% 14/1/2038 "MTN" Gcnworrh Financial, Inc. FRN 1511 112066 Ginnie Mae 5.5% TEA "5.5 7/08" Ginnic Mae I Pool 5% 15/12/2036 "618741" Ginnic Mae 1 Pool 5% 15/6/2038 "632260" Ginnie Mae I Pool 5.5% 15/12/2037 "661189"
22/5/2014 "2004-A A4"
1,020,000 3,608,419 1,005,844 4,341,857 13,459,274 2,041,925 1,584,680 1,852,768 19,277,957 16,875,780 2,550,468 2,261,807 3,492,864 3,500,000
1.1 10,000
1,386,780 200,000 110,000 170,000
15,000,000
5,290,000 6,500,000 6,500,000
3,400,000 2,979,999 4,500,450
10,000,000
9,635,752 1,556,309 930,776 1,837,636 4,837,746 2,402,432 5,970,564 4,131,975 8,368,333
513,526 1,750,000 2,080,000 1,740,000 1,950,000 860,329
6,000,000 1,371,OI 9
111
USD USD USD USD USD USD USD USD USD USD USD USD USD USD
USD
USD USD USD USD USD USD USD USD USD USD USD USD USD USD USD USD USD USD USD USD USD
USD USD USD USD USD USD USD USD
970,147 3,557,355 964.25 1
4,344,873 13,346,247 2,091,345 1,603,920 1,867,742 19,333,446 17,333,491 2,592,214 2,348,217 3,560,976 3,504,365
927,994
1,223,408 202,746 111,795 182,761
14,995,447 5,186,263 6,373,381 6,653,830 3,320,491 2,909,381 4,490,627 9,928,125 7,592,596 1,592,312 95 1,033 1,890,581 4,834,876 2,469,871 6,199,608 4,283,910 8,363,844
510,605 1,745,422 1,974,500 1,617,684 1,906,183 856,502
531 0,082 1,388,486
944,138 3,488,439 931,918
4,293,280 12,896,85 1 2,056,729 1,596,169 1,826,260 19,002,147 17,035,138 2,574,552 2,327,696 3,539,133 3,350,158
784,823
1,042,160 200,782 111,204 172,456
14,677,530 5,065,175 6,398,438 6,692,972 3,284,825 2,877,052 4,446,726 9,948,438 9,496,486 1,593,077 952,766 1,881,050 4,889,476 2,476,922 6,255,450 4,329,132 8,395,642
514,452 1,704,904 1,885,027 1,403,343 1,936,594 833,763
5,814,726 1,364,244
0.16 0.58 0.16 0.71 2.15 0.34 0.27 0.30 3.16 2.83 0.43 0.39 0.53 0.56
0.13
0.17 0.03 0.02 0.03 2.44 0.84 1.06 1.11 0.55 0.48 0.74 1.65 1.58 0.27 0.16 0.31 0.81 0.41 1.04 0.72 1.40
0.09 0.28 0.31 0.23 0.32 0.14 0.97 0.23

INTERNATIONAL OPPORTCTNITIES FUNDS - US BOND -
S- OF -S As AT JUNE 30,2008 (continued) (expressed in USD)
~~____________
Aquisition 016 net Description Quantity Currency cost Evaluation assets
Ginnie Mae I Pool 6% 15/9/2037 "674455" Ginnie Mae 1 Pool 6% 15/12/2037 "646077" Ginnie Mae I Pool 6% 15/12/2037 "664481" GlaxoSrnithKIine Capital, Inc. 5.65% 15/5/2018 GlaxoSrnithKIinc Capital, Inc. 6.375% 15/5/2038 GMAC Commercial Mortgage Sccuritics, Inc. 4.079% 10/5/2036 "2003-C1 A2" GS Mortgage Sccurities Corp. I1 FRN 10/4/2038 "2006-GG6 A4" HouseholdAutomotiveTNst 5.3% 17/11/2011 "2007-1 A3" Household Crcdit Card Master Note Trust I 5.1% 15/61 2012 "2006-1 A" Humana, Inc. 6.3% 1/8/2018 iscar Financial, Inc. 8.625% 1/6/2013 JP Morgan Chasc Capital X X V 6.8% 111012037 "Y" JP Morgan Chase Cornmcrcial Mortgage Securities Corp. 4.994% 12/7/2035 "2002-C3 A2" JP Morgan Chase Cornmcrcial Mortgage Securities Corp. 6.465% 1511 112035 "2001-CIB3 A3" JP Morgan Chase Commercial Mortgage Securities Corp. FRN 12/8/2037 JP Morgan Chase Cornmcrcial Mortgage Securities Corp. FRN 12/1/2043 "2005-CB13 A4" JP Morgan Chase Commercial Mortgage Securities Corp.
JP Morgan Chase Commcrcial Mortgage Securities Corp. FRN 12/12/2044 "2006-CB14 A4" JP Morgan Chasc Commercial Mortgage Securities Corp. FRN 12/2/2049 "2007-CB 19 AM" JPMorgan Chase & Co. 5.125% 15/9/2014 JPMorgan Chase & Co. 5.15% 111012015 JPMorgan Chase & Co. 6.6259'0 15/3/2012 Kansas City Power & Light Co. 5.85% 15/6/2017 Keycorp 6.5% 14/5/2013 "MTN" LB-UBS Commercial Mortgage Trust 4.166% 15/5/2032 "2003-C3 A4" LB-UBS Commercial Mortgage Trust FRN 15/7/2040 "2007-C6 A4" Lehman Brothers Holdings, Inc. 6.2% 26/9/2014 "MTN" Lehrnan Brothers Holdings, Inc. 6.625% 18/1/2012 MBNA Credit Card Martcr Note Trust 4.45% 15/8/2016
Mellon Funding Corp. 5.2% 15/5/2014 Mcrrill Lynch & Co., Inc. 7.75% 14/5/2038 Merrill Lynch Mortgage Trust FRN 1211 112035 "2003-KEY 1 A4" Mctlifc Capital Trust IV 7.875% 15/12/2037 "144A Metropolitan Life Global Funding I 5.125% 9/11/2011 "144A
FRN 15/1-2/2044 "2005-LDP5 A4"
"2004-81 B1"
3,159,414 883,404
1,816,379 1,762,000 1,384,000
495,000
2,000,000 3,416,000
5,474,000 200,000
1,545,000 2,433,000
1,580,000
2,700,000
6,220,000
5,000,000
2,550,000
5,700,000
1,500,000 1,125,000 1,070,000 3,020,000 1,020,000
1,125,000
2,400,000
377,000 2,870,000 1,470,000
925,000 1,200,000 1,450,000
400,000
800,000
3,380,000
112
USD us13 USD USD USD
USD
USD USD
USD USD USD USD
USD
USD
USD
USD
USD
USD
USD USD USD USD USD USD
USD
USD USD USD
USD USD USD
USD USD
USD
3,224,968 905,236
1,874,321 1,760,94 1
1,379,786
450,312
1,900,795 3,417,029
5,490,430 204,552
1,537,376 2,220,057
1,574,039
2,810,301
5,840,768
5,017,969
2,528,589
5,723,133
1,393,717 1,109,316 1,033,616 3,191,699 1,056,049 1,120,499
2,287,583
385J 73 2,870,484 1,517,999
877,344 1,196,264 1,449,668
398,929 792,702
3,455,908
3,208,286 897,069
1,844,476 1,753,960 1,371,988
467,823
1,926,912 3,413,338
5,526,641 185,349
1,419,469 2,181,754
1,554,255
2,775,284
6,019,434
4,817,875
2,448,599
5,460,367
1,363,017 1,097,1;70 1,035,738 3,118,932
989,728 1,036,092
2,301,946
358.828 2,745,895 1,455,732
807,334 1,182,277 1,357,822
391,398
785,052
3,413,388
0.53 0.15 0.31 0.29 0.23
0.08
0.32 0.57
0.92 0.03 0.24 0.36
0.26
0.46
I .oo
0.80
0.41
0.91
0.23 0.18 0.17 0.52 0.17 0.17
0.38
0.06 0.46 0.24
0.1 3 0.20 0.23
0.07 0.13
0.57

INTERNATIONAL OPPORTUNITIES FUNDS
- US BOND -
SU- OF INVESTMENTS AS AT JUNE 30,2008 (continued) (expressed in USD)
Aquisition Yo net Description Quantity Currency cost Evaluation assets
Monumental Global Funding 111 5.25% 15/1/2014 " 1 4 M Morgan Sranley 6.625% 1/4/2018 "MTN" Morgan Stanley Capital 1 5.01% 15/4/2038 "2003-1Q5 A4" Morgan Stanley Capital I FRN 15/7/2030 "1998-WF2 F" Morgan Stanley Capitd I FRN 12/7/2044 "2006-HQ9 A4" MorganStanlcy Capital I F R N 12/12/2049 "2007-1Q16AM" Morgan Stanley Dean Witter Capitd 14.74% 13/11/2036 "2003-TOP9 A2" Nisource Finance Corp. 7.875% 1511 1/2010 Nissan Auto Receivables Owner Trust 5.05% 17/11/2014 "2008-B A4" Northern States PowerlMN 5.25% 15/7/2035 Northern States Powcr/MN 6.2% 1/7/2037 Ohio Power Co. 5.5% 15/2/2013 "F" Ohio Power Co. 6.6% 15/2/2033 "G" Orade Corp. 6.5% 15/4/2038 Pacificorp 6.1% 1/8/2036 Philip Morris Intcrnational, Inc. 5.65% 16/5/2018 Philip Morris International, Inc. 6.375% 16/5/2038 Pricoa Global Funding 1 5.3Oh 27/9/2013 " 1 4 W Principal Life Income Funding Trusts 5.125% 1/3/2011 RBS Capital Trust 1 FRN Perpetual Residential Funding Mortgage Securities I 5.7596 25/3/2034 SCANA Corp. 6.875% 15/5/2011 "MTN" Time Warner Cable, Inc. 6.75% 1/7/2018 Time Warner, Inc. 7.7% 1/5/2032 Travelers Property Casualty Corp. 5% 15/3/2013 Union Electric Co. 5.30/0 1/8/2037 Union Electric Co. 6.4% 15/6/2017 United States Treasury Note/Bond 3.5% 31/5/2013 United States Treasury NotelBond 3.5% 15/2/2018 United States Treasury NotelBond 3.875% 15/5/2018 United Srates Treasury NorclBond 4% 15/2/2015 United Stares Treasury Note/Bond 4.25% 1511 112017 United States Treasury NotclBond 4.75% 15/8/2017 Unired Statcs Treasury NotelBond 5% 15/5/2037 USAA Auto Owncr Trust 4.16% 16/4/2012 "2008-1 A3" USA4 Auto Owner Trust 5.16% 15/11/2013 "2008-2 A4" Vokswagen Auto Loan Enhanced Trust 4.5% 20/7/2012
WachoviaAuro Loan Owner Trusr 2006-1 4.27% 20/4/2012 Wachovia Auto Owner Trust 5.49% 22/4/2013 "2007-AA4" Wachovia Bank Commercial Mortgage Trust FRN 15/3/2042 "2005-Cl7 A4" Wachovia Bank NA 5.6% 15/3/2016 WashingtonMutualBanWMend~rsonNV5.125~~ 15/1/2015 Wells Fargo Capital XllI FRN Perperual "GMTN"
"2008-1 A3"
3,500,000 2,974,000 5,250,000 3,250,000 3,900,000
200,000
5,590,000 5 10.000
2,700,000
225,000 370,000 455,000 305,000
1,000 325,000
1,160,000 1,160,000 2,940,000 1,960,000 2,440,000
950,000 600,000
1,680,000 600,000 280,000 155,000 266,000
7,620,000 7,904,000 4,077,000 9,750,000
14,525,000 5,530,000
12,807,000 5,710,000 3,700,000
8,000,000
. 7,200,000 5,300,000
3,000,000
1,310,000 1,940,000 1,413,000
113
USD USD USD USD USD USD
USD USD
USD USD USD USD USD USD USD USD USD USD USD USD USD USD USD USD USD USD USD USD USD USD USD USD USD USD USD USD
USD USD USD
USD USD USD USD
3,468,479 3,009,224 5,218,694 3,376,811 3,972,996
186,269
5,500,404 545,865
2,699,217 206,818 387,425 457,852 317,881
998 333,012
1,156,977 1,154,791 3,052,535 1,998,915 2,195,019
924,698 630,820
1,678.61 1 617,056 282.410 136,419 281,726
7,585,682 7,805,854 4,049,705
10,069,308 15,245,533 5,907,895
13,5G0,064 5,713,135 3,699,035
7,999,617 7,199,953 5,386,932
2,867,763 1,277,643 1,603,707 1,413,000
3,368,957 2,837*577 5,168,423 3,328,534 3,780,734
176,231
5,390,509 529,076
2,7141 17 200,062 372,939 454,584 291,052
1,014 318,344
1,135,711 1,126,765 2,875.1 20 1,931,711 2,117,120
887,656 624,460
1,689,930 613,744 273,130 123,383 265,309
7,664,05 1 7,602,044 4,039,414
10,028,031 14,826,844
5,854,456 13,747,520 5,731,945 3,727,926
8,042,169 7,181 ,640 5,414,602
2,863,158 1,238,609 1,473,764 1,402,675
0.56 0.47 0.86 0.55 0.63 0.03
0.90
0.09
0.45
0.03 0.06 0.08 0.05 0.00 0.05 0.19 0.19 0.48 0.32 0.35 0.15 0.10 0.28 0.10 0.05 0.02 0.04 1.27 1.26 0.67 1.67 2.47 0.97 2.29 0.95 0.62
1.34 1.19 0.90
0.48
0.21 0.25 0.23
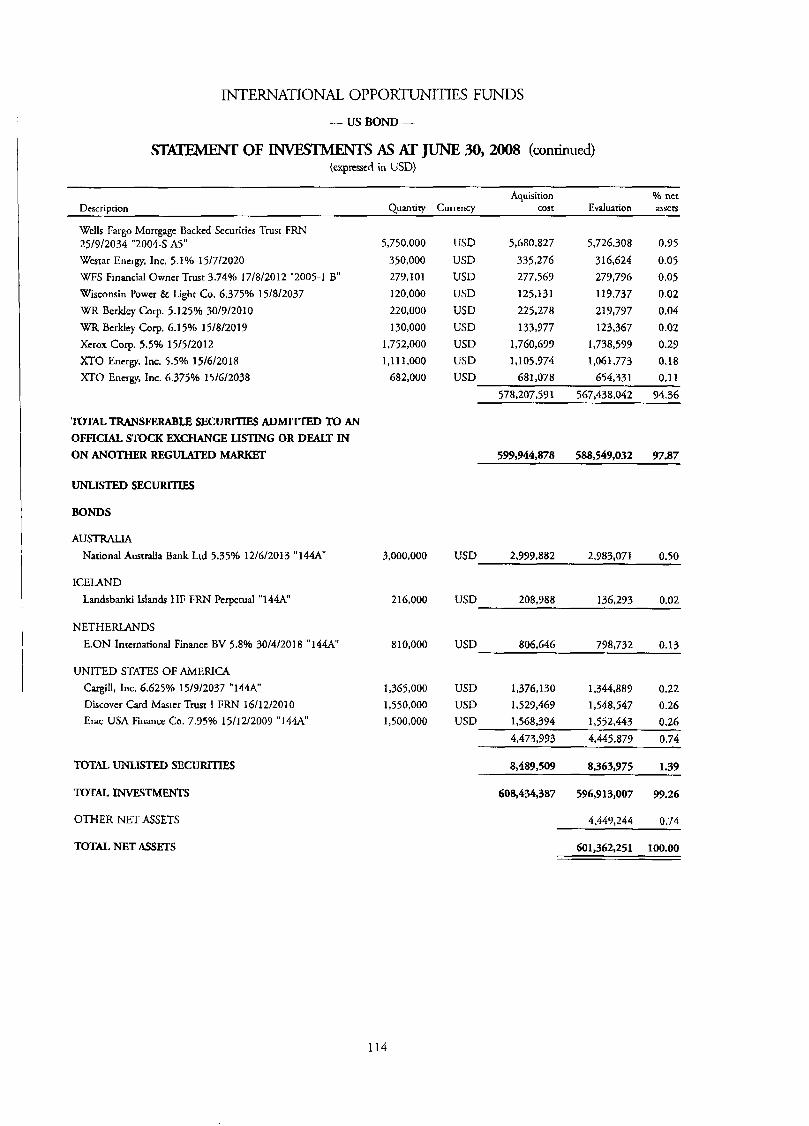
INTERNATIONAL O P P O R ~ I T I E S FUNDS
- us BOND -
OF -S AS AT JUNE 30,2008 (continued) (expressed in USD)
~ ~
Aquisition % net Description Quanriry Currency cost Evaluation assets
Wells Fargo Mortgage Backed Securities Trust FRN 25/9/2034 "2004-S A5" Westar Energy, Inc. 5.10/0 15/7/2020 WFS Financial Owner Trust 3.74% 17/8/2012 "2005-1 B" Wisconsin Power & Light Co. 6.375% 15/8/2037 WR Berkley Corp. 5.125% 30/9/2010 WR Berkley Corp. 6.15% 15/8/2019 Xerox Corp. 5.5% 15/5/2012 XTO Energy, Inc. 5.5% 15/6/2018 XTO Energy, Inc. 6.375% 15/6/2038
5,750,000 350,000 279,101 I20,OOO 220,000 130,000
1,752,000 I ,111.000
682,000
USD 5,680,827 USD 335,276 USD 277,569 USD 125,131 USD 225,278 USD 133,977 USD 1,760,699 USD 1 JOS.974 USD 681,078
5,726,308 316,624 279,796 119,737 219,797 123,367
1,738,599 1,061,773
654,331
0.95 0.05 0.05 0.02 0.04 0.02 0.29 0.18 0.1 1
TOTAL TRANSFERABLE SECURITLES ADMI'ITED TO AN OFFICIAL STOCK EXCHANGE LISTING OR DEALT IN ON ANOTHER REGULATED MARKET
UNLISTED SECURITIES
BONDS
AUSTRALIA National Australia Bank Ltd 5.35% 12/6/2013 "l44A"
ICELAND Landsbanki Islands HF FRN Perpetual " 1 4 W
N E T H E W D S E.ON lnrctnationd Finance BV 5.8% 30/4/2018 "144A'
UNITED STATES OF AMERICA Cargill, Inc. 6.625% 15/9/2037 "144A" Discover Card Master Trusr I FRN 16/12/2010 Erac USA Finance Co. 7.95% 15/12/2009 "144A"
TOTAL UNLISTED SECURITIES
TOTAL INVESTMJXR
OTHER NET ASSETS
3,000,000
2 16,000
8 10,000
1,365,000 1,550,000 1,500,000
578,207,591 567,438,042 94.36
599,944,878 588,549,032 97.87
USD 2,979,882 2,983,071 0.50
USD 208,988 136,293 0.02
USD 806,646 798,732 0.13
USD 1,376,130 1,344,889 0.22 USD 1,529,469 1,548,547 0.26 USD 1,568,394 1,552,443 0.26
4,473,993 4,445,879 0.74
8,489,509 8.363,975 1.39 ~
608,434,387 596,913,007 m.26
4,449,244 0.74
601,362,251 100.00 TOTAL NET ASSETS
114

INTERNATIONAL OPPOR'IZTNITIES FUNDS
- us CORPORATE BOND -
STATEMEW OF As AT JUNE 30,2008 (cxprcssed in USD)
Aquisition 96 net Description Quanriry Currency cost Evaluation assets
TRANSFERABLE SECURITIES ADMITTED TO AN OFFICJAL STOCK EXCHANGE LISTING OR DEALT IN ON ANOTHER REGULATED MARKET
BONDS
BERMUDA Weathcrford International Ltd 5.1 5% 15/3/2013
CANADA Anadarko Finance Co. 7.5% 1/5/2031 '73" Canadian National Railway Co. 6.25% 1/8/2034 Canadian National Railway Co. 6.375% 15/11/2037 Canadian Natural Resources Ltd 5.15% 1/2/2013 Canadian Natural Resources Ltd 5.7% 15/5/2017 Canadian Natural Resources Ltd 5.85940 1/2/2035 Canadian Natural Resources Ltd 6.25% 15/3/2038 Husky Energy, Inc. 6.8% 15/9/2037 Nexcn, Inc. 6.4% 15/5/2037 Petro-Canada 6.05% 15/5/2018 Pctro-Canada 6.8% 15/5/2038 Suncor Energy, Inc. 6.1% 1/6/2018 Suncor Energy, Inc. 6.85% 1/6/2039 TransCanada Pipelines Ltd 6.2% 15/10/2037 Xsttara Finance Canada Ltd 5.5% 16/11/2011 "144A" Xstrata Finance Canada Lrd 5.8% 15/11/2016 "144A"
CAYMAN ISLANDS Transocean, Inc. 5,25% 15/3/2013 Vale Ovcrscas Ltd 6.875% 21/11/2036 XL Capital Lrd FRN Pcrperual " E
FRANCE Lafarge SA 7.125% 15/7/2036
G E W Y Deuache Bank AG (London) 4.875% 20/5/2013 Deutsche Bank AG (London) 5.375% 12/10/2012 Deursche Bank AG (London) 6% 1/9/2017
GUERNSEY Credit Suisse Gucrnscy Ltd FRN Perpetual
ITALY Iralian Rcpublic 3.5% 15/7/20] 1
4,000,000
375,000 725,000 946,000
3,500,000 576,000
1,250,000 750,000
1,000,000 2,050,000
556,000 1,050,000 1,528,000 1,801,000
905,000 730,000
1,120,000
1,600,000 409,000 625,000
345,000
5,250,000 2,050,000 1,225,000
1,775,000
7,500,000
USD 3,992,222 3,952,160 0.53
USD USD USD USD USD USD USD USD USD USD USD USD WSD USD WSD USD
425.392 752,620 995,947
3,499,079 577,115
1,171,775 739,486
1,057,751 1,999,070
555,062 1,047,742 1,526,225 1,790,506
928,693 745,334
1,135,218
403,339 720,248 950,171
3,511,025 562,348
1,134,459 712,093 998,476
1,939,048 545,130
1,027,452 1,533,762 1,835,682
828,726 721,329
1,055,566
0.05
0.10 0.13 0.47 0.08 0.15 0.10 0.13 0.26 0.07 0.14 0.21 0.25 0.1 1 0.10 0.14
18,947,015 18,478,856 2.49
USD 1,538,108 1,614,387 0.22 USD 422,825 388,676 0.05 USD 554,065 421,875 0.06
2,574,998 2,424,938 0.33
USD 379,043 313,170 0.04
USD 5,243,036 5,157,574 0.70 2,077,458 0.28 USD 2,089,117
USD 1,264,783 1,244,651 0.17 8,596,936 8,479,683 1.15
USD 1,573,266 1,471,360 0.20
USD 7.477.329 7.460.100 1.01
115
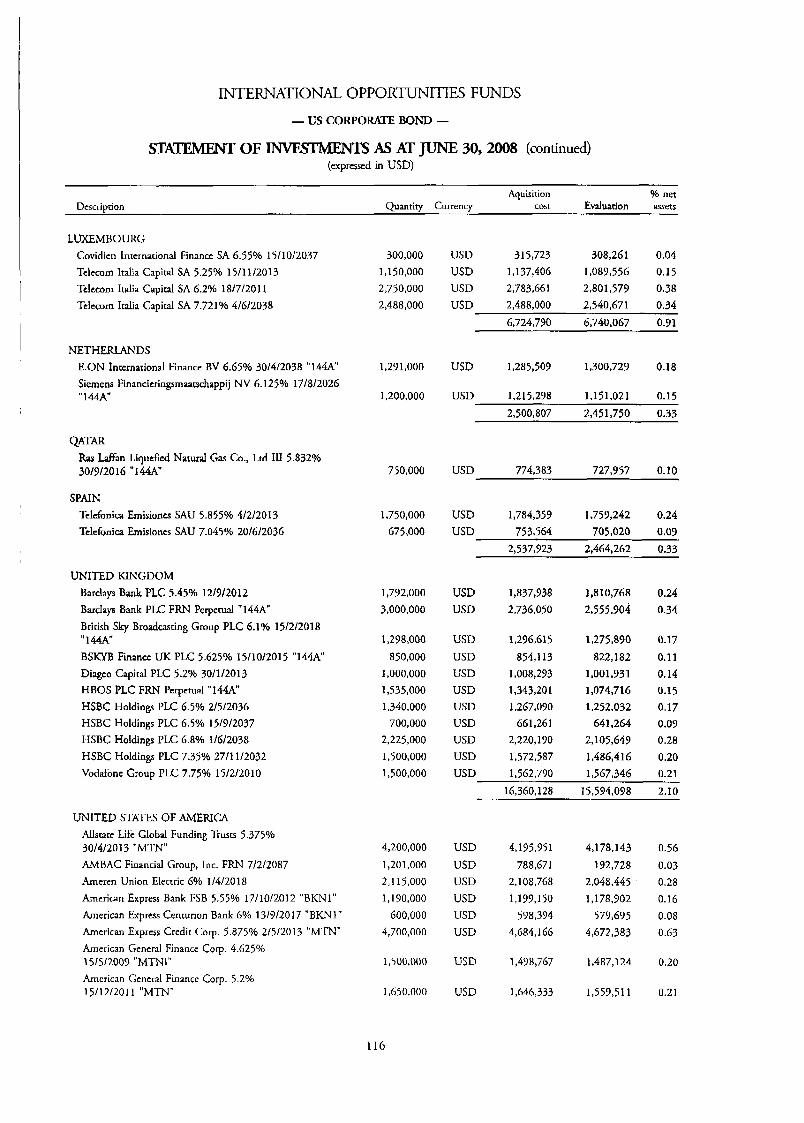
INTERNATIONAL OPPORTUNITIES FUNDS
- us CORPORATE BOND -
OF -S As AT JUNE 30,2008 (continued) (expressed in USD)
Aquisition % net Dcscription Quantity Currency cost Evaluation assets
LUXEMBOURG Covidicn International Finance SA 6.55% 15/10/2037 Tclccom Italia Capital SA 5.25% 15/11/2013 Telecom Italia Capital SA 6.2% 18/7/2011 Telecom ltalia Capital SA 7.721% 4/6/2038
NETHERL4NDS E.ON International Finance BV 6.65% 30/4/2038 "144A" Siemens Financieringsrnaatschappij NV 6.125% 17/8/2026 144A"
QATAR Ras Man Liquefied Natural Gas Co., Ltd 111 5.832% 30/9/2016 "144A"
SPAIN Tclcfonica Emisioncs MU 5.855% 4/2/2013 Telcfonica Emisioncs MU 7.045% 20/6/2036
UNITED KINGDOM Barclays Bank PLC 5.45% 12/9/2012 Barclays Bank PLC FRN Perpetual "144A" British Sky Broadcasting Group PLC 6.1% 15/2/2018 I' 144A" BSKYB Financc UK PLC 5.625% 15/10/2015 "144A" Diageo Capital PLC 5.2% 30/1/2013 HBOS PLC FRN Pcrpctual "144.4" HSBC Holdings PLC 6.5% 2/5/2036 HSBC Holdings PLC 6.5% 15/9/2037 HSBC Holdings PLC 6.8% 1/6/2038 HSBC Holdings PLC 7.35% 27/11/2032 Vodafone Group PLC 7.75% 15/2/2010
UNITED STATES O F AMERICA Allstate Life Global Funding Trusts 5.375% 30/4/2013 "MTN" AMBAC Financial Group, Inc. FRN 7/2/2087 Amcren Union Electric 6% 1/4/20 18
American Express Bank FSB 5.55% 17/10/2012 "BKNI" American Express Centurion Bank 6% 13/7/2017 "BKN1" American Express Credit Corp. 5.875% 2/5/2013 "MTN" American General Financc Corp. 4.625% 15/5/2009 "MTNI" American General Finance Corp. 5.2% 15/12/2011 "MTN"
300,000 1,150,000 2,750,000 2,488,000
1,291,000
1,200,000
750,000
1,750,000 675,000
1,792,000 3,000,000
1,298,000
850,000 1,000,000 1,535,000 1,340,000
700,000 2,225,000 1,500,000 1,500,000
4,200,000 1,201,000 2,115,000 1,130,000
600,000 4,700,000
1,500,000
1,650,000
1 1 6
USD 315,723 308,261 0.04 USD 1,137,406 1,089,556 0.15 USD 2,783,661 2,801,579 0.38 USD 2,488,000 2,540,671 0.34
6,724,790 6,740,067 0.91
1,285,509 1,300,729 0.18 USD
USD 1,215,298 1,151,021 0.15 2,500,807 2,451,750 0.33
USD 774,383 727,757 0.10
USD 1,784,359 1,759,242 0.24 USD 753.564 705,020 0.09
2,537,923 2,464,262- 0.33
USD USD
USD USD USD USD USD USD USD USD USD
1,837,938 2,736,050
1,296,615 854,113
1,008,293 1,343,201 1,267,090
661,261 2,220,190 1,572,587 1,562,790
1,810,768 2,555,904
1,275,890 822,182
1,001,931 1,074,716 1,252,032
641,264 2,105,649 1,486,4 I6 1,567,346
0.24 0.34
0.17 0.11 0.14 0.15 0.17 0.09 0.28 0.20 0.21
16,360,128 15,594,078 2.10
USD USD USD USD USD USD
USD
USD
4,195,951 788,671
2,108,768 I ,199,150
578,394 4,684,166
1,498,767
1,646,333
4,178,143 172,728
2,048,445 1,178,902
579,695 4,672,383
1,487,124
1,557.51 1
0.56 0.03 0.28 0.16 0.08 0.63
0.20
0.21
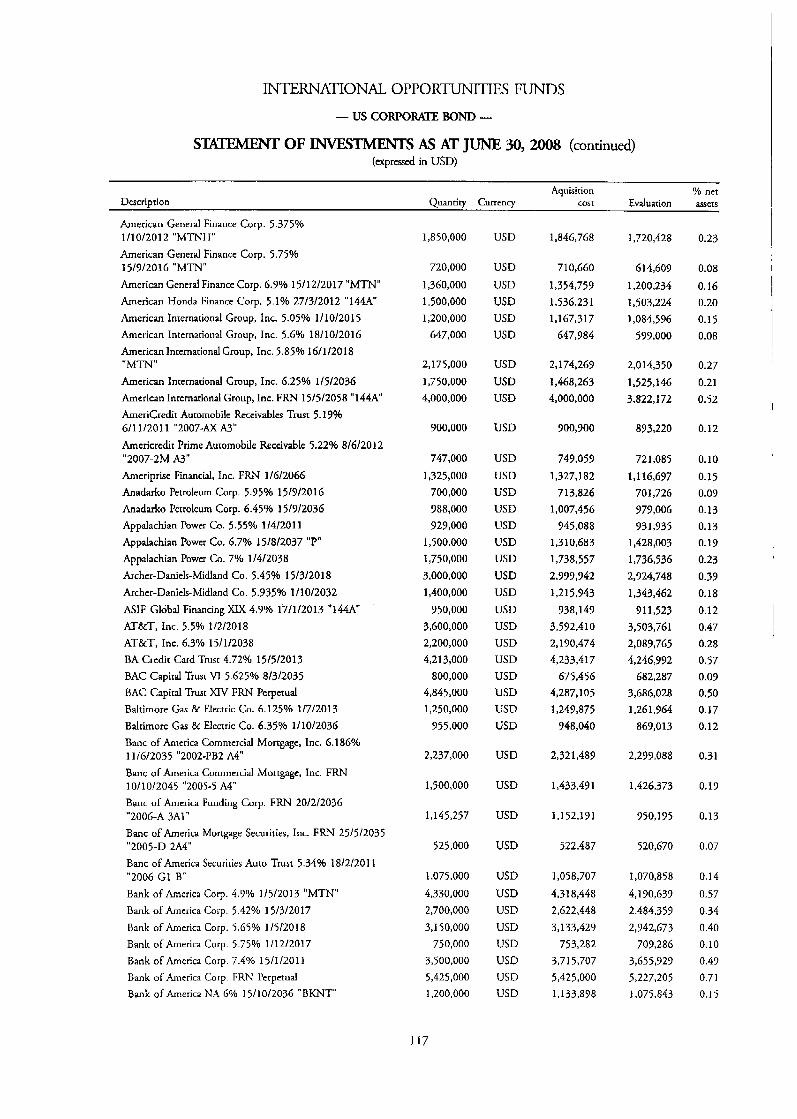
INTERNATIONAL OPPORTUNITIES FUNDS
- us CORPORATE BOND -
STATFAEW OF As AT JUNE 30,2008 (continued) (expressed in USD)
Aquisition Yo net Description Quantity Currency C a s t Evaluation assers
American General Finance Corp. 5.375% 1 / I 0120 1 2 "MTNH" American General Finance Corp. 5.75% 15/9/2016 "MTN" American General Finance Corp. 6.9% 1511 2/2017 "MTN" American Honda Finance Corp. 5.1% 27/3/2012 "144A" American International Group, Inc. 5.05% 1/10/2015 American International Group, Inc. 5.6% 18/10/2016 American International Group, Inc. 5.85% 16/1/2018 "MTN" American Inrcrnarional Group, Inc. 6.25% 1 /5/2036 American International Group, Inc. FRN 15/5/2058 "144A" AmeriCredit Automobile Receivables Trust 5.1996 611 11201 1 "2007-AX A3" Amcricrcdit Prime Auromobile Receivable 5.22% 8/6/2012 "2007-2M A3" her ipr i se Financial, Inc. F R N 1/6/2066 Anadarko Petroleum Corp. 5.95% 15/9/2016 Anadarko Petroleum Corp. 6.45% 15/7/2036 Appalachian Power Co. 5.55% 1/4/2011 Appalachian Power Co. 6.7% 15/8/2037 "P" Appalachian Power Co. 7% 1/4/2038 Archer-Daniels-Midland Co. 5.45% 15/3/2018 Archer-Daniels-Midland Co. 5.935% 111012032 ASlF Global Financing XIX 4.9% 17/1/2013 "144A" AT&T, Inc. 5.5% 1/2/2018 ATBrT, Inc. 6.3% 15/1/2038 BA Credit Card Trusr 4.72% 15/5/2013 BAC Capital Trust VI 5 625% 8/3/2035 BAC Capital Trust XIV F R N Perpetual Baltimore Gas & Electric Co. 6.125% 1/7/2013 Baltimore Gas & Electric Co. 6.35% 111012036 Banc of America Commercial Mortgage, Inc. 6.186%
Banc of America Commercial Mortgage, Inc. FRN
Banc of America Funding Corp. F R N 20/2/2036
Banc of America Mortgage Securities, Inc. F R N 25/5/2035
Banc of America Securities Auto Trust 5.34% 18/2/2011
Bank of America Corp 4.9% 1/5/2013 "MTN" Bank of America Corp. 5.42% 15/3/2017 Bank ofAmerica Corp. 5.65% 1/5/2018 Bank of America Corp. 5.75% 1/12/2017 Bank of America Corp 7 4% 15/1/2011 Bank of America Coip FRN I'erpetual Bank of America NA 6% 15/10/2036 "BKNT"
11/6/2035 "2002-PB2 A4"
10/10/2045 "2005-5 A4"
"2006-A 3A1"
"2005-D 2A4"
"2006-GI B"
1,850,000
720,000 1,360,000 1,500,000 1,200,000
647,000
2,175,000 1,750,000 4,000,000
900,000
747,000 1,325,000
700,000 988,000 929,000
1,500,000 1,750,000 3,000,000 1,400,000
950,000 3,600,000 2,200,000 4,213,000
800,000 4,845,000 1,250,000
955,000
2,237,000
1,500,000
1,145,257
525,000
1,075,000
4,330,000 2,700,000 3,150,000
750,000 3,500,000 5,425,000 1,200,000
117
USD
USD USD USD USD USD
USD USD USD
USD
USD USD USD USD USD USD USD USD USD USD USD USD USD USD USD USD USD
USD
USD
USD
USD
USD USD USD USD USD USD USD USD
1,846,768
7 10,660
1,354,759 1,536,231 1,167,317
647,9 84
2,174,269 1,468,263 4,000,000
900,900
749,059 1,327,182
713,826 1,007,456
945,088 1,310,683 1,738,557 2,999,942 1,215,943
938,149 3,592,410 2,190,474 4,233,417
675,456 4,287,105 1,249,875
948,040
2,321,489
1,433,491
1,152,191
522,487
1,058,707 4,318,448 2,622,448 3,133,429
753,282 3,715,707 5,425,000 1,133,898
1,720,428
614,609
1,200,234 1,503,224 1,084,596
599,000
2,014,350 1,525,146 3,822,172
893,220
721,085
I, 1 16,697 701,726 979,006 931,935
1,428,003 1,736,536 2,924,748 1,343,462
91 1,523 3,503,761 2,089,765 4,246,932
682,287 3,686,028 1,261,964
869,013
2,299,088
1,426,373
950,195
520,670
1,070,858 4,190,639 2,484,359 2,942,673
709,286 3,655,929 5,227,205 1,075,843
0.23
0.08
0.16 0.20 0.15 0.08
0.27 0.21 0.52
0.12
0.10
0.15 0.09 0.13 0.13 0.19
0.23 0.39 0.18 0.12 0.47 0.28 0.57 0.09 0.50 0.17 0.12
0.31
0.19
0.13
0.07
0.14
0.57 0.34 0.40 0.10 0.49 0.71 0.1 5
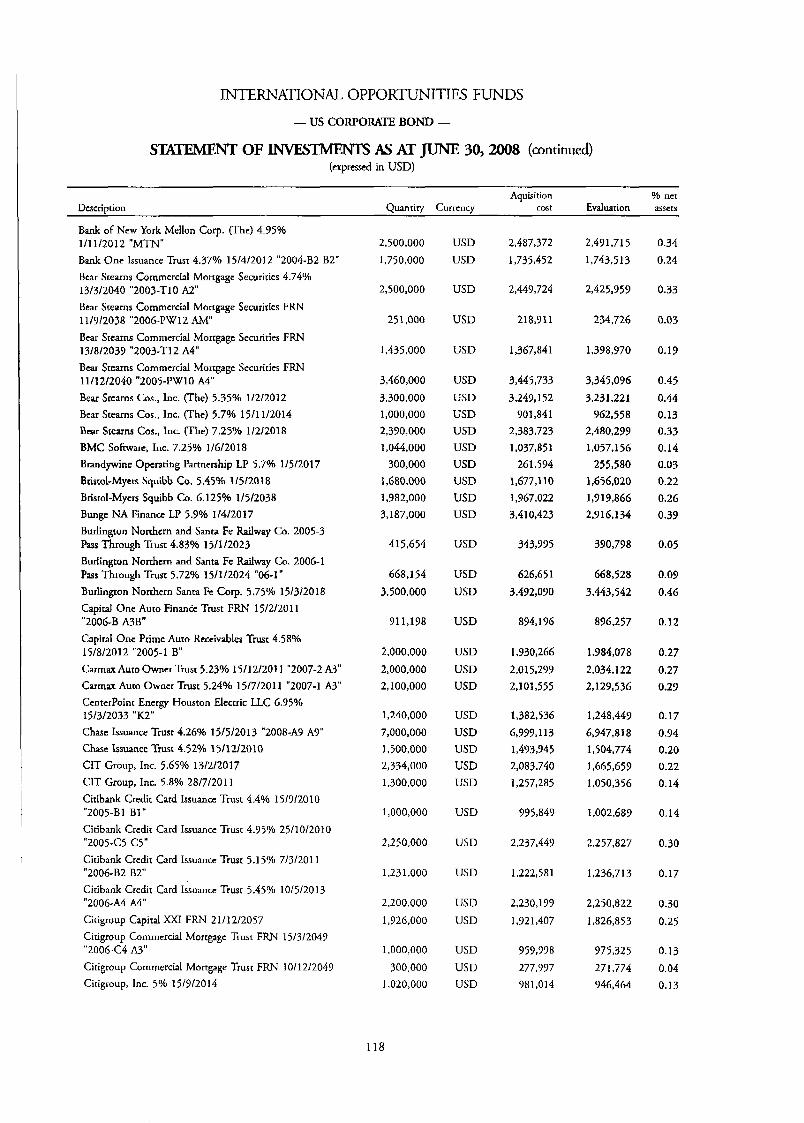
INTERNATIONAL OPPORTUNITIES FUNDS
- US CORPORATE BOND -
SKEMFNT OF INVESTMENTS AS AT JUNE 30,2008 (continued) (exprcsscd in USD)
Dcscriotion Aquisition Yo net
Ouanriw Currcncv C a s t Evaluation assets
Bank of New York Mellon Corp. (The) 4.95% 1/11/2012 "MTN" Bank One Issuance Trust 4.37% 15/4/2012 "2004-B2 B2" Bcar Stearns Commercial Mongage Securities 4.74% 13/3/2040 "2003-T10 A2" Bear Stearns Commercial Mortgage Securities FRN
Bear Stearns Commercial Mortgage Securities FRN 13/8/2039 "2003-Tl2 A4" Bear Stearns Commcrcial Mortgage Securirics FRN
Bear Stearns Cos., Inc. (The) 5.35'3'0 1/2/2012 Bear Stearns Cos., Inc. (The) 5.7% 15/11/2014 Bear Stearns Cos., Inc. (The) 7.259'0 1/2/2018 BMC Sofrwarc, Inc. 7.25% 1/6/2018 Brandywine Operating Partnership LP 5.7% 1/5/2017
11/9/2038 "2006-PW12 AM"
11/12/2040 "2005-PW10 A4"
Bristol-Mye~ Squibb Co. 5.45% 1/5/2018 Bristol-Myers Squibb Co. 6.125% 1/5/2038 Bunge NA Financc LP 5.9% 1/4/2017 Burlington Northern and Santa Fe Railway Co. 2005-3 Pass Through Trust 4.83% 15/1/2023 Burlington Northern and Santa Fc Raiiway Co. 2006-1 Pass Through Trust 5.72% 15/1/2024 "06-1" Burlington Northern Santa Fe COT. 5.754/0 15/3/2018 Capital One Auto Financc Trust FRN 15/2/2011 "2006-8 A3B" Capital Onc Prime Auto Receivables Trust 4.58% 15/8/2012 "2005-1 B" Carmax Auto Owner Trust 5.23% 15/12/2011 "2007-2 A3" Carrnax Auto Owner Trust 5.24'3'0 15/7/20] 1 "2007-1 A3" Ccnterl'oinr Energy Houston Electric LLC 6.95% 15/3/2033 "K2" Chase Issuance Trust 4.26% 15/5/2013 "2008-A7 A9" Chase Issuance Trust 4.52% 15/12/2010 CIT Group, Inc. 5.65% 13/2/2017 CIT Group, Inc. 5.8% 28/7/2011 Citibank Credit Card Issuance Trust 4.4% 15/9/2010 "2005-B1 BI" Citibank Credit Card Issuance Trust 4.95% 25/10/2010 "2005-C5 C5" Ciribank Credit Card Issuance Trust 5.15% 7/3/20] 1
Citibank Credit Card Issuance Trust 5.45% 10/5/2013
Citigroup Capital XXI FRN 21/12/2057 Citigroup Commercial Mortgage Trust FRN 15/3/2049
Cirigtoup Commercial Mortgage Trust FRN 1011 2/2049 Cirigroup, Inc. 5% 15/7/2014
"2006-B2 B2"
"2006-A4 A4"
"2006-C4 A3"
2,500,000 1,750,000
2,500,000
251,000
1,435,000
3,460,000 3,300,000 1,000,000 2,370,000 1,044,000
300,000 1,680,000 1,982,000 3,187,000
415,654
668,154 3,500,000
911,198
2,000,000 2,000,000 2,100,000
1,240,000 7,000,000 1,500,000 2,334,000 1,300,000
1,000,000
2,250,000
1,231,000
2,200,000 1,926,000
1 .ooo,ooo 300,000
1,020,000
118
USD USD
USD
USD
USD
USD USD USD USD USD USD USD USD USD
USD
USD USD
USD
USD USD USD
USD USD USD USD USD
USD
USD
USD
USD USD
USD USD USD
2,487,372 1,735,452
2,449,724
218,711
1,367,841
3,445,733 3,249,152
901,841 2,383,723 1,037,851
261,594 1,677,110 1,967,022 3,410,423
343,995
626,65 1
3,492,090
894,196
1,930,266 2,015,299 2,101,555
1,382,536 6,999,113 1,433,745 2,083,740 1,257,285
795,849
2,237,449
1,222,581
2,230,199
1,921,407
959.998 277,997 981,014
2,471,715
1,743.5 13
2,425,959
234,726
1,398,970
3,345,096 3,231,221
962,558 2,480,299 1,057,156
255,580 1,656,020 1,919,866 2.9 16.1 34
390,798
668,528 3,443,542
896,257
1 ,9 84,078 2,034,122 2,129,536
1,248,449 6,947,818 1,504,774 1,665,659 1,050,356
1,002,689
2,257,827
1,236,713
2,250,822 1,826,853
975,325 271,774 946,464
0.34 0.24
0.33
0.03
0.19
0.45 0.44 0.13 0.33 0.14 0.03 0.22 0.26 0.39
0.05
0.09
0.46
0.12
0.27 0.27 0.29
0.17 0.94 0.20 0.22 0.14
0.14
0.30
0.17
0.30 0.25
0.13 0.04 0.13
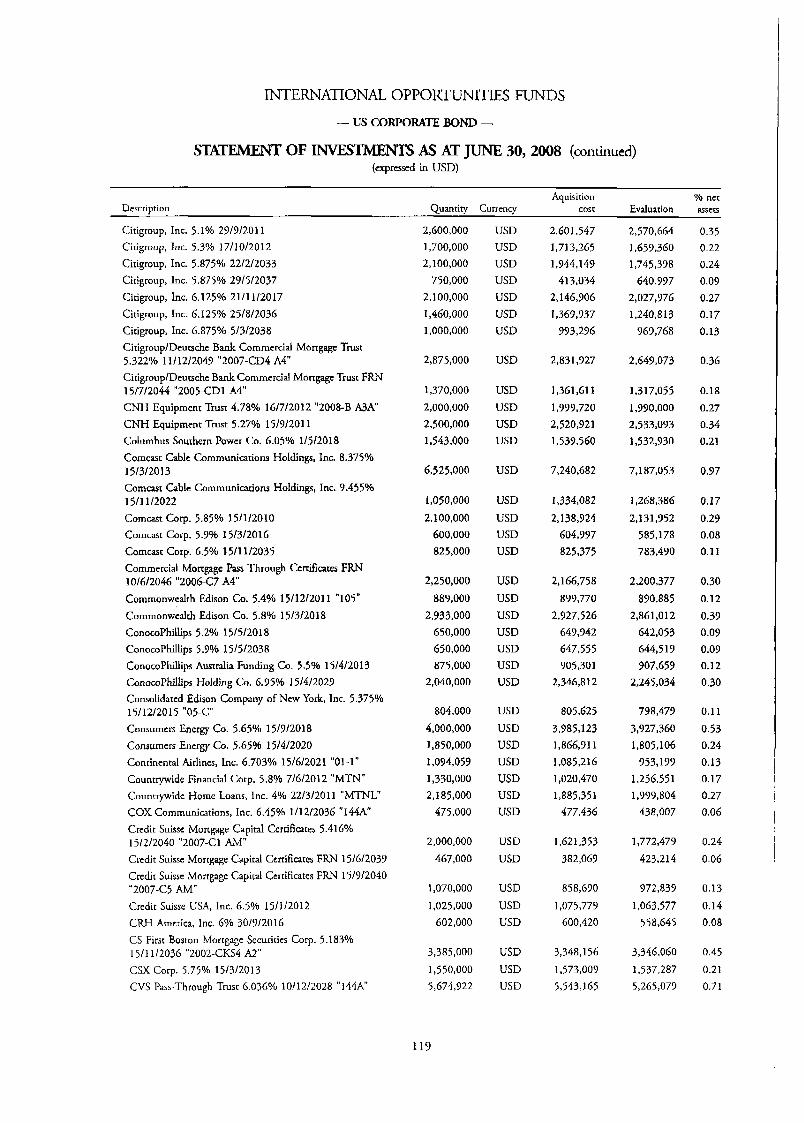
INTERNATIONAL OPPORTUNITIE!3 FUNDS
- us CORPORATE BOND -
OF INVESTMENTS AS AT JUNE 30,2008 (continued) (expressed in USD)
Aquisition Yo nct Description Quantity Currency cost Evaluation asscts
Citigroup, Inc. 5.1% 29/9/2011 Cirigroup, Inc. 5.3% 17/10/2012 Citigroup, Inc. 5.875% 22/2/2033 Citigroup, Inc. 5.875% 29/5/2037 Citigroup, Inc. 6.125% 21/11/2017 Citigroup, Inc. 6.125% 25/8/203G Citigroup, Inc. 6.875% 5/3/2038 CitigrouplDeucsche Bank Commercia Mortgage Trust
CitigrouplDeutschc Bank Commercial Mortgage Trust FRN 15/7/2044 "2005-CD1 A4" CNH Equipment Trust 4.78% 16/7/2012 "2008-B A 3 A CNH Equipment Trust 5.27% 15/9/2011 Columbus Southern Power Co. 6.05% 1/5/2018 Corncast Cable Communications Holdings, Inc. 8.375% 15/3/2013 Comcast Cable Communications Holdings, Inc. 9.455% 15/11/2022 Comcast Corp. 5.85% 15/1/2010 Comcast Corp. 5.9% 15/3/2016 Comcast Corp. 6.5% 1511 112035 Commercial Mortgage Pass Through Certificates FRN
Commonwealth Mison Co. 5.4% 15/12/2011 "105" Commonwealth Edison Co. 5.8% 15/3/2018 ConocoPhillips 5.2% 15/5/2018 ConocoPhillips 5.9% 15/5/2038 ConocoPhillips Australia Funding Co. 5.5% 15/4/2013 ConocoPhillips Holding Co. 6.95% 15/4/2029 Consalidatcd Edison Company of New York, Inc. 5.375% 15/12/2015 "05-C Consumers Energy Co. 5.65% 15/9/2018 Consumers Energy Co. 5.65% 15/4/2020 Conrinentd Airlincs, Inc. 6.703% 15/6/2021 "01-1" Countrywide Financial Corp. 5.8% 7/6/2012 "MTN" Countrywide Home Loans, Inc. 4% 22/3/2011 "MTNL" COX Communications, Inc. 6.45% 1/12/2036 "144A" Credit Suisse Mortgage Capital Certificates 5.416%
Credit Suisse Mortgage Capita Certificates FRN 15/6/2039 Credit Suissc Morrgage Capital Certificates FRN 15/9/2040
Credit Suisse USA, Inc. 6.5% 15/1/2012 CRH America, Inc. 6% 30/9/2016 CS First Boston Mortgage Securities Corp. 5.183% 15/11/2036 "2002-CKS4 A2" CSX Corp. 5.75% 15/3/2013 CVS Pass-Through Trust 6.036% 10/12/2028 "144A"
5.322% 11/12/2049 "2007-CD4 A4"
10/6/2046 "2006-C7 A4"
15/2/2040 "2007-C1 AM"
"2007-C5 AM"
2,600,000 1,700,000 2,100,000
750,000 2,100,000 1,460,000 1,000,000
2,875,000
1,370,000 2,000,000
2,500,000 1,543,000
6,525,000
1,050,000 2,100,000
600,000 825,000
2,250,000
889.000 2,933,000
G50,OOO 650,000 875,000
2,040,000
804,000 4,000,000 1,850,000 1,094,059 1,330,000 2,185,000
475,000
2,000,000 467,000
1,070,000
1,025,000 602,000
3,385,000 1,550,000 5,674,922
119
USD USD USD USD USD USD USD
USD
USD USD USD USD
USD
USD USD USD USD
USD USD WSD USD USD USD USD
USD
USD USD USD USD USD USD
USD USD
USD USD USD
US R USD USD
2,601,547 I ,713,265 1,944,149
413,034 2,146,906 1,369,937
993,296
2,831,927
3,361,611 1,999,720 2,520,921 1,539,560
7,240,682
1,334,082
2,138,924 604,997 825,375
2,166,758 899,770
2,927,526 649,942 647,555 905,301
2,346,812
805,625 3,985,123 1,866,911 1,085,216 1,020,470 1,885,351
477,436
1,621,353 382,069
858,690 1,075,779
600,420
3,348,156 1,573,009 5,543,165
2,570,664 1,659,360 1,745,398
640,997 2,027,976 1,240,813
969,768
2,649,073
1,317,055 1,990,000 2,533,093 1,532,930
7,187,053
1,268,386 2,131,952
585,178 783,490
2,200,377 890,885
2,861,012 642,053 644,5 19 907,659
2,245,034
798,479 3,927,360 1,805,106
953,199 1,256,551 1,999,804
438,007
1,772,479 423,214
972,839 1,063,577
5 5 8,645
3,346,060 1,537,287 5,265,079
0.35 0.22 0.24 0.09 0.27 0.17 0.13
0.36
0.18 0.27 0.34 0.21
0.97
0.17
0.29 0.08 0.1 1
0.30 0.12 0.39 0.09 0.09 0.12 0.30
0.1 1
0.53 0.24 0.13 0.17 0.27 0.0g
0.24 0.06
0.13 0.14 0.08
0.45
0.21 0.71
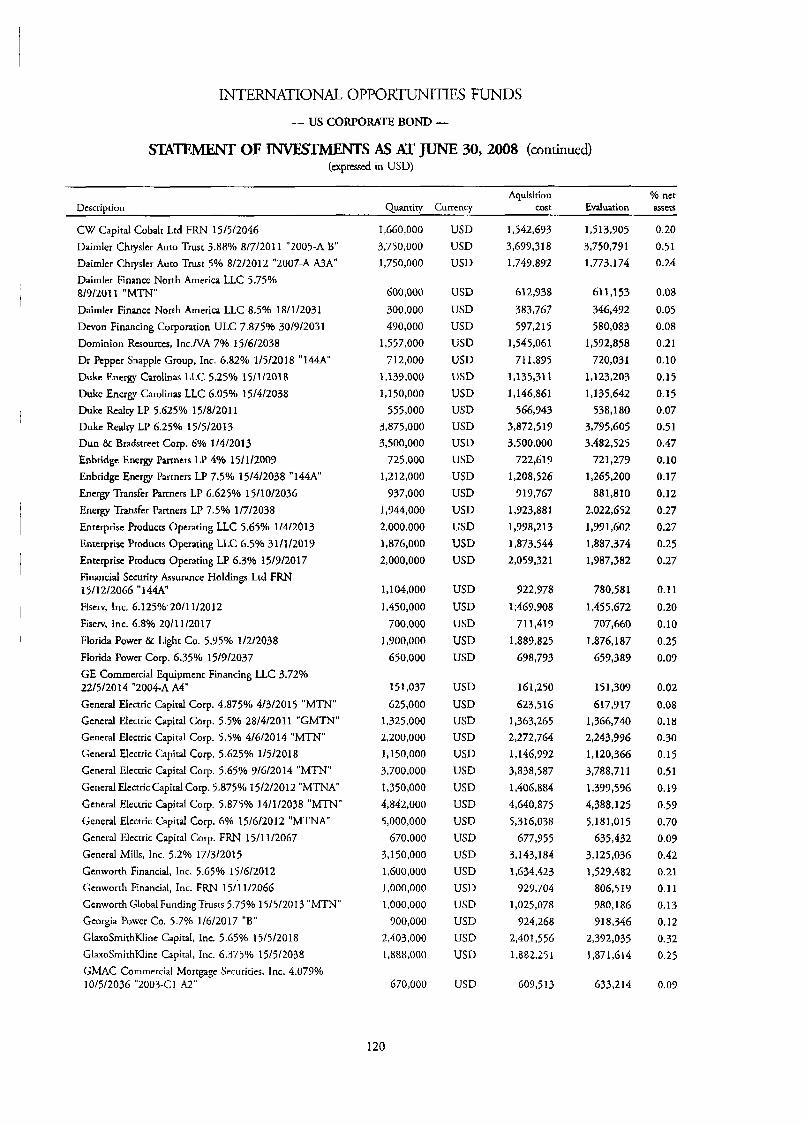
INTERNATIONAL OPPORTUNITIES FUNDS
- US CORPORATE BOND -
STATEMENT OF m S As AT JUNE 30,2008 (continued) (expressed in USD)
Aquisition Yo net Descriation Quantiw Currency cost Evaluation assets
CW Capital Cobalt Ltd FRN 15/5/2046 Dairnler Chryslcr Auto Trust 3.88% 8/7/2011 "2005-A B" Dairnler Chryslcr Auto Trust 5% 8/2/2012 "2007-A M A " Dairnler Finance North America LLC 5.750/0 8/9/2011 "MTN" Dairnler Finance North America LLC 8.5016 18/1/2031 Devon Financing Corporation ULC 7.875% 30/9/2031 Dominion Resources, Inc.NA 7% 15/6/2038 Dr Pepper Snapple Group, Inc. 6.82% 1/5/2018 "144A" Duke Energy Carolinas LLC 5.25% 15/1/2018 Duke Energy Carolinas LLC 6.05% 15/4/2038 Duke Redry LP 5.625% 15/8/2011 Duke Realty LP 6.25% 15/5/2013 Dun Br Bradstreet Corp. 6% 1/4/2013 Enbridge Energy Partners LP 4% 15/1/2009 Enbridge Energy Partners LP 7.5% 15/4/2038 "144A Energy Transfer Partners LP 6.625% 15/10/2036 Energy Transfer Partners LP 7.5% 1/7/2038 Enterprise Products Operating LLC 5.65% 1/4/2013 Enterprise Products Operating LLC 6.5% 31 /1/2019 Enterprise Products Operating LP 6.3% 15/9/2017 Financial Security Assurance Holdings Ltd FRN 15/12/2066 "144A" Fiserv, Inc. 6.125% 2011 1/2012 Fiserv, Inc. 6.8% 20/11/2017 Florida Power & Light Co. 5.95% 1/2/2038 Florida Powcr Corp. 6.35% 15/3/2037 GE Commercia Equipment Financing LLC 3.72% 22/5/2014 "2004-A A4" General Elcctric Capital Corp. 4.875% 4/3/2015 "MTN" General Electric Capital Corp. 5.5% 28/4/2011 "GMTN" General Elcctric Capital Corp. 5.5% 4/6/2014 "MTN" General Electric Capital Corp. 5.625% 1/5/2018 General Elccttic Capital Corp. 5.65% 9/6/2014 "MTN" General Electric Capital Corp. 5.875% 15/2/2012 "MTNA" General Electric Capital Corp. 5.875% 14/1/2038 "MTN" General Elcctric Capital Corp. 6% 15/6/2012 "MTNA General Electric Capital Corp. FRN 15/11/2067 General Mills, Inc. 5.2% 17/3/2015 Genworth Financial, Inc. 5.65% 15/6/2012 Genworth Financial, Inc. F R N 15/11/2066 Gcnworth Global FundingTrusrs 5.75% 15/5/2013 "MTN" Georgia Power Co. 5.7% 1/6/2017 "E" GlaxoSrnithKline Capital, Inc. 5.65% 15/5/2018 GlaxoSrnirhKline Capital, Inc. 6.375% 15/5/2038 GMAC Commercial Mortgage Securirics, Inc. 4.079% 10/5/2036 "2003-C1 A2"
1,660,000 3,750,000 1,750,000
600,000
300,000 490,000
1,557,000 7 12,000
1,139,000 1,150,000
555,000 3,875,000 3,500,000
725,000 1,212,000
937,000 1,944,000 2,000,000 1,876,000 2,000,000
1,104,000
1,450,000 700,000
1,900,000
650,000
151,037 625,000
1,325,000 2,200,000
1,150,000 3,700,000 1,350,000 4,842,000 5,000,000
670,000 3,150,000 1,600,000 1,000,000 1.000,000
900,000 2,403,000 1,888,000
670,000
I20
USD USD USD
USD USD USD USD USD USD USD USD USD USD USD USD USD USD USD USD USD
USD USD USD USD USD
USD USD USD USD USD USD USD USD USD USD USD USD USD USD USD USD USD
USD
1,542,673 3,699,318 1,749,892
612,938
383,767 597,215
1,545,061 71 1,895
1,135,311 I ,14686l
566,943 3,872,519 3,500,000
722,619 1,208,526
919,767 1,923,881 1,998,213 1,873,544 2,059,321
922,978 1,469,908
711,419 1,889,825
698,793
161,250 623,516
1,363,265 2,272,764 1,146,992 3,838,587 1,406,884 4,640,875 5,316,038
677,955 3,143,184 1,634,423
929.704 1,025,078
724,268 2,401,556 1,882,251
609,513
1,513,905 3,750,791 1,773,174
61 1,153
346,492 580,083
1,592,858 720,031
1,123,203 1,135,642
538,180 3,795,605 3,482,525
721,279 1,265,200
881,810 2,022,652 1,991,602 1,887,374 1,987,382
780,581
1,455,672 707,660
1,876,187 659,389
151,307
617,917 1,366,740 2,243,996 1,120,366 3,788,711 1,399,596 4,388,125 5,181,015
635,432 3,125,036 1,529,482
806,519 980,186 918,346
2,392,035 1,871,614
633,214
0.20 0.51 0.24
0.08
0.05 0.08 0.21 0.10 0.15 0.15 0.07 0.51 0.47 0.10 0.17 0.12 0.27 0.27 0.25 0.27
0.11
0.20 0.10 0.25 0.09
0.02
0.08 0.18 0.30 0.15 0.51 0.19 0.59 0.70 0.09 0.42 0.21 0.1 1
0.13 0.12 0.32 0.25
0.09
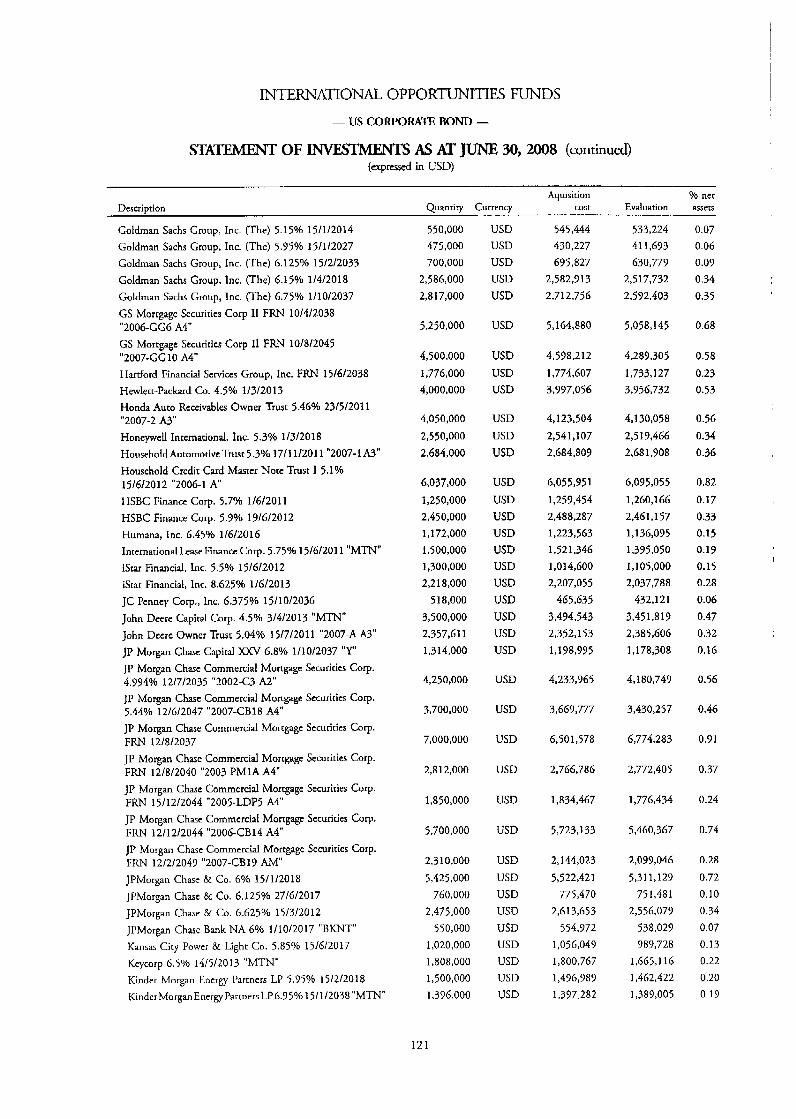
INTERNAmONAL OPPORTUNITIES FUNDS
- us CORPORATE BOND -
S m OF -S AS AT JUNE 30, 2008 (continued) (expressed in USD)
Aquisition % net Evaluation assets Description Quantity Currency cost
Goldman Sachs Group, Inc. (The) 5.15% 15/1/2014 Goldman Sachs Group, Inc. (The) 5.95% 15/1/2027 Goldman Sachs Group, Inc. (The) 6.125% 15/2/2033 Goldman Sachs Group, Inc. (The) 6.15% 1/4/2018 Goldman Sachs Group, Inc. (The) 6.75% 1/10/2037 GS Mortgage Securities Corp I1 FRN 10/4/2038
GS Mortgage Securities Corp I1 F R N 10/8/2045
Hartford Financial Services Group, Inc. FRN 15/6/2038 Hewlett-Packard Co. 4.5% 1/3/2013 Honda Auto Receivables Owner Trust 5.46% 23/5/2011
"2006-GG6 A4"
"2007-GG10 A4"
"2007-2 A3" Honeywell Intcmational, Inc. 5.3% 1/3/2018 HouseholdAutomotiveTrust 5.3% 1711 11201 1 "2007-1 A3" Household Credit Card Master Note Trust I 5.1% 15/6/2012 "2006-1 A" HSBC Finance Corp. 5.7% 1/6/20] 1 HSBC Finance Corp. 5.9p/o 19/6/2012 Humana, Inc. 6.45% 1/6/2016 International LeaseFinance Corp. 5.75% 15/6/2011 "MTN" iSrar Financial, Inc. 5.5% 15/6/2012 Star Financial, Inc. 8.625% 1/6/2013 JC Penney Corp., Inc. 6.375% 15/10/2036 John Deere Capital Corp. 4.5% 3/4/2013 "MTN" John Dccrc Owner Trust 5.04% 15/7/2011 "2007-A A3" JP Morgan Chase Capital X X V 6.8% 111012037 "Y" JP Morgan Chase Commercial Mortgage Securities cop.
JP Morgan C h c Commercial Mortgage Securities corp. 5.44% 12/6/2047 "2007-CB18 A4" JP Morgan Chase Commercia Mortgage Securirics COT. FRN 12/8/2037 JP Morgan Chase Commercial Mortgage Sccurities corp. FRN 12/8/2040 "2003-PM1A A4" JP Morgan Chase Commercia Mortgage Sccuriries Corp. FRN 15/12/2044 "2005-LDP5 A4" JP Morgan Chase Commercial Mortgage Securities Corp.
JP Morgan Chase Commercial Mortgage Securities G r p . FRN 12/2/2049 "2007-CB17 AM" JPMorgan Chase & Co. 6% 15/1/2018 JPMorgan Chase & Co. 6.125% 27/6/2017 JPMorgan Chase & Co. 6.625% 15/3/2012 JPMorgan Chase Bank NA 6% 1/10/2017 "BKNT" Kansas City Power & Light Co. 5.85% 15/6/2017 Keycorp 6.59'0 14/5/2013 "MTN" Kinder Morgan Energy Partners LP 5.95% 15/2/2018 KinderMorganEncrgyPartnersLP6.95% 15/1/2038 "MTN"
4.994% 12/7/2035 "2002-C3 A2"
FRN 12/12/2044 "2006-CB14 A4"
550,000 475,000 700,000
2,586,000 2,817,000
5,250,000
4,500,000 1,776,000 4,000,000
4,050,000
2,550,000 2,684,000
6,037,000 1,250,000 2,450,000 1,172,000 1,500,000 1,300,000 2,218,000
5 18,000
3,500,000 2,357,611 1,314,000
4,250,000
3,700,000
7,000,000
2.8 12,000
1,850,000
5,700,000
2,310,000
5,425,000 760,000
2,475,000 550,000
1,020,000 1,808,000 1,500,000 1,396,000
121
USD USD USD USD USD
USD
USD USD USD
USD USD USD
USD USD USD USD USD USD USD USD USD USD USD
USD
USD
USD
USD
USD
USD
USD USD USD USB USD USD USD USD USD
545,444 430,227 695,827
2,582,713 2,712,756
5,164,880
4,598,212 1,774,607 3,777,056
4,123,504 2,541,107 2,684,809
6,055,751 1,259,454 2,488,287 1,223,563 1,521,346 1,014,600 2,207,055
465.635 3,494,543 2,352,153 1,198.99 5
4,2 3 3,7 6 5
3,667,777
6,501,578
2,766,786
1,834,467
5,723,133
2,144,023 5,522,421
775,470 2,613,653
554,772 1,056,049 1,800,767 1,496,989 1,377,282
533,224 411,693 630,777
2,5 17,732 2,572,403
5,058,145
4,289,305 1,733,127 3,756,732
4,130,058 2,519,466 2,681,908
6,075,055 1,260,166 2.46 1,157 1,136,075 1,395,050 1,105,000 2,037,788
432,121 3,45 1,s 19 2,385,606 1,178,308
4,180,749
3,430,257
6,774,283
2,772,405
1,776,434
5,460,367
2,077,046 5,311,129
751,481 2,556,079
538,029 9 8 9,7 2 8
1,665,116 1,462,422 1,389,005
0.07 0.06 0.07 0.34 0.35
0.68
0.58 0.23 0.53
0.56 0.34 0.36
0.82 0.17 0.33 0.15 0.19 0.15 0.28 0.06 0.47 1
0.32 1
0.16
1
1
0.56
0.46
0.31
0.37
0.24
0.74
0.28 0.72 0.10 0.34 0.07 0.13 0.22 0.20 0.19
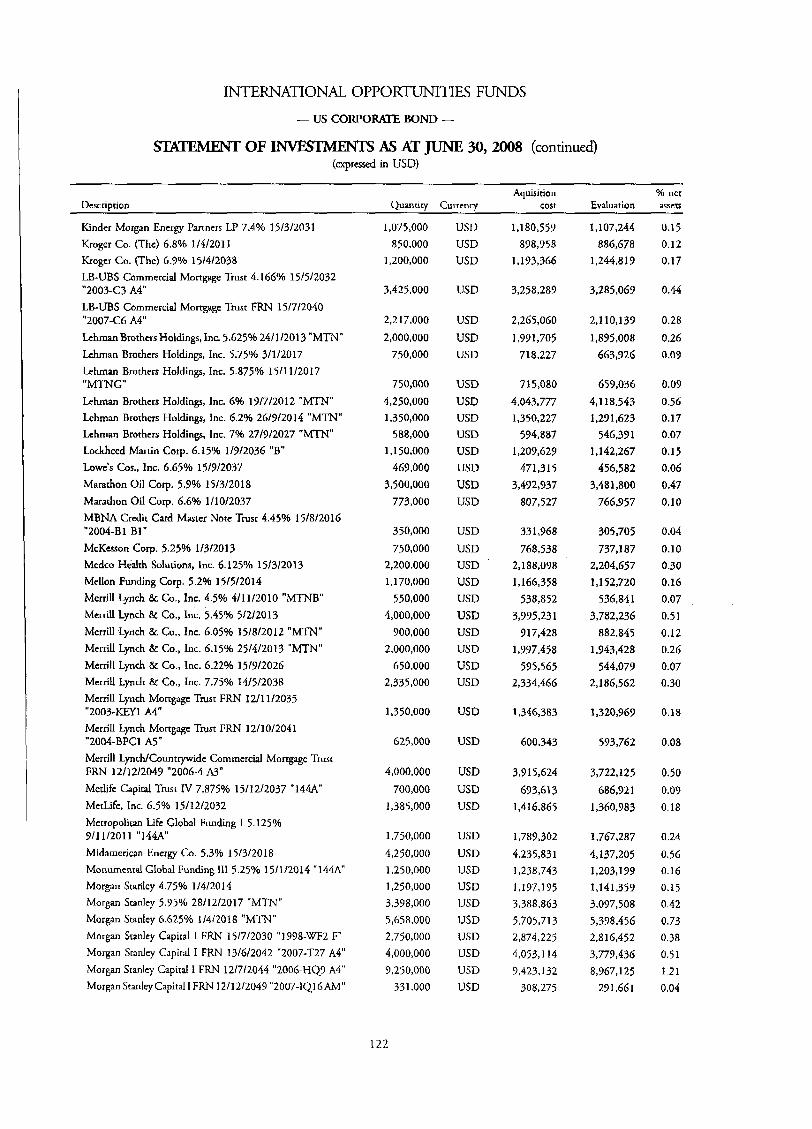
INTERNATIONAL OPPORmITIES FUNDS
- us coRpoR4rE BOND -
OF AS AT JUNE 30,2008 (continued) (expressed in USD)
Aquisirion % net Description Quanriry Currency cost Evaluation a s s e ~ ~
Kinder Morgan Energy Partners LP 7.4% 15/3/2031 Kroger Co. (The) 6.8% 1/4/2011 Kroger Co. (The) 6.99'0 15/4/2038 LB-UBS Commercial Mortgage Trust 4.1 66% 15/5/2032 "2003-C3 A4" LB-UBS Commercial Mortgage Trust FRN 15/7/2040 "2007-C6 A4" Lchman Brothers Holdings, Inc. 5.625% 2411 12013 "MTN" Lehrnan Brothers Holdings, Inc. 5.75% 3/1/2017 Lehman Brothers Holdings, Inc. 5.875% 1511 1/2017 "MTNG" Lehman Brothers Holdings, Inc. 6% 19/7/2012 "MTN" Lehman Brothers Holdings, Inc. 6.2% 26/9/2014 "MTN" Lehman Brothers Holdings, Inc. 7% 27/9/2027 "MTN" Lockheed Martin COT. 6.15% 1/9/2036 "B" Lowe's Cos., Inc. 6.65% 15/9/2037 Mararhon Oil Corp. 5.9% 15/3/2018 Marathon Oil Carp. 6.6% 1/10/2037 MBNA Credit Card Master Note Trust 4.45% 15/8/2016 "2004-B1 B1" McKesson Corp. 5.25% 1/3/2013 Medca Health Solutions, Inc. 6.125% 15/3/2013 Mellon Funding Corp. 5.2% 15/5/2014 Merrill Lynch & Co., Inc. 4.5% 4/11/2010 "MTNB" Merrill Lynch & Co., Inc. 5.45% 5/2/2013 Merrill Lynch & Co., Inc. 6.05% 15/8/2012 "MTN" Mcrtill Lynch & Co., Inc. 6.15% 25/4/2013 "MTN" Merrill Lynch & Co., Inc. 6.22% 15/9/2026 Merrill Lynch I% Co., Inc. 7.75% 14/5/2038 Merrill Lynch Mortgage Trusr FRN 12/11/2035 "2003-KEY1 A4" Mcrtill Lynch Mortgage Trust FRN 12/10/2041
Merrill LyncIdCountrywide Commercial Mortgage Trust
Metlife Capital Trust IV 7.875% 15/12/2037 "144.4" MctLife, Inc. 6.5% 15/12/2032 Metropolitan Life Global Funding I 5.125% 911 11201 1 "144A" Midamerican Energy Co. 5,3% 15/3/2016 Monumental Global Funding 111 5.25% 15/1/2014 " 1 4 W Morgan Stanley 4.75% 1/4/2014 Morgan Stanley 5.95% 28/12/2017 "MTN" Morgan Stanley 6.625% 1/4/2018 "MTN" Morgan Stanley Capiral I FRN 15/7/2030 "1998-WF2 F" Morgan Stanley Capital I F R N 13/6/2042 "2007-T27 A4" Morgan Stanley Capital I FRN 12/7/2044 "2006-HQ9 A4" MorganStmley Capital I FRN 12/12/2049 "2007-IQ16AM"
"2004-BPCl AS"
F R N 12/12/2049 "2006-4 A3"
1,075,000 850,000
1,200,000
3,425,000
2.2 17,000
2,000,000 750,000
750,000
4,250,000 1,350,000
588,000 1,150,000
469,000 3,500,000
773.000
350,000 750,000
2,200,000 1,170,000
550,000 4,000,000
700,000 2,000,000
650,000 2,335,000
1,350,000
625,000
4,000,000 700,000
1,385,000
1,750,000 4,250,000 1,250,000 1,250,000 3,398,000 5,658,000 2,750,000 4,000,000 9,250,000
331,000
122
USD USD USD
USD
USD USD USD
USD USD USD USD USD USD USD USD
USD USD USD USD USD USD USD USD USD USD
USD
USD
USD USD USD
USD USD USD USD USD USD USD USD USD USD
1,180,559 898,958
1,193,366
3,258,289
2,265,060
1,391,705 7 18,227
7 15,080 4,043,777 1,350,227
594,887 1,209,629
471,315 3,492,937
807,527
33 1,968
768,538 2,188,098 1,166,358
5 3 8,s 5 2 3,995,231
917,428 1,997,458
595,565 2,334,466
1,346,383
600,343
3,915,624 693,613
1,416,865
1,789,302 4,235,831 1,238,743 I ,197,195
5,705,713 3,388,863
2,a74,225 4,053,114 9,423,132
308,275
1,107,244 886,678
1,244,819
3,285,069
2,110,139 1,895,008
663,926
659,036 4,118,543 1,231,623
546.331 1,142,267
456,582 3,481,800
766,957
305,705 737J 87
2,204,657 1,152,720
536,841 3,782,236
882,845 1,943,428
544,079 2,186,562
1,320,965)
593,762
3,722,125 686,921
1,360,983
1,767,287
4,137,205 1,203,179 1,141,359 3,097,508 5,398,456 2,816,452 3,779,436 8,967,125
291,661
0.15 0.12 0.17
0.44
0.28 0.26 0.07
0.09
0.56 0.17 0.07 0.15 0.06 0.47 0.10
0.04 0.10 0.30 0.16 0.07 0.51 0.12 0.26 0.07 0.30
0.18
0.08
0.50 0.09 0.18
0.24 0.56 0.16 0.15 0.42 0.73 0.38 0.5 1 1.21 0.04

INTERNATIONAL OPPORTUNITIES FUNDS
- us CORPORATE BOND -
S?IATEMENT OF INVESTMENTS As AT JUNE 30, 2008 (conrinued) (expressed in USD)
Dcscriudon Aquisition % net
Quantity Currency cost Evaluation assets
National City BanWClcveland OH 5.250/0 15/12/2016 "BKNT" New Cingular Wireless Services, Inc. 7.875% 1/3/2011 Ncw Cingdar Wireless Services, Inc. 8.750/0 1/3/2031 News America Holdings, Inc. 7.75% 20/1/2024 News America, Inc. 6.65% 1511 1/2037 Nisource Finance Corp. 7.875% 1511 1/2010 Nissan Auto Receivables Owner Trust 5.03% 16/5/2011 "2007-8 A3" Northern States PowerlMN 5.25% 15/7/2035 Northern Srares PowerlMN 6.2% 1 /7/2037 Nusrar Logistics 7.65% 15/4/2018 Ohio Power Co. 5.5% 15/2/2013 "F" Oracle Corp. 5.75% 15/4/2018 Oracle Corp. 6.5% 15/4/2038 Pacific Gas & Electric Co. 6.05% 1/3/2034 Pacific Gas & Electric Co. 6.35% 15/2/2038 Pacificorp 6.1% 1/8/2036 Panhandle Eastern Pipeline Co. 6.2% 111 112017 Peco Energy Co. 5.35% 1/3/2018 Philip Morris Inrcrnational, Inc. 5.65% 16/5/2018 Philip Morris International, Inc. 6.375% 16/5/2038 PNC Mortgage Acceptance Corp. 6.36% 12/3/2034 "2001-G1 A2" Potomac Electric Power Co. 6.5% 1511 112037 PPL Energy Supply LLC 6.5% 1/5/2018 Pricoa Global Funding I 5.3% 27/9/2013 "144A" Principal Financial Group, Inc. 6.05% 15/10/2036 Principal Life Income Funding Trusts 5.3% 24141201 3 "MTN" Procrcr & Gamble Co. 5.55% 5/3/2037 Prudential Financial, Inc. 4.5% 15/7/2013 "MTNB" Prudential Financial, Inc. 5.15% 15/1/2013 "MTN" Prudential Financial, Inc. 5.7% 14/12/2036 "MTN" PSEG Power LLC 7.75% 15/4/2011 Public Scrvicc Electric & Gas Co. 5.846 1/5\2037 "MTN" Quest Diagnostics, Inc. 6.95Yo 1/7/2037 RBS Capital Trust I FRN Perpetual Safeway, Inc. 6.35Yo 15/8/2017 Safeway, Inc. 6.5% 1/3/2011 San Diego Gas & Electric Co. 6% 1/6/2026 San Dicgo Gas & Elccrric Co. 6.125% 15/9/2037 "FFF" S W A Corp. 6.875% 15/5/2011 "MTN" Schering-Plough Corp. 6% 15/9/2017 Simon Propcrty Group LP 4.6% 15/6/2010 Simon Property Group LP 5.6% 1/9/20] 1 SLM Corp. 4% 15/1/2010
1,200,000 1,825,000
545,000 1,775,000
700,000 700,000
1,200,000 349,000 950,000
2,120,000 725,000
2,310,000 1,426,000 1,345,000 1,267,000
645,000 620,000
3,215,000 2,400,000 2,400,000
1,175,000 2,170,000
70,000 1,5 50,000
715,000
2,500,000 1,315,000
900,000 3,500,000 1,796,000
850,000 825,000 750,000
1,550,000 700,000
2,655,000 1,500,000
825,000 575,000 840,000 950,000
1,197,000 2,500,000
123
USD USD USD USD USD USD
USD USD USD USD USD USD USD USD USD USD USD USD USD USD
USD USD USD USD USD
USD USD USD USD USD USD USD USD USD USD USD USD USD USD USD USD USD USD
1,198,124 1,952,148
704,605 2,O 13,952
691,953 963,290
1,202,286
320,778 994,742
2,115,905 729,544
2,308,941 1,423,567 1,340,371 1,265,221
660,900 631,168
3,209,784 2,393,745 2,389,222
1,224,402 2,103,698
89,704 1,609,330
695,375
2,495,631 1,314,877
865,608 3,496,788 1,625,801
7 0 3,4 3 9 818,630 796,203
1,394,377 745,637
2,781,066 1,543,374
863,645 604,536 867,040 746,513
1.21 6,115 2.28 1,222
894,424
1,741,477 646,133
1,915,3 10 672,253 933,664
1,219,689 310,319 957,545
2,142,767 724,337
2,314,874 1,446,571 1,295,571 1,265,037
632,781 586,845
3,144.1 32 2,349,746 2,331,238
1,203,917 2,144,281
87,837 1,515,795
636,529
2,476,765 1,270,782
850,794 3,434,420 1,536,778
904,970 792,493 746,291
1,344,892 930,739
2,743,858 1,489,987
824,239 578,440 828,352 935,133
1,184,171 2,328,305
0.12 0.26 0.09 0.26 0.09 0.13
0.17 0.04 0.13 0.29 0.10 0.31 0.20 0.18 0.17 0.07 0.08 0.42 0.32 0.32
0.16 0.29 0.01 0.20 0.09
0.34 0.17 0.12 0.46 0.21 0.12 0.1 1 0.10 0.18 0.13 0.37 0.20 0.1 1 0.08 0.11 0.13 0.16
0.3 1

INTERNATIONAL OPPORTUNITIES FUNDS
- US CORPORATE BOND -
OF -S AS AT JUNE 30,2008 (continued) (expressed in USD)
Aquisition % net Description Quantity Currency cost Evaluation assets
Southwestern Public Service Co. 6% 111012036 Spectra Energy Capital LLC 6.2% 15/4/2018 TEPPCO Parrners LP 7.55% 15/4/2038 Timc Warner Cable, Inc. 5.4% 2/7/2012 Time Warner Cable, Inc. 6.75% 1/7/2018 Time Warner Entertainment Co. LP 8.375Yo 15/3/2023 Time Warner, Inc. 7.7% 1/5/2032 Union Electric Co. 5.3% 1/8/2037 Union Electric Co. 6.4% 15/6/2017 Union Pacific corp. 5.45% 31/1/2013 Union Pacific Corp. 5.65% 1/5/2017 Union Pacific Corp. 7.125% 1/2/2028 Union Pacific Railroad Co. 2005 Pass Through Trust
United States Treasury NotelBond 3.125% 30/4/2013 United States Treasury NotdBond 3.5% 15/2/2018 United Statcs Treasury NotelBond 4.5% 15/2/2016 United States Treasury NotelBond 5% 15/5/2037 UnitedHedrh Group, Inc. 5.5% 1511 112012 UnitedHcalth Group, Inc. 6% 15/6/2017 UnitcdHealth Group, Inc. 6.8759'0 15/2/2038 USA4 Auto Owner Trust 4.16% 16/4/2012 "2008-1 A3" USAA Auto Owner Trust 4.9% 15/2/2012 "2007-2 A.3" USAA Auto Owner Trust 5.16% 1511 112013 "2008-2 A4" Valero Energy Corp. 6.125% 15/6/2017 Valero Energy Corp. 6.625% 15/6/2037 Verizon Communications, Inc. 5.5% 15/2/2018 Vcrizon Cornmunicarions, Inc. 6.4% 15/2/2038 Verizon Global Funding Corp. 7.75% 1/12/2030 Viacom, Inc. 5.75% 30/4/2011 Wachovia Auto Loan Owner Trust 2006-1 5.29%
Wachovia Auto Owner Trust 5.49% 22/4/2013 "2007-AA4" Wachovia Bank Commercial Mortgage Trust 4.8679'0 15/2/2035 Wachovia Bank Commercial Mortgage Trust FRN 15/3/2042 "2005-Cl7 A4" Wachovia Bank Commercial Mortgage Trust F R N 15/2/205 1 "2007-C33 AM" Wachovia Bank NA 7.8% 18/8/2010 "BKNT" Wachovia Corp. 5.25% 1/8/2014 Wachovia Corp. 5.5% 1/5/2013 "MTN" Wachovia Corp. 5.625% 15/10/2016 Wachovia Corp. 5.7% 1/8/2013 "MTN" Wal-Marr Storcs, Inc. 6.2% 15/4/2038 Washington Murual BankIHenderson NV 5.1 25% 15/1/2015 Washington Murual Bank/Henderson NV 5.5% 15/1/2013
5.082% 2/1/2029 "05-1"
20/4/2012 "2007-1 &A"
475,000 1,080,000 2,170,000 1,387,000 4,000,000
540,000 3,050,000 1,345,000 1,247,000 1,000,000
541,000 545,000
497,773 1,723,000 2,261,000 7,000,000 4,285,000 1,850,000
700,000 1,958,000 4,720,000 1,000,000 4,000,000 1,065,000
860,000 2,100,000 2,100,000
575,000 1,400,000
2,300,000 3,250,000
1,240,000
2,000,000
960,000 4,000,000 1,500,000 6,350,000
725,000 950,000
1,736,000
2,750,000 1,175,000
I24
USD USD USD USD USD USD USD USD USD USD USD USD
USD USD USD WSD USD USD USD USD USD USD USD USD USD USD USD USD USD
USD USD
USD
USD
USD USD USD USD USD USD USD
USD USD
453,171 1,078,12 1 2,158,193 1,376,863 3,996,692
628,633 3,192,729
998,138 1,282,383 1,012,717
545,396 608,418
475,188
1,727,633 2,205,597 7,408,038 4,554,694 1,877,668
701,403 1,928,538 4,721,489
999,762 3,998,957 1,098,694
830,941 2,095,076 2,080,331
684, I47 1,417,575
2,311.638
3,305,028
1,200,970
1,9 13,175
899,954 4,253,736 1,467,742 6,336,181
716,352 96 1,276
1,730,883
2,156,718 1,039,117
430,752 1,046,957 2,259,402 1,374,720 4,023,644
581,509 3,119,863 1,070,650 1,243,757 1,001,471
526,962 575,038
462,893 1,706,173 2,174,623 7,362,033 4,599,682 1,813,372
681,113 1,857,394 4,738,140 1,013,205 4,030,130. 1,027,825
787,531 2,003,585 1,970,277
617,174 1,402,002
2,343,684 3,320,275
1 s 99,800
1,908,772
877,385 4.21 4,260 1,416,795 6,146,146
671,624 921,445
1,703,433
2,089,098
357,906
0.06 0.14 0.30 0.19 0.54 0.08 0.42 0.14 0.17 0.14 0.07 0.08
0.06 0.23 0.29 0.99 0.62 0.24 0.09 0.25 0.64 0.14 0.54 0.14 0.1 1 0.27 0.27 0.08 0.19
0.32 0.45
0.16
0.26
0.12
0.57 0.19 0.83 0.09 0.12 0.23
0.28 0.13
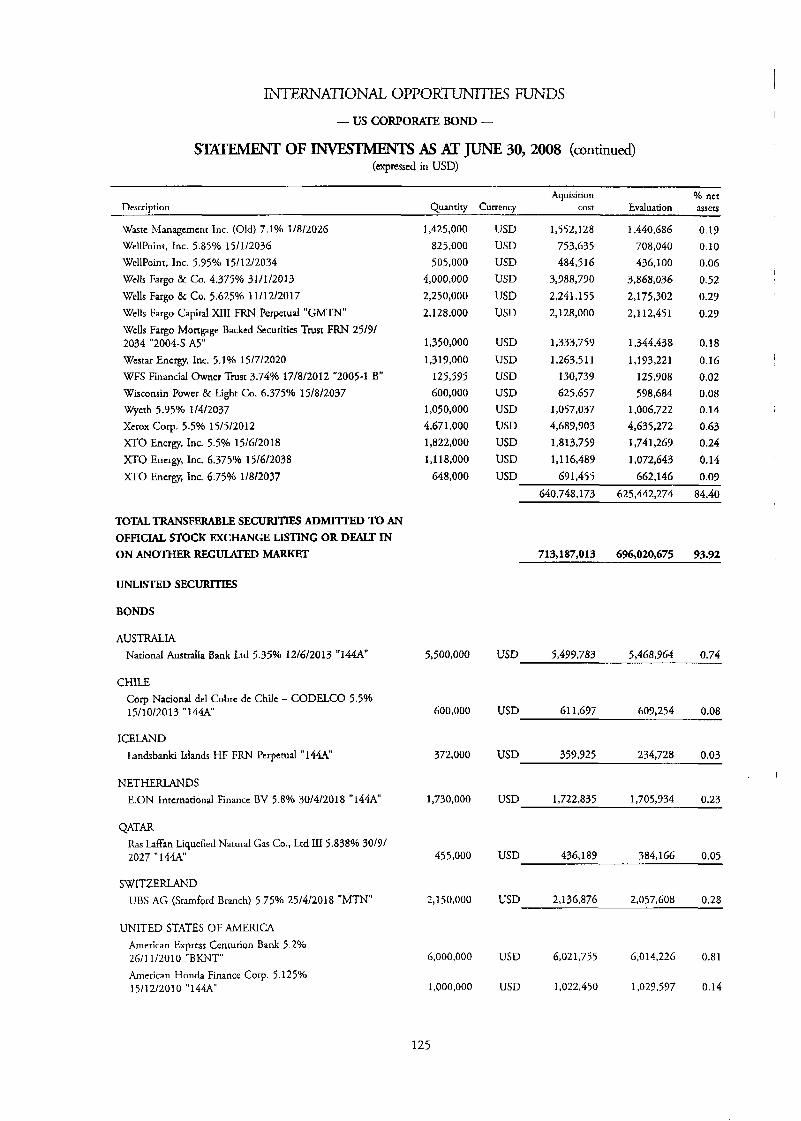
INTERNATIONAL OPPORTUNITIES FUNDS
- us CORPORATE BOND -
OF -S As AT JUNE 30,2008 (continued) (expressed in USD)
Aquisition % ncr Description Quantity Currency cost Evaluation asseuj
Waste Management Inc. (Old) 7.1% 1/8/2026 WellPoint, Inc. 5.85% 15/1/2036 WellPoint, Inc. 5.95% 15/12\2034 Wells Fargo Br Co. 4.375% 31/1/2013 Wells Fargo & Co. 5.625% 11/12/2017 Wells Fargo Capital XI11 FRN Perpetud "GMTN" Wells Fargo Mortgage Backed Securities Trust FRN 25/91
Westar Energy, Inc. 5.1% 15/7/2020 WFS Financial Owner Trust 3.74% 17/8/2012 "2005-1 B" Wisconsin Power & Light Co. 6.375% 15/8/2037 Wyeth 5.95% 1/4/2037 Xerox Corp. 5.5% 15/5/2012 XTO Energy, Inc. 5.5% 15/6/2018 XTO Energy, Inc. 6.375% 15/6/2038 XTO Energy, Inc. 6.75% 1/8/2037
2034 "2004-S A5"
TOTAL TRANSFERABLE SECURITIES ADMITIED TO AN OFFICIAL STOCK EXCHANGE LISTING OR DEALT IN ON ANOTHER REGULATED MARKET
UNLI!XED SECUFUTZES
BONDS
AUSTRALIA National Australia Bank Ltd 5.35% 12/6/2013 " 1 4 4 "
CHILE Corp Naciond del Cobre dc Chile - CODELCO 5.5% 15/10/2013 "I 44A"
ICELAND Landsbanki Islands HF F R N Perpetual "144A"
NETHERLANDS E.ON Intcrnarional Finance BV 5.8% 30/4/2018 "144A"
QATAR Ras LafFan Liquefied Natural Gas Co., Ltd I11 5.838% 30/9/ 2027 144A"
SWITZERLAND UBS AG (Stamford Branch) 5.75% 25/4/2018 "MTN"
UNITED STATES OF AMERICA American Express Centurion Bank 5.2% 26/11/2010 "BKNT" American Honda Finance Corp. 5.125% 1511 2/2010 "144A
1,425,000 825,000 505,000
4,000,000 2,250,000 2.1 28,000
1,350,000 1,319,000
125,595 600,000
1,050,000 4,671,000 1,822,000 1,118,000
648.000
5,500,000
600,000
372,000
1,730,000
455,000
2,150,000
6,000,000
1,000,000
125
USD 1,552,128 1,440,686 0.19 753,635 708,040 0.10 USD
USD 484,5 16 436,100 0.06 USD 3,988,730 3,868,036 0.52 USB 2,241,155 2,175,302 0.29 USD 2,128,000 2,112,451 0.29
USD 1,333,753 1,344,438 0.18 USD 1,263,51 I 1,193,221 0.16 USD 130,739 125,908 0.02 USD 625,657 598,684 0.08 USD 1,057,037 1,006,722 0.14 USD 4,689,903 4,635,272 0.63 USD 1,813,759 1,741,269 0.24 USD 1,116,489 1,072,643 0.14 USD 691,455 662,146 0.09
640,748,173 625,442,274 84.40
I
I
713,187,013 696,020,675 93.92
USD 5,499,783 5,468,964 0.74
USD 61 1,697 609,254 0.08
USD 359,925 234,728 0.03
I
USD 1,722,835 1,705,934 0.23
384,166 0.05 USD 436.1 89
USD 2,136,876 2,057,608 0.28
USD 6,021,755 6,014,226 0.81
USD 1,022,450 1,029,597 0.14
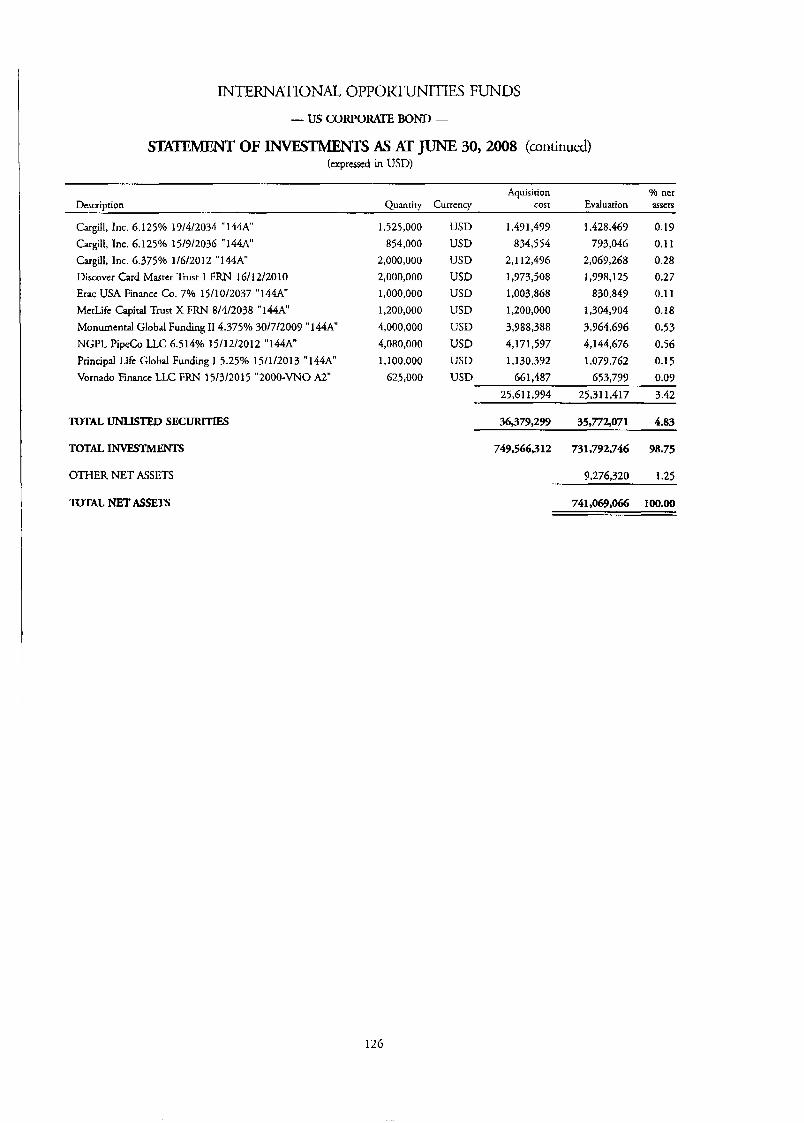
INTERNATIONAL OPPORTUNITIES FUNDS
- us CORPORATE BOND -
SWTMENT OF INvEsIhlENTS AS AT JUNE 30, 2008 (continued) (expressed in USD)
Aquisition Yo net Description Quantiry Currency cost Evaluation assets
Cargill, Inc. 6.125% 17/4/2034 "144A" Cargill, Inc. 6.125% 15/9/2036 "144A" Cargill, Inc. 6.375% 1/6/2012 "I44A" Discover Card Master Trust 1 F R N 16/12/2010 Erac USA Finance Co. 7% 15/10/2037 "144A" MerLifc Capital Trust X F R N 8/4/2038 "1444" Monumental Global Funding I1 4.375% 30/7/2009 "144A" NGPL Pipe& LLC 6.514% 15/12/2012 "144A" Principal Lift Global Funding I 5.25% 15/1/2013 "144A" Vornado Finance LLC FRN 15/3/2015 "2000-VNO A2"
1,525,000 854,000
2,000,000 2,000,000
1,000,000
1,200,000 4,000,000 4,080,000 1,100,000
625,000
USD USD USD USD USD USD USD USD USD USD
1,491,499 834,554
2,112,476 1,973,508 1,003,868 1,200,000
3,988,388 4,171,597 1,130,392
661,487
1,428,469 793,046
2,067,268 1,998,125
830,849 1,304,904 3,964,696 4,144,676 1,079,762
653,799
0.19 0.1 1 0.28 0.27 0.1 1
0.18 0.53 0.56 0.15
0.09
TOTAL IJNLKTED SECURITIES
25.61 1,994 25.31 1,417 3.42
36,379.299 35,772.071 4.83
TOTAL INVESTMENTS
OTHER NET ASSETS
nTTAz, NET ASSETS
~
749,566,312 731,792,746 98.75
8,276,320 1.25
741,069.066 100.00
126
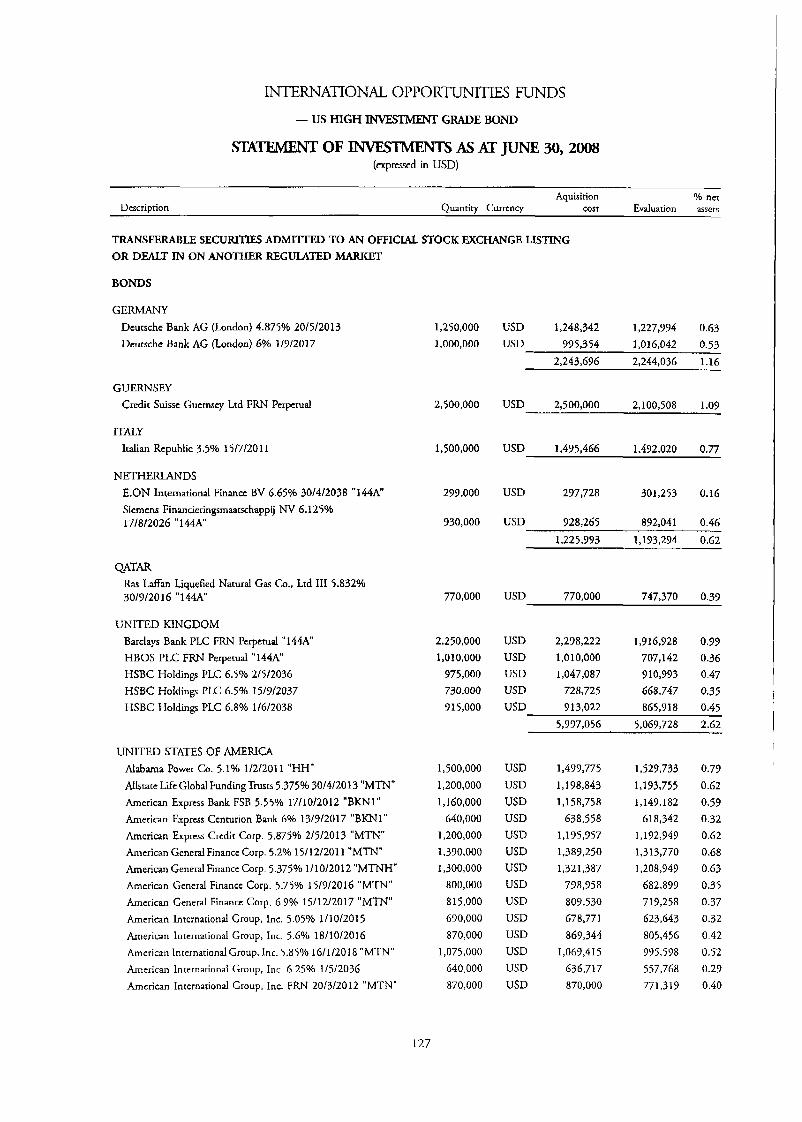
INTERNATIONAL OPPORmITIES FUNDS
- US HIGH GRADE BOND -
s- OF 6 AT JUNE 30,208 (expressed in USD)
- Aquisition % net
Description Quantity Currcncy cost Evaluation assets
TRANSFERABLE SECURITIES ADMITIED TO AN OFFICIAL STOCK EXCHANGE LISTING OR DEALT IN ON ANOTHER REGULATED MARKET
BONDS
GERMANY Dcutschc Bank AG (London) 4.875% 20/5/2013 Deutsche Bank AG (London) 6% 1/9/2017
GUERNSEY Credit Suissc Guernsey Ltd FRN Perpetual
ITALY Italian Rcpublic 3.5% 15/7/2011
NETHERLANDS E.ON International Finance BV 6.65% 30/4/2038 "144A" Siemens Financieringsmaatschappij NV 6.125% 17/8/2026 "144A"
QATAR Ras EafFan Liquefied Natural Gas Co., Ltd 111 5.832% 30/9/2016 "144A"
UNITED KINGDOM Barclays Bank PLC FRN Perpetual "144A" HBOS PLC FRN Perpetual "14W HSBC Holdings PLC 6.5% 2/5/2036 HSBC Holdings PLC 6.5% 15/9/2037 HSBC Holdings PLC 6.8% 1/6/2038
UNITED STATES OF AMERICA Alabama Power Co. 5.1% 1/2/20] 1 "HH" Allstate Life Global FundingTrusts 5.375% 301412013 "MTN" American Express Bank FSB 5.55% 17/10/2012 "BKNI" American Express Centurion Bank 6% 13/9/2017 "BKNl" American Exprcss Credit Corp. 5.8750/0 2/5/2013 "MTN" American General Finance Corp. 5.2% 15/12/2011 "MTN" American General Finance Corp. 5.375% 1/10/2012 "MTNH" American General Finance Corp. 5.75% 15/9/2016 "MTN" American General Finance Corp. 6.9% 15/12/2017 "MTN" Amcrican International Group, Inc. 5.05% 111012015 American International Group, Inc. 5.6Yo 18/10/2016 American International Group, Inc. 5.850/0 16/1/2018 "MTN" Amcrican lnternariond Group, Inc. 6.25% 1/5/2036 American Inrernariond Group, Inc. FRN 201312012 "MTN"
1,250,000 1,000,000
2,s00,000
1,500,000
277,000
930,000
770,000
2,250,000 1,010,000 775,000 730,000 915,000
1,500,000 1,200,000 1,160,000 640,000 1,200,000 1.390,OOO 1,300,000 800,000 ai5.000 690,000 870,000
1,075,000 640,000 870,ooo
USD 1,248,342 1,227,994 0.63 USD 995,354 1,016,042 0.53
2,243,696 2,244,036 1.16
USD 2,500,000 2,100,508 1.09
USD 1,495,466 1,492,020 0.77
USD 297,728 301,253 0.16
USD 928,265 892,041 0.46 1,225,773 1,173,294 0.62
USD 7 7 0,O 0 0 747,370 0.39
USD 2,298,222 1,916,928 0.99 USD 1,010,000 707,142 0.36 USD 1,047,087 910,993 0.47 USD 728,725 6158,747 0.35 USD 913,022 865,718 0.45
5,737,056 5,069,728 2.62
USD USD USD USD USD USD USD USD USD USD USD USD USD USD
1,499,775 1,198,843 1 , I 58,758 638,558 1,195,957 1,387,250 1,321,387 778,9sa 809,530 678,771 869,344
1,069,415 636,717 870,000
1,529,733 1,193,755 1,149,182 618,342 1,192,949 1,313,770 1,208,949 682,899 719,258 623,643 805,456 995,598 557,768 771,319
0.79 0.62 0.59 0.32 0.62 0.68 0.63 0.35 0.37 0.32 0.42 0.52 0.29 0.40
127

INTERNATIONAL OPPORTUNITIES FUNDS
- US HIGH GRADE BOND -
STATEMENT OF -S As AT JUNE 30,2008 (continued) (expressed in USD)
~~
Aquisition % net Evaluation asscrs Dwcription Quantity Currency cost
American International Group, Inc. FRN 15/5/2058 "144A" Archer-Daniels-Midland Co. 5.935% 1 /I012032 ATaT, Inc. 5.1% 15/9/2014 AT&T, Inc. 5.875% 1/2/2012 AT&T, Inc. 6.3% 15/1/2038 BAC Capital Trust XI. 6.625% 23/5/2036 BAC Capital Trust XIV FRN Perpetual Bank of America Corp. 4.9% 1/5/2013 "MTN" Bank of America Cop. 5.42% 15/3/2017 Bank of America Corp. 5.65% 1/5/2018 Bank of America Corp. 5.75% 1/12/2017 Bank ofAmerica Corp. 7.125% 15/10/2011 Bank of America Corp. 7.40/0 15/1/2011 Bank of America Corp. FRN Pcrpetud Bank of America NA 6% 15/10/2036 "BKNT Bank of Ncw York Mellon Corp. (The) 4.95% 1/11/2012 "MTN" Bank One Issuance Trust 4.3746 15/4/2012 "2004-82 B2" Bear Stearns Commercial Mortgage Securities 6.489'0 15/21 2035 "2001-TOP2 A2" Bear Stearns Cos, Inc. (The) 5.35% 1/2/2012 Bear Stearns Cos, Inc. (The) 7.25% 1/2/2018 Bristol-Myers Squibb Co. 5.45% 1/5/2018 Bristol-Myers Squibb Co. 6.125% 1/5/2038 Burlington Norrhcrn and Santa Fe Railway Co. 2005-3 Pass Through Trust 4.8346 15/1/2023 Burlingron Northern and Sanra Fe Railway Co. 2006-1 Pass Through Trust 5.72% 15/1/2024 "06-1" Carrnax Auto Owncr Trust 5.23% 15/12/2011 "2007-2 A3" Citigroup Capital XXI FRN 21/12/2057 Citigroup Commercial Mortgage Trust FRN 1011 2/2049 Citigroup, Inc. 5.1% 29/9/20] I Citigroup, Inc. 5.3% 17/10/2012 Citigroup, Inc. 5.875% 22/2/2033 Citigroup, Inc. 5.875% 27/5/2037 Citigroup, Inc. 6.125% 21/11/2017 Citigroup, Inc. 6.875% 5/3/2038 CitigrouplDeurschc Bank Commercial Mortgage Trust 5.322% 11/12/2049 "2007-CD4 A4" CitigrouplDeursche Bank Commercial Mortgage Trust FRN
ConocoPhillips 5.2% 15/5/2018 ConocoPhillips 5.70/0 15/5/2038 CS First Boston Morrgage Securities Corp. 4.7% 15/8/2036 CW Capital Cobalr Ltd FRN 15/5/2046 Duke Energy Carolinas LLC 6.05% 15/4/2038 Financial Security Assurance Holdings Ltd FRN 1511 212066 "144A"
15/7/2044 "2005-CD1 A4"
128
1,100,000 1,125,000 1,220,000
720,000 1,050,000 1,500,000 3,000,000
750,000 1,000,000 1,250,000 1,400,000 1,520,000 2,000,000 1,53 1,000
160,000
2,000,000 2,000,000 1,000,000
1,700,000 970,000 650,000 725,000
1,208,475
2,155,335 3,000,000
807,000 100,000
1,530,000 1,530,000 1,160,000
750,000 1,400,000
575,000
2,500,000
2,300,000 9 0 0,O 0 0 900,000
2,000,000 700,000 325,000
1,000,000
USD USD USD USD USD USD USD USD USD USD USD USD USD USD USD
USD USD USD
USD USD USD USD
USD
USD USD USD USD USD USB USD USD USD USD
USD
USD USD USD USD USD USD
USD
1,100,000 1,139,413 1 , I 92,210
949,855 1,045,457 1,620,007 3,011,531
747,999 I , 145,307 1,243,424 1,370,731 1,626,531 2.1 23,261 1,531,000
159,337
1,786,329 1,965,618 1,036,068
1,640,913 967,453 648,882 719,521
1,208,475
2,155,336 2,990,671
805,076 92,666
1,527,925 1,527,549 1,146,029
716,751 1,394,382
571,146
2,380,718
2,277,265
899,920 896.61 5
2,008,813 650,533 324,113
1 ,O 14,727
1,051,097 1,079,568 1,201,580
942,085 997,388
1,389,775 2,282,370
725,861 920,133
1,167,728 1,324,000 1,584,101 2,089,102 1,475,180
143,446
1,793,372 1,992,586 1,026,423
1,664,569 1,006,649
640,722 702,272
1,136,208
2,156,542 3,051,182
765,457 90,591
1,512,737 1,473,424
764,125 640,997
1,351,984 557,617
2,303,542
2,211,114
888,997 892,410
1,778,139 638,394 320,942
707,048
0.54 0.56 0.62 0.49 0.52 0.72 1.18 0.38 0.48 0.60 0.69 0.82 1.08 0.76 0.07
1.03
1.03 0.53
0.86 0.52 0.33 0.36
0.59
1.12 1.58 0.40
0.05 0.78 0.77 0.50 0.33 0.70 0.29
1.19
1.14 0.46 0.46 1.02 0.33 0.17
0.37
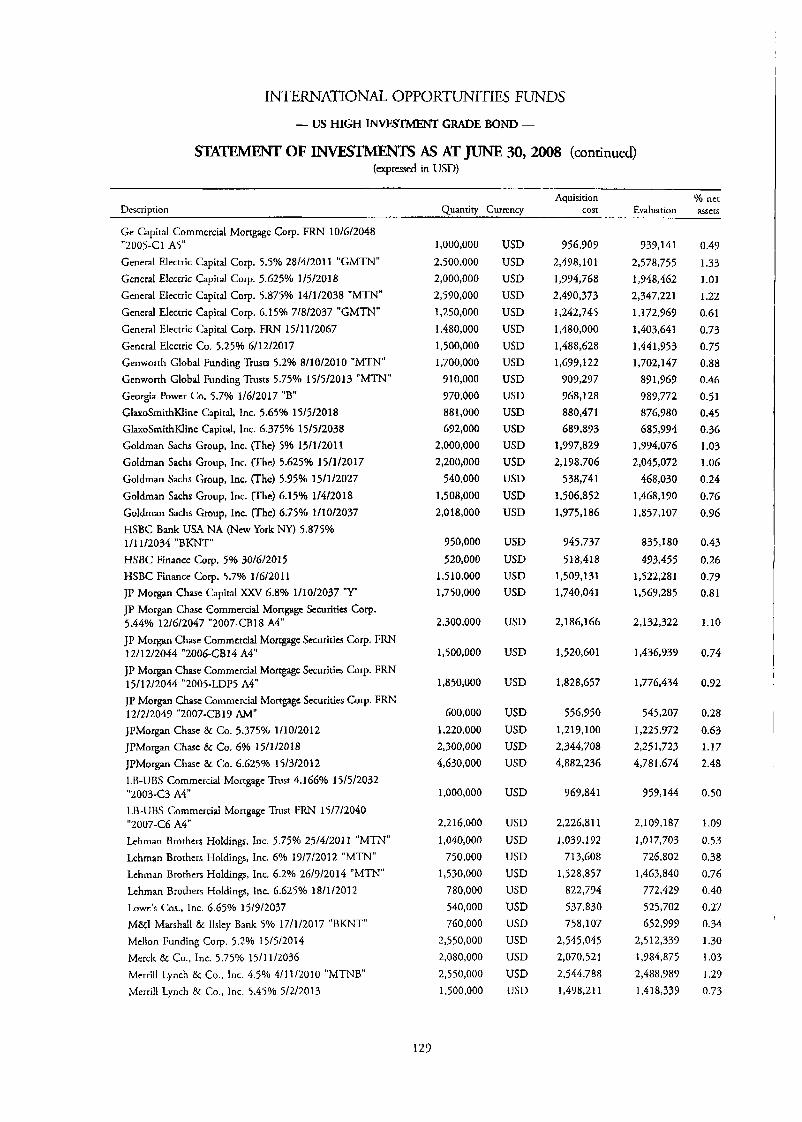
INTERNATIONAL OPPORTUNITIES FUNDS
- US HIGH INVESTMENT GRADE BOND -
STATEMIENT OF INVESTMENTS As AT JUNE 30, 2008 (continued) (expressed in USD)
Aquisition % nct Description Quantity Currency cost Evaluation assets
Ge Capital Commercial Mortgage Corp. FRN 10/6/2048 "2005-C1 AS" General Electric Capital Corp. 5.5% 28/4/2011 "GMTN" General Electric Capital Corp. 5.625% 1/5/2018 General Electric Capital Corp. 5.875% 14/1/2038 "MTN" General Electric Capital Corp. 6.15% 7/8/2037 "GMTN" General Electric Capital Cotp. FRN 1511 112067 General Electric Co. 5.25% 6/12/2017 Genworth Global Funding 'Trusts 5.2% 8/10/2010 "MTN" Genworth Global Funding Trusts 5.75% 15/5/2013 "MTN" Georgia Power Co. 5.7% 1/6/2017 "B" GlaxoSmithKlinc Capital, Inc. 5.65% 15/5/2018 GlaxoSmithKline Capital, Inc. 6.375% 15/5/2038 Goldman Sachs Group, Inc. (The) 5% 15/1/2011 Goldman Sachs Group, Inc. (The) 5.625% 15/1/2017 Goldman Sachs Group, Inc. (The) 5.95% 15/1/2027 Goldman Sachs Group, Inc. (The) 6.15% 1/4/2018 Goldman Sachs Group, Inc. (The) 6.75% 1/10/2037 HSBC Bank USA NA (New York NY) 5.875% 111 112034 "BKNT" HSBC Finance G r p . 5% 30/6/2015 HSBC Finance Corp. 5.7% 1/6/2011 JP Morgan Chase Capital XXV 6.8% 111012037 "Y" JP Morgan Chase Commercial Mortgage Securities Corp. 5.44% 12/6/2047 "2007-CB18 A4" JP Morgan Chase Commercial Mortgage Securities Corp. FRN 12/12/2044 "2006-CB14 A4" JP Morgan Chase Commercial Mortgage Securities Cotp. FRN 15/12/2044 "2005-LDP5 A4" JP Morgan Chase Commercial Mortgage Securities Corp. FRN 12/2/2049 "2007-CB19 AM" JPMorgan Chasc & Co. 5.375% 1/10/2012 JPMorgan Chasc & Co. 6% 15/1/2018 JPMorgan Chase & Co. 6.625% 15/3/2012 LB-UBS Commercial Mortgage Trust 4.166% 15/5/2032
LB-UBS Commercial Mortgage Trust FRN 15/7/2040 "2007-C6 A4" Lehman Brothers Holdings, Inc. 5.75% 25/4/20] 1 "MTN" Lehrnan Brothers Holdings, Inc. 6% 19/7/2012 "MTN" Lchman Brothers Holdings, Inc. 6.2% 26/9/2014 "MTN" Lchman Brothers Holdings, Inc. 6.625% 18/1/2012
"2003-C3 A4"
Lowc's Cos., Inc. 6.65% 15/9/2037 M&I Marshall & Ilsley Bank 5% 17/1/2017 "BKNT" Mellon Funding COT. 5.2% 15/5/2014 Merck & Co., Inc. 5.75% 1511 112036 Merrill Lynch & Co., Inc. 4.5% 4/11/2010 "MTNB" Merrill Lynch & Co , lnc 5.45% 5/2/2013
1,000,000 2,500,000 2,000,000 2,590,000 1,250,000 1,480,000 1,500,000 1,700,000
710,000 970,000 881,000 672,000
2,000,000 2,200,000
540.000 1,508,000 2,018,000
950,000 520,000
1,510,000 1,750,000
2,300,000
1,500,000
1,850,000
600,000 1,220,000 2,300,000 4,630,000
1,000,000
2.2 16,000
1,040,000 750,000
1,530,000 780,000 540,000 760,000
2,550,000 2,080,000 2,550,000 1,500,000
129
USD USD USD USD USD USD USD USD USD USD USD USD USD USD USD USD USD
USD
USD USD USD
USD
USD
USD
USD USD USD USD
USD
USD USD USD USD USD USD USD USD USD USD USD
956,909 2,498,101 I ,9 94,768 2,490,373 1,242,745 1,480,000 1,488,628 1,699,122
909,297 968,128 880,471 689,893
1,997,829 2,198,706
538,741 1,506,852 1,975,186
945,737 5 18,418
1,509.13 1
1,740,041
2,186,166
1,520,601
1,828,657
5 5 6,9 5 0 1,219,100 2,344,708 4,882,236
767,841
2,226.81 1
1,039,192 71 3,608
1,528,857 822,794 537,830 758,107
2,545,045 2,070,521 2,544,788 I ,498,211
737,14 1
2,578,755 1,948,462 2,347,221 1,172,767 1,403,641 1,441,953 1,702,147
891,969 989,772 876,980 685,994
I. ,794,076 2,045,072
468,030 1,468,190 1,857,107
835,180 433,455
1,522,281 1,569,285
2,132,322
1,436,939
1,776,434
545,207 1,225,972 2,251,723 4,781,674
959,144
2,109,187 1,017,703
726,802 1,463,840
772.429 525,702 652,999
2,512,339 1,784,875 2,488,989 1,418,339
0.49 1.33 1.01 1.22 0.61 0.73 0.75 0.88 0.46 0.51 0.45 0.36 1.03 I .06 0.24 0.76 0.96
0.43 0.26 0.79 0.81
1.10
0.74
0.92
0.28 0.63 1.17 2.48
0.50
1.09 0.53 0.38 0.76 0.40 0.27 0.34 1.30 1.03 1.29 0.73
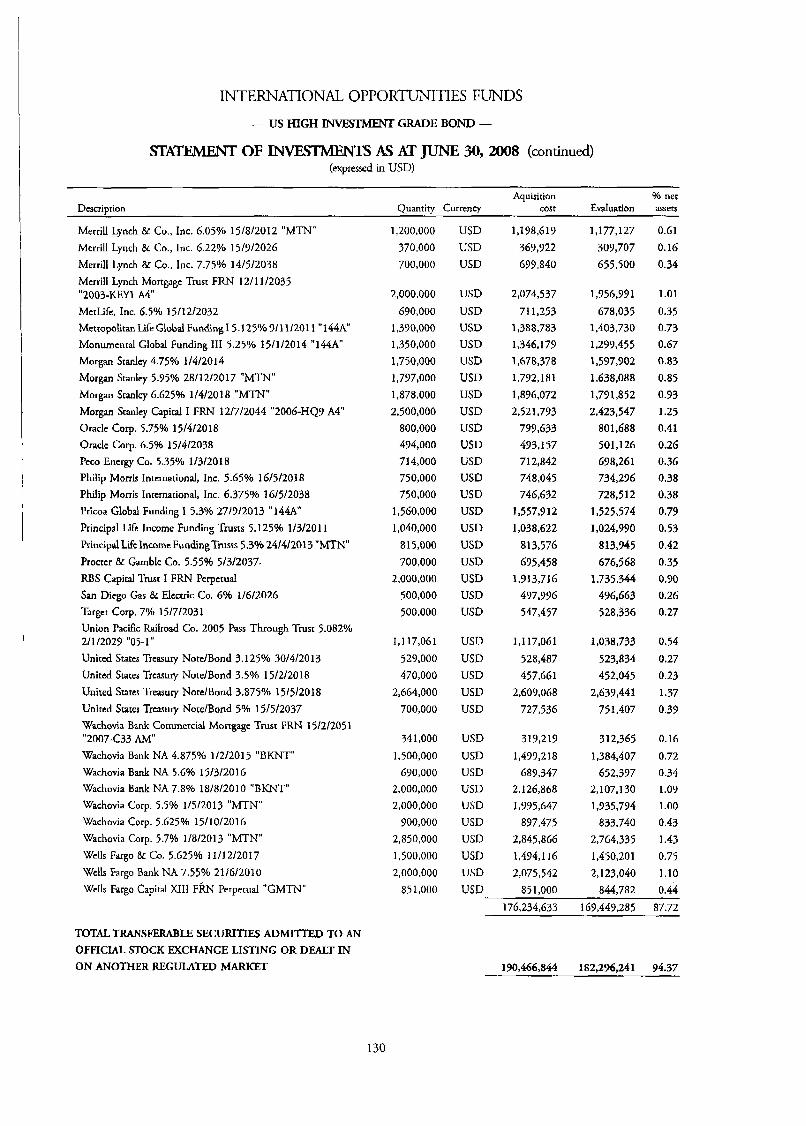
INTERNATIONAL OPPORmITIES FUNDS - US HIGH INvEsIhlENT GRADE BOKW -
OF -S AS AT JUNE 30,2008 (continued) (expressed in USD)
Aquisition Yo net Evaluation assets Description Quantity Currency cost
Merrill Lynch & Co., Inc. 6.059'0 15/8/2012 "MTN" Merrill Lynch & Co., Inc. 6.22% 15/9/2026 Merrill Lynch & Co., Inc. 7.75% 14/5/2038 Merrill Lynch Mortgage Trust FRN 12/11/2035 "2003-KEY1 A4" MerLifc, Inc. 6.5% 15/12/2032 MetropolitanLifeGlobal Funding1 5.125%9/11/2011 "144A" Monumental Global Funding 111 5.25% 15/1/2014 "144A" Morgan Stanley 4.75% 1/4/2014 Morgan Stanlcy 5.95% 28/12/2017 "MTN" Morgan Stanley 6.625% 1/4/2018 "MTN" Morgan Stanley Capita I FRN 12/7/2044 "2006-HQ9 A4" Orade Corp. 5.75% 15/4/2018 Oracle Carp. 6.5% 15/4/2038 Peco Energy Co. 5.35% 1/3/2018 Philip Morris International, Inc. 5.65% 16/5/2018 Philip Morris International, Inc. 6.375% 16/5/2038 Pricoa Global Funding I 5.3% 27/9/2013 "144A" Principal Life Income Funding Trusts 5.125% 1/3/2011 Principal Life Income Funding Trusts 5.3% 24/4/2013 "MTN" Proctcr Br Gamble Co. 5.55% 5/3/2037. RBS Capita Trusr I FRN Perpetual San Diego Gas & Electric Co. 6% 1/6/2026 Target Corp. 7% 15/7/2031 Union Pacific Railroad Co. 2005 Pass Through Trust 5.082% 2/1/2029 "05-1" Unircd States Treasury NotelBond 3.125% 30/4/2013 United States Treasury NotelBond 3.5% 15/2/2018 United States Treasury Note/Bond 3.875% 15/5/2018 United States Treasury NotelBond 5% 15/5/2037 Wachovia Bank Commercial Mortgage Trust FRN 15/2/2051
Wachovia Bank NA 4.875% 1/2/2015 "BKNT" Wachovia Bank NA 5.6% 15/3/2016 Wachovia Bank NA 7.8% 18/8/2010 " B K N T Wachovia Corp. 5.54/0 1/5/2013 "MTN" Wachovia Corp. 5.625% 15/10/2016 Wachovia Corp. 5.7% 1/8/2013 "MTN" Wells Fargo & Co. 5.625% 11/12/2017 Wclls Fargo Bank NA 7.559'0 211612010 Wells Fargo Capital XI11 Fm Perperual "GMTN"
"2007-C33 AM"
TOTAL TRANSFERABLE SECURITIES ADMITTED TO AN
OFFICIAL. STOCK FXCHANGE LISTING OR DEALT IN ON ANOTHER REGULATED MARKET
1,200,000 370,000 700,000
2,000,000 690,000
1,390,000 1,350,000 1,750,000 1,797,000 1,878,000 2,500,000
800,000 494,000 714,000 750,000 750,000
1,560,000 1,040,000
815,000 700,000
2,000,000 500,000 500.000
1.1 17,061
529,000 470,000
2,664,000 700,000
341,000 1,500,000
690,000 2,000,000 2,000,000
900,000 2,850,000 1,500,000 2,000,000
85 1,000
USD USD USD
USD USD USD USD USD USD USD USD USD USD USD USD USD USD USD USD USD USD USD USD
USD USD WSD USD USD
USD USD USD USD USD USD USD USD USD USD
1,198,619 369,922 699,840
2,074,537
71 1,253 1,388,783 1,346,179 1,678,378 1,792,181 1,896,072 2,521,793
799,633 493,157 712,842 748,045 746,632
1,557,912 1,038,622
813,576 695,458
1.91 3,716 497,996 547,457
1.1 17,061 528,487 457,661
2,607,068 727,536
319,219 1,499,2 18
689,347 2,126,868 1,995,647
897,475 2,845,866 1,494s 16 2,075,542
851,000 176,234,633 169,447,285 87.72
190,466,844 182,296,241 94.37
1,177,127 303,707 655,500
1,956,991
678,035 1,403,730 1,299,455 1,597,902 1,638,088 1,79 1,852
2,423,547 801,688 501 ,I 26 498,261 734,296 728,512
1,525,574 1,024,790
813,945 676,568
1,735,344 496,663 528,336
1,038,733 523,834 452,045
2,639,441 75 1,407
312,365 1,384,407
652,397 2,107,130 1,935,794
833,740 2,764,335 1,450,201 2,123,040
844,782
0.61 0.16 0.34
1.01 0.35 0.73 0.67 0.83 0.85 0.93 1.25
0.41 0.26 0.36 0.38 0.38 0.79 0.53 0.42 0.35 0.90 0.26 0.27
0.54 0.27 0.23
1.37 0.39
0.16 0.72 0.34 1.07 1 .oo 0.43 1.43 0.75 1.10 0.44
130

INTERNATIONAL OPPORTUNITIES FUNDS
- US HIGH INVESTMENT GRADE BOND -
S n OF INVESTMENTS AS AT JUNE 30, 2008 (continued) (expressed in USD)
Aquisition Yo net Descrivtion Quantiry Currency COST Evaluation assets
UNLISTED SECURITIES
BONDS
AUSTRALIA National Ausrralia Bank Ltd 5.35% 12/6/2013 "144A"
CHILE Corp Nacional del Cobre de Chile - CODELCO 5.5% 15/10/2013 "144A"
NETHERLANDS E.ON International Finance BV 5.8% 30/4/2018 "144A"
QATAR Ras Laffan Liquefied Natural Gar Co., Ltd 111 5.838% 30191 2027 "144A"
SWITZERLAND UBS AG (Stamford Branch) 5.75% 25/4/2018 "MTN"
UNITED STATES OF AMERICA Cargill, Inc. 6.125% 19/4/2034 "144A" Cargill, Inc. 6.625% 15/3/2037 "144A" Monumental Global Funding I1 4.375% 30/7/2009 "144A" Principal Life Global Funding 1 5.25% 15/1/2013 "144A"
TOTAL WNJASTED SECURITIES
TOTAL INVF,STMENTS
OTHER NET ASSETS
1,500,000
750,000
400,000
970,000
750,000
725,000 500,000
2,000,000 810,000
USD 1,499,941 1,491,535 0.77
USD 778,386 761,568 0.40
USD 398,343 394,436 0.20
USD 972,719 818,990 0.42
USD 745,422 717,770 0.37
USD 707,674 677,108 0.35 USD 498,862 492,634 0.26 USD 1,994,194 1,982,348 1.03 USD 814,977 795,038 0.41
4,017,727 3,949,188 2.05
8,412,538 8,133,487 4.21
198,879,382 190,429,728 98.58
2,751,556 1.42
TOTAL NET ASSETS
131
193,181,284 100.00
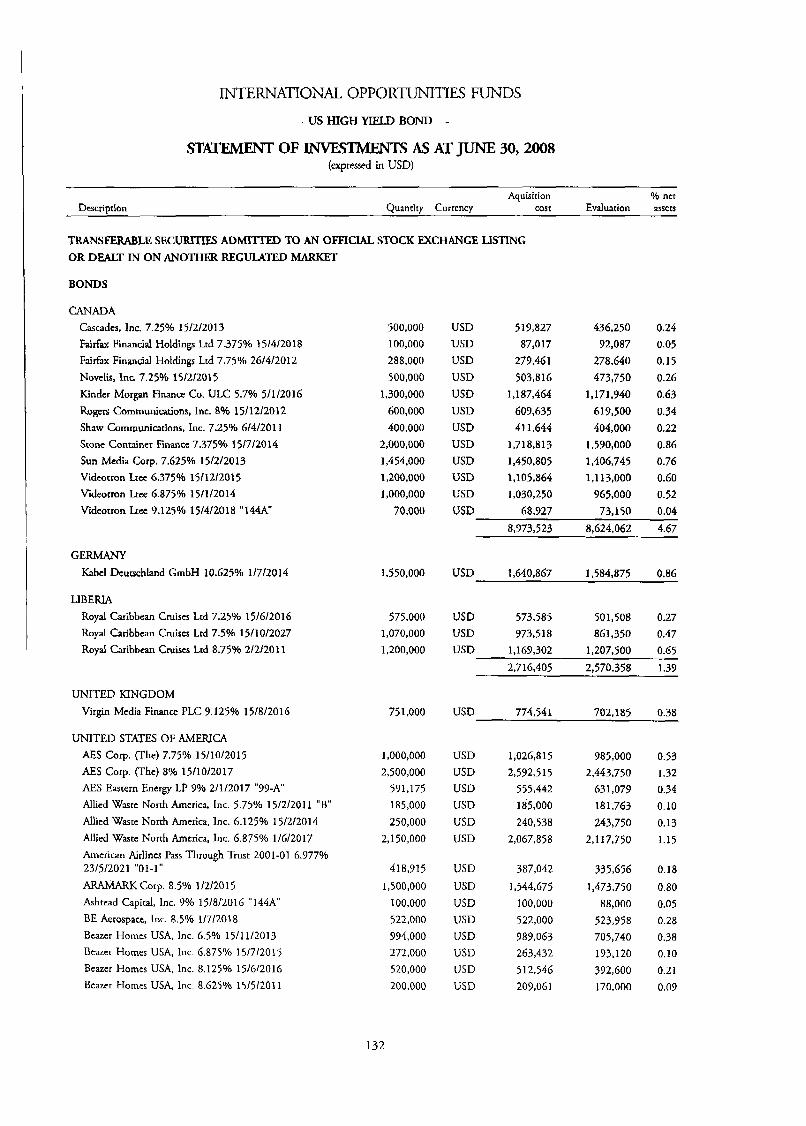
INTERNATIONAL OPPORTUNITIES FUNDS
- US HIGH YIELD BOND -
STATEMENT OF -As ATJUNE 30,2008 (expressed in USD)
- Aquisirion 96 nct
Evduarion assets Description Quantity Currency con
TRANSFERABLE SECURITIES ADMITTED TO AN OFFICIAL STOCK EXCHANGE LISTING OR DEALT IN ON ANOTHER REGUJATED MARKET
BONDS
CANADA Cascades, Inc. 7.25% 15/2/2013 Fairfax Financial Holdings Ltd 7.3759'0 15/4/2018 Fairfax Financial Holdings Ltd 7.75% 26/4/2012 Novelis, Inc. 7.25% 15/2/2015 Kinder Morgan Finance Co. ULC 5.7% 5/1/2016 Rogers Communications, Inc. 8% 15/12/2012 Shaw Communicarions, Inc. 7.25% 6141201 1
Stone Container Finance 7.375% 15/7\2014 Sun Media Corp. 7.625% 15/2/2013 Videocron Ltcc 6.375% 15/12/2015 Videorron Ltee 6.875% 15/1/2014 Videorron Lee 3.125% 1514/2018 "144A"
GERMANY Kabcl Dcutschland GmbH 10.625% 1/7/2014
LIBERIA Royal Caribbean Cruises Ltd 7.25% 15/6/2016 h y a l Caribbean Cmiscs Lrd 7.5% 15/10/2027 Royal Caribbean Cruises Lrd 8.75% 2/2/2011
UNITED KINGDOM Virgin Media Finance PLC 9.125% 15/8/2016
UNITED STATES OF AMERICA AES Corp. (The) 7.75% 15/10/2015 AES Corp. (The) 8% 15/10/2017 AES Eastern Energy LP 9% 2/1/2017 "99-A" Allied Wasre North America, Inc. 5.75% 15/2/2011 "B" Allied Waste North America, Inc. 6.125% 15/2/2014 Allied Waste North America, Inc. 6.875% 1/6/2017 American Airlines Pass Through Trust 2001-01 6.977%
AFL4MAM Corp. 8.5% 1 /2/2015 Ashtead Capital, Inc. 9% 15/8/2016 "144A" BE Aerospace, lnc. 8.5% 1/7/2018 Bcazer Homcs USA, Inc. 6.5% 15/11/2013 Bcazer Homes USA, Inc. 6.875Yo 15/7/2015 Bcazer Homcs USA, Inc. 8.125% 15/6/2016 Bcazcr Homes USA, Inc. 8.625% 15/5/2011
23/5/2021 "01-1"
500,000 100,000 288,000 500,000
1,300,000 600,000 400,000
2,000,000 1,454,000 1,200,000 1,000,000 70,000
1,550,000
575,000 1,070,000 1,200,000
751,000
1,000,000 2,500,000
591,175 185,000 250,000
2,150,000
418,915 1,500,000
100,000 522,000 994,000 272,000 520,000 200,000
132
USD 519,827 436,250 0.24 USD 87,017 92,087 0.05 USD 279,461 278,640 0.15 USD 503,816 473,750 0.26 USD 1,187,464 1,171,940 0.63 USD 609,635 619,500 0.34 USD 41 1,644 404,000 0.22 USD 1,718,813 1,590,000 0.86 USD 1,450,805 1,406,745 0.76 USD 1,105,864 1,113,000 0.60 USD 1,030,250 965,000 0.52 USD 68,927 73,150 0.04
8,973,523 8,624,062 4.67
USD 1,640,867 1,584,875 0.86
USD 573,585 501,508 0.27 USD 973,518 861,350 0.47 USD 1,167,302 1,207,500 0.65
2,716,405 2,570,358 1.39
USD 774,541 702.185 0.38
USD USD USD USD USD USD
USD USD USD USD USD USD USD USD
1,0268 15 2,592,515
555,442 185,000 240,538
2,067,858
387,042 1,544,675
100,000 522,000 989.063 263,432 512,546 209,061
985,000 2,443,750
63 1,079 18 1,763 243,750
2,117,750
335,656 1,473,750
88,000 523,958 705,740 193,120 392,600 170,000
0.53 1.32 0.34 0.10 0.13 1.15
0.18
0.80 0.05 0.28 0.38 0.10 0.21 0.09
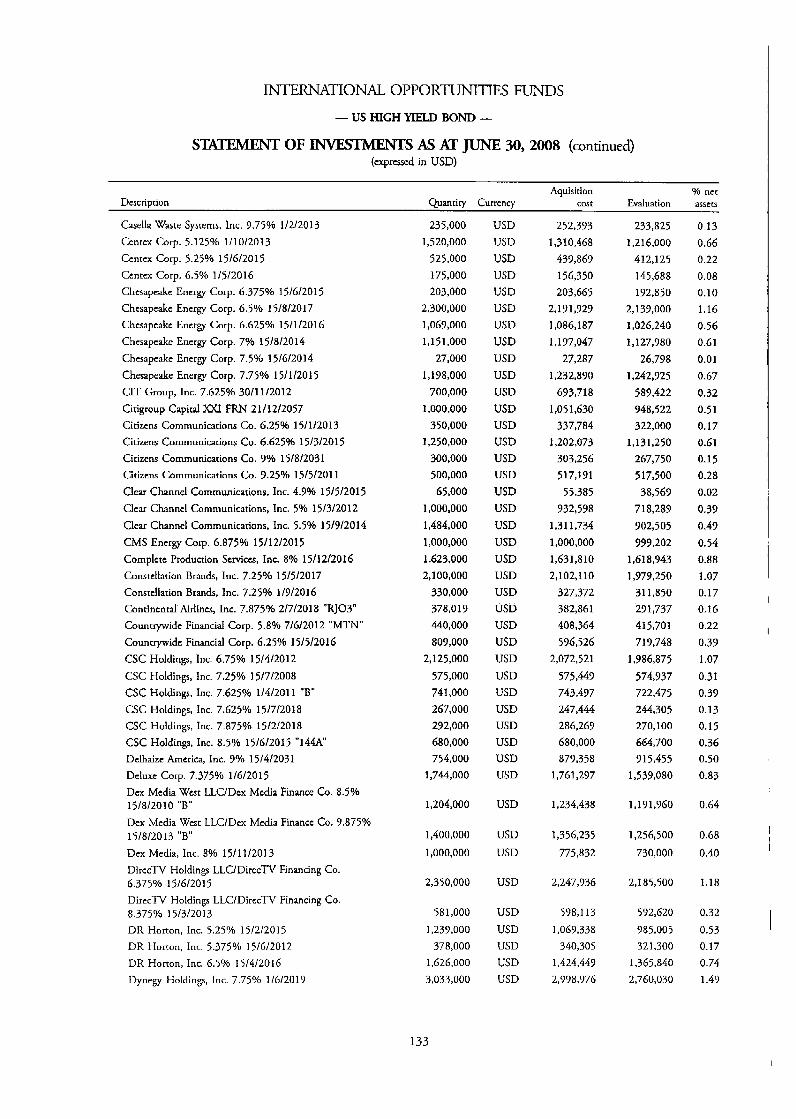
INTERNATONAL OPPOR?ZTNITIES FUNDS
- US HIGH YIELD BOND -
STIATEMIENT OF INVESTMENTS AS AT JUNE 30,2008 (continued) (expressed in USD)
Aquisition Yo nct Evaluation assets Description Quantity Currency cost
Casella Waste Systems, Inc. 9.75% 1/2/2013 Centex Corp. 5.125% 1/10/2013 Ccntcx Corp. 5.25% 15/6/2015 Centex Corp. 6.5% 1/5/2016 Chesapeake Energy Corp. 6.375% 15/6/2015 Chcsapcakc Energy Corp. 6.5% 15/8/2017 Chcsapcakc Energy Corp. 6.625% 15/1/2016 Chesapeake Energy Corp. 7% 15/8/2014 Chesapeake Energy Corp. 7.50/0 15/6/2014 Chesapeake Energy Corp. 7.75Oh 15/1/2015 CIT Group, Inc. 7.625% 30/11/2012 Citigroup Capital Mu F R N 21/12/2057 Citizens Communications Co. 6.25% 15/1/2013 Citizens Communications Co. 6.6259'0 15/3/2015 Citizens Communications Co. 9% 15/8/2031 Citizens Communications Co. 9.259'0 15/5/2011 Clear Channel Communications, Inc. 4.9% 15/5/2015 Clear Channel Communications, Inc. 5% 15/3/2012 Clear Channel Communications, Inc. 5.5% 15/9/2014 CMS Energy Corp. 6.875% 15/12/2015 Complcte Production Services, Inc. 8% 15/12/2016 Constellation Brands, Inc. 7.25% 15/5/2017 Constellation Brands, Inc. 7.25% 1/9/2016 Contincntal Airlines, Inc. 7.875% 2/7/2018 "RJ03" Countrywidc Financial Corp. 5.8% 7/6/2012 "MTN" Countrywide Financial Corp. 6.25% 15/5/2016 CSC Holdings, Inc. 6.75% 15/4/2012 CSC Holdings, Inc. 7.25% 15/7/2008 CSC Holdings, Inc. 7.625% 1/4/2011 "B" CSC Holdings, Inc. 7.6259'0 15/7/2018 CSC Holdings, Inc. 7.875% 15/2/2018 CSC Holdings, Inc. 8.5% 15/6/2015 "144A" Delhaize America, Inc. 99/0 15/4/2031 Deluxe Corp. 7.375% 1/6/2015 Dex Media West LLClDcx Media Finance Co. 8.5% 15/8/2010 "B" Dex Media West LLClDex Media Finance Co. 9.875% 15/8/2013 "B" Dex Media, Inc. 8% 15/11/2013 DirccTV Holdings LLC/DirecTV Financing Co. 6.375% 15/6/2015 DirecrV Holdings LLC/DirccTV Financing Co. 8.375% 15/3/2013 DR Horton, Inc. 5.259'0 15/2/2015 DR Horton, Inc. 5.375% 15/6/2012 DR Horton, Inc. 6.5% 15/4/2016 Dynegy Holdings, Inc. 7.75% 1/6/2019
235,000 1,520,000
525,000 175,000 203,000
2,300,000 1,069,000 1,151,000
27,000 1,198,000
700,000 1,000,000
350,000 1,250,000
3 0 0,O 0 0 500,000 65,000
1,000,000 1,484,000 1,000,000 1,623,000 2,100,000
330,000 378,019 440,000 809,000
2,125,000 575,000 741,000 267,000 292,000 680,000 754,000
1,744,000
1,204,000
1,400,000 1,000,000
2,350,000
581,000
1,237,000 378,000
1,626,000 3,033,000
133
USD USD USD USD USD USD USD USD USD USD USD USD USD US13 USD USD USD USD USD USD USD USD USD USD USD USD USD USD USD USD USD USD WSB USD
USD
USD USD
USD
USD
USD USD USD USD
252,393 1,310,468
439,869 156,350 203,665
2.1 91,929 1,086,187 1,197,047
27,287 1,232,890
693,718 1,051,630
337,784 1,202,073
303,256 5 17,191
55,385 932,598
1.31 1,734 1,000,000 1,631,810 2,102,110
327,372 382,861 408,364 596,526
2,072,521 575,449 743,497 247,444 286,263 680,000 879,358
1,761,277
1,234,438
1,356,235
775,832
2,247,936
598,113 1,069,338
340,305 1,424,449 2,798,976
233,825 1,2 16,000
412,125 145,688 192,850
2,133,000 1,026,240 1,127,380
26,798 1,242,925
589,422 748,522 322,000
1,131,250 267,750 517,500 38,569
718,289 902,505 999,202
1.61 8,943 1,979,250
31 1,850 291,737 415,701 719,748
1,986,875 574,337 722,475 244,305 270,100 664,700 915,455
1,539,080
1 , I 91,960
1,256,500
730,000
2,185,500
592,620 785,005 321,300
1,365,840 2,760,030
0.13 0.66 0.22 0.08 0.10 1.16 0.56 0.61 0.01 0.67 0.32 0.51 0.17 0.61 0.15 0.28 0.02 0.39 0.49 0.54 0.88 1.07 0.17 0.16 0.22
0.39 1.07 0.31 0.39 0.13 0.15 0.36 0.50 0.83
0.64
0.68 0.40
1.18
0.32
0.53 0.17 0.74 1.49

INTERNATIONAL OPPORTUNITIES FUNDS
- US HIGH YIELD BOND -
SlXTMENT OF -S AS AT JUNE 30,2008 (continued) (expressed in USD)
Descriotion Aquisirion % net
Quanriry Currencv cost Evaluation assers
Echostar DBS Corp. 5.75% 1/10/2008 Echostar DES Corp. 6.625% 1/10/2014 Echostar DBS Corp. 7% 1/10/2013 Edison Mission Energy 7% 15/5/2017 El Paso Corp. 7.375% 15/12/2012 "MTN" EJ Paso Corp. 7.75% 15/1/2032 "MTN" El Paso Corp. 7.875% 15/6/2012 El Paso Natural Gas Co. 7.5% 15/11/2026 El Paso Natural Gas Co. 8.375% 15/6/2032 Energy Future Holdings Carp. 10.875% 1/11/2017 " 1 4 W Equistar Chemicals LP 7.55% 15/2/2026 First Data Corp. 9.875% 24/9/2015 "144A" Ford Motor Credit CO LLC 5.7% 15/1/2010 Ford Motor Credit Co LLC 7% 1/10/2013 Ford Motor Credit Co LLC 7.25% 2511012011 Ford Motor Credit Co LLC 7.375% 28/10/2009 Ford Motor Credit CO LLC 7.375% 1/2/2011 Ford Motor Credit CO LLC 7.8Yo 1/6/2012 Ford Motor Credit Co LLC 8.625% 1/11/2010 Frecport-McMoRan Copper 8r Gold, Inc. 8.25% 1/4/2015 Freeport-McMoRan Copper & Gold, Inc. 8.375% 1/4/2017 Freescale Semiconductor, Inc. 8.875% 15/12/2014 Freescale Semiconducror, Inc. 7.125% 15/12/2014 Georgia-Pacific LLC 7.7% 15/6/2015 Georgia-Pacific LLC 8.125% 15/5/2011 Georgia-Pacific LLC 8.875% 15/5/2031 GMAC LLC 6.75% 1/12/2014 GMAC LLC 6.875% 15/3/20] I GMAC LLC 7.25% 2/3/2011 GMAC LLC 8% 1/11/2031 Goldman Sa& Group, Inc. (The) 6.75% 111012037 Harrah's Operating Co., Inc. 10.75% 1/2/2016 "144A" Hawker Beechcraft Acquisition Co. LLCIHawkcr Beechcraft Notes Co. 8.5% 1/4/2015 HCA, Inc./DE 9.125% 15/11/2014 HCA, Inc./DE 9.25% 1511 112016 Host Hotels & Resorts LP 6.75Yo 1/6/2016 "Q" Huntsman International LLC 7.875% 15/11/2014 Idearc, Inc. 8% 15/11/2016 "144A K Hovnanian Enterprises, Inc. 11.5% 1/5/2013 "144A" KB Home 5.75% 1/2/2014 KB Home 6.25% 15/6/2015 KB Home 6.375% 15/8/2011 KB Home 7.759'0 1/2/2010 Knighr Ridder, Inc. 5.75% 1/9/2017 Knighr, Inc. 6.5% 1/9/2012
1,000,000 863,000 887,000
3,333,000 500,000
1,728,000 1,550,000
38,000 36,000
4,000,000 325,000 300,000 240,000 310,000
1,180,000 100,000
1,080,000 400,000 100,000 435,000
522,000 3,300,000
500,000 583,000 760,000 250,000 500,000
1,988,000 1,158,000 1,300.000
874,000 5,673,000
1,000,000 289,000
3,320,000 1,650,000
300,000 882,000 96,000
1,450,000 460,000 135,000 93,000
1,037,000 1,633,000
134
USD USD USD USD USD USD USD USD USD USD USD USD USD USD USD USD USD USD USD USD
USD USD USD USD USD USD USD USD USD USD USD USD
USD USD USD USD USD USD USD USD USD USD USD USD USD
1,000,000 845,640 888,153
3,280,320 508,121
1,779,Ol I 1,600,603
37,348 38,752
4,214,327 215,973 288,653 229,299 28 1,604
1,116,221 77,964
977,057 399,481 99,065
435,000
559,783 2,760,725
477;500 588,719 774,017 230,21 I 386,563
1,900,580 1,101,548 1,402,640
836,934 4,891,638
1,044,194 289,000
3,466,05 1 1,62 1,070
282,072 894,624
95,122 1,325,132
42 1,773 131,024 93,267
921,135 1,624,424
999,495
840,433 3,116,355
5 1 3,344 1,738,926 1,611,112
38,986 40,387
4,020,000 228,245 260,250 205,460 230,340 921 ,I 86
90,751 918,893 314,300
86,042 457,294
552,772 2,664,750
390,000 550,935 752,400 235,000 319,034
1.39 1,544 839,036 836,478 804,317
4,651,860
1,007,500
294,057 3.4 1 1,300 1,466,500
276,000 546,840 79,000
1,227,062 388,700 125,550 94,795
678,5 5 5 1,600,340
783,645 0.54 0.43 0.45 1.69 0.28 0.94 0.87 0.02 0.02 2.17 0.12 0.14 0.11 0.12 0.50 0.05 0.50 0.17 0.05 0.25
0.30 1.44 0.21 0.30 0.41 0.13 0.17 0.75 0.45 0.45 0.44 2.52
0.54 0.16 1.85 0.79 0.15 0.30 0.05 0.66 0.21 0.07 0.05 0.37 0.87

INTERNATIONAL OPPORTUNITIES FUNDS
- US HIGH YIELD BOND -
STATEMENT OF INvEsxhlENTS As AT JUNE 30, 2008 (continued) (expressed in USD)
Aquisition Yo net Description Quantity Currency W S t Evaluation assets
L-3 Communications Corp. 6.125% 15/7/2013 L-3 Communications Corp. 6.375% 15/10/2015 "B" L-3 Communications Corp. 7.625% 15/6/2012 Lamar Media Corp. 6.625% 15/8/2015 Lear Corp. 5.75% 1/8/2014 "B" Lennar Corp. 5.5% 1/9/2014 "B" Lennar Corp. 5.6% 31/5/2015 "B" Lennar Corp. 5.95% 1/3/2013 Liberty Media LLC 8.25% 1/2/2030 LIN Television Corp. 6.5% 15/5/2013 Lucent Tcchnologies, Inc. 6.45Oh 15/3/2029 Mandalay Rcson Group 6.375% 15/12/2011 Mandalay Resort Group 9.5% 1/8/2008 MarkWest Energy PaKnerS LPlMarkWcst Energy Finance COT. 8.75% 15/4/2018 "1444" Meritage Homes Corp. 6.25% 15/3/2015 Meritage Homes Corp. 70/0 1/5/2014 MGM Mirage 5.875% 27/2/2014 MGM Mirage 6.75% 1/9/2012 MGM Mirage 6.759'0 1/4/2013 Neiman Marcus Group, Inc. (The) 90/0 15/10/2015 Nevada Powcr Co. 6.5% 15/5/2018 "0" Ncw Albertsons, Inc. 7.25% 1/5/2013 New Albertsons, Inc. 7.45% 11812029 Noyfcld Exploration Co. 6.625% 1/7/2014 NewPage Corp. 10% 1/5/2012 Ncxrel Communications, Inc. 5.95% 15/3/2014 Nextel Communications, Inc. 6.875% 31/10/2013 "E" NRG Energy, Inc. 7.375% 1/2/2016 Omnicare, Jnc. 6.875% 15/12/2015 Pioneer Natural Resources Co. 6.65% 15/3/2017 Pioneer Natural Resources Co. 6.875% 1/5/2018 Plains Exploration & Production Co. 7% 15/3/2017 Plains Exploration & Production Co. 7.625% 1/6/2018 Pulte Homes, Inc. 5.25% 15/1/2014 @est Capital Funding, Inc. 6.875% 15/7/2028 Qwest CommunicationsInternariona, Inc.7.25Yo 15/2/2011 Qwesr Communications International, Inc. 7.5% 15/2/2014 Qwesr Corp. 7.25% 15/10/2035 Qwcsr Corp. 7.875% 1/9/2011 Qwcst Corp. 8.875% 15/3/2012 Range Rcsourccs Corp. 7.25% 1/5/2018 Reliant Energy, Inc. 7.625% 15/6/2014 RH Donncllcy Corp. 8.875% 15/10/2017 "144A" Salron Sea Funding C o p 7.84% 30/5/2010 "C" Sanrnina-SCI Corp. 8.125% 1/3/2016 Service Corporation Inrernational (US) 6.75% 1/4/2016
1,000,000 1,000,000
400,000 1,000,000 2,346,000
500,000 200,000 300,000 400,000
1,500,000 900,000 400,000 5 0 0,O 0 0
1,633,000 803,000 138,000
1,000,000 1,630,000 2,600,000 2,000,000
5 1,000 600,000
1,232,000 500,000
1,020,000 1,075,000 575,000
1,000,000 476,000 500,000
1,000,000 157,000
2,601,000 2,200,000
5 0 0,O 0 0
300,000 1,030,000 1,000,000
600,000 875,000
2,096,000 700,000
64,000 428.1 59
1,000,000 1,250,000
135
USD USD USD USD USD USD USD USD USD USD USD USD USD
USD USD USD USD USD USD USD USD USD USD USD USD USD USD USD USD USD USD USD USD USD USD USD USD USD USD USD USD USD USD USD USD USD
980,554 958,935 405,560 960,680
2,016,775 398,40 1
158,826 254,780 409,318
1,428,008 833,997 410,504 501,415
1,707,187
734,709 129,716 8 7 0,3 2 2
1,644.984 2,540,507 2,04 1,677
50,875 598,138
1,194,632 511,592
1,090,244 858,452 471,444 961,805 478,088 473,711 777,777 159,000
2,628,540 1,994,052
415,611 304,357
1,002,608 888,006 618,277 918,303
2,138,089 741,062 64,000
426,155 938,488
1,223,939
942,500 732,500 404,000 9 10,000
1,712,580 365,000 147,000 246,000 353,065
1,372,500 677,182 364,000 502,415
1,669,742 644,407 1 12,470 805,000
1,454,775 2,242,500 1,770,000
52.1 57 6 10,264
1,164,461 470,000
1,030,200 857,312 483,000 945,000 440,300 468.934 937,938 152,640
2,594,498 1,837,000
395,000 272,500 981,075 832,500 578,500 889,219
2,069,800 682,500
37,760 438,444 905,000
1,182,812
0.51 0.50 0.22
0.49 0.93 0.20 0.08 0.13 0.19 0.74 0.37 0.20 0.27
0.90
0.35 0.06 0.44 0.79 1.21 1.07 0.03 0.33 0.63 0.25 0.56 0.46 0.26 0.51 0.24 0.25 0.51 0.08 1.40 0.99 0.21 0.16 0.53 0.45 0.32 0.48 1.12 0.37 0.02 0.24 0.49 0.64
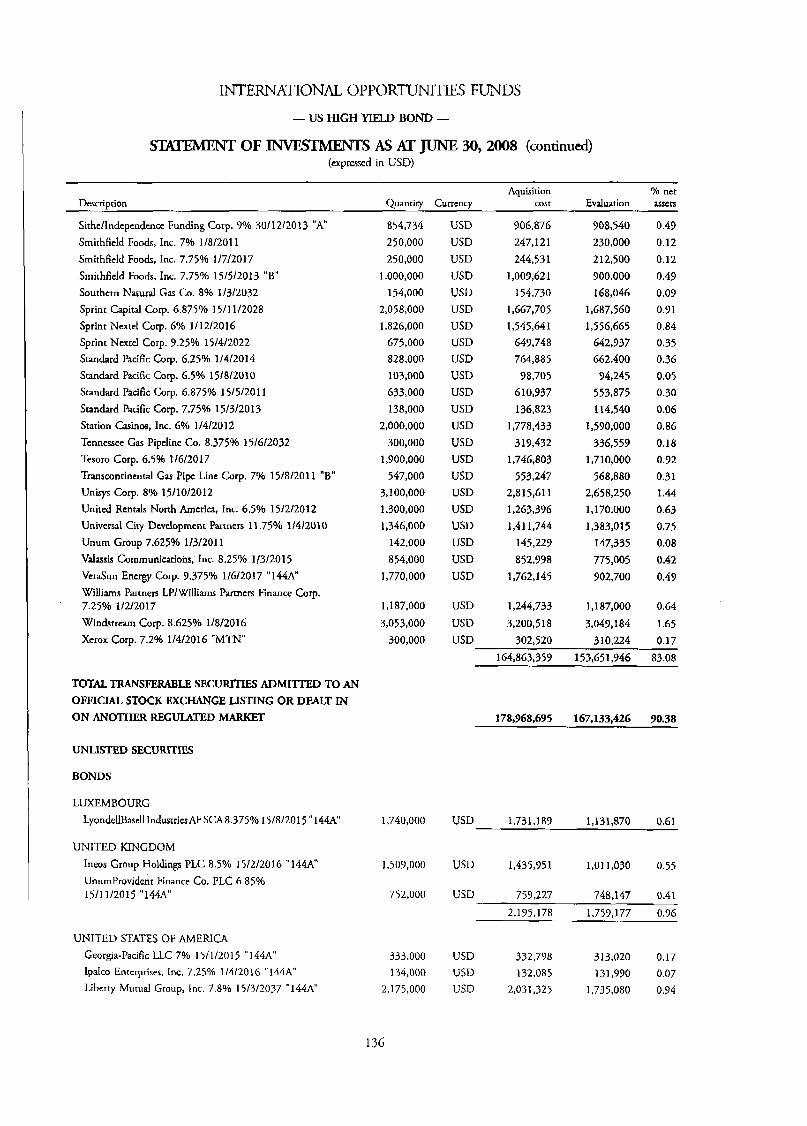
INTERNATIONAL OPPORTUNITIES FUNDS - US HIGH YIELD BOND -
SMEMENT OF INVIEETMENTS As AT JUNE 30,2008 (continued) (expressed in USD)
Aquisition % net Description Quantity Currency cost Evaluation asscts
Sithelhdcpcndcnce Funding Corp. 9% 3011 212013 "A" Smithfield Foods, Inc. 7% 1/8/2011 Smithfield Foods, Inc. 7.75% 1/7/2017 Smithfield Foods, Inc. 7.75% 15/5/2013 "B" Southctn Natural Gas Co. 8% 1/3/2032 Sprint Capital Cop. 6.875% 1511 1/2028 Sprint Ncxtel Corp. 6% 1/12/2016 Sprint Ncxtel Corp. 3.25% 15/4/2022 Standard Pacific Corp. 6.25% 1/4/2014 Standard Pacific Cop. 6.5% 15/8/2010 Standard Pacific Corp. 6.875% 1 5/5/2011 Standard Pacific Corp. 7.75% 15/3/2013 Station Chinos, Inc. 6% 1/4/2012 Tennessee Gas Pipeline Co. 8.375% 15/6/2032 Tesoro Corp. 6.5% 1/6/2017 Transcontinental Gas Pipe Line Corp. 7% 15/8/2011 "B" Unisys Corp. 8% 15/10/2012 United Rentals North America, Inc. 6.5% 15/2/2012 Universal City Development Partners 11.75% 1/4/2010 Unurn Group 7.625% 1/3/2011 Vdassis Communications, Inc. 8.25% 1/3/2015 VeraSun Energy Corp. 9.375% 1/6/2017 "144tl" Williams Partners LP/Williams Partners Finance C o p 7.25% 1/2/2017 Windstream Corp. 8.625% 1/8/2016 Xcrox Corp. 7.2% 1/4/2016 "MTN"
854,734 250,000 250,000
1,000,000 154,000
2,058,000 1,826,000
675,000 828,000 103,000 633,000 138,000
2,000,000 300,000
1,900,000
547,000 3,100,000
1,300,000 1,346,000
142,000 854,000
1,770,000
I , I 87,000
3,053,000 300,000
USD USD USD USD USD USD USD USD USD USD USD USD USD
USD USD USD USD USD USD USD USD USD
USD
USD USD
906,876 247,121 244,53 1
1,009,621 154,730
1,667,705 1,545,641
649,748 764,885 78,705
610,937 136,823
1,778,433 319,432
1,746,803 553,247
2,815,611 1,263,396 1,411,744
145,229
852,998 1,762, I45
1,244,733
3,200,518 302,520
908.~40 230,000 212,500 9 00,000 168,046
1,687,560 1,556,665
642,937 662,400 94,245
553,875 114,540
1,530,000 336,553
1.71 0,000 568,880
2,658,250 1,170,000 1,383,015
147,335 775,005 902,700
1,187,000
3,049,184 3 10.224
0.49 0.12 0.12 0.49 0.09 0.91 0.84 0.35 0.36 0.05 0.30 0.06 0.86 0.18 0.92 0.31 1.44 0.63
0.75 0.08 0.42 0.49
0.64 I .65 0.17
TOTAL TRANSFFRABLE SECURITIES ADMITTED TO AN OFFICIAL, STOCK EXCHANGE LISTING OR DEALT IN ON ANOTHER REGULATED MARKET
UNLISTED SECUFUTIES
BONDS
LUXEMBOURG LyondellBascll Industries AF S C A 8.375% 15/8/2015 "144.4"
UNITED KINGDOM Ineos Group Holdings PLC 8.5% 15/2/2016 " 1 4 W UnurnProvidenr Finance Co. PLC 6.85% 1 5/11 /20 15 "1 44A"
UNITED STATES OF AMERICA Georgia-Pacific LLC 7% 15/1/2015 "144A" lpalco Entcrprises, Inc. 7.25% 1/4/2016 "144A" Liberty Mutual Group, Inc. 7.8% 15/3/2037 "144A"
1,740,000
1,509,000
752,000
333,000 134,000
2,175,000
136
178,768,695 167,133,426 90.38
USD 1,731,189 1,131,870 0.61
1,011,030 0.55 USD 1,435,95 1
USD 759,227 748,147 0.41
2,175,178 1,759,177 0.96
USD 332,798 313,020 0.17 USD 132.085 131,990 0.07 USD 2,031,325 1,735,080 0.94
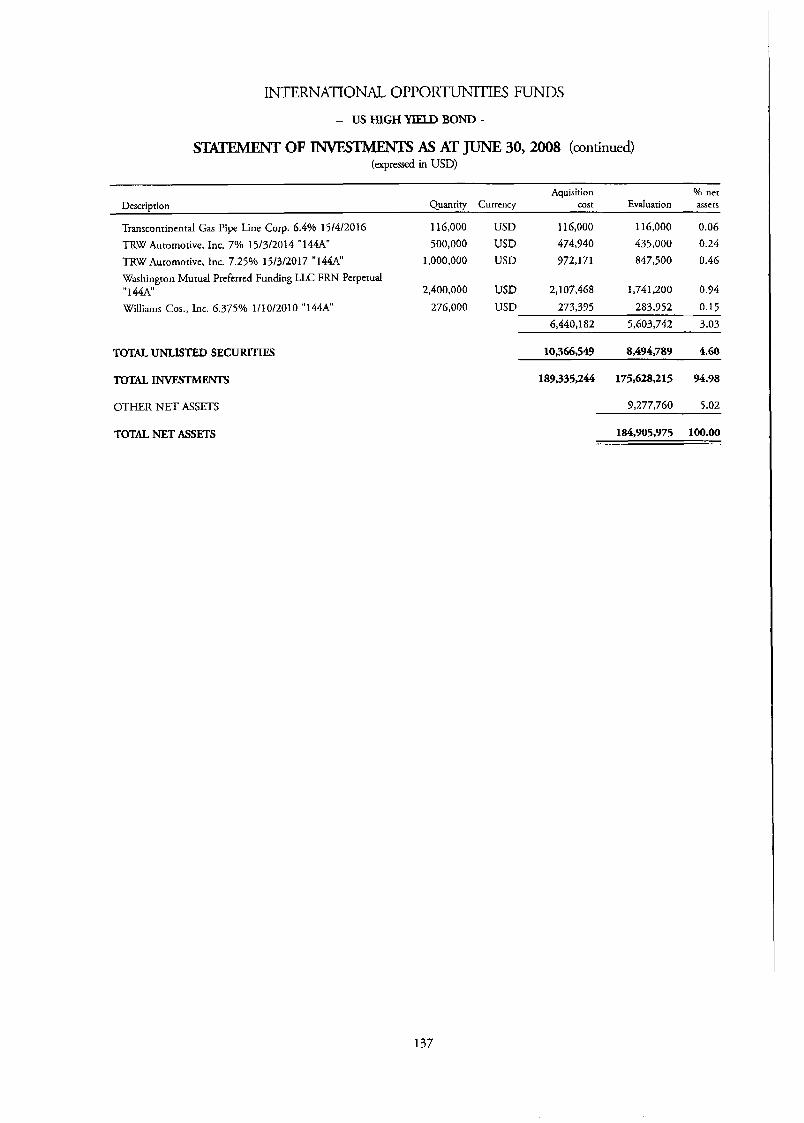
INTERNATIONAL OPPORTUNlTIES FUNDS
- US HIGH YIELD BOND -
STATEMENT OF -S As AT JUNE 30,2008 (continued) (expressed in USD)
Aquisition Yo net Description Quantity Currency cost Evaluation assets
Transcontincntal Gas Pipe Line Corp. 6.4% 15/4/2016 116,000 USD 1 16,000 116,000 0.06 TRW Automotive, Inc. 7% 15/3/2014 "144A" 500,000 USD 474,940 435,000 0.24 TRW Automotive, Inc. 7.25% 15/3/2017 "144A" 1,000,000 USD 972,17 1 847,500 0.46
Washington Mutual Preferred Funding LLC FRN Perpetual "144A" 2,400,000 USD 2,107,468 1,741,200 0.94
Williams Cos., Inc. 6.3759'0 1/10/2010 "144A" 276,000 USD 273,395 283,952 0.15
6,440,182 5,603,742 3.03
TOTAL U N L I S D SECURlTIES 10,366,549 8,494,789 4.60
TOTAL INVESTMENTS 189,335,244 175,628,215 94.98
OTHER NET ASSETS 3,277,760 5.02
184,905,975 100.00 TOTAL NET ASSETS
137
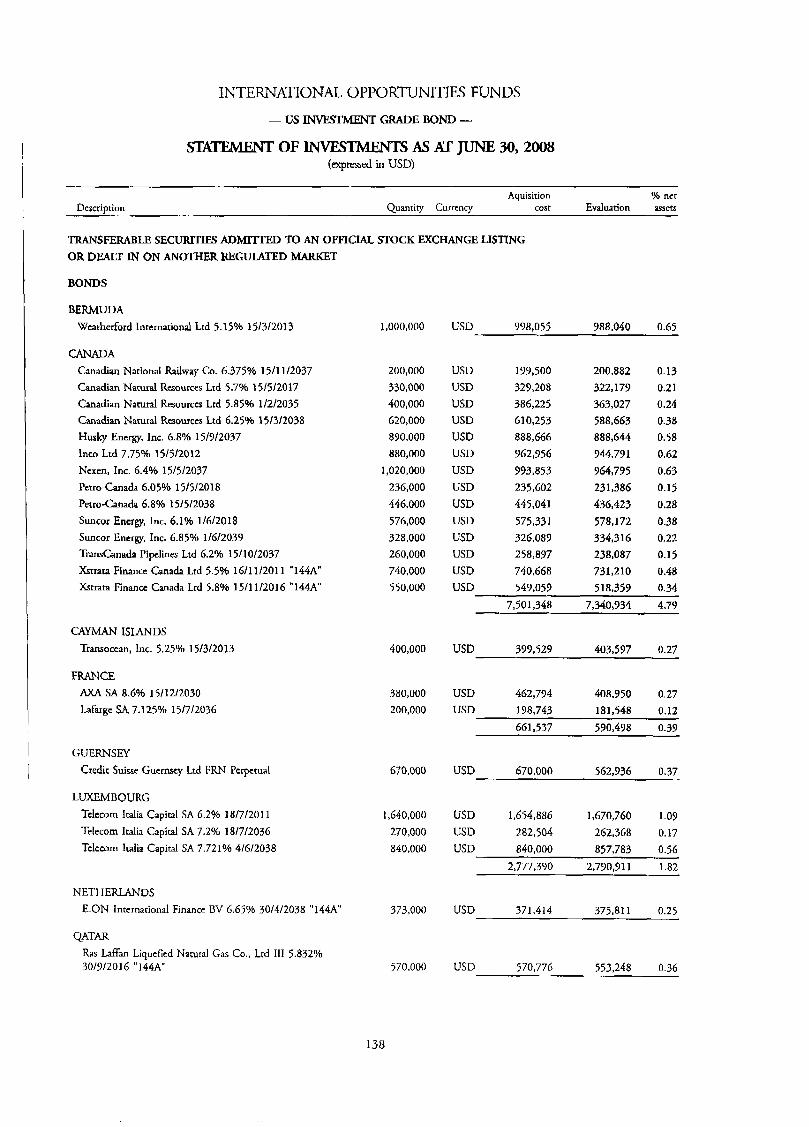
INTERNATIONAL O P P O R ~ I T I E S FUNDS
- US INvEsThlENT GRADE BOND -
OF m S AS AT JUNE 30,2OO8 (expressed in USD)
Aquisition Oh ner Description Quantity Currency cost Evaluation assets
TRANSFERABLE SECURITIES ADMITIED TO AN OFFICIAL STOCK EXCHANGE LISTING OR DEALT IN ON ANOTHER REGULATFD MARKET
BONDS
BERMUDA Weatherford International Lrd 5.15% 15/3/2013
CANADA Canadian Narional Railway Co. 6.375% 15/11/2037 Canadian Narural Resources Lrd 5.7% 15/5/2017 Canadian Natural Rmourccs Lrd 5.85% 1/2/2035 Canadian Natural Resources Ltd 6.25% 15/3/2038 Husky Energy, Inc. 6.8% 15/9/2037 Inco Ltd 7.75% 15/5/2012 Nexen, Inc. 6.4% 15/5/2037 Pctro-Canada 6.059'0 15/5/2018 Petro-Canada 6.8Yo 15/5/2038 Suncor Energy, Inc. 6.1% 1/6/2018 Suncor Energy, Inc. 6.85% 1/6/2039 TransCanada Pipelines Ltd 6.2% 1511 012037 Xstrata Finance Canada Lrd 5.5% 16/11/2011 "144A" Xrtrata Finance Canada Lrd 5.8% 15/11/2016 "144A"
CAYMAN ISLANDS Transocean, Inc. 5,259'0 15/3/2013
FRANCE AXA SA 8.6% 15/12/2030 Lafargc SA 7.1259'0 15/7/2036
GUERNSEY Credir Suisse Guernsey Ltd FRN Perpetual
LUXEMBOURG Telecom M i a Capital SA 6.2% 18/7/2011 Telecom Italia Capital SA 7.2% 18/7/2036 Telccom Itaha Capital SA 7.721% 4/6/2038
NETHERLANDS E.ON International Finance BV 6.65% 30/4/2038 "144A"
QATAR Ras Man Liqucficd Natural Gas Co., Lrd I11 5.832% 30/9/2016 "144A
1,000,000
200,000 330,000 400,000 620,000 890,000 880,000
1,020,000 236,000 446,000 576,000 328,000 260,000 740,000 550,000
400,000
380,000 200,000
670,000
1,640,000 270,000 840,000
373,000
570,000
USD 998,055 988.040 0.65
USD 139,500 200,882 0.13 USD 329,208 322,179 0.21 USD 386,225 363,027 0.24 USD 610,253 588,663 0.38 USD 888,666 888,644 0.58 USD 962,956 944,791 0.62 USD 973,853 964,795 0.63 USD 235,602 231,386 0.15 USD 445,041 438,423 0.28 USD 575,331 578,172 0.38 USD 326,089 334,316 0.22 USD 258,897 238,087 0.15 USD 740,668 731,210 0.48 USD 549,059 518,359 0.34
7,501,348 7,340,934 4.79
USD 399,529 403,597 0.27
USD 462,794 408,950 0.27 181,548 0.12 USD 198,743
661,537 590,498 0.39
562.336 0.37 670,000 USD
1,670,760 1 .OY USD 1,654,886 USD 282,504 262,368 0.17 USD 840,000 857,783 0.56
2,79031 1 1.82 2,777,390
USD 371,414 375,811 0.25
USD 570,776 553,248 0.36
138

INTERNATIONAL OPPORTUNITIES FUNDS
--US- GRADE BOND -
SIX- OF -S As AT JUNE 30,2008 (continued) (expressed in USD)
Aquisition % nct Evaluation assets Description Quantity Currency cost
SPAIN Telefonica Emisiones SAU 5.855% 4/2/2013 Telefonica Emisiones SAU 6.421% 20/6/2016 Tclefonica Emisiones SAU 7.045% 20/6/2036
UNITED KINGDOM Barclays Bank PLC FRN Perpetual "144A" British Sky Broadcasting Group PLC 6.1% 15/2/2018 "144A" BSKYB Finance UK PLC 5.625Yo 15/10/2015 "1444" Diageo Capital PLC 5.2% 30/1/2013 HBOS PLC FRN Perpetual "144A" HSBC Holdings PLC 6.5% 2/5/2036 HSBC Holdings PLC 6.8% 1/6/2038 SAl3Millet PLC 6.2% 1/7/2011 "144A Vodafone Group PLC 7.75% 15/2/2010
UNITED STATES OF AMERICA AMBAC Financial Group, Inc. FRN 7/2/2087 Ameren Union Electric 6% 1/4/2018 American Express Credit Corp. 5.875% 2/5/2013 "MTN" American General Finance COT. 5.2% 15/12/2011 "MTN" American General Finance Cop. 5.75% 15/9/2016 "MTN" American Gcncral Finance Cop. 6.9% 15/12/2017 "MTN" AmericanInternarionalGroup, Inc. 5.85% 16111201 8"MTN" Amcrican Internarional Group, Inc. 6.25% 1/5/2036 Amcrican Inrcrnarional Group, Inc. FRN 20/3/2012 "MTN" American lnternationd Group, Inc. FRN 15/5/2058 "144A AmeriCredit Automobile Receivables Trust 5.17% 6/11/20] 1 "2007-AX A3" Anadarko Petroleum Corp. 5.95% 15/9/2016 Anadarko Pcrrolcum Corp. 6.45% 15/9/2036 Appalachian Power Co. 5.55% 1/4/2011 Appalachian Power Co. 6.7% 15/8/2037 "P" Appalachian Power Co. 7% 1/4/2038 Assurant, Inc. 5.625% 15/2/2014 BAC Capital Trust XI 6.625% 23/5/2036 BAC Capital Trust XIV FRN Perpetual Baltimore Gas & Electric Co. 6.125% 1/7/2013 Baltimore Gas & Electric Co. 6.35% 1/10/2036 Bank of America Corp. 4.9% 1/5/2013 "MTN" Bank of America Corp. 5.65% 1/5/2018 Bank of America Corp. FRN Pcrpctud Bank One Issuance Trust 4.7740 16/2/2016 "2003-C3 C3"
1,090,000 610,000 370,000
670,000
625,000 480,000
1,280,000 310,000 270,000 360,000 810,000
2,650,000
1 ,I 35,000 677,000 900,000 560,000 390,000 175,000 575,000 230,000 740,000
1,100,000
800,000 880,000 530,000 530,000 620,000 400,000 770,000 220,000 840,000 833,000 190,000 8 0 0,o 0 0 800,000
1,138,000 750,000
USD 1,090,000 1,095,756 0.71 USD 629,181 622,655 0.41 USD 396,667 386,455 0.25
2,115,848 2,104,866 1.37
USB 683,928 570,819 0.37
USD 624,333 USD 473,250 USD 1,278,753 USD 310,000 USD 294,706 USD 359,222 WSD 809,655 USD 2,738,426
614,354 464,291
1,282,472 2 17,044 252,275 340,689 829,870
2,768,977
0.40 0.30 0.84 0.14 0.17 0.22 0.54 1.81
7,572,473 7,340,771 4.79
USD USD USD USD USD USD USD USD USD USD
USD USD USD USD USD USD USD USD USD USD USD USD USD USD USD
682,557 675,005 896,968 559,698 392,352 173,826 572,006 228,820 740,000
1,100,000
799,955 884,346 534,932 529,452 6 19,849 397,384 773,589 237,850 840,247 832,717 189,767 797,866 795,791
1,138,000 736,988
182,137 655,696 894,712 5 2 7.2 8 8 332,913 154,442 532,529 200,448 656,065
1,05 1,097
793,774 882,170 525,175 531,674 590,241 396,922 729,004 203,837 639,064 840,973 172,893 774.252 747,346
1,036,509 644,779
0.12 0.43 0.58 0.35 0.22 0.10 0.35 0.13 0.43 0.69
0.52 0.58 0.34 0.35 0.39 0.26 0.48 0.13 0.42 0.55 0.11 0.51 0.43 0.72 0.42
139
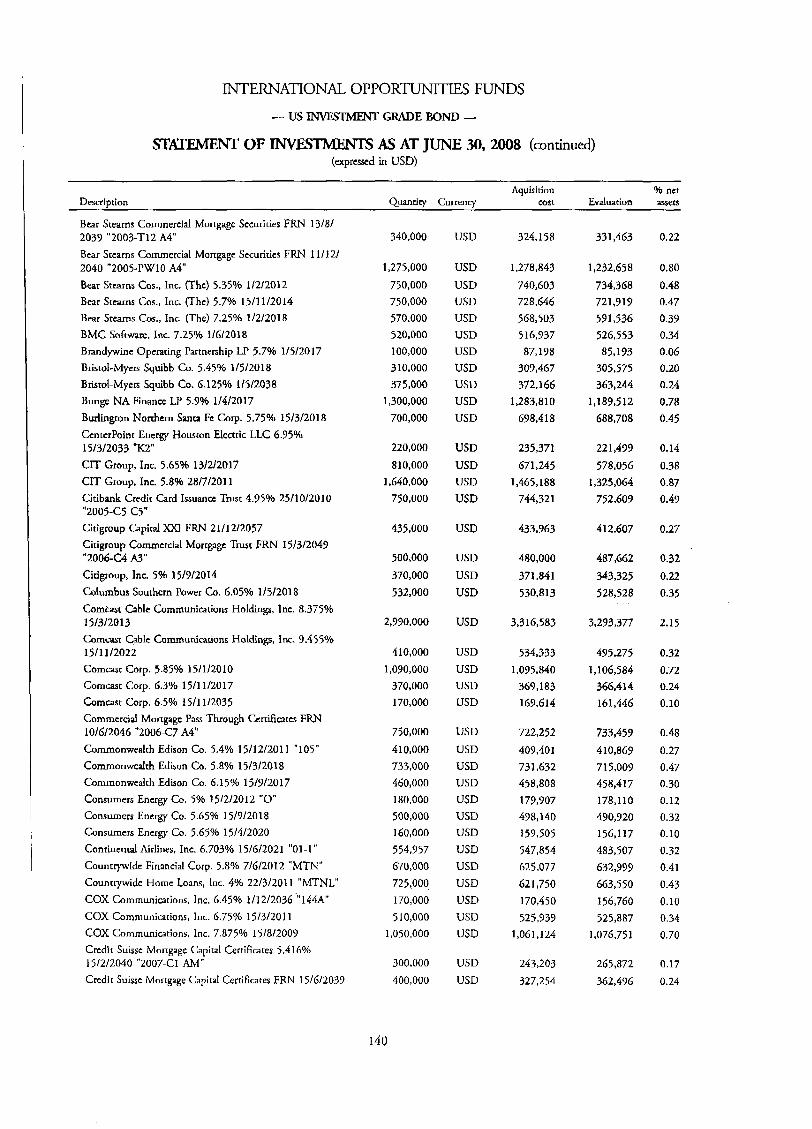
INTERNATIONAL OPPORTUNITIES FUNDS
- US-GRADE BOND - STATEMENT OF As AT JUNE 30, 2008 (continued)
(arpressed in USD) ~ ~ ~ ~ ~~ ~ ~ .~ ~
Aquisition 96 net Description Quantity Currency cost Evaluation assets
Bear Stearns Commercial Mortgage Securities F R N 13/81
Bear Stearns Commercial Mortgage Securities FRN 11/12/
Bear Stearns Cos., Inc. (The) 5.35% 1/2/2012 Bear Stearns Cos., Inc. (The) 5.7% 15/11/2014 Bear Stearns Cos., Inc. (The) 7.25% 1/2/2018 BMC Software, Inc. 7.25% 1/6/2018 Brandywine Operating Partnership LP 5.7% 1/5\2017 Bristol-Myers Squibb Co. 5.45% 1/5/2018 Bristol-Myers Squibb Co. 6.125% 1/5/2038 Bunge NA Finance LP 5.9% 1/4/2017 Burlingon Northern Santa Fc COT. 5.75% 15/3/2018 Ccnterl’oint Energy Houston Electric LLC 6.95% 15/3/2033 “K2” CIT Group, Inc. 5.65% 13/2/2017 CIT Group, Inc. 5.8% 28/7/2011 Citibank Credit Card Issuance Trust 4.95% 25/10/2010 “2005-C5 C5” Citigroup Capital XXI F R N 21/12/2057 Citigroup Commercial Mortgagc Trust F R N 15/3/2049 “2006-C4 A3“ Citigroup, Inc. 5% 15/9/2014 Columbus Southern Power Co. 6.05% 1/5/2018 Comcast Cable Communications Holdings, Inc. 8.375% 15/3/2013 Corncast Cable Comaunicarions Holdings, Inc. 9.455Yo 15/11/2022 Comcast Corp. 5.85% 15/1/2010 Comcast Corp. 6.3% 15/11/2017 Corncast Corp. 6.5% 15/11/2035 Commercial Mortgage Pass Through Certificates FRN 10/6/2046 “2006-C7 A4” Commonwealth Edison Co. 5.4% 15/12/2011 ”105” Commonwealth Edison Co. 5.8% 15/3/2018 Commonwealth Edison Co. 6.15% 15/9/2017 Consumers Energy Co. 5% 15/2/2012 “0” Consumers Energy Co. 5.65% 15/9/2018 Consumers Energy Co. 5.65% 15/4/2020 Contincntd Airlines, Inc. 6.703% 15/15/2021 “01-1 ”
Countrywide Financial Corp. 5.8% 7/6/2012 “MTN” Countrywide Home Loans, Inc. 4% 22/3/201 I ”MTNL” COX Communications, Inc. 6.45% 1/12/2036 ”144A” COX Communications, Inc. 6.75% 15/3/2011 COX Communications, Inc. 7.875% 15/8/2009 Credit Suisse Mortgage Capital Certificates 5.4 16% 15/2/2040 ”2007-C1 AM“ Credit Suisse Mortgage Capital Certificates FRN 15/6/2039
2039 “2003-Tl2 A4”
2040 ”2005-PW10 A4”
340,000
1,275,000
750,000 750,000 570,000 520,000 100,000 310,000 375,000
1,300,000 700,000
220,000 810,000
1,640.000 750,000
435,000
500,000
370,000 532,000
2,990,000
410,000 1,030,000
370,000 170,000
750,000 4 10,000 733,000 460,000 180,000 500,000 160,000 554,957 670,000 725,000 170,000 5 10,000
1,050,000
300,000 400,000
140
USD
USD USD USD USD USD USD USD USD USD USD
USD USD USD USD
USD
USD USD USD
USD
USD USD USD USD
USD USD USD USD USD USD USD USD USD USD USD USD USD
USD USD
324,158
1,278,843 740,603 728,641; 568,503 516,937 87,198
309,467 372,166
I , 2 a m o 698,418
235,371 671,245
1,465,188 744,32 1
433,963
480,000 371,841 530,813
3,316,583
534,333 1,095,840
369.183 169,614
722,252
409,401 731,632 458,808 179,907 498,140 159,505 547,854 625,077 621,750 170,450 525,939
1,061 , I 24
243,203 327,254
33 1,463
1,232,658
734,368 721,919 59 1,536 526,553 85,193
305,575 363,244
1,189,s 12 688,708
221,499 578,056
1,325,064 752,609
4 12,607
487,662
343,325 528,528
3,293,377
495,275 1,106,584
366,414 161,446
733,459 410,869 71 5,009 458,417 178,110 490,920 156,l 17 483,507 632,999 663,550 156,760 525,887
1,07675 1
265,872 362,496
0.22
0.80 0.48 0.47 0.39 0.34 0.06 0.20 0.24 0.78 0.45
0.14 0.38 0.87 0.49
0.27
0.32 0.22 0.35
2.15
0.32 0.72 0.24 0.10
0.48
0.27 0.47 0.30 0.12 0.32 0.10 0.32 0.41 0.43 0.10 0.34 0.70
0.17 0.24
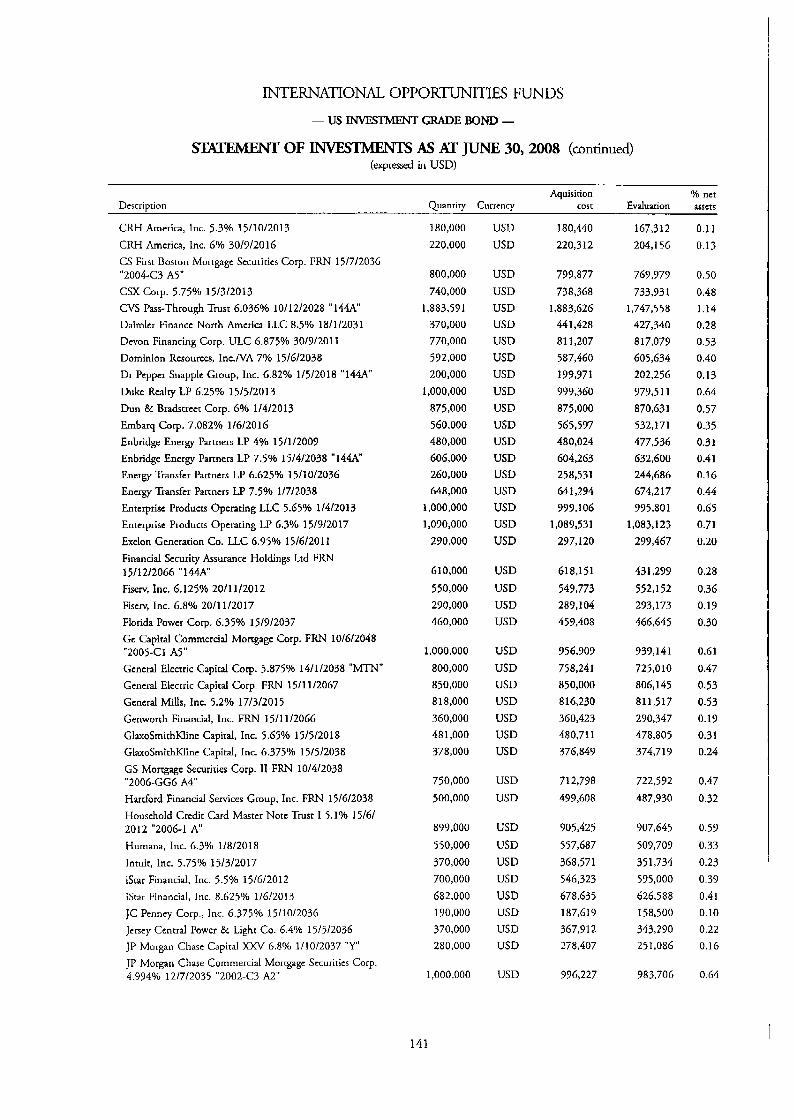
INTERNATIONAL OPPORTUNITIES FUNDS
- US GRADE BOND -
STATEMENT OF INVESTMENTS AS AT JUNE 30, 2008 (continued) (expressed in USD)
Aquisition % net Evaluation asscts Dcscription Quantity Currency cost
CRH America, Inc. 5.3% 15/10/2013 CRH America, Inc. 6% 30/9/2016 CS First Boston Mortgagc Sccurirics Corp. FRN 15/7/2036
CSX Corp. 5.759'0 15/3/2013 CVS Pass-Through Trust 6.036% 10/12/2028 "144A" Daimlcr Finance North America LLC 8.5% 18/1/2031 Dcvon Financing Corp. ULC 6.875% 30/7/2011 Dominion Resources, Inc.NA 7% 15/6/2038 Dr Pepper Snapple Group, Inc. 6.82% 1/5/2018 "144A" Duke Rcalry LP 6.25% 15/5/2013 Dun & Bradstrcct Corp. 6% 1/4/2013 Embarq Corp. 7.082% 1/6/2016 Enbridge Energy Partners LP 49'0 15/1/2009 Enbridge Energy Partners LP 7.5% 15/4/2038 "144A" Energy Transfer Partners LP 6.625% 15/10/2036 Energy Transfer Partners LP 7.5% 1/7/2038 Enterprise Products Operating LLC 5.65% 1/4/2013 Enterprise Products Operating LP 6.3% 15/9/2017 Exelon Generation Co. LLC 6.95% 15/6/2011 Financial Security Assurance Holdings Ltd FRN 15/12/2066 "144A Fiserv, Inc. 6.125% 20/11/2012 Fiscrv, Inc. 6.8% 2011 112017 Florida Power Corp. 6.350/0 15/9/2037 Gc Capital Commercial Mortgage Corp. FRN 10/6/2048
Gcncral Electric Capital Corp. 5.875% 14/1/2038 "MTN" Gcncral Electric Capital Corp. F R N 15/11/2067 General Mills, Inc. 5.2% 17/3/2015 Genworth Financial, Inc. FRN 15/11/2066 GlaxoSrnithKline Capital, Inc. 5.650/0 15/5/2018 GlaxoSmithKline Capital, Inc. 6.375% 15/5/2038 GS Morrgagc Securities Corp. 11 FRN 10/4/2038
Hartford Financial Services Group, Inc. FRN 15/6/2038 Household Credit Card Master Note Trust I 5.1% 15/6/
"2004-C3 A5"
"2005-C1 A5"
"2006-GG6 A4"
2012 "2006-1 A" Humana, Inc. 6.39'0 1/8/2018 Intuir, Inc. 5.75% 15/3/2017 iStar Financial, Inc. 5.5% 15/6/2012 iStar Financial, Inc. 8.625% 1/6/2013 JC Pcnney Corp., Inc. 6.375% 15/10/2036 Jersey Central Power & Light Co. 6.4% 15/5/2036 JP Morgan Chase Capital XXV 6.8% 1/10/2037 "Y ' JP Morgan Chase Commercial Mortgagc Sccuritics Corp. 4.994% 12/7/2035 "2002-C3 A2"
180,000 220,000
aoo,ooo 740,000
1,883.59 I 370,000 770,000 532,000 200,000
1,000,000 875.000 560,000 480,000 606,000 260,000 648,000
1,000,000 1,090,000
290,000
610,000
550,000 290,000 460,000
1,000,000 800,000 850,000 81 8,000 360,000 48 1,000 378,000
750,000 500,000
899,000 550,000 370,000 700,000 682,000 190,000 370,000 280,000
1,000,000
USD USD
USD USD USD USD USD USD USD USD USD USD USD USD USD USD USD USD USD
USD USD USD USD
USD USD USD USD USD USD USD
USD USD
USD USD USD USD USD USD USD USD
USD
180,440 220,312
799,877 738,368
1,883,626 44 1,428 81 1,207 587,460 199,971 939,360 875,000 565,597 480,024 604,263 258,531 641,294 999,106
1,089,531 297,120
61 a,i 51
549,773 289,104 459,408
956,909 758,241 850,000 816,230 360,423 480.71 1 376,849
712,798 499,608
905,425 557,687 3~8,571 546,323 678,63 5 187,619 367,912 278,407
996,227
167,312 204.1 56
769,779 733,931
1,747,558 427,340 817,079 605,634 202,256 979,5 1 1 870,631 532,171 477,536 632,600 244,686 674,217 995,801
1,083,123 299,467
431,299 552,152 293,173 466,645
939,14 1 725,010 806,145 811,517 290,347 478,805 374,719
722,592 487,930
907,645 509,709 35 1,734 595,000 626,588 158,500 343,290 251,086
983.706
0.1 1 0.13
0.50 0.48 1.14 0.28 0.53 0.40 0.13 0.64
0.57 0.35 0.31 0.41 0.16 0.44 0.65 0.71 0.20
0.28
0.36 0.19 0.30
0.61
0.47 0.53 0.53 0.19 0.31 0.24
0.47 0.32
0.59 0.33 0.23 0.39 0.41 0.10 0.22 0.16
0.64
141
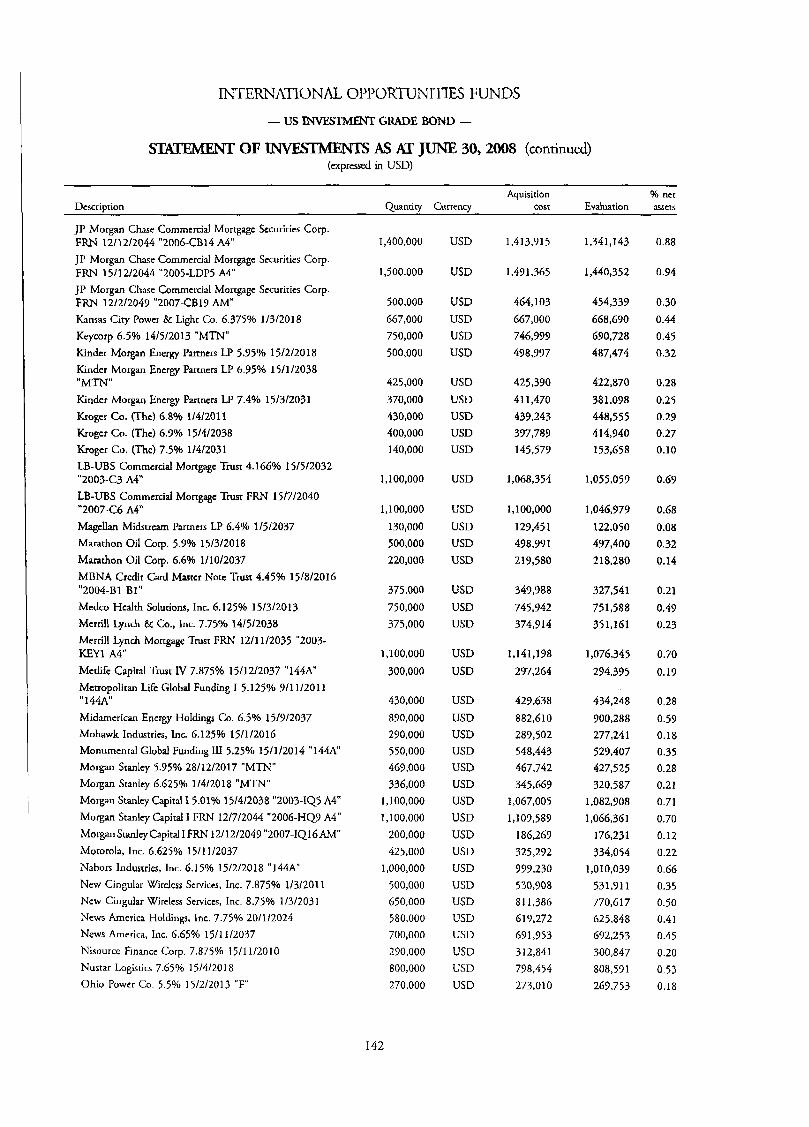
INTERNAXONAL. OPPORTUNITIES FUNDS
- US DWSIMBT GR4DE BOND -
STATEMENT OF m S As AT JUNE 30,2008 (continued) (expressed in USD)
Aquisirion % ncr Dcscriptian Quantity Currency cast Evaluation assets
JP Morgan Chase Commercial Mortgage Securities Corp.
JP Morgan Chase Commercial Morrgagc Securities Corp.
JP Morgan Chase Commercial Mortgage Securities Corp F R N 12/2/2049 "2007-C819 AM" Kansas City Powcr 8 Light Co. 6.375% 1/3/2018 Keycorp 6.5% 14/5/2013 "MTN" Kinder Morgan Energy Partners LP 5.95% 15/2/2018 Kinder Morgan Energy Partners LP 6.95% 15/1/2038 "MTN" Kinder Morgan Encrgy Partners LP 7.4% 15/3/2031 Kroger Co. (The) 6.8% 1/4/2011 Krogcr Co. (Thc) 6.9% 15/4/2038 Kroger Co. (The) 7.5% 1/4/2031 LB-UBS Commercial Mortgagc Trust 4.166% 15/5/2032
LB-UBS Commercial Mortgage Trust FRN 15/7/2040
Magellan Midstream Partners LP 6.4% 1/5/2037 Marathon Oil Cop. 5.9% 15/3/2018 Marathon Oil Corp. 6.6% 1/10/2037 MBNA Credit Card MaFrer Note Trust 4.45% 15/8/2016 "2004-BI E l " Medco Health Solutions, Inc. 6.125% 15/3/2013 Merrill Lynch & Co., Inc. 7.75% 14/5/2038 Merrill Lynch Mortgage Trust FRN 1211 1/2035 "2003- KEY1 A4" Mcdifc Capiral Trust IV 7.875% 15/12/2037 "144A" Metropolitan Life Global Funding I 5.125% 9/11/2011 " 144A" Midamcrican Energy Holdings Co. 6.5% 15/9/2037 Mohawk Industrics, Inc. 6.125% 15/1/2016 Monumental Global Funding 111 5.25% 15/1/2014 "144A" Morgan Sranlcy 5.95% 28/12/2017 "MTN" Morgan Sranley 6.625% 1/4/2018 "MTN" Morgan Stanley Capital I 5.01% 15/4/2038 "2003-IQ5 A4" Morgan Stanley Capital I FRN 12/7/2044 "2006-HQY A4" MorganStanlcy Capital 1 FRN 12\12/2049 "2007-1Q16AM" Motorola, Inc. 6.625% 1511 1/2037 Nabors Industries, Inc. 6.1 5% 15/2/2018 "144A New Cingular Wireless Scrviccs, Inc. 7.875% 1/3/2011 Ncw Cingular Wireless Scrviccs, Inc. 8.75% 1/3/2031 News America Holdings, Inc. 7.75% 201112024 News America, Inc. 6.65% 15/11/2037 Nisource Finance Corp. 7.875% 15/11/2010 Nustar Logistics 7.65% 15/4/20] 8 Ohio Powcr Co. 5.5% 15/2/2013 "F"
FRN 12/12/2044 "2006-CB14 A4"
FRN 15/12/2044 "2005-LDPS A4"
"2003C3 A4"
"2007-C6 A4"
1,400,000
1,500,000
500,000 667,000 750,000 500,000
425,000 370,000 430,000 400,000 140,000
1,100,000
I , 100,000 130,000 500,000 220,000
375,000 750,000 375,000
1,100,000 300,000
430,000
890,000 290,000 550,000 469,000 336,000
1,100,000 1,100,000
200,000 425,000
1,000,000 500,000 650,000 580,000 700,000 290,000 800,000 270,000
142
USD
USD
USD USD USD USD
USD USD USD USD USD
USD
USD USD USD USD
USD USD USD
USD USD
USD
USD USD USD USD USD USD USD USD USD USD USD USD USD USD USD USD USD
1,413,915
1,471,365
464,103 667,000 746,999 498,997
425.390 41 1,470 437,243 377,789 145,579
1,068,354
1,100,000
127,451 498,991 219,580
349,988 745,942 374,Y 14
1,141,198 297,264
429,638 882,610 289,502 548,443 467,742 345,669
1,067,005 1,109,589
186,269 325,272 997,230 530,908 81 1,386 617,272 671,953 312,841 798,454 273,010
1,341,143
1,440,352
454,339 668,670 690,728 487,474
422,870 381,098 448,555 414,940 153,658
1,055,059
1,046,977 122,050 497,400 218,280
327,541 751,588 35 1,161
1,076,345 294,395
434,248 900,288 277,241 523,407 427,525 320,587
1,082,908 1,066,361
176,23 1 334,054
1,010,039 531,911 770,617 625,848 692,253 300,847 808,591 269,753
0.88
0.94
0.30 0.44 0.45 0.32
0.28 0.25 0.29 0.27 0.10
0.69
0.68 0.08 0.32 0.14
0.21
0.49 0.23
0.70 0.19
0.28
0.59 0.18 0.35 0.28 0.21 0.71 0.70 0.12 0.22 0.66 0.35 0.50 0.41 0.45 0.20
0.53 0.18
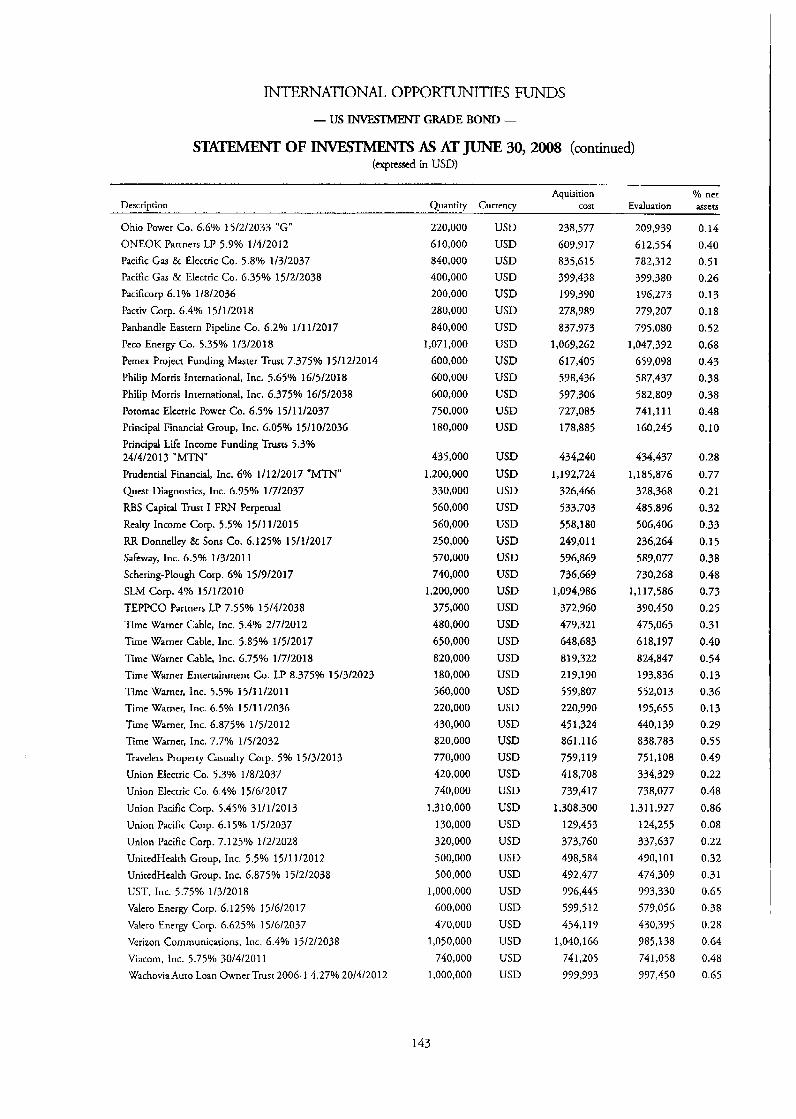
NTERNATIONAL OPPORTUNITIES FUNDS
- US GRADE BOND -
STMXMENT OF -S AS AT JUNE 30,2008 (continued) (expressed in USD)
Aquisition Yo net Evaluation assets Description Quantity Currency cost
Ohio Power Co. 6.69'0 15/2/2033 "G" ONEOK Partners LP 5.9% 1/4/2012 Pacific Gas & Electric Co. 5.8% 1/3/2037 Pacific Gas 8r Electric Co. 6.35% 15/2/2038 Pacificorp 6.19'0 1/8/2036 Pactiv Corp. 6.4% 15/1/2018 Panhandle Eastern Pipeline Co. 6.2% 1/11/2017 Peco Energy Co. 5.35% 1/3/2018 Pemex Project Funding Master Trust 7.375% 15/12/2014 Philip Morris Jnternariond, Inc. 5.65% 16/5/2018 Philip Morris International, Inc. 6.375% 16/5/2038 Potomac Electric Power Co. 6.54/0 15/11/2037 Principal Financial Group, Inc. 6.05% 1511012036 Principal Life Income Funding Trusts 5.3% 24/4/2013 "MTN" Ptudcntial Financial, Inc. 6% 1/12/2017 "MTN" Quest Diagnostics, Inc. 6.95% 1/7/2037 RBS Capital Trust I FRN Perpetual Realry Income COT. 5.5% 1511 1/2015 RR Donnellcy & Sons Co. 6.125% 15/1/2017 Safeway, Inc. 6.5% 1/3/2011 Schering-Plough Corp. 6% 15/9/2017 SLM Corp. 4% 15/1/2010 TEPPCO Partners LP 7.55% 15/4/2038 Time Warner Cable, Inc. 5.4% 2/7/2012 Time Warner Cable, Inc. 5.85% 1/5/2017 Time Warner Cable, Inc. 6.75% 1/7/2018 Time Warner Entertainment Co. LP 8.375% 15/3/2023 Time Warner, Inc. 5.5% 15/11/2011 Time Warner, Inc. 6.5% 15/11/2036 Time Warner, Inc. 6.875940 1/5/2012 Time Warner, Inc. 7.7% 1/5/2032 Travelers Properry Casualty C o p 5% 15/3/2013 Union Electric Co. 5.3% 1/8/2037 Union Electric Co. 6.4% 15/6/2017 Union Pacific Corp. 5.45% 31/1/2013 Union Pacific Corp. 6.15% 1/5/2037 Union Pacific Corp. 7.125% 1/2/2028 UnitedHcalth Group, Inc. 5.5% 15/11/2012 UnitcdHealth Group, Inc. 6.875% 15/2/2038 UST. Inc. 5.75% 1/3/2018 Valero Energy Corp. 6.125% 15/6/2017 Valero Energy Corp. 6.625% 15/6/2037 Verizon Communications, Inc. 6.4% 15/2/2038 Viacom, Inc. 5.75% 30/4/2011 Wachovia Auto Loan Owncr Trust 2006-1 4.27% 20/4/2012
220,000 610,000 840,000 400,000 200,000 280,000 840,000
1,071,000 600,000
600,000 600,000 750,000 180,000
435,000 1,200,000
330,000 560,000 560,000
250,000 570,000 7 4 0.0 0 0
1,200,000 375,000 480,000 650,000 820,000 180,000 560,000 220,000 430,000 820,000 770,000 420,000 740,000
1,310,000 130,000 320,000 500,000 500,000
1,000,000 600,000 470,000
1,050,000
740,000 1,000,000
USD USD USD USD USD USD USD USD USD USD USD USD USD
USD USD USD USD USD USD USD USD USD USD USD USD USD USD USD USD USD USD USD USD USD USD USD USD USD USD USD USD USD USD USD USD
238,577 609,917 835,615 399,438 199,390 278,989 837,973
1,069,262 617,405 598,436 597,306 727,085 178,885
434,240
1,192,724 326,466 533,703 558,180 249,011 596,869 736,669
1,094,986 372,960 479,321 648,683 8 19,322 217,130 559,807 220,990 45 1,324 861,116 759,119 418,708 739,417
1,308,300 129,453 373,760 498,584 492,477 996,445 599,512 454,119
1,040,166 741,205 937,793
209,939 6 12,554 782,312 377,380 176,273 279,207 795,080
1,047,392 659,098 587,437 582,809 741.11 1 160,245
434,437 1,185,876
328,368 485,896 506,406 236,264 589.077 730,268
1,117,586 390,450 475,065 618,197 824,847 173,836 552,013 195,655 440,139 838,783 75 1,108 334,329 738,077
1.31 1,927 124,255 337,637 490,101 474,309 993,330 579,056 430,395 985,138 741,058 797,450
0.14 0.40 0.51 0.26 0.13 0.18 0.52 0.68 0.43 0.38 0.38 0.48 0.10
0.28
0.77 0.21 0.32 0.33 0.15 0.38 0.48 0.73 0.25 0.31 0.40 0.54 0.13 0.36 0.13 0.29 0.55 0.49 0.22 0.48 0.86 0.08 0.22 0.32 0.3 1
0.65 0.38 0.28 0.64 0.48 0.65
143

INTERNATIONAL OPPORTUNTTIES FUNDS
- US GRAJDE BOND -
S n OF AS AT JUNE 30,2008 (continued) (expressed in USD)
Aquisition 46 net Description Quantity Currency cost Evaluation assets
Wachovia Bank Commercial Mortgage Trust 4.867% 15/2/2035 Wachovia Bank Commercial Mortgage Trust FRN
Wachovia Corp. 5.7% 1/8/2013 "MTN" Washington Mutual BanWHenderson NV 5.125% 1 5/1/2015 Waste Managcment, Inc. (Old) 7.1% 1/8/2026 Waste Managcmcnt, Inc. 6.1% 15/3/2018 WellPoint, Inc. 5% 15/1/2011 Wclll'oint, Inc. 5.85% 15/1/2036 Wells Fargo Capital XlIl FRN Perpetual "GMTN" Westar Enctgy, Inc. 5.1% 15/7/2020 Wisconsin Power & Light Co. 6.375% 15/8/2037 WR Berkley Corp. 5.125% 30/9/2010 WR Berkley Corp. 6.15% 15/8/2019 Xerox Corp. 5.5% 15/5/2012 XTO Energy, Inc. 6.375% 15/6/2038 XTO Energy, Inc. 6.75% 1/8/2037
15/2/20S 1 "2007-C33 AM"
TOTALTRANSFlX4EbL.E SECURI'XIJ3 ADMITIED TO AN OFFICIAL STOCK EXCHANGE LISTING OR DEAIT IN ON ANOTHER REGUUTED MARKET
UNLISTED SECURITIES
BONDS
CHILE Corp Nacional del Cobre dc Chile - CODELCO 5.5% 1 S/10/2013 "1 44A
NETHERLANDS E.ON International Finance BV 5.8% 30/4/2018 "144A"
QATAR Ras Man Liquefied Natural Gas Co., Ltd 111 5.838% 30/9/2027 "144A"
UNITED STATES OF AMElUCA cargill, Inc. 6.375% 1/6/2012 "144A"
Cargill, Inc. 6.625% 15/9/2037 "144A" Erac USA Finance Co. 7% 15/10/2037 "144A" FPL Energy National Wind 5.608% 10/3/2024 "144A" MetLife Capital Trust X FRN 8/4/2038 "144A"
660,000
263,000 580,000
1,3 10,000 270,000
1,000,000 230,000 390,000 638,000 200,000 330,000 580,000 320,000
1,840,000 338,000 370,000
220,000
500,000
180,000
1,250,000 290,000 480,000 397,955 300,000
USD
US D USD
USD USD USD USD USD USD USD WSD US D USD USD USD
639,333
246,04 1
579,158
1,135,791 303,637 996,106 223,805 377,760 638,000 199,596 328,178 577,560 318,507
1,836,314 337,543
638,603
240,915 562,566
995,170 272,972 996,978 227,123 334,710 633,338 180,928 329,276 579,464 303,672
1,825,926 324,287
0.42
0.16 0.37
0.65 0.18 0.65 0.15 0.22 0.4 1
0.12 0.22 0.38 0.20 1.13 0.21
USD 370,644 378,077 0.25 125,952,446 121,395,288 79.66
149,590,816 145,046,920 94.72
USD 222,868 223,393 0.14
497,929 493,045 0.32 USD
USD 180,120 151.978 0.10
USD 1,320.3 10 1,293,292 0.85 289,340 285,727 0.19 USD
USD 475,943 398,808 0.26 USD 401,728 387,135 0.25 USD 300,000 326,226 0.21
144
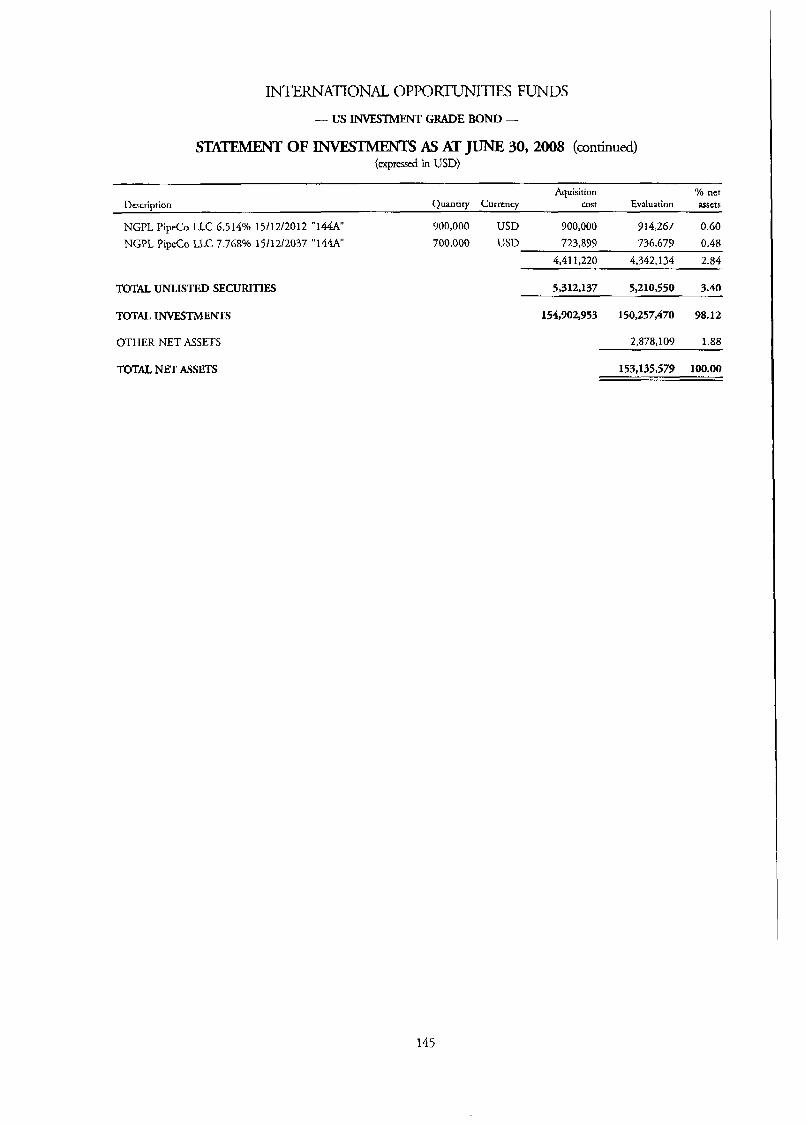
INTERNATIONAL OPPORWITIES FUNDS
- US INvEsIhlENT GRADE BOND -
S n OF INvEsIhlENTS AS AT JUNE 30,2008 (continued) (expressed in USD)
Aquisition Yo net Description Quantity Currcncy cost Evaluation asscts
NGPL PipeCo LLC 6.514% 15/12/2012 "144A 900,000 USD 900,000 914,267 0.60 NGPL PipeCo LLC 7.768Yo 15/12/2037 "14W 700,000 USD 723,899 736,673 0.48
4,411,220 4,342,134 2.84
TOTAL UNLISTED SECUFUTIES
TOTAL INVESTMENTS
OTHER NET ASSETS
TOTAL NET ASSETS
5,312,137 5,210,550 3.40
154,902,353 150,257,470 98.12
2,878,109 1.88
153.135579 100.00
145
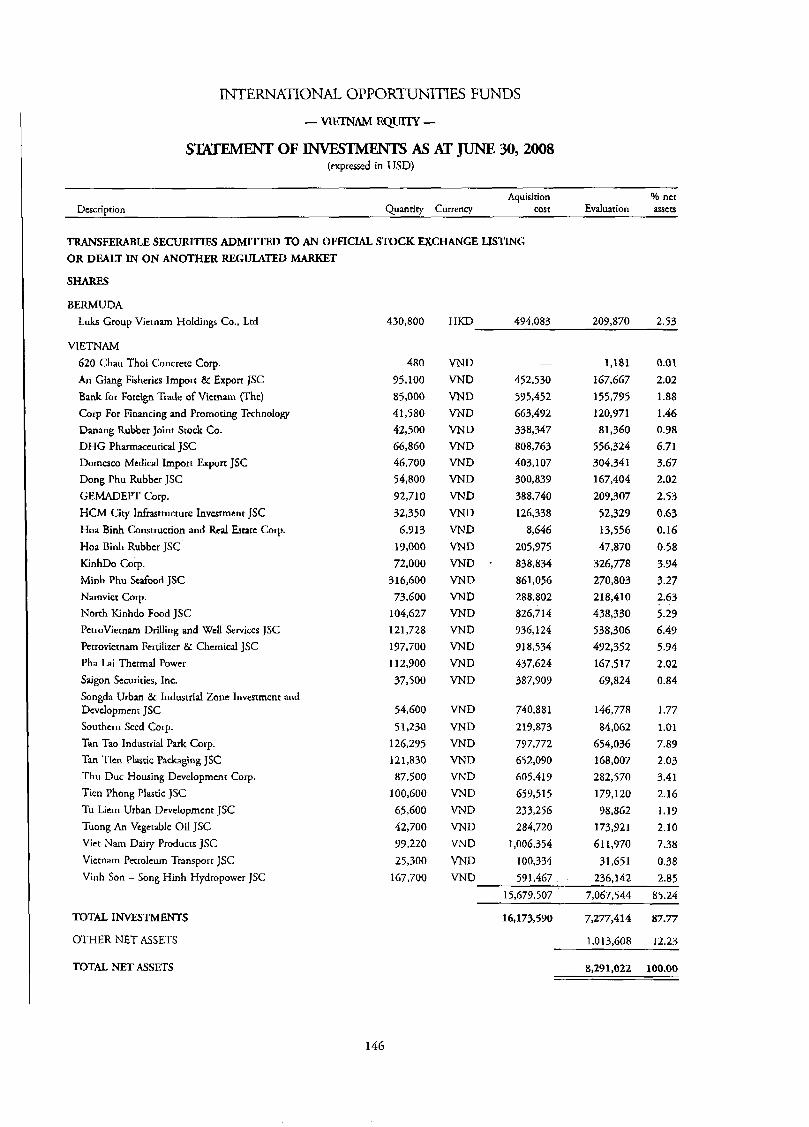
INTERNATONAL OPPORTUNITIES FUNDS
- VIlXNAh4 EQUITY - SEUEMENT OF INVESTMENTS As AT JUNE 30,2008
(expressed in USD)
Aquisirion 96 ner Description Quanrity Currency cost Evaluation assets
TRANSFERABLE SECURITIJ3 ADMI'ITED TO AN OFFICIAL STOCK F X C W G E WSTING OR DEALT IN ON ANOTHER REGULATED MARKET
SHARES
BERMUDA Luks Group Vietnam Holdings Co., Ltd
VIETNAM 620 Chau Thoi Concrete Corp. An Giang Fisheries Import & EXPOIT JSC Bank for Foreign Trade of Viernam (The) Corp For Financing and Promoting Technology Danang Rubber Joint Stock Co. DHG Pharmaceutical JSC Domesco Medical Import Export JSC Dong Phu Rubber JSC GEMADEPT Corp. HCM City Infrastructure Investment JSC Hoa Binh Construction and Real Estacc Corp.
I-Ioa Binh Rubber JSC KinhDo Corp. Minh Phu Seafood JSC Namvier Corp. North Kinhdo Food JSC PctroViernam Drilling and Well Services JSC Pctrovietnam Fertilizer 81 Chemical JSC Pha Lai Thermal Power Saigon Securities, Inc. Songda Urban & Industrial Zone Investment and Dcvclopmenr JSC Southern Seed Corp. Tan Tao Industrial Park Corp. Tan Ticn Plastic Packaging JSC Thu Duc Housing Dcvelopmcnr Corp. Tien Phong Plastic JSC Tu Liem Urban Development JSC Tuong An Vegetable Oil JSC Vict Nam Dairy Products JSC Vietnam Perroleurn Transport JSC Vinh Son - Song Hinh Hydropower JSC
430,800
480 95,100 85,000 41,580 42,500 66,860 46,700 54,800 92,710 32,350
6,913 19,000 72,000
316,600 73,600
104,627 121,728 197,700 112,900 37,500
54,600 5 1,230
126,295 121,830 87,500
100,600 65,600 42,700 99,220 25,300
167,700
HKD 494,083 209,870 2.53
VND VND VND VND VND VND VND VND VND VND VND VND VND VND VND VND VND VND VND VND
VND VND VND VND VND VND VND VND VND VND
-
452,530 595,452 663,492 338,347 808,763 403,107 300,839 388,740 126,338
8,646 205,975 838,834 861,056 288,802 826,714 936,124 91 8,534 437,624 387,909
740,881 219,873 797,772 652,090 605,419 659,515 233,256 284,720
1,006,354 100,334
VND 59 1,467
1,181 167,667 155,795 120,971 81,360
556,324 304,341 167,404 203,307
52,329 13,556 47,870
326,778 270,803 218,410 438,330 538,306 492,352 167,517 69,824
146,778 84,062
654,036 168,007 282,570 179,120 98,862
173,921 611,970
31,651 236.142
0.01 2.02 1.88 I .46 0.98 6.71 3.67 2.02 2.53 0.63 0.16 0.58 3.94 3.27 2.63 5.29 6.49 5.94 2.02 0.84
I .77 1.01 7.89 2.03 3.41 2.16 1.19 2.10 7.38 0.38 2.85
15,679,507 7,067,544 85.24
TOTAL INVESTMENTS
OTHER NET ASSETS
16,173,570 7,277,414 87-77
1,013,608 12.23
TOTAL NET ASSETS 8,291,022 100.00
146
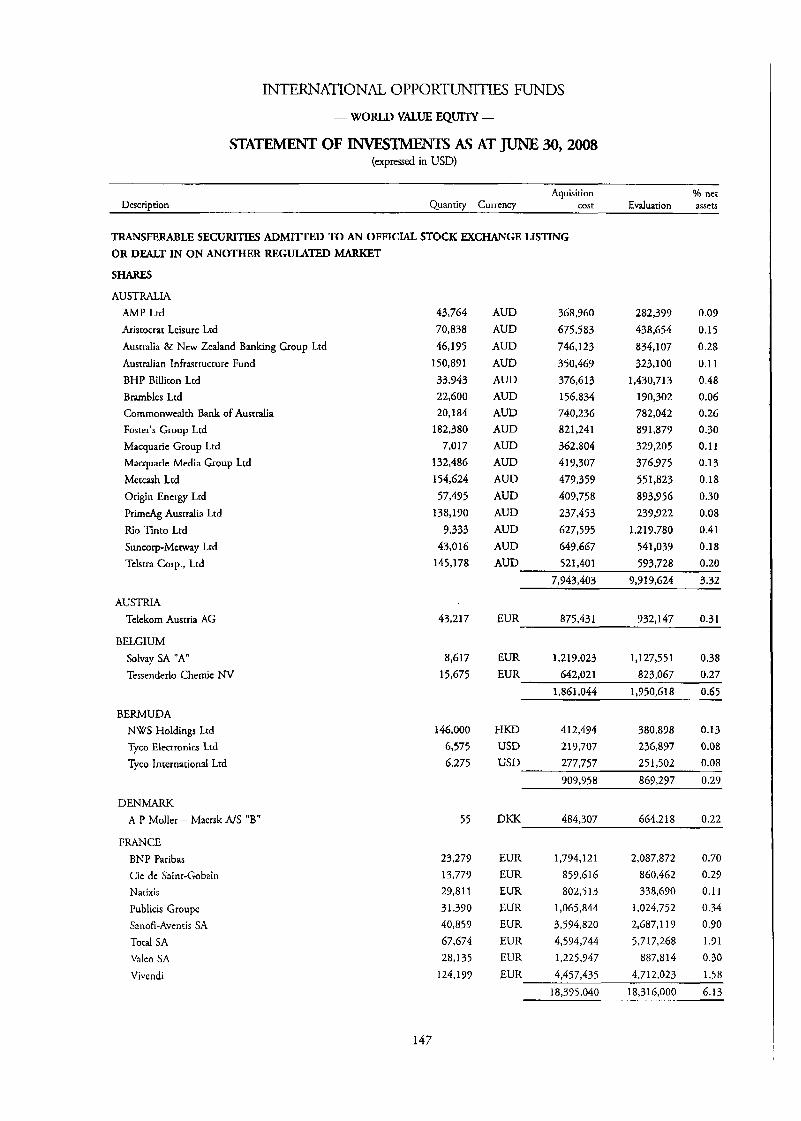
INTERNATTONAL OPPORWlTIES FUNDS
- WORLD VALUE EQUITY -
SKEMENT OF INVESTMENTS AS AT JUNE 30,2008 (expressed in USD)
Aquisition Description Quantity Currency cost Evaluation
TRANSFERABLE SECURITIES ADMIlTED TO AN OFFICL4L STOCK EXCHANGE LISTING OR DEALT IN ON ANOTHER REGULATED MARKET
SHARES
AUSTRALIA AMP Ltd Aristocrat Leisure Lrd Australia & New Zealand Banking Group Ltd Australian Infrastructure Fund BHP Billiton Ltd Brambles Ltd Commonwealth Bank of Australia Foster's Group Ltd Macquaric Group Ltd Macquaric Media Group Ltd Metcash Ltd Origin Energy Ltd PrirneAg Australia Ltd Rio Tinto Ltd Suncorp-Meovay Ltd Tclstra Corp., Ltd
AUSTRIA Tclckom Austria AG
BELGIUM Solvay SA " A Tessenderlo Chemie NV
BERMUDA NWS Holdings Ltd Tyco Electronics Ltd Tyco International Ltd
DEN= A P Moller - Maersk A/S "B"
FRANCE BNP Paribas Cic de Saint-Gobain Narixis Publicis Groupe Sanofi-Aventis SA Total SA Valco SA Vivendi
43,764 70,838 46,195
150,891 33,943 22,600 20,184
182,380 7,017
132,486 154,624 57,495
138,190 9,333
43,016 145,178
43,217
8,617 15,675
146,000 6,575 6,275
55
23,279 13,779 27,811 3 1,370 40,857 67~574 28,135
124,177
AUD AUD AUD AUD AUD AUD AUD AUD AUD AUD AUD AUD AUD AUD AUD
368,960 675,583 746,123 350,469 376,613 156,834 740,236 821,241 362,804 4 19,307 479,359 409,758 237,453 627,595 649,667
282,399 438,654 834,107 323,100
1,430,713 190,302 782,042 891,879 329,205 376,975 55 1,823 893,956 239,922
1,219,780 541,039
016 net assets -
0.07 0.15 0.28 0.1 1 0.48 0.06 0.26 0.30 0.11 0.13 0.18 0.30 0.08 0.4 1 0.18
0.20 AUD 521,401 593,728 7,943,403 9,919,624 3.32
EUR 875,431 932,147 0.31
EUR 1,219,023 1,127,551 0.38 EUR 642.021 823.067 0.27 1,950,618 ~ 0.65
1,861,044
HKD 412,494 380,898 0.13 USD 219,707 236,897 0.08 USD 277,757 251,502 0.08
907,958 869,297 0.29
DKK 484,307 664,218 0.22
EUR EUR EUR EUR EUR EUR EUR EUR
1,794,121 859,616 802,513
1,065,844 3,594,820 4,574,744 1,225,947 4,457,435
2,087,872 860,462 338,670
1,024,752 2,687,119 5,717,268
887,814 4,712,023
0.70 0.29 0.1 1
0.34 0.90 1.91 0.30 1.58
1.47
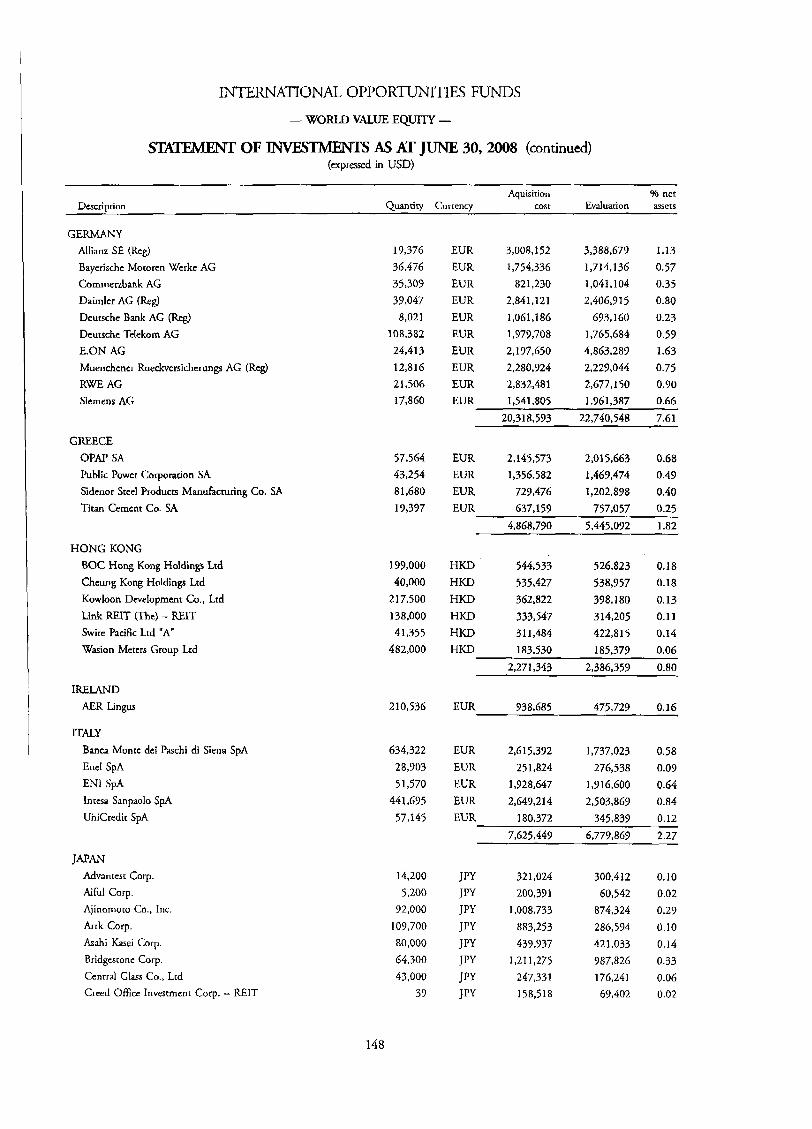
INTERNATIONAL OPPORTUNITIES FUNDS
- WORLD VALUE EQUITY -
SlIATEMENT OF -S AS AT JUNE 30, 2008 (continued) (expressed in USD)
Aquisirion 40 net Description Quantity Currency cost Evaluation assets
GERMANY Allianz SE (Reg) Bayerische Motoren Wcrkc AG Cornmerzbank AG Daimler AG (Reg) Deursche Bank AG (Reg) Dcutsche Telekom AG E.ON AG Muenchencr Rueckversichcrungs AG (Reg) RWE AG Siemens AG
GEECE OPAP SA
Public Power Corporation SA Sidenor Steel Products Manufacturing Co. SA Titan Cement Co. SA
HONG KONG BOC Hong Kong Holdings Ltd Chtung Kong Holdings Ltd Kowloon Dcvelopmenr Co., Ltd Link REIT (The) - REIT Swire Pacific Ltd "A" Wasion Meters Group Ltd
IRELAND AER Lingus
ITALY Banca Monte dei Paschi di Siena SPA Enel SpA EN1 SPA lncesa Sanpaolo SPA UniCredit SpA
JAPAN Advantcst Corp. Aiful Corp. Ajinomoro Co., Inc. Arrk Corp. Asahi Kasei Corp. Bridgcsrone Corp.
Ccnrral Glass Co., Ltd Creed Ofkc lnvesrmcnt Corp. - REIT
19,376 36,476 35,309 39,047
8,021 108,382 24,413 12,816 21,506 17,860
57,564 43,254 8 1,680 19,397
199,000 40,000
217,500 138,000 41,355
482,000
210,536
634,322 28,903 51,570
441,695 57,145
14,200 5,200
72,000 109,700 80,000
43,000 37
64,300
148
EUR EUR EUR EUR EUR EUR EUR EUR EUR EUR
3,008,152 1,754,336
821,230 2,841,12 1 1,061,18G 1,979,708 2,197,650 2,280,924 2,832,481 1,541,805
20.318.593
3,388,679 1,714.1 36 1,041,104 2,406,915
693,160 1,765,684 4,863,289 2,229,044 2,677,150 1,961,387
22.740.548
1.13 0.57 0.35 0.80 0.23 0.59 1.63 0.75 0.90 0.66 7.61 -
EUR 2,145,573 2,015,663 0.68 EUR 1,356,582 1,469,474 0.49 EUR 729,476 1,202,898 0.40 EUR 637,159 757,057 0.25
4,868,790 5,445,092 1.82
HKD 544,533 526,823 0.18 HKD 535,427 538,957 0.18 HKD 362,822 398,180 0.13 HKD 333,547 314,205 0.11
HKD 311,484 422,815 0.14 HKD 183,530 185.379 0.06
2,271,343 2,386,357 0.80
EUR 938,685 475,729 0.16
EUR 2,615,392 1,737,023 0.58 EUR 251,824 276,538 0.09 EUR 1,928,647 1,916,600 0.64 EUR 2,649,214 2,503,867 0.84 EUR 180,372 345,839 0.12
7,625,449
321,024 200,39 1
1,008,733 883,253 437,937
1 2 1 1,275 247,331 158,518
6,779,869
300,412 60,542
874,324 286,594 421.033 987,826 176,24 1
69,402
2.27
0.10 0.02 0.23 0.10 0.14 0.33 0.06 0.02
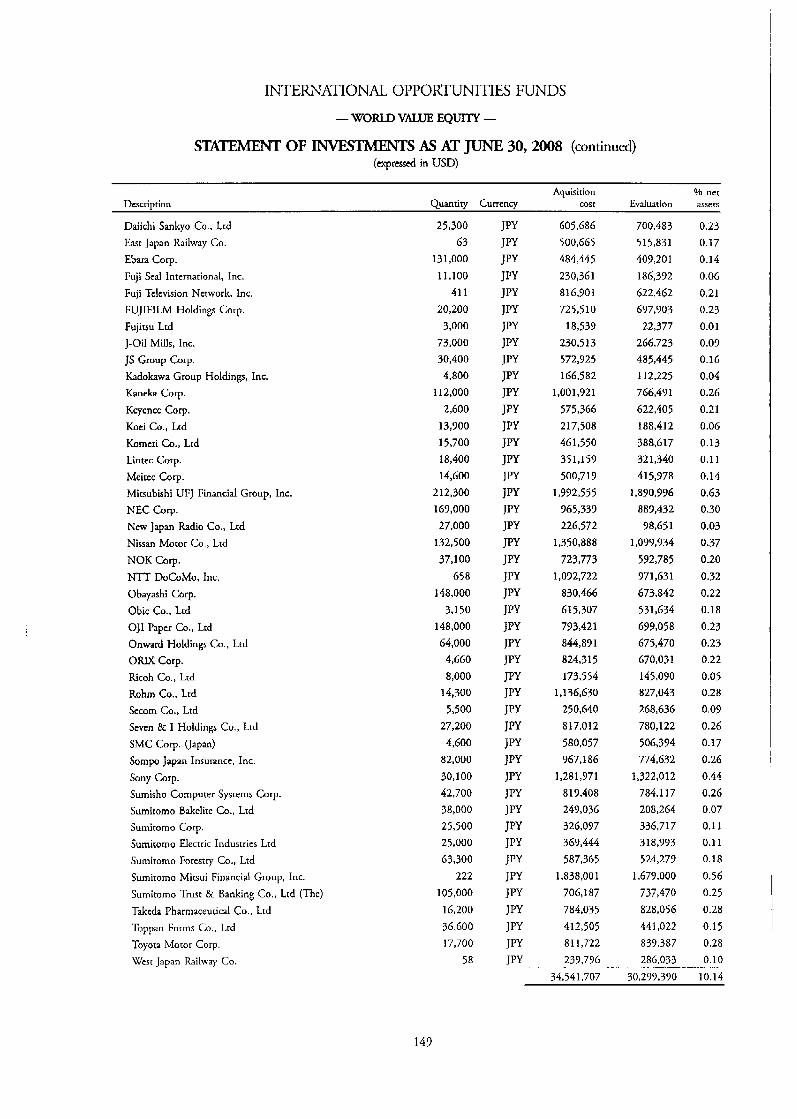
INTERNATIONAL OPPOR?ZTNITIES FUNDS
-WORLD VALUE EQUITY -
STATEMENT OF -S As AT JUNE 30,2008 (continued) (expressed in USD)
Dcscrimion Aquisition % net
Quantity Currency cost Evaluation assets
Daiichi Sankyo Co., Ltd East Japan Railway Co. Ebara Corp. Fuji Seal International, Inc. Fuji Television Network, Inc. FUJIFILM Holdings Corp. Fujitsu Ltd J-Oil Mills, Inc. JS Group Corp. Kadokawa Group Holdings, Inc. Kaneka Corp. Keyence Corp. Koei Co., Ltd Korncri Co., Ltd Lintec Corp. Meitec Corp. Mirsubishi UFJ Financial Group, Inc. NEC Corp. New Japan Radio Co., Ltd Nissan Motor Co., Lrd NOK Cop. NTT DoCoMo, Inc. Obayashi Corp. Obic Co., Ltd OJl Paper Co., Ltd Onward Holdings Co., Ltd ORUC Corp. Ricoh Co., Ltd Rohm Co., Ltd Secorn Co., Ltd Seven & I Holdings Co., Ltd SMC Corp. (Japan) Sornpo Japan Insurancc, Inc. Sony Corp. Sumisho Computer Systems Corp. Sumitorno Bakelite Co., Ltd Sumiromo Corp. Sumiromo Electric Industries Ltd Sumitorno Forestry Co., Ltd Sumitorno Mitsui Financial Group, Inc. Sumitorno Trust & Banking Co., Lrd (The) Takcda Pharmaceutical Co., Ltd Toppan Forms Co., Lrd Toyota Motor Corp. West Japan Railway Co.
25,300 63
131,000 11,100
41 1 20,200
3,000 73,000 30,400 4,800
112,000 2,600
13,900 15,700 18,400 14,600
212,300 169,000 27,000
132,500 37,100
658 148,000
3.150 148,000 64,000
4,660 8,000
14,300 5,500
27,200 4,600 82,000 30,100 42,700 38,000 25,500 25,000 63,300
222 105,000
16,200 36,600 17,700
58
605,686 500,665 484,445 230,361 816,901 725,510
18,539 230,513 572,925 166,582
1,001,921
575,366 217,508 461,550 351,159 500,719
1,992,555 965,339 226,572
1,350,888 723,773
1,092,722 830,466 615,307 793,421 844,891 824,315 173,554
1,136,630 250,640 817,012 580,057 967,lSG
1,281,371 819,408 249,036 326,097 369,444 587,365
1,838,001 706,187 784.035 412,505 81 1,722 239.716
700,483 515.831 409,201 186,392 622,462 697,903
22,377 266,723 485,445 112,225 766,471 622,405 188,412 388,617 321,340 4 15,978
1,890,976 889,432 98,651
1,099,934 592,785 971,631 673,842 531,634 699,058 675,470 670,03 1 145,090 827,043 268,636 780,122 506,394 774,632
1,322,012 784,117 208,264 336,717 318,993 524,279
1,679,000 737,470
441,022 839,387 286.033
828,056
0.23 0.17 0.14 0.06 0.21 0.23 0.01 0.09 0.16 0.04 0.26 0.21 0.06 0.13 0.1 1
0.14 0.63 0.30 0.03 0.37 0.20 0.32 0.22 0.18 0.23 0.23 0.22 0.05 0.28 0.09 0.26 0.17 0.26 0.44 0.26 0.07 0.1 1 0.1 1
0.18 0.56 0.25 0.28 0.15 0.28 0.10
34,541,707 30,299,390 10.14
149
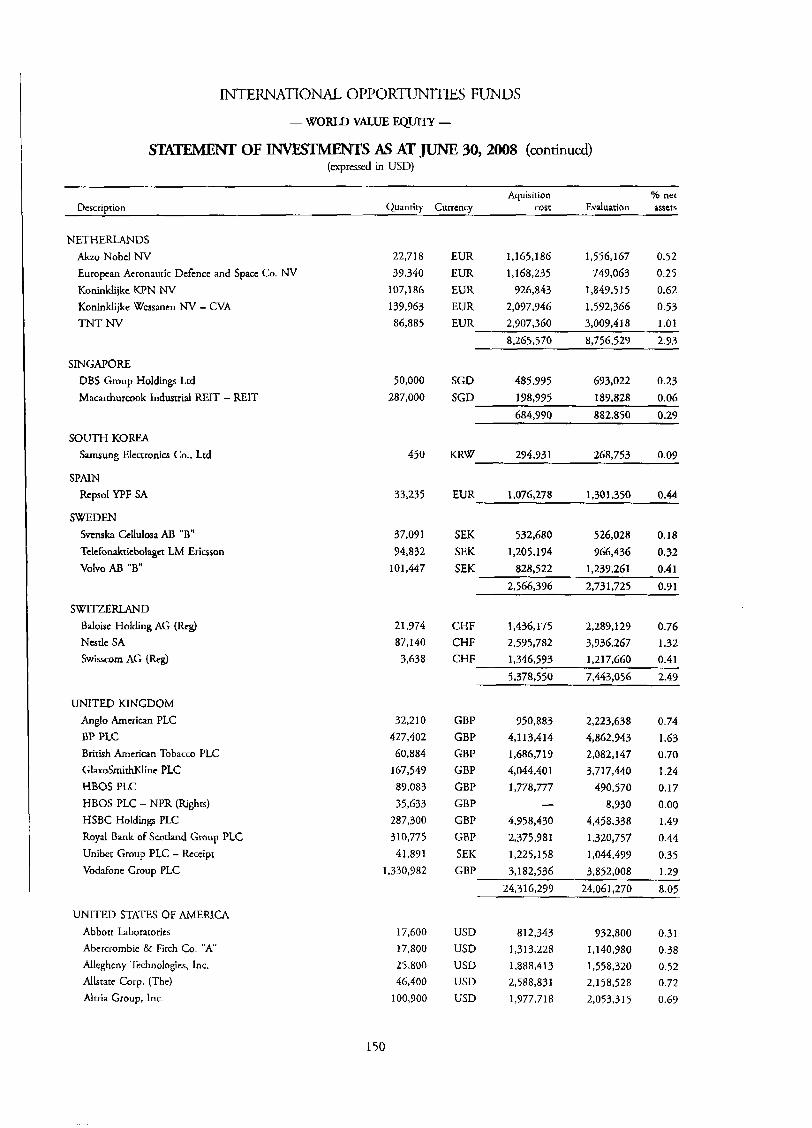
INTERNATIONAL OPPORTUNITIES FUNDS
- WORLD VALUE EQ- -
S- OF m S As AT JUNE 30,2008 (continued) (expressed in USD)
~~ ______ ~
Aquisition % net Description Quantity Currency cost Evaluation assets
NETHERLANDS Akzo Nobel NV European Aeronautic Defence and Space Co. NV Koninklijke KPN NV Koninklijke Wessancn NV - CVA TNT NV
SINGAPORE DBS Group Holdings Ltd Macarthurmok Industrial REIT - REIT
SOUTH KOREA Samsung Electronics Co., Ltd
SPAIN Rcpsol YPF SA
SWEDEN Svcnska CcUulosa AB "B" Tclefonakticbolaget LM Ericsson Volvo AB "8"
SWITZERIAND Bdoise Holding AG (Reg) Nestle SA Swisscom AG (Reg)
UNITED KINGDOM Anglo Amcrican PLC BP PLC British American Tobacco PLC GlaxoSmirhKlinc PLC HBOS PLC HBOS PLC - NPR (Rights) HSBC Holdings PLC Royal Bank of Scotland Group PLC Uniber Group PLC - Receipt Vodafone Group PLC
UNITED STATES OF AMERICA Abbotr Laboratories Abercrombie & Fitch Co. "A" Allegheny Technologies, Inc.
Allstate Corp. (The) Altria Group, Inc.
22,718 39,340 107,186 139,963 86,885
50,000 287,000
450
33,235
37,091 94,832 101,447
21,974 87,140 3,638
32,210 427,402 60,884 167,549 89,083 35,633 287,300 310,775 41,891
1,330,982
17,600 17,800 25.800 46400 100,900
150
EUR 1,165,186 1,556,167 0.52 EUR 1,168,235 749,063 0.25 EUR 926,843 1,849.51 5 0.62 EUR 2,037,946 1,592,366 0.53 EUR 2,907,360 3,009,418 1.01
8,265,570 8,756,527 2.73
SGD 485,995 693,022 0.23 198.995 189,828 0.06 SGD 684,990 882,850 OlT9
KRW 274,931 268,753 0.09
EUR 1,076.278 1,301,350 0.44
SEK 532,680 526,028 0.18 SEK 1,205.1 94 966,436 0.32 SEK 828.522 1,239,261 0.41
2,566,396 2,731,725 G I
CHF 1,436,175 2,289,129 0.76 CHF 2,535,782 3,936,267 1.32 CHF 1,346,593 1,217,660 0.41
5,378,550 7,443,056 2.49
GBP 950,883 2,223,638 0.74 GBP 4,113,414 4,862,943 1.63 GBP 1,686,7 19 2,082,147 0.70 GBP 4,044,401 3,717,440 1.24 GBP 1,778,777 490,570 0.17 GBP - 8.930 0.00 GBP 4,958,430 4,458,338 1.49 GBP 2,375,981 1,320,757 0.44 SEK 1,225,158 1,044,499 0.35 GBP 3,182,536 3,852,008 1.29
24,316,233 24,061,270 8.05
USD 812,343 932,800 0.31 USD 1,313,228 1,140,980 0.38 USD 1,888,413 1,558,320 0.52
2,588,831 2,158,528 0.72 USD
USD 1,977,718 2,053.31 5 0.69
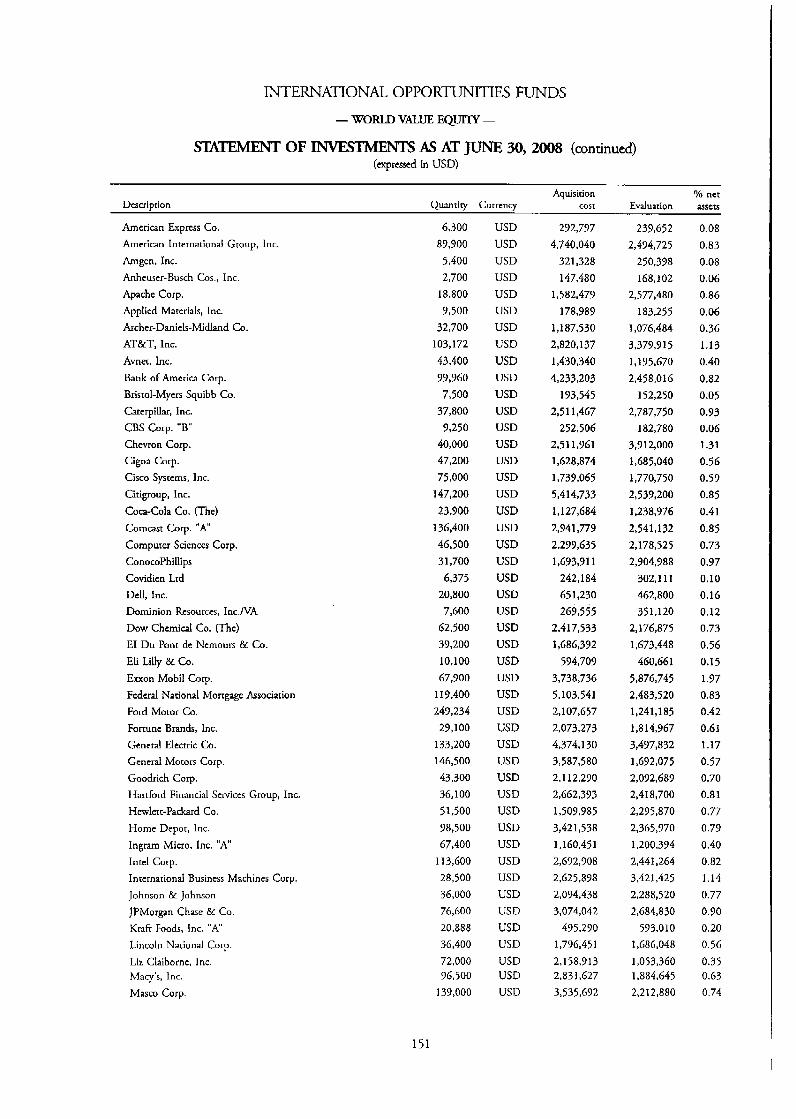
INTERNATIONAL OPPORTUNITIES FUNDS
- WORLD VALUE EQUITY -
S-ZIATEMENT OF INVESTMENTS AS AT JUNE 30,2008 (continued) (expressed in USD)
Aquisition Yo net Evaluation mcts Descriprion Quantiry Currency cost
American Express Co. American International Group, Inc.
Amgen, Inc. Anheuser-Busch Cos., Inc. Apache Corp. Applied Materials, Inc. Archer-Daniels-Midland Co. ATBrT, Inc. Avner, Inc. Bank of America Corp. Btistol-Myers Squibb Co. Caterpillar, Inc.
CBS Corp. "B" Chevron Corp. Cigna Corp. Cisco Systems, Inc. Citigroup, Inc.
Coca-Cola Co. (The) Corncast Corp. "A" Cornpurer Sciences Carp. ConocoPhiUips Covidicn Ltd Dell, Inc. Dominion Resourccs, Inc./VA Dow Chemical Co. (The) E1 Du Pont de Ncmours & Co. Eli Lilly & Co. Exxon Mobil Corp.
Federal National Morrgage Association Ford Motor Co. Fortune Brands, Inc. General Electric Co. General Motors Corp. Goodrich Corp.
Hartford Financial Services Group, Inc. Hewlett-Packard Co.
Home Depot, Inc. Ingram Micro, Inc. "A" Intel Corp.
International Business Machines Corp. Johnson &Johnson JPMorgan Chase & Co. Kraft Foods, Inc. "A' Lincoln National Corp. Liz Claibornc, Inc. Macy's, Inc. Masco Corp.
6,300 89,900
5,400 2,700
18,800 9,500
32,700 103,172 43,400 99,960 7,500
37,800 9,250
40,000 47,200 75,000
147,200 23,900
136,400 46,500 3 1,700
6,375 20,800 7,600
62,500 39,200 10,100 67,900
1 19,400 249,234 29,100
133,200 146,500 43,300 36,100 51,500 98,500 67,400
113,600 28,500 36,000 76,600 20,888 36,400 72,000 96,500
139,000
151
USD USD USD USD USD USD USD USD USD USD USD USD USD USD USD USD USD USD USD USD USD USD USD USD USD USD USD USD USD USD USD USD USD USD USD USD USD USD USD USD USD USD USD USD USD USD USD
292,797 4,740,040
321,328 147,480
1,582,479 178,989
1,187,530 2,820,137 1,430,340 4,233,203
193,545 2,511,467
252,506 2.51 1,961 1,628,874 1,739,065 5,414,733 1,127,684 2,941,779 2,299,635 1,693,91 I
242,184 65 1,230 269,555
2,417,533 1,686,392
594,709 3,738,736 5,103,541 2,107,657 2,073,273 4,374,130 3,587,580 2,112,290 2,662,393 1,509,985 3,421,538 1,160,45 1 2,692,908 2,625,898 2,094,438 3,074,042
495,290 1,796,45 1
2.1 58,913 2,83 1,627 3,535,692
239,652 2,494,725
250,398 168,102
2,577,480 183,255
1,076,484 3,379,915 1,195,670 2,458,016
152,250 2,787,750
182,780 3,912,000 1,685,040 1,770,750 2,539,200 1,238,976 2,541,132 2,178,525 2,904,988
302,111 462,800 35 1,120
2,176,875 1,673,448
460,661 5,876,745 2,483,520 1,241,185 1,814,967 3,497,832 1,692,075 2,092,689 2,418,700 2,29 5,870 2,365,970 1,200,394 2,441,264 3,421,425 2,288,520 2,684,830
593,010 1,686,048 1,053,360 1,884,645 2,212,880
0.08 0.83 0.08 0.06 0.86 0.06 0.36 1.13 0.40 0.82 0.05 0.93 0.06 1.31 0.56 0.59 0.85 0.41 0.85 0.73 0.97 0.10 0.16 0.12 0.73 0.56 0.15 1.97 0.83 0.42 0.61 1.17 0.57 0.70 0.81 0.77 0.79 0.40 0.82 1.14 0.77 0.90 0.20 0.56 0.35 0.63 0.74
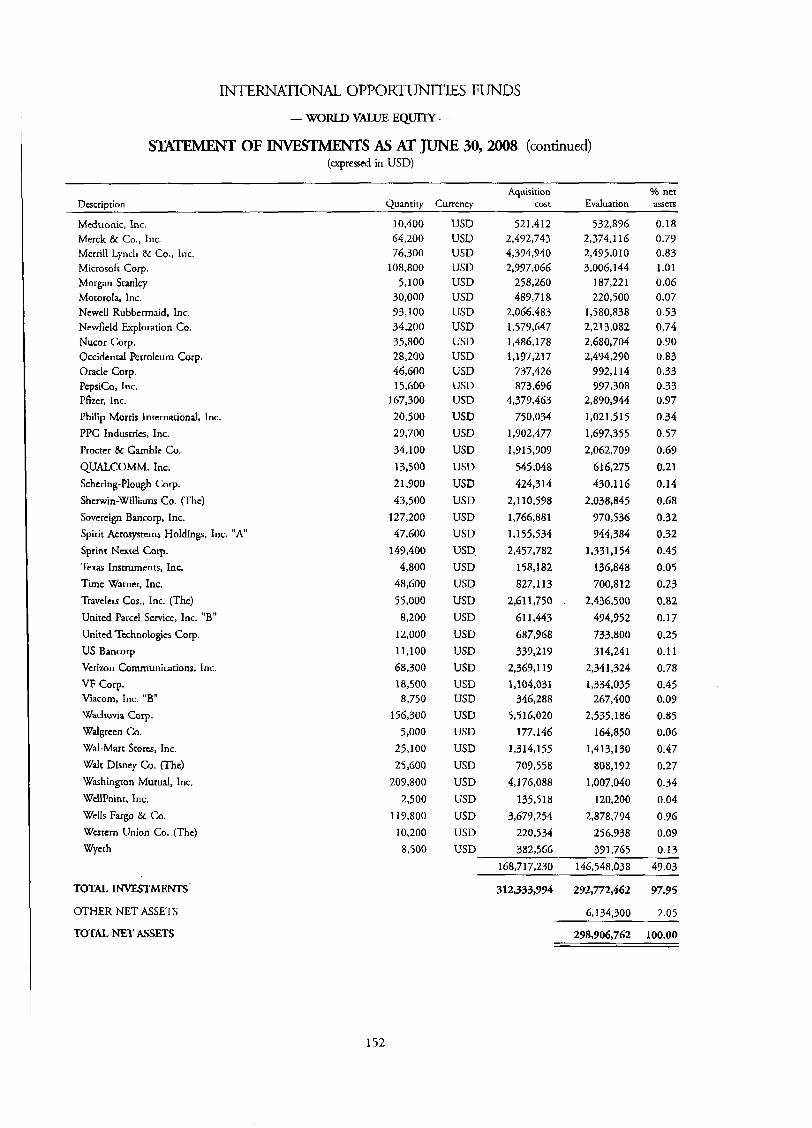
INTERNATIONAL OPPORmITIES FUNDS
-WORLD VXUE EQUrrY -
OF N X S T M E N S AS AT JUNE 30,2008 (continued) (expressed in USD)
Aquisition % net Description Quantity Currency cost Evaluation assets
Medrronic, Inc. Merck & Co., Inc. Merrill Lynch & Co., Inc. Microsoft Corp. Morgan Stanley Motorola, Inc. Newell Rubbcrrnaid, Inc. Newfield Exploration Co. Nucor Corp. Occidental Petrolcum Corp. Oracle Corp. PcpsiCo, Inc. Pfizer, Inc. Philip Morris International, Inc. PPG Industries, Inc. Procter & Gamble Co. QUALCOMM, Inc. Schering-Plough Corp. Sherwin-Williams Co. (The) Sovereign Bancorp, Inc. Spirit Aerosystems Holdings, Inc. Sprint Ncxtel Corp. Texas Instruments, Inc. Trne Warner, Inc. Traveled Cos., Inc. (The) United Parcel Service, Inc. "B" United Technologies COT. US Bancorp Verizon Communications, Inc. VF Corp. Viacom, Inc. "B" Wachovia Corp. Walgreen Co. Wal-Mart Stores, Inc. Walt Disney Co. (The) Washington Mutual, Inc. WcllPoint, Inc. Wells Fargo & Co. Wcstern Union Cn. (The) Wycth
TOTAL INVESTMENTS.
OTHER NET ASSETS
TOTAL NET ASSETS
"A"
10,400 64,200 76,300
108,800 5,100
30,000 93,100 34,200 35,800 28,200 46,600 15,600
167,300 20,500 29,700 34,100 13,500 21,900 43,500
127,200 47,600
149,400 4,800
48,600 55,000
8,200 12,000 11,100 68,300 18,500 8,750
156,300 5,000
25,100 25,600
209,800
2,500 119,800
10,200 8,500
USD usu USD USD USD USD USD USD USD USD USD USD USD USD USD USD USD USD USD USD USD USD USD USD USD USD USD USD USD USD USD USD USD USD USD USD USD USD USD USD
521,412 2,492,743 4,394,940 2,997,066
258,260 489,718
2,066,483 1,579,647 1,486,178 1,197,217
737,426 873,696
4,379,463 750,034
1,902,477 1,315,909
545,048 424,314
2,110,598 1,766,881 1 ,I 55,534 2,457,782
158,182 827,113
2,611,750 61 1,443 687,968 339,217
2,369,117 1,104,031
346,288 5.51 6,020
177,146 1,314,155
707,558 4,176,088
135,518 3,679,254
220,534 382,566
532,896 2,374.1 16 2,495,010 3,006,144
187,221 220,500
1,580,838 2,213,082 2,180,704 2,494,290
772,114 997,308
2,870,944 1,021,515 1,697,355 2,062,709
614,275 430,116
2,038,845 970,536 744,384
1 , 3 3 1 ~ 54 136,848 700,8 12
2,436,500 494,952 733,800 314,241
2,341,324 1,334,035
267,400 2,535,186
164,850 1,413,130
808,192 1,007,040
120,200 2,878,794
256,938 391.765
0.18 0.77 0.83 1.01 0.06 0.07 0.53 0.74 0.90 0.83 0.33 0.33 0.77 0.34 0.57 0.69 0.21 0.14 0.68 0.32 0.32 0.45 0.05 0.23 0.82 0.17 0.25 0.1 1 0.78 0.45 0.09 0.85 0.06 0.47 0.27 0.34 0.04 0.96 0.07 0.13
168,717,230 146,548,038 47.03
312,333,994 292,772,462 97.95
6,134,300 2.05
238,906,762 100.00
152
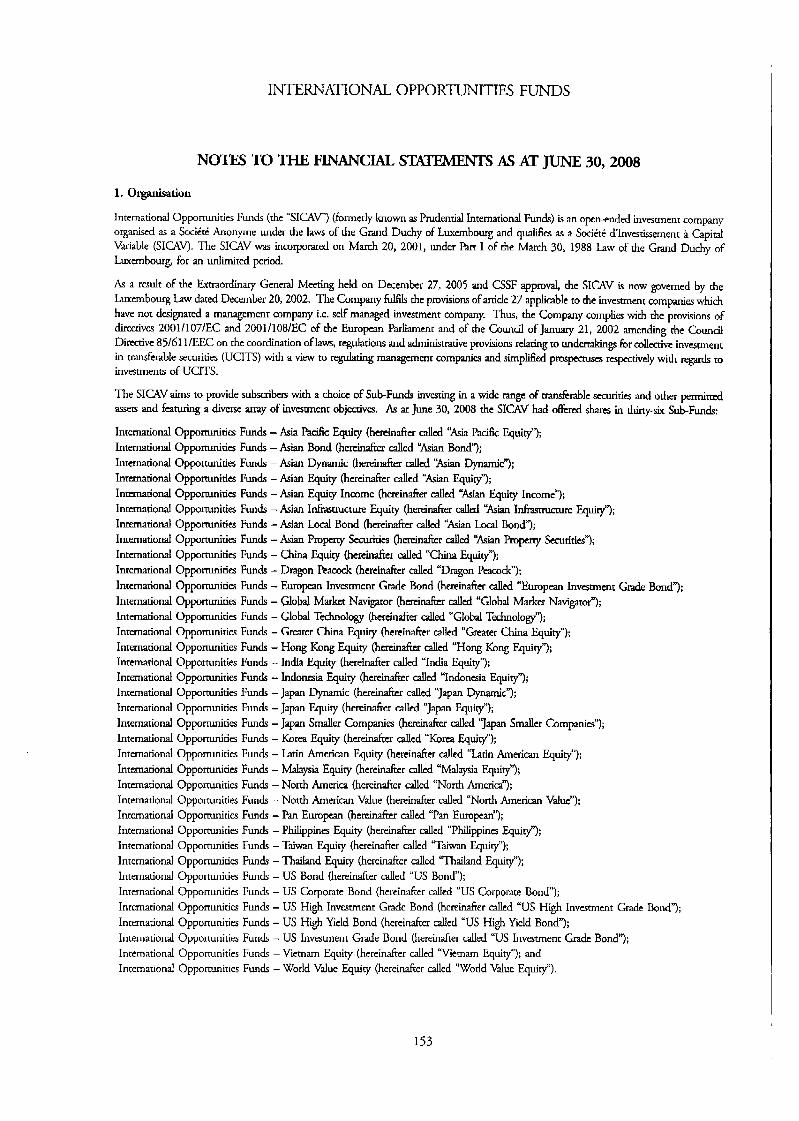
INTERNATIONAL OPPORTUNITIES FUNDS
NOTES TO THE FINANCIAL STATEMENTS AS AT JUNE 30,2008
1. Organisation
International Opportunities Funds (the “SICAV’) (fbrmerly known as Prudendal International Funds) is an open-ended investment company organised as a Sociiti Anonyme under the laws of the Grand Duchy of Lmembourg and qualifies as a Sociiti d’hvesrissement i Capital Variable (SIcAv). The SICAV was incorporated on March 20, 2001, under Part I of rhe March 30, 1788 Law of the Grand Duchy of‘ Luxembourg, for an unlimited period.
As a result of the Extraordinary General Meeting held on December 27, 2005 and CSSF approval, the SICAV is now governed by che Luxembourg Law dated December 20,2002. The Company f4I.s the provisions of a d e 27 applicable to the investment companies which have not designated a management company i.e. self managed investment company. Thus, the Company complies with the provisions of direcuves 20011107/EC and 200111081EC of the European Parliament and of the Council of January 21, 2002 a r n e n k h e Council Directive 85/61 VEEC on the coordination oflaws, regulations and administrative provisions relacing to undertakings br ColleniM inwment in tmkrab le securities (UCITS) with a view to regukting management companies and simplified prospectuses reswvcly with to investmenc of UCITS.
The SICAV a ims to provide subscribers with a choice of Sub-Funds investing in a wide mge of mnsferable securidcs and other p e r m i m d assers and hturing a diverse array of invesunent objectives. As at June 30, 2008 the SICAV had o & d shares in thlrty-sbr SubFunds:
International Opportunities Funds - Asia paafic Equity (hereinafter dd “Asia Pacif~c FquiV’); International Opportunides Funds - Asian Bond (hereinafter d e d “Asian Bond’): International Oppormniues Funds - Asian Dynamic (hereinafter d c d “Asian Dynamic”); International Opportunities Funds - Asian Equity (hereinafter called “Asian Equirf); International Opportunities Fun& - Asian Equity Inmrne (hereinafter d e d “Asian Equity Incomen); International Opportunities Funds - Asian I k m c n r r e Equity (hereinafter d e d “Asian I k r u c t u r e Equity”); Intemarional Oppormnides Funds - Asian Local Bond (hereinafter d e d “hian Local Bond‘); International Opportunities Funds - Asian Property Securities (hereinafter called “Asian Property Securities”); International Opportunities Funds - China Equity (hereinafter called “China Fquity”); International Opportunities Funds - Dragon l’camck (hcreinafcer d e d “Dtagun Pam&); International Opportunities Funds - European Investment Grade Bond (heremafter d e d “European Investment Grade Bond”); International Opportunities Funds - Global Market Navigator (hercinafrcr d c d “Global Market Navigator“); International Opportunides Funds - Global Technology (hereinafter d e d ”Global Technology”); International Opportunities Funds - Greater Chma Equity (hereinafter called “Greater China Fquity”); International Opportunities Funds - Hong Kong Equity (hereinafrcr called “Wong Kong Equity”); International Oppomitjes Funds - India Equity (hereinafter d e d “India Equity”); International Opportunities Funds - Indonsia Equity (hereinafter called “Indonesia Equity”); International Opportunities Funds -Japan Dynam~c (hereinafter called ‘yapan Dynamic”); International Opportunities Funds -Japan Equity (hereinafter called “Japan Equity”); International Opportunities Funds -Japan Smaller Companies (hereinafcer dd “Japan Smaller Companies”); International Opportunides Funds - Korea Equity (hereinafter d e d “Kom Equif); International Opportunities Funds - Iatin h e r i m Equity (hereinafter d e d “Latin American Equity”); Internauond Opporrunities Funds - Malaysia Equity (hereinafter called “Malaysia Equity”); International Oppormnities Funds - North Amer i~ (hereinafter called “North h e r i a ” ) ; International Oppomrnities Funds - North h e r i m Value (hereinafter called “North American Value”); International Opportunities Funds - Pan European (hereinafir called “Pan European”); International opportunities Funds - Philippines Equity (hereinafter d c d "Philippines Equity”); International Oppormnities Funds - Taiwan Equity (hereinafter called “Taiwan Equity”); International Opportunities Funds - Thailand Equity (hereinafter called “Thailand Fquity”): International Opportunities Funds - US Bond (hereinafter d e d “US Bond”); International Opportunities Funds - US Corporate Bond (hereinafcer called “US Corporate Bond”); International Opporcunities Funds - US High Investment Grade Bond (hereinafter &d “US High Investment Grade Bond”); International Opportunities Funds - US High Yield Bond (hereinafter called “US High Yield Bond); International Opportunities Funds - US Investment Grade Bond (hereinafter called “US Investment Grade Bond‘); International Opporrunities Fun& - Vietnam Equity (hereinah called “Vietnam Equity”); and International Opportunities Funds - World Value Equity (hereinafcer called “World Value Equity”).
153
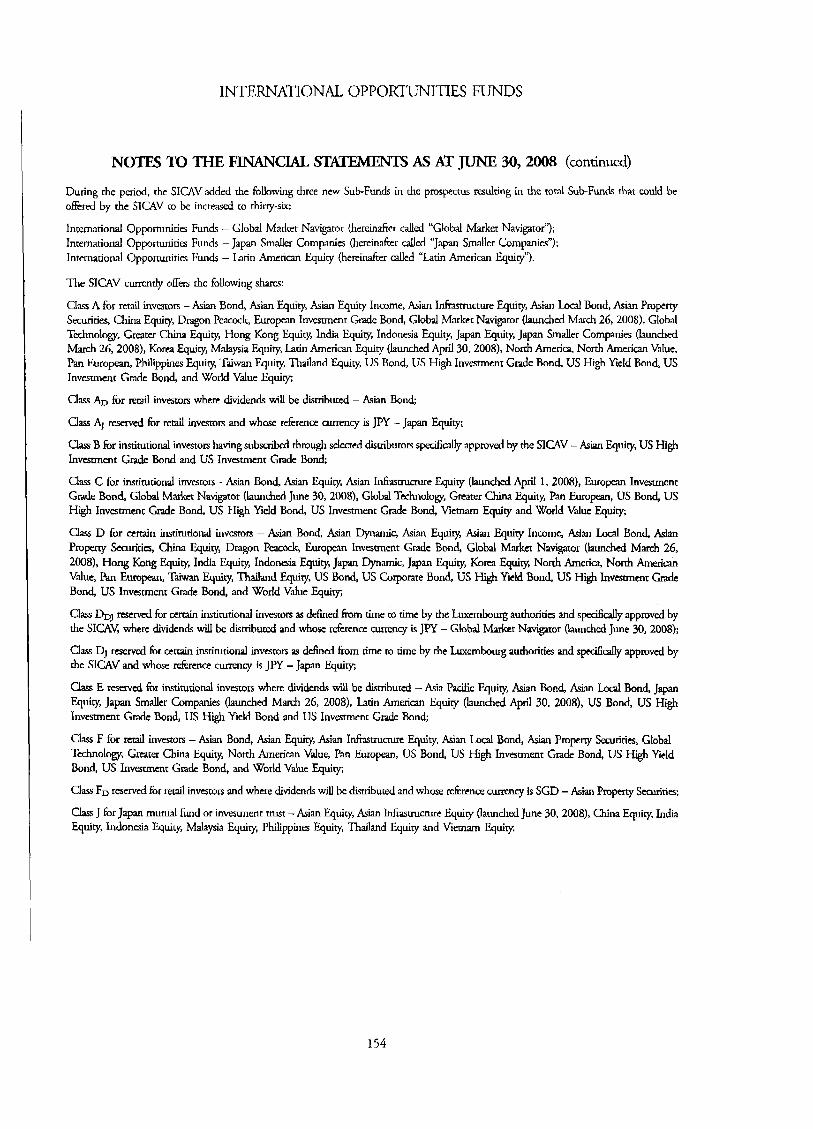
INTERNATIONAL O P P O R ~ I T I E S FUNDS
NOTES TO THE FINANCIAL ! X . S As AT JUNE 30,2008 (continued)
During rhe period, the SICAV added rhe following three new Sub-Funds in the prospectus resulting in the total SubFunds &at could be ofired by rhc SICAV to be incteased to thirty-six:
International Oppormnities Funds - Global Market Navigator (hereinafter called “Global Market Navigatoi‘); International Oppormnities Funds -Japan Smaller Companies (hereinah called “Japan Smaller Companies”); International Opportunities Funds - Latin American Equity (hereinafter d e d “Latin American Equity”).
The SICAV m n d y offers the following shares:
Class A for red investors -Asian Bond, Asian Equity, A s i i Equity Income, Asian Infrastrucnue Fquity, Asian Local Bond, Asian Property Securities, China Equity, Dragon Peacock, European Investment Grade Bond, Global Market Navigator (launched March 26,2008), Global Technology, Grater China Equity, Hong Kong Equity, India Equity, Indonesia %uity, Japan Equity, Japan Smaller Companies (launched March 26, ZOOS), Korm Equity, Malaysia Equity, Laun American Equity (hunched Apd 30, ZOOS), No& h e r i m , North American Value, Pan European, Philippines Equity, Taiwan Equity, Thailand Equity, US Bond, US High Investment Gmde Bond, US High Yield Bond, US Investment Grade Bond, and World Value Equity;
Class AD h r r e d investors where dividends will be distributed - Asian Bond;
Class A1 reserved fir retail investors and whose reference cumncy is JPY - Japan Equity;
Class B for institutional investors having subscribed rhrough selected distributors specifically approved by the SICAV - A s i i Equity, US High I n v m e n t Grade Bond and US Investment Grade Bond;
Class C for instimdonal investors - Asian Bond, Asian Fquiry, Asian Infrastructure Equity (launched April 1, ZOOS), European Investment Grade Bond, Global Marker Navigator (launched June 30,2008), Global Technology, Greater China Equity Pan European, US Bond, US Hgh Investment Grade Bond, US High Meld Bond, US Investment Grade Bond, Vietnam Equity and World Value Equity;
Class D b r ccrcdin institudonal investors - Asian Bond, Asian Dynanic, Asian Equity, Asian Equity Income, Asian Local Bond, Asian Property Securitia, China Equity, Dragon P d European h a a n e n t Grade Bond, Global Market Navigator (launched March 26, 2008), Hong Kong Equity, India Equity, Indonesia Equity, Japan Dynamic, Japan Fquity, Korea Equity, North America, North American Value, Pan European, Taiw Fquity, Thailand Equity, US Bond, US Corporate Bond, US Hgh Xeld Bond, US High Investment Gradc Bond, US I n v m e n t Gradc Bond, and Wodd Value Equity;
Class DDJ mewed for certain institutional investors as defined from time to rime by the Luxembourg authorities and spedfically approved by the SICAX where dividends will be distributed and whose reference currency is JPY - Globd Market Navigator (launched June 30,2008);
class DJ reserved for Wtain insrituaonal invesrors as defined from h e to time by rhe Luxembourg authorities and spmfiCayr appmvd by the SlCAV and whose reference currency is JPY - Japan Qui?.,
Class E reserved for instituuonal invenots where dividends will be distributed - Asia Pacific Equity, A s i Bond, Asian Local Bond, Japan F-quity, Japan Smaller Companies (launched March 26, ZOOS), Latin A m e r i m Equity (launched April 30, ZOOS), US Bond, US High Investment Grade Bond, US High Yield Bond and US Investment Grade Bond;
C k F for rerail investors - Asian Bond, Asian Equiry, Asian Infrastructure Equity, Asian Local Bond, Asian Property Securidcs, Global Tedmology, Grater China Equity, No& American Vdue, Pan European, US Bond, US High Investment Grade Bond, US High Kdd Bond, US Invesuncnt Grade Bond, and World Value Equity;
Clas F, reserved fbr r e d invcstors and where dividends will be disuibuted and whose r e f e m currency is SGD - Asian Pmpeq Smuidcs;
Class J For Japan mutual fund or investment uust -Asian Equity, A s i I&tructure Equity (launched June 30,2008), China Equity, India Equity, Indonesia Quity, Malaysia Equity, Philippines Equity, Thailand Equiry and Vietnam F.quiy
154
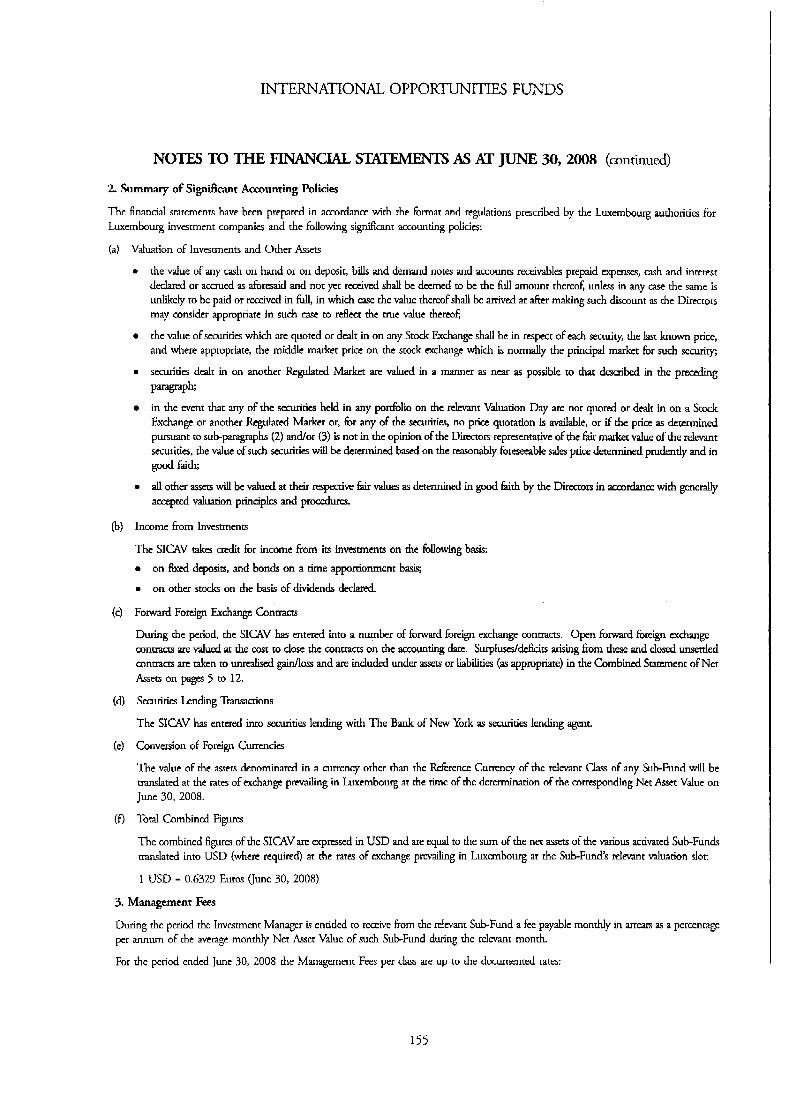
INTERNATIONAL OPPORTUNITIES FUNDS
NOTES TO THE FINANCIAL AS AT JUNE 30,2008 (continued)
2. Summary of Sigdicant h u n t i n g Policies
The financial smtements have been prepared in acmrdanoe with rhe format and regulations prescribed by the Luxembourg authorities for Luxembourg investment companies and the following signifimt accounting policics:
(a) Valuation of Investments and Other Assets
0 the value of any cash on hand or on deposit, bills and demand notes and accounts receimbles prepaid acpenses, cash and interest dedared or accrued as &r&d and not yet received shall be deemed to be the full amount thereof, unless in any case the same is unlikely to be paid or received in full, in which case the value thereof shall be arrived ar after making such discount as the Directoa may consider appropriate in such crasc to reflm the true value thereof;
the value of securities which are quoted or dealt in on any Stock Fxchange shall be in respect of each security, the last known price, and where appropriate, the middle m a r k price on rht stodc exchange which is normally the principal market fbr such security;
securities dealt in on another Regulated Market are valued in a manner as near as possible to that described in the preceding
in the event that any of the securities held in any pordblio on the relevant Valuation Day are not quoted or dtat in on a S t d Exchange or another Rcgulatcd Market or, tbr any of rhe securities, no price quotation is available, or if the price as determined pursuant to sub-paragraphs (2) and/or (3) is not in the opinion of the Directors representative of the fair market d u e of the relevant sccuriacs, the value of such securities will be k r m i n c d based on the reasonably foresaable sales price determined prudently and in
0
P=WPh;
good fiith;
0 all other assea will be valued at their mpective kit valw as determined in pod &ch by the Dirmors in acmrdance with generally accepted valuation principles and procedures.
(b) Income from hesunents
The SICAV rakes credit for income from its invesmcnn on the following basis: 0
0
on ttccd dcposio, and bonds on a time appomonment basis;
on other stocks on the basis of dividends dedared.
(c) F o d Foreign Exchange Contracts
During the period, rhe SICAV has entered into a number of forward foreign exchange mntracts. Open forward foreign exchange contracts are d u e d at the cost to dosc the contracts on the accounting date. Surpluscs/dcficio arisiig from these and d d unsettled m n m m arc taken to un& gaidloss and are included under assets or liabilities (as appropriate) in the Combined Statement of Net Assets on p a p 5 to 12.
(d) Semrities Lendmg Transactions
The SICAV has entered into securities lending with The Bank of New York as securities lending agent.
(e) Conversion of Foreign Currencies
The value of the assets denominated in a currency other than the Reference Currency of the relevant Class of any Sub-Fund will be uanslated at the rates of exchange pmailing in Luxembourg at the rime of the determinarion of rhe comsponding Net Asset Value on June 30, 2008.
(f) Total Combined Figures
The combined figures of the SlCAV are expressed in USD and are equal to the s u m of the net assets of the various acrivaud SubFunds uanslated into USD (where required) at the rates of exchange prwailing in Luxembourg at rhe Sub-Fund's relevant valuation slot:
1 USD = 0.6329 Euros (June 30, 2008)
3. Management Fees
During rhe period h e Invesunent Manager is entitled to receive from the relevant SubFund a fee payable monthly in arras as a percentage per annum of the average monthly Net Asset Value of such SubFund during the relevant month.
For the period ended June 30, 2008 rhe Management Fees per dass are up to the documented rata:
155
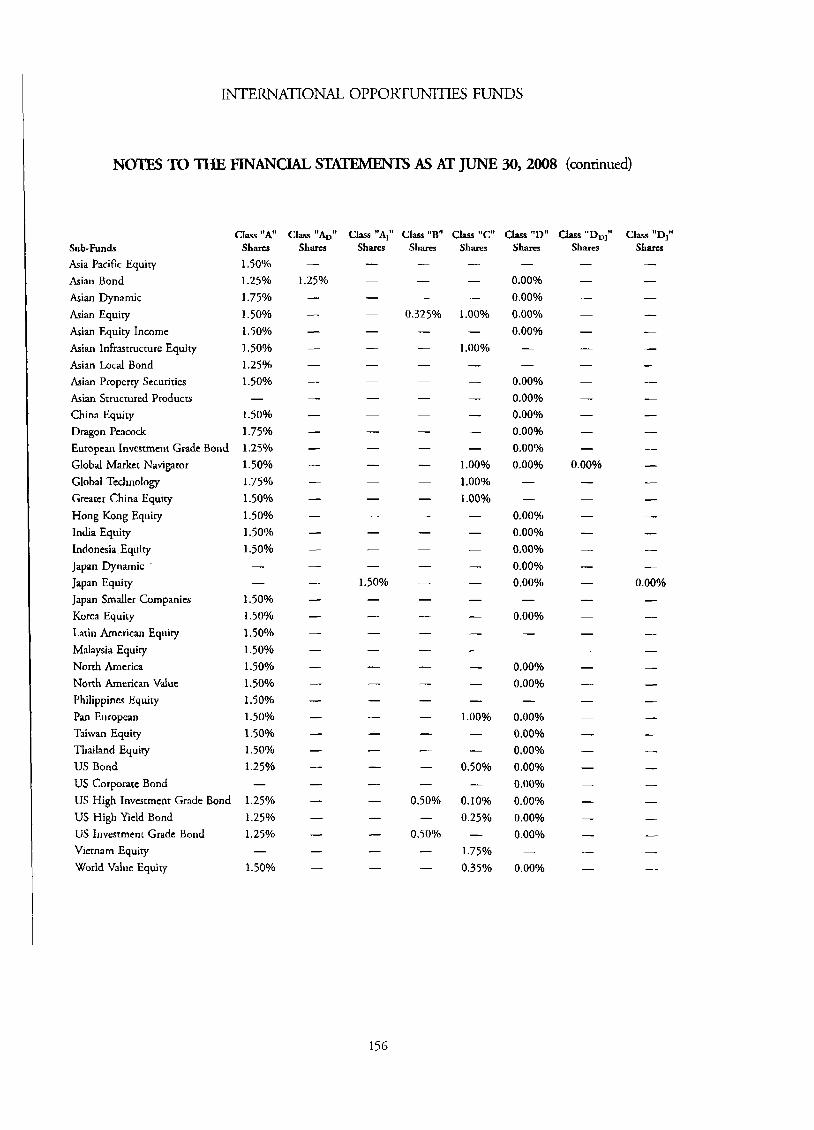
INTERNATIONAL OPPORTUNITIES FUNDS
NOTES TO THE FINANCIAL STATEMENTS As AT JurvE 30,2008 (continued)
Class "A" Sub-Funds Shares Asia Pacific Equity 1.500/0 Asian Bond 1.25Yo Asian Dynamic 1.75% Asian Equity 1.50% Asian Equity Income 1.50% Asian Infrastructure Equity 1 SO% Asian Local Bond 1.25% Asian Property Securities 1 SOYO Asian Srrucrured Products - China Equity 1.50% Dragon Peacock 1.75Oh European Investment Grade Bond 1.25Oh
Global Technology 1.75% Greater China Equity 1.50% Hong Kong Equity 1.50% India Equity 1.50% Indonesia Equity 1.50%
Global Market Navigator 1.50%
Japan Dynamic - Japan Equity - Japan Smaller Companies 1.509'0 Korea Equity 1 .509'0
Malaysia Equity 1.5Ooh No& America 1.50% North American Value 1.50% Philippines Equity 1.5Ooh Pan European 1 .509'0 Taiwan Equity 1 SOYO Thailand Equity 1.504/0 US Bond 1.25%
Latin American Equity 1.50%
US Corporate Bond - US High Investment Grade Bond 1.25% US High Yield Bond 1.25% US Investment Grade Bond 1.25% Vietnam Equity - World Value Equity 1.50%
Class "A," Class "B" Class "C" Shares Shares I -
- - 0.325% 1.00% - - - 1 .OO%
- - I 1 .OO%
1 .OOYo - 1.00940
-
- I
0.50% 0.109'0 - 0.25%
0.50% - - 1.75% - 0.35%
Class "D" Sham -
0.00% 0.00% O.OOY0 0.0040 I
-
0.00% 0.00% 0.00% 0.00% 0.00% 0.00% -
I
0.00% 0.00% 0.00% 0.00% O.OOY0
0.00%
-
- -
O.OOY0 0.00%
0.00% 0.009/0 O.OOY0 0.009'0 0.00% 0.00% 0.00% 0.00%
0.00%
-
-

INTERNATIONAL OPPOR?ZTNITfES FUNDS
NOTES TO THE FINANCIAL STATEMENTS As AT JUNE 30,2008 (continued)
Class "E" Sub-Fmdr Sham
Asian Bond 0.00% Asian Dynamic -
Asian Equity - Asian Equity Income -
Asia Pacific Equity 0.00%
Asian Infrastructurc Equity -
Asian Local Bond 0.00%
Asian Structured Products -
China Equity -
Dragon Peacock -
Asian Propery Securities I
Class "F" Shares
Class "FD" Shares
Class "J" Sham
1.25% - -
0.325% -
0.45% -
1 SOYO I
1.50% 1.25% 1 .%yo
- 0.2259/0 -
European Investment Grade Bond Global Market Navigator Global Technology Greater China Equity Hong Kong Equity India Equiry Indonesia Equity Japan Dynamic Japan Equity Japan Smaller Companies
- 1.75Yo 1.50% - I
- -
0.2259'0 0.225% - I
0.00% 0.00%
Korea Equity -
Latin American Equity 0.00Oh Malaysia Equity I
- -
0.25% - -
0.25% - L
0.225% -
- -
1.50% -
1.50% - -
1.25% - I
1.25%
North America North American Value Philippines Equity Pan European Taiwan Equiry Thailand Equity US Bond US Corporate Bond US High Investment Grade Bond US High Yield Bond US Investment Grade Bond Vietnam Equity World Value Equity
1
- 1 .OO% -
1.50%
157
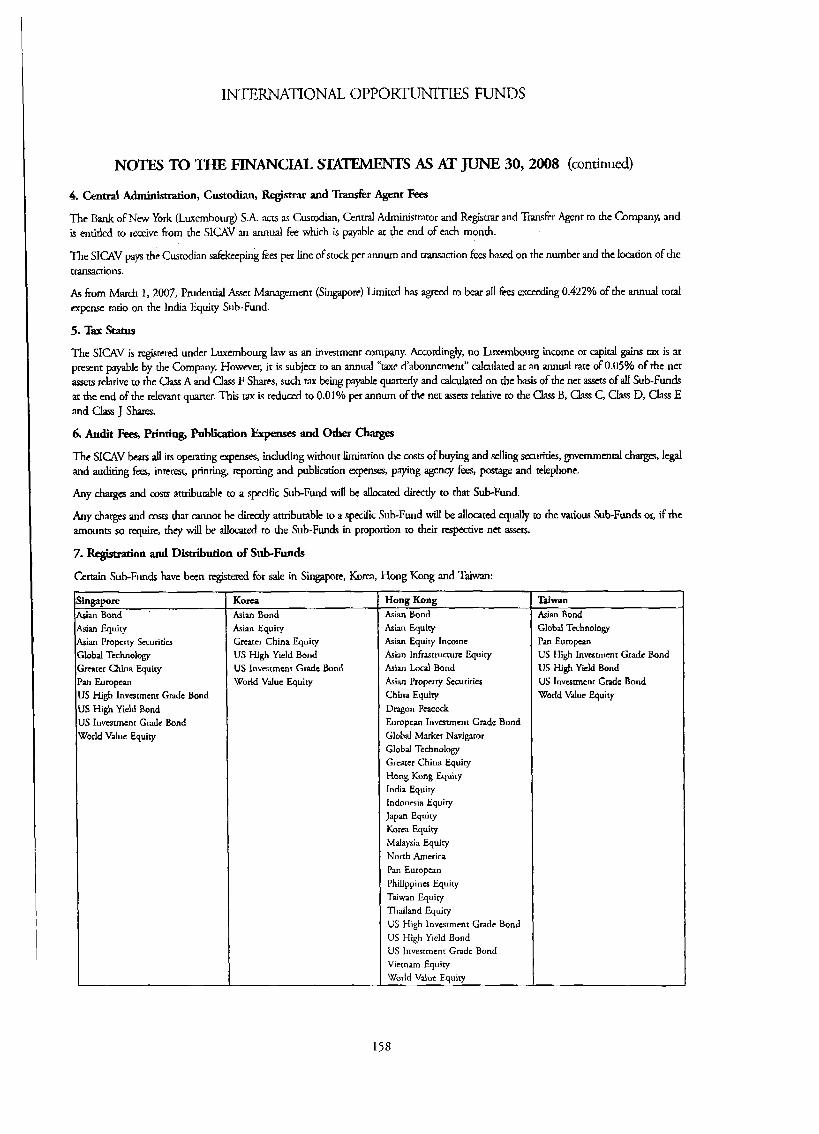
INTERNATIONAL O P P O R ~ I T I E S FUNDS
NOTES TO THE FINANCIAL -S As AT JUNE 30,2008 (continued)
4. C e n d Administration, Custodian, Reghrar and Transfer Agent Fea The Bank of New York (Luxembourg) S A acts as Custodian, Central Administrator and Registrar and Transfer Agent to the Company, and is entitled to receive from the SICAV an annual fee which is payable at the end of each month.
n e S I U V pays 31; Custodian &keeping fies per line of stock per annum and transaction &es based on the number and the loanon of the transactions.
As from March 1,2007, Prudential Asset Management (Singapore) Limited has greed to bear d fres exceeding 0.422% of the ann4 r o d expense ratio on the India Equity Sub-Fund
5. Tax Status The SICAV is registered under Luxembourg law as an investment company. h & g l y , PO Luxunbourg income or q i d gains tax is at present payable by the Company. However, it is subject to an a n d 'bxe d'abonnement" calculated at an mud rate of 0.05% of the net assers relative to the Class A and Class F Shares, such rax being payable quarterly and dculatd on the basis of the net asstts of all Sub-Funds at the end of the relevant quarter. T h i 5 tax is reduced to 0.01% per annum of the net assm relarive to the class B, class C, Class D, Class E and Class J Sham.
6. Audit Fees, Printing, Publidon Expenm and Other charges The SICAV beats all irs operating expenses, including without limitation the casts of buying and selling securicics, guvemcnd charga, legal and auditing fees, interest, printiig, reporting and publication expenses, paying agency fees, posmge and telephone.
Any charges and corn amiburable to a speafic Sub-Fund will be allocated d k d y to that Sub-Fund.
Any chatges and mscs that cannot be directly atuibutable to a specific Sub-Fund will be d m n d equally m the various SUb-Funds or, if thc amounts $0 require, they will be aUmted to the Sub-Funds in proportion to their mpective net assets.
7. Regkiwion and Distribution of Sub-Funds
Certain SubFunds have been registered fbr sale in Singapore, Korea, Hong Kong and Taiwan: I "gapore ian Bond ian Equity (ian Propcrty Securitics lobal TcchnologV Rater Chitm Equity t~ European S High Invcstrnenr Grade Bond S High Yield Bond S Investment Grade Bond 'odd Value Equity
~~ ~~
Corca hian Bond him Equiv ;ream China Equity JS High Yield Bond JS lnvestmenr G d e Bond World Value Equity
Hong Kong kian Bond kian Equity kian Equity Income Asian Infrastructure Equity Asian Local Bond Asian Property Securities China Equity Dragon Peacock Eumpcan Investment Gradc Bond Global Marker Navigator Global Technology Grcatcr China Equiry Hong Kong Equity India Equity Indoncsia Equiry Japan Equity Korea Equity Malaysia Equity North America Pan European Philippines F.quity Taiwan Equity Thailand E.quiry US High Investment Gade Bond US High Yield Bond US Investment Gtadc Bond Viccnarn Equity World Value Equity
~
rsm bian Bond Jobd Technology ?an European US High Investment Grade Bond US High Yield Bond US lnvcsrmenr Grade Bond World Value Equity
158
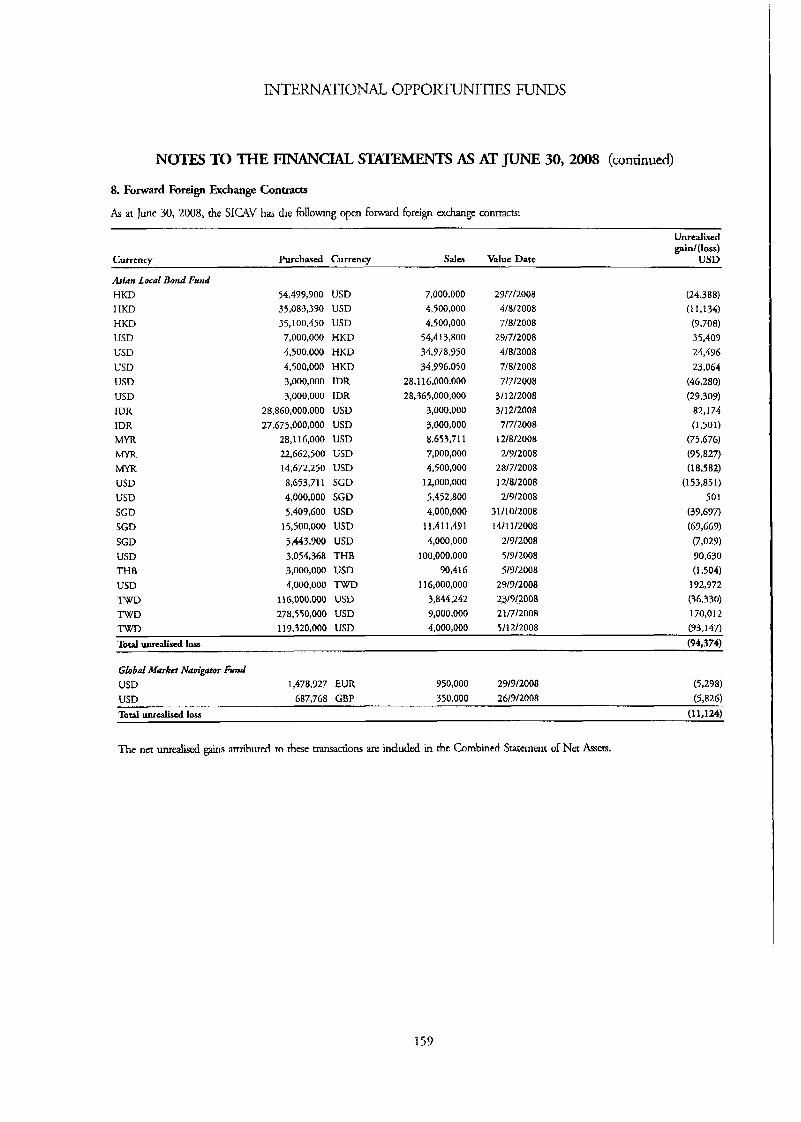
INTERNATIONAL OPPORTUNITIES FUNDS
NOTES TO THE FINANCIAL STATEMENTS AS AT JUNE 30,2008 (continued)
8. Forward Foreign Exchange Conp.ac*i
As at June 30, 2008, the SICAV has the fbllowing open forward &reign exchange conwcts:
Unrtalised
Cumcncy Purchased Currency Sacs Value Date USD g a i d ( l 0 S S )
Asian Lwa[ Bond Fund HKD HKD HKD USD USD USD USD USD IDR 1DR MYR MYR h4YR USD USD SGD SGD SGD USD THB USD TWD TWD
54,499,900 USD 35,083,390 USD 35,100.450 USD 7,000,000 HKD 4,500,000 HKD 4,500,000 HKD 3,000,000 ID!? 3,000,000 IDR
28,860,000,000 USD 27,675,000,000 USD
28,116,000 USD 22,662,500 USD 14,672.250 USD 8653.71 1 SGD 4,000,000 SGD 5,409,600 USD 15,500,000 USD 5,443,900 USD 3,054,368 THB 3,000,000 USD 4,000,000 lX'D
11 6,000,000 USD 278,550,000 USD
7,000,000 4,500,000 4,500,000 54,4 13,800 34.978.750 34,996.050
28.1 16,000.000 28,365,000,000
3,000,000 3,000,000 8,653,711 7,000,000 4,500,000 12,000,000 5,452,800 4,000,000
1 1.4 1 1,491 4,000,000
100,000,000 90,416
1 16,000,000
9,000,000 3,844,242
29/7/2008 4/8/2008 7/8/2008 29/7/2008 4/8/2008 7/8/2008 7/7/2008 3/12/2008 3/12/2008 7/7/2008 12/8/2008 2/9/2008 28/7/2008 12/8/2008 2/9/2008
31 /10/2008 14/1112008 2/9/2008 5/9/2008 5/7/2008 29/9/2008 23/9/2008 2 1/7/2008
(24.388) (1 1,134) (9.708) 35,409 24,496 23,064 (4G,280) (27,309) 82,174 (1,501) (75,67G) (95,827)
(153,85 1) 501
(37,697) (69,GG7) (7,029) 70,630 (1,504) 192,972 (36,330) 170,012
(18,582)
TWD 119,320,000 USD 4,000,000 5/12/2008 (93,147) Total unrealiscd loss (94,374)
Gbbd Market Navigator Fund USD 1,478,927 EUR 950,000 29/7/2008 (5,298) USD 687,768 GBD 350,000 26/9/2008 (5,826) Tout unrcaliscd loss ( 1 W w
The net unrealid gabs attributed to these transactions are included in rhe Combined Sarement of Net Assets.
159

INTERNATIONAL OPPORTUNITIES FUNDS
NOTES TO THE FINANCIAL. S M E M E N T S AS AT JUNE 30,2008 (continued)
9. securities Lending Transactions
As at June 30, 2008, the SlCAV has pmicipared in securities lending transactions as follows:
Numbtr of Market Shares Vdue Dcscrietion Broker
Contract Shares on Shares Unrealired
Loan Value Gain/(Lass)
Arian Equiiy 46,503.000 20,687,208 Bank of China Ltd "H" Mcrrill Lynch PFS
Deutschc Bank Securities, Inc. Lehman Brothers, Inc.
4,873,GOO 9,084,598 Guangzhou R&F Propertics Co., Ltd "H" Lehman Brothers, Inc. Goldman Sa& & Co. B ~ a r Stearns Sccuriries Corp. Citigroup Global, lnc. Goldman Sachs & Co.
105,675 5,149.952 NCSofr Corp. Deutsche Bank Sccuriries, Inc. 9,494,000 7,935,755 AAC Acoustic Tcchnologies Holdings, Inc. Merrill Lynch PFS 2,972,000 8,763,308 Hcngan Intcrnarional Group Co., Ltd Goldman Sachs & Co.
Lehman Brothers, lnc. Deurschc Bank Sccurities, Inc.
15,000,000 6,900,000 1,700,000 379,000 424,000 37.200 196,000
1,400,000 22,000 18,000 900,500 200,000 172,000
9,669,000 13,145,853 Yanlord Land Group Ltd Goldman Sachs & Co. 1,633,000 Tod unrtaiscd gain 227,574 rota revenue 204,723
h g i m Peamck 374,000 2,500,445 Anhui Conch Cement Co., Lrd "H" Goldman Sa& & Co. 187.000 1,290,300 651
7,500,000 60,537 3,450,000 27,585 850,000 5,622 758,000 578 826,800 108 74,400 - 392,000 28
2,730,000 55.048 1,122,000 88,708
16,200 84 1 2,836,575 (4,448) 620,000 660 533,200 (757)
2,449,500 (6,936)
18,611,000 8,279,243 Bank of China Lrd "H" Mcrrill Lynch PFS 1,200,000 600,000 4,257 Deurschc Bank Securities, Inc. 3,900,000 1,950,000 15,347 UBS Securities LLC 3,300,000 1,B50,000 11,282
2.836.000 2,359,622 Bcijing wid lnrernational Airport Co., Goldman Sachs & Co. 786,000 668,100 4,763
Citigroup Global, Inc. 632,000 568,800 297 4,158,400 5,331.111 Byd CO., Ltd "H" Goldman Sachs 8r Co. 756,000 1,058,400 5,916 4,546,000 2,989,773 Travelsky Technology Ltd Goldman Sachs & Co. 1,118,714 837,036 558 1,831,500 1,333,665 Faun International Bear Stearns Sccuriries Corp. 915,000 732,000 1,491 6,996,000 2,663.776 Franshion Properria China Ltd Cirigroup Global, Inc. 2,000,000 8 0 0,O 0 0 712
Total unrdiscd gain 45,274 Total m n u c 39,006
Greater Cbim Equiiy
Ltd "H"
158,000 1,056,338 Anhui Conch Cement Co., Lrd "H" Goldman Sachs 81 GI. 79,000 545,100 275 2,866.000 1,274,962 Bank of China Ltd "H" Mcrrill Lynch PFS 1,480,000 740,000 4,480 428,000 356,107 Bcijing Capid International Airpon Co., Goldman Sachs & 6. 214,000 181,900 1,297
126,000 144,572 Shimao Properry Holdings Ltd Citigroup Global, Inc. 60,000 78,000 18
Total unrealiscd gam 6,070 Total rcvenue 8,086
Ltd "H"
160
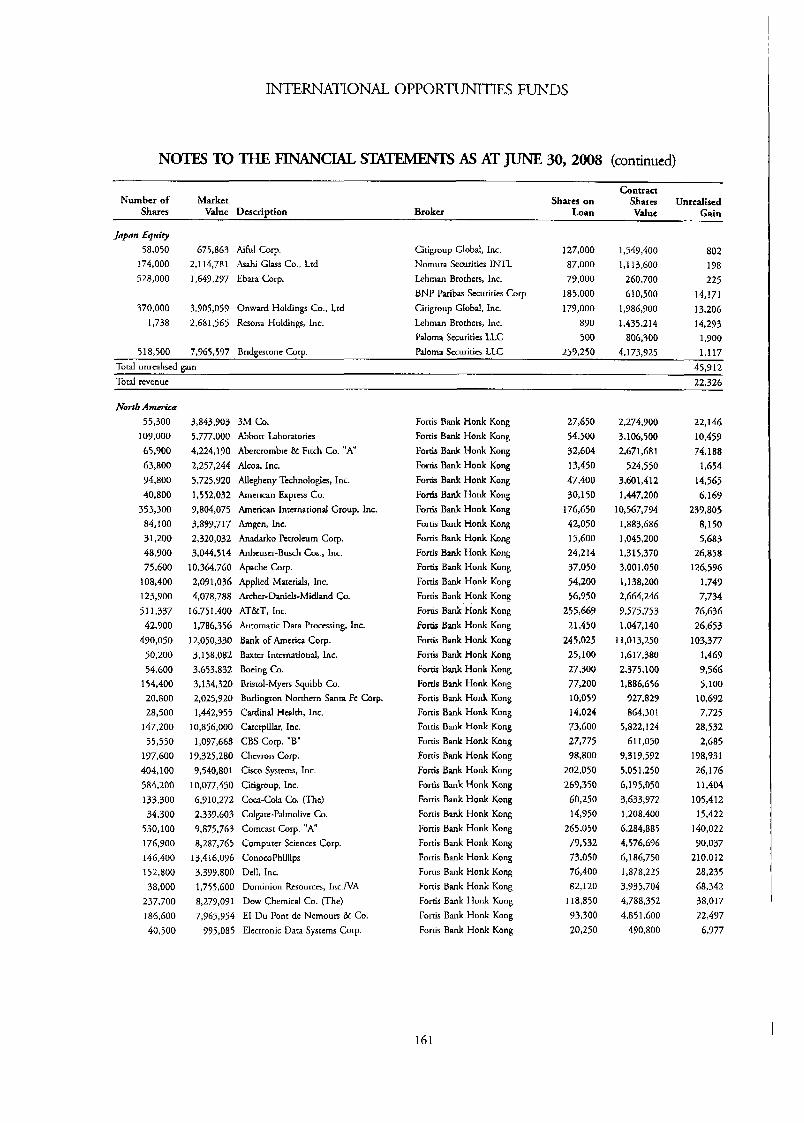
INTERNATIONAL OPPORTUNITIES FUNDS
NOTES TO THE FINANCIAL As AT JUNE 30,2008 (continued)
Contract Number of Market Shares on Shares Unrcaliscd
Shares Value Dwcription Broker Loan value Gain
Japan Equity 58.050 675,863 Aihl Corp. 174,000 2.1 14,781 Asahi Glass Co., Ltd
127,000 1,549,400 802 87,000 1,113,600 178
Citigroup Global, Inc. Nomura Securities INTL
528,000 1,647,297 Ebara Corp. Lehman Brothers, Inc. 77,000 260,700 225 BNP Paribas Securiries Corp. 185,000 610,500 14,171
370,000 3,905,059 Onward Holdings Co., Lrd Cirigroup Global, Inc. 179,000 1,986,700 13,206 1,738 2,681,565 Rsona Holdings, Inc. Lehman Brothers, Inc. 890 1,435,214 14,293
Pdoma Sccurities LLC 500 806,300 1,900 518,500 7,965,597 Bridgesronc Corp. Pdoma Sccuritics LLC 259,250 4.173325 1.117
Total unrcaliscd gain 45,912 Toral revenue 22.326
h'ortb America 55,300 109,000 65,900 63,800 94,800 40,800 353,300 84,100 31,200 48,900 75,600 108,400 123,900 511,337 42,700 490,050 50,200 54.600 154,400 20,800 28,500 147,200 55,550 197,600 404,100 584,200 133.300 34,300 530,100 176,900 146,400 I 52,800 38,000 237.700 186,600 40.500
3,843,703 3 M Co. 5,777,000 Abborr Laboratories 4,224,190 Abercrornbic & Firch Co. "A" 2,257,244 Alcoa, Inc. 5,725,920 Allegheny Technologies, Inc. 1,552,032 American Express Co. 9,804,075 American Intcrnationd Group, Inc. 3,899,717 h g e n , Inc. 2,320,032 Anadarko Perroleurn Corp. 3,044,514 Anhcuscr-Buch Cos., lnc. 10,364,760 Apache Corp. 2,091,036 Applied Materials, Inc. 4,078,788 Archcr-Daniels-Midland Co. 16,751,400 AT&T, Inc.
1,786,356 Automatic Dam Proccssing, Inc. 12,050,330 Bank of Arncrica Corp. 3,158,082 Baxtcr lnrctnational, Inc. 3.653,832 Bocing Co. 3,134,320 Brisrol-Myers Squibb Co. 2,025,920 Burlington Northern S a n a Fe Corp. 1,442,955 Cardinal H d t h , lnc. 10,856,000 Caterpillar, Inc. 1,097,668 CBS Corp. "B" 19,325,280 Chcvron Corp. 9,540,801 Cisco Systems, Inc.
6,910,272 Coca-Cola Co. (The) 2,339,603 Colgare-Palmolive Co. 9,875,763 Corncast Corp. "A" 8,287,765 Computcr Scicnccs Corp.
3,399,800 Dell, Inc. 1,755,600 Dominion Resources, 1nc.IV.A 8,279,091 Dow Chemical Co. (The) 7,965,954 El Du Ponr de Nernours & Co.
10,077,450 Citigroup, Inc.
13,416,096 ConocoPhillips
995,085 Electronic Data Systems Corp.
Fortis Bank Honk Kong Fortis Bank Honk Kong
Fortis Bank Honk Kong
Fortis Bank Honk Kong Fortis Bank Honk Kong Fortis Bank Honk Kong Fortis Bank Honk Kong Fomr Bank Honk Kong Fortis Bank Honk Kong
Fonis Bank Honk Kong Foortis Bank Honk Kong Fortis Bank Honk Kong
Fortis Bank Honk Kong Forris Bank Honk Kong Fortis Bank Honk Kong Fortis Bank Honk Kong Fortis Bank Honk Kong Fortis Bank Honk Kong Fortis Bank Honk Kong FoFtis Bank Honk Kong Fonis Bank Honk Kong Fortis Bank Honk Kong Fords Bank Honk Kong h t i s Bank Honk Kong FOK~S Bank Honk Kong Fortis Bank Honk Kong Fortis Bank Honk Kong Fonis Bank Honk Kong Fonis Bank Honk Kong Fortis Bank Honk Kong Fortis Bank Honk Kong Fortis Bank Honk Kong Fortis Bank Honk Kong Fortis Bank Honk Kong Fortis Bank Honk Kong Fortis Bank Honk Kong
27,650 54,500 32,604 13,450 47,400 30,150 176,650 42,050 15,600 24,214 37,050 54,200 56,950 255,669 21,450 245,025 25,100 27,300 77,200 10,059 14,024 73,600 27,775 98,800 202,050 269,350 60,250 14,950
265,050 79,532 73,050 76,400 82,120 118,850 93,300 20,250
2,274,900 3,106,500 2,671,681 524,550
3,601,412 1,447,200 10,567,794 1,883,686 1,045,200 1.3 15,370 3,001,050 1 ,I 38,200 2,664,246 9,575,753 1,047,140 11,013,250 1,617,380 2,375,100 1,886,656 927,829 864,301
5,822,124 611,050
9,319.592 5,05 1.250 6,195,050 3,633,972 1,208,400 6,284,885 4,576,696 6,186,750 1378.225 3,935,704 4,788,352 4,851,600 490,800
22,146 10,459 74,188 1,654 14,565 6,169
239,805 8,150 5,683 26,858 126,596 1,749 7,734 76,636 26,653 103,377 1,469 9,566 5,100 10,692 7.725 28,532 2,685
198,931 26,176 11,404 105,4 12 15,422 140,022 90,037 210,012 28,235 68,342 38.017 22,497 6,977
161
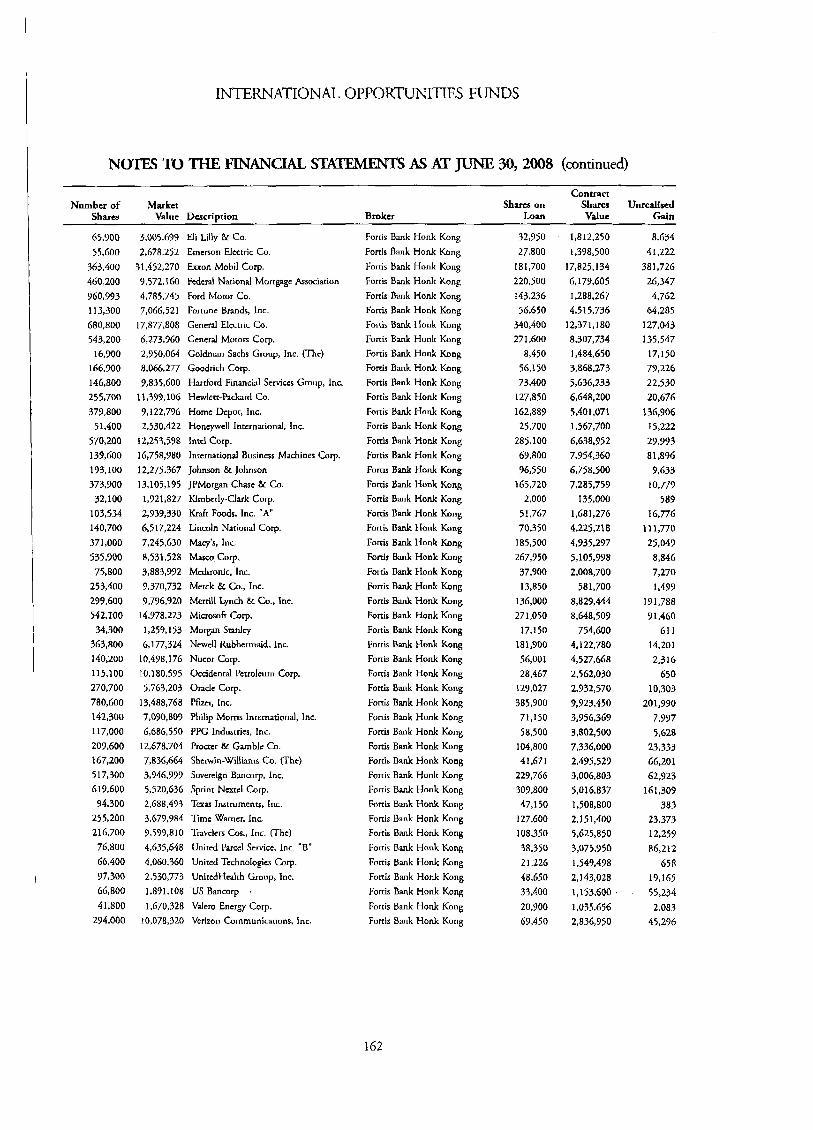
INTERNATIONAL OPPORmITIES FUNDS
NOTES TO THE FINANCIAL AS AT JUNE 30,2008 (continued)
Contract Number of Market Sharrs on Shares Unrealised
Shares Value Description Bmkcr Loan Value Gain
65,700 55.600
363.400 460,200 960,973 11 3,300 680,800 543,200 16,900
166,900 146,800 255,700 379,800
51,400 570,200 139,600 193,100 373,300 32,100
103,534 140,700 37 1.000 535,900 75,800
253,400 279,600 542,100 34,300
363,800 140,200 115,100 2 7 0,7 0 0 780,600 142,300 117,000 209,600 167,200 517,300 619.600 94.300
255,200 216,700 76.800 66.400 97,300 66,800 41.800
294,000
3,005.699 Eli Lilly & Co. 2,678,252 Emerson Elccrric Co.
31,452,270 Exon Mobil Corp. 9,572,160 Federal National Mortgagc Association 4,785,745 Ford Motor Co. 7,066,521 Fortunc Brands, lnc.
17,877,808 General Elcctric CO. 6,273,360 Gcncral Motors Corp. 2,950,064 Goldman Sachs Group, Inc. (Thc) 8,066,277 Goodrich Corp. 9,835,600 Hmford Financial Services Group, Inc.
11,379.106 Hcwlett-Packad Co. %122,796 Home Dcpor, Inc. 2,530,422 Honcywell Intcrnarional, Inc.
12,253,598 lntcl Corp. 16,758,980 International Busincss Machines Carp. 12,275,367 Johnson & Johnson 13,105,195 J P M o r p Chase & Co. 1,921,827 Kimberly-Clark Corp. 2,939,330 KraFr Fwds, Inc. “A”
6,517,224 Lincoln National Corp.
7,245.630 Macy’s, Inc. 8,531,528 Masco Corp. 3,883,972 Mcdtronic, Inc. 9,370,732 Mer& & Co., Inc. 9,796,920 Merrill Lynch Br Co., Inc.
14,978.223 Microsofr Corp. 1,259,153 Morgan Sranlcy 6,177,324 Newcll Rubbermaid, Inc.
10,498,176 Nucor Corp. 10,180,595 Occidental Petroleum Corp. 5,763,203 Orade Corp.
13,488,768 Pfiztr, Inc. 7,090,809 Philip Morris International, Inc. 6,686,550 PPG Industries, Inc.
12,678,704 Procter & Gamble Co. 7,836,664 Shewin-Williams Co. (The) 3,946.999 Sovereign Bancorp, lnc. 5,520,636 Sprint Ncxtel Corp. 2,688,493 Texas Instruments, Inc. 3,677,984 Time Warner, Inc. 7,599,810 Travclcrs Cos., lnc. (Thc) 4,635,648 Unitcd Parcel Service, Inc. “B” 4,060,360 United Technologies Corp. 2,530,773 UnitcdHcalth Group, Inc. 1,891.108 US Bancorp 1,670,328 Valero Energy Corp.
10,078,320 Verizon Communications. Inc.
Fortis Bank Honk Kong Fortis Bank Honk Kong Fortis Bank Honk Kong Fortis Bank Honk Kong Fortis Bank Honk Kong Fortis Bank Honk Kong Fortis Bank Honk Kong Fortis Bank Honk Knng Fortis Bank Honk Kong Fortis Bank Honk Kong Fortis Bank Honk Kong Fortis Bank Honk Kong Fortis Bank Honk Kong Fortis Bank Honk Kong Fortis Bank Honk Kong Fortis Bank Honk Kong Fortis Bank Honk Kong Fortis Bank Honk Kong Fortis Bank Honk Kong Fonis Bank Honk Kong Fortis Bank Honk Kong Fortis Bank Honk Kong Fortis Bank Honk Kong Fortis Bank Honk Kong Fortis Bank Honk Kong Fonis Bank Honk Kong Fortis Bank Honk Kong Fortis Bank Honk Kong Fortis Bank Honk Kong Fonis Bank Honk Kong Fortis Bank Honk Kong Forcis Bank Honk Kong Fortis Bank Honk Kong Fortis Bank Honk Kong Forris Bank Honk Kong Fortis Bank Honk Kong Fortis Bank Honk Kong Fortis Bank Honk Kong Fortis Bank Honk Kong Fortis Bank Honk Kong Fanis Bank Honk Kong Fortis Bank Honk Kong Fortis Bank Honk Kong Fortis Bank Honk Kong Fortis Bank Honk Kong Fortis Bank Honk Kong Fortis Bank Honk Kong Fortis Bank Honk Kong
32,750 27,800
181,700 220,500 143.236 56,650
340,400 271,600
8,450 56,150 73,400
127,850 162,887 25,700
285,100 69,800 96,550
165,720 2,000
5 1.767 70,350
185,500 267,950 37,900 13,850
136,000 27 1,050
17,150 181,900 56,001 28.467
129,027 385,900 71,150 58,500
104,800 41,671
229,766 309,800 47,150
127,600 108,350 38,350 2 1,226 48,650 33,400 20,700 69,450
1,812,250 1,398,500
17,825,134 6,179,605 1,288,267 4,515,736
12,371,180 8.307,734 1,484,650 3,868,273 5,636,233 6,648,200 5,401,071 1,567,700 6,638,952 7,954,360 6,758,500 7,285,759
135,000 1,681,276 4,225,218 4,935,297 5,105,998 2,008,700
58 1,700 8,827,444 8,648,509
754,1500 4,122.780 4,527,668 2,562,030 2,932,570 9,923,450 3,956,369 3,802,500 7,336,000 2,435,529 3,006,803 5,016,837 1,508,800 2,151,400 5,625,850 3,075,950 1,549,498 2,143,028 1,153,600 . 1,035.656 2,836,950
8.634 41,222
38 1,726 26,347 4,762
64,285 127,043 135,547 17,150 79,226 22,530 20,676
136,906 15,222 29,993 8 1,896 9,633
10.779 587
16,776 111,770 25,049 8.846 7,270 1,497
191,788 91,460
61 1 14,201 2.3 16
650 10,303
201,990 7,997 5,628
23,333 66,201 62,923
161,309 383
23,373 12,259 86,212
658 19,165 55,234 2,083
45,296
162

INTERNATIONAL OPPORTUNITIES FUNDS
NOTES TO THE FINANCIAL ST-S AS AT JrnvE 30, 2008 (continued)
Number of Market Shares Value Descriotion Broker
Contract Shares on Shares Wnrealiaed
Loan value Gain
71,500 5,155,865 VI: COT. 50,050 1,529,528 Viacom, Inc. "B" 602,600 9,774,172 Wachovia Corp. 159,700 8,991,110 Wd-Man Stores, Inc. 778.300 3,831,840 Washington Mutua, Inc. 460,900 11,075,427 Wells Fargo 8r co. 62.400 1,571,856 Wcstcrn Union Co. (The)
Fonis Bank Honk Kong 35,750 2,788,500 53.455 Fortis Bank Honk Kong 25,025 1,028,925 7,811 Fortis Bank Honk Kmg 234,250 8,357,750 130,236 Forris Bank Honk Kong 79,850 4,685,748 32,751 Fortis Bank Honk Kong 274.750 3,024,450 13,496 Fortis Bank Honk Kong 21 1,750 6,776,000 16,861 Forris Bank Honk Kong 3 1,200 742,550 6,927
90,900 4,189,581 Wyeth Fortis Bank Honk Kong 45,450 2,205,616 37,142 Total unrealised gain 4,55 1,103 Total revenue 437,470
163