Matthews Asian Funds
96
Matthews Asian Funds SEMI-ANNUAL REPORT JUNE 30, 2008 Asia Pacific Equity Income Fund Asian Growth and Income Fund Asia Pacific Fund Pacific Tiger Fund Asian Technology Fund China Fund India Fund Japan Fund Korea Fund
-
Upload
khangminh22 -
Category
Documents
-
view
3 -
download
0
Transcript of Matthews Asian Funds

Matthews Asian Funds
SEMI-ANNUAL REpoRtJUNE 30, 2008
Asia pacific Equity Income FundAsian Growth and Income Fund Asia pacific Fundpacific tiger FundAsian technology FundChina FundIndia FundJapan Fund Korea Fund

Matthews Asian Funds
E-mail communications on Asia and the Funds are available at www.matthewsfunds.com
n Asia Weekly
n Asia Insight (monthly)
n AsiaNow Special Reports
n occasional Fund Updates
Investing in the future of Asia since 1994

Message to Shareholders 2
Redemption Fee policy and Investor Disclosure 5
Manager Commentaries, Fund Characteristics and Schedules of Investments:
Matthews Asia pacific Equity Income Fund 6
Matthews Asian Growth and Income Fund 12
Matthews Asia pacific Fund 20
Matthews pacific tiger Fund 26
Matthews Asian technology Fund 32
Matthews China Fund 38
Matthews India Fund 46
Matthews Japan Fund 52
Matthews Korea Fund 58
Disclosure of Fund Expenses 64
Statements of Assets and Liabilities 66
Statements of operations 68
Statements of Changes in Net Assets 70
Financial Highlights 75
Notes to Financial Statements 84
CoNtENtS
The views and opinions in this report were current as of June 30, 2008. They are not guarantees of performance or investment results and should not be taken as invest-ment advice. Investment decisions reflect a variety of factors, and the managers reserve the right to change their views about individual stocks, sectors, and the markets at any time. As a result, the views expressed should not be relied upon as a forecast of the Funds’ future investment intent.
Statements of fact are from sources considered reliable, but neither the Funds nor the Investment Advisor makes any representation or guarantee as to their completeness or accuracy.
This report has been prepared for Matthews Asian Funds shareholders. It is not authorized for distribution to prospective investors unless accompanied or preceded by a current Matthews Asian Funds prospectus, which contains more complete informa-tion about the Funds’ investment objectives, risks and expenses. You should read the prospectus carefully before investing. Additional copies of the prospectus may be obtained at www.matthewsfunds.com. Please read the prospectus carefully before you invest or send money.
the Matthews Asian Funds are distributed by:
pFpC Distributors, Inc. 760 Moore Road King of prussia, pA 19406

MESSAGE to SHAREHoLDERS
� Matthews asian Funds
FRoM tHE INvEStMENt ADvISoR
Dear Valued Shareholders,
The first quarter of 2008 will undoubtedly be remembered for its caustic markets, and the second quarter saw no respite. Equities around the world generally continued their descent, and shares in Asian markets suffered in tandem. Stocks retreated on concerns that the global economy might slow substantially, with U.S. financial institutions under severe pressure. These fears have weighed heavily on overseas markets, including Asia, though the U.S. credit market’s collapse has had only a limited impact on fundamentals in the region so far. Thus, cumulative losses announced by Asian banks have been relatively small, less than 10% of the $400 billion estimated to have been lost globally. Meanwhile, the Asian region is still projected to grow at a healthy, albeit moderated rate: the International Monetary Fund forecasts that the economies of the developing nations of Asia will grow at 8.4% this year, and Japan at 1.5%.
If there are greater concerns ahead for the region, they emanate from two other sources: accelerating inflation on consumer goods, and high energy prices, especially for oil. The latest readings of prices in the region generally suggest that inflation is running at the highest levels seen in the last one to two decades. As we have highlighted in recent commentaries posted on our website, this is not necessarily damaging in and of itself, provided that such inflation does not escalate to even higher levels. In our view, Asia’s greater challenge arises not from issues affecting the U.S., but rather the potential for policy errors by governments in reaction to burgeoning inflation. Many consumers in the region are expecting local governments to blunt or contain the impact of inflation on their living
standards. Governments, in a bid to shore up voter support, have in turn sought to intervene in markets, typically via subsidies, price controls or trading restrictions. It is our experience that such intervention typically serves to exacerbate inflationary pressures, or makes them more structurally permanent. The region’s greatest risks are ultimately that policy overreaction may lead to greater market distortions and more permanent inflation, or may otherwise hinder the region’s growth prospects.
Oil prices have posed a second stumbling block to the region. Only a few decades ago, the region outside Japan and Australia was a relatively small consumer of oil and other natural resources. Several large markets, such as China and Indonesia, were once net exporters of oil. However, as the region’s economies have developed, local governments have done little to wean their industries off of hydrocarbon-based production and transportation systems. Worse, many governments have sought to subsidize energy prices domestically, so as to make fuels more affordable for end consumers (especially households). While this has meant that local economies have expanded smoothly in recent years, it has also meant growing distortions in the structure of the economies: many domestic consumers have not been forced to pay a mar-ket-based price for their energy consumption, and this has arguably led to excessive consump-tion and waste.
The bill for such subsidies, incurred by rising fiscal deficits in the region, has grown sharply in recent quarters as oil prices have surpassed $140 per barrel. Some currencies around the region have begun to swoon from such fiscal

JUNE 30, 2008
800 .789 .asia [2742 ] www.mat thewsfunds .com �
pressure. There is a small silver lining to this situation, though: during the last quarter, many Asian countries have been forced to reduce their subsidies, or depart from them entirely, as the sheer financial cost has proved too great. As market participants are forced to pay market prices for their consumption, it may induce greater conservation and efficiency in the future.
Asian markets have been decidedly weak in the first half, and we would make no predic-tions about their near-term course. Investors’ attention has rightly been focused on the current slump; however, to illustrate ways in which the region continues to evolve, we would like to highlight a few notable news events from the second quarter. During times such as these, it is important to cultivate an understanding of this evolution. It is this ongoing development that we, as long-term investors, remain excited about, even as the present condition of markets might be frustrating.
Perhaps the most notable of all these events was China’s growing political complexity and sophis-tication. During the past six months, China has been confronted with considerable challenges: severe blizzards threatened lives and crippled transport; the country’s relationship with Darfur was roundly criticized; suppression in Tibet invoked global scorn; and a tragic earthquake wrought destruction, killing more than 69,000. China’s leadership was tested on each of these occasions, and the results are safely interpreted as mixed. China’s slow movement on Darfur has come at terrible cost, and its suppression of Tibetan unrest has left even the country’s enthu-siasts disappointed. Yet it would be a mistake
not to acknowledge that there is also a different strain of thought emerging in the government, one characterized by a new sort of transparency, responsiveness and civic orientation.
While the affairs of Tibet remain murky, one could not help but notice that protests this spring garnered a greater level of international media coverage than in times past. Improved media access was even more apparent in May, following the earthquake that hit the Sichuan region. Jour-nalists had nearly unrestrained access to disaster zones, as they reported on the devastation, the government’s response, and most importantly, on the political unrest that ensued. Press reports included accounts from bereaved parents who decried corruption, shoddy building codes and lax enforcement as reasons that many schools in the earthquake zone collapsed. While the media presented images of prostrate officials, kneeling before wrathful parents holding photos of their lost loved ones, many stories also praised the central government for its swift and thorough response to the crisis.
In our view, this sort of openness about a national catastrophe and its causes, as well as the responsiveness that ensued, is something new to China. The earthquake even initiated a small but notable political détente: for the first time since World War II, a Japanese naval ship was allowed into a Chinese port—this time with the intent of offering assistance. This small but symbolic gesture was accompanied by a landmark agreement between Japan and China to co-develop a set of underwater gas fields in long-disputed territory in the East China Sea.
continued on page 4

MESSAGE to SHAREHoLDERS
4 Matthews asian Funds
A thawing of sorts also came to China’s dealings with Taiwan. More frequent dialogue has helped bridge some of the worst sources of tension between the two parties. The mood in Taiwan itself has shifted, as there appears to be increasing recognition that the country’s economic destiny (if not its political center) is forever intertwined with the mainland. Taiwan’s recent political election hints at as much, as the opposition party overturned the incumbent primarily on a platform that espoused better ties with China. Though few changes have taken place to cement such ties, direct airline flights between the two countries began on July 4—an important symbol of the growing links between the two former foes. While there is much ground still to cover, this shift in the cross-strait relations, if it should deepen and become more perma-nent, would alleviate one of the greatest security threats hanging over the region.
In another part of the region, there was one more important change to Asia’s security sphere: North Korea took small but deliberate steps toward defusing its own status as a hostile threat. The country destroyed a cooling tower at one of its main nuclear facilities, and then shared details of its nuclear planning framework with international inspectors. For this, the U.S. has undertaken to remove North Korea from the U.S. watch list of terrorist-sponsoring nations. These events do not, by any means, constitute an end to the North Korea problem, but they do represent one of the biggest steps forward in relations with the country in the last decade.
Thus, even as financial markets have been shaken, the landscape in Asia continues to evolve in an encouraging fashion. Fundamentals
in the region, including earnings growth, will undoubtedly suffer some in the current environ-ment, though it has been encouraging to see that export and economic activity in the region remains robust, at least thus far. Valuations, of course, have declined, particularly as multiples have fallen faster than earnings estimates. This is a glass that is at once half full and half empty. Capital has been lost as markets have declined, but valuations are beginning to look more reasonable, and arguably are healthier, than they were not long ago. Most importantly, we see Asian corporates and consumers to be in fairly healthy shape, with high savings rates, income growth and low rates of leverage. It is this sort of condition that makes us confident in the long-term prospects for the region, even as present markets are challenging.
It is our great privilege to serve as your invest-ment advisor in Asia. We appreciate your persist-ence amid difficult markets, and we pledge to continue to seek out Asia’s investment potential in the years ahead.
Sincerely,
Andrew T. FosterActing Chief Investment OfficerMatthews International Capital Management, LLC
continued from page 3
G. Paul MatthewsChairmanMatthews International Capital Management, LLC

REdEmpTIoN FEE polIcyMarket timing can disrupt the management of a Fund’s investment portfolio and cause the targeted Fund to incur costs to accommodate frequent buying and selling of shares by the market timer. These costs are borne by the Fund’s non-redeeming shareholders. As part of their efforts to discourage market timing activity, the Funds attempt to allocate these costs, to the extent permissible, to redeeming shareholders through the assessment of a redemption fee of 2.00% of the total redemption proceeds of shareholders who sell or exchange shares within 90 calendar days after purchasing them. This fee is pay-able directly to the Funds. For purposes of determining whether the redemption fee applies, the shares that have been held longest will be redeemed first. The Funds may grant exemptions from the redemp-tion fee where the Funds believe the transaction or account will not involve market timing activity. The Funds reserve the right at any time to restrict purchases or exchanges or impose conditions that are more restrictive on excessive or disruptive trading, and to modify or eliminate the redemption fee at any time, without notice to shareholders. You will receive notice of any material changes to the Funds’ redemption fee policies. For more information on this policy, please see the Funds’ prospectus. Additional restrictions may apply to shareholders who purchase shares of the Funds through a financial intermediary; please consult your intermediary.
INvESToR dIScloSUREpast performance: All performance quoted in this report is past performance and is no guarantee of future results. Investment return and principal value will fluctuate with changing market conditions so that when redeemed, shares may be worth more or less than their original cost. Current performance may be lower or higher than the returns quoted. If certain of the Funds’ fees and expenses had not been waived, returns would have been lower. For the Funds’ most recent month-end performance, please call 1-800-789-ASIA [2742] or visit www.matthewsfunds.com.
Investment Risk: Mutual fund shares are not deposits or obligations of, or guaranteed by, any depositary institution. Shares are not insured by the FDIC, Federal Reserve Board or any government agency and are subject to investment risks, including possible loss of principal amount invested. Investing in inter-national markets may involve additional risks, such as social and political instability, market illiquidity, exchange-rate fluctuations, a high level of volatility and limited regulation. In addition, single-country and sector funds may be subject to a higher degree of market risk than diversified funds because of concentration in a specific industry, sector or geographic location. Please see the Funds’ prospectus and Statement of Additional Information for more risk disclosure.
Fund Holdings: The Fund holdings shown in this report are as of June 30, 2008. Holdings are subject to change at any time, so holdings shown in this report may not reflect current Fund holdings. The Funds file complete schedules of portfolio holdings with the Securities and Exchange Commission (the “SEC”) for the first and third quarters of each fiscal year on Form N-Q. The Funds’ Form N-Q is filed with the SEC within 60 days of the end of the quarter to which it relates, and is available on the SEC’s website at www.sec.gov. It may also be reviewed and copied at the Commission’s Public Reference Room in Washington, D.C. Information on the operation of the Public Reference Room may be obtained by calling 800-SEC-0330.
proxy voting Record: The Funds’ Statement of Additional Information containing a description of the policies and procedures that the Funds have used to vote proxies relating to portfolio securities, along with each Fund’s proxy voting record relating to portfolio securities held during the 12-month period ended June 30, 2008, is available upon request, at no charge, at the Funds’ website at www.matthewsfunds.com or by calling 1-800-789-ASIA [2742], or on the SEC’s website at www.sec.gov.
Shareholder Reports and prospectuses: To reduce the Funds’ expenses, we try to identify related share-holders in a household and send only one copy of the Funds’ prospectus and financial reports to that address. This process, called “householding,” will continue indefinitely unless you instruct us otherwise. At any time you may view the Funds’ current prospectus and financial reports on our website. If you prefer to receive individual copies of the Funds’ prospectus or financial reports, please call us at 1-800-789-ASIA [2742].
800 .789 .asia [2742 ] www.mat thewsfunds .com 5
JUNE 30, 2008

MAttHEWS ASIA pACIFIC EqUIty INCoME FUND
poRTFolIo mANAgER commENTARy
6 Matthews asian Fundscontinued on page 9
FUNd oBJEcTIvE ANd STRATEgy SymBol: mApIx
objective: total return with an emphasis on providing current income. total return includes current income (dividends and distributions paid to shareholders) and capital gains (share price appreciation). the Fund measures total return over longer periods.
Strategy: under normal market conditions, the Matthews asia Pacific equity income Fund seeks to achieve its investment objective by investing at least 80% of its total net assets, which include borrowings for investment purposes, in income-paying publicly traded common stocks, preferred stocks, convertible preferred stocks, and other equity-related instruments (including, for example, investment trusts and other financial instruments) of companies located in the asia Pacific region, which includes australia, China, hong Kong, india, indonesia, Japan, Malaysia, new Zealand, Pakistan, Philippines, singapore, south Korea, taiwan, thailand and Vietnam.
poRTFolIo mANAgERS
Lead Manager: Jesper madsen, cFA Co-Manager: Andrew T. Foster
The Matthews Asia Pacific Equity Income Fund declined –4.66% during the first six months of 2008, while its benchmark, the MSCI All Country Asia Pacific Index, fell –12.18%. During the quarter ending June 30, 2008, the Fund distributed its second quarterly dividend of 7.53 cents, bringing the total year-to-date income distribution to 13.39 cents per share.
Inflation fears, driven by rising oil and food prices, as well as worries about the impact of a potential U.S. recession on corporate profits in Asia, weighed on equities across the region. Equity markets in Asia Pacific continued to exhibit a high degree of correlation with global markets. However, a short-term singular focus on the correlation in equity markets misses the point that when it comes to dividend payments, Asian companies are moving to a different beat than their U.S. counterparts. The balance sheets of companies in the region generally remain as healthy as they have been during the past decade, while earnings growth has continued to support dividend payments. This is important
for long-term investors since sustainable and growing dividends can help mitigate some downside volatility during periods of pull-backs in equity markets. The Fund’s relative outperformance for the period may, in part, be reflective of this. For dividends to offer support to share prices though, they must at a minimum be “sustainable.” Once the dividend is cut or market participants suspect it cannot be maintained, share prices tend to suffer as a consequence. The financial sector in the U.S. during the past 12 months has shown evidence of this.
The Fund seeks to invest in companies we believe will grow dividends over time. Dividends may not always grow in a straight line from year to year and in some cases, may even be cut. This holds particularly true for smaller companies, with more volatile earn-ings, less access to capital markets and there-fore, a greater need to maintain capital on the balance sheet. The attraction of successful smaller companies, though, is their potential

ALL DAtA IS AS oF JUNE 30, 2008, UNLESS otHERWISE NotED
800 .789 .asia [2742 ] www.mat thewsfunds .com 7
1 the MsCi all Country asia Pacific index is a free float–adjusted market capitalization–weighted index of the stock markets of australia, China, hong Kong, india, indonesia, Japan, Malaysia, new Zealand, Pakistan, Philippines, singapore, south Korea, taiwan and thailand. the Fund invests in countries that are not included in the MsCi all Country asia Pacific index. it is not possible to invest directly in an index. source: index data from Morgan stanley Capital international; total return calculations performed by PnC Global investment servicing (“PnC”), formerly known as PFPC inc.
2 Lipper, inc. fund performance does not reflect sales charges and is based on total return, including reinvestment of dividends and capital gains, for the stated periods.
3 Ratio has been restated to reflect current management and administrative and shareholder servicing fees expected to be incurred by the Funds and paid to Matthews international Capital Management (the “advisor”). the advisor has contractually agreed to waive fees and reimburse expenses to the extent needed to limit total annual operating expenses to 1.50% until October 31, 2009. Matthews asian Funds do not charge 12b-1 fees.
4 the lesser of fiscal year 2007 long-term purchase costs or sales proceeds divided by the average monthly market value of long-term securities.
FIScAl yEAR 2007 RATIoS
Gross Operating expense:3 1.41% Portfolio turnover:4 26.95%
pERFoRmANcE AS oF JUNE 30, 2008
Fund Inception: 10/31/063 mo yTd
Average Annual Total Returns
1 yR SINcE INcEpTIoN
Matthews asia Pacific equity income Fund –1.60% –4.66% 1.57% 12.39%
MsCi all Country asia Pacific index 1 –1.37% –12.18% –8.43% 4.26%
Lipper Pacific Region Funds Category average 2 –1.62% –12.69% –9.85% 5.50%
All performance quoted is past performance and is no guarantee of future results. assumes reinvestment of all dividends and/or distributions. unusually high returns may not be sustainable. investment return and principal value will fluctuate with changing market conditions so that shares, when redeemed, may be worth more or less than their original cost. Current performance may be lower or higher than the return figures quoted. Returns would have been lower if certain of the Fund’s fees and expenses had not been waived. For the Fund’s most recent month-end performance please call 800-789-asia [2742] or visit www.matthewsfunds.com.
INcomE dISTRIBUTIoN HISToRy Q1 Q2 Q3 Q4 ToTAl
2008 5.86¢ 7.53¢ n/a n/a n/a
2007 — 10.30¢ — 17.12¢ 27.42¢
2006 (Fund inception: 10/31/06) 1.97¢ 1.97¢
gRoWTH oF A $10,000 INvESTmENT SINcE FUNd INcEpTIoN
Plotted monthly.the performance data and graph do not reflect the deduction of taxes that a shareholder would pay on dividends, capital gain distributions or redemption of Fund shares.
Matthews Asia Pacific Equity Income Fund ($12,143)MSCI AC Asia Pacific Index ($10,719)1
Lipper Pacific Region Funds Category Average ($10,948)2
$10,000
$11,000
$12,000
$13,000
$14,000
12/079/07 3/08 6/086/073/0712/0610/06
in March 2008, the Fund began to distribute investment income dividends on a quarterly rather than semiannual basis. For additional details regarding Fund distributions, visit www.matthewsfunds.com.

8 Matthews asian Funds
MAttHEWS ASIA pACIFIC EqUIty INCoME FUND
coUNTRy AllocATIoN
Japan 22.9%
China/hong Kong 21.3%
taiwan 15.8%
singapore 7.4%
Malaysia 7.4%
australia 7.0%
united Kingdom 2 3.5%
south Korea 3.4%
thailand 3.2%
india 3.0%
Philippines 3.0%
indonesia 1.6%
Cash and other assets, less liabilities 0.5%
NUmBER oF SEcURITIES NAv FUNd ASSETS REdEmpTIoN FEE 12b-1 FEES
56 $11.29 $99.1 million2.00% within
90 calendar daysnone
SEcToR AllocATIoN
Consumer discretionary 24.4%
Financials 22.8%
information technology 16.7%
telecommunication services 10.7%
Consumer staples 10.1%
health Care 5.9%
utilities 3.6%
industrials 3.4%
energy 1.9%
Cash and other assets, less liabilities 0.5%
mARKET cAp ExpoSURE 3
Large cap (over $5 billion) 43.3%
Mid cap ($1–$5 billion) 34.5%
small cap (under $1 billion) 21.7%
Cash and other assets, less liabilities 0.5%
1 holdings may combine more than one security from same issuer and related depositary receipts.2 the united Kingdom is not included in the MsCi all Country asia Pacific index.3 source: Factset Research systems. Percentage values in data are rounded to the nearest tenth of one percent; the values may not sum
to 100% due to rounding.
Top TEN HoldINgS 1
coUNTRy % oF NET ASSETS
taiwan semiconductor Manufacturing Co., Ltd. taiwan 4.8% Lawson, inc. Japan 3.7% hsBC holdings PLC united Kingdom 3.5% singapore Press holdings, Ltd. singapore 3.3% Monex Group, inc. Japan 3.2% Globe telecom, inc. Philippines 2.9% Vtech holdings, Ltd. China/hong Kong 2.8% the sumitomo trust & Banking Co., Ltd. Japan 2.7% ito en, Ltd., Pfd. Japan 2.6% BOC hong Kong holdings, Ltd. China/hong Kong 2.6%
% oF ASSETS IN Top 10 32.1%

800 .789 .asia [2742 ] www.mat thewsfunds .com 9
poRTFolIo mANAgER commENTARy continued from page 6
ALL DAtA IS AS oF JUNE 30, 2008, UNLESS otHERWISE NotED
to grow the dividend at a faster rate over the longer term. To mitigate the risk of dividend cuts, the Fund is diversified across 51 compa-nies along the market capitalization spectrum, residing in 12 countries and operating in nine different economic sectors. While five of the Fund’s holdings cut dividends during the last fiscal year, as of the end of June, 36 have raised dividends, resulting in a weighted 13% increase in the dividend per share at the port-folio level. The companies that cut their divi-dends were of small or medium capitalization.
Lawson, Inc., Japan’s second-largest conven-ience store operator with more than 8,500 stores, was the Fund’s primary contributor to performance during the first six months of 2008. Japan has been a challenging environ-ment for retailers for years. Deflationary pressures made it difficult for retailers to increase prices and general spending was subdued due to stagnant wage growth. Retailers generally benefit from a moderate level of inflation since it allows them to pass through price increases that, in turn, underpin same-store sales growth. Furthermore, the convenience store segment in Japan has become increasingly competitive as the main convenience store operators have pursued aggressive store roll-outs. Even given these challenges, Lawson, Inc., a holding since the Fund’s inception, has done well: while same-store sales had experienced protracted declines in recent years, the company still managed to grow cash flows and dividends. The company has been at the forefront in Japan when it comes to capital management. Lawson’s
estimated dividend payment for the current fiscal year represents an increase of 45% compared to the previous year. The company is also engaging in share buybacks in order to improve capital efficiency. Furthermore, should inflation take root in Japan, Lawson, Inc., could be a primary beneficiary.
The Fund’s Indian holdings were the main detractors to performance as foreign portfo-lio flows continued to exit the country. With wholesale inflation accelerating from 3.8% at the end of 2007 to 11.9% at the end of June, investors expect the Reserve Bank of India (RBI) to become increasingly assertive in its stance toward inflation. The RBI has already twice raised the repurchase rate, increasing it from 7.75% to 8.50% during the month of June. The higher credit costs mixed with a hike in fuel prices represented two strong headwinds for Ashok Leyland, India’s second-largest com-mercial vehicle manufacturer, making it the Fund’s main detractor to performance during the first six months.
The Fund continues to invest in companies we believe can sustain or grow their dividends, even during periods of rising cost pressures. We continue to find attractive investment candidates, especially in companies that enjoy a strong market position. This standing can derive from brand power or from dominant market share within their respective industries. These companies retain a greater ability to pass through costs via higher prices, thereby maintaining margins and the cash flows to fund dividend payments.

10 Matthews asian Funds
MAttHEWS ASIA pACIFIC EqUIty INCoME FUND
ScHEdUlE oF INvESTmENTS a (UNAUDItED) commoN EQUITIES: 96.8%
SHARES vAlUE SHARES vAlUE
cHINA/HoNg KoNg: 21.3% Vtech holdings, Ltd. 452,000 $2,727,260 BOC hong Kong holdings, Ltd. 966,000 2,560,602 CLP holdings, Ltd. 289,500 2,482,694 hang seng Bank, Ltd. 100,100 2,113,523 television Broadcasts, Ltd. 352,000 2,033,194 asM Pacific technology, Ltd. 242,000 1,829,052 sa sa international holdings, Ltd. 3,800,000 1,721,450 Café de Coral holdings, Ltd. 912,000 1,636,700 Pico Far east holdings, Ltd. 10,696,000 1,628,208 next Media, Ltd. 3,466,000 1,331,615 huaneng Power international, inc. h shares 836,000 580,093 huaneng Power international, inc. adR 17,500 483,875
Total china/Hong Kong 21,128,266
JApAN: 20.2% Lawson, inc. 75,700 3,685,728 Monex Group, inc. 4,594 3,123,669 the sumitomo trust & Banking Co., Ltd. 383,000 2,676,329 eisai Co., Ltd. 69,800 2,465,037 Benesse Corp. 54,800 2,219,146 hitachi Koki Co., Ltd. 108,000 1,777,878 nomura Research institute, Ltd. 67,000 1,571,126 tokyu Reit, inc. 155 1,259,735 takeda Pharmaceutical Co., Ltd. 24,700 1,256,110
Total Japan 20,034,758
TAIWAN: 15.8% taiwan semiconductor Manufacturing Co., Ltd. 1,986,298 $4,253,595 Cyberlink Corp. 535,000 2,555,761 Chunghwa telecom Co., Ltd. 857,727 2,218,284 Johnson health tech Co., Ltd. 1,193,000 1,918,044 President Chain store Corp. 485,000 1,613,844 Giant Manufacturing Co., Ltd. 527,000 1,415,033 taiwan secom Co., Ltd. 609,000 1,157,688 taiwan semiconductor
Manufacturing Co., Ltd. adR 50,087 546,449
Total Taiwan 15,678,698
SINgApoRE: 7.4% singapore Press holdings, Ltd. 1,036,000 3,236,191 Venture Corp., Ltd. 275,000 1,982,838 Parkway Life Reit 1,430,868 1,188,402 singapore Post, Ltd. 1,142,000 923,303
Total Singapore 7,330,734
mAlAySIA: 7.4% Public Bank Bhd 676,000 2,151,614 top Glove Corp. Bhd 1,637,100 2,124,347 Media Prima Bhd 3,235,900 1,792,496 Berjaya sports toto Bhd 811,200 1,206,559
Total malaysia 7,275,016
AUSTRAlIA: 7.0% Coca-Cola amatil, Ltd. 309,730 2,081,434 aXa asia Pacific holdings, Ltd. 413,439 1,854,892 Billabong international, Ltd. 160,951 1,666,399 insurance australia Group, Ltd. 230,121 765,504 tabcorp holdings, Ltd. 61,523 578,586
Total Australia 6,946,815

800 .789 .asia [2742 ] www.mat thewsfunds .com 11
JUNE 30, 2008
SHARES vAlUE SHARES vAlUE
UNITEd KINgdom: 3.5% hsBC holdings PLC adR 26,900 $2,063,230 hsBC holdings PLC 90,800 1,399,576
Total United Kingdom 3,462,806
SoUTH KoREA: 3.4% hana Financial Group, inc. 37,640 1,448,315 sK telecom Co., Ltd. 6,570 1,196,487 sK telecom Co., Ltd. adR 36,300 753,951
Total South Korea 3,398,753
THAIlANd: 3.2% advanced info service Public
Co., Ltd. 710,600 1,965,919 Ptt Public Co., Ltd. 136,500 1,232,930
Total Thailand 3,198,849
INdIA: 3.0% ashok Leyland, Ltd. 1,845,000 1,224,282 hCL-infosystems, Ltd. 340,167 1,108,854 Chennai Petroleum Corp., Ltd. 105,000 653,916
Total India 2,987,052
pHIlIppINES: 3.0% Globe telecom, inc. 110,560 2,905,909
Total philippines 2,905,909
INdoNESIA: 1.6% Pt telekomunikasi indonesia adR 35,200 1,135,200 Pt telekomunikasi indonesia 559,000 442,592
Total Indonesia 1,577,792
ToTAl commoN EQUITIES 95,925,448 (Cost $96,237,073)
JApAN: 2.7% ito en, Ltd., Pfd. 246,700 $2,625,333
Total Japan 2,625,333
ToTAl pREFERREd EQUITIES 2,625,333 (Cost $2,711,890)
ToTAl INvESTmENTS: 99.5% 98,550,781 (Cost $98,948,963b)
cASH ANd oTHER ASSETS, lESS lIABIlITIES: 0.5% 525,524
NET ASSETS: 100.0% $99,076,305
a Certain securities were fair valued under the discretion of the Board of trustees (note 1-a).
b Cost of investments is $98,948,963 and net unrealized depreciation consists of:
Gross unrealized appreciation . . . . . . . . . . . . . . . . . $7,768,055
Gross unrealized depreciation . . . . . . . . . . . . . . . . . (8,166,237)
net unrealized depreciation . . . . . . . . . . . . . . . . . . . $ (398,182)
adR american depositary Receipt
Pfd. Preferred
Reit Real estate investment trust
see accompanying notes to financial statements.
pREFERREd EQUITIES: 2.7%

MAttHEWS ASIAN GRoWtH AND INCoME FUND
poRTFolIo mANAgER commENTARy
During the first half of 2008, the Matthews Asian Growth and Income Fund declined –8.04%, while its primary benchmark, the MSCI All Country Asia ex-Japan Index, fell –21.10% and the MSCI All Country Far East ex-Japan Index dropped –18.21% during the same period. On June 25, the Fund paid a semi-annual distribution of approximately 68 cents per share, of which about 25 cents represented income, and 43 cents was capital gain.
During the second quarter, markets around the world, and especially in Asia, continued the slump that commenced earlier in the year. Asian shares were hit particularly hard, by a dual set of head-winds: inflation and energy prices. Throughout the region, inflation measurements suggest that price increases for most goods and services are running at levels not seen in a decade. Mean-while, high and rapidly rising prices for oil, coal and other resources have given markets pause. Energy prices have risen to such levels as to prove daunting for many Asian governments, several of which have been forced to abandon energy- related subsidies for consumers for fear of incur-ring enormous fiscal liabilities.
The twin difficulties of inflationary pressures and high oil prices put central banks in the region in an awkward spot. Most central banks have half-heartedly tried to quell inflation by raising interest rates or by other means. However, most banks have moved cautiously, as there is considerable concern that high oil prices, against the backdrop of what may be a slowing global economy, might temper Asian growth and demand. The fear that such central bankers share is that as they act to reign in inflation, they will do so at a time when the growth of their respective economies may already be drifting lower—and thus their actions could initiate or aggravate a downturn in growth.
Such fears weighed heavily on markets, as they discounted the likelihood of rising rates and the possibility of slower growth. The Fund was unable to escape such downside in markets. However, we are generally pleased that the Fund’s defensive nature is reflected in its relative outperformance for the period. We have for some time now been wary of valuations in the region: fundamental growth has been strong; but after five years of nearly uninterrupted gains in share price, very few segments of the market offered the sort of low valuations that this Fund seeks
1� Matthews asian Funds
(cloSEd To moST NEW INvESToRS)
continued on page 15
FUNd oBJEcTIvE ANd STRATEgy SymBol: mAcSx
objective: Long-term capital appreciation. the Fund also seeks to provide some current income.
Strategy: under normal market conditions, the Matthews asian Growth and income Fund seeks to achieve its investment objective by investing at least 80% of its total net assets, which include borrowings for investment purposes, in dividend-paying equity securities and the convertible securities, of any duration or quality, of companies located in asia. asia includes China, hong Kong, india, indonesia, Japan, Malaysia, Pakistan, Philippines, singapore, south Korea, taiwan, thailand and Vietnam.
poRTFolIo mANAgERS
Lead Manager: Andrew T. Foster Co-Manager: g. paul matthews

Plotted monthly.the performance data and graph do not reflect the deduction of taxes that a shareholder would pay on dividends, capital gain distributions or redemption of Fund shares.
ALL DAtA IS AS oF JUNE 30, 2008, UNLESS otHERWISE NotED
800 .789 .asia [2742 ] www.mat thewsfunds .com 1�
1 the MsCi all Country asia ex-Japan index is a free float–adjusted market capitalization–weighted index of the stock of markets of China, hong Kong, india, indonesia, Malaysia, Pakistan, Philippines, singapore, south Korea, taiwan, and thailand. it is not possible to invest directly in an index. source: index data from Morgan stanley Capital international; total return calculations performed by PnC.
2 Calculated from 8/31/94.3 the MsCi all Country Far east ex-Japan index is a free float–adjusted market capitalization–weighted index of the stock markets of
China, hong Kong, indonesia, Malaysia, Philippines, singapore, south Korea, taiwan and thailand. the Fund invests in countries that are not included in the MsCi all Country Far east ex-Japan index. it is not possible to invest directly in an index. source: index data from Morgan stanley Capital international; total return calculations performed by PnC.
4 Lipper, inc. fund performance does not reflect sales charges and is based on total return, including reinvestment of dividends and capital gains, for the stated periods.
5 Ratio has been restated to reflect current management and administrative and shareholder servicing fees expected to be incurred by the Funds and paid to the advisor. Matthews asian Funds do not charge 12b-1 fees.
6 the lesser of fiscal year 2007 long-term purchase costs or sales proceeds divided by the average monthly market value of long-term securities.
FIScAl yEAR 2007 RATIoS
Gross Operating expense:5 1.15% Portfolio turnover:6 27.93%
pERFoRmANcE AS oF JUNE 30, 2008
Fund Inception: 9/12/943 mo yTd
Average Annual Total Returns
1 yR 3 yRS 5 yRS 10 yRS SINcE INcEpTIoN
All performance quoted is past performance and is no guarantee of future results. assumes reinvestment of all dividends and/or distributions. unusually high returns may not be sustainable. investment return and principal value will fluctuate with changing market conditions so that shares, when redeemed, may be worth more or less than their original cost. Current performance may be lower or higher than the return figures quoted. Returns would have been lower if certain of the Fund’s fees and expenses had not been waived. For the Fund’s most recent month-end performance please call 800-789-asia [2742] or visit www.matthewsfunds.com.
Matthews asian Growth and income Fund –3.96% –8.04% 0.19% 15.02% 19.54% 18.46% 12.11%
MsCi all Country asia ex-Japan index 1 –7.88% –21.10% –5.48% 19.89% 23.53% 13.85% 3.70% 2
MsCi all Country Far east ex-Japan index 3 –6.40% –18.21% –4.50% 19.52% 22.81% 13.64% 3.40% 2
Lipper Pacific ex-Japan Funds Category average 4 –6.40% –19.67% –5.93% 19.41% 22.62% 14.78% 5.72% 2
INcomE dISTRIBUTIoN HISToRy JUNE dEcEmBER ToTAl
2008 24.82¢ n/a n/a
2007 21.51¢ 68.91¢ 90.42¢
2006 21.89¢ 39.85¢ 61.74¢
1994–2005 $1.88 $2.07 $3.95
For a history of the Fund’s distributions since its inception, visit www.matthewsfunds.com.
gRoWTH oF A $10,000 INvESTmENT SINcE FUNd INcEpTIoN
20072006 2008200520042003200220012000199919981997199619951994
Matthews Asian Growth and Income Fund ($48,424)MSCI AC Asia ex-Japan Index ($16,524)1,2
MSCI AC Far East ex-Japan Index ($15,891)2,3
Lipper Pacific ex-Japan Funds Category Average ($22,070)2,4
$0
$10,000
$20,000
$30,000
$40,000
$50,000
$60,000

14 Matthews asian Funds
MAttHEWS ASIAN GRoWtH AND INCoME FUND(cloSEd To moST NEW INvESToRS)
coUNTRy AllocATIoN
China/hong Kong 32.9%
singapore 14.2%
taiwan 12.7%
south Korea 10.7%
Malaysia 6.0%
india 5.5%
thailand 4.7%
Japan 2 4.0%
united Kingdom 2 3.0%
australia 2 2.9%
indonesia 1.7%
Philippines 1.1%
Cash and other assets, less liabilities 0.6%
NUmBER oF SEcURITIES NAv FUNd ASSETS REdEmpTIoN FEE 12b-1 FEES
74 $17.52 $2.0 billion2.00% within
90 calendar daysnone
SEcToR AllocATIoN
Financials 25.6%
telecommunication services 22.1%
Consumer discretionary 16.7%
industrials 8.1%
information technology 8.0%
utilities 7.0%
health Care 5.0%
Consumer staples 4.8%
energy 2.1%
Cash and other assets, less liabilities 0.6%
mARKET cAp ExpoSURE3
Large cap (over $5 billion) 57.3%
Mid cap ($1–$5 billion) 28.4%
small cap (under $1 billion) 13.7%
Cash and other assets, less liabilities 0.6%
BREAKdoWN By SEcURITy
Common equities 77.8%
Convertible Bonds4 19.4%
Preferred equities 2.2%
Cash and other assets, less liabilities 0.6%
Top TEN HoldINgS 1
coUNTRy SEcURITy TypE % oF NET ASSETS
taiwan semiconductor Manufacturing Co., Ltd. taiwan equity 3.5% singapore Press holdings, Ltd. singapore equity 3.5% CLP holdings, Ltd. China/hong Kong equity 3.2% hsBC holdings PLC united Kingdom equity 3.0% hongkong Land CB 2005, Ltd., Cnv., 2.750%, 12/21/12 China/hong Kong Convertible Bond 3.0%Chungwa telecom Co., Ltd. taiwan equity 2.9% sK telecom Co., Ltd. south Korea equity 2.9% advanced info service Public Co., Ltd. thailand equity 2.7% Rafflesia Capital, Ltd., Cnv., 1.250%, 10/04/11 Malaysia Convertible Bond 2.5% Far eastone telecommunications Co., Ltd. taiwan equity 2.4%
% oF ASSETS IN Top 10 29.6%
1 holdings may combine more than one security from same issuer and related depositary receipts.2 australia, the united Kingdom and Japan are not included in the MsCi all Country asia ex-Japan index.3 source: Factset Research systems. Percentage values in data are rounded to the nearest tenth of one percent; the values may not sum
to 100% due to rounding.4 Convertible bonds are not included in the MsCi all Country asia ex-Japan index.

800 .789 .asia [2742 ] www.mat thewsfunds .com 15
poRTFolIo mANAgER commENTARy continued from page 12
as a means to shelter financial storms. However, despite these general concerns, we have remained fully invested throughout the recent cycle, without retreating to cash.
We remain fully invested for two reasons. First, at Matthews we strongly believe that it is often impractical to attempt to time market cycles, and thus we adopt a discipline of being fully invested over longer horizons. Second, during market volatility such as the present, it is important to return to the original investment premise: that is, it remains an exciting time to be a long-term investor in Asia’s economic evolution. This is particularly true now when the Fund has begun to identify a handful of new opportunities emerging as a result of the market’s contraction.
One such opportunity came in the form of a convertible bond issued by a smaller company called FU JI Foods. FU JI is engaged in the industrial catering business in mainland China. In its large-scale, centralized kitchens, it has the capacity to prepare 1 million meal sets per day, and deliver to canteens and cafeterias in corpo-rate parks throughout the country. Though FU JI’s business model is relatively simple, it represented the emergence of yet another new industry in China, unique to the current land-scape, but comparable to businesses overseas. Efficiency, hygiene and cost pressures are forcing the market to transition away from sub-scale “mom and pop” caterers to industrial players. FU JI is the largest such caterer in the country, and yet it has less than 1% share of the national market. Despite its small size, and the substantial competition it faces in the market, FU JI enjoys profit margins vastly superior to those of compa-rable caterers in Europe. In order to finance its growth, the company issued a Chinese renminbi-denominated convertible bond, a relatively rare
instrument in the Asian landscape, and one in which the Fund has established a small position. Convertible bonds, such as the one issued by FU JI, illustrate the Fund’s aim: to discover investments that trace the evolution of Asia’s markets, yet offer some downside protection even amidst volatility.
The Fund’s experience has been mixed amidst the market’s decline. For several years now, the Fund’s largest exposure has been to SK Telecom, South Korea’s largest and most profitable mobile phone company. Unfortunately, the position has been one of the largest detractors to performance so far this year; its shares have stumbled due to increasing regulatory burdens at home, and some misfiring investments abroad. Yet we remain convinced of the company’s strong fundamentals, particularly its strong cash flow, which in turn underwrites an attractive dividend on the com-pany’s shares.
Meanwhile, the Fund has taken up the largest sector exposure to technology and light manufac-turing it has had in several years. A number of companies in such industries have seen their valuations depressed on perceptions of a cyclical decline in growth. Yet we have added several such companies to the portfolio, having found them to be well-run, to offer strong cash flow and to have strong balance sheets. These new positions have performed marginally to the Fund’s benefit in the short-run. More importantly, however, we believe that such companies will be well positioned to trace the rise of consumer demand in Asia, whether for electronics or manufactured goods. It is this evolution that is at the heart of the Fund’s construct, and what makes us enthusiastic long-term investors in Asia, despite what are currently rocky markets.
ALL DAtA IS AS oF JUNE 30, 2008, UNLESS otHERWISE NotED

16 Matthews asian Funds
MAttHEWS ASIAN GRoWtH AND INCoME FUND
ScHEdUlE oF INvESTmENTS a (UNAUDItED) commoN EQUITIES: 77.8%
SHARES vAlUE SHARES vAlUE
cHINA/HoNg KoNg: 25.6% CLP holdings, Ltd. 7,370,200 $63,205,366 hang seng Bank, Ltd. 2,040,900 43,091,805 television Broadcasts, Ltd. 6,280,000 36,274,032 hongKong electric holdings, Ltd. 5,858,000 35,052,368 PCCw, Ltd. 48,711,000 29,501,140 hang Lung Group, Ltd. 6,586,000 29,373,756 Café de Coral holdings, Ltd. 16,281,100 29,218,499 next Media, Ltd. 75,042,000 28,830,651 BOC hong Kong holdings, Ltd. 10,562,000 27,996,978 Giordano international, Ltd. 66,675,000 27,342,381 Vtech holdings, Ltd. 4,331,300 26,134,034 Vitasoy international holdings, Ltd. 50,051,000 23,759,488 asM Pacific technology, Ltd. 2,986,800 22,574,430 CitiC Pacific, Ltd. 6,095,000 22,541,322 hong Kong & China Gas Co., Ltd. 8,553,490 20,353,595 i-CaBLe Communications, Ltd.† 129,832,000 19,117,178 hang Lung Properties, Ltd. 5,935,920 19,056,479 China-hong Kong Photo Products holdings, Ltd. 14,998,003 1,308,637
Total china/Hong Kong 504,732,139
SINgApoRE: 14.2% singapore Press holdings, Ltd. 22,020,500 68,786,245 ascendas Reit 23,690,000 38,480,688 Parkway holdings, Ltd. 19,699,093 33,590,751 Fraser and neave, Ltd. 10,006,100 33,315,669 dBs Group holdings, Ltd. 2,382,000 33,019,382 singapore Post, Ltd. 29,248,000 23,646,908 Cerebos Pacific, Ltd. 8,208,000 23,105,832 Parkway Life Reit 26,137,110 21,708,084 Yellow Pages (singapore), Ltd. 6,638,000 3,366,447 hong Leong Finance, Ltd. 157,000 400,419
Total Singapore 279,420,425
TAIWAN: 12.7% taiwan semiconductor Manufacturing Co., Ltd. 31,361,352 $67,159,354 Chunghwa telecom Co., Ltd. adR 2,009,404 50,978,580 Far eastone telecommunications Co., Ltd. 29,485,611 46,871,174 President Chain store Corp. 11,192,000 37,241,525 Cathay Financial holding Co., Ltd. 8,973,705 19,512,553 Cyberlink Corp. 2,946,000 14,073,403 Chunghwa telecom Co., Ltd. 2,561,960 6,625,831 taiwan secom Co., Ltd. 3,010,779 5,723,386 taiwan semiconductor Manufacturing Co., Ltd. adR 200,000 2,182,000
Total Taiwan 250,367,806
SoUTH KoREA: 6.8% sK telecom Co., Ltd. 254,760 46,395,278 hana Financial Group, inc. 751,889 28,931,248 Kt Corp. 505,730 21,635,120 Kt Corp. adR 718,800 15,324,816 sK telecom Co., Ltd. adR 522,200 10,846,094 daehan City Gas Co., Ltd. 280,300 9,057,062 G11R, inc. 309,540 2,352,510
Total South Korea 134,542,128
THAIlANd: 4.7% advanced info service
Public Co., Ltd. 18,935,000 52,384,851 BeC world Public Co., Ltd. 47,386,400 34,723,099 thai Reinsurance Public
Co., Ltd. 25,672,800 4,683,837
Total Thailand 91,791,787

800 .789 .asia [2742 ] www.mat thewsfunds .com 17
JUNE 30, 2008
SHARES vAlUE SHARES vAlUE
JApAN: 4.0% nippon Building Fund, inc. Reit 2,865 $33,726,515 trend Micro, inc. 749,500 24,704,525 Japan Real estate investment Corp. Reit 1,911 20,156,519
Total Japan 78,587,559
UNITEd KINgdom: 3.0% hsBC holdings PLC adR 741,600 56,880,720 hsBC holdings PLC 196,800 3,033,441
Total United Kingdom 59,914,161
AUSTRAlIA: 2.9% aXa asia Pacific holdings, Ltd. 6,744,925 30,261,079 insurance australia Group, Ltd. 7,851,267 26,117,443
Total Australia 56,378,522
INdoNESIA: 1.7% Pt telekomunikasi
indonesia adR 745,500 24,042,375 Pt tempo scan Pacific 139,445,000 10,284,447
Total Indonesia 34,326,822
pHIlIppINES: 1.1% Globe telecom, inc. 856,190 22,503,713
Total philippines 22,503,713
INdIA: 1.1% sun Pharmaceutical industries, Ltd. 674,811 21,972,724
Total philippines 21,972,724
ToTAl commoN EQUITIES 1,534,537,786 (Cost $1,244,293,766)
SoUTH KoREA: 2.2% hyundai Motor Co., Ltd., Pfd. 566,280 $14,643,539 LG household & health Care, Ltd., Pfd. 177,830 10,421,088 samsung Fire & Marine insurance Co., Ltd., Pfd. 119,550 9,085,823 hyundai Motor Co., Ltd., 2nd Pfd. 305,760 8,359,768
Total South Korea 42,510,218
ToTAl pREFERREd EQUITIES 42,510,218 (Cost $19,413,954)
see footnotes on page 19.
pREFERREd EQUITIES: 2.2%

18 Matthews asian Funds
MAttHEWS ASIAN GRoWtH AND INCoME FUND
ScHEdUlE oF INvESTmENTS a (UNAUDItED) (continued)
INTERNATIoNAl dollAR BoNdS: 19.4%
FAcE AmoUNT vAlUE FAcE AmoUNT vAlUE
cHINA/HoNg KoNg: 7.3% hongkong Land CB 2005,
Ltd., Cnv. 2.750%, 12/21/12 $49,200,000 $58,671,000
China Petroleum & Chemical Corp., (sinopec), Cnv. 0.000%, 04/24/14 295,950,000b 40,377,262
Fu Ji Food and Catering services holdings, Ltd., Cnv. 0.000%, 10/18/10 247,500,000b 28,933,917 Brilliance China Finance,
Ltd., Cnv. 0.000%, 06/07/11 14,950,000 15,376,075
Total china/Hong Kong 143,358,254
mAlAySIA: 6.0% Rafflesia Capital, Ltd., Cnv.
1.250%,c 10/04/11 42,100,000 49,046,500 Cherating Capital, Ltd., Cnv.
2.000%, 07/05/12 44,900,000 45,519,620 Prime Venture Labuan, Ltd., Cnv.
1.000%, 12/12/08 11,170,000 12,552,287 YtL Power Finance Cayman,
Ltd., Cnv. 0.000%, 05/09/10 9,400,000 11,233,000
Total malaysia 118,351,407
INdIA: 4.4% Ranbaxy Laboratories,
Ltd., Cnv. 0.000%, 03/18/11 29,326,000 33,175,038
tata Motors, Ltd., Cnv. 1.000%, 04/27/11 27,349,000 27,827,608
Reliance Communications, Ltd., Cnv. 0.000%, 05/10/11 22,290,000 25,744,950
Total India 86,747,596
SoUTH KoREA: 1.7% sK telecom Co., Ltd., Cnv.
0.000%, 05/27/09 $29,430,000 $32,991,030
Total South Korea 32,991,030
ToTAl INTERNATIoNAl dollAR BoNdS 381,448,287 (Cost $376,384,411)

800 .789 .asia [2742 ] www.mat thewsfunds .com 19
JUNE 30, 2008
vAlUE
ToTAl INvESTmENTS: 99.4% $1,958,496,291 (Cost $1,640,092,131d)
cASH ANd oTHER ASSETS, lESS lIABIlITIES: 0.6% 12,043,622
NET ASSETS: 100.0% $1,970,539,913
a Certain securities were fair valued under the discretion of the Board of trustees (note 1-a).
b Face amount reflects principal in local currency.
c Variable rate security. the rate represents the rate in effect at June 30, 2008.
d Cost of investments is $1,640,092,131 and net unrealized appreciation consists of:
Gross unrealized appreciation . . . . . . . . . . . . . . . . . $368,515,768
Gross unrealized depreciation . . . . . . . . . . . . . . . . . (50,111,608)
net unrealized appreciation . . . . . . . . . . . . . . . . . . . $318,404,160
† affiliated issuer, as defined under the investment Company act of 1940 (ownership of 5% or more of the outstanding voting securities of this issuer)
adR american depositary Receipt
Cnv. Convertible
Pfd. Preferred
Reit Real estate investment trust
see accompanying notes to financial statements.

MAttHEWS ASIA pACIFIC FUND
poRTFolIo mANAgER commENTARy
The Matthews Asia Pacific Fund declined
–15.38% during the first half of 2008,
compared with its benchmark, the MSCI
All Country Asia Pacific Index, which
fell –12.18%.
The Asia Pacific markets continued through
tough times in the second quarter of 2008 as
prices for food and energy jumped to record
levels. Ongoing problems related to U.S. finan-
cial institutions also continued to be a drag on
market sentiment. While the second quarter
marked declines throughout the region, these
varied widely by country and, in some cases,
even among different exchanges within the
same country: the domestic Chinese A share
market declined another 26% in the second
quarter after falling 29% in the first quarter.
The MSCI China Index, however, was down
just under 5% in the second quarter. The India
portion of the MSCI All Country Asia Pacific
Index declined 41%, while Japan was down
only 5%.
We have, however, seen encouraging signs in
recently passed legislation that, we believe,
should help Chinese manufacturers reduce
inefficiencies in the years to come. A new
Chinese labor law that raises the minimum
wage by an annual double-digit percentage
increase, coupled with annual appreciation
of China’s currency against the U.S. dollar,
should prompt factories to shift manufacturing
methods so they are more capital-intensive and
less labor-intensive.
In addition, new regulations to battle pollu-
tion should help produce better conditions.
Improved factory automation is something
that has been emerging in China and some
Japanese companies are big beneficiaries of
this. Two of the portfolio’s holdings, FANUC
and Keyence, both Japanese, are good
examples of this trend in Chinese factories.
FANUC is a leading supplier of industrial
robots to Chinese companies and Keyence
offers Chinese firms automation technology
mainly through its advanced sensors.
20 Matthews asian Funds
continued on page 23
FUNd oBJEcTIvE ANd STRATEgy SymBol: mpAcx
objective: Long-term capital appreciation.
Strategy: under normal market conditions, the Matthews asia Pacific Fund seeks to achieve its investment objective by investing at least 80% of its total net assets, which include borrowings for investment purposes, in the common and preferred stocks of companies located in the asia Pacific region. the asia Pacific region includes australia, China, hong Kong, india, indonesia, Japan, Malaysia, new Zealand, Pakistan, Philippines, singapore, south Korea, taiwan, thailand and Vietnam. the Fund may also invest in the convertible securities, of any duration or quality, of asia Pacific companies.
poRTFolIo mANAgERS
Lead Manager: Taizo Ishida Co-Manager: Sharat Shroff, cFA

ALL DAtA IS AS oF DECEMbER 31, 2006, UNLESS otHERWISE NotED
800 .789 .asia [2742 ] www.mat thewsfunds .com �1
gRoWTH oF A $10,000 INvESTmENT SINcE FUNd INcEpTIoN
pERFoRmANcE AS oF JUNE 30, 2008
Fund Inception: 10/31/033 mo yTd
Average Annual Total Returns
1 yR 3 yRS SINcE INcEpTIoN
Matthews asia Pacific Fund –7.05% –15.38% –12.01% 9.32% 11.59%
MsCi all Country asia Pacific index 1 –1.37% –12.18% –8.43% 13.75% 13.50%
Lipper Pacific Region Funds Category average 2 –1.62% –12.69% –9.85% 15.14% 14.23%
All performance quoted is past performance and is no guarantee of future results. assumes reinvestment of all dividends and/or distributions. unusually high returns may not be sustainable. investment return and principal value will fluctuate with changing market conditions so that shares, when redeemed, may be worth more or less than their original cost. Current performance may be lower or higher than the return figures quoted. Returns would have been lower if certain of the Fund’s fees and expenses had not been waived. For the Fund’s most recent month-end performance please call 800-789-asia [2742] or visit www.matthewsfunds.com.
Plotted monthly.the performance data and graph do not reflect the deduction of taxes that a shareholder would pay on dividends, capital gain distributions or redemption of Fund shares.
ALL DAtA IS AS oF JUNE 30, 2008, UNLESS otHERWISE NotED
FIScAl yEAR 2007 RATIoS
Gross Operating expense:3 1.20% Portfolio turnover:4 40.49%
1 the MsCi all Country asia Pacific index is a free float–adjusted market capitalization–weighted index of the stock markets of australia, China, hong Kong, india, indonesia, Japan, Malaysia, new Zealand, Pakistan, Philippines, singapore, south Korea, taiwan and thailand. it is not possible to invest directly in an index. source: index data from Morgan stanley Capital international; total return calculations performed by PnC.
2 Lipper, inc. fund performance does not reflect sales charges and is based on total return, including reinvestment of dividends and capital gains, for the stated periods.
3 Ratio has been restated to reflect current management and administrative and shareholder servicing fees expected to be incurred by the Funds and paid to the advisor. Matthews asian Funds do not charge 12b-1 fees.
4 the lesser of fiscal year 2007 long-term purchase costs or sales proceeds divided by the average monthly market value of long-term securities.
$5,000
$15,000
$20,000
$25,000
$10,000
9/073/07 3/08 6/089/063/069/053/059/043/0410/03
Matthews Asia Pacific Fund ($16,680)MSCI AC Asia Pacific Index ($18,059)1
Lipper Pacific Region Funds Category Average ($18,679)2

�� Matthews asian Funds
MAttHEWS ASIA pACIFIC FUND
coUNTRy AllocATIoN
Japan 47.0%
China/hong Kong 21.2%
south Korea 8.2%
india 6.8%
thailand 4.1%
taiwan 3.7%
australia 3.5%
singapore 3.2%
indonesia 2.1%
Cash and other assets, less liabilities 0.2%
NUmBER oF SEcURITIES NAv FUNd ASSETS REdEmpTIoN FEE 12b-1 FEES
77 $14.63 $369.3 million2.00% within
90 calendar daysnone
SEcToR AllocATIoN
Financials 32.6%
information technology 20.7%
Consumer discretionary 16.8%
Consumer staples 9.7%
industrials 7.0%
health Care 6.6%
telecommunication services 4.3%
Materials 2.1%
Cash and other assets, less liabilities 0.2%
mARKET cAp ExpoSURE2
Large cap (over $5 billion) 58.2%
Mid cap ($1–$5 billion) 23.4%
small cap (under $1 billion) 18.2%
Cash and other assets, less liabilities 0.2%
1 holdings may combine more than one security from same issuer and related depositary receipts.2 source: Factset Research systems. Percentage values in data are rounded to the nearest tenth of one percent; the values may not sum
to 100% due to rounding.
Top TEN HoldINgS 1
coUNTRy % oF NET ASSETS
nintendo Co., Ltd. Japan 2.9% Funai Zaisan Consultants Co., Ltd. Japan 2.6% unicharm Petcare Corp. Japan 2.4% Benesse Corp. Japan 2.2% sony Corp. Japan 2.1% China Mobile, Ltd. China/hong Kong 2.1% the sumitomo trust & Banking Co., Ltd. Japan 2.0% taiwan semiconductor Manufacturing Co., Ltd. taiwan 2.0% ichiyoshi securities Co., Ltd. Japan 1.9% sekisui house, Ltd. Japan 1.9%
% oF ASSETS IN Top 10 22.1%

800 .789 .asia [2742 ] www.mat thewsfunds .com ��
poRTFolIo mANAgER commENTARy continued from page 20
One of the Fund’s new holdings serves as
another example of efficient manufacturing:
China’s Tingyi is one of the country’s best food
and beverage companies, and the country’s top
instant noodle maker with dominant market
share. What is so attractive about this company
is its efficient manufacturing technologies,
which are competitive with those of its
Japanese and Korean peers. The company
possesses a rare combination of both impres-
sive factory automation and efforts to make
daily improvements, which is the basic driving
force behind the industry’s consolidation.
These improvements are reminiscent of
Toyota’s “kaizen,” a Japanese philosophy of
bettering standardized activities and processes
through daily activities to eliminate waste.
The Fund has traditionally avoided commodity
companies where we believe forward earnings
are unpredictable due to the cyclical nature of
these firms. Because of this, we have typi-
cally underweighted Australia due to its large
commodities and energy sectors. This hurt
performance in the first half of 2008 as com-
modities prices rose. Our overweight in Korean
stocks also hurt the Fund as Korea has faced a
rapid depreciation of its currency against the
U.S. dollar, which has pushed up import costs.
From a valuation standpoint, China and India
now appear more attractive, and the Fund has
a growing list of new investment opportunities
in solid companies with attractive long-term
growth prospects. We also retain conviction in
our current holdings.
The Fund attempts to capture the growth
prospects for the entire Asia Pacific region, in
which Japan is becoming more and more rel-
evant. Japan’s domestic growth potential may
not be as high as that of Asia-ex Japan, but it
is our belief that more Japanese companies
will benefit from growth in the region. It is
important to note that we have been witnessing
more regional cooperation, both economically
and politically, over the last six months than we
have at any time in the last decade. Looking
ahead, one of the key questions facing investors
is the ability of the region to withstand a global
slowdown. In that context, it is encouraging
to see these signs of greater integration within
the Asia Pacific region, despite the current
downturn in Asian equity markets.
ALL DAtA IS AS oF JUNE 30, 2008, UNLESS otHERWISE NotED

�4 Matthews asian Funds
MAttHEWS ASIA pACIFIC FUND
ScHEdUlE oF INvESTmENTS a (UNAUDItED)
commoN EQUITIES: 99.8%
SHARES vAlUE SHARES vAlUE
JApAN: 47.0% nintendo Co., Ltd. 18,800 $10,605,264 Funai Zaisan Consultants Co., Ltd.† 7,081 9,469,341 unicharm Petcare Corp. 299,100 8,929,199 Benesse Corp. 203,900 8,257,004 sony Corp. adR 180,100 7,877,574 the sumitomo trust & Banking Co., Ltd. 1,078,000 7,532,853 ichiyoshi securities Co., Ltd. 764,900 7,008,972 sekisui house, Ltd. 738,000 6,887,583 Yahoo! Japan Corp. 17,612 6,783,734 Pigeon Corp. 334,300 6,721,576 daibiru Corp. 598,700 6,647,524 nomura Research institute, Ltd. 282,800 6,631,558 sysmex Corp. 159,800 6,290,568 GCa savvian Group Corp. 1,776 6,171,719 ORiX Corp. 37,950 5,428,832 nidec Corp. 79,500 5,293,262 nitto denko Corp. 137,700 5,290,917 takeda Pharmaceutical Co., Ltd. 95,600 4,861,704 sumitomo Realty & development Co., Ltd. 234,000 4,649,809 hoya Corp. 189,400 4,378,933 toyota Motor Corp. adR 45,600 4,286,400 Canon, inc. adR 82,650 4,232,507 nGK insulators, Ltd. 216,000 4,200,593 Monex Group, inc. 6,094 4,143,587 takeuchi Manufacturing Co., Ltd. 154,500 3,790,295 Mitsubishi estate Co., Ltd. 162,000 3,707,303 Fanuc, Ltd. 36,800 3,593,879 Keyence Corp. 14,600 3,477,271 honda Motor Co., Ltd. adR 81,200 2,763,236 toray industries, inc. 459,000 2,459,585 Mori trust sogo Reit, inc. 135 1,271,366
Total Japan 173,643,948
cHINA/HoNg KoNg: 21.2% China Mobile, Ltd. adR 117,400 $7,859,930 hang Lung Group, Ltd. 1,379,000 6,150,381 Lenovo Group, Ltd. 8,928,000 6,073,731 Pico Far east holdings, Ltd. 37,582,000 5,720,952 China Life insurance Co., Ltd. h shares 1,528,000 5,323,453 China Merchants Bank Co., Ltd. h shares 1,625,000 5,117,621 dairy Farm international holdings, Ltd. 1,041,300 5,039,892 China Vanke Co., Ltd. B shares 3,693,722 4,725,877 shangri-La asia, Ltd. 1,988,000 4,657,993 Ping an insurance (Group) Co. of China, Ltd. h shares 574,000 4,277,996 netease.com, inc. adRb 194,800 4,244,692 Kingdee international software Group Co., Ltd. 19,448,000 4,002,119 Ctrip.com international, Ltd. adR 73,900 3,383,142 China Merchants holdings international Co., Ltd. 848,000 3,282,010 tingyi (Cayman islands) holding Corp. 2,378,000 2,940,899 China Yurun Food Group, Ltd. 1,254,000 2,062,870 dongfeng Motor Group Co., Ltd. h shares 5,012,000 2,007,841 television Broadcasts, Ltd. 231,000 1,334,284
Total china/Hong Kong 78,205,683
SoUTH KoREA: 8.2% hanmi Pharmaceutical Co., Ltd. 46,114 6,788,926 shinhan Financial Group Co., Ltd. 113,517 5,132,980 amorepacific Corp. 8,254 5,113,134 hyundai department store Co., Ltd. 45,970 3,722,249 Kiwoom securities Co., Ltd. 100,715 3,610,547 nhn Corp.b 20,470 3,571,316 Cdnetworks Co., Ltd.b 107,409 1,185,961 Modetour network, inc. 49,754 1,117,747
Total South Korea 30,242,860

800 .789 .asia [2742 ] www.mat thewsfunds .com 25
JUNE 30, 2008
SHARES vAlUE SHARES vAlUE
INdIA: 6.8% sun Pharmaceutical industries, Ltd. 201,218 $6,551,920 hdFC Bank, Ltd. 221,500 5,186,266 dabur india, Ltd. 2,788,605 5,123,515 infosys technologies, Ltd. 90,990 3,673,014 Bharti airtel, Ltd.b 205,528 3,445,371 Financial technologies (india), Ltd. 30,015 1,172,800
Total India 25,152,886
THAIlANd: 4.1% Land & houses Public Co., Ltd. 22,417,300 4,961,508 advanced info service Public Co., Ltd. 1,658,600 4,588,620 Major Cineplex Group Public Co., Ltd. 7,285,400 3,181,302 siam Commercial Bank
Public Co., Ltd. 1,014,400 2,351,309
Total Thailand 15,082,739
TAIWAN: 3.7% taiwan semiconductor Manufacturing Co., Ltd. 3,393,029 7,266,065 taiwan secom Co., Ltd. 3,348,160 6,364,736
Total Taiwan 13,630,801
AUSTRAlIA: 3.5% aXa asia Pacific holdings, Ltd. 1,424,589 6,391,413 Computershare, Ltd. 437,302 3,861,024 tabcorp holdings, Ltd. 297,625 2,798,980
Total Australia 13,051,417
SINgApoRE: 3.2% hyflux, Ltd. 2,130,812 4,682,759 dBs Group holdings, Ltd. 269,700 3,738,592 Keppel Land, Ltd. 951,000 3,466,951
Total Singapore 11,888,302
INdoNESIA: 2.1% Bank Rakyat indonesia 6,988,500 $3,865,656 Pt astra international 1,827,000 3,814,507
Total Indonesia 7,680,163
ToTAl INvESTmENTS: 99.8% 368,578,799 (Cost $361,846,264 c)
cASH ANd oTHER ASSETS, lESS lIABIlITIES: 0.2% 753,756
NET ASSETS: 100.0% $369,332,555
a Certain securities were fair valued under the discretion of the Board of trustees (note 1-a).
b non–income producing security
c Cost of investments is $361,846,264 and net unrealized appreciation consists of:
Gross unrealized appreciation . . . . . . . . . . . . . . . . . $54,610,733
Gross unrealized depreciation . . . . . . . . . . . . . . . . . (47,878,198)
net unrealized appreciation . . . . . . . . . . . . . . . . . . . $ 6,732,535
† affiliated issuer, as defined under the investment Company act of 1940 (ownership of 5% or more of the outstanding voting securities of this issuer)
adR american depositary Receipt
see accompanying notes to financial statements.

MAttHEWS pACIFIC tIGER FUND
26 Matthews asian Funds
(cloSEd To moST NEW INvESToRS)
poRTFolIo mANAgER commENTARy
For the six months ending June 30, 2008, the Matthews Pacific Tiger Fund declined –19.20%, while its primary benchmark, the MSCI All Country Asia ex-Japan Index, fell –21.10%. During the same period, the MSCI All Country Far East ex-Japan Index was down –18.21%.
Various stocks from across the region helped the Fund’s relative performance, but were unable to offset broader weakness in the markets. Asia ex-Japan equities ended the first half of the year with one of the worst performances in recent history. The economic environment across large parts of the region worsened in the second quarter, and any partial attempts at a recovery in the markets in April proved to be short-lived.
Inflationary levels have increased across the region to multi-year highs, led by rising food and fuel costs, which account for almost half of the consumer’s basket. Meanwhile, pricing pressures may become more systemic. With the exception of Taiwan and Korea, wages are also starting to rise in the region, threatening the longer-term viability of many export-oriented
businesses, particularly as currencies appreciate. To mitigate this affect, we have consciously avoided business models that rely solely on a weaker currency to arbitrage labor costs. Where the Fund does have exposure to export-oriented companies, the investment is predi-cated on the ability of management teams to generate sustainable sources of competitive advantage. A case in point is Sun Pharmaceuti-cals. The Indian company has managed to carve out a niche within the generic pharma-ceuticals sector in domestic and overseas markets such as the U.S. Compared to some of its peers in India, Sun’s focus on specialty therapy areas including psychiatry, neurology and cardiology have allowed it to maintain healthy operating margins in excess of 35%. One reason behind its success has been its continued investment in research and develop-ment, regularly exceeding 10% of sales.
Beyond the near-term imperatives of inflation, the structural challenge for policy makers in the region is to continue to liberalize currency regimes, and rebalance growth by stimulating domestic consumption. Rising domestic
continued on page 29
FUNd oBJEcTIvE ANd STRATEgy SymBol: mApTx
objective: Long-term capital appreciation.
Strategy: under normal market conditions, the Matthews Pacific tiger Fund seeks to achieve its investment objective by investing at least 80% of its total net assets, which include borrowings for investment purposes, in the common and preferred stocks of companies located in the Pacific tiger countries of China, hong Kong, india, indonesia, Malaysia, Pakistan, Philippines, singapore, south Korea, taiwan, thailand and Vietnam.
poRTFolIo mANAgERS
Lead Managers: Richard H. gao and Sharat Shroff, cFA Co-Manager: mark W. Headley

ALL DAtA IS AS oF DECEMbER 31, 2006, UNLESS otHERWISE NotED
800 .789 .asia [2742 ] www.mat thewsfunds .com 27
gRoWTH oF A $10,000 INvESTmENT SINcE FUNd INcEpTIoN
Plotted monthly.the performance data and graph do not reflect the deduction of taxes that a shareholder would pay on dividends, capital gain distributions or redemption of Fund shares.
ALL DAtA IS AS oF JUNE 30, 2008, UNLESS otHERWISE NotED
Matthews Pacific Tiger Fund ($32,553)MSCI AC Asia ex-Japan Index ($16,524)1,2
MSCI AC Far East ex-Japan Index ($15,891)2,3
Lipper Pacific ex-Japan Funds Category Average ($22,070)2,4
$0
$10,000
$20,000
$30,000
$40,000
$50,000
20072006 2008200520042003200220012000199919981997199619951994
FIScAl yEAR 2007 RATIoS
Gross Operating expense:5 1.10% Portfolio turnover:6 24.09%
1 the MsCi all Country asia ex-Japan index is a free float–adjusted market capitalization–weighted index of the stock of markets of China, hong Kong, india, indonesia, Malaysia, Pakistan, Philippines, singapore, south Korea, taiwan, and thailand. it is not possible to invest directly in an index. source: index data from Morgan stanley Capital international; total return calculations performed by PnC.
2 Calculated from 8/31/94.3 the MsCi all Country Far east ex-Japan index is a free float–adjusted market capitalization–weighted index of the stock markets of China,
hong Kong, indonesia, Malaysia, Philippines, singapore, south Korea, taiwan and thailand. the Fund invests in countries that are not included in the MsCi all Country Far east ex-Japan index. it is not possible to invest directly in an index. source: index data from Morgan stanley Capital international; total return calculations performed by PnC.
4 Lipper, inc. fund performance does not reflect sales charges and is based on total return, including reinvestment of dividends and capital gains, for the stated periods.
5 Ratio has been restated to reflect current management and administrative and shareholder servicing fees expected to be incurred by the Funds and paid to the advisor. Matthews asian Funds do not charge 12b-1 fees.
6 the lesser of fiscal year 2007 long-term purchase costs or sales proceeds divided by the average monthly market value of long-term securities.
pERFoRmANcE AS oF JUNE 30, 2008
Fund Inception: 9/12/943 mo yTd
Average Annual Total Returns
1 yR 3 yRS 5 yRS 10 yRS SINcE INcEpTIoN
All performance quoted is past performance and is no guarantee of future results. assumes reinvestment of all dividends and/or distributions. unusually high returns may not be sustainable. investment return and principal value will fluctuate with changing market conditions so that shares, when redeemed, may be worth more or less than their original cost. Current performance may be lower or higher than the return figures quoted. Returns would have been lower if certain of the Fund’s fees and expenses had not been waived. For the Fund’s most recent month-end performance please call 800-789-asia [2742] or visit www.matthewsfunds.com.
Matthews Pacific tiger Fund –8.20% –19.20% –6.79% 17.73% 23.54% 20.13% 8.93%
MsCi all Country asia ex-Japan index 1 –7.88% –21.10% –5.48% 19.89% 23.53% 13.85% 3.70% 2
MsCi all Country Far east ex-Japan index 3 –6.40% –18.21% –4.50% 19.52% 22.81% 13.64% 3.40% 2
Lipper Pacific ex-Japan Funds Category average 4 –6.40% –19.67% –5.93% 19.41% 22.62% 14.78% 5.72% 2

28 Matthews asian Funds
MAttHEWS pACIFIC tIGER FUND (cloSEd To moST NEW INvESToRS)
coUNTRy AllocATIoN
China/hong Kong 34.8%
south Korea 16.7%
india 15.2%
singapore 9.4%
thailand 6.6%
taiwan 5.1%
indonesia 4.9%
Malaysia 3.9%
Philippines 0.4%
Cash and other assets, less liabilities 3.0%
NUmBER oF SEcURITIES NAv FUNd ASSETS REdEmpTIoN FEE 12b-1 FEES
71 $22.51 $2.8 billion2.00% within
90 calendar daysnone
SEcToR AllocATIoN
Financials 27.8%
Consumer discretionary 15.7%
information technology 14.2%
health Care 12.2%
Consumer staples 9.6%
industrials 9.6%
telecommunication services 7.0%
utilities 0.9%
Cash and other assets, less liabilities 3.0%
mARKET cAp ExpoSURE2
Large cap (over $5 billion) 48.7%
Mid cap ($1–$5 billion) 40.6%
small cap (under $1 billion) 7.7%
Cash and other assets, less liabilities 3.0%
1 holdings may combine more than one security from same issuer and related depositary receipts.2 source: Factset Research systems. Percentage values in data are rounded to the nearest tenth of one percent; the values may not sum
to 100% due to rounding.
Top TEN HoldINgS 1
coUNTRy % oF NET ASSETS
Lenovo Group, Ltd. China/hong Kong 3.0% sun Pharmaceutical industries, Ltd. india 2.7% hang Lung Group, Ltd. China/hong Kong 2.7% President Chain store Corp. taiwan 2.6% amorepacific Corp. south Korea 2.6% swire Pacific, Ltd. China/hong Kong 2.6% advanced info service Public Co., Ltd. thailand 2.5% dBs Group holdings, Ltd. singapore 2.3% hanmi Pharmaceutical Co., Ltd. south Korea 2.3% tencent holdings, Ltd. China/hong Kong 2.2%
% oF ASSETS IN Top 10 25.5%

800 .789 .asia [2742 ] www.mat thewsfunds .com �9
ALL DAtA IS AS oF JUNE 30, 2008, UNLESS otHERWISE NotED
poRTFolIo mANAgER commENTARy continued from page 26
consumption would alleviate the dependence on exports, and provide greater flexibility to currencies. Consumers in Asia have been resilient so far, although there are signs of moderating demand. Higher interest rates are crimping the ability to spend, particularly on big-ticket items. But Asian households are still sitting on trillions of dollars of savings that can help buffer rising cost pressures, although that is unlikely to happen immediately.
In the long term, the next big story to unfold will be China’s gradual shift from being a producer to becoming a consumer. Our strategy has been to focus on the creation of newer markets that are aided by an environ-ment of liberalization and deregulation. One good example of such an approach is Dongfeng Motors, one of the largest auto manufacturing companies in China. The availability of auto financing has gained momentum in China only in the last few years. That, combined with rising household wealth, has translated into growing demand for automobiles. In the near term, rising interest rates, surging commodity costs and costlier gasoline have created an overhang for Dongfeng. We believe the company has been proactive in rolling out new models, and has demonstrated the ability to grow consist-ently at 20% over the past several years. It is well placed to benefit from rising consumption in China.
Even though it has been painful, the Fund remains consistent with its discipline of staying fully invested through these volatile markets. Our approach to risk mitigation stems from focused security selection instead of trying to
build cash levels in anticipation of the next trough in the market. Asian equities have been correcting since early November, with India peaking in the first week of January. What began as a healthy adjustment to investor expectations has appeared more indiscriminate in recent weeks. We continue to believe that Asian lifestyles have improved significantly in the last decade, and will continue to improve in the coming years. Some of the recent additions to the portfolio, particularly in the media and tourism sectors, are likely to benefit from this trend. We have also raised stakes in some of our holdings that offer wealth management services in the region.
Asia is currently in an unusual position. On the one hand, the world sees it as one of the few engines of growth globally. In fact, on the basis of purchasing power parity, Asia accounts for more than 40% of global GDP growth. Yet, there are considerable uncertainties that may cause some pain for companies and consumers. Political shifts in countries such as Thailand and Malaysia add another layer of uncertainty. However, we remain enthused by the flexibility of Asian economies to evolve. During the Asian crisis, many pundits predicted a lost decade for Asia, but the region was able to turnaround in less than 18 months and resume growth. Even as many parts of the Western world are experiencing some devastation to wealth, there is a secular trend toward wealth creation in Asia, and we believe our portfolios are positioned to participate in that.

30 Matthews asian Funds
MAttHEWS pACIFIC tIGER FUND
ScHEdUlE oF INvESTmENTS a (UNAUDItED) commoN EQUITIES: 97.0%
SHARES vAlUE SHARES vAlUE
cHINA/HoNg KoNg: 34.8% Lenovo Group, Ltd. 123,704,000 $84,156,003 hang Lung Group, Ltd. 17,068,000 76,123,788 swire Pacific, Ltd. a shares 7,187,500 73,570,125 tencent holdings, Ltd. 8,190,600 63,524,763 nws holdings, Ltd. 22,086,636 57,676,209 dairy Farm international holdings, Ltd. 10,937,300 52,936,532 Ping an insurance (Group) Co. of China, Ltd. h shares 6,858,000 51,112,362 television Broadcasts, Ltd. 8,590,700 49,620,912 shangri-La asia, Ltd. 19,268,000 45,145,985 China Vanke Co., Ltd. B shares 31,972,360 40,906,558 China Mobile, Ltd. adR 610,550 40,876,323 netease.com, inc. adRb 1,825,100 39,768,929 China Merchants Bank Co., Ltd. h shares 11,084,500 34,908,475 dongfeng Motor Group Co., Ltd. h shares 78,810,000 31,571,818 China Resources enterprise, Ltd. 10,250,000 29,301,953 Focus Media holding, Ltd. adRb 973,913 26,996,868 Ctrip.com international, Ltd. adR 587,475 26,894,606 travelsky technology, Ltd. h shares† 40,812,000 26,836,403 towngas China Co., Ltd.b 51,937,000 24,909,238 dickson Concepts international, Ltd.† 32,547,900 22,671,509 dah sing Financial holdings, Ltd. 2,568,800 20,753,456 integrated distribution services Group, Ltd. 10,491,000 20,590,347 Glorious sun enterprises, Ltd. 41,262,000 20,335,756 China Yurun Food Group, Ltd. 8,885,000 14,616,106 dynasty Fine wines Group, Ltd. 34,175,000 6,004,724 new Oriental education & technology Group, inc. adRb 90,000 5,257,800
Total china/Hong Kong 987,067,548
SoUTH KoREA: 16.7% amorepacific Corp. 120,429 $74,602,550 hanmi Pharmaceutical Co., Ltd.† 435,636 64,134,548 nhn Corp.b 335,268 58,492,816 hana Financial Group, inc. 1,445,743 55,629,421 s1 Corp. 907,944 54,508,755 Megastudy Co., Ltd. 156,037 49,404,383 Yuhan Corp. 218,497 45,744,318 samsung securities Co., Ltd. 514,989 32,148,350 hyundai development Co. 541,382 27,430,090 On*Media Corp.b 3,798,200 13,271,279
Total South Korea 475,366,510
INdIA: 15.2% sun Pharmaceutical industries, Ltd. 2,341,856 76,253,879 infosys technologies, Ltd. 1,513,401 61,091,804 Cipla, Ltd. 11,729,421 57,536,184 dabur india, Ltd. 27,630,888 50,766,338 hdFC Bank, Ltd. 2,152,568 50,400,860 Bharti airtel, Ltd.b 2,732,503 45,806,340 titan industries, Ltd. 1,406,895 32,449,326 sintex industries, Ltd.b 2,719,170 19,525,568 Bank of Baroda 3,993,505 18,879,231 Kotak Mahindra Bank, Ltd. 1,119,670 12,009,941 sun tV network, Ltd. 950,000 6,268,565 sun Pharma advanced Research Co., Ltd.b 737,126 1,375,740
Total India 432,363,776
SINgApoRE: 9.4% dBs Group holdings, Ltd. 4,695,750 65,092,679 hyflux, Ltd. 24,508,187 53,860,188 Parkway holdings, Ltd. 28,144,540 47,991,866 Fraser and neave, Ltd. 12,713,750 42,330,886 Keppel Land, Ltd. 11,182,000 40,764,926 tat hong holdings, Ltd. 11,947,000 16,683,915
Total Singapore 266,724,460

800 .789 .asia [2742 ] www.mat thewsfunds .com �1
JUNE 30, 2008
SHARES vAlUE vAlUE
THAIlANd: 6.6% advanced info service Public Co., Ltd. 25,188,500 $69,685,547 Bank of ayudhya Public Co., Ltd., nVdRb 60,278,900 39,663,101 Land & houses Public Co., Ltd. 154,102,800 34,106,796 Bangkok Bank Public Co., Ltd. 6,440,000 23,113,504 amata Corp. Public Co., Ltd.† 58,667,900 21,933,565
Total Thailand 188,502,513
TAIWAN: 5.1% President Chain store Corp. 22,545,000 75,018,779 taiwan semiconductor Manufacturing Co., Ltd. 24,259,053 51,950,003 hon hai Precision industry
Co., Ltd. 3,393,000 16,711,808
Total Taiwan 143,680,590
INdoNESIA: 4.9% Pt Bank Central asia 137,025,000 36,782,741 Pt telekomunikasi indonesia 44,860,500 35,518,617 Pt Kalbe Farmab 348,388,000 32,118,200 Pt astra international 13,017,230 27,178,056 Pt telekomunikasi indonesia adR 259,500 8,368,875
Total Indonesia 139,966,489
mAlAySIA: 3.9% Public Bank Bhd 15,777,900 50,218,871 Resorts world Bhd 49,121,200 39,086,494 top Glove Corp. Bhd † 15,609,880 20,255,820
Total malaysia 109,561,185
pHIlIppINES: 0.4% sM Prime holdings, inc. 68,769,117 10,722,437
Total philippines 10,722,437
ToTAl INvESTmENTS: 97.0% $2,753,955,508 (Cost $2,282,421,218c)
cASH ANd oTHER ASSETS, lESS lIABIlITIES: 3.0% 85,806,318
NET ASSETS: 100.0% $2,839,761,826
a Certain securities were fair valued under the discretion of the Board of trustees (note 1-a).
b non–income producing security
c Cost of investments is $2,282,421,218 and net unrealized appreciation consists of:
Gross unrealized appreciation . . . . . . . . . . . . . . . . $681,131,209
Gross unrealized depreciation . . . . . . . . . . . . . . . . (209,596,919)
net unrealized appreciation . . . . . . . . . . . . . . . . . . $471,534,290
† affiliated issuer, as defined under the investment Company act of 1940 (ownership of 5% or more of the outstanding voting securities of this issuer)
adR american depositary Receipt
nVdR non-voting depositary Receipt
see accompanying notes to financial statements.

MAttHEWS ASIAN tECHNoLoGy FUND
�� Matthews asian Funds
poRTFolIo mANAgER commENTARy
For the six months ending June 30, 2008, the Matthews Asian Technology Fund lost –22.04%, underperforming its benchmark, the MSCI/Matthews Asian Technology Index, which declined –11.27%.
The Fund continued to look for long-term opportunities in a broad range of technology industries that we believe are poised to benefit from increasing demand from Asian consumers and overall growth in the Asia Pacific region. During the first half of 2008, the Asian tech-nology sector corrected due to a worsening macroeconomic environment that stemmed from worries over the U.S. credit crisis, high oil prices and increasing fears of a recession in the U.S. market. This period was, likewise, a challenging one for the Fund.
On a sector basis, the software and services segment experienced the most significant decline, making it the worst performer for the Fund. Over the years, the Fund has benefited from its software and services holdings, and the
segment’s growth outlook in the region still remains solid. Demand for various Internet services such as keyword search, casual and massively multiplayer online role-playing games (MMORPG), multimedia content and social networking sites also remains strong. Despite short-term volatility in share prices, we believe that the long-term growth potential of the Asian Internet sector remains attractive. The Fund added to core holdings in the sector where we saw good long-term investment opportunities. In this same period, the Fund also benefited from some exposure to pharma-ceutical companies in India, which can be defensive and outperform during volatile market environments.
The technology hardware and equipment sector was also hit by the difficult global macro environment during the period. The U.S. remains one of the most important markets for Asian technology equipment, and a slowdown in consumer demand in the U.S. remains a key concern for the sector. In response, we have
continued on page 35
FUNd oBJEcTIvE ANd STRATEgy SymBol: mATFx
objective: Long-term capital appreciation.
Strategy: under normal market conditions, the Matthews asian technology Fund seeks to achieve its investment objective by investing at least 80% of its total net assets, which include borrowings for investment purposes, in the common and preferred stocks of companies located in asia that derive greater than 50% of their revenues from the sale of products or services in technology-related industries and services. asia includes China, hong Kong, india, indonesia, Japan, Malaysia, Pakistan, Philippines, singapore, south Korea, taiwan, thailand and Vietnam.
Matthews considers technology-related industries and businesses to include, but not be limited to, the following: telecommunications, telecommunications equipment, computers, semiconductors, semiconductor capital equipment, networking, internet and online service companies, media, office automation, server hardware producers, software companies (e.g., design, consumer and industrial), biotechnology and medical device technology companies, pharma-ceuticals and companies involved in the distribution and servicing of these products.
poRTFolIo mANAgERS
Lead Manager: J. michael oh Co-Managers: mark W. Headley and lydia So

ALL DAtA IS AS oF DECEMbER 31, 2006, UNLESS otHERWISE NotED
800 .789 .asia [2742 ] www.mat thewsfunds .com ��
gRoWTH oF A $10,000 INvESTmENT SINcE FUNd INcEpTIoN
pERFoRmANcE AS oF JUNE 30, 2008
Fund Inception: 12/27/993 mo yTd
Average Annual Total Returns
1 yR 3 yRS 5 yRS SINcEINcEpTIoN
All performance quoted is past performance and is no guarantee of future results. assumes reinvestment of all dividends and/or distributions. unusually high returns may not be sustainable. investment return and principal value will fluctuate with changing market conditions so that shares, when redeemed, may be worth more or less than their original cost. Current performance may be lower or higher than the return figures quoted. Returns would have been lower if certain of the Fund’s fees and expenses had not been waived. For the Fund’s most recent month-end performance please call 800-789-asia [2742] or visit www.matthewsfunds.com.
Plotted monthly.the performance data and graph do not reflect the deduction of taxes that a shareholder would pay on dividends, capital gain distributions or redemption of Fund shares.
ALL DAtA IS AS oF JUNE 30, 2008, UNLESS otHERWISE NotED
Matthews asian technology Fund –6.94% –22.04% –13.48% 11.78% 17.25% –2.49%
MsCi/Matthews asian technology index 1 –2.32% –11.27% –7.50% 10.66% 12.13% –6.86% 2
Lipper Global science & technology Funds Category avg 3 1.87% –15.08% –10.36% 6.88% 8.37% –7.84% 2
FIScAl yEAR 2007 RATIoS
Gross Operating expense:4 1.25% Portfolio turnover:5 33.21%
1 the MsCi/Matthews asian technology index is a free float–adjusted market capitalization–weighted index of asian equities tracking a broad range of technology stocks including semiconductor equipment and products, communications equipment, computers and peripherals, electronic equipment and instruments, office electronics, software, it consulting and services, internet software and services, diversified telecommunications services, and wireless telecommunications services. it is not possible to invest directly in an index. source: index data from Morgan stanley Capital international; total return calculations performed by PnC.
2 Calculated from 12/31/99.3 Lipper, inc. fund performance does not reflect sales charges and is based on total return, including reinvestment of dividends and capital gains, for the stated periods.
4 Ratio has been restated to reflect current management and administrative and shareholder servicing fees expected to be incurred by the Funds and paid to the advisor. Matthews asian Funds do not charge 12b-1 fees.
5 the lesser of fiscal year 2007 long-term purchase costs or sales proceeds divided by the average monthly market value of long-term securities.
Matthews Asian Technology Fund ($8,070)MSCI/Matthews Asian Technology Index ($5,464)1,2
Lipper Global Science and Technology Funds Category Average ($5,165)2,3
$2,000
$4,000
$6,000
$8,000
$10,000
$12,000
$14,000
$0
20072006 2008200520042003200220012000

�4 Matthews asian Funds
MAttHEWS ASIAN tECHNoLoGy FUND
coUNTRy AllocATIoN
China/hong Kong 31.5%
Japan 23.2%
south Korea 16.6%
india 13.6%
taiwan 11.1%
thailand 1.8%
indonesia 1.6%
Malaysia 1.0%
Liabilities in excess of cashand other assets –0.4%
NUmBER oF SEcURITIES NAv FUNd ASSETS REdEmpTIoN FEE 12b-1 FEES
52 $7.64 $178.4 million2.00% within
90 calendar daysnone
SEcToR AllocATIoN
information technology 58.8%
Consumer discretionary 17.2%
telecommunication services 11.5%
health Care 5.1%
industrials 4.0%
Materials 3.8%
Liabilities in excess of cash and other assets –0.4%
mARKET cAp ExpoSURE2
Large cap (over $5 billion) 62.0%
Mid cap ($1–$5 billion) 23.6%
small cap (under $1 billion) 14.8%
Liabilities in excess of cashand other assets –0.4%
Top TEN HoldINgS 1
coUNTRy % oF NET ASSETS
nintendo Co., Ltd. Japan 4.4% Baidu.com, inc. China/hong Kong 4.4% tencent holdings, Ltd. China/hong Kong 4.2% nhn Corp. south Korea 4.2% samsung electronics Co., Ltd. south Korea 4.1% China Mobile, Ltd. China/hong Kong 3.8% sony Corp. Japan 2.9% new Oriental education & technology Group, inc. China/hong Kong 2.9% sina Corp. China/hong Kong 2.8% Bharti airtel, Ltd. india 2.7%
% oF ASSETS IN Top 10 36.4%
1 holdings may combine more than one security from same issuer and related depositary receipts.2 source: Factset Research systems. Percentage values in data are rounded to the nearest tenth of one percent; the values may not sum
to 100% due to rounding.

800 .789 .asia [2742 ] www.mat thewsfunds .com 35
ALL DAtA IS AS oF JUNE 30, 2008 UNLESS otHERWISE NotED
poRTFolIo mANAgER commENTARy continued from page 32
increased our focus on specialized components and manufacturers of specialty materials that may have less cyclical margin structures than other technology hardware manufacturers.
During the first half of 2008, the Fund’s Chinese and Indian technology holdings saw the biggest corrections. After strongly out-performing last year, these stocks had high valuations relative to other technology stocks in the region. Small-cap holdings in South Korea also underperformed the broader technology universe, hurt by a weak macro environment. These Korean small-cap firms were also impacted by the rapid depreciation of the Korean currency, the won. The Fund’s over-weight exposure to China, India and South Korea as well as its underweight in Japan and Taiwan hurt its performance relative to its benchmark during the period.
On a company basis, the Fund’s performance was helped most by China’s Tencent Holdings, which provides value-added services for the Internet as well as online advertising. Despite the overall weakness of the Internet sector, Shenzhen-based Tencent held up relatively better than specialized service providers due to its diverse exposure to various Internet services such as casual games, community-based por-tals, instant messenger services and other value-added Internet services. Kingdee International Software was the second-largest contributor to the Fund. Kingdee provides enterprise manage-ment and accounting solutions to small- to medium-sized companies in China.
The Fund’s worst performers were Mixi, Inc. in Japan and NHN in Korea. Mixi, Inc. is a social networking site in Japan that was hurt by slower-than-expected profit growth. Mixi, Inc. operates one of the largest social networking
sites in Japan and is popular among Japanese youth. The company continues to see its core asset—membership—grow, and we believe that its management should be able to find more ways to monetize its user base in the future. NHN, Korea’s largest Internet company providing search, casual games, e-commerce and news, was hurt by increasing regulatory risks involving its media business and slower-than-expected growth in the search business. We view these issues as short-term in nature and expect NHN to continue its growth in various Internet services, and believe it should maintain its dominant position in Korea.
Overall returns were strongest in Hong Kong and Thailand while China was the Fund’s worst-performing country. We took advantage of the short-term volatility in Chinese and Indian technology companies, to increase the portfolio’s weightings in some key holdings where we have seen good, long-term invest-ment opportunities. We also have added to leading consumer services companies in Korea and China. The Fund has continued to main-tain its overweight positions in China, India and Korea as well as its underweight positions in Japan and Taiwan.
Over the next six months, high energy prices, high inflation and a dampened U.S. consumer spending trend will remain key concerns for Asian technology industries. Despite short- term volatility in the technology sector and the overall equity market, we continue to look for long-term opportunities, and we believe the Fund is well positioned to capture growth from the increasing wealth of Asian con-sumers, and the rise of Asia’s leading global technology companies.

36 Matthews asian Funds
MAttHEWS ASIAN tECHNoLoGy FUND
ScHEdUlE oF INvESTmENTS a (UNAUDItED) commoN EQUITIES: 100.4%
SHARES vAlUE SHARES vAlUE
cHINA/HoNg KoNg: 31.5% Baidu.com, inc. adRb 24,800 $7,761,408 tencent holdings, Ltd. 973,000 7,546,406 China Mobile, Ltd. adR 101,500 6,795,425 new Oriental education & technology Group, inc. adRb 88,500 5,170,170 sina Corp.b 119,400 5,080,470 Ctrip.com international, Ltd. adR 102,000 4,669,560 Perfect world Co., Ltd. adRb 160,324 4,006,497 Mindray Medical international, Ltd. adR 85,000 3,172,200 China Communications services Corp., Ltd. h shares 3,892,000 2,838,952 Kingdee international software Group Co., Ltd. 13,080,000 2,691,676 Focus Media holding, Ltd. adRb 96,700 2,680,524 the9, Ltd. adRb 85,860 1,938,719 Lenovo Group, Ltd. 2,748,000 1,869,468
Total china/Hong Kong 56,221,475
JApAN: 23.2% nintendo Co., Ltd. 13,885 7,832,665 sony Corp. 120,200 5,252,418 nikon Corp. 129,000 3,766,068 Yahoo! Japan Corp. 9,361 3,605,640 nidec Corp. 43,300 2,882,997 sumco Corp. 129,400 2,863,775 nomura Research institute, Ltd. 113,000 2,649,809 toray industries, inc. 454,000 2,432,792 Mixi, inc.b 370 2,327,636 nitto denko Corp. 58,500 2,247,775 ibiden Co., Ltd. 53,700 1,952,084 Keyence Corp. 7,600 1,810,086 Fanuc, Ltd. 18,500 1,806,705
Total Japan 41,430,450
SoUTH KoREA: 16.6% nhn Corp.b 42,447 $7,405,552 samsung electronics Co., Ltd. 12,337 7,371,182 JVM Co., Ltd. 113,775 4,236,448 LG electronics, inc. 29,189 3,306,626 ssCP Co., Ltd.b 134,644 2,078,773 Cdnetworks Co., Ltd.b 138,265 1,526,658 On*Media Corp.b 431,150 1,506,480 sFa engineering Corp. 17,513 1,113,345 Megastudy Co., Ltd. 3,138 993,553
Total South Korea 29,538,617
INdIA: 13.6% Bharti airtel, Ltd.b 289,743 4,857,110 Glenmark Pharmaceuticals, Ltd. 251,680 3,724,455 Rolta india, Ltd. 584,443 3,341,615 infosys technologies, Ltd. 81,427 3,286,982 tata Consultancy services, Ltd. 150,408 3,000,120 info edge (india), Ltd. 106,177 2,350,577 sun Pharmaceutical industries, Ltd. 68,365 2,226,053 television eighteen india, Ltd. 281,976 1,434,620
Total India 24,221,532
TAIWAN: 11.1% Mediatek, inc. 394,970 4,554,393 hon hai Precision industry Co., Ltd. 885,261 4,360,245 taiwan semiconductor Manufacturing Co., Ltd. 1,769,930 3,790,250 synnex technology international Corp. 1,710,000 3,521,069 innoLux display Corp. 1,058,258 1,900,144 epistar Corp. 904,643 1,633,263
Total Taiwan 19,759,364
THAIlANd: 1.8% advanced info service
Public Co., Ltd. 1,131,100 3,129,258
Total Thailand 3,129,258

800 .789 .asia [2742 ] www.mat thewsfunds .com 37
JUNE 30, 2008
SHARES vAlUE
INdoNESIA: 1.6% Pt telekomunikasi indonesia adR 90,600 $2,921,850
Total Indonesia 2,921,850
mAlAySIA: 1.0% Media Prima Bhd 3,259,300 1,805,458
Total malaysia 1,805,458
ToTAl INvESTmENTS: 100.4% 179,028,004 (Cost $173,420,788c)
lIABIlITIES IN ExcESS oF cASH ANd oTHER ASSETS: –0.4% (658,535)
NET ASSETS: 100.0% $178,369,469
a Certain securities were fair valued under the discretion of the Board of trustees (note 1-a).
b non–income producing security
c Cost of investments is $173,420,788 and net unrealized appreciation consists of:
Gross unrealized appreciation . . . . . . . . . . . . . . . . . $30,688,685
Gross unrealized depreciation . . . . . . . . . . . . . . . . . (25,081,469)
net unrealized appreciation . . . . . . . . . . . . . . . . . . . $ 5,607,216
adR american depositary Receipt
see accompanying notes to financial statements.

MAttHEWS CHINA FUND
38 Matthews asian Funds
poRTFolIo mANAgER commENTARy
The Matthews China Fund ended the first six months of 2008 down –23.99%, while its benchmark, the MSCI China Index, fell –26.33%.
After a sharp decline in the first quarter, Chinese equities staged a strong rally in April, supported by early optimism that the global economy was hitting bottom, and by better-than-expected 2007 corporate earnings results. However, all April gains were wiped out in the following two months as the market refocused on record oil prices and China’s continued battle with inflation.
The first half of 2008 posed several challenges for China’s economy, stock markets and its people. As China prepared to celebrate its Lunar New Year holiday in late January, the country suffered its biggest snow storm in 50 years, affecting tens of millions of travelers. The country’s next crisis came when a devastating 7.9 magnitude earthquake struck western China in May, resulting in a tragic human toll of more than 55,000 dead. Although the overall economic impact from the two natural disasters was limited, some
short-term disruptions in economic activity and consumer behavior were seen. With respect to inflation, the central bank seems to have made some progress as food-driven infla-tion trended down from its peak level by the second quarter. However, China’s latest move to raise both fuel and electricity prices added some renewed pressure on overall inflation. In the stock markets, the domestic A share market’s sharp decline of about 55% from its peak levels in 2007 (the Fund does not invest in A shares) had a negative spillover effect on Chinese equities listed in Hong Kong.
The Fund seeks to invest where we identify new markets emerging. With the ongoing rise of China’s middle class many of these markets tend to be in the consumer and financial sectors. What we have seen and heard during recent visits to China have reaffirmed our view that rapid income growth has been generat-ing increasing consumer demands, and the momentum does not appear to be slowing. We also see banks and insurance companies continuing to improve efficiencies and expand into new business areas. We, therefore, continue to have overweight positions in these
continued on page 41
FUNd oBJEcTIvE ANd STRATEgy SymBol: mcHFx
objective: Long-term capital appreciation.
Strategy: under normal market conditions, the Matthews China Fund seeks to achieve its investment objective by investing at least 80% of its total net assets, which include borrowings for investment purposes, in the common and preferred stocks of companies located in China. China includes its political, administrative and other districts, such as hong Kong.
poRTFolIo mANAgERS
Lead Manager: Richard H. gao Co-Managers: mark W. Headley and Andrew T. Foster

ALL DAtA IS AS oF DECEMbER 31, 2006, UNLESS otHERWISE NotED
800 .789 .asia [2742 ] www.mat thewsfunds .com �9
ALL DAtA IS AS oF JUNE 30, 2008, UNLESS otHERWISE NotED
gRoWTH oF A $10,000 INvESTmENT SINcE FUNd INcEpTIoN
Plotted monthly.the performance data and graph do not reflect the deduction of taxes that a shareholder would pay on dividends, capital gain distributions or redemption of Fund shares.
pERFoRmANcE AS oF JUNE 30, 2008
Fund Inception: 2/19/983 mo yTd
Average Annual Total Returns
1 yR 3 yRS 5 yRS 10 yRS SINcEINcEpTIoN
All performance quoted is past performance and is no guarantee of future results. assumes reinvestment of all dividends and/or distributions. unusually high returns may not be sustainable. investment return and principal value will fluctuate with changing market conditions so that shares, when redeemed, may be worth more or less than their original cost. Current performance may be lower or higher than the return figures quoted. Returns would have been lower if certain of the Fund’s fees and expenses had not been waived. For the Fund’s most recent month-end performance please call 800-789-asia [2742] or visit www.matthewsfunds.com.
FIScAl yEAR 2007 RATIoS
Gross Operating expense:4 1.17% Portfolio turnover:5 22.13%
1 the MsCi China index is a free float–adjusted market capitalization–weighted index of Chinese equities that includes China-affiliated corporations and h shares listed on the hong Kong exchange, and B shares listed on the shanghai and shenzhen exchanges. source: index data from Morgan stanley Capital international; total return calculations performed by PnC.
2 Calculated from 2/28/98.3 Lipper, inc. fund performance does not reflect sales charges and is based on total return, including reinvestment of dividends and capital
gains, for the stated periods.4 Ratio has been restated to reflect current management and administrative and shareholder servicing fees expected to be incurred by
the Funds and paid to the advisor. Matthews asian Funds do not charge 12b-1 fees.5 the lesser of fiscal year 2007 long-term purchase costs or sales proceeds divided by the average monthly market value of long-term securities.
Matthews China Fund –1.98% –23.99% 0.15% 31.25% 28.01% 18.15% 13.65%
MsCi China index 1 –3.46% –26.33% 0.72% 36.59% 34.14% 8.81% 3.93% 2
Lipper China Region Funds Category average 3 –5.14% –25.36% –7.47% 25.86% 24.47% 15.82% 11.01% 2
Matthews China Fund ($37,629)MSCI China Index ($14,901)1,2
Lipper China Region Funds Category Average ($30,108)2,3
$0
$10,000
$20,000
$30,000
$40,000
$50,000
$60,000
20072006 200820052004200320022001200019991998

40 Matthews asian Funds
MAttHEWS CHINA FUND
cHINA ExpoSURE 2,3
saR (hong Kong) 37.4%
h share 30.3%
China-affiliated corporations 18.2%
Overseas Listed 9.7%
B share 4.1%
Cash and other assets, less liabilities 0.3%
NUmBER oF SEcURITIES NAv FUNd ASSETS REdEmpTIoN FEE 12b-1 FEES
64 $30.20 $1.3 billion2. 00% within
90 calendar daysnone
SEcToR AllocATIoN
Consumer discretionary 21.0%
Financials 18.4%
information technology 15.0%
industrials 12.4%
utilities 10.4%
energy 7.7%
telecommunication services 6.7%
Consumer staples 6.2%
Materials 1.9%
Cash and other assets, less liabilities 0.3%
mARKET cAp ExpoSURE3
Large cap (over $5 billion) 55.0%
Mid cap ($1–$5 billion) 33.9%
small cap (under $1 billion) 10.7%
Cash and other assets, less liabilities 0.3%
Top TEN HoldINgS 1
SEcToR % oF NET ASSETS
China Mobile, Ltd. telecommunication services 5.2% Cheung Kong infrastructure holdings, Ltd. utilities 3.4% CnOOC, Ltd. energy 3.4% sina Corp. information technology 3.3% hong Kong & China Gas Co., Ltd. utilities 3.3% China Vanke Co., Ltd. Financials 2.8% dongfeng Motor Group Co., Ltd. Consumer discretionary 2.6% Ping an insurance (Group) Co. of China, Ltd. Financials 2.6% nws holdings, Ltd. industrials 2.3% China high speed transmission equipment Group Co., Ltd. industrials 2.3%
% oF ASSETS IN Top 10 31.3%
1 holdings may combine more than one security from same issuer and related depositary receipts.2 saR (hong Kong) companies are companies that conduct business in hong Kong and/or mainland China. h shares are mainland China com-
panies listed on the hong Kong exchange but incorporated in mainland China. China-affiliated corporations, also known as “Red Chips,” are mainland China companies with partial state ownership listed and incorporated in hong Kong. Overseas Listed companies are companies that conduct business in mainland China but are listed in overseas markets such as Japan, singapore, taiwan and the united states. B shares are mainland Chinese companies listed on the shanghai and shenzhen stock exchanges, available to both Chinese and non-Chinese investors.
3 source: Factset Research systems. Percentage values in data are rounded to the nearest tenth of one percent; the values may not sum to 100% due to rounding.

800 .789 .asia [2742 ] www.mat thewsfunds .com 41
ALL DAtA IS AS oF JUNE 30, 2008, UNLESS otHERWISE NotED
poRTFolIo mANAgER commENTARy continued from page 38
areas. However, the Fund saw heavy selling pressure on most sectors in which it is invested. The consumer discretionary, industrials and financial sectors were again the worst-per-forming sectors in the second quarter after suffering the most sell-offs in the first quarter. The financial sector’s woes came mainly from the decline of the A share market. Consumer companies were hurt by the correction in the high-flying and high-valuation consumer discretionary sector.
The information technology sector has been a bright spot in the portfolio. Internet-related companies in the sector stood out as relatively strong performers during the period. Our holdings in this area include China’s top online gaming companies, the country’s most popular web portal, and the company that built China’s biggest online community. Internet-related firms still make up a high-growth segment in China, and these companies are all market leaders in their respective business segments.
During the first half of 2008, the Fund was fully invested and we made very few changes to the portfolio. The Fund continued to be oriented for domestic growth with diversified allocations to different sectors. During this volatile market environment the Fund showed its relative defensiveness as a result of our diversified approach, and stuck with quality companies in which we have long-term convic-tions. We did, however, sell Petro China, and in turn increased our position in CNOOC. Although Petro China is the country’s largest upstream oil explorer, it has not benefited from recent oil price spikes. Its upstream
profits have been offset by its downstream oil refining losses as the government has placed strict controls on downstream products. The Fund has also started a position in the online travel agency Ctrip International. Ctrip, which offers hotel and airline bookings, has secured its dominant position in this new and rapidly growing industry. In building up the portfolio’s consumer holdings, we have been looking not only at traditional consumer companies but also at companies that tap into new areas of consumption growth. Ctrip is one such company to create a niche new market, and it has been experiencing strong growth.
February 19, 2008 marked a decade since the Fund’s inception, and through the end of June it posted a 10-year average annual total return of 18.15%. Since the Fund’s launch, China has experienced the Asian financial crisis, the dotcom crash and the outbreak of a viral illness known as the severe acute respiratory syndrome (SARS), which all had devastating short-term effects on the Chinese economy. China is currently facing some challenging issues—among them are growing inflation-ary pressures and the challenge of balancing growth while controlling inflation—and we believe the stock market will likely be volatile in the near term. However, we are convinced that the long-term economic fundamentals remain solid and the domestic consumption growth story remains unchanged. As always, we try not to overreact to short-term market volatilities, and instead focus on holding quality stocks that will ride through tough times and stand out as winners in the end.

4� Matthews asian Funds
MAttHEWS CHINA FUND
ScHEdUlE oF INvESTmENTS a (UNAUDItED) commoN EQUITIES: cHINA/HoNg KoNg: 99.7%
SHARES vAlUE SHARES vAlUE
coNSUmER dIScRETIoNARy: 21.0%
Hotels, Restaurants & leisure: 4.0% Café de Coral holdings, Ltd. 12,784,100 $22,942,689 shangri-La asia, Ltd. 7,315,600 17,140,854 China travel international investment hK, Ltd. 38,412,000 10,411,845 Ctrip.com international, Ltd. adR 72,000 3,296,160 53,791,548
distributors: 3.0% China Resources enterprise, Ltd. 8,962,000 25,619,912 Li & Fung, Ltd. 5,001,200 15,090,910 40,710,822
media: 3.0% television Broadcasts, Ltd. 2,542,000 14,682,896 airMedia Group, inc. adRb 630,200 9,100,088 Clear Media, Ltd.b 10,128,000 8,829,342 Pico Far east holdings, Ltd. 49,062,000 7,468,505 40,080,831
Textiles, Apparel & luxury goods: 2.9% Ports design, Ltd. 7,813,500 22,407,780 Glorious sun enterprises, Ltd. 33,994,000 16,753,761 39,161,541
Automobiles: 2.6% dongfeng Motor Group Co.,
Ltd. h shares 86,208,000 34,535,507
diversified consumer Services: 1.8% new Oriental education &
technology Group, inc. adR b 411,800 24,057,356
Specialty Retail: 1.3% Belle international
holdings, Ltd. 20,036,000 18,077,939
multiline Retail: 1.2% Golden eagle Retail Group, Ltd. 17,277,000 16,824,976
leisure Equipment & products: 1.2% Li ning Co., Ltd. 6,686,500 15,495,267
Total consumer discretionary 282,735,787
FINANcIAlS: 18.4%
Real Estate management & development: 7.6% China Vanke Co., Ltd. B shares 29,628,448 $37,907,675 swire Pacific, Ltd. a shares 2,815,000 28,813,899 hang Lung Group, Ltd. 5,235,000 23,348,256 agile Property holdings, Ltd. 13,704,000 11,960,739 102,030,569
commercial Banks: 6.8% China Merchants Bank Co., Ltd. h shares 9,349,000 29,442,856 BOC hong Kong holdings, Ltd. 9,420,500 24,971,174 Bank of Communications Co., Ltd. h shares 16,264,000 19,109,174 China Construction Bank Corp.
h shares 22,953,000 18,521,255 92,044,459
Insurance: 4.0% Ping an insurance (Group) Co. of China, Ltd. h shares 4,619,500 34,428,923 China Life insurance Co.,
Ltd. h shares 5,508,000 19,189,515 53,618,438
Total Financials 247,693,466

800 .789 .asia [2742 ] www.mat thewsfunds .com 4�
JUNE 30, 2008
SHARES vAlUE SHARES vAlUE
INFoRmATIoN TEcHNology: 15.0%
Internet Software & Services: 6.8% sina Corp.b 1,051,300 $44,732,815 tencent holdings, Ltd. 3,159,000 24,500,614 netease.com, inc. adR b 997,000 21,724,630 90,958,059
computers & peripherals: 3.1% Lenovo Group, Ltd. 37,890,000 25,776,620 tPV technology, Ltd. 31,868,000 16,628,971 42,405,591
Software: 2.5% Kingdee international
software Group Co., Ltd.† 102,944,000 21,184,396 the9, Ltd. adR b 532,300 12,019,334 33,203,730
communications Equipment: 2.0% Zte Corp. h shares 5,538,120 26,650,298
IT Services: 0.6% travelsky technology,
Ltd. h shares 12,178,000 8,007,785
Total Information Technology 201,225,463
INdUSTRIAlS: 12.4%
Transportation Infrastructure: 4.0% GZi transport, Ltd. 36,765,000 17,716,800 China Merchants holdings international Co., Ltd. 3,732,581 14,446,191 Beijing Capital international airport Co., Ltd. h shares 13,332,000 11,122,758 COsCO Pacific, Ltd. 6,730,000 11,048,428 54,334,177
Industrial conglomerates: 2.3% nws holdings, Ltd. 12,021,276 31,391,907
Electrical Equipment: 2.3% China high speed transmission
equipment Group Co., Ltd. 14,850,000 30,477,740
construction & Engineering: 1.9% China Communications
Construction Co., Ltd. h shares 10,709,000 $18,359,122
China Railway Construction Corp., Ltd. h sharesb 4,802,000 6,774,439
25,133,561
machinery: 1.3% shanghai Zhenhua Port
Machinery Co., Ltd. B shares 11,989,906 17,360,101
Airlines: 0.6% air China, Ltd. h shares 16,937,900 8,367,815
Total Industrials 167,065,301
see footnotes on page 45.

44 Matthews asian Funds
MAttHEWS CHINA FUND
SHARES vAlUE SHARES vAlUE
UTIlITIES: 10.4%
Independent power producers & Energy Traders: 3.7%datang international Power Generation Co., Ltd. h shares 39,968,000 $23,755,127 huaneng Power international, inc. h shares 28,088,000 19,490,030 huaneng Power international,
inc. adR 213,400 5,900,510 49,145,667
Electric Utilities: 3.4% Cheung Kong infrastructure
holdings, Ltd. 10,955,500 46,420,673
gas Utilities: 3.3% hong Kong & China Gas
Co., Ltd. 18,733,594 44,577,826
Total Utilities 140,144,166
ENERgy: 7.7%
oil, gas & consumable Fuels: 6.0% CnOOC, Ltd. 26,595,000 46,166,570 China shenhua energy Co., Ltd. h shares 4,824,000 18,985,747 China Petroleum & Chemical Corp. (sinopec) h shares 16,242,000 15,181,711 80,334,028
Energy Equipment & Services: 1.7% China Oilfield services,
Ltd. h shares 12,740,000 22,953,077
Total Energy 103,287,105
TElEcommUNIcATIoN SERvIcES: 6.7%
Wireless Telecommunication Services: 5.2% China Mobile, Ltd. 3,503,583 $47,028,046 China Mobile, Ltd. adR 345,400 23,124,530 70,152,576
diversified Telecommunication Services: 1.5% China Communications services
Corp., Ltd. h shares 27,438,000 20,014,174
Total Telecommunication Services 90,166,750
coNSUmER STAplES: 6.2%
Food products: 4.0% China Yurun Food Group, Ltd. 17,085,000 28,105,366 tingyi (Cayman islands) holding Corp. 21,379,000 26,439,650 54,545,016
Food & Staples Retailing: 1.3% Lianhua supermarket holdings
Co.,Ltd. h shares † 13,648,000 17,519,239
Beverages: 0.9% tsingtao Brewery Co.,
Ltd. h shares 5,727,000 11,687,026
Total consumer Staples 83,751,281
mATERIAlS: 1.9%
construction materials: 1.3% China national Building
Material Co., Ltd. h shares 9,112,000 17,582,538
paper & Forest products: 0.6% nine dragons Paper
holdings, Ltd. 10,157,000 7,939,659
Total materials 25,522,197
ScHEdUlE oF INvESTmENTS a (UNAUDItED) (continued)
commoN EQUITIES: cHINA/HoNg KoNg (continued)

800 .789 .asia [2742 ] www.mat thewsfunds .com 45
JUNE 30, 2008
vAlUE
ToTAl INvESTmENTS: 99.7% $1,341,591,516 (Cost $1,209,259,927c)
cASH ANd oTHER ASSETS, lESS lIABIlITIES: 0.3% 4,449,342
NET ASSETS: 100.0% $1,346,040,858
a Certain securities were fair valued under the discretion of the Board of trustees (note 1-a).
b non–income producing security
c Cost of investments is $1,209,259,927 and net unrealized appreciation consists of:
Gross unrealized appreciation . . . . . . . . . . . . . . . . . $241,986,531
Gross unrealized depreciation . . . . . . . . . . . . . . . . . (109,654,942)
net unrealized appreciation . . . . . . . . . . . . . . . . . . . $132,331,589
† affiliated issuer, as defined under the investment Company act of 1940 (ownership of 5% or more of the outstanding voting securities of this issuer)
adR american depositary Receipt
see accompanying notes to financial statements.

MAttHEWS INDIA FUND
46 Matthews asian Funds
poRTFolIo mANAgER commENTARy
During the first half of 2008, the Matthews
India Fund declined –37.36%, while its
benchmark, the Bombay Stock Exchange 100
Index, fell –42.03%.
Indian shares suffered a sharp collapse during
the second quarter, buffeted by two intertwined
storms: inflation and record oil prices. We have
been concerned about the pace of inflation in
the country for some time now, dating back
to the Fund’s launch in October of 2005. We
had seemingly been wrong to harbor such
concerns: until the beginning of this year,
inflation had been remarkably quiescent. It is
not certain whether this was testament to the
growing efficiencies of the domestic economy
or, what may be more worrisome, the result of
faulty measurement (India does not measure
consumer price inflation at the national level).
Whatever the case, inflationary pressures
returned with a vengeance this year, with
wholesale prices currently rising in excess of
11% per annum. This has created a headwind
for stocks for dual reasons: first, corporate
profits must contend with rising prices on most
inputs, possibly squeezing margins; second,
and more importantly, the national central
bank, the Reserve Bank of India (RBI), has
been prompted to raise rates. India owes its
growth in recent years to many underlying
causes, not least a relatively benign interest
rate environment. However, the RBI is one
of the most independent and capable central
banks in all of Asia; and with pricing pressures
mounting again, we would expect the bank to
fight inflation doggedly, raising and holding
firm interest rates, as it has already done.
Indian markets have also suffered from higher
oil prices. For some time now, India’s govern-
ment has adopted a policy that subsidizes
energy prices for some domestic constituen-
cies—especially for cooking, heating and trans-
portation. However, India’s own hydrocarbon
resources are very limited; this has meant that
as global oil prices have risen, the fiscal deficit
arising from the subsidy policy has overshad-
owed the markets. India has famously suffered
from one of the largest fiscal deficits in the
world (measured relative to the size of the local
continued on page 49
FUNd oBJEcTIvE ANd STRATEgy SymBol: mINdx
objective: Long-term capital appreciation.
Strategy: under normal market conditions, the Matthews india Fund, a non-diversified fund, seeks to achieve its investment objective by investing at least 80% of its total net assets, which include borrowings for investment purposes, in publicly traded common stocks, preferred stocks and convertible securities of companies located in india.
poRTFolIo mANAgERS
Lead Manager: Andrew T. Foster Co-Manager: Sharat Shroff, cFA

ALL DAtA IS AS oF DECEMbER 31, 2006, UNLESS otHERWISE NotED
800 .789 .asia [2742 ] www.mat thewsfunds .com 47
gRoWTH oF A $10,000 INvESTmENT SINcE FUNd INcEpTIoN
Plotted monthly.the performance data and graph do not reflect the deduction of taxes that a shareholder would pay on dividends, capital gain distributions or redemption of Fund shares.
pERFoRmANcE AS oF JUNE 30, 2008
Fund Inception: 10/31/053 mo yTd
Average Annual Total Returns
1 yR SINcEINcEpTIoN
Matthews india Fund –18.69% –37.36% –13.05% 18.98%
Bombay stock exchange 100 index 1 –20.14% –42.03% –11.84% 25.35%
Lipper emerging Markets Funds Category average2 –1.05% –12.37% 2.55% 24.77%
All performance quoted is past performance and is no guarantee of future results. assumes reinvestment of all dividends and/or distributions. unusually high returns may not be sustainable. investment return and principal value will fluctuate with changing market conditions so that shares, when redeemed, may be worth more or less than their original cost. Current performance may be lower or higher than the return figures quoted. Returns would have been lower if certain of the Fund’s fees and expenses had not been waived. For the Fund’s most recent month-end performance please call 800-789-asia [2742] or visit www.matthewsfunds.com.
ALL DAtA IS AS oF JUNE 30, 2008, UNLESS otHERWISE NotED
FIScAl yEAR 2007 RATIoS
Gross Operating expense:3 1.28% Portfolio turnover:4 25.59%
1 the Bombay stock exchange 100 (Bse 100) index is a free float–adjusted market capitalization–weighted index of the 100 stocks listed on the Bombay stock exchange. it is not possible to invest in an index. source: index data from Bloomberg; total return calculations performed by PnC.
2 Lipper, inc. fund performance does not reflect sales charges and is based on total return, including reinvestment of dividends and capital gains, for the stated periods.
3 Ratio has been restated to reflect current management and administrative and shareholder servicing fees expected to be incurred by the Funds and paid to the advisor. Matthews asian Funds do not charge 12b-1 fees.
4 the lesser of fiscal year 2007 long-term purchase costs or sales proceeds divided by the average monthly market value of long-term securities.
Matthews India Fund ($15,885)Bombay Stock Exchange 100 Index ($18,261)1
Lipper Emerging Markets Funds Category Average ($18,090)2
$5,000
$10,000
$15,000
$20,000
$25,000
$30,000
$35,000
9/07 12/07 3/086/073/0712/069/066/063/0612/0510/05 6/08

48 Matthews asian Funds
MAttHEWS INDIA FUND
coUNTRy AllocATIoN
india 100.3%
Liabilities in excess of cash and other assets –0.3%
NUmBER oF SEcURITIES NAv FUNd ASSETS REdEmpTIoN FEE 12b-1 FEES
56 $15.31 $707.6 million2.00% within
90 calendar daysnone
SEcToR AllocATIoN
Financials 16.8%
information technology 15.4%
Consumer discretionary 13.6%
health Care 13.2%
industrials 13.0%
Consumer staples 9.7%
telecommunication services 7.4%
utilities 6.5%
energy 4.7%
Liabilities in excess of cash and other assets –0.3%
mARKET cAp ExpoSURE 2
Large cap (over $5 billion) 37.7%
Mid cap ($1–$5 billion) 28.9%
small cap (under $1 billion) 33.7%
Liabilities in excess of cash and other assets –0.3%
Top TEN HoldINgS 1
SEcToR % oF NET ASSETS
sun Pharmaceutical industries, Ltd. health Care 4.8% infosys technologies, Ltd. information technology 4.7% Glenmark Pharmaceuticals, Ltd. health Care 4.5% dabur india, Ltd. Consumer staples 4.5% Bharti airtel, Ltd. telecommunication services 4.4% hdFC Bank, Ltd. Financials 3.5% ashok Leyland, Ltd. industrials 3.0% Gail (india), Ltd. utilities 3.0% Reliance Communications, Ltd. telecommunication services 2.9% axis Bank, Ltd. Financials 2.8%
% oF ASSETS IN Top 10 38.1%
1 holdings may combine more than one security from same issuer and related depositary receipts.2 source: Factset Research systems. Percentage values in data are rounded to the nearest tenth of one percent; the values may not sum to
100% due to rounding.

800 .789 .asia [2742 ] www.mat thewsfunds .com 49
ALL DAtA IS AS oF JUNE 30, 2008, UNLESS otHERWISE NotED
poRTFolIo mANAgER commENTARy continued from page 46
economy). Unfortunately, even as tax revenues
have grown at record rates during the past few
years, government spending has not slowed,
meaning that the deficit is quite large even
before taking into account the impact of the
energy subsidy. Yet now as oil prices have
accelerated, the energy subsidy has begun
to dwarf nearly all other components of the
deficit. Consequently, global investors have
lost a measure of faith in the local currency, as
well as the country’s growth prospects. This in
turn has pushed India’s currency, the rupee,
and stock prices substantially lower.
Amid a very difficult six months, there was
little shelter in the marketplace. From the
portfolio’s perspective, the greatest positive
returns arose from its holdings in pharma-
ceuticals. Indian pharmaceutical companies
continue to make inroads to the global
marketplace, particularly as the cost of health
care around the world dictates that many
seek cheaper drug alternatives—which India
is well-suited to provide. Two of the Fund’s
best-performing positions during the first half,
Sun Pharmaceuticals and Glenmark Phar-
maceuticals, exemplify this idea. Both enjoyed
profits derived from the domestic marketplace,
but their performance during the quarter
was even more linked to the perception that
each has begun to successfully tap the global
market for generic drugs.
At present, nearly all of the Fund’s gains from
last year have been surrendered amid the
market’s broader decline. However, the Fund’s
emphasis continues to be to generate long-
term returns, rather than to beat a benchmark
in a given quarter. The Fund has offered a
modicum of relative outperformance, falling
less than the market as a whole. Notably, this
has been achieved without retreating to cash,
but rather via security selection and diver-
sification. Nevertheless, this sort of relative
outperformance is of little consolation to those
shareholders who have invested with the Fund
more recently.
It is in this regard we remain focused on
improving the Fund’s long-term record,
despite its losses in recent months. This
long-term perspective is important because,
as you will note, from its inception to the
present, the Fund has offered substantial
absolute gains, and has outpaced the S&P 500.
More importantly, even as India may stumble
from time to time, we remain enthusiastic
long-term investors in the country. We believe
that the economic evolution and mod-
ernization that has taken hold there is neither
transitory nor reversible. Volatility, often in
the extreme, is to be expected from such a
transition; yet we also believe that over the long
term, the inherent risks will be compensated
with commensurate reward.

50 Matthews asian Funds
MAttHEWS INDIA FUND
ScHEdUlE oF INvESTmENTS (UNAUDItED) commoN EQUITIES: INdIA: 98.3%
SHARES vAlUE SHARES vAlUE
FINANcIAlS: 16.8%
commercial Banks: 10.1% hdFC Bank, Ltd. 970,533 $22,724,345 axis Bank, Ltd. 1,424,200 20,028,175 Corporation Bank 3,159,331 19,168,933 Oriental Bank of Commerce 2,596,834 7,779,940 hdFC Bank, Ltd. adR 27,500 1,970,650 71,672,043
Thrifts & mortgage Finance: 1.9%housing development Finance Corp. 289,973 13,242,381
Real Estate management & development: 1.4%unitech, Ltd. 2,588,777 10,312,990
consumer Finance: 1.2%shriram transport Finance Co., Ltd. 1,280,000 8,557,629
diversified Financial Services: 1.1%sRei infrastructure Finance, Ltd. 3,750,000 7,791,981
capital markets: 1.1% iL&Fs investsmart, Ltd. 1,674,537 7,513,524
Total Financials 119,090,548
INFoRmATIoN TEcHNology: 15.4%
IT Services: 11.0% infosys technologies, Ltd. 717,591 28,967,160 Rolta india, Ltd. 2,833,990 16,203,638 wipro, Ltd. 1,397,435 14,289,402 hCL-infosystems, Ltd. 4,253,185 13,864,246 infosys technologies, Ltd. adR 104,500 4,541,570 77,866,016
Internet Software & Services: 2.2% info edge (india), Ltd. 566,727 12,546,368 sify technologies, Ltd. adRa 861,724 3,309,020 15,855,388
Software: 2.2% Financial technologies (india), Ltd. 399,855 15,623,852
Total Information Technology 109,345,256
coNSUmER dIScRETIoNARy: 13.6%
media: 5.6% sun tV network, Ltd. 1,500,091 $9,898,334 ht Media, Ltd. 3,777,688 8,714,365 Zee entertainment enterprises, Ltd. 1,618,908 7,525,429 television eighteen india, Ltd. 801,847 4,079,589 dish tV india, Ltd.a 4,737,097 3,308,536 PVR, Ltd. 879,751 3,297,149 inox Leisure, Ltd. 1,516,527 2,566,024 39,389,426
Automobiles: 2.1% Mahindra & Mahindra, Ltd. 1,302,500 14,789,922
multiline Retail: 1.8% Vishal Retail, Ltd.a 916,436 12,774,724
Hotels, Restaurants & leisure: 1.6% indian hotels Co., Ltd. 6,274,840 11,288,149
Auto components: 1.3% Bharat Forge, Ltd. 1,706,000 9,322,036
Textiles, Apparel & luxury goods: 1.2% titan industries, Ltd. 369,589 8,524,385
Total consumer discretionary 96,088,642
INdUSTRIAlS: 13.0%
machinery: 6.3% ashok Leyland, Ltd. 32,311,277 21,440,720 Jain irrigation systems, Ltd. 1,281,590 14,530,148 thermax, Ltd. 990,000 8,596,490 44,567,358
Building products: 2.2% sintex industries, Ltd.a 2,131,834 15,308,079
construction & Engineering: 1.9% Larsen & toubro, Ltd. 266,330 13,523,560
Industrial conglomerates: 1.4% MaX india, Ltd.a 2,303,102 8,318,467 siemens india, Ltd. 146,473 1,314,597 9,633,064

800 .789 .asia [2742 ] www.mat thewsfunds .com 51
JUNE 30, 2008
SHARES vAlUE SHARES vAlUE
Air Freight & logistics: 0.8% Gati, Ltd. 3,281,339 $5,594,101
Road & Rail: 0.4% Container Corp. of india, Ltd. 170,557 3,074,387
Total Industrials 91,700,549
HEAlTH cARE: 12.2%
pharmaceuticals: 12.2% sun Pharmaceutical industries, Ltd. 1,034,260 33,676,852 Glenmark Pharmaceuticals, Ltd. 2,163,570 32,017,316 Cipla, Ltd. 3,994,657 19,594,941 sun Pharma advanced
Research Co., Ltd.a 594,260 1,109,101
Total Health care 86,398,210
coNSUmER STAplES: 8.7%
personal products: 6.3% dabur india, Ltd. 17,324,779 31,830,884 Marico, Ltd. 10,555,233 13,100,510 44,931,394 Household products: 1.9% hindustan unilever, Ltd. 2,792,269 13,443,777
Beverages: 0.5% Radico Khaitan, Ltd. 1,542,000 3,386,845
Total consumer Staples 61,762,016
TElEcommUNIcATIoN SERvIcES: 7.4%
Wireless Telecommunication Services: 7.4% Bharti airtel, Ltd.a 1,864,191 31,250,384 Reliance Communications, Ltd. 2,024,755 20,838,152
Total Telecommunication Services 52,088,536
UTIlITIES: 6.5%
gas Utilities: 4.3% Gail (india), Ltd. 2,756,501 21,344,063 Gujarat state Petronet, Ltd. 7,075,000 9,167,490 30,511,553 Electric Utilities: 2.2% CesC, Ltd. 1,666,117 15,234,176
Total Utilities 45,745,729
ENERgy: 4.7%
oil, gas & consumable Fuels: 4.7% Reliance industries, Ltd. 339,371 $16,526,046 Chennai Petroleum Corp., Ltd. 2,652,744 16,520,692
Total Energy 33,046,738
ToTAl commoN EQUITIES: INdIA 695,266,224 (Cost $707,438,481)
INTERNATIoNAl dollAR BoNdS: 2.0%
FAcE AmoUNT vAlUE
HEAlTH cARE: 1.0%
pharmaceuticals: 1.0% Ranbaxy Laboratories, Ltd., Cnv.
0.000%, 03/18/11 $6,500,000 7,353,125
Total Health care 7,353,125
coNSUmER STAplES: 1.0%
Beverages: 1.0% Radico Khaitan, Ltd., Cnv.
3.500%, 07/27/11 7,000,000 7,035,000
Total consumer Staples 7,035,000
ToTAl INTERNATIoNAl dollAR BoNdS 14,388,125 (Cost $15,641,444)
ToTAl INvESTmENTS: 100.3% 709,654,349 (Cost $723,079,925b)
lIABIlITIES IN ExcESS oF cASH ANd oTHER ASSETS: –0.3% (2,047,828)
NET ASSETS: 100.0% $707,606,521
a non–income producing security
b Cost of investments is $723,079,925 and net unrealized depreciation consists of:
Gross unrealized appreciation . . . . . . . . . . . . . . . . . $106,382,208
Gross unrealized depreciation . . . . . . . . . . . . . . . . . (119,807,784)
net unrealized depreciation . . . . . . . . . . . . . . . . . . . $(13,425,576)
adR american depositary Receipt
Cnv. Convertible
see accompanying notes to financial statements.

MAttHEWS JApAN FUND
52 Matthews asian Funds
poRTFolIo mANAgER commENTARy
During the first half of 2008, the Matthews
Japan Fund was down –7.29%, while its
benchmark, the MSCI Japan Index, fell
–5.46%. In the same period, the Tokyo Stock
Price Index declined –4.07%.
During the first half of 2008, Japan’s economy
grew due to strong export demand from Asia,
Europe and the Middle East. In this sense, it
is safe to say that Japan is less dependent on
the U.S. than it once was. However, a healthy
U.S. economy is still a requisite for a healthy
global economy. When the U.S. economy
does recover, we believe, Japan should also
benefit. During the second half of 2008, we
believe that inflation will pose an even bigger
issue for Japanese companies, as we expect
companies will have a tough time transferring
higher costs to customers. However, inflation
tends to put upward pressure on wage growth,
which should be positive for Japan’s domestic
demand. We believe this should discourage the
Bank of Japan from cutting its current 0.5%
key policy rate.
During the second quarter of 2008, the Fund
fell –3.23%, while the MSCI Japan Index
rose 2.48%, and the Tokyo Stock Price Index
gained 2.42%. After hitting a low in the middle
of March, the Japanese market rallied in April
and May, led by foreign buying of large-cap
firms as is typically the case in major rallies.
After a long absence from the Japanese market,
foreign investors returned mainly to cover
short-selling, and continued buying throughout
the second quarter—a major factor behind the
market’s relatively strong performance during
this period.
The Fund’s concentration in small- and
medium-cap firms held back performance
during the market’s surge. More specifically,
the rally in Japan’s financial sector was led by
the country’s top three mega-banks: Mitsubishi
UFJ, Mizuho and Sumitomo Mitsui financial
groups. Our exposure in the Japanese merg-
ers and acquisitions, wealth management
and real estate industries also suffered in part
because of lackluster retail investment activity
stemming from a battered global economy.
FUNd oBJEcTIvE ANd STRATEgy SymBol: mJFox
objective: Long-term capital appreciation.
Strategy: under normal market conditions, the Matthews Japan Fund seeks to achieve its investment objective by investing at least 80% of its total net assets, which include borrowings for investment purposes, in the common and preferred stocks of companies located in Japan.
poRTFolIo mANAgER
Lead Manager: Taizo Ishida
continued on page 55

ALL DAtA IS AS oF DECEMbER 31, 2006, UNLESS otHERWISE NotED
800 .789 .asia [2742 ] www.mat thewsfunds .com 53
gRoWTH oF A $10,000 INvESTmENT SINcE FUNd INcEpTIoN
pERFoRmANcE AS oF JUNE 30, 2008
Fund Inception: 12/31/983 mo yTd
Average Annual Total Returns
1 yR 3 yRS 5 yRS SINcEINcEpTIoN
Matthews Japan Fund –3.23% –7.29% –15.49% –2.45% 9.72% 5.39%
MsCi Japan index 1 2.48% –5.46% –11.93% 8.72% 13.14% 3.71%
tokyo stock Price index (tOPiX ) 2 2.42% –4.07% –12.38% 6.59% 11.75% 3.91%
Lipper Japanese Funds Category average 3 1.33% –7.50% –16.97% 4.40% 10.24% 3.77%
All performance quoted is past performance and is no guarantee of future results. assumes reinvestment of all dividends and/or distributions. unusually high returns may not be sustainable. investment return and principal value will fluctuate with changing market conditions so that shares, when redeemed, may be worth more or less than their original cost. Current performance may be lower or higher than the return figures quoted. Returns would have been lower if certain of the Fund’s fees and expenses had not been waived. For the Fund’s most recent month-end performance please call 800-789-asia [2742] or visit www.matthewsfunds.com.
Plotted monthly.the performance data and graph do not reflect the deduction of taxes that a shareholder would pay on dividends, capital gain distributions or redemption of Fund shares.
ALL DAtA IS AS oF JUNE 30, 2008, UNLESS otHERWISE NotED
FIScAl yEAR 2007 RATIoS
Gross Operating expense:4 1.23% Portfolio turnover:5 45.51%
1 the MsCi Japan index is a free float–adjusted market capitalization–weighted index of Japanese equities listed in Japan. it is not possible to invest in an index. source: index data from Morgan stanley Capital international; total return calculations performed by PnC.
2 the tokyo stock Price index (tOPiX) is a market capitalization–weighted index of all companies listed on the First section of the tokyo stock exchange. it is not possible to invest in an index. source: index data from Bloomberg; total return calculations performed by PnC.
3 Lipper, inc. fund performance does not reflect sales charges and is based on total return, including reinvestment of dividends and capital gains, for the stated periods.
4 Ratio has been restated to reflect current management and administrative and shareholder servicing fees expected to be incurred by the Funds and paid to the advisor. Matthews asian Funds do not charge 12b-1 fees.
5 the lesser of fiscal year 2007 long-term purchase costs or sales proceeds divided by the average monthly market value of long-term securities.
Matthews Japan Fund ($16,469)MSCI Japan Index ($14,136)1
Tokyo Stock Price Index (TOPIX) ($14,391)2
Lipper Japanese Funds Category Average ($14,593)3
$5,000
$10,000
$15,000
$20,000
$25,000
$30,000
20072006 20082005200420032002200120001999

54 Matthews asian Funds
MAttHEWS JApAN FUND
coUNTRy AllocATIoN
Japan 99.7%
Cash and other assets, less liabilities 0.3%
NUmBER oF SEcURITIES NAv FUNd ASSETS REdEmpTIoN FEE 12b-1 FEES
71 $13.49 $200.6 million2.00% within
90 calendar daysnone
mARKET cAp ExpoSURE2
Large cap (over $5 billion) 55.4%
Mid cap ($1–$5 billion) 22.7%
small cap (under $1 billion) 21.5%
Cash and other assets, less liabilities 0.3%
Top TEN HoldINgS 1
SEcToR % oF NET ASSETS
nintendo Co., Ltd. information technology 3.4% toyota Motor Corp. Consumer discretionary 3.3% sony Corp. Consumer discretionary 3.0% Pigeon Corp. Consumer staples 3.0% Mitsubishi uFJ Financial Group, inc. Financials 2.7% unicharm Petcare Corp. Consumer staples 2.4% the sumitomo trust & Banking Co., Ltd. Financials 2.2% sysmex Corp. health Care 2.2% Benesse Corp. Consumer discretionary 2.1% Keyence Corp. information technology 2.1%
% oF ASSETS IN Top 10 26.4%
1 holdings may combine more than one security from same issuer and related depositary receipts.2 source: Factset Research systems. Percentage values in data are rounded to the nearest tenth of one percent; the values may not sum
to 100% due to rounding.
SEcToR AllocATIoN
Financials 26.9%
information technology 19.9%
Consumer discretionary 17.6%
industrials 16.7%
health Care 6.9%
Consumer staples 6.4%
Materials 3.0%
energy 1.8%
telecommunication services 0.5%
Cash and other assets, less liabilities 0.3%

800 .789 .asia [2742 ] www.mat thewsfunds .com 55
ALL DAtA IS AS oF JUNE 30, 2008, UNLESS otHERWISE NotED
Contributing to the continued weakness in the
small-cap arena was the dearth of Japanese
retail investors in so-called emerging new
markets, such as the Tokyo Stock Exchange’s
Mothers market (Market of the High-Growth
and Emerging Stocks) and the Osaka Hercules
exchange.
Three sectors that helped the Fund’s perform-
ance during the first half of the year were
consumer staples, industrials and energy. Some
of these companies offer exposure in con-
sumer businesses we expect should grow, such
as the Japanese pet care business and China’s
baby care industry. The Fund also added hold-
ings in the industrials sector, which have been
positive for performance. The decision to add
them was triggered by attractive valuations
and global leadership in each sub-segment.
Our holdings in the energy sector also served
the Fund well as a result of rising oil prices.
As for Japan’s domestic political landscape, a
general election is likely to take place by the
end of this fiscal year. With Japanese Prime
Minister Yasuo Fukuda’s approval rating
at a historic low, the market may welcome
change. Company earnings should remain
relatively healthy, provided there are no
drastic changes in the exchange rate as most
companies already discounted a strengthened
yen in March, at the end of the fiscal year for
Japanese firms.
Finally, we are seeing some progress in
Japan’s corporate governance. While this
year’s annual shareholder meetings in June
did not reveal ground-breaking progress, we
did note dramatically increased pressure from
domestic shareholders for higher returns.
Japanese companies are well-aware of greater
expectations from shareholders, and have
raised dividend payout ratios to almost 30%
of earnings in the last fiscal year-end, along
with increasing share buybacks, which
accounted for about 20% of earnings.
Overall, we are cautiously optimistic about
the Japanese equity market going forward,
with an eye on the long-term growth pros-
pects for each holding in the portfolio.
poRTFolIo mANAgER commENTARy continued from page 52

56 Matthews asian Funds
MAttHEWS JApAN FUND
ScHEdUlE oF INvESTmENTS (UNAUDItED) commoN EQUITIES: JApAN: 99.7%
SHARES vAlUE SHARES vAlUE
FINANcIAlS: 26.9%
commercial Banks: 7.3% the sumitomo trust & Banking Co., Ltd. 632,000 $4,416,292 Mitsubishi uFJ Financial Group, inc. 471,930 4,182,193 the Chiba Bank, Ltd. 338,000 2,368,244 the Joyo Bank, Ltd. 462,000 2,245,063 Mitsubishi uFJ Financial Group, inc. adR 150,400 1,323,520 14,535,312
Real Estate management & development: 6.4% daibiru Corp. 309,800 3,439,791 Funai Zaisan Consultants Co., Ltd. 2,409 3,221,528 sumitomo Realty & development Co., Ltd. 127,000 2,523,614 Mitsubishi estate Co., Ltd. 88,000 2,013,844 shoei Co., Ltd. 113,080 1,324,778 JOint Corp. 75,100 376,260 12,899,815
capital markets: 5.1% GCa savvian Group Corp. 1,141 3,965,052 ichiyoshi securities Co., Ltd. 369,200 3,383,073 Monex Group, inc. 4,240 2,882,968 10,231,093
Real Estate Investment Trusts: 4.4% tokyu Reit, inc. 304 2,470,707 nomura Real estate Office Fund, inc., Reit 233 1,753,232 Japan Logistics Fund, inc., Reit 267 1,734,991 Global One Real estate investment Corp., Reit 143 1,616,047 united urban investment Corp., Reit 273 1,228,931 8,803,908
consumer Finance: 2.0% ORiX Corp. 28,250 4,041,225
Insurance: 1.7% the Fuji Fire & Marine
insurance Co., Ltd. 1,302,000 3,470,038
Total Financials 53,981,391
INFoRmATIoN TEcHNology: 19.9%
Electronic Equipment & Instruments: 7.7% Keyence Corp. 17,870 $4,256,084 nidec Corp. 57,200 3,808,485 Murata Manufacturing Co., Ltd. 55,000 2,589,820 topcon Corp. 263,700 2,498,302 hoya Corp. 95,500 2,207,962 15,360,653
Software: 3.4% nintendo Co., Ltd. 12,215 6,890,601
Internet Software & Services: 2.5% Yahoo! Japan Corp. 7,680 2,958,158 Gourmet navigator, inc. 935 1,937,185 4,895,343 office Electronics: 2.0% Canon, inc. adR 79,450 4,068,635
IT Services: 1.9% nomura Research institute, Ltd. 164,600 3,859,811
computers & peripherals: 1.3% Melco holdings, inc. 130,500 2,562,438
Semiconductors & Semiconductor Equipment: 1.1% sumco Corp. 100,800 2,230,824
Total Information Technology 39,868,305
coNSUmER dIScRETIoNARy: 17.6%
Household durables: 6.3% sekisui house, Ltd. 438,000 4,087,753 sony Corp. adR 75,900 3,319,866 sony Corp. 62,700 2,739,822 Matsushita electric industrial Co., Ltd. 121,000 2,609,502 12,756,943
Automobiles: 4.7% toyota Motor Corp. adR 53,100 4,991,400 honda Motor Co., Ltd. adR 81,200 2,763,236 toyota Motor Corp. 34,600 1,632,490 9,387,126
Hotels, Restaurants & leisure: 2.8% Pacific Golf Group international holdings KK 3,478 3,471,940 doutor nichires holdings Co., Ltd. 136,300 2,076,879 5,548,819

800 .789 .asia [2742 ] www.mat thewsfunds .com 57
JUNE 30, 2008
SHARES vAlUE SHARES vAlUE
diversified consumer Services: 2.1% Benesse Corp. 105,700 $4,280,360
Specialty Retail: 1.7% nitori Co., Ltd. 66,100 3,398,842
Total consumer discretionary 35,372,090
INdUSTRIAlS: 16.7%
machinery: 10.4% Fanuc, Ltd. 40,000 3,906,390 Mitsubishi heavy industries, Ltd. 777,000 3,702,613 nGK insulators, Ltd. 180,000 3,500,494 Komatsu, Ltd. 95,600 2,664,934 OsG Corp. 205,100 2,317,842 takeuchi Manufacturing Co., Ltd. 81,400 1,996,958 OKuMa Corp. 183,000 1,818,195 aichi Corp. 142,300 989,004 20,896,430
commercial Services & Supplies: 1.6% daiseki Co., Ltd. 65,890 2,097,360 secom Co., Ltd. 22,300 1,083,656 3,181,016
Trading companies & distributors: 1.4% Mitsubishi Corp. 87,000 2,867,637
Airlines: 1.2% Japan airlines Corp.a 1,101,000 2,312,219
Road & Rail: 1.1% east Japan Railway Co. 267 2,175,025
construction & Engineering: 1.0% JGC Corp. 105,000 2,066,676
Total Industrials 33,499,003
HEAlTH cARE: 6.9%
Health care Equipment & Supplies: 5.4% sysmex Corp. 111,300 4,381,353 nakanishi, inc. 28,300 3,048,943 terumo Corp. 54,000 2,756,322 asahi inteCC Co., Ltd. 88,400 590,249 10,776,867 pharmaceuticals: 1.5% takeda Pharmaceutical Co., Ltd. 60,400 3,071,620
Total Health care 13,848,487
coNSUmER STAplES: 6.4%
Household products: 3.0% Pigeon Corp. 296,500 $5,961,553
Food products: 2.4% unicharm Petcare Corp. 163,600 4,884,042
personal products: 1.0% shiseido Co., Ltd. 87,000 1,990,959
Total consumer Staples 12,836,554
mATERIAlS: 3.0%
chemicals: 3.0% toray industries, inc. 488,000 2,614,983 nitto denko Corp. 50,100 1,925,018 OhaRa, inc. 76,300 1,362,385
Total materials 5,902,386
ENERgy: 1.8%
oil, gas & consumable Fuels: 1.8% inpex holdings, inc. 278 3,508,217
Total Energy 3,508,217
TElEcommUNIcATIoN SERvIcES: 0.5%
Wireless Telecommunication Services: 0.5% Kddi Corp. 177 1,093,488
Total Telecommunication Services 1,093,488
ToTAl INvESTmENTS: 99.7% 199,909,921 (Cost $223,734,885b)
cASH ANd oTHER ASSETS, lESS lIABIlITIES: 0.3% 694,348
NET ASSETS: 100.0% $200,604,269
a non–income producing security b Cost of investments is $223,734,885 and net unrealized depreciation
consists of: Gross unrealized appreciation . . . . . . . . . . . . . . . . . $11,657,290 Gross unrealized depreciation . . . . . . . . . . . . . . . . . (35,482,254) net unrealized depreciation . . . . . . . . . . . . . . . . . . . $(23,824,964)adR american depositary Receipt Reit Real estate investment trust see accompanying notes to financial statements.

MAttHEWS KoREA FUND
58 Matthews asian Funds
poRTFolIo mANAgER commENTARy
For the six months ending June 30, 2008, the Matthews Korea Fund lost –24.09%, while its benchmark, the Korea Composite Stock Price Index (KOSPI), declined –21.12%.
The Korean equity market faced various obstacles during this period, including a weak-ened currency, high inflation and dampened consumer sentiment. A weak currency is gener-ally positive for exports, and as the Korean won has fallen against the U.S. dollar, Korean exports have remained strong. Auto-related sales were up 9.2% for the first half of the year, compared to a year ago. However, a steep cur-rency depreciation does more harm than good to the economy, particularly in light of high energy costs. South Korea’s recent challenges have also involved falling currency reserves and rising short-term foreign currency debt. Inflation has negatively impacted domestic consumption, which is already at a low. Foreign investors continued to sell Korean equities during the first half of the year, and foreign ownership in KOSPI-listed securities fell to a low not seen since about 2001. The combined effects of a weaker won and record oil prices kept South Korea’s current account balance—the country’s broadest measure of trade—at a deficit for the first six months of the year.
Hopes for positive change were high with the late-February inauguration of President Lee Myung Bak, a former chairman of Hyundai who was welcomed by Korea’s business com-munity. President Lee pledged to cut taxes and speed up deregulations to encourage invest-ment and boost economic growth. But just months after taking office, Lee’s administration met with backlash over a U.S. beef trade deal that the public felt could expose them to mad cow disease. Following extensive public protests in May, President Lee amended the import deal, publicly apologized for not being more sensitive to concerns and reshuffled his cabinet. Despite his efforts, however, the beef issue remains largely unresolved and demonstrations continued into June.
The second quarter did, however, see some notable progress with South Korea’s neighbors to the North. In June, North Korea made a gesture toward dismantling its nuclear program by demolishing a cooling tower at its main nuclear reactor. The action was welcomed by nations involved in multilateral talks with North Korea. In particular, the U.S. govern-ment said that it would lift some economic sanctions against the isolated country, and remove it from a U.S. State Department list of
continued on page 61
FUNd oBJEcTIvE ANd STRATEgy SymBol: mAKox
objective: Long-term capital appreciation.
Strategy: under normal market conditions, the Matthews Korea Fund, a non-diversified fund, seeks to achieve its investment objective by investing at least 80% of its total net assets, which include borrowings for investment purposes, in the common and preferred stocks of companies located in south Korea.
poRTFolIo mANAgER
Lead Manager: J. michael oh Co-Managers: mark W. Headley and michael B. Han, cFA

ALL DAtA IS AS oF DECEMbER 31, 2006, UNLESS otHERWISE NotED
800 .789 .asia [2742 ] www.mat thewsfunds .com 59
gRoWTH oF A $10,000 INvESTmENT SINcE FUNd INcEpTIoN
pERFoRmANcE AS oF JUNE 30, 2008
Fund Inception: 1/3/953 mo yTd
Average Annual Total Returns
1 yR 3 yRS 5 yRS 10 yRS SINcEINcEpTIoN
All performance quoted is past performance and is no guarantee of future results. assumes reinvestment of all dividends and/or distributions. unusually high returns may not be sustainable. investment return and principal value will fluctuate with changing market conditions so that shares, when redeemed, may be worth more or less than their original cost. Current performance may be lower or higher than the return figures quoted. Returns would have been lower if certain of the Fund’s fees and expenses had not been waived. For the Fund’s most recent month-end performance please call 800-789-asia [2742] or visit www.matthewsfunds.com.
Plotted monthly.the performance data and graph do not reflect the deduction of taxes that a shareholder would pay on dividends, capital gain distributions or redemption of Fund shares.
ALL DAtA IS AS oF JUNE 30, 2008, UNLESS otHERWISE NotED
Matthews Korea Fund –9.12% –24.09% –20.01% 13.23% 19.30% 25.73% 5.24%
Korea Composite stock Price index (KOsPi) 1 –6.98% –21.12% –14.08% 18.69% 23.87% 22.73% 2.11% 2
Lipper Pacific ex-Japan Funds Category average 3 –6.40% –19.67% –5.93% 19.41% 22.62% 14.78% 7.52% 2
FIScAl yEAR 2007 RATIoS
Gross Operating expense:4 1.21% Portfolio turnover:5 24.20%
1 the Korea Composite stock Price index (KOsPi) is a market–capitalization weighted index of all common stocks listed on the Korea stock exchange. it is not possible to invest in an index. source: index data from Bloomberg; total return calculations performed by PnC.
2 Calculated from 12/31/94.3 Lipper, inc. fund performance does not reflect sales charges and is based on total return, including reinvestment of dividends and capital
gains, for the stated periods.4 Ratio has been restated to reflect current management and administrative and shareholder servicing fees expected to be incurred by
the Funds and paid to the advisor. Matthews asian Funds do not charge 12b-1 fees.5 the lesser of fiscal year 2007 long-term purchase costs or sales proceeds divided by the average monthly market value of long-term securities.
Matthews Korea Fund ($19,912)Korea Composite Stock Price Index (KOSPI) ($13,260)1,2
Lipper Pacific ex-Japan Funds Category Average ($27,760)2,3
$0
$5,000
$10,000
$15,000
$20,000
$25,000
$30,000
$35,000
$40,000
2007 2008200620052004200320022001200019991998199719961995

60 Matthews asian Funds
MAttHEWS KoREA FUND
coUNTRy AllocATIoN
south Korea 100.3%
Liabilities in excess of cashand other assets –0.3%
NUmBER oF SEcURITIES NAv FUNd ASSETS REdEmpTIoN FEE 12b-1 FEES
50 $4.98 $160.4 million2.00% within
90 calendar daysnone
SEcToR AllocATIoN
Financials 22.5%
information technology 15.0%
industrials 14.9%
Consumer discretionary 13.2%
Consumer staples 12.2%
health Care 10.0%
telecommunication services 4.9%
Materials 4.5%
energy 3.1%
Liabilities in excess of cashand other assets –0.3%
mARKET cAp ExpoSURE 2
Large cap (over $5 billion) 45.8%
Mid cap ($1–$5 billion) 33.9%
small cap (under $1 billion) 20.6%
Liabilities in excess of cashand other assets –0.3%
Top TEN HoldINgS 1
SEcToR % oF NET ASSETS
samsung electronics Co., Ltd. information technology 8.5% samsung Fire & Marine insurance Co., Ltd. Financials 4.4% nhn Corp. information technology 4.3% s1 Corp. industrials 4.3% shinhan Financial Group Co., Ltd. Financials 4.2% Kookmin Bank Financials 3.7% amorepacific Corp. Consumer staples 3.5% sK telecom Co., Ltd. telecommunication services 3.5% Yuhan Corp. health Care 3.4% hanmi Pharmaceutical Co., Ltd. health Care 3.4%
% oF ASSETS IN Top 10 43.2%
1 holdings may combine more than one security from same issuer and related depositary receipts.2 source: Factset Research systems. Percentage values in data are rounded to the nearest tenth of one percent; the values may not sum
to 100% due to rounding.

800 .789 .asia [2742 ] www.mat thewsfunds .com 61
ALL DAtA IS AS oF JUNE 30, 2008, UNLESS otHERWISE NotED
poRTFolIo mANAgER commENTARy continued from page 58
state-sponsored terrorism. The moves seem to be encouraging steps that could signal greater regional cooperation.
During the second quarter of the year, the Fund trailed its benchmark primarily due to its positions in financials, particularly in brokerage firms, as well as in consumer sectors. The weak equity market and an increase in the number of new brokerage licenses continued to dampen the outlook for the brokerage industry. Additionally, weak domestic consumer senti-ment and slow growth in real disposable incomes hurt the consumer sector. The Fund’s small-cap exposure also detracted from per-formance during the first half of the year. Small-cap companies are typically more vola-tile than large-cap companies, and premiums enjoyed by small-cap firms were eroded during the period’s weak equity environment. Additionally, some small-cap companies suf-fered currency woes as most did not anticipate the won’s rapid depreciation. However, we remain committed to these firms and their long-term prospects.
On a company basis, the biggest contribu-tion to Fund performance came from LG Electronics, which benefited from stronger-than-expected mobile phone sales, and diverse exposure to emerging markets. LG has been a pioneer in emerging markets, such as China and India, and currently dominates market share in the appliances segment of several of these markets. During the first half of the year, Samsung Electronics also held up well, benefiting from the expected recovery of the memory chip industry and market share gains in the mobile phone handset market, especially in the U.S. Generally, large-cap companies
fared better than small- to mid-cap companies during the downturn.
The Fund’s worst performers during the period were Samsung Securities and Kiwoom Securities, which faced intensifying competi-tion in the domestic brokerage business. The overall profitability of the industry declined as competition to attract new clients intensified amid the weak market environment. Though the financial sector has suffered from an unclear regulatory environment, intensifying competition and subdued domestic sentiment, it still holds one of the most attractive valua-tions in the region, particularly in banks and brokerage firms. We believe that our financial holdings in the Fund are well-positioned to benefit once the sector recovers from currently unfavorable conditions.
In recent years, the Korean equity market has been led by segments of the industrials sector. This has been due in part to limited supply capacity and increasing demand from emerging countries. While the margin expansion of some industrial companies has been impressive, it is hard to believe that the current margins are sustainable in the long term, especially given increasing capacity within the emerging countries. We have evaluated long-term investment opportunities within the industrials sector, especially in the components and specialized parts industries, but the Fund continues to underweight indus-trials compared to its benchmark. The Fund continues to maintain overweight positions in the consumer, financials and information technology sectors. We believe that in the long term, these sectors will create sustainable value and returns for shareholders.

62 Matthews asian Funds
MAttHEWS KoREA FUND
ScHEdUlE oF INvESTmENTS (UNAUDItED) commoN EQUITIES: SoUTH KoREA: 99.4%
SHARES vAlUE SHARES vAlUE
FINANcIAlS: 22.5%
commercial Banks: 11.0% shinhan Financial Group Co., Ltd. 148,937 $6,734,592 Kookmin Bank 86,782 5,127,028 hana Financial Group, inc. 128,022 4,926,041 Kookmin Bank adR 13,839 809,720 17,597,381
Insurance: 6.4% samsung Fire & Marine insurance Co., Ltd. 33,909 7,082,947 Meritz Fire & Marine insurance Co., Ltd. 330,960 3,195,541 10,278,488
capital markets: 5.1% samsung securities Co., Ltd. 63,790 3,982,111 Kiwoom securities Co., Ltd. 81,319 2,915,216 Korea investment holdings Co., Ltd. 34,232 1,369,542 8,266,869
Total Financials 36,142,738
INFoRmATIoN TEcHNology: 15.0%
Semiconductors & Semiconductor Equipment: 8.5% samsung electronics Co., Ltd. 22,707 13,567,110
Internet Software & Services: 5.1% nhn Corp.a 39,418 6,877,095 Cdnetworks Co., Ltd.a 118,492 1,308,334 8,185,429
Electronic Equipment & Instruments: 1.4% thinkware systems Corp.a 66,724 1,492,607 sFa engineering Corp. 13,055 829,939 2,322,546
Total Information Technology 24,075,085
INdUSTRIAlS: 14.9% commercial Services & Supplies: 4.3% s1 Corp. 114,137 $6,852,257
Industrial conglomerates: 3.8% Orion Corp. 15,887 3,364,056 samsung techwin Co., Ltd. 61,012 2,703,414 6,067,470
machinery: 3.3% JVM Co., Ltd. 102,874 3,830,546 stX engine Co., Ltd. 38,140 1,489,431 5,319,977
construction & Engineering: 2.5% Gs engineering & Construction Corp. 20,657 2,261,103 hyundai development Co. 21,875 1,108,336 samsung engineering Co., Ltd. 7,874 589,392 3,958,831
Building producst: 1.0% sung Kwang Bend Co., Ltd. 60,113 1,701,013
Total Industrials 23,899,548
coNSUmER dIScRETIoNARy: 13.2%
Household durabales: 2.9% LG electronics, inc. 27,465 3,111,326 intelligent digital integrated security Co., Ltd. 92,332 1,584,398 4,695,724
media: 2.7% Cheil Communications, inc. 12,437 2,948,593 On*Media Corp.a 397,700 1,389,602 4,338,195
multiline Retail: 2.5% hyundai department store Co., Ltd. 49,311 3,992,774
Auto components: 2.3% hankook tire Co., Ltd. 194,340 2,703,166 s&t daewoo Co., Ltd. 29,130 1,008,084 3,711,250
Automobiles: 1.6% hyundai Motor Co. 37,055 2,515,085

800 .789 .asia [2742 ] www.mat thewsfunds .com 63
JUNE 30, 2008
SHARES vAlUE SHARES vAlUE
Hotels, Restaurants & leisure: 1.2% Modetour network, inc. 82,735 $1,858,680
Total consumer discretionary 21,111,708
coNSUmER STAplES: 11.3%
Food & Staples Retailing: 5.7% shinsegae Co., Ltd. 9,878 5,316,490 shinsegae Food Co., Ltd. 59,441 3,807,224 9,123,714
personal products: 3.5% amorepacific Corp. 9,121 5,650,216
Beverages: 1.8% hite Brewery Co., Ltd.b 25,422 2,842,617
Food products: 0.3% CJ CheilJedang Corp.a 2,278 595,605
Total consumer Staples 18,212,152
HEAlTH cARE: 10.0%
pharmaceuticals: 10.0% Yuhan Corp. 26,421 5,531,475 hanmi Pharmaceutical Co., Ltd. 36,792 5,416,536 daewoong Pharmaceutical Co., Ltd. 61,669 5,093,640
Total Health care 16,041,651
TElEcommUNIcATIoN SERvIcES: 4.9%
Wireless Telecommunication Services: 3.5% sK telecom Co., Ltd. 20,249 3,687,620 sK telecom Co., Ltd. adR 89,500 1,858,915 5,546,535
diversified Telecommunication Services: 1.4% Kt Corp. 35,630 1,524,251 Kt Corp. adR 36,900 786,708 2,310,959
Total Telecommunication Services 7,857,494
mATERIAlS: 4.5%
chemicals: 2.8% LG Chem, Ltd. 29,515 $2,821,567 ssCP Co., Ltd.a 107,380 1,657,843 4,479,410 metals & mining: 1.7% POsCO adR 20,500 2,660,490
Total materials 7,139,900
ENERgy: 3.1%
oil, gas & consumable Fuels: 3.1% Gs holdings Corp. 84,337 3,224,970 s-Oil Corp. 27,358 1,757,524
Total Energy 4,982,494
ToTAl commoN EQUITIES: 99.4% 159,462,770 (Cost $134,246,434)
pREFERREd EQUITIES: SoUTH KoREA: 0.9%
coNSUmER STAplES: 0.9%
Food products: 0.9% CJ CheilJedang Corp., 2nd Pfd.a 5,626 1,392,987
Total consumer Staples 1,392,987
ToTAl pREFERREd EQUITIES 1,392,987 (Cost $1,298,118)
ToTAl INvESTmENTS: 100.3% 160,855,757 (Cost $135,544,552c)
lIABIlITIES IN ExcESS oF cASH ANd oTHER ASSETS: –0.3% (480,158)
NET ASSETS: 100.0% $160,375,599
a non–income producing security
b illiquid security
c Cost of investments is $135,544,552 and net unrealized appreciation consists of:
Gross unrealized appreciation . . . . . . . . . . . . . . . . . $43,810,683
Gross unrealized depreciation . . . . . . . . . . . . . . . . . (18,499,478)
net unrealized appreciation . . . . . . . . . . . . . . . . . . . $25,311,205
adR american depositary Receipt
Pfd. Preferred
see accompanying notes to financial statements.

DISCLoSURE oF FUND ExpENSES (Unaudited)
64 Matthews asian Funds
We believe it is important for you to understand the impact of fees regarding your investment. All mutual funds have operating expenses. As a shareholder of a mutual fund, you incur ongoing costs, which include costs for portfolio management, administrative services, and shareholder reports (like this one), among others. Operating expenses, which are deducted from a fund’s gross income, directly reduce the investment return of the fund. A fund’s operating expenses are expressed as a percentage of its average net assets. This figure is known as the expense ratio. The following examples are intended to help you understand the ongoing fees (in dollars) of investing in your Fund and to compare these costs with those of other mutual funds. The examples are based on an investment of $1,000 made at the beginning of the period shown and held for the entire period.
This table illustrates your fund’s costs in two ways:Actual Fund Return: This section helps you to estimate the actual operating expenses, after any applicable fee waivers, that you paid over the period. The “Ending Account Value” shown is derived from the Fund’s actual return for the past six month period, the “Expense Ratio” column shows the period’s annualized expense ratio, and the “Operating Expenses Paid During Period” column shows the dollar amount that would have been paid by an investor who started with $1,000 in the fund at the beginning of the period.
You may use the information here, together with your account value, to estimate the expenses that you paid over the period. To do so, simply divide your account value by $1,000 (for example, an $8,600 account value divided by $1,000 = 8.6), then multiply the result by the number given for your Fund in the first line under the heading entitled “Operating Expenses Paid During Period.”
Hypothetical 5% Return: This section is intended to help you compare your Fund’s costs with those of other mutual funds. It assumes that the Fund had an annual return of 5% before operating expenses, but that the expense ratio is unchanged. In this case, because the return used is not the Fund’s actual return, the results do not apply to your investment. This example is useful in making comparisons to other mutual funds because the Securities and Exchange Commission requires all mutual funds to calculate expenses based on an assumed 5% annual return. You can assess your Fund’s costs by comparing this hypothetical example with the hypothetical examples that appear in shareholder reports of other funds.
Please note that the operating expenses shown in the table are meant to highlight and help you compare your ongoing costs only and do not reflect any transactional costs such as sales charges (loads), redemption fees, or exchange fees. The Funds assess a redemption fee of 2.00% of the total redemption proceeds if you sell or exchange your shares within 90 calendar days after purchasing them. The redemption fee is paid directly to the Funds and is designed to discourage frequent short-term trading and to offset transaction costs associated with such trading of Fund shares. For purposes of determining whether the redemption fee applies, the shares that have been held the longest will be redeemed first. The redemption fee does not apply to redemptions of shares held in certain omnibus accounts and retirement plans that cannot currently implement the redemption fee. While these exceptions exist, the Funds are not accepting any new accounts which cannot implement the redemption fee. In addition, the Funds are actively discussing a schedule for implementation of the fee with these providers.
For more information on this policy, please see the Funds’ prospectus.
The Matthews Asian Funds do not charge any sales loads, exchange fees, or 12b-1 fees, but these may be present in other funds to which you compare this data. Therefore, the hypothetical portions of the table are useful in comparing ongoing costs only, and will not help you determine the relative total costs of owning different funds.

800 .789 .asia [2742 ] www.mat thewsfunds .com 65
JUNE 30, 2008
Beginning Account value 1/1/08
Ending Account value 6/30/08
Expense Ratio 1
Expenses paid during period
1/1/08–6/30/08 2
matthews Asia pacific Equity Income Fund
actual Fund Return $1,000.00 $953.40 1.22% $5.93 hypothetical 5% Return $1,000.00 $1,018.80 1.22% $6.12
matthews Asian growth and Income Fund
actual Fund Return $1,000.00 $919.60 1.15% $5.49 hypothetical 5% Return $1,000.00 $1,019.14 1.15% $5.77 matthews Asia pacific Fund
actual Fund Return $1,000.00 $846.20 1.23% $5.65 hypothetical 5% Return $1,000.00 $1,018.75 1.23% $6.17 matthews pacific Tiger Fund
actual Fund Return $1,000.00 $808.00 1.12% $5.03 hypothetical 5% Return $1,000.00 $1,019.29 1.12% $5.62 matthews Asian Technology Fund
actual Fund Return $1,000.00 $779.60 1.27% $5.62 hypothetical 5% Return $1,000.00 $1,018.55 1.27% $6.37 matthews china Fund
actual Fund Return $1,000.00 $760.10 1.23% $5.38 hypothetical 5% Return $1,000.00 $1,018.75 1.23% $6.17 matthews India Fund
actual Fund Return $1,000.00 $626.40 1.29% $5.22 hypothetical 5% Return $1,000.00 $1,018.45 1.29% $6.47 matthews Japan Fund
actual Fund Return $1,000.00 $927.10 1.25% $5.99 hypothetical 5% Return $1,000.00 $1,018.65 1.25% $6.27 matthews Korea Fund actual Fund Return $1,000.00 $759.10 1.24% $5.42 hypothetical 5% Return $1,000.00 $1,018.70 1.24% $6.22
1 annualized, based on the Fund’s most recent fiscal half-year expenses. 2 Operating expenses are equal to the Fund’s annualized expense ratio multiplied by the average account value over the period, multiplied by the number of days
in the most recent fiscal half-year, then divided by 366.

StAtEMENtS oF ASSEtS AND LIAbILItIES
66 Matthews asian Funds
matthews Asia matthews Asian matthews matthews matthews pacific Equity growth and Asia pacific pacific Tiger Asian Technology matthews matthews matthews matthews Income Fund Income Fund Fund Fund Fund china Fund India Fund Japan Fund Korea FundAssets: investments at value (a) (note 1-a and 5): unaffiliated issuers $98,550,781 $1,939,379,113 $359,109,458 $2,598,123,663 $179,028,004 $1,302,887,881 $709,654,349 $199,909,921 $160,855,757 affiliated issuers — 19,117,178 9,469,341 155,831,845 — 38,703,635 — — — total investments 98,550,781 1,958,496,291 368,578,799 2,753,955,508 179,028,004 1,341,591,516 709,654,349 199,909,921 160,855,757 Cash 1,076,076 12,820,419 — 41,633,653 436,670 6,113,187 — 296,475 — Foreign currency at value (B) 13 802,269 — 6,006,290 92 — 3,470,337 — — dividends and interest receivable 233,762 2,776,416 1,005,892 4,103,927 318,294 5,287,879 1,773,416 732,609 2,966 Receivable for securities sold 1,115,442 1,720,430 8,346,611 49,754,501 1,154,031 7,816,803 6,838,007 3,747,031 963,301 Receivable for capital shares sold 257,780 1,291,532 906,770 779,037 218,252 1,301,884 1,360,662 439,421 153,050 Prepaid expenses and other assets 36,477 47,334 27,631 64,383 21,368 111,421 116,580 20,772 21,047 Total assets 101,270,331 1,977,954,691 378,865,703 2,856,297,299 181,176,711 1,362,222,690 723,213,351 205,146,229 161,996,121
liabilities: Payable for securities purchased 595,459 1,262,583 3,287,390 1,777,383 481,147 3,315,017 546,341 3,819,223 335,131 Payable for capital shares redeemed 1,502,339 3,917,043 1,655,275 10,411,679 1,986,742 11,146,722 8,334,356 415,269 958,224 Cash overdraft — — 3,888,432 — — — 4,113,526 — 58,322 deferred tax liability (note 1-d) — — 135,026 989,953 99,177 — 1,344,880 — — due to advisor (note 3) 56,141 1,120,591 213,539 1,651,579 106,800 793,466 454,741 113,425 95,701 administration and accounting fees payable 1,469 29,336 5,586 43,185 2,791 20,707 11,889 2,969 2,503 administration and shareholder servicing fees payable 14,941 457,536 96,113 640,189 43,321 399,834 179,372 46,790 46,523 Custodian fees payable 6,526 87,361 20,034 186,209 11,475 59,642 95,788 1,800 8,793 transfer agent fees payable 4,309 334,844 87,701 456,269 36,376 416,918 141,617 38,771 52,517 accrued expenses payable 12,842 205,484 144,052 379,027 39,413 29,526 384,320 103,713 62,808 Total liabilities 2,194,026 7,414,778 9,533,148 16,535,473 2,807,242 16,181,832 15,606,830 4,541,960 1,620,522 Net Assets $99,076,305 $1,970,539,913 $369,332,555 $2,839,761,826 $178,369,469 $1,346,040,858 $707,606,521 $200,604,269 $160,375,599
Shares outstanding: (shares of beneficial interest issued and outstanding, respectively, unlimited number of shares authorized with a $0.001 par value) 8,778,237 112,502,667 25,251,787 126,136,226 23,343,515 44,575,884 46,232,740 14,869,427 32,173,159 net asset value, offering price and redemption price $11.29 $17.52 $14.63 $22.51 $7.64 $30.20 $15.31 $13.49 $4.98
Net Assets consist of: Capital paid-in $99,724,988 $1,581,359,686 $343,625,098 $1,997,753,115 $183,885,445 $884,345,615 $692,591,610 $229,011,670 $103,193,485 undistributed/accumulated net investment income (loss) (182,266) (19,544,558) 1,594,675 13,596,502 (348,019) 10,760,946 (13,021,559) 256,870 960,765 undistributed/accumulated net realized gain (loss) on investments and foreign currency related transactions (66,657) 90,309,595 17,540,852 357,917,956 (10,663,276) 318,600,423 42,833,740 (4,804,571) 30,912,870 net unrealized appreciation/depreciation on investments, foreign currency transactions and deferred taxes (399,760) 318,415,190 6,571,930 470,494,253 5,495,319 132,333,874 (14,797,270) (23,859,700) 25,308,479 Net Assets $99,076,305 $1,970,539,913 $369,332,555 $2,839,761,826 $178,369,469 $1,346,040,858 $707,606,521 $200,604,269 $160,375,599 (a) investments at cost: unaffiliated issuers $98,948,963 $1,604,040,457 $347,331,624 $2,110,187,596 $173,420,788 $1,180,418,560 $723,079,925 $223,734,885 $135,544,552 affiliated issuers — 36,051,674 14,514,640 172,233,622 — 28,841,367 — — — total investments at cost $98,948,963 $1,640,092,131 $361,846,264 $2,282,421,218 $173,420,788 $1,209,259,927 $723,079,925 $223,734,885 $135,544,552 (B) Foreign currency at cost $12 $802,262 $— $6,006,273 $91 $— $3,470,337 $— $—
see accompanying notes to financial statements.
UNAUDItED

800 .789 .asia [2742 ] www.mat thewsfunds .com 67
JUNE 30, 2008
matthews Asia matthews Asian matthews matthews matthews pacific Equity growth and Asia pacific pacific Tiger Asian Technology matthews matthews matthews matthews Income Fund Income Fund Fund Fund Fund china Fund India Fund Japan Fund Korea FundAssets: investments at value (a) (note 1-a and 5): unaffiliated issuers $98,550,781 $1,939,379,113 $359,109,458 $2,598,123,663 $179,028,004 $1,302,887,881 $709,654,349 $199,909,921 $160,855,757 affiliated issuers — 19,117,178 9,469,341 155,831,845 — 38,703,635 — — — total investments 98,550,781 1,958,496,291 368,578,799 2,753,955,508 179,028,004 1,341,591,516 709,654,349 199,909,921 160,855,757 Cash 1,076,076 12,820,419 — 41,633,653 436,670 6,113,187 — 296,475 — Foreign currency at value (B) 13 802,269 — 6,006,290 92 — 3,470,337 — — dividends and interest receivable 233,762 2,776,416 1,005,892 4,103,927 318,294 5,287,879 1,773,416 732,609 2,966 Receivable for securities sold 1,115,442 1,720,430 8,346,611 49,754,501 1,154,031 7,816,803 6,838,007 3,747,031 963,301 Receivable for capital shares sold 257,780 1,291,532 906,770 779,037 218,252 1,301,884 1,360,662 439,421 153,050 Prepaid expenses and other assets 36,477 47,334 27,631 64,383 21,368 111,421 116,580 20,772 21,047 Total assets 101,270,331 1,977,954,691 378,865,703 2,856,297,299 181,176,711 1,362,222,690 723,213,351 205,146,229 161,996,121
liabilities: Payable for securities purchased 595,459 1,262,583 3,287,390 1,777,383 481,147 3,315,017 546,341 3,819,223 335,131 Payable for capital shares redeemed 1,502,339 3,917,043 1,655,275 10,411,679 1,986,742 11,146,722 8,334,356 415,269 958,224 Cash overdraft — — 3,888,432 — — — 4,113,526 — 58,322 deferred tax liability (note 1-d) — — 135,026 989,953 99,177 — 1,344,880 — — due to advisor (note 3) 56,141 1,120,591 213,539 1,651,579 106,800 793,466 454,741 113,425 95,701 administration and accounting fees payable 1,469 29,336 5,586 43,185 2,791 20,707 11,889 2,969 2,503 administration and shareholder servicing fees payable 14,941 457,536 96,113 640,189 43,321 399,834 179,372 46,790 46,523 Custodian fees payable 6,526 87,361 20,034 186,209 11,475 59,642 95,788 1,800 8,793 transfer agent fees payable 4,309 334,844 87,701 456,269 36,376 416,918 141,617 38,771 52,517 accrued expenses payable 12,842 205,484 144,052 379,027 39,413 29,526 384,320 103,713 62,808 Total liabilities 2,194,026 7,414,778 9,533,148 16,535,473 2,807,242 16,181,832 15,606,830 4,541,960 1,620,522 Net Assets $99,076,305 $1,970,539,913 $369,332,555 $2,839,761,826 $178,369,469 $1,346,040,858 $707,606,521 $200,604,269 $160,375,599
Shares outstanding: (shares of beneficial interest issued and outstanding, respectively, unlimited number of shares authorized with a $0.001 par value) 8,778,237 112,502,667 25,251,787 126,136,226 23,343,515 44,575,884 46,232,740 14,869,427 32,173,159 net asset value, offering price and redemption price $11.29 $17.52 $14.63 $22.51 $7.64 $30.20 $15.31 $13.49 $4.98
Net Assets consist of: Capital paid-in $99,724,988 $1,581,359,686 $343,625,098 $1,997,753,115 $183,885,445 $884,345,615 $692,591,610 $229,011,670 $103,193,485 undistributed/accumulated net investment income (loss) (182,266) (19,544,558) 1,594,675 13,596,502 (348,019) 10,760,946 (13,021,559) 256,870 960,765 undistributed/accumulated net realized gain (loss) on investments and foreign currency related transactions (66,657) 90,309,595 17,540,852 357,917,956 (10,663,276) 318,600,423 42,833,740 (4,804,571) 30,912,870 net unrealized appreciation/depreciation on investments, foreign currency transactions and deferred taxes (399,760) 318,415,190 6,571,930 470,494,253 5,495,319 132,333,874 (14,797,270) (23,859,700) 25,308,479 Net Assets $99,076,305 $1,970,539,913 $369,332,555 $2,839,761,826 $178,369,469 $1,346,040,858 $707,606,521 $200,604,269 $160,375,599 (a) investments at cost: unaffiliated issuers $98,948,963 $1,604,040,457 $347,331,624 $2,110,187,596 $173,420,788 $1,180,418,560 $723,079,925 $223,734,885 $135,544,552 affiliated issuers — 36,051,674 14,514,640 172,233,622 — 28,841,367 — — — total investments at cost $98,948,963 $1,640,092,131 $361,846,264 $2,282,421,218 $173,420,788 $1,209,259,927 $723,079,925 $223,734,885 $135,544,552 (B) Foreign currency at cost $12 $802,262 $— $6,006,273 $91 $— $3,470,337 $— $—
see accompanying notes to financial statements.
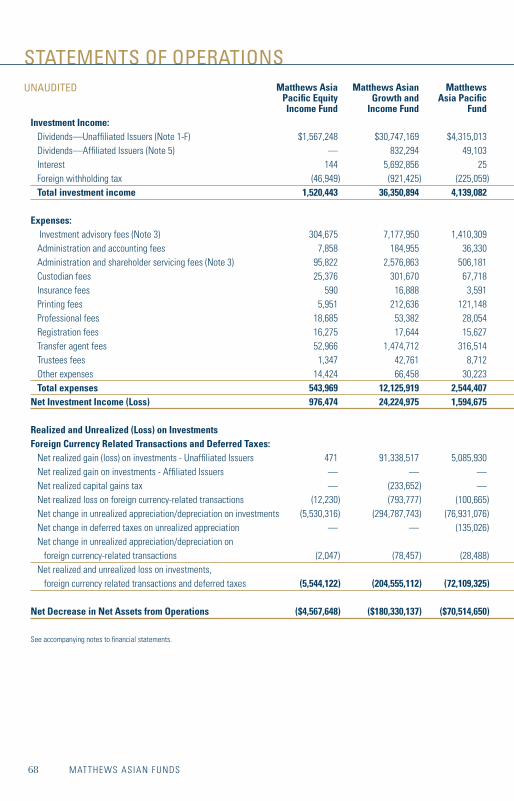
StAtEMENtS oF opERAtIoNS
68 Matthews asian Funds
matthews Asia matthews Asian matthews matthews matthews pacific Equity growth and Asia pacific pacific Tiger Asian Technology matthews matthews matthews matthews Income Fund Income Fund Fund Fund Fund china Fund India Fund Japan Fund Korea FundInvestment Income: dividends—unaffiliated issuers (note 1-F) $1,567,248 $30,747,169 $4,315,013 $31,372,478 $1,002,911 $19,812,048 $4,699,813 $1,839,899 $640,663 dividends—affiliated issuers (note 5) — 832,294 49,103 1,659,725 —- 514,743 — — — interest 144 5,692,856 25 1,436 265 — 628,406 — — Foreign withholding tax (46,949) (921,425) (225,059) (1,101,926) (45,350) — — (128,095) (105,917) Total investment income 1,520,443 36,350,894 4,139,082 31,931,713 957,826 20,326,791 5,328,219 1,711,804 534,746 Expenses: investment advisory fees (note 3) 304,675 7,177,950 1,410,309 11,070,771 701,060 5,661,059 3,556,841 638,255 678,670 administration and accounting fees 7,858 184,955 36,330 285,131 18,054 145,666 91,531 16,462 17,473 administration and shareholder servicing fees (note 3) 95,822 2,576,863 506,181 3,680,333 256,930 2,124,930 1,295,420 227,661 242,000 Custodian fees 25,376 301,670 67,718 627,140 42,589 328,970 371,298 20,090 32,231 insurance fees 590 16,888 3,591 28,399 1,858 17,447 9,166 1,434 1,885 Printing fees 5,951 212,636 121,148 351,726 35,326 176,481 145,919 62,002 39,268 Professional fees 18,685 53,382 28,054 72,819 24,455 37,926 148,033 20,212 20,652 Registration fees 16,275 17,644 15,627 16,732 17,062 89,604 82,938 16,048 9,804 transfer agent fees 52,966 1,474,712 316,514 1,803,479 182,898 1,491,722 874,879 142,777 172,746 trustees fees 1,347 42,761 8,712 67,315 4,014 34,318 21,087 4,237 4,800 Other expenses 14,424 66,458 30,223 110,952 21,599 125,993 100,889 18,149 17,310 Total expenses 543,969 12,125,919 2,544,407 18,114,797 1,305,845 10,234,116 6,698,001 1,167,327 1,236,839 Net Investment Income (loss) 976,474 24,224,975 1,594,675 13,816,916 (348,019) 10,092,675 (1,369,782) 544,477 (702,093) Realized and Unrealized (loss) on Investments Foreign currency Related Transactions and deferred Taxes: net realized gain (loss) on investments - unaffiliated issuers 471 91,338,517 5,085,930 188,715,956 1,121,116 211,733,975 31,702,232 (7,051,983) 24,065,948 net realized gain on investments - affiliated issuers — — — 6,446,247 — — — — — net realized capital gains tax — (233,652) — — (4,066) — (128,095) — — net realized loss on foreign currency-related transactions (12,230) (793,777) (100,665) (944,039) (55,748) (31,489) (415,833) (29,947) (198,678) net change in unrealized appreciation/depreciation on investments (5,530,316) (294,787,743) (76,931,076) (914,733,883) (55,557,251) (746,504,263) (520,244,971) (6,540,299) (79,880,255) net change in deferred taxes on unrealized appreciation — — (135,026) (989,953) (99,178) — 1,361,787 — — net change in unrealized appreciation/depreciation on foreign currency-related transactions (2,047) (78,457) (28,488) (69,009) (13,257) 3,132 (44,517) (37,429) (13,300) net realized and unrealized loss on investments, foreign currency related transactions and deferred taxes (5,544,122) (204,555,112) (72,109,325) (721,574,681) (54,608,384) (534,798,645) (487,769,397) (13,659,658) (56,026,285)
Net decrease in Net Assets from operations ($4,567,648) ($180,330,137) ($70,514,650) ($707,757,765) ($54,956,403) ($524,705,970) ($489,139,179) ($13,115,181) ($56,728,378)
see accompanying notes to financial statements.
UNAUDItED

800 .789 .asia [2742 ] www.mat thewsfunds .com 69
JUNE 30, 2008
matthews Asia matthews Asian matthews matthews matthews pacific Equity growth and Asia pacific pacific Tiger Asian Technology matthews matthews matthews matthews Income Fund Income Fund Fund Fund Fund china Fund India Fund Japan Fund Korea FundInvestment Income: dividends—unaffiliated issuers (note 1-F) $1,567,248 $30,747,169 $4,315,013 $31,372,478 $1,002,911 $19,812,048 $4,699,813 $1,839,899 $640,663 dividends—affiliated issuers (note 5) — 832,294 49,103 1,659,725 —- 514,743 — — — interest 144 5,692,856 25 1,436 265 — 628,406 — — Foreign withholding tax (46,949) (921,425) (225,059) (1,101,926) (45,350) — — (128,095) (105,917) Total investment income 1,520,443 36,350,894 4,139,082 31,931,713 957,826 20,326,791 5,328,219 1,711,804 534,746 Expenses: investment advisory fees (note 3) 304,675 7,177,950 1,410,309 11,070,771 701,060 5,661,059 3,556,841 638,255 678,670 administration and accounting fees 7,858 184,955 36,330 285,131 18,054 145,666 91,531 16,462 17,473 administration and shareholder servicing fees (note 3) 95,822 2,576,863 506,181 3,680,333 256,930 2,124,930 1,295,420 227,661 242,000 Custodian fees 25,376 301,670 67,718 627,140 42,589 328,970 371,298 20,090 32,231 insurance fees 590 16,888 3,591 28,399 1,858 17,447 9,166 1,434 1,885 Printing fees 5,951 212,636 121,148 351,726 35,326 176,481 145,919 62,002 39,268 Professional fees 18,685 53,382 28,054 72,819 24,455 37,926 148,033 20,212 20,652 Registration fees 16,275 17,644 15,627 16,732 17,062 89,604 82,938 16,048 9,804 transfer agent fees 52,966 1,474,712 316,514 1,803,479 182,898 1,491,722 874,879 142,777 172,746 trustees fees 1,347 42,761 8,712 67,315 4,014 34,318 21,087 4,237 4,800 Other expenses 14,424 66,458 30,223 110,952 21,599 125,993 100,889 18,149 17,310 Total expenses 543,969 12,125,919 2,544,407 18,114,797 1,305,845 10,234,116 6,698,001 1,167,327 1,236,839 Net Investment Income (loss) 976,474 24,224,975 1,594,675 13,816,916 (348,019) 10,092,675 (1,369,782) 544,477 (702,093) Realized and Unrealized (loss) on Investments Foreign currency Related Transactions and deferred Taxes: net realized gain (loss) on investments - unaffiliated issuers 471 91,338,517 5,085,930 188,715,956 1,121,116 211,733,975 31,702,232 (7,051,983) 24,065,948 net realized gain on investments - affiliated issuers — — — 6,446,247 — — — — — net realized capital gains tax — (233,652) — — (4,066) — (128,095) — — net realized loss on foreign currency-related transactions (12,230) (793,777) (100,665) (944,039) (55,748) (31,489) (415,833) (29,947) (198,678) net change in unrealized appreciation/depreciation on investments (5,530,316) (294,787,743) (76,931,076) (914,733,883) (55,557,251) (746,504,263) (520,244,971) (6,540,299) (79,880,255) net change in deferred taxes on unrealized appreciation — — (135,026) (989,953) (99,178) — 1,361,787 — — net change in unrealized appreciation/depreciation on foreign currency-related transactions (2,047) (78,457) (28,488) (69,009) (13,257) 3,132 (44,517) (37,429) (13,300) net realized and unrealized loss on investments, foreign currency related transactions and deferred taxes (5,544,122) (204,555,112) (72,109,325) (721,574,681) (54,608,384) (534,798,645) (487,769,397) (13,659,658) (56,026,285)
Net decrease in Net Assets from operations ($4,567,648) ($180,330,137) ($70,514,650) ($707,757,765) ($54,956,403) ($524,705,970) ($489,139,179) ($13,115,181) ($56,728,378)
see accompanying notes to financial statements.

StAtEMENtS oF CHANGES IN NEt ASSEtS
70 Matthews asian Funds
Six-month period Ended June 30, 2008 year Ended (unaudited) december 31, 2007 operations: net investment income (note 1-F) $976,474 $1,565,379 net realized gain (loss) on investments and foreign currency- related transactions (11,759) 3,363,363 net change in unrealized appreciation/depreciation on investments and foreign currency related transactions (5,532,363) 4,107,245 net increase (decrease) in net assets resulting from operations (4,567,648) 9,035,987 distributions to Shareholders from: net investment income (1,118,325) (1,596,567) Realized gains on investments (142,301) (2,815,658) net decrease in net assets resulting from distributions (1,260,626) (4,412,225)capital Share Transactions (net) (Note 2) 23,252,747 51,177,008 Redemption Fees 27,777 83,071 total increase in net assets 17,452,250 55,883,841 Net Assets Beginning of period 81,624,055 25,740,214 end of period (including distributions in excess of net investment income of ($182,266) and ($40,415), respectively) $99,076,305 $81,624,055
matthews Asia pacific Equity Income Fund
Six-month period Ended June 30, 2008 year Ended (unaudited) december 31, 2007 operations: net investment income (note 1-F) $24,224,975 $56,457,307 net realized gain on investments and foreign currency- related transactions 90,311,088 278,910,606 net change in unrealized appreciation/depreciation on investments and foreign currency related transactions (294,866,200) 90,739,295 net increase (decrease) in net assets resulting from operations (180,330,137) 426,107,208 distributions to Shareholders from: net investment income (27,170,730) (96,264,281) Realized gains on investments (47,215,410) (212,785,553) net decrease in net assets resulting from distributions (74,386,140) (309,049,834)capital Share Transactions (net) (Note 2) (48,234,478) 134,811,741 Redemption Fees 83,088 175,559 total increase (decrease) in net assets (302,867,667) 252,044,674 Net Assets: Beginning of period 2,273,407,580 2,021,362,906 end of period (including distributions in excess of net investment income of ($19,544,558) and ($16,598,803), respectively) $1,970,539,913 $2,273,407,580
matthews Asian growth and Income Fund
see accompanying notes to financial statements.

800 .789 .asia [2742 ] www.mat thewsfunds .com 71
JUNE 30, 2008
Six-month period Ended June 30, 2008 year Ended (unaudited) december 31, 2007 operations: net investment income (note 1-F) $1,594,675 $2,836,437 net realized gain on investments and foreign currency- related transactions 4,985,265 56,028,503 net change in unrealized appreciation/depreciation on investments and foreign currency related transactions (76,959,564) (6,309,200) net change in deferred taxes on unrealized appreciation (135,026) — net increase (decrease) in net assets resulting from operations (70,514,650) 52,555,740 distributions to Shareholders from: net investment income — (2,370,383) Realized gains on investments — (42,227,483) net decrease in net assets resulting from distributions — (44,597,866)capital Share Transactions (net) (Note 2) (31,263,646) 13,108,865 Redemption Fees 56,385 289,043 total increase (decrease) in net assets (101,721,911) 21,355,782 Net Assets: Beginning of period 471,054,466 449,698,684 end of period (including undistributed net investment income of $1,594,675 and $0, respectively) $369,332,555 $471,054,466
matthews Asia pacific Fund
Six-month period Ended June 30, 2008 year Ended (unaudited) december 31, 2007 operations: net investment income (note 1-F) $13,816,916 $40,633,130 net realized gain on investments and foreign currency- related transactions 194,218,164 616,532,248 net change in unrealized appreciation/depreciation on investments and foreign currency related transactions (914,802,892) 401,089,243 net change in deferred taxes on unrealized appreciation (989,953) — net increase (decrease) in net assets resulting from operations (707,757,765) 1,058,254,621 distributions to Shareholders from: net investment income — (39,622,673) Realized gains on investments — (456,164,472) net decrease in net assets resulting from distributions — (495,787,145)capital Share Transactions (net) (Note 2) (259,337,693) (59,741,167)Redemption Fees 142,813 270,920 total increase (decrease) in net assets (966,952,645) 502,997,229 Net Assets: Beginning of period 3,806,714,471 3,303,717,242 end of period (including undistributed/(distributions in excess of) net investment income of $13,596,502 and ($220,414) respectively) $2,839,761,826 $3,806,714,471
matthews pacific Tiger Fund
see accompanying notes to financial statements.

StAtEMENtS oF CHANGES IN NEt ASSEtS
72 Matthews asian Funds
Six-month period Ended June 30, 2008 year Ended (unaudited) december 31, 2007 operations: net investment loss (note 1-F) ($348,019) ($536,127) net realized gain on investments and foreign currency- related transactions 1,061,302 908,230 net change in unrealized appreciation/depreciation on investments and foreign currency related transactions (55,570,508) 33,855,661 net change in deferred taxes on unrealized appreciation (99,178) — net increase (decrease) in net assets resulting from operations (54,956,403) 34,227,764 capital Share Transactions (net) (Note 2) (19,118,389) 88,052,034 Redemption Fees 140,174 205,263 total increase (decrease) in net assets (73,934,618) 122,485,061 Net Assets: Beginning of period 252,304,087 129,819,026 end of period (including undistributed net investment income/ accumulated net investment loss of ($348,019) and $0, respectively) $178,369,469 $252,304,087
matthews Asian Technology Fund
Six-month period Ended June 30, 2008 year Ended (unaudited) december 31, 2007 operations: net investment income $10,092,675 $7,829,613 net realized gain on investments and foreign currency- related transactions 211,702,486 227,250,534 net change in unrealized appreciation/depreciation on investments and foreign currency related transactions (746,501,131) 511,274,206 net increase (decrease) in net assets resulting from operations (524,705,970) 746,354,353 distributions to Shareholders from: net investment income — (6,158,810) Realized gains on investments — (77,731,715) net decrease in net assets resulting from distributions — (83,890,525)capital Share Transactions (net) (Note 2) (466,191,272) 701,616,219 Redemption Fees 1,535,961 4,794,051 total increase (decrease) in net assets (989,361,281) 1,368,874,098 Net Assets: Beginning of period 2,335,402,139 966,528,041 end of period (including undistributed net investment income of $10,760,946 and $668,271, respectively) $1,346,040,858 $2,335,402,139
matthews china Fund
see accompanying notes to financial statements.

800 .789 .asia [2742 ] www.mat thewsfunds .com 73
JUNE 30, 2008
Six-month period Ended June 30, 2008 year Ended (unaudited) december 31, 2007 operations: net investment loss ($1,369,782) ($333,161) net realized gain on investments and foreign currency- related transactions 31,158,304 53,166,317 net change in unrealized appreciation/depreciation on investments and foreign currency related transactions (520,289,488) 394,310,928 net change in deferred taxes on unrealized appreciation 1,361,787 (2,706,668) net increase (decrease) in net assets resulting from operations (489,139,179) 444,437,416 distributions to Shareholders from: net investment income — (10,292,742) Realized gains on investments — (33,448,687) net decrease in net assets resulting from distributions — (43,741,429)capital Share Transactions (net) (Note 2) (115,566,600) 239,741,332 Redemption Fees 1,240,610 991,445 total increase (decrease) in net assets (603,465,169) 641,428,764 Net Assets: Beginning of period 1,311,071,690 669,642,926 end of period (including accumulated net investment loss/(distributions in excess of net investment income) of ($13,021,559) and ($11,651,777) respectively) $707,606,521 $1,311,071,690
matthews India Fund
Six-month period Ended June 30, 2008 year Ended (unaudited) december 31, 2007 operations: net investment income (loss) $544,477 ($33,074) net realized gain (loss) on investments and foreign currency- related transactions (7,081,930) 11,569,558 net change in unrealized appreciation/depreciation on investments and foreign currency related transactions (6,577,728) (41,405,843) net decrease in net assets resulting from operations (13,115,181) (29,869,359)distributions to Shareholders from: net investment income — (82,767) Realized gains on investments — (11,302,469) net decrease in net assets resulting from distributions — (11,385,236)capital Share Transactions (net) (Note 2) 46,809,583 (68,606,284)Redemption Fees 49,636 65,210 total increase (decrease) in net assets 33,744,038 (109,795,669)Net Assets: Beginning of period 166,860,231 276,655,900 end of period (including undistributed (distributions in excess of) net investment income of $256,870 and ($287,607), respectively) $200,604,269 $166,860,231
matthews Japan Fund
see accompanying notes to financial statements.

StAtEMENtS oF CHANGES IN NEt ASSEtS
74 Matthews asian Funds
Six-month period Ended June 30, 2008 year Ended (unaudited) december 31, 2007 operations: net investment income (loss) (note 1-F) ($702,093) $2,792,938 net realized gain on investments and foreign currency- related transactions 23,867,270 28,585,298 net change in unrealized appreciation/depreciation on investments and foreign currency related transactions (79,893,555) 6,798,387 net increase (decrease) in net assets resulting from operations (56,728,378) 38,176,623 distributions to Shareholders from: net investment income — (627,099) Realized gains on investments — (30,040,481) net decrease in net assets resulting from distributions — (30,667,580)capital Share Transactions (net) (Note 2) (33,364,847) 1,773,202 Redemption Fees 47,395 136,425 total increase (decrease) in net assets (90,045,830) 9,418,670 Net Assets: Beginning of period 250,421,429 241,002,759 end of period (including undistributed net investment income of $960,765 and $1,662,858, respectively) $160,375,599 $250,421,429
matthews Korea Fund
see accompanying notes to financial statements.

800 .789 .asia [2742 ] www.mat thewsfunds .com 75
FINANCIAL HIGHLIGHtS JUNE 30, 2008
matthews Asia pacific Equity Income Fund
the table below sets forth financial data for a share of beneficial interest outstanding throughout each period presented.
Six-month period Ended June 30, 2008 year Ended period Ended (unaudited) dec. 31, 2007 dec. 31, 20061
net asset Value, beginning of period $12.00 $10.77 $10.00 INcomE (loSS) FRom INvESTmENT opERATIoNS: net investment income 0.132 0.27 0.02 net realized gain (loss) and unrealized appreciation (depreciation) on investments and foreign currency (0.69) 1.67 0.77 total from investment operations (0.56) 1.94 0.79 lESS dISTRIBUTIoNS FRom: net investment income (0.13) (0.27) (0.02) net realized gains on investments (0.02) (0.45) — total distributions (0.15) (0.72) (0.02) Paid-in capital from redemption fees (note 2) — 3 0.01 —3
net asset Value, end of period $11.29 $12.00 $10.77
ToTAl RETURN (4.66%)4 18.05% 7.90%4
RATIoS/SUpplEmENTAl dATA net assets, end of period (in 000’s) $99,076 $81,624 $25,740 Ratio of expenses to average net assets before reimbursement, waiver or recapture of expenses by advisor and administrator (note 3) 1.22%5 1.42% 2.93%5
Ratio of expenses to average net assets after reimbursement, waiver or recapture of expenses by advisor and administrator 1.22%5 1.39% 1.50%5
Ratio of net investment income to average net assets (note 1-F) 2.19%5 2.66% 1.34%5
Portfolio turnover 16.49%4 26.95% 0.00%4
1 the Matthews asia Pacific equity income Fund commenced operations on October 31, 2006. 2 Calculated using the average daily shares method. 3 Less than $0.01 per share. 4 not annualized. 5 annualized.
see accompanying notes to financial statements.

FINANCIAL HIGHLIGHtS
76 Matthews asian Funds
matthews Asian growth and Income Fund
the table below sets forth financial data for a share of beneficial interest outstanding throughout each period presented.
Six-month Four-month period Ended period Ended years Ended June 30, 2008 years Ended dec. 31, dec. 31, August 31, (unaudited) 2007 2006 2005 20041 2004 2003
net asset Value, beginning of period $19.78 $18.68 $17.14 $15.82 $14.65 $12.21 $10.71 INcomE FRom INvESTmENT opERATIoNS: net investment income 0.22 2 1.07 0.46 0.45 0.11 0.32 0.23 net realized gain and unrealized appreciation (depreciation) on investments and foreign currency (1.80) 2.93 3.47 2.02 1.83 2.56 1.61 total from investment operations (1.58) 4.00 3.93 2.47 1.94 2.88 1.84 lESS dISTRIBUTIoNS FRom: net investment income (0.25) (0.90) (0.62) (0.43) (0.38) (0.25) (0.20) net realized gains on investments (0.43) (2.00) (1.77) (0.72) (0.39) (0.20) (0.15) total distributions (0.68) (2.90) (2.39) (1.15) (0.77) (0.45) (0.35)Paid-in capital from redemption fees (note 2) — 3 — 3 — 3 — 3 — 3 0.01 0.01
net asset Value, end of period $17.52 $19.78 $18.68 $17.14 $15.82 $14.65 $12.21
ToTAl RETURN (8.04%)4 21.54% 23.38% 15.76% 13.32%4 23.99% 17.81%
RATIoS/SUpplEmENTAl dATAnet assets, end of period (in 000’s) $1,970,540 $2,273,408 $2,021,363 $1,676,559 $1,236,491 $1,007,187 $533,302 Ratio of expenses to average net assets before reimbursement, waiver or recapture of expenses by advisor and administrator (note 3) 1.15%5 1.16% 1.20% 1.28% 1.35%5 1.45% 1.69%Ratio of expenses to average net assets after reimbursement, waiver or recapture of expenses by advisor and administrator 1.15%5 1.15% 1.19% 1.27% 1.31%5 1.44% 1.69%Ratio of net investment income to average net assets (note 1-F) 2.30%5 2.59% 2.27% 2.60% 2.19%5 2.28% 2.69%Portfolio turnover 20.21%4 27.93% 28.37% 20.16% 7.32%4 17.46% 13.33%
1 the Fund’s fiscal year-end changed from august 31 to december 31, effective december 31, 2004. 2 Calculated using the average daily shares method. 3 Less than $0.01 per share. 4 not annualized. 5 annualized.
see accompanying notes to financial statements.

800 .789 .asia [2742 ] www.mat thewsfunds .com 77
JUNE 30, 2008
matthews Asia pacific Fund
the table below sets forth financial data for a share of beneficial interest outstanding throughout each period presented.
Six-month Four-month period period Ended period Ended Ended June 30, 2008 years Ended dec. 31, dec. 31, Aug. 31, (unaudited) 2007 2006 2005 20041 20042
net asset Value, beginning of period $17.29 $16.92 $14.89 $12.58 $10.70 $10.00INcomE (loSS) FRom INvESTmENT opERATIoNS: net investment income (loss) 0.063 0.09 0.07 0.07 (0.01) 0.02 net realized gain and unrealized appreciation (depreciation) on investments and foreign currency (2.72) 2.02 2.50 2.30 1.93 0.66 total from investment operations (2.66) 2.11 2.57 2.37 1.92 0.68 lESS dISTRIBUTIoNS FRom: net investment income — (0.09) (0.07) (0.06) (0.02) — net realized gains on investments — (1.66) (0.48) — (0.02) — total distributions — (1.75) (0.55) (0.06) (0.04) — Paid-in capital from redemption fees (note 2) — 4 0.01 0.01 — 4 — 4 0.02
net asset Value, end of period $14.63 $17.29 $16.92 $14.89 $12.58 $10.70
ToTAl RETURN (15.38%)5 11.92% 17.39% 18.84% 18.00%5 7.00%5
RATIoS/SUpplEmENTAl dATAnet assets, end of period (in 000’s) $369,333 $471,054 $449,699 $285,169 $112,043 $76,222Ratio of expenses to average net assets before reimbursement, waiver or recapture of expenses by advisor and administrator (note 3) 1.23%6 1.20% 1.26% 1.35% 1.52%6 1.67%6
Ratio of expenses to average net assets after reimbursement, waiver or recapture of expenses by advisor and administrator 1.23%6 1.20% 1.24% 1.34% 1.51%6 1.66%6
Ratio of net investment income (loss) to average net assets (note 1-F) 0.77%6 0.60% 0.47% 0.67% (0.30%)6 0.39%6
Portfolio turnover 37.46%5 40.49% 40.45% 15.84% 1.28%5 10.75%5
1 the Fund’s fiscal year-end changed from august 31 to december 31, effective december 31, 2004. 2 the Matthews asia Pacific Fund commenced operations on October 31, 2003. 3 Calculated using the average daily shares method. 4 Less than $0.01 per share. 5 not annualized.6 annualized.
see accompanying notes to financial statements.

FINANCIAL HIGHLIGHtS
78 Matthews asian Funds
matthews pacific Tiger Fund
the table below sets forth financial data for a share of beneficial interest outstanding throughout each period presented.
Six-month Four-month period Ended period Ended years Ended June 30, 2008 years Ended dec. 31, dec. 31, August 31, (unaudited) 2007 2006 2005 20041 2004 2003
net asset Value, beginning of period $27.86 $23.71 $19.27 $15.90 $13.22 $11.20 $8.54 INcomE (loSS) FRom INvESTmENT opERATIoNS: net investment income (loss) 0.112 0.30 0.22 0.14 (0.01) 0.09 0.07 net realized gain and unrealized appreciation (depreciation) on investments and foreign currency (5.46) 7.78 5.01 3.43 3.00 1.95 2.58 total from investment operations (5.35) 8.08 5.23 3.57 2.99 2.04 2.65 lESS dISTRIBUTIoNS FRom: net investment income — (0.31) (0.21) (0.12) (0.10) (0.04) — net realized gains on investments — (3.62) (0.58) (0.09) (0.21) — — total distributions — (3.93) (0.79) (0.21) (0.31) (0.04) — Paid-in capital from redemption fees (note 2) —3 —3 —3 0.01 —3 0.02 0.01
net asset Value, end of period $22.51 $27.86 $23.71 $19.27 $15.90 $13.22 $11.20
ToTAl RETURN (19.20%)4 33.66% 27.22% 22.51% 22.69%4 18.45% 31.15%
RATIoS/SUpplEmENTAl dATAnet assets, end of period (in 000’s) $2,839,762 $3,806,714 $3,303,717 $2,031,995 $855,153 $587,133 $229,467Ratio of expenses to average net assets before reimbursement, waiver or recapture of expenses by advisor and administrator (note 3) 1.12%5 1.11% 1.18% 1.31% 1.39%5 1.50% 1.75%Ratio of expenses to average net assets after reimbursement, waiver or recapture of expenses by advisor and administrator 1.12%5 1.10% 1.16% 1.31% 1.36%5 1.48% 1.75%Ratio of net investment income (loss) to average net assets (note 1-F) 0.85%5 1.12% 1.12% 1.10% (0.16%)5 0.95% 1.04%Portfolio turnover 18.02%4 24.09% 18.80% 3.03% 3.82%4 15.16% 28.24%
1 the Fund’s fiscal year-end changed from august 31 to december 31, effective december 31, 2004. 2 Calculated using the average daily shares method. 3 Less than $0.01 per share. 4 not annualized. 5 annualized.
see accompanying notes to financial statements.

800 .789 .asia [2742 ] www.mat thewsfunds .com 79
JUNE 30, 2008
matthews Asian Technology Fund
the table below sets forth financial data for a share of beneficial interest outstanding throughout each period presented.
Six-month Four-month period Ended period Ended years Ended June 30, 2008 years Ended dec. 31, dec. 31, August 31, (unaudited) 2007 2006 2005 20041 2004 2003
net asset Value, beginning of period $9.80 $7.92 $6.53 $5.45 $4.83 $4.30 $3.13 INcomE (loSS) FRom INvESTmENT opERATIoNS: net investment income (loss) (0.01)2 —3 (0.02) —3 (0.02) (0.02) (0.01) net realized gain and unrealized appreciation (depreciation) on investments and foreign currency (2.16) 1.87 1.40 1.08 0.64 0.53 1.16 total from investment operations (2.17) 1.87 1.38 1.08 0.62 0.51 1.15 Paid-in capital from redemption fees (note 2) 0.01 0.01 0.01 —3 —3 0.02 0.02
net asset Value, end of period $7.64 $9.80 $7.92 $6.53 $5.45 $4.83 $4.30
ToTAl RETURN (22.04%)4 23.74% 21.29% 19.82% 12.84%4 12.40% 37.38%
RATIoS/SUpplEmENTAl dATAnet assets, end of period (in 000’s) $178,369 $252,304 $129,819 $50,426 $38,865 $34,297 $18,769Ratio of expenses to average net assets before reimbursement, waiver or recapture of expenses by advisor and administrator (note 3) 1.27%5 1.26% 1.41% 1.49% 1.64%5 1.63% 2.10%Ratio of expenses to average net assets after reimbursement, waiver or recapture of expenses by advisor and administrator 1.27%5 1.25% 1.39% 1.48% 1.60%5 1.91% 2.00%Ratio of net investment income (loss) to average net assets (note 1-F) (0.34%)5 (0.30%) (0.29%) 0.08% (0.85%)5 (0.31%) (0.61%)Portfolio turnover 44.64%4 33.21% 34.77% 29.76% 7.36%4 41.25% 72.03%
1 the Fund’s fiscal year-end changed from august 31 to december 31, effective december 31, 2004. 2 Calculated using the average daily shares method. 3 Less than $0.01 per share. 4 not annualized. 5 annualized.
see accompanying notes to financial statements.

FINANCIAL HIGHLIGHtS
80 Matthews asian Funds
matthews china Fund
the table below sets forth financial data for a share of beneficial interest outstanding throughout each period presented.
Six-month Four-month period Ended period Ended years Ended June 30, 2008 years Ended dec. 31, dec. 31, August 31, (unaudited) 2007 2006 2005 20041 2004 2003
net asset Value, beginning of period $39.73 $24.16 $14.76 $14.01 $13.26 $11.54 $8.96 INcomE FRom INvESTmENT opERATIoNS: net investment income 0.202 0.12 0.15 0.22 0.03 0.08 0.11 net realized gain and unrealized appreciation (depreciation) on investments and foreign currency (9.76) 16.85 9.39 0.74 1.38 1.67 2.59 total from investment operations (9.56) 16.97 9.54 0.96 1.41 1.75 2.70 lESS dISTRIBUTIoNS FRom: net investment income — (0.11) (0.15) (0.22) (0.14) (0.07) (0.14) net realized gains on investments — (1.37) — — (0.53) — — Return of capital — — — 3 — — — — total distributions — (1.48) (0.15) (0.22) (0.67) (0.07) (0.14) Paid-in capital from redemption fees (note 2) 0.03 0.08 0.01 0.01 0.01 0.04 0.02
net asset Value, end of period $30.20 $39.73 $24.16 $14.76 $14.01 $13.26 $11.54
ToTAl RETURN (23.99%)4 70.14% 64.81% 6.91% 10.61%4 15.48% 30.88%
RATIoS/SUpplEmENTAl dATAnet assets, end of period (in 000’s) $1,346,041 $2,335,402 $966,528 $388,950 $380,121 $340,251 $111,950Ratio of expenses to average net assets before reimbursement, waiver or recapture of expenses by advisor and administrator (note 3) 1.23%5 1.18% 1.27% 1.31% 1.47%5 1.52% 1.78%Ratio of expenses to average net assets after reimbursement, waiver or recapture of expenses by advisor and administrator 1.23%5 1.17% 1.26% 1.30% 1.43%5 1.50% 1.79%Ratio of net investment income to average net assets 1.22%5 0.49% 0.96% 1.46% 0.85%5 1.04% 1.93%Portfolio turnover 5.57%4 22.13% 11.65% 11.82% 4.99%4 28.99% 19.34%
1 the Fund’s fiscal year-end changed from august 31 to december 31, effective december 31, 2004. 2 Calculated using the average daily shares method. 3 Less than $0.01 per share. 4 not annualized. 5 annualized.
see accompanying notes to financial statements.

800 .789 .asia [2742 ] www.mat thewsfunds .com 81
JUNE 30, 2008
matthews India Fund
the table below sets forth financial data for a share of beneficial interest outstanding throughout each period presented.
Six-month period Ended period Ended June 30, 2008 years Ended dec. 31, dec. 31, (unaudited) 2007 2006 20051
net asset Value, beginning of period $24.44 $15.45 $11.32 $10.00 INcomE (loSS) FRom INvESTmENT opERATIoNS: net investment loss (0.03)2 (0.01) (0.01) (0.01) net realized gain and unrealized appreciation (depreciation) on investments and foreign currency (9.12) 9.87 4.11 1.33 total from investment operations (9.15) 9.86 4.10 1.32 lESS dISTRIBUTIoNS FRom: net investment income — (0.21) — — net realized gains on investments — (0.68) — — total distributions — (0.89) — — Paid-in capital from redemption fees (note 2) 0.02 0.02 0.03 — 3
net asset Value, end of period $15.31 $24.44 $15.45 $11.32
ToTAl RETURN (37.36%)4 64.13% 36.48% 13.20%4
RATIoS/SUpplEmENTAl dATAnet assets, end of period (in 000’s) $707,607 $1,311,072 $669,643 $80,897Ratio of expenses to average net assets before reimbursement, waiver or recapture of expenses by advisor and administrator (note 3) 1.29%5 1.29% 1.41% 2.75%5
Ratio of expenses to average net assets after reimbursement, waiver or recapture of expenses by advisor and administrator 1.29%5 1.28% 1.41% 2.00%5
Ratio of net investment loss to average net assets (0.26%)5 (0.04%) (0.08%) (1.17%)5
Portfolio turnover 27.01%4 25.59% 21.57% 0.00%4
1 the Matthews india Fund commenced operations on October 31, 2005. 2 Calculated using the average daily shares method. 3 Less than $0.01 per share. 4 not annualized.5 annualized.
see accompanying notes to financial statements.

FINANCIAL HIGHLIGHtS
82 Matthews asian Funds
matthews Japan Fund
the table below sets forth financial data for a share of beneficial interest outstanding throughout each period presented.
Six-month Four-month period Ended period Ended years Ended June 30, 2008 years Ended dec. 31, dec. 31, August 31, (unaudited) 2007 2006 2005 20041 2004 2003
net asset Value, beginning of period $14.55 $17.29 $18.48 $16.12 $14.73 $10.90 $9.60 INcomE (loSS) FRom INvESTmENT opERATIoNS: net investment income (loss) 0.042 0.03 (0.08) 0.02 (0.02) (0.05) (0.03) net realized gain (loss) and unrealized appreciation (depreciation) on investments and foreign currency (1.10) (1.86) (1.12) 2.36 1.40 3.82 1.30 total from investment operations (1.06) (1.83) (1.20) 2.38 1.38 3.77 1.27 lESS dISTRIBUTIoNS FRom: net investment income — (0.01) — (0.03) — — — net realized gains on investments — (0.91) — — — — — total distributions — (0.92) — (0.03) — — — Paid-in capital from redemption fees (note 2) — 3 0.01 0.01 0.01 0.01 0.06 0.03
net asset Value, end of period $13.49 $14.55 $17.29 $18.48 $16.12 $14.73 $10.90
ToTAl RETURN (7.29%)4 (10.96%) (6.44%) 14.83% 9.44%4 35.14% 13.54%
RATIoS/SUpplEmENTAl dATAnet assets, end of period (in 000’s) $200,604 $166,860 $276,656 $367,618 $200,482 $195,256 $23,653Ratio of expenses to average net assets before reimbursement, waiver or recapture of expenses by advisor and administrator (note 3) 1.25%5 1.24% 1.25% 1.29% 1.40%5 1.46% 1.92%Ratio of expenses to average net assets after reimbursement, waiver or recapture of expenses by advisor and administrator 1.25%5 1.23% 1.24% 1.28% 1.38%5 1.45% 2.00%Ratio of net investment income (loss) to average net assets 0.58%5 (0.01%) (0.29%) (0.10%) (0.31%)5 (0.71%) (1.05%)Portfolio turnover 43.18%4 45.51% 59.95% 20.88% 5.30%4 14.57% 77.30%
1 the Fund’s fiscal year-end changed from august 31 to december 31, effective december 31, 2004. 2 Calculated using the average daily shares method. 3 Less than $0.01 per share. 4 not annualized. 5 annualized.
see accompanying notes to financial statements.

800 .789 .asia [2742 ] www.mat thewsfunds .com 83
JUNE 30, 2008
matthews Korea Fund
the table below sets forth financial data for a share of beneficial interest outstanding throughout each period presented.
Six-month Four-month period Ended period Ended years Ended June 30, 2008 years Ended dec. 31, dec. 31, August 31, (unaudited) 2007 2006 2005 20041 2004 2003
net asset Value, beginning of period $6.56 $6.23 $6.37 $4.08 $3.94 $4.37 $4.42 INcomE (loSS) FRom INvESTmENT opERATIoNS: net investment income (loss) (0.02)2 0.07 0.01 0.01 — 0.04 0.01 net realized gain and unrealized appreciation (depreciation) on investments and foreign currency (1.56) 1.15 0.80 2.39 0.78 0.34 0.32 total from investment operations (1.58) 1.22 0.81 2.40 0.78 0.38 0.33 lESS dISTRIBUTIoNS FRom: net investment income — (0.02) (0.01) — (0.01) — — net realized gains on investments — (0.87) (0.95) (0.11) (0.63) (0.82) (0.39) total distributions — (0.89) (0.96) (0.11) (0.64) (0.82) (0.39) Paid-in capital from redemption fees (note 2) — 3 — 3 0.01 — 3 — 3 0.01 0.01
net asset Value, end of period $4.98 $6.56 $6.23 $6.37 $4.08 $3.94 $4.37
ToTAl RETURN (24.09%)4 18.90% 12.99% 58.76% 20.60%4 9.91% 8.80%
RATIoS/SUpplEmENTAl dATAnet assets, end of period (in 000’s) $160,376 $250,421 $241,003 $269,925 $127,794 $110,199 $217,267 Ratio of expenses to average net assets before reimbursement, waiver or recapture of expenses by advisor and administrator (note 3) 1.24%5 1.21% 1.30% 1.35% 1.49%5 1.51% 1.72%Ratio of expenses to average net assets after reimbursement, waiver or recapture of expenses by advisor and administrator 1.24%5 1.21% 1.28% 1.35% 1.31%5 1.50% 1.72%Ratio of net investment income (loss) to average net assets (0.71%)5 1.17% (0.09%) 0.27% (0.69%) 5 0.29% 0.17%Portfolio turnover 29.78%4 24.20% 25.82% 10.13% 6.53%4 18.40% 29.90%
1 the Fund’s fiscal year-end changed from august 31 to december 31, effective december 31, 2004. 2 Calculated using the average daily shares method. 3 Less than $0.01 per share. 4 not annualized. 5 annualized.
see accompanying notes to financial statements.

NotES to FINANCIAL StAtEMENtS (Unaudited)
84 Matthews asian Funds
1. SIgNIFIcANT AccoUNTINg polIcIES Matthews asian Funds (the “trust”) is an open-end investment management company registered under the investment Company act of 1940, as amended (the “act”). the trust currently issues nine separate series of shares (each a “Fund” and collectively, the “Funds”): Matthews asia Pacific equity income Fund, Matthews asian Growth and income Fund, Matthews asia Pacific Fund, Matthews Pacific tiger Fund, Matthews asian technology Fund, Matthews China Fund, Matthews india Fund, Matthews Japan Fund and Matthews Korea Fund. Matthews Pacific tiger Fund, Matthews China Fund and Matthews Korea Fund are authorized to offer two classes of shares: Class i shares and Class a shares. Currently, only Class i shares are offered. effective december 31, 2004, the Funds fiscal year end changed from august 31 to december 31. the following is a summary of significant accounting policies consistently followed by the Funds in preparation of their financial statements.
A. SEcURITy vAlUATIoN: the Funds’ equity securities are valued based on market quotations or at fair value as determined in good faith by or under the direction of the Board of trustees (the “Board”) when no market quotations are available or when market quotations have become unreliable. the Board has delegated the responsibility of making fair value determinations to the Funds’ Valuation Committee (the “Valuation Committee”), subject to the Funds’ Pricing Policies. the Funds have retained third-party pricing services which may be utilized by the Valuation Committee under circumstances described in the Pricing Policies to provide fair value prices for certain securities held by the Funds. when fair value pricing is employed, the prices of securities used by a Fund to calculate its naV differ from quoted or published prices for the same securities for that day. all fair value determinations are made subject to the Board’s oversight.
the books and records of the Funds are maintained in u.s. dollars. transactions denominated in foreign currencies are recorded at the current prevailing exchange rates. all assets and liabilities denominated in foreign currencies are translated into u.s. dollars at the current exchange rate. translation gains or losses resulting from changes in the exchange rate during the reporting period and realized gains and losses on the settlement of foreign currency transactions are reported in the results of operations for the current period. the Funds do not isolate that portion of gains and losses on investments in equity securities which is due to changes in the foreign exchange rate from that which is due to changes in market prices of equity securities. international dollar bonds are issued offshore, pay interest and principal in u.s. dollars, and are denominated in u.s. dollars.
Market values for equity securities are determined based on the last sale price on the principal (or most advantageous) market on which the security is traded. if a reliable last sale price is not available, market values for equity securities are determined using the mean between the last available bid and asked price. securities are valued through valuations obtained from a commercial pricing service or at the most recent mean of the bid and asked prices provided by investment dealers in accordance with procedures established by the Board.
Foreign securities are valued as of the close of trading on the primary (or most advantageous) market on which they trade. the value is then converted to u.s. dollars using current exchange rates and in accordance with the Pricing Policies. Foreign currency exchange rates are determined as of the close of trading on the new York stock exchange, inc. (“nYse”).
events affecting the value of foreign investments occur between the time at which they are determined and the close of trading on the nYse. such events would not normally be reflected in a calculation of a Funds’ naV on that day. if events that materially affect the value of the Funds’ foreign investments occur during such period and the impact of such events can be reasonably determined, the investments will be valued at their fair value as described above.
Foreign securities held by the Funds may be traded on days and at times when the nYse is closed. accordingly, the naV of the Funds may be significantly affected on days when shareholders have no access to the Funds. For valuation purposes, quotations of foreign portfolio securities, other assets and liabilities, and forward contracts stated in foreign currency are translated into u.s. dollar equivalents at the prevailing market rates.
B. AdopTIoN oF STATEmENT oF FINANcIAl AccoUNTINg STANdARdS No. 157 “FAIR vAlUE mEASUREmENTS” (“FAS 157”) : in september 2006, the Financial accounting standards Board issued Fas 157 effective for fiscal years beginning after november 15, 2007. this standard clarifies the definition of fair value for financial reporting, establishes a framework for measuring fair value and requires additional disclosures about the use of fair value measurements. the Funds have adopted Fas 157 as of January 1, 2008. the three levels of the fair value hierarchy under Fas 157 are described below:

Level 1: Quoted prices in active markets for identical securities Level 2: Other significant observable inputs (including quoted prices for similar securities, interest rates, prepayment speeds,
credit risk, etc.) Level 3: significant unobservable inputs (including the Fund’s own assumptions in determining the fair value of investments)
the inputs or methodology used for valuing securities are not necessarily an indication of the risk associated with investing in those securities.
the summary of inputs used to value the Fund’s net assets as of June 30, 2008 is as follows:
mATTHEWS mATTHEWS mATTHEWS ASIA ASIAN mATTHEWS mATTHEWS ASIAN pAcIFIc EQUITy gRoWTH ANd ASIA pAcIFIc TEcHNology INcomE FUNd INcomE FUNd pAcIFIc FUNd TIgER FUNd FUNd
Level 1: Quoted Prices $74,540,895 $1,161,465,456 $303,130,850 $1,867,999,906 $160,952,243 Level 2: Other significant Observable inputs 24,009,886 797,030,835 65,447,949 885,955,602 18,075,761 Level 3: significant unobservable inputs — — — — — total Market Value of investments $98,550,781 $1,958,496,291 $368,578,799 $2,753,955,508 $179,028,004
mATTHEWS mATTHEWS mATTHEWS mATTHEWS cHINA FUNd INdIA FUNd JApAN FUNd KoREA FUNd
Level 1: Quoted Prices $168,089,964 $695,266,224 $199,909,921 $158,013,140 Level 2: Other significant Observable inputs 1,173,501,552 14,388,125 — — Level 3: significant unobservable inputs — — — 2,842,617 total Market Value of investments $1,341,591,516 $709,654,349 $199,909,921 $160,855,757
Following is reconciliation of Level 3 investments for which significant unobservable inputs were used to determine fair value:
mATTHEWS mATTHEWS ASIA ASIAN pAcIFIc EQUITy gRoWTH ANd mATTHEWS INcomE FUNd INcomE FUNd KoREA FUNd
Balance as of 12/31/07 (market value) $2,115,979 $6,791,533 $— transfers in and/or out of Level 3 (2,115,979) (6,791,533) 2,842,617 Balance as of 6/30/08 (market value) $— $— $2,842,617
c. RISKS ASSocIATEd WITH NoN–U.S. compANIES: investments by the Funds in the securities of non–u.s. companies may involve investment risks different from those of u.s. issuers including possible political or economical instability of the country of the issuer, the possibility of disruption to international trade patterns, the possibility of currency crises and exchange controls, the possible imposition of foreign withholding tax on the interest income payable on such instruments, the possible establishment of foreign controls, the possible seizure or nationalization of foreign deposits or assets, or the adoption of other foreign government restrictions that might adversely affect the foreign securities held by the Funds. Foreign securities may also be subject to greater fluctuations in price than securities of domestic corporations or the u.s. government. there may be less publicly available information about a non–u.s. company than about a u.s. company. sometimes non–u.s. companies are subject to different accounting, auditing, and financial reporting standards, practices, and requirements than u.s. companies. there is generally less government regulation of stock exchanges, brokers, and listed companies abroad than in the u.s., which may result in less transparency with respect to a company’s operations. the absence of negotiated brokerage commissions in certain countries may result in higher brokerage fees. with respect to certain non–u.s. countries, there is a possibility of expropriation, nationalization, confiscatory taxation, or diplomatic developments that could affect investments in those countries.
800 .789 .asia [2742 ] www.mat thewsfunds .com 85
JUNE 30, 2008

NotES to FINANCIAL StAtEMENtS (Unaudited)
86 Matthews asian Funds
d. FEdERAl INcomE TAxES: it is the policy of the Funds to comply with all requirements of the internal Revenue Code of 1986, as amended (“the Code”) applicable to regulated investment companies and to distribute substantially all of their taxable income to their shareholders. the Funds have met the requirements of the Code applicable to regulated investment companies for the period ended June 30, 2008. therefore, no federal income tax provision is required. income and capital gains of the Funds are determined in accordance with both tax regulations and accounting principles generally accepted in the u.s. (GaaP). such treatment may result in temporary and permanent differences between tax basis earnings and earnings reported for financial statement purposes. these reclassifications, which have no impact on the net asset value of the Funds, are primarily attributable to certain differences in computation of distributable income and capital gains under federal tax rules versus GaaP. and the use of the tax accounting practice known as equalization.
in addition to the requirements of the Code, the Funds may also be subject to capital gains tax in india on gains realized upon sale of indian securities, payable upon repatriation of sales proceeds. any realized losses in excess of gains may be carried forward to offset future gains. Funds with exposure to indian securities may accrue a deferred liability for unrealized gains in excess of available carryforwards on indian securities based on existing tax rates and holding periods of the securities. as of June 30, 2008, the Matthews asia Pacific Fund, Matthews Pacific tiger Fund, Matthews asia technology Funds and Matthews india Fund have recorded a payable of $135,026, $989,953, $99,177 and $1,344,880, respectively as an estimate for potential future india capital gains taxes.
the Funds adopted the provisions of FasB interpretation no. 48 (“Fin48”), accounting for uncertainty in income taxes, on June 29, 2007 and was applied to all open tax years as of the date of effectiveness. the implementation of Fin48 resulted in no material liability for unrecognized tax benefits and no material change to the beginning net asset value of the Funds. as of and during the period ended June 30, 2008, the Funds did not have a liability for any unrecognized tax benefits. the Funds recognize interest and penalties, if any, related to unrecognized tax benefits as income tax expense in the statements of Operations. during the period, the Funds did not incur any interest or penalties.
under the current tax law, capital and currency losses realized after October 31 and prior to the Fund’s fiscal year end may be deferred as occurring on the first day of the following fiscal year. Post October losses at the fiscal year ended december 31, 2007 were as follows:
poST-ocToBER poST-ocToBER cApITAl loSSES cURRENcy loSSES
Matthews asian Growth and income Fund $— ($22,680) Matthews Pacific tiger Fund — (220,413) Matthews asian technology Fund (587,611) — Matthews China Fund — (19,959) Matthews india Fund — (31,442) Matthews Korea Fund — (10,385)
For federal income tax purposes, the Funds indicated below have capital loss carryforwards, which expire in the year indicated, as of december 31, 2007, which are available to offset future capital gains, if any:
loSSES dEFERREd ExpIRINg IN: 2008 2009 2010 ToTAl
Matthews asian technology Fund ($1,570,881) ($5,967,059) ($3,461,198) ($10,999,138)
E. dISTRIBUTIoNS To SHAREHoldERS: it is the policy of Matthews asia Pacific equity income Fund to distribute net investment income on a quarterly basis and capital gains, if any, annually. it is the policy of Matthews asian Growth and income Fund to distribute net investment income on a semi-annual basis and capital gains, if any, annually. Matthews asia Pacific Fund, Matthews Pacific tiger Fund, Matthews asian technology Fund, Matthews China Fund, Matthews india Fund, Matthews Japan Fund and Matthews Korea Fund distribute net investment income and capital gains, if any, annually. distributions to shareholders are recorded on the ex-dividend date. income and capital gain distributions are determined in accordance with income tax regulations which may differ from GaaP. net investment losses may not be utilized to offset net investment income in future periods for tax purposes.

800 .789 .asia [2742 ] www.mat thewsfunds .com 87
JUNE 30, 2008
the tax character of distributions paid for the fiscal year december 31, 2007 were as follows:
oRdINARy NET loNg-TERm ToTAl TAxABlE yEAR ENdEd dEcEmBER 31, 2007 INcomE cApITAl gAINS dISTRIBUTIoNS
Matthews asia Pacific equity income Fund $4,412,225 $— $4,412,225 Matthews asian Growth and income Fund 113,973,409 195,076,425 309,049,834 Matthews asia Pacific Fund 5,198,959 39,398,907 44,597,866 Matthews Pacific tiger Fund 47,688,902 448,098,243 495,787,145 Matthews China Fund 6,158,810 77,731,715 83,890,525 Matthews india Fund 11,776,278 31,965,151 43,741,429 Matthews Japan Fund 82,727 11,302,509 11,385,236 Matthews Korea Fund 627,099 30,040,481 30,667,580
F. INvESTmENT TRANSAcTIoNS ANd INcomE: securities transactions are accounted for on the date the securities are purchased or sold. Gains or losses on the sale of securities are determined on the identified cost basis. interest income is recorded on the accrual basis. dividend income is recorded on the ex-dividend date.
For the year ended december 31, 2007, the Funds changed the method by which it records and recognizes dividend income for Korean equity securities held in the Funds as a result of, among other things, establishing a reasonable basis to estimate for Korean dividends at ex-date. Prior to 2007, it had been the policy of the Funds to record dividends for certain Korean securities following the annual general meeting of shareholders of such companies. these dividends were records in the next fiscal year following the ex-date of these distributions. dividend income is now recorded in the current fiscal year on ex-date based on estimated dividend rates. estimated dividends are updated as additional information becomes available.
as a result of this change, there was an increase in dividend income and the net investment income ratio for the fiscal year ended december 31, 2007, as follows:
INcREASE IN INcREASE IN INcREASE IN 1-yEAR NET INvESTmENT dIvIdENd INcomE ToTAl RETURN INcomE RATIo
Matthews asia Pacific equity income Fund $58,830 0.10% 0.10% Matthews asian Growth and income Fund 5,529,268 0.30% 0.25% Matthews asia Pacific Fund 310,558 0.06% 0.07% Matthews Pacific tiger Fund 4,117,625 0.14% 0.11% Matthews asian technology Fund 110,740 0.00% 0.06% Matthews Korea Fund 2,308,504 1.09% 0.97%
g. FUNd ExpENSE AllocATIoNS: the Funds account separately for the assets, liabilities and operations of each Fund. direct expenses of each Fund are charged to the Fund while general expenses are allocated pro-rata among the Funds based on net assets.
H. USE oF ESTImATES: the preparation of financial statements in conformity with GaaP requires management to make estimates and assumptions that affect the amounts reported in the financial statements and accompanying notes. actual results may differ from those estimates.

NotES to FINANCIAL StAtEMENtS (Unaudited)
88 Matthews asian Funds
2. cApITAl SHARE TRANSAcTIoNS: each Fund is authorized to issue an unlimited number of shares of beneficial interest with a par value of $0.001 per share.
mATTHEWS ASIA pAcIFIc EQUITy INcomE FUNd SIx-moNTH pERIod ENdEd yEAR ENdEd JUNE 30, 2008 (unaudited) dEcEmBER 31, 2007
SHARES AmoUNT SHARES AmoUNT
shares sold 3,353,021 $39,072,273 6,323,727 $73,333,655 shares issued through reinvestment of distributions 101,414 1,158,301 344,963 4,244,205 shares redeemed (1,478,095) (16,977,827) (2,257,812) (26,400,852) net increase 1,976,340 $23,252,747 4,410,878 $51,177,008
mATTHEWS ASIAN gRoWTH ANd INcomE FUNd SIx-moNTH pERIod ENdEd yEAR ENdEd JUNE 30, 2008 (unaudited) dEcEmBER 31, 2007
SHARES AmoUNT SHARES AmoUNT
shares sold 7,145,580 $135,889,055 14,935,556 $298,658,709 shares issued through reinvestment of distributions 3,990,838 70,854,156 14,482,732 291,967,013 shares redeemed (13,553,120) (254,977,689) (22,714,991) (455,813,981) net increase (decrease) (2,416,702) ($48,234,478) 6,703,297 $134,811,741
mATTHEWS ASIA pAcIFIc FUNd SIx-moNTH pERIod ENdEd yEAR ENdEd JUNE 30, 2008 (unaudited) dEcEmBER 31, 2007
SHARES AmoUNT SHARES AmoUNT
shares sold 2,632,557 $41,632,770 9,065,758 $160,241,353 shares issued through reinvestment of distributions 6 108 1,758,055 32,330,674 shares redeemed (4,627,694) (72,896,524) (10,147,960) (179,463,162) net increase (decrease) (1,995,131) ($31,263,646) 675,853 $13,108,865
mATTHEWS pAcIFIc TIgER FUNd SIx-moNTH pERIod ENdEd yEAR ENdEd JUNE 30, 2008 (unaudited) dEcEmBER 31, 2007
SHARES AmoUNT SHARES AmoUNT
shares sold 6,967,710 $174,564,748 15,328,359 $411,688,821 shares issued through reinvestment of distributions 1,775 50,864 12,817,908 367,232,760 shares redeemed (17,450,078) (433,953,305) (30,872,328) (838,662,748) net decrease (10,480,593) ($259,337,693) (2,726,061) ($59,741,167)
mATTHEWS ASIAN TEcHNology FUNd SIx-moNTH pERIod ENdEd yEAR ENdEd JUNE 30, 2008 (unaudited) dEcEmBER 31, 2007
SHARES AmoUNT SHARES AmoUNT
shares sold 5,236,940 $45,589,204 17,487,919 $157,985,546 shares redeemed (7,639,741) (64,707,593) (8,141,399) (69,933,512) net increase (decrease) (2,402,801) ($19,118,389) 9,346,520 $88,052,034

800 .789 .asia [2742 ] www.mat thewsfunds .com 89
JUNE 30, 2008
mATTHEWS cHINA FUNd SIx-moNTH pERIod ENdEd yEAR ENdEd JUNE 30, 2008 (unaudited) dEcEmBER 31, 2007
SHARES AmoUNT SHARES AmoUNT
shares sold 8,442,268 $289,645,868 48,359,909 $1,656,572,773 shares issued through reinvestment of distributions 19 — 1,903,538 81,509,428 shares redeemed (22,652,955) (755,837,140) (31,479,275) (1,036,465,982) net increase (decrease) (14,210,668) ($466,191,272) 18,784,172 $701,616,219
mATTHEWS INdIA FUNd SIx-moNTH pERIod ENdEd yEAR ENdEd JUNE 30, 2008 (unaudited) dEcEmBER 31, 2007
SHARES AmoUNT SHARES AmoUNT
shares sold 13,652,672 $288,431,878 30,843,762 $585,830,908 shares issued through reinvestment of distributions 44 960 1,800,066 42,355,560 shares redeemed (21,069,491) (403,999,438) (22,324,006) (388,445,136) net increase (decrease) (7,416,775) ($115,566,600) 10,319,822 $239,741,332
mATTHEWS JApAN FUNd SIx-moNTH pERIod ENdEd yEAR ENdEd JUNE 30, 2008 (unaudited) dEcEmBER 31, 2007
SHARES AmoUNT SHARES AmoUNT
shares sold 6,084,219 $83,987,817 7,269,785 $122,963,016 shares issued through reinvestment of distributions — 7 675,084 10,605,563 shares redeemed (2,680,885) (37,178,241) (12,481,836) (202,174,863) net increase (decrease) 3,403,334 $46,809,583 (4,536,967) ($68,606,284)
mATTHEWS KoREA FUNd SIx-moNTH pERIod ENdEd yEAR ENdEd JUNE 30, 2008 (unaudited) dEcEmBER 31, 2007
SHARES AmoUNT SHARES AmoUNT
shares sold 2,614,749 $15,044,265 11,259,470 $78,007,171 shares issued through reinvestment of distributions — (1,702) 4,266,568 29,311,398 shares redeemed (8,627,632) (48,407,410) (16,053,299) (105,545,367) net decrease (6,012,883) ($33,364,847) (527,261) $1,773,202
the Funds assess a redemption fee of 2.00% of the total redemption proceeds if you sell or exchange your shares within 90 calendar days after purchasing them. the redemption fee is paid directly to the Funds and is designed to discourage frequent short-term trading and to offset transaction costs associated with such trading of Fund shares. For purposes of determining whether the redemption fee applies, the shares that have been held the longest will be redeemed first. the redemption fee does not apply to redemptions of shares held in certain omnibus accounts and retirement plans that cannot currently implement the redemption fee. while these exceptions exist, the Funds are not accepting any new accounts which cannot implement the redemption fee. in addition, the Funds are actively discussing a schedule for implementation of the fee with these providers. For more information on this policy, please see the Funds’ prospectus. the redemption fees returned to the assets of the Funds are stated in the statements of Changes in net assets.

NotES to FINANCIAL StAtEMENtS (Unaudited)
90 Matthews asian Funds
3. INvESTmENT AdvISoRy FEES ANd oTHER TRANSAcTIoNS WITH AFFIlIATES Matthews international Capital Management, LLC (the “advisor”), a registered investment advisor under the investment
advisers act of 1940, as amended, provides the Funds with investment management services. as compensation for these services, the advisor charges the Funds an annual investment management fee payable at the end of each calendar month based on each Fund’s respective average daily net assets for the month. the fee is charged at a rate of 0.75% of average daily net assets in the trust complex (the “Complex”) from $0 to $2 billion, 0.6834% of average daily net assets within the Complex between $2 billion and $5 billion, and 0.65% of average daily net assets within the Complex over $5 billion.
investment advisory fees charged, for the six-month period ended June 30, 2008, were as follows:
volUNTARy ExpENSE gRoSS lImITATIoN AdvISoRy FEES
Matthews asia Pacific equity income Fund 1.50% $304,675 Matthews asian Growth and income Fund 1.90% 7,177,950 Matthews asia Pacific Fund 1.90% 1,410,309 Matthews Pacific tiger Fund 1.90% 11,070,771 Matthews asian technology Fund 2.00% 701,060 Matthews China Fund 2.00% 5,661,059 Matthews india Fund 2.00% 3,556,841 Matthews Japan Fund 2.00% 638,255 Matthews Korea Fund 2.00% 678,670
the investment advisory agreements provide that any reductions made by the advisor in its fees, in the event a Fund’s expenses exceed the voluntary expense limitation, are subject to reimbursements by such Fund within the following three years provided that such Fund is able to effect such reimbursements and remain in compliance with applicable expense limitations. at June 30, 2008, there was no recoupment by the advisor.
Certain officers and trustees of the Funds are also officers and directors of the advisor. all officers serve without direct compensation from the Funds. the Funds paid the independent trustees $188,591 in aggregate for regular compensation during the six-month period ended June 30, 2008; no special compensation was paid during this period.
the Funds have an administration shareholder servicing agreement, pursuant to which, the Funds reimburse the advisor for administration and shareholder servicing activities based on each Fund’s average daily net assets. the fee is charged at a rate of 0.25% of average daily net assets in the Complex from $0 to $2 billion, 0.1834% of average daily net assets in the Complex between $2 billion and $5 billion, and 0.15% of average daily net assets in the Complex between $5 billion and $7.5 billion, and 0.125% of average daily net assets in the Complex over $7.5 billion.
administration and shareholder servicing fees charged, for the six-month period ended June 30, 2008, were as follows:
AdmINISTRATIoN & SHAREHoldER SERvIcINg FEES
Matthews asia Pacific equity income Fund $79,637 Matthews asian Growth and income Fund 1,873,738 Matthews asia Pacific Fund 368,014 Matthews Pacific tiger Fund 2,888,125 Matthews asian technology Fund 182,869 Matthews China Fund 1,474,976 Matthews india Fund 926,855 Matthews Japan Fund 166,832 Matthews Korea Fund 176,971

800 .789 .asia [2742 ] www.mat thewsfunds .com 91
JUNE 30, 2008
the Funds bear a portion of the fees paid to certain services providers (exclusive of the Funds’ transfer agent) which provide transfer agency and shareholder servicing to certain shareholders. Fees accrued to pay to such service providers for the six-month period ended June 30, 2008 are reflected in the statements of Operations as follows:
TRANSFER AdmINISTRATIoN & AgENT SHAREHoldER SERvIcINg FEES FEES ToTAl
Matthews asia Pacific equity income Fund $32,369 $16,184 $48,553 Matthews asian Growth and income Fund 1,406,249 703,125 2,109,374 Matthews asia Pacific Fund 276,334 138,167 414,501 Matthews Pacific tiger Fund 1,584,417 792,208 2,376,625 Matthews asian technology Fund 148,122 74,061 222,183 Matthews China Fund 1,299,904 649,952 1,949,856 Matthews india Fund 737,130 368,565 1,105,695 Matthews Japan Fund 121,656 60,828 182,484 Matthews Korea Fund 130,057 65,029 195,086
PnC Global investment servicing (“PnC”), formerly known as PFPC inc., an indirect wholly-owned subsidiary of the PnC Financial services Group, serves as the trust’s administrator, and in that capacity, performs various administrative and accounting services for each Fund. PnC also serves as the trust’s transfer agent, dividend disbursing agent and registrar. an officer of PnC serves as assistant treasurer to the trust. total fees accrued by the Funds for administration and accounting services for the six-month period ended June 30, 2008 were as follows:
AdmINISTRATIoN & AccoUNTINg FEES
Matthews asia Pacific equity income Fund $7,858 Matthews asian Growth and income Fund 184,955 Matthews asia Pacific Fund 36,330 Matthews Pacific tiger Fund 285,131 Matthews asian technology Fund 18,054 Matthews China Fund 145,666 Matthews india Fund 91,531 Matthews Japan Fund 16,462 Matthews Korea Fund 17,473
Brown Brothers harriman & Co. serves as custodian to the trust. PFPC distributors, inc. (the “distributor”) serves as the Fund’s distributor pursuant to an underwriting agreement.
4. INvESTmENT TRANSAcTIoNS the value of investment transactions made for affiliated and unaffiliated holdings for the six-month period ended June 30,
2008, excluding short-term investments, were as follows: AFFIlIATEd UNAFFIlIATEd
AFFIlIATEd pRocEEdS UNAFFIlIATEd pRocEEdS pURcHASES FRom SAlES pURcHASES FRom SAlES
Matthews asia Pacific equity income Fund $— $— $32,024,525 $7,306,073 Matthews asian Growth and income Fund 101,841 — 210,708,598 323,448,155 Matthews asia Pacific Fund 2,615,959 — 75,358,948 109,227,428 Matthews Pacific tiger Fund — 38,025,628 291,705,107 577,164,735 Matthews asian technology Fund — — 45,878,745 61,785,065 Matthews China Fund — — 46,656,633 467,966,048 Matthews india Fund — — 139,497,909 224,182,307 Matthews Japan Fund — — 87,665,483 40,102,269 Matthews Korea Fund — — 29,689,528 61,467,228

NotES to FINANCIAL StAtEMENtS (Unaudited)
9� Matthews asian Funds
5. HoldINgS oF 5% voTINg SHARES oF poRTFolIo compANIES the act defines “affiliated companies” to include investments in portfolio companies in which a fund owns 5% or more of the
outstanding voting shares. during the period January 1, 2008 through June 30, 2008, the Funds below held 5% or more of the outstanding voting shares of the noted portfolio companies. during this period, other Funds in the trust may also have held voting shares of the issuers at levels below 5%.
Investments in affiliates: a summary of the Funds’ transactions in securities of affiliated issuers for the six-month period ended June 30, 2008 is set forth below:
dIvIdENd SHARES HEld SHARES SHARES SHARES HEld vAlUE INcomE AT 12/31/07 pURcHASEd Sold AT 6/30/08 AT 6/30/08 1/1/08–6/30/08
mATTHEWS ASIAN gRoWTH ANd INcomE FUNd
i-CaBLe Communications, Ltd. 129,144,000 688,000 — 129,832,000 $19,117,178 $832,294 total affiliates $19,117,178 $832,294
mATTHEWS ASIA pAcIFIc FUNd
Funai Zaisan Consultants Co., Ltd. 5,310 1,771 — 7,081 $9,469,341 $49,103 total affiliates $9,469,341 $49,103
mATTHEWS pAcIFIc TIgER FUNd
amata Corp. Public Co., Ltd. 59,894,900 — 1,227,000 58,667,900 $21,933,565 $649,257 dickson Concepts
international, Ltd. 32,715,400 — 167,500 32,547,900 22,671,509 — dynasty Fine wines Group, Ltd.* 89,260,000 — 55,085,000 34,175,000 — —
hanmi Pharmaceutical Co., Ltd. 462,747 — 27,111 435,636 64,134,548 — hyflux, Ltd.* 33,427,187 — 8,919,000 24,508,187 — —
top Glove Corp. Bhd 15,609,880 — — 15,609,880 20,255,820 251,609 travelsky technology, Ltd.
h shares 40,812,000 — — 40,812,000 26,836,403 758,859 total affiliates $155,831,845 $1,659,725
mATTHEWS cHINA FUNd
Kingdee international software Group Co., Ltd. 25,736,000 77,208,000† — 102,944,000 $21,184,396 $280,613
Lianhua supermarket holdings Co., Ltd. h shares 13,648,000 — — 13,648,000 17,519,239 234,130
total affiliates $38,703,635 $514,743
* issuer was not an affiliated company as of June 30, 2008. † increase due to 4-for-1 stock split during the period.

MAttHEWS ASIAN FUNDSBoARd oF TRUSTEES
Independent Trustees:Geoffrey h. Bobroff, ChairmanRhoda Rossmantoshi shibanoJonathan Zeschin
Interested Trustee:1
G. Paul Matthews
oFFIcERSwilliam J. GuilfoyleJohn P. McGowanshai a. Malkaandrew t. Fosterwilliam J. hacketttimothy B. ParkerManoj K. Pombra
INvESTmENT AdvISoRMatthews international Capital Management, LLCFour embarcadero Center, suite 550san Francisco, Ca 94111800-789-asia [2742]
AccoUNT SERvIcESPnC Global investment servicing, formerly known as PFPC inc.P.O. Box 9791Providence, Ri 02940800-789-asia [2742]
1as defined under the investment Company act of 1940, as amended.

©2008 Matthews International Capital Management, LLCSAR-0608-225M
FoR moRE INFoRmATIoN ABoUT
mATTHEWS ASIAN FUNdS
800.789.ASIA [2742]
www.matthewsfunds.com