31 March 2021 Annual Report ... - Matthews Asia Funds
77
Société d’investissement à Capital Variable Luxembourg RCS Luxembourg B 151 275 ASIA FIXED INCOME STRATEGIES Asia Total Return Bond Fund Asia Credit Opportunities Fund ASIA GROWTH AND INCOME STRATEGIES Asia Dividend Fund Asia ex Japan Dividend Fund China Dividend Fund ASIA GROWTH STRATEGIES Pacific Tiger Fund Asia Innovative Growth Fund China Fund India Fund Japan Fund ASIA SMALL COMPANY STRATEGIES Asia Small Companies Fund China Small Companies Fund '21 Matthews Asia Funds | 31 March 2021 Annual Report, including Audited Financial Statements
-
Upload
khangminh22 -
Category
Documents
-
view
1 -
download
0
Transcript of 31 March 2021 Annual Report ... - Matthews Asia Funds
Société d’investissement à Capital VariableLuxembourgRCS Luxembourg B 151 275
ASIA FIXED INCOME STRATEGIES
Asia Total Return Bond Fund
Asia Credit Opportunities Fund
ASIA GROWTH AND INCOME STRATEGIES
Asia Dividend Fund
Asia ex Japan Dividend Fund
China Dividend Fund
ASIA GROWTH STRATEGIES
Pacific Tiger Fund
Asia Innovative Growth Fund
China Fund
India Fund
Japan Fund
ASIA SMALL COMPANY STRATEGIES
Asia Small Companies Fund
China Small Companies Fund
'21
Matthews Asia Funds | 31 March 2021
Annual Report, including Audited Financial Statements
Special Notice to Hong Kong InvestorsPlease note that the Annual Report, including audited financial statements and unaudited Semi Annual Report are global documents and therefore also contain information concerning the Asia Total Return Bond Fund *, the Asia Credit Opportunities Fund and the Asia Innovative Growth Fund, which are not authorized in Hong Kong and are not available to the public in Hong Kong, as well as information concerning certain share classes which are also not available to the public in Hong Kong.
The Hong Kong Offering Document of the Matthews Asia Funds (which comprises the Prospectus, Supplement for Hong Kong Investors, and Product Key Facts Statements), the latest annual reports, including audited financial statements, and unaudited semi-annual reports are available free of charge from the Hong Kong Representative (contact details are provided below).
Brown Brothers Harriman (Hong Kong) Limited13/F Man Yee Building68 Des Voeux Road CentralHong KongPhone: +852 3756 1755
Please note that the website mentioned in the Annual Report, including audited financial statements, and unaudited Semi Annual Report has not been reviewed by the Securities and Futures Commission and may contain information in respect of funds which are not authorized in Hong Kong and may not be offered to the public in Hong Kong.
* The Fund’s name changed from Matthews Asia Strategic Income Fund to Matthews Asia Total Return Bond Fund on 25 May 2020.
General InformationMatthews International Capital Management, LLC (“Matthews”), formed under the laws of Delaware and regulated by the U.S. Securities and Exchange Com-mission, acts as Investment Manager to the Matthews Asia Funds (the “Fund”). Matthews believes in the long-term growth of Asia. Since Matthews was founded in 1991 by Paul Matthews, the firm has focused its efforts and exper-tise within the Asian region, investing through a variety of market environ-ments. As an independent, privately owned firm, Matthews is the largest dedicated Asia investment specialist in the United States.
The Fund has an “umbrella” structure comprising a number of separate sub-funds. As at the closing date, 12 Sub-Funds were available for investment: Asia Total Return Bond Fund *, Asia Credit Opportunities Fund, Asia Dividend Fund, Asia ex Japan Dividend Fund, China Dividend Fund, Pacific Tiger Fund, Asia Innovative Growth Fund**, China Fund, India Fund, Japan Fund, Asia Small Companies Fund and China Small Companies Fund (each a “Sub-Fund,” and together the “Sub-Funds”). This report covers the year from 1 April 2020 to 31 March 2021. The last day on which official prices were calculated was 31 March 2021. The figures presented in the financial statements are as at that date.
The annual general meeting of Shareholders will be held in accordance with the Articles of Incorporation, the law of 17 December 2010 relating to under-takings for collective investment, and the law of 10 August 1915 on commercial companies (together referred to as the “Luxembourg Laws”). Notices of all general meetings will be published to the extent required by Luxembourg Laws in RESA (“Recueil Electronique des Sociétés et Associations”), and in such other newspaper as the Board of Directors of the Fund shall determine and will be sent to the Shareholders of registered Shares in accordance with Luxembourg Laws to their addresses shown on the register of Shareholders. Such notices should include the agenda and will specify the time and place of the meeting and the conditions of admission. They will also refer to the rules of quorum and majorities required by Luxembourg Laws.
Each Share confers the right to one vote. The vote on the payment of a divi-dend on a particular Class requires a separate majority vote from the meeting of Shareholders of the Class concerned. Any change in the Articles of Incorpora-tion affecting the rights of a Sub-Fund must be approved by a resolution of both the Shareholders at the general meeting of the Fund and the Shareholders of the Sub-Fund concerned.
Annual reports, including audited financial statements shall be published within four months following the end of the accounting year and unaudited semi-annual reports shall be published within two months following the period to which they refer. The annual reports, including audited financial statements and the unaudited semi-annual reports shall be made available at the registered office of the Fund during ordinary office hours.
The Fund’s accounting year ends on 31 March each year.
The Base Currency of the Fund is U.S. dollars (USD). The aforesaid reports will comprise combined financial statements of the Fund expressed in USD as well as individual information on each Sub-Fund expressed in the Base Currency of each Sub-Fund.
Shares have not been registered under the United States Securities Act of 1933, as amended, nor the Investment Companies Act of 1940, as amended, and may not be offered directly or indirectly in the United States of America (including its terri-tories and possessions) to nationals or residents thereof or to persons normally resi-dent therein, or to any partnership or persons connected thereto unless pursuant to any applicable statute, rule or interpretation available under United States Law.
* The Sub-Fund’s name changed from Asia Strategic Income Fund to Asia Total Return Bond Fund on 25 May 2020.
** The Sub-Fund launched on 23 March 2021.

This page intentionally left blank.
global.matthewsasia.com 1
Contents
Management and Administration 2
Other Information 3
Report of the Board of Directors of the Fund to the Shareholders 4
Investment Manager’s Report 6
Independent Auditors’ Report 8
Confirmation of Depositary Oversight Duties 10
Schedules of Investments:
ASIA FIXED INCOME STRATEGIESAsia Total Return Bond Fund * 11Asia Credit Opportunities Fund 14
ASIA GROWTH AND INCOME STRATEGIESAsia Dividend Fund 16Asia ex Japan Dividend Fund 19China Dividend Fund 21
ASIA GROWTH STRATEGIESPacific Tiger Fund 24Asia Innovative Growth Fund 26China Fund 28India Fund 31Japan Fund 34
ASIA SMALL COMPANY STRATEGIESAsia Small Companies Fund 37China Small Companies Fund 39
Statement of Assets and Liabilities 42
Statement of Operations and Changes in Net Assets 45
Statement of Changes in Number of Shares 48
Statement of Net Asset Value (NAV) Per Share and Net Asset Statistics 53
Notes to Financial Statements 58
Performance and Expenses (Unaudited) 68
Remuneration Disclosures (Unaudited) 71
Securities Financing Transactions Regulation (Unaudited) 71
Disclosures and Index Definitions (Unaudited) 72
* The Fund’s name changed from Matthews Asia Strategic Income Fund to Matthews Asia Total Return Bond Fund on 25 May 2020.
Cover photo: Asian Palace.
This report does not constitute or form part of any offer of shares or an invitation to subscribe for shares of the Funds. Subscriptions are to be made on the basis of the Key Investor Information Documents (KIIDs) accompanied by the current full prospectus, and supplemented by the latest Annual Report, including Audited Financial Statements, or the most recent unaudited Semi-Annual Report.
The views and opinions in this report were current as at 31 March 2021. They are not guarantees of performance or investment results and should not be taken as investment advice. Investment decisions reflect a variety of factors, and the managers reserve the right to change their views about individual stocks, sectors and the markets at any time. As a result, the views expressed should not be relied upon as a forecast of a Fund’s future investment intent.
The subject matter contained herein has been derived from several sources believed to be reliable and accurate at the time of compilation. Matthews does not accept any liability for losses either direct or consequential caused by the use of this information.
The most current Key Investor Information Documents, full prospectus, and most recent unaudited Semi-Annual Report and Annual Report, including Audited Financial Statements for the Fund, can be found at global.matthewsasia.com. Please read the Key Investor Information Documents and current full prospectus carefully before investing.
In Singapore, this document is available to, and intended for Institutional Investors under Section 304 of the SFA (Securities and Futures Act), and to Relevant Persons pursuant to section 305 of the SFA, as those terms are used under the SFA.
2 MATTHEWS ASIA FUNDS
Matthews Asia Funds
Management and Administration
BOARD OF DIRECTORS OF THE FUNDChairmanWilliam J. Hackett, Chief Executive OfficerMatthews International Capital Management, LLCFour Embarcadero Center, Suite 550San Francisco, CA 94111, United States of America
DirectorsHanna Esmee Duer, Independent Director80, route d’Esch L-1470 LuxembourgGrand Duchy of Luxembourg
Richard Goddard, Independent DirectorThe Directors’ Office, S.A.19, rue de Bitbourg, L-1273 LuxembourgGrand Duchy of Luxembourg
John P. McGowan, Head of Fund AdministrationMatthews International Capital Management, LLCFour Embarcadero Center, Suite 550 San Francisco, CA 94111, United States of America
Jonathan Schuman, Global Head of Sales and Client ServiceMatthews International Capital Management, LLCFour Embarcadero Center, Suite 550San Francisco, CA 94111, United States of America
MANAGEMENT COMPANY1
Carne Global Fund Managers (Luxembourg) S.A.3, rue Jean Piret1
L-2350 LuxembourgGrand Duchy of Luxembourg
BOARD OF DIRECTORS OF THE MANAGEMENT COMPANYWilliam BlackwellJohn AlldisJohn DonohoeDavid McGowan (appointed on 29 April 2020)Veronica Buffoni (appointed on 13 October 2020)Martin Dobbins (appointed on 13 October 2020)
INVESTMENT MANAGER AND GLOBAL DISTRIBUTORMatthews International Capital Management, LLCFour Embarcadero Center, Suite 550San Francisco, CA 94111, United States of America
SUB-INVESTMENT ADVISORMatthews Global Investors (Singapore) Pte. Ltd. 10 Collyer Quay #23-06Ocean Financial CentreSingapore
SUB-INVESTMENT MANAGER (since 25 May 2020)Matthews Global Investors (Hong Kong) Ltd.Suite 3602Two Pacific Place88 QueenswayAdmiralty, Hong Kong
DEPOSITARY, ADMINISTRATIVE AGENT, DOMICILIARY AGENT, REGISTRAR AND TRANSFER AGENT AND PAYING AGENTBrown Brothers Harriman (Luxembourg) S.C.A. 80, route d’Esch L-1470 Luxembourg Grand Duchy of Luxembourg
INDEPENDENT AUDITORDeloitte Audit Société à responsabilité limitée20, Boulevard de Kockelscheuer L-1821 LuxembourgGrand Duchy of Luxembourg
LEGAL ADVISORArendt & Medernach S.A. 41A, avenue J.F. KennedyL-2082 LuxembourgGrand Duchy of Luxembourg
REGISTERED OFFICEBrown Brothers Harriman (Luxembourg) S.C.A. 80, route d’Esch L-1470 Luxembourg Grand Duchy of Luxembourg
1 Prior to 1 July 2020, the entity’s address was 6B, route de Trèves L-2633 Senningerberg
global.matthewsasia.com 3
Matthews Asia Funds
Other Information
THE PAYING AND INFORMATION AGENT IN AUSTRIAErste Bank AM Belvedere 11100 ViennaAustria
CENTRALIZING CORRESPONDENT AND PAYING AGENT IN FRANCECACEIS Bank France1-3 Place ValhubertF-75013 ParisFrance
PAYING AND INFORMATION AGENT IN GERMANYBNP Paribas Securities Services S.C.A.ZweigniederlassungEuropa-Allee 12D-60327 Frankfurt am MainGermany
THE FACILITIES AGENT IN IRELANDMaples Fund Services (Ireland) Limited32 Molesworth Street Dublin 2Ireland
REPRESENTATIVE IN SPAINAllfunds Bank S.A.C/ Estafeta 6, La Moraleja28109 AlcobendasMadridSpain
PAYING AND INFORMATION AGENT IN SWEDEN MFEX Mutual Funds Exchange ABGrev Turegatan 19, Box 5378SE-102 49 StockholmSweden
FACILITIES AND INFORMATION AGENT IN UNITED KINGDOMBNP Paribas Securities Services10 Harewood AvenueLondon, NW1 6AAUnited Kingdom
REPRESENTATIVE IN SWITZERLAND1741 Fund Solutions AGBurggraben 16 CH-9000 St. Gallen Switzerland
PAYING AGENT IN SWITZERLAND Tellco AG Bahnhofstrasse 4 6430 Schwyz Switzerland
4 MATTHEWS ASIA FUNDS
Report of the Board of Directors of the Fund to the ShareholdersThe Board of Directors of the Fund (the “Board”) is pleased to present the Annual Report of the Fund, including the audited financial statements, for the year ended 31 March 2021. These have been prepared in accordance with Luxembourg legal and regulatory requirements relating to undertakings for collective investment.
Activities and outlook
During the year ended 31 March 2021, the Fund launched the Asia Innova-tive Growth Fund on 23 March 2021, which increased the total number of sub-funds in issue to 12. The separate Investment Manager’s report included in this Annual Report reviews the performance of the sub-funds, summarizes the economic environment during the year, and provides an outlook for the upcoming year.
Covid-19
The emergence and evolution of Covid-19 has created economic and finan-cial disruptions in the global economy which has led to operational chal-lenges. In line with national and local guidelines, the Management Company, Investment Manager, Global Distributor, Depositary Bank, Admin-istrative Agent, and other service providers of the Fund have required staff to work from home and business travel is severely restricted.
The financial effects of the pandemic have a high degree of uncertainty, given that they are dependent on external factors such as the spread of the virus, its mutation, the effectiveness of vaccines, and the measures taken by the various governments and central banks. The Management Company and Investment Manager therefore continue to deploy their risk management framework, including stress testing, to understand these uncertainties and address their potential impact on the Fund’s operations, liquidity and performance.
The Board of Directors, in consultation with the Fund’s service providers, has carefully considered the impact of the Covid-19 outbreak and its impacts on the Fund and on the markets in which it invests. As at the date of this report, the Fund has not received significant net redemptions, and the ability of its principal service providers to function has not been significantly impaired. On this basis, the Board does not believe that there has been a material impact on the ability of the Fund to operate normally.
Corporate Governance
The Board has put in place a framework for corporate governance which is consistent with the principles and recommendations of the Association of the Luxembourg Fund Industry (“ALFI”) Code of Conduct for Luxembourg Investment Funds (the “Code”). The Code sets out principles of good gover-nance and a code of best practice. It can be found on the Association’s web-site www.alfi.lu.
The Board
The Directors of the Fund are responsible for supervising the Fund in accor-dance with its articles of incorporation, prospectus, and laws and regulations applicable to Luxembourg investment funds. The names and addresses of the Directors are listed with their principal occupations in the Management and Administration section of this report. More detailed biographical informa-tion is disclosed on the Fund’s website at global.matthewsasia.com.
The Board holds formal Board meetings at least four times a year. At the Board meetings, the Directors review the management of the Fund’s assets and all other significant matters so as to ensure that the Directors maintain overall control and supervision of the Fund’s affairs. The Board is responsible for the appointment and monitoring of all service providers to the Fund.
global.matthewsasia.com 5
The Directors are kept fully informed of investment and financial controls and other matters relevant to the business of the Fund. The Directors are responsible for ensuring that the Fund’s annual report, including the audited financial statements, are prepared in accordance with Luxembourg GAAP and applicable legal and regulatory requirements.
Internal Controls
The Board is also ultimately responsible for the Fund’s system of internal controls and for reviewing its effectiveness. The Board confirms that there is an ongoing process for identifying, evaluating and managing the significant risks faced by the Fund.
The Annual General Meeting
The annual general meeting of the shareholders is expected to be held on the third Tuesday of August, which is 17 August 2021. Notice and agenda of the meeting will be sent to shareholders prior to the meeting.
The Board of Directors
Matthews Asia Funds SICAV
24 June 2021
Report of the Board of Directors of the Fund to the Shareholders (continued)
6 MATTHEWS ASIA FUNDS
As we look back on the year ending 30 March 2020, we’ve seen tremendous volatility in the markets. Adaptability has been key, not only for businesses, but also for policymakers, ordinary citizens and investors of all stripes.
The financial year 2020 began at the height of crisis due to the economic shock of the COVID-19 pandemic lockdowns. Frightened citizens sold finan-cial assets to raise cash. Bond yields rose, equities collapsed—there was a dash to cash. However, there were opportunities for those with a longer-term time horizon; to buy into high-quality businesses that had seemed too expensive up to that point.
As the Federal Reserve stepped in to supply unlimited cash, the panic sub-sided and the markets recovered and changed direction. The equity market recovered its lost fundamental value and continued to rise. Ultimately, this rally started to go beyond what in our judgment could be justified by long-term fundamentals. The euphoria was not in every sector or business. Rather it was concentrated in a few conceptual areas, notably electronic vehicles, biotechnology and some online names whose valuations became extreme—all the more so because the high valuations were exacerbated by extraordi-nary absolute market capitalizations and the lack of cash flows or even profits or reliable sales in some cases.
By the end of the calendar year and moving into 2021, some of the frailties of the latter part of the rally started to get exposed. Hopes of vaccines against the coronavirus and a return to more normal global economic conditions gave people more hope in the near term, caused bond yields to rise and, more significantly, provoked the yield curve to steepen. This higher discount rate for far off profits and sales hit the conceptual stocks particularly hard, for they had not even proven their ability to generate acceptable returns on capital in the near future. Consequently, the market began to fall as it had been disproportionately buoyed by activity in these stocks.
It’s undeniable that some of the valuation effects have helped performance of our portfolios this past year. However, these effects are mitigated by sev-eral factors. First, of course, we are aware of these effects and always strive to own securities whose valuations are justifiable in the face of their long-term business prospects. Second, we have been trying to take advantage of those businesses which have suffered most from the direct effects of the lockdown. In our view, these are not poor businesses but businesses that many investors have overlooked simply because they have been fascinated by the momen-tum elsewhere. And finally, when we look at the strange interaction between weak activity, collapsing bond yields and high valuations on weak profits that has been the heady, if startling, recipe of 2020, it is perhaps least in evi-dence in China—economic activity has bounced back earlier and stronger than elsewhere and bond yields are, for want of a better word, “normal.”
From a relative sense, valuations in Asia are still reasonable and at a discount to much of the developed world. We have made the point previously that this is the case on depressed margins in Asia and expanded margins in the West—this continues to be the case. So, we are comfortable with overall valu-ations from a relative viewpoint across regions. For particular sectors, how-ever, we do see huge discrepancies in the way the market is discounting the future prospects of some untried and untested business models versus the steady track records of more established businesses. This is absolutely not to say that one should abandon the former in favour of the security and pre-dictability of the latter. Nevertheless, it is true that some parts of the markets seem to be moving on hype, momentum, news flow and speculation. Here, it is most assuredly a case of buyer beware! I do not, however, subscribe to the notion that the markets as a whole are overvalued, but with a rising long bond yield, we will have to work even harder for returns.
Investment Manager’s Report
global.matthewsasia.com 7
One question that I get a lot at the moment is: “Are higher interest rates bad for the Asian markets?” Well, everything else being equal, the higher the interest rate the lower the valuation and that is true in Asia as well as any-where else. However, when higher interest rates are a sign that global growth is accelerating, Asia has tended to do well. If higher interest rates are a sign that monetary policy has been loosened (we are talking about long-term rates that move with inflation expectations and not the short-term rates con-trolled by central banks), then the effect has been positive for Asia and emerging markets too. So, outside of the effects on some highly valued sec-tors and stocks—effects that may continue—I am fairly sanguine about the current economic environment and the opportunities for Asia and emerging market economies and policy makers.
At Matthews Asia, we maintained full operations and consistent communica-tion with our clients, colleagues and portfolio companies throughout the first year of the pandemic. Looking ahead, we expect continued smooth operations going forward for the firm and remain committed to meeting our clients’ needs across all market conditions. In terms of our own operations as an investment manager, we have assessed our own resilience and the resil-ience of all relevant third party service providers and remain confident in our support structures. Our business continuity plans are designed to help us mitigate the impact of COVID-19 across operations, as well as protect against other economic disruptions and surprises. Naturally, risks remain. Markets may be volatile over the short term, as the effects of COVID-19 continue to create disruptions in markets where we invest. But volatility is part and par-cel of investing in fast-growing economies. At Matthews Asia, dealing with market volatility by investing with a long-term view is part of the core fabric of our firm.
So, what is the challenge for our analysts and portfolio managers at the moment? To be a little more sensitive to valuations? Yes. Where we are deal-ing with new businesses that have yet to prove themselves with real profit growth, to run the rule again over business models and markets? Yes. To con-tinue to allocate capital where we think the long-term prospects have been under appreciated by the marginal investor? Yes. But we are not defensive! The stance in the portfolios is to continue to expect strong long-term growth in our target markets and companies—we have just emerged from some very trying global economic conditions. It is normal that there should be some frictions in the system as things start to improve. It would be wrong to inter-pret them as permanent changes to the investment landscape. I remain opti-mistic about Asia’s economic prospects and believe it is an exciting place to find new investment opportunities.
Robert J. Horrocks, PhD Chief Investment Officer Matthews International Capital Management, LLC
The figures stated in the Investment Manager`s Report are historical and not necessarily indicative of future performance.
Investment Manager’s Report (continued)
Société à responsabilité limitée au capital de 360.000 € RCS Luxembourg B 67.895 Autorisation d’établissement 10022179
© Deloitte Audit, SARL
Deloitte Audit Société à responsabilité limitée 20 Boulevard de Kockelscheuer L-1821 Luxembourg
Tel: +352 451 451 www.deloitte.lu
To the Shareholders of Matthews Asia Funds
INDEPENDENT AUDITORS’ REPORT
Opinion We have audited the financial statements of Matthews Asia Funds (the “Fund”) and of each of its sub-funds, which comprise the statement of assets and liabilities and the schedule of investments as at 31 March 2021 and the statement of operations and changes in net assets for the year then ended, and notes to financial statements, including a summary of significant accounting policies.
In our opinion, the accompanying financial statements give a true and fair view of the financial position of the Fund and of each of its sub-funds as at 31 March 2021, and of the results of their operations and changes in their net assets for the year then ended in accordance with Luxembourg legal and regulatory requirements relating to the preparation and presentation of the financial statements.
Basis for Opinion We conducted our audit in accordance with the Law of 23 July 2016 on the audit profession (“Law of 23 July 2016”) and with International Standards on Auditing (ISAs) as adopted for Luxembourg by the “Commission de Surveillance du Secteur Financier” (CSSF). Our responsibilities under the Law of 23 July 2016 and ISAs as adopted for Luxembourg by the CSSF are further described in the “Responsibilities of the independent auditor for the Audit of the Financial Statements” section of our report. We are also independent of the Fund in accordance with the International Code of Ethics for Professional Accountants, including International Independence Standards, issued by the International Ethics Standards Board for Accountants (IESBA Code) as adopted for Luxembourg by the CSSF together with the ethical requirements that are relevant to our audit of the financial statements, and have fulfilled our other ethical responsibilities under those ethical requirements. We believe that the audit evidence we have obtained is sufficient and appropriate to provide a basis for our opinion.
Other information
The Board of Directors of the Fund is responsible for the other information. The other information comprises the information stated in the annual report but does not include the financial statements and our report of the independent auditor thereon.
Our opinion on the financial statements does not cover the other information and we do not express any form of assurance conclusion thereon.
In connection with our audit of the financial statements, our responsibility is to read the other information and, in doing so, consider whether the other information is materially inconsistent with the financial statements or our knowledge obtained in the audit or otherwise appears to be materially misstated. If, based on the work we have performed, we conclude that there is a material misstatement of this other information, we are required to report this fact. We have nothing to report in this regard.
8 MATTHEWS ASIA FUNDS
Responsibilities of the Board of Directors of the Fund for the Financial Statements The Board of Directors of the Fund is responsible for the preparation and fair presentation of the financial statements in accordance with Luxembourg legal and regulatory requirements relating to the preparation and presentation of the financial statements, and for such internal control as the Board of Directors of the Fund determines is necessary to enable the preparation of financial statements that are free from material misstatement, whether due to fraud or error.
In preparing the financial statements, the Board of Directors of the Fund is responsible for assessing the Fund’s ability to continue as a going concern, disclosing, as applicable, matters related to going concern and using the going concern basis of accounting unless the Board of Directors of the Fund either intends to liquidate the Fund or to cease operations, or has no realistic alternative but to do so.
Responsibilities of the Independent Auditor for the Audit of the Financial Statements The objectives of our audit are to obtain reasonable assurance about whether the financial statements as a whole are free from material misstatement, whether due to fraud or error, and to issue a report of the independent auditor that includes our opinion. Reasonable assurance is a high level of assurance, but is not a guarantee that an audit conducted in accordance with the Law dated 23 July 2016 and with ISAs as adopted for Luxembourg by the CSSF will always detect a material misstatement when it exists. Misstatements can arise from fraud or error and are considered material if, individually or in the aggregate, they could reasonably be expected to influence the economic decisions of users taken on the basis of these financial statements.
As part of an audit in accordance with the Law dated 23 July 2016 and with ISAs as adopted for Luxembourg by the CSSF, we exercise professional judgment and maintain professional skepticism throughout the audit. We also: • Identify and assess the risks of material misstatement of the financial statements, whether due to fraud or
error, design and perform audit procedures responsive to those risks, and obtain audit evidence that issufficient and appropriate to provide a basis for our opinion. The risk of not detecting a materialmisstatement resulting from fraud is higher than for one resulting from error, as fraud may involve collusion,forgery, intentional omissions, misrepresentations, or the override of internal control.
• Obtain an understanding of internal control relevant to the audit in order to design audit procedures that areappropriate in the circumstances, but not for the purpose of expressing an opinion on the effectiveness of theFund’s internal control.
• Evaluate the appropriateness of accounting policies used and the reasonableness of accounting estimates andrelated disclosures made by the Board of Directors of the Fund.
• Conclude on the appropriateness of the Board of Directors of the Fund use of the going concern basis ofaccounting and, based on the audit evidence obtained, whether a material uncertainty exists related toevents or conditions that may cast significant doubt on the Fund’s ability to continue as a going concern. If weconclude that a material uncertainty exists, we are required to draw attention in our report of theindependent auditor to the related disclosures in the financial statements or, if such disclosures areinadequate, to modify our opinion. Our conclusions are based on the audit evidence obtained up to the dateof our report of the independent auditor. However, future events or conditions may cause the Fund to ceaseto continue as a going concern.
• Evaluate the overall presentation, structure and content of the financial statements, including the disclosures,and whether the financial statements represent the underlying transactions and events in a manner thatachieves fair presentation.
We communicate with those charged with governance regarding, among other matters, the planned scope and timing of the audit and significant audit findings, including any significant deficiencies in internal control that we identify during our audit.
We also provide those charged with governance with a statement that we have complied with relevant ethical requirements regarding independence, and to communicate with them all relationships and other matters that may reasonably be thought to bear on our independence, and where applicable, “related safeguards”.
For Deloitte Audit, Cabinet de révision agréé
Justin Griffiths, Réviseur d’entreprises agréé Partner
28 June 2021 global.matthewsasia.com 9
10 MATTHEWS ASIA FUNDS
Matthews Asia Funds 80 route d’Esch L-1470 Luxembourg
BROWN BROTHERS HARRIMAN (LUXEMBOURG) S.C.A.
80, ROUTE D’ESCH, L-1470 LUXEMBOURG
B.P. 403, L-2014 LUXEMBOURG
TEL. +352.474.066.1 FAX. +352.470.580 www.bbh.com
R.C.S. LUXEMBOURG B29 923
SOCIÉTÉ EN COMMANDITE PAR ACTIONS
10th June 2021
Confi rmation of Depositary Oversight Duties
We act as depositary for Matthews Asia Funds, a Luxembourg société d’investissement à capital variable under Part I of the law of 17 December 2010 concerning undertakings for collective investment (the “Company”).
This letter is issued to the Company in connection with the shares of the Company being made available to the public in Hong Kong and certain confi r-mations being required from the depositary/custodian pursuant to Chap-ter 4.5(f) of the Securities and Futures Commission’s Code on Unit Trusts and Mutual Funds having regards to the duties and obligations of the depositary to the Company under the laws and regulations of Luxembourg for the year ended March 31st 2021.
We perform verifi cations of processes and procedures that are under the responsibility of the Company or certain of its appointed delegates to ensure that the Company, in all material respect, acted in compliance with the provi-sions of the Constitutive Documents inter alia with respect to the following:
• that the sale, issue, repurchase and cancellation of shares or units effectedby or on behalf of the Company are carried out in accordance with the lawand the constitutive documents of the Company (the “ConstitutiveDocuments”);
• that the income of the Company is applied in accordance with the law andthe Constitutive Documents;
• that the value of the shares or units of the Company is calculated in accor-dance with the law, the Constitutive Documents and the valuation proce-dures adopted in respect of the Company pursuant to applicable law.
It is and remains the ultimate responsibility of the Company to comply with the Constitutive Documents and applicable law as they apply to the above.
This letter is to confi rm that for the fi nancial year ended March 31st 2021, we have satisfactorily performed our oversight duties in connection with the above and to the best of our knowledge and belief and subject to our oversight duties as set forth herein and any exception or recommended remedial action with respect to the same duly reported to the Company in our opinion, the Company has been managed during the year in review in all material respects in accordance with the provisions of the Constitutive Documents.
Yours Sincerely
Nicholas Graybrook
Senior Vice President
global.matthewsasia.com 11
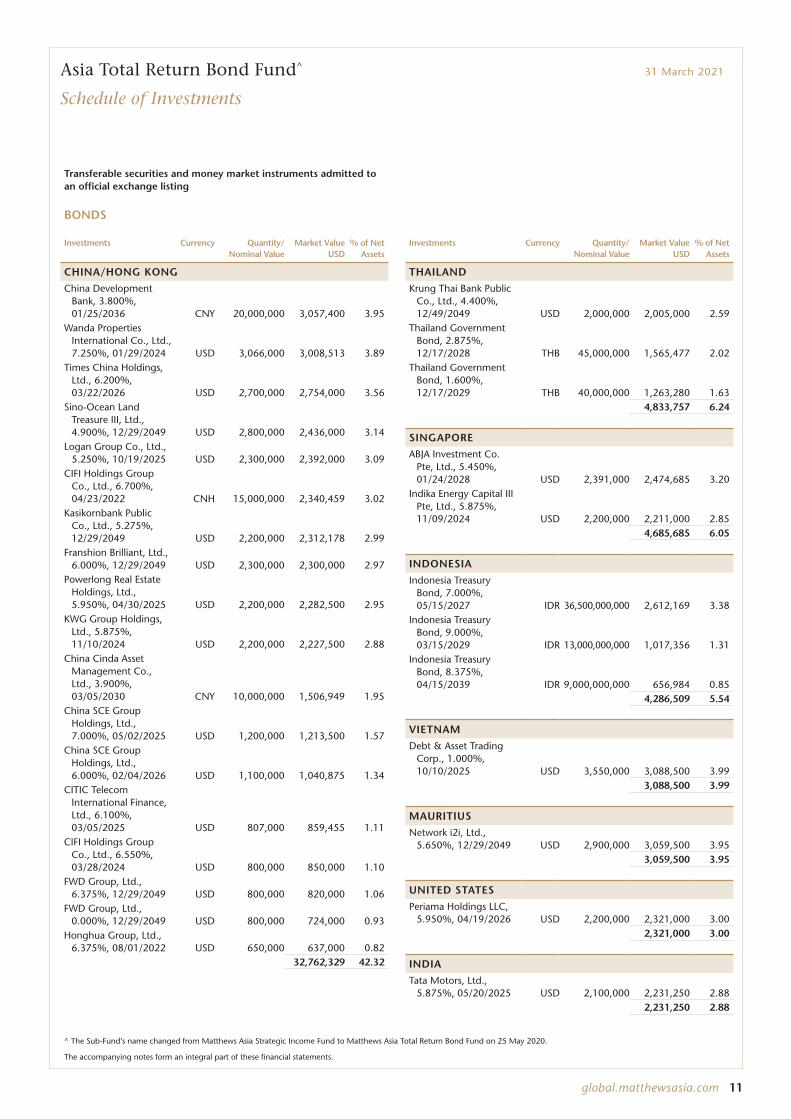
Asia Total Return Bond Fund^ 31 March 2021
Schedule of Investments
Transferable securities and money market instruments admitted to an official exchange listing
BONDS
Investments Currency Quantity/ Nominal Value
Market Value USD
% of Net Assets
CHINA/HONG KONG
China Development Bank, 3.800%, 01/25/2036 CNY 20,000,000 3,057,400 3.95
Wanda Properties International Co., Ltd., 7.250%, 01/29/2024 USD 3,066,000 3,008,513 3.89
Times China Holdings, Ltd., 6.200%, 03/22/2026 USD 2,700,000 2,754,000 3.56
Sino-Ocean Land Treasure III, Ltd., 4.900%, 12/29/2049 USD 2,800,000 2,436,000 3.14
Logan Group Co., Ltd., 5.250%, 10/19/2025 USD 2,300,000 2,392,000 3.09
CIFI Holdings Group Co., Ltd., 6.700%, 04/23/2022 CNH 15,000,000 2,340,459 3.02
Kasikornbank Public Co., Ltd., 5.275%, 12/29/2049 USD 2,200,000 2,312,178 2.99
Franshion Brilliant, Ltd., 6.000%, 12/29/2049 USD 2,300,000 2,300,000 2.97
Powerlong Real Estate Holdings, Ltd., 5.950%, 04/30/2025 USD 2,200,000 2,282,500 2.95
KWG Group Holdings, Ltd., 5.875%, 11/10/2024 USD 2,200,000 2,227,500 2.88
China Cinda Asset Management Co., Ltd., 3.900%, 03/05/2030 CNY 10,000,000 1,506,949 1.95
China SCE Group Holdings, Ltd., 7.000%, 05/02/2025 USD 1,200,000 1,213,500 1.57
China SCE Group Holdings, Ltd., 6.000%, 02/04/2026 USD 1,100,000 1,040,875 1.34
CITIC Telecom International Finance, Ltd., 6.100%, 03/05/2025 USD 807,000 859,455 1.11
CIFI Holdings Group Co., Ltd., 6.550%, 03/28/2024 USD 800,000 850,000 1.10
FWD Group, Ltd., 6.375%, 12/29/2049 USD 800,000 820,000 1.06
FWD Group, Ltd., 0.000%, 12/29/2049 USD 800,000 724,000 0.93
Honghua Group, Ltd., 6.375%, 08/01/2022 USD 650,000 637,000 0.82
32,762,329 42.32
Investments Currency Quantity/ Nominal Value
Market Value USD
% of Net Assets
THAILAND
Krung Thai Bank Public Co., Ltd., 4.400%, 12/49/2049 USD 2,000,000 2,005,000 2.59
Thailand Government Bond, 2.875%, 12/17/2028 THB 45,000,000 1,565,477 2.02
Thailand Government Bond, 1.600%, 12/17/2029 THB 40,000,000 1,263,280 1.63
4,833,757 6.24
SINGAPORE
ABJA Investment Co. Pte, Ltd., 5.450%, 01/24/2028 USD 2,391,000 2,474,685 3.20
Indika Energy Capital III Pte, Ltd., 5.875%, 11/09/2024 USD 2,200,000 2,211,000 2.85
4,685,685 6.05
INDONESIA
Indonesia Treasury Bond, 7.000%, 05/15/2027 IDR 36,500,000,000 2,612,169 3.38
Indonesia Treasury Bond, 9.000%, 03/15/2029 IDR 13,000,000,000 1,017,356 1.31
Indonesia Treasury Bond, 8.375%, 04/15/2039 IDR 9,000,000,000 656,984 0.85
4,286,509 5.54
VIETNAM
Debt & Asset Trading Corp., 1.000%, 10/10/2025 USD 3,550,000 3,088,500 3.99
3,088,500 3.99
MAURITIUS
Network i2i, Ltd., 5.650%, 12/29/2049 USD 2,900,000 3,059,500 3.95
3,059,500 3.95
UNITED STATES
Periama Holdings LLC, 5.950%, 04/19/2026 USD 2,200,000 2,321,000 3.00
2,321,000 3.00
INDIA
Tata Motors, Ltd., 5.875%, 05/20/2025 USD 2,100,000 2,231,250 2.88
2,231,250 2.88
The accompanying notes form an integral part of these financial statements.
^ The Sub-Fund’s name changed from Matthews Asia Strategic Income Fund to Matthews Asia Total Return Bond Fund on 25 May 2020.
12 MATTHEWS ASIA FUNDS
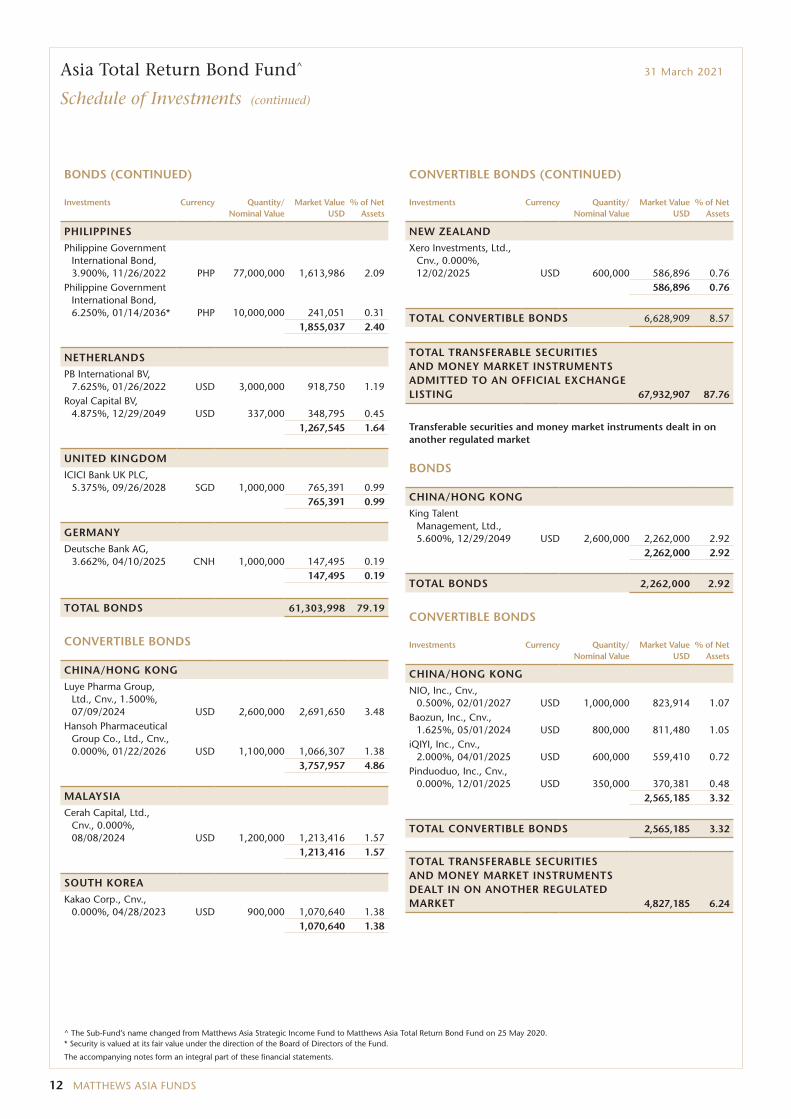
BONDS (CONTINUED)
Investments Currency Quantity/ Nominal Value
Market Value USD
% of Net Assets
PHILIPPINES
Philippine Government International Bond, 3.900%, 11/26/2022 PHP 77,000,000 1,613,986 2.09
Philippine Government International Bond, 6.250%, 01/14/2036* PHP 10,000,000 241,051 0.31
1,855,037 2.40
NETHERLANDS
PB International BV, 7.625%, 01/26/2022 USD 3,000,000 918,750 1.19
Royal Capital BV, 4.875%, 12/29/2049 USD 337,000 348,795 0.45
1,267,545 1.64
UNITED KINGDOM
ICICI Bank UK PLC, 5.375%, 09/26/2028 SGD 1,000,000 765,391 0.99
765,391 0.99
GERMANY
Deutsche Bank AG, 3.662%, 04/10/2025 CNH 1,000,000 147,495 0.19
147,495 0.19
TOTAL BONDS 61,303,998 79.19
CONVERTIBLE BONDS
CHINA/HONG KONG
Luye Pharma Group, Ltd., Cnv., 1.500%, 07/09/2024 USD 2,600,000 2,691,650 3.48
Hansoh Pharmaceutical Group Co., Ltd., Cnv., 0.000%, 01/22/2026 USD 1,100,000 1,066,307 1.38
3,757,957 4.86
MALAYSIA
Cerah Capital, Ltd., Cnv., 0.000%, 08/08/2024 USD 1,200,000 1,213,416 1.57
1,213,416 1.57
SOUTH KOREA
Kakao Corp., Cnv., 0.000%, 04/28/2023 USD 900,000 1,070,640 1.38
1,070,640 1.38
CONVERTIBLE BONDS (CONTINUED)
Investments Currency Quantity/ Nominal Value
Market Value USD
% of Net Assets
NEW ZEALAND
Xero Investments, Ltd., Cnv., 0.000%, 12/02/2025 USD 600,000 586,896 0.76
586,896 0.76
TOTAL CONVERTIBLE BONDS 6,628,909 8.57
TOTAL TRANSFERABLE SECURITIES AND MONEY MARKET INSTRUMENTS ADMITTED TO AN OFFICIAL EXCHANGE LISTING 67,932,907 87.76
Transferable securities and money market instruments dealt in on another regulated market
BONDS
CHINA/HONG KONG
King Talent Management, Ltd., 5.600%, 12/29/2049 USD 2,600,000 2,262,000 2.92
2,262,000 2.92
TOTAL BONDS 2,262,000 2.92
CONVERTIBLE BONDS
Investments Currency Quantity/ Nominal Value
Market Value USD
% of Net Assets
CHINA/HONG KONG
NIO, Inc., Cnv., 0.500%, 02/01/2027 USD 1,000,000 823,914 1.07
Baozun, Inc., Cnv., 1.625%, 05/01/2024 USD 800,000 811,480 1.05
iQIYI, Inc., Cnv., 2.000%, 04/01/2025 USD 600,000 559,410 0.72
Pinduoduo, Inc., Cnv., 0.000%, 12/01/2025 USD 350,000 370,381 0.48
2,565,185 3.32
TOTAL CONVERTIBLE BONDS 2,565,185 3.32
TOTAL TRANSFERABLE SECURITIES AND MONEY MARKET INSTRUMENTS DEALT IN ON ANOTHER REGULATED MARKET 4,827,185 6.24
Asia Total Return Bond Fund^ 31 March 2021
Schedule of Investments (continued)
The accompanying notes form an integral part of these financial statements.
^ The Sub-Fund’s name changed from Matthews Asia Strategic Income Fund to Matthews Asia Total Return Bond Fund on 25 May 2020. * Security is valued at its fair value under the direction of the Board of Directors of the Fund.
global.matthewsasia.com 13
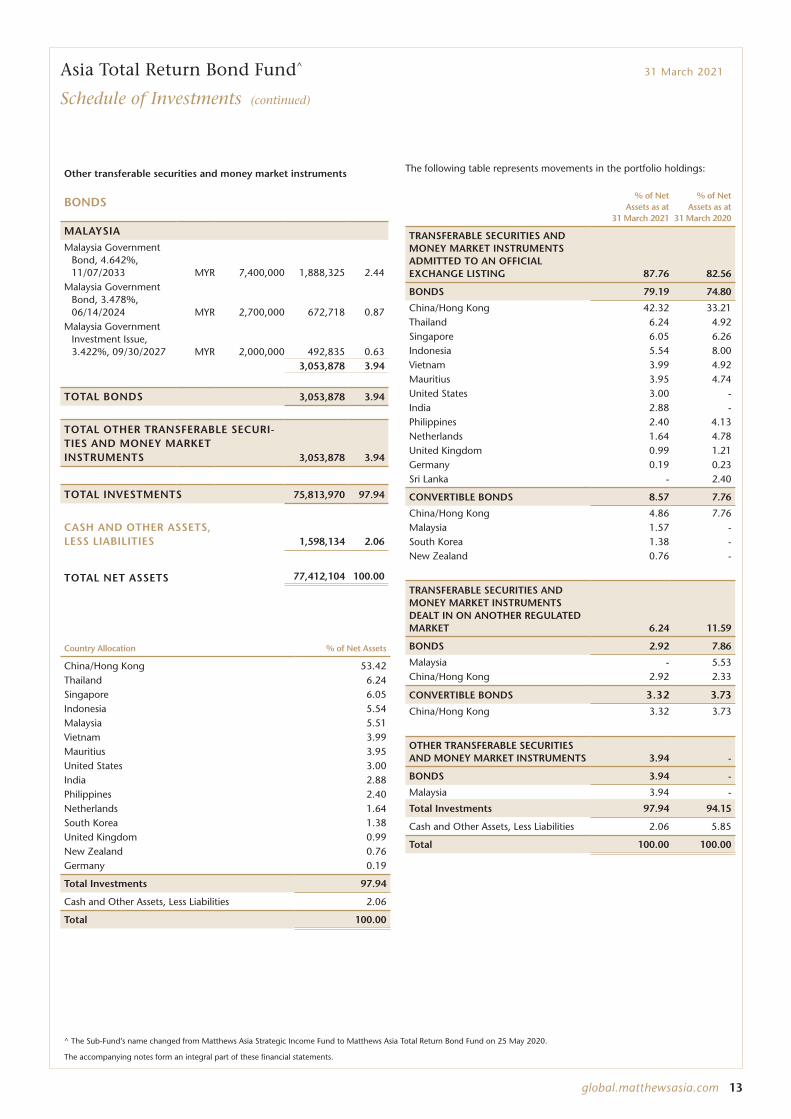
Other transferable securities and money market instruments
BONDS
MALAYSIA
Malaysia Government Bond, 4.642%, 11/07/2033 MYR 7,400,000 1,888,325 2.44
Malaysia Government Bond, 3.478%, 06/14/2024 MYR 2,700,000 672,718 0.87
Malaysia Government Investment Issue, 3.422%, 09/30/2027 MYR 2,000,000 492,835 0.63
3,053,878 3.94
TOTAL BONDS 3,053,878 3.94
TOTAL OTHER TRANSFERABLE SECURI-TIES AND MONEY MARKET INSTRUMENTS 3,053,878 3.94
TOTAL INVESTMENTS 75,813,970 97.94
CASH AND OTHER ASSETS, LESS LIABILITIES 1,598,134 2.06
TOTAL NET ASSETS 77,412,104 100.00
Country Allocation % of Net Assets
China/Hong Kong 53.42Thailand 6.24Singapore 6.05Indonesia 5.54Malaysia 5.51Vietnam 3.99Mauritius 3.95United States 3.00India 2.88Philippines 2.40Netherlands 1.64South Korea 1.38United Kingdom 0.99New Zealand 0.76Germany 0.19
Total Investments 97.94
Cash and Other Assets, Less Liabilities 2.06
Total 100.00
The following table represents movements in the portfolio holdings:
% of Net Assets as at
31 March 2021
% of Net Assets as at
31 March 2020
TRANSFERABLE SECURITIES AND MONEY MARKET INSTRUMENTS ADMITTED TO AN OFFICIAL EXCHANGE LISTING 87.76 82.56
BONDS 79.19 74.80
China/Hong Kong 42.32 33.21Thailand 6.24 4.92Singapore 6.05 6.26Indonesia 5.54 8.00Vietnam 3.99 4.92Mauritius 3.95 4.74United States 3.00 -India 2.88 -Philippines 2.40 4.13Netherlands 1.64 4.78United Kingdom 0.99 1.21Germany 0.19 0.23Sri Lanka - 2.40
CONVERTIBLE BONDS 8.57 7.76
China/Hong Kong 4.86 7.76Malaysia 1.57 -South Korea 1.38 -New Zealand 0.76 -
TRANSFERABLE SECURITIES AND MONEY MARKET INSTRUMENTS DEALT IN ON ANOTHER REGULATED MARKET 6.24 11.59
BONDS 2.92 7.86
Malaysia - 5.53China/Hong Kong 2.92 2.33
CONVERTIBLE BONDS 3.32 3.73
China/Hong Kong 3.32 3.73
OTHER TRANSFERABLE SECURITIES AND MONEY MARKET INSTRUMENTS 3.94 -
BONDS 3.94 -
Malaysia 3.94 -
Total Investments 97.94 94.15
Cash and Other Assets, Less Liabilities 2.06 5.85
Total 100.00 100.00
Asia Total Return Bond Fund^ 31 March 2021
Schedule of Investments (continued)
The accompanying notes form an integral part of these financial statements.
^ The Sub-Fund’s name changed from Matthews Asia Strategic Income Fund to Matthews Asia Total Return Bond Fund on 25 May 2020.
14 MATTHEWS ASIA FUNDS
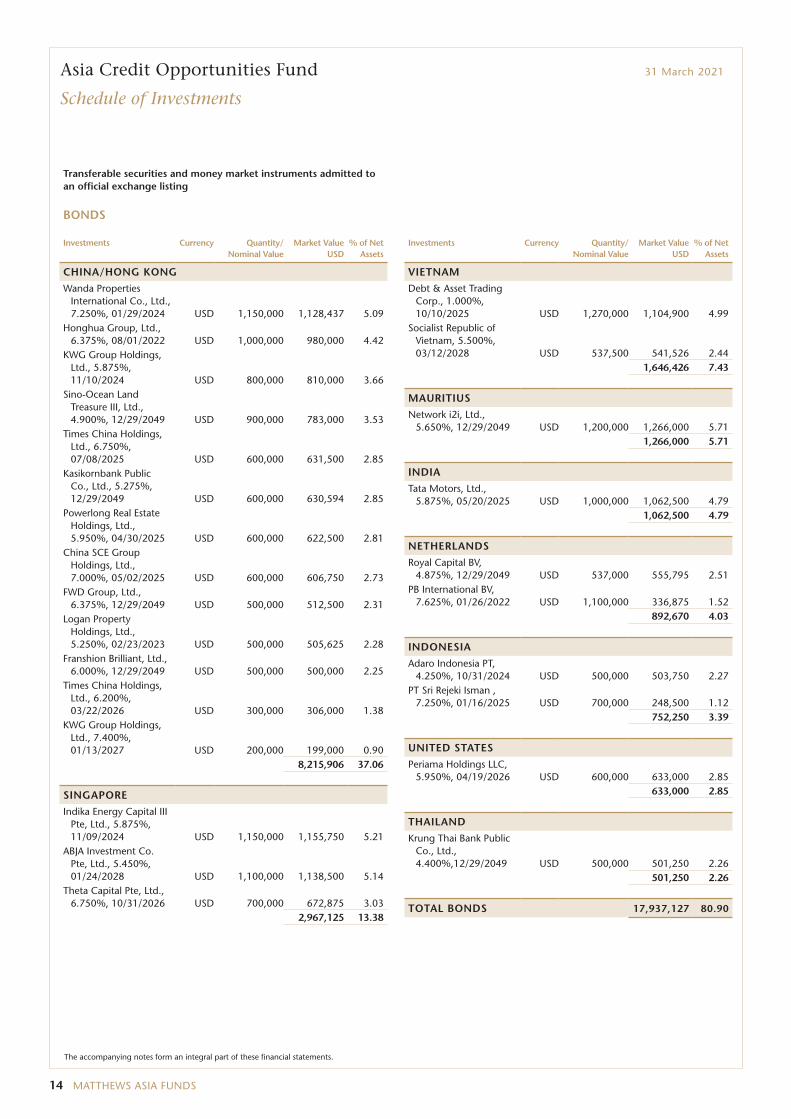
Asia Credit Opportunities Fund 31 March 2021
Schedule of Investments
Transferable securities and money market instruments admitted to an official exchange listing
BONDS
Investments Currency Quantity/ Nominal Value
Market Value USD
% of Net Assets
CHINA/HONG KONG
Wanda Properties International Co., Ltd., 7.250%, 01/29/2024 USD 1,150,000 1,128,437 5.09
Honghua Group, Ltd., 6.375%, 08/01/2022 USD 1,000,000 980,000 4.42
KWG Group Holdings, Ltd., 5.875%, 11/10/2024 USD 800,000 810,000 3.66
Sino-Ocean Land Treasure III, Ltd., 4.900%, 12/29/2049 USD 900,000 783,000 3.53
Times China Holdings, Ltd., 6.750%, 07/08/2025 USD 600,000 631,500 2.85
Kasikornbank Public Co., Ltd., 5.275%, 12/29/2049 USD 600,000 630,594 2.85
Powerlong Real Estate Holdings, Ltd., 5.950%, 04/30/2025 USD 600,000 622,500 2.81
China SCE Group Holdings, Ltd., 7.000%, 05/02/2025 USD 600,000 606,750 2.73
FWD Group, Ltd., 6.375%, 12/29/2049 USD 500,000 512,500 2.31
Logan Property Holdings, Ltd., 5.250%, 02/23/2023 USD 500,000 505,625 2.28
Franshion Brilliant, Ltd., 6.000%, 12/29/2049 USD 500,000 500,000 2.25
Times China Holdings, Ltd., 6.200%, 03/22/2026 USD 300,000 306,000 1.38
KWG Group Holdings, Ltd., 7.400%, 01/13/2027 USD 200,000 199,000 0.90
8,215,906 37.06
SINGAPORE
Indika Energy Capital III Pte, Ltd., 5.875%, 11/09/2024 USD 1,150,000 1,155,750 5.21
ABJA Investment Co. Pte, Ltd., 5.450%, 01/24/2028 USD 1,100,000 1,138,500 5.14
Theta Capital Pte, Ltd., 6.750%, 10/31/2026 USD 700,000 672,875 3.03
2,967,125 13.38
Investments Currency Quantity/ Nominal Value
Market Value USD
% of Net Assets
VIETNAM
Debt & Asset Trading Corp., 1.000%, 10/10/2025 USD 1,270,000 1,104,900 4.99
Socialist Republic of Vietnam, 5.500%, 03/12/2028 USD 537,500 541,526 2.44
1,646,426 7.43
MAURITIUS
Network i2i, Ltd., 5.650%, 12/29/2049 USD 1,200,000 1,266,000 5.71
1,266,000 5.71
INDIA
Tata Motors, Ltd., 5.875%, 05/20/2025 USD 1,000,000 1,062,500 4.79
1,062,500 4.79
NETHERLANDS
Royal Capital BV, 4.875%, 12/29/2049 USD 537,000 555,795 2.51
PB International BV, 7.625%, 01/26/2022 USD 1,100,000 336,875 1.52
892,670 4.03
INDONESIA
Adaro Indonesia PT, 4.250%, 10/31/2024 USD 500,000 503,750 2.27
PT Sri Rejeki Isman , 7.250%, 01/16/2025 USD 700,000 248,500 1.12
752,250 3.39
UNITED STATES
Periama Holdings LLC, 5.950%, 04/19/2026 USD 600,000 633,000 2.85
633,000 2.85
THAILAND
Krung Thai Bank Public Co., Ltd., 4.400%,12/29/2049 USD 500,000 501,250 2.26
501,250 2.26
TOTAL BONDS 17,937,127 80.90
The accompanying notes form an integral part of these financial statements.
global.matthewsasia.com 15
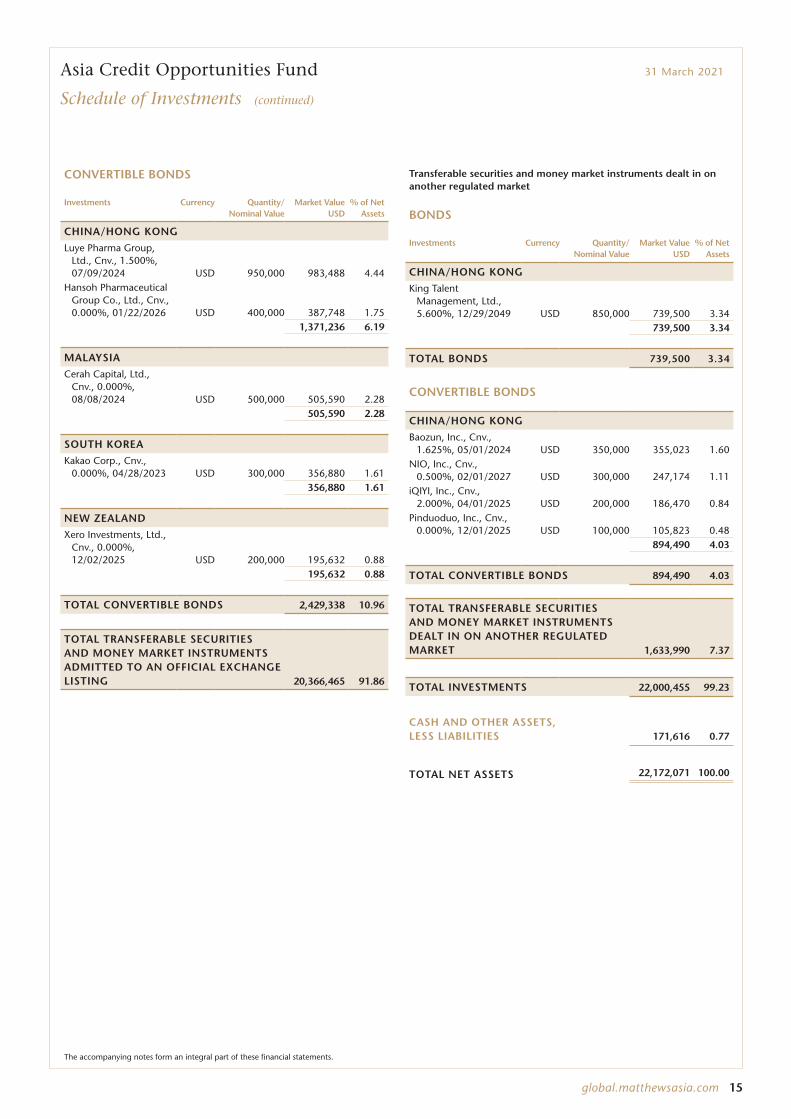
Asia Credit Opportunities Fund 31 March 2021
Schedule of Investments (continued)
CONVERTIBLE BONDS
Investments Currency Quantity/ Nominal Value
Market Value USD
% of Net Assets
CHINA/HONG KONG
Luye Pharma Group, Ltd., Cnv., 1.500%, 07/09/2024 USD 950,000 983,488 4.44
Hansoh Pharmaceutical Group Co., Ltd., Cnv., 0.000%, 01/22/2026 USD 400,000 387,748 1.75
1,371,236 6.19
MALAYSIA
Cerah Capital, Ltd., Cnv., 0.000%, 08/08/2024 USD 500,000 505,590 2.28
505,590 2.28
SOUTH KOREA
Kakao Corp., Cnv., 0.000%, 04/28/2023 USD 300,000 356,880 1.61
356,880 1.61
NEW ZEALAND
Xero Investments, Ltd., Cnv., 0.000%, 12/02/2025 USD 200,000 195,632 0.88
195,632 0.88
TOTAL CONVERTIBLE BONDS 2,429,338 10.96
TOTAL TRANSFERABLE SECURITIES AND MONEY MARKET INSTRUMENTS ADMITTED TO AN OFFICIAL EXCHANGE LISTING 20,366,465 91.86
Transferable securities and money market instruments dealt in on another regulated market
BONDS
Investments Currency Quantity/ Nominal Value
Market Value USD
% of Net Assets
CHINA/HONG KONG
King Talent Management, Ltd., 5.600%, 12/29/2049 USD 850,000 739,500 3.34
739,500 3.34
TOTAL BONDS 739,500 3.34
CONVERTIBLE BONDS
CHINA/HONG KONG
Baozun, Inc., Cnv., 1.625%, 05/01/2024 USD 350,000 355,023 1.60
NIO, Inc., Cnv., 0.500%, 02/01/2027 USD 300,000 247,174 1.11
iQIYI, Inc., Cnv., 2.000%, 04/01/2025 USD 200,000 186,470 0.84
Pinduoduo, Inc., Cnv., 0.000%, 12/01/2025 USD 100,000 105,823 0.48
894,490 4.03
TOTAL CONVERTIBLE BONDS 894,490 4.03
TOTAL TRANSFERABLE SECURITIES AND MONEY MARKET INSTRUMENTS DEALT IN ON ANOTHER REGULATED MARKET 1,633,990 7.37
TOTAL INVESTMENTS 22,000,455 99.23
CASH AND OTHER ASSETS, LESS LIABILITIES 171,616 0.77
TOTAL NET ASSETS 22,172,071 100.00
The accompanying notes form an integral part of these financial statements.
16 MATTHEWS ASIA FUNDS
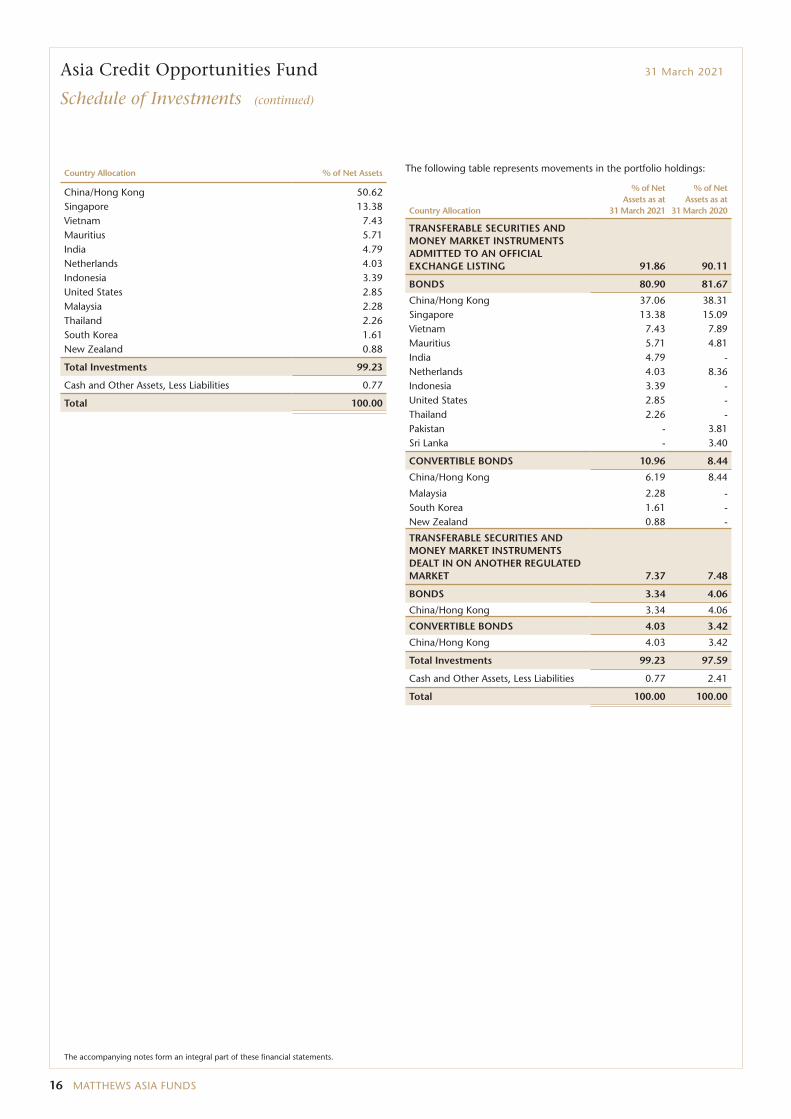
Country Allocation % of Net Assets
China/Hong Kong 50.62Singapore 13.38Vietnam 7.43Mauritius 5.71India 4.79Netherlands 4.03Indonesia 3.39United States 2.85Malaysia 2.28Thailand 2.26South Korea 1.61New Zealand 0.88
Total Investments 99.23
Cash and Other Assets, Less Liabilities 0.77
Total 100.00
The following table represents movements in the portfolio holdings:
Country Allocation
% of Net Assets as at
31 March 2021
% of Net Assets as at
31 March 2020
TRANSFERABLE SECURITIES AND MONEY MARKET INSTRUMENTS ADMITTED TO AN OFFICIAL EXCHANGE LISTING 91.86 90.11
BONDS 80.90 81.67
China/Hong Kong 37.06 38.31Singapore 13.38 15.09Vietnam 7.43 7.89Mauritius 5.71 4.81India 4.79 -Netherlands 4.03 8.36Indonesia 3.39 -United States 2.85 -Thailand 2.26 -Pakistan - 3.81Sri Lanka - 3.40
CONVERTIBLE BONDS 10.96 8.44
China/Hong Kong 6.19 8.44
Malaysia 2.28 -South Korea 1.61 -New Zealand 0.88 -
TRANSFERABLE SECURITIES AND MONEY MARKET INSTRUMENTS DEALT IN ON ANOTHER REGULATED MARKET 7.37 7.48
BONDS 3.34 4.06
China/Hong Kong 3.34 4.06
CONVERTIBLE BONDS 4.03 3.42
China/Hong Kong 4.03 3.42
Total Investments 99.23 97.59
Cash and Other Assets, Less Liabilities 0.77 2.41
Total 100.00 100.00
Asia Credit Opportunities Fund 31 March 2021
Schedule of Investments (continued)
The accompanying notes form an integral part of these financial statements.
global.matthewsasia.com 17
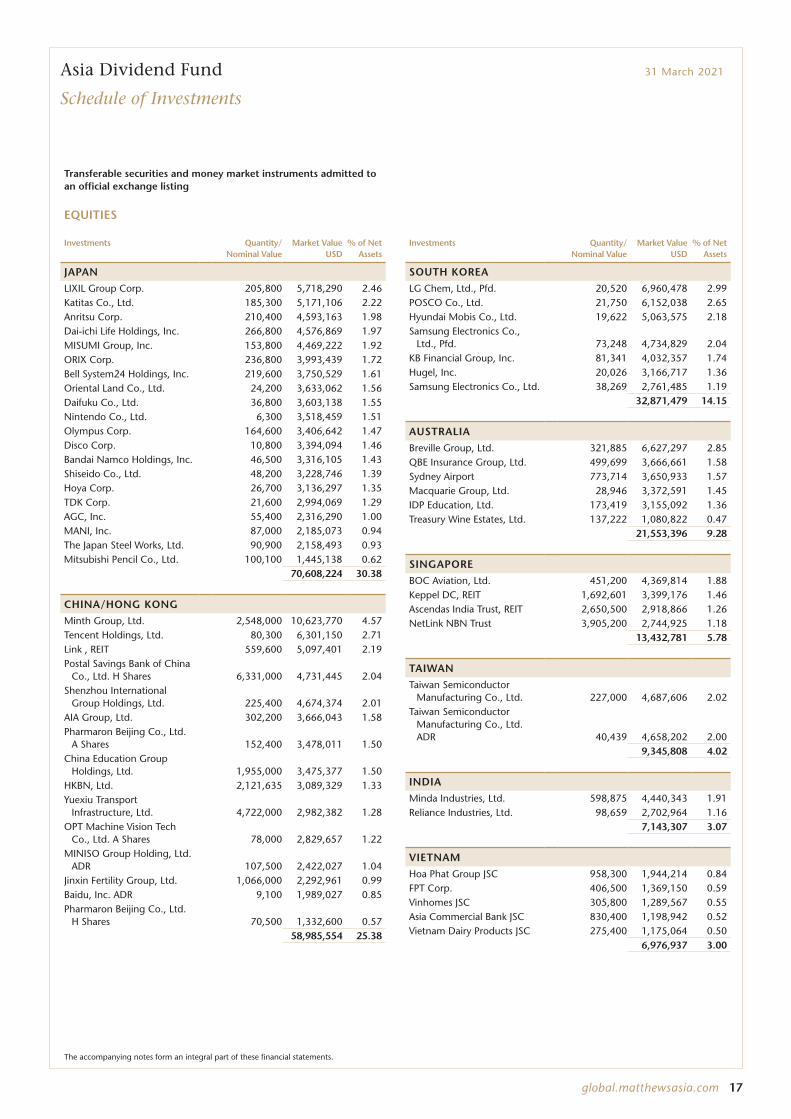
Asia Dividend Fund 31 March 2021
Schedule of Investments
The accompanying notes form an integral part of these financial statements.
Transferable securities and money market instruments admitted to an official exchange listing
EQUITIES
Investments Quantity/ Nominal Value
Market Value USD
% of Net Assets
JAPAN
LIXIL Group Corp. 205,800 5,718,290 2.46Katitas Co., Ltd. 185,300 5,171,106 2.22Anritsu Corp. 210,400 4,593,163 1.98Dai-ichi Life Holdings, Inc. 266,800 4,576,869 1.97MISUMI Group, Inc. 153,800 4,469,222 1.92ORIX Corp. 236,800 3,993,439 1.72Bell System24 Holdings, Inc. 219,600 3,750,529 1.61Oriental Land Co., Ltd. 24,200 3,633,062 1.56Daifuku Co., Ltd. 36,800 3,603,138 1.55Nintendo Co., Ltd. 6,300 3,518,459 1.51Olympus Corp. 164,600 3,406,642 1.47Disco Corp. 10,800 3,394,094 1.46Bandai Namco Holdings, Inc. 46,500 3,316,105 1.43Shiseido Co., Ltd. 48,200 3,228,746 1.39Hoya Corp. 26,700 3,136,297 1.35TDK Corp. 21,600 2,994,069 1.29AGC, Inc. 55,400 2,316,290 1.00MANI, Inc. 87,000 2,185,073 0.94The Japan Steel Works, Ltd. 90,900 2,158,493 0.93Mitsubishi Pencil Co., Ltd. 100,100 1,445,138 0.62
70,608,224 30.38
CHINA/HONG KONG
Minth Group, Ltd. 2,548,000 10,623,770 4.57Tencent Holdings, Ltd. 80,300 6,301,150 2.71Link , REIT 559,600 5,097,401 2.19Postal Savings Bank of China
Co., Ltd. H Shares 6,331,000 4,731,445 2.04Shenzhou International
Group Holdings, Ltd. 225,400 4,674,374 2.01AIA Group, Ltd. 302,200 3,666,043 1.58Pharmaron Beijing Co., Ltd.
A Shares 152,400 3,478,011 1.50China Education Group
Holdings, Ltd. 1,955,000 3,475,377 1.50HKBN, Ltd. 2,121,635 3,089,329 1.33Yuexiu Transport
Infrastructure, Ltd. 4,722,000 2,982,382 1.28OPT Machine Vision Tech
Co., Ltd. A Shares 78,000 2,829,657 1.22MINISO Group Holding, Ltd.
ADR 107,500 2,422,027 1.04Jinxin Fertility Group, Ltd. 1,066,000 2,292,961 0.99Baidu, Inc. ADR 9,100 1,989,027 0.85Pharmaron Beijing Co., Ltd.
H Shares 70,500 1,332,600 0.5758,985,554 25.38
Investments Quantity/ Nominal Value
Market Value USD
% of Net Assets
SOUTH KOREA
LG Chem, Ltd., Pfd. 20,520 6,960,478 2.99POSCO Co., Ltd. 21,750 6,152,038 2.65Hyundai Mobis Co., Ltd. 19,622 5,063,575 2.18Samsung Electronics Co.,
Ltd., Pfd. 73,248 4,734,829 2.04KB Financial Group, Inc. 81,341 4,032,357 1.74Hugel, Inc. 20,026 3,166,717 1.36Samsung Electronics Co., Ltd. 38,269 2,761,485 1.19
32,871,479 14.15
AUSTRALIA
Breville Group, Ltd. 321,885 6,627,297 2.85QBE Insurance Group, Ltd. 499,699 3,666,661 1.58Sydney Airport 773,714 3,650,933 1.57Macquarie Group, Ltd. 28,946 3,372,591 1.45IDP Education, Ltd. 173,419 3,155,092 1.36Treasury Wine Estates, Ltd. 137,222 1,080,822 0.47
21,553,396 9.28
SINGAPORE
BOC Aviation, Ltd. 451,200 4,369,814 1.88Keppel DC, REIT 1,692,601 3,399,176 1.46Ascendas India Trust, REIT 2,650,500 2,918,866 1.26NetLink NBN Trust 3,905,200 2,744,925 1.18
13,432,781 5.78
TAIWAN
Taiwan Semiconductor Manufacturing Co., Ltd. 227,000 4,687,606 2.02
Taiwan Semiconductor Manufacturing Co., Ltd. ADR 40,439 4,658,202 2.00
9,345,808 4.02
INDIA
Minda Industries, Ltd. 598,875 4,440,343 1.91Reliance Industries, Ltd. 98,659 2,702,964 1.16
7,143,307 3.07
VIETNAM
Hoa Phat Group JSC 958,300 1,944,214 0.84FPT Corp. 406,500 1,369,150 0.59Vinhomes JSC 305,800 1,289,567 0.55Asia Commercial Bank JSC 830,400 1,198,942 0.52Vietnam Dairy Products JSC 275,400 1,175,064 0.50
6,976,937 3.00
18 MATTHEWS ASIA FUNDS
Asia Dividend Fund 31 March 2021
Schedule of Investments (continued)
EQUITIES (CONTINUED)
Investments Quantity/ Nominal Value
Market Value USD
% of Net Assets
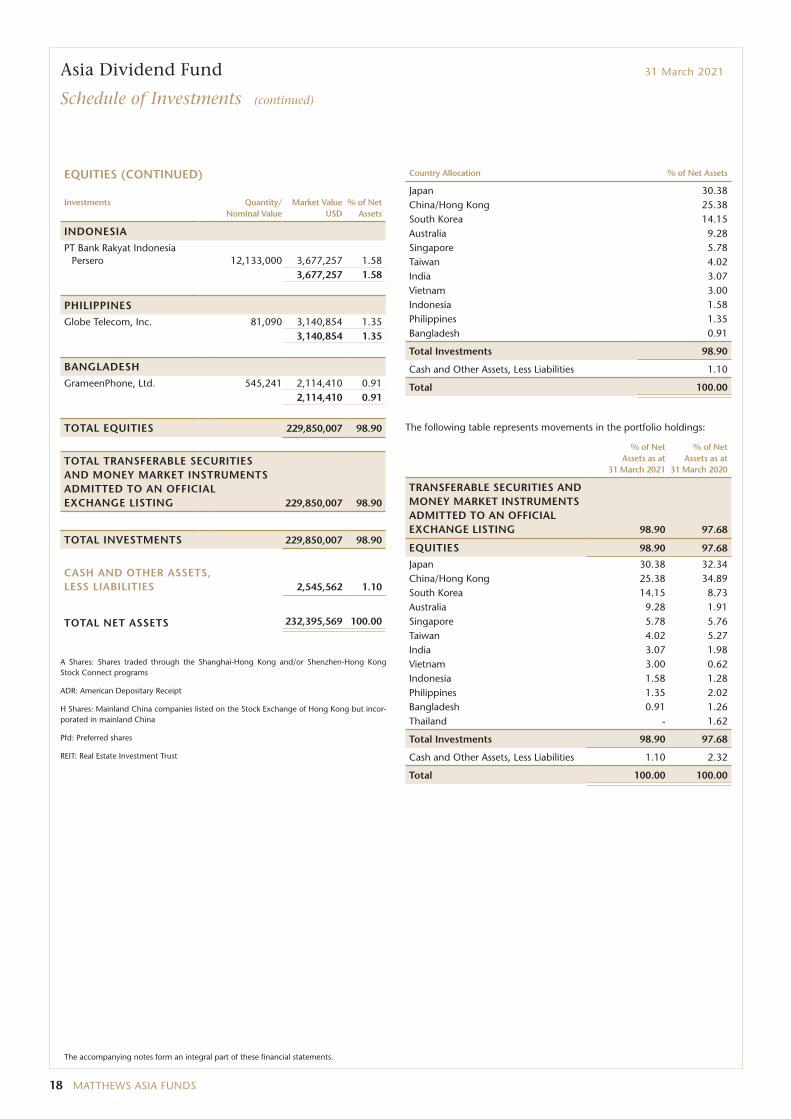
INDONESIA
PT Bank Rakyat Indonesia Persero 12,133,000 3,677,257 1.58
3,677,257 1.58
PHILIPPINES
Globe Telecom, Inc. 81,090 3,140,854 1.353,140,854 1.35
BANGLADESH
GrameenPhone, Ltd. 545,241 2,114,410 0.912,114,410 0.91
TOTAL EQUITIES 229,850,007 98.90
TOTAL TRANSFERABLE SECURITIES AND MONEY MARKET INSTRUMENTS ADMITTED TO AN OFFICIAL EXCHANGE LISTING 229,850,007 98.90
TOTAL INVESTMENTS 229,850,007 98.90
CASH AND OTHER ASSETS, LESS LIABILITIES 2,545,562 1.10
TOTAL NET ASSETS 232,395,569 100.00
A Shares: Shares traded through the Shanghai-Hong Kong and/or Shenzhen-Hong Kong Stock Connect programs
ADR: American Depositary Receipt
H Shares: Mainland China companies listed on the Stock Exchange of Hong Kong but incor-porated in mainland China
Pfd: Preferred shares
REIT: Real Estate Investment Trust
Country Allocation % of Net Assets
Japan 30.38China/Hong Kong 25.38South Korea 14.15Australia 9.28Singapore 5.78Taiwan 4.02India 3.07Vietnam 3.00Indonesia 1.58Philippines 1.35Bangladesh 0.91
Total Investments 98.90
Cash and Other Assets, Less Liabilities 1.10
Total 100.00
The following table represents movements in the portfolio holdings:
% of Net Assets as at
31 March 2021
% of Net Assets as at
31 March 2020
TRANSFERABLE SECURITIES AND MONEY MARKET INSTRUMENTS ADMITTED TO AN OFFICIAL EXCHANGE LISTING 98.90 97.68
EQUITIES 98.90 97.68
Japan 30.38 32.34China/Hong Kong 25.38 34.89South Korea 14.15 8.73Australia 9.28 1.91Singapore 5.78 5.76Taiwan 4.02 5.27India 3.07 1.98Vietnam 3.00 0.62Indonesia 1.58 1.28Philippines 1.35 2.02Bangladesh 0.91 1.26Thailand - 1.62
Total Investments 98.90 97.68
Cash and Other Assets, Less Liabilities 1.10 2.32
Total 100.00 100.00
The accompanying notes form an integral part of these financial statements.
global.matthewsasia.com 19
Asia ex Japan Dividend Fund 31 March 2021
Schedule of Investments
Transferable securities and money market instruments admitted to an official exchange listing
EQUITIES
Investments Quantity/ Nominal Value
Market Value USD
% of Net Assets
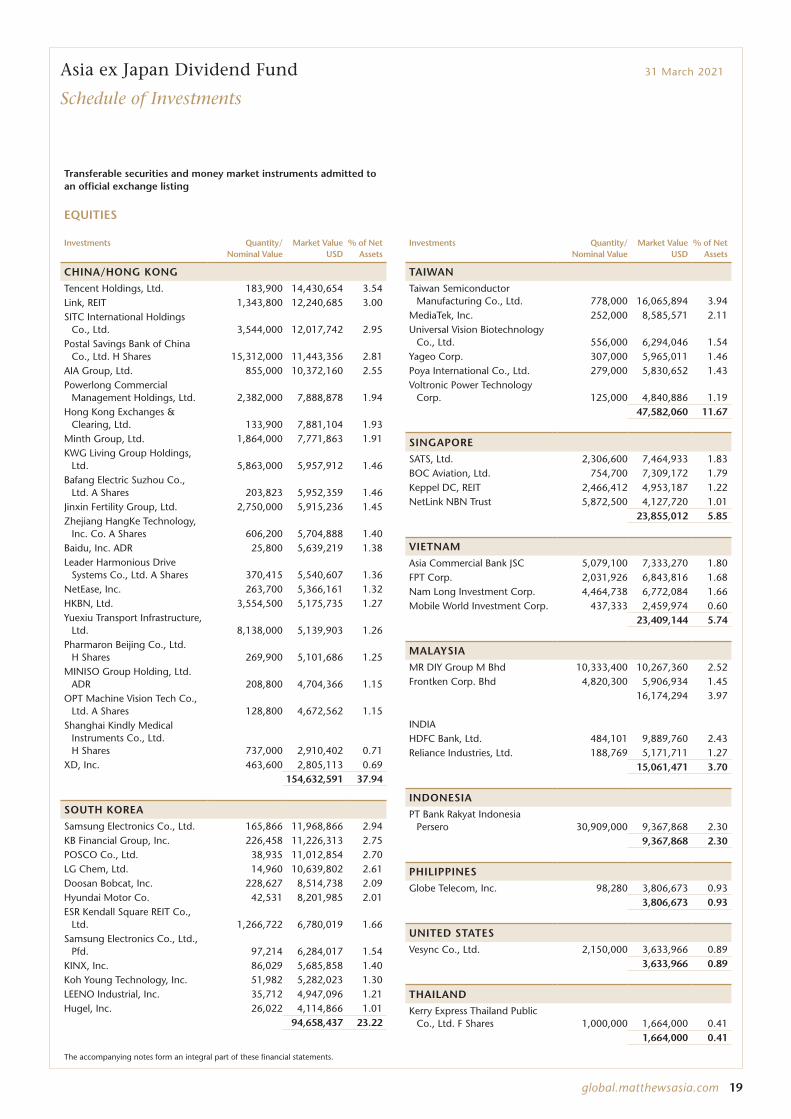
CHINA/HONG KONG
Tencent Holdings, Ltd. 183,900 14,430,654 3.54Link, REIT 1,343,800 12,240,685 3.00SITC International Holdings
Co., Ltd. 3,544,000 12,017,742 2.95Postal Savings Bank of China
Co., Ltd. H Shares 15,312,000 11,443,356 2.81AIA Group, Ltd. 855,000 10,372,160 2.55Powerlong Commercial
Management Holdings, Ltd. 2,382,000 7,888,878 1.94Hong Kong Exchanges &
Clearing, Ltd. 133,900 7,881,104 1.93Minth Group, Ltd. 1,864,000 7,771,863 1.91KWG Living Group Holdings,
Ltd. 5,863,000 5,957,912 1.46Bafang Electric Suzhou Co.,
Ltd. A Shares 203,823 5,952,359 1.46Jinxin Fertility Group, Ltd. 2,750,000 5,915,236 1.45Zhejiang HangKe Technology,
Inc. Co. A Shares 606,200 5,704,888 1.40Baidu, Inc. ADR 25,800 5,639,219 1.38Leader Harmonious Drive
Systems Co., Ltd. A Shares 370,415 5,540,607 1.36NetEase, Inc. 263,700 5,366,161 1.32HKBN, Ltd. 3,554,500 5,175,735 1.27Yuexiu Transport Infrastructure,
Ltd. 8,138,000 5,139,903 1.26Pharmaron Beijing Co., Ltd.
H Shares 269,900 5,101,686 1.25MINISO Group Holding, Ltd.
ADR 208,800 4,704,366 1.15OPT Machine Vision Tech Co.,
Ltd. A Shares 128,800 4,672,562 1.15Shanghai Kindly Medical
Instruments Co., Ltd. H Shares 737,000 2,910,402 0.71
XD, Inc. 463,600 2,805,113 0.69154,632,591 37.94
SOUTH KOREA
Samsung Electronics Co., Ltd. 165,866 11,968,866 2.94KB Financial Group, Inc. 226,458 11,226,313 2.75POSCO Co., Ltd. 38,935 11,012,854 2.70LG Chem, Ltd. 14,960 10,639,802 2.61Doosan Bobcat, Inc. 228,627 8,514,738 2.09Hyundai Motor Co. 42,531 8,201,985 2.01ESR Kendall Square REIT Co.,
Ltd. 1,266,722 6,780,019 1.66Samsung Electronics Co., Ltd.,
Pfd. 97,214 6,284,017 1.54KINX, Inc. 86,029 5,685,858 1.40Koh Young Technology, Inc. 51,982 5,282,023 1.30LEENO Industrial, Inc. 35,712 4,947,096 1.21Hugel, Inc. 26,022 4,114,866 1.01
94,658,437 23.22
Investments Quantity/ Nominal Value
Market Value USD
% of Net Assets
TAIWAN
Taiwan Semiconductor Manufacturing Co., Ltd. 778,000 16,065,894 3.94
MediaTek, Inc. 252,000 8,585,571 2.11Universal Vision Biotechnology
Co., Ltd. 556,000 6,294,046 1.54Yageo Corp. 307,000 5,965,011 1.46Poya International Co., Ltd. 279,000 5,830,652 1.43Voltronic Power Technology
Corp. 125,000 4,840,886 1.1947,582,060 11.67
SINGAPORE
SATS, Ltd. 2,306,600 7,464,933 1.83BOC Aviation, Ltd. 754,700 7,309,172 1.79Keppel DC, REIT 2,466,412 4,953,187 1.22NetLink NBN Trust 5,872,500 4,127,720 1.01
23,855,012 5.85
VIETNAM
Asia Commercial Bank JSC 5,079,100 7,333,270 1.80FPT Corp. 2,031,926 6,843,816 1.68Nam Long Investment Corp. 4,464,738 6,772,084 1.66Mobile World Investment Corp. 437,333 2,459,974 0.60
23,409,144 5.74
MALAYSIA
MR DIY Group M Bhd 10,333,400 10,267,360 2.52Frontken Corp. Bhd 4,820,300 5,906,934 1.45
16,174,294 3.97
INDIAHDFC Bank, Ltd. 484,101 9,889,760 2.43Reliance Industries, Ltd. 188,769 5,171,711 1.27
15,061,471 3.70
INDONESIA
PT Bank Rakyat Indonesia Persero 30,909,000 9,367,868 2.30
9,367,868 2.30
PHILIPPINES
Globe Telecom, Inc. 98,280 3,806,673 0.933,806,673 0.93
UNITED STATES
Vesync Co., Ltd. 2,150,000 3,633,966 0.893,633,966 0.89
THAILAND
Kerry Express Thailand Public Co., Ltd. F Shares 1,000,000 1,664,000 0.41
1,664,000 0.41
The accompanying notes form an integral part of these financial statements.
20 MATTHEWS ASIA FUNDS
Asia ex Japan Dividend Fund 31 March 2021
Schedule of Investments (continued)
EQUITIES (CONTINUED)
Investments Quantity/ Nominal Value
Market Value USD
% of Net Assets
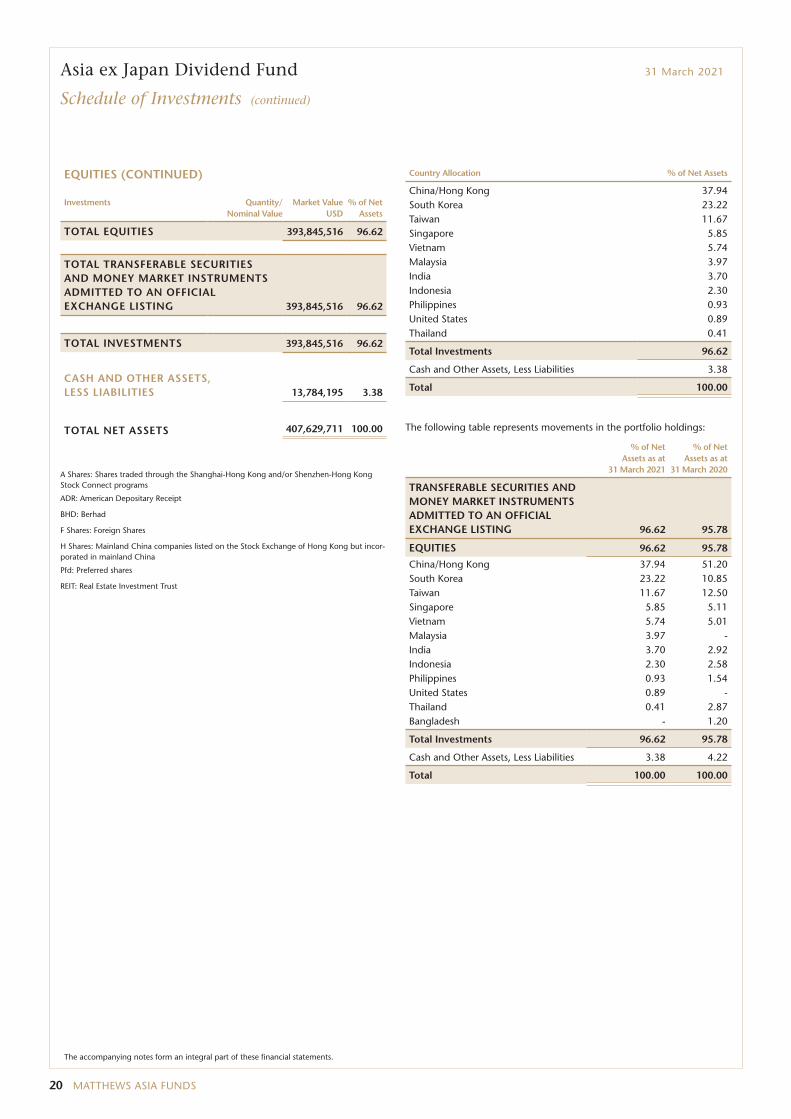
TOTAL EQUITIES 393,845,516 96.62
TOTAL TRANSFERABLE SECURITIES AND MONEY MARKET INSTRUMENTS ADMITTED TO AN OFFICIAL EXCHANGE LISTING 393,845,516 96.62
TOTAL INVESTMENTS 393,845,516 96.62
CASH AND OTHER ASSETS, LESS LIABILITIES 13,784,195 3.38
TOTAL NET ASSETS 407,629,711 100.00
A Shares: Shares traded through the Shanghai-Hong Kong and/or Shenzhen-Hong Kong Stock Connect programs
ADR: American Depositary Receipt
BHD: Berhad
F Shares: Foreign Shares
H Shares: Mainland China companies listed on the Stock Exchange of Hong Kong but incor-porated in mainland China
Pfd: Preferred shares
REIT: Real Estate Investment Trust
Country Allocation % of Net Assets
China/Hong Kong 37.94South Korea 23.22Taiwan 11.67Singapore 5.85Vietnam 5.74Malaysia 3.97India 3.70Indonesia 2.30Philippines 0.93United States 0.89Thailand 0.41
Total Investments 96.62
Cash and Other Assets, Less Liabilities 3.38
Total 100.00
The following table represents movements in the portfolio holdings:
% of Net Assets as at
31 March 2021
% of Net Assets as at
31 March 2020
TRANSFERABLE SECURITIES AND MONEY MARKET INSTRUMENTS ADMITTED TO AN OFFICIAL EXCHANGE LISTING 96.62 95.78
EQUITIES 96.62 95.78
China/Hong Kong 37.94 51.20South Korea 23.22 10.85Taiwan 11.67 12.50Singapore 5.85 5.11Vietnam 5.74 5.01Malaysia 3.97 -India 3.70 2.92Indonesia 2.30 2.58Philippines 0.93 1.54United States 0.89 -Thailand 0.41 2.87Bangladesh - 1.20
Total Investments 96.62 95.78
Cash and Other Assets, Less Liabilities 3.38 4.22
Total 100.00 100.00
The accompanying notes form an integral part of these financial statements.
global.matthewsasia.com 21
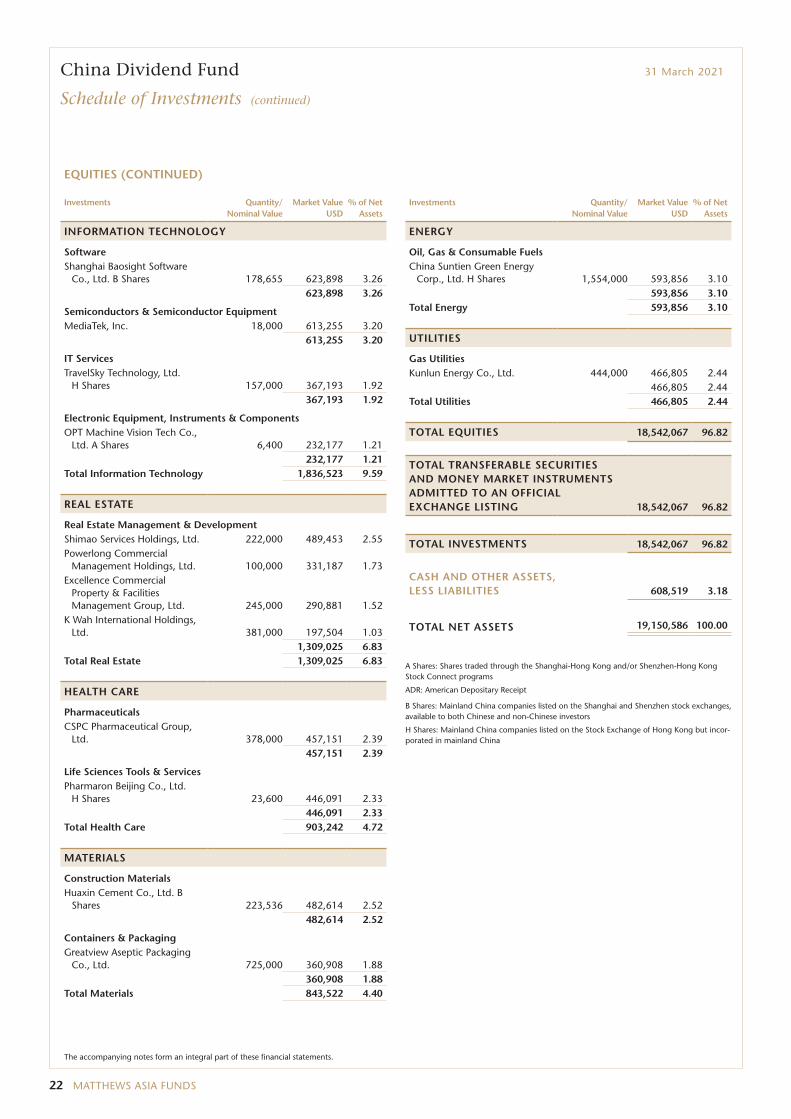
China Dividend Fund 31 March 2021
Schedule of Investments
Transferable securities and money market instruments admitted to an official exchange listing
EQUITIES
Investments Quantity/ Nominal Value
Market Value USD
% of Net Assets
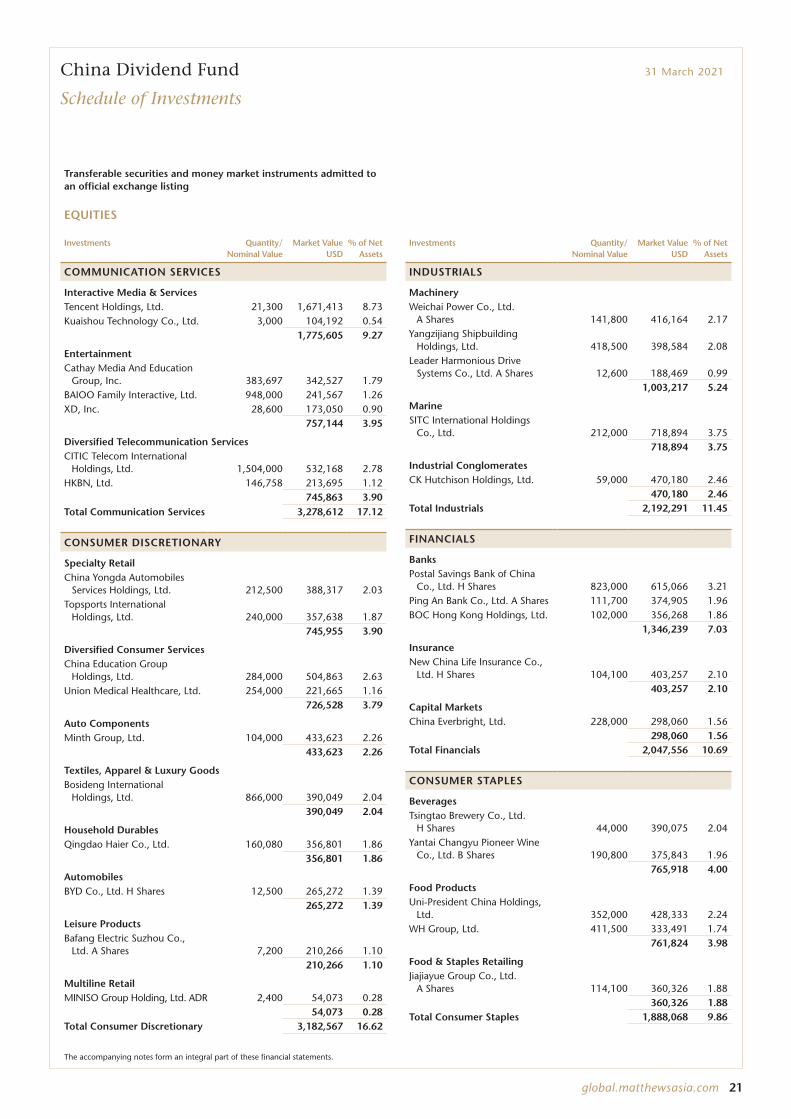
COMMUNICATION SERVICES
Interactive Media & ServicesTencent Holdings, Ltd. 21,300 1,671,413 8.73Kuaishou Technology Co., Ltd. 3,000 104,192 0.54
1,775,605 9.27
EntertainmentCathay Media And Education
Group, Inc. 383,697 342,527 1.79BAIOO Family Interactive, Ltd. 948,000 241,567 1.26XD, Inc. 28,600 173,050 0.90
757,144 3.95
Diversified Telecommunication ServicesCITIC Telecom International
Holdings, Ltd. 1,504,000 532,168 2.78HKBN, Ltd. 146,758 213,695 1.12
745,863 3.90Total Communication Services 3,278,612 17.12
CONSUMER DISCRETIONARY
Specialty RetailChina Yongda Automobiles
Services Holdings, Ltd. 212,500 388,317 2.03Topsports International
Holdings, Ltd. 240,000 357,638 1.87745,955 3.90
Diversified Consumer ServicesChina Education Group
Holdings, Ltd. 284,000 504,863 2.63Union Medical Healthcare, Ltd. 254,000 221,665 1.16
726,528 3.79
Auto ComponentsMinth Group, Ltd. 104,000 433,623 2.26
433,623 2.26
Textiles, Apparel & Luxury GoodsBosideng International
Holdings, Ltd. 866,000 390,049 2.04390,049 2.04
Household DurablesQingdao Haier Co., Ltd. 160,080 356,801 1.86
356,801 1.86
AutomobilesBYD Co., Ltd. H Shares 12,500 265,272 1.39
265,272 1.39
Leisure ProductsBafang Electric Suzhou Co.,
Ltd. A Shares 7,200 210,266 1.10210,266 1.10
Multiline RetailMINISO Group Holding, Ltd. ADR 2,400 54,073 0.28
54,073 0.28Total Consumer Discretionary 3,182,567 16.62
Investments Quantity/ Nominal Value
Market Value USD
% of Net Assets
INDUSTRIALS
MachineryWeichai Power Co., Ltd.
A Shares 141,800 416,164 2.17Yangzijiang Shipbuilding
Holdings, Ltd. 418,500 398,584 2.08Leader Harmonious Drive
Systems Co., Ltd. A Shares 12,600 188,469 0.991,003,217 5.24
MarineSITC International Holdings
Co., Ltd. 212,000 718,894 3.75718,894 3.75
Industrial ConglomeratesCK Hutchison Holdings, Ltd. 59,000 470,180 2.46
470,180 2.46Total Industrials 2,192,291 11.45
FINANCIALS
BanksPostal Savings Bank of China
Co., Ltd. H Shares 823,000 615,066 3.21Ping An Bank Co., Ltd. A Shares 111,700 374,905 1.96BOC Hong Kong Holdings, Ltd. 102,000 356,268 1.86
1,346,239 7.03
InsuranceNew China Life Insurance Co.,
Ltd. H Shares 104,100 403,257 2.10403,257 2.10
Capital MarketsChina Everbright, Ltd. 228,000 298,060 1.56
298,060 1.56Total Financials 2,047,556 10.69
CONSUMER STAPLES
BeveragesTsingtao Brewery Co., Ltd.
H Shares 44,000 390,075 2.04Yantai Changyu Pioneer Wine
Co., Ltd. B Shares 190,800 375,843 1.96765,918 4.00
Food ProductsUni-President China Holdings,
Ltd. 352,000 428,333 2.24WH Group, Ltd. 411,500 333,491 1.74
761,824 3.98
Food & Staples RetailingJiajiayue Group Co., Ltd.
A Shares 114,100 360,326 1.88360,326 1.88
Total Consumer Staples 1,888,068 9.86
The accompanying notes form an integral part of these financial statements.
22 MATTHEWS ASIA FUNDS
China Dividend Fund 31 March 2021
Schedule of Investments (continued)
EQUITIES (CONTINUED)
Investments Quantity/ Nominal Value
Market Value USD
% of Net Assets
INFORMATION TECHNOLOGY
SoftwareShanghai Baosight Software
Co., Ltd. B Shares 178,655 623,898 3.26623,898 3.26
Semiconductors & Semiconductor EquipmentMediaTek, Inc. 18,000 613,255 3.20
613,255 3.20
IT ServicesTravelSky Technology, Ltd.
H Shares 157,000 367,193 1.92367,193 1.92
Electronic Equipment, Instruments & ComponentsOPT Machine Vision Tech Co.,
Ltd. A Shares 6,400 232,177 1.21232,177 1.21
Total Information Technology 1,836,523 9.59
REAL ESTATE
Real Estate Management & DevelopmentShimao Services Holdings, Ltd. 222,000 489,453 2.55Powerlong Commercial
Management Holdings, Ltd. 100,000 331,187 1.73Excellence Commercial
Property & Facilities Management Group, Ltd. 245,000 290,881 1.52
K Wah International Holdings, Ltd. 381,000 197,504 1.03
1,309,025 6.83Total Real Estate 1,309,025 6.83
HEALTH CARE
PharmaceuticalsCSPC Pharmaceutical Group,
Ltd. 378,000 457,151 2.39457,151 2.39
Life Sciences Tools & ServicesPharmaron Beijing Co., Ltd.
H Shares 23,600 446,091 2.33446,091 2.33
Total Health Care 903,242 4.72
MATERIALS
Construction MaterialsHuaxin Cement Co., Ltd. B
Shares 223,536 482,614 2.52482,614 2.52
Containers & PackagingGreatview Aseptic Packaging
Co., Ltd. 725,000 360,908 1.88360,908 1.88
Total Materials 843,522 4.40
Investments Quantity/ Nominal Value
Market Value USD
% of Net Assets
ENERGY
Oil, Gas & Consumable FuelsChina Suntien Green Energy
Corp., Ltd. H Shares 1,554,000 593,856 3.10593,856 3.10
Total Energy 593,856 3.10
UTILITIES
Gas UtilitiesKunlun Energy Co., Ltd. 444,000 466,805 2.44
466,805 2.44Total Utilities 466,805 2.44
TOTAL EQUITIES 18,542,067 96.82
TOTAL TRANSFERABLE SECURITIES AND MONEY MARKET INSTRUMENTS ADMITTED TO AN OFFICIAL EXCHANGE LISTING 18,542,067 96.82
TOTAL INVESTMENTS 18,542,067 96.82
CASH AND OTHER ASSETS, LESS LIABILITIES 608,519 3.18
TOTAL NET ASSETS 19,150,586 100.00
A Shares: Shares traded through the Shanghai-Hong Kong and/or Shenzhen-Hong Kong Stock Connect programs
ADR: American Depositary Receipt
B Shares: Mainland China companies listed on the Shanghai and Shenzhen stock exchanges, available to both Chinese and non-Chinese investors
H Shares: Mainland China companies listed on the Stock Exchange of Hong Kong but incor-porated in mainland China
The accompanying notes form an integral part of these financial statements.
global.matthewsasia.com 23
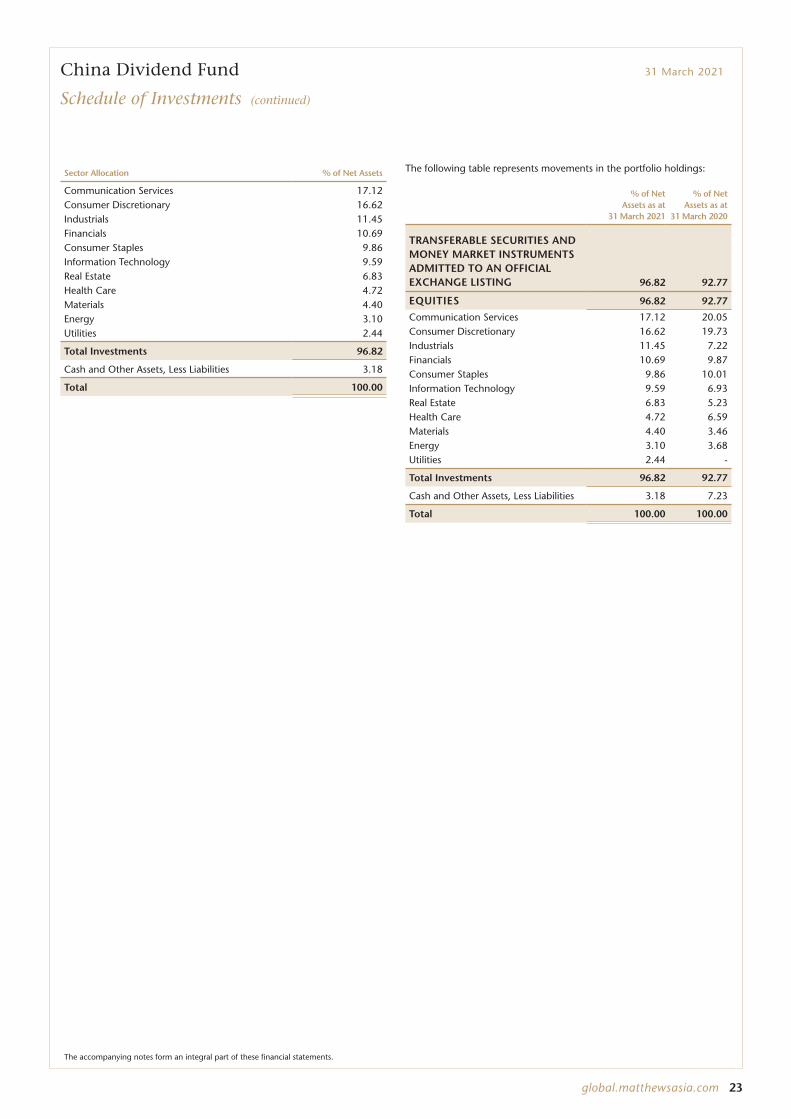
China Dividend Fund 31 March 2021
Schedule of Investments (continued)
Sector Allocation % of Net Assets
Communication Services 17.12Consumer Discretionary 16.62Industrials 11.45Financials 10.69Consumer Staples 9.86Information Technology 9.59Real Estate 6.83Health Care 4.72Materials 4.40Energy 3.10Utilities 2.44
Total Investments 96.82
Cash and Other Assets, Less Liabilities 3.18
Total 100.00
The following table represents movements in the portfolio holdings:
% of Net Assets as at
31 March 2021
% of Net Assets as at
31 March 2020
TRANSFERABLE SECURITIES AND MONEY MARKET INSTRUMENTS ADMITTED TO AN OFFICIAL EXCHANGE LISTING 96.82 92.77
EQUITIES 96.82 92.77
Communication Services 17.12 20.05Consumer Discretionary 16.62 19.73Industrials 11.45 7.22Financials 10.69 9.87Consumer Staples 9.86 10.01Information Technology 9.59 6.93Real Estate 6.83 5.23Health Care 4.72 6.59Materials 4.40 3.46Energy 3.10 3.68Utilities 2.44 -
Total Investments 96.82 92.77
Cash and Other Assets, Less Liabilities 3.18 7.23
Total 100.00 100.00
The accompanying notes form an integral part of these financial statements.

24 MATTHEWS ASIA FUNDS
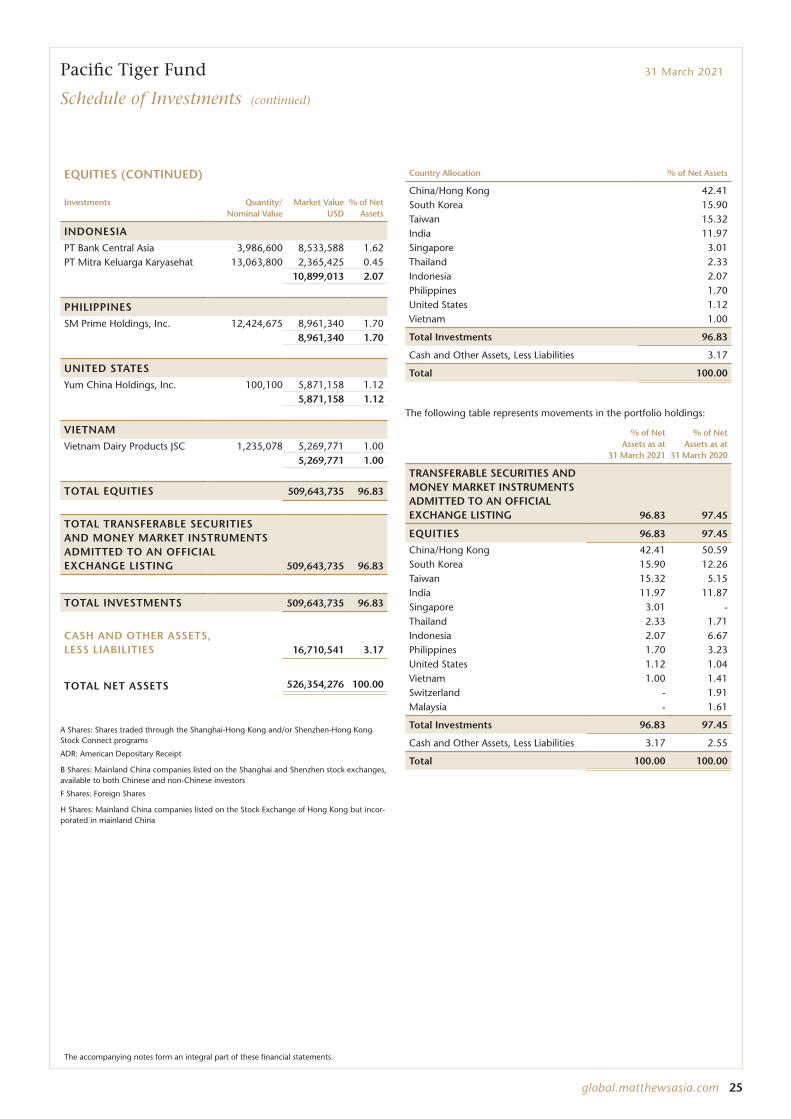
Pacific Tiger Fund 31 March 2021
Schedule of Investments
Transferable securities and money market instruments admitted to an official exchange listing
EQUITIES
Investments Quantity/ Nominal Value
Market Value USD
% of Net Assets
CHINA/HONG KONG
Tencent Holdings, Ltd. 384,700 30,187,453 5.74Alibaba Group Holding, Ltd. 773,072 21,877,098 4.16AIA Group, Ltd. 1,247,400 15,132,435 2.87Hong Kong Exchanges &
Clearing, Ltd. 188,700 11,106,530 2.11ENN Energy Holdings, Ltd. 650,900 10,440,657 1.98Kweichow Moutai Co., Ltd.
A Shares 31,420 9,641,565 1.83Wuxi Biologics Cayman, Inc. 760,000 9,523,311 1.81Weichai Power Co., Ltd.
A Shares 2,956,600 8,677,228 1.65Topsports International
Holdings, Ltd. 5,155,000 7,681,757 1.46China Resources Land, Ltd. 1,423,111 6,893,797 1.31Ping An Insurance Group Co.
of China, Ltd. H Shares 573,000 6,823,355 1.30China Resources Beer Holdings
Co., Ltd. 857,086 6,721,200 1.28Kuaishou Technology B Shares 184,100 6,393,882 1.22China Resources Mixc Lifestyle
Services, Ltd. 1,060,100 6,319,655 1.20Xinyi Solar Holdings, Ltd. 3,402,000 5,595,684 1.06China East Education Holdings,
Ltd. 2,499,000 5,445,362 1.04Suofeiya Home Collection Co.,
Ltd. A Shares 1,010,488 5,071,576 0.96Inner Mongolia Yili Industrial
Group Co., Ltd. A Shares 787,875 4,812,986 0.91JD.com, Inc. ADR 55,300 4,598,506 0.87StarPower Semiconductor, Ltd.
A Shares 168,239 4,368,813 0.83CITIC Securities Co., Ltd.
H Shares 1,891,000 4,356,679 0.83Baidu, Inc. ADR 19,600 4,284,058 0.81Shandong Sinocera Functional
Material Co., Ltd. A Shares 602,176 3,898,380 0.74CSPC Pharmaceutical Group,
Ltd. 3,014,000 3,645,114 0.69Ming Yuan Cloud Group
Holdings, Ltd. 774,825 3,535,416 0.67WH Group, Ltd. 3,499,500 2,836,094 0.54TravelSky Technology, Ltd.
H Shares 1,104,000 2,582,045 0.49OPT Machine Vision Tech Co.,
Ltd. A Shares 64,598 2,343,464 0.45JD.com, Inc. A Shares 54,650 2,265,003 0.43Kingdee International Software
Group Co., Ltd. 701,000 2,173,890 0.41Yidu Tech, Inc. 353,700 1,615,141 0.31Tuya, Inc. ADR 69,206 1,410,418 0.27China International Travel
Service Corp., Ltd. A Shares 20,099 937,626 0.18223,196,178 42.41
Investments Quantity/ Nominal Value
Market Value USD
% of Net Assets
SOUTH KOREA
Samsung Electronics Co., Ltd. 393,910 28,424,487 5.40Naver Corp. 30,327 10,126,415 1.93HMM Co., Ltd. 347,212 8,915,495 1.69LG Chem, Ltd. 9,793 6,964,945 1.32Amorepacific Corp. 26,663 6,097,180 1.16LEENO Industrial, Inc. 41,088 5,691,821 1.08Koh Young Technology, Inc. 51,398 5,222,682 0.99Mando Corp. 85,102 4,946,028 0.94NCSoft Corp. 5,640 4,350,537 0.83Korea Electric Power Corp. 144,288 2,956,453 0.56
83,696,043 15.90
TAIWAN
Taiwan Semiconductor Manufacturing Co., Ltd. 1,490,000 30,768,872 5.84
MediaTek, Inc. 352,000 11,992,543 2.28President Chain Store Corp. 849,000 8,105,263 1.54Yageo Corp. 403,000 7,830,292 1.49Pan Jit International, Inc. 3,893,000 7,309,337 1.39Delta Electronics, Inc. 638,032 6,458,198 1.23ASMedia Technology, Inc. 90,000 4,713,925 0.89Realtek Semiconductor Corp. 199,000 3,455,639 0.66
80,634,069 15.32
INDIA
The Tata Power Co., Ltd. 7,343,078 10,369,771 1.97Housing Development Finance
Corp., Ltd. 229,483 7,840,816 1.49Titan Co., Ltd. 357,015 7,607,970 1.44Kotak Mahindra Bank, Ltd. 266,207 6,382,669 1.21Crompton Greaves Consumer
Electricals, Ltd. 1,173,643 6,300,523 1.20Dabur India, Ltd. 818,215 6,048,728 1.15Tata Consultancy Services, Ltd. 128,850 5,600,396 1.06PVR, Ltd. 279,123 4,681,017 0.89PI Industries, Ltd. 120,645 3,726,173 0.71Info Edge India, Ltd. 58,149 3,404,417 0.65Pidilite Industries, Ltd. 42,045 1,040,519 0.20
63,002,999 11.97
SINGAPORE
SATS, Ltd. 2,099,000 6,793,069 1.29Sea, Ltd. ADR 29,013 6,244,434 1.19Aztech Global, Ltd. 3,123,500 2,811,139 0.53
15,848,642 3.01
THAILAND
Central Pattana Public Co., Ltd. F Shares 6,578,600 12,264,522 2.33
12,264,522 2.33
The accompanying notes form an integral part of these financial statements.
global.matthewsasia.com 25
Pacific Tiger Fund 31 March 2021
Schedule of Investments (continued)
EQUITIES (CONTINUED)
Investments Quantity/ Nominal Value
Market Value USD
% of Net Assets
INDONESIA
PT Bank Central Asia 3,986,600 8,533,588 1.62PT Mitra Keluarga Karyasehat 13,063,800 2,365,425 0.45
10,899,013 2.07
PHILIPPINES
SM Prime Holdings, Inc. 12,424,675 8,961,340 1.708,961,340 1.70
UNITED STATES
Yum China Holdings, Inc. 100,100 5,871,158 1.125,871,158 1.12
VIETNAM
Vietnam Dairy Products JSC 1,235,078 5,269,771 1.005,269,771 1.00
TOTAL EQUITIES 509,643,735 96.83
TOTAL TRANSFERABLE SECURITIES AND MONEY MARKET INSTRUMENTS ADMITTED TO AN OFFICIAL EXCHANGE LISTING 509,643,735 96.83
TOTAL INVESTMENTS 509,643,735 96.83
CASH AND OTHER ASSETS, LESS LIABILITIES 16,710,541 3.17
TOTAL NET ASSETS 526,354,276 100.00
A Shares: Shares traded through the Shanghai-Hong Kong and/or Shenzhen-Hong Kong Stock Connect programs
ADR: American Depositary Receipt
B Shares: Mainland China companies listed on the Shanghai and Shenzhen stock exchanges, available to both Chinese and non-Chinese investors
F Shares: Foreign Shares
H Shares: Mainland China companies listed on the Stock Exchange of Hong Kong but incor-porated in mainland China
Country Allocation % of Net Assets
China/Hong Kong 42.41South Korea 15.90Taiwan 15.32India 11.97Singapore 3.01Thailand 2.33Indonesia 2.07Philippines 1.70United States 1.12Vietnam 1.00
Total Investments 96.83
Cash and Other Assets, Less Liabilities 3.17
Total 100.00
The following table represents movements in the portfolio holdings:
% of Net Assets as at
31 March 2021
% of Net Assets as at
31 March 2020
TRANSFERABLE SECURITIES AND MONEY MARKET INSTRUMENTS ADMITTED TO AN OFFICIAL EXCHANGE LISTING 96.83 97.45
EQUITIES 96.83 97.45
China/Hong Kong 42.41 50.59South Korea 15.90 12.26Taiwan 15.32 5.15India 11.97 11.87Singapore 3.01 -Thailand 2.33 1.71Indonesia 2.07 6.67Philippines 1.70 3.23United States 1.12 1.04Vietnam 1.00 1.41Switzerland - 1.91Malaysia - 1.61
Total Investments 96.83 97.45
Cash and Other Assets, Less Liabilities 3.17 2.55
Total 100.00 100.00
The accompanying notes form an integral part of these financial statements.
26 MATTHEWS ASIA FUNDS
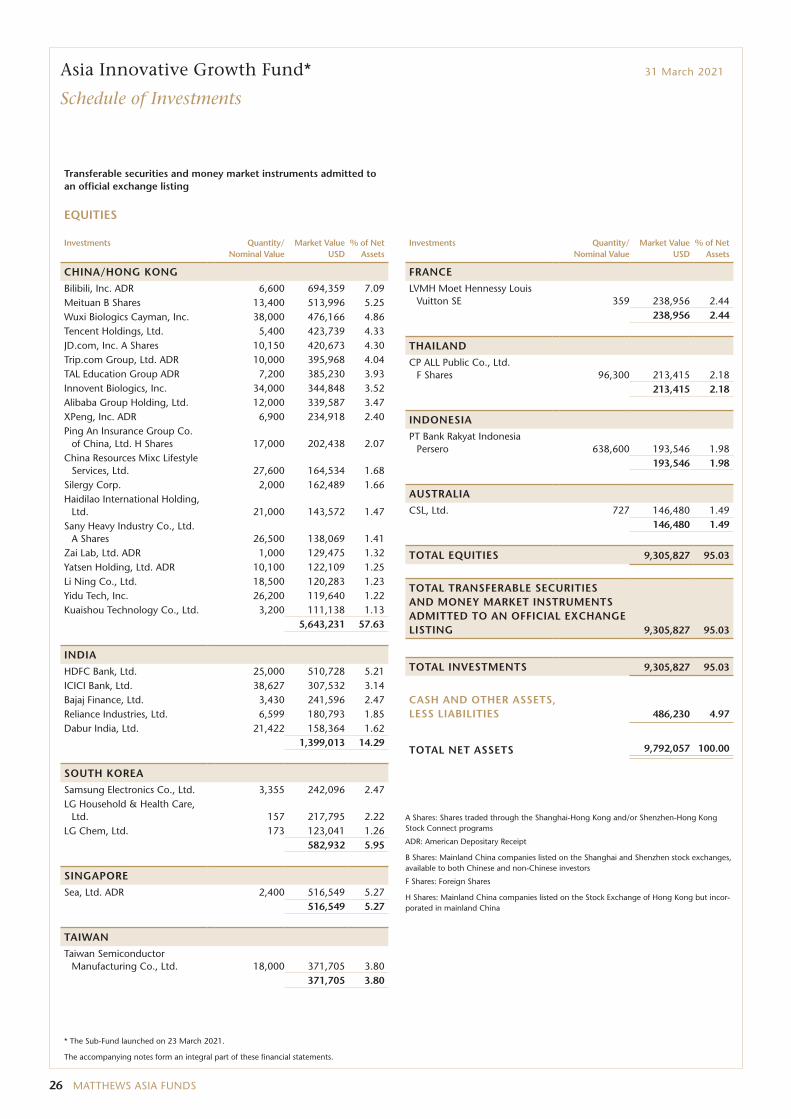
Asia Innovative Growth Fund* 31 March 2021
Schedule of Investments
Transferable securities and money market instruments admitted to an official exchange listing
EQUITIES
Investments Quantity/ Nominal Value
Market Value USD
% of Net Assets
CHINA/HONG KONG
Bilibili, Inc. ADR 6,600 694,359 7.09Meituan B Shares 13,400 513,996 5.25Wuxi Biologics Cayman, Inc. 38,000 476,166 4.86Tencent Holdings, Ltd. 5,400 423,739 4.33JD.com, Inc. A Shares 10,150 420,673 4.30Trip.com Group, Ltd. ADR 10,000 395,968 4.04TAL Education Group ADR 7,200 385,230 3.93Innovent Biologics, Inc. 34,000 344,848 3.52Alibaba Group Holding, Ltd. 12,000 339,587 3.47XPeng, Inc. ADR 6,900 234,918 2.40Ping An Insurance Group Co.
of China, Ltd. H Shares 17,000 202,438 2.07China Resources Mixc Lifestyle
Services, Ltd. 27,600 164,534 1.68Silergy Corp. 2,000 162,489 1.66Haidilao International Holding,
Ltd. 21,000 143,572 1.47Sany Heavy Industry Co., Ltd.
A Shares 26,500 138,069 1.41Zai Lab, Ltd. ADR 1,000 129,475 1.32Yatsen Holding, Ltd. ADR 10,100 122,109 1.25Li Ning Co., Ltd. 18,500 120,283 1.23Yidu Tech, Inc. 26,200 119,640 1.22Kuaishou Technology Co., Ltd. 3,200 111,138 1.13
5,643,231 57.63
INDIA
HDFC Bank, Ltd. 25,000 510,728 5.21ICICI Bank, Ltd. 38,627 307,532 3.14Bajaj Finance, Ltd. 3,430 241,596 2.47Reliance Industries, Ltd. 6,599 180,793 1.85Dabur India, Ltd. 21,422 158,364 1.62
1,399,013 14.29
SOUTH KOREA
Samsung Electronics Co., Ltd. 3,355 242,096 2.47LG Household & Health Care,
Ltd. 157 217,795 2.22LG Chem, Ltd. 173 123,041 1.26
582,932 5.95
SINGAPORE
Sea, Ltd. ADR 2,400 516,549 5.27516,549 5.27
TAIWAN
Taiwan Semiconductor Manufacturing Co., Ltd. 18,000 371,705 3.80
371,705 3.80
Investments Quantity/ Nominal Value
Market Value USD
% of Net Assets
FRANCE
LVMH Moet Hennessy Louis Vuitton SE 359 238,956 2.44
238,956 2.44
THAILAND
CP ALL Public Co., Ltd. F Shares 96,300 213,415 2.18
213,415 2.18
INDONESIA
PT Bank Rakyat Indonesia Persero 638,600 193,546 1.98
193,546 1.98
AUSTRALIA
CSL, Ltd. 727 146,480 1.49146,480 1.49
TOTAL EQUITIES 9,305,827 95.03
TOTAL TRANSFERABLE SECURITIES AND MONEY MARKET INSTRUMENTS ADMITTED TO AN OFFICIAL EXCHANGE LISTING 9,305,827 95.03
TOTAL INVESTMENTS 9,305,827 95.03
CASH AND OTHER ASSETS, LESS LIABILITIES 486,230 4.97
TOTAL NET ASSETS 9,792,057 100.00
A Shares: Shares traded through the Shanghai-Hong Kong and/or Shenzhen-Hong Kong Stock Connect programs
ADR: American Depositary Receipt
B Shares: Mainland China companies listed on the Shanghai and Shenzhen stock exchanges, available to both Chinese and non-Chinese investors
F Shares: Foreign Shares
H Shares: Mainland China companies listed on the Stock Exchange of Hong Kong but incor-porated in mainland China
The accompanying notes form an integral part of these financial statements.
* The Sub-Fund launched on 23 March 2021.
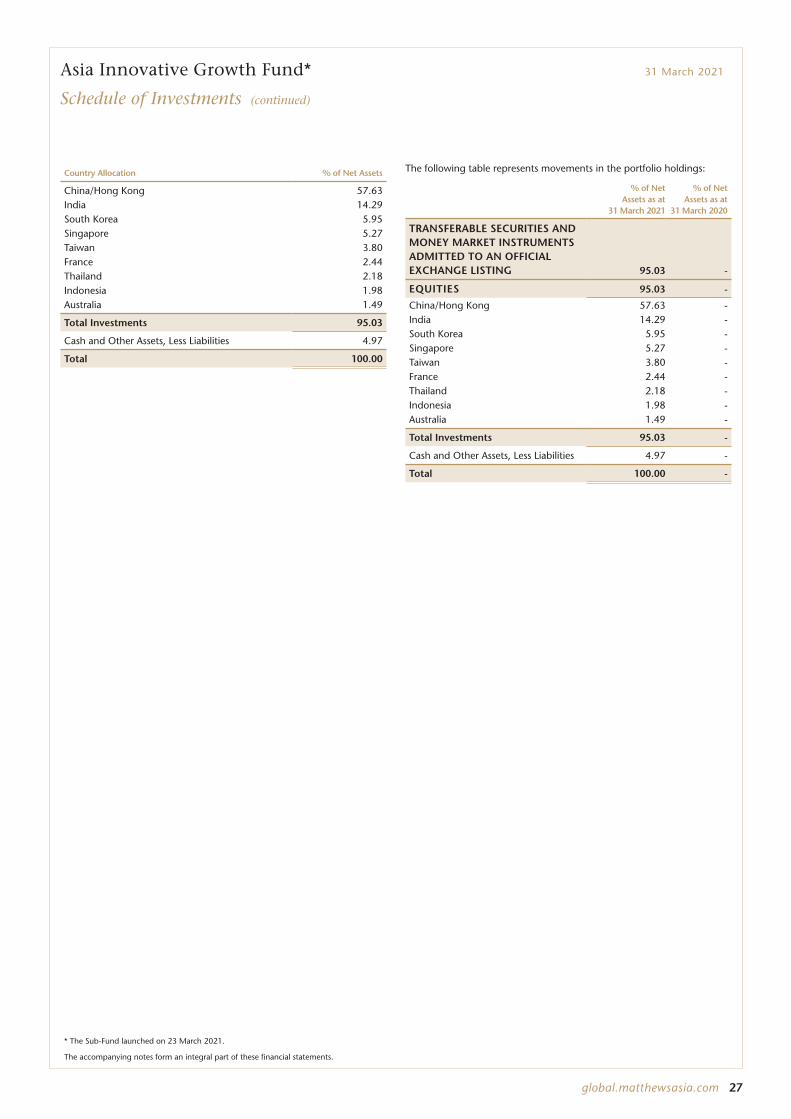
global.matthewsasia.com 27
Asia Innovative Growth Fund* 31 March 2021
Schedule of Investments (continued)
Country Allocation % of Net Assets
China/Hong Kong 57.63India 14.29South Korea 5.95Singapore 5.27Taiwan 3.80France 2.44Thailand 2.18Indonesia 1.98Australia 1.49
Total Investments 95.03
Cash and Other Assets, Less Liabilities 4.97
Total 100.00
The following table represents movements in the portfolio holdings:
% of Net Assets as at
31 March 2021
% of Net Assets as at
31 March 2020
TRANSFERABLE SECURITIES AND MONEY MARKET INSTRUMENTS ADMITTED TO AN OFFICIAL EXCHANGE LISTING 95.03 -
EQUITIES 95.03 -
China/Hong Kong 57.63 -India 14.29 -South Korea 5.95 -Singapore 5.27 -Taiwan 3.80 -France 2.44 -Thailand 2.18 -Indonesia 1.98 -Australia 1.49 -
Total Investments 95.03 -
Cash and Other Assets, Less Liabilities 4.97 -
Total 100.00 -
The accompanying notes form an integral part of these financial statements.
* The Sub-Fund launched on 23 March 2021.
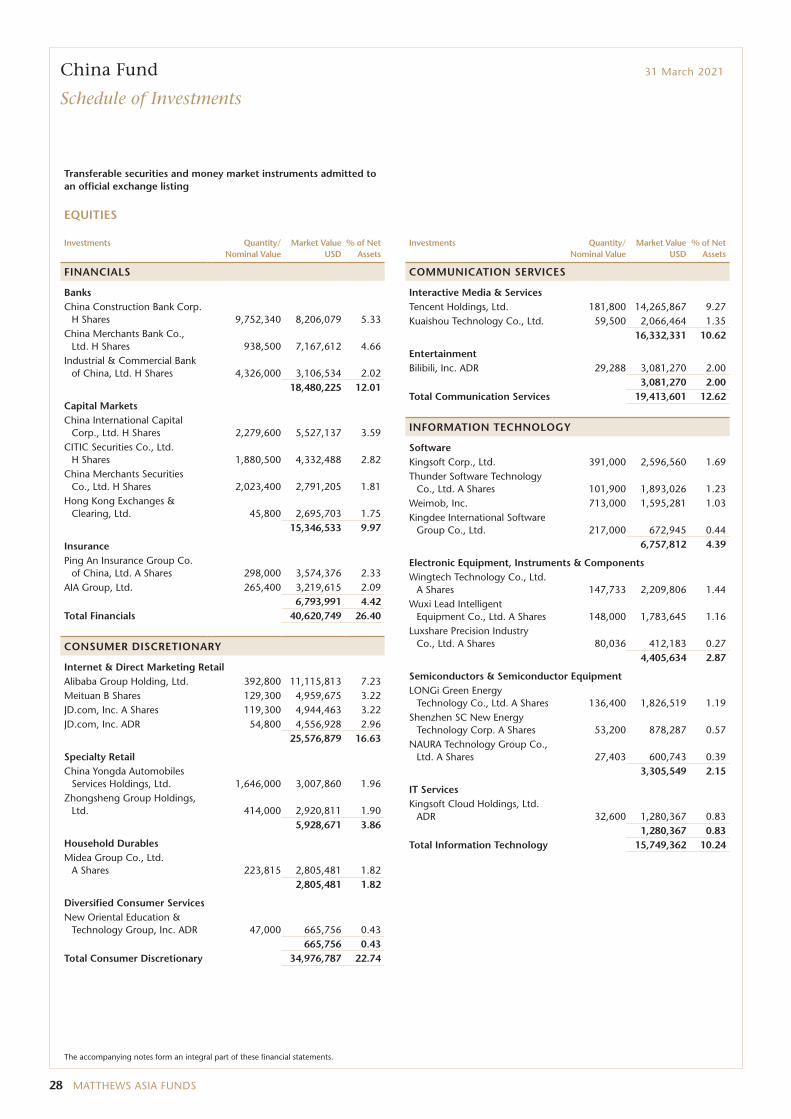
28 MATTHEWS ASIA FUNDS
China Fund 31 March 2021
Schedule of Investments
Transferable securities and money market instruments admitted to an official exchange listing
EQUITIES
Investments Quantity/ Nominal Value
Market Value USD
% of Net Assets
FINANCIALS
BanksChina Construction Bank Corp.
H Shares 9,752,340 8,206,079 5.33China Merchants Bank Co.,
Ltd. H Shares 938,500 7,167,612 4.66Industrial & Commercial Bank
of China, Ltd. H Shares 4,326,000 3,106,534 2.0218,480,225 12.01
Capital MarketsChina International Capital
Corp., Ltd. H Shares 2,279,600 5,527,137 3.59CITIC Securities Co., Ltd.
H Shares 1,880,500 4,332,488 2.82China Merchants Securities
Co., Ltd. H Shares 2,023,400 2,791,205 1.81Hong Kong Exchanges &
Clearing, Ltd. 45,800 2,695,703 1.7515,346,533 9.97
InsurancePing An Insurance Group Co.
of China, Ltd. A Shares 298,000 3,574,376 2.33AIA Group, Ltd. 265,400 3,219,615 2.09
6,793,991 4.42Total Financials 40,620,749 26.40
CONSUMER DISCRETIONARY
Internet & Direct Marketing RetailAlibaba Group Holding, Ltd. 392,800 11,115,813 7.23Meituan B Shares 129,300 4,959,675 3.22JD.com, Inc. A Shares 119,300 4,944,463 3.22JD.com, Inc. ADR 54,800 4,556,928 2.96
25,576,879 16.63
Specialty RetailChina Yongda Automobiles
Services Holdings, Ltd. 1,646,000 3,007,860 1.96Zhongsheng Group Holdings,
Ltd. 414,000 2,920,811 1.905,928,671 3.86
Household DurablesMidea Group Co., Ltd.
A Shares 223,815 2,805,481 1.822,805,481 1.82
Diversified Consumer ServicesNew Oriental Education &
Technology Group, Inc. ADR 47,000 665,756 0.43665,756 0.43
Total Consumer Discretionary 34,976,787 22.74
Investments Quantity/ Nominal Value
Market Value USD
% of Net Assets
COMMUNICATION SERVICES
Interactive Media & ServicesTencent Holdings, Ltd. 181,800 14,265,867 9.27Kuaishou Technology Co., Ltd. 59,500 2,066,464 1.35
16,332,331 10.62
EntertainmentBilibili, Inc. ADR 29,288 3,081,270 2.00
3,081,270 2.00Total Communication Services 19,413,601 12.62
INFORMATION TECHNOLOGY
SoftwareKingsoft Corp., Ltd. 391,000 2,596,560 1.69Thunder Software Technology
Co., Ltd. A Shares 101,900 1,893,026 1.23Weimob, Inc. 713,000 1,595,281 1.03Kingdee International Software
Group Co., Ltd. 217,000 672,945 0.446,757,812 4.39
Electronic Equipment, Instruments & ComponentsWingtech Technology Co., Ltd.
A Shares 147,733 2,209,806 1.44Wuxi Lead Intelligent
Equipment Co., Ltd. A Shares 148,000 1,783,645 1.16Luxshare Precision Industry
Co., Ltd. A Shares 80,036 412,183 0.274,405,634 2.87
Semiconductors & Semiconductor EquipmentLONGi Green Energy
Technology Co., Ltd. A Shares 136,400 1,826,519 1.19Shenzhen SC New Energy
Technology Corp. A Shares 53,200 878,287 0.57NAURA Technology Group Co.,
Ltd. A Shares 27,403 600,743 0.393,305,549 2.15
IT ServicesKingsoft Cloud Holdings, Ltd.
ADR 32,600 1,280,367 0.831,280,367 0.83
Total Information Technology 15,749,362 10.24
The accompanying notes form an integral part of these financial statements.
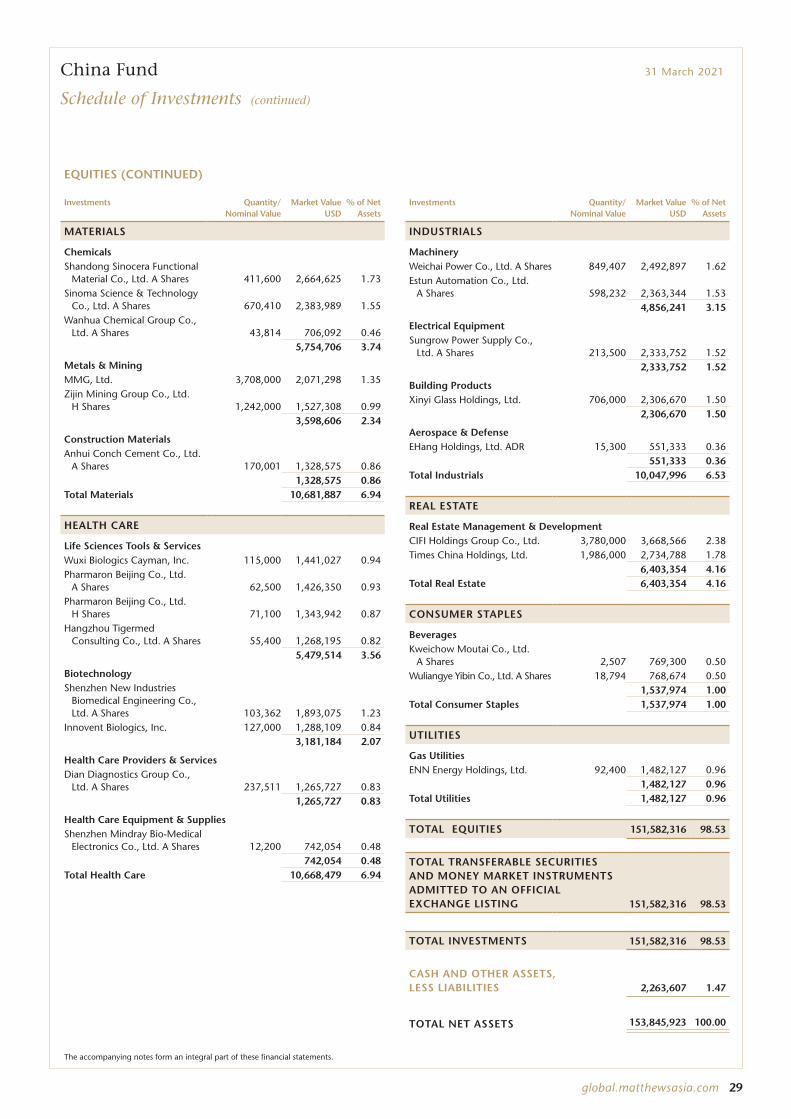
global.matthewsasia.com 29
China Fund 31 March 2021
Schedule of Investments (continued)
EQUITIES (CONTINUED)
Investments Quantity/ Nominal Value
Market Value USD
% of Net Assets
MATERIALS
ChemicalsShandong Sinocera Functional
Material Co., Ltd. A Shares 411,600 2,664,625 1.73Sinoma Science & Technology
Co., Ltd. A Shares 670,410 2,383,989 1.55Wanhua Chemical Group Co.,
Ltd. A Shares 43,814 706,092 0.465,754,706 3.74
Metals & MiningMMG, Ltd. 3,708,000 2,071,298 1.35Zijin Mining Group Co., Ltd.
H Shares 1,242,000 1,527,308 0.993,598,606 2.34
Construction MaterialsAnhui Conch Cement Co., Ltd.
A Shares 170,001 1,328,575 0.861,328,575 0.86
Total Materials 10,681,887 6.94
HEALTH CARE
Life Sciences Tools & ServicesWuxi Biologics Cayman, Inc. 115,000 1,441,027 0.94Pharmaron Beijing Co., Ltd.
A Shares 62,500 1,426,350 0.93Pharmaron Beijing Co., Ltd.
H Shares 71,100 1,343,942 0.87Hangzhou Tigermed
Consulting Co., Ltd. A Shares 55,400 1,268,195 0.825,479,514 3.56
BiotechnologyShenzhen New Industries
Biomedical Engineering Co., Ltd. A Shares 103,362 1,893,075 1.23
Innovent Biologics, Inc. 127,000 1,288,109 0.843,181,184 2.07
Health Care Providers & ServicesDian Diagnostics Group Co.,
Ltd. A Shares 237,511 1,265,727 0.831,265,727 0.83
Health Care Equipment & SuppliesShenzhen Mindray Bio-Medical
Electronics Co., Ltd. A Shares 12,200 742,054 0.48742,054 0.48
Total Health Care 10,668,479 6.94
Investments Quantity/ Nominal Value
Market Value USD
% of Net Assets
INDUSTRIALS
MachineryWeichai Power Co., Ltd. A Shares 849,407 2,492,897 1.62Estun Automation Co., Ltd.
A Shares 598,232 2,363,344 1.534,856,241 3.15
Electrical EquipmentSungrow Power Supply Co.,
Ltd. A Shares 213,500 2,333,752 1.522,333,752 1.52
Building ProductsXinyi Glass Holdings, Ltd. 706,000 2,306,670 1.50
2,306,670 1.50
Aerospace & DefenseEHang Holdings, Ltd. ADR 15,300 551,333 0.36
551,333 0.36Total Industrials 10,047,996 6.53
REAL ESTATE
Real Estate Management & DevelopmentCIFI Holdings Group Co., Ltd. 3,780,000 3,668,566 2.38Times China Holdings, Ltd. 1,986,000 2,734,788 1.78
6,403,354 4.16Total Real Estate 6,403,354 4.16
CONSUMER STAPLES
BeveragesKweichow Moutai Co., Ltd.
A Shares 2,507 769,300 0.50Wuliangye Yibin Co., Ltd. A Shares 18,794 768,674 0.50
1,537,974 1.00Total Consumer Staples 1,537,974 1.00
UTILITIES
Gas UtilitiesENN Energy Holdings, Ltd. 92,400 1,482,127 0.96
1,482,127 0.96Total Utilities 1,482,127 0.96
TOTAL EQUITIES 151,582,316 98.53
TOTAL TRANSFERABLE SECURITIES AND MONEY MARKET INSTRUMENTS ADMITTED TO AN OFFICIAL EXCHANGE LISTING 151,582,316 98.53
TOTAL INVESTMENTS 151,582,316 98.53
CASH AND OTHER ASSETS, LESS LIABILITIES 2,263,607 1.47
TOTAL NET ASSETS 153,845,923 100.00
The accompanying notes form an integral part of these financial statements.
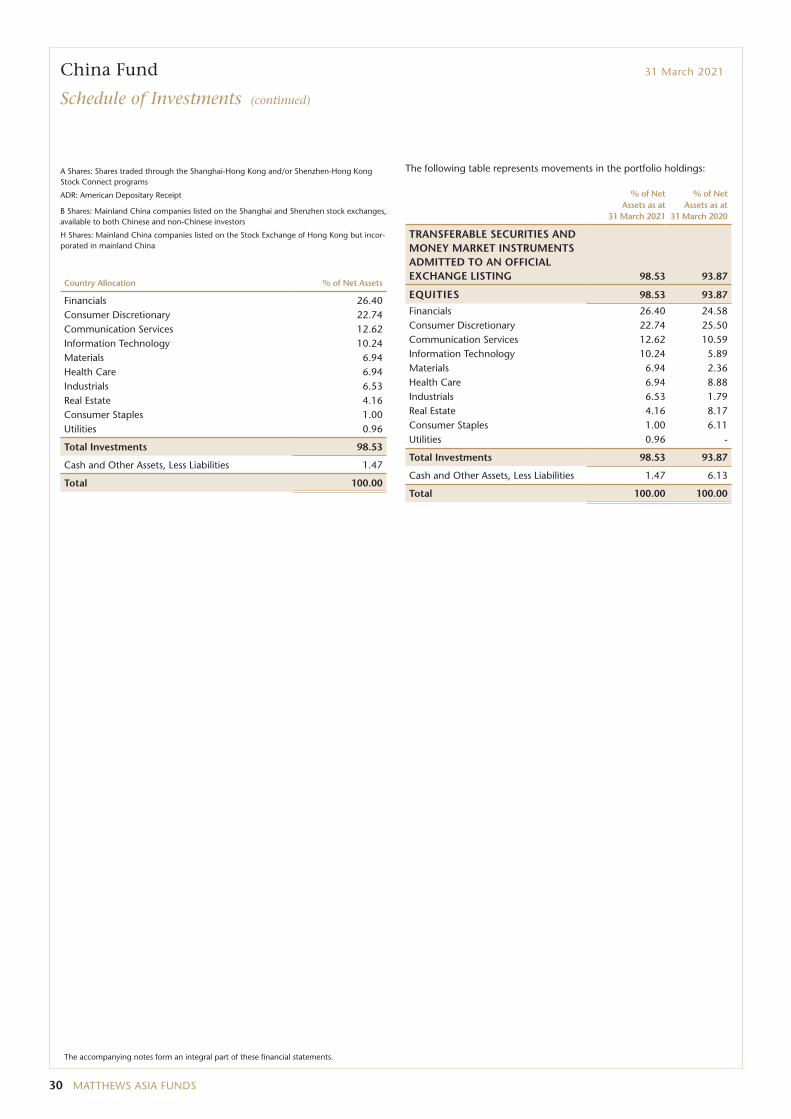
30 MATTHEWS ASIA FUNDS
A Shares: Shares traded through the Shanghai-Hong Kong and/or Shenzhen-Hong Kong Stock Connect programs
ADR: American Depositary Receipt
B Shares: Mainland China companies listed on the Shanghai and Shenzhen stock exchanges, available to both Chinese and non-Chinese investors
H Shares: Mainland China companies listed on the Stock Exchange of Hong Kong but incor-porated in mainland China
Country Allocation % of Net Assets
Financials 26.40Consumer Discretionary 22.74Communication Services 12.62Information Technology 10.24Materials 6.94Health Care 6.94Industrials 6.53Real Estate 4.16Consumer Staples 1.00Utilities 0.96
Total Investments 98.53
Cash and Other Assets, Less Liabilities 1.47
Total 100.00
The following table represents movements in the portfolio holdings:
% of Net Assets as at
31 March 2021
% of Net Assets as at
31 March 2020
TRANSFERABLE SECURITIES AND MONEY MARKET INSTRUMENTS ADMITTED TO AN OFFICIAL EXCHANGE LISTING 98.53 93.87
EQUITIES 98.53 93.87
Financials 26.40 24.58Consumer Discretionary 22.74 25.50Communication Services 12.62 10.59Information Technology 10.24 5.89Materials 6.94 2.36Health Care 6.94 8.88Industrials 6.53 1.79Real Estate 4.16 8.17Consumer Staples 1.00 6.11Utilities 0.96 -
Total Investments 98.53 93.87
Cash and Other Assets, Less Liabilities 1.47 6.13
Total 100.00 100.00
China Fund 31 March 2021
Schedule of Investments (continued)
The accompanying notes form an integral part of these financial statements.
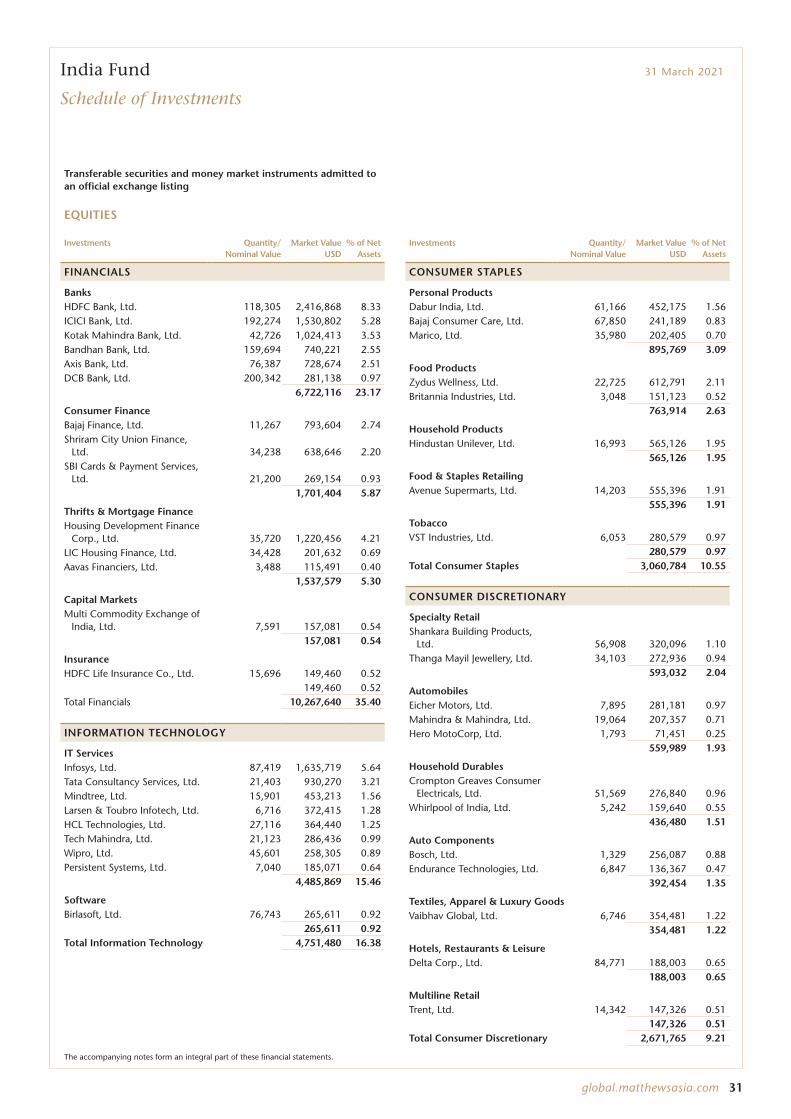
global.matthewsasia.com 31
India Fund 31 March 2021
Schedule of Investments
Transferable securities and money market instruments admitted to an official exchange listing
EQUITIES
Investments Quantity/ Nominal Value
Market Value USD
% of Net Assets
FINANCIALS
BanksHDFC Bank, Ltd. 118,305 2,416,868 8.33ICICI Bank, Ltd. 192,274 1,530,802 5.28Kotak Mahindra Bank, Ltd. 42,726 1,024,413 3.53Bandhan Bank, Ltd. 159,694 740,221 2.55Axis Bank, Ltd. 76,387 728,674 2.51DCB Bank, Ltd. 200,342 281,138 0.97
6,722,116 23.17
Consumer FinanceBajaj Finance, Ltd. 11,267 793,604 2.74Shriram City Union Finance,
Ltd. 34,238 638,646 2.20SBI Cards & Payment Services,
Ltd. 21,200 269,154 0.931,701,404 5.87
Thrifts & Mortgage FinanceHousing Development Finance
Corp., Ltd. 35,720 1,220,456 4.21LIC Housing Finance, Ltd. 34,428 201,632 0.69Aavas Financiers, Ltd. 3,488 115,491 0.40
1,537,579 5.30
Capital MarketsMulti Commodity Exchange of
India, Ltd. 7,591 157,081 0.54157,081 0.54
InsuranceHDFC Life Insurance Co., Ltd. 15,696 149,460 0.52
149,460 0.52Total Financials 10,267,640 35.40
INFORMATION TECHNOLOGY
IT ServicesInfosys, Ltd. 87,419 1,635,719 5.64Tata Consultancy Services, Ltd. 21,403 930,270 3.21Mindtree, Ltd. 15,901 453,213 1.56Larsen & Toubro Infotech, Ltd. 6,716 372,415 1.28HCL Technologies, Ltd. 27,116 364,440 1.25Tech Mahindra, Ltd. 21,123 286,436 0.99Wipro, Ltd. 45,601 258,305 0.89Persistent Systems, Ltd. 7,040 185,071 0.64
4,485,869 15.46
SoftwareBirlasoft, Ltd. 76,743 265,611 0.92
265,611 0.92Total Information Technology 4,751,480 16.38
Investments Quantity/ Nominal Value
Market Value USD
% of Net Assets
CONSUMER STAPLES
Personal ProductsDabur India, Ltd. 61,166 452,175 1.56Bajaj Consumer Care, Ltd. 67,850 241,189 0.83Marico, Ltd. 35,980 202,405 0.70
895,769 3.09
Food ProductsZydus Wellness, Ltd. 22,725 612,791 2.11Britannia Industries, Ltd. 3,048 151,123 0.52
763,914 2.63
Household ProductsHindustan Unilever, Ltd. 16,993 565,126 1.95
565,126 1.95
Food & Staples RetailingAvenue Supermarts, Ltd. 14,203 555,396 1.91
555,396 1.91
TobaccoVST Industries, Ltd. 6,053 280,579 0.97
280,579 0.97Total Consumer Staples 3,060,784 10.55
CONSUMER DISCRETIONARY
Specialty RetailShankara Building Products,
Ltd. 56,908 320,096 1.10Thanga Mayil Jewellery, Ltd. 34,103 272,936 0.94
593,032 2.04
AutomobilesEicher Motors, Ltd. 7,895 281,181 0.97Mahindra & Mahindra, Ltd. 19,064 207,357 0.71Hero MotoCorp, Ltd. 1,793 71,451 0.25
559,989 1.93
Household DurablesCrompton Greaves Consumer
Electricals, Ltd. 51,569 276,840 0.96Whirlpool of India, Ltd. 5,242 159,640 0.55
436,480 1.51
Auto ComponentsBosch, Ltd. 1,329 256,087 0.88Endurance Technologies, Ltd. 6,847 136,367 0.47
392,454 1.35
Textiles, Apparel & Luxury GoodsVaibhav Global, Ltd. 6,746 354,481 1.22
354,481 1.22
Hotels, Restaurants & LeisureDelta Corp., Ltd. 84,771 188,003 0.65
188,003 0.65
Multiline RetailTrent, Ltd. 14,342 147,326 0.51
147,326 0.51Total Consumer Discretionary 2,671,765 9.21
The accompanying notes form an integral part of these financial statements.
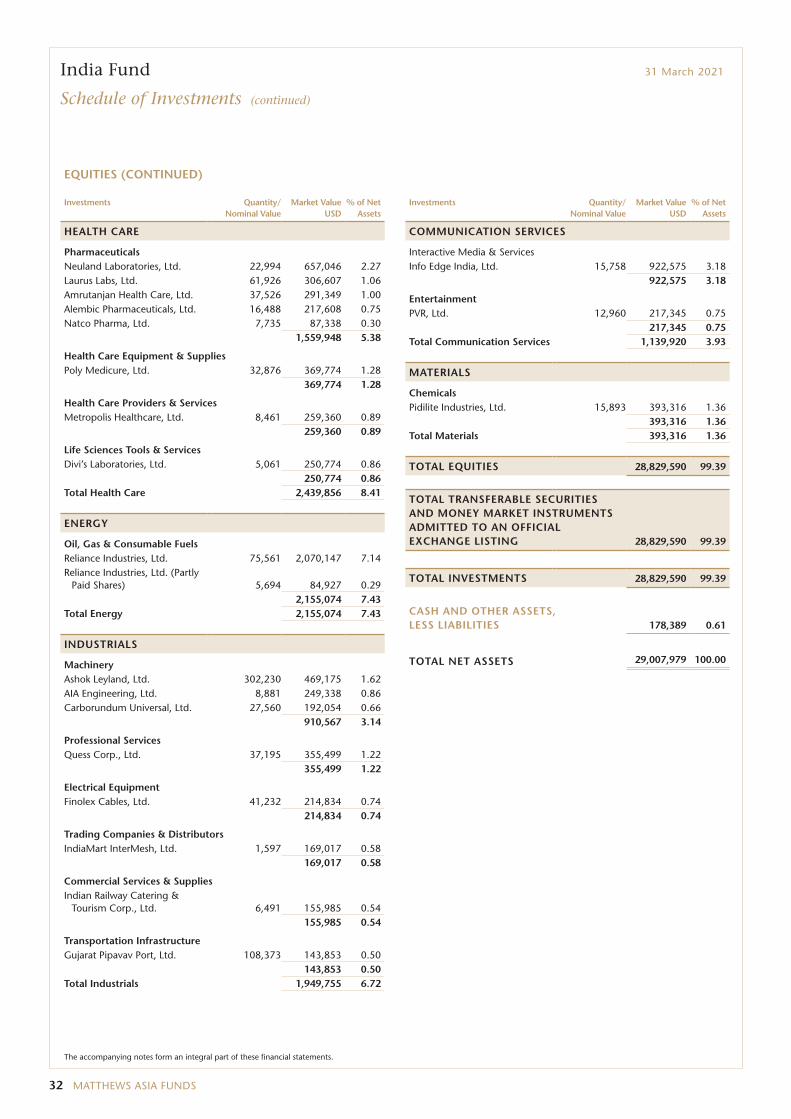
32 MATTHEWS ASIA FUNDS
India Fund 31 March 2021
Schedule of Investments (continued)
EQUITIES (CONTINUED)
Investments Quantity/ Nominal Value
Market Value USD
% of Net Assets
HEALTH CARE
PharmaceuticalsNeuland Laboratories, Ltd. 22,994 657,046 2.27Laurus Labs, Ltd. 61,926 306,607 1.06Amrutanjan Health Care, Ltd. 37,526 291,349 1.00Alembic Pharmaceuticals, Ltd. 16,488 217,608 0.75Natco Pharma, Ltd. 7,735 87,338 0.30
1,559,948 5.38
Health Care Equipment & SuppliesPoly Medicure, Ltd. 32,876 369,774 1.28
369,774 1.28
Health Care Providers & ServicesMetropolis Healthcare, Ltd. 8,461 259,360 0.89
259,360 0.89
Life Sciences Tools & ServicesDivi’s Laboratories, Ltd. 5,061 250,774 0.86
250,774 0.86Total Health Care 2,439,856 8.41
ENERGY
Oil, Gas & Consumable FuelsReliance Industries, Ltd. 75,561 2,070,147 7.14Reliance Industries, Ltd. (Partly
Paid Shares) 5,694 84,927 0.292,155,074 7.43
Total Energy 2,155,074 7.43
INDUSTRIALS
MachineryAshok Leyland, Ltd. 302,230 469,175 1.62AIA Engineering, Ltd. 8,881 249,338 0.86Carborundum Universal, Ltd. 27,560 192,054 0.66
910,567 3.14
Professional ServicesQuess Corp., Ltd. 37,195 355,499 1.22
355,499 1.22
Electrical EquipmentFinolex Cables, Ltd. 41,232 214,834 0.74
214,834 0.74
Trading Companies & DistributorsIndiaMart InterMesh, Ltd. 1,597 169,017 0.58
169,017 0.58
Commercial Services & SuppliesIndian Railway Catering &
Tourism Corp., Ltd. 6,491 155,985 0.54155,985 0.54
Transportation InfrastructureGujarat Pipavav Port, Ltd. 108,373 143,853 0.50
143,853 0.50Total Industrials 1,949,755 6.72
Investments Quantity/ Nominal Value
Market Value USD
% of Net Assets
COMMUNICATION SERVICES
Interactive Media & ServicesInfo Edge India, Ltd. 15,758 922,575 3.18
922,575 3.18
EntertainmentPVR, Ltd. 12,960 217,345 0.75
217,345 0.75Total Communication Services 1,139,920 3.93
MATERIALS
ChemicalsPidilite Industries, Ltd. 15,893 393,316 1.36
393,316 1.36Total Materials 393,316 1.36
TOTAL EQUITIES 28,829,590 99.39
TOTAL TRANSFERABLE SECURITIES AND MONEY MARKET INSTRUMENTS ADMITTED TO AN OFFICIAL EXCHANGE LISTING 28,829,590 99.39
TOTAL INVESTMENTS 28,829,590 99.39
CASH AND OTHER ASSETS, LESS LIABILITIES 178,389 0.61
TOTAL NET ASSETS 29,007,979 100.00
The accompanying notes form an integral part of these financial statements.
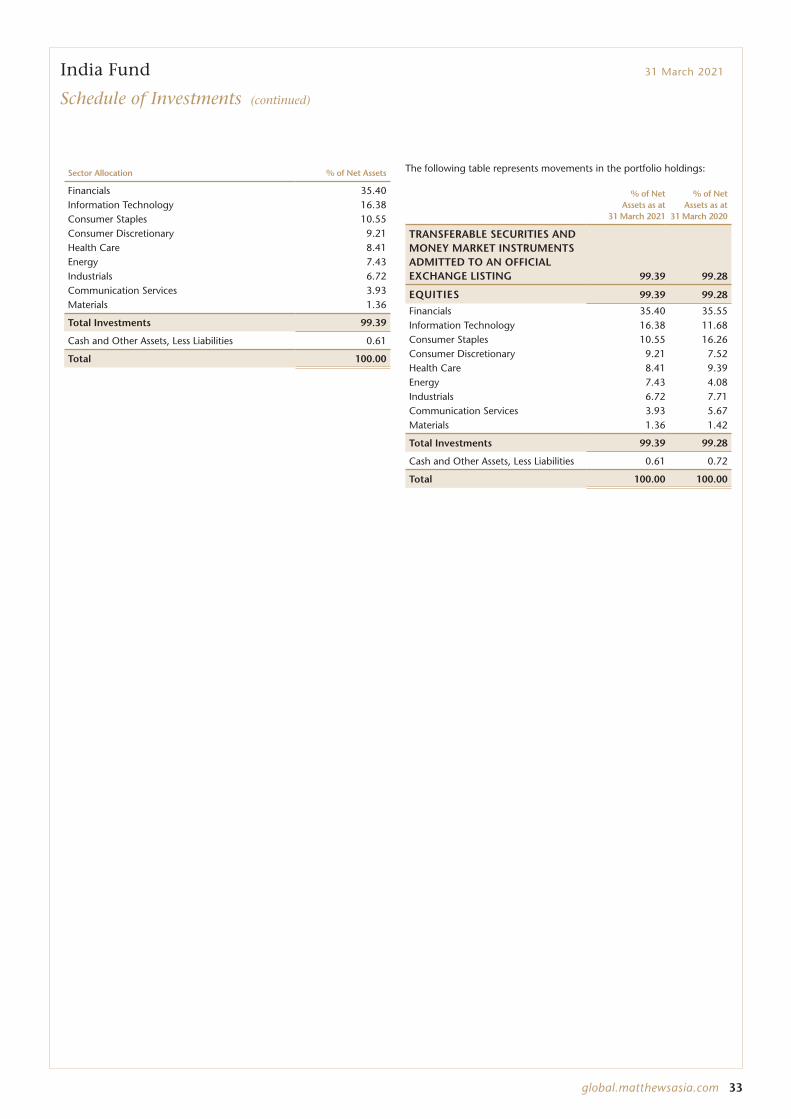
global.matthewsasia.com 33
Sector Allocation % of Net Assets
Financials 35.40Information Technology 16.38Consumer Staples 10.55Consumer Discretionary 9.21Health Care 8.41Energy 7.43Industrials 6.72Communication Services 3.93Materials 1.36
Total Investments 99.39
Cash and Other Assets, Less Liabilities 0.61
Total 100.00
The following table represents movements in the portfolio holdings:
% of Net Assets as at
31 March 2021
% of Net Assets as at
31 March 2020
TRANSFERABLE SECURITIES AND MONEY MARKET INSTRUMENTS ADMITTED TO AN OFFICIAL EXCHANGE LISTING 99.39 99.28
EQUITIES 99.39 99.28
Financials 35.40 35.55Information Technology 16.38 11.68Consumer Staples 10.55 16.26Consumer Discretionary 9.21 7.52Health Care 8.41 9.39Energy 7.43 4.08Industrials 6.72 7.71Communication Services 3.93 5.67Materials 1.36 1.42
Total Investments 99.39 99.28
Cash and Other Assets, Less Liabilities 0.61 0.72
Total 100.00 100.00
India Fund 31 March 2021
Schedule of Investments (continued)
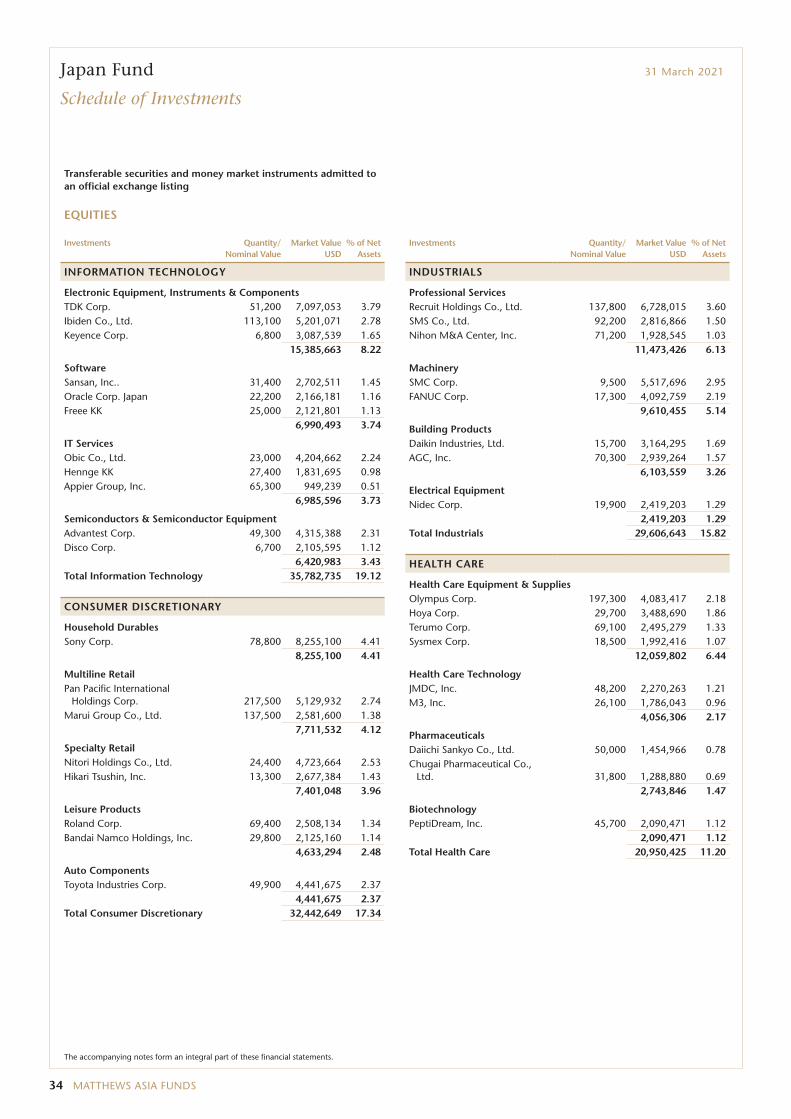
34 MATTHEWS ASIA FUNDS
Japan Fund 31 March 2021
Schedule of Investments
Transferable securities and money market instruments admitted to an official exchange listing
EQUITIES
Investments Quantity/ Nominal Value
Market Value USD
% of Net Assets
INFORMATION TECHNOLOGY
Electronic Equipment, Instruments & ComponentsTDK Corp. 51,200 7,097,053 3.79Ibiden Co., Ltd. 113,100 5,201,071 2.78Keyence Corp. 6,800 3,087,539 1.65
15,385,663 8.22
SoftwareSansan, Inc.. 31,400 2,702,511 1.45Oracle Corp. Japan 22,200 2,166,181 1.16Freee KK 25,000 2,121,801 1.13
6,990,493 3.74
IT ServicesObic Co., Ltd. 23,000 4,204,662 2.24Hennge KK 27,400 1,831,695 0.98Appier Group, Inc. 65,300 949,239 0.51
6,985,596 3.73
Semiconductors & Semiconductor EquipmentAdvantest Corp. 49,300 4,315,388 2.31Disco Corp. 6,700 2,105,595 1.12
6,420,983 3.43Total Information Technology 35,782,735 19.12
CONSUMER DISCRETIONARY
Household DurablesSony Corp. 78,800 8,255,100 4.41
8,255,100 4.41
Multiline RetailPan Pacific International
Holdings Corp. 217,500 5,129,932 2.74Marui Group Co., Ltd. 137,500 2,581,600 1.38
7,711,532 4.12
Specialty RetailNitori Holdings Co., Ltd. 24,400 4,723,664 2.53Hikari Tsushin, Inc. 13,300 2,677,384 1.43
7,401,048 3.96
Leisure ProductsRoland Corp. 69,400 2,508,134 1.34Bandai Namco Holdings, Inc. 29,800 2,125,160 1.14
4,633,294 2.48
Auto ComponentsToyota Industries Corp. 49,900 4,441,675 2.37
4,441,675 2.37Total Consumer Discretionary 32,442,649 17.34
Investments Quantity/ Nominal Value
Market Value USD
% of Net Assets
INDUSTRIALS
Professional ServicesRecruit Holdings Co., Ltd. 137,800 6,728,015 3.60SMS Co., Ltd. 92,200 2,816,866 1.50Nihon M&A Center, Inc. 71,200 1,928,545 1.03
11,473,426 6.13
MachinerySMC Corp. 9,500 5,517,696 2.95FANUC Corp. 17,300 4,092,759 2.19
9,610,455 5.14
Building ProductsDaikin Industries, Ltd. 15,700 3,164,295 1.69AGC, Inc. 70,300 2,939,264 1.57
6,103,559 3.26
Electrical EquipmentNidec Corp. 19,900 2,419,203 1.29
2,419,203 1.29Total Industrials 29,606,643 15.82
HEALTH CARE
Health Care Equipment & SuppliesOlympus Corp. 197,300 4,083,417 2.18Hoya Corp. 29,700 3,488,690 1.86Terumo Corp. 69,100 2,495,279 1.33Sysmex Corp. 18,500 1,992,416 1.07
12,059,802 6.44
Health Care TechnologyJMDC, Inc. 48,200 2,270,263 1.21M3, Inc. 26,100 1,786,043 0.96
4,056,306 2.17
PharmaceuticalsDaiichi Sankyo Co., Ltd. 50,000 1,454,966 0.78Chugai Pharmaceutical Co.,
Ltd. 31,800 1,288,880 0.692,743,846 1.47
BiotechnologyPeptiDream, Inc. 45,700 2,090,471 1.12
2,090,471 1.12Total Health Care 20,950,425 11.20
The accompanying notes form an integral part of these financial statements.
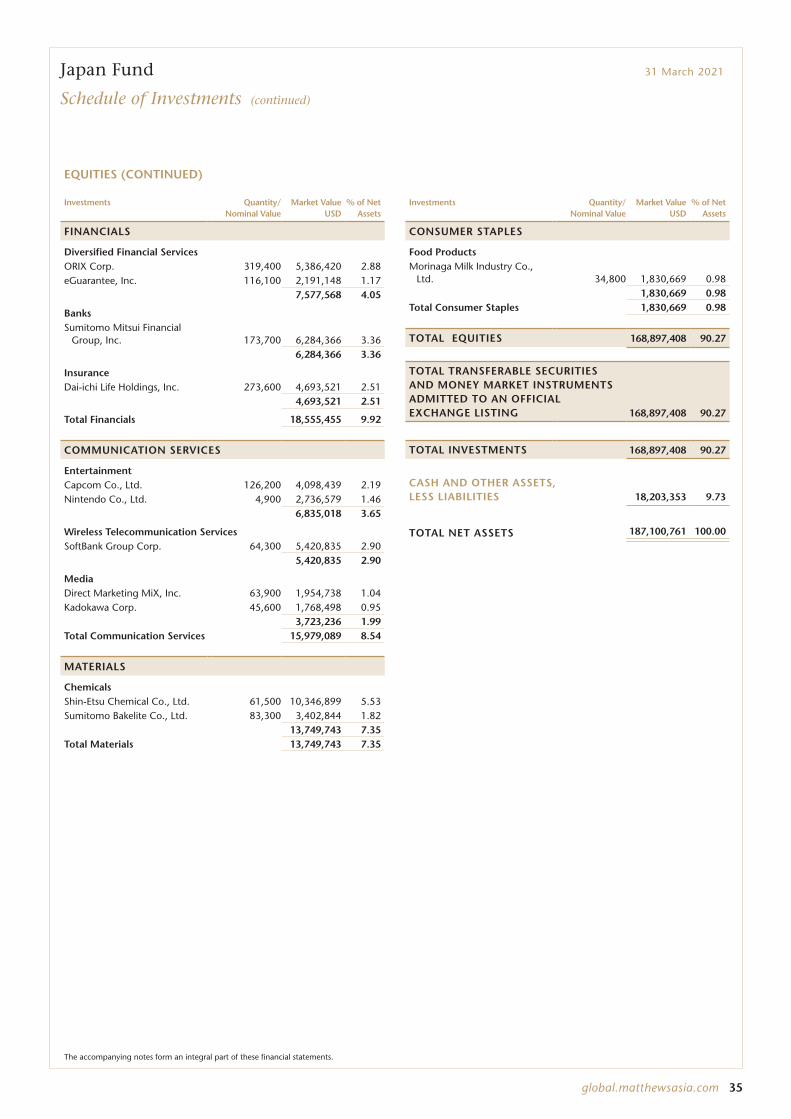
global.matthewsasia.com 35
Japan Fund 31 March 2021
Schedule of Investments (continued)
EQUITIES (CONTINUED)
Investments Quantity/ Nominal Value
Market Value USD
% of Net Assets
FINANCIALS
Diversified Financial ServicesORIX Corp. 319,400 5,386,420 2.88eGuarantee, Inc. 116,100 2,191,148 1.17
7,577,568 4.05
BanksSumitomo Mitsui Financial
Group, Inc. 173,700 6,284,366 3.366,284,366 3.36
InsuranceDai-ichi Life Holdings, Inc. 273,600 4,693,521 2.51
4,693,521 2.51
Total Financials 18,555,455 9.92
COMMUNICATION SERVICES
EntertainmentCapcom Co., Ltd. 126,200 4,098,439 2.19Nintendo Co., Ltd. 4,900 2,736,579 1.46
6,835,018 3.65
Wireless Telecommunication ServicesSoftBank Group Corp. 64,300 5,420,835 2.90
5,420,835 2.90
MediaDirect Marketing MiX, Inc. 63,900 1,954,738 1.04Kadokawa Corp. 45,600 1,768,498 0.95
3,723,236 1.99Total Communication Services 15,979,089 8.54
MATERIALS
ChemicalsShin-Etsu Chemical Co., Ltd. 61,500 10,346,899 5.53Sumitomo Bakelite Co., Ltd. 83,300 3,402,844 1.82
13,749,743 7.35Total Materials 13,749,743 7.35
Investments Quantity/ Nominal Value
Market Value USD
% of Net Assets
CONSUMER STAPLES
Food ProductsMorinaga Milk Industry Co.,
Ltd. 34,800 1,830,669 0.981,830,669 0.98
Total Consumer Staples 1,830,669 0.98
TOTAL EQUITIES 168,897,408 90.27
TOTAL TRANSFERABLE SECURITIES AND MONEY MARKET INSTRUMENTS ADMITTED TO AN OFFICIAL EXCHANGE LISTING 168,897,408 90.27
TOTAL INVESTMENTS 168,897,408 90.27
CASH AND OTHER ASSETS, LESS LIABILITIES 18,203,353 9.73
TOTAL NET ASSETS 187,100,761 100.00
The accompanying notes form an integral part of these financial statements.
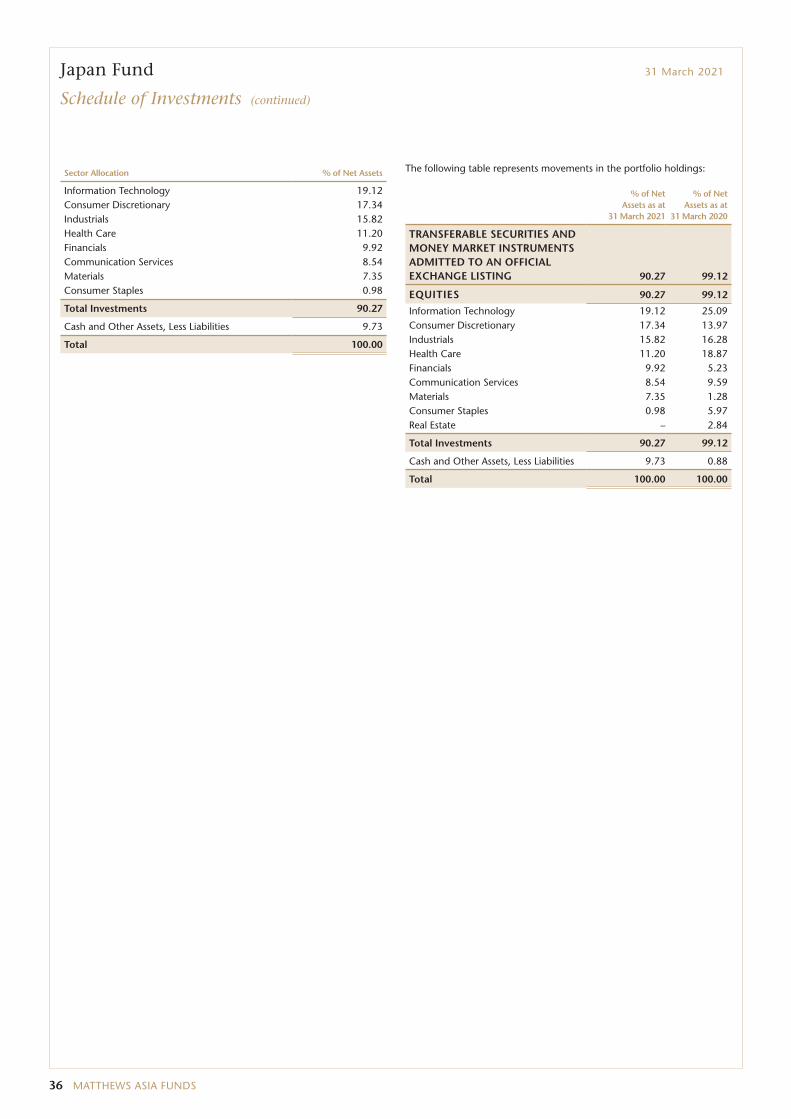
36 MATTHEWS ASIA FUNDS
Sector Allocation % of Net Assets
Information Technology 19.12Consumer Discretionary 17.34Industrials 15.82Health Care 11.20Financials 9.92Communication Services 8.54Materials 7.35Consumer Staples 0.98
Total Investments 90.27
Cash and Other Assets, Less Liabilities 9.73
Total 100.00
The following table represents movements in the portfolio holdings:
% of Net Assets as at
31 March 2021
% of Net Assets as at
31 March 2020
TRANSFERABLE SECURITIES AND MONEY MARKET INSTRUMENTS ADMITTED TO AN OFFICIAL EXCHANGE LISTING 90.27 99.12
EQUITIES 90.27 99.12
Information Technology 19.12 25.09Consumer Discretionary 17.34 13.97Industrials 15.82 16.28Health Care 11.20 18.87Financials 9.92 5.23Communication Services 8.54 9.59Materials 7.35 1.28Consumer Staples 0.98 5.97Real Estate – 2.84
Total Investments 90.27 99.12
Cash and Other Assets, Less Liabilities 9.73 0.88
Total 100.00 100.00
Japan Fund 31 March 2021
Schedule of Investments (continued)
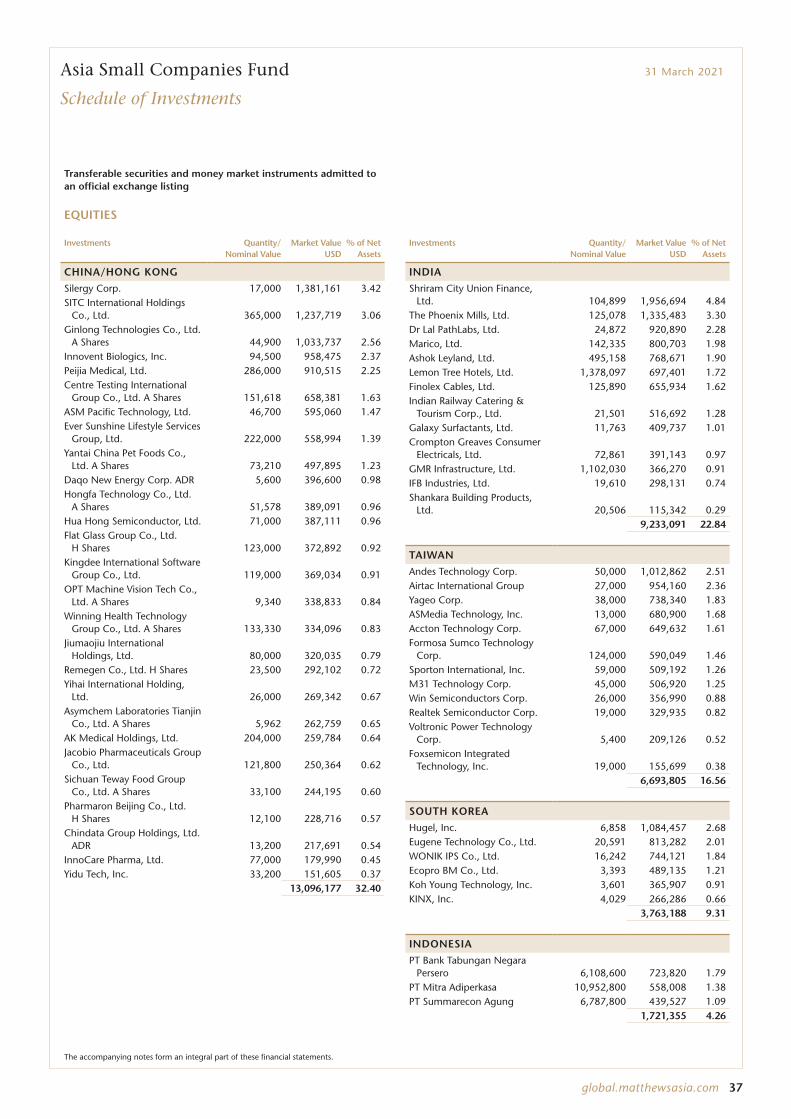
global.matthewsasia.com 37
Transferable securities and money market instruments admitted to an official exchange listing
EQUITIES
Investments Quantity/ Nominal Value
Market Value USD
% of Net Assets
CHINA/HONG KONG
Silergy Corp. 17,000 1,381,161 3.42SITC International Holdings
Co., Ltd. 365,000 1,237,719 3.06Ginlong Technologies Co., Ltd.
A Shares 44,900 1,033,737 2.56Innovent Biologics, Inc. 94,500 958,475 2.37Peijia Medical, Ltd. 286,000 910,515 2.25Centre Testing International
Group Co., Ltd. A Shares 151,618 658,381 1.63ASM Pacific Technology, Ltd. 46,700 595,060 1.47Ever Sunshine Lifestyle Services
Group, Ltd. 222,000 558,994 1.39Yantai China Pet Foods Co.,
Ltd. A Shares 73,210 497,895 1.23Daqo New Energy Corp. ADR 5,600 396,600 0.98Hongfa Technology Co., Ltd.
A Shares 51,578 389,091 0.96Hua Hong Semiconductor, Ltd. 71,000 387,111 0.96Flat Glass Group Co., Ltd.
H Shares 123,000 372,892 0.92Kingdee International Software
Group Co., Ltd. 119,000 369,034 0.91OPT Machine Vision Tech Co.,
Ltd. A Shares 9,340 338,833 0.84Winning Health Technology
Group Co., Ltd. A Shares 133,330 334,096 0.83Jiumaojiu International
Holdings, Ltd. 80,000 320,035 0.79Remegen Co., Ltd. H Shares 23,500 292,102 0.72Yihai International Holding,
Ltd. 26,000 269,342 0.67Asymchem Laboratories Tianjin
Co., Ltd. A Shares 5,962 262,759 0.65AK Medical Holdings, Ltd. 204,000 259,784 0.64Jacobio Pharmaceuticals Group
Co., Ltd. 121,800 250,364 0.62Sichuan Teway Food Group
Co., Ltd. A Shares 33,100 244,195 0.60Pharmaron Beijing Co., Ltd.
H Shares 12,100 228,716 0.57Chindata Group Holdings, Ltd.
ADR 13,200 217,691 0.54InnoCare Pharma, Ltd. 77,000 179,990 0.45Yidu Tech, Inc. 33,200 151,605 0.37
13,096,177 32.40
Investments Quantity/ Nominal Value
Market Value USD
% of Net Assets
INDIA
Shriram City Union Finance, Ltd. 104,899 1,956,694 4.84
The Phoenix Mills, Ltd. 125,078 1,335,483 3.30Dr Lal PathLabs, Ltd. 24,872 920,890 2.28Marico, Ltd. 142,335 800,703 1.98Ashok Leyland, Ltd. 495,158 768,671 1.90Lemon Tree Hotels, Ltd. 1,378,097 697,401 1.72Finolex Cables, Ltd. 125,890 655,934 1.62Indian Railway Catering &
Tourism Corp., Ltd. 21,501 516,692 1.28Galaxy Surfactants, Ltd. 11,763 409,737 1.01Crompton Greaves Consumer
Electricals, Ltd. 72,861 391,143 0.97GMR Infrastructure, Ltd. 1,102,030 366,270 0.91IFB Industries, Ltd. 19,610 298,131 0.74Shankara Building Products,
Ltd. 20,506 115,342 0.299,233,091 22.84
TAIWAN
Andes Technology Corp. 50,000 1,012,862 2.51Airtac International Group 27,000 954,160 2.36Yageo Corp. 38,000 738,340 1.83ASMedia Technology, Inc. 13,000 680,900 1.68Accton Technology Corp. 67,000 649,632 1.61Formosa Sumco Technology
Corp. 124,000 590,049 1.46Sporton International, Inc. 59,000 509,192 1.26M31 Technology Corp. 45,000 506,920 1.25Win Semiconductors Corp. 26,000 356,990 0.88Realtek Semiconductor Corp. 19,000 329,935 0.82Voltronic Power Technology
Corp. 5,400 209,126 0.52Foxsemicon Integrated
Technology, Inc. 19,000 155,699 0.386,693,805 16.56
SOUTH KOREA
Hugel, Inc. 6,858 1,084,457 2.68Eugene Technology Co., Ltd. 20,591 813,282 2.01WONIK IPS Co., Ltd. 16,242 744,121 1.84Ecopro BM Co., Ltd. 3,393 489,135 1.21Koh Young Technology, Inc. 3,601 365,907 0.91KINX, Inc. 4,029 266,286 0.66
3,763,188 9.31
INDONESIA
PT Bank Tabungan Negara Persero 6,108,600 723,820 1.79
PT Mitra Adiperkasa 10,952,800 558,008 1.38PT Summarecon Agung 6,787,800 439,527 1.09
1,721,355 4.26
Asia Small Companies Fund 31 March 2021
Schedule of Investments
The accompanying notes form an integral part of these financial statements.
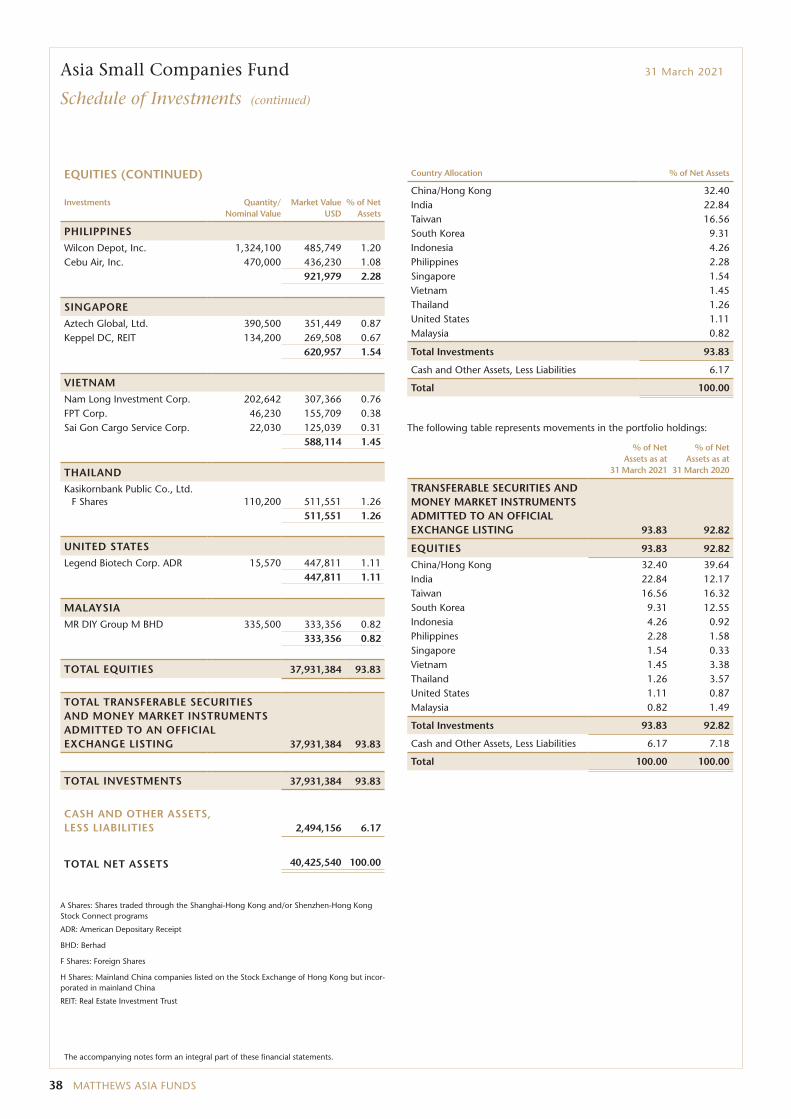
38 MATTHEWS ASIA FUNDS
Asia Small Companies Fund 31 March 2021
Schedule of Investments (continued)
The accompanying notes form an integral part of these financial statements.
EQUITIES (CONTINUED)
Investments Quantity/ Nominal Value
Market Value USD
% of Net Assets
PHILIPPINES
Wilcon Depot, Inc. 1,324,100 485,749 1.20Cebu Air, Inc. 470,000 436,230 1.08
921,979 2.28
SINGAPORE
Aztech Global, Ltd. 390,500 351,449 0.87Keppel DC, REIT 134,200 269,508 0.67
620,957 1.54
VIETNAM
Nam Long Investment Corp. 202,642 307,366 0.76FPT Corp. 46,230 155,709 0.38Sai Gon Cargo Service Corp. 22,030 125,039 0.31
588,114 1.45
THAILAND
Kasikornbank Public Co., Ltd. F Shares 110,200 511,551 1.26
511,551 1.26
UNITED STATES
Legend Biotech Corp. ADR 15,570 447,811 1.11447,811 1.11
MALAYSIA
MR DIY Group M BHD 335,500 333,356 0.82333,356 0.82
TOTAL EQUITIES 37,931,384 93.83
TOTAL TRANSFERABLE SECURITIES AND MONEY MARKET INSTRUMENTS ADMITTED TO AN OFFICIAL EXCHANGE LISTING 37,931,384 93.83
TOTAL INVESTMENTS 37,931,384 93.83
CASH AND OTHER ASSETS, LESS LIABILITIES 2,494,156 6.17
TOTAL NET ASSETS 40,425,540 100.00
A Shares: Shares traded through the Shanghai-Hong Kong and/or Shenzhen-Hong Kong Stock Connect programs
ADR: American Depositary Receipt
BHD: Berhad
F Shares: Foreign Shares
H Shares: Mainland China companies listed on the Stock Exchange of Hong Kong but incor-porated in mainland China
REIT: Real Estate Investment Trust
Country Allocation % of Net Assets
China/Hong Kong 32.40India 22.84Taiwan 16.56South Korea 9.31Indonesia 4.26Philippines 2.28Singapore 1.54Vietnam 1.45Thailand 1.26United States 1.11Malaysia 0.82
Total Investments 93.83
Cash and Other Assets, Less Liabilities 6.17
Total 100.00
The following table represents movements in the portfolio holdings:
% of Net Assets as at
31 March 2021
% of Net Assets as at
31 March 2020
TRANSFERABLE SECURITIES AND MONEY MARKET INSTRUMENTS ADMITTED TO AN OFFICIAL EXCHANGE LISTING 93.83 92.82
EQUITIES 93.83 92.82
China/Hong Kong 32.40 39.64India 22.84 12.17Taiwan 16.56 16.32South Korea 9.31 12.55Indonesia 4.26 0.92Philippines 2.28 1.58Singapore 1.54 0.33Vietnam 1.45 3.38Thailand 1.26 3.57United States 1.11 0.87Malaysia 0.82 1.49
Total Investments 93.83 92.82
Cash and Other Assets, Less Liabilities 6.17 7.18
Total 100.00 100.00
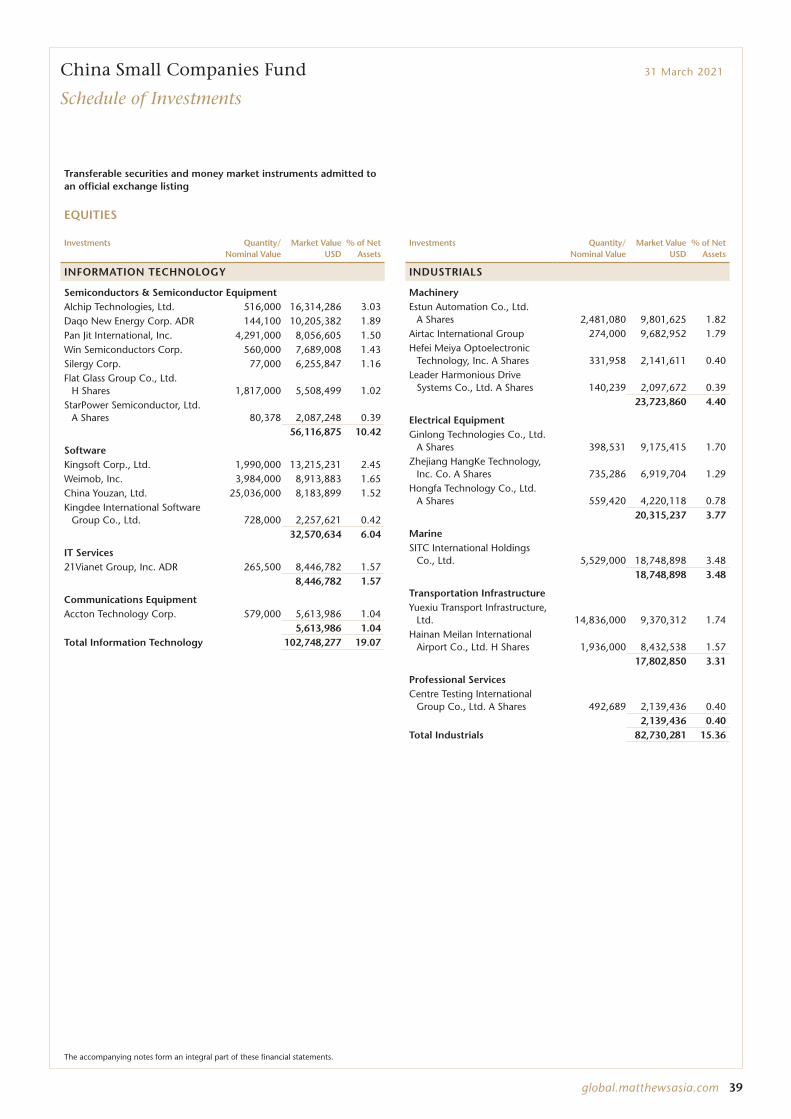
global.matthewsasia.com 39
China Small Companies Fund 31 March 2021
Schedule of Investments
Transferable securities and money market instruments admitted to an official exchange listing
EQUITIES
Investments Quantity/ Nominal Value
Market Value USD
% of Net Assets
INFORMATION TECHNOLOGY
Semiconductors & Semiconductor EquipmentAlchip Technologies, Ltd. 516,000 16,314,286 3.03Daqo New Energy Corp. ADR 144,100 10,205,382 1.89Pan Jit International, Inc. 4,291,000 8,056,605 1.50Win Semiconductors Corp. 560,000 7,689,008 1.43Silergy Corp. 77,000 6,255,847 1.16Flat Glass Group Co., Ltd.
H Shares 1,817,000 5,508,499 1.02StarPower Semiconductor, Ltd.
A Shares 80,378 2,087,248 0.3956,116,875 10.42
SoftwareKingsoft Corp., Ltd. 1,990,000 13,215,231 2.45Weimob, Inc. 3,984,000 8,913,883 1.65China Youzan, Ltd. 25,036,000 8,183,899 1.52Kingdee International Software
Group Co., Ltd. 728,000 2,257,621 0.4232,570,634 6.04
IT Services21Vianet Group, Inc. ADR 265,500 8,446,782 1.57
8,446,782 1.57
Communications EquipmentAccton Technology Corp. 579,000 5,613,986 1.04
5,613,986 1.04Total Information Technology 102,748,277 19.07
Investments Quantity/ Nominal Value
Market Value USD
% of Net Assets
INDUSTRIALS
MachineryEstun Automation Co., Ltd.
A Shares 2,481,080 9,801,625 1.82Airtac International Group 274,000 9,682,952 1.79Hefei Meiya Optoelectronic
Technology, Inc. A Shares 331,958 2,141,611 0.40Leader Harmonious Drive
Systems Co., Ltd. A Shares 140,239 2,097,672 0.3923,723,860 4.40
Electrical EquipmentGinlong Technologies Co., Ltd.
A Shares 398,531 9,175,415 1.70Zhejiang HangKe Technology,
Inc. Co. A Shares 735,286 6,919,704 1.29Hongfa Technology Co., Ltd.
A Shares 559,420 4,220,118 0.7820,315,237 3.77
MarineSITC International Holdings
Co., Ltd. 5,529,000 18,748,898 3.4818,748,898 3.48
Transportation InfrastructureYuexiu Transport Infrastructure,
Ltd. 14,836,000 9,370,312 1.74Hainan Meilan International
Airport Co., Ltd. H Shares 1,936,000 8,432,538 1.5717,802,850 3.31
Professional ServicesCentre Testing International
Group Co., Ltd. A Shares 492,689 2,139,436 0.402,139,436 0.40
Total Industrials 82,730,281 15.36
The accompanying notes form an integral part of these financial statements.
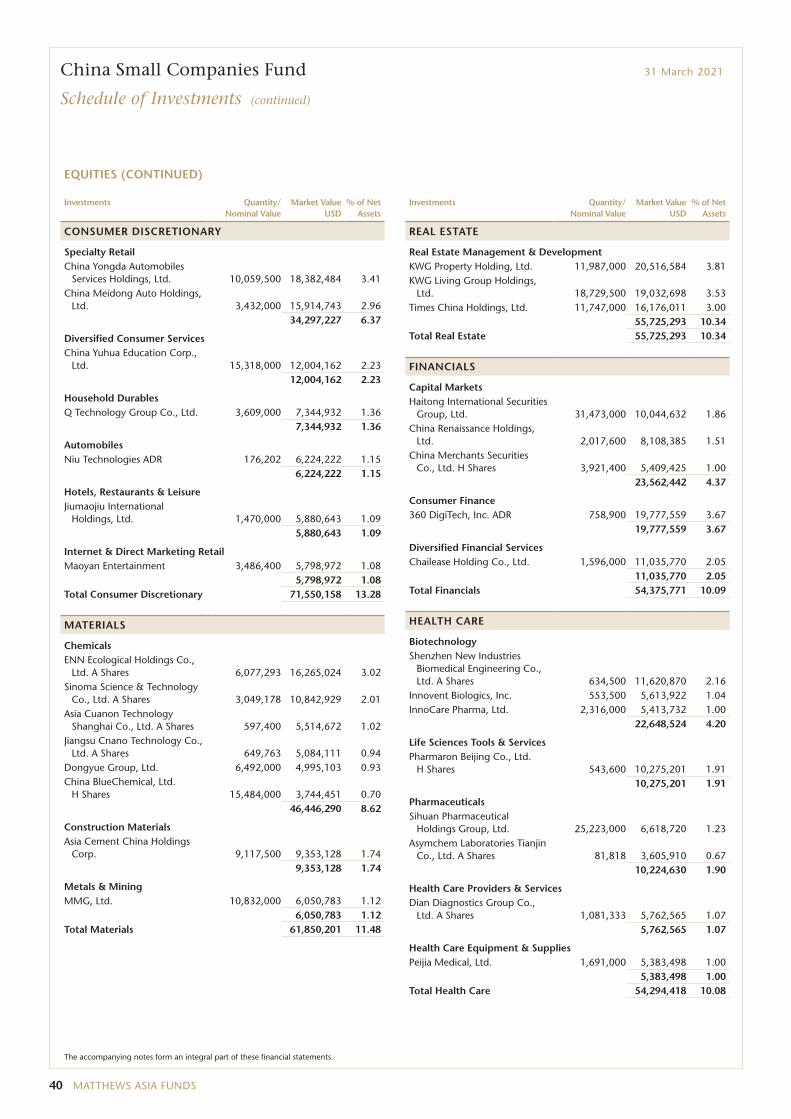
40 MATTHEWS ASIA FUNDS
China Small Companies Fund 31 March 2021
Schedule of Investments (continued)
EQUITIES (CONTINUED)
Investments Quantity/ Nominal Value
Market Value USD
% of Net Assets
CONSUMER DISCRETIONARY
Specialty RetailChina Yongda Automobiles
Services Holdings, Ltd. 10,059,500 18,382,484 3.41China Meidong Auto Holdings,
Ltd. 3,432,000 15,914,743 2.9634,297,227 6.37
Diversified Consumer ServicesChina Yuhua Education Corp.,
Ltd. 15,318,000 12,004,162 2.2312,004,162 2.23
Household DurablesQ Technology Group Co., Ltd. 3,609,000 7,344,932 1.36
7,344,932 1.36
AutomobilesNiu Technologies ADR 176,202 6,224,222 1.15
6,224,222 1.15
Hotels, Restaurants & LeisureJiumaojiu International
Holdings, Ltd. 1,470,000 5,880,643 1.095,880,643 1.09
Internet & Direct Marketing RetailMaoyan Entertainment 3,486,400 5,798,972 1.08
5,798,972 1.08Total Consumer Discretionary 71,550,158 13.28
MATERIALS
ChemicalsENN Ecological Holdings Co.,
Ltd. A Shares 6,077,293 16,265,024 3.02Sinoma Science & Technology
Co., Ltd. A Shares 3,049,178 10,842,929 2.01Asia Cuanon Technology
Shanghai Co., Ltd. A Shares 597,400 5,514,672 1.02Jiangsu Cnano Technology Co.,
Ltd. A Shares 649,763 5,084,111 0.94Dongyue Group, Ltd. 6,492,000 4,995,103 0.93China BlueChemical, Ltd.
H Shares 15,484,000 3,744,451 0.7046,446,290 8.62
Construction MaterialsAsia Cement China Holdings
Corp. 9,117,500 9,353,128 1.749,353,128 1.74
Metals & MiningMMG, Ltd. 10,832,000 6,050,783 1.12
6,050,783 1.12Total Materials 61,850,201 11.48
Investments Quantity/ Nominal Value
Market Value USD
% of Net Assets
REAL ESTATE
Real Estate Management & DevelopmentKWG Property Holding, Ltd. 11,987,000 20,516,584 3.81KWG Living Group Holdings,
Ltd. 18,729,500 19,032,698 3.53Times China Holdings, Ltd. 11,747,000 16,176,011 3.00
55,725,293 10.34Total Real Estate 55,725,293 10.34
FINANCIALS
Capital MarketsHaitong International Securities
Group, Ltd. 31,473,000 10,044,632 1.86China Renaissance Holdings,
Ltd. 2,017,600 8,108,385 1.51China Merchants Securities
Co., Ltd. H Shares 3,921,400 5,409,425 1.0023,562,442 4.37
Consumer Finance360 DigiTech, Inc. ADR 758,900 19,777,559 3.67
19,777,559 3.67
Diversified Financial ServicesChailease Holding Co., Ltd. 1,596,000 11,035,770 2.05
11,035,770 2.05Total Financials 54,375,771 10.09
HEALTH CARE
BiotechnologyShenzhen New Industries
Biomedical Engineering Co., Ltd. A Shares 634,500 11,620,870 2.16
Innovent Biologics, Inc. 553,500 5,613,922 1.04InnoCare Pharma, Ltd. 2,316,000 5,413,732 1.00
22,648,524 4.20
Life Sciences Tools & ServicesPharmaron Beijing Co., Ltd.
H Shares 543,600 10,275,201 1.9110,275,201 1.91
PharmaceuticalsSihuan Pharmaceutical
Holdings Group, Ltd. 25,223,000 6,618,720 1.23Asymchem Laboratories Tianjin
Co., Ltd. A Shares 81,818 3,605,910 0.6710,224,630 1.90
Health Care Providers & ServicesDian Diagnostics Group Co.,
Ltd. A Shares 1,081,333 5,762,565 1.075,762,565 1.07
Health Care Equipment & SuppliesPeijia Medical, Ltd. 1,691,000 5,383,498 1.00
5,383,498 1.00Total Health Care 54,294,418 10.08
The accompanying notes form an integral part of these financial statements.
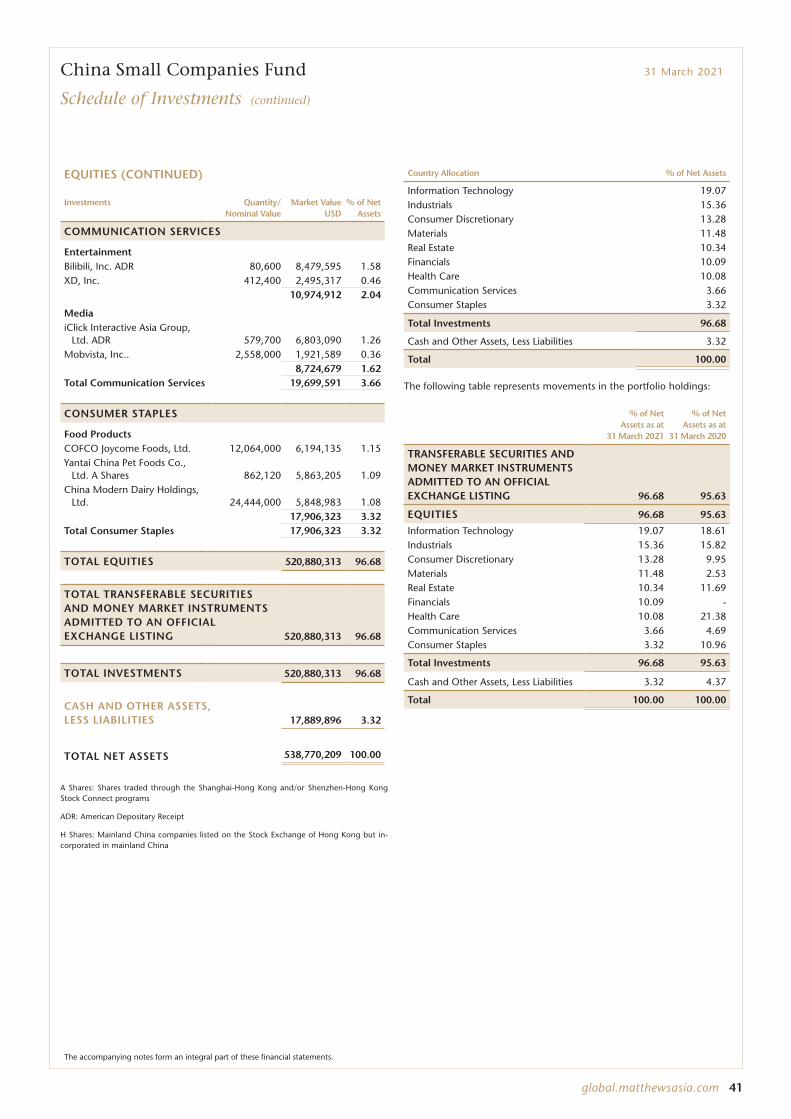
global.matthewsasia.com 41
China Small Companies Fund 31 March 2021
Schedule of Investments (continued)
EQUITIES (CONTINUED)
Investments Quantity/ Nominal Value
Market Value USD
% of Net Assets
COMMUNICATION SERVICES
EntertainmentBilibili, Inc. ADR 80,600 8,479,595 1.58XD, Inc. 412,400 2,495,317 0.46
10,974,912 2.04
MediaiClick Interactive Asia Group,
Ltd. ADR 579,700 6,803,090 1.26Mobvista, Inc.. 2,558,000 1,921,589 0.36
8,724,679 1.62Total Communication Services 19,699,591 3.66
CONSUMER STAPLES
Food ProductsCOFCO Joycome Foods, Ltd. 12,064,000 6,194,135 1.15Yantai China Pet Foods Co.,
Ltd. A Shares 862,120 5,863,205 1.09China Modern Dairy Holdings,
Ltd. 24,444,000 5,848,983 1.0817,906,323 3.32
Total Consumer Staples 17,906,323 3.32
TOTAL EQUITIES 520,880,313 96.68
TOTAL TRANSFERABLE SECURITIES AND MONEY MARKET INSTRUMENTS ADMITTED TO AN OFFICIAL EXCHANGE LISTING 520,880,313 96.68
TOTAL INVESTMENTS 520,880,313 96.68
CASH AND OTHER ASSETS, LESS LIABILITIES 17,889,896 3.32
TOTAL NET ASSETS 538,770,209 100.00
A Shares: Shares traded through the Shanghai-Hong Kong and/or Shenzhen-Hong Kong Stock Connect programs
ADR: American Depositary Receipt
H Shares: Mainland China companies listed on the Stock Exchange of Hong Kong but in-corporated in mainland China
Country Allocation % of Net Assets
Information Technology 19.07Industrials 15.36Consumer Discretionary 13.28Materials 11.48Real Estate 10.34Financials 10.09Health Care 10.08Communication Services 3.66Consumer Staples 3.32
Total Investments 96.68
Cash and Other Assets, Less Liabilities 3.32
Total 100.00
The following table represents movements in the portfolio holdings:
% of Net Assets as at
31 March 2021
% of Net Assets as at
31 March 2020
TRANSFERABLE SECURITIES AND MONEY MARKET INSTRUMENTS ADMITTED TO AN OFFICIAL EXCHANGE LISTING 96.68 95.63
EQUITIES 96.68 95.63
Information Technology 19.07 18.61Industrials 15.36 15.82Consumer Discretionary 13.28 9.95Materials 11.48 2.53Real Estate 10.34 11.69Financials 10.09 -Health Care 10.08 21.38Communication Services 3.66 4.69Consumer Staples 3.32 10.96
Total Investments 96.68 95.63
Cash and Other Assets, Less Liabilities 3.32 4.37
Total 100.00 100.00
The accompanying notes form an integral part of these financial statements.
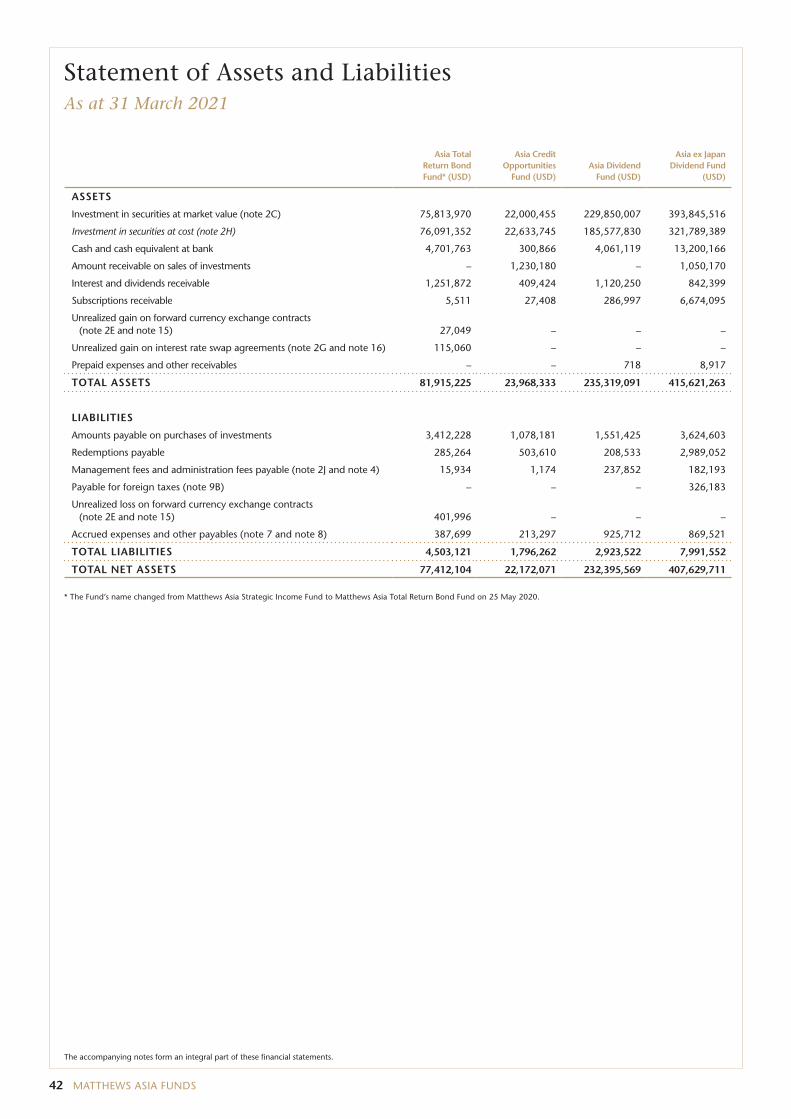
42 MATTHEWS ASIA FUNDS
Statement of Assets and LiabilitiesAs at 31 March 2021
Asia Total Return Bond Fund* (USD)
Asia Credit Opportunities
Fund (USD)Asia Dividend
Fund (USD)
Asia ex Japan Dividend Fund
(USD)
ASSETS
Investment in securities at market value (note 2C) 75,813,970 22,000,455 229,850,007 393,845,516
Investment in securities at cost (note 2H) 76,091,352 22,633,745 185,577,830 321,789,389
Cash and cash equivalent at bank 4,701,763 300,866 4,061,119 13,200,166
Amount receivable on sales of investments – 1,230,180 – 1,050,170
Interest and dividends receivable 1,251,872 409,424 1,120,250 842,399
Subscriptions receivable 5,511 27,408 286,997 6,674,095
Unrealized gain on forward currency exchange contracts (note 2E and note 15) 27,049 – – –
Unrealized gain on interest rate swap agreements (note 2G and note 16) 115,060 – – –
Prepaid expenses and other receivables – – 718 8,917
TOTAL ASSETS 81,915,225 23,968,333 235,319,091 415,621,263
LIABILITIES
Amounts payable on purchases of investments 3,412,228 1,078,181 1,551,425 3,624,603
Redemptions payable 285,264 503,610 208,533 2,989,052
Management fees and administration fees payable (note 2J and note 4) 15,934 1,174 237,852 182,193
Payable for foreign taxes (note 9B) – – – 326,183
Unrealized loss on forward currency exchange contracts (note 2E and note 15) 401,996 – – –
Accrued expenses and other payables (note 7 and note 8) 387,699 213,297 925,712 869,521
TOTAL LIABILITIES 4,503,121 1,796,262 2,923,522 7,991,552
TOTAL NET ASSETS 77,412,104 22,172,071 232,395,569 407,629,711
* The Fund’s name changed from Matthews Asia Strategic Income Fund to Matthews Asia Total Return Bond Fund on 25 May 2020.
The accompanying notes form an integral part of these financial statements.
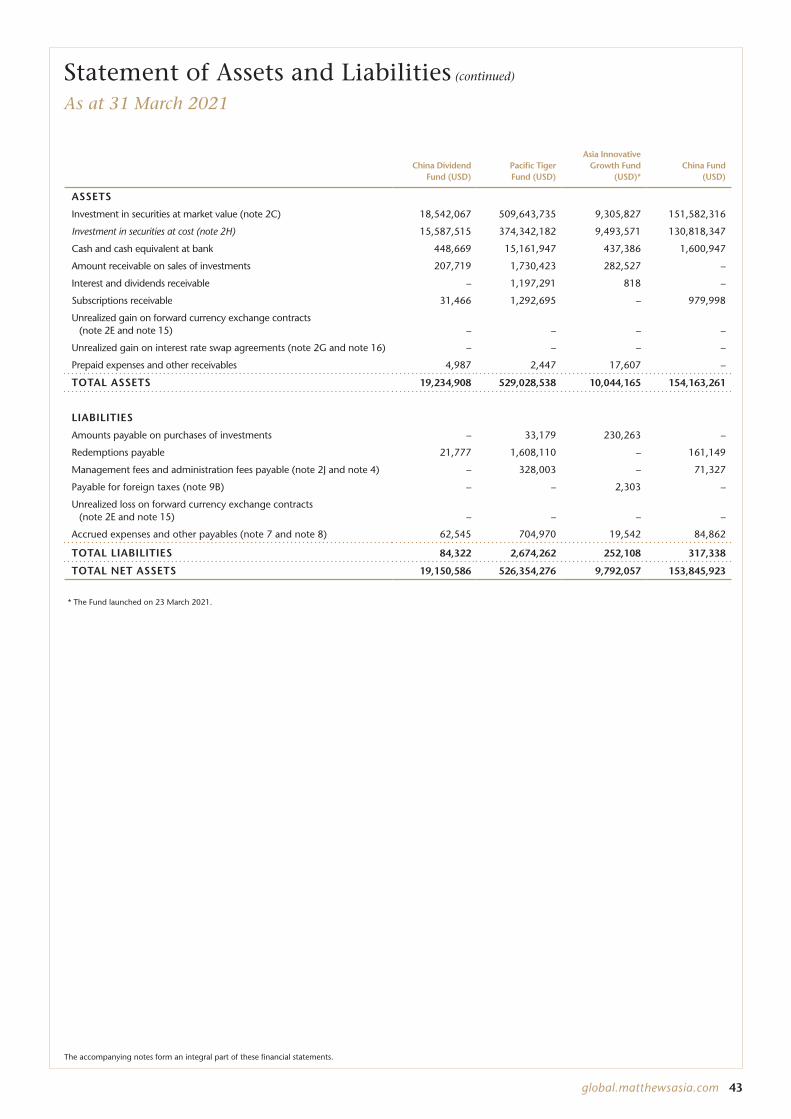
global.matthewsasia.com 43
Statement of Assets and Liabilities (continued)
As at 31 March 2021
China Dividend Fund (USD)
Pacific Tiger Fund (USD)
Asia Innovative Growth Fund
(USD)*China Fund
(USD)
ASSETS
Investment in securities at market value (note 2C) 18,542,067 509,643,735 9,305,827 151,582,316
Investment in securities at cost (note 2H) 15,587,515 374,342,182 9,493,571 130,818,347
Cash and cash equivalent at bank 448,669 15,161,947 437,386 1,600,947
Amount receivable on sales of investments 207,719 1,730,423 282,527 –
Interest and dividends receivable – 1,197,291 818 –
Subscriptions receivable 31,466 1,292,695 – 979,998
Unrealized gain on forward currency exchange contracts (note 2E and note 15) – – – –
Unrealized gain on interest rate swap agreements (note 2G and note 16) – – – –
Prepaid expenses and other receivables 4,987 2,447 17,607 –
TOTAL ASSETS 19,234,908 529,028,538 10,044,165 154,163,261
LIABILITIES
Amounts payable on purchases of investments – 33,179 230,263 –
Redemptions payable 21,777 1,608,110 – 161,149
Management fees and administration fees payable (note 2J and note 4) – 328,003 – 71,327
Payable for foreign taxes (note 9B) – – 2,303 –
Unrealized loss on forward currency exchange contracts (note 2E and note 15) – – – –
Accrued expenses and other payables (note 7 and note 8) 62,545 704,970 19,542 84,862
TOTAL LIABILITIES 84,322 2,674,262 252,108 317,338
TOTAL NET ASSETS 19,150,586 526,354,276 9,792,057 153,845,923
* The Fund launched on 23 March 2021.
The accompanying notes form an integral part of these financial statements.
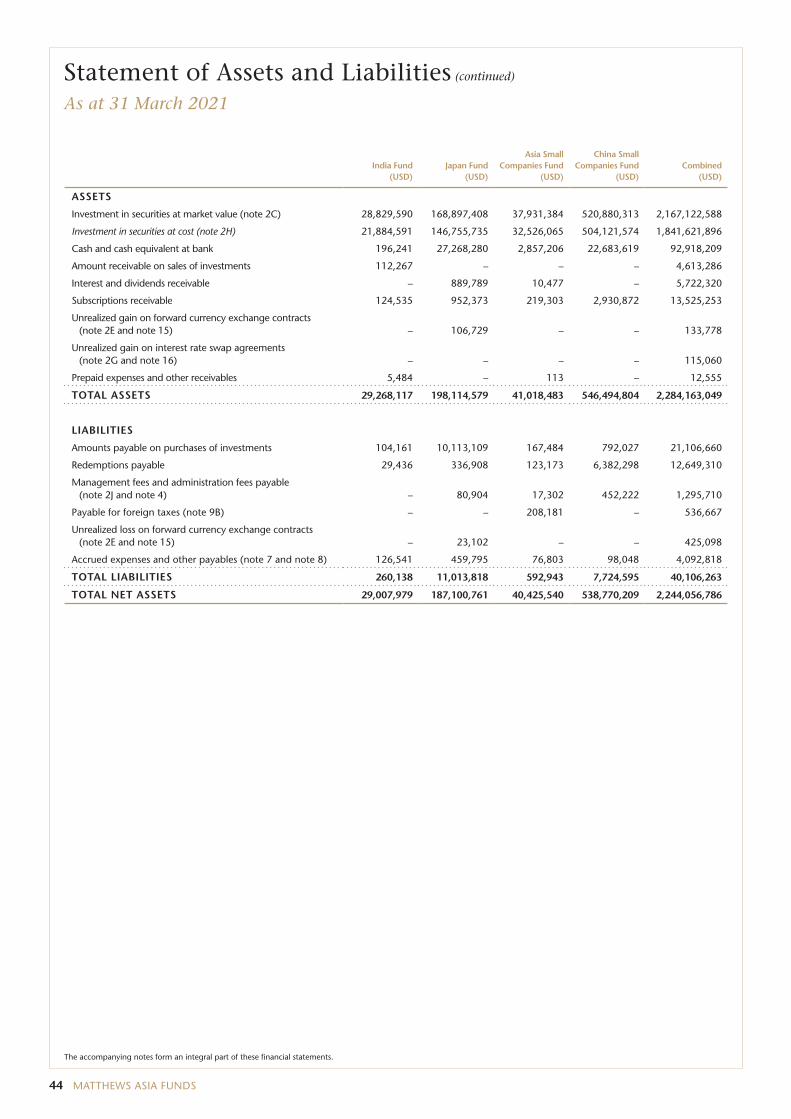
44 MATTHEWS ASIA FUNDS
Statement of Assets and Liabilities (continued)
As at 31 March 2021
India Fund (USD)
Japan Fund (USD)
Asia Small Companies Fund
(USD)
China Small Companies Fund
(USD)Combined
(USD)
ASSETS
Investment in securities at market value (note 2C) 28,829,590 168,897,408 37,931,384 520,880,313 2,167,122,588
Investment in securities at cost (note 2H) 21,884,591 146,755,735 32,526,065 504,121,574 1,841,621,896
Cash and cash equivalent at bank 196,241 27,268,280 2,857,206 22,683,619 92,918,209
Amount receivable on sales of investments 112,267 – – – 4,613,286
Interest and dividends receivable – 889,789 10,477 – 5,722,320
Subscriptions receivable 124,535 952,373 219,303 2,930,872 13,525,253
Unrealized gain on forward currency exchange contracts (note 2E and note 15) – 106,729 – – 133,778
Unrealized gain on interest rate swap agreements (note 2G and note 16) – – – – 115,060
Prepaid expenses and other receivables 5,484 – 113 – 12,555
TOTAL ASSETS 29,268,117 198,114,579 41,018,483 546,494,804 2,284,163,049
LIABILITIES
Amounts payable on purchases of investments 104,161 10,113,109 167,484 792,027 21,106,660
Redemptions payable 29,436 336,908 123,173 6,382,298 12,649,310
Management fees and administration fees payable (note 2J and note 4) – 80,904 17,302 452,222 1,295,710
Payable for foreign taxes (note 9B) – – 208,181 – 536,667
Unrealized loss on forward currency exchange contracts (note 2E and note 15) – 23,102 – – 425,098
Accrued expenses and other payables (note 7 and note 8) 126,541 459,795 76,803 98,048 4,092,818
TOTAL LIABILITIES 260,138 11,013,818 592,943 7,724,595 40,106,263
TOTAL NET ASSETS 29,007,979 187,100,761 40,425,540 538,770,209 2,244,056,786
The accompanying notes form an integral part of these financial statements.
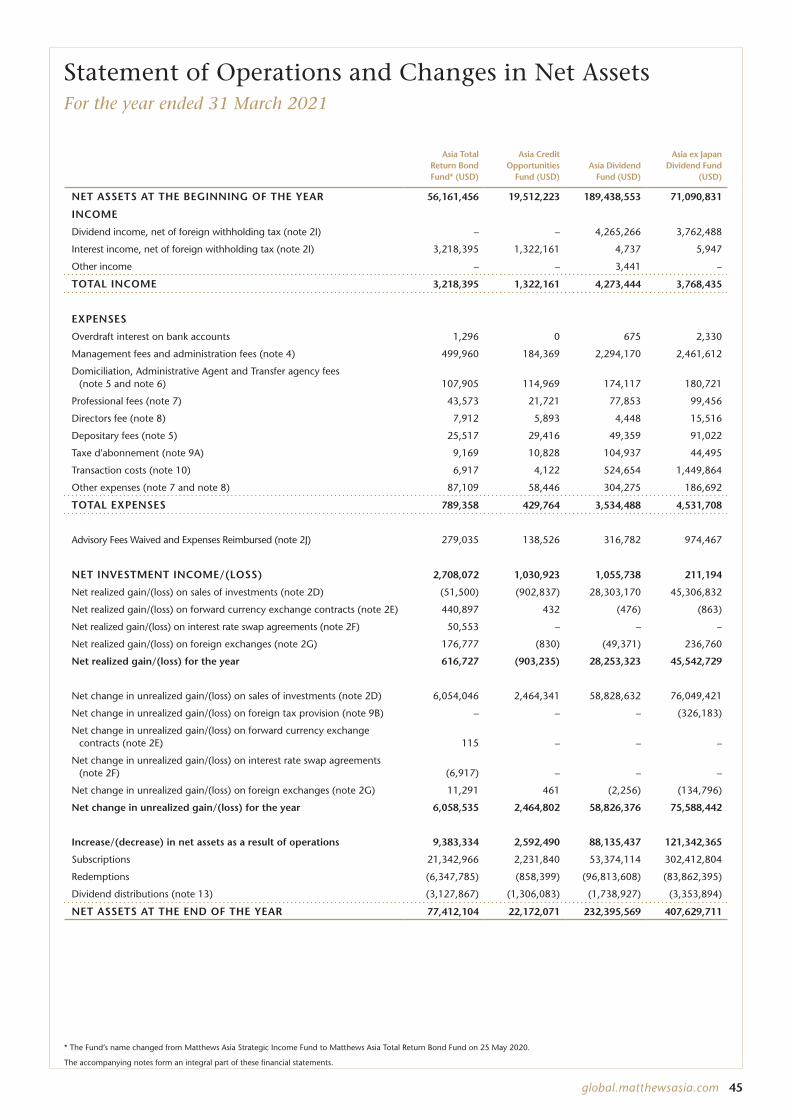
global.matthewsasia.com 45
Statement of Operations and Changes in Net AssetsFor the year ended 31 March 2021
Asia Total Return Bond Fund* (USD)
Asia Credit Opportunities
Fund (USD)Asia Dividend
Fund (USD)
Asia ex Japan Dividend Fund
(USD)
NET ASSETS AT THE BEGINNING OF THE YEAR 56,161,456 19,512,223 189,438,553 71,090,831
INCOME
Dividend income, net of foreign withholding tax (note 2I) – – 4,265,266 3,762,488
Interest income, net of foreign withholding tax (note 2I) 3,218,395 1,322,161 4,737 5,947
Other income – – 3,441 –
TOTAL INCOME 3,218,395 1,322,161 4,273,444 3,768,435
EXPENSES
Overdraft interest on bank accounts 1,296 0 675 2,330
Management fees and administration fees (note 4) 499,960 184,369 2,294,170 2,461,612
Domiciliation, Administrative Agent and Transfer agency fees (note 5 and note 6) 107,905 114,969 174,117 180,721
Professional fees (note 7) 43,573 21,721 77,853 99,456
Directors fee (note 8) 7,912 5,893 4,448 15,516
Depositary fees (note 5) 25,517 29,416 49,359 91,022
Taxe d'abonnement (note 9A) 9,169 10,828 104,937 44,495
Transaction costs (note 10) 6,917 4,122 524,654 1,449,864
Other expenses (note 7 and note 8) 87,109 58,446 304,275 186,692
TOTAL EXPENSES 789,358 429,764 3,534,488 4,531,708
Advisory Fees Waived and Expenses Reimbursed (note 2J) 279,035 138,526 316,782 974,467
NET INVESTMENT INCOME/(LOSS) 2,708,072 1,030,923 1,055,738 211,194
Net realized gain/(loss) on sales of investments (note 2D) (51,500) (902,837) 28,303,170 45,306,832
Net realized gain/(loss) on forward currency exchange contracts (note 2E) 440,897 432 (476) (863)
Net realized gain/(loss) on interest rate swap agreements (note 2F) 50,553 – – –
Net realized gain/(loss) on foreign exchanges (note 2G) 176,777 (830) (49,371) 236,760
Net realized gain/(loss) for the year 616,727 (903,235) 28,253,323 45,542,729
Net change in unrealized gain/(loss) on sales of investments (note 2D) 6,054,046 2,464,341 58,828,632 76,049,421
Net change in unrealized gain/(loss) on foreign tax provision (note 9B) – – – (326,183)
Net change in unrealized gain/(loss) on forward currency exchange contracts (note 2E) 115 – – –
Net change in unrealized gain/(loss) on interest rate swap agreements (note 2F) (6,917) – – –
Net change in unrealized gain/(loss) on foreign exchanges (note 2G) 11,291 461 (2,256) (134,796)
Net change in unrealized gain/(loss) for the year 6,058,535 2,464,802 58,826,376 75,588,442
Increase/(decrease) in net assets as a result of operations 9,383,334 2,592,490 88,135,437 121,342,365
Subscriptions 21,342,966 2,231,840 53,374,114 302,412,804
Redemptions (6,347,785) (858,399) (96,813,608) (83,862,395)
Dividend distributions (note 13) (3,127,867) (1,306,083) (1,738,927) (3,353,894)
NET ASSETS AT THE END OF THE YEAR 77,412,104 22,172,071 232,395,569 407,629,711
The accompanying notes form an integral part of these financial statements.
* The Fund’s name changed from Matthews Asia Strategic Income Fund to Matthews Asia Total Return Bond Fund on 25 May 2020.
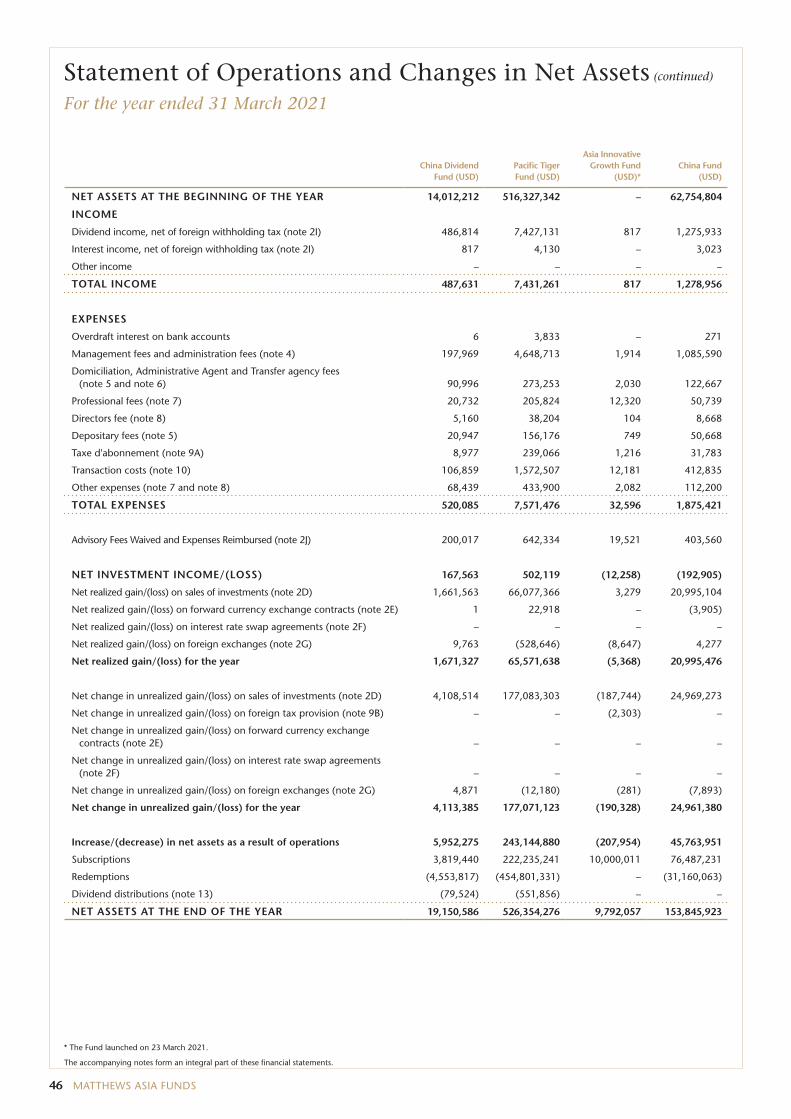
46 MATTHEWS ASIA FUNDS
* The Fund launched on 23 March 2021.
Statement of Operations and Changes in Net Assets (continued)
For the year ended 31 March 2021
China Dividend Fund (USD)
Pacific Tiger Fund (USD)
Asia Innovative Growth Fund
(USD)*China Fund
(USD)
NET ASSETS AT THE BEGINNING OF THE YEAR 14,012,212 516,327,342 – 62,754,804
INCOME
Dividend income, net of foreign withholding tax (note 2I) 486,814 7,427,131 817 1,275,933
Interest income, net of foreign withholding tax (note 2I) 817 4,130 – 3,023
Other income – – – –
TOTAL INCOME 487,631 7,431,261 817 1,278,956
EXPENSES
Overdraft interest on bank accounts 6 3,833 – 271
Management fees and administration fees (note 4) 197,969 4,648,713 1,914 1,085,590
Domiciliation, Administrative Agent and Transfer agency fees (note 5 and note 6) 90,996 273,253 2,030 122,667
Professional fees (note 7) 20,732 205,824 12,320 50,739
Directors fee (note 8) 5,160 38,204 104 8,668
Depositary fees (note 5) 20,947 156,176 749 50,668
Taxe d'abonnement (note 9A) 8,977 239,066 1,216 31,783
Transaction costs (note 10) 106,859 1,572,507 12,181 412,835
Other expenses (note 7 and note 8) 68,439 433,900 2,082 112,200
TOTAL EXPENSES 520,085 7,571,476 32,596 1,875,421
Advisory Fees Waived and Expenses Reimbursed (note 2J) 200,017 642,334 19,521 403,560
NET INVESTMENT INCOME/(LOSS) 167,563 502,119 (12,258) (192,905)
Net realized gain/(loss) on sales of investments (note 2D) 1,661,563 66,077,366 3,279 20,995,104
Net realized gain/(loss) on forward currency exchange contracts (note 2E) 1 22,918 – (3,905)
Net realized gain/(loss) on interest rate swap agreements (note 2F) – – – –
Net realized gain/(loss) on foreign exchanges (note 2G) 9,763 (528,646) (8,647) 4,277
Net realized gain/(loss) for the year 1,671,327 65,571,638 (5,368) 20,995,476
Net change in unrealized gain/(loss) on sales of investments (note 2D) 4,108,514 177,083,303 (187,744) 24,969,273
Net change in unrealized gain/(loss) on foreign tax provision (note 9B) – – (2,303) –
Net change in unrealized gain/(loss) on forward currency exchange contracts (note 2E) – – – –
Net change in unrealized gain/(loss) on interest rate swap agreements (note 2F) – – – –
Net change in unrealized gain/(loss) on foreign exchanges (note 2G) 4,871 (12,180) (281) (7,893)
Net change in unrealized gain/(loss) for the year 4,113,385 177,071,123 (190,328) 24,961,380
Increase/(decrease) in net assets as a result of operations 5,952,275 243,144,880 (207,954) 45,763,951
Subscriptions 3,819,440 222,235,241 10,000,011 76,487,231
Redemptions (4,553,817) (454,801,331) – (31,160,063)
Dividend distributions (note 13) (79,524) (551,856) – –
NET ASSETS AT THE END OF THE YEAR 19,150,586 526,354,276 9,792,057 153,845,923
The accompanying notes form an integral part of these financial statements.
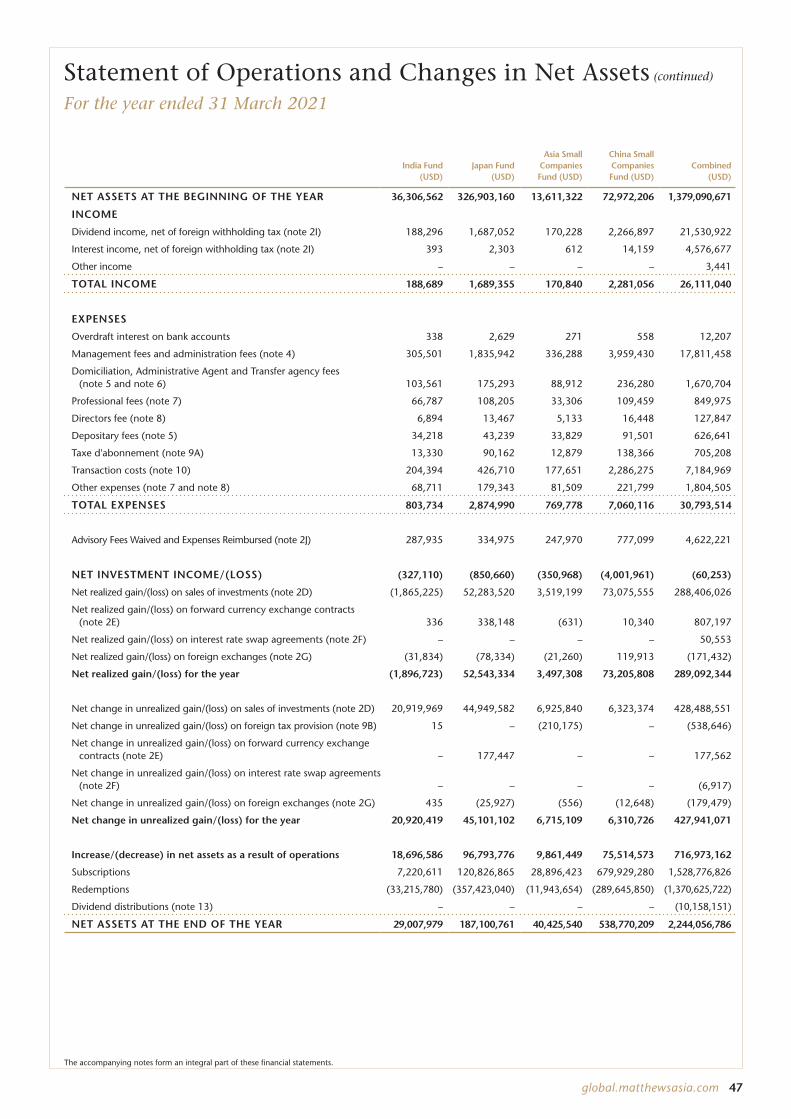
global.matthewsasia.com 47
Statement of Operations and Changes in Net Assets (continued)
For the year ended 31 March 2021
India Fund (USD)
Japan Fund (USD)
Asia Small Companies Fund (USD)
China Small Companies Fund (USD)
Combined (USD)
NET ASSETS AT THE BEGINNING OF THE YEAR 36,306,562 326,903,160 13,611,322 72,972,206 1,379,090,671
INCOME
Dividend income, net of foreign withholding tax (note 2I) 188,296 1,687,052 170,228 2,266,897 21,530,922
Interest income, net of foreign withholding tax (note 2I) 393 2,303 612 14,159 4,576,677
Other income – – – – 3,441
TOTAL INCOME 188,689 1,689,355 170,840 2,281,056 26,111,040
EXPENSES
Overdraft interest on bank accounts 338 2,629 271 558 12,207
Management fees and administration fees (note 4) 305,501 1,835,942 336,288 3,959,430 17,811,458
Domiciliation, Administrative Agent and Transfer agency fees (note 5 and note 6) 103,561 175,293 88,912 236,280 1,670,704
Professional fees (note 7) 66,787 108,205 33,306 109,459 849,975
Directors fee (note 8) 6,894 13,467 5,133 16,448 127,847
Depositary fees (note 5) 34,218 43,239 33,829 91,501 626,641
Taxe d'abonnement (note 9A) 13,330 90,162 12,879 138,366 705,208
Transaction costs (note 10) 204,394 426,710 177,651 2,286,275 7,184,969
Other expenses (note 7 and note 8) 68,711 179,343 81,509 221,799 1,804,505
TOTAL EXPENSES 803,734 2,874,990 769,778 7,060,116 30,793,514
Advisory Fees Waived and Expenses Reimbursed (note 2J) 287,935 334,975 247,970 777,099 4,622,221
NET INVESTMENT INCOME/(LOSS) (327,110) (850,660) (350,968) (4,001,961) (60,253)
Net realized gain/(loss) on sales of investments (note 2D) (1,865,225) 52,283,520 3,519,199 73,075,555 288,406,026
Net realized gain/(loss) on forward currency exchange contracts (note 2E) 336 338,148 (631) 10,340 807,197
Net realized gain/(loss) on interest rate swap agreements (note 2F) – – – – 50,553
Net realized gain/(loss) on foreign exchanges (note 2G) (31,834) (78,334) (21,260) 119,913 (171,432)
Net realized gain/(loss) for the year (1,896,723) 52,543,334 3,497,308 73,205,808 289,092,344
Net change in unrealized gain/(loss) on sales of investments (note 2D) 20,919,969 44,949,582 6,925,840 6,323,374 428,488,551
Net change in unrealized gain/(loss) on foreign tax provision (note 9B) 15 – (210,175) – (538,646)
Net change in unrealized gain/(loss) on forward currency exchange contracts (note 2E) – 177,447 – – 177,562
Net change in unrealized gain/(loss) on interest rate swap agreements (note 2F) – – – – (6,917)
Net change in unrealized gain/(loss) on foreign exchanges (note 2G) 435 (25,927) (556) (12,648) (179,479)
Net change in unrealized gain/(loss) for the year 20,920,419 45,101,102 6,715,109 6,310,726 427,941,071
Increase/(decrease) in net assets as a result of operations 18,696,586 96,793,776 9,861,449 75,514,573 716,973,162
Subscriptions 7,220,611 120,826,865 28,896,423 679,929,280 1,528,776,826
Redemptions (33,215,780) (357,423,040) (11,943,654) (289,645,850) (1,370,625,722)
Dividend distributions (note 13) – – – – (10,158,151)
NET ASSETS AT THE END OF THE YEAR 29,007,979 187,100,761 40,425,540 538,770,209 2,244,056,786
The accompanying notes form an integral part of these financial statements.
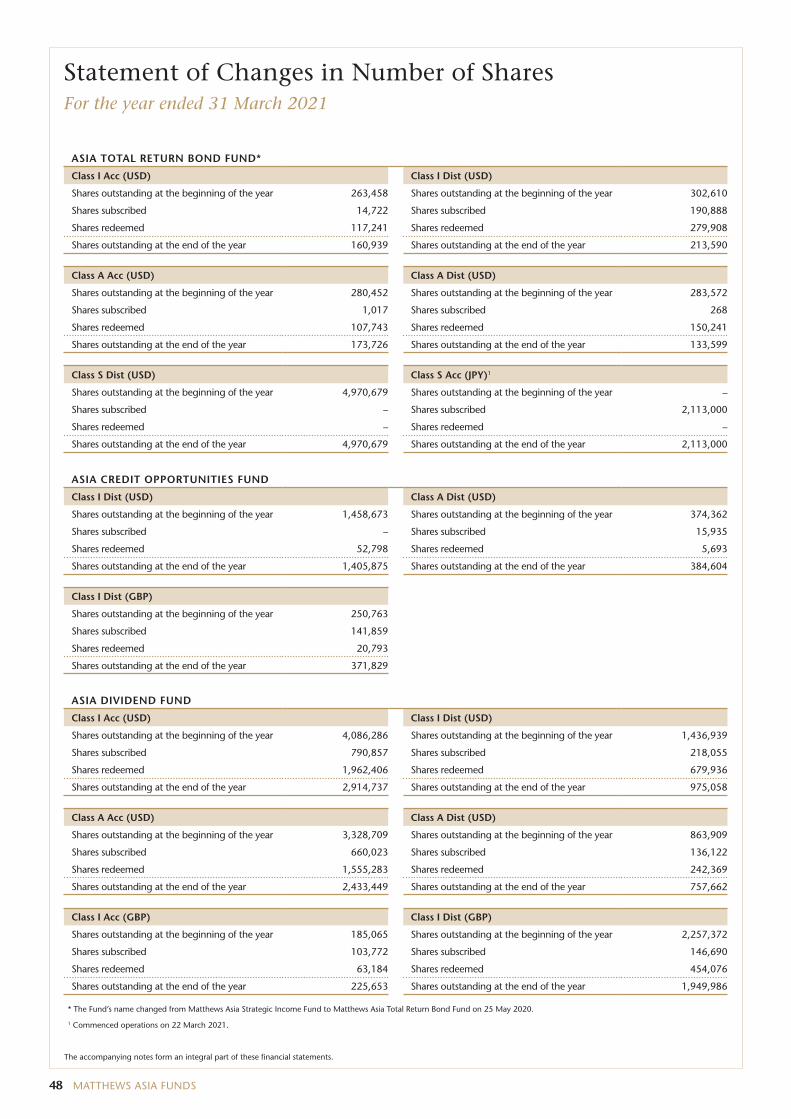
48 MATTHEWS ASIA FUNDS
Statement of Changes in Number of SharesFor the year ended 31 March 2021
ASIA TOTAL RETURN BOND FUND*
Class I Acc (USD) Class I Dist (USD)
Shares outstanding at the beginning of the year 263,458 Shares outstanding at the beginning of the year 302,610
Shares subscribed 14,722 Shares subscribed 190,888
Shares redeemed 117,241 Shares redeemed 279,908
Shares outstanding at the end of the year 160,939 Shares outstanding at the end of the year 213,590
Class A Acc (USD) Class A Dist (USD)
Shares outstanding at the beginning of the year 280,452 Shares outstanding at the beginning of the year 283,572
Shares subscribed 1,017 Shares subscribed 268
Shares redeemed 107,743 Shares redeemed 150,241
Shares outstanding at the end of the year 173,726 Shares outstanding at the end of the year 133,599
Class S Dist (USD) Class S Acc (JPY)1
Shares outstanding at the beginning of the year 4,970,679 Shares outstanding at the beginning of the year –
Shares subscribed – Shares subscribed 2,113,000
Shares redeemed – Shares redeemed –
Shares outstanding at the end of the year 4,970,679 Shares outstanding at the end of the year 2,113,000
ASIA CREDIT OPPORTUNITIES FUND
Class I Dist (USD) Class A Dist (USD)
Shares outstanding at the beginning of the year 1,458,673 Shares outstanding at the beginning of the year 374,362
Shares subscribed – Shares subscribed 15,935
Shares redeemed 52,798 Shares redeemed 5,693
Shares outstanding at the end of the year 1,405,875 Shares outstanding at the end of the year 384,604
Class I Dist (GBP)
Shares outstanding at the beginning of the year 250,763
Shares subscribed 141,859
Shares redeemed 20,793
Shares outstanding at the end of the year 371,829
ASIA DIVIDEND FUND
Class I Acc (USD) Class I Dist (USD)
Shares outstanding at the beginning of the year 4,086,286 Shares outstanding at the beginning of the year 1,436,939
Shares subscribed 790,857 Shares subscribed 218,055
Shares redeemed 1,962,406 Shares redeemed 679,936
Shares outstanding at the end of the year 2,914,737 Shares outstanding at the end of the year 975,058
Class A Acc (USD) Class A Dist (USD)
Shares outstanding at the beginning of the year 3,328,709 Shares outstanding at the beginning of the year 863,909
Shares subscribed 660,023 Shares subscribed 136,122
Shares redeemed 1,555,283 Shares redeemed 242,369
Shares outstanding at the end of the year 2,433,449 Shares outstanding at the end of the year 757,662
Class I Acc (GBP) Class I Dist (GBP)
Shares outstanding at the beginning of the year 185,065 Shares outstanding at the beginning of the year 2,257,372
Shares subscribed 103,772 Shares subscribed 146,690
Shares redeemed 63,184 Shares redeemed 454,076
Shares outstanding at the end of the year 225,653 Shares outstanding at the end of the year 1,949,986
The accompanying notes form an integral part of these financial statements.
* The Fund’s name changed from Matthews Asia Strategic Income Fund to Matthews Asia Total Return Bond Fund on 25 May 2020.
1 Commenced operations on 22 March 2021.
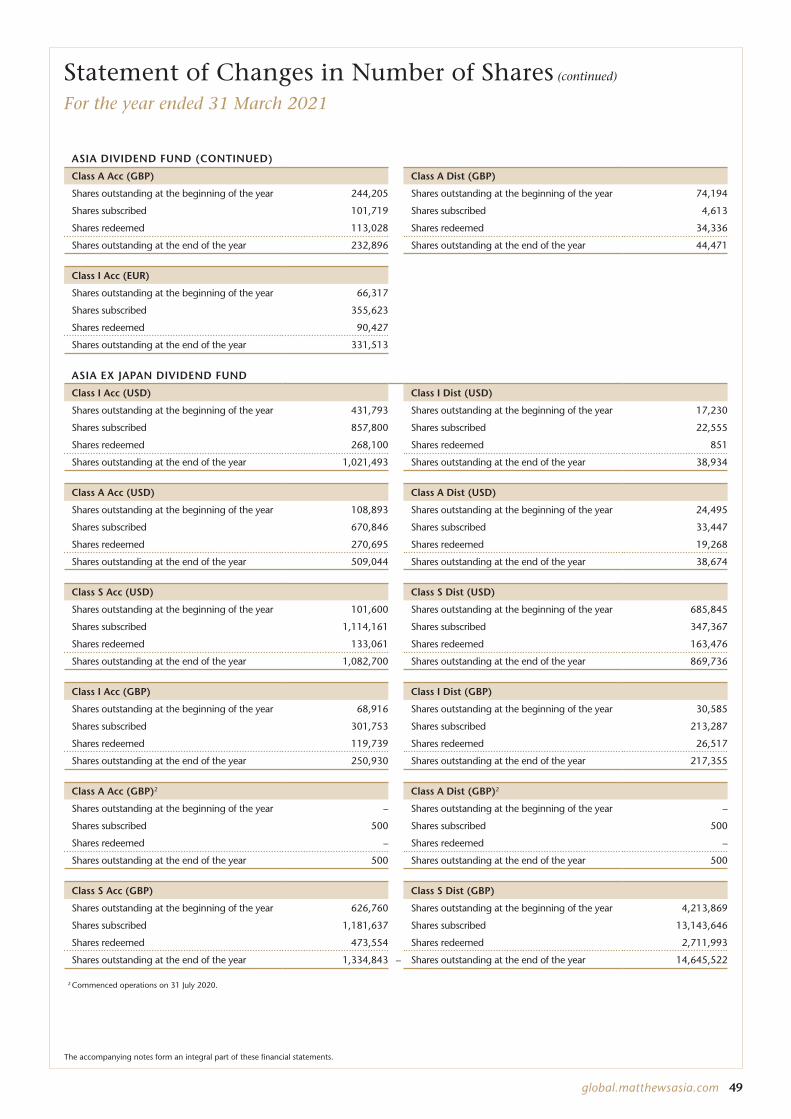
global.matthewsasia.com 49
Statement of Changes in Number of Shares (continued)
For the year ended 31 March 2021
ASIA DIVIDEND FUND (CONTINUED)
Class A Acc (GBP) Class A Dist (GBP)
Shares outstanding at the beginning of the year 244,205 Shares outstanding at the beginning of the year 74,194
Shares subscribed 101,719 Shares subscribed 4,613
Shares redeemed 113,028 Shares redeemed 34,336
Shares outstanding at the end of the year 232,896 Shares outstanding at the end of the year 44,471
Class I Acc (EUR)
Shares outstanding at the beginning of the year 66,317
Shares subscribed 355,623
Shares redeemed 90,427
Shares outstanding at the end of the year 331,513
ASIA EX JAPAN DIVIDEND FUND
Class I Acc (USD) Class I Dist (USD)
Shares outstanding at the beginning of the year 431,793 Shares outstanding at the beginning of the year 17,230
Shares subscribed 857,800 Shares subscribed 22,555
Shares redeemed 268,100 Shares redeemed 851
Shares outstanding at the end of the year 1,021,493 Shares outstanding at the end of the year 38,934
Class A Acc (USD) Class A Dist (USD)
Shares outstanding at the beginning of the year 108,893 Shares outstanding at the beginning of the year 24,495
Shares subscribed 670,846 Shares subscribed 33,447
Shares redeemed 270,695 Shares redeemed 19,268
Shares outstanding at the end of the year 509,044 Shares outstanding at the end of the year 38,674
Class S Acc (USD) Class S Dist (USD)
Shares outstanding at the beginning of the year 101,600 Shares outstanding at the beginning of the year 685,845
Shares subscribed 1,114,161 Shares subscribed 347,367
Shares redeemed 133,061 Shares redeemed 163,476
Shares outstanding at the end of the year 1,082,700 Shares outstanding at the end of the year 869,736
Class I Acc (GBP) Class I Dist (GBP)
Shares outstanding at the beginning of the year 68,916 Shares outstanding at the beginning of the year 30,585
Shares subscribed 301,753 Shares subscribed 213,287
Shares redeemed 119,739 Shares redeemed 26,517
Shares outstanding at the end of the year 250,930 Shares outstanding at the end of the year 217,355
Class A Acc (GBP)2 Class A Dist (GBP)2
Shares outstanding at the beginning of the year – Shares outstanding at the beginning of the year –
Shares subscribed 500 Shares subscribed 500
Shares redeemed – Shares redeemed –
Shares outstanding at the end of the year 500 Shares outstanding at the end of the year 500
Class S Acc (GBP) Class S Dist (GBP)
Shares outstanding at the beginning of the year 626,760 Shares outstanding at the beginning of the year 4,213,869
Shares subscribed 1,181,637 Shares subscribed 13,143,646
Shares redeemed 473,554 Shares redeemed 2,711,993
Shares outstanding at the end of the year 1,334,843 – Shares outstanding at the end of the year 14,645,522
2 Commenced operations on 31 July 2020.
The accompanying notes form an integral part of these financial statements.
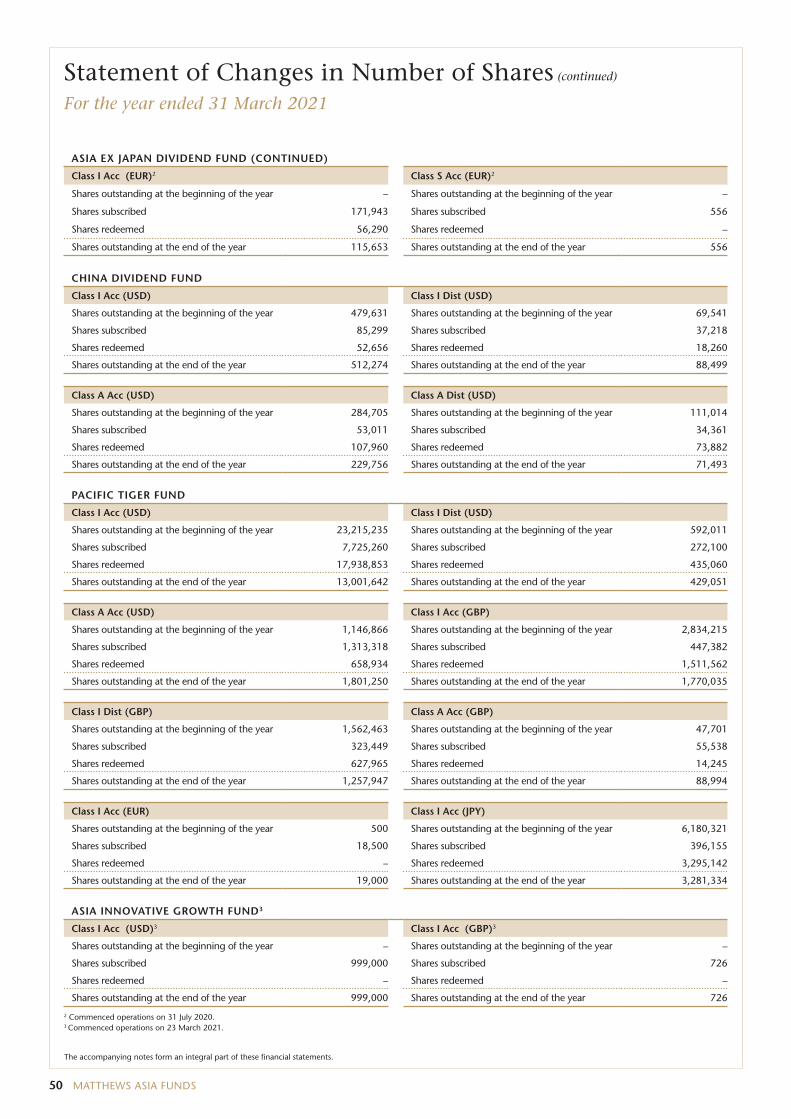
50 MATTHEWS ASIA FUNDS
2 Commenced operations on 31 July 2020. 3 Commenced operations on 23 March 2021.
ASIA EX JAPAN DIVIDEND FUND (CONTINUED)
Class I Acc (EUR)2 Class S Acc (EUR)2
Shares outstanding at the beginning of the year – Shares outstanding at the beginning of the year –
Shares subscribed 171,943 Shares subscribed 556
Shares redeemed 56,290 Shares redeemed –
Shares outstanding at the end of the year 115,653 Shares outstanding at the end of the year 556
CHINA DIVIDEND FUND
Class I Acc (USD) Class I Dist (USD)
Shares outstanding at the beginning of the year 479,631 Shares outstanding at the beginning of the year 69,541
Shares subscribed 85,299 Shares subscribed 37,218
Shares redeemed 52,656 Shares redeemed 18,260
Shares outstanding at the end of the year 512,274 Shares outstanding at the end of the year 88,499
Class A Acc (USD) Class A Dist (USD)
Shares outstanding at the beginning of the year 284,705 Shares outstanding at the beginning of the year 111,014
Shares subscribed 53,011 Shares subscribed 34,361
Shares redeemed 107,960 Shares redeemed 73,882
Shares outstanding at the end of the year 229,756 Shares outstanding at the end of the year 71,493
PACIFIC TIGER FUND
Class I Acc (USD) Class I Dist (USD)
Shares outstanding at the beginning of the year 23,215,235 Shares outstanding at the beginning of the year 592,011
Shares subscribed 7,725,260 Shares subscribed 272,100
Shares redeemed 17,938,853 Shares redeemed 435,060
Shares outstanding at the end of the year 13,001,642 Shares outstanding at the end of the year 429,051
Class A Acc (USD) Class I Acc (GBP)
Shares outstanding at the beginning of the year 1,146,866 Shares outstanding at the beginning of the year 2,834,215
Shares subscribed 1,313,318 Shares subscribed 447,382
Shares redeemed 658,934 Shares redeemed 1,511,562
Shares outstanding at the end of the year 1,801,250 Shares outstanding at the end of the year 1,770,035
Class I Dist (GBP) Class A Acc (GBP)
Shares outstanding at the beginning of the year 1,562,463 Shares outstanding at the beginning of the year 47,701
Shares subscribed 323,449 Shares subscribed 55,538
Shares redeemed 627,965 Shares redeemed 14,245
Shares outstanding at the end of the year 1,257,947 Shares outstanding at the end of the year 88,994
Class I Acc (EUR) Class I Acc (JPY)
Shares outstanding at the beginning of the year 500 Shares outstanding at the beginning of the year 6,180,321
Shares subscribed 18,500 Shares subscribed 396,155
Shares redeemed – Shares redeemed 3,295,142
Shares outstanding at the end of the year 19,000 Shares outstanding at the end of the year 3,281,334
ASIA INNOVATIVE GROWTH FUND3
Class I Acc (USD)3 Class I Acc (GBP)3
Shares outstanding at the beginning of the year – Shares outstanding at the beginning of the year –
Shares subscribed 999,000 Shares subscribed 726
Shares redeemed – Shares redeemed –
Shares outstanding at the end of the year 999,000 Shares outstanding at the end of the year 726
Statement of Changes in Number of Shares (continued)
For the year ended 31 March 2021
The accompanying notes form an integral part of these financial statements.
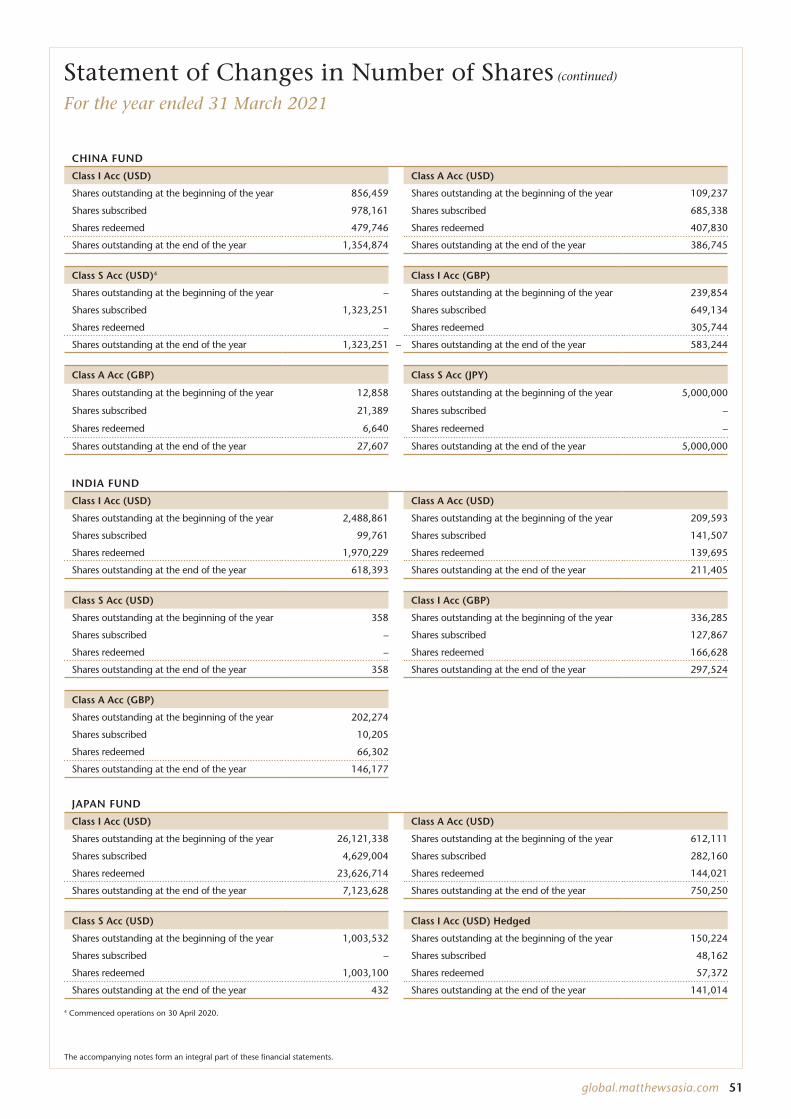
global.matthewsasia.com 51
CHINA FUND
Class I Acc (USD) Class A Acc (USD)
Shares outstanding at the beginning of the year 856,459 Shares outstanding at the beginning of the year 109,237
Shares subscribed 978,161 Shares subscribed 685,338
Shares redeemed 479,746 Shares redeemed 407,830
Shares outstanding at the end of the year 1,354,874 Shares outstanding at the end of the year 386,745
Class S Acc (USD)4 Class I Acc (GBP)
Shares outstanding at the beginning of the year – Shares outstanding at the beginning of the year 239,854
Shares subscribed 1,323,251 Shares subscribed 649,134
Shares redeemed – Shares redeemed 305,744
Shares outstanding at the end of the year 1,323,251 – Shares outstanding at the end of the year 583,244
Class A Acc (GBP) Class S Acc (JPY)
Shares outstanding at the beginning of the year 12,858 Shares outstanding at the beginning of the year 5,000,000
Shares subscribed 21,389 Shares subscribed –
Shares redeemed 6,640 Shares redeemed –
Shares outstanding at the end of the year 27,607 Shares outstanding at the end of the year 5,000,000
INDIA FUND
Class I Acc (USD) Class A Acc (USD)
Shares outstanding at the beginning of the year 2,488,861 Shares outstanding at the beginning of the year 209,593
Shares subscribed 99,761 Shares subscribed 141,507
Shares redeemed 1,970,229 Shares redeemed 139,695
Shares outstanding at the end of the year 618,393 Shares outstanding at the end of the year 211,405
Class S Acc (USD) Class I Acc (GBP)
Shares outstanding at the beginning of the year 358 Shares outstanding at the beginning of the year 336,285
Shares subscribed – Shares subscribed 127,867
Shares redeemed – Shares redeemed 166,628
Shares outstanding at the end of the year 358 Shares outstanding at the end of the year 297,524
Class A Acc (GBP)
Shares outstanding at the beginning of the year 202,274
Shares subscribed 10,205
Shares redeemed 66,302
Shares outstanding at the end of the year 146,177
JAPAN FUND
Class I Acc (USD) Class A Acc (USD)
Shares outstanding at the beginning of the year 26,121,338 Shares outstanding at the beginning of the year 612,111
Shares subscribed 4,629,004 Shares subscribed 282,160
Shares redeemed 23,626,714 Shares redeemed 144,021
Shares outstanding at the end of the year 7,123,628 Shares outstanding at the end of the year 750,250
Class S Acc (USD) Class I Acc (USD) Hedged
Shares outstanding at the beginning of the year 1,003,532 Shares outstanding at the beginning of the year 150,224
Shares subscribed – Shares subscribed 48,162
Shares redeemed 1,003,100 Shares redeemed 57,372
Shares outstanding at the end of the year 432 Shares outstanding at the end of the year 141,014
Statement of Changes in Number of Shares (continued)
For the year ended 31 March 2021
The accompanying notes form an integral part of these financial statements.
4 Commenced operations on 30 April 2020.
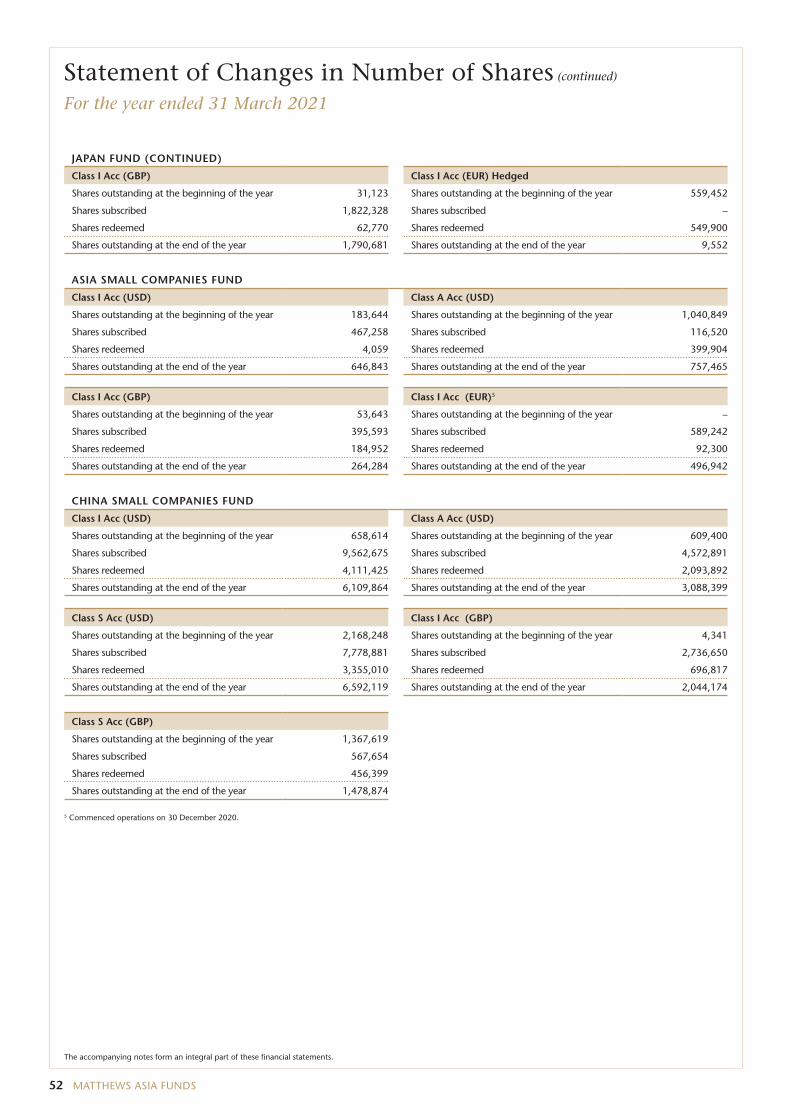
52 MATTHEWS ASIA FUNDS
Statement of Changes in Number of Shares (continued)
For the year ended 31 March 2021
JAPAN FUND (CONTINUED)
Class I Acc (GBP) Class I Acc (EUR) Hedged
Shares outstanding at the beginning of the year 31,123 Shares outstanding at the beginning of the year 559,452
Shares subscribed 1,822,328 Shares subscribed –
Shares redeemed 62,770 Shares redeemed 549,900
Shares outstanding at the end of the year 1,790,681 Shares outstanding at the end of the year 9,552
ASIA SMALL COMPANIES FUND
Class I Acc (USD) Class A Acc (USD)
Shares outstanding at the beginning of the year 183,644 Shares outstanding at the beginning of the year 1,040,849
Shares subscribed 467,258 Shares subscribed 116,520
Shares redeemed 4,059 Shares redeemed 399,904
Shares outstanding at the end of the year 646,843 Shares outstanding at the end of the year 757,465
Class I Acc (GBP) Class I Acc (EUR)5
Shares outstanding at the beginning of the year 53,643 Shares outstanding at the beginning of the year –
Shares subscribed 395,593 Shares subscribed 589,242
Shares redeemed 184,952 Shares redeemed 92,300
Shares outstanding at the end of the year 264,284 Shares outstanding at the end of the year 496,942
CHINA SMALL COMPANIES FUND
Class I Acc (USD) Class A Acc (USD)
Shares outstanding at the beginning of the year 658,614 Shares outstanding at the beginning of the year 609,400
Shares subscribed 9,562,675 Shares subscribed 4,572,891
Shares redeemed 4,111,425 Shares redeemed 2,093,892
Shares outstanding at the end of the year 6,109,864 Shares outstanding at the end of the year 3,088,399
Class S Acc (USD) Class I Acc (GBP)
Shares outstanding at the beginning of the year 2,168,248 Shares outstanding at the beginning of the year 4,341
Shares subscribed 7,778,881 Shares subscribed 2,736,650
Shares redeemed 3,355,010 Shares redeemed 696,817
Shares outstanding at the end of the year 6,592,119 Shares outstanding at the end of the year 2,044,174
Class S Acc (GBP)
Shares outstanding at the beginning of the year 1,367,619
Shares subscribed 567,654
Shares redeemed 456,399
Shares outstanding at the end of the year 1,478,874
The accompanying notes form an integral part of these financial statements.
5 Commenced operations on 30 December 2020.
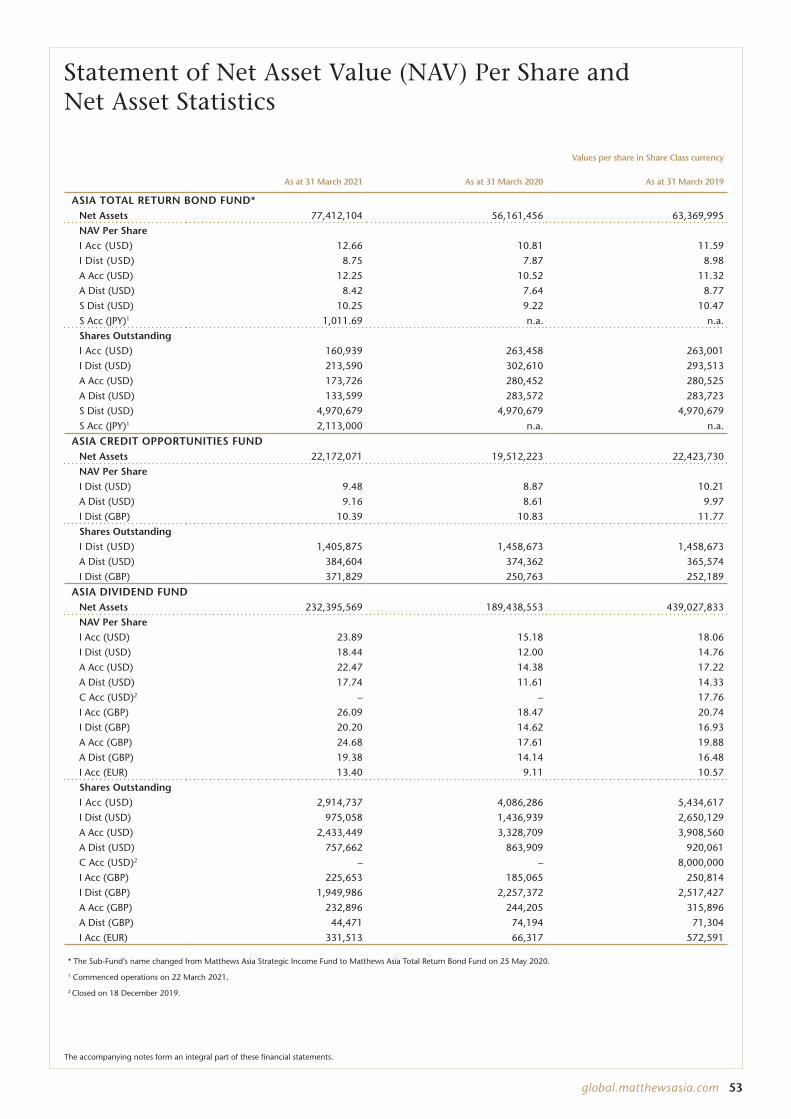
global.matthewsasia.com 53
Statement of Net Asset Value (NAV) Per Share and Net Asset Statistics
Values per share in Share Class currency
As at 31 March 2021 As at 31 March 2020 As at 31 March 2019
ASIA TOTAL RETURN BOND FUND*Net Assets 77,412,104 56,161,456 63,369,995
NAV Per Share
I Acc (USD) 12.66 10.81 11.59
I Dist (USD) 8.75 7.87 8.98
A Acc (USD) 12.25 10.52 11.32
A Dist (USD) 8.42 7.64 8.77
S Dist (USD) 10.25 9.22 10.47
S Acc (JPY)1 1,011.69 n.a. n.a.
Shares Outstanding
I Acc (USD) 160,939 263,458 263,001
I Dist (USD) 213,590 302,610 293,513
A Acc (USD) 173,726 280,452 280,525
A Dist (USD) 133,599 283,572 283,723
S Dist (USD) 4,970,679 4,970,679 4,970,679
S Acc (JPY)1 2,113,000 n.a. n.a.
ASIA CREDIT OPPORTUNITIES FUNDNet Assets 22,172,071 19,512,223 22,423,730
NAV Per Share
I Dist (USD) 9.48 8.87 10.21
A Dist (USD) 9.16 8.61 9.97
I Dist (GBP) 10.39 10.83 11.77
Shares Outstanding
I Dist (USD) 1,405,875 1,458,673 1,458,673
A Dist (USD) 384,604 374,362 365,574
I Dist (GBP) 371,829 250,763 252,189
ASIA DIVIDEND FUNDNet Assets 232,395,569 189,438,553 439,027,833
NAV Per Share
I Acc (USD) 23.89 15.18 18.06
I Dist (USD) 18.44 12.00 14.76
A Acc (USD) 22.47 14.38 17.22
A Dist (USD) 17.74 11.61 14.33
C Acc (USD)2 – – 17.76
I Acc (GBP) 26.09 18.47 20.74
I Dist (GBP) 20.20 14.62 16.93
A Acc (GBP) 24.68 17.61 19.88
A Dist (GBP) 19.38 14.14 16.48
I Acc (EUR) 13.40 9.11 10.57
Shares Outstanding
I Acc (USD) 2,914,737 4,086,286 5,434,617
I Dist (USD) 975,058 1,436,939 2,650,129
A Acc (USD) 2,433,449 3,328,709 3,908,560
A Dist (USD) 757,662 863,909 920,061
C Acc (USD)2 – – 8,000,000
I Acc (GBP) 225,653 185,065 250,814
I Dist (GBP) 1,949,986 2,257,372 2,517,427
A Acc (GBP) 232,896 244,205 315,896
A Dist (GBP) 44,471 74,194 71,304
I Acc (EUR) 331,513 66,317 572,591
* The Sub-Fund’s name changed from Matthews Asia Strategic Income Fund to Matthews Asia Total Return Bond Fund on 25 May 2020.
1 Commenced operations on 22 March 2021.
2 Closed on 18 December 2019.
The accompanying notes form an integral part of these financial statements.
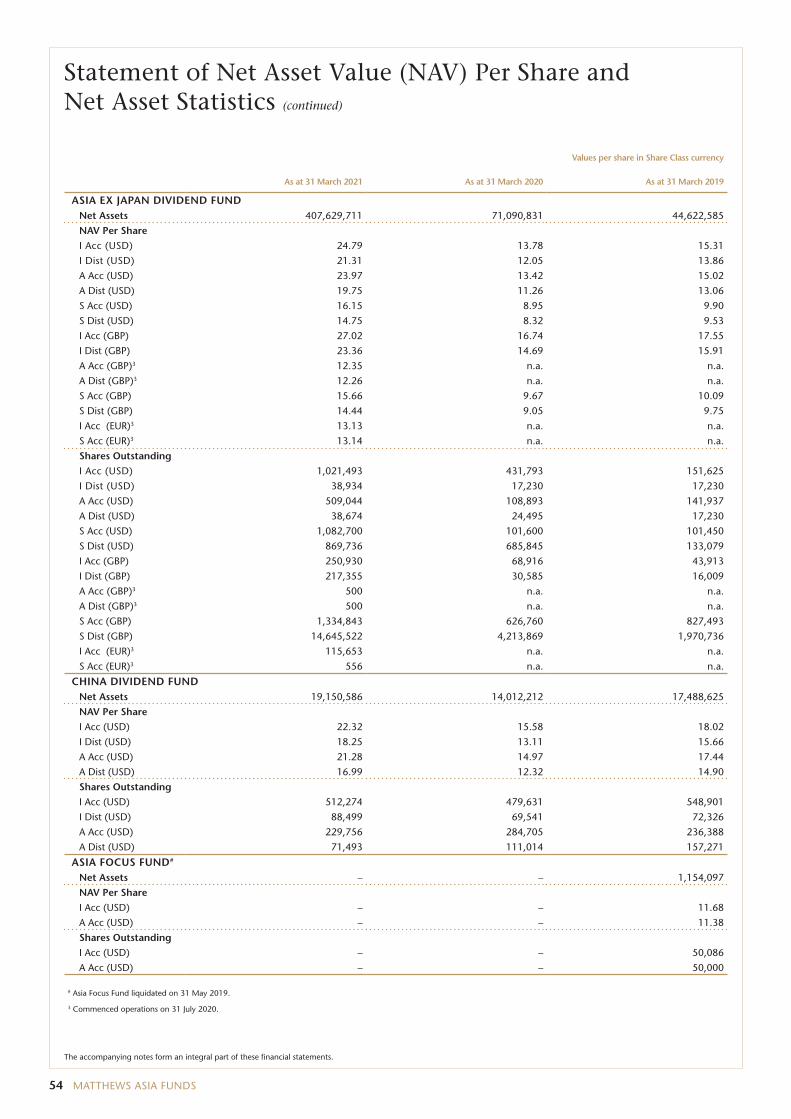
54 MATTHEWS ASIA FUNDS
Statement of Net Asset Value (NAV) Per Share and Net Asset Statistics (continued)
Values per share in Share Class currency
As at 31 March 2021 As at 31 March 2020 As at 31 March 2019
ASIA EX JAPAN DIVIDEND FUNDNet Assets 407,629,711 71,090,831 44,622,585
NAV Per Share
I Acc (USD) 24.79 13.78 15.31
I Dist (USD) 21.31 12.05 13.86
A Acc (USD) 23.97 13.42 15.02
A Dist (USD) 19.75 11.26 13.06
S Acc (USD) 16.15 8.95 9.90
S Dist (USD) 14.75 8.32 9.53
I Acc (GBP) 27.02 16.74 17.55
I Dist (GBP) 23.36 14.69 15.91
A Acc (GBP)3 12.35 n.a. n.a.
A Dist (GBP)3 12.26 n.a. n.a.
S Acc (GBP) 15.66 9.67 10.09
S Dist (GBP) 14.44 9.05 9.75
I Acc (EUR)3 13.13 n.a. n.a.
S Acc (EUR)3 13.14 n.a. n.a.
Shares Outstanding
I Acc (USD) 1,021,493 431,793 151,625
I Dist (USD) 38,934 17,230 17,230
A Acc (USD) 509,044 108,893 141,937
A Dist (USD) 38,674 24,495 17,230
S Acc (USD) 1,082,700 101,600 101,450
S Dist (USD) 869,736 685,845 133,079
I Acc (GBP) 250,930 68,916 43,913
I Dist (GBP) 217,355 30,585 16,009
A Acc (GBP)3 500 n.a. n.a.
A Dist (GBP)3 500 n.a. n.a.
S Acc (GBP) 1,334,843 626,760 827,493
S Dist (GBP) 14,645,522 4,213,869 1,970,736
I Acc (EUR)3 115,653 n.a. n.a.
S Acc (EUR)3 556 n.a. n.a.
CHINA DIVIDEND FUNDNet Assets 19,150,586 14,012,212 17,488,625
NAV Per Share
I Acc (USD) 22.32 15.58 18.02
I Dist (USD) 18.25 13.11 15.66
A Acc (USD) 21.28 14.97 17.44
A Dist (USD) 16.99 12.32 14.90
Shares Outstanding
I Acc (USD) 512,274 479,631 548,901
I Dist (USD) 88,499 69,541 72,326
A Acc (USD) 229,756 284,705 236,388
A Dist (USD) 71,493 111,014 157,271
ASIA FOCUS FUND#
Net Assets – – 1,154,097
NAV Per Share
I Acc (USD) – – 11.68
A Acc (USD) – – 11.38
Shares Outstanding
I Acc (USD) – – 50,086
A Acc (USD) – – 50,000
# Asia Focus Fund liquidated on 31 May 2019.
3 Commenced operations on 31 July 2020.
The accompanying notes form an integral part of these financial statements.
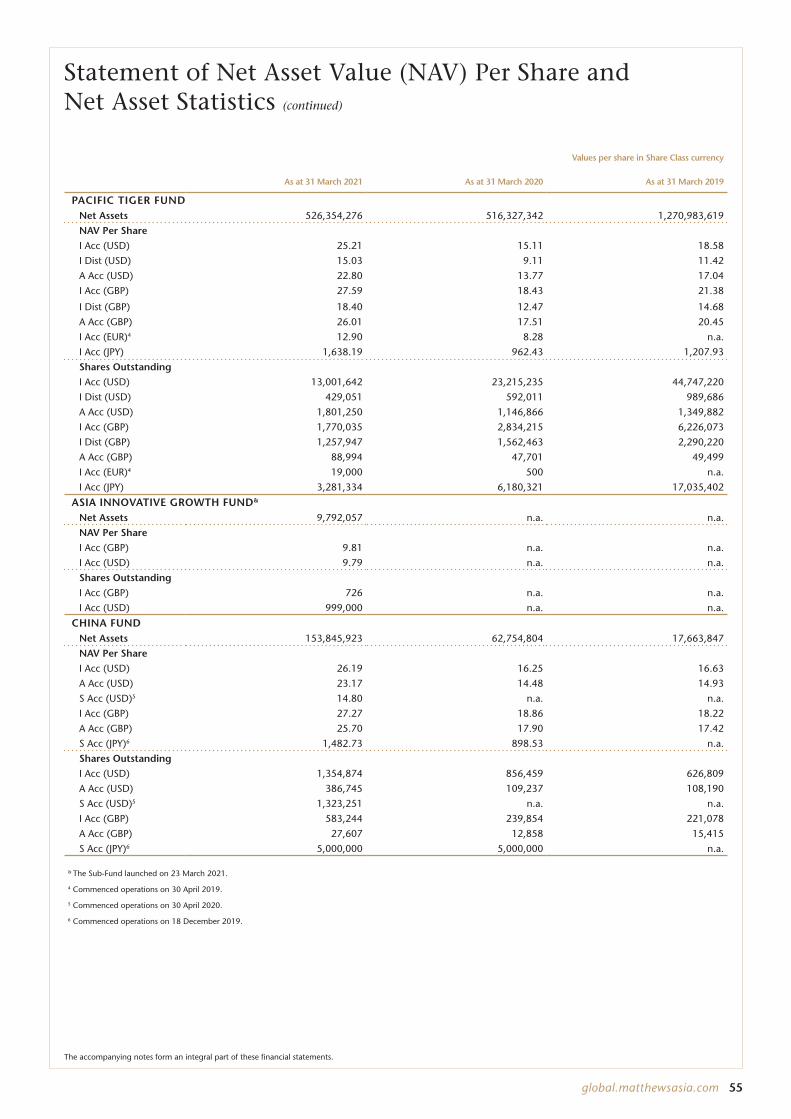
global.matthewsasia.com 55
Statement of Net Asset Value (NAV) Per Share and Net Asset Statistics (continued)
Values per share in Share Class currency
As at 31 March 2021 As at 31 March 2020 As at 31 March 2019
PACIFIC TIGER FUNDNet Assets 526,354,276 516,327,342 1,270,983,619
NAV Per Share
I Acc (USD) 25.21 15.11 18.58
I Dist (USD) 15.03 9.11 11.42
A Acc (USD) 22.80 13.77 17.04
I Acc (GBP) 27.59 18.43 21.38
I Dist (GBP) 18.40 12.47 14.68
A Acc (GBP) 26.01 17.51 20.45
I Acc (EUR)4 12.90 8.28 n.a.
I Acc (JPY) 1,638.19 962.43 1,207.93
Shares Outstanding
I Acc (USD) 13,001,642 23,215,235 44,747,220
I Dist (USD) 429,051 592,011 989,686
A Acc (USD) 1,801,250 1,146,866 1,349,882
I Acc (GBP) 1,770,035 2,834,215 6,226,073
I Dist (GBP) 1,257,947 1,562,463 2,290,220
A Acc (GBP) 88,994 47,701 49,499
I Acc (EUR)4 19,000 500 n.a.
I Acc (JPY) 3,281,334 6,180,321 17,035,402
ASIA INNOVATIVE GROWTH FUND&
Net Assets 9,792,057 n.a. n.a.
NAV Per Share
I Acc (GBP) 9.81 n.a. n.a.
I Acc (USD) 9.79 n.a. n.a.
Shares Outstanding
I Acc (GBP) 726 n.a. n.a.
I Acc (USD) 999,000 n.a. n.a.
CHINA FUNDNet Assets 153,845,923 62,754,804 17,663,847
NAV Per Share
I Acc (USD) 26.19 16.25 16.63
A Acc (USD) 23.17 14.48 14.93
S Acc (USD)5 14.80 n.a. n.a.
I Acc (GBP) 27.27 18.86 18.22
A Acc (GBP) 25.70 17.90 17.42
S Acc (JPY)6 1,482.73 898.53 n.a.
Shares Outstanding
I Acc (USD) 1,354,874 856,459 626,809
A Acc (USD) 386,745 109,237 108,190
S Acc (USD)5 1,323,251 n.a. n.a.
I Acc (GBP) 583,244 239,854 221,078
A Acc (GBP) 27,607 12,858 15,415
S Acc (JPY)6 5,000,000 5,000,000 n.a.
& The Sub-Fund launched on 23 March 2021.
4 Commenced operations on 30 April 2019.
5 Commenced operations on 30 April 2020.
6 Commenced operations on 18 December 2019.
The accompanying notes form an integral part of these financial statements.
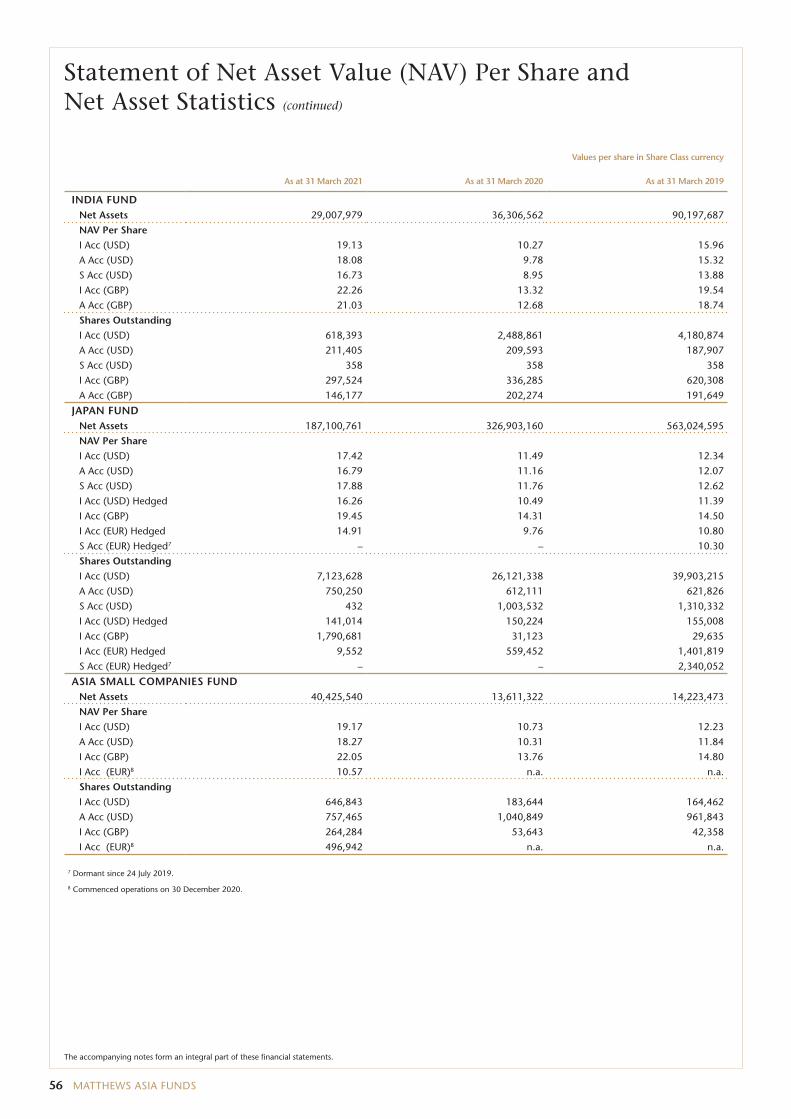
56 MATTHEWS ASIA FUNDS
Statement of Net Asset Value (NAV) Per Share and Net Asset Statistics (continued)
Values per share in Share Class currency
As at 31 March 2021 As at 31 March 2020 As at 31 March 2019
INDIA FUNDNet Assets 29,007,979 36,306,562 90,197,687
NAV Per Share
I Acc (USD) 19.13 10.27 15.96
A Acc (USD) 18.08 9.78 15.32
S Acc (USD) 16.73 8.95 13.88
I Acc (GBP) 22.26 13.32 19.54
A Acc (GBP) 21.03 12.68 18.74
Shares Outstanding
I Acc (USD) 618,393 2,488,861 4,180,874
A Acc (USD) 211,405 209,593 187,907
S Acc (USD) 358 358 358
I Acc (GBP) 297,524 336,285 620,308
A Acc (GBP) 146,177 202,274 191,649
JAPAN FUNDNet Assets 187,100,761 326,903,160 563,024,595
NAV Per Share
I Acc (USD) 17.42 11.49 12.34
A Acc (USD) 16.79 11.16 12.07
S Acc (USD) 17.88 11.76 12.62
I Acc (USD) Hedged 16.26 10.49 11.39
I Acc (GBP) 19.45 14.31 14.50
I Acc (EUR) Hedged 14.91 9.76 10.80
S Acc (EUR) Hedged7 – – 10.30
Shares Outstanding
I Acc (USD) 7,123,628 26,121,338 39,903,215
A Acc (USD) 750,250 612,111 621,826
S Acc (USD) 432 1,003,532 1,310,332
I Acc (USD) Hedged 141,014 150,224 155,008
I Acc (GBP) 1,790,681 31,123 29,635
I Acc (EUR) Hedged 9,552 559,452 1,401,819
S Acc (EUR) Hedged7 – – 2,340,052
ASIA SMALL COMPANIES FUNDNet Assets 40,425,540 13,611,322 14,223,473
NAV Per Share
I Acc (USD) 19.17 10.73 12.23
A Acc (USD) 18.27 10.31 11.84
I Acc (GBP) 22.05 13.76 14.80
I Acc (EUR)8 10.57 n.a. n.a.
Shares Outstanding
I Acc (USD) 646,843 183,644 164,462
A Acc (USD) 757,465 1,040,849 961,843
I Acc (GBP) 264,284 53,643 42,358
I Acc (EUR)8 496,942 n.a. n.a.
7 Dormant since 24 July 2019.
8 Commenced operations on 30 December 2020.
The accompanying notes form an integral part of these financial statements.
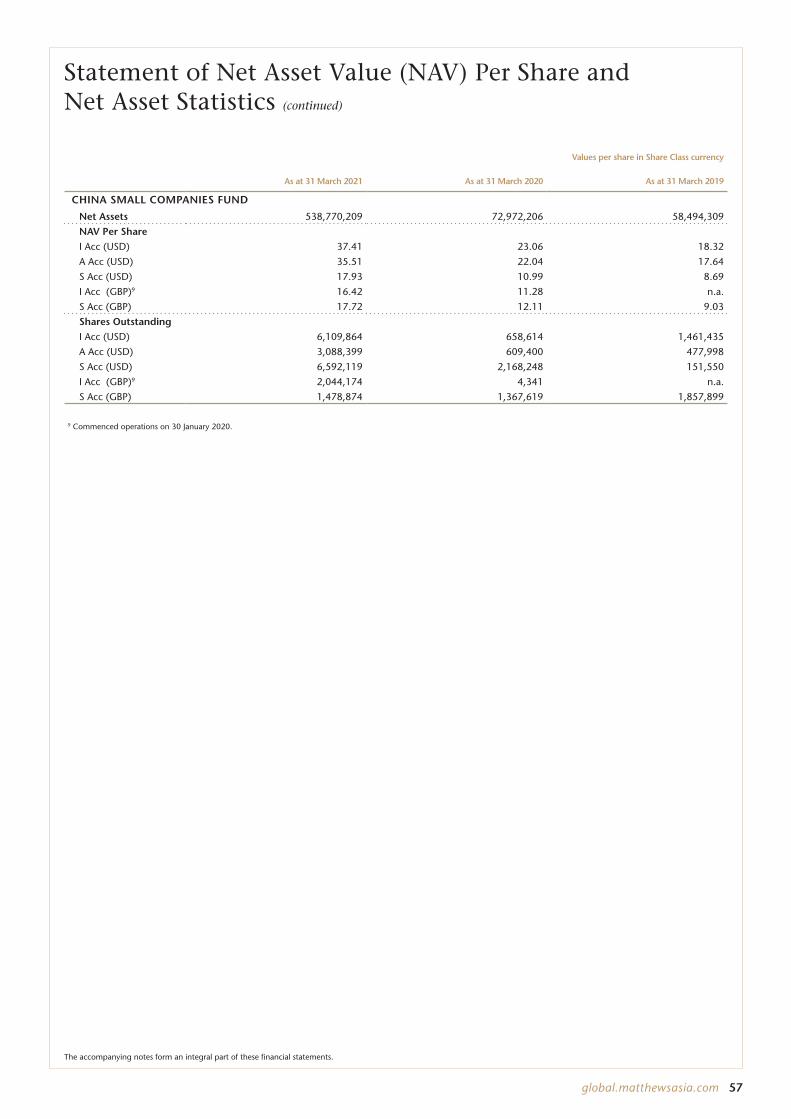
global.matthewsasia.com 57
Statement of Net Asset Value (NAV) Per Share and Net Asset Statistics (continued)
Values per share in Share Class currency
As at 31 March 2021 As at 31 March 2020 As at 31 March 2019
CHINA SMALL COMPANIES FUND
Net Assets 538,770,209 72,972,206 58,494,309
NAV Per Share
I Acc (USD) 37.41 23.06 18.32
A Acc (USD) 35.51 22.04 17.64
S Acc (USD) 17.93 10.99 8.69
I Acc (GBP)9 16.42 11.28 n.a.
S Acc (GBP) 17.72 12.11 9.03
Shares Outstanding
I Acc (USD) 6,109,864 658,614 1,461,435
A Acc (USD) 3,088,399 609,400 477,998
S Acc (USD) 6,592,119 2,168,248 151,550
I Acc (GBP)9 2,044,174 4,341 n.a.
S Acc (GBP) 1,478,874 1,367,619 1,857,899
9 Commenced operations on 30 January 2020.
The accompanying notes form an integral part of these financial statements.
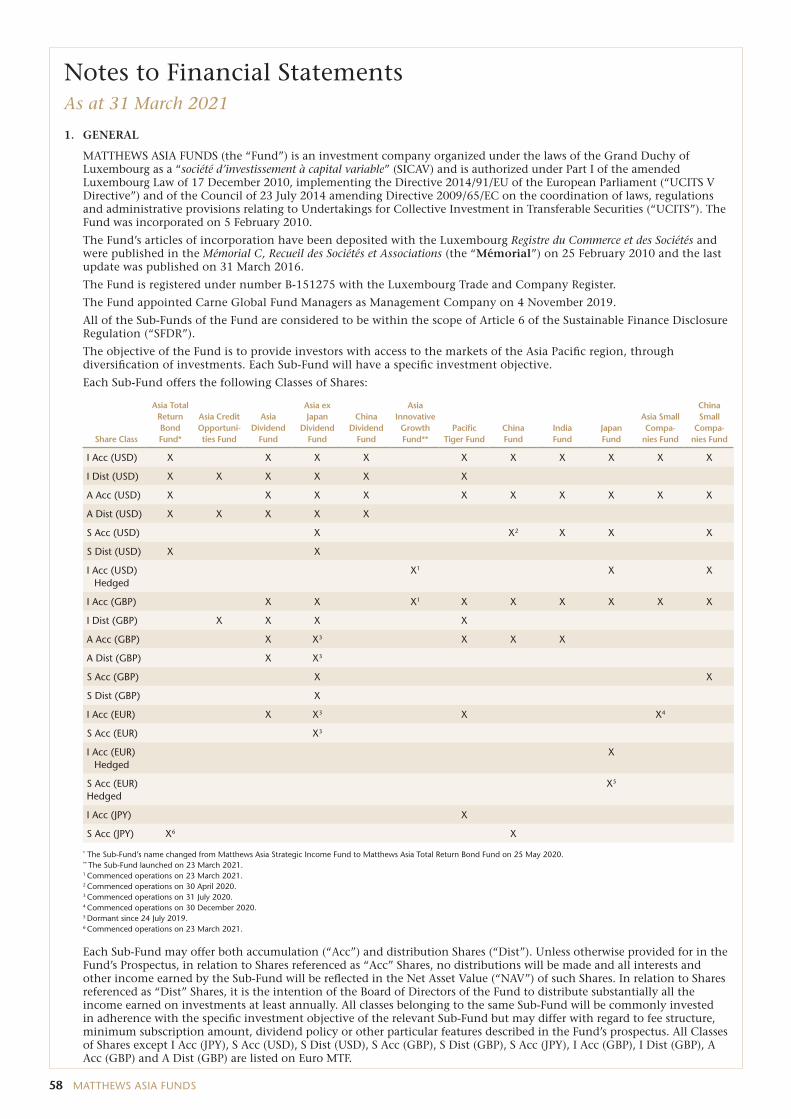
58 MATTHEWS ASIA FUNDS
Notes to Financial Statements As at 31 March 2021
1. GENERAL
MATTHEWS ASIA FUNDS (the “Fund”) is an investment company organized under the laws of the Grand Duchy of Luxembourg as a “société d’investissement à capital variable” (SICAV) and is authorized under Part I of the amended Luxembourg Law of 17 December 2010, implementing the Directive 2014/91/EU of the European Parliament (“UCITS V Directive”) and of the Council of 23 July 2014 amending Directive 2009/65/EC on the coordination of laws, regulations and administrative provisions relating to Undertakings for Collective Investment in Transferable Securities (“UCITS”). The Fund was incorporated on 5 February 2010.
The Fund’s articles of incorporation have been deposited with the Luxembourg Registre du Commerce et des Sociétés and were published in the Mémorial C, Recueil des Sociétés et Associations (the “Mémorial”) on 25 February 2010 and the last update was published on 31 March 2016.
The Fund is registered under number B-151275 with the Luxembourg Trade and Company Register.
The Fund appointed Carne Global Fund Managers as Management Company on 4 November 2019.
All of the Sub-Funds of the Fund are considered to be within the scope of Article 6 of the Sustainable Finance Disclosure Regulation (“SFDR”).
The objective of the Fund is to provide investors with access to the markets of the Asia Pacific region, through diversification of investments. Each Sub-Fund will have a specific investment objective.
Each Sub-Fund offers the following Classes of Shares:
Share Class
Asia Total Return Bond Fund*
Asia Credit Opportuni-ties Fund
Asia Dividend
Fund
Asia ex Japan
Dividend Fund
China Dividend
Fund
Asia Innovative
Growth Fund**
Pacific Tiger Fund
China Fund
India Fund
Japan Fund
Asia Small Compa-
nies Fund
China Small
Compa-nies Fund
I Acc (USD) X X X X X X X X X X
I Dist (USD) X X X X X X
A Acc (USD) X X X X X X X X X X
A Dist (USD) X X X X X
S Acc (USD) X X2 X X X
S Dist (USD) X X
I Acc (USD) Hedged
X1 X X
I Acc (GBP) X X X1 X X X X X X
I Dist (GBP) X X X X
A Acc (GBP) X X3 X X X
A Dist (GBP) X X3
S Acc (GBP) X X
S Dist (GBP) X
I Acc (EUR) X X3 X X4
S Acc (EUR) X3
I Acc (EUR) Hedged
X
S Acc (EUR)Hedged
X5
I Acc (JPY) X
S Acc (JPY) X6 X
* The Sub-Fund’s name changed from Matthews Asia Strategic Income Fund to Matthews Asia Total Return Bond Fund on 25 May 2020.** The Sub-Fund launched on 23 March 2021.1 Commenced operations on 23 March 2021. 2 Commenced operations on 30 April 2020.3 Commenced operations on 31 July 2020. 4 Commenced operations on 30 December 2020.5 Dormant since 24 July 2019.6 Commenced operations on 23 March 2021.
Each Sub-Fund may offer both accumulation (“Acc”) and distribution Shares (“Dist”). Unless otherwise provided for in the Fund’s Prospectus, in relation to Shares referenced as “Acc” Shares, no distributions will be made and all interests and other income earned by the Sub-Fund will be reflected in the Net Asset Value (“NAV”) of such Shares. In relation to Shares referenced as “Dist” Shares, it is the intention of the Board of Directors of the Fund to distribute substantially all the income earned on investments at least annually. All classes belonging to the same Sub-Fund will be commonly invested in adherence with the specific investment objective of the relevant Sub-Fund but may differ with regard to fee structure, minimum subscription amount, dividend policy or other particular features described in the Fund’s prospectus. All Classes of Shares except I Acc (JPY), S Acc (USD), S Dist (USD), S Acc (GBP), S Dist (GBP), S Acc (JPY), I Acc (GBP), I Dist (GBP), A Acc (GBP) and A Dist (GBP) are listed on Euro MTF.
global.matthewsasia.com 59
2. SUMMARY OF SIGNIFICANT ACCOUNTING POLICIES
A) PRESENTATION OF FINANCIAL STATEMENTS
The financial statements are prepared in accordance with Luxembourg law and regulations relating to UCITS and generally accepted accounting principles in Luxembourg.
B) COMBINED FINANCIAL STATEMENTS
The Combined Financial Statements equal the sum of the financial statements of all Sub-Funds.
The Combined Statement of Assets and Liabilities and Combined Statement of Operations and Changes in Net Assets are expressed in USD. The currency of all Sub-Funds is USD and therefore there is no currency translation adjustment.
C) VALUATION OF THE INVESTMENTS IN SECURITIES AND MONEY MARKET INSTRUMENTS
The Fund’s equity securities are valued based on market quotations or at fair value as determined in good faith by or under the direction of the Board of Directors of the Fund when no market quotations are available or when market quotations have become unreliable.
Market values for equity securities are determined based on the last sale price on the principal (or most advantageous) market on which the security is traded. If a reliable last sale price is not available, market values for equity securities are determined using the mean between the last available bid and ask price. Securities are valued through valuations obtained from a commercial pricing service or at the most recent mean of the bid and ask prices provided by investment dealers in accordance with the Fund’s Pricing Policies.
Securities that trade in over-the-counter markets, including most debt securities (bonds), may be valued by other third-party vendors or by using indicative bid quotations from dealers or market makers, or other available market information.
Events affecting the value of foreign investments may occur between the time at which they are determined and the Fund’s valuation point of 2:00 p.m. Luxembourg time. When such events occur, each Sub-Fund may apply a model-derived factor, as provided by an independent pricing service, to the closing price of equity securities traded on foreign securities exchanges. Notwithstanding the foregoing, the Fund may determine not to fair value securities where it believes that the impact of doing so would not have a material impact on the calculation of a Sub-Fund’s NAV on that day.
The Board of Directors of the Fund has delegated the fair value analysis and assessment to the Investment Manager’s Valuation Committee (the “Valuation Committee”), subject to the Fund’s Pricing and Valuation Policy and Procedures (the “Pricing Policies”). The Fund has retained third-party pricing services that may be utilized by the Valuation Committee under circumstances described in the Pricing Policies to provide fair value prices for certain securities held by the Fund. To propose the fair value price of the suspended securities, the Valuation Committee may use techniques such as analysis of the price movements of selected proxies / indices whose performance might indicate valuation changes of the suspended securities.
When fair value pricing is used, the prices of securities used by a Sub-Fund to calculate its Net Asset Value differ from quoted or published prices for the same securities for that day. All fair value determinations are made subject to the Board of Directors of the Fund’s oversight.
D) NET REALIZED GAIN/(LOSS) ON SALES OF INVESTMENTS AND CHANGE IN UNREALIZED GAIN/(LOSS) ON INVESTMENTS
Net realized gain or loss on sales of investments are calculated on the basis of first in first out cost method of the investments sold. At year end, holdings in securities have been valued at their last available prices on the main market for the relevant security. The net realized gain or loss and net change in unrealized gain or loss are included within the Statement of Operations and Changes in Net Assets.
E) FORWARD CURRENCY EXCHANGE CONTRACTS
A forward currency exchange contract is an agreement to buy or sell a specific amount of foreign currency at a certain rate, on or before a certain date. Outstanding forward currency exchange contracts are valued by reference to the forward rate of exchange applicable to the maturity of the contracts.
The unrealized gain and loss are shown in the Statement of Assets and Liabilities under “Unrealized gain on forward currency exchange contracts” and “Unrealized loss on forward currency exchange contracts.”
Net realized gain/(loss) and net change in unrealized gain/(loss) as a result thereof are included in the Statement of Operations and Changes in Net Assets under “Net realized gain/(loss) on forward currency exchange contracts” and “Net change in unrealized gain/(loss) on forward currency exchange contracts,” respectively.
Notes to Financial Statements (continued)
As at 31 March 2021
60 MATTHEWS ASIA FUNDS
2. SUMMARY OF SIGNIFICANT ACCOUNTING POLICIES (continued)
F) INTEREST RATE SWAP AGREEMENTS
An interest rate swap agreement is a bilateral agreement in which each party agrees to exchange a series of interest payments for another series for interest payments (usually fixed/floating) based on a notional amount that serves as a computation basis and that is usually not exchanged. Dirty pricing is utilized for all interest rate swap agreements where the floating rate index resets daily.
The unrealized gain and loss as shown in the Statement of Assets and Liabilities under “Unrealized gain on interest rate swap agreements” and “Unrealized loss on interest rate swap agreements.”
Net change in unrealized gain/(loss) as result thereof is included in the Statement of Operations and Changes in Net Assets under “Net change in unrealized gain/(loss) on interest rate swap agreements.”
In case of settlements of the interest rate swap agreements, the net realized gain/(loss) as a result thereof is included in the Statement of Operations and Changes in Net Assets under “Net realized gain/(loss) on interest rate swap agreement.”
G) CONVERSION OF FOREIGN CURRENCIES
The books and records of the Fund are maintained in USD.
Transactions denominated in foreign currencies are recorded at the current prevailing exchange rates on the transaction date. All assets and liabilities denominated in foreign currencies are translated into USD at the exchange rate as at 31 March 2021.
Conversion gains or losses resulting from changes in the exchange rate during the year and realized gains and losses on the settlement of foreign currency transactions are reported in the Statement of Operations and Changes in Net Assets for the current year.
The Fund does not isolate that portion of gains and losses on investments in equity securities that are due to changes in the foreign exchange rate from those that are due to changes in market prices of equity securities.
The accounting records and the financial statements of each Sub-Fund are expressed in USD.
Bank accounts, other net assets and market value of the investments in securities expressed in currencies other than the currency of a Sub-Fund are converted at the exchange rates prevailing on the date of the Statement of Assets and Liabilities. Income and expenses in currencies other than the currency of a Sub-Fund are converted at the rate of exchange prevailing at the transaction date.
Net realized gain and loss on foreign exchanges and net change in unrealized gain and loss on foreign exchanges represent: (i) foreign exchange gains and losses from the sale and holding of foreign currencies; (ii) gains and losses between trade date and settlement date on securities transactions and (iii) gains and losses arising from the difference between amounts of dividends and interest recorded and the amounts actually received.
H) COST OF INVESTMENTS IN SECURITIES
Cost of investments in securities in currencies other than the currency of a Sub-Fund is converted into the Sub-Fund’s currency at the exchange rate applicable at purchase date.
I) INCOME
Interest income is accrued on a daily basis and may include the amortization of premiums and accretions of discounts. Bank and time deposits interest income are recognized on an accrual basis.
Dividends are credited to income on the date upon which the relevant securities are first listed as ‘ex dividend’ provided that the amount of a dividend is known with reasonable certainty.
J) FEE WAIVER
The Investment Manager may, for such time as it considers appropriate, choose to waive all or part of the fees that it is entitled to receive, or to reimburse a Sub-Fund for other expenses, in order to reduce the impact such fees and expenses may have on the performance of the Share Class. The Investment Manager will reimburse on a monthly basis the amount of the fee waiver or expense reimbursement to the respective Sub-Fund. Fees that have been previously waived and expenses that have been previously reimbursed may be recovered by the Investment Manager.
The waived fees are settled monthly on a net basis with management and administration fees and therefore they are presented as one line item in the Statement of Assets and Liabilities under “Management fees and administration fees payable.”
The amounts of the fees waived for the current year is separately disclosed as “Fees Waived and Expenses Reimbursed” in the Statement of Operations and Changes in Net Assets.
K) USE OF ESTIMATES
The preparation of financial statements in conformity with generally accepted accounting principles requires management to make estimates and assumptions that affect the amounts reported in the financial statements and accompanying notes. Actual results may differ from those estimates.
Notes to Financial Statements (continued)
As at 31 March 2021
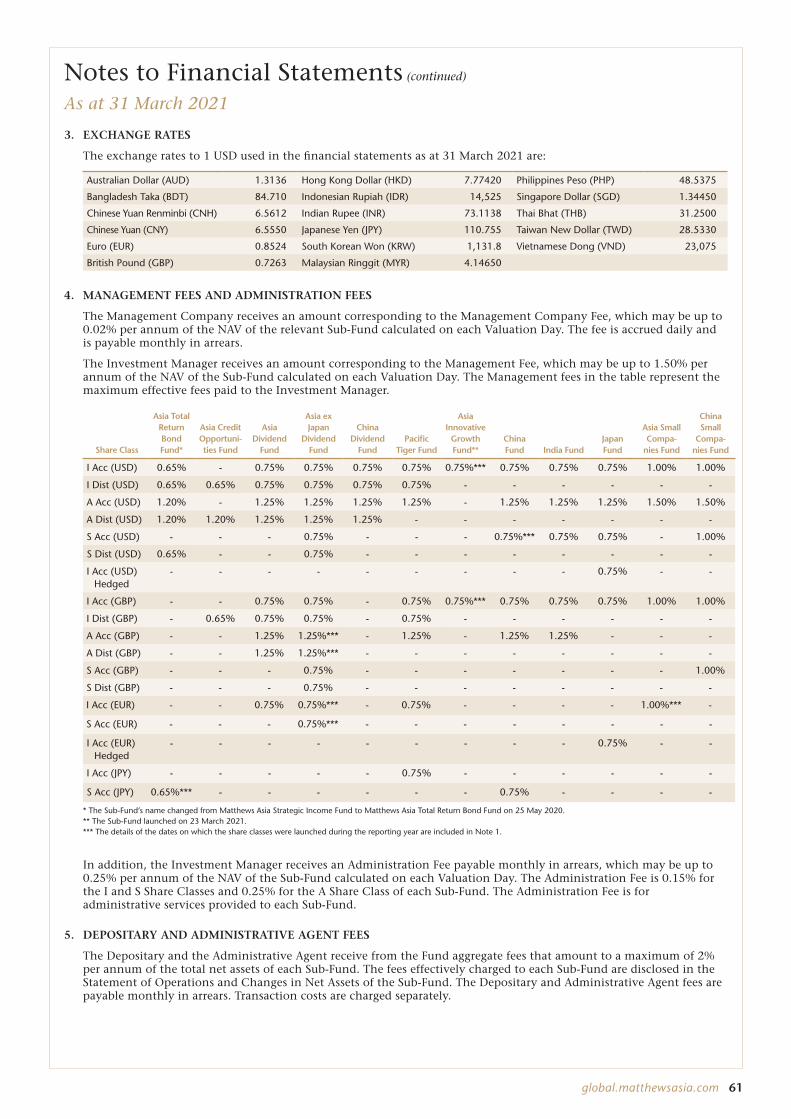
global.matthewsasia.com 61
3. EXCHANGE RATES
The exchange rates to 1 USD used in the financial statements as at 31 March 2021 are:
Australian Dollar (AUD) 1.3136 Hong Kong Dollar (HKD) 7.77420 Philippines Peso (PHP) 48.5375
Bangladesh Taka (BDT) 84.710 Indonesian Rupiah (IDR) 14,525 Singapore Dollar (SGD) 1.34450
Chinese Yuan Renminbi (CNH) 6.5612 Indian Rupee (INR) 73.1138 Thai Bhat (THB) 31.2500
Chinese Yuan (CNY) 6.5550 Japanese Yen (JPY) 110.755 Taiwan New Dollar (TWD) 28.5330
Euro (EUR) 0.8524 South Korean Won (KRW) 1,131.8 Vietnamese Dong (VND) 23,075
British Pound (GBP) 0.7263 Malaysian Ringgit (MYR) 4.14650
4. MANAGEMENT FEES AND ADMINISTRATION FEES
The Management Company receives an amount corresponding to the Management Company Fee, which may be up to 0.02% per annum of the NAV of the relevant Sub-Fund calculated on each Valuation Day. The fee is accrued daily and is payable monthly in arrears.
The Investment Manager receives an amount corresponding to the Management Fee, which may be up to 1.50% per annum of the NAV of the Sub-Fund calculated on each Valuation Day. The Management fees in the table represent the maximum effective fees paid to the Investment Manager.
Share Class
Asia Total Return Bond Fund*
Asia Credit Opportuni-ties Fund
Asia Dividend
Fund
Asia ex Japan
Dividend Fund
China Dividend
FundPacific
Tiger Fund
Asia Innovative
Growth Fund**
China Fund India Fund
Japan Fund
Asia Small Compa-
nies Fund
China Small
Compa-nies Fund
I Acc (USD) 0.65% - 0.75% 0.75% 0.75% 0.75% 0.75%*** 0.75% 0.75% 0.75% 1.00% 1.00%
I Dist (USD) 0.65% 0.65% 0.75% 0.75% 0.75% 0.75% - - - - - -
A Acc (USD) 1.20% - 1.25% 1.25% 1.25% 1.25% - 1.25% 1.25% 1.25% 1.50% 1.50%
A Dist (USD) 1.20% 1.20% 1.25% 1.25% 1.25% - - - - - - -
S Acc (USD) - - - 0.75% - - - 0.75%*** 0.75% 0.75% - 1.00%
S Dist (USD) 0.65% - - 0.75% - - - - - - - -
I Acc (USD) Hedged
- - - - - - - - - 0.75% - -
I Acc (GBP) - - 0.75% 0.75% - 0.75% 0.75%*** 0.75% 0.75% 0.75% 1.00% 1.00%
I Dist (GBP) - 0.65% 0.75% 0.75% - 0.75% - - - - - -
A Acc (GBP) - - 1.25% 1.25%*** - 1.25% - 1.25% 1.25% - - -
A Dist (GBP) - - 1.25% 1.25%*** - - - - - - - -
S Acc (GBP) - - - 0.75% - - - - - - - 1.00%
S Dist (GBP) - - - 0.75% - - - - - - - -
I Acc (EUR) - - 0.75% 0.75%*** - 0.75% - - - - 1.00%*** -
S Acc (EUR) - - - 0.75%*** - - - - - - - -
I Acc (EUR) Hedged
- - - - - - - - - 0.75% - -
I Acc (JPY) - - - - - 0.75% - - - - - -
S Acc (JPY) 0.65%*** - - - - - - 0.75% - - - -
* The Sub-Fund’s name changed from Matthews Asia Strategic Income Fund to Matthews Asia Total Return Bond Fund on 25 May 2020.** The Sub-Fund launched on 23 March 2021.*** The details of the dates on which the share classes were launched during the reporting year are included in Note 1.
In addition, the Investment Manager receives an Administration Fee payable monthly in arrears, which may be up to 0.25% per annum of the NAV of the Sub-Fund calculated on each Valuation Day. The Administration Fee is 0.15% for the I and S Share Classes and 0.25% for the A Share Class of each Sub-Fund. The Administration Fee is for administrative services provided to each Sub-Fund.
5. DEPOSITARY AND ADMINISTRATIVE AGENT FEES
The Depositary and the Administrative Agent receive from the Fund aggregate fees that amount to a maximum of 2% per annum of the total net assets of each Sub-Fund. The fees effectively charged to each Sub-Fund are disclosed in the Statement of Operations and Changes in Net Assets of the Sub-Fund. The Depositary and Administrative Agent fees are payable monthly in arrears. Transaction costs are charged separately.
Notes to Financial Statements (continued)
As at 31 March 2021
62 MATTHEWS ASIA FUNDS
Notes to Financial Statements (continued)
As at 31 March 2021
6. TRANSFER AGENCY FEES
The Transfer Agent receives a minimum annual fee of USD 3,000 per Sub-Fund. The fees effectively charged to each Sub-Fund are disclosed in the Statement of Operations and Changes in Net Assets of the Sub-Fund. The Transfer agency fees are payable monthly.
7. OTHER EXPENSES
The Fund bears its operational costs including but not limited to governmental fees, taxes, professional fees (legal and auditing), infrastructure fees, publishing and printing expenses, the cost of preparing the explanatory memoranda, financial reports and other documents for the Shareholders.
Professional fees are disclosed in the Statement of Operations and Changes in Net Assets of the Sub-Fund.
In addition to the fees paid to the Fund’s transfer agent, the relevant Sub-Funds bear the cost of fees paid to certain service providers, such as distributors or financial intermediaries, which provide transfer agency, record-keeping and shareholder servicing to certain shareholders. Such fees accrued to pay these service providers are a component of “accrued expenses and other payables” on the Statement of Assets and Liabilities as well as included in “other expenses” in the Statement of Operations and Changes in Net Assets.
8. COMPENSATION OF THE FUND’S IDENTIFIED STAFF
The Fund has no employees and has identified members whose professional activities have a material impact on its risk profile (the “Identified Staff”). The Fund’s Identified Staff is composed of the five members of its Board of Directors. Two members of the Board of Directors each receives fixed remuneration for their responsibilities. The three other directors are employees of the Investment Manager and do not receive additional compensation in respect of their roles as directors of the Fund.
None of the Identified Staff of the Fund receives any variable remuneration in exchange for professional services rendered to the Fund.
The aggregate compensation of the Fund’s Identified Staff, all of which is composed of fixed remuneration, for the year from 1 April 2020 to 31 March 2021 was EUR 60,000.
9. TAXATION
A) TAXE D’ABONNEMENT
The subscription tax is payable quarterly and calculated on the total net assets of each Sub-Fund at the end of the relevant quarter at a rate of 0.05% per annum.
This rate is reduced to 0.01% (i) for Sub-Funds or individual classes of shares reserved to one or more institutional investors or (ii) funds or Sub-Funds having the exclusive objective to invest in money market instruments as defined by the amended law of 17 December 2010 relating to undertakings of collective investment.
The portion of a Sub-Fund’s assets invested in other Luxembourg funds, which have already been subject to subscription tax, is excluded for the purposes of computing the tax.
B) PROVISION FOR FOREIGN TAXES
The Sub-Funds may be subject to foreign taxation related to income received, capital gains on the sale of securities and certain foreign currency transactions in the foreign jurisdictions in which they invest. Foreign taxes, if any, are recorded based on the tax regulations and rates that exist in the foreign markets in which the Sub-Funds invest. When a capital gain tax is determined to apply, the Sub-Funds may record estimated deferred tax liability in an amount that may be payable if the securities were disposed of on the valuation date.
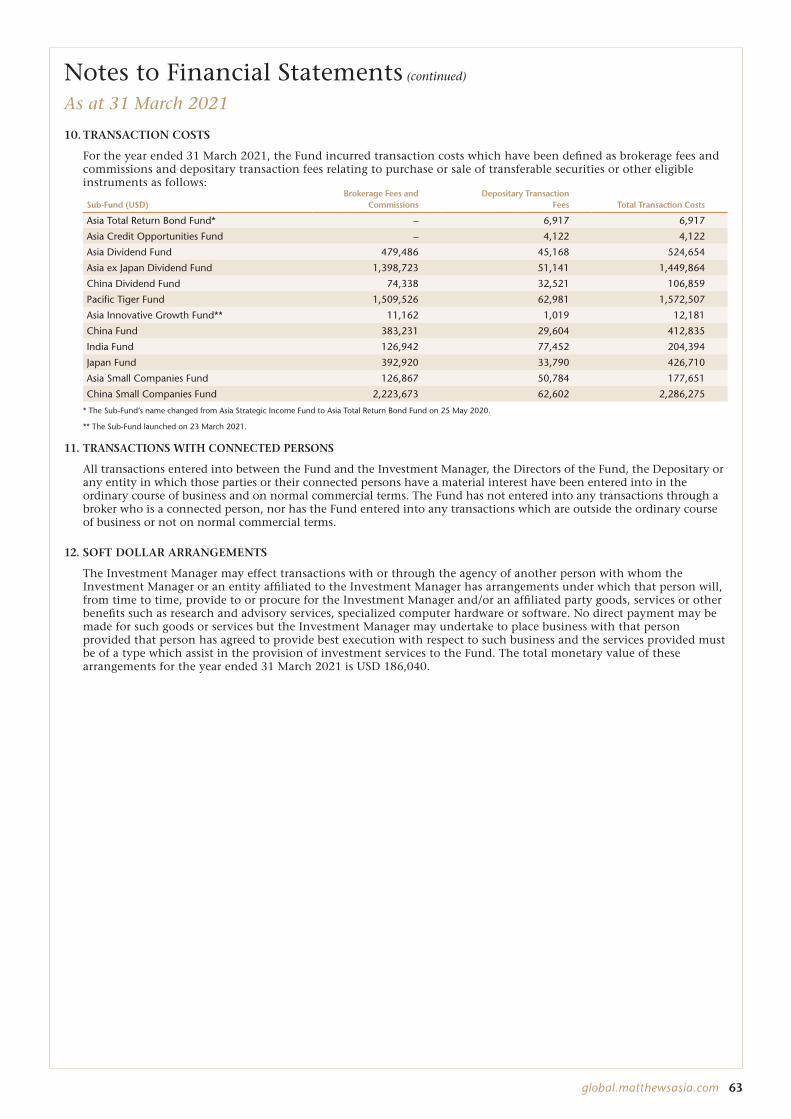
global.matthewsasia.com 63
10. TRANSACTION COSTS
For the year ended 31 March 2021, the Fund incurred transaction costs which have been defined as brokerage fees and commissions and depositary transaction fees relating to purchase or sale of transferable securities or other eligible instruments as follows:
Sub-Fund (USD)Brokerage Fees and
CommissionsDepositary Transaction
Fees Total Transaction Costs
Asia Total Return Bond Fund* – 6,917 6,917
Asia Credit Opportunities Fund – 4,122 4,122
Asia Dividend Fund 479,486 45,168 524,654
Asia ex Japan Dividend Fund 1,398,723 51,141 1,449,864
China Dividend Fund 74,338 32,521 106,859
Pacific Tiger Fund 1,509,526 62,981 1,572,507
Asia Innovative Growth Fund** 11,162 1,019 12,181
China Fund 383,231 29,604 412,835
India Fund 126,942 77,452 204,394
Japan Fund 392,920 33,790 426,710
Asia Small Companies Fund 126,867 50,784 177,651
China Small Companies Fund 2,223,673 62,602 2,286,275
* The Sub-Fund’s name changed from Asia Strategic Income Fund to Asia Total Return Bond Fund on 25 May 2020.
** The Sub-Fund launched on 23 March 2021.
11. TRANSACTIONS WITH CONNECTED PERSONS
All transactions entered into between the Fund and the Investment Manager, the Directors of the Fund, the Depositary or any entity in which those parties or their connected persons have a material interest have been entered into in the ordinary course of business and on normal commercial terms. The Fund has not entered into any transactions through a broker who is a connected person, nor has the Fund entered into any transactions which are outside the ordinary course of business or not on normal commercial terms.
12. SOFT DOLLAR ARRANGEMENTS
The Investment Manager may effect transactions with or through the agency of another person with whom the Investment Manager or an entity affiliated to the Investment Manager has arrangements under which that person will, from time to time, provide to or procure for the Investment Manager and/or an affiliated party goods, services or other benefits such as research and advisory services, specialized computer hardware or software. No direct payment may be made for such goods or services but the Investment Manager may undertake to place business with that person provided that person has agreed to provide best execution with respect to such business and the services provided must be of a type which assist in the provision of investment services to the Fund. The total monetary value of these arrangements for the year ended 31 March 2021 is USD 186,040.
Notes to Financial Statements (continued)
As at 31 March 2021
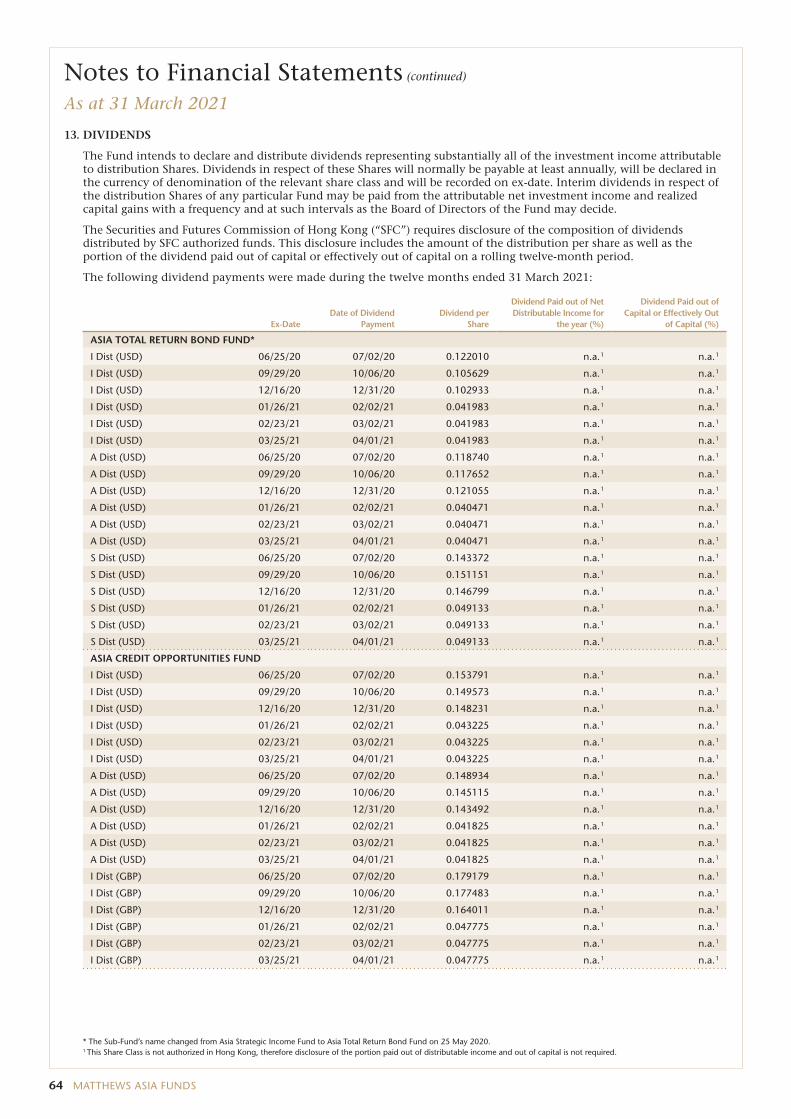
64 MATTHEWS ASIA FUNDS
Notes to Financial Statements (continued)
As at 31 March 2021
* The Sub-Fund’s name changed from Asia Strategic Income Fund to Asia Total Return Bond Fund on 25 May 2020.1 This Share Class is not authorized in Hong Kong, therefore disclosure of the portion paid out of distributable income and out of capital is not required.
13. DIVIDENDS
The Fund intends to declare and distribute dividends representing substantially all of the investment income attributable to distribution Shares. Dividends in respect of these Shares will normally be payable at least annually, will be declared in the currency of denomination of the relevant share class and will be recorded on ex-date. Interim dividends in respect of the distribution Shares of any particular Fund may be paid from the attributable net investment income and realized capital gains with a frequency and at such intervals as the Board of Directors of the Fund may decide.
The Securities and Futures Commission of Hong Kong (“SFC”) requires disclosure of the composition of dividends distributed by SFC authorized funds. This disclosure includes the amount of the distribution per share as well as the portion of the dividend paid out of capital or effectively out of capital on a rolling twelve-month period.
The following dividend payments were made during the twelve months ended 31 March 2021:
Ex-DateDate of Dividend
PaymentDividend per
Share
Dividend Paid out of Net Distributable Income for
the year (%)
Dividend Paid out of Capital or Effectively Out
of Capital (%)
ASIA TOTAL RETURN BOND FUND*
I Dist (USD) 06/25/20 07/02/20 0.122010 n.a. 1 n.a. 1
I Dist (USD) 09/29/20 10/06/20 0.105629 n.a. 1 n.a. 1
I Dist (USD) 12/16/20 12/31/20 0.102933 n.a. 1 n.a. 1
I Dist (USD) 01/26/21 02/02/21 0.041983 n.a. 1 n.a. 1
I Dist (USD) 02/23/21 03/02/21 0.041983 n.a. 1 n.a. 1
I Dist (USD) 03/25/21 04/01/21 0.041983 n.a. 1 n.a. 1
A Dist (USD) 06/25/20 07/02/20 0.118740 n.a. 1 n.a. 1
A Dist (USD) 09/29/20 10/06/20 0.117652 n.a. 1 n.a. 1
A Dist (USD) 12/16/20 12/31/20 0.121055 n.a. 1 n.a. 1
A Dist (USD) 01/26/21 02/02/21 0.040471 n.a. 1 n.a. 1
A Dist (USD) 02/23/21 03/02/21 0.040471 n.a. 1 n.a. 1
A Dist (USD) 03/25/21 04/01/21 0.040471 n.a. 1 n.a. 1
S Dist (USD) 06/25/20 07/02/20 0.143372 n.a. 1 n.a. 1
S Dist (USD) 09/29/20 10/06/20 0.151151 n.a. 1 n.a. 1
S Dist (USD) 12/16/20 12/31/20 0.146799 n.a. 1 n.a. 1
S Dist (USD) 01/26/21 02/02/21 0.049133 n.a. 1 n.a. 1
S Dist (USD) 02/23/21 03/02/21 0.049133 n.a. 1 n.a. 1
S Dist (USD) 03/25/21 04/01/21 0.049133 n.a. 1 n.a. 1
ASIA CREDIT OPPORTUNITIES FUND
I Dist (USD) 06/25/20 07/02/20 0.153791 n.a. 1 n.a. 1
I Dist (USD) 09/29/20 10/06/20 0.149573 n.a. 1 n.a. 1
I Dist (USD) 12/16/20 12/31/20 0.148231 n.a. 1 n.a. 1
I Dist (USD) 01/26/21 02/02/21 0.043225 n.a. 1 n.a. 1
I Dist (USD) 02/23/21 03/02/21 0.043225 n.a. 1 n.a. 1
I Dist (USD) 03/25/21 04/01/21 0.043225 n.a. 1 n.a. 1
A Dist (USD) 06/25/20 07/02/20 0.148934 n.a. 1 n.a. 1
A Dist (USD) 09/29/20 10/06/20 0.145115 n.a. 1 n.a. 1
A Dist (USD) 12/16/20 12/31/20 0.143492 n.a. 1 n.a. 1
A Dist (USD) 01/26/21 02/02/21 0.041825 n.a. 1 n.a. 1
A Dist (USD) 02/23/21 03/02/21 0.041825 n.a. 1 n.a. 1
A Dist (USD) 03/25/21 04/01/21 0.041825 n.a. 1 n.a. 1
I Dist (GBP) 06/25/20 07/02/20 0.179179 n.a. 1 n.a. 1
I Dist (GBP) 09/29/20 10/06/20 0.177483 n.a. 1 n.a. 1
I Dist (GBP) 12/16/20 12/31/20 0.164011 n.a. 1 n.a. 1
I Dist (GBP) 01/26/21 02/02/21 0.047775 n.a. 1 n.a. 1
I Dist (GBP) 02/23/21 03/02/21 0.047775 n.a. 1 n.a. 1
I Dist (GBP) 03/25/21 04/01/21 0.047775 n.a. 1 n.a. 1
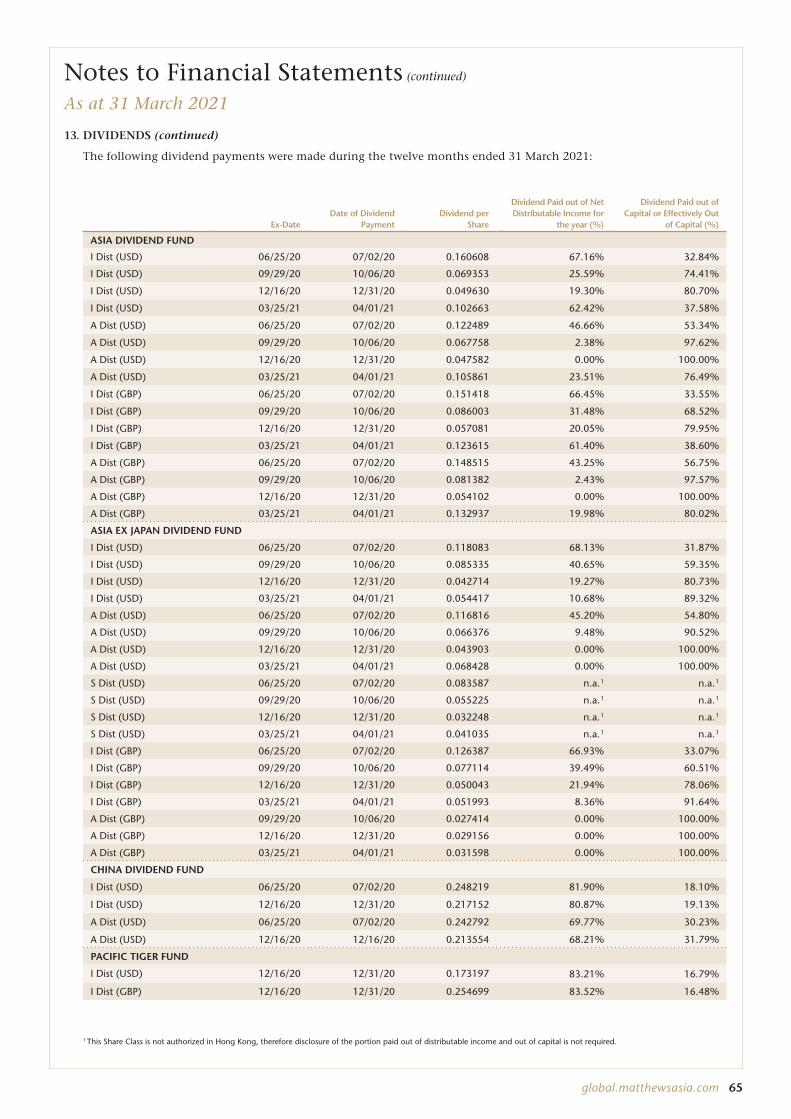
global.matthewsasia.com 65
13. DIVIDENDS (continued)
The following dividend payments were made during the twelve months ended 31 March 2021:
Ex-DateDate of Dividend
PaymentDividend per
Share
Dividend Paid out of Net Distributable Income for
the year (%)
Dividend Paid out of Capital or Effectively Out
of Capital (%)
ASIA DIVIDEND FUND
I Dist (USD) 06/25/20 07/02/20 0.160608 67.16% 32.84%
I Dist (USD) 09/29/20 10/06/20 0.069353 25.59% 74.41%
I Dist (USD) 12/16/20 12/31/20 0.049630 19.30% 80.70%
I Dist (USD) 03/25/21 04/01/21 0.102663 62.42% 37.58%
A Dist (USD) 06/25/20 07/02/20 0.122489 46.66% 53.34%
A Dist (USD) 09/29/20 10/06/20 0.067758 2.38% 97.62%
A Dist (USD) 12/16/20 12/31/20 0.047582 0.00% 100.00%
A Dist (USD) 03/25/21 04/01/21 0.105861 23.51% 76.49%
I Dist (GBP) 06/25/20 07/02/20 0.151418 66.45% 33.55%
I Dist (GBP) 09/29/20 10/06/20 0.086003 31.48% 68.52%
I Dist (GBP) 12/16/20 12/31/20 0.057081 20.05% 79.95%
I Dist (GBP) 03/25/21 04/01/21 0.123615 61.40% 38.60%
A Dist (GBP) 06/25/20 07/02/20 0.148515 43.25% 56.75%
A Dist (GBP) 09/29/20 10/06/20 0.081382 2.43% 97.57%
A Dist (GBP) 12/16/20 12/31/20 0.054102 0.00% 100.00%
A Dist (GBP) 03/25/21 04/01/21 0.132937 19.98% 80.02%
ASIA EX JAPAN DIVIDEND FUND
I Dist (USD) 06/25/20 07/02/20 0.118083 68.13% 31.87%
I Dist (USD) 09/29/20 10/06/20 0.085335 40.65% 59.35%
I Dist (USD) 12/16/20 12/31/20 0.042714 19.27% 80.73%
I Dist (USD) 03/25/21 04/01/21 0.054417 10.68% 89.32%
A Dist (USD) 06/25/20 07/02/20 0.116816 45.20% 54.80%
A Dist (USD) 09/29/20 10/06/20 0.066376 9.48% 90.52%
A Dist (USD) 12/16/20 12/31/20 0.043903 0.00% 100.00%
A Dist (USD) 03/25/21 04/01/21 0.068428 0.00% 100.00%
S Dist (USD) 06/25/20 07/02/20 0.083587 n.a. 1 n.a. 1
S Dist (USD) 09/29/20 10/06/20 0.055225 n.a. 1 n.a. 1
S Dist (USD) 12/16/20 12/31/20 0.032248 n.a. 1 n.a. 1
S Dist (USD) 03/25/21 04/01/21 0.041035 n.a. 1 n.a. 1
I Dist (GBP) 06/25/20 07/02/20 0.126387 66.93% 33.07%
I Dist (GBP) 09/29/20 10/06/20 0.077114 39.49% 60.51%
I Dist (GBP) 12/16/20 12/31/20 0.050043 21.94% 78.06%
I Dist (GBP) 03/25/21 04/01/21 0.051993 8.36% 91.64%
A Dist (GBP) 09/29/20 10/06/20 0.027414 0.00% 100.00%
A Dist (GBP) 12/16/20 12/31/20 0.029156 0.00% 100.00%
A Dist (GBP) 03/25/21 04/01/21 0.031598 0.00% 100.00%
CHINA DIVIDEND FUND
I Dist (USD) 06/25/20 07/02/20 0.248219 81.90% 18.10%
I Dist (USD) 12/16/20 12/31/20 0.217152 80.87% 19.13%
A Dist (USD) 06/25/20 07/02/20 0.242792 69.77% 30.23%
A Dist (USD) 12/16/20 12/16/20 0.213554 68.21% 31.79%
PACIFIC TIGER FUND
I Dist (USD) 12/16/20 12/31/20 0.173197 83.21% 16.79%
I Dist (GBP) 12/16/20 12/31/20 0.254699 83.52% 16.48%
Notes to Financial Statements (continued)
As at 31 March 2021
1 This Share Class is not authorized in Hong Kong, therefore disclosure of the portion paid out of distributable income and out of capital is not required.
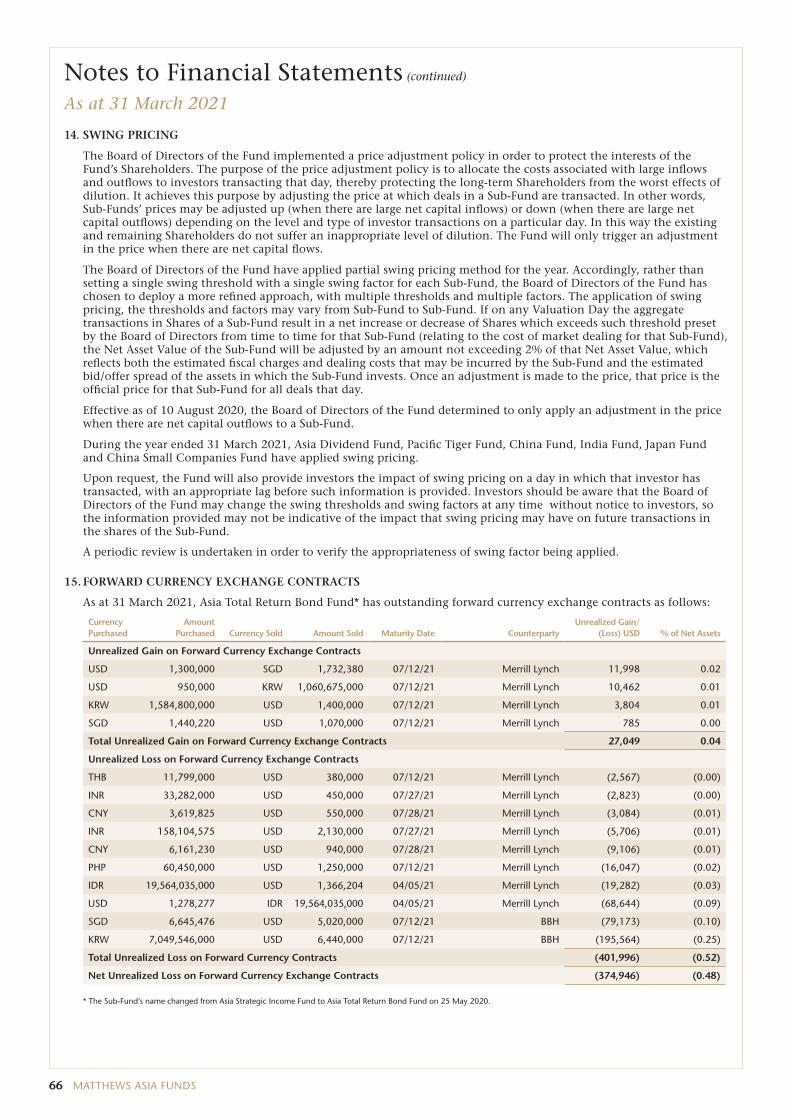
66 MATTHEWS ASIA FUNDS
14. SWING PRICING
The Board of Directors of the Fund implemented a price adjustment policy in order to protect the interests of the Fund’s Shareholders. The purpose of the price adjustment policy is to allocate the costs associated with large inflows and outflows to investors transacting that day, thereby protecting the long-term Shareholders from the worst effects of dilution. It achieves this purpose by adjusting the price at which deals in a Sub-Fund are transacted. In other words, Sub-Funds’ prices may be adjusted up (when there are large net capital inflows) or down (when there are large net capital outflows) depending on the level and type of investor transactions on a particular day. In this way the existing and remaining Shareholders do not suffer an inappropriate level of dilution. The Fund will only trigger an adjustment in the price when there are net capital flows.
The Board of Directors of the Fund have applied partial swing pricing method for the year. Accordingly, rather than setting a single swing threshold with a single swing factor for each Sub-Fund, the Board of Directors of the Fund has chosen to deploy a more refined approach, with multiple thresholds and multiple factors. The application of swing pricing, the thresholds and factors may vary from Sub-Fund to Sub-Fund. If on any Valuation Day the aggregate transactions in Shares of a Sub-Fund result in a net increase or decrease of Shares which exceeds such threshold preset by the Board of Directors from time to time for that Sub-Fund (relating to the cost of market dealing for that Sub-Fund), the Net Asset Value of the Sub-Fund will be adjusted by an amount not exceeding 2% of that Net Asset Value, which reflects both the estimated fiscal charges and dealing costs that may be incurred by the Sub-Fund and the estimated bid/offer spread of the assets in which the Sub-Fund invests. Once an adjustment is made to the price, that price is the official price for that Sub-Fund for all deals that day.
Effective as of 10 August 2020, the Board of Directors of the Fund determined to only apply an adjustment in the price when there are net capital outflows to a Sub-Fund.
During the year ended 31 March 2021, Asia Dividend Fund, Pacific Tiger Fund, China Fund, India Fund, Japan Fund and China Small Companies Fund have applied swing pricing.
Upon request, the Fund will also provide investors the impact of swing pricing on a day in which that investor has transacted, with an appropriate lag before such information is provided. Investors should be aware that the Board of Directors of the Fund may change the swing thresholds and swing factors at any time without notice to investors, so the information provided may not be indicative of the impact that swing pricing may have on future transactions in the shares of the Sub-Fund.
A periodic review is undertaken in order to verify the appropriateness of swing factor being applied.
15. FORWARD CURRENCY EXCHANGE CONTRACTS
As at 31 March 2021, Asia Total Return Bond Fund* has outstanding forward currency exchange contracts as follows:
Currency Purchased
Amount Purchased Currency Sold Amount Sold Maturity Date Counterparty
Unrealized Gain/(Loss) USD % of Net Assets
Unrealized Gain on Forward Currency Exchange Contracts
USD 1,300,000 SGD 1,732,380 07/12/21 Merrill Lynch 11,998 0.02
USD 950,000 KRW 1,060,675,000 07/12/21 Merrill Lynch 10,462 0.01
KRW 1,584,800,000 USD 1,400,000 07/12/21 Merrill Lynch 3,804 0.01
SGD 1,440,220 USD 1,070,000 07/12/21 Merrill Lynch 785 0.00
Total Unrealized Gain on Forward Currency Exchange Contracts 27,049 0.04
Unrealized Loss on Forward Currency Exchange Contracts
THB 11,799,000 USD 380,000 07/12/21 Merrill Lynch (2,567) (0.00)
INR 33,282,000 USD 450,000 07/27/21 Merrill Lynch (2,823) (0.00)
CNY 3,619,825 USD 550,000 07/28/21 Merrill Lynch (3,084) (0.01)
INR 158,104,575 USD 2,130,000 07/27/21 Merrill Lynch (5,706) (0.01)
CNY 6,161,230 USD 940,000 07/28/21 Merrill Lynch (9,106) (0.01)
PHP 60,450,000 USD 1,250,000 07/12/21 Merrill Lynch (16,047) (0.02)
IDR 19,564,035,000 USD 1,366,204 04/05/21 Merrill Lynch (19,282) (0.03)
USD 1,278,277 IDR 19,564,035,000 04/05/21 Merrill Lynch (68,644) (0.09)
SGD 6,645,476 USD 5,020,000 07/12/21 BBH (79,173) (0.10)
KRW 7,049,546,000 USD 6,440,000 07/12/21 BBH (195,564) (0.25)
Total Unrealized Loss on Forward Currency Contracts (401,996) (0.52)
Net Unrealized Loss on Forward Currency Exchange Contracts (374,946) (0.48)
* The Sub-Fund’s name changed from Asia Strategic Income Fund to Asia Total Return Bond Fund on 25 May 2020.
Notes to Financial Statements (continued)
As at 31 March 2021
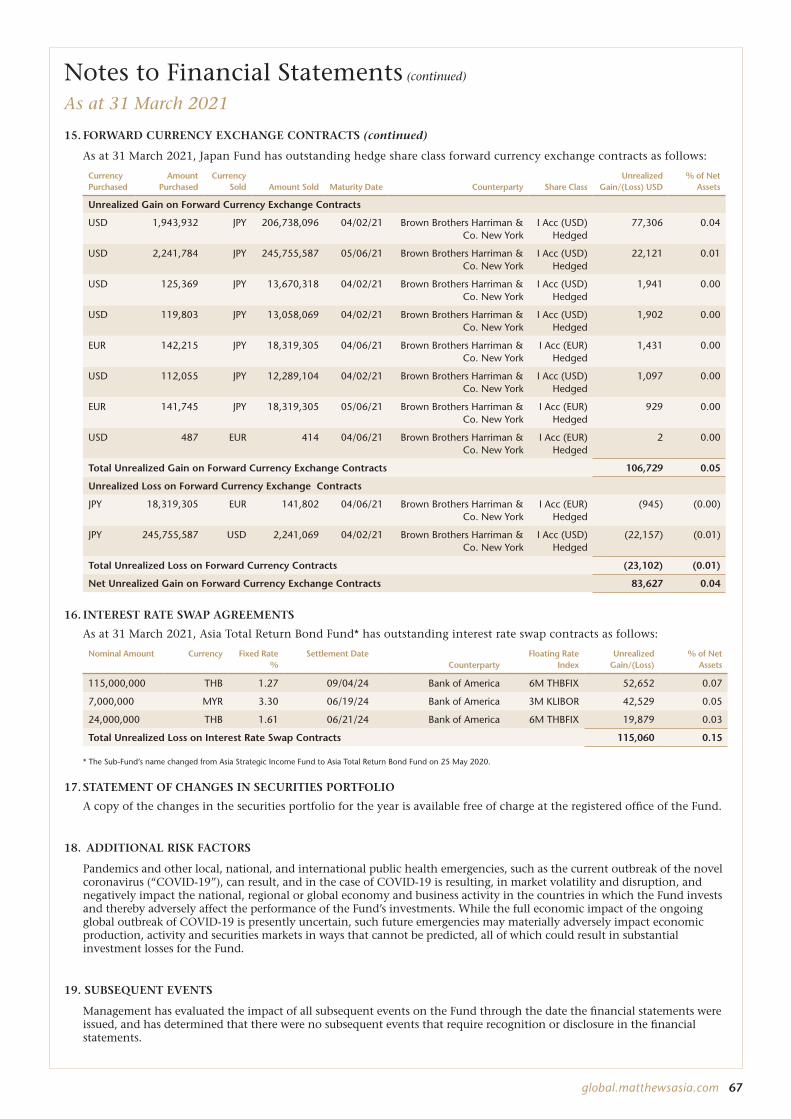
global.matthewsasia.com 67
15. FORWARD CURRENCY EXCHANGE CONTRACTS (continued)
As at 31 March 2021, Japan Fund has outstanding hedge share class forward currency exchange contracts as follows:
Currency Purchased
Amount Purchased
Currency Sold Amount Sold Maturity Date Counterparty Share Class
Unrealized Gain/(Loss) USD
% of Net Assets
Unrealized Gain on Forward Currency Exchange Contracts
USD 1,943,932 JPY 206,738,096 04/02/21 Brown Brothers Harriman & Co. New York
I Acc (USD) Hedged
77,306 0.04
USD 2,241,784 JPY 245,755,587 05/06/21 Brown Brothers Harriman & Co. New York
I Acc (USD) Hedged
22,121 0.01
USD 125,369 JPY 13,670,318 04/02/21 Brown Brothers Harriman & Co. New York
I Acc (USD) Hedged
1,941 0.00
USD 119,803 JPY 13,058,069 04/02/21 Brown Brothers Harriman & Co. New York
I Acc (USD) Hedged
1,902 0.00
EUR 142,215 JPY 18,319,305 04/06/21 Brown Brothers Harriman & Co. New York
I Acc (EUR) Hedged
1,431 0.00
USD 112,055 JPY 12,289,104 04/02/21 Brown Brothers Harriman & Co. New York
I Acc (USD) Hedged
1,097 0.00
EUR 141,745 JPY 18,319,305 05/06/21 Brown Brothers Harriman & Co. New York
I Acc (EUR) Hedged
929 0.00
USD 487 EUR 414 04/06/21 Brown Brothers Harriman & Co. New York
I Acc (EUR) Hedged
2 0.00
Total Unrealized Gain on Forward Currency Exchange Contracts 106,729 0.05
Unrealized Loss on Forward Currency Exchange Contracts
JPY 18,319,305 EUR 141,802 04/06/21 Brown Brothers Harriman & Co. New York
I Acc (EUR) Hedged
(945) (0.00)
JPY 245,755,587 USD 2,241,069 04/02/21 Brown Brothers Harriman & Co. New York
I Acc (USD) Hedged
(22,157) (0.01)
Total Unrealized Loss on Forward Currency Contracts (23,102) (0.01)
Net Unrealized Gain on Forward Currency Exchange Contracts 83,627 0.04
16. INTEREST RATE SWAP AGREEMENTS
As at 31 March 2021, Asia Total Return Bond Fund* has outstanding interest rate swap contracts as follows:
Nominal Amount Currency Fixed Rate %
Settlement Date Counterparty
Floating Rate Index
Unrealized Gain/(Loss)
% of Net Assets
115,000,000 THB 1.27 09/04/24 Bank of America 6M THBFIX 52,652 0.07
7,000,000 MYR 3.30 06/19/24 Bank of America 3M KLIBOR 42,529 0.05
24,000,000 THB 1.61 06/21/24 Bank of America 6M THBFIX 19,879 0.03
Total Unrealized Loss on Interest Rate Swap Contracts 115,060 0.15
* The Sub-Fund’s name changed from Asia Strategic Income Fund to Asia Total Return Bond Fund on 25 May 2020.
17. STATEMENT OF CHANGES IN SECURITIES PORTFOLIO
A copy of the changes in the securities portfolio for the year is available free of charge at the registered office of the Fund.
18. ADDITIONAL RISK FACTORS
Pandemics and other local, national, and international public health emergencies, such as the current outbreak of the novel coronavirus (“COVID-19”), can result, and in the case of COVID-19 is resulting, in market volatility and disruption, and negatively impact the national, regional or global economy and business activity in the countries in which the Fund invests and thereby adversely affect the performance of the Fund’s investments. While the full economic impact of the ongoing global outbreak of COVID-19 is presently uncertain, such future emergencies may materially adversely impact economic production, activity and securities markets in ways that cannot be predicted, all of which could result in substantial investment losses for the Fund.
19. SUBSEQUENT EVENTS
Management has evaluated the impact of all subsequent events on the Fund through the date the financial statements were issued, and has determined that there were no subsequent events that require recognition or disclosure in the financial statements.
Notes to Financial Statements (continued)
As at 31 March 2021
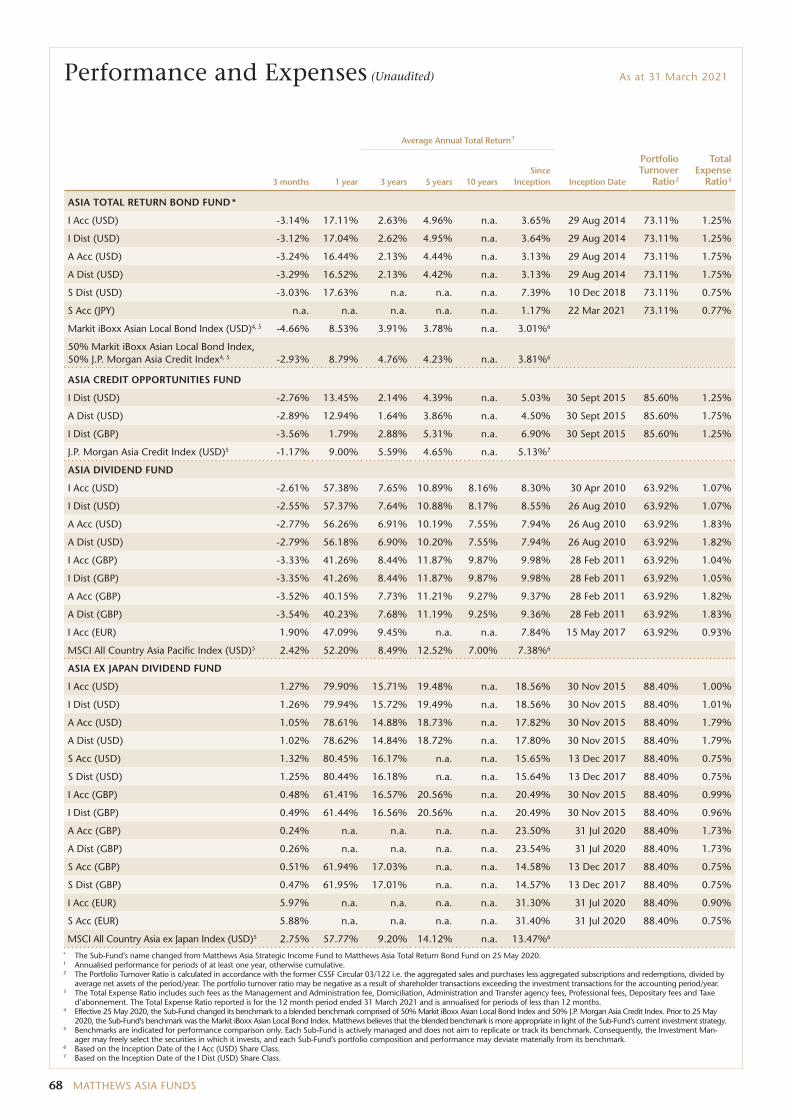
68 MATTHEWS ASIA FUNDS
Performance and Expenses (Unaudited) As at 31 March 2021
Average Annual Total Return 1
3 months 1 year 3 years 5 years 10 yearsSince
Inception Inception Date
Portfolio Turnover
Ratio 2
Total Expense
Ratio 3
ASIA TOTAL RETURN BOND FUND *
I Acc (USD) -3.14% 17.11% 2.63% 4.96% n.a. 3.65% 29 Aug 2014 73.11% 1.25%
I Dist (USD) -3.12% 17.04% 2.62% 4.95% n.a. 3.64% 29 Aug 2014 73.11% 1.25%
A Acc (USD) -3.24% 16.44% 2.13% 4.44% n.a. 3.13% 29 Aug 2014 73.11% 1.75%
A Dist (USD) -3.29% 16.52% 2.13% 4.42% n.a. 3.13% 29 Aug 2014 73.11% 1.75%
S Dist (USD) -3.03% 17.63% n.a. n.a. n.a. 7.39% 10 Dec 2018 73.11% 0.75%
S Acc (JPY) n.a. n.a. n.a. n.a. n.a. 1.17% 22 Mar 2021 73.11% 0.77%
Markit iBoxx Asian Local Bond Index (USD)4, 5 -4.66% 8.53% 3.91% 3.78% n.a. 3.01%6
50% Markit iBoxx Asian Local Bond Index, 50% J.P. Morgan Asia Credit Index4, 5 -2.93% 8.79% 4.76% 4.23% n.a. 3.81%6
ASIA CREDIT OPPORTUNITIES FUND
I Dist (USD) -2.76% 13.45% 2.14% 4.39% n.a. 5.03% 30 Sept 2015 85.60% 1.25%
A Dist (USD) -2.89% 12.94% 1.64% 3.86% n.a. 4.50% 30 Sept 2015 85.60% 1.75%
I Dist (GBP) -3.56% 1.79% 2.88% 5.31% n.a. 6.90% 30 Sept 2015 85.60% 1.25%
J.P. Morgan Asia Credit Index (USD)5 -1.17% 9.00% 5.59% 4.65% n.a. 5.13%7
ASIA DIVIDEND FUND
I Acc (USD) -2.61% 57.38% 7.65% 10.89% 8.16% 8.30% 30 Apr 2010 63.92% 1.07%
I Dist (USD) -2.55% 57.37% 7.64% 10.88% 8.17% 8.55% 26 Aug 2010 63.92% 1.07%
A Acc (USD) -2.77% 56.26% 6.91% 10.19% 7.55% 7.94% 26 Aug 2010 63.92% 1.83%
A Dist (USD) -2.79% 56.18% 6.90% 10.20% 7.55% 7.94% 26 Aug 2010 63.92% 1.82%
I Acc (GBP) -3.33% 41.26% 8.44% 11.87% 9.87% 9.98% 28 Feb 2011 63.92% 1.04%
I Dist (GBP) -3.35% 41.26% 8.44% 11.87% 9.87% 9.98% 28 Feb 2011 63.92% 1.05%
A Acc (GBP) -3.52% 40.15% 7.73% 11.21% 9.27% 9.37% 28 Feb 2011 63.92% 1.82%
A Dist (GBP) -3.54% 40.23% 7.68% 11.19% 9.25% 9.36% 28 Feb 2011 63.92% 1.83%
I Acc (EUR) 1.90% 47.09% 9.45% n.a. n.a. 7.84% 15 May 2017 63.92% 0.93%
MSCI All Country Asia Pacific Index (USD)5 2.42% 52.20% 8.49% 12.52% 7.00% 7.38%6
ASIA EX JAPAN DIVIDEND FUND
I Acc (USD) 1.27% 79.90% 15.71% 19.48% n.a. 18.56% 30 Nov 2015 88.40% 1.00%
I Dist (USD) 1.26% 79.94% 15.72% 19.49% n.a. 18.56% 30 Nov 2015 88.40% 1.01%
A Acc (USD) 1.05% 78.61% 14.88% 18.73% n.a. 17.82% 30 Nov 2015 88.40% 1.79%
A Dist (USD) 1.02% 78.62% 14.84% 18.72% n.a. 17.80% 30 Nov 2015 88.40% 1.79%
S Acc (USD) 1.32% 80.45% 16.17% n.a. n.a. 15.65% 13 Dec 2017 88.40% 0.75%
S Dist (USD) 1.25% 80.44% 16.18% n.a. n.a. 15.64% 13 Dec 2017 88.40% 0.75%
I Acc (GBP) 0.48% 61.41% 16.57% 20.56% n.a. 20.49% 30 Nov 2015 88.40% 0.99%
I Dist (GBP) 0.49% 61.44% 16.56% 20.56% n.a. 20.49% 30 Nov 2015 88.40% 0.96%
A Acc (GBP) 0.24% n.a. n.a. n.a. n.a. 23.50% 31 Jul 2020 88.40% 1.73%
A Dist (GBP) 0.26% n.a. n.a. n.a. n.a. 23.54% 31 Jul 2020 88.40% 1.73%
S Acc (GBP) 0.51% 61.94% 17.03% n.a. n.a. 14.58% 13 Dec 2017 88.40% 0.75%
S Dist (GBP) 0.47% 61.95% 17.01% n.a. n.a. 14.57% 13 Dec 2017 88.40% 0.75%
I Acc (EUR) 5.97% n.a. n.a. n.a. n.a. 31.30% 31 Jul 2020 88.40% 0.90%
S Acc (EUR) 5.88% n.a. n.a. n.a. n.a. 31.40% 31 Jul 2020 88.40% 0.75%
MSCI All Country Asia ex Japan Index (USD)5 2.75% 57.77% 9.20% 14.12% n.a. 13.47%6
* The Sub-Fund’s name changed from Matthews Asia Strategic Income Fund to Matthews Asia Total Return Bond Fund on 25 May 2020.1 Annualised performance for periods of at least one year, otherwise cumulative.2 The Portfolio Turnover Ratio is calculated in accordance with the former CSSF Circular 03/122 i.e. the aggregated sales and purchases less aggregated subscriptions and redemptions, divided by
average net assets of the period/year. The portfolio turnover ratio may be negative as a result of shareholder transactions exceeding the investment transactions for the accounting period/year.3 The Total Expense Ratio includes such fees as the Management and Administration fee, Domiciliation, Administration and Transfer agency fees, Professional fees, Depositary fees and Taxe
d’abonnement. The Total Expense Ratio reported is for the 12 month period ended 31 March 2021 and is annualised for periods of less than 12 months.4 Effective 25 May 2020, the Sub-Fund changed its benchmark to a blended benchmark comprised of 50% Markit iBoxx Asian Local Bond Index and 50% J.P. Morgan Asia Credit Index. Prior to 25 May
2020, the Sub-Fund’s benchmark was the Markit iBoxx Asian Local Bond Index. Matthews believes that the blended benchmark is more appropriate in light of the Sub-Fund’s current investment strategy.5 Benchmarks are indicated for performance comparison only. Each Sub-Fund is actively managed and does not aim to replicate or track its benchmark. Consequently, the Investment Man-
ager may freely select the securities in which it invests, and each Sub-Fund’s portfolio composition and performance may deviate materially from its benchmark.6 Based on the Inception Date of the I Acc (USD) Share Class.7 Based on the Inception Date of the I Dist (USD) Share Class.
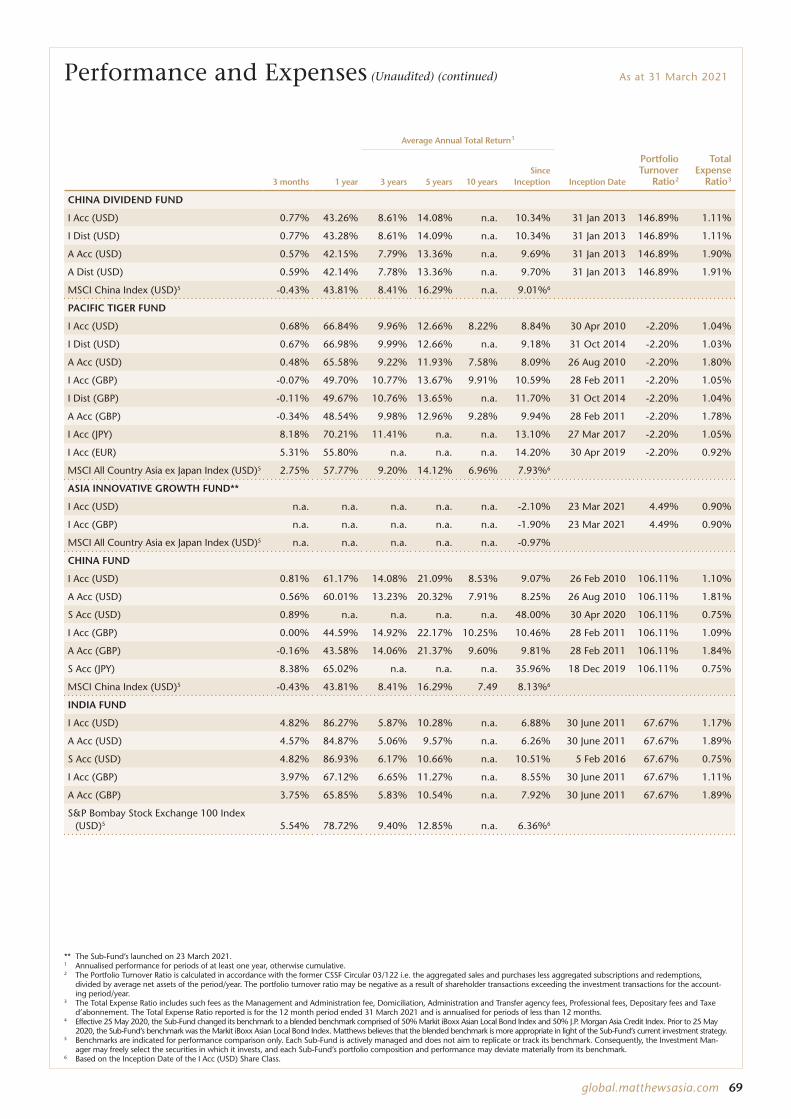
global.matthewsasia.com 69
Average Annual Total Return 1
3 months 1 year 3 years 5 years 10 yearsSince
Inception Inception Date
Portfolio Turnover
Ratio 2
Total Expense
Ratio 3
CHINA DIVIDEND FUND
I Acc (USD) 0.77% 43.26% 8.61% 14.08% n.a. 10.34% 31 Jan 2013 146.89% 1.11%
I Dist (USD) 0.77% 43.28% 8.61% 14.09% n.a. 10.34% 31 Jan 2013 146.89% 1.11%
A Acc (USD) 0.57% 42.15% 7.79% 13.36% n.a. 9.69% 31 Jan 2013 146.89% 1.90%
A Dist (USD) 0.59% 42.14% 7.78% 13.36% n.a. 9.70% 31 Jan 2013 146.89% 1.91%
MSCI China Index (USD)5 -0.43% 43.81% 8.41% 16.29% n.a. 9.01%6
PACIFIC TIGER FUND
I Acc (USD) 0.68% 66.84% 9.96% 12.66% 8.22% 8.84% 30 Apr 2010 -2.20% 1.04%
I Dist (USD) 0.67% 66.98% 9.99% 12.66% n.a. 9.18% 31 Oct 2014 -2.20% 1.03%
A Acc (USD) 0.48% 65.58% 9.22% 11.93% 7.58% 8.09% 26 Aug 2010 -2.20% 1.80%
I Acc (GBP) -0.07% 49.70% 10.77% 13.67% 9.91% 10.59% 28 Feb 2011 -2.20% 1.05%
I Dist (GBP) -0.11% 49.67% 10.76% 13.65% n.a. 11.70% 31 Oct 2014 -2.20% 1.04%
A Acc (GBP) -0.34% 48.54% 9.98% 12.96% 9.28% 9.94% 28 Feb 2011 -2.20% 1.78%
I Acc (JPY) 8.18% 70.21% 11.41% n.a. n.a. 13.10% 27 Mar 2017 -2.20% 1.05%
I Acc (EUR) 5.31% 55.80% n.a. n.a. n.a. 14.20% 30 Apr 2019 -2.20% 0.92%
MSCI All Country Asia ex Japan Index (USD)5 2.75% 57.77% 9.20% 14.12% 6.96% 7.93%6
ASIA INNOVATIVE GROWTH FUND**
I Acc (USD) n.a. n.a. n.a. n.a. n.a. -2.10% 23 Mar 2021 4.49% 0.90%
I Acc (GBP) n.a. n.a. n.a. n.a. n.a. -1.90% 23 Mar 2021 4.49% 0.90%
MSCI All Country Asia ex Japan Index (USD)5 n.a. n.a. n.a. n.a. n.a. -0.97%
CHINA FUND
I Acc (USD) 0.81% 61.17% 14.08% 21.09% 8.53% 9.07% 26 Feb 2010 106.11% 1.10%
A Acc (USD) 0.56% 60.01% 13.23% 20.32% 7.91% 8.25% 26 Aug 2010 106.11% 1.81%
S Acc (USD) 0.89% n.a. n.a. n.a. n.a. 48.00% 30 Apr 2020 106.11% 0.75%
I Acc (GBP) 0.00% 44.59% 14.92% 22.17% 10.25% 10.46% 28 Feb 2011 106.11% 1.09%
A Acc (GBP) -0.16% 43.58% 14.06% 21.37% 9.60% 9.81% 28 Feb 2011 106.11% 1.84%
S Acc (JPY) 8.38% 65.02% n.a. n.a. n.a. 35.96% 18 Dec 2019 106.11% 0.75%
MSCI China Index (USD)5 -0.43% 43.81% 8.41% 16.29% 7.49 8.13%6
INDIA FUND
I Acc (USD) 4.82% 86.27% 5.87% 10.28% n.a. 6.88% 30 June 2011 67.67% 1.17%
A Acc (USD) 4.57% 84.87% 5.06% 9.57% n.a. 6.26% 30 June 2011 67.67% 1.89%
S Acc (USD) 4.82% 86.93% 6.17% 10.66% n.a. 10.51% 5 Feb 2016 67.67% 0.75%
I Acc (GBP) 3.97% 67.12% 6.65% 11.27% n.a. 8.55% 30 June 2011 67.67% 1.11%
A Acc (GBP) 3.75% 65.85% 5.83% 10.54% n.a. 7.92% 30 June 2011 67.67% 1.89%
S&P Bombay Stock Exchange 100 Index (USD)5 5.54% 78.72% 9.40% 12.85% n.a. 6.36%6
Performance and Expenses (Unaudited) (continued) As at 31 March 2021
** The Sub-Fund’s launched on 23 March 2021.1 Annualised performance for periods of at least one year, otherwise cumulative.2 The Portfolio Turnover Ratio is calculated in accordance with the former CSSF Circular 03/122 i.e. the aggregated sales and purchases less aggregated subscriptions and redemptions,
divided by average net assets of the period/year. The portfolio turnover ratio may be negative as a result of shareholder transactions exceeding the investment transactions for the account-ing period/year.
3 The Total Expense Ratio includes such fees as the Management and Administration fee, Domiciliation, Administration and Transfer agency fees, Professional fees, Depositary fees and Taxe d’abonnement. The Total Expense Ratio reported is for the 12 month period ended 31 March 2021 and is annualised for periods of less than 12 months.
4 Effective 25 May 2020, the Sub-Fund changed its benchmark to a blended benchmark comprised of 50% Markit iBoxx Asian Local Bond Index and 50% J.P. Morgan Asia Credit Index. Prior to 25 May 2020, the Sub-Fund’s benchmark was the Markit iBoxx Asian Local Bond Index. Matthews believes that the blended benchmark is more appropriate in light of the Sub-Fund’s current investment strategy.
5 Benchmarks are indicated for performance comparison only. Each Sub-Fund is actively managed and does not aim to replicate or track its benchmark. Consequently, the Investment Man-ager may freely select the securities in which it invests, and each Sub-Fund’s portfolio composition and performance may deviate materially from its benchmark.
6 Based on the Inception Date of the I Acc (USD) Share Class.
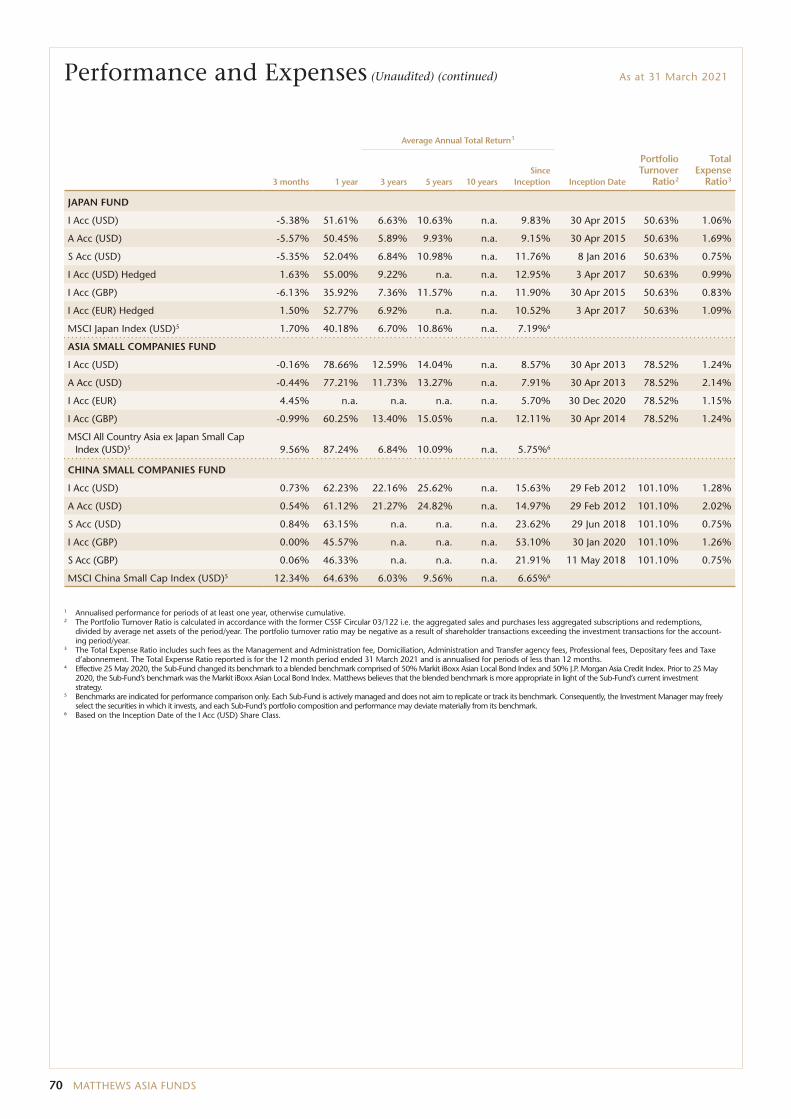
70 MATTHEWS ASIA FUNDS
Performance and Expenses (Unaudited) (continued) As at 31 March 2021
Average Annual Total Return 1
3 months 1 year 3 years 5 years 10 yearsSince
Inception Inception Date
Portfolio Turnover
Ratio 2
Total Expense
Ratio 3
JAPAN FUND
I Acc (USD) -5.38% 51.61% 6.63% 10.63% n.a. 9.83% 30 Apr 2015 50.63% 1.06%
A Acc (USD) -5.57% 50.45% 5.89% 9.93% n.a. 9.15% 30 Apr 2015 50.63% 1.69%
S Acc (USD) -5.35% 52.04% 6.84% 10.98% n.a. 11.76% 8 Jan 2016 50.63% 0.75%
I Acc (USD) Hedged 1.63% 55.00% 9.22% n.a. n.a. 12.95% 3 Apr 2017 50.63% 0.99%
I Acc (GBP) -6.13% 35.92% 7.36% 11.57% n.a. 11.90% 30 Apr 2015 50.63% 0.83%
I Acc (EUR) Hedged 1.50% 52.77% 6.92% n.a. n.a. 10.52% 3 Apr 2017 50.63% 1.09%
MSCI Japan Index (USD)5 1.70% 40.18% 6.70% 10.86% n.a. 7.19%6
ASIA SMALL COMPANIES FUND
I Acc (USD) -0.16% 78.66% 12.59% 14.04% n.a. 8.57% 30 Apr 2013 78.52% 1.24%
A Acc (USD) -0.44% 77.21% 11.73% 13.27% n.a. 7.91% 30 Apr 2013 78.52% 2.14%
I Acc (EUR) 4.45% n.a. n.a. n.a. n.a. 5.70% 30 Dec 2020 78.52% 1.15%
I Acc (GBP) -0.99% 60.25% 13.40% 15.05% n.a. 12.11% 30 Apr 2014 78.52% 1.24%
MSCI All Country Asia ex Japan Small Cap Index (USD)5 9.56% 87.24% 6.84% 10.09% n.a. 5.75%6
CHINA SMALL COMPANIES FUND
I Acc (USD) 0.73% 62.23% 22.16% 25.62% n.a. 15.63% 29 Feb 2012 101.10% 1.28%
A Acc (USD) 0.54% 61.12% 21.27% 24.82% n.a. 14.97% 29 Feb 2012 101.10% 2.02%
S Acc (USD) 0.84% 63.15% n.a. n.a. n.a. 23.62% 29 Jun 2018 101.10% 0.75%
I Acc (GBP) 0.00% 45.57% n.a. n.a. n.a. 53.10% 30 Jan 2020 101.10% 1.26%
S Acc (GBP) 0.06% 46.33% n.a. n.a. n.a. 21.91% 11 May 2018 101.10% 0.75%
MSCI China Small Cap Index (USD)5 12.34% 64.63% 6.03% 9.56% n.a. 6.65%6
1 Annualised performance for periods of at least one year, otherwise cumulative.2 The Portfolio Turnover Ratio is calculated in accordance with the former CSSF Circular 03/122 i.e. the aggregated sales and purchases less aggregated subscriptions and redemptions,
divided by average net assets of the period/year. The portfolio turnover ratio may be negative as a result of shareholder transactions exceeding the investment transactions for the account-ing period/year.
3 The Total Expense Ratio includes such fees as the Management and Administration fee, Domiciliation, Administration and Transfer agency fees, Professional fees, Depositary fees and Taxe d’abonnement. The Total Expense Ratio reported is for the 12 month period ended 31 March 2021 and is annualised for periods of less than 12 months.
4 Effective 25 May 2020, the Sub-Fund changed its benchmark to a blended benchmark comprised of 50% Markit iBoxx Asian Local Bond Index and 50% J.P. Morgan Asia Credit Index. Prior to 25 May 2020, the Sub-Fund’s benchmark was the Markit iBoxx Asian Local Bond Index. Matthews believes that the blended benchmark is more appropriate in light of the Sub-Fund’s current investment strategy.
5 Benchmarks are indicated for performance comparison only. Each Sub-Fund is actively managed and does not aim to replicate or track its benchmark. Consequently, the Investment Man ager may freely select the securities in which it invests, and each Sub-Fund’s portfolio composition and performance may deviate materially from its benchmark.
6 Based on the Inception Date of the I Acc (USD) Share Class.
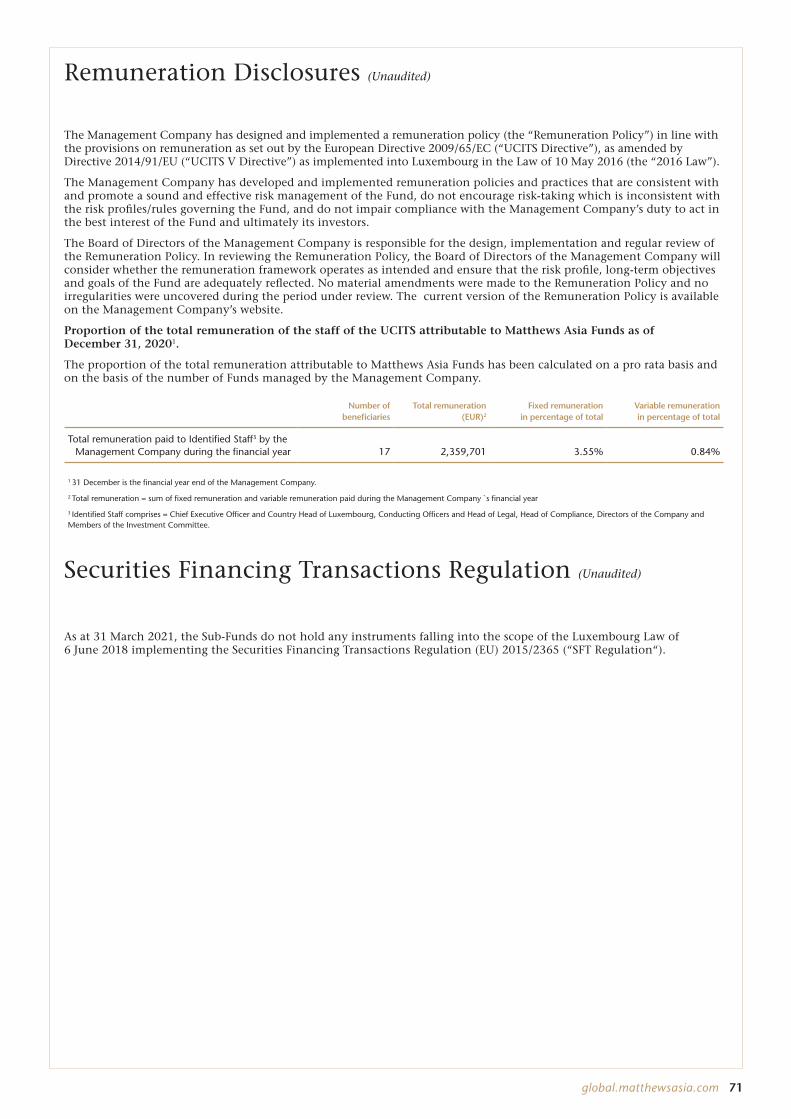
global.matthewsasia.com 71
The Management Company has designed and implemented a remuneration policy (the “Remuneration Policy”) in line with the provisions on remuneration as set out by the European Directive 2009/65/EC (“UCITS Directive”), as amended by Directive 2014/91/EU (“UCITS V Directive”) as implemented into Luxembourg in the Law of 10 May 2016 (the “2016 Law”).
The Management Company has developed and implemented remuneration policies and practices that are consistent with and promote a sound and effective risk management of the Fund, do not encourage risk-taking which is inconsistent with the risk profiles/rules governing the Fund, and do not impair compliance with the Management Company’s duty to act in the best interest of the Fund and ultimately its investors.
The Board of Directors of the Management Company is responsible for the design, implementation and regular review of the Remuneration Policy. In reviewing the Remuneration Policy, the Board of Directors of the Management Company will consider whether the remuneration framework operates as intended and ensure that the risk profile, long-term objectives and goals of the Fund are adequately reflected. No material amendments were made to the Remuneration Policy and no irregularities were uncovered during the period under review. The current version of the Remuneration Policy is available on the Management Company’s website.
Proportion of the total remuneration of the staff of the UCITS attributable to Matthews Asia Funds as of December 31, 20201.
The proportion of the total remuneration attributable to Matthews Asia Funds has been calculated on a pro rata basis and on the basis of the number of Funds managed by the Management Company.
Number of beneficiaries
Total remuneration (EUR)2
Fixed remuneration in percentage of total
Variable remuneration in percentage of total
Total remuneration paid to Identified Staff3 by the Management Company during the financial year 17 2,359,701 3.55% 0.84%
1 31 December is the financial year end of the Management Company.
2 Total remuneration = sum of fixed remuneration and variable remuneration paid during the Management Company `s financial year
3 Identified Staff comprises = Chief Executive Officer and Country Head of Luxembourg, Conducting Officers and Head of Legal, Head of Compliance, Directors of the Company and Members of the Investment Committee.
Securities Financing Transactions Regulation (Unaudited)
As at 31 March 2021, the Sub-Funds do not hold any instruments falling into the scope of the Luxembourg Law of 6 June 2018 implementing the Securities Financing Transactions Regulation (EU) 2015/2365 (“SFT Regulation“).
Remuneration Disclosures (Unaudited)
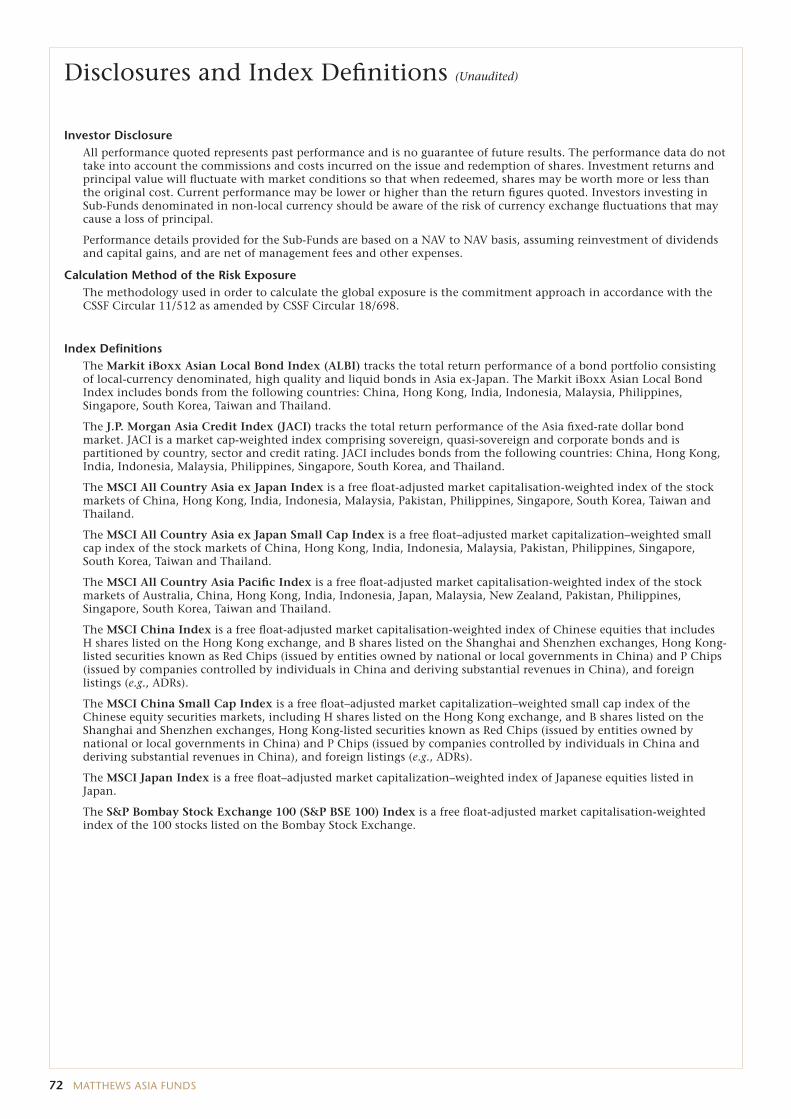
72 MATTHEWS ASIA FUNDS
Investor Disclosure All performance quoted represents past performance and is no guarantee of future results. The performance data do not
take into account the commissions and costs incurred on the issue and redemption of shares. Investment returns and principal value will fluctuate with market conditions so that when redeemed, shares may be worth more or less than the original cost. Current performance may be lower or higher than the return figures quoted. Investors investing in Sub-Funds denominated in non-local currency should be aware of the risk of currency exchange fluctuations that may cause a loss of principal.
Performance details provided for the Sub-Funds are based on a NAV to NAV basis, assuming reinvestment of dividends and capital gains, and are net of management fees and other expenses.
Calculation Method of the Risk Exposure The methodology used in order to calculate the global exposure is the commitment approach in accordance with the
CSSF Circular 11/512 as amended by CSSF Circular 18/698.
Index Definitions The Markit iBoxx Asian Local Bond Index (ALBI) tracks the total return performance of a bond portfolio consisting
of local-currency denominated, high quality and liquid bonds in Asia ex-Japan. The Markit iBoxx Asian Local Bond Index includes bonds from the following countries: China, Hong Kong, India, Indonesia, Malaysia, Philippines, Singapore, South Korea, Taiwan and Thailand.
The J.P. Morgan Asia Credit Index (JACI) tracks the total return performance of the Asia fixed-rate dollar bond market. JACI is a market cap-weighted index comprising sovereign, quasi-sovereign and corporate bonds and is partitioned by country, sector and credit rating. JACI includes bonds from the following countries: China, Hong Kong, India, Indonesia, Malaysia, Philippines, Singapore, South Korea, and Thailand.
The MSCI All Country Asia ex Japan Index is a free float-adjusted market capitalisation-weighted index of the stock markets of China, Hong Kong, India, Indonesia, Malaysia, Pakistan, Philippines, Singapore, South Korea, Taiwan and Thailand.
The MSCI All Country Asia ex Japan Small Cap Index is a free float–adjusted market capitalization–weighted small cap index of the stock markets of China, Hong Kong, India, Indonesia, Malaysia, Pakistan, Philippines, Singapore, South Korea, Taiwan and Thailand.
The MSCI All Country Asia Pacific Index is a free float-adjusted market capitalisation-weighted index of the stock markets of Australia, China, Hong Kong, India, Indonesia, Japan, Malaysia, New Zealand, Pakistan, Philippines, Singapore, South Korea, Taiwan and Thailand.
The MSCI China Index is a free float-adjusted market capitalisation-weighted index of Chinese equities that includes H shares listed on the Hong Kong exchange, and B shares listed on the Shanghai and Shenzhen exchanges, Hong Kong-listed securities known as Red Chips (issued by entities owned by national or local governments in China) and P Chips (issued by companies controlled by individuals in China and deriving substantial revenues in China), and foreign listings (e.g., ADRs).
The MSCI China Small Cap Index is a free float–adjusted market capitalization–weighted small cap index of the Chinese equity securities markets, including H shares listed on the Hong Kong exchange, and B shares listed on the Shanghai and Shenzhen exchanges, Hong Kong-listed securities known as Red Chips (issued by entities owned by national or local governments in China) and P Chips (issued by companies controlled by individuals in China and deriving substantial revenues in China), and foreign listings (e.g., ADRs).
The MSCI Japan Index is a free float–adjusted market capitalization–weighted index of Japanese equities listed in Japan.
The S&P Bombay Stock Exchange 100 (S&P BSE 100) Index is a free float-adjusted market capitalisation-weighted index of the 100 stocks listed on the Bombay Stock Exchange.
Disclosures and Index Definitions (Unaudited)

global.matthewsasia.com G-AR001-0321
©2021 Matthews Asia Funds (SICAV)