The Olstein Funds
86
Olstein All Cap Value Fund Olstein Strategic Opportunities Fund The Olstein Funds ANNUAL REPORT JUNE 30, 2015
-
Upload
khangminh22 -
Category
Documents
-
view
1 -
download
0
Transcript of The Olstein Funds
OlsteinAll Cap Value Fund
OlsteinStrategic Opportunities Fund
The Olstein Funds
A N N U A L R E P O R T
J U N E 3 0 , 2 0 1 5
O L S T E I N A L L C A P V A L U E F U N D
2
CON T EN T S
3 Olstein All Cap Value Fund
33 Olstein StrategicOpportunities Fund
63 Combined Notes toFinancial Statements
74 Report of IndependentRegistered Public Accounting Firm
75 Additional Information
O L S T E I N A L L C A P V A L U E F U N D
3
O L S T E I N A L L CA P VA LU E F UND
4 Letter to Shareholders
17 Expense Example
19 Schedule of Investments
26 Statement of Assetsand Liabilities
28 Statement of Operations
29 Statements of Changesin Net Assets
30 Financial Highlights
O L S T E I N A L L C A P V A L U E F U N D

Performance data quoted represents past performance. Past performance does not guarantee future results. All performance stated in this document assumes the reinvestment of dividends and capital gains. We caution shareholders that we can never predict or assure future returns on investments. The investment return and principal value of an investment with our Funds will fluctuate over time so that your shares, when redeemed, may be with more or less than their original cost. Current performance may be lower or higher than the performance data quoted. Click the following links for the annual expense ratios and standardized performance current to the most recent quarter and month end periods for The Olstein All Cap Value Fund.
O L S T E I N A L L C A P V A L U E F U N D
4
O L S T E I N A L L CA P VA LU E F UNDLetter to Shareholders
D E A R F E L L O W S H A R E H O L D E R S :
For the fiscal year ended June 30, 2015, Class C shares of the Olstein AllCap Value Fund appreciated 9.24%. During the same twelve month period,the S&P 500® Index appreciated 7.42% and the Russell 3000® Index appre-ciated 7.29%. For the three-year period ended June 30, 2015, Class C sharesof the Olstein All Cap Value Fund had an average annual return of 18.35%compared to annualized total returns of 17.31% for the S&P 500® Index and17.73% for the Russell 3000® Index.
M A R K E T O U T L O O K
The ongoing financial crisis in Greece, the slowdown in the Chinese economyand the expected negative impact of rising U.S. interest rates and strengthen-ing U.S. dollar caused an increase in market volatility during the first sixmonths of 2015 fueling forecasters’ predictions of a market pullback. Whilethere are always forecasters predicting the next market correction or down-turn, we believe it is important for investors to weather market events andperiods of short-term volatility by favoring the equities of financially strongcompanies with stable or growing free cash flow, run by managements thathave a demonstrated history of deploying cash to the benefit of shareholders.
In the current market, an enormous amount of investor money is flowinginto high revenue growth companies with little, if any, free cash flow (e.g.,internet, social media, etc.). The money flowing into these high revenuegrowth companies is coming from the liquidation of industrial stocks that, in
O L S T E I N A L L C A P V A L U E F U N D
The performance data quoted represents past performance and does not guaranteefuture results. The Olstein All Cap Value Fund’s Class C average annual return forthe one-year, five-year, and ten-year periods ended 6/30/15, assuming reinvestmentof dividends and capital gain distributions and deduction of the Olstein All CapValue Fund’s maximum CDSC of 1% during the one-year period, was 8.24%,16.11%, and 5.97%, respectively. Per the Fund’s prospectus dated 4/28/15, theexpense ratio for the Olstein All Cap Value Fund Class C was 2.28%. Performanceand expense ratios for other share classes will vary due to differences in sales chargestructure and class expenses. The investment return and principal value of an invest-ment will fluctuate so that an investor’s shares, when redeemed, may be worth moreor less than their original cost. Current performance may be lower or higher than per-formance quoted. To obtain performance data current to the most recent month endplease go to our website at www.olsteinfunds.com.
5
our opinion, are temporarily affected by a strong dollar and a less than robusteconomy (especially overseas), creating what we believe are deep discountstock purchase opportunities with free cash flow yields as high as 10%. Inthe current environment, there is a strong case for investing in equity securi-ties of companies whose real economic value is unrecognized by the market,obscured by recent market uncertainty or over shadowed by temporary prob-lems. We believe investors can find viable opportunities by focusing on fourprimary, company-specific factors: (1) a commitment to maintain a strongfinancial position as evidenced by a solid balance sheet; (2) an ability to gen-erate sustainable free cash flow; (3) management that intelligently deployscash balances and free cash flow from operations to increase returns to share-holders; and (4) a stock price that is at a discount to intrinsic value becauseof short-term factors. We further believe that, by prioritizing these factors,we are investing in companies that are positioned to compete more advanta-geously as economic growth accelerates.
O U R S T R A T E G Y
There are times when the combination of certain events, such as the Greekfinancial crisis and slowdown in the Chinese economy, tend to overwhelmequity markets and hit a value-oriented portfolio, such as the Fund’s, particu-larly hard causing a period of short-term underperformance. At the sametime, however, from our perspective as long-term value investors, the nega-tive reaction during periods of increased market volatility creates manyfavorable opportunities for the Fund to buy good companies at bargain prices.
Throughout the Fund’s history, Wall Street’s obsessive focus on short-termevents and obsession with pouring money into “exciting in your face highgrowth companies” selling at prices and valuations that have already morethan discounted the future growth (reducing the probability of future appreci-ation), often produced significant opportunities for the Fund to purchasestocks in under the radar with 8% to 10% free cash flow yielding companiesbeing thrown out the window to raise money for the overvalued excitingcompanies. The Fund usually purchases what we believe are undervaluedstocks selling at discounts to our calculation of intrinsic value, during periodsof pessimism and underperformance by the company or industry that we deemto be temporary. Before purchasing, we conclude that the bargain prices arenot warranted by our estimate of the company’s normalized ability to producefuture free cash flow. Buying high growth companies at any price can reducefuture returns. Although growth companies are exciting, the price you pay iscritical. For example, the stock of Coca Cola is still not above its 1998 highstock price (when investors believed it was worth 95 times earnings based onassuming nonstop double digit growth forever). We believe we are currently
O L S T E I N A L L C A P V A L U E F U N D

6
in one of those periods with many investors buying and selling stocks with lit-tle regard for company fundamentals. We, on the other hand, continue toseek and invest in companies that we believe have an ability to deliver long-term value to their shareholders that, in many cases, is not currently recog-nized by the market. We remain focused on individual companies, theiroperations and prospects for maintaining or growing sustainable free cashflow. Patience is the most important virtue of a value investor. Forever is anoverused word in our industry. Throughout our career, we have seen thatwhatever is working and/or not working over 3-6 month time periods, theword “forever” is usually attached. Rarely is “forever” true but the word pro-duces both overvalued and undervalued securities in most markets.
P O R T F O L I O R E V I E W
The Fund’s current portfolio consists of companies that we believe have asustainable competitive advantage, discernible balance sheet strength, amanagement team that emphasizes decisions based on cost of capital calcula-tions and deploys free cash flow to create shareholder value and are selling atdiscounts to our estimate of intrinsic value. We believe companies withthese characteristics are poised to eliminate the valuation gaps created by therecent events as the economic growth accelerates.
At June 30, 2015, the Olstein All Cap Value Fund portfolio consisted of 103holdings with an average weighted market capitalization of $57.57 billion.During the fiscal year, the Fund initiated positions in 30 companies andstrategically added to positions in 27 companies. Over the same time period,the Fund eliminated its holdings in 32 companies and strategically decreasedits holdings in another 12 companies.
Positions initiated during the last twelve months include: Alaska Air Group,Brady Corporation, Citizens Financial Group, Discovery Communications,Dorman Products, Dover Corp., DSW Inc., First Niagara Financial Group,HCA Inc., Janus Capital Group, JetBlue Airways, Johnson Controls Inc., JoyGlobal Inc., Keysight Technologies, MasterCard Inc., MSC Industrial DirectCo., NVIDIA Corp., Oshkosh Truck Corp, Owens-Illinois, Packaging Corpof America, Patterson Companies, Inc., Pentair Ltd., The TravelersCompanies, Twenty-First Century Fox, United Parcel Service, UniversalHealth Services Inc., Vasco Data Security, Viacom Inc., Visa Inc. and TheWendy’s Company.
Positions eliminated during the past twelve months include: 3M Company,ABB Ltd., American Express, Ann Inc., Avery Dennison, BaxterInternational, CR Bard, Inc., CareFusion Corp., Charles River LaboratoriesInc., Cintas Corp., Coca-Cola Company, Deere & Co., DentsplyInternational Inc., DuPont, Ethan Allen Interiors, Hormel Foods Corp.,
O L S T E I N A L L C A P V A L U E F U N D

7
International Game Technology, Jones Lang LaSalle Inc., McDonalds Corp.,Newell Rubbermaid Inc., NOW Inc., PetSmart Inc., Quest Diagnostics, RossStores Inc., Sysco Corp., Teleflex Inc., TJX Companies Inc., TRWAutomotive Holdings, URS Corp., V F Corp., Walt Disney Company andWhole Foods Market Inc. As previously discussed in shareholder letters forthe third and fourth quarters of 2014, the Fund eliminated its positions inCareFusion Corp., International Game Technology, PetSmart, Inc., TRWAutomotive Holdings and URS Corp. on very favorable terms as these com-panies were targeted by strategic acquirers during the reporting period.
Our LeadersThe stocks which contributed positively to performance for the twelve-month reporting period include: Sealed Air Corp, Universal Health Services,UnitedHealth Group, Zoetis, Inc., and Ross Stores. At the close of the fiscalyear, the Fund continued to hold Sealed Air, Universal Health Services,UnitedHealth Group and Zoetis, Inc. The Fund sold its position in RossStores, which it held for a couple of years as the price of the company’s stockreached our valuation level during the fourth quarter of 2014.
Our LaggardsLaggards during the twelve-month reporting period include: NationalOilwell Varco, Fossil Group, Now, Inc., Vishay Intertechnology and WescoInternational. As of the close of the reporting period, the Fund continued tohold National Oilwell Varco, Fossil Group, Vishay Intertechnology andWesco International in its portfolio. The Fund acquired the equity of NOWas a result of a spinoff from National Oilwell Varco in early June 2014, andheld the company’s stock despite falling oil prices during the second half of2014. The Fund liquidated its position in NOW in February of 2015 as oilprices continued to fall and the outlook for oil remained uncertain.
A V A L U E I N V E S T O R ’ S P E R S P E C T I V EO N T U R B U L E N T M A R K E T S
To a certain degree, investor apprehension and concerns about equity mar-kets are understandable when considering the media’s breathless coverage ofnegative events. Whether it is the Greek debt crisis, uncertainty about thefuture of the Eurozone, the economic slowdown in China or the expectednegative impact of a strengthening U.S. dollar on corporate earnings, crisesand calamities continue to dominate headlines and shake investor confi-dence. It feels like yesterday that the media were warning investors aboutthe future devastating impact of the “Fiscal Cliff” and government shutdownright before the stock market went on a material rise. While we do not mini-
O L S T E I N A L L C A P V A L U E F U N D

8
mize the potential worst-case scenarios that any of these events may bring toequity markets, we believe it is more important to distinguish between thevariability of an investment’s value due to temporary market volatility andthe likelihood of permanent impairment of an investors’ capital. For a valueinvestor, short-term market volatility is less of a concern than the irreversibleloss of capital due to the erosion of a company’s fundamentals over time.Another meaningful worry for value investors is a poorly timed decision tosell a particular holding by reacting to short-term events that turned out tobe temporary and had little to do with a company’s long-term ability to gen-erate normalized free cash flow and thus its intrinsic value.
F O C U S I N G O N F A C T O R S C O N D U C I V ET O F A V O R A B L E P E R F O R M A N C E
In our experience, pessimism about the direction of the overall market oftenleads investors to make poorly timed asset allocation or sell decisions, blind-ing an investor to the long-term future appreciation potential of companieswith a sustainable competitive advantage, discernible balance sheet strengthand a management team that effectively adjusts to challenging times to cre-ate meaningful shareholder value. Companies with such characteristics arenot only poised to overcome temporary valuation gaps created by marketvolatility but are usually in a position to achieve greater capital appreciationas market conditions improve and economic activity accelerates. While webelieve investors are wise to be wary of risk, we also believe that instead ofmaking investment decisions based on market sentiment, investors shouldfocus on opportunities for meaningful capital appreciation by studying oppor-tunities presented by individual company fundamentals after a forensicanalysis of financial statements.
From our perspective as value investors, recent market volatility has pro-duced an environment in which there are many individual opportunities thatoffer investors the potential for above-average capital appreciation. Ourquest for value is guided by two prerequisites: (1) a company’s ability to gen-erate sustainable future free cash flow; and (2) securities prices that allow usto buy good companies with solid balance sheets and profitable businessmodels at very advantageous prices. These two requirements guide ourinvestment process and force us to focus on a company’s future prospects andvalue while capitalizing on current favorable prices.
Uncertainty and volatility usually present opportunities when determiningthe future value of a company, even under normal market conditions.However, when market downturns or periods of volatility hit equity marketsacross the board – roughly half of S&P 500 Index companies have negativeyear-to-date performance through July 28, 2015 – the stocks of many good
O L S T E I N A L L C A P V A L U E F U N D

9
O L S T E I N A L L C A P V A L U E F U N D
companies are penalized by negative market sentiment or reduced expecta-tions that have little to do with a company’s underlying financial perform-ance. A company may have the misfortune of being in a sector that hasfallen out of favor or may have material revenues in an industry that isexpected to underperform for a period of time. A portion of a company’sbusiness may originate from a country or region suffering from a pullback ineconomic activity or a company may have exposure to an unfavorable eco-nomic trend such as falling commodities prices. Whatever the reason,investors often feed off of and into broad negative market sentiment to pullback from a broad range of companies without regard for individual companyperformance or without considering how well individual companies mayweather such adversity. Most investors, as always, believe negative trends orpositive trends are forever creating pockets of overvaluation and undervalua-tion during all markets.
For value investors, this often short-sighted market dynamic creates ampleopportunities to buy great companies at substantial discounts which, in turn,sows the seeds for future potential outperformance. We never know theexact timing of sentiment changes and, thus, our timing is based on the sizeof the discount from our calculation of long-term intrinsic value rather thantrying to gauge the specific date that market sentiment changes. For us, themost important metric for identifying superior investment opportunities inan uncertain market is a company’s ability to generate future sustainable freecash flow. We look to invest in companies with strong balance sheets thathave not only have the financial strength to weather periods of economicuncertainty but have also demonstrated an ability to allocate capital wiselyduring such challenging periods. Because we are so focused on a company’sability to generate free cash flow during both favorable and unfavorable eco-nomic cycles, we often identify many investment opportunities initially over-looked by the market or disregarded by investors too concerned with thevolatility or pessimism dominating the ‘here and now’. If an investorbelieves as we do that a company’s ability to generate future free cash flow isthe primary determinant of its value as an ongoing enterprise, then a compa-ny’s ability to adapt to a challenging environment and continue to generatesustainable free cash flow will separate it from its competition and eventuallydraw the favorable attention of equity investors as markets regain a more bal-anced perspective and the company hopefully begins to show signs of its nor-malized ability to generate future free cash flow.
We believe an analysis on a company by company basis and not overall mar-ket sentiment, should concern investors - what is the cash return an investorcan expect from owning a share of a business over the next three to fiveyears, and does that return compensate the investor sufficiently in excess ofthe risk-free rate for the risk of investing in equities? To us, this last question

10
holds greater importance at a time when nervous investors are being told,often quite loudly, to avoid equities and seek safer opportunities. We believesuch times have the potential to set up significant above-average long-terminvestment returns.
W H E R E W E A R E N O W –T H E S E E D S W E ’ V E S O W N
As previously reported in this letter, as of June 30, 2015, the Olstein All CapValue Fund portfolio consisted of 103 holdings with the Fund initiating 30holdings and eliminating 32 holdings over the past twelve months. Of these103 holdings, the Fund has considerable exposure to unusual value opportu-nities whose future prospects, in our opinion, are currently unrecognized,misunderstood, disregarded or undervalued by the current market.
Since the beginning of the fiscal year, 25 of the Fund’s holdings (representingapproximately 27% of the Fund’s equity investments) have been the subjectof significant announcements, including three merger & acquisition deals,two completed spinoffs as well as a contemplated spinoff; six share repurchaseplans, seven substantial dividend increases (four of these dividend increaseswere announced along with share repurchase programs) and ten activist cam-paigns. We are hopeful that, over our expected holding period, the Fund willbenefit from a continuation of these value-creation initiatives as marketsregain a surer footing and activist investors look under the microscope forundervalued free cash flow companies affected by temporary conditions.
What made each of the 23 companies mentioned above that were the sub-ject of value enhancing corporate actions appealing to us as value investorswere favorable company-specific characteristics (unique product or serviceniche, competitive strength, and clean capital structure), an ability to gener-ate sustainable free cash flow and stocks trading at a significant discount toour determination of each company’s intrinsic value. While the combina-tion of these factors pointed to significant potential for capital appreciation,our in-depth understanding of each company’s potential usually flew in theface of the short-term collective wisdom regarding its future prospects andthat is precisely the reason we were able to buy these companies at materialdiscounts. With a period of market volatility added into the mix, the poten-tial for such unusual value situations was further clouded, and, thus, thesecompanies tend to get hit a little harder over the short-term. As with manyof our investments, we usually find ourselves patiently waiting for the rest ofthe market to recognize and understand a company’s true investment poten-tial before we see the valuation gap close. We usually keep some cash fire-power to add to the positions if the stock prices continue to fall for noapparent long-term value reason. As volatility once again shakes markets,
O L S T E I N A L L C A P V A L U E F U N D
11
we realize that it may take a little longer for the market to see what we seeand remind you that it is the patient investor that usually reaps above-aver-age rewards. The exact timing as to precisely when (or if) an activist oranother catalyst strikes is virtually impossible and that is why we believe theFund is for investors with a 3-5 year investment horizon. Investors trying totime the Fund based on past experience or temporary moves up or downhave been mostly wrong in the past and, we believe, will unfortunately con-tinue to do so. No philosophy or discipline works all of the time and, in fact,any attempt to make this happen is a long term failure process.
F I N A L T H O U G H T S
As value investors, we believe in having a long-term horizon in an environ-ment that is maniacally focused on short-term events. We believe that ourlong-term horizon, in conjunction with our emphasis on an in-depth analysisof financial statements, should provide the Fund with an advantage evenduring the most negative environments. To repeat, we believe in perform-ance over time and believe that any attempt to perform all of the time wouldbe an impediment to performing over time, especially when the core of ourphilosophy seeks to buy companies at bargain prices. Battleships do not turnon a dime and bargains usually require patience until being discovered by theinvestment masses. It is our opinion that purchases made in the Fund’s port-folio during the most recent period of extreme market negativity shouldresult in higher future rates of return. The market is a discounting mecha-nism and, while past performance is not necessarily indicative of futureresults, it is noteworthy that the seeds of past periods of relative outperfor-mance were often sown during previous periods of extreme volatility.
Uncertainty and fear, fueled by troubling news, short-term events and con-flicting economic data usually produces the discounted stock prices we seekto take advantage of. Individual stock and/or market declines or just plainmisperception, often present us with buying opportunities, especially if webelieve the short-term events are of little consequence to the long-termvalue. While price declines present us with buying opportunities, low stockprices are not the sole criteria for buying companies for our portfolio underour strict free cash flow value-based stock selection criteria. Additional cri-teria include: strong balance sheets; well-run operations which have the abil-ity to consistently generate excess free cash flow and company managementswith a disciplined track record of improving the returns of the business.
We believe the best approach for an uneven economic and investment envi-ronment is to buy companies that have the ability to generate free cash flow,have little or no debt or are aggressively paying down debt and to buy suchcompanies at a significant discount to our assessment of their intrinsic value.
O L S T E I N A L L C A P V A L U E F U N D

12
The Fund’s portfolio primarily consists of fiscally strong, excess cash flowcompanies whose businesses, in our opinion, are primed to provide suitablereturns over the long-term.
We value your trust and remind you that our money is invested alongsideyours as we work hard to accomplish the Fund’s objective of long-term capi-tal appreciation. We look forward to writing to you again at the close of thenext quarter.
Sincerely,
Robert A. Olstein Eric HeymanChairman and Chief Investment Officer Co-Portfolio Manager
O L S T E I N A L L C A P V A L U E F U N D

13
O L S T E I N A L L C A P V A L U E F U N D
9/21/95 $10,0009/30/95 10,010
12/31/95 10,2613/31/96 10,8826/30/96 11,4629/30/96 11,713
12/31/96 12,7603/31/97 13,3276/30/97 14,6029/30/97 17,250
12/31/97 17,2053/31/98 19,8516/30/98 18,4689/30/98 15,499
12/31/98 19,7883/31/99 20,7176/30/99 25,3659/30/99 23,675
12/31/99 26,6923/31/00 28,1706/30/00 28,8999/30/00 30,596
12/31/00 30,1423/31/01 30,2076/30/01 36,1929/30/01 28,213
12/31/01 35,3403/31/02 38,2596/30/02 33,7979/30/02 25,870
12/31/02 28,5283/31/03 26,2266/30/03 31,4489/30/03 33,797
12/31/03 38,8533/31/04 40,8706/30/04 41,2979/30/04 39,043
12/31/04 43,1463/31/05 42,6406/30/05 42,302
9/30/05 43,74912/31/05 44,350
3/31/06 46,5666/30/06 44,2419/30/06 46,836
12/31/06 50,7553/31/07 51,8636/30/07 55,5369/30/07 53,029
12/31/07 49,0123/31/08 42,4476/30/08 40,1899/30/08 38,452
12/31/08 27,5453/31/09 24,7676/30/09 30,1029/30/09 35,648
12/31/09 37,7413/31/10 40,3926/30/10 35,7889/30/10 39,695
12/31/10 43,8453/31/11 45,2766/30/11 45,3109/30/11 37,497
12/31/11 41,9623/31/12 48,5196/30/12 45,5559/30/12 47,159
12/31/12 48,3803/31/13 54,2756/30/13 56,7869/30/13 60,379
12/31/13 65,9953/31/14 66,8676/30/14 69,1349/30/14 69,413
12/31/14 75,9133/31/15 77,2906/30/15 75,525
Details:The performance data quoted represents past performance and does not guaranteefuture results. The Olstein All Cap Value Fund’s Class C average annual return forthe one-year, five-year, and ten-year periods ended 6/30/15, assuming reinvestment
The following chart illustrates the growth, on a quarterly basis, of a hypothet-ical $10,000 investment made in the Olstein All Cap Value Fund’s Class Cshare at the Olstein All Cap Value Fund’s inception date of September 21,1995. (With dividends and capital gain distributions reinvested but no deduc-tion of taxes on reinvested distributions—see important disclosures below):
Value of Shares Owned, Value of Shares Owned,If Initial Investment If Initial Investment
Date was $10,000 Date was $10,000_____________________________ _____________________________

14
O L S T E I N A L L C A P V A L U E F U N D
of dividends and capital gain distributions and deduction of the Olstein All Cap ValueFund’s maximum CDSC of 1% during the one-year period, was 8.24%, 16.11%,and 5.97%, respectively. Per the Fund’s prospectus dated 4/28/15, the expense ratiofor the Olstein All Cap Value Fund Class C was 2.28%. Performance and expenseratios for other share classes will vary due to differences in sales charge structure andclass expenses. The investment return and principal value of an investment will fluc-tuate so that an investor’s shares, when redeemed, may be worth more or less thantheir original cost. Current performance may be lower or higher than performancequoted. To obtain performance data current to the most recent month end please goto our website at www.olsteinfunds.com.
A current prospectus may be obtained by calling (800) 799-2113 or visiting TheOlstein Funds’ website at www.olsteinfunds.com.
The above represents opinion, and is not intended to be a forecast of future events,a guarantee of future results, or investment advice. The references to securities arenot buy or sell recommendations, but are intended to be descriptive examples of theFund’s investment philosophy and are subject to change. Do not make investmentsbased on the securities referenced.
The Olstein Funds follow a value-oriented investment approach. However, a par-ticular value stock may not increase in price as the Investment Manager anticipatesand may actually decline in price if other investors fail to recognize the stock’s valueor if a catalyst that the Investment Manager believes will increase the price of thestock does not occur or does not affect the price of the stock in the manner or to thedegree that the Investment Manager anticipated. Also, the Investment Manager’scalculation of a stock’s private market value involves estimates of future cash flowwhich may prove to be incorrect and, therefore, could result in sales of the stock atprices lower than the Fund’s original purchase price.
The S&P 500® Index is an unmanaged index created by Standard & Poor’sCorporation that includes a representative sample of 500 leading companies inleading industries of the U.S. economy and is considered to represent the U.S.stock market performance in general. The Russell 3000® Index is an unmanagedindex that measures the performance of the 3,000 largest U.S. companies based ontotal market capitalization, and represents approximately 98% of the investableU.S. Equity market. Investors cannot actually make investments in either index.
Not FDIC insured – Not bank-guaranteed – May lose value.
Distributed by Olstein Capital Management, L.P. – Member FINRA.
15
O L S T E I N A L L C A P V A L U E F U N D
$17,854
$21,894
6/30
/05
6/30
/06
$21,377
6/30
/07
6/30
/08
6/30
/09
6/30
/10
$5,000
$10,000
$15,000
$20,000
$25,000
$30,000
$35,000
Olstein All Cap Value Fund – Class C S&P 500® Index Russell 3000® Index
6/30
/11
6/30
/12
6/30
/13
6/30
/14
6/30
/15
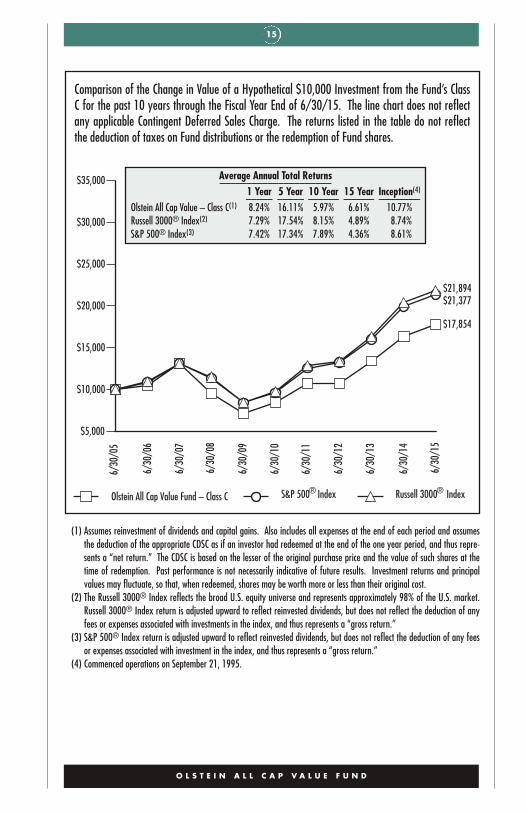
(1) Assumes reinvestment of dividends and capital gains. Also includes all expenses at the end of each period and assumesthe deduction of the appropriate CDSC as if an investor had redeemed at the end of the one year period, and thus repre-sents a “net return.” The CDSC is based on the lesser of the original purchase price and the value of such shares at thetime of redemption. Past performance is not necessarily indicative of future results. Investment returns and principalvalues may fluctuate, so that, when redeemed, shares may be worth more or less than their original cost.
(2) The Russell 3000® Index reflects the broad U.S. equity universe and represents approximately 98% of the U.S. market.Russell 3000® Index return is adjusted upward to reflect reinvested dividends, but does not reflect the deduction of anyfees or expenses associated with investments in the index, and thus represents a “gross return.”
(3) S&P 500® Index return is adjusted upward to reflect reinvested dividends, but does not reflect the deduction of any feesor expenses associated with investment in the index, and thus represents a “gross return.”
(4) Commenced operations on September 21, 1995.
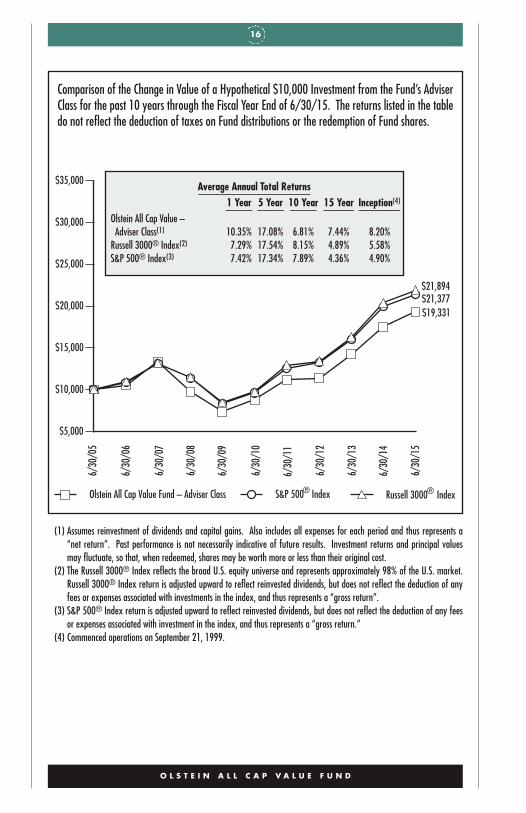
Average Annual Total Returns_____________________1 Year 5 Year 10 Year 15 Year Inception(4)_____ _____ ______ ______ _________
Olstein All Cap Value – Class C(1) 8.24% 16.11% 5.97% 6.61% 10.77%Russell 3000® Index(2) 7.29% 17.54% 8.15% 4.89% 8.74%S&P 500® Index(3) 7.42% 17.34% 7.89% 4.36% 8.61%
Comparison of the Change in Value of a Hypothetical $10,000 Investment from the Fund’s ClassC for the past 10 years through the Fiscal Year End of 6/30/15. The line chart does not reflectany applicable Contingent Deferred Sales Charge. The returns listed in the table do not reflectthe deduction of taxes on Fund distributions or the redemption of Fund shares.
16
O L S T E I N A L L C A P V A L U E F U N D
$5,000
$10,000
$15,000
$20,000
$25,000
$30,000
$35,000
Olstein All Cap Value Fund – Adviser Class S&P 500® Index Russell 3000® Index
$21,894
$19,331
6/30
/05
6/30
/06
$21,377
6/30
/07
6/30
/08
6/30
/09
6/30
/10
6/30
/11
6/30
/12
6/30
/13
6/30
/14
6/30
/15
(1) Assumes reinvestment of dividends and capital gains. Also includes all expenses for each period and thus represents a“net return”. Past performance is not necessarily indicative of future results. Investment returns and principal valuesmay fluctuate, so that, when redeemed, shares may be worth more or less than their original cost.
(2) The Russell 3000® Index reflects the broad U.S. equity universe and represents approximately 98% of the U.S. market.Russell 3000® Index return is adjusted upward to reflect reinvested dividends, but does not reflect the deduction of anyfees or expenses associated with investments in the index, and thus represents a “gross return”.
(3) S&P 500® Index return is adjusted upward to reflect reinvested dividends, but does not reflect the deduction of any feesor expenses associated with investment in the index, and thus represents a “gross return.”
(4) Commenced operations on September 21, 1999.
Comparison of the Change in Value of a Hypothetical $10,000 Investment from the Fund’s AdviserClass for the past 10 years through the Fiscal Year End of 6/30/15. The returns listed in the tabledo not reflect the deduction of taxes on Fund distributions or the redemption of Fund shares.
Average Annual Total Returns_____________________1 Year 5 Year 10 Year 15 Year Inception(4)_____ _____ _____ ______ _________
Olstein All Cap Value –Adviser Class(1) 10.35% 17.08% 6.81% 7.44% 8.20%
Russell 3000® Index(2) 7.29% 17.54% 8.15% 4.89% 5.58%S&P 500® Index(3) 7.42% 17.34% 7.89% 4.36% 4.90%
17
O L S T E I N A L L C A P V A L U E F U N D
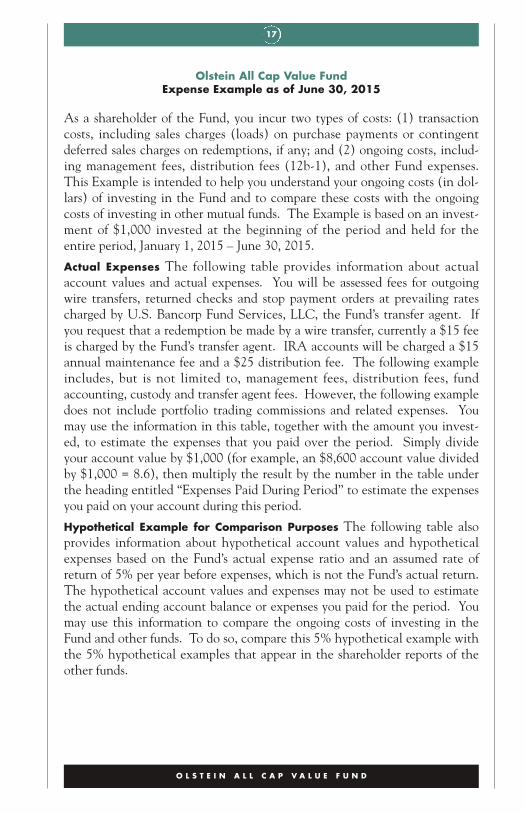
Olstein All Cap Value FundExpense Example as of June 30, 2015
As a shareholder of the Fund, you incur two types of costs: (1) transactioncosts, including sales charges (loads) on purchase payments or contingentdeferred sales charges on redemptions, if any; and (2) ongoing costs, includ-ing management fees, distribution fees (12b-1), and other Fund expenses.This Example is intended to help you understand your ongoing costs (in dol-lars) of investing in the Fund and to compare these costs with the ongoingcosts of investing in other mutual funds. The Example is based on an invest-ment of $1,000 invested at the beginning of the period and held for theentire period, January 1, 2015 – June 30, 2015.
Actual Expenses The following table provides information about actualaccount values and actual expenses. You will be assessed fees for outgoingwire transfers, returned checks and stop payment orders at prevailing ratescharged by U.S. Bancorp Fund Services, LLC, the Fund’s transfer agent. Ifyou request that a redemption be made by a wire transfer, currently a $15 feeis charged by the Fund’s transfer agent. IRA accounts will be charged a $15annual maintenance fee and a $25 distribution fee. The following exampleincludes, but is not limited to, management fees, distribution fees, fundaccounting, custody and transfer agent fees. However, the following exampledoes not include portfolio trading commissions and related expenses. Youmay use the information in this table, together with the amount you invest-ed, to estimate the expenses that you paid over the period. Simply divideyour account value by $1,000 (for example, an $8,600 account value dividedby $1,000 = 8.6), then multiply the result by the number in the table underthe heading entitled “Expenses Paid During Period’’ to estimate the expensesyou paid on your account during this period.
Hypothetical Example for Comparison Purposes The following table alsoprovides information about hypothetical account values and hypotheticalexpenses based on the Fund’s actual expense ratio and an assumed rate ofreturn of 5% per year before expenses, which is not the Fund’s actual return.The hypothetical account values and expenses may not be used to estimatethe actual ending account balance or expenses you paid for the period. Youmay use this information to compare the ongoing costs of investing in theFund and other funds. To do so, compare this 5% hypothetical example withthe 5% hypothetical examples that appear in the shareholder reports of theother funds.

18
O L S T E I N A L L C A P V A L U E F U N D
Common Stocks Short-Term Investments-10%
0%
10%
20%
30%
40%
50%
60%
70%
80%
90%
100%
96.0% 4.0%
Please note that the expenses shown in the table are meant to highlight yourongoing costs only and do not reflect any transactional costs, such as salescharges (loads) on purchase payments or contingent deferred sales charges onredemptions, if any. Therefore, the hypothetical information is useful incomparing ongoing costs only, and will not help you determine the relativetotal costs of owning different funds. In addition, if these transactional costswere included, your costs would have been higher.All Cap Value Fund
Beginning Ending Expenses PaidAccount Value Account Value During Period*
1/1/15 6/30/15 1/1/15 – 6/30/15Actual
Class C $1,000.00 $994.90 $11.13Adviser Class $1,000.00 $999.60 $6.20
Hypothetical (5% annualreturn before expenses)
Class C $1,000.00 $1,013.64 $11.23Adviser Class $1,000.00 $1,018.60 $6.26
* Expenses are equal to the Fund’s annualized expense ratio of 2.25% and 1.25% for Class C and Adviser Class, respectively,multiplied by the average account value over the period, multiplied by 181/365 (to reflect the one-half year period).
Allocation of Portfolio Assets as a percentage of investmentsJune 30, 2015
19
The accompanying notes are an integral part of these financial statements.
O L S T E I N A L L C A P V A L U E F U N D
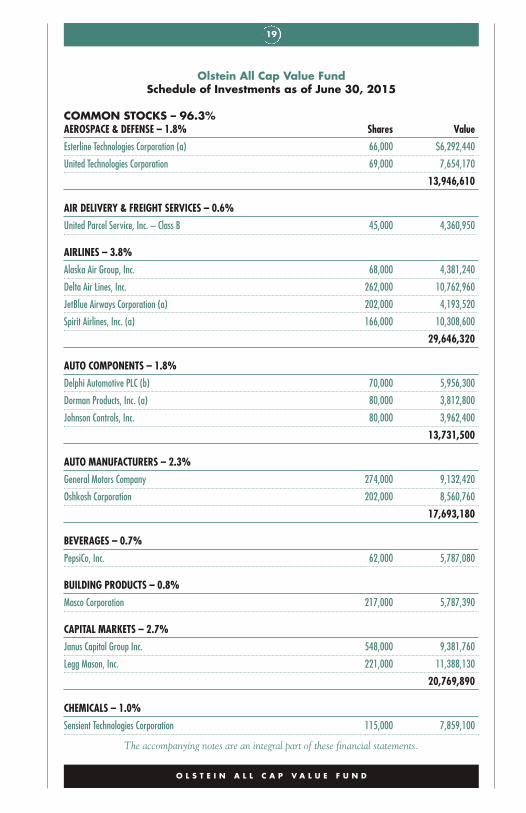
Olstein All Cap Value FundSchedule of Investments as of June 30, 2015
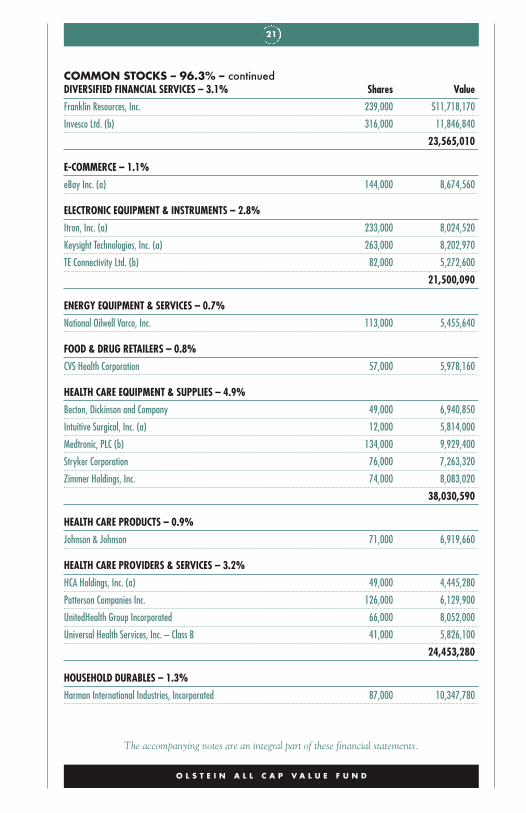
COMMON STOCKS – 96.3%AEROSPACE & DEFENSE – 1.8% Shares Value
Esterline Technologies Corporation (a) 66,000 $6,292,440
United Technologies Corporation 69,000 7,654,170
13,946,610
AIR DELIVERY & FREIGHT SERVICES – 0.6%
United Parcel Service, Inc. – Class B 45,000 4,360,950
AIRLINES – 3.8%
Alaska Air Group, Inc. 68,000 4,381,240
Delta Air Lines, Inc. 262,000 10,762,960
JetBlue Airways Corporation (a) 202,000 4,193,520
Spirit Airlines, Inc. (a) 166,000 10,308,600
29,646,320
AUTO COMPONENTS – 1.8%
Delphi Automotive PLC (b) 70,000 5,956,300
Dorman Products, Inc. (a) 80,000 3,812,800
Johnson Controls, Inc. 80,000 3,962,400
13,731,500
AUTO MANUFACTURERS – 2.3%
General Motors Company 274,000 9,132,420
Oshkosh Corporation 202,000 8,560,760
17,693,180
BEVERAGES – 0.7%
PepsiCo, Inc. 62,000 5,787,080
BUILDING PRODUCTS – 0.8%
Masco Corporation 217,000 5,787,390
CAPITAL MARKETS – 2.7%
Janus Capital Group Inc. 548,000 9,381,760
Legg Mason, Inc. 221,000 11,388,130
20,769,890
CHEMICALS – 1.0%
Sensient Technologies Corporation 115,000 7,859,100
20
The accompanying notes are an integral part of these financial statements.
O L S T E I N A L L C A P V A L U E F U N D
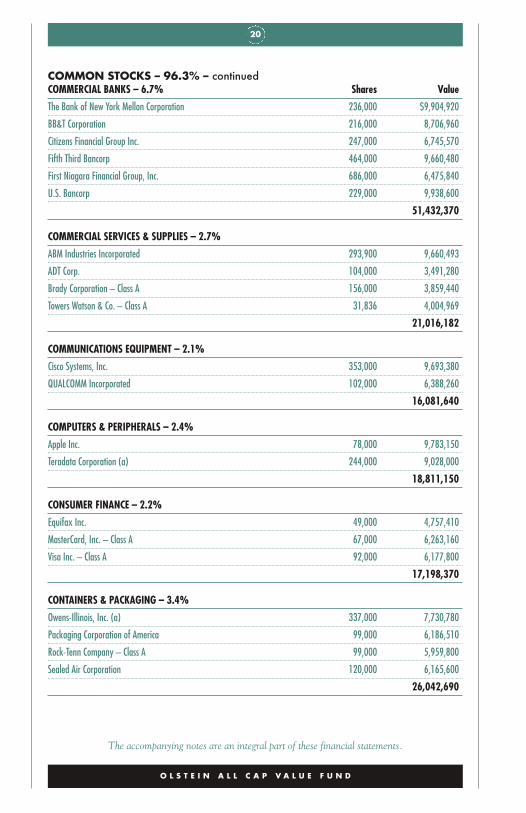
COMMON STOCKS – 96.3% – continuedCOMMERCIAL BANKS – 6.7% Shares Value
The Bank of New York Mellon Corporation 236,000 $9,904,920
BB&T Corporation 216,000 8,706,960
Citizens Financial Group Inc. 247,000 6,745,570
Fifth Third Bancorp 464,000 9,660,480
First Niagara Financial Group, Inc. 686,000 6,475,840
U.S. Bancorp 229,000 9,938,600
51,432,370
COMMERCIAL SERVICES & SUPPLIES – 2.7%
ABM Industries Incorporated 293,900 9,660,493
ADT Corp. 104,000 3,491,280
Brady Corporation – Class A 156,000 3,859,440
Towers Watson & Co. – Class A 31,836 4,004,969
21,016,182
COMMUNICATIONS EQUIPMENT – 2.1%
Cisco Systems, Inc. 353,000 9,693,380
QUALCOMM Incorporated 102,000 6,388,260
16,081,640
COMPUTERS & PERIPHERALS – 2.4%
Apple Inc. 78,000 9,783,150
Teradata Corporation (a) 244,000 9,028,000
18,811,150
CONSUMER FINANCE – 2.2%
Equifax Inc. 49,000 4,757,410
MasterCard, Inc. – Class A 67,000 6,263,160
Visa Inc. – Class A 92,000 6,177,800
17,198,370
CONTAINERS & PACKAGING – 3.4%
Owens-Illinois, Inc. (a) 337,000 7,730,780
Packaging Corporation of America 99,000 6,186,510
Rock-Tenn Company – Class A 99,000 5,959,800
Sealed Air Corporation 120,000 6,165,600
26,042,690
21
The accompanying notes are an integral part of these financial statements.
O L S T E I N A L L C A P V A L U E F U N D
COMMON STOCKS – 96.3% – continuedDIVERSIFIED FINANCIAL SERVICES – 3.1% Shares Value
Franklin Resources, Inc. 239,000 $11,718,170
Invesco Ltd. (b) 316,000 11,846,840
23,565,010
E-COMMERCE – 1.1%
eBay Inc. (a) 144,000 8,674,560
ELECTRONIC EQUIPMENT & INSTRUMENTS – 2.8%
Itron, Inc. (a) 233,000 8,024,520
Keysight Technologies, Inc. (a) 263,000 8,202,970
TE Connectivity Ltd. (b) 82,000 5,272,600
21,500,090
ENERGY EQUIPMENT & SERVICES – 0.7%
National Oilwell Varco, Inc. 113,000 5,455,640
FOOD & DRUG RETAILERS – 0.8%
CVS Health Corporation 57,000 5,978,160
HEALTH CARE EQUIPMENT & SUPPLIES – 4.9%
Becton, Dickinson and Company 49,000 6,940,850
Intuitive Surgical, Inc. (a) 12,000 5,814,000
Medtronic, PLC (b) 134,000 9,929,400
Stryker Corporation 76,000 7,263,320
Zimmer Holdings, Inc. 74,000 8,083,020
38,030,590
HEALTH CARE PRODUCTS – 0.9%
Johnson & Johnson 71,000 6,919,660
HEALTH CARE PROVIDERS & SERVICES – 3.2%
HCA Holdings, Inc. (a) 49,000 4,445,280
Patterson Companies Inc. 126,000 6,129,900
UnitedHealth Group Incorporated 66,000 8,052,000
Universal Health Services, Inc. – Class B 41,000 5,826,100
24,453,280
HOUSEHOLD DURABLES – 1.3%
Harman International Industries, Incorporated 87,000 10,347,780
22
The accompanying notes are an integral part of these financial statements.
O L S T E I N A L L C A P V A L U E F U N D
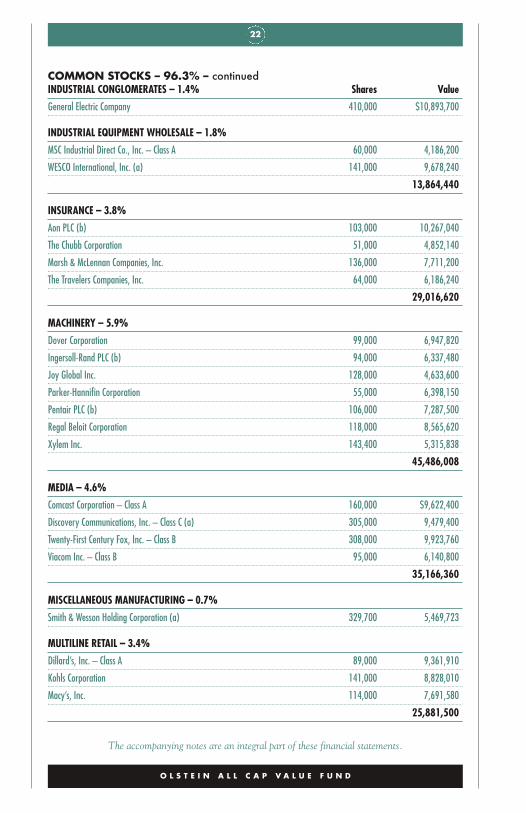
COMMON STOCKS – 96.3% – continuedINDUSTRIAL CONGLOMERATES – 1.4% Shares Value
General Electric Company 410,000 $10,893,700
INDUSTRIAL EQUIPMENT WHOLESALE – 1.8%
MSC Industrial Direct Co., Inc. – Class A 60,000 4,186,200
WESCO International, Inc. (a) 141,000 9,678,240
13,864,440
INSURANCE – 3.8%
Aon PLC (b) 103,000 10,267,040
The Chubb Corporation 51,000 4,852,140
Marsh & McLennan Companies, Inc. 136,000 7,711,200
The Travelers Companies, Inc. 64,000 6,186,240
29,016,620
MACHINERY – 5.9%
Dover Corporation 99,000 6,947,820
Ingersoll-Rand PLC (b) 94,000 6,337,480
Joy Global Inc. 128,000 4,633,600
Parker-Hannifin Corporation 55,000 6,398,150
Pentair PLC (b) 106,000 7,287,500
Regal Beloit Corporation 118,000 8,565,620
Xylem Inc. 143,400 5,315,838
45,486,008
MEDIA – 4.6%
Comcast Corporation – Class A 160,000 $9,622,400
Discovery Communications, Inc. – Class C (a) 305,000 9,479,400
Twenty-First Century Fox, Inc. – Class B 308,000 9,923,760
Viacom Inc. – Class B 95,000 6,140,800
35,166,360
MISCELLANEOUS MANUFACTURING – 0.7%
Smith & Wesson Holding Corporation (a) 329,700 5,469,723
MULTILINE RETAIL – 3.4%
Dillard’s, Inc. – Class A 89,000 9,361,910
Kohls Corporation 141,000 8,828,010
Macy’s, Inc. 114,000 7,691,580
25,881,500
23
The accompanying notes are an integral part of these financial statements.
O L S T E I N A L L C A P V A L U E F U N D
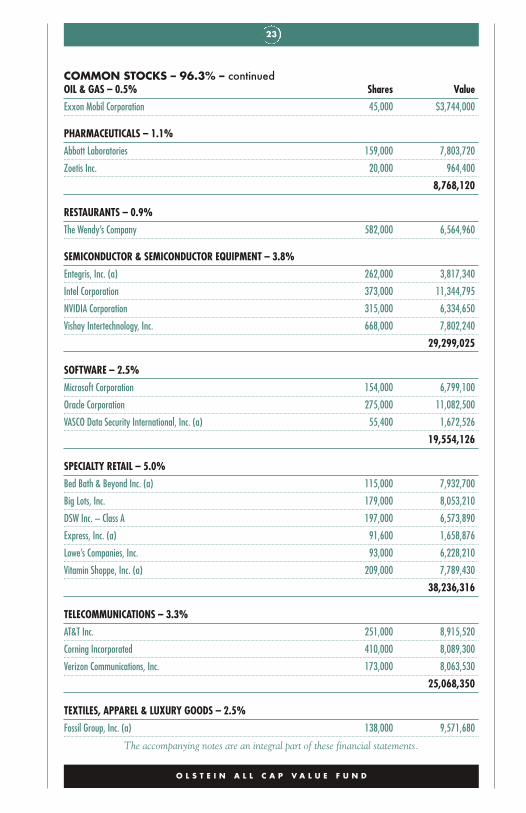
COMMON STOCKS – 96.3% – continuedOIL & GAS – 0.5% Shares Value
Exxon Mobil Corporation 45,000 $3,744,000
PHARMACEUTICALS – 1.1%
Abbott Laboratories 159,000 7,803,720
Zoetis Inc. 20,000 964,400
8,768,120
RESTAURANTS – 0.9%
The Wendy’s Company 582,000 6,564,960
SEMICONDUCTOR & SEMICONDUCTOR EQUIPMENT – 3.8%
Entegris, Inc. (a) 262,000 3,817,340
Intel Corporation 373,000 11,344,795
NVIDIA Corporation 315,000 6,334,650
Vishay Intertechnology, Inc. 668,000 7,802,240
29,299,025
SOFTWARE – 2.5%
Microsoft Corporation 154,000 6,799,100
Oracle Corporation 275,000 11,082,500
VASCO Data Security International, Inc. (a) 55,400 1,672,526
19,554,126
SPECIALTY RETAIL – 5.0%
Bed Bath & Beyond Inc. (a) 115,000 7,932,700
Big Lots, Inc. 179,000 8,053,210
DSW Inc. – Class A 197,000 6,573,890
Express, Inc. (a) 91,600 1,658,876
Lowe’s Companies, Inc. 93,000 6,228,210
Vitamin Shoppe, Inc. (a) 209,000 7,789,430
38,236,316
TELECOMMUNICATIONS – 3.3%
AT&T Inc. 251,000 8,915,520
Corning Incorporated 410,000 8,089,300
Verizon Communications, Inc. 173,000 8,063,530
25,068,350
TEXTILES, APPAREL & LUXURY GOODS – 2.5%
Fossil Group, Inc. (a) 138,000 9,571,680
24
The accompanying notes are an integral part of these financial statements.
O L S T E I N A L L C A P V A L U E F U N D
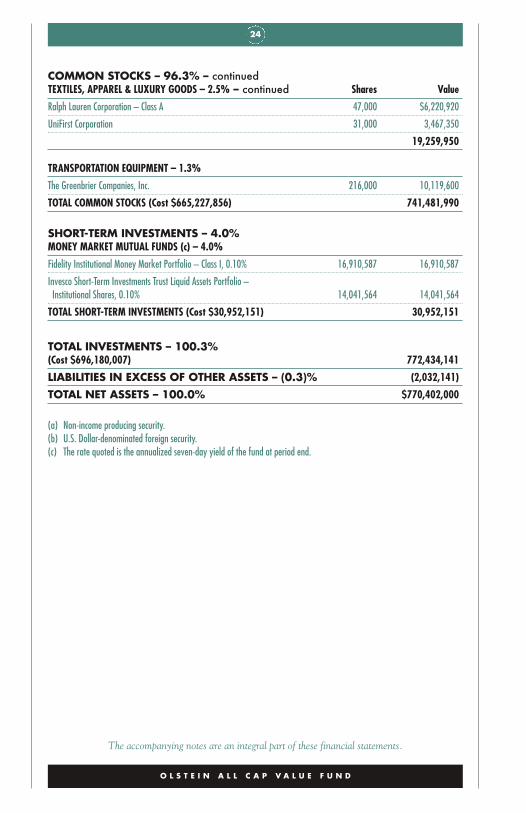
COMMON STOCKS – 96.3% – continuedTEXTILES, APPAREL & LUXURY GOODS – 2.5% – continued Shares Value
Ralph Lauren Corporation – Class A 47,000 $6,220,920
UniFirst Corporation 31,000 3,467,350
19,259,950
TRANSPORTATION EQUIPMENT – 1.3%
The Greenbrier Companies, Inc. 216,000 10,119,600
TOTAL COMMON STOCKS (Cost $665,227,856) 741,481,990
SHORT-TERM INVESTMENTS – 4.0%MONEY MARKET MUTUAL FUNDS (c) – 4.0%
Fidelity Institutional Money Market Portfolio – Class I, 0.10% 16,910,587 16,910,587
Invesco Short-Term Investments Trust Liquid Assets Portfolio –Institutional Shares, 0.10% 14,041,564 14,041,564
TOTAL SHORT-TERM INVESTMENTS (Cost $30,952,151) 30,952,151
TOTAL INVESTMENTS – 100.3%(Cost $696,180,007) 772,434,141
LIABILITIES IN EXCESS OF OTHER ASSETS – (0.3)% (2,032,141)
TOTAL NET ASSETS – 100.0% $770,402,000
(a) Non-income producing security.(b) U.S. Dollar-denominated foreign security.(c) The rate quoted is the annualized seven-day yield of the fund at period end.

25
( T H I S P A G E I N T E N T I O N A L L Y L E F T B L A N K . )
26
The accompanying notes are an integral part of these financial statements.
O L S T E I N A L L C A P V A L U E F U N D
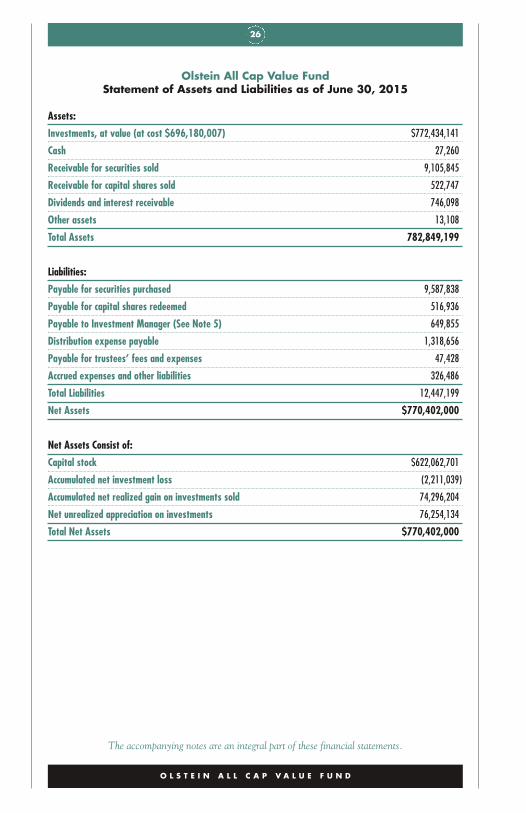
Olstein All Cap Value FundStatement of Assets and Liabilities as of June 30, 2015
Assets:
Investments, at value (at cost $696,180,007) $772,434,141
Cash 27,260
Receivable for securities sold 9,105,845
Receivable for capital shares sold 522,747
Dividends and interest receivable 746,098
Other assets 13,108
Total Assets 782,849,199
Liabilities:
Payable for securities purchased 9,587,838
Payable for capital shares redeemed 516,936
Payable to Investment Manager (See Note 5) 649,855
Distribution expense payable 1,318,656
Payable for trustees’ fees and expenses 47,428
Accrued expenses and other liabilities 326,486
Total Liabilities 12,447,199
Net Assets $770,402,000
Net Assets Consist of:
Capital stock $622,062,701
Accumulated net investment loss (2,211,039)
Accumulated net realized gain on investments sold 74,296,204
Net unrealized appreciation on investments 76,254,134
Total Net Assets $770,402,000
27
The accompanying notes are an integral part of these financial statements.
O L S T E I N A L L C A P V A L U E F U N D
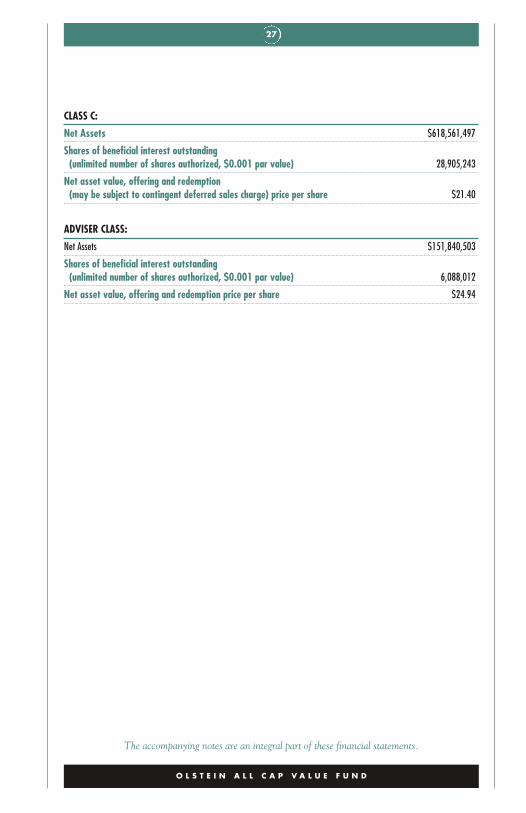
CLASS C:
Net Assets $618,561,497
Shares of beneficial interest outstanding(unlimited number of shares authorized, $0.001 par value) 28,905,243
Net asset value, offering and redemption(may be subject to contingent deferred sales charge) price per share $21.40
ADVISER CLASS:
Net Assets $151,840,503
Shares of beneficial interest outstanding(unlimited number of shares authorized, $0.001 par value) 6,088,012
Net asset value, offering and redemption price per share $24.94
28
The accompanying notes are an integral part of these financial statements.
O L S T E I N A L L C A P V A L U E F U N D
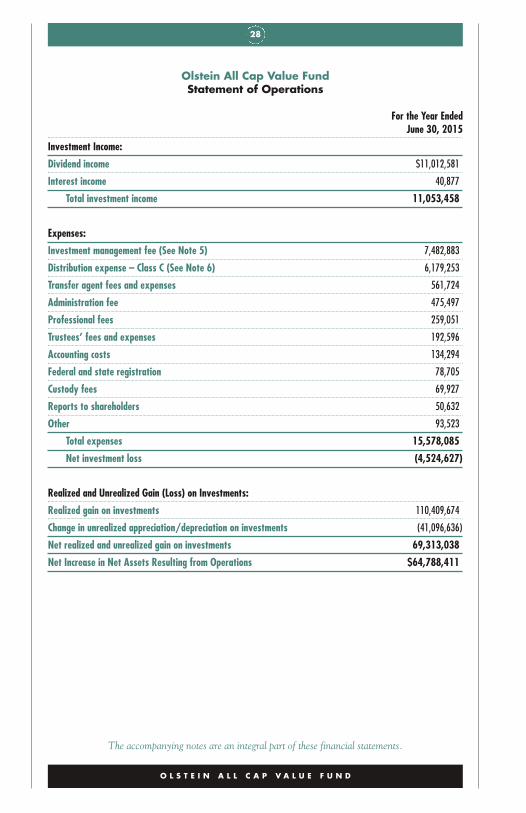
Olstein All Cap Value FundStatement of Operations
For the Year EndedJune 30, 2015
Investment Income:
Dividend income $11,012,581
Interest income 40,877
Total investment income 11,053,458
Expenses:
Investment management fee (See Note 5) 7,482,883
Distribution expense – Class C (See Note 6) 6,179,253
Transfer agent fees and expenses 561,724
Administration fee 475,497
Professional fees 259,051
Trustees’ fees and expenses 192,596
Accounting costs 134,294
Federal and state registration 78,705
Custody fees 69,927
Reports to shareholders 50,632
Other 93,523
Total expenses 15,578,085
Net investment loss (4,524,627)
Realized and Unrealized Gain (Loss) on Investments:
Realized gain on investments 110,409,674
Change in unrealized appreciation/depreciation on investments (41,096,636)
Net realized and unrealized gain on investments 69,313,038
Net Increase in Net Assets Resulting from Operations $64,788,411
29
The accompanying notes are an integral part of these financial statements.
O L S T E I N A L L C A P V A L U E F U N D
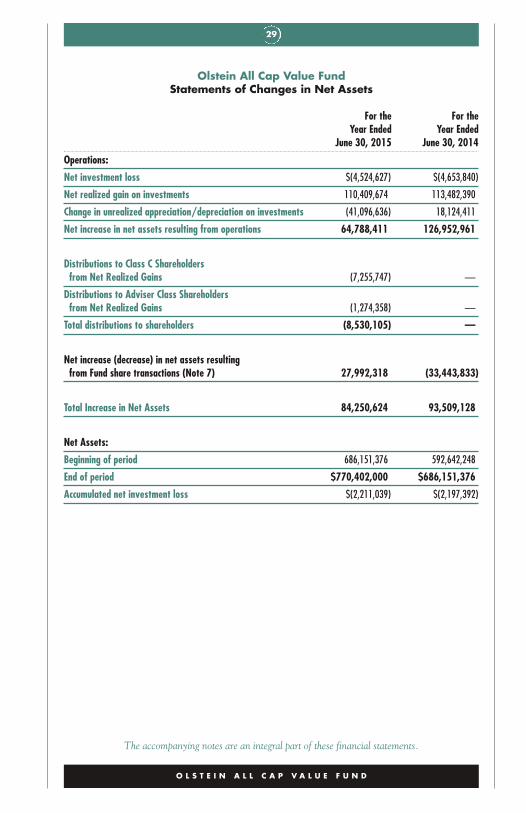
Olstein All Cap Value FundStatements of Changes in Net Assets
For the For theYear Ended Year Ended
June 30, 2015 June 30, 2014
Operations:
Net investment loss $(4,524,627) $(4,653,840)
Net realized gain on investments 110,409,674 113,482,390
Change in unrealized appreciation/depreciation on investments (41,096,636) 18,124,411
Net increase in net assets resulting from operations 64,788,411 126,952,961
Distributions to Class C Shareholdersfrom Net Realized Gains (7,255,747) —
Distributions to Adviser Class Shareholdersfrom Net Realized Gains (1,274,358) —
Total distributions to shareholders (8,530,105) —
Net increase (decrease) in net assets resultingfrom Fund share transactions (Note 7) 27,992,318 (33,443,833)
Total Increase in Net Assets 84,250,624 93,509,128
Net Assets:
Beginning of period 686,151,376 592,642,248
End of period $770,402,000 $686,151,376
Accumulated net investment loss $(2,211,039) $(2,197,392)
30
The accompanying notes are an integral part of these financial statements.
O L S T E I N A L L C A P V A L U E F U N D
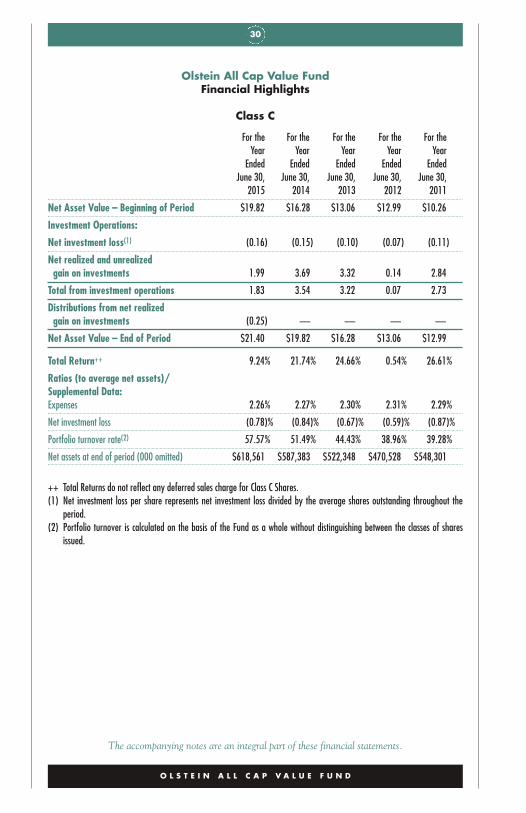
Olstein All Cap Value FundFinancial Highlights
Class C
For the For the For the For the For theYear Year Year Year Year
Ended Ended Ended Ended EndedJune 30, June 30, June 30, June 30, June 30,
2015 2014 2013 2012 2011
Net Asset Value – Beginning of Period $19.82 $16.28 $13.06 $12.99 $10.26
Investment Operations:
Net investment loss(1) (0.16) (0.15) (0.10) (0.07) (0.11)
Net realized and unrealizedgain on investments 1.99 3.69 3.32 0.14 2.84
Total from investment operations 1.83 3.54 3.22 0.07 2.73
Distributions from net realizedgain on investments (0.25) — — — —
Net Asset Value – End of Period $21.40 $19.82 $16.28 $13.06 $12.99
Total Return++ 9.24% 21.74% 24.66% 0.54% 26.61%
Ratios (to average net assets)/Supplemental Data:Expenses 2.26% 2.27% 2.30% 2.31% 2.29%
Net investment loss (0.78)% (0.84)% (0.67)% (0.59)% (0.87)%
Portfolio turnover rate(2) 57.57% 51.49% 44.43% 38.96% 39.28%
Net assets at end of period (000 omitted) $618,561 $587,383 $522,348 $470,528 $548,301
++ Total Returns do not reflect any deferred sales charge for Class C Shares.(1) Net investment loss per share represents net investment loss divided by the average shares outstanding throughout the
period.(2) Portfolio turnover is calculated on the basis of the Fund as a whole without distinguishing between the classes of shares
issued.
31
The accompanying notes are an integral part of these financial statements.
O L S T E I N A L L C A P V A L U E F U N D
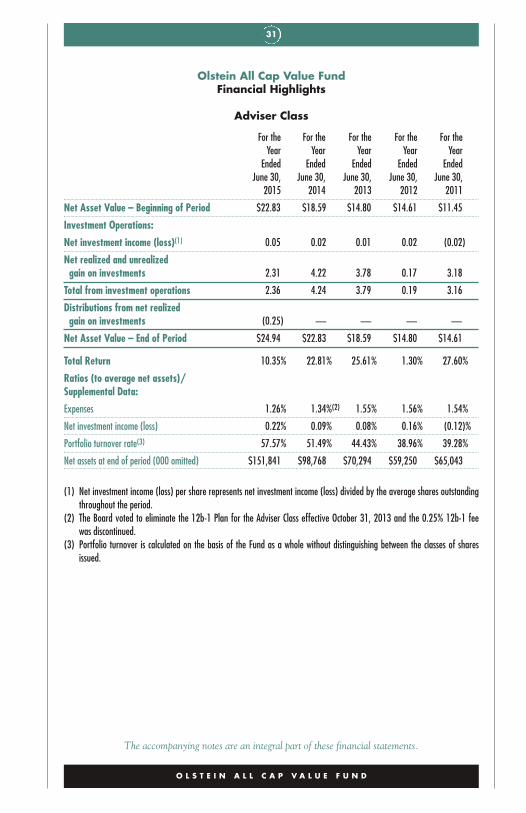
Olstein All Cap Value FundFinancial Highlights
Adviser Class
For the For the For the For the For theYear Year Year Year Year
Ended Ended Ended Ended EndedJune 30, June 30, June 30, June 30, June 30,
2015 2014 2013 2012 2011
Net Asset Value – Beginning of Period $22.83 $18.59 $14.80 $14.61 $11.45
Investment Operations:
Net investment income (loss)(1) 0.05 0.02 0.01 0.02 (0.02)
Net realized and unrealizedgain on investments 2.31 4.22 3.78 0.17 3.18
Total from investment operations 2.36 4.24 3.79 0.19 3.16
Distributions from net realizedgain on investments (0.25) — — — —
Net Asset Value – End of Period $24.94 $22.83 $18.59 $14.80 $14.61
Total Return 10.35% 22.81% 25.61% 1.30% 27.60%
Ratios (to average net assets)/Supplemental Data:
Expenses 1.26% 1.34%(2) 1.55% 1.56% 1.54%
Net investment income (loss) 0.22% 0.09% 0.08% 0.16% (0.12)%
Portfolio turnover rate(3) 57.57% 51.49% 44.43% 38.96% 39.28%
Net assets at end of period (000 omitted) $151,841 $98,768 $70,294 $59,250 $65,043
(1) Net investment income (loss) per share represents net investment income (loss) divided by the average shares outstandingthroughout the period.
(2) The Board voted to eliminate the 12b-1 Plan for the Adviser Class effective October 31, 2013 and the 0.25% 12b-1 feewas discontinued.
(3) Portfolio turnover is calculated on the basis of the Fund as a whole without distinguishing between the classes of sharesissued.

32
( T H I S P A G E I N T E N T I O N A L L Y L E F T B L A N K . )
OL S T E I N S T RAT EG I COP POR TUN I T I E S F UND
34 Letter to Shareholders
49 Expense Example
52 Schedule of Investments
56 Statement of Assetsand Liabilities
58 Statement of Operations
59 Statements of Changesin Net Assets
60 Financial Highlights
O L S T E I N S T R A T E G I C O P P O R T U N I T I E S F U N D
33
Performance data quoted represents past performance. Past performance does not guarantee future results. All performance stated in this document assumes the reinvestment of dividends and capital gains. We caution shareholders that we can never predict or assure future returns on investments. The investment return and principal value of an investment with our Funds will fluctuate over time so that your shares, when redeemed, may be with more or less than their original cost. Current performance may be lower or higher than the performance data quoted. Click the following links for the annual expense ratios and standardized performance current to the most recent quarter and month end periods for The Olstein Strategic Opportunities Fund.
O L S T E I N S T R A T E G I C O P P O R T U N I T I E S F U N D
34
O L S T E I N S T RAT EG I COP POR TUN I T I E S F UND
Letter to Shareholders
D E A R F E L L O W S H A R E H O L D E R S :
For the fiscal year ended June 30, 2015, load-waived Class A shares of theOlstein Strategic Opportunities Fund appreciated 7.19% compared to totalreturns of 5.92% and 7.42% for the Russell 2500™ Index and the S&P 500®Index, respectively. For the three years ended June 30, 2015, load-waivedClass A shares of the Olstein Strategic Opportunities Fund had an averageannual return of 21.44% compared to average annual returns of 18.66% forthe Russell 2500™ Index and 17.31% for the S&P 500® Index over thesame time period.
M A R K E T O U T L O O K & S T R A T E G Y
A sharp increase in volatility during the first six months of the year, triggeredby the ongoing financial crisis in Greece, a slowdown in the Chinese econo-my, the expected negative impact from rising U.S. interest rates and thestrengthening U.S. dollar, dampened equity market returns and further fueledforecasters’ predictions of a market pullback. The small- to mid-sized compa-ny benchmark Russell 2500™ Index seemed to hold up well during the spikein market volatility, appreciating 4.81% during the first six months of theyear, compared to a return of 1.23% for the broader market benchmark S&P500® Index over the same time period. The relatively strong performance ofthe Russell 2500 Index, however, was driven primarily by a narrow segment ofthe index, specifically, a boom in biotech and pharmaceutical firms.
O L S T E I N S T R A T E G I C O P P O R T U N I T I E S F U N D
The performance data quoted represents past performance and does not guaranteefuture results. The Olstein Strategic Opportunities Fund Class A return as of6/30/15 for the one-year period, five-year period, and since inception (11/1/06),assuming deduction of the maximum Class A sales charge of 5.50% was 1.28%,18.03% and 8.17%, respectively. Per the Fund’s 4/28/15 prospectus, the Fund’sClass A expense ratio was 1.61%. Expense ratios for other share classes will vary.Performance for other share classes will vary due to differences in sales chargestructure and class expenses. The investment return and principal value of aninvestment will fluctuate so that an investor’s shares, when redeemed, may beworth more or less than their original cost. Current performance may be lower orhigher than performance quoted. To obtain performance data current to the mostrecent month end, please visit our website at www.olsteinfunds.com.
35
During the first six months of the year, the Fund experienced a period ofunderperformance with load-waived Class A shares appreciating 0.40%.There are times when the combination of certain events, (such as the currentGreek financial crisis and slowdown in the Chinese economy) tend to over-whelm equity markets. During these times, investors who focus on achievinginstantaneous gratification with little patience for disappointments, often liq-uidate stocks of good companies facing short term issues which are underper-forming the market. A value oriented portfolio of small to midsizedcompanies (such as the Fund’s) that, in our opinion, are selling at discounts asa result of the temporary events, short-term earnings disappointments, misper-ception or just plain overall negativity, often go through periods of short-termunderperformance under these conditions. As long-term value investors, weare currently searching for companies whose long-term value is not affectedby these short-term events. In the current environment, we are having notrouble purchasing good companies at what we believe are bargain prices.
We believe we are currently in a period of overall market skittishness, withmany investors reacting to short-term company negative news issued byindustrial companies, by moving to the sidelines without consideringwhether or not current prices are more than discounting the long-termpotential based on the company’s future ability to generate normalized freecash flow. Wall Street’s obsessive focus on short-term events has often pro-duced significant opportunities to profit from short-term pessimism whendeviations between stock prices and long-term company valuations increasedramatically. We never know the exact timing when (or if) catalysts appearor psychology changes which results in bargain hunters, in mass jumpingaboard, quickly eliminating the deviation between a company’s stock priceand our estimate of intrinsic value. Although we are patient investors, we doexpect to see catalysts arise within a 24 month period which should begineliminating the discount from our calculation of intrinsic value. At times,24 months seems like a long period of time, and thus, we believe our Fund isbetter suited for investors with a 2 to 3 year time horizon to fully experiencethe Fund’s investment discipline and strategy. We continue to seek andinvest in companies that we believe have an ability to deliver long-termvalue to their shareholders that, in many cases, is not currently recognized bythe market. While there are always forecasters predicting the next marketcorrection or downturn, we believe it is important to weather market eventsand periods of short-term volatility by favoring the equities of financiallystrong companies with stable or growing free cash flow, run by managementsthat have a demonstrated history of deploying cash to the benefit of share-holders and whose stock price is selling at a discount to our estimate ofintrinsic value as a result of short-term factors.
O L S T E I N S T R A T E G I C O P P O R T U N I T I E S F U N D

36
P O R T F O L I O A N D P E R F O R M A N C E R E V I E W
At June 30, 2015, the Fund’s portfolio consisted of 49 holdings with an aver-age weighted market capitalization of $3.21 billion. Throughout the yearended June 30, 2015, we continued to modify the portfolio in light of thevolatility in the overall market. By paying strict attention to our companyvaluations, we reduced or eliminated positions in which the discounts fromour calculation of intrinsic value were no longer large enough to justify thesize of our position. At the same time, we increased or added new positionsin what we believe to be well run, conservatively capitalized companies pur-suing the correct strategies whose discounts have widened as a result ofinvestor disenchantment with short term stock performance.
During the twelve month reporting period, the Fund initiated positions intwenty companies and strategically added to established positions in anothertwelve companies. Positions initiated during the past fiscal year include:Blount International, Brady Corporation, Cynosure Inc., Daktronics Inc.,DSW Inc., Federal Signal Corp., First Niagara Financial Group, Fox FactoryHolding Corp., Joy Global Inc., Keysight Technologies Inc., Land’s End Inc.,Lifetime Brands Inc., Oshkosh Truck Corp., Owens-Illinois Inc., PattersonCompanies, Vasco Data Security, Wabash National Corporation, TheWendy’s Company and Wesco International Inc.
During the twelve month reporting period, the Fund eliminated its holdingsin twenty companies and strategically reduced its holdings in another threecompanies. The Fund eliminated or reduced its holdings in companies thateither reached our valuation levels, or where, in our opinion, changing con-ditions or new information resulted in additional risk and/or reduced appreci-ation potential. We redeployed proceeds from such sales into opportunitiesthat we believe offer a more favorable risk/reward profile. During the fiscalyear, the Fund eliminated its holdings in Aegion Corp., Ann Inc., Arctic CatInc., Avery Dennison Corp., AVX Corp., CareFusion Corp., Charles RiverLaboratories, Culp Inc., Ethan Allen Interiors, International GameTechnology, Jones Lang LaSalle Inc., NOW Inc., Nutraceutical InternationalCorp., PetSmart Inc., Rocky Brands Inc., Steelcase Inc., Teleflex Inc., UFPTechnologies, Inc., URS Corp. and Xylem, Inc. As reported in previous let-ters to our shareholders, of the twenty companies eliminated from the Fund’sportfolio over the course of the fiscal year, five companies were sold due tocorporate actions that caused the price of each company’s stock to increaseto our valuation levels. URS Corporation, International Game Technologyand CareFusion entered into merger agreements with strategic acquirers dur-ing the reporting period; a private equity firm acquired PetSmart; and anactivist investor, as well as a private equity firm, disclosed significant stakesin Ann Inc.
O L S T E I N S T R A T E G I C O P P O R T U N I T I E S F U N D
37
Our LeadersThe stocks which contributed positively to performance for the twelvemonth reporting period include: Culp, Inc., Sealed Air Corp., Rocky Brands,Integra LifeSciences Corporation and Janus Capital Group. The Fund soldits positions in Culp and Rocky Brands as the price of each company’s stockreached our valuation levels. At the close of the fiscal year, the Fund contin-ued to hold Sealed Air, Integra Life Sciences and Janus Capital Group.
Our LaggardsLaggards during the twelve month reporting period include: BlountInternational, Nutraceutical International Corporation, NOW Inc., CECOEnvironmental Corp. and Vishay Intertechnology Inc. The Fund liquidatedits holdings in Nutraceutical International and NOW Inc. during the report-ing period. The Fund sold its position in NOW Inc. as crude oil prices col-lapsed from over $100/barrel in mid-June 2014 to under $55/barrel early in2015. The Fund sold its position in Nutraceutical International as we ques-tioned company management’s understanding of and ability to implementthe changes needed to increase shareholder value. At the close of the fiscalyear, the Fund continued to hold Blount International, CECOEnvironmental Corp. and Vishay Intertechnology Inc.
R E V I E W O F A C T I V I S T H O L D I N G S
As of June 30, 2015, the Fund was invested in sixteen activist situations,which represented approximately 33% of the Fund’s equity investments, andfive of its top ten holdings. In general, these situations fit our definition ofan activist investment where Olstein Capital Management or an outsideinvestor, usually a hedge fund, private equity investor, seeks to influencecompany management to adopt strategic alternatives that we expect tounlock greater shareholder value.
The Fund’s activist holdings as of June 30, 2015, include agriculturalmachine and equipment manufacturer, Blount International; environmentaltechnology company, CECO Environmental; aerospace and defense productsmanufacturer, Esterline Technologies Corp.; specialty apparel and accessoryretailer, Express Inc.; recreational vehicle suspension products manufacturer,Fox Factory Holding Corp.; money management firms, Janus Capital Groupand Legg Mason Inc.; multi-channel retailer, Land’s End; kitchenware andhousewares manufacturer, Lifetime Brands Inc.; department store company,Macy’s; glass container manufacturer, Owens-Illinois; specialty eatery,Potbelly Inc.; data solutions company, Teradata Corporation; specialty retail-er of nutritional products, Vitamin Shoppe Inc.; fast-food restaurant chain,The Wendy’s Company; and industrial equipment supplier, WESCO
O L S T E I N S T R A T E G I C O P P O R T U N I T I E S F U N D

38
International. We continue to monitor the progress of the activist investorsinvolved in these situations as they work to increase shareholder valuethrough a specific plan for improving each company’s results. While eachinvestment is at a different strategic stage, we believe the actions that havebeen proposed or implemented for each company should increase sharehold-er value through improved future operating results.
With each of our activist situations, one of the most important variables weconsider, (especially during tough economic times), is “how long do weexpect it to take for this company to improve its operations and results?”Although we know from experience that successful turnarounds don’t hap-pen overnight, we do expect specific improvements in operations to occurwithin a defined period of time (two years or less), notwithstanding the eco-nomic environment. Although a turnaround process may not be in fullswing, if a company has adopted what we believe is the right strategy toincrease shareholder value within two years, we are willing to wait beyondtwo years for operating results to start improving if we are being sufficientlyrewarded for the risk, and if our ongoing analysis of the company’s financialstatements tell us the company is headed in the right direction.
U N D E R S T A N D I N G U N D E R V A L U A T I O NA N D F O R E C A S T I N G T H E F U T U R E
Our ongoing search for value focuses on identifying significant deviationsbetween the current price of a stock and our determination of the issuingcompany’s intrinsic value. Our intrinsic value is based on our prediction of acompany’s normalized ability to produce future free cash flow. One of theprimary challenges of our analysis is to understand what is creating the dis-count; determining if the issues causing the discount are temporary or chron-ic in nature; and recognizing the circumstances that are likely to close thegap between the company’s current stock price and its intrinsic value.
For small- to mid-sized companies, assessing the underlying causes of why acompany is undervalued helps us to separate those companies with seriousstructural, financial or secular problems from those that are simply not per-forming to their full potential. In a challenging economic environment,understanding the nature of the discount also helps us separate viable valueinvesting opportunities from potential value traps. We seek to determine ifthe discount is the result of misperceptions about the company, a build-up ofunmerited negative sentiment, an over-reaction to temporary bad news, or if itis a result of chronic issues the company is not likely to successfully overcome.
O L S T E I N S T R A T E G I C O P P O R T U N I T I E S F U N D

39
O L S T E I N S T R A T E G I C O P P O R T U N I T I E S F U N D
M A K I N G S E N S E O F T H E ‘ D I S C O U N T ’
Our first mission when analyzing company stocks which appear to be sellingat a discounted price is to look for specific financial, competitive and struc-tural characteristics that signal that a company’s problems are temporary.When evaluating the investment potential of an undervalued company, wefirst consider if the company is well positioned to create shareholder valueand close the valuation gap. While most companies endure varying degreesof performance problems throughout their life, a challenging economic envi-ronment may make it difficult to implement the changes needed to createlong-term value and thus successfully close the gap between current stockprice and intrinsic value. In light of such challenges, our analysis focuses onseveral company-specific factors:
The Core Business and Financial Strength: We seek to determinewhether the company has a strong core business and a competitiveadvantage that will allow it to overcome any temporary setbacks nega-tively affecting its stock price. Since companies that improve their per-formance after temporary setbacks may find their stocks still held backby negative market sentiment, it is extremely important for us that thecore business is able to generate sustainable free cash flow over ouranticipated holding period of three years or longer. Free cash flowcompanies add value while we wait for the catalyst to arrive. Ouranalysis focuses on how the company’s operations generate sustainablefree cash flow and the level of investment required to improve compa-ny performance and eventually grow the business. We also believe it isextremely important to assess whether the balance sheet is strongenough to ride out the current problems if the issues the company isfacing last longer than expected.
Nature of the Company’s Problems: For small- to mid-sized compa-nies, an extremely important part of understanding the valuation gapbetween stock price and intrinsic value is an assessment of the compa-ny’s difficulties and problems. Some factors contributing to the dis-count may stem from the company itself, including failure to keep pacewith market trends; poor allocation of capital; an under achievingproduct line or division that needs to be fixed, sold or shut down; toomuch debt; insufficient operating controls or a weak management teamthat lacks depth and expertise. Other problems may come from outsidethe company, such as economic shifts creating headwinds for the busi-ness, social change, technological change, regulatory constraints, ormisperceptions about the company or its industry. We carefully evalu-ate the many factors that may have contributed to a company’s set-backs, determine the severity of these factors and assess what corrective
40
measures the company must pursue to successfully reinvigorate thebusiness and whether or not they are currently being instituted.
Clean accounting: We undertake a thorough review of financial state-ments over the past three to five years to determine if management hasmasked the scope and depth of the company’s problems by creatingunrealistic financial statements and results of operations by adoptingnonconservative accounting techniques and making financial assump-tions which deviate from economic reality. When faced with a signifi-cant discount in stock price, it’s extremely important to judge thequality of management by its commitment to creating shareholdervalue, as well as the conservatism and transparency of its financialreporting and how effectively it communicates the company’s prob-lems, its strategic alternatives to be adopted and assess the economicreality thereof.
Quality of Company Management: In light of a significant gapbetween the company’s stock price and our determination of its intrin-sic value, we assess the decision-making skills and leadership of a com-pany’s management team. For small- to mid-sized companies, anassessment of management’s skill level and experience is critical inlight of the company’s undervaluation. Management must not onlyrecognize the true extent of the company’s problems and identify solu-tions that are in the best interests of shareholders, management shouldhave the requisite skills and experience to effect needed change. Anongoing analysis of a company’s financial statements, accompanyingfootnotes and shareholder communications help us determine whethermanagement’s actions have resulted or are likely to result in real funda-mental progress towards closing the valuation gap.
As balanced and experienced investors, we constantly look out for company-specific factors that may signal a potential value trap. We avoid situationswhere a company’s core business has failed to keep pace with dramaticchanges in the economic, competitive or technological landscape or compa-nies with products and services that have become less relevant to the market.We also avoid companies which have fallen to what appears to be underval-ued territory that, in our opinion, have weak balance sheets, lack significantfinancial resources to ride out economic storms or do not exert proper con-trol over existing resources through proper cash flow management, workingcapital controls, meaningful cost reduction efforts, and appropriate return oninvestment and profitability analysis.
O L S T E I N S T R A T E G I C O P P O R T U N I T I E S F U N D
41
C L O S I N G T H E V A L U A T I O N G A P
Following our assessment of the factors we believe have created the discountbetween a company’s current stock price and its intrinsic value, we conduct adeeper analysis of those companies that we believe have normalized free cashflow potential that is not recognized or properly valued by the market. In orderto reach conclusions about unrecognized future free cash flow potential, weundertake an intensive, forensic analysis of a company’s financial statements,footnotes and other regulatory filings in order develop a deeper understandingof the stability and reliability of the company’s free cash flow potential underdifferent economic scenarios, and to assess the capabilities and fiscal conser-vatism of the management team and finally, the quality of its earnings.
Company managements make mistakes all the time. Some are financial,some operational, some strategic – almost all weigh on the stock price in thenear term. For small- to mid-sized companies that have been unduly penal-ized by short-term market reactions or negative sentiment, we seek to identi-fy a catalyst or strategic alternatives that we believe will unlock thecompany’s underlying value and accelerate closing of the valuation gap.Some potential catalysts we analyze when considering investments for theFund include;
Unrecognized or Hidden Free Cash Flow Potential: We look for com-panies that generate significant cash flow from their operations, butdue to various reasons, net income (reported earnings per share) ismaterially below what the company actually generates in free cash flow.In these cases, we look at the company’s free cash flow yield, (calculat-ed as cash flow divided by the enterprise value), to determine if thecash flow yield is materially above competitive yields in the bond mar-ket or stock market. Our experience indicates that companies withabove average free cash flow yields combined with strong (or improv-ing) returns on invested capital and strong returns on assets have ahigher probability of successfully managing temporary problems and arelikely to provide increasing value to shareholders over time.
Niche Power: Some small- to mid-sized companies provide unique,essential, niche products and/or services, with few true substitutes capa-ble of displacing the product or service in the market. However, as aresult of various circumstances, the company does not realize its trueearnings potential, often weighed down by a status quo view, miscon-ceptions or mismanagement. With niche power, the company may beable to change marketing and sales techniques or undertake price orvolume increases that, once properly implemented, can lead directly tomargin and earnings increases which should eventually result inincreased shareholder value.
O L S T E I N S T R A T E G I C O P P O R T U N I T I E S F U N D
42
Segment Analysis: A company’s stock price is often disproportionatelypenalized if the company has an underperforming business segmentthat is hiding a company’s normalized long-term ability to generatefuture free cash flow, even though the underperforming segment mayrepresent only a fraction of the company’s overall earnings. We assessthe true earnings power of all of a company’s segments to determine ourintrinsic value and recognize that if an underperforming segmentimproves or is jettisoned, the company’s shares are more likely to movetowards fair value.
Hidden Assets/Liquidity: We spend a lot of time analyzing balancesheets of companies looking for assets that are either not utilized effi-ciently or not essential to the company’s operations. These assets caninclude licenses, intangibles, non-core divisions or real estate. Webelieve value can be created if companies monetize non-core assets andallocate capital to more strategic operations, complementary acquisi-tions, debt pay-down, or increased returns to shareholders.
Management Changes: Although we are known for not talking tomanagement, we are very concerned with what a company’s manage-ment actually does. We evaluate management by judging what theyactually do rather than what they say by undertaking an inferentialanalysis of current and historical shareholder letters, financial state-ments, footnotes and disclosure practices, looking for clues thatchanges are being implemented and assessing a company’s normalizedability to generate future free cash flow. We emphasize financialstrength first by evaluating the conservation of the balance sheet andlook behind all the numbers and disclosures to determine whether ornot the statements are in accord with economic reality. For manysmall- to mid-sized companies, the quality and skill of the managementteam is a key determinant of whether or not the company is likely toincrease shareholder value. Managements that are inconsistent,unwilling to judge their performance against previously stated objec-tives and too focused on temporary fixes cannot serve as catalysts forunlocking a company’s unrealized value. In many cases, a managementteam that lacks the expertise needed to succeed in the company’s mar-ket or a management team that lacks the appropriate emphasis onreturns on invested capital can be improved by hiring new team mem-bers with the required skills and experience. In other cases, manage-ment teams that consistently exhibit poor decision-making andquestionable leadership skills may need to be replaced in their entirety.
O L S T E I N S T R A T E G I C O P P O R T U N I T I E S F U N D
43
S T A Y I N G F O C U S E D O N F U N D A M E N T A L S
Another critical element of our analytical process lies in our ability to identi-fy and separate those factors likely to affect a company’s future prosperity –its future free cash flow – from the excessive “noise” that characterizes today’sinvesting environment. We filter a great deal of noise, particularly the short-term price predictions of the analysts and financial press, pay little attentionto the quarterly reporting game whereby analysts are obsessively assessingwhether or not estimates were beaten or missed, rather than assessingwhether or not there is any information reported in the quarter that couldresult in a long-term valuation change. We pay little attention to the con-stant onslaught of market predictions and top-down economic news, fore-casts and data, by focusing on the fundamental merits of a company’sunderlying business. We seek to estimate a company’s future earnings andfree cash flow potential by assessing the resiliency of its business model inboth favorable and unfavorable economic environments.
While we are concerned with the overall economic environment and outlookand recognize that macro-economic factors and other newsworthy events canexert extreme short-term influence over equity prices from time to time, weare more concerned with how individual companies operate under all types ofeconomic conditions and cycles, and whether or not we are being compensat-ed for taking the risk of an equity investment that includes predicting thecompany’s ability to generate future free cash flow and thus its intrinsic value.We believe it is an important job of company management to adequatelyanticipate and plan for the impact of macro-economic shifts on their businessand its ability to generate sustainable free cash flow. From our focused analy-sis of a company, we judge its resiliency in the face of macro-economic shiftsand shocks and incorporate that judgment into our future normalized cashflow projections which is the only arbiter of long-term intrinsic value.
F I N A L T H O U G H T S
Since we launched the Olstein Strategic Opportunities Fund more than eightyears ago, we have identified many small- to mid-sized companies that havesuccessfully navigated turbulent economic times to adapt, invest, grow andrestructure for the future. As economic news and events overwhelm equitymarkets from time to time, we believe it is critical to remain focused on com-pany fundamentals as we wait for equity markets to regain a balanced perspec-tive with regard to future company fundamentals. We remind you that, as thepast has proven, patience usually provides generous opportunities for the dili-gent investor. We intend to stay the course (despite short term disappoint-ment) since we are invested in companies that we believe have the financialstrength to ride out current market jitters while offering favorable long-term
O L S T E I N S T R A T E G I C O P P O R T U N I T I E S F U N D
44
business prospects and, in our opinion, are materially undervalued. Weappreciate your trust and our personal funds are invested alongside yours.
Sincerely,
Eric R. Heyman Robert A. OlsteinCo-Portfolio Manager Chairman, Chief Investment Officer
and Co-Portfolio Manager
The above represents the opinion of the Manager, and is not intended to be a fore-cast of future events, a guarantee of future results, or investment advice. The refer-ences to securities are not buy or sell recommendations, but are intended to bedescriptive examples of the Fund’s investment philosophy and are subject to change.Do not make investments based on the securities referenced. A full schedule ofFund holdings as of 6/30/15 is contained in this report, and is subject to change.This information should be preceded or accompanied by a current prospectus,which contains more complete information, including investment objectives, risks,charges and expenses of the Olstein Funds and should be read carefully beforeinvesting. A current prospectus may be obtained by calling (800) 799-2113 or vis-iting the Olstein Funds’ website at www.olsteinfunds.com.
The investment return and principal value of an investment will fluctuate so thatan investor’s shares, when redeemed, may be worth more or less than their originalcost. There is no assurance that the Fund will achieve its investment objective.
An investment in a portfolio containing small- and mid-cap companies is subject toadditional risks, as the share prices of small- and mid-cap companies are often morevolatile than those of larger companies due to several factors, including limited trad-ing volumes, products, financial resources, management inexperience and less pub-licly available information. The activist strategy invests in stocks ofunderperforming companies and any shareholder activism might not result in achange in performance or corporate governance. These stocks could also experienceless liquidity and higher share price and trading volume volatility than stocks ofother companies.
The Russell 2500™ Index is an unmanaged index created by The RussellInvestment Group. The Russell 2500™ Index is constructed to provide a compre-hensive and unbiased barometer for the small to mid-cap segment and is completelyreconstituted annually to ensure larger stocks do not distort the performance andcharacteristics of the true small to mid-cap opportunity set. The Russell 2500™Index includes the smallest 2500 securities in the Russell 3000™ Index. The
O L S T E I N S T R A T E G I C O P P O R T U N I T I E S F U N D
45
O L S T E I N S T R A T E G I C O P P O R T U N I T I E S F U N D
Russell 2500™ Index is not an investment product available for purchase. TheS&P 500® Index is an unmanaged index created by Standard & Poor’sCorporation that includes a representative sample of 500 leading companies inleading industries of the U.S. economy and is considered to represent the U.S.stock market performance in general.
Not FDIC-insured / Not bank-guaranteed / May lose value.
Distributed by Olstein Capital Management, L.P. Member FINRA.
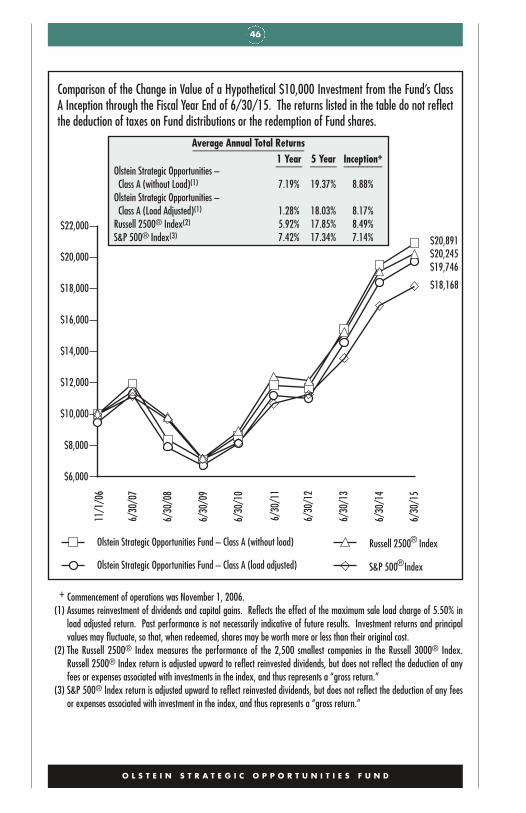
46
O L S T E I N S T R A T E G I C O P P O R T U N I T I E S F U N D
$6,000
$8,000
$10,000
$12,000
$14,000
$16,000
$18,000
$20,000
$22,000
Olstein Strategic Opportunities Fund – Class A (without load)
Olstein Strategic Opportunities Fund – Class A (load adjusted)
Russell 2500® Index
S&P 500®Index
$19,746$20,245
11/1
/06
$18,168
6/30
/08
$20,891
6/30
/07
6/30
/10
6/30
/09
6/30
/11
6/30
/12
6/30
/13
6/30
/14
6/30
/15
+ Commencement of operations was November 1, 2006.(1) Assumes reinvestment of dividends and capital gains. Reflects the effect of the maximum sale load charge of 5.50% in
load adjusted return. Past performance is not necessarily indicative of future results. Investment returns and principalvalues may fluctuate, so that, when redeemed, shares may be worth more or less than their original cost.
(2) The Russell 2500® Index measures the performance of the 2,500 smallest companies in the Russell 3000® Index.Russell 2500® Index return is adjusted upward to reflect reinvested dividends, but does not reflect the deduction of anyfees or expenses associated with investments in the index, and thus represents a “gross return.”
(3) S&P 500® Index return is adjusted upward to reflect reinvested dividends, but does not reflect the deduction of any feesor expenses associated with investment in the index, and thus represents a “gross return.”
Average Annual Total Returns_____________________1 Year 5 Year Inception+_____ _____ ________
Olstein Strategic Opportunities –Class A (without Load)(1) 7.19% 19.37% 8.88%
Olstein Strategic Opportunities –Class A (Load Adjusted)(1) 1.28% 18.03% 8.17%
Russell 2500® Index(2) 5.92% 17.85% 8.49%S&P 500® Index(3) 7.42% 17.34% 7.14%
Comparison of the Change in Value of a Hypothetical $10,000 Investment from the Fund’s ClassA Inception through the Fiscal Year End of 6/30/15. The returns listed in the table do not reflectthe deduction of taxes on Fund distributions or the redemption of Fund shares.
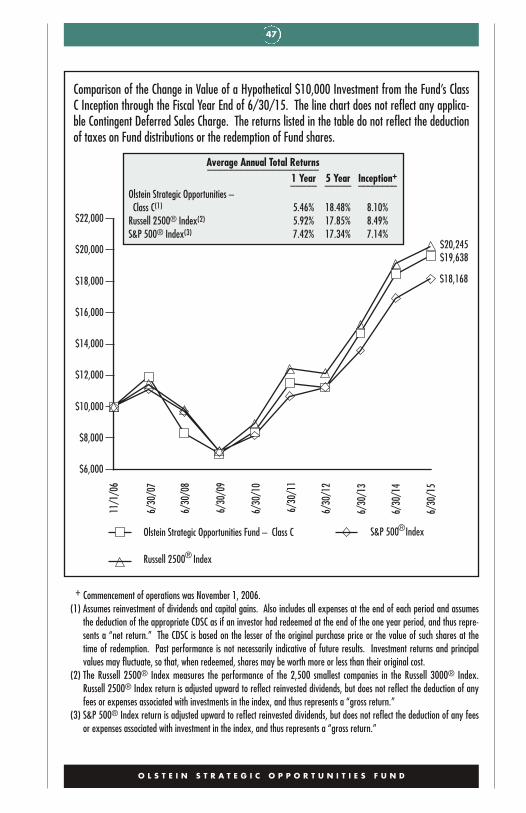
47
O L S T E I N S T R A T E G I C O P P O R T U N I T I E S F U N D
$6,000
$8,000
$10,000
$12,000
$14,000
$16,000
$18,000
$20,000
$22,000
Olstein Strategic Opportunities Fund – Class C
Russell 2500® Index
S&P 500®Index
$18,168
11/1
/06
$19,638
6/30
/08
$20,245
6/30
/07
6/30
/10
6/30
/09
6/30
/11
6/30
/12
6/30
/13
6/30
/14
6/30
/15
+ Commencement of operations was November 1, 2006.(1) Assumes reinvestment of dividends and capital gains. Also includes all expenses at the end of each period and assumes
the deduction of the appropriate CDSC as if an investor had redeemed at the end of the one year period, and thus repre-sents a “net return.” The CDSC is based on the lesser of the original purchase price or the value of such shares at thetime of redemption. Past performance is not necessarily indicative of future results. Investment returns and principalvalues may fluctuate, so that, when redeemed, shares may be worth more or less than their original cost.
(2) The Russell 2500® Index measures the performance of the 2,500 smallest companies in the Russell 3000® Index.Russell 2500® Index return is adjusted upward to reflect reinvested dividends, but does not reflect the deduction of anyfees or expenses associated with investments in the index, and thus represents a “gross return.”
(3) S&P 500® Index return is adjusted upward to reflect reinvested dividends, but does not reflect the deduction of any feesor expenses associated with investment in the index, and thus represents a “gross return.”
Comparison of the Change in Value of a Hypothetical $10,000 Investment from the Fund’s ClassC Inception through the Fiscal Year End of 6/30/15. The line chart does not reflect any applica-ble Contingent Deferred Sales Charge. The returns listed in the table do not reflect the deductionof taxes on Fund distributions or the redemption of Fund shares.
Average Annual Total Returns_____________________1 Year 5 Year Inception+_____ _____ ________
Olstein Strategic Opportunities –Class C(1) 5.46% 18.48% 8.10%
Russell 2500® Index(2) 5.92% 17.85% 8.49%S&P 500® Index(3) 7.42% 17.34% 7.14%
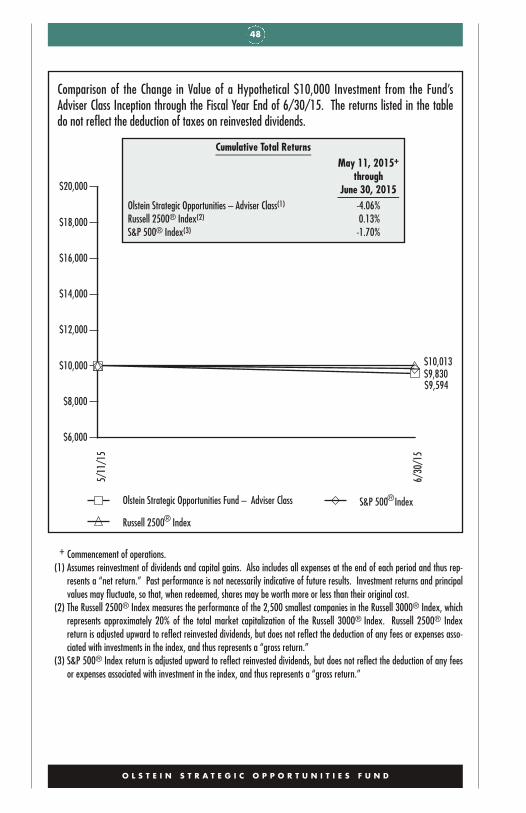
48
O L S T E I N S T R A T E G I C O P P O R T U N I T I E S F U N D
$6,000
$8,000
$10,000
$12,000
$14,000
$16,000
$18,000
$20,000
Olstein Strategic Opportunities Fund – Adviser Class
Russell 2500® Index
S&P 500®Index
$9,594
5/11
/15
$9,830$10,013
6/30
/15
+ Commencement of operations.(1) Assumes reinvestment of dividends and capital gains. Also includes all expenses at the end of each period and thus rep-
resents a “net return.” Past performance is not necessarily indicative of future results. Investment returns and principalvalues may fluctuate, so that, when redeemed, shares may be worth more or less than their original cost.
(2) The Russell 2500® Index measures the performance of the 2,500 smallest companies in the Russell 3000® Index, whichrepresents approximately 20% of the total market capitalization of the Russell 3000® Index. Russell 2500® Indexreturn is adjusted upward to reflect reinvested dividends, but does not reflect the deduction of any fees or expenses asso-ciated with investments in the index, and thus represents a “gross return.”
(3) S&P 500® Index return is adjusted upward to reflect reinvested dividends, but does not reflect the deduction of any feesor expenses associated with investment in the index, and thus represents a “gross return.”
Comparison of the Change in Value of a Hypothetical $10,000 Investment from the Fund’sAdviser Class Inception through the Fiscal Year End of 6/30/15. The returns listed in the tabledo not reflect the deduction of taxes on reinvested dividends.
Cumulative Total Returns__________________May 11, 2015+
throughJune 30, 2015_____________
Olstein Strategic Opportunities – Adviser Class(1) -4.06%Russell 2500® Index(2) 0.13%S&P 500® Index(3) -1.70%

49
Olstein Strategic Opportunities FundExpense Example as of June 30, 2015
As a shareholder of the Fund, you incur two types of costs: (1) transactioncosts, including sales charges (loads) on purchase payments or contingentdeferred sales charges on redemptions, if any; and (2) ongoing costs, includ-ing management fees, distribution fees (12b-1), and other Fund expenses.This Example is intended to help you understand your ongoing costs (in dol-lars) of investing in the Fund and to compare these costs with the ongoingcosts of investing in other mutual funds. The Example is based on an invest-ment of $1,000 invested at the beginning of the period and held for theentire period, January 1, 2015 – June 30, 2015.
Actual Expenses The following table provides information about actualaccount values and actual expenses. You will be assessed fees for outgoingwire transfers, returned checks and stop payment orders at prevailing ratescharged by U.S. Bancorp Fund Services, LLC, the Fund’s transfer agent. Ifyou request that a redemption be made by a wire transfer, currently a $15 feeis charged by the Fund’s transfer agent. IRA accounts will be charged a $15annual maintenance fee and a $25 distribution fee. The following exampleincludes, but is not limited to, management fees, distribution fees, fundaccounting, custody and transfer agent fees. However, the following exampledoes not include portfolio trading commissions and related expenses. Youmay use the information in this table, together with the amount you invest-ed, to estimate the expenses that you paid over the period. Simply divideyour account value by $1,000 (for example, an $8,600 account value dividedby $1,000 = 8.6), then multiply the result by the number in the table underthe heading entitled “Expenses Paid During Period’’ to estimate the expensesyou paid on your account during this period.
Hypothetical Example for Comparison Purposes The following table alsoprovides information about hypothetical account values and hypotheticalexpenses based on the Fund’s actual expense ratio and an assumed rate ofreturn of 5% per year before expenses, which is not the Fund’s actual return.The hypothetical account values and expenses may not be used to estimatethe actual ending account balance or expenses you paid for the period. Youmay use this information to compare the ongoing costs of investing in theFund and other funds. To do so, compare this 5% hypothetical example withthe 5% hypothetical examples that appear in the shareholder reports of theother funds.
O L S T E I N S T R A T E G I C O P P O R T U N I T I E S F U N D

50
O L S T E I N S T R A T E G I C O P P O R T U N I T I E S F U N D
Please note that the expenses shown in the table are meant to highlight yourongoing costs only and do not reflect any transactional costs, such as salescharges (loads) on purchase payments or contingent deferred sales charges onredemptions, if any. Therefore, the hypothetical information is useful incomparing ongoing costs only, and will not help you determine the relativetotal costs of owning different funds. In addition, if these transactional costswere included, your costs would have been higher.Strategic Opportunities Fund
Beginning Ending Expenses PaidAccount Value Account Value During Period*
1/1/15 6/30/15 1/1/15 – 6/30/15Actual
Class A $1,000.00 $1,004.00 $7.95Class C $1,000.00 $1,000.00 $11.65
Hypothetical (5% annualreturn before expenses)
Class A $1,000.00 $1,016.86 $8.00Class C $1,000.00 $1,013.14 $11.73
* Expenses are equal to the Fund’s annualized expense ratio of 1.60% and 2.35% for Class A and Class C, respectively, multi-plied by the average account value over the period, multiplied by 181/365.
Beginning Ending Expenses PaidAccount Value Account Value During Period**
5/11/15 6/30/15 5/11/15 – 6/30/15Actual
Adviser Class $1,000.00 $959.40 $1.81
Hypothetical (5% annualreturn before expenses)
Adviser Class $1,000.00 $1,018.10 $1.87
** Expenses are equal to the Fund’s annualized expense ratio of 1.35% for Adviser Class, multiplied by the average accountvalue over the period since inception, multiplied by 50/365 (to reflect the period since the Fund’s inception on 5/11/2015).
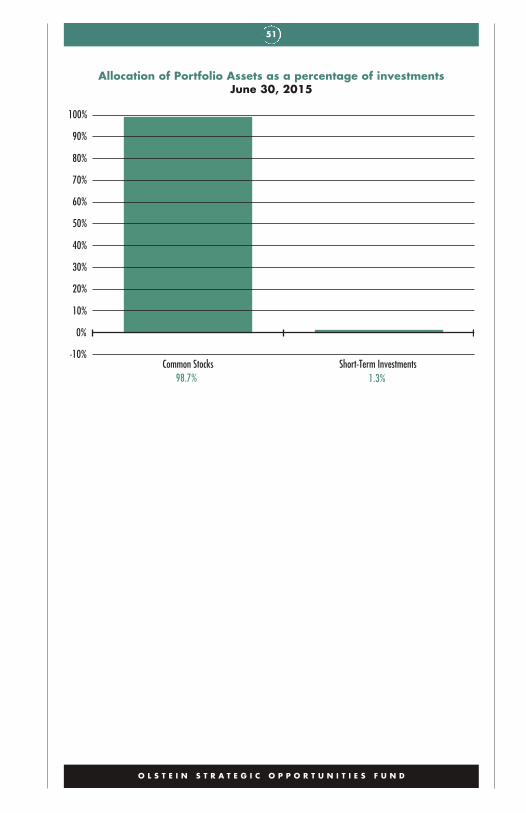
51
Allocation of Portfolio Assets as a percentage of investmentsJune 30, 2015
O L S T E I N S T R A T E G I C O P P O R T U N I T I E S F U N D
Common Stocks Short-Term Investments-10%
0%
10%
20%
30%
40%
50%
60%
70%
80%
90%
100%
98.7% 1.3%
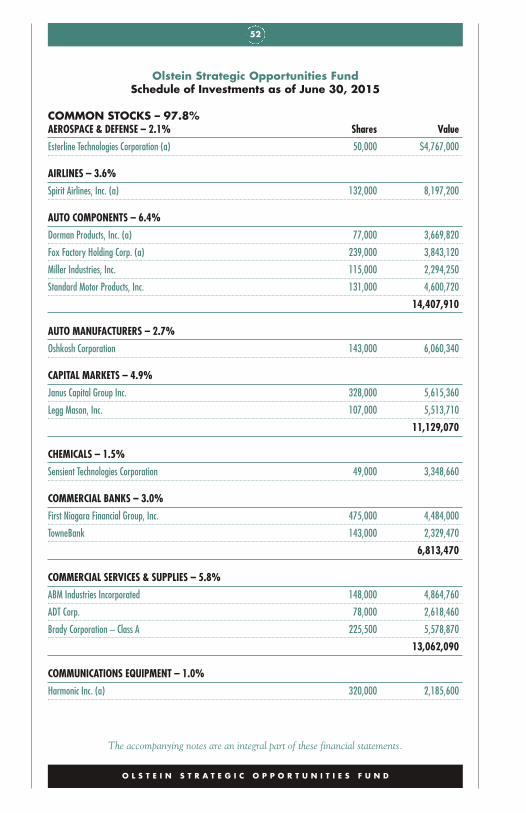
52
Olstein Strategic Opportunities FundSchedule of Investments as of June 30, 2015
COMMON STOCKS – 97.8%AEROSPACE & DEFENSE – 2.1% Shares Value
Esterline Technologies Corporation (a) 50,000 $4,767,000
AIRLINES – 3.6%
Spirit Airlines, Inc. (a) 132,000 8,197,200
AUTO COMPONENTS – 6.4%
Dorman Products, Inc. (a) 77,000 3,669,820
Fox Factory Holding Corp. (a) 239,000 3,843,120
Miller Industries, Inc. 115,000 2,294,250
Standard Motor Products, Inc. 131,000 4,600,720
14,407,910
AUTO MANUFACTURERS – 2.7%
Oshkosh Corporation 143,000 6,060,340
CAPITAL MARKETS – 4.9%
Janus Capital Group Inc. 328,000 5,615,360
Legg Mason, Inc. 107,000 5,513,710
11,129,070
CHEMICALS – 1.5%
Sensient Technologies Corporation 49,000 3,348,660
COMMERCIAL BANKS – 3.0%
First Niagara Financial Group, Inc. 475,000 4,484,000
TowneBank 143,000 2,329,470
6,813,470
COMMERCIAL SERVICES & SUPPLIES – 5.8%
ABM Industries Incorporated 148,000 4,864,760
ADT Corp. 78,000 2,618,460
Brady Corporation – Class A 225,500 5,578,870
13,062,090
COMMUNICATIONS EQUIPMENT – 1.0%
Harmonic Inc. (a) 320,000 2,185,600
O L S T E I N S T R A T E G I C O P P O R T U N I T I E S F U N D
The accompanying notes are an integral part of these financial statements.
53
O L S T E I N S T R A T E G I C O P P O R T U N I T I E S F U N D
COMMON STOCKS – 97.8% – continuedCOMPUTERS & PERIPHERALS – 2.5% Shares Value
Teradata Corporation (a) 153,000 $5,661,000
CONTAINERS & PACKAGING – 3.9%
Owens-Illinois, Inc. (a) 195,000 4,473,300
Sealed Air Corporation 82,000 4,213,160
8,686,460
ELECTRONIC EQUIPMENT & INSTRUMENTS – 8.8%
Daktronics, Inc. 502,000 5,953,720
GSI Group Inc. (a) (b) 346,000 5,200,380
Itron, Inc. (a) 132,000 4,546,080
Keysight Technologies, Inc. (a) 134,000 4,179,460
19,879,640
ENVIRONMENTAL CONTROL – 2.2%
CECO Environmental Corp. 442,000 5,007,860
HEALTH CARE EQUIPMENT & SUPPLIES – 1.7%
Cynosure Inc. – Class A (a) 101,000 3,896,580
HEALTH CARE PRODUCTS – 1.7%
Integra LifeSciences Holdings Corporation (a) 58,000 3,907,460
HEALTH CARE PROVIDERS & SERVICES – 1.7%
Patterson Companies Inc. 80,000 3,892,000
HOUSEHOLD DURABLES – 4.7%
Harman International Industries, Incorporated 58,000 $6,898,520
Lifetime Brands, Inc. 258,000 3,810,660
10,709,180
INDUSTRIAL EQUIPMENT WHOLESALE – 2.8%
WESCO International, Inc. (a) 91,000 6,246,240
INTERNET & CATALOG RETAIL – 1.3%
Lands’ End, Inc. (a) 122,000 3,029,260
MACHINERY – 7.6%
Blount International, Inc. (a) 313,000 3,417,960
Federal Signal Corporation 231,000 3,444,210
Joy Global Inc. 94,000 3,402,800
The accompanying notes are an integral part of these financial statements.
54
COMMON STOCKS – 97.8% – continuedMACHINERY – 7.6% – continued Shares Value
Kadant Inc. 40,000 $1,888,000
Regal Beloit Corporation 69,000 5,008,710
17,161,680
MISCELLANEOUS MANUFACTURING – 2.4%
Smith & Wesson Holding Corporation (a) 328,445 5,448,903
MULTILINE RETAIL – 4.6%
Dillard’s, Inc. – Class A 56,000 5,890,640
Macy’s, Inc. 67,000 4,520,490
10,411,130
RESTAURANTS – 4.6%
Potbelly Corporation (a) 350,000 4,287,500
The Wendy’s Company 537,000 6,057,360
10,344,860
SEMICONDUCTOR & SEMICONDUCTOR EQUIPMENT – 3.2%
Entegris, Inc. (a) 204,000 2,972,280
Vishay Intertechnology, Inc. 366,000 4,274,880
7,247,160
SOFTWARE – 0.5%
VASCO Data Security International, Inc. (a) 33,100 999,289
SPECIALTY RETAIL – 7.2%
Big Lots, Inc. 100,000 4,499,000
DSW Inc. – Class A 147,000 4,905,390
Express, Inc. (a) 58,400 1,057,624
Vitamin Shoppe, Inc. (a) 155,000 5,776,850
16,238,864
TEXTILES, APPAREL & LUXURY GOODS – 0.8%
UniFirst Corporation 17,000 1,901,450
TRANSPORTATION EQUIPMENT – 4.6%
The Greenbrier Companies, Inc. 138,000 6,465,300
Wabash National Corporation (a) 310,000 3,887,400
10,352,700
TOTAL COMMON STOCKS (Cost $210,794,747) 220,993,056
O L S T E I N S T R A T E G I C O P P O R T U N I T I E S F U N D
The accompanying notes are an integral part of these financial statements.
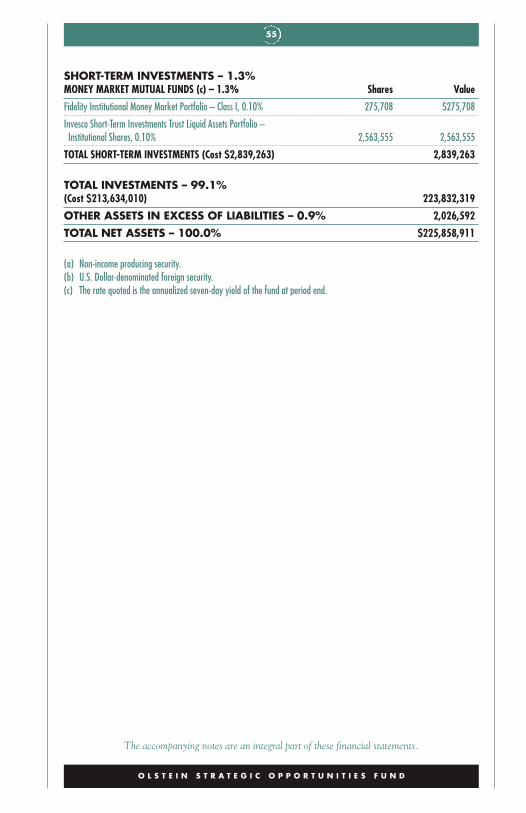
55
The accompanying notes are an integral part of these financial statements.
SHORT-TERM INVESTMENTS – 1.3%MONEY MARKET MUTUAL FUNDS (c) – 1.3% Shares Value
Fidelity Institutional Money Market Portfolio – Class I, 0.10% 275,708 $275,708
Invesco Short-Term Investments Trust Liquid Assets Portfolio –Institutional Shares, 0.10% 2,563,555 2,563,555
TOTAL SHORT-TERM INVESTMENTS (Cost $2,839,263) 2,839,263
TOTAL INVESTMENTS – 99.1%(Cost $213,634,010) 223,832,319
OTHER ASSETS IN EXCESS OF LIABILITIES – 0.9% 2,026,592
TOTAL NET ASSETS – 100.0% $225,858,911
(a) Non-income producing security.(b) U.S. Dollar-denominated foreign security.(c) The rate quoted is the annualized seven-day yield of the fund at period end.
O L S T E I N S T R A T E G I C O P P O R T U N I T I E S F U N D

56
The accompanying notes are an integral part of these financial statements.
Olstein Strategic Opportunities FundStatement of Assets and Liabilities as of June 30, 2015
Assets:
Investments, at value (at cost $213,634,010) $223,832,319
Receivable for securities sold 1,395,668
Receivable for capital shares sold 2,927,158
Dividends and interest receivable 109,071
Other assets 30,261
Total Assets 228,294,477
Liabilities:
Payable for securities purchased 1,800,972
Payable for capital shares redeemed 224,677
Payable to Investment Manager (See Note 5) 159,288
Distribution expense payable 153,056
Payable for trustees’ fees and expenses 6,558
Accrued expenses and other liabilities 91,015
Total Liabilities 2,435,566
Net Assets $225,858,911
Net Assets Consist of:
Capital stock $207,899,242
Accumulated net realized gain on investments sold 7,761,360
Net unrealized appreciation on investments 10,198,309
Total Net Assets $225,858,911
O L S T E I N S T R A T E G I C O P P O R T U N I T I E S F U N D
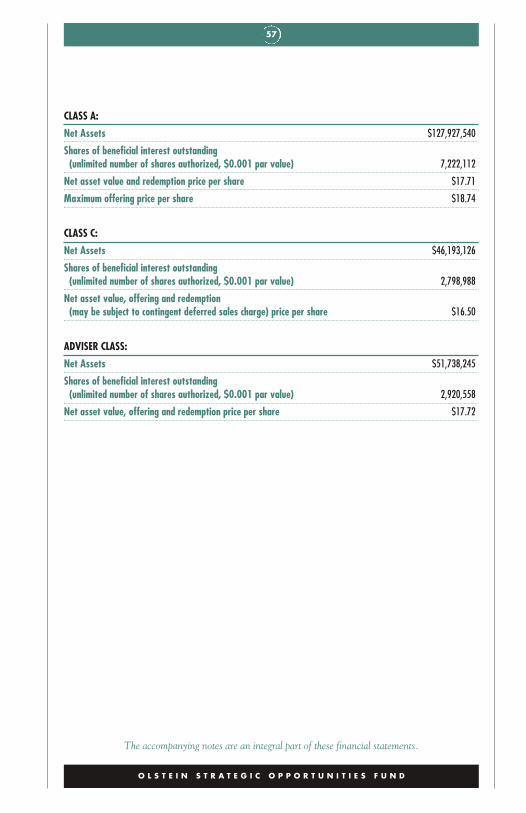
57
The accompanying notes are an integral part of these financial statements.
CLASS A:
Net Assets $127,927,540
Shares of beneficial interest outstanding(unlimited number of shares authorized, $0.001 par value) 7,222,112
Net asset value and redemption price per share $17.71
Maximum offering price per share $18.74
CLASS C:
Net Assets $46,193,126
Shares of beneficial interest outstanding(unlimited number of shares authorized, $0.001 par value) 2,798,988
Net asset value, offering and redemption(may be subject to contingent deferred sales charge) price per share $16.50
ADVISER CLASS:
Net Assets $51,738,245
Shares of beneficial interest outstanding(unlimited number of shares authorized, $0.001 par value) 2,920,558
Net asset value, offering and redemption price per share $17.72
O L S T E I N S T R A T E G I C O P P O R T U N I T I E S F U N D

58
Olstein Strategic Opportunities FundStatement of Operations
For the Year EndedJune 30, 2015
Investment Income:
Dividend income $1,565,586
Interest income 3,879
Total investment income 1,569,465
Expenses:
Investment management fee (See Note 5) 1,581,195
Distribution expense – Class A (See Note 6) 308,059
Distribution expense – Class C (See Note 6) 334,981
Transfer agent fees and expenses 158,326
Administration fee 113,946
Federal and state registration 66,247
Professional fees 66,028
Accounting costs 47,002
Trustees’ fees and expenses 33,762
Custody fees 22,527
Reports to shareholders 16,732
Interest expense (See Note 8) 248
Other 12,364
Total expenses 2,761,417
Expense recoupment by Investment Manager (See Note 5) 16,484
Net expenses 2,777,901
Net investment loss (1,208,436)
Realized and Unrealized Gain (Loss) on Investments:
Realized gain on investments 14,157,607
Change in unrealized appreciation / depreciation on investments (6,614,275)
Net realized and unrealized gain on investments 7,543,332
Net Increase in Net Assets Resulting from Operations $6,334,896
The accompanying notes are an integral part of these financial statements.
O L S T E I N S T R A T E G I C O P P O R T U N I T I E S F U N D
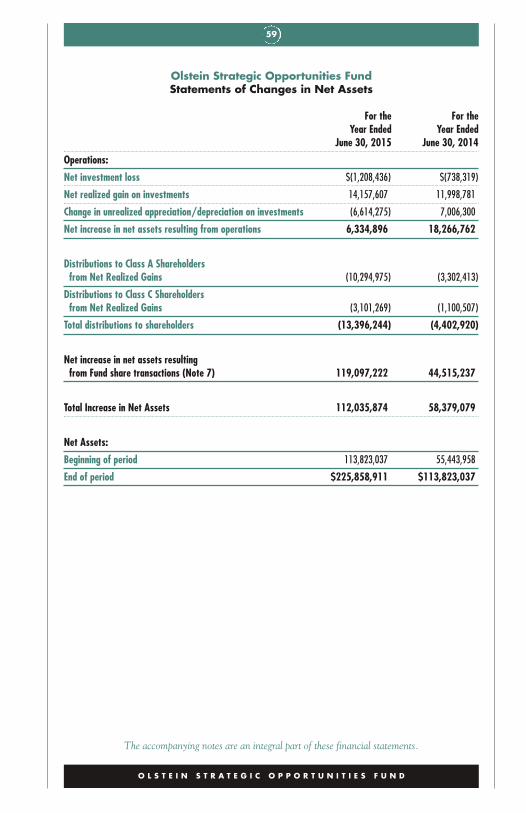
59
Olstein Strategic Opportunities FundStatements of Changes in Net Assets
For the For theYear Ended Year Ended
June 30, 2015 June 30, 2014
Operations:
Net investment loss $(1,208,436) $(738,319)
Net realized gain on investments 14,157,607 11,998,781
Change in unrealized appreciation/depreciation on investments (6,614,275) 7,006,300
Net increase in net assets resulting from operations 6,334,896 18,266,762
Distributions to Class A Shareholdersfrom Net Realized Gains (10,294,975) (3,302,413)
Distributions to Class C Shareholdersfrom Net Realized Gains (3,101,269) (1,100,507)
Total distributions to shareholders (13,396,244) (4,402,920)
Net increase in net assets resultingfrom Fund share transactions (Note 7) 119,097,222 44,515,237
Total Increase in Net Assets 112,035,874 58,379,079
Net Assets:
Beginning of period 113,823,037 55,443,958
End of period $225,858,911 $113,823,037
The accompanying notes are an integral part of these financial statements.
O L S T E I N S T R A T E G I C O P P O R T U N I T I E S F U N D
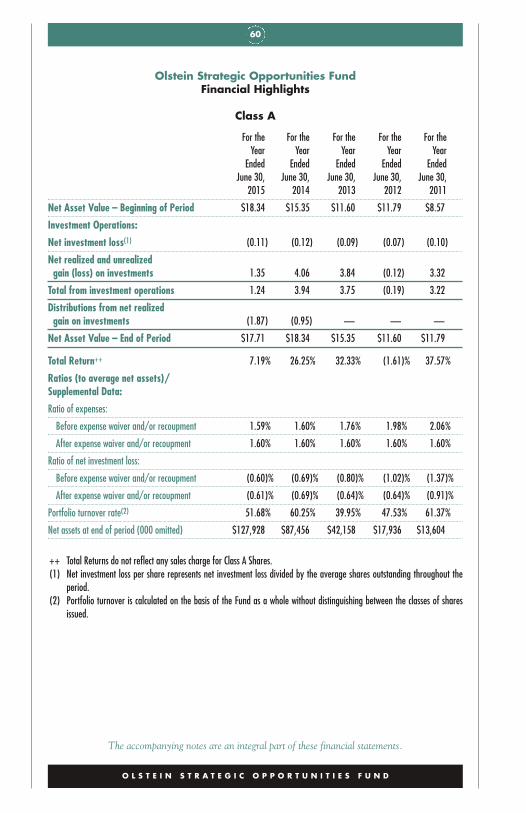
60
The accompanying notes are an integral part of these financial statements.
Olstein Strategic Opportunities FundFinancial Highlights
Class A
For the For the For the For the For theYear Year Year Year Year
Ended Ended Ended Ended EndedJune 30, June 30, June 30, June 30, June 30,
2015 2014 2013 2012 2011
Net Asset Value – Beginning of Period $18.34 $15.35 $11.60 $11.79 $8.57
Investment Operations:
Net investment loss(1) (0.11) (0.12) (0.09) (0.07) (0.10)
Net realized and unrealizedgain (loss) on investments 1.35 4.06 3.84 (0.12) 3.32
Total from investment operations 1.24 3.94 3.75 (0.19) 3.22
Distributions from net realizedgain on investments (1.87) (0.95) — — —
Net Asset Value – End of Period $17.71 $18.34 $15.35 $11.60 $11.79
Total Return++ 7.19% 26.25% 32.33% (1.61)% 37.57%
Ratios (to average net assets)/Supplemental Data:
Ratio of expenses:
Before expense waiver and/or recoupment 1.59% 1.60% 1.76% 1.98% 2.06%
After expense waiver and/or recoupment 1.60% 1.60% 1.60% 1.60% 1.60%
Ratio of net investment loss:
Before expense waiver and/or recoupment (0.60)% (0.69)% (0.80)% (1.02)% (1.37)%
After expense waiver and/or recoupment (0.61)% (0.69)% (0.64)% (0.64)% (0.91)%
Portfolio turnover rate(2) 51.68% 60.25% 39.95% 47.53% 61.37%
Net assets at end of period (000 omitted) $127,928 $87,456 $42,158 $17,936 $13,604
++ Total Returns do not reflect any sales charge for Class A Shares.(1) Net investment loss per share represents net investment loss divided by the average shares outstanding throughout the
period.(2) Portfolio turnover is calculated on the basis of the Fund as a whole without distinguishing between the classes of shares
issued.
O L S T E I N S T R A T E G I C O P P O R T U N I T I E S F U N D
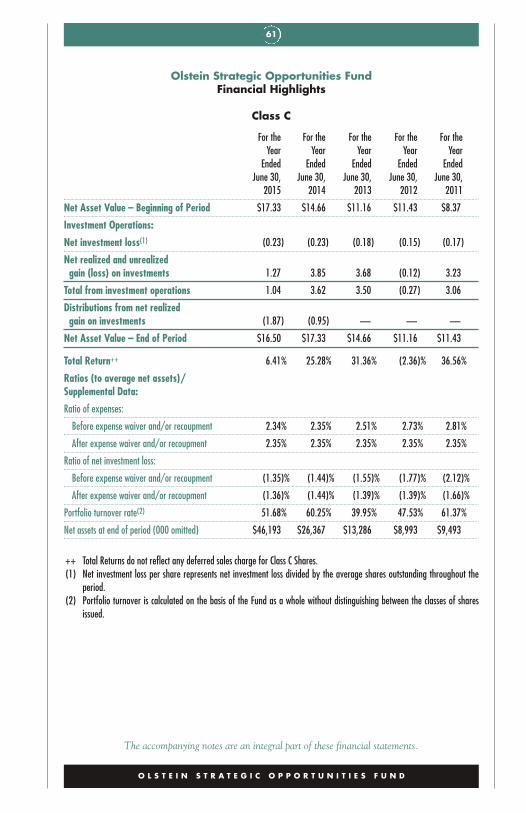
61
The accompanying notes are an integral part of these financial statements.
Olstein Strategic Opportunities FundFinancial Highlights
Class C
For the For the For the For the For theYear Year Year Year Year
Ended Ended Ended Ended EndedJune 30, June 30, June 30, June 30, June 30,
2015 2014 2013 2012 2011
Net Asset Value – Beginning of Period $17.33 $14.66 $11.16 $11.43 $8.37
Investment Operations:
Net investment loss(1) (0.23) (0.23) (0.18) (0.15) (0.17)
Net realized and unrealizedgain (loss) on investments 1.27 3.85 3.68 (0.12) 3.23
Total from investment operations 1.04 3.62 3.50 (0.27) 3.06
Distributions from net realizedgain on investments (1.87) (0.95) — — —
Net Asset Value – End of Period $16.50 $17.33 $14.66 $11.16 $11.43
Total Return++ 6.41% 25.28% 31.36% (2.36)% 36.56%
Ratios (to average net assets)/Supplemental Data:
Ratio of expenses:
Before expense waiver and/or recoupment 2.34% 2.35% 2.51% 2.73% 2.81%
After expense waiver and/or recoupment 2.35% 2.35% 2.35% 2.35% 2.35%
Ratio of net investment loss:
Before expense waiver and/or recoupment (1.35)% (1.44)% (1.55)% (1.77)% (2.12)%
After expense waiver and/or recoupment (1.36)% (1.44)% (1.39)% (1.39)% (1.66)%
Portfolio turnover rate(2) 51.68% 60.25% 39.95% 47.53% 61.37%
Net assets at end of period (000 omitted) $46,193 $26,367 $13,286 $8,993 $9,493
++ Total Returns do not reflect any deferred sales charge for Class C Shares.(1) Net investment loss per share represents net investment loss divided by the average shares outstanding throughout the
period.(2) Portfolio turnover is calculated on the basis of the Fund as a whole without distinguishing between the classes of shares
issued.
O L S T E I N S T R A T E G I C O P P O R T U N I T I E S F U N D
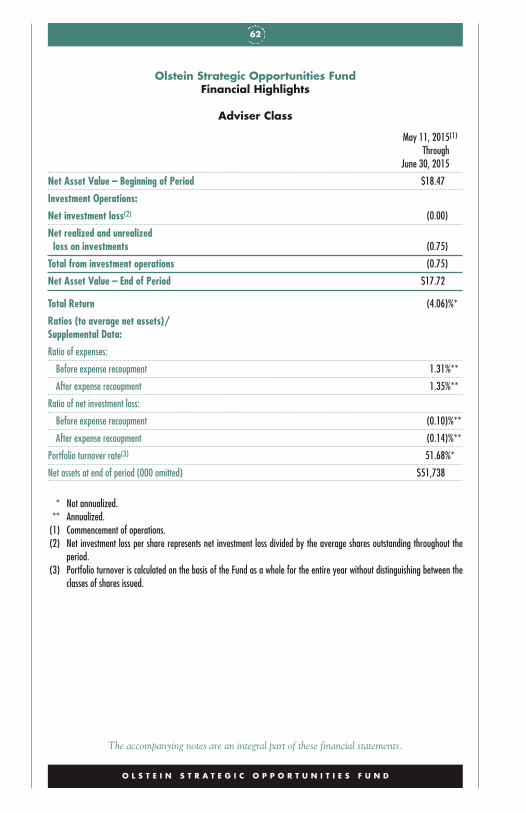
62
Olstein Strategic Opportunities FundFinancial Highlights
Adviser Class
May 11, 2015(1)
ThroughJune 30, 2015
Net Asset Value – Beginning of Period $18.47
Investment Operations:
Net investment loss(2) (0.00)
Net realized and unrealizedloss on investments (0.75)
Total from investment operations (0.75)
Net Asset Value – End of Period $17.72
Total Return (4.06)%*
Ratios (to average net assets)/Supplemental Data:
Ratio of expenses:
Before expense recoupment 1.31%**
After expense recoupment 1.35%**
Ratio of net investment loss:
Before expense recoupment (0.10)%**
After expense recoupment (0.14)%**
Portfolio turnover rate(3) 51.68%*
Net assets at end of period (000 omitted) $51,738
* Not annualized.** Annualized.
(1) Commencement of operations.(2) Net investment loss per share represents net investment loss divided by the average shares outstanding throughout the
period.(3) Portfolio turnover is calculated on the basis of the Fund as a whole for the entire year without distinguishing between the
classes of shares issued.
The accompanying notes are an integral part of these financial statements.
O L S T E I N S T R A T E G I C O P P O R T U N I T I E S F U N D

63
The Olstein FundsNotes to Financial Statements
1 Description of the Funds The Olstein Funds (the “Trust”), a Delawarestatutory trust organized on March 31, 1995, is registered under theInvestment Company Act of 1940, as amended (the “1940 Act”), as anopen-end investment management company. The Trust consists of twoseries, the Olstein All Cap Value Fund (“All Cap Value Fund”) and theOlstein Strategic Opportunities Fund (“Strategic Fund”) (collectively,the “Funds”). Each Fund is a diversified investment management compa-ny. The primary investment objective of each Fund is long-term capitalappreciation with a secondary objective of income. The All Cap ValueFund commenced investment operations on September 21, 1995, and theStrategic Fund commenced operations on November 1, 2006.
The All Cap Value Fund issued a second class of shares, Adviser Classshares, and renamed the initial class as Class C shares on September 1,1999. The Adviser Class shares were initially sold on September 21,1999, and were subject to expenses pursuant to the ShareholderServicing and Distribution Plan described in Note 6 through October 30,2013 and was eliminated thereafter. The Class C shares are subject to acontingent deferred sales charge (“CDSC”) for redemptions in accor-dance with the All Cap Value Fund’s prospectus, and expenses pursuantto the Shareholder Servicing and Distribution Plan described in Note 6.The maximum CDSC is 1.00% based on the lesser of the original pur-chase price or the value of such shares at the time of redemption for ClassC shares within one year of purchase.
The Strategic Fund offers Class A and Class C shares, which are subjectto expenses pursuant to the Shareholder Servicing and Distribution Plandescribed in Note 6. Class A shares have a maximum front-end salescharge of 5.50% that is included in the offering price of the Class Ashares. The Class C shares are subject to a CDSC for redemptions withinone year of purchase in accordance with the Strategic Fund’s prospectus.The maximum CDSC is 1.00% based on the lesser of the original pur-chase price or the value of such shares at the time of redemption. TheStrategic Fund offered a third class of shares, Adviser Class shares, onApril 28, 2015, which were initially sold on May 11, 2015.
T H E O L S T E I N F U N D S
64
2 Significant Accounting Policies The following is a summary of the signif-icant accounting policies of the Funds:
Security Valuation. The Funds’ equity securities, except securities report-ed on the NASDAQ NMS or Small Cap exchanges, are valued at theirfair value as determined by their last reported sale price on the exchangeon which the security is principally traded. Securities traded onNASDAQ NMS or Small Cap exchanges are valued at the NASDAQOfficial Closing Price (“NOCP”). Lacking any sales, the security is val-ued at the mean between the closing bid and asked prices. The value ofsecurities, for which no quotations are readily available, is determined ingood faith by, or under procedures approved by, the Board of Trustees(the “Board”). The Board has adopted specific procedures for valuingportfolio securities and delegated the implementation of these proce-dures to Olstein Capital Management, L.P. (“Olstein” or the“Investment Manager”). The procedures authorize the InvestmentManager to make all necessary determinations regarding the fair value ofa portfolio security and to report such determinations to the Board ofTrustees. The Funds use independent pricing services to assist in pricingportfolio securities.
The Trust has adopted fair valuation accounting standards which estab-lish an authoritative definition of fair value and set out a hierarchy formeasuring fair value. These standards require additional disclosuresabout the various inputs and valuation techniques used to develop themeasurements of fair value and a discussion of changes in valuation tech-niques and related inputs during the period. These standards define fairvalue as the price that would be received to sell an asset or paid to trans-fer a liability in an orderly transaction between market participants at themeasurement date. The fair value hierarchy is organized into three levelsbased upon the assumptions (referred to as “inputs”) used in pricing theasset or liability. These standards state that “observable inputs” reflect theassumptions market participants would use in pricing the asset or liabilitybased on market data obtained from independent sources and “unobserv-able inputs” reflect an entity’s own assumptions about the assumptionsmarket participants would use in pricing the asset or liability. Theseinputs are summarized in the three broad levels listed below.
Level 1 – Quoted unadjusted prices for identical instruments in active mar-kets to which the Trust has access at the date of measurement.
T H E O L S T E I N F U N D S
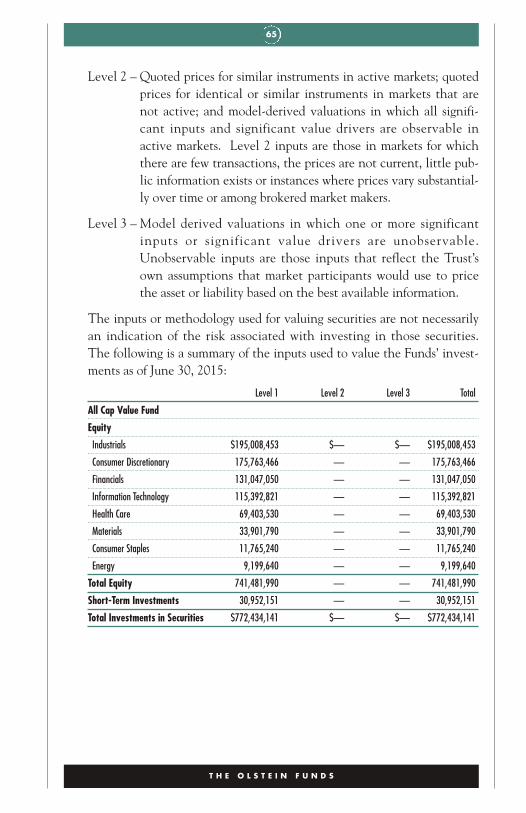
65
Level 2 – Quoted prices for similar instruments in active markets; quotedprices for identical or similar instruments in markets that arenot active; and model-derived valuations in which all signifi-cant inputs and significant value drivers are observable inactive markets. Level 2 inputs are those in markets for whichthere are few transactions, the prices are not current, little pub-lic information exists or instances where prices vary substantial-ly over time or among brokered market makers.
Level 3 – Model derived valuations in which one or more significantinputs or significant value drivers are unobservable.Unobservable inputs are those inputs that reflect the Trust’sown assumptions that market participants would use to pricethe asset or liability based on the best available information.
The inputs or methodology used for valuing securities are not necessarilyan indication of the risk associated with investing in those securities.The following is a summary of the inputs used to value the Funds’ invest-ments as of June 30, 2015:
Level 1 Level 2 Level 3 Total
All Cap Value Fund
Equity
Industrials $195,008,453 $— $— $195,008,453
Consumer Discretionary 175,763,466 — — 175,763,466
Financials 131,047,050 — — 131,047,050
Information Technology 115,392,821 — — 115,392,821
Health Care 69,403,530 — — 69,403,530
Materials 33,901,790 — — 33,901,790
Consumer Staples 11,765,240 — — 11,765,240
Energy 9,199,640 — — 9,199,640
Total Equity 741,481,990 — — 741,481,990
Short-Term Investments 30,952,151 — — 30,952,151
Total Investments in Securities $772,434,141 $— $— $772,434,141
T H E O L S T E I N F U N D S
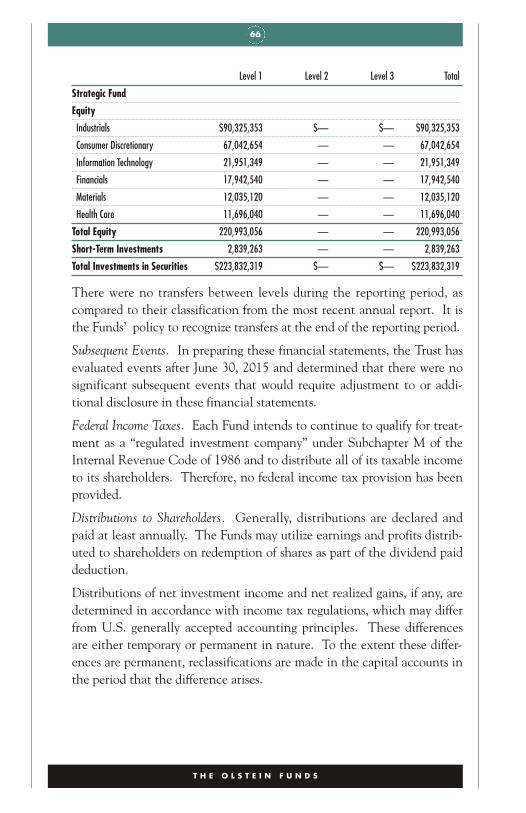
66
Level 1 Level 2 Level 3 Total
Strategic Fund
Equity
Industrials $90,325,353 $— $— $90,325,353
Consumer Discretionary 67,042,654 — — 67,042,654
Information Technology 21,951,349 — — 21,951,349
Financials 17,942,540 — — 17,942,540
Materials 12,035,120 — — 12,035,120
Health Care 11,696,040 — — 11,696,040
Total Equity 220,993,056 — — 220,993,056
Short-Term Investments 2,839,263 — — 2,839,263
Total Investments in Securities $223,832,319 $— $— $223,832,319
There were no transfers between levels during the reporting period, ascompared to their classification from the most recent annual report. It isthe Funds’ policy to recognize transfers at the end of the reporting period.
Subsequent Events. In preparing these financial statements, the Trust hasevaluated events after June 30, 2015 and determined that there were nosignificant subsequent events that would require adjustment to or addi-tional disclosure in these financial statements.
Federal Income Taxes. Each Fund intends to continue to qualify for treat-ment as a “regulated investment company” under Subchapter M of theInternal Revenue Code of 1986 and to distribute all of its taxable incometo its shareholders. Therefore, no federal income tax provision has beenprovided.
Distributions to Shareholders. Generally, distributions are declared andpaid at least annually. The Funds may utilize earnings and profits distrib-uted to shareholders on redemption of shares as part of the dividend paiddeduction.
Distributions of net investment income and net realized gains, if any, aredetermined in accordance with income tax regulations, which may differfrom U.S. generally accepted accounting principles. These differencesare either temporary or permanent in nature. To the extent these differ-ences are permanent, reclassifications are made in the capital accounts inthe period that the difference arises.
T H E O L S T E I N F U N D S
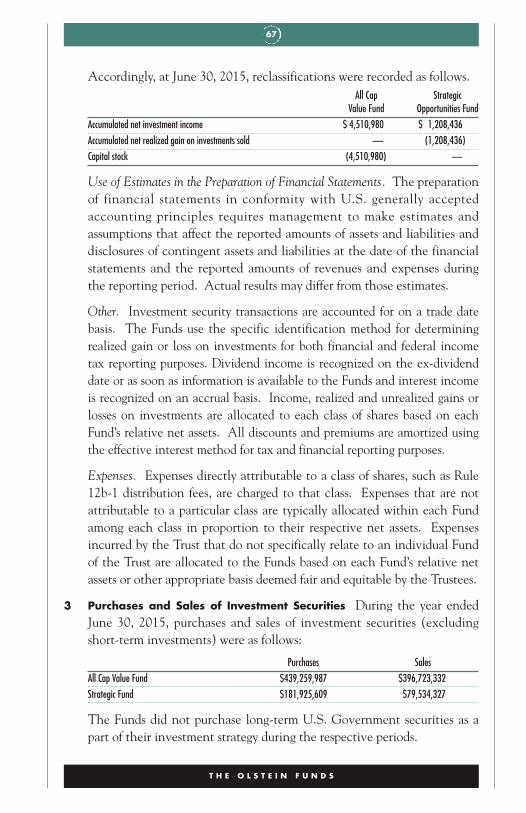
67
Accordingly, at June 30, 2015, reclassifications were recorded as follows.All Cap Strategic
Value Fund Opportunities FundAccumulated net investment income $ 4,510,980 $ 1,208,436Accumulated net realized gain on investments sold — (1,208,436)Capital stock (4,510,980) —
Use of Estimates in the Preparation of Financial Statements. The preparationof financial statements in conformity with U.S. generally acceptedaccounting principles requires management to make estimates andassumptions that affect the reported amounts of assets and liabilities anddisclosures of contingent assets and liabilities at the date of the financialstatements and the reported amounts of revenues and expenses duringthe reporting period. Actual results may differ from those estimates.
Other. Investment security transactions are accounted for on a trade datebasis. The Funds use the specific identification method for determiningrealized gain or loss on investments for both financial and federal incometax reporting purposes. Dividend income is recognized on the ex-dividenddate or as soon as information is available to the Funds and interest incomeis recognized on an accrual basis. Income, realized and unrealized gains orlosses on investments are allocated to each class of shares based on eachFund’s relative net assets. All discounts and premiums are amortized usingthe effective interest method for tax and financial reporting purposes.
Expenses. Expenses directly attributable to a class of shares, such as Rule12b-1 distribution fees, are charged to that class. Expenses that are notattributable to a particular class are typically allocated within each Fundamong each class in proportion to their respective net assets. Expensesincurred by the Trust that do not specifically relate to an individual Fundof the Trust are allocated to the Funds based on each Fund’s relative netassets or other appropriate basis deemed fair and equitable by the Trustees.
3 Purchases and Sales of Investment Securities During the year endedJune 30, 2015, purchases and sales of investment securities (excludingshort-term investments) were as follows:
Purchases SalesAll Cap Value Fund $439,259,987 $396,723,332Strategic Fund $181,925,609 $79,534,327
The Funds did not purchase long-term U.S. Government securities as apart of their investment strategy during the respective periods.
T H E O L S T E I N F U N D S
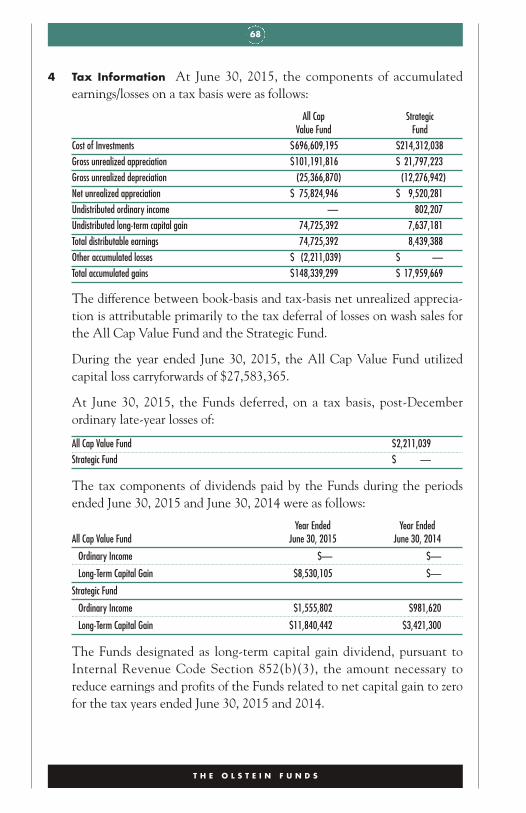
68
4 Tax Information At June 30, 2015, the components of accumulatedearnings/losses on a tax basis were as follows:
All Cap StrategicValue Fund Fund
Cost of Investments $696,609,195 $214,312,038Gross unrealized appreciation $101,191,816 $ 21,797,223Gross unrealized depreciation (25,366,870) (12,276,942)Net unrealized appreciation $ 75,824,946 $ 9,520,281Undistributed ordinary income — 802,207Undistributed long-term capital gain 74,725,392 7,637,181Total distributable earnings 74,725,392 8,439,388Other accumulated losses $ (2,211,039) $ —Total accumulated gains $148,339,299 $ 17,959,669
The difference between book-basis and tax-basis net unrealized apprecia-tion is attributable primarily to the tax deferral of losses on wash sales forthe All Cap Value Fund and the Strategic Fund.
During the year ended June 30, 2015, the All Cap Value Fund utilizedcapital loss carryforwards of $27,583,365.
At June 30, 2015, the Funds deferred, on a tax basis, post-Decemberordinary late-year losses of:
All Cap Value Fund $2,211,039Strategic Fund $ —
The tax components of dividends paid by the Funds during the periodsended June 30, 2015 and June 30, 2014 were as follows:
Year Ended Year EndedAll Cap Value Fund June 30, 2015 June 30, 2014
Ordinary Income $— $—
Long-Term Capital Gain $8,530,105 $—
Strategic Fund
Ordinary Income $1,555,802 $981,620
Long-Term Capital Gain $11,840,442 $3,421,300
The Funds designated as long-term capital gain dividend, pursuant toInternal Revenue Code Section 852(b)(3), the amount necessary toreduce earnings and profits of the Funds related to net capital gain to zerofor the tax years ended June 30, 2015 and 2014.
T H E O L S T E I N F U N D S
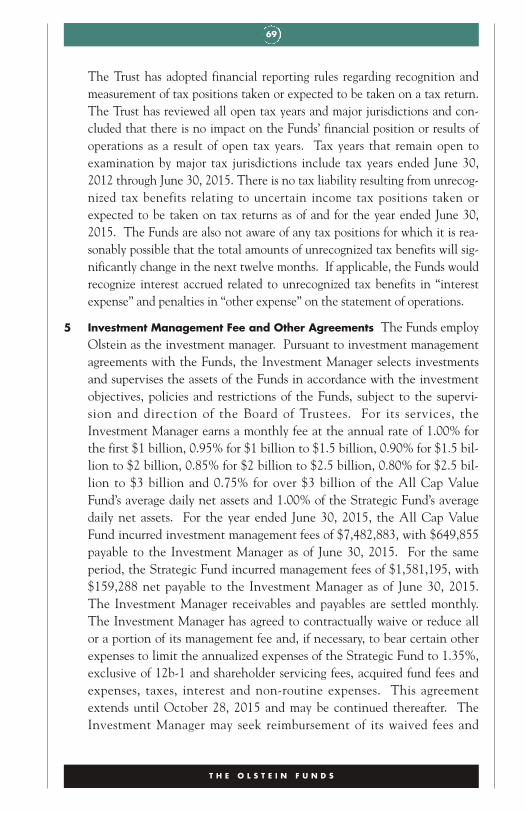
69
The Trust has adopted financial reporting rules regarding recognition andmeasurement of tax positions taken or expected to be taken on a tax return.The Trust has reviewed all open tax years and major jurisdictions and con-cluded that there is no impact on the Funds’ financial position or results ofoperations as a result of open tax years. Tax years that remain open toexamination by major tax jurisdictions include tax years ended June 30,2012 through June 30, 2015. There is no tax liability resulting from unrecog-nized tax benefits relating to uncertain income tax positions taken orexpected to be taken on tax returns as of and for the year ended June 30,2015. The Funds are also not aware of any tax positions for which it is rea-sonably possible that the total amounts of unrecognized tax benefits will sig-nificantly change in the next twelve months. If applicable, the Funds wouldrecognize interest accrued related to unrecognized tax benefits in “interestexpense” and penalties in “other expense” on the statement of operations.
5 Investment Management Fee and Other Agreements The Funds employOlstein as the investment manager. Pursuant to investment managementagreements with the Funds, the Investment Manager selects investmentsand supervises the assets of the Funds in accordance with the investmentobjectives, policies and restrictions of the Funds, subject to the supervi-sion and direction of the Board of Trustees. For its services, theInvestment Manager earns a monthly fee at the annual rate of 1.00% forthe first $1 billion, 0.95% for $1 billion to $1.5 billion, 0.90% for $1.5 bil-lion to $2 billion, 0.85% for $2 billion to $2.5 billion, 0.80% for $2.5 bil-lion to $3 billion and 0.75% for over $3 billion of the All Cap ValueFund’s average daily net assets and 1.00% of the Strategic Fund’s averagedaily net assets. For the year ended June 30, 2015, the All Cap ValueFund incurred investment management fees of $7,482,883, with $649,855payable to the Investment Manager as of June 30, 2015. For the sameperiod, the Strategic Fund incurred management fees of $1,581,195, with$159,288 net payable to the Investment Manager as of June 30, 2015.The Investment Manager receivables and payables are settled monthly.The Investment Manager has agreed to contractually waive or reduce allor a portion of its management fee and, if necessary, to bear certain otherexpenses to limit the annualized expenses of the Strategic Fund to 1.35%,exclusive of 12b-1 and shareholder servicing fees, acquired fund fees andexpenses, taxes, interest and non-routine expenses. This agreementextends until October 28, 2015 and may be continued thereafter. TheInvestment Manager may seek reimbursement of its waived fees and
T H E O L S T E I N F U N D S
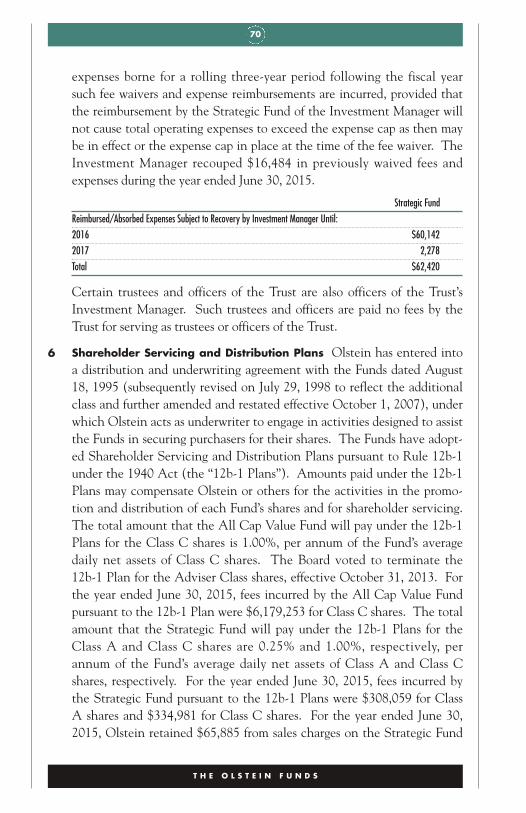
70
expenses borne for a rolling three-year period following the fiscal yearsuch fee waivers and expense reimbursements are incurred, provided thatthe reimbursement by the Strategic Fund of the Investment Manager willnot cause total operating expenses to exceed the expense cap as then maybe in effect or the expense cap in place at the time of the fee waiver. TheInvestment Manager recouped $16,484 in previously waived fees andexpenses during the year ended June 30, 2015.
Strategic FundReimbursed/Absorbed Expenses Subject to Recovery by Investment Manager Until:2016 $60,1422017 2,278Total $62,420
Certain trustees and officers of the Trust are also officers of the Trust’sInvestment Manager. Such trustees and officers are paid no fees by theTrust for serving as trustees or officers of the Trust.
6 Shareholder Servicing and Distribution Plans Olstein has entered intoa distribution and underwriting agreement with the Funds dated August18, 1995 (subsequently revised on July 29, 1998 to reflect the additionalclass and further amended and restated effective October 1, 2007), underwhich Olstein acts as underwriter to engage in activities designed to assistthe Funds in securing purchasers for their shares. The Funds have adopt-ed Shareholder Servicing and Distribution Plans pursuant to Rule 12b-1under the 1940 Act (the “12b-1 Plans”). Amounts paid under the 12b-1Plans may compensate Olstein or others for the activities in the promo-tion and distribution of each Fund’s shares and for shareholder servicing.The total amount that the All Cap Value Fund will pay under the 12b-1Plans for the Class C shares is 1.00%, per annum of the Fund’s averagedaily net assets of Class C shares. The Board voted to terminate the12b-1 Plan for the Adviser Class shares, effective October 31, 2013. Forthe year ended June 30, 2015, fees incurred by the All Cap Value Fundpursuant to the 12b-1 Plan were $6,179,253 for Class C shares. The totalamount that the Strategic Fund will pay under the 12b-1 Plans for theClass A and Class C shares are 0.25% and 1.00%, respectively, perannum of the Fund’s average daily net assets of Class A and Class Cshares, respectively. For the year ended June 30, 2015, fees incurred bythe Strategic Fund pursuant to the 12b-1 Plans were $308,059 for ClassA shares and $334,981 for Class C shares. For the year ended June 30,2015, Olstein retained $65,885 from sales charges on the Strategic Fund
T H E O L S T E I N F U N D S
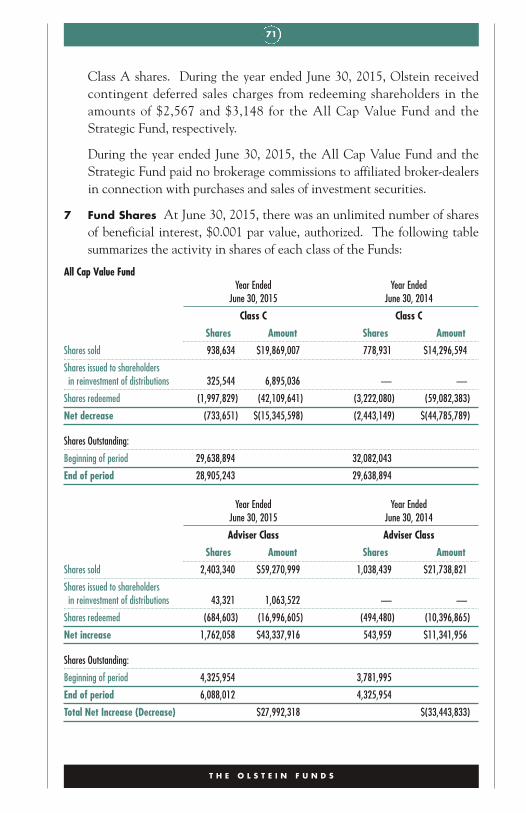
71
T H E O L S T E I N F U N D S
Class A shares. During the year ended June 30, 2015, Olstein receivedcontingent deferred sales charges from redeeming shareholders in theamounts of $2,567 and $3,148 for the All Cap Value Fund and theStrategic Fund, respectively.
During the year ended June 30, 2015, the All Cap Value Fund and theStrategic Fund paid no brokerage commissions to affiliated broker-dealersin connection with purchases and sales of investment securities.
7 Fund Shares At June 30, 2015, there was an unlimited number of sharesof beneficial interest, $0.001 par value, authorized. The following tablesummarizes the activity in shares of each class of the Funds:
All Cap Value FundYear Ended Year Ended
June 30, 2015 June 30, 2014
Class C Class C
Shares Amount Shares Amount
Shares sold 938,634 $19,869,007 778,931 $14,296,594
Shares issued to shareholdersin reinvestment of distributions 325,544 6,895,036 — —
Shares redeemed (1,997,829) (42,109,641) (3,222,080) (59,082,383)
Net decrease (733,651) $(15,345,598) (2,443,149) $(44,785,789)
Shares Outstanding:
Beginning of period 29,638,894 32,082,043
End of period 28,905,243 29,638,894
Year Ended Year EndedJune 30, 2015 June 30, 2014
Adviser Class Adviser Class
Shares Amount Shares Amount
Shares sold 2,403,340 $59,270,999 1,038,439 $21,738,821
Shares issued to shareholdersin reinvestment of distributions 43,321 1,063,522 — —
Shares redeemed (684,603) (16,996,605) (494,480) (10,396,865)
Net increase 1,762,058 $43,337,916 543,959 $11,341,956
Shares Outstanding:
Beginning of period 4,325,954 3,781,995
End of period 6,088,012 4,325,954
Total Net Increase (Decrease) $27,992,318 $(33,443,833)

72
Strategic FundYear Ended Year Ended
June 30, 2015 June 30, 2014
Class A Class A
Shares Amount Shares Amount
Shares sold 6,495,344 $118,003,318 2,631,776 $45,049,508
Shares issued to shareholdersin reinvestment of distributions 574,233 9,733,245 189,338 3,180,885
Shares redeemed (4,616,441) (83,856,016) (798,339) (13,742,662)
Net increase 2,453,136 $43,880,547 2,022,775 $34,487,731
Shares Outstanding:
Beginning of period 4,768,976 2,746,201
End of period 7,222,112 4,768,976
Year Ended Year EndedJune 30, 2015 June 30, 2014
Class C Class C
Shares Amount Shares Amount
Shares sold 1,321,449 $22,536,637 687,127 $11,221,578
Shares issued to shareholdersin reinvestment of distributions 180,165 2,857,420 64,042 1,020,826
Shares redeemed (223,948) (3,732,058) (136,261) (2,214,898)
Net increase 1,277,666 $21,661,999 614,908 $10,027,506
Shares Outstanding:
Beginning of period 1,521,322 906,414
End of period 2,798,988 1,521,322
May 11, 2015*through
June 30, 2015
Adviser Class
Shares Amount
Shares sold 2,927,941 $53,689,155
Shares redeemed (7,383) (134,479)
Net increase 2,920,558 $53,554,676
Shares Outstanding:
Beginning of period —
End of period 2,920,558
Total Net Increase $119,097,222 $44,515,237
* Commencement of operations.
T H E O L S T E I N F U N D S
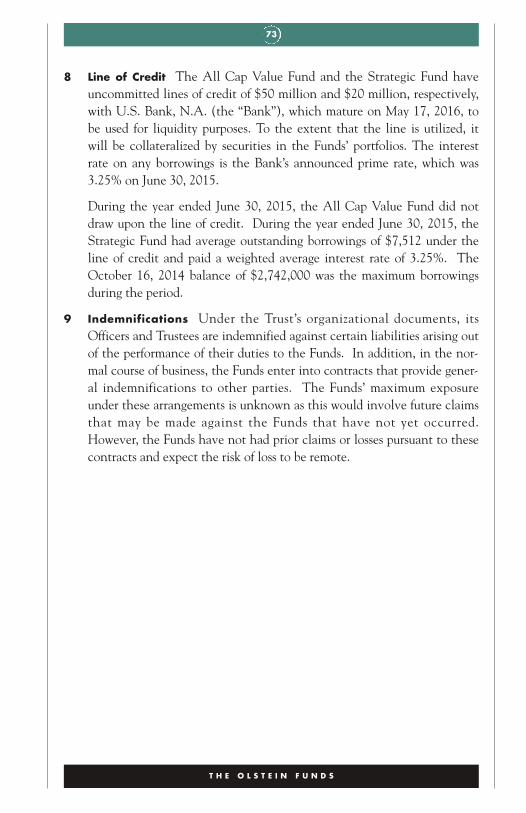
73
8 Line of Credit The All Cap Value Fund and the Strategic Fund haveuncommitted lines of credit of $50 million and $20 million, respectively,with U.S. Bank, N.A. (the “Bank”), which mature on May 17, 2016, tobe used for liquidity purposes. To the extent that the line is utilized, itwill be collateralized by securities in the Funds’ portfolios. The interestrate on any borrowings is the Bank’s announced prime rate, which was3.25% on June 30, 2015.
During the year ended June 30, 2015, the All Cap Value Fund did notdraw upon the line of credit. During the year ended June 30, 2015, theStrategic Fund had average outstanding borrowings of $7,512 under theline of credit and paid a weighted average interest rate of 3.25%. TheOctober 16, 2014 balance of $2,742,000 was the maximum borrowingsduring the period.
9 Indemnifications Under the Trust’s organizational documents, itsOfficers and Trustees are indemnified against certain liabilities arising outof the performance of their duties to the Funds. In addition, in the nor-mal course of business, the Funds enter into contracts that provide gener-al indemnifications to other parties. The Funds’ maximum exposureunder these arrangements is unknown as this would involve future claimsthat may be made against the Funds that have not yet occurred.However, the Funds have not had prior claims or losses pursuant to thesecontracts and expect the risk of loss to be remote.
T H E O L S T E I N F U N D S
74
Report of Independent Registered Public Accounting Firm
To the Shareholders and Board of Trustees ofThe Olstein Funds
We have audited the accompanying statements of assets and liabilities, including theschedules of investments, of The Olstein Funds comprising Olstein All Cap ValueFund and Olstein Strategic Opportunities Fund (the “Funds”) as of June 30, 2015,and the related statements of operations for the year then ended, the statements ofchanges in net assets for each of the two years in the period then ended, and thefinancial highlights for each of the four years in the period then ended. These finan-cial statements and financial highlights are the responsibility of the Funds’ manage-ment. Our responsibility is to express an opinion on these financial statements andfinancial highlights based on our audits. The financial highlights for the year endedprior to June 30, 2012, were audited by other auditors whose report dated August 26,2011, expressed an unqualified opinion on those financial highlights.
We conducted our audits in accordance with the standards of the Public CompanyAccounting Oversight Board (United States). Those standards require that we planand perform the audit to obtain reasonable assurance about whether the financialstatements and financial highlights are free of material misstatement. An auditincludes examining, on a test basis, evidence supporting the amounts and disclosuresin the financial statements. Our procedures included confirmation of securitiesowned as of June 30, 2015, by correspondence with the custodian and brokers. Anaudit also includes assessing the accounting principles used and significant estimatesmade by management, as well as evaluating the overall financial statement presenta-tion. We believe that our audits provide a reasonable basis for our opinion.
In our opinion, the financial statements and financial highlights referred to abovepresent fairly, in all material respects, the financial position of each of the Funds con-stituting The Olstein Funds as of June 30, 2015, the results of their operations for theyear then ended, the changes in their net assets for each of the two years in the peri-od then ended, and the financial highlights for each of the four years in the periodthen ended, in conformity with accounting principles generally accepted in theUnited States of America.
Our audit was conducted for the purpose of forming an opinion on each Fund’s finan-cial statements and financial highlights as a whole. The information presented onpages 4 through 18, pages 34 through 51, and pages 75 through 80, which is theresponsibility of the Funds’ management, is presented for purposes of additionalanalysis. Such information has not been subjected to the auditing procedures appliedin the audit of the financial statements, and accordingly, we do not express an opin-ion or provide any assurance on it.
Cleveland, OhioAugust 27, 2015
T H E O L S T E I N F U N D S
75
T H E O L S T E I N FUNDS
Additional Information
P R O X Y V O T I N G
The Board of Trustees of the Trust, on behalf of the Funds, has delegated allproxy voting responsibilities related to the portfolio securities held by theFunds to the Investment Manager. A description of the Funds’ proxy votingpolicies and procedures is available without charge, upon request, by callingtoll-free 1-800-799-2113. A description is also included in the Funds’Statement of Additional Information, which is available on the SEC’s websiteat http://www.sec.gov.
The Investment Manager’s proxy voting record for the Funds for annual peri-ods ending June 30 each year will be available to shareholders. The proxyvoting record is available, without charge, upon request by calling, toll-free,1-800-799-2113 and on the SEC website at http://www.sec.gov.
P O R T F O L I O H O L D I N G S
The Funds include complete schedules of their portfolio holdings in the annualand semi-annual reports. The Funds are required to file complete schedules ofportfolio holdings with the SEC for the first and third fiscal quarters on FormN-Q. Once filed, the Form N-Q is available, without charge, upon request onthe SEC’s website at http://www.sec.gov. Copies of Form N-Q can also beobtained by: (i) visiting the SEC’s Public Reference Room in Washington, DC(information on the operation of the Public Reference Room may be obtainedby calling 1-800-SEC-0330); (ii) sending your request and a duplicating fee tothe SEC’s Public Reference Room, Washington, DC 20549-0102; or (iii) send-ing your request electronically to http://[email protected].
A D D I T I O N A L T A X I N F O R M A T I O N
For corporate shareholders in the Strategic Opportunities Fund, the percent-age of dividend income distributed for the year ended June 30, 2015, which isdesignated as qualifying for the dividends received deduction, is 67.23%.
For shareholders in the Strategic Opportunities Fund, the percentage of divi-dend income distributed for the year ended June 30, 2015, which is designatedas qualified dividend income under the Jobs and Growth Tax Relief Act 2003,is 67.23%.
T H E O L S T E I N F U N D S
76
A D D I T I O N A L I N F O R M A T I O N A P P L I C A B L ET O F O R E I G N S H A R E H O L D E R S O N L Y
The Strategic Opportunities Fund hereby designates 100% of its ordinaryincome distributions for the fiscal year ended June 30, 2015 as short-term capitalgain distributions under Internal Revenue Service Code Section 871(k)(2)(C).
T H E O L S T E I N F U N D S
77
B O A R D O F T R U S T E E S A N D O F F I C E R S O F T H E T R U S T
The Board of Trustees of the Trust consists of seven individuals, five of whomare not “interested persons” of the Trust or Funds as that term is defined in the1940 Act. The Trustees are fiduciaries for the Funds’ shareholders and aregoverned by the law of the State of Delaware in this regard. They establishpolicy for the operation of the Funds and appoint the officers who conductthe daily business of the Funds.
The officers conduct and supervise the daily business operations of the Trust,while the Trustees review such actions and decide on general policy.Compensation to officers and Trustees of the Trust who are affiliated with theInvestment Manager is paid by the Investment Manager and not by the Trust.
Information pertaining to the Trustees and Principal Executive Officers of theFunds is set forth below. The Statement of Additional Information includesadditional information about the Funds’ Trustees and Officers and is available,without charge, upon request by calling 1-800-799-2113.
Term of Number ofOffice and Portfolios inLength Fund Complex Other
Position(s) Held of Time Principal Occupation Overseen DirectorshipsName, Address and Age with the Trust Served** During Past Five Years by Trustee Held by Trustee___________________ __________ _______ ______________ _________ __________Disinterested Trustees:Fred W. Lange Trustee Since Private investor. 2 Wagner4 Manhattanville Road 1995 CollegePurchase, NY 10577Age: 83
John Lohr Trustee Since Owner, Howling 2 LAMCO4 Manhattanville Road 1996 Wolf Enterprises LLC, AdvisoryPurchase, NY 10577 (financial educator) ServicesAge: 70 since 1986; General (investment
Counsel, LFG, Inc. adviser);(provider of Howling Wolfinvestment products), EnterprisesSeptember 1995- LLCOctober 2002 and (publishing);President, Lockwood HowlingFinancial Services Wolf Capital(broker-dealer), Partners LLCJanuary 1996- (private equitySeptember 2002. company).
T H E O L S T E I N F U N D S

78
Term of Number ofOffice and Portfolios inLength Fund Complex Other
Position(s) Held of Time Principal Occupation Overseen DirectorshipsName, Address and Age with the Trust Served** During Past Five Years by Trustee Held by Trustee___________________ __________ _______ ______________ _________ __________D. Michael Murray Trustee Since President, Murray, 2 The Eric Fund4 Manhattanville Road 1996 Montgomery & (charitablePurchase, NY 10577 O’Donnell organization);Age: 75 (consultants), Stuart Murray
since 1968. Group LLC(governmentrelations).
Daniel G. Nelson Trustee Since Senior Vice 2 None4 Manhattanville Road 2014 President, Ingalls &Purchase, NY 10577 Snyder LLCAge: 70 (investment adviser
and broker-dealer),since May 2015;Managing Director,Morgan StanleyWealth ManagementResearch and StrategyGroup, MorganStanley, June 2010-January 2013;Managing Director,Smith Barney Researchand Strategy Group,Citi-Smith Barney,June 1980-June 2010.
Lawrence K. Wein Lead Since Private 2 eRooms4 Manhattanville Road Independent 1995 Consultant for SystemsPurchase, NY 10577 Trustee telecommunications TechnologiesAge: 73 industry, since July (ERMS. OB)
2001; Former VicePresident-WholesaleBusiness Operations,ConcertCommunicationsan ATT/BT Company,April 2000-June 2001;Former ExecutiveManager, AT&T, Inc.,for 35 years, retiredJuly 2001.
T H E O L S T E I N F U N D S
79
Term of Number ofOffice and Portfolios inLength Fund Complex Other
Position(s) Held of Time Principal Occupation Overseen DirectorshipsName, Address and Age with the Trust Served** During Past Five Years by Trustee Held by Trustee___________________ __________ _______ ______________ _________ __________Interested Trustees:
Erik K. Olstein*+ Trustee, Since President and Chief 2 The Trinity-Olstein Capital Secretary 1995 Operating Officer, PawlingManagement, L.P. and Olstein Capital School;4 Manhattanville Road Assistant Management, L.P., AmericanPurchase, NY 10577 Treasurer since 2000; Vice Friends of theAge: 48 President of Sales National
and Chief Operating MuseumOfficer, Olstein of theCapital Management, Royal Navy;L.P., 1994-2000. United States
Naval ServicePersonnelEducationalAssistanceFund (non-profits).
Robert A. Olstein*+ Trustee, Since Chairman, Chief 2 NoneOlstein Capital Chairman 1995 Executive OfficerManagement, L.P. and and Chief Investment4 Manhattanville Road President Officer, OlsteinPurchase, NY 10577 Capital Management,Age: 74 L.P., since 2000;
Chairman, ChiefExecutive Officer,Chief InvestmentOfficer and President,Olstein CapitalManagement, L.P.,1994-2000; President,Secretary and SoleShareholder ofOlstein, Inc., sinceJune 1994.
T H E O L S T E I N F U N D S
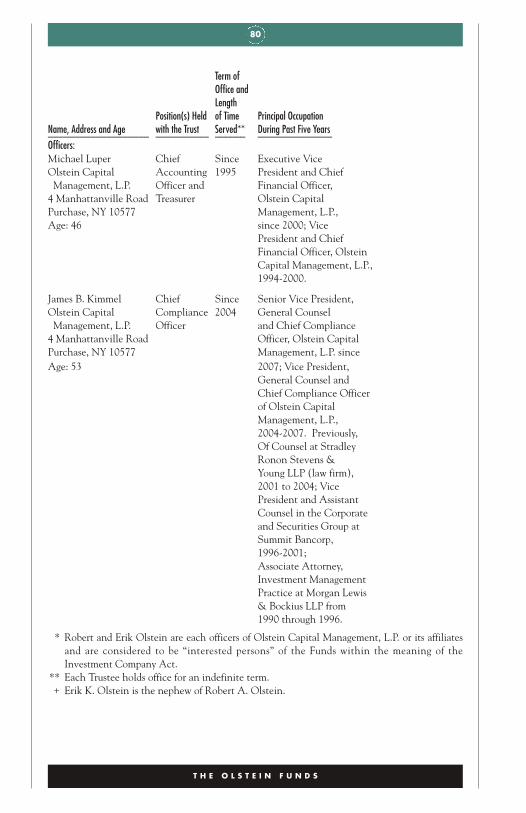
80
Term ofOffice andLength
Position(s) Held of Time Principal OccupationName, Address and Age with the Trust Served** During Past Five Years___________________ __________ ______ ______________Officers:Michael Luper Chief Since Executive ViceOlstein Capital Accounting 1995 President and ChiefManagement, L.P. Officer and Financial Officer,4 Manhattanville Road Treasurer Olstein CapitalPurchase, NY 10577 Management, L.P.,Age: 46 since 2000; Vice
President and ChiefFinancial Officer, OlsteinCapital Management, L.P.,1994-2000.
James B. Kimmel Chief Since Senior Vice President,Olstein Capital Compliance 2004 General CounselManagement, L.P. Officer and Chief Compliance4 Manhattanville Road Officer, Olstein CapitalPurchase, NY 10577 Management, L.P. sinceAge: 53 2007; Vice President,
General Counsel andChief Compliance Officerof Olstein CapitalManagement, L.P.,2004-2007. Previously,Of Counsel at StradleyRonon Stevens &Young LLP (law firm),2001 to 2004; VicePresident and AssistantCounsel in the Corporateand Securities Group atSummit Bancorp,1996-2001;Associate Attorney,Investment ManagementPractice at Morgan Lewis& Bockius LLP from1990 through 1996.
* Robert and Erik Olstein are each officers of Olstein Capital Management, L.P. or its affiliatesand are considered to be “interested persons” of the Funds within the meaning of theInvestment Company Act.
** Each Trustee holds office for an indefinite term.+ Erik K. Olstein is the nephew of Robert A. Olstein.
T H E O L S T E I N F U N D S

81
( T H I S P A G E I N T E N T I O N A L L Y L E F T B L A N K . )

82
T H E O L S T E I N F U N D S
P R I V A C Y P O L I C Y
FACTS WHAT DOES THE OLSTEIN FUNDS DOWITH YOUR PERSONAL INFORMATION?
Why? Financial companies choose how they share your personal informa-tion. Federal law gives consumers the right to limit some but not allsharing. Federal law also requires us to tell you how we collect,share, and protect your personal information. Please read this noticecarefully to understand what we do.
What? The types of personal information we collect and share depend on theproduct or service you have with us. This information can include:• Social Security number and employment information• transaction history and wire transfer instructions• account balances and checking account informationWhen you are no longer our customer, we continue to share yourinformation as described in this notice.
How? All financial companies need to share customers’ personal informa-tion to run their everyday business. In the section below, we list thereasons financial companies can share their customers’ personalinformation; the reasons The Olstein Funds chooses to share; andwhether you can limit this sharing.
Reasons we can share your Does The Olstein Can you limitpersonal information Funds share? this sharing?
For our everyday business purposes—such as to process your transactions,maintain your account(s), respond to Yes Nocourt orders and legal investigations,or report to credit bureaus
For our marketing purposes—to offer our products and services to you Yes No
For joint marketing withother financial companies No We don’t share
For our affiliates’ everydaybusiness purposes—information about your Yes No
transactions and experiences
For our affiliates’ everydaybusiness purposes— No We don’t shareinformation about your creditworthiness
For our affiliates to market to you No We don’t share
For nonaffiliates to market to you No We don’t share
Questions? Call 800-799-2113 or go to www.olsteinfunds.com

83
T H E O L S T E I N F U N D S
H O U S E H O L D I N G N O T I C E
In order to reduce expenses, we will deliver a single copy of prospectuses andfinancial reports to shareholders with the same residential address, providedthey have the same last name or we reasonably believe them to be members ofthe same family. Unless we are notified otherwise, we will continue to sendyou only one copy of these materials for as long as you remain a shareholderin The Olstein Funds. If you would like to receive individual mailings, pleasecall (800) 799-2113 and you will be sent a separate copy of these materials.
This Privacy Policy is not a part of this Annual Report.
Who we are
Who is providing The Olstein Fundsthis notice?
What we do
How does The Olstein To protect your personal information from unauthorizedFunds protect my access and use, we use security measures that comply withpersonal information? federal law. These measures include computer safeguards
and secured files and buildings.
How does The Olstein We collect your personal information, for example, when you:Funds collect my • open an account or give us your contact informationpersonal information? • make a wire transfer or seek advice about your investments
• make deposits or withdrawals from your account
Why can’t I limit Federal law gives you the right to limit only:all sharing? • sharing for affiliates’ everyday business purposes—infor-
mation about your creditworthiness• affiliates from using your information to market to you• sharing for nonaffiliates to market to youState laws and individual companies may give you addi-tional rights to limit sharing.
Definitions
Affiliates Companies related by common ownership or control.They can be financial and nonfinancial companies.• Our affiliates include Olstein Capital Management, L.P.
Nonaffiliates Companies not related by common ownership or control.They can be financial and nonfinancial companies.• The Olstein Funds does not share with nonaffiliates so theycan market to you.
Joint marketing A formal agreement between nonaffiliated financial com-panies that together market financial products or servicesto you.• The Olstein Funds doesn’t jointly market.
The Olstein Funds4 Manhattanville RoadPurchase, NY 10577
OlsteinAll Cap Value Fund
OlsteinStrategic Opportunities Fund
TrusteesRobert A. Olstein, ChairmanFred W. LangeJohn LohrD. Michael MurrayDaniel G. NelsonErik K. OlsteinLawrence K. Wein
Investment ManagerOlstein Capital Management, L.P.4 Manhattanville RoadPurchase, NY 10577
DistributorOlstein Capital Management, L.P.
Administrator, Transfer Agent,Dividend Paying Agent &Shareholder Servicing AgentU.S. Bancorp Fund Services, LLC615 East Michigan StreetP.O. Box 701Milwaukee, WI 53202
CustodianU.S. Bank, N.A.1555 North RiverCenter Drive, Suite 302Milwaukee, WI 53212
Legal CounselStradley, Ronon, Stevens & Young, LLP2005 Market Street, Suite 2600Philadelphia, PA 19103-7098
Independent Registered PublicAccounting FirmCohen Fund Audit Services1350 Euclid Avenue, Suite 800Cleveland, OH 44115
This report is submitted for the generalinformation of the shareholders of theFunds. The report is not authorized fordistribution to prospective investors in theFunds unless preceded or accompaniedby an effective Prospectus.
Toll Free Telephone800.799.2113www.olsteinfunds.com