mfs meridian® funds
236
SHAREHOLDER ANNUAL REPORT 31 January 2017 MFS MERIDIAN ® FUNDS Luxembourg-Registered SICAV RCS: B0039346 SICAV-UK-GG-ANN-1/17
-
Upload
khangminh22 -
Category
Documents
-
view
0 -
download
0
Transcript of mfs meridian® funds

SHAREHOLDERANNUAL REPORT31 January 2017
MFS MERIDIAN®
FUNDS
Luxembourg-Registered SICAVRCS: B0039346
SICAV-UK-GG-ANN-1/17

CONTENTS
Letter from the Chairperson . . . . . . . . . . . . . . . . . . . . . . . . . . . . . . . . . . . . . . . . . . . . . . . . . . . . . . . . . . . . . . . . . . . . . . . . . . . . . 3
Performance table . . . . . . . . . . . . . . . . . . . . . . . . . . . . . . . . . . . . . . . . . . . . . . . . . . . . . . . . . . . . . . . . . . . . . . . . . . . . . . . . . . . . . 4
Notes to performance summary . . . . . . . . . . . . . . . . . . . . . . . . . . . . . . . . . . . . . . . . . . . . . . . . . . . . . . . . . . . . . . . . . . . . . . . . . . 8
General information . . . . . . . . . . . . . . . . . . . . . . . . . . . . . . . . . . . . . . . . . . . . . . . . . . . . . . . . . . . . . . . . . . . . . . . . . . . . . . . . . . . 8
Corporate governance . . . . . . . . . . . . . . . . . . . . . . . . . . . . . . . . . . . . . . . . . . . . . . . . . . . . . . . . . . . . . . . . . . . . . . . . . . . . . . . . . . 8
Certain risk management disclosures . . . . . . . . . . . . . . . . . . . . . . . . . . . . . . . . . . . . . . . . . . . . . . . . . . . . . . . . . . . . . . . . . . . . . . 9
Shareholder complaints . . . . . . . . . . . . . . . . . . . . . . . . . . . . . . . . . . . . . . . . . . . . . . . . . . . . . . . . . . . . . . . . . . . . . . . . . . . . . . . . . 9
Schedules of investments . . . . . . . . . . . . . . . . . . . . . . . . . . . . . . . . . . . . . . . . . . . . . . . . . . . . . . . . . . . . . . . . . . . . . . . . . . . . . . . 11
Statements of assets and liabilities . . . . . . . . . . . . . . . . . . . . . . . . . . . . . . . . . . . . . . . . . . . . . . . . . . . . . . . . . . . . . . . . . . . . . . . . 126
Statements of operations and changes in net assets . . . . . . . . . . . . . . . . . . . . . . . . . . . . . . . . . . . . . . . . . . . . . . . . . . . . . . . . . . 131
Statistical information . . . . . . . . . . . . . . . . . . . . . . . . . . . . . . . . . . . . . . . . . . . . . . . . . . . . . . . . . . . . . . . . . . . . . . . . . . . . . . . . . . 136
Notes to financial statements . . . . . . . . . . . . . . . . . . . . . . . . . . . . . . . . . . . . . . . . . . . . . . . . . . . . . . . . . . . . . . . . . . . . . . . . . . . . 175
Addendum . . . . . . . . . . . . . . . . . . . . . . . . . . . . . . . . . . . . . . . . . . . . . . . . . . . . . . . . . . . . . . . . . . . . . . . . . . . . . . . . . . . . . . . . . . . 227
Independent auditor’s report . . . . . . . . . . . . . . . . . . . . . . . . . . . . . . . . . . . . . . . . . . . . . . . . . . . . . . . . . . . . . . . . . . . . . . . . . . . . 233
Directors and administration . . . . . . . . . . . . . . . . . . . . . . . . . . . . . . . . . . . . . . . . . . . . . . . . . . . . . . . . . . . . . . . . . . . . . . . . . . . . . 235
Primary local agents . . . . . . . . . . . . . . . . . . . . . . . . . . . . . . . . . . . . . . . . . . . . . . . . . . . . . . . . . . . . . . . . . . . . . . . . . . . . . . back cover
MFS Meridian® Funds listingThe following sub-funds comprise the MFS Meridian Funds family.Each sub-fund name is preceded with “MFS Meridian Funds –” which may not be stated throughout this report.
Absolute Return FundAsia Pacific Ex-Japan FundBlended Research® European Equity Fund (formerly European Concentrated Fund)Continental European Equity FundDiversified Income FundEmerging Markets Debt FundEmerging Markets Debt Local Currency FundEmerging Markets Equity FundEuropean Core Equity FundEuropean Research FundEuropean Smaller Companies FundEuropean Value FundGlobal Concentrated FundGlobal Credit FundGlobal Energy FundGlobal Equity FundGlobal Equity Income FundGlobal High Yield FundGlobal Multi-Asset FundGlobal Opportunistic Bond FundGlobal Research Focused Fund (formerly Global Research Fund)Global Total Return FundInflation-Adjusted Bond FundJapan Equity FundLatin American Equity FundLimited Maturity FundManaged Wealth FundPrudent Capital FundPrudent Wealth FundU.K. Equity FundU.S. Concentrated Growth FundU.S. Corporate Bond Fund (formerly Bond Fund)U.S. Equity Income FundU.S. Equity Opportunities FundU.S. Government Bond FundU.S. Total Return Bond Fund (formerly Research Bond Fund)U.S. Value Fund
In case of a conflict between the English and translated versions, the English version will govern.
The English Prospectus, the English Articles of Incorporation, the audited annual and unaudited semi-annual financial statements as well as the German KeyInvestor Information Documents of the fund may be inspected at and are available free of charge by mail or by e-mail from the German Paying and InformationAgent Marcard, Stein & Co AG, Ballindamm 36, 20095 Hamburg.
MFS Meridian Funds Annual Report 2017

LETTER FROM THE CHAIRPERSON
Dear Shareholders:
Despite June’s unexpected vote by the United Kingdom to leave the European Unionand the surprising result in November’s U.S. presidential election, most markets haveproved resilient. U.S. share prices quickly reversed post-Brexit declines, and indicesreached new highs following the November elections. U.S. bond yields rose afterDonald Trump’s victory on hopes that his proposed policy mix of lower taxes,increased spending on infrastructure and a lighter regulatory burden for businesseswill lift both U.S. economic growth and inflation. However, interest rates in mostdeveloped markets remain very low, with major central banks maintaining extremelyaccommodative monetary policies to reinvigorate slow-growing economies against abackdrop of still-low inflation. Even after the rise in yields following the election,interest rates remain low by historical standards.
Globally, economic growth has shown signs of recovery of late, led by the UnitedStates and the eurozone. Despite better growth, there are few immediate signs ofworrisome inflation. Emerging market economies are recovering at a somewhatslower pace amid fears that restrictive U.S. trade policies could further hamper thealready slow pace of global trade growth. Looking ahead, markets will have tocontend with a series of European elections during 2017, which, depending on theoutcomes, could further call into question the future direction of the European Union.
At MFS®, we believe in a patient, long-term approach to investing. Viewinginvestments with a long lens makes it possible to filter out short-term market noiseand focus on achieving solid risk-adjusted returns over a full market cycle.
In our view, such an approach, along with the professional guidance of a financialadvisor, will help you reach your investment objectives.
Respectfully,
Robin StelmachChairperson of the BoardMFS Investment Management Company (Lux) S.à.r.l13 April 2017
The opinions expressed in this letter are subject to change and may not be relied upon for investment advice. No forecasts can be guaranteed.
MFS Meridian Funds Annual Report 2017 3

PERFORMANCE TABLE (unaudited)
Total Rates of Return for the year ended 31 January 2017
Share Class
AbsoluteReturnFund
Asia PacificEx-Japan
Fund
BlendedResearchEuropean
EquityFund (a)
ContinentalEuropean
EquityFund
DiversifiedIncomeFund
EmergingMarkets
DebtFund
EmergingMarkets
Debt LocalCurrency
Fund
A1 (EUR) 5.29% 19.98% 14.00% 6.70% N/A 11.74% 12.38%
A1 (GBP) N/A N/A N/A 20.52% N/A 26.13% N/A
A1 (USD) 4.58% 19.21% 13.23% 6.02% 11.32% 11.01% 11.69%
A2 (EUR) N/A N/A N/A N/A N/A N/A N/A
A2 (USD) 4.62% N/A N/A N/A 11.35% 11.03% 11.63%
A3 (USD) N/A N/A N/A N/A 11.26% 10.97% 4.11%(g)
A4 (EUR) N/A N/A N/A N/A (1.11)%(g) N/A N/A
AH1 (CHF) N/A N/A N/A N/A N/A 8.88% N/A
AH1 (EUR) 3.61% N/A N/A N/A 10.20% 9.57% N/A
AH1 (USD) N/A N/A 17.20%(g) N/A N/A N/A N/A
AH2 (EUR) N/A N/A N/A N/A 10.47% 9.69% N/A
AH3 (EUR) N/A N/A N/A N/A 9.84% 9.65% N/A
AH4 (EUR) N/A N/A N/A N/A 1.39%(g) N/A N/A
B1 (USD) 3.48% 18.28% N/A N/A N/A 9.91% 10.58%
B2 (USD) 3.49% N/A N/A N/A N/A 9.93% 10.48%
C1 (USD) 3.55% 18.27% 13.10%(g) 5.19% 10.08% 9.94% 10.48%
C2 (USD) 3.61% N/A N/A N/A 10.22% 9.92% 10.49%
C3 (USD) N/A N/A N/A N/A 10.26% 9.93% 3.39%(g)
CH1 (USD) N/A N/A 16.80%(g) N/A N/A N/A N/A
I1 (EUR) 5.86% N/A 15.16% N/A N/A N/A N/A
I1 (GBP) 19.57% 36.91% 30.19% 21.98% N/A 26.88% N/A
I1 (JPY) N/A N/A N/A N/A N/A N/A N/A
I1 (USD) 5.31% 20.56% 14.41% 7.19% 12.08% 11.73% 12.35%
I1X (GBP) N/A N/A N/A N/A N/A N/A N/A
I1X (USD) N/A N/A N/A N/A N/A 11.72% N/A
I2 (GBP) N/A N/A N/A N/A 27.28% 26.88% N/A
I3 (USD) N/A N/A N/A N/A N/A N/A N/A
IH1 (CHF) N/A N/A N/A N/A N/A 8.84% N/A
IH1 (EUR) 4.32% N/A N/A N/A 10.67% 10.45% N/A
IH1 (GBP) N/A N/A N/A 8.94% 11.85% 11.80% 12.08%
IH1 (JPY) N/A N/A N/A N/A N/A N/A N/A
IH1 (USD) N/A N/A 17.89%(g) N/A N/A N/A N/A
N1 (EUR) N/A N/A N/A N/A N/A 11.17% 11.77%
N1 (USD) 4.01% 18.63% 13.30%(g) 5.39% 10.65% 10.36% 11.09%
N2 (USD) 4.03% N/A N/A N/A 10.76% 10.47% 11.17%
N3 (USD) N/A N/A N/A N/A 10.68% 10.48% 3.70%(g)
NH1 (USD) N/A N/A 16.90%(g) N/A N/A N/A N/A
S1 (USD) N/A 20.43% N/A N/A N/A 11.62% N/A
W1 (EUR) N/A N/A 15.04% 7.87% 12.73% 12.41% N/A
W1 (GBP) N/A N/A N/A N/A N/A N/A N/A
W1 (USD) 5.25% 20.45% 14.20%(g) 4.10%(g) 11.97% 11.56% 12.27%
W2 (EUR) N/A N/A N/A N/A 12.66% 12.32% N/A
W2 (GBP) N/A N/A N/A N/A N/A N/A N/A
W2 (USD) 1.41%(g) N/A N/A N/A 11.99% 11.56% 12.34%
W3 (EUR) N/A N/A N/A N/A 12.67% 12.30% N/A
W3 (USD) N/A N/A N/A N/A 12.00% 11.54% 4.55%(g)
WH1 (CHF) N/A N/A N/A N/A N/A 3.40%(g) N/A
WH1 (EUR) N/A N/A N/A N/A 10.50% 10.42% 10.68%
WH1 (GBP) N/A N/A 15.72% 9.44% 11.41% 11.22% 11.69%
WH1 (USD) N/A N/A 17.80%(g) N/A N/A N/A N/A
WH2 (EUR) N/A N/A N/A N/A 10.56% 10.02% N/A
WH2 (GBP) N/A N/A N/A N/A 11.39% 11.71% N/A
WH3 (EUR) N/A N/A N/A N/A 10.62% 10.05% N/A
WH3 (GBP) N/A N/A N/A N/A 11.60% 11.18% N/A
Z1 (EUR) N/A N/A N/A N/A N/A N/A N/A
Z1 (USD) N/A N/A N/A N/A N/A 12.62% N/A
Z2 (USD) N/A N/A N/A N/A N/A N/A N/A
4 MFS Meridian Funds Annual Report 2017

PERFORMANCE TABLE (unaudited)
Share Class
EmergingMarketsEquityFund
EuropeanCore Equity
Fund
EuropeanResearch
Fund
EuropeanSmaller
CompaniesFund
EuropeanValueFund
GlobalConcentrated
Fund
GlobalCreditFund
GlobalEnergyFund
GlobalEquityFund
GlobalEquity Income
Fund
A1 (EUR) 22.23% 7.21% 3.61% 4.81% 3.67% 13.27% 7.31% 18.84% 15.15% N/A
A1 (GBP) N/A N/A N/A N/A 17.20% N/A N/A N/A 29.88% N/A
A1 (USD) 21.31% 6.53% 2.94% 4.09% 3.04% 12.53% 6.69% 18.06% 14.38% 14.29%
A2 (EUR) N/A N/A N/A N/A N/A N/A N/A N/A N/A N/A
A2 (USD) N/A N/A N/A N/A N/A N/A 6.60% N/A N/A 14.34%
A3 (USD) N/A N/A N/A N/A N/A N/A N/A N/A N/A 14.30%
A4 (EUR) N/A N/A N/A N/A N/A N/A N/A N/A N/A N/A
AH1 (CHF) N/A N/A 3.14% N/A 3.39% N/A N/A N/A N/A N/A
AH1 (EUR) N/A N/A N/A N/A N/A N/A 5.27% N/A N/A 12.42%
AH1 (USD) N/A N/A 4.65% 5.88% 5.05% N/A N/A N/A N/A N/A
AH2 (EUR) N/A N/A N/A N/A N/A N/A N/A N/A N/A 12.78%
AH3 (EUR) N/A N/A N/A N/A N/A N/A N/A N/A N/A 12.81%
AH4 (EUR) N/A N/A N/A N/A N/A N/A N/A N/A N/A N/A
B1 (USD) 20.50% 5.66% 2.21% 3.34% 2.23% 11.71% 5.65% 17.16% 13.51% N/A
B2 (USD) N/A N/A N/A N/A N/A N/A 5.62% N/A N/A N/A
C1 (USD) 20.39% 5.65% 2.25% 3.33% N/A 11.71% 5.65% 17.07% 13.53% 13.38%
C2 (USD) N/A N/A N/A N/A N/A N/A 5.57% N/A N/A 13.39%
C3 (USD) N/A N/A N/A N/A N/A N/A N/A N/A N/A 13.35%
CH1 (USD) N/A 7.82% 3.53% 5.03% N/A N/A N/A N/A N/A N/A
I1 (EUR) 23.46% 8.45% 4.79% 5.84% 4.72% 14.42% N/A 20.20% 16.28% 16.25%
I1 (GBP) 39.27% 22.59% 18.44% N/A 18.36% 29.07% 21.92% 35.59% 31.18% N/A
I1 (JPY) N/A N/A N/A N/A N/A N/A N/A N/A N/A N/A
I1 (USD) 22.64% 7.68% 4.10% 5.12% 3.97% 13.67% 7.36% 19.40% 15.51% 15.67%
I1X (GBP) N/A N/A N/A N/A N/A N/A N/A N/A N/A N/A
I1X (USD) N/A N/A N/A N/A N/A N/A N/A N/A N/A N/A
I2 (GBP) N/A N/A N/A N/A N/A N/A N/A N/A N/A N/A
I3 (USD) N/A N/A N/A N/A N/A N/A N/A N/A N/A N/A
IH1 (CHF) N/A N/A 4.42% N/A 4.52% N/A N/A N/A N/A N/A
IH1 (EUR) N/A N/A N/A N/A N/A N/A N/A N/A N/A 13.78%
IH1 (GBP) 22.04% N/A N/A N/A N/A N/A 7.05% N/A N/A 14.34%
IH1 (JPY) N/A N/A N/A N/A N/A N/A N/A N/A N/A N/A
IH1 (USD) N/A N/A 5.53% 6.85% 6.31% N/A N/A N/A N/A N/A
N1 (EUR) N/A N/A 3.12% N/A 3.15% N/A N/A N/A N/A N/A
N1 (USD) 20.73% 5.96% 2.52% 3.57% 2.50% 11.98% 6.00% 17.45% 13.83% 13.69%
N2 (USD) N/A N/A N/A N/A N/A N/A 6.18% N/A N/A 13.70%
N3 (USD) N/A N/A N/A N/A N/A N/A N/A N/A N/A 13.66%
NH1 (USD) N/A 7.76% 4.07% 5.35% N/A N/A N/A N/A N/A N/A
S1 (USD) 22.84% N/A N/A N/A N/A 13.72% N/A N/A 15.40% N/A
W1 (EUR) N/A 8.38% 4.67% 5.57% 4.46% N/A N/A N/A N/A N/A
W1 (GBP) N/A 22.44% N/A N/A 17.97% 28.82% N/A N/A 30.90% N/A
W1 (USD) 22.49% 7.59% 3.99% 4.91% 3.76% 13.30% 7.19% 19.27% 15.24% 15.38%
W2 (EUR) N/A N/A N/A N/A N/A N/A N/A N/A N/A N/A
W2 (GBP) N/A N/A N/A N/A N/A N/A N/A N/A N/A N/A
W2 (USD) N/A N/A N/A N/A N/A N/A 7.34% N/A N/A 15.41%
W3 (EUR) N/A N/A N/A N/A N/A N/A N/A N/A N/A N/A
W3 (USD) N/A N/A N/A N/A N/A N/A N/A N/A N/A 15.33%
WH1 (CHF) N/A N/A 5.20%(g) N/A 3.40%(g) N/A N/A N/A 7.10%(g) N/A
WH1 (EUR) 20.63% N/A N/A N/A N/A 11.97% 5.80% N/A 13.17% 13.86%
WH1 (GBP) 21.80% 9.23% 5.07% N/A 5.37% 12.11% 6.78% 18.74% 14.02% 14.26%
WH1 (USD) N/A N/A 5.68% 6.61% 1.90%(g) N/A N/A N/A N/A N/A
WH2 (EUR) N/A N/A N/A N/A N/A N/A N/A N/A N/A 13.86%
WH2 (GBP) N/A N/A N/A N/A N/A N/A N/A N/A N/A 14.26%
WH3 (EUR) N/A N/A N/A N/A N/A N/A N/A N/A N/A 13.84%
WH3 (GBP) N/A N/A N/A N/A N/A N/A N/A N/A N/A 14.20%
Z1 (EUR) 24.64% N/A 5.58% N/A 5.61% N/A N/A N/A N/A N/A
Z1 (USD) N/A N/A N/A N/A N/A N/A N/A N/A N/A N/A
Z2 (USD) N/A N/A N/A N/A N/A N/A N/A N/A N/A 16.29%
MFS Meridian Funds Annual Report 2017 5

PERFORMANCE TABLE (unaudited)
Share Class
GlobalHigh Yield
Fund
GlobalMulti-Asset
Fund
GlobalOpportunistic
BondFund (b)
GlobalResearchFocusedFund (c)
GlobalTotal
ReturnFund
Inflation-AdjustedBondFund
JapanEquityFund
LatinAmerican
EquityFund
LimitedMaturity
Fund
ManagedWealthFund
A1 (EUR) 16.88% 11.09% 1.50% 13.98% 9.12% N/A 10.23% 35.05% N/A N/A
A1 (GBP) N/A N/A N/A N/A 23.11% N/A N/A N/A N/A N/A
A1 (USD) 16.13% 10.25% (1.30)% 13.22% 8.45% 2.65% 9.43% 34.13% 0.93% 3.63%
A2 (EUR) 16.86% N/A N/A N/A N/A N/A N/A N/A N/A N/A
A2 (USD) 16.09% 10.25% (1.34)% N/A 8.44% 2.66% N/A N/A 0.89% N/A
A3 (USD) 16.06% N/A (1.31)% N/A 8.42% N/A N/A N/A N/A N/A
A4 (EUR) N/A N/A N/A N/A (0.97)%(g) N/A N/A N/A N/A N/A
AH1 (CHF) N/A N/A N/A N/A N/A N/A N/A 31.69% N/A N/A
AH1 (EUR) N/A N/A (2.30)% N/A 7.05% N/A N/A N/A N/A 2.61%
AH1 (USD) N/A N/A N/A N/A N/A N/A N/A N/A N/A N/A
AH2 (EUR) 14.99% N/A (2.25)% N/A 6.77% N/A N/A N/A N/A N/A
AH3 (EUR) 14.79% N/A (2.23)% N/A 7.29% N/A N/A N/A N/A N/A
AH4 (EUR) N/A N/A N/A N/A 1.51%(g) N/A N/A N/A N/A N/A
B1 (USD) 14.95% 9.50% N/A 12.41% 7.63% 1.61% 8.75% 33.20% (0.00)% N/A
B2 (USD) 14.92% 9.48% N/A N/A 7.65% 1.61% N/A N/A (0.12)% N/A
C1 (USD) 14.96% 9.50% (1.90)% 12.41% 7.60% 1.62% 8.72% 33.10% (0.08)% 2.91%
C2 (USD) 14.85% 9.51% (1.89)% N/A 7.66% 1.59% N/A N/A 0.00% N/A
C3 (USD) 15.03% N/A (1.83)% N/A 7.61% N/A N/A N/A N/A N/A
CH1 (USD) N/A N/A N/A N/A N/A N/A N/A N/A N/A N/A
I1 (EUR) N/A 12.36% N/A 15.23% N/A N/A 11.50% 36.47% N/A 5.52%
I1 (GBP) N/A 26.74% N/A 29.99% 24.49% N/A 25.78% 53.95% N/A 19.03%
I1 (JPY) N/A N/A N/A 15.23%(g) N/A N/A N/A N/A N/A N/A
I1 (USD) 16.84% 11.62% (0.94)% 14.47% 9.63% 3.36% 10.76% 35.56% 1.58% 4.81%
I1X (GBP) N/A N/A N/A N/A N/A N/A N/A N/A N/A N/A
I1X (USD) N/A N/A N/A N/A N/A N/A N/A 35.57% N/A N/A
I2 (GBP) N/A N/A N/A N/A N/A N/A N/A N/A N/A N/A
I3 (USD) N/A N/A N/A N/A 7.03%(g) N/A N/A N/A N/A N/A
IH1 (CHF) N/A N/A N/A N/A N/A N/A N/A 33.20% N/A N/A
IH1 (EUR) N/A N/A (1.87)% N/A 7.97% N/A N/A N/A N/A 3.93%
IH1 (GBP) 17.18% N/A (1.22)% N/A 9.07% N/A N/A N/A N/A 4.91%
IH1 (JPY) N/A N/A N/A 4.47%(g) N/A N/A N/A N/A N/A N/A
IH1 (USD) N/A N/A N/A N/A N/A N/A N/A N/A N/A N/A
N1 (EUR) N/A N/A N/A N/A N/A N/A N/A 34.36% N/A N/A
N1 (USD) 15.53% 9.83% (1.60)% 12.75% 7.94% 2.09% 8.95% 33.78% 0.41% 3.12%
N2 (USD) 15.49% N/A (1.58)% N/A 7.92% 2.14% N/A N/A 0.48% N/A
N3 (USD) 15.55% N/A (1.62)% N/A 7.91% N/A N/A N/A N/A N/A
NH1 (USD) N/A N/A N/A N/A N/A N/A N/A N/A N/A N/A
S1 (USD) 16.67% 11.50% N/A 14.38% 9.43% 3.21% N/A N/A 1.47% N/A
W1 (EUR) N/A N/A N/A N/A 9.97% N/A N/A N/A N/A N/A
W1 (GBP) N/A N/A N/A N/A N/A N/A N/A N/A N/A N/A
W1 (USD) 16.78% 11.49% (1.00)% 14.30% 9.26% 3.30% 3.50%(g) 35.34% 1.48% 4.65%
W2 (EUR) N/A N/A N/A N/A 10.02% N/A N/A N/A N/A N/A
W2 (GBP) N/A N/A N/A N/A N/A N/A N/A N/A N/A N/A
W2 (USD) 16.78% 2.19%(g) (1.02)% N/A 9.24% 3.33% N/A N/A 1.49% N/A
W3 (EUR) N/A N/A N/A N/A 9.99% N/A N/A N/A N/A N/A
W3 (USD) 16.72% N/A (1.01)% N/A 9.06% N/A N/A N/A N/A N/A
WH1 (CHF) N/A N/A N/A N/A 1.90%(g) N/A N/A N/A N/A N/A
WH1 (EUR) 15.68% N/A (1.90)% N/A 7.53% N/A N/A 33.48% N/A 3.73%
WH1 (GBP) 17.14% N/A (1.30)% N/A 8.78% N/A N/A 34.71% N/A 4.76%
WH1 (USD) N/A N/A N/A N/A N/A N/A N/A N/A N/A N/A
WH2 (EUR) 15.62% N/A (1.92)% N/A 7.63% N/A N/A N/A N/A N/A
WH2 (GBP) 16.56% N/A (1.32)% N/A 8.66% N/A N/A N/A N/A N/A
WH3 (EUR) 15.69% N/A (1.92)% N/A 7.69% N/A N/A N/A N/A N/A
WH3 (GBP) 16.64% N/A (1.31)% N/A 8.72% N/A N/A N/A N/A N/A
Z1 (EUR) N/A N/A N/A N/A N/A N/A N/A N/A N/A N/A
Z1 (USD) N/A N/A (0.67)% N/A N/A N/A N/A N/A N/A N/A
Z2 (USD) N/A N/A N/A N/A N/A N/A N/A N/A N/A N/A
6 MFS Meridian Funds Annual Report 2017

PERFORMANCE TABLE (unaudited)
Share Class
PrudentCapitalFund (d)
PrudentWealthFund
U.K.EquityFund
U.S.ConcentratedGrowth Fund
U.S.Corporate
Bond Fund (e)
U.S.EquityIncomeFund
U.S.Equity
OpportunitiesFund
U.S.GovernmentBond Fund
U.S. TotalReturnBond
Fund (f)
U.S.ValueFund
A1 (EUR) 2.90% 1.49% N/A N/A N/A N/A N/A (0.68)% N/A N/A
A1 (GBP) N/A N/A 13.19% N/A N/A N/A N/A N/A N/A N/A
A1 (USD) (0.10)% 0.82% (0.21)% 11.34% 5.52% 17.69% 17.67% (1.39)% 2.23% 18.44%
A2 (EUR) N/A N/A N/A N/A N/A N/A N/A N/A N/A N/A
A2 (USD) N/A N/A N/A N/A 5.52% 17.59% N/A (1.32)% 2.20% N/A
A3 (USD) N/A N/A N/A N/A 1.11%(g) 17.62% N/A N/A (0.00)%(g) N/A
A4 (EUR) (1.30)%(g) N/A N/A N/A N/A N/A N/A N/A N/A N/A
AH1 (CHF) N/A N/A N/A N/A N/A N/A N/A N/A N/A N/A
AH1 (EUR) (0.60)% (0.43)% N/A N/A 4.41% 16.37% 16.49% N/A 1.03% 17.01%
AH1 (USD) N/A N/A N/A N/A N/A N/A N/A N/A N/A N/A
AH2 (EUR) N/A N/A N/A N/A N/A 16.50% N/A N/A N/A N/A
AH3 (EUR) N/A N/A N/A N/A N/A 16.26% N/A N/A N/A N/A
AH4 (EUR) 1.20%(g) N/A N/A N/A N/A N/A N/A N/A N/A N/A
B1 (USD) N/A 0.07% N/A 10.51% N/A N/A N/A (2.36)% 1.24% 17.59%
B2 (USD) N/A N/A N/A N/A N/A N/A N/A (2.38)% 1.21% N/A
C1 (USD) (0.30)% 0.07% (1.05)% 10.47% 4.60% 16.70% 16.83% (2.31)% 1.25% 17.62%
C2 (USD) N/A N/A N/A N/A 4.55% 16.72% N/A (2.36)% 1.19% N/A
C3 (USD) N/A N/A N/A N/A 0.40%(g) 16.70% N/A N/A (0.74)%(g) N/A
CH1 (USD) N/A N/A N/A N/A N/A N/A N/A N/A N/A N/A
I1 (EUR) 3.16% 2.52% N/A N/A N/A 19.66% 19.79% N/A N/A 20.56%
I1 (GBP) (1.59)% 15.65% 14.57% 27.67% N/A N/A 35.13% N/A N/A 36.00%
I1 (JPY) N/A N/A N/A N/A N/A N/A N/A N/A N/A N/A
I1 (USD) 0.18% 1.84% 1.18% 12.43% 6.30% 18.86% 19.00% (0.73)% 2.91% 19.76%
I1X (GBP) N/A N/A 14.57% N/A N/A N/A N/A N/A N/A N/A
I1X (USD) N/A N/A N/A N/A N/A N/A N/A N/A N/A N/A
I2 (GBP) N/A N/A 14.57% N/A N/A N/A N/A N/A N/A N/A
I3 (USD) N/A N/A N/A N/A N/A N/A N/A N/A N/A N/A
IH1 (CHF) N/A N/A N/A N/A N/A N/A N/A N/A N/A N/A
IH1 (EUR) (0.31)% 0.51% N/A N/A 33.37% 17.49% 17.84% N/A 1.78% 18.48%
IH1 (GBP) (0.01)% N/A N/A N/A 6.24% 18.28% 18.41% N/A 3.13% N/A
IH1 (JPY) N/A N/A N/A N/A N/A N/A N/A N/A N/A N/A
IH1 (USD) N/A N/A N/A N/A N/A N/A N/A N/A N/A N/A
N1 (EUR) N/A N/A N/A N/A N/A N/A N/A N/A N/A N/A
N1 (USD) (0.20)% 0.35% (0.79)% 10.73% 5.02% 16.98% 17.10% (1.87)% 1.66% 17.90%
N2 (USD) N/A N/A N/A N/A 5.06% 17.06% N/A (1.79)% 1.77% N/A
N3 (USD) N/A N/A N/A N/A 0.74%(g) 17.01% N/A N/A (0.34)%(g) N/A
NH1 (USD) N/A N/A N/A N/A N/A N/A N/A N/A N/A N/A
S1 (USD) N/A N/A N/A 12.51% N/A N/A N/A (0.86)% 2.79% 19.53%
W1 (EUR) N/A N/A N/A N/A N/A N/A N/A N/A N/A N/A
W1 (GBP) (1.60)% 15.37% 14.53% N/A N/A N/A N/A N/A N/A N/A
W1 (USD) 0.10% 1.60% 0.77% 12.33% 6.20% 18.65% 18.89% (0.85)% 2.87% 19.65%
W2 (EUR) N/A N/A N/A N/A N/A N/A N/A N/A N/A N/A
W2 (GBP) N/A N/A 14.42% N/A N/A N/A N/A N/A N/A N/A
W2 (USD) N/A N/A N/A N/A 6.22% 18.79% N/A (0.90)% 2.87% N/A
W3 (EUR) N/A N/A N/A N/A N/A N/A N/A N/A N/A N/A
W3 (USD) N/A N/A N/A N/A 1.53%(g) 18.75% N/A N/A 0.38%(g) N/A
WH1 (CHF) (0.50)% N/A N/A N/A N/A N/A N/A N/A (3.60)%(g) N/A
WH1 (EUR) (0.30)% 0.30% N/A 10.74% 4.95% 17.58% 17.62% N/A 1.80% 17.97%
WH1 (GBP) (0.00)% 1.32% N/A 11.16% 6.15% 18.15% 18.23% N/A 3.02% 18.38%
WH1 (USD) N/A N/A N/A N/A N/A N/A N/A N/A N/A N/A
WH2 (EUR) N/A N/A N/A N/A 4.98% 17.57% N/A N/A N/A N/A
WH2 (GBP) N/A N/A N/A N/A N/A 18.13% N/A N/A N/A N/A
WH3 (EUR) N/A N/A N/A N/A N/A 17.56% N/A N/A N/A N/A
WH3 (GBP) N/A N/A N/A N/A N/A 18.13% N/A N/A N/A N/A
Z1 (EUR) N/A N/A N/A N/A N/A N/A N/A N/A N/A N/A
Z1 (USD) N/A N/A N/A N/A N/A N/A N/A N/A N/A N/A
Z2 (USD) N/A N/A N/A N/A N/A N/A N/A N/A N/A N/A
MFS Meridian Funds Annual Report 2017 7

(a) Effective 29 June 2016, the MFS Meridian Funds – European Concentrated Fund was renamed the MFS Meridian Funds – Blended Research European Equity Fund.(b) The inception date of the sub-fund was 12 July 2016.(c) Effective 29 June 2016, the MFS Meridian Funds – Global Research Fund was renamed the MFS Meridian Funds – Global Research Focused Fund.(d) The inception date of the sub-fund was 3 November 2016.(e) Effective 29 June 2016, the MFS Meridian Funds – Bond Fund was renamed the MFS Meridian Funds – U.S. Corporate Bond Fund.(f) Effective 29 June 2016, the MFS Meridian Funds – Research Bond Fund was renamed the MFS Meridian Funds – U.S. Total Return Bond Fund.(g) See Note 17 for additional information.
NOTES TO PERFORMANCE SUMMARY
Performance data shown represents past performance and is no guarantee of future results. Investment return andprincipal value fluctuate so your shares, when sold, may be worth more or less than the original cost; currentperformance may be lower or higher than quoted. For most recent month-end performance, please contact yourfinancial consultant.
Performance results reflect any applicable expense subsidies and waivers in effect during the periods shown. Withoutsuch subsidies and waivers, the sub-funds’ performance results would have been less favorable. Please see theprospectus and financial statements for details. All results are historical and assume the reinvestment of dividends andcapital gains.
Total returns do not include the applicable sales charges. If these charges had been included, the results would havebeen lower.
Changes in currency exchange rates may affect the net asset values per share and the performance of share classesdenominated in currencies other than a sub-fund’s base currency.
Performance results include the impact of swing pricing, if applicable. See Note 3 of the Notes to Financial Statementsfor additional information.
From time to time the sub-funds may receive proceeds from litigation settlements, without which performance would belower.
GENERAL INFORMATION
Audited annual and unaudited semi-annual financial statements are available at the registered office of the fund and atmeridian.mfs.com.
Notices of general meetings are published in the Mémorial – Journal Officiel du Grand-Duché de Luxembourg and in othernewspapers circulating in jurisdictions in which the fund is registered or in other publications as determined by thedirectors.
The list of changes in the portfolios for the period ended 31 January 2017 is available at the registered office of thefund.
Information concerning the sub-funds’ net asset values and purchases and sales of securities is available at the registeredoffice of the fund.
The Articles of Incorporation are lodged at the office of the Chief Registrar of the District Court of Luxembourg (Greffedu Tribunal d’Arrondissement de et à Luxembourg), at meridian.mfs.com, and at the registered office of the fund wherethey are available for inspection and where copies thereof may be obtained upon request.
The fund’s most recent offering documents, including the Key Investor Information Documents (KIIDs) and Key FactsStatements (KFS) for Hong Kong investors, contain information on the fund’s investment objectives, charges, expensesand risks. The offering documents, Articles of Incorporation and financial reports and other information about the fundsare available to investors at no cost at the fund’s registered office, from your financial intermediary, or on the web atmeridian.mfs.com. Please read them carefully before you invest. Please note that not all of the sub-funds or classes may beregistered or authorized for distribution in every jurisdiction. In certain jurisdictions, investments may only be made byqualified investors and/or through authorized intermediaries on a limited private placement basis subject to applicablelaws and regulations in the country of distribution. In particular, please note that as of 31 January 2017 the DiversifiedIncome Fund, Global Equity Income Fund, Global Opportunistic Bond Fund, Managed Wealth Fund, Prudent CapitalFund, U.S. Corporate Bond Fund, U.S. Equity Income Fund, and U.S. Equity Opportunities Fund were not registered inHong Kong and these sub-funds were not offered to the public in this jurisdiction.
CORPORATE GOVERNANCE
ALFI CODE OF CONDUCT
The fund is committed to corporate governance standards relating to its management. In connection therewith, thefund adheres to the ALFI (Association of the Luxembourg Fund Industry) Code of Conduct for Luxembourg InvestmentFunds, which was issued in September 2009 and updated and re-issued in 2013. This Code sets forth principles
8 MFS Meridian Funds Annual Report 2017

regarding qualified and experienced personnel, conflicts of interests and serving the best interests of fund shareholders,due diligence and oversight, compliance with applicable laws and risk management processes.
SHAREHOLDER COMPLAINTS
If you wish to make a complaint about any aspect of the service you have received, you may contact your local agent inyour respective country, or contact the funds’ transfer agent at State Street Bank Luxembourg S.C.A., by mail, phone oremail.
Mail: MFS Meridian Funds c/o State Street Bank Luxembourg S.C.A.49 Avenue J.F. KennedyL-1855 LuxembourgGrand Duchy of Luxembourg
Telephone: Europe and Asia: +352-46-40-10-600The Americas: +1-416-506-8418
Email: Europe and Asia: [email protected] Americas: [email protected]
You may find more information on the fund’s complaint handling process at meridian.mfs.com.
CERTAIN RISK MANAGEMENT DISCLOSURES (unaudited)
Information Regarding Global Exposure Under The Funds’ Risk Management Program
The fund’s Management Company must employ a risk management process which enables it to monitor and measure atany time the risk of the positions in the sub-funds’ portfolios and their contribution to the overall risk profile of theirportfolios. The global exposure relating to financial derivative instruments may be calculated through the “commitmentapproach” or through a Value-at-Risk (“VaR”) methodology. Generally, a sub-fund that uses derivatives more extensivelyor as part of its investment objective will utilize the VaR methodology, and a sub-fund that uses derivatives lessextensively will utilize the commitment approach.
For each sub-fund except the Absolute Return Fund, Emerging Markets Debt Local Currency Fund, Global Multi-AssetFund, Global Opportunistic Bond Fund, and the Managed Wealth Fund, the commitment approach methodology is usedto calculate global exposure. The commitment approach is based, in part, on the principle of converting the exposure toderivative instruments into equivalent positions of the underlying assets and quantifying the exposure in absolute valueof the total commitments (which may account for hedging and netting).
For the Absolute Return Fund, Global Multi-Asset Fund, and the Managed Wealth Fund, an absolute Value-at-Risk(“VaR”) approach is used and for the Emerging Markets Debt Local Currency Fund and the Global Opportunistic BondFund, a relative VaR approach is used, to measure global exposure. VaR provides a measure of the potential minimumloss that could arise over a given time interval under normal market conditions, and at a given confidence level. The sub-funds’ risk management program limits the maximum VaR that the sub-fund can have relative to its net asset value forabsolute VaR or relative to its benchmark for relative VaR, as determined by the sub-fund taking into account itsinvestment policy and risk profile. For each of the Absolute Return Fund, Global Multi-Asset Fund, and the ManagedWealth Fund the absolute VaR cannot be greater than 20% of its respective net asset value. For the Emerging MarketsDebt Local Currency Fund and the Global Opportunistic Bond Fund the relative VaR cannot be greater than 200% of itscurrent benchmark. The VaR approach used by each of these sub-funds is based upon an historical model. The VaR ismeasured daily at the 99% level of confidence based on a one month (20 day) holding period. The underlying data setencompasses one year of data (minimum of 250 observations).
For the Absolute Return Fund, the expected level of leverage may vary between 0% and 400% (measured using the sumof the notional value of derivatives used by the sub-fund), based on the net asset value of the sub-fund. In addition, theManagement Company supplementally monitors the expected level of leverage measured using the commitmentapproach, which may vary between 0% and 200% based on the net asset value of the sub-fund. Under certaincircumstances, the level of leverage might exceed the ranges noted above.
For the Emerging Markets Debt Local Currency Fund, the expected level of leverage may vary between 0% and 375%(measured using the sum of the notional value of derivatives used by the sub-fund), based on the net asset value of thesub-fund. In addition, the Management Company supplementally monitors the expected level of leverage measuredusing the commitment approach, which may vary between 0% and 125% based on the net asset value of the sub-fund.Under certain circumstances, the level of leverage might exceed the ranges noted above.
For the Global Multi-Asset Fund, the expected level of leverage may vary between 0% and 400% (measured using thesum of notional value of derivatives used by the sub-fund), based on the net asset value of the sub-fund. In addition, theManagement Company supplementally monitors the expected level of leverage measured using the commitment
MFS Meridian Funds Annual Report 2017 9

approach, which may vary between 0% and 200% based on the net asset value of the sub-fund. Under certaincircumstances, the level of leverage might exceed the ranges noted above.
For the Global Opportunistic Bond Fund, the expected level of leverage may vary between 0% and 400% (measuredusing the sum of the notional value of derivatives used by the sub-fund), based on the net asset value of the sub-fund.In addition, the Management Company supplementally monitors the expected level of leverage measured using thecommitment approach, which may vary between 0% and 125% based on the net asset value of the sub-fund. Undercertain circumstances, the level of leverage might exceed the ranges noted above.
For the Managed Wealth Fund, the expected level of leverage may vary between 0% and 200% (measured using thesum of the notional value of derivatives used by the sub-fund), based on the net asset value of the sub-fund. In addition,the Management Company supplementally monitors the expected level of leverage measured using the commitmentapproach, which may vary between 0% and 150% based on the net asset value of the sub-fund. Under certaincircumstances, the level of leverage might exceed the ranges noted above.
The sum of notional value is the sum of the absolute values of the full underlying exposures of our derivative positions.The sum of notional value is based upon the full notional exposure with no netting or hedging. Under both levels ofleverage methodologies, the sum of the absolute exposures is calculated in order that exposures of opposite signs tounrelated assets do not offset each other in the final result.
Please see the table below for summary information regarding the daily VaR and leverage results for the Absolute ReturnFund, Emerging Markets Debt Local Currency Fund, Global Multi-Asset Fund and Managed Wealth Fund beginning1 February 2016 through the year ended 31 January 2017:
1 February 2016 – 31 January 2017 Absolute Return FundEmerging Markets DebtLocal Currency Fund Global Multi-Asset Fund Managed Wealth Fund
Lowest VaR 1.46% 5.60% 3.84% 2.91%
Highest VaR 3.78% 8.76% 6.33% 4.22%
Average VaR 2.05% 6.93% 5.09% 3.50%
Lowest Leverage Level (Sum of Notional Value) 120.27% 60.25% 181.46% 66.13%
Highest Leverage Level (Sum of Notional Value) 253.28% 174.71% 382.50% 118.76%
Average Leverage Level (Sum of Notional Value) 174.96% 107.90% 253.83% 97.36%
Lowest Leverage Level (Commitment Approach) 94.44% 29.40% 106.66% 56.55%
Highest Leverage Level (Commitment Approach) 160.21% 71.73% 189.74% 70.12%
Average Leverage Level (Commitment Approach) 135.19% 51.27% 158.38% 64.71%
Please see the table below for summary information regarding the daily VaR and leverage results for the GlobalOpportunistic Bond Fund beginning 12 July 2016 through the period ended 31 January 2017:12 July 2016 – 31 January 2017 Global Opportunistic Bond Fund (a)
Lowest VaR 1.46%
Highest VaR 3.27%
Average VaR 2.09%
Lowest Leverage Level (Sum of Notional Value) 103.91%
Highest Leverage Level (Sum of Notional Value) 223.55%
Average Leverage Level (Sum of Notional Value) 126.05%
Lowest Leverage Level (Commitment Approach) 21.18%
Highest Leverage Level (Commitment Approach) 72.49%
Average Leverage Level (Commitment Approach) 60.86%
(a) The inception date of the sub-fund was 12 July 2016.
10 MFS Meridian Funds Annual Report 2017

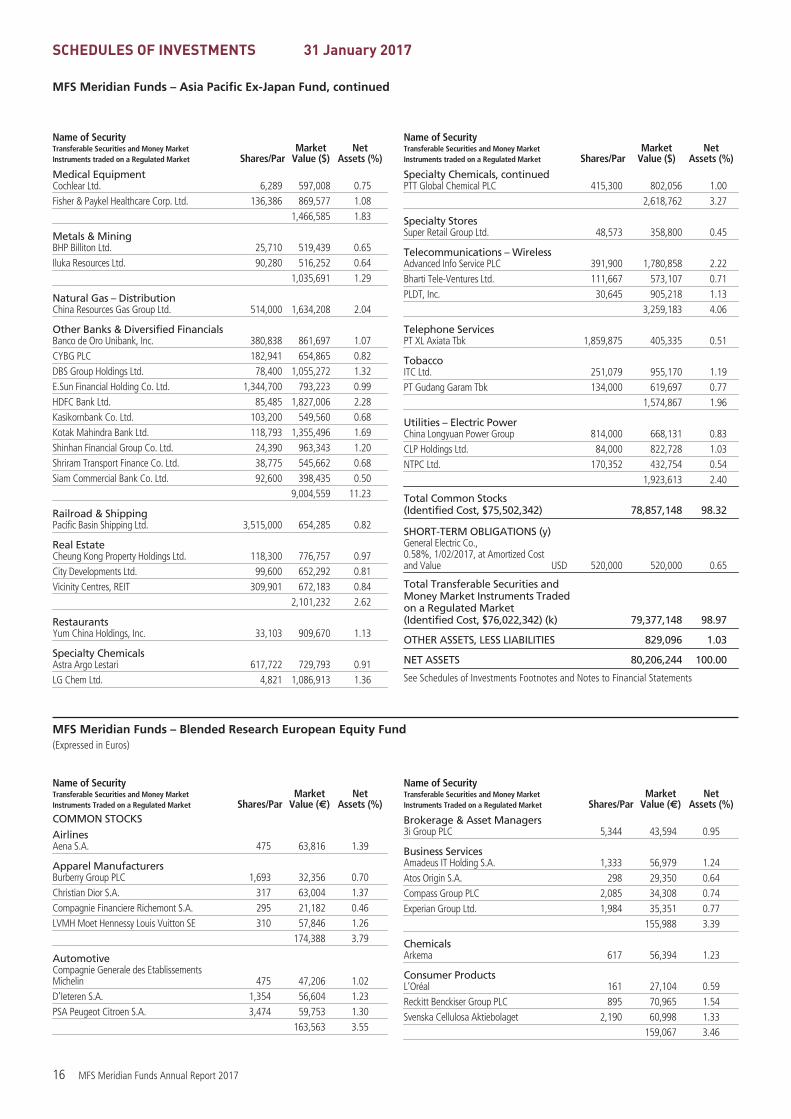
SCHEDULES OF INVESTMENTS 31 January 2017
MFS Meridian Funds – Absolute Return Fund(Expressed in U.S. Dollars)
Name of SecurityTransferable Securities and Money MarketInstruments traded on a Regulated Market Shares/Par
MarketValue ($)
NetAssets (%)
BONDS
Asset-Backed & SecuritizedAmeriCredit Automobile Receivables Trust,2015-3, “A2A”,1.07%, 8/01/2019 USD 10,567 10,561 0.07AmeriCredit Automobile Receivables Trust,2016-3, “A2A”,1.37%, 8/11/2019 40,000 40,001 0.26Capital Auto Receivables Asset Trust,2016-3, “A2A”,1.36%, 22/04/2019 20,000 20,005 0.13Capital One Multi-Asset Execution Trust,2016-A4, “A4”,1.33%, 15/06/2022 120,000 118,624 0.76Chesapeake Funding LLC, 2015-1A, “A”,FRN, 1.265%, 7/02/2027 141,920 141,772 0.91Chrysler Capital Auto Receivables Trust2016-B, “A2”,1.36%, 15/01/2020 100,000 99,868 0.64Colony Starwood Homes, 2016-2A, “A”,FRN, 1.954%, 17/12/2033 99,771 100,240 0.64Credit Suisse Commercial Mortgage Trust,“A4”, FRN,5.938%, 15/09/2039 29,865 30,204 0.19CWCapital Cobalt Ltd., “A4”, FRN,5.764%, 15/05/2046 36,492 36,771 0.24Drive Auto Receivables Trust,2017-AA, “A3”,1.77%, 15/01/2020 80,000 79,987 0.51Drive Auto Receivables Trust, 2016-CA,“A3”, 1.67%, 15/11/2019 70,000 69,966 0.45Enterprise Fleet Financing LLC,1.74%, 22/02/2022 30,000 29,966 0.19Exeter Automobile Receivables Trust,2015-1A, “A”,1.6%, 17/06/2019 5,038 5,038 0.03Exeter Automobile Receivables Trust,2015-2A, “A”,1.54%, 15/11/2019 10,048 10,045 0.06Exeter Automobile Receivables Trust,2016-3A, “A”,1.84%, 16/11/2020 64,613 64,571 0.41Exeter Automobile Receivables Trust,2017-1A, “A”,1.96%, 15/03/2021 30,000 29,998 0.19Flagship Credit Auto Trust, 2016-1, “A”,2.77%, 15/12/2020 31,499 31,763 0.20Ford Credit Floorplan Master Owner Trust,2015-1, “A2”, FRN,1.168%, 15/01/2020 80,000 80,111 0.51GE Dealer Floorplan Master Note Trust,2014-1, “A”, FRN,1.156%, 20/07/2019 107,000 107,013 0.68GM Financial Automobile Leasing Trust,2015-3A, “A2”,1.17%, 20/06/2018 28,760 28,757 0.18GMF Floorplan Owner Revolving Trust,2017-A1, “A”,2.22%, 18/01/2022 100,000 99,974 0.64GO Financial Auto Securitization Trust,2015-2, “A”,3.27%, 15/11/2018 8,039 8,050 0.05Hertz Fleet Lease Funding LP, 2013-3,“A”, FRN,1.313%, 10/12/2027 11,755 11,755 0.08Hyundai Auto Lease Securitization Trust,2016-C, “A2”,1.3%, 15/03/2019 60,000 59,921 0.38
Name of SecurityTransferable Securities and Money MarketInstruments traded on a Regulated Market Shares/Par
MarketValue ($)
NetAssets (%)
Asset-Backed & Securitized, continuedHyundai Auto Receivables Trust 2015-C,“A2A”,0.99%, 15/11/2018 USD 16,402 16,389 0.10JPMorgan Chase Commercial MortgageSecurities Corp.,5.42%, 15/01/2049 11,266 11,253 0.07Mercedes-Benz Auto Lease Trust, 2015-B,“A2A”,1%, 16/01/2018 16,956 16,950 0.11Nextgear Floorplan Master Owner Trust,2015-1A, “A”,1.8%, 15/07/2019 100,000 99,998 0.64Oscar U.S. Funding Trust, 2016-2A, “A”,2.31%, 15/11/2019 20,000 20,005 0.13Paragon Mortgages PLC, FRN,0.048%, 15/05/2041 EUR 47,155 47,941 0.31Securitized Term Auto Receivables Trust,2016-1A, “A2A”,1.284%, 26/11/2018 USD 30,000 29,965 0.19Sierra Receivables Funding Co. LLC,2015-1A, “A”,2.4%, 22/03/2032 35,290 35,107 0.22SPS Servicer Advance Receivables Trust,2016-T1, “AT1”,2.53%, 16/11/2048 100,000 99,710 0.64Tricon American Homes 2015-SFR1,Trust “1A”, FRN,2.589%, 17/11/2033 100,000 97,447 0.62Verizon Owner Trust, 2016-1A, “A”,1.42%, 20/01/2021 62,000 61,553 0.39Volkswagen Credit Auto Master Trust,2014-1A, “A1”, FRN,0.911%, 22/07/2019 110,000 109,922 0.70
1,961,201 12.52
AutomotiveAmerican Honda Finance Corp.,1.6%, 13/07/2018 USD 70,000 70,105 0.45American Honda Finance Corp., FRN,1.447%, 20/09/2017 80,000 80,180 0.51Daimler Finance North America LLC,1.65%, 18/05/2018 150,000 149,732 0.96Hyundai Capital America,2%, 19/03/2018 72,000 71,992 0.46Hyundai Capital America,2.4%, 30/10/2018 50,000 50,204 0.32Nissan Motor Acceptance Corp., FRN,1.491%, 3/03/2017 50,000 50,024 0.32Toyota Motor Credit Corp.,1.7%, 19/02/2019 120,000 119,952 0.76
592,189 3.78
BroadcastingSES Global Americas Holdings GP,2.5%, 25/03/2019 USD 32,000 31,873 0.20
Brokerage & Asset ManagersIntercontinental Exchange, Inc.,2.75%, 1/12/2020 USD 61,000 62,052 0.40NYSE Euronext,2%, 5/10/2017 66,000 66,320 0.42
128,372 0.82
BuildingStanley Black & Decker, Inc.,1.622%, 17/11/2018 USD 80,000 79,708 0.51
MFS Meridian Funds Annual Report 2017 11

SCHEDULES OF INVESTMENTS 31 January 2017
MFS Meridian Funds – Absolute Return Fund, continued
Name of SecurityTransferable Securities and Money MarketInstruments traded on a Regulated Market Shares/Par
MarketValue ($)
NetAssets (%)
Business ServicesCisco Systems, Inc., FRN,1.221%, 3/03/2017 USD 110,000 110,036 0.70Fidelity National Information Services, Inc.,2.85%, 15/10/2018 20,000 20,314 0.13Fidelity National Information Services, Inc.,2.25%, 15/08/2021 40,000 39,136 0.25
169,486 1.08
ChemicalsCF Industries, Inc.,6.875%, 1/05/2018 USD 20,000 21,075 0.14Chevron Phillips Chemical Co. LLC,1.7%, 1/05/2018 50,000 49,995 0.32Dow Chemical Co.,8.55%, 15/05/2019 40,000 45,728 0.29LyondellBasell Industries N.V.,5%, 15/04/2019 200,000 211,510 1.35
328,308 2.10
Computer SoftwareDiamond 1 Finance Corp./Diamond 2Finance Corp.,3.48%, 1/06/2019 USD 40,000 40,823 0.26Microsoft Corp.,2%, 3/11/2020 111,000 110,870 0.71
151,693 0.97
ConglomeratesABB Finance (USA), Inc.,1.625%, 8/05/2017 USD 112,000 112,188 0.72Roper Industries, Inc.,1.85%, 15/11/2017 33,000 33,076 0.21Roper Technologies, Inc.,2.8%, 15/12/2021 19,000 18,987 0.12
164,251 1.05
Consumer ProductsMattel, Inc.,1.7%, 15/03/2018 USD 3,000 2,999 0.02Newell Brands, Inc.,2.6%, 29/03/2019 30,000 30,373 0.19Newell Rubbermaid, Inc.,2.875%, 1/12/2019 50,000 50,877 0.33
84,249 0.54
Electrical EquipmentArrow Electronics, Inc.,3%, 1/03/2018 USD 26,000 26,261 0.17Molex Electronic Technologies LLC,2.878%, 15/04/2020 54,000 54,268 0.34
80,529 0.51
ElectronicsBroadcom Corp., “A”,3%, 15/01/2022 USD 70,000 69,696 0.44Intel Corp.,1.35%, 15/12/2017 127,000 127,166 0.81Xilinx, Inc.,2.125%, 15/03/2019 40,000 40,098 0.26
236,960 1.51
Emerging Market Quasi-SovereignPetroleos Mexicanos,3.125%, 23/01/2019 USD 15,000 15,060 0.10
Energy – IntegratedBP Capital Markets PLC,2.521%, 15/01/2020 USD 40,000 40,502 0.26Chevron Corp.,1.104%, 5/12/2017 68,000 67,898 0.43
Name of SecurityTransferable Securities and Money MarketInstruments traded on a Regulated Market Shares/Par
MarketValue ($)
NetAssets (%)
Energy – Integrated, continuedShell International Finance B.V.,1.125%, 21/08/2017 USD 70,000 69,992 0.45Shell International Finance B.V.,1.375%, 10/05/2019 60,000 59,560 0.38Total Capital International S.A.,1.5%, 17/02/2017 150,000 150,039 0.96
387,991 2.48
Food & BeveragesAnheuser-Busch InBev Finance, Inc.,1.9%, 1/02/2019 USD 118,000 118,161 0.75Anheuser-Busch InBev Finance, Inc.,2.65%, 1/02/2021 60,000 60,350 0.39Anheuser-Busch InBev Finance, Inc., FRN,2.15%, 1/02/2019 80,000 80,621 0.51Ingredion, Inc.,1.8%, 25/09/2017 43,000 43,087 0.28J.M. Smucker Co.,1.75%, 15/03/2018 20,000 20,035 0.13Kraft Heinz Foods Co.,1.6%, 30/06/2017 70,000 70,045 0.45Molson Coors Brewing Co.,2%, 1/05/2017 57,000 57,120 0.36Mondelez International, Inc., FRN,1.5%, 28/10/2019 100,000 100,336 0.64Wm. Wrigley Jr. Co.,2.4%, 21/10/2018 8,000 8,075 0.05
557,830 3.56
Food & Drug StoresCVS Health Corp.,1.9%, 20/07/2018 USD 50,000 50,185 0.32CVS Health Corp.,2.8%, 20/07/2020 150,000 152,119 0.97Walgreens Boots Alliance, Inc.,1.75%, 17/11/2017 50,000 50,101 0.32Walgreens Boots Alliance, Inc.,1.75%, 30/05/2018 10,000 10,018 0.06
262,423 1.67
Gaming & LodgingWyndham Worldwide Corp.,2.95%, 1/03/2017 USD 65,000 65,092 0.42
InsuranceAmerican International Group, Inc.,2.3%, 16/07/2019 USD 34,000 34,220 0.22American International Group, Inc.,3.3%, 1/03/2021 46,000 47,168 0.30Metropolitan Life Global Funding I, FRN,1.423%, 19/12/2018 300,000 300,638 1.92Prudential Financial, Inc., FRN,1.685%, 15/08/2018 60,000 60,237 0.39Voya Financial, Inc.,2.9%, 15/02/2018 36,000 36,385 0.23
478,648 3.06
Insurance – HealthAetna, Inc.,1.5%, 15/11/2017 USD 12,000 12,002 0.08Aetna, Inc.,1.9%, 7/06/2019 50,000 50,109 0.32UnitedHealth Group, Inc.,1.45%, 17/07/2017 50,000 50,080 0.32
112,191 0.72
Insurance – Property & CasualtyMarsh & McLennan Cos., Inc.,2.35%, 10/09/2019 USD 40,000 40,241 0.26
12 MFS Meridian Funds Annual Report 2017

SCHEDULES OF INVESTMENTS 31 January 2017
MFS Meridian Funds – Absolute Return Fund, continued
Name of SecurityTransferable Securities and Money MarketInstruments traded on a Regulated Market Shares/Par
MarketValue ($)
NetAssets (%)
International Market Quasi-SovereignBank Nederlandse Gemeenten N.V.,1.375%, 19/03/2018 USD 76,000 76,022 0.49Caisse d’Amortissement de la Dette Sociale,1.875%, 13/01/2020 100,000 100,141 0.64CPPIB Capital, Inc.,1.25%, 20/09/2019 250,000 246,767 1.57Dexia Credit Local, “A”,2.25%, 18/02/2020 250,000 249,580 1.59Electricite de France,2.15%, 22/01/2019 68,000 68,091 0.43KFW Government Development Banks,1.125%, 16/11/2018 30,000 29,848 0.19Swedish Export Credit Corp.,1.125%, 28/08/2019 200,000 196,874 1.26
967,323 6.17
International Market SovereignKingdom of Denmark,0.875%, 20/03/2017 USD 160,000 159,997 1.02Kingdom of Sweden,1%, 27/02/2018 110,000 109,704 0.70
269,701 1.72
Local AuthoritiesKommuninvest i Sverige AB,1.125%, 17/09/2019 USD 200,000 196,686 1.26
Major BanksABN AMRO Bank N.V.,1.8%, 4/06/2018 USD 200,000 199,534 1.27Bank of Montreal, FRN,1.673%, 18/07/2019 80,000 80,285 0.51BNP Paribas,2.7%, 20/08/2018 80,000 81,028 0.52BNP Paribas, FRN,1.473%, 17/03/2017 110,000 110,057 0.70Commonwealth Bank of Australia, FRN,1.52%, 7/11/2019 120,000 120,103 0.77Commonwealth Bank of Australia, FRN,1.316%, 13/03/2017 20,000 20,010 0.13ING Bank N.V.,1.8%, 16/03/2018 200,000 200,205 1.28Skandinaviska Enskilda Banken AB,2.45%, 27/05/2020 200,000 199,572 1.27Svenska Handelsbanken AB,2.875%, 4/04/2017 250,000 250,820 1.60Toronto-Dominion Bank,1.75%, 23/07/2018 80,000 80,089 0.51Toronto-Dominion Bank,1.45%, 6/09/2018 100,000 99,613 0.64Westpac Banking Corp.,2%, 14/08/2017 140,000 140,534 0.90
1,581,850 10.10
Medical & Health Technology & ServicesCatholic Health Initiatives,1.6%, 1/11/2017 USD 50,000 50,020 0.32Covidien International Finance S.A.,6%, 15/10/2017 42,000 43,429 0.27Laboratory Corp. of America Holdings,2.625%, 1/02/2020 165,000 165,690 1.06
259,139 1.65
Medical EquipmentAbbott Laboratories,2.35%, 22/11/2019 USD 80,000 80,212 0.51Abbott Laboratories,2.9%, 30/11/2021 40,000 39,824 0.25
Name of SecurityTransferable Securities and Money MarketInstruments traded on a Regulated Market Shares/Par
MarketValue ($)
NetAssets (%)
Medical Equipment, continuedZimmer Holdings, Inc.,2%, 1/04/2018 USD 173,000 173,499 1.11
293,535 1.87
Metals & MiningFreeport-McMoRan, Inc.,2.15%, 1/03/2017 USD 100,000 100,000 0.64Freeport-McMoRan, Inc.,2.375%, 15/03/2018 20,000 19,940 0.13Glencore Funding LLC,2.125%, 16/04/2018 40,000 39,961 0.25
159,901 1.02
MidstreamEnergy Transfer Partners LP,2.5%, 15/06/2018 USD 30,000 30,208 0.19EnLink Midstream Partners LP,2.7%, 1/04/2019 37,000 37,156 0.24Enterprise Products Operating LP,6.5%, 31/01/2019 110,000 119,722 0.76Kinder Morgan (Delaware), Inc.,2%, 1/12/2017 40,000 40,093 0.26ONEOK Partners LP,3.2%, 15/09/2018 50,000 51,038 0.33
278,217 1.78
Mortgage-BackedFannie Mae,1.114%, 25/02/2017 USD 8,081 8,075 0.05Fannie Mae,3%, 1/05/2030 – 1/12/2031 150,751 155,033 0.99Fannie Mae, FRN,1.121%, 25/05/2018 35,653 35,655 0.23Freddie Mac,1.426%, 25/08/2017 6,544 6,546 0.04Freddie Mac,3.5%, 1/08/2026 148,356 154,822 0.99
360,131 2.30
Natural Gas – DistributionEngie,1.625%, 10/10/2017 USD 90,000 90,015 0.57
Network & TelecomAT&T, Inc.,2.4%, 15/03/2017 USD 30,000 30,054 0.19AT&T, Inc.,2.3%, 11/03/2019 130,000 130,430 0.83AT&T, Inc.,2.45%, 30/06/2020 40,000 39,690 0.25AT&T, Inc., FRN,1.847%, 27/11/2018 40,000 40,252 0.26Verizon Communications, Inc., FRN,1.763%, 17/06/2019 250,000 252,235 1.61
492,661 3.14
Oil ServicesSchlumberger Holdings Corp.,1.9%, 21/12/2017 USD 60,000 60,244 0.38
OilsMarathon Petroleum Corp.,2.7%, 14/12/2018 USD 68,000 68,938 0.44
Other Banks & Diversified FinancialsBanque Federative du Credit Mutuel,2%, 12/04/2019 USD 250,000 249,111 1.59Fifth Third Bancorp,2.3%, 1/03/2019 31,000 31,176 0.20
MFS Meridian Funds Annual Report 2017 13

SCHEDULES OF INVESTMENTS 31 January 2017
MFS Meridian Funds – Absolute Return Fund, continued
Name of SecurityTransferable Securities and Money MarketInstruments traded on a Regulated Market Shares/Par
MarketValue ($)
NetAssets (%)
Other Banks & Diversified Financials, continuedGroupe BPCE S.A.,2.5%, 10/12/2018 USD 250,000 252,100 1.61Lloyds Bank PLC,1.75%, 14/05/2018 200,000 199,769 1.27Santander UK Group Holdings PLC,2.875%, 5/08/2021 200,000 197,492 1.26Santander UK PLC,3.05%, 23/08/2018 42,000 42,735 0.27SunTrust Banks, Inc.,2.7%, 27/01/2022 45,000 44,822 0.29
1,017,205 6.49
Personal Computers & PeripheralsEquifax, Inc.,2.3%, 1/06/2021 USD 15,000 14,768 0.09
PharmaceuticalsAbbVie, Inc.,1.8%, 14/05/2018 USD 70,000 70,103 0.45Actavis Funding SCS,2.35%, 12/03/2018 53,000 53,332 0.34Actavis Funding SCS,3%, 12/03/2020 22,000 22,343 0.14Actavis, Inc.,1.875%, 1/10/2017 40,000 40,077 0.26Biogen, Inc.,2.9%, 15/09/2020 40,000 40,651 0.26Bristol-Myers Squibb Co.,0.875%, 1/08/2017 105,000 104,862 0.67Celgene Corp.,2.125%, 15/08/2018 60,000 60,271 0.38EMD Finance LLC,1.7%, 19/03/2018 100,000 99,697 0.64Gilead Sciences, Inc.,1.85%, 4/09/2018 60,000 60,274 0.38Mylan N.V.,2.5%, 7/06/2019 20,000 19,906 0.13Sanofi,1.25%, 10/04/2018 90,000 90,028 0.57Shire Acquisitions Investments IrelandDesignated Activity Co.,1.9%, 23/09/2019 110,000 108,695 0.69Teva Pharmaceutical Industries Ltd.,1.7%, 19/07/2019 70,000 68,745 0.44
838,984 5.35
Real Estate – HealthcareWelltower, Inc., REIT,2.25%, 15/03/2018 USD 31,000 31,181 0.20
Real Estate – OfficeVornado Realty LP, REIT,2.5%, 30/06/2019 USD 47,000 47,203 0.30
Real Estate – RetailSimon Property Group, Inc., REIT,1.5%, 1/02/2018 USD 35,000 35,008 0.22
RestaurantsMcDonald’s Corp.,2.1%, 7/12/2018 USD 40,000 40,281 0.26
RetailersDollar General Corp.,4.125%, 15/07/2017 USD 60,000 60,736 0.39Dollar General Corp.,1.875%, 15/04/2018 10,000 10,015 0.06Wesfarmers Ltd.,1.874%, 20/03/2018 45,000 45,051 0.29
115,802 0.74
Name of SecurityTransferable Securities and Money MarketInstruments traded on a Regulated Market Shares/Par
MarketValue ($)
NetAssets (%)
Specialty ChemicalsAirgas, Inc.,3.05%, 1/08/2020 USD 30,000 30,741 0.20
SupranationalCorporacion Andina de Fomento,1.5%, 8/08/2017 USD 40,000 40,023 0.25Corporacion Andina de Fomento, FRN,1.437%, 29/01/2018 40,000 40,090 0.26
80,113 0.51
Telecommunications – WirelessAmerican Tower Trust I, REIT,1.551%, 15/03/2018 USD 50,000 49,920 0.32SBA Tower Trust,2.877%, 15/07/2021 25,000 24,749 0.16SBA Tower Trust,2.898%, 15/10/2044 57,000 57,395 0.36
132,064 0.84
Telephone ServicesQwest Corp.,6.5%, 1/06/2017 USD 40,000 40,550 0.26
TobaccoReynolds American, Inc.,2.3%, 12/06/2018 USD 50,000 50,302 0.32
U.S. Government Agencies and EquivalentsAID-Ukraine,1.847%, 29/05/2020 USD 200,000 199,498 1.28Private Export Funding Corp.,1.875%, 15/07/2018 100,000 100,729 0.64
300,227 1.92
Utilities – Electric PowerAmerican Electric Power Co., Inc.,1.65%, 15/12/2017 USD 48,000 47,992 0.31Dominion Resources, Inc.,2.962%, 1/07/2019 30,000 30,401 0.19Duke Energy Corp.,1.625%, 15/08/2017 28,000 28,024 0.18Duke Energy Corp., FRN,1.377%, 3/04/2017 50,000 50,039 0.32Emera U.S. Finance LP,2.15%, 15/06/2019 46,000 45,962 0.29Eversource Energy,1.6%, 15/01/2018 30,000 29,966 0.19Eversource Energy,2.5%, 15/03/2021 150,000 148,994 0.95NextEra Energy Capital Holdings, Inc.,2.056%, 1/09/2017 139,000 139,521 0.89PG&E Corp.,2.4%, 1/03/2019 57,000 57,388 0.37PSEG Power LLC,3%, 15/06/2021 65,000 65,395 0.42Southern Co.,1.85%, 1/07/2019 80,000 79,738 0.51Southern Power Co.,1.85%, 1/12/2017 90,000 90,256 0.57Xcel Energy, Inc.,1.2%, 1/06/2017 50,000 49,953 0.32Xcel Energy, Inc.,2.4%, 15/03/2021 50,000 49,697 0.32
913,326 5.83
Total Bonds(Identified Cost, $14,748,785) 14,694,391 93.79
14 MFS Meridian Funds Annual Report 2017

SCHEDULES OF INVESTMENTS 31 January 2017
MFS Meridian Funds – Absolute Return Fund, continued
Name of SecurityTransferable Securities and Money MarketInstruments traded on a Regulated Market Shares/Par
MarketValue ($)
NetAssets (%)
SHORT-TERM OBLIGATIONS (y)Bank of Nova Scotia, 1.44%, 1/09/2017 USD 210,000 210,191 1.34General Electric Co., 0.58%, 1/02/2017 5,000 5,000 0.04
Total Short-Term Obligations, atAmortized Cost and Value 215,191 1.38
Total Transferable Securities andMoney Market Instruments Tradedon a Regulated Market(Identified Cost, $14,963,807) 14,909,582 95.16
Issuer/Expiration Month/Strike PricePar
AmountMarket
Value ($)Net
Assets (%)PUT OPTIONS PURCHASEDiShares Russell 2000 ETF –April 2017 @ $120(Premiums Paid, $6,721) USD 47 4,794 0.03
Total Investments(Identified Cost, $14,970,528) 14,914,376 95.20
OTHER ASSETS, LESS LIABILITIES 752,759 4.80
NET ASSETS 15,667,135 100.00
See Schedules of Investments Footnotes and Notes to Financial Statements
MFS Meridian Funds – Asia Pacific Ex-Japan Fund(Expressed in U.S. Dollars)
Name of SecurityTransferable Securities and Money MarketInstruments traded on a Regulated Market Shares/Par
MarketValue ($)
NetAssets (%)
COMMON STOCKS
AerospaceSingapore Technologies Engineering Ltd. 416,900 976,171 1.22
Alcoholic BeveragesChina Resources Enterprise Ltd. 550,000 1,114,581 1.39
Apparel ManufacturersTitan Co. Ltd. 35,544 189,678 0.24
AutomotiveGuangzhou Automobile Group Co.Ltd., “H” 226,000 308,282 0.38Kia Motors Corp. 7,130 223,330 0.28
531,612 0.66
Brokerage & Asset ManagersComputershare Ltd. 95,763 936,158 1.17Hong Kong Exchanges & Clearing Ltd. 10,500 254,328 0.31
1,190,486 1.48
Business ServicesCognizant Technology SolutionsCorp., “A” 30,583 1,608,360 2.01
ChemicalsOrica Ltd. 54,001 767,894 0.95UPL Ltd. 45,616 487,290 0.61
1,255,184 1.56
Computer Software – SystemsAsustek Computer, Inc. 86,120 752,997 0.94Hon Hai Precision Industry Co. Ltd. 570,579 1,531,994 1.91
2,284,991 2.85
ConglomeratesCK Hutchison Holdings Ltd. 40,800 489,299 0.61
ConstructionReliance Worldwide Corp. Ltd. 390,886 859,699 1.07Techtronic Industries Co. Ltd. 325,000 1,122,444 1.40
1,982,143 2.47
Consumer ProductsAmorePacific Corp. 1,713 467,276 0.58
Consumer ServicesChina Maple Leaf Educational Systems 964,000 581,037 0.72Ctrip.com International Ltd., ADR 24,293 1,049,701 1.31SEEK Ltd. 70,084 767,511 0.96
2,398,249 2.99
Name of SecurityTransferable Securities and Money MarketInstruments traded on a Regulated Market Shares/Par
MarketValue ($)
NetAssets (%)
ContainersBrambles Ltd. 183,078 1,445,391 1.80
ElectronicsASM Pacific Technology Ltd. 23,200 282,176 0.35Samsung Electronics Co. Ltd. 2,941 4,993,196 6.23Taiwan Semiconductor Manufacturing Co.Ltd. 635,814 3,789,261 4.72
9,064,633 11.30
Energy – IndependentCoal India Ltd. 148,613 677,296 0.84Oil Search Ltd. 212,382 1,106,555 1.38Santos Ltd. 192,106 582,773 0.73
2,366,624 2.95
Food & Drug StoresWesfarmers Ltd. 47,794 1,459,303 1.82
Furniture & AppliancesCoway Co. Ltd. 11,545 869,278 1.08
Gaming & LodgingSands China Ltd. 213,600 943,481 1.18
InsuranceAIA Group Ltd. 554,800 3,436,602 4.29AMP Ltd. 162,444 615,988 0.77AUB Group Ltd. 114,141 906,331 1.13Samsung Fire & Marine Insurance Co. Ltd. 7,222 1,671,730 2.08
6,630,651 8.27
InternetAlibaba Group Holding Ltd., ADR 29,877 3,026,839 3.77NAVER Corp. 1,742 1,136,250 1.42Tencent Holdings Ltd. 65,000 1,695,986 2.11
5,859,075 7.30
Major BanksBOC Hong Kong Holdings Ltd. 192,500 769,779 0.96China Construction Bank 2,993,250 2,225,162 2.77Industrial & Commercial Bank ofChina, “H” 1,336,000 818,126 1.02National Australia Bank Ltd. 91,433 2,103,167 2.62Westpac Banking Corp. 91,565 2,202,035 2.75
8,118,269 10.12
Medical & Health Technology & ServicesSonic Healthcare Ltd. 42,155 665,623 0.83
MFS Meridian Funds Annual Report 2017 15
SCHEDULES OF INVESTMENTS 31 January 2017
MFS Meridian Funds – Asia Pacific Ex-Japan Fund, continued
Name of SecurityTransferable Securities and Money MarketInstruments traded on a Regulated Market Shares/Par
MarketValue ($)
NetAssets (%)
Medical EquipmentCochlear Ltd. 6,289 597,008 0.75Fisher & Paykel Healthcare Corp. Ltd. 136,386 869,577 1.08
1,466,585 1.83
Metals & MiningBHP Billiton Ltd. 25,710 519,439 0.65Iluka Resources Ltd. 90,280 516,252 0.64
1,035,691 1.29
Natural Gas – DistributionChina Resources Gas Group Ltd. 514,000 1,634,208 2.04
Other Banks & Diversified FinancialsBanco de Oro Unibank, Inc. 380,838 861,697 1.07CYBG PLC 182,941 654,865 0.82DBS Group Holdings Ltd. 78,400 1,055,272 1.32E.Sun Financial Holding Co. Ltd. 1,344,700 793,223 0.99HDFC Bank Ltd. 85,485 1,827,006 2.28Kasikornbank Co. Ltd. 103,200 549,560 0.68Kotak Mahindra Bank Ltd. 118,793 1,355,496 1.69Shinhan Financial Group Co. Ltd. 24,390 963,343 1.20Shriram Transport Finance Co. Ltd. 38,775 545,662 0.68Siam Commercial Bank Co. Ltd. 92,600 398,435 0.50
9,004,559 11.23
Railroad & ShippingPacific Basin Shipping Ltd. 3,515,000 654,285 0.82
Real EstateCheung Kong Property Holdings Ltd. 118,300 776,757 0.97City Developments Ltd. 99,600 652,292 0.81Vicinity Centres, REIT 309,901 672,183 0.84
2,101,232 2.62
RestaurantsYum China Holdings, Inc. 33,103 909,670 1.13
Specialty ChemicalsAstra Argo Lestari 617,722 729,793 0.91LG Chem Ltd. 4,821 1,086,913 1.36
Name of SecurityTransferable Securities and Money MarketInstruments traded on a Regulated Market Shares/Par
MarketValue ($)
NetAssets (%)
Specialty Chemicals, continuedPTT Global Chemical PLC 415,300 802,056 1.00
2,618,762 3.27
Specialty StoresSuper Retail Group Ltd. 48,573 358,800 0.45
Telecommunications – WirelessAdvanced Info Service PLC 391,900 1,780,858 2.22Bharti Tele-Ventures Ltd. 111,667 573,107 0.71PLDT, Inc. 30,645 905,218 1.13
3,259,183 4.06
Telephone ServicesPT XL Axiata Tbk 1,859,875 405,335 0.51
TobaccoITC Ltd. 251,079 955,170 1.19PT Gudang Garam Tbk 134,000 619,697 0.77
1,574,867 1.96
Utilities – Electric PowerChina Longyuan Power Group 814,000 668,131 0.83CLP Holdings Ltd. 84,000 822,728 1.03NTPC Ltd. 170,352 432,754 0.54
1,923,613 2.40
Total Common Stocks(Identified Cost, $75,502,342) 78,857,148 98.32
SHORT-TERM OBLIGATIONS (y)General Electric Co.,0.58%, 1/02/2017, at Amortized Costand Value USD 520,000 520,000 0.65
Total Transferable Securities andMoney Market Instruments Tradedon a Regulated Market(Identified Cost, $76,022,342) (k) 79,377,148 98.97
OTHER ASSETS, LESS LIABILITIES 829,096 1.03
NET ASSETS 80,206,244 100.00
See Schedules of Investments Footnotes and Notes to Financial Statements
MFS Meridian Funds – Blended Research European Equity Fund(Expressed in Euros)
Name of SecurityTransferable Securities and Money MarketInstruments Traded on a Regulated Market Shares/Par
MarketValue (€)
NetAssets (%)
COMMON STOCKS
AirlinesAena S.A. 475 63,816 1.39
Apparel ManufacturersBurberry Group PLC 1,693 32,356 0.70Christian Dior S.A. 317 63,004 1.37Compagnie Financiere Richemont S.A. 295 21,182 0.46LVMH Moet Hennessy Louis Vuitton SE 310 57,846 1.26
174,388 3.79
AutomotiveCompagnie Generale des EtablissementsMichelin 475 47,206 1.02D’Ieteren S.A. 1,354 56,604 1.23PSA Peugeot Citroen S.A. 3,474 59,753 1.30
163,563 3.55
Name of SecurityTransferable Securities and Money MarketInstruments Traded on a Regulated Market Shares/Par
MarketValue (€)
NetAssets (%)
Brokerage & Asset Managers3i Group PLC 5,344 43,594 0.95
Business ServicesAmadeus IT Holding S.A. 1,333 56,979 1.24Atos Origin S.A. 298 29,350 0.64Compass Group PLC 2,085 34,308 0.74Experian Group Ltd. 1,984 35,351 0.77
155,988 3.39
ChemicalsArkema 617 56,394 1.23
Consumer ProductsL’Oréal 161 27,104 0.59Reckitt Benckiser Group PLC 895 70,965 1.54Svenska Cellulosa Aktiebolaget 2,190 60,998 1.33
159,067 3.46
16 MFS Meridian Funds Annual Report 2017

SCHEDULES OF INVESTMENTS 31 January 2017
MFS Meridian Funds – Blended Research European Equity Fund, continued
Name of SecurityTransferable Securities and Money MarketInstruments Traded on a Regulated Market Shares/Par
MarketValue (€)
NetAssets (%)
Electrical EquipmentNexans S.A. 688 36,952 0.80OSARM Licht AG 728 39,043 0.85Schneider Electric S.A. 1,169 77,411 1.68Siemens AG 876 101,835 2.21
255,241 5.54
ElectronicsSTMicroelectronics N.V. 4,152 50,634 1.10
Energy – IndependentGalp Energia SGPS S.A., “B” 4,756 64,777 1.41
Energy – IntegratedBP PLC 22,750 125,361 2.72Royal Dutch Shell PLC, “A” 5,336 133,539 2.90
258,900 5.62
Engineering – ConstructionBouygues S.A. 1,636 55,060 1.20
Food & BeveragesBakkafrost P/f 1,536 54,652 1.19Marine Harvest 2,191 35,878 0.78Nestle S.A. 2,521 170,628 3.70Suedzucker AG 888 21,694 0.47
282,852 6.14
Food & Drug StoresWilliam Morrison Supermarkets PLC 8,257 22,718 0.49
Forest & Paper ProductsStora Enso Oyj 3,570 37,556 0.82UPM-Kymmene Corp. 2,502 52,542 1.14
90,098 1.96
General MerchandiseMETRO AG 1,068 33,759 0.73
InsuranceAgeas 1,179 46,665 1.01Mapfre S.A. 9,226 25,833 0.56NN Group N.V. 1,743 57,048 1.24Old Mutual PLC 7,585 18,359 0.40Swiss Life Holding AG 144 40,320 0.88Zurich Insurance Group AG 360 95,542 2.07
283,767 6.16
Machinery & ToolsGEA Group AG 1,195 45,697 0.99Schindler Holding AG 267 46,990 1.02
92,687 2.01
Major BanksBanco Bilbao Vizcaya Argentaria, S.A. 6,098 38,265 0.83Barclays PLC 31,173 79,721 1.73BNP Paribas 1,667 98,653 2.14HSBC Holdings PLC 9,744 76,807 1.67Lloyds Banking Group PLC 108,784 82,313 1.79
375,759 8.16
Metals & MiningGlencore PLC 17,142 65,213 1.41Rio Tinto Ltd. 2,374 96,580 2.10
161,793 3.51
Natural Gas – DistributionEngie 4,098 45,344 0.99
Network & TelecomLM Ericsson Telephone Co., “B” 5,693 31,140 0.68
Name of SecurityTransferable Securities and Money MarketInstruments Traded on a Regulated Market Shares/Par
MarketValue (€)
NetAssets (%)
Oil ServicesTechnipFMC PLC 1,288 39,104 0.85
Other Banks & Diversified FinancialsDnB NOR A.S.A. 3,795 58,648 1.27Erste Group Bank AG 1,708 48,063 1.04Exor N.V. 443 18,677 0.41Intesa Sanpaolo S.p.A. 28,711 62,303 1.35UBS AG 5,712 85,395 1.86
273,086 5.93
PharmaceuticalsBayer AG 1,080 110,484 2.40GlaxoSmithKline PLC 1,993 35,489 0.77Novartis AG 1,604 108,788 2.36Roche Holding AG 597 130,218 2.83Sanofi 1,300 96,837 2.11
481,816 10.47
Printing & PublishingInforma PLC 6,382 48,491 1.05
Real EstateBritish Land Co. PLC, REIT 3,593 24,411 0.53
RestaurantsEnterprise Inns PLC 10,462 16,154 0.35Greggs PLC 1,890 21,408 0.47
37,562 0.82
Specialty ChemicalsAkzo Nobel N.V. 509 31,960 0.69Covestro AG 277 19,249 0.42Linde AG 170 25,577 0.56Sika AG 11 53,393 1.16
130,179 2.83
Specialty StoresJust Eat PLC 8,884 55,854 1.21
Telecommunications – WirelessVodafone Group PLC 32,771 74,222 1.61
Telephone ServicesDeutsche Telekom AG 4,457 72,025 1.56France Telecom S.A. 3,971 56,885 1.24TDC A.S. 6,329 30,853 0.67
159,763 3.47
TobaccoBritish American Tobacco PLC 1,933 110,367 2.40
Utilities – Electric PowerEnel S.p.A. 18,054 69,761 1.52Energias de Portugal S.A. 22,686 60,980 1.32
130,741 2.84
Total Common Stocks(Identified Cost, €3,985,459) 4,486,935 97.47
PREFERRED STOCKSMedical EquipmentDragerwerk AG & Co. KGaA(Identified Cost, €48,956) 882 71,583 1.56
Total Transferable Securities andMoney Market Instruments Tradedon a Regulated Market(Identified Cost, €4,034,415) 4,558,518 99.03
OTHER ASSETS, LESS LIABILITIES 44,734 0.97
NET ASSETS 4,603,252 100.00
See Schedules of Investments Footnotes and Notes to Financial Statements
MFS Meridian Funds Annual Report 2017 17

SCHEDULES OF INVESTMENTS 31 January 2017
MFS Meridian Funds – Continental European Equity Fund(Expressed in Euros)
Name of SecurityTransferable Securities and Money MarketInstruments Traded on a Regulated Market Shares/Par
MarketValue (€)
NetAssets (%)
COMMON STOCKS
Alcoholic BeveragesPernod Ricard S.A. 2,039 220,926 3.02
Apparel ManufacturersKering S.A. 908 199,942 2.74LVMH Moet Hennessy Louis Vuitton SE 1,302 242,953 3.32Tod’s S.p.A. 504 33,642 0.46
476,537 6.52
AutomotiveD’Ieteren S.A. 1,515 63,335 0.87
BroadcastingPublicis Groupe S.A. 3,674 233,519 3.20
Business ServicesAmadeus IT Holding S.A. 4,652 198,850 2.72Cap Gemini S.A. 2,323 175,085 2.40DKSH Holding Ltd. 930 63,511 0.87
437,446 5.99
Computer SoftwareDassault Systems S.A. 2,330 167,014 2.29SAP AG 5,121 433,390 5.93
600,404 8.22
Consumer ProductsL’Oréal 1,477 248,653 3.40Unilever N.V. 3,986 149,056 2.04
397,709 5.44
Electrical EquipmentPrysmian S.p.A. 5,038 121,214 1.66Schneider Electric S.A. 4,050 268,191 3.67Siemens AG 816 94,860 1.30
484,265 6.63
Energy – IndependentGalp Energia SGPS S.A., “B” 8,023 109,273 1.50
Energy – IntegratedEni S.p.A. 3,627 51,540 0.71
Engineering – ConstructionArcadis N.V. 3,415 42,927 0.59
Food & BeveragesDanone S.A. 2,375 137,726 1.89Nestle S.A. 6,628 448,601 6.14
586,327 8.03
Gaming & LodgingPaddy Power Betfair PLC 1,128 109,697 1.50
Machinery & ToolsGEA Group AG 2,508 95,906 1.31
Name of SecurityTransferable Securities and Money MarketInstruments Traded on a Regulated Market Shares/Par
MarketValue (€)
NetAssets (%)
Machinery & Tools, continuedSchindler Holding AG 443 77,965 1.07
173,871 2.38
Medical & Health Technology & ServicesFresenius Medical Care AG & Co. KGaA 2,391 180,018 2.46
Medical EquipmentQIAGEN N.V. 6,190 165,178 2.26Sonova Holding AG 316 38,575 0.53
203,753 2.79
Network & TelecomLM Ericsson Telephone Co., “B” 16,228 88,766 1.21
Other Banks & Diversified FinancialsErste Group Bank AG 1,663 46,797 0.64ING Groep N.V. 14,062 186,322 2.55Intesa Sanpaolo S.p.A. 27,789 60,302 0.83Julius Baer Group Ltd. 3,454 149,513 2.05Komercni Banka A.S. 1,343 43,986 0.60UBS AG 16,117 240,951 3.30
727,871 9.97
PharmaceuticalsBayer AG 3,003 307,207 4.21Novartis AG 5,667 384,354 5.26Roche Holding AG 1,892 412,683 5.65
1,104,244 15.12
Real EstateDeutsche Wohnen AG 7,993 240,909 3.30
Specialty ChemicalsAkzo Nobel N.V. 4,210 264,346 3.62Linde AG 953 143,379 1.96Sika AG 25 121,347 1.66
529,072 7.24
TobaccoSwedish Match AB 3,069 92,501 1.27
Utilities – Electric PowerFortum Corp. 4,688 69,336 0.95
Total Common Stocks(Identified Cost, €6,316,180) 7,224,246 98.91
Total Transferable Securities andMoney Market Instruments Tradedon a Regulated Market(Identified Cost, €6,316,180) 7,224,246 98.91
OTHER ASSETS, LESS LIABILITIES 79,705 1.09
NET ASSETS 7,303,951 100.00
See Schedules of Investments Footnotes and Notes to Financial Statements
18 MFS Meridian Funds Annual Report 2017

SCHEDULES OF INVESTMENTS 31 January 2017
MFS Meridian Funds – Diversified Income Fund(Expressed in U.S. Dollars)
Name of SecurityTransferable Securities and Money MarketInstruments traded on a Regulated Market Shares/Par
MarketValue ($)
NetAssets (%)
COMMON STOCKS
AerospaceNorthrop Grumman Corp. 812 186,013 0.13
AirlinesAir Canada 12,815 131,671 0.09Copa Holdings S.A., “A” 1,515 147,697 0.11
279,368 0.20
AutomotiveGeneral Motors Co. 9,923 363,281 0.26Hyundai Motor Co. Ltd. 738 88,590 0.06Magna International, Inc. 2,320 100,360 0.07
552,231 0.39
BiotechnologyCelgene Corp. 2,424 281,548 0.20
Cable TVCharter Communications, Inc., “A” 1,763 571,124 0.41
ChemicalsLyondellBasell Industries N.V., “A” 904 84,316 0.06
Computer SoftwareCheck Point Software Technologies Ltd. 4,320 426,686 0.30
Computer Software – SystemsHon Hai Precision Industry Co. Ltd. 102,700 275,748 0.20
ConstructionBellway PLC 1,736 54,248 0.04Owens Corning 2,719 150,225 0.11
204,473 0.15
Consumer ProductsProcter & Gamble Co. 7,386 647,014 0.46Svenska Cellulosa Aktiebolaget 17,513 526,565 0.38
1,173,579 0.84
Electrical EquipmentSiemens AG 5,123 642,895 0.46
ElectronicsIntel Corp. 8,970 330,275 0.23Samsung Electronics Co. Ltd. 322 546,688 0.39Taiwan Semiconductor Manufacturing Co.Ltd., ADR 27,014 835,003 0.60
1,711,966 1.22
Energy – IndependentGalp Energia SGPS S.A., “B” 17,204 252,947 0.18Pacific Exploration & Production Corp. 3,247 129,932 0.09Rice Energy, Inc. 13,393 265,583 0.19Valero Energy Corp. 4,335 285,070 0.21
933,532 0.67
Energy – IntegratedBP PLC 64,679 384,740 0.28China Petroleum & Chemical Corp. 174,000 139,265 0.10Exxon Mobil Corp. 4,664 391,263 0.28LUKOIL PJSC, ADR 4,610 258,667 0.18
1,173,935 0.84
Engineering – ConstructionBouygues S.A. 2,892 105,068 0.07VINCI S.A. 4,106 287,664 0.21
392,732 0.28
Food & BeveragesGeneral Mills, Inc. 8,534 533,204 0.38Marine Harvest 17,291 305,651 0.22
Name of SecurityTransferable Securities and Money MarketInstruments traded on a Regulated Market Shares/Par
MarketValue ($)
NetAssets (%)
Food & Beverages, continuedNestle S.A. 1,949 142,401 0.10Tyson Foods, Inc., “A” 2,069 129,913 0.09
1,111,169 0.79
Food & Drug StoresLawson, Inc. 2,000 145,957 0.10Wesfarmers Ltd. 8,224 251,105 0.18
397,062 0.28
Gaming & LodgingSands China Ltd. 68,400 302,126 0.22
InsuranceMetLife, Inc. 6,408 348,659 0.25Prudential Financial, Inc. 3,155 331,622 0.24Swiss Re Ltd. 1,522 141,657 0.10Zurich Insurance Group AG 2,904 831,978 0.59
1,653,916 1.18
Major BanksBNP Paribas 3,933 251,259 0.18BOC Hong Kong Holdings Ltd. 49,000 195,944 0.14Canadian Imperial Bank of Commerce 3,091 263,219 0.19China Construction Bank 481,000 357,572 0.25National Australia Bank Ltd. 3,723 85,637 0.06Royal Bank of Canada 1,544 110,967 0.08Toronto-Dominion Bank 3,674 190,328 0.14
1,454,926 1.04
Medical & Health Technology & ServicesHCA Holdings, Inc. 2,710 217,559 0.16
Metals & MiningRio Tinto Ltd. 12,972 569,688 0.41
Natural Gas – DistributionEngie 27,632 330,055 0.24
Natural Gas – PipelineWilliams Partners LP 4,541 186,363 0.13
Network & TelecomCisco Systems, Inc. 9,351 287,263 0.20
Oil ServicesTechnipFMC PLC 3,784 124,015 0.09
Other Banks & Diversified FinancialsAgricultural Bank of China Ltd., “H” 199,000 83,252 0.06DBS Group Holdings Ltd. 33,300 448,221 0.32UBS AG 11,440 184,626 0.13
716,099 0.51
PharmaceuticalsBayer AG 4,091 451,781 0.32Eli Lilly & Co. 8,219 633,110 0.45Merck & Co., Inc. 19,148 1,186,985 0.85Novartis AG 9,200 673,579 0.48Roche Holding AG 1,150 270,780 0.20
3,216,235 2.30
Real EstateAlexandria Real Estate Equities, Inc., REIT 12,422 1,376,606 0.98AvalonBay Communities, Inc., REIT 10,045 1,740,899 1.24Boardwalk, REIT (l) 27,452 995,550 0.71Colony Starwood Homes, REIT 28,253 888,557 0.63Equity Commonwealth, REIT 40,652 1,253,708 0.90Equity Lifestyle Properties, Inc., REIT 17,068 1,262,008 0.90
MFS Meridian Funds Annual Report 2017 19

SCHEDULES OF INVESTMENTS 31 January 2017
MFS Meridian Funds – Diversified Income Fund, continued
Name of SecurityTransferable Securities and Money MarketInstruments traded on a Regulated Market Shares/Par
MarketValue ($)
NetAssets (%)
Real Estate, continuedGramercy Property Trust, REIT 37,513 988,092 0.71Life Storage, Inc., REIT 15,951 1,299,209 0.93Medical Properties Trust, Inc., REIT 115,841 1,476,973 1.05Mid-America Apartment Communities,Inc., REIT 15,457 1,467,642 1.05OUTFRONT Media, Inc., REIT 34,937 958,322 0.68Parkway, Inc., REIT 15,164 322,842 0.23Public Storage, Inc., REIT 11,312 2,432,080 1.74Rexford Industrial Realty, Inc., REIT 28,174 639,832 0.46Simon Property Group, Inc., REIT 10,752 1,975,895 1.41STAG Industrial, Inc., REIT 34,818 805,689 0.58Starwood Property Trust, Inc., REIT 47,216 1,051,028 0.75Store Capital Corp., REIT 44,981 1,064,250 0.76Sun Communities, Inc., REIT 13,370 1,053,021 0.75Tanger Factory Outlet Centers, Inc., REIT 23,292 796,353 0.57Urban Edge Properties, REIT 32,521 909,612 0.65Vornado Realty Trust, REIT 5,401 574,180 0.41Washington Prime Group, Inc., REIT 107,053 1,033,061 0.74Weyerhaeuser Co., REIT 32,357 1,013,745 0.72
27,379,154 19.55
RestaurantsBrinker International, Inc. 3,865 171,993 0.12Greggs PLC 4,168 50,965 0.04
222,958 0.16
Specialty ChemicalsPTT Global Chemical PLC 173,800 335,655 0.24Tosoh Corp. 7,000 53,007 0.04
388,662 0.28
Specialty StoresGap, Inc. 14,250 328,177 0.23Just Eat PLC 27,638 187,577 0.13Urban Outfitters, Inc. 2,387 63,351 0.05
579,105 0.41
Telecommunications – WirelessAmerican Tower Corp., REIT 7,393 765,176 0.55SoftBank Corp. 1,900 146,417 0.10Vodafone Group PLC 66,836 163,409 0.12
1,075,002 0.77
Telephone ServicesAT&T, Inc. 2,807 118,343 0.08BT Group PLC 96,585 369,189 0.26Nippon Television Holdings, Inc. 5,000 220,485 0.16TDC A.S. 36,171 190,347 0.14
898,364 0.64
TobaccoAltria Group, Inc. 15,722 1,119,092 0.80Imperial Tobacco Group PLC 2,561 118,350 0.08Japan Tobacco, Inc. 16,800 541,599 0.39Philip Morris International, Inc. 5,472 526,023 0.38
2,305,064 1.65
Utilities – Electric PowerAmerican Electric Power Co., Inc. 8,668 555,272 0.40Energias de Portugal S.A. 46,646 135,352 0.10Korea Electric Power Corp. 1,476 53,916 0.04SSE PLC 20,294 380,139 0.27
Name of SecurityTransferable Securities and Money MarketInstruments traded on a Regulated Market Shares/Par
MarketValue ($)
NetAssets (%)
Utilities – Electric Power, continuedXcel Energy, Inc. 4,917 203,170 0.14
1,327,849 0.95
Total Common Stocks(Identified Cost, $51,382,616) 53,632,780 38.31
BONDS
AerospaceCPI International, Inc.,8.75%, 15/02/2018 USD 170,000 172,125 0.12KLX, Inc.,5.875%, 1/12/2022 40,000 41,900 0.03TransDigm, Inc.,6%, 15/07/2022 125,000 125,938 0.09Transdigm, Inc.,6.375%, 15/06/2026 25,000 24,625 0.02
364,588 0.26
Asset-Backed & SecuritizedCitigroup Commercial Mortgage Trust,2015-GC27, “A5”,3.137%, 10/02/2048 USD 100,000 99,959 0.07Citigroup/Deutsche Bank CommercialMortgage Trust, FRN,5.366%, 11/12/2049 34,120 34,095 0.02CNH Equipment Trust, 2015-C, “A2B”,FRN,1.238%, 17/12/2018 20,324 20,332 0.02Commercial Mortgage Trust, 2015-DC1,“A5”,3.35%, 10/02/2048 40,000 40,424 0.03Commercial Mortgage Trust, 2015-PC1,“A5”,3.902%, 10/07/2050 110,000 115,256 0.08Ford Credit Floorplan Master OwnerTrust, 2015-4, “A2”, FRN,1.368%, 15/08/2020 34,000 34,132 0.02Greenwich Capital Commercial FundingCorp.,5.475%, 10/03/2039 3,804 3,802 0.00GS Mortgage Securities Trust,2015-GC30, “A4”,3.382%, 10/05/2050 125,000 126,842 0.09JPMBB Commercial Mortgage SecuritiesTrust, 2014-C26,3.494%, 15/01/2048 111,484 114,226 0.08Morgan Stanley Capital I Trust, “AM”,FRN,5.706%, 15/04/2049 50,000 49,238 0.04Wells Fargo Commercial MortgageTrust, 2015-C28, “A4”,3.54%, 15/05/2048 89,543 91,773 0.07Wells Fargo Commercial MortgageTrust, 2015-NXS1, “A5”,3.148%, 15/05/2048 100,000 100,672 0.07
830,751 0.59
AutomotiveAllison Transmission, Inc.,5%, 1/10/2024 USD 150,000 151,125 0.11Gates Global LLC,6%, 15/07/2022 105,000 103,556 0.07Hyundai Capital America,2%, 19/03/2018 37,000 36,996 0.03Hyundai Capital America,2.4%, 30/10/2018 10,000 10,041 0.01IHO Verwaltungs GmbH,4.75%, 15/09/2026 200,000 196,500 0.14
20 MFS Meridian Funds Annual Report 2017

SCHEDULES OF INVESTMENTS 31 January 2017
MFS Meridian Funds – Diversified Income Fund, continued
Name of SecurityTransferable Securities and Money MarketInstruments traded on a Regulated Market Shares/Par
MarketValue ($)
NetAssets (%)
Automotive, continuedZF North America Capital, Inc.,4.5%, 29/04/2022 USD 150,000 153,938 0.11ZF North America Capital, Inc.,4.75%, 29/04/2025 150,000 152,505 0.11
804,661 0.58
BroadcastingCBS Radio, Inc.,7.25%, 1/11/2024 USD 85,000 88,559 0.06Clear Channel Worldwide Holdings, Inc.,“A”,6.5%, 15/11/2022 25,000 25,225 0.02Clear Channel Worldwide Holdings, Inc.,“B”,6.5%, 15/11/2022 165,000 172,260 0.12iHeartMedia, Inc.,9%, 1/03/2021 80,000 59,800 0.04Liberty Media Corp. – Liberty Formula One,8.5%, 15/07/2029 115,000 127,650 0.09Match Group, Inc.,6.375%, 1/06/2024 125,000 134,063 0.10Netflix, Inc.,5.375%, 1/02/2021 100,000 107,375 0.08Netflix, Inc.,5.875%, 15/02/2025 65,000 70,525 0.05Netflix, Inc.,4.375%, 15/11/2026 60,000 58,875 0.04Nexstar Broadcasting, Inc.,6.875%, 15/11/2020 140,000 145,194 0.11
989,526 0.71
BuildingABC Supply Co., Inc.,5.75%, 15/12/2023 USD 80,000 83,200 0.06Allegion PLC,5.875%, 15/09/2023 90,000 95,850 0.07Allegion U.S. Holding Co., Inc.,5.75%, 1/10/2021 115,000 119,888 0.08Beacon Roofing Supply, Inc.,6.375%, 1/10/2023 140,000 150,150 0.11Cementos Progreso Trust Co.,7.125%, 6/11/2023 263,000 276,550 0.20Elementia S.A. de C.V.,5.5%, 15/01/2025 400,000 386,000 0.28Gibraltar Industries, Inc.,6.25%, 1/02/2021 125,000 129,141 0.09HD Supply, Inc.,5.75%, 15/04/2024 120,000 126,300 0.09PriSo Acquisition Corp.,9%, 15/05/2023 125,000 127,500 0.09Standard Industries, Inc.,5.375%, 15/11/2024 125,000 128,906 0.09Standard Industries, Inc.,6%, 15/10/2025 110,000 116,050 0.08Summit Materials LLC/Summit MaterialsFinance Co.,6.125%, 15/07/2023 195,000 201,338 0.14Union Andina de Cementos S.A.A.,5.875%, 30/10/2021 350,000 361,410 0.26
2,302,283 1.64
Business ServicesAlliance Data Systems Corp.,5.875%, 1/11/2021 USD 155,000 160,038 0.11Alliance Data Systems Corp.,5.375%, 1/08/2022 10,000 9,775 0.01
Name of SecurityTransferable Securities and Money MarketInstruments traded on a Regulated Market Shares/Par
MarketValue ($)
NetAssets (%)
Business Services, continuedCisco Systems, Inc.,2.6%, 28/02/2023 USD 49,000 48,672 0.04Equinix, Inc.,5.375%, 1/01/2022 175,000 185,063 0.13Equinix, Inc.,5.375%, 1/04/2023 40,000 41,853 0.03Equinix, Inc.,5.75%, 1/01/2025 30,000 31,650 0.02Iron Mountain, Inc., REIT,6%, 1/10/2020 80,000 83,800 0.06Iron Mountain, Inc., REIT,6%, 15/08/2023 135,000 143,100 0.10
703,951 0.50
Cable TVAltice Financing S.A.,6.625%, 15/02/2023 USD 200,000 209,500 0.15CCO Holdings LLC/CCO Holdings CapitalCorp.,5.125%, 1/05/2023 180,000 186,750 0.13CCO Holdings LLC/CCO Holdings CapitalCorp.,5.75%, 15/01/2024 255,000 267,750 0.19CCO Holdings LLC/CCO Holdings CapitalCorp.,5.375%, 1/05/2025 40,000 41,650 0.03CCO Holdings LLC/CCO Holdings CapitalCorp.,5.75%, 15/02/2026 50,000 52,984 0.04Cequel Communications Holdings,6.375%, 15/09/2020 90,000 92,475 0.07CSC Holdings LLC,5.5%, 15/04/2027 200,000 203,000 0.14DISH DBS Corp.,5.875%, 15/11/2024 170,000 171,913 0.12Intelsat Jackson Holdings S.A.,7.25%, 1/04/2019 120,000 103,125 0.07Intelsat Jackson Holdings S.A.,5.5%, 1/08/2023 45,000 31,500 0.02Intelsat Jackson Holdings S.A.,8%, 15/02/2024 40,000 41,500 0.03LGE Holdco VI B.V.,7.125%, 15/05/2024 EUR 100,000 122,928 0.09Sirius XM Radio, Inc.,4.625%, 15/05/2023 USD 50,000 50,406 0.04Sirius XM Radio, Inc.,6%, 15/07/2024 140,000 149,013 0.11Sirius XM Radio, Inc.,5.375%, 15/04/2025 100,000 101,750 0.07Unitymedia KabelBW GmbH,6.125%, 15/01/2025 200,000 206,750 0.15VTR Finance B.V.,6.875%, 15/01/2024 400,000 420,000 0.30
2,452,994 1.75
ChemicalsChemours Co.,6.625%, 15/05/2023 USD 120,000 119,400 0.09Chemours Co.,7%, 15/05/2025 45,000 44,843 0.03Consolidated Energy Finance S.A.,6.75%, 15/10/2019 400,000 401,000 0.29GCP Applied Technologies Co.,9.5%, 1/02/2023 100,000 114,000 0.08Tronox Finance LLC,6.375%, 15/08/2020 50,000 48,063 0.03
MFS Meridian Funds Annual Report 2017 21

SCHEDULES OF INVESTMENTS 31 January 2017
MFS Meridian Funds – Diversified Income Fund, continued
Name of SecurityTransferable Securities and Money MarketInstruments traded on a Regulated Market Shares/Par
MarketValue ($)
NetAssets (%)
Chemicals, continuedTronox Finance LLC,7.5%, 15/03/2022 USD 180,000 175,500 0.13W.R. Grace & Co.,5.125%, 1/10/2021 150,000 157,313 0.11
1,060,119 0.76
Computer SoftwareDiamond 1 Finance Corp./Diamond 2Finance Corp.,6.02%, 15/06/2026 USD 150,000 161,952 0.12Diamond 1 Finance Corp./Diamond 2Finance Corp.,5.875%, 15/06/2021 55,000 58,017 0.04Microsoft Corp.,3.125%, 3/11/2025 28,000 27,951 0.02Nuance Communications, Inc.,5.625%, 15/12/2026 125,000 124,844 0.09VeriSign, Inc.,4.625%, 1/05/2023 150,000 151,635 0.11
524,399 0.38
Computer Software – SystemsApple, Inc.,3.25%, 23/02/2026 USD 66,000 65,692 0.05CDW LLC/CDW Finance Corp.,5.5%, 1/12/2024 215,000 223,869 0.16JDA Software Group, Inc.,7.375%, 15/10/2024 140,000 147,000 0.10Sabre GLBL, Inc.,5.375%, 15/04/2023 195,000 198,352 0.14Western Digital Corp.,10.5%, 1/04/2024 140,000 164,850 0.12
799,763 0.57
ConglomeratesAmsted Industries Co.,5%, 15/03/2022 USD 210,000 210,525 0.15Apex Tool Group,7%, 1/02/2021 150,000 138,750 0.10EnerSys,5%, 30/04/2023 230,000 234,025 0.17Enpro Industries, Inc.,5.875%, 15/09/2022 185,000 192,400 0.14Entegris, Inc.,6%, 1/04/2022 170,000 177,650 0.13Gardner Denver, Inc.,6.875%, 15/08/2021 125,000 124,688 0.09Grupo KUO S.A.B de C.V.,6.25%, 4/12/2022 200,000 196,700 0.14SPX FLOW, Inc.,5.625%, 15/08/2024 145,000 147,900 0.10
1,422,638 1.02
ConstructionEmpresas ICA S.A.B. de C.V.,8.9%, 4/02/2021 (d) USD 200,000 42,250 0.03Empresas ICA S.A.B. de C.V.,8.875%, 29/05/2024 (d) 200,000 44,175 0.03Empresas ICA S.A.B. de C.V.,8.875%, 29/05/2024 (d) 200,000 44,175 0.03
130,600 0.09
Consumer ProductsNBTY, Inc.,7.625%, 15/05/2021 USD 160,000 167,600 0.12Newell Rubbermaid, Inc.,3.15%, 1/04/2021 41,000 41,622 0.03
Name of SecurityTransferable Securities and Money MarketInstruments traded on a Regulated Market Shares/Par
MarketValue ($)
NetAssets (%)
Consumer Products, continuedPrestige Brands, Inc.,5.375%, 15/12/2021 USD 130,000 133,900 0.10Spectrum Brands, Inc.,6.125%, 15/12/2024 5,000 5,288 0.00Spectrum Brands, Inc.,5.75%, 15/07/2025 140,000 146,300 0.10
494,710 0.35
Consumer ServicesADT Corp.,6.25%, 15/10/2021 USD 275,000 299,063 0.21Garda World Security Corp.,7.25%, 15/11/2021 225,000 215,438 0.15Grupo Posadas S.A.B. de C.V.,7.875%, 30/06/2022 400,000 401,500 0.29Interval Acquisition Corp.,5.625%, 15/04/2023 250,000 255,000 0.18Mobile Mini, Inc.,5.875%, 1/07/2024 145,000 151,163 0.11Monitronics International, Inc.,9.125%, 1/04/2020 165,000 160,463 0.11Service Corp. International,5.375%, 15/05/2024 90,000 94,275 0.07ServiceMaster Co. LLC,5.125%, 15/11/2024 145,000 146,813 0.11
1,723,715 1.23
ContainersBerry Plastics Group, Inc.,5.5%, 15/05/2022 USD 225,000 234,000 0.17Berry Plastics Group, Inc.,6%, 15/10/2022 60,000 63,525 0.04Crown American LLC,4.5%, 15/01/2023 130,000 132,763 0.09Crown American LLC,4.25%, 30/09/2026 70,000 66,938 0.05Multi-Color Corp.,6.125%, 1/12/2022 170,000 179,775 0.13Plastipak Holdings, Inc.,6.5%, 1/10/2021 173,000 180,569 0.13Reynolds Group,8.25%, 15/02/2021 69,359 71,405 0.05Reynolds Group,5.125%, 15/07/2023 190,000 194,313 0.14Reynolds Group,7%, 15/07/2024 60,000 63,930 0.05Sealed Air Corp.,4.875%, 1/12/2022 195,000 201,094 0.14Signode Industrial Group,6.375%, 1/05/2022 140,000 142,100 0.10
1,530,412 1.09
ElectronicsSensata Technologies B.V.,5.625%, 1/11/2024 USD 140,000 146,912 0.11Sensata Technologies B.V.,5%, 1/10/2025 160,000 159,920 0.11
306,832 0.22
Emerging Market Quasi-SovereignCorporacion Financiera de Desarrollo S.A.,4.75%, 15/07/2025 USD 202,000 212,544 0.15Development Bank of Kazakhstan,4.125%, 10/12/2022 400,000 389,984 0.28Empresa Nacional del Petroleo,4.375%, 30/10/2024 200,000 202,534 0.14
22 MFS Meridian Funds Annual Report 2017
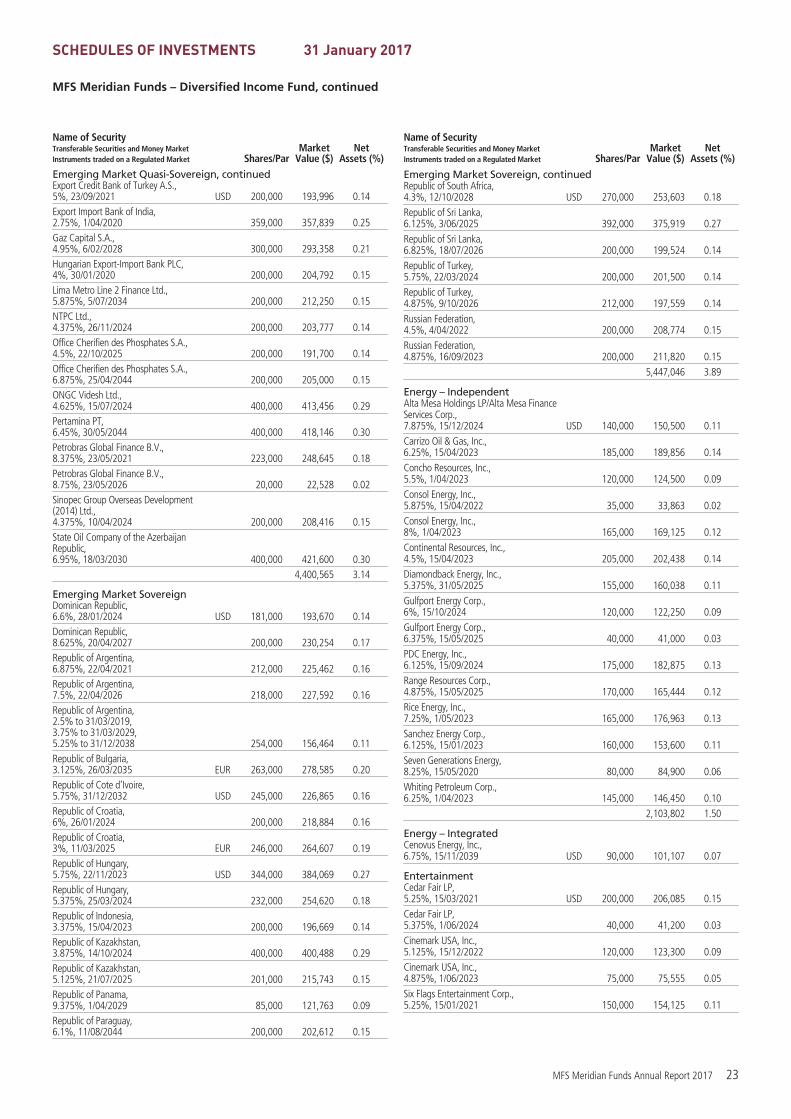
SCHEDULES OF INVESTMENTS 31 January 2017
MFS Meridian Funds – Diversified Income Fund, continued
Name of SecurityTransferable Securities and Money MarketInstruments traded on a Regulated Market Shares/Par
MarketValue ($)
NetAssets (%)
Emerging Market Quasi-Sovereign, continuedExport Credit Bank of Turkey A.S.,5%, 23/09/2021 USD 200,000 193,996 0.14Export Import Bank of India,2.75%, 1/04/2020 359,000 357,839 0.25Gaz Capital S.A.,4.95%, 6/02/2028 300,000 293,358 0.21Hungarian Export-Import Bank PLC,4%, 30/01/2020 200,000 204,792 0.15Lima Metro Line 2 Finance Ltd.,5.875%, 5/07/2034 200,000 212,250 0.15NTPC Ltd.,4.375%, 26/11/2024 200,000 203,777 0.14Office Cherifien des Phosphates S.A.,4.5%, 22/10/2025 200,000 191,700 0.14Office Cherifien des Phosphates S.A.,6.875%, 25/04/2044 200,000 205,000 0.15ONGC Videsh Ltd.,4.625%, 15/07/2024 400,000 413,456 0.29Pertamina PT,6.45%, 30/05/2044 400,000 418,146 0.30Petrobras Global Finance B.V.,8.375%, 23/05/2021 223,000 248,645 0.18Petrobras Global Finance B.V.,8.75%, 23/05/2026 20,000 22,528 0.02Sinopec Group Overseas Development(2014) Ltd.,4.375%, 10/04/2024 200,000 208,416 0.15State Oil Company of the AzerbaijanRepublic,6.95%, 18/03/2030 400,000 421,600 0.30
4,400,565 3.14
Emerging Market SovereignDominican Republic,6.6%, 28/01/2024 USD 181,000 193,670 0.14Dominican Republic,8.625%, 20/04/2027 200,000 230,254 0.17Republic of Argentina,6.875%, 22/04/2021 212,000 225,462 0.16Republic of Argentina,7.5%, 22/04/2026 218,000 227,592 0.16Republic of Argentina,2.5% to 31/03/2019,3.75% to 31/03/2029,5.25% to 31/12/2038 254,000 156,464 0.11Republic of Bulgaria,3.125%, 26/03/2035 EUR 263,000 278,585 0.20Republic of Cote d’Ivoire,5.75%, 31/12/2032 USD 245,000 226,865 0.16Republic of Croatia,6%, 26/01/2024 200,000 218,884 0.16Republic of Croatia,3%, 11/03/2025 EUR 246,000 264,607 0.19Republic of Hungary,5.75%, 22/11/2023 USD 344,000 384,069 0.27Republic of Hungary,5.375%, 25/03/2024 232,000 254,620 0.18Republic of Indonesia,3.375%, 15/04/2023 200,000 196,669 0.14Republic of Kazakhstan,3.875%, 14/10/2024 400,000 400,488 0.29Republic of Kazakhstan,5.125%, 21/07/2025 201,000 215,743 0.15Republic of Panama,9.375%, 1/04/2029 85,000 121,763 0.09Republic of Paraguay,6.1%, 11/08/2044 200,000 202,612 0.15
Name of SecurityTransferable Securities and Money MarketInstruments traded on a Regulated Market Shares/Par
MarketValue ($)
NetAssets (%)
Emerging Market Sovereign, continuedRepublic of South Africa,4.3%, 12/10/2028 USD 270,000 253,603 0.18Republic of Sri Lanka,6.125%, 3/06/2025 392,000 375,919 0.27Republic of Sri Lanka,6.825%, 18/07/2026 200,000 199,524 0.14Republic of Turkey,5.75%, 22/03/2024 200,000 201,500 0.14Republic of Turkey,4.875%, 9/10/2026 212,000 197,559 0.14Russian Federation,4.5%, 4/04/2022 200,000 208,774 0.15Russian Federation,4.875%, 16/09/2023 200,000 211,820 0.15
5,447,046 3.89
Energy – IndependentAlta Mesa Holdings LP/Alta Mesa FinanceServices Corp.,7.875%, 15/12/2024 USD 140,000 150,500 0.11Carrizo Oil & Gas, Inc.,6.25%, 15/04/2023 185,000 189,856 0.14Concho Resources, Inc.,5.5%, 1/04/2023 120,000 124,500 0.09Consol Energy, Inc.,5.875%, 15/04/2022 35,000 33,863 0.02Consol Energy, Inc.,8%, 1/04/2023 165,000 169,125 0.12Continental Resources, Inc.,4.5%, 15/04/2023 205,000 202,438 0.14Diamondback Energy, Inc.,5.375%, 31/05/2025 155,000 160,038 0.11Gulfport Energy Corp.,6%, 15/10/2024 120,000 122,250 0.09Gulfport Energy Corp.,6.375%, 15/05/2025 40,000 41,000 0.03PDC Energy, Inc.,6.125%, 15/09/2024 175,000 182,875 0.13Range Resources Corp.,4.875%, 15/05/2025 170,000 165,444 0.12Rice Energy, Inc.,7.25%, 1/05/2023 165,000 176,963 0.13Sanchez Energy Corp.,6.125%, 15/01/2023 160,000 153,600 0.11Seven Generations Energy,8.25%, 15/05/2020 80,000 84,900 0.06Whiting Petroleum Corp.,6.25%, 1/04/2023 145,000 146,450 0.10
2,103,802 1.50
Energy – IntegratedCenovus Energy, Inc.,6.75%, 15/11/2039 USD 90,000 101,107 0.07
EntertainmentCedar Fair LP,5.25%, 15/03/2021 USD 200,000 206,085 0.15Cedar Fair LP,5.375%, 1/06/2024 40,000 41,200 0.03Cinemark USA, Inc.,5.125%, 15/12/2022 120,000 123,300 0.09Cinemark USA, Inc.,4.875%, 1/06/2023 75,000 75,555 0.05Six Flags Entertainment Corp.,5.25%, 15/01/2021 150,000 154,125 0.11
MFS Meridian Funds Annual Report 2017 23

SCHEDULES OF INVESTMENTS 31 January 2017
MFS Meridian Funds – Diversified Income Fund, continued
Name of SecurityTransferable Securities and Money MarketInstruments traded on a Regulated Market Shares/Par
MarketValue ($)
NetAssets (%)
Entertainment, continuedSix Flags Entertainment Corp.,4.875%, 31/07/2024 USD 90,000 89,325 0.06
689,590 0.49
Financial InstitutionsAircastle Ltd.,5.125%, 15/03/2021 USD 100,000 105,125 0.07Aircastle Ltd.,5.5%, 15/02/2022 210,000 220,479 0.16CIT Group, Inc.,5.25%, 15/03/2018 85,000 87,848 0.06CIT Group, Inc.,6.625%, 1/04/2018 100,000 105,050 0.07CIT Group, Inc.,5.5%, 15/02/2019 140,000 147,291 0.11Credit Acceptance Corp.,7.375%, 15/03/2023 150,000 153,909 0.11Nationstar Mortgage LLC/Capital Corp.,7.875%, 1/10/2020 225,000 234,000 0.17Nationstar Mortgage LLC/Capital Corp.,6.5%, 1/07/2021 60,000 61,125 0.04Navient Corp.,8%, 25/03/2020 140,000 150,500 0.11Navient Corp.,7.25%, 25/01/2022 200,000 205,750 0.15Navient Corp.,7.25%, 25/09/2023 65,000 65,488 0.05Navient Corp.,6.125%, 25/03/2024 70,000 66,238 0.05Park Aerospace Holdings Ltd.,5.5%, 15/02/2024 110,000 112,970 0.08
1,715,773 1.23
Food & BeveragesAramark Services, Inc.,4.75%, 1/06/2026 USD 95,000 94,620 0.07Central American Bottling Corp.,5.75%, 31/01/2027 300,000 302,160 0.22Corporacion Lindley S.A.,6.75%, 23/11/2021 110,000 123,200 0.09JBS USA LLC/JBS USA Finance, Inc.,5.875%, 15/07/2024 190,000 196,175 0.14Lamb Weston Holdings, Inc.,4.625%, 1/11/2024 70,000 70,175 0.05Lamb Weston Holdings, Inc.,4.875%, 1/11/2026 30,000 30,038 0.02Minerva Luxembourg S.A.,6.5%, 20/09/2026 230,000 228,563 0.16Pinnacle Foods Finance LLC/Pinnacle FoodsFinance Corp.,5.875%, 15/01/2024 130,000 137,450 0.10Sun Merger Sub, Inc.,5.875%, 1/08/2021 135,000 140,928 0.10U.S. Foods Holding Corp.,5.875%, 15/06/2024 160,000 167,200 0.12
1,490,509 1.07
Forest & Paper ProductsAppvion, Inc.,9%, 1/06/2020 USD 55,000 30,525 0.02
Gaming & LodgingCCM Merger, Inc.,9.125%, 1/05/2019 USD 105,000 108,694 0.08GLP Capital LP/GLP Financing II, Inc.,5.375%, 1/11/2023 160,000 171,600 0.12
Name of SecurityTransferable Securities and Money MarketInstruments traded on a Regulated Market Shares/Par
MarketValue ($)
NetAssets (%)
Gaming & Lodging, continuedGLP Capital LP/GLP Financing II, Inc.,5.375%, 15/04/2026 USD 20,000 20,850 0.02Greektown Holdings LLC,8.875%, 15/03/2019 175,000 183,313 0.13Hilton Worldwide Finance LLC/HiltonWorldwide Finance Corp.,5.625%, 15/10/2021 20,000 20,622 0.01Isle of Capri Casinos, Inc.,5.875%, 15/03/2021 175,000 180,915 0.13MGM Resorts International,6.625%, 15/12/2021 140,000 156,100 0.11MGM Resorts International,6%, 15/03/2023 90,000 96,750 0.07Ryman Hospitality Properties, Inc., REIT,5%, 15/04/2021 160,000 163,200 0.12Ryman Hospitality Properties, Inc., REIT,5%, 15/04/2023 60,000 60,600 0.04
1,162,644 0.83
IndustrialHoward Hughes Corp.,6.875%, 1/10/2021 USD 160,000 168,600 0.12
Insurance – HealthCentene Corp.,5.625%, 15/02/2021 USD 85,000 89,233 0.06Centene Corp.,6.125%, 15/02/2024 105,000 111,563 0.08
200,796 0.14
Local AuthoritiesBuenos Aires Province,7.5%, 1/06/2027 USD 250,000 254,375 0.18
Machinery & ToolsAshtead Capital, Inc.,5.625%, 1/10/2024 USD 200,000 210,000 0.15CNH Industrial Capital LLC,4.375%, 6/11/2020 180,000 186,525 0.13CNH Industrial N.V.,4.5%, 15/08/2023 80,000 80,048 0.06H&E Equipment Services Co.,7%, 1/09/2022 185,000 194,946 0.14Light Tower Rentals, Inc.,8.125%, 1/08/2019 (d) 105,000 47,241 0.03
718,760 0.51
Major BanksBank of America Corp., FRN,6.1%, 29/12/2049 USD 205,000 213,713 0.15JPMorgan Chase & Co.,6% to 1/08/2023, FRN to 31/12/2049 155,000 159,263 0.12
372,976 0.27
Medical & Health Technology & ServicesAmSurg Corp.,5.625%, 15/07/2022 USD 130,000 133,900 0.10CHS/Community Health Systems, Inc.,6.875%, 1/02/2022 175,000 127,313 0.09DaVita, Inc.,5%, 1/05/2025 170,000 165,920 0.12Envision Healthcare Corp.,6.25%, 1/12/2024 60,000 63,150 0.05HCA, Inc.,4.25%, 15/10/2019 240,000 248,400 0.18HCA, Inc.,7.5%, 15/02/2022 220,000 250,250 0.18HCA, Inc.,5.875%, 15/03/2022 65,000 70,606 0.05
24 MFS Meridian Funds Annual Report 2017

SCHEDULES OF INVESTMENTS 31 January 2017
MFS Meridian Funds – Diversified Income Fund, continued
Name of SecurityTransferable Securities and Money MarketInstruments traded on a Regulated Market Shares/Par
MarketValue ($)
NetAssets (%)
Medical & Health Technology & Services, continuedHCA, Inc.,5%, 15/03/2024 USD 45,000 46,856 0.03HCA, Inc.,5.375%, 1/02/2025 170,000 173,400 0.12HCA, Inc.,5.875%, 15/02/2026 80,000 83,200 0.06HealthSouth Corp.,5.125%, 15/03/2023 105,000 104,475 0.07HealthSouth Corp.,5.75%, 1/11/2024 155,000 157,519 0.11LifePoint Health, Inc.,5.375%, 1/05/2024 115,000 110,113 0.08MEDNAX, Inc.,5.25%, 1/12/2023 125,000 129,063 0.09Quintiles IMS Holdings, Inc.,5%, 15/10/2026 200,000 201,332 0.14Quorum Health Corp.,11.625%, 15/04/2023 145,000 136,300 0.10Tenet Healthcare Corp.,8%, 1/08/2020 245,000 246,531 0.18Tenet Healthcare Corp.,8.125%, 1/04/2022 55,000 55,550 0.04Tenet Healthcare Corp.,6.75%, 15/06/2023 150,000 141,750 0.10Universal Health Services, Inc.,7.625%, 15/08/2020 125,000 124,063 0.09
2,769,691 1.98
Medical EquipmentHologic, Inc.,5.25%, 15/07/2022 USD 135,000 140,738 0.10Teleflex, Inc.,5.25%, 15/06/2024 250,000 257,500 0.19Teleflex, Inc.,4.875%, 1/06/2026 75,000 74,625 0.05
472,863 0.34
Metals & MiningCommercial Metals Co.,4.875%, 15/05/2023 USD 175,000 178,500 0.13First Quantum Minerals Ltd.,7%, 15/02/2021 60,000 61,500 0.04Freeport-McMoRan, Inc.,3.875%, 15/03/2023 140,000 129,150 0.09Freeport-McMoRan, Inc.,6.5%, 15/11/2020 25,000 25,625 0.02Freeport-McMoRan, Inc.,6.875%, 15/02/2023 40,000 41,700 0.03Freeport-McMoRan, Inc.,6.875%, 15/02/2023 110,000 114,675 0.08Freeport-McMoRan, Inc.,5.45%, 15/03/2043 65,000 55,900 0.04GrafTech International Co.,6.375%, 15/11/2020 145,000 119,263 0.08Kaiser Aluminum Corp.,5.875%, 15/05/2024 120,000 125,700 0.09Kinross Gold Corp.,5.125%, 1/09/2021 75,000 78,000 0.06Kinross Gold Corp.,5.95%, 15/03/2024 80,000 83,940 0.06Lundin Mining Corp.,7.5%, 1/11/2020 95,000 100,740 0.07Lundin Mining Corp.,7.875%, 1/11/2022 35,000 38,150 0.03Steel Dynamics, Inc.,5.25%, 15/04/2023 145,000 150,981 0.11
Name of SecurityTransferable Securities and Money MarketInstruments traded on a Regulated Market Shares/Par
MarketValue ($)
NetAssets (%)
Metals & Mining, continuedSuncoke Energy Partners LP/Suncoke EnergyPartners Finance Corp.,7.375%, 1/02/2020 USD 95,000 94,763 0.07TMS International Corp.,7.625%, 15/10/2021 115,000 114,713 0.08
1,513,300 1.08
MidstreamBlue Racer Midstream LLC/Blue RacerFinance Corp.,6.125%, 15/11/2022 USD 195,000 199,875 0.14Crestwood Midstream Partners LP,6%, 15/12/2020 100,000 103,000 0.07Crestwood Midstream Partners LP,6.125%, 1/03/2022 35,000 36,190 0.03Energy Transfer Equity LP,7.5%, 15/10/2020 190,000 213,275 0.15Ferrellgas LP/Ferrellgas Finance Corp.,6.75%, 15/01/2022 70,000 70,350 0.05Kinder Morgan (Delaware), Inc.,7.75%, 15/01/2032 170,000 212,212 0.15ONEOK, Inc.,7.5%, 1/09/2023 80,000 93,000 0.07Sabine Pass Liquefaction LLC,5.625%, 1/02/2021 100,000 108,000 0.08Sabine Pass Liquefaction LLC,5.625%, 15/04/2023 200,000 217,000 0.16Sabine Pass Liquefaction LLC,5.625%, 1/03/2025 170,000 184,663 0.13Targa Resources Partners LP/TargaResources Finance Corp.,5.25%, 1/05/2023 145,000 148,625 0.11Targa Resources Partners LP/TargaResources Finance Corp.,5.375%, 1/02/2027 220,000 227,975 0.16Williams Cos., Inc.,4.55%, 24/06/2024 165,000 167,063 0.12
1,981,228 1.42
Mortgage-BackedFannie Mae,5.286%, 1/06/2018 USD 83,069 85,820 0.06Fannie Mae,4.26%, 1/12/2019 44,644 47,237 0.03Fannie Mae,4.88%, 1/03/2020 33,771 35,348 0.03Fannie Mae,3.87%, 1/07/2022 37,626 39,927 0.03Fannie Mae,2.152%, 25/01/2023 66,000 64,830 0.05Fannie Mae,3.65%, 1/09/2023 33,279 35,212 0.03Fannie Mae,3.78%, 1/10/2023 28,707 30,298 0.02Fannie Mae,3.92%, 1/10/2023 40,000 42,695 0.03Fannie Mae,3.59%, 1/09/2026 14,507 15,168 0.01Fannie Mae,3%, 1/04/2030 – 1/11/2046 1,277,344 1,294,206 0.91Fannie Mae,5.5%, 1/08/2037 – 1/12/2038 577,936 646,516 0.47Fannie Mae,4.5%, 1/01/2040 – 1/02/2046 1,105,714 1,190,844 0.86Fannie Mae,4%, 1/09/2040 – 1/02/2045 2,455,227 2,585,519 1.86
MFS Meridian Funds Annual Report 2017 25

SCHEDULES OF INVESTMENTS 31 January 2017
MFS Meridian Funds – Diversified Income Fund, continued
Name of SecurityTransferable Securities and Money MarketInstruments traded on a Regulated Market Shares/Par
MarketValue ($)
NetAssets (%)
Mortgage-Backed, continuedFannie Mae,5%, 1/10/2040 – 1/03/2042 USD 470,571 515,147 0.37Fannie Mae,3.5%, 1/07/2043 – 1/10/2046 1,768,296 1,811,651 1.31Fannie Mae, FRN,1.121%, 25/05/2018 44,376 44,380 0.03Fannie Mae, TBA,3%, 1/02/2032 325,000 333,430 0.24Freddie Mac,3.154%, 25/02/2018 46,287 46,894 0.03Freddie Mac,2.699%, 25/05/2018 641,125 649,387 0.46Freddie Mac,2.412%, 25/08/2018 147,601 149,213 0.11Freddie Mac,2.13%, 25/01/2019 99,129 99,995 0.07Freddie Mac,4.251%, 25/01/2020 150,000 159,599 0.11Freddie Mac,3.808%, 25/08/2020 49,000 51,829 0.04Freddie Mac,3.034%, 25/10/2020 300,000 310,480 0.22Freddie Mac,2.991%, 25/09/2021 100,000 103,397 0.07Freddie Mac,2.791%, 25/01/2022 112,000 114,759 0.08Freddie Mac,2.716%, 25/06/2022 82,272 83,953 0.06Freddie Mac,3.3%, 25/04/2023 – 25/10/2026 136,000 140,576 0.10Freddie Mac,3.06%, 25/07/2023 70,000 72,226 0.05Freddie Mac,3.531%, 25/07/2023 50,000 52,965 0.04Freddie Mac,2.454%, 25/08/2023 159,000 158,208 0.11Freddie Mac,2.67%, 25/12/2024 77,000 76,743 0.06Freddie Mac,2.811%, 25/01/2025 103,000 103,315 0.07Freddie Mac,3.329%, 25/05/2025 180,000 187,104 0.13Freddie Mac,3.01%, 25/07/2025 45,000 45,678 0.03Freddie Mac,2.745%, 25/01/2026 150,000 150,464 0.11Freddie Mac,2.673%, 25/03/2026 160,000 157,306 0.11Freddie Mac,4.5%, 1/07/2040 – 1/05/2042 195,147 210,174 0.14Freddie Mac,5%, 1/07/2041 20,925 23,119 0.02Freddie Mac,3%, 1/03/2043 – 1/11/2046 1,031,749 1,023,043 0.73Freddie Mac,4%, 1/04/2044 79,021 83,000 0.06Freddie Mac,3.5%, 1/09/2045 – 1/01/2047 1,250,645 1,278,352 0.91Ginnie Mae,4.5%, 20/07/2041 – 20/09/2041 324,380 351,162 0.25Ginnie Mae,3%, 20/07/2043 99,102 100,367 0.07Ginnie Mae,3.5%, 20/07/2043 – 20/05/2046 965,821 1,002,239 0.71
15,803,775 11.29
Name of SecurityTransferable Securities and Money MarketInstruments traded on a Regulated Market Shares/Par
MarketValue ($)
NetAssets (%)
Natural Gas – DistributionGNL Quintero S.A.,4.634%, 31/07/2029 USD 410,000 411,394 0.29
Network & TelecomCenturylink, Inc.,6.45%, 15/06/2021 USD 100,000 106,250 0.08Centurylink, Inc.,7.65%, 15/03/2042 110,000 100,031 0.07Empresa Nacional de TelecomunicacionesS.A.,4.75%, 1/08/2026 200,000 202,797 0.14Frontier Communications Corp.,6.25%, 15/09/2021 75,000 70,125 0.05Frontier Communications Corp.,7.125%, 15/01/2023 80,000 71,600 0.05Frontier Communications Corp.,9%, 15/08/2031 95,000 81,908 0.06Telecom Italia S.p.A.,5.303%, 30/05/2024 200,000 201,100 0.14Telefonica Celular del Paraguay S.A.,6.75%, 13/12/2022 400,000 413,000 0.30Zayo Group LLC/Zayo Capital, Inc.,5.75%, 15/01/2027 90,000 92,142 0.07
1,338,953 0.96
Oil ServicesBristow Group, Inc.,6.25%, 15/10/2022 USD 66,000 58,988 0.04Odebrecht Offshore Drilling Finance Ltd.,6.75%, 1/10/2023 168,240 55,099 0.04Trinidad Drilling Ltd.,6.625%, 15/02/2025 30,000 30,675 0.02Weatherford International Ltd.,8.25%, 15/06/2023 165,000 168,300 0.12
313,062 0.22
OilsCITGO Holding, Inc.,10.75%, 15/02/2020 USD 95,000 101,489 0.07CITGO Petroleum Corp.,6.25%, 15/08/2022 175,000 181,125 0.13
282,614 0.20
Other Banks & Diversified FinancialsBanco de Bogota S.A.,6.25%, 12/05/2026 USD 200,000 207,800 0.15Groupe BPCE S.A.,12.5% to 30/09/2019,FRN to 29/08/2049 100,000 122,500 0.09
330,300 0.24
PharmaceuticalsEndo Finance LLC/Endo Finco, Inc.,7.25%, 15/01/2022 USD 205,000 185,525 0.13Mallinckrodt International Finance S.A.,5.75%, 1/08/2022 145,000 134,488 0.10Mallinckrodt International Finance S.A.,5.5%, 15/04/2025 115,000 99,044 0.07Valeant Pharmaceuticals International, Inc.,7%, 1/10/2020 110,000 99,550 0.07Valeant Pharmaceuticals International, Inc.,7.5%, 15/07/2021 100,000 86,875 0.06Valeant Pharmaceuticals International, Inc.,7.25%, 15/07/2022 85,000 71,410 0.05
676,892 0.48
Precious Metals & MineralsEldorado Gold Corp.,6.125%, 15/12/2020 USD 155,000 158,488 0.12
26 MFS Meridian Funds Annual Report 2017

SCHEDULES OF INVESTMENTS 31 January 2017
MFS Meridian Funds – Diversified Income Fund, continued
Name of SecurityTransferable Securities and Money MarketInstruments traded on a Regulated Market Shares/Par
MarketValue ($)
NetAssets (%)
Precious Metals & Minerals, continuedTeck Resources Ltd.,4.5%, 15/01/2021 USD 70,000 71,225 0.05Teck Resources Ltd.,8%, 1/06/2021 50,000 55,125 0.04Teck Resources Ltd.,3.75%, 1/02/2023 45,000 43,706 0.03
328,544 0.24
Printing & PublishingNielsen Finance LLC,5%, 15/04/2022 USD 200,000 204,250 0.15Outdoor Americas Capital LLC/OutfrontMedia Capital Corp.,5.625%, 15/02/2024 140,000 146,125 0.10TEGNA, Inc.,5.125%, 15/07/2020 150,000 155,250 0.11
505,625 0.36
Real Estate – HealthcareMPT Operating Partnership LP, REIT,6.375%, 15/02/2022 USD 190,000 196,650 0.14MPT Operating Partnership LP, REIT,5.25%, 1/08/2026 145,000 142,463 0.10
339,113 0.24
Real Estate – OtherDuPont Fabros Technology LP, REIT,5.875%, 15/09/2021 USD 180,000 188,100 0.13Felcor Lodging LP, REIT,5.625%, 1/03/2023 145,000 150,075 0.11Starwood Property Trust, Inc., REIT,5%, 15/12/2021 90,000 91,463 0.07
429,638 0.31
RestaurantsKFC Holding Co./Pizza Hut HoldingsLLC/Taco Bell of America LLC,5.25%, 1/06/2026 USD 65,000 65,758 0.05McDonald’s Corp.,2.75%, 9/12/2020 15,000 15,216 0.01
80,974 0.06
RetailersCencosud S.A.,5.15%, 12/02/2025 USD 200,000 205,802 0.15Dollar Tree, Inc.,5.75%, 1/03/2023 205,000 217,095 0.15DriveTime Automotive Group, Inc./DTAcceptance Corp.,8%, 1/06/2021 95,000 93,813 0.07Hanesbrands, Inc.,4.875%, 15/05/2026 130,000 128,050 0.09Rite Aid Corp.,9.25%, 15/03/2020 15,000 15,507 0.01Rite Aid Corp.,6.75%, 15/06/2021 75,000 78,000 0.05Rite Aid Corp.,6.125%, 1/04/2023 145,000 150,981 0.11Sally Beauty Holdings, Inc.,5.625%, 1/12/2025 105,000 109,725 0.08
998,973 0.71
Specialty ChemicalsA. Schulman, Inc.,6.875%, 1/06/2023 USD 140,000 147,700 0.11Chemtura Corp.,5.75%, 15/07/2021 165,000 171,600 0.12Koppers, Inc.,6%, 15/02/2025 90,000 93,150 0.07
Name of SecurityTransferable Securities and Money MarketInstruments traded on a Regulated Market Shares/Par
MarketValue ($)
NetAssets (%)
Specialty Chemicals, continuedUnivar USA, Inc.,6.75%, 15/07/2023 USD 195,000 202,800 0.14
615,250 0.44
Specialty StoresArgos Merger Sub, Inc.,7.125%, 15/03/2023 USD 145,000 142,463 0.10Group 1 Automotive, Inc.,5%, 1/06/2022 195,000 197,438 0.14Michaels Stores, Inc.,5.875%, 15/12/2020 115,000 118,163 0.09
458,064 0.33
SupermarketsAlbertsons Cos. LLC/Safeway, Inc.,6.625%, 15/06/2024 USD 175,000 182,385 0.13
Telecommunications – WirelessAltice Luxembourg S.A.,7.75%, 15/05/2022 USD 200,000 212,250 0.15Comcel Trust,6.875%, 6/02/2024 276,000 289,110 0.21Digicel Group Ltd.,7.125%, 1/04/2022 200,000 159,912 0.12Millicom International Cellular S.A.,6.625%, 15/10/2021 200,000 209,000 0.15Sprint Capital Corp.,6.875%, 15/11/2028 100,000 103,000 0.07Sprint Corp.,7.125%, 15/06/2024 305,000 318,725 0.23Sprint Nextel Corp.,9%, 15/11/2018 100,000 109,500 0.08Sprint Nextel Corp.,6%, 15/11/2022 115,000 116,725 0.08T-Mobile USA, Inc.,6.5%, 15/01/2024 130,000 140,088 0.10T-Mobile USA, Inc.,6.25%, 1/04/2021 220,000 227,964 0.16T-Mobile USA, Inc.,6.5%, 15/01/2026 145,000 159,319 0.11
2,045,593 1.46
Telephone ServicesLevel 3 Financing, Inc.,5.375%, 15/01/2024 USD 70,000 70,788 0.05Level 3 Financing, Inc.,5.375%, 1/05/2025 150,000 153,095 0.11
223,883 0.16
Transportation – ServicesNavios Maritime Acquisition Corp.,8.125%, 15/11/2021 USD 65,000 58,988 0.04Navios Maritime Holding, Inc.,7.375%, 15/01/2022 95,000 65,134 0.05Navios South American Logistics,Inc./Navios Logistics Finance (U.S.), Inc.,7.25%, 1/05/2022 35,000 32,331 0.02Syncreon Group BV/Syncre,8.625%, 1/11/2021 200,000 147,000 0.11
303,453 0.22
U.S. Government Agencies and EquivalentsAID-Ukraine,1.847%, 29/05/2020 USD 200,000 199,498 0.14Fannie Mae,1.75%, 26/11/2019 250,000 251,814 0.18Fannie Mae,1.625%, 21/01/2020 850,000 852,477 0.61
MFS Meridian Funds Annual Report 2017 27

SCHEDULES OF INVESTMENTS 31 January 2017
MFS Meridian Funds – Diversified Income Fund, continued
Name of SecurityTransferable Securities and Money MarketInstruments traded on a Regulated Market Shares/Par
MarketValue ($)
NetAssets (%)
U.S. Government Agencies and Equivalents, continuedPrivate Export Funding Corp.,2.3%, 15/09/2020 USD 200,000 202,851 0.15
1,506,640 1.08
U.S. Treasury ObligationsU.S. Treasury Bonds,4.5%, 15/02/2036 USD 303,000 382,845 0.27U.S. Treasury Bonds,4.375%, 15/02/2038 36,000 44,731 0.03U.S. Treasury Bonds,2.875%, 15/05/2043 1,461,200 1,415,139 1.01U.S. Treasury Bonds,2.5%, 15/02/2045 927,000 827,746 0.59U.S. Treasury Notes,1%, 30/06/2019 958,000 950,328 0.68U.S. Treasury Notes,1.625%, 30/06/2019 2,831,000 2,849,135 2.04U.S. Treasury Notes,2.625%, 15/08/2020 1,487,000 1,537,826 1.10U.S. Treasury Notes,2.5%, 15/08/2023 3,755,000 3,823,206 2.73U.S. Treasury Notes,2.5%, 15/05/2024 786,000 797,943 0.57U.S. Treasury Notes,2%, 15/02/2025 419,000 407,788 0.29U.S. Treasury Notes,2%, 15/11/2026 87,000 83,605 0.06
13,120,292 9.37
Utilities – Electric PowerCalpine Corp.,5.5%, 1/02/2024 USD 155,000 151,125 0.11Calpine Corp.,5.75%, 15/01/2025 125,000 122,188 0.09Covanta Holding Corp.,7.25%, 1/12/2020 100,000 102,950 0.07Covanta Holding Corp.,5.875%, 1/03/2024 180,000 179,100 0.13Dynegy, Inc.,7.375%, 1/11/2022 50,000 49,375 0.04Dynegy, Inc.,8%, 15/01/2025 40,000 38,400 0.03Enel Americas S.A.,4%, 25/10/2026 18,000 17,554 0.01Greenko Dutch B.V.,8%, 1/08/2019 200,000 212,250 0.15NextEra Energy Capital Holdings, Inc.,2.056%, 1/09/2017 59,000 59,221 0.04
Name of SecurityTransferable Securities and Money MarketInstruments traded on a Regulated Market Shares/Par
MarketValue ($)
NetAssets (%)
Utilities – Electric Power, continuedNRG Energy, Inc.,6.625%, 15/03/2023 USD 25,000 25,750 0.02NRG Energy, Inc.,7.25%, 15/05/2026 125,000 130,781 0.09Transelec S.A.,4.25%, 14/01/2025 200,000 202,846 0.14
1,291,540 0.92
Total Bonds(Identified Cost, $84,645,846) 83,623,049 59.73
PREFERRED STOCKS
Other Banks & Diversified FinancialsItau Unibanco Holding S.A.(Identified Cost, $62,901) 6,300 74,454 0.05
CONVERTIBLE PREFERRED STOCKS
Utilities – Electric PowerExelon Corp.,6.5%(Identified Cost, $541,966) 12,276 608,521 0.43
SHORT-TERM OBLIGATIONS (y)General Electric Co.,0.58%, 1/02/2017, at AmortizedCost and Value USD 697,000 697,000 0.50
Total Transferable Securities andMoney Market Instruments Tradedon a Regulated Market(Identified Cost, $137,330,329) 138,635,804 99.02
Issuer/Expiration Month/Strike PriceNumber
of ContractsMarket
Value ($)Net
Assets (%)
PUT OPTIONS PURCHASEDiShares U.S. Real Estate ETF –March 2017 @ $71 190 5,510 0.00iShares U.S. Real Estate ETF –March 2017 @ $69 190 3,230 0.00iShares U.S. Real Estate ETF –June 2017 @ $67 176 11,440 0.01
Total Put Options Purchased(Premiums paid, $120,290) 20,180 0.01
Total Investments(Identified Cost, $137,450,619) (k) 138,655,984 99.03
OTHER ASSETS, LESS LIABILITIES 1,357,927 0.97
NET ASSETS 140,013,911 100.00
See Schedules of Investments Footnotes and Notes to Financial Statements
28 MFS Meridian Funds Annual Report 2017

SCHEDULES OF INVESTMENTS 31 January 2017
MFS Meridian Funds – Emerging Markets Debt Fund(Expressed in U.S. Dollars)
Name of SecurityTransferable Securities and Money MarketInstruments traded on a Regulated Market Shares/Par
MarketValue ($)
NetAssets (%)
BONDS
AngolaRepublic of Angola,9.5%, 12/11/2025 USD 5,632,000 5,376,532 0.19
ArgentinaAeropuertos Argentina 2000 S.A.,6.875%, 1/02/2027 USD 4,641,000 4,692,051 0.16Buenos Aires Province,9.125%, 16/03/2024 4,015,000 4,376,350 0.15Buenos Aires Province,7.875%, 15/06/2027 2,392,000 2,382,910 0.08Genneia S.A.,8.75%, 20/01/2022 4,752,000 4,918,320 0.17Province of Cordoba,7.125%, 10/06/2021 5,429,000 5,564,725 0.20Province of Santa Fe,6.9%, 1/11/2027 6,509,000 6,136,815 0.22Republic of Argentina,6.25%, 22/04/2019 6,737,000 7,117,641 0.25Republic of Argentina,8.75%, 2/06/2017 17,624,000 17,976,480 0.63Republic of Argentina,6.875%, 22/04/2021 10,519,000 11,186,957 0.39Republic of Argentina,5.625%, 26/01/2022 14,981,000 15,010,962 0.53Republic of Argentina,7.5%, 22/04/2026 2,340,000 2,442,960 0.09Republic of Argentina,5%, 15/01/2027 EUR 2,867,000 2,823,810 0.10Republic of Argentina,6.875%, 26/01/2027 USD 39,464,000 39,069,360 1.37Republic of Argentina,7.125%, 6/07/2036 4,493,000 4,227,913 0.15Republic of Argentina,2.5% to 31/03/2019,3.75% to 31/03/2029,5.25% to 31/12/2038 45,006,000 27,723,696 0.97YPF S.A.,8.5%, 23/03/2021 3,197,000 3,464,749 0.12
159,115,699 5.58
AzerbaijanSouthern Gas Corridor CJSC,6.875%, 24/03/2026 USD 14,574,000 15,748,956 0.55State Oil Company of the AzerbaijanRepublic,4.75%, 13/03/2023 3,100,000 2,992,585 0.11State Oil Company of the AzerbaijanRepublic,6.95%, 18/03/2030 17,727,000 18,684,258 0.65
37,425,799 1.31
BarbadosColumbus International, Inc.,7.375%, 30/03/2021 USD 7,001,000 7,438,563 0.26
BermudaGovernment of Bermuda,4.854%, 6/02/2024 USD 3,440,000 3,593,080 0.13Government of Bermuda,3.717%, 25/01/2027 3,031,000 2,884,997 0.10
6,478,077 0.23
BrazilBanco do Brasil S.A. (Cayman Branch),6.25% to 15/04/2024,FRN to 29/10/2049 USD 9,124,000 7,379,035 0.26ESAL GmbH,6.25%, 5/02/2023 5,930,000 5,916,954 0.21
Name of SecurityTransferable Securities and Money MarketInstruments traded on a Regulated Market Shares/Par
MarketValue ($)
NetAssets (%)
Brazil, continuedFederative Republic of Brazil,5%, 27/01/2045 USD 6,193,000 5,295,015 0.18Federative Republic of Brazil,6%, 15/08/2022 BRL 12,891,821 4,117,399 0.14Federative Republic of Brazil,6%, 7/04/2026 USD 15,485,000 16,592,178 0.58Federative Republic of Brazil,7.125%, 20/01/2037 13,425,000 14,733,938 0.52Federative Republic of Brazil,5.625%, 7/01/2041 23,050,000 21,551,750 0.75JBS Investments GmbH,7.25%, 3/04/2024 842,000 883,048 0.03Marfrig Holdings (Europe) B.V.,8%, 8/06/2023 4,025,000 4,241,344 0.15Nota do Tesouro Nacional,6%, 15/05/2023 BRL 15,116,083 4,846,339 0.17Nota do Tesouro Nacional,6%, 15/08/2026 21,860,044 7,070,128 0.25Odebrecht Offshore Drilling Finance Ltd.,6.625%, 1/10/2023 USD 3,980,804 1,303,713 0.05Odebrecht Offshore Drilling Finance Ltd.,6.75%, 1/10/2023 4,073,090 1,333,937 0.05Petrobras Global Finance B.V.,8.375%, 23/05/2021 20,193,000 22,515,195 0.79Petrobras Global Finance B.V.,4.375%, 20/05/2023 21,738,000 20,053,305 0.70Petrobras Global Finance B.V.,7.375%, 17/01/2027 6,848,000 7,109,594 0.25Petrobras International Finance Co.,6.875%, 20/01/2040 3,356,000 2,988,602 0.10Raizen Fuels Finance S.A.,5.3%, 20/01/2027 4,485,000 4,476,030 0.16TerraForm Global Operating LLC,9.75%, 15/08/2022 1,515,000 1,670,288 0.06Ultrapetrol (Bahamas) Ltd.,8.875%, 15/06/2021 (d) 3,396,000 594,300 0.02Votorantim Cimentos S.A.,7.25%, 5/04/2041 3,911,000 3,812,834 0.13
158,484,926 5.55
BulgariaRepublic of Bulgaria,3.125%, 26/03/2035 EUR 3,830,000 4,056,963 0.14
CanadaFirst Quantum Minerals Ltd.,7.25%, 15/05/2022 USD 3,613,000 3,685,260 0.13
ChileCencosud S.A.,4.875%, 20/01/2023 USD 5,884,000 6,085,637 0.21Cencosud S.A.,5.15%, 12/02/2025 5,262,000 5,414,653 0.19E.CL S.A.,4.5%, 29/01/2025 6,767,000 6,767,831 0.24Empresa de Transporte de PasajerosMetro S.A.,5%, 25/01/2047 5,877,000 5,869,654 0.21Empresa Nacional deTelecomunicaciones S.A.,4.75%, 1/08/2026 9,076,000 9,202,919 0.32Empresa Nacional del Petroleo,4.75%, 6/12/2021 1,055,000 1,100,510 0.04Empresa Nacional del Petroleo,4.375%, 30/10/2024 6,676,000 6,760,598 0.24Empresa Nacional del Petroleo S.A.,3.75%, 5/08/2026 7,441,000 7,106,155 0.25
MFS Meridian Funds Annual Report 2017 29

SCHEDULES OF INVESTMENTS 31 January 2017
MFS Meridian Funds – Emerging Markets Debt Fund, continued
Name of SecurityTransferable Securities and Money MarketInstruments traded on a Regulated Market Shares/Par
MarketValue ($)
NetAssets (%)
Chile, continuedEnel Americas S.A.,4%, 25/10/2026 USD 5,669,000 5,528,409 0.19Engie Energia Chile S.A.,5.625%, 15/01/2021 4,221,000 4,582,137 0.16ENTEL Chile S.A.,4.875%, 30/10/2024 2,241,000 2,286,644 0.08GNL Quintero S.A.,4.634%, 31/07/2029 17,593,000 17,652,816 0.62Transelec S.A.,4.625%, 26/07/2023 5,049,000 5,258,944 0.19Transelec S.A.,4.25%, 14/01/2025 2,321,000 2,354,337 0.08Transelec S.A.,4.25%, 14/01/2025 300,000 304,309 0.01Transelec S.A.,3.875%, 12/01/2029 3,334,000 3,177,002 0.11VTR Finance B.V.,6.875%, 15/01/2024 10,394,000 10,913,700 0.38
100,366,255 3.52
ChinaCNOOC Finance (2013) Ltd.,3%, 9/05/2023 USD 4,256,000 4,125,622 0.14CNOOC Finance (2015) U.S.A. LLC,3.5%, 5/05/2025 3,738,000 3,644,785 0.13CNPC General Capital Ltd.,3.95%, 19/04/2022 4,317,000 4,465,077 0.16CNPC General Capital Ltd.,3.4%, 16/04/2023 4,234,000 4,232,179 0.15Export-Import Bank of China,3.625%, 31/07/2024 3,776,000 3,843,966 0.13Export-Import Bank of China,2.875%, 26/04/2026 5,318,000 5,014,704 0.18Sinopec Capital (2013) Ltd.,3.125%, 24/04/2023 2,855,000 2,803,838 0.10Sinopec Group Overseas Development(2012) Ltd.,3.9%, 17/05/2022 3,871,000 3,996,978 0.14Sinopec Group Overseas Development(2013) Ltd.,4.375%, 17/10/2023 2,555,000 2,691,974 0.09Sinopec Group Overseas Development(2014) Ltd.,4.375%, 10/04/2024 3,006,000 3,132,492 0.11State Grid Overseas Investment Co.,4.125%, 7/05/2024 1,432,000 1,497,495 0.05State Grid Overseas Investment Co.,4.85%, 7/05/2044 2,130,000 2,354,430 0.08
41,803,540 1.46
ColombiaBanco de Bogota S.A.,6.25%, 12/05/2026 USD 9,205,000 9,563,995 0.33Empresa de Energia de Bogota S.A.,6.125%, 10/11/2021 2,120,000 2,188,900 0.08Gruposura Finance S.A.,5.5%, 29/04/2026 3,313,000 3,458,772 0.12Republic of Colombia,6.125%, 18/01/2041 8,237,000 9,122,478 0.32Republic of Colombia,5.625%, 26/02/2044 11,085,000 11,750,100 0.41Republic of Colombia,5%, 15/06/2045 13,505,000 13,147,118 0.46
49,231,363 1.72
Name of SecurityTransferable Securities and Money MarketInstruments traded on a Regulated Market Shares/Par
MarketValue ($)
NetAssets (%)
Costa RicaBanco Nacional de Costa Rica, FRN,3.8% to 11/08/2021,FRN to 11/08/2026 USD 6,868,000 6,541,770 0.23Republic of Costa Rica,7%, 4/04/2044 2,505,000 2,410,336 0.08Republic of Costa Rica,7.158%, 12/03/2045 3,849,000 3,744,230 0.13
12,696,336 0.44
Cote d’IvoireRepublic of Cote d’Ivoire,6.375%, 3/03/2028 USD 2,956,000 2,875,952 0.10Republic of Cote d’Ivoire,5.75%, 31/12/2032 12,873,280 11,920,400 0.42
14,796,352 0.52
CroatiaHrvatska Elektroprivreda,5.875%, 23/10/2022 USD 6,621,000 6,955,202 0.24Republic of Croatia,6%, 26/01/2024 6,365,000 6,965,983 0.25Republic of Croatia,6.625%, 14/07/2020 4,274,000 4,674,346 0.16Republic of Croatia,6.375%, 24/03/2021 3,432,000 3,753,750 0.13Republic of Croatia,5.5%, 4/04/2023 3,000,000 3,190,650 0.11
25,539,931 0.89
Dominican RepublicAeropuertos Dominicanos Siglo XXI S.A.,6.75%, 30/03/2029 USD 5,918,000 6,043,758 0.21Banco de Reservas de la RepublicaDominicana,7%, 1/02/2023 9,175,000 9,191,607 0.32Dominican Republic,8.5%, 2/01/2020 2,400,000 2,532,000 0.09Dominican Republic,7.5%, 6/05/2021 5,464,000 6,010,400 0.21Dominican Republic,5.875%, 18/04/2024 4,261,000 4,370,422 0.15Dominican Republic,5.5%, 27/01/2025 4,000,000 3,971,880 0.14Dominican Republic,5.95%, 25/01/2027 9,050,000 9,050,000 0.32Dominican Republic,8.625%, 20/04/2027 7,648,000 8,804,913 0.31Dominican Republic,6.85%, 27/01/2045 2,698,000 2,652,997 0.09
52,627,977 1.84
EcuadorEmpresa Publica de Hidrocarburos delEcuador, FRN,6.627%, 24/09/2019 USD 6,568,737 6,698,141 0.23Republic of Ecuador,10.5%, 24/03/2020 1,474,000 1,610,345 0.06Republic of Ecuador,10.75%, 28/03/2022 10,510,000 11,797,475 0.41Republic of Ecuador,9.65%, 13/12/2026 4,318,000 4,555,490 0.16
24,661,451 0.86
EgyptArab Republic of Egypt,6.125%, 31/01/2022 USD 13,318,000 13,437,729 0.47
30 MFS Meridian Funds Annual Report 2017
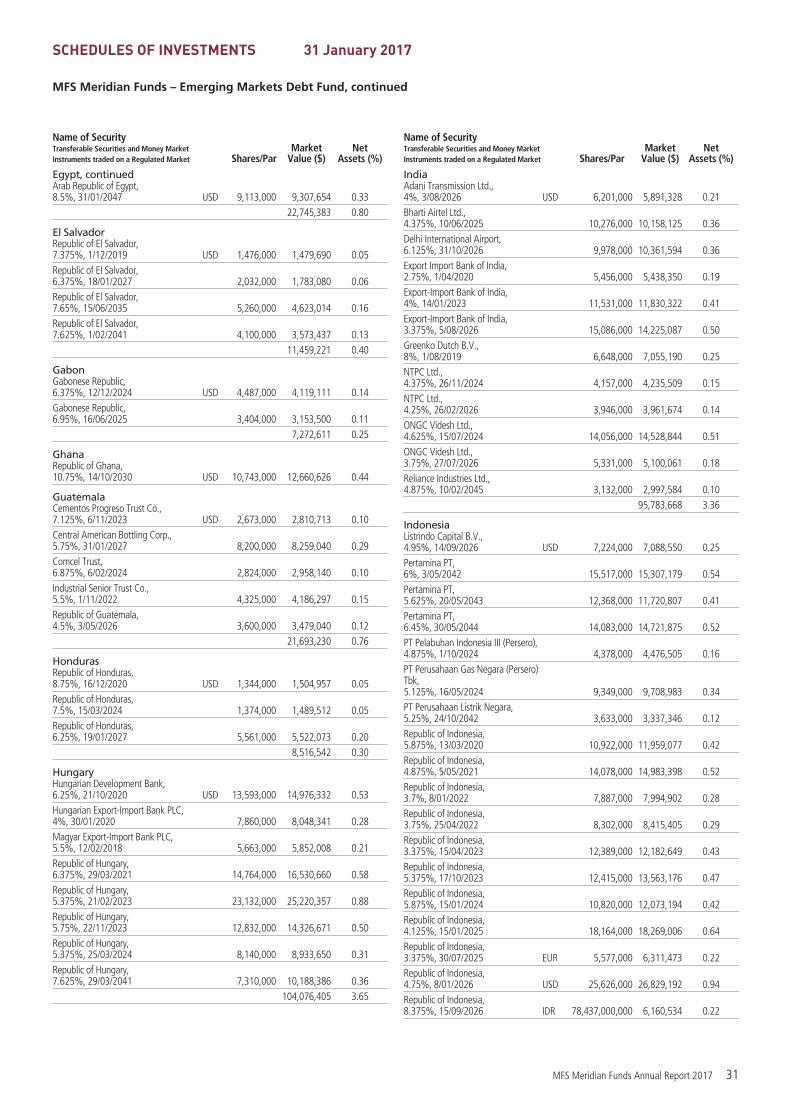
SCHEDULES OF INVESTMENTS 31 January 2017
MFS Meridian Funds – Emerging Markets Debt Fund, continued
Name of SecurityTransferable Securities and Money MarketInstruments traded on a Regulated Market Shares/Par
MarketValue ($)
NetAssets (%)
Egypt, continuedArab Republic of Egypt,8.5%, 31/01/2047 USD 9,113,000 9,307,654 0.33
22,745,383 0.80
El SalvadorRepublic of El Salvador,7.375%, 1/12/2019 USD 1,476,000 1,479,690 0.05Republic of El Salvador,6.375%, 18/01/2027 2,032,000 1,783,080 0.06Republic of El Salvador,7.65%, 15/06/2035 5,260,000 4,623,014 0.16Republic of El Salvador,7.625%, 1/02/2041 4,100,000 3,573,437 0.13
11,459,221 0.40
GabonGabonese Republic,6.375%, 12/12/2024 USD 4,487,000 4,119,111 0.14Gabonese Republic,6.95%, 16/06/2025 3,404,000 3,153,500 0.11
7,272,611 0.25
GhanaRepublic of Ghana,10.75%, 14/10/2030 USD 10,743,000 12,660,626 0.44
GuatemalaCementos Progreso Trust Co.,7.125%, 6/11/2023 USD 2,673,000 2,810,713 0.10Central American Bottling Corp.,5.75%, 31/01/2027 8,200,000 8,259,040 0.29Comcel Trust,6.875%, 6/02/2024 2,824,000 2,958,140 0.10Industrial Senior Trust Co.,5.5%, 1/11/2022 4,325,000 4,186,297 0.15Republic of Guatemala,4.5%, 3/05/2026 3,600,000 3,479,040 0.12
21,693,230 0.76
HondurasRepublic of Honduras,8.75%, 16/12/2020 USD 1,344,000 1,504,957 0.05Republic of Honduras,7.5%, 15/03/2024 1,374,000 1,489,512 0.05Republic of Honduras,6.25%, 19/01/2027 5,561,000 5,522,073 0.20
8,516,542 0.30
HungaryHungarian Development Bank,6.25%, 21/10/2020 USD 13,593,000 14,976,332 0.53Hungarian Export-Import Bank PLC,4%, 30/01/2020 7,860,000 8,048,341 0.28Magyar Export-Import Bank PLC,5.5%, 12/02/2018 5,663,000 5,852,008 0.21Republic of Hungary,6.375%, 29/03/2021 14,764,000 16,530,660 0.58Republic of Hungary,5.375%, 21/02/2023 23,132,000 25,220,357 0.88Republic of Hungary,5.75%, 22/11/2023 12,832,000 14,326,671 0.50Republic of Hungary,5.375%, 25/03/2024 8,140,000 8,933,650 0.31Republic of Hungary,7.625%, 29/03/2041 7,310,000 10,188,386 0.36
104,076,405 3.65
Name of SecurityTransferable Securities and Money MarketInstruments traded on a Regulated Market Shares/Par
MarketValue ($)
NetAssets (%)
IndiaAdani Transmission Ltd.,4%, 3/08/2026 USD 6,201,000 5,891,328 0.21Bharti Airtel Ltd.,4.375%, 10/06/2025 10,276,000 10,158,125 0.36Delhi International Airport,6.125%, 31/10/2026 9,978,000 10,361,594 0.36Export Import Bank of India,2.75%, 1/04/2020 5,456,000 5,438,350 0.19Export-Import Bank of India,4%, 14/01/2023 11,531,000 11,830,322 0.41Export-Import Bank of India,3.375%, 5/08/2026 15,086,000 14,225,087 0.50Greenko Dutch B.V.,8%, 1/08/2019 6,648,000 7,055,190 0.25NTPC Ltd.,4.375%, 26/11/2024 4,157,000 4,235,509 0.15NTPC Ltd.,4.25%, 26/02/2026 3,946,000 3,961,674 0.14ONGC Videsh Ltd.,4.625%, 15/07/2024 14,056,000 14,528,844 0.51ONGC Videsh Ltd.,3.75%, 27/07/2026 5,331,000 5,100,061 0.18Reliance Industries Ltd.,4.875%, 10/02/2045 3,132,000 2,997,584 0.10
95,783,668 3.36
IndonesiaListrindo Capital B.V.,4.95%, 14/09/2026 USD 7,224,000 7,088,550 0.25Pertamina PT,6%, 3/05/2042 15,517,000 15,307,179 0.54Pertamina PT,5.625%, 20/05/2043 12,368,000 11,720,807 0.41Pertamina PT,6.45%, 30/05/2044 14,083,000 14,721,875 0.52PT Pelabuhan Indonesia III (Persero),4.875%, 1/10/2024 4,378,000 4,476,505 0.16PT Perusahaan Gas Negara (Persero)Tbk,5.125%, 16/05/2024 9,349,000 9,708,983 0.34PT Perusahaan Listrik Negara,5.25%, 24/10/2042 3,633,000 3,337,346 0.12Republic of Indonesia,5.875%, 13/03/2020 10,922,000 11,959,077 0.42Republic of Indonesia,4.875%, 5/05/2021 14,078,000 14,983,398 0.52Republic of Indonesia,3.7%, 8/01/2022 7,887,000 7,994,902 0.28Republic of Indonesia,3.75%, 25/04/2022 8,302,000 8,415,405 0.29Republic of Indonesia,3.375%, 15/04/2023 12,389,000 12,182,649 0.43Republic of Indonesia,5.375%, 17/10/2023 12,415,000 13,563,176 0.47Republic of Indonesia,5.875%, 15/01/2024 10,820,000 12,073,194 0.42Republic of Indonesia,4.125%, 15/01/2025 18,164,000 18,269,006 0.64Republic of Indonesia,3.375%, 30/07/2025 EUR 5,577,000 6,311,473 0.22Republic of Indonesia,4.75%, 8/01/2026 USD 25,626,000 26,829,192 0.94Republic of Indonesia,8.375%, 15/09/2026 IDR 78,437,000,000 6,160,534 0.22
MFS Meridian Funds Annual Report 2017 31

SCHEDULES OF INVESTMENTS 31 January 2017
MFS Meridian Funds – Emerging Markets Debt Fund, continued
Name of SecurityTransferable Securities and Money MarketInstruments traded on a Regulated Market Shares/Par
MarketValue ($)
NetAssets (%)
Indonesia, continuedRepublic of Indonesia,4.35%, 8/01/2027 USD 15,056,000 15,286,372 0.54Republic of Indonesia,8.75%, 15/05/2031 IDR 72,114,000,000 5,678,927 0.20Republic of Indonesia,8.5%, 12/10/2035 USD 2,545,000 3,532,796 0.12Republic of Indonesia,5.25%, 17/01/2042 5,575,000 5,707,579 0.20Republic of Indonesia,4.625%, 15/04/2043 6,682,000 6,556,592 0.23Republic of Indonesia,6.75%, 15/01/2044 2,886,000 3,562,582 0.12Republic of Indonesia,5.125%, 15/01/2045 6,077,000 6,101,630 0.21
251,529,729 8.81
JamaicaDigicel Group Ltd.,8.25%, 30/09/2020 USD 7,039,000 6,238,314 0.22Digicel Group Ltd.,6%, 15/04/2021 862,000 803,643 0.03Digicel Group Ltd.,7.125%, 1/04/2022 5,314,000 4,248,862 0.15Digicel Group Ltd.,6.75%, 1/03/2023 3,170,000 2,946,119 0.10Government of Jamaica,8%, 15/03/2039 3,439,000 3,851,783 0.14Government of Jamaica,7.875%, 28/07/2045 2,673,000 2,968,286 0.10
21,057,007 0.74
JordanHikma Pharmaceuticals PLC,4.25%, 10/04/2020 USD 4,774,000 4,806,845 0.17Kingdom of Jordan,5.75%, 31/01/2027 7,462,000 7,112,331 0.25
11,919,176 0.42
KazakhstanDevelopment Bank of Kazakhstan,4.125%, 10/12/2022 USD 28,762,000 28,041,800 0.98Halyk Savings Bank Kazak,7.25%, 28/01/2021 602,000 644,260 0.02KazAgro National ManagementHolding,4.625%, 24/05/2023 6,435,000 6,104,601 0.22KazMunayGas National Co.,6.375%, 9/04/2021 3,805,000 4,145,243 0.15Republic of Kazakhstan,6.5%, 21/07/2045 14,065,000 16,491,213 0.58Tengizchevroil Finance Co.International Ltd.,4%, 15/08/2026 16,550,000 15,513,705 0.54
70,940,822 2.49
KenyaRepublic of Kenya,6.875%, 24/06/2024 USD 7,666,000 7,398,073 0.26
KuwaitEQUATE Petrochemical B.V.,4.25%, 3/11/2026 USD 7,708,000 7,573,110 0.27
MalaysiaPetronas Capital Ltd.,3.5%, 18/03/2025 USD 10,744,000 10,812,837 0.38
MexicoCEMEX S.A.B. de C.V.,7.75%, 16/04/2026 USD 3,464,000 3,849,370 0.13
Name of SecurityTransferable Securities and Money MarketInstruments traded on a Regulated Market Shares/Par
MarketValue ($)
NetAssets (%)
Mexico, continuedComision Federal de Electricidad,4.875%, 26/05/2021 USD 3,133,000 3,234,823 0.11Comision Federal de Electricidad,4.875%, 15/01/2024 2,941,000 2,958,646 0.10Controladora Mabe S.A. de C.V.,7.875%, 28/10/2019 5,233,000 5,697,429 0.20Elementia S.A. de C.V.,5.5%, 15/01/2025 6,609,000 6,377,685 0.22Empresas ICA S.A.B. de C.V.,8.9%, 4/02/2021 (d) 9,113,000 1,925,121 0.07Empresas ICA S.A.B. de C.V.,8.875%, 29/05/2024 (d) 11,855,000 2,618,473 0.09Empresas ICA S.A.B. de C.V.,8.875%, 29/05/2024 (d) 800,000 176,700 0.01Fibra Uno, REIT,6.95%, 30/01/2044 8,051,000 7,346,538 0.26Grupo Cementos de Chihuahua S.A.B.de C.V.,8.125%, 8/02/2020 7,029,000 7,310,160 0.26Grupo Posadas S.A.B. de C.V.,7.875%, 30/06/2022 5,703,000 5,724,386 0.20JB Y Co. S.A. de C.V.,3.75%, 13/05/2025 5,664,000 5,417,875 0.19Petroleos Mexicanos,4.625%, 21/09/2023 3,147,000 3,068,325 0.11Petroleos Mexicanos,6.5%, 13/03/2027 11,274,000 11,594,745 0.41Petroleos Mexicanos Co.,6.875%, 4/08/2026 3,619,000 3,831,797 0.13Petroleos Mexicanos Co.,6.75%, 21/09/2047 4,593,000 4,334,414 0.15Petroleos Mexicanos, FRN,3.043%, 18/07/2018 7,849,000 7,939,264 0.28Petroleos Mexicanos, FRN,4.606%, 11/03/2022 10,285,000 10,683,544 0.37Red de Carreteras de Occidente SAPIBde C.V.,9%, 10/06/2028 MXN 136,790,000 6,212,635 0.22Sigma Alimentos S.A. de C.V.,4.125%, 2/05/2026 USD 5,870,000 5,520,735 0.19United Mexican States,4.35%, 15/01/2047 5,031,000 4,345,778 0.15United Mexican States,3.625%, 15/03/2022 16,840,000 16,999,980 0.60United Mexican States,4%, 2/10/2023 22,014,000 22,157,091 0.78United Mexican States,4.125%, 21/01/2026 5,736,000 5,753,208 0.20
155,078,722 5.43
MongoliaTrade & Development Bank ofMongolia LLC,9.375%, 19/05/2020 USD 4,693,000 4,645,765 0.16
MoroccoOffice Cherifien des Phosphates S.A.,4.5%, 22/10/2025 USD 13,864,000 13,288,644 0.47Office Cherifien des Phosphates S.A.,6.875%, 25/04/2044 12,519,000 12,831,975 0.45
26,120,619 0.92
NigeriaAfren PLC,6.625%, 9/12/2020 (d) USD 2,665,008 533 0.00Afren PLC,10.25%, 8/04/2019 (d) 5,102,646 1,021 0.00
1,554 0.00
32 MFS Meridian Funds Annual Report 2017

SCHEDULES OF INVESTMENTS 31 January 2017
MFS Meridian Funds – Emerging Markets Debt Fund, continued
Name of SecurityTransferable Securities and Money MarketInstruments traded on a Regulated Market Shares/Par
MarketValue ($)
NetAssets (%)
PanamaAutoridad del Canal de Panama,4.95%, 29/07/2035 USD 6,666,000 7,049,295 0.25Panama Canal Railway Co.,7%, 1/11/2026 3,578,484 3,542,699 0.12Republic of Panama,3.75%, 16/03/2025 3,838,000 3,876,380 0.13Republic of Panama,8.875%, 30/09/2027 1,054,000 1,467,695 0.05Republic of Panama,3.875%, 17/03/2028 3,602,000 3,591,194 0.13Republic of Panama,9.375%, 1/04/2029 2,738,000 3,922,185 0.14Republic of Panama,6.7%, 26/01/2036 1,756,000 2,173,050 0.08
25,622,498 0.90
ParaguayRepublic of Paraguay,4.625%, 25/01/2023 USD 8,723,000 8,857,247 0.31Republic of Paraguay,5%, 15/04/2026 4,696,000 4,825,140 0.17Republic of Paraguay,6.1%, 11/08/2044 22,829,000 23,127,147 0.81Telefonica Celular del Paraguay S.A.,6.75%, 13/12/2022 9,268,000 9,569,210 0.34
46,378,744 1.63
PeruCorporacion Financiera de DesarrolloS.A.,4.75%, 15/07/2025 USD 2,797,000 2,943,003 0.10Corporacion Lindley S.A.,6.75%, 23/11/2021 2,604,000 2,916,480 0.10El Fondo Mivivienda S.A.,3.5%, 31/01/2023 2,757,000 2,736,323 0.10Gas Natural de Lima y Callao S.A.,4.375%, 1/04/2023 9,481,000 9,575,810 0.34IIRSA Norte Finance Ltd.,8.75%, 30/05/2024 1,303,518 1,486,011 0.05Inkia Energy Ltd.,8.375%, 4/04/2021 7,393,000 7,651,755 0.27Kallpa Generacion S.A.,4.875%, 24/05/2026 3,972,000 4,051,440 0.14Lima Metro Line 2 Finance Ltd.,5.875%, 5/07/2034 7,966,000 8,453,918 0.30Republic of Peru,2.75%, 30/01/2026 EUR 2,871,000 3,347,183 0.12Republic of Peru,6.35%, 12/08/2028 PEN 14,799,000 4,560,974 0.16Republic of Peru,3.75%, 1/03/2030 EUR 2,656,000 3,253,873 0.11Republic of Peru,8.75%, 21/11/2033 USD 5,476,000 8,118,170 0.28Republic of Peru,6.9%, 12/08/2037 PEN 11,278,000 3,535,751 0.12San Miguel Industrias PET S.A.,7.75%, 6/11/2020 USD 7,008,000 7,424,976 0.26Transportadora de Gas del Peru,4.25%, 30/04/2028 4,113,000 4,102,718 0.14Union Andina de Cementos S.A.A.,5.875%, 30/10/2021 9,559,000 9,870,623 0.35
84,029,008 2.94
PolandRepublic of Poland,5.125%, 21/04/2021 USD 1,563,000 1,704,326 0.06
Name of SecurityTransferable Securities and Money MarketInstruments traded on a Regulated Market Shares/Par
MarketValue ($)
NetAssets (%)
Poland, continuedRepublic of Poland,5%, 23/03/2022 USD 5,523,000 6,021,175 0.21Republic of Poland,4%, 22/01/2024 4,284,000 4,421,088 0.15Republic of Poland,3.25%, 6/04/2026 13,988,000 13,555,491 0.48
25,702,080 0.90
QatarState of Qatar,4.625%, 2/06/2046 USD 8,542,000 8,675,597 0.30
RomaniaRepublic of Romania,6.125%, 22/01/2044 USD 2,022,000 2,385,899 0.08Republic of Romania,3.875%, 29/10/2035 EUR 7,967,000 8,817,448 0.31
11,203,347 0.39
RussiaCredit Bank of Moscow PJSC,5.875%, 7/11/2021 USD 7,067,000 7,054,633 0.25Gaz Capital S.A.,4.95%, 6/02/2028 4,015,000 3,926,108 0.14Gaz Capital S.A.,7.288%, 16/08/2037 9,908,000 11,379,338 0.40Gazprom Neft,4.375%, 19/09/2022 4,550,000 4,538,079 0.16Polyus Gold International Ltd.,5.25%, 7/02/2023 5,813,000 5,813,000 0.20Russian Federation,5%, 29/04/2020 22,600,000 24,125,500 0.85Russian Federation,4.5%, 4/04/2022 29,200,000 30,481,004 1.07Russian Federation,4.875%, 16/09/2023 16,800,000 17,792,880 0.62Russian Federation,4.75%, 27/05/2026 28,600,000 29,535,792 1.03Russian Federation,5.625%, 4/04/2042 18,800,000 20,371,304 0.71Russian Federation,5.875%, 16/09/2043 5,600,000 6,286,000 0.22Vnesheconombank,6.8%, 22/11/2025 4,298,000 4,717,055 0.17
166,020,693 5.82
SerbiaRepublic of Serbia,6.75%, 1/11/2024 USD 11,443,987 11,559,571 0.40
SingaporeBPRL International Singapore Pte. Ltd.,4.375%, 18/01/2027 USD 9,455,000 9,452,409 0.33
SloveniaRepublic of Slovenia,5.85%, 10/05/2023 USD 7,446,000 8,455,692 0.30
South AfricaPetra Diamonds U.S. Treasury PLC,8.25%, 31/05/2020 USD 200,000 210,000 0.01Petra Diamonds U.S. Treasury PLC,8.25%, 31/05/2020 7,338,000 7,704,900 0.27Republic of South Africa,5.5%, 9/03/2020 4,000,000 4,262,688 0.15Republic of South Africa,4.665%, 17/01/2024 1,429,000 1,444,362 0.05Republic of South Africa,5.875%, 16/09/2025 2,078,000 2,240,167 0.08
MFS Meridian Funds Annual Report 2017 33

SCHEDULES OF INVESTMENTS 31 January 2017
MFS Meridian Funds – Emerging Markets Debt Fund, continued
Name of SecurityTransferable Securities and Money MarketInstruments traded on a Regulated Market Shares/Par
MarketValue ($)
NetAssets (%)
South Africa, continuedRepublic of South Africa,4.875%, 14/04/2026 USD 6,873,000 6,914,348 0.24Republic of South Africa,4.3%, 12/10/2028 11,348,000 10,658,836 0.37Republic of South Africa,7%, 28/02/2031 ZAR 40,504,000 2,480,215 0.09Republic of South Africa,6.25%, 31/03/2036 65,808,000 3,506,905 0.12Republic of South Africa,8.5%, 31/01/2037 58,526,000 3,939,619 0.14
43,362,040 1.52
Sri LankaRepublic of Sri Lanka,6.25%, 4/10/2020 USD 4,707,000 4,841,093 0.17Republic of Sri Lanka,6.25%, 27/07/2021 6,381,000 6,521,733 0.23Republic of Sri Lanka,5.875%, 25/07/2022 15,020,000 15,047,517 0.53Republic of Sri Lanka,6.125%, 3/06/2025 12,441,000 11,930,620 0.42Republic of Sri Lanka,6.85%, 3/11/2025 22,402,000 22,377,380 0.78Republic of Sri Lanka,6.825%, 18/07/2026 28,933,000 28,864,139 1.01
89,582,482 3.14
SupranationalWest African Development Bank,5.5%, 6/05/2021 USD 5,460,000 5,655,468 0.20
SurinameRepublic of Suriname,9.25%, 26/10/2026 USD 5,152,000 5,200,583 0.18
Trinidad & TobagoConsolidated Energy Finance S.A.,6.75%, 15/10/2019 USD 8,852,000 8,874,130 0.31
TurkeyExport Credit Bank of Turkey A.S.,5.875%, 24/04/2019 USD 3,566,000 3,653,866 0.13Export Credit Bank of Turkey A.S.,5.375%, 8/02/2021 7,233,000 7,178,753 0.25Export Credit Bank of Turkey A.S.,5%, 23/09/2021 12,261,000 11,892,925 0.42Republic of Turkey,7.5%, 7/11/2019 8,689,000 9,427,565 0.33Republic of Turkey,7%, 5/06/2020 12,094,000 13,037,332 0.46Republic of Turkey,5.625%, 30/03/2021 8,218,000 8,457,966 0.30Republic of Turkey,5.125%, 25/03/2022 7,399,000 7,372,734 0.26Republic of Turkey,6.25%, 26/09/2022 4,948,000 5,174,668 0.18Republic of Turkey,3.25%, 23/03/2023 11,806,000 10,540,043 0.37Republic of Turkey,5.75%, 22/03/2024 12,665,000 12,759,988 0.45Republic of Turkey,7.375%, 5/02/2025 16,134,000 17,781,604 0.62Republic of Turkey,4.25%, 14/04/2026 16,686,000 14,930,633 0.52Republic of Turkey,4.875%, 9/10/2026 16,997,000 15,839,164 0.55Republic of Turkey,6%, 25/03/2027 11,658,000 11,628,855 0.41
Name of SecurityTransferable Securities and Money MarketInstruments traded on a Regulated Market Shares/Par
MarketValue ($)
NetAssets (%)
Turkey, continuedRepublic of Turkey,6.875%, 17/03/2036 USD 3,994,000 4,133,790 0.14Republic of Turkey,6.75%, 30/05/2040 6,913,000 7,041,582 0.25Republic of Turkey,6.625%, 17/02/2045 19,385,000 19,540,855 0.68
180,392,323 6.32
UkraineGovernment of Ukraine,7.75%, 1/09/2022 USD 8,176,000 7,812,167 0.27Government of Ukraine,7.75%, 1/09/2019 2,667,000 2,652,332 0.09Government of Ukraine,7.75%, 1/09/2020 1,707,000 1,669,651 0.06Government of Ukraine,7.75%, 1/09/2021 2,956,000 2,856,974 0.10Government of Ukraine,7.75%, 1/09/2023 6,190,000 5,856,607 0.21Government of Ukraine,7.75%, 1/09/2024 6,967,000 6,518,771 0.23Government of Ukraine,7.75%, 1/09/2025 7,050,000 6,557,064 0.23Government of Ukraine,7.75%, 1/09/2026 7,676,000 7,100,300 0.25Government of Ukraine,7.75%, 1/09/2027 5,333,000 4,913,400 0.17JSC State Savings Bank of Ukraine,9.625%, 20/03/2025 4,527,000 4,340,986 0.15State Export-Import Bank of Ukraine,9.75%, 22/01/2025 3,780,000 3,626,910 0.13
53,905,162 1.89
United Arab EmiratesEmirate of Abu Dhabi,3.125%, 3/05/2026 USD 3,336,000 3,299,838 0.12
UruguayNavios South American Logistics,Inc./Navios Logistics Finance (U.S.), Inc.,7.25%, 1/05/2022 USD 9,319,000 8,608,426 0.30Oriental Republic of Uruguay,4.375%, 27/10/2027 3,789,650 3,880,033 0.14
12,488,459 0.44
VenezuelaPetroleos de Venezuela S.A.,6%, 15/11/2026 USD 20,352,000 7,726,630 0.27Petroleos de Venezuela S.A.,5.375%, 12/04/2027 22,809,000 8,610,398 0.30Petroleos de Venezuela S.A.,6%, 16/05/2024 17,939,800 7,238,709 0.25Republic of Venezuela,8.25%, 13/10/2024 5,290,000 2,512,750 0.09Republic of Venezuela,7.65%, 21/04/2025 9,236,000 4,283,657 0.15Republic of Venezuela,9.25%, 15/09/2027 23,198,000 12,294,940 0.43Republic of Venezuela,7%, 31/03/2038 51,547,500 22,938,638 0.81
65,605,722 2.30
ZambiaRepublic of Zambia,8.5%, 14/04/2024 USD 3,801,000 3,783,135 0.13
34 MFS Meridian Funds Annual Report 2017

SCHEDULES OF INVESTMENTS 31 January 2017
MFS Meridian Funds – Emerging Markets Debt Fund, continued
Name of SecurityTransferable Securities and Money MarketInstruments traded on a Regulated Market Shares/Par
MarketValue ($)
NetAssets (%)
Zambia, continuedRepublic of Zambia,8.97%, 30/07/2027 USD 1,845,000 1,842,786 0.07
5,625,921 0.20
Total Bonds(Identified Cost, $2,463,394,144) 2,426,161,891 85.01
COMMON STOCKS
Energy – IndependentPacific Exploration &Production Corp. 96,097 3,845,418 0.14
SHORT-TERM OBLIGATIONS (y)Apple, Inc.,0.68%, 15/02/2017 USD 15,000,000 14,996,033 0.53Chevron Corp.,0.6%, 14/02/2017 21,070,000 21,065,435 0.74Chevron Corp.,0.62%, 14/02/2017 50,000,000 49,988,806 1.75Exxon Mobil Corp.,0.63%, 22/02/2017 50,745,000 50,726,351 1.78General Electric Co.,0.58%, 1/02/2017 11,441,000 11,441,000 0.40Microsoft Corp.,0.72%, 22/02/2017 40,000,000 39,983,200 1.40Mizuho Bank Ltd.,0.7%, 3/02/2017 10,000,000 10,000,000 0.35Mizuho Bank Ltd.,0.7%, 14/02/2017 27,000,000 27,001,283 0.95Nestle Cap Corp.,0.72%, 15/03/2017 11,291,000 11,281,516 0.39Novartis Finance Corp.,0.7%, 21/02/2017 8,500,000 8,496,694 0.30Novartis Finance Corp.,0.68%, 3/02/2017 15,500,000 15,499,414 0.54
Name of SecurityTransferable Securities and Money MarketInstruments traded on a Regulated Market Shares/Par
MarketValue ($)
NetAssets (%)
SHORT-TERM OBLIGATIONS (y), continuedNovartis Fnc Crp,0.66%, 6/02/2017 USD 9,750,000 9,749,106 0.34Novartis Fnc Crp,0.68%, 6/02/2017 20,000,000 19,998,111 0.70Pepsico Inc.,0.64%, 24/02/2017 17,000,000 16,993,049 0.59Sanofi,0.62%, 24/02/2017 6,015,000 6,012,617 0.21Toronto Dominion Holding,0.66%, 8/02/2017 21,026,000 21,023,302 0.74Toronto Dominion Holding,0.72%, 10/02/2017 29,868,000 29,862,624 1.05
Total Short-Term Obligations, atAmortized Cost and Value 364,118,541 12.76
Total Transferable Securities andMoney Market Instruments Tradedon a Regulated Market(Identified Cost, $2,843,669,816) 2,794,125,850 97.90
Issuer/Expiration Month/Strike PriceNumber
of ContractsMarket
Value ($)Net
Assets (%)
PUT OPTIONS PURCHASEDiShares MSCI Emerging MarketsETF – March 2017 @ $30.50(Premiums Paid, $319,960) USD 8,420 25,260 0.00
Total Investments(Identified Cost, $2,843,989,776) (k) 2,794,151,110 97.91
OTHER ASSETS, LESS LIABILITIES 59,779,817 2.09
NET ASSETS 2,853,930,927 100.00
See Schedules of Investments Footnotes and Notes to Financial Statements
MFS Meridian Funds – Emerging Markets Debt Local Currency Fund(Expressed in U.S. Dollars)
Name of SecurityTransferable Securities and Money MarketInstruments traded on a Regulated Market Shares/Par
MarketValue ($)
NetAssets (%)
BONDS
BermudaGovernment of Bermuda,4.854%, 6/02/2024 USD 200,000 208,900 0.56
BrazilFederative Republic of Brazil,6%, 15/08/2022 BRL 886,739 283,205 0.77Nota do Tesouro Nacional,6%, 15/08/2026 1,126,959 364,489 0.99Nota do Tesouro Nacional,6%, 15/08/2050 293,603 99,812 0.27Nota do Tesouro Nacional,10%, 1/01/2021 5,322,000 1,659,411 4.49Nota do Tesouro Nacional,10%, 1/01/2023 3,138,000 962,003 2.60Nota do Tesouro Nacional,10%, 1/01/2025 1,303,000 395,553 1.07Nota do Tesouro Nacional,6%, 15/05/2021 625,759 200,045 0.54Nota do Tesouro Nacional,10%, 1/01/2027 620,000 186,813 0.51
4,151,331 11.24
Name of SecurityTransferable Securities and Money MarketInstruments traded on a Regulated Market Shares/Par
MarketValue ($)
NetAssets (%)
ChileEmpresa de Transporte de PasajerosMetro S.A.,5%, 25/01/2047 USD 200,000 199,750 0.54Empresa Nacional del Petroleo,4.75%, 6/12/2021 100,000 104,314 0.28Enel Americas S.A.,4%, 25/10/2026 17,000 16,578 0.05
320,642 0.87
ColombiaFinanciera de Desarrollo TerritorialS.A.,7.875%, 12/08/2024 COP 569,000,000 186,803 0.51Republic of Colombia,5%, 15/06/2045 USD 217,000 211,250 0.57Titulos de Tesoreria,7.5%, 26/08/2026 COP 889,500,000 317,492 0.86Titulos de Tesoreria,11%, 24/07/2020 472,200,000 183,718 0.50Titulos de Tesoreria, “B”,6%, 28/04/2028 2,241,800,000 709,009 1.92
MFS Meridian Funds Annual Report 2017 35

SCHEDULES OF INVESTMENTS 31 January 2017
MFS Meridian Funds – Emerging Markets Debt Local Currency Fund, continued
Name of SecurityTransferable Securities and Money MarketInstruments traded on a Regulated Market Shares/Par
MarketValue ($)
NetAssets (%)
Colombia, continuedTitulos de Tesoreria, “B”,7%, 4/05/2022 COP 1,250,000,000 436,281 1.18Titulos de Tesoreria, “B”,10%, 24/07/2024 1,648,600,000 671,708 1.82Titulos de Tesoreria, “B”,7.75%, 18/09/2030 1,069,200,000 389,269 1.05
3,105,530 8.41
GuatemalaCentral American Bottling Corp.,5.75%, 31/01/2027 USD 150,000 151,080 0.41
HungaryRepublic of Hungary,5.5%, 24/06/2025 HUF 82,530,000 336,378 0.91Republic of Hungary,7%, 24/06/2022 41,410,000 180,478 0.49
516,856 1.40
IndiaExport-Import Bank of India,3.375%, 5/08/2026 USD 200,000 188,587 0.51Government of India,7.59%, 11/01/2026 INR 19,950,000 314,695 0.85
503,282 1.36
IndonesiaRepublic of Indonesia,3.7%, 8/01/2022 USD 245,000 248,352 0.67Republic of Indonesia,8.75%, 15/05/2031 IDR 600,000,000 47,250 0.13Republic of Indonesia,8.25%, 15/07/2021 4,280,000,000 329,835 0.89Republic of Indonesia,8.25%, 15/06/2032 3,439,000,000 257,738 0.70Republic of Indonesia,8.375%, 15/09/2026 13,419,000,000 1,053,944 2.86Republic of Indonesia,7%, 15/05/2027 3,373,000,000 240,992 0.65Republic of Indonesia,9%, 15/03/2029 16,236,000,000 1,313,107 3.56Republic of Indonesia,8.375%, 15/03/2034 2,394,000,000 182,430 0.49Republic of Indonesia,8.375%, 15/03/2024 12,116,000,000 941,423 2.55
4,615,071 12.50
MalaysiaGovernment of Malaysia,4.254%, 31/05/2035 MYR 1,281,000 274,819 0.74Government of Malaysia,4.232%, 30/06/2031 5,402,000 1,180,184 3.20Government of Malaysia,3.9%, 30/11/2026 1,063,000 234,981 0.64
1,689,984 4.58
MexicoAmerica Movil S.A.B. de C.V.,6%, 9/06/2019 MXN 2,570,000 118,235 0.32Petroleos Mexicanos,6.5%, 13/03/2027 USD 129,000 132,670 0.36Petroleos Mexicanos,4.625%, 21/09/2023 94,000 91,650 0.25Petroleos Mexicanos,9.1%, 27/01/2020 MXN 2,559,000 121,528 0.33Petroleos Mexicanos,7.47%, 12/11/2026 3,257,500 128,523 0.35Petroleos Mexicanos, FRN,4.606%, 11/03/2022 USD 149,000 154,774 0.42
Name of SecurityTransferable Securities and Money MarketInstruments traded on a Regulated Market Shares/Par
MarketValue ($)
NetAssets (%)
Mexico, continuedRed de Carreteras de Occidente SAPIB deC.V.,9%, 10/06/2028 MXN 3,430,000 155,781 0.42United Mexican States,8%, 7/12/2023 21,000,000 1,044,167 2.82United Mexican States,8%, 11/06/2020 12,400,000 612,853 1.66
2,560,181 6.93
MoroccoOffice Cherifien des Phosphates S.A.,5.625%, 25/04/2024 USD 200,000 207,658 0.56
NigeriaAfren PLC,10.25%, 8/04/2019 (d) USD 325,929 65 0.00
ParaguayTelefonica Celular del Paraguay S.A.,6.75%, 13/12/2022 USD 200,000 206,500 0.56
PeruBonos de Tesoreria,8.2%, 12/08/2026 PEN 1,789,000 631,106 1.71Bonos de Tesoreria,5.7%, 12/08/2024 596,000 182,756 0.49Inkia Energy Ltd.,8.375%, 4/04/2021 USD 200,000 207,000 0.56Republic of Peru,6.35%, 12/08/2028 PEN 1,140,000 351,342 0.95
1,372,204 3.71
PolandGovernment of Poland,5.5%, 25/10/2019 PLN 572,000 154,473 0.42Government of Poland,5.25%, 25/10/2020 902,000 245,349 0.66Government of Poland,5.75%, 25/10/2021 2,209,000 617,904 1.67Government of Poland,3.25%, 25/07/2019 1,891,000 483,056 1.31Government of Poland,2%, 25/04/2021 668,000 160,933 0.44Government of Poland,2.5%, 25/07/2026 2,108,000 473,585 1.28
2,135,300 5.78
RussiaRussian Federation,6.8%, 11/12/2019 RUB 33,706,000 543,510 1.47Russian Federation,7.05%, 19/01/2028 38,202,000 586,795 1.59Russian Federation,7%, 25/01/2023 45,830,000 728,343 1.97Russian Federation,6.4%, 27/05/2020 27,200,000 430,687 1.17
2,289,335 6.20
SerbiaRepublic of Serbia,6.75%, 1/11/2024 USD 56,498 57,068 0.15
South AfricaEskom Holdings SOC Ltd.,7.85%, 2/04/2026 ZAR 3,000,000 196,687 0.53Republic of South Africa,10.5%, 21/12/2026 12,392,000 1,019,869 2.76Republic of South Africa,6.5%, 28/02/2041 21,195,000 1,125,781 3.05Republic of South Africa,7%, 28/02/2031 24,415,000 1,495,024 4.05
36 MFS Meridian Funds Annual Report 2017

SCHEDULES OF INVESTMENTS 31 January 2017
MFS Meridian Funds – Emerging Markets Debt Local Currency Fund, continued
Name of SecurityTransferable Securities and Money MarketInstruments traded on a Regulated Market Shares/Par
MarketValue ($)
NetAssets (%)
South Africa, continuedTransnet Ltd.,10.5%, 17/09/2020 ZAR 2,000,000 152,962 0.42Transnet SOC Ltd.,9.5%, 13/05/2021 3,540,000 248,417 0.67
4,238,740 11.48
Sri LankaGovernment of Sri Lanka,10.75%, 1/03/2021 LKR 15,000,000 94,955 0.26Government of Sri Lanka,11.5%, 1/08/2026 16,000,000 99,231 0.27
194,186 0.53
ThailandGovernment of Thailand,2.125%, 17/12/2026 THB 25,033,000 671,844 1.82
TurkeyRepublic of Turkey,8%, 12/03/2025 TRY 1,576,000 356,288 0.97Republic of Turkey,10.6%, 11/02/2026 3,280,000 864,519 2.34
1,220,807 3.31
United StatesU.S. Treasury Notes,2%, 15/11/2026 USD 191,000 183,547 0.50
Total Bonds(Identified Cost, $32,184,548) 30,600,111 82.86
Name of SecurityTransferable Securities and Money MarketInstruments traded on a Regulated Market Shares/Par
MarketValue ($)
NetAssets (%)
COMMON STOCKSForeign StocksPacific Exploration & ProductionCorp.,(Identified Cost, $268,562) USD 1,333 53,341 0.14
SHORT-TERM OBLIGATIONS (y)Federal Home Loan Bank,0.4%, 1/02/2017 USD 799,000 799,000 2.17General Electric Co.,0.58%, 1/02/2017 1,459,000 1,459,000 3.95
Total Short-Term Obligations, atAmortized Cost and Value 2,258,000 6.12
Total Transferable Securities andMoney Market Instruments Tradedon a Regulated Market(Identified Cost, $34,711,110) 32,911,452 89.12
Issuer/Expiration Month/Strike PriceNumber
of ContractsMarket
Value ($)Net
Assets (%)PUT OPTIONS PURCHASEDiShares MSCI Emerging MarketsETF – March 2017 @ $30.50(Premiums Paid, $11,970) USD 315 945 0.00
Total Investments(Identified Cost, $34,723,080) (k) 32,912,397 89.12
OTHER ASSETS, LESS LIABILITIES 4,016,059 10.88
NET ASSETS 36,928,456 100.00
See Schedules of Investments Footnotes and Notes to Financial Statements
MFS Meridian Funds – Emerging Markets Equity Fund(Expressed in U.S. Dollars)
Name of SecurityTransferable Securities and Money MarketInstruments traded on a Regulated Market Shares/Par
MarketValue ($)
NetAssets (%)
COMMON STOCKS
AirlinesGrupo Aeroportuario del Sureste S.A. deC.V., ADR 1,591 230,488 0.36
Alcoholic BeveragesAmBev S.A., ADR 199,472 1,075,154 1.70China Resources Enterprise Ltd. 350,000 709,279 1.12
1,784,433 2.82
Apparel ManufacturersGlobal Brands Group Holding Ltd. 4,598,000 576,469 0.91Stella International Holdings 332,000 506,171 0.80Titan Co. Ltd. 107,293 572,561 0.91
1,655,201 2.62
AutomotiveFord Otomotiv Sanayi A.S. 36,132 334,397 0.53Kia Motors Corp. 13,901 435,416 0.69
769,813 1.22
Business ServicesCognizant Technology SolutionsCorp., “A” 21,102 1,109,754 1.76Eurocash S.A. 50,306 501,213 0.79
1,610,967 2.55
Cable TVNaspers Ltd. 5,783 917,486 1.45
Name of SecurityTransferable Securities and Money MarketInstruments traded on a Regulated Market Shares/Par
MarketValue ($)
NetAssets (%)
Computer Software – SystemsEPAM Systems, Inc. 9,053 582,651 0.92Globant S.A. 19,186 636,016 1.01Linx S.A. 67,500 386,436 0.61
1,605,103 2.54
ConstructionTechtronic Industries Co. Ltd. 273,500 944,580 1.49
Consumer ProductsDabur India Ltd. 138,425 563,126 0.89Hengan International Group Co. Ltd. 124,000 1,016,191 1.61
1,579,317 2.50
Consumer Services51job, Inc., ADR 21,222 746,590 1.18China Maple Leaf Educational Systems 526,000 317,039 0.50Ctrip.com International Ltd., ADR 16,096 695,508 1.10Kroton Educacional S.A. 120,900 518,346 0.82MakeMyTrip Ltd. 19,797 661,220 1.05SEEK Ltd. 48,704 533,372 0.84
3,472,075 5.49
ElectronicsASM Pacific Technology Ltd. 78,300 952,344 1.51Samsung Electronics Co. Ltd. 2,195 3,726,646 5.89Taiwan Semiconductor ManufacturingCo. Ltd. 538,330 3,208,286 5.07
7,887,276 12.47
MFS Meridian Funds Annual Report 2017 37

SCHEDULES OF INVESTMENTS 31 January 2017
MFS Meridian Funds – Emerging Markets Equity Fund, continued
Name of SecurityTransferable Securities and Money MarketInstruments traded on a Regulated Market Shares/Par
MarketValue ($)
NetAssets (%)
Energy – IndependentGran Tierra Energy, Inc. 190,438 488,809 0.77Ultrapar Participacoes S.A. 14,769 310,088 0.49
798,897 1.26
Energy – IntegratedLUKOIL PJSC, ADR 30,648 1,719,659 2.72
Engineering – ConstructionMills Estruturas e Servicos de EngenhariaS.A. 188,333 237,277 0.38
Food & BeveragesAVI Ltd. 128,808 875,799 1.39BRF S.A. 37,191 524,741 0.83Tingyi (Cayman Islands) Holding Corp. 418,000 475,143 0.75
1,875,683 2.97
Food & Drug StoresClicks Group Ltd. 51,715 468,217 0.74Dairy Farm International Holdings Ltd. 54,000 452,520 0.71Lenta Ltd., GDR 39,081 307,177 0.49
1,227,914 1.94
Forest & Paper ProductsFibria Celulose S.A. 35,532 331,178 0.52
Furniture & AppliancesCoway Co. Ltd. 11,112 836,675 1.32
General MerchandiseS.A.C.I. Falabella 64,822 525,502 0.83
Health Maintenance OrganizationsOdontoPrev S.A. 93,925 334,137 0.53Qualicorp S.A. 87,445 571,940 0.90
906,077 1.43
InsuranceAIA Group Ltd. 178,800 1,107,542 1.75BB Seguridade Participacoes S.A. 43,647 386,591 0.61Brasil Insurance Participacoes eAdministracao S.A. 4,251 27,008 0.05Samsung Fire & Marine Insurance Co. Ltd. 1,508 349,068 0.55
1,870,209 2.96
InternetAlibaba Group Holding Ltd., ADR 24,263 2,458,085 3.89Baidu, Inc., ADR 3,590 628,501 0.99NAVER Corp. 976 636,613 1.01Tencent Holdings Ltd. 50,200 1,309,823 2.07
5,033,022 7.96
Major BanksChina Construction Bank 1,914,750 1,423,412 2.25Industrial & Commercial Bank of China,“H” 1,329,000 813,839 1.29
2,237,251 3.54
Metals & MiningGrupo Mexico S.A.B. de C.V., “B” 99,575 298,627 0.47Iluka Resources Ltd. 111,242 636,119 1.01
934,746 1.48
Natural Gas – DistributionChina Resources Gas Group Ltd. 250,000 794,848 1.26Infraestructura Energetica Nova, S.A. deC.V. 37,941 167,476 0.26
962,324 1.52
Network & TelecomVTech Holdings Ltd. 40,100 497,597 0.79
Name of SecurityTransferable Securities and Money MarketInstruments traded on a Regulated Market Shares/Par
MarketValue ($)
NetAssets (%)
Oil ServicesLamprell PLC 402,722 462,294 0.73
Other Banks & Diversified FinancialsBanco Bradesco S.A., ADR 61,654 636,886 1.01Banco Santander Chile, ADR 10,950 236,411 0.37Bancolombia S.A., ADR 11,469 434,216 0.69Credicorp Ltd. 2,129 348,475 0.55E.Sun Financial Holding Co. Ltd. 1,205,855 711,320 1.13Grupo Financiero Banorte S.A. de C.V. 64,758 310,383 0.49Grupo Financiero Inbursa S.A. de C.V. 431,628 639,779 1.01Housing Development Finance Corp.Ltd. 91,777 1,847,647 2.92Kasikornbank Co. Ltd. 126,400 673,104 1.07Komercni Banka A.S. 6,831 241,518 0.38Kotak Mahindra Bank Ltd. 95,471 1,089,378 1.72PT Bank Central Asia Tbk 329,000 376,986 0.60Public Bank Berhad 126,800 575,388 0.91Sberbank of Russia 133,828 383,097 0.61Shriram Transport Finance Co. Ltd. 35,564 500,475 0.79Turkiye Sinai Kalkinma Bankasi A.S. 817,126 311,851 0.49Union National Bank 302,135 361,947 0.57
9,678,861 15.31
PharmaceuticalsGenomma Lab Internacional S.A., “B” 675,007 708,234 1.12
Real EstateAldar Properties PJSC 562,023 391,728 0.62Concentradora Fibra Hotelera MexicanaS.A. de C.V., REIT 373,672 270,934 0.43Hang Lung Properties Ltd. 342,000 838,780 1.32
1,501,442 2.37
RestaurantsAlsea S.A.B. de C.V. 80,519 232,790 0.37Jollibee Foods Corp. 66,090 273,045 0.43Yum China Holdings, Inc. 43,331 1,190,736 1.88
1,696,571 2.68
Specialty ChemicalsAstra Argo Lestari 429,333 507,225 0.80PTT Global Chemical PLC 256,900 496,143 0.79
1,003,368 1.59
Specialty StoresDufry AG 9,394 1,335,694 2.11
Telephone ServicesHellenic TelecommunicationsOrganization S.A. 7,674 69,835 0.11PT XL Axiata Tbk 1,807,750 393,975 0.62
463,810 0.73
TobaccoITC Ltd. 267,695 1,018,381 1.61PT Hanjaya Mandala Sampoerna Tbk 1,328,000 382,910 0.61
1,401,291 2.22
TruckingImperial Holdings, Ltd. 54,380 673,182 1.06
Utilities – Electric PowerCESC Ltd. 73,729 802,168 1.27
Total Common Stocks(Identified Cost, $58,753,647) 62,177,665 98.32
38 MFS Meridian Funds Annual Report 2017

SCHEDULES OF INVESTMENTS 31 January 2017
MFS Meridian Funds – Emerging Markets Equity Fund, continued
Name of SecurityTransferable Securities and Money MarketInstruments traded on a Regulated Market Shares/Par
MarketValue ($)
NetAssets (%)
PREFERRED STOCKS
Forest & Paper ProductsSuzano Papel e Celulose S.A(Identified Cost, $457,923) 125,000 531,560 0.84
SHORT-TERM OBLIGATIONS (y)General Electric Co.,0.58%, 1/02/2017, at AmortizedCost and Value USD 281,000 281,000 0.44
Total Transferable Securities andMoney Market Instruments Tradedon a Regulated Market(Identified Cost, $59,492,570) (k) 62,990,225 99.60
OTHER ASSETS, LESS LIABILITIES 250,584 0.40
NET ASSETS 63,240,809 100.00
See Schedules of Investments Footnotes and Notes to Financial Statements
MFS Meridian Funds – European Core Equity Fund(Expressed in Euros)
Name of SecurityTransferable Securities and Money MarketInstruments Traded on a Regulated Market Shares/Par
MarketValue (€)
NetAssets (%)
COMMON STOCKS
AerospaceMeggitt PLC 34,458 167,811 0.90MTU Aero Engines Holding AG 3,136 346,842 1.85
514,653 2.75
AirlinesAena S.A. 1,266 170,087 0.91
Alcoholic BeveragesCarlsberg A.S., “B” 3,719 311,080 1.66Diageo PLC 18,593 477,442 2.55Heineken Holding N.V. 4,292 278,894 1.49Pernod Ricard S.A. 6,506 704,925 3.77
1,772,341 9.47
Apparel ManufacturersBurberry Group PLC 13,871 265,100 1.42Christian Dior S.A. 1,360 270,300 1.44Compagnie Financiere Richemont S.A. 4,379 314,420 1.68LVMH Moet Hennessy Louis Vuitton SE 2,528 471,725 2.52Swatch Group Ltd. 594 194,345 1.04
1,515,890 8.10
AutomotiveD’Ieteren S.A. 3,934 164,461 0.88Delphi Automotive PLC 5,677 368,440 1.97
532,901 2.85
BroadcastingWPP PLC 23,383 502,480 2.69
Brokerage & Asset ManagersDeutsche Boerse AG 1,805 153,858 0.82IG Group Holdings PLC 28,585 177,551 0.95Rathbone Brothers PLC 9,055 219,382 1.17
550,791 2.94
Business ServicesAmadeus IT Holding S.A. 3,655 156,233 0.84Applus Services, S.A. 34,770 367,345 1.96Brenntag AG 5,624 302,234 1.62
Name of SecurityTransferable Securities and Money MarketInstruments Traded on a Regulated Market Shares/Par
MarketValue (€)
NetAssets (%)
Business Services, continuedCerved Information Solutions S.p.A. 26,113 197,284 1.05Compass Group PLC 16,226 266,996 1.43Experian Group Ltd. 8,917 158,885 0.85Hays PLC 212,698 377,752 2.02Intertek Group PLC 8,589 339,513 1.81Michael Page International PLC 32,411 162,941 0.87
2,329,183 12.45
Cable TVSky PLC 14,069 164,118 0.88
Computer SoftwareDassault Systems S.A. 1,739 124,652 0.67
Consumer ProductsBeiersdorf AG 2,420 198,295 1.06Reckitt Benckiser Group PLC 6,930 549,483 2.94Svenska Cellulosa Aktiebolaget 14,124 393,393 2.10
1,141,171 6.10
Electrical EquipmentLegrand S.A. 3,363 180,862 0.96Schneider Electric S.A. 5,728 379,308 2.03
560,170 2.99
EntertainmentParques Reunidos Servicios CentralesS.A.U. 10,801 162,015 0.87
Food & BeveragesDanone S.A. 8,081 468,617 2.50Nestle S.A. 6,716 454,557 2.43
923,174 4.93
Gaming & LodgingPaddy Power Betfair PLC 1,960 190,608 1.02
InsuranceBeazley PLC 58,178 274,989 1.47Hiscox Ltd. 29,186 348,963 1.87
623,952 3.34
MFS Meridian Funds Annual Report 2017 39

SCHEDULES OF INVESTMENTS 31 January 2017
MFS Meridian Funds – European Core Equity Fund, continued
Name of SecurityTransferable Securities and Money MarketInstruments Traded on a Regulated Market Shares/Par
MarketValue (€)
NetAssets (%)
Major BanksBNP Paribas 4,519 267,434 1.43Standard Chartered PLC 7,967 71,870 0.38
339,304 1.81
Medical EquipmentSmith & Nephew PLC 19,832 273,407 1.46Sonova Holding AG 867 105,837 0.57
379,244 2.03
Other Banks & Diversified FinancialsErste Group Bank AG 12,699 357,350 1.91ING Groep N.V. 32,184 426,438 2.28Julius Baer Group Ltd. 6,264 271,150 1.45Jyske Bank A.S. 3,038 144,626 0.77Komercni Banka A.S. 2,683 87,875 0.47Sydbank A.S. 6,350 194,699 1.04UBS AG 18,407 275,187 1.47
1,757,325 9.39
PharmaceuticalsBayer AG 4,824 493,495 2.64Merck KGaA 2,200 223,630 1.19
717,125 3.83
Real EstateDeutsche Wohnen AG 11,914 359,088 1.92LEG Immobilien AG 3,393 246,535 1.32TAG Immobilien AG 17,518 218,800 1.17Vonovia SE 16,009 484,592 2.59
1,309,015 7.00
Name of SecurityTransferable Securities and Money MarketInstruments Traded on a Regulated Market Shares/Par
MarketValue (€)
NetAssets (%)
RestaurantsWhitbread PLC 5,210 238,306 1.27
Specialty ChemicalsAkzo Nobel N.V. 7,718 484,613 2.59Croda International PLC 7,945 309,983 1.66L’Air Liquide S.A. 3,093 309,300 1.65Linde AG 2,587 389,214 2.08Symrise AG 6,169 343,305 1.84
1,836,415 9.82
Specialty StoresHermes International 263 105,844 0.57
TruckingDSV A.S. 1,970 88,591 0.47
Total Common Stocks(Identified Cost, €15,302,847) 18,549,355 99.15
Total Transferable Securities andMoney Market Instruments Tradedon a Regulated Market(Identified Cost, €15,302,847) 18,549,355 99.15
OTHER ASSETS, LESS LIABILITIES 159,298 0.85
NET ASSETS 18,708,653 100.00
See Schedules of Investments Footnotes and Notes to Financial Statements
MFS Meridian Funds – European Research Fund(Expressed in Euros)
Name of SecurityTransferable Securities and Money MarketInstruments Traded on a Regulated Market Shares/Par
MarketValue (€)
NetAssets (%)
COMMON STOCKS
AirlinesAena S.A. 201,333 27,049,089 1.35
Apparel ManufacturersBurberry Group PLC 708,332 13,537,503 0.68Compagnie Financiere Richemont S.A. 304,309 21,849,921 1.09LVMH Moet Hennessy Louis Vuitton SE 206,711 38,572,273 1.93
73,959,697 3.70
AutomotiveD’Ieteren S.A. 312,331 13,056,997 0.65GKN PLC 3,267,322 13,075,252 0.66
26,132,249 1.31
BroadcastingWPP PLC 1,490,054 32,019,959 1.60
Brokerage & Asset ManagersIG Group Holdings PLC 3,038,037 18,870,270 0.94
Business ServicesAmadeus IT Holding S.A. 526,219 22,493,231 1.13Babcock International Group PLC 1,179,170 12,271,163 0.61Cerved Information Solutions S.p.A. 1,166,378 8,811,986 0.44Compass Group PLC 1,231,647 20,266,502 1.02Elior Participations SCA 790,378 16,360,825 0.82
Name of SecurityTransferable Securities and Money MarketInstruments Traded on a Regulated Market Shares/Par
MarketValue (€)
NetAssets (%)
Business Services, continuedExperian Group Ltd. 1,211,521 21,587,198 1.08
101,790,905 5.10
Computer SoftwareFidessa Group PLC 356,627 9,558,724 0.48
ConstructionBellway PLC 363,748 10,529,556 0.53
Consumer ProductsL’Oréal 272,975 45,955,341 2.30Reckitt Benckiser Group PLC 597,809 47,400,684 2.37Svenska Cellulosa Aktiebolaget 1,083,638 30,182,370 1.51
123,538,395 6.18
Consumer ServicesMoneysupermarket.com Group PLC 3,927,999 15,082,893 0.76
Electrical EquipmentIMI PLC 392,990 5,339,959 0.27Legrand S.A. 309,198 16,628,668 0.83Schneider Electric S.A. 498,864 33,034,774 1.65
55,003,401 2.75
ElectronicsASM International N.V. 269,627 12,294,991 0.62
40 MFS Meridian Funds Annual Report 2017

SCHEDULES OF INVESTMENTS 31 January 2017
MFS Meridian Funds – European Research Fund, continued
Name of SecurityTransferable Securities and Money MarketInstruments Traded on a Regulated Market Shares/Par
MarketValue (€)
NetAssets (%)
Energy – IndependentCairn Energy PLC 2,712,166 7,168,316 0.36Galp Energia SGPS S.A., “B” 1,543,394 21,021,026 1.05
28,189,342 1.41
Energy – IntegratedBP PLC 8,177,885 45,063,222 2.26Eni S.p.A. 2,348,657 33,374,416 1.67
78,437,638 3.93
EntertainmentCTS Eventim AG 374,688 12,029,358 0.60
Food & BeveragesDanone S.A. 719,350 41,715,107 2.09Nestle S.A. 1,428,126 96,659,497 4.84
138,374,604 6.93
Food & Drug StoresBooker Group PLC 13,624,259 32,357,497 1.62Jeronimo Martins SGPS S.A. 1,307,271 20,465,328 1.02
52,822,825 2.64
Gaming & LodgingPaddy Power Betfair PLC 449,772 43,739,781 2.19
InsuranceBeazley PLC 10,084,933 47,668,207 2.38Hiscox Ltd. 1,782,480 21,312,278 1.07
68,980,485 3.45
InternetScout24 AG 284,707 9,396,755 0.47
Machinery & ToolsGEA Group AG 617,491 23,612,856 1.18Schindler Holding AG 91,406 16,086,896 0.81
39,699,752 1.99
Major BanksBarclays PLC 10,102,766 25,836,503 1.29BNP Paribas 699,997 41,425,822 2.08Lloyds Banking Group PLC 33,029,812 24,992,480 1.25
92,254,805 4.62
Metals & MiningRio Tinto Ltd. 918,184 37,354,026 1.87
Natural Gas – DistributionEngie 1,134,551 12,553,807 0.63
Network & TelecomLM Ericsson Telephone Co., “B” 4,337,305 23,724,859 1.19
Oil ServicesTechnipFMC PLC 351,208 10,662,675 0.53
Other Banks & Diversified FinancialsDnB NOR A.S.A. 1,391,763 21,508,488 1.08Intesa Sanpaolo S.p.A. 10,365,321 22,492,747 1.13Julius Baer Group Ltd. 275,548 11,927,647 0.60Jyske Bank A.S. 316,038 15,045,219 0.75KBC Groep N.V. 407,185 24,439,244 1.22Sydbank A.S. 329,526 10,103,701 0.50UBS AG 2,390,929 35,744,671 1.79
141,261,717 7.07
PharmaceuticalsBayer AG 430,239 44,013,450 2.20
Name of SecurityTransferable Securities and Money MarketInstruments Traded on a Regulated Market Shares/Par
MarketValue (€)
NetAssets (%)
Pharmaceuticals, continuedNovartis AG 823,174 55,830,272 2.79Novo Nordisk A.S., “B” 796,993 26,516,130 1.33Roche Holding AG 278,921 60,838,268 3.05
187,198,120 9.37
Printing & PublishingRELX N.V. 1,690,600 26,415,625 1.32
Real EstateLEG Immobilien AG 196,595 14,284,593 0.72
RestaurantsDomino’s Pizza Group PLC 7,037,754 29,713,942 1.49Greggs PLC 609,781 6,907,136 0.34Whitbread PLC 254,022 11,619,002 0.58
48,240,080 2.41
Specialty ChemicalsAkzo Nobel N.V. 592,579 37,208,035 1.86Croda International PLC 568,416 22,177,347 1.11Linde AG 269,336 40,521,601 2.03Sika AG 3,167 15,372,218 0.77Symrise AG 479,690 26,694,749 1.34
141,973,950 7.11
Specialty StoresEsprit Holdings Ltd. 12,835,372 9,282,304 0.47Just Eat PLC 3,414,216 21,465,465 1.07NEXT PLC 213,554 9,531,568 0.48
40,279,337 2.02
Telecommunications – WirelessCellnex Telecom S.A.U. 1,435,498 18,891,154 0.95Vodafone Group PLC 11,508,756 26,065,783 1.30
44,956,937 2.25
Telephone ServicesBT Group PLC 3,583,554 12,689,106 0.64Com Hem Holding AB 2,621,529 25,417,122 1.27Hellenic TelecommunicationsOrganization S.A. 121,811 1,026,867 0.05Royal KPN N.V. 10,123,594 26,969,254 1.35TDC A.S. 5,427,532 26,458,568 1.32
92,560,917 4.63
Utilities – Electric PowerDrax Group 1,617,503 6,981,905 0.35Enel S.p.A. 7,768,475 30,017,387 1.50SSE PLC 1,131,666 19,636,804 0.99
56,636,096 2.84
Utilities – WaterSUEZ Environnement 673,278 9,446,090 0.47
Total Common Stocks(Identified Cost, €1,944,143,633) 1,957,304,303 97.98
Total Transferable Securities andMoney Market Instruments Tradedon a Regulated Market(Identified Cost, €1,944,143,633) (k) 1,957,304,303 97.98
OTHER ASSETS, LESS LIABILITIES 40,376,663 2.02
NET ASSETS 1,997,680,966 100.00
See Schedules of Investments Footnotes and Notes to Financial Statements
MFS Meridian Funds Annual Report 2017 41

SCHEDULES OF INVESTMENTS 31 January 2017
MFS Meridian Funds – European Smaller Companies Fund(Expressed in Euros)
Name of SecurityTransferable Securities and Money MarketInstruments Traded on a Regulated Market Shares/Par
MarketValue (€)
NetAssets (%)
COMMON STOCKS
AerospaceKongsberg Gruppen A.S.A. 128,186 1,957,968 0.20LISI Group 164,988 5,528,748 0.57MTU Aero Engines Holding AG 79,436 8,785,622 0.91Saab AB 63,110 2,387,388 0.25
18,659,726 1.93
AirlinesAena S.A. 52,524 7,056,599 0.73Stagecoach Group PLC 1,932,371 4,710,967 0.49
11,767,566 1.22
Alcoholic BeveragesCarlsberg A.S., “B” 69,882 5,845,365 0.61
Apparel ManufacturersBurberry Group PLC 210,887 4,030,431 0.42Ted Baker PLC 68,028 2,253,044 0.23
6,283,475 0.65
AutomotiveAutoliv, Inc., SDR 29,166 3,110,425 0.32Hella KGaA Hueck & Co. 188,659 7,112,444 0.74
10,222,869 1.06
BiotechnologyAbcam PLC 239,107 2,280,703 0.24BioInvent International AB (l) 4,350,077 1,299,150 0.13
3,579,853 0.37
Brokerage & Asset ManagersHargreaves Lansdown PLC 184,024 2,901,550 0.30Rathbone Brothers PLC 207,161 5,019,036 0.52Schroders PLC 415,496 10,526,506 1.09
18,447,092 1.91
Business ServicesAmadeus Fire AG 21,100 1,540,300 0.16Amadeus IT Holding S.A. 493,436 21,091,922 2.18Amsterdam Commodities N.V. 154,202 3,170,393 0.33Ashtead Group PLC 500,796 9,372,690 0.97Asiakastieto Group Oyj 441,349 8,518,036 0.88Auto Trader Group PLC 1,054,675 4,916,279 0.51Babcock International Group PLC 1,281,624 13,337,362 1.38Brenntag AG 157,281 8,452,281 0.88Bunzl PLC 1,568,654 38,187,696 3.96Cerved Information Solutions S.p.A. 2,385,061 18,019,136 1.87Compass Group PLC 2,038,175 33,537,757 3.47Diploma PLC 274,939 3,252,073 0.34Elior Participations SCA 631,816 13,078,591 1.35Elis S.A. (l) 178,663 2,963,126 0.31Exova Group PLC 810,855 1,835,532 0.19Intertek Group PLC 307,436 12,152,578 1.26Sodexo 58,159 5,952,574 0.62Zoopla Property Group PLC 2,039,488 8,703,568 0.90
208,081,894 21.56
Cable TVNOS, SGPS, S.A. 827,414 4,310,000 0.45
ChemicalsVictrex PLC 147,876 3,274,230 0.34
Computer Software – SystemsEMIS Group PLC 281,629 2,896,343 0.30Lectra 329,679 5,930,925 0.62
Name of SecurityTransferable Securities and Money MarketInstruments Traded on a Regulated Market Shares/Par
MarketValue (€)
NetAssets (%)
Computer Software – Systems, continuedServelec Group PLC 1,369,343 4,653,662 0.48Sopra Group S.A. 9,120 979,032 0.10
14,459,962 1.50
ConglomeratesDCC PLC 122,394 9,121,338 0.94
ConstructionBellway PLC 150,232 4,348,825 0.45Bovis Homes Group PLC 527,263 5,072,268 0.53Centrotec 321,283 5,134,102 0.53Somfy S.A. 7,335 2,926,665 0.30Volution Group PLC 2,144,723 4,348,889 0.45
21,830,749 2.26
Consumer ProductsHenkel AG & Co. KGaA 57,756 5,627,745 0.58Societe BIC S.A. 19,982 2,418,821 0.25
8,046,566 0.83
Consumer ServicesDignity PLC 649,365 18,502,295 1.92Moneysupermarket.com Group PLC 778,789 2,990,426 0.31
21,492,721 2.23
ContainersDS Smith PLC 1,250,950 6,458,052 0.67Mayr-Melnhof Karton AG 104,443 10,909,071 1.13RPC Group PLC 144,113 1,798,666 0.19
19,165,789 1.99
Electrical EquipmentIMI PLC 129,859 1,764,528 0.18Spectris PLC 138,753 3,908,201 0.41
5,672,729 0.59
ElectronicsHalma PLC 249,760 2,692,294 0.28
EntertainmentCTS Eventim AG 125,347 4,024,265 0.42Merlin Entertainment 920,576 5,118,314 0.53
9,142,579 0.95
Food & BeveragesBakkafrost P/f 735,183 26,158,136 2.71Bonduelle S.A. 76,726 1,832,984 0.19Britvic PLC 444,172 3,237,698 0.33Cloetta AB, “B” 593,180 1,853,198 0.19Cranswick PLC 276,266 7,456,308 0.77Devro PLC 632,676 1,216,531 0.13Fyffes PLC 8,664,060 19,398,830 2.01Greencore Group PLC 3,145,436 8,650,689 0.90Leroy Seafood Group A.S.A. 129,468 6,675,686 0.69Norway Royal Salmon A.S.A. 201,843 4,171,168 0.43Origin Enterprises PLC 202,384 1,285,543 0.13Salmar A.S.A. 168,139 4,405,644 0.46Scandi Standard AB 861,158 5,107,216 0.53Total Produce PLC 4,320,599 7,777,078 0.81
99,226,709 10.28
Food & Drug StoresBooker Group PLC 6,078,796 14,437,088 1.50
Furniture & AppliancesSEB S.A. 34,714 4,045,917 0.42
42 MFS Meridian Funds Annual Report 2017

SCHEDULES OF INVESTMENTS 31 January 2017
MFS Meridian Funds – European Smaller Companies Fund, continued
Name of SecurityTransferable Securities and Money MarketInstruments Traded on a Regulated Market Shares/Par
MarketValue (€)
NetAssets (%)
Gaming & LodgingPaddy Power Betfair PLC 195,869 19,048,023 1.97
General MerchandiseB&M European Value Retail S.A. 1,526,399 5,341,722 0.55
InsuranceAdmiral Group PLC 156,072 3,230,173 0.33Beazley PLC 809,583 3,826,636 0.40Jardine Lloyd Thompson Group PLC 620,659 7,449,860 0.77
14,506,669 1.50
InternetReply S.p.A. 50,068 5,958,092 0.62Rightmove PLC 282,090 13,215,135 1.37Scout24 AG 203,450 6,714,867 0.69
25,888,094 2.68
Leisure & ToysThule Group AB 351,133 5,276,761 0.55
Machinery & ToolsBelimo Holding AG 898 2,674,953 0.28GEA Group AG 101,486 3,880,825 0.40Rotork PLC 774,788 2,306,012 0.24Spirax Sarco Engineering PLC 91,144 4,572,557 0.47
13,434,347 1.39
Medical & Health Technology & ServicesSelcuk Ecza Deposu Ticaret ve Sanayi A.S. 14,769,397 12,509,940 1.30
Medical EquipmentAdvanced Medical Solutions Group PLC 949,789 2,213,681 0.23Gerresheimer AG 111,157 8,361,230 0.87Smith & Nephew PLC 632,919 8,725,508 0.90Sonova Holding AG 30,055 3,668,884 0.38
22,969,303 2.38
Oil ServicesAker Solutions ASA 1,560,580 7,771,554 0.80John Wood Group PLC 224,361 2,191,035 0.23TechnipFMC PLC 117,470 3,566,389 0.37
13,528,978 1.40
Other Banks & Diversified FinancialsFinecoBank, S.p.A. 1,022,671 5,614,464 0.58Jyske Bank A.S. 60,757 2,892,381 0.30
8,506,845 0.88
PharmaceuticalsVirbac 8,162 1,392,845 0.14
Precious Metals & MineralsRandgold Resources Ltd. 94,066 7,404,843 0.77
Real EstateGrand City Properties S.A. 664,050 11,199,203 1.16LEG Immobilien AG 265,144 19,265,363 2.00Shaftesbury PLC, REIT 342,719 3,500,644 0.36
33,965,210 3.52
RestaurantsDomino’s Pizza Group PLC 3,350,064 14,144,229 1.46Greggs PLC 535,883 6,070,076 0.63Whitbread PLC 155,680 7,120,825 0.74
27,335,130 2.83
Name of SecurityTransferable Securities and Money MarketInstruments Traded on a Regulated Market Shares/Par
MarketValue (€)
NetAssets (%)
Specialty ChemicalsBorregaard ASA 827,854 8,437,748 0.87Croda InternationalPLC 599,394 23,385,986 2.42Fuchs Petrolub SE 161,716 6,319,861 0.65IMCD Group NV 252,298 10,488,028 1.09Symrise AG 533,631 29,696,565 3.08
78,328,188 8.11
Specialty StoresCard Factory PLC 940,454 2,736,617 0.28Grandvision N.V. 246,565 5,441,690 0.56Howden JoineryGroup PLC 991,341 4,359,963 0.45Just Eat PLC 1,254,845 7,889,317 0.82NEXT PLC 67,304 3,003,983 0.31XXL ASA 657,578 7,016,121 0.73
30,447,691 3.15
Telecommunications – WirelessCellnex TelecomS.A.U. 321,844 4,235,467 0.44WirelessInfrastructure ItalianS.p.A. 469,421 2,064,514 0.21
6,299,981 0.65
Telephone ServicesCom Hem HoldingAB 500,097 4,848,707 0.50TDC A.S. 903,427 4,404,098 0.46
9,252,805 0.96
TobaccoSwedish Match AB 204,609 6,166,986 0.64
Total Common Stocks(Identified Cost, €714,454,838) 861,410,872 89.24
PREFERREDSTOCKS
MedicalEquipmentSartorius AG 95,784 6,225,960 0.65
SpecialtyChemicalsFuchs Petrolub SE 28,380 1,200,190 0.12
Total Preferred Stocks(Identified Cost, €3,277,231) 7,426,150 0.77
StrikePrice
FirstExercise
RIGHTS
BusinessServicesElis S.A. (1 share for1 right)(Identified Cost, €0) EUR 12.55 25/01/2017 178,663 170,266 0.02
Total Transferable Securities andMoney Market Instruments Tradedon a Regulated Market(Identified Cost, €717,732,069) 869,007,288 90.03
OTHER ASSETS, LESS LIABILITIES 96,280,118 9.97
NET ASSETS 965,287,406 100.00
See Schedules of Investments Footnotes and Notes to Financial Statements
MFS Meridian Funds Annual Report 2017 43

SCHEDULES OF INVESTMENTS 31 January 2017
MFS Meridian Funds – European Value Fund(Expressed in Euros)
Name of SecurityTransferable Securities and Money MarketInstruments Traded on a Regulated Market Shares/Par
MarketValue (€)
NetAssets (%)
COMMON STOCKSAlcoholic BeveragesHeineken N.V. 1,528,954 105,849,485 2.08Pernod Ricard S.A. 1,442,797 156,327,055 3.06
262,176,540 5.14
Apparel ManufacturersCompagnie Financiere Richemont S.A. 877,857 63,031,675 1.24
AutomotiveD’Ieteren S.A. 50,031 2,091,546 0.04
Brokerage & Asset ManagersIG Group Holdings PLC 4,446,066 27,616,012 0.54
Business ServicesAmadeus IT Holding S.A. 3,085,217 131,877,601 2.58Berendsen PLC 1,655,370 16,059,691 0.31Brenntag AG 1,034,963 55,618,912 1.09Bunzl PLC 4,434,302 107,949,729 2.12Compass Group PLC 9,829,266 161,738,583 3.17Experian Group Ltd. 1,362,962 24,285,614 0.48Intertek Group PLC 1,048,550 41,447,929 0.81Rentokil Initial PLC 6,313,643 16,812,182 0.33Serco Group PLC 8,619,965 14,465,247 0.28SGS S.A. 46,596 91,253,604 1.79
661,509,092 12.96
ChemicalsGivaudan S.A. 82,303 137,066,499 2.69Syngenta AG 135,354 53,154,834 1.04
190,221,333 3.73
Computer SoftwareAveva Group PLC 3,478,651 77,307,104 1.51Check Point Software Technologies Ltd. 436,400 39,928,891 0.78Dassault Systems S.A. 1,250,937 89,667,164 1.76Fidessa Group PLC 3,124,124 83,736,335 1.64
290,639,494 5.69
Computer Software – SystemsTemenos Group AG 1,170,335 78,554,136 1.54
ConstructionGeberit AG 48,385 19,096,380 0.37
Consumer ProductsReckitt Benckiser Group PLC 3,411,028 270,462,738 5.30
Electrical EquipmentIMI PLC 8,623,033 117,170,005 2.30Legrand S.A. 2,460,635 132,332,950 2.59Schneider Electric S.A. 1,625,240 107,623,393 2.11Spectris PLC 2,273,588 64,039,255 1.25
421,165,603 8.25
ElectronicsASM International N.V. 553,001 25,216,846 0.49Halma PLC 8,469,665 91,298,957 1.79Infineon Technologies AG 5,302,993 90,097,851 1.77
206,613,654 4.05
Energy – IndependentCairn Energy PLC 6,588,913 17,414,647 0.34
Food & BeveragesDanone S.A. 2,971,503 172,317,459 3.38Kerry Group PLC 1,139,265 74,166,151 1.45Nestle S.A. 4,394,782 297,450,937 5.83
543,934,547 10.66
Gaming & LodgingPaddy Power Betfair PLC 1,228,747 119,494,155 2.34
Name of SecurityTransferable Securities and Money MarketInstruments Traded on a Regulated Market Shares/Par
MarketValue (€)
NetAssets (%)
InsuranceBeazley PLC 15,732,040 74,360,250 1.46Euler Hermes Group 257,806 21,550,004 0.42Hiscox Ltd. 3,396,472 40,610,024 0.79Jardine Lloyd Thompson Group PLC 2,918,808 35,034,877 0.69
171,555,155 3.36
Machinery & ToolsGEA Group AG 2,268,427 86,744,648 1.70Neopost S.A. 371,116 11,352,438 0.22Schindler Holding AG 224,846 39,571,519 0.78Spirax Sarco Engineering PLC 1,627,595 81,653,979 1.60Wartsila Corp. 439,954 20,435,863 0.40
239,758,447 4.70
Major BanksBank of Ireland 127,369,560 31,587,651 0.62Svenska Handelsbanken AB, “A” 6,823,795 94,380,551 1.85
125,968,202 2.47
Other Banks & Diversified FinancialsING Groep N.V. 4,285,109 56,777,694 1.11Julius Baer Group Ltd. 891,301 38,581,750 0.76Jyske Bank A.S. 945,230 44,998,361 0.88Sydbank A.S. 1,195,007 36,640,487 0.72UBS AG 5,538,647 82,803,427 1.62
259,801,719 5.09
PharmaceuticalsBayer AG 665,262 68,056,303 1.33Roche Holding AG 297,282 64,843,171 1.27
132,899,474 2.60
Printing & PublishingRELX N.V. 2,970,432 46,413,000 0.91
Real EstateDeutsche Wohnen AG 4,934,126 148,714,558 2.91LEG Immobilien AG 645,337 46,890,186 0.92TAG Immobilien AG 3,959,932 49,459,551 0.97Vonovia SE 4,134,008 125,136,422 2.45
370,200,717 7.25
Specialty ChemicalsSymrise AG 1,699,965 94,603,052 1.85
Specialty StoresEsprit Holdings Ltd. 39,498,229 28,564,391 0.56
TobaccoBritish American Tobacco PLC 2,126,635 121,423,450 2.38Imperial Tobacco Group PLC 1,409,895 60,356,586 1.18
181,780,036 3.56
Total Common Stocks(Identified Cost, €4,150,466,702) 4,825,565,745 94.54
PREFERRED STOCKS
Consumer ProductsHenkel AG & Co. KGaA(Identified Cost, €145,458,811) 1,555,229 175,274,308 3.44
Total Transferable Securities andMoney Market Instruments Tradedon a Regulated Market(Identified Cost, €4,295,925,513) (k) 5,000,840,053 97.98
OTHER ASSETS, LESS LIABILITIES 103,309,114 2.02
NET ASSETS 5,104,149,167 100.00
See Schedules of Investments Footnotes and Notes to Financial Statements
44 MFS Meridian Funds Annual Report 2017

SCHEDULES OF INVESTMENTS 31 January 2017
MFS Meridian Funds – Global Concentrated Fund(Expressed in U.S. Dollars)
Name of SecurityTransferable Securities and Money MarketInstruments traded on a Regulated Market Shares/Par
MarketValue ($)
NetAssets (%)
COMMON STOCKS
AerospaceHoneywell International, Inc. 420,447 49,747,288 4.97
Alcoholic BeveragesDiageo PLC 1,210,182 33,546,263 3.35Heineken N.V. 258,203 19,296,483 1.93
52,842,746 5.28
Apparel ManufacturersCompagnie Financiere Richemont S.A. 386,471 29,955,359 2.99LVMH Moet Hennessy Louis Vuitton SE 205,676 41,430,274 4.14
71,385,633 7.13
BroadcastingTime Warner, Inc. 443,503 42,953,266 4.29Walt Disney Co. 441,864 48,892,252 4.88
91,845,518 9.17
Business ServicesAccenture PLC, “A” 417,993 47,596,863 4.75
Chemicals3M Co. 180,562 31,565,849 3.15
Computer SoftwareOracle Corp. 756,288 30,334,712 3.03
Consumer ProductsCoty, Inc., “A” 1,053,565 20,228,448 2.02Reckitt Benckiser Group PLC 443,040 37,921,687 3.79
58,150,135 5.81
Electrical EquipmentLegrand S.A. 435,381 25,276,260 2.53
Food & BeveragesDanone S.A. 515,825 32,290,744 3.23Nestle S.A. 527,665 38,553,059 3.85
70,843,803 7.08
Major BanksState Street Corp. 587,597 44,774,891 4.47
Name of SecurityTransferable Securities and Money MarketInstruments traded on a Regulated Market Shares/Par
MarketValue ($)
NetAssets (%)
Medical EquipmentMedtronic PLC 643,396 48,910,964 4.89Thermo Fisher Scientific, Inc. 366,770 55,892,080 5.58Waters Corp. 216,407 30,654,052 3.06Zimmer Biomet Holdings, Inc. 441,217 52,209,208 5.22
187,666,304 18.75
Other Banks & Diversified FinancialsVisa, Inc., “A” 644,368 53,295,677 5.32
PharmaceuticalsBayer AG 364,935 40,300,803 4.03
Railroad & ShippingCanadian National Railway Co. 609,453 42,369,173 4.23
Specialty ChemicalsAkzo Nobel N.V. 327,873 22,223,819 2.22Linde AG 154,043 25,018,237 2.50
47,242,056 4.72
TruckingUnited Parcel Service, Inc., “B” 382,325 41,723,127 4.17
Total Common Stocks(Identified Cost, $871,485,677) 986,960,838 98.59
SHORT-TERM OBLIGATIONS (y)General Electric Co.,0.58%, 1/02/2017, at AmortizedCost and Value USD 5,017,000 5,017,000 0.50
Total Transferable Securities andMoney Market Instruments Tradedon a Regulated Market(Identified Cost, $876,502,677) 991,977,838 99.09
OTHER ASSETS, LESS LIABILITIES 9,140,352 0.91
NET ASSETS 1,001,118,190 100.00
See Schedules of Investments Footnotes and Notes to Financial Statements
MFS Meridian Funds – Global Credit Fund(Expressed in U.S. Dollars)
Name of SecurityTransferable Securities and Money MarketInstruments traded on a Regulated Market Shares/Par
MarketValue ($)
NetAssets (%)
BONDS
AirlinesRyanair Ltd.,1.125%, 10/03/2023 EUR 100,000 107,494 0.50
Apparel ManufacturersChristian Dior SE,0.75%, 24/06/2021 EUR 100,000 108,424 0.50
AutomotiveFCA Capital Ireland PLC,1.25%, 21/01/2021 EUR 100,000 109,077 0.50Ferrari N.V.,1.5%, 16/03/2023 100,000 107,277 0.50General Motors Co.,6.6%, 1/04/2036 USD 98,000 112,875 0.52General Motors Financial Co., Inc.,4.35%, 17/01/2027 34,000 33,708 0.16Jaguar Land Rover Automotive PLC,3.875%, 1/03/2023 GBP 100,000 129,322 0.60
Name of SecurityTransferable Securities and Money MarketInstruments traded on a Regulated Market Shares/Par
MarketValue ($)
NetAssets (%)
Automotive, continuedRCI Banque S.A.,1.25%, 8/06/2022 EUR 40,000 43,767 0.20Volkswagen International Finance N.V.,3.875% to 4/09/2018, FRN to 29/09/2049 60,000 66,681 0.31Volkswagen International Finance N.V.,FRN, 2.5% to 20/03/2022,FRN to 29/12/2049 37,000 38,675 0.18ZF North America Capital, Inc.,4.75%, 29/04/2025 USD 150,000 152,505 0.70
793,887 3.67
BiotechnologyLife Technologies Corp.,6%, 1/03/2020 USD 190,000 207,560 0.96
BroadcastingOmnicom Group, Inc.,3.65%, 1/11/2024 USD 190,000 191,880 0.89Omnicom Group, Inc.,3.6%, 15/04/2026 85,000 84,241 0.39
MFS Meridian Funds Annual Report 2017 45

SCHEDULES OF INVESTMENTS 31 January 2017
MFS Meridian Funds – Global Credit Fund, continued
Name of SecurityTransferable Securities and Money MarketInstruments traded on a Regulated Market Shares/Par
MarketValue ($)
NetAssets (%)
Broadcasting, continuedProSiebenSat.1 Media AG,2.625%, 15/04/2021 EUR 85,000 97,276 0.45SES S.A.,5.625% 29/01/2024, FRN to 29/12/2049 100,000 111,892 0.52Time Warner, Inc.,3.8%, 15/02/2027 USD 92,000 89,735 0.41
575,024 2.66
Brokerage & Asset ManagersIntercontinental Exchange, Inc.,2.75%, 1/12/2020 USD 40,000 40,690 0.19Intercontinental Exchange, Inc.,3.75%, 1/12/2025 116,000 119,237 0.55
159,927 0.74
BuildingHeidelbergCement AG,2.25%, 30/03/2023 EUR 100,000 114,831 0.53Masco Corp.,4.375%, 1/04/2026 USD 146,000 149,887 0.69
264,718 1.22
Business ServicesCisco Systems, Inc.,2.2%, 28/02/2021 USD 105,000 104,736 0.48Equinix, Inc.,5.75%, 1/01/2025 72,000 75,960 0.35Fidelity National Information Services, Inc.,3.875%, 5/06/2024 190,000 193,851 0.90Fidelity National Information Services, Inc.,3%, 15/08/2026 91,000 85,635 0.40Fidelity National Information Services, Inc.,4.5%, 15/08/2046 43,000 41,436 0.19MSCI, Inc.,5.75%, 15/08/2025 108,000 114,413 0.53
616,031 2.85
Cable TVCharter Communications Operating LLC,6.384%, 23/10/2035 USD 124,000 139,816 0.65Comcast Corp.,2.75%, 1/03/2023 247,000 243,681 1.13Comcast Corp.,4.65%, 15/07/2042 126,000 129,564 0.60NBCUniversal Enterprise, Inc.,1.974%, 15/04/2019 200,000 200,371 0.93Shaw Communications, Inc.,5.65%, 1/10/2019 CAD 73,000 61,278 0.28Sirius XM Radio, Inc.,5.375%, 15/07/2026 USD 84,000 85,365 0.39Time Warner Cable, Inc.,5.75%, 2/06/2031 GBP 50,000 74,343 0.34Time Warner Cable, Inc.,4.5%, 15/09/2042 USD 39,000 35,038 0.16
969,456 4.48
ChemicalsHuntsman International LLC,5.125%, 15/04/2021 EUR 100,000 117,665 0.54LANXESS AG,4.5% to 6/06/2023, FRN to 6/12/2076 140,000 157,591 0.73LyondellBasell Industries N.V.,5.75%, 15/04/2024 USD 200,000 228,224 1.06PPG Industries, Inc.,0.875%, 3/11/2025 EUR 100,000 104,571 0.48
608,051 2.81
Name of SecurityTransferable Securities and Money MarketInstruments traded on a Regulated Market Shares/Par
MarketValue ($)
NetAssets (%)
Computer SoftwareMicrosoft Corp.,1.55%, 8/08/2021 USD 182,000 176,171 0.82Microsoft Corp.,4.1%, 6/02/2037 163,000 164,967 0.76VeriSign, Inc.,4.625%, 1/05/2023 179,000 180,951 0.84
522,089 2.42
Computer Software – SystemsApple, Inc.,3.85%, 4/08/2046 USD 53,000 49,259 0.23
Consumer ProductsNewell Rubbermaid, Inc.,2.05%, 1/12/2017 USD 150,000 150,516 0.70Newell Rubbermaid, Inc.,5.375%, 1/04/2036 31,000 34,778 0.16Spectrum Brands, Inc.,4%, 1/10/2026 EUR 100,000 111,337 0.51
296,631 1.37
Consumer ServicesG4S International Finance PLC,1.5%, 9/01/2023 EUR 100,000 108,067 0.50Priceline Group, Inc.,3.65%, 15/03/2025 USD 78,000 77,736 0.36Priceline Group, Inc.,1.8%, 3/03/2027 EUR 100,000 104,668 0.48
290,471 1.34
ContainersBall Corp.,5.25%, 1/07/2025 USD 60,000 63,075 0.29Crown Euro Holdings S.A.,3.375%, 15/05/2025 EUR 100,000 109,704 0.51
172,779 0.80
Defense ElectronicsBAE Systems PLC,4.125%, 8/06/2022 GBP 100,000 140,522 0.65
ElectronicsBroadcom Corp./Broadcom CaymanFinance Ltd.,3.875%, 15/01/2027 USD 188,000 186,566 0.86Flextronics International Ltd.,4.625%, 15/02/2020 32,000 33,556 0.16Tyco Electronics Group S.A.,2.375%, 17/12/2018 190,000 191,575 0.89Tyco Electronics Group S.A.,1.1%, 1/03/2023 EUR 100,000 108,522 0.50
520,219 2.41
Emerging Market Quasi-SovereignPetroleos Mexicanos,6.5%, 13/03/2027 USD 29,000 29,825 0.14
Energy – IndependentConcho Resources, Inc.,4.375%, 15/01/2025 USD 100,000 102,250 0.47
EntertainmentCarnival Corp.,1.875%, 7/11/2022 EUR 100,000 113,297 0.52
Food & BeveragesAnheuser-Busch InBev Worldwide, Inc.,4.7%, 1/02/2036 USD 140,000 146,554 0.68Anheuser-Busch InBev Worldwide, Inc.,2.75%, 17/03/2036 EUR 51,000 58,008 0.27Constellation Brands, Inc.,4.25%, 1/05/2023 USD 174,000 182,650 0.84
46 MFS Meridian Funds Annual Report 2017

SCHEDULES OF INVESTMENTS 31 January 2017
MFS Meridian Funds – Global Credit Fund, continued
Name of SecurityTransferable Securities and Money MarketInstruments traded on a Regulated Market Shares/Par
MarketValue ($)
NetAssets (%)
Food & Beverages, continuedConstellation Brands, Inc.,4.75%, 1/12/2025 USD 59,000 62,909 0.29J.M. Smucker Co.,2.5%, 15/03/2020 22,000 22,194 0.10J.M. Smucker Co.,4.375%, 15/03/2045 24,000 23,854 0.11Kraft Heinz Foods Co.,3.5%, 15/07/2022 61,000 62,041 0.29Kraft Heinz Foods Co.,5%, 15/07/2035 31,000 32,503 0.15
590,713 2.73
Food & Drug StoresWalgreens Boots Alliance, Inc.,4.65%, 1/06/2046 USD 113,000 113,126 0.52
InsuranceAmerican International Group, Inc.,3.75%, 10/07/2025 USD 126,000 126,427 0.59Aviva PLC,3.376% to 4/12/2025, FRN to 4/12/2045 EUR 100,000 104,644 0.48CNP Assurances S.A.,6% to 14/09/2020, FRN to 14/09/2040 50,000 61,127 0.28Delta Lloyd N.V., FRN,9%, 29/08/2042 100,000 135,166 0.63Hiscox Ltd.,6.125% to 24/11/2025,FRN to 24/11/2045 GBP 100,000 133,977 0.62Old Mutual PLC,7.875%, 3/11/2025 100,000 147,529 0.68Unum Group,4%, 15/03/2024 USD 90,000 90,547 0.42
799,417 3.70
Insurance – HealthAetna, Inc.,2.8%, 15/06/2023 USD 86,000 85,311 0.39UnitedHealth Group, Inc.,4.625%, 15/07/2035 147,000 159,561 0.74
244,872 1.13
Insurance – Property & CasualtyBerkshire Hathaway, Inc.,2.75%, 15/03/2023 USD 167,000 166,734 0.77Chubb INA Holdings, Inc.,2.3%, 3/11/2020 171,000 171,472 0.79Chubb INA Holdings, Inc.,2.875%, 3/11/2022 50,000 50,401 0.23CNA Financial Corp.,5.875%, 15/08/2020 190,000 211,192 0.98Liberty Mutual Group, Inc.,4.25%, 15/06/2023 103,000 108,099 0.50Marsh & McLennan Cos., Inc.,3.5%, 3/06/2024 150,000 152,405 0.71Marsh & McLennan Cos., Inc.,4.35%, 30/01/2047 34,000 33,316 0.15
893,619 4.13
International Market Quasi-SovereignElectricite de France S.A.,5.375% to 29/01/2025,FRN to 29/01/2049 EUR 100,000 108,505 0.50
International Market SovereignGovernment of Japan,2.1%, 20/09/2024 JPY 2,100,000 21,538 0.10Government of Japan,0.3%, 20/12/2025 4,600,000 41,606 0.19Government of Japan,2.4%, 20/03/2037 2,150,000 25,220 0.12
88,364 0.41
Name of SecurityTransferable Securities and Money MarketInstruments traded on a Regulated Market Shares/Par
MarketValue ($)
NetAssets (%)
Local AuthoritiesProvince of Alberta,1.25%, 1/06/2020 CAD 52,000 39,751 0.18Province of Alberta,4.5%, 1/12/2040 70,000 63,021 0.29Province of Manitoba,4.15%, 3/06/2020 46,000 38,485 0.18
141,257 0.65
Major BanksBank of America Corp.,1.75%, 5/06/2018 USD 250,000 250,146 1.16Bank of America Corp.,2.625%, 19/04/2021 108,000 107,188 0.50Bank of America Corp.,3.248%, 21/10/2027 166,000 156,708 0.72Bank of America Corp., FRN,6.1%, 29/12/2049 71,000 74,018 0.34Bank of New York Mellon Corp.,3.442% to 7/02/2027, FRN to 7/02/2028 114,000 114,000 0.53Barclays Bank PLC,6%, 14/01/2021 EUR 50,000 62,685 0.29Barclays Bank PLC,6.75% to 16/01/2018, FRN to 16/01/2023 GBP 50,000 65,462 0.30Barclays Bank PLC,3.125%, 17/01/2024 100,000 125,430 0.58Credit Agricole S.A.,7.875% to 26/10/2019,FRN to 29/10/2049 EUR 50,000 62,729 0.29Goldman Sachs Group, Inc.,5.75%, 24/01/2022 USD 220,000 246,980 1.14JPMorgan Chase & Co.,4.25%, 15/10/2020 150,000 159,131 0.74JPMorgan Chase & Co.,2.95%, 1/10/2026 166,000 156,978 0.73Morgan Stanley,2.2%, 7/12/2018 82,000 82,313 0.38Morgan Stanley,5.5%, 28/07/2021 150,000 166,253 0.77Morgan Stanley,3.125%, 27/07/2026 106,000 100,640 0.46Morgan Stanley,3.95%, 23/04/2027 75,000 73,333 0.34PNC Bank N.A.,2.6%, 21/07/2020 250,000 252,643 1.17Sumitomo Mitsui Financial Group, Inc.,0.606%, 18/01/2022 EUR 100,000 107,627 0.50Wells Fargo & Co.,4.1%, 3/06/2026 USD 140,000 141,701 0.65
2,505,965 11.59
Medical & Health Technology & ServicesBecton, Dickinson and Co.,3.734%, 15/12/2024 USD 13,000 13,325 0.06Becton, Dickinson and Co.,4.685%, 15/12/2044 30,000 30,991 0.15HCA, Inc.,5.25%, 15/06/2026 89,000 92,783 0.43Laboratory Corp. of America Holdings,4.7%, 1/02/2045 118,000 117,059 0.54Universal Health Services, Inc.,5%, 1/06/2026 85,000 84,575 0.39
338,733 1.57
Medical EquipmentMedtronic, Inc.,3.5%, 15/03/2025 USD 285,000 291,281 1.35
MFS Meridian Funds Annual Report 2017 47
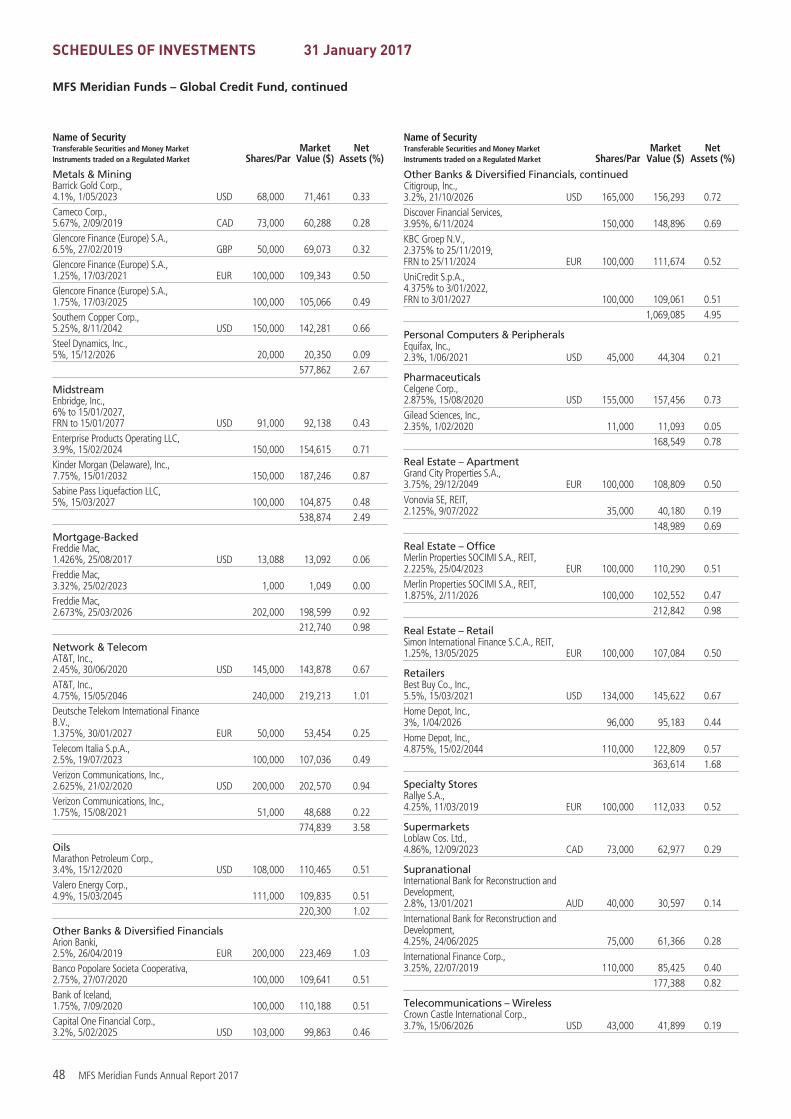
SCHEDULES OF INVESTMENTS 31 January 2017
MFS Meridian Funds – Global Credit Fund, continued
Name of SecurityTransferable Securities and Money MarketInstruments traded on a Regulated Market Shares/Par
MarketValue ($)
NetAssets (%)
Metals & MiningBarrick Gold Corp.,4.1%, 1/05/2023 USD 68,000 71,461 0.33Cameco Corp.,5.67%, 2/09/2019 CAD 73,000 60,288 0.28Glencore Finance (Europe) S.A.,6.5%, 27/02/2019 GBP 50,000 69,073 0.32Glencore Finance (Europe) S.A.,1.25%, 17/03/2021 EUR 100,000 109,343 0.50Glencore Finance (Europe) S.A.,1.75%, 17/03/2025 100,000 105,066 0.49Southern Copper Corp.,5.25%, 8/11/2042 USD 150,000 142,281 0.66Steel Dynamics, Inc.,5%, 15/12/2026 20,000 20,350 0.09
577,862 2.67
MidstreamEnbridge, Inc.,6% to 15/01/2027,FRN to 15/01/2077 USD 91,000 92,138 0.43Enterprise Products Operating LLC,3.9%, 15/02/2024 150,000 154,615 0.71Kinder Morgan (Delaware), Inc.,7.75%, 15/01/2032 150,000 187,246 0.87Sabine Pass Liquefaction LLC,5%, 15/03/2027 100,000 104,875 0.48
538,874 2.49
Mortgage-BackedFreddie Mac,1.426%, 25/08/2017 USD 13,088 13,092 0.06Freddie Mac,3.32%, 25/02/2023 1,000 1,049 0.00Freddie Mac,2.673%, 25/03/2026 202,000 198,599 0.92
212,740 0.98
Network & TelecomAT&T, Inc.,2.45%, 30/06/2020 USD 145,000 143,878 0.67AT&T, Inc.,4.75%, 15/05/2046 240,000 219,213 1.01Deutsche Telekom International FinanceB.V.,1.375%, 30/01/2027 EUR 50,000 53,454 0.25Telecom Italia S.p.A.,2.5%, 19/07/2023 100,000 107,036 0.49Verizon Communications, Inc.,2.625%, 21/02/2020 USD 200,000 202,570 0.94Verizon Communications, Inc.,1.75%, 15/08/2021 51,000 48,688 0.22
774,839 3.58
OilsMarathon Petroleum Corp.,3.4%, 15/12/2020 USD 108,000 110,465 0.51Valero Energy Corp.,4.9%, 15/03/2045 111,000 109,835 0.51
220,300 1.02
Other Banks & Diversified FinancialsArion Banki,2.5%, 26/04/2019 EUR 200,000 223,469 1.03Banco Popolare Societa Cooperativa,2.75%, 27/07/2020 100,000 109,641 0.51Bank of Iceland,1.75%, 7/09/2020 100,000 110,188 0.51Capital One Financial Corp.,3.2%, 5/02/2025 USD 103,000 99,863 0.46
Name of SecurityTransferable Securities and Money MarketInstruments traded on a Regulated Market Shares/Par
MarketValue ($)
NetAssets (%)
Other Banks & Diversified Financials, continuedCitigroup, Inc.,3.2%, 21/10/2026 USD 165,000 156,293 0.72Discover Financial Services,3.95%, 6/11/2024 150,000 148,896 0.69KBC Groep N.V.,2.375% to 25/11/2019,FRN to 25/11/2024 EUR 100,000 111,674 0.52UniCredit S.p.A.,4.375% to 3/01/2022,FRN to 3/01/2027 100,000 109,061 0.51
1,069,085 4.95
Personal Computers & PeripheralsEquifax, Inc.,2.3%, 1/06/2021 USD 45,000 44,304 0.21
PharmaceuticalsCelgene Corp.,2.875%, 15/08/2020 USD 155,000 157,456 0.73Gilead Sciences, Inc.,2.35%, 1/02/2020 11,000 11,093 0.05
168,549 0.78
Real Estate – ApartmentGrand City Properties S.A.,3.75%, 29/12/2049 EUR 100,000 108,809 0.50Vonovia SE, REIT,2.125%, 9/07/2022 35,000 40,180 0.19
148,989 0.69
Real Estate – OfficeMerlin Properties SOCIMI S.A., REIT,2.225%, 25/04/2023 EUR 100,000 110,290 0.51Merlin Properties SOCIMI S.A., REIT,1.875%, 2/11/2026 100,000 102,552 0.47
212,842 0.98
Real Estate – RetailSimon International Finance S.C.A., REIT,1.25%, 13/05/2025 EUR 100,000 107,084 0.50
RetailersBest Buy Co., Inc.,5.5%, 15/03/2021 USD 134,000 145,622 0.67Home Depot, Inc.,3%, 1/04/2026 96,000 95,183 0.44Home Depot, Inc.,4.875%, 15/02/2044 110,000 122,809 0.57
363,614 1.68
Specialty StoresRallye S.A.,4.25%, 11/03/2019 EUR 100,000 112,033 0.52
SupermarketsLoblaw Cos. Ltd.,4.86%, 12/09/2023 CAD 73,000 62,977 0.29
SupranationalInternational Bank for Reconstruction andDevelopment,2.8%, 13/01/2021 AUD 40,000 30,597 0.14International Bank for Reconstruction andDevelopment,4.25%, 24/06/2025 75,000 61,366 0.28International Finance Corp.,3.25%, 22/07/2019 110,000 85,425 0.40
177,388 0.82
Telecommunications – WirelessCrown Castle International Corp.,3.7%, 15/06/2026 USD 43,000 41,899 0.19
48 MFS Meridian Funds Annual Report 2017
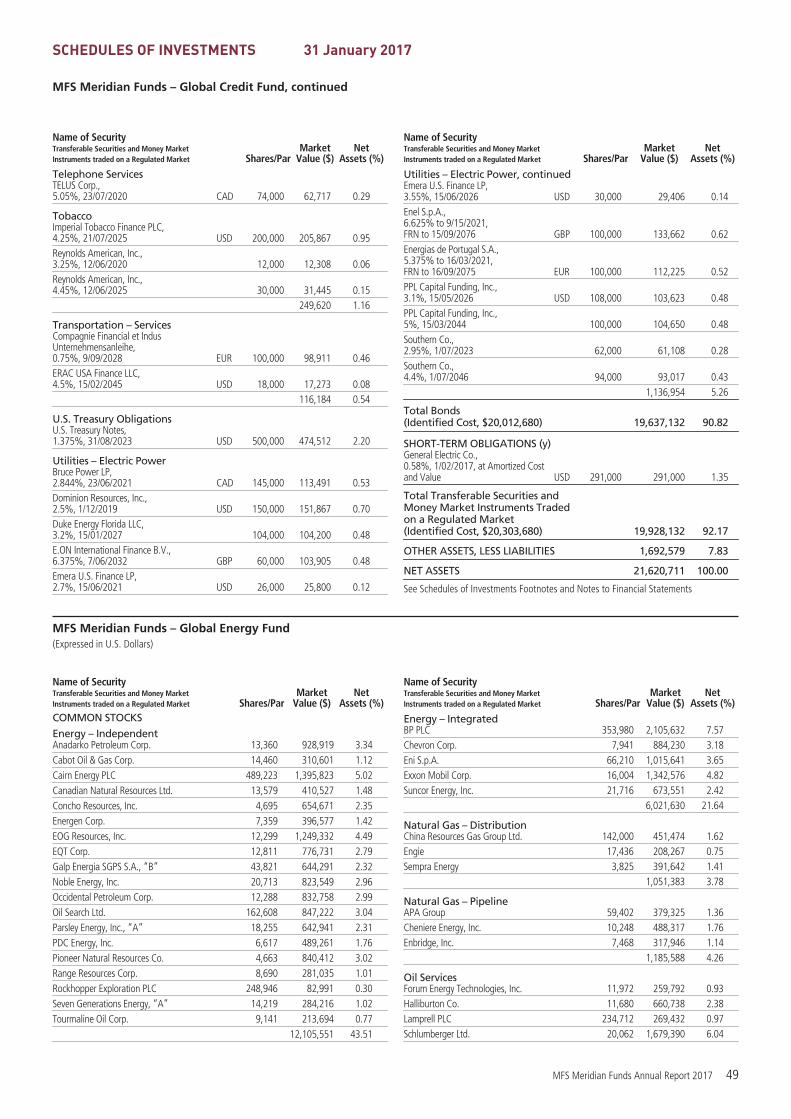
SCHEDULES OF INVESTMENTS 31 January 2017
MFS Meridian Funds – Global Credit Fund, continued
Name of SecurityTransferable Securities and Money MarketInstruments traded on a Regulated Market Shares/Par
MarketValue ($)
NetAssets (%)
Telephone ServicesTELUS Corp.,5.05%, 23/07/2020 CAD 74,000 62,717 0.29
TobaccoImperial Tobacco Finance PLC,4.25%, 21/07/2025 USD 200,000 205,867 0.95Reynolds American, Inc.,3.25%, 12/06/2020 12,000 12,308 0.06Reynolds American, Inc.,4.45%, 12/06/2025 30,000 31,445 0.15
249,620 1.16
Transportation – ServicesCompagnie Financial et IndusUnternehmensanleihe,0.75%, 9/09/2028 EUR 100,000 98,911 0.46ERAC USA Finance LLC,4.5%, 15/02/2045 USD 18,000 17,273 0.08
116,184 0.54
U.S. Treasury ObligationsU.S. Treasury Notes,1.375%, 31/08/2023 USD 500,000 474,512 2.20
Utilities – Electric PowerBruce Power LP,2.844%, 23/06/2021 CAD 145,000 113,491 0.53Dominion Resources, Inc.,2.5%, 1/12/2019 USD 150,000 151,867 0.70Duke Energy Florida LLC,3.2%, 15/01/2027 104,000 104,200 0.48E.ON International Finance B.V.,6.375%, 7/06/2032 GBP 60,000 103,905 0.48Emera U.S. Finance LP,2.7%, 15/06/2021 USD 26,000 25,800 0.12
Name of SecurityTransferable Securities and Money MarketInstruments traded on a Regulated Market Shares/Par
MarketValue ($)
NetAssets (%)
Utilities – Electric Power, continuedEmera U.S. Finance LP,3.55%, 15/06/2026 USD 30,000 29,406 0.14Enel S.p.A.,6.625% to 9/15/2021,FRN to 15/09/2076 GBP 100,000 133,662 0.62Energias de Portugal S.A.,5.375% to 16/03/2021,FRN to 16/09/2075 EUR 100,000 112,225 0.52PPL Capital Funding, Inc.,3.1%, 15/05/2026 USD 108,000 103,623 0.48PPL Capital Funding, Inc.,5%, 15/03/2044 100,000 104,650 0.48Southern Co.,2.95%, 1/07/2023 62,000 61,108 0.28Southern Co.,4.4%, 1/07/2046 94,000 93,017 0.43
1,136,954 5.26
Total Bonds(Identified Cost, $20,012,680) 19,637,132 90.82
SHORT-TERM OBLIGATIONS (y)General Electric Co.,0.58%, 1/02/2017, at Amortized Costand Value USD 291,000 291,000 1.35
Total Transferable Securities andMoney Market Instruments Tradedon a Regulated Market(Identified Cost, $20,303,680) 19,928,132 92.17
OTHER ASSETS, LESS LIABILITIES 1,692,579 7.83
NET ASSETS 21,620,711 100.00
See Schedules of Investments Footnotes and Notes to Financial Statements
MFS Meridian Funds – Global Energy Fund(Expressed in U.S. Dollars)
Name of SecurityTransferable Securities and Money MarketInstruments traded on a Regulated Market Shares/Par
MarketValue ($)
NetAssets (%)
COMMON STOCKS
Energy – IndependentAnadarko Petroleum Corp. 13,360 928,919 3.34Cabot Oil & Gas Corp. 14,460 310,601 1.12Cairn Energy PLC 489,223 1,395,823 5.02Canadian Natural Resources Ltd. 13,579 410,527 1.48Concho Resources, Inc. 4,695 654,671 2.35Energen Corp. 7,359 396,577 1.42EOG Resources, Inc. 12,299 1,249,332 4.49EQT Corp. 12,811 776,731 2.79Galp Energia SGPS S.A., “B” 43,821 644,291 2.32Noble Energy, Inc. 20,713 823,549 2.96Occidental Petroleum Corp. 12,288 832,758 2.99Oil Search Ltd. 162,608 847,222 3.04Parsley Energy, Inc., “A” 18,255 642,941 2.31PDC Energy, Inc. 6,617 489,261 1.76Pioneer Natural Resources Co. 4,663 840,412 3.02Range Resources Corp. 8,690 281,035 1.01Rockhopper Exploration PLC 248,946 82,991 0.30Seven Generations Energy, “A” 14,219 284,216 1.02Tourmaline Oil Corp. 9,141 213,694 0.77
12,105,551 43.51
Name of SecurityTransferable Securities and Money MarketInstruments traded on a Regulated Market Shares/Par
MarketValue ($)
NetAssets (%)
Energy – IntegratedBP PLC 353,980 2,105,632 7.57Chevron Corp. 7,941 884,230 3.18Eni S.p.A. 66,210 1,015,641 3.65Exxon Mobil Corp. 16,004 1,342,576 4.82Suncor Energy, Inc. 21,716 673,551 2.42
6,021,630 21.64
Natural Gas – DistributionChina Resources Gas Group Ltd. 142,000 451,474 1.62Engie 17,436 208,267 0.75Sempra Energy 3,825 391,642 1.41
1,051,383 3.78
Natural Gas – PipelineAPA Group 59,402 379,325 1.36Cheniere Energy, Inc. 10,248 488,317 1.76Enbridge, Inc. 7,468 317,946 1.14
1,185,588 4.26
Oil ServicesForum Energy Technologies, Inc. 11,972 259,792 0.93Halliburton Co. 11,680 660,738 2.38Lamprell PLC 234,712 269,432 0.97Schlumberger Ltd. 20,062 1,679,390 6.04
MFS Meridian Funds Annual Report 2017 49

SCHEDULES OF INVESTMENTS 31 January 2017
MFS Meridian Funds – Global Energy Fund, continued
Name of SecurityTransferable Securities and Money MarketInstruments traded on a Regulated Market Shares/Par
MarketValue ($)
NetAssets (%)
Oil Services, continuedSuperior Energy Services, Inc. 8,099 143,109 0.51TechnipFMC PLC 8,356 273,856 0.98
3,286,317 11.81
Specialty ChemicalsLG Chem Ltd. 1,267 285,650 1.02
Utilities – Electric PowerCMS Energy Corp. 7,976 339,778 1.22Dominion Resources, Inc. 4,111 313,587 1.13EDP Renovaveis S.A. 67,979 436,117 1.57Glow Energy PLC 55,900 123,834 0.44NextEra Energy, Inc. 3,938 487,209 1.75PPL Corp. 9,646 336,067 1.21
2,036,592 7.32
Total Common Stocks(Identified Cost, $24,664,291) 25,972,711 93.34
Name of SecurityTransferable Securities and Money MarketInstruments traded on a Regulated Market Shares/Par
MarketValue ($)
NetAssets (%)
CLOSED-END FUND
Special Products & ServicesRiverstone Energy Ltd. 76,640 1,224,446 4.40
SHORT-TERM OBLIGATIONS (y)General Electric Co.,0.58%, 1/02/2017, at Amortized Costand Value USD 264,000 264,000 0.95
Total Transferable Securities andMoney Market Instruments Tradedon a Regulated Market(Identified Cost, $25,943,687) (k) 27,461,157 98.69
OTHER ASSETS, LESS LIABILITIES 363,229 1.31
NET ASSETS 27,824,386 100.00
See Schedules of Investments Footnotes and Notes to Financial Statements
MFS Meridian Funds – Global Equity Fund(Expressed in U.S. Dollars)
Name of SecurityTransferable Securities and Money MarketInstruments traded on a Regulated Market Shares/Par
MarketValue ($)
NetAssets (%)
COMMON STOCKS
AerospaceHoneywell International, Inc. 1,084,493 128,317,208 2.42MTU Aero Engines Holding AG 353,166 42,165,433 0.80United Technologies Corp. 532,865 58,439,305 1.10
228,921,946 4.32
AirlinesAena S.A. 234,651 34,031,621 0.64
Alcoholic BeveragesAmBev S.A. 5,408,373 29,521,125 0.56Carlsberg A.S., “B” 478,988 43,250,737 0.82Diageo PLC 3,890,878 107,855,195 2.03Heineken N.V. 597,515 44,654,548 0.84Pernod Ricard S.A. 840,547 98,313,570 1.85
323,595,175 6.10
Apparel ManufacturersBurberry Group PLC 1,632,413 33,678,620 0.64Compagnie Financiere Richemont S.A. 700,343 54,283,571 1.02LVMH Moet Hennessy Louis Vuitton SE 455,226 91,698,292 1.73
179,660,483 3.39
AutomotiveDelphi Automotive PLC 438,940 30,752,136 0.58Harley-Davidson, Inc. 498,601 28,440,201 0.54
59,192,337 1.12
BroadcastingOmnicom Group, Inc. 549,917 47,100,391 0.89Time Warner, Inc. 1,276,689 123,647,330 2.33Walt Disney Co. 1,119,390 123,860,504 2.34WPP PLC 4,076,091 94,555,150 1.78
389,163,375 7.34
Brokerage & Asset ManagersDeutsche Boerse AG 321,917 29,621,695 0.56Franklin Resources, Inc. 1,229,998 48,880,121 0.92
78,501,816 1.48
Name of SecurityTransferable Securities and Money MarketInstruments traded on a Regulated Market Shares/Par
MarketValue ($)
NetAssets (%)
Business ServicesAccenture PLC, “A” 996,364 113,455,969 2.14Adecco S.A. 584,751 41,601,203 0.78Brenntag AG 327,701 19,010,694 0.36Cognizant Technology Solutions Corp., “A” 605,601 31,848,557 0.60Compass Group PLC 3,239,178 57,537,357 1.09PayPal Holdings, Inc. 654,322 26,028,929 0.49
289,482,709 5.46
Cable TVCharter Communications, Inc., “A” 117,495 38,062,505 0.72Sky PLC 3,273,514 41,221,964 0.77
79,284,469 1.49
Chemicals3M Co. 492,703 86,134,338 1.62Monsanto Co. 523,424 56,692,053 1.07
142,826,391 2.69
Computer SoftwareCheck Point Software Technologies Ltd. 544,632 53,793,303 1.01Oracle Corp. 2,196,723 88,110,560 1.66
141,903,863 2.67
Consumer ProductsColgate-Palmolive Co. 951,375 61,439,798 1.16Coty, Inc., “A” 3,921,508 75,292,954 1.42International Flavors & Fragrances, Inc. 130,994 15,353,807 0.29Reckitt Benckiser Group PLC 1,288,610 110,297,636 2.08Svenska Cellulosa Aktiebolaget 3,590,242 107,948,194 2.03
370,332,389 6.98
Electrical EquipmentAmphenol Corp., “A” 501,316 33,833,817 0.64Legrand S.A. 721,313 41,876,185 0.79Schneider Electric S.A. 849,263 60,709,119 1.14W.W. Grainger, Inc. 149,727 37,816,548 0.71
174,235,669 3.28
50 MFS Meridian Funds Annual Report 2017

SCHEDULES OF INVESTMENTS 31 January 2017
MFS Meridian Funds – Global Equity Fund, continued
Name of SecurityTransferable Securities and Money MarketInstruments traded on a Regulated Market Shares/Par
MarketValue ($)
NetAssets (%)
ElectronicsHoya Corp. 729,000 31,778,744 0.60Microchip Technology, Inc. 503,489 33,909,984 0.64Samsung Electronics Co. Ltd. 25,341 43,023,658 0.81
108,712,386 2.05
Food & BeveragesDanone S.A. 1,228,663 76,914,539 1.45Kellogg Co. 950,745 69,128,669 1.31Nestle S.A. 1,831,177 133,792,226 2.52
279,835,434 5.28
Gaming & LodgingMarriott International, Inc., “A” 225,279 19,058,603 0.36Sands China Ltd. 2,467,200 10,897,731 0.21Wynn Resorts Ltd. 100,062 10,149,289 0.19
40,105,623 0.76
InsuranceSwiss Re Ltd. 203,191 18,911,516 0.36
InterneteBay, Inc. 1,436,866 45,735,445 0.86
Machinery & ToolsKubota Corp. 1,965,600 31,335,400 0.59
Major BanksBank of New York Mellon Corp. 1,951,120 87,273,598 1.65Goldman Sachs Group, Inc. 264,226 60,592,306 1.14Standard Chartered PLC 905,830 8,821,129 0.17State Street Corp. 1,316,937 100,350,599 1.89
257,037,632 4.85
Medical EquipmentAbbott Laboratories 1,187,237 49,590,889 0.93Cooper Cos., Inc. 302,628 55,868,155 1.05Dentsply Sirona, Inc. 407,083 23,081,606 0.44Medtronic PLC 1,569,285 119,297,046 2.25Sonova Holding AG 213,102 28,081,957 0.53Stryker Corp. 865,645 106,933,127 2.02Thermo Fisher Scientific, Inc. 1,016,496 154,903,825 2.92Waters Corp. 311,654 44,145,789 0.83Zimmer Biomet Holdings, Inc. 951,179 112,553,011 2.12
694,455,405 13.09
Network & TelecomCisco Systems, Inc. 1,205,151 37,022,239 0.70
Oil ServicesNational Oilwell Varco, Inc. 476,042 17,999,148 0.34NOW, Inc. 268,299 5,704,037 0.11Schlumberger Ltd. 561,880 47,034,975 0.88
70,738,160 1.33
Other Banks & Diversified FinancialsAmerican Express Co. 964,040 73,633,375 1.39Erste Group Bank AG 708,317 21,516,633 0.40
Name of SecurityTransferable Securities and Money MarketInstruments traded on a Regulated Market Shares/Par
MarketValue ($)
NetAssets (%)
Other Banks & Diversified Financials, continuedGrupo Financiero Banorte S.A. deC.V. 3,276,683 15,705,012 0.29Julius Baer Group Ltd. 586,673 27,414,238 0.52Kasikornbank Co. Ltd. 2,214,300 11,791,572 0.22Komercni Banka A.S. 212,654 7,518,629 0.14UBS AG 4,722,640 76,217,029 1.44Visa, Inc., “A” 1,350,819 111,726,239 2.11
345,522,727 6.51
PharmaceuticalsBayer AG 1,262,055 139,372,300 2.63Johnson & Johnson 187,726 21,259,970 0.40Merck KGaA 419,022 45,979,766 0.87Roche Holding AG 386,090 90,908,969 1.71
297,521,005 5.61
Railroad & ShippingCanadian National Railway Co. 1,303,918 90,648,379 1.71Union Pacific Corp. 245,346 26,148,977 0.49
116,797,356 2.20
RestaurantsWhitbread PLC 676,778 33,416,910 0.63
Specialty ChemicalsAkzo Nobel N.V. 886,077 60,059,885 1.13L’Air Liquide S.A. 257,369 27,782,977 0.52Linde AG 404,782 65,740,944 1.24Praxair, Inc. 312,113 36,966,664 0.70
190,550,470 3.59
Specialty StoresAutoZone, Inc. 50,460 36,582,491 0.69Hermes International 25,260 10,974,073 0.21Sally Beauty Holdings, Inc. 1,196,463 28,475,819 0.54Urban Outfitters, Inc. 883,161 23,439,093 0.44
99,471,476 1.88
TruckingUnited Parcel Service, Inc., “B” 715,521 78,084,807 1.47
Total Common Stocks(Identified Cost, $4,410,507,373) 5,236,386,234 98.72
SHORT-TERM OBLIGATIONS (y)General Electric Co.,0.58%, 1/02/2017, atAmortized Cost and Value USD 28,770,000 28,770,000 0.54
Total Transferable Securities andMoney Market Instruments Tradedon a Regulated Market(Identified Cost, $4,439,277,373) (k) 5,265,156,234 99.26
OTHER ASSETS, LESS LIABILITIES 39,006,740 0.74
NET ASSETS 5,304,162,974 100.00
See Schedules of Investments Footnotes and Notes to Financial Statements
MFS Meridian Funds Annual Report 2017 51

SCHEDULES OF INVESTMENTS 31 January 2017
MFS Meridian Funds – Global Equity Income Fund(Expressed in U.S. Dollars)
Name of SecurityTransferable Securities and Money MarketInstruments traded on a Regulated Market Shares/Par
MarketValue ($)
NetAssets (%)
COMMON STOCKS
AerospaceNorthrop Grumman Corp. 7,673 1,757,731 0.70
AirlinesAir Canada 121,003 1,243,274 0.50Copa Holdings S.A., “A” 14,291 1,393,230 0.55
2,636,504 1.05
AutomotiveGeneral Motors Co. 93,666 3,429,112 1.36Hyundai Motor Co. Ltd. 6,946 833,807 0.33Magna International, Inc. 21,847 945,066 0.38
5,207,985 2.07
BiotechnologyCelgene Corp. 22,861 2,655,305 1.06
Cable TVCharter Communications, Inc., “A” 16,402 5,313,428 2.11
ChemicalsLyondellBasell Industries N.V., “A” 8,527 795,313 0.32
Computer SoftwareCheck Point Software Technologies Ltd. 40,744 4,024,285 1.60
Computer Software – SystemsHon Hai Precision Industry Co. Ltd. 961,300 2,581,073 1.03
ConstructionBellway PLC 16,215 506,698 0.20Owens Corning 25,640 1,416,610 0.56
1,923,308 0.76
Consumer ProductsProcter & Gamble Co. 69,559 6,093,368 2.43Svenska Cellulosa Aktiebolaget 169,077 5,083,656 2.02
11,177,024 4.45
Electrical EquipmentSiemens AG 48,239 6,053,601 2.41
ElectronicsIntel Corp. 84,709 3,118,985 1.24Samsung Electronics Co. Ltd. 3,118 5,293,705 2.10Taiwan Semiconductor Manufacturing Co.Ltd., ADR 254,380 7,862,886 3.13
16,275,576 6.47
Energy – IndependentGalp Energia SGPS S.A., “B” 159,713 2,348,226 0.93Rice Energy, Inc. 126,440 2,507,305 1.00Valero Energy Corp. 40,890 2,688,926 1.07
7,544,457 3.00
Energy – IntegratedBP PLC 611,412 3,636,953 1.45China Petroleum & Chemical Corp. 1,646,000 1,317,411 0.52Exxon Mobil Corp. 44,059 3,696,110 1.47LUKOIL PJSC, ADR 43,479 2,439,607 0.97
11,090,081 4.41
Engineering – ConstructionBouygues S.A. 27,279 991,062 0.40VINCI S.A. 39,174 2,744,512 1.09
3,735,574 1.49
Food & BeveragesGeneral Mills, Inc. 81,040 5,063,379 2.01Marine Harvest 162,826 2,878,260 1.15Nestle S.A. 18,380 1,342,907 0.53
Name of SecurityTransferable Securities and Money MarketInstruments traded on a Regulated Market Shares/Par
MarketValue ($)
NetAssets (%)
Food & Beverages, continuedTyson Foods, Inc., “A” 19,483 1,223,338 0.49
10,507,884 4.18
Food & Drug StoresLawson, Inc. 17,800 1,299,017 0.52Wesfarmers Ltd. 76,816 2,345,438 0.93
3,644,455 1.45
Gaming & LodgingSands China Ltd. 637,600 2,816,307 1.12
InsuranceMetLife, Inc. 60,135 3,271,945 1.30Prudential Financial, Inc. 29,736 3,125,551 1.25Swiss Re Ltd. 14,365 1,336,988 0.53Zurich Insurance Group AG 26,953 7,721,869 3.07
15,456,353 6.15
Major BanksBNP Paribas 37,091 2,369,551 0.94BOC Hong Kong Holdings Ltd. 459,500 1,837,472 0.73Canadian Imperial Bank of Commerce 29,102 2,478,227 0.99China Construction Bank 4,575,000 3,401,024 1.35National Australia Bank Ltd. 35,107 807,541 0.32Royal Bank of Canada 14,597 1,049,086 0.42Toronto-Dominion Bank 34,883 1,807,080 0.72
13,749,981 5.47
Medical & Health Technology & ServicesHCA Holdings, Inc. 25,588 2,054,205 0.82
Metals & MiningRio Tinto Ltd. 123,777 5,435,884 2.16
Natural Gas – DistributionEngie 266,753 3,186,275 1.27
Natural Gas – PipelineWilliams Partners LP 42,831 1,757,784 0.70
Network & TelecomCisco Systems, Inc. 87,985 2,702,899 1.07
Oil ServicesTechnipFMC PLC 35,692 1,169,756 0.47
Other Banks & Diversified FinancialsAgricultural Bank of China Ltd., “H” 1,916,000 801,561 0.32DBS Group Holdings Ltd. 315,000 4,239,933 1.68UBS AG 107,860 1,740,715 0.69
6,782,209 2.69
PharmaceuticalsBayer AG 38,607 4,263,480 1.70Eli Lilly & Co. 77,394 5,961,660 2.37Merck & Co., Inc. 180,311 11,177,479 4.45Novartis AG 86,714 6,348,774 2.52Roche Holding AG 10,925 2,572,407 1.02
30,323,800 12.06
Real EstateMedical Properties Trust, Inc., REIT 221,431 2,823,245 1.12Starwood Property Trust, Inc., REIT 71,155 1,583,910 0.63Washington Prime Group, Inc., REIT 47,420 457,603 0.18
4,864,758 1.93
RestaurantsBrinker International, Inc. 36,095 1,606,228 0.64Greggs PLC 39,342 481,064 0.19
2,087,292 0.83
52 MFS Meridian Funds Annual Report 2017
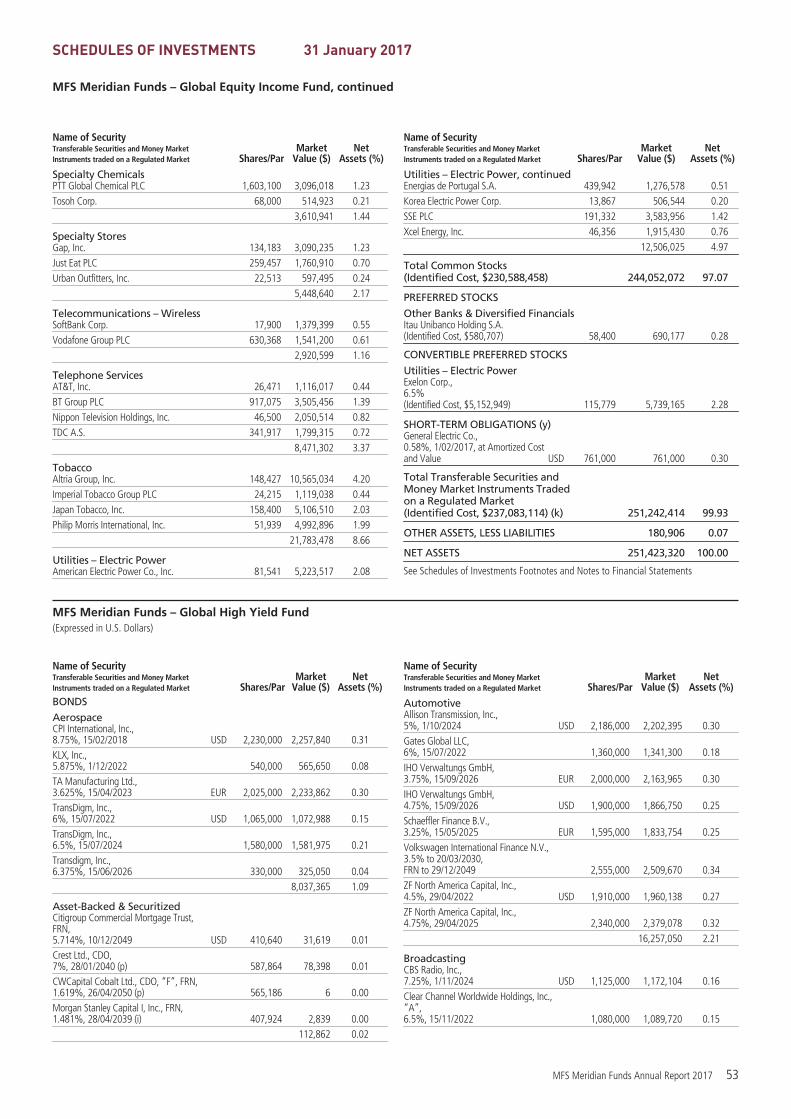
SCHEDULES OF INVESTMENTS 31 January 2017
MFS Meridian Funds – Global Equity Income Fund, continued
Name of SecurityTransferable Securities and Money MarketInstruments traded on a Regulated Market Shares/Par
MarketValue ($)
NetAssets (%)
Specialty ChemicalsPTT Global Chemical PLC 1,603,100 3,096,018 1.23Tosoh Corp. 68,000 514,923 0.21
3,610,941 1.44
Specialty StoresGap, Inc. 134,183 3,090,235 1.23Just Eat PLC 259,457 1,760,910 0.70Urban Outfitters, Inc. 22,513 597,495 0.24
5,448,640 2.17
Telecommunications – WirelessSoftBank Corp. 17,900 1,379,399 0.55Vodafone Group PLC 630,368 1,541,200 0.61
2,920,599 1.16
Telephone ServicesAT&T, Inc. 26,471 1,116,017 0.44BT Group PLC 917,075 3,505,456 1.39Nippon Television Holdings, Inc. 46,500 2,050,514 0.82TDC A.S. 341,917 1,799,315 0.72
8,471,302 3.37
TobaccoAltria Group, Inc. 148,427 10,565,034 4.20Imperial Tobacco Group PLC 24,215 1,119,038 0.44Japan Tobacco, Inc. 158,400 5,106,510 2.03Philip Morris International, Inc. 51,939 4,992,896 1.99
21,783,478 8.66
Utilities – Electric PowerAmerican Electric Power Co., Inc. 81,541 5,223,517 2.08
Name of SecurityTransferable Securities and Money MarketInstruments traded on a Regulated Market Shares/Par
MarketValue ($)
NetAssets (%)
Utilities – Electric Power, continuedEnergias de Portugal S.A. 439,942 1,276,578 0.51Korea Electric Power Corp. 13,867 506,544 0.20SSE PLC 191,332 3,583,956 1.42Xcel Energy, Inc. 46,356 1,915,430 0.76
12,506,025 4.97
Total Common Stocks(Identified Cost, $230,588,458) 244,052,072 97.07
PREFERRED STOCKS
Other Banks & Diversified FinancialsItau Unibanco Holding S.A.(Identified Cost, $580,707) 58,400 690,177 0.28
CONVERTIBLE PREFERRED STOCKS
Utilities – Electric PowerExelon Corp.,6.5%(Identified Cost, $5,152,949) 115,779 5,739,165 2.28
SHORT-TERM OBLIGATIONS (y)General Electric Co.,0.58%, 1/02/2017, at Amortized Costand Value USD 761,000 761,000 0.30
Total Transferable Securities andMoney Market Instruments Tradedon a Regulated Market(Identified Cost, $237,083,114) (k) 251,242,414 99.93
OTHER ASSETS, LESS LIABILITIES 180,906 0.07
NET ASSETS 251,423,320 100.00
See Schedules of Investments Footnotes and Notes to Financial Statements
MFS Meridian Funds – Global High Yield Fund(Expressed in U.S. Dollars)
Name of SecurityTransferable Securities and Money MarketInstruments traded on a Regulated Market Shares/Par
MarketValue ($)
NetAssets (%)
BONDS
AerospaceCPI International, Inc.,8.75%, 15/02/2018 USD 2,230,000 2,257,840 0.31KLX, Inc.,5.875%, 1/12/2022 540,000 565,650 0.08TA Manufacturing Ltd.,3.625%, 15/04/2023 EUR 2,025,000 2,233,862 0.30TransDigm, Inc.,6%, 15/07/2022 USD 1,065,000 1,072,988 0.15TransDigm, Inc.,6.5%, 15/07/2024 1,580,000 1,581,975 0.21Transdigm, Inc.,6.375%, 15/06/2026 330,000 325,050 0.04
8,037,365 1.09
Asset-Backed & SecuritizedCitigroup Commercial Mortgage Trust,FRN,5.714%, 10/12/2049 USD 410,640 31,619 0.01Crest Ltd., CDO,7%, 28/01/2040 (p) 587,864 78,398 0.01CWCapital Cobalt Ltd., CDO, “F”, FRN,1.619%, 26/04/2050 (p) 565,186 6 0.00Morgan Stanley Capital I, Inc., FRN,1.481%, 28/04/2039 (i) 407,924 2,839 0.00
112,862 0.02
Name of SecurityTransferable Securities and Money MarketInstruments traded on a Regulated Market Shares/Par
MarketValue ($)
NetAssets (%)
AutomotiveAllison Transmission, Inc.,5%, 1/10/2024 USD 2,186,000 2,202,395 0.30Gates Global LLC,6%, 15/07/2022 1,360,000 1,341,300 0.18IHO Verwaltungs GmbH,3.75%, 15/09/2026 EUR 2,000,000 2,163,965 0.30IHO Verwaltungs GmbH,4.75%, 15/09/2026 USD 1,900,000 1,866,750 0.25Schaeffler Finance B.V.,3.25%, 15/05/2025 EUR 1,595,000 1,833,754 0.25Volkswagen International Finance N.V.,3.5% to 20/03/2030,FRN to 29/12/2049 2,555,000 2,509,670 0.34ZF North America Capital, Inc.,4.5%, 29/04/2022 USD 1,910,000 1,960,138 0.27ZF North America Capital, Inc.,4.75%, 29/04/2025 2,340,000 2,379,078 0.32
16,257,050 2.21
BroadcastingCBS Radio, Inc.,7.25%, 1/11/2024 USD 1,125,000 1,172,104 0.16Clear Channel Worldwide Holdings, Inc.,“A”,6.5%, 15/11/2022 1,080,000 1,089,720 0.15
MFS Meridian Funds Annual Report 2017 53

SCHEDULES OF INVESTMENTS 31 January 2017
MFS Meridian Funds – Global High Yield Fund, continued
Name of SecurityTransferable Securities and Money MarketInstruments traded on a Regulated Market Shares/Par
MarketValue ($)
NetAssets (%)
Broadcasting, continuedClear Channel Worldwide Holdings, Inc.,“B”,6.5%, 15/11/2022 USD 1,345,000 1,404,180 0.19iHeartMedia, Inc.,9%, 1/03/2021 1,170,000 874,575 0.12Liberty Media Corp. – Liberty FormulaOne,8.5%, 15/07/2029 1,330,000 1,476,300 0.20Liberty Media Corp. – Liberty FormulaOne,8.25%, 1/02/2030 265,000 278,250 0.04Match Group, Inc.,6.375%, 1/06/2024 1,510,000 1,619,475 0.22Netflix, Inc.,5.375%, 1/02/2021 1,575,000 1,691,156 0.23Netflix, Inc.,5.875%, 15/02/2025 225,000 244,125 0.03Netflix, Inc.,4.375%, 15/11/2026 825,000 809,531 0.11Nexstar Broadcasting, Inc.,6.875%, 15/11/2020 1,650,000 1,711,215 0.23
12,370,631 1.68
BuildingABC Supply Co., Inc.,5.75%, 15/12/2023 USD 1,030,000 1,071,200 0.15Allegion PLC,5.875%, 15/09/2023 661,000 703,965 0.10Allegion U.S. Holding Co., Inc.,5.75%, 1/10/2021 1,945,000 2,027,663 0.28Beacon Roofing Supply, Inc.,6.375%, 1/10/2023 1,805,000 1,935,863 0.26CEMEX S.A.B. de C.V.,5.7%, 11/01/2025 350,000 354,025 0.05Cimpor Financial Operations B.V.,5.75%, 17/07/2024 2,861,000 2,487,640 0.34Elementia S.A. de C.V.,5.5%, 15/01/2025 3,131,000 3,021,415 0.41Gibraltar Industries, Inc.,6.25%, 1/02/2021 1,675,000 1,730,484 0.23Grupo Cementos de Chihuahua S.A.B. deC.V.,8.125%, 8/02/2020 3,717,000 3,865,680 0.52HD Supply, Inc.,5.75%, 15/04/2024 1,410,000 1,484,025 0.20Paroc Group OY,6.25%, 15/05/2020 EUR 2,075,000 2,297,417 0.31PriSo Acquisition Corp.,9%, 15/05/2023 USD 2,145,000 2,187,900 0.30Standard Industries, Inc.,5.375%, 15/11/2024 1,510,000 1,557,188 0.21Standard Industries, Inc.,6%, 15/10/2025 1,340,000 1,413,700 0.19Summit Materials LLC/Summit MaterialsFinance Co.,6.125%, 15/07/2023 2,450,000 2,529,625 0.34Titan Global Finance PLC,4.25%, 10/07/2019 EUR 1,875,000 2,118,181 0.29Union Andina de Cementos S.A.A.,5.875%, 30/10/2021 USD 3,031,000 3,129,811 0.43
33,915,782 4.61
Business ServicesAlliance Data Systems Corp.,5.875%, 1/11/2021 USD 1,645,000 1,698,463 0.23Alliance Data Systems Corp.,5.375%, 1/08/2022 420,000 410,550 0.06
Name of SecurityTransferable Securities and Money MarketInstruments traded on a Regulated Market Shares/Par
MarketValue ($)
NetAssets (%)
Business Services, continuedEquinix, Inc.,4.875%, 1/04/2020 USD 1,540,000 1,582,350 0.21Equinix, Inc.,5.375%, 1/01/2022 340,000 359,550 0.05Equinix, Inc.,5.375%, 1/04/2023 700,000 732,431 0.10Equinix, Inc.,5.75%, 1/01/2025 365,000 385,075 0.05Iron Mountain, Inc., REIT,6%, 1/10/2020 440,000 460,900 0.06Iron Mountain, Inc., REIT,6%, 15/08/2023 2,005,000 2,125,300 0.29Worldpay Finance Co.,3.75%, 15/11/2022 EUR 1,781,000 2,041,790 0.28
9,796,409 1.33
Cable TVAltice Financing S.A.,6.625%, 15/02/2023 USD 3,495,000 3,661,013 0.50Altice Financing S.A.,7.5%, 15/05/2026 3,225,000 3,402,375 0.46Altice Finco S.A.,8.125%, 15/01/2024 387,000 411,188 0.06Altice U.S. Finance I Corp.,5.5%, 15/05/2026 995,000 1,019,875 0.14CCO Holdings LLC/CCO Holdings CapitalCorp.,5.125%, 1/05/2023 3,190,000 3,309,625 0.45CCO Holdings LLC/CCO Holdings CapitalCorp.,5.75%, 15/01/2024 2,160,000 2,268,000 0.31CCO Holdings LLC/CCO Holdings CapitalCorp.,5.375%, 1/05/2025 655,000 682,019 0.09CCO Holdings LLC/CCO Holdings CapitalCorp.,5.75%, 15/02/2026 910,000 964,316 0.13Cequel Communications Holdings,6.375%, 15/09/2020 1,360,000 1,397,400 0.19Cogeco Communications, Inc.,4.875%, 1/05/2020 1,865,000 1,920,950 0.26CSC Holdings LLC,5.5%, 15/04/2027 2,070,000 2,101,050 0.29DISH DBS Corp.,5%, 15/03/2023 950,000 934,563 0.13DISH DBS Corp.,5.875%, 15/11/2024 1,250,000 1,264,063 0.17Intelsat Jackson Holdings S.A.,7.25%, 1/04/2019 650,000 558,594 0.08Intelsat Jackson Holdings S.A.,5.5%, 1/08/2023 1,495,000 1,046,500 0.14Intelsat Jackson Holdings S.A.,8%, 15/02/2024 450,000 466,875 0.06LGE Holdco VI B.V.,7.125%, 15/05/2024 EUR 2,500,000 3,073,201 0.42Lynx II Corp.,6.375%, 15/04/2023 USD 820,000 861,000 0.12Sirius XM Radio, Inc.,4.625%, 15/05/2023 855,000 861,943 0.12Sirius XM Radio, Inc.,6%, 15/07/2024 2,050,000 2,181,979 0.30Sirius XM Radio, Inc.,5.375%, 15/04/2025 765,000 778,388 0.11Telenet Finance V,6.25%, 15/08/2022 EUR 1,220,000 1,392,848 0.19
54 MFS Meridian Funds Annual Report 2017

SCHEDULES OF INVESTMENTS 31 January 2017
MFS Meridian Funds – Global High Yield Fund, continued
Name of SecurityTransferable Securities and Money MarketInstruments traded on a Regulated Market Shares/Par
MarketValue ($)
NetAssets (%)
Cable TV, continuedUnitymedia Hessen,5.5%, 15/01/2023 USD 1,380,000 1,435,200 0.19Unitymedia Hessen NRW GmbH,6.25%, 15/01/2029 EUR 1,840,000 2,228,407 0.30Unitymedia KabelBW GmbH,6.125%, 15/01/2025 USD 1,135,000 1,173,306 0.16Videotron Ltd.,5.375%, 15/06/2024 2,710,000 2,831,950 0.38Virgin Media Finance PLC,5.75%, 15/01/2025 545,000 553,175 0.07Virgin Media Secured Finance PLC,5.25%, 15/01/2026 1,240,000 1,244,179 0.17VTR Finance B.V.,6.875%, 15/01/2024 2,333,000 2,449,650 0.33Ziggo Bond Finance B.V.,3.75%, 15/01/2025 EUR 1,600,000 1,761,053 0.24Ziggo Bond Finance B.V.,5.875%, 15/01/2025 USD 765,000 770,259 0.10
49,004,944 6.66
ChemicalsAxalta Coating Systems Co.,4.875%, 15/08/2024 USD 1,745,000 1,766,813 0.24Axalta Coating Systems Co.,3.75%, 15/01/2025 EUR 2,565,000 2,838,140 0.39Chemours Co.,6.625%, 15/05/2023 USD 1,330,000 1,323,350 0.18Chemours Co.,7%, 15/05/2025 540,000 538,110 0.07Consolidated Energy Finance S.A.,6.75%, 15/10/2019 2,888,000 2,895,220 0.39Consolidated Energy Finance S.A.,6.75%, 15/10/2019 1,025,000 1,027,563 0.14GCP Applied Technologies Co.,9.5%, 1/02/2023 1,745,000 1,989,300 0.27INEOS Group Holdings S.A.,5.75%, 15/02/2019 EUR 1,240,000 1,363,076 0.18SPCM S.A.,2.875%, 15/06/2023 2,428,000 2,647,341 0.36Tronox Finance LLC,6.375%, 15/08/2020 USD 1,820,000 1,749,475 0.24Tronox Finance LLC,7.5%, 15/03/2022 1,105,000 1,077,375 0.15W.R. Grace & Co.,5.125%, 1/10/2021 2,240,000 2,349,200 0.32
21,564,963 2.93
Computer SoftwareDiamond 1 Finance Corp./Diamond 2Finance Corp.,6.02%, 15/06/2026 USD 1,565,000 1,689,701 0.23Diamond 1 Finance Corp./Diamond 2Finance Corp.,5.875%, 15/06/2021 675,000 712,033 0.10Nuance Communications, Inc.,5.625%, 15/12/2026 1,585,000 1,583,019 0.21VeriSign, Inc.,4.625%, 1/05/2023 1,895,000 1,915,656 0.26
5,900,409 0.80
Computer Software – SystemsCDW LLC/CDW Finance Corp.,5.5%, 1/12/2024 USD 2,385,000 2,483,381 0.34JDA Software Group, Inc.,7.375%, 15/10/2024 1,750,000 1,837,500 0.25Sabre GLBL, Inc.,5.375%, 15/04/2023 2,515,000 2,558,228 0.35
Name of SecurityTransferable Securities and Money MarketInstruments traded on a Regulated Market Shares/Par
MarketValue ($)
NetAssets (%)
Computer Software – Systems, continuedWestern Digital Corp.,10.5%, 1/04/2024 USD 1,665,000 1,960,538 0.26
8,839,647 1.20
ConglomeratesAmsted Industries Co.,5%, 15/03/2022 USD 2,400,000 2,406,000 0.33Apex Tool Group,7%, 1/02/2021 1,845,000 1,706,625 0.23EnerSys,5%, 30/04/2023 3,010,000 3,062,675 0.42Enpro Industries, Inc.,5.875%, 15/09/2022 2,270,000 2,360,800 0.32Entegris, Inc.,6%, 1/04/2022 2,561,000 2,676,245 0.36Gardner Denver, Inc.,6.875%, 15/08/2021 1,580,000 1,576,050 0.22Grupo KUO S.A.B de C.V.,6.25%, 4/12/2022 2,795,000 2,748,883 0.37SPX FLOW, Inc.,5.625%, 15/08/2024 1,815,000 1,851,300 0.25Votorantim Cimentos S.A.,7.25%, 5/04/2041 2,097,000 2,044,365 0.28
20,432,943 2.78
ConstructionBuzzi Unicem S.p.A.,2.125%, 28/04/2023 EUR 2,560,000 2,835,700 0.39Empresas ICA S.A.B. de C.V.,8.375%, 24/07/2017 (d) USD 599,000 132,379 0.02Empresas ICA S.A.B. de C.V.,8.9%, 4/02/2021 (d) 4,302,000 908,798 0.12Empresas ICA S.A.B. de C.V.,8.875%, 29/05/2024 (d) 1,839,000 406,189 0.05
4,283,066 0.58
Consumer ProductsNBTY, Inc.,7.625%, 15/05/2021 USD 2,045,000 2,142,138 0.29Prestige Brands, Inc.,5.375%, 15/12/2021 1,365,000 1,405,950 0.19Spectrum Brands, Inc.,6.125%, 15/12/2024 320,000 338,400 0.05Spectrum Brands, Inc.,5.75%, 15/07/2025 1,780,000 1,860,100 0.25
5,746,588 0.78
Consumer ServicesADT Corp.,6.25%, 15/10/2021 USD 2,740,000 2,979,750 0.40ADT Corp.,4.125%, 15/06/2023 435,000 414,881 0.06Garda World Security Corp.,7.25%, 15/11/2021 835,000 799,513 0.11Garda World Security Corp.,7.25%, 15/11/2021 1,585,000 1,517,638 0.21Grupo Posadas S.A.B. de C.V.,7.875%, 30/06/2022 2,470,000 2,479,263 0.34Interval Acquisition Corp.,5.625%, 15/04/2023 3,115,000 3,177,300 0.43Mobile Mini, Inc.,5.875%, 1/07/2024 1,865,000 1,944,263 0.26Monitronics International, Inc.,9.125%, 1/04/2020 1,785,000 1,735,913 0.24Service Corp. International,5.375%, 15/05/2024 1,165,000 1,220,338 0.16
MFS Meridian Funds Annual Report 2017 55

SCHEDULES OF INVESTMENTS 31 January 2017
MFS Meridian Funds – Global High Yield Fund, continued
Name of SecurityTransferable Securities and Money MarketInstruments traded on a Regulated Market Shares/Par
MarketValue ($)
NetAssets (%)
Consumer Services, continuedServiceMaster Co. LLC,5.125%, 15/11/2024 USD 1,870,000 1,893,375 0.26
18,162,234 2.47
ContainersArdagh Packaging Finance PLC/ArdaghHoldings USA, Inc.,4.125%, 15/05/2023 EUR 2,240,000 2,557,119 0.35Berry Plastics Group, Inc.,5.5%, 15/05/2022 USD 2,035,000 2,116,400 0.29Berry Plastics Group, Inc.,6%, 15/10/2022 1,000,000 1,058,750 0.14Crown American LLC,4.5%, 15/01/2023 1,503,000 1,534,939 0.21Crown American LLC,4.25%, 30/09/2026 905,000 865,406 0.12Multi-Color Corp.,6.125%, 1/12/2022 2,255,000 2,384,663 0.32Plastipak Holdings, Inc.,6.5%, 1/10/2021 2,240,000 2,338,000 0.32Reynolds Group,5.75%, 15/10/2020 900,000 926,622 0.13Reynolds Group,8.25%, 15/02/2021 814,965 839,006 0.11Reynolds Group,5.125%, 15/07/2023 1,335,000 1,365,305 0.19Reynolds Group,7%, 15/07/2024 770,000 820,435 0.11San Miguel Industrias PET S.A.,7.75%, 6/11/2020 2,382,000 2,523,729 0.34Sealed Air Corp.,4.875%, 1/12/2022 1,985,000 2,047,031 0.28Sealed Air Corp.,5.125%, 1/12/2024 410,000 424,863 0.06Signode Industrial Group,6.375%, 1/05/2022 1,840,000 1,867,600 0.25
23,669,868 3.22
ElectronicsSensata Technologies B.V.,5.625%, 1/11/2024 USD 1,755,000 1,841,644 0.25Sensata Technologies B.V.,5%, 1/10/2025 850,000 849,575 0.12
2,691,219 0.37
Emerging Market Quasi-SovereignBanco de Reservas de la RepublicaDominicana,7%, 1/02/2023 USD 909,000 910,645 0.12Banco do Brasil S.A.,6.25% to 15/04/2024,FRN to 29/10/2049 1,765,000 1,427,444 0.19Banco do Brasil S.A. (Cayman Branch),9% to 18/06/2024, FRN to 29/06/2049 1,590,000 1,605,900 0.22Gaz Capital S.A.,4.95%, 19/07/2022 2,860,000 2,944,095 0.40Petrobras Global Finance B.V.,8.375%, 23/05/2021 2,235,000 2,492,025 0.34Petrobras Global Finance B.V.,8.75%, 23/05/2026 132,000 148,685 0.02Petrobras Global Finance B.V.,4.375%, 20/05/2023 2,126,000 1,961,235 0.27Petrobras Global Finance B.V.,6.25%, 17/03/2024 1,853,000 1,860,412 0.25Petroleos Mexicanos,6.5%, 13/03/2027 928,000 954,402 0.13
Name of SecurityTransferable Securities and Money MarketInstruments traded on a Regulated Market Shares/Par
MarketValue ($)
NetAssets (%)
Emerging Market Quasi-Sovereign, continuedSberbank Capital S.A.,5.25%, 23/05/2023 USD 2,085,000 2,111,063 0.29Southern Gas Corridor CJSC,6.875%, 24/03/2026 631,000 681,871 0.09Trade & Development Bank of MongoliaLLC,9.375%, 19/05/2020 1,025,000 1,014,683 0.14
18,112,460 2.46
Emerging Market SovereignDominican Republic,7.5%, 6/05/2021 USD 1,350,000 1,485,000 0.20Dominican Republic,5.875%, 18/04/2024 170,000 174,366 0.02Dominican Republic,5.5%, 27/01/2025 270,000 268,102 0.04Government of Jamaica,7.875%, 28/07/2045 849,000 942,789 0.13Republic of Argentina,6.875%, 22/04/2021 453,000 481,766 0.06Republic of Argentina,7.5%, 22/04/2026 2,366,000 2,470,104 0.34Republic of Argentina,6.875%, 26/01/2027 2,528,000 2,502,720 0.34Republic of Argentina,7.125%, 6/07/2036 1,508,000 1,419,028 0.19Republic of Croatia,5.5%, 4/04/2023 1,377,000 1,464,508 0.20Republic of Croatia,5.5%, 4/04/2023 686,000 729,595 0.10Republic of Ecuador,10.5%, 24/03/2020 2,518,000 2,750,915 0.37Republic of Sri Lanka,6.125%, 3/06/2025 2,135,000 2,047,414 0.28Republic of Sri Lanka,6.825%, 18/07/2026 200,000 199,524 0.03Republic of Suriname,9.25%, 26/10/2026 200,000 201,886 0.03Republic of Venezuela,7%, 31/03/2038 1,535,000 683,075 0.09Russian Federation,5%, 29/04/2020 1,400,000 1,494,500 0.20
19,315,292 2.62
Energy – IndependentAfren PLC,6.625%, 9/12/2020 (d) USD 822,630 165 0.00Afren PLC,11.5%, 1/02/2016 (d) 1,707,713 342 0.00Alta Mesa Holdings LP/Alta Mesa FinanceServices Corp.,7.875%, 15/12/2024 1,835,000 1,972,625 0.27Carrizo Oil & Gas, Inc.,6.25%, 15/04/2023 2,270,000 2,329,588 0.32Concho Resources, Inc.,5.5%, 1/04/2023 1,520,000 1,577,000 0.21Consol Energy, Inc.,5.875%, 15/04/2022 600,000 580,500 0.08Consol Energy, Inc.,8%, 1/04/2023 2,015,000 2,065,375 0.28Continental Resources, Inc.,4.5%, 15/04/2023 2,160,000 2,133,000 0.29Diamondback Energy, Inc.,5.375%, 31/05/2025 1,980,000 2,044,350 0.28Gulfport Energy Corp.,6%, 15/10/2024 1,560,000 1,589,250 0.22
56 MFS Meridian Funds Annual Report 2017

SCHEDULES OF INVESTMENTS 31 January 2017
MFS Meridian Funds – Global High Yield Fund, continued
Name of SecurityTransferable Securities and Money MarketInstruments traded on a Regulated Market Shares/Par
MarketValue ($)
NetAssets (%)
Energy – Independent, continuedGulfport Energy Corp.,6.375%, 15/05/2025 USD 515,000 527,875 0.07PDC Energy, Inc.,6.125%, 15/09/2024 2,205,000 2,304,225 0.31Range Resources Corp.,4.875%, 15/05/2025 2,230,000 2,170,236 0.29Rice Energy, Inc.,7.25%, 1/05/2023 2,070,000 2,220,075 0.30Sanchez Energy Corp.,6.125%, 15/01/2023 2,070,000 1,987,200 0.27Seven Generations Energy,8.25%, 15/05/2020 1,290,000 1,369,013 0.19Whiting Petroleum Corp.,6.25%, 1/04/2023 1,885,000 1,903,850 0.26
26,774,669 3.64
Energy – IntegratedCenovus Energy, Inc.,6.75%, 15/11/2039 USD 1,710,000 1,921,024 0.26Inkia Energy Ltd.,8.375%, 4/04/2021 2,703,000 2,797,605 0.38LUKOIL International Finance B.V.,4.563%, 24/04/2023 3,145,000 3,169,217 0.43
7,887,846 1.07
EntertainmentCedar Fair LP,5.25%, 15/03/2021 USD 2,195,000 2,261,783 0.31Cedar Fair LP,5.375%, 1/06/2024 575,000 592,250 0.08Cinemark USA, Inc.,5.125%, 15/12/2022 1,280,000 1,315,200 0.18Cinemark USA, Inc.,4.875%, 1/06/2023 940,000 946,956 0.13CPUK Finance Ltd.,7%, 28/02/2042 GBP 2,530,000 3,365,914 0.45Six Flags Entertainment Corp.,5.25%, 15/01/2021 USD 1,710,000 1,757,025 0.24Six Flags Entertainment Corp.,4.875%, 31/07/2024 1,185,000 1,176,113 0.16
11,415,241 1.55
Financial InstitutionsAircastle Ltd.,4.625%, 15/12/2018 USD 890,000 923,375 0.13Aircastle Ltd.,5.125%, 15/03/2021 1,125,000 1,182,656 0.16Aircastle Ltd.,5.5%, 15/02/2022 1,645,000 1,727,086 0.24CIT Group, Inc.,5.25%, 15/03/2018 1,150,000 1,188,525 0.16CIT Group, Inc.,6.625%, 1/04/2018 1,833,000 1,925,567 0.26CIT Group, Inc.,5.5%, 15/02/2019 1,129,000 1,187,798 0.16Credit Acceptance Corp.,6.125%, 15/02/2021 238,000 241,570 0.03Credit Acceptance Corp.,7.375%, 15/03/2023 1,215,000 1,246,663 0.17Nationstar Mortgage LLC/Capital Corp.,6.5%, 1/08/2018 1,010,000 1,025,150 0.14Nationstar Mortgage LLC/Capital Corp.,7.875%, 1/10/2020 2,135,000 2,220,400 0.30Nationstar Mortgage LLC/Capital Corp.,6.5%, 1/07/2021 655,000 667,281 0.09Navient Corp.,8%, 25/03/2020 2,010,000 2,160,750 0.29
Name of SecurityTransferable Securities and Money MarketInstruments traded on a Regulated Market Shares/Par
MarketValue ($)
NetAssets (%)
Financial Institutions, continuedNavient Corp.,7.25%, 25/01/2022 USD 2,150,000 2,211,813 0.30Navient Corp.,7.25%, 25/09/2023 455,000 458,413 0.06Navient Corp.,6.125%, 25/03/2024 1,330,000 1,258,513 0.17Park Aerospace Holdings Ltd.,5.5%, 15/02/2024 1,470,000 1,509,690 0.21
21,135,250 2.87
Food & BeveragesAramark Services, Inc.,4.75%, 1/06/2026 USD 1,280,000 1,274,880 0.17Central American Bottling Corp.,5.75%, 31/01/2027 2,600,000 2,618,720 0.36JBS Investments GmbH,7.75%, 28/10/2020 1,694,000 1,791,405 0.24JBS Investments GmbH,7.25%, 3/04/2024 1,922,000 2,015,698 0.27JBS USA LLC/JBS USA Finance, Inc.,5.875%, 15/07/2024 2,380,000 2,457,350 0.33Lamb Weston Holdings, Inc.,4.625%, 1/11/2024 920,000 922,300 0.13Lamb Weston Holdings, Inc.,4.875%, 1/11/2026 425,000 425,531 0.06Marfrig Holdings (Europe) B.V.,8%, 8/06/2023 1,364,000 1,437,315 0.20Pinnacle Foods Finance LLC/PinnacleFoods Finance Corp.,5.875%, 15/01/2024 1,625,000 1,718,129 0.23Sun Merger Sub, Inc.,5.875%, 1/08/2021 1,645,000 1,717,232 0.23U.S. Foods Holding Corp.,5.875%, 15/06/2024 2,025,000 2,116,125 0.29
18,494,685 2.51
Forest & Paper ProductsAppvion, Inc.,9%, 1/06/2020 USD 1,160,000 643,800 0.09
Gaming & LodgingCCM Merger, Inc.,9.125%, 1/05/2019 USD 1,291,000 1,336,417 0.18Cirsa Funding Luxembourg S.A.,5.875%, 15/05/2023 EUR 2,250,000 2,522,143 0.34GLP Capital LP/GLP Financing II, Inc.,5.375%, 1/11/2023 USD 1,855,000 1,989,488 0.27GLP Capital LP/GLP Financing II, Inc.,5.375%, 15/04/2026 275,000 286,688 0.04Great Canadian Gaming Corp.,6.625%, 25/07/2022 CAD 2,125,000 1,718,780 0.23Greektown Holdings LLC,8.875%, 15/03/2019 USD 1,595,000 1,670,763 0.23Hilton Worldwide Finance LLC/HiltonWorldwide Finance Corp.,5.625%, 15/10/2021 2,270,000 2,340,541 0.32Isle of Capri Casinos, Inc.,8.875%, 15/06/2020 650,000 678,438 0.09Isle of Capri Casinos, Inc.,5.875%, 15/03/2021 1,485,000 1,535,193 0.21MGM Resorts International,6.625%, 15/12/2021 1,930,000 2,151,950 0.29MGM Resorts International,6%, 15/03/2023 840,000 903,000 0.12Ryman Hospitality Properties, Inc., REIT,5%, 15/04/2021 1,930,000 1,968,600 0.27
MFS Meridian Funds Annual Report 2017 57

SCHEDULES OF INVESTMENTS 31 January 2017
MFS Meridian Funds – Global High Yield Fund, continued
Name of SecurityTransferable Securities and Money MarketInstruments traded on a Regulated Market Shares/Par
MarketValue ($)
NetAssets (%)
Gaming & Lodging, continuedRyman Hospitality Properties, Inc., REIT,5%, 15/04/2023 USD 770,000 777,700 0.11
19,879,701 2.70
IndustrialGalapagos Holding S.A.,5.375%, 15/06/2021 EUR 404,000 428,529 0.06Galapagos Holding S.A.,7%, 15/06/2022 1,719,000 1,571,744 0.21Howard Hughes Corp.,6.875%, 1/10/2021 USD 1,845,000 1,944,169 0.26Transfield Services Ltd.,8.375%, 15/05/2020 2,500,000 2,625,000 0.36
6,569,442 0.89
Insurance – HealthCentene Corp.,5.625%, 15/02/2021 USD 1,080,000 1,133,784 0.16Centene Corp.,6.125%, 15/02/2024 1,260,000 1,338,750 0.18
2,472,534 0.34
International Market Quasi-SovereignElectricite de France S.A.,5.375% to 29/01/2025,FRN to 29/01/2049 EUR 1,900,000 2,061,598 0.28
Machinery & ToolsAshtead Capital, Inc.,5.625%, 1/10/2024 USD 2,905,000 3,050,250 0.41CNH Industrial Capital LLC,4.375%, 6/11/2020 2,665,000 2,761,606 0.38CNH Industrial N.V.,2.875%, 17/05/2023 EUR 3,840,000 4,243,729 0.58CNH Industrial N.V.,4.5%, 15/08/2023 USD 1,060,000 1,060,636 0.14H&E Equipment Services Co.,7%, 1/09/2022 1,940,000 2,044,294 0.28Light Tower Rentals, Inc.,8.125%, 1/08/2019 (d) 1,240,000 557,893 0.08Loxam S.A.S.,7%, 23/07/2022 EUR 2,800,000 3,184,308 0.43
16,902,716 2.30
Major BanksBanco Bilbao Vizcaya Argentaria, S.A., ,8.875 TO 4/14/2021,FRN to 29/12/2049 EUR 1,200,000 1,399,032 0.19Bank of America Corp., FRN,6.1%, 29/12/2049 USD 2,635,000 2,746,988 0.37Barclays PLC,8% to 15/12/2020, FRN to 15/12/2049 EUR 2,555,000 2,975,407 0.41JPMorgan Chase & Co.,6% to 1/08/2023, FRN to 31/12/2049 USD 2,170,000 2,229,675 0.30Royal Bank of Scotland Group PLC,6%, 19/12/2023 3,150,000 3,312,238 0.45Royal Bank of Scotland Group PLC,3.625% to 25/03/2019,FRN to 25/03/2024 EUR 3,650,000 3,991,747 0.54Royal Bank of Scotland Group PLC,7.5% to 10/08/2020,FRN to 29/12/2049 USD 1,225,000 1,188,250 0.16Royal Bank of Scotland Group PLC,8.625% to 15/08/2021,FRN to 29/12/2049 960,000 991,200 0.14
18,834,537 2.56
Medical & Health Technology & ServicesAmSurg Corp.,5.625%, 15/07/2022 USD 1,700,000 1,751,000 0.24
Name of SecurityTransferable Securities and Money MarketInstruments traded on a Regulated Market Shares/Par
MarketValue ($)
NetAssets (%)
Medical & Health Technology & Services, continuedCHS/Community Health Systems, Inc.,6.875%, 1/02/2022 USD 2,140,000 1,556,850 0.21DaVita, Inc.,5.125%, 15/07/2024 845,000 834,438 0.11DaVita, Inc.,5%, 1/05/2025 2,520,000 2,459,520 0.33Envision Healthcare Corp.,6.25%, 1/12/2024 760,000 799,900 0.11HCA, Inc.,4.25%, 15/10/2019 1,505,000 1,557,675 0.21HCA, Inc.,7.5%, 15/02/2022 2,430,000 2,764,125 0.38HCA, Inc.,5.875%, 15/03/2022 2,030,000 2,205,088 0.30HCA, Inc.,5%, 15/03/2024 1,670,000 1,738,888 0.24HCA, Inc.,5.375%, 1/02/2025 1,440,000 1,468,800 0.20HCA, Inc.,5.875%, 15/02/2026 895,000 930,800 0.13HealthSouth Corp.,5.125%, 15/03/2023 1,805,000 1,795,975 0.24HealthSouth Corp.,5.75%, 1/11/2024 1,270,000 1,290,638 0.17LifePoint Health, Inc.,5.375%, 1/05/2024 1,455,000 1,393,163 0.19Medi-Partenaires S.A.S,7%, 15/05/2020 EUR 2,500,000 2,840,596 0.39MEDNAX, Inc.,5.25%, 1/12/2023 USD 1,675,000 1,729,438 0.23Quintiles IMS Holdings, Inc.,5%, 15/10/2026 1,540,000 1,550,256 0.21Quorum Health Corp.,11.625%, 15/04/2023 1,645,000 1,546,300 0.21Tenet Healthcare Corp.,8%, 1/08/2020 3,000,000 3,018,750 0.41Tenet Healthcare Corp.,8.125%, 1/04/2022 1,500,000 1,515,000 0.21Tenet Healthcare Corp.,6.75%, 15/06/2023 1,760,000 1,663,200 0.23Universal Health Services, Inc.,7.625%, 15/08/2020 1,610,000 1,597,925 0.22
38,008,325 5.17
Medical EquipmentHologic, Inc.,5.25%, 15/07/2022 USD 1,700,000 1,772,250 0.24Teleflex, Inc.,5.25%, 15/06/2024 1,240,000 1,277,200 0.17Teleflex, Inc.,4.875%, 1/06/2026 915,000 910,425 0.13
3,959,875 0.54
Metals & MiningBluescope Steel Finance Ltd./BluescopeSteel,6.5%, 15/05/2021 USD 865,000 915,819 0.12Commercial Metals Co.,4.875%, 15/05/2023 1,393,000 1,420,860 0.19First Quantum Minerals Ltd.,7%, 15/02/2021 1,255,000 1,286,375 0.18Freeport-McMoRan, Inc.,3.875%, 15/03/2023 1,535,000 1,416,038 0.19Freeport-McMoRan, Inc.,6.5%, 15/11/2020 310,000 317,750 0.04Freeport-McMoRan, Inc.,6.875%, 15/02/2023 1,406,000 1,465,755 0.20
58 MFS Meridian Funds Annual Report 2017

SCHEDULES OF INVESTMENTS 31 January 2017
MFS Meridian Funds – Global High Yield Fund, continued
Name of SecurityTransferable Securities and Money MarketInstruments traded on a Regulated Market Shares/Par
MarketValue ($)
NetAssets (%)
Metals & Mining, continuedFreeport-McMoRan, Inc.,6.875%, 15/02/2023 USD 490,000 510,825 0.07Freeport-McMoRan, Inc.,5.45%, 15/03/2043 1,230,000 1,057,800 0.14GrafTech International Co.,6.375%, 15/11/2020 1,670,000 1,373,575 0.19Kaiser Aluminum Corp.,5.875%, 15/05/2024 1,510,000 1,581,725 0.22Kinross Gold Corp.,5.125%, 1/09/2021 945,000 982,800 0.13Kinross Gold Corp.,5.95%, 15/03/2024 635,000 666,274 0.09Lundin Mining Corp.,7.5%, 1/11/2020 760,000 805,919 0.11Lundin Mining Corp.,7.875%, 1/11/2022 1,390,000 1,515,100 0.21Petra Diamonds U.S. Treasury PLC,8.25%, 31/05/2020 640,000 672,000 0.09Petra Diamonds U.S. Treasury PLC,8.25%, 31/05/2020 1,762,000 1,850,100 0.25Steel Dynamics, Inc.,5.125%, 1/10/2021 1,065,000 1,102,275 0.15Steel Dynamics, Inc.,5.25%, 15/04/2023 190,000 197,838 0.03Steel Dynamics, Inc.,5.5%, 1/10/2024 565,000 599,606 0.08Suncoke Energy Partners LP/SuncokeEnergy Partners Finance Corp.,7.375%, 1/02/2020 1,190,000 1,187,025 0.16Suncoke Energy, Inc.,7.625%, 1/08/2019 342,000 339,392 0.05TMS International Corp.,7.625%, 15/10/2021 1,280,000 1,276,800 0.17
22,541,651 3.06
MidstreamBlue Racer Midstream LLC/Blue RacerFinance Corp.,6.125%, 15/11/2022 USD 2,220,000 2,275,500 0.31Crestwood Midstream Partners LP,6%, 15/12/2020 960,000 988,800 0.13Crestwood Midstream Partners LP,6.125%, 1/03/2022 420,000 434,280 0.06Energy Transfer Equity LP,7.5%, 15/10/2020 2,535,000 2,845,538 0.39Ferrellgas LP/Ferrellgas Finance Corp.,6.75%, 15/01/2022 1,580,000 1,587,900 0.21Kinder Morgan (Delaware), Inc.,7.75%, 15/01/2032 2,665,000 3,326,735 0.45ONEOK, Inc.,7.5%, 1/09/2023 995,000 1,156,688 0.16Sabine Pass Liquefaction LLC,5.625%, 1/02/2021 1,720,000 1,857,600 0.25Sabine Pass Liquefaction LLC,5.625%, 15/04/2023 2,485,000 2,696,225 0.37Sabine Pass Liquefaction LLC,5.75%, 15/05/2024 755,000 822,006 0.11Sabine Pass Liquefaction LLC,5.625%, 1/03/2025 1,106,000 1,201,393 0.16Targa Resources Partners LP/TargaResources Finance Corp.,4.125%, 15/11/2019 850,000 862,750 0.12Targa Resources Partners LP/TargaResources Finance Corp.,5.25%, 1/05/2023 1,335,000 1,368,375 0.19
Name of SecurityTransferable Securities and Money MarketInstruments traded on a Regulated Market Shares/Par
MarketValue ($)
NetAssets (%)
Midstream, continuedTarga Resources Partners LP/TargaResources Finance Corp.,5.375%, 1/02/2027 USD 2,485,000 2,575,081 0.35Williams Cos., Inc.,4.55%, 24/06/2024 2,010,000 2,035,125 0.28
26,033,996 3.54
Network & TelecomCenturylink, Inc.,6.45%, 15/06/2021 USD 1,580,000 1,678,750 0.23Centurylink, Inc.,7.65%, 15/03/2042 1,085,000 986,672 0.13Columbus International, Inc.,7.375%, 30/03/2021 2,960,000 3,145,000 0.43Frontier Communications Corp.,6.25%, 15/09/2021 990,000 925,650 0.13Frontier Communications Corp.,7.125%, 15/01/2023 1,130,000 1,011,350 0.14Frontier Communications Corp.,9%, 15/08/2031 1,195,000 1,030,317 0.14Telecom Italia Capital,6%, 30/09/2034 305,000 300,425 0.04Telecom Italia S.p.A.,5.303%, 30/05/2024 5,945,000 5,977,698 0.81Zayo Group LLC/Zayo Capital, Inc.,5.75%, 15/01/2027 1,180,000 1,208,084 0.16
16,263,946 2.21
Oil ServicesBristow Group, Inc.,6.25%, 15/10/2022 USD 866,000 773,988 0.11Odebrecht Offshore Drilling Finance Ltd.,6.75%, 1/10/2023 2,633,797 862,569 0.12Trinidad Drilling Ltd.,6.625%, 15/02/2025 420,000 429,450 0.06Weatherford International Ltd.,8.25%, 15/06/2023 2,125,000 2,167,500 0.29
4,233,507 0.58
OilsCITGO Holding, Inc.,10.75%, 15/02/2020 USD 1,635,000 1,746,671 0.24CITGO Petroleum Corp.,6.25%, 15/08/2022 1,970,000 2,038,950 0.27
3,785,621 0.51
Other Banks & Diversified FinancialsBanco de Bogota S.A.,6.25%, 12/05/2026 USD 3,808,000 3,956,512 0.54Banco Popolare Societa Cooperativa,3.5%, 14/03/2019 EUR 2,520,000 2,809,213 0.38BBVA Subordinated Capital S.A.U.,3.5%, 11/04/2024 1,600,000 1,799,980 0.24Deutsche Bank AG,6% to 30/04/2022, FRN to 29/12/2049 1,600,000 1,507,845 0.21Groupe BPCE S.A.,12.5% to 30/09/2019,FRN to 29/08/2049 2,112,000 2,587,200 0.35UBS Group AG,6.875%, 29/12/2049 3,615,000 3,600,323 0.49UniCredit S.p.A.,6.75% to 10/09/2021,FRN to 29/12/2049 1,920,000 1,932,736 0.26
18,193,809 2.47
PharmaceuticalsCatalent Pharma Solutions, Inc.,4.75%, 15/12/2024 EUR 955,000 1,080,451 0.15
MFS Meridian Funds Annual Report 2017 59

SCHEDULES OF INVESTMENTS 31 January 2017
MFS Meridian Funds – Global High Yield Fund, continued
Name of SecurityTransferable Securities and Money MarketInstruments traded on a Regulated Market Shares/Par
MarketValue ($)
NetAssets (%)
Pharmaceuticals, continuedEndo Finance LLC/Endo Finco, Inc.,7.25%, 15/01/2022 USD 515,000 466,075 0.06Endo Finance LLC/Endo Finco, Inc.,7.25%, 15/01/2022 1,515,000 1,371,075 0.18Mallinckrodt International Finance S.A.,5.75%, 1/08/2022 1,765,000 1,637,038 0.22Mallinckrodt International Finance S.A.,5.5%, 15/04/2025 1,080,000 930,150 0.13Valeant Pharmaceuticals International,Inc.,7%, 1/10/2020 2,520,000 2,280,600 0.31Valeant Pharmaceuticals International,Inc.,7.5%, 15/07/2021 330,000 286,688 0.04Valeant Pharmaceuticals International,Inc.,7.25%, 15/07/2022 1,370,000 1,150,964 0.16
9,203,041 1.25
Pollution ControlPaprec Holding,5.25%, 1/04/2022 EUR 635,000 724,130 0.10
Precious Metals & MineralsEldorado Gold Corp.,6.125%, 15/12/2020 USD 1,910,000 1,952,975 0.26Teck Resources Ltd.,4.5%, 15/01/2021 915,000 931,013 0.13Teck Resources Ltd.,8%, 1/06/2021 585,000 644,963 0.09Teck Resources Ltd.,3.75%, 1/02/2023 565,000 548,756 0.07
4,077,707 0.55
Printing & PublishingNielsen Finance LLC,5%, 15/04/2022 USD 2,720,000 2,777,800 0.38Outdoor Americas Capital LLC/OutfrontMedia Capital Corp.,5.625%, 15/02/2024 1,290,000 1,346,438 0.18TEGNA, Inc.,5.125%, 15/07/2020 135,000 139,725 0.02TEGNA, Inc.,4.875%, 15/09/2021 1,035,000 1,060,875 0.15TEGNA, Inc.,6.375%, 15/10/2023 1,130,000 1,194,975 0.16
6,519,813 0.89
Real Estate – HealthcareMPT Operating Partnership LP, REIT,6.375%, 15/02/2022 USD 1,945,000 2,013,075 0.27MPT Operating Partnership LP, REIT,5.25%, 1/08/2026 1,305,000 1,282,163 0.18
3,295,238 0.45
Real Estate – OtherDuPont Fabros Technology LP, REIT,5.875%, 15/09/2021 USD 2,445,000 2,555,025 0.35Felcor Lodging LP, REIT,5.625%, 1/03/2023 1,850,000 1,914,750 0.26Starwood Property Trust, Inc., REIT,5%, 15/12/2021 1,175,000 1,194,094 0.16
5,663,869 0.77
RestaurantsKFC Holding Co./Pizza Hut HoldingsLLC/Taco Bell of America LLC,5.25%, 1/06/2026 USD 1,060,000 1,072,360 0.14Stonegate Pub Co. Financing PLC,5.75%, 15/04/2019 GBP 1,825,000 2,339,470 0.32
3,411,830 0.46
Name of SecurityTransferable Securities and Money MarketInstruments traded on a Regulated Market Shares/Par
MarketValue ($)
NetAssets (%)
RetailersAA Bond Co. Ltd.,5.5%, 31/07/2043 GBP 1,605,000 2,064,518 0.28Dollar Tree, Inc.,5.75%, 1/03/2023 USD 2,400,000 2,541,600 0.35DriveTime Automotive Group, Inc./DTAcceptance Corp.,8%, 1/06/2021 1,233,000 1,217,588 0.17Dufry Finance S.C.A.,4.5%, 1/08/2023 EUR 1,920,000 2,216,315 0.30Hanesbrands, Inc.,4.875%, 15/05/2026 USD 1,620,000 1,595,700 0.22Kirk Beauty Zero GmbH,6.25%, 15/07/2022 EUR 1,150,000 1,351,787 0.18Rite Aid Corp.,9.25%, 15/03/2020 USD 445,000 460,041 0.06Rite Aid Corp.,6.75%, 15/06/2021 670,000 696,800 0.09Rite Aid Corp.,6.125%, 1/04/2023 1,510,000 1,572,288 0.21Sally Beauty Holdings, Inc.,5.625%, 1/12/2025 1,110,000 1,159,950 0.16
14,876,587 2.02
Specialty ChemicalsA. Schulman, Inc.,6.875%, 1/06/2023 USD 1,825,000 1,925,375 0.26Chemtura Corp.,5.75%, 15/07/2021 2,010,000 2,090,400 0.28Koppers, Inc.,6%, 15/02/2025 1,250,000 1,293,750 0.18Univar USA, Inc.,6.75%, 15/07/2023 2,506,000 2,606,240 0.36
7,915,765 1.08
Specialty StoresArgos Merger Sub, Inc.,7.125%, 15/03/2023 USD 1,870,000 1,837,275 0.25Group 1 Automotive, Inc.,5%, 1/06/2022 2,320,000 2,349,000 0.32Michaels Stores, Inc.,5.875%, 15/12/2020 1,355,000 1,392,263 0.19
5,578,538 0.76
SupermarketsAlbertsons Cos. LLC/Safeway, Inc.,6.625%, 15/06/2024 USD 2,260,000 2,355,372 0.32Casino Guichard Perrachon S.A.,4.87% to 31/01/2019,FRN to 31/01/2049 EUR 2,000,000 2,126,615 0.29
4,481,987 0.61
Telecommunications – WirelessAltice Luxembourg S.A.,7.75%, 15/05/2022 USD 3,180,000 3,374,775 0.46Altice Luxembourg S.A.,7.625%, 15/02/2025 1,840,000 1,945,800 0.26Comcel Trust,6.875%, 6/02/2024 823,000 862,093 0.12Digicel Group Ltd.,8.25%, 30/09/2020 260,000 230,425 0.03Digicel Group Ltd.,6%, 15/04/2021 2,663,000 2,482,715 0.34Digicel Group Ltd.,6.75%, 1/03/2023 3,640,000 3,382,925 0.46Digicel Group Ltd.,6.75%, 1/03/2023 1,070,000 994,431 0.13
60 MFS Meridian Funds Annual Report 2017

SCHEDULES OF INVESTMENTS 31 January 2017
MFS Meridian Funds – Global High Yield Fund, continued
Name of SecurityTransferable Securities and Money MarketInstruments traded on a Regulated Market Shares/Par
MarketValue ($)
NetAssets (%)
Telecommunications – Wireless, continuedMillicom International Cellular S.A.,6.625%, 15/10/2021 USD 2,503,000 2,615,635 0.36Mobile Telesystems International FundingLtd.,5%, 30/05/2023 3,846,000 3,957,765 0.54SFR Group S.A.,7.375%, 1/05/2026 1,630,000 1,672,788 0.23Sprint Capital Corp.,6.875%, 15/11/2028 1,930,000 1,987,900 0.27Sprint Corp.,7.875%, 15/09/2023 970,000 1,059,725 0.14Sprint Corp.,7.125%, 15/06/2024 2,320,000 2,424,400 0.33Sprint Corp.,7%, 1/03/2020 500,000 543,125 0.07Sprint Nextel Corp.,9%, 15/11/2018 1,190,000 1,303,050 0.18Sprint Nextel Corp.,6%, 15/11/2022 735,000 746,025 0.10T-Mobile USA, Inc.,6.125%, 15/01/2022 320,000 338,400 0.05T-Mobile USA, Inc.,6.5%, 15/01/2024 470,000 506,472 0.07T-Mobile USA, Inc.,6.25%, 1/04/2021 1,970,000 2,041,314 0.28T-Mobile USA, Inc.,6.633%, 28/04/2021 1,285,000 1,339,613 0.18T-Mobile USA, Inc.,6.5%, 15/01/2026 1,425,000 1,565,719 0.21VimpelCom Ltd.,5.95%, 13/02/2023 2,900,000 3,033,980 0.41
38,409,075 5.22
Telephone ServicesLevel 3 Financing, Inc.,5.375%, 15/01/2024 USD 1,420,000 1,435,975 0.20Level 3 Financing, Inc.,5.375%, 1/05/2025 1,975,000 2,015,744 0.27
3,451,719 0.47
Transportation – ServicesDelhi International Airport,6.125%, 31/10/2026 USD 1,895,000 1,967,851 0.27Europcar Groupe S.A.,5.75%, 15/06/2022 EUR 1,920,000 2,165,784 0.29Navios Maritime Acquisition Corp.,8.125%, 15/11/2021 USD 836,000 758,670 0.10Navios Maritime Holding, Inc.,7.375%, 15/01/2022 1,195,000 819,322 0.11Navios South American Logistics, Inc./Navios Logistics Finance (U.S.), Inc.,7.25%, 1/05/2022 940,000 868,325 0.12Navios South American Logistics, Inc./Navios Logistics Finance (U.S.), Inc.,7.25%, 1/05/2022 1,240,000 1,145,450 0.16
Name of SecurityTransferable Securities and Money MarketInstruments traded on a Regulated Market Shares/Par
MarketValue ($)
NetAssets (%)
Transportation – Services, continuedSyncreon Group BV/Syncre,8.625%, 1/11/2021 USD 1,455,000 1,069,425 0.14Ultrapetrol (Bahamas) Ltd.,8.875%, 15/06/2021 (d) 743,000 130,025 0.02
8,924,852 1.21
Utilities – Electric PowerCalpine Corp.,5.5%, 1/02/2024 USD 2,765,000 2,695,875 0.37Calpine Corp.,5.75%, 15/01/2025 1,600,000 1,564,000 0.21Covanta Holding Corp.,7.25%, 1/12/2020 1,485,000 1,528,808 0.21Covanta Holding Corp.,6.375%, 1/10/2022 1,010,000 1,041,563 0.14Covanta Holding Corp.,5.875%, 1/03/2024 1,010,000 1,004,950 0.14Dynegy, Inc.,7.375%, 1/11/2022 580,000 572,750 0.08Dynegy, Inc.,8%, 15/01/2025 565,000 542,400 0.07Enel S.p.A.,8.75% to 24/09/2013,FRN to 24/09/2073 1,545,000 1,761,300 0.24Greenko Dutch B.V.,8%, 1/08/2019 2,042,000 2,167,073 0.29NRG Energy, Inc.,6.625%, 15/03/2023 1,340,000 1,380,200 0.19NRG Energy, Inc.,7.25%, 15/05/2026 1,850,000 1,935,563 0.26TerraForm Global Operating LLC,9.75%, 15/08/2022 2,920,000 3,219,300 0.44
19,413,782 2.64
Total Bonds(Identified Cost, $709,448,538) 700,254,414 95.17
COMMON STOCKS
Energy – IndependentPacific Exploration & Production Corp.(Identified Cost, $4,196,903) 22,836 913,805 0.12
SHORT-TERM OBLIGATIONS (y)General Electric Co.,0.58%, 1/02/2017, at AmortizedCost and Value USD 8,287,000 8,287,000 1.13
Total Transferable Securities andMoney Market Instruments Tradedon a Regulated Market(Identified Cost, $721,932,441) (k) 709,455,219 96.42
Total Investments(Identified Cost, $721,932,441) 709,455,219 96.42
OTHER ASSETS, LESS LIABILITIES 26,358,247 3.58
NET ASSETS 735,813,466 100.00
See Schedules of Investments Footnotes and Notes to Financial Statements
MFS Meridian Funds Annual Report 2017 61
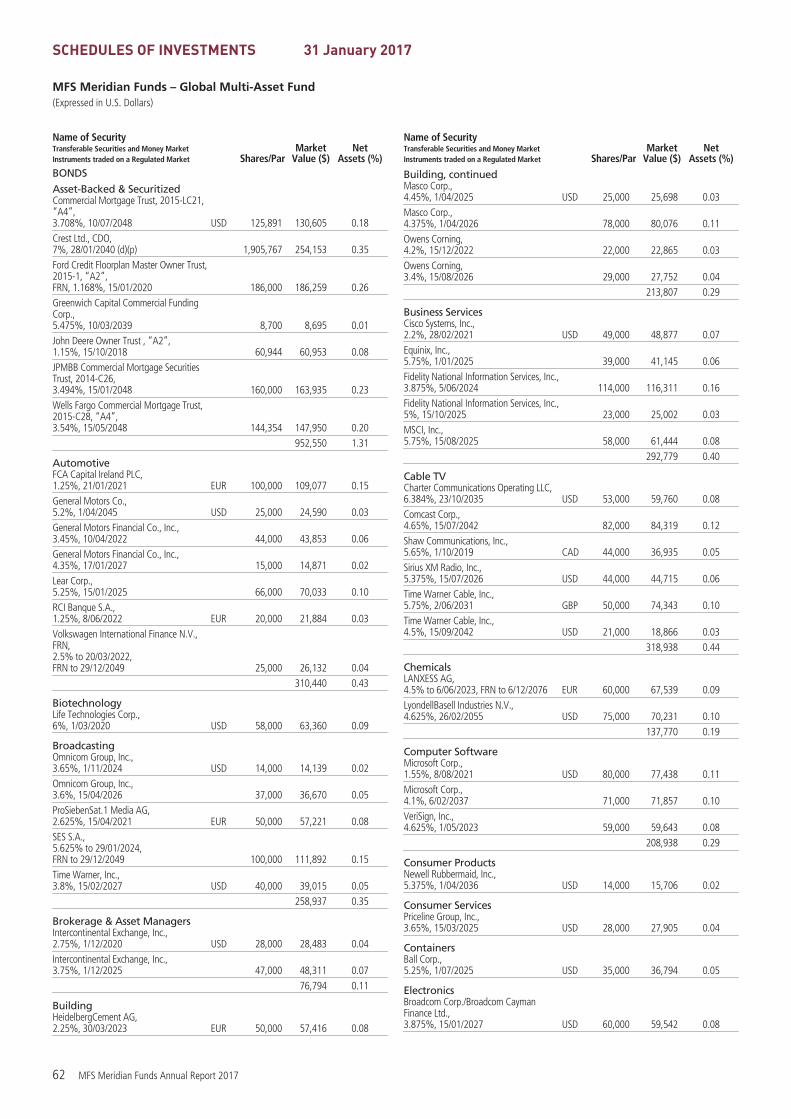
SCHEDULES OF INVESTMENTS 31 January 2017
MFS Meridian Funds – Global Multi-Asset Fund(Expressed in U.S. Dollars)
Name of SecurityTransferable Securities and Money MarketInstruments traded on a Regulated Market Shares/Par
MarketValue ($)
NetAssets (%)
BONDS
Asset-Backed & SecuritizedCommercial Mortgage Trust, 2015-LC21,“A4”,3.708%, 10/07/2048 USD 125,891 130,605 0.18Crest Ltd., CDO,7%, 28/01/2040 (d)(p) 1,905,767 254,153 0.35Ford Credit Floorplan Master Owner Trust,2015-1, “A2”,FRN, 1.168%, 15/01/2020 186,000 186,259 0.26Greenwich Capital Commercial FundingCorp.,5.475%, 10/03/2039 8,700 8,695 0.01John Deere Owner Trust , “A2”,1.15%, 15/10/2018 60,944 60,953 0.08JPMBB Commercial Mortgage SecuritiesTrust, 2014-C26,3.494%, 15/01/2048 160,000 163,935 0.23Wells Fargo Commercial Mortgage Trust,2015-C28, “A4”,3.54%, 15/05/2048 144,354 147,950 0.20
952,550 1.31
AutomotiveFCA Capital Ireland PLC,1.25%, 21/01/2021 EUR 100,000 109,077 0.15General Motors Co.,5.2%, 1/04/2045 USD 25,000 24,590 0.03General Motors Financial Co., Inc.,3.45%, 10/04/2022 44,000 43,853 0.06General Motors Financial Co., Inc.,4.35%, 17/01/2027 15,000 14,871 0.02Lear Corp.,5.25%, 15/01/2025 66,000 70,033 0.10RCI Banque S.A.,1.25%, 8/06/2022 EUR 20,000 21,884 0.03Volkswagen International Finance N.V.,FRN,2.5% to 20/03/2022,FRN to 29/12/2049 25,000 26,132 0.04
310,440 0.43
BiotechnologyLife Technologies Corp.,6%, 1/03/2020 USD 58,000 63,360 0.09
BroadcastingOmnicom Group, Inc.,3.65%, 1/11/2024 USD 14,000 14,139 0.02Omnicom Group, Inc.,3.6%, 15/04/2026 37,000 36,670 0.05ProSiebenSat.1 Media AG,2.625%, 15/04/2021 EUR 50,000 57,221 0.08SES S.A.,5.625% to 29/01/2024,FRN to 29/12/2049 100,000 111,892 0.15Time Warner, Inc.,3.8%, 15/02/2027 USD 40,000 39,015 0.05
258,937 0.35
Brokerage & Asset ManagersIntercontinental Exchange, Inc.,2.75%, 1/12/2020 USD 28,000 28,483 0.04Intercontinental Exchange, Inc.,3.75%, 1/12/2025 47,000 48,311 0.07
76,794 0.11
BuildingHeidelbergCement AG,2.25%, 30/03/2023 EUR 50,000 57,416 0.08
Name of SecurityTransferable Securities and Money MarketInstruments traded on a Regulated Market Shares/Par
MarketValue ($)
NetAssets (%)
Building, continuedMasco Corp.,4.45%, 1/04/2025 USD 25,000 25,698 0.03Masco Corp.,4.375%, 1/04/2026 78,000 80,076 0.11Owens Corning,4.2%, 15/12/2022 22,000 22,865 0.03Owens Corning,3.4%, 15/08/2026 29,000 27,752 0.04
213,807 0.29
Business ServicesCisco Systems, Inc.,2.2%, 28/02/2021 USD 49,000 48,877 0.07Equinix, Inc.,5.75%, 1/01/2025 39,000 41,145 0.06Fidelity National Information Services, Inc.,3.875%, 5/06/2024 114,000 116,311 0.16Fidelity National Information Services, Inc.,5%, 15/10/2025 23,000 25,002 0.03MSCI, Inc.,5.75%, 15/08/2025 58,000 61,444 0.08
292,779 0.40
Cable TVCharter Communications Operating LLC,6.384%, 23/10/2035 USD 53,000 59,760 0.08Comcast Corp.,4.65%, 15/07/2042 82,000 84,319 0.12Shaw Communications, Inc.,5.65%, 1/10/2019 CAD 44,000 36,935 0.05Sirius XM Radio, Inc.,5.375%, 15/07/2026 USD 44,000 44,715 0.06Time Warner Cable, Inc.,5.75%, 2/06/2031 GBP 50,000 74,343 0.10Time Warner Cable, Inc.,4.5%, 15/09/2042 USD 21,000 18,866 0.03
318,938 0.44
ChemicalsLANXESS AG,4.5% to 6/06/2023, FRN to 6/12/2076 EUR 60,000 67,539 0.09LyondellBasell Industries N.V.,4.625%, 26/02/2055 USD 75,000 70,231 0.10
137,770 0.19
Computer SoftwareMicrosoft Corp.,1.55%, 8/08/2021 USD 80,000 77,438 0.11Microsoft Corp.,4.1%, 6/02/2037 71,000 71,857 0.10VeriSign, Inc.,4.625%, 1/05/2023 59,000 59,643 0.08
208,938 0.29
Consumer ProductsNewell Rubbermaid, Inc.,5.375%, 1/04/2036 USD 14,000 15,706 0.02
Consumer ServicesPriceline Group, Inc.,3.65%, 15/03/2025 USD 28,000 27,905 0.04
ContainersBall Corp.,5.25%, 1/07/2025 USD 35,000 36,794 0.05
ElectronicsBroadcom Corp./Broadcom CaymanFinance Ltd.,3.875%, 15/01/2027 USD 60,000 59,542 0.08
62 MFS Meridian Funds Annual Report 2017

SCHEDULES OF INVESTMENTS 31 January 2017
MFS Meridian Funds – Global Multi-Asset Fund, continued
Name of SecurityTransferable Securities and Money MarketInstruments traded on a Regulated Market Shares/Par
MarketValue ($)
NetAssets (%)
Electronics, continuedFlextronics International Ltd.,4.625%, 15/02/2020 USD 16,000 16,778 0.02Tyco Electronics Group S.A.,2.375%, 17/12/2018 56,000 56,464 0.08
132,784 0.18
Emerging Market Quasi-SovereignPetroleos Mexicanos,6.5%, 13/03/2027 USD 13,000 13,370 0.02
Emerging Market SovereignRepublic of Peru,5.625%, 18/11/2050 USD 2,000 2,310 0.00
Energy – IndependentConcho Resources, Inc.,4.375%, 15/01/2025 USD 57,000 58,283 0.08
Food & BeveragesAnheuser-Busch InBev Worldwide, Inc.,4.7%, 1/02/2036 USD 81,000 84,792 0.12Anheuser-Busch InBev Worldwide, Inc.,2.75%,17/03/2036 EUR 23,000 26,160 0.04Constellation Brands, Inc.,4.25%, 1/05/2023 USD 80,000 83,977 0.12Constellation Brands, Inc.,4.75%, 1/12/2025 27,000 28,789 0.04J.M. Smucker Co.,2.5%, 15/03/2020 61,000 61,537 0.08J.M. Smucker Co.,4.375%, 15/03/2045 11,000 10,933 0.01Kraft Heinz Foods Co.,3.5%, 15/07/2022 34,000 34,580 0.05Kraft Heinz Foods Co.,5%, 15/07/2035 17,000 17,824 0.02Tyson Foods, Inc.,5.15%, 15/08/2044 14,000 14,696 0.02Wm. Wrigley Jr. Co.,2.9%, 21/10/2019 25,000 25,431 0.03Wm. Wrigley Jr. Co.,3.375%, 21/10/2020 11,000 11,341 0.02
400,060 0.55
Food & Drug StoresWalgreens Boots Alliance, Inc.,4.5%, 18/11/2034 USD 54,000 54,225 0.07
Forest & Paper ProductsGeorgia-Pacific LLC,5.4%, 1/11/2020 USD 73,000 80,402 0.11
InsuranceAmerican International Group, Inc.,4.875%, 1/06/2022 USD 32,000 34,889 0.05American International Group, Inc.,3.75%, 10/07/2025 31,000 31,105 0.04CNP Assurances S.A.,6% to 14/09/2020, FRN to 14/09/2040 EUR 50,000 61,127 0.09Old Mutual PLC,7.875%, 3/11/2025 GBP 100,000 147,529 0.20
274,650 0.38
Insurance – HealthAetna, Inc.,2.8%, 15/06/2023 USD 36,000 35,712 0.05UnitedHealth Group, Inc.,2.7%, 15/07/2020 82,000 83,354 0.11
119,066 0.16
Name of SecurityTransferable Securities and Money MarketInstruments traded on a Regulated Market Shares/Par
MarketValue ($)
NetAssets (%)
Insurance – Property & CasualtyBerkshire Hathaway, Inc.,2.75%, 15/03/2023 USD 29,000 28,954 0.04Chubb INA Holdings, Inc.,2.3%, 3/11/2020 15,000 15,041 0.02Chubb INA Holdings, Inc.,2.875%, 3/11/2022 36,000 36,289 0.05Liberty Mutual Group, Inc.,4.25%, 15/06/2023 51,000 53,525 0.07Marsh & McLennan Cos., Inc.,2.55%, 15/10/2018 26,000 26,291 0.04Marsh & McLennan Cos., Inc.,4.35%, 30/01/2047 15,000 14,698 0.02
174,798 0.24
International Market Quasi-SovereignStatoil A.S.A.,4.25%, 23/11/2041 USD 170,000 171,849 0.24Statoil A.S.A., FRN,1.195%, 15/05/2018 33,000 33,063 0.04Temasek Financial I Ltd.,2.375%, 23/01/2023 280,000 274,845 0.38
479,757 0.66
International Market SovereignCommonwealth of Australia,5.75%, 15/05/2021 AUD 751,000 655,400 0.90Federal Republic of Germany,0.5%, 15/02/2026 EUR 123,000 135,451 0.19Federal Republic of Germany,6.25%, 4/01/2030 81,000 149,039 0.20Federal Republic of Germany,2.5%, 4/07/2044 113,000 161,412 0.22Government of Canada,4.25%, 1/06/2018 CAD 280,000 225,356 0.31Government of Canada,2.5%, 1/06/2024 600,000 491,684 0.67Government of Canada,5.75%, 1/06/2033 185,000 209,533 0.29Government of Canada,4%, 1/06/2041 40,000 39,482 0.05Government of Japan,2.1%, 20/09/2024 JPY 1,000,000 10,256 0.01Government of Japan,0.4%, 20/09/2025 41,500,000 378,330 0.52Government of Japan,0.3%, 20/12/2025 2,300,000 20,803 0.03Government of Japan,2.2%, 20/09/2027 51,850,000 559,306 0.77Government of Japan,1.7%, 20/09/2032 32,000,000 338,765 0.46Government of Japan,1.5%, 20/03/2034 75,000,000 773,567 1.06Government of Japan,2.4%, 20/03/2037 10,900,000 127,860 0.18Government of Japan,1.8%, 20/03/2043 23,700,000 261,313 0.36Government of Japan,2%, 20/03/2052 10,000,000 118,527 0.16Kingdom of Belgium,4.5%, 28/03/2026 EUR 84,000 121,092 0.17Kingdom of Belgium,4%, 28/03/2032 108,000 159,311 0.22Kingdom of Denmark,1.5%, 15/11/2023 DKK 640,000 101,554 0.14Kingdom of Denmark,1.75%, 15/11/2025 770,000 124,168 0.17
MFS Meridian Funds Annual Report 2017 63

SCHEDULES OF INVESTMENTS 31 January 2017
MFS Meridian Funds – Global Multi-Asset Fund, continued
Name of SecurityTransferable Securities and Money MarketInstruments traded on a Regulated Market Shares/Par
MarketValue ($)
NetAssets (%)
International Market Sovereign, continuedKingdom of Spain,5.4%, 31/01/2023 EUR 77,000 105,765 0.15Kingdom of Spain,5.15%, 31/10/2028 59,000 85,792 0.12Kingdom of Sweden,3.5%, 1/06/2022 SEK 845,000 114,088 0.16Kingdom of the Netherlands,5.5%, 15/01/2028 EUR 126,000 205,567 0.28Republic of France,6%, 25/10/2025 189,000 294,614 0.40Republic of France,4.75%, 25/04/2035 60,970 98,402 0.13Republic of France,4.5%, 25/04/2041 113,000 184,271 0.25Republic of Ireland,5.4%, 13/03/2025 (e) 43,000 62,452 0.09Republic of Italy,3.75%, 1/03/2021 116,000 140,839 0.19Republic of Italy,5.5%, 1/09/2022 654,000 868,029 1.19United Kingdom Treasury,4.25%, 7/12/2027 GBP 35,000 56,022 0.08United Kingdom Treasury,4.25%, 7/03/2036 75,000 128,995 0.18United Kingdom Treasury,3.25%, 22/01/2044 95,000 149,264 0.20United Kingdom Treasury,3.75%, 22/07/2052 52,000 95,996 0.13United Kingdom Treasury,4%, 22/01/2060 22,000 45,155 0.06
7,797,460 10.69
Local AuthoritiesProvince of Alberta,1.25%, 1/06/2020 CAD 31,000 23,698 0.03Province of Alberta,4.5%, 1/12/2040 45,000 40,514 0.06Province of Manitoba,4.15%, 3/06/2020 28,000 23,426 0.03
87,638 0.12
Major BanksBank of America Corp.,2.625%, 19/04/2021 USD 89,000 88,331 0.12Bank of America Corp.,3.248%, 21/10/2027 74,000 69,858 0.10Bank of America Corp.,FRN,6.1%, 29/12/2049 31,000 32,318 0.04Bank of New York Mellon Corp.,3.442% to 7/02/2027, FRN to 7/02/2028 49,000 49,000 0.07Barclays Bank PLC,6%, 14/01/2021 EUR 50,000 62,685 0.09Credit Agricole S.A.,7.375%, 18/12/2023 GBP 50,000 80,027 0.11Credit Agricole S.A.,7.875% to 26/10/2019,FRN to 29/10/2049 EUR 50,000 62,729 0.09Goldman Sachs Group, Inc.,5.75%, 24/01/2022 USD 164,000 184,112 0.25Goldman Sachs Group, Inc.,3.625%, 22/01/2023 72,000 73,453 0.10JPMorgan Chase & Co.,4.25%, 15/10/2020 25,000 26,522 0.04JPMorgan Chase & Co.,2.95%, 1/10/2026 95,000 89,837 0.12
Name of SecurityTransferable Securities and Money MarketInstruments traded on a Regulated Market Shares/Par
MarketValue ($)
NetAssets (%)
Major Banks, continuedJPMorgan Chase & Co.,6.75% to 1/02/2024, FRN to 29/01/2049 USD 55,000 60,193 0.08Morgan Stanley,2.2%, 7/12/2018 40,000 40,153 0.05Morgan Stanley,3.125%, 27/07/2026 48,000 45,576 0.06Morgan Stanley,3.95%, 23/04/2027 39,000 38,133 0.05Sumitomo Mitsui Financial Group, Inc.,0.606%, 18/01/2022 EUR 100,000 107,627 0.15Wells Fargo & Co.,4.1%, 3/06/2026 USD 15,000 15,182 0.02
1,125,736 1.54
Medical & Health Technology & ServicesBecton, Dickinson and Co.,3.734%, 15/12/2024 USD 7,000 7,175 0.01Becton, Dickinson and Co.,4.685%, 15/12/2044 15,000 15,495 0.02Fresenius U.S. Finance II, Inc.,4.25%, 1/02/2021 65,000 67,681 0.09HCA, Inc.,4.75%, 1/05/2023 27,000 27,979 0.04HCA, Inc.,5.25%, 15/06/2026 33,000 34,403 0.05Laboratory Corp. of America Holdings,4.7%, 1/02/2045 30,000 29,761 0.04Thermo Fisher Scientific, Inc.,2.95%, 19/09/2026 20,000 18,904 0.03Universal Health Services, Inc.,5%, 1/06/2026 48,000 47,760 0.06
249,158 0.34
Medical EquipmentMedtronic, Inc.,3.5%, 15/03/2025 USD 112,000 114,468 0.16
Metals & MiningBarrick Gold Corp.,4.1%, 1/05/2023 USD 31,000 32,578 0.05Cameco Corp.,5.67%, 2/09/2019 CAD 44,000 36,338 0.05Glencore Finance (Europe) S.A.,1.75%, 17/03/2025 EUR 100,000 105,066 0.14Steel Dynamics, Inc.,5%, 15/12/2026 USD 10,000 10,175 0.01
184,157 0.25
MidstreamAPT Pipelines Ltd.,5%, 23/03/2035 USD 75,000 73,056 0.10Dominion Gas Holdings LLC,2.8%, 15/11/2020 44,000 44,613 0.06Enbridge, Inc.,6% to 15/01/2027, FRN to 15/01/2077 43,000 43,538 0.06Enterprise Products Operating LLC,3.9%, 15/02/2024 30,000 30,923 0.04Enterprise Products Operating LLC,4.85%, 15/03/2044 13,000 13,254 0.02Kinder Morgan (Delaware), Inc.,7.75%, 15/01/2032 15,000 18,725 0.03Kinder Morgan Energy Partners LP,5.4%, 1/09/2044 49,000 50,832 0.07Sabine Pass Liquefaction LLC,5%, 15/03/2027 45,000 47,194 0.07Spectra Energy Capital LLC,8%, 1/10/2019 41,000 46,430 0.06
368,565 0.51
64 MFS Meridian Funds Annual Report 2017

SCHEDULES OF INVESTMENTS 31 January 2017
MFS Meridian Funds – Global Multi-Asset Fund, continued
Name of SecurityTransferable Securities and Money MarketInstruments traded on a Regulated Market Shares/Par
MarketValue ($)
NetAssets (%)
Mortgage-BackedFannie Mae,4.88%, 1/03/2020 USD 36,585 38,294 0.05Fannie Mae,5%, 1/08/2040 48,541 52,928 0.07Fannie Mae,4%, 1/11/2040 – 1/02/2041 356,170 374,923 0.52Fannie Mae,4.5%, 1/02/2041 – 1/02/2046 472,917 509,584 0.70Fannie Mae,3.5%, 1/05/2043 235,729 242,543 0.33Freddie Mac,4.224%, 25/03/2020 350,000 372,524 0.51Freddie Mac,2.673%, 25/03/2026 98,000 96,350 0.13Freddie Mac,4.5%, 1/12/2039 – 1/05/2042 105,076 113,097 0.16Freddie Mac,5%, 1/07/2041 83,699 92,475 0.13Ginnie Mae,3.5%, 20/06/2043 166,831 173,656 0.24
2,066,374 2.84
Network & TelecomAT&T, Inc.,2.45%, 30/06/2020 USD 48,000 47,628 0.07AT&T, Inc.,4.75%, 15/05/2046 103,000 94,082 0.13British Telecom PLC,5.75%, 7/12/2028 GBP 20,000 32,637 0.04Deutsche Telekom InternationalFinance B.V.,1.375%, 30/01/2027 EUR 20,000 21,381 0.03Telecom Italia S.p.A.,2.5%, 19/07/2023 100,000 107,036 0.15Verizon Communications, Inc.,4.5%, 15/09/2020 USD 70,000 74,717 0.10Verizon Communications, Inc.,6.4%, 15/09/2033 71,000 86,088 0.12
463,569 0.64
OilsMarathon Petroleum Corp.,3.4%, 15/12/2020 USD 54,000 55,232 0.08Valero Energy Corp.,4.9%, 15/03/2045 40,000 39,580 0.05
94,812 0.13
Other Banks & Diversified FinancialsArion Banki,2.5%, 26/04/2019 EUR 100,000 111,735 0.15Citigroup, Inc.,3.2%, 21/10/2026 USD 75,000 71,042 0.10Discover Bank,4.25%, 13/03/2026 36,000 36,678 0.05Groupe BPCE S.A.,12.5% to 30/09/2019,FRN to 29/08/2049 171,000 209,475 0.29Intesa Sanpaolo S.p.A.,5.25%, 28/01/2022 50,000 68,771 0.10KBC Groep N.V.,2.375% to 25/11/2019,FRN to 25/11/2024 100,000 111,674 0.15UniCredit S.p.A.,4.375% to 3/01/2022, FRN to 3/01/2027 100,000 109,061 0.15
718,436 0.99
Name of SecurityTransferable Securities and Money MarketInstruments traded on a Regulated Market Shares/Par
MarketValue ($)
NetAssets (%)
Personal Computers & PeripheralsEquifax, Inc.,2.3%, 1/06/2021 USD 19,000 18,706 0.03
PharmaceuticalsCelgene Corp.,2.875%, 15/08/2020 USD 73,000 74,156 0.10Gilead Sciences, Inc.,2.35%, 1/02/2020 26,000 26,219 0.04
100,375 0.14
Real Estate – ApartmentVonovia SE, REIT,2.125%, 9/07/2022 EUR 50,000 57,400 0.08
Real Estate – OfficeBoston Properties, Inc., REIT,3.125%, 1/09/2023 USD 67,000 66,212 0.09
Real Estate – OtherHost Hotels & Resorts, Inc., REIT,4%, 15/06/2025 USD 45,000 44,617 0.06
Real Estate – RetailSimon International Finance S.C.A., REIT,1.25%, 13/05/2025 EUR 100,000 107,084 0.15
RetailersBest Buy Co., Inc.,5.5%, 15/03/2021 USD 90,000 97,806 0.13Home Depot, Inc.,3.35%, 15/09/2025 65,000 66,335 0.09
164,141 0.22
SupermarketsLoblaw Cos. Ltd.,4.86%, 12/09/2023 CAD 44,000 37,959 0.05
SupranationalInternational Bank for Reconstruction andDevelopment,2.8%, 13/01/2021 AUD 25,000 19,123 0.03International Bank for Reconstruction andDevelopment,4.25%, 24/06/2025 35,000 28,638 0.04International Finance Corp.,3.25%, 22/07/2019 50,000 38,830 0.05
86,591 0.12
Telecommunications – WirelessAmerican Tower Corp., REIT,4.7%, 15/03/2022 USD 34,000 36,292 0.05American Tower Corp., REIT,3.5%, 31/01/2023 64,000 64,183 0.09Crown Castle International Corp.,2.25%, 1/09/2021 47,000 45,510 0.06Crown Castle International Corp.,3.7%, 15/06/2026 18,000 17,539 0.02SBA Tower Trust,2.898%, 15/10/2044 41,000 41,284 0.06
204,808 0.28
Telephone ServicesTELUS Corp.,5.05%, 23/07/2020 CAD 45,000 38,139 0.05
TobaccoB.A.T. International Finance PLC,0.875%, 13/10/2023 EUR 100,000 106,445 0.15Philip Morris International, Inc.,4.875%, 15/11/2043 USD 32,000 34,101 0.05Reynolds American, Inc.,3.25%, 12/06/2020 15,000 15,384 0.02
MFS Meridian Funds Annual Report 2017 65

SCHEDULES OF INVESTMENTS 31 January 2017
MFS Meridian Funds – Global Multi-Asset Fund, continued
Name of SecurityTransferable Securities and Money MarketInstruments traded on a Regulated Market Shares/Par
MarketValue ($)
NetAssets (%)
Tobacco, continuedReynolds American, Inc.,4%, 12/06/2022 USD 23,000 24,029 0.03Reynolds American, Inc.,4.45%, 12/06/2025 17,000 17,819 0.02
197,778 0.27
Transportation – ServicesERAC USA Finance LLC,7%, 15/10/2037 USD 35,000 44,397 0.06
U.S. Treasury ObligationsU.S. Treasury Bonds,3.625%, 15/02/2044 USD 213,000 236,280 0.32U.S. Treasury Bonds, TIPS,0.125%, 15/04/2020 343,200 349,509 0.48U.S. Treasury Bonds, TIPS,1.125%, 15/01/2021 444,638 470,356 0.65U.S. Treasury Bonds, TIPS,0.375%, 15/07/2023 394,102 401,977 0.55U.S. Treasury Bonds, TIPS,0.625%, 15/01/2024 506,846 521,198 0.72U.S. Treasury Bonds, TIPS,0.125%, 15/07/2024 533,636 530,443 0.73U.S. Treasury Bonds, TIPS,0.25%, 15/01/2025 392,311 389,810 0.53U.S. Treasury Bonds, TIPS,2.375%, 15/01/2025 524,968 608,485 0.83U.S. Treasury Bonds, TIPS,0.375%, 15/07/2025 397,940 400,034 0.55U.S. Treasury Bonds, TIPS,0.625%, 15/01/2026 154,394 157,432 0.22U.S. Treasury Bonds, TIPS,2%, 15/01/2026 356,294 405,901 0.56U.S. Treasury Bonds, TIPS,2.375%, 15/01/2027 177,126 210,399 0.29U.S. Treasury Bonds, TIPS,1.75%, 15/01/2028 104,837 118,592 0.16U.S. Treasury Bonds, TIPS,3.625%, 15/04/2028 198,467 263,879 0.36U.S. Treasury Bonds, TIPS,2.5%, 15/01/2029 182,111 222,481 0.31U.S. Treasury Bonds, TIPS,3.875%, 15/04/2029 177,645 245,771 0.34U.S. Treasury Bonds, TIPS,3.375%, 15/04/2032 67,987 95,300 0.13U.S. Treasury Bonds, TIPS,2.125%, 15/02/2040 112,782 141,444 0.19U.S. Treasury Bonds, TIPS,2.125%, 15/02/2041 121,232 152,840 0.21U.S. Treasury Bonds, TIPS,0.75%, 15/02/2042 215,760 206,854 0.28U.S. Treasury Bonds, TIPS,0.625%, 15/02/2043 153,266 142,162 0.20U.S. Treasury Bonds, TIPS,1.375%, 15/02/2044 219,545 242,472 0.33U.S. Treasury Bonds, TIPS,0.75%, 15/02/2045 260,332 248,277 0.34U.S. Treasury Bonds, TIPS,1%, 15/02/2046 7,130 7,261 0.01U.S. Treasury Notes,1.125%, 15/06/2018 820,000 821,314 1.13U.S. Treasury Notes,1.75%, 15/05/2022 732,000 723,021 0.99U.S. Treasury Notes,2.25%, 15/11/2025 157,000 154,823 0.21
Name of SecurityTransferable Securities and Money MarketInstruments traded on a Regulated Market Shares/Par
MarketValue ($)
NetAssets (%)
U.S. Treasury Obligations, continuedU.S. Treasury Notes, TIPS,0.125%, 15/04/2018 USD 438,518 444,355 0.61U.S. Treasury Notes, TIPS,1.375%, 15/07/2018 117,520 122,355 0.17U.S. Treasury Notes, TIPS,2.125%, 15/01/2019 161,876 171,635 0.24U.S. Treasury Notes, TIPS,0.125%, 15/04/2019 303,856 309,552 0.42U.S. Treasury Notes, TIPS,1.875%, 15/07/2019 226,072 241,921 0.33U.S. Treasury Notes, TIPS,1.375%, 15/01/2020 217,640 230,351 0.32U.S. Treasury Notes, TIPS,1.25%, 15/07/2020 422,756 449,790 0.62U.S. Treasury Notes, TIPS,0.125%, 15/04/2021 137,476 139,420 0.19U.S. Treasury Notes, TIPS,0.625%, 15/07/2021 430,482 448,634 0.62U.S. Treasury Notes, TIPS,0.125%, 15/01/2022 469,194 475,002 0.65U.S. Treasury Notes, TIPS,0.125%, 15/07/2022 504,824 511,653 0.70U.S. Treasury Notes, TIPS,0.125%, 15/01/2023 357,602 358,623 0.49
12,371,606 16.98
Utilities – Electric PowerBruce Power LP,2.844%, 23/06/2021 CAD 70,000 54,789 0.08CMS Energy Corp.,5.05%, 15/03/2022 USD 13,000 14,242 0.02Duke Energy Corp.,2.65%, 1/09/2026 44,000 41,112 0.06Duke Energy Florida LLC,3.2%, 15/01/2027 46,000 46,088 0.06E.ON International Finance B.V.,6.375%, 7/06/2032 GBP 20,000 34,635 0.05Emera U.S. Finance LP,2.7%, 15/06/2021 USD 11,000 10,916 0.01Emera U.S. Finance LP,3.55%, 15/06/2026 13,000 12,743 0.02Energias de Portugal S.A.,5.375% to 16/03/2021,FRN to 16/09/2075 EUR 100,000 112,225 0.15PPL Capital Funding, Inc.,3.1%, 15/05/2026 USD 45,000 43,176 0.06PPL Capital Funding, Inc.,5%, 15/03/2044 29,000 30,348 0.04PPL WEM Holdings PLC,5.375%, 1/05/2021 21,000 22,776 0.03Southern Co.,2.95%, 1/07/2023 26,000 25,626 0.04Southern Co.,4.4%, 1/07/2046 40,000 39,582 0.05
488,258 0.67
Total Bonds(Identified Cost, $34,313,153) 32,002,867 43.92
COMMON STOCKS
AerospaceHoneywell International, Inc. 5,274 624,020 0.86
Apparel ManufacturersLVMH Moet Hennessy Louis Vuitton SE 2,490 501,572 0.69
AutomotiveDelphi Automotive PLC 6,344 444,461 0.61
66 MFS Meridian Funds Annual Report 2017

SCHEDULES OF INVESTMENTS 31 January 2017
MFS Meridian Funds – Global Multi-Asset Fund, continued
Name of SecurityTransferable Securities and Money MarketInstruments traded on a Regulated Market Shares/Par
MarketValue ($)
NetAssets (%)
BiotechnologyBiogen, Inc. 1,966 499,207 0.69
Brokerage & Asset ManagersNASDAQ, Inc. 3,213 226,645 0.31
Business ServicesCognizant Technology SolutionsCorp., “A” 5,833 306,757 0.42Fidelity National Information Services, Inc. 5,139 408,139 0.56Global Payments, Inc. 4,630 357,806 0.49
1,072,702 1.47
ChemicalsMonsanto Co. 3,679 398,472 0.55PPG Industries, Inc. 4,274 427,443 0.58
825,915 1.13
Computer SoftwareSalesforce.com, Inc. 7,027 555,836 0.76
Computer Software – SystemsHewlett Packard Enterprise 12,398 281,187 0.39
Consumer ProductsNewell Brands, Inc. 13,003 615,432 0.85
Consumer ServicesPriceline Group, Inc. 250 393,783 0.54
Electrical EquipmentJohnson Controls International PLC 10,690 470,146 0.65
ElectronicsBroadcom Corp. 2,494 497,553 0.68Taiwan Semiconductor Manufacturing Co.Ltd., ADR 11,065 342,019 0.47
839,572 1.15
Energy – IndependentEOG Resources, Inc. 6,038 613,340 0.84Oil Search Ltd. 62,777 327,081 0.45
940,421 1.29
Energy – IntegratedBP PLC 101,871 605,975 0.83
Food & BeveragesDanone S.A. 7,524 471,004 0.64Mondelez International, Inc. 12,958 573,780 0.79
1,044,784 1.43
Food & Drug StoresCVS Health Corp. 4,188 330,056 0.45
General MerchandiseCostco Wholesale Corp. 2,252 369,215 0.51
InsuranceAIA Group Ltd. 58,400 361,748 0.50Aon PLC 3,331 375,404 0.51Chubb Ltd. 2,391 314,393 0.43
1,051,545 1.44
InternetAlphabet, Inc., “A” 932 764,417 1.05
Machinery & ToolsKubota Corp. 25,500 406,518 0.56
Major BanksLloyds Banking Group PLC 397,815 324,943 0.45
Medical EquipmentMedtronic PLC 8,655 657,953 0.90
Name of SecurityTransferable Securities and Money MarketInstruments traded on a Regulated Market Shares/Par
MarketValue ($)
NetAssets (%)
Medical Equipment, continuedPerkinElmer, Inc. 7,489 398,340 0.55
1,056,293 1.45
Metals & MiningRio Tinto Ltd. 6,206 272,547 0.37
Natural Gas – DistributionChina Resources Gas Group Ltd. 76,000 241,634 0.33
Other Banks & Diversified FinancialsCitigroup, Inc. 9,524 531,725 0.73HDFC Bank Ltd., ADR 4,505 310,530 0.43Julius Baer Group Ltd. 6,897 322,285 0.44KBC Groep N.V. 4,882 316,312 0.43U.S. Bancorp 7,273 382,923 0.53UBS AG 23,200 374,417 0.51Visa, Inc., “A” 5,486 453,747 0.62
2,691,939 3.69
PharmaceuticalsRoche Holding AG 1,789 421,239 0.58Zoetis, Inc. 6,300 346,122 0.47
767,361 1.05
Printing & PublishingRELX N.V. 22,556 380,456 0.52
Railroad & ShippingUnion Pacific Corp. 4,987 531,514 0.73
Real EstateAdvance Residence Investment Corp., REIT 34 89,705 0.12Alexandria Real Estate Equities, Inc., REIT 682 75,579 0.10Ascendas India Trust, REIT 91,200 67,946 0.09Atrium European Real Estate Ltd. 19,143 80,180 0.11AvalonBay Communities, Inc., REIT 637 110,398 0.15Big Yellow Group PLC, REIT 6,655 57,599 0.08Boardwalk, REIT 3,071 111,370 0.15Colony Starwood Homes, REIT 2,104 66,171 0.09Derwent London PLC, REIT 2,389 74,142 0.10Dream Office, REIT 8,302 122,560 0.17Entra ASA 3,565 38,468 0.05Equity Commonwealth, REIT 2,504 77,223 0.11Equity Lifestyle Properties, Inc., REIT 1,079 79,781 0.11Gateway Lifestyle Group Stapled Security 38,992 60,030 0.08Gramercy Property Trust, REIT 3,427 90,267 0.12Grand City Properties S.A. 3,033 55,218 0.08Hang Lung Properties Ltd. 52,000 127,534 0.18Hibernia PLC, REIT 23,961 31,479 0.04Japan Logistics Fund, Inc., REIT 30 63,289 0.09Kenedix Office Investment Corp., REIT 12 70,782 0.10Kerry Properties Ltd. 19,000 53,685 0.07LEG Immobilien AG 3,548 278,293 0.38Life Storage, Inc., REIT 1,008 82,102 0.11Link REIT 13,562 92,363 0.13LondonMetric Property PLC, REIT 24,607 45,690 0.06Mapletree Logistics Trust, REIT 100,053 74,542 0.10Medical Properties Trust, Inc., REIT 5,410 68,978 0.10Mid-America Apartment Communities,Inc., REIT 982 93,241 0.13Mitsui Fudosan Co. Ltd. 6,000 139,040 0.19National Storage, REIT 71,866 78,757 0.11OUTFRONT Media, Inc., REIT 1,601 43,915 0.06Parkway, Inc., REIT 1,065 22,674 0.03
MFS Meridian Funds Annual Report 2017 67

SCHEDULES OF INVESTMENTS 31 January 2017
MFS Meridian Funds – Global Multi-Asset Fund, continued
Name of SecurityTransferable Securities and Money MarketInstruments traded on a Regulated Market Shares/Par
MarketValue ($)
NetAssets (%)
Real Estate, continuedPublic Storage, Inc., REIT 708 152,220 0.21Rexford Industrial Realty, Inc., REIT 2,805 63,702 0.09Shaftesbury PLC, REIT 4,479 49,387 0.07Simon Property Group, Inc., REIT 881 161,901 0.22Sino Land Co. Ltd. 20,550 33,822 0.05STAG Industrial, Inc., REIT 1,480 34,247 0.05Starwood Property Trust, Inc., REIT 3,417 76,062 0.10Store Capital Corp., REIT 3,158 74,718 0.10Sun Communities, Inc., REIT 824 64,898 0.09Tanger Factory Outlet Centers, Inc., REIT 1,928 65,918 0.09Unibail-Rodamco, REIT 381 87,584 0.12Urban Edge Properties, REIT 1,898 53,087 0.07Vornado Realty Trust, REIT 337 35,826 0.05Washington Prime Group, Inc., REIT 6,740 65,041 0.09Weyerhaeuser Co., REIT 1,759 55,109 0.08
3,696,523 5.07
RestaurantsStarbucks Corp. 6,778 374,281 0.51
Specialty ChemicalsLinde AG 1,703 276,585 0.38
Telecommunications – WirelessAmerican Tower Corp., REIT 378 39,123 0.06KDDI Corp. 31,600 848,003 1.16
887,126 1.22
Telephone ServicesHellenic Telecommunications OrganizationS.A. 3,158 28,738 0.04
Name of SecurityTransferable Securities and Money MarketInstruments traded on a Regulated Market Shares/Par
MarketValue ($)
NetAssets (%)
Utilities – Electric PowerCMS Energy Corp. 8,633 367,766 0.51
Total Common Stocks(Identified Cost,$23,013,968) 24,761,115 33.98
SHORT-TERM OBLIGATIONS (y)Federal Home Loan Bank,0.40%, 1/02/2017 USD 1,611,000 1,611,000 2.21General Electric Co.,0.58%, 1/02/2017 2,877,000 2,877,000 3.95Novartis Finance Corp.,0.7%, 21/02/2017 1,000,000 999,611 1.37
Total Short-TermObligations, at AmortizedCost and Value 5,487,611 7.53
Total Transferable Securities andMoney Market Instruments Tradedon a Regulated Market(Identified Cost, $62,814,732) (k) 62,251,593 85.43
Issuer/Expiration Month/ Strike PriceNumber
of ContractsMarket
Value ($)Net
Assets (%)PUT OPTIONS PURCHASEDiShares Russell 2000 ETF – April2017 @ $120(Premiums Paid, $37,892) 265 27,030 0.04
Total Investments(Identified Cost, $62,852,624) 62,278,623 85.47
OTHER ASSETS, LESS LIABILITIES 10,583,947 14.53
NET ASSETS 72,862,570 100.00
See Schedules of Investments Footnotes and Notes to Financial Statements
MFS Meridian Funds – Global Opportunistic Bond Fund(Expressed in U.S. Dollars)
Name of SecurityTransferable Securities and Money MarketInstruments traded on a Regulated Market Shares/Par
MarketValue ($)
NetAssets (%)
BONDS
AerospaceKLX, Inc.,5.875%, 1/12/2022 USD 15,000 15,713 0.04TransDigm, Inc.,6%, 15/07/2022 60,000 60,450 0.15
76,163 0.19
AirlinesRyanair Ltd.,1.125%, 10/03/2023 EUR 100,000 107,494 0.27
Asset-Backed & SecuritizedCitigroup/Deutsche Bank CommercialMortgage Trust, FRN,5.366%, 11/12/2049 USD 109,185 109,105 0.27Commercial Mortgage Trust, 2015-DC1,“A5”,3.35%, 10/02/2048 160,000 161,696 0.40Flatiron CLO Ltd., 2013-1A, “A2R”, FRN,2.58%, 17/01/2026 250,000 251,047 0.63Ford Credit Floorplan Master Owner Trust,2015-1, “A2”, FRN,1.168%, 15/01/2020 308,000 308,428 0.77GS Mortgage Securities Trust, 2015-GC30,“A4”,3.382%, 10/05/2050 160,000 162,358 0.40
Name of SecurityTransferable Securities and Money MarketInstruments traded on a Regulated Market Shares/Par
MarketValue ($)
NetAssets (%)
Asset-Backed & Securitized, continuedJPMorgan Chase Commercial MortgageTrust, 2007-LD11, “AM”, FRN,5.759%, 15/06/2049 USD 160,000 162,071 0.40Loomis, Sayles & Co., CLO, “A1”, FRN,2.553%, 15/10/2027 250,000 249,392 0.62
1,404,097 3.49
AutomotiveFCA Capital Ireland PLC,1.25%, 21/01/2021 EUR 100,000 109,077 0.27General Motors Co.,6.6%, 1/04/2036 USD 50,000 57,589 0.14General Motors Financial Co., Inc.,3.45%, 10/04/2022 52,000 51,826 0.13General Motors Financial Co., Inc.,4.35%, 17/01/2027 21,000 20,820 0.05RCI Banque S.A.,1.25%, 8/06/2022 EUR 50,000 54,709 0.14RCI Banque S.A.,1%, 17/05/2023 100,000 106,715 0.27Volkswagen International Finance N.V.,2.5% to 20/03/2022,FRN to 29/12/2049 50,000 52,264 0.13
68 MFS Meridian Funds Annual Report 2017

SCHEDULES OF INVESTMENTS 31 January 2017
MFS Meridian Funds – Global Opportunistic Bond Fund, continued
Name of SecurityTransferable Securities and Money MarketInstruments traded on a Regulated Market Shares/Par
MarketValue ($)
NetAssets (%)
Automotive, continuedZF North America Capital, Inc.,4.75%, 29/04/2025 USD 150,000 152,505 0.38
605,505 1.51
BiotechnologyLife Technologies Corp.,6%, 1/03/2020 USD 75,000 81,932 0.20
BroadcastingClear Channel Worldwide Holdings, Inc.,“A”,6.5%, 15/11/2022 USD 10,000 10,090 0.02Clear Channel Worldwide Holdings, Inc.,“B”,6.5%, 15/11/2022 80,000 83,520 0.21Liberty Media Corp. – Liberty Formula One,8.5%, 15/07/2029 45,000 49,950 0.12Match Group, Inc.,6.375%, 1/06/2024 30,000 32,175 0.08Netflix, Inc.,5.875%, 15/02/2025 65,000 70,525 0.18Netflix, Inc.,4.375%, 15/11/2026 15,000 14,719 0.04Omnicom Group, Inc.,3.6%, 15/04/2026 75,000 74,330 0.18ProSiebenSat.1 Media AG,2.625%, 15/04/2021 EUR 50,000 57,221 0.14Time Warner, Inc.,3.8%, 15/02/2027 USD 53,000 51,695 0.13
444,225 1.10
Brokerage & Asset ManagersCME Group, Inc.,3%, 15/03/2025 USD 100,000 99,609 0.25Intercontinental Exchange, Inc.,2.75%, 1/12/2020 50,000 50,863 0.12Intercontinental Exchange, Inc.,3.75%, 1/12/2025 50,000 51,395 0.13
201,867 0.50
BuildingABC Supply Co., Inc.,5.75%, 15/12/2023 USD 25,000 26,000 0.07Beacon Roofing Supply, Inc.,6.375%, 1/10/2023 50,000 53,625 0.13HD Supply, Inc.,5.75%, 15/04/2024 55,000 57,888 0.14HeidelbergCement AG,2.25%, 30/03/2023 EUR 30,000 34,449 0.09Standard Industries, Inc.,5.375%, 15/11/2024 USD 125,000 128,906 0.32
300,868 0.75
Business ServicesAlliance Data Systems Corp.,5.875%, 1/11/2021 USD 55,000 56,788 0.14Alliance Data Systems Corp.,5.375%, 1/08/2022 20,000 19,550 0.05Cisco Systems, Inc.,2.2%, 28/02/2021 50,000 49,874 0.13Equinix, Inc.,5.375%, 1/04/2023 100,000 104,633 0.26Fidelity National Information Services, Inc.,5%, 15/10/2025 100,000 108,703 0.27Iron Mountain, Inc., REIT,6%, 15/08/2023 80,000 84,800 0.21
424,348 1.06
Name of SecurityTransferable Securities and Money MarketInstruments traded on a Regulated Market Shares/Par
MarketValue ($)
NetAssets (%)
Cable TVAltice Financing S.A.,6.625%, 15/02/2023 USD 200,000 209,500 0.52CCO Holdings LLC/CCO Holdings CapitalCorp.,5.125%, 1/05/2023 200,000 207,500 0.52Charter Communications Operating LLC,6.384%, 23/10/2035 75,000 84,566 0.21Comcast Corp.,2.75%, 1/03/2023 100,000 98,656 0.25DISH DBS Corp.,5.875%, 15/11/2024 60,000 60,675 0.15Shaw Communications, Inc.,5.65%, 1/10/2019 CAD 45,000 37,774 0.09Sirius XM Radio, Inc.,6%, 15/07/2024 USD 150,000 159,657 0.40Time Warner Cable, Inc.,5.75%, 2/06/2031 GBP 50,000 74,343 0.18Unitymedia Hessen,5.5%, 15/01/2023 USD 200,000 208,000 0.52Virgin Media Secured Finance PLC,5.25%, 15/01/2026 200,000 200,674 0.50
1,341,345 3.34
ChemicalsChemours Co.,7%, 15/05/2025 USD 15,000 14,948 0.04GCP Applied Technologies Co.,9.5%, 1/02/2023 55,000 62,700 0.15LYB International Finance B.V.,4%, 15/07/2023 100,000 104,534 0.26Tronox Finance LLC,6.375%, 15/08/2020 55,000 52,869 0.13
235,051 0.58
Computer SoftwareDiamond 1 Finance Corp./Diamond 2Finance Corp.,6.02%, 15/06/2026 USD 50,000 53,984 0.13Diamond 1 Finance Corp./Diamond 2Finance Corp.,5.875%, 15/06/2021 30,000 31,646 0.08Microsoft Corp.,1.55%, 8/08/2021 150,000 145,196 0.36Nuance Communications, Inc.,5.625%, 15/12/2026 35,000 34,956 0.09Oracle Corp.,3.4%, 8/07/2024 50,000 50,990 0.13VeriSign, Inc.,4.625%, 1/05/2023 70,000 70,763 0.17
387,535 0.96
Computer Software – SystemsApple, Inc.,2.7%, 13/05/2022 USD 75,000 75,370 0.19Sabre GLBL, Inc.,5.375%, 15/04/2023 80,000 81,375 0.20Western Digital Corp.,10.5%, 1/04/2024 55,000 64,763 0.16
221,508 0.55
ConglomeratesAmsted Industries Co.,5%, 15/03/2022 USD 90,000 90,225 0.22EnerSys,5%, 30/04/2023 70,000 71,225 0.18Enpro Industries, Inc.,5.875%, 15/09/2022 85,000 88,400 0.22
MFS Meridian Funds Annual Report 2017 69

SCHEDULES OF INVESTMENTS 31 January 2017
MFS Meridian Funds – Global Opportunistic Bond Fund, continued
Name of SecurityTransferable Securities and Money MarketInstruments traded on a Regulated Market Shares/Par
MarketValue ($)
NetAssets (%)
Conglomerates, continuedEntegris, Inc.,6%, 1/04/2022 USD 73,000 76,285 0.19SPX FLOW, Inc.,5.625%, 15/08/2024 45,000 45,900 0.11
372,035 0.92
Consumer ProductsNewell Rubbermaid, Inc.,5.375%, 1/04/2036 USD 50,000 56,094 0.14Prestige Brands, Inc.,5.375%, 15/12/2021 50,000 51,500 0.13Spectrum Brands, Inc.,5.75%, 15/07/2025 75,000 78,375 0.19
185,969 0.46
Consumer ServicesADT Corp.,6.25%, 15/10/2021 USD 90,000 97,875 0.24G4S International Finance PLC,1.5%, 9/01/2023 EUR 100,000 108,067 0.27Garda World Security Corp.,7.25%, 15/11/2021 USD 60,000 57,450 0.14Interval Acquisition Corp.,5.625%, 15/04/2023 85,000 86,700 0.22Mobile Mini, Inc.,5.875%, 1/07/2024 55,000 57,338 0.14Priceline Group, Inc.,3.65%, 15/03/2025 100,000 99,662 0.25Priceline Group, Inc.,1.8%, 3/03/2027 EUR 100,000 104,668 0.26ServiceMaster Co. LLC,5.125%, 15/11/2024 USD 45,000 45,563 0.11
657,323 1.63
ContainersBerry Plastics Group, Inc.,6%, 15/10/2022 USD 65,000 68,819 0.17Crown American LLC,4.5%, 15/01/2023 60,000 61,275 0.15Crown American LLC,4.25%, 30/09/2026 15,000 14,344 0.04Multi-Color Corp.,6.125%, 1/12/2022 60,000 63,450 0.16Plastipak Holdings, Inc.,6.5%, 1/10/2021 70,000 73,063 0.18Reynolds Group,5.125%, 15/07/2023 65,000 66,476 0.17Sealed Air Corp.,5.125%, 1/12/2024 75,000 77,719 0.19
425,146 1.06
ElectronicsBroadcom Corp./Broadcom CaymanFinance Ltd.,3.875%, 15/01/2027 USD 83,000 82,367 0.21Sensata Technologies B.V.,5%, 1/10/2025 70,000 69,965 0.17
152,332 0.38
Emerging Market Quasi-SovereignCorporacion Financiera de Desarrollo S.A.,4.75%, 15/07/2025 USD 200,000 210,440 0.52ONGC Videsh Ltd.,3.75%, 27/07/2026 200,000 191,336 0.48Pertamina PT,6%, 3/05/2042 200,000 197,296 0.49Petrobras Global Finance B.V.,4.375%, 20/05/2023 121,000 111,623 0.28
Name of SecurityTransferable Securities and Money MarketInstruments traded on a Regulated Market Shares/Par
MarketValue ($)
NetAssets (%)
Emerging Market Quasi-Sovereign, continuedPetroleos Mexicanos,6.5%, 13/03/2027 USD 13,000 13,370 0.03Southern Gas Corridor CJSC,6.875%, 24/03/2026 200,000 216,124 0.54
940,189 2.34
Emerging Market SovereignRepublic of Argentina,7%, 17/04/2017 USD 58,000 58,324 0.15Republic of Argentina,2.5% to 31/03/2019,3.75% to 31/03/2029,5.25% to 31/12/2038 74,000 45,584 0.11Republic of Hungary,5.375%, 25/03/2024 100,000 109,750 0.27
213,658 0.53
Energy – IndependentCarrizo Oil & Gas, Inc.,6.25%, 15/04/2023 USD 60,000 61,575 0.15Concho Resources, Inc.,5.5%, 1/04/2023 55,000 57,063 0.14Consol Energy, Inc.,8%, 1/04/2023 55,000 56,375 0.14Continental Resources, Inc.,4.5%, 15/04/2023 55,000 54,313 0.13Diamondback Energy, Inc.,5.375%, 31/05/2025 65,000 67,113 0.17Gulfport Energy Corp.,6%, 15/10/2024 35,000 35,656 0.09Gulfport Energy Corp.,6.375%, 15/05/2025 10,000 10,250 0.03PDC Energy, Inc.,6.125%, 15/09/2024 50,000 52,250 0.13Range Resources Corp.,4.875%, 15/05/2025 80,000 77,856 0.19Rice Energy, Inc.,7.25%, 1/05/2023 55,000 58,988 0.15Seven Generations Energy,8.25%, 15/05/2020 35,000 37,144 0.09Tengizchevroil Finance Co. InternationalLtd.,4%, 15/08/2026 200,000 187,477 0.47
756,060 1.88
Energy – IntegratedCenovus Energy, Inc.,6.75%, 15/11/2039 USD 70,000 78,638 0.20
EntertainmentCedar Fair LP,5.25%, 15/03/2021 USD 55,000 56,673 0.14Cinemark USA, Inc.,5.125%, 15/12/2022 60,000 61,650 0.15Cinemark USA, Inc.,4.875%, 1/06/2023 10,000 10,074 0.03Six Flags Entertainment Corp.,4.875%, 31/07/2024 30,000 29,775 0.07
158,172 0.39
Financial InstitutionsAircastle Ltd.,5.5%, 15/02/2022 USD 125,000 131,238 0.33CIT Group, Inc.,5.5%, 15/02/2019 115,000 120,989 0.30Credit Acceptance Corp.,7.375%, 15/03/2023 80,000 82,085 0.20Nationstar Mortgage LLC/Capital Corp.,7.875%, 1/10/2020 75,000 78,000 0.19
70 MFS Meridian Funds Annual Report 2017
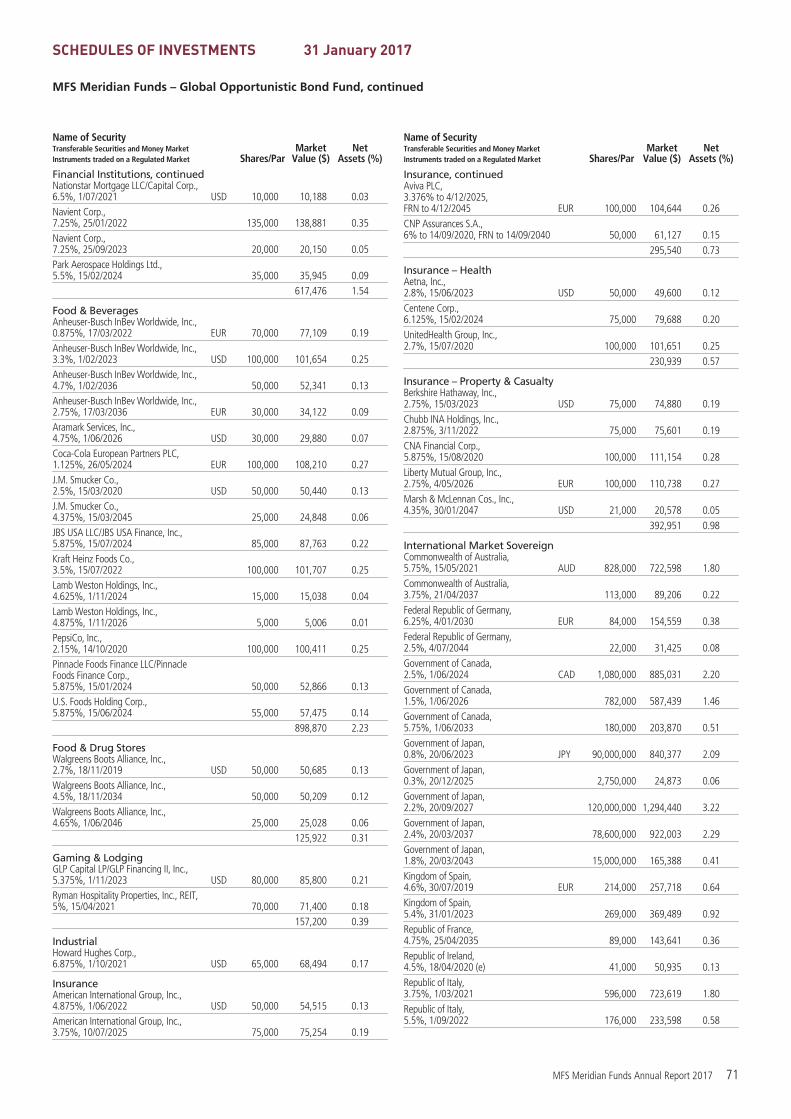
SCHEDULES OF INVESTMENTS 31 January 2017
MFS Meridian Funds – Global Opportunistic Bond Fund, continued
Name of SecurityTransferable Securities and Money MarketInstruments traded on a Regulated Market Shares/Par
MarketValue ($)
NetAssets (%)
Financial Institutions, continuedNationstar Mortgage LLC/Capital Corp.,6.5%, 1/07/2021 USD 10,000 10,188 0.03Navient Corp.,7.25%, 25/01/2022 135,000 138,881 0.35Navient Corp.,7.25%, 25/09/2023 20,000 20,150 0.05Park Aerospace Holdings Ltd.,5.5%, 15/02/2024 35,000 35,945 0.09
617,476 1.54
Food & BeveragesAnheuser-Busch InBev Worldwide, Inc.,0.875%, 17/03/2022 EUR 70,000 77,109 0.19Anheuser-Busch InBev Worldwide, Inc.,3.3%, 1/02/2023 USD 100,000 101,654 0.25Anheuser-Busch InBev Worldwide, Inc.,4.7%, 1/02/2036 50,000 52,341 0.13Anheuser-Busch InBev Worldwide, Inc.,2.75%, 17/03/2036 EUR 30,000 34,122 0.09Aramark Services, Inc.,4.75%, 1/06/2026 USD 30,000 29,880 0.07Coca-Cola European Partners PLC,1.125%, 26/05/2024 EUR 100,000 108,210 0.27J.M. Smucker Co.,2.5%, 15/03/2020 USD 50,000 50,440 0.13J.M. Smucker Co.,4.375%, 15/03/2045 25,000 24,848 0.06JBS USA LLC/JBS USA Finance, Inc.,5.875%, 15/07/2024 85,000 87,763 0.22Kraft Heinz Foods Co.,3.5%, 15/07/2022 100,000 101,707 0.25Lamb Weston Holdings, Inc.,4.625%, 1/11/2024 15,000 15,038 0.04Lamb Weston Holdings, Inc.,4.875%, 1/11/2026 5,000 5,006 0.01PepsiCo, Inc.,2.15%, 14/10/2020 100,000 100,411 0.25Pinnacle Foods Finance LLC/PinnacleFoods Finance Corp.,5.875%, 15/01/2024 50,000 52,866 0.13U.S. Foods Holding Corp.,5.875%, 15/06/2024 55,000 57,475 0.14
898,870 2.23
Food & Drug StoresWalgreens Boots Alliance, Inc.,2.7%, 18/11/2019 USD 50,000 50,685 0.13Walgreens Boots Alliance, Inc.,4.5%, 18/11/2034 50,000 50,209 0.12Walgreens Boots Alliance, Inc.,4.65%, 1/06/2046 25,000 25,028 0.06
125,922 0.31
Gaming & LodgingGLP Capital LP/GLP Financing II, Inc.,5.375%, 1/11/2023 USD 80,000 85,800 0.21Ryman Hospitality Properties, Inc., REIT,5%, 15/04/2021 70,000 71,400 0.18
157,200 0.39
IndustrialHoward Hughes Corp.,6.875%, 1/10/2021 USD 65,000 68,494 0.17
InsuranceAmerican International Group, Inc.,4.875%, 1/06/2022 USD 50,000 54,515 0.13American International Group, Inc.,3.75%, 10/07/2025 75,000 75,254 0.19
Name of SecurityTransferable Securities and Money MarketInstruments traded on a Regulated Market Shares/Par
MarketValue ($)
NetAssets (%)
Insurance, continuedAviva PLC,3.376% to 4/12/2025,FRN to 4/12/2045 EUR 100,000 104,644 0.26CNP Assurances S.A.,6% to 14/09/2020, FRN to 14/09/2040 50,000 61,127 0.15
295,540 0.73
Insurance – HealthAetna, Inc.,2.8%, 15/06/2023 USD 50,000 49,600 0.12Centene Corp.,6.125%, 15/02/2024 75,000 79,688 0.20UnitedHealth Group, Inc.,2.7%, 15/07/2020 100,000 101,651 0.25
230,939 0.57
Insurance – Property & CasualtyBerkshire Hathaway, Inc.,2.75%, 15/03/2023 USD 75,000 74,880 0.19Chubb INA Holdings, Inc.,2.875%, 3/11/2022 75,000 75,601 0.19CNA Financial Corp.,5.875%, 15/08/2020 100,000 111,154 0.28Liberty Mutual Group, Inc.,2.75%, 4/05/2026 EUR 100,000 110,738 0.27Marsh & McLennan Cos., Inc.,4.35%, 30/01/2047 USD 21,000 20,578 0.05
392,951 0.98
International Market SovereignCommonwealth of Australia,5.75%, 15/05/2021 AUD 828,000 722,598 1.80Commonwealth of Australia,3.75%, 21/04/2037 113,000 89,206 0.22Federal Republic of Germany,6.25%, 4/01/2030 EUR 84,000 154,559 0.38Federal Republic of Germany,2.5%, 4/07/2044 22,000 31,425 0.08Government of Canada,2.5%, 1/06/2024 CAD 1,080,000 885,031 2.20Government of Canada,1.5%, 1/06/2026 782,000 587,439 1.46Government of Canada,5.75%, 1/06/2033 180,000 203,870 0.51Government of Japan,0.8%, 20/06/2023 JPY 90,000,000 840,377 2.09Government of Japan,0.3%, 20/12/2025 2,750,000 24,873 0.06Government of Japan,2.2%, 20/09/2027 120,000,000 1,294,440 3.22Government of Japan,2.4%, 20/03/2037 78,600,000 922,003 2.29Government of Japan,1.8%, 20/03/2043 15,000,000 165,388 0.41Kingdom of Spain,4.6%, 30/07/2019 EUR 214,000 257,718 0.64Kingdom of Spain,5.4%, 31/01/2023 269,000 369,489 0.92Republic of France,4.75%, 25/04/2035 89,000 143,641 0.36Republic of Ireland,4.5%, 18/04/2020 (e) 41,000 50,935 0.13Republic of Italy,3.75%, 1/03/2021 596,000 723,619 1.80Republic of Italy,5.5%, 1/09/2022 176,000 233,598 0.58
MFS Meridian Funds Annual Report 2017 71

SCHEDULES OF INVESTMENTS 31 January 2017
MFS Meridian Funds – Global Opportunistic Bond Fund, continued
Name of SecurityTransferable Securities and Money MarketInstruments traded on a Regulated Market Shares/Par
MarketValue ($)
NetAssets (%)
International Market Sovereign, continuedUnited Kingdom Treasury,4.25%, 7/12/2027 GBP 178,000 284,913 0.71United Kingdom Treasury,4.25%, 7/03/2036 113,000 194,353 0.48United Kingdom Treasury,3.25%, 22/01/2044 66,000 103,699 0.26
8,283,174 20.60
Local AuthoritiesProvince of Alberta,1.25%, 1/06/2020 CAD 30,000 22,933 0.06Province of Alberta,4.5%, 1/12/2040 40,000 36,012 0.09Province of Manitoba,4.15%, 3/06/2020 25,000 20,916 0.05
79,861 0.20
Machinery & ToolsCNH Industrial Capital LLC,4.375%, 6/11/2020 USD 85,000 88,081 0.22CNH Industrial N.V.,4.5%, 15/08/2023 20,000 20,012 0.05H&E Equipment Services Co.,7%, 1/09/2022 85,000 89,570 0.22
197,663 0.49
Major BanksBank of America Corp.,2.625%, 19/04/2021 USD 75,000 74,436 0.18Bank of America Corp.,4.1%, 24/07/2023 61,000 63,424 0.16Bank of America Corp.,3.5%, 19/04/2026 58,000 57,009 0.14Bank of America Corp.,3.248%, 21/10/2027 76,000 71,746 0.18Bank of America Corp.,FRN,6.1%, 29/12/2049 95,000 99,038 0.25Barclays Bank PLC,6%, 14/01/2021 EUR 50,000 62,685 0.16Goldman Sachs Group, Inc.,5.75%, 24/01/2022 USD 125,000 140,330 0.35Goldman Sachs Group, Inc.,3.625%, 22/01/2023 75,000 76,514 0.19Goldman Sachs Group, Inc.,1.625%, 27/07/2026 EUR 50,000 52,591 0.13Goldman Sachs Group, Inc.,3.85%, 26/01/2027 USD 80,000 79,829 0.20HSBC Holdings PLC,4.375%, 23/11/2026 200,000 201,065 0.50JPMorgan Chase & Co.,4.25%, 15/10/2020 100,000 106,087 0.26JPMorgan Chase & Co.,3.25%, 23/09/2022 50,000 50,639 0.13JPMorgan Chase & Co.,2.95%, 1/10/2026 99,000 93,619 0.23JPMorgan Chase & Co.,6.75% to 1/02/2024, FRN to 29/01/2049 50,000 54,721 0.14JPMorgan Chase & Co.,6% to 1/08/2023, FRN to 31/12/2049 110,000 113,025 0.28Morgan Stanley,5.5%, 28/07/2021 50,000 55,418 0.14Morgan Stanley,3.125%, 27/07/2026 50,000 47,475 0.12Morgan Stanley,3.95%, 23/04/2027 50,000 48,888 0.12Wells Fargo & Co.,4.1%, 3/06/2026 50,000 50,607 0.12
1,599,146 3.98
Name of SecurityTransferable Securities and Money MarketInstruments traded on a Regulated Market Shares/Par
MarketValue ($)
NetAssets (%)
Medical & Health Technology & ServicesAmSurg Corp.,5.625%, 15/07/2022 USD 55,000 56,650 0.14Becton, Dickinson and Co.,3.734%, 15/12/2024 12,000 12,300 0.03Becton, Dickinson and Co.,4.685%, 15/12/2044 25,000 25,826 0.06CHS/Community Health Systems, Inc.,6.875%, 1/02/2022 30,000 21,825 0.06DaVita, Inc.,5.125%, 15/07/2024 100,000 98,750 0.25Envision Healthcare Corp.,6.25%, 1/12/2024 15,000 15,788 0.04HCA, Inc.,7.5%, 15/02/2022 200,000 227,500 0.57HCA, Inc.,5.375%, 1/02/2025 20,000 20,400 0.05HealthSouth Corp.,5.75%, 1/11/2024 80,000 81,300 0.20Laboratory Corp. of America Holdings,3.2%, 1/02/2022 50,000 50,562 0.13Laboratory Corp. of America Holdings,4.7%, 1/02/2045 50,000 49,601 0.12LifePoint Health, Inc.,5.375%, 1/05/2024 35,000 33,513 0.08MEDNAX, Inc.,5.25%, 1/12/2023 55,000 56,788 0.14Tenet Healthcare Corp.,8%, 1/08/2020 100,000 100,625 0.25Thermo Fisher Scientific, Inc.,3%, 15/04/2023 100,000 98,811 0.25Universal Health Services, Inc.,7.625%, 15/08/2020 50,000 49,625 0.12
999,864 2.49
Medical EquipmentMedtronic, Inc.,3.5%, 15/03/2025 USD 100,000 102,204 0.26Teleflex, Inc.,4.875%, 1/06/2026 125,000 124,375 0.31Zimmer Biomet Holdings, Inc.,1.414%, 13/12/2022 EUR 100,000 109,463 0.27
336,042 0.84
Metals & MiningBarrick Gold Corp.,4.1%, 1/05/2023 USD 32,000 33,629 0.08Cameco Corp.,5.67%, 2/09/2019 CAD 45,000 37,164 0.09Commercial Metals Co.,4.875%, 15/05/2023 USD 50,000 51,000 0.13Freeport-McMoRan, Inc.,3.875%, 15/03/2023 100,000 92,250 0.23Freeport-McMoRan, Inc.,6.875%, 15/02/2023 33,000 34,403 0.09Freeport-McMoRan, Inc.,6.875%, 15/02/2023 10,000 10,425 0.03Kaiser Aluminum Corp.,5.875%, 15/05/2024 75,000 78,563 0.19Kinross Gold Corp.,5.125%, 1/09/2021 10,000 10,400 0.03Kinross Gold Corp.,5.95%, 15/03/2024 100,000 104,925 0.26Lundin Mining Corp.,7.5%, 1/11/2020 70,000 74,229 0.18Steel Dynamics, Inc.,5.25%, 15/04/2023 80,000 83,300 0.21
610,288 1.52
72 MFS Meridian Funds Annual Report 2017

SCHEDULES OF INVESTMENTS 31 January 2017
MFS Meridian Funds – Global Opportunistic Bond Fund, continued
Name of SecurityTransferable Securities and Money MarketInstruments traded on a Regulated Market Shares/Par
MarketValue ($)
NetAssets (%)
MidstreamAPT Pipelines Ltd.,5%, 23/03/2035 USD 51,000 49,678 0.12Blue Racer Midstream LLC/Blue RacerFinance Corp.,6.125%, 15/11/2022 65,000 66,625 0.17Enbridge, Inc.,5.5%, 1/12/2046 28,000 30,265 0.08Enterprise Products Operating LLC,3.9%, 15/02/2024 75,000 77,307 0.19Ferrellgas LP/Ferrellgas Finance Corp.,6.75%, 15/01/2022 65,000 65,325 0.16Kinder Morgan (Delaware), Inc.,7.75%, 15/01/2032 75,000 93,623 0.23Kinder Morgan Energy Partners LP,5.4%, 1/09/2044 50,000 51,870 0.13ONEOK, Inc.,7.5%, 1/09/2023 25,000 29,063 0.07Sabine Pass Liquefaction LLC,5.75%, 15/05/2024 150,000 163,313 0.41Targa Resources Partners LP/TargaResources Finance Corp.,5.25%, 1/05/2023 95,000 97,375 0.24Targa Resources Partners LP/TargaResources Finance Corp.,5.375%, 1/02/2027 60,000 62,175 0.16Williams Cos., Inc.,4.55%, 24/06/2024 100,000 101,250 0.25
887,869 2.21
Mortgage-BackedFannie Mae,4.5%, 1/06/2044 USD 64,334 69,296 0.17Freddie Mac,2.673%, 25/03/2026 100,000 98,317 0.25
167,613 0.42
Network & TelecomAT&T, Inc.,2.8%, 17/02/2021 USD 75,000 74,691 0.19AT&T, Inc.,4.75%, 15/05/2046 194,000 177,203 0.44British Telecom PLC,5.75%, 7/12/2028 GBP 30,000 48,956 0.12Centurylink, Inc.,6.45%, 15/06/2021 USD 75,000 79,688 0.20Deutsche Telekom International FinanceB.V.,1.375%, 30/01/2027 EUR 40,000 42,763 0.11Empresa Nacional de TelecomunicacionesS.A.,4.75%, 1/08/2026 USD 200,000 202,797 0.50Frontier Communications Corp.,6.25%, 15/09/2021 50,000 46,750 0.12Frontier Communications Corp.,9%, 15/08/2031 30,000 25,866 0.06Verizon Communications, Inc.,2.625%, 21/02/2020 100,000 101,285 0.25Verizon Communications, Inc.,1.375%, 2/11/2028 EUR 140,000 141,322 0.35Verizon Communications, Inc.,6.4%, 15/09/2033 USD 50,000 60,625 0.15Zayo Group LLC/Zayo Capital, Inc.,5.75%, 15/01/2027 25,000 25,595 0.06
1,027,541 2.55
OilsCITGO Petroleum Corp.,6.25%, 15/08/2022 USD 50,000 51,750 0.13
Name of SecurityTransferable Securities and Money MarketInstruments traded on a Regulated Market Shares/Par
MarketValue ($)
NetAssets (%)
Oils, continuedMarathon Petroleum Corp.,4.75%, 15/09/2044 USD 25,000 22,285 0.06Valero Energy Corp.,4.9%, 15/03/2045 50,000 49,475 0.12
123,510 0.31
Other Banks & Diversified FinancialsBank of Iceland,1.75%, 7/09/2020 EUR 100,000 110,188 0.27Capital One Financial Corp.,3.2%, 5/02/2025 USD 50,000 48,477 0.12Citigroup, Inc.,3.2%, 21/10/2026 76,000 71,990 0.18Citizens Financial Group, Inc.,2.375%, 28/07/2021 54,000 53,103 0.13Deutsche Bank AG London,3.7%, 30/05/2024 30,000 28,861 0.07Discover Financial Services,3.95%, 6/11/2024 75,000 74,448 0.19Intesa Sanpaolo S.p.A.,5.25%, 28/01/2022 GBP 50,000 68,771 0.17KBC Groep N.V., FRN,1.875%, 11/03/2027 EUR 100,000 107,613 0.27UBS Group AG,6.875%, 29/12/2049 USD 200,000 199,188 0.50UniCredit S.p.A.,2%, 4/03/2023 EUR 100,000 108,934 0.27
871,573 2.17
PharmaceuticalsCelgene Corp.,2.875%, 15/08/2020 USD 100,000 101,584 0.25Gilead Sciences, Inc.,2.35%, 1/02/2020 75,000 75,633 0.19Mallinckrodt International Finance S.A.,5.75%, 1/08/2022 70,000 64,925 0.16Mallinckrodt International Finance S.A.,5.5%, 15/04/2025 20,000 17,225 0.04Valeant Pharmaceuticals International,Inc.,7.25%, 15/07/2022 100,000 84,012 0.21
343,379 0.85
Precious Metals & MineralsEldorado Gold Corp.,6.125%, 15/12/2020 USD 80,000 81,800 0.20Teck Resources Ltd.,4.5%, 15/01/2021 25,000 25,438 0.06Teck Resources Ltd.,3.75%, 1/02/2023 15,000 14,569 0.04
121,807 0.30
Printing & PublishingOutdoor Americas Capital LLC/OutfrontMedia Capital Corp.,5.625%, 15/02/2024 USD 90,000 93,938 0.23
Real Estate – ApartmentVonovia SE, REIT,2.125%, 9/07/2022 EUR 50,000 57,400 0.14
Real Estate – HealthcareMPT Operating Partnership LP, REIT,5.25%, 1/08/2026 USD 85,000 83,513 0.21
Real Estate – OfficeBoston Properties, Inc., REIT,3.125%, 1/09/2023 USD 50,000 49,412 0.12Merlin Properties SOCIMI S.A., REIT,1.875%, 2/11/2026 EUR 100,000 102,552 0.26
151,964 0.38
MFS Meridian Funds Annual Report 2017 73

SCHEDULES OF INVESTMENTS 31 January 2017
MFS Meridian Funds – Global Opportunistic Bond Fund, continued
Name of SecurityTransferable Securities and Money MarketInstruments traded on a Regulated Market Shares/Par
MarketValue ($)
NetAssets (%)
Real Estate – OtherStarwood Property Trust, Inc., REIT,5%, 15/12/2021 USD 30,000 30,488 0.08
Real Estate – RetailSimon International Finance S.C.A., REIT,1.25%, 13/05/2025 EUR 100,000 107,084 0.27
RestaurantsKFC Holding Co./Pizza Hut HoldingsLLC/Taco Bell of America LLC,5.25%, 1/06/2026 USD 40,000 40,466 0.10
RetailersBest Buy Co., Inc.,5.5%, 15/03/2021 USD 50,000 54,337 0.13Dollar Tree, Inc.,5.75%, 1/03/2023 80,000 84,720 0.21Hanesbrands, Inc.,4.875%, 15/05/2026 40,000 39,400 0.10Home Depot, Inc.,3%, 1/04/2026 50,000 49,575 0.12Sally Beauty Holdings, Inc.,5.625%, 1/12/2025 60,000 62,700 0.16
290,732 0.72
Specialty ChemicalsChemtura Corp.,5.75%, 15/07/2021 USD 70,000 72,800 0.18Koppers, Inc.,6%, 15/02/2025 30,000 31,050 0.08
103,850 0.26
Specialty StoresGroup 1 Automotive, Inc.,5%, 1/06/2022 USD 55,000 55,688 0.14
SupermarketsAlbertsons Cos. LLC/Safeway, Inc.,6.625%, 15/06/2024 USD 90,000 93,798 0.23Loblaw Cos. Ltd.,4.86%, 12/09/2023 CAD 45,000 38,821 0.10
132,619 0.33
SupranationalInternational Bank for Reconstruction andDevelopment,2.8%, 13/01/2021 AUD 30,000 22,948 0.06International Bank for Reconstruction andDevelopment,4.25%, 24/06/2025 40,000 32,729 0.08
55,677 0.14
Telecommunications – WirelessAmerican Tower Corp., REIT,4.7%, 15/03/2022 USD 50,000 53,370 0.13American Tower Corp., REIT,4%, 1/06/2025 50,000 50,097 0.12Crown Castle International Corp.,2.25%, 1/09/2021 56,000 54,225 0.14Crown Castle International Corp.,3.7%, 15/06/2026 50,000 48,719 0.12Sprint Nextel Corp.,9%, 15/11/2018 100,000 109,500 0.27Sprint Nextel Corp.,6%, 15/11/2022 75,000 76,125 0.19T-Mobile USA, Inc.,6.5%, 15/01/2024 200,000 215,520 0.54
607,556 1.51
Telephone ServicesLevel 3 Financing, Inc.,5.375%, 1/05/2025 USD 80,000 81,650 0.20
Name of SecurityTransferable Securities and Money MarketInstruments traded on a Regulated Market Shares/Par
MarketValue ($)
NetAssets (%)
Telephone Services, continuedTELUS Corp.,5.05%, 23/07/2020 CAD 45,000 38,139 0.10
119,789 0.30
TobaccoReynolds American, Inc.,5.7%, 15/08/2035 USD 75,000 85,808 0.21
Transportation – ServicesAutostrade per L’Italia S.p.A.,1.75%, 26/06/2026 EUR 100,000 108,759 0.27Compagnie Financial et IndusUnternehmensanleihe,0.75%, 9/09/2028 100,000 98,911 0.25ERAC USA Finance LLC,4.5%, 15/02/2045 USD 50,000 47,981 0.12Heathrow Funding Ltd.,4.625%, 31/10/2046 GBP 100,000 158,090 0.39
413,741 1.03
U.S. Treasury ObligationsU.S. Treasury Bonds,5.25%, 15/02/2029 USD 520,000 664,503 1.65U.S. Treasury Bonds,4.5%, 15/02/2036 233,000 294,399 0.73U.S. Treasury Bonds,4.75%, 15/02/2037 625,000 812,476 2.02U.S. Treasury Bonds,3.125%, 15/02/2043 949,400 963,493 2.40U.S. Treasury Bonds,3.625%, 15/02/2044 203,000 225,187 0.56
2,960,058 7.36
Utilities – Electric PowerCalpine Corp.,5.75%, 15/01/2025 USD 105,000 102,638 0.25Covanta Holding Corp.,5.875%, 1/03/2024 105,000 104,475 0.26Dominion Resources, Inc.,2.5%, 1/12/2019 75,000 75,934 0.19Duke Energy Corp.,2.65%, 1/09/2026 50,000 46,718 0.12Duke Energy Florida LLC,3.2%, 15/01/2027 85,000 85,163 0.21EDP Finance B.V.,4.125%, 20/01/2021 EUR 100,000 120,352 0.30Emera U.S. Finance LP,2.7%, 15/06/2021 USD 50,000 49,616 0.12Enel Americas S.A.,4%, 25/10/2026 20,000 19,504 0.05NRG Energy, Inc.,6.625%, 15/03/2023 100,000 103,000 0.26NRG Energy, Inc.,7.25%, 15/05/2026 15,000 15,694 0.04PPL Capital Funding, Inc.,3.1%, 15/05/2026 75,000 71,960 0.18PPL Capital Funding, Inc.,5%, 15/03/2044 25,000 26,162 0.06Public Service Enterprise Group,2%, 15/11/2021 69,000 66,926 0.17Southern Co.,2.95%, 1/07/2023 50,000 49,281 0.12Southern Co.,4.4%, 1/07/2046 50,000 49,459 0.12
986,882 2.45
Total Bonds(Identified Cost, $36,160,901) 34,585,435 86.00
74 MFS Meridian Funds Annual Report 2017

SCHEDULES OF INVESTMENTS 31 January 2017
MFS Meridian Funds – Global Opportunistic Bond Fund, continued
Name of SecurityTransferable Securities and Money MarketInstruments traded on a Regulated Market Shares/Par
MarketValue ($)
NetAssets (%)
SHORT-TERM OBLIGATIONS (y)General Electric Co.,0.58%, 1/02/2017,at Amortized Cost and Value USD 1,588,000 1,588,000 3.95
Total Transferable Securities andMoney Market Instruments Tradedon a Regulated Market(Identified Cost, $37,748,901) 36,173,435 89.95
OTHER ASSETS, LESS LIABILITIES 4,042,147 10.05
NET ASSETS 40,215,582 100.00
See Schedules of Investments Footnotes and Notes to Financial Statements
MFS Meridian Funds – Global Research Focused Fund(Expressed in U.S. Dollars)
Name of SecurityTransferable Securities and Money MarketInstruments traded on a Regulated Market Shares/Par
MarketValue ($)
NetAssets (%)
COMMON STOCKSAerospaceHoneywell International, Inc. 58,056 6,869,188 2.93
Apparel ManufacturersLVMH Moet Hennessy Louis Vuitton SE 27,555 5,550,532 2.37
AutomotiveDelphi Automotive PLC 69,881 4,895,863 2.09
BiotechnologyBiogen, Inc. 21,694 5,508,540 2.35
Brokerage & Asset ManagersNASDAQ, Inc. 35,359 2,494,224 1.06
Business ServicesCognizant Technology Solutions Corp.,“A” 64,510 3,392,581 1.45Fidelity National Information Services, Inc. 56,867 4,516,377 1.92Global Payments, Inc. 51,030 3,943,598 1.68
11,852,556 5.05
ChemicalsMonsanto Co. 40,519 4,388,613 1.87PPG Industries, Inc. 46,674 4,667,867 1.99
9,056,480 3.86
Computer SoftwareSalesforce.com, Inc. 77,711 6,146,940 2.62
Computer Software – SystemsHewlett Packard Enterprise 137,869 3,126,869 1.33
Consumer ProductsNewell Brands, Inc. 143,880 6,809,840 2.90
Consumer ServicesPriceline Group, Inc. 2,755 4,339,483 1.85
Electrical EquipmentJohnson Controls International PLC 117,649 5,174,203 2.21
ElectronicsBroadcom Corp. 27,581 5,502,410 2.35Taiwan Semiconductor Manufacturing Co.Ltd., ADR 122,620 3,790,184 1.61
9,292,594 3.96
Energy – IndependentEOG Resources, Inc. 66,806 6,786,153 2.90Oil Search Ltd. 693,924 3,615,489 1.54
10,401,642 4.44
Name of SecurityTransferable Securities and Money MarketInstruments traded on a Regulated Market Shares/Par
MarketValue ($)
NetAssets (%)
Energy – IntegratedBP PLC 1,127,458 6,706,627 2.86
Food & BeveragesDanone S.A. 83,254 5,211,716 2.22Mondelez International, Inc. 143,380 6,348,866 2.71
11,560,582 4.93
Food & Drug StoresCVS Health Corp. 46,327 3,651,031 1.56
General MerchandiseCostco Wholesale Corp. 24,897 4,081,863 1.74
InsuranceAIA Group Ltd. 650,200 4,027,539 1.72Aon PLC 36,867 4,154,911 1.77Chubb Ltd. 26,609 3,498,817 1.49
11,681,267 4.98
InternetAlphabet, Inc., “A” 10,316 8,461,080 3.61
Machinery & ToolsKubota Corp. 281,800 4,492,428 1.92
Major BanksLloyds Banking Group PLC 4,401,928 3,595,578 1.53
Medical EquipmentMedtronic PLC 95,781 7,281,272 3.10PerkinElmer, Inc. 82,677 4,397,590 1.88
11,678,862 4.98
Metals & MiningRio Tinto Ltd. 65,366 2,870,663 1.22
Natural Gas – DistributionChina Resources Gas Group Ltd. 836,000 2,657,972 1.13
Other Banks & Diversified FinancialsCitigroup, Inc. 105,457 5,887,664 2.51HDFC Bank Ltd., ADR 49,851 3,436,229 1.47Julius Baer Group Ltd. 76,328 3,566,679 1.52KBC Groep N.V. 54,015 3,499,717 1.49U.S. Bancorp 80,571 4,242,063 1.81UBS AG 256,698 4,142,759 1.77Visa, Inc., “A” 60,709 5,021,241 2.14
29,796,352 12.71
MFS Meridian Funds Annual Report 2017 75

SCHEDULES OF INVESTMENTS 31 January 2017
MFS Meridian Funds – Global Research Focused Fund, continued
Name of SecurityTransferable Securities and Money MarketInstruments traded on a Regulated Market Shares/Par
MarketValue ($)
NetAssets (%)
PharmaceuticalsRoche Holding AG 19,792 4,660,235 1.99Zoetis, Inc. 69,749 3,832,010 1.63
8,492,245 3.62
Printing & PublishingRELX N.V. 249,600 4,210,049 1.79
Railroad & ShippingUnion Pacific Corp. 54,907 5,851,988 2.50
Real EstateLEG Immobilien AG 33,403 2,620,013 1.12
RestaurantsStarbucks Corp. 74,648 4,122,063 1.76
Specialty ChemicalsLinde AG 18,740 3,043,577 1.30
Telecommunications – WirelessKDDI Corp. 350,800 9,413,905 4.01
Telephone ServicesHellenic Telecommunications OrganizationS.A. 34,141 310,689 0.13
Name of SecurityTransferable Securities and Money MarketInstruments traded on a Regulated Market Shares/Par
MarketValue ($)
NetAssets (%)
Utilities – Electric PowerCMS Energy Corp. 95,609 4,072,943 1.74
Total Common Stocks(Identified Cost, $217,920,541) 234,890,731 100.16
SHORT-TERM OBLIGATIONS (y)General Electric Co.,0.58%, 1/02/2017, at Amortized Costand Value USD 2,023,000 2,023,000 0.86
Total Transferable Securities andMoney Market Instruments Tradedon a Regulated Market(Identified Cost, $219,943,541) (k) 236,913,731 101.02
OTHER ASSETS, LESS LIABILITIES (2,402,161) (1.02)
NET ASSETS 234,511,570 100.00
See Schedules of Investments Footnotes and Notes to Financial Statements
MFS Meridian Funds – Global Total Return Fund(Expressed in U.S. Dollars)
Name of SecurityTransferable Securities and Money MarketInstruments traded on a Regulated Market Shares/Par
MarketValue ($)
NetAssets (%)
COMMON STOCKS
AerospaceHoneywell International, Inc. 244,594 28,940,362 1.03Northrop Grumman Corp. 17,087 3,914,290 0.14United Technologies Corp. 114,418 12,548,222 0.45
45,402,874 1.62
AirlinesAir Canada 269,455 2,768,579 0.10Copa Holdings S.A., “A” 31,824 3,102,522 0.11
5,871,101 0.21
Alcoholic BeveragesHeineken N.V. 166,069 12,410,962 0.44Pernod Ricard S.A. 114,893 13,438,322 0.48
25,849,284 0.92
Apparel ManufacturersCompagnie Financiere Richemont S.A. 74,912 5,806,428 0.21
AutomotiveDelphi Automotive PLC 72,624 5,088,037 0.18General Motors Co. 208,417 7,630,146 0.27Hyundai Motor Co. Ltd. 15,470 1,857,039 0.07Magna International, Inc. 48,660 2,104,954 0.07USS Co. Ltd. 189,400 3,323,013 0.12
20,003,189 0.71
BiotechnologyCelgene Corp. 50,853 5,906,576 0.21
BroadcastingOmnicom Group, Inc. 138,101 11,828,351 0.42Time Warner, Inc. 76,544 7,413,286 0.27
19,241,637 0.69
Brokerage & Asset ManagersBlackRock, Inc. 23,337 8,727,571 0.31
Name of SecurityTransferable Securities and Money MarketInstruments traded on a Regulated Market Shares/Par
MarketValue ($)
NetAssets (%)
Brokerage & Asset Managers, continuedDaiwa Securities Group, Inc. 443,000 2,838,637 0.10
11,566,208 0.41
Business ServicesAccenture PLC, “A” 186,019 21,181,984 0.76Amadeus IT Holding S.A. 216,996 10,012,894 0.36Bunzl PLC 288,506 7,581,824 0.27Compass Group PLC 896,083 15,917,078 0.57Equifax, Inc. 29,891 3,505,616 0.13Fidelity National Information Services, Inc. 74,145 5,888,596 0.21Nomura Research, Inc. 306,900 10,491,843 0.37Secom Co. Ltd. 102,100 7,384,187 0.26SGS S.A. 2,840 6,004,022 0.21
87,968,044 3.14
Cable TVCharter Communications, Inc., “A” 36,520 11,830,654 0.42Comcast Corp., “A” 226,853 17,109,253 0.61
28,939,907 1.03
Chemicals3M Co. 139,844 24,447,528 0.87Givaudan S.A. 4,896 8,801,965 0.31LyondellBasell Industries N.V., “A” 18,967 1,769,052 0.06Monsanto Co. 30,888 3,345,479 0.12Orica Ltd. 274,303 3,900,590 0.14PPG Industries, Inc. 155,687 15,570,257 0.56
57,834,871 2.06
Computer SoftwareCadence Design Systems, Inc. 392,410 10,214,432 0.36Check Point Software Technologies Ltd. 90,634 8,951,920 0.32Oracle Corp. 151,763 6,087,214 0.22
25,253,566 0.90
76 MFS Meridian Funds Annual Report 2017

SCHEDULES OF INVESTMENTS 31 January 2017
MFS Meridian Funds – Global Total Return Fund, continued
Name of SecurityTransferable Securities and Money MarketInstruments traded on a Regulated Market Shares/Par
MarketValue ($)
NetAssets (%)
Computer Software – SystemsHon Hai Precision Industry Co. Ltd. 2,140,700 5,747,741 0.20International Business Machines Corp. 64,124 11,190,920 0.40
16,938,661 0.60
ConstructionBellway PLC 36,116 1,128,578 0.04Geberit AG 10,088 4,298,015 0.16Owens Corning 57,037 3,151,294 0.11Sherwin-Williams Co. 25,708 7,810,347 0.28Stanley Black & Decker, Inc. 22,978 2,849,272 0.10
19,237,506 0.69
Consumer ProductsCoty, Inc., “A” 174,455 3,349,536 0.12Kao Corp. 340,600 16,841,465 0.60Kobayashi Pharmaceutical Co. Ltd. 130,800 5,826,977 0.21KOSE Corp. 38,000 3,230,892 0.12Procter & Gamble Co. 242,154 21,212,690 0.76Reckitt Benckiser Group PLC 220,981 18,914,708 0.67Svenska Cellulosa Aktiebolaget 373,064 11,216,956 0.40
80,593,224 2.88
ContainersBrambles Ltd. 1,275,987 10,073,849 0.36Crown Holdings, Inc. 41,713 2,259,593 0.08
12,333,442 0.44
Electrical EquipmentIMI PLC 193,631 2,840,232 0.10Johnson Controls International PLC 410,186 18,039,980 0.64Legrand S.A. 113,492 6,588,834 0.24OMRON Corp. 138,500 5,983,200 0.21Schneider Electric S.A. 104,879 7,497,220 0.27Siemens AG 107,441 13,482,970 0.48Spectris PLC 133,237 4,051,183 0.15
58,483,619 2.09
ElectronicsAnalog Devices, Inc. 71,707 5,373,723 0.19Halma PLC 370,856 4,315,463 0.16Hirose Electric Co. Ltd. 41,300 5,384,253 0.19Intel Corp. 188,638 6,945,651 0.25NVIDIA Corp. 48,503 5,295,558 0.19Samsung Electronics Co. Ltd. 6,794 11,534,775 0.41Taiwan Semiconductor Manufacturing Co.Ltd., ADR 1,061,493 32,810,749 1.17Texas Instruments, Inc. 296,406 22,390,509 0.80
94,050,681 3.36
Energy – IndependentCairn Energy PLC 620,325 1,769,876 0.06Galp Energia SGPS S.A., “B” 355,667 5,229,296 0.19Occidental Petroleum Corp. 80,255 5,438,881 0.20Rice Energy, Inc. 281,568 5,583,493 0.20Valero Energy Corp. 90,960 5,981,530 0.21
24,003,076 0.86
Energy – IntegratedBP PLC 1,358,222 8,079,315 0.29Chevron Corp. 62,505 6,959,932 0.25China Petroleum & Chemical Corp. 3,668,000 2,935,762 0.10Exxon Mobil Corp. 228,966 19,207,958 0.69LUKOIL PJSC, ADR 96,718 5,426,847 0.19
Name of SecurityTransferable Securities and Money MarketInstruments traded on a Regulated Market Shares/Par
MarketValue ($)
NetAssets (%)
Energy – Integrated, continuedSuncor Energy, Inc. 148,554 4,607,600 0.16
47,217,414 1.68
Engineering – ConstructionBouygues S.A. 60,683 2,204,648 0.08VINCI S.A. 86,626 6,068,977 0.22
8,273,625 0.30
Food & BeveragesDanone S.A. 174,188 10,904,202 0.39General Mills, Inc. 346,680 21,660,566 0.77J.M. Smucker Co. 41,139 5,588,733 0.20Marine Harvest 362,661 6,410,724 0.23Mead Johnson Nutrition Co., “A” 54,319 3,827,317 0.14Nestle S.A. 437,992 32,001,235 1.14Tyson Foods, Inc., “A” 43,393 2,724,646 0.10
83,117,423 2.97
Food & Drug StoresCVS Health Corp. 180,853 14,253,025 0.51Lawson, Inc. 39,600 2,889,948 0.10Wesfarmers Ltd. 171,092 5,223,985 0.19
22,366,958 0.80
Gaming & LodgingSands China Ltd. 1,420,400 6,273,969 0.22
General MerchandiseTarget Corp. 75,531 4,870,239 0.17
Health Maintenance OrganizationsCigna Corp. 36,026 5,267,722 0.19
InsuranceAon PLC 94,185 10,614,650 0.38Chubb Ltd. 60,139 7,907,677 0.28Fairfax Financial Holdings Ltd. (l) 24,515 11,454,463 0.41Hiscox Ltd. 209,177 2,699,863 0.10MetLife, Inc. 336,625 18,315,766 0.65Prudential Financial, Inc. 137,447 14,447,054 0.51Swiss Re Ltd. 31,990 2,977,393 0.11Travelers Cos., Inc. 137,169 16,155,765 0.58Zurich Insurance Group AG 60,022 17,195,935 0.61
101,768,566 3.63
Machinery & ToolsIllinois Tool Works, Inc. 59,104 7,518,029 0.27
Major BanksBank of New York Mellon Corp. 249,273 11,149,981 0.40BNP Paribas 82,508 5,271,007 0.19BOC Hong Kong Holdings Ltd. 1,022,500 4,088,825 0.15Canadian Imperial Bank of Commerce 64,819 5,519,764 0.20China Construction Bank 10,165,000 7,556,593 0.27Goldman Sachs Group, Inc. 43,896 10,066,231 0.36JPMorgan Chase & Co. 315,885 26,733,348 0.95National Australia Bank Ltd. 78,169 1,798,065 0.06PNC Financial Services Group, Inc. 31,308 3,771,362 0.14Royal Bank of Canada 32,507 2,336,278 0.08State Street Corp. 114,642 8,735,720 0.31Sumitomo Mitsui Financial Group, Inc. 71,400 2,814,644 0.10Svenska Handelsbanken AB, “A” 1,001,917 14,959,285 0.53Toronto-Dominion Bank 77,503 4,014,968 0.14Wells Fargo & Co. 392,018 22,082,374 0.79
130,898,445 4.67
MFS Meridian Funds Annual Report 2017 77

SCHEDULES OF INVESTMENTS 31 January 2017
MFS Meridian Funds – Global Total Return Fund, continued
Name of SecurityTransferable Securities and Money MarketInstruments traded on a Regulated Market Shares/Par
MarketValue ($)
NetAssets (%)
Medical & Health Technology & ServicesHCA Holdings, Inc. 56,983 4,574,595 0.16
Medical EquipmentAbbott Laboratories 252,981 10,567,016 0.38Danaher Corp. 84,646 7,103,492 0.25Medtronic PLC 185,832 14,126,949 0.50Thermo Fisher Scientific, Inc. 28,873 4,399,956 0.16
36,197,413 1.29
Metals & MiningRio Tinto Ltd. 274,348 12,048,474 0.43
Natural Gas – DistributionEngie 588,585 7,030,451 0.25
Natural Gas – PipelineWilliams Partners LP 95,277 3,910,168 0.14
Network & TelecomCisco Systems, Inc. 195,967 6,020,106 0.22LM Ericsson Telephone Co., “B” 395,650 2,336,240 0.08
8,356,346 0.30
Oil ServicesSchlumberger Ltd. 118,269 9,900,298 0.36TechnipFMC PLC 79,397 2,602,127 0.09
12,502,425 0.45
Other Banks & Diversified FinancialsAgricultural Bank of China Ltd., “H” 4,258,000 1,781,340 0.06American Express Co. 71,828 5,486,223 0.19DBS Group Holdings Ltd. 701,600 9,443,610 0.34DnB NOR A.S.A. 180,575 3,012,484 0.11Hachijuni Bank Ltd. 232,000 1,370,507 0.05ING Groep N.V. 639,780 9,151,011 0.33North Pacific Bank Ltd. 216,900 874,055 0.03U.S. Bancorp 297,221 15,648,686 0.56UBS AG 920,978 14,863,341 0.53
61,631,257 2.20
PharmaceuticalsBayer AG 182,536 20,157,966 0.72Eli Lilly & Co. 172,378 13,278,277 0.47Johnson & Johnson 225,464 25,533,798 0.91Merck & Co., Inc. 401,604 24,895,432 0.89Novartis AG 243,344 17,816,455 0.64Pfizer, Inc. 520,556 16,517,242 0.59Roche Holding AG 63,177 14,875,692 0.53Santen Pharmaceutical Co. Ltd. 469,300 5,885,473 0.21
138,960,335 4.96
Printing & PublishingMoody’s Corp. 77,759 8,061,276 0.29RELX N.V. 335,841 5,664,692 0.20
13,725,968 0.49
Railroad & ShippingCanadian National Railway Co. 46,091 3,204,246 0.12Union Pacific Corp. 32,652 3,480,050 0.12
6,684,296 0.24
Real EstateDeutsche Wohnen AG 579,304 18,848,306 0.67Medical Properties Trust, Inc., REIT 493,033 6,286,171 0.22Starwood Property Trust, Inc., REIT 158,482 3,527,809 0.13Washington Prime Group, Inc., REIT 105,584 1,018,886 0.04
29,681,172 1.06
Name of SecurityTransferable Securities and Money MarketInstruments traded on a Regulated Market Shares/Par
MarketValue ($)
NetAssets (%)
RestaurantsBrinker International, Inc. 80,395 3,577,578 0.13Greggs PLC 87,610 1,071,273 0.04
4,648,851 0.17
Specialty ChemicalsPTT Global Chemical PLC 3,674,200 7,095,870 0.25Tosoh Corp. 151,000 1,143,433 0.04
8,239,303 0.29
Specialty StoresEsprit Holdings Ltd. 1,635,350 1,276,676 0.04Gap, Inc. 298,864 6,882,838 0.25Just Eat PLC 577,700 3,920,796 0.14Urban Outfitters, Inc. 50,126 1,330,344 0.05
13,410,654 0.48
Telecommunications – WirelessKDDI Corp. 781,300 20,966,602 0.75SoftBank Corp. 39,900 3,074,749 0.11Vodafone Group PLC 1,402,252 3,428,396 0.12
27,469,747 0.98
Telephone ServicesAT&T, Inc. 58,954 2,485,501 0.09BT Group PLC 2,037,530 7,788,318 0.28Nippon Television Holdings, Inc. 103,600 4,568,456 0.16TDC A.S. 759,550 3,997,080 0.14Verizon Communications, Inc. 291,277 14,275,486 0.51
33,114,841 1.18
TobaccoAltria Group, Inc. 330,533 23,527,339 0.84British American Tobacco PLC 204,598 12,610,536 0.45Imperial Tobacco Group PLC 53,794 2,485,961 0.09Japan Tobacco, Inc. 702,500 22,647,241 0.81Philip Morris International, Inc. 333,195 32,030,035 1.14
93,301,112 3.33
TruckingUnited Parcel Service, Inc., “B” 78,629 8,580,783 0.31Yamato Holdings Co. Ltd. 530,500 10,710,077 0.38
19,290,860 0.69
Utilities – Electric PowerAmerican Electric Power Co., Inc. 181,617 11,634,385 0.42Energias de Portugal S.A. 978,650 2,839,744 0.10Korea Electric Power Corp. 31,042 1,133,924 0.04SSE PLC 426,014 7,979,928 0.28Xcel Energy, Inc. 103,216 4,264,885 0.15
27,852,866 0.99
Total Common Stocks(Identified Cost, $1,479,793,346) 1,625,487,418 58.01
BONDS
AirlinesRyanair Ltd.,1.125%, 10/03/2023 EUR 1,050,000 1,128,686 0.04
Apparel ManufacturersChristian Dior SE,0.75%, 24/06/2021 EUR 900,000 975,759 0.03
Asset-Backed & SecuritizedCent LP, 2013-17A, “A1”, CLO,FRN,2.187%, 30/01/2025 USD 2,718,000 2,716,831 0.10
78 MFS Meridian Funds Annual Report 2017

SCHEDULES OF INVESTMENTS 31 January 2017
MFS Meridian Funds – Global Total Return Fund, continued
Name of SecurityTransferable Securities and Money MarketInstruments traded on a Regulated Market Shares/Par
MarketValue ($)
NetAssets (%)
Asset-Backed & Securitized, continuedChesapeake Funding II LLC, 2016-1A,“A2”, FRN,1.917%, 15/03/2028 USD 4,024,000 4,048,620 0.14Chesapeake Funding II LLC, 2016-2A,“A2”, FRN,1.768%, 15/06/2028 3,040,000 3,055,546 0.11Commercial Mortgage Trust, 2015-LC21,“A4”,3.708%, 10/07/2048 4,491,465 4,659,639 0.17Dryden Senior Loan Fund, 2013-26A,“A”, CLO, FRN,2.123%, 15/07/2025 3,494,000 3,481,181 0.12Flatiron CLO Ltd., 2013-1A, “A2R”, FRN,1%, 17/01/2026 4,432,678 4,451,241 0.16Ford Credit Floorplan Master Owner Trust,2015-1, “A2”, FRN,1.168%, 15/01/2020 8,284,000 8,295,517 0.30GS Mortgage Securities Trust, 2015-GC30,“A4”,3.382%, 10/05/2050 5,114,335 5,189,713 0.19ING Investment Management Ltd.,2013-2A, “A1”, CLO, FRN,2.031%, 25/04/2025 3,171,000 3,170,984 0.11John Deere Owner Trust , “A2”,1.15%, 15/10/2018 3,217,506 3,217,982 0.11JPMBB Commercial Mortgage SecuritiesTrust, 2014-C26,3.494%, 15/01/2048 5,850,000 5,993,881 0.21JPMorgan Chase Commercial MortgageSecurities Corp., “A4”, FRN,5.759%, 15/06/2049 827,454 830,554 0.03Merrill Lynch Mortgage Trust, FRN,5.826%, 12/06/2050 1,450,898 1,459,977 0.05Wells Fargo Commercial Mortgage Trust,2015-C28, “A4”,3.54%, 15/05/2048 5,179,939 5,308,959 0.19Wells Fargo Commercial Mortgage Trust,2015-NXS1, “A5”,3.148%, 15/05/2048 2,181,058 2,195,707 0.08
58,076,332 2.07
AutomotiveDelphi Automotive PLC,1.5%, 10/03/2025 EUR 1,200,000 1,268,082 0.05FCA Capital Ireland PLC,1.25%, 21/01/2021 1,000,000 1,090,773 0.04Ferrari N.V.,1.5%, 16/03/2023 1,300,000 1,394,607 0.05General Motors Co.,6.6%, 1/04/2036 USD 1,692,000 1,948,824 0.07General Motors Financial Co., Inc.,4.35%, 17/01/2027 810,000 803,046 0.03RCI Banque S.A.,1.25%, 8/06/2022 EUR 890,000 973,821 0.03RCI Banque S.A.,1%, 17/05/2023 1,300,000 1,387,295 0.05Volkswagen International Finance N.V.,FRN,2.5% to 20/03/2022,FRN to 29/12/2049 900,000 940,752 0.03
9,807,200 0.35
BiotechnologyLife Technologies Corp.,6%, 1/03/2020 USD 728,000 795,282 0.03
BroadcastingOmnicom Group, Inc.,3.65%, 1/11/2024 USD 464,000 468,591 0.02Omnicom Group, Inc.,3.6%, 15/04/2026 USD 1,619,000 1,604,546 0.06
Name of SecurityTransferable Securities and Money MarketInstruments traded on a Regulated Market Shares/Par
MarketValue ($)
NetAssets (%)
Broadcasting, continuedProSiebenSat.1 Media AG,2.625%, 15/04/2021 EUR 1,520,000 1,739,526 0.06SES Global Americas Holdings GP,2.5%, 25/03/2019 USD 1,225,000 1,220,139 0.04SES S.A.,3.6%, 4/04/2023 400,000 393,986 0.02Time Warner, Inc.,3.8%, 15/02/2027 2,073,000 2,021,954 0.07
7,448,742 0.27
Brokerage & Asset ManagersCME Group, Inc.,3%, 15/03/2025 USD 2,063,000 2,054,932 0.07Intercontinental Exchange, Inc.,2.75%, 1/12/2020 1,122,000 1,141,358 0.04Intercontinental Exchange, Inc.,3.75%, 1/12/2025 1,843,000 1,894,427 0.07TD Ameritrade Holding Corp.,2.95%, 1/04/2022 1,512,000 1,529,512 0.06
6,620,229 0.24
BuildingHeidelbergCement AG,2.25%, 30/03/2023 EUR 1,000,000 1,148,311 0.04Imerys S.A.,1.5%, 15/01/2027 900,000 949,123 0.03Martin Marietta Materials, Inc.,4.25%, 2/07/2024 USD 950,000 982,548 0.04Mohawk Industries, Inc.,2%, 14/01/2022 EUR 1,025,000 1,166,145 0.04Owens Corning,4.2%, 15/12/2022 USD 629,000 653,732 0.02Owens Corning,3.4%, 15/08/2026 1,435,000 1,373,226 0.05
6,273,085 0.22
Business ServicesCisco Systems, Inc.,2.2%, 28/02/2021 USD 2,253,000 2,247,340 0.08Fidelity National Information Services, Inc.,5%, 15/03/2022 1,300,000 1,334,661 0.05Fidelity National Information Services, Inc.,3.875%, 5/06/2024 2,534,000 2,585,367 0.09Fidelity National Information Services, Inc.,5%, 15/10/2025 444,000 482,643 0.02Fidelity National Information Services, Inc.,3%, 15/08/2026 1,618,000 1,522,604 0.05Fidelity National Information Services, Inc.,4.5%, 15/08/2046 809,000 779,566 0.03
8,952,181 0.32
Cable TVCharter Communications Operating LLC,6.384%, 23/10/2035 USD 3,415,000 3,850,590 0.14Comcast Corp.,4.65%, 15/07/2042 979,000 1,006,688 0.04Comcast Corp.,4.75%, 1/03/2044 360,000 381,862 0.01Cox Communications, Inc.,3.25%, 15/12/2022 1,028,000 1,002,190 0.03NBCUniversal Enterprise, Inc.,1.974%, 15/04/2019 2,000,000 2,003,710 0.07NBCUniversal Media LLC,5.15%, 30/04/2020 1,556,000 1,702,804 0.06Shaw Communications, Inc.,5.65%, 1/10/2019 CAD 1,574,000 1,321,253 0.05
MFS Meridian Funds Annual Report 2017 79

SCHEDULES OF INVESTMENTS 31 January 2017
MFS Meridian Funds – Global Total Return Fund, continued
Name of SecurityTransferable Securities and Money MarketInstruments traded on a Regulated Market Shares/Par
MarketValue ($)
NetAssets (%)
Cable TV, continuedSky PLC,2.5%, 15/09/2026 EUR 1,150,000 1,319,558 0.05Time Warner Cable, Inc.,5.75%, 2/06/2031 GBP 400,000 594,742 0.02Time Warner Cable, Inc.,5.25%, 15/07/2042 350,000 496,250 0.02
13,679,647 0.49
ChemicalsAir Liquide Finance Co.,2.25%, 27/09/2023 USD 1,585,000 1,515,837 0.05LYB International Finance B.V.,4%, 15/07/2023 934,000 976,348 0.04LyondellBasell Industries N.V.,5%, 15/04/2019 500,000 528,775 0.02LyondellBasell Industries N.V.,5.75%, 15/04/2024 237,000 270,446 0.01LyondellBasell Industries N.V.,4.625%, 26/02/2055 949,000 888,661 0.03PPG Industries, Inc.,0.875%, 3/11/2025 EUR 1,100,000 1,150,283 0.04
5,330,350 0.19
Computer SoftwareMicrosoft Corp.,1.55%, 8/08/2021 USD 3,936,000 3,809,942 0.13Oracle Corp.,3.4%, 8/07/2024 1,843,000 1,879,491 0.07
5,689,433 0.20
Computer Software – SystemsApple, Inc.,3.6%, 31/07/2042 GBP 570,000 795,926 0.03
Consumer ProductsNewell Brands, Inc.,3.75%, 1/10/2021 EUR 1,750,000 2,103,650 0.07Newell Rubbermaid, Inc.,5.375%, 1/04/2036 USD 630,000 706,784 0.03Reckitt Benckiser Treasury Services PLC,3.625%, 21/09/2023 1,365,000 1,415,827 0.05
4,226,261 0.15
Consumer ServicesG4S International Finance PLC,1.5%, 9/01/2023 EUR 700,000 756,467 0.03Priceline Group, Inc.,2.15%, 25/11/2022 690,000 789,257 0.03Priceline Group, Inc.,1.8%, 3/03/2027 1,900,000 1,988,689 0.07
3,534,413 0.13
Defense ElectronicsBAE Systems PLC,4.125%, 8/06/2022 GBP 550,000 772,868 0.03
ElectronicsBroadcom Corp./Broadcom CaymanFinance Ltd.,3.875%, 15/01/2027 USD 3,182,000 3,157,734 0.12Flextronics International Ltd.,4.625%, 15/02/2020 553,000 579,887 0.02Tyco Electronics Group S.A.,2.375%, 17/12/2018 1,401,000 1,412,614 0.05Tyco Electronics Group S.A.,1.1%, 1/03/2023 EUR 1,850,000 2,007,659 0.07
7,157,894 0.26
Emerging Market Quasi-SovereignComision Federal de Electricidad,4.875%, 15/01/2024 USD 1,580,000 1,589,480 0.06
Name of SecurityTransferable Securities and Money MarketInstruments traded on a Regulated Market Shares/Par
MarketValue ($)
NetAssets (%)
Emerging Market Quasi-Sovereign, continuedComision Federal de Electricidad,5.75%, 14/02/2042 USD 817,000 765,938 0.03Office Cherifien des Phosphates S.A.,6.875%, 25/04/2044 3,570,000 3,659,250 0.13Petroleos Mexicanos,6.5%, 13/03/2027 579,000 595,473 0.02
6,610,141 0.24
Emerging Market SovereignRepublic of Indonesia,2.875%, 8/07/2021 EUR 850,000 962,765 0.03
EntertainmentCarnival Corp.,1.875%, 7/11/2022 EUR 1,800,000 2,039,345 0.07
Financial InstitutionsInternational Lease Finance Corp.,7.125%, 1/09/2018 USD 900,000 968,130 0.03
Food & BeveragesAnheuser-Busch InBev S.A.,5.375%, 15/01/2020 USD 1,522,000 1,658,866 0.06Anheuser-Busch InBev Worldwide, Inc.,3.75%, 15/01/2022 748,000 783,128 0.03Anheuser-Busch InBev Worldwide, Inc.,3.3%, 1/02/2023 2,559,000 2,601,323 0.09Anheuser-Busch InBev Worldwide, Inc.,4.7%, 1/02/2036 3,347,000 3,503,693 0.12Anheuser-Busch InBev Worldwide, Inc.,2.75%, 17/03/2036 EUR 833,000 947,459 0.03Coca-Cola Co.,1.1%, 2/09/2036 270,000 254,113 0.01Coca-Cola Enterprises, Inc.,1.875%, 18/03/2030 1,250,000 1,325,713 0.05Coca-Cola European Partners PLC,1.125%, 26/05/2024 900,000 973,891 0.03Danone S.A.,2.589%, 2/11/2023 USD 3,414,000 3,295,032 0.12Fomento Economico Mexicano S.A.B. deC.V.,1.75%, 20/03/2023 EUR 1,800,000 1,972,468 0.07J.M. Smucker Co.,2.5%, 15/03/2020 USD 2,765,000 2,789,346 0.10J.M. Smucker Co.,4.375%, 15/03/2045 433,000 430,364 0.02Kraft Heinz Foods Co.,3.5%, 15/07/2022 1,443,000 1,467,625 0.05Kraft Heinz Foods Co.,5%, 15/07/2035 733,000 768,531 0.03Tyson Foods, Inc.,5.15%, 15/08/2044 427,000 448,231 0.02Wm. Wrigley Jr. Co.,2.9%, 21/10/2019 404,000 410,971 0.01Wm. Wrigley Jr. Co.,3.375%, 21/10/2020 1,250,000 1,288,758 0.05
24,919,512 0.89
Food & Drug StoresWalgreens Boots Alliance, Inc.,2.875%, 20/11/2020 GBP 1,300,000 1,704,364 0.06Walgreens Boots Alliance, Inc.,4.65%, 1/06/2046 USD 1,937,000 1,939,154 0.07
3,643,518 0.13
Forest & Paper ProductsGeorgia-Pacific LLC,5.4%, 1/11/2020 USD 1,527,000 1,681,830 0.06
80 MFS Meridian Funds Annual Report 2017

SCHEDULES OF INVESTMENTS 31 January 2017
MFS Meridian Funds – Global Total Return Fund, continued
Name of SecurityTransferable Securities and Money MarketInstruments traded on a Regulated Market Shares/Par
MarketValue ($)
NetAssets (%)
Gaming & LodgingInterContinental Hotels Group PLC,3.75%, 14/08/2025 GBP 1,580,000 2,156,638 0.08
InsuranceAmerican International Group, Inc.,4.875%, 1/06/2022 USD 2,724,000 2,969,964 0.10American International Group, Inc.,1.5%, 8/06/2023 EUR 930,000 1,013,993 0.04American International Group, Inc.,3.75%, 10/07/2025 USD 2,428,000 2,436,233 0.09Aviva PLC,3.376% to 4/12/2025, FRN to 4/12/2045 EUR 800,000 837,153 0.03Delta Lloyd N.V., FRN,9%, 29/08/2042 1,200,000 1,621,991 0.06Hiscox Ltd.,6.125% to24/11/2025, FRN to 24/11/2045 GBP 1,100,000 1,473,746 0.05NN Group N.V.,1%, 13/01/2023 EUR 1,339,000 1,434,433 0.05
11,787,513 0.42
Insurance – HealthAetna, Inc.,2.8%, 15/06/2023 USD 1,876,000 1,860,977 0.07UnitedHealth Group, Inc.,2.7%, 15/07/2020 3,669,000 3,729,583 0.13
5,590,560 0.20
Insurance – Property & CasualtyBerkshire Hathaway, Inc.,2.75%, 15/03/2023 USD 1,355,000 1,352,839 0.05Berkshire Hathaway, Inc.,1.625%, 16/03/2035 EUR 1,000,000 982,321 0.03Berkshire Hathaway, Inc.,4.5%, 11/02/2043 USD 680,000 720,584 0.02Chubb Corp.,6.375 to 15/04/2017, FRN to29/03/2067 1,060,000 1,034,030 0.04Chubb INA Holdings, Inc.,2.3%, 3/11/2020 597,000 598,647 0.02Liberty Mutual Group, Inc.,4.25%, 15/06/2023 1,793,000 1,881,755 0.07Liberty Mutual Group, Inc.,2.75%, 4/05/2026 EUR 900,000 996,645 0.03Marsh & McLennan Cos., Inc.,2.55%, 15/10/2018 USD 479,000 484,355 0.02Marsh & McLennan Cos., Inc.,3.5%, 3/06/2024 744,000 755,929 0.03Marsh & McLennan Cos., Inc.,4.35%, 30/01/2047 809,000 792,734 0.03QBE Insurance Group Ltd.,6.115%, 24/05/2042 GBP 843,000 1,141,161 0.04
10,741,000 0.38
International Market Quasi-SovereignElectricite de France S.A.,5.375% to 29/01/2025,FRN to 29/01/2049 EUR 1,100,000 1,193,557 0.04Electricite de France,FRN,5.875%, 31/12/2049 GBP 600,000 692,076 0.03ESB Finance Ltd.,2.125%, 8/06/2027 EUR 1,400,000 1,595,267 0.06Israel Electric Corp. Ltd.,5.625%, 21/06/2018 USD 1,603,000 1,668,531 0.06Statoil A.S.A.,4.25%, 23/11/2041 890,000 899,682 0.03Statoil A.S.A.,FRN,1.195%, 15/05/2018 675,000 676,280 0.02
Name of SecurityTransferable Securities and Money MarketInstruments traded on a Regulated Market Shares/Par
MarketValue ($)
NetAssets (%)
International Market Quasi-Sovereign, continuedTemasek Financial I Ltd.,2.375%, 23/01/2023 USD 1,820,000 1,786,492 0.06
8,511,885 0.30
International Market SovereignCommonwealth of Australia,5.75%, 15/05/2021 AUD 25,308,000 22,086,375 0.79Commonwealth of Australia,3.75%, 21/04/2037 2,639,000 2,083,310 0.07Federal Republic of Germany,1.75%, 15/02/2024 EUR 4,500,000 5,471,904 0.20Federal Republic of Germany,0.5%, 15/02/2026 5,465,000 6,018,199 0.21Federal Republic of Germany,6.25%, 4/01/2030 4,286,000 7,886,179 0.28Federal Republic of Germany,2.5%, 4/07/2044 5,552,000 7,930,618 0.28Government of Canada,4.25%, 1/06/2018 CAD 11,378,000 9,157,487 0.33Government of Canada,2.5%, 1/06/2024 30,968,000 25,377,458 0.91Government of Canada,5.75%, 1/06/2033 8,158,000 9,239,840 0.33Government of Canada,4%, 1/06/2041 1,661,000 1,639,504 0.06Government of Japan,2.1%, 20/09/2024 JPY 34,500,000 353,834 0.01Government of Japan,0.4%, 20/09/2025 1,812,500,000 16,523,431 0.59Government of Japan,0.3%, 20/12/2025 80,300,000 726,299 0.03Government of Japan,2.2%, 20/09/2027 2,902,350,000 31,307,645 1.12Government of Japan,1.7%, 20/09/2032 1,282,000,000 13,571,760 0.48Government of Japan,1.5%, 20/03/2034 2,252,000,000 23,227,652 0.83Government of Japan,2.4%, 20/03/2037 1,402,500,000 16,451,768 0.59Government of Japan,1.8%, 20/03/2043 1,046,100,000 11,534,154 0.41Government of Japan,2%, 20/03/2052 375,000,000 4,444,768 0.16Kingdom of Belgium,4.5%, 28/03/2026 EUR 3,730,000 5,377,046 0.19Kingdom of Belgium,4%, 28/03/2032 8,493,000 12,528,004 0.45Kingdom of Denmark,1.75%, 15/11/2025 DKK 31,515,000 5,082,020 0.18Kingdom of Spain,5.4%, 31/01/2023 EUR 5,376,000 7,384,292 0.26Kingdom of Spain,5.15%, 31/10/2028 4,835,000 7,030,606 0.25Kingdom of the Netherlands,5.5%, 15/01/2028 6,640,000 10,833,058 0.39Republic of Austria,1.75%, 20/10/2023 3,040,000 3,639,382 0.13Republic of France,1.75%, 25/05/2023 6,768,000 7,961,627 0.28Republic of France,6%, 25/10/2025 3,653,000 5,694,319 0.20Republic of France,4.75%, 25/04/2035 3,071,000 4,956,405 0.18Republic of France,4.5%, 25/04/2041 543,000 885,479 0.03
MFS Meridian Funds Annual Report 2017 81
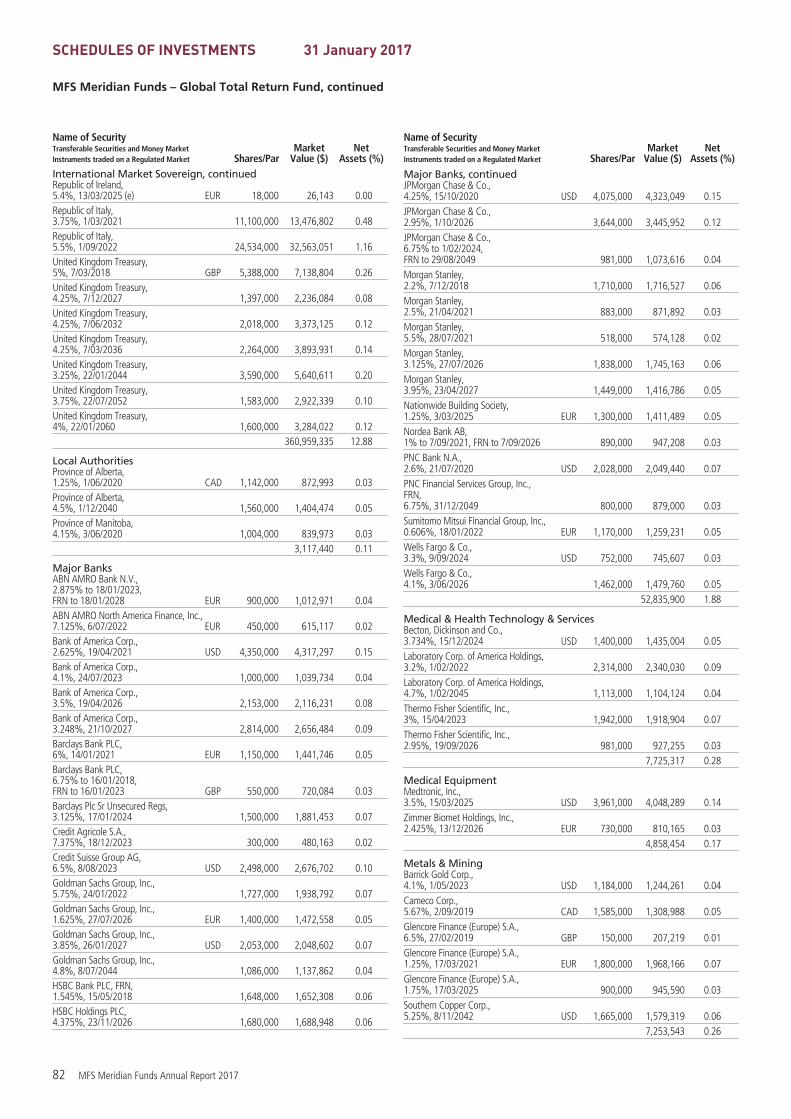
SCHEDULES OF INVESTMENTS 31 January 2017
MFS Meridian Funds – Global Total Return Fund, continued
Name of SecurityTransferable Securities and Money MarketInstruments traded on a Regulated Market Shares/Par
MarketValue ($)
NetAssets (%)
International Market Sovereign, continuedRepublic of Ireland,5.4%, 13/03/2025 (e) EUR 18,000 26,143 0.00Republic of Italy,3.75%, 1/03/2021 11,100,000 13,476,802 0.48Republic of Italy,5.5%, 1/09/2022 24,534,000 32,563,051 1.16United Kingdom Treasury,5%, 7/03/2018 GBP 5,388,000 7,138,804 0.26United Kingdom Treasury,4.25%, 7/12/2027 1,397,000 2,236,084 0.08United Kingdom Treasury,4.25%, 7/06/2032 2,018,000 3,373,125 0.12United Kingdom Treasury,4.25%, 7/03/2036 2,264,000 3,893,931 0.14United Kingdom Treasury,3.25%, 22/01/2044 3,590,000 5,640,611 0.20United Kingdom Treasury,3.75%, 22/07/2052 1,583,000 2,922,339 0.10United Kingdom Treasury,4%, 22/01/2060 1,600,000 3,284,022 0.12
360,959,335 12.88
Local AuthoritiesProvince of Alberta,1.25%, 1/06/2020 CAD 1,142,000 872,993 0.03Province of Alberta,4.5%, 1/12/2040 1,560,000 1,404,474 0.05Province of Manitoba,4.15%, 3/06/2020 1,004,000 839,973 0.03
3,117,440 0.11
Major BanksABN AMRO Bank N.V.,2.875% to 18/01/2023,FRN to 18/01/2028 EUR 900,000 1,012,971 0.04ABN AMRO North America Finance, Inc.,7.125%, 6/07/2022 EUR 450,000 615,117 0.02Bank of America Corp.,2.625%, 19/04/2021 USD 4,350,000 4,317,297 0.15Bank of America Corp.,4.1%, 24/07/2023 1,000,000 1,039,734 0.04Bank of America Corp.,3.5%, 19/04/2026 2,153,000 2,116,231 0.08Bank of America Corp.,3.248%, 21/10/2027 2,814,000 2,656,484 0.09Barclays Bank PLC,6%, 14/01/2021 EUR 1,150,000 1,441,746 0.05Barclays Bank PLC,6.75% to 16/01/2018,FRN to 16/01/2023 GBP 550,000 720,084 0.03Barclays Plc Sr Unsecured Regs,3.125%, 17/01/2024 1,500,000 1,881,453 0.07Credit Agricole S.A.,7.375%, 18/12/2023 300,000 480,163 0.02Credit Suisse Group AG,6.5%, 8/08/2023 USD 2,498,000 2,676,702 0.10Goldman Sachs Group, Inc.,5.75%, 24/01/2022 1,727,000 1,938,792 0.07Goldman Sachs Group, Inc.,1.625%, 27/07/2026 EUR 1,400,000 1,472,558 0.05Goldman Sachs Group, Inc.,3.85%, 26/01/2027 USD 2,053,000 2,048,602 0.07Goldman Sachs Group, Inc.,4.8%, 8/07/2044 1,086,000 1,137,862 0.04HSBC Bank PLC, FRN,1.545%, 15/05/2018 1,648,000 1,652,308 0.06HSBC Holdings PLC,4.375%, 23/11/2026 1,680,000 1,688,948 0.06
Name of SecurityTransferable Securities and Money MarketInstruments traded on a Regulated Market Shares/Par
MarketValue ($)
NetAssets (%)
Major Banks, continuedJPMorgan Chase & Co.,4.25%, 15/10/2020 USD 4,075,000 4,323,049 0.15JPMorgan Chase & Co.,2.95%, 1/10/2026 3,644,000 3,445,952 0.12JPMorgan Chase & Co.,6.75% to 1/02/2024,FRN to 29/08/2049 981,000 1,073,616 0.04Morgan Stanley,2.2%, 7/12/2018 1,710,000 1,716,527 0.06Morgan Stanley,2.5%, 21/04/2021 883,000 871,892 0.03Morgan Stanley,5.5%, 28/07/2021 518,000 574,128 0.02Morgan Stanley,3.125%, 27/07/2026 1,838,000 1,745,163 0.06Morgan Stanley,3.95%, 23/04/2027 1,449,000 1,416,786 0.05Nationwide Building Society,1.25%, 3/03/2025 EUR 1,300,000 1,411,489 0.05Nordea Bank AB,1% to 7/09/2021, FRN to 7/09/2026 890,000 947,208 0.03PNC Bank N.A.,2.6%, 21/07/2020 USD 2,028,000 2,049,440 0.07PNC Financial Services Group, Inc.,FRN,6.75%, 31/12/2049 800,000 879,000 0.03Sumitomo Mitsui Financial Group, Inc.,0.606%, 18/01/2022 EUR 1,170,000 1,259,231 0.05Wells Fargo & Co.,3.3%, 9/09/2024 USD 752,000 745,607 0.03Wells Fargo & Co.,4.1%, 3/06/2026 1,462,000 1,479,760 0.05
52,835,900 1.88
Medical & Health Technology & ServicesBecton, Dickinson and Co.,3.734%, 15/12/2024 USD 1,400,000 1,435,004 0.05Laboratory Corp. of America Holdings,3.2%, 1/02/2022 2,314,000 2,340,030 0.09Laboratory Corp. of America Holdings,4.7%, 1/02/2045 1,113,000 1,104,124 0.04Thermo Fisher Scientific, Inc.,3%, 15/04/2023 1,942,000 1,918,904 0.07Thermo Fisher Scientific, Inc.,2.95%, 19/09/2026 981,000 927,255 0.03
7,725,317 0.28
Medical EquipmentMedtronic, Inc.,3.5%, 15/03/2025 USD 3,961,000 4,048,289 0.14Zimmer Biomet Holdings, Inc.,2.425%, 13/12/2026 EUR 730,000 810,165 0.03
4,858,454 0.17
Metals & MiningBarrick Gold Corp.,4.1%, 1/05/2023 USD 1,184,000 1,244,261 0.04Cameco Corp.,5.67%, 2/09/2019 CAD 1,585,000 1,308,988 0.05Glencore Finance (Europe) S.A.,6.5%, 27/02/2019 GBP 150,000 207,219 0.01Glencore Finance (Europe) S.A.,1.25%, 17/03/2021 EUR 1,800,000 1,968,166 0.07Glencore Finance (Europe) S.A.,1.75%, 17/03/2025 900,000 945,590 0.03Southern Copper Corp.,5.25%, 8/11/2042 USD 1,665,000 1,579,319 0.06
7,253,543 0.26
82 MFS Meridian Funds Annual Report 2017

SCHEDULES OF INVESTMENTS 31 January 2017
MFS Meridian Funds – Global Total Return Fund, continued
Name of SecurityTransferable Securities and Money MarketInstruments traded on a Regulated Market Shares/Par
MarketValue ($)
NetAssets (%)
MidstreamAPT Pipelines Ltd.,5%, 23/03/2035 USD 1,526,000 1,486,438 0.05Enbridge, Inc.,5.5%, 1/12/2046 1,018,000 1,100,366 0.04Enterprise Products Operating LLC,4.85%, 15/03/2044 434,000 442,489 0.02Kinder Morgan Energy Partners LP,3.5%, 1/03/2021 830,000 846,419 0.03Kinder Morgan Energy Partners LP,5.4%, 1/09/2044 1,467,000 1,521,854 0.05
5,397,566 0.19
Mortgage-BackedFannie Mae,2.578%, 25/09/2018 USD 1,026,183 1,036,043 0.04Fannie Mae,5.1%, 1/03/2019 523,834 551,490 0.02Fannie Mae,5.18%, 1/03/2019 524,756 549,711 0.02Fannie Mae,3.416%, 1/10/2020 798,872 832,661 0.03Fannie Mae,5%, 1/12/2020 – 1/08/2040 5,277,005 5,782,310 0.20Fannie Mae,4.448%, 1/01/2021 1,388,806 1,482,843 0.05Fannie Mae,2.64%, 1/11/2021 362,374 367,866 0.01Fannie Mae,2.75%, 1/03/2022 317,250 323,406 0.01Fannie Mae,2.68%, 1/03/2023 372,947 376,674 0.01Fannie Mae,4.5%, 1/03/2025 – 1/02/2046 21,819,206 23,508,615 0.86Fannie Mae,6%, 1/09/2037 – 1/06/2038 604,644 691,300 0.03Fannie Mae,4%, 1/11/2040 – 1/02/2041 9,182,931 9,656,228 0.34Fannie Mae,3.5%, 1/05/2043 – 1/07/2046 7,215,811 7,416,963 0.27Freddie Mac,1.426%, 25/08/2017 411,608 411,749 0.01Freddie Mac,3.882%, 25/11/2017 1,456,976 1,475,962 0.05Freddie Mac,2.412%, 25/08/2018 1,050,918 1,062,395 0.04Freddie Mac,2.303%, 25/09/2018 279,008 281,991 0.01Freddie Mac,5.085%, 25/03/2019 666,000 704,725 0.03Freddie Mac,1.883%, 25/05/2019 2,000,000 2,007,421 0.07Freddie Mac,2.456%, 25/08/2019 2,500,000 2,535,980 0.09Freddie Mac,2.313%, 25/03/2020 1,525,000 1,543,453 0.05Freddie Mac,3.808%, 25/08/2020 665,000 703,398 0.02Freddie Mac,2.682%, 25/10/2022 344,000 349,447 0.01Freddie Mac,3.32%, 25/02/2023 162,000 169,945 0.01Freddie Mac,3.458%, 25/08/2023 464,000 489,022 0.02Freddie Mac,3.329%, 25/05/2025 8,347,395 8,676,827 0.31
Name of SecurityTransferable Securities and Money MarketInstruments traded on a Regulated Market Shares/Par
MarketValue ($)
NetAssets (%)
Mortgage-Backed, continuedFreddie Mac,2.673%, 25/03/2026 USD 3,464,000 3,405,684 0.12Freddie Mac,5%, 1/10/2035 – 1/07/2041 4,171,144 4,602,971 0.16Freddie Mac,5.5%, 1/07/2037 161,938 179,567 0.01Freddie Mac,4.5%, 1/07/2039 – 1/05/2042 7,924,754 8,529,706 0.30Freddie Mac,3.5%, 1/12/2042 – 1/01/2047 7,330,080 7,496,866 0.27Ginnie Mae,5%, 15/05/2040 996,625 1,091,231 0.04Ginnie Mae,3.5%, 20/06/2043 – 20/05/2046 7,009,166 7,285,738 0.26
105,580,188 3.77
Natural Gas – DistributionGNL Quintero S.A.,4.634%, 31/07/2029 USD 3,230,000 3,240,982 0.12
Network & TelecomAT&T, Inc.,2.45%, 30/06/2020 USD 1,683,000 1,669,972 0.06AT&T, Inc.,3%, 30/06/2022 4,064,000 4,006,242 0.14AT&T, Inc.,4.75%, 15/05/2046 2,744,000 2,506,416 0.09British Telecom PLC,5.75%, 7/12/2028 GBP 325,000 530,359 0.02Deutsche Telekom International FinanceB.V.,1.375%, 30/01/2027 EUR 990,000 1,058,381 0.04Empresa Nacional deTelecomunicaciones S.A.,4.75%, 1/08/2026 USD 3,900,000 3,954,533 0.14Verizon Communications, Inc.,4.5%, 15/09/2020 5,599,000 5,976,266 0.21Verizon Communications, Inc.,1.75%, 15/08/2021 1,112,000 1,061,596 0.04Verizon Communications, Inc.,1.375%, 2/11/2028 EUR 1,160,000 1,170,951 0.04Verizon Communications, Inc.,6.4%, 15/09/2033 USD 783,000 949,388 0.04
22,884,104 0.82
OilsMarathon Petroleum Corp.,3.4%, 15/12/2020 USD 2,125,000 2,173,495 0.08Marathon Petroleum Corp.,3.625%, 15/09/2024 1,113,000 1,091,456 0.04Valero Energy Corp.,4.9%, 15/03/2045 1,366,000 1,351,664 0.05
4,616,615 0.17
Other Banks & Diversified FinancialsArion Banki,2.5%, 26/04/2019 EUR 2,400,000 2,681,633 0.10Bank of Iceland,1.75%, 7/09/2020 1,830,000 2,016,436 0.07Belfius Bank S.A.,3.125%, 11/05/2026 900,000 973,291 0.03BPCE S.A.,5.25%, 16/04/2029 GBP 600,000 816,633 0.03BPCE S.A.,4.5%, 15/03/2025 USD 733,000 716,166 0.03Citigroup, Inc.,3.2%, 21/10/2026 2,797,000 2,649,411 0.09
MFS Meridian Funds Annual Report 2017 83

SCHEDULES OF INVESTMENTS 31 January 2017
MFS Meridian Funds – Global Total Return Fund, continued
Name of SecurityTransferable Securities and Money MarketInstruments traded on a Regulated Market Shares/Par
MarketValue ($)
NetAssets (%)
Other Banks & Diversified Financials, continuedCitizens Bank N.A.,2.55%, 13/05/2021 USD 1,027,000 1,022,476 0.04Deutsche Bank AG London,3.7%, 30/05/2024 1,020,000 981,289 0.03Discover Bank,7%, 15/04/2020 1,839,000 2,045,652 0.07Discover Bank,3.1%, 4/06/2020 1,139,000 1,154,456 0.04Intesa Sanpaolo S.p.A.,5.25%, 28/01/2022 GBP 400,000 550,167 0.02KBC Groep N.V.,2.375% to 25/11/2019,FRN to 25/11/2024 EUR 1,200,000 1,340,086 0.05UBS Group Funding (Jersey) Ltd.,1.5%, 30/11/2024 1,500,000 1,612,970 0.06UniCredit S.p.A.,2%, 4/03/2023 1,500,000 1,634,017 0.06
20,194,683 0.72
Personal Computers & PeripheralsEquifax, Inc.,2.3%, 1/06/2021 USD 958,000 943,191 0.03Equifax, Inc.,3.3%, 15/12/2022 1,300,000 1,322,130 0.05
2,265,321 0.08
PharmaceuticalsCelgene Corp.,2.875%, 15/08/2020 USD 3,487,000 3,542,241 0.13Forest Laboratories, Inc.,4.375%, 1/02/2019 2,043,000 2,121,486 0.07Gilead Sciences, Inc.,2.35%, 1/02/2020 1,009,000 1,017,516 0.04
6,681,243 0.24
Real Estate – ApartmentDeutsche Wohnen AG, REIT,1.375%, 24/07/2020 EUR 1,900,000 2,118,708 0.07LEG Immobilien AG,1.25%, 23/01/2024 700,000 751,093 0.03
2,869,801 0.10
Real Estate – OfficeBoston Properties, Inc., REIT,3.125%, 1/09/2023 USD 1,500,000 1,482,359 0.05Merlin Properties SOCIMI S.A., REIT,2.225%, 25/04/2023 EUR 1,000,000 1,102,902 0.04Merlin Properties SOCIMI S.A., REIT,1.875%, 2/11/2026 1,490,000 1,528,029 0.06
4,113,290 0.15
Real Estate – RetailSimon International Finance S.C.A., REIT,1.25%, 13/05/2025 EUR 700,000 749,588 0.03Simon Property Group, Inc., REIT,5.65%, 1/02/2020 USD 1,950,000 2,132,358 0.07
2,881,946 0.10
RetailersBest Buy Co., Inc.,5.5%, 15/03/2021 USD 2,306,000 2,506,006 0.09Home Depot, Inc.,2.625%, 1/06/2022 3,200,000 3,221,971 0.11Home Depot, Inc.,4.875%, 15/02/2044 394,000 439,879 0.02Kering S.A.,1.25%, 10/05/2026 EUR 1,100,000 1,165,443 0.04
7,333,299 0.26
Name of SecurityTransferable Securities and Money MarketInstruments traded on a Regulated Market Shares/Par
MarketValue ($)
NetAssets (%)
Specialty ChemicalsEcolab, Inc.,2.625%, 8/07/2025 EUR 750,000 889,260 0.03
SupermarketsLoblaw Cos. Ltd.,4.86%, 12/09/2023 CAD 1,588,000 1,369,957 0.05William Morrison Supermarkets PLC,3.5%, 27/07/2026 GBP 300,000 392,463 0.01
1,762,420 0.06
SupranationalInternational Bank for Reconstruction andDevelopment,2.8%, 13/01/2021 AUD 800,000 611,941 0.02International Bank for Reconstruction andDevelopment,4.25%, 24/06/2025 995,000 814,128 0.03International Finance Corp.,3.25%, 22/07/2019 1,440,000 1,118,291 0.04
2,544,360 0.09
Telecommunications – WirelessAmerica Movil S.A.B. de C.V.,1.5%, 10/03/2024 EUR 1,010,000 1,084,187 0.04American Tower Corp., REIT,3.5%, 31/01/2023 USD 1,358,000 1,361,878 0.05American Tower Corp., REIT,4%, 1/06/2025 2,800,000 2,805,418 0.10Crown Castle International Corp.,2.25%, 1/09/2021 2,317,000 2,243,565 0.08Crown Castle International Corp.,3.7%, 15/06/2026 912,000 888,640 0.03SBA Tower Trust,2.898%, 15/10/2044 1,301,000 1,310,011 0.05
9,693,699 0.35
Telephone ServicesChorus Ltd. Co.,1.125%, 18/10/2023 EUR 900,000 960,105 0.03TELUS Corp.,5.05%, 23/07/2020 CAD 970,000 822,105 0.03
1,782,210 0.06
TobaccoB.A.T. International Finance PLC,0.875%, 13/10/2023 EUR 1,100,000 1,170,899 0.04Imperial Brands Finance PLC,1.375%, 27/01/2025 700,000 752,607 0.03Imperial Tobacco Finance PLC,4.25%, 21/07/2025 USD 1,606,000 1,653,114 0.06Reynolds American, Inc.,8.125%, 23/06/2019 732,000 831,332 0.03Reynolds American, Inc.,3.25%, 12/06/2020 293,000 300,510 0.01Reynolds American, Inc.,4%, 12/06/2022 801,000 836,822 0.03Reynolds American, Inc.,4.45%, 12/06/2025 588,000 616,317 0.02Reynolds American, Inc.,5.7%, 15/08/2035 1,890,000 2,162,362 0.08
8,323,963 0.30
Transportation – ServicesAtlantia SpA,1.625%, 3/02/2025 EUR 800,000 859,878 0.03Autoroutes du Sud de La France,1.25%, 18/01/2027 900,000 964,169 0.03Autostrade per L’Italia S.p.A.,1.75%, 26/06/2026 250,000 271,898 0.01
84 MFS Meridian Funds Annual Report 2017

SCHEDULES OF INVESTMENTS 31 January 2017
MFS Meridian Funds – Global Total Return Fund, continued
Name of SecurityTransferable Securities and Money MarketInstruments traded on a Regulated Market Shares/Par
MarketValue ($)
NetAssets (%)
Transportation – Services, continuedAutrostrade per L’italia Group,1.125%, 4/11/2021 EUR 900,000 995,642 0.04Compagnie Financial et IndusUnternehmensanleihe,0.75%, 9/09/2028 1,700,000 1,681,487 0.06ERAC USA Finance LLC,7%, 15/10/2037 USD 780,000 989,415 0.03ERAC USA Finance LLC,4.5%, 15/02/2045 237,000 227,431 0.01Heathrow Funding Ltd.,4.625%, 31/10/2046 GBP 475,000 750,928 0.03
6,740,848 0.24
U.S. Government Agencies and EquivalentsSmall Business Administration,5.09%, 1/10/2025 USD 38,104 40,213 0.00Small Business Administration,5.21%, 1/01/2026 466,391 497,340 0.02Small Business Administration,5.31%, 1/05/2027 322,810 349,486 0.01Small Business Administration,2.22%, 1/03/2033 1,266,297 1,234,108 0.05
2,121,147 0.08
U.S. Treasury ObligationsU.S. Treasury Bonds,4.5%, 15/08/2039 USD 4,737,500 5,950,745 0.21U.S. Treasury Bonds,3.625%, 15/02/2044 9,802,000 10,873,329 0.39U.S. Treasury Notes,1.125%, 15/06/2018 18,089,000 18,117,979 0.65U.S. Treasury Notes,2%, 15/02/2025 14,715,000 14,321,256 0.51
49,263,309 1.76
Utilities – Electric PowerBruce Power LP,2.844%, 23/06/2021 CAD 2,485,000 1,944,994 0.07CMS Energy Corp.,5.05%, 15/03/2022 USD 800,000 876,414 0.03DTE Electric Co.,3.7%, 15/03/2045 1,500,000 1,439,123 0.05Duke Energy Corp.,2.65%, 1/09/2026 2,147,000 2,006,058 0.07Duke Energy Florida LLC,3.2%, 15/01/2027 1,821,000 1,824,498 0.07E.ON International Finance B.V.,6.375%, 7/06/2032 GBP 300,000 519,525 0.02EDP Finance B.V.,1.875%, 29/09/2023 EUR 690,000 741,503 0.03EDP Finance B.V.,4.9%, 1/10/2019 USD 923,000 969,588 0.03EDP Finance B.V.,4.125%, 20/01/2021 EUR 1,000,000 1,203,517 0.04Emera U.S. Finance LP,2.7%, 15/06/2021 USD 583,000 578,523 0.02Emera U.S. Finance LP,3.55%, 15/06/2026 666,000 652,808 0.02Enel Finance International N.V.,5.625%, 14/08/2024 GBP 550,000 830,487 0.03Innogy Finance B.V.,4.75%, 31/01/2034 500,000 734,287 0.03PG&E Corp.,2.4%, 1/03/2019 USD 818,000 823,563 0.03PPL Capital Funding, Inc.,3.1%, 15/05/2026 2,268,000 2,176,083 0.08
Name of SecurityTransferable Securities and Money MarketInstruments traded on a Regulated Market Shares/Par
MarketValue ($)
NetAssets (%)
Utilities – Electric Power, continuedPPL Capital Funding, Inc.,5%, 15/03/2044 USD 636,000 665,571 0.02PPL WEM Holdings PLC,5.375%, 1/05/2021 1,000,000 1,084,564 0.04Progress Energy, Inc.,7.05%, 15/03/2019 1,450,000 1,598,650 0.06Public Service Enterprise Group,2%, 15/11/2021 2,744,000 2,661,513 0.09Southern Co.,2.95%, 1/07/2023 1,331,000 1,311,851 0.05Southern Co.,4.4%, 1/07/2046 2,008,000 1,987,002 0.07
26,630,122 0.95
Total Bonds(Identified Cost, $987,447,764) 955,437,490 34.10
PREFERRED STOCKS
Consumer ProductsHenkel AG & Co. KGaA 119,359 14,521,171 0.52
Other Banks & Diversified FinancialsItau Unibanco Holding S.A. 130,100 1,537,534 0.05
Total Preferred Stocks(Identified Cost, $14,155,746) 16,058,705 0.57
CONVERTIBLE PREFERRED STOCKS
Utilities – Electric PowerExelon Corp.6.5%(Identified Cost, $11,418,875) 257,550 12,766,754 0.46
SHORT-TERM OBLIGATIONS (y)Apple, Inc.,0.68%, 15/02/2017 USD 7,340,000 7,338,059 0.26Chevron Corp.,0.62%, 14/02/2017 5,000,000 4,998,881 0.18Exxon Mobil Corp.,0.63%, 22/02/2017 20,000,000 19,992,650 0.71General Electric Co.,0.58%, 1/02/2017 14,406,000 14,406,000 0.51Microsoft Corp.,0.72%, 22/02/2017 19,750,000 19,741,705 0.71Mizuho Bank Ltd.,0.7%, 3/02/2017 8,811,000 8,811,000 0.32Mizuho Bank Ltd.,0.7%, 14/02/2017 9,000,000 9,000,350 0.32Nestle Cap Corp.,0.72%, 15/03/2017 7,566,000 7,559,645 0.27Novartis Finance Corp.,0.64%, 13/02/2017 8,855,000 8,853,111 0.32Novartis Finance Corp.,0.65%, 13/02/2017 3,000,000 2,999,350 0.11Novartis Finance Corp.,0.68%, 6/02/2017 5,565,000 5,564,474 0.20Novartis Finance Corp.,0.7%, 21/02/2017 4,000,000 3,998,444 0.14Pepsico Inc.,0.64%, 24/02/2017 6,000,000 5,997,547 0.21Sanofi,0.62%, 24/02/2017 3,067,000 3,065,785 0.11Sanofi,0.63%, 27/02/2017 20,000,000 19,990,900 0.71Toronto Dominion Holding,0.66%, 8/02/2017 8,500,000 8,498,909 0.30
MFS Meridian Funds Annual Report 2017 85

SCHEDULES OF INVESTMENTS 31 January 2017
MFS Meridian Funds – Global Total Return Fund, continued
Name of SecurityTransferable Securities and Money MarketInstruments traded on a Regulated Market Shares/Par
MarketValue ($)
NetAssets (%)
SHORT-TERM OBLIGATIONS (y), continuedToronto Dominion Holding,0.72%, 10/02/2017 USD 12,006,000 12,003,839 0.43
Total Short-Term Obligations, atAmortized Cost and Value 162,820,649 5.81
Total Transferable Securities andMoney Market Instruments Tradedon a Regulated Market(Identified Cost, $2,655,636,380) (k) 2,772,571,016 98.95
OTHER ASSETS, LESS LIABILITIES 29,298,595 1.05
NET ASSETS 2,801,869,611 100.00
See Schedules of Investments Footnotes and Notes to Financial Statements
MFS Meridian Funds – Inflation-Adjusted Bond Fund(Expressed in U.S. Dollars)
Name of SecurityTransferable Securities and Money MarketInstruments traded on a Regulated Market Shares/Par
MarketValue ($)
NetAssets (%)
BONDSU.S. Treasury Inflation Protected SecuritiesU.S. Treasury Bonds,0.125%, 15/04/2020 USD 4,051,303 4,125,783 3.25U.S. Treasury Bonds,1.125%, 15/01/2021 5,245,183 5,548,570 4.38U.S. Treasury Bonds,0.375%, 15/07/2023 4,757,214 4,852,277 3.83U.S. Treasury Bonds,0.125%, 15/07/2024 5,607,755 5,574,198 4.40U.S. Treasury Bonds,0.25%, 15/01/2025 4,769,892 4,739,484 3.74U.S. Treasury Bonds,2.375%, 15/01/2025 5,869,399 6,803,156 5.36U.S. Treasury Bonds,0.375%, 15/07/2025 4,706,076 4,730,839 3.73U.S. Treasury Bonds,0.625%, 15/01/2026 3,884,228 3,960,662 3.12U.S. Treasury Bonds,2%, 15/01/2026 3,610,342 4,113,010 3.24U.S. Treasury Bonds,2.375%, 15/01/2027 1,612,090 1,914,914 1.51U.S. Treasury Bonds,1.75%, 15/01/2028 2,471,169 2,795,392 2.20U.S. Treasury Bonds,3.625%, 15/04/2028 2,089,119 2,777,674 2.19U.S. Treasury Bonds,2.5%, 15/01/2029 1,889,679 2,308,585 1.82U.S. Treasury Bonds,3.875%, 15/04/2029 1,868,942 2,585,678 2.04U.S. Treasury Bonds,3.375%, 15/04/2032 632,279 886,287 0.70U.S. Treasury Bonds,2.125%, 15/02/2040 1,401,396 1,757,546 1.39U.S. Treasury Bonds,2.125%, 15/02/2041 1,151,705 1,451,981 1.14U.S. Treasury Bonds,0.75%, 15/02/2042 2,906,355 2,786,383 2.20U.S. Treasury Bonds,1.375%, 15/02/2044 2,633,505 2,908,525 2.29U.S. Treasury Bonds,0.75%, 15/02/2045 3,016,369 2,876,687 2.27U.S. Treasury Bonds,1%, 15/02/2046 550,049 560,109 0.44
Name of SecurityTransferable Securities and Money MarketInstruments traded on a Regulated Market Shares/Par
MarketValue ($)
NetAssets (%)
U.S. Treasury Inflation Protected Securities, continuedU.S. Treasury Notes,0.125%, 15/04/2018 USD 4,495,852 4,555,696 3.59U.S. Treasury Notes,1.375%, 15/07/2018 1,701,245 1,771,227 1.40U.S. Treasury Notes,2.125%, 15/01/2019 1,846,962 1,958,302 1.54U.S. Treasury Notes,0.125%, 15/04/2019 3,281,644 3,343,158 2.64U.S. Treasury Notes,1.875%, 15/07/2019 2,525,224 2,702,263 2.13U.S. Treasury Notes,1.375%, 15/01/2020 2,679,756 2,836,265 2.24U.S. Treasury Notes,1.25%, 15/07/2020 4,873,863 5,185,541 4.09U.S. Treasury Notes,0.125%, 15/04/2021 2,240,348 2,272,029 1.79U.S. Treasury Notes,0.625%, 15/07/2021 5,008,365 5,219,558 4.12U.S. Treasury Notes,0.125%, 15/01/2022 5,372,271 5,438,775 4.29U.S. Treasury Notes,0.125%, 15/07/2022 6,321,319 6,406,834 5.05U.S. Treasury Notes,0.125%, 15/01/2023 6,265,355 6,283,236 4.95U.S. Treasury Notes,0.625%, 15/01/2024 4,742,632 4,876,925 3.85U.S. Treasury Notes,0.625%, 15/02/2043 1,981,966 1,838,374 1.45
Total Bonds(Identified Cost, $126,843,905) 124,745,923 98.37
SHORT-TERM OBLIGATIONS (y)General Electric Co.,0.58%, 1/02/2017, at AmortizedCost and Value USD 1,644,000 1,644,000 1.30
Total Transferable Securities andMoney Market Instruments Tradedon a Regulated Market(Identified Cost, $128,487,905) 126,389,923 99.67
OTHER ASSETS, LESS LIABILITIES 424,044 0.33
NET ASSETS 126,813,967 100.00
See Schedules of Investments Footnotes and Notes to Financial Statements
86 MFS Meridian Funds Annual Report 2017

SCHEDULES OF INVESTMENTS 31 January 2017
MFS Meridian Funds – Japan Equity Fund(Expressed in U.S. Dollars)
Name of SecurityTransferable Securities and Money MarketInstruments traded on a Regulated Market Shares/Par
MarketValue ($)
NetAssets (%)
COMMON STOCKS
AutomotiveDENSO Corp. 1,300 56,426 0.84Koito Manufacturing Co. Ltd. 4,000 211,850 3.14NGK Spark Plug Co. Ltd. 6,900 155,465 2.30Toyota Motor Corp. 2,800 163,273 2.42USS Co. Ltd. 11,100 194,749 2.88
781,763 11.58
Business ServicesMitsui & Co. Ltd. 11,000 161,381 2.39Nomura Research, Inc. 3,000 102,560 1.52
263,941 3.91
Computer SoftwareOBIC Co. Ltd. 3,400 163,210 2.42
Computer Software – SystemsBrother Industries, Ltd. 3,000 55,478 0.82Hitachi Ltd. 29,000 166,331 2.47
221,809 3.29
ConstructionRinnai Corp. 2,000 170,047 2.52Toto Ltd. 5,300 213,812 3.17
383,859 5.69
Consumer ProductsKao Corp. 3,900 192,841 2.86KOSE Corp. 1,400 119,033 1.76
311,874 4.62
ElectronicsHoya Corp. 3,900 170,010 2.52Kyocera Corp. 2,600 142,220 2.11
312,230 4.63
Energy – IndependentINPEX Corp. 8,100 79,666 1.18
Food & Drug StoresSeven & I Holdings Co. Ltd. 3,000 119,803 1.78Sundrug Co. Ltd. 1,900 130,918 1.94
250,721 3.72
InsuranceSony Financial Holdings, Inc. 4,359 73,467 1.09Tokio Marine Holding, Inc. 2,400 100,562 1.49
174,029 2.58
Machinery & ToolsDaikin Industries Ltd. 2,200 218,714 3.24Glory Ltd. 5,700 178,204 2.64Kubota Corp. 15,000 239,129 3.54
636,047 9.42
Major BanksMitsubishi UFJ Financial Group, Inc. 39,300 254,401 3.77Sumitomo Mitsui Financial Group, Inc. 5,500 216,814 3.21
471,215 6.98
Name of SecurityTransferable Securities and Money MarketInstruments traded on a Regulated Market Shares/Par
MarketValue ($)
NetAssets (%)
Medical EquipmentNihon Kohden Corp. 6,900 157,727 2.34Terumo Corp. 2,000 73,864 1.09
231,591 3.43
Natural Gas – DistributionTokyo Gas Co. Ltd. 25,000 110,663 1.64
Other Banks & Diversified FinancialsAeon Credit Service Co. Ltd. 8,000 143,265 2.12
PharmaceuticalsKyowa Hakko Kirin Co. Ltd. 3,000 40,413 0.60Santen Pharmaceutical Co. Ltd. 14,900 186,860 2.77Shionogi & Co. Ltd. 2,200 105,704 1.56
332,977 4.93
Railroad & ShippingEast Japan Railway Co. 1,800 163,086 2.42
Real EstateMitsui Fudosan Co. Ltd. 10,000 231,733 3.43
Specialty ChemicalsJSR Corp. 7,900 135,736 2.01Nitto Denko Corp. 2,400 190,091 2.82
325,827 4.83
Specialty StoresABC-MART, Inc. 2,100 122,009 1.81Ryohin Keikaku Co. Ltd. 700 131,122 1.94
253,131 3.75
Telecommunications – WirelessKDDI Corp. 10,100 271,039 4.02SoftBank Corp. 3,700 285,127 4.22
556,166 8.24
TobaccoJapan Tobacco, Inc. 5,100 164,414 2.44
TruckingYamato Holdings Co. Ltd. 5,500 111,038 1.65
Total Common Stocks(Identified Cost, $6,226,172) 6,674,255 98.90
SHORT-TERM OBLIGATIONS (y)General Electric Co.,0.58%, 1/02/2017, at Amortized Costand Value USD 73,000 73,000 1.08
Total Transferable Securities andMoney Market Instruments Tradedon a Regulated Market(Identified Cost, $6,299,172) (k) 6,747,255 99.98
OTHER ASSETS, LESS LIABILITIES 1,620 0.02
NET ASSETS 6,748,875 100.00
See Schedules of Investments Footnotes and Notes to Financial Statements
MFS Meridian Funds Annual Report 2017 87

SCHEDULES OF INVESTMENTS 31 January 2017
MFS Meridian Funds – Latin American Equity Fund(Expressed in U.S. Dollars)
Name of SecurityTransferable Securities and Money MarketInstruments traded on a Regulated Market Shares/Par
MarketValue ($)
NetAssets (%)
COMMON STOCKS
AirlinesCopa Holdings S.A., “A” 953 92,908 0.40Grupo Aeroportuario del Sureste S.A. deC.V., ADR 2,035 294,810 1.26
387,718 1.66
Alcoholic BeveragesAmBev S.A., ADR 270,076 1,455,710 6.24Compania Cervecerias Unidas S.A., ADR 7,401 167,189 0.72
1,622,899 6.96
AutomotiveTenedora Nemak S.A. de C.V. 125,400 116,539 0.50
BroadcastingGrupo Televisa S.A., ADR 9,596 214,950 0.92
Brokerage & Asset ManagersBM&F Bovespa S.A. 118,041 692,640 2.97Bolsa Mexicana de Valores S.A. de C.V. 163,111 222,842 0.96CETIP S.A. – Balcao Organizado de Ativos eDerivativos 8,300 123,930 0.53
1,039,412 4.46
Business ServicesCielo S.A. 24,140 202,935 0.87
Computer SoftwareTotvs S.A. 18,962 156,999 0.67
Computer Software – SystemsGlobant S.A. 8,399 278,427 1.20Linx S.A. 44,419 254,298 1.09
532,725 2.29
ConglomeratesAlfa S.A de C.V., “A” 62,936 81,667 0.35
ConstructionCemex Latam Holdings S.A. 24,185 94,764 0.41CEMEX S.A.B. de C.V., ADR 25,970 240,482 1.03Elementia S.A.B. de C.V. 174,350 192,129 0.82
527,375 2.26
Consumer ServicesEstacio Participacoes S.A. 40,261 203,151 0.87GAEC Educacao S.A. 47,671 202,720 0.87Kroton Educacional S.A. 91,182 390,933 1.68Localiza Rent a Car S.A. 19,781 231,326 0.99
1,028,130 4.41
Electrical EquipmentWEG S.A. 34,300 173,182 0.74
Energy – IndependentGran Tierra Energy, Inc. 80,276 206,049 0.89Ultrapar Participacoes S.A. 28,205 592,188 2.54
798,237 3.43
Energy – IntegratedPetroleo Brasileiro S.A., ADR 41,391 424,672 1.82
Engineering – ConstructionMills Estruturas e Servicos deEngenharia S.A. 171,092 215,555 0.93
Food & BeveragesArca Continental S.A.B de C.V. 54,980 296,605 1.27BRF S.A. 50,475 712,170 3.06Fomento Economico Mexicano S.A.B. deC.V., ADR 4,386 329,959 1.42Gruma S.A.B. De C.V. 14,342 192,962 0.83
Name of SecurityTransferable Securities and Money MarketInstruments traded on a Regulated Market Shares/Par
MarketValue ($)
NetAssets (%)
Food & Beverages, continuedGrupo Bimbo S.A. de C.V., “A” 52,888 117,247 0.50
1,648,943 7.08
Forest & Paper ProductsFibria Celulose S.A. 28,576 266,344 1.14
General MerchandiseLojas Renner S.A. 24,915 188,813 0.81PriceSmart, Inc. 2,305 195,234 0.84S.A.C.I. Falabella 61,486 498,458 2.14Walmart de Mexico S.A.B. de C.V. 138,834 245,665 1.05
1,128,170 4.84
Health Maintenance OrganizationsOdontoPrev S.A. 156,529 556,850 2.39Qualicorp S.A. 47,766 312,417 1.34
869,267 3.73
InsuranceBB Seguridade Participacoes S.A. 54,441 482,196 2.07Brasil Insurance Participacoes eAdministracao S.A. 4,702 29,873 0.13
512,069 2.20
Metals & MiningGrupo Mexico S.A.B. de C.V., “B” 286,502 859,224 3.69Vale S.A., ADR 48,089 489,546 2.10
1,348,770 5.79
Natural Gas – DistributionInfraestructura Energetica Nova, S.A.de C.V. 16,035 70,781 0.30
Oil ServicesTenaris S.A., ADR 6,490 227,410 0.98
Other Banks & Diversified FinancialsBanco Bradesco S.A., ADR 46,738 482,804 2.07Banco Santander Chile, ADR 11,264 243,190 1.04Bancolombia S.A., ADR 7,848 297,125 1.28Credicorp Ltd. 3,931 643,426 2.76Grupo Financiero Banorte S.A. de C.V. 128,158 614,256 2.64Grupo Financiero Inbursa S.A. de C.V. 252,252 373,899 1.60Itau Unibanco Holding S.A., ADR 139,174 1,643,645 7.05
4,298,345 18.44
PharmaceuticalsGenomma Lab Internacional S.A., “B” 452,400 474,669 2.04
Precious Metals & MineralsCompania de Minas BuenaventuraS.A.A., ADR 13,176 181,697 0.78
Real EstateConcentradora Fibra Danhos S.A. deC.V., REIT 73,783 110,815 0.48Concentradora Fibra Hotelera MexicanaS.A. de C.V., REIT 390,203 282,920 1.21Concentradora Hipotecaria S.A. 188,252 199,234 0.85Fibra Uno Administracion S.A. 101,045 144,492 0.62
737,461 3.16
RestaurantsAlsea S.A.B. de C.V. 45,064 130,285 0.56
Specialty ChemicalsMexichem S.A.B de C.V. 97,996 232,237 1.00
Telecommunications – WirelessAmerica Movil S.A.B. de C.V., “L”, ADR 38,753 488,675 2.10
88 MFS Meridian Funds Annual Report 2017

SCHEDULES OF INVESTMENTS 31 January 2017
MFS Meridian Funds – Latin American Equity Fund, continued
Name of SecurityTransferable Securities and Money MarketInstruments traded on a Regulated Market Shares/Par
MarketValue ($)
NetAssets (%)
Telephone ServicesTelefonica Brasil S.A., ADR 19,323 285,594 1.23
Utilities – Electric PowerEnel Americas S.A., ADR 17,442 157,501 0.67Enel Chile S.A., ADR 38,550 185,811 0.80Engie Brasil Energia S.A. 34,600 393,094 1.69Equatorial Energia S.A. 13,048 240,579 1.03Terna Participacoes S.A., IEU 52,287 356,091 1.53
1,333,076 5.72
Utilities – WaterAguas Andinas S.A. 453,031 245,824 1.06
Total Common Stocks(Identified Cost, $21,465,669) 22,002,612 94.42
PREFERRED STOCKS
Food & Drug StoresCia Brasileira de Distribuicao 4,200 77,226 0.33
Name of SecurityTransferable Securities and Money MarketInstruments traded on a Regulated Market Shares/Par
MarketValue ($)
NetAssets (%)
Forest & Paper ProductsSuzano Papel e Celulose S.A. 99,900 424,823 1.82
Metals & MiningUsinas Siderurgicas de Minas Gerais S.A. 298,700 497,661 2.14
Total Preferred Stocks(Identified Cost, $822,157) 999,710 4.29
SHORT-TERM OBLIGATIONS (y)General Electric Co.,0.58%, 1/02/2017, at Amortized Costand Value USD 84,000 84,000 0.36
Total Transferable Securities andMoney Market Instruments Tradedon a Regulated Market(Identified Cost, $22,371,826) 23,086,322 99.07
OTHER ASSETS, LESS LIABILITIES 217,890 0.93
NET ASSETS 23,304,212 100.00
See Schedules of Investments Footnotes and Notes to Financial Statements
MFS Meridian Funds – Limited Maturity Fund(Expressed in U.S. Dollars)
Name of SecurityTransferable Securities and Money MarketInstruments traded on a Regulated Market Shares/Par
MarketValue ($)
NetAssets (%)
BONDSAsset-Backed & SecuritizedAdirondack Park CLO Ltd., FRN,2.173%, 15/04/2024 USD 630,000 628,875 0.08AmeriCredit Automobile Receivables Trust,2015-3, “A2A”,1.07%, 8/01/2019 479,747 479,624 0.06AmeriCredit Automobile Receivables Trust,2016-3, “A2A”,1.37%, 8/11/2019 2,130,000 2,130,072 0.28ARI Fleet Lease Trust, “A2”,0.81%, 15/11/2022 101,804 101,753 0.01ARI Fleet Lease Trust, 2016-A, “A2”,1.82%, 15/07/2024 2,292,334 2,292,572 0.30Atrium CDO Corp., FRN,2.143%, 16/07/2025 1,400,000 1,397,428 0.18Bayview Commercial Asset Trust, FRN,1.041%, 25/04/2036 228,418 204,879 0.03Bayview Commercial Asset Trust, FRN,0%, 25/07/2036 (i) 1,091,531 0 0.00Bayview Financial Revolving MortgageLoan Trust, FRN,2.202%, 28/12/2040 308,249 236,429 0.03Capital Auto Receivables Asset Trust,2016-3, “A2A”,1.36%, 22/04/2019 1,150,000 1,150,313 0.15Capital One Multi-Asset Execution Trust,2016-A4, “A4”,1.33%, 15/06/2022 5,450,000 5,387,518 0.71Chesapeake Funding II LLC, 2016-1A,“A2”, FRN,1.917%, 15/03/2028 2,048,000 2,060,530 0.27Chesapeake Funding LLC, “A”, FRN,1.215%, 7/01/2025 650,626 650,240 0.09Chesapeake Funding LLC, 2015-1A, “A”,FRN,1.265%, 7/02/2027 1,405,008 1,403,543 0.18Chrysler Capital Auto Receivables Trust2016-A,1.47%, 15/04/2019 1,389,894 1,391,165 0.18
Name of SecurityTransferable Securities and Money MarketInstruments traded on a Regulated Market Shares/Par
MarketValue ($)
NetAssets (%)
Asset-Backed & Securitized, continuedChrysler Capital Auto Receivables Trust2016-B, “A2”,1.36%, 15/01/2020 USD 1,600,000 1,597,883 0.21Colony Starwood Homes, 2016-2A, “A”,FRN,1.954%, 17/12/2033 3,262,520 3,277,833 0.43Commercial Mortgage Asset Trust, FRN,0.571%, 17/01/2032 (i) 1,730,361 766 0.00Credit Acceptance Auto Loan Trust,2015-2A, “A”,2.4%, 15/02/2023 2,869,000 2,886,889 0.38Credit Acceptance Auto Loan Trust,2016-2A, “A”,2.42%, 15/11/2023 2,000,000 2,002,351 0.26Credit Acceptance Auto Loan Trust,2016-3A, “A”,2.15%, 15/04/2024 3,262,000 3,236,214 0.43Credit Suisse Commercial Mortgage Trust,“A4”, FRN,5.938%, 15/09/2039 1,313,258 1,328,144 0.17Credit-Based Asset Servicing &Securitization LLC, FRN,5.303%, 25/12/2035 207,200 205,152 0.03Credit-Based Asset Servicing &Securitization LLC, FRN,3.969%, 25/03/2037 1,139,937 627,858 0.08Cutwater Ltd., 2014-1A, “A”, FRN,2.543%, 15/07/2026 2,350,000 2,344,321 0.31CWCapital Cobalt Ltd., “A4”, FRN,5.764%, 15/05/2046 1,669,850 1,682,623 0.22Drive Auto Receivables Trust, 2016-CA,“A3”,1.67%, 15/11/2019 2,990,000 2,988,558 0.39DT Auto Owner Trust, 2016-2A, “A”,4/6/16 15/08/2019 602,424 602,767 0.08Enterprise Fleet Financing LLC,1.74%, 22/02/2022 1,930,000 1,927,791 0.25
MFS Meridian Funds Annual Report 2017 89

SCHEDULES OF INVESTMENTS 31 January 2017
MFS Meridian Funds – Limited Maturity Fund, continued
Name of SecurityTransferable Securities and Money MarketInstruments traded on a Regulated Market Shares/Par
MarketValue ($)
NetAssets (%)
Asset-Backed & Securitized, continuedEnterprise Fleet Financing LLC, 2014-1,“A2”,0.87%, 20/09/2019 USD 83,681 83,651 0.01Exeter Automobile Receivables Trust,2015-1A, “A”,1.6%, 17/06/2019 207,566 207,551 0.03Exeter Automobile Receivables Trust,2015-2A, “A”,1.54%, 15/11/2019 466,208 466,110 0.06Exeter Automobile Receivables Trust,2016-1A, “A”,2.35%, 15/07/2020 544,742 546,652 0.07Exeter Automobile Receivables Trust,2016-3A, “A”,1.84%, 16/11/2020 3,411,551 3,409,333 0.45Exeter Automobile Receivables Trust,2017-1A, “A”,1.96%, 15/03/2021 1,445,000 1,444,896 0.19Flagship Credit Auto Trust, 2016-1, “A”,2.77%, 15/12/2020 1,477,317 1,489,670 0.20Ford Credit Auto Owner Trust, 2014-1,“A”,2.26%, 15/11/2025 1,087,000 1,096,850 0.14Ford Credit Auto Owner Trust, 2014-2,“A”,2.31%, 15/04/2026 5,163,000 5,209,468 0.68Ford Credit Floorplan Master Owner Trust,2015-1, “A2”, FRN,1.168%, 15/01/2020 3,580,000 3,584,977 0.47GE Dealer Floorplan Master Note Trust,2014-1, “A”, FRN,1.156%, 20/07/2019 6,142,000 6,142,724 0.81GM Financial Automobile Leasing Trust,2015-3A, “A2”,1.17%, 20/06/2018 1,311,446 1,311,308 0.17GMAC Mortgage Corp. Loan Trust,5.805%, 25/10/2036 542,883 523,285 0.07GMF Floorplan Owner Revolving Trust,2017-A1, “A”,2.22%, 18/01/2022 2,110,000 2,109,449 0.28GO Financial Auto Securitization Trust,2015-2, “A”,3.27%, 15/11/2018 367,776 368,270 0.05Hertz Fleet Lease Funding LP, 2013-3, “A”,FRN,1.313%, 10/12/2027 512,327 512,311 0.07Hertz Fleet Lease Funding LP, 2016-1,“A2”,1.96%, 10/04/2030 1,810,000 1,817,010 0.24Hyundai Auto Lease Securitization Trust,2016-C, “A2”,1.3%, 15/03/2019 3,550,000 3,545,346 0.47Hyundai Auto Receivables Trust 2015-C,“A2A”,0.99%, 15/11/2018 803,693 803,037 0.11IMPAC CMB Trust, FRN,1.496%, 25/11/2034 98,696 95,277 0.01IMPAC CMB Trust, FRN,1.676%, 25/11/2034 126,895 117,886 0.02IMPAC Secured Assets Corp., FRN,1.106%, 25/05/2036 201,117 181,563 0.02Interstar Millennium Trust, FRN,1.358%, 14/03/2036 80,083 76,084 0.01JPMorgan Chase Commercial MortgageSecurities Corp.,5.42%, 15/01/2049 492,121 491,528 0.06Kubota Credit Owner Trust, 2015-1A,“A2”,0.94%, 15/12/2017 96,390 96,377 0.01
Name of SecurityTransferable Securities and Money MarketInstruments traded on a Regulated Market Shares/Par
MarketValue ($)
NetAssets (%)
Asset-Backed & Securitized, continuedLehman Brothers Commercial ConduitMortgage Trust, FRN,1.477%, 15/10/2035 (i) USD 1,383,005 24,116 0.00Limerock CLO III Ltd, 2014-3A, “A1”, FRN,2.56%, 20/10/2026 1,563,025 1,565,942 0.21Loomis, Sayles & Co., CLO, “A1”, FRN,2.41%, 15/10/2027 2,109,313 2,104,187 0.28Mercedes-Benz Auto Lease Trust, 2015-B,“A2A”,1%, 16/01/2018 1,130,430 1,129,980 0.15Mercedes-Benz Master Owner Trust,2016-AA, “A”, FRN,1.283%, 15/05/2020 3,260,000 3,269,911 0.43Merrill Lynch Mortgage Investors, Inc., FRN,4.524%, 25/02/2037 930,295 173,729 0.02Morgan Stanley Capital I, Inc., FRN,1.531%, 15/03/2031 (i) 152,059 2 0.00Motor PLC, 2015-1A, “A1”, FRN,1.371%, 25/06/2022 1,390,154 1,390,092 0.18Nationstar HECM Loan Trust, 2015-2A,“A”,2.882%, 25/11/2025 349,017 349,156 0.05Nationstar HECM Loan Trust, 2016-2A,“A”,2.239%, 25/06/2026 627,725 631,060 0.08Navient Student Loan Trust, 2016-AA ,“A1”, FRN,1.867%, 15/12/2025 667,767 670,463 0.09Navient Student Loan Trust, 2016-3A,“A1”, FRN,1.356%, 25/06/2065 1,296,022 1,300,141 0.17Nextgear Floorplan Master Owner Trust,2015-1A, “A”,1.8%, 15/07/2019 4,177,000 4,176,909 0.55OneMain Direct Auto Receivables Trust,2016-1A, “A”,2.04%, 15/01/2021 1,004,159 1,006,942 0.13Option One Mortgage Loan Trust, FRN,5.611%, 25/01/2037 295,055 299,648 0.04Oscar U.S. Funding Trust, 2016-2A, “A”,2.31%, 15/11/2019 1,060,000 1,060,251 0.14Santander Drive Auto Receivable Trust,2016-2A, “A2”,1.38%, 15/07/2019 815,708 815,877 0.11Securitized Term Auto Receivables Trust,2016-1A, “A2A”,1.284%, 26/11/2018 1,630,000 1,628,087 0.21Sierra Receivables Funding Co. LLC,2015-1A, “A”,2.4%, 22/03/2032 1,048,117 1,042,690 0.14SPS Servicer Advance Receivables Trust,2016-T1, “AT1”,2.53%, 16/11/2048 4,070,000 4,058,211 0.53Sway Residential Trust, 2014-1, “A”, FRN,2.068%, 17/01/2032 2,020,087 2,020,085 0.27Thornburg Mortgage Securities Trust, FRN,1.436%, 25/04/2043 83,731 82,045 0.01Tricon American Homes 2015-SFR1, Trust“1A”, FRN,2.018%, 17/05/2032 1,635,468 1,633,959 0.21Tricon American Homes 2015-SFR1, Trust“1A”, FRN,2.589%, 17/11/2033 2,230,000 2,173,057 0.29Verizon Owner Trust, 2016-1A, “A”,1.42%, 20/01/2021 4,258,000 4,227,299 0.56
90 MFS Meridian Funds Annual Report 2017

SCHEDULES OF INVESTMENTS 31 January 2017
MFS Meridian Funds – Limited Maturity Fund, continued
Name of SecurityTransferable Securities and Money MarketInstruments traded on a Regulated Market Shares/Par
MarketValue ($)
NetAssets (%)
Asset-Backed & Securitized, continuedVolkswagen Credit Auto Master Trust,2014-1A, “A1”, FRN,0.911%, 22/07/2019 USD 5,070,000 5,066,420 0.67Volvo Financial Equipment LLC, “A2”,1.44%, 15/10/2018 1,721,411 1,722,331 0.23Wheels SPV LLC, 2014-1A, “A2”,0.84%, 20/03/2023 271,945 271,791 0.04Wheels SPV LLC, 2015-1A, “A2”,1.27%, 22/04/2024 2,543,144 2,537,260 0.33
126,386,345 16.61
AutomotiveAmerican Honda Finance Corp.,1.6%, 13/07/2018 USD 1,500,000 1,502,258 0.20American Honda Finance Corp., FRN,1.191%, 19/11/2018 3,190,000 3,194,361 0.42Daimler Finance North America LLC,1.65%, 18/05/2018 1,697,000 1,693,973 0.22Ford Motor Credit Co. LLC,2.021%, 3/05/2019 3,230,000 3,201,014 0.42Ford Motor Credit Co. LLC, FRN,1.47%, 8/09/2017 1,000,000 1,000,319 0.13Ford Motor Credit Co. LLC, FRN,1.949%, 9/01/2018 3,220,000 3,231,602 0.43Hyundai Capital America,2%, 19/03/2018 3,069,000 3,068,662 0.40Hyundai Capital America,2.4%, 30/10/2018 1,980,000 1,988,059 0.26Nissan Motor Acceptance Corp., FRN,1.491%, 3/03/2017 2,140,000 2,141,008 0.28Toyota Motor Credit Corp.,1.7%, 19/02/2019 1,740,000 1,739,309 0.23Volkswagen Group of America FinanceLLC, FRN,1.289%, 23/05/2017 2,200,000 2,199,751 0.29Volkswagen Group of America FinanceLLC, FRN,1.351%, 20/11/2017 1,170,000 1,167,307 0.15
26,127,623 3.43
Banks & Diversified Financials (Covered Bonds)Credit Mutuel-CIC Home Loan,1.5%, 16/11/2017 USD 4,600,000 4,601,707 0.60
BroadcastingSES Global Americas Holdings GP,2.5%, 25/03/2019 USD 1,417,000 1,411,377 0.19
Brokerage & Asset ManagersIntercontinental Exchange, Inc.,2.75%, 1/12/2020 USD 2,672,000 2,718,100 0.36
BuildingStanley Black & Decker, Inc.,1.622%, 17/11/2018 USD 2,290,000 2,281,639 0.30
Business ServicesFidelity National Information Services,Inc.,2.85%, 15/10/2018 USD 855,000 868,420 0.12Fidelity National Information Services,Inc.,2.25%, 15/08/2021 2,360,000 2,309,012 0.30
3,177,432 0.42
ChemicalsCF Industries, Inc.,6.875%, 1/05/2018 USD 2,535,000 2,671,256 0.35Chevron Phillips Chemical Co. LLC,1.7%, 1/05/2018 2,470,000 2,469,760 0.32Dow Chemical Co.,8.55%, 15/05/2019 1,650,000 1,886,260 0.25
Name of SecurityTransferable Securities and Money MarketInstruments traded on a Regulated Market Shares/Par
MarketValue ($)
NetAssets (%)
Chemicals, continuedLyondellBasell Industries N.V.,5%, 15/04/2019 USD 3,370,000 3,563,944 0.47
10,591,220 1.39
Computer SoftwareDiamond 1 Finance Corp./Diamond 2Finance Corp.,3.48%, 1/06/2019 USD 2,060,000 2,102,382 0.28Microsoft Corp.,2%, 3/11/2020 4,688,000 4,682,496 0.61
6,784,878 0.89
Computer Software – SystemsApple, Inc.,1.7%, 22/02/2019 USD 1,065,000 1,067,620 0.14
ConglomeratesABB Finance (USA), Inc.,1.625%, 8/05/2017 USD 1,706,000 1,708,868 0.23Roper Industries, Inc.,1.85%, 15/11/2017 1,376,000 1,379,158 0.18Roper Technologies, Inc.,2.8%, 15/12/2021 989,000 988,329 0.13
4,076,355 0.54
Consumer ProductsMattel, Inc.,1.7%, 15/03/2018 USD 962,000 961,518 0.13Newell Brands, Inc.,2.6%, 29/03/2019 1,325,000 1,341,458 0.17Newell Rubbermaid, Inc.,2.05%, 1/12/2017 1,957,000 1,963,726 0.26Newell Rubbermaid, Inc.,2.875%, 1/12/2019 2,600,000 2,645,591 0.35Reckitt Benckiser PLC,2.125%, 21/09/2018 2,900,000 2,904,292 0.38
9,816,585 1.29
Consumer ServicesExperian Finance PLC,2.375%, 15/06/2017 USD 2,234,000 2,240,434 0.29
Electrical EquipmentAmphenol Corp.,1.55%, 15/09/2017 USD 1,330,000 1,330,746 0.18Arrow Electronics, Inc.,3%, 1/03/2018 1,073,000 1,083,779 0.14Molex Electronic Technologies LLC,2.878%, 15/04/2020 2,687,000 2,700,346 0.35
5,114,871 0.67
ElectronicsBroadcom Corp., “A”,3%, 15/01/2022 USD 3,200,000 3,186,096 0.42Tyco Electronics Group S.A.,2.375%, 17/12/2018 1,163,000 1,172,641 0.16Xilinx, Inc.,2.125%, 15/03/2019 1,690,000 1,694,151 0.22
6,052,888 0.80
Emerging Market Quasi-SovereignCorporacion Financiera de Desarrollo S.A.,3.25%, 15/07/2019 USD 2,161,000 2,207,462 0.29Korea Gas Corp.,2.25%, 25/07/2017 1,850,000 1,855,792 0.24Petroleos Mexicanos,3.125%, 23/01/2019 1,632,000 1,638,528 0.22State Grid Overseas Investment(2013) Ltd.,1.75%, 22/05/2018 2,374,000 2,363,741 0.31
8,065,523 1.06
MFS Meridian Funds Annual Report 2017 91

SCHEDULES OF INVESTMENTS 31 January 2017
MFS Meridian Funds – Limited Maturity Fund, continued
Name of SecurityTransferable Securities and Money MarketInstruments traded on a Regulated Market Shares/Par
MarketValue ($)
NetAssets (%)
Emerging Market SovereignState of Qatar,2.375%, 2/06/2021 USD 2,590,000 2,557,211 0.34
Energy – IntegratedBP Capital Markets PLC,2.521%, 15/01/2020 USD 1,527,000 1,546,156 0.20Chevron Corp.,1.104%, 5/12/2017 2,604,000 2,600,086 0.34Shell International Finance B.V.,1.125%, 21/08/2017 2,350,000 2,349,727 0.31Shell International Finance B.V.,1.375%, 10/05/2019 3,280,000 3,255,928 0.43Total Capital International S.A.,1.5%, 17/02/2017 1,080,000 1,080,279 0.14
10,832,176 1.42
Financial InstitutionsLeasePlan Corp. N.V.,3%, 23/10/2017 USD 2,430,000 2,444,998 0.32LeasePlan Corp. N.V.,2.5%, 16/05/2018 1,286,000 1,287,807 0.17
3,732,805 0.49
Food & BeveragesAnheuser-Busch InBev Finance, Inc.,1.9%, 1/02/2019 USD 2,551,000 2,554,490 0.34Anheuser-Busch InBev Finance, Inc.,2.65%, 1/02/2021 2,682,000 2,697,633 0.35Anheuser-Busch InBev Worldwide, Inc.,FRN,1.575%, 1/08/2018 3,690,000 3,716,000 0.49Diageo Capital PLC,1.5%, 11/05/2017 1,570,000 1,571,865 0.21General Mills, Inc.,1.4%, 20/10/2017 1,300,000 1,301,258 0.17Ingredion, Inc.,1.8%, 25/09/2017 1,385,000 1,387,800 0.18J.M. Smucker Co.,1.75%, 15/03/2018 1,020,000 1,021,787 0.13Kraft Heinz Foods Co.,1.6%, 30/06/2017 2,880,000 2,881,866 0.38Kraft Heinz Foods Co.,6.125%, 23/08/2018 2,050,000 2,182,512 0.29Molson Coors Brewing Co.,2%, 1/05/2017 1,734,000 1,737,660 0.23Mondelez International, Inc., FRN,1.5%, 28/10/2019 4,080,000 4,093,692 0.54Pernod Ricard S.A.,5.75%, 7/04/2021 1,460,000 1,626,539 0.21Want Want China Finance Co.,1.875%, 14/05/2018 2,370,000 2,351,653 0.31Wm. Wrigley Jr. Co.,2.4%, 21/10/2018 408,000 411,820 0.05
29,536,575 3.88
Food & Drug StoresCVS Health Corp.,1.9%, 20/07/2018 USD 2,230,000 2,238,242 0.29CVS Health Corp.,2.8%, 20/07/2020 1,950,000 1,977,550 0.26Walgreens Boots Alliance, Inc.,1.75%, 30/05/2018 2,580,000 2,584,690 0.34
6,800,482 0.89
Gaming & LodgingWyndham Worldwide Corp.,2.95%, 1/03/2017 USD 2,558,000 2,561,602 0.34
Name of SecurityTransferable Securities and Money MarketInstruments traded on a Regulated Market Shares/Par
MarketValue ($)
NetAssets (%)
InsuranceAmerican International Group, Inc.,2.3%, 16/07/2019 USD 213,000 214,376 0.03American International Group, Inc.,3.3%, 1/03/2021 3,776,000 3,871,910 0.51Metropolitan Life Global Funding I,2%, 14/04/2020 2,800,000 2,783,609 0.36Prudential Financial, Inc., FRN,1.685%, 15/08/2018 2,850,000 2,861,277 0.38
9,731,172 1.28
Insurance – HealthAetna, Inc.,1.5%, 15/11/2017 USD 839,000 839,143 0.11Aetna, Inc.,1.9%, 7/06/2019 3,690,000 3,698,074 0.49UnitedHealth Group, Inc.,1.45%, 17/07/2017 2,210,000 2,213,538 0.29
6,750,755 0.89
Insurance – Property & CasualtyMarsh & McLennan Cos., Inc.,2.35%, 10/09/2019 USD 1,880,000 1,891,321 0.25
International Market Quasi-SovereignBank Nederlandse Gemeenten N.V.,1.375%, 19/03/2018 USD 3,308,000 3,308,939 0.44CPPIB Capital, Inc.,1.25%, 20/09/2019 4,250,000 4,195,035 0.55Dexia Credit Local S.A.,1.875%, 15/09/2021 4,300,000 4,147,324 0.55Dexia Credit Local S.A.,2.25%, 30/01/2019 1,360,000 1,366,656 0.18Electricite de France,2.15%, 22/01/2019 2,845,000 2,848,824 0.37KFW Government Development Banks,0.875%, 19/04/2018 1,979,000 1,970,273 0.26KFW Government Development Banks,1.125%, 16/11/2018 1,250,000 1,243,683 0.16Kommunalbanken A.S.,1.375%, 26/10/2020 2,280,000 2,227,701 0.29Kommunalbanken A.S.,1%, 15/03/2018 1,480,000 1,474,894 0.19Nederlandse Waterschapsbank N.V.,1.5%, 16/04/2018 2,960,000 2,964,049 0.39Statoil A.S.A., FRN,1.195%, 15/05/2018 1,855,000 1,858,519 0.24Statoil A.S.A., FRN,1.342%, 8/11/2018 1,650,000 1,659,286 0.22Swedish Export Credit Corp.,1.125%, 28/08/2019 5,840,000 5,748,727 0.76
35,013,910 4.60
International Market SovereignKingdom of Denmark,0.875%, 20/03/2017 USD 480,000 479,992 0.06Kingdom of Sweden,1%, 27/02/2018 3,610,000 3,600,275 0.48Republic of Finland,1%, 23/04/2019 3,000,000 2,962,959 0.39
7,043,226 0.93
InternetBaidu, Inc.,3.25%, 6/08/2018 USD 634,000 644,620 0.09Baidu, Inc.,2.75%, 9/06/2019 1,584,000 1,602,194 0.21
2,246,814 0.30
92 MFS Meridian Funds Annual Report 2017

SCHEDULES OF INVESTMENTS 31 January 2017
MFS Meridian Funds – Limited Maturity Fund, continued
Name of SecurityTransferable Securities and Money MarketInstruments traded on a Regulated Market Shares/Par
MarketValue ($)
NetAssets (%)
Local AuthoritiesKommuninvest i Sverige AB,1.125%, 17/09/2019 USD 5,118,000 5,033,192 0.66
Major BanksABN AMRO Bank N.V.,2.1%, 18/01/2019 USD 4,000,000 4,005,420 0.53ABN AMRO Bank N.V.,4.25%, 2/02/2017 5,280,000 5,280,000 0.69Bank of America Corp.,6%, 1/09/2017 2,000,000 2,050,560 0.27Bank of America Corp.,6.875%, 25/04/2018 2,416,000 2,559,631 0.34Bank of America Corp.,1.75%, 5/06/2018 3,930,000 3,932,299 0.52Bank of America Corp.,2.151%, 9/11/2020 750,000 737,572 0.10Bank of Montreal, FRN,1.609%, 9/04/2018 1,630,000 1,635,871 0.21Bank of Montreal, FRN,1.673%, 18/07/2019 4,750,000 4,766,901 0.63Barclays PLC,3.25%, 12/01/2021 5,565,000 5,569,803 0.73BNP Paribas, FRN,1.473%, 17/03/2017 1,750,000 1,750,912 0.23Commonwealth Bank of Australia,1.75%, 2/11/2018 4,000,000 4,002,160 0.52Commonwealth Bank of Australia, FRN,1.52%, 7/11/2019 1,500,000 1,501,287 0.20Commonwealth Bank of Australia, FRN,1.316%, 13/03/2017 660,000 660,322 0.09Credit Agricole, “A”, FRN,2.44%, 10/01/2022 1,540,000 1,548,373 0.20Credit Suisse Group AG, “A”,3.574%, 9/01/2023 2,460,000 2,448,662 0.32Credit Suisse New York,1.75%, 29/01/2018 2,440,000 2,443,174 0.32DBS Bank Ltd.,2.35%, 28/02/2017 2,590,000 2,588,179 0.34DNB Bank A.S.A.,3.2%, 3/04/2017 3,395,000 3,406,316 0.45Goldman Sachs Group, Inc.,2%, 25/04/2019 530,000 528,475 0.07Goldman Sachs Group, Inc.,3%, 26/04/2022 2,400,000 2,384,006 0.31Goldman Sachs Group, Inc., FRN,1.586%, 22/05/2017 940,000 941,401 0.12Goldman Sachs Group, Inc., FRN,2.087%, 30/04/2018 1,870,000 1,886,811 0.25Goldman Sachs Group, Inc., FRN,2.005%, 15/11/2018 5,190,000 5,241,589 0.69Goldman Sachs Group, Inc., FRN,2.061%, 23/10/2019 2,140,000 2,154,167 0.28HSBC Bank PLC, FRN,1.545%, 15/05/2018 3,157,000 3,165,252 0.42Huntington National Bank, FRN,1.468%, 24/04/2017 3,810,000 3,811,269 0.50ING Bank N.V.,1.8%, 16/03/2018 1,510,000 1,511,551 0.20ING Bank N.V.,3.75%, 7/03/2017 1,700,000 1,704,063 0.22ING Bank N.V.,2%, 26/11/2018 2,030,000 2,027,229 0.27ING Bank N.V.,2.3%, 22/03/2019 2,500,000 2,510,453 0.33JPMorgan Chase & Co.,2%, 15/08/2017 1,360,000 1,364,813 0.18
Name of SecurityTransferable Securities and Money MarketInstruments traded on a Regulated Market Shares/Par
MarketValue ($)
NetAssets (%)
Major Banks, continuedJPMorgan Chase & Co.,2.2%, 22/10/2019 USD 3,170,000 3,176,460 0.42Mitsubishi UFJ Financial Group, Inc.,2.95%, 1/03/2021 1,550,000 1,557,617 0.20Mizuho Bank Ltd., FRN,1.447%, 25/09/2017 1,040,000 1,040,593 0.14Mizuho Bank Ltd., FRN,2.22%, 20/10/2018 2,520,000 2,532,212 0.33Morgan Stanley,4.75%, 22/03/2017 2,000,000 2,009,940 0.26Morgan Stanley,2.65%, 27/01/2020 3,920,000 3,946,433 0.52Morgan Stanley, FRN,2.26%, 1/02/2019 2,450,000 2,492,880 0.33Morgan Stanley, FRN,1.781%, 23/07/2019 1,090,000 1,095,221 0.14Nordea Bank AB, FRN,1.357%, 4/04/2017 1,740,000 1,740,981 0.23PNC Bank N.A.,2.25%, 2/07/2019 2,600,000 2,620,296 0.34Royal Bank of Canada, FRN,1.653%, 10/12/2018 4,390,000 4,411,471 0.58Skandinaviska Enskilda,1.75%, 19/03/2018 2,028,000 2,026,009 0.27Sumitomo Mitsui Banking Corp., FRN,1.694%, 19/10/2018 3,530,000 3,531,398 0.46Sumitomo Mitsui Banking Corp., FRN,1.334%, 11/07/2017 2,650,000 2,649,801 0.35Svenska Handelsbanken AB,2.875%, 4/04/2017 2,284,000 2,291,492 0.30Svenska Handelsbanken AB, FRN,1.436%, 6/09/2019 3,420,000 3,422,360 0.45Swedbank AB,2.125%, 29/09/2017 5,518,000 5,543,570 0.73Toronto-Dominion Bank,1.75%, 23/07/2018 1,600,000 1,601,776 0.21Toronto-Dominion Bank,1.45%, 6/09/2018 2,420,000 2,410,644 0.32Toronto-Dominion Bank,1.552%, 13/08/2019 4,060,000 4,078,838 0.54Westpac Banking Corp.,2%, 14/08/2017 2,330,000 2,338,889 0.31Westpac Banking Corp., FRN,1.241%, 19/05/2017 2,680,000 2,682,500 0.35
139,319,902 18.31
Medical & Health Technology & ServicesBecton, Dickinson and Co.,1.8%, 15/12/2017 USD 1,500,000 1,503,845 0.20Catholic Health Initiatives,1.6%, 1/11/2017 1,820,000 1,820,744 0.24Covidien International Finance S.A.,6%, 15/10/2017 1,777,000 1,837,452 0.24Laboratory Corp. of America Holdings,2.625%, 1/02/2020 2,890,000 2,902,080 0.38
8,064,121 1.06
Medical EquipmentAbbott Laboratories,2.35%, 22/11/2019 USD 3,460,000 3,469,176 0.46Abbott Laboratories,2.9%, 30/11/2021 2,290,000 2,279,942 0.30Zimmer Holdings, Inc.,2%, 1/04/2018 2,428,000 2,434,998 0.32
8,184,116 1.08
MFS Meridian Funds Annual Report 2017 93

SCHEDULES OF INVESTMENTS 31 January 2017
MFS Meridian Funds – Limited Maturity Fund, continued
Name of SecurityTransferable Securities and Money MarketInstruments traded on a Regulated Market Shares/Par
MarketValue ($)
NetAssets (%)
Metals & MiningFreeport-McMoRan, Inc.,2.15%, 1/03/2017 USD 2,990,000 2,990,000 0.39Freeport-McMoRan, Inc.,2.375%, 15/03/2018 2,000,000 1,994,000 0.26Glencore Funding LLC,2.125%, 16/04/2018 1,740,000 1,738,295 0.23
6,722,295 0.88
MidstreamEnergy Transfer Partners LP,2.5%, 15/06/2018 USD 1,110,000 1,117,713 0.15EnLink Midstream Partners LP,2.7%, 1/04/2019 1,645,000 1,651,930 0.22Enterprise Products Operating LP,6.5%, 31/01/2019 1,350,000 1,469,316 0.19Kinder Morgan (Delaware), Inc.,2%, 1/12/2017 1,580,000 1,583,661 0.21ONEOK Partners LP,3.2%, 15/09/2018 2,360,000 2,408,998 0.31TransCanada PipeLines Ltd.,1.875%, 12/01/2018 1,141,000 1,143,865 0.15
9,375,483 1.23
Mortgage-BackedFannie Mae,1.114%, 25/02/2017 USD 404,042 403,727 0.05Fannie Mae,5.5%, 1/11/2017 19,455 19,655 0.00Fannie Mae,6%, 1/12/2017 9,383 9,453 0.00Fannie Mae,5%, 1/02/2018 – 1/07/2023 174,647 184,114 0.03Fannie Mae,4.5%, 1/10/2018 –1/06/2024 747,686 785,455 0.11Fannie Mae,3%, 1/05/2030 – 1/12/2031 4,983,105 5,124,690 0.68Fannie Mae,2.5%, 1/11/2031 8,217,242 8,223,209 1.08Fannie Mae, FRN,1.121%, 25/05/2018 1,676,437 1,676,557 0.22Freddie Mac,6%, 1/08/2017 – 1/05/2021 147,188 154,525 0.02Freddie Mac,1.426%, 25/08/2017 250,957 251,043 0.03Freddie Mac,5.5%, 1/09/2017 – 1/06/2025 124,696 136,747 0.02Freddie Mac,5%, 1/05/2018 – 1/08/2020 124,952 130,358 0.01
17,099,533 2.25
Network & TelecomAT&T, Inc.,2.4%, 15/03/2017 USD 970,000 971,732 0.13AT&T, Inc.,2.3%, 11/03/2019 2,310,000 2,317,635 0.30AT&T, Inc.,2.45%, 30/06/2020 1,600,000 1,587,614 0.21AT&T, Inc.,3.2%, 1/03/2022 2,711,000 2,708,940 0.36AT&T, Inc., FRN,1.847%, 27/11/2018 1,820,000 1,831,450 0.24British Telecommunications PLC,2.35%, 14/02/2019 2,170,000 2,181,972 0.29Verizon Communications, Inc.,6.1%, 15/04/2018 2,023,000 2,133,241 0.28Verizon Communications, Inc., FRN,1.763%, 17/06/2019 3,650,000 3,682,631 0.48
17,415,215 2.29
Name of SecurityTransferable Securities and Money MarketInstruments traded on a Regulated Market Shares/Par
MarketValue ($)
NetAssets (%)
Oil ServicesSchlumberger Holdings Corp.,1.9%, 21/12/2017 USD 1,600,000 1,606,517 0.21
OilsMarathon Petroleum Corp.,2.7%, 14/12/2018 USD 3,085,000 3,127,558 0.41
Other Banks & Diversified FinancialsBanco Santander Chile,1.914%, 11/04/2017 USD 2,240,000 2,237,312 0.29Banque Federative du Credit Mutuel,2%, 12/04/2019 3,560,000 3,547,337 0.47BNZ International Funding Ltd. London,1.9%, 26/02/2018 2,700,000 2,706,423 0.36BPCE S.A.,1.625%, 26/01/2018 2,660,000 2,654,861 0.35BPCE S.A.,2.5%, 15/07/2019 2,914,000 2,929,182 0.39Branch Banking & Trust Co.,1.45%, 10/05/2019 4,000,000 3,958,368 0.52Capital One Bank (USA) N.A., FRN,1.56%, 5/02/2018 2,580,000 2,588,591 0.34Citigroup, Inc., FRN,1.779%, 8/04/2019 2,820,000 2,829,503 0.37Citigroup, Inc., FRN,2.074%, 2/08/2021 3,120,000 3,150,461 0.41Citizens Bank N.A.,2.3%, 3/12/2018 1,470,000 1,478,248 0.19Citizens Bank N.A.,2.5%, 14/03/2019 1,800,000 1,813,291 0.24Citizens Bank N.A.,2.55%, 13/05/2021 479,000 476,890 0.06Discover Bank,3.1%, 4/06/2020 1,826,000 1,850,779 0.24Fifth Third Bancorp,2.3%, 1/03/2019 1,419,000 1,427,074 0.19Fifth Third Bancorp,2.3%, 15/03/2019 1,380,000 1,391,864 0.18First Republic Bank,2.375%, 17/06/2019 971,000 969,748 0.13Groupe BPCE S.A.,2.5%, 10/12/2018 1,580,000 1,593,272 0.21Lloyds Bank PLC,1.75%, 14/05/2018 610,000 609,296 0.08Lloyds Bank PLC,2.3%, 27/11/2018 1,690,000 1,701,103 0.22Lloyds Bank PLC,2.041%, 22/01/2019 3,050,000 3,079,222 0.41Macquarie Bank Ltd., FRN,1.515%, 27/10/2017 1,750,000 1,752,853 0.23Mizuho Corp. Bank Ltd.,2.55%, 17/03/2017 950,000 951,728 0.13National Australia Bank Ltd.,1.375%, 12/07/2019 4,250,000 4,177,066 0.55National Bank of Canada, FRN,1.798%, 14/12/2018 2,680,000 2,691,446 0.35Santander UK Group Holdings PLC,2.875%, 5/08/2021 2,200,000 2,172,410 0.29Santander UK PLC,3.05%, 23/08/2018 1,862,000 1,894,566 0.25SunTrust Banks, Inc.,2.7%, 27/01/2022 2,775,000 2,763,997 0.36UBS AG, FRN,1.282%, 14/08/2017 2,230,000 2,230,772 0.29UBS Group Funding (Jersey) Ltd.,3%, 15/04/2021 3,434,000 3,427,190 0.45
94 MFS Meridian Funds Annual Report 2017

SCHEDULES OF INVESTMENTS 31 January 2017
MFS Meridian Funds – Limited Maturity Fund, continued
Name of SecurityTransferable Securities and Money MarketInstruments traded on a Regulated Market Shares/Par
MarketValue ($)
NetAssets (%)
Other Banks & Diversified Financials, continuedUBS Group Funding (Jersey) Ltd., FRN,2.437%, 24/09/2020 USD 2,260,000 2,291,003 0.30
67,345,856 8.85
Personal Computers & PeripheralsEquifax, Inc.,2.3%, 1/06/2021 USD 847,000 833,907 0.11
PharmaceuticalsAbbVie, Inc.,1.8%, 14/05/2018 USD 3,260,000 3,264,805 0.43Actavis Funding SCS,2.35%, 12/03/2018 4,121,000 4,146,802 0.54Actavis Funding SCS,3%, 12/03/2020 338,000 343,273 0.04Actavis, Inc.,1.875%, 1/10/2017 2,130,000 2,134,079 0.28Bayer U.S. Finance LLC,1.5%, 6/10/2017 1,690,000 1,688,832 0.22Biogen, Inc.,2.9%, 15/09/2020 1,920,000 1,951,254 0.26Celgene Corp.,2.125%, 15/08/2018 2,760,000 2,772,481 0.36EMD Finance LLC,1.7%, 19/03/2018 2,970,000 2,961,004 0.39Gilead Sciences, Inc.,1.85%, 4/09/2018 2,680,000 2,692,240 0.35Mylan N.V.,2.5%, 7/06/2019 1,350,000 1,343,687 0.18Shire Acquisitions Investments IrelandDesignated Activity Co.,1.9%, 23/09/2019 5,820,000 5,750,946 0.76Teva Pharmaceutical Industries Ltd.,1.7%, 19/07/2019 2,840,000 2,789,067 0.37
31,838,470 4.18
Real Estate – ApartmentERP Operating LP,4.75%, 15/07/2020 USD 700,000 751,370 0.10
Real Estate – HealthcareWelltower, Inc., REIT,2.25%, 15/03/2018 USD 1,211,000 1,218,058 0.16
Real Estate – OfficeMack-Cali Realty LP,2.5%, 15/12/2017 USD 1,470,000 1,474,110 0.20Vornado Realty LP, REIT,2.5%, 30/06/2019 2,071,000 2,079,951 0.27
3,554,061 0.47
Real Estate – RetailSimon Property Group, Inc., REIT,1.5%, 1/02/2018 USD 1,385,000 1,385,303 0.18WEA Finance LLC/Westfield Co., REIT,1.75%, 15/09/2017 1,290,000 1,291,228 0.17
2,676,531 0.35
RestaurantsMcDonald’s Corp.,2.1%, 7/12/2018 USD 1,520,000 1,530,695 0.20
RetailersDollar General Corp.,4.125%, 15/07/2017 USD 2,640,000 2,672,388 0.35Dollar General Corp.,1.875%, 15/04/2018 405,000 405,618 0.05Wesfarmers Ltd.,1.874%, 20/03/2018 1,940,000 1,942,192 0.26
5,020,198 0.66
Name of SecurityTransferable Securities and Money MarketInstruments traded on a Regulated Market Shares/Par
MarketValue ($)
NetAssets (%)
Specialty ChemicalsAirgas, Inc.,3.05%, 1/08/2020 USD 1,370,000 1,403,820 0.18
SupranationalBanco Latinoamericano de ComercioExterior S.A.,3.25%, 7/05/2020 USD 2,580,000 2,595,480 0.34Corporacion Andina de Fomento,1.5%, 8/08/2017 1,790,000 1,791,020 0.24Corporacion Andina de Fomento, FRN,1.437%, 29/01/2018 1,710,000 1,713,846 0.22Corporacion Andina de Fomento, FRN,2%, 10/05/2019 1,800,000 1,795,286 0.24West African Development Bank,5.5%, 6/05/2021 549,000 568,654 0.07
8,464,286 1.11
Telecommunications – WirelessAmerican Tower Trust I, REIT,1.551%, 15/03/2018 USD 2,270,000 2,266,368 0.30Crown Castle International Corp.,3.4%, 15/02/2021 1,250,000 1,267,738 0.17SBA Tower Trust,2.877%, 15/07/2021 952,000 942,442 0.12SBA Tower Trust,2.898%, 15/10/2044 2,585,000 2,602,904 0.34
7,079,452 0.93
Telephone ServicesQwest Corp.,6.5%, 1/06/2017 USD 1,800,000 1,824,750 0.24
TobaccoImperial Tobacco Finance PLC,2.05%, 20/07/2018 USD 2,674,000 2,674,554 0.35Reynolds American, Inc.,2.3%, 12/06/2018 2,080,000 2,092,563 0.28
4,767,117 0.63
Transportation – ServicesERAC USA Finance Co.,2.75%, 15/03/2017 USD 539,000 540,026 0.07TTX Co.,2.6%, 15/06/2020 3,350,000 3,342,653 0.44
3,882,679 0.51
U.S. Government Agencies and EquivalentsAID-Ukraine,1.844%, 16/05/2019 USD 437,000 436,402 0.06Hashemite Kingdom of Jordan,1.945%, 23/06/2019 2,280,000 2,303,388 0.30Private Export Funding Corp.,1.875%, 15/07/2018 4,490,000 4,522,732 0.59
7,262,522 0.95
Utilities – Electric PowerAmerican Electric Power Co., Inc.,1.65%, 15/12/2017 USD 1,829,000 1,828,682 0.24Dominion Resources, Inc.,1.6%, 15/08/2019 2,290,000 2,262,041 0.30Dominion Resources, Inc.,2.962%, 1/07/2019 1,630,000 1,651,777 0.22Dominion Resources, Inc.,2.5%, 1/12/2019 2,750,000 2,784,232 0.36Duke Energy Corp.,1.625%, 15/08/2017 918,000 918,798 0.12Duke Energy Corp., FRN,1.377%, 3/04/2017 780,000 780,606 0.10Emera U.S. Finance LP,2.15%, 15/06/2019 4,401,000 4,397,321 0.58
MFS Meridian Funds Annual Report 2017 95

SCHEDULES OF INVESTMENTS 31 January 2017
MFS Meridian Funds – Limited Maturity Fund, continued
Name of SecurityTransferable Securities and Money MarketInstruments traded on a Regulated Market Shares/Par
MarketValue ($)
NetAssets (%)
Utilities – Electric Power, continuedEnel Finance International S.A.,6.25%, 15/09/2017 USD 1,430,000 1,469,086 0.19Eversource Energy,2.5%, 15/03/2021 1,450,000 1,440,276 0.19NextEra Energy Capital Holdings, Inc.,2.056%, 1/09/2017 5,835,000 5,856,881 0.77NextEra Energy Capital Holdings, Inc.,2.3%, 1/04/2019 1,907,000 1,925,143 0.25PG&E Corp.,2.4%, 1/03/2019 2,577,000 2,594,526 0.34PSEG Power LLC,3%, 15/06/2021 3,547,000 3,568,552 0.47Southern Co.,2.45%, 1/09/2018 1,340,000 1,351,830 0.18Southern Co.,1.85%, 1/07/2019 4,000,000 3,986,916 0.52Southern Power Co.,1.85%, 1/12/2017 2,330,000 2,336,622 0.31Xcel Energy, Inc.,2.4%, 15/03/2021 2,290,000 2,276,129 0.30
41,429,418 5.44
Total Bonds(Identified Cost, $750,697,968) 746,043,768 98.04
Name of SecurityTransferable Securities and Money MarketInstruments traded on a Regulated Market Shares/Par
MarketValue ($)
NetAssets (%)
SHORT-TERM OBLIGATIONS (y)Bank of Nova Scotia,1.44%, 1/09/2017 USD 10,410,000 10,419,431 1.37Credit Agricole,1.43%, 31/08/2017 4,720,000 4,723,274 0.62
Total Short-Term Obligations, atAmortized Cost and Value 15,142,705 1.99
Total Transferable Securities andMoney Market Instruments Tradedon a Regulated Market(Identified Cost, $765,829,112) 761,186,473 100.03
OTHER ASSETS, LESS LIABILITIES (193,529) (0.03)
NET ASSETS 760,992,944 100.00
See Schedules of Investments Footnotes and Notes to Financial Statements
MFS Meridian Funds – Managed Wealth Fund(Expressed in U.S. Dollars)
Name of SecurityTransferable Securities and Money MarketInstruments traded on a Regulated Market Shares/Par
MarketValue ($)
NetAssets (%)
COMMON STOCKSAerospaceLeidos Holdings, Inc. 5,386 260,247 0.48Northrop Grumman Corp. 3,018 691,363 1.27Spirit AeroSystems Holdings, Inc., “A” 2,346 140,877 0.26
1,092,487 2.01
AirlinesAena S.A. 3,038 440,604 0.81Air Canada 39,338 404,188 0.74
844,792 1.55
Apparel ManufacturersPVH Corp. 5,517 517,550 0.95
AutomotiveGeneral Motors Co. 7,404 271,060 0.50Hyundai Motor Co. Ltd. 2,446 293,621 0.54Kia Motors Corp. 13,373 418,877 0.77Magna International, Inc. 9,330 403,802 0.74
1,387,360 2.55
BiotechnologyCelgene Corp. 5,874 682,265 1.25Gilead Sciences, Inc. 4,516 327,184 0.60
1,009,449 1.85
Brokerage & Asset ManagersApollo Global Management LLC, “A” 16,741 355,579 0.65
Business ServicesAccenture PLC, “A” 2,466 280,803 0.51Ashtead Group PLC 9,107 183,993 0.34Global Payments, Inc. 5,404 417,621 0.77
882,417 1.62
Name of SecurityTransferable Securities and Money MarketInstruments traded on a Regulated Market Shares/Par
MarketValue ($)
NetAssets (%)
Cable TVCharter Communications, Inc., “A” 2,700 874,665 1.61Comcast Corp., “A” 8,811 664,526 1.22
1,539,191 2.83
ChemicalsLyondellBasell Industries N.V., “A” 3,123 291,282 0.53Mitsubishi Chemical Holdings Corp. 15,500 108,408 0.20
399,690 0.73
Computer SoftwareAdobe Systems, Inc. 3,762 426,536 0.78Check Point Software Technologies Ltd. 2,559 252,752 0.46Intuit, Inc. 4,810 570,370 1.05VMware, Inc., “A” 6,075 531,806 0.98
1,781,464 3.27
Computer Software – SystemsApple, Inc. 1,784 216,488 0.40Hitachi Ltd. 46,000 263,835 0.48Hon Hai Precision Industry Co. Ltd., GDR 49,354 259,602 0.48NICE Systems Ltd., ADR 2,247 157,694 0.29
897,619 1.65
ConstructionOwens Corning 12,138 670,625 1.23
Consumer ProductsProcter & Gamble Co. 2,878 252,113 0.46Svenska Cellulosa Aktiebolaget 20,698 622,329 1.15
874,442 1.61
ContainersBrambles Ltd. 23,289 183,865 0.34
96 MFS Meridian Funds Annual Report 2017

SCHEDULES OF INVESTMENTS 31 January 2017
MFS Meridian Funds – Managed Wealth Fund, continued
Name of SecurityTransferable Securities and Money MarketInstruments traded on a Regulated Market Shares/Par
MarketValue ($)
NetAssets (%)
Electrical EquipmentMitsubishi Electric Corp. 11,000 167,713 0.31Schneider Electric S.A. 4,912 351,132 0.64Siemens AG 4,881 612,526 1.13
1,131,371 2.08
ElectronicsSamsung Electronics Co. Ltd. 586 994,904 1.83Taiwan Semiconductor Manufacturing Co.Ltd., ADR 29,681 917,440 1.68
1,912,344 3.51
Energy – IndependentEOG Resources, Inc. 3,076 312,460 0.58Galp Energia SGPS S.A., “B” 26,051 383,022 0.70Occidental Petroleum Corp. 3,803 257,729 0.47Rice Energy, Inc. 22,548 447,127 0.82Valero Energy Corp. 4,313 283,623 0.52
1,683,961 3.09
Energy – IntegratedBP PLC 78,718 468,250 0.86LUKOIL PJSC, ADR 5,664 317,807 0.59Royal Dutch Shell PLC, “B” 13,615 383,060 0.70
1,169,117 2.15
Food & BeveragesArcher Daniels Midland Co. 9,810 434,191 0.80Bakkafrost P/f 8,393 322,367 0.59J.M. Smucker Co. 1,314 178,507 0.33Marine Harvest 27,861 492,496 0.90Tyson Foods, Inc., “A” 2,621 164,573 0.30
1,592,134 2.92
Food & Drug StoresWesfarmers Ltd. 15,857 484,165 0.89
Gaming & LodgingCarnival Corp. 1,887 104,502 0.19
Health Maintenance OrganizationsAnthem, Inc. 2,559 394,444 0.73WellCare Health Plans, Inc. 2,558 372,291 0.68
766,735 1.41
InsuranceMetLife, Inc. 13,510 735,079 1.35Prudential Financial, Inc. 6,313 663,559 1.22Tokio Marine Holding, Inc. 7,500 314,255 0.58Zurich Insurance Group AG 2,345 671,828 1.23
2,384,721 4.38
InternetAlphabet, Inc., “A” 1,149 942,398 1.73Alphabet, Inc., “C” 333 265,331 0.49Facebook, Inc., “A” 5,183 675,449 1.24
1,883,178 3.46
Machinery & ToolsDaikin Industries Ltd. 2,100 208,772 0.39Glory Ltd. 13,800 431,441 0.79
640,213 1.18
Major BanksBank of China Ltd. 577,000 261,818 0.48BNP Paribas 12,167 777,286 1.43China Construction Bank 351,000 260,931 0.48JPMorgan Chase & Co. 9,017 763,109 1.40
Name of SecurityTransferable Securities and Money MarketInstruments traded on a Regulated Market Shares/Par
MarketValue ($)
NetAssets (%)
Major Banks, continuedRoyal Bank of Canada 3,134 225,335 0.41Sumitomo Mitsui Financial Group, Inc. 20,100 792,358 1.46Toronto-Dominion Bank 9,734 504,260 0.93
3,585,097 6.59
Medical & Health Technology & ServicesHCA Holdings, Inc. 8,099 650,188 1.19
Medical EquipmentNihon Kohden Corp. 9,600 219,446 0.40
Metals & MiningPOSCO 854 199,152 0.36Rio Tinto Ltd. 18,553 814,788 1.50
1,013,940 1.86
Natural Gas – DistributionEngie 17,599 210,214 0.39
Natural Gas – PipelineWilliams Partners LP 9,060 371,822 0.68
Network & TelecomCisco Systems, Inc. 22,131 679,864 1.25
Oil ServicesTechnipFMC PLC 8,008 262,451 0.48
Other Banks & Diversified FinancialsBanco Bradesco S.A., ADR 45,853 473,661 0.87Credicorp Ltd. 1,643 268,926 0.49DBS Group Holdings Ltd. 42,400 570,708 1.05Discover Financial Services 8,774 607,863 1.12UBS AG 39,157 631,941 1.16
2,553,099 4.69
PharmaceuticalsBayer AG 4,117 454,652 0.83Bristol-Myers Squibb Co. 8,706 427,987 0.79Eli Lilly & Co. 10,194 785,244 1.44Merck & Co., Inc. 13,146 814,921 1.50Shionogi & Co. Ltd. 10,200 490,081 0.90
2,972,885 5.46
Printing & PublishingTranscontinental, Inc., “A” 20,207 336,512 0.62
Railroad & ShippingCanadian National Railway Co. 6,213 431,928 0.79
Real EstateMedical Properties Trust, Inc., REIT 22,234 283,484 0.52Mid-America Apartment Communities,Inc., REIT 1,447 137,393 0.25Store Capital Corp., REIT 14,416 341,083 0.63Washington Prime Group, Inc., REIT 35,247 340,134 0.62
1,102,094 2.02
RestaurantsBrinker International, Inc. 8,260 367,570 0.68Greggs PLC 23,812 291,167 0.53
658,737 1.21
Specialty ChemicalsAkzo Nobel N.V. 7,133 483,488 0.89LG Chem Ltd. 1,492 336,377 0.62
819,865 1.51
Specialty StoresAmazon.com, Inc. 927 763,366 1.40AutoZone, Inc. 271 196,470 0.36
MFS Meridian Funds Annual Report 2017 97

SCHEDULES OF INVESTMENTS 31 January 2017
MFS Meridian Funds – Managed Wealth Fund, continued
Name of SecurityTransferable Securities and Money MarketInstruments traded on a Regulated Market Shares/Par
MarketValue ($)
NetAssets (%)
Specialty Stores, continuedBest Buy Co., Inc. 11,511 512,470 0.94Ross Stores, Inc. 4,370 288,901 0.53Urban Outfitters, Inc. 13,716 364,023 0.67
2,125,230 3.90
Telecommunications – WirelessKDDI Corp. 11,900 319,343 0.59SoftBank Corp. 8,600 662,728 1.22Vodafone Group PLC 70,398 172,118 0.31
1,154,189 2.12
Telephone ServicesChina Unicom (Hong Kong) Ltd. 144,000 170,178 0.31Nippon Television Holdings, Inc. 8,600 379,235 0.70
549,413 1.01
TobaccoAltria Group, Inc. 11,536 821,132 1.51Japan Tobacco, Inc. 14,300 461,004 0.84Philip Morris International, Inc. 2,651 254,841 0.47
1,536,977 2.82
Utilities – Electric PowerCLP Holdings Ltd. 16,000 156,710 0.29Energias de Portugal S.A. 55,084 159,837 0.29Exelon Corp. 18,120 650,146 1.20SSE PLC 10,752 201,402 0.37
1,168,095 2.15
Total Common Stocks(Identified Cost, $44,411,093) 48,591,017 89.24
PREFERRED STOCKS
Other Banks & Diversified FinancialsItau Unibanco Holding S.A. 50,617 598,197 1.10
Name of SecurityTransferable Securities and Money MarketInstruments traded on a Regulated Market Shares/Par
MarketValue ($)
NetAssets (%)
Telephone ServicesTelecom Italia S.p.A. 328,880 234,850 0.43
Total Preferred Stocks(Identified Cost, $634,740) 833,047 1.53
SHORT-TERM OBLIGATIONS (y)General Electric Co.,0.58%, 1/02/2017, at AmortizedCost and Value USD 738,000 738,000 1.36
Total Transferable Securities andMoney Market Instruments Tradedon a Regulated Market(Identified Cost, $45,783,833) 50,162,064 92.13
Issuer/Expiration Month/Strike PriceNumber
of ContractsMarket
Value ($)Net
Assets (%)
PUT OPTIONS PURCHASEDRussell 2000 Index –June 2017 @ $1,180 20 34,000 0.06Russell 2000 Index –March 2017 @ $1,280 12 12,768 0.02S&P 500 Index –June 2017 @ $1,900 12 13,920 0.03S&P 500 Index –March 2017 @ $2,150 8 6,880 0.01S&P 500 Index –September 2017 @ $2,000 8 31,600 0.06
Total Put Options Purchased(Premiums Paid, $138,660) 99,168 0.18
Total Investments(Identified Cost, $45,922,493) (k) 50,261,232 92.31
OTHER ASSETS, LESS LIABILITIES 4,186,494 7.69
NET ASSETS 54,447,726 100.00
See Schedules of Investments Footnotes and Notes to Financial Statements
MFS Meridian Funds – Prudent Capital Fund(Expressed in U.S. Dollars)
Name of SecurityTransferable Securities and Money MarketInstruments traded on a Regulated Market Shares/Par
MarketValue ($)
NetAssets (%)
COMMON STOCKS
Business ServicesAccenture PLC, “A” 2,154 245,278 1.83Amadeus IT Holding S.A. 3,151 145,397 1.08Compass Group PLC 9,174 162,957 1.22
553,632 4.13
Computer SoftwareCadence Design Systems, Inc. 9,945 258,868 1.93Check Point Software Technologies Ltd. 3,012 297,495 2.22
556,363 4.15
Computer Software – SystemsConstellation Software, Inc. 690 311,649 2.33
Consumer ProductsColgate-Palmolive Co. 5,762 372,110 2.78Henkel AG & Co. KGaA 2,800 294,522 2.20Kao Corp. 7,900 390,627 2.91Procter & Gamble Co. 4,172 365,467 2.73
1,422,726 10.62
Name of SecurityTransferable Securities and Money MarketInstruments traded on a Regulated Market Shares/Par
MarketValue ($)
NetAssets (%)
ElectronicsKyocera Corp. 2,800 153,160 1.14Texas Instruments, Inc. 3,603 272,171 2.03
425,331 3.17
Food & BeveragesDanone S.A. 4,045 253,218 1.89Nestle S.A. 5,119 374,012 2.79
627,230 4.68
General MerchandiseCostco Wholesale Corp. 3,413 559,561 4.18
Network & TelecomLM Ericsson Telephone Co., “B” 46,929 277,107 2.07
Printing & PublishingRELX N.V. 16,646 280,771 2.10
Real EstateDeutsche Wohnen AG 10,711 348,494 2.60LEG Immobilien AG 7,048 552,820 4.13
901,314 6.73
98 MFS Meridian Funds Annual Report 2017

SCHEDULES OF INVESTMENTS 31 January 2017
MFS Meridian Funds – Prudent Capital Fund, continued
Name of SecurityTransferable Securities and Money MarketInstruments traded on a Regulated Market Shares/Par
MarketValue ($)
NetAssets (%)
Telecommunications – WirelessKDDI Corp. 9,000 241,520 1.80
TruckingYamato Holdings Co. Ltd. 10,900 220,056 1.64
Total Common Stocks(Identified Cost, $6,318,538) 6,377,260 47.60
BONDS
AerospaceTransDigm, Inc.,6.5%, 15/07/2024 USD 100,000 100,125 0.75
BuildingBeacon Roofing Supply, Inc.,6.375%, 1/10/2023 USD 100,000 107,250 0.80Summit Materials LLC/Summit MaterialsFinance Co.,6.125%, 15/07/2023 120,000 123,900 0.92
231,150 1.72
ChemicalsAxalta Coating Systems Co.,3.75%, 15/01/2025 EUR 100,000 110,649 0.83
ConglomeratesAmsted Industries Co.,5%, 15/03/2022 USD 100,000 100,250 0.75
Consumer ServicesGarda World Security Corp.,7.25%, 15/11/2021 USD 150,000 143,625 1.07
ContainersBerry Plastics Corp.,5.125%, 15/07/2023 USD 100,000 102,320 0.76Multi-Color Corp.,6.125%, 1/12/2022 100,000 105,750 0.79
208,070 1.55
Financial InstitutionsNationstar Mortgage LLC/Capital Corp.,7.875%, 1/10/2020 USD 100,000 104,000 0.78
MidstreamSabine Pass Liquefaction LLC,5.625%, 15/04/2023 USD 100,000 108,500 0.81
Real Estate – HealthcareMPT Operating Partnership LP, REIT,6.375%, 15/02/2022 USD 110,000 113,850 0.85
U.S. Treasury ObligationsU.S. Treasury Notes,0.625%, 31/05/2017 USD 499,000 499,039 3.73U.S. Treasury Notes,0.625%, 30/06/2017 499,000 499,000 3.72U.S. Treasury Notes,0.625%, 31/07/2017 499,000 498,922 3.72U.S. Treasury Notes,0.625%, 31/08/2017 500,000 499,844 3.73
1,996,805 14.90
Utilities – Electric PowerCovanta Holding Corp.,6.375%, 1/10/2022 USD 150,000 154,688 1.15
Total Bonds(Identified Cost, $3,365,303) 3,371,712 25.16
Name of SecurityTransferable Securities and Money MarketInstruments traded on a Regulated Market Shares/Par
MarketValue ($)
NetAssets (%)
PREFERRED STOCKS
ElectronicsSamsung Electronics Co. Ltd.(Identified Cost, $198,837) 174 235,224 1.76
SHORT-TERM OBLIGATIONS (y)Apple, Inc.,0.68%, 15/02/2017 USD 400,000 399,894 2.98Chevron Corp.,0.62%, 14/02/2017 500,000 499,888 3.73General Electric Co.,0.58%, 1/02/2017 181,000 181,000 1.35Microsoft Corp.,0.72%, 22/02/2017 250,000 249,895 1.86Novartis Finance Corp.,0.66%, 6/02/2017 250,000 249,977 1.87Novartis Finance Corp.,0.7%, 21/02/2017 250,000 249,903 1.87Sanofi,0.63%, 27/02/2017 500,000 499,773 3.73
Total Short-Term Obligations,at Amortized Cost and Value 2,330,330 17.39
Total Transferable Securities andMoney Market Instruments Tradedon a Regulated Market(Identified Cost, $12,213,008) 12,314,526 91.91
Issuer/Expiration Month/Strike PriceNumber
of ContractsMarket
Value ($)Net
Assets (%)PUT OPTIONS PURCHASEDRussell 2000 Index –September 2017 @ $1,150 3 7,620 0.06Russell 2000 Index –September 2017 @ $1,200 3 10,050 0.08Russell 2000 Index –June 2018 @ $1,000 3 8,400 0.06Russell 2000 Index –June 2018 @ $1,050 3 10,800 0.08S&P 500 Index –September 2017 @ $1,900 3 7,410 0.06S&P/ASX 200 Index –March 2018 @ $4,500 120 9,480 0.07S&P/ASX 200 Index –September 2017 @ $5,000 12 8,985 0.07
Total Put Options Purchased(Premiums Paid, $106,164) 62,745 0.47
Total Investments(Identified Cost, $12,319,172) (k) 12,377,271 92.38
OTHER ASSETS, LESS LIABILITIES 1,021,585 7.62
NET ASSETS 13,398,856 100.00
See Schedules of Investments Footnotes and Notes to Financial Statements
MFS Meridian Funds Annual Report 2017 99

SCHEDULES OF INVESTMENTS 31 January 2017
MFS Meridian Funds – Prudent Wealth Fund(Expressed in U.S. Dollars)
Name of SecurityTransferable Securities and Money MarketInstruments traded on a Regulated Market Shares/Par
MarketValue ($)
NetAssets (%)
COMMON STOCKS
AerospaceUltra Electronics Holdings PLC 874,462 20,318,341 0.80
AutomotiveD’Ieteren S.A. 307,507 13,877,326 0.55
Brokerage & Asset ManagersIG Group Holdings PLC 3,474,660 23,298,069 0.92
Business ServicesAccenture PLC, “A” 318,177 36,230,815 1.43Amadeus IT Holding S.A. 567,703 26,195,643 1.03Bunzl PLC 300,191 7,888,901 0.31Compass Group PLC 1,565,631 27,810,225 1.10Midland IC&I Ltd. 151,550,000 1,047,171 0.04Serco Group PLC 13,739,665 24,889,664 0.98
124,062,419 4.89
Computer SoftwareCadence Design Systems, Inc. 1,037,025 26,993,761 1.06Check Point Software Technologies Ltd. 305,184 30,143,024 1.19OBIC Business Consultants Co. Ltd. 101,900 4,810,265 0.19OBIC Co. Ltd. 756,100 36,294,943 1.43
98,241,993 3.87
Computer Software – SystemsAddtech AB, “B” 745,914 12,876,612 0.51Constellation Software, Inc. 68,712 31,034,854 1.22
43,911,466 1.73
Consumer ProductsColgate-Palmolive Co. 883,530 57,058,367 2.25Henkel AG & Co. KGaA 410,602 43,189,769 1.70Kao Corp. 1,061,700 52,497,308 2.07Kobayashi Pharmaceutical Co. Ltd. 328,800 14,647,631 0.58KOSE Corp. 212,700 18,084,492 0.71Procter & Gamble Co. 615,396 53,908,690 2.12ROHTO Pharmaceutical Co. Ltd. 946,000 16,379,683 0.65
255,765,940 10.08
Electrical EquipmentSpectris PLC 746,363 22,693,796 0.90
ElectronicsHalma PLC 1,444,316 16,806,774 0.66Kyocera Corp. 396,600 21,694,021 0.86Texas Instruments, Inc. 351,459 26,549,213 1.05
65,050,008 2.57
Food & BeveragesDanone S.A. 567,972 35,555,156 1.40Emmi AG 43,871 27,442,928 1.08ITO EN Ltd. 297,300 9,874,015 0.39Nestle S.A. 808,471 59,069,732 2.33
131,941,831 5.20
General MerchandiseCostco Wholesale Corp. 494,747 81,113,771 3.20
InsuranceApril Group 1,843,301 23,679,132 0.93Beazley PLC 5,859,772 29,899,165 1.18Hiscox Ltd. 2,354,861 30,394,362 1.20
83,972,659 3.31
InternetScout24 AG 337,392 12,020,902 0.47
Name of SecurityTransferable Securities and Money MarketInstruments traded on a Regulated Market Shares/Par
MarketValue ($)
NetAssets (%)
Leisure & ToysGames Workshop Group PLC 3,199,238 33,243,520 1.31
Machinery & ToolsAzbil Corp. 814,800 24,571,730 0.97Neopost S.A. 230,444 7,609,698 0.30
32,181,428 1.27
Medical EquipmentNakanishi, Inc. 223,700 8,648,043 0.34
Network & TelecomLM Ericsson Telephone Co., “B” 4,194,025 24,764,938 0.98
Pollution ControlDaiseki Co. Ltd. 1,665,900 33,256,032 1.31
Printing & PublishingRELX N.V. 2,244,148 37,852,457 1.49
Real EstateADLER Real Estate AG (l) 791,343 11,570,878 0.46Deutsche Wohnen AG 1,606,599 52,272,502 2.06Grand City Properties S.A. 2,066,021 37,613,490 1.48LEG Immobilien AG 995,580 78,089,763 3.08Midland Holdings Ltd. 30,310,000 7,637,390 0.30TAG Immobilien AG 3,380,355 45,577,164 1.80
232,761,187 9.18
RestaurantsGreggs PLC 1,296,525 15,853,588 0.63
Specialty ChemicalsNihon Parkerizing Co. Ltd. 2,017,700 24,714,189 0.97
Specialty StoresEsprit Holdings Ltd. 19,377,100 15,127,204 0.60Sally Beauty Holdings, Inc. 891,368 21,214,558 0.83
36,341,762 1.43
Telecommunications – WirelessKDDI Corp. 1,242,500 33,343,149 1.31
TruckingYamato Holdings Co. Ltd. 1,765,700 35,647,092 1.41
Total Common Stocks(Identified Cost, $1,425,294,891) 1,524,875,906 60.12
BONDSInsuranceHiscox Ltd.,6.125% to24/11/2025, FRN to 24/11/2045 GBP 10,000,000 13,397,693 0.53
Real Estate – ApartmentVonovia Finance B.V., FRN, REIT,4%, 29/12/2049 EUR 3,000,000 3,364,153 0.13Vonovia Finance B.V., FRN, REIT,4.625%, 8/04/2074 7,400,000 8,382,521 0.33
11,746,674 0.46
U.S. Treasury ObligationsU.S. Treasury Notes,0.5%, 28/02/2017 USD 50,000,000 50,002,200 1.97U.S. Treasury Notes,0.5%, 31/03/2017 50,000,000 50,002,300 1.97U.S. Treasury Notes,0.5%, 30/04/2017 50,000,000 49,999,900 1.97U.S. Treasury Notes,0.625%, 31/05/2017 50,000,000 50,003,900 1.98U.S. Treasury Notes,0.625%, 30/06/2017 50,000,000 50,000,000 1.97U.S. Treasury Notes,0.5%, 31/07/2017 50,000,000 49,962,900 1.97
100 MFS Meridian Funds Annual Report 2017

SCHEDULES OF INVESTMENTS 31 January 2017
MFS Meridian Funds – Prudent Wealth Fund, continued
Name of SecurityTransferable Securities and Money MarketInstruments traded on a Regulated Market Shares/Par
MarketValue ($)
NetAssets (%)
U.S. Treasury Obligations, continuedU.S. Treasury Notes,0.625%, 31/08/2017 USD 50,000,000 49,984,400 1.97U.S. Treasury Notes,0.625%, 30/09/2017 50,000,000 49,957,050 1.97U.S. Treasury Notes,0.75%, 31/10/2017 50,000,000 49,992,200 1.97
449,904,850 17.74
Total Bonds(Identified Cost, $478,960,547) 475,049,217 18.73
PREFERRED STOCKS
ElectronicsSamsung Electronics Co. Ltd. 22,300 30,146,545 1.19
Food & BeveragesITO EN Ltd. (l) 804,600 14,152,295 0.56
Total Preferred Stocks(Identified Cost, $32,224,197) 44,298,840 1.75
CONVERTIBLE BONDS
Real EstateADLER Real Estate AG,2.5%, 19/07/2021(Identified Cost, $1,309,967) EUR 90,328 13,900 0.00
SHORT-TERM OBLIGATIONS (y)Apple, Inc.,0.68%, 15/02/2017 USD 20,000,000 19,994,711 0.79Chevron Corp.,0.62%, 14/02/2017 38,530,000 38,521,374 1.52Exxon Mobil Corp.,0.63%, 22/02/2017 52,000,000 51,980,890 2.05General Electric Co.,0.58%, 1/02/2017 40,208,000 40,208,000 1.59Microsoft Corp.,0.72%, 22/02/2017 40,000,000 39,983,200 1.58Mizuho Bank Ltd.,0.7%, 3/02/2017 10,000,000 10,000,000 0.39Mizuho Bank Ltd.,0.7%, 14/02/2017 27,000,000 27,001,283 1.06Nestle Cap Corp.,0.72%, 15/03/2017 10,938,000 10,928,812 0.43Novartis Finance Corp.,0.66%, 6/02/2017 10,000,000 9,999,083 0.39Novartis Finance Corp.,0.68%, 3/02/2017 15,500,000 15,499,414 0.61Novartis Finance Corp.,0.64%, 13/02/2017 9,000,000 8,998,080 0.36Novartis Finance Corp.,0.7%, 21/02/2017 21,170,000 21,161,767 0.83Pepsico Inc.,0.64%, 24/02/2017 17,000,000 16,993,049 0.67Sanofi,0.63%, 27/02/2017 31,587,000 31,572,628 1.25Toronto Dominion Holding,0.66%, 8/02/2017 21,285,000 21,282,268 0.84Toronto Dominion Holding,0.72%, 10/02/2017 30,015,000 30,009,597 1.18
Total Short-Term Obligations, atAmortized Cost and Value 394,134,156 15.54
Total Transferable Securities andMoney Market InstrumentsTraded on a Regulated Market(Identified Cost, $2,331,923,758) 2,438,372,019 96.14
Issuer/Expiration Month/Strike Price
Par Amount/Number ofContracts
MarketValue ($)
NetAssets (%)
PUT OPTIONS PURCHASEDJPY Currency –February 2019 @ $0.01 JPY 4,607,406,000 520,638 0.02JPY Currency –January 2018 @ $0.01 JPY 4,418,021,000 216,483 0.01Russell 2000 Index –December 2017 @ $1,150 250 975,000 0.04Russell 2000 Index –December 2017 @ $8,000 250 147,500 0.01Russell 2000 Index –December 2017 @ $850 250 202,500 0.01Russell 2000 Index –December 2017 @ $900 250 267,500 0.01Russell 2000 Index –December 2017 @ $950 250 350,000 0.01Russell 2000 Index –December 2018 @ $1,000 250 1,075,000 0.04Russell 2000 Index –December 2018 @ $850 250 525,000 0.02Russell 2000 Index –December 2018 @ $900 250 687,500 0.03Russell 2000 Index –June 2017 @ $1,000 250 115,000 0.01Russell 2000 Index –June 2017 @ $850 250 33,750 0.00Russell 2000 Index –June 2017 @ $900 250 52,500 0.00Russell 2000 Index –June 2017 @ $950 250 82,500 0.00Russell 2000 Index –June 2018 @ $1,000 250 700,000 0.03Russell 2000 Index –June 2018 @ $1,050 250 900,000 0.04Russell 2000 Index –June 2018 @ $900 250 400,000 0.02Russell 2000 Index –June 2018 @ $950 250 585,000 0.02Russell 2000 Index –March 2017 @ $1,000 250 13,750 0.00Russell 2000 Index –March 2017 @ $1,050 250 23,000 0.00Russell 2000 Index –March 2017 @ $900 250 1,250 0.00Russell 2000 Index –March 2017 @ $950 250 5,000 0.00Russell 2000 Index –September 2017 @ $1,050 250 310,000 0.01Russell 2000 Index –September 2017 @ $1,100 250 437,500 0.02Russell 2000 Index –September 2017 @ $1,150 250 635,000 0.03Russell 2000 Index –September 2017 @ $1,200 250 837,500 0.03S&P 500 Index –December 2017 @ $1,500 250 252,500 0.01S&P 500 Index –December 2017 @ $1,600 250 390,000 0.02S&P 500 Index –December 2017 @ $1,700 250 565,000 0.02S&P 500 Index –June 2017 @ $1,500 250 52,000 0.00S&P 500 Index –June 2017 @ $1,600 250 63,750 0.00S&P 500 Index –June 2017 @ $1,700 250 115,000 0.00
MFS Meridian Funds Annual Report 2017 101

SCHEDULES OF INVESTMENTS 31 January 2017
MFS Meridian Funds – Prudent Wealth Fund, continued
Issuer/Expiration Month/Strike Price
Par Amount/Number ofContracts
MarketValue ($)
NetAssets (%)
PUT OPTIONS PURCHASED, continuedS&P 500 Index –June 2018 @ $1,600 250 702,500 0.03S&P 500 Index –June 2018 @ $1,750 250 1,120,000 0.04S&P 500 Index –March 2017 @ $1,700 250 13,750 0.00S&P 500 Index –March 2017 @ $1,900 250 41,250 0.00S&P 500 Index –September 2017 @ $1,800 250 459,250 0.02S&P 500 Index –September 2017 @ $1,900 250 617,500 0.02S&P/ASX 200 Index –December 2017 @ AUD 4,600 10,000 652,224 0.03S&P/ASX 200 Index –December 2017 @ AUD 4,800 10,000 876,400 0.04S&P/ASX 200 Index –June 2017 @ AUD 4,400 10,000 84,061 0.00S&P/ASX 200 Index –June 2017 @ AUD 4,600 1,000 147,100 0.01
Issuer/Expiration Month/Strike Price
Par Amount/Number ofContracts
MarketValue ($)
NetAssets (%)
PUT OPTIONS PURCHASED, continuedS&P/ASX 200 Index –March 2017 @ AUD 4,300 1,000 3,860 0.00S&P/ASX 200 Index –March 2017 @ AUD 4,500 1,000 15,168 0.00S&P/ASX 200 Index –March 2018 @ AUD 4,500 10,000 789,997 0.03S&P/ASX 200 Index –September 2017 @ AUD 4,600 1,000 352,912 0.01S&P/ASX 200 Index –September 2017 @ AUD 4,800 10,000 561,216 0.02S&P/ASX 200 Index –September 2017 @ AUD 5,000 1,000 748,761 0.03
Total Put Options Purchased(Premiums Paid, $69,578,520) 18,723,070 0.74
Total Investments(Identified Cost, $2,401,502,278) (k) 2,457,095,089 96.88
OTHER ASSETS, LESS LIABILITIES 79,254,636 3.12
NET ASSETS 2,536,349,725 100.00
See Schedules of Investments Footnotes and Notes to Financial Statements
MFS Meridian Funds – U.K. Equity Fund(Expressed in British Pounds)
Name of SecurityTransferable Securities and Money MarketInstruments Traded on a Regulated Market Shares/Par
MarketValue (£)
NetAssets (%)
COMMON STOCKSAerospaceCobham PLC 1,089,367 1,477,182 1.91Rolls-Royce Holdings PLC 121,233 809,230 1.04
2,286,412 2.95
Alcoholic BeveragesDiageo PLC 157,897 3,479,260 4.48
Apparel ManufacturersBurberry Group PLC 89,581 1,469,128 1.89
AutomotiveGKN PLC 271,460 932,194 1.20
BroadcastingWPP PLC 116,813 2,154,032 2.78
Brokerage & Asset ManagersIG Group Holdings PLC 221,667 1,181,485 1.52Rathbone Brothers PLC 66,175 1,375,778 1.78
2,557,263 3.30
Business ServicesBabcock International Group PLC 93,198 832,258 1.07Compass Group PLC 156,489 2,209,625 2.85Experian Group Ltd. 99,409 1,519,964 1.96Michael Page International PLC 171,770 741,016 0.95
5,302,863 6.83
Computer SoftwareFidessa Group PLC 14,381 330,763 0.43
ConstructionBellway PLC 18,713 464,831 0.60SIG PLC 629,526 647,153 0.83
1,111,984 1.43
Consumer ProductsReckitt Benckiser Group PLC 41,576 2,828,831 3.65
Name of SecurityTransferable Securities and Money MarketInstruments Traded on a Regulated Market Shares/Par
MarketValue (£)
NetAssets (%)
Consumer ServicesMoneysupermarket.com Group PLC 326,114 1,074,546 1.39
Electrical EquipmentSpectris PLC 70,935 1,714,499 2.21
ElectronicsHalma PLC 71,858 664,687 0.86
Energy – IndependentCairn Energy PLC 353,014 800,636 1.03
Energy – IntegratedBP PLC 1,040,181 4,918,496 6.34
Food & Drug StoresBooker Group PLC 618,395 1,260,289 1.62
Gaming & LodgingPaddy Power Betfair PLC 17,658 1,473,560 1.90
InsuranceBeazley PLC 121,597 493,197 0.64Hiscox Ltd. 116,207 1,192,284 1.54Jardine Lloyd Thompson Group PLC 99,522 1,025,077 1.32JRP Group PLC 246,027 358,953 0.46
3,069,511 3.96
Major BanksHSBC Holdings PLC 441,570 2,986,779 3.85Lloyds TSB Group PLC 2,871,564 1,864,507 2.40
4,851,286 6.25
Metals & MiningRio Tinto Ltd. 97,354 3,398,628 4.38
Oil ServicesLamprell PLC 241,736 220,584 0.28
Other Banks & Diversified FinancialsCYBG PLC 122,418 330,161 0.43
102 MFS Meridian Funds Annual Report 2017

SCHEDULES OF INVESTMENTS 31 January 2017
MFS Meridian Funds – U.K. Equity Fund, continued
Name of SecurityTransferable Securities and Money MarketInstruments Traded on a Regulated Market Shares/Par
MarketValue (£)
NetAssets (%)
PharmaceuticalsBayer AG 8,242 723,520 0.93GlaxoSmithKline PLC 169,327 2,587,317 3.34Novartis AG 29,903 1,740,344 2.24Roche Holding AG 8,067 1,509,906 1.95
6,561,087 8.46
Printing & PublishingReed Elsevier PLC 190,855 2,715,867 3.50
Real EstateDerwent London PLC, REIT 39,738 980,336 1.26
RestaurantsDomino’s Pizza Group PLC 312,043 1,130,532 1.46Greggs PLC 63,461 616,841 0.79Whitbread PLC 44,904 1,762,482 2.27
3,509,855 4.52
Specialty ChemicalsAkzo Nobel N.V. 29,434 1,585,922 2.04Croda International PLC 39,552 1,324,201 1.71
2,910,123 3.75
Specialty StoresJust Eat PLC 179,585 968,861 1.25Kingfisher PLC 250,728 842,948 1.09NEXT PLC 15,103 578,445 0.74
2,390,254 3.08
Name of SecurityTransferable Securities and Money MarketInstruments Traded on a Regulated Market Shares/Par
MarketValue (£)
NetAssets (%)
Telecommunications – WirelessVodafone Group PLC 1,518,387 2,950,983 3.80
Telephone ServicesBT Group PLC 690,565 2,098,282 2.70
TobaccoBritish American Tobacco PLC 94,774 4,643,452 5.98
Utilities – Electric PowerDrax Group 124,073 459,566 0.59
Utilities – WaterSevern Trent PLC 28,912 656,302 0.85
Total Common Stocks(Identified Cost, £69,114,273) 76,105,720 98.08
Total Transferable Securities andMoney Market Instruments Tradedon a Regulated Market(Identified Cost, £69,114,273) 76,105,720 98.08
OTHER ASSETS, LESS LIABILITIES 1,487,834 1.92
NET ASSETS 77,593,554 100.00
See Schedules of Investments Footnotes and Notes to Financial Statements
MFS Meridian Funds – U.S. Concentrated Growth Fund(Expressed in U.S. Dollars)
Name of SecurityTransferable Securities and Money MarketInstruments traded on a Regulated Market Shares/Par
MarketValue ($)
NetAssets (%)
COMMON STOCKSApparel ManufacturersLVMH Moet Hennessy Louis Vuitton SE 51,371 10,347,899 2.38NIKE, Inc., “B” 279,372 14,778,779 3.41
25,126,678 5.79
BroadcastingTwenty-First Century Fox, Inc. 364,395 11,434,715 2.63
Brokerage & Asset ManagersBlackstone Group LP 381,936 11,698,700 2.70
Business ServicesAccenture PLC, “A” 163,450 18,612,052 4.29Cognizant Technology Solutions Corp., “A” 225,527 11,860,465 2.73Equifax, Inc. 82,602 9,687,563 2.23Fidelity National Information Services, Inc. 154,482 12,268,960 2.83
52,429,040 12.08
ChemicalsMonsanto Co. 114,611 12,413,517 2.86PPG Industries, Inc. 97,786 9,779,578 2.25
22,193,095 5.11
ConstructionSherwin-Williams Co. 46,922 14,255,373 3.28
Consumer ProductsColgate-Palmolive Co. 250,871 16,201,249 3.73Coty, Inc., “A” 498,790 9,576,768 2.21Estee Lauder Cos., Inc., “A” 159,625 12,963,146 2.98
38,741,163 8.92
Name of SecurityTransferable Securities and Money MarketInstruments traded on a Regulated Market Shares/Par
MarketValue ($)
NetAssets (%)
Electrical EquipmentAmphenol Corp., “A” 134,554 9,081,049 2.09Mettler-Toledo International, Inc. 28,389 12,111,599 2.79
21,192,648 4.88
ElectronicsTaiwan Semiconductor ManufacturingCo. Ltd., ADR 236,814 7,319,921 1.69Texas Instruments, Inc. 169,858 12,831,073 2.95
20,150,994 4.64
Food & BeveragesMead Johnson Nutrition Co., “A” 180,785 12,738,111 2.94
Food & Drug StoresCVS Health Corp. 129,708 10,222,287 2.36
InsuranceAon PLC 80,850 9,111,795 2.10
InternetAlphabet, Inc., “A” 33,138 27,179,456 6.26
Medical & Health Technology & ServicesExpress Scripts Holding Co. 93,368 6,431,188 1.48
Medical EquipmentAbbott Laboratories 402,457 16,810,629 3.87Danaher Corp. 128,355 10,771,552 2.48Thermo Fisher Scientific, Inc. 129,789 19,778,546 4.56Waters Corp. 62,305 8,825,503 2.03
56,186,230 12.94
MFS Meridian Funds Annual Report 2017 103
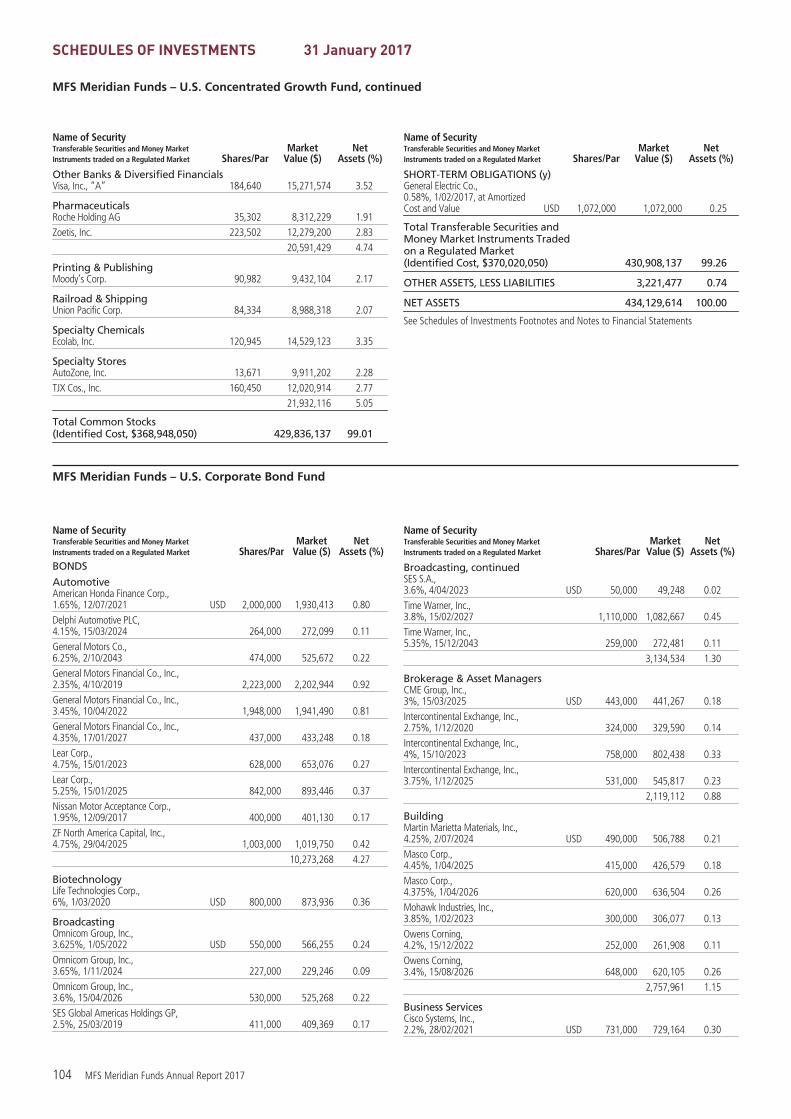
SCHEDULES OF INVESTMENTS 31 January 2017
MFS Meridian Funds – U.S. Concentrated Growth Fund, continued
Name of SecurityTransferable Securities and Money MarketInstruments traded on a Regulated Market Shares/Par
MarketValue ($)
NetAssets (%)
Other Banks & Diversified FinancialsVisa, Inc., “A” 184,640 15,271,574 3.52
PharmaceuticalsRoche Holding AG 35,302 8,312,229 1.91Zoetis, Inc. 223,502 12,279,200 2.83
20,591,429 4.74
Printing & PublishingMoody’s Corp. 90,982 9,432,104 2.17
Railroad & ShippingUnion Pacific Corp. 84,334 8,988,318 2.07
Specialty ChemicalsEcolab, Inc. 120,945 14,529,123 3.35
Specialty StoresAutoZone, Inc. 13,671 9,911,202 2.28TJX Cos., Inc. 160,450 12,020,914 2.77
21,932,116 5.05
Total Common Stocks(Identified Cost, $368,948,050) 429,836,137 99.01
Name of SecurityTransferable Securities and Money MarketInstruments traded on a Regulated Market Shares/Par
MarketValue ($)
NetAssets (%)
SHORT-TERM OBLIGATIONS (y)General Electric Co.,0.58%, 1/02/2017, at AmortizedCost and Value USD 1,072,000 1,072,000 0.25
Total Transferable Securities andMoney Market Instruments Tradedon a Regulated Market(Identified Cost, $370,020,050) 430,908,137 99.26
OTHER ASSETS, LESS LIABILITIES 3,221,477 0.74
NET ASSETS 434,129,614 100.00
See Schedules of Investments Footnotes and Notes to Financial Statements
MFS Meridian Funds – U.S. Corporate Bond Fund
Name of SecurityTransferable Securities and Money MarketInstruments traded on a Regulated Market Shares/Par
MarketValue ($)
NetAssets (%)
BONDS
AutomotiveAmerican Honda Finance Corp.,1.65%, 12/07/2021 USD 2,000,000 1,930,413 0.80Delphi Automotive PLC,4.15%, 15/03/2024 264,000 272,099 0.11General Motors Co.,6.25%, 2/10/2043 474,000 525,672 0.22General Motors Financial Co., Inc.,2.35%, 4/10/2019 2,223,000 2,202,944 0.92General Motors Financial Co., Inc.,3.45%, 10/04/2022 1,948,000 1,941,490 0.81General Motors Financial Co., Inc.,4.35%, 17/01/2027 437,000 433,248 0.18Lear Corp.,4.75%, 15/01/2023 628,000 653,076 0.27Lear Corp.,5.25%, 15/01/2025 842,000 893,446 0.37Nissan Motor Acceptance Corp.,1.95%, 12/09/2017 400,000 401,130 0.17ZF North America Capital, Inc.,4.75%, 29/04/2025 1,003,000 1,019,750 0.42
10,273,268 4.27
BiotechnologyLife Technologies Corp.,6%, 1/03/2020 USD 800,000 873,936 0.36
BroadcastingOmnicom Group, Inc.,3.625%, 1/05/2022 USD 550,000 566,255 0.24Omnicom Group, Inc.,3.65%, 1/11/2024 227,000 229,246 0.09Omnicom Group, Inc.,3.6%, 15/04/2026 530,000 525,268 0.22SES Global Americas Holdings GP,2.5%, 25/03/2019 411,000 409,369 0.17
Name of SecurityTransferable Securities and Money MarketInstruments traded on a Regulated Market Shares/Par
MarketValue ($)
NetAssets (%)
Broadcasting, continuedSES S.A.,3.6%, 4/04/2023 USD 50,000 49,248 0.02Time Warner, Inc.,3.8%, 15/02/2027 1,110,000 1,082,667 0.45Time Warner, Inc.,5.35%, 15/12/2043 259,000 272,481 0.11
3,134,534 1.30
Brokerage & Asset ManagersCME Group, Inc.,3%, 15/03/2025 USD 443,000 441,267 0.18Intercontinental Exchange, Inc.,2.75%, 1/12/2020 324,000 329,590 0.14Intercontinental Exchange, Inc.,4%, 15/10/2023 758,000 802,438 0.33Intercontinental Exchange, Inc.,3.75%, 1/12/2025 531,000 545,817 0.23
2,119,112 0.88
BuildingMartin Marietta Materials, Inc.,4.25%, 2/07/2024 USD 490,000 506,788 0.21Masco Corp.,4.45%, 1/04/2025 415,000 426,579 0.18Masco Corp.,4.375%, 1/04/2026 620,000 636,504 0.26Mohawk Industries, Inc.,3.85%, 1/02/2023 300,000 306,077 0.13Owens Corning,4.2%, 15/12/2022 252,000 261,908 0.11Owens Corning,3.4%, 15/08/2026 648,000 620,105 0.26
2,757,961 1.15
Business ServicesCisco Systems, Inc.,2.2%, 28/02/2021 USD 731,000 729,164 0.30
104 MFS Meridian Funds Annual Report 2017

SCHEDULES OF INVESTMENTS 31 January 2017
MFS Meridian Funds – U.S. Corporate Bond Fund, continued
Name of SecurityTransferable Securities and Money MarketInstruments traded on a Regulated Market Shares/Par
MarketValue ($)
NetAssets (%)
Business Services, continuedEquinix, Inc.,5.75%, 1/01/2025 USD 1,837,000 1,938,035 0.81Fidelity National Information Services, Inc.,5%, 15/03/2022 500,000 513,331 0.21Fidelity National Information Services, Inc.,3.875%, 5/06/2024 352,000 359,135 0.15Fidelity National Information Services, Inc.,5%, 15/10/2025 392,000 426,117 0.18Fidelity National Information Services, Inc.,3%, 15/08/2026 852,000 801,767 0.33Fidelity National Information Services, Inc.,4.5%, 15/08/2046 926,000 892,309 0.37Fiserv, Inc.,2.7%, 1/06/2020 500,000 504,973 0.21MSCI, Inc.,5.75%, 15/08/2025 1,246,000 1,319,987 0.55MSCI, Inc.,4.75%, 1/08/2026 295,000 293,525 0.12
7,778,343 3.23
Cable TVCharter Communications Operating LLC,6.384%, 23/10/2035 USD 1,505,000 1,696,966 0.71Comcast Corp.,4.2%, 15/08/2034 428,000 431,846 0.18Comcast Corp.,4.65%, 15/07/2042 300,000 308,485 0.13Comcast Corp.,4.75%, 1/03/2044 459,000 486,875 0.20Cox Communications, Inc.,6.25%, 1/06/2018 300,000 315,931 0.13NBCUniversal Enterprise, Inc.,1.974%, 15/04/2019 300,000 300,557 0.13Sirius XM Radio, Inc.,5.75%, 1/08/2021 278,000 289,449 0.12Sirius XM Radio, Inc.,5.375%, 15/04/2025 80,000 81,400 0.03Sirius XM Radio, Inc.,5.375%, 15/07/2026 665,000 675,806 0.28Time Warner Cable, Inc.,5%, 1/02/2020 1,300,000 1,382,911 0.58Time Warner Cable, Inc.,4.5%, 15/09/2042 493,000 442,911 0.18Videotron Ltd.,5%, 15/07/2022 1,050,000 1,092,000 0.45
7,505,137 3.12
ChemicalsAir Liquide Finance Co.,2.25%, 27/09/2023 USD 898,000 858,815 0.36LyondellBasell Industries N.V.,5%, 15/04/2019 612,000 647,221 0.27
1,506,036 0.63
Computer SoftwareMicrosoft Corp.,1.55%, 8/08/2021 USD 1,783,000 1,725,896 0.72Oracle Corp.,3.4%, 8/07/2024 341,000 347,752 0.14VeriSign, Inc.,4.625%, 1/05/2023 918,000 928,006 0.39
3,001,654 1.25
Computer Software – SystemsApple, Inc.,4.375%, 13/05/2045 USD 204,000 208,346 0.09
Name of SecurityTransferable Securities and Money MarketInstruments traded on a Regulated Market Shares/Par
MarketValue ($)
NetAssets (%)
Computer Software – Systems, continuedApple, Inc.,3.85%, 4/08/2046 USD 660,000 613,419 0.25
821,765 0.34
ConglomeratesJohnson Controls International PLC,4.95%, 2/07/2064 USD 236,000 227,542 0.09Roper Industries, Inc.,1.85%, 15/11/2017 300,000 300,689 0.13
528,231 0.22
Consumer ProductsHasbro, Inc.,5.1%, 15/05/2044 USD 395,000 401,279 0.17Mattel, Inc.,1.7%, 15/03/2018 600,000 599,699 0.25Mattel, Inc.,5.45%, 1/11/2041 255,000 254,210 0.11Newell Rubbermaid, Inc.,2.05%, 1/12/2017 700,000 702,406 0.29Newell Rubbermaid, Inc.,5.375%, 1/04/2036 195,000 218,766 0.09
2,176,360 0.91
Consumer ServicesPriceline Group, Inc.,3.65%, 15/03/2025 USD 982,000 978,678 0.41Priceline Group, Inc.,3.6%, 1/06/2026 1,935,000 1,934,518 0.80Service Corp. International,5.375%, 15/01/2022 125,000 130,000 0.05Service Corp. International,5.375%, 15/05/2024 1,274,000 1,334,515 0.56Visa, Inc.,4.15%, 14/12/2035 1,206,000 1,247,519 0.52
5,625,230 2.34
ContainersBall Corp.,5%, 15/03/2022 USD 425,000 446,250 0.19Ball Corp.,4%, 15/11/2023 299,000 296,758 0.12Ball Corp.,5.25%, 1/07/2025 500,000 525,625 0.22Crown American LLC,4.5%, 15/01/2023 953,000 973,251 0.40Sealed Air Corp.,5.5%, 15/09/2025 1,570,000 1,656,350 0.69
3,898,234 1.62
Defense ElectronicsBAE Systems Holdings, Inc.,6.375%, 1/06/2019 USD 400,000 438,184 0.18
Electrical EquipmentArrow Electronics, Inc.,3.5%, 1/04/2022 USD 237,000 238,029 0.10Molex Electronic Technologies LLC,3.9%, 15/04/2025 318,000 315,858 0.13
553,887 0.23
ElectronicsBroadcom Corp./Broadcom CaymanFinance Ltd.,3.875%, 15/01/2027 USD 1,719,000 1,705,891 0.71Flextronics International Ltd.,4.625%, 15/02/2020 674,000 706,771 0.29Flextronics International Ltd.,4.75%, 15/06/2025 374,000 393,828 0.16
MFS Meridian Funds Annual Report 2017 105

SCHEDULES OF INVESTMENTS 31 January 2017
MFS Meridian Funds – U.S. Corporate Bond Fund, continued
Name of SecurityTransferable Securities and Money MarketInstruments traded on a Regulated Market Shares/Par
MarketValue ($)
NetAssets (%)
Electronics, continuedNXP B.V./NXP Funding LLC,4.125%, 15/06/2020 USD 814,000 842,490 0.35NXP B.V./NXP Funding LLC,4.625%, 1/06/2023 516,000 545,670 0.23Tyco Electronics Group S.A.,6.55%, 1/10/2017 300,000 310,467 0.13Tyco Electronics Group S.A.,3.5%, 3/02/2022 600,000 618,195 0.26
5,123,312 2.13
Emerging Market Quasi-SovereignComision Federal de Electricidad,5.75%, 14/02/2042 USD 800,000 750,000 0.31Petroleos Mexicanos,6.5%, 13/03/2027 328,000 337,332 0.14
1,087,332 0.45
Energy – IndependentConcho Resources, Inc.,4.375%, 15/01/2025 USD 701,000 716,773 0.30Continental Resources, Inc.,4.9%, 1/06/2044 915,000 805,200 0.34Pioneer Natural Resources Co.,7.5%, 15/01/2020 263,000 299,786 0.12
1,821,759 0.76
Energy – IntegratedShell International Finance B.V.,3.75%, 12/09/2046 USD 1,126,000 1,045,284 0.43
Financial InstitutionsAerCap Ireland Capital Ltd.,4.625%, 30/10/2020 USD 150,000 157,554 0.07International Lease Finance Corp.,7.125%, 1/09/2018 250,000 268,925 0.11International Lease Finance Corp.,5.875%, 15/08/2022 750,000 828,600 0.35Navient Corp.,7.25%, 25/09/2023 1,035,000 1,042,763 0.43
2,297,842 0.96
Food & BeveragesAnheuser-Busch InBev Worldwide, Inc.,3.75%, 15/01/2022 USD 771,000 807,208 0.33Anheuser-Busch InBev Worldwide, Inc.,3.3%, 1/02/2023 1,749,000 1,777,927 0.74Anheuser-Busch InBev Worldwide, Inc.,4.7%, 1/02/2036 2,730,000 2,857,808 1.19Constellation Brands, Inc.,4.25%, 1/05/2023 2,488,000 2,611,678 1.09Danone S.A.,2.077%, 2/11/2021 743,000 722,379 0.30Danone S.A.,2.589%, 2/11/2023 1,740,000 1,679,366 0.70J.M. Smucker Co.,2.5%, 15/03/2020 150,000 151,321 0.06J.M. Smucker Co.,3.5%, 15/10/2021 600,000 622,442 0.26J.M. Smucker Co.,4.375%, 15/03/2045 160,000 159,026 0.07Kraft Heinz Foods Co.,3.5%, 15/07/2022 446,000 453,611 0.19Kraft Heinz Foods Co.,3%, 1/06/2026 340,000 317,739 0.13Kraft Heinz Foods Co.,5%, 15/07/2035 226,000 236,955 0.10Kraft Heinz Foods Co.,6.5%, 9/02/2040 637,000 780,627 0.32
Name of SecurityTransferable Securities and Money MarketInstruments traded on a Regulated Market Shares/Par
MarketValue ($)
NetAssets (%)
Food & Beverages, continuedMolson Coors Brewing Co.,2.1%, 15/07/2021 USD 952,000 928,572 0.39Molson Coors Brewing Co.,4.2%, 15/07/2046 336,000 311,821 0.13PepsiCo, Inc.,4.45%, 14/04/2046 177,000 188,595 0.08Pernod Ricard S.A.,4.25%, 15/07/2022 550,000 577,171 0.24SYSCO Corp.,2.5%, 15/07/2021 229,000 227,753 0.09Tyson Foods, Inc.,4.5%, 15/06/2022 400,000 425,600 0.18Tyson Foods, Inc.,5.15%, 15/08/2044 127,000 133,315 0.05Wm. Wrigley Jr. Co.,2.9%, 21/10/2019 198,000 201,417 0.08Wm. Wrigley Jr. Co.,3.375%, 21/10/2020 300,000 309,302 0.13
16,481,633 6.85
Food & Drug StoresCVS Health Corp.,2.125%, 1/06/2021 USD 1,259,000 1,232,406 0.51Walgreens Boots Alliance, Inc.,3.45%, 1/06/2026 1,500,000 1,462,416 0.61Walgreens Boots Alliance, Inc.,4.5%, 18/11/2034 226,000 226,943 0.10
2,921,765 1.22
Forest & Paper ProductsGeorgia-Pacific LLC,5.4%, 1/11/2020 USD 650,000 715,907 0.30International Paper Co.,6%, 15/11/2041 300,000 347,039 0.14
1,062,946 0.44
Gaming & LodgingWyndham Worldwide Corp.,2.5%, 1/03/2018 USD 300,000 301,837 0.13Wyndham Worldwide Corp.,5.1%, 1/10/2025 229,000 241,583 0.10
543,420 0.23
InsuranceAmerican International Group, Inc.,4.875%, 1/06/2022 USD 1,000,000 1,090,295 0.45American International Group, Inc.,4.7%, 10/07/2035 1,561,000 1,606,818 0.67American International Group, Inc.,4.5%, 16/07/2044 461,000 444,812 0.19Unum Group,4%, 15/03/2024 500,000 503,039 0.21
3,644,964 1.52
Insurance – HealthHumana, Inc.,7.2%, 15/06/2018 USD 300,000 321,382 0.13UnitedHealth Group, Inc.,4.625%, 15/07/2035 1,256,000 1,363,326 0.57
1,684,708 0.70
Insurance – Property & CasualtyAon PLC,4.6%, 14/06/2044 USD 103,000 101,877 0.04Berkshire Hathaway, Inc.,2.75%, 15/03/2023 427,000 426,319 0.18Chubb INA Holdings, Inc.,2.3%, 3/11/2020 174,000 174,480 0.07
106 MFS Meridian Funds Annual Report 2017

SCHEDULES OF INVESTMENTS 31 January 2017
MFS Meridian Funds – U.S. Corporate Bond Fund, continued
Name of SecurityTransferable Securities and Money MarketInstruments traded on a Regulated Market Shares/Par
MarketValue ($)
NetAssets (%)
Insurance – Property & Casualty, continuedLiberty Mutual Group, Inc.,4.85%, 1/08/2044 USD 1,173,000 1,158,546 0.48Marsh & McLennan Cos., Inc.,2.55%, 15/10/2018 281,000 284,142 0.12Marsh & McLennan Cos., Inc.,4.8%, 15/07/2021 400,000 434,613 0.18Marsh & McLennan Cos., Inc.,3.5%, 3/06/2024 262,000 266,201 0.11Marsh & McLennan Cos., Inc.,4.35%, 30/01/2047 437,000 428,214 0.18XL Group Ltd.,5.75%, 1/10/2021 300,000 334,795 0.14ZFS Finance USA Trust V,6.5% to 9/05/2017, FRN to 9/05/2067 500,000 501,250 0.21
4,110,437 1.71
Major BanksBank of America Corp.,2%, 11/01/2018 USD 500,000 501,705 0.21Bank of America Corp.,3.124% to 20/01/2022,FRN to 20/01/2023 1,170,000 1,168,233 0.49Bank of America Corp.,4.1%, 24/07/2023 500,000 519,867 0.22Bank of America Corp.,4.125%, 22/01/2024 717,000 742,835 0.31Bank of America Corp.,3.875%, 1/08/2025 1,000,000 1,010,797 0.42Bank of America Corp.,4.45%, 3/03/2026 1,653,000 1,687,004 0.70Bank of America Corp.,3.5%, 19/04/2026 1,274,000 1,252,243 0.52Bank of America Corp., FRN,6.1%, 29/12/2049 1,189,000 1,239,533 0.52Barclays PLC,4.95%, 10/01/2047 1,761,000 1,762,921 0.73Credit Agricole S.A.,4.125%, 10/01/2027 1,164,000 1,158,733 0.48Goldman Sachs Group, Inc.,2.625%, 25/04/2021 1,657,000 1,645,633 0.68Goldman Sachs Group, Inc.,3.625%, 22/01/2023 500,000 510,093 0.21Goldman Sachs Group, Inc.,3.85%, 26/01/2027 1,721,000 1,717,314 0.71Goldman Sachs Group, Inc.,4.8%, 8/07/2044 250,000 261,939 0.11HSBC Holdings PLC,4.375%, 23/11/2026 849,000 853,522 0.35JPMorgan Chase & Co.,4.25%, 15/10/2020 1,500,000 1,591,307 0.66JPMorgan Chase & Co.,3.25%, 23/09/2022 2,100,000 2,126,851 0.88JPMorgan Chase & Co.,3.125%, 23/01/2025 1,543,000 1,510,876 0.63JPMorgan Chase & Co.,3.2%, 15/06/2026 1,000,000 967,447 0.40JPMorgan Chase & Co.,2.95%, 1/10/2026 1,087,000 1,027,923 0.43JPMorgan Chase & Co.,6.75% to 1/02/2024, FRN to 29/08/2049 957,000 1,047,350 0.44Morgan Stanley,2.5%, 21/04/2021 2,377,000 2,347,097 0.98Morgan Stanley,5.5%, 28/07/2021 66,000 73,151 0.03Morgan Stanley,3.75%, 25/02/2023 500,000 513,368 0.21
Name of SecurityTransferable Securities and Money MarketInstruments traded on a Regulated Market Shares/Par
MarketValue ($)
NetAssets (%)
Major Banks, continuedMorgan Stanley,3.125%, 27/07/2026 USD 2,738,000 2,599,704 1.08Morgan Stanley,3.95%, 23/04/2027 1,531,000 1,496,963 0.62PNC Bank N.A.,2.6%, 21/07/2020 735,000 742,770 0.31PNC Funding Corp.,5.625%, 1/02/2017 500,000 500,000 0.21Wells Fargo & Co.,3.069%, 24/01/2023 2,500,000 2,497,398 1.04Wells Fargo & Co.,4.1%, 3/06/2026 803,000 812,755 0.34Wells Fargo & Co.,5.875% to 15/06/2025,FRN to 31/12/2049 356,000 378,473 0.16Wells Fargo & Co.,5.9%, 29/12/2049 514,000 528,495 0.22
36,794,300 15.30
Medical & Health Technology & ServicesBecton, Dickinson and Co.,2.675%, 15/12/2019 USD 853,000 866,338 0.36Becton, Dickinson and Co.,3.734%, 15/12/2024 93,000 95,325 0.04Becton, Dickinson and Co.,4.685%, 15/12/2044 205,000 211,770 0.09Fresenius U.S. Finance II, Inc.,4.25%, 1/02/2021 68,000 70,805 0.03HCA, Inc.,4.75%, 1/05/2023 750,000 777,188 0.32HCA, Inc.,5.25%, 15/06/2026 479,000 499,358 0.21Laboratory Corp. of America Holdings,3.6%, 1/02/2025 256,000 253,222 0.10Laboratory Corp. of America Holdings,4.7%, 1/02/2045 442,000 438,475 0.18Thermo Fisher Scientific, Inc.,3%, 15/04/2023 437,000 431,803 0.18Thermo Fisher Scientific, Inc.,2.95%, 19/09/2026 477,000 450,867 0.19Universal Health Services, Inc.,4.75%, 1/08/2022 550,000 553,438 0.23Universal Health Services, Inc.,5%, 1/06/2026 532,000 529,340 0.22
5,177,929 2.15
Medical EquipmentAbbott Laboratories,2.9%, 30/11/2021 USD 2,082,000 2,072,856 0.86Abbott Laboratories,4.75%, 30/11/2036 1,487,000 1,495,692 0.62Medtronic, Inc.,3.5%, 15/03/2025 1,480,000 1,512,615 0.63Medtronic, Inc.,4.375%, 15/03/2035 468,000 489,504 0.21
5,570,667 2.32
Metals & MiningBarrick Gold Corp.,3.85%, 1/04/2022 USD 151,000 156,000 0.07Barrick Gold Corp.,4.1%, 1/05/2023 348,000 365,712 0.15Barrick North America Finance LLC,4.4%, 30/05/2021 48,000 51,176 0.02Freeport-McMoRan, Inc.,5.4%, 14/11/2034 1,107,000 966,898 0.40Glencore Funding LLC,4.125%, 30/05/2023 799,000 819,055 0.34
MFS Meridian Funds Annual Report 2017 107

SCHEDULES OF INVESTMENTS 31 January 2017
MFS Meridian Funds – U.S. Corporate Bond Fund, continued
Name of SecurityTransferable Securities and Money MarketInstruments traded on a Regulated Market Shares/Par
MarketValue ($)
NetAssets (%)
Metals & Mining, continuedGlencore Funding LLC,4%, 16/04/2025 USD 495,000 492,616 0.21Kinross Gold Corp.,5.95%, 15/03/2024 1,240,000 1,301,070 0.54Southern Copper Corp.,5.25%, 8/11/2042 747,000 708,559 0.29Steel Dynamics, Inc.,5%, 15/12/2026 145,000 147,538 0.06
5,008,624 2.08
MidstreamAPT Pipelines Ltd.,5%, 23/03/2035 USD 691,000 673,086 0.28Enbridge, Inc.,5.5%, 1/12/2046 897,000 969,576 0.40Enbridge, Inc.,6% to 15/01/2027, FRN to 15/01/2077 1,642,000 1,662,525 0.69Energy Transfer Partners LP,5.2%, 1/02/2022 500,000 539,593 0.22Enterprise Products Operating LLC,4.45%, 15/02/2043 500,000 479,670 0.20Enterprise Products Operating LLC,4.85%, 15/03/2044 140,000 142,739 0.06Kinder Morgan (Delaware), Inc.,7.75%, 15/01/2032 170,000 212,212 0.09Kinder Morgan Energy Partners LP,6.5%, 1/04/2020 311,000 347,193 0.14Kinder Morgan Energy Partners LP,5.4%, 1/09/2044 1,057,000 1,096,523 0.46ONEOK Partners LP,2%, 1/10/2017 300,000 300,692 0.13Phillips 66 Partners LP,4.9%, 1/10/2046 610,000 592,702 0.25Sabine Pass Liquefaction LLC,5.625%, 15/04/2023 668,000 724,780 0.30Sabine Pass Liquefaction LLC,5.625%, 1/03/2025 64,000 69,520 0.03Sabine Pass Liquefaction LLC,5.875%, 30/06/2026 871,000 965,721 0.40Sabine Pass Liquefaction LLC,5%, 15/03/2027 467,000 489,766 0.20
9,266,298 3.85
Natural Gas – DistributionNiSource Finance Corp.,3.85%, 15/02/2023 USD 550,000 566,239 0.24NiSource Finance Corp.,4.8%, 15/02/2044 300,000 318,242 0.13
884,481 0.37
Network & TelecomAT&T, Inc.,2.45%, 30/06/2020 USD 2,000,000 1,984,518 0.83AT&T, Inc.,3%, 30/06/2022 1,500,000 1,478,682 0.62AT&T, Inc.,3.8%, 1/03/2024 1,091,000 1,090,302 0.45AT&T, Inc.,4.75%, 15/05/2046 764,000 697,851 0.29AT&T, Inc.,5.65%, 15/02/2047 555,000 576,853 0.24Verizon Communications, Inc.,4.5%, 15/09/2020 2,000,000 2,134,762 0.89Verizon Communications, Inc.,1.75%, 15/08/2021 487,000 464,926 0.19Verizon Communications, Inc.,5.05%, 15/03/2034 1,412,000 1,449,264 0.60
Name of SecurityTransferable Securities and Money MarketInstruments traded on a Regulated Market Shares/Par
MarketValue ($)
NetAssets (%)
Network & Telecom, continuedVerizon Communications, Inc.,6.55%, 15/09/2043 USD 612,000 754,830 0.31
10,631,988 4.42
OilsMarathon Petroleum Corp.,3.4%, 15/12/2020 USD 545,000 557,437 0.23Marathon Petroleum Corp.,3.625%, 15/09/2024 228,000 223,587 0.09Marathon Petroleum Corp.,4.75%, 15/09/2044 829,000 738,964 0.31Valero Energy Corp.,3.4%, 15/09/2026 1,373,000 1,318,039 0.55Valero Energy Corp.,4.9%, 15/03/2045 1,034,000 1,023,148 0.43
3,861,175 1.61
Other Banks & Diversified FinancialsBPCE S.A.,4.5%, 15/03/2025 USD 303,000 296,041 0.12Citigroup, Inc.,4.4%, 10/06/2025 1,000,000 1,013,160 0.42Citigroup, Inc.,3.2%, 21/10/2026 2,306,000 2,184,319 0.91Citizens Bank N.A.,2.55%, 13/05/2021 502,000 499,789 0.21Citizens Financial Group, Inc.,2.375%, 28/07/2021 941,000 925,365 0.38Citizens Financial Group, Inc.,4.3%, 3/12/2025 460,000 467,006 0.19Discover Bank,7%, 15/04/2020 650,000 723,042 0.30Discover Bank,3.1%, 4/06/2020 523,000 530,097 0.22Discover Bank,4.25%, 13/03/2026 314,000 319,914 0.13Discover Bank,3.45%, 27/07/2026 1,399,000 1,347,655 0.56Discover Financial Services,3.75%, 4/03/2025 185,000 180,680 0.08Groupe BPCE S.A.,12.5% to 30/09/2019,FRN to 29/08/2049 350,000 428,750 0.18Macquarie Bank Ltd.,1.6%, 27/10/2017 679,000 679,500 0.28SunTrust Banks, Inc.,2.7%, 27/01/2022 2,885,000 2,873,561 1.20SunTrust Banks, Inc.,3.3%, 15/05/2026 665,000 642,073 0.27
13,110,952 5.45
Personal Computers & PeripheralsEquifax, Inc.,2.3%, 1/06/2021 USD 300,000 295,363 0.12
PharmaceuticalsActavis Funding SCS,2.45%, 15/06/2019 USD 412,000 415,424 0.17Actavis, Inc.,1.875%, 1/10/2017 300,000 300,575 0.13Biogen, Inc.,3.625%, 15/09/2022 635,000 654,316 0.27Celgene Corp.,2.875%, 15/08/2020 942,000 956,923 0.40EMD Finance LLC,2.95%, 19/03/2022 677,000 675,064 0.28Forest Laboratories, Inc.,4.375%, 1/02/2019 1,218,000 1,264,792 0.53
108 MFS Meridian Funds Annual Report 2017

SCHEDULES OF INVESTMENTS 31 January 2017
MFS Meridian Funds – U.S. Corporate Bond Fund, continued
Name of SecurityTransferable Securities and Money MarketInstruments traded on a Regulated Market Shares/Par
MarketValue ($)
NetAssets (%)
Pharmaceuticals, continuedGilead Sciences, Inc.,3.65%, 1/03/2026 USD 813,000 826,244 0.34Gilead Sciences, Inc.,4.5%, 1/02/2045 456,000 455,078 0.19Shire Acquisitions Investments Ireland,2.4%, 23/09/2021 964,000 936,089 0.39
6,484,505 2.70
Precious Metals & MineralsTeck Resources Ltd.,4.5%, 15/01/2021 USD 1,194,000 1,214,895 0.50Teck Resources Ltd.,6%, 15/08/2040 545,000 546,363 0.23
1,761,258 0.73
Railroad & ShippingCanadian Pacific Railway Co.,7.25%, 15/05/2019 USD 750,000 835,909 0.35
Real Estate – OfficeBoston Properties LP, REIT,3.7%, 15/11/2018 USD 273,000 280,633 0.12
Real Estate – OtherHost Hotels & Resorts, Inc., REIT,4%, 15/06/2025 USD 206,000 204,246 0.08
Real Estate – RetailDDR Corp., REIT,3.625%, 1/02/2025 USD 689,000 666,705 0.28Simon Property Group, Inc., REIT,4.375%, 1/03/2021 1,000,000 1,072,383 0.44
1,739,088 0.72
RetailersBest Buy Co., Inc.,5%, 1/08/2018 USD 650,000 678,828 0.28Best Buy Co., Inc.,5.5%, 15/03/2021 1,703,000 1,850,706 0.77Dollar General Corp.,4.125%, 15/07/2017 450,000 455,521 0.19Dollar General Corp.,4.15%, 1/11/2025 1,000,000 1,025,638 0.43Home Depot, Inc.,2%, 15/06/2019 2,100,000 2,117,539 0.88Home Depot, Inc.,4.875%, 15/02/2044 500,000 558,222 0.23
6,686,454 2.78
Telecommunications – WirelessAmerican Tower Corp., REIT,3.5%, 31/01/2023 USD 1,000,000 1,002,856 0.42American Tower Corp., REIT,4%, 1/06/2025 664,000 665,285 0.28Crown Castle International Corp.,2.25%, 1/09/2021 1,068,000 1,034,151 0.43Crown Castle International Corp.,5.25%, 15/01/2023 570,000 619,191 0.26Crown Castle International Corp.,4.45%, 15/02/2026 1,256,000 1,295,833 0.54SBA Tower Trust,2.898%, 15/10/2044 775,000 780,368 0.32T-Mobile USA, Inc.,6%, 15/04/2024 1,586,000 1,685,125 0.70
7,082,809 2.95
TobaccoAltria Group, Inc.,2.95%, 2/05/2023 USD 435,000 434,010 0.18Altria Group, Inc.,4%, 31/01/2024 400,000 419,326 0.17
Name of SecurityTransferable Securities and Money MarketInstruments traded on a Regulated Market Shares/Par
MarketValue ($)
NetAssets (%)
Tobacco, continuedImperial Tobacco Finance PLC,4.25%, 21/07/2025 USD 862,000 887,288 0.37Philip Morris International, Inc.,4.875%, 15/11/2043 359,000 382,574 0.16Reynolds American, Inc.,8.125%, 23/06/2019 403,000 457,687 0.19Reynolds American, Inc.,6.875%, 1/05/2020 250,000 283,911 0.12Reynolds American, Inc.,3.25%, 12/06/2020 1,589,000 1,629,729 0.68Reynolds American, Inc.,4.45%, 12/06/2025 204,000 213,824 0.09Reynolds American, Inc.,5.7%, 15/08/2035 260,000 297,468 0.12
5,005,817 2.08
Transportation – ServicesERAC USA Finance LLC,6.375%, 15/10/2017 USD 400,000 413,112 0.17ERAC USA Finance LLC,3.85%, 15/11/2024 1,000,000 1,015,776 0.42ERAC USA Finance LLC,7%, 15/10/2037 105,000 133,191 0.06ERAC USA Finance LLC,4.5%, 15/02/2045 99,000 95,003 0.04
1,657,082 0.69
U.S. Treasury ObligationsU.S. Treasury Bonds,3.5%, 15/02/2039 USD 1,767,000 1,932,587 0.80U.S. Treasury Bonds,2.25%, 15/08/2046 1,250,000 1,051,368 0.44U.S. Treasury Notes,2.5%, 15/08/2023 2,000,000 2,036,328 0.85
5,020,283 2.09
Utilities – Electric PowerAlabama Power Co.,4.15%, 15/08/2044 USD 165,000 168,121 0.07American Electric Power Co., Inc.,1.65%, 15/12/2017 800,000 799,861 0.33Berkshire Hathaway Energy,4.5%, 1/02/2045 465,000 483,297 0.20CMS Energy Corp.,5.05%, 15/03/2022 200,000 219,104 0.09Dominion Resources, Inc.,2.5%, 1/12/2019 800,000 809,958 0.34Duke Energy Corp.,1.625%, 15/08/2017 205,000 205,178 0.09Duke Energy Corp.,3.75%, 1/09/2046 818,000 741,906 0.31EDP Finance B.V.,5.25%, 14/01/2021 462,000 491,736 0.20Emera U.S. Finance LP,2.7%, 15/06/2021 415,000 411,813 0.17Emera U.S. Finance LP,3.55%, 15/06/2026 474,000 464,611 0.19PPL Capital Funding, Inc.,4.2%, 15/06/2022 1,300,000 1,372,964 0.57PPL Capital Funding, Inc.,3.1%, 15/05/2026 728,000 698,496 0.29PPL Capital Funding, Inc.,5%, 15/03/2044 221,000 231,275 0.10PSEG Power LLC,3%, 15/06/2021 2,500,000 2,515,190 1.05Public Service Enterprise Group,2%, 15/11/2021 1,388,000 1,346,275 0.56
MFS Meridian Funds Annual Report 2017 109

SCHEDULES OF INVESTMENTS 31 January 2017
MFS Meridian Funds – U.S. Corporate Bond Fund, continued
Name of SecurityTransferable Securities and Money MarketInstruments traded on a Regulated Market Shares/Par
MarketValue ($)
NetAssets (%)
Utilities – Electric Power, continuedSouthern Co.,2.95%, 1/07/2023 USD 426,000 419,871 0.17Southern Co.,4.4%, 1/07/2046 785,000 776,791 0.32
12,156,447 5.05
Total Bonds(Identified Cost, $236,584,805) 234,333,582 97.44
SHORT-TERM OBLIGATIONS (y)General Electric Co.,0.58%, 1/02/2017, at Amortized Costand Value USD 1,781,000 1,781,000 0.74
Total Transferable Securities andMoney Market Instruments Tradedon a Regulated Market(Identified Cost, $238,365,805) 236,114,582 98.18
OTHER ASSETS, LESS LIABILITIES 4,380,865 1.82
NET ASSETS 240,495,447 100.00
See Schedules of Investments Footnotes and Notes to Financial Statements
MFS Meridian Funds – U.S. Equity Income Fund
(Expressed in U.S. Dollars)
Name of SecurityTransferable Securities and Money MarketInstruments traded on a Regulated Market Shares/Par
MarketValue ($)
NetAssets (%)
COMMON STOCKS
AerospaceL3 Technologies, Inc. 198 31,421 0.77Northrop Grumman Corp. 429 98,275 2.42United Technologies Corp. 340 37,288 0.92
166,984 4.11
AirlinesCopa Holdings S.A., “A” 523 50,987 1.25
AutomotiveGeneral Motors Co. 927 33,937 0.83Hyundai Motor Co. Ltd. 199 23,888 0.59Kia Motors Corp. 990 31,009 0.76
88,834 2.18
BiotechnologyCelgene Corp. 288 33,449 0.82Gilead Sciences, Inc. 264 19,127 0.47
52,576 1.29
Business ServicesAccenture PLC, “A” 278 31,656 0.78
Cable TVCharter Communications, Inc., “A” 278 90,058 2.22Comcast Corp., “A” 1,161 87,563 2.15
177,621 4.37
Computer SoftwareCA, Inc. 325 10,163 0.25Check Point Software Technologies Ltd. 657 64,892 1.59Intuit, Inc. 123 14,585 0.36Microsoft Corp. 1,303 84,239 2.07
173,879 4.27
Computer Software – SystemsApple, Inc. 259 31,430 0.77
Name of SecurityTransferable Securities and Money MarketInstruments traded on a Regulated Market Shares/Par
MarketValue ($)
NetAssets (%)
Computer Software – Systems, continuedHewlett Packard Enterprise 2,436 55,248 1.36International Business Machines Corp. 199 34,729 0.85Seagate Technology PLC 374 16,886 0.42
138,293 3.40
ConstructionOwens Corning 1,559 86,135 2.12
Consumer ProductsProcter & Gamble Co. 713 62,459 1.54
Electrical EquipmentMSC Industrial Direct Co., Inc., “A” 131 13,382 0.33
ElectronicsIntel Corp. 922 33,948 0.84Taiwan Semiconductor Manufacturing Co.Ltd., ADR 2,230 68,929 1.69
102,877 2.53
Energy – IndependentGalp Energia SGPS S.A., “B” 1,386 20,378 0.50Occidental Petroleum Corp. 254 17,214 0.42Rice Energy, Inc. 939 18,620 0.46Valero Energy Corp. 204 13,415 0.33
69,627 1.71
Energy – IntegratedBP PLC 10,560 62,816 1.54
Food & BeveragesArcher Daniels Midland Co. 1,210 53,555 1.32Marine Harvest 2,240 39,596 0.97
93,151 2.29
Food & Drug StoresCVS Health Corp. 469 36,962 0.91
110 MFS Meridian Funds Annual Report 2017

SCHEDULES OF INVESTMENTS 31 January 2017
MFS Meridian Funds – U.S. Equity Income Fund, continued
Name of SecurityTransferable Securities and Money MarketInstruments traded on a Regulated Market Shares/Par
MarketValue ($)
NetAssets (%)
General MerchandiseTarget Corp. 514 33,143 0.82Wal-Mart Stores, Inc. 270 18,020 0.44
51,163 1.26
InsuranceMetLife, Inc. 1,872 101,856 2.51Prudential Financial, Inc. 376 39,521 0.97Zurich Insurance Group AG 196 56,153 1.38
197,530 4.86
InternetAlphabet, Inc., “A” 34 27,886 0.69Facebook, Inc., “A” 840 109,469 2.69
137,355 3.38
Machinery & ToolsAllison Transmission Holdings, Inc. 515 18,015 0.44Cummins, Inc. 58 8,527 0.21
26,542 0.65
Major BanksBank of America Corp. 4,672 105,774 2.60BNP Paribas 269 17,185 0.42JPMorgan Chase & Co. 676 57,210 1.41Morgan Stanley 2,205 93,690 2.31Royal Bank of Canada 323 23,224 0.57Sumitomo Mitsui Financial Group, Inc. 900 35,479 0.87
332,562 8.18
Medical & Health Technology & ServicesHCA Holdings, Inc. 130 10,436 0.26McKesson Corp. 56 7,792 0.19
18,228 0.45
Medical EquipmentAbbott Laboratories 971 40,559 1.00
Metals & MiningRio Tinto Ltd. 795 34,914 0.86
Natural Gas – DistributionEngie 1,587 18,956 0.47
Natural Gas – PipelineEnterprise Products Partners LP 1,456 41,248 1.02Plains All American Pipeline LP 451 14,157 0.35Western Gas Equity Partners LP 314 19,273 0.47Williams Partners LP 766 31,437 0.77
106,115 2.61
Network & TelecomCisco Systems, Inc. 3,820 117,350 2.88Motorola Solutions, Inc. 242 19,532 0.48
136,882 3.36
Other Banks & Diversified FinancialsDiscover Financial Services 774 53,623 1.32UBS AG 2,174 35,085 0.86
88,708 2.18
PharmaceuticalsBayer AG 519 57,315 1.41Bristol-Myers Squibb Co. 419 20,598 0.51Eli Lilly & Co. 1,297 99,908 2.46Johnson & Johnson 94 10,646 0.26Merck & Co., Inc. 1,939 120,199 2.95Pfizer, Inc. 1,097 34,808 0.85
343,474 8.44
Name of SecurityTransferable Securities and Money MarketInstruments traded on a Regulated Market Shares/Par
MarketValue ($)
NetAssets (%)
Printing & PublishingTranscontinental, Inc., “A” 1,184 19,717 0.48
Railroad & ShippingUnion Pacific Corp. 330 35,171 0.86
Real EstateAnnaly Mortgage Management, Inc., REIT 1,529 15,626 0.38LaSalle Hotel Properties, REIT 593 17,891 0.44Medical Properties Trust, Inc., REIT 5,905 75,289 1.85Starwood Property Trust, Inc., REIT 1,872 41,671 1.02Store Capital Corp., REIT 1,282 30,332 0.75Washington Prime Group, Inc., REIT 2,898 27,966 0.69
208,775 5.13
RestaurantsBrinker International, Inc. 605 26,923 0.66YUM! Brands, Inc. 330 21,625 0.53
48,548 1.19
Specialty StoresBest Buy Co., Inc. 1,209 53,825 1.32Gap, Inc. 3,542 81,572 2.01Ross Stores, Inc. 739 48,855 1.20
184,252 4.53
Telephone ServicesFrontier Communications Corp. 3,546 12,376 0.30TDC A.S. 2,987 15,719 0.39Telefonica Brasil S.A., ADR 1,138 16,820 0.41Verizon Communications, Inc. 1,652 80,965 1.99
125,880 3.09
TobaccoAltria Group, Inc. 1,597 113,674 2.79Japan Tobacco, Inc. 300 9,671 0.24Philip Morris International, Inc. 1,200 115,356 2.84
238,701 5.87
Utilities – Electric PowerAmerican Electric Power Co., Inc. 606 38,820 0.95Exelon Corp. 1,548 55,542 1.37FirstEnergy Corp. 690 20,921 0.51PPL Corp. 1,187 41,355 1.02SSE PLC 898 16,821 0.41
173,459 4.26
Total Common Stocks(Identified Cost, $3,741,050) 3,975,730 97.73
CONVERTIBLE PREFERRED STOCKS
Food & BeveragesTyson Foods, Inc.,4.75% 350 23,856 0.59
PharmaceuticalsAllergan PLC,5.5% 25 19,787 0.49
Telephone ServicesFrontier Communications Corp.,11.125% 78 5,703 0.14
Utilities – Electric PowerExelon Corp.,6.5% 668 33,113 0.81
Total Convertible Preferred Stocks(Identified Cost, $82,235) 82,459 2.03
MFS Meridian Funds Annual Report 2017 111

SCHEDULES OF INVESTMENTS 31 January 2017
MFS Meridian Funds – U.S. Equity Income Fund, continued
Name of SecurityTransferable Securities and Money MarketInstruments traded on a Regulated Market Shares/Par
MarketValue ($)
NetAssets (%)
SHORT-TERM OBLIGATIONS (y)General Electric Co.,0.58%, 1/02/2017, at Amortized Costand Value USD 54,000 54,000 1.33
Total Transferable Securities andMoney Market Instruments Tradedon a Regulated Market(Identified Cost, $3,877,285) 4,112,189 101.09
OTHER ASSETS, LESS LIABILITIES (44,173) (1.09)
NET ASSETS 4,068,016 100.00
See Schedules of Investments Footnotes and Notes to Financial Statements
MFS Meridian Funds – U.S. Equity Opportunities Fund(Expressed in U.S. Dollars)
Name of SecurityTransferable Securities and Money MarketInstruments traded on a Regulated Market Shares/Par
MarketValue ($)
NetAssets (%)
COMMON STOCKS
AerospaceNorthrop Grumman Corp. 2,089 478,548 3.05
BiotechnologyCelgene Corp. 3,502 406,757 2.59
Brokerage & Asset ManagersApollo Global Management LLC, “A” 20,136 427,689 2.72
Business ServicesEquifax, Inc. 3,384 396,875 2.53Fiserv, Inc. 3,596 386,318 2.46FleetCor Technologies, Inc. 2,687 396,306 2.52Travelport Worldwide Ltd. 25,864 371,407 2.36WEX, Inc. 4,158 475,384 3.02
2,026,290 12.89
Computer SoftwareIntuit, Inc. 3,433 407,085 2.59
Computer Software – SystemsHewlett Packard Enterprise 19,856 450,334 2.87
ConstructionOwens Corning 8,081 446,475 2.84Toll Brothers, Inc. 12,699 398,241 2.53
844,716 5.37
Consumer ServicesPriceline Group, Inc. 293 461,513 2.94
Energy – IndependentAnadarko Petroleum Corp. 5,958 414,260 2.64Rice Energy, Inc. 18,345 363,781 2.31
778,041 4.95
Food & BeveragesJ.M. Smucker Co. 2,459 334,055 2.12PepsiCo, Inc. 3,962 411,176 2.62
745,231 4.74
InsuranceHartford Financial Services Group, Inc. 7,910 385,296 2.45MetLife, Inc. 4,484 243,974 1.55Unum Group 10,163 461,704 2.94XL Group Ltd. 10,868 408,311 2.60
1,499,285 9.54
Name of SecurityTransferable Securities and Money MarketInstruments traded on a Regulated Market Shares/Par
MarketValue ($)
NetAssets (%)
Leisure & ToysElectronic Arts, Inc. 5,302 442,346 2.81
Machinery & ToolsAllison Transmission Holdings, Inc. 10,915 381,807 2.43Regal Beloit Corp. 4,432 321,763 2.04SPX Corp. 15,167 378,417 2.41
1,081,987 6.88
Major BanksBank of America Corp. 25,939 587,259 3.73Morgan Stanley 9,604 408,074 2.60
995,333 6.33
Natural Gas – PipelineWestern Gas Equity Partners LP 7,015 430,581 2.74
Other Banks & Diversified FinancialsDiscover Financial Services 5,893 408,267 2.60
PharmaceuticalsEli Lilly & Co. 4,536 349,408 2.22Merck & Co., Inc. 5,297 328,361 2.09
677,769 4.31
Real EstateEquity Lifestyle Properties, Inc., REIT 4,889 361,493 2.30Medical Properties Trust, Inc., REIT 24,047 306,599 1.95STAG Industrial, Inc., REIT 17,383 402,243 2.56Store Capital Corp., REIT 2,448 57,920 0.37Washington Prime Group, Inc., REIT 33,310 321,442 2.04
1,449,697 9.22
Specialty ChemicalsA. Schulman, Inc. 11,180 385,710 2.45
Utilities – Electric PowerDTE Energy Co. 4,151 409,455 2.61Exelon Corp. 11,044 396,259 2.52FirstEnergy Corp. 12,650 383,548 2.44
1,189,262 7.57
Total Common Stocks(Identified Cost, $14,303,765) 15,586,441 99.16
112 MFS Meridian Funds Annual Report 2017
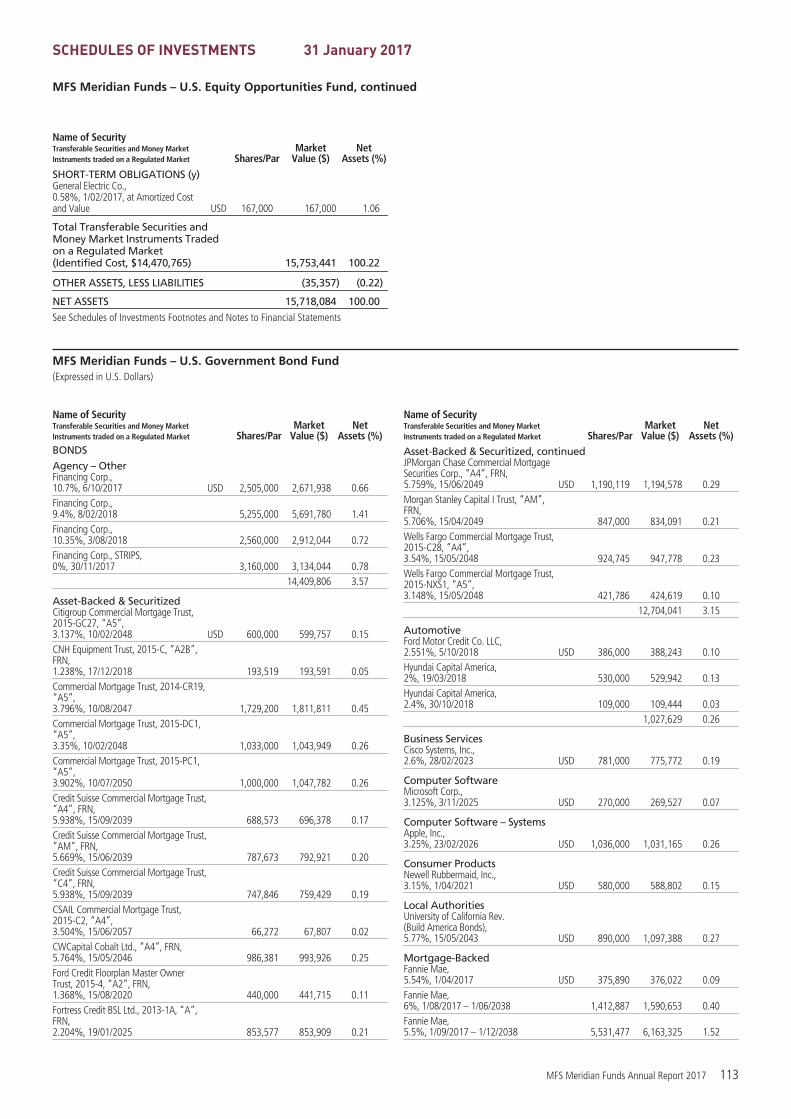
SCHEDULES OF INVESTMENTS 31 January 2017
MFS Meridian Funds – U.S. Equity Opportunities Fund, continued
Name of SecurityTransferable Securities and Money MarketInstruments traded on a Regulated Market Shares/Par
MarketValue ($)
NetAssets (%)
SHORT-TERM OBLIGATIONS (y)General Electric Co.,0.58%, 1/02/2017, at Amortized Costand Value USD 167,000 167,000 1.06
Total Transferable Securities andMoney Market Instruments Tradedon a Regulated Market(Identified Cost, $14,470,765) 15,753,441 100.22
OTHER ASSETS, LESS LIABILITIES (35,357) (0.22)
NET ASSETS 15,718,084 100.00
See Schedules of Investments Footnotes and Notes to Financial Statements
MFS Meridian Funds – U.S. Government Bond Fund(Expressed in U.S. Dollars)
Name of SecurityTransferable Securities and Money MarketInstruments traded on a Regulated Market Shares/Par
MarketValue ($)
NetAssets (%)
BONDSAgency – OtherFinancing Corp.,10.7%, 6/10/2017 USD 2,505,000 2,671,938 0.66Financing Corp.,9.4%, 8/02/2018 5,255,000 5,691,780 1.41Financing Corp.,10.35%, 3/08/2018 2,560,000 2,912,044 0.72Financing Corp., STRIPS,0%, 30/11/2017 3,160,000 3,134,044 0.78
14,409,806 3.57
Asset-Backed & SecuritizedCitigroup Commercial Mortgage Trust,2015-GC27, “A5”,3.137%, 10/02/2048 USD 600,000 599,757 0.15CNH Equipment Trust, 2015-C, “A2B”,FRN,1.238%, 17/12/2018 193,519 193,591 0.05Commercial Mortgage Trust, 2014-CR19,“A5”,3.796%, 10/08/2047 1,729,200 1,811,811 0.45Commercial Mortgage Trust, 2015-DC1,“A5”,3.35%, 10/02/2048 1,033,000 1,043,949 0.26Commercial Mortgage Trust, 2015-PC1,“A5”,3.902%, 10/07/2050 1,000,000 1,047,782 0.26Credit Suisse Commercial Mortgage Trust,“A4”, FRN,5.938%, 15/09/2039 688,573 696,378 0.17Credit Suisse Commercial Mortgage Trust,“AM”, FRN,5.669%, 15/06/2039 787,673 792,921 0.20Credit Suisse Commercial Mortgage Trust,“C4”, FRN,5.938%, 15/09/2039 747,846 759,429 0.19CSAIL Commercial Mortgage Trust,2015-C2, “A4”,3.504%, 15/06/2057 66,272 67,807 0.02CWCapital Cobalt Ltd., “A4”, FRN,5.764%, 15/05/2046 986,381 993,926 0.25Ford Credit Floorplan Master OwnerTrust, 2015-4, “A2”, FRN,1.368%, 15/08/2020 440,000 441,715 0.11Fortress Credit BSL Ltd., 2013-1A, “A”,FRN,2.204%, 19/01/2025 853,577 853,909 0.21
Name of SecurityTransferable Securities and Money MarketInstruments traded on a Regulated Market Shares/Par
MarketValue ($)
NetAssets (%)
Asset-Backed & Securitized, continuedJPMorgan Chase Commercial MortgageSecurities Corp., “A4”, FRN,5.759%, 15/06/2049 USD 1,190,119 1,194,578 0.29Morgan Stanley Capital I Trust, “AM”,FRN,5.706%, 15/04/2049 847,000 834,091 0.21Wells Fargo Commercial Mortgage Trust,2015-C28, “A4”,3.54%, 15/05/2048 924,745 947,778 0.23Wells Fargo Commercial Mortgage Trust,2015-NXS1, “A5”,3.148%, 15/05/2048 421,786 424,619 0.10
12,704,041 3.15
AutomotiveFord Motor Credit Co. LLC,2.551%, 5/10/2018 USD 386,000 388,243 0.10Hyundai Capital America,2%, 19/03/2018 530,000 529,942 0.13Hyundai Capital America,2.4%, 30/10/2018 109,000 109,444 0.03
1,027,629 0.26
Business ServicesCisco Systems, Inc.,2.6%, 28/02/2023 USD 781,000 775,772 0.19
Computer SoftwareMicrosoft Corp.,3.125%, 3/11/2025 USD 270,000 269,527 0.07
Computer Software – SystemsApple, Inc.,3.25%, 23/02/2026 USD 1,036,000 1,031,165 0.26
Consumer ProductsNewell Rubbermaid, Inc.,3.15%, 1/04/2021 USD 580,000 588,802 0.15
Local AuthoritiesUniversity of California Rev.(Build America Bonds),5.77%, 15/05/2043 USD 890,000 1,097,388 0.27
Mortgage-BackedFannie Mae,5.54%, 1/04/2017 USD 375,890 376,022 0.09Fannie Mae,6%, 1/08/2017 – 1/06/2038 1,412,887 1,590,653 0.40Fannie Mae,5.5%, 1/09/2017 – 1/12/2038 5,531,477 6,163,325 1.52
MFS Meridian Funds Annual Report 2017 113

SCHEDULES OF INVESTMENTS 31 January 2017
MFS Meridian Funds – U.S. Government Bond Fund, continued
Name of SecurityTransferable Securities and Money MarketInstruments traded on a Regulated Market Shares/Par
MarketValue ($)
NetAssets (%)
Mortgage-Backed, continuedFannie Mae,2.71%, 1/11/2017 USD 192,126 192,947 0.05Fannie Mae,5.37%, 1/05/2018 191,119 196,671 0.05Fannie Mae,3.828%, 1/07/2018 1,032,315 1,058,958 0.26Fannie Mae,2.578%, 25/09/2018 1,282,729 1,295,053 0.32Fannie Mae,4.5%, 1/10/2018 – 1/06/2044 15,558,679 16,758,472 4.15Fannie Mae,5.51%, 1/03/2019 285,436 302,279 0.08Fannie Mae,5.08%, 1/04/2019 221,942 236,585 0.06Fannie Mae,5%, 1/07/2019 – 1/03/2042 5,899,201 6,442,431 1.60Fannie Mae,4.829%, 1/08/2019 1,076,319 1,147,741 0.28Fannie Mae,4.83%, 1/08/2019 – 1/09/2019 464,818 495,489 0.12Fannie Mae,5.05%, 1/08/2019 212,914 227,709 0.06Fannie Mae,4.6%, 1/09/2019 477,800 506,474 0.13Fannie Mae,4.67%, 1/09/2019 361,176 384,193 0.10Fannie Mae,4.94%, 1/09/2019 123,872 132,377 0.03Fannie Mae,4.45%, 1/10/2019 333,595 353,605 0.09Fannie Mae,5.19%, 1/09/2020 301,551 321,112 0.08Fannie Mae,3.99%, 1/07/2021 272,175 290,854 0.07Fannie Mae,2.152%, 25/01/2023 849,000 833,945 0.21Fannie Mae,2.41%, 1/05/2023 268,465 266,348 0.07Fannie Mae,2.55%, 1/05/2023 230,621 230,565 0.06Fannie Mae,2.59%, 1/05/2023 147,181 147,450 0.04Fannie Mae,3.78%, 1/10/2023 185,638 195,924 0.05Fannie Mae,4.5%, 1/05/2025 123,449 130,284 0.03Fannie Mae,3.59%, 1/09/2026 215,665 225,499 0.06Fannie Mae,3%, 1/03/2027 – 1/11/2046 20,956,782 21,255,442 5.28Fannie Mae,6.5%, 1/02/2032 – 1/10/2037 791,192 904,818 0.22Fannie Mae,4%, 1/09/2040 – 1/02/2045 29,170,179 30,714,472 7.63Fannie Mae,3.5%, 1/01/2042 – 1/10/2046 19,265,311 19,742,914 4.89Fannie Mae, FRN,1.121%, 25/05/2018 713,827 713,878 0.18Freddie Mac,3.154%, 25/02/2018 1,128,489 1,143,274 0.28Freddie Mac,2.699%, 25/05/2018 1,173,752 1,188,879 0.30Freddie Mac,5%, 1/07/2018 – 1/07/2041 2,258,457 2,465,319 0.60
Name of SecurityTransferable Securities and Money MarketInstruments traded on a Regulated Market Shares/Par
MarketValue ($)
NetAssets (%)
Mortgage-Backed, continuedFreddie Mac,2.412%, 25/08/2018 USD 2,755,216 2,785,306 0.69Freddie Mac,2.303%, 25/09/2018 749,952 757,970 0.19Freddie Mac,2.323%, 25/10/2018 1,212,435 1,226,906 0.30Freddie Mac,1.72%, 25/01/2019 977,629 980,717 0.24Freddie Mac,2.13%, 25/01/2019 1,982,586 1,999,901 0.50Freddie Mac,5.085%, 25/03/2019 425,000 449,712 0.11Freddie Mac,6%, 1/08/2019 – 1/06/2038 1,199,153 1,344,238 0.32Freddie Mac,2.456%, 25/08/2019 723,000 733,405 0.18Freddie Mac,3.808%, 25/08/2020 485,000 513,004 0.13Freddie Mac,3.034%, 25/10/2020 2,566,000 2,655,641 0.66Freddie Mac,5.5%, 1/04/2021 – 1/06/2036 900,668 999,745 0.25Freddie Mac,2.791%, 25/01/2022 1,157,000 1,185,500 0.29Freddie Mac,2.716%, 25/06/2022 804,344 820,777 0.20Freddie Mac,2.682%, 25/10/2022 393,000 399,223 0.10Freddie Mac,4.5%, 1/11/2022 – 1/05/2042 3,232,976 3,473,779 0.86Freddie Mac,2.51%, 25/11/2022 1,110,000 1,119,164 0.28Freddie Mac,2.637%, 25/01/2023 1,200,000 1,215,543 0.30Freddie Mac,3.32%, 25/02/2023 971,000 1,018,620 0.25Freddie Mac,3.3%, 25/04/2023 – 25/10/2026 2,510,790 2,599,959 0.64Freddie Mac,3.06%, 25/07/2023 946,000 976,086 0.24Freddie Mac,3.531%, 25/07/2023 1,700,000 1,800,804 0.45Freddie Mac,2.454%, 25/08/2023 950,000 945,266 0.23Freddie Mac,3.458%, 25/08/2023 2,610,000 2,750,747 0.68Freddie Mac,2.67%, 25/12/2024 1,828,000 1,821,908 0.45Freddie Mac,2.811%, 25/01/2025 1,444,000 1,448,420 0.36Freddie Mac,3.329%, 25/05/2025 1,512,000 1,571,671 0.39Freddie Mac,4%, 1/07/2025 – 1/04/2044 2,596,840 2,729,418 0.68Freddie Mac,3.01%, 25/07/2025 450,000 456,777 0.11Freddie Mac,2.745%, 25/01/2026 1,649,000 1,654,100 0.41Freddie Mac,2.673%, 25/03/2026 1,000,000 983,165 0.24Freddie Mac,6.5%, 1/05/2037 29,380 33,118 0.01Freddie Mac,3.5%, 1/12/2041 – 1/01/2047 19,124,859 19,576,235 4.86Freddie Mac,3%, 1/04/2043 – 1/11/2046 12,507,006 12,412,240 3.08
114 MFS Meridian Funds Annual Report 2017

SCHEDULES OF INVESTMENTS 31 January 2017
MFS Meridian Funds – U.S. Government Bond Fund, continued
Name of SecurityTransferable Securities and Money MarketInstruments traded on a Regulated Market Shares/Par
MarketValue ($)
NetAssets (%)
Mortgage-Backed, continuedGinnie Mae,5.5%, 15/01/2033 – 20/01/2042 USD 998,051 1,121,696 0.28Ginnie Mae,4.5%, 15/08/2039 – 20/07/2041 3,038,015 3,302,498 0.82Ginnie Mae,4%, 15/10/2039 – 20/04/2041 542,145 574,598 0.15Ginnie Mae,3.5%, 15/12/2041 – 20/05/2046 11,616,464 12,062,135 2.99Ginnie Mae,3%, 20/07/2043 1,571,939 1,592,001 0.40Ginnie Mae,6.157%, 20/04/2058 32,309 34,717 0.01
212,758,671 52.77
Other Banks & Diversified FinancialsBanque Federative du Credit MutuelS.A.,2.5%, 13/04/2021 USD 667,000 659,423 0.16
RestaurantsMcDonald’s Corp.,2.75%, 9/12/2020 USD 207,000 209,981 0.05
SupranationalInter-American Development Bank,4.375%, 24/01/2044 USD 442,000 511,522 0.13
U.S. Government Agencies and EquivalentsAID-Tunisia,2.452%, 24/07/2021 USD 530,000 539,146 0.13AID-Ukraine,1.844%, 16/05/2019 1,084,000 1,082,516 0.27AID-Ukraine,1.847%, 29/05/2020 720,000 718,194 0.18Hashemite Kingdom of Jordan,1.945%, 23/06/2019 833,000 841,545 0.21Hashemite Kingdom of Jordan,2.503%, 30/10/2020 1,044,000 1,068,766 0.27Private Export Funding Corp.,2.25%, 15/03/2020 220,000 223,593 0.06Private Export Funding Corp.,2.3%, 15/09/2020 570,000 578,126 0.14Private Export Funding Corp.,1.875%, 15/07/2018 1,060,000 1,067,727 0.27Small Business Administration,4.98%, 1/11/2023 93,311 99,528 0.02Small Business Administration,4.89%, 1/12/2023 194,019 204,329 0.05Small Business Administration,4.77%, 1/04/2024 226,421 236,692 0.06Small Business Administration,4.99%, 1/09/2024 138,190 145,164 0.04Small Business Administration,4.86%, 1/10/2024 83,375 87,495 0.02Small Business Administration,4.86%, 1/01/2025 131,216 137,962 0.03Small Business Administration,5.11%, 1/04/2025 157,376 166,891 0.04Small Business Administration,5.16%, 1/02/2028 404,802 435,374 0.11Small Business Administration,2.21%, 1/02/2033 576,879 562,151 0.14Small Business Administration,2.22%, 1/03/2033 1,004,205 978,678 0.24Small Business Administration,3.15%, 1/07/2033 764,895 784,911 0.19Tennessee Valley Authority,1.75%, 15/10/2018 725,000 731,742 0.18
10,690,530 2.65
Name of SecurityTransferable Securities and Money MarketInstruments traded on a Regulated Market Shares/Par
MarketValue ($)
NetAssets (%)
U.S. Treasury ObligationsU.S. Treasury Bonds,6.25%, 15/08/2023 USD 857,000 1,071,217 0.27U.S. Treasury Bonds,6%, 15/02/2026 62,000 80,045 0.02U.S. Treasury Bonds,6.75%, 15/08/2026 614,000 839,285 0.21U.S. Treasury Bonds,4.375%, 15/02/2038 632,000 785,285 0.19U.S. Treasury Bonds,4.5%, 15/08/2039 3,408,300 4,281,145 1.06U.S. Treasury Bonds,3.75%, 15/08/2041 1,538,000 1,735,296 0.43U.S. Treasury Bonds,3.125%, 15/02/2043 1,870,700 1,898,469 0.47U.S. Treasury Bonds,2.875%, 15/05/2043 15,345,400 14,861,667 3.69U.S. Treasury Bonds,2.5%, 15/02/2045 9,334,000 8,334,609 2.07U.S. Treasury Notes,3.125%, 15/05/2019 8,128,000 8,455,981 2.10U.S. Treasury Notes,1%, 30/06/2019 7,206,000 7,148,294 1.77U.S. Treasury Notes,1.625%, 30/06/2019 24,565,000 24,722,363 6.13U.S. Treasury Notes,2.625%, 15/08/2020 13,614,000 14,079,327 3.49U.S. Treasury Notes,2%, 30/11/2020 3,919,000 3,961,251 0.98U.S. Treasury Notes,3.125%, 15/05/2021 9,621,000 10,138,504 2.51U.S. Treasury Notes,1.75%, 15/05/2022 1,194,000 1,179,354 0.29U.S. Treasury Notes,2.5%, 15/08/2023 30,834,000 31,394,069 7.79U.S. Treasury Notes,2.75%, 15/02/2024 1,176,000 1,214,266 0.30U.S. Treasury Notes,2.5%, 15/05/2024 5,143,000 5,221,148 1.30U.S. Treasury Notes,2%, 15/08/2025 670,000 648,853 0.16U.S. Treasury Notes,2.25%, 15/11/2025 1,973,000 1,945,640 0.48
143,996,068 35.71
Utilities – Electric PowerNextEra Energy Capital Holdings, Inc.,2.056%, 1/09/2017 USD 567,000 569,126 0.14
Total Bonds(Identified Cost, $410,144,298) 401,299,451 99.53
Total Transferable Securities andMoney Market Instruments Tradedon a Regulated Market(Identified Cost, $410,144,298) 401,299,451 99.53
OTHER ASSETS, LESS LIABILITIES 1,910,194 0.47
NET ASSETS 403,209,645 100.00
See Schedules of Investments Footnotes and Notes to Financial Statements
MFS Meridian Funds Annual Report 2017 115

SCHEDULES OF INVESTMENTS 31 January 2017
MFS Meridian Funds – U.S. Total Return Bond Fund(Expressed in U.S. Dollars)
Name of SecurityTransferable Securities and Money MarketInstruments traded on a Regulated Market Shares/Par
MarketValue ($)
NetAssets (%)
BONDSAerospaceTransDigm, Inc.,6.5%, 15/07/2024 USD 1,693,000 1,695,107 0.22
Asset-Backed & SecuritizedALM XIV Ltd., CLO, 2014-14A, “A1”, FRN,2.32%, 28/07/2026 USD 2,059,273 2,062,913 0.27ARI Fleet Lease Trust, 2015-A, “A2”,1.11%, 15/11/2018 741,674 741,183 0.10ARI Fleet Lease Trust, 2016-A, “A2”,1.82%, 15/07/2024 1,335,491 1,335,630 0.17Babson Ltd., CLO, FRN,2.13%, 20/04/2025 2,500,000 2,498,128 0.32Ballyrock Ltd., CLO, FRN,2.091%, 20/05/2025 1,500,000 1,498,194 0.19Banc of America Large Loan, Inc., FRN,5.325%, 24/02/2044 88,830 88,693 0.01Bayview Commercial Asset Trust, FRN,0%, 25/04/2036 (i) 243,594 895 0.00Bayview Commercial Asset Trust, FRN,0%, 25/07/2036 (i) 177,759 0 0.00Bayview Commercial Asset Trust, FRN,0%, 25/10/2036 (i) 455,385 0 0.00Bayview Commercial Asset Trust, FRN,0%, 25/12/2036 (i) 216,383 0 0.00Bayview Financial Revolving MortgageLoan Trust, FRN,2.202%, 28/12/2040 112,339 86,165 0.01Carlyle Global Market Strategies, 2013-3A,“A1A”, FRN,2.143%, 15/07/2025 1,566,125 1,566,091 0.20Cent CLO LP, 2014-16AR, “A1AR”, FRN,2.135%, 1/08/2024 1,259,260 1,256,832 0.16Chesapeake Funding II LLC, 2016-1A,“A1”,2.11%, 15/03/2028 1,970,000 1,967,547 0.25Chesapeake Funding LLC, “A”, FRN,1.215%, 7/01/2025 486,184 485,895 0.06Citigroup Commercial Mortgage Trust,2014-GC25, “A4”,3.635%, 10/10/2047 2,000,000 2,075,362 0.27Citigroup Commercial Mortgage Trust,2015-GC27, “A5”,3.137%, 10/02/2048 3,675,000 3,673,510 0.47Citigroup/Deutsche Bank CommercialMortgage Trust, FRN,5.366%, 11/12/2049 1,125,966 1,125,144 0.14Commercial Mortgage Asset Trust, FRN,0.571%, 17/01/2032 (i) 252,884 112 0.00Commercial Mortgage Pass-ThroughCertificates, “A4”,3.183%, 10/02/2048 3,819,000 3,852,504 0.49Commercial Mortgage Trust, 2014-CR19,“A5”,3.796%, 10/08/2047 2,514,530 2,634,660 0.34Commercial Mortgage Trust, 2014-UBS4,“A5”,3.694%, 10/08/2047 3,689,000 3,813,136 0.49Commercial Mortgage Trust, 2015-DC1,“A5”,3.35%, 10/02/2048 4,044,000 4,086,864 0.52Commercial Mortgage Trust, 2015-LC21,“A4”,3.708%, 10/07/2048 1,901,154 1,972,339 0.25Commercial Mortgage Trust, 2015-PC1,“A5”,3.902%, 10/07/2050 3,754,051 3,933,427 0.51Commercial Mortgage Trust, 2016-COR1,“A4”,3.091%, 10/10/2049 3,604,623 3,540,894 0.45Credit Suisse Commercial Mortgage Trust,“A4”, FRN,5.938%, 15/09/2039 1,826,925 1,847,633 0.24
Name of SecurityTransferable Securities and Money MarketInstruments traded on a Regulated Market Shares/Par
MarketValue ($)
NetAssets (%)
Asset-Backed & Securitized, continuedCredit Suisse Commercial Mortgage Trust,“AM”, FRN,5.669%, 15/06/2039 USD 1,730,602 1,742,132 0.22Credit Suisse Commercial Mortgage Trust,“C4”, FRN,5.938%, 15/09/2039 228,281 231,817 0.03Credit-Based Asset Servicing &Securitization LLC, FRN,5.303%, 25/12/2035 12,460 12,336 0.00CSAIL Commercial Mortgage Trust,2015-C2, “A4”,3.504%, 15/06/2057 600,929 614,845 0.08Cutwater Ltd., 2014-1A, “A1B” , FRN,2.383%, 15/07/2026 2,496,021 2,490,390 0.32CWCapital Cobalt Ltd., “A4”, FRN,5.764%, 15/05/2046 1,066,235 1,074,391 0.14Figueroa CLO Ltd., 2013-2A, “A1”, FRN,2.447%, 18/12/2025 1,150,000 1,149,654 0.15First Union National Bank CommercialMortgage Trust, FRN,2.477%, 12/01/2043 (i) 24,988 121 0.00First Union-Lehman Brothers Bank ofAmerica, FRN,1.095%, 18/11/2035 (i) 12,770 108 0.00Flatiron CLO Ltd., 2013-1A, “A1”, FRN,2.423%, 17/01/2026 1,290,833 1,290,069 0.17Flatiron CLO Ltd., 2013-1A, “A1R”, FRN,1%, 17/01/2026 2,033,235 2,032,031 0.26Ford Credit Auto Owner Trust,2014-2,“A”,2.31%, 15/04/2026 1,874,000 1,890,866 0.24Ford Credit Floorplan Master Owner Trust,2015-1, “A2”, FRN,1.168%, 15/01/2020 2,000,000 2,002,781 0.26Galaxy CLO Ltd., FRN,3.511%, 16/11/2025 1,710,000 1,681,613 0.22GE Capital Commercial Mortgage Corp.,“A”,5.543%, 10/12/2049 124,763 124,676 0.02GMF Floorplan Owner Revolving Trust,2017-1, “A2”, FRN,1.634%, 18/01/2022 4,776,000 4,775,522 0.61Greenwich Capital Commercial FundingCorp.,5.475%, 10/03/2039 217,576 217,463 0.03GS Mortgage Securities Trust, 2015-GC30, “A4”,3.382%, 10/05/2050 1,816,255 1,843,024 0.24Harley-Davidson Motorcycle Trust, “A2”,FRN,1.068%, 15/01/2019 48,838 48,839 0.01JPMBB Commercial Mortgage SecuritiesTrust, 2014-C26,3.494%, 15/01/2048 3,275,911 3,356,482 0.43JPMBB Commercial Mortgage SecuritiesTrust, 2015-C28, “A4”,3.227%, 15/10/2048 729,193 730,918 0.09JPMorgan Chase Commercial MortgageSecurities Corp., FRN,5.659%, 15/07/2042 77,703 19,966 0.00JPMorgan Chase Commercial MortgageSecurities Corp., FRN,5.734%, 12/02/2049 233,575 234,133 0.03JPMorgan Chase Commercial MortgageTrust, 2007-LD11, “AM”, FRN,5.759%, 15/06/2049 1,896,485 1,921,033 0.25Lehman Brothers Commercial ConduitMortgage Trust, FRN,1.152%, 18/02/2030 (i) 26,901 0 0.00Lehman Brothers Commercial ConduitMortgage Trust, FRN,1.477%, 15/10/2035 (i) 9,935 173 0.00
116 MFS Meridian Funds Annual Report 2017

SCHEDULES OF INVESTMENTS 31 January 2017
MFS Meridian Funds – U.S. Total Return Bond Fund, continued
Name of SecurityTransferable Securities and Money MarketInstruments traded on a Regulated Market Shares/Par
MarketValue ($)
NetAssets (%)
Asset-Backed & Securitized, continuedLoomis, Sayles & Co., CLO, “A1”, FRN,2.41%, 15/10/2027 USD 3,584,989 3,576,277 0.46Morgan Stanley Bank of America MerrillLynch Trust, 2015-C21, “A4”,3.338%, 15/03/2048 1,111,591 1,131,004 0.15Morgan Stanley Capital I Trust, “AM”,FRN,5.706%, 15/04/2049 2,619,000 2,579,086 0.33Morgan Stanley Capital I, Inc., FRN,1.531%, 15/03/2031 (i) 9,422 0 0.00Morgan Stanley Re-REMIC Trust, FRN,5.796%, 15/08/2045 2,676,065 2,681,317 0.34Motor PLC, 2015-1A, “A1”, FRN,1.371%, 25/06/2022 874,444 874,405 0.11Neuberger Berman CLO Ltd., 2014-17A,“A”, FRN,2.345%, 4/08/2025 2,925,000 2,925,102 0.38Nextgear Floorplan Master Owner Trust,2015-1A, “A”,1.8%, 15/07/2019 2,187,000 2,186,952 0.28Nextgear Floorplan Master Owner Trust,2015-2A, “A”,2.38%, 15/10/2020 1,860,000 1,872,147 0.24Nissan Master Owner Trust Receivables2015,“A-2”,1.44%, 15/01/2020 2,335,000 2,334,186 0.30Preferred Term Securities XIX Ltd., CDO,FRN,1.313%, 22/12/2035 508,993 400,063 0.05Race Point CLO Ltd., “A”, FRN,2.161%, 20/02/2025 1,185,000 1,185,045 0.15Residential Funding Mortgage Securities,Inc.,5.32%, 25/12/2035 68,720 58,464 0.01Volkswagen Credit Auto Master Trust,2014-1A, “A1”, FRN,0.911%, 22/07/2019 931,000 930,343 0.12Wachovia Bank Commercial MortgageTrust, “A4”, FRN,5.965%, 15/02/2051 560,917 563,704 0.07Wachovia Bank Commercial MortgageTrust, FRN,5.716%, 15/06/2049 2,533,862 2,540,739 0.33Wells Fargo Commercial Mortgage Trust,2015-C28, “A4”,3.54%, 15/05/2048 2,448,036 2,509,011 0.32Wells Fargo Commercial Mortgage Trust,2016-LC25, “A4”,3.64%, 15/12/2059 4,459,047 4,570,911 0.59West CLO Ltd., 2014-1A, “A2”, FRN,3.123%, 18/07/2026 2,500,000 2,505,579 0.32
111,053,469 14.26
AutomotiveGeneral Motors Co.,4.875%, 2/10/2023 USD 1,200,000 1,272,086 0.16General Motors Co.,5.2%, 1/04/2045 662,000 651,146 0.08General Motors Financial Co., Inc.,3.45%, 10/04/2022 1,362,000 1,357,448 0.18General Motors Financial Co., Inc.,4%, 6/10/2026 1,198,000 1,160,810 0.15Volkswagen Group of America FinanceLLC,2.4%, 22/05/2020 603,000 598,495 0.08
5,039,985 0.65
BiotechnologyLife Technologies Corp.,5%, 15/01/2021 USD 2,381,000 2,547,449 0.33
Name of SecurityTransferable Securities and Money MarketInstruments traded on a Regulated Market Shares/Par
MarketValue ($)
NetAssets (%)
BroadcastingOmnicom Group, Inc.,3.65%, 1/11/2024 USD 455,000 459,502 0.06SES Global Americas Holdings GP,5.3%, 25/03/2044 254,000 222,762 0.03SES S.A.,5.3%, 4/04/2043 474,000 419,346 0.05Time Warner, Inc.,3.8%, 15/02/2027 1,095,000 1,068,037 0.14
2,169,647 0.28
Brokerage & Asset ManagersIntercontinental Exchange, Inc.,2.75%, 1/12/2020 USD 368,000 374,349 0.05NYSE Euronext,2%, 5/10/2017 1,179,000 1,184,721 0.15Raymond James Financial,3.625%, 15/09/2026 714,000 699,003 0.09TD Ameritrade Holding Corp.,5.6%, 1/12/2019 396,000 433,875 0.06TD Ameritrade Holding Corp.,2.95%, 1/04/2022 798,000 807,242 0.10
3,499,190 0.45
BuildingMartin Marietta Materials, Inc.,4.25%, 2/07/2024 USD 1,921,000 1,986,815 0.26Masco Corp.,4.375%, 1/04/2026 1,974,000 2,026,548 0.26Mohawk Industries, Inc.,3.85%, 1/02/2023 780,000 795,801 0.10
4,809,164 0.62
Business ServicesEquinix, Inc.,4.875%, 1/04/2020 USD 1,500,000 1,541,250 0.20Fidelity National Information Services, Inc.,3.875%, 5/06/2024 168,000 171,406 0.02Fidelity National Information Services, Inc.,3%, 15/08/2026 2,594,000 2,441,060 0.31Fidelity National Information Services, Inc.,4.5%, 15/08/2046 1,407,000 1,355,809 0.18
5,509,525 0.71
Cable TVCCO Holdings LLC/CCO Holdings CapitalCorp.,5.75%, 15/01/2024 USD 1,120,000 1,176,000 0.15Charter Communications Operating LLC/Charter Communications Operating CapitalCorp.,4.908%, 23/07/2025 1,925,000 2,024,157 0.26Comcast Corp.,2.75%, 1/03/2023 706,000 696,513 0.09Sirius XM Radio, Inc.,5.375%, 15/07/2026 2,021,000 2,053,841 0.26Time Warner Cable, Inc.,4.5%, 15/09/2042 2,195,000 1,971,986 0.25Time Warner Entertainment Co. LP,8.375%, 15/07/2033 442,000 580,017 0.08Videotron Ltd.,5%, 15/07/2022 1,500,000 1,560,000 0.20
10,062,514 1.29
ChemicalsTronox Finance LLC,6.375%, 15/08/2020 USD 1,549,000 1,488,976 0.19
Computer SoftwareMicrosoft Corp.,2%, 8/08/2023 USD 2,564,000 2,442,182 0.31Microsoft Corp.,4.1%, 6/02/2037 2,211,000 2,237,685 0.29
MFS Meridian Funds Annual Report 2017 117

SCHEDULES OF INVESTMENTS 31 January 2017
MFS Meridian Funds – U.S. Total Return Bond Fund, continued
Name of SecurityTransferable Securities and Money MarketInstruments traded on a Regulated Market Shares/Par
MarketValue ($)
NetAssets (%)
Computer Software, continuedVeriSign, Inc.,4.625%, 1/05/2023 USD 1,450,000 1,465,805 0.19
6,145,672 0.79
Computer Software – SystemsApple, Inc.,4.375%, 13/05/2045 USD 1,090,000 1,113,220 0.14
ConglomeratesJohnson Controls International PLC,5.7%, 1/03/2041 USD 540,000 615,436 0.08Johnson Controls International PLC,4.625%, 2/07/2044 593,000 588,174 0.07
1,203,610 0.15
Consumer ProductsMattel, Inc.,5.45%, 1/11/2041 USD 651,000 648,983 0.08Reckitt Benckiser Treasury Services PLC,3.625%, 21/09/2023 1,341,000 1,390,933 0.18
2,039,916 0.26
Consumer ServicesADT Corp.,6.25%, 15/10/2021 USD 1,450,000 1,576,875 0.20Priceline Group, Inc.,3.65%, 15/03/2025 3,524,000 3,512,078 0.45Visa, Inc.,2.8%, 14/12/2022 4,206,000 4,229,856 0.55
9,318,809 1.20
ContainersBall Corp.,5%, 15/03/2022 USD 300,000 315,000 0.04Ball Corp.,4%, 15/11/2023 1,080,000 1,071,900 0.14Berry Plastics Corp.,5.125%, 15/07/2023 1,655,000 1,693,396 0.21Sealed Air Corp.,5.125%, 1/12/2024 1,560,000 1,616,550 0.21
4,696,846 0.60
Defense ElectronicsBAE Systems Holdings, Inc.,6.375%, 1/06/2019 USD 590,000 646,321 0.08
Emerging Market Quasi-SovereignPetroleos Mexicanos,5.5%, 27/06/2044 USD 16,000 13,123 0.00
Energy – IndependentAnadarko Petroleum Corp.,5.55%, 15/03/2026 USD 1,106,000 1,244,168 0.16
Energy – IntegratedShell International Finance B.V.,3.75%, 12/09/2046 USD 851,000 789,997 0.10
Financial InstitutionsInternational Lease Finance Corp.,7.125%, 1/09/2018 USD 676,000 727,173 0.09Nationstar Mortgage LLC/Capital Corp.,6.5%, 1/07/2021 1,650,000 1,680,938 0.21Navient Corp.,8%, 25/03/2020 1,000,000 1,075,000 0.14Navient Corp.,5%, 26/10/2020 2,325,000 2,307,563 0.30
5,790,674 0.74
Food & BeveragesAnheuser-Busch InBev Finance, Inc.,2.65%, 1/02/2021 USD 3,035,000 3,052,691 0.39Anheuser-Busch InBev Finance, Inc.,4.9%, 1/02/2046 3,875,000 4,146,657 0.53
Name of SecurityTransferable Securities and Money MarketInstruments traded on a Regulated Market Shares/Par
MarketValue ($)
NetAssets (%)
Food & Beverages, continuedAnheuser-Busch InBev Worldwide, Inc.,3.7%, 1/02/2024 USD 806,000 829,589 0.11Anheuser-Busch InBev Worldwide, Inc.,3.75%, 15/01/2022 1,227,000 1,284,622 0.17Constellation Brands, Inc.,4.25%, 1/05/2023 2,121,000 2,226,435 0.29Constellation Brands, Inc.,4.75%, 1/12/2025 2,153,000 2,295,636 0.29Kraft Foods Group, Inc.,5.375%, 10/02/2020 195,000 211,008 0.03Pernod Ricard S.A.,3.25%, 8/06/2026 4,000,000 3,845,840 0.49Wm. Wrigley Jr. Co.,3.375%, 21/10/2020 1,822,000 1,878,493 0.24
19,770,971 2.54
Food & Drug StoresCVS Health Corp.,2.125%, 1/06/2021 USD 2,192,000 2,145,698 0.27CVS Health Corp.,3.5%, 20/07/2022 1,165,000 1,197,070 0.15CVS Health Corp.,5.125%, 20/07/2045 3,306,000 3,636,041 0.47Walgreens Boots Alliance, Inc.,3.3%, 18/11/2021 1,500,000 1,530,995 0.20Walgreens Boots Alliance, Inc.,3.8%, 18/11/2024 1,589,000 1,606,916 0.21
10,116,720 1.30
Forest & Paper ProductsPackaging Corp. of America,3.65%, 15/09/2024 USD 562,000 568,528 0.07
Gaming & LodgingGLP Capital LP/GLP Financing II, Inc.,5.375%, 1/11/2023 USD 1,110,000 1,190,475 0.15Wyndham Worldwide Corp.,5.1%, 1/10/2025 258,000 272,177 0.04
1,462,652 0.19
General Obligations – General PurposeState of Illinois,5.65%, 1/12/2038 USD 1,115,000 1,162,733 0.15State of Illinois, “B”,5.75%, 1/01/2037 270,000 282,050 0.04
1,444,783 0.19
InsuranceAmerican International Group, Inc.,3.75%, 10/07/2025 USD 2,871,000 2,880,736 0.37American International Group, Inc.,3.9%, 1/04/2026 1,237,000 1,247,219 0.16Metropolitan Life Global Funding I,3.45%, 18/12/2026 1,707,000 1,713,522 0.22Pacific Lifecorp,5.125%, 30/01/2043 281,000 293,524 0.04Principal Financial Group, Inc.,3.4%, 15/05/2025 1,290,000 1,285,726 0.16
7,420,727 0.95
Insurance – HealthAetna, Inc. ,2.4%, 15/06/2021 USD 3,123,000 3,134,393 0.40UnitedHealth Group, Inc.,3.35%, 15/07/2022 1,587,000 1,636,997 0.21
4,771,390 0.61
Insurance – Property & CasualtyAllied World Assurance,5.5%, 15/11/2020 USD 350,000 375,734 0.05
118 MFS Meridian Funds Annual Report 2017

SCHEDULES OF INVESTMENTS 31 January 2017
MFS Meridian Funds – U.S. Total Return Bond Fund, continued
Name of SecurityTransferable Securities and Money MarketInstruments traded on a Regulated Market Shares/Par
MarketValue ($)
NetAssets (%)
Insurance – Property & Casualty, continuedAllied World Assurance Co. Holdings Ltd.,4.35%, 29/10/2025 USD 1,685,000 1,667,004 0.21CNA Financial Corp.,5.875%, 15/08/2020 800,000 889,229 0.11Liberty Mutual Group, Inc.,4.25%, 15/06/2023 1,500,000 1,574,252 0.20Liberty Mutual Group, Inc.,4.85%, 1/08/2044 1,911,000 1,887,453 0.24Swiss Re Ltd.,4.25%, 6/12/2042 594,000 578,579 0.08ZFS Finance USA Trust V,6.5% to 9/05/2017, FRN to 9/05/2067 126,000 126,315 0.02
7,098,566 0.91
Local AuthoritiesState of California (Build America Bonds),7.625%, 1/03/2040 USD 165,000 241,044 0.03State of California (Build America Bonds),7.6%, 1/11/2040 1,695,000 2,535,432 0.33University of California Limited Project Rev.,“J”,4.131%, 15/05/2045 470,000 466,734 0.06
3,243,210 0.42
Major BanksABN AMRO Bank N.V.,4.25%, 2/02/2017 USD 1,063,000 1,063,000 0.14ABN AMRO Bank N.V.,4.8%, 18/04/2026 2,000,000 2,046,806 0.26Bank of America Corp.,5.625%, 1/07/2020 260,000 285,698 0.04Bank of America Corp.,5.875%, 5/01/2021 740,000 824,513 0.11Bank of America Corp.,3.3%, 11/01/2023 2,185,000 2,188,929 0.28Bank of America Corp.,4.125%, 22/01/2024 586,000 607,115 0.08Bank of America Corp.,3.95%, 21/04/2025 470,000 466,290 0.06Bank of America Corp.,3.875%, 1/08/2025 1,791,000 1,810,337 0.23Bank of America Corp.,4.45%, 3/03/2026 1,837,000 1,874,789 0.24Bank of America Corp.,4.443% to 20/01/2047,FRN to 20/01/2048 2,500,000 2,491,528 0.32Bank of America Corp., FRN,6.5%, 29/10/2049 661,000 708,923 0.09Bank of America Corp., FRN,6.1%, 29/12/2049 1,416,000 1,476,180 0.19Bank of New York Mellon Corp.,3.442% to 7/02/2027, FRN to 7/02/2028 2,017,000 2,017,000 0.26Barclays PLC,4.375%, 12/01/2026 1,521,000 1,527,887 0.20Barclays PLC,4.95%, 10/01/2047 324,000 324,353 0.04Credit Suisse Group AG,6.5%, 8/08/2023 304,000 325,748 0.04Credit Suisse Group Fund Guernsey Ltd.,3.75%, 26/03/2025 1,808,000 1,759,108 0.23DBS Bank Ltd.,3.625% to 21/09/2017,FRN to 21/09/2022 815,000 820,925 0.11Goldman Sachs Group, Inc.,2.375%, 22/01/2018 627,000 631,395 0.08Goldman Sachs Group, Inc.,3.625%, 22/01/2023 1,723,000 1,757,779 0.23
Name of SecurityTransferable Securities and Money MarketInstruments traded on a Regulated Market Shares/Par
MarketValue ($)
NetAssets (%)
Major Banks, continuedGoldman Sachs Group, Inc.,3.85%, 26/01/2027 USD 1,076,000 1,073,695 0.14Goldman Sachs Group, Inc.,5.15%, 22/05/2045 2,940,000 3,041,198 0.39JPMorgan Chase & Co.,4.25%, 15/10/2020 385,000 408,435 0.05JPMorgan Chase & Co.,4.5%, 24/01/2022 527,000 566,158 0.07JPMorgan Chase & Co.,3.125%, 23/01/2025 3,000,000 2,937,543 0.38JPMorgan Chase & Co.,2.95%, 1/10/2026 4,162,000 3,935,799 0.51Lloyds Bank PLC,3.75%, 11/01/2027 2,537,000 2,493,937 0.32Morgan Stanley,5.5%, 24/07/2020 1,000,000 1,092,302 0.14Morgan Stanley,2.5%, 21/04/2021 442,000 436,440 0.06Morgan Stanley,5.5%, 28/07/2021 2,069,000 2,293,187 0.29Morgan Stanley,3.7%, 23/10/2024 511,000 514,765 0.07Morgan Stanley,3.875%, 27/01/2026 2,118,000 2,131,174 0.27Morgan Stanley,3.125%, 27/07/2026 2,515,000 2,387,967 0.31Morgan Stanley,4.3%, 27/01/2045 415,000 405,439 0.05Morgan Stanley,4.375%, 22/01/2047 1,748,000 1,728,345 0.22PNC Funding Corp.,5.625%, 1/02/2017 606,000 606,000 0.08Royal Bank of Scotland Group PLC,6%, 19/12/2023 1,145,000 1,203,972 0.15Royal Bank of Scotland Group PLC,7.5% to 10/08/2020, FRN to 29/12/2049 1,235,000 1,197,950 0.15Royal Bank of Scotland Group PLC,8%, 29/12/2049 354,000 343,426 0.04Sumitomo Mitsui Financial Group, Inc.,2.442%, 19/10/2021 2,378,000 2,335,845 0.30Sumitomo Mitsui Financial Group, Inc.,3.01%, 19/10/2026 5,024,000 4,778,025 0.61Wachovia Corp.,6.605%, 1/10/2025 160,000 186,307 0.02Wells Fargo & Co.,3.3%, 9/09/2024 2,000,000 1,982,998 0.25
63,089,210 8.10
Medical & Health Technology & ServicesCatholic Health Initiatives,2.95%, 1/11/2022 USD 1,782,000 1,734,565 0.22HCA, Inc.,5.25%, 15/06/2026 1,405,000 1,464,713 0.19Laboratory Corp. of America Holdings,3.6%, 1/02/2025 584,000 577,662 0.07Laboratory Corp. of America Holdings,4.7%, 1/02/2045 1,172,000 1,162,653 0.15Thermo Fisher Scientific, Inc.,3%, 15/04/2023 974,000 962,416 0.12Thermo Fisher Scientific, Inc.,2.95%, 19/09/2026 793,000 749,555 0.10
6,651,564 0.85
Medical EquipmentAbbott Laboratories,3.4%, 30/11/2023 USD 3,592,000 3,584,180 0.46
MFS Meridian Funds Annual Report 2017 119

SCHEDULES OF INVESTMENTS 31 January 2017
MFS Meridian Funds – U.S. Total Return Bond Fund, continued
Name of SecurityTransferable Securities and Money MarketInstruments traded on a Regulated Market Shares/Par
MarketValue ($)
NetAssets (%)
Medical Equipment, continuedMedtronic, Inc.,4.625%, 15/03/2045 USD 2,076,000 2,212,615 0.28Zimmer Holdings, Inc.,2.7%, 1/04/2020 2,459,000 2,472,561 0.32
8,269,356 1.06
Metals & MiningBarrick Gold Corp.,4.1%, 1/05/2023 USD 3,803,000 3,996,557 0.51Freeport-McMoRan, Inc.,6.875%, 15/02/2023 1,300,000 1,355,250 0.17Freeport-McMoRan, Inc.,5.4%, 14/11/2034 1,500,000 1,310,160 0.17Glencore Funding LLC,4.125%, 30/05/2023 1,398,000 1,433,090 0.19Glencore Funding LLC,4%, 16/04/2025 880,000 875,762 0.11Kinross Gold Corp.,5.95%, 15/03/2024 885,000 928,586 0.12Steel Dynamics, Inc.,5.125%, 1/10/2021 1,311,000 1,356,885 0.18
11,256,290 1.45
MidstreamEnbridge, Inc.,4.25%, 1/12/2026 USD 866,000 891,177 0.11Enbridge, Inc.,6% to 15/01/2027, FRN to 15/01/2077 1,135,000 1,149,188 0.15Kinder Morgan (Delaware), Inc.,7.75%, 15/01/2032 1,230,000 1,535,416 0.20Kinder Morgan Energy Partners LP,4.3%, 1/05/2024 837,000 860,567 0.11Kinder Morgan Energy Partners LP,6.375%, 1/03/2041 1,270,000 1,415,016 0.18Kinder Morgan Energy Partners LP,5.4%, 1/09/2044 1,027,000 1,065,402 0.13Phillips 66 Partners LP,4.9%, 1/10/2046 540,000 524,687 0.07Sabine Pass Liquefaction LLC,5.625%, 1/02/2021 1,423,000 1,536,840 0.20Spectra Energy Capital LLC,8%, 1/10/2019 349,000 395,221 0.05
9,373,514 1.20
Mortgage-BackedFannie Mae,5.65%, 1/06/2017 USD 134,920 135,629 0.02Fannie Mae,3.189%, 1/12/2017 275,455 277,038 0.04Fannie Mae,5.5%, 1/02/2018 – 1/04/2040 3,269,625 3,645,998 0.44Fannie Mae,5.286%, 1/06/2018 166,139 171,640 0.02Fannie Mae,3.828%, 1/07/2018 813,339 834,330 0.11Fannie Mae,2.578%, 25/09/2018 2,137,882 2,158,422 0.28Fannie Mae,4.6%, 1/09/2019 370,365 392,592 0.05Fannie Mae,4.67%, 1/09/2019 165,053 175,572 0.02Fannie Mae,4.45%, 1/10/2019 258,064 273,544 0.04Fannie Mae,5%, 1/06/2020 – 1/03/2042 3,473,612 3,790,031 0.50Fannie Mae,2.41%, 1/05/2023 327,396 324,815 0.04
Name of SecurityTransferable Securities and Money MarketInstruments traded on a Regulated Market Shares/Par
MarketValue ($)
NetAssets (%)
Mortgage-Backed, continuedFannie Mae,3.65%, 1/09/2023 USD 880,457 931,617 0.12Fannie Mae,3.92%, 1/10/2023 1,063,000 1,134,627 0.15Fannie Mae,3.93%, 1/10/2023 348,936 373,092 0.05Fannie Mae,4.5%, 1/05/2024 – 1/06/2044 12,351,961 13,309,959 1.72Fannie Mae,4%, 1/03/2025 – 1/02/2045 28,552,678 30,058,728 3.84Fannie Mae,4.5%, 1/05/2025 48,047 50,707 0.01Fannie Mae,3.96%, 1/11/2025 594,462 634,146 0.08Fannie Mae,3.43%, 1/06/2026 892,565 923,136 0.12Fannie Mae,4.54%, 1/07/2026 642,380 714,373 0.09Fannie Mae,3.95%, 1/01/2027 127,947 134,921 0.02Fannie Mae,3%, 1/03/2027 – 1/11/2046 10,862,031 10,867,408 1.41Fannie Mae,6.5%, 1/01/2033 4,098 4,636 0.00Fannie Mae,6%, 1/09/2034 – 1/06/2038 1,022,023 1,162,574 0.15Fannie Mae,3.5%, 1/11/2041 – 1/07/2046 7,366,754 7,551,643 0.96Freddie Mac,2.699%, 25/05/2018 2,115,713 2,142,979 0.28Freddie Mac,5%, 1/06/2018 – 1/07/2041 1,661,626 1,828,399 0.24Freddie Mac,2.303%, 25/09/2018 888,065 897,559 0.12Freddie Mac,2.323%, 25/10/2018 1,046,062 1,058,547 0.14Freddie Mac,2.13%, 25/01/2019 1,486,940 1,499,925 0.19Freddie Mac,2.086%, 25/03/2019 1,100,000 1,108,822 0.14Freddie Mac,5.5%, 1/06/2019 – 1/01/2038 230,254 256,764 0.02Freddie Mac,1.869%, 25/11/2019 587,000 587,972 0.08Freddie Mac,2.791%, 25/01/2022 960,000 983,647 0.13Freddie Mac,2.716%, 25/06/2022 572,499 584,195 0.08Freddie Mac,2.355%, 25/07/2022 4,800,000 4,802,991 0.62Freddie Mac,3.3%, 25/04/2023 – 25/10/2026 2,329,356 2,422,883 0.31Freddie Mac,3.06%, 25/07/2023 898,000 926,559 0.12Freddie Mac,3.531%, 25/07/2023 423,000 448,083 0.06Freddie Mac,3.458%, 25/08/2023 2,215,000 2,334,446 0.30Freddie Mac,2.67%, 25/12/2024 1,482,000 1,477,061 0.19Freddie Mac,2.811%, 25/01/2025 1,073,000 1,076,285 0.14Freddie Mac,3.329%, 25/05/2025 1,420,000 1,476,041 0.19
120 MFS Meridian Funds Annual Report 2017

SCHEDULES OF INVESTMENTS 31 January 2017
MFS Meridian Funds – U.S. Total Return Bond Fund, continued
Name of SecurityTransferable Securities and Money MarketInstruments traded on a Regulated Market Shares/Par
MarketValue ($)
NetAssets (%)
Mortgage-Backed, continuedFreddie Mac,4%, 1/07/2025 – 1/04/2044 USD 2,731,187 2,873,543 0.37Freddie Mac,4.5%, 1/07/2025 – 1/05/2042 2,686,943 2,889,233 0.37Freddie Mac,2.745%, 25/01/2026 870,000 872,691 0.11Freddie Mac,2.673%, 25/03/2026 4,000,000 3,932,661 0.51Freddie Mac,3.5%, 1/08/2026 – 1/12/2046 15,034,793 15,386,948 1.96Freddie Mac,6%, 1/08/2034 – 1/11/2037 49,157 56,016 0.00Freddie Mac,3%, 1/04/2043 – 1/10/2046 8,062,306 7,997,252 1.03Ginnie Mae,6%, 20/01/2036 – 15/01/2039 187,994 213,706 0.01Ginnie Mae,5.5%, 15/04/2038 – 20/01/2042 528,820 587,328 0.08Ginnie Mae,4.5%, 15/04/2039 – 20/09/2041 3,764,830 4,089,737 0.54Ginnie Mae,4%, 20/10/2040 681,350 725,631 0.09Ginnie Mae,3.5%, 15/12/2041 – 20/05/2046 5,442,279 5,648,592 0.72
151,217,674 19.42
Natural Gas – DistributionGNL Quintero S.A.,4.634%, 31/07/2029 USD 205,000 205,697 0.03KeySpan Gas East Corp.,2.742%, 15/08/2026 2,566,000 2,449,896 0.31
2,655,593 0.34
Network & TelecomAT&T, Inc.,4.5%, 15/05/2035 USD 5,553,000 5,220,609 0.67AT&T, Inc.,5.25%, 1/03/2037 3,320,000 3,304,363 0.42AT&T, Inc.,4.75%, 15/05/2046 2,018,000 1,843,276 0.24Frontier Communications Corp.,11%, 15/09/2025 1,693,000 1,712,046 0.22Verizon Communications, Inc.,6.55%, 15/09/2043 1,126,000 1,388,788 0.18
13,469,082 1.73
Oil ServicesOdebrecht Offshore Drilling Finance Ltd.,6.75%, 1/10/2023 USD 1,223,105 400,567 0.05Schlumberger Norge A.S.,1.25%, 1/08/2017 1,184,000 1,184,202 0.15
1,584,769 0.20
OilsMarathon Petroleum Corp.,4.75%, 15/09/2044 USD 3,138,000 2,797,188 0.36Marathon Petroleum Corp.,5.85%, 15/12/2045 916,000 906,952 0.12
3,704,140 0.48
Other Banks & Diversified FinancialsBank of Tokyo-Mitsubishi UFJ Ltd.,2.7%, 9/09/2018 USD 308,000 311,183 0.04BBVA Bancomer S.A. de C.V.,6.75%, 30/09/2022 629,000 684,038 0.09BPCE S.A.,4.5%, 15/03/2025 942,000 920,366 0.12
Name of SecurityTransferable Securities and Money MarketInstruments traded on a Regulated Market Shares/Par
MarketValue ($)
NetAssets (%)
Other Banks & Diversified Financials, continuedCitizens Bank N.A.,2.55%, 13/05/2021 USD 950,000 945,815 0.12Citizens Financial Group, Inc.,4.3%, 3/12/2025 1,290,000 1,309,647 0.17Discover Bank,7%, 15/04/2020 1,943,000 2,161,339 0.28Discover Financial Services,3.75%, 4/03/2025 174,000 169,937 0.02Groupe BPCE S.A.,12.5% to 30/09/2019,FRN to 29/08/2049 2,203,000 2,698,675 0.35Intesa Sanpaolo S.p.A.,5.71%, 15/01/2026 601,000 569,701 0.07Macquarie Bank Ltd.,1.6%, 27/10/2017 2,821,000 2,823,076 0.36Rabobank Nederland N.V.,3.95%, 9/11/2022 920,000 941,350 0.12SunTrust Banks, Inc.,2.7%, 27/01/2022 1,980,000 1,972,149 0.25SunTrust Banks, Inc.,3.3%, 15/05/2026 2,250,000 2,172,429 0.28U.S. Bank NA Cincinnati,2.8%, 27/01/2025 583,000 569,600 0.07UBS Group Funding (Jersey) Ltd.,3%, 15/04/2021 2,039,000 2,034,957 0.26UBS Group Funding (Jersey) Ltd.,4.125%, 24/09/2025 1,083,000 1,093,333 0.14
21,377,595 2.74
PharmaceuticalsActavis Funding SCS,3%, 12/03/2020 USD 1,120,000 1,137,474 0.15Actavis Funding SCS,3.8%, 15/03/2025 1,520,000 1,517,249 0.19Actavis Funding SCS,4.55%, 15/03/2035 2,727,000 2,688,680 0.34Bayer U.S. Finance LLC,3.375%, 8/10/2024 452,000 451,413 0.06Biogen, Inc.,5.2%, 15/09/2045 1,095,000 1,172,600 0.15Celgene Corp.,2.875%, 15/08/2020 2,280,000 2,316,120 0.30Forest Laboratories, Inc.,4.875%, 15/02/2021 2,314,000 2,491,086 0.32Gilead Sciences, Inc.,2.35%, 1/02/2020 218,000 219,840 0.03Gilead Sciences, Inc.,4.8%, 1/04/2044 961,000 1,000,127 0.13Gilead Sciences, Inc.,4.75%, 1/03/2046 3,294,000 3,415,012 0.44Shire Acquisitions Investments IrelandDesignated Activity Co.,2.875%, 23/09/2023 4,246,000 4,056,425 0.52
20,466,026 2.63
Precious Metals & MineralsTeck Resources Ltd.,6%, 15/08/2040 USD 167,000 167,418 0.02
Real Estate – ApartmentMid-America Apartment Communities, Inc.,REIT,4.3%, 15/10/2023 USD 428,000 447,556 0.06
Real Estate – OfficeBoston Properties LP, REIT,3.7%, 15/11/2018 USD 557,000 572,574 0.07
MFS Meridian Funds Annual Report 2017 121

SCHEDULES OF INVESTMENTS 31 January 2017
MFS Meridian Funds – U.S. Total Return Bond Fund, continued
Name of SecurityTransferable Securities and Money MarketInstruments traded on a Regulated Market Shares/Par
MarketValue ($)
NetAssets (%)
Real Estate – RetailBrixmor Operating Partnership LP, REIT,3.875%, 15/08/2022 USD 955,000 976,158 0.13DDR Corp., REIT,4.625%, 15/07/2022 749,000 791,973 0.10DDR Corp., REIT,3.375%, 15/05/2023 1,746,000 1,705,491 0.22
3,473,622 0.45
RetailersBed Bath & Beyond, Inc.,5.165%, 1/08/2044 USD 1,081,000 922,976 0.12Best Buy Co., Inc.,5.5%, 15/03/2021 2,593,000 2,817,899 0.36
3,740,875 0.48
Telecommunications – WirelessAmerican Tower Corp., REIT,5%, 15/02/2024 USD 138,000 147,967 0.02Crown Castle International Corp.,2.25%, 1/09/2021 1,804,000 1,746,824 0.22Crown Castle International Corp.,3.7%, 15/06/2026 611,000 595,350 0.08Crown Castle International Corp.,4%, 1/03/2027 308,000 307,378 0.04Crown Castle Towers LLC,4.883%, 15/08/2020 163,000 173,656 0.02SBA Tower Trust,2.898%, 15/10/2044 1,173,000 1,181,124 0.15SFR Group S.A.,6%, 15/05/2022 750,000 771,563 0.10
4,923,862 0.63
TobaccoImperial Tobacco Finance Co.,3.75%, 21/07/2022 USD 2,031,000 2,089,091 0.27Reynolds American, Inc.,8.125%, 23/06/2019 649,000 737,069 0.09
2,826,160 0.36
Transportation – ServicesERAC USA Finance LLC,3.85%, 15/11/2024 USD 361,000 366,695 0.05ERAC USA Finance LLC,4.5%, 15/02/2045 366,000 351,222 0.04
717,917 0.09
U.S. Government Agencies and EquivalentsSmall Business Administration,4.35%, 1/07/2023 USD 7,653 7,972 0.00Small Business Administration,4.98%, 1/11/2023 8,667 9,244 0.00Small Business Administration,4.89%, 1/12/2023 7,156 7,537 0.00Small Business Administration,4.93%, 1/01/2024 5,328 5,596 0.00Small Business Administration,4.34%, 1/03/2024 11,259 11,682 0.00Small Business Administration,5.52%, 1/06/2024 6,125 6,527 0.00Small Business Administration,5.19%, 1/07/2024 7,037 7,403 0.00Small Business Administration,4.86%, 1/10/2024 5,354 5,619 0.00Small Business Administration,4.57%, 1/06/2025 22,606 23,661 0.00Small Business Administration,4.76%, 1/09/2025 44,550 46,809 0.01
Name of SecurityTransferable Securities and Money MarketInstruments traded on a Regulated Market Shares/Par
MarketValue ($)
NetAssets (%)
U.S. Government Agencies and Equivalents, continuedSmall Business Administration,5.35%, 1/02/2026 USD 53,417 57,273 0.01Small Business Administration,4.43%, 1/05/2029 295,700 314,612 0.04Small Business Administration,3.25%, 1/11/2030 264,277 272,029 0.04Small Business Administration,2.85%, 1/09/2031 458,474 462,082 0.06Small Business Administration,2.37%, 1/08/2032 652,170 646,640 0.08Small Business Administration,2.13%, 1/01/2033 1,157,036 1,124,581 0.15Small Business Administration,2.21%, 1/02/2033 315,390 307,338 0.04Small Business Administration,2.22%, 1/03/2033 1,131,631 1,102,865 0.14Small Business Administration,2.08%, 1/04/2033 1,418,970 1,371,630 0.18Small Business Administration,2.45%, 1/06/2033 1,497,916 1,483,918 0.19Small Business Administration,3.62%, 1/09/2033 389,984 408,883 0.05
7,683,901 0.99
U.S. Treasury ObligationsU.S. Treasury Bonds,4.5%, 15/02/2036 USD 3,435,000 4,340,177 0.56U.S. Treasury Bonds,5%, 15/05/2037 41,000 54,958 0.01U.S. Treasury Bonds,4.375%, 15/02/2038 555,000 689,609 0.09U.S. Treasury Bonds,3.5%, 15/02/2039 3,124,000 3,416,753 0.44U.S. Treasury Bonds,4.5%, 15/08/2039 4,444,600 5,582,835 0.72U.S. Treasury Bonds,2.875%, 15/05/2043 11,956,500 11,579,595 1.48U.S. Treasury Notes,0.75%, 31/01/2018 7,389,000 7,379,764 0.95U.S. Treasury Notes,1%, 30/06/2019 32,935,000 32,671,257 4.19U.S. Treasury Notes,1.625%, 30/06/2019 91,628,000 92,214,969 11.84U.S. Treasury Notes,1.625%, 30/11/2020 6,811,000 6,789,450 0.87U.S. Treasury Notes,2%, 15/11/2026 5,000,000 4,804,885 0.62
169,524,252 21.77
Utilities – Electric PowerAEP Transmission Co. LLC,3.1%, 1/12/2026 USD 1,155,000 1,138,845 0.15AEP Transmission Co. LLC,4%, 1/12/2046 1,409,000 1,411,357 0.18Berkshire Hathaway Energy Co.,5.15%, 15/11/2043 890,000 1,000,800 0.13Constellation Energy Group, Inc.,5.15%, 1/12/2020 468,000 507,383 0.06Dominion Resources, Inc.,3.625%, 1/12/2024 2,727,000 2,749,430 0.35Dominion Resources, Inc.,3.9%, 1/10/2025 458,000 467,985 0.06EDP Finance B.V.,4.9%, 1/10/2019 622,000 653,395 0.08EDP Finance B.V.,5.25%, 14/01/2021 2,266,000 2,411,849 0.31
122 MFS Meridian Funds Annual Report 2017

SCHEDULES OF INVESTMENTS 31 January 2017
MFS Meridian Funds – U.S. Total Return Bond Fund, continued
Name of SecurityTransferable Securities and Money MarketInstruments traded on a Regulated Market Shares/Par
MarketValue ($)
NetAssets (%)
Utilities – Electric Power, continuedExelon Corp.,4.45%, 15/04/2046 USD 1,312,000 1,303,355 0.17Exelon Generation Co. LLC,4.25%, 15/06/2022 1,695,000 1,761,647 0.23PPL Capital Funding, Inc.,5%, 15/03/2044 496,000 519,062 0.07PPL Corp.,3.5%, 1/12/2022 680,000 694,766 0.09PPL WEM Holdings PLC,5.375%, 1/05/2021 1,167,000 1,265,686 0.16Southern Co.,2.35%, 1/07/2021 2,002,000 1,971,065 0.25Southern Co.,4.4%, 1/07/2046 1,231,000 1,218,127 0.16
19,074,752 2.45
Total Bonds(Identified Cost, $771,306,274) 763,042,631 97.97
Name of SecurityTransferable Securities and Money MarketInstruments traded on a Regulated Market Shares/Par
MarketValue ($)
NetAssets (%)
SHORT-TERM OBLIGATIONS (y)General Electric Co.,0.58%, 1/02/2017, at Amortized Costand Value USD 8,277,000 8,277,000 1.06
Total Transferable Securities andMoney Market Instruments Tradedon a Regulated Market(Identified Cost, $779,583,274) 771,319,631 99.03
OTHER ASSETS, LESS LIABILITIES 7,566,831 0.97
NET ASSETS 778,886,462 100.00
See Schedules of Investments Footnotes and Notes to Financial Statements
MFS Meridian Funds – U.S. Value Fund(Expressed in U.S. Dollars)
Name of SecurityTransferable Securities and Money MarketInstruments traded on a Regulated Market Shares/Par
MarketValue ($)
NetAssets (%)
COMMON STOCKS
AerospaceHoneywell International, Inc. 426,120 50,418,520 2.92Northrop Grumman Corp. 156,174 35,776,340 2.08United Technologies Corp. 160,215 17,570,779 1.02
103,765,639 6.02
Alcoholic BeveragesDiageo PLC 640,154 17,745,078 1.03
Apparel ManufacturersHanesbrands, Inc. 274,801 6,515,532 0.38
AutomotiveDelphi Automotive PLC 221,628 15,527,258 0.90Harley-Davidson, Inc. 146,815 8,374,328 0.49
23,901,586 1.39
BroadcastingInterpublic Group of Companies, Inc. 284,725 6,699,579 0.39Omnicom Group, Inc. 291,402 24,958,581 1.45Time Warner, Inc. 156,717 15,178,041 0.88Walt Disney Co. 33,182 3,671,588 0.21
50,507,789 2.93
Brokerage & Asset ManagersBlackRock, Inc. 42,130 15,755,777 0.91Franklin Resources, Inc. 215,707 8,572,196 0.50NASDAQ, Inc. 259,059 18,274,022 1.06T. Rowe Price Group, Inc. 46,681 3,148,167 0.18
45,750,162 2.65
Business ServicesAccenture PLC, “A” 373,283 42,505,735 2.46Amdocs Ltd. 72,666 4,266,221 0.25Cognizant Technology Solutions Corp., “A” 113,438 5,965,704 0.35Equifax, Inc. 60,440 7,088,403 0.41
Name of SecurityTransferable Securities and Money MarketInstruments traded on a Regulated Market Shares/Par
MarketValue ($)
NetAssets (%)
Business Services, continuedFidelity National Information Services, Inc. 200,109 15,892,657 0.92Fiserv, Inc. 69,964 7,516,233 0.44
83,234,953 4.83
Cable TVComcast Corp., “A” 312,016 23,532,247 1.36
Chemicals3M Co. 182,570 31,916,887 1.85E.I. du Pont de Nemours & Co. 169,642 12,807,971 0.74Monsanto Co. 61,221 6,630,847 0.39PPG Industries, Inc. 328,064 32,809,681 1.90
84,165,386 4.88
Computer SoftwareOracle Corp. 264,619 10,613,868 0.61
Computer Software – SystemsInternational Business Machines Corp. 65,120 11,364,742 0.66
ConstructionSherwin-Williams Co. 41,894 12,727,816 0.74Stanley Black & Decker, Inc. 74,102 9,188,648 0.53
21,916,464 1.27
Consumer ProductsCoty, Inc., “A” 398,264 7,646,669 0.44Newell Brands, Inc. 62,586 2,962,195 0.17Procter & Gamble Co. 77,617 6,799,249 0.40
17,408,113 1.01
ContainersCrown Holdings, Inc. 151,095 8,184,816 0.47
.Electrical EquipmentJohnson Controls International PLC 752,625 33,100,448 1.92Pentair PLC 120,903 7,088,543 0.41
40,188,991 2.33
MFS Meridian Funds Annual Report 2017 123
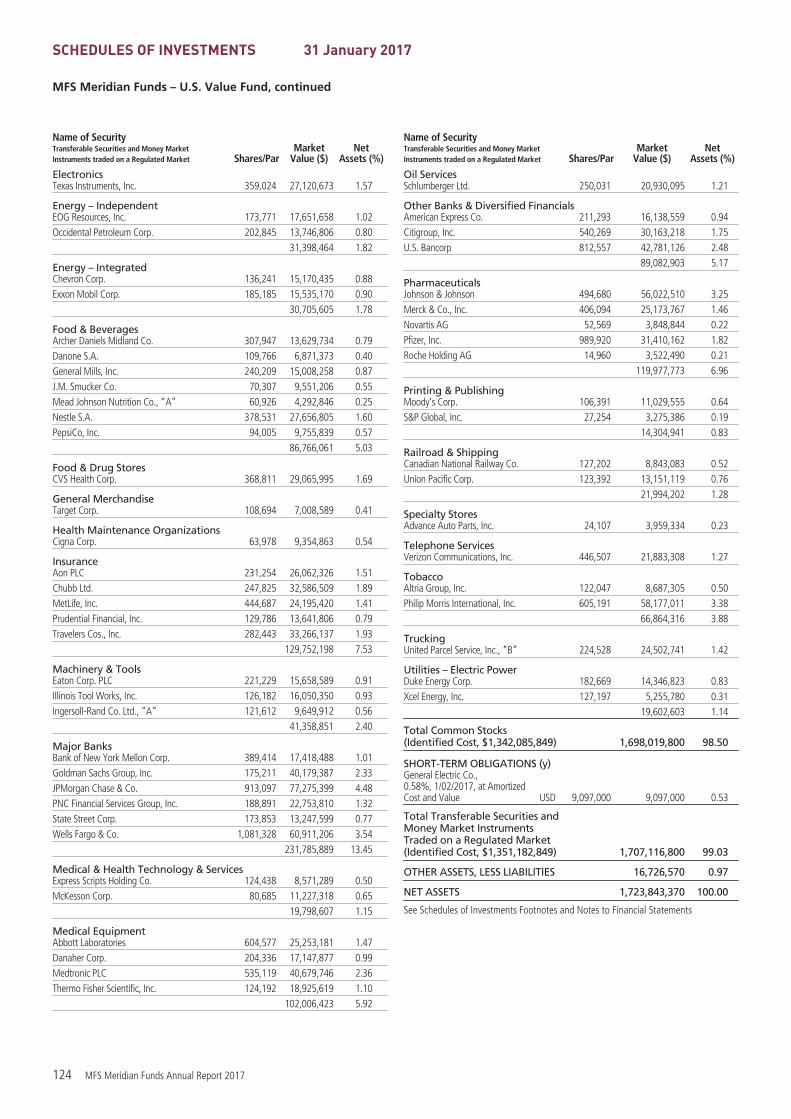
SCHEDULES OF INVESTMENTS 31 January 2017
MFS Meridian Funds – U.S. Value Fund, continued
Name of SecurityTransferable Securities and Money MarketInstruments traded on a Regulated Market Shares/Par
MarketValue ($)
NetAssets (%)
ElectronicsTexas Instruments, Inc. 359,024 27,120,673 1.57
Energy – IndependentEOG Resources, Inc. 173,771 17,651,658 1.02Occidental Petroleum Corp. 202,845 13,746,806 0.80
31,398,464 1.82
Energy – IntegratedChevron Corp. 136,241 15,170,435 0.88Exxon Mobil Corp. 185,185 15,535,170 0.90
30,705,605 1.78
Food & BeveragesArcher Daniels Midland Co. 307,947 13,629,734 0.79Danone S.A. 109,766 6,871,373 0.40General Mills, Inc. 240,209 15,008,258 0.87J.M. Smucker Co. 70,307 9,551,206 0.55Mead Johnson Nutrition Co., “A” 60,926 4,292,846 0.25Nestle S.A. 378,531 27,656,805 1.60PepsiCo, Inc. 94,005 9,755,839 0.57
86,766,061 5.03
Food & Drug StoresCVS Health Corp. 368,811 29,065,995 1.69
General MerchandiseTarget Corp. 108,694 7,008,589 0.41
Health Maintenance OrganizationsCigna Corp. 63,978 9,354,863 0.54
InsuranceAon PLC 231,254 26,062,326 1.51Chubb Ltd. 247,825 32,586,509 1.89MetLife, Inc. 444,687 24,195,420 1.41Prudential Financial, Inc. 129,786 13,641,806 0.79Travelers Cos., Inc. 282,443 33,266,137 1.93
129,752,198 7.53
Machinery & ToolsEaton Corp. PLC 221,229 15,658,589 0.91Illinois Tool Works, Inc. 126,182 16,050,350 0.93Ingersoll-Rand Co. Ltd., “A” 121,612 9,649,912 0.56
41,358,851 2.40
Major BanksBank of New York Mellon Corp. 389,414 17,418,488 1.01Goldman Sachs Group, Inc. 175,211 40,179,387 2.33JPMorgan Chase & Co. 913,097 77,275,399 4.48PNC Financial Services Group, Inc. 188,891 22,753,810 1.32State Street Corp. 173,853 13,247,599 0.77Wells Fargo & Co. 1,081,328 60,911,206 3.54
231,785,889 13.45
Medical & Health Technology & ServicesExpress Scripts Holding Co. 124,438 8,571,289 0.50McKesson Corp. 80,685 11,227,318 0.65
19,798,607 1.15
Medical EquipmentAbbott Laboratories 604,577 25,253,181 1.47Danaher Corp. 204,336 17,147,877 0.99Medtronic PLC 535,119 40,679,746 2.36Thermo Fisher Scientific, Inc. 124,192 18,925,619 1.10
102,006,423 5.92
Name of SecurityTransferable Securities and Money MarketInstruments traded on a Regulated Market Shares/Par
MarketValue ($)
NetAssets (%)
Oil ServicesSchlumberger Ltd. 250,031 20,930,095 1.21
Other Banks & Diversified FinancialsAmerican Express Co. 211,293 16,138,559 0.94Citigroup, Inc. 540,269 30,163,218 1.75U.S. Bancorp 812,557 42,781,126 2.48
89,082,903 5.17
PharmaceuticalsJohnson & Johnson 494,680 56,022,510 3.25Merck & Co., Inc. 406,094 25,173,767 1.46Novartis AG 52,569 3,848,844 0.22Pfizer, Inc. 989,920 31,410,162 1.82Roche Holding AG 14,960 3,522,490 0.21
119,977,773 6.96
Printing & PublishingMoody’s Corp. 106,391 11,029,555 0.64S&P Global, Inc. 27,254 3,275,386 0.19
14,304,941 0.83
Railroad & ShippingCanadian National Railway Co. 127,202 8,843,083 0.52Union Pacific Corp. 123,392 13,151,119 0.76
21,994,202 1.28
Specialty StoresAdvance Auto Parts, Inc. 24,107 3,959,334 0.23
Telephone ServicesVerizon Communications, Inc. 446,507 21,883,308 1.27
TobaccoAltria Group, Inc. 122,047 8,687,305 0.50Philip Morris International, Inc. 605,191 58,177,011 3.38
66,864,316 3.88
TruckingUnited Parcel Service, Inc., “B” 224,528 24,502,741 1.42
Utilities – Electric PowerDuke Energy Corp. 182,669 14,346,823 0.83Xcel Energy, Inc. 127,197 5,255,780 0.31
19,602,603 1.14
Total Common Stocks(Identified Cost, $1,342,085,849) 1,698,019,800 98.50
SHORT-TERM OBLIGATIONS (y)General Electric Co.,0.58%, 1/02/2017, at AmortizedCost and Value USD 9,097,000 9,097,000 0.53
Total Transferable Securities andMoney Market InstrumentsTraded on a Regulated Market(Identified Cost, $1,351,182,849) 1,707,116,800 99.03
OTHER ASSETS, LESS LIABILITIES 16,726,570 0.97
NET ASSETS 1,723,843,370 100.00
See Schedules of Investments Footnotes and Notes to Financial Statements
124 MFS Meridian Funds Annual Report 2017

SCHEDULES OF INVESTMENTS 31 January 2017
Footnotes to Schedules of Investments:(d) In default.(e) Guaranteed by Minister for Finance of Ireland.(i) Interest only security for which the sub-fund receives interest on notional principal (Par amount). Par amount shown is the notional principal and does not reflect the cost
of the security.(k) As of 31 January 2017, the following sub-funds held securities that were fair valued in accordance with the policies adopted by the Board of Directors:
Sub-Fund Market Value % of Total Sub-Fund Market Value Number of Securities
Asia Pacific Ex-Japan Fund $25,464,867 32.08% 22Diversified Income Fund $1,261,883 0.91% 6Emerging Markets Debt Fund $16,033,866 0.57% 3Emerging Markets Debt Local Currency Fund $4,272,859 12.98% 9Emerging Markets Equity Fund $16,892,937 26.82% 19European Research Fund €9,282,304 0.47% 1European Value Fund €28,564,391 0.57% 1Global Energy Fund $451,474 1.64% 1Global Equity Fund $10,897,731 0.21% 1Global Equity Income Fund $11,437,437 4.55% 5Global High Yield Fund $557,893 0.08% 1Global Multi-Asset Fund $910,786 1.45% 6Global Research Focused Fund $6,685,511 2.82% 2Global Total Return Fund $32,708,344 1.18% 7Japan Equity Fund $142,220 2.11% 1Managed Wealth Fund $849,637 1.69% 4Prudent Capital Fund $171,625 1.39% 3Prudent Wealth Fund $48,513,877 1.97% 12
(l) A portion of this security is on loan.(p) Payment-in-kind security.(y) The rate shown represents an annualized yield at time of purchase.
The following abbreviations are used in this report and are defined:ADR American Depositary ReceiptCDO Collateralized Debt ObligationCLO Collateralized Loan ObligationCLN Credit-Linked NotesETF Exchange-Traded FundFRN Floating Rate Note. Interest rate resets periodically and the current rate
may not be the rate reported at period end.GDR Global Depositary ReceiptIEU International Equity Unit
IPS International Preference StockPJSC Public Joint Stock CompanyPLC Public Limited CompanyREIT Real Estate Investment TrustSDR Swedish Depositary Receipt
STRIPS Separate Trading of Registered Interest and Principal of SecuritiesTBA To Be AnnouncedTIPS Treasury Inflation Protected Security
Currency abbreviations have been used throughout this report. A list of abbreviations is shown below:ARS Argentine PesoAUD Australian DollarBRL Brazilian Real
CAD Canadian DollarCHF Swiss FrancCLP Chilean Peso
CNH Chinese YuanCOP Colombian PesoCZK Czech KorunaDKK Danish KroneEUR EuroGBP British PoundHKD Hong Kong DollarHUF Hungarian ForintIDR Indonesian RupiahILS Israeli Sheqel
INR Indian Rupee
JPY Japanese YenKRW Korean WonMXN Mexican PesoMYR Malaysian RinggitNOK Norwegian KroneNZD New Zealand DollarPEN Peruvian Nuevo SolPHP Philippine PesoPLN Polish ZlotyRUB Russian RubleSEK Swedish KronaSGD Singapore DollarTHB Thailand BahtTRY Turkish Lira
TWD Taiwan New DollarUSD U.S. DollarZAR South African Rand
See Notes to Financial Statements
MFS Meridian Funds Annual Report 2017 125

FINANCIAL STATEMENTS at 31 January 2017
STATEMENTS OF ASSETS AND LIABILITIES
AbsoluteReturnFund
$
AsiaPacific
Ex-JapanFund
$
BlendedResearchEuropean
EquityFund (a)
€
ContinentalEuropean
EquityFund
€
DiversifiedIncomeFund
$
EmergingMarkets
DebtFund
$
EmergingMarkets DebtLocal Currency
Fund$
EmergingMarketsEquityFund
$Assets:
Investments, at value 14,914,376 79,377,148 4,558,518 7,224,246 138,655,984 2,794,151,110 32,912,397 62,990,225
Repurchase agreements (Note 12) 10,000 996,000 — — 1,337,000 21,911,000 3,690,000 541,000
Cash and other liquid assets 57,921 355 101,943 149,168 26,858 4,107,873 — 674
Restricted cash (Note 2) — — — — — 2,290,000 — —
Deposits with brokers (Note 2 & 13) 727,163 — — — — 2,879,285 26,580 —
Receivable for open forward foreign currency exchangecontracts (Note 10) 130,602 — — — — 6,676,769 368,602 —
Receivable for class specific open forward foreign currencyexchange contracts (Note 11) 423 — — 280 16,429 1,449,312 190 192
Receivable for daily variation margin on open futurescontracts 12,715 — — — — 419,136 — —
Receivable for fund shares sold — 11,174 — 10,680 412,438 14,381,448 25,333 165,494
Receivable for investments sold 20,059 134,139 516,832 — 1,647,833 37,361,352 945,975 3,304
Interest and dividends receivable 69,102 134,443 5,719 9,047 934,445 34,720,426 655,490 111,292
Interest receivable on swap agreements — — — — — 24,532 15,485 —
Receivable from related parties (Note 5) 13,365 — 13,735 24,207 — — — —
Receivable due from brokers — — — — — — — —
Swaps, at value (Note 14) 50,703 — — — — 973,641 71,361 —
Other assets 158 526 77 100 814 15,577 328 25,274
Total assets 16,006,587 80,653,785 5,196,824 7,417,728 143,031,801 2,921,361,461 38,711,741 63,837,455
Liabilities:
Payable to depositary — — — — — — 192,158 —
Distributions payable 82 — — — 63,467 1,293,669 57,300 —
Payable for open forward foreign currency exchangecontracts (Note 10) 130,936 — — — 2,571 6,090,318 622,697 —
Payable for class specific open forward foreign currencyexchange contracts (Note 11) — — 2,156 3,484 3,058 775,916 1,396 825
Payable for daily variation margin on open futurescontracts — — — — — — 523 —
Payable for investments purchased 50,057 — — — 2,031,806 40,551,393 643,825 8,785
Payable for fund shares reacquired 10 71,601 509,266 221 574,475 15,829,047 53,669 209,246
Payable for capital gains tax — 96,623 — — 1,048 — — 51,579
Interest payable on swap agreements 1,894 — — — — 28,964 13,558 —
Swaps, at value (Note 14) — — — — — 1,030,609 3,448 —
Payable to related parties (Note 5) — 9,227 — — 14,768 178,833 2,149 6,305
Accrued expenses and other liabilities 156,473 270,090 82,150 110,072 326,697 1,651,785 192,562 319,906
Total liabilities 339,452 447,541 593,572 113,777 3,017,890 67,430,534 1,783,285 596,646
Total net assets 15,667,135 80,206,244 4,603,252 7,303,951 140,013,911 2,853,930,927 36,928,456 63,240,809
(a) Effective 29 June 2016, the MFS Meridian Funds – European Concentrated Fund was renamed the MFS Meridian Funds – Blended Research European Equity Fund.
See Notes to Financial Statements
126 MFS Meridian Funds Annual Report 2017

FINANCIAL STATEMENTS at 31 January 2017
STATEMENTS OF ASSETS AND LIABILITIES
EuropeanCore
EquityFund
€
EuropeanResearch
Fund€
EuropeanSmaller
CompaniesFund
€
EuropeanValueFund
€
GlobalConcentrated
Fund$
GlobalCreditFund
$
GlobalEnergyFund
$
GlobalEquityFund
$Assets:
Investments, at value 18,549,355 1,957,304,303 869,007,288 5,000,840,053 991,977,838 19,928,132 27,461,157 5,265,156,234
Repurchase agreements (Note 12) — — — — 9,608,000 1,719,000 507,000 55,097,000
Cash and other liquid assets 318,680 34,617,106 8,906,364 86,135,896 5,622 18,943 684 906
Restricted cash (Note 2) — — — — — — — 260,000
Deposits with brokers (Note 2 & 13) — — — — — — — —
Receivable for open forward foreign currencyexchange contracts (Note 10) — — — — — 43,082 — —
Receivable for class specific open forward foreigncurrency exchange contracts (Note 11) 23 558,871 289,397 2,262,723 2,793 389 13 5,775
Receivable for daily variation margin on openfutures contracts — — — — — — — —
Receivable for fund shares sold 25,057 12,813,094 94,936,076 24,561,140 4,407,060 — 62,056 27,087,675
Receivable for investments sold — — — 140,463,066 — 338,613 — 898,355
Interest and dividends receivable 21,919 2,423,862 1,597,251 7,302,216 — 199,668 — —
Interest receivable on swap agreements — — — — — — — —
Receivable from related parties (Note 5) 28,792 — — — — 8,724 13,171 —
Receivable due from brokers — — — — — — — —
Swaps, at value (Note 14) — — — — — — — —
Other assets 1,091 8,831 4,304 26,300 4,407 196 238 7,412,916
Total assets 18,944,917 2,007,726,067 974,740,680 5,261,591,394 1,006,005,720 22,256,747 28,044,319 5,355,918,861
Liabilities:
Payable to depositary — — — — — — — —
Distributions payable — — — — — 4,224 — —
Payable for open forward foreign currencyexchange contracts (Note 10) — — — — — 30,347 — —
Payable for class specific open forward foreigncurrency exchange contracts (Note 11) 6,281 938,233 166,025 247,944 1,181 1,895 7,375 66,507
Payable for daily variation margin on open futurescontracts — — — — — — — —
Payable for investments purchased — — 3,935,395 — 502,866 436,928 — 38,574,116
Payable for fund shares reacquired 68,282 7,958,862 4,404,455 154,269,801 2,800,318 16,473 48,826 7,992,621
Payable for capital gains tax — — — — — — — 152,572
Interest payable on swap agreements — — — — — — — —
Swaps, at value (Note 14) — — — — — — — —
Payable to related parties (Note 5) — 122,989 73,923 402,441 66,402 — — 352,160
Accrued expenses and other liabilities 161,701 1,025,017 873,476 2,522,041 1,516,763 146,169 163,732 4,617,911
Total liabilities 236,264 10,045,101 9,453,274 157,442,227 4,887,530 636,036 219,933 51,755,887
Total net assets 18,708,653 1,997,680,966 965,287,406 5,104,149,167 1,001,118,190 21,620,711 27,824,386 5,304,162,974
See Notes to Financial Statements
MFS Meridian Funds Annual Report 2017 127

FINANCIAL STATEMENTS at 31 January 2017
STATEMENTS OF ASSETS AND LIABILITIES
GlobalEquityIncomeFund
$
GlobalHighYieldFund
$
GlobalMulti-Asset
Fund$
GlobalOpportunistic
BondFund (b)
$
GlobalResearchFocusedFund (c)
$
GlobalTotal
ReturnFund
$
Inflation-Adjusted
BondFund
$
JapanEquityFund
$Assets:
Investments, at value 251,242,414 709,455,219 62,278,623 36,173,435 236,913,731 2,772,571,016 126,389,923 6,747,255
Repurchase agreements (Note 12) 1,455,000 15,868,000 7,211,000 3,977,000 3,874,000 27,589,000 3,147,000 141,000
Cash and other liquid assets 11,369 1,469,116 331,915 16,822 824 492,489 310 354
Restricted cash (Note 2) — — — — — 630,000 — —
Deposits with brokers (Note 2 & 13) — — 4,046,277 204,398 — 246,550 — —
Receivable for open forward foreign currencyexchange contracts (Note 10) — 105,232 614,550 66,138 — 3,882,691 — —
Receivable for class specific open forward foreigncurrency exchange contracts (Note 11) 2,128 4,248 — 1,211 1,988 160,687 — —
Receivable for daily variation margin on open futurescontracts — — 68,324 — — — — —
Receivable for fund shares sold — 1,864,695 6,171 — 123,552 8,342,498 765,623 —
Receivable for investments sold 11,499,983 3,693,532 113,183 18,300 — 32,227,488 1,801,414 —
Interest and dividends receivable — 11,323,480 161,074 385,411 — 6,836,285 162,614 5,596
Interest receivable on swap agreements — — — — — — — —
Receivable from related parties (Note 5) 47,100 — — 24,989 — — — 17,322
Receivable due from brokers — — 65,056 — — — — —
Swaps, at value (Note 14) — — 6,048 — — — — —
Other assets 1,438 3,662 511 305 1,418 480,856 685 91
Total assets 264,259,432 743,787,184 74,902,732 40,868,009 240,915,513 2,853,459,560 132,267,569 6,911,618
Liabilities:
Payable to depositary — — — — — — — —
Distributions payable — 1,148,488 — 42 — — 52,011 —
Payable for open forward foreign currency exchangecontracts (Note 10) — 410,666 845,360 136,330 — 3,251,822 — —
Payable for class specific open forward foreigncurrency exchange contracts (Note 11) 1,536 2,666 — 1,756 6 65,674 — —
Payable for daily variation margin on open futurescontracts — — — 14,745 — 24,508 — —
Payable for investments purchased 12,443,770 4,096,190 736,108 379,752 5,486,811 38,105,199 709,594 40,414
Payable for fund shares reacquired — 1,420,851 201,649 — 191,232 7,938,712 4,479,569 555
Payable for capital gains tax 86,108 — — — — 153,736 — —
Interest payable on swap agreements — — 5,188 — — — — —
Swaps, at value (Note 14) — — — — — — — —
Payable to related parties (Note 5) — 65,428 24,257 — 25,643 284,013 24,111 —
Accrued expenses and other liabilities 304,698 829,429 227,600 119,802 700,251 1,766,285 188,317 121,774
Total liabilities 12,836,112 7,973,718 2,040,162 652,427 6,403,943 51,589,949 5,453,602 162,743
Total net assets 251,423,320 735,813,466 72,862,570 40,215,582 234,511,570 2,801,869,611 126,813,967 6,748,875
(b) The inception date of the sub-fund was 12 July 2016.(c) Effective 29 June 2016, the MFS Meridian Funds – Global Research Fund was renamed the MFS Meridian Funds – Global Research Focused Fund.
See Notes to Financial Statements
128 MFS Meridian Funds Annual Report 2017

FINANCIAL STATEMENTS at 31 January 2017
STATEMENTS OF ASSETS AND LIABILITIES
LatinAmerican
EquityFund
$
LimitedMaturity
Fund$
ManagedWealthFund
$
PrudentCapitalFund (d)
$
PrudentWealthFund
$
U.K.EquityFund
£
U.S.Concentrated
GrowthFund
$
U.S.Corporate
BondFund (e)
$Assets:
Investments, at value 23,086,322 761,186,473 50,261,232 12,377,271 2,457,095,089 76,105,720 430,908,137 236,114,582
Repurchase agreements (Note 12) 162,000 — 2,745,000 706,000 93,781,000 — 2,051,000 3,410,000
Cash and other liquid assets 18,760 — 5,059 788 88 1,368,595 191 43,391
Restricted cash (Note 2) — — — — 310,000 — — —
Deposits with brokers (Note 2 & 13) — 159,550 1,620,200 — — — — —
Receivable for open forward foreign currency exchangecontracts (Note 10) — — — — 8,491,442 863 — —
Receivable for class specific open forward foreign currencyexchange contracts (Note 11) 2,105 — 339 2,493 980,562 — 153 62,500
Receivable for daily variation margin on open futurescontracts — 17,542 — — — — — —
Receivable for fund shares sold 46,156 2,947,565 19,900 514,017 2,291,872 95,974 239,227 781,491
Receivable for investments sold 203,960 1,353,964 — — 5,269,325 94,395 6,492,343 1,799,737
Interest and dividends receivable 74,544 3,448,703 — 36,730 4,139,326 142,160 — 2,356,366
Interest receivable on swap agreements — — — — — — — —
Receivable from related parties (Note 5) — — 22,415 45,568 — 27,287 — —
Receivable due from brokers — — — — — — — —
Swaps, at value (Note 14) — — — — — — — —
Other assets 248 3,912 400 — 15,997 539 2,092 1,245
Total assets 23,594,095 769,117,709 54,674,545 13,682,867 2,572,374,701 77,835,533 439,693,143 244,569,312
Liabilities:
Payable to depositary — 609,452 34,058 — — — — —
Distributions payable — 26,423 — — — — — 115,833
Payable for open forward foreign currency exchangecontracts (Note 10) — — — 471 3,257,504 3,169 — —
Payable for class specific open forward foreign currencyexchange contracts (Note 11) 401 — 731 15,127 801,154 — 387 148,557
Payable for daily variation margin on open futurescontracts — — 10,970 — — — — —
Payable for investments purchased — 5,507,800 — 164,508 — 30,903 2,183,500 1,775,202
Payable for fund shares reacquired 57,403 1,403,431 — — 30,157,701 48,926 2,459,885 1,769,242
Payable for capital gains tax — — — — — — — —
Interest payable on swap agreements — — — — — — — —
Swaps, at value (Note 14) — — — — — — — —
Payable to related parties (Note 5) 27,053 47,393 — — 254,328 — 42,086 18,647
Accrued expenses and other liabilities 205,026 530,266 181,060 103,905 1,554,289 158,981 877,671 246,384
Total liabilities 289,883 8,124,765 226,819 284,011 36,024,976 241,979 5,563,529 4,073,865
Total net assets 23,304,212 760,992,944 54,447,726 13,398,856 2,536,349,725 77,593,554 434,129,614 240,495,447
(d) The inception date of the sub-fund was 3 November 2016.(e) Effective 29 June 2016, the MFS Meridian Funds – Bond Fund was renamed the MFS Meridian Funds – U.S. Corporate Bond Fund.
See Notes to Financial Statements
MFS Meridian Funds Annual Report 2017 129
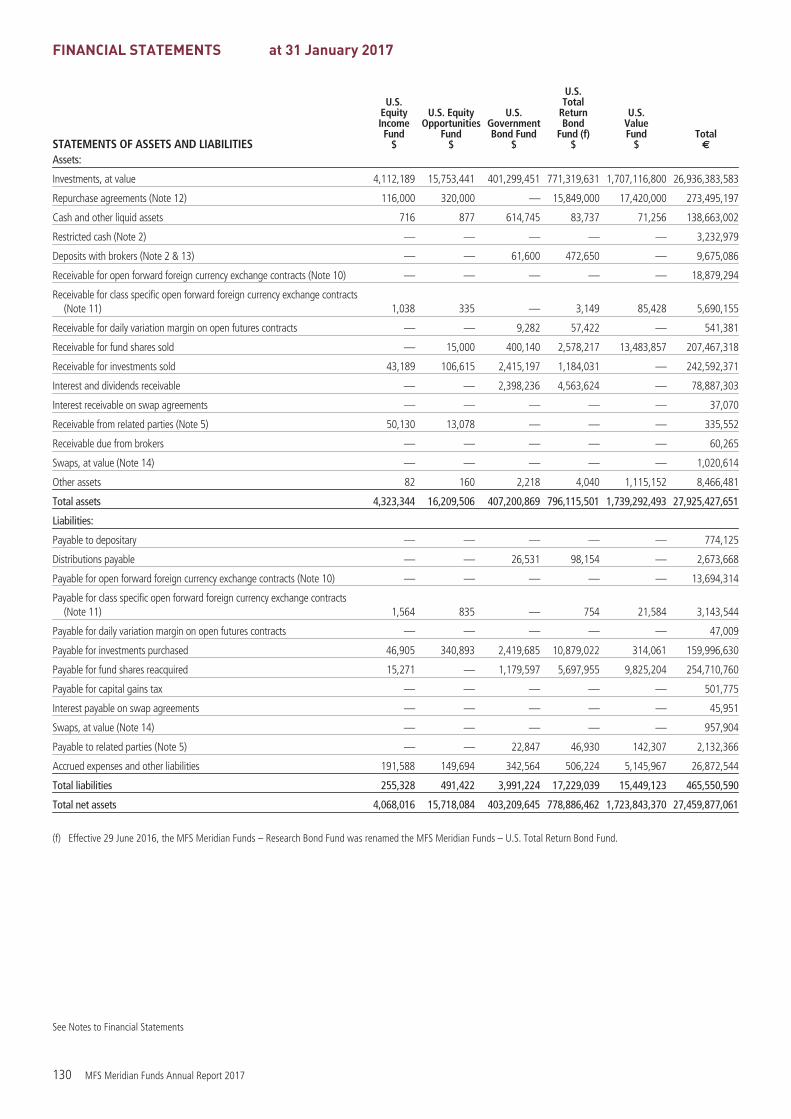
FINANCIAL STATEMENTS at 31 January 2017
STATEMENTS OF ASSETS AND LIABILITIES
U.S.EquityIncomeFund
$
U.S. EquityOpportunities
Fund$
U.S.GovernmentBond Fund
$
U.S.Total
ReturnBond
Fund (f)$
U.S.ValueFund
$Total
€
Assets:
Investments, at value 4,112,189 15,753,441 401,299,451 771,319,631 1,707,116,800 26,936,383,583
Repurchase agreements (Note 12) 116,000 320,000 — 15,849,000 17,420,000 273,495,197
Cash and other liquid assets 716 877 614,745 83,737 71,256 138,663,002
Restricted cash (Note 2) — — — — — 3,232,979
Deposits with brokers (Note 2 & 13) — — 61,600 472,650 — 9,675,086
Receivable for open forward foreign currency exchange contracts (Note 10) — — — — — 18,879,294
Receivable for class specific open forward foreign currency exchange contracts(Note 11) 1,038 335 — 3,149 85,428 5,690,155
Receivable for daily variation margin on open futures contracts — — 9,282 57,422 — 541,381
Receivable for fund shares sold — 15,000 400,140 2,578,217 13,483,857 207,467,318
Receivable for investments sold 43,189 106,615 2,415,197 1,184,031 — 242,592,371
Interest and dividends receivable — — 2,398,236 4,563,624 — 78,887,303
Interest receivable on swap agreements — — — — — 37,070
Receivable from related parties (Note 5) 50,130 13,078 — — — 335,552
Receivable due from brokers — — — — — 60,265
Swaps, at value (Note 14) — — — — — 1,020,614
Other assets 82 160 2,218 4,040 1,115,152 8,466,481
Total assets 4,323,344 16,209,506 407,200,869 796,115,501 1,739,292,493 27,925,427,651
Liabilities:
Payable to depositary — — — — — 774,125
Distributions payable — — 26,531 98,154 — 2,673,668
Payable for open forward foreign currency exchange contracts (Note 10) — — — — — 13,694,314
Payable for class specific open forward foreign currency exchange contracts(Note 11) 1,564 835 — 754 21,584 3,143,544
Payable for daily variation margin on open futures contracts — — — — — 47,009
Payable for investments purchased 46,905 340,893 2,419,685 10,879,022 314,061 159,996,630
Payable for fund shares reacquired 15,271 — 1,179,597 5,697,955 9,825,204 254,710,760
Payable for capital gains tax — — — — — 501,775
Interest payable on swap agreements — — — — — 45,951
Swaps, at value (Note 14) — — — — — 957,904
Payable to related parties (Note 5) — — 22,847 46,930 142,307 2,132,366
Accrued expenses and other liabilities 191,588 149,694 342,564 506,224 5,145,967 26,872,544
Total liabilities 255,328 491,422 3,991,224 17,229,039 15,449,123 465,550,590
Total net assets 4,068,016 15,718,084 403,209,645 778,886,462 1,723,843,370 27,459,877,061
(f) Effective 29 June 2016, the MFS Meridian Funds – Research Bond Fund was renamed the MFS Meridian Funds – U.S. Total Return Bond Fund.
See Notes to Financial Statements
130 MFS Meridian Funds Annual Report 2017

FINANCIAL STATEMENTS for the year ended 31 January 2017
STATEMENTS OF OPERATIONS ANDCHANGES IN NET ASSETS
AbsoluteReturnFund
$
AsiaPacific
Ex-JapanFund
$
BlendedResearchEuropean
EquityFund (a)
€
ContinentalEuropean
EquityFund
€
DiversifiedIncomeFund
$
EmergingMarkets Debt
Fund$
EmergingMarkets DebtLocal Currency
Fund$
EmergingMarketsEquityFund
$Net investment income (loss)
Income
Dividends — 2,401,615 151,975 220,479 2,042,415 — — 1,554,123
Interest 281,104 2,486 — — 4,763,439 188,781,667 2,726,188 1,707
Income on repurchase agreements (Note 2) 1,222 2,014 — — 5,539 117,760 2,978 1,445
Net income on securities loaned (Note 4) — — — — 1,516 — — —
Other — 10,243 — — — 18,007 — —
Withholding taxes (Note 8) — (259,845) (14,541) (30,270) (431,562) (115,708) (47,923) (171,604)
Total investment income 282,326 2,156,513 137,434 190,209 6,381,347 188,801,726 2,681,243 1,385,671
Expenses
Investment management fee (Note 5) 118,900 808,209 35,582 76,709 1,295,928 24,401,854 331,840 678,632
Distribution and service fees (Note 5) 96,279 507,799 19,288 52,410 1,307,133 10,876,828 281,466 403,403
Management company fee (Note 5) 19,998 28,764 18,306 18,306 41,774 698,347 20,000 24,625
Depositary fee (Note 6) 41,609 123,394 15,978 45,219 141,632 701,296 97,308 207,255
Reimbursement of depositary fee (Note 6) (2) (46,693) — (2) (8) (77,613) (7) (10)
Shareholder servicing costs 40,021 64,707 10,906 20,246 75,078 470,067 35,148 44,600
Printing 38,165 35,480 37,659 37,659 31,388 43,852 35,481 31,915
Audit and other professional fees 68,320 103,056 55,218 56,225 114,421 182,732 71,583 102,580
Taxe d’abonnement (Note 8) 7,617 31,489 1,589 3,561 71,011 957,955 18,665 23,352
Interest expense and similar charges (Note 2) 7,754 — 760 1,203 — 3,305 120 —
Miscellaneous 30,694 26,709 20,158 20,496 37,738 98,556 26,145 27,920
Total expenses 469,355 1,682,914 215,444 332,032 3,116,095 38,357,179 917,749 1,544,272
Expenses reimbursed by related parties (Note 5) (207,681) (245,827) (150,278) (183,510) (155,036) (794) (176,043) (277,080)
Net expenses 261,674 1,437,087 65,166 148,522 2,961,059 38,356,385 741,706 1,267,192
Net investment income (loss) 20,652 719,426 72,268 41,687 3,420,288 150,445,341 1,939,537 118,479
Realized and unrealized gain (loss) oninvestments, derivatives, and currencytransactions
Net realized gain (loss) on investments,derivatives, and currency transactions 522,762 (2,349,303) 575,755 298,753 (3,460,595) 999,893 (2,218,411) (4,218,798)
Net change in unrealized gain (loss) oninvestments, derivatives, and currencytranslation 74,358 16,364,261 18,808 84,514 14,570,095 191,084,390 3,544,530 15,817,399
Results of operations 617,772 14,734,384 666,831 424,954 14,529,788 342,529,624 3,265,656 11,717,080
Distributions declared to shareholders (Note 2) (1,455) — — — (1,280,964) (22,524,280) (1,103,069) —
Change in net assets from fund sharetransactions (1,470,116) (20,489,389) (517,452) (1,253,637) (21,902,618) (579,911,218) 661,000 (7,299,104)
Total change in net assets (853,799) (5,755,005) 149,379 (828,683) (8,653,794) (259,905,874) 2,823,587 4,417,976
Net assets
At the beginning of the year 16,520,934 85,961,249 4,453,873 8,132,634 148,667,705 3,113,836,801 34,104,869 58,822,833
Beginning of year currency translation (Note 2) — — — — — — — —
At the end of the year 15,667,135 80,206,244 4,603,252 7,303,951 140,013,911 2,853,930,927 36,928,456 63,240,809
(a) Effective 29 June 2016, the MFS Meridian Funds – European Concentrated Fund was renamed the MFS Meridian Funds – Blended Research European Equity Fund.
See Notes to Financial Statements
MFS Meridian Funds Annual Report 2017 131

FINANCIAL STATEMENTS for the year ended 31 January 2017
STATEMENTS OF OPERATIONS ANDCHANGES IN NET ASSETS
EuropeanCore
EquityFund
€
EuropeanResearch
Fund€
EuropeanSmaller
CompaniesFund
€
EuropeanValueFund
€
GlobalConcentrated
Fund$
GlobalCreditFund
$
GlobalEnergyFund
$
GlobalEquityFund
$Net investment income (loss)
Income
Dividends 557,010 59,627,013 25,141,453 164,333,077 15,647,451 — 716,997 102,886,369
Interest — — 532 279 22,792 791,095 2,040 91,158
Income on repurchase agreements (Note 2) — — — — 18,564 1,914 2,314 74,464
Net income on securities loaned (Note 4) 1,507 612,352 64,865 247,604 84,723 — — 260,686
Other — 16,211 — 3 33,876 — — 12,951
Withholding taxes (Note 8) (34,023) (5,630,277) (1,047,524) (12,163,579) (2,926,118) (295) (132,220) (17,608,909)
Total investment income 524,494 54,625,299 24,159,326 152,417,384 12,881,288 792,714 589,131 85,716,719
Expenses
Investment management fee (Note 5) 187,779 15,566,053 9,932,804 55,948,807 8,690,007 119,633 285,065 46,276,626
Distribution and service fees (Note 5) 113,173 5,048,217 4,898,613 26,273,452 2,058,900 81,490 179,288 14,476,309
Management company fee (Note 5) 18,306 390,889 223,280 774,470 192,437 19,998 19,998 846,489
Depositary fee (Note 6) 67,939 569,651 405,336 1,170,828 221,821 46,995 33,020 689,832
Reimbursement of depositary fee (Note 6) (4) (68,019) (75) (485) (130,401) (2) (2) (50,413)
Shareholder servicing costs 40,345 274,484 296,357 567,096 125,385 27,377 37,164 465,821
Printing 37,678 37,474 37,694 37,679 35,480 35,481 35,481 39,777
Audit and other professional fees 58,151 61,972 62,001 65,688 72,662 71,340 59,270 73,132
Taxe d’abonnement (Note 8) 7,651 429,336 341,784 1,977,089 186,477 5,562 12,970 1,242,350
Interest expense and similar charges (Note 2) 1,883 204,283 206,407 931,692 842 14 — 2,405
Miscellaneous 22,905 76,261 61,512 341,911 36,599 23,827 26,187 100,960
Total expenses 555,806 22,590,601 16,465,713 88,088,227 11,490,209 431,715 688,441 64,163,288
Expenses reimbursed by related parties (Note 5) (209,507) (239) — (295) (24,911) (189,027) (157,537) (28,379)
Net expenses 346,299 22,590,362 16,465,713 88,087,932 11,465,298 242,688 530,904 64,134,909
Net investment income (loss) 178,195 32,034,937 7,693,613 64,329,452 1,415,990 550,026 58,227 21,581,810
Realized and unrealized gain (loss) on investments,derivatives, and currency transactions
Net realized gain (loss) on investments,derivatives, and currency transactions 1,451,121 68,340,735 43,422,247 241,797,493 17,660,584 (140,643) (1,504,076) 184,620,993
Net change in unrealized gain (loss) oninvestments, derivatives, and currencytranslation (198,350) (25,912,555) (7,710,078) (95,066,576) 79,903,701 936,461 6,563,797 485,297,318
Results of operations 1,430,966 74,463,117 43,405,782 211,060,369 98,980,275 1,345,844 5,117,948 691,500,121
Distributions declared to shareholders (Note 2) — — — — — (63,568) — —
Change in net assets from fund share transactions (5,428,593) (95,163,375) (305,274,293)(1,255,756,848) 207,162,550 1,636,751 128,101 (110,812,789)
Total change in net assets (3,997,627) (20,700,258) (261,868,511)(1,044,696,479) 306,142,825 2,919,027 5,246,049 580,687,332
Net assets
At the beginning of the year 22,706,280 2,018,381,224 1,227,155,917 6,148,845,646 694,975,365 18,701,684 22,578,337 4,723,475,642
Beginning of year currency translation (Note 2) — — — — — — — —
At the end of the year 18,708,653 1,997,680,966 965,287,406 5,104,149,167 1,001,118,190 21,620,711 27,824,386 5,304,162,974
See Notes to Financial Statements
132 MFS Meridian Funds Annual Report 2017

FINANCIAL STATEMENTS for the year ended 31 January 2017
STATEMENTS OF OPERATIONS ANDCHANGES IN NET ASSETS
GlobalEquityIncomeFund
$
GlobalHighYieldFund
$
GlobalMulti-Asset
Fund$
GlobalOpportunistic
BondFund (b)
$
GlobalResearchFocusedFund (c)
$
GlobalTotal
ReturnFund
$
Inflation-Adjusted
BondFund
$
JapanEquityFund
$Net investment income (loss)
Income
Dividends 8,594,305 183,813 759,712 — 8,244,422 54,815,926 — 175,466
Interest 4,440 48,123,364 1,191,897 803,102 3,229 31,855,744 2,785,711 329
Income on repurchase agreements (Note 2) 3,772 43,463 11,727 4,568 2,761 64,587 2,253 284
Net income on securities loaned (Note 4) — — 1,628 — 34,285 184,072 — —
Other — 3,343 11,252 — 28,585 27,001 184 —
Withholding taxes (Note 8) (1,340,380) (19,156) (131,050) (2,506) (1,383,732) (9,214,838) — (26,873)
Total investment income 7,262,137 48,334,827 1,845,166 805,164 6,929,550 77,732,492 2,788,148 149,206
Expenses
Investment management fee (Note 5) 17,914 5,628,076 806,711 111,356 2,989,397 28,908,048 655,002 84,849
Distribution and service fees (Note 5) 11,904 6,368,817 600,644 3,272 1,706,760 24,539,495 712,358 63,619
Management company fee (Note 5) 60,246 169,475 27,879 11,154 75,070 602,094 34,920 19,998
Depositary fee (Note 6) 150,097 278,166 114,789 45,353 144,260 544,665 42,086 37,882
Reimbursement of depositary fee (Note 6) — (16,566) (42,061) — (108,735) (106,078) (1,040) (1)
Shareholder servicing costs 36,883 293,359 52,727 18,739 69,385 579,679 52,569 28,624
Printing 46,379 48,128 35,481 28,031 35,480 43,831 35,480 35,480
Audit and other professional fees 139,777 126,392 67,361 54,276 64,825 129,343 65,575 59,166
Taxe d’abonnement (Note 8) 25,036 362,362 33,477 2,569 112,612 1,294,179 54,019 3,644
Interest expense and similar charges (Note 2) 172 1,722 46,411 704 33 4,427 21 —
Miscellaneous 20,784 44,681 37,322 14,086 30,492 82,240 22,255 20,692
Total expenses 509,192 13,304,612 1,780,741 289,540 5,119,579 56,621,923 1,673,245 353,953
Expenses reimbursed by related parties (Note 5) (128,691) (1,105) (210,033) (140,384) (41,563) (47,954) (41,923) (185,410)
Net expenses 380,501 13,303,507 1,570,708 149,156 5,078,016 56,573,969 1,631,322 168,543
Net investment income (loss) 6,881,636 35,031,320 274,458 656,008 1,851,534 21,158,523 1,156,826 (19,337)
Realized and unrealized gain (loss) oninvestments, derivatives, and currencytransactions
Net realized gain (loss) on investments,derivatives, and currency transactions (1,504,295) (27,357,005) 5,312,044 551,015 36,024,482 (32,359,516) (1,279,942) 36,731
Net change in unrealized gain (loss) oninvestments, derivatives, and currencytranslation 26,911,475 101,448,016 2,230,789 (1,612,725) 2,663,965 226,697,635 2,964,602 781,095
Results of operations 32,288,816 109,122,331 7,817,291 (405,702) 40,539,981 215,496,642 2,841,486 798,489
Distributions declared to shareholders (Note 2) (7,376,752) (19,267,790) (85,227) (11,605) — (3,721,649) (207,122) —
Change in net assets from fund sharetransactions 42,616,370 (54,009,328) (16,152,365) 40,632,889 (154,331,850) (179,643,833) 20,975,320 (5,478,227)
Total change in net assets 67,528,434 35,845,213 (8,420,301) 40,215,582 (113,791,869) 32,131,160 23,609,684 (4,679,738)
Net assets
At the beginning of the year 183,894,886 699,968,253 81,282,871 — 348,303,439 2,769,738,451 103,204,283 11,428,613
Beginning of year currency translation (Note 2) — — — — — — — —
At the end of the year 251,423,320 735,813,466 72,862,570 40,215,582 234,511,570 2,801,869,611 126,813,967 6,748,875
(b) The inception date of the sub-fund was 12 July 2016.(c) Effective 29 June 2016, the MFS Meridian Funds – Global Research Fund was renamed the MFS Meridian Funds – Global Research Focused Fund.
See Notes to Financial Statements
MFS Meridian Funds Annual Report 2017 133
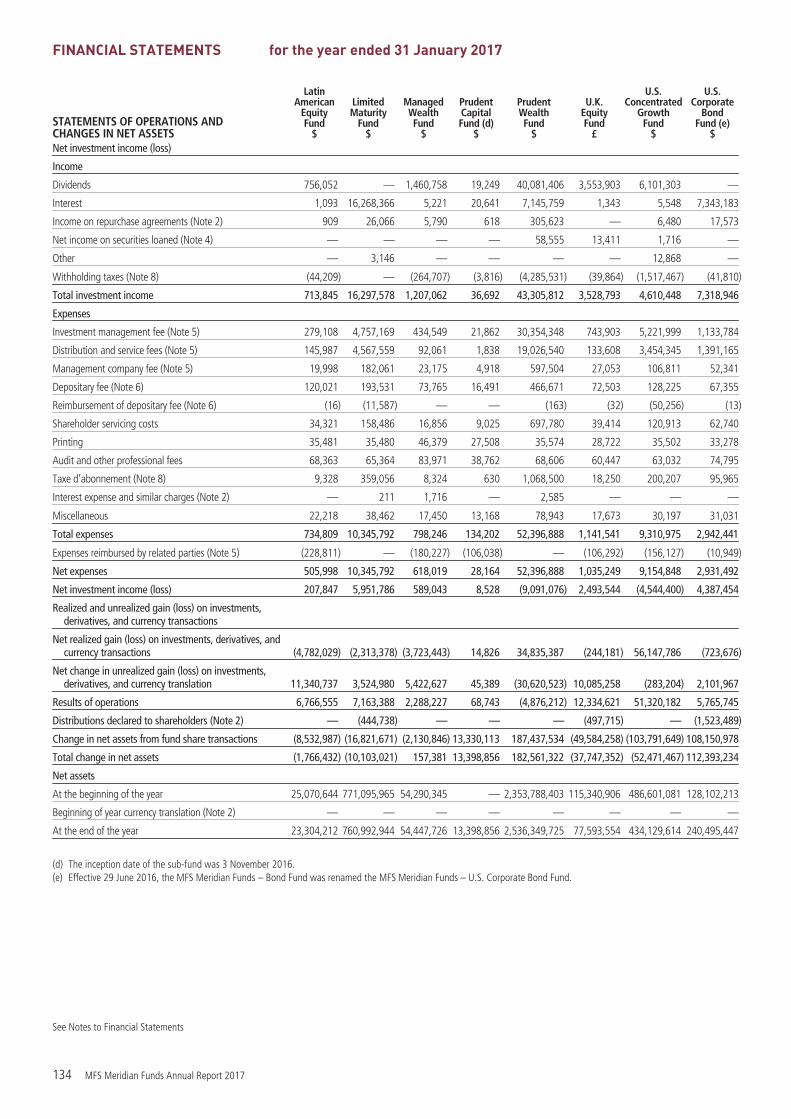
FINANCIAL STATEMENTS for the year ended 31 January 2017
STATEMENTS OF OPERATIONS ANDCHANGES IN NET ASSETS
LatinAmerican
EquityFund
$
LimitedMaturity
Fund$
ManagedWealthFund
$
PrudentCapitalFund (d)
$
PrudentWealthFund
$
U.K.EquityFund
£
U.S.Concentrated
GrowthFund
$
U.S.Corporate
BondFund (e)
$Net investment income (loss)
Income
Dividends 756,052 — 1,460,758 19,249 40,081,406 3,553,903 6,101,303 —
Interest 1,093 16,268,366 5,221 20,641 7,145,759 1,343 5,548 7,343,183
Income on repurchase agreements (Note 2) 909 26,066 5,790 618 305,623 — 6,480 17,573
Net income on securities loaned (Note 4) — — — — 58,555 13,411 1,716 —
Other — 3,146 — — — — 12,868 —
Withholding taxes (Note 8) (44,209) — (264,707) (3,816) (4,285,531) (39,864) (1,517,467) (41,810)
Total investment income 713,845 16,297,578 1,207,062 36,692 43,305,812 3,528,793 4,610,448 7,318,946
Expenses
Investment management fee (Note 5) 279,108 4,757,169 434,549 21,862 30,354,348 743,903 5,221,999 1,133,784
Distribution and service fees (Note 5) 145,987 4,567,559 92,061 1,838 19,026,540 133,608 3,454,345 1,391,165
Management company fee (Note 5) 19,998 182,061 23,175 4,918 597,504 27,053 106,811 52,341
Depositary fee (Note 6) 120,021 193,531 73,765 16,491 466,671 72,503 128,225 67,355
Reimbursement of depositary fee (Note 6) (16) (11,587) — — (163) (32) (50,256) (13)
Shareholder servicing costs 34,321 158,486 16,856 9,025 697,780 39,414 120,913 62,740
Printing 35,481 35,480 46,379 27,508 35,574 28,722 35,502 33,278
Audit and other professional fees 68,363 65,364 83,971 38,762 68,606 60,447 63,032 74,795
Taxe d’abonnement (Note 8) 9,328 359,056 8,324 630 1,068,500 18,250 200,207 95,965
Interest expense and similar charges (Note 2) — 211 1,716 — 2,585 — — —
Miscellaneous 22,218 38,462 17,450 13,168 78,943 17,673 30,197 31,031
Total expenses 734,809 10,345,792 798,246 134,202 52,396,888 1,141,541 9,310,975 2,942,441
Expenses reimbursed by related parties (Note 5) (228,811) — (180,227) (106,038) — (106,292) (156,127) (10,949)
Net expenses 505,998 10,345,792 618,019 28,164 52,396,888 1,035,249 9,154,848 2,931,492
Net investment income (loss) 207,847 5,951,786 589,043 8,528 (9,091,076) 2,493,544 (4,544,400) 4,387,454
Realized and unrealized gain (loss) on investments,derivatives, and currency transactions
Net realized gain (loss) on investments, derivatives, andcurrency transactions (4,782,029) (2,313,378) (3,723,443) 14,826 34,835,387 (244,181) 56,147,786 (723,676)
Net change in unrealized gain (loss) on investments,derivatives, and currency translation 11,340,737 3,524,980 5,422,627 45,389 (30,620,523) 10,085,258 (283,204) 2,101,967
Results of operations 6,766,555 7,163,388 2,288,227 68,743 (4,876,212) 12,334,621 51,320,182 5,765,745
Distributions declared to shareholders (Note 2) — (444,738) — — — (497,715) — (1,523,489)
Change in net assets from fund share transactions (8,532,987) (16,821,671) (2,130,846) 13,330,113 187,437,534 (49,584,258) (103,791,649) 108,150,978
Total change in net assets (1,766,432) (10,103,021) 157,381 13,398,856 182,561,322 (37,747,352) (52,471,467) 112,393,234
Net assets
At the beginning of the year 25,070,644 771,095,965 54,290,345 — 2,353,788,403 115,340,906 486,601,081 128,102,213
Beginning of year currency translation (Note 2) — — — — — — — —
At the end of the year 23,304,212 760,992,944 54,447,726 13,398,856 2,536,349,725 77,593,554 434,129,614 240,495,447
(d) The inception date of the sub-fund was 3 November 2016.(e) Effective 29 June 2016, the MFS Meridian Funds – Bond Fund was renamed the MFS Meridian Funds – U.S. Corporate Bond Fund.
See Notes to Financial Statements
134 MFS Meridian Funds Annual Report 2017

FINANCIAL STATEMENTS for the year ended 31 January 2017
STATEMENTS OF OPERATIONS AND CHANGES IN NET ASSETS
U.S.EquityIncomeFund
$
U.S. EquityOpportunities
Fund$
U.S.GovernmentBond Fund
$
U.S.Total
ReturnBond
Fund (f)$
U.S.ValueFund
$Total
€
Net investment income (loss)
Income
Dividends 145,175 372,774 — — 41,213,840 521,123,220
Interest 246 326 13,359,050 26,069,359 — 326,496,459
Income on repurchase agreements (Note 2) 231 384 17,854 24,831 40,231 748,698
Net income on securities loaned (Note 4) — — — — — 1,522,949
Other — — 3,417 1,415 12,788 182,102
Withholding taxes (Note 8) (33,079) (100,335) (422) (50,098) (9,787,636) (65,230,533)
Total investment income 112,573 273,149 13,379,899 26,045,507 31,479,223 784,842,895
Expenses
Investment management fee (Note 5) 37,528 173,051 2,528,725 4,569,785 14,776,308 255,376,390
Distribution and service fees (Note 5) 36,226 97,690 2,050,771 4,166,292 9,056,568 136,943,281
Management company fee (Note 5) 19,998 19,998 102,808 176,137 331,411 5,690,393
Depositary fee (Note 6) 57,662 31,367 121,733 193,878 269,562 7,363,354
Reimbursement of depositary fee (Note 6) — — (12,031) (6,321) (53,934) (729,996)
Shareholder servicing costs 35,681 23,565 105,556 131,749 317,252 5,175,011
Printing 37,779 51,197 35,481 35,481 35,502 1,292,600
Audit and other professional fees 125,229 41,144 66,406 79,709 66,611 2,715,759
Taxe d’abonnement (Note 8) 1,641 5,675 183,956 339,077 615,938 9,575,835
Interest expense and similar charges (Note 2) — — 32 214 39 1,413,599
Miscellaneous 18,832 18,250 31,840 42,784 48,309 1,582,246
Total expenses 370,576 461,937 5,215,277 9,728,785 25,463,566 426,398,472
Expenses reimbursed by related parties (Note 5) (287,034) (152,550) — (301) (87,885) (3,881,500)
Net expenses 83,542 309,387 5,215,277 9,728,484 25,375,681 422,516,972
Net investment income (loss) 29,031 (36,238) 8,164,622 16,317,023 6,103,542 362,325,923
Realized and unrealized gain (loss) on investments, derivatives, and currencytransactions
Net realized gain (loss) on investments, derivatives, and currencytransactions 246,228 857,561 (3,136,521) (4,987,097) 63,830,195 638,697,264
Net change in unrealized gain (loss) on investments, derivatives, andcurrency translation 401,697 2,338,755 (11,152,881) 1,634,301 182,151,528 1,127,199,166
Results of operations 676,956 3,160,078 (6,124,780) 12,964,227 252,085,265 2,128,222,353
Distributions declared to shareholders (Note 2) (14,926) — (759,428) (1,790,456) — (56,324,833)
Change in net assets from fund share transactions (416,195) (10,291,090) 2,161,565 112,418,800 109,863,764 (2,134,618,482)
Total change in net assets 245,835 (7,131,012) (4,722,643) 123,592,571 361,949,029 (62,720,962)
Net assets
At the beginning of the year 3,822,181 22,849,096 407,932,288 655,293,891 1,361,894,341 27,476,891,418
Beginning of year currency translation (Note 2) — — — — — 45,706,605
At the end of the year 4,068,016 15,718,084 403,209,645 778,886,462 1,723,843,370 27,459,877,061
(f) Effective 29 June 2016, the MFS Meridian Funds – Research Bond Fund was renamed the MFS Meridian Funds – U.S. Total Return Bond Fund.
See Notes to Financial Statements
MFS Meridian Funds Annual Report 2017 135

FINANCIAL STATEMENTS at 31 January 2017
STATISTICAL INFORMATION
AbsoluteReturnFund
$
AsiaPacific
Ex-JapanFund
$
BlendedResearchEuropean
EquityFund (a)
€
ContinentalEuropean
EquityFund
€
DiversifiedIncomeFund
$
EmergingMarkets
DebtFund
$
Net Asset Value
31 January 2015 21,523,048 126,847,944 5,632,170 14,865,744 93,357,831 3,560,717,302
31 January 2016 16,520,934 85,961,249 4,453,873 8,132,634 148,667,705 3,113,836,801
31 January 2017 15,667,135 80,206,244 4,603,252 7,303,951 140,013,911 2,853,930,927
Shares outstanding at 31 January 2016
Class A1 (EUR) 321,813 47,125 6,565 83,634 — 1,210,905
Class A1 (GBP) — — — 211,835 — 961,684
Class A1 (USD) 314,629 2,063,835 206,095 259,601 3,644,344 16,372,346
Class AH1 (CHF) — — — — — 180,959
Class AH1 (EUR) 4,771 — — — 209,548 7,867,636
Class A2 (USD) 60,236 — — — 1,949,296 16,091,639
Class AH2 (EUR) — — — — 4,729 4,482
Class A3 (USD) — — — — 103,042 7,237
Class AH3 (EUR) — — — — 4,674 4,509
Class B1 (USD) 34,868 128,073 — — — 519,685
Class B2 (USD) 12,197 — — — — 1,899,918
Class C1 (USD) 110,723 368,658 — 8,842 3,352,647 4,203,965
Class C2 (USD) 60,225 — — — 1,513,626 8,069,992
Class C3 (USD) — — — — 41,643 34,707
Class I1 (EUR) 324 — 10,400 — — —
Class I1 (GBP) 252 170 216 736 — 62,027
Class I1 (USD) 8,315 122,248 4,941 4,771 17,075 4,387,757
Class IH1 (CHF) — — — — — 615,983
Class IH1 (EUR) 453 — — — 458 1,940,178
Class IH1 (GBP) — — — 325 342 331
Class I1X (USD) — — — — — 39,273
Class I2 (GBP) — — — — 331 498,253
Class N1 (EUR) — — — — — 8,687
Class N1 (USD) 32,264 347,884 — 5,041 3,420,651 9,742,447
Class N2 (USD) 9,393 — — — 1,016,043 1,083,315
Class N3 (USD) — — — — 115,200 65,364
Class S1 (USD) — 267,181 — — — 732,448
Class W1 (EUR) — — 8,744 3,616 4,730 4,730
Class W1 (USD) 85,078 48,336 — — 75,406 2,274,987
Class WH1 (EUR) — — — — 4,730 4,730
Class WH1 (GBP) — — 2,476 9,187 3,291 37,661
Class W2 (EUR) — — — — 4,753 4,762
Class W2 (USD) — — — — 65,741 946,052
Class WH2 (EUR) — — — — 4,753 4,762
Class WH2 (GBP) — — — — 3,313 21,497
Class W3 (EUR) — — — — 4,762 4,770
Class W3 (USD) — — — — 5,254 5,636
Class WH3 (EUR) — — — — 4,762 4,770
Class WH3 (GBP) — — — — 3,289 3,551
Class Z1 (USD) — — — — — 2,549,539
Total shares outstanding at 31 January 2016 1,055,541 3,393,510 239,437 587,588 15,578,433 82,473,174
See Notes to Financial Statements
136 MFS Meridian Funds Annual Report 2017

FINANCIAL STATEMENTS at 31 January 2017
STATISTICAL INFORMATION – (continued)
AbsoluteReturnFund
$
AsiaPacific
Ex-JapanFund
$
BlendedResearchEuropean
EquityFund (a)
€
ContinentalEuropean
EquityFund
€
DiversifiedIncomeFund
$
EmergingMarkets
DebtFund
$
Shares outstanding at 31 January 2017
Class A1 (EUR) 276,806 43,780 18,516 78,591 — 1,232,548
Class A1 (GBP) — — — 189,779 — 692,176
Class A1 (USD) 346,535 1,762,132 122,715 186,552 3,229,049 16,697,445
Class AH1 (CHF) — — — — — 160,824
Class AH1 (EUR) 4,771 — — — 191,698 10,252,413
Class AH1 (USD) — — 5,000 — — —
Class A2 (USD) 56,414 — — — 2,310,506 17,286,123
Class AH2 (EUR) — — — — 55,627 58,904
Class A3 (USD) — — — — 300,695 243,988
Class AH3 (EUR) — — — — 26,529 18,578
Class A4 (EUR) — — — — 4,724 —
Class AH4 (EUR) — — — — 4,724 —
Class B1 (USD) 26,563 57,213 — — — 396,028
Class B2 (USD) 5,055 — — — — 1,418,081
Class C1 (USD) 84,311 225,478 5,000 5,051 2,597,406 3,528,917
Class CH1 (USD) — — 5,000 — — —
Class C2 (USD) 55,913 — — — 860,628 6,018,222
Class C3 (USD) — — — — 108,752 71,401
Class I1 (EUR) 324 — 10,400 — — —
Class I1 (GBP) 252 170 216 989 — 102,681
Class I1 (USD) 1,921 84,397 4,941 4,771 7,970 3,040,329
Class IH1 (CHF) — — — — — 40,342
Class IH1 (EUR) 453 — — — 458 2,304,785
Class IH1 (GBP) — — — 325 342 331
Class IH1 (USD) — — 500 — — —
Class I1X (USD) — — — — — 30,968
Class I2 (GBP) — — — — 343 506,346
Class N1 (EUR) — — — — — 11,332
Class N1 (USD) 33,879 295,672 5,000 5,041 2,343,453 5,080,896
Class NH1 (USD) — — 5,000 — — —
Class N2 (USD) 7,162 — — — 686,518 1,210,937
Class N3 (USD) — — — — 273,054 166,629
Class S1 (USD) — 227,086 — — — 627,796
Class W1 (EUR) — — 3,744 3,616 5,730 4,730
Class W1 (USD) 104,401 36,773 5,000 5,000 289,665 3,012,160
Class WH1 (CHF) — — — — — 4,880
Class WH1 (EUR) — — — — 4,730 39,848
Class WH1 (GBP) — — 2,476 11,148 3,291 75,235
Class WH1 (USD) — — 5,000 — — —
Class W2 (EUR) — — — — 4,918 4,992
Class W2 (USD) 5,006 — — — 85,574 2,846,328
Class WH2 (EUR) — — — — 4,919 4,988
Class WH2 (GBP) — — — — 3,429 172,393
Class W3 (EUR) — — — — 4,979 5,051
Class W3 (USD) — — — — 10,499 7,562
Class WH3 (EUR) — — — — 4,978 5,052
Class WH3 (GBP) — — — — 3,439 3,762
Class Z1 (USD) — — — — — 1,198,152
Total shares outstanding at 31 January 2017 1,009,766 2,732,701 198,508 490,863 13,428,627 78,584,153
See Notes to Financial Statements
MFS Meridian Funds Annual Report 2017 137

FINANCIAL STATEMENTS at 31 January 2017
STATISTICAL INFORMATION – (continued)
AbsoluteReturnFund
$
AsiaPacific
Ex-JapanFund
$
BlendedResearchEuropean
EquityFund (a)
€
ContinentalEuropean
EquityFund
€
DiversifiedIncomeFund
$
EmergingMarkets
DebtFund
$
Net asset value per share Class A1 (EUR)
31 January 2015 19.88 19.58 17.18 16.82 — 19.72
31 January 2016 19.90 17.57 16.36 16.71 — 20.15
31 January 2017 20.89 21.01 18.65 17.83 — 22.45
Net asset value per share Class A1 (GBP)
31 January 2015 — — — 8.72 — 8.11
31 January 2016 — — — 8.78 — 8.39
31 January 2017 — — — 10.57 — 10.56
Net asset value per share Class A1 (USD)
31 January 2015 13.86 24.59 13.47 16.20 10.12 32.99
31 January 2016 13.31 21.15 12.30 15.43 9.54 32.32
31 January 2017 13.92 25.20 13.96 16.40 10.61 35.88
Net asset value per share Class AH1 (CHF)
31 January 2015 — — — — — 9.72
31 January 2016 — — — — — 9.38
31 January 2017 — — — — — 10.19
Net asset value per share Class AH1 (EUR)
31 January 2015 9.78 — — — 10.11 12.15
31 January 2016 9.17 — — — 9.54 11.84
31 January 2017 9.47 — — — 10.47 12.93
Net asset value per share Class AH1 (USD)
31 January 2017 — — 11.73(g) — — —
Net asset value per share Class A2 (USD)
31 January 2015 11.15 — — — 10.09 17.26
31 January 2016 10.69 — — — 9.31 16.23
31 January 2017 11.15 — — — 10.07 17.28
Net asset value per share Class AH2 (EUR)
31 January 2015 — — — — 10.08 —
31 January 2016 — — — — 9.24 9.62
31 January 2017 — — — — 9.89 10.12
Net asset value per share Class A3 (USD)
31 January 2016 — — — — 9.28 16.19
31 January 2017 — — — — 9.89 17.03
Net asset value per share Class AH3 (EUR)
31 January 2016 — — — — 9.19 9.57
31 January 2017 — — — — 9.64 9.89
Net asset value per share Class A4 (EUR)
31 January 2017 — — — — 9.85(g) —
Net asset value per share Class AH4 (EUR)
31 January 2017 — — — — 10.10(g) —
Net asset value per share Class B1 (USD)
31 January 2015 12.71 21.98 — — — 29.35
31 January 2016 12.08 18.77 — — — 28.47
31 January 2017 12.50 22.20 — — — 31.29
See Notes to Financial Statements
138 MFS Meridian Funds Annual Report 2017

FINANCIAL STATEMENTS at 31 January 2017
STATISTICAL INFORMATION – (continued)
AbsoluteReturnFund
$
AsiaPacific
Ex-JapanFund
$
BlendedResearchEuropean
EquityFund (a)
€
ContinentalEuropean
EquityFund
€
DiversifiedIncomeFund
$
EmergingMarkets
DebtFund
$
Net asset value per share Class B2 (USD)
31 January 2015 11.14 — — — — 17.26
31 January 2016 10.59 — — — — 16.23
31 January 2017 10.96 — — — — 17.27
Net asset value per share Class C1 (USD)
31 January 2015 12.73 21.80 — 9.76 10.09 28.94
31 January 2016 12.10 18.62 — 9.22 9.42 28.06
31 January 2017 12.53 22.01 11.32(g) 9.73 10.37 30.85
Net asset value per share Class CH1 (USD)
31 January 2017 — — 11.68(g) — — —
Net asset value per share Class C2 (USD)
31 January 2015 11.09 — — — 10.08 17.26
31 January 2016 10.55 — — — 9.29 16.23
31 January 2017 10.92 — — — 10.04 17.27
Net asset value per share Class C3 (USD)
31 January 2016 — — — — 9.23 16.14
31 January 2017 — — — — 9.74 16.78
Net asset value per share Class I1 (EUR)
31 January 2015 157.48 — 178.15 — — —
31 January 2016 158.83 — 171.43 — — —
31 January 2017 167.62 — 197.40 — — —
Net asset value per share Class I1 (GBP)
31 January 2015 140.09 220.48 152.78 191.37 — 167.75
31 January 2016 143.17 202.80 149.05 194.91 — 174.70
31 January 2017 170.74 276.86 193.70 237.40 — 221.22
Net asset value per share Class I1 (USD)
31 January 2015 101.00 208.07 10.06 10.22 101.35 198.97
31 January 2016 97.65 181.05 9.28 9.85 96.23 196.14
31 January 2017 102.82 218.22 10.64 10.59 107.80 219.14
Net asset value per share Class IH1 (CHF)
31 January 2015 — — — — — 99.41
31 January 2016 — — — — — 96.82
31 January 2017 — — — — — 105.08
Net asset value per share Class IH1 (EUR)
31 January 2015 100.89 — — — 101.41 124.11
31 January 2016 96.83 — — — 95.80 121.67
31 January 2017 100.69 — — — 105.64 133.99
Net asset value per share Class IH1 (GBP)
31 January 2016 — — — 97.82 93.91 97.42
31 January 2017 — — — 106.41 104.71 108.63
Net asset value per share Class IH1 (USD)
31 January 2017 — — 117.97(g) — — —
See Notes to Financial Statements
MFS Meridian Funds Annual Report 2017 139

FINANCIAL STATEMENTS at 31 January 2017
STATISTICAL INFORMATION – (continued)
AbsoluteReturnFund
$
AsiaPacific
Ex-JapanFund
$
BlendedResearchEuropean
EquityFund (a)
€
ContinentalEuropean
EquityFund
€
DiversifiedIncomeFund
$
EmergingMarkets
DebtFund
$
Net asset value per share Class I2 (GBP)
31 January 2015 — — — — 106.82 97.44
31 January 2016 — — — — 103.94 96.91
31 January 2017 — — — — 127.35 116.85
Net asset value per share Class I1X (USD)
31 January 2015 — — — — — 103.11
31 January 2016 — — — — — 101.67
31 January 2017 — — — — — 113.59
Net asset value per share Class N1 (EUR)
31 January 2015 — — — — — 11.47
31 January 2016 — — — — — 11.66
31 January 2017 — — — — — 12.93
Net asset value per share Class N1 (USD)
31 January 2015 9.65 9.92 — 9.76 10.10 9.70
31 January 2016 9.22 8.49 — 9.25 9.48 9.46
31 January 2017 9.59 10.06 11.34(g) 9.78 10.49 10.44
Net asset value per share Class NH1 (USD)
31 January 2017 — — 11.70(g) — — —
Net asset value per share Class N2 (USD)
31 January 2015 9.61 — — — 10.09 9.05
31 January 2016 9.18 — — — 9.30 8.52
31 January 2017 9.55 — — — 10.05 9.07
Net asset value per share Class N3 (USD)
31 January 2016 — — — — 9.27 8.49
31 January 2017 — — — — 9.83 8.86
Net asset value per share Class S1 (USD)
31 January 2015 — 27.99 — — — 28.39
31 January 2016 — 24.33 — — — 27.96
31 January 2017 — 29.30 — — — 31.21
Net asset value per share Class W1 (EUR)
31 January 2015 — — 11.83 12.02 — —
31 January 2016 — — 11.38 12.07 9.77 9.86
31 January 2017 — — 13.08 13.02 10.97 11.04
Net asset value per share Class W1 (USD)
31 January 2015 10.07 12.21 — — 10.13 13.79
31 January 2016 9.72 10.62 — — 9.61 13.58
31 January 2017 10.23 12.78 11.43(g) 10.42(g) 10.75 15.15
Net asset value per share Class WH1 (CHF)
31 January 2017 — — — — — 10.34(g)
Net asset value per share Class WH1 (EUR)
31 January 2016 — — — — 9.73 9.82
31 January 2017 — — — — 10.72 10.80
See Notes to Financial Statements
140 MFS Meridian Funds Annual Report 2017

FINANCIAL STATEMENTS at 31 January 2017
STATISTICAL INFORMATION – (continued)
AbsoluteReturnFund
$
AsiaPacific
Ex-JapanFund
$
BlendedResearchEuropean
EquityFund (a)
€
ContinentalEuropean
EquityFund
€
DiversifiedIncomeFund
$
EmergingMarkets
DebtFund
$
Net asset value per share Class WH1 (GBP)
31 January 2015 — — 13.35 13.39 10.44 13.28
31 January 2016 — — 12.36 12.93 9.65 12.75
31 January 2017 — — 14.27 14.13 10.72 14.16
Net asset value per share Class WH1 (USD)
31 January 2017 — — 11.79(g) — — —
Net asset value per share Class W2 (EUR)
31 January 2016 — — — — 9.72 9.79
31 January 2017 — — — — 10.55 10.46
Net asset value per share Class W2 (USD)
31 January 2015 — — — — 10.08 9.25
31 January 2016 — — — — 9.31 8.70
31 January 2017 10.13(g) — — — 10.07 9.27
Net asset value per share Class WH2 (EUR)
31 January 2016 — — — — 9.68 9.75
31 January 2017 — — — — 10.31 10.21
Net asset value per share Class WH2 (GBP)
31 January 2015 — — — — 10.68 9.74
31 January 2016 — — — — 9.59 8.92
31 January 2017 — — — — 10.29 9.50
Net asset value per share Class W3 (EUR)
31 January 2016 — — — — 9.70 9.77
31 January 2017 — — — — 10.42 10.34
Net asset value per share Class W3 (USD)
31 January 2016 — — — — 9.28 8.70
31 January 2017 — — — — 9.94 9.17
Net asset value per share Class WH3 (EUR)
31 January 2016 — — — — 9.66 9.73
31 January 2017 — — — — 10.19 10.08
Net asset value per share Class WH3 (GBP)
31 January 2016 — — — — 9.54 8.88
31 January 2017 — — — — 10.15 9.30
Net asset value per share Class Z1 (USD)
31 January 2015 — — — — — 182.29
31 January 2016 — — — — — 181.14
31 January 2017 — — — — — 204.01
See Notes to Financial Statements
MFS Meridian Funds Annual Report 2017 141

FINANCIAL STATEMENTS at 31 January 2017
STATISTICAL INFORMATION – (continued)
AbsoluteReturnFund
$
AsiaPacific
Ex-JapanFund
$
BlendedResearchEuropean
EquityFund (a)
€
ContinentalEuropean
EquityFund
€
DiversifiedIncomeFund
$
EmergingMarkets
DebtFund
$Expense ratios (unaudited) (%) (Note 5)For the year ended 31 January 2017:
Expense Ratio Class A1 (EUR) 1.55 1.99 1.86 2.07 — 1.51
Expense Ratio Class A1 (GBP) — — — 2.07 — 1.51
Expense Ratio Class A1 (USD) 1.55 1.99 1.87 2.07 1.65 1.51
Expense Ratio Class AH1 (CHF) — — — — — 1.54
Expense Ratio Class AH1 (EUR) 1.55 — — — 1.65 1.52
Expense Ratio Class AH1 (USD) — — 1.67(h) — — —
Expense Ratio Class A2 (USD) 1.55 — — — 1.65 1.51
Expense Ratio Class AH2 (EUR) — — — — 1.65 1.65
Expense Ratio Class A3 (USD) — — — — 1.65 1.52
Expense Ratio Class AH3 (EUR) — — — — 1.65 1.65
Expense Ratio Class A4 (EUR) — — — — 1.65(h) —
Expense Ratio Class AH4 (EUR) — — — — 1.65(h) —
Expense Ratio Class B1 (USD) 2.55 2.76 — — — 2.51
Expense Ratio Class B2 (USD) 2.56 — — — — 2.51
Expense Ratio Class C1 (USD) 2.55 2.75 2.42(h) 2.81 2.65 2.51
Expense Ratio Class CH1 (USD) — — 2.42(h) — — —
Expense Ratio Class C2 (USD) 2.55 — — — 2.65 2.51
Expense Ratio Class C3 (USD) — — — — 2.65 2.52
Expense Ratio Class I1 (EUR) 0.88 — 0.84 — — —
Expense Ratio Class I1 (GBP) 0.85 0.84 0.84 0.92 — 0.87
Expense Ratio Class I1 (USD) 0.86 0.84 0.84 0.92 0.95 0.87
Expense Ratio Class IH1 (CHF) — — — — — 0.89
Expense Ratio Class IH1 (EUR) 0.85 — — — 0.95 0.87
Expense Ratio Class IH1 (GBP) — — — 0.92 0.95 0.95
Expense Ratio Class IH1 (USD) — — 0.67(h) — — —
Expense Ratio Class I2 (GBP) — — — — 0.95 0.87
Expense Ratio Class I1X (USD) — — — — — 0.87
Expense Ratio Class N1 (EUR) — — — — — 2.01
Expense Ratio Class N1 (USD) 2.05 2.49 2.17(h) 2.57 2.15 2.01
Expense Ratio Class NH1 (USD) — — 2.17(h) — — —
Expense Ratio Class N2 (USD) 2.05 — — — 2.15 2.01
Expense Ratio Class N3 (USD) — — — — 2.15 2.01
Expense Ratio Class S1 (USD) — 0.94 — — — 0.97
Expense Ratio Class W1 (EUR) — — 1.00 1.02 1.05 1.01
Expense Ratio Class W1 (USD) 0.95 0.94 0.82(h) 1.03(h) 1.05 1.01
Expense Ratio Class WH1 (CHF) — — — — — 1.10(h)
Expense Ratio Class WH1 (EUR) — — — — 1.05 1.07
Expense Ratio Class WH1 (GBP) — — 0.98 1.02 1.05 1.10
Expense Ratio Class WH1 (USD) — — 0.82(h) — — —
Expense Ratio Class W2 (EUR) — — — — 1.05 1.01
Expense Ratio Class W2 (USD) 0.93(h) — — — 1.05 1.02
Expense Ratio Class WH2 (EUR) — — — — 1.05 1.10
Expense Ratio Class WH2 (GBP) — — — — 1.05 1.07
Expense Ratio Class W3 (EUR) — — — — 1.05 1.01
Expense Ratio Class W3 (USD) — — — — 1.05 1.01
Expense Ratio Class WH3 (EUR) — — — — 1.05 1.10
Expense Ratio Class WH3 (GBP) — — — — 1.05 1.10
Expense Ratio Class Z1 (USD) — — — — — 0.08Portfolio turnover (unaudited) (%)For the year ended 31 January 2017 33 61 175 (8) 34 61
See Notes to Financial Statements
142 MFS Meridian Funds Annual Report 2017

FINANCIAL STATEMENTS at 31 January 2017
STATISTICAL INFORMATION
EmergingMarkets DebtLocal Currency
Fund$
EmergingMarketsEquityFund
$
EuropeanCore
EquityFund
€
EuropeanResearch
Fund€
EuropeanSmaller
CompaniesFund
€
EuropeanValueFund
€
Net Asset Value
31 January 2015 60,062,824 95,372,799 30,113,020 1,209,704,603 595,606,801 4,644,096,163
31 January 2016 34,104,869 58,822,833 22,706,280 2,018,381,224 1,227,155,917 6,148,845,646
31 January 2017 36,928,456 63,240,809 18,708,653 1,997,680,966 965,287,406 5,104,149,167
Shares outstanding at 31 January 2016
Class A1 (EUR) 37,607 25,792 116,800 16,067,201 9,029,256 59,628,725
Class A1 (GBP) — — — — — 349,127
Class A1 (USD) 780,715 3,014,191 528,965 5,890,343 3,414,674 19,177,865
Class AH1 (CHF) — — — 44,065 — 773,516
Class AH1 (USD) — — — 13,100,150 10,806,838 88,387,200
Class A2 (USD) 1,806,640 — — — — —
Class B1 (USD) 14,432 381,656 44,372 222,280 175,382 566,183
Class B2 (USD) 52,223 — — — — —
Class C1 (USD) 376,334 786,593 21,017 165,838 115,626 —
Class CH1 (USD) — — 126,701 2,710,543 1,121,246 —
Class C2 (USD) 560,792 — — — — —
Class I1 (EUR) — 83,274 21,357 4,277,984 1,402,282 8,025,860
Class I1 (GBP) — 266 189 20,419 — 25,590
Class I1 (USD) 684 33,989 68,806 1,105,454 1,916,422 2,200,913
Class IH1 (CHF) — — — 347 — 2,772
Class IH1 (GBP) 374 384 — — — —
Class IH1 (USD) — — — 1,636,497 205,557 25,643,321
Class N1 (EUR) 6,126 — — 140,598 — 1,653,161
Class N1 (USD) 199,064 276,648 10,844 637,071 1,617,113 7,042,902
Class NH1 (USD) — — 46,790 3,979,025 3,220,010 —
Class N2 (USD) 40,038 — — — — —
Class S1 (USD) — 246,927 — — — —
Class W1 (EUR) — — 130,985 1,533,950 280,338 3,215,875
Class W1 (GBP) — — 6,397 — — 3,320
Class W1 (USD) 113,829 41,593 4,864 116,700 100,104 2,564,940
Class WH1 (EUR) 4,730 4,730 — — — —
Class WH1 (GBP) 14,439 12,460 1,589 128,866 — 289,542
Class WH1 (USD) — — — 645,007 973,207 —
Class W2 (USD) 30,939 — — — — —
Class Z1 (EUR) — 460 — 286 — 811,512
Total shares outstanding at 31 January 2016 4,038,966 4,908,963 1,129,676 52,422,624 34,378,055 220,362,324
See Notes to Financial Statements
MFS Meridian Funds Annual Report 2017 143

FINANCIAL STATEMENTS at 31 January 2017
STATISTICAL INFORMATION – (continued)
EmergingMarkets DebtLocal Currency
Fund$
EmergingMarketsEquityFund
$
EuropeanCore
EquityFund
€
EuropeanResearch
Fund€
EuropeanSmaller
CompaniesFund
€
EuropeanValueFund
€
Shares outstanding at 31 January 2017
Class A1 (EUR) 28,733 21,080 68,952 12,452,545 9,003,364 56,698,916
Class A1 (GBP) — — — — — 277,222
Class A1 (USD) 516,851 2,256,060 431,097 4,511,449 1,954,278 11,892,370
Class AH1 (CHF) — — — 11,943 — 700,039
Class AH1 (USD) — — — 8,955,080 5,980,482 47,751,499
Class A2 (USD) 1,898,508 — — — — —
Class A3 (USD) 26,402 — — — — —
Class B1 (USD) 16,051 289,451 25,012 163,509 115,639 304,859
Class B2 (USD) 36,843 — — — — —
Class C1 (USD) 483,684 794,016 22,357 219,001 88,080 —
Class CH1 (USD) — — 74,594 1,686,983 564,449 —
Class C2 (USD) 390,318 — — — — —
Class C3 (USD) 5,269 — — — — —
Class I1 (EUR) — 83,274 15,430 5,105,745 921,601 6,317,160
Class I1 (GBP) — 266 189 16,392 — 17,422
Class I1 (USD) 583 38,798 68,806 1,472,024 978,557 1,827,007
Class IH1 (CHF) — — — 347 — 337
Class IH1 (GBP) 374 384 — — — —
Class IH1 (USD) — — — 714,523 103,961 20,928,061
Class N1 (EUR) 5,604 — — 111,779 — 1,332,079
Class N1 (USD) 363,568 324,437 14,212 442,888 880,571 3,875,911
Class NH1 (USD) — — 33,536 1,780,344 1,151,107 —
Class N2 (USD) 130,007 — — — — —
Class N3 (USD) 5,269 — — — — —
Class S1 (USD) — 238,514 — — — —
Class W1 (EUR) — — 130,985 1,136,019 213,241 3,724,670
Class W1 (GBP) — — 10,397 — — 27,531
Class W1 (USD) 110,195 108,710 4,864 507,597 32,885 1,981,116
Class WH1 (CHF) — — — 4,880 — 39,880
Class WH1 (EUR) 4,730 4,730 — — — —
Class WH1 (GBP) 9,856 4,409 2,627 51,001 — 234,664
Class WH1 (USD) — — — 687,562 632,176 5,000
Class W2 (USD) 146,061 — — — — —
Class W3 (USD) 5,269 — — — — —
Class Z1 (EUR) — 460 — 286 — 713,710
Total shares outstanding at 31 January 2017 4,184,175 4,164,589 903,058 40,031,897 22,620,391 158,649,453
Net asset value per share Class A1 (EUR)
31 January 2015 15.59 13.17 29.44 30.61 45.32 34.40
31 January 2016 13.28 11.15 29.83 30.73 49.73 35.18
31 January 2017 14.88 13.57 31.98 31.84 52.12 36.47
See Notes to Financial Statements
144 MFS Meridian Funds Annual Report 2017

FINANCIAL STATEMENTS at 31 January 2017
STATISTICAL INFORMATION – (continued)
EmergingMarkets DebtLocal Currency
Fund$
EmergingMarketsEquityFund
$
EuropeanCore
EquityFund
€
EuropeanResearch
Fund€
EuropeanSmaller
CompaniesFund
€
EuropeanValueFund
€
Net asset value per share Class A1 (GBP)
31 January 2015 — — — — — 25.28
31 January 2016 — — — — — 26.20
31 January 2017 — — — — — 30.66
Net asset value per share Class A1 (USD)
31 January 2015 12.99 11.62 19.18 20.12 24.58 19.77
31 January 2016 10.61 9.44 18.64 19.36 25.86 19.39
31 January 2017 11.85 11.44 19.91 20.00 27.00 20.03
Net asset value per share Class AH1 (CHF)
31 January 2015 — — — 13.19 — 14.04
31 January 2016 — — — 13.09 — 14.19
31 January 2017 — — — 13.45 — 14.61
Net asset value per share Class AH1 (USD)
31 January 2015 — — — 11.62 11.18 12.84
31 January 2016 — — — 11.59 12.21 13.03
31 January 2017 — — — 12.17 12.97 13.73
Net asset value per share Class A2 (USD)
31 January 2015 9.69 — — — — —
31 January 2016 7.52 — — — — —
31 January 2017 7.94 — — — — —
Net asset value per share Class A3 (USD)
31 January 2017 9.92(g) — — — — —
Net asset value per share Class B1 (USD)
31 January 2015 12.26 10.91 17.90 17.94 22.87 18.41
31 January 2016 9.92 8.79 17.26 17.14 23.89 17.92
31 January 2017 10.96 10.58 18.30 17.57 24.76 18.38
Net asset value per share Class B2 (USD)
31 January 2015 9.69 — — — — —
31 January 2016 7.51 — — — — —
31 January 2017 7.92 — — — — —
Net asset value per share Class C1 (USD)
31 January 2015 12.26 10.90 9.88 9.74 9.76 —
31 January 2016 9.92 8.79 9.52 9.30 10.18 —
31 January 2017 10.96 10.57 10.10 9.54 10.55 —
Net asset value per share Class CH1 (USD)
31 January 2015 — — 10.78 10.62 10.63 —
31 January 2016 — — 10.71 10.45 11.51 —
31 January 2017 — — 11.59 10.86 12.13 —
Net asset value per share Class C2 (USD)
31 January 2015 9.70 — — — — —
31 January 2016 7.51 — — — — —
31 January 2017 7.92 — — — — —
Net asset value per share Class C3 (USD)
31 January 2017 9.81(g) — — — — —
See Notes to Financial Statements
MFS Meridian Funds Annual Report 2017 145
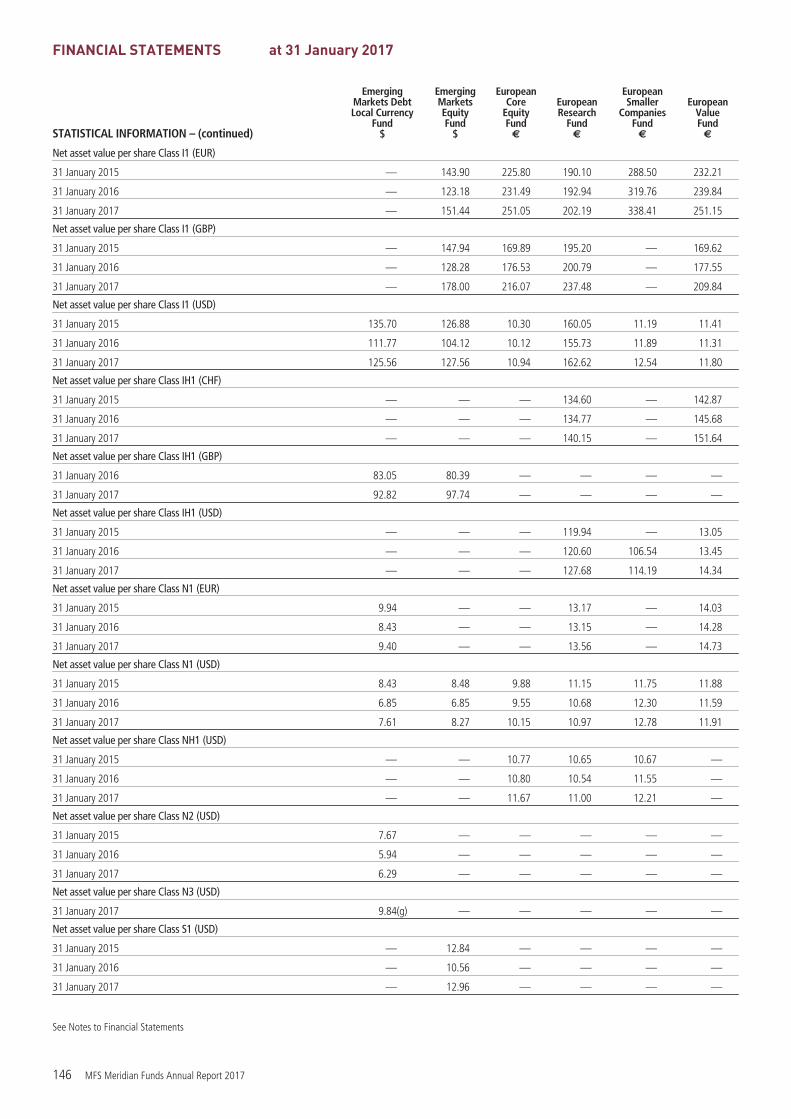
FINANCIAL STATEMENTS at 31 January 2017
STATISTICAL INFORMATION – (continued)
EmergingMarkets DebtLocal Currency
Fund$
EmergingMarketsEquityFund
$
EuropeanCore
EquityFund
€
EuropeanResearch
Fund€
EuropeanSmaller
CompaniesFund
€
EuropeanValueFund
€
Net asset value per share Class I1 (EUR)
31 January 2015 — 143.90 225.80 190.10 288.50 232.21
31 January 2016 — 123.18 231.49 192.94 319.76 239.84
31 January 2017 — 151.44 251.05 202.19 338.41 251.15
Net asset value per share Class I1 (GBP)
31 January 2015 — 147.94 169.89 195.20 — 169.62
31 January 2016 — 128.28 176.53 200.79 — 177.55
31 January 2017 — 178.00 216.07 237.48 — 209.84
Net asset value per share Class I1 (USD)
31 January 2015 135.70 126.88 10.30 160.05 11.19 11.41
31 January 2016 111.77 104.12 10.12 155.73 11.89 11.31
31 January 2017 125.56 127.56 10.94 162.62 12.54 11.80
Net asset value per share Class IH1 (CHF)
31 January 2015 — — — 134.60 — 142.87
31 January 2016 — — — 134.77 — 145.68
31 January 2017 — — — 140.15 — 151.64
Net asset value per share Class IH1 (GBP)
31 January 2016 83.05 80.39 — — — —
31 January 2017 92.82 97.74 — — — —
Net asset value per share Class IH1 (USD)
31 January 2015 — — — 119.94 — 13.05
31 January 2016 — — — 120.60 106.54 13.45
31 January 2017 — — — 127.68 114.19 14.34
Net asset value per share Class N1 (EUR)
31 January 2015 9.94 — — 13.17 — 14.03
31 January 2016 8.43 — — 13.15 — 14.28
31 January 2017 9.40 — — 13.56 — 14.73
Net asset value per share Class N1 (USD)
31 January 2015 8.43 8.48 9.88 11.15 11.75 11.88
31 January 2016 6.85 6.85 9.55 10.68 12.30 11.59
31 January 2017 7.61 8.27 10.15 10.97 12.78 11.91
Net asset value per share Class NH1 (USD)
31 January 2015 — — 10.77 10.65 10.67 —
31 January 2016 — — 10.80 10.54 11.55 —
31 January 2017 — — 11.67 11.00 12.21 —
Net asset value per share Class N2 (USD)
31 January 2015 7.67 — — — — —
31 January 2016 5.94 — — — — —
31 January 2017 6.29 — — — — —
Net asset value per share Class N3 (USD)
31 January 2017 9.84(g) — — — — —
Net asset value per share Class S1 (USD)
31 January 2015 — 12.84 — — — —
31 January 2016 — 10.56 — — — —
31 January 2017 — 12.96 — — — —
See Notes to Financial Statements
146 MFS Meridian Funds Annual Report 2017

FINANCIAL STATEMENTS at 31 January 2017
STATISTICAL INFORMATION – (continued)
EmergingMarkets DebtLocal Currency
Fund$
EmergingMarketsEquityFund
$
EuropeanCore
EquityFund
€
EuropeanResearch
Fund€
EuropeanSmaller
CompaniesFund
€
EuropeanValueFund
€
Net asset value per share Class W1 (EUR)
31 January 2015 — — 12.12 12.25 13.16 13.05
31 January 2016 — — 12.41 12.43 14.55 13.45
31 January 2017 — — 13.45 13.01 15.36 14.05
Net asset value per share Class W1 (GBP)
31 January 2016 — — 9.77 — — 9.97
31 January 2017 — — 11.94 — — 11.75
Net asset value per share Class W1 (USD)
31 January 2015 11.01 9.72 9.90 9.77 9.78 17.18
31 January 2016 9.05 7.97 9.73 9.49 10.37 16.98
31 January 2017 10.16 9.75 10.50 9.90 10.91 17.67
Net asset value per share Class WH1 (CHF)
31 January 2017 — — — 10.49(g) — 10.31(g)
Net asset value per share Class WH1 (EUR)
31 January 2016 9.76 9.19 — — — —
31 January 2017 10.77 11.04 — — — —
Net asset value per share Class WH1 (GBP)
31 January 2015 — 9.22 14.50 13.78 — 15.41
31 January 2016 8.31 7.36 14.67 13.43 — 15.28
31 January 2017 9.26 8.93 15.96 14.09 — 16.07
Net asset value per share Class WH1 (USD)
31 January 2015 — — — 10.66 10.70 —
31 January 2016 — — — 10.70 11.77 —
31 January 2017 — — — 11.35 12.59 10.20(g)
Net asset value per share Class W2 (USD)
31 January 2015 8.01 — — — — —
31 January 2016 6.16 — — — — —
31 January 2017 6.52 — — — — —
Net asset value per share Class W3 (USD)
31 January 2017 9.92(g) — — — — —
Net asset value per share Class Z1 (EUR)
31 January 2015 — 110.81 — 148.67 — 181.27
31 January 2016 — 95.76 — 152.03 — 188.83
31 January 2017 — 118.86 — 160.52 — 199.42
See Notes to Financial Statements
MFS Meridian Funds Annual Report 2017 147

FINANCIAL STATEMENTS at 31 January 2017
STATISTICAL INFORMATION – (continued)
EmergingMarkets DebtLocal Currency
Fund$
EmergingMarketsEquityFund
$
EuropeanCore
EquityFund
€
EuropeanResearch
Fund€
EuropeanSmaller
CompaniesFund
€
EuropeanValueFund
€
Expense ratios (unaudited) (%) (Note 5)For the year ended 31 January 2017:
Expense Ratio Class A1 (EUR) 1.75 2.25 2.06 1.93 1.97 1.92
Expense Ratio Class A1 (GBP) — — — — — 1.91
Expense Ratio Class A1 (USD) 1.75 2.25 2.06 1.93 1.97 1.91
Expense Ratio Class AH1 (CHF) — — — 2.00 — 1.94
Expense Ratio Class AH1 (USD) — — — 1.94 1.98 1.91
Expense Ratio Class A2 (USD) 1.75 — — — — —
Expense Ratio Class A3 (USD) 1.75(h) — — — — —
Expense Ratio Class B1 (USD) 2.75 3.00 2.81 2.68 2.72 2.66
Expense Ratio Class B2 (USD) 2.75 — — — — —
Expense Ratio Class C1 (USD) 2.75 3.00 2.81 2.68 2.72 —
Expense Ratio Class CH1 (USD) — — 2.81 2.70 2.75 —
Expense Ratio Class C2 (USD) 2.75 — — — — —
Expense Ratio Class C3 (USD) 2.75(h) — — — — —
Expense Ratio Class I1 (EUR) — 1.20 0.91 0.84 0.98 0.93
Expense Ratio Class I1 (GBP) — 1.20 0.91 0.84 — 0.92
Expense Ratio Class I1 (USD) 1.05 1.20 0.91 0.84 0.98 0.93
Expense Ratio Class IH1 (CHF) — — — 0.91 — 1.01
Expense Ratio Class IH1 (GBP) 1.05 1.20 — — — —
Expense Ratio Class IH1 (USD) — — — 0.85 0.99 0.93
Expense Ratio Class N1 (EUR) 2.25 — — 2.43 — 2.41
Expense Ratio Class N1 (USD) 2.25 2.75 2.56 2.43 2.47 2.41
Expense Ratio Class NH1 (USD) — — 2.56 2.45 2.49 —
Expense Ratio Class N2 (USD) 2.25 — — — — —
Expense Ratio Class N3 (USD) 2.25(h) — — — — —
Expense Ratio Class S1 (USD) — 1.00 — — — —
Expense Ratio Class W1 (EUR) — — 1.01 0.93 1.22 1.17
Expense Ratio Class W1 (GBP) — — 1.01 — — 1.16
Expense Ratio Class W1 (USD) 1.15 1.35 1.01 0.94 1.22 1.16
Expense Ratio Class WH1 (CHF) — — — 1.01(h) — 1.28(h)
Expense Ratio Class WH1 (EUR) 1.15 1.35 — — — —
Expense Ratio Class WH1 (GBP) 1.15 1.35 1.01 0.97 — 1.19
Expense Ratio Class WH1 (USD) — — — 0.96 1.24 1.29(h)
Expense Ratio Class W2 (USD) 1.15 — — — — —
Expense Ratio Class W3 (USD) 1.15(h) — — — — —
Expense Ratio Class Z1 (EUR) — 0.25 — 0.09 — 0.08
Portfolio turnover (unaudited) (%)For the year ended 31 January 2017 87 55 (45) (30) (50) (53)
See Notes to Financial Statements
148 MFS Meridian Funds Annual Report 2017

FINANCIAL STATEMENTS at 31 January 2017
STATISTICAL INFORMATION
GlobalConcentrated
Fund$
GlobalCreditFund
$
GlobalEnergyFund
$
GlobalEquityFund
$
GlobalEquity Income
Fund$
GlobalHigh Yield
Fund$
Net Asset Value
31 January 2015 723,492,347 22,506,769 16,571,684 4,953,379,208 — 885,171,745
31 January 2016 694,975,365 18,701,684 22,578,337 4,723,475,642 183,894,886 699,968,253
31 January 2017 1,001,118,190 21,620,711 27,824,386 5,304,162,974 251,423,320 735,813,466
Shares outstanding at 31 January 2016
Class A1 (EUR) 2,013,259 11,306 182,673 17,836,179 — 157,465
Class A1 (GBP) — — — 728,454 — —
Class A1 (USD) 3,489,291 86,397 1,003,863 25,212,219 5,000 6,547,939
Class AH1 (EUR) — 4,709 — — 4,420 —
Class A2 (EUR) — — — — — 254,377
Class A2 (USD) — 104,010 — — 5,005 35,973,809
Class AH2 (EUR) — — — — 4,424 4,505
Class A3 (USD) — — — — 5,031 789,981
Class AH3 (EUR) — — — — 4,447 4,531
Class B1 (USD) 174,647 76,652 29,252 582,466 — 313,752
Class B2 (USD) — 33,770 — — — 7,243,167
Class C1 (USD) 1,010,542 264,384 251,750 3,740,997 5,000 4,147,045
Class C2 (USD) — 80,515 — — 5,000 19,407,111
Class C3 (USD) — — — — 5,031 347,118
Class I1 (EUR) 990,427 — 323 5,225,512 442 —
Class I1 (GBP) 173 300 1,229 2,328,778 — —
Class I1 (USD) 1,073,961 103,606 5,992 4,052,205 19,500 289,997
Class IH1 (EUR) — — — — 442 —
Class IH1 (GBP) — 338 — — 322 334
Class N1 (USD) 1,674,119 81,288 17,296 3,741,271 5,000 2,975,174
Class N2 (USD) — 35,727 — — 5,000 2,052,296
Class N3 (USD) — — — — 5,030 262,549
Class S1 (USD) 245,785 — — 512,544 — 1,124,664
Class W1 (GBP) 54,943 — — 6,369 — —
Class W1 (USD) 5,000 8,651 331,650 3,801,759 5,000 114,742
Class WH1 (EUR) 4,730 4,730 — 4,730 4,730 4,730
Class WH1 (GBP) 6,769 15,294 42,198 319,556 3,220 3,338
Class W2 (USD) — 6,135 — — 5,018 120,908
Class WH2 (EUR) — — — — 4,734 4,773
Class WH2 (GBP) — — — — 3,232 3,289
Class W3 (USD) — — — — 5,030 5,445
Class WH3 (EUR) — — — — 4,737 4,780
Class WH3 (GBP) — — — — 3,240 3,300
Class Z2 (USD) — — — — 1,952,996 —
Total shares outstanding at 31 January 2016 10,743,646 917,812 1,866,226 68,093,039 2,071,031 82,161,119
See Notes to Financial Statements
MFS Meridian Funds Annual Report 2017 149
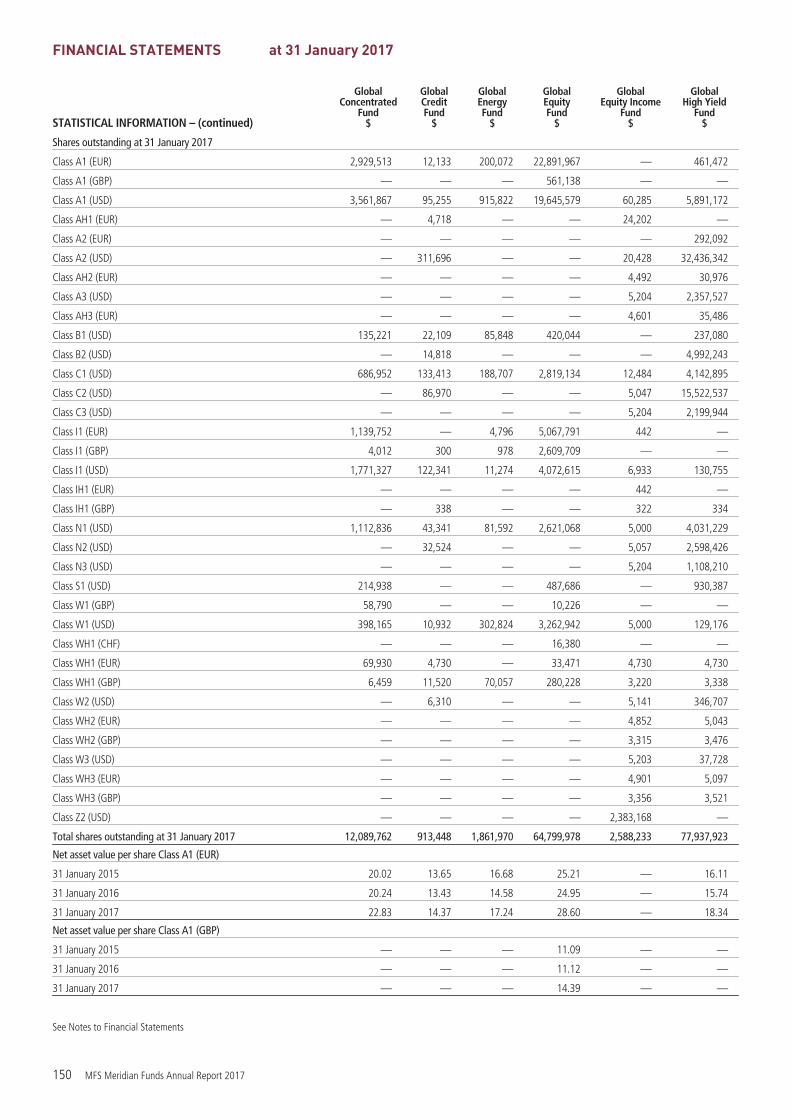
FINANCIAL STATEMENTS at 31 January 2017
STATISTICAL INFORMATION – (continued)
GlobalConcentrated
Fund$
GlobalCreditFund
$
GlobalEnergyFund
$
GlobalEquityFund
$
GlobalEquity Income
Fund$
GlobalHigh Yield
Fund$
Shares outstanding at 31 January 2017
Class A1 (EUR) 2,929,513 12,133 200,072 22,891,967 — 461,472
Class A1 (GBP) — — — 561,138 — —
Class A1 (USD) 3,561,867 95,255 915,822 19,645,579 60,285 5,891,172
Class AH1 (EUR) — 4,718 — — 24,202 —
Class A2 (EUR) — — — — — 292,092
Class A2 (USD) — 311,696 — — 20,428 32,436,342
Class AH2 (EUR) — — — — 4,492 30,976
Class A3 (USD) — — — — 5,204 2,357,527
Class AH3 (EUR) — — — — 4,601 35,486
Class B1 (USD) 135,221 22,109 85,848 420,044 — 237,080
Class B2 (USD) — 14,818 — — — 4,992,243
Class C1 (USD) 686,952 133,413 188,707 2,819,134 12,484 4,142,895
Class C2 (USD) — 86,970 — — 5,047 15,522,537
Class C3 (USD) — — — — 5,204 2,199,944
Class I1 (EUR) 1,139,752 — 4,796 5,067,791 442 —
Class I1 (GBP) 4,012 300 978 2,609,709 — —
Class I1 (USD) 1,771,327 122,341 11,274 4,072,615 6,933 130,755
Class IH1 (EUR) — — — — 442 —
Class IH1 (GBP) — 338 — — 322 334
Class N1 (USD) 1,112,836 43,341 81,592 2,621,068 5,000 4,031,229
Class N2 (USD) — 32,524 — — 5,057 2,598,426
Class N3 (USD) — — — — 5,204 1,108,210
Class S1 (USD) 214,938 — — 487,686 — 930,387
Class W1 (GBP) 58,790 — — 10,226 — —
Class W1 (USD) 398,165 10,932 302,824 3,262,942 5,000 129,176
Class WH1 (CHF) — — — 16,380 — —
Class WH1 (EUR) 69,930 4,730 — 33,471 4,730 4,730
Class WH1 (GBP) 6,459 11,520 70,057 280,228 3,220 3,338
Class W2 (USD) — 6,310 — — 5,141 346,707
Class WH2 (EUR) — — — — 4,852 5,043
Class WH2 (GBP) — — — — 3,315 3,476
Class W3 (USD) — — — — 5,203 37,728
Class WH3 (EUR) — — — — 4,901 5,097
Class WH3 (GBP) — — — — 3,356 3,521
Class Z2 (USD) — — — — 2,383,168 —
Total shares outstanding at 31 January 2017 12,089,762 913,448 1,861,970 64,799,978 2,588,233 77,937,923
Net asset value per share Class A1 (EUR)
31 January 2015 20.02 13.65 16.68 25.21 — 16.11
31 January 2016 20.24 13.43 14.58 24.95 — 15.74
31 January 2017 22.83 14.37 17.24 28.60 — 18.34
Net asset value per share Class A1 (GBP)
31 January 2015 — — — 11.09 — —
31 January 2016 — — — 11.12 — —
31 January 2017 — — — 14.39 — —
See Notes to Financial Statements
150 MFS Meridian Funds Annual Report 2017

FINANCIAL STATEMENTS at 31 January 2017
STATISTICAL INFORMATION – (continued)
GlobalConcentrated
Fund$
GlobalCreditFund
$
GlobalEnergyFund
$
GlobalEquityFund
$
GlobalEquity Income
Fund$
GlobalHigh Yield
Fund$
Net asset value per share Class A1 (USD)
31 January 2015 35.66 10.77 13.88 44.86 — 25.01
31 January 2016 34.56 10.17 11.63 42.57 9.59 23.37
31 January 2017 38.85 10.84 13.71 48.62 10.94 27.14
Net asset value per share Class AH1 (EUR)
31 January 2015 — 9.97 — — — —
31 January 2016 — 9.31 — — 9.60 —
31 January 2017 — 9.77 — — 10.74 —
Net asset value per share Class A2 (EUR)
31 January 2015 — — — — — 13.20
31 January 2016 — — — — — 12.21
31 January 2017 — — — — — 13.54
Net asset value per share Class A2 (USD)
31 January 2015 — 9.38 — — — 6.03
31 January 2016 — 8.63 — — 9.58 5.35
31 January 2017 — 9.01 — — 10.80 5.91
Net asset value per share Class AH2 (EUR)
31 January 2016 — — — — 9.59 9.25
31 January 2017 — — — — 10.60 10.12
Net asset value per share Class A3 (USD)
31 January 2016 — — — — 9.53 5.35
31 January 2017 — — — — 10.51 5.83
Net asset value per share Class AH3 (EUR)
31 January 2016 — — — — 9.54 9.20
31 January 2017 — — — — 10.35 9.92
Net asset value per share Class B1 (USD)
31 January 2015 31.52 10.22 13.30 39.54 — 21.69
31 January 2016 30.32 9.55 11.07 37.24 — 20.07
31 January 2017 33.83 10.09 12.94 42.22 — 23.07
Net asset value per share Class B2 (USD)
31 January 2015 — 9.38 — — — 6.07
31 January 2016 — 8.64 — — — 5.39
31 January 2017 — 9.00 — — — 5.95
Net asset value per share Class C1 (USD)
31 January 2015 31.15 10.24 13.30 39.24 — 21.25
31 January 2016 29.97 9.56 11.07 36.96 9.56 19.65
31 January 2017 33.44 10.10 12.94 41.90 10.83 22.59
Net asset value per share Class C2 (USD)
31 January 2015 — 9.11 — — — 6.10
31 January 2016 — 8.38 — — 9.56 5.41
31 January 2017 — 8.74 — — 10.73 5.97
Net asset value per share Class C3 (USD)
31 January 2016 — — — — 9.51 5.38
31 January 2017 — — — — 10.40 5.82
See Notes to Financial Statements
MFS Meridian Funds Annual Report 2017 151

FINANCIAL STATEMENTS at 31 January 2017
STATISTICAL INFORMATION – (continued)
GlobalConcentrated
Fund$
GlobalCreditFund
$
GlobalEnergyFund
$
GlobalEquityFund
$
GlobalEquity Income
Fund$
GlobalHigh Yield
Fund$
Net asset value per share Class I1 (EUR)
31 January 2015 221.64 — 177.76 223.38 — —
31 January 2016 226.28 — 157.20 223.27 99.59 —
31 January 2017 257.84 — 188.05 258.50 115.20 —
Net asset value per share Class I1 (GBP)
31 January 2015 195.84 114.95 141.72 228.55 — —
31 January 2016 202.66 115.49 127.02 231.51 — —
31 January 2017 260.61 140.43 171.49 302.52 — —
Net asset value per share Class I1 (USD)
31 January 2015 210.04 111.54 148.17 212.15 — 172.91
31 January 2016 205.59 106.02 125.63 203.29 96.27 162.60
31 January 2017 233.43 113.82 149.75 234.52 111.16 189.98
Net asset value per share Class IH1 (EUR)
31 January 2015 — — — — — —
31 January 2016 — — — — 96.39 —
31 January 2017 — — — — 109.14 —
Net asset value per share Class IH1 (GBP)
31 January 2016 — 95.44 — — 96.25 92.47
31 January 2017 — 101.91 — — 109.56 108.07
Net asset value per share Class N1 (USD)
31 January 2015 12.29 9.23 9.41 11.88 — 10.45
31 January 2016 11.85 8.67 7.85 11.21 9.57 9.72
31 January 2017 13.26 9.19 9.20 12.75 10.86 11.23
Net asset value per share Class N2 (USD)
31 January 2015 — 8.69 — — — 9.55
31 January 2016 — 8.00 — — 9.57 8.48
31 January 2017 — 8.35 — — 10.74 9.37
Net asset value per share Class N3 (USD)
31 January 2016 — — — — 9.52 8.46
31 January 2017 — — — — 10.44 9.18
Net asset value per share Class S1 (USD)
31 January 2015 42.34 — — 52.71 — 11.24
31 January 2016 41.46 — — 50.46 — 10.56
31 January 2017 47.10 — — 58.16 — 12.32
Net asset value per share Class W1 (GBP)
31 January 2015 — — — — — —
31 January 2016 9.91 — — 9.89 — —
31 January 2017 12.71 — — 12.89 — —
Net asset value per share Class W1 (USD)
31 January 2015 — 11.12 11.64 18.19 — 14.60
31 January 2016 9.40 10.57 9.86 17.39 9.62 13.71
31 January 2017 10.64 11.33 11.74 20.01 11.08 16.01
Net asset value per share Class WH1 (CHF)
31 January 2017 — — — 10.70(g) — —
See Notes to Financial Statements
152 MFS Meridian Funds Annual Report 2017

FINANCIAL STATEMENTS at 31 January 2017
STATISTICAL INFORMATION – (continued)
GlobalConcentrated
Fund$
GlobalCreditFund
$
GlobalEnergyFund
$
GlobalEquityFund
$
GlobalEquity Income
Fund$
GlobalHigh Yield
Fund$
Net asset value per share Class WH1 (EUR)
31 January 2016 9.38 9.85 — 9.36 9.40 9.66
31 January 2017 10.46 10.38 — 10.55 10.65 11.13
Net asset value per share Class WH1 (GBP)
31 January 2015 15.46 11.19 9.46 15.88 — —
31 January 2016 14.80 10.35 7.80 14.78 9.62 9.24
31 January 2017 16.54 11.02 9.22 16.79 10.94 10.79
Net asset value per share Class W2 (USD)
31 January 2015 — 8.73 — — — 9.79
31 January 2016 — 8.03 — — 9.59 8.68
31 January 2017 — 8.38 — — 10.78 9.57
Net asset value per share Class WH2 (EUR)
31 January 2016 — — — — 9.39 9.57
31 January 2017 — — — — 10.38 10.44
Net asset value per share Class WH2 (GBP)
31 January 2016 — — — — 9.59 9.25
31 January 2017 — — — — 10.63 10.18
Net asset value per share Class W3 (USD)
31 January 2016 — — — — 9.57 8.69
31 January 2017 — — — — 10.65 9.54
Net asset value per share Class WH3 (EUR)
31 January 2016 — — — — 9.39 9.56
31 January 2017 — — — — 10.28 10.33
Net asset value per share Class WH3 (GBP)
31 January 2016 — — — — 9.56 9.22
31 January 2017 — — — — 10.50 10.05
Net asset value per share Class Z2 (USD)
31 January 2016 — — — — 92.62 —
31 January 2017 — — — — 104.20 —
See Notes to Financial Statements
MFS Meridian Funds Annual Report 2017 153

FINANCIAL STATEMENTS at 31 January 2017
STATISTICAL INFORMATION – (continued)
GlobalConcentrated
Fund$
GlobalCreditFund
$
GlobalEnergyFund
$
GlobalEquityFund
$
GlobalEquity Income
Fund$
GlobalHigh Yield
Fund$
Expense ratios (unaudited) (%) (Note 5)For the year ended 31 January 2017:
Expense Ratio Class A1 (EUR) 2.02 1.35 2.05 1.89 — 1.40
Expense Ratio Class A1 (GBP) — — — 1.89 — —
Expense Ratio Class A1 (USD) 2.02 1.35 2.05 1.89 1.90 1.42
Expense Ratio Class AH1 (EUR) — 1.35 — — 1.90 —
Expense Ratio Class A2 (EUR) — — — — — 1.42
Expense Ratio Class A2 (USD) — 1.35 — — 1.90 1.42
Expense Ratio Class AH2 (EUR) — — — — 1.90 1.50
Expense Ratio Class A3 (USD) — — — — 1.90 1.43
Expense Ratio Class AH3 (EUR) — — — — 1.90 1.49
Expense Ratio Class B1 (USD) 2.77 2.35 2.80 2.64 — 2.42
Expense Ratio Class B2 (USD) — 2.35 — — — 2.42
Expense Ratio Class C1 (USD) 2.77 2.35 2.80 2.64 2.65 2.42
Expense Ratio Class C2 (USD) — 2.35 — — 2.65 2.42
Expense Ratio Class C3 (USD) — — — — 2.65 2.42
Expense Ratio Class I1 (EUR) 1.02 — 0.90 0.90 0.85 —
Expense Ratio Class I1 (GBP) 1.01 0.65 0.90 0.90 — —
Expense Ratio Class I1 (USD) 1.02 0.65 0.90 0.90 0.85 0.79
Expense Ratio Class IH1 (EUR) — — — — 0.85 —
Expense Ratio Class IH1 (GBP) — 0.65 — — 0.85 0.80
Expense Ratio Class N1 (USD) 2.52 1.85 2.55 2.39 2.38 1.92
Expense Ratio Class N2 (USD) — 1.85 — — 2.40 1.92
Expense Ratio Class N3 (USD) — — — — 2.40 1.93
Expense Ratio Class S1 (USD) 0.99 — — 1.00 — 0.88
Expense Ratio Class W1 (GBP) 1.26 — — 1.14 — —
Expense Ratio Class W1 (USD) 1.26 0.75 1.00 1.14 0.95 0.87
Expense Ratio Class WH1 (CHF) — — — 1.25(h) — —
Expense Ratio Class WH1 (EUR) 1.32 0.75 — 1.25 0.95 0.90
Expense Ratio Class WH1 (GBP) 1.34 0.75 1.00 1.16 0.95 0.90
Expense Ratio Class W2 (USD) — 0.75 — — 0.95 0.87
Expense Ratio Class WH2 (EUR) — — — — 0.95 0.90
Expense Ratio Class WH2 (GBP) — — — — 0.95 0.90
Expense Ratio Class W3 (USD) — — — — 0.95 0.86
Expense Ratio Class WH3 (EUR) — — — — 0.95 0.90
Expense Ratio Class WH3 (GBP) — — — — 0.95 0.90
Expense Ratio Class Z2 (USD) — — — — 0.15 —
Portfolio turnover (unaudited) (%)For the year ended 31 January 2017 (28) 85 (77) (34) 93 5
See Notes to Financial Statements
154 MFS Meridian Funds Annual Report 2017

FINANCIAL STATEMENTS at 31 January 2017
STATISTICAL INFORMATION
GlobalMulti-Asset
Fund$
GlobalOpportunistic
BondFund (b)
$
GlobalResearchFocusedFund (c)
$
GlobalTotal
ReturnFund
$
Inflation-Adjusted
BondFund
$
JapanEquityFund
$
Net Asset Value
31 January 2015 107,640,470 — 423,360,953 3,270,739,306 141,919,008 7,905,969
31 January 2016 81,282,871 — 348,303,439 2,769,738,451 103,204,283 11,428,613
31 January 2017 72,862,570 40,215,582 234,511,570 2,801,869,611 126,813,967 6,748,875
Shares outstanding at 31 January 2016
Class A1 (EUR) 79,879 — 19,323 7,731,599 — 4,839
Class A1 (GBP) — — — 462,715 — —
Class A1 (USD) 1,477,973 — 9,267,679 35,874,324 3,859,006 988,288
Class AH1 (EUR) — — — 89,341 — —
Class A2 (USD) 3,030,451 — — 10,621,763 736,085 —
Class AH2 (EUR) — — — 52,509 — —
Class A3 (USD) — — — 18,494 — —
Class AH3 (EUR) — — — 4,718 — —
Class B1 (USD) 124,978 — 101,737 1,642,840 254,304 11,597
Class B2 (USD) 187,347 — — 1,913,186 231,194 —
Class C1 (USD) 696,457 — 607,076 20,713,287 1,130,568 112,603
Class C2 (USD) 697,108 — — 8,887,899 841,626 —
Class C3 (USD) — — — 9,174 — —
Class I1 (EUR) 7,828 — 1,601 — — 570
Class I1 (GBP) 286 — 204 603 — 231
Class I1 (USD) 1,043 — 537,843 1,130,074 21,245 2,396
Class IH1 (EUR) — — — 473 — —
Class IH1 (GBP) — — — 342 — —
Class N1 (USD) 251,899 — 11,636 24,091,319 121,707 7,334
Class N2 (USD) — — — 7,860 19,779 —
Class N3 (USD) — — — 100,408 — —
Class S1 (USD) 888,325 — 737,102 1,297,686 176,678 —
Class W1 (EUR) — — — 4,730 — —
Class W1 (USD) 250,706 — 39,972 7,011,290 485,013 —
Class WH1 (EUR) — — — 4,730 — —
Class WH1 (GBP) — — — 83,682 — —
Class W2 (EUR) — — — 4,733 — —
Class W2 (USD) — — — 770,557 61,713 —
Class WH2 (EUR) — — — 4,733 — —
Class WH2 (GBP) — — — 3,230 — —
Class W3 (EUR) — — — 4,736 — —
Class W3 (USD) — — — 134,534 — —
Class WH3 (EUR) — — — 4,736 — —
Class WH3 (GBP) — — — 3,241 — —
Total shares outstanding at 31 January 2016 7,694,280 — 11,324,173 122,685,546 7,938,918 1,127,858
See Notes to Financial Statements
MFS Meridian Funds Annual Report 2017 155

FINANCIAL STATEMENTS at 31 January 2017
STATISTICAL INFORMATION – (continued)
GlobalMulti-Asset
Fund$
GlobalOpportunistic
BondFund (b)
$
GlobalResearchFocusedFund (c)
$
GlobalTotal
ReturnFund
$
Inflation-Adjusted
BondFund
$
JapanEquityFund
$
Shares outstanding at 31 January 2017
Class A1 (EUR) 83,854 4,520 18,455 13,077,901 — 29,017
Class A1 (GBP) — — — 652,961 — —
Class A1 (USD) 1,235,610 5,000 6,590,939 32,360,692 4,718,211 486,032
Class AH1 (EUR) — 4,520 — 938,675 — —
Class A2 (USD) 2,406,287 5,065 — 8,497,494 802,364 —
Class AH2 (EUR) — 4,578 — 427,345 — —
Class A3 (USD) — 5,103 — 68,766 — —
Class AH3 (EUR) — 4,613 — 52,837 — —
Class A4 (EUR) — — — 4,716 — —
Class AH4 (EUR) — — — 4,715 — —
Class B1 (USD) 100,422 — 52,475 1,001,545 166,216 5,431
Class B2 (USD) 127,895 — — 910,690 110,426 —
Class C1 (USD) 562,850 20,228 442,656 15,900,723 788,025 36,811
Class C2 (USD) 496,637 5,036 — 6,283,448 678,277 —
Class C3 (USD) — 5,103 — 15,008 — —
Class I1 (EUR) 7,928 — 1,767 — — 570
Class I1 (GBP) 286 — 204 2,206 — 231
Class I1 (JPY) — — 8,899 — — —
Class I1 (USD) 818 387,500 109,904 1,337,910 41,475 3,167
Class IH1 (EUR) — 452 — 34,672 — —
Class IH1 (GBP) — 387 — 342 — —
Class IH1 (JPY) — — 1,873 — — —
Class I3 (USD) — — — 566,653 — —
Class N1 (USD) 132,749 35,172 13,287 18,090,540 525,593 6,143
Class N2 (USD) — 22,353 — 86,013 35,484 —
Class N3 (USD) — 5,103 — 103,863 — —
Class S1 (USD) 809,386 — 658,823 1,083,085 144,771 —
Class W1 (EUR) — — — 79,600 — —
Class W1 (USD) 191,023 5,000 34,030 7,588,027 797,252 5,000
Class WH1 (CHF) — — — 24,880 — —
Class WH1 (EUR) — 4,520 — 878,294 — —
Class WH1 (GBP) — 3,870 — 376,905 — —
Class W2 (EUR) — — — 16,830 — —
Class W2 (USD) 5,004 5,081 — 1,996,908 793,171 —
Class WH2 (EUR) — 4,594 — 4,811 — —
Class WH2 (GBP) — 3,933 — 3,285 — —
Class W3 (EUR) — — — 4,873 — —
Class W3 (USD) — 5,103 — 7,928 — —
Class WH3 (EUR) — 4,613 — 4,874 — —
Class WH3 (GBP) — 3,950 — 3,338 — —
Class Z1 (USD) — 500 — — — —
Total shares outstanding at 31 January 2017 6,160,749 555,897 7,933,312 112,493,353 9,601,265 572,402
See Notes to Financial Statements
156 MFS Meridian Funds Annual Report 2017

FINANCIAL STATEMENTS at 31 January 2017
STATISTICAL INFORMATION – (continued)
GlobalMulti-Asset
Fund$
GlobalOpportunistic
BondFund (b)
$
GlobalResearchFocusedFund (c)
$
GlobalTotal
ReturnFund
$
Inflation-Adjusted
BondFund
$
JapanEquityFund
$
Net asset value per share Class A1 (EUR)
31 January 2015 13.68 — 16.39 17.47 — 11.41
31 January 2016 12.83 — 16.13 17.48 — 12.44
31 January 2017 14.21 10.14 18.29 19.00 — 13.67
Net asset value per share Class A1 (GBP)
31 January 2015 — — — 9.14 — —
31 January 2016 — — — 9.27 — —
31 January 2017 — — — 11.37 — —
Net asset value per share Class A1 (USD)
31 January 2015 16.14 — 25.41 28.63 14.57 9.43
31 January 2016 14.52 — 23.97 27.47 13.94 9.86
31 January 2017 16.01 9.87 27.09 29.75 14.31 10.79
Net asset value per share Class AH1 (EUR)
31 January 2015 — — — 9.85 — —
31 January 2016 — — — 9.38 — —
31 January 2017 — 9.77 — 10.00 — —
Net asset value per share Class A2 (USD)
31 January 2015 8.94 — — 23.74 11.31 —
31 January 2016 8.03 — — 22.61 10.80 —
31 January 2017 8.82 9.74 — 24.25 10.98 —
Net asset value per share Class AH2 (EUR)
31 January 2015 — — — 9.85 — —
31 January 2016 — — — 9.33 — —
31 January 2017 — 9.64 — 9.85 — —
Net asset value per share Class A3 (USD)
31 January 2016 — — — 22.59 — —
31 January 2017 — 9.67 — 23.83 — —
Net asset value per share Class AH3 (EUR)
31 January 2016 — — — 9.30 — —
31 January 2017 — 9.57 — 9.72 — —
Net asset value per share Class A4 (EUR)
31 January 2017 — — — 9.87(g) — —
Net asset value per share Class AH4 (EUR)
31 January 2017 — — — 10.12(g) — —
Net asset value per share Class B1 (USD)
31 January 2015 14.14 — 22.55 25.60 13.09 8.92
31 January 2016 12.63 — 21.12 24.38 12.40 9.26
31 January 2017 13.82 — 23.69 26.20 12.60 10.07
Net asset value per share Class B2 (USD)
31 January 2015 8.85 — — 23.49 11.26 —
31 January 2016 7.91 — — 22.34 10.67 —
31 January 2017 8.65 — — 23.94 10.82 —
Net asset value per share Class C1 (USD)
31 January 2015 14.03 — 22.29 25.41 13.07 8.96
31 January 2016 12.52 — 20.87 24.20 12.38 9.29
31 January 2017 13.71 9.81 23.41 26.01 12.58 10.10
See Notes to Financial Statements
MFS Meridian Funds Annual Report 2017 157

FINANCIAL STATEMENTS at 31 January 2017
STATISTICAL INFORMATION – (continued)
GlobalMulti-Asset
Fund$
GlobalOpportunistic
BondFund (b)
$
GlobalResearchFocusedFund (c)
$
GlobalTotal
ReturnFund
$
Inflation-Adjusted
BondFund
$
JapanEquityFund
$
Net asset value per share Class C2 (USD)
31 January 2015 8.84 — — 23.27 11.25 —
31 January 2016 7.89 — — 22.13 10.66 —
31 January 2017 8.64 9.74 — 23.72 10.81 —
Net asset value per share Class C3 (USD)
31 January 2016 — — — 22.03 — —
31 January 2017 — 9.61 — 23.05 — —
Net asset value per share Class I1 (EUR)
31 January 2015 141.83 — 188.97 — — 124.13
31 January 2016 134.65 — 187.98 — — 136.94
31 January 2017 150.73 — 215.51 — — 152.22
Net asset value per share Class I1 (GBP)
31 January 2015 121.50 — 161.89 190.02 — 133.28
31 January 2016 116.90 — 163.20 194.83 — 149.01
31 January 2017 147.70 — 211.17 241.59 — 186.94
Net asset value per share Class I1 (JPY)
31 January 2017 — — 11,452(g) — — —
Net asset value per share Class I1 (USD)
31 January 2015 150.72 — 174.39 182.63 144.38 102.69
31 January 2016 137.19 — 166.31 177.14 139.14 108.62
31 January 2017 153.03 99.06 189.99 193.93 143.81 120.30
Net asset value per share Class IH1 (EUR)
31 January 2016 — — — 97.24 — —
31 January 2017 — 98.07 — 104.53 — —
Net asset value per share Class IH1 (GBP)
31 January 2016 — — — 95.01 — —
31 January 2017 — 98.66 — 103.22 — —
Net asset value per share Class IH1 (JPY)
31 January 2017 — — 10,383(g) — — —
Net asset value per share Class I3 (USD)
31 January 2017 — — — 104.88(g) — —
Net asset value per share Class N1 (USD)
31 January 2015 10.11 — 9.61 11.22 9.55 9.77
31 January 2016 9.05 — 9.02 10.71 9.10 10.17
31 January 2017 9.93 9.84 10.14 11.54 9.29 11.08
Net asset value per share Class N2 (USD)
31 January 2015 — — — — 9.34 —
31 January 2016 — — — 9.91 8.89 —
31 January 2017 — 9.75 — 10.65 9.06 —
Net asset value per share Class N3 (USD)
31 January 2016 — — — 9.89 — —
31 January 2017 — 9.64 — 10.36 — —
Net asset value per share Class S1 (USD)
31 January 2015 13.29 — 29.12 29.14 14.61 —
31 January 2016 12.09 — 27.74 28.22 14.04 —
31 January 2017 13.47 — 31.66 30.84 14.49 —
See Notes to Financial Statements
158 MFS Meridian Funds Annual Report 2017

FINANCIAL STATEMENTS at 31 January 2017
STATISTICAL INFORMATION – (continued)
GlobalMulti-Asset
Fund$
GlobalOpportunistic
BondFund (b)
$
GlobalResearchFocusedFund (c)
$
GlobalTotal
ReturnFund
$
Inflation-Adjusted
BondFund
$
JapanEquityFund
$
Net asset value per share Class W1 (EUR)
31 January 2016 — — — 9.75 — —
31 January 2017 — — — 10.68 — —
Net asset value per share Class W1 (USD)
31 January 2015 12.06 — 15.84 14.86 11.98 —
31 January 2016 10.96 — 15.09 14.37 11.53 —
31 January 2017 12.22 9.90 17.23 15.68 11.91 10.35(g)
Net asset value per share Class WH1 (CHF)
31 January 2017 — — — 10.18(g) — —
Net asset value per share Class WH1 (EUR)
31 January 2016 — — — 9.72 — —
31 January 2017 — 9.80 — 10.41 — —
Net asset value per share Class WH1 (GBP)
31 January 2015 — — — 10.99 — —
31 January 2016 — — — 10.38 — —
31 January 2017 — 9.86 — 11.24 — —
Net asset value per share Class W2 (EUR)
31 January 2016 — — — 9.75 — —
31 January 2017 — — — 10.50 — —
Net asset value per share Class W2 (USD)
31 January 2015 — — — 11.79 9.36 —
31 January 2016 — — — 11.20 8.95 —
31 January 2017 10.21(g) 9.74 — 12.03 9.08 —
Net asset value per share Class WH2 (EUR)
31 January 2016 — — — 9.71 — —
31 January 2017 — 9.64 — 10.24 — —
Net asset value per share Class WH2 (GBP)
31 January 2016 — — — 9.93 — —
31 January 2017 — 9.70 — 10.58 — —
Net asset value per share Class W3 (EUR)
31 January 2016 — — — 9.74 — —
31 January 2017 — — — 10.37 — —
Net asset value per share Class W3 (USD)
31 January 2016 — — — 11.23 — —
31 January 2017 — 9.70 — 11.82 — —
Net asset value per share Class WH3 (EUR)
31 January 2016 — — — 9.71 — —
31 January 2017 — 9.60 — 10.11 — —
Net asset value per share Class WH3 (GBP)
31 January 2016 — — — 9.90 — —
31 January 2017 — 9.66 — 10.41 — —
Net asset value per share Class Z1 (USD)
31 January 2017 — 99.33 — — — —
See Notes to Financial Statements
MFS Meridian Funds Annual Report 2017 159

FINANCIAL STATEMENTS at 31 January 2017
STATISTICAL INFORMATION – (continued)
GlobalMulti-Asset
Fund$
GlobalOpportunistic
BondFund (b)
$
GlobalResearchFocusedFund (c)
$
GlobalTotal
ReturnFund
$
Inflation-Adjusted
BondFund
$
JapanEquityFund
$
Expense ratios (unaudited) (%) (Note 5)For the year ended 31 January 2017:
Expense Ratio Class A1 (EUR) 2.05 1.35(h) 1.94 1.91 — 2.05
Expense Ratio Class A1 (GBP) — — — 1.92 — —
Expense Ratio Class A1 (USD) 2.06 1.35(h) 1.95 1.92 1.35 2.05
Expense Ratio Class AH1 (EUR) — 1.35(h) — 1.93 — —
Expense Ratio Class A2 (USD) 2.06 1.35(h) — 1.92 1.35 —
Expense Ratio Class AH2 (EUR) — 1.35(h) — 2.05 — —
Expense Ratio Class A3 (USD) — 1.35(h) — 1.91 — —
Expense Ratio Class AH3 (EUR) — 1.35(h) — 2.04 — —
Expense Ratio Class A4 (EUR) — — — 1.90(h) — —
Expense Ratio Class AH4 (EUR) — — — 2.05(h) — —
Expense Ratio Class B1 (USD) 2.81 — 2.70 2.67 2.35 2.80
Expense Ratio Class B2 (USD) 2.81 — — 2.67 2.35 —
Expense Ratio Class C1 (USD) 2.81 2.35(h) 2.70 2.67 2.35 2.80
Expense Ratio Class C2 (USD) 2.81 2.35(h) — 2.67 2.35 —
Expense Ratio Class C3 (USD) — 2.35(h) — 2.68 — —
Expense Ratio Class I1 (EUR) 0.90 — 0.86 — — 0.90
Expense Ratio Class I1 (GBP) 0.90 — 0.85 0.81 — 0.90
Expense Ratio Class I1 (JPY) — — 0.77(h) — — —
Expense Ratio Class I1 (USD) 0.90 0.65(h) 0.87 0.82 0.65 0.90
Expense Ratio Class IH1 (EUR) — 0.65(h) — 0.83 — —
Expense Ratio Class IH1 (GBP) — 0.65(h) — 0.90 — —
Expense Ratio Class IH1 (JPY) — — 0.80(h) — — —
Expense Ratio Class I3 (USD) — — — 0.81(h) — —
Expense Ratio Class N1 (USD) 2.56 1.85(h) 2.44 2.42 1.85 2.55
Expense Ratio Class N2 (USD) — 1.85(h) — 2.40 1.85 —
Expense Ratio Class N3 (USD) — 1.85(h) — 2.42 — —
Expense Ratio Class S1 (USD) 1.00 — 0.96 1.00 0.84 —
Expense Ratio Class W1 (EUR) — — — 1.14 — —
Expense Ratio Class W1 (USD) 1.01 0.75(h) 0.94 1.17 0.75 1.00(h)
Expense Ratio Class WH1 (CHF) — — — 1.24(h) — —
Expense Ratio Class WH1 (EUR) — 0.75(h) — 1.18 — —
Expense Ratio Class WH1 (GBP) — 0.75(h) — 1.19 — —
Expense Ratio Class W2 (EUR) — — — 1.14 — —
Expense Ratio Class W2 (USD) 1.04(h) 0.75(h) — 1.15 0.75 —
Expense Ratio Class WH2 (EUR) — 0.75(h) — 1.25 — —
Expense Ratio Class WH2 (GBP) — 0.75(h) — 1.25 — —
Expense Ratio Class W3 (EUR) — — — 1.16 — —
Expense Ratio Class W3 (USD) — 0.75(h) — 1.21 — —
Expense Ratio Class WH3 (EUR) — 0.75(h) — 1.25 — —
Expense Ratio Class WH3 (GBP) — 0.75(h) — 1.25 — —
Expense Ratio Class Z1 (USD) — 0.15(h) — — — —
Portfolio turnover (unaudited) (%)For the year ended 31 January 2017 90 33(i) 194 9 (38) (12)
See Notes to Financial Statements
160 MFS Meridian Funds Annual Report 2017

FINANCIAL STATEMENTS at 31 January 2017
STATISTICAL INFORMATION
LatinAmerican
EquityFund
$
LimitedMaturity
Fund$
ManagedWealthFund
$
PrudentCapitalFund (d)
$
PrudentWealthFund
$
U.K.EquityFund
£
Net Asset Value
31 January 2015 105,177,219 923,257,825 — — 1,811,365,804 202,003,865
31 January 2016 25,070,644 771,095,965 54,290,345 — 2,353,788,403 115,340,906
31 January 2017 23,304,212 760,992,944 54,447,726 13,398,856 2,536,349,725 77,593,554
Shares outstanding at 31 January 2016
Class A1 (EUR) 62,542 — — — 5,057,442 —
Class A1 (GBP) — — — — — 1,172,481
Class A1 (USD) 772,241 30,017,843 29,316 — 45,566,645 1,094,234
Class AH1 (CHF) 9,200 — — — — —
Class AH1 (EUR) — — 4,420 — 1,635,439 —
Class A2 (USD) — 6,417,578 — — — —
Class B1 (USD) 25,659 1,260,058 — — 2,178,201 —
Class B2 (USD) — 415,428 — — — —
Class C1 (USD) 300,600 5,881,461 409,090 — 32,612,082 15,055
Class C2 (USD) — 3,954,456 — — — —
Class I1 (EUR) 1,079 — 442 — 2,455,360 —
Class I1 (GBP) 598 — 322 — 18,657 388,825
Class I1 (USD) 72,954 648,155 504,973 — 1,415,775 271,528
Class IH1 (CHF) 920 — — — — —
Class IH1 (EUR) — — 442 — 843,288 —
Class IH1 (GBP) — — 322 — — —
Class I1X (GBP) — — — — — 332
Class I1X (USD) 751 — — — — —
Class I2 (GBP) — — — — — 182,146
Class N1 (EUR) 7,659 — — — — —
Class N1 (USD) 83,354 1,633,637 85,579 — 20,107,824 5,176
Class N2 (USD) — 728,620 — — — —
Class S1 (USD) — 988,801 — — — —
Class W1 (GBP) — — — — 3,320 492,585
Class W1 (USD) 664,865 4,671,413 5,000 — 3,604,552 5,118
Class WH1 (EUR) 4,730 — 4,730 — 4,730 —
Class WH1 (GBP) 5,246 — 3,220 — 312,205 —
Class W2 (GBP) — — — — — 64,252
Class W2 (USD) — 268,256 — — — —
Total shares outstanding at 31 January 2016 2,012,398 56,885,706 1,047,856 — 115,815,520 3,691,732
See Notes to Financial Statements
MFS Meridian Funds Annual Report 2017 161

FINANCIAL STATEMENTS at 31 January 2017
STATISTICAL INFORMATION – (continued)
LatinAmerican
EquityFund
$
LimitedMaturity
Fund$
ManagedWealthFund
$
PrudentCapitalFund (d)
$
PrudentWealthFund
$
U.K.EquityFund
£
Shares outstanding at 31 January 2017
Class A1 (EUR) 53,668 — — 6,537 8,255,070 —
Class A1 (GBP) — — — — — 982,571
Class A1 (USD) 550,056 28,055,175 143,944 72,297 53,908,753 765,218
Class AH1 (CHF) 9,550 — — — — —
Class AH1 (EUR) — — 4,420 4,560 5,103,677 —
Class A2 (USD) — 4,739,227 — — — —
Class A4 (EUR) — — — 4,710 — —
Class AH4 (EUR) — — — 4,710 — —
Class B1 (USD) 20,675 688,785 — — 1,586,850 —
Class B2 (USD) — 292,771 — — — —
Class C1 (USD) 300,190 5,115,990 310,547 5,000 32,964,528 6,480
Class C2 (USD) — 3,245,199 — — — —
Class I1 (EUR) 1,421 — 442 456 1,909,280 —
Class I1 (GBP) 678 — 322 410 10,210 226,136
Class I1 (USD) 56,906 836,499 484,988 93,000 1,555,477 6,561
Class IH1 (CHF) 920 — — — — —
Class IH1 (EUR) — — 442 456 472,008 —
Class IH1 (GBP) — — 322 13,186 — —
Class I1X (GBP) — — — — — 332
Class I1X (USD) 751 — — — — —
Class I2 (GBP) — — — — — 110,729
Class N1 (EUR) 7,234 — — — — —
Class N1 (USD) 58,451 3,531,571 46,238 63,060 23,618,403 16,010
Class N2 (USD) — 652,802 — — — —
Class S1 (USD) — 919,094 — — — —
Class W1 (GBP) — — — 4,100 140,305 117,229
Class W1 (USD) 92,731 5,237,166 5,000 44,960 6,010,728 5,118
Class WH1 (CHF) — — — 4,950 — —
Class WH1 (EUR) 4,730 — 4,730 4,560 54,544 —
Class WH1 (GBP) 5,249 — 3,220 4,100 270,715 —
Class W2 (GBP) — — — — — 53,895
Class W2 (USD) — 417,061 — — — —
Total shares outstanding at 31 January 2017 1,163,210 53,731,340 1,004,615 331,052 135,860,548 2,290,279
Net asset value per share Class A1 (EUR)
31 January 2015 17.99 — — — 15.60 —
31 January 2016 13.01 — — — 16.87 —
31 January 2017 17.52 — — 10.28 17.06 —
Net asset value per share Class A1 (GBP)
31 January 2015 — — — — — 8.16
31 January 2016 — — — — — 7.81
31 January 2017 — — — — — 8.84
See Notes to Financial Statements
162 MFS Meridian Funds Annual Report 2017

FINANCIAL STATEMENTS at 31 January 2017
STATISTICAL INFORMATION – (continued)
LatinAmerican
EquityFund
$
LimitedMaturity
Fund$
ManagedWealthFund
$
PrudentCapitalFund (d)
$
PrudentWealthFund
$
U.K.EquityFund
£
Net asset value per share Class A1 (USD)
31 January 2015 15.00 14.07 — — 14.15 15.71
31 January 2016 10.40 14.00 9.64 — 14.66 14.20
31 January 2017 13.95 14.13 9.98 9.99 14.78 14.20
Net asset value per share Class AH1 (CHF)
31 January 2015 6.53 — — — — —
31 January 2016 4.46 — — — — —
31 January 2017 5.86 — — — — —
Net asset value per share Class AH1 (EUR)
31 January 2015 — — — — 11.24 —
31 January 2016 — — 9.62 — 11.72 —
31 January 2017 — — 9.82 9.93 11.63 —
Net asset value per share Class A2 (USD)
31 January 2015 — 8.83 — — — —
31 January 2016 — 8.72 — — — —
31 January 2017 — 8.73 — — — —
Net asset value per share Class A4 (EUR)
31 January 2017 — — — 9.86 — —
Net asset value per share Class AH4 (EUR)
31 January 2017 — — — 10.12 — —
Net asset value per share Class B1 (USD)
31 January 2015 14.36 12.27 — — 13.34 —
31 January 2016 9.88 12.08 — — 13.72 —
31 January 2017 13.16 12.08 — — 13.72 —
Net asset value per share Class B2 (USD)
31 January 2015 — 8.80 — — — —
31 January 2016 — 8.67 — — — —
31 January 2017 — 8.66 — — — —
Net asset value per share Class C1 (USD)
31 January 2015 14.36 12.15 — — 13.33 —
31 January 2016 9.88 11.97 9.61 — 13.71 8.60
31 January 2017 13.15 11.96 9.87 9.97 13.71 8.53
Net asset value per share Class C2 (USD)
31 January 2015 — 8.81 — — — —
31 January 2016 — 8.67 — — — —
31 January 2017 — 8.67 — — — —
Net asset value per share Class I1 (EUR)
31 January 2015 190.91 — — — 162.36 —
31 January 2016 139.47 — 100.13 — 177.27 —
31 January 2017 189.77 — 105.13 103.08 181.09 —
Net asset value per share Class I1 (GBP)
31 January 2015 70.27 — — — 142.30 173.98
31 January 2016 52.03 — 105.26 — 157.45 168.18
31 January 2017 79.90 — 124.74 98.29 181.55 192.68
See Notes to Financial Statements
MFS Meridian Funds Annual Report 2017 163

FINANCIAL STATEMENTS at 31 January 2017
STATISTICAL INFORMATION – (continued)
LatinAmerican
EquityFund
$
LimitedMaturity
Fund$
ManagedWealthFund
$
PrudentCapitalFund (d)
$
PrudentWealthFund
$
U.K.EquityFund
£
Net asset value per share Class I1 (USD)
31 January 2015 159.11 127.86 — — 148.75 10.22
31 January 2016 111.45 127.99 96.79 — 155.71 9.34
31 January 2017 151.10 130.01 101.26 100.17 158.50 9.48
Net asset value per share Class IH1 (CHF)
31 January 2015 66.61 — — — — —
31 January 2016 45.94 — — — — —
31 January 2017 61.01 — — — — —
Net asset value per share Class IH1 (EUR)
31 January 2015 — — — — 115.84 —
31 January 2016 — — 96.56 — 120.83 —
31 January 2017 — — 99.87 99.62 121.00 —
Net asset value per share Class IH1 (GBP)
31 January 2016 — — 96.74 — — —
31 January 2017 — — 101.03 99.88 — —
Net asset value per share Class I2 (GBP)
31 January 2015 — — — — — 121.07
31 January 2016 — — — — — 113.58
31 January 2017 — — — — — 126.12
Net asset value per share Class I1X (GBP)
31 January 2015 — — — — — 101.81
31 January 2016 — — — — — 98.46
31 January 2017 — — — — — 112.81
Net asset value per share Class I1X (USD)
31 January 2015 82.16 — — — — —
31 January 2016 57.55 — — — — —
31 January 2017 78.02 — — — — —
Net asset value per share Class N1 (EUR)
31 January 2015 7.67 — — — — —
31 January 2016 5.51 — — — — —
31 January 2017 7.39 — — — — —
Net asset value per share Class N1 (USD)
31 January 2015 6.49 9.93 — — 11.24 9.86
31 January 2016 4.47 9.83 9.62 — 11.59 8.88
31 January 2017 5.98 9.87 9.90 9.98 11.62 8.83
Net asset value per share Class N2 (USD)
31 January 2015 — 9.86 — — — —
31 January 2016 — 9.74 — — — —
31 January 2017 — 9.76 — — — —
Net asset value per share Class S1 (USD)
31 January 2015 — 12.24 — — — —
31 January 2016 — 12.24 — — — —
31 January 2017 — 12.42 — — — —
See Notes to Financial Statements
164 MFS Meridian Funds Annual Report 2017

FINANCIAL STATEMENTS at 31 January 2017
STATISTICAL INFORMATION – (continued)
LatinAmerican
EquityFund
$
LimitedMaturity
Fund$
ManagedWealthFund
$
PrudentCapitalFund (d)
$
PrudentWealthFund
$
U.K.EquityFund
£
Net asset value per share Class W1 (GBP)
31 January 2015 — — — — — 13.68
31 January 2016 — — — — 10.42 13.21
31 January 2017 — — — 9.83 11.99 15.13
Net asset value per share Class W1 (USD)
31 January 2015 8.53 10.84 — — 13.16 9.88
31 January 2016 5.97 10.84 9.68 — 13.74 9.03
31 January 2017 8.08 11.00 10.11 10.01 13.96 9.12
Net asset value per share Class WH1 (CHF)
31 January 2017 — — — 9.95 — —
Net asset value per share Class WH1 (EUR)
31 January 2016 9.04 — 9.68 — 9.87 —
31 January 2017 12.03 — 10.00 9.96 9.86 —
Net asset value per share Class WH1 (GBP)
31 January 2015 7.84 — — — 14.11 —
31 January 2016 5.34 — 9.67 — 14.39 —
31 January 2017 7.18 — 10.09 9.99 14.54 —
Net asset value per share Class W2 (GBP)
31 January 2015 — — — — — 12.03
31 January 2016 — — — — — 11.29
31 January 2017 — — — — — 12.57
Net asset value per share Class W2 (USD)
31 January 2015 — 9.82 — — — —
31 January 2016 — 9.70 — — — —
31 January 2017 — 9.72 — — — —
See Notes to Financial Statements
MFS Meridian Funds Annual Report 2017 165

FINANCIAL STATEMENTS at 31 January 2017
STATISTICAL INFORMATION – (continued)
LatinAmerican
EquityFund
$
LimitedMaturity
Fund$
ManagedWealthFund
$
PrudentCapitalFund (d)
$
PrudentWealthFund
$
U.K.EquityFund
£Expense ratios (unaudited) (%) (Note 5)For the year ended 31 January 2017:
Expense Ratio Class A1 (EUR) 2.25 — — 2.05(h) 2.02 —
Expense Ratio Class A1 (GBP) — — — — — 2.05
Expense Ratio Class A1 (USD) 2.25 1.23 2.05 2.05(h) 2.02 2.05
Expense Ratio Class AH1 (CHF) 2.25 — — — — —
Expense Ratio Class AH1 (EUR) — — 2.05 2.05(h) 2.04 —
Expense Ratio Class A2 (USD) — 1.23 — — — —
Expense Ratio Class A4 (EUR) — — — 2.05(h) — —
Expense Ratio Class AH4 (EUR) — — — 2.05(h) — —
Expense Ratio Class B1 (USD) 3.00 2.23 — — 2.77 —
Expense Ratio Class B2 (USD) — 2.23 — — — —
Expense Ratio Class C1 (USD) 3.00 2.23 2.80 2.80(h) 2.77 2.80
Expense Ratio Class C2 (USD) — 2.23 — — — —
Expense Ratio Class I1 (EUR) 1.20 — 0.90 0.90(h) 1.03 —
Expense Ratio Class I1 (GBP) 1.20 — 0.90 0.90(h) 1.03 0.90
Expense Ratio Class I1 (USD) 1.20 0.59 0.90 0.90(h) 1.03 0.90
Expense Ratio Class IH1 (CHF) 1.20 — — — — —
Expense Ratio Class IH1 (EUR) — — 0.90 0.90(h) 1.03 —
Expense Ratio Class IH1 (GBP) — — 0.90 0.90(h) — —
Expense Ratio Class I2 (GBP) — — — — — 0.90
Expense Ratio Class I1X (GBP) — — — — — 0.90
Expense Ratio Class I1X (USD) 1.20 — — — — —
Expense Ratio Class N1 (EUR) 2.75 — — — — —
Expense Ratio Class N1 (USD) 2.75 1.73 2.55 2.55(h) 2.52 2.55
Expense Ratio Class N2 (USD) — 1.73 — — — —
Expense Ratio Class S1 (USD) — 0.69 — — — —
Expense Ratio Class W1 (GBP) — — — 1.00(h) 1.28 1.00
Expense Ratio Class W1 (USD) 1.35 0.68 1.00 1.00(h) 1.27 1.00
Expense Ratio Class WH1 (CHF) — — — 1.00(h) — —
Expense Ratio Class WH1 (EUR) 1.35 — 1.00 1.00(h) 1.33 —
Expense Ratio Class WH1 (GBP) 1.35 — 1.00 1.00(h) 1.28 —
Expense Ratio Class W2 (GBP) — — — — — 1.00
Expense Ratio Class W2 (USD) — 0.68 — — — —
Portfolio turnover (unaudited) (%)For the year ended 31 January 2017 (8) (11) 92 (42)(i) (60) 22
See Notes to Financial Statements
166 MFS Meridian Funds Annual Report 2017

FINANCIAL STATEMENTS at 31 January 2017
STATISTICAL INFORMATION
U.S.Concentrated
GrowthFund
$
U.S.Corporate
BondFund (e)
$
U.S.EquityIncomeFund
$
U.S.Equity
OpportunitiesFund
$
U.S.Government
BondFund
$
U.S.Total
ReturnBond
Fund (f)$
Net Asset Value
31 January 2015 596,989,866 146,516,716 — — 370,672,800 643,711,086
31 January 2016 486,601,081 128,102,213 3,822,181 22,849,096 407,932,288 655,293,891
31 January 2017 434,129,614 240,495,447 4,068,016 15,718,084 403,209,645 778,886,462
Shares outstanding at 31 January 2016
Class A1 (EUR) — — — — 114,330 —
Class A1 (USD) 21,543,235 2,521,818 11,048 714,217 13,325,270 25,300,723
Class AH1 (EUR) — 298,461 4,420 4,625 — 17,436
Class A2 (USD) — 2,886,781 5,009 — 3,110,942 4,726,620
Class AH2 (EUR) — — 4,428 — — —
Class A3 (USD) — — 5,035 — — —
Class AH3 (EUR) — — 4,451 — — —
Class B1 (USD) 1,016,076 — — — 336,985 183,435
Class B2 (USD) — — — — 626,695 407,386
Class C1 (USD) 4,608,574 3,081,411 164,152 59,845 1,128,828 4,078,061
Class C2 (USD) — 1,183,915 5,000 — 884,743 2,606,131
Class C3 (USD) — — 5,035 — — —
Class I1 (EUR) — — 442 452 — —
Class I1 (GBP) 164 — — 333 — —
Class I1 (USD) 10,437 21,829 11,500 132,435 472,771 411,172
Class IH1 (EUR) — 58,511 442 460 — 459
Class IH1 (GBP) — 332 322 335 — 330
Class N1 (USD) 1,520,633 722,292 5,000 310,026 37,792 1,122,106
Class N2 (USD) — 264,182 5,002 — 118,707 280,219
Class N3 (USD) — — 5,035 — — —
Class S1 (USD) 3,567,727 — — — 805,640 484,055
Class W1 (USD) 768,096 338,577 5,000 5,610 1,625,710 248,095
Class WH1 (EUR) 4,730 4,730 4,730 4,730 — 4,730
Class WH1 (GBP) 2,262 3,320 3,220 3,345 — 3,301
Class W2 (USD) — 670,000 5,022 — 117,403 694,519
Class WH2 (EUR) — 4,754 4,735 — — —
Class WH2 (GBP) — — 3,235 — — —
Class W3 (USD) — — 5,035 — — —
Class WH3 (EUR) — — 4,738 — — —
Class WH3 (GBP) — — 3,243 — — —
Total shares outstanding at 31 January 2016 33,041,934 12,060,913 275,279 1,236,413 22,705,816 40,568,778
See Notes to Financial Statements
MFS Meridian Funds Annual Report 2017 167

FINANCIAL STATEMENTS at 31 January 2017
STATISTICAL INFORMATION – (continued)
U.S.Concentrated
GrowthFund
$
U.S.Corporate
BondFund (e)
$
U.S.EquityIncomeFund
$
U.S.Equity
OpportunitiesFund
$
U.S.Government
BondFund
$
U.S.Total
ReturnBond
Fund (f)$
Shares outstanding at 31 January 2017
Class A1 (EUR) — — — — 198,586 —
Class A1 (USD) 16,326,686 6,708,377 35,222 332,189 12,936,724 25,484,635
Class AH1 (EUR) — 333,472 4,729 4,625 — 93,782
Class A2 (USD) — 3,162,030 5,053 — 2,870,840 5,461,054
Class AH2 (EUR) — — 4,468 — — —
Class A3 (USD) — 35,672 14,355 — — 12,676
Class AH3 (EUR) — — 9,070 — — —
Class B1 (USD) 690,691 — — — 207,904 113,065
Class B2 (USD) — — — — 436,464 301,542
Class C1 (USD) 3,514,140 4,557,945 49,167 108,934 1,307,532 3,832,812
Class C2 (USD) — 1,587,269 5,010 — 388,276 2,192,635
Class C3 (USD) — 5,133 5,175 — — 5,116
Class I1 (EUR) — — 442 452 — —
Class I1 (GBP) 164 — — 333 — —
Class I1 (USD) 92,092 137,792 11,500 63,248 527,837 962,230
Class IH1 (EUR) — 29,538 442 460 — 459
Class IH1 (GBP) — 332 322 335 — 330
Class N1 (USD) 1,496,382 1,096,923 27,574 320,294 382,875 1,579,251
Class N2 (USD) — 373,419 24,438 — 33,066 492,661
Class N3 (USD) — 13,903 5,175 — — 5,116
Class S1 (USD) 2,948,690 — — — 778,152 425,397
Class W1 (USD) 477,046 765,508 5,000 5,610 2,115,977 1,389,465
Class WH1 (CHF) — — — — — 4,890
Class WH1 (EUR) 4,730 4,730 4,730 4,730 — 4,730
Class WH1 (GBP) 2,262 3,320 3,220 3,345 — 3,301
Class W2 (USD) — 2,478,698 5,113 — 63,036 760,218
Class WH2 (EUR) — 4,901 4,822 — — —
Class WH2 (GBP) — — 3,296 — — —
Class W3 (USD) — 5,133 5,174 — — 5,116
Class WH3 (EUR) — — 4,869 — — —
Class WH3 (GBP) — — 3,336 — — —
Total shares outstanding at 31 January 2017 25,552,883 21,304,095 241,702 844,555 22,247,269 43,130,481
Net asset value per share Class A1 (EUR)
31 January 2015 — — — — 11.40 —
31 January 2016 — — — — 11.86 —
31 January 2017 — — — — 11.74 —
Net asset value per share Class A1 (USD)
31 January 2015 14.98 10.63 — — 17.31 16.91
31 January 2016 14.73 10.32 9.62 9.28 17.26 16.59
31 January 2017 16.37 10.89 11.27 10.89 17.02 16.96
Net asset value per share Class AH1 (EUR)
31 January 2015 — 10.62 — — — —
31 January 2016 — 10.23 9.61 9.25 — 9.74
31 January 2017 — 10.65 11.12 10.71 — 9.81
See Notes to Financial Statements
168 MFS Meridian Funds Annual Report 2017
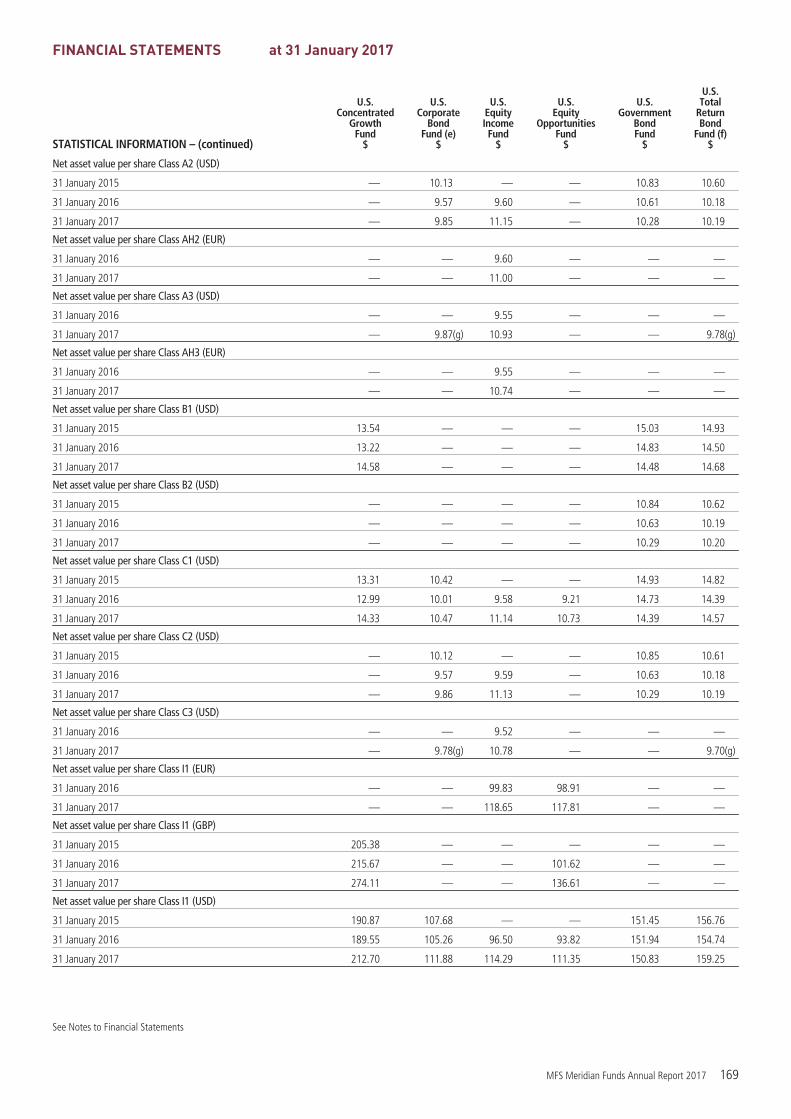
FINANCIAL STATEMENTS at 31 January 2017
STATISTICAL INFORMATION – (continued)
U.S.Concentrated
GrowthFund
$
U.S.Corporate
BondFund (e)
$
U.S.EquityIncomeFund
$
U.S.Equity
OpportunitiesFund
$
U.S.Government
BondFund
$
U.S.Total
ReturnBond
Fund (f)$
Net asset value per share Class A2 (USD)
31 January 2015 — 10.13 — — 10.83 10.60
31 January 2016 — 9.57 9.60 — 10.61 10.18
31 January 2017 — 9.85 11.15 — 10.28 10.19
Net asset value per share Class AH2 (EUR)
31 January 2016 — — 9.60 — — —
31 January 2017 — — 11.00 — — —
Net asset value per share Class A3 (USD)
31 January 2016 — — 9.55 — — —
31 January 2017 — 9.87(g) 10.93 — — 9.78(g)
Net asset value per share Class AH3 (EUR)
31 January 2016 — — 9.55 — — —
31 January 2017 — — 10.74 — — —
Net asset value per share Class B1 (USD)
31 January 2015 13.54 — — — 15.03 14.93
31 January 2016 13.22 — — — 14.83 14.50
31 January 2017 14.58 — — — 14.48 14.68
Net asset value per share Class B2 (USD)
31 January 2015 — — — — 10.84 10.62
31 January 2016 — — — — 10.63 10.19
31 January 2017 — — — — 10.29 10.20
Net asset value per share Class C1 (USD)
31 January 2015 13.31 10.42 — — 14.93 14.82
31 January 2016 12.99 10.01 9.58 9.21 14.73 14.39
31 January 2017 14.33 10.47 11.14 10.73 14.39 14.57
Net asset value per share Class C2 (USD)
31 January 2015 — 10.12 — — 10.85 10.61
31 January 2016 — 9.57 9.59 — 10.63 10.18
31 January 2017 — 9.86 11.13 — 10.29 10.19
Net asset value per share Class C3 (USD)
31 January 2016 — — 9.52 — — —
31 January 2017 — 9.78(g) 10.78 — — 9.70(g)
Net asset value per share Class I1 (EUR)
31 January 2016 — — 99.83 98.91 — —
31 January 2017 — — 118.65 117.81 — —
Net asset value per share Class I1 (GBP)
31 January 2015 205.38 — — — — —
31 January 2016 215.67 — — 101.62 — —
31 January 2017 274.11 — — 136.61 — —
Net asset value per share Class I1 (USD)
31 January 2015 190.87 107.68 — — 151.45 156.76
31 January 2016 189.55 105.26 96.50 93.82 151.94 154.74
31 January 2017 212.70 111.88 114.29 111.35 150.83 159.25
See Notes to Financial Statements
MFS Meridian Funds Annual Report 2017 169

FINANCIAL STATEMENTS at 31 January 2017
STATISTICAL INFORMATION – (continued)
U.S.Concentrated
GrowthFund
$
U.S.Corporate
BondFund (e)
$
U.S.EquityIncomeFund
$
U.S.Equity
OpportunitiesFund
$
U.S.Government
BondFund
$
U.S.Total
ReturnBond
Fund (f)$
Net asset value per share Class IH1 (EUR)
31 January 2015 — 107.66 — — — —
31 January 2016 — 104.66 96.53 93.39 — 97.99
31 January 2017 — 139.15 112.65 109.42 — 99.42
Net asset value per share Class IH1 (GBP)
31 January 2016 — 99.39 96.59 94.02 — 99.75
31 January 2017 — 105.32 113.54 110.75 — 102.62
Net asset value per share Class N1 (USD)
31 January 2015 12.38 10.52 — — 10.24 10.50
31 January 2016 12.11 10.16 9.60 9.24 10.16 10.25
31 January 2017 13.38 10.67 11.19 10.79 9.97 10.42
Net asset value per share Class N2 (USD)
31 January 2015 — 10.11 — — 9.96 10.09
31 January 2016 — 9.56 9.59 — 9.77 9.69
31 January 2017 — 9.85 11.15 — 9.46 9.71
Net asset value per share Class N3 (USD)
31 January 2016 — — 9.53 — — —
31 January 2017 — 9.83(g) 10.81 — — 9.74(g)
Net asset value per share Class S1 (USD)
31 January 2015 17.30 — — — 15.11 15.61
31 January 2016 17.19 — — — 15.15 15.39
31 January 2017 19.30 — — — 15.02 15.82
Net asset value per share Class W1 (USD)
31 January 2015 18.48 10.74 — — 11.71 12.74
31 January 2016 18.33 10.49 9.65 9.37 11.74 12.56
31 January 2017 20.55 11.14 11.41 11.11 11.64 12.92
Net asset value per share Class WH1 (CHF)
31 January 2017 — — — — — 9.64(g)
Net asset value per share Class WH1 (EUR)
31 January 2016 9.43 9.93 9.35 9.27 — 10.03
31 January 2017 10.39 10.39 10.92 10.84 — 10.17
Net asset value per share Class WH1 (GBP)
31 January 2015 14.85 — — — — —
31 January 2016 14.36 9.94 9.66 9.39 — 9.96
31 January 2017 15.89 10.52 11.34 11.05 — 10.24
Net asset value per share Class W2 (USD)
31 January 2015 — 10.15 — — 9.79 10.09
31 January 2016 — 9.60 9.60 — 9.60 9.68
31 January 2017 — 9.90 11.16 — 9.28 9.70
Net asset value per share Class WH2 (EUR)
31 January 2016 — 9.88 9.35 — — —
31 January 2017 — 10.03 10.72 — — —
Net asset value per share Class WH2 (GBP)
31 January 2016 — — 9.61 — — —
31 January 2017 — — 11.08 — — —
See Notes to Financial Statements
170 MFS Meridian Funds Annual Report 2017

FINANCIAL STATEMENTS at 31 January 2017
STATISTICAL INFORMATION – (continued)
U.S.Concentrated
GrowthFund
$
U.S.Corporate
BondFund (e)
$
U.S.EquityIncomeFund
$
U.S.Equity
OpportunitiesFund
$
U.S.Government
BondFund
$
U.S.Total
ReturnBond
Fund (f)$
Net asset value per share Class W3 (USD)
31 January 2016 — — 9.58 — — —
31 January 2017 — 9.89(g) 11.03 — — 9.81(g)
Net asset value per share Class WH3 (EUR)
31 January 2016 — — 9.34 — — —
31 January 2017 — — 10.61 — — —
Net asset value per share Class WH3 (GBP)
31 January 2016 — — 9.59 — — —
31 January 2017 — — 10.94 — — —
Expense ratios (unaudited) (%) (Note 5)For the year ended 31 January 2017:
Expense Ratio Class A1 (EUR) — — — — 1.26 —
Expense Ratio Class A1 (USD) 2.04 1.32 1.90 2.05 1.25 1.23
Expense Ratio Class AH1 (EUR) — 1.35 1.90 2.05 — 1.30
Expense Ratio Class A2 (USD) — 1.32 1.90 — 1.25 1.23
Expense Ratio Class AH2 (EUR) — — 1.90 — — —
Expense Ratio Class A3 (USD) — 1.31(h) 1.90 — — 1.24(h)
Expense Ratio Class AH3 (EUR) — — 1.90 — — —
Expense Ratio Class B1 (USD) 2.80 — — — 2.25 2.23
Expense Ratio Class B2 (USD) — — — — 2.25 2.23
Expense Ratio Class C1 (USD) 2.80 2.32 2.65 2.80 2.26 2.23
Expense Ratio Class C2 (USD) — 2.32 2.65 — 2.25 2.23
Expense Ratio Class C3 (USD) — 2.31(h) 2.65 — — 2.24(h)
Expense Ratio Class I1 (EUR) — — 0.85 0.90 — —
Expense Ratio Class I1 (GBP) 1.05 — — 0.90 — —
Expense Ratio Class I1 (USD) 1.01 0.65 0.85 0.90 0.61 0.59
Expense Ratio Class IH1 (EUR) — 0.65 0.85 0.90 — 0.65
Expense Ratio Class IH1 (GBP) — 0.65 0.85 0.90 — 0.65
Expense Ratio Class N1 (USD) 2.54 1.82 2.39 2.55 1.76 1.74
Expense Ratio Class N2 (USD) — 1.82 2.40 — 1.75 1.74
Expense Ratio Class N3 (USD) — 1.81(h) 2.40 — — 1.74(h)
Expense Ratio Class S1 (USD) 0.99 — — — 0.71 0.69
Expense Ratio Class W1 (USD) 1.15 0.75 0.95 1.00 0.71 0.69
Expense Ratio Class WH1 (CHF) — — — — — 0.75(h)
Expense Ratio Class WH1 (EUR) 1.19 0.75 0.95 1.00 — 0.75
Expense Ratio Class WH1 (GBP) 1.19 0.75 0.95 1.00 — 0.75
Expense Ratio Class W2 (USD) — 0.75 0.95 — 0.70 0.68
Expense Ratio Class WH2 (EUR) — 0.75 0.95 — — —
Expense Ratio Class WH2 (GBP) — — 0.95 — — —
Expense Ratio Class W3 (USD) — 0.75(h) 0.95 — — 0.69(h)
Expense Ratio Class WH3 (EUR) — — 0.95 — — —
Expense Ratio Class WH3 (GBP) — — 0.95 — — —
Portfolio turnover (unaudited) (%)For the year ended 31 January 2017 47 (32) (9) 185 40 13
See Notes to Financial Statements
MFS Meridian Funds Annual Report 2017 171

FINANCIAL STATEMENTS at 31 January 2017
STATISTICAL INFORMATION
U.S.ValueFund
$
Net Asset Value
31 January 2015 1,423,995,986
31 January 2016 1,361,894,341
31 January 2017 1,723,843,370
Shares outstanding at 31 January 2016
Class A1 (USD) 37,725,522
Class AH1 (EUR) 493,026
Class B1 (USD) 821,299
Class C1 (USD) 6,702,573
Class I1 (EUR) 45,523
Class I1 (GBP) 39,818
Class I1 (USD) 1,105,976
Class IH1 (EUR) 1,496
Class N1 (USD) 4,126,538
Class S1 (USD) 2,789,916
Class W1 (USD) 4,581,323
Class WH1 (EUR) 4,730
Class WH1 (GBP) 29,910
Total shares outstanding at 31 January 2016 58,467,650
Shares outstanding at 31 January 2017
Class A1 (USD) 33,659,201
Class AH1 (EUR) 448,274
Class B1 (USD) 662,424
Class C1 (USD) 7,714,779
Class I1 (EUR) 56,707
Class I1 (GBP) 25,399
Class I1 (USD) 1,784,891
Class IH1 (EUR) 2,155
Class N1 (USD) 5,967,720
Class S1 (USD) 2,217,599
Class W1 (USD) 6,199,224
Class WH1 (EUR) 32,101
Class WH1 (GBP) 51,015
Total shares outstanding at 31 January 2017 58,821,489
Net asset value per share Class A1 (USD)
31 January 2015 21.27
31 January 2016 20.72
31 January 2017 24.47
Net asset value per share Class AH1 (EUR)
31 January 2015 14.54
31 January 2016 14.15
31 January 2017 16.45
See Notes to Financial Statements
172 MFS Meridian Funds Annual Report 2017

FINANCIAL STATEMENTS at 31 January 2017
STATISTICAL INFORMATION – (continued)
U.S.ValueFund
$
Net asset value per share Class B1 (USD)
31 January 2015 19.29
31 January 2016 18.65
31 January 2017 21.86
Net asset value per share Class C1 (USD)
31 January 2015 19.02
31 January 2016 18.40
31 January 2017 21.56
Net asset value per share Class I1 (EUR)
31 January 2015 194.90
31 January 2016 200.27
31 January 2017 239.92
Net asset value per share Class I1 (GBP)
31 January 2015 215.91
31 January 2016 224.84
31 January 2017 304.01
Net asset value per share Class I1 (USD)
31 January 2015 190.24
31 January 2016 187.41
31 January 2017 223.71
Net asset value per share Class IH1 (EUR)
31 January 2015 152.08
31 January 2016 150.02
31 January 2017 170.15
Net asset value per share Class N1 (USD)
31 January 2015 12.68
31 January 2016 12.30
31 January 2017 14.45
Net asset value per share Class S1 (USD)
31 January 2015 25.25
31 January 2016 24.83
31 January 2017 29.59
Net asset value per share Class W1 (USD)
31 January 2015 18.41
31 January 2016 18.12
31 January 2017 21.61
Net asset value per share Class WH1 (EUR)
31 January 2016 9.37
31 January 2017 10.99
Net asset value per share Class WH1 (GBP)
31 January 2015 16.52
31 January 2016 15.85
31 January 2017 18.66
See Notes to Financial Statements
MFS Meridian Funds Annual Report 2017 173
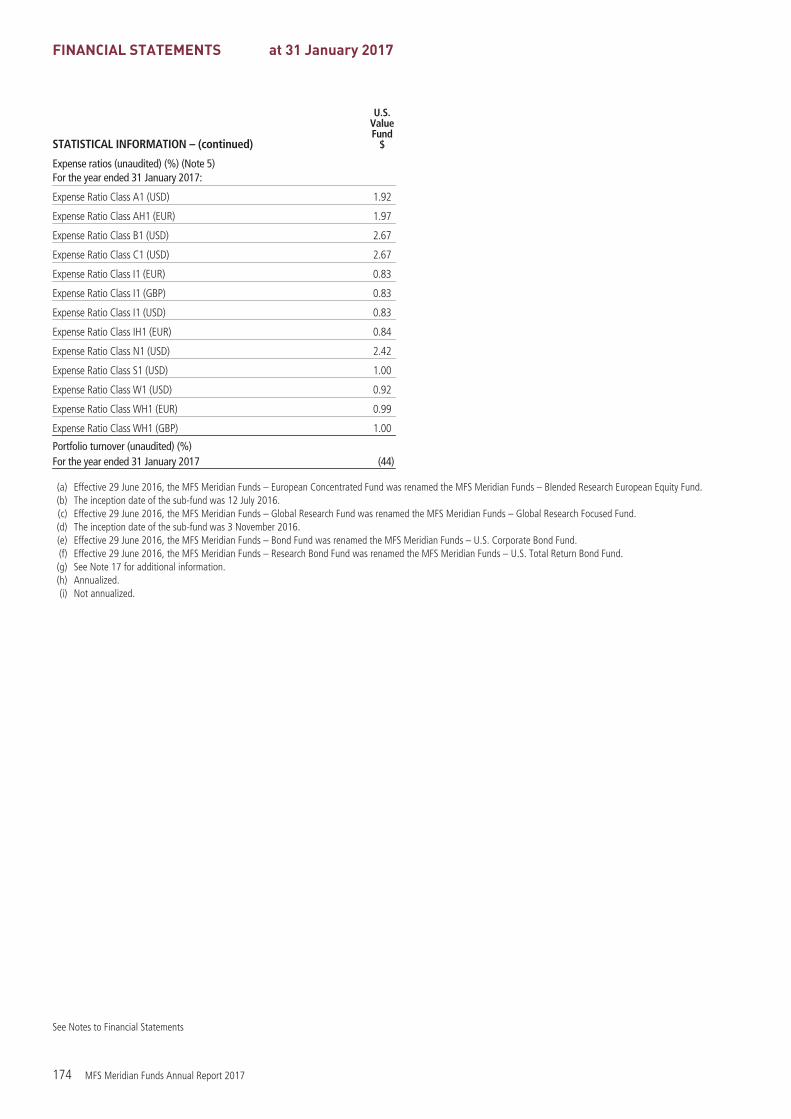
FINANCIAL STATEMENTS at 31 January 2017
STATISTICAL INFORMATION – (continued)
U.S.ValueFund
$
Expense ratios (unaudited) (%) (Note 5)For the year ended 31 January 2017:
Expense Ratio Class A1 (USD) 1.92
Expense Ratio Class AH1 (EUR) 1.97
Expense Ratio Class B1 (USD) 2.67
Expense Ratio Class C1 (USD) 2.67
Expense Ratio Class I1 (EUR) 0.83
Expense Ratio Class I1 (GBP) 0.83
Expense Ratio Class I1 (USD) 0.83
Expense Ratio Class IH1 (EUR) 0.84
Expense Ratio Class N1 (USD) 2.42
Expense Ratio Class S1 (USD) 1.00
Expense Ratio Class W1 (USD) 0.92
Expense Ratio Class WH1 (EUR) 0.99
Expense Ratio Class WH1 (GBP) 1.00
Portfolio turnover (unaudited) (%)For the year ended 31 January 2017 (44)
(a) Effective 29 June 2016, the MFS Meridian Funds – European Concentrated Fund was renamed the MFS Meridian Funds – Blended Research European Equity Fund.(b) The inception date of the sub-fund was 12 July 2016.(c) Effective 29 June 2016, the MFS Meridian Funds – Global Research Fund was renamed the MFS Meridian Funds – Global Research Focused Fund.(d) The inception date of the sub-fund was 3 November 2016.(e) Effective 29 June 2016, the MFS Meridian Funds – Bond Fund was renamed the MFS Meridian Funds – U.S. Corporate Bond Fund.(f) Effective 29 June 2016, the MFS Meridian Funds – Research Bond Fund was renamed the MFS Meridian Funds – U.S. Total Return Bond Fund.(g) See Note 17 for additional information.(h) Annualized.(i) Not annualized.
See Notes to Financial Statements
174 MFS Meridian Funds Annual Report 2017

NOTES TO FINANCIAL STATEMENTS at 31 January 2017
Note 1: The Fund
The MFS Meridian Funds (the “fund” or the “Company”) is an open-ended investment company incorporated under the laws of the Grand Duchy ofLuxembourg on 4 February 1992. It is organised under Part I of the Luxembourg Law of 17 December 2010 on Undertakings for Collective Investment, asamended as a Société Anonyme qualifying as a “Société d’Investissement à Capital Variable” (SICAV). The fund is registered with the Registre de Commerceet des Sociétés of Luxembourg, under number R.C.S. B 39346. On 31 October 2014, MFS Investment Management Company (Lux) S.à r.l. (“MFS Lux”) wasappointed by the fund to act as Management Company.
The fund is organised as an “umbrella fund” comprising separate sub-funds each of which relates to a separate portfolio of securities with specific investmentobjectives. At 31 January 2017, it comprises 37 sub-funds, each relating to a separate investment portfolio consisting of securities, cash, and otherinstruments. Each sub-fund may offer various types of classes of shares, which may differ in the minimum subscription amount, minimum holding amount,currency and/or eligibility requirements, the fees and expenses, and the dividend policy applicable to them. The fund may be offered for sale in EuropeanEconomic Area (“EEA”) states, subject to notification in countries other than the Grand Duchy of Luxembourg. Please note that not all of the sub-funds orclasses may be registered or authorized for distribution in every jurisdiction. Share classes available for each sub-fund at 31 January 2017 can be found under“Statistical Information” in this report.
Effective as of the close of trading on 29 July 2016, the Prudent Wealth Fund was closed to new accounts and/or new investors, subject to certain exceptions.Existing investors (holding shares directly or via a Financial Intermediary holding an account with the sub-fund) as of the close of business on 29 July 2016can continue to make additional purchases and reinvest distributions in the sub-fund in any account that held shares of the sub-fund as of such date. See thesub-fund’s prospectus for additional details.
Note 2: Summary of Significant Accounting Policies
The financial statements have been prepared in accordance with Luxembourg legal and regulatory requirements applicable to investment funds. Areconciliation of the impact on net investment income for those impacted sub-funds arising from accounting differences between Luxembourg legal andregulatory requirements for investment funds and Generally Accepted Accounting Principles (“GAAP”) used in the United States is provided in Note 16.
A) Use of Estimates – The preparation of financial statements in conformity with accounting principles generally accepted in Luxembourg requiresmanagement to make estimates and assumptions that affect the reported amounts of assets and liabilities and the reported amounts of income andexpenses during the reporting period. Actual results may differ from those estimates.
B) Financial Instrument Valuations – Equity securities are generally valued at the last sale or official closing price on their primary market or exchange asprovided by a third-party pricing service. Equity securities, for which there were no sales reported that day, are generally valued at the last quoted dailybid quotation on their primary market or exchange as provided by a third-party pricing service.
Debt instruments and floating rate loans are generally valued at an evaluated or composite bid as provided by a third-party pricing service.
Exchange-traded options are generally valued at the last sale or official closing price on their primary exchange as provided by a third-party pricingservice. Exchange-traded options for which there were no sales reported that day are generally valued at the last daily bid quotation on their primaryexchange as provided by a third-party pricing service. Options not traded on an exchange are generally valued at a broker/dealer bid quotation. Foreigncurrency options are generally valued at valuations provided by a third-party pricing service.
Futures contracts are generally valued at the last posted settlement price on their primary exchange as provided by a third-party pricing service. Futurescontracts for which there were no trades that day for a particular position are generally valued at the closing bid quotation on their primary exchange asprovided by a third-party pricing service.
Swap agreements are generally valued at valuations provided by a third-party pricing service, which for cleared swaps includes an evaluation of anytrading activity at the clearinghouses.
Forward foreign currency exchange contracts are generally valued at the mean of bid and asked prices for the time period interpolated from ratesprovided by a third-party pricing service for proximate time periods.
Short-term instruments with a maturity at issuance of 60 days or less may be valued at amortized cost, which approximates market value.
Securities and other assets generally valued on the basis of information from a third-party pricing service may also be valued at a broker/dealer bidquotation.
Values obtained from third-party pricing services can utilize both transaction data and market information such as yield, quality, coupon rate, maturity,type of issue, trading characteristics, and other market data. The values of securities and other assets and liabilities expressed in non-base currencies areconverted to the base currency of the sub-fund based upon exchange rates provided by a third-party source.
The Management Company has delegated primary responsibility for determining or causing to be determined the value of the sub-fund’s investments(including any fair valuation) to Massachusetts Financial Services Company (“MFS”), the Investment Manager, pursuant to valuation policies andprocedures approved by the Board of Directors and under the oversight of the Board of Directors. In carrying out the valuation policies and procedures,the Investment Manager provides instructions to the Administration Agent on an ongoing basis. If the Investment Manager determines that reliablemarket quotations are not readily available, investments are valued at fair value as determined in good faith by the Investment Manager in accordancewith such procedures under the oversight of the Board of Directors.
Under the valuation policies and procedures applicable to the sub-funds, investments may be valued at fair value if the Investment Manager determinesthat an investment’s value has been materially affected by events occurring after the close of the exchange or market on which the investment isprincipally traded (such as foreign exchange or market) and prior to the determination of the sub-fund’s net asset value, or after the halting of trading ofa specific security where trading does not resume prior to the close of the exchange or market on which the security is principally traded. Events that
MFS Meridian Funds Annual Report 2017 175

NOTES TO FINANCIAL STATEMENTS at 31 January 2017
occur on a frequent basis after markets close (such as developments in foreign markets) and prior to the determination of the sub-fund’s net asset valuemay be deemed to have a material effect on the value of securities traded in these markets. Accordingly, the sub-fund’s non-U.S. (“foreign”) equitysecurities may often be valued at fair value. The Investment Manager may rely on third-party pricing services or other information (such as the correlationwith price movements of similar securities in the same or other markets; the type, cost and investment characteristics of the security; the business andfinancial condition of the issuer; and trading and other market data) to assist in determining whether to fair value and at what value to fair value aninvestment. The value of an investment for purposes of calculating the sub-fund’s net asset value can differ depending on the source and method used todetermine the value. When fair valuation is used, the value of an investment used to determine the sub-fund’s net asset value may differ from quoted orpublished prices for the same investment. There can be no assurance that the sub-fund could obtain the fair value assigned to an investment if it were tosell the investment at the same time at which the sub-fund determines its net asset value per share.
C) Dividends and Interest – Dividends received in cash are recorded on the ex-dividend date. Certain dividends from foreign securities will be recordedwhen the sub-fund is informed of the dividend if such information is obtained subsequent to the ex-dividend date. Interest income is recorded on theaccrual basis. Each sub-fund generally accretes discounts on debt securities as adjustments to interest income. The sub-funds do not amortize premiumson debt securities. Dividend and interest payments received in additional securities are recorded on the ex-dividend or ex-interest date in an amount equalto the value of the security on such date.
The sub-funds may receive proceeds from litigation settlements. Any proceeds received from litigation involving portfolio holdings are reflected in theStatements of Operations and Changes in Net Assets in net realized gain (loss) on investments, derivatives, and currency transactions if the security hasbeen disposed of by the sub-fund or in net change in unrealized gain (loss) on investments, derivatives, and currency translation if the security is still heldby the sub-fund. Any other proceeds from litigation not related to portfolio holdings are recorded as net realized gain, in the Statements of Operationsand Changes in Net Assets.
D) Foreign Currency Translation – Purchases and sales of foreign investments, income, and expenses initially expressed in foreign currencies are convertedeach business day into each sub-fund’s base currency based upon currency exchange rates prevailing on the respective dates of such transactions or onthe reporting date for foreign denominated receivables and payables. The base currency for the Blended Research European Equity Fund, ContinentalEuropean Equity Fund, European Core Equity Fund, European Research Fund, European Smaller Companies Fund, and European Value Fund is EUR. Thebase currency for the U.K. Equity Fund is GBP. The base currency for all the remaining sub-funds is USD. Gains and losses attributable to foreign currencyexchange rates on sales of securities and foreign exchange rate movements on receivables, payables, income, and expenses are recorded for financialstatement purposes as net realized gain (loss) on investments, derivatives, and currency transactions. The portion of both realized and unrealized gainsand losses on investments that results from fluctuations in currency exchange rates is not separately disclosed.
E) Cost of Securities Sold – In determining the cost of securities sold, each sub-fund uses the identified cost basis.
F) Derivative Collateral Requirements – Derivative counterparty credit risk is managed through formal evaluation of the creditworthiness of all potentialcounterparties. On certain, but not all, uncleared derivatives, the sub-fund attempts to reduce its exposure to counterparty credit risk, whenever possibleby entering into an International Swaps and Derivatives Association (“ISDA”) Master Agreement on a bilateral basis, at the sub-fund level. The ISDAMaster Agreement gives each party to the agreement the right to terminate all transactions traded under such agreement if there is a certain deteriorationin the credit quality of the other party. Upon an event of default or a termination of the ISDA Master Agreement, the non-defaulting party has the right toclose out all transactions traded under such agreement and to net amounts owed under each agreement to one net amount payable by one party to theother. This right to close out and net payments across all transactions traded under the ISDA Master Agreement could result in a reduction of thesub-fund’s credit risk to such counterparty equal to any amounts payable by the sub-fund under the applicable transactions, if any. These netting rightsmay be stayed or limited in the event the counterparty becomes insolvent. However, absent an event of default by the counterparty or a termination of theagreement, the ISDA Master Agreement does not result in an offset of reported balance sheet assets and liabilities across transactions between thesub-fund and the applicable counterparty.
Collateral and margin requirements differ by type of derivative. Margin requirements are set by the clearing broker and the clearinghouse for clearedderivatives (e.g., futures contracts, cleared swaps, and exchange-traded options). Collateral terms are contract specific for uncleared derivatives(e.g., forward foreign currency exchange contracts, uncleared swap agreements, and uncleared options). For derivatives traded under an ISDA MasterAgreement, which contains a collateral support annex, the collateral requirements are netted across all transactions traded under such agreement andone amount is posted from one party to the other to collateralize such obligations. Cash that has been segregated to cover the sub-fund’s collateral ormargin obligations under derivative contracts, if any, will be reported separately in the Statements of Assets and Liabilities as restricted cash. Securitiespledged as collateral or margin for the same purpose, if any, are noted in the Schedules of Investments. The sub-funds may be required to make payments
176 MFS Meridian Funds Annual Report 2017

NOTES TO FINANCIAL STATEMENTS at 31 January 2017
of interest on uncovered collateral or margin obligations with the broker. Any such payments are included in “Interest expense and similar charges” in theStatements of Operations and Changes in Net Assets. Collateral received consists of cash and/or high quality government debt, which is not reported inthe Statements of Assets and Liabilities or Schedules of Investments. At 31 January 2017, the following sub-funds had segregated cash or received cashand/or high quality government debt as collateral for open uncleared derivatives.
Sub-Fund Name
CashSegregated
by theSub-Fund
CollateralReceived
by theSub-Fund
Emerging Markets Debt Fund $2,290,000 $330,000
European Research Fund €— €2,081,292
European Smaller Companies Fund €— €1,051,217
European Value Fund €— €6,998,353
Global Equity Fund $260,000 $—
Global High Yield Fund $— $299,959
Global Multi-Asset Fund $— $306,892
Global Total Return Fund $630,000 $—
Prudent Wealth Fund $310,000 $3,816,518
G) Forward Foreign Currency Exchange Contracts – Each sub-fund may enter into forward foreign currency exchange contracts for the purchase or saleof a specific foreign currency at a fixed price on a future date. Risks may arise upon entering into these contracts from the potential inability ofcounterparties to meet the terms of their contracts and from unanticipated movements in the value of the contract. Certain sub-funds may enter intoforward foreign currency exchange contracts for efficient portfolio management, hedging, or for investment purposes. For efficient portfolio managementpurposes, the sub-fund may enter into contracts to deliver or receive foreign currency it will receive from or require in its normal investment activities. Forhedging purposes, the sub-fund may use contracts in a manner intended to protect foreign currency denominated securities from declines in value due tounfavorable exchange rate movements. For investment purposes, certain sub-funds may enter into contracts with the intent of changing the relativeexposure of the sub-fund’s portfolio of securities to different currencies to take advantage of anticipated exchange rate changes. The forward foreigncurrency exchange contracts are adjusted by the daily exchange rate of the underlying currency and any unrealized gains or losses are recorded as areceivable or payable for forward foreign currency exchange contracts until the contract settlement date. On contract settlement date, any gains or lossesare recorded as realized gain (loss) on investments, derivatives, and currency transactions in the Statements of Operations and Changes in Net Assets.Collateral, in the form of cash or securities, is held in segregated accounts with the sub-fund’s depositary in connection with these agreements. Details ofthe forward foreign currency exchange contracts outstanding are listed in Note 10.
H) Hedged Share Classes – Certain sub-funds offer classes with the aim to reduce exchange rate and return fluctuations between the applicable non-basecurrency hedged share class (“Hedged Share Classes”) and the unhedged base currency class of the relevant sub-fund. MFS will be responsible for engagingin hedging transactions for such Hedged Share Classes. The terms and conditions applicable to the Hedged Share Classes are the same as those which applyfor the same classes of shares offered in the base currency, the difference being the hedging of the Hedged Share Class to the base currency of the sub-fund. MFS may execute such hedging transactions by using various hedging techniques and instruments, including forward foreign currency exchangecontracts, foreign exchange swap contracts, currency futures, written call options, and purchased put options. The gains/losses and expenses of the hedgingprocess will be borne by the Hedged Share Classes. Given that there is no segregation of liabilities between share classes of the sub-funds, there is a riskthat, under certain circumstances, currency hedging transactions in relation to one share class (e.g. a Hedged Share Class) could result in liabilities whichmight affect the net asset value of the other share classes of the same sub-fund. For example, if a currency hedging transaction in respect of a Hedged ShareClass were to result in liabilities that the Hedged Share Class has insufficient assets to cover, assets attributable to the other share classes of the sub-fundmay be used to cover the liabilities. Further, collateral posting requirements, which may become more burdensome in light of recent regulatorydevelopments, may require the sub-fund to maintain a larger allocation to cash and cash-equivalent instruments than the Investment Manager wouldotherwise determine to hold. This could negatively affect performance for the sub-fund as a whole, even where the corresponding derivative transactionsare in respect of the Hedged Share Classes alone. Details of the class specific forward foreign currency exchange contracts outstanding are listed in Note 11.
I) Written Options – In exchange for a premium, each sub-fund may write call options on securities for which it anticipated the price would decline andalso write put options on securities for which it anticipated the price would increase. At the time the option was written, the sub-fund believed thepremium received exceeded the potential loss that could result from adverse price changes in the options’ underlying securities. In a written option, thesub-fund as the option writer grants the buyer the right to purchase from, or sell to, the sub-fund a specified number of shares or units of a particularsecurity, currency or index at a specified price within a specified period of time. The premium is initially recorded as a liability in the Statements of Assetsand Liabilities. The option is subsequently marked-to-market daily with the difference between the premium received and the market value of the writtenoption being recorded as unrealized appreciation or depreciation. When a written option expires, the sub-fund realizes a gain equal to the amount of thepremium received. The difference between the premium and the amount paid on effecting a closing transaction is considered a realized gain or loss.When a written call option is exercised, the premium received is offset against the proceeds to determine the realized gain or loss. When a written putoption is exercised, the premium reduces the cost basis of the security purchased by the sub-fund. In general, written call options may serve as a partialhedge against decreases in value in the underlying securities to the extent of the premium received. Collateral, for uncleared options, in the form of cashor securities, is held in segregated accounts with the sub-fund’s depositary in connection with these agreements.
At the initiation of the written option contract, for exchange traded options, the sub-fund is required to deposit securities or cash as collateral with eitherthe depositary for the benefit of the broker or directly with the clearing broker, based on the type of option. For uncleared options, the sub-fund may post
MFS Meridian Funds Annual Report 2017 177

NOTES TO FINANCIAL STATEMENTS at 31 January 2017
collateral subject to the terms of an ISDA Master Agreement as generally described above if the market value of the options contract moves against it.The sub-fund, as writer of an option, may have no control over whether the underlying securities may be sold (call) or purchased (put) and, as a result,bears the market risk of an unfavorable change in the price of the securities underlying the written option. Losses from writing options can exceed thepremium received and can exceed the potential loss from an ordinary buy and sell transaction. Although the sub-fund’s market risk may be significant, themaximum counterparty credit risk to the sub-fund is equal to the market value of any collateral posted to the broker. For uncleared options, this risk ismitigated in cases where there is an ISDA Master Agreement between the sub-fund and the counterparty providing for netting as described above.
J) Purchased Options – Each sub-fund may purchase call or put options for a premium. Purchased call and put options entitle the holder to buy or sell aspecified number of shares or units of a particular security, currency or index at a specified price at a specified date or within a specified period of time.Purchasing call options may be used to hedge against an anticipated increase in the cost of securities or currency to be acquired or to increase the sub-fund’s exposure to an underlying instrument. Purchasing put options may hedge against an anticipated decline in the value of portfolio securities or currencyor decrease the sub-fund’s exposure to an underlying instrument. The premium paid is initially recorded as an investment in the Schedules of Investments.That investment is subsequently marked-to-market daily with the difference between the premium paid and the market value of the purchased option beingrecorded as unrealized appreciation or depreciation. Premiums paid for purchased call and put options which have expired are treated as net realized loss oninvestments in the Statements of Operations and Changes in Net Assets. Upon the exercise or closing of a purchased option, the premium paid is eitheradded to the cost of the security or financial instrument in the case of a call option, or offset against the proceeds on the sale of the underlying security orfinancial instrument in the case of a put option, in order to determine the net realized gain or loss on investments, derivatives, and currency transactions.Whether or not the option is exercised, the sub-fund’s maximum risk of loss from purchasing an option is the amount of premium paid. All option contractsinvolve credit risk if the counterparty to the option contract fails to perform. For uncleared options, this risk is mitigated in cases where there is an ISDAMaster Agreement between the fund and the counterparty providing for netting as described above and, where applicable, by the posting of collateral bythe counterparty to the sub-fund to cover the sub-fund’s exposure to the counterparty under such ISDA Master Agreement.
K) Swap Agreements – Certain sub-funds may enter into swap agreements. A swap agreement is generally an exchange of cash payments, at specifiedintervals or upon the occurrence of specified events, between the sub-fund and another party. Swaps may be centrally cleared (“cleared swaps”) oruncleared (“uncleared swaps”). In a cleared swap transaction, the ultimate counterparty to the transaction is a clearinghouse (the “clearinghouse”). Thecontract is transferred and accepted by the clearinghouse immediately following execution of the swap contract with an executing broker. Thereafter,throughout the term of the cleared swap, the sub-fund interfaces indirectly with the clearinghouse through a clearing broker and has counterparty risk tothe clearing broker as well. Net cash payments are exchanged at specified intervals and the expected income or expense is recorded on the accrual basis.The swap agreement is recorded at value and adjusted daily and the change in value is recorded as unrealized appreciation or depreciation in theStatements of Operations and Changes in Net Assets. The value of the swap agreement, which is adjusted daily, is recorded in the Statements of Assetsand Liabilities, as “Swaps, at value” for uncleared swaps and is included in “Due from brokers” or “Due to brokers” for cleared swaps. Amounts paid orreceived at the inception of the swap agreement are disclosed as premiums paid or received in Note 14 and are amortized using the effective interestmethod over the term of the agreement. A liquidation payment received or made upon early termination is recorded as a realized gain or loss in theStatements of Operations and Changes in Net Assets. In most instances, collateral for uncleared swaps, in the form of cash or securities, is held insegregated accounts with the sub-fund’s depositary in connection with these agreements. Collateral may also be posted directly with certaincounterparties. Collateral for cleared swaps, in the form of cash or securities, is posted by the sub-fund directly to the clearing broker.
Risks related to swap agreements include the possible lack of a liquid market, unfavorable market and interest rate movements of the underlyinginstrument and the failure of the counterparty to perform under the terms of the agreements. The sub-fund’s maximum risk of loss from counterpartycredit risk is the discounted net value of the cash flows to be received from/paid to the counterparty over the contract’s remaining life, to the extent thatthe amount is positive, plus any collateral posted directly to the counterparty. To address counterparty risk, uncleared swap agreements are limited to onlyhighly-rated counterparties. Risk is further reduced by having an ISDA Master Agreement between the sub-fund and its counterparty providing for nettingas described above and, where applicable, by the posting of collateral by the counterparty to the sub-fund to cover the sub-fund’s exposure to thecounterparty under such ISDA Master Agreement. The sub-fund’s counterparty risk due to cleared swaps is mitigated by the fact that the clearinghouse isthe true counterparty to the transaction and the regulatory safeguards in the event of a clearinghouse or clearing broker bankruptcy. Certain sub-fundsmay enter into swaps for efficient portfolio management. Certain sub-funds may also enter into swaps for investment purposes. For efficient portfoliomanagement purposes, the sub-fund may use swaps to reduce its exposure to interest and foreign exchange rate fluctuations. For investment purposes,certain sub-funds may use swaps to take a position on anticipated changes in the underlying financial index.
Interest Rate Swaps – Interest rate swap agreements involve the periodic exchange of cash flows, between the sub-fund and a counterparty, based onthe differences between two interest rates applied to a notional principal amount. The two interest rates exchanged may either be a fixed rate and afloating rate or two floating rates based on different indices. The net receivable or payable associated with these payments is accrued daily and recordedas an unrealized gain or loss, and any payments received or made are recorded as realized gain or loss, in the Statements of Operations and Changes inNet Assets. Details of the interest rate swaps outstanding are listed in Note 14.
Total Return Swaps – Total return swap agreements involve commitments to pay interest in exchange for a market-linked return based on a notionalamount. To the extent the total return of the security or index underlying the transaction exceeds or falls short of the offsetting interest rate obligation,the sub-funds will receive a payment from or make a payment to the counterparty, respectively. The sub-funds may enter into total return swaps on aparticular security, or a basket or index of securities, in order to gain exposure to the underlying security or securities. Details of the total return swapsoutstanding are listed in Note 14.
Credit Default Swaps – Credit default swaps are agreements to manage a sub-fund’s exposure to the market or certain sectors of the market, to reducea sub-fund’s credit risk exposure to defaults of corporate and sovereign issuers or to create exposure to corporate or sovereign issuers to which it is nototherwise exposed. In a credit default swap, the protection buyer can make an upfront payment and will make a stream of payments to the protectionseller based on a fixed percentage applied to the contract notional amount in exchange for the right to receive a specified return upon the occurrence of adefined credit event on the reference obligation (which may be either a single security or a basket of securities issued by corporate or sovereign issuers)and, with respect to the cases where physical settlement applies, the delivery by the buyer to the seller of a defined deliverable obligation. Although
178 MFS Meridian Funds Annual Report 2017
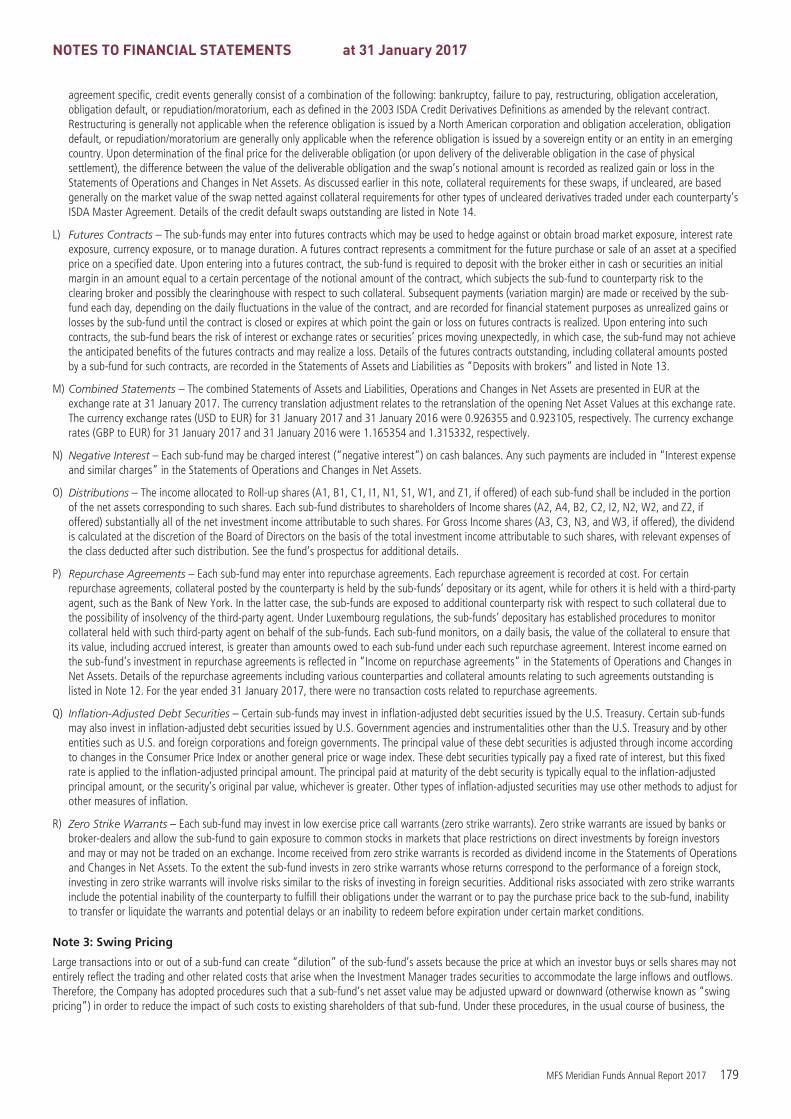
NOTES TO FINANCIAL STATEMENTS at 31 January 2017
agreement specific, credit events generally consist of a combination of the following: bankruptcy, failure to pay, restructuring, obligation acceleration,obligation default, or repudiation/moratorium, each as defined in the 2003 ISDA Credit Derivatives Definitions as amended by the relevant contract.Restructuring is generally not applicable when the reference obligation is issued by a North American corporation and obligation acceleration, obligationdefault, or repudiation/moratorium are generally only applicable when the reference obligation is issued by a sovereign entity or an entity in an emergingcountry. Upon determination of the final price for the deliverable obligation (or upon delivery of the deliverable obligation in the case of physicalsettlement), the difference between the value of the deliverable obligation and the swap’s notional amount is recorded as realized gain or loss in theStatements of Operations and Changes in Net Assets. As discussed earlier in this note, collateral requirements for these swaps, if uncleared, are basedgenerally on the market value of the swap netted against collateral requirements for other types of uncleared derivatives traded under each counterparty’sISDA Master Agreement. Details of the credit default swaps outstanding are listed in Note 14.
L) Futures Contracts – The sub-funds may enter into futures contracts which may be used to hedge against or obtain broad market exposure, interest rateexposure, currency exposure, or to manage duration. A futures contract represents a commitment for the future purchase or sale of an asset at a specifiedprice on a specified date. Upon entering into a futures contract, the sub-fund is required to deposit with the broker either in cash or securities an initialmargin in an amount equal to a certain percentage of the notional amount of the contract, which subjects the sub-fund to counterparty risk to theclearing broker and possibly the clearinghouse with respect to such collateral. Subsequent payments (variation margin) are made or received by the sub-fund each day, depending on the daily fluctuations in the value of the contract, and are recorded for financial statement purposes as unrealized gains orlosses by the sub-fund until the contract is closed or expires at which point the gain or loss on futures contracts is realized. Upon entering into suchcontracts, the sub-fund bears the risk of interest or exchange rates or securities’ prices moving unexpectedly, in which case, the sub-fund may not achievethe anticipated benefits of the futures contracts and may realize a loss. Details of the futures contracts outstanding, including collateral amounts postedby a sub-fund for such contracts, are recorded in the Statements of Assets and Liabilities as “Deposits with brokers” and listed in Note 13.
M) Combined Statements – The combined Statements of Assets and Liabilities, Operations and Changes in Net Assets are presented in EUR at theexchange rate at 31 January 2017. The currency translation adjustment relates to the retranslation of the opening Net Asset Values at this exchange rate.The currency exchange rates (USD to EUR) for 31 January 2017 and 31 January 2016 were 0.926355 and 0.923105, respectively. The currency exchangerates (GBP to EUR) for 31 January 2017 and 31 January 2016 were 1.165354 and 1.315332, respectively.
N) Negative Interest – Each sub-fund may be charged interest (“negative interest”) on cash balances. Any such payments are included in “Interest expenseand similar charges” in the Statements of Operations and Changes in Net Assets.
O) Distributions – The income allocated to Roll-up shares (A1, B1, C1, I1, N1, S1, W1, and Z1, if offered) of each sub-fund shall be included in the portionof the net assets corresponding to such shares. Each sub-fund distributes to shareholders of Income shares (A2, A4, B2, C2, I2, N2, W2, and Z2, ifoffered) substantially all of the net investment income attributable to such shares. For Gross Income shares (A3, C3, N3, and W3, if offered), the dividendis calculated at the discretion of the Board of Directors on the basis of the total investment income attributable to such shares, with relevant expenses ofthe class deducted after such distribution. See the fund’s prospectus for additional details.
P) Repurchase Agreements – Each sub-fund may enter into repurchase agreements. Each repurchase agreement is recorded at cost. For certainrepurchase agreements, collateral posted by the counterparty is held by the sub-funds’ depositary or its agent, while for others it is held with a third-partyagent, such as the Bank of New York. In the latter case, the sub-funds are exposed to additional counterparty risk with respect to such collateral due tothe possibility of insolvency of the third-party agent. Under Luxembourg regulations, the sub-funds’ depositary has established procedures to monitorcollateral held with such third-party agent on behalf of the sub-funds. Each sub-fund monitors, on a daily basis, the value of the collateral to ensure thatits value, including accrued interest, is greater than amounts owed to each sub-fund under each such repurchase agreement. Interest income earned onthe sub-fund’s investment in repurchase agreements is reflected in “Income on repurchase agreements” in the Statements of Operations and Changes inNet Assets. Details of the repurchase agreements including various counterparties and collateral amounts relating to such agreements outstanding islisted in Note 12. For the year ended 31 January 2017, there were no transaction costs related to repurchase agreements.
Q) Inflation-Adjusted Debt Securities – Certain sub-funds may invest in inflation-adjusted debt securities issued by the U.S. Treasury. Certain sub-fundsmay also invest in inflation-adjusted debt securities issued by U.S. Government agencies and instrumentalities other than the U.S. Treasury and by otherentities such as U.S. and foreign corporations and foreign governments. The principal value of these debt securities is adjusted through income accordingto changes in the Consumer Price Index or another general price or wage index. These debt securities typically pay a fixed rate of interest, but this fixedrate is applied to the inflation-adjusted principal amount. The principal paid at maturity of the debt security is typically equal to the inflation-adjustedprincipal amount, or the security’s original par value, whichever is greater. Other types of inflation-adjusted securities may use other methods to adjust forother measures of inflation.
R) Zero Strike Warrants – Each sub-fund may invest in low exercise price call warrants (zero strike warrants). Zero strike warrants are issued by banks orbroker-dealers and allow the sub-fund to gain exposure to common stocks in markets that place restrictions on direct investments by foreign investorsand may or may not be traded on an exchange. Income received from zero strike warrants is recorded as dividend income in the Statements of Operationsand Changes in Net Assets. To the extent the sub-fund invests in zero strike warrants whose returns correspond to the performance of a foreign stock,investing in zero strike warrants will involve risks similar to the risks of investing in foreign securities. Additional risks associated with zero strike warrantsinclude the potential inability of the counterparty to fulfill their obligations under the warrant or to pay the purchase price back to the sub-fund, inabilityto transfer or liquidate the warrants and potential delays or an inability to redeem before expiration under certain market conditions.
Note 3: Swing Pricing
Large transactions into or out of a sub-fund can create “dilution” of the sub-fund’s assets because the price at which an investor buys or sells shares may notentirely reflect the trading and other related costs that arise when the Investment Manager trades securities to accommodate the large inflows and outflows.Therefore, the Company has adopted procedures such that a sub-fund’s net asset value may be adjusted upward or downward (otherwise known as “swingpricing”) in order to reduce the impact of such costs to existing shareholders of that sub-fund. Under these procedures, in the usual course of business, the
MFS Meridian Funds Annual Report 2017 179

NOTES TO FINANCIAL STATEMENTS at 31 January 2017
adjustment will be triggered whenever the net subscriptions, exchanges, and redemptions in shares of all classes on a particular business day exceed a certainpercentage of the sub-fund’s assets as set by the Board of Directors of the Company or Management Company from time to time. Any adjustment to asub-fund’s net asset value will not exceed 2% of the net asset value of the relevant sub-fund on the relevant valuation date. In case of a large amount of netpurchases, the net asset value per share will be adjusted upward and purchasers of sub-fund shares on that valuation date will effectively contribute anadditional amount to offset the related transaction costs. Conversely, net asset value per share will be adjusted downward with a large amount of netredemptions. The adjusted net asset value will be applicable to all purchases, exchanges, or redemptions in shares of all classes on that valuation day. As asub-fund’s net purchases, redemptions, and exchanges vary from business day to business day, it is not possible to predict how frequently a sub-fund’s netasset value will be adjusted. Based on these adjustments, the volatility of a sub-fund’s net asset value may not fully reflect the true performance of the sub-fund’s underlying assets. The published/dealing NAV per share is disclosed in Statistical Information and may include a swing pricing adjustment. Thisadjustment is not recognized in either the Statements of Assets and Liabilities or the Statements of Operations and Changes in Net Assets.
Note 4: Securities Loaned
Goldman Sachs Agency Lending (“GSAL”), as lending agent, may loan the securities of certain sub-funds to certain qualified institutions (the “Borrowers”)approved by the fund. The loans are collateralized by high quality government debt in an amount typically at least equal to the market value of the securitiesloaned marked-to-market on a daily basis; such collateral is held at the sub-fund’s depositary. GSAL provides the applicable sub-fund with indemnificationagainst Borrower default, including failure to deliver to the sub-fund any applicable distributions with respect to securities on loan or to return to theapplicable sub-fund securities on loan in accordance with the lending agreement. On loans collateralized by high quality government debt, a fee is receivedfrom the Borrower, and is allocated between the sub-fund and the lending agent (which is not a related party to the fund, Management Company,Investment Manager or Depositary). Net income from securities lending is separately reported in the Statements of Operations and Changes in Net Assets.The fee allocated to the lending agent is not an expense of the sub-funds and is therefore not disclosed in the Statements of Operations and Changes in NetAssets. The dividend and interest income earned on the securities loaned is accounted for in the same manner as other dividend and interest income asdisclosed in Note 2. The market value of securities loaned and collateral outstanding at 31 January 2017 for the applicable sub-funds were as follows:
Sub-FundMarket Value of
Securities LoanedMarket Valueof Collateral
Diversified Income Fund $430,728 $479,707
European Smaller Companies Fund €156,179 €176,567
Global Total Return Fund $10,259,636 $11,248,562
Prudent Wealth Fund $1,335,787 $2,395,220
For the year ended 31 January 2017, the securities lending fees allocated to the lending agent for the applicable sub-funds were as follows:
Sub-Fund Cost
Diversified Income Fund $268
European Core Equity Fund €269
European Research Fund €111,535
European Smaller Companies Fund €11,863
European Value Fund €45,364
Global Concentrated Fund $14,951
Global Equity Fund $46,003
Global Multi-Asset Fund $287
Global Research Focused Fund $6,050
Global Total Return Fund $32,483
Prudent Wealth Fund $10,333
U.K. Equity Fund £2,501
U.S. Concentrated Growth Fund $303
Note 5: Related Party Transactions
A) Management Company Fee – The Board of Directors of the fund has appointed MFS Investment Management Company (Lux) S.à r.l. pursuant to aManagement Company Agreement to carry out the functions of management of the fund as prescribed under Luxembourg regulations. The ManagementCompany is responsible for the fund’s investment management, administration and distribution and marketing functions. The Management Company hasbeen permitted by the fund to delegate, under the Management Company’s supervision and control, certain administrative, distribution and investmentmanagement functions to affiliates or third party service providers. The Management Company has appointed MFS, an affiliate, as the InvestmentManager and Administrative Services Agent.
Each sub-fund pays the Management Company an annual fee approved by the fund’s Board of Directors, which is intended to cover the expenses ofservices the Management Company provides in connection with its mandate, plus a target profit margin. These expenses include fees paid to theManagement Company’s independent Conducting Persons and Directors of the Management Company, legal, regulatory and operational costs of theManagement Company as well as fees paid by the Management Company to third parties to provide certain infrastructure, administrative, risk
180 MFS Meridian Funds Annual Report 2017

NOTES TO FINANCIAL STATEMENTS at 31 January 2017
management and reporting services to the Management Company, including the administrative support services provided by MFS. The fund alsoreimburses the Management Company for out-of-pocket expenses related to its services. The management company fee is computed daily and isallocated such that each sub-fund pays a fixed fee of $20,000 (or currency equivalent) plus an asset-based fee based on average daily net assets over$40 million and up to $4 billion (or currency equivalent) for each sub-fund. The management company fee incurred by each sub-fund for the year ended31 January 2017 was equivalent to the following annual effective rates of each sub-fund’s average daily net assets:
Sub-Fund
% of AverageDaily Net
Assets
Absolute Return Fund 0.1248%
Asia Pacific Ex-Japan Fund 0.0351%
Blended Research European Equity Fund 0.3934%
Continental European Equity Fund 0.2457%
Diversified Income Fund 0.0289%
Emerging Markets Debt Fund 0.0212%
Emerging Markets Debt Local Currency Fund 0.0541%
Emerging Markets Equity Fund 0.0396%
European Core Equity Fund 0.0929%
European Research Fund 0.0214%
European Smaller Companies Fund 0.0219%
European Value Fund 0.0131%
Global Concentrated Fund 0.0223%
Global Credit Fund 0.0897%
Global Energy Fund 0.0673%
Global Equity Fund 0.0169%
Global Equity Income Fund 0.0260%
Global High Yield Fund 0.0224%
Global Multi-Asset Fund 0.0358%
Global Opportunistic Bond Fund (a) 0.0503%
Global Research Focused Fund 0.0246%
Global Total Return Fund 0.0213%
Inflation-Adjusted Bond Fund 0.0314%
Japan Equity Fund 0.2432%
Latin American Equity Fund 0.0769%
Limited Maturity Fund 0.0223%
Managed Wealth Fund 0.0420%
Prudent Capital Fund (b) 0.1736%
Prudent Wealth Fund 0.0214%
U.K. Equity Fund 0.0295%
U.S. Concentrated Growth Fund 0.0234%
U.S. Corporate Bond Fund 0.0270%
U.S. Equity Income Fund 0.4394%
U.S. Equity Opportunities Fund 0.1047%
U.S. Government Bond Fund 0.0236%
U.S. Total Return Bond Fund 0.0224%
U.S. Value Fund 0.0217%
(a) The inception date of the sub-fund was 12 July 2016.(b) The inception date of the sub-fund was 3 November 2016.
MFS Meridian Funds Annual Report 2017 181

NOTES TO FINANCIAL STATEMENTS at 31 January 2017
B) Investment Management Fee – The Management Company has an investment management agreement with MFS to provide investment managementservices for the sub-funds. The investment management fee is computed daily and paid monthly at the following annual rates as of 31 January 2017based on average daily net assets of each share class for the sub-funds below:
Sub-Fund Class A Class B Class C Class I Class N Class S Class W
Absolute Return Fund 0.75% 0.75% 0.75% 0.65% 0.75% — 0.70%
Asia Pacific Ex-Japan Fund 1.05% 1.05% 1.05% 0.75% 1.05% 1.05% 0.80%
Blended Research European Equity Fund (a) 0.65% — 0.65%(d) 0.50% 0.65%(d) — 0.60%
Continental European Equity Fund 1.05% — 1.05% 0.75% 1.05% — 0.80%
Diversified Income Fund 0.90% — 0.90% 0.80% 0.90% — 0.85%
Emerging Markets Debt Fund 0.90% 0.90% 0.90% 0.80% 0.90% 0.90% 0.90%
Emerging Markets Debt Local Currency Fund 0.90% 0.90% 0.90% 0.80% 0.90% — 0.85%
Emerging Markets Equity Fund 1.15% 1.15% 1.15% 0.95% 1.15% 1.15% 1.05%
European Core Equity Fund 1.05% 1.05% 1.05% 0.75% 1.05% — 0.80%
European Research Fund 1.05% 1.05% 1.05% 0.75% 1.05% — 0.80%
European Smaller Companies Fund 1.05% 1.05% 1.05% 0.85% 1.05% — 1.05%
European Value Fund 1.05% 1.05% — 0.85% 1.05% — 1.05%
Global Concentrated Fund 1.15% 1.15% 1.15% 0.95% 1.15% 1.15% 1.15%
Global Credit Fund 0.60% 0.60% 0.60% 0.50% 0.60% — 0.55%
Global Energy Fund 1.05% 1.05% 1.05% 0.75% 1.05% — 0.80%
Global Equity Fund 1.05% 1.05% 1.05% 0.85% 1.05% 1.05% 1.05%
Global Equity Income Fund 0.90% — 0.90% 0.70% 0.90% — 0.75%
Global High Yield Fund 0.75% 0.75% 0.75% 0.65% 0.75% 0.75% 0.70%
Global Multi-Asset Fund 1.05% 1.05% 1.05% 0.75% 1.05% 1.05% 0.80%
Global Opportunistic Bond Fund (b) 0.60% — 0.60% 0.50% 0.60% — 0.55%
Global Research Focused Fund 1.05% 1.05% 1.05% 0.75% 1.05% 1.05% 0.80%
Global Total Return Fund 1.05% 1.05% 1.05% 0.75% 1.05% 1.05% 1.05%
Inflation-Adjusted Bond Fund 0.60% 0.60% 0.60% 0.50% 0.60% 0.60% 0.55%
Japan Equity Fund 1.05% 1.05% 1.05% 0.75% 1.05% — 0.80%(d)
Latin American Equity Fund 1.15% 1.15% 1.15% 0.95% 1.15% — 1.05%
Limited Maturity Fund 0.60% 0.60% 0.60% 0.50% 0.60% 0.60% 0.55%
Managed Wealth Fund 1.05% — 1.05% 0.75% 1.05% — 0.80%
Prudent Capital Fund (c) 1.05% — 1.05% 0.75% 1.05% — 0.80%
Prudent Wealth Fund 1.15% 1.15% 1.15% 0.95% 1.15% — 1.15%
U.K. Equity Fund 1.05% — 1.05% 0.75% 1.05% — 0.80%
U.S. Concentrated Growth Fund 1.15% 1.15% 1.15% 0.95% 1.15% 1.15% 1.00%
U.S. Corporate Bond Fund 0.60% — 0.60% 0.50% 0.60% — 0.55%
U.S. Equity Income Fund 0.90% — 0.90% 0.70% 0.90% — 0.75%
U.S. Equity Opportunities Fund 1.05% — 1.05% 0.75% 1.05% — 0.80%
U.S. Government Bond Fund 0.60% 0.60% 0.60% 0.50% 0.60% 0.60% 0.55%
U.S. Total Return Bond Fund 0.60% 0.60% 0.60% 0.50% 0.60% 0.60% 0.55%
U.S. Value Fund 1.05% 1.05% 1.05% 0.75% 1.05% 1.05% 0.80%
(a) Prior to 29 June 2016, the investment management fee for Class A, Class I, and Class W was 1.15%, 0.95%, and 1.00%, respectively.(b) The inception date of the sub-fund was 12 July 2016.(c) The inception date of the sub-fund was 3 November 2016.(d) See Note 17 for additional information.
The investment management fee for Class Z shares will be administratively levied and will be paid directly by the shareholder, in relation to investmentmanagement services provided by MFS to the sub-fund, and the payment of such fee is not charged to or paid by the sub-fund.
C) Distribution and Service Fees – The Management Company is also responsible for oversight of the distribution and marketing function with respect tothe fund. All distribution and service fees are being paid to the Management Company or its affiliate. The Management Company may engage certain ofits affiliates (including MFS International Limited) to provide distribution support to the Management Company.
182 MFS Meridian Funds Annual Report 2017

NOTES TO FINANCIAL STATEMENTS at 31 January 2017
The fund has adopted a distribution plan, which provides that each sub-fund pays the Management Company or its affiliate an annual distribution and/orservice fee paid on a monthly basis. In the case of Class A shares and Class N shares, the sub-fund pays a distribution fee of up to 0.50% and 1.00%,respectively, annually of average daily net assets of each share class for Absolute Return Fund, Diversified Income Fund, Emerging Markets Debt Fund,Emerging Markets Debt Local Currency Fund, Global Credit Fund, Global High Yield Fund, Global Opportunistic Bond Fund, Inflation-Adjusted Bond Fund,Limited Maturity Fund, U.S. Corporate Bond Fund, U.S. Total Return Bond Fund, and U.S. Government Bond Fund and up to 0.75% and 1.25%,respectively, annually of average daily net assets of Class A shares and Class N shares for each remaining sub-fund. In the case of Class B shares andClass C shares, each sub-fund pays a distribution fee of 1.00% of average daily net assets of the share class. In consideration for the distribution fees, theManagement Company or its affiliate pays expenses on behalf of these sub-funds related to the marketing and distribution of their shares, including a feepaid to financial intermediaries or institutions.
The service fee paid to the Management Company or its affiliate is established at the annual rate of 0.50% of average daily net assets attributable to theClass B and Class C shares of each sub-fund.
Class A shares are subject to a front-end load of up to 6.00% of the net asset value of such shares. With respect to each sub-fund, certain largepurchases of Class A shares may be purchased without a front-end load, but may be subject to a back-end load up to 1.00% in the event of a shareredemption within 24 months following purchase. Class N shares are subject to a front-end load of up to 3.00% of the net asset value of such shares. Aback-end load up to a maximum of 4.00% is imposed on shareholder redemptions of Class B shares in the event of a shareholder redemption within fouryears from the purchase. Class C shares are subject to a back-end load up to a maximum of 1.00% in the event of a shareholder redemption withintwelve months following the purchase. Front-end loads may be paid to the Management Company or its affiliate (all or a portion of which may be paid asa commission by the Management Company or its affiliate to the applicable financial intermediary upon the sale of Class A shares) or may be deductedfrom the applicable purchase amount directly by the financial intermediary upon the purchase of Class A shares. The Management Company or its affiliatereceives all back-end loads, which are generally intended to recapture sales commissions paid by the Management Company or its affiliate to financialintermediaries upon the purchase of the applicable class.
D) Directors’ Fees – The fund pays no compensation directly to Directors of the fund who are Officers or employees of the Management Company,Investment Manager or its affiliates (other than fund related out-of-pocket expenses). As of the date of this report, all Directors of the fund are Officers orDirectors of the Management Company, MFS and its affiliates, except for Thomas Bogart and James R. Julian, Jr., whose compensation is paid by the sub-funds. These fees are included in the “Miscellaneous” expenses in the Statements of Operations and Changes in Net Assets.
E) Expense Cap Arrangement – Each sub-fund has entered into a temporary expense cap agreement whereby MFS has voluntarily agreed to bear certainof the sub-fund’s “Other Expenses,” excluding taxes (other than the Luxembourg taxe d’abonnement) and expenses associated with the sub-fund’sinvestment activities such as interest expense, such that these expenses do not exceed the rates of average daily net assets of Class A, Class B, Class C,Class I, Class N, Class W, and Class Z noted in the table below.
“Other Expenses” generally include all direct sub-fund expenses other than investment management, distribution and service fees. “Other Expenses”include fees paid to the Management Company, Depositary and Transfer Agent, legal and audit fees, certain expenses associated with the sub-fund’sinvestment activities including interest, and expenses in connection with the sub-fund’s operation and central administration in Luxembourg, amongothers. “Other Expenses” do not include brokerage commissions and transaction costs or currency conversion costs.
For Class S, each sub-fund has entered into a temporary expense cap agreement whereby MFS has voluntarily agreed to bear certain direct expenses,excluding taxes (other than the Luxembourg taxe d’abonnement) and expenses associated with the sub-fund’s investment activities such as interestexpense, such that the “Total Expense Ratio” does not exceed the rates of average daily net assets noted in the table below.
To the extent the “Total Expense Ratio” (in the case of Class S) or “Other Expenses” (in the case of other classes) exceeds the expense cap rate, thedifference is attributable to certain other expenses that are excluded from the expense cap arrangement, such as interest expenses associated with thesub-fund’s investment activities.
Sub-Fund Class A Class B Class C Class I Class N Class S Class W Class Z
Absolute Return Fund 0.25% 0.25% 0.25% 0.15% 0.25% — 0.20% —
Asia Pacific Ex-Japan Fund 0.25% 0.25% 0.25% 0.15% 0.25% 1.00% 0.20% —
Blended Research European Equity Fund 0.25% — 0.25%(a) 0.15% 0.25%(a) — 0.20% —
Continental European Equity Fund 0.25% — 0.25% 0.15% 0.25% — 0.20% —
Diversified Income Fund 0.25% — 0.25% 0.15% 0.25% — 0.20% —
Emerging Markets Debt Fund 0.25% 0.25% 0.25% 0.15% 0.25% 1.00% 0.20% 0.15%
Emerging Markets Debt Local Currency Fund 0.35% 0.35% 0.35% 0.25% 0.35% — 0.30% —
Emerging Markets Equity Fund 0.35% 0.35% 0.35% 0.25% 0.35% 1.00% 0.30% 0.25%
European Core Equity Fund 0.25% 0.25% 0.25% 0.15% 0.25% — 0.20% —
European Research Fund 0.25% 0.25% 0.25% 0.15% 0.25% — 0.20% 0.15%
European Smaller Companies Fund 0.25% 0.25% 0.25% 0.15% 0.25% — 0.20% —
European Value Fund 0.25% 0.25% — 0.15% 0.25% — 0.20% 0.15%
Global Concentrated Fund 0.25% 0.25% 0.25% 0.15% 0.25% 1.00% 0.20% —
Global Credit Fund 0.25% 0.25% 0.25% 0.15% 0.25% — 0.20% —
MFS Meridian Funds Annual Report 2017 183

NOTES TO FINANCIAL STATEMENTS at 31 January 2017
Sub-Fund - (continued) Class A Class B Class C Class I Class N Class S Class W Class Z
Global Energy Fund 0.25% 0.25% 0.25% 0.15% 0.25% — 0.20% —
Global Equity Fund 0.25% 0.25% 0.25% 0.15% 0.25% 1.00% 0.20% —
Global Equity Income Fund 0.25% — 0.25% 0.15% 0.25% — 0.20% 0.15%
Global High Yield Fund 0.25% 0.25% 0.25% 0.15% 0.25% 1.00% 0.20% —
Global Multi-Asset Fund 0.25% 0.25% 0.25% 0.15% 0.25% 1.00% 0.20% —
Global Opportunistic Bond Fund (b) 0.25% — 0.25% 0.15% 0.25% — 0.20% 0.15%
Global Research Focused Fund 0.25% 0.25% 0.25% 0.15% 0.25% 1.00% 0.20% —
Global Total Return Fund 0.25% 0.25% 0.25% 0.15% 0.25% 1.00% 0.20% —
Inflation-Adjusted Bond Fund 0.25% 0.25% 0.25% 0.15% 0.25% 1.00% 0.20% —
Japan Equity Fund 0.25% 0.25% 0.25% 0.15% 0.25% — 0.20%(a) —
Latin American Equity Fund 0.35% 0.35% 0.35% 0.25% 0.35% — 0.30% —
Limited Maturity Fund 0.25% 0.25% 0.25% 0.15% 0.25% 1.00% 0.20% —
Managed Wealth Fund 0.25% — 0.25% 0.15% 0.25% — 0.20% —
Prudent Capital Fund (c) 0.25% — 0.25% 0.15% 0.25% — 0.20% —
Prudent Wealth Fund 0.25% 0.25% 0.25% 0.15% 0.25% — 0.20% —
U.K. Equity Fund 0.25% — 0.25% 0.15% 0.25% — 0.20% —
U.S. Concentrated Growth Fund 0.25% 0.25% 0.25% 0.15% 0.25% 1.00% 0.20% —
U.S. Corporate Bond Fund 0.25% — 0.25% 0.15% 0.25% — 0.20% —
U.S. Equity Income Fund 0.25% — 0.25% 0.15% 0.25% — 0.20% —
U.S. Equity Opportunities Fund 0.25% — 0.25% 0.15% 0.25% — 0.20% —
U.S. Government Bond Fund 0.25% 0.25% 0.25% 0.15% 0.25% 1.00% 0.20% —
U.S. Total Return Bond Fund 0.25% 0.25% 0.25% 0.15% 0.25% 1.00% 0.20% —
U.S. Value Fund 0.25% 0.25% 0.25% 0.15% 0.25% 1.00% 0.20% —
(a) See Note 17 for additional information.(b) The inception date of the sub-fund was 12 July 2016.(c) The inception date of the sub-fund was 3 November 2016.
The reductions under these agreements are reported as “Expenses reimbursed by related parties” in the Statements of Operations and Changes in NetAssets. These expense cap agreements are in place until 31 January 2018, at which time the arrangements may or may not be continued. All transactionsentered into between the fund and MFS have been entered into in the ordinary course of business and on normal commercial terms. The fund has not enteredinto any transactions through a broker who is a connected person, nor has the fund entered into any transactions which are outside the ordinary course ofbusiness or not on normal commercial terms.
Note 6: Depositary Fees
Each sub-fund will pay State Street Bank Luxembourg S.C.A., the fund’s depositary and global custodian (the “Depositary”), a fee based on the monthly netasset value of the sub-funds plus a fee based upon the trading activity of each sub-fund. The Depositary and the Management Company or MFS, on behalf ofthe fund, shall determine the level of the fee from time to time in light of market rates applicable in Luxembourg. The fee is approved by the fund’s Board ofDirectors. Reasonable disbursements and out-of-pocket expenses incurred by the Depositary or by other banks and financial institutions to which safekeepingof assets of the sub-funds is entrusted are in addition to the Depositary’s fee. The Management Company and the fund have also entered into agreementswith State Street to serve as the Registrar, Transfer Agent, Luxembourg Paying Agent, Central Administration Agent, and Fund Accounting Agent. The fundpays State Street fees for such services at commercial rates agreed upon between the parties, together with reasonable out-of-pocket expenses. The fees paidto State Street for these services are part of each sub-fund’s operating expenses which are capped by MFS as described in Note 5.
In December 2015, the fund’s depositary, announced that it intended to reimburse its asset servicing clients for expense amounts that it billed in error duringthe period 1998 through 2015. The amount of this one-time reimbursement attributable to the fund is reflected as “Reimbursement of depositary fee” in theStatements of Operations and Changes in Net Assets.
Note 7: Commission Sharing
In allocating brokerage commissions, MFS may take into consideration the receipt of research and brokerage services, consistent with its obligation to seekbest price and execution for client transactions. Such services include advice as to the value of securities, the advisability of investing in, purchasing or sellingsecurities, and the availability of securities or purchasers or sellers of securities, furnishing analyses and reports concerning issuers, industries, securities,economic factors and trends, portfolio strategy and the performance of accounts, and effecting securities transactions and performing functions incidentalthereto (such as clearance and settlement) or required in connection therewith by applicable rules. Research services can include access to corporatemanagement, industry conferences, research field trips to visit corporate management and/or to tour manufacturing, production or distribution facilities,statistical, research and other factual information or services such as investment research reports; access to analysts; execution systems and trading analytics;reports or databases containing corporate, fundamental and technical analyses; portfolio modelling strategies; and economic research services, such as
184 MFS Meridian Funds Annual Report 2017

NOTES TO FINANCIAL STATEMENTS at 31 January 2017
publications, chart services and advice from economists concerning macroeconomics information, and analytical investment information about particularcorporations (collectively, “Research”). Securities may be bought or sold from time to time through such broker-dealers on behalf of a sub-fund. MFS hasentered into Client Commission Agreements with certain broker/dealers that execute, clear or settle securities transactions on behalf of clients (collectively,“Executing Brokers”) which provide for the Executing Brokers to pool a portion of the commissions paid by MFS’ clients for securities transactions (“PooledCommissions”) to research providers. Such research providers shall provide Research for the benefit of MFS. To the extent a research provider plays no role inexecuting client securities transactions, any Research prepared by that research provider would constitute third-party research. The investment managementfee, paid by the sub-funds to MFS, is not reduced as a consequence of MFS’ receipt of Research. To the extent a sub-fund’s portfolio transactions are used toobtain Research, the brokerage commissions paid by the sub-fund may exceed those that might otherwise be paid for execution only. The Research receivedmay be useful and of value to MFS in serving both a sub-fund and other clients of MFS or its affiliates; accordingly, not all of the Research provided bybrokers through whom client securities transactions are effected may be used by MFS in connection with the clients. MFS would, through the use of theResearch acquired with trade commissions or Pooled Commissions, avoid the additional expenses that would be incurred if it attempted to developcomparable information through its own staff or if it purchased such Research with its own resources. All trades with Research Firms will be effected inaccordance with MFS’ obligation to seek best execution for its client accounts.
Note 8: Taxation
The fund is subject to Luxembourg law with respect to its tax status. Under legislation and regulations currently prevailing in Luxembourg, the fund is subjectto a “taxe d’abonnement” on its net assets at an annual rate of 0.05% for Class A, Class B, Class C, Class N, and Class W and 0.01% for Class I, Class S,and Class Z. The “taxe d’abonnement” is calculated and payable quarterly on the basis of the net assets at the end of each calendar quarter. Interest anddividend income, and gains on securities, may be subject to non-recoverable withholding taxes deducted at source in the countries of origin.
The fund is registered for Value Added Tax in the Grand-Duchy of Luxembourg and subject to account for Value Added Tax in accordance with currentregulations.
United Kingdom Tax Considerations – The Company has received “reporting fund” status for certain sub-funds and share classes for the fiscal year ended31 January 2017. More information can be found at www.mfs.com.
Note 9: Line of Credit
Each sub-fund and other funds managed by MFS participate in an unsecured committed line of credit, subject to a $250 million sublimit provided by asyndication of banks under a credit agreement. Borrowings may be made for temporary financing needs. Interest is charged to each sub-fund, based on itsborrowings, generally at a rate equal to the higher of the Overnight U.S. Federal Reserve funds rate or daily one month LIBOR plus an agreed upon spread. Acommitment fee, based on the average daily unused portion of the committed line of credit, is allocated among the participating sub-funds at the end of eachcalendar quarter. In addition, each sub-fund and other funds managed by MFS have established a $200 million unsecured uncommitted borrowingarrangement with its depositary bank for temporary financing needs. Interest is charged to each participating sub-fund, based on its borrowings, at a rateequal to the Overnight U.S. Federal Reserve funds rate plus an agreed upon spread. Any interest and commitment fees are reflected in “Interest expense andsimilar charges” in the Statements of Operations and Changes in Net Assets. None of the sub-funds had any borrowings outstanding under thesearrangements at 31 January 2017. The Prudent Capital Fund and the Global Opportunistic Bond Fund did not participate in these agreements during the yearended 31 January 2017. The Prudent Capital Fund and the Global Opportunistic Bond Fund will be added to the agreements in the next fiscal year.
Note 10: Open Forward Foreign Currency Exchange Contracts
At 31 January 2017, the sub-funds had outstanding the following forward foreign currency exchange contracts. Each sub-fund had sufficient cash and/orother securities to cover any commitments under these derivative contracts.
Type Currency CounterpartyContracts to
Deliver/ReceiveSettlement Date
Range In Exchange ForContracts at
ValueNet Unrealized
Gain (Loss)
Absolute Return FundAppreciationBUY AUD JPMorgan Chase Bank N.A. 1,665,795 15/02/2017 $1,231,780 $1,262,942 $31,162
BUY CAD JPMorgan Chase Bank N.A. 993,592 15/02/2017 758,000 763,663 5,663
BUY CHF Goldman Sachs International 61,489 15/02/2017 61,000 62,177 1,177
BUY CHF JPMorgan Chase Bank N.A. 313,802 15/02/2017 307,000 317,315 10,315
BUY EUR Goldman Sachs International 252,382 15/02/2017 265,451 272,571 7,120
BUY GBP JPMorgan Chase Bank N.A. 283,103 15/02/2017 350,000 356,219 6,219
SELL GBP JPMorgan Chase Bank N.A. 637,046 15/02/2017 802,353 801,573 780
BUY JPY JPMorgan Chase Bank N.A. 128,718,950 15/02/2017 1,126,097 1,140,383 14,286
BUY NOK Goldman Sachs International 11,427,679 15/02/2017 1,353,521 1,385,636 32,115
BUY NZD Goldman Sachs International 187,431 15/02/2017 133,937 137,465 3,528
BUY SEK Goldman Sachs International 4,513,108 15/02/2017 498,000 516,237 18,237
Total $130,602
DepreciationSELL AUD JPMorgan Chase Bank N.A. 711,569 15/02/2017 $531,000 $539,484 $(8,484)
SELL CAD JPMorgan Chase Bank N.A. 1,030,649 15/02/2017 776,905 792,145 (15,240)
SELL CHF JPMorgan Chase Bank N.A. 1,143,371 15/02/2017 1,130,687 1,156,170 (25,483)
MFS Meridian Funds Annual Report 2017 185

NOTES TO FINANCIAL STATEMENTS at 31 January 2017
Type Currency CounterpartyContracts to
Deliver/ReceiveSettlement Date
Range In Exchange ForContracts at
ValueNet Unrealized
Gain (Loss)
Absolute Return Fund – (continued)Depreciation – (continued)SELL EUR Citibank N.A. 221,047 10/03/2017 $237,928 $238,973 $(1,045)
SELL EUR Goldman Sachs International 967,984 15/02/2017 1,032,000 1,045,418 (13,418)
BUY GBP JPMorgan Chase Bank N.A. 349,386 15/02/2017 444,000 439,621 (4,379)
SELL JPY JPMorgan Chase Bank N.A. 26,143,944 15/02/2017 224,000 231,622 (7,622)
SELL NOK Goldman Sachs International 3,822,589 15/02/2017 447,000 463,499 (16,499)
SELL NZD Goldman Sachs International 746,517 15/02/2017 526,000 547,505 (21,505)
SELL SEK Goldman Sachs International 3,863,874 15/02/2017 424,714 441,975 (17,261)
Total $(130,936)
Diversified Income FundDepreciationSELL EUR Citibank N.A. 543,752 10/03/2017 $585,276 $587,847 $(2,571)
Emerging Markets Debt FundAppreciationBUY BRL Citibank N.A. 1,262,604 2/02/2017 $363,800 $400,687 $36,887
BUY BRL Goldman Sachs International 9,192,561 2/02/2017 2,908,854 2,917,255 8,401
BUY BRL JPMorgan Chase Bank N.A. 49,973,133 2/02/2017 14,273,300 15,858,949 1,585,649
SELL BRL Citibank N.A. 1,262,604 2/02/2017 403,775 400,687 3,088
SELL BRL JPMorgan Chase Bank N.A. 49,973,133 2/02/2017 15,981,175 15,858,949 122,226
BUY CNH HSBC Bank 103,304,000 6/04/2017 - 10/04/2017 14,809,260 14,988,293 179,033
BUY CNH JPMorgan Chase Bank N.A. 133,875,000 28/02/2017 - 6/04/2017 19,106,665 19,483,192 376,527
SELL CNH Barclays Bank PLC 44,131,000 26/04/2017 6,630,258 6,388,263 241,995
SELL CNH HSBC Bank 22,070,000 14/11/2017 3,167,109 3,129,376 37,733
SELL CNH JPMorgan Chase Bank N.A. 110,339,000 28/02/2017 - 14/11/2017 16,100,290 15,906,016 194,274
BUY COP BNP Paribas S.A. 30,541,725,000 16/02/2017 - 21/03/2017 10,131,648 10,369,489 237,841
BUY COP Citibank N.A. 9,361,146,000 16/02/2017 - 15/03/2017 3,121,672 3,184,800 63,128
BUY COP Goldman Sachs International 4,712,474,000 15/03/2017 1,570,302 1,599,703 29,401
BUY COP JPMorgan Chase Bank N.A. 13,350,756,000 15/03/2017 4,440,702 4,532,065 91,363
BUY COP Morgan Stanley Capital Services, Inc. 25,913,862,000 16/02/2017 - 15/03/2017 8,642,633 8,818,381 175,748
BUY EUR Citibank N.A. 728,415 10/03/2017 784,140 787,485 3,345
BUY EUR Goldman Sachs International 5,202,450 10/03/2017 5,596,391 5,624,338 27,947
BUY EUR Morgan Stanley Capital Services, Inc. 332,684 10/03/2017 348,416 359,662 11,246
SELL EUR JPMorgan Chase Bank N.A. 36,505,871 10/03/2017 39,529,653 39,466,283 63,370
BUY IDR Barclays Bank PLC 125,823,740,000 15/02/2017 9,398,221 9,411,793 13,572
BUY IDR Merrill Lynch International 49,323,378,000 15/02/2017 3,686,351 3,689,458 3,107
BUY KRW BNP Paribas S.A. 9,875,354,000 2/02/2017 8,399,552 8,497,852 98,300
BUY KRW JPMorgan Chase Bank N.A. 13,800,716,000 2/02/2017 11,810,955 11,875,670 64,715
SELL MXN Goldman Sachs International 14,369,000 10/03/2017 689,428 685,500 3,928
SELL MXN JPMorgan Chase Bank N.A. 124,961,884 10/03/2017 6,083,562 5,961,542 122,020
BUY PEN BNP Paribas S.A. 10,048,471 2/02/2017 3,035,550 3,071,987 36,437
BUY PEN JPMorgan Chase Bank N.A. 15,346,204 2/02/2017 - 1/03/2017 4,542,097 4,690,004 147,907
BUY PEN Morgan Stanley Capital Services, Inc. 20,859,000 2/02/2017 - 20/03/2017 6,128,551 6,362,192 233,641
BUY RUB BNP Paribas S.A. 215,049,000 2/02/2017 3,327,387 3,574,915 247,528
BUY RUB Goldman Sachs International 64,510,000 2/02/2017 997,518 1,072,396 74,878
BUY RUB HSBC Bank 437,138,000 2/02/2017 - 22/02/2017 6,728,690 7,240,184 511,494
BUY RUB JPMorgan Chase Bank N.A. 215,049,000 1/03/2017 3,551,007 3,551,838 831
SELL RUB Barclays Bank PLC 96,665,000 22/02/2017 1,609,206 1,599,178 10,028
SELL RUB Goldman Sachs International 64,510,000 2/02/2017 1,073,422 1,072,396 1,026
SELL RUB HSBC Bank 621,640,149 2/02/2017 - 22/02/2017 10,357,925 10,292,497 65,428
BUY TRY JPMorgan Chase Bank N.A. 29,048,000 10/03/2017 7,569,511 7,620,732 51,221
186 MFS Meridian Funds Annual Report 2017

NOTES TO FINANCIAL STATEMENTS at 31 January 2017
Type Currency CounterpartyContracts to
Deliver/ReceiveSettlement Date
Range In Exchange ForContracts at
ValueNet Unrealized
Gain (Loss)
Emerging Markets Debt Fund – (continued)Appreciation – (continued)SELL TRY Barclays Bank PLC 25,478,000 10/03/2017 $7,099,962 $6,684,144 $415,818
SELL TRY Brown Brothers Harriman 4,837,000 10/03/2017 1,346,190 1,268,985 77,205
SELL TRY Citibank N.A. 4,683,000 10/03/2017 1,314,943 1,228,583 86,360
SELL TRY HSBC Bank 2,843,000 10/03/2017 799,044 745,860 53,184
SELL TRY JPMorgan Chase Bank N.A. 38,792,000 10/03/2017 10,894,271 10,177,067 717,204
BUY ZAR JPMorgan Chase Bank N.A. 144,369,508 10/03/2017 10,500,746 10,645,692 144,946
SELL ZAR Barclays Bank PLC 52,836,000 10/03/2017 3,900,840 3,896,085 4,755
SELL ZAR Citibank N.A. 24,185,000 10/03/2017 1,785,417 1,783,383 2,034
Total $6,676,769
DepreciationBUY BRL BNP Paribas S.A. 43,823,299 2/02/2017 $14,014,486 $13,907,301 $(107,185)
BUY BRL Goldman Sachs International 7,412,439 2/02/2017 2,370,464 2,352,334 (18,130)
SELL BRL BNP Paribas S.A. 43,823,299 2/02/2017 12,645,957 13,907,302 (1,261,345)
SELL BRL Goldman Sachs International 25,797,561 2/02/2017 - 24/02/2017 7,582,800 8,170,372 (587,572)
BUY CNH JPMorgan Chase Bank N.A. 1,658,000 31/08/2017 243,229 236,702 (6,527)
SELL CNH JPMorgan Chase Bank N.A. 62,297,000 11/12/2017 8,739,146 8,812,205 (73,059)
SELL COP BNP Paribas S.A. 16,566,068,000 16/02/2017 5,411,309 5,649,603 (238,294)
SELL COP JPMorgan Chase Bank N.A. 17,430,089,000 21/03/2017 5,850,986 5,911,197 (60,211)
SELL COP Morgan Stanley Capital Services, Inc. 14,291,169,000 16/02/2017 4,667,876 4,873,784 (205,908)
BUY EUR Goldman Sachs International 1,764,982 10/03/2017 1,908,915 1,908,112 (803)
SELL EUR Goldman Sachs International 7,259,000 10/03/2017 7,589,376 7,847,662 (258,286)
SELL EUR HSBC Bank 4,887,000 10/03/2017 5,258,803 5,283,307 (24,504)
SELL IDR Barclays Bank PLC 44,171,926,295 15/02/2017 3,298,381 3,304,122 (5,741)
SELL IDR JPMorgan Chase Bank N.A. 94,747,678,200 15/02/2017 7,070,722 7,087,260 (16,538)
SELL IDR Merrill Lynch International 44,171,926,295 15/02/2017 3,296,412 3,304,122 (7,710)
SELL KRW Barclays Bank PLC 4,205,179,000 21/02/2017 3,589,691 3,619,400 (29,709)
SELL KRW BNP Paribas S.A. 19,750,708,000 2/02/2017 - 2/03/2017 16,874,115 16,998,264 (124,149)
SELL KRW JPMorgan Chase Bank N.A. 17,726,078,000 2/02/2017 - 2/03/2017 15,072,913 15,254,505 (181,592)
BUY MXN Barclays Bank PLC 76,874,000 10/03/2017 3,691,227 3,667,419 (23,808)
BUY MXN Brown Brothers Harriman 45,481,000 10/03/2017 2,183,216 2,169,757 (13,459)
SELL MXN Barclays Bank PLC 32,751,000 10/03/2017 1,515,077 1,562,448 (47,371)
SELL MXN Brown Brothers Harriman 24,718,000 10/03/2017 1,143,842 1,179,219 (35,377)
SELL MXN Goldman Sachs International 62,572,000 10/03/2017 2,892,178 2,985,115 (92,937)
SELL PEN BNP Paribas S.A. 10,048,471 2/02/2017 2,921,237 3,071,987 (150,750)
SELL PEN JPMorgan Chase Bank N.A. 13,585,102 2/02/2017 4,134,953 4,153,195 (18,242)
SELL PEN Morgan Stanley Capital Services, Inc. 10,720,000 2/02/2017 3,265,306 3,277,285 (11,979)
SELL PLN Citibank N.A. 1,737,000 10/03/2017 420,215 433,484 (13,269)
BUY RUB BNP Paribas S.A. 2,581,163 22/02/2017 43,055 42,701 (354)
BUY RUB Credit Suisse Group 631,457,848 22/02/2017 10,589,600 10,446,529 (143,071)
BUY RUB Goldman Sachs International 64,510,000 1/03/2017 1,066,546 1,065,474 (1,072)
BUY RUB HSBC Bank 384,181,000 22/02/2017 - 1/03/2017 6,391,441 6,352,869 (38,572)
SELL RUB BNP Paribas S.A. 186,707,000 22/02/2017 2,978,258 3,088,789 (110,531)
SELL RUB HSBC Bank 320,724,000 22/02/2017 5,180,867 5,305,901 (125,034)
SELL RUB JPMorgan Chase Bank N.A. 215,049,000 2/02/2017 3,574,202 3,574,915 (713)
BUY TRY Barclays Bank PLC 58,797,000 10/03/2017 16,824,044 15,425,371 (1,398,673)
BUY TRY Brown Brothers Harriman 6,403,000 15/02/2017 1,823,223 1,690,411 (132,812)
BUY TRY Citibank N.A. 4,804,000 10/03/2017 1,366,949 1,260,328 (106,621)
BUY TRY Morgan Stanley Capital Services, Inc. 6,629,000 10/03/2017 1,903,321 1,739,116 (164,205)
SELL TRY JPMorgan Chase Bank N.A. 29,047,000 10/03/2017 7,505,115 7,620,470 (115,355)
MFS Meridian Funds Annual Report 2017 187

NOTES TO FINANCIAL STATEMENTS at 31 January 2017
Type Currency CounterpartyContracts to
Deliver/ReceiveSettlement Date
Range In Exchange ForContracts at
ValueNet Unrealized
Gain (Loss)
Emerging Markets Debt Fund – (continued)Depreciation – (continued)SELL TWD Goldman Sachs International 91,470,000 21/02/2017 $2,851,753 $2,919,397 $(67,644)
SELL TWD Morgan Stanley Capital Services, Inc. 96,287,000 21/02/2017 3,001,933 3,073,139 (71,206)
Total $(6,090,318)
Emerging Markets Debt Local Currency FundAppreciationBUY BRL Banco Santander Brasil S.A. 3,205,598 2/02/2017 $995,156 $1,017,295 $22,139
BUY BRL Citibank N.A. 980,769 2/02/2017 294,109 311,246 17,137
BUY BRL Goldman Sachs International 986,000 2/02/2017 300,238 312,907 12,669
BUY BRL JPMorgan Chase Bank N.A. 3,713,099 2/02/2017 1,159,480 1,178,350 18,870
BUY BRL Morgan Stanley Capital Services, Inc. 179,000 2/02/2017 51,935 56,806 4,871
SELL BRL Banco Santander Brasil S.A. 3,205,598 2/02/2017 1,025,135 1,017,295 7,840
SELL BRL Citibank N.A. 980,769 2/02/2017 313,645 311,246 2,399
SELL BRL Goldman Sachs International 623,000 2/02/2017 199,232 197,709 1,523
SELL BRL JPMorgan Chase Bank N.A. 2,997,668 2/02/2017 958,640 951,308 7,332
BUY CAD Brown Brothers Harriman 249,000 10/03/2017 189,654 191,425 1,771
BUY CHF UBS AG 1,000 10/03/2017 995 1,013 18
BUY CLP Morgan Stanley Capital Services, Inc. 156,166,800 7/02/2017 - 13/02/2017 234,451 240,685 6,234
BUY CNH HSBC Bank 2,539,000 10/04/2017 365,350 368,320 2,970
BUY CNH JPMorgan Chase Bank N.A. 5,230,000 28/02/2017 - 11/12/2017 745,654 760,819 15,165
SELL CNH Barclays Bank PLC 1,453,000 26/04/2017 217,878 210,332 7,546
SELL CNH JPMorgan Chase Bank N.A. 4,503,000 28/02/2017 - 11/08/2017 665,497 652,283 13,214
BUY COP Citibank N.A. 1,031,165,350 15/03/2017 342,239 350,041 7,802
BUY COP Morgan Stanley Capital Services, Inc. 578,892,000 15/03/2017 191,854 196,511 4,657
SELL COP Morgan Stanley Capital Services, Inc. 102,739,000 15/03/2017 35,197 34,876 321
BUY CZK Goldman Sachs International 2,282,000 14/11/2018 94,807 95,937 1,130
BUY EUR Barclays Bank PLC 93,000 10/03/2017 99,442 100,542 1,100
BUY EUR Citibank N.A. 599,821 10/03/2017 645,626 648,463 2,837
BUY EUR Goldman Sachs International 86,000 10/03/2017 92,211 92,974 763
BUY EUR Morgan Stanley Capital Services, Inc. 86,597 10/03/2017 92,482 93,619 1,137
SELL EUR Goldman Sachs International 291,000 14/11/2018 327,957 326,316 1,641
BUY HUF Barclays Bank PLC 126,133,579 10/03/2017 433,790 439,687 5,897
BUY HUF Brown Brothers Harriman 2,676,000 10/03/2017 9,279 9,328 49
BUY HUF JPMorgan Chase Bank N.A. 12,900,900 10/03/2017 44,302 44,971 669
BUY HUF Morgan Stanley Capital Services, Inc. 52,822,089 10/03/2017 183,298 184,132 834
BUY IDR Barclays Bank PLC 109,625,000 13/02/2017 8,119 8,202 83
BUY IDR JPMorgan Chase Bank N.A. 10,536,095,700 13/02/2017 - 15/02/2017 786,280 788,153 1,873
BUY JPY Citibank N.A. 20,904,000 10/03/2017 182,638 185,354 2,716
BUY JPY Goldman Sachs International 1,000 10/03/2017 9 10 1
BUY JPY Morgan Stanley Capital Services, Inc. 20,360,000 10/03/2017 179,735 180,530 795
BUY KRW Barclays Bank PLC 202,099,000 2/02/2017 171,961 173,908 1,947
BUY KRW JPMorgan Chase Bank N.A. 685,972,000 2/02/2017 583,201 590,287 7,086
BUY MXN Barclays Bank PLC 698,000 10/03/2017 33,015 33,299 284
BUY MXN Goldman Sachs International 3,894,000 10/03/2017 185,261 185,771 510
BUY MXN JPMorgan Chase Bank N.A. 1,036,921 10/03/2017 47,556 49,468 1,912
SELL MXN JPMorgan Chase Bank N.A. 1,316,000 10/03/2017 63,180 62,782 398
SELL MXN Morgan Stanley Capital Services, Inc. 16,120,354 10/03/2017 783,160 769,052 14,108
BUY MYR Barclays Bank PLC 296,928 6/02/2017 66,388 67,023 635
BUY MYR Citibank N.A. 2,343,189 6/02/2017 519,669 528,909 9,240
BUY MYR JPMorgan Chase Bank N.A. 2,350,000 6/02/2017 522,745 530,447 7,702
188 MFS Meridian Funds Annual Report 2017

NOTES TO FINANCIAL STATEMENTS at 31 January 2017
Type Currency CounterpartyContracts to
Deliver/ReceiveSettlement Date
Range In Exchange ForContracts at
ValueNet Unrealized
Gain (Loss)
Emerging Markets Debt Local Currency Fund – (continued)Appreciation – (continued)BUY PEN HSBC Bank 295,921 2/02/2017 $90,137 $90,468 $331
BUY PEN JPMorgan Chase Bank N.A. 359,863 2/02/2017 106,446 110,016 3,570
BUY PEN Morgan Stanley Capital Services, Inc. 51,000 2/02/2017 15,535 15,592 57
BUY PHP JPMorgan Chase Bank N.A. 7,394,000 2/02/2017 147,682 148,578 896
SELL PHP JPMorgan Chase Bank N.A. 7,394,000 2/02/2017 148,895 148,578 317
BUY PLN Barclays Bank PLC 361,000 10/03/2017 85,136 90,091 4,955
BUY PLN Citibank N.A. 3,801,444 10/03/2017 919,645 948,685 29,040
BUY PLN Goldman Sachs International 164,000 10/03/2017 39,157 40,928 1,771
BUY PLN JPMorgan Chase Bank N.A. 183,790 10/03/2017 44,313 45,866 1,553
BUY RON JPMorgan Chase Bank N.A. 3,116,359 27/03/2017 742,167 749,273 7,106
BUY RUB Credit Suisse Group 26,022,353 22/02/2017 427,500 430,501 3,001
BUY RUB Goldman Sachs International 23,486,000 22/02/2017 360,161 388,541 28,380
BUY RUB HSBC Bank 10,261,000 22/02/2017 157,716 169,753 12,037
SELL RUB BNP Paribas S.A. 202,777,821 22/02/2017 3,382,449 3,354,657 27,792
SELL RUB Goldman Sachs International 2,227,000 22/02/2017 37,154 36,842 312
SELL RUB HSBC Bank 25,554,000 22/02/2017 426,039 422,753 3,286
BUY THB JPMorgan Chase Bank N.A. 61,103,315 23/03/2017 1,724,086 1,734,589 10,503
BUY TRY Brown Brothers Harriman 906,712 10/03/2017 237,160 237,875 715
BUY TRY Goldman Sachs International 340,262 10/03/2017 87,561 89,268 1,707
BUY TRY Morgan Stanley Capital Services, Inc. 130,160 10/03/2017 33,400 34,147 747
SELL TRY Brown Brothers Harriman 96,000 10/03/2017 26,815 25,186 1,629
SELL TRY Goldman Sachs International 273,000 10/03/2017 74,339 71,621 2,718
BUY ZAR Barclays Bank PLC 602,000 2/02/2017 44,403 44,675 272
BUY ZAR BNP Paribas S.A. 559,544 10/03/2017 40,521 41,260 739
BUY ZAR Citibank N.A. 135,000 10/03/2017 9,571 9,955 384
BUY ZAR JPMorgan Chase Bank N.A. 1,187,036 10/03/2017 85,662 87,531 1,869
BUY ZAR Morgan Stanley Capital Services, Inc. 2,077,303 10/03/2017 150,367 153,179 2,812
SELL ZAR Goldman Sachs International 602,000 2/02/2017 44,953 44,675 278
Total $368,602
DepreciationBUY BRL BNP Paribas S.A. 6,560,034 2/02/2017 $2,097,868 $2,081,823 $(16,045)
BUY BRL Morgan Stanley Capital Services, Inc. 1,247,000 2/02/2017 398,785 395,735 (3,050)
SELL BRL BNP Paribas S.A. 6,560,034 2/02/2017 1,893,009 2,081,823 (188,814)
SELL BRL Goldman Sachs International 363,000 2/02/2017 105,857 115,198 (9,341)
SELL BRL JPMorgan Chase Bank N.A. 3,593,161 2/02/2017 - 24/02/2017 1,128,226 1,135,131 (6,905)
SELL BRL Morgan Stanley Capital Services, Inc. 1,426,000 2/02/2017 406,165 452,540 (46,375)
SELL CAD Brown Brothers Harriman 242,000 15/03/2017 181,628 186,054 (4,426)
SELL CAD Merrill Lynch International 496,000 10/03/2017 374,316 381,312 (6,996)
SELL CLP Morgan Stanley Capital Services, Inc. 127,716,000 7/02/2017 187,611 196,848 (9,237)
SELL CNH JPMorgan Chase Bank N.A. 1,813,000 11/12/2017 254,331 256,457 (2,126)
SELL COP BNP Paribas S.A. 1,169,306,250 15/03/2017 386,728 396,934 (10,206)
SELL COP HSBC Bank 610,078,564 15/03/2017 201,919 207,098 (5,179)
SELL COP JPMorgan Chase Bank N.A. 50,424,000 15/03/2017 16,699 17,117 (418)
SELL COP Morgan Stanley Capital Services, Inc. 121,482,000 15/03/2017 40,206 41,238 (1,032)
BUY CZK Goldman Sachs International 8,026,000 14/11/2018 340,619 337,418 (3,201)
BUY CZK JPMorgan Chase Bank N.A. 5,003,000 9/10/2018 217,422 209,814 (7,608)
SELL CZK JPMorgan Chase Bank N.A. 1,246,000 9/10/2018 51,763 52,254 (491)
SELL CZK Morgan Stanley Capital Services, Inc. 329,000 10/03/2017 12,932 13,171 (239)
SELL EUR Goldman Sachs International 620,000 10/03/2017 - 14/11/2018 657,192 674,104 (16,912)
SELL EUR Morgan Stanley Capital Services, Inc. 176,000 10/03/2017 187,354 190,273 (2,919)
MFS Meridian Funds Annual Report 2017 189

NOTES TO FINANCIAL STATEMENTS at 31 January 2017
Type Currency CounterpartyContracts to
Deliver/ReceiveSettlement Date
Range In Exchange ForContracts at
ValueNet Unrealized
Gain (Loss)
Emerging Markets Debt Local Currency Fund – (continued)Depreciation – (continued)SELL HUF Morgan Stanley Capital Services, Inc. 115,648,544 10/03/2017 $397,070 $403,137 $(6,067)
SELL IDR Barclays Bank PLC 11,483,899,817 13/02/2017 - 15/02/2017 856,273 859,077 (2,804)
SELL IDR JPMorgan Chase Bank N.A. 599,346,000 15/02/2017 43,992 44,832 (840)
SELL IDR Merrill Lynch International 8,490,835,829 15/02/2017 633,644 635,126 (1,482)
SELL INR JPMorgan Chase Bank N.A. 21,654,000 20/03/2017 316,126 317,225 (1,099)
SELL KRW Barclays Bank PLC 404,198,000 2/02/2017 - 2/03/2017 344,143 347,869 (3,726)
SELL KRW JPMorgan Chase Bank N.A. 1,367,140,000 2/02/2017 - 2/03/2017 1,163,880 1,176,616 (12,736)
BUY MXN Brown Brothers Harriman 3,387,000 15/03/2017 164,845 161,466 (3,379)
BUY MXN Goldman Sachs International 5,518,000 10/03/2017 266,356 263,247 (3,109)
BUY MXN JPMorgan Chase Bank N.A. 38,602,289 10/03/2017 1,878,282 1,841,595 (36,687)
BUY MXN Morgan Stanley Capital Services, Inc. 246,000 10/03/2017 12,037 11,736 (301)
SELL MXN Brown Brothers Harriman 3,587,000 10/03/2017 165,727 171,125 (5,398)
SELL MXN Goldman Sachs International 955,000 10/03/2017 44,455 45,560 (1,105)
SELL MXN Morgan Stanley Capital Services, Inc. 2,236,000 10/03/2017 104,963 106,673 (1,710)
SELL MYR JPMorgan Chase Bank N.A. 108,000 6/02/2017 24,322 24,378 (56)
SELL PEN HSBC Bank 295,921 2/02/2017 85,999 90,468 (4,469)
SELL PEN JPMorgan Chase Bank N.A. 359,863 2/02/2017 109,614 110,016 (402)
SELL PEN Morgan Stanley Capital Services, Inc. 51,000 2/02/2017 14,928 15,592 (664)
BUY PHP JPMorgan Chase Bank N.A. 5,438,000 1/03/2017 109,340 109,187 (153)
SELL PLN Barclays Bank PLC 67,000 10/03/2017 16,430 16,720 (290)
SELL PLN Brown Brothers Harriman 98,000 10/03/2017 23,238 24,457 (1,219)
SELL PLN Morgan Stanley Capital Services, Inc. 210,000 10/03/2017 50,282 52,407 (2,125)
BUY RUB Credit Suisse Group 191,645,034 22/02/2017 3,212,520 3,170,481 (42,039)
SELL RUB Barclays Bank PLC 670,000 22/02/2017 10,937 11,084 (147)
SELL RUB Goldman Sachs International 10,125,000 22/02/2017 156,098 167,503 (11,405)
SELL RUB HSBC Bank 12,563,000 22/02/2017 200,341 207,836 (7,495)
SELL SGD Morgan Stanley Capital Services, Inc. 521,000 10/03/2017 - 24/04/2017 363,991 369,864 (5,873)
BUY TRY Barclays Bank PLC 2,577,655 10/03/2017 727,133 676,247 (50,886)
BUY TRY Citibank N.A. 1,932,680 10/03/2017 549,651 507,038 (42,613)
BUY TRY Goldman Sachs International 130,937 10/03/2017 35,965 34,351 (1,614)
BUY TRY Morgan Stanley Capital Services, Inc. 392,408 10/03/2017 109,815 102,948 (6,867)
SELL TRY Barclays Bank PLC 468,000 10/03/2017 119,419 122,780 (3,361)
SELL TWD JPMorgan Chase Bank N.A. 23,371,000 15/02/2017 736,325 745,793 (9,468)
SELL ZAR Barclays Bank PLC 602,000 10/03/2017 44,117 44,391 (274)
SELL ZAR JPMorgan Chase Bank N.A. 7,770,550 10/03/2017 565,192 572,994 (7,802)
SELL ZAR Morgan Stanley Capital Services, Inc. 1,031,000 10/03/2017 74,513 76,025 (1,512)
Total $(622,697)
Global Credit FundAppreciationBUY AUD Westpac Banking Corp. 64,743 10/03/2017 $48,179 $49,059 $880
BUY CAD Citibank N.A. 84,397 10/03/2017 63,331 64,882 1,551
BUY CAD Goldman Sachs International 32,169 10/03/2017 24,542 24,731 189
BUY CHF UBS AG 194,295 10/03/2017 193,410 196,728 3,318
BUY DKK Citibank N.A. 6,123 10/03/2017 889 890 1
BUY EUR Citibank N.A. 227,165 10/03/2017 243,240 245,587 2,347
BUY EUR Goldman Sachs International 466,507 10/03/2017 494,468 504,338 9,870
BUY EUR JPMorgan Chase Bank N.A. 203,829 10/03/2017 219,435 220,358 923
BUY EUR Morgan Stanley Capital Services, Inc. 518,762 10/03/2017 546,954 560,831 13,877
BUY GBP Citibank N.A. 24,490 10/03/2017 30,554 30,830 276
BUY GBP Goldman Sachs International 220,104 10/03/2017 272,034 277,093 5,059
190 MFS Meridian Funds Annual Report 2017

NOTES TO FINANCIAL STATEMENTS at 31 January 2017
Type Currency CounterpartyContracts to
Deliver/ReceiveSettlement Date
Range In Exchange ForContracts at
ValueNet Unrealized
Gain (Loss)
Global Credit Fund – (continued)Appreciation – (continued)SELL GBP Merrill Lynch International 129,744 10/03/2017 $164,806 $163,336 $1,470
BUY JPY Goldman Sachs International 24,051,144 10/03/2017 212,160 213,260 1,100
BUY KRW JPMorgan Chase Bank N.A. 17,661,000 16/03/2017 15,002 15,204 202
BUY NOK Citibank N.A. 111,727 10/03/2017 13,309 13,550 241
BUY NZD JPMorgan Chase Bank N.A. 52,380 10/03/2017 37,402 38,389 987
BUY SEK Citibank N.A. 108,782 10/03/2017 11,972 12,457 485
BUY SGD Barclays Bank PLC 21,641 10/03/2017 15,267 15,360 93
BUY ZAR JPMorgan Chase Bank N.A. 212,000 10/03/2017 15,420 15,633 213
Total $43,082
DepreciationSELL CAD Citibank N.A. 101,945 10/03/2017 $76,423 $78,373 $(1,950)
SELL CAD Merrill Lynch International 145,697 10/03/2017 109,953 112,008 (2,055)
SELL EUR Citibank N.A. 527,764 10/03/2017 562,897 570,563 (7,666)
SELL EUR Goldman Sachs International 500,073 10/03/2017 529,400 540,626 (11,226)
SELL EUR JPMorgan Chase Bank N.A. 66,000 10/03/2017 69,897 71,352 (1,455)
SELL GBP JPMorgan Chase Bank N.A. 35,000 10/03/2017 43,382 44,062 (680)
SELL GBP Morgan Stanley Capital Services, Inc. 99,560 10/03/2017 121,311 125,338 (4,027)
SELL JPY Citibank N.A. 4,068,000 10/03/2017 34,783 36,071 (1,288)
Total $(30,347)
Global High Yield FundAppreciationBUY EUR Citibank N.A. 540,640 10/03/2017 $576,319 $584,483 $8,164
BUY GBP Morgan Stanley Capital Services, Inc. 1,703,211 10/03/2017 2,119,835 2,144,200 24,365
SELL GBP Merrill Lynch International 6,414,906 10/03/2017 8,148,534 8,075,831 72,703
Total $105,232
DepreciationSELL CAD Merrill Lynch International 2,125,000 10/03/2017 $1,603,671 $1,633,645 $(29,974)
SELL EUR Citibank N.A. 72,744,743 10/03/2017 78,299,968 78,643,913 (343,945)
SELL EUR Morgan Stanley Capital Services, Inc. 955,000 10/03/2017 1,023,878 1,032,445 (8,567)
SELL GBP Barclays Bank PLC 1,706,446 10/03/2017 2,120,094 2,148,274 (28,180)
Total $(410,666)
Global Multi-Asset FundAppreciationBUY AUD JPMorgan Chase Bank N.A. 6,673,577 15/02/2017 $4,923,580 $5,059,651 $136,071
BUY CAD Citibank N.A. 50,638 10/03/2017 37,999 38,930 931
BUY CAD Goldman Sachs International 16,084 10/03/2017 12,271 12,365 94
BUY CAD JPMorgan Chase Bank N.A. 4,786,690 15/02/2017 - 10/03/2017 3,651,652 3,679,047 27,395
BUY CAD Merrill Lynch International 104,000 10/03/2017 79,803 79,953 150
BUY CHF Goldman Sachs International 440,500 15/02/2017 437,000 445,431 8,431
BUY CHF JPMorgan Chase Bank N.A. 618,281 15/02/2017 614,000 625,202 11,202
BUY CHF UBS AG 178,892 10/03/2017 178,078 181,133 3,055
BUY CNH JPMorgan Chase Bank N.A. 1,830,000 26/04/2017 262,893 264,905 2,012
SELL CNH JPMorgan Chase Bank N.A. 1,824,000 26/04/2017 273,853 264,036 9,817
BUY CZK Goldman Sachs International 807,000 10/03/2017 32,228 32,308 80
BUY DKK Goldman Sachs International 403,880 15/02/2017 58,000 58,659 659
BUY EUR Citibank N.A. 619,953 10/03/2017 664,330 670,228 5,898
BUY EUR Goldman Sachs International 525,383 10/03/2017 550,575 567,989 17,414
BUY EUR JPMorgan Chase Bank N.A. 72,307 10/03/2017 76,673 78,171 1,498
BUY EUR Merrill Lynch International 205,000 10/03/2017 218,299 221,624 3,325
BUY EUR Morgan Stanley Capital Services, Inc. 534,698 10/03/2017 561,357 578,058 16,701
MFS Meridian Funds Annual Report 2017 191

NOTES TO FINANCIAL STATEMENTS at 31 January 2017
Type Currency CounterpartyContracts to
Deliver/ReceiveSettlement Date
Range In Exchange ForContracts at
ValueNet Unrealized
Gain (Loss)
Global Multi-Asset Fund – (continued)Appreciation – (continued)BUY GBP Citibank N.A. 9,796 10/03/2017 $12,222 $12,332 $110
BUY GBP Goldman Sachs International 159,671 10/03/2017 195,527 201,012 5,485
BUY GBP JPMorgan Chase Bank N.A. 1,169,908 15/02/2017 1,443,000 1,472,056 29,056
SELL GBP JPMorgan Chase Bank N.A. 5,542,229 15/02/2017 6,980,388 6,973,601 6,787
SELL GBP Merrill Lynch International 53,306 10/03/2017 67,712 67,108 604
SELL HKD JPMorgan Chase Bank N.A. 8,268,897 15/02/2017 1,066,573 1,065,888 685
BUY IDR JPMorgan Chase Bank N.A. 1,284,511,857 15/02/2017 95,859 96,083 224
BUY ILS Goldman Sachs International 414,406 15/02/2017 - 10/03/2017 109,356 109,998 642
SELL INR JPMorgan Chase Bank N.A. 15,022,350 15/02/2017 221,474 221,035 439
BUY JPY Barclays Bank PLC 8,516,000 10/03/2017 72,546 75,511 2,965
BUY JPY Goldman Sachs International 207,133,175 10/03/2017 1,823,877 1,836,633 12,756
BUY JPY JPMorgan Chase Bank N.A. 253,817,300 15/02/2017 2,200,000 2,248,688 48,688
BUY JPY Merrill Lynch International 8,100,000 10/03/2017 69,003 71,822 2,819
BUY KRW JPMorgan Chase Bank N.A. 394,215,160 15/02/2017 - 16/03/2017 334,644 339,351 4,707
SELL MXN JPMorgan Chase Bank N.A. 3,424,239 15/02/2017 166,713 163,903 2,810
BUY MYR Citibank N.A. 392,000 6/02/2017 86,937 88,483 1,546
BUY NOK Barclays Bank PLC 301,000 10/03/2017 34,735 36,504 1,769
BUY NOK Citibank N.A. 2,074,106 10/03/2017 247,070 251,538 4,468
BUY NOK Goldman Sachs International 51,121,297 15/02/2017 6,054,787 6,198,591 143,804
BUY NZD Goldman Sachs International 786,326 15/02/2017 561,901 576,702 14,801
BUY NZD JPMorgan Chase Bank N.A. 47,761 10/03/2017 34,104 35,004 900
BUY PLN Citibank N.A. 227,685 10/03/2017 55,081 56,821 1,740
BUY SEK Citibank N.A. 2,181,393 10/03/2017 240,075 249,807 9,732
BUY SEK Goldman Sachs International 21,330,684 15/02/2017 2,370,000 2,439,936 69,936
BUY SGD Barclays Bank PLC 60,622 10/03/2017 42,767 43,028 261
BUY THB JPMorgan Chase Bank N.A. 2,902,505 23/03/2017 81,897 82,396 499
SELL TRY Citibank N.A. 3,000 10/03/2017 853 787 66
BUY TWD JPMorgan Chase Bank N.A. 2,278,570 15/02/2017 71,943 72,712 769
BUY ZAR JPMorgan Chase Bank N.A. 746,524 10/03/2017 54,299 55,048 749
Total $614,550
DepreciationSELL AUD Goldman Sachs International 14,000 10/03/2017 $10,346 $10,608 $(262)
SELL AUD JPMorgan Chase Bank N.A. 2,817,967 15/02/2017 2,109,000 2,136,474 (27,474)
SELL AUD Westpac Banking Corp. 560,664 10/03/2017 417,222 424,842 (7,620)
SELL BRL JPMorgan Chase Bank N.A. 535,619 15/02/2017 156,248 169,392 (13,144)
SELL CAD Citibank N.A. 52,679 10/03/2017 39,513 40,498 (985)
SELL CAD Goldman Sachs International 327,000 10/03/2017 245,488 251,389 (5,901)
SELL CAD JPMorgan Chase Bank N.A. 6,695,880 15/02/2017 - 10/03/2017 5,055,762 5,146,377 (90,615)
SELL CAD Merrill Lynch International 1,198,706 10/03/2017 904,626 921,535 (16,909)
SELL CHF JPMorgan Chase Bank N.A. 6,215,109 15/02/2017 6,146,161 6,284,680 (138,519)
SELL CLP JPMorgan Chase Bank N.A. 33,809,250 15/02/2017 51,622 52,081 (459)
SELL DKK Citibank N.A. 1,058,493 10/03/2017 153,765 153,899 (134)
SELL DKK Goldman Sachs International 1,731,017 15/02/2017 248,028 251,412 (3,384)
SELL EUR Brown Brothers Harriman 52,000 10/03/2017 54,657 56,217 (1,560)
SELL EUR Citibank N.A. 70,843 10/03/2017 75,057 76,588 (1,531)
SELL EUR Goldman Sachs International 12,496,172 15/02/2017 - 10/03/2017 13,316,077 13,496,077 (180,000)
SELL EUR JPMorgan Chase Bank N.A. 146,000 10/03/2017 153,220 157,840 (4,620)
SELL EUR Morgan Stanley Capital Services, Inc. 245,204 10/03/2017 256,213 265,089 (8,876)
BUY GBP JPMorgan Chase Bank N.A. 2,052,249 15/02/2017 2,608,000 2,582,276 (25,724)
SELL GBP Goldman Sachs International 9,000 10/03/2017 10,918 11,330 (412)
192 MFS Meridian Funds Annual Report 2017

NOTES TO FINANCIAL STATEMENTS at 31 January 2017
Type Currency CounterpartyContracts to
Deliver/ReceiveSettlement Date
Range In Exchange ForContracts at
ValueNet Unrealized
Gain (Loss)
Global Multi-Asset Fund – (continued)Depreciation – (continued)SELL GBP JPMorgan Chase Bank N.A. 221,000 10/03/2017 $273,297 $278,221 $(4,924)
BUY HKD Goldman Sachs International 420,412 15/02/2017 54,206 54,193 (13)
BUY HKD JPMorgan Chase Bank N.A. 581,388 15/02/2017 75,000 74,943 (57)
SELL IDR Barclays Bank PLC 689,867,000 15/02/2017 51,513 51,603 (90)
SELL IDR JPMorgan Chase Bank N.A. 1,081,350,000 14/02/2017 80,171 80,894 (723)
SELL IDR Merrill Lynch International 689,867,000 15/02/2017 51,483 51,603 (120)
SELL ILS Goldman Sachs International 418,003 15/02/2017 109,769 110,921 (1,152)
SELL JPY Brown Brothers Harriman 4,173,000 10/03/2017 36,991 37,002 (11)
SELL JPY Citibank N.A. 1,421,000 10/03/2017 12,150 12,600 (450)
SELL JPY Goldman Sachs International 871,000 10/03/2017 7,648 7,723 (75)
SELL JPY JPMorgan Chase Bank N.A. 450,540,372 15/02/2017 - 10/03/2017 3,952,578 3,991,617 (39,039)
SELL JPY Morgan Stanley Capital Services, Inc. 16,982,761 10/03/2017 144,783 150,585 (5,802)
SELL KRW JPMorgan Chase Bank N.A. 807,646,310 15/02/2017 694,361 695,104 (743)
BUY MXN JPMorgan Chase Bank N.A. 1,731,942 10/03/2017 84,317 82,626 (1,691)
SELL NOK Citibank N.A. 1,050,000 10/03/2017 123,233 127,339 (4,106)
SELL NOK Goldman Sachs International 9,118,467 15/02/2017 1,084,000 1,105,638 (21,638)
SELL NOK JPMorgan Chase Bank N.A. 588,000 10/03/2017 68,935 71,310 (2,375)
SELL NOK UBS AG 486,000 10/03/2017 57,054 58,940 (1,886)
SELL NZD Goldman Sachs International 3,991,672 15/02/2017 2,811,000 2,927,543 (116,543)
SELL PLN Goldman Sachs International 329,265 15/02/2017 78,536 82,200 (3,664)
SELL RUB JPMorgan Chase Bank N.A. 5,469,512 15/02/2017 86,408 90,634 (4,226)
SELL SEK Goldman Sachs International 21,019,821 15/02/2017 2,310,480 2,404,378 (93,898)
SELL SGD JPMorgan Chase Bank N.A. 344,206 15/02/2017 241,786 244,263 (2,477)
SELL THB JPMorgan Chase Bank N.A. 5,383,861 15/02/2017 150,880 152,888 (2,008)
SELL TWD Goldman Sachs International 11,644,980 15/02/2017 367,523 371,604 (4,081)
SELL ZAR JPMorgan Chase Bank N.A. 3,252,707 15/02/2017 235,409 240,848 (5,439)
Total $(845,360)
Global Opportunistic Bond FundAppreciationBUY CAD Citibank N.A. 49,645 10/03/2017 $37,254 $38,166 $912
BUY CAD JPMorgan Chase Bank N.A. 433,000 10/03/2017 330,693 332,879 2,186
BUY CAD Merrill Lynch International 167,000 10/03/2017 128,145 128,385 240
BUY CHF UBS AG 4,000 10/03/2017 3,982 4,050 68
BUY CNH JPMorgan Chase Bank N.A. 2,586,000 26/04/2017 371,498 374,341 2,843
SELL CNH JPMorgan Chase Bank N.A. 2,721,000 28/07/2017 - 20/10/2017 398,711 389,382 9,329
BUY EUR Citibank N.A. 12,000 10/03/2017 12,930 12,973 43
BUY EUR Citibank N.A. 247,165 10/03/2017 264,426 267,209 2,783
BUY EUR JPMorgan Chase Bank N.A. 137,972 10/03/2017 146,608 149,161 2,553
BUY EUR Merrill Lynch International 360,000 10/03/2017 383,354 389,194 5,840
BUY GBP Citibank N.A. 14,694 10/03/2017 18,332 18,498 166
SELL GBP Merrill Lynch International 1,086,361 10/03/2017 1,379,950 1,367,637 12,313
SELL HKD Brown Brothers Harriman 6,164,000 10/03/2017 795,185 794,766 419
BUY IDR JPMorgan Chase Bank N.A. 2,060,359,129 15/02/2017 153,758 154,118 360
BUY JPY Brown Brothers Harriman 3,658,000 10/03/2017 32,425 32,435 10
BUY JPY JPMorgan Chase Bank N.A. 6,924,000 10/03/2017 58,838 61,395 2,557
BUY NOK Citibank N.A. 3,222,865 10/03/2017 383,912 390,854 6,942
BUY SEK Citibank N.A. 3,715,000 10/03/2017 408,857 425,431 16,574
Total $66,138
MFS Meridian Funds Annual Report 2017 193

NOTES TO FINANCIAL STATEMENTS at 31 January 2017
Type Currency CounterpartyContracts to
Deliver/ReceiveSettlement Date
Range In Exchange ForContracts at
ValueNet Unrealized
Gain (Loss)
Global Opportunistic Bond Fund – (continued)DepreciationSELL AUD Westpac Banking Corp. 1,154,761 10/03/2017 $859,325 $875,017 $(15,692)
SELL CAD Citibank N.A. 46,826 10/03/2017 35,123 35,999 (876)
SELL CAD Goldman Sachs International 533,000 10/03/2017 400,137 409,757 (9,620)
SELL CAD Merrill Lynch International 3,093,521 10/03/2017 2,334,583 2,378,219 (43,636)
SELL EUR Brown Brothers Harriman 231,000 10/03/2017 245,577 249,733 (4,156)
SELL EUR Citibank N.A. 4,778,730 10/03/2017 5,142,729 5,166,257 (23,528)
SELL GBP JPMorgan Chase Bank N.A. 328,000 10/03/2017 405,869 412,925 (7,056)
BUY HKD Brown Brothers Harriman 6,214,000 10/03/2017 801,430 801,213 (217)
BUY HKD JPMorgan Chase Bank N.A. 9,225,000 10/03/2017 1,190,153 1,189,441 (712)
SELL IDR Barclays Bank PLC 1,046,021,000 15/02/2017 78,108 78,244 (136)
SELL IDR Merrill Lynch International 1,046,021,000 15/02/2017 78,061 78,244 (183)
SELL JPY Citibank N.A. 1,416,000 10/03/2017 12,107 12,555 (448)
SELL JPY Goldman Sachs International 377,918,975 10/03/2017 3,333,692 3,350,977 (17,285)
BUY MXN JPMorgan Chase Bank N.A. 18,496 10/03/2017 900 882 (18)
SELL NOK Citibank N.A. 1,598,000 10/03/2017 187,549 193,798 (6,249)
SELL NOK JPMorgan Chase Bank N.A. 893,000 10/03/2017 104,691 108,299 (3,608)
SELL NOK UBS AG 739,000 10/03/2017 86,755 89,622 (2,867)
SELL NZD JPMorgan Chase Bank N.A. 2,295 10/03/2017 1,639 1,682 (43)
Total $(136,330)
Global Total Return FundAppreciationBUY CAD Citibank N.A. 1,841,839 10/03/2017 $1,382,118 $1,415,958 $33,840
BUY CAD Goldman Sachs International 981,154 10/03/2017 748,515 754,286 5,771
BUY CAD JPMorgan Chase Bank N.A. 12,911,000 10/03/2017 9,847,360 9,925,646 78,286
BUY CAD Merrill Lynch International 4,695,000 10/03/2017 3,602,646 3,609,396 6,750
BUY CHF UBS AG 6,958,000 10/03/2017 6,926,312 7,045,131 118,819
BUY CNH JPMorgan Chase Bank N.A. 72,180,000 26/04/2017 10,369,200 10,448,548 79,348
SELL CNH JPMorgan Chase Bank N.A. 71,114,000 26/04/2017 10,676,976 10,294,237 382,739
BUY CZK Goldman Sachs International 26,196,000 10/03/2017 1,046,147 1,048,747 2,600
BUY EUR Citibank N.A. 16,832,529 10/03/2017 18,108,777 18,197,548 88,771
BUY EUR Goldman Sachs International 11,532,142 10/03/2017 12,202,920 12,467,331 264,411
BUY EUR JPMorgan Chase Bank N.A. 7,968,194 10/03/2017 8,517,040 8,614,368 97,328
BUY EUR Merrill Lynch International 8,400,000 10/03/2017 8,944,935 9,081,191 136,256
BUY EUR Morgan Stanley Capital Services, Inc. 18,153,212 10/03/2017 19,158,659 19,625,331 466,672
SELL EUR Barclays Bank PLC 1,046,000 10/03/2017 1,131,124 1,130,824 300
BUY GBP Citibank N.A. 904,583 10/03/2017 1,128,582 1,138,794 10,212
BUY GBP Goldman Sachs International 4,483,453 10/03/2017 5,550,298 5,644,293 93,995
SELL GBP Merrill Lynch International 3,125,284 10/03/2017 3,969,892 3,934,472 35,420
BUY ILS Goldman Sachs International 5,166,000 10/03/2017 1,364,532 1,371,646 7,114
BUY JPY Barclays Bank PLC 569,364,000 10/03/2017 4,890,712 5,048,505 157,793
BUY JPY Goldman Sachs International 9,372,828,552 10/03/2017 82,533,205 83,108,117 574,912
BUY JPY Merrill Lynch International 360,858,000 10/03/2017 3,074,117 3,199,699 125,582
BUY KRW Barclays Bank PLC 15,043,129,000 16/03/2017 12,871,677 12,949,899 78,222
BUY KRW JPMorgan Chase Bank N.A. 223,473,000 16/03/2017 189,818 192,377 2,559
BUY MYR Citibank N.A. 6,269,233 6/02/2017 1,390,382 1,415,104 24,722
BUY NOK Citibank N.A. 107,424,097 10/03/2017 12,796,505 13,027,897 231,392
BUY NZD JPMorgan Chase Bank N.A. 2,107,048 10/03/2017 1,504,547 1,544,239 39,692
BUY PLN Citibank N.A. 8,295,955 10/03/2017 2,006,957 2,070,331 63,374
BUY SEK Citibank N.A. 138,578,462 10/03/2017 15,251,363 15,869,631 618,268
BUY SGD Barclays Bank PLC 1,853,000 10/03/2017 1,307,235 1,315,213 7,978
BUY THB JPMorgan Chase Bank N.A. 111,088,730 23/03/2017 3,134,470 3,153,566 19,096
194 MFS Meridian Funds Annual Report 2017

NOTES TO FINANCIAL STATEMENTS at 31 January 2017
Type Currency CounterpartyContracts to
Deliver/ReceiveSettlement Date
Range In Exchange ForContracts at
ValueNet Unrealized
Gain (Loss)
Global Total Return Fund – (continued)Appreciation – (continued)SELL TRY Citibank N.A. 76,000 10/03/2017 $21,615 $19,939 $1,676
BUY ZAR JPMorgan Chase Bank N.A. 28,677,032 10/03/2017 2,085,830 2,114,623 28,793
Total $3,882,691
DepreciationSELL AUD Westpac Banking Corp. 16,509,181 10/03/2017 $12,285,439 $12,509,793 $(224,354)
SELL CAD Citibank N.A. 2,058,207 10/03/2017 1,543,302 1,582,297 (38,995)
SELL CAD Goldman Sachs International 19,386,674 10/03/2017 14,574,316 14,903,978 (329,662)
SELL CAD Merrill Lynch International 48,599,083 10/03/2017 36,676,200 37,361,728 (685,528)
SELL DKK Citibank N.A. 15,411,630 10/03/2017 2,238,810 2,240,772 (1,962)
SELL EUR Brown Brothers Harriman 3,206,533 10/03/2017 3,392,060 3,466,564 (74,504)
SELL EUR Citibank N.A. 3,301,847 10/03/2017 3,491,624 3,569,607 (77,984)
SELL EUR Goldman Sachs International 2,265,623 10/03/2017 2,407,844 2,449,352 (41,508)
SELL EUR HSBC Bank 2,508,000 10/03/2017 2,628,534 2,711,384 (82,850)
SELL EUR JPMorgan Chase Bank N.A. 99,751 10/03/2017 104,853 107,840 (2,987)
SELL EUR Morgan Stanley Capital Services, Inc. 14,898,940 10/03/2017 15,655,733 16,107,157 (451,424)
SELL GBP JPMorgan Chase Bank N.A. 9,531,000 10/03/2017 11,794,417 11,998,734 (204,317)
SELL GBP Morgan Stanley Capital Services, Inc. 1,493,400 10/03/2017 1,819,667 1,880,066 (60,399)
SELL JPY Brown Brothers Harriman 190,937,000 10/03/2017 1,692,515 1,693,023 (508)
SELL JPY Citibank N.A. 64,599,000 10/03/2017 552,343 572,794 (20,451)
SELL JPY JPMorgan Chase Bank N.A. 757,427,000 10/03/2017 6,445,696 6,716,044 (270,348)
SELL JPY Morgan Stanley Capital Services, Inc. 742,389,283 10/03/2017 6,329,083 6,582,706 (253,623)
BUY MXN JPMorgan Chase Bank N.A. 55,389,791 10/03/2017 2,696,560 2,642,474 (54,086)
SELL NOK Citibank N.A. 47,263,000 10/03/2017 5,547,020 5,731,838 (184,818)
SELL NOK JPMorgan Chase Bank N.A. 26,391,000 10/03/2017 3,093,963 3,200,578 (106,615)
SELL NOK UBS AG 21,883,000 10/03/2017 2,568,970 2,653,869 (84,899)
Total $ (3,251,822)
Prudent Capital FundDepreciationSELL EUR Citibank N.A. 99,625 10/03/2017 $107,233 $107,704 $(471)
Prudent Wealth FundAppreciationSELL JPY Goldman Sachs International 9,232,965,000 27/03/2017 - 15/05/2017 $90,527,296 $82,035,854 $8,491,442
DepreciationBUY JPY Goldman Sachs International 4,515,267,000 27/03/2017 $43,329,661 $40,072,157 $(3,257,504)
U.K. Equity FundAppreciationBUY CHF JPMorgan Chase Bank N.A. 175,000 21/02/2017 £140,378 £140,664 £286
BUY EUR JPMorgan Chase Bank N.A. 240,000 21/02/2017 205,731 206,021 290
BUY EUR Barclays Bank PLC 270,000 21/02/2017 231,487 231,774 287
Total £863
DepreciationSELL CHF JPMorgan Chase Bank N.A. 1,078,641 21/02/2017 £865,244 £867,008 £(1,764)
SELL EUR JPMorgan Chase Bank N.A. 1,163,083 21/02/2017 997,011 998,416 (1,405)
Total £(3,169)
MFS Meridian Funds Annual Report 2017 195

NOTES TO FINANCIAL STATEMENTS at 31 January 2017
Note 11: Class Specific Open Forward Foreign Currency Exchange Contracts
At 31 January 2017, the sub-funds had outstanding the following class specific forward foreign currency exchange contracts. Each sub-fund had sufficientcash and/or other securities to cover any commitments under these derivative contracts.
Type Currency Counterparty ClassContracts to
Deliver/ReceiveSettlementDate Range In Exchange For
Contracts atValue
NetUnrealizedGain (Loss)
Absolute Return FundAppreciationBUY EUR Citibank N.A. AH1 (EUR) 44,083 10/03/2017 $47,450 $47,658 $208
BUY EUR Citibank N.A. IH1 (EUR) 45,463 10/03/2017 48,935 49,150 215
Total $423
Blended Research European Equity FundDepreciationBUY GBP Goldman Sachs International WH1 (GBP) 33,490 10/03/2017 €39,518 €38,998 €(520)
BUY GBP Merrill Lynch International WH1 (GBP) 1,837 10/03/2017 2,175 2,140 (35)
BUY USD Barclays Bank PLC CH1 (USD) 3,203 10/03/2017 2,969 2,963 (6)
BUY USD Barclays Bank PLC NH1 (USD) 3,258 10/03/2017 3,020 3,014 (6)
BUY USD Goldman Sachs International AH1 (USD) 55,627 10/03/2017 51,684 51,454 (230)
BUY USD Goldman Sachs International CH1 (USD) 52,795 10/03/2017 49,053 48,835 (218)
BUY USD Goldman Sachs International IH1 (USD) 55,850 10/03/2017 51,891 51,660 (231)
BUY USD Goldman Sachs International NH1 (USD) 52,800 10/03/2017 49,057 48,839 (218)
BUY USD Goldman Sachs International WH1 (USD) 55,815 10/03/2017 51,859 51,629 (230)
BUY USD Merrill Lynch International AH1 (USD) 2,944 10/03/2017 2,810 2,723 (87)
BUY USD Merrill Lynch International IH1 (USD) 2,992 10/03/2017 2,855 2,767 (88)
BUY USD Merrill Lynch International WH1 (USD) 2,984 10/03/2017 2,848 2,760 (88)
BUY USD Morgan Stanley Capital Services, Inc. CH1 (USD) 3,233 10/03/2017 3,090 2,991 (99)
BUY USD Morgan Stanley Capital Services, Inc. NH1 (USD) 3,248 10/03/2017 3,104 3,004 (100)
Total €(2,156)
Continental European Equity FundAppreciationBUY GBP Goldman Sachs International WH1 (GBP) 22,682 10/03/2017 €26,356 €26,413 €57
SELL GBP Goldman Sachs International WH1 (GBP) 104,121 10/03/2017 121,470 121,247 223
€280
DepreciationBUY GBP Goldman Sachs International IH1 (GBP) 32,816 10/03/2017 €38,724 €38,214 €(510)
BUY GBP Morgan Stanley Capital Services, Inc. IH1 (GBP) 1,782 10/03/2017 2,092 2,075 (17)
BUY GBP Goldman Sachs International WH1 (GBP) 124,528 10/03/2017 146,946 145,011 (1,935)
BUY GBP Goldman Sachs International WH1 (GBP) 100,000 10/03/2017 117,180 116,448 (731)
BUY GBP Barclays Bank PLC WH1 (GBP) 12,273 10/03/2017 14,583 14,292 (291)
Total €(3,484)
Diversified Income FundAppreciationBUY EUR Barclays Bank PLC AH3 (EUR) 5,000 10/03/2017 $5,304 $5,405 $101
BUY EUR Barclays Bank PLC AH3 (EUR) 5,000 10/03/2017 5,357 5,405 48
BUY EUR Barclays Bank PLC AH3 (EUR) 17,820 10/03/2017 19,038 19,265 227
BUY EUR Citibank N.A. AH2 (EUR) 489,167 10/03/2017 526,523 528,836 2,313
BUY EUR Citibank N.A. AH3 (EUR) 153,806 10/03/2017 165,552 166,279 727
BUY EUR Citibank N.A. IH1 (EUR) 48,825 10/03/2017 52,674 52,784 110
BUY EUR Citibank N.A. IH1 (EUR) 2,010,434 10/03/2017 2,163,962 2,173,468 9,506
BUY EUR Citibank N.A. WH1 (EUR) 49,821 10/03/2017 53,749 53,861 112
BUY EUR Citibank N.A. WH1 (EUR) 49,824 10/03/2017 53,752 53,864 112
BUY EUR Citibank N.A. WH3 (EUR) 49,824 10/03/2017 53,752 53,864 112
BUY EUR Goldman Sachs International AH2 (EUR) 29,990 10/03/2017 32,318 32,422 104
196 MFS Meridian Funds Annual Report 2017

NOTES TO FINANCIAL STATEMENTS at 31 January 2017
Type Currency Counterparty ClassContracts to
Deliver/ReceiveSettlementDate Range In Exchange For
Contracts atValue
NetUnrealizedGain (Loss)
Diversified Income Fund – (continued)Appreciation – (continued)BUY EUR Goldman Sachs International AH2 (EUR) 30,000 10/03/2017 $31,999 $32,433 $434
BUY EUR Goldman Sachs International AH3 (EUR) 4,000 10/03/2017 4,220 4,324 104
BUY EUR Goldman Sachs International AH3 (EUR) 5,000 10/03/2017 5,214 5,405 191
BUY EUR Goldman Sachs International AH3 (EUR) 12,011 10/03/2017 12,756 12,985 229
BUY EUR Goldman Sachs International AH3 (EUR) 40,000 10/03/2017 42,982 43,244 262
BUY EUR Goldman Sachs International AH4 (EUR) 47,100 10/03/2017 49,693 50,920 1,227
BUY EUR Goldman Sachs International IH1 (EUR) 5,000 10/03/2017 5,345 5,405 60
BUY EUR JPMorgan Chase Bank N.A. AH3 (EUR) 10,000 10/03/2017 10,670 10,811 141
BUY EUR JPMorgan Chase Bank N.A. IH1 (EUR) 20,000 10/03/2017 21,313 21,622 309
Total $16,429
DepreciationSELL EUR Goldman Sachs International IH1 (EUR) 965 10/03/2017 $1,013 $1,044 $(31)
SELL EUR Goldman Sachs International IH1 (EUR) 7,200 10/03/2017 7,590 7,784 (194)
BUY EUR Goldman Sachs International AH2 (EUR) 5,000 10/03/2017 5,418 5,405 (13)
SELL EUR JPMorgan Chase Bank N.A. IH1 (EUR) 62,160 10/03/2017 65,986 67,201 (1,215)
BUY GBP Merrill Lynch International WH2 (GBP) 35,869 10/03/2017 45,563 45,156 (407)
BUY GBP Merrill Lynch International WH1 (GBP) 35,858 10/03/2017 45,549 45,142 (407)
BUY GBP Merrill Lynch International IH1 (GBP) 35,961 10/03/2017 45,679 45,272 (407)
BUY GBP Merrill Lynch International WH3 (GBP) 33,943 10/03/2017 43,116 42,732 (384)
Total $(3,058)
Emerging Markets Debt FundAppreciationBUY CHF UBS AG AH1 (CHF) 1,604,320 10/03/2017 $1,597,014 $1,624,410 $27,396
BUY CHF Goldman Sachs International AH1 (CHF) 47,856 10/03/2017 47,703 48,455 752
BUY CHF JPMorgan Chase Bank N.A. AH1 (CHF) 11,964 10/03/2017 12,038 12,114 76
BUY CHF UBS AG IH1 (CHF) 2,869,073 10/03/2017 2,856,006 2,905,000 48,994
BUY CHF Goldman Sachs International IH1 (CHF) 1,400,000 10/03/2017 1,370,278 1,417,531 47,253
BUY CHF UBS AG WH1 (CHF) 51,406 10/03/2017 51,171 52,049 878
BUY EUR Goldman Sachs International AH1 (EUR) 3,210,643 10/03/2017 3,348,341 3,471,007 122,666
BUY EUR JPMorgan Chase Bank N.A. AH1 (EUR) 2,767,194 10/03/2017 2,928,513 2,991,597 63,084
BUY EUR Goldman Sachs International AH1 (EUR) 1,796,616 10/03/2017 1,932,455 1,942,311 9,856
BUY EUR JPMorgan Chase Bank N.A. AH1 (EUR) 354,770 10/03/2017 375,161 383,540 8,379
BUY EUR Goldman Sachs International AH1 (EUR) 255,956 10/03/2017 268,471 276,713 8,242
BUY EUR Goldman Sachs International AH1 (EUR) 1,075,054 10/03/2017 1,155,590 1,162,234 6,644
BUY EUR Goldman Sachs International AH1 (EUR) 142,066 10/03/2017 148,974 153,587 4,613
BUY EUR Morgan Stanley Capital Services, Inc. AH1 (EUR) 118,470 10/03/2017 124,326 128,077 3,751
BUY EUR JPMorgan Chase Bank N.A. AH1 (EUR) 199,773 10/03/2017 212,362 215,973 3,611
BUY EUR Goldman Sachs International AH1 (EUR) 128,452 10/03/2017 135,402 138,868 3,466
BUY EUR JPMorgan Chase Bank N.A. AH1 (EUR) 337,225 10/03/2017 361,356 364,572 3,216
BUY EUR HSBC Bank AH1 (EUR) 98,857 10/03/2017 103,805 106,874 3,069
BUY EUR Barclays Bank PLC AH1 (EUR) 135,459 10/03/2017 143,683 146,444 2,761
BUY EUR Goldman Sachs International AH1 (EUR) 57,842 10/03/2017 60,631 62,533 1,902
BUY EUR Goldman Sachs International AH1 (EUR) 47,688 10/03/2017 50,113 51,556 1,443
BUY EUR Goldman Sachs International AH1 (EUR) 100,589 10/03/2017 107,526 108,746 1,220
BUY EUR JPMorgan Chase Bank N.A. AH1 (EUR) 49,475 10/03/2017 52,792 53,490 698
BUY EUR JPMorgan Chase Bank N.A. AH1 (EUR) 39,387 10/03/2017 41,973 42,581 608
BUY EUR Goldman Sachs International AH1 (EUR) 41,475 10/03/2017 44,239 44,839 600
BUY EUR Barclays Bank PLC AH1 (EUR) 12,585 10/03/2017 13,242 13,606 364
BUY EUR Morgan Stanley Capital Services, Inc. AH1 (EUR) 8,566 10/03/2017 8,934 9,261 327
MFS Meridian Funds Annual Report 2017 197
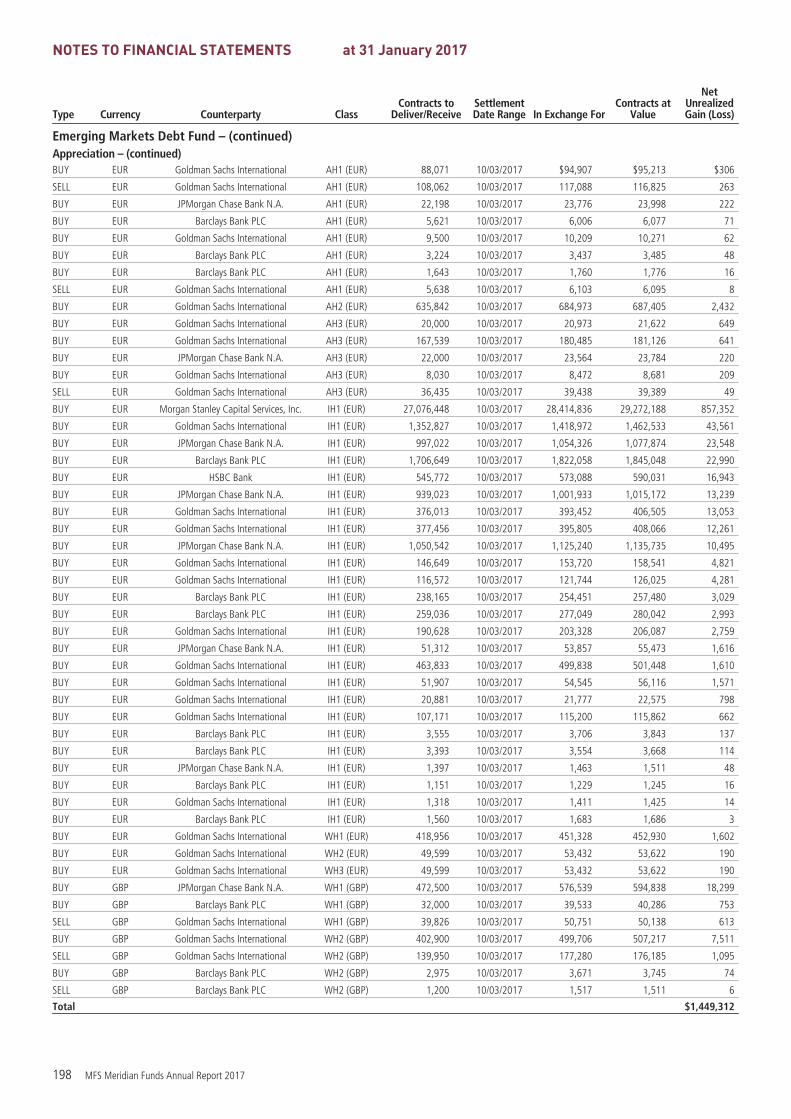
NOTES TO FINANCIAL STATEMENTS at 31 January 2017
Type Currency Counterparty ClassContracts to
Deliver/ReceiveSettlementDate Range In Exchange For
Contracts atValue
NetUnrealizedGain (Loss)
Emerging Markets Debt Fund – (continued)Appreciation – (continued)BUY EUR Goldman Sachs International AH1 (EUR) 88,071 10/03/2017 $94,907 $95,213 $306
SELL EUR Goldman Sachs International AH1 (EUR) 108,062 10/03/2017 117,088 116,825 263
BUY EUR JPMorgan Chase Bank N.A. AH1 (EUR) 22,198 10/03/2017 23,776 23,998 222
BUY EUR Barclays Bank PLC AH1 (EUR) 5,621 10/03/2017 6,006 6,077 71
BUY EUR Goldman Sachs International AH1 (EUR) 9,500 10/03/2017 10,209 10,271 62
BUY EUR Barclays Bank PLC AH1 (EUR) 3,224 10/03/2017 3,437 3,485 48
BUY EUR Barclays Bank PLC AH1 (EUR) 1,643 10/03/2017 1,760 1,776 16
SELL EUR Goldman Sachs International AH1 (EUR) 5,638 10/03/2017 6,103 6,095 8
BUY EUR Goldman Sachs International AH2 (EUR) 635,842 10/03/2017 684,973 687,405 2,432
BUY EUR Goldman Sachs International AH3 (EUR) 20,000 10/03/2017 20,973 21,622 649
BUY EUR Goldman Sachs International AH3 (EUR) 167,539 10/03/2017 180,485 181,126 641
BUY EUR JPMorgan Chase Bank N.A. AH3 (EUR) 22,000 10/03/2017 23,564 23,784 220
BUY EUR Goldman Sachs International AH3 (EUR) 8,030 10/03/2017 8,472 8,681 209
SELL EUR Goldman Sachs International AH3 (EUR) 36,435 10/03/2017 39,438 39,389 49
BUY EUR Morgan Stanley Capital Services, Inc. IH1 (EUR) 27,076,448 10/03/2017 28,414,836 29,272,188 857,352
BUY EUR Goldman Sachs International IH1 (EUR) 1,352,827 10/03/2017 1,418,972 1,462,533 43,561
BUY EUR JPMorgan Chase Bank N.A. IH1 (EUR) 997,022 10/03/2017 1,054,326 1,077,874 23,548
BUY EUR Barclays Bank PLC IH1 (EUR) 1,706,649 10/03/2017 1,822,058 1,845,048 22,990
BUY EUR HSBC Bank IH1 (EUR) 545,772 10/03/2017 573,088 590,031 16,943
BUY EUR JPMorgan Chase Bank N.A. IH1 (EUR) 939,023 10/03/2017 1,001,933 1,015,172 13,239
BUY EUR Goldman Sachs International IH1 (EUR) 376,013 10/03/2017 393,452 406,505 13,053
BUY EUR Goldman Sachs International IH1 (EUR) 377,456 10/03/2017 395,805 408,066 12,261
BUY EUR JPMorgan Chase Bank N.A. IH1 (EUR) 1,050,542 10/03/2017 1,125,240 1,135,735 10,495
BUY EUR Goldman Sachs International IH1 (EUR) 146,649 10/03/2017 153,720 158,541 4,821
BUY EUR Goldman Sachs International IH1 (EUR) 116,572 10/03/2017 121,744 126,025 4,281
BUY EUR Barclays Bank PLC IH1 (EUR) 238,165 10/03/2017 254,451 257,480 3,029
BUY EUR Barclays Bank PLC IH1 (EUR) 259,036 10/03/2017 277,049 280,042 2,993
BUY EUR Goldman Sachs International IH1 (EUR) 190,628 10/03/2017 203,328 206,087 2,759
BUY EUR JPMorgan Chase Bank N.A. IH1 (EUR) 51,312 10/03/2017 53,857 55,473 1,616
BUY EUR Goldman Sachs International IH1 (EUR) 463,833 10/03/2017 499,838 501,448 1,610
BUY EUR Goldman Sachs International IH1 (EUR) 51,907 10/03/2017 54,545 56,116 1,571
BUY EUR Goldman Sachs International IH1 (EUR) 20,881 10/03/2017 21,777 22,575 798
BUY EUR Goldman Sachs International IH1 (EUR) 107,171 10/03/2017 115,200 115,862 662
BUY EUR Barclays Bank PLC IH1 (EUR) 3,555 10/03/2017 3,706 3,843 137
BUY EUR Barclays Bank PLC IH1 (EUR) 3,393 10/03/2017 3,554 3,668 114
BUY EUR JPMorgan Chase Bank N.A. IH1 (EUR) 1,397 10/03/2017 1,463 1,511 48
BUY EUR Barclays Bank PLC IH1 (EUR) 1,151 10/03/2017 1,229 1,245 16
BUY EUR Goldman Sachs International IH1 (EUR) 1,318 10/03/2017 1,411 1,425 14
BUY EUR Barclays Bank PLC IH1 (EUR) 1,560 10/03/2017 1,683 1,686 3
BUY EUR Goldman Sachs International WH1 (EUR) 418,956 10/03/2017 451,328 452,930 1,602
BUY EUR Goldman Sachs International WH2 (EUR) 49,599 10/03/2017 53,432 53,622 190
BUY EUR Goldman Sachs International WH3 (EUR) 49,599 10/03/2017 53,432 53,622 190
BUY GBP JPMorgan Chase Bank N.A. WH1 (GBP) 472,500 10/03/2017 576,539 594,838 18,299
BUY GBP Barclays Bank PLC WH1 (GBP) 32,000 10/03/2017 39,533 40,286 753
SELL GBP Goldman Sachs International WH1 (GBP) 39,826 10/03/2017 50,751 50,138 613
BUY GBP Goldman Sachs International WH2 (GBP) 402,900 10/03/2017 499,706 507,217 7,511
SELL GBP Goldman Sachs International WH2 (GBP) 139,950 10/03/2017 177,280 176,185 1,095
BUY GBP Barclays Bank PLC WH2 (GBP) 2,975 10/03/2017 3,671 3,745 74
SELL GBP Barclays Bank PLC WH2 (GBP) 1,200 10/03/2017 1,517 1,511 6
Total $1,449,312
198 MFS Meridian Funds Annual Report 2017
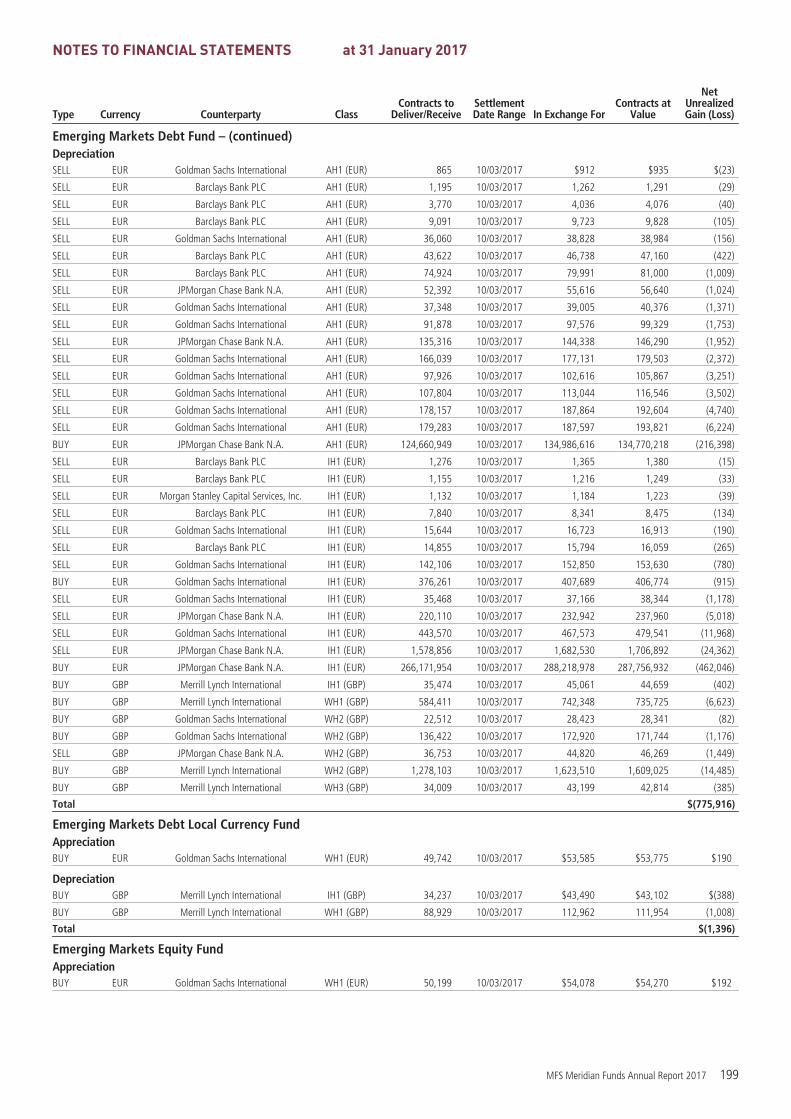
NOTES TO FINANCIAL STATEMENTS at 31 January 2017
Type Currency Counterparty ClassContracts to
Deliver/ReceiveSettlementDate Range In Exchange For
Contracts atValue
NetUnrealizedGain (Loss)
Emerging Markets Debt Fund – (continued)DepreciationSELL EUR Goldman Sachs International AH1 (EUR) 865 10/03/2017 $912 $935 $(23)
SELL EUR Barclays Bank PLC AH1 (EUR) 1,195 10/03/2017 1,262 1,291 (29)
SELL EUR Barclays Bank PLC AH1 (EUR) 3,770 10/03/2017 4,036 4,076 (40)
SELL EUR Barclays Bank PLC AH1 (EUR) 9,091 10/03/2017 9,723 9,828 (105)
SELL EUR Goldman Sachs International AH1 (EUR) 36,060 10/03/2017 38,828 38,984 (156)
SELL EUR Barclays Bank PLC AH1 (EUR) 43,622 10/03/2017 46,738 47,160 (422)
SELL EUR Barclays Bank PLC AH1 (EUR) 74,924 10/03/2017 79,991 81,000 (1,009)
SELL EUR JPMorgan Chase Bank N.A. AH1 (EUR) 52,392 10/03/2017 55,616 56,640 (1,024)
SELL EUR Goldman Sachs International AH1 (EUR) 37,348 10/03/2017 39,005 40,376 (1,371)
SELL EUR Goldman Sachs International AH1 (EUR) 91,878 10/03/2017 97,576 99,329 (1,753)
SELL EUR JPMorgan Chase Bank N.A. AH1 (EUR) 135,316 10/03/2017 144,338 146,290 (1,952)
SELL EUR Goldman Sachs International AH1 (EUR) 166,039 10/03/2017 177,131 179,503 (2,372)
SELL EUR Goldman Sachs International AH1 (EUR) 97,926 10/03/2017 102,616 105,867 (3,251)
SELL EUR Goldman Sachs International AH1 (EUR) 107,804 10/03/2017 113,044 116,546 (3,502)
SELL EUR Goldman Sachs International AH1 (EUR) 178,157 10/03/2017 187,864 192,604 (4,740)
SELL EUR Goldman Sachs International AH1 (EUR) 179,283 10/03/2017 187,597 193,821 (6,224)
BUY EUR JPMorgan Chase Bank N.A. AH1 (EUR) 124,660,949 10/03/2017 134,986,616 134,770,218 (216,398)
SELL EUR Barclays Bank PLC IH1 (EUR) 1,276 10/03/2017 1,365 1,380 (15)
SELL EUR Barclays Bank PLC IH1 (EUR) 1,155 10/03/2017 1,216 1,249 (33)
SELL EUR Morgan Stanley Capital Services, Inc. IH1 (EUR) 1,132 10/03/2017 1,184 1,223 (39)
SELL EUR Barclays Bank PLC IH1 (EUR) 7,840 10/03/2017 8,341 8,475 (134)
SELL EUR Goldman Sachs International IH1 (EUR) 15,644 10/03/2017 16,723 16,913 (190)
SELL EUR Barclays Bank PLC IH1 (EUR) 14,855 10/03/2017 15,794 16,059 (265)
SELL EUR Goldman Sachs International IH1 (EUR) 142,106 10/03/2017 152,850 153,630 (780)
BUY EUR Goldman Sachs International IH1 (EUR) 376,261 10/03/2017 407,689 406,774 (915)
SELL EUR Goldman Sachs International IH1 (EUR) 35,468 10/03/2017 37,166 38,344 (1,178)
SELL EUR JPMorgan Chase Bank N.A. IH1 (EUR) 220,110 10/03/2017 232,942 237,960 (5,018)
SELL EUR Goldman Sachs International IH1 (EUR) 443,570 10/03/2017 467,573 479,541 (11,968)
SELL EUR JPMorgan Chase Bank N.A. IH1 (EUR) 1,578,856 10/03/2017 1,682,530 1,706,892 (24,362)
BUY EUR JPMorgan Chase Bank N.A. IH1 (EUR) 266,171,954 10/03/2017 288,218,978 287,756,932 (462,046)
BUY GBP Merrill Lynch International IH1 (GBP) 35,474 10/03/2017 45,061 44,659 (402)
BUY GBP Merrill Lynch International WH1 (GBP) 584,411 10/03/2017 742,348 735,725 (6,623)
BUY GBP Goldman Sachs International WH2 (GBP) 22,512 10/03/2017 28,423 28,341 (82)
BUY GBP Goldman Sachs International WH2 (GBP) 136,422 10/03/2017 172,920 171,744 (1,176)
SELL GBP JPMorgan Chase Bank N.A. WH2 (GBP) 36,753 10/03/2017 44,820 46,269 (1,449)
BUY GBP Merrill Lynch International WH2 (GBP) 1,278,103 10/03/2017 1,623,510 1,609,025 (14,485)
BUY GBP Merrill Lynch International WH3 (GBP) 34,009 10/03/2017 43,199 42,814 (385)
Total $(775,916)
Emerging Markets Debt Local Currency FundAppreciationBUY EUR Goldman Sachs International WH1 (EUR) 49,742 10/03/2017 $53,585 $53,775 $190
DepreciationBUY GBP Merrill Lynch International IH1 (GBP) 34,237 10/03/2017 $43,490 $43,102 $(388)
BUY GBP Merrill Lynch International WH1 (GBP) 88,929 10/03/2017 112,962 111,954 (1,008)
Total $(1,396)
Emerging Markets Equity FundAppreciationBUY EUR Goldman Sachs International WH1 (EUR) 50,199 10/03/2017 $54,078 $54,270 $192
MFS Meridian Funds Annual Report 2017 199

NOTES TO FINANCIAL STATEMENTS at 31 January 2017
Type Currency Counterparty ClassContracts to
Deliver/ReceiveSettlementDate Range In Exchange For
Contracts atValue
NetUnrealizedGain (Loss)
Emerging Markets Equity Fund – (continued)DepreciationBUY GBP Merrill Lynch International IH1 (GBP) 35,409 10/03/2017 $44,978 $44,576 $(402)
BUY GBP BNP Paribas S.A. IH1 (GBP) 1,937 10/03/2017 2,440 2,439 (1)
BUY GBP Merrill Lynch International WH1 (GBP) 37,154 10/03/2017 47,195 46,774 (421)
BUY GBP BNP Paribas S.A. WH1 (GBP) 2,015 10/03/2017 2,538 2,537 (1)
Total $(825)
European Core Equity FundAppreciationBUY GBP Barclays Bank PLC WH1 (GBP) 2,287 10/03/2017 €2,640 €2,663 €23
DepreciationBUY GBP Goldman Sachs International WH1 (GBP) 39,837 10/03/2017 €47,009 €46,390 €(619)
BUY USD Goldman Sachs International CH1 (USD) 822,847 10/03/2017 764,521 761,124 (3,397)
BUY USD Barclays Bank PLC CH1 (USD) 45,676 10/03/2017 42,600 42,250 (350)
BUY USD Barclays Bank PLC NH1 (USD) 20,091 10/03/2017 18,770 18,584 (186)
BUY USD Goldman Sachs International NH1 (USD) 365,648 10/03/2017 339,729 338,219 (1,510)
BUY USD JPMorgan Chase Bank N.A. NH1 (USD) 10,600 10/03/2017 10,024 9,805 (219)
Total €(6,281)
European Research FundAppreciationBUY CHF Morgan Stanley Capital Services, Inc. AH1 (CHF) 337,798 10/03/2017 €312,753 €316,372 €3,619
BUY CHF Goldman Sachs International AH1 (CHF) 18,482 10/03/2017 17,212 17,310 98
BUY CHF Morgan Stanley Capital Services, Inc. IH1 (CHF) 47,302 10/03/2017 43,795 44,301 506
BUY CHF Morgan Stanley Capital Services, Inc. WH1 (CHF) 48,440 10/03/2017 44,848 45,367 519
BUY CHF Goldman Sachs International WH1 (CHF) 2,707 10/03/2017 2,521 2,535 14
SELL GBP Goldman Sachs International WH1 (GBP) 46,010 10/03/2017 54,705 53,578 1,127
SELL GBP Goldman Sachs International WH1 (GBP) 741 10/03/2017 884 863 21
BUY USD JPMorgan Chase Bank N.A. AH1 (USD) 82,866,173 10/03/2017 76,527,408 76,650,240 122,832
SELL USD Barclays Bank PLC AH1 (USD) 1,548,898 10/03/2017 1,460,242 1,432,712 27,530
SELL USD Goldman Sachs International AH1 (USD) 524,075 10/03/2017 499,773 484,763 15,010
SELL USD Goldman Sachs International AH1 (USD) 412,285 10/03/2017 394,768 381,359 13,409
SELL USD Goldman Sachs International AH1 (USD) 299,789 10/03/2017 285,815 277,302 8,513
SELL USD Goldman Sachs International AH1 (USD) 285,474 10/03/2017 270,579 264,060 6,519
SELL USD Barclays Bank PLC AH1 (USD) 232,873 10/03/2017 221,328 215,405 5,923
SELL USD Goldman Sachs International AH1 (USD) 141,268 10/03/2017 135,459 130,672 4,787
SELL USD Goldman Sachs International AH1 (USD) 888,290 10/03/2017 826,382 821,657 4,725
SELL USD Barclays Bank PLC AH1 (USD) 121,907 10/03/2017 116,357 112,763 3,594
SELL USD Goldman Sachs International AH1 (USD) 286,734 10/03/2017 268,777 265,225 3,552
SELL USD JPMorgan Chase Bank N.A. AH1 (USD) 256,282 10/03/2017 240,490 237,057 3,433
SELL USD JPMorgan Chase Bank N.A. AH1 (USD) 157,251 10/03/2017 148,704 145,456 3,248
SELL USD Goldman Sachs International AH1 (USD) 103,252 10/03/2017 98,503 95,507 2,996
SELL USD JPMorgan Chase Bank N.A. AH1 (USD) 187,120 10/03/2017 175,371 173,084 2,287
SELL USD Goldman Sachs International AH1 (USD) 90,048 10/03/2017 84,790 83,293 1,497
SELL USD JPMorgan Chase Bank N.A. AH1 (USD) 49,494 10/03/2017 47,155 45,781 1,374
SELL USD Barclays Bank PLC AH1 (USD) 146,907 10/03/2017 137,114 135,887 1,227
SELL USD JPMorgan Chase Bank N.A. AH1 (USD) 90,336 10/03/2017 84,690 83,560 1,130
SELL USD Morgan Stanley Capital Services, Inc. AH1 (USD) 28,994 10/03/2017 27,778 26,819 959
SELL USD JPMorgan Chase Bank N.A. AH1 (USD) 108,811 10/03/2017 101,588 100,649 939
SELL USD Goldman Sachs International AH1 (USD) 29,953 10/03/2017 28,584 27,706 878
SELL USD Goldman Sachs International AH1 (USD) 73,250 10/03/2017 68,425 67,755 670
SELL USD HSBC Bank AH1 (USD) 18,089 10/03/2017 17,227 16,732 495
200 MFS Meridian Funds Annual Report 2017

NOTES TO FINANCIAL STATEMENTS at 31 January 2017
Type Currency Counterparty ClassContracts to
Deliver/ReceiveSettlementDate Range In Exchange For
Contracts atValue
NetUnrealizedGain (Loss)
European Research Fund – (continued)Appreciation – (continued)SELL USD Goldman Sachs International AH1 (USD) 44,219 10/03/2017 €41,372 €40,902 €470
SELL USD Goldman Sachs International AH1 (USD) 67,596 10/03/2017 62,906 62,526 380
SELL USD Goldman Sachs International AH1 (USD) 22,511 10/03/2017 21,132 20,822 310
SELL USD BNP Paribas S.A. AH1 (USD) 56,354 10/03/2017 52,353 52,127 226
SELL USD JPMorgan Chase Bank N.A. AH1 (USD) 65,049 10/03/2017 60,353 60,170 183
SELL USD Goldman Sachs International AH1 (USD) 66,891 10/03/2017 62,038 61,874 164
SELL USD Barclays Bank PLC AH1 (USD) 5,228 10/03/2017 4,994 4,836 158
BUY USD Goldman Sachs International AH1 (USD) 70,532 10/03/2017 65,095 65,241 146
BUY USD Goldman Sachs International AH1 (USD) 68,394 10/03/2017 63,186 63,264 78
SELL USD Merrill Lynch International AH1 (USD) 1,834 10/03/2017 1,751 1,697 54
SELL USD Barclays Bank PLC AH1 (USD) 2,000 10/03/2017 1,870 1,850 20
SELL USD Barclays Bank PLC AH1 (USD) 1,262 10/03/2017 1,178 1,168 10
SELL USD BNP Paribas S.A. AH1 (USD) 1,068 10/03/2017 997 988 9
BUY USD JPMorgan Chase Bank N.A. CH1 (USD) 18,979,235 10/03/2017 17,527,438 17,555,571 28,133
SELL USD Goldman Sachs International CH1 (USD) 188,880 10/03/2017 180,124 174,712 5,412
SELL USD JPMorgan Chase Bank N.A. CH1 (USD) 233,144 10/03/2017 219,627 215,656 3,971
SELL USD Barclays Bank PLC CH1 (USD) 159,932 10/03/2017 149,986 147,935 2,051
SELL USD Goldman Sachs International CH1 (USD) 56,835 10/03/2017 54,498 52,572 1,926
SELL USD Barclays Bank PLC CH1 (USD) 62,446 10/03/2017 59,614 57,761 1,853
SELL USD Goldman Sachs International CH1 (USD) 56,432 10/03/2017 54,034 52,199 1,835
SELL USD Goldman Sachs International CH1 (USD) 60,872 10/03/2017 58,072 56,306 1,766
SELL USD Goldman Sachs International CH1 (USD) 50,977 10/03/2017 48,613 47,153 1,460
SELL USD Goldman Sachs International CH1 (USD) 129,099 10/03/2017 120,769 119,415 1,354
SELL USD Goldman Sachs International CH1 (USD) 37,089 10/03/2017 35,154 34,307 847
SELL USD JPMorgan Chase Bank N.A. CH1 (USD) 29,079 10/03/2017 27,705 26,898 807
SELL USD Goldman Sachs International CH1 (USD) 23,366 10/03/2017 22,331 21,614 717
SELL USD Goldman Sachs International CH1 (USD) 54,377 10/03/2017 50,971 50,298 673
SELL USD Goldman Sachs International CH1 (USD) 67,739 10/03/2017 63,278 62,658 620
SELL USD JPMorgan Chase Bank N.A. CH1 (USD) 73,796 10/03/2017 68,868 68,260 608
SELL USD JPMorgan Chase Bank N.A. CH1 (USD) 46,309 10/03/2017 43,401 42,835 566
SELL USD JPMorgan Chase Bank N.A. CH1 (USD) 25,160 10/03/2017 23,792 23,273 519
SELL USD Goldman Sachs International CH1 (USD) 17,157 10/03/2017 16,277 15,870 407
SELL USD JPMorgan Chase Bank N.A. CH1 (USD) 23,250 10/03/2017 21,872 21,506 366
SELL USD Goldman Sachs International CH1 (USD) 9,474 10/03/2017 9,041 8,764 277
SELL USD Goldman Sachs International CH1 (USD) 45,750 10/03/2017 42,562 42,318 244
SELL USD Goldman Sachs International CH1 (USD) 10,000 10/03/2017 9,375 9,250 125
SELL USD Goldman Sachs International CH1 (USD) 40,383 10/03/2017 37,474 37,354 120
SELL USD Barclays Bank PLC CH1 (USD) 25,077 10/03/2017 23,243 23,196 47
SELL USD Goldman Sachs International CH1 (USD) 16,279 10/03/2017 15,098 15,058 40
SELL USD Goldman Sachs International CH1 (USD) 2,401 10/03/2017 2,254 2,221 33
BUY USD JPMorgan Chase Bank N.A. IH1 (USD) 83,484,972 10/03/2017 77,098,872 77,222,622 123,750
SELL USD Goldman Sachs International IH1 (USD) 530,747 10/03/2017 506,135 490,934 15,201
SELL USD Goldman Sachs International IH1 (USD) 285,584 10/03/2017 273,450 264,162 9,288
SELL USD JPMorgan Chase Bank N.A. IH1 (USD) 210,974 10/03/2017 198,742 195,148 3,594
SELL USD Goldman Sachs International IH1 (USD) 125,339 10/03/2017 119,528 115,937 3,591
SELL USD Goldman Sachs International IH1 (USD) 136,596 10/03/2017 129,538 126,349 3,189
SELL USD JPMorgan Chase Bank N.A. IH1 (USD) 335,375 10/03/2017 312,980 310,218 2,762
SELL USD Barclays Bank PLC IH1 (USD) 142,619 10/03/2017 134,456 131,921 2,535
SELL USD Goldman Sachs International IH1 (USD) 76,136 10/03/2017 72,761 70,425 2,336
MFS Meridian Funds Annual Report 2017 201

NOTES TO FINANCIAL STATEMENTS at 31 January 2017
Type Currency Counterparty ClassContracts to
Deliver/ReceiveSettlementDate Range In Exchange For
Contracts atValue
NetUnrealizedGain (Loss)
European Research Fund – (continued)Appreciation – (continued)SELL USD Goldman Sachs International IH1 (USD) 172,149 10/03/2017 €161,396 €159,236 €2,160
SELL USD Goldman Sachs International IH1 (USD) 56,248 10/03/2017 53,935 52,029 1,906
SELL USD HSBC Bank IH1 (USD) 56,500 10/03/2017 53,807 52,262 1,545
SELL USD Goldman Sachs International IH1 (USD) 41,512 10/03/2017 39,615 38,398 1,217
BUY USD Goldman Sachs International IH1 (USD) 888,445 10/03/2017 820,788 821,801 1,013
SELL USD Barclays Bank PLC IH1 (USD) 25,050 10/03/2017 23,463 23,171 292
SELL USD Goldman Sachs International IH1 (USD) 25,749 10/03/2017 23,954 23,817 137
SELL USD Goldman Sachs International IH1 (USD) 5,274 10/03/2017 4,966 4,879 87
SELL USD JPMorgan Chase Bank N.A. IH1 (USD) 3,971 10/03/2017 3,755 3,673 82
SELL USD Goldman Sachs International IH1 (USD) 2,504 10/03/2017 2,351 2,316 35
SELL USD Goldman Sachs International IH1 (USD) 10,523 10/03/2017 9,765 9,734 31
SELL USD Barclays Bank PLC IH1 (USD) 1,168 10/03/2017 1,092 1,081 11
BUY USD JPMorgan Chase Bank N.A. NH1 (USD) 20,360,176 10/03/2017 18,802,744 18,832,924 30,180
SELL USD Goldman Sachs International NH1 (USD) 259,855 10/03/2017 247,978 240,362 7,616
SELL USD Goldman Sachs International NH1 (USD) 197,149 10/03/2017 186,863 182,361 4,502
SELL USD JPMorgan Chase Bank N.A. NH1 (USD) 227,746 10/03/2017 213,446 210,663 2,783
SELL USD JPMorgan Chase Bank N.A. NH1 (USD) 101,362 10/03/2017 95,779 93,759 2,020
SELL USD Goldman Sachs International NH1 (USD) 177,558 10/03/2017 166,102 164,239 1,863
SELL USD Goldman Sachs International NH1 (USD) 28,135 10/03/2017 26,939 26,024 915
SELL USD Goldman Sachs International NH1 (USD) 22,252 10/03/2017 21,337 20,583 754
SELL USD Goldman Sachs International NH1 (USD) 24,457 10/03/2017 23,323 22,623 700
SELL USD Barclays Bank PLC NH1 (USD) 41,132 10/03/2017 38,527 38,047 480
SELL USD JPMorgan Chase Bank N.A. NH1 (USD) 14,731 10/03/2017 14,035 13,626 409
SELL USD Goldman Sachs International NH1 (USD) 14,828 10/03/2017 14,111 13,716 395
SELL USD Barclays Bank PLC NH1 (USD) 22,981 10/03/2017 21,600 21,258 342
SELL USD HSBC Bank NH1 (USD) 10,497 10/03/2017 9,997 9,710 287
SELL USD Goldman Sachs International NH1 (USD) 9,435 10/03/2017 8,884 8,727 157
SELL USD JPMorgan Chase Bank N.A. NH1 (USD) 14,981 10/03/2017 13,980 13,857 123
SELL USD Barclays Bank PLC NH1 (USD) 7,636 10/03/2017 7,127 7,063 64
SELL USD Goldman Sachs International NH1 (USD) 4,360 10/03/2017 4,072 4,033 39
BUY USD JPMorgan Chase Bank N.A. WH1 (USD) 8,112,988 10/03/2017 7,492,393 7,504,419 12,026
SELL USD Goldman Sachs International WH1 (USD) 867,887 10/03/2017 813,534 802,785 10,749
SELL USD JPMorgan Chase Bank N.A. WH1 (USD) 215,393 10/03/2017 202,905 199,236 3,669
SELL USD Goldman Sachs International WH1 (USD) 51,587 10/03/2017 49,195 47,717 1,478
SELL USD Goldman Sachs International WH1 (USD) 10,110 10/03/2017 9,459 9,351 108
SELL USD Goldman Sachs International WH1 (USD) 2,129 10/03/2017 1,998 1,969 29
SELL USD Goldman Sachs International WH1 (USD) 1,500 10/03/2017 1,392 1,387 5
Total €558,871
DepreciationSELL CHF Goldman Sachs International AH1 (CHF) 199,085 10/03/2017 €185,779 €186,457 €(678)
BUY GBP Goldman Sachs International WH1 (GBP) 732,842 10/03/2017 864,770 853,383 (11,387)
BUY GBP Morgan Stanley Capital Services, Inc. WH1 (GBP) 42,134 10/03/2017 49,531 49,064 (467)
BUY USD Goldman Sachs International AH1 (USD) 14,767,063 10/03/2017 14,112,538 13,659,361 (453,177)
BUY USD Goldman Sachs International AH1 (USD) 5,492,847 10/03/2017 5,227,126 5,080,819 (146,307)
BUY USD Goldman Sachs International AH1 (USD) 6,071,534 10/03/2017 5,634,186 5,616,098 (18,088)
BUY USD Goldman Sachs International AH1 (USD) 346,648 10/03/2017 328,853 320,646 (8,207)
BUY USD Morgan Stanley Capital Services, Inc. AH1 (USD) 230,925 10/03/2017 220,703 213,603 (7,100)
BUY USD Goldman Sachs International AH1 (USD) 286,902 10/03/2017 272,077 265,381 (6,696)
BUY USD Barclays Bank PLC AH1 (USD) 577,989 10/03/2017 540,409 534,633 (5,776)
202 MFS Meridian Funds Annual Report 2017

NOTES TO FINANCIAL STATEMENTS at 31 January 2017
Type Currency Counterparty ClassContracts to
Deliver/ReceiveSettlementDate Range In Exchange For
Contracts atValue
NetUnrealizedGain (Loss)
European Research Fund – (continued)Depreciation – (continued)BUY USD JPMorgan Chase Bank N.A. AH1 (USD) 216,693 10/03/2017 €204,130 €200,439 €(3,691)
BUY USD Goldman Sachs International AH1 (USD) 344,151 10/03/2017 321,947 318,336 (3,611)
BUY USD Goldman Sachs International AH1 (USD) 275,606 10/03/2017 258,391 254,932 (3,459)
BUY USD Goldman Sachs International AH1 (USD) 103,127 10/03/2017 98,346 95,391 (2,955)
BUY USD JPMorgan Chase Bank N.A. AH1 (USD) 76,262 10/03/2017 72,061 70,542 (1,519)
BUY USD Barclays Bank PLC AH1 (USD) 120,820 10/03/2017 113,167 111,757 (1,410)
BUY USD Barclays Bank PLC AH1 (USD) 119,998 10/03/2017 112,318 110,997 (1,321)
BUY USD Goldman Sachs International AH1 (USD) 200,653 10/03/2017 186,549 185,602 (947)
BUY USD JPMorgan Chase Bank N.A. AH1 (USD) 28,932 10/03/2017 27,217 26,762 (455)
BUY USD Barclays Bank PLC AH1 (USD) 2,928 10/03/2017 2,753 2,708 (45)
BUY USD JPMorgan Chase Bank N.A. AH1 (USD) 4,366 10/03/2017 4,074 4,038 (36)
BUY USD Barclays Bank PLC AH1 (USD) 2,307 10/03/2017 2,163 2,134 (29)
BUY USD Barclays Bank PLC AH1 (USD) 14,729 10/03/2017 13,652 13,624 (28)
BUY USD Goldman Sachs International AH1 (USD) 3,769 10/03/2017 3,500 3,486 (14)
BUY USD Barclays Bank PLC AH1 (USD) 1,094 10/03/2017 1,022 1,012 (10)
BUY USD Morgan Stanley Capital Services, Inc. CH1 (USD) 1,071,392 10/03/2017 1,023,964 991,026 (32,938)
BUY USD Barclays Bank PLC CH1 (USD) 25,000 10/03/2017 23,375 23,125 (250)
BUY USD Goldman Sachs International CH1 (USD) 50,000 10/03/2017 46,485 46,249 (236)
BUY USD Barclays Bank PLC CH1 (USD) 3,406 10/03/2017 3,179 3,150 (29)
SELL USD Goldman Sachs International CH1 (USD) 24,347 10/03/2017 22,493 22,521 (28)
BUY USD Morgan Stanley Capital Services, Inc. IH1 (USD) 4,781,692 10/03/2017 4,570,014 4,423,009 (147,005)
BUY USD Goldman Sachs International IH1 (USD) 981,352 10/03/2017 935,607 907,740 (27,867)
BUY USD Goldman Sachs International IH1 (USD) 4,000,000 10/03/2017 3,718,827 3,699,953 (18,874)
BUY USD Goldman Sachs International IH1 (USD) 181,014 10/03/2017 169,335 167,436 (1,899)
BUY USD JPMorgan Chase Bank N.A. IH1 (USD) 110,201 10/03/2017 102,886 101,935 (951)
BUY USD JPMorgan Chase Bank N.A. IH1 (USD) 67,939 10/03/2017 63,753 62,843 (910)
BUY USD Barclays Bank PLC IH1 (USD) 57,520 10/03/2017 53,838 53,205 (633)
BUY USD JPMorgan Chase Bank N.A. IH1 (USD) 40,490 10/03/2017 37,948 37,453 (495)
BUY USD JPMorgan Chase Bank N.A. IH1 (USD) 22,016 10/03/2017 20,803 20,364 (439)
BUY USD Goldman Sachs International IH1 (USD) 15,229 10/03/2017 14,172 14,087 (85)
BUY USD Goldman Sachs International IH1 (USD) 3,478 10/03/2017 3,299 3,217 (82)
SELL USD Goldman Sachs International IH1 (USD) 36,183 10/03/2017 33,393 33,469 (76)
BUY USD Barclays Bank PLC IH1 (USD) 3,792 10/03/2017 3,540 3,508 (32)
BUY USD JPMorgan Chase Bank N.A. IH1 (USD) 1,608 10/03/2017 1,512 1,487 (25)
BUY USD JPMorgan Chase Bank N.A. NH1 (USD) 998,872 10/03/2017 936,839 923,945 (12,894)
SELL USD Goldman Sachs International NH1 (USD) 330,081 10/03/2017 304,636 305,321 (685)
BUY USD Goldman Sachs International NH1 (USD) 53,900 10/03/2017 50,533 49,857 (676)
BUY USD Morgan Stanley Capital Services, Inc. NH1 (USD) 20,623 10/03/2017 19,186 19,076 (110)
SELL USD Goldman Sachs International NH1 (USD) 29,126 10/03/2017 26,908 26,941 (33)
BUY USD Barclays Bank PLC NH1 (USD) 1,068 10/03/2017 1,019 987 (32)
BUY USD Barclays Bank PLC NH1 (USD) 1,670 10/03/2017 1,566 1,545 (21)
BUY USD Barclays Bank PLC WH1 (USD) 378,026 10/03/2017 361,063 349,669 (11,394)
BUY USD Goldman Sachs International WH1 (USD) 429,499 10/03/2017 399,309 397,282 (2,027)
BUY USD JPMorgan Chase Bank N.A. WH1 (USD) 8,000 10/03/2017 7,466 7,400 (66)
BUY USD Goldman Sachs International WH1 (USD) 5,375 10/03/2017 5,000 4,972 (28)
Total €(938,233)
European Smaller Companies FundAppreciationBUY USD JPMorgan Chase Bank N.A. AH1 (USD) 74,290,475 10/03/2017 €68,607,700 €68,717,820 €110,120
SELL USD Goldman Sachs International AH1 (USD) 809,745 10/03/2017 770,573 749,005 21,568
MFS Meridian Funds Annual Report 2017 203

NOTES TO FINANCIAL STATEMENTS at 31 January 2017
Type Currency Counterparty ClassContracts to
Deliver/ReceiveSettlementDate Range In Exchange For
Contracts atValue
NetUnrealizedGain (Loss)
European Smaller Companies Fund – (continued)Appreciation – (continued)SELL USD Goldman Sachs International AH1 (USD) 415,026 10/03/2017 €397,959 €383,894 €14,065
SELL USD JPMorgan Chase Bank N.A. AH1 (USD) 474,790 10/03/2017 452,354 439,175 13,179
SELL USD JPMorgan Chase Bank N.A. AH1 (USD) 291,918 10/03/2017 275,838 270,021 5,817
SELL USD Goldman Sachs International AH1 (USD) 162,043 10/03/2017 154,531 149,888 4,643
SELL USD Goldman Sachs International AH1 (USD) 149,319 10/03/2017 142,395 138,118 4,277
SELL USD Barclays Bank PLC AH1 (USD) 310,433 10/03/2017 290,249 287,147 3,102
SELL USD JPMorgan Chase Bank N.A. AH1 (USD) 240,320 10/03/2017 225,230 222,293 2,937
SELL USD Goldman Sachs International AH1 (USD) 214,967 10/03/2017 201,504 198,842 2,662
SELL USD Goldman Sachs International AH1 (USD) 77,461 10/03/2017 74,170 71,650 2,520
SELL USD Barclays Bank PLC AH1 (USD) 99,360 10/03/2017 93,672 91,906 1,766
SELL USD JPMorgan Chase Bank N.A. AH1 (USD) 177,538 10/03/2017 165,753 164,221 1,532
SELL USD Goldman Sachs International AH1 (USD) 358,939 10/03/2017 333,350 332,015 1,335
SELL USD Goldman Sachs International AH1 (USD) 54,960 10/03/2017 52,092 50,837 1,255
SELL USD HSBC Bank AH1 (USD) 40,099 10/03/2017 38,188 37,091 1,097
SELL USD Goldman Sachs International AH1 (USD) 24,700 10/03/2017 23,564 22,847 717
SELL USD BNP Paribas S.A. AH1 (USD) 35,436 10/03/2017 33,431 32,778 653
SELL USD Goldman Sachs International AH1 (USD) 89,703 10/03/2017 83,479 82,975 504
SELL USD Goldman Sachs International AH1 (USD) 29,997 10/03/2017 28,245 27,746 499
SELL USD JPMorgan Chase Bank N.A. AH1 (USD) 39,765 10/03/2017 37,279 36,782 497
SELL USD Morgan Stanley Capital Services, Inc. AH1 (USD) 14,972 10/03/2017 14,345 13,849 496
SELL USD Goldman Sachs International AH1 (USD) 15,295 10/03/2017 14,596 14,148 448
SELL USD Goldman Sachs International AH1 (USD) 150,094 10/03/2017 139,283 138,836 447
SELL USD JPMorgan Chase Bank N.A. AH1 (USD) 27,564 10/03/2017 25,930 25,496 434
SELL USD Goldman Sachs International AH1 (USD) 84,502 10/03/2017 78,562 78,164 398
SELL USD Goldman Sachs International AH1 (USD) 10,746 10/03/2017 10,269 9,940 329
SELL USD Barclays Bank PLC AH1 (USD) 26,324 10/03/2017 24,657 24,350 307
SELL USD Barclays Bank PLC AH1 (USD) 20,297 10/03/2017 18,998 18,775 223
SELL USD JPMorgan Chase Bank N.A. AH1 (USD) 7,459 10/03/2017 7,107 6,900 207
SELL USD Goldman Sachs International AH1 (USD) 7,757 10/03/2017 7,359 7,175 184
SELL USD Barclays Bank PLC AH1 (USD) 17,968 10/03/2017 16,771 16,621 150
SELL USD Goldman Sachs International AH1 (USD) 2,740 10/03/2017 2,612 2,534 78
SELL USD Barclays Bank PLC AH1 (USD) 1,255 10/03/2017 1,183 1,161 22
SELL USD Goldman Sachs International AH1 (USD) 2,342 10/03/2017 2,188 2,166 22
SELL USD Goldman Sachs International AH1 (USD) 2,037 10/03/2017 1,906 1,884 22
SELL USD JPMorgan Chase Bank N.A. AH1 (USD) 1,482 10/03/2017 1,390 1,371 19
SELL USD JPMorgan Chase Bank N.A. AH1 (USD) 1,094 10/03/2017 1,031 1,012 19
SELL USD Goldman Sachs International CH1 (USD) 260,417 10/03/2017 248,341 240,882 7,459
SELL USD Goldman Sachs International CH1 (USD) 114,850 10/03/2017 109,601 106,235 3,366
SELL USD Goldman Sachs International CH1 (USD) 103,433 10/03/2017 98,638 95,675 2,963
SELL USD Goldman Sachs International CH1 (USD) 61,954 10/03/2017 59,208 57,306 1,902
SELL USD Goldman Sachs International CH1 (USD) 36,935 10/03/2017 35,148 34,165 983
SELL USD JPMorgan Chase Bank N.A. CH1 (USD) 61,730 10/03/2017 58,071 57,100 971
SELL USD Goldman Sachs International CH1 (USD) 25,915 10/03/2017 24,814 23,971 843
SELL USD Goldman Sachs International CH1 (USD) 36,510 10/03/2017 34,605 33,771 834
SELL USD JPMorgan Chase Bank N.A. CH1 (USD) 25,242 10/03/2017 24,049 23,349 700
SELL USD Goldman Sachs International CH1 (USD) 49,416 10/03/2017 46,321 45,709 612
SELL USD Barclays Bank PLC CH1 (USD) 1,455 10/03/2017 1,390 1,346 44
BUY USD JPMorgan Chase Bank N.A. IH1 (USD) 11,135,995 10/03/2017 10,284,159 10,300,665 16,506
SELL USD Goldman Sachs International IH1 (USD) 50,000 10/03/2017 47,784 46,249 1,535
204 MFS Meridian Funds Annual Report 2017

NOTES TO FINANCIAL STATEMENTS at 31 January 2017
Type Currency Counterparty ClassContracts to
Deliver/ReceiveSettlementDate Range In Exchange For
Contracts atValue
NetUnrealizedGain (Loss)
European Smaller Companies Fund – (continued)Appreciation – (continued)SELL USD JPMorgan Chase Bank N.A. IH1 (USD) 130,000 10/03/2017 €121,319 €120,248 €1,071
SELL USD Goldman Sachs International IH1 (USD) 100,000 10/03/2017 93,548 92,499 1,049
BUY USD JPMorgan Chase Bank N.A. NH1 (USD) 14,197,045 10/03/2017 13,111,056 13,132,100 21,044
SELL USD Barclays Bank PLC NH1 (USD) 503,052 10/03/2017 470,856 465,318 5,538
SELL USD Goldman Sachs International NH1 (USD) 217,000 10/03/2017 203,410 200,722 2,688
SELL USD JPMorgan Chase Bank N.A. NH1 (USD) 103,469 10/03/2017 97,769 95,708 2,061
SELL USD Goldman Sachs International NH1 (USD) 55,689 10/03/2017 53,108 51,512 1,596
SELL USD Goldman Sachs International NH1 (USD) 52,700 10/03/2017 50,243 48,747 1,496
SELL USD JPMorgan Chase Bank N.A. NH1 (USD) 40,503 10/03/2017 38,589 37,464 1,125
SELL USD Goldman Sachs International NH1 (USD) 35,998 10/03/2017 34,329 33,298 1,031
SELL USD Goldman Sachs International NH1 (USD) 40,371 10/03/2017 38,299 37,343 956
SELL USD Barclays Bank PLC NH1 (USD) 10,667 10/03/2017 9,992 9,867 125
SELL USD Goldman Sachs International NH1 (USD) 19,347 10/03/2017 17,967 17,895 72
SELL USD JPMorgan Chase Bank N.A. NH1 (USD) 4,000 10/03/2017 3,749 3,700 49
SELL USD JPMorgan Chase Bank N.A. NH1 (USD) 3,000 10/03/2017 2,822 2,775 47
SELL USD Goldman Sachs International NH1 (USD) 1,886 10/03/2017 1,788 1,745 43
SELL USD Goldman Sachs International NH1 (USD) 1,638 10/03/2017 1,533 1,516 17
BUY USD JPMorgan Chase Bank N.A. WH1 (USD) 7,422,275 10/03/2017 6,854,515 6,865,517 11,002
SELL USD Goldman Sachs International WH1 (USD) 42,073 10/03/2017 39,878 38,917 961
SELL USD Goldman Sachs International WH1 (USD) 31,551 10/03/2017 29,333 29,184 149
SELL USD JPMorgan Chase Bank N.A. WH1 (USD) 567 10/03/2017 534 525 9
Total €289,397
DepreciationBUY USD Barclays Bank PLC AH1 (USD) 1,375 10/03/2017 €1,275 €1,272 €(3)
BUY USD JPMorgan Chase Bank N.A. AH1 (USD) 1,941 10/03/2017 1,800 1,795 (5)
BUY USD Barclays Bank PLC AH1 (USD) 1,940 10/03/2017 1,819 1,794 (25)
BUY USD Barclays Bank PLC AH1 (USD) 2,030 10/03/2017 1,930 1,878 (52)
BUY USD JPMorgan Chase Bank N.A. AH1 (USD) 12,000 10/03/2017 11,199 11,100 (99)
BUY USD JPMorgan Chase Bank N.A. AH1 (USD) 7,428 10/03/2017 7,024 6,871 (153)
BUY USD JPMorgan Chase Bank N.A. AH1 (USD) 27,008 10/03/2017 25,442 24,982 (460)
SELL USD Goldman Sachs International AH1 (USD) 563,362 10/03/2017 520,460 521,103 (643)
SELL USD Goldman Sachs International AH1 (USD) 384,871 10/03/2017 355,203 356,001 (798)
BUY USD Goldman Sachs International AH1 (USD) 203,726 10/03/2017 189,529 188,445 (1,084)
BUY USD JPMorgan Chase Bank N.A. AH1 (USD) 91,344 10/03/2017 85,716 84,492 (1,224)
BUY USD Goldman Sachs International AH1 (USD) 137,389 10/03/2017 128,807 127,083 (1,724)
BUY USD Barclays Bank PLC AH1 (USD) 197,690 10/03/2017 185,803 182,861 (2,942)
BUY USD Barclays Bank PLC AH1 (USD) 666,993 10/03/2017 623,636 616,960 (6,676)
BUY USD Goldman Sachs International AH1 (USD) 1,754,691 10/03/2017 1,641,478 1,623,069 (18,409)
BUY USD Goldman Sachs International AH1 (USD) 4,070,999 10/03/2017 3,821,623 3,765,626 (55,997)
SELL USD Goldman Sachs International CH1 (USD) 26,095 10/03/2017 24,108 24,138 (30)
SELL USD Goldman Sachs International CH1 (USD) 30,393 10/03/2017 28,050 28,113 (63)
BUY USD Goldman Sachs International CH1 (USD) 380,957 10/03/2017 357,621 352,381 (5,240)
BUY USD Goldman Sachs International CH1 (USD) 7,171,862 10/03/2017 6,663,500 6,633,888 (29,612)
BUY USD Goldman Sachs International IH1 (USD) 60,000 10/03/2017 55,782 55,499 (283)
BUY USD Barclays Bank PLC IH1 (USD) 25,000 10/03/2017 23,417 23,125 (292)
BUY USD Barclays Bank PLC IH1 (USD) 79,000 10/03/2017 74,478 73,074 (1,404)
BUY USD Goldman Sachs International IH1 (USD) 606,519 10/03/2017 569,366 561,023 (8,343)
BUY USD JPMorgan Chase Bank N.A. NH1 (USD) 10,000 10/03/2017 9,456 9,250 (206)
BUY USD Barclays Bank PLC NH1 (USD) 786,167 10/03/2017 750,891 727,196 (23,695)
MFS Meridian Funds Annual Report 2017 205

NOTES TO FINANCIAL STATEMENTS at 31 January 2017
Type Currency Counterparty ClassContracts to
Deliver/ReceiveSettlementDate Range In Exchange For
Contracts atValue
NetUnrealizedGain (Loss)
European Smaller Companies Fund – (continued)Depreciation – (continued)BUY USD JPMorgan Chase Bank N.A. WH1 (USD) 50,360 10/03/2017 €47,623 €46,582 €(1,041)
BUY USD Goldman Sachs International WH1 (USD) 401,480 10/03/2017 376,886 371,364 (5,522)
Total €(166,025)
European Value FundAppreciationBUY CHF Morgan Stanley Capital Services, Inc. AH1 (CHF) 9,967,202 10/03/2017 €9,228,210 €9,335,002 €106,792
SELL CHF JPMorgan Chase Bank N.A. AH1 (CHF) 49,762 10/03/2017 46,720 46,605 115
BUY CHF Goldman Sachs International AH1 (CHF) 8,605 10/03/2017 7,993 8,059 66
BUY CHF Morgan Stanley Capital Services, Inc. AH1 (CHF) 8,754 10/03/2017 8,149 8,199 50
BUY CHF Morgan Stanley Capital Services, Inc. IH1 (CHF) 48,747 10/03/2017 45,133 45,655 522
BUY CHF Barclays Bank PLC IH1 (CHF) 2,617 10/03/2017 2,445 2,451 6
BUY CHF Morgan Stanley Capital Services, Inc. WH1 (CHF) 392,931 10/03/2017 363,798 368,008 4,210
SELL GBP Goldman Sachs International WH1 (GBP) 441,188 10/03/2017 516,983 513,756 3,227
BUY GBP JPMorgan Chase Bank N.A. WH1 (GBP) 100,626 10/03/2017 114,910 117,177 2,267
SELL GBP Goldman Sachs International WH1 (GBP) 40,371 10/03/2017 48,000 47,011 989
SELL GBP Goldman Sachs International WH1 (GBP) 34,752 10/03/2017 41,391 40,468 923
SELL GBP Goldman Sachs International WH1 (GBP) 96,768 10/03/2017 113,007 112,684 323
BUY USD JPMorgan Chase Bank N.A. AH1 (USD) 679,351,457 10/03/2017 627,385,146 628,392,148 1,007,002
SELL USD Goldman Sachs International AH1 (USD) 2,184,129 10/03/2017 2,084,302 2,020,294 64,008
SELL USD Goldman Sachs International AH1 (USD) 1,566,887 10/03/2017 1,502,450 1,449,352 53,098
SELL USD Goldman Sachs International AH1 (USD) 1,618,916 10/03/2017 1,540,599 1,497,478 43,121
SELL USD Barclays Bank PLC AH1 (USD) 3,564,322 10/03/2017 3,338,560 3,296,957 41,603
SELL USD Goldman Sachs International AH1 (USD) 1,051,966 10/03/2017 1,003,185 973,056 30,129
SELL USD Goldman Sachs International AH1 (USD) 966,087 10/03/2017 921,301 893,619 27,682
SELL USD JPMorgan Chase Bank N.A. AH1 (USD) 1,602,639 10/03/2017 1,509,721 1,482,422 27,299
SELL USD Goldman Sachs International AH1 (USD) 1,137,134 10/03/2017 1,078,377 1,051,836 26,541
SELL USD Goldman Sachs International AH1 (USD) 666,331 10/03/2017 638,020 616,349 21,671
SELL USD Barclays Bank PLC AH1 (USD) 1,931,811 10/03/2017 1,808,172 1,786,903 21,269
SELL USD JPMorgan Chase Bank N.A. AH1 (USD) 1,644,952 10/03/2017 1,541,668 1,521,561 20,107
SELL USD JPMorgan Chase Bank N.A. AH1 (USD) 1,290,494 10/03/2017 1,209,836 1,193,691 16,145
SELL USD Goldman Sachs International AH1 (USD) 568,309 10/03/2017 541,817 525,679 16,138
SELL USD Goldman Sachs International AH1 (USD) 555,543 10/03/2017 529,988 513,871 16,117
SELL USD JPMorgan Chase Bank N.A. AH1 (USD) 1,196,672 10/03/2017 1,122,936 1,106,908 16,028
SELL USD Goldman Sachs International AH1 (USD) 674,448 10/03/2017 639,825 623,856 15,969
SELL USD Goldman Sachs International AH1 (USD) 1,153,681 10/03/2017 1,079,245 1,067,141 12,104
SELL USD Goldman Sachs International AH1 (USD) 651,053 10/03/2017 613,037 602,217 10,820
SELL USD Goldman Sachs International AH1 (USD) 756,207 10/03/2017 708,973 699,483 9,490
SELL USD HSBC Bank AH1 (USD) 328,823 10/03/2017 313,150 304,158 8,992
SELL USD JPMorgan Chase Bank N.A. AH1 (USD) 849,583 10/03/2017 792,850 785,854 6,996
SELL USD Goldman Sachs International AH1 (USD) 1,406,391 10/03/2017 1,307,531 1,300,895 6,636
SELL USD Goldman Sachs International AH1 (USD) 464,615 10/03/2017 436,155 429,764 6,391
SELL USD Goldman Sachs International AH1 (USD) 1,191,517 10/03/2017 1,108,476 1,102,139 6,337
SELL USD Barclays Bank PLC AH1 (USD) 176,389 10/03/2017 168,390 163,157 5,233
SELL USD JPMorgan Chase Bank N.A. AH1 (USD) 606,010 10/03/2017 565,781 560,552 5,229
SELL USD Goldman Sachs International AH1 (USD) 1,746,817 10/03/2017 1,620,990 1,615,786 5,204
SELL USD Barclays Bank PLC AH1 (USD) 291,817 10/03/2017 275,115 269,928 5,187
SELL USD JPMorgan Chase Bank N.A. AH1 (USD) 188,900 10/03/2017 178,494 174,730 3,764
SELL USD Goldman Sachs International AH1 (USD) 111,192 10/03/2017 106,264 102,852 3,412
SELL USD Barclays Bank PLC AH1 (USD) 224,609 10/03/2017 211,103 207,761 3,342
206 MFS Meridian Funds Annual Report 2017

NOTES TO FINANCIAL STATEMENTS at 31 January 2017
Type Currency Counterparty ClassContracts to
Deliver/ReceiveSettlementDate Range In Exchange For
Contracts atValue
NetUnrealizedGain (Loss)
European Value Fund – (continued)Appreciation – (continued)SELL USD Barclays Bank PLC AH1 (USD) 365,623 10/03/2017 €341,250 €338,197 €3,053
SELL USD JPMorgan Chase Bank N.A. AH1 (USD) 180,555 10/03/2017 169,851 167,011 2,840
SELL USD Goldman Sachs International AH1 (USD) 645,220 10/03/2017 599,221 596,821 2,400
SELL USD Morgan Stanley Capital Services, Inc. AH1 (USD) 66,801 10/03/2017 64,054 61,790 2,264
SELL USD Barclays Bank PLC AH1 (USD) 253,758 10/03/2017 236,666 234,723 1,943
SELL USD Goldman Sachs International AH1 (USD) 183,308 10/03/2017 170,589 169,558 1,031
SELL USD Barclays Bank PLC AH1 (USD) 20,323 10/03/2017 19,412 18,799 613
SELL USD Goldman Sachs International AH1 (USD) 58,304 10/03/2017 54,463 53,930 533
SELL USD BNP Paribas S.A. AH1 (USD) 125,976 10/03/2017 117,032 116,526 506
SELL USD JPMorgan Chase Bank N.A. AH1 (USD) 17,535 10/03/2017 16,707 16,220 487
SELL USD Barclays Bank PLC AH1 (USD) 34,415 10/03/2017 32,177 31,833 344
SELL USD JPMorgan Chase Bank N.A. AH1 (USD) 21,187 10/03/2017 19,871 19,598 273
SELL USD BNP Paribas S.A. AH1 (USD) 27,678 10/03/2017 25,823 25,602 221
SELL USD Barclays Bank PLC AH1 (USD) 6,947 10/03/2017 6,617 6,426 191
SELL USD Barclays Bank PLC AH1 (USD) 6,474 10/03/2017 6,179 5,988 191
SELL USD Barclays Bank PLC AH1 (USD) 11,627 10/03/2017 10,891 10,755 136
SELL USD JPMorgan Chase Bank N.A. AH1 (USD) 48,283 10/03/2017 44,797 44,661 136
SELL USD Goldman Sachs International AH1 (USD) 41,946 10/03/2017 38,903 38,800 103
SELL USD Barclays Bank PLC AH1 (USD) 37,961 10/03/2017 35,198 35,114 84
SELL USD JPMorgan Chase Bank N.A. AH1 (USD) 3,889 10/03/2017 3,664 3,598 66
SELL USD Barclays Bank PLC AH1 (USD) 3,013 10/03/2017 2,852 2,787 65
SELL USD Morgan Stanley Capital Services, Inc. AH1 (USD) 2,044 10/03/2017 1,954 1,891 63
SELL USD Morgan Stanley Capital Services, Inc. AH1 (USD) 1,423 10/03/2017 1,363 1,316 47
SELL USD Barclays Bank PLC AH1 (USD) 4,122 10/03/2017 3,854 3,812 42
SELL USD Merrill Lynch International AH1 (USD) 1,402 10/03/2017 1,337 1,296 41
BUY USD Goldman Sachs International IH1 (USD) 302,187,602 10/03/2017 279,149,402 279,519,996 370,594
SELL USD JPMorgan Chase Bank N.A. IH1 (USD) 1,307,075 10/03/2017 1,245,310 1,209,029 36,281
SELL USD Goldman Sachs International IH1 (USD) 1,025,000 10/03/2017 979,569 948,113 31,456
SELL USD Barclays Bank PLC IH1 (USD) 1,293,226 10/03/2017 1,219,205 1,196,219 22,986
SELL USD Barclays Bank PLC IH1 (USD) 1,813,112 10/03/2017 1,698,270 1,677,107 21,163
SELL USD JPMorgan Chase Bank N.A. IH1 (USD) 987,490 10/03/2017 933,818 913,417 20,401
SELL USD Goldman Sachs International IH1 (USD) 397,786 10/03/2017 378,543 367,948 10,595
SELL USD Goldman Sachs International IH1 (USD) 305,009 10/03/2017 290,866 282,130 8,736
SELL USD JPMorgan Chase Bank N.A. IH1 (USD) 408,250 10/03/2017 384,048 377,626 6,422
SELL USD Goldman Sachs International IH1 (USD) 242,406 10/03/2017 229,758 224,223 5,535
SELL USD Goldman Sachs International IH1 (USD) 188,851 10/03/2017 180,048 174,685 5,363
SELL USD Morgan Stanley Capital Services, Inc. IH1 (USD) 145,000 10/03/2017 138,581 134,123 4,458
SELL USD JPMorgan Chase Bank N.A. IH1 (USD) 199,310 10/03/2017 188,330 184,359 3,971
SELL USD Goldman Sachs International IH1 (USD) 98,800 10/03/2017 94,601 91,388 3,213
SELL USD JPMorgan Chase Bank N.A. IH1 (USD) 360,000 10/03/2017 336,102 332,996 3,106
SELL USD Goldman Sachs International IH1 (USD) 400,076 10/03/2017 372,194 370,066 2,128
SELL USD JPMorgan Chase Bank N.A. IH1 (USD) 189,559 10/03/2017 176,900 175,339 1,561
SELL USD Goldman Sachs International IH1 (USD) 82,297 10/03/2017 77,492 76,124 1,368
SELL USD Goldman Sachs International IH1 (USD) 38,533 10/03/2017 36,771 35,642 1,129
SELL USD Goldman Sachs International IH1 (USD) 23,040 10/03/2017 21,980 21,312 668
SELL USD Goldman Sachs International IH1 (USD) 20,000 10/03/2017 19,073 18,500 573
SELL USD Barclays Bank PLC IH1 (USD) 38,218 10/03/2017 35,772 35,352 420
MFS Meridian Funds Annual Report 2017 207

NOTES TO FINANCIAL STATEMENTS at 31 January 2017
Type Currency Counterparty ClassContracts to
Deliver/ReceiveSettlementDate Range In Exchange For
Contracts atValue
NetUnrealizedGain (Loss)
European Value Fund – (continued)Appreciation – (continued)SELL USD JPMorgan Chase Bank N.A. IH1 (USD) 29,983 10/03/2017 €28,100 €27,734 €366
SELL USD Goldman Sachs International IH1 (USD) 917 10/03/2017 851 848 3
Total €2,262,723
DepreciationSELL CHF JPMorgan Chase Bank N.A. AH1 (CHF) 11,520 10/03/2017 €10,710 €10,789 €(79)
SELL CHF JPMorgan Chase Bank N.A. AH1 (CHF) 19,910 10/03/2017 18,561 18,648 (87)
SELL CHF Goldman Sachs International AH1 (CHF) 21,960 10/03/2017 20,467 20,567 (100)
SELL CHF Barclays Bank PLC AH1 (CHF) 36,600 10/03/2017 34,130 34,279 (149)
SELL CHF Goldman Sachs International AH1 (CHF) 43,470 10/03/2017 40,540 40,713 (173)
BUY CHF Barclays Bank PLC AH1 (CHF) 540,877 10/03/2017 506,851 506,571 (280)
BUY CHF Barclays Bank PLC WH1 (CHF) 22,043 10/03/2017 20,656 20,645 (11)
BUY GBP Barclays Bank PLC WH1 (GBP) 2,254 10/03/2017 2,640 2,625 (15)
BUY GBP Goldman Sachs International WH1 (GBP) 9,984 10/03/2017 11,818 11,626 (192)
BUY GBP Barclays Bank PLC WH1 (GBP) 25,275 10/03/2017 29,665 29,433 (232)
SELL GBP JPMorgan Chase Bank N.A. WH1 (GBP) 44,326 10/03/2017 50,751 51,616 (865)
BUY GBP Goldman Sachs International WH1 (GBP) 512,624 10/03/2017 600,304 596,942 (3,362)
BUY GBP Goldman Sachs International WH1 (GBP) 3,735,873 10/03/2017 4,408,412 4,350,362 (58,050)
BUY USD Barclays Bank PLC AH1 (USD) 1,984 10/03/2017 1,853 1,835 (18)
BUY USD Barclays Bank PLC AH1 (USD) 2,058 10/03/2017 1,955 1,903 (52)
BUY USD Barclays Bank PLC AH1 (USD) 5,321 10/03/2017 5,033 4,922 (111)
BUY USD Barclays Bank PLC AH1 (USD) 9,087 10/03/2017 8,546 8,405 (141)
BUY USD Barclays Bank PLC AH1 (USD) 11,625 10/03/2017 10,902 10,753 (149)
BUY USD Goldman Sachs International AH1 (USD) 21,883 10/03/2017 20,474 20,241 (233)
BUY USD Barclays Bank PLC AH1 (USD) 79,034 10/03/2017 73,836 73,105 (731)
BUY USD Barclays Bank PLC AH1 (USD) 56,631 10/03/2017 54,321 52,383 (1,938)
SELL USD Goldman Sachs International AH1 (USD) 2,040,555 10/03/2017 1,885,162 1,887,490 (2,328)
SELL USD Goldman Sachs International AH1 (USD) 2,016,510 10/03/2017 1,861,064 1,865,248 (4,184)
BUY USD JPMorgan Chase Bank N.A. AH1 (USD) 316,971 10/03/2017 299,743 293,194 (6,549)
BUY USD JPMorgan Chase Bank N.A. AH1 (USD) 609,530 10/03/2017 581,870 563,808 (18,062)
BUY USD Goldman Sachs International AH1 (USD) 1,832,058 10/03/2017 1,717,323 1,694,632 (22,691)
BUY USD Goldman Sachs International AH1 (USD) 1,341,473 10/03/2017 1,271,479 1,240,846 (30,633)
BUY USD JPMorgan Chase Bank N.A. AH1 (USD) 1,907,091 10/03/2017 1,816,973 1,764,037 (52,936)
BUY USD BNP Paribas S.A. IH1 (USD) 1,438 10/03/2017 1,336 1,330 (6)
BUY USD Barclays Bank PLC IH1 (USD) 2,086 10/03/2017 1,945 1,929 (16)
BUY USD Barclays Bank PLC IH1 (USD) 1,204 10/03/2017 1,150 1,114 (36)
BUY USD Barclays Bank PLC IH1 (USD) 4,405 10/03/2017 4,118 4,074 (44)
SELL USD Goldman Sachs International IH1 (USD) 37,032 10/03/2017 34,177 34,254 (77)
SELL USD Goldman Sachs International IH1 (USD) 98,134 10/03/2017 90,660 90,772 (112)
BUY USD Goldman Sachs International IH1 (USD) 52,100 10/03/2017 48,386 48,192 (194)
BUY USD Goldman Sachs International IH1 (USD) 28,389 10/03/2017 26,611 26,259 (352)
BUY USD Goldman Sachs International IH1 (USD) 35,000 10/03/2017 32,742 32,375 (367)
BUY USD Goldman Sachs International IH1 (USD) 37,039 10/03/2017 34,726 34,261 (465)
BUY USD Goldman Sachs International IH1 (USD) 85,227 10/03/2017 79,313 78,834 (479)
BUY USD Barclays Bank PLC IH1 (USD) 116,071 10/03/2017 108,334 107,365 (969)
BUY USD Goldman Sachs International IH1 (USD) 355,000 10/03/2017 330,046 328,371 (1,675)
BUY USD JPMorgan Chase Bank N.A. IH1 (USD) 325,000 10/03/2017 304,974 300,621 (4,353)
BUY USD Goldman Sachs International IH1 (USD) 431,040 10/03/2017 404,636 398,707 (5,929)
BUY USD JPMorgan Chase Bank N.A. IH1 (USD) 355,000 10/03/2017 334,418 328,371 (6,047)
BUY USD Goldman Sachs International IH1 (USD) 190,137 10/03/2017 182,318 175,875 (6,443)
208 MFS Meridian Funds Annual Report 2017
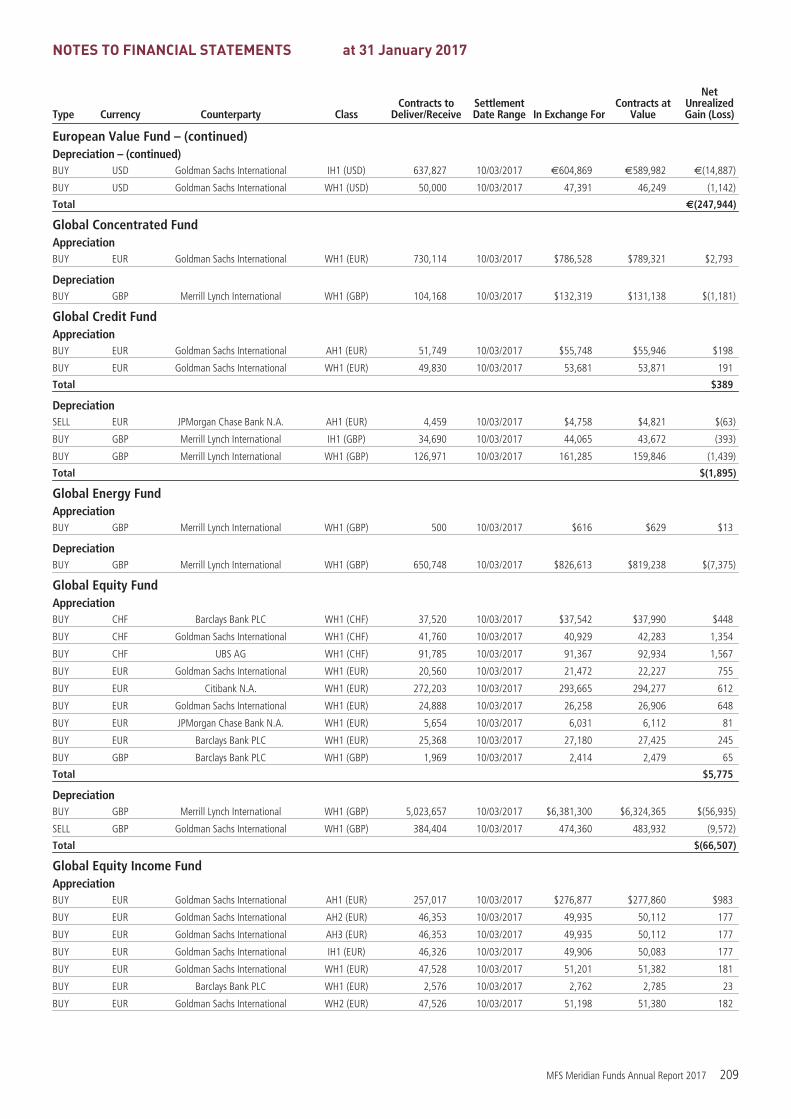
NOTES TO FINANCIAL STATEMENTS at 31 January 2017
Type Currency Counterparty ClassContracts to
Deliver/ReceiveSettlementDate Range In Exchange For
Contracts atValue
NetUnrealizedGain (Loss)
European Value Fund – (continued)Depreciation – (continued)BUY USD Goldman Sachs International IH1 (USD) 637,827 10/03/2017 €604,869 €589,982 €(14,887)
BUY USD Goldman Sachs International WH1 (USD) 50,000 10/03/2017 47,391 46,249 (1,142)
Total €(247,944)
Global Concentrated FundAppreciationBUY EUR Goldman Sachs International WH1 (EUR) 730,114 10/03/2017 $786,528 $789,321 $2,793
DepreciationBUY GBP Merrill Lynch International WH1 (GBP) 104,168 10/03/2017 $132,319 $131,138 $(1,181)
Global Credit FundAppreciationBUY EUR Goldman Sachs International AH1 (EUR) 51,749 10/03/2017 $55,748 $55,946 $198
BUY EUR Goldman Sachs International WH1 (EUR) 49,830 10/03/2017 53,681 53,871 191
Total $389
DepreciationSELL EUR JPMorgan Chase Bank N.A. AH1 (EUR) 4,459 10/03/2017 $4,758 $4,821 $(63)
BUY GBP Merrill Lynch International IH1 (GBP) 34,690 10/03/2017 44,065 43,672 (393)
BUY GBP Merrill Lynch International WH1 (GBP) 126,971 10/03/2017 161,285 159,846 (1,439)
Total $(1,895)
Global Energy FundAppreciationBUY GBP Merrill Lynch International WH1 (GBP) 500 10/03/2017 $616 $629 $13
DepreciationBUY GBP Merrill Lynch International WH1 (GBP) 650,748 10/03/2017 $826,613 $819,238 $(7,375)
Global Equity FundAppreciationBUY CHF Barclays Bank PLC WH1 (CHF) 37,520 10/03/2017 $37,542 $37,990 $448
BUY CHF Goldman Sachs International WH1 (CHF) 41,760 10/03/2017 40,929 42,283 1,354
BUY CHF UBS AG WH1 (CHF) 91,785 10/03/2017 91,367 92,934 1,567
BUY EUR Goldman Sachs International WH1 (EUR) 20,560 10/03/2017 21,472 22,227 755
BUY EUR Citibank N.A. WH1 (EUR) 272,203 10/03/2017 293,665 294,277 612
BUY EUR Goldman Sachs International WH1 (EUR) 24,888 10/03/2017 26,258 26,906 648
BUY EUR JPMorgan Chase Bank N.A. WH1 (EUR) 5,654 10/03/2017 6,031 6,112 81
BUY EUR Barclays Bank PLC WH1 (EUR) 25,368 10/03/2017 27,180 27,425 245
BUY GBP Barclays Bank PLC WH1 (GBP) 1,969 10/03/2017 2,414 2,479 65
Total $5,775
DepreciationBUY GBP Merrill Lynch International WH1 (GBP) 5,023,657 10/03/2017 $6,381,300 $6,324,365 $(56,935)
SELL GBP Goldman Sachs International WH1 (GBP) 384,404 10/03/2017 474,360 483,932 (9,572)
Total $(66,507)
Global Equity Income FundAppreciationBUY EUR Goldman Sachs International AH1 (EUR) 257,017 10/03/2017 $276,877 $277,860 $983
BUY EUR Goldman Sachs International AH2 (EUR) 46,353 10/03/2017 49,935 50,112 177
BUY EUR Goldman Sachs International AH3 (EUR) 46,353 10/03/2017 49,935 50,112 177
BUY EUR Goldman Sachs International IH1 (EUR) 46,326 10/03/2017 49,906 50,083 177
BUY EUR Goldman Sachs International WH1 (EUR) 47,528 10/03/2017 51,201 51,382 181
BUY EUR Barclays Bank PLC WH1 (EUR) 2,576 10/03/2017 2,762 2,785 23
BUY EUR Goldman Sachs International WH2 (EUR) 47,526 10/03/2017 51,198 51,380 182
MFS Meridian Funds Annual Report 2017 209

NOTES TO FINANCIAL STATEMENTS at 31 January 2017
Type Currency Counterparty ClassContracts to
Deliver/ReceiveSettlementDate Range In Exchange For
Contracts atValue
NetUnrealizedGain (Loss)
Global Equity Income Fund – (continued)Appreciation – (continued)BUY EUR Barclays Bank PLC WH2 (EUR) 2,576 10/03/2017 $2,762 $2,785 $23
BUY EUR Goldman Sachs International WH3 (EUR) 47,526 10/03/2017 51,198 51,380 182
BUY EUR Barclays Bank PLC WH3 (EUR) 2,576 10/03/2017 2,762 2,785 23
Total $2,128
DepreciationBUY GBP Merrill Lynch International IH1 (GBP) 33,921 10/03/2017 $43,087 $42,703 $(384)
BUY GBP Merrill Lynch International WH1 (GBP) 33,898 10/03/2017 43,059 42,675 (384)
BUY GBP Merrill Lynch International WH2 (GBP) 33,892 10/03/2017 43,051 42,667 (384)
BUY GBP Merrill Lynch International WH3 (GBP) 33,892 10/03/2017 43,051 42,667 (384)
Total $(1,536)
Global High Yield FundAppreciationBUY EUR Goldman Sachs International AH2 (EUR) 305,996 10/03/2017 $329,640 $330,810 $1,170
BUY EUR Goldman Sachs International AH3 (EUR) 421,655 10/03/2017 453,663 455,849 2,186
SELL EUR Goldman Sachs International AH3 (EUR) 30,207 10/03/2017 32,697 32,657 40
BUY EUR Barclays Bank PLC WH1 (EUR) 2,639 10/03/2017 2,790 2,853 63
BUY EUR Goldman Sachs International WH1 (EUR) 49,790 10/03/2017 53,638 53,828 190
BUY EUR Barclays Bank PLC WH2 (EUR) 2,639 10/03/2017 2,790 2,853 63
BUY EUR Goldman Sachs International WH2 (EUR) 49,790 10/03/2017 53,638 53,828 190
BUY EUR Barclays Bank PLC WH3 (EUR) 2,639 10/03/2017 2,790 2,853 63
BUY EUR Goldman Sachs International WH3 (EUR) 49,793 10/03/2017 53,640 53,831 191
BUY GBP Barclays Bank PLC IH1 (GBP) 1,856 10/03/2017 2,290 2,336 46
BUY GBP Barclays Bank PLC WH1 (GBP) 1,834 10/03/2017 2,263 2,309 46
Total $4,248
DepreciationSELL EUR Goldman Sachs International AH3 (EUR) 43,100 10/03/2017 $45,473 $46,596 $(1,123)
BUY GBP Merrill Lynch International IH1 (GBP) 34,059 10/03/2017 43,263 42,877 (386)
BUY GBP Merrill Lynch International WH1 (GBP) 33,991 10/03/2017 43,177 42,792 (385)
BUY GBP Merrill Lynch International WH2 (GBP) 34,088 10/03/2017 43,300 42,914 (386)
BUY GBP Merrill Lynch International WH3 (GBP) 34,087 10/03/2017 43,299 42,913 (386)
Total $(2,666)
Global Opportunistic Bond FundAppreciationBUY EUR Goldman Sachs International AH1 (EUR) 45,200 10/03/2017 $48,692 $48,865 $173
BUY EUR Goldman Sachs International AH2 (EUR) 45,200 10/03/2017 48,692 48,865 173
BUY EUR Goldman Sachs International AH3 (EUR) 45,200 10/03/2017 48,692 48,865 173
BUY EUR Goldman Sachs International IH1 (EUR) 45,200 10/03/2017 48,692 48,865 173
BUY EUR Goldman Sachs International WH1 (EUR) 45,200 10/03/2017 48,692 48,865 173
BUY EUR Goldman Sachs International WH2 (EUR) 45,200 10/03/2017 48,692 48,865 173
BUY EUR Goldman Sachs International WH3 (EUR) 45,200 10/03/2017 48,692 48,865 173
Total $1,211
DepreciationBUY GBP Merrill Lynch International IH1 (GBP) 38,700 10/03/2017 $49,159 $48,720 $(439)
BUY GBP Merrill Lynch International WH1 (GBP) 38,700 10/03/2017 49,159 48,720 (439)
BUY GBP Merrill Lynch International WH2 (GBP) 38,700 10/03/2017 49,159 48,720 (439)
BUY GBP Merrill Lynch International WH3 (GBP) 38,700 10/03/2017 49,159 48,720 (439)
Total $(1,756)
Global Research Focused FundAppreciationBUY JPY Goldman Sachs International IH1 (JPY) 2,300,000 10/03/2017 $19,656 $20,394 $738
BUY JPY Goldman Sachs International IH1 (JPY) 12,501,692 10/03/2017 110,280 110,852 572
210 MFS Meridian Funds Annual Report 2017

NOTES TO FINANCIAL STATEMENTS at 31 January 2017
Type Currency Counterparty ClassContracts to
Deliver/ReceiveSettlementDate Range In Exchange For
Contracts atValue
NetUnrealizedGain (Loss)
Global Research Focused Fund – (continued)Appreciation – (continued)BUY JPY Barclays Bank PLC IH1 (JPY) 2,800,000 10/03/2017 $24,343 $24,827 $484
BUY JPY Goldman Sachs International IH1 (JPY) 200,000 10/03/2017 1,698 1,773 75
BUY JPY Barclays Bank PLC IH1 (JPY) 700,000 10/03/2017 6,139 6,207 68
BUY JPY JPMorgan Chase Bank N.A. IH1 (JPY) 400,000 10/03/2017 3,514 3,547 32
BUY JPY Goldman Sachs International IH1 (JPY) 200,000 10/03/2017 1,755 1,773 18
Total $1,988
DepreciationSELL JPY Goldman Sachs International IH1 (JPY) 100,000 10/03/2017 $881 $887 $(6)
Global Total Return FundAppreciationBUY EUR Citibank N.A. WH1 (EUR) 9,429,254 10/03/2017 $10,149,328 $10,193,889 $44,561
BUY EUR Citibank N.A. AH1 (EUR) 9,406,907 10/03/2017 10,125,274 10,169,751 44,477
BUY EUR Citibank N.A. IH1 (EUR) 3,639,390 10/03/2017 3,917,316 3,934,523 17,207
BUY EUR Citibank N.A. AH2 (EUR) 2,926,458 10/03/2017 3,149,939 3,163,776 13,837
BUY EUR Goldman Sachs International AH2 (EUR) 409,234 10/03/2017 431,532 442,421 10,889
BUY EUR Goldman Sachs International AH2 (EUR) 150,296 10/03/2017 157,604 162,484 4,880
BUY CHF UBS AG WH1 (CHF) 258,800 10/03/2017 257,622 262,041 4,419
BUY EUR Goldman Sachs International AH2 (EUR) 72,714 10/03/2017 76,410 78,610 2,200
BUY EUR Barclays Bank PLC AH2 (EUR) 151,400 10/03/2017 161,638 163,678 2,040
BUY EUR Goldman Sachs International IH1 (EUR) 49,625 10/03/2017 52,311 53,650 1,339
BUY EUR Goldman Sachs International AH1 (EUR) 303,170 10/03/2017 326,442 327,755 1,313
BUY EUR Goldman Sachs International AH4 (EUR) 47,100 10/03/2017 49,693 50,920 1,227
BUY EUR Citibank N.A. AH3 (EUR) 526,599 10/03/2017 568,120 569,303 1,183
BUY EUR JPMorgan Chase Bank N.A. AH2 (EUR) 72,419 10/03/2017 77,175 78,292 1,117
BUY GBP Goldman Sachs International WH1 (GBP) 120,000 10/03/2017 150,132 151,070 938
BUY EUR Goldman Sachs International AH2 (EUR) 115,081 10/03/2017 123,703 124,414 711
BUY EUR JPMorgan Chase Bank N.A. AH2 (EUR) 28,586 10/03/2017 30,229 30,904 675
BUY EUR JPMorgan Chase Bank N.A. AH1 (EUR) 63,423 10/03/2017 67,933 68,567 634
BUY EUR Goldman Sachs International AH2 (EUR) 14,443 10/03/2017 15,063 15,615 552
BUY EUR Barclays Bank PLC AH1 (EUR) 40,030 10/03/2017 42,737 43,276 539
BUY EUR JPMorgan Chase Bank N.A. AH2 (EUR) 24,426 10/03/2017 25,965 26,407 442
BUY EUR Barclays Bank PLC AH1 (EUR) 36,886 10/03/2017 39,451 39,877 426
BUY EUR Goldman Sachs International IH1 (EUR) 10,000 10/03/2017 10,444 10,811 367
BUY EUR Barclays Bank PLC AH2 (EUR) 35,327 10/03/2017 37,850 38,192 342
BUY GBP Goldman Sachs International WH1 (GBP) 14,706 10/03/2017 18,181 18,513 332
BUY EUR JPMorgan Chase Bank N.A. AH2 (EUR) 21,178 10/03/2017 22,589 22,895 306
BUY EUR Goldman Sachs International AH2 (EUR) 24,717 10/03/2017 26,421 26,721 300
SELL EUR Goldman Sachs International WH1 (EUR) 121,499 10/03/2017 131,647 131,352 295
BUY EUR Goldman Sachs International AH2 (EUR) 19,580 10/03/2017 20,884 21,167 283
BUY EUR JPMorgan Chase Bank N.A. AH1 (EUR) 29,519 10/03/2017 31,631 31,913 282
BUY EUR Goldman Sachs International AH2 (EUR) 8,019 10/03/2017 8,411 8,669 258
BUY EUR JPMorgan Chase Bank N.A. AH2 (EUR) 13,060 10/03/2017 13,864 14,119 255
BUY EUR Barclays Bank PLC AH1 (EUR) 20,080 10/03/2017 21,514 21,708 194
BUY EUR Goldman Sachs International AH1 (EUR) 35,000 10/03/2017 37,646 37,838 192
BUY EUR Goldman Sachs International AH3 (EUR) 4,990 10/03/2017 5,212 5,395 183
BUY EUR Morgan Stanley Capital Services, Inc. AH2 (EUR) 5,157 10/03/2017 5,412 5,575 163
BUY EUR JPMorgan Chase Bank N.A. AH2 (EUR) 15,002 10/03/2017 16,076 16,219 143
BUY EUR Goldman Sachs International AH2 (EUR) 20,104 10/03/2017 21,603 21,734 131
BUY EUR Goldman Sachs International AH3 (EUR) 4,990 10/03/2017 5,265 5,395 130
BUY EUR Goldman Sachs International AH2 (EUR) 3,600 10/03/2017 3,766 3,891 125
MFS Meridian Funds Annual Report 2017 211

NOTES TO FINANCIAL STATEMENTS at 31 January 2017
Type Currency Counterparty ClassContracts to
Deliver/ReceiveSettlementDate Range In Exchange For
Contracts atValue
NetUnrealizedGain (Loss)
Global Total Return Fund – (continued)Appreciation – (continued)BUY EUR Barclays Bank PLC AH1 (EUR) 9,657 10/03/2017 $10,317 $10,440 $123
BUY EUR Citibank N.A. WH2 (EUR) 50,168 10/03/2017 54,123 54,236 113
BUY EUR Citibank N.A. WH3 (EUR) 50,168 10/03/2017 54,123 54,236 113
BUY EUR Goldman Sachs International AH2 (EUR) 31,615 10/03/2017 34,069 34,179 110
BUY EUR JPMorgan Chase Bank N.A. AH2 (EUR) 7,965 10/03/2017 8,531 8,611 80
BUY EUR Goldman Sachs International AH2 (EUR) 4,875 10/03/2017 5,201 5,271 70
BUY EUR Barclays Bank PLC AH2 (EUR) 5,029 10/03/2017 5,379 5,437 58
BUY EUR Goldman Sachs International AH2 (EUR) 13,024 10/03/2017 14,024 14,080 56
BUY EUR Goldman Sachs International AH2 (EUR) 1,211 10/03/2017 1,270 1,310 40
BUY EUR Barclays Bank PLC AH2 (EUR) 1,266 10/03/2017 1,337 1,368 31
BUY EUR Brown Brothers Harriman AH1 (EUR) 1,830 10/03/2017 1,972 1,978 6
Total $160,687
DepreciationSELL EUR Goldman Sachs International WH1 (EUR) 952 10/03/2017 $1,019 $1,029 $(10)
BUY EUR Goldman Sachs International AH2 (EUR) 58,378 10/03/2017 63,190 63,112 (78)
SELL EUR Goldman Sachs International AH2 (EUR) 2,274 10/03/2017 2,375 2,459 (84)
SELL EUR Goldman Sachs International AH1 (EUR) 20,163 10/03/2017 21,673 21,798 (125)
SELL EUR JPMorgan Chase Bank N.A. WH1 (EUR) 13,997 10/03/2017 14,998 15,132 (134)
SELL EUR Goldman Sachs International AH3 (EUR) 11,860 10/03/2017 12,596 12,822 (226)
SELL EUR Goldman Sachs International AH1 (EUR) 36,704 10/03/2017 39,441 39,681 (240)
BUY EUR Goldman Sachs International AH1 (EUR) 109,511 10/03/2017 118,657 118,391 (266)
BUY GBP Merrill Lynch International WH2 (GBP) 34,023 10/03/2017 43,218 42,832 (386)
BUY GBP Merrill Lynch International WH3 (GBP) 34,023 10/03/2017 43,218 42,832 (386)
BUY GBP Merrill Lynch International IH1 (GBP) 35,960 10/03/2017 45,679 45,271 (408)
SELL EUR Goldman Sachs International IH1 (EUR) 13,345 10/03/2017 13,994 14,427 (433)
SELL EUR JPMorgan Chase Bank N.A. AH1 (EUR) 43,966 10/03/2017 46,911 47,531 (620)
SELL EUR Goldman Sachs International AH1 (EUR) 134,736 10/03/2017 141,586 145,663 (4,077)
SELL EUR Goldman Sachs International AH1 (EUR) 392,814 10/03/2017 411,910 424,669 (12,759)
BUY GBP Merrill Lynch International WH1 (GBP) 4,016,407 10/03/2017 5,101,763 5,056,321 (45,442)
Total $(65,674)
Latin American Equity FundAppreciationBUY CHF UBS AG AH1 (CHF) 53,061 10/03/2017 $ 52,819 $53,726 $907
BUY CHF UBS AG IH1 (CHF) 52,957 10/03/2017 52,716 53,620 904
BUY EUR Goldman Sachs International WH1 (EUR) 53,687 10/03/2017 57,836 58,041 205
BUY CHF Goldman Sachs International IH1 (CHF) 3,174 10/03/2017 3,184 3,213 29
BUY CHF Goldman Sachs International AH1 (CHF) 2,937 10/03/2017 2,946 2,973 27
BUY GBP JPMorgan Chase Bank N.A. WH1 (GBP) 2,242 10/03/2017 2,801 2,823 22
BUY EUR Brown Brothers Harriman WH1 (EUR) 3,238 10/03/2017 3,489 3,500 11
Total $2,105
DepreciationBUY GBP Merrill Lynch International WH1 (GBP) 35,413 10/03/2017 $44,983 $44,582 $ (401)
Managed Wealth FundAppreciationBUY EUR Citibank N.A. WH1 (EUR) 45,037 10/03/2017 $48,588 $48,690 $101
BUY EUR Citibank N.A. AH1 (EUR) 42,090 10/03/2017 45,408 45,503 95
BUY EUR Citibank N.A. IH1 (EUR) 41,990 10/03/2017 45,301 45,396 94
BUY EUR Goldman Sachs International WH1 (EUR) 2,372 10/03/2017 2,540 2,565 25
BUY EUR Goldman Sachs International IH1 (EUR) 2,250 10/03/2017 2,409 2,433 24
Total $339
212 MFS Meridian Funds Annual Report 2017

NOTES TO FINANCIAL STATEMENTS at 31 January 2017
Type Currency Counterparty ClassContracts to
Deliver/ReceiveSettlementDate Range In Exchange For
Contracts atValue
NetUnrealizedGain (Loss)
Managed Wealth Fund – (continued)DepreciationBUY GBP Merrill Lynch International IH1 (GBP) 32,256 10/03/2017 $40,974 $40,608 $(366)
BUY GBP Merrill Lynch International WH1 (GBP) 32,264 10/03/2017 40,983 40,617 (366)
Total $(731)
Prudent Capital FundAppreciationBUY CHF UBS AG WH1 (CHF) 49,500 10/03/2017 $49,275 $50,120 $845
BUY EUR Citibank N.A. IH1 (EUR) 45,600 10/03/2017 49,195 49,298 103
BUY EUR Citibank N.A. AH1 (EUR) 45,600 10/03/2017 49,195 49,298 103
BUY EUR Citibank N.A. WH1 (EUR) 45,600 10/03/2017 49,083 49,298 215
BUY EUR Goldman Sachs International AH4 (EUR) 47,100 10/03/2017 49,693 50,920 1,227
Total $2,493
DepreciationBUY GBP Merrill Lynch International IH1 (GBP) 1,293,720 10/03/2017 $1,643,348 $1,628,686 $(14,662)
BUY GBP Merrill Lynch International WH1 (GBP) 41,000 10/03/2017 52,080 51,615 (465)
Total $(15,127)
Prudent Wealth FundAppreciationBUY EUR Barclays Bank PLC AH1 (EUR) 93,866 10/03/2017 $100,285 $101,478 $1,193
BUY EUR Barclays Bank PLC AH1 (EUR) 2,257 10/03/2017 2,363 2,440 77
BUY EUR Barclays Bank PLC AH1 (EUR) 3,377 10/03/2017 3,594 3,651 57
BUY EUR Barclays Bank PLC AH1 (EUR) 1,303 10/03/2017 1,368 1,408 40
BUY EUR Barclays Bank PLC AH1 (EUR) 1,591 10/03/2017 1,689 1,720 31
BUY EUR Barclays Bank PLC AH1 (EUR) 1,867 10/03/2017 1,993 2,018 25
BUY EUR Citibank N.A. AH1 (EUR) 75,705,251 10/03/2017 81,486,558 81,844,501 357,943
SELL EUR Goldman Sachs International AH1 (EUR) 58,021 10/03/2017 62,867 62,726 141
SELL EUR Goldman Sachs International AH1 (EUR) 37,631 10/03/2017 40,733 40,683 50
BUY EUR Goldman Sachs International AH1 (EUR) 873 10/03/2017 932 944 12
BUY EUR JPMorgan Chase Bank N.A. AH1 (EUR) 51,593 10/03/2017 54,558 55,777 1,219
BUY EUR JPMorgan Chase Bank N.A. AH1 (EUR) 74,851 10/03/2017 80,208 80,921 713
BUY EUR Merrill Lynch International AH1 (EUR) 3,563 10/03/2017 3,733 3,852 119
BUY EUR Morgan Stanley Capital Services, Inc. AH1 (EUR) 37,812 10/03/2017 39,563 40,878 1,315
BUY EUR Barclays Bank PLC IH1 (EUR) 252,937 10/03/2017 270,041 273,449 3,408
BUY EUR Barclays Bank PLC IH1 (EUR) 2,836 10/03/2017 2,971 3,066 95
BUY EUR Barclays Bank PLC IH1 (EUR) 19,034 10/03/2017 20,529 20,578 49
BUY EUR Barclays Bank PLC IH1 (EUR) 1,671 10/03/2017 1,784 1,807 23
BUY EUR BNP Paribas S.A. IH1 (EUR) 1,891 10/03/2017 1,983 2,044 61
BUY EUR BNP Paribas S.A. IH1 (EUR) 978 10/03/2017 1,048 1,057 9
BUY EUR BNP Paribas S.A. IH1 (EUR) 1,356 10/03/2017 1,460 1,466 6
BUY EUR Citibank N.A. IH1 (EUR) 107,005,763 10/03/2017 115,177,365 115,683,300 505,935
BUY EUR Goldman Sachs International IH1 (EUR) 1,092,346 10/03/2017 1,145,463 1,180,929 35,466
SELL EUR Goldman Sachs International IH1 (EUR) 16,048,948 10/03/2017 17,371,863 17,350,423 21,440
SELL EUR Goldman Sachs International IH1 (EUR) 7,959,673 10/03/2017 8,624,504 8,605,155 19,349
BUY EUR Goldman Sachs International IH1 (EUR) 424,660 10/03/2017 446,247 459,097 12,850
BUY EUR Goldman Sachs International IH1 (EUR) 121,879 10/03/2017 127,755 131,762 4,007
BUY EUR Goldman Sachs International IH1 (EUR) 87,173 10/03/2017 92,980 94,242 1,262
BUY EUR Goldman Sachs International IH1 (EUR) 24,024 10/03/2017 25,198 25,972 774
BUY EUR Goldman Sachs International IH1 (EUR) 14,125 10/03/2017 14,890 15,271 381
BUY EUR Goldman Sachs International IH1 (EUR) 2,082 10/03/2017 2,211 2,250 39
BUY EUR Goldman Sachs International IH1 (EUR) 1,629 10/03/2017 1,752 1,761 9
MFS Meridian Funds Annual Report 2017 213

NOTES TO FINANCIAL STATEMENTS at 31 January 2017
Type Currency Counterparty ClassContracts to
Deliver/ReceiveSettlementDate Range In Exchange For
Contracts atValue
NetUnrealizedGain (Loss)
Prudent Wealth Fund – (continued)Appreciation – (continued)BUY EUR HSBC Bank IH1 (EUR) 52,672 10/03/2017 $55,308 $56,943 $1,635
BUY EUR JPMorgan Chase Bank N.A. IH1 (EUR) 166,469 10/03/2017 176,174 179,969 3,795
BUY EUR JPMorgan Chase Bank N.A. IH1 (EUR) 256,537 10/03/2017 273,724 277,341 3,617
BUY EUR JPMorgan Chase Bank N.A. IH1 (EUR) 738 10/03/2017 786 798 12
BUY EUR Morgan Stanley Capital Services, Inc. IH1 (EUR) 23,139 10/03/2017 24,282 25,015 733
BUY EUR Morgan Stanley Capital Services, Inc. IH1 (EUR) 1,838 10/03/2017 1,919 1,987 68
BUY EUR Goldman Sachs International WH1 (EUR) 645,532 10/03/2017 695,411 697,881 2,470
SELL GBP Goldman Sachs International WH1 (GBP) 15,586 10/03/2017 19,755 19,621 134
Total $980,562
DepreciationSELL EUR Barclays Bank PLC AH1 (EUR) 991 10/03/2017 $1,063 $1,072 $(9)
SELL EUR Barclays Bank PLC AH1 (EUR) 1,017 10/03/2017 1,081 1,100 (19)
SELL EUR Barclays Bank PLC AH1 (EUR) 1,025 10/03/2017 1,084 1,108 (24)
SELL EUR Barclays Bank PLC AH1 (EUR) 7,847 10/03/2017 8,399 8,483 (84)
SELL EUR Barclays Bank PLC AH1 (EUR) 176,982 10/03/2017 189,622 191,334 (1,712)
SELL EUR Barclays Bank PLC AH1 (EUR) 145,988 10/03/2017 154,851 157,827 (2,976)
SELL EUR Barclays Bank PLC AH1 (EUR) 258,713 10/03/2017 276,704 279,693 (2,989)
SELL EUR Barclays Bank PLC AH1 (EUR) 602,182 10/03/2017 642,904 651,016 (8,112)
SELL EUR Brown Brothers Harriman AH1 (EUR) 2,993 10/03/2017 3,226 3,236 (10)
SELL EUR BNP Paribas S.A. AH1 (EUR) 1,348 10/03/2017 1,413 1,457 (44)
SELL EUR Goldman Sachs International AH1 (EUR) 2,275 10/03/2017 2,453 2,460 (7)
SELL EUR Goldman Sachs International AH1 (EUR) 17,432 10/03/2017 18,732 18,846 (114)
SELL EUR Goldman Sachs International AH1 (EUR) 48,401 10/03/2017 52,158 52,326 (168)
SELL EUR Goldman Sachs International AH1 (EUR) 45,585 10/03/2017 48,412 49,282 (870)
SELL EUR Goldman Sachs International AH1 (EUR) 48,644 10/03/2017 51,321 52,588 (1,267)
SELL EUR Goldman Sachs International AH1 (EUR) 120,912 10/03/2017 128,990 130,717 (1,727)
SELL EUR Goldman Sachs International AH1 (EUR) 565,175 10/03/2017 608,560 611,007 (2,447)
SELL EUR Goldman Sachs International AH1 (EUR) 228,486 10/03/2017 244,244 247,015 (2,771)
SELL EUR Goldman Sachs International AH1 (EUR) 507,539 10/03/2017 545,561 548,697 (3,136)
SELL EUR Goldman Sachs International AH1 (EUR) 106,371 10/03/2017 110,933 114,997 (4,064)
SELL EUR Goldman Sachs International AH1 (EUR) 160,710 10/03/2017 168,459 173,743 (5,284)
SELL EUR Goldman Sachs International AH1 (EUR) 214,204 10/03/2017 225,875 231,574 (5,699)
SELL EUR Goldman Sachs International AH1 (EUR) 232,878 10/03/2017 245,479 251,763 (6,284)
SELL EUR Goldman Sachs International AH1 (EUR) 244,468 10/03/2017 256,177 264,293 (8,116)
SELL EUR Goldman Sachs International AH1 (EUR) 384,659 10/03/2017 404,213 415,853 (11,640)
SELL EUR Goldman Sachs International AH1 (EUR) 2,305,007 10/03/2017 2,479,284 2,491,929 (12,645)
SELL EUR Goldman Sachs International AH1 (EUR) 396,716 10/03/2017 416,113 428,887 (12,774)
SELL EUR Goldman Sachs International AH1 (EUR) 477,049 10/03/2017 500,246 515,735 (15,489)
SELL EUR Goldman Sachs International AH1 (EUR) 616,573 10/03/2017 646,545 666,573 (20,028)
SELL EUR Goldman Sachs International AH1 (EUR) 827,858 10/03/2017 864,593 894,992 (30,399)
SELL EUR Goldman Sachs International AH1 (EUR) 4,238,232 10/03/2017 4,434,797 4,581,928 (147,131)
SELL EUR HSBC Bank AH1 (EUR) 75,607 10/03/2017 79,391 81,739 (2,348)
SELL EUR JPMorgan Chase Bank N.A. AH1 (EUR) 11,436 10/03/2017 12,140 12,363 (223)
SELL EUR JPMorgan Chase Bank N.A. AH1 (EUR) 122,539 10/03/2017 130,749 132,477 (1,728)
SELL EUR JPMorgan Chase Bank N.A. AH1 (EUR) 149,264 10/03/2017 159,065 161,368 (2,303)
SELL EUR JPMorgan Chase Bank N.A. AH1 (EUR) 234,997 10/03/2017 251,706 254,054 (2,348)
SELL EUR JPMorgan Chase Bank N.A. AH1 (EUR) 167,031 10/03/2017 176,768 180,576 (3,808)
SELL EUR JPMorgan Chase Bank N.A. AH1 (EUR) 287,522 10/03/2017 306,691 310,839 (4,148)
SELL EUR JPMorgan Chase Bank N.A. AH1 (EUR) 401,099 10/03/2017 426,376 433,626 (7,250)
214 MFS Meridian Funds Annual Report 2017

NOTES TO FINANCIAL STATEMENTS at 31 January 2017
Type Currency Counterparty ClassContracts to
Deliver/ReceiveSettlementDate Range In Exchange For
Contracts atValue
NetUnrealizedGain (Loss)
Prudent Wealth Fund – (continued)Depreciation – (continued)SELL EUR Morgan Stanley Capital Services, Inc. AH1 (EUR) 106,815 10/03/2017 $112,095 $115,477 $(3,382)
SELL EUR Barclays Bank PLC IH1 (EUR) 747 10/03/2017 792 808 (16)
SELL EUR Barclays Bank PLC IH1 (EUR) 1,503 10/03/2017 1,600 1,625 (25)
SELL EUR Barclays Bank PLC IH1 (EUR) 12,523 10/03/2017 13,417 13,538 (121)
SELL EUR Barclays Bank PLC IH1 (EUR) 169,654 10/03/2017 181,254 183,412 (2,158)
SELL EUR Barclays Bank PLC IH1 (EUR) 347,777 10/03/2017 371,961 375,979 (4,018)
SELL EUR Goldman Sachs International IH1 (EUR) 968 10/03/2017 1,042 1,046 (4)
SELL EUR Goldman Sachs International IH1 (EUR) 7,293 10/03/2017 7,859 7,884 (25)
SELL EUR Goldman Sachs International IH1 (EUR) 3,998 10/03/2017 4,296 4,322 (26)
SELL EUR Goldman Sachs International IH1 (EUR) 17,150 10/03/2017 18,330 18,541 (211)
SELL EUR Goldman Sachs International IH1 (EUR) 24,259 10/03/2017 25,932 26,226 (294)
SELL EUR Goldman Sachs International IH1 (EUR) 42,711 10/03/2017 45,723 46,175 (452)
SELL EUR Goldman Sachs International IH1 (EUR) 15,597 10/03/2017 16,344 16,862 (518)
SELL EUR Goldman Sachs International IH1 (EUR) 16,360 10/03/2017 17,119 17,686 (567)
SELL EUR Goldman Sachs International IH1 (EUR) 48,042 10/03/2017 51,177 51,938 (761)
SELL EUR Goldman Sachs International IH1 (EUR) 36,867 10/03/2017 38,876 39,857 (981)
SELL EUR Goldman Sachs International IH1 (EUR) 41,321 10/03/2017 43,155 44,672 (1,517)
SELL EUR Goldman Sachs International IH1 (EUR) 256,728 10/03/2017 269,208 277,548 (8,340)
SELL EUR Goldman Sachs International IH1 (EUR) 1,105,494 10/03/2017 1,166,351 1,195,143 (28,792)
SELL EUR Goldman Sachs International IH1 (EUR) 5,813,243 10/03/2017 6,201,626 6,284,662 (83,036)
SELL EUR JPMorgan Chase Bank N.A. IH1 (EUR) 14,074 10/03/2017 15,074 15,215 (141)
SELL EUR JPMorgan Chase Bank N.A. IH1 (EUR) 282,111 10/03/2017 300,919 304,989 (4,070)
SELL EUR JPMorgan Chase Bank N.A. IH1 (EUR) 5,458,875 10/03/2017 5,849,491 5,901,558 (52,067)
SELL EUR JPMorgan Chase Bank N.A. IH1 (EUR) 11,659,573 10/03/2017 12,377,173 12,605,095 (227,922)
SELL EUR JPMorgan Chase Bank N.A. WH1 (EUR) 99,578 10/03/2017 106,658 107,653 (995)
SELL GBP Barclays Bank PLC WH1 (GBP) 8,904 10/03/2017 11,000 11,210 (210)
SELL GBP JPMorgan Chase Bank N.A. WH1 (GBP) 73,017 10/03/2017 89,044 91,923 (2,879)
BUY GBP Merrill Lynch International WH1 (GBP) 4,008,541 10/03/2017 5,091,849 5,046,418 (45,431)
Total $(801,154)
U.S. Concentrated Growth FundAppreciationBUY EUR Citibank N.A. WH1 (EUR) 47,647 10/03/2017 $51,404 $51,511 $107
BUY GBP Barclays Bank PLC WH1 (GBP) 2,284 10/03/2017 2,238 2,284 46
Total $153
DepreciationBUY GBP Merrill Lynch International WH1 (GBP) 43,042 10/03/2017 $43,429 $43,042 $(387)
U.S. Corporate Bond FundAppreciationBUY EUR Citibank N.A. IH1 (EUR) 8,630,143 10/03/2017 $9,289,192 $9,329,996 $40,804
BUY EUR Citibank N.A. AH1 (EUR) 3,587,811 10/03/2017 3,861,798 3,878,761 16,964
BUY EUR Goldman Sachs International AH1 (EUR) 50,000 10/03/2017 52,144 54,055 1,910
BUY EUR Goldman Sachs International AH1 (EUR) 30,000 10/03/2017 31,447 32,433 986
BUY EUR Morgan Stanley Capital Services, Inc. IH1 (EUR) 19,558 10/03/2017 20,464 21,144 680
BUY EUR Goldman Sachs International AH1 (EUR) 20,000 10/03/2017 20,978 21,622 644
BUY EUR Citibank N.A. WH2 (EUR) 49,968 10/03/2017 53,784 54,020 236
BUY EUR Goldman Sachs International IH1 (EUR) 3,896 10/03/2017 4,082 4,212 129
BUY EUR Citibank N.A. WH1 (EUR) 49,968 10/03/2017 53,907 54,020 112
SELL EUR Goldman Sachs International IH1 (EUR) 13,901 10/03/2017 15,062 15,029 34
Total $62,500
MFS Meridian Funds Annual Report 2017 215

NOTES TO FINANCIAL STATEMENTS at 31 January 2017
Type Currency Counterparty ClassContracts to
Deliver/ReceiveSettlementDate Range In Exchange For
Contracts atValue
NetUnrealizedGain (Loss)
U.S. Corporate Bond Fund – (continued)DepreciationSELL EUR Goldman Sachs International IH1 (EUR) 4,116,067 10/03/2017 $4,306,948 $4,449,856 $(142,908)
SELL EUR Goldman Sachs International AH1 (EUR) 37,688 10/03/2017 39,360 40,744 (1,384)
BUY GBP Merrill Lynch International WH1 (GBP) 35,240 10/03/2017 44,763 44,364 (399)
BUY GBP Merrill Lynch International IH1 (GBP) 34,960 10/03/2017 44,407 44,011 (396)
SELL EUR Barclays Bank PLC IH1 (EUR) 39,929 10/03/2017 42,781 43,167 (386)
SELL EUR HSBC Bank IH1 (EUR) 11,953 10/03/2017 12,551 12,922 (371)
SELL EUR Goldman Sachs International IH1 (EUR) 11,966 10/03/2017 12,625 12,936 (312)
SELL EUR Goldman Sachs International IH1 (EUR) 10,199 10/03/2017 10,717 11,026 (309)
SELL EUR JPMorgan Chase Bank N.A. IH1 (EUR) 9,288 10/03/2017 9,859 10,041 (182)
SELL EUR Goldman Sachs International IH1 (EUR) 5,003 10/03/2017 5,247 5,409 (163)
SELL EUR Goldman Sachs International IH1 (EUR) 23,906 10/03/2017 25,688 25,845 (156)
SELL EUR Goldman Sachs International IH1 (EUR) 4,204 10/03/2017 4,390 4,545 (154)
SELL EUR Goldman Sachs International IH1 (EUR) 4,747 10/03/2017 4,979 5,132 (153)
SELL EUR Goldman Sachs International IH1 (EUR) 4,418 10/03/2017 4,632 4,776 (143)
SELL EUR JPMorgan Chase Bank N.A. IH1 (EUR) 12,785 10/03/2017 13,695 13,822 (128)
SELL EUR JPMorgan Chase Bank N.A. IH1 (EUR) 6,954 10/03/2017 7,392 7,518 (126)
SELL EUR JPMorgan Chase Bank N.A. IH1 (EUR) 11,523 10/03/2017 12,347 12,457 (110)
SELL EUR Barclays Bank PLC IH1 (EUR) 5,062 10/03/2017 5,370 5,473 (103)
SELL EUR Barclays Bank PLC IH1 (EUR) 7,843 10/03/2017 8,379 8,479 (100)
SELL EUR JPMorgan Chase Bank N.A. IH1 (EUR) 6,084 10/03/2017 6,484 6,578 (94)
SELL EUR JPMorgan Chase Bank N.A. IH1 (EUR) 4,002 10/03/2017 4,235 4,326 (91)
SELL EUR Goldman Sachs International IH1 (EUR) 2,186 10/03/2017 2,280 2,363 (84)
SELL EUR Goldman Sachs International IH1 (EUR) 5,356 10/03/2017 5,714 5,791 (77)
SELL EUR JPMorgan Chase Bank N.A. IH1 (EUR) 5,348 10/03/2017 5,706 5,781 (75)
SELL EUR Goldman Sachs International IH1 (EUR) 11,453 10/03/2017 12,342 12,382 (40)
SELL EUR Goldman Sachs International IH1 (EUR) 4,435 10/03/2017 4,767 4,795 (27)
SELL EUR Barclays Bank PLC IH1 (EUR) 2,361 10/03/2017 2,525 2,553 (27)
SELL EUR Goldman Sachs International IH1 (EUR) 885 10/03/2017 933 957 (24)
SELL EUR Goldman Sachs International IH1 (EUR) 4,226 10/03/2017 4,550 4,569 (18)
SELL EUR Barclays Bank PLC IH1 (EUR) 784 10/03/2017 837 847 (11)
SELL EUR Goldman Sachs International IH1 (EUR) 1,374 10/03/2017 1,477 1,485 (8)
Total $(148,557)
U.S. Equity Income FundAppreciationBUY EUR Citibank N.A. AH1 (EUR) 49,445 10/03/2017 $53,343 $53,454 $111
BUY EUR Goldman Sachs International AH1 (EUR) 2,702 10/03/2017 2,907 2,922 15
BUY EUR Barclays Bank PLC AH1 (EUR) 740 10/03/2017 793 800 7
BUY EUR Citibank N.A. AH2 (EUR) 46,588 10/03/2017 50,261 50,366 105
BUY EUR Goldman Sachs International AH2 (EUR) 2,566 10/03/2017 2,742 2,774 32
BUY EUR Citibank N.A. AH3 (EUR) 95,326 10/03/2017 102,842 103,056 214
BUY EUR Citibank N.A. IH1 (EUR) 46,606 10/03/2017 50,281 50,386 105
BUY EUR Goldman Sachs International IH1 (EUR) 2,511 10/03/2017 2,689 2,715 26
BUY EUR Citibank N.A. WH1 (EUR) 49,545 10/03/2017 53,452 53,563 111
BUY EUR Barclays Bank PLC WH1 (EUR) 2,752 10/03/2017 2,945 2,975 30
BUY EUR Citibank N.A. WH2 (EUR) 49,545 10/03/2017 53,452 53,563 111
BUY EUR Barclays Bank PLC WH2 (EUR) 2,752 10/03/2017 2,945 2,975 30
BUY EUR Citibank N.A. WH3 (EUR) 49,545 10/03/2017 53,452 53,563 111
BUY EUR Barclays Bank PLC WH3 (EUR) 2,752 10/03/2017 2,945 2,975 30
Total $1,038
216 MFS Meridian Funds Annual Report 2017

NOTES TO FINANCIAL STATEMENTS at 31 January 2017
Type Currency Counterparty ClassContracts to
Deliver/ReceiveSettlementDate Range In Exchange For
Contracts atValue
NetUnrealizedGain (Loss)
U.S. Equity Income Fund – (continued)DepreciationBUY GBP Goldman Sachs International IH1 (GBP) 2,287 10/03/2017 $2,888 $2,879 $(9)
BUY GBP Merrill Lynch International IH1 (GBP) 33,742 10/03/2017 42,860 42,478 (382)
BUY GBP Goldman Sachs International WH1 (GBP) 2,268 10/03/2017 2,864 2,855 (9)
BUY GBP Merrill Lynch International WH1 (GBP) 33,714 10/03/2017 42,825 42,443 (382)
BUY GBP Goldman Sachs International WH2 (GBP) 2,269 10/03/2017 2,865 2,856 (9)
BUY GBP Merrill Lynch International WH2 (GBP) 33,715 10/03/2017 42,826 42,444 (382)
BUY GBP Goldman Sachs International WH3 (GBP) 2,269 10/03/2017 2,865 2,856 (9)
BUY GBP Merrill Lynch International WH3 (GBP) 33,715 10/03/2017 42,826 42,444 (382)
Total $(1,564)
U.S. Equity Opportunities FundAppreciationBUY EUR Citibank N.A. AH1 (EUR) 48,988 10/03/2017 $52,850 $52,960 $110
BUY EUR Citibank N.A. IH1 (EUR) 50,204 10/03/2017 54,162 54,275 113
BUY EUR Citibank N.A. WH1 (EUR) 49,941 10/03/2017 53,879 53,991 112
Total $335
DepreciationBUY GBP Merrill Lynch International IH1 (GBP) 36,891 10/03/2017 $46,860 $46,442 $(418)
BUY GBP Merrill Lynch International WH1 (GBP) 36,759 10/03/2017 46,693 46,276 (417)
Total $(835)
U.S. Total Return Bond FundAppreciationBUY CHF UBS AG WH1 (CHF) 48,900 10/03/2017 $48,677 $49,512 $835
BUY EUR Citibank N.A. AH1 (EUR) 935,865 10/03/2017 1,009,655 1,011,757 2,102
BUY EUR Citibank N.A. IH1 (EUR) 47,300 10/03/2017 51,029 51,136 107
BUY EUR Goldman Sachs International WH1 (EUR) 46,707 10/03/2017 50,390 50,495 105
Total $3,149
DepreciationBUY GBP Merrill Lynch International IH1 (GBP) 33,257 10/03/2017 $42,244 $41,867 $(377)
BUY GBP Merrill Lynch International WH1 (GBP) 33,270 10/03/2017 42,261 41,884 (377)
Total $(754)
U.S. Value FundAppreciationBUY EUR Goldman Sachs International AH1 (EUR) 19,944 10/03/2017 $21,042 $21,561 $519
BUY EUR Goldman Sachs International AH1 (EUR) 35,000 10/03/2017 36,501 37,838 1,337
BUY EUR Goldman Sachs International AH1 (EUR) 93,881 10/03/2017 98,445 101,495 3,050
BUY EUR Goldman Sachs International AH1 (EUR) 3,918 10/03/2017 4,131 4,235 104
BUY EUR JPMorgan Chase Bank N.A. AH1 (EUR) 40,000 10/03/2017 42,299 43,244 945
BUY EUR JPMorgan Chase Bank N.A. AH1 (EUR) 30,432 10/03/2017 32,350 32,900 550
BUY EUR JPMorgan Chase Bank N.A. AH1 (EUR) 12,646 10/03/2017 13,546 13,672 126
SELL EUR Goldman Sachs International AH1 (EUR) 20,713 10/03/2017 22,443 22,393 50
BUY EUR Goldman Sachs International IH1 (EUR) 287,398 10/03/2017 306,152 310,704 4,552
BUY EUR Citibank N.A. IH1 (EUR) 5,053,122 10/03/2017 5,439,009 5,462,901 23,892
BUY EUR Barclays Bank PLC IH1 (EUR) 1,051 10/03/2017 1,122 1,136 14
BUY EUR Citibank N.A. WH1 (EUR) 339,321 10/03/2017 366,075 366,838 763
BUY EUR JPMorgan Chase Bank N.A. AH1 (EUR) 19,521 10/03/2017 20,803 21,104 301
BUY EUR Barclays Bank PLC AH1 (EUR) 80,914 10/03/2017 86,541 87,476 935
BUY EUR Barclays Bank PLC AH1 (EUR) 8,020 10/03/2017 8,593 8,670 77
BUY EUR Goldman Sachs International AH1 (EUR) 9,409 10/03/2017 9,827 10,172 345
BUY EUR Goldman Sachs International AH1 (EUR) 20,000 10/03/2017 21,017 21,622 605
MFS Meridian Funds Annual Report 2017 217

NOTES TO FINANCIAL STATEMENTS at 31 January 2017
Type Currency Counterparty ClassContracts to
Deliver/ReceiveSettlementDate Range In Exchange For
Contracts atValue
NetUnrealizedGain (Loss)
U.S. Value Fund – (continued)Appreciation – (continued)BUY EUR Goldman Sachs International AH1 (EUR) 14,990 10/03/2017 $15,708 $16,206 $498
BUY EUR Goldman Sachs International AH1 (EUR) 25,015 10/03/2017 26,686 27,044 358
BUY EUR JPMorgan Chase Bank N.A. AH1 (EUR) 20,733 10/03/2017 22,009 22,414 405
BUY EUR Goldman Sachs International AH1 (EUR) 200,470 10/03/2017 214,297 216,727 2,430
BUY EUR Citibank N.A. AH1 (EUR) 6,318,366 10/03/2017 6,800,874 6,830,748 29,874
BUY EUR Goldman Sachs International AH1 (EUR) 16,138 10/03/2017 17,390 17,446 56
BUY EUR Goldman Sachs International AH1 (EUR) 10,142 10/03/2017 10,817 10,964 147
BUY EUR JPMorgan Chase Bank N.A. AH1 (EUR) 414,468 10/03/2017 442,235 448,079 5,844
BUY GBP Barclays Bank PLC WH1 (GBP) 5,000 10/03/2017 6,177 6,295 118
BUY GBP Goldman Sachs International WH1 (GBP) 21,203 10/03/2017 26,374 26,693 319
BUY GBP JPMorgan Chase Bank N.A. WH1 (GBP) 7,416 10/03/2017 9,287 9,336 49
BUY GBP JPMorgan Chase Bank N.A. WH1 (GBP) 2,297 10/03/2017 2,872 2,892 20
BUY GBP Barclays Bank PLC WH1 (GBP) 25,000 10/03/2017 31,382 31,473 91
BUY GBP Goldman Sachs International WH1 (GBP) 2,000 10/03/2017 2,502 2,518 16
BUY GBP Barclays Bank PLC WH1 (GBP) 152,000 10/03/2017 187,424 191,355 3,931
BUY GBP Morgan Stanley Capital Services, Inc. WH1 (GBP) 101,103 10/03/2017 124,200 127,280 3,080
BUY GBP Barclays Bank PLC WH1 (GBP) 842 10/03/2017 1,032 1,059 27
Total $85,428
DepreciationSELL EUR Goldman Sachs International AH1 (EUR) 36,315 10/03/2017 $39,061 $39,260 $(199)
SELL EUR Goldman Sachs International AH1 (EUR) 1,990 10/03/2017 2,139 2,152 (13)
SELL EUR Goldman Sachs International AH1 (EUR) 29,381 10/03/2017 30,971 31,764 (793)
SELL EUR Goldman Sachs International AH1 (EUR) 56,671 10/03/2017 59,427 61,267 (1,840)
SELL EUR JPMorgan Chase Bank N.A. IH1 (EUR) 332,333 10/03/2017 354,489 359,284 (4,795)
SELL EUR Barclays Bank PLC IH1 (EUR) 806 10/03/2017 861 872 (11)
SELL EUR Goldman Sachs International IH1 (EUR) 2,547 10/03/2017 2,669 2,753 (84)
SELL EUR JPMorgan Chase Bank N.A. AH1 (EUR) 58,643 10/03/2017 62,553 63,398 (845)
BUY EUR Goldman Sachs International AH1 (EUR) 44,540 10/03/2017 48,212 48,153 (59)
BUY GBP Goldman Sachs International WH1 (GBP) 49,020 10/03/2017 62,466 61,712 (754)
BUY GBP Merrill Lynch International WH1 (GBP) 606,340 10/03/2017 770,204 763,332 (6,872)
BUY GBP Goldman Sachs International WH1 (GBP) 34,777 10/03/2017 43,918 43,781 (137)
BUY GBP Barclays Bank PLC WH1 (GBP) 60,502 10/03/2017 77,085 76,167 (918)
SELL GBP JPMorgan Chase Bank N.A. WH1 (GBP) 800 10/03/2017 973 1,006 (33)
SELL GBP Goldman Sachs International WH1 (GBP) 87,284 10/03/2017 107,164 109,884 (2,720)
SELL GBP Goldman Sachs International WH1 (GBP) 40,614 10/03/2017 50,203 51,129 (926)
SELL GBP HSBC Bank WH1 (GBP) 18,000 10/03/2017 22,145 22,661 (516)
BUY GBP Goldman Sachs International WH1 (GBP) 1,100 10/03/2017 1,394 1,385 (9)
BUY GBP HSBC Bank WH1 (GBP) 30,070 10/03/2017 37,916 37,856 (60)
Total $(21,584)
Note 12: Repurchase Agreements
Details of the repurchase agreements outstanding at 31 January 2017:
Sub-Fund CounterpartyMaturity
DateInterest
Rate CurrencyMarketValue Collateral
Absolute Return Fund Merrill Lynch, Pierce, Fenner & Smith, Inc. 1/02/2017 0.51% USD $10,000 $10,986
Asia Pacific Ex-Japan Fund Merrill Lynch, Pierce, Fenner & Smith, Inc. 1/02/2017 0.51% USD 996,000 1,016,728
Diversified Income Fund Merrill Lynch, Pierce, Fenner & Smith, Inc. 1/02/2017 0.51% USD 1,337,000 1,364,293
Emerging Markets Debt Fund Merrill Lynch, Pierce, Fenner & Smith, Inc. 1/02/2017 0.51% USD 21,911,000 22,357,019
Emerging Markets Debt Local Currency Fund Merrill Lynch, Pierce, Fenner & Smith, Inc. 1/02/2017 0.51% USD 3,690,000 3,765,288
218 MFS Meridian Funds Annual Report 2017

NOTES TO FINANCIAL STATEMENTS at 31 January 2017
Sub-Fund CounterpartyMaturity
DateInterest
Rate CurrencyMarketValue Collateral
Emerging Markets Equity Fund Merrill Lynch, Pierce, Fenner & Smith, Inc. 1/02/2017 0.51% USD $541,000 $552,309
Global Concentrated Fund Merrill Lynch, Pierce, Fenner & Smith, Inc. 1/02/2017 0.51% USD 9,608,000 9,803,730
Global Credit Fund Merrill Lynch, Pierce, Fenner & Smith, Inc. 1/02/2017 0.51% USD 1,719,000 1,754,804
Global Energy Fund Merrill Lynch, Pierce, Fenner & Smith, Inc. 1/02/2017 0.51% USD 507,000 517,353
Global Equity Fund Merrill Lynch, Pierce, Fenner & Smith, Inc. 1/02/2017 0.51% USD 55,097,000 56,216,641
Global Equity Income Fund Merrill Lynch, Pierce, Fenner & Smith, Inc. 1/02/2017 0.51% USD 1,455,000 1,485,141
Global High Yield fund Merrill Lynch, Pierce, Fenner & Smith, Inc. 1/02/2017 0.51% USD 15,868,000 16,190,736
Global Multi-Asset Fund Merrill Lynch, Pierce, Fenner & Smith, Inc. 1/02/2017 0.51% USD 7,211,000 7,357,791
Global Opportunistic Bond Fund Merrill Lynch, Pierce, Fenner & Smith, Inc. 1/02/2017 0.51% USD 3,977,000 4,057,921
Global Research Focused Fund Merrill Lynch, Pierce, Fenner & Smith, Inc. 1/02/2017 0.51% USD 3,874,000 3,953,053
Global Total Return Fund Merrill Lynch, Pierce, Fenner & Smith, Inc. 1/02/2017 0.51% USD 27,589,000 28,149,769
Inflation-Adjusted Bond Fund Merrill Lynch, Pierce, Fenner & Smith, Inc. 1/02/2017 0.51% USD 3,147,000 3,210,981
Japan Equity Fund Merrill Lynch, Pierce, Fenner & Smith, Inc. 1/02/2017 0.51% USD 141,000 144,819
Latin American Equity Fund Merrill Lynch, Pierce, Fenner & Smith, Inc. 1/02/2017 0.51% USD 162,000 165,793
Managed Wealth Fund Merrill Lynch, Pierce, Fenner & Smith, Inc. 1/02/2017 0.51% USD 2,745,000 2,801,494
Prudent Capital Fund Merrill Lynch, Pierce, Fenner & Smith, Inc. 1/02/2017 0.51% USD 706,000 721,098
Prudent Wealth Fund Merrill Lynch, Pierce, Fenner & Smith, Inc. 1/02/2017 0.51% USD 93,781,000 95,687,241
U.S. Concentrated Growth Fund Merrill Lynch, Pierce, Fenner & Smith, Inc. 1/02/2017 0.51% USD 2,051,000 2,093,380
U.S. Corporate Bond Merrill Lynch, Pierce, Fenner & Smith, Inc. 1/02/2017 0.51% USD 3,410,000 3,479,645
U.S. Equity Income Fund Merrill Lynch, Pierce, Fenner & Smith, Inc. 1/02/2017 0.51% USD 116,000 118,851
U.S. Equity Opportunities Fund Merrill Lynch, Pierce, Fenner & Smith, Inc. 1/02/2017 0.51% USD 320,000 326,591
U.S. Total Return Bond Fund Merrill Lynch, Pierce, Fenner & Smith, Inc. 1/02/2017 0.51% USD 15,849,000 16,171,760
U.S. Value Fund Merrill Lynch, Pierce, Fenner & Smith, Inc. 1/02/2017 0.51% USD 17,420,000 17,774,754
At 31 January 2017, with respect to the Merrill Lynch, Pierce, Fenner & Smith, Inc. repurchase agreements which are held by a third-party agent, collateralwas received with a market value of $301,249,969. Collateral received consists of high-quality United States government and agency debt.
Note 13: Open Futures Contracts
At 31 January 2017, the sub-funds had the following futures contracts outstanding:
Description Currency Counterparty Expiration Notional Contracts
NetUnrealizedGain (Loss)
Absolute Return Fund(b)
AEX Index (Short) EUR Goldman Sachs Group, Inc. February 2017 400 2 $2,519
Australian Treasury Bond 10 yr (Long) AUD Merrill Lynch, Pierce, Fenner & Smith, Inc. March 2017 2,000,000 20 22,519
Bovespa Index (Long) BRL Goldman Sachs Group, Inc. February 2017 31 31 33,673
CAC 40 Index (Long) EUR Goldman Sachs Group, Inc. February 2017 80 8 (10,253)
Canadian Treasury Bond 10 yr (Long) CAD Merrill Lynch, Pierce, Fenner & Smith, Inc. March 2017 800,000 8 1,867
DAX Index (Long) EUR Goldman Sachs Group, Inc. March 2017 50 2 (527)
E-Mini S&P 500 Index (Short) USD Goldman Sachs Group, Inc. March 2017 350 7 (7,843)
FTSE 100 Index (Long) GBP Goldman Sachs Group, Inc. March 2017 80 8 10,992
FTSE/JSE Top 40 Index (Short) ZAR Goldman Sachs Group, Inc. March 2017 150 15 (14,816)
FTSE/MIB Index (Long) EUR Goldman Sachs Group, Inc. March 2017 20 4 (834)
German Euro Bund (Short) EUR Merrill Lynch, Pierce, Fenner & Smith, Inc. March 2017 1,400,000 14 (14,606)
Hang Seng China Enterprises Index (Long) HKD Goldman Sachs Group, Inc. February 2017 450 9 (1,433)
Hang Seng Index (Long) HKD Goldman Sachs Group, Inc. February 2017 200 4 4,444
Japan Government Note 10 yr (Short) JPY Merrill Lynch, Pierce, Fenner & Smith, Inc. March 2017 100,000,000 1 695
Kospi 200 Index (Short) KRW Goldman Sachs Group, Inc. March 2017 500,000 1 (8,713)
Mexico Bolsa Index (Short) MXN Goldman Sachs Group, Inc. March 2017 50 5 (892)
MSCI Singapore Index (Short) SGD Goldman Sachs Group, Inc. February 2017 1,200 12 (1,200)
MSCI Taiwan Index (Long) USD Goldman Sachs Group, Inc. February 2017 1,300 13 12,925
OMX 30 Index (Long) SEK Goldman Sachs Group, Inc. February 2017 400 4 1,278
Russell 2000 Mini Index (Short) USD Goldman Sachs Group, Inc. March 2017 150 3 2,001
MFS Meridian Funds Annual Report 2017 219

NOTES TO FINANCIAL STATEMENTS at 31 January 2017
Description Currency Counterparty Expiration Notional Contracts
NetUnrealizedGain (Loss)
Absolute Return Fund(b) – (continued)S&P/TSE 60 Index (Short) CAD Goldman Sachs Group, Inc. March 2017 800 4 $(933)
S&P/ASX 200 Index (Short) AUD Goldman Sachs Group, Inc. March 2017 175 7 (3,747)
SGX CNX Nifty Index (Short) USD Goldman Sachs Group, Inc. February 2017 50 25 (9,104)
TOPIX Index (Short) JPY Goldman Sachs Group, Inc. March 2017 40,000 4 (18,425)
Turk DEX-BIST 30 Index (Long) TRY Goldman Sachs Group, Inc. February 2017 13,300 133 38,501
United Kingdom Treasury 10 yr (Short) GBP Merrill Lynch, Pierce, Fenner & Smith, Inc. March 2017 400,000 4 (600)
U.S. Treasury Note 5 yr (Long) USD Merrill Lynch, Pierce, Fenner & Smith, Inc. March 2017 300,000 3 2,333
U.S. Treasury Note 10 yr (Long) USD Merrill Lynch, Pierce, Fenner & Smith, Inc. March 2017 1,000,000 10 (1,234)
Total $38,587
Emerging Markets Debt Fund(b)
Euro-OAT 10 yr (Short) EUR Merrill Lynch, Pierce, Fenner & Smith, Inc. March 2017 7,200,000 72 $17,424
U.S. Treasury Ultra Note 10 yr (Long) USD Merrill Lynch, Pierce, Fenner & Smith, Inc. March 2017 63,000,000 630 170,597
U.S. Treasury Bond 30 yr (Long) USD Merrill Lynch, Pierce, Fenner & Smith, Inc. March 2017 17,000,000 170 (104,505)
U.S. Treasury Note 10 yr (Long) USD Merrill Lynch, Pierce, Fenner & Smith, Inc. March 2017 15,200,000 152 (50,990)
U.S. Treasury Ultra Bond (Long) USD Merrill Lynch, Pierce, Fenner & Smith, Inc. March 2017 6,100,000 61 175,470
Total $207,996
Emerging Markets Debt Local Currency Fund(b)
Euro-OAT 10 yr (Short) EUR Merrill Lynch, Pierce, Fenner & Smith, Inc. March 2017 600,000 6 $17,424
Global Multi-Asset Fund(b)
AEX Index (Short) EUR Goldman Sachs Group, Inc. February 2017 2,400 12 $15,117
ASX SPI 200 Index (Short) AUD Goldman Sachs Group, Inc. March 2017 925 37 (16,877)
Australian Treasury Bond 10 yr (Long) AUD Merrill Lynch, Pierce, Fenner & Smith, Inc. March 2017 11,000,000 110 124,534
Bovespa Index (Long) BRL Goldman Sachs Group, Inc. February 2017 176 176 190,747
CAC 40 Index (Long) EUR Goldman Sachs Group, Inc. February 2017 460 46 (58,953)
Canadian Treasury Bond 10 yr (Long) CAD Merrill Lynch, Pierce, Fenner & Smith, Inc. March 2017 4,600,000 46 10,139
DAX Index (Long) EUR Goldman Sachs Group, Inc. March 2017 225 9 25,633
E-Mini S&P 500 Index (Short) USD Goldman Sachs Group, Inc. March 2017 1,850 37 (43,299)
FTSE 100 Index (Long) GBP Goldman Sachs Group, Inc. March 2017 430 43 74,298
FTSE/JSE Top 40 Index (Short) ZAR Goldman Sachs Group, Inc. March 2017 830 83 (84,811)
FTSE/MIB Index (Long) EUR Goldman Sachs Group, Inc. March 2017 125 25 (16,515)
German Euro Bund (Short) EUR Merrill Lynch, Pierce, Fenner & Smith, Inc. March 2017 7,800,000 78 (81,042)
Hang Seng China Enterprises Index (Long) HKD Goldman Sachs Group, Inc. February 2017 2,600 52 (8,279)
Hang Seng Index (Long) HKD Goldman Sachs Group, Inc. February 2017 1,250 25 27,773
Japanese Government Bond 10 yr (Short) JPY Merrill Lynch, Pierce, Fenner & Smith, Inc. March 2017 600,000,000 6 9,840
Kospi 200 Index (Short) KRW Goldman Sachs Group, Inc. March 2017 4,000,000 8 (69,770)
Mexico Bolsa Index (Short) MXN Goldman Sachs Group, Inc. March 2017 260 26 (4,638)
MSCI Singapore Index (Short) SGD Goldman Sachs Group, Inc. February 2017 6,500 65 (6,503)
MSCI Taiwan Index (Long) USD Goldman Sachs Group, Inc. February 2017 7,500 75 74,569
OMX 30 Index (Long) SEK Goldman Sachs Group, Inc. February 2017 2,200 22 7,030
Russell 2000 Mini Index (Short) USD Goldman Sachs Group, Inc. March 2017 800 16 11,211
S&P/TSE 60 Index (Short) CAD Goldman Sachs Group, Inc. March 2017 4,800 24 (1,968)
SGX CNX Nifty Index (Short) USD Goldman Sachs Group, Inc. February 2017 282 141 (51,349)
TOPIX Index (Short) JPY Goldman Sachs Group, Inc. March 2017 210,000 21 (96,733)
TurkDEX-BIST 30 Index (Long) TRY Goldman Sachs Group, Inc. February 2017 74,300 743 212,441
United Kingdom Treasury 10 yr (Short) GBP Merrill Lynch, Pierce, Fenner & Smith, Inc. March 2017 2,100,000 21 (11,809)
U.S. Treasury Note 10 yr (Long) USD Merrill Lynch, Pierce, Fenner & Smith, Inc. March 2017 4,600,000 46 (6,222)
U.S. Treasury Bond 30 yr (Long) USD Merrill Lynch, Pierce, Fenner & Smith, Inc. March 2017 100,000 1 (615)
Total $223,949
220 MFS Meridian Funds Annual Report 2017

NOTES TO FINANCIAL STATEMENTS at 31 January 2017
Description Currency Counterparty Expiration Notional Contracts
NetUnrealizedGain (Loss)
Global Opportunistic Bond Fund(b)
Euro Government Bond 5 yr (Long) EUR Merrill Lynch, Pierce, Fenner & Smith, Inc. March 2017 400,000 4 $2,850
Euro Government Bond 10 yr (Long) EUR Merrill Lynch, Pierce, Fenner & Smith, Inc. March 2017 1,000,000 10 10,282
Euro Government Bond 30 yr (Long) EUR Merrill Lynch, Pierce, Fenner & Smith, Inc. March 2017 300,000 3 (8,809)
United Kingdom Treasury 10 yr (Long) GBP Merrill Lynch, Pierce, Fenner & Smith, Inc. March 2017 600,000 6 906
U.S. Treasury Note 2 yr (Short) USD Merrill Lynch, Pierce, Fenner & Smith, Inc. March 2017 2,200,000 11 (344)
U.S. Treasury Note 5 yr (Long) USD Merrill Lynch, Pierce, Fenner & Smith, Inc. March 2017 3,500,000 35 1,367
U.S. Treasury Note 10 yr (Short) USD Merrill Lynch, Pierce, Fenner & Smith, Inc. March 2017 7,200,000 72 24,750
U.S. Treasury Note Ultra 10 yr (Long) USD Merrill Lynch, Pierce, Fenner & Smith, Inc. March 2017 500,000 5 (2,978)
U.S. Treasury Bond 30 yr (Short) USD Merrill Lynch, Pierce, Fenner & Smith, Inc. March 2017 500,000 5 3,008
U.S. Treasury Ultra Bond (Short) USD Merrill Lynch, Pierce, Fenner & Smith, Inc. March 2017 400,000 4 3,281
Total $34,313
Global Total Return Fund(b)
Euro Government Bond (Short) EUR Merrill Lynch, Pierce, Fenner & Smith, Inc. March 2017 4,400,000 44 $(45,442)
U.S. Treasury Note 10 yr (Short) USD Merrill Lynch, Pierce, Fenner & Smith, Inc. March 2017 8,500,000 85 24,223
Total $(21,219)
Limited Maturity Fund(b)
U.S. Treasury Note 2 yr (Long) USD Merrill Lynch, Pierce, Fenner & Smith, Inc. March 2017 20,000,000 100 $9,022
U.S. Treasury Note 5 yr (Long) USD Merrill Lynch, Pierce, Fenner & Smith, Inc. March 2017 12,300,000 123 78,589
Total $87,611
Managed Wealth Fund(b)
E-Mini S&P 500 Index Future (Short) USD Merrill Lynch, Pierce, Fenner & Smith, Inc. March 2017 9,000 180 $(175,350)
Mini MSCI EAFE Index Future (Short) USD Merrill Lynch, Pierce, Fenner & Smith, Inc. March 2017 6,800 136 (268,482)
Mini MSCI EM Index Future (Short) USD Merrill Lynch, Pierce, Fenner & Smith, Inc. March 2017 4,850 97 (172,589)
Total $(616,421)
U.S. Government Bond Fund(b)
U.S. Treasury Ultra Bond (Long) USD Merrill Lynch, Pierce, Fenner & Smith, Inc. March 2017 1,100,000 11 $11,990
U.S. Total Return Bond Fund(b)
U.S. Treasury Note 2 yr (Long) USD Merrill Lynch, Pierce, Fenner & Smith, Inc. March 2017 5,000,000 25 $(479)
U.S. Treasury Note 5 yr (Long) USD Merrill Lynch, Pierce, Fenner & Smith, Inc. March 2017 25,000,000 250 8,883
U.S. Treasury Bond 30 yr (Long) USD Merrill Lynch, Pierce, Fenner & Smith, Inc. March 2017 6,500,000 65 83,859
U.S. Treasury Ultra Note 10 yr (Short) USD Merrill Lynch, Pierce, Fenner & Smith, Inc. March 2017 3,000,000 30 17,887
Total $110,150
The Statements of Assets and Liabilities reflect the net daily variation margin, if any, as of 31 January 2017 on open futures which differs from the netunrealized gain/(loss) shown above. At 31 January 2017, each sub-fund had sufficient cash and/or other securities to cover any commitments under thesederivative contracts.
(b) The Absolute Return Fund, Emerging Markets Debt Fund, Emerging Markets Debt Local Currency Fund, Global Multi-Asset Fund, Global OpportunisticBond Fund, Global Total Return Fund, Limited Maturity Fund, Managed Wealth Fund, U.S. Government Bond Fund, and U.S. Total Return Bond Fundsegregated $727,163, $2,879,285, $26,580, $4,046,277, $204,398, $246,550, $159,550, $1,620,200, $61,600, and $472,650, respectively, as cashcollateral for open futures contracts, which is held with the counterparty.
MFS Meridian Funds Annual Report 2017 221

NOTES TO FINANCIAL STATEMENTS at 31 January 2017
Note 14: Swap Agreements
At 31 January 2017, the sub-funds had outstanding the following swap agreements. Each sub-fund had sufficient cash and/or other securities to cover anycommitments under these derivative contracts.
ExpirationNotionalAmount Counterparty Cash Flows to Receive Cash Flows to Pay Value
Absolute Return Fund
Total Return Swaps
Appreciation20/06/2017 USD 1,590,000 Goldman Sachs International IBOXHY (floating rate) 0.857% (fixed rate) $50,703
Emerging Markets Debt Fund
Credit Default Swaps
Appreciation20/12/2021 USD 10,471,000(a) Barclays Bank PLC (1) 1.00% (fixed rate) $763,613
20/12/2021 USD 2,880,000(b) Goldman Sachs International (1) 1.00% (fixed rate) 210,028
Total $973,641
Depreciation20/12/2021 USD 10,898,000(c) Barclays Bank PLC (2) 1.00% (fixed rate) $(267,543)
20/12/2021 USD 18,206,000(d) Barclays Bank PLC 1.00% (fixed rate) (3) (679,799)
20/12/2021 USD 2,230,000(e) Merrill Lynch International 1.00% (fixed rate) (3) (83,267)
Total $(1,030,609)
(1) Sub-fund, as protection buyer, to receive notional amount upon a defined credit event by Republic of Turkey, 11.875%, 1/15/2030.(2) Sub-fund, as protection buyer, to receive notional amount upon a defined credit event by Republic of Korea, 7.125%, 16/04/2029.(3) Sub-fund, as protection seller, to pay notional amount upon a defined credit event by Republic of Russia, 4.25%, 31/03/2030, BB+ rated bond. The fund entered into the
contract to gain issuer exposure.(a) Net unamortized premiums paid by the sub-fund amounted to $885,286.(b) Net unamortized premiums paid by the sub-fund amounted to $243,494.(c) Net unamortized premiums received by the sub-fund amounted to $279,826.(d) Net unamortized premiums paid by the sub-fund amounted to $523,284.(e) Net unamortized premiums paid by the sub-fund amounted to $64,096.
ExpirationNotionalAmount Counterparty Cash Flows to Receive Cash Flows to Pay Value
Emerging Markets Debt Local Currency Fund
Credit Default Swaps
Appreciation20/12/2021 USD 551,000(a) JPMorgan Chase Bank N.A. (1) 1.00% (fixed rate) $27,403
Interest Rate Swaps
Appreciation29/01/2019 MXN 7,702,000 Merrill Lynch International 7.30% (fixed rate) TIIE (floating rate) $237
30/01/2019 MXN 7,672,000 Goldman Sachs International 7.28% (fixed rate) TIIE (floating rate) 0
31/01/2019 ZAR 9,993,000 JPMorgan Chase Bank N.A. JIBAR (floating rate) 7.49% (fixed rate) 0
29/07/2021 COP 1,150,000,000 Goldman Sachs International 6.58% (fixed rate) COLIBOR (floating rate) 12,060
26/04/2026 CZK 8,622,000 JPMorgan Chase Bank N.A. PRIBOR (floating rate) 0.66% (fixed rate) 11,675
3/06/2026 ZAR 3,508,000 JPMorgan Chase Bank N.A. 8.81% (fixed rate) JIBAR (floating rate) 10,616
6/06/2026 ZAR 2,629,000 JPMorgan Chase Bank N.A. 8.68% (fixed rate) JIBAR (floating rate) 6,287
24/10/2026 CZK 2,000,000 JPMorgan Chase Bank N.A. 0.68% (fixed rate) PRIBOR (floating rate) 3,083
20/01/2027 MXN 5,754,000 Goldman Sachs International 7.86% (fixed rate) TIIE (floating rate) 0
Total $43,958
Depreciation
26/04/2018 CZK 43,108,000 JPMorgan Chase Bank N.A. 0.30% (fixed rate) PRIBOR (floating rate) $(1,175)
24/10/2018 CZK 10,000,000 JPMorgan Chase Bank N.A. 0.32% (fixed rate) PRIBOR (floating rate) (407)
7/12/2019 INR 25,018,000 JPMorgan Chase Bank N.A. 5.91% (fixed rate) JIBOR (floating rate) (1,866)
Total $(3,448)
(1) Sub-fund, as protection buyer, to receive notional amount upon a defined credit event by the Republic of South Africa, 5.5%, 9/03/2020.(a) Net unamortized premiums paid by the sub-fund amounted to $39,178.
222 MFS Meridian Funds Annual Report 2017

NOTES TO FINANCIAL STATEMENTS at 31 January 2017
ExpirationNotionalAmount Counterparty Cash Flows to Receive Cash Flows to Pay Value
Global Multi-Asset Fund
Total Return Swaps
Appreciation
8/01/2018 USD 5,450,086 JPMorgan Chase Bank N.A. BCOMTR (floating rate) 0.09% (fixed rate) $3,023
8/01/2018 USD 5,456,763 JPMorgan Chase Bank N.A. BCOMF3T (floating rate) 0.14% (fixed rate) 3,025
Total $6,048
BCOMF3T Bloomberg Commodity Index 3 Month Forward Total ReturnBCOMTR Bloomberg Commodity Index Total ReturnCOLIBOR Columbia Interbank Offered RateIBOXHY IBOXX USD Liquid High Yield Index Series 1JIBAR Johannesburg Interbank Agreed RateJIBOR Jakarta Interbank Offered RatePRIBOR Prague Interbank Offered RateTIIE Interbank Equilibrium Interest Rate
Note 15: Transaction Costs
For the year ended 31 January 2017, the sub-funds incurred transaction costs which have been defined as brokerage commissions in respect of the purchaseor sale of transferable securities, money market instruments, derivatives or other eligible assets, and fees charged by the Depositary for the execution of thesub-funds transactions. Brokerage commissions are included in Identified Cost in the Schedules of Investments or in Net Realized Gain (Loss) on Investments,Derivatives, and Currency Transactions in the Statements of Operations and Changes in Net Assets. Fees charged by the Depositary are disclosed as part ofthe depositary fee in the Statements of Operations and Changes in Net Assets.
Sub-FundTransaction
Costs
Absolute Return Fund $24,924
Asia Pacific Ex-Japan Fund $126,104
Blended Research European Equity Fund €15,389
Continental European Equity Fund €6,937
Diversified Income Fund $61,498
Emerging Markets Debt Fund $112,470
Emerging Markets Debt Local Currency Fund $21,121
Emerging Markets Equity Fund $141,930
European Core Equity Fund €13,809
European Research Fund €1,236,868
European Smaller Companies Fund €525,184
European Value Fund €1,975,226
Global Concentrated Fund $187,995
Global Credit Fund $3,625
Global Energy Fund $11,619
Global Equity Fund $805,259
Global Equity Income Fund $147,238
Global High Yield Fund $17,689
Global Multi-Asset Fund $166,572
Global Opportunistic Bond Fund (a) $6,616
Global Research Focused Fund $307,262
Global Total Return Fund $545,660
Inflation-Adjusted Bond Fund $1,667
Japan Equity Fund $10,207
Latin American Equity Fund $88,327
Limited Maturity Fund $4,548
MFS Meridian Funds Annual Report 2017 223

NOTES TO FINANCIAL STATEMENTS at 31 January 2017
Sub-Fund - (continued)Transaction
Costs
Managed Wealth Fund $48,015
Prudent Capital Fund (b) $4,965
Prudent Wealth Fund $768,682
U.K. Equity Fund £73,138
U.S. Concentrated Growth Fund $120,044
U.S. Corporate Bond Fund $4,728
U.S. Equity Income Fund $8,595
U.S. Equity Opportunities Fund $21,961
U.S. Government Bond Fund $1,283
U.S. Total Return Bond Fund $24,189
U.S. Value Fund $196,364
(a) The inception date of the sub-fund was 12 July 2016.(b) The inception date of the sub-fund was 3 November 2016.
Note 16: Summary of accounting differences between Luxembourg legal and regulatory requirements for investmentfunds and accounting principles generally accepted in the United States
The fund’s financial statements are prepared in accordance with Luxembourg legal and regulatory requirements for investment funds. These requirementsdiffer in the manner in which discount is accreted and premium is amortized into income for certain fixed income securities from accounting principlesgenerally accepted in the United States (“U.S. GAAP”). These differences do not change the total results of operations but may impact amounts reported fornet investment income and change in realized and unrealized gain (loss) for investments, derivatives, and currency translation. These differences have noimpact on the net assets of the sub-funds. The financial statement impact and a description of the material differences for those impacted sub-funds are asfollows:
Sub-Fund
Total net investment income inaccordance with Luxembourglegal and regulatoryrequirements
Net adjustment foramortization of premium, andaccretion of discount on certainfixed income securities
Total net investment income inaccordance with U.S. GAAP
Absolute Return Fund $ 20,652 $ (23,014) $ (2,362)
Diversified Income Fund 3,420,288 (343,043) 3,077,245
Emerging Markets Debt Fund 150,445,341 (9,274,031) 141,171,310
Emerging Markets Debt Local Currency Fund 1,939,537 (139,090) 1,800,447
Global Credit Fund 550,026 (60,838) 489,188
Global High Yield Fund 35,031,320 (2,042,477) 32,988,843
Global Multi-Asset Fund 274,458 (228,846) 45,612
Global Opportunistic Bond Fund (a) 656,008 (198,635) 457,373
Global Total Return Fund 21,158,523 (7,670,478) 13,488,045
Inflation-Adjusted Bond Fund 1,156,826 (887,194) 269,632
Limited Maturity Fund 5,951,786 (1,711,890) 4,239,896
Prudent Capital Fund (b) 8,528 (1,243) 7,285
Prudent Wealth Fund (9,091,076) (1,210,064) (10,301,140)
U.S. Corporate Bond Fund 4,387,454 (761,929) 3,625,525
U.S. Government Bond Fund 8,164,622 (1,854,851) 6,309,771
U.S. Total Return Bond Fund 16,317,023 (1,876,951) 14,440,072
224 MFS Meridian Funds Annual Report 2017

NOTES TO FINANCIAL STATEMENTS at 31 January 2017
Sub-Fund
Net realized gain (loss) oninvestments, derivatives andcurrency transactions inaccordance with Luxembourglegal and regulatoryrequirements
Net adjustment foramortization of premium, andaccretion of discount oncertain fixed income securities
Net realized gain (loss) oninvestments, derivatives andcurrency transactions inaccordance with U.S. GAAP
Absolute Return Fund $ 522,762 $ 53,656 $ 576,416
Diversified Income Fund (3,460,595) 294,763 (3,165,832)
Emerging Markets Debt Fund 999,893 15,876,430 16,876,323
Emerging Markets Debt Local Currency Fund (2,218,411) 120,675 (2,097,736)
Global Credit Fund (140,643) 34,304 (106,339)
Global High Yield Fund (27,357,005) 2,446,314 (24,910,691)
Global Multi-Asset Fund 5,312,044 430,520 5,742,564
Global Opportunistic Bond Fund (a) 551,015 22,077 573,092
Global Total Return Fund (32,359,516) 7,878,433 (24,481,083)
Inflation-Adjusted Bond Fund (1,279,942) 1,383,379 103,437
Limited Maturity Fund (2,313,378) 2,056,623 (256,755)
Prudent Capital Fund (b) 14,826 0 14,826
Prudent Wealth Fund 34,835,387 1,140,012 35,975,399
U.S. Corporate Bond Fund (723,676) 658,834 (64,842)
U.S. Government Bond Fund (3,136,521) 935,465 (2,201,056)
U.S. Total Return Bond Fund (4,987,097) 2,479,902 (2,507,195)
Sub-Fund
Net change in unrealized gain(loss) on investments,derivatives and currencytranslations in accordance withLuxembourg legal andregulatory requirements
Net adjustment foramortization of premium, andaccretion of discount oncertain fixed income securities
Net change in unrealized gain(loss) on investments,derivatives and currencytranslations in accordance withU.S. GAAP
Absolute Return Fund $ 74,358 $ (30,642) $ 43,716
Diversified Income Fund 14,570,095 48,280 14,618,375
Emerging Markets Debt Fund 191,084,390 (6,602,399) 184,481,991
Emerging Markets Debt Local Currency Fund 3,544,530 18,415 3,562,945
Global Credit Fund 936,461 26,534 962,995
Global High Yield Fund 101,448,016 (403,837) 101,044,179
Global Multi-Asset Fund 2,230,789 (201,674) 2,029,115
Global Opportunistic Bond Fund (a) (1,612,725) 176,558 (1,436,167)
Global Total Return Fund 226,697,635 (207,955) 226,489,680
Inflation-Adjusted Bond Fund 2,964,602 (496,185) 2,468,417
Limited Maturity Fund 3,524,980 (344,733) 3,180,247
Prudent Capital Fund (b) 45,389 1,243 46,632
Prudent Wealth Fund (30,620,523) 70,052 (30,550,471)
U.S. Corporate Bond Fund 2,101,967 103,095 2,205,062
U.S. Government Bond Fund (11,152,881) 919,386 (10,233,495)
U.S. Total Return Bond Fund 1,634,301 (602,951) 1,031,350
(a) The inception date of the sub-fund was 12 July 2016.(b) The inception date of the sub-fund was 3 November 2016.
The following table shows the significant accounting policy differences between Luxembourg legal and regulatory requirements and U.S. GAAP.
Luxembourg legal and regulatory requirements U.S. GAAP
Fixed income securities Premium on fixed income securities is not required tobe amortized to income on a daily basis. Discount oninterest only securities is not required to be accreted toincome on a daily basis.
Premium on fixed income securities is amortized toincome on a daily basis. Discount on interest onlysecurities is accreted to income on a daily basis.
MFS Meridian Funds Annual Report 2017 225

NOTES TO FINANCIAL STATEMENTS at 31 January 2017
Note 17: Share Class Events
On 9 March 2016, the following MFS Meridian Funds’ share class commenced operations:
Global Total Return Fund I3 (USD)
On 20 May 2016, the following MFS Meridian Funds’ share classes commenced operations:
Emerging Markets Debt Fund WH1 (CHF)Emerging Markets Debt Local Currency Fund A3 (USD), C3 (USD), N3 (USD), W3 (USD)European Research Fund WH1 (CHF)European Value Fund WH1 (CHF)Global Equity Fund WH1 (CHF)Global Total Return Fund WH1 (CHF)U.S. Corporate Bond Fund A3 (USD), C3 (USD), N3 (USD), W3 (USD)U.S. Total Return Bond Fund A3 (USD), C3 (USD), N3 (USD), W3 (USD)
On 29 June 2016, the following MFS Meridian Funds’ share classes commenced operations:
Blended Research European Equity Fund AH1 (USD), C1 (USD), CH1 (USD), IH1 (USD), N1 (USD), NH1 (USD), W1 (USD), WH1 (USD)
On 12 July 2016, the following MFS Meridian Funds’ share classes commenced operations:
Global Research Focused Fund I1 (JPY), IH1 (JPY)U.S. Total Return Bond Fund WH1 (CHF)
On 15 December 2016, the following MFS Meridian Funds’ share classes commenced operations:
Absolute Return Fund W2 (USD)Continental European Equity Fund W1 (USD)Diversified Income Fund A4 (EUR), AH4 (EUR)European Value Fund WH1 (USD)Global Multi-Asset Fund W2 (USD)Global Total Return Fund A4 (EUR), AH4 (EUR)Japan Equity Fund W1 (USD)Prudent Capital Fund A4 (EUR), AH4 (EUR)
226 MFS Meridian Funds Annual Report 2017

ADDENDUM
INFORMATION RELATING TO PLANS D’E´PARGNE EN ACTIONS (PEA) IN FRANCE – (unaudited)
Through the year ended 31 January 2017, the following sub-funds invest primarily (i.e., at least 75% of their net assets) in PEA eligible equity-relatedsecurities (excluding convertible bonds) of companies that are based in continental EEA countries (except Liechtenstein). Beginning 1 February 2016 throughthe year ended 31 January 2017, the daily average percentile for each sub-fund’s investment in such securities is as follows:
Sub-Fund
DailyAverage for
Year (%)
European Research Fund 79.08%
European Smaller Companies Fund 90.02%
EXPENSE RATIOS – (audited)
For the year ended 31 January 2017:
The following expense ratio has been calculated in accordance with the Swiss Funds & Asset Management Association Guidelines on the calculation anddisclosure of the Total Expense Ratio of collective investment schemes 16 May 2008 (Version of 20 April 2015).
Emerging Markets Debt Fund
Class Z1 (USD) 0.08%
REMUNERATION POLICY – (unaudited)
The Management Company has adopted a remuneration policy and implements related procedures and practices which are consistent with and promotesound and effective risk management in a manner appropriate to the Management Company’s size, internal organization, and the nature, scope andcomplexity of its activities. The remuneration policy of the Management Company is administered and overseen by a remuneration committee composed ofmembers of MFS executive management and its human resources team. Further details on the remuneration policy are available by referring tomeridian.mfs.com (and clicking the link “Information on MFS’ Remuneration Policy”), and a paper copy of such details is available on request at theregistered office of the Management Company without charge. The total amount of remuneration for the financial year and the results of periodic reviews ofthe principles and implementation of the remuneration policy conducted during the financial year are not available as the Management Company has not yetcompleted the first annual performance period in which it has to comply with articles 111bis and 111ter of the Luxembourg Law of 17 December 2010, asamended.
SECURITIES FINANCING TRANSACTIONS REGULATION – (unaudited)
Securities Financing Transactions Regulation (Regulation (EU) 2015/2365) (“SFTR”) entered into force on 12 January 2016 and, among other requirements,introduces new disclosure requirements in the Company’s annual and semiannual reports published after 13 January 2017 detailing the Company’s use ofsecurities financing transactions.
A securities financing transaction (“SFT”) is defined per Article 3(11) of the SFTR as:• a repurchase transaction;• securities or commodities lending and securities or commodities borrowing;• a buy-sell back transaction or sell-buy back transaction;• a margin lending transaction.
The SFTR also extends the new disclosure requirements to total return swaps.
The new disclosure requirements are presented in the tables below. For additional information regarding the sub-funds’ usage of SFTs and total return swaps,refer to the following Notes within the Notes to Financial Statements:
• Repurchase Agreements: Note 2 and Note 12• Securities Loaned: Note 4• Total Return Swaps: Note 2 and Note 14
At 31 January 2017, the sub-funds had the following amounts of securities on loan as a proportion to total lendable assets:
Sub-FundMarket Value of
Securities LoanedMarket Value as % of
Total Lendable Assets (a)
Diversified Income Fund $430,728 0.31%
European Smaller Companies Fund €156,179 0.02%
Global Total Return Fund $10,259,636 0.37%
Prudent Wealth Fund $1,335,787 0.05%
(a) Total Lendable Assets is defined as “Investments, at value” on the Statements of Assets and Liabilities which excludes cash and cash equivalents.
MFS Meridian Funds Annual Report 2017 227

ADDENDUM
At 31 January 2017, the sub-funds had the following amounts of assets engaged in each type of SFT and total return swaps expressed asan absolute amount and as a percentage of the sub-fund’s net assets:
Market Value ofSecurities Loaned
% ofNet Assets
Market Value ofRepurchase Agreements
% ofNet Assets
Value ofTotal Return Swaps
% ofNet Assets
Settlement/clearing for each type of SFT: Bi-Lateral Tri-Party Bi-LateralSub-Fund
Absolute Return Fund $— 0.00% $10,000 0.06% $50,703 0.32%
Asia Pacific Ex-Japan Fund $— 0.00% $996,000 1.24% $— 0.00%
Diversified Income Fund $430,728 0.31% $1,337,000 0.95% $— 0.00%
Emerging Markets Debt Fund $— 0.00% $21,911,000 0.77% $— 0.00%
Emerging Markets Debt Local Currency Fund $— 0.00% $3,690,000 9.99% $— 0.00%
Emerging Markets Equity Fund $— 0.00% $541,000 0.86% $— 0.00%
European Smaller Companies Fund €156,179 0.02% €— 0.00% €— 0.00%
Global Concentrated Fund $— 0.00% $9,608,000 0.96% $— 0.00%
Global Credit Fund $— 0.00% $1,719,000 7.95% $— 0.00%
Global Energy Fund $— 0.00% $507,000 1.82% $— 0.00%
Global Equity Fund $— 0.00% $55,097,000 1.04% $— 0.00%
Global Equity Income Fund $— 0.00% $1,455,000 0.58% $— 0.00%
Global High Yield Fund $— 0.00% $15,868,000 2.16% $— 0.00%
Global Multi-Asset Fund $— 0.00% $7,211,000 9.90% $6,048 0.01%
Global Opportunistic Bond Fund $— 0.00% $3,977,000 9.89% $— 0.00%
Global Research Focused Fund $— 0.00% $3,874,000 1.65% $— 0.00%
Global Total Return Fund $10,259,636 0.37% $27,589,000 0.98% $— 0.00%
Inflation-Adjusted Bond Fund $— 0.00% $3,147,000 2.48% $— 0.00%
Japan Equity Fund $— 0.00% $141,000 2.09% $— 0.00%
Latin American Equity Fund $— 0.00% $162,000 0.70% $— 0.00%
Managed Wealth Fund $— 0.00% $2,745,000 5.04% $— 0.00%
Prudent Capital Fund $— 0.00% $706,000 5.27% $— 0.00%
Prudent Wealth Fund $1,335,787 0.05% $93,781,000 3.70% $— 0.00%
U.S. Concentrated Growth Fund $— 0.00% $2,051,000 0.47% $— 0.00%
U.S. Corporate Bond Fund $— 0.00% $3,410,000 1.42% $— 0.00%
U.S. Equity Income Fund $— 0.00% $116,000 2.85% $— 0.00%
U.S. Equity Opportunities Fund $— 0.00% $320,000 2.04% $— 0.00%
U.S. Total Return Bond Fund $— 0.00% $15,849,000 2.03% $— 0.00%
U.S. Value Fund $— 0.00% $17,420,000 1.01% $— 0.00%
At 31 January 2017, the (up to) ten largest collateral issuers across all SFTs and total return swaps utilized by the sub-funds were asfollows:
Securities Loaned Collateral
Collateral Issuer: Germany France Netherlands
Sub-Fund Type CurrencyQuality
(Moody’s) ValueQuality
(Moody’s) ValueQuality
(Moody’s) Value
Diversified Income Fund Bonds USD Aaa $479,707 — $— — $—
European Smaller Companies Fund Bonds USD Aaa €108,843 Aa2 €67,724 — €—
Global Total Return Fund Bonds USD Aaa $8,227,162 Aa2 $2,614,353 Not Rated $407,047
Prudent Wealth Fund Bonds USD Aaa $1,320,845 Aa2 $1,074,375 — $—
Repurchase Agreements Collateral
Collateral Issuer: United States
Sub-Fund Type CurrencyQuality
(Moody’s) Value
Absolute Return Fund Bonds USD Aaa $10,986
Asia Pacific Ex-Japan Fund Bonds USD Aaa $1,016,728
Diversified Income Fund Bonds USD Aaa $1,364,293
Emerging Markets Debt Fund Bonds USD Aaa $22,357,019
Emerging Markets Debt Local Currency Fund Bonds USD Aaa $3,765,288
228 MFS Meridian Funds Annual Report 2017

ADDENDUM
Repurchase Agreements Collateral
Collateral Issuer: United States
Sub-Fund Type CurrencyQuality
(Moody’s) Value
Emerging Markets Equity Fund Bonds USD Aaa $552,309
Global Concentrated Fund Bonds USD Aaa $9,803,730
Global Credit Fund Bonds USD Aaa $1,754,804
Global Energy Fund Bonds USD Aaa $517,353
Global Equity Fund Bonds USD Aaa $56,216,641
Global Equity Income Fund Bonds USD Aaa $1,485,141
Global High Yield Fund Bonds USD Aaa $16,190,736
Global Multi-Asset Fund Bonds USD Aaa $7,357,791
Global Opportunistic Bond Fund Bonds USD Aaa $4,057,921
Global Research Focused Fund Bonds USD Aaa $3,953,053
Global Total Return Fund Bonds USD Aaa $28,149,769
Inflation-Adjusted Bond Fund Bonds USD Aaa $3,210,981
Japan Equity Fund Bonds USD Aaa $144,819
Latin American Equity Fund Bonds USD Aaa $165,793
Managed Wealth Fund Bonds USD Aaa $2,801,494
Prudent Capital Fund Bonds USD Aaa $721,098
Prudent Wealth Fund Bonds USD Aaa $95,687,241
U.S. Concentrated Growth Fund Bonds USD Aaa $2,093,380
U.S. Corporate Bond Fund Bonds USD Aaa $3,479,645
U.S. Equity Income Fund Bonds USD Aaa $118,851
U.S. Equity Opportunities Fund Bonds USD Aaa $326,591
U.S. Total Return Bond Fund Bonds USD Aaa $16,171,760
U.S. Value Fund Bonds USD Aaa $17,774,754
At 31 January 2017, the (up to) top 10 counterparties of each type of SFTs and total return swaps separately were as follows:
SFT: Securities Loaned Repurchase Agreements Total Return Swaps
Counterparty: Goldman SachsAgency Lending
Merrill Lynch, Pierce,Fenner & Smith, Inc.
JPMorgan ChaseBank N.A.
Goldman SachsInternational
Country of establishment: USA USA USA USA
Sub-Fund
Absolute Return Fund $— $10,000 $— $50,703
Asia Pacific Ex-Japan Fund $— $996,000 $— $—
Diversified Income Fund $430,728 $1,337,000 $— $—
Emerging Markets Debt Fund $— $21,911,000 $— $—
Emerging Markets Debt Local Currency Fund $— $3,690,000 $— $—
Emerging Markets Equity Fund $— $541,000 $— $—
European Smaller Companies Fund €156,179 €— €— €—
Global Concentrated Fund $— $9,608,000 $— $—
Global Credit Fund $— $1,719,000 $— $—
Global Energy Fund $— $507,000 $— $—
Global Equity Fund $— $55,097,000 $— $—
Global Equity Income Fund $— $1,455,000 $— $—
Global High Yield Fund $— $15,868,000 $— $—
Global Multi-Asset Fund $— $7,211,000 $6,048 $—
Global Opportunistic Bond Fund $— $3,977,000 $— $—
Global Research Focused Fund $— $3,874,000 $— $—
Global Total Return Fund $10,259,636 $27,589,000 $— $—
Inflation-Adjusted Bond Fund $— $3,147,000 $— $—
Japan Equity Fund $— $141,000 $— $—
Latin American Equity Fund $— $162,000 $— $—
Managed Wealth Fund $— $2,745,000 $— $—
MFS Meridian Funds Annual Report 2017 229

ADDENDUM
SFT: Securities Loaned Repurchase Agreements Total Return Swaps
Counterparty: Goldman SachsAgency Lending
Merrill Lynch, Pierce,Fenner & Smith, Inc.
JPMorgan ChaseBank N.A.
Goldman SachsInternational
Country of establishment: USA USA USA USA
Sub-Fund
Prudent Capital Fund $— $706,000 $— $—
Prudent Wealth Fund $1,335,787 $93,781,000 $— $—
U.S. Concentrated Growth Fund $— $2,051,000 $— $—
U.S. Corporate Bond Fund $— $3,410,000 $— $—
U.S. Equity Income Fund $— $116,000 $— $—
U.S. Equity Opportunities Fund $— $320,000 $— $—
U.S. Total Return Bond Fund $— $15,849,000 $— $—
U.S. Value Fund $— $17,420,000 $— $—
Aggregate transaction data for each type of SFTs and total return swaps separately broken down according to the maturity tenor of thecollateral:
SFT: Securities Loaned
Sub-FundLess than
1 day1 day to1 week
1 week to1 month
1 to 3months
3 months to1 year
Greater than1 year
Openmaturity
Diversified Income Fund $— $— $— $7,470 $— $472,237 $—
European Smaller Companies Fund €— €— €— €2,748 €— €173,819 €—
Global Total Return Fund $— $— $128,703 $175,090 $— $10,944,769 $—
Prudent Wealth Fund $— $— $990,025 $37,304 $763,889 $604,002 $—
SFT: Repurchase Agreements
Sub-FundLess than
1 day1 day to1 week
1 week to1 month
1 to 3months
3 months to1 year
Greaterthan 1 year
Openmaturity
Absolute Return Fund $— $— $— $— $— $10,986 $—
Asia Pacific Ex-Japan Fund $— $— $— $— $— $1,016,728 $—
Diversified Income Fund $— $— $— $— $— $1,364,293 $—
Emerging Markets Debt Fund $— $— $— $— $— $22,357,019 $—
Emerging Markets Debt Local Currency Fund $— $— $— $— $— $3,765,288 $—
Emerging Markets Equity Fund $— $— $— $— $— $552,309 $—
Global Concentrated Fund $— $— $— $— $— $9,803,730 $—
Global Credit Fund $— $— $— $— $— $1,754,804 $—
Global Energy Fund $— $— $— $— $— $517,353 $—
Global Equity Fund $— $— $— $— $— $56,216,641 $—
Global Equity Income Fund $— $— $— $— $— $1,485,141 $—
Global High Yield Fund $— $— $— $— $— $16,190,736 $—
Global Multi-Asset Fund $— $— $— $— $— $7,357,791 $—
Global Opportunistic Bond Fund $— $— $— $— $— $4,057,921 $—
Global Research Focused Fund $— $— $— $— $— $3,953,053 $—
Global Total Return Fund $— $— $— $— $— $28,149,769 $—
Inflation-Adjusted Bond Fund $— $— $— $— $— $3,210,981 $—
Japan Equity Fund $— $— $— $— $— $144,819 $—
Latin American Equity Fund $— $— $— $— $— $165,793 $—
Managed Wealth Fund $— $— $— $— $— $2,801,494 $—
Prudent Capital Fund $— $— $— $— $— $721,098 $—
Prudent Wealth Fund $— $— $— $— $— $95,687,241 $—
U.S. Concentrated Growth Fund $— $— $— $— $— $2,093,380 $—
U.S. Corporate Bond Fund $— $— $— $— $— $3,479,645 $—
U.S. Equity Income Fund $— $— $— $— $— $118,851 $—
U.S. Equity Opportunities Fund $— $— $— $— $— $326,591 $—
U.S. Total Return Bond Fund $— $— $— $— $— $16,171,760 $—
U.S. Value Fund $— $— $— $— $— $17,774,754 $—
230 MFS Meridian Funds Annual Report 2017

ADDENDUM
Aggregate transaction data for each type of SFTs and total return swaps separately broken down according to the maturity tenor ofSFTs and total return swaps:
SFT: Securities Loaned
Sub-FundLess than
1 day1 day to1 week
1 week to1 month
1 to 3months
3 months to1 year
Greater than1 year
Openmaturity
Diversified Income Fund $— $— $— $— $— $— $430,728
European Smaller Companies Fund €— €— €— €— €— €— €156,179
Global Total Return Fund $— $— $— $— $— $— $10,259,636
Prudent Wealth Fund $— $— $— $— $— $— $1,335,787
SFT: Repurchase Agreements
Sub-FundLess than
1 day1 day to1 week
1 week to1 month
1 to 3months
3 months to1 year
Greater than1 year
Openmaturity
Absolute Return Fund $— $10,000 $— $— $— $— $—
Asia Pacific Ex-Japan Fund $— $996,000 $— $— $— $— $—
Diversified Income Fund $— $1,337,000 $— $— $— $— $—
Emerging Markets Debt Fund $— $21,911,000 $— $— $— $— $—
Emerging Markets Debt Local Currency Fund $— $3,690,000 $— $— $— $— $—
Emerging Markets Equity Fund $— $541,000 $— $— $— $— $—
Global Concentrated Fund $— $9,608,000 $— $— $— $— $—
Global Credit Fund $— $1,719,000 $— $— $— $— $—
Global Energy Fund $— $507,000 $— $— $— $— $—
Global Equity Fund $— $55,097,000 $— $— $— $— $—
Global Equity Income Fund $— $1,455,000 $— $— $— $— $—
Global High Yield Fund $— $15,868,000 $— $— $— $— $—
Global Multi-Asset Fund $— $7,211,000 $— $— $— $— $—
Global Opportunistic Bond Fund $— $3,977,000 $— $— $— $— $—
Global Research Focused Fund $— $3,874,000 $— $— $— $— $—
Global Total Return Fund $— $27,589,000 $— $— $— $— $—
Inflation-Adjusted Bond Fund $— $3,147,000 $— $— $— $— $—
Japan Equity Fund $— $141,000 $— $— $— $— $—
Latin American Equity Fund $— $162,000 $— $— $— $— $—
Managed Wealth Fund $— $2,745,000 $— $— $— $— $—
Prudent Capital Fund $— $706,000 $— $— $— $— $—
Prudent Wealth Fund $— $93,781,000 $— $— $— $— $—
U.S. Concentrated Growth Fund $— $2,051,000 $— $— $— $— $—
U.S. Corporate Bond Fund $— $3,410,000 $— $— $— $— $—
U.S. Equity Income Fund $— $116,000 $— $— $— $— $—
U.S. Equity Opportunities Fund $— $320,000 $— $— $— $— $—
U.S. Total Return Bond Fund $— $15,849,000 $— $— $— $— $—
U.S. Value Fund $— $17,420,000 $— $— $— $— $—
SFT: Total Return Swaps
Sub-FundLess than
1 day1 day to1 week
1 week to1 month
1 to 3months
3 months to1 year
Greater than1 year
Openmaturity
Absolute Return Fund $— $— $— $— $50,703 $— $—
Global Multi-Asset Fund $— $— $— $— $— $6,048 $—
Share of collateral received that is reused, compared to the maximum amount specified in the prospectus or in the disclosure toinvestors:
The sub-funds are not permitted to sell, reinvest or pledge collateral received in the form of securities. To the extent the sub-funds receive cash as collateral,such cash collateral would only be placed on deposit with credit institutions allowed under Luxembourg law, and if applicable may only be reinvested in highquality government bonds, reverse repurchase transactions (provided the transactions are with credit institutions subject to prudential supervision and thesub-fund is able to recall at any time the full amount of cash on accrued basis) or short-term money market funds allowed by Luxembourg law in order tomitigate the risk of losses on reinvestment. The sub-funds did not receive cash collateral for SFTs or total return swaps at 31 January 2017.
MFS Meridian Funds Annual Report 2017 231
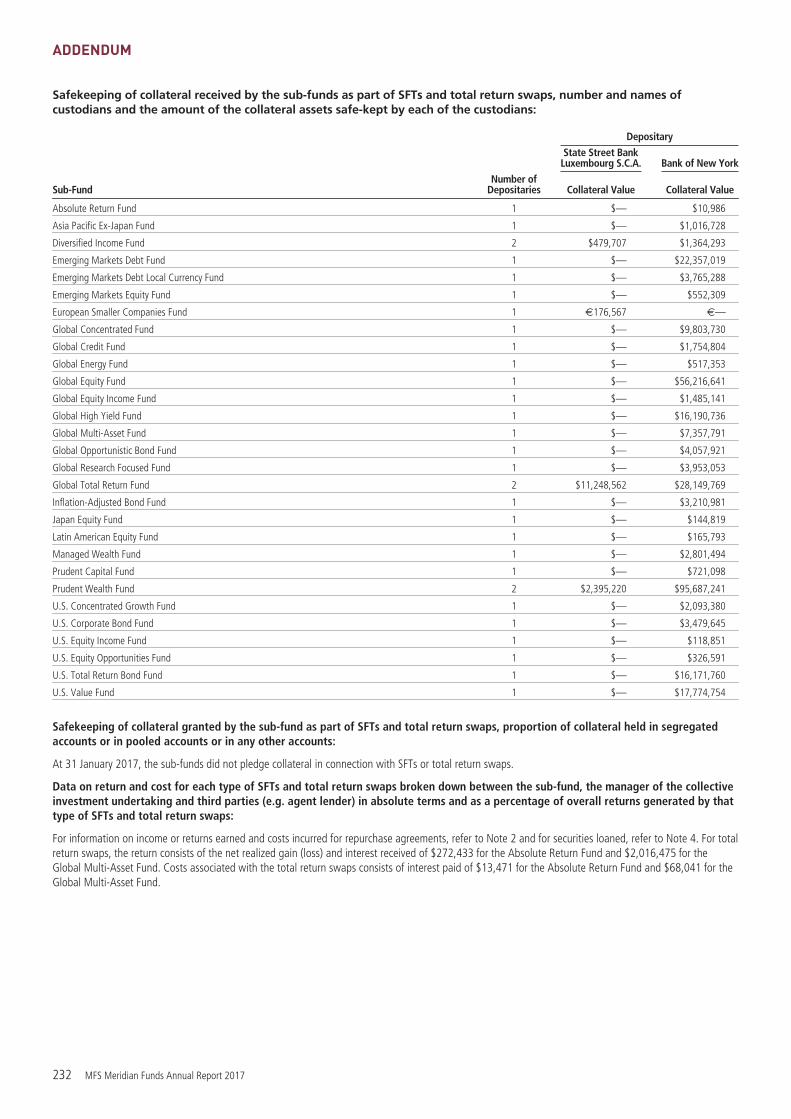
ADDENDUM
Safekeeping of collateral received by the sub-funds as part of SFTs and total return swaps, number and names ofcustodians and the amount of the collateral assets safe-kept by each of the custodians:
Depositary
State Street BankLuxembourg S.C.A. Bank of New York
Sub-FundNumber of
Depositaries Collateral Value Collateral Value
Absolute Return Fund 1 $— $10,986
Asia Pacific Ex-Japan Fund 1 $— $1,016,728
Diversified Income Fund 2 $479,707 $1,364,293
Emerging Markets Debt Fund 1 $— $22,357,019
Emerging Markets Debt Local Currency Fund 1 $— $3,765,288
Emerging Markets Equity Fund 1 $— $552,309
European Smaller Companies Fund 1 €176,567 €—
Global Concentrated Fund 1 $— $9,803,730
Global Credit Fund 1 $— $1,754,804
Global Energy Fund 1 $— $517,353
Global Equity Fund 1 $— $56,216,641
Global Equity Income Fund 1 $— $1,485,141
Global High Yield Fund 1 $— $16,190,736
Global Multi-Asset Fund 1 $— $7,357,791
Global Opportunistic Bond Fund 1 $— $4,057,921
Global Research Focused Fund 1 $— $3,953,053
Global Total Return Fund 2 $11,248,562 $28,149,769
Inflation-Adjusted Bond Fund 1 $— $3,210,981
Japan Equity Fund 1 $— $144,819
Latin American Equity Fund 1 $— $165,793
Managed Wealth Fund 1 $— $2,801,494
Prudent Capital Fund 1 $— $721,098
Prudent Wealth Fund 2 $2,395,220 $95,687,241
U.S. Concentrated Growth Fund 1 $— $2,093,380
U.S. Corporate Bond Fund 1 $— $3,479,645
U.S. Equity Income Fund 1 $— $118,851
U.S. Equity Opportunities Fund 1 $— $326,591
U.S. Total Return Bond Fund 1 $— $16,171,760
U.S. Value Fund 1 $— $17,774,754
Safekeeping of collateral granted by the sub-fund as part of SFTs and total return swaps, proportion of collateral held in segregatedaccounts or in pooled accounts or in any other accounts:
At 31 January 2017, the sub-funds did not pledge collateral in connection with SFTs or total return swaps.
Data on return and cost for each type of SFTs and total return swaps broken down between the sub-fund, the manager of the collectiveinvestment undertaking and third parties (e.g. agent lender) in absolute terms and as a percentage of overall returns generated by thattype of SFTs and total return swaps:
For information on income or returns earned and costs incurred for repurchase agreements, refer to Note 2 and for securities loaned, refer to Note 4. For totalreturn swaps, the return consists of the net realized gain (loss) and interest received of $272,433 for the Absolute Return Fund and $2,016,475 for theGlobal Multi-Asset Fund. Costs associated with the total return swaps consists of interest paid of $13,471 for the Absolute Return Fund and $68,041 for theGlobal Multi-Asset Fund.
232 MFS Meridian Funds Annual Report 2017

INDEPENDENT AUDITOR’S REPORT
To the Shareholders of MFS Meridian Funds35, Boulevard du Prince HenriL-1724 Luxembourg
We have audited the accompanying financial statements of MFSMeridian Funds (the “SICAV”) and of each of its sub-funds, whichcomprise the statements of assets and liabilities and the schedulesof investments as at 31 January 2017 and the statements ofoperations and changes in net assets for the year then ended, anda summary of significant accounting policies and otherexplanatory notes to the financial statements.
Board of Directors of the SICAV responsibility for the financialstatementsThe Board of Directors of the SICAV is responsible for thepreparation and fair presentation of these financial statements inaccordance with Luxembourg legal and regulatory requirementsrelating to the preparation and presentation of the financialstatements and for such internal control as the Board of Directorsof the SICAV determines is necessary to enable the preparationand presentation of financial statements that are free frommaterial misstatement, whether due to fraud or error.
Responsibility of the “réviseur d’entreprises agréé”Our responsibility is to express an opinion on these financialstatements based on our audit. We conducted our audit inaccordance with International Standards on Auditing as adoptedfor Luxembourg by the “Commission de Surveillance du SecteurFinancier”. Those standards require that we comply with ethicalrequirements and plan and perform the audit to obtainreasonable assurance about whether the financial statements arefree from material misstatement.
An audit involves performing procedures to obtain audit evidenceabout the amounts and disclosures in the financial statements.The procedures selected depend on the judgement of the“réviseur d’entreprises agréé”, including the assessment of therisks of material misstatement of the financial statements,whether due to fraud or error. In making those risk assessments,
the “réviseur d’entreprises agréé” considers internal controlrelevant to the entity’s preparation and fair presentation of thefinancial statements in order to design audit procedures that areappropriate in the circumstances, but not for the purpose ofexpressing an opinion on the effectiveness of the entity’s internalcontrol. An audit also includes evaluating the appropriateness ofaccounting policies used and the reasonableness of accountingestimates made by the Board of Directors of the SICAV, as well asevaluating the overall presentation of the financial statements.
We believe that the audit evidence we have obtained is sufficientand appropriate to provide a basis for our audit opinion.
OpinionIn our opinion, the financial statements give a true and fair viewof the financial position of MFS Meridian Funds and of each of itssub-funds as of 31 January 2017, and of the results of theiroperations and changes in their net assets for the year then endedin accordance with Luxembourg legal and regulatory requirementsrelating to the preparation and presentation of the financialstatements.
Other matterSupplementary information included in the annual report hasbeen reviewed in the context of our mandate but has not beensubject to specific audit procedures carried out in accordance withthe standards described above. Consequently, we express noopinion on such information. However, we have no observation tomake concerning such information in the context of the financialstatements taken as a whole.
ERNST & YOUNGSociété AnonymeCabinet de révision agréé
M. Ferguson
Luxembourg13 April 2017
MFS Meridian Funds Annual Report 2017 233
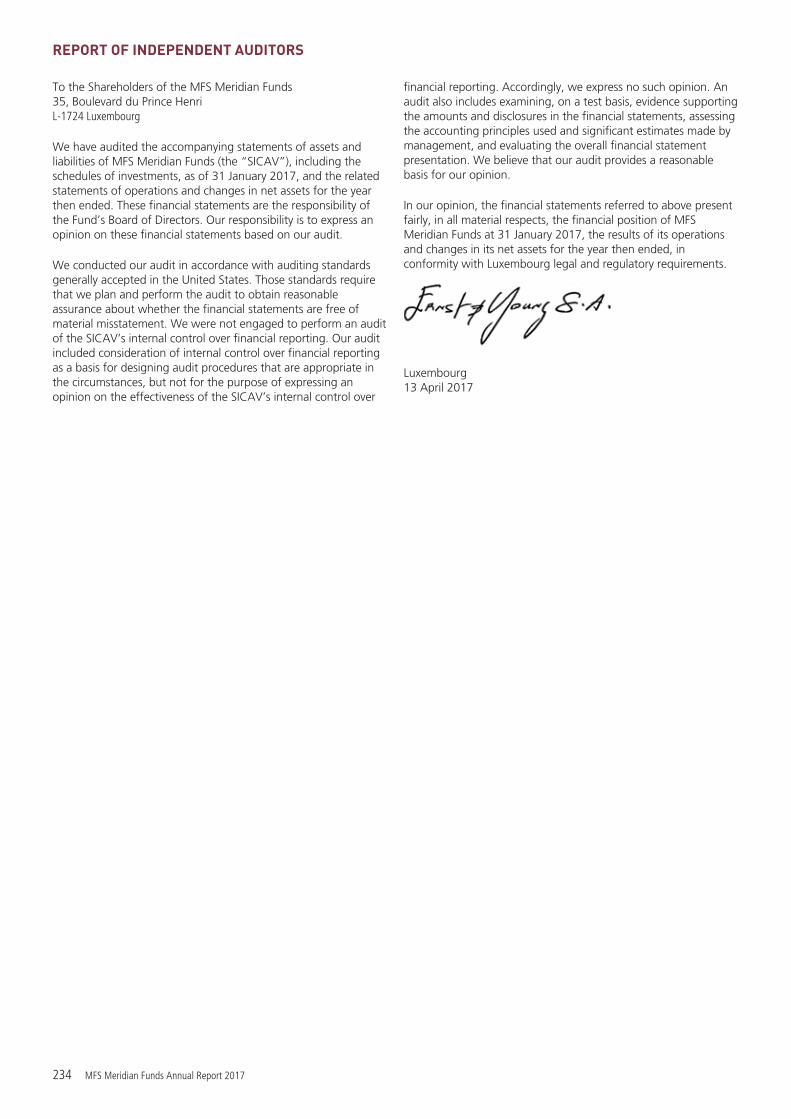
REPORT OF INDEPENDENT AUDITORS
To the Shareholders of the MFS Meridian Funds35, Boulevard du Prince HenriL-1724 Luxembourg
We have audited the accompanying statements of assets andliabilities of MFS Meridian Funds (the “SICAV”), including theschedules of investments, as of 31 January 2017, and the relatedstatements of operations and changes in net assets for the yearthen ended. These financial statements are the responsibility ofthe Fund’s Board of Directors. Our responsibility is to express anopinion on these financial statements based on our audit.
We conducted our audit in accordance with auditing standardsgenerally accepted in the United States. Those standards requirethat we plan and perform the audit to obtain reasonableassurance about whether the financial statements are free ofmaterial misstatement. We were not engaged to perform an auditof the SICAV’s internal control over financial reporting. Our auditincluded consideration of internal control over financial reportingas a basis for designing audit procedures that are appropriate inthe circumstances, but not for the purpose of expressing anopinion on the effectiveness of the SICAV’s internal control over
financial reporting. Accordingly, we express no such opinion. Anaudit also includes examining, on a test basis, evidence supportingthe amounts and disclosures in the financial statements, assessingthe accounting principles used and significant estimates made bymanagement, and evaluating the overall financial statementpresentation. We believe that our audit provides a reasonablebasis for our opinion.
In our opinion, the financial statements referred to above presentfairly, in all material respects, the financial position of MFSMeridian Funds at 31 January 2017, the results of its operationsand changes in its net assets for the year then ended, inconformity with Luxembourg legal and regulatory requirements.
Luxembourg13 April 2017
234 MFS Meridian Funds Annual Report 2017

DIRECTORS AND ADMINISTRATION
MANAGEMENT COMPANYMFS Investment Management Company (Lux) S.à.r.l.35 Boulevard du Prince HenriL-1724 LuxembourgGrand Duchy of Luxembourg
BOARD OF DIRECTORS OF THE FUND
Robin A. Stelmach (Chairperson)
Vice Chair (since January 2017);Executive Vice President andChief Operating Officer (until January 2017)Massachusetts Financial Services Company
James R. Julian, Jr.
Executive Vice President andChief Operating OfficerUniversity of MassachusettsIndependent Director
Lina M. Medeiros
DirectorMFS International (U.K.) Limited
Mitchell Freestone
Vice President and Assistant General CounselMFS International (U.K.) Limited
David Mace
Senior Managing DirectorMFS Institutional Advisors, Inc.
Thomas Bogart
Independent Director
REGISTERED OFFICE35 Boulevard du Prince HenriL-1724 LuxembourgGrand Duchy of LuxembourgR.C.S. Luxembourg B 39346
INVESTMENT MANAGER
Massachusetts Financial Services Company111 Huntington AvenueBoston, Massachusetts USA 02199-7618
DEPOSITARY, ADMINISTRATION,
REGISTRAR, AND TRANSFER AGENT
State Street Bank Luxembourg S.C.A.49, Avenue J.F. KennedyL-1855 LuxembourgGrand Duchy of Luxembourg
INDEPENDENT AUDITOR
Ernst & Young S.A.35E, Avenue J.F. KennedyL-1855 LuxembourgGrand Duchy of Luxembourg
LEGAL ADVISER
Arendt & Medernach41A, Avenue J.F. KennedyL-2082 LuxembourgGrand Duchy of Luxembourg
MFS Meridian Funds Annual Report 2017 235

PRIMARY LOCAL AGENTS
Austria Belgium DenmarkRaiffeisen Bank International AGAm Stadtpark 9, A-1030Vienna, AustriaTel: +43-1-71-707-1730
CACEIS Belgium S.A./N.V.Avenue du Port/Havenlaan86C b 320B-1000 Brussels, BelgiumTel: +32-2-209-2600
Nordea Bank Danmark A/SIssuer Services, Securities Services,Hermes Hus, Helgeshøj Alle 33Postbox 850, DK-0900Copenhagen C, DenmarkTel: +45-33-33-33-3301
France Germany Hong KongBNP Paribas Securities Services66 Rue de la Victoire75009 Paris, FranceTel: +33-1-42-98-05-77
Marcard, Stein & Co. AGBallindamm 36, 20095Hamburg, GermanyTel: +49-40-32-099-224
State Street Trust (HK) Limited68th Floor, Two InternationalFinance Centre8 Finance Street, Central, Hong KongTel: +852-2840-5388
Ireland Italy LuxembourgBridge Consulting Limited33 Sir John Rogerson’s QuayDublin 2, IrelandTel: +353 (0)1-631-6444
AllFunds Bank S.A.,Via Santa Margherita 7, 20121Milano, ItalyTel: +39-02-3211-7001BNP Paribas Securities Services,Milan BranchVia Ansperto 5, 20123Milano, ItalySociete Generale Securities Services,S.p.A.Via Benigno Crespi19/A-MAC 2, 20159Milano, ItalyTel: +39-02-9178-4588
State Street Bank Luxembourg S.C.A.49, Avenue J.F. KennedyL-1855 LuxembourgGrand Duchy of LuxembourgTel: +352-46-40-10-600
Netherlands Sweden SwitzerlandCACEIS Netherlands N.V.Gustav Mahlerlaan 310-B1082 ME Amsterdam, the NetherlandsTel: +31-20-530-8300
Securities Services, SkandinaviskaEnskilda Banken AB, Global FundsRA 6, Rissneleden 110, SE-106 40Stockholm, SwedenTel: +46-8763-6906/5960
REPRESENTATIVE:Carnegie Fund Services S.A.11, rue du General-Dufour1204 Geneva, SwitzerlandTel: +41-22-705-1178;PAYING AGENT:Banque Cantonale de Geneve17 Quai de l’lle1204 Geneva, SwitzerlandTel: +41-22-317-2727
Taiwan United KingdomMASTER AGENT:PineBridge Investments ConsultingTaiwan Limited, 10th Floor144 Min Chuan East Road. Section 2Taipei, Taiwan 10436
FACILITIES AGENT:MFS International (UK) Ltd.One Carter LaneLondon, United Kingdom EC4V 5ERTel: +44 (0) 20 7429 7200
©2017 MFS Investment Management