AQR UCITS FUNDS
254
AQR UCITS FUNDS Société d’Investissement à Capital Variable Audited Annual Report for the year ended 31 March 2019 R.C.S. Luxembourg: B 165881 No subscription can be received on the sole basis of the present report. Subscriptions are only valid if made on the sole basis of the current Full Prospectus supplemented by the application form, the Key Investor Information Documents (KIID), the latest semi-annual report and the latest annual report if published hereafter.
-
Upload
khangminh22 -
Category
Documents
-
view
0 -
download
0
Transcript of AQR UCITS FUNDS

AQR UCITS FUNDS
Société d’Investissement à Capital Variable
Audited Annual Reportfor the year ended 31 March 2019
R.C.S. Luxembourg: B 165881
No subscription can be received on the sole basis of the present report. Subscriptions are only valid if madeon the sole basis of the current Full Prospectus supplemented by the application form, the Key InvestorInformation Documents (�KIID�), the latest semi-annual report and the latest annual report if publishedhereafter.

AQR UCITS FUNDS
Table of Contents
General Information 2
Investment Management Report (Unaudited) 4
Audit Report and Report of Independent Auditors 10
Schedule of Investments
• AQR Delphi Long-Short Equity UCITS Fund 15
• AQR Emerging Equities UCITS Fund 57
• AQR Global Aggregate Bond UCITS Fund 64
• AQR Global Core Equity UCITS Fund 70
• AQR Global Defensive Equity UCITS Fund 76
• AQR Global Enhanced Equity UCITS Fund 83
• AQR Global Macro Opportunities UCITS Fund 88
• AQR Global Relaxed Constraint Equity UCITS Fund 95
• AQR Global Risk Parity UCITS Fund 107
• AQR Managed Futures UCITS Fund 111
• AQR Style Premia: Equity Market Neutral UCITS Fund 117
• AQR Style Premia UCITS Fund 138
• AQR Systematic Fixed Income: US High Yield UCITS Fund 161
• AQR Systematic Total Return UCITS Fund 165
Statements of Assets and Liabilities 194
Statements of Operations 197
Statements of Changes in Net Assets 200
Statements of Changes in Shares Outstanding 203
Statistical Information 206
Notes to the Financial Statements 215
Additional Information for Shareholders (Unaudited) 237
Additional Information for Shareholders Domiciled in Switzerland(Unaudited) 245

General Information
Board of DirectorsChairmanAntonio ThomasLuxembourg Resident Independent Director
MembersAndrew BastowExecutive Director
Philip John Gough(Since 1 March 2019)
William Joseph FenrichExecutive Director(Since 27 July 2018 to 31 December 2018)
Brendan KalbExecutive Director(Until 31 May 2018)
Thomas NummerLuxembourg Resident Independent Director
Administrator, Transfer Agent, Domiciliaryand Paying AgentHedgeServ (Luxembourg) S.à r.l.2c, rue Albert BorschetteL-1246 Luxembourg
DepositaryJ.P. Morgan Bank Luxembourg S.A.European Bank & Business Centre6C, route de TrevesL-2633 Senningerberg
AuditorPricewaterhouseCoopers, Société coopérative2, rue Gerhard MercatorBP 1443L-1014 Luxembourg
Legal AdvisersIn EnglandSimmons & Simmons LLPCityPointOne Ropemaker StreetLondon EC2Y 9SSUnited Kingdom
In LuxembourgArendt & Medernach S.A.41A, avenue J.F. KennedyL-2082 Luxembourg
Management CompanyFundRock Management Company S.A.33, rue de GasperichL-5826 Hesperange
Investment Manager and DistributorAQR Capital Management, LLCTwo Greenwich PlazaGreenwich, Connecticut 06830USA
Sub-Investment ManagerUBS Global Asset Management (Americas) Inc.One North Wacker DriveChicago, IL 60606USA
AQR UCITS FUNDS
2

General Information (continued)Swiss RepresentativeCarnegie Fund Services S.A.11, rue du Général-DufourCH-1204 GenevaSwitzerland
Paying Agent in Switzerland*Banque Cantonale de Genève17, quai de l’lleCH-1204 GenevaSwitzerland
Paying Agent in Austria*Societe GeneralePrinz Eugen Strasse 810/5/Top 11Vienna, 1040Austria
Paying Agent in France*State Street Banque, S.A.Immeuble Défense Plaza23-25 Rue Delarivière-LefoullonParis La Défense Cedex, 92064France
Paying Agent in Germany*Marcard Stein & CompanyBallindamm 36Hamburg, 20095Germany
Paying Agent in Spain*Simmons and Simmons LLPCalle Miguel Ángel 1128010, MadridSpain
Paying Agent in Sweden*Skandinaviska Enskilda Banken ABKungstradgardsgatan 8SE-106 40 StockholmSweden
Paying Agent in the United Kingdom*AQR Capital Management (Europe) LLPSuite 1, 3rd Floor11-12 St. James’s SquareLondon SW1Y 4LBUnited Kingdom
*Please be advised that the function of ’Paying Agent’ may be subject to a
different corresponding title such as Information, Facilities or Centralising
Agent, depending on the jurisdiction.
AQR UCITS FUNDS
3

Investment Management Report (Unaudited)AQR Delphi Long-Short Equity UCITS Fund
The investment objective of AQR Delphi Long-Short Equity UCITS Fund (the “Sub-Fund”) is to seek capitalappreciation by investing on a long basis in attractively valued, high quality and low beta assets and on ashort basis in expensive, low quality, and high beta assets.
For the period 26 October 2018 (the date the Sub-Fund was launched) through 31 March 2019, theSub-Fund’s Class IAU1F shares returned 10.75%.
The Sub-Fund’s outperformance was driven by strong performance of high quality defensive stocksrelative to low quality stocks. This effect was particularly strong during global stock market drawdown latein 2018.
As of 31 March 2019, the Sub-Fund’s largest active positions within the stock selection strategy includednotable long positions in consumer staples and industrials.
There have been no material changes to the Sub-Fund’s investment strategy or objectives during theperiod ended 31 March 2019.
AQR Emerging Equities UCITS Fund
The investment objective of AQR Emerging Equities UCITS Fund (the “Sub-Fund”) is to add value byemploying a disciplined approach emphasising both bottom-up security selection and top-down countryand currency allocation. The Sub-Fund attempts to achieve its investment objective by underweighting andoverweighting securities, industries/sectors, countries and currencies relative to its benchmark, the MorganStanley Capital International Inc. Emerging Markets Total Return Index with Net Dividends Unhedged inUSD (the “Benchmark”).
For the year ended 31 March 2019, the Sub-Fund’s Class A3 shares returned -12.24%. The Class A3shares are denominated in U.S. Dollar, which is the reference currency of the Sub-Fund. A U.S. Dollardenominated investment in the Benchmark would have returned -7.41% for the year ended 31 March 2019,resulting in underperformance by the Sub-Fund.
The Sub-Fund’s relative performance was driven primarily by stock selection, with both currency selectionand country selection detracting, but to a lesser extent. Stock selection within the energy and health caresectors were the primary detractors.
As of 31 March 2019, the Sub-Fund’s largest active positions within the stock selection strategy includedsector overweights to information technology and energy, while the Sub-Fund was underweight toconsumer staples and financials.
There have been no material changes to the Sub-Fund’s investment strategy or objectives during the yearended 31 March 2019.
AQR Global Aggregate Bond UCITS Fund
The investment objective of Global Aggregate Bond UCITS Fund (the “Sub-Fund”) is to outperform theBloomberg Barclays Global Aggregate Bond Index (the “Benchmark”). The Sub-Fund seeks to achieve itsinvestment objective by investing primarily in investment grade global fixed and floating rate debtsecurities, using derivative strategies where appropriate, and currency allocation.
For the year ended 31 March 2019, the Sub-Fund’s Class IAU3F shares returned 4.63%. The Sub-Fund’sClass IAU3F shares are denominated in U.S. Dollar, which is the reference currency of the Sub-Fund. AU.S. Dollar denominated investment in the Benchmark would have returned 4.93%, resulting in a relativeunderperformance by the Sub-Fund.
AQR UCITS FUNDS
4

Investment Management Report (Unaudited)
AQR Global Aggregate Bond UCITS Fund (continued)
The underperformance was largely driven by bets within our country selection sleeve of the strategy.Specifically, we were positioned overweight in European countries in the second and fourth quarters of2018, driven by attractive momentum and relatively higher carry, while European debt underperformed.Strong performance in the first quarter of 2019, led by our currency selection sleeve of the strategy,contributed to performance, though not enough to offset the underperformance in 2018. We remainconfident that these themes and our approach within sector security selection will provide positive excessof benchmark returns over the medium and long-term.
There have been no material changes to the Sub-Fund’s investment strategy or objectives during the yearended 31 March 2019.
AQR Global Core Equity UCITS Fund
The investment objective of AQR Global Core Equity UCITS Fund (the “Sub-Fund”) is long term capitalappreciation which it seeks to obtain through investments in equities or equity-related securities ofattractively valued companies with positive momentum and a stable business model. In assessing positivemomentum, the Sub-Fund favors securities with strong medium term performance relative to othersecurities based on the internal screening process. Further, the Sub-Fund favors stable companies in goodbusiness health, including those with strong profitability and stable earnings. The Sub-Fund generallyattempts to achieve its investment objective by underweighting and overweighting securities, industries,and sectors, relative to its benchmark, the Morgan Stanley Capital International Inc. World Total ReturnIndex, (Net), U.S. Dollar Unhedged (the “Benchmark”) at the time of purchase.
For the year ended 31 March 2019, the Sub-Fund’s Class B3 shares returned 7.89%. The Class B3 sharesare denominated in Euro. A Euro denominated investment in the Benchmark would have returned 13.93%for the year ended 31 March 2019.
The Sub-Fund’s underperformance was driven primarily by stock selection within sectors and withincountries. Specifically, stocks within the consumer discretionary, information technology, and industrialssectors detracted from relative returns. This was primarily concentrated in U.S. Stocks in the financialssector, as well as underweighting to financials which contributed to a lesser extent.
As of 31 March 2019, the Sub-Fund’s largest active positions within the stock selection strategy includedsector overweights to information technology, and consumer discretionary, and underweights to financials,energy, and consumer staples.
There have been no material changes to the Sub-Fund’s investment strategy or objectives during the yearended 31 March 2019.
AQR Global Defensive Equity UCITS Fund
The investment objective of AQR Global Defensive Equity UCITS Fund (the “Sub-Fund”) is to seek totalreturn. The Sub-Fund pursues a “defensive” strategy, seeking to provide downside protection with upsidepotential through active stock selection, risk management and diversification. To pursue this investmentobjective, risk management and absolute return/absolute risk-based portfolio construction techniques areused in an attempt to achieve risk diversification across names, industries and countries, combined withactive stock selection focusing on high quality companies.
For the year ended 31 March 2019, the Sub-Fund’s Class B3 shares returned 15.59%. Class B3 sharesare denominated in Euro and are not hedged against the U.S. Dollar.
The Sub-Fund’s performance was positively impacted by its positioning in utilities and consumer staples,which were more heavily weighted than most other sectors and performed well on a relative basis over theyear. Similarly, a lower relative weighting to financials (one of the poorest performing sectors) alsobenefited the Sub-Fund.
As of 31 March 2019, the Sub-Fund’s largest aggregated position within the stock selection strategyincluded a 21% allocation to consumer staples.
AQR UCITS FUNDS
5

Investment Management Report (Unaudited)
AQR Global Defensive Equity UCITS Fund (continued)
There have been no material changes to the Sub-Fund’s investment strategy or objectives during the yearended 31 March 2019.
AQR Global Enhanced Equity UCITS Fund
The investment objective of AQR Global Enhanced Equity UCITS Fund (the “Sub-Fund”) is to invest in aglobal, long-only equities portfolio, in order to efficiently provide diversified exposure to three investmentstyles: value, momentum, and defensive.
The Sub-Fund seeks to outperform the Morgan Stanley Capital International Inc. World Total Return Index,(Net), U.S. Dollar Unhedged (the “Benchmark”), while aiming to provide some downside protection throughactive stock selection, risk management and diversification.
For the year ended 31 March 2019, the Sub-Fund’s Class A2 shares returned -2.23%. The Class A2 sharesare denominated in U.S. Dollar, which is the reference currency of the Sub-Fund. A U.S. Dollardenominated investment in the Benchmark would have returned 4.01% over the year, resulting in a relativeunderperformance by the Sub-Fund.
The Sub-Fund’s underperformance was driven primarily by stock selection within sectors, and mostlywithin the U.S. and Europe. Specifically, stock selection within information technology, industrials, andconsumer discretionary detracted from performance.
As of 31 March 2019, the Sub-Fund’s largest active positions within the stock selection strategy includedsector overweights to healthcare and information tech, and underweights to financials and consumerstaples.
There have been no material changes to the Sub-Fund’s investment strategy or objectives during the yearended 31 March 2019.
AQR Global Macro Opportunities UCITS Fund
The investment objective of AQR Global Macro Opportunities UCITS Fund (the “Sub-Fund”) is to producehigh risk-adjusted returns while maintaining low-to-zero correlation to traditional markets. The Sub-Fundseeks to achieve its investment objective by combining Systematic macro trading, which seeks to capitaliseon fundamental trends and other factors, with Opportunistic trading, which seeks to capture deep value andother contrarian opportunities.
For the period 14 November 2018 (the date the Sub-Fund was launched) through 31 March 2019, theSub-Fund’s Class IAU3 shares returned -0.36%. The Sub-Fund’s Class IAU3 shares are denominated inU.S. Dollar, which is the reference currency of the Sub-Fund.
The Sub-Fund’s performance was negatively impacted by the Systematic sub-strategy, while theOpportunistic sub-strategy contributed positively.
There have been no material changes to the Sub-Fund’s investment strategy or objectives during theperiod ended 31 March 2019.
AQR UCITS FUNDS
6
Investment Management Report (Unaudited)
AQR Global Relaxed Constraint Equity UCITS Fund
The investment objective of AQR Global Relaxed Constraint Equity UCITS Sub-Fund (the “Sub-Fund”) isto outperform, after expenses, the Morgan Stanley Capital International Inc. World Total Return Index,(Net), U.S. Dollar Unhedged (the “Benchmark”) while seeking to control its tracking error relative to thisBenchmark, The Sub-Fund’s portfolio is managed by both overweighting and underweighting securities,industries, and sectors relative to the Benchmark. “Relaxed Constraint” in the Sub-Fund’s name reflectsthe Sub-Fund’s strategy to take long as well as short positions in the equity securities in which it invests,as opposed to a traditional “long-only” portfolio which does not establish short positions (i.e. relaxing the“long-only” constraint). Through the reinvestment of the short sale proceeds, the Sub-Fund generallyintends to target a long exposure of 130% of the Sub-Fund’s net assets with a short exposure of 30% ofthe Sub-Fund’s net assets. Actual long and short exposures, however, will vary according to marketconditions.
For the period 19 September 2018 (the date the Sub-Fund was launched) through 31 March 2019, theSub-Fund’s Class IAU1F shares returned –6.57%. A U.S. Dollar denominated investment in theBenchmark would have returned -2.24% over the period, resulting in a relative underperformance by theSub-Fund.
The Sub-Fund’s underperformance was driven primarily by stock selection within sectors. Specifically, theSub-Fund’s performance was negatively impacted by stock selection within the materials, informationtechnology, and industrials sectors, and primarily in the U.S. and Canada.
As of 31 March 2019, the Sub-Fund’s largest active positions within the stock selection strategy includedsector overweight to information technology and healthcare and underweights to financials and consumerstaples.
There have been no material changes to the Sub-Fund’s investment strategy and objectives during theperiod ended 31 March 2019.
AQR Global Risk Parity UCITS Fund
The investment objective of AQR Global Risk Parity UCITS Fund (the “Sub-Fund”) is to efficiently deliverexposure to a broadly diversified set of global risk premia covering equities, government bonds andcommodity indices. The risk allocation of the Sub-Fund is spread across three major categories: equity risk,interest rate risk, and inflation risk. The Sub-Fund seeks to achieve a long-term risk-adjusted return that ishigher than traditional allocations by combining these market exposures in a risk-diversified way andactively managing them to target a desired level of risk.
For the year ended 31 March 2019, the Sub-Fund’s Class A1 shares returned 6.45%. The Class A1 sharesare denominated in U.S. Dollar, which is also the reference currency of the Sub-Fund.
Bonds and equities contributed positively to the return of the Sub-Fund for the year ended 31 March 2019,while commodities detracted. Both nominal and inflation linked bonds contributed strongly as safe-havendemand and global growth uncertainty in Q4 2018 followed by more-dovish-than-expected central bankrhetoric in Q1 2019 pushed global yields lower. Equities contributed modestly to performance, whilecommodities detracted across sectors.
There have been no material changes to the Sub-Fund’s investment strategy or objectives during the yearended 31 March 2019.
AQR Managed Futures UCITS Fund
The investment objective of AQR Managed Futures UCITS Fund (the “Sub-Fund”) is to produce attractiverisk-adjusted returns while maintaining low-to-zero long-term average correlation to traditional markets.The Sub-Fund seeks to achieve its investment objective by investing in a diversified portfolio of futures,forwards and swaps (including, but not limited to, equity index futures, bond futures, interest rate futures,currency forwards, and swaps on eligible diversified commodity indices). The Sub-Fund seeks to provideperformance with low long-term correlation to equities and other traditional asset classes.
AQR UCITS FUNDS
7

Investment Management Report (Unaudited)
AQR Managed Futures UCITS Fund (continued)
For the year ended 31 March 2019, the Sub-Fund’s Class A shares returned -3.78%. The Class A sharesare denominated in U.S. Dollar, which is the reference currency of the Sub-Fund.
Negative performance for the year ended 31 March 2019 was predominantly driven by reversals incurrencies, while trend following in fixed income contributed positively to performance and equities andeligible diversified commodity indices had a modest performance impact. In currencies, sharp reversals inthe Euro and U.S. Dollar led to losses early in the year, with additional losses in the Japanese Yen onchanging risk sentiment and in the British Pound as expectations for Brexit fluctuated over the year.Uncertainty around trade negotiations also caused reversals in currencies such as the Canadian Dollar andMexican Peso that detracted. Gains from trend following in fixed income partially offset these losseshowever, particularly due to sustained bullish trends across global fixed income markets late in the year.Trend following in equities had a modest impact on performance as there were a number of notablereversals that caused losses for long-term signals, but short-term signals offered offsetting positiveperformance as their views turned more quickly in line with new trends. Commodities also had a modestperformance impact as eligible diversified commodity indices were introduced into the Sub-Fund late in theyear.
There have been no material changes to the Sub-Fund’s investment strategy and objectives during theyear ended 31 March 2019. Note that the Sub-Fund began trading eligible diversified commodity indicesstarting late in the year to improve diversification of the portfolio.
AQR Style Premia: Equity Market Neutral UCITS Fund
The investment objective of AQR Style Premia: Equity Market Neutral UCITS Fund (the “Sub-Fund”) is toproduce high risk adjusted returns while maintaining low-to-zero correlation to traditional markets. TheSub-Fund seeks to achieve its investment objective by aiming to provide exposure to three separateinvestment styles: value, momentum, and defensive. The Sub-Fund pursues its objectives throughinvestments in equity stocks, and/or swaps on equity stocks.
For the year ended 31 March 2019, the Class A1 returned -12.47%. The Class A1 shares are denominatedin U.S. Dollar, which is the reference currency of the Sub-Fund.
Underperformance resulted from trends in investment styles as described above and was not the result oflarge losses from a small group of securities. Specifically, inexpensive value stocks underperformedexpensively priced stocks, and momentum stocks (those showing signs of improvement in either price orfundamentals, or both) underperformed those showing deterioration by those measures.
As of 31 March 2019, the Sub-Fund’s largest active positions within the stock selection strategy includesector longs to information technology and health care; the Sub-Fund was short financials and consumerdiscretionary.
There have been no material changes to the Sub-Fund’s investment strategy or objectives during the yearended 31 March 2019.
AQR Style Premia UCITS Fund
The investment objective of AQR Style Premia UCITS Fund (the “Sub-Fund”) is to produce highrisk-adjusted returns while maintaining low-to-zero correlation to traditional markets. The Sub-Fund seeksto achieve its investment objective by aiming to provide exposure to four separate investment styles: value,momentum, carry and defensive. The Sub-Fund invests within four broad asset groups which includestocks, equity indices, fixed-income and currencies.
For the year ended 31 March 2019, the Sub-Fund’s Class A shares returned -10.40%. The Class A sharesare denominated in U.S. Dollar, which is the reference currency of the Sub-Fund.
AQR UCITS FUNDS
8

Investment Management Report (Unaudited)
AQR Style Premia UCITS Fund (continued)
Trading within stocks and industries were the largest contributors to losses over the year. Equity indicesalso detracted, though more modestly, while fixed income and currencies contributed positively. From aninvestment style perspective, value produced the largest losses mainly stemming from the stocks andindustries portfolio, as investors showed abnormal enthusiasm for expensive stocks. Momentum’sdetraction occurred entirely in the last quarter of 2018 which saw widespread market reversals within andacross industries. Defensive was the only style to contribute meaningful performance, with gains seenlargely in the last quarter of 2018 as risk-averse sentiment dominated, while carry also gained albeit moremodestly.
There have been no material changes to the Sub-Fund’s investment strategy or objectives during the yearended 31 March 2019.
AQR Systematic Fixed Income: US High Yield UCITS Fund
The investment objective of AQR Systematic Fixed Income: US High Yield UCITS Fund (the “Sub-Fund”)is to outperform the Bank of America Merrill Lynch U.S. High Yield Index (the “Benchmark”). The Sub-Fundseeks to achieve its investment objective by systematically applying fundamental investment ideas,primarily through security selection; the Sub-Fund does not seek to engage in any credit or duration timing.
For the year ended 31 March 2019, the Sub-Fund’s Class A2 shares returned 4.48%. The Sub-Fund’sClass A2 shares are denominated in U.S. Dollar, which is the reference currency of the Sub-Fund. AU.S. Dollar denominated investment in the Benchmark would have returned 5.97%, resulting in a relativeunderperformance by the Sub-Fund.
The underperformance was driven by security selection within specific industries; the Sub-Fund notably didnot derive significant returns from either market timing or industry selection. Underperformance wasdiversified across various sectors. These properties are consistent with the Sub-Fund’s objective oftargeting a beta of 1 and minimal tilts relative to the Benchmark. From a thematic perspective, ourdefensive signals were the largest detractors in the beginning of the fiscal year, while our value signalshave detracted more recently. From an industry perspective, security selection within consumer cyclical,basic industry, and telecommunications were the largest detractors, while contributions elsewhere were notenough to offset these. We remain confident that these themes and our security selection approach willprovide positive excess of Benchmark returns over the medium and long-term, and in fact, performanceremains attractive since the inception of the strategy.
There have been no material changes to the Sub-Fund’s investment strategy or objectives during the yearended 31 March 2019.
AQR Systematic Total Return UCITS Fund
The investment objective of AQR Systematic Total Return UCITS Fund (the “Sub-Fund”) is to generatesustainable total returns through an efficient, diversified allocation to a broad set of traditional market riskpremia, alternative risk premia, and differentiated sources of alpha. The strategy is implemented via abalanced risk allocation to three of AQR’s core competencies: risk-balanced market exposures, multi-assettrend, and market-neutral security selection, in a single, integrated portfolio.
For the year ended 31 March 2019, the Sub-Fund’s Class A1 shares returned -12.50%. The Class A1shares are denominated in U.S. Dollar, which is also the reference currency of the Sub-Fund.
Stocks and industries, commodities, currencies, and equity indices detracted from the return of theSub-Fund for the year ended 31 March 2019, while fixed income contributed positively. Losses in themarket-neutral security selection sub-strategy and, to a lesser extent, the multi-asset trend sub-strategywere only partially offset by gains from the risk-balanced market exposures sub-strategy.
There have been no material changes to the Sub-Fund’s investment strategy or objectives during the yearended 31 March 2019.
The figures stated in this report are historical and not necessarily indicative of future performance.
AQR UCITS FUNDS
9

PricewaterhouseCoopers, Société coopérative, 2 rue Gerhard Mercator, B.P. 1443, L-1014 LuxembourgT : +352 494848 1, F : +352 494848 2900, www.pwc.lu Cabinet de révision agréé. Expert-comptable (autorisation gouvernementale n°10028256)R.C.S. Luxembourg B 65 477 - TVA LU25482518
Audit report
To the Shareholders ofAQR UCITS Funds
Our opinion
In our opinion, the accompanying financial statements give a true and fair view of the financial position of AQR UCITS Funds and of each of its sub-funds (the “Fund”) as at 31 March 2019, and of the results of their operations and changes in their net assets for the year then ended in accordance with Luxembourg legal and regulatory requirements relating to the preparation and presentation of the financial statements.
What we have audited
The Fund’s financial statements comprise:
the Schedule of Investments as at 31 March 2019; the Statements of Assets and Liabilities as at 31 March 2019; the Statements of Operations for the year then ended; the Statements of Changes in Net Assets for the year then ended; the Statements of Changes in Shares Outstanding for the year then ended; and the Notes to the financial statements, which include a summary of significant accounting policies.
Basis for opinion
We conducted our audit in accordance with the Law of 23 July 2016 on the audit profession (Law of 23 July 2016) and with International Standards on Auditing (ISAs) as adopted for Luxembourg by the “Commission de Surveillance du Secteur Financier” (CSSF). Our responsibilities under the Law of 23 July 2016 and ISAs as adopted for Luxembourg by the CSSF are further described in the “Responsibilities of the “Réviseur d’entreprises agréé” for the audit of the financial statements” section of our report.
We believe that the audit evidence we have obtained is sufficient and appropriate to provide a basis for our opinion.
We are independent of the Fund in accordance with the International Ethics Standards Board for Accountants’ Code of Ethics for Professional Accountants (IESBA Code) as adopted for Luxembourg by the CSSF together with the ethical requirements that are relevant to our audit of the financial statements. We have fulfilled our other ethical responsibilities under those ethical requirements.
Other information
The Board of Directors of the Fund is responsible for the other information. The other information comprises the information stated in the annual report but does not include the financial statements and our audit report thereon.
Our opinion on the financial statements does not cover the other information and we do not express any form of assurance conclusion thereon.

11
In connection with our audit of the financial statements, our responsibility is to read the other information identified above and, in doing so, consider whether the other information is materially inconsistent with the financial statements or our knowledge obtained in the audit, or otherwise appears to be materially misstated. If, based on the work we have performed, we conclude that there is a material misstatement of this other information, we are required to report that fact. We have nothing to report in this regard.
Responsibilities of the Board of Directors of the Fund for the financial statements
The Board of Directors of the Fund is responsible for the preparation and fair presentation of the financial statements in accordance with Luxembourg legal and regulatory requirements relating to the preparation and presentation of the financial statements, and for such internal control as the Board of Directors of the Fund determines is necessary to enable the preparation of financial statements that are free from material misstatement, whether due to fraud or error.
In preparing the financial statements, the Board of Directors of the Fund is responsible for assessing the Fund’s ability to continue as a going concern, disclosing, as applicable, matters related to going concern and using the going concern basis of accounting unless the Board of Directors of the Fund either intends to liquidate the Fund or to cease operations, or has no realistic alternative but to do so.
Responsibilities of the “Réviseur d’entreprises agréé” for the audit of the financial statements
The objectives of our audit are to obtain reasonable assurance about whether the financial statements as a whole are free from material misstatement, whether due to fraud or error, and to issue an audit report that includes our opinion. Reasonable assurance is a high level of assurance, but is not a guarantee that an audit conducted in accordance with the Law of 23 July 2016 and with ISAs as adopted for Luxembourg by the CSSF will always detect a material misstatement when it exists. Misstatements can arise from fraud or error and are considered material if, individually or in the aggregate, they could reasonably be expected to influence the economic decisions of users taken on the basis of these financial statements.
As part of an audit in accordance with the Law of 23 July 2016 and with ISAs as adopted for Luxembourg by the CSSF, we exercise professional judgment and maintain professional scepticism throughout the audit. We also:
identify and assess the risks of material misstatement of the financial statements, whether due to fraud or error, design and perform audit procedures responsive to those risks, and obtain audit evidence that is sufficient and appropriate to provide a basis for our opinion. The risk of not detecting a material misstatement resulting from fraud is higher than for one resulting from error, as fraud may involve collusion, forgery, intentional omissions, misrepresentations, or the override of internal control;
obtain an understanding of internal control relevant to the audit in order to design audit procedures that are appropriate in the circumstances, but not for the purpose of expressing an opinion on the effectiveness of the Fund’s internal control;
evaluate the appropriateness of accounting policies used and the reasonableness of accounting estimates and related disclosures made by the Board of Directors of the Fund;

12
conclude on the appropriateness of the Board of Directors of the Fund’s use of the going concern basis of accounting and, based on the audit evidence obtained, whether a material uncertainty exists related to events or conditions that may cast significant doubt on the Fund’s ability to continue as a going concern. If we conclude that a material uncertainty exists, we are required to draw attention in our audit report to the related disclosures in the financial statements or, if such disclosures are inadequate, to modify our opinion. Our conclusions are based on the audit evidence obtained up to the date of our audit report. However, future events or conditions may cause the Fund to cease to continue as a going concern;
evaluate the overall presentation, structure and content of the financial statements, including the disclosures, and whether the financial statements represent the underlying transactions and events in a manner that achieves fair presentation.
We communicate with those charged with governance regarding, among other matters, the planned scope and timing of the audit and significant audit findings, including any significant deficiencies in internal control that we identify during our audit.
Other Matter
In addition to our responsibility to audit and express an opinion on the financial statements in accordance with the Law of 23 July 2016 and with ISAs as adopted for Luxembourg by the CSSF, we have been requested by the Board of Directors of the Fund to express an opinion on the financial statements in accordance with generally accepted auditing standards in the United States of America as issued by the AICPA, in order to meet the requirements of Rule 206(4)-2 of the US Investment Advisors Act of 1940. We have reported separately in this respect on Page 13.
PricewaterhouseCoopers, Société coopérativeRepresented by
Didier Prime
Luxembourg, 20 June 2019

PricewaterhouseCoopers, Société coopérative, 2 rue Gerhard Mercator, B.P. 1443, L-1014 Luxembourg T : +352 494848 1, F : +352 494848 2900, www.pwc.lu
Cabinet de révision agréé. Expert-comptable (autorisation gouvernementale n°10028256) R.C.S. Luxembourg B 65 477 - TVA LU25482518
Report of Independent Auditors
To the Shareholders of AQR UCITS Funds
We have audited the accompanying financial statements of AQR UCITS Funds and of each of its sub-funds (the “Fund”), which comprise the Schedule of Investments, the Statements of Assets and Liabilities as of 31 March 2019, the Statements of Operations and of Changes in Net Assets and of Changes in Shares Outstanding for the year then ended. Responsibility of the Board of Directors of the Fund for the financial statements
The Board of Directors of the Fund is responsible for the preparation and fair presentation of the financial statements in accordance with Luxembourg legal and regulatory requirements relating to the preparation and presentation of the financial statements; this includes the design, implementation, and maintenance of internal controls relevant to the preparation and fair presentation of financial statements that are free from material misstatement, whether due to fraud or error. Auditors’ Responsibility
Our responsibility is to express an opinion on the financial statements based on our audit. We conducted our audit in accordance with auditing standards generally accepted in the United States of America. Those standards require that we plan and perform the audit to obtain reasonable assurance about whether the financial statements are free from material misstatement. An audit involves performing procedures to obtain audit evidence about the amounts and disclosures in the financial statements. The procedures selected depend on our judgment, including the assessment of the risks of material misstatement of the financial statements, whether due to fraud or error. In making those risk assessments, we consider internal control relevant to the Fund’s preparation and fair presentation of the financial statements in order to design audit procedures that are appropriate in the circumstances, but not for the purpose of expressing an opinion on the effectiveness of the Fund’s internal control. Accordingly, we express no such opinion. An audit also includes evaluating the appropriateness of accounting policies used and the reasonableness of accounting estimates made by the Board of Directors of the Fund, as well as evaluating the overall presentation of the financial statements. We believe that the audit evidence we have obtained is sufficient and appropriate to provide a basis for our audit opinion.

14
Opinion
Other Matter
Our audit was conducted for the purpose of forming an opinion on the financial statements taken as a whole. The Investment Management Report is presented for purposes of additional analysis and is not a required part of the financial statements. The information is the responsibility of the Board of Directors of the Fund and was derived from and relates directly to the underlying accounting and other records used to prepare the financial statements. The Investment Management Report has not been subjected to the auditing procedures applied in the audit of the financial statements and, accordingly, we express no opinion nor provide any assurance on it. PricewaterhouseCoopers, Société coopérative Luxembourg, 20 June 2019 Represented by Didier Prime
In our opinion, the financial statements referred to above present fairly, in all material respects, thefinancial position of AQR UCITS Funds and of each of its sub-funds as of 31 March 2019, andthe results of their operations and changes in their net assets for the year then ended in accordancewith Luxembourg legal and regulatory requirements relating to the preparation and presentationof the financial statements.

Investments CouponMaturityDate Currency
Shares/PrincipalAmounts
Fair Valuein USD
Percentof Net
Assets
Short Term InvestmentsFranceAntalis SA 0.000% 02/04/2019 USD 250,000 249,932 2.09
Total France 249,932 2.09
LuxembourgNestle Finance International Ltd 0.000% 12/04/2019 USD 100,000 99,907 0.84
Total Luxembourg 99,907 0.84
SwedenSkandinaviska Enskilda Banken AB 0.000% 22/05/2019 USD 300,000 298,902 2.51
Total Sweden 298,902 2.51
United KingdomASB Finance Ltd 0.000% 14/05/2019 USD 250,000 249,212 2.09
Total United Kingdom 249,212 2.09
United StatesBank of Montreal 2.430% 02/04/2019 USD 250,000 250,000 2.10Chevron Corporation 0.000% 02/04/2019 USD 250,000 249,934 2.09Gotham Funding Corp 0.000% 13/05/2019 USD 250,000 249,222 2.09Liberty Street Funding LLC 0.000% 20/05/2019 USD 250,000 249,097 2.09Mizuho Bank Ltd 0.000% 11/04/2019 USD 250,000 249,782 2.09Nieuw Amsterdam Receivables Corp 0.000% 01/04/2019 USD 250,000 249,946 2.10Oversea-Chinese Banking Corp Ltd 2.560% 14/05/2019 USD 250,000 250,012 2.10PACCAR Financial Corp 0.000% 02/05/2019 USD 100,000 99,767 0.84Starbird Funding Corp 0.000% 13/06/2019 USD 250,000 248,639 2.08The Coca-Cola Co 0.000% 17/06/2019 USD 250,000 248,607 2.08The Toronto-Dominion Bank 2.650% 20/05/2019 USD 250,000 250,038 2.10Walmart Inc 0.000% 08/04/2019 USD 250,000 249,834 2.09
Total United States 2,844,878 23.85
Other Investment FundsUnited StatesUBS (Irl) Select Money Market Fund^ 0.000% USD 932,961 932,961 7.82
Total United States 932,961 7.82
Total Other Investment Funds 932,961 7.82
Total Short Term Investments 4,675,792 39.20
Total Investments (Total Cost: $4,676,180) 4,675,792 39.20
Other Assets/(Liabilities) 7,252,123 60.80
Total Net Assets 11,927,915 100.00
^Seven-day effective yield at 31 March 2019 was 2.29%.
Economic Classification of InvestmentsAs at 31 March 2019
Industry ClassificationPercent ofNet Assets
Consumer Cyclical 2.09Consumer Non-cyclical 4.18Financial 32.93Total Investments 39.20
Other Assets/(Liabilities) 60.80Total Net Assets 100.00
AQR UCITS FUNDS
AQR Delphi Long-Short Equity UCITS Fund
Schedule of InvestmentsAs at 31 March 2019
The accompanying notes form an integral part of these audited financial statements. 15

Derivatives
Hedge Forward Foreign Exchange ContractsOver-the-Counter
Counterparty† Currency Purchased Amount Purchased Currency Sold Amount Sold Settlement Date
UnrealisedAppreciation/
(Depreciation)in USD
Percent ofNet Assets
CITI CHF 147,500 USD 148,527 19/06/2019 711 0.00CITI GBP 286 USD 372 19/06/2019 2 0.00JPMC CHF 147,500 USD 148,527 19/06/2019 711 0.01JPMC GBP 287 USD 373 19/06/2019 2 0.00CITI EUR 2,365,554 USD 2,702,431 19/06/2019 (29,055) (0.24)CITI GBP 3,606 USD 4,765 19/06/2019 (59) (0.00)JPMC EUR 2,365,534 USD 2,702,411 19/06/2019 (29,058) (0.25)JPMC GBP 3,611 USD 4,771 19/06/2019 (59) (0.00)
Total Hedge Forward Foreign Exchange Contracts (56,805) (0.48)
AQR UCITS FUNDS
AQR Delphi Long-Short Equity UCITS Fund
Schedule of Investments (continued)As at 31 March 2019
The accompanying notes form an integral part of these audited financial statements. 16

Total Return Basket Swap ContractsOver-the-Counter
Counterparty† Description‡ Termination DateFair Value in
USDJPMC The Sub-Fund receives the total return on a portfolio of long and short positions and pays FFR plus or minus a
specified spread, which is denominated in USD based on the local currency of the positions within the swap.22.12.2020 60,395
The following table represents the long and short positions and related values within the total return equity basket swap as at 31 March 2019
Reference Entity Currency Shares Notional Amount
UnrealisedAppreciation/
(Depreciation)in USD
Percent ofNet Assets
Long PositionsCommon StocksBermudaEnstar Group Ltd USD 15 2,616 16 0.00RenaissanceRe Holdings Ltd USD 164 23,485 (455) (0.01)
(439) (0.01)CanadaGran Tierra Energy Inc USD 698 1,591 (112) (0.00)
(112) (0.00)NetherlandsCimpress NV USD 25 1,985 7 0.00
7 0.00Puerto RicoEVERTEC Inc USD 37 1,043 (24) (0.00)Popular Inc USD 789 41,328 (2,664) (0.02)Triple-S Management Corp USD 89 2,032 (396) (0.01)
(3,084) (0.03)SingaporeKulicke & Soffa Industries Inc USD 16 350 (13) (0.00)
(13) (0.00)South AfricaNet 1 UEPS Technologies Inc USD 139 491 (60) (0.00)
(60) (0.00)SwedenAutoliv Inc USD 257 18,882 (1,313) (0.01)
(1,313) (0.01)SwitzerlandGarrett Motion Inc USD 134 2,010 (13) (0.00)
(13) (0.00)ThailandFabrinet USD 87 4,551 (109) (0.00)
(109) (0.00)United KingdomJanus Henderson Group PLC USD 100 2,499 (17) (0.00)Linde PLC USD 444 77,365 (135) (0.00)
(152) (0.00)United States1-800-Flowers.com Inc USD 464 8,384 51 0.001st Source Corp USD 128 5,770 (306) (0.00)2U Inc USD 78 5,639 299 0.003M Co USD 594 122,833 (1,010) (0.01)8x8 Inc USD 17 345 (7) (0.00)AAON Inc USD 39 1,810 141 0.00AAR Corp USD 122 3,948 (339) (0.00)Aarons Inc USD 282 14,653 59 0.00AbbVie Inc USD 51 4,102 (15) (0.00)ABIOMED Inc USD 140 40,093 (6,623) (0.06)Abraxas Petroleum Corp USD 640 819 (96) (0.00)Accenture PLC USD 692 121,446 6,276 0.05ACE Ltd USD 423 59,089 977 0.01Acorda Therapeutics Inc USD 304 4,049 (322) (0.00)Addus HomeCare Corp USD 265 16,690 (856) (0.01)Adobe Systems Inc USD 249 66,147 1,951 0.02ADTRAN Inc USD 523 7,244 (419) (0.00)Advanced Drainage Systems Inc USD 490 12,598 (177) (0.00)Advanced Energy Industries Inc USD 190 9,415 165 0.00AdvanSix Inc USD 225 6,386 (459) (0.00)Aerovironment Inc USD 119 8,238 (273) (0.00)Aflac Inc USD 1,084 53,983 (488) (0.00)Agilent Technologies Inc USD 565 45,211 (541) (0.00)Agree Realty Corp USD 122 8,525 495 0.00Aimmune Therapeutics Inc USD 60 1,333 (11) (0.00)Air Products Chemicals Inc USD 471 89,038 1,729 0.01Aircastle Ltd USD 31 628 (5) (0.00)Akamai Technologies Inc USD 177 12,641 (146) (0.00)Alamo Group Inc USD 68 6,756 18 0.00Alarm.com Holdings Inc USD 83 5,342 221 0.00Align Technology Inc USD 88 24,651 2,182 0.02Alleghany Corp USD 52 31,926 (393) (0.00)Allegion PLC USD 589 53,075 709 0.01ALLETE Inc USD 550 45,227 (457) (0.00)Allied Motion Technologies Inc USD 127 4,398 (709) (0.01)Alphabet Inc - Class A USD 102 119,151 (2,081) (0.02)Alphabet Inc - Class C USD 46 53,616 (860) (0.01)Altair Engineering Inc USD 122 4,543 (110) (0.00)Altria Group Inc USD 422 24,008 (173) (0.00)AMAG Pharmaceuticals Inc USD 50 631 9 0.00Amazon.com Inc USD 73 129,962 2,785 0.02AMC Networks Inc USD 580 33,060 (1,150) (0.01)Amdocs Ltd USD 58 3,137 3 0.00Amedisys Inc USD 82 10,022 (171) (0.00)Ameren Corp USD 377 27,653 366 0.00American Campus Communities Inc USD 162 7,760 277 0.00
AQR UCITS FUNDS
AQR Delphi Long-Short Equity UCITS Fund
Schedule of Investments (continued)As at 31 March 2019
The accompanying notes form an integral part of these audited financial statements. 17

Reference Entity Currency Shares Notional Amount
UnrealisedAppreciation/
(Depreciation)in USD
Percent ofNet Assets
Long Positions (continued)Common Stocks (continued)United States (continued)American Eagle Outfitters Inc USD 503 11,182 744 0.01American Electric Power Co Inc USD 549 46,006 223 0.00American Financial Group Inc USD 445 42,667 (890) (0.01)American National Insurance Co USD 42 5,148 (593) (0.01)American Public Education Inc USD 429 13,239 (669) (0.01)American States Water Co USD 164 11,713 21 0.00American Vanguard Corp USD 320 5,571 (245) (0.00)American Water Works Co Inc USD 126 13,149 (97) (0.00)America’s Car-Mart Inc USD 100 9,289 831 0.01AMERISAFE Inc USD 335 19,866 (468) (0.00)AMETEK Inc USD 531 43,903 489 0.00Amgen Inc USD 202 38,375 (270) (0.00)AMN Healthcare Services Inc USD 112 5,224 44 0.00Amphastar Pharmaceuticals Inc USD 311 6,366 18 0.00Amphenol Corp USD 445 41,848 (619) (0.01)Anadarko Petroleum Corp USD 1,079 49,041 388 0.00Analog Devices Inc USD 216 22,656 (920) (0.01)AnaptysBio Inc USD 7 506 (10) (0.00)AngioDynamics Inc USD 88 2,010 82 0.00ANI Pharmaceuticals Inc USD 96 6,720 635 0.01Anika Therapeutics Inc USD 252 7,608 (58) (0.00)Ansys Inc USD 262 47,663 267 0.00Anthem Inc USD 107 30,321 (2,660) (0.02)AO Smith Corp USD 1,115 59,418 1,327 0.01Aon PLC USD 155 26,314 106 0.00Apartment Investment & Management Co USD 319 16,068 683 0.01Apogee Enterprises Inc USD 165 6,194 241 0.00Appfolio Inc USD 153 12,144 851 0.01Apple Hospitality REIT Inc USD 645 10,601 13 0.00Apple Inc USD 817 154,241 687 0.01Applied Industrial Technologies Inc USD 143 8,467 95 0.00Applied Materials Inc USD 540 21,260 (541) (0.00)AptarGroup Inc USD 378 39,974 771 0.01Aqua America Inc USD 359 13,279 355 0.00ArcBest Corp USD 132 4,132 (221) (0.00)Arch Coal Inc USD 115 10,617 117 0.00Archer-Daniels-Midland Co USD 479 20,535 177 0.00Argo Group International Holdings Ltd USD 108 7,647 293 0.00Arista Networks Inc USD 85 26,568 1,136 0.01Armada Hoffler Properties Inc USD 482 7,543 145 0.00Arrowhead Pharmaceuticals Inc USD 209 3,812 (128) (0.00)Asbury Automotive Group Inc USD 91 6,304 30 0.00Aspen Technology Inc USD 368 38,298 920 0.01Assertio Therapeutics Inc USD 187 883 39 0.00Associated Banc-Corp USD 85 1,818 (113) (0.00)Assurant Inc USD 154 14,605 (748) (0.01)Assured Guaranty Ltd USD 626 27,838 (425) (0.00)Astec Industries Inc USD 35 1,319 (57) (0.00)Astronics Corp USD 77 2,456 (36) (0.00)Athene Holding Ltd USD 1,882 76,616 (5,834) (0.05)Atkore International Group Inc USD 290 6,339 (186) (0.00)Atlantic Capital Bancshares Inc USD 90 1,615 (86) (0.00)Atmos Energy Corp USD 663 68,137 511 0.00ATN International Inc USD 23 1,305 29 0.00AtriCure Inc USD 80 2,137 (130) (0.00)Atrion Corp USD 21 18,627 1,596 0.01Automatic Data Processing Inc USD 187 29,720 794 0.01AutoZone Inc USD 35 35,464 1,312 0.01Avalonbay Communities Inc USD 310 62,264 1,136 0.01Avangrid Inc USD 232 11,612 128 0.00Avery Dennison Corp USD 563 63,613 777 0.01Avnet Inc USD 110 4,754 (67) (0.00)AVX Corp USD 56 970 (37) (0.00)Axcelis Technologies Inc USD 220 4,448 (99) (0.00)Axis Capital Holdings Ltd USD 58 3,195 (107) (0.00)Axon Enterprise Inc USD 102 5,585 482 0.00AZZ Inc USD 89 3,667 (193) (0.00)Badger Meter Inc USD 208 11,596 (290) (0.00)Balchem Corp USD 56 5,197 (99) (0.00)BancFirst Corp USD 129 6,694 (469) (0.00)Bank of Hawaii Corp USD 586 46,593 (1,776) (0.02)Banner Corp USD 6 327 (11) (0.00)Barrett Business Services Inc USD 10 772 (21) (0.00)Baxter International Inc USD 500 40,315 1,840 0.02BBX Capital Corp USD 178 1,056 (51) (0.00)Berkshire Hathaway Inc USD 168 33,687 (1,035) (0.01)Berry Petroleum Corp USD 34 401 (5) (0.00)Best Buy Co Inc USD 783 55,632 633 0.01Big Lots Inc USD 81 3,063 236 0.00Biogen Inc USD 268 62,988 (24,279) (0.20)Bio-Rad Laboratories Inc USD 47 14,439 (305) (0.00)BioSpecifics Technologies Corp USD 229 14,264 (1,018) (0.01)Bio-Techne Corp USD 174 34,487 252 0.00BioTelemetry Inc USD 37 2,312 (228) (0.00)BJ’s Restaurants Inc USD 143 6,698 (83) (0.00)Blue Bird Corp USD 470 7,943 (89) (0.00)BMC Stock Holdings Inc USD 698 12,410 (223) (0.00)Boingo Wireless Inc USD 25 575 46 0.00Boise Cascade Co USD 273 7,393 (112) (0.00)BOK Financial Corp USD 262 21,481 (1,391) (0.01)Bonanza Creek Energy Inc USD 245 5,346 47 0.00Booking Holdings Inc USD 34 59,289 (488) (0.00)Booz Allen Hamilton Holding Corp USD 838 48,679 808 0.01Bottomline Technologies DE Inc USD 61 3,051 25 0.00Brady Corp USD 66 3,084 (5) (0.00)
AQR UCITS FUNDS
AQR Delphi Long-Short Equity UCITS Fund
Schedule of Investments (continued)As at 31 March 2019
The accompanying notes form an integral part of these audited financial statements. 18

Reference Entity Currency Shares Notional Amount
UnrealisedAppreciation/
(Depreciation)in USD
Percent ofNet Assets
Long Positions (continued)Common Stocks (continued)United States (continued)Braemar Hotels & Resorts Inc USD 31 388 25 0.00Bright Horizons Family Solutions Inc USD 132 16,753 140 0.00Brinker International Inc USD 343 15,106 (16) (0.00)Bristol-Myers Squibb Co USD 1,103 51,885 (3,098) (0.03)Broadcom Inc USD 141 42,331 900 0.01Broadridge Financial Solutions Inc USD 839 86,249 (439) (0.00)Brookline Bancorp Inc USD 178 2,579 (87) (0.00)Brown & Brown Inc USD 231 6,808 0 0.00Bruker Corp USD 590 22,703 (460) (0.00)Brunswick Corp USD 451 22,690 (1,176) (0.01)Bryn Mawr Bank Corp USD 127 4,585 (338) (0.00)Burlington Stores Inc USD 56 8,737 592 0.00C&J Energy Services Inc USD 133 2,088 (137) (0.00)Cable One Inc USD 40 39,032 1,426 0.01Cabot Microelectronics Corp USD 221 24,398 (453) (0.00)Cabot Oil Gas Corp USD 1,964 51,280 314 0.00Cadence Design Systems Inc USD 881 55,573 1,780 0.01CalAmp Corp USD 55 690 (13) (0.00)Calavo Growers Inc USD 135 11,437 (8) (0.00)Calix Inc USD 667 5,136 (287) (0.00)Cal-Maine Foods Inc USD 473 21,167 142 0.00Camden Property Trust USD 436 44,367 802 0.01Cannae Holdings Inc USD 238 5,705 87 0.00Cantel Medical Corp USD 263 17,653 24 0.00Carbonite Inc USD 303 7,493 83 0.00Cardiovascular Systems Inc USD 60 2,294 (73) (0.00)Care.com Inc USD 81 1,582 5 0.00CareDx Inc USD 162 5,169 (638) (0.01)Career Education Corp USD 52 865 4 0.00Cargurus Inc USD 89 3,486 (3) (0.00)Carnival Corp USD 300 15,141 (2,014) (0.02)Carolina Financial Corp USD 70 2,435 (130) (0.00)Carriage Services Inc USD 301 5,800 (223) (0.00)Carrols Restaurant Group Inc USD 239 2,371 (93) (0.00)Carters Inc USD 228 23,044 902 0.01Casa Systems Inc USD 100 835 (68) (0.00)Caseys General Stores Inc USD 42 5,419 45 0.00Cass Information Systems Inc USD 355 16,809 (672) (0.01)Cathay General Bancorp USD 1,331 45,334 (3,494) (0.03)Cavco Industries Inc USD 82 9,561 (239) (0.00)CBIZ Inc USD 507 10,307 142 0.00CBOE Holdings Inc USD 156 14,823 (119) (0.00)CBTX Inc USD 173 5,633 (124) (0.00)CDW Corp USD 367 35,232 (386) (0.00)Celanese Corp USD 345 33,896 (1,070) (0.01)Celgene Corp USD 75 6,980 381 0.00CenterPoint Energy Inc USD 1,986 60,772 40 0.00Central Pacific Financial Corp USD 196 5,668 35 0.00Cerner Corp USD 586 33,267 (527) (0.00)CEVA Inc USD 38 1,040 (15) (0.00)CH Robinson Worldwide Inc USD 957 83,020 (3,168) (0.03)Charles River Laboratories International Inc USD 14 2,024 (18) (0.00)Chase Corp USD 234 21,640 746 0.01Chatham Lodging Trust USD 134 2,601 64 0.00Chemed Corp USD 165 53,120 (1,115) (0.01)Chesapeake Utilities Corp USD 113 10,308 (184) (0.00)Chicos FAS Inc USD 157 670 (56) (0.00)Choice Hotels International Inc USD 351 27,329 (88) (0.00)Church & Dwight Co Inc USD 107 7,576 422 0.00Churchill Downs Inc USD 288 25,860 1,236 0.01Chuy’s Holdings Inc USD 379 8,482 (117) (0.00)Cimarex Energy Co USD 787 55,114 (1,365) (0.01)Cincinnati Financial Corp USD 120 10,262 (48) (0.00)Cintas Corp USD 370 74,122 (2,661) (0.02)Cirrus Logic Inc USD 519 21,715 156 0.00Cisco Systems Inc USD 1,402 74,881 (140) (0.00)Citi Trends Inc USD 413 7,959 (181) (0.00)City Holding Co USD 154 11,730 (231) (0.00)City Office REIT Inc USD 383 4,370 126 0.00CME Group Inc USD 420 68,586 (2,768) (0.02)CMS Energy Corp USD 505 27,932 (5) (0.00)Codexis Inc USD 385 7,839 (177) (0.00)Cogent Communications Holdings Inc USD 72 3,887 171 0.00Cognex Corp USD 596 30,271 (1,973) (0.02)Cognizant Technology Solutions Corp USD 880 63,650 396 0.00Cohen & Steers Inc USD 30 1,268 28 0.00Cohu Inc USD 405 6,047 (53) (0.00)Colgate-Palmolive Co USD 1,276 86,251 1,665 0.01Collegium Pharmaceutical Inc USD 494 7,272 (1,405) (0.01)Columbia Sportswear Co USD 257 26,910 (77) (0.00)Columbus McKinnon Corp USD 396 13,706 40 0.00Comcast Corp USD 3,001 119,230 (570) (0.01)Comfort Systems USA Inc USD 150 7,949 33 0.00Commerce Bancshares Inc USD 551 32,173 (1,934) (0.02)Community Healthcare Trust Inc USD 127 4,619 293 0.00Community Trust Bancorp Inc USD 326 13,464 (232) (0.00)CommVault Systems Inc USD 82 5,322 (16) (0.00)Computer Programs & Systems Inc USD 378 11,196 (125) (0.00)Comtech Telecommunications Corp USD 192 4,385 92 0.00Consol Energy Inc USD 159 5,404 (569) (0.01)Consolidated Edison Inc USD 422 35,710 (34) (0.00)Continental Building Products Inc USD 225 5,522 (183) (0.00)Control4 Corp USD 927 15,472 129 0.00Cooper-Standard Holdings Inc USD 7 334 (30) (0.00)Copart Inc USD 196 11,803 221 0.00
AQR UCITS FUNDS
AQR Delphi Long-Short Equity UCITS Fund
Schedule of Investments (continued)As at 31 March 2019
The accompanying notes form an integral part of these audited financial statements. 19

Reference Entity Currency Shares Notional Amount
UnrealisedAppreciation/
(Depreciation)in USD
Percent ofNet Assets
Long Positions (continued)Common Stocks (continued)United States (continued)Corcept Therapeutics Inc USD 731 8,516 (476) (0.00)Core Laboratories NV USD 49 3,364 (140) (0.00)Core-Mark Holding Co Inc USD 52 1,939 34 0.00CoreSite Realty Corp USD 22 2,357 74 0.00CorVel Corp USD 226 14,713 (239) (0.00)CoStar Group Inc USD 67 31,154 (211) (0.00)Costco Wholesale Corp USD 173 41,672 742 0.01Coty Inc USD 62 709 10 0.00Covenant Transportation Group Inc USD 242 4,627 (552) (0.00)CRA International Inc USD 166 8,488 (91) (0.00)Cracker Barrel Old Country Store Inc USD 307 49,673 1,629 0.01Crane Co USD 299 25,313 (36) (0.00)Credit Acceptance Corp USD 55 24,793 (106) (0.00)Crocs Inc USD 77 2,019 37 0.00Cross Country Healthcare Inc USD 396 2,839 (43) (0.00)Crown Castle International Corp USD 412 52,312 952 0.01CryoLife Inc USD 16 459 (15) (0.00)CSG Systems International Inc USD 171 7,257 101 0.00CSW Industrials Inc USD 440 25,234 70 0.00CTS Corp USD 287 8,467 (418) (0.00)CubeSmart USD 563 18,067 548 0.00Cubic Corp USD 35 1,939 (68) (0.00)Cullen/Frost Bankers Inc USD 21 2,054 (72) (0.00)Cummins Inc USD 345 54,203 (1,177) (0.01)Curtiss-Wright Corp USD 320 36,141 (698) (0.01)Cutera Inc USD 193 3,391 (77) (0.00)CVR Energy Inc USD 259 10,710 (64) (0.00)CytomX Therapeutics Inc USD 240 2,522 (63) (0.00)CytoSorbents Corp USD 104 785 (37) (0.00)Dana Holding Corp USD 826 14,612 (752) (0.01)Danaher Corp USD 291 37,987 719 0.01Darden Restaurants Inc USD 364 44,404 3,968 0.03Deckers Outdoor Corp USD 132 19,515 412 0.00Delek US Holdings Inc USD 248 9,089 101 0.00Deluxe Corp USD 214 9,337 114 0.00Denny’s Corp USD 327 6,023 141 0.00Devon Energy Corp USD 2,368 75,302 3,055 0.03DHT Holdings Inc USD 546 2,435 (98) (0.00)Diamond Hill Investment Group Inc USD 133 18,567 (130) (0.00)Dicks Sporting Goods Inc USD 411 15,071 606 0.00Diodes Inc USD 50 1,744 (136) (0.00)Discover Financial Services USD 357 25,536 (817) (0.01)DMC Global Inc USD 139 6,906 627 0.00Dolby Laboratories Inc USD 577 36,334 (792) (0.01)Dollar General Corp USD 553 65,978 1,526 0.01Dominion Resources Inc USD 34 2,575 (30) (0.00)Dominos Pizza Inc USD 96 24,828 1,359 0.01Domtar Corp USD 74 3,663 (14) (0.00)Donaldson Co Inc USD 544 27,195 272 0.00Dorman Products Inc USD 68 5,989 388 0.00Douglas Dynamics Inc USD 126 4,818 (40) (0.00)Douglas Emmett Inc USD 49 1,984 19 0.00Dova Pharmaceuticals Inc USD 244 2,220 29 0.00DSW Inc USD 560 12,527 (1,563) (0.01)DTE Energy Co USD 422 52,366 317 0.00Ducommun Inc USD 36 1,567 (20) (0.00)Duke Realty Corp USD 718 22,057 273 0.00Duluth Holdings Inc USD 367 8,705 666 0.01DXP Enterprises Inc USD 9 353 (25) (0.00)Eagle Pharmaceuticals Inc USD 188 9,520 276 0.00East West Bancorp Inc USD 485 23,464 (2,481) (0.02)Easterly Government Properties Inc USD 58 1,057 39 0.00EastGroup Properties Inc USD 11 1,234 27 0.00Eastman Chemical Co USD 480 36,355 (1,308) (0.01)Eaton Corp PLC USD 523 42,034 (905) (0.01)Echo Global Logistics Inc USD 240 5,986 150 0.00Ecolab Inc USD 432 75,851 186 0.00Edwards Lifesciences Corp USD 190 36,068 (201) (0.00)El Pollo Loco Holdings Inc USD 61 791 (5) (0.00)Electronic Arts Inc USD 519 52,595 872 0.01Eli Lilly Co USD 416 53,893 1,793 0.01EMCOR Group Inc USD 688 50,657 (43) (0.00)Emergent BioSolutions Inc USD 147 7,384 101 0.00Emerson Electric Co USD 1,007 68,446 (826) (0.01)Employers Holdings Inc USD 661 26,757 (410) (0.00)Enanta Pharmaceuticals Inc USD 122 11,457 (1,057) (0.01)Encore Wire Corp USD 105 6,014 (293) (0.00)Ennis Inc USD 938 19,285 (947) (0.01)Enterprise Financial Services Corp USD 131 5,383 (402) (0.00)EOG Resources Inc USD 851 80,998 2,774 0.02EPAM Systems Inc USD 198 33,585 113 0.00ePlus Inc USD 78 6,962 (73) (0.00)EPR Properties USD 40 3,089 98 0.00Equinix Inc USD 75 33,497 189 0.00Equity Bancshares Inc USD 81 2,330 (312) (0.00)Equity Commonwealth USD 644 21,065 (200) (0.00)Equity LifeStyle Properties Inc USD 401 45,915 1,103 0.01Equity Residential USD 319 24,059 459 0.00Erie Indemnity Co USD 78 13,837 246 0.00ESCO Technologies Inc USD 20 1,335 (53) (0.00)Essex Property Trust Inc USD 167 48,490 686 0.01Ethan Allen Interiors Inc USD 1,006 19,275 (227) (0.00)Evercore Inc USD 490 44,365 (803) (0.01)Everest Re Group Ltd USD 364 78,409 (1,805) (0.02)Evergy Inc USD 51 2,967 66 0.00
AQR UCITS FUNDS
AQR Delphi Long-Short Equity UCITS Fund
Schedule of Investments (continued)As at 31 March 2019
The accompanying notes form an integral part of these audited financial statements. 20

Reference Entity Currency Shares Notional Amount
UnrealisedAppreciation/
(Depreciation)in USD
Percent ofNet Assets
Long Positions (continued)Common Stocks (continued)United States (continued)Eversource Energy USD 84 5,935 (51) (0.00)Evolution Petroleum Corp USD 2,204 15,031 (754) (0.01)Exelixis Inc USD 1,872 44,703 (503) (0.00)Exelon Corp USD 1,055 52,729 349 0.00Expeditors International of Washington Inc USD 764 57,751 (726) (0.01)Exponent Inc USD 304 17,690 286 0.00Exterran Corp USD 39 659 (55) (0.00)Extra Space Storage Inc USD 213 21,769 652 0.01Extreme Networks Inc USD 132 989 (15) (0.00)Exxon Mobil Corp USD 1,030 83,080 (553) (0.00)F5 Networks Inc USD 547 85,890 1,455 0.01Facebook Inc USD 913 150,745 4,079 0.03FactSet Research Systems Inc USD 97 23,906 759 0.01Fair Isaac Corp USD 87 23,316 332 0.00FARO Technologies Inc USD 40 1,748 (171) (0.00)Fastenal Co USD 1,073 68,758 987 0.01Fate Therapeutics Inc USD 53 923 (47) (0.00)FB Financial Corp USD 252 8,059 (680) (0.01)FBL Financial Group Inc USD 155 9,515 (1,027) (0.01)Federal Agricultural Mortgage Corp USD 181 13,374 (753) (0.01)Federal Realty Investment Trust USD 161 22,377 1,063 0.01Federal Signal Corp USD 323 8,366 65 0.00Federated Investors Inc USD 1,307 38,478 (1,255) (0.01)FibroGen Inc USD 29 1,575 (48) (0.00)Fiesta Restaurant Group Inc USD 371 4,853 (332) (0.00)Fifth Third Bancorp USD 1,277 32,417 (4,037) (0.03)First American Financial Corp USD 850 43,877 1,303 0.01First Bancorp/Southern Pines NC USD 344 12,009 (790) (0.01)First Busey Corp USD 17 417 (39) (0.00)First Citizens BancShares Inc USD 91 37,371 (1,791) (0.02)First Data Corp USD 68 1,784 60 0.00First Defiance Financial Corp USD 685 19,927 (947) (0.01)First Hawaiian Inc USD 626 16,282 (573) (0.01)First Horizon National Corp USD 159 2,229 (196) (0.00)First Merchants Corp USD 9 335 (14) (0.00)FirstCash Inc USD 65 5,626 (9) (0.00)Fiserv Inc USD 294 25,896 887 0.01Five9 Inc USD 9 478 (17) (0.00)FLIR Systems Inc USD 959 45,428 (1,770) (0.02)Flowers Foods Inc USD 1,502 31,902 1,397 0.01Flushing Financial Corp USD 21 464 (14) (0.00)FMC Corp USD 333 25,521 (93) (0.00)FNF Group USD 1,694 62,221 2,690 0.02Foot Locker Inc USD 284 17,068 32 0.00FormFactor Inc USD 106 1,698 22 0.00Forrester Research Inc USD 294 14,388 (208) (0.00)Fortinet Inc USD 302 25,157 (365) (0.00)Forward Air Corp USD 71 4,610 67 0.00Four Corners Property Trust Inc USD 323 9,529 371 0.00Fox Corp USD 37 1,340 1,340 0.01Fox Factory Holding Corp USD 141 9,826 106 0.00Franklin Electric Co Inc USD 419 21,423 (375) (0.00)Franklin Financial Network Inc USD 18 527 (33) (0.00)Franklin Resources Inc USD 984 32,634 (572) (0.01)FTI Consulting Inc USD 21 1,630 50 0.00Fulton Financial Corp USD 125 1,948 (105) (0.00)Funko Inc USD 25 536 (2) (0.00)FutureFuel Corp USD 646 8,676 (459) (0.00)GAIN Capital Holdings Inc USD 524 3,285 (155) (0.00)Gaming and Leisure Properties Inc USD 721 27,780 1,195 0.01Garmin Ltd USD 699 59,883 1,206 0.01Generac Holdings Inc USD 58 2,970 (98) (0.00)General Dynamics Corp USD 120 20,248 (353) (0.00)Genesco Inc USD 75 3,428 244 0.00Genomic Health Inc USD 214 14,740 (1,150) (0.01)Gentex Corp USD 2,548 52,693 (1) (0.00)Gentherm Inc USD 286 10,542 (254) (0.00)Genuine Parts Co USD 313 34,997 1,409 0.01Getty Realty Corp USD 504 16,314 91 0.00Gladstone Commercial Corp USD 158 3,299 (6) (0.00)Global Brass & Copper Holdings Inc USD 826 28,274 1,065 0.01Globus Medical Inc USD 868 42,211 991 0.01Glu Mobile Inc USD 203 2,227 212 0.00GMS Inc USD 130 1,983 (156) (0.00)Gold Resource Corp USD 1,905 7,534 10 0.00Graco Inc USD 1,173 57,864 1,143 0.01Graham Holdings Co USD 52 35,636 683 0.01Grand Canyon Education Inc USD 209 23,874 (192) (0.00)Great Western Bancorp Inc USD 10 318 (24) (0.00)Green Dot Corp USD 19 1,173 36 0.00Greif Inc USD 52 2,152 20 0.00H&E Equipment Services Inc USD 56 1,421 (53) (0.00)Hamilton Lane Inc USD 329 14,471 290 0.00Hanmi Financial Corp USD 117 2,506 (75) (0.00)Hannon Armstrong Sustainable Infrastructure CapitalInc USD 116 2,974 95 0.00Harris Corp USD 194 31,077 (603) (0.01)Hasbro Inc USD 440 37,589 (735) (0.01)Haverty Furniture Cos Inc USD 525 11,613 (467) (0.00)Hawaiian Electric Industries Inc USD 673 27,405 117 0.00Haynes International Inc USD 67 2,210 10 0.00HCI Group Inc USD 127 5,462 182 0.00Health Insurance Innovations Inc USD 103 2,762 (638) (0.01)Healthcare Services Group Inc USD 769 25,431 1,510 0.01HealthEquity Inc USD 130 9,538 (1,284) (0.01)
AQR UCITS FUNDS
AQR Delphi Long-Short Equity UCITS Fund
Schedule of Investments (continued)As at 31 March 2019
The accompanying notes form an integral part of these audited financial statements. 21

Reference Entity Currency Shares Notional Amount
UnrealisedAppreciation/
(Depreciation)in USD
Percent ofNet Assets
Long Positions (continued)Common Stocks (continued)United States (continued)HealthStream Inc USD 301 8,470 36 0.00Heartland Express Inc USD 33 641 (23) (0.00)HEICO Corp USD 180 17,024 306 0.00Heidrick & Struggles International Inc USD 90 3,521 (170) (0.00)Helen of Troy Ltd USD 129 14,979 32 0.00Helmerich Payne Inc USD 414 23,126 (170) (0.00)Henry Schein Inc USD 542 32,298 (103) (0.00)Heritage Commerce Corp USD 335 4,077 (322) (0.00)Heritage Insurance Holdings Inc USD 323 4,745 (142) (0.00)Herman Miller Inc USD 216 7,584 (193) (0.00)Hershey Co USD 535 61,252 2,136 0.02Heska Corp USD 92 7,754 247 0.00Hexcel Corp USD 31 2,148 (5) (0.00)HFF Inc USD 38 1,833 (2) (0.00)Hibbett Sports Inc USD 329 7,366 1,142 0.01Highwoods Properties Inc USD 47 2,197 63 0.00Hillenbrand Inc USD 226 9,476 (368) (0.00)HNI Corp USD 191 6,979 (375) (0.00)HollyFrontier Corp USD 417 20,800 (1,205) (0.01)Homology Medicines Inc USD 37 1,039 6 0.00Honeywell International Inc USD 479 75,711 541 0.00Horace Mann Educators Corp USD 11 389 (23) (0.00)Horizon Bancorp Inc USD 112 1,803 (113) (0.00)Hormel Foods Corp USD 1,123 49,771 1,989 0.02Hospitality Properties Trust USD 105 2,789 47 0.00Houlihan Lokey Inc USD 493 22,663 (230) (0.00)HP Inc USD 2,050 39,555 (1,425) (0.01)HR Block Inc USD 2,294 55,113 (672) (0.01)Hub Group Inc USD 23 957 (35) (0.00)Hubbell Inc USD 55 6,466 (313) (0.00)Humana Inc USD 449 118,060 (8,738) (0.07)Huntington Ingalls Industries Inc USD 306 63,345 (110) (0.00)Huntsman Corp USD 1,020 22,593 (306) (0.00)Huron Consulting Group Inc USD 10 478 (20) (0.00)Hyster-Yale Materials Handling Inc USD 57 3,512 (158) (0.00)ICU Medical Inc USD 105 25,080 (23) (0.00)IDACORP Inc USD 677 67,199 (154) (0.00)IDEX Corp USD 462 69,926 635 0.01IDEXX Laboratories Inc USD 162 35,865 882 0.01Illinois Tool Works Inc USD 841 120,667 (1,598) (0.01)Illumina Inc USD 53 16,248 7 0.00IMAX Corp USD 91 2,057 (46) (0.00)Immersion Corp USD 1,225 10,180 135 0.00Incyte Corp USD 268 23,075 128 0.00Independence Realty Trust Inc USD 204 2,207 75 0.00Independent Bank Corp USD 1,115 24,028 (1,706) (0.01)Industrial Logistics Properties Trust USD 302 6,119 (4) (0.00)Ingersoll-Rand PLC USD 330 35,455 129 0.00Ingevity Corp USD 89 9,540 40 0.00Ingles Markets Inc USD 32 881 (33) (0.00)Ingredion Inc USD 487 45,627 (232) (0.00)Innophos Holdings Inc USD 103 3,118 (49) (0.00)Innospec Inc USD 70 5,888 62 0.00Innovative Industrial Properties Inc USD 48 3,959 (179) (0.00)Innoviva Inc USD 383 5,366 (64) (0.00)Inogen Inc USD 77 7,234 (136) (0.00)Insight Enterprises Inc USD 142 7,831 (243) (0.00)Insperity Inc USD 188 23,122 (280) (0.00)Insteel Industries Inc USD 192 4,026 102 0.00Instructure Inc USD 18 850 46 0.00Intel Corp USD 1,481 79,352 (770) (0.01)Inter Parfums Inc USD 107 8,087 (184) (0.00)Intercontinental Exchange Inc USD 728 54,884 568 0.00InterDigital Inc USD 435 28,553 (418) (0.00)International Bancshares Corp USD 142 5,409 (376) (0.00)International Paper Co USD 1,152 52,911 (397) (0.00)International Speedway Corp USD 94 4,095 73 0.00Interpublic Group of Cos Inc USD 1,457 30,539 (1,827) (0.02)Intersect ENT Inc USD 254 8,136 (409) (0.00)IntriCon Corp USD 153 3,868 481 0.00Intuit Inc USD 647 168,207 1,462 0.01Intuitive Surgical Inc USD 86 48,547 431 0.00Investors Real Estate Trust USD 38 2,319 94 0.00IPG Photonics Corp USD 74 11,169 61 0.00iRadimed Corp USD 327 9,287 932 0.01iRhythm Technologies Inc USD 21 1,584 (338) (0.00)iRobot Corp USD 13 1,519 (111) (0.00)Ironwood Pharmaceuticals Inc USD 187 2,478 (47) (0.00)ITT Inc USD 289 16,782 (215) (0.00)J&J Snack Foods Corp USD 111 17,492 546 0.00j2 Global Inc USD 142 12,294 104 0.00Jack Henry Associates Inc USD 462 64,001 195 0.00Jack in the Box Inc USD 31 2,518 104 0.00James River Group Holdings Ltd USD 304 12,166 (15) (0.00)Jazz Pharmaceuticals PLC USD 93 13,151 544 0.00JB Hunt Transport Services Inc USD 269 27,269 (692) (0.01)JBG SMITH Properties USD 132 5,478 28 0.00Jernigan Capital Inc USD 316 6,633 (180) (0.00)JetBlue Airways Corp USD 623 10,170 (190) (0.00)John B Sanfilippo & Son Inc USD 218 15,576 301 0.00John Wiley Sons Inc USD 627 27,406 (1,120) (0.01)Johnson & Johnson USD 786 109,340 1,464 0.01Johnson Outdoors Inc USD 37 2,653 63 0.00Jones Lang LaSalle Inc USD 169 26,254 (1,296) (0.01)Juniper Networks Inc USD 465 12,243 (11) (0.00)
AQR UCITS FUNDS
AQR Delphi Long-Short Equity UCITS Fund
Schedule of Investments (continued)As at 31 March 2019
The accompanying notes form an integral part of these audited financial statements. 22

Reference Entity Currency Shares Notional Amount
UnrealisedAppreciation/
(Depreciation)in USD
Percent ofNet Assets
Long Positions (continued)Common Stocks (continued)United States (continued)K12 Inc USD 269 9,264 312 0.00Kadant Inc USD 135 11,908 (209) (0.00)Kaiser Aluminum Corp USD 72 7,516 (9) (0.00)Kaman Corp USD 187 10,945 125 0.00Keane Group Inc USD 490 5,287 304 0.00Kellogg Co USD 546 31,155 1,521 0.01Kelly Services Inc USD 296 6,616 (44) (0.00)Keysight Technologies Inc USD 372 32,286 391 0.00Kforce Inc USD 964 33,923 (728) (0.01)Kimball International Inc USD 1,002 14,198 (1,035) (0.01)Kimberly-Clark Corp USD 220 27,137 827 0.01Kinder Morgan Inc USD 1,827 36,449 (185) (0.00)Kinsale Capital Group Inc USD 226 15,436 (203) (0.00)Kirkland’s Inc USD 224 1,590 (171) (0.00)KLA-Tencor Corp USD 466 55,128 (739) (0.01)KLX Energy Services Holdings Inc USD 79 2,005 (11) (0.00)Kronos Worldwide Inc USD 187 2,609 (57) (0.00)Lakeland Bancorp Inc USD 39 585 (38) (0.00)Lakeland Financial Corp USD 215 9,752 (660) (0.01)Lam Research Corp USD 394 70,211 (788) (0.01)Lamar Advertising Co USD 87 6,907 135 0.00Lamb Weston Holdings Inc USD 405 30,136 1,827 0.02Lancaster Colony Corp USD 283 44,253 785 0.01Landstar System Inc USD 896 98,497 (1,263) (0.01)Laredo Petroleum Inc USD 481 1,501 34 0.00Las Vegas Sands Corp USD 912 55,304 546 0.00La-Z-Boy Inc USD 351 11,569 (235) (0.00)LCI Industries USD 49 3,821 (92) (0.00)Lear Corp USD 481 65,402 (2,766) (0.02)Leggett Platt Inc USD 476 20,211 (290) (0.00)LeMaitre Vascular Inc USD 451 13,643 (586) (0.01)Lennox International Inc USD 243 64,150 2,847 0.02LGI Homes Inc USD 60 3,674 257 0.00LHC Group Inc USD 22 2,420 (64) (0.00)Liberty Oilfield Services Inc USD 475 7,320 (400) (0.00)Liberty Property Trust USD 290 14,135 144 0.00Life Storage Inc USD 44 4,305 118 0.00Limelight Networks Inc USD 785 2,367 35 0.00Limoneira Co USD 22 516 (14) (0.00)Lincoln Electric Holdings Inc USD 780 65,200 (1,654) (0.01)Lincoln National Corp USD 359 21,063 (1,648) (0.01)Lindsay Corp USD 50 4,851 65 0.00Littelfuse Inc USD 89 16,251 (670) (0.01)Live Oak Bancshares Inc USD 214 3,114 (195) (0.00)LivePerson Inc USD 13 377 2 0.00Loral Space & Communications Inc USD 115 4,140 (301) (0.00)Lowe’s Cos Inc USD 350 38,262 2,604 0.02LTC Properties Inc USD 62 2,860 105 0.00lululemon athletica Inc USD 331 54,605 6,826 0.06Luminex Corp USD 529 12,151 (565) (0.01)LyondellBasell Industries NV USD 641 53,600 (2,340) (0.02)M/I Homes Inc USD 78 2,093 74 0.00Mammoth Energy Services Inc USD 976 16,309 (1,448) (0.01)Manhattan Associates Inc USD 768 42,294 (331) (0.00)ManTech International Corp USD 16 868 (8) (0.00)Marcus & Millichap Inc USD 231 9,388 377 0.00MarineMax Inc USD 76 1,455 (19) (0.00)Markel Corp USD 9 8,991 9 0.00MarketAxess Holdings Inc USD 325 80,395 3,170 0.03Marriott International Inc USD 300 37,452 (118) (0.00)Marsh McLennan Cos Inc USD 518 48,335 196 0.00Masco Corp USD 558 21,963 117 0.00Masimo Corp USD 249 34,036 1,086 0.01MasterCraft Boat Holdings Inc USD 194 4,355 (243) (0.00)Match Group Inc USD 48 2,706 33 0.00Materion Corp USD 222 12,816 131 0.00Matrix Service Co USD 489 9,594 (778) (0.01)Matson Inc USD 126 4,605 10 0.00Maxim Integrated Products Inc USD 809 42,909 (744) (0.01)MAXIMUS Inc USD 933 66,635 579 0.00Mccormick Co Inc USD 40 5,986 358 0.00McDonalds Corp USD 254 48,260 1,543 0.01McGrath RentCorp USD 445 25,494 (636) (0.01)Mcgraw Hill Financial Inc USD 190 39,860 773 0.01Medifast Inc USD 41 5,233 (317) (0.00)Medpace Holdings Inc USD 77 4,470 168 0.00Merck & Co Inc USD 733 60,876 1,225 0.01Meridian Bancorp Inc USD 889 14,037 (9) (0.00)Meridian Bioscience Inc USD 533 9,354 634 0.01Mesa Laboratories Inc USD 63 14,929 300 0.00Mettler-Toledo International Inc USD 101 72,197 806 0.01MGE Energy Inc USD 84 5,714 100 0.00MGIC Investment Corp USD 174 2,304 (21) (0.00)MGP Ingredients Inc USD 28 2,135 (15) (0.00)Michael Kors Holdings Ltd USD 381 17,785 (152) (0.00)Micron Technology Inc USD 565 23,165 769 0.01Microsoft Corp USD 1,474 172,679 (619) (0.01)MicroStrategy Inc USD 52 7,540 (147) (0.00)Mid-America Apartment Communities Inc USD 87 9,520 246 0.00Middlesex Water Co USD 164 9,153 (320) (0.00)Milacron Holdings Corp USD 64 725 (129) (0.00)Mimecast Ltd USD 40 1,888 34 0.00MKS Instruments Inc USD 130 11,864 471 0.00Model N Inc USD 113 1,974 66 0.00Moelis & Co USD 73 3,011 (126) (0.00)
AQR UCITS FUNDS
AQR Delphi Long-Short Equity UCITS Fund
Schedule of Investments (continued)As at 31 March 2019
The accompanying notes form an integral part of these audited financial statements. 23

Reference Entity Currency Shares Notional Amount
UnrealisedAppreciation/
(Depreciation)in USD
Percent ofNet Assets
Long Positions (continued)Common Stocks (continued)United States (continued)Monarch Casino & Resort Inc USD 126 5,545 48 0.00Monmouth Real Estate Investment Corp USD 409 5,419 8 0.00Monolithic Power Systems Inc USD 285 38,372 (1,801) (0.02)Monotype Imaging Holdings Inc USD 286 5,666 (57) (0.00)Monro Inc USD 25 2,152 223 0.00Monster Beverage Corp USD 722 38,981 (4,569) (0.04)Moog Inc USD 38 3,300 (57) (0.00)Morningstar Inc USD 75 9,377 212 0.00Motorola Solutions Inc USD 173 24,191 (115) (0.00)Movado Group Inc USD 94 3,499 264 0.00MSA Safety Inc USD 151 15,701 163 0.00MSC Industrial Direct Co Inc USD 626 52,046 34 0.00MSCI Inc USD 174 34,409 1,175 0.01MSG Networks Inc USD 506 10,945 (888) (0.01)MT Bank Corp USD 162 25,518 (2,653) (0.02)MTS Systems Corp USD 92 5,062 47 0.00Myers Industries Inc USD 147 2,536 (156) (0.00)MYR Group Inc USD 306 10,710 (389) (0.00)Myriad Genetics Inc USD 117 3,976 8 0.00Nanometrics Inc USD 329 10,003 (8) (0.00)National Bank Holdings Corp USD 123 4,077 (193) (0.00)National Beverage Corp USD 70 3,931 (238) (0.00)National CineMedia Inc USD 1,191 8,385 (347) (0.00)National Fuel Gas Co USD 33 2,002 15 0.00National Health Investors Inc USD 56 4,433 63 0.00National HealthCare Corp USD 139 10,653 (680) (0.01)National Instruments Corp USD 947 42,227 (320) (0.00)National Presto Industries Inc USD 163 18,075 450 0.00National Retail Properties Inc USD 178 9,883 525 0.00National Storage Affiliates Trust USD 142 4,064 136 0.00National Western Life Group Inc USD 22 5,852 (306) (0.00)Natural Grocers by Vitamin Cottage Inc USD 224 2,713 (160) (0.00)Natus Medical Inc USD 163 4,155 (249) (0.00)Nautilus Inc USD 783 4,291 (574) (0.01)NCI Building Systems Inc USD 266 1,639 (117) (0.00)Neenah Inc USD 132 8,575 108 0.00Nelnet Inc USD 6 333 0 0.00Neogen Corp USD 64 3,640 (404) (0.00)NeoGenomics Inc USD 18 357 5 0.00NetApp Inc USD 1,128 77,178 1,703 0.01NETGEAR Inc USD 23 759 (48) (0.00)Neurocrine Biosciences Inc USD 78 6,780 165 0.00New Jersey Resources Corp USD 492 24,566 34 0.00New Media Investment Group Inc USD 539 5,751 (746) (0.01)NewMarket Corp USD 66 28,885 (203) (0.00)Newpark Resources Inc USD 618 5,649 272 0.00NexPoint Residential Trust Inc USD 161 6,194 475 0.00NextEra Energy Inc USD 247 47,552 455 0.00NextGen Healthcare Inc USD 632 10,719 (23) (0.00)NIC Inc USD 631 10,771 (133) (0.00)NIKE Inc USD 753 63,757 (2,372) (0.02)Nine Energy Service Inc USD 57 1,317 (9) (0.00)Noodles & Co USD 376 2,568 41 0.00Nordic American Tankers Ltd USD 1,125 2,284 (103) (0.00)Nordson Corp USD 240 31,793 (120) (0.00)Norfolk Southern Corp USD 144 26,927 642 0.01Northern Oil and Gas Inc USD 359 962 76 0.00Northern Trust Corp USD 206 18,612 (1,144) (0.01)Northfield Bancorp Inc USD 835 11,673 (465) (0.00)Northrop Grumman Corp USD 208 55,819 (1,358) (0.01)Northwest Bancshares Inc USD 229 3,900 (78) (0.00)Northwest Natural Holding Co USD 127 8,331 88 0.00NorthWestern Corp USD 757 53,331 128 0.00Novanta Inc USD 12 1,015 9 0.00Nu Skin Enterprises Inc USD 158 7,521 (1,439) (0.01)Nucor Corp USD 871 50,771 (540) (0.00)NV5 Global Inc USD 152 8,912 (584) (0.01)NVE Corp USD 103 10,021 (56) (0.00)NVIDIA Corp USD 182 32,485 1,162 0.01NVR Inc USD 13 36,469 616 0.00Occidental Petroleum Corp USD 900 59,688 (621) (0.01)OGE Energy Corp USD 937 40,310 159 0.00Old Dominion Freight Line Inc USD 572 82,660 (2,672) (0.02)Old Republic International Corp USD 609 12,810 (41) (0.00)Ollie’s Bargain Outlet Holdings Inc USD 148 12,725 709 0.01Omnicom Group Inc USD 517 37,803 (781) (0.01)ONE Gas Inc USD 403 35,952 15 0.00Oracle Corp USD 830 44,322 (522) (0.00)OraSure Technologies Inc USD 344 3,873 (145) (0.00)OReilly Automotive Inc USD 63 24,444 769 0.01Oritani Financial Corp USD 1,340 22,378 (831) (0.01)Orthofix Medical Inc USD 171 9,610 2 0.00Oshkosh Corp USD 143 10,682 (230) (0.00)Otter Tail Corp USD 119 5,948 (20) (0.00)Oxford Immunotec Global PLC USD 213 3,670 (166) (0.00)Oxford Industries Inc USD 208 15,721 (258) (0.00)Pacira Pharmaceuticals Inc USD 140 5,361 (182) (0.00)Packaging Corp of America USD 715 70,377 550 0.00PacWest Bancorp USD 101 3,813 (152) (0.00)Par Pacific Holdings Inc USD 325 5,811 111 0.00PAR Technology Corp USD 100 2,357 32 0.00Park Electrochemical Corp USD 390 6,213 (299) (0.00)Parker-Hannifin Corp USD 205 35,092 (590) (0.01)Patrick Industries Inc USD 29 1,308 (46) (0.00)Patterson Cos Inc USD 239 5,174 (170) (0.00)
AQR UCITS FUNDS
AQR Delphi Long-Short Equity UCITS Fund
Schedule of Investments (continued)As at 31 March 2019
The accompanying notes form an integral part of these audited financial statements. 24

Reference Entity Currency Shares Notional Amount
UnrealisedAppreciation/
(Depreciation)in USD
Percent ofNet Assets
Long Positions (continued)Common Stocks (continued)United States (continued)Patterson-UTI Energy Inc USD 2,131 30,111 (604) (0.01)Paychex Inc USD 800 63,792 341 0.00PC Connection Inc USD 484 17,656 (624) (0.01)PDC Energy Inc USD 70 2,869 (120) (0.00)PDL BioPharma Inc USD 1,277 4,674 33 0.00Peabody Energy Corp USD 116 3,294 (174) (0.00)Peapack Gladstone Financial Corp USD 151 3,955 (214) (0.00)Penumbra Inc USD 44 6,517 (180) (0.00)Pepsico Inc USD 796 96,889 3,507 0.03Perficient Inc USD 321 8,831 (469) (0.00)Performance Food Group Co USD 221 8,718 200 0.00PetMed Express Inc USD 502 11,245 663 0.01Pfizer Inc USD 2,678 113,146 1,178 0.01PGT Innovations Inc USD 83 1,159 (30) (0.00)Phibro Animal Health Corp USD 346 11,293 197 0.00Philip Morris International Inc USD 363 31,940 (987) (0.01)Phillips 66 USD 762 72,131 (3,094) (0.03)Photronics Inc USD 412 3,947 115 0.00Pinnacle West Capital Corp USD 835 79,659 177 0.00Plexus Corp USD 15 912 (6) (0.00)PolyOne Corp USD 72 2,109 (78) (0.00)Pool Corp USD 302 50,099 2,132 0.02Potbelly Corp USD 789 6,793 126 0.00Power Integrations Inc USD 53 3,703 (96) (0.00)PPG Industries Inc USD 373 41,925 541 0.00Preferred Bank USD 170 7,694 (557) (0.00)Premier Inc USD 149 5,105 (55) (0.00)Primerica Inc USD 198 24,360 (909) (0.01)Primo Water Corp USD 184 2,834 4 0.00Progress Software Corp USD 106 4,650 722 0.01ProPetro Holding Corp USD 340 7,636 303 0.00Proto Labs Inc USD 26 2,741 (44) (0.00)PS Business Parks Inc USD 63 10,034 336 0.00PTC Therapeutics Inc USD 49 1,814 4 0.00Public Storage USD 325 71,000 229 0.00PulteGroup Inc USD 405 11,457 641 0.01QAD Inc USD 244 10,311 (730) (0.01)Quaker Chemical Corp USD 69 13,986 (6) (0.00)Qualys Inc USD 64 5,292 (150) (0.00)Quanex Building Products Corp USD 295 4,696 3 0.00Quanta Services Inc USD 530 19,912 85 0.00Quantenna Communications Inc USD 240 5,796 732 0.01Quanterix Corp USD 15 371 3 0.00Quidel Corp USD 25 1,642 (48) (0.00)QuinStreet Inc USD 256 3,395 (8) (0.00)Ra Pharmaceuticals Inc USD 19 424 (86) (0.00)RadNet Inc USD 105 1,302 (244) (0.00)Ralph Lauren Corp USD 392 50,976 2,285 0.02Raven Industries Inc USD 33 1,296 14 0.00Rayonier Inc USD 390 12,359 996 0.01Raytheon Co USD 428 77,691 552 0.00RBC Bearings Inc USD 27 3,432 (198) (0.00)Realty Income Corp USD 340 24,956 840 0.01Reata Pharmaceuticals Inc USD 34 2,868 (366) (0.00)Red Robin Gourmet Burgers Inc USD 163 4,810 31 0.00Regeneron Pharmaceuticals Inc USD 118 48,336 241 0.00REGENXBIO Inc USD 197 11,146 (351) (0.00)Regis Corp USD 88 1,744 99 0.00Reinsurance Group of America Inc USD 116 16,443 (577) (0.01)Reliance Steel Aluminum Co USD 492 44,329 776 0.01Renewable Energy Group Inc USD 513 11,378 (616) (0.01)Rent-A-Center Inc USD 237 4,975 (50) (0.00)Repligen Corp USD 111 6,515 (79) (0.00)Republic Services Inc USD 431 34,575 537 0.00ResMed Inc USD 200 20,686 1,206 0.01Resources Connection Inc USD 476 7,954 (209) (0.00)Retrophin Inc USD 90 2,057 (100) (0.00)REX American Resources Corp USD 216 17,664 359 0.00Robert Half International Inc USD 1,213 79,148 (1,663) (0.01)Rockwell Automation Inc USD 415 72,658 (2,370) (0.02)Rollins Inc USD 1,744 72,864 1,378 0.01Roper Technologies Inc USD 42 14,272 350 0.00Rosetta Stone Inc USD 130 2,755 (138) (0.00)Ross Stores Inc USD 688 63,805 1,108 0.01Royal Gold Inc USD 23 2,113 46 0.00RPC Inc USD 3,017 34,183 3,228 0.03RPM International Inc USD 471 27,356 (92) (0.00)RPT Realty USD 357 4,320 171 0.00Rudolph Technologies Inc USD 406 9,204 (23) (0.00)Rush Enterprises Inc USD 72 3,015 (4) (0.00)Ruth’s Hospitality Group Inc USD 948 24,373 284 0.00S&T Bancorp Inc USD 89 3,537 (86) (0.00)Safety Insurance Group Inc USD 189 16,651 (179) (0.00)Saia Inc USD 69 4,261 (56) (0.00)Sally Beauty Holdings Inc USD 675 12,363 118 0.00SandRidge Energy Inc USD 373 2,980 (67) (0.00)Sandy Spring Bancorp Inc USD 259 8,073 (622) (0.01)Saul Centers Inc USD 97 5,060 155 0.00ScanSource Inc USD 63 2,260 (119) (0.00)Schneider National Inc USD 91 1,922 24 0.00Schnitzer Steel Industries Inc USD 545 13,004 (24) (0.00)Scholastic Corp USD 193 7,681 11 0.00Schweitzer-Mauduit International Inc USD 142 5,541 126 0.00SEACOR Holdings Inc USD 89 3,827 1 0.00Seagate Technology PLC USD 163 7,736 (114) (0.00)
AQR UCITS FUNDS
AQR Delphi Long-Short Equity UCITS Fund
Schedule of Investments (continued)As at 31 March 2019
The accompanying notes form an integral part of these audited financial statements. 25

Reference Entity Currency Shares Notional Amount
UnrealisedAppreciation/
(Depreciation)in USD
Percent ofNet Assets
Long Positions (continued)Common Stocks (continued)United States (continued)SeaSpine Holdings Corp USD 171 2,514 39 0.00SEI Investments Co USD 483 25,271 (181) (0.00)Select Energy Services Inc USD 402 4,812 273 0.00Sensient Technologies Corp USD 400 27,220 704 0.01Shenandoah Telecommunications Co USD 12 539 (13) (0.00)Shoe Carnival Inc USD 213 7,338 209 0.00ShotSpotter Inc USD 76 3,042 23 0.00Silicon Laboratories Inc USD 52 4,181 (67) (0.00)Simon Property Group Inc USD 241 44,144 2,156 0.02Simpson Manufacturing Co Inc USD 222 13,076 (276) (0.00)SiteOne Landscape Supply Inc USD 7 399 12 0.00SJW Group USD 140 8,690 (92) (0.00)Skechers U.S.A. Inc USD 694 23,423 464 0.00SkyWest Inc USD 122 6,634 323 0.00Skyworks Solutions Inc USD 658 53,785 (559) (0.00)Sleep Number Corp USD 100 4,802 24 0.00SMART Global Holdings Inc USD 257 4,940 (1,433) (0.01)Snap-on Inc USD 531 82,613 (1,789) (0.02)SolarEdge Technologies Inc USD 126 4,769 (232) (0.00)Solaris Oilfield Infrastructure Inc USD 619 9,991 (198) (0.00)Sonic Automotive Inc USD 865 12,750 155 0.00Sonoco Products Co USD 974 59,433 1,085 0.01Southwest Airlines Co USD 1,776 90,754 36 0.00SP Plus Corp USD 144 4,863 (62) (0.00)SpartanNash Co USD 594 9,492 (226) (0.00)Spire Inc USD 123 10,118 189 0.00Sprouts Farmers Market Inc USD 488 10,609 (383) (0.00)SPS Commerce Inc USD 93 9,897 (99) (0.00)SPX Corp USD 112 3,900 (76) (0.00)STAAR Surgical Co USD 81 2,902 (58) (0.00)Stamps.com Inc USD 40 3,246 (213) (0.00)Standard Motor Products Inc USD 164 8,098 118 0.00Standex International Corp USD 78 5,782 (163) (0.00)Stanley Black Decker Inc USD 160 21,733 262 0.00Starbucks Corp USD 990 73,240 3,109 0.03Steel Dynamics Inc USD 1,852 65,172 385 0.00Stepan Co USD 86 7,569 (178) (0.00)STERIS PLC USD 17 2,163 67 0.00Sterling Construction Co Inc USD 204 2,562 (162) (0.00)Steven Madden Ltd USD 248 8,457 248 0.00Stock Yards Bancorp Inc USD 256 8,719 (425) (0.00)Stoneridge Inc USD 367 10,452 132 0.00STORE Capital Corp USD 348 11,665 431 0.00Strategic Education Inc USD 15 2,018 (29) (0.00)Stryker Corp USD 188 36,880 454 0.00Sturm Ruger & Co Inc USD 442 23,422 748 0.01Sun Communities Inc USD 280 33,219 725 0.01Supernus Pharmaceuticals Inc USD 218 7,634 (730) (0.01)Surmodics Inc USD 159 6,886 (651) (0.01)Sykes Enterprises Inc USD 430 12,182 (60) (0.00)Synchrony Financial USD 1,749 55,968 (2,162) (0.02)Synopsys Inc USD 161 18,367 769 0.01Sysco Corp USD 964 63,894 (183) (0.00)Systemax Inc USD 526 11,803 626 0.00T Rowe Price Group Inc USD 525 52,269 (1,639) (0.01)Tabula Rasa HealthCare Inc USD 16 912 (44) (0.00)Tactile Systems Technology Inc USD 135 7,123 (1,263) (0.01)Target Corp USD 633 50,887 1,563 0.01TCF Financial Corp USD 126 2,615 (191) (0.00)TE Connectivity Ltd USD 627 50,398 (1,856) (0.02)TechTarget Inc USD 847 13,848 (491) (0.00)Teledyne Technologies Inc USD 155 36,397 34 0.00Tennant Co USD 126 7,815 (12) (0.00)Terex Corp USD 419 13,383 (561) (0.00)Tetra Tech Inc USD 179 10,688 161 0.00Texas Instruments Inc USD 1,179 124,432 (5,034) (0.04)Texas Roadhouse Inc USD 600 37,308 832 0.01TFS Financial Corp USD 24 396 (2) (0.00)The Allstate Corp USD 1,034 97,113 (1,137) (0.01)The Babcock Wilcox Co USD 738 36,885 (310) (0.00)The Boston Beer Co Inc USD 143 41,779 (2,923) (0.02)The Buckle Inc USD 309 5,797 152 0.00The Cato Corp USD 623 9,414 860 0.01The Cheesecake Factory Inc USD 854 41,547 2,068 0.02The Chefs’ Warehouse Inc USD 150 4,643 (53) (0.00)The Chemours Co USD 483 17,779 (1,093) (0.01)The Children’s Place Inc USD 190 18,305 1,421 0.01The Clorox Co USD 210 33,508 94 0.00The Ensign Group Inc USD 93 4,773 34 0.00The Estee Lauder Cos Inc USD 352 57,848 447 0.00The Gorman-Rupp Co USD 422 14,361 (338) (0.00)The Hackett Group Inc USD 1,325 21,068 (861) (0.01)The Hanover Insurance Group Inc USD 254 29,101 (387) (0.00)The Hartford Financial Services Group Inc USD 357 17,657 33 0.00The Home Depot Inc USD 536 102,376 4,063 0.03The Kroger Co USD 1,125 27,664 47 0.00The Madison Square Garden Co USD 13 3,809 (19) (0.00)The Marcus Corp USD 215 8,622 (92) (0.00)The New York Times Co USD 732 23,878 (1,118) (0.01)The PNC Financial Services Group Inc USD 547 67,232 (4,907) (0.04)The Procter Gamble Co USD 852 87,926 1,418 0.01The Providence Service Corp USD 57 3,807 60 0.00The RMR Group Inc USD 125 7,623 (551) (0.00)The Scotts Miracle-Gro Co USD 27 2,107 (108) (0.00)The Sherwin-Williams Co USD 118 50,705 (185) (0.00)
AQR UCITS FUNDS
AQR Delphi Long-Short Equity UCITS Fund
Schedule of Investments (continued)As at 31 March 2019
The accompanying notes form an integral part of these audited financial statements. 26

Reference Entity Currency Shares Notional Amount
UnrealisedAppreciation/
(Depreciation)in USD
Percent ofNet Assets
Long Positions (continued)Common Stocks (continued)United States (continued)The Simply Good Foods Co USD 18 371 4 0.00The TJX Cos Inc USD 1,548 82,245 1,207 0.01The Toro Co USD 829 56,936 285 0.00The Travelers Cos Inc USD 500 68,520 1,100 0.01The Ultimate Software Group Inc USD 55 18,130 (75) (0.00)The Walt Disney Co USD 958 105,955 (3,930) (0.03)TherapeuticsMD Inc USD 337 1,651 (217) (0.00)Thermo Fisher Scientific Inc USD 120 32,514 890 0.01Thermon Group Holdings Inc USD 22 541 (18) (0.00)Tier REIT Inc USD 224 6,429 844 0.01Tilly’s Inc USD 454 5,062 (483) (0.00)Tivity Health Inc USD 482 8,305 (261) (0.00)T-Mobile US Inc USD 202 13,807 (1,077) (0.01)Toll Brothers Inc USD 89 3,241 100 0.00Tompkins Financial Corp USD 30 2,303 (55) (0.00)Tootsie Roll Industries Inc USD 127 4,743 136 0.00Torchmark Corp USD 293 24,008 (610) (0.01)Tower International Inc USD 16 338 (24) (0.00)TPI Composites Inc USD 16 454 (41) (0.00)Tractor Supply Co USD 435 42,199 3,097 0.03Trex Co Inc USD 88 5,485 (780) (0.01)TriCo Bancshares USD 115 4,534 (94) (0.00)TriMas Corp USD 106 3,228 (135) (0.00)Trinseo SA USD 136 6,261 (142) (0.00)TripAdvisor Inc USD 423 21,852 147 0.00TriState Capital Holdings Inc USD 49 994 (72) (0.00)TrueBlue Inc USD 369 8,823 191 0.00TrustCo Bank Corp NY USD 670 5,179 (332) (0.00)Trustmark Corp USD 1,054 35,752 (1,244) (0.01)Tucows Inc USD 40 3,297 96 0.00Turning Point Brands Inc USD 111 5,124 (393) (0.00)Turtle Beach Corp USD 269 3,045 (304) (0.00)Tyler Technologies Inc USD 17 3,484 7 0.00Tyson Foods Inc USD 1,458 100,310 5,059 0.04Ubiquiti Networks Inc USD 46 6,859 254 0.00UDR Inc USD 598 27,257 582 0.00UGI Corp USD 965 53,519 303 0.00Ulta Beauty Inc USD 119 41,392 668 0.01UMB Financial Corp USD 29 1,881 (53) (0.00)UMH Properties Inc USD 472 6,712 299 0.00Umpqua Holdings Corp USD 223 3,708 (217) (0.00)UniFirst Corp USD 151 23,156 2,027 0.02Union Pacific Corp USD 277 46,245 197 0.00Unisys Corp USD 134 1,544 (257) (0.00)United Continental Holdings Inc USD 109 8,669 (131) (0.00)United Fire Group Inc USD 413 18,032 (710) (0.01)United Therapeutics Corp USD 392 46,256 (333) (0.00)UnitedHealth Group Inc USD 421 102,720 (4,635) (0.04)Unitil Corp USD 351 18,947 (256) (0.00)Universal Corp USD 121 6,985 (287) (0.00)Universal Forest Products Inc USD 224 6,733 (265) (0.00)Universal Health Realty Income Trust USD 121 9,179 346 0.00Universal Insurance Holdings Inc USD 566 17,778 (419) (0.00)Univest Financial Corp USD 101 2,480 (109) (0.00)UroGen Pharma Ltd USD 18 672 (14) (0.00)Urstadt Biddle Properties Inc USD 552 11,581 293 0.00US Bancorp USD 1,450 69,702 (6,375) (0.05)US Physical Therapy Inc USD 82 8,671 (178) (0.00)USANA Health Sciences Inc USD 121 10,056 (993) (0.01)Vail Resorts Inc USD 107 23,402 215 0.00Valero Energy Corp USD 555 46,565 (1,562) (0.01)Valmont Industries Inc USD 81 10,618 (409) (0.00)Valvoline Inc USD 1,078 19,921 (66) (0.00)Varian Medical Systems Inc USD 231 32,758 1,432 0.01Varonis Systems Inc USD 42 2,471 (45) (0.00)Vectrus Inc USD 253 6,725 (101) (0.00)Veeva Systems Inc USD 89 11,209 311 0.00Vera Bradley Inc USD 543 7,162 (212) (0.00)Veracyte Inc USD 216 5,605 884 0.01Vericel Corp USD 192 3,308 (386) (0.00)VeriSign Inc USD 131 23,796 97 0.00Verisk Analytics Inc USD 289 38,440 1,246 0.01Veritiv Corp USD 78 2,071 (77) (0.00)Verizon Communications Inc USD 1,883 110,777 1,431 0.01Verso Corp USD 205 4,362 148 0.00Vertex Pharmaceuticals Inc USD 251 45,755 (1,303) (0.01)VF Corp USD 409 35,828 630 0.01Vicor Corp USD 254 7,991 (138) (0.00)Virtus Investment Partners Inc USD 112 11,072 (477) (0.00)Virtusa Corp USD 23 1,235 (10) (0.00)Vishay Intertechnology Inc USD 100 1,846 (154) (0.00)Vishay Precision Group Inc USD 278 9,508 (231) (0.00)VMware Inc USD 210 37,485 (892) (0.01)Vonage Holdings Corp USD 852 8,537 (136) (0.00)W&T Offshore Inc USD 1,150 8,062 605 0.00Wabash National Corp USD 218 2,971 (24) (0.00)Walmart Inc USD 602 58,563 (1,433) (0.01)Warrior Met Coal Inc USD 452 13,800 692 0.01Washington Federal Inc USD 69 2,014 (42) (0.00)Washington Trust Bancorp Inc USD 155 7,604 (329) (0.00)Waste Management Inc USD 327 33,854 701 0.01Waters Corp USD 237 59,274 1,145 0.01Watsco Inc USD 417 59,197 (626) (0.01)Watts Water Technologies Inc USD 79 6,357 5 0.00WD-40 Co USD 82 13,874 (287) (0.00)
AQR UCITS FUNDS
AQR Delphi Long-Short Equity UCITS Fund
Schedule of Investments (continued)As at 31 March 2019
The accompanying notes form an integral part of these audited financial statements. 27

Reference Entity Currency Shares Notional Amount
UnrealisedAppreciation/
(Depreciation)in USD
Percent ofNet Assets
Long Positions (continued)Common Stocks (continued)United States (continued)Webster Financial Corp USD 37 1,884 (150) (0.00)WEC Energy Group Inc USD 573 45,055 138 0.00Weingarten Realty Investors USD 115 3,393 220 0.00Weis Markets Inc USD 246 9,997 (76) (0.00)Werner Enterprises Inc USD 1,469 50,313 (715) (0.01)West Pharmaceutical Services Inc USD 179 19,592 630 0.00Western Alliance Bancorp USD 44 1,820 (137) (0.00)Westwood Holdings Group Inc USD 417 15,004 (538) (0.00)White Mountains Insurance Group Ltd USD 3 2,783 4 0.00Williams-Sonoma Inc USD 161 9,105 18 0.00Wingstop Inc USD 196 14,841 707 0.01Wintrust Financial Corp USD 455 30,826 (2,794) (0.02)Workiva Inc USD 152 7,560 207 0.00World Acceptance Corp USD 52 6,139 133 0.00World Wrestling Entertainment Inc USD 114 9,766 (511) (0.00)Worthington Industries Inc USD 456 17,018 (23) (0.00)WP Carey Inc USD 342 26,762 540 0.00WR Berkley Corp USD 423 35,820 274 0.00WW Grainger Inc USD 206 60,920 (1,294) (0.01)Xcel Energy Inc USD 474 26,591 (9) (0.00)Xencor Inc USD 93 2,978 149 0.00Xilinx Inc USD 277 35,306 604 0.00Xylem Inc USD 197 15,502 71 0.00Yelp Inc USD 121 4,201 18 0.00Zafgen Inc USD 126 334 (52) (0.00)ZAGG Inc USD 905 8,045 (751) (0.01)Zebra Technologies Corp USD 9 1,883 (40) (0.00)Zix Corp USD 892 6,075 (64) (0.00)Zoetis Inc USD 480 48,034 1,104 0.01Zumiez Inc USD 75 1,856 25 0.00Zynga Inc USD 1,400 7,315 (175) (0.00)
(69,586) (0.58)
Total Long Positions (74,874) (0.63)
Short PositionsCommon StocksArgentinaMercadoLibre Inc USD (65) (32,840) (1,317) (0.01)
(1,317) (0.01)BermudaThird Point Reinsurance Ltd USD (1,131) (11,740) 859 0.01Triton International Ltd USD (277) (8,662) (135) (0.00)
724 0.01CanadaMercer International Inc USD (104) (1,410) 23 0.00
23 0.00ChileLiberty Latin America Ltd USD (703) (13,420) 977 0.01
977 0.01ChinaTextainer Group Holdings Ltd USD (1,011) (9,665) 1,097 0.01
1,097 0.01GhanaKosmos Energy Ltd USD (2,647) (16,332) (450) (0.00)
(450) (0.00)MonacoCostamare Inc USD (101) (524) (3) (0.00)GasLog Ltd USD (117) (2,051) 35 0.00Scorpio Tankers Inc USD (844) (16,703) (549) (0.01)
(517) (0.01)PanamaCopa Holdings SA USD (240) (19,051) 776 0.01
776 0.01Puerto RicoFirst BanCorp USD (2,035) (23,199) 406 0.00
406 0.00SwedenVeoneer Inc USD (51) (1,195) 20 0.00
20 0.00SwitzerlandCRISPR Therapeutics AG USD (14) (494) 36 0.00
36 0.00United KingdomAvon Products Inc USD (1,800) (5,328) 36 0.00
36 0.00United States3D Systems Corp USD (277) (2,967) 168 0.00Abbott Laboratories USD (72) (5,710) 47 0.00Abercrombie & Fitch Co USD (151) (4,115) (145) (0.00)ABM Industries Inc USD (81) (2,952) (141) (0.00)Acacia Communications Inc USD (106) (6,081) (153) (0.00)Acadia Healthcare Co Inc USD (2,129) (62,593) 2,257 0.02Acceleron Pharma Inc USD (7) (323) 1 0.00ACCO Brands Corp USD (444) (3,810) 160 0.00Accuray Inc USD (464) (2,185) (20) (0.00)Aclaris Therapeutics Inc USD (542) (3,209) 466 0.00Actavis plc USD (280) (40,883) 1,352 0.01Activision Blizzard Inc USD (216) (9,735) (22) (0.00)Actuant Corp USD (256) (6,246) 169 0.00Acxiom Corp USD (399) (21,738) 2,870 0.02
AQR UCITS FUNDS
AQR Delphi Long-Short Equity UCITS Fund
Schedule of Investments (continued)As at 31 March 2019
The accompanying notes form an integral part of these audited financial statements. 28

Reference Entity Currency Shares Notional Amount
UnrealisedAppreciation/
(Depreciation)in USD
Percent ofNet Assets
Short Positions (continued)Common Stocks (continued)United States (continued)Adamas Pharmaceuticals Inc USD (256) (1,838) 166 0.00Adient plc USD (2,617) (34,257) 3,323 0.03Aduro Biotech Inc USD (533) (2,063) 69 0.00Advance Auto Parts Inc USD (302) (51,409) (2,499) (0.02)Advanced Disposal Services Inc USD (51) (1,430) (44) (0.00)Advanced Micro Devices Inc USD (1,668) (42,317) (3,085) (0.03)AECOM USD (493) (14,652) 418 0.00Aerie Pharmaceuticals Inc USD (23) (1,084) (1) (0.00)Aerojet Rocketdyne Holdings Inc USD (86) (3,064) (119) (0.00)AES Corp USD (427) (7,733) (98) (0.00)Agenus Inc USD (1,618) (4,741) (81) (0.00)Agios Pharmaceuticals Inc USD (616) (40,792) (850) (0.01)Air Lease Corp USD (921) (31,756) (350) (0.00)Air Transport Services Group Inc USD (248) (5,689) (643) (0.01)AK Steel Holding Corp USD (463) (1,278) (5) (0.00)Akebia Therapeutics Inc USD (112) (932) (17) (0.00)Akorn Inc USD (1,756) (6,111) (63) (0.00)Albemarle Corp USD (462) (37,551) 2,379 0.02Alcoa Corp USD (200) (5,608) 120 0.00Alder Biopharmaceuticals Inc USD (378) (5,039) 144 0.00Alexion Pharmaceuticals Inc USD (60) (8,041) (65) (0.00)Allegheny Technologies Inc USD (1,099) (28,101) 481 0.00Alliance Data Systems Corp USD (208) (36,044) (314) (0.00)Allison Transmission Holdings Inc USD (155) (6,964) 285 0.00Allscripts Healthcare Solution Inc USD (2,971) (28,581) 2,466 0.02Ally Financial Inc USD (2,349) (64,598) (423) (0.00)Alnylam Pharmaceuticals Inc USD (417) (38,956) (1,326) (0.01)Alta Mesa Resources Inc USD (7,848) (2,198) 173 0.00Altra Industrial Motion Corp USD (145) (4,499) 200 0.00AMC Entertainment Holdings Inc USD (733) (10,885) 25 0.00American Airlines Group Inc USD (1,721) (54,022) 0 0.00American Axle & Manufacturing Holdings Inc USD (584) (8,386) (6) (0.00)American Equity Investment Life Holding Co USD (43) (1,174) 126 0.00American Homes 4 Rent USD (1,155) (26,322) (205) (0.00)American International Group Inc USD (1,702) (73,271) 2,093 0.02American Renal Associates Holdings Inc USD (375) (2,284) 1,403 0.01American Tower Corp USD (12) (2,337) (58) (0.00)American Woodmark Corp USD (205) (16,921) (447) (0.00)Ameris Bancorp USD (532) (18,471) 1,921 0.02AmerisourceBergen Corp USD (322) (25,274) 612 0.01Amkor Technology Inc USD (911) (7,753) 165 0.00Anixter International Inc USD (67) (3,753) 74 0.00Antares Pharma Inc USD (188) (556) 96 0.00Antero Resources Corp USD (720) (6,329) (122) (0.00)Apache Corp USD (100) (3,497) (48) (0.00)Applied Optoelectronics Inc USD (380) (4,640) 707 0.01Aramark USD (599) (17,724) 224 0.00Aratana Therapeutics Inc USD (417) (1,530) 58 0.00Archrock Inc USD (864) (8,433) 415 0.00Arconic Inc USD (3,909) (75,033) 137 0.00Armstrong Flooring Inc USD (114) (1,549) 55 0.00Armstrong World Industries Inc USD (27) (2,131) (121) (0.00)Artisan Partners Asset Management Inc USD (230) (5,844) 274 0.00Ascena Retail Group Inc USD (1,676) (1,810) 328 0.00ASGN Inc USD (39) (2,484) 50 0.00Ashford Hospitality Trust Inc USD (1,230) (6,089) (185) (0.00)Ashland Inc USD (319) (25,093) 77 0.00Assembly Biosciences Inc USD (104) (2,059) (17) (0.00)Asure Software Inc USD (822) (4,973) 132 0.00At Home Group Inc USD (264) (4,805) 1,083 0.01Atara Biotherapeutics Inc USD (50) (2,016) (57) (0.00)Atlas Air Worldwide Holdings Inc USD (136) (6,920) (135) (0.00)Atlassian Corp PLC USD (376) (41,728) 107 0.00AutoNation Inc USD (804) (28,775) (1,713) (0.01)Avanos Medical Inc USD (957) (40,481) 669 0.01Avaya Holdings Corp USD (254) (4,267) (602) (0.00)Avis Budget Group Inc USD (1,236) (42,963) 507 0.00Axalta Coating Systems Ltd USD (1,179) (29,758) 1,013 0.01AXT Inc USD (981) (4,297) 64 0.00Baker Hughes a GE Co USD (1,060) (29,044) 827 0.01Ball Corp USD (884) (51,316) (123) (0.00)Banc of California Inc USD (1,320) (18,374) 1,088 0.01Bank of America Corp USD (260) (7,116) 650 0.01Barnes & Noble Inc USD (708) (3,894) (52) (0.00)Basic Energy Services Inc USD (332) (1,295) 332 0.00BB&T Corp USD (70) (3,256) 207 0.00Beacon Roofing Supply Inc USD (287) (9,282) 784 0.01Beazer Homes USA Inc USD (649) (7,470) 26 0.00Bed Bath Beyond Inc USD (488) (8,450) (1,618) (0.01)Belden Inc USD (392) (21,027) 1,396 0.01Bellicum Pharmaceuticals Inc USD (1,501) (5,133) 210 0.00Benchmark Electronics Inc USD (71) (1,869) (11) (0.00)Berkshire Hills Bancorp Inc USD (49) (1,344) 130 0.00Berry Plastics Group Inc USD (129) (6,934) 152 0.00BGC Partners Inc USD (4,208) (22,597) 1,760 0.02BioCryst Pharmaceuticals Inc USD (225) (1,800) 22 0.00BioMarin Pharmaceutical Inc USD (65) (5,746) 198 0.00Blackbaud Inc USD (76) (6,020) (81) (0.00)Blucora Inc USD (49) (1,652) (182) (0.00)Bluebird Bio Inc USD (340) (52,697) 401 0.00BlueLinx Holdings Inc USD (120) (3,265) (200) (0.00)Boot Barn Holdings Inc USD (123) (3,615) (192) (0.00)Boston Private Financial Holdings Inc USD (646) (7,112) 347 0.00Boston Scientific Corp USD (437) (16,669) 45 0.00Box Inc USD (36) (695) 22 0.00
AQR UCITS FUNDS
AQR Delphi Long-Short Equity UCITS Fund
Schedule of Investments (continued)As at 31 March 2019
The accompanying notes form an integral part of these audited financial statements. 29
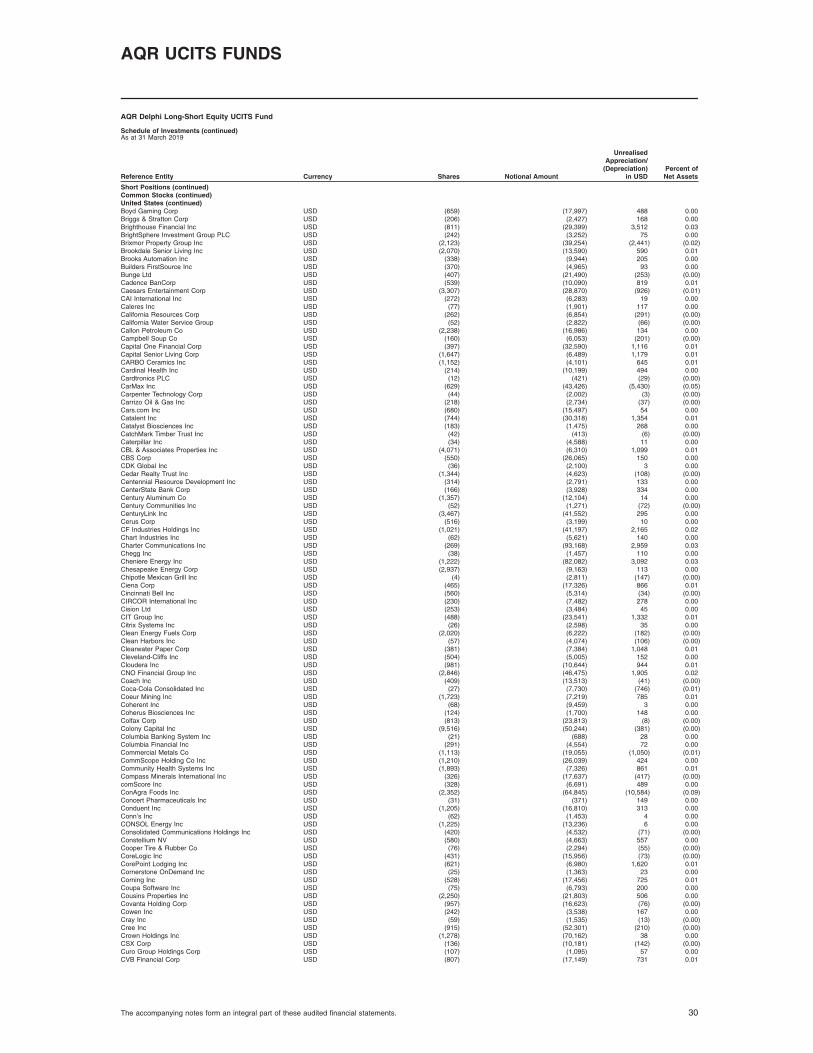
Reference Entity Currency Shares Notional Amount
UnrealisedAppreciation/
(Depreciation)in USD
Percent ofNet Assets
Short Positions (continued)Common Stocks (continued)United States (continued)Boyd Gaming Corp USD (659) (17,997) 488 0.00Briggs & Stratton Corp USD (206) (2,427) 168 0.00Brighthouse Financial Inc USD (811) (29,399) 3,512 0.03BrightSphere Investment Group PLC USD (242) (3,252) 75 0.00Brixmor Property Group Inc USD (2,123) (39,254) (2,441) (0.02)Brookdale Senior Living Inc USD (2,070) (13,590) 590 0.01Brooks Automation Inc USD (338) (9,944) 205 0.00Builders FirstSource Inc USD (370) (4,965) 93 0.00Bunge Ltd USD (407) (21,490) (253) (0.00)Cadence BanCorp USD (539) (10,090) 819 0.01Caesars Entertainment Corp USD (3,307) (28,870) (926) (0.01)CAI International Inc USD (272) (6,283) 19 0.00Caleres Inc USD (77) (1,901) 117 0.00California Resources Corp USD (262) (6,854) (291) (0.00)California Water Service Group USD (52) (2,822) (66) (0.00)Callon Petroleum Co USD (2,238) (16,986) 134 0.00Campbell Soup Co USD (160) (6,053) (201) (0.00)Capital One Financial Corp USD (397) (32,590) 1,116 0.01Capital Senior Living Corp USD (1,647) (6,489) 1,179 0.01CARBO Ceramics Inc USD (1,152) (4,101) 645 0.01Cardinal Health Inc USD (214) (10,199) 494 0.00Cardtronics PLC USD (12) (421) (29) (0.00)CarMax Inc USD (629) (43,426) (5,430) (0.05)Carpenter Technology Corp USD (44) (2,002) (3) (0.00)Carrizo Oil & Gas Inc USD (218) (2,734) (37) (0.00)Cars.com Inc USD (680) (15,497) 54 0.00Catalent Inc USD (744) (30,318) 1,354 0.01Catalyst Biosciences Inc USD (183) (1,475) 268 0.00CatchMark Timber Trust Inc USD (42) (413) (6) (0.00)Caterpillar Inc USD (34) (4,588) 11 0.00CBL & Associates Properties Inc USD (4,071) (6,310) 1,099 0.01CBS Corp USD (550) (26,065) 150 0.00CDK Global Inc USD (36) (2,100) 3 0.00Cedar Realty Trust Inc USD (1,344) (4,623) (108) (0.00)Centennial Resource Development Inc USD (314) (2,791) 133 0.00CenterState Bank Corp USD (166) (3,928) 334 0.00Century Aluminum Co USD (1,357) (12,104) 14 0.00Century Communities Inc USD (52) (1,271) (72) (0.00)CenturyLink Inc USD (3,467) (41,552) 295 0.00Cerus Corp USD (516) (3,199) 10 0.00CF Industries Holdings Inc USD (1,021) (41,197) 2,165 0.02Chart Industries Inc USD (62) (5,621) 140 0.00Charter Communications Inc USD (269) (93,168) 2,959 0.03Chegg Inc USD (38) (1,457) 110 0.00Cheniere Energy Inc USD (1,222) (82,082) 3,092 0.03Chesapeake Energy Corp USD (2,937) (9,163) 113 0.00Chipotle Mexican Grill Inc USD (4) (2,811) (147) (0.00)Ciena Corp USD (465) (17,326) 866 0.01Cincinnati Bell Inc USD (560) (5,314) (34) (0.00)CIRCOR International Inc USD (230) (7,482) 278 0.00Cision Ltd USD (253) (3,484) 45 0.00CIT Group Inc USD (488) (23,541) 1,332 0.01Citrix Systems Inc USD (26) (2,598) 35 0.00Clean Energy Fuels Corp USD (2,020) (6,222) (182) (0.00)Clean Harbors Inc USD (57) (4,074) (106) (0.00)Clearwater Paper Corp USD (381) (7,384) 1,048 0.01Cleveland-Cliffs Inc USD (504) (5,005) 152 0.00Cloudera Inc USD (981) (10,644) 944 0.01CNO Financial Group Inc USD (2,846) (46,475) 1,905 0.02Coach Inc USD (409) (13,513) (41) (0.00)Coca-Cola Consolidated Inc USD (27) (7,730) (746) (0.01)Coeur Mining Inc USD (1,723) (7,219) 785 0.01Coherent Inc USD (68) (9,459) 3 0.00Coherus Biosciences Inc USD (124) (1,700) 148 0.00Colfax Corp USD (813) (23,813) (8) (0.00)Colony Capital Inc USD (9,516) (50,244) (381) (0.00)Columbia Banking System Inc USD (21) (688) 28 0.00Columbia Financial Inc USD (291) (4,554) 72 0.00Commercial Metals Co USD (1,113) (19,055) (1,050) (0.01)CommScope Holding Co Inc USD (1,210) (26,039) 424 0.00Community Health Systems Inc USD (1,893) (7,326) 861 0.01Compass Minerals International Inc USD (326) (17,637) (417) (0.00)comScore Inc USD (328) (6,691) 489 0.00ConAgra Foods Inc USD (2,352) (64,845) (10,584) (0.09)Concert Pharmaceuticals Inc USD (31) (371) 149 0.00Conduent Inc USD (1,205) (16,810) 313 0.00Conn’s Inc USD (62) (1,453) 4 0.00CONSOL Energy Inc USD (1,225) (13,236) 6 0.00Consolidated Communications Holdings Inc USD (420) (4,532) (71) (0.00)Constellium NV USD (580) (4,663) 557 0.00Cooper Tire & Rubber Co USD (76) (2,294) (55) (0.00)CoreLogic Inc USD (431) (15,956) (73) (0.00)CorePoint Lodging Inc USD (621) (6,980) 1,620 0.01Cornerstone OnDemand Inc USD (25) (1,363) 23 0.00Corning Inc USD (528) (17,456) 725 0.01Coupa Software Inc USD (75) (6,793) 200 0.00Cousins Properties Inc USD (2,250) (21,803) 506 0.00Covanta Holding Corp USD (957) (16,623) (76) (0.00)Cowen Inc USD (242) (3,538) 167 0.00Cray Inc USD (59) (1,535) (13) (0.00)Cree Inc USD (915) (52,301) (210) (0.00)Crown Holdings Inc USD (1,278) (70,162) 38 0.00CSX Corp USD (136) (10,181) (142) (0.00)Curo Group Holdings Corp USD (107) (1,095) 57 0.00CVB Financial Corp USD (807) (17,149) 731 0.01
AQR UCITS FUNDS
AQR Delphi Long-Short Equity UCITS Fund
Schedule of Investments (continued)As at 31 March 2019
The accompanying notes form an integral part of these audited financial statements. 30

Reference Entity Currency Shares Notional Amount
UnrealisedAppreciation/
(Depreciation)in USD
Percent ofNet Assets
Short Positions (continued)Common Stocks (continued)United States (continued)CVS Health Corp USD (377) (20,170) 1,208 0.01Cymabay Therapeutics Inc USD (87) (1,134) 28 0.00Cypress Semiconductor Corp USD (3,121) (46,378) 982 0.01Darling Ingredients Inc USD (353) (7,653) (138) (0.00)Daseke Inc USD (1,563) (8,065) 141 0.00Dave & Buster’s Entertainment Inc USD (106) (5,287) (232) (0.00)DaVita HealthCare Partners Inc USD (792) (42,713) (1,434) (0.01)Dean Foods Co USD (2,707) (8,256) (325) (0.00)Deere & Co USD (131) (20,998) 368 0.00Del Frisco’s Restaurant Group Inc USD (2,216) (14,160) 728 0.01Dell Technologies Inc USD (533) (30,775) 1,463 0.01Delphi Automotive PLC USD (307) (24,308) 635 0.01Delphi Technologies PLC USD (122) (2,358) 33 0.00Delta Air Lines Inc USD (40) (2,051) (12) (0.00)Denbury Resources Inc USD (1,551) (3,226) (399) (0.00)DENTSPLY International Inc USD (1,189) (58,630) 238 0.00Dermira Inc USD (458) (6,078) (302) (0.00)DexCom Inc USD (78) (9,240) 2,177 0.02Diamond Offshore Drilling Inc USD (1,872) (19,300) 1,572 0.01DiamondRock Hospitality Co USD (481) (5,281) (123) (0.00)Dicerna Pharmaceuticals Inc USD (157) (2,270) (214) (0.00)Diebold Inc USD (422) (4,499) 304 0.00Diplomat Pharmacy Inc USD (1,406) (8,099) 53 0.00Discovery Communications Inc USD (1,149) (31,012) 277 0.00DISH Network Corp USD (1,286) (40,123) 1,556 0.01Dollar Tree Inc USD (250) (25,893) (606) (0.00)Donnelley Financial Solutions Inc USD (278) (4,173) (56) (0.00)DowDuPont Inc USD (1,042) (53,788) 3,841 0.03DR Horton Inc USD (344) (14,338) (480) (0.00)Dril-Quip Inc USD (95) (4,308) 15 0.00Dycom Industries Inc USD (57) (2,588) 231 0.00E*TRADE Financial Corp USD (1,380) (64,060) 4,430 0.04EchoStar Corp USD (217) (7,940) 143 0.00Editas Medicine Inc USD (58) (1,382) 9 0.00eHealth Inc USD (44) (2,740) (193) (0.00)Eldorado Resorts Inc USD (181) (8,453) (199) (0.00)elf Beauty Inc USD (562) (5,879) (635) (0.01)Emerald Expositions Events Inc USD (394) (5,031) 25 0.00Empire State Realty Trust Inc USD (351) (5,553) 47 0.00Encore Capital Group Inc USD (16) (447) 22 0.00Endo International PLC USD (725) (5,829) 403 0.00Endurance International Group Holdings Inc USD (850) (6,129) (111) (0.00)Energizer Holdings Inc USD (607) (26,829) (292) (0.00)Energizer Holdings Inc USD (648) (28,979) 1,160 0.01ENERSYS USD (56) (3,692) 87 0.00Enova International Inc USD (32) (727) 88 0.00Ensco PLC USD (4,109) (16,107) 2,301 0.02Entegris Inc USD (116) (4,082) (3) (0.00)Entercom Communications Corp USD (1,529) (7,966) 948 0.01Entergy Corp USD (619) (59,009) (599) (0.00)Envestnet Inc USD (65) (4,228) 89 0.00Epizyme Inc USD (234) (2,897) (26) (0.00)EQT Corp USD (2,064) (42,622) (1,259) (0.01)Equifax Inc USD (97) (11,409) (426) (0.00)Equitrans Midstream Corp USD (119) (2,557) (159) (0.00)Esperion Therapeutics Inc USD (39) (1,558) 335 0.00Etsy Inc USD (49) (3,314) 94 0.00Everett Spinco Inc USD (382) (24,715) 535 0.00Everi Holdings Inc USD (1,273) (13,507) (1,286) (0.01)Evolent Health Inc USD (726) (9,046) 123 0.00Evoqua Water Technologies Corp USD (446) (5,566) 540 0.00Exact Sciences Corp USD (491) (41,976) 3,143 0.03Express Inc USD (434) (1,845) 17 0.00Extended Stay America Inc USD (165) (2,975) (8) (0.00)Extraction Oil Gas Inc USD (2,315) (9,746) 69 0.00EZCORP Inc USD (121) (1,137) 18 0.00FedEx Corp USD (11) (1,991) 5 0.00Ferro Corp USD (141) (2,679) (16) (0.00)FireEye Inc USD (2,963) (49,423) 770 0.01First Financial Bancorp USD (87) (2,111) 102 0.00First Midwest Bancorp Inc USD (240) (4,939) 379 0.00First Solar Inc USD (500) (26,418) 923 0.01FirstEnergy Corp USD (1,360) (56,413) (1,077) (0.01)Fitbit Inc USD (1,293) (7,629) 0 0.00Five Prime Therapeutics Inc USD (369) (4,989) (196) (0.00)Flagstar Bancorp Inc USD (338) (11,191) (125) (0.00)FleetCor Technologies Inc USD (37) (9,101) (188) (0.00)Flexion Therapeutics Inc USD (206) (2,509) (52) (0.00)Flextronics International Ltd USD (4,805) (47,978) 1,658 0.01Floor & Decor Holdings Inc USD (288) (12,047) (988) (0.01)Flotek Industries Inc USD (2,824) (9,206) 254 0.00Flowserve Corp USD (701) (31,734) (58) (0.00)Fluidigm Corp USD (425) (5,580) 289 0.00FNB Corp USD (2,576) (27,756) 3,181 0.03Ford Motor Co USD (6,742) (58,959) (1,180) (0.01)ForeScout Technologies Inc USD (58) (2,428) 144 0.00Fortune Brands Home & Security Inc USD (68) (3,221) (84) (0.00)Forum Energy Technologies Inc USD (1,082) (5,540) 1,028 0.01Fossil Group Inc USD (115) (1,604) 151 0.00Frank’s International NV USD (666) (4,123) 220 0.00Freeport-McMoRan Inc USD (3,800) (48,735) (752) (0.01)Fresh Del Monte Produce Inc USD (165) (4,478) 144 0.00Freshpet Inc USD (8) (338) 1 0.00Front Yard Residential Corp USD (713) (6,617) 989 0.01GameStop Corp USD (60) (616) 49 0.00
AQR UCITS FUNDS
AQR Delphi Long-Short Equity UCITS Fund
Schedule of Investments (continued)As at 31 March 2019
The accompanying notes form an integral part of these audited financial statements. 31

Reference Entity Currency Shares Notional Amount
UnrealisedAppreciation/
(Depreciation)in USD
Percent ofNet Assets
Short Positions (continued)Common Stocks (continued)United States (continued)Gannett Co Inc USD (1,679) (23,640) 890 0.01Gardner Denver Holdings Inc USD (99) (2,729) 17 0.00GATX Corp USD (39) (2,967) 19 0.00GCI Liberty Inc USD (790) (43,711) 514 0.00GCP Applied Technologies Inc USD (61) (1,790) 50 0.00Genco Shipping & Trading Ltd USD (54) (400) 62 0.00General Electric Co USD (6,279) (62,602) 1,444 0.01General Motors Co USD (891) (33,225) 615 0.01Genesee Wyoming Inc USD (441) (38,407) 26 0.00GenMark Diagnostics Inc USD (1,054) (7,441) 179 0.00G-III Apparel Group Ltd USD (182) (7,202) (697) (0.01)Glacier Bancorp Inc USD (61) (2,448) 12 0.00Global Blood Therapeutics Inc USD (72) (3,792) 16 0.00Global Payments Inc USD (459) (62,406) (820) (0.01)Globalstar Inc USD (11,273) (4,791) 485 0.00GlycoMimetics Inc USD (198) (2,509) (26) (0.00)GNC Holdings Inc USD (179) (496) (39) (0.00)GoDaddy Inc USD (185) (13,892) 92 0.00Gogo Inc USD (105) (476) 52 0.00Golden Entertainment Inc USD (161) (2,344) (69) (0.00)GoPro Inc USD (864) (5,564) (164) (0.00)Granite Construction Inc USD (43) (1,866) 116 0.00Graphic Packaging Holding Co USD (4,005) (50,183) 1,043 0.01Gray Television Inc USD (386) (8,257) 350 0.00Green Plains Inc USD (417) (6,976) (71) (0.00)Greenhill & Co Inc USD (271) (5,875) (5) (0.00)Greenlight Capital Re Ltd USD (1,258) (13,876) 191 0.00Griffon Corp USD (384) (7,162) (23) (0.00)Group 1 Automotive Inc USD (114) (7,396) (304) (0.00)Groupon Inc USD (979) (3,446) (59) (0.00)GrubHub Inc USD (62) (4,256) 372 0.00Guess? Inc USD (107) (2,096) 327 0.00Guidewire Software Inc USD (396) (38,258) (622) (0.00)Haemonetics Corp USD (30) (2,626) (21) (0.00)Halcon Resources Corp USD (10,198) (14,022) (1,459) (0.01)Halliburton Co USD (175) (5,110) (58) (0.00)Hanesbrands Inc USD (3,570) (63,939) (928) (0.01)Harmonic Inc USD (63) (343) 14 0.00Harsco Corp USD (142) (2,864) 307 0.00Hawaiian Holdings Inc USD (246) (6,544) (156) (0.00)HCA Holdings Inc USD (190) (24,645) 1,054 0.01HCP Inc USD (66) (2,081) (81) (0.00)Hecla Mining Co USD (3,157) (7,435) 147 0.00Helix Energy Solutions Group Inc USD (1,095) (8,579) 93 0.00Heron Therapeutics Inc USD (20) (481) 8 0.00Hertz Global Holdings Inc USD (593) (10,360) (314) (0.00)Hertz Global Holdings Inc USD (72) (2,825) 63 0.00Hess Corp USD (906) (55,184) (1,633) (0.01)HighPoint Resources Corp USD (149) (356) 30 0.00Hilltop Holdings Inc USD (160) (2,963) (96) (0.00)Hilton Grand Vacations Inc USD (178) (5,511) 167 0.00Hilton Worldwide Holdings Inc USD (818) (68,156) 2,395 0.02HMS Holdings Corp USD (24) (720) 65 0.00Hologic Inc USD (198) (9,433) (76) (0.00)Hope Bancorp Inc USD (127) (1,664) 142 0.00Horizon Pharma Plc USD (86) (2,241) 146 0.00Hostess Brands Inc USD (663) (8,135) (250) (0.00)Houghton Mifflin Harcourt Co USD (1,162) (8,285) (59) (0.00)Hyatt Hotels Corp USD (257) (18,494) 188 0.00IAC/InterActiveCorp USD (24) (5,032) 194 0.00IBERIABANK Corp USD (27) (1,938) 164 0.00ICF International Inc USD (8) (607) 1 0.00IHS Markit Ltd USD (415) (22,414) 528 0.00ImmunoGen Inc USD (1,698) (4,491) (93) (0.00)Immunomedics Inc USD (229) (4,241) 73 0.00INC Research Holdings Inc USD (1,139) (58,738) (4,727) (0.04)Independent Bank Group Inc USD (106) (5,481) 511 0.00Infinera Corp USD (2,570) (11,038) 1,268 0.01Inovalon Holdings Inc USD (746) (9,243) 53 0.00Inovio Pharmaceuticals Inc USD (723) (2,639) (93) (0.00)Inphi Corp USD (165) (7,191) 43 0.00Installed Building Products Inc USD (101) (4,876) (432) (0.00)Insulet Corp USD (634) (60,192) 1,604 0.01Integra LifeSciences Holdings Corp USD (224) (12,479) 59 0.00Intellia Therapeutics Inc USD (100) (1,668) 3 0.00Intelsat SA USD (415) (6,462) 187 0.00Interface Inc USD (69) (1,060) 71 0.00Internap Corp USD (1,754) (8,665) (593) (0.00)International Game Technology PLC USD (1,460) (19,038) 350 0.00International Seaways Inc USD (53) (911) 68 0.00INTL. FCStone Inc USD (36) (1,398) 113 0.00Intrepid Potash Inc USD (669) (2,549) 27 0.00Intrexon Corp USD (125) (641) 61 0.00Invacare Corp USD (774) (6,370) 937 0.01Invesco Ltd USD (1,155) (22,413) 964 0.01Invitae Corp USD (35) (802) 45 0.00Iovance Biotherapeutics Inc USD (225) (2,144) 185 0.00Iridium Communications Inc USD (139) (3,690) (60) (0.00)Isis Pharmaceuticals Inc USD (427) (34,237) (282) (0.00)iStar Inc USD (43) (361) (11) (0.00)Itron Inc USD (170) (7,900) 568 0.01J. Jill Inc USD (322) (1,768) 58 0.00Jabil Circuit Inc USD (1,394) (36,997) 511 0.00Jagged Peak Energy Inc USD (50) (527) (7) (0.00)Jefferies Financial Group Inc USD (1,084) (20,379) 1,192 0.01
AQR UCITS FUNDS
AQR Delphi Long-Short Equity UCITS Fund
Schedule of Investments (continued)As at 31 March 2019
The accompanying notes form an integral part of these audited financial statements. 32

Reference Entity Currency Shares Notional Amount
UnrealisedAppreciation/
(Depreciation)in USD
Percent ofNet Assets
Short Positions (continued)Common Stocks (continued)United States (continued)JELD-WEN Holding Inc USD (988) (17,409) 1,536 0.01John Bean Technologies Corp USD (4) (369) 3 0.00Johnson Controls International plc USD (2,452) (90,749) (1,450) (0.01)Kadmon Holdings Inc USD (1,413) (3,759) 353 0.00Kansas City Southern USD (215) (25,243) (339) (0.00)KAR Auction Services Inc USD (565) (28,634) (1,199) (0.01)Karyopharm Therapeutics Inc USD (1,164) (6,693) (512) (0.00)KB Home USD (2,371) (58,327) (3,549) (0.03)KBR Inc USD (1,329) (25,371) 249 0.00KEMET Corp USD (180) (3,046) 254 0.00Kemper Corp USD (362) (27,867) 854 0.01Kimco Realty Corp USD (3,135) (58,217) (3,260) (0.03)Kite Realty Group Trust USD (349) (5,640) (178) (0.00)Knight-Swift Transportation Holdings Inc USD (1,882) (61,560) 3,538 0.03Knowles Corp USD (428) (7,413) (330) (0.00)Koppers Holdings Inc USD (171) (4,424) 121 0.00Korn Ferry USD (233) (10,557) 555 0.00Kraton Corp USD (23) (745) 16 0.00Kratos Defense & Security Solutions Inc USD (1,035) (16,193) 150 0.00Kura Oncology Inc USD (109) (1,790) (50) (0.00)L Brands Inc USD (3,100) (86,056) (932) (0.01)La Jolla Pharmaceutical Co USD (379) (2,418) 345 0.00Laboratory Corp of America Holdings USD (40) (6,070) 168 0.00Lands’ End Inc USD (40) (670) 59 0.00Lantheus Holdings Inc USD (16) (395) (2) (0.00)Lattice Semiconductor Corp USD (313) (3,712) 219 0.00Laureate Education Inc USD (360) (5,393) 94 0.00Legg Mason Inc USD (1,076) (29,698) 1,421 0.01Leidos Holdings Inc USD (845) (54,376) (735) (0.01)LendingClub Corp USD (3,696) (11,291) (55) (0.00)LendingTree Inc USD (47) (16,474) (515) (0.00)Lennar Corp USD (1,739) (86,028) (2,800) (0.02)Lexicon Pharmaceuticals Inc USD (433) (2,373) 927 0.01Lexington Realty Trust USD (442) (4,033) (91) (0.00)Liberty Broadband Corp USD (60) (5,492) 113 0.00Liberty Interactive Corp QVC Group USD (1,486) (23,754) 1,939 0.02Liberty Media Corp-Liberty Braves USD (13) (363) 8 0.00Liberty Media Corp-Liberty SiriusXM USD (392) (14,759) 1,356 0.01Liberty TripAdvisor Holdings Inc USD (203) (2,897) 6 0.00Ligand Pharmaceuticals Inc USD (260) (32,419) (16) (0.00)Lions Gate Entertainment Corp USD (2,176) (33,902) 1,034 0.01Live Nation Entertainment Inc USD (47) (2,990) (46) (0.00)LKQ Corp USD (897) (25,403) 0 0.00Loews Corp USD (901) (43,212) 446 0.00LogMeIn Inc USD (268) (21,480) 418 0.00Louisiana-Pacific Corp USD (748) (18,461) 45 0.00LPL Financial Holdings Inc USD (829) (57,632) 5,030 0.04Lumber Liquidators Holdings Inc USD (182) (1,838) (51) (0.00)Lumentum Holdings Inc USD (621) (34,813) (2,099) (0.02)Mack-Cali Realty Corp USD (860) (19,161) (662) (0.01)MACOM Technology Solutions Holdings Inc USD (407) (6,772) 993 0.01Macquarie Infrastructure Corp USD (1,009) (41,551) (494) (0.00)Macys Inc USD (673) (16,165) (87) (0.00)Malibu Boats Inc USD (10) (391) 15 0.00Mallinckrodt PLC USD (1,006) (21,750) 1,097 0.01Manitowoc Foodservice Inc USD (1,661) (27,008) (465) (0.00)Marathon Oil Corp USD (1,480) (24,760) 977 0.01Marathon Petroleum Corp USD (141) (8,432) 385 0.00Marinus Pharmaceuticals Inc USD (852) (3,365) (85) (0.00)Marriott Vacations Worldwide Corp USD (95) (9,049) 71 0.00Martin Marietta Materials Inc USD (86) (17,362) (511) (0.00)Marvell Technology Group Ltd USD (2,589) (51,107) 734 0.01Masonite International Corp USD (91) (4,529) 242 0.00MasTec Inc USD (748) (36,031) (146) (0.00)Matador Resources Co USD (494) (9,564) (117) (0.00)Mattel Inc USD (3,217) (41,853) 5,372 0.05Maxar Technologies Inc USD (1,014) (3,965) 609 0.01MaxLinear Inc USD (235) (5,981) (38) (0.00)MBIA Inc USD (1,478) (14,322) 869 0.01McDermott International Inc USD (251) (1,850) 93 0.00Medical Properties Trust Inc USD (450) (8,388) (186) (0.00)Medidata Solutions Inc USD (229) (16,774) 956 0.01Mercury Systems Inc USD (6) (385) (10) (0.00)Meredith Corp USD (503) (28,128) 684 0.01Meritor Inc USD (85) (1,731) 72 0.00Meta Financial Group Inc USD (441) (8,701) 252 0.00Methode Electronics Inc USD (15) (428) 25 0.00MetLife Inc USD (44) (1,875) 107 0.00MGM Resorts International USD (3,278) (84,867) 1,180 0.01Microchip Technology Inc USD (357) (29,378) 1,157 0.01Mirati Therapeutics Inc USD (5) (368) (2) (0.00)Mobile Mini Inc USD (85) (2,902) 132 0.00MobileIron Inc USD (130) (716) (64) (0.00)Modine Manufacturing Co USD (117) (1,617) 57 0.00Mohawk Industries Inc USD (25) (3,164) 34 0.00Molina Healthcare Inc USD (190) (26,874) 300 0.00Molson Coors Brewing Co USD (764) (45,779) 787 0.01Momenta Pharmaceuticals Inc USD (360) (5,134) 97 0.00Mondelez International Inc USD (522) (25,865) (673) (0.01)Montage Resources Corp USD (573) (8,744) 848 0.01Morgan Stanley USD (1,483) (62,464) 2,833 0.02Motorcar Parts of America Inc USD (167) (3,161) 188 0.00MRC Global Inc USD (351) (6,181) (53) (0.00)Mueller Industries Inc USD (183) (5,757) 163 0.00Mueller Water Products Inc USD (132) (1,317) 61 0.00
AQR UCITS FUNDS
AQR Delphi Long-Short Equity UCITS Fund
Schedule of Investments (continued)As at 31 March 2019
The accompanying notes form an integral part of these audited financial statements. 33

Reference Entity Currency Shares Notional Amount
UnrealisedAppreciation/
(Depreciation)in USD
Percent ofNet Assets
Short Positions (continued)Common Stocks (continued)United States (continued)Murphy Oil Corp USD (1,273) (37,541) 967 0.01Mylan Inc USD (1,093) (31,019) (219) (0.00)MyoKardia Inc USD (45) (2,312) 112 0.00Nabors Industries Ltd USD (2,943) (10,153) 265 0.00Natera Inc USD (100) (2,048) (73) (0.00)National General Holdings Corp USD (32) (767) 18 0.00National Oilwell Varco Inc USD (790) (20,927) 1,288 0.01National Vision Holdings Inc USD (70) (2,181) (75) (0.00)Navient Corp USD (2,177) (25,863) 566 0.01Navigant Consulting Inc USD (282) (5,530) 148 0.00Navistar International Corp USD (294) (9,564) 44 0.00NCR Corp USD (1,453) (39,347) 2,267 0.02NeoPhotonics Corp USD (411) (2,577) 52 0.00Netflix Inc USD (115) (40,824) 972 0.01NetScout Systems Inc USD (996) (27,619) 12 0.00Nevro Corp USD (12) (743) (208) (0.00)New Relic Inc USD (41) (4,047) 210 0.00New Senior Investment Group Inc USD (1,547) (8,307) (325) (0.00)New York Community Bancorp Inc USD (4,376) (51,199) 2,232 0.02Newell Rubbermaid Inc USD (4,230) (64,508) 3,088 0.03Newmark Group Inc USD (235) (1,969) 139 0.00News Corp USD (5,245) (64,881) 1,308 0.01Nielsen Holdings PLC USD (1,916) (45,275) 6,946 0.06NiSource Inc USD (2,727) (78,347) (1,854) (0.02)NN Inc USD (596) (4,458) (12) (0.00)Noble Corp plc USD (3,414) (9,525) 1,092 0.01Noble Energy Inc USD (1,074) (26,796) (1,111) (0.01)Nordstrom Inc USD (129) (5,759) (54) (0.00)NorthStar Realty Europe Corp USD (59) (1,030) 27 0.00Norwegian Cruise Line Holdings Ltd USD (464) (25,325) 733 0.01Novocure Ltd USD (14) (668) 48 0.00NRG Energy Inc USD (917) (39,064) (660) (0.01)Nuance Communications Inc USD (2,396) (40,349) (299) (0.00)Nutanix Inc USD (1,031) (38,838) 691 0.01NuVasive Inc USD (288) (16,459) (611) (0.00)Nuvectra Corp USD (66) (732) 107 0.00nVent Electric PLC USD (171) (4,639) 33 0.00Oasis Petroleum Inc USD (3,086) (18,717) (375) (0.00)Oceaneering International Inc USD (592) (9,318) 643 0.01Ocular Therapeutix Inc USD (657) (2,602) 66 0.00Ocwen Financial Corp USD (7,539) (13,646) 1,508 0.01Office Depot Inc USD (2,520) (9,286) (542) (0.00)Office Properties Income Trust USD (373) (10,425) 242 0.00Oil States International Inc USD (114) (1,917) (55) (0.00)Okta Inc USD (152) (12,608) (54) (0.00)Old National Bancorp USD (1,316) (21,767) 874 0.01Olin Corp USD (2,685) (62,131) 1,450 0.01On Deck Capital Inc USD (576) (3,139) 156 0.00ON Semiconductor Corp USD (1,502) (30,806) 2,103 0.02ONEOK Inc USD (348) (24,183) (391) (0.00)OneSpan Inc USD (47) (925) 31 0.00OPKO Health Inc USD (1,425) (3,698) (108) (0.00)Oppenheimer Holdings Inc USD (57) (1,499) 64 0.00Opus Bank USD (24) (478) 38 0.00ORBCOMM Inc USD (472) (3,186) 28 0.00OSI Systems Inc USD (10) (870) (12) (0.00)Outfront Media Inc USD (179) (4,147) (140) (0.00)Owens Minor Inc USD (827) (3,432) 323 0.00Owens Corning USD (821) (38,784) 484 0.00Owens-Illinois Inc USD (1,760) (33,598) 1,514 0.01Pacific Premier Bancorp Inc USD (296) (7,948) 580 0.01Paramount Group Inc USD (854) (12,118) 131 0.00Paratek Pharmaceuticals Inc USD (362) (1,987) 275 0.00Parsley Energy Inc USD (116) (2,248) (120) (0.00)Party City Holdco Inc USD (419) (3,369) 218 0.00Pattern Energy Group Inc USD (252) (5,513) (26) (0.00)Paylocity Holding Corp USD (115) (10,270) (359) (0.00)PBF Energy Inc USD (336) (10,497) 766 0.01Pebblebrook Hotel Trust USD (847) (26,350) 839 0.01Penn National Gaming Inc USD (691) (13,779) 1,575 0.01Pennsylvania Real Estate Investment Trust USD (1,236) (7,836) (544) (0.00)Penske Automotive Group Inc USD (166) (7,425) (238) (0.00)PerkinElmer Inc USD (42) (4,034) (40) (0.00)Perrigo Co PLC USD (475) (22,810) 309 0.00PetIQ Inc USD (123) (3,840) (387) (0.00)PH Glatfelter Co USD (136) (1,900) (14) (0.00)Physicians Realty Trust USD (69) (1,312) (62) (0.00)Pier 1 Imports Inc USD (2,568) (1,970) (314) (0.00)Pitney Bowes Inc USD (6,009) (41,041) 307 0.00PJT Partners Inc USD (75) (3,176) (56) (0.00)Planet Fitness Inc USD (32) (2,187) (35) (0.00)Plantronics Inc USD (741) (34,308) 2,660 0.02Platform Specialty Products Corp USD (4,031) (40,632) 1,979 0.02Playa Hotels & Resorts NV USD (844) (6,381) 444 0.00Plug Power Inc USD (291) (701) 8 0.00PNM Resources Inc USD (228) (10,837) (138) (0.00)Polaris Industries Inc USD (223) (18,906) 611 0.01Post Holdings Inc USD (319) (34,883) (1,853) (0.02)PotlatchDeltic Corp USD (206) (7,770) (249) (0.00)PPL Corp USD (176) (5,567) 156 0.00PQ Group Holdings Inc USD (744) (11,339) 48 0.00PRA Group Inc USD (197) (5,347) 58 0.00Preferred Apartment Communities Inc USD (375) (5,554) 372 0.00Presidio Inc USD (453) (6,809) 135 0.00Prestige Brands Holdings Inc USD (662) (19,701) (862) (0.01)
AQR UCITS FUNDS
AQR Delphi Long-Short Equity UCITS Fund
Schedule of Investments (continued)As at 31 March 2019
The accompanying notes form an integral part of these audited financial statements. 34

Reference Entity Currency Shares Notional Amount
UnrealisedAppreciation/
(Depreciation)in USD
Percent ofNet Assets
Short Positions (continued)Common Stocks (continued)United States (continued)PriceSmart Inc USD (6) (358) 17 0.00Progressive Waste Solutions Ltd USD (401) (35,452) (1,404) (0.01)Prologis Inc USD (65) (4,675) (97) (0.00)Proofpoint Inc USD (49) (5,875) 206 0.00PROS Holdings Inc USD (171) (7,191) 32 0.00Proteostasis Therapeutics Inc USD (220) (261) 644 0.01Public Service Enterprise Group Inc USD (98) (5,781) 25 0.00Pure Storage Inc USD (1,250) (27,013) (925) (0.01)PVH Corp USD (479) (58,792) (5,408) (0.05)Q2 Holdings Inc USD (80) (5,554) (30) (0.00)QIAGEN NV USD (92) (3,721) (53) (0.00)QTS Realty Trust Inc USD (152) (6,813) (148) (0.00)Quad/Graphics Inc USD (596) (7,206) (224) (0.00)QUALCOMM Inc USD (175) (9,994) (45) (0.00)Quintiles Transnational Holdings Inc USD (436) (62,235) 251 0.00Quotient Technology Inc USD (593) (5,823) 174 0.00R1 RCM Inc USD (495) (4,747) 245 0.00Radian Group Inc USD (951) (19,857) 25 0.00Radius Health Inc USD (62) (1,233) (68) (0.00)Rambus Inc USD (202) (2,083) 95 0.00Range Resources Corp USD (3,361) (37,946) (1,366) (0.01)Rapid7 Inc USD (166) (8,278) (3) (0.00)Rayonier Advanced Materials Inc USD (542) (7,312) (152) (0.00)RE/MAX Holdings Inc USD (27) (1,047) 7 0.00Realogy Holdings Corp USD (240) (2,762) 70 0.00RealPage Inc USD (59) (3,607) 87 0.00Red Rock Resorts Inc USD (448) (11,563) 271 0.00Renasant Corp USD (16) (546) 55 0.00Resolute Forest Products Inc USD (161) (1,265) 22 0.00Restoration Hardware Holdings Inc USD (25) (2,673) 727 0.01REV Group Inc USD (666) (7,146) 273 0.00Revance Therapeutics Inc USD (414) (6,521) 104 0.00Ring Energy Inc USD (111) (644) (5) (0.00)RingCentral Inc USD (302) (32,625) (513) (0.00)Rite Aid Corp USD (10,788) (6,918) 633 0.01RLJ Lodging Trust USD (216) (3,825) 121 0.00Rogers Corp USD (48) (7,556) 34 0.00Roku Inc USD (41) (2,616) (3) (0.00)Royal Caribbean Cruises Ltd USD (154) (17,487) 719 0.01RR Donnelley & Sons Co USD (1,894) (8,978) 507 0.00Ryder System Inc USD (179) (11,189) (197) (0.00)Sabra Health Care REIT Inc USD (1,137) (22,342) (1,728) (0.01)Sabre Corp USD (1,852) (39,596) 22 0.00Sage Therapeutics Inc USD (269) (43,293) (1,092) (0.01)Sanderson Farms Inc USD (247) (32,251) (769) (0.01)Sanmina Corp USD (188) (5,429) 276 0.00Santander Consumer USA Holdings Inc USD (367) (7,766) 62 0.00SBA Communications Corp USD (52) (10,186) (208) (0.00)Scientific Games Corp USD (448) (9,193) 896 0.01Scorpio Bulkers Inc USD (1,914) (7,369) 708 0.01Seacoast Banking Corp of Florida USD (13) (345) 37 0.00Sealed Air Corp USD (749) (34,746) (550) (0.00)SeaWorld Entertainment Inc USD (182) (4,550) (227) (0.00)Select Medical Holdings Corp USD (426) (5,998) 111 0.00SemGroup Corp USD (905) (13,222) 154 0.00Sempra Energy USD (321) (40,164) (322) (0.00)Senior Housing Properties Trust USD (1,412) (16,746) (85) (0.00)Sensata Technologies Holding PLC USD (567) (25,441) 1,691 0.01Senseonics Holdings Inc USD (1,590) (3,832) 271 0.00Service Corp International USD (191) (7,654) (26) (0.00)ServiceMaster Global Holdings Inc USD (614) (28,778) 597 0.01Shake Shack Inc USD (180) (10,465) (585) (0.00)Shutterfly Inc USD (177) (7,110) 127 0.00Shutterstock Inc USD (8) (370) 7 0.00Signature Bank USD (441) (57,092) 2,814 0.02Signet Jewelers Ltd USD (521) (14,202) (89) (0.00)Simmons First National Corp USD (116) (2,859) 127 0.00SITE Centers Corp USD (3,472) (48,052) (3,541) (0.03)Six Flags Entertainment Corp USD (196) (9,677) 235 0.00SL Green Realty Corp USD (198) (17,834) (28) (0.00)SLM Corp USD (648) (6,474) 427 0.00SM Energy Co USD (1,167) (20,446) (1,680) (0.01)Smart & Final Stores Inc USD (1,191) (5,836) 371 0.00SolarWinds Corp USD (100) (1,920) 96 0.00Sothebys USD (603) (22,920) 1,097 0.01South Jersey Industries Inc USD (147) (4,739) (188) (0.00)Southwest Gas Corp USD (232) (19,094) 223 0.00Spectrum Brands Holdings Inc USD (409) (22,295) 757 0.01Spectrum Pharmaceuticals Inc USD (97) (1,023) (12) (0.00)Spirit AeroSystems Holdings Inc USD (149) (13,636) 146 0.00Spirit Airlines Inc USD (12) (629) 15 0.00Spirit Realty Capital Inc USD (441) (17,358) (979) (0.01)Splunk Inc USD (224) (27,888) 961 0.01Springleaf Holdings Inc USD (854) (27,302) 1,862 0.02SPX FLOW Inc USD (111) (3,576) 202 0.00STAG Industrial Inc USD (68) (2,022) (80) (0.00)Stericycle Inc USD (1,137) (61,534) (5,537) (0.05)Sterling Bancorp USD (5,442) (101,929) 8,272 0.07Stifel Financial Corp USD (423) (22,474) 1,392 0.01Stratasys Ltd USD (145) (3,437) 29 0.00Summit Hotel Properties Inc USD (252) (2,901) (45) (0.00)Summit Materials Inc USD (514) (8,085) 1,007 0.01Sun Hydraulics Corp USD (296) (13,841) 385 0.00Sunrun Inc USD (542) (7,669) 365 0.00Superior Energy Services Inc USD (827) (3,970) (25) (0.00)
AQR UCITS FUNDS
AQR Delphi Long-Short Equity UCITS Fund
Schedule of Investments (continued)As at 31 March 2019
The accompanying notes form an integral part of these audited financial statements. 35

Reference Entity Currency Shares Notional Amount
UnrealisedAppreciation/
(Depreciation)in USD
Percent ofNet Assets
Short Positions (continued)Common Stocks (continued)United States (continued)Superior Industries International Inc USD (1,026) (4,668) 575 0.01SVB Financial Group USD (34) (7,586) 762 0.01Switch Inc USD (935) (9,602) 47 0.00Symantec Corp USD (2,707) (61,963) 487 0.00Synaptics Inc USD (195) (7,574) (1,049) (0.01)SYNNEX Corp USD (451) (42,872) 350 0.00T2 Biosystems Inc USD (1,297) (3,450) 13 0.00Tailored Brands Inc USD (363) (2,857) 97 0.00Take-Two Interactive Software Inc USD (287) (27,188) (258) (0.00)Targa Resources Corp USD (1,505) (62,172) (850) (0.01)Taubman Centers Inc USD (321) (17,116) (969) (0.01)Taylor Morrison Home Corp USD (415) (7,445) (49) (0.00)Team Inc USD (356) (6,244) 324 0.00Teladoc Health Inc USD (102) (5,646) 791 0.01Tenet Healthcare Corp USD (2,161) (62,280) 1,729 0.01Tenneco Inc USD (279) (6,183) 1,205 0.01Teradata Corp USD (584) (25,591) 2,295 0.02Teradyne Inc USD (201) (7,972) 165 0.00TerraForm Power Inc USD (774) (10,627) (433) (0.00)Tesla Motors Inc USD (249) (69,215) (2,112) (0.02)TETRA Technologies Inc USD (1,830) (4,191) 567 0.01Texas Capital Bancshares Inc USD (338) (18,462) 1,758 0.01Textron Inc USD (1,374) (69,607) 2,592 0.02The Andersons Inc USD (161) (5,224) 271 0.00The Brink’s Co USD (497) (37,573) 856 0.01The Container Store Group Inc USD (335) (2,938) (653) (0.01)The EW Scripps Co USD (338) (7,105) 470 0.00The Goldman Sachs Group Inc USD (233) (44,624) 2,551 0.02The Goodyear Tire & Rubber Co USD (2,091) (37,973) (774) (0.01)The Habit Restaurants Inc USD (459) (4,829) 280 0.00The Hain Celestial Group Inc USD (836) (19,429) (426) (0.00)The Howard Hughes Corp USD (50) (5,517) 59 0.00The KeyW Holding Corp USD (719) (6,320) (705) (0.01)The Kraft Heinz Co USD (1,904) (62,166) (1,180) (0.01)The Macerich Co USD (204) (8,890) (196) (0.00)The Manitowoc Co Inc USD (385) (6,291) 419 0.00The Medicines Co USD (14) (389) (9) (0.00)The Meet Group Inc USD (160) (806) 64 0.00The Michaels Cos Inc USD (243) (2,846) 104 0.00The Mosaic Co USD (1,818) (49,922) 2,141 0.02The Southern Co USD (750) (38,640) (291) (0.00)The St Joe Co USD (31) (520) (19) (0.00)The Timken Co USD (303) (13,156) 161 0.00The Trade Desk Inc USD (11) (2,158) 83 0.00The Wendy’s Co USD (520) (9,347) (714) (0.01)The Williams Cos Inc USD (2,354) (67,301) (1,883) (0.02)Tidewater Inc USD (108) (2,475) 158 0.00Tiffany Co USD (38) (3,993) (306) (0.00)TimkenSteel Corp USD (325) (3,552) 117 0.00Titan International Inc USD (1,472) (8,729) (1,016) (0.01)TiVo Corp USD (601) (5,565) 65 0.00Tocagen Inc USD (96) (1,012) 25 0.00TopBuild Corp USD (21) (1,378) (44) (0.00)Total System Services Inc USD (216) (20,583) (229) (0.00)TransDigm Group Inc USD (92) (41,567) (259) (0.00)Transocean Ltd USD (5,299) (46,181) 4,109 0.03TransUnion USD (638) (42,382) (764) (0.01)Travelport Worldwide Ltd USD (324) (5,098) (7) (0.00)TreeHouse Foods Inc USD (699) (44,617) (1,748) (0.01)TRI Pointe Group Inc USD (1,870) (24,217) (131) (0.00)Tribune Publishing Co USD (209) (2,487) (42) (0.00)Trimble Navigation Ltd USD (577) (23,288) (110) (0.00)TriNet Group Inc USD (221) (13,152) 493 0.00Trinity Industries Inc USD (1,457) (31,617) 1,472 0.01Triumph Group Inc USD (408) (7,825) 751 0.01Tronox Holdings PLC USD (934) (11,965) (681) (0.01)TrueCar Inc USD (895) (5,813) 307 0.00TTEC Holdings Inc USD (43) (1,558) (31) (0.00)TTM Technologies Inc USD (719) (8,484) 24 0.00Tutor Perini Corp USD (552) (9,417) 951 0.01Twitter Inc USD (2,720) (88,862) (4,325) (0.04)Ultra Clean Holdings Inc USD (478) (4,995) 10 0.00Ultra Petroleum Corp USD (3,915) (2,294) 155 0.00Ultragenyx Pharmaceutical Inc USD (66) (4,514) (2) (0.00)Under Armour Inc USD (2,387) (51,344) 2,005 0.02Unifi Inc USD (208) (4,039) 351 0.00Union Bankshares Corp USD (250) (8,160) 747 0.01Unit Corp USD (36) (515) 25 0.00United Insurance Holdings Corp USD (56) (889) 21 0.00United Natural Foods Inc USD (596) (7,891) 358 0.00United Parcel Service Inc USD (24) (2,678) (29) (0.00)United Rentals Inc USD (304) (34,644) 2,745 0.02United States Steel Corp USD (1,244) (24,208) 411 0.00United Technologies Corp USD (29) (3,708) (39) (0.00)Uniti Group Inc USD (2,486) (27,371) (3,907) (0.03)Univar Inc USD (739) (16,169) 835 0.01Universal Display Corp USD (60) (9,167) 290 0.00Universal Electronics Inc USD (200) (7,468) (666) (0.01)Universal Health Services Inc USD (106) (14,196) 153 0.00Unum Group USD (361) (12,216) 1,043 0.01US Concrete Inc USD (47) (1,966) 25 0.00US Ecology Inc USD (86) (4,799) 41 0.00US Foods Holding Corp USD (286) (9,976) (73) (0.00)US Silica Holdings Inc USD (476) (8,211) (248) (0.00)Valley National Bancorp USD (1,643) (16,036) 1,023 0.01
AQR UCITS FUNDS
AQR Delphi Long-Short Equity UCITS Fund
Schedule of Investments (continued)As at 31 March 2019
The accompanying notes form an integral part of these audited financial statements. 36

Reference Entity Currency Shares Notional Amount
UnrealisedAppreciation/
(Depreciation)in USD
Percent ofNet Assets
Short Positions (continued)Common Stocks (continued)United States (continued)Vantiv Inc USD (375) (42,143) (1,580) (0.01)Veeco Instruments Inc USD (1,033) (11,177) 795 0.01Venator Materials PLC USD (1,750) (9,625) 53 0.00VEREIT Inc USD (6,768) (56,851) (1,557) (0.01)Verint Systems Inc USD (8) (489) (67) (0.00)Veritex Holdings Inc USD (61) (1,481) 76 0.00Viacom Inc USD (303) (8,345) 68 0.00ViaSat Inc USD (227) (17,547) 111 0.00Viavi Solutions Inc USD (272) (3,405) (100) (0.00)VICI Properties Inc USD (100) (2,182) (43) (0.00)ViewRay Inc USD (490) (3,609) 394 0.00Virtu Financial Inc USD (970) (23,329) 844 0.01Vista Outdoor Inc USD (1,387) (11,221) 402 0.00Vistra Energy Corp USD (165) (4,288) (22) (0.00)Voyager Therapeutics Inc USD (168) (3,126) 44 0.00WABCO Holdings Inc USD (14) (1,847) 129 0.00Wabtec Corp USD (516) (37,735) (528) (0.00)Waddell & Reed Financial Inc USD (355) (6,157) 169 0.00WageWorks Inc USD (341) (12,869) 627 0.01Walker & Dunlop Inc USD (60) (3,063) 129 0.00Washington Prime Group Inc USD (2,181) (12,312) (992) (0.01)WaVe Life Sciences Ltd USD (8) (307) 62 0.00Wayfair Inc USD (127) (19,252) 2,243 0.02Weatherford International PLC USD (8,329) (5,830) 791 0.01Weight Watchers International Inc USD (319) (6,495) (45) (0.00)WellCare Health Plans Inc USD (72) (19,396) (1,655) (0.01)Wesco Aircraft Holdings Inc USD (56) (492) (10) (0.00)WESCO International Inc USD (130) (6,915) 70 0.00Westamerica Bancorporation USD (151) (9,400) 181 0.00Western Digital Corp USD (649) (31,061) 279 0.00WestRock Co USD (807) (30,626) 266 0.00WEX Inc USD (52) (9,985) (303) (0.00)Weyerhaeuser Co USD (1,181) (31,391) (1,157) (0.01)Whiting Petroleum Corp USD (604) (15,825) (532) (0.00)WideOpenWest Inc USD (1,438) (13,503) (259) (0.00)Willdan Group Inc USD (191) (6,891) (135) (0.00)William Lyon Homes USD (586) (9,159) (352) (0.00)Winnebago Industries Inc USD (20) (626) (3) (0.00)WisdomTree Investments Inc USD (3,253) (23,064) 524 0.00Wolverine World Wide Inc USD (167) (5,974) 45 0.00Woodward Inc USD (25) (2,368) 37 0.00Workday Inc USD (131) (25,316) (696) (0.01)World Fuel Services Corp USD (272) (7,942) 245 0.00WPX Energy Inc USD (2,637) (34,545) (1,028) (0.01)Wright Medical Group NV USD (260) (8,174) 189 0.00Wyndham Hotels & Resorts Inc USD (100) (4,997) 155 0.00Wyndham Worldwide Corp USD (376) (15,187) 658 0.01Wynn Resorts Ltd USD (17) (2,039) (36) (0.00)Xerox Corp USD (1,212) (38,893) (97) (0.00)Xperi Corp USD (207) (4,848) (4) (0.00)XPO Logistics Inc USD (415) (22,510) (1,129) (0.01)Yext Inc USD (21) (452) 32 0.00YRC Worldwide Inc USD (241) (1,634) 113 0.00Zayo Group Holdings Inc USD (807) (22,903) (65) (0.00)Zendesk Inc USD (618) (52,332) (1,088) (0.01)Zillow Group Inc USD (937) (32,327) 3,111 0.03Zimmer Biomet Holdings Inc USD (521) (65,985) (693) (0.01)Zogenix Inc USD (23) (1,273) (62) (0.00)
134,770 1.13
Total Short Positions 136,581 1.15
Total of Long and Short Equity Positions 61,707 0.52Net Cash and Other Receivables/(Payables) (1,312) (0.01)
Total of Total Return Basket Swap Contract - JPMC - USD 60,395 0.51
Counterparty† Description‡ Termination DateFair Value in
USDMSIP The Sub-Fund receives the total return on a portfolio of long and short positions and pays RBACR-1D plus or
minus a specified spread, which is denominated in AUD based on the local currency of the positions within theswap.
28.10.2020 (4,374)
The following table represents the long and short positions and related values within the total return equity basket swap as at 31 March 2019
Reference Entity Currency Shares Notional Amount
UnrealisedAppreciation/
(Depreciation)in USD
Percent ofNet Assets
Long PositionsCommon StocksAustraliaAGL Energy Ltd AUD 1,646 25,399 (105) (0.00)Amcor Ltd AUD 681 7,429 275 0.00Aristocrat Leisure Ltd AUD 1,019 17,703 643 0.01Aurizon Holdings Ltd AUD 1,933 6,234 110 0.00BHP Group Ltd AUD 356 9,712 381 0.00Cochlear Ltd AUD 134 16,458 (893) (0.01)Computershare Limited AUD 213 2,579 (74) (0.00)CSL Ltd AUD 144 19,897 (190) (0.00)Flight Centre Travel Group Ltd AUD 199 5,931 (345) (0.00)Harvey Norman Holdings Ltd AUD 1,492 4,251 296 0.00Iluka Resources Ltd AUD 314 2,003 (16) (0.00)Incitec Pivot Ltd AUD 1,042 2,304 (155) (0.00)
AQR UCITS FUNDS
AQR Delphi Long-Short Equity UCITS Fund
Schedule of Investments (continued)As at 31 March 2019
The accompanying notes form an integral part of these audited financial statements. 37

Reference Entity Currency Shares Notional Amount
UnrealisedAppreciation/
(Depreciation)in USD
Percent ofNet Assets
Long Positions (continued)Common Stocks (continued)Australia (continued)Leighton Holdings Ltd AUD 490 16,761 (726) (0.01)Magellan Financial Group Ltd AUD 79 2,040 (6) (0.00)Newcrest Mining Ltd AUD 1,583 28,623 613 0.01Sonic Healthcare Ltd AUD 119 2,072 14 0.00The Star Entertainment Grp Ltd AUD 672 1,991 (67) (0.00)Woodside Petroleum Ltd AUD 1,449 35,557 (694) (0.01)Woolworths Ltd AUD 1,562 33,657 111 0.00
(828) (0.01)
Total Long Positions (828) (0.01)
Short PositionsCommon StocksAustraliaAMP Ltd AUD (16,457) (24,496) 2,099 0.02Bank of Queensland Ltd AUD (316) (2,038) 27 0.00Fortescue Metals Group Ltd AUD (7,285) (36,713) (1,446) (0.01)Treasury Wine Estates Ltd AUD (175) (1,852) 115 0.00
795 0.01
Total Short Positions 795 0.01
Total of Long and Short Equity Positions (33) 0.00Net Cash and Other Receivables/(Payables) (4,341) (0.04)
Total of Total Return Basket Swap Contract - MSIP - AUD (4,374) (0.04)
Counterparty† Description‡ Termination DateFair Value in
USDMSIP The Sub-Fund receives the total return on a portfolio of long and short positions and pays DISC-1D plus or minus
a specified spread, which is denominated in CAD based on the local currency of the positions within the swap.30.10.2019 (17,890)
The following table represents the long and short positions and related values within the total return equity basket swap as at 31 March 2019
Reference Entity Currency Shares Notional Amount
UnrealisedAppreciation/
(Depreciation)in USD
Percent ofNet Assets
Long PositionsCommon StocksCanadaAlimentation Couche-Tard Inc CAD 410 24,128 1,430 0.01ARC Resources Ltd CAD 1,542 10,724 (496) (0.00)CAE Inc CAD 381 8,471 123 0.00Cameco Corp CAD 639 7,577 (273) (0.00)Canadian Imperial Bank of Commerce CAD 474 37,709 (2,635) (0.02)Canadian Natural Resources Ltd CAD 779 21,414 (391) (0.00)Canadian Tire Corp Ltd CAD 72 7,739 (56) (0.00)CGI Group Inc CAD 384 26,341 331 0.00CI Financial Corp CAD 444 6,063 (75) (0.00)Constellation Software Inc CAD 24 20,338 405 0.00Empire Co Ltd CAD 944 20,551 511 0.00Fairfax Financial Holdings Ltd CAD 45 20,402 (63) (0.00)Finning International Inc CAD 532 9,463 40 0.00Franco-Nevada Corp CAD 50 3,767 (11) (0.00)Genworth MI Canada Inc CAD 290 8,723 (469) (0.00)Husky Energy Inc CAD 1,586 15,827 (613) (0.00)Hydro One Ltd CAD 1,010 15,651 204 0.00Intact Financial Corp CAD 586 49,541 1,316 0.01Kinross Gold Corp CAD 1,757 6,037 210 0.00Loblaw Cos Ltd CAD 117 5,758 24 0.00Magna International Inc CAD 564 27,638 (170) (0.00)Maple Leaf Foods Inc CAD 120 2,780 345 0.00Methanex Corp CAD 150 8,507 (62) (0.00)Metro Inc CAD 815 30,006 555 0.00Nutrien Ltd CAD 498 26,089 (643) (0.01)Quebecor Inc CAD 340 8,275 249 0.00Sun Life Financial Inc CAD 1,683 64,546 (630) (0.01)The Toronto-Dominion Bank CAD 33 1,793 (90) (0.00)Thomson Reuters Corp CAD 312 18,330 754 0.01TMX Group Ltd CAD 134 8,602 146 0.00Tourmaline Oil Corp CAD 1,056 16,380 (553) (0.00)Vermilion Energy Inc CAD 939 23,296 (619) (0.01)West Fraser Timber Co Ltd CAD 617 29,871 (522) (0.00)WSP Global Inc CAD 68 3,713 66 0.00
(1,662) (0.02)
Total Long Positions (1,662) (0.02)
AQR UCITS FUNDS
AQR Delphi Long-Short Equity UCITS Fund
Schedule of Investments (continued)As at 31 March 2019
The accompanying notes form an integral part of these audited financial statements. 38

Reference Entity Currency Shares Notional Amount
UnrealisedAppreciation/
(Depreciation)in USD
Percent ofNet Assets
Short PositionsCommon StocksCanadaAltaGas Ltd CAD (1,797) (23,784) 287 0.00BlackBerry Ltd CAD (2,240) (22,538) (1,465) (0.01)Bombardier Inc CAD (7,080) (13,622) 1,436 0.01Brookfield Asset Management Inc CAD (818) (38,046) (80) (0.00)Cenovus Energy Inc CAD (5,337) (45,867) 1,642 0.01Element Financial Corp CAD (3,580) (22,834) (243) (0.00)Encana Corp CAD (2,287) (16,624) 548 0.00George Weston Ltd CAD (29) (2,083) (84) (0.00)Restaurant Brands International Inc CAD (54) (3,533) (106) (0.00)Royal Bank of Canada CAD (48) (3,634) 91 0.00Shopify Inc CAD (89) (18,286) 31 0.00Silver Wheaton Corp CAD (290) (6,943) (439) (0.00)SNC-Lavalin Group Inc CAD (590) (15,092) 496 0.00Teck Resources Ltd CAD (170) (3,955) (211) (0.00)The Stars Group Inc CAD (724) (12,661) (365) (0.00)TransCanada Corp CAD (738) (32,906) 856 0.01WestJet Airlines Ltd CAD (236) (3,401) 60 0.00Whitecap Resources Inc CAD (575) (1,993) 38 0.00
2,492 0.02ChileLundin Mining Corp CAD (2,631) (12,349) 118 0.00
118 0.00United StatesValeant Pharmaceuticals International Inc CAD (181) (4,424) 67 0.00
67 0.00ZambiaFirst Quantum Minerals Ltd CAD (2,409) (26,907) (505) (0.00)
(505) (0.00)
Total Short Positions 2,172 0.02
Total of Long and Short Equity Positions 510 0.00Net Cash and Other Receivables/(Payables) (18,400) (0.15)
Total of Total Return Basket Swap Contract - MSIP - CAD (17,890) (0.15)
Counterparty† Description‡ Termination DateFair Value in
USDMSIP The Sub-Fund receives the total return on a portfolio of long and short positions and pays SARON-1D plus or
minus a specified spread, which is denominated in CHF based on the local currency of the positions within theswap.
30.01.2020 (393)
The following table represents the long and short positions and related values within the total return equity basket swap as at 31 March 2019
Reference Entity Currency Shares Notional Amount
UnrealisedAppreciation/
(Depreciation)in USD
Percent ofNet Assets
Long PositionsCommon StocksSwitzerlandAdecco SA CHF 250 13,288 (262) (0.00)APG SGA SA CHF 27 7,715 (213) (0.00)Ascom Holding AG CHF 50 669 13 0.00Banque Cantonale Vaudoise CHF 1 801 (19) (0.00)Barry Callebaut AG CHF 4 7,203 (72) (0.00)BKW AG CHF 166 11,304 250 0.00Bucher Industries AG CHF 6 1,993 (78) (0.00)Burkhalter Holding AG CHF 19 1,319 (130) (0.00)Cembra Money Bank AG CHF 19 1,792 (13) (0.00)Chocoladefabriken Lindt Spruengli AG CHF 6 40,677 (30) (0.00)Conzzeta AG CHF 12 9,377 (530) (0.00)EMS-Chemie Holding AG CHF 100 54,236 (4,644) (0.04)Flughafen Zuerich AG CHF 12 2,192 16 0.00Forbo Holding AG CHF 10 15,638 (121) (0.00)Galenica AG CHF 307 15,158 (191) (0.00)Geberit AG CHF 140 57,116 (1,153) (0.01)Georg Fischer AG CHF 4 3,630 (149) (0.00)Givaudan SA CHF 18 45,956 (307) (0.00)Huber + Suhner AG CHF 80 5,777 (492) (0.00)Inficon Holding AG CHF 33 18,412 580 0.00Komax Holding AG CHF 15 3,158 (177) (0.00)Kuehne + Nagel International AG CHF 656 89,375 (735) (0.01)LEM Holding SA CHF 9 11,787 (90) (0.00)Nestle SA CHF 777 73,950 468 0.00Orior AG CHF 241 19,267 799 0.01Partners Group Holding AG CHF 146 105,726 (1,866) (0.02)Roche Holding AG CHF 351 95,960 423 0.00Schindler Holding AG CHF 136 28,084 (1,021) (0.01)Schweiter Technologies AG CHF 1 965 10 0.00SFS Group AG CHF 22 1,889 0 0.00SGS SA CHF 12 29,733 (1,524) (0.01)Sika AG CHF 129 17,867 (75) (0.00)Sonova Holding AG CHF 193 38,148 78 0.00Sunrise Communications Group AG CHF 68 4,948 (92) (0.00)Swisscom AG CHF 183 89,069 0 0.00Swissquote Group Holding SA CHF 12 439 (13) (0.00)Tecan Group AG CHF 41 9,611 (222) (0.00)Zehnder Group AG CHF 226 7,593 (149) (0.00)
AQR UCITS FUNDS
AQR Delphi Long-Short Equity UCITS Fund
Schedule of Investments (continued)As at 31 March 2019
The accompanying notes form an integral part of these audited financial statements. 39

Reference Entity Currency Shares Notional Amount
UnrealisedAppreciation/
(Depreciation)in USD
Percent ofNet Assets
Long Positions (continued)Common Stocks (continued)Switzerland (continued)Zurich Insurance Group AG CHF 229 75,670 (2,315) (0.02)
(14,046) (0.12)
Total Long Positions (14,046) (0.12)
Short PositionsCommon StocksSwitzerlandABB Ltd CHF (734) (13,760) 705 0.01Arbonia AG CHF (182) (1,861) 84 0.00Aryzta AG CHF (9,895) (13,596) 776 0.01Autoneum Holding AG CHF (4) (460) 44 0.00Bachem Holding AG CHF (72) (8,808) 14 0.00Basilea Pharmaceutica AG CHF (81) (3,762) 130 0.00Burckhardt Compression Holding AG CHF (21) (5,699) 280 0.00Cie Financiere Richemont SA CHF (217) (15,718) 326 0.00Credit Suisse Group AG CHF (10,128) (117,591) 8,290 0.07Daetwyler Holding AG CHF (64) (9,436) (304) (0.00)Dufry AG CHF (119) (12,406) 482 0.00EFG International AG CHF (1,697) (10,823) 682 0.01Galenica AG CHF (167) (22,493) 763 0.01Holcim Ltd CHF (340) (16,750) 673 0.01Idorsia Ltd CHF (352) (6,173) 58 0.00Implenia AG CHF (278) (8,265) (26) (0.00)Interroll Holding AG CHF (2) (4,048) (366) (0.00)Logitech International SA CHF (174) (6,802) (149) (0.00)Lonza Group AG CHF (310) (95,648) (2,958) (0.02)Meyer Burger Technology AG CHF (15,647) (10,152) 347 0.00OC Oerlikon Corp AG CHF (1,569) (19,982) 425 0.00St Galler Kantonalbank AG CHF (2) (918) 47 0.00Sulzer AG CHF (20) (1,943) 51 0.00Swiss Life Holding AG CHF (30) (13,143) 232 0.00Swiss Re AG CHF (248) (24,121) 679 0.01The Swatch Group AG CHF (7) (2,011) 88 0.00u-blox Holding AG CHF (102) (7,678) 722 0.01UBS Group AG CHF (1,734) (20,960) 784 0.01Valora Holding AG CHF (2) (548) 2 0.00VAT Group AG CHF (96) (10,008) 19 0.00Zur Rose Group AG CHF (19) (1,635) 17 0.00
12,917 0.11
Total Short Positions 12,917 0.11
Total of Long and Short Equity Positions (1,129) (0.01)Net Cash and Other Receivables/(Payables) 736 0.01
Total of Total Return Basket Swap Contract - MSIP - CHF (393) (0.00)
Counterparty† Description‡ Termination DateFair Value in
USDMSIP The Sub-Fund receives the total return on a portfolio of long and short positions and pays 1-week CIBOR plus or
minus a specified spread, which is denominated in DKK based on the local currency of the positions within theswap.
28.10.2020 17,330
The following table represents the long and short positions and related values within the total return equity basket swap as at 31 March 2019
Reference Entity Currency Shares Notional Amount
UnrealisedAppreciation/
(Depreciation)in USD
Percent ofNet Assets
Long PositionsCommon StocksDenmarkCarlsberg A/S DKK 120 15,045 177 0.00Chr Hansen Holding A/S DKK 121 12,343 18 0.00Coloplast A/S DKK 961 105,629 3,847 0.03DONG Energy A/S DKK 241 18,356 (579) (0.00)DSV A/S DKK 105 8,651 (193) (0.00)H Lundbeck A/S DKK 966 41,887 (639) (0.01)NNIT A/S DKK 413 10,610 (555) (0.00)Novo Nordisk A/S DKK 2,279 119,027 2,896 0.02Novozymes A/S DKK 290 13,390 (79) (0.00)Pandora A/S DKK 627 29,140 (678) (0.01)Per Aarsleff Holding A/S DKK 488 16,184 (839) (0.01)Rockwool International A/S DKK 144 33,635 (1,743) (0.01)Royal Unibrew A/S DKK 52 3,837 (124) (0.00)Scandinavian Tobacco Group A/S DKK 841 10,467 (348) (0.00)SimCorp A/S DKK 158 15,209 655 0.01Tryg A/S DKK 471 12,971 (156) (0.00)
1,660 0.01
Total Long Positions 1,660 0.01
Short PositionsCommon StocksDenmarkAmbu A/S DKK (109) (2,887) (213) (0.00)AP Moeller - Maersk A/S DKK (102) (128,958) 5,600 0.05Bang & Olufsen A/S DKK (462) (4,183) 2,078 0.02Danske Bank A/S DKK (2,529) (44,504) 6,542 0.05GN Store Nord A/S DKK (44) (2,053) (7) (0.00)ISS A/S DKK (361) (11,028) 314 0.00Jyske Bank A/S DKK (167) (6,445) 136 0.00Matas A/S DKK (627) (6,186) 247 0.00Netcompany Group A/S DKK (31) (1,090) (71) (0.00)
AQR UCITS FUNDS
AQR Delphi Long-Short Equity UCITS Fund
Schedule of Investments (continued)As at 31 March 2019
The accompanying notes form an integral part of these audited financial statements. 40

Reference Entity Currency Shares Notional Amount
UnrealisedAppreciation/
(Depreciation)in USD
Percent ofNet Assets
Short Positions (continued)Common Stocks (continued)Denmark (continued)Schouw & Co A/S DKK (48) (3,549) 109 0.00Spar Nord Bank A/S DKK (261) (2,296) (33) (0.00)Vestas Wind Systems A/S DKK (25) (2,102) 42 0.00William Demant Holding A/S DKK (64) (1,883) 114 0.00
14,858 0.12
Total Short Positions 14,858 0.12
Total of Long and Short Equity Positions 16,518 0.13Net Cash and Other Receivables/(Payables) 812 0.01
Total of Total Return Basket Swap Contract - MSIP - DKK 17,330 0.14
Counterparty† Description‡ Termination DateFair Value in
USDMSIP The Sub-Fund receives the total return on a portfolio of long and short positions and pays EONIA-1D plus or
minus a specified spread, which is denominated in EUR based on the local currency of the positions within theswap.
28.10.2020 29,826
The following table represents the long and short positions and related values within the total return equity basket swap as at 31 March 2019
Reference Entity Currency Shares Notional Amount
UnrealisedAppreciation/
(Depreciation)in USD
Percent ofNet Assets
Long PositionsCommon StocksBelgiumAGFA-Gevaert NV EUR 94 394 7 0.00Barco NV EUR 64 9,787 98 0.00Belgacom SA EUR 1,219 35,010 1,373 0.01Colruyt SA EUR 741 54,826 2,520 0.02Elia System Operator SA EUR 150 10,509 (84) (0.00)Fagron EUR 366 6,558 0 0.00Gimv NV EUR 133 7,459 (204) (0.00)KBC Groep NV EUR 557 38,698 (961) (0.01)Melexis NV EUR 73 4,414 (393) (0.00)Orange Belgium SA EUR 258 5,527 107 0.00Recticel SA EUR 1,192 8,940 (575) (0.00)Telenet Group Holding NV EUR 50 2,400 6 0.00Tessenderlo Group SA EUR 63 2,118 (51) (0.00)UCB SA EUR 110 9,413 (86) (0.00)
1,757 0.01FinlandDNA Oyj EUR 497 10,217 (664) (0.01)Elisa OYJ EUR 1,802 80,887 (308) (0.00)Kemira OYJ EUR 37 457 (36) (0.00)Kesko OYJ EUR 48 2,930 (6) (0.00)Kone OYJ EUR 478 24,113 123 0.00Neste Oil OYJ EUR 710 75,682 (399) (0.00)Nokian Renkaat OYJ EUR 1,886 63,144 (5,029) (0.04)Sampo Oyj EUR 305 13,876 (860) (0.01)Sanoma OYJ EUR 812 7,977 (474) (0.00)Tieto OYJ EUR 481 14,614 (702) (0.01)Tokmanni Group Corp EUR 1,519 14,147 (1,500) (0.01)UPM-Kymmene OYJ EUR 1,625 47,035 (2,412) (0.02)Valmet OYJ EUR 464 11,722 (490) (0.00)YIT OYJ EUR 58 335 (17) (0.00)
(12,774) (0.11)FranceAeroports de Paris EUR 36 6,891 (237) (0.00)Air Liquide SA EUR 264 33,449 105 0.00Alstom SA EUR 1,567 67,629 (1,443) (0.01)Amundi SA EUR 316 19,854 (1,001) (0.01)Arkema SA EUR 73 6,942 (445) (0.00)AXA SA EUR 1,601 40,202 (782) (0.01)Bouygues SA EUR 558 19,822 (681) (0.01)Cie Generale des Etablissements Michelin EUR 328 38,686 41 0.00Coface SA EUR 328 2,913 (49) (0.00)Dassault Aviation SA EUR 8 11,838 (813) (0.01)Dassault Systemes EUR 273 40,413 555 0.00Devoteam SA EUR 69 7,724 (205) (0.00)Essilor International SA EUR 191 20,737 (1,823) (0.02)Eutelsat Communications SA EUR 432 7,564 (475) (0.00)Gaztransport Et Technigaz SA EUR 262 23,842 (838) (0.01)GDF Suez EUR 1,647 24,566 (398) (0.00)Groupe Eurotunnel SE EUR 810 12,245 (392) (0.00)Hermes International EUR 164 108,343 1,178 0.01Interparfums SA EUR 145 7,896 407 0.00Ipsen SA EUR 77 10,461 (347) (0.00)Kaufman & Broad SA EUR 289 11,759 897 0.01Lagardere SCA EUR 254 6,508 (291) (0.00)Legrand SA EUR 790 52,544 (634) (0.01)L’Oreal SA EUR 106 28,396 404 0.00Maisons du Monde SA EUR 125 2,391 (305) (0.00)Manitou BF SA EUR 160 4,491 (292) (0.00)Mersen SA EUR 69 2,254 (77) (0.00)Metropole Television SA EUR 874 16,015 (618) (0.01)Neopost SA EUR 216 5,180 (308) (0.00)Peugeot SA EUR 1,876 45,454 (1,497) (0.01)Rubis SCA EUR 67 3,648 (255) (0.00)Sartorius Stedim Biotech EUR 142 17,713 (119) (0.00)Societe BIC SA EUR 440 39,101 (813) (0.01)
AQR UCITS FUNDS
AQR Delphi Long-Short Equity UCITS Fund
Schedule of Investments (continued)As at 31 March 2019
The accompanying notes form an integral part of these audited financial statements. 41
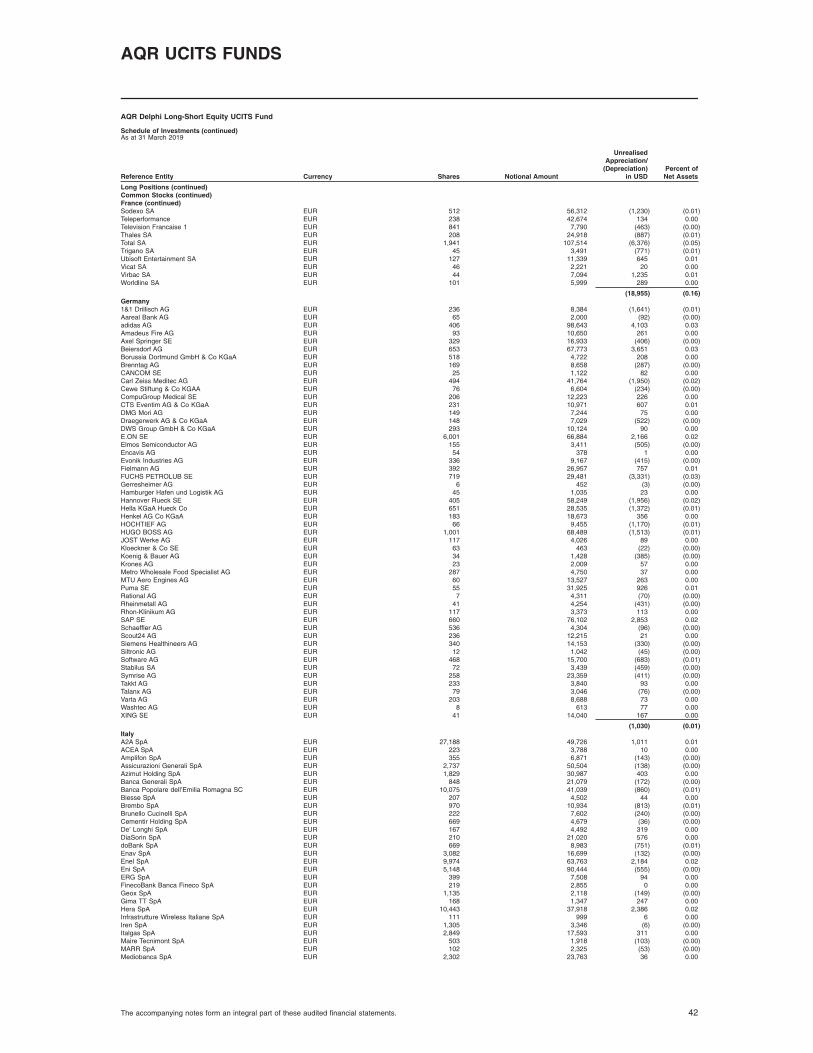
Reference Entity Currency Shares Notional Amount
UnrealisedAppreciation/
(Depreciation)in USD
Percent ofNet Assets
Long Positions (continued)Common Stocks (continued)France (continued)Sodexo SA EUR 512 56,312 (1,230) (0.01)Teleperformance EUR 238 42,674 134 0.00Television Francaise 1 EUR 841 7,790 (463) (0.00)Thales SA EUR 208 24,918 (887) (0.01)Total SA EUR 1,941 107,514 (6,376) (0.05)Trigano SA EUR 45 3,491 (771) (0.01)Ubisoft Entertainment SA EUR 127 11,339 645 0.01Vicat SA EUR 46 2,221 20 0.00Virbac SA EUR 44 7,094 1,235 0.01Worldline SA EUR 101 5,999 289 0.00
(18,955) (0.16)Germany1&1 Drillisch AG EUR 236 8,384 (1,641) (0.01)Aareal Bank AG EUR 65 2,000 (92) (0.00)adidas AG EUR 406 98,643 4,103 0.03Amadeus Fire AG EUR 93 10,650 261 0.00Axel Springer SE EUR 329 16,933 (406) (0.00)Beiersdorf AG EUR 653 67,773 3,651 0.03Borussia Dortmund GmbH & Co KGaA EUR 518 4,722 208 0.00Brenntag AG EUR 169 8,658 (287) (0.00)CANCOM SE EUR 25 1,122 82 0.00Carl Zeiss Meditec AG EUR 494 41,764 (1,950) (0.02)Cewe Stiftung & Co KGAA EUR 76 6,604 (234) (0.00)CompuGroup Medical SE EUR 206 12,223 226 0.00CTS Eventim AG & Co KGaA EUR 231 10,971 607 0.01DMG Mori AG EUR 149 7,244 75 0.00Draegerwerk AG & Co KGaA EUR 148 7,029 (522) (0.00)DWS Group GmbH & Co KGaA EUR 293 10,124 90 0.00E.ON SE EUR 6,001 66,884 2,166 0.02Elmos Semiconductor AG EUR 155 3,411 (505) (0.00)Encavis AG EUR 54 378 1 0.00Evonik Industries AG EUR 336 9,167 (415) (0.00)Fielmann AG EUR 392 26,957 757 0.01FUCHS PETROLUB SE EUR 719 29,481 (3,331) (0.03)Gerresheimer AG EUR 6 452 (3) (0.00)Hamburger Hafen und Logistik AG EUR 45 1,035 23 0.00Hannover Rueck SE EUR 405 58,249 (1,956) (0.02)Hella KGaA Hueck Co EUR 651 28,535 (1,372) (0.01)Henkel AG Co KGaA EUR 183 18,673 356 0.00HOCHTIEF AG EUR 66 9,455 (1,170) (0.01)HUGO BOSS AG EUR 1,001 68,489 (1,513) (0.01)JOST Werke AG EUR 117 4,026 89 0.00Kloeckner & Co SE EUR 63 463 (22) (0.00)Koenig & Bauer AG EUR 34 1,428 (385) (0.00)Krones AG EUR 23 2,009 57 0.00Metro Wholesale Food Specialist AG EUR 287 4,750 37 0.00MTU Aero Engines AG EUR 60 13,527 263 0.00Puma SE EUR 55 31,925 926 0.01Rational AG EUR 7 4,311 (70) (0.00)Rheinmetall AG EUR 41 4,254 (431) (0.00)Rhon-Klinikum AG EUR 117 3,373 113 0.00SAP SE EUR 660 76,102 2,853 0.02Schaeffler AG EUR 536 4,304 (96) (0.00)Scout24 AG EUR 236 12,215 21 0.00Siemens Healthineers AG EUR 340 14,153 (330) (0.00)Siltronic AG EUR 12 1,042 (45) (0.00)Software AG EUR 468 15,700 (683) (0.01)Stabilus SA EUR 72 3,439 (459) (0.00)Symrise AG EUR 258 23,359 (411) (0.00)Takkt AG EUR 233 3,840 93 0.00Talanx AG EUR 79 3,046 (76) (0.00)Varta AG EUR 203 8,688 73 0.00Washtec AG EUR 8 613 77 0.00XING SE EUR 41 14,040 167 0.00
(1,030) (0.01)ItalyA2A SpA EUR 27,188 49,726 1,011 0.01ACEA SpA EUR 223 3,788 10 0.00Amplifon SpA EUR 355 6,871 (143) (0.00)Assicurazioni Generali SpA EUR 2,737 50,504 (138) (0.00)Azimut Holding SpA EUR 1,829 30,987 403 0.00Banca Generali SpA EUR 848 21,079 (172) (0.00)Banca Popolare dell’Emilia Romagna SC EUR 10,075 41,039 (860) (0.01)Biesse SpA EUR 207 4,502 44 0.00Brembo SpA EUR 970 10,934 (813) (0.01)Brunello Cucinelli SpA EUR 222 7,602 (240) (0.00)Cementir Holding SpA EUR 669 4,679 (36) (0.00)De’ Longhi SpA EUR 167 4,492 319 0.00DiaSorin SpA EUR 210 21,020 576 0.00doBank SpA EUR 669 8,983 (751) (0.01)Enav SpA EUR 3,082 16,699 (132) (0.00)Enel SpA EUR 9,974 63,763 2,184 0.02Eni SpA EUR 5,148 90,444 (555) (0.00)ERG SpA EUR 399 7,508 94 0.00FinecoBank Banca Fineco SpA EUR 219 2,855 0 0.00Geox SpA EUR 1,135 2,118 (149) (0.00)Gima TT SpA EUR 168 1,347 247 0.00Hera SpA EUR 10,443 37,918 2,386 0.02Infrastrutture Wireless Italiane SpA EUR 111 999 6 0.00Iren SpA EUR 1,305 3,346 (6) (0.00)Italgas SpA EUR 2,849 17,593 311 0.00Maire Tecnimont SpA EUR 503 1,918 (103) (0.00)MARR SpA EUR 102 2,325 (53) (0.00)Mediobanca SpA EUR 2,302 23,763 36 0.00
AQR UCITS FUNDS
AQR Delphi Long-Short Equity UCITS Fund
Schedule of Investments (continued)As at 31 March 2019
The accompanying notes form an integral part of these audited financial statements. 42

Reference Entity Currency Shares Notional Amount
UnrealisedAppreciation/
(Depreciation)in USD
Percent ofNet Assets
Long Positions (continued)Common Stocks (continued)Italy (continued)Moncler SpA EUR 1,973 79,503 (1,972) (0.02)Piaggio & C SpA EUR 1,662 4,023 (180) (0.00)Reply SpA EUR 66 4,242 (4) (0.00)Saras SpA EUR 10,457 19,419 (1,007) (0.01)Societa Iniziative Autostradali e Servizi SpA EUR 197 3,419 84 0.00Technogym SpA EUR 794 9,708 (456) (0.00)Terna Rete Elettrica Nazionale EUR 5,678 36,031 867 0.01UnipolSai SpA EUR 15,430 41,491 569 0.00
1,377 0.01LuxembourgSES SA EUR 1,324 20,388 (2,501) (0.02)
(2,501) (0.02)NetherlandsAkzo Nobel NV EUR 197 17,540 (487) (0.00)Corbion NV EUR 266 7,980 (203) (0.00)Flow Traders EUR 348 9,541 (508) (0.00)ForFarmers NV EUR 1,051 8,685 (436) (0.00)ING Groep NV EUR 410 4,942 (108) (0.00)Intertrust NV EUR 493 9,188 (249) (0.00)Koninklijke Ahold NV EUR 2,233 59,168 276 0.00Koninklijke DSM NV EUR 165 17,951 (319) (0.00)Koninklijke Volkerwessels NV EUR 163 3,367 (132) (0.00)Koninklijke Vopak NV EUR 124 5,886 (107) (0.00)NIBC Holding NV EUR 423 3,880 (52) (0.00)Pharming Group NV EUR 798 723 (16) (0.00)Randstad Holding NV EUR 304 14,796 (1,269) (0.01)Wolters Kluwer NV EUR 296 20,080 338 0.00
(3,272) (0.03)PortugalAltri SGPS SA EUR 308 2,400 (138) (0.00)CTT-Correios de Portugal SA EUR 1,780 5,084 (428) (0.00)Galp Energia SGPS SA EUR 2,542 40,627 (942) (0.01)Jeronimo Martins SGPS SA EUR 282 4,184 (51) (0.00)NOS SGPS SA EUR 577 3,667 10 0.00REN - Redes Energeticas Nacionais SGPS SA EUR 6,074 17,254 (873) (0.01)Semapa-Sociedade de Investimento e Gestao EUR 160 2,601 (109) (0.00)The Navigator Co SA EUR 839 3,828 (209) (0.00)
(2,740) (0.02)SpainAmadeus IT Holding SA EUR 33 2,618 118 0.00Atresmedia Corporacion de Medios de ComunicacionSA EUR 231 1,077 (83) (0.00)Bankinter SA EUR 1,934 14,661 (825) (0.01)BBVA EUR 12,186 69,298 (4,871) (0.04)Cia de Distribucion Integral Logista Holdings SA EUR 513 12,107 (54) (0.00)Construcciones y Auxiliar de Ferrocarriles SA EUR 49 2,366 80 0.00Ebro Foods SA EUR 433 9,242 53 0.00Endesa SA EUR 2,956 75,769 271 0.00Faes Farma SA EUR 4,978 20,959 1,285 0.01Fomento de Construcciones y Contratas SA EUR 78 1,011 (58) (0.00)Gas Natural SDG SA EUR 145 4,085 120 0.00Gestamp Automocion SA EUR 59 341 (22) (0.00)Global Dominion Access SA EUR 159 852 15 0.00Grupo Catalana Occidente SA EUR 344 12,147 (376) (0.00)Mediaset Espana Comunicacion SA EUR 1,657 12,279 (421) (0.00)Melia Hotels International SA EUR 477 4,386 (137) (0.00)Red Electrica Corp SA EUR 3,303 70,590 (849) (0.01)Talgo SA EUR 80 519 7 0.00Zardoya Otis SA EUR 88 730 13 0.00
(5,734) (0.05)United KingdomDialog Semiconductor PLC EUR 1,068 32,268 (303) (0.00)Linde PLC EUR 29 5,052 60 0.00Unilever NV EUR 1,488 86,306 1,955 0.02
1,712 0.01
Total Long Positions (42,160) (0.35)
Short PositionsCommon StocksAustriaS&T AG EUR (414) (10,226) 56 0.00
56 0.00BelgiumAnheuser-Busch InBev SA EUR (1,220) (102,184) (3,068) (0.03)Bekaert SA EUR (421) (9,870) 994 0.01Biocartis NV EUR (833) (10,587) 403 0.00Euronav NV EUR (585) (4,749) 2 0.00Ontex Group NV EUR (349) (7,719) (443) (0.00)
(2,112) (0.02)FinlandCargotec OYJ EUR (194) (7,127) 396 0.00Fortum OYJ EUR (193) (4,009) 315 0.00Konecranes OYJ EUR (35) (1,239) 32 0.00Metso OYJ EUR (250) (8,564) 147 0.00Nokia OYJ EUR (5,037) (28,661) 2,781 0.02Outokumpu OYJ EUR (8,497) (30,852) 2,719 0.02Outotec OYJ EUR (2,992) (13,034) 111 0.00
6,501 0.05FranceAccor SA EUR (204) (8,234) 474 0.00Air France-KLM EUR (4,114) (46,107) 3,270 0.03
AQR UCITS FUNDS
AQR Delphi Long-Short Equity UCITS Fund
Schedule of Investments (continued)As at 31 March 2019
The accompanying notes form an integral part of these audited financial statements. 43

Reference Entity Currency Shares Notional Amount
UnrealisedAppreciation/
(Depreciation)in USD
Percent ofNet Assets
Short Positions (continued)Common Stocks (continued)France (continued)Akka Technologies EUR (41) (2,790) 18 0.00ALD SA EUR (165) (2,306) 61 0.00Altran Technologies SA EUR (4,037) (44,147) 1,088 0.01Beneteau SA EUR (653) (7,669) 213 0.00Bollore SA EUR (3,894) (17,575) (542) (0.00)CGG SA EUR (2,033) (4,159) (212) (0.00)Chargeurs SA EUR (318) (6,694) 384 0.00Credit Agricole SA EUR (1,349) (16,221) 933 0.01Derichebourg SA EUR (572) (2,340) 122 0.00Elior Participations SCA EUR (1,435) (19,173) 2,069 0.02Elis SA EUR (151) (2,446) 51 0.00Eramet EUR (142) (7,844) 280 0.00Europcar Mobility Group EUR (550) (4,394) 349 0.00Fnac Darty SA EUR (25) (1,881) 108 0.00Ingenico EUR (28) (1,990) 14 0.00Jacquet Metal Service SA EUR (41) (686) 66 0.00Kering EUR (98) (55,983) (1,382) (0.01)Korian SA EUR (48) (1,924) 32 0.00Latecoere SACA EUR (1,461) (5,085) 148 0.00LISI EUR (153) (4,664) (155) (0.00)Orpea EUR (24) (2,871) (62) (0.00)Renault SA EUR (582) (38,383) 1,006 0.01Rexel SA EUR (2,153) (24,245) 1,608 0.01SEB SA EUR (74) (12,305) (63) (0.00)Societe Generale SA EUR (1,977) (56,813) 5,275 0.04SOITEC EUR (56) (4,562) (185) (0.00)Solocal Group EUR (2,270) (1,313) (104) (0.00)Solutions 30 SE EUR (780) (9,493) 280 0.00Sopra Steria Group EUR (105) (12,143) 224 0.00SPIE SA EUR (614) (10,740) 565 0.00Technicolor SA EUR (9,154) (10,432) 2,081 0.02Valeo SA EUR (2,587) (74,850) 4,095 0.03Vivendi SA EUR (558) (16,157) 146 0.00
22,255 0.19GermanyADVA Optical Networking SE EUR (135) (1,362) (49) (0.00)AIXTRON SE EUR (374) (3,337) (24) (0.00)Bayer AG EUR (136) (8,707) 1,681 0.01CECONOMY AG EUR (2,402) (12,697) 623 0.01Commerzbank AG EUR (2,786) (21,483) 2,484 0.02Daimler AG EUR (233) (13,561) 150 0.00Delivery Hero SE EUR (476) (16,941) 2,155 0.02Deutsche Bank AG EUR (11,829) (95,849) 12,239 0.10Deutsche Beteiligungs AG EUR (36) (1,348) 43 0.00Deutsche Pfandbriefbank AG EUR (1,453) (17,749) 491 0.00Evotec SE EUR (404) (10,641) (1,107) (0.01)Fraport AG Frankfurt Airport Services Worldwide EUR (134) (10,188) 770 0.01Isra Vision AG EUR (242) (9,021) 356 0.00Jenoptik AG EUR (132) (4,903) (18) (0.00)MorphoSys AG EUR (23) (2,097) 65 0.00OSRAM Licht AG EUR (411) (14,097) 3,004 0.03Rocket Internet SE EUR (205) (5,123) 222 0.00RWE AG EUR (2,821) (75,445) (4,069) (0.03)ThyssenKrupp AG EUR (5,384) (73,899) 4,215 0.04United Internet AG EUR (398) (14,456) 612 0.01Volkswagen AG EUR (97) (15,234) 789 0.01
24,632 0.21ItalyAnima Holding SpA EUR (1,929) (7,836) 22 0.00Arnoldo Mondadori Editore SpA EUR (3,221) (5,584) 665 0.01Atlantia SpA EUR (229) (5,893) (132) (0.00)Banca Popolare di Sondrio SCPA EUR (2,614) (7,155) 152 0.00Banco BPM SpA EUR (23,418) (48,189) 5,934 0.05Credito Valtellinese SpA EUR (123,746) (9,948) 42 0.00Datalogic SpA EUR (231) (5,395) 571 0.00El.En. SpA EUR (35) (742) 11 0.00Falck Renewables SpA EUR (925) (3,329) (353) (0.00)Fincantieri SpA EUR (7,215) (8,749) 763 0.01IMA Industria Macchine Automatiche SpA EUR (24) (1,787) (164) (0.00)Interpump Group SpA EUR (42) (1,361) (25) (0.00)Juventus Football Club SpA EUR (352) (595) (16) (0.00)La Doria SpA EUR (64) (579) 14 0.00Leonardo-Finmeccanica SpA EUR (5,269) (61,139) (637) (0.01)OVS SpA EUR (3,596) (6,585) (113) (0.00)Poste Italiane SpA EUR (398) (3,847) (150) (0.00)Prysmian SpA EUR (1,877) (35,162) (482) (0.00)Saipem SpA EUR (5,646) (29,819) 1,027 0.01Snam SpA EUR (1,240) (6,417) (178) (0.00)Tamburi Investment Partners SpA EUR (505) (3,549) (6) (0.00)Telecom Italia SpA EUR (37,296) (23,215) (176) (0.00)UniCredit SpA EUR (3,712) (47,386) 2,934 0.02Unione di Banche Italiane SCpA EUR (19,257) (50,722) 4,119 0.03Unipol Gruppo Finanziario SpA EUR (2,086) (10,345) (187) (0.00)
13,635 0.11LuxembourgArcelorMittal EUR (2,001) (40,641) 3,280 0.03
3,280 0.03NetherlandsAccell Group NV EUR (362) (10,039) (1,097) (0.01)Aegon NV EUR (6,422) (30,903) 3,158 0.03Altice NV EUR (18,848) (48,566) (5,348) (0.04)AMG Advanced Metallurgical Group NV EUR (306) (9,469) 708 0.01Arcadis NV EUR (112) (1,744) 97 0.00
AQR UCITS FUNDS
AQR Delphi Long-Short Equity UCITS Fund
Schedule of Investments (continued)As at 31 March 2019
The accompanying notes form an integral part of these audited financial statements. 44

Reference Entity Currency Shares Notional Amount
UnrealisedAppreciation/
(Depreciation)in USD
Percent ofNet Assets
Short Positions (continued)Common Stocks (continued)Netherlands (continued)OCI NV EUR (245) (6,695) (176) (0.00)SBM Offshore NV EUR (197) (3,753) 99 0.00Takeaway.com NV EUR (121) (9,116) 122 0.00
(2,437) (0.02)PortugalBanco Comercial Portugues SA EUR (44,917) (11,513) 177 0.00Mota-Engil SGPS SA EUR (4,323) (9,853) 874 0.01
1,051 0.01SpainAlmirall SA EUR (947) (16,087) 111 0.00Banco de Sabadell SA EUR (29,768) (29,224) 3,776 0.03Banco Santander SA EUR (6,721) (31,052) 2,366 0.02Cellnex Telecom SAU EUR (1,689) (49,646) (5,211) (0.04)Ercros SA EUR (106) (373) 7 0.00Ferrovial SA EUR (85) (1,985) 6 0.00Fluidra SA EUR (170) (1,947) (27) (0.00)Grifols SA EUR (770) (21,656) (879) (0.01)Indra Sistemas SA EUR (784) (8,626) 66 0.00Liberbank SA EUR (29,288) (12,496) 901 0.01Masmovil Ibercom SA EUR (254) (5,259) (95) (0.00)Neinor Homes SA EUR (377) (4,495) 386 0.00Prosegur Cia de Seguridad SA EUR (233) (1,256) 65 0.00Sacyr SA EUR (912) (2,311) 53 0.00Unicaja Banco SA EUR (5,244) (5,593) 302 0.00
1,827 0.02SwitzerlandSTMicroelectronics NV EUR (144) (2,115) 190 0.00
190 0.00
Total Short Positions 68,878 0.58
Total of Long and Short Equity Positions 26,718 0.23Net Cash and Other Receivables/(Payables) 3,108 0.03
Total of Total Return Basket Swap Contract - MSIP - EUR 29,826 0.26
Counterparty† Description‡ Termination DateFair Value in
USDMSIP The Sub-Fund receives the total return on a portfolio of long and short positions and pays SONIA-1D plus or
minus a specified spread, which is denominated in GBP based on the local currency of the positions within theswap.
28.10.2020 (44,386)
The following table represents the long and short positions and related values within the total return equity basket swap as at 31 March 2019
Reference Entity Currency Shares Notional Amount
UnrealisedAppreciation/
(Depreciation)in USD
Percent ofNet Assets
Long PositionsCommon StocksAustraliaRio Tinto PLC GBP 51 2,959 120 0.00
120 0.00EgyptCentamin PLC GBP 2,910 3,388 (61) (0.00)
(61) (0.00)GeorgiaBank of Georgia Group PLC GBP 20 430 (16) (0.00)
(16) (0.00)JordanHikma Pharmaceuticals PLC GBP 205 4,758 431 0.00
431 0.00NetherlandsRoyal Dutch Shell PLC GBP 398 12,556 (16) (0.00)
(16) (0.00)RussiaEvraz PLC GBP 2,942 23,687 (341) (0.00)
(341) (0.00)South AfricaInvestec PLC GBP 687 3,943 (281) (0.00)
(281) (0.00)SwitzerlandCoca-Cola HBC AG GBP 504 17,118 (168) (0.00)
(168) (0.00)United Kingdom888 Holdings PLC GBP 2,814 5,713 (476) (0.00)Abcam PLC GBP 1,319 19,288 (1,114) (0.01)Admiral Group PLC GBP 1,828 51,419 (271) (0.00)Advanced Medical Solutions Group PLC GBP 3,607 14,910 (258) (0.00)Ashmore Group PLC GBP 3,904 21,608 61 0.00Associated British Foods PLC GBP 691 21,952 1,168 0.01Auto Trader Group PLC GBP 7,752 52,539 2,067 0.02BAE Systems PLC GBP 5,387 33,541 (498) (0.00)Bellway PLC GBP 331 13,045 (271) (0.00)boohoo Group PLC GBP 3,532 8,652 308 0.00Brewin Dolphin Holdings PLC GBP 189 764 (47) (0.00)Britvic PLC GBP 159 1,960 4 0.00Bunzl PLC GBP 513 16,917 385 0.00Burberry Group PLC GBP 2,978 75,696 3,478 0.03Central Asia Metals PLC GBP 1,541 4,827 (225) (0.00)
AQR UCITS FUNDS
AQR Delphi Long-Short Equity UCITS Fund
Schedule of Investments (continued)As at 31 March 2019
The accompanying notes form an integral part of these audited financial statements. 45

Reference Entity Currency Shares Notional Amount
UnrealisedAppreciation/
(Depreciation)in USD
Percent ofNet Assets
Long Positions (continued)Common Stocks (continued)United Kingdom (continued)Centrica PLC GBP 14,216 21,311 (1,204) (0.01)Chemring Group PLC GBP 1,556 2,864 (239) (0.00)Close Brothers Group PLC GBP 322 6,023 (230) (0.00)CMC Markets PLC GBP 5,932 6,492 93 0.00Compass Group PLC GBP 1,699 39,658 1,158 0.01Computacenter PLC GBP 54 768 (65) (0.00)Costain Group PLC GBP 810 3,543 (47) (0.00)Cranswick PLC GBP 97 3,397 86 0.00Croda International PLC GBP 562 36,833 1,366 0.01CVS Group PLC GBP 1,008 7,861 1,088 0.01Dart Group PLC GBP 351 3,632 (220) (0.00)De La Rue PLC GBP 1,117 5,634 (428) (0.00)Dechra Pharmaceuticals PLC GBP 58 2,022 161 0.00Diploma PLC GBP 659 12,438 86 0.00Direct Line Insurance Group PLC GBP 21,028 96,350 (3,259) (0.03)Drax Group PLC GBP 1,698 8,405 45 0.00DS Smith PLC GBP 432 1,879 (110) (0.00)Dunelm Group PLC GBP 680 7,659 (173) (0.00)easyJet PLC GBP 871 12,477 (1,652) (0.01)Electrocomponents PLC GBP 92 664 (17) (0.00)EMIS Group PLC GBP 911 12,386 948 0.01Fevertree Drinks PLC GBP 251 9,876 767 0.01Forterra PLC GBP 1,987 7,568 (155) (0.00)Frontier Developments PLC GBP 229 2,902 (59) (0.00)Games Workshop Group PLC GBP 288 11,755 417 0.00GB Group PLC GBP 443 2,799 31 0.00Genus PLC GBP 188 5,366 (523) (0.00)GlaxoSmithKline PLC GBP 2,746 56,925 2,934 0.02Grafton Group PLC GBP 669 6,974 (313) (0.00)Greggs PLC GBP 399 9,476 (104) (0.00)Halfords Group PLC GBP 2,518 7,587 (515) (0.00)Halma PLC GBP 1,451 31,403 (68) (0.00)Hargreaves Lansdown PLC GBP 1,407 33,990 885 0.01Hays PLC GBP 12,005 23,376 (924) (0.01)Hill & Smith Holdings PLC GBP 97 1,562 60 0.00HomeServe PLC GBP 424 5,633 110 0.00Howden Joinery Group PLC GBP 6,608 41,641 (1,533) (0.01)Hunting PLC GBP 678 5,191 147 0.00Indivior PLC GBP 5,612 6,988 (1,091) (0.01)International Consolidated Airlines Group SA GBP 7,532 49,677 (3,466) (0.03)International Personal Finance PLC GBP 554 1,386 18 0.00Intertek Group PLC GBP 184 11,593 64 0.00iomart Group PLC GBP 1,527 6,873 (172) (0.00)J D Wetherspoon PLC GBP 98 1,659 (56) (0.00)JD Sports Fashion PLC GBP 3,528 22,618 83 0.00John Laing Group PLC GBP 683 3,361 (119) (0.00)Johnson Matthey PLC GBP 470 19,128 (324) (0.00)JPJ Group PLC GBP 192 1,697 (5) (0.00)Jupiter Fund Management PLC GBP 2,746 12,914 245 0.00Learning Technologies Group PLC GBP 2,584 2,365 20 0.00Legal and General Group PLC GBP 7,247 25,849 (1,059) (0.01)Lloyds Banking Group PLC GBP 57,724 46,108 (2,941) (0.02)Majestic Wine PLC GBP 1,365 3,930 (1,032) (0.01)Man Group PLC GBP 4,131 7,308 (185) (0.00)Marshalls PLC GBP 1,907 15,195 397 0.00McCarthy & Stone PLC GBP 233 386 (9) (0.00)Meggitt PLC GBP 1,003 6,566 (334) (0.00)Mondi PLC GBP 1,614 35,497 (1,311) (0.01)Moneysupermarket.com Group PLC GBP 10,479 50,262 1,210 0.01Morgan Sindall Group PLC GBP 26 424 (20) (0.00)National Express Group PLC GBP 954 5,045 (231) (0.00)Next PLC GBP 389 28,063 1,329 0.01Numis Corp PLC GBP 2,373 7,711 (509) (0.00)Oxford Biomedica PLC GBP 196 1,784 0 0.00Pagegroup PLC GBP 3,127 19,055 (754) (0.01)Pearson PLC GBP 1,393 15,224 234 0.00Persimmon PLC GBP 971 27,338 (1,504) (0.01)Photo-Me International PLC GBP 2,731 2,868 (318) (0.00)Polypipe Group plc GBP 508 2,661 (195) (0.00)QinetiQ Group PLC GBP 1,024 3,998 (127) (0.00)Redde PLC GBP 7,182 10,979 299 0.00Renishaw PLC GBP 91 4,391 (533) (0.00)Rentokil Initial PLC GBP 434 1,980 13 0.00Rightmove PLC GBP 8,142 53,764 1,023 0.01Rolls-Royce Holdings PLC GBP 1,393 16,409 (39) (0.00)Royal Bank of Scotland Group PLC GBP 14,147 45,071 (4,395) (0.04)Royal Mail PLC GBP 11,698 36,356 (4,471) (0.04)RSA Insurance Group PLC GBP 1,093 7,214 (273) (0.00)RWS Holdings PLC GBP 1,576 9,887 (100) (0.00)Sabre Insurance Group PLC GBP 2,612 9,744 (34) (0.00)Scapa Group PLC GBP 483 1,778 (56) (0.00)Schroders PLC GBP 422 14,778 (258) (0.00)Smith Nephew PLC GBP 2,127 42,080 1,009 0.01Softcat PLC GBP 1,344 14,343 (280) (0.00)Sound Energy PLC GBP 2,367 654 (43) (0.00)Spectris PLC GBP 197 6,379 (510) (0.00)Spirax-Sarco Engineering PLC GBP 31 2,885 38 0.00SSP Group Plc GBP 851 7,623 31 0.00Superdry PLC GBP 225 1,601 0 0.00Taylor Wimpey PLC GBP 4,887 11,133 (525) (0.00)Ted Baker PLC GBP 104 2,110 (278) (0.00)Telecom Plus PLC GBP 1,002 19,823 339 0.00Telford Homes PLC GBP 885 3,313 (256) (0.00)The Go-Ahead Group PLC GBP 472 11,964 (446) (0.00)The Sage Group PLC GBP 1,477 13,451 359 0.00
AQR UCITS FUNDS
AQR Delphi Long-Short Equity UCITS Fund
Schedule of Investments (continued)As at 31 March 2019
The accompanying notes form an integral part of these audited financial statements. 46

Reference Entity Currency Shares Notional Amount
UnrealisedAppreciation/
(Depreciation)in USD
Percent ofNet Assets
Long Positions (continued)Common Stocks (continued)United Kingdom (continued)Unilever PLC GBP 128 7,321 223 0.00Victrex PLC GBP 293 8,186 (482) (0.00)WH Smith PLC GBP 1,859 51,276 (624) (0.01)Whitbread PLC GBP 135 8,925 60 0.00William Hill PLC GBP 3,292 6,667 (133) (0.00)
(19,649) (0.16)United StatesBurford Capital Ltd GBP 295 6,473 (204) (0.00)Wolseley PLC GBP 670 42,496 (3,993) (0.03)
(4,197) (0.04)
Total Long Positions (24,178) (0.20)
Short PositionsCommon StocksCanadaEntertainment One Ltd GBP (2,304) (13,147) 67 0.00
67 0.00GermanyTUI AG GBP (1,553) (14,748) 1,680 0.01
1,680 0.01IndiaRhi Magnesita NV GBP (25) (1,456) 23 0.00
23 0.00IrelandGreencore Group PLC GBP (6,538) (17,430) (311) (0.00)Keywords Studios PLC GBP (183) (2,707) (62) (0.00)UDG Healthcare PLC GBP (602) (4,366) 395 0.00
22 0.00JerseySanne Group PLC GBP (437) (3,084) (210) (0.00)
(210) (0.00)KazakhstanKAZ Minerals PLC GBP (2,027) (17,037) (569) (0.00)
(569) (0.00)PeruHochschild Mining PLC GBP (2,137) (5,784) (371) (0.00)
(371) (0.00)South AfricaOld Mutual Ltd GBP (24,350) (36,760) (340) (0.00)Petra Diamonds Ltd GBP (11,125) (2,803) 394 0.00
54 0.00SwitzerlandGlencore PLC GBP (7,769) (32,178) (792) (0.01)IWG PLC GBP (8,549) (27,670) 1,441 0.01Mediclinic International PLC GBP (3,344) (13,205) 530 0.00
1,179 0.01United Arab EmiratesNMC Health PLC GBP (596) (17,663) 2,676 0.02
2,676 0.02United KingdomAA PLC GBP (11,541) (13,606) 924 0.01ASOS PLC GBP (47) (1,938) 26 0.00Babcock International Group PL GBP (2,070) (13,392) 1,359 0.01BCA Marketplace PLC GBP (1,853) (4,706) 310 0.00Beazley PLC GBP (504) (3,374) 34 0.00British American Tobacco PLC GBP (1,457) (60,339) (492) (0.00)Capita PLC GBP (37,603) (60,267) 378 0.00Card Factory PLC GBP (768) (1,797) 96 0.00Cineworld Group PLC GBP (689) (2,619) 32 0.00ConvaTec Group PLC GBP (11,027) (20,346) (907) (0.01)Countryside Properties PLC GBP (87) (366) 19 0.00Crest Nicholson Holdings plc GBP (1,275) (6,102) 607 0.01CYBG PLC GBP (2,296) (5,876) 364 0.00Dignity PLC GBP (1,000) (8,917) 549 0.00Dixons Carphone PLC GBP (10,202) (19,408) 16 0.00Elementis PLC GBP (1,548) (3,258) 151 0.00Equiniti Group PLC GBP (2,072) (5,548) 94 0.00Essentra PLC GBP (1,241) (6,636) (137) (0.00)Firstgroup PLC GBP (4,962) (5,821) 137 0.00G4S PLC GBP (5,648) (13,446) 845 0.01Galliford Try PLC GBP (483) (4,194) 534 0.00GVC Holdings PLC GBP (6,312) (45,208) 83 0.00Ibstock PLC GBP (103) (321) 25 0.00Informa PLC GBP (1,374) (13,309) (429) (0.00)Inmarsat PLC GBP (3,092) (22,258) (4,864) (0.04)ITE Group PLC GBP (9,586) (8,710) 12 0.00John Wood Group PLC GBP (6,389) (42,520) 6,923 0.06Just Eat PLC GBP (205) (2,004) (35) (0.00)Just Group PLC GBP (7,012) (5,637) 1,767 0.01Keller Group PLC GBP (132) (1,065) 18 0.00Lancashire Holdings Ltd GBP (529) (4,525) (31) (0.00)Melrose Industries PLC GBP (15,883) (37,637) 1,280 0.01Micro Focus International PLC GBP (2,136) (55,252) (2,427) (0.02)Mitie Group PLC GBP (4,530) (8,605) 246 0.00N Brown Group PLC GBP (6,541) (8,579) (123) (0.00)NCC Group PLC GBP (1,700) (3,149) 38 0.00Northgate PLC GBP (129) (630) 2 0.00Ocado Group PLC GBP (4,807) (84,759) (13,013) (0.11)OneSavings Bank PLC GBP (67) (336) 16 0.00Paragon Banking Group PLC GBP (586) (3,338) 108 0.00
AQR UCITS FUNDS
AQR Delphi Long-Short Equity UCITS Fund
Schedule of Investments (continued)As at 31 March 2019
The accompanying notes form an integral part of these audited financial statements. 47

Reference Entity Currency Shares Notional Amount
UnrealisedAppreciation/
(Depreciation)in USD
Percent ofNet Assets
Short Positions (continued)Common Stocks (continued)United Kingdom (continued)Pendragon PLC GBP (1,457) (527) (23) (0.00)Pennon Group PLC GBP (689) (6,728) 346 0.00Petrofac Ltd GBP (3,027) (19,248) (63) (0.00)Pets at Home Group Plc GBP (749) (1,528) 19 0.00Playtech Plc GBP (771) (4,291) 18 0.00Premier Oil PLC GBP (4,965) (6,047) (526) (0.00)Provident Financial PLC GBP (641) (4,281) 478 0.00Quilter PLC GBP (1,000) (1,900) 22 0.00Rathbone Brothers PLC GBP (21) (607) 39 0.00Reckitt Benckiser Group PLC GBP (155) (12,913) (285) (0.00)Renewi PLC GBP (26,602) (8,074) (498) (0.00)RPS Group PLC GBP (1,767) (4,272) (211) (0.00)Senior PLC GBP (699) (1,968) (70) (0.00)Serco Group PLC GBP (9,700) (16,139) 504 0.00Severn Trent PLC GBP (698) (18,101) 731 0.01Smart Metering Systems PLC GBP (592) (4,132) 684 0.01Smiths Group PLC GBP (498) (9,193) 161 0.00Sophos Group PLC GBP (3,744) (14,665) 936 0.01Spire Healthcare Group PLC GBP (6,527) (10,912) 855 0.01Sports Direct International PLC GBP (1,281) (4,887) (72) (0.00)SSE PLC GBP (697) (10,836) 272 0.00St James’s Place PLC GBP (1,429) (18,909) 964 0.01Standard Chartered PLC GBP (3,378) (25,972) 1,145 0.01Standard Life PLC GBP (3,133) (10,727) 274 0.00Stobart Group Ltd GBP (2,955) (5,739) 1,260 0.01Tesco PLC GBP (12,914) (39,179) 356 0.00The Restaurant Group PLC GBP (3,696) (5,601) 906 0.01The Weir Group PLC GBP (1,549) (31,058) 1,430 0.01Thomas Cook Group PLC GBP (28,123) (8,910) 2,672 0.02Ultra Electronics Holdings PLC GBP (33) (691) (13) (0.00)United Utilities Group PLC GBP (5,397) (57,876) 3,139 0.03Vectura Group PLC GBP (3,428) (3,213) 158 0.00Vodafone Group PLC GBP (12,466) (22,555) 804 0.01WM Morrison Supermarkets PLC GBP (908) (2,679) 4 0.00WPP PLC GBP (2,371) (24,964) 1,652 0.01
12,603 0.11
Total Short Positions 17,154 0.14
Total of Long and Short Equity Positions (7,024) (0.06)Net Cash and Other Receivables/(Payables) (37,362) (0.31)
Total of Total Return Basket Swap Contract - MSIP - GBP (44,386) (0.37)
Counterparty† Description‡ Termination DateFair Value in
USDMSIP The Sub-Fund receives the total return on a portfolio of long and short positions and pays HONIX-1D plus or
minus a specified spread, which is denominated in HKD based on the local currency of the positions within theswap.
30.10.2020 2,580
The following table represents the long and short positions and related values within the total return equity basket swap as at 31 March 2019
Reference Entity Currency Shares Notional Amount
UnrealisedAppreciation/
(Depreciation)in USD
Percent ofNet Assets
Long PositionsCommon StocksHong KongCLP Holdings Ltd HKD 1,500 17,389 (134) (0.00)Hang Lung Properties Ltd HKD 2,000 4,882 0 0.00Henderson Land Development Co HKD 3,000 19,070 1,701 0.01HKT Trust HKT Ltd HKD 3,000 4,823 153 0.00Hong Kong China Gas Co Ltd HKD 6,000 14,385 336 0.00Hong Kong Exchanges & Clearing Ltd HKD 100 3,485 (89) (0.00)Hysan Development Co Ltd HKD 2,000 10,713 89 0.00MTR Corp Ltd HKD 1,500 9,287 172 0.00Sino Land Co Ltd HKD 10,000 19,338 662 0.01Swire Properties Ltd HKD 2,800 12,038 334 0.00Techtronic Industries Co Ltd HKD 1,500 10,080 354 0.00Xinyi Glass Holdings Ltd HKD 4,000 4,586 (158) (0.00)
3,420 0.03MacauWynn Macau Ltd HKD 1,200 2,828 (6) (0.00)
(6) (0.00)
Total Long Positions 3,414 0.03
Short PositionsCommon StocksHong KongASM Pacific Technology Ltd HKD (900) (10,038) (165) (0.00)The Wharf Holdings Ltd HKD (5,000) (15,096) (127) (0.00)
(292) (0.00)MacauMGM China Holdings Ltd HKD (10,000) (20,917) (1,011) (0.01)
AQR UCITS FUNDS
AQR Delphi Long-Short Equity UCITS Fund
Schedule of Investments (continued)As at 31 March 2019
The accompanying notes form an integral part of these audited financial statements. 48

Reference Entity Currency Shares Notional Amount
UnrealisedAppreciation/
(Depreciation)in USD
Percent ofNet Assets
Short Positions (continued)Common Stocks (continued)Macau (continued)Sands China Ltd HKD (400) (2,010) (74) (0.00)
(1,085) (0.01)
Total Short Positions (1,377) (0.01)
Total of Long and Short Equity Positions 2,037 0.02Net Cash and Other Receivables/(Payables) 543 0.00
Total of Total Return Basket Swap Contract - MSIP - HKD 2,580 0.02
Counterparty† Description‡ Termination DateFair Value in
USDMSIP The Sub-Fund receives the total return on a portfolio of long and short positions and pays MUTSC-1D plus or
minus a specified spread, which is denominated in JPY based on the local currency of the positions within theswap.
29.10.2020 40,482
The following table represents the long and short positions and related values within the total return equity basket swap as at 31 March 2019
Reference Entity Currency Shares Notional Amount
UnrealisedAppreciation/
(Depreciation)in USD
Percent ofNet Assets
Long PositionsCommon StocksJapanABC-Mart Inc JPY 800 47,553 (334) (0.00)Adastria Co Ltd JPY 100 2,214 (3) (0.00)ADEKA Corp JPY 100 1,464 26 0.00Aeon Delight Co Ltd JPY 100 3,883 185 0.00Air Water Inc JPY 300 4,340 (181) (0.00)Alfresa Holdings Corp JPY 500 14,206 (631) (0.01)Altech Corp JPY 100 1,666 (45) (0.00)Amano Corp JPY 100 2,352 157 0.00ANA Holdings Inc JPY 800 29,290 171 0.00Aozora Bank Ltd JPY 1,000 24,679 (3,275) (0.03)Arcland Sakamoto Co Ltd JPY 100 1,352 23 0.00Arcland Service Holdings Co Ltd JPY 300 5,490 (111) (0.00)Arcs Co Ltd JPY 300 6,586 (141) (0.00)Asahi Co Ltd JPY 400 5,527 (25) (0.00)Asahi Intecc Co Ltd JPY 800 37,523 649 0.01Asahi Kasei Corp JPY 1,100 11,331 (490) (0.00)Astellas Pharma Inc JPY 5,400 80,782 (4,165) (0.03)Atom Corp JPY 400 3,547 (188) (0.00)Autobacs Seven Co Ltd JPY 400 6,639 (278) (0.00)Axial Retailing Inc JPY 300 9,227 (284) (0.00)Bandai Namco Holdings Inc JPY 1,800 84,265 2,435 0.02Belc Co Ltd JPY 100 4,519 (171) (0.00)Benefit One Inc JPY 100 1,959 147 0.00BML Inc JPY 200 5,791 (207) (0.00)Bridgestone Corp JPY 1,500 57,719 (317) (0.00)BRONCO BILLY Co Ltd JPY 100 2,379 (51) (0.00)Brother Industries Ltd JPY 1,100 20,320 199 0.00Calbee Inc JPY 1,700 45,726 (646) (0.01)Canon Electronics Inc JPY 100 1,582 3 0.00Central Japan Railway Co JPY 100 23,190 257 0.00Century Tokyo Leasing Corp JPY 100 4,343 95 0.00Chiyoda Co Ltd JPY 100 1,605 (60) (0.00)Chiyoda Integre Co Ltd JPY 100 1,852 31 0.00Chofu Seisakusho Co Ltd JPY 200 4,137 (70) (0.00)Chubu Electric Power Co Inc JPY 1,600 24,946 (945) (0.01)Chugai Pharmaceutical Co Ltd JPY 800 54,914 54 0.00CI Takiron Corp JPY 300 1,624 (81) (0.00)cocokara fine Inc JPY 100 3,964 (365) (0.00)CONEXIO Corp JPY 200 2,517 (110) (0.00)Create SD Holdings Co Ltd JPY 200 4,696 (458) (0.00)Daiichikosho Co Ltd JPY 100 5,105 54 0.00Daikin Industries Ltd JPY 100 11,699 483 0.00Daiwa Industries Ltd JPY 500 5,119 (77) (0.00)DCM Holdings Co Ltd JPY 700 6,516 (95) (0.00)Descente Ltd JPY 200 5,232 595 0.00Dip Corp JPY 100 1,725 53 0.00Don Quijote Holdings Co Ltd JPY 500 33,058 586 0.00DTS Corp JPY 100 3,689 (171) (0.00)Duskin Co Ltd JPY 100 2,377 (5) (0.00)East Japan Railway Co JPY 200 19,267 (54) (0.00)Elecom Co Ltd JPY 100 3,080 131 0.00Electric Power Development Co Ltd JPY 400 9,727 (137) (0.00)Ezaki Glico Co Ltd JPY 800 41,997 361 0.00Fancl Corp JPY 100 2,580 28 0.00France Bed Holdings Co Ltd JPY 500 4,068 (104) (0.00)Fuji Co Ltd JPY 200 3,444 (43) (0.00)Fuji Oil Holdings Inc JPY 100 3,419 (5) (0.00)Fuji Pharma Co Ltd JPY 200 3,155 (52) (0.00)Fujicco Co Ltd JPY 200 3,880 (150) (0.00)Fujimi Inc JPY 100 2,182 4 0.00Fujiya Co Ltd JPY 200 3,933 (128) (0.00)Fukushima Industries Corp JPY 100 3,207 (221) (0.00)Future Corp JPY 200 3,424 305 0.00GMO Financial Holdings Inc JPY 300 1,745 (68) (0.00)Hakuhodo DY Holdings Inc JPY 1,100 17,641 (2) (0.00)Hamamatsu Photonics KK JPY 300 11,582 122 0.00Hazama Ando Corp JPY 700 4,679 (189) (0.00)Heiwado Co Ltd JPY 200 4,252 (110) (0.00)Hiday Hidaka Corp JPY 440 8,493 20 0.00
AQR UCITS FUNDS
AQR Delphi Long-Short Equity UCITS Fund
Schedule of Investments (continued)As at 31 March 2019
The accompanying notes form an integral part of these audited financial statements. 49

Reference Entity Currency Shares Notional Amount
UnrealisedAppreciation/
(Depreciation)in USD
Percent ofNet Assets
Long Positions (continued)Common Stocks (continued)Japan (continued)Hitachi High-Technologies Corp JPY 900 36,815 807 0.01Hokuto Corp JPY 200 3,460 (134) (0.00)Hoshizaki Electric Co Ltd JPY 200 12,375 (90) (0.00)Hoya Corp JPY 900 59,334 (739) (0.01)Ichibanya Co Ltd JPY 200 8,731 81 0.00Infocom Corp JPY 200 3,321 76 0.00Ito En Ltd JPY 400 20,746 1,118 0.01Itochu Enex Co Ltd JPY 500 4,023 (129) (0.00)Itoham Yonekyu Holdings Inc JPY 400 2,486 (33) (0.00)Itokuro Inc JPY 200 5,520 (18) (0.00)JAC Recruitment Co Ltd JPY 300 6,613 246 0.00Japan Airlines Co Ltd JPY 4,100 144,192 (1,266) (0.01)Japan Meat Co Ltd JPY 400 7,115 278 0.00Japan Post Bank Co Ltd JPY 2,000 21,810 (613) (0.01)Japan Post Holdings Co Ltd JPY 3,300 38,577 (592) (0.00)JINS Inc JPY 100 5,394 18 0.00J-Oil Mills Inc JPY 100 3,716 36 0.00Kakaku.com Inc JPY 2,800 53,719 1,311 0.01Kaken Pharmaceutical Co Ltd JPY 200 9,074 (595) (0.00)Kameda Seika Co Ltd JPY 100 4,790 (171) (0.00)Kamigumi Co Ltd JPY 1,700 39,316 253 0.00Kanematsu Electronics Ltd JPY 100 3,017 (9) (0.00)Kansai Electric Power Co Inc JPY 200 2,944 (144) (0.00)Kappa Create Co Ltd JPY 200 2,605 (134) (0.00)KDDI Corp JPY 4,300 92,504 (5,834) (0.05)Keihan Electric Railway Co Ltd JPY 100 4,199 144 0.00Keihin Corp JPY 100 1,634 4 0.00Kewpie Corp JPY 200 4,790 (20) (0.00)Key Coffee Inc JPY 200 3,747 (130) (0.00)Keyence Corp JPY 200 124,422 4,763 0.04Kinden Corp JPY 200 3,309 56 0.00Kintetsu Corp JPY 100 4,654 9 0.00Kisoji Co Ltd JPY 300 7,176 (60) (0.00)Kissei Pharmaceutical Co Ltd JPY 100 2,614 (60) (0.00)Kobayashi Pharmaceutical Co Ltd JPY 300 25,274 (406) (0.00)Koei Tecmo Holdings Co Ltd JPY 200 3,850 206 0.00Koito Manufacturing Co Ltd JPY 400 22,622 433 0.00Kose Corp JPY 300 55,013 3,058 0.03Kura Corp JPY 100 4,573 (171) (0.00)KYORIN Holdings Inc JPY 600 11,695 (287) (0.00)Kyowa Exeo Corp JPY 100 2,756 60 0.00Kyowa Hakko Kirin Co Ltd JPY 1,700 36,955 632 0.01Kyushu Railway Co JPY 1,800 59,099 (4,104) (0.03)Lawson Inc JPY 600 33,230 (1,299) (0.01)Lintec Corp JPY 100 2,159 (45) (0.00)Lion Corp JPY 1,100 23,118 (1,022) (0.01)M3 Inc JPY 1,700 28,475 153 0.00Maeda Kosen Co Ltd JPY 100 2,200 (248) (0.00)Maeda Road Construction Co Ltd JPY 100 1,938 (27) (0.00)Makita Corp JPY 200 6,954 189 0.00Mandom Corp JPY 200 5,134 (105) (0.00)Maruichi Steel Tube Ltd JPY 200 5,818 (27) (0.00)Maruzen Showa Unyu Co Ltd JPY 200 5,412 (72) (0.00)Marvelous Inc JPY 500 3,874 (85) (0.00)Matsumotokiyoshi Holdings Co Ltd JPY 700 23,267 (1,389) (0.01)Matsuyafoods Holdings Co Ltd JPY 100 3,328 (203) (0.00)McDonalds Japan JPY 300 13,855 27 0.00Medipal Holdings Corp JPY 400 9,489 (65) (0.00)MEIJI Holdings Co Ltd JPY 400 32,436 (36) (0.00)Melco Holdings Inc JPY 100 3,446 59 0.00Mie Kotsu Group Holdings Inc JPY 100 507 (24) (0.00)Milbon Co Ltd JPY 100 4,645 (18) (0.00)Ministop Co Ltd JPY 100 1,546 (60) (0.00)Mitsubishi Shokuhin Co Ltd JPY 300 7,837 106 0.00Mitsubishi Tanabe Pharma Corp JPY 900 12,006 (1,047) (0.01)Mixi Inc JPY 800 18,458 (563) (0.00)Mochida Pharmaceutical Co Ltd JPY 200 10,247 (207) (0.00)MonotaRO Co Ltd JPY 1,000 22,198 (695) (0.01)Morinaga & Co Ltd JPY 100 4,334 (140) (0.00)MOS Food Services Inc JPY 200 4,853 (312) (0.00)Nagaileben Co Ltd JPY 500 10,824 (383) (0.00)Nagoya Railroad Co Ltd JPY 300 8,294 95 0.00Nakanishi Inc JPY 400 7,804 299 0.00Nexon Co Ltd JPY 1,600 25,025 938 0.01NHK Spring Co Ltd JPY 200 1,793 52 0.00Nifco Inc JPY 200 5,087 (41) (0.00)Nihon Kohden Corp JPY 100 2,968 (284) (0.00)Nikkon Holdings Co Ltd JPY 200 4,725 (137) (0.00)Nippon Flour Mills Co Ltd JPY 100 1,714 (39) (0.00)Nippon Kanzai Co Ltd JPY 200 3,567 74 0.00Nippon Seiki Co Ltd JPY 100 1,614 (55) (0.00)Nippon Telegraph Telephone Corp JPY 600 25,453 (530) (0.00)Nishimatsuya Chain Co Ltd JPY 100 839 (28) (0.00)Nishimoto Co Ltd JPY 200 7,829 (90) (0.00)Nishi-Nippon Financial Holdings Inc JPY 100 848 (47) (0.00)Nissan Chemical Industries Ltd JPY 800 36,585 (740) (0.01)Nissin Electric Co Ltd JPY 100 916 29 0.00Nissin Foods Holdings Co Ltd JPY 500 34,276 (361) (0.00)Nitori Holdings Co Ltd JPY 400 51,594 2,219 0.02Nitto Kohki Co Ltd JPY 100 1,970 (3) (0.00)NOF Corp JPY 200 6,801 (81) (0.00)Nohmi Bosai Ltd JPY 100 1,632 (38) (0.00)Nomura Research Institute Ltd JPY 200 9,074 153 0.00NSD Co Ltd JPY 200 4,649 31 0.00NTT DOCOMO Inc JPY 100 2,211 (64) (0.00)
AQR UCITS FUNDS
AQR Delphi Long-Short Equity UCITS Fund
Schedule of Investments (continued)As at 31 March 2019
The accompanying notes form an integral part of these audited financial statements. 50

Reference Entity Currency Shares Notional Amount
UnrealisedAppreciation/
(Depreciation)in USD
Percent ofNet Assets
Long Positions (continued)Common Stocks (continued)Japan (continued)Obic Co Ltd JPY 300 30,199 216 0.00Ohsho Food Service Corp JPY 100 6,323 (370) (0.00)Okamoto Industries Inc JPY 100 5,042 (370) (0.00)Omron Corp JPY 500 23,362 (169) (0.00)Ono Pharmaceutical Co Ltd JPY 1,400 27,390 (1,503) (0.01)Oracle Corp Japan JPY 500 33,509 (4,781) (0.04)Oriental Land Co Ltd JPY 300 34,014 866 0.01ORIX Corp JPY 2,800 40,144 631 0.01Osaka Gas Co Ltd JPY 1,100 21,670 (1,558) (0.01)Otsuka Corp JPY 800 29,838 144 0.00Park24 Co Ltd JPY 700 15,173 (1,124) (0.01)PeptiDream Inc JPY 500 24,489 (180) (0.00)Pigeon Corp JPY 500 20,408 (474) (0.00)Pilot Corp JPY 100 4,045 (135) (0.00)Piolax Inc JPY 200 3,841 (32) (0.00)Pola Orbis Holdings Inc JPY 1,700 54,129 230 0.00Raito Kogyo Co Ltd JPY 100 1,346 29 0.00Rakus Co Ltd JPY 200 3,640 128 0.00Recruit Holdings Co Ltd JPY 1,100 31,363 149 0.00Relia Inc JPY 100 870 (20) (0.00)Riken Vitamin Co Ltd JPY 100 3,166 (171) (0.00)Rinnai Corp JPY 100 7,063 235 0.00Riso Kyoiku Co Ltd JPY 900 4,140 (130) (0.00)Rock Field Co Ltd JPY 400 5,899 58 0.00Rohto Pharmaceutical Co Ltd JPY 100 2,563 (123) (0.00)Royal Holdings Co Ltd JPY 100 2,497 14 0.00Ryohin Keikaku Co Ltd JPY 200 50,584 1,588 0.01Sakai Moving Service Co Ltd JPY 100 6,332 (9) (0.00)San-A Co Ltd JPY 200 7,992 153 0.00San-Ai Oil Co Ltd JPY 100 820 (81) (0.00)Sangetsu Corp JPY 200 3,624 (179) (0.00)Sankyo Co Ltd JPY 500 19,032 68 0.00Sankyu Inc JPY 200 9,742 (108) (0.00)Santen Pharmaceutical Co Ltd JPY 1,900 28,261 (617) (0.01)SCSK Corp JPY 200 8,903 9 0.00Secom Co Ltd JPY 300 25,658 (346) (0.00)Seino Holdings Co Ltd JPY 300 3,991 (296) (0.00)Seria Co Ltd JPY 200 6,882 (18) (0.00)Seven i Holdings Co Ltd JPY 700 26,367 (2,393) (0.02)Seven Bank Ltd JPY 1,900 5,604 (198) (0.00)SG Holdings Co Ltd JPY 1,800 52,361 699 0.01Shimadzu Corp JPY 200 5,773 235 0.00Shimamura Co Ltd JPY 400 33,807 (577) (0.00)Shimano Inc JPY 200 32,472 1,479 0.01Shinko Plantech Co Ltd JPY 200 2,129 (27) (0.00)Shionogi Co Ltd JPY 900 55,624 122 0.00Ship Healthcare Holdings Inc JPY 100 4,100 41 0.00Shizuoka Gas Co Ltd JPY 300 2,276 (268) (0.00)Showa Corp JPY 100 1,274 (9) (0.00)Showa Sangyo Co Ltd JPY 100 2,704 (15) (0.00)Sohgo Security Services Co Ltd JPY 400 17,391 289 0.00Square Enix Holdings Co Ltd JPY 700 24,498 1,736 0.01Stanley Electric Co Ltd JPY 1,500 40,252 (353) (0.00)Start Today Co Ltd JPY 2,500 47,039 (3,811) (0.03)Studio Alice Co Ltd JPY 100 2,058 6 0.00Sugi Holdings Co Ltd JPY 600 26,383 (1,055) (0.01)Sumitomo Dainippon Pharma Co Ltd JPY 100 2,469 (23) (0.00)Sumitomo Mitsui Construction Co Ltd JPY 300 2,086 89 0.00Sumitomo Rubber Industries Ltd JPY 400 4,791 (85) (0.00)Sundrug Co Ltd JPY 1,100 30,262 (3,586) (0.03)Suzuken Co Ltd JPY 400 23,127 (216) (0.00)Suzuki Motor Corp JPY 2,100 92,778 (3,683) (0.03)Sysmex Corp JPY 400 24,137 (1,227) (0.01)Tachi-S Co Ltd JPY 100 1,429 (31) (0.00)Taisei Corp JPY 800 37,090 (649) (0.01)Taisho Pharmaceutical Holdings JPY 100 9,516 (731) (0.01)Takamatsu Construction Group Co Ltd JPY 100 2,156 (324) (0.00)Takara Bio Inc JPY 200 4,631 (254) (0.00)Takara Standard Co Ltd JPY 100 1,529 (36) (0.00)Takasago Thermal Engineering Co Ltd JPY 300 4,822 32 0.00Takuma Co Ltd JPY 100 1,192 (40) (0.00)Tamron Co Ltd JPY 100 1,821 (74) (0.00)T-Gaia Corp JPY 300 4,968 (303) (0.00)The Chugoku Electric Power Co Inc JPY 200 2,491 (153) (0.00)The Chukyo Bank Ltd JPY 300 6,145 (43) (0.00)The Ehime Bank Ltd JPY 300 3,079 (54) (0.00)The Hachijuni Bank Ltd JPY 500 2,070 (49) (0.00)The Oita Bank Ltd JPY 100 3,121 (140) (0.00)The Okinawa Electric Power Co Inc JPY 200 3,401 (281) (0.00)The Pack Corp JPY 100 3,062 32 0.00The San-In Godo Bank Ltd JPY 300 2,149 (148) (0.00)The Towa Bank Ltd JPY 100 642 (46) (0.00)TKC Corp JPY 100 3,649 (216) (0.00)Toagosei Co Ltd JPY 200 2,111 (11) (0.00)Toei Animation Co Ltd JPY 200 9,850 1,371 0.01Toho Co Ltd JPY 600 24,056 1,082 0.01Toho Gas Co Ltd JPY 500 22,415 (1,218) (0.01)Toho Holdings Co Ltd JPY 100 2,492 (63) (0.00)Tohoku Electric Power Co Inc JPY 800 10,189 (291) (0.00)Tokai Corp JPY 200 4,867 (336) (0.00)Tokyo Gas Co Ltd JPY 1,100 29,701 (1,245) (0.01)Tokyo Seimitsu Co Ltd JPY 100 2,540 3 0.00Tokyo Steel Manufacturing Co Ltd JPY 100 868 31 0.00Tokyu Construction Co Ltd JPY 500 3,743 (284) (0.00)Toppan Forms Co Ltd JPY 400 3,410 (11) (0.00)
AQR UCITS FUNDS
AQR Delphi Long-Short Equity UCITS Fund
Schedule of Investments (continued)As at 31 March 2019
The accompanying notes form an integral part of these audited financial statements. 51

Reference Entity Currency Shares Notional Amount
UnrealisedAppreciation/
(Depreciation)in USD
Percent ofNet Assets
Long Positions (continued)Common Stocks (continued)Japan (continued)Torii Pharmaceutical Co Ltd JPY 200 4,018 (274) (0.00)Toshiba Plant Systems & Services Corp JPY 100 1,771 (78) (0.00)Toyo Suisan Kaisha Ltd JPY 600 22,812 487 0.00Toyota Boshoku Corp JPY 100 1,511 (47) (0.00)Trancom Co Ltd JPY 100 5,872 (108) (0.00)TS Tech Co Ltd JPY 100 2,873 (14) (0.00)Tsuruha Holdings Inc JPY 300 24,354 (1,975) (0.02)TV Asahi Holdings Corp JPY 100 1,752 (66) (0.00)Unicharm Corp JPY 600 19,824 (227) (0.00)Unipres Corp JPY 100 1,560 20 0.00United Arrows Ltd JPY 100 3,477 117 0.00United Super Markets Holdings Inc JPY 400 3,951 (184) (0.00)USS Co Ltd JPY 200 3,705 60 0.00Vital KSK Holdings Inc JPY 600 5,910 (27) (0.00)Welcia Holdings Co Ltd JPY 500 16,935 (316) (0.00)West Japan Railway Co JPY 400 30,087 (404) (0.00)Wowow Inc JPY 100 2,674 (73) (0.00)Yakult Honsha Co Ltd JPY 100 6,981 (108) (0.00)Yamada Denki Co Ltd JPY 1,200 5,910 (216) (0.00)Yamaguchi Financial Group Inc JPY 800 6,769 (541) (0.00)Yamazen Corp JPY 100 1,053 (12) (0.00)Yellow Hat Ltd JPY 200 2,627 (16) (0.00)Yondoshi Holdings Inc JPY 100 1,880 (60) (0.00)Yurtec Corp JPY 100 731 (18) (0.00)Zojirushi Corp JPY 200 2,075 45 0.00
(46,026) (0.39)
Total Long Positions (46,026) (0.39)
Short PositionsCommon StocksJapanAeon Co Ltd JPY (500) (10,447) (31) (0.00)Aiful Corp JPY (500) (1,254) 59 0.00Alps Electric Co Ltd JPY (900) (18,753) (674) (0.01)Anritsu Corp JPY (100) (1,849) 106 0.00Asahi Diamond Industrial Co Ltd JPY (100) (689) (37) (0.00)Ashikaga Holdings Co Ltd JPY (800) (2,042) 86 0.00Asics Corp JPY (1,400) (18,753) (820) (0.01)ASKA Pharmaceutical Co Ltd JPY (500) (5,168) 584 0.00Bell System24 Holdings Inc JPY (200) (2,468) 155 0.00Belluna Co Ltd JPY (100) (774) 38 0.00CKD Corp JPY (600) (5,401) 59 0.00CMK Corp JPY (500) (2,913) 5 0.00Cosmo Energy Holdings Co Ltd JPY (100) (2,006) 369 0.00Credit Saison Co Ltd JPY (2,300) (30,331) 1,853 0.02CyberAgent Inc JPY (100) (4,073) (262) (0.00)Daido Metal Co Ltd JPY (400) (2,554) 63 0.00Daifuku Co Ltd JPY (700) (36,369) (884) (0.01)Daihen Corp JPY (100) (2,566) (82) (0.00)Daiichi Sankyo Co Ltd JPY (300) (13,801) (1,702) (0.01)Daiwa Securities Group Inc JPY (400) (1,945) 137 0.00DeNA Co Ltd JPY (600) (9,022) 303 0.00Denki Kogyo Co Ltd JPY (100) (3,004) 45 0.00Denso Corp JPY (300) (11,682) 368 0.00Dexerials Corp JPY (700) (4,634) 149 0.00DMG Mori Co Ltd JPY (400) (4,939) 206 0.00FamilyMart Co Ltd JPY (1,800) (45,802) 4,818 0.04Ferrotec Holdings Corp JPY (300) (2,993) (149) (0.00)Foster Electric Co Ltd JPY (300) (4,497) (214) (0.00)Fujikura Ltd JPY (2,200) (8,275) 361 0.00Furukawa Co Ltd JPY (200) (2,513) 117 0.00Furukawa Electric Co Ltd JPY (100) (2,517) 77 0.00Futaba Industrial Co Ltd JPY (800) (3,933) (229) (0.00)Gakken Holdings Co Ltd JPY (100) (4,636) 640 0.01GMO internet Inc JPY (500) (8,136) 496 0.00Hitachi Chemical Co Ltd JPY (2,200) (48,657) (218) (0.00)Hitachi Construction Machinery JPY (700) (18,544) (328) (0.00)Hitachi Zosen Corp JPY (1,900) (5,827) 86 0.00Hodogaya Chemical Co Ltd JPY (200) (5,818) 280 0.00Honda Motor Co Ltd JPY (1,600) (43,224) 880 0.01Hosiden Corp JPY (300) (2,508) (97) (0.00)Ibiden Co Ltd JPY (300) (4,551) (78) (0.00)Ichikoh Industries Ltd JPY (100) (537) (28) (0.00)IHI Corp JPY (1,900) (45,570) (232) (0.00)Iino Kaiun Kaisha Ltd JPY (1,300) (4,374) 193 0.00Inpex Corp JPY (200) (1,904) 8 0.00Iseki & Co Ltd JPY (300) (4,408) 62 0.00Isetan Mitsukoshi Holdings Ltd JPY (200) (2,019) 12 0.00Ishihara Sangyo Kaisha Ltd JPY (400) (4,070) (22) (0.00)Isuzu Motors Ltd JPY (800) (10,492) 231 0.00J Front Retailing Co Ltd JPY (2,300) (27,322) (934) (0.01)Japan Petroleum Exploration Co Ltd JPY (100) (2,161) (74) (0.00)JGC Corp JPY (4,100) (54,400) 1,927 0.02JTEKT Corp JPY (1,100) (13,514) (268) (0.00)JVC Kenwood Corp JPY (1,000) (2,417) 90 0.00JX Holdings Inc JPY (4,200) (19,188) 1,417 0.01Kadokawa Dwango Corp JPY (200) (2,105) 0 0.00Kansai Paint Co Ltd JPY (400) (7,616) 130 0.00Kanto Denka Kogyo Co Ltd JPY (200) (1,346) 54 0.00Kawasaki Heavy Industries Ltd JPY (1,700) (41,862) (613) (0.01)Koa Corp JPY (100) (1,343) 6 0.00Kobe Steel Ltd JPY (7,700) (57,716) 2,369 0.02Komatsu Ltd JPY (200) (4,637) 204 0.00Koshidaka Holdings Co Ltd JPY (100) (1,498) (9) (0.00)
AQR UCITS FUNDS
AQR Delphi Long-Short Equity UCITS Fund
Schedule of Investments (continued)As at 31 March 2019
The accompanying notes form an integral part of these audited financial statements. 52

Reference Entity Currency Shares Notional Amount
UnrealisedAppreciation/
(Depreciation)in USD
Percent ofNet Assets
Short Positions (continued)Common Stocks (continued)Japan (continued)Kubota Corp JPY (2,500) (36,069) (823) (0.01)KYB Corp JPY (100) (2,452) 64 0.00Kyocera Corp JPY (300) (17,589) (379) (0.00)LIFULL Co Ltd JPY (600) (3,139) 16 0.00LIXIL Group Corp JPY (800) (10,665) (332) (0.00)Macnica Fuji Electronics Holdings Inc JPY (100) (1,362) (9) (0.00)Macromill Inc JPY (500) (6,016) 327 0.00Marui Group Co Ltd JPY (2,500) (50,399) (2,817) (0.02)Matsuya Co Ltd JPY (600) (5,434) 124 0.00Minebea Co Ltd JPY (1,100) (16,500) (427) (0.00)Mitsuba Corp JPY (1,700) (9,538) 877 0.01Mitsubishi Heavy Industries Lt JPY (300) (12,442) 130 0.00Mitsubishi Logisnext Co Ltd JPY (200) (2,174) 40 0.00Mitsubishi Logistics Corp JPY (400) (11,149) (606) (0.01)Mitsubishi Materials Corp JPY (900) (23,721) 146 0.00Mitsubishi UFJ Financial Group Inc JPY (700) (3,473) 133 0.00Mitsui E&S Holdings Co Ltd JPY (700) (6,592) 1,061 0.01Mitsui Mining & Smelting Co Ltd JPY (400) (10,243) (346) (0.00)Mitsui OSK Lines Ltd JPY (1,800) (38,658) 575 0.00Mizuho Financial Group Inc JPY (8,900) (13,752) 185 0.00MS&AD Insurance Group Holdings Inc JPY (500) (15,199) (131) (0.00)Murata Manufacturing Co Ltd JPY (1,500) (74,577) (997) (0.01)Nabtesco Corp JPY (1,600) (46,543) (2,381) (0.02)Namura Shipbuilding Co Ltd JPY (1,300) (4,233) 287 0.00NET One Systems Co Ltd JPY (100) (2,514) 7 0.00NGK Insulators Ltd JPY (600) (8,702) 595 0.00NH Foods Ltd JPY (100) (3,594) (14) (0.00)Nichicon Corp JPY (700) (6,396) (246) (0.00)Nihon Chouzai Co Ltd JPY (100) (3,382) 149 0.00Nikkiso Co Ltd JPY (500) (5,827) (158) (0.00)Nintendo Co Ltd JPY (100) (28,467) 415 0.00Nippon Chemi-Con Corp JPY (300) (5,155) 165 0.00Nippon Denko Co Ltd JPY (1,300) (2,627) 115 0.00Nippon Electric Glass Co Ltd JPY (500) (13,237) 226 0.00Nippon Paint Holdings Co Ltd JPY (100) (3,924) 27 0.00Nippon Sheet Glass Co Ltd JPY (300) (2,411) 78 0.00Nippon Steel & Sumitomo Metal JPY (1,400) (24,675) 360 0.00Nippon Suisan Kaisha Ltd JPY (600) (4,573) (200) (0.00)Nippon Thompson Co Ltd JPY (300) (1,377) (11) (0.00)Nippon Yusen KK JPY (4,300) (62,911) 1,103 0.01Nipro Corp JPY (200) (2,578) (31) (0.00)Nissan Motor Co Ltd JPY (700) (5,734) 288 0.00Nisshinbo Holdings Inc JPY (400) (3,489) (51) (0.00)Nomura Holdings Inc JPY (10,200) (36,820) 1,715 0.01NSK Ltd JPY (700) (6,548) (303) (0.00)NTN Corp JPY (4,200) (12,426) 265 0.00NTT Data Corp JPY (1,600) (17,621) 292 0.00Olympus Corp JPY (400) (4,337) 42 0.00Optex Group Co Ltd JPY (100) (1,592) 57 0.00Orient Corp JPY (2,000) (2,039) 162 0.00Outsourcing Inc JPY (600) (7,393) (16) (0.00)Pacific Industrial Co Ltd JPY (100) (1,404) (9) (0.00)Pacific Metals Co Ltd JPY (100) (2,429) 235 0.00Pasona Group Inc JPY (200) (3,018) (211) (0.00)PC Depot Corp JPY (300) (1,199) 14 0.00Penta-Ocean Construction Co Ltd JPY (100) (463) 18 0.00Qol Holdings Co Ltd JPY (100) (1,360) (3) (0.00)Rakuten Inc JPY (10,500) (99,256) (5,398) (0.05)Renesas Electronics Corp JPY (800) (3,695) 123 0.00Resorttrust Inc JPY (200) (2,706) 22 0.00Rohm Co Ltd JPY (100) (6,224) (90) (0.00)Round One Corp JPY (400) (5,055) 152 0.00Sakai Chemical Industry Co Ltd JPY (100) (2,193) 37 0.00Sanden Holdings Corp JPY (1,300) (8,841) (23) (0.00)Sanken Electric Co Ltd JPY (300) (5,558) (246) (0.00)Sanyo Denki Co Ltd JPY (100) (3,581) 95 0.00Sapporo Holdings Ltd JPY (100) (2,180) 95 0.00SBS Holdings Inc JPY (200) (3,357) (80) (0.00)Sega Sammy Holdings Inc JPY (700) (8,246) (13) (0.00)Seiko Epson Corp JPY (1,000) (15,289) (144) (0.00)Seiko Holdings Corp JPY (100) (2,377) 110 0.00Sharp Corp JPY (800) (8,789) 14 0.00Shindengen Electric Manufacturing Co Ltd JPY (100) (3,685) 113 0.00Shiseido Co Ltd JPY (700) (50,430) 32 0.00Showa Denko KK JPY (700) (24,561) (95) (0.00)Sinfonia Technology Co Ltd JPY (100) (1,220) (16) (0.00)Sodick Co Ltd JPY (400) (3,330) (198) (0.00)SoftBank Corp JPY (400) (38,768) 794 0.01Sumco Corp JPY (3,800) (42,194) 1,508 0.01Sumitomo Metal Mining Co Ltd JPY (800) (23,596) (476) (0.00)Tadano Ltd JPY (300) (2,844) (24) (0.00)Taiheiyo Cement Corp JPY (200) (6,657) 99 0.00Taiyo Yuden Co Ltd JPY (200) (3,927) (180) (0.00)Takashimaya Co Ltd JPY (400) (5,318) 40 0.00Takeda Pharmaceutical Co Ltd JPY (500) (20,390) 998 0.01Tamura Corp JPY (500) (2,756) (54) (0.00)TD Holdings Inc JPY (2,900) (30,448) 391 0.00TDK Corp JPY (800) (62,563) 433 0.00The Bank of Kyoto Ltd JPY (100) (4,176) 523 0.00The Chugoku Bank Ltd JPY (700) (6,560) 581 0.00The Tochigi Bank Ltd JPY (1,000) (2,120) 18 0.00The Yokohama Rubber Co Ltd JPY (200) (3,709) 20 0.00Toa Corp JPY (400) (5,758) (346) (0.00)Toho Titanium Co Ltd JPY (300) (2,568) 39 0.00Toho Zinc Co Ltd JPY (200) (5,647) 550 0.00
AQR UCITS FUNDS
AQR Delphi Long-Short Equity UCITS Fund
Schedule of Investments (continued)As at 31 March 2019
The accompanying notes form an integral part of these audited financial statements. 53

Reference Entity Currency Shares Notional Amount
UnrealisedAppreciation/
(Depreciation)in USD
Percent ofNet Assets
Short Positions (continued)Common Stocks (continued)Japan (continued)Tokai Tokyo Financial Holdings Inc JPY (1,800) (6,511) 1,055 0.01Tokuyama Corp JPY (100) (2,356) 3 0.00Tokyo Electric Power Co Inc JPY (1,100) (6,945) (40) (0.00)Tokyo Kiraboshi Financial Group Inc JPY (600) (8,470) 1,066 0.01Tomy Co Ltd JPY (200) (2,060) 87 0.00Topcon Corp JPY (200) (2,356) 233 0.00Toray Industries Inc JPY (300) (1,913) 70 0.00Toshiba Machine Co Ltd JPY (100) (2,009) (14) (0.00)Toyo Kanetsu KK JPY (200) (3,615) 255 0.00Toyo Seikan Group Holdings Ltd JPY (800) (16,359) 759 0.01Toyo Tire Corp JPY (100) (1,132) 60 0.00Toyota Industries Corp JPY (600) (30,037) 1,137 0.01Toyota Tsusho Corp JPY (800) (26,014) 216 0.00Tsugami Corp JPY (800) (6,148) (1,123) (0.01)Tsukui Corp JPY (100) (628) 47 0.00Ulvac Inc JPY (100) (2,886) (86) (0.00)Unitika Ltd JPY (1,400) (5,367) 0 0.00Wacom Co Ltd JPY (400) (1,681) (65) (0.00)World Holdings Co Ltd JPY (100) (1,704) 69 0.00Yahoo Japan Corp JPY (19,900) (48,644) 1,974 0.02YAMABIKO Corp JPY (100) (959) (15) (0.00)Yamaha Motor Co Ltd JPY (1,000) (19,582) 109 0.00Yaskawa Electric Corp JPY (1,600) (50,151) (1,371) (0.01)ZIGExN Co Ltd JPY (400) (2,111) 108 0.00
14,788 0.12
Total Short Positions 14,788 0.12
Total of Long and Short Equity Positions (31,238) (0.27)Net Cash and Other Receivables/(Payables) 71,720 0.60
Total of Total Return Basket Swap Contract - MSIP - JPY 40,482 0.33
Counterparty† Description‡ Termination DateFair Value in
USDMSIP The Sub-Fund receives the total return on a portfolio of long and short positions and pays 1-week NIBOR plus or
minus a specified spread, which is denominated in NOK based on the local currency of the positions within theswap.
28.10.2020 (9,986)
The following table represents the long and short positions and related values within the total return equity basket swap as at 31 March 2019
Reference Entity Currency Shares Notional Amount
UnrealisedAppreciation/
(Depreciation)in USD
Percent ofNet Assets
Long PositionsCommon StocksFaroe IslandsBakkafrost P/F NOK 361 17,979 (461) (0.00)
(461) (0.00)NorwayAker Solutions ASA NOK 254 1,286 (15) (0.00)Atea ASA NOK 451 6,570 84 0.00Austevoll Seafood ASA NOK 75 891 (16) (0.00)B2Holding ASA NOK 2,149 3,026 (249) (0.00)Borregaard ASA NOK 795 7,893 (166) (0.00)DNO ASA NOK 4,244 9,394 194 0.00Kvaerner ASA NOK 7,206 10,581 (951) (0.01)Marine Harvest ASA NOK 2,076 46,698 (1,481) (0.01)Norwegian Finans Holding ASA NOK 1,729 13,345 (998) (0.01)Ocean Yield ASA NOK 62 459 6 0.00Orkla ASA NOK 1,838 14,091 (192) (0.00)Salmar ASA NOK 935 44,786 (162) (0.00)SpareBank 1 Nord Norge NOK 1,193 8,855 (669) (0.01)SpareBank 1 SMN NOK 1,065 10,734 (790) (0.01)Statoil ASA NOK 2,084 45,863 (1,235) (0.01)Storebrand ASA NOK 398 3,103 (157) (0.00)Telenor ASA NOK 1,326 26,613 (1,069) (0.01)TGS NOPEC Geophysical Co ASA NOK 202 5,524 (190) (0.00)Tomra Systems ASA NOK 37 1,103 71 0.00Veidekke ASA NOK 624 6,542 (94) (0.00)
(8,079) (0.07)
Total Long Positions (8,540) (0.07)
Short PositionsCommon StocksNorwayBW Offshore Ltd NOK (1,090) (5,664) 186 0.00Elkem ASA NOK (162) (570) 26 0.00Grieg Seafood ASA NOK (130) (1,577) 39 0.00Nordic Nanovector ASA NOK (107) (551) 35 0.00Odfjell Drilling Ltd NOK (1,040) (3,275) (199) (0.00)Petroleum Geo-Services ASA NOK (2,579) (5,937) 215 0.00Sbanken ASA NOK (1,532) (13,895) 124 0.00Scatec Solar ASA NOK (1,317) (13,594) (354) (0.00)Schibsted ASA NOK (486) (19,131) 840 0.01Yara International ASA NOK (297) (12,173) 407 0.00
1,319 0.01SingaporeBW LPG Ltd NOK (151) (526) (34) (0.00)
(34) (0.00)
AQR UCITS FUNDS
AQR Delphi Long-Short Equity UCITS Fund
Schedule of Investments (continued)As at 31 March 2019
The accompanying notes form an integral part of these audited financial statements. 54

Reference Entity Currency Shares Notional Amount
UnrealisedAppreciation/
(Depreciation)in USD
Percent ofNet Assets
Short Positions (continued)Common Stocks (continued)United Arab EmiratesBorr Drilling Ltd NOK (4,213) (12,900) (382) (0.00)
(382) (0.00)United KingdomSubsea 7 SA NOK (2,011) (24,910) 956 0.01
956 0.01
Total Short Positions 1,859 0.02
Total of Long and Short Equity Positions (6,681) (0.05)Net Cash and Other Receivables/(Payables) (3,305) (0.03)
Total of Total Return Basket Swap Contract - MSIP - NOK (9,986) (0.08)
Counterparty† Description‡ Termination DateFair Value in
USDMSIP The Sub-Fund receives the total return on a portfolio of long and short positions and pays 1-week STIBOR plus
or minus a specified spread, which is denominated in SEK based on the local currency of the positions within theswap.
28.10.2020 6,166
The following table represents the long and short positions and related values within the total return equity basket swap as at 31 March 2019
Reference Entity Currency Shares Notional Amount
UnrealisedAppreciation/
(Depreciation)in USD
Percent ofNet Assets
Long PositionsCommon StocksMaltaKambi Group PLC SEK 127 2,140 99 0.00Unibet Group PLC SEK 4,960 49,420 (1,030) (0.01)
(931) (0.01)SwedenAAK AB SEK 295 4,402 127 0.00Atlas Copco AB SEK 1,118 29,856 (493) (0.00)Axfood AB SEK 1,970 36,535 (781) (0.01)Betsson AB SEK 1,727 13,124 (602) (0.01)BioGaia AB SEK 343 16,796 (290) (0.00)Biotage AB SEK 77 982 (128) (0.00)Boliden AB SEK 549 15,617 907 0.01Bonava AB SEK 265 3,330 17 0.00Bure Equity AB SEK 327 5,481 368 0.00Clas Ohlson AB SEK 120 927 11 0.00Epiroc AB SEK 1,075 10,796 59 0.00Essity AB SEK 322 9,283 (66) (0.00)Evolution Gaming Group AB SEK 142 11,119 406 0.00Hennes Mauritz AB SEK 988 16,611 1,959 0.02Hexagon AB SEK 184 9,558 (95) (0.00)Holmen AB SEK 117 2,538 15 0.00ICA Gruppen AB SEK 1,019 40,841 791 0.01Mycronic AB SEK 1,249 17,863 (593) (0.00)NetEnt AB SEK 2,745 9,920 (314) (0.00)New Wave Group AB SEK 63 412 (3) (0.00)Nobia AB SEK 483 2,834 (128) (0.00)Nobina AB SEK 145 938 (87) (0.00)Resurs Holding AB SEK 684 4,246 (70) (0.00)Sandvik AB SEK 4,327 70,120 (2,240) (0.02)SAS AB SEK 894 1,803 (137) (0.00)Securitas AB SEK 896 14,452 (15) (0.00)Skanska AB SEK 1,003 18,212 (665) (0.01)SkiStar AB SEK 741 8,264 (301) (0.00)Swedish Match AB SEK 620 31,603 695 0.01Swedish Orphan Biovitrum AB SEK 1,160 27,049 125 0.00Tele2 AB SEK 288 3,856 (176) (0.00)Telia Co AB SEK 1,453 6,554 (157) (0.00)Vitrolife AB SEK 494 11,125 498 0.00Volvo AB SEK 992 15,321 611 0.01
(752) (0.01)
Total Long Positions (1,683) (0.01)
Short PositionsCommon StocksFinlandNordea Bank AB SEK (1,221) (9,290) 1,940 0.02
1,940 0.02SwedenAcadeMedia AB SEK (94) (526) 14 0.00Attendo AB SEK (334) (1,673) 483 0.00Avanza Bank Holding AB SEK (29) (1,247) 47 0.00Cherry AB SEK (53) (497) (1) (0.00)Cloetta AB SEK (799) (2,061) (20) (0.00)Dometic Group AB SEK (832) (6,510) 243 0.00Dustin Group AB SEK (570) (5,330) (77) (0.00)Electrolux AB SEK (77) (1,977) 33 0.00Elekta AB SEK (157) (1,952) 46 0.00Ericsson SEK (241) (2,208) 116 0.00Getinge AB SEK (5,241) (61,049) (863) (0.01)Granges AB SEK (103) (1,068) (4) (0.00)Husqvarna AB SEK (253) (2,062) (36) (0.00)Inwido AB SEK (1,481) (8,729) 567 0.00Lindab International AB SEK (61) (555) (2) (0.00)Loomis AB SEK (11) (381) (4) (0.00)Mekonomen AB SEK (740) (5,132) 320 0.00
AQR UCITS FUNDS
AQR Delphi Long-Short Equity UCITS Fund
Schedule of Investments (continued)As at 31 March 2019
The accompanying notes form an integral part of these audited financial statements. 55

Reference Entity Currency Shares Notional Amount
UnrealisedAppreciation/
(Depreciation)in USD
Percent ofNet Assets
Short Positions (continued)Common Stocks (continued)Sweden (continued)Nolato AB SEK (45) (1,849) 99 0.00Paradox Interactive AB SEK (342) (5,341) 119 0.00Peab AB SEK (348) (3,014) 36 0.00Recipharm AB SEK (952) (14,005) 41 0.00Scandic Hotels Group AB SEK (368) (3,292) 242 0.00SKF AB SEK (115) (1,913) 97 0.00SSAB AB SEK (7,179) (25,761) 1,471 0.01Svenska Cellulosa AB SCA SEK (4,150) (35,808) 1,628 0.01Svenska Handelsbanken AB SEK (4,954) (52,459) 4,392 0.04Sweco AB SEK (26) (626) (2) (0.00)Thule Group AB SEK (231) (5,187) (38) (0.00)
8,947 0.08SwitzerlandOriflame Holding AG SEK (21) (401) 12 0.00
12 0.00
Total Short Positions 10,899 0.09
Total of Long and Short Equity Positions 9,216 0.08Net Cash and Other Receivables/(Payables) (3,050) (0.03)
Total of Total Return Basket Swap Contract - MSIP - SEK 6,166 0.05
Counterparty† Description‡ Termination DateFair Value in
USDMSIP The Sub-Fund receives the total return on a portfolio of long positions and pays 1-month SIBOR plus or minus a
specified spread, which is denominated in SGD based on the local currency of the positions within the swap.29.10.2020 184
The following table represents the long positions and related values within the total return equity basket swap as at 31 March 2019
Reference Entity Currency Shares Notional Amount
UnrealisedAppreciation/
(Depreciation)in USD
Percent ofNet Assets
Long PositionsCommon StocksSingaporeComfortDelGro Corp Ltd SGD 5,000 9,484 406 0.00SATS Ltd SGD 2,600 9,806 (58) (0.00)Venture Corp Ltd SGD 700 9,269 (31) (0.00)
317 0.00
Total Long Positions 317 0.00
Net Cash and Other Receivables/(Payables) (133) (0.00)
Total of Total Return Basket Swap Contract - MSIP - SGD 184 (0.00)
AQR UCITS FUNDS
AQR Delphi Long-Short Equity UCITS Fund
Schedule of Investments (continued)As at 31 March 2019
The accompanying notes form an integral part of these audited financial statements. 56
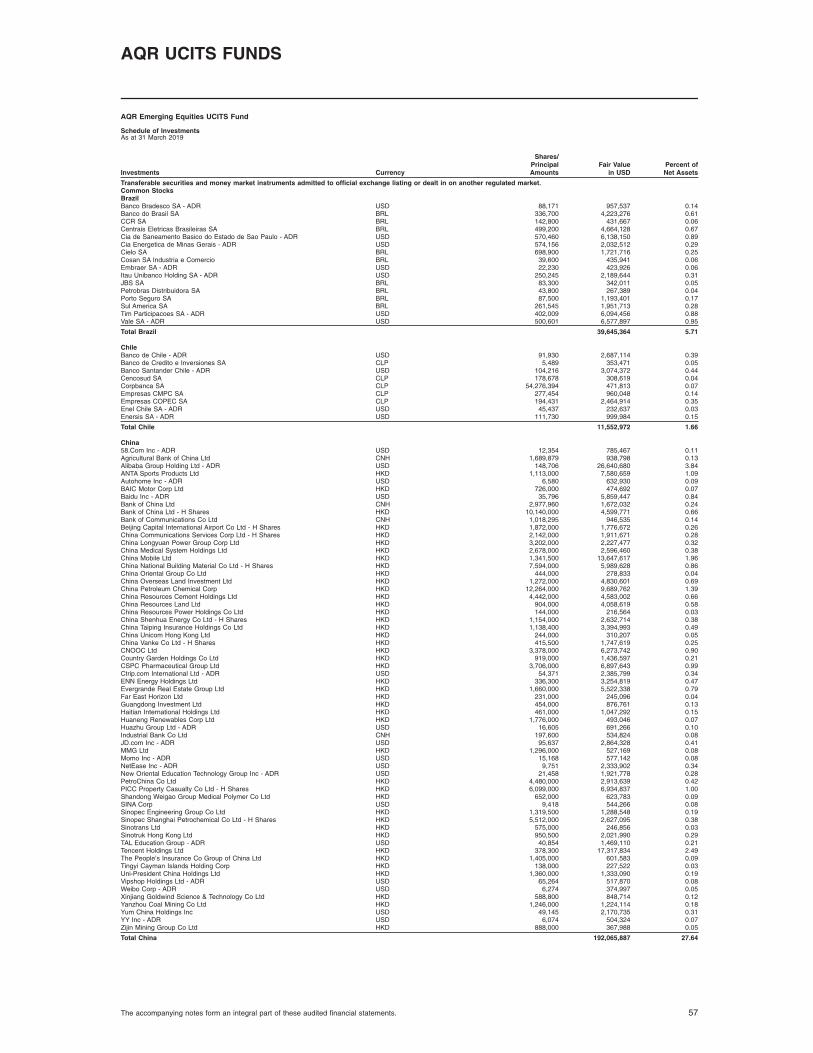
Investments Currency
Shares/PrincipalAmounts
Fair Valuein USD
Percent ofNet Assets
Transferable securities and money market instruments admitted to official exchange listing or dealt in on another regulated market.Common StocksBrazilBanco Bradesco SA - ADR USD 88,171 957,537 0.14Banco do Brasil SA BRL 336,700 4,223,276 0.61CCR SA BRL 142,800 431,667 0.06Centrais Eletricas Brasileiras SA BRL 499,200 4,664,128 0.67Cia de Saneamento Basico do Estado de Sao Paulo - ADR USD 570,460 6,138,150 0.89Cia Energetica de Minas Gerais - ADR USD 574,156 2,032,512 0.29Cielo SA BRL 698,900 1,721,716 0.25Cosan SA Industria e Comercio BRL 39,600 435,941 0.06Embraer SA - ADR USD 22,230 423,926 0.06Itau Unibanco Holding SA - ADR USD 250,245 2,189,644 0.31JBS SA BRL 83,300 342,011 0.05Petrobras Distribuidora SA BRL 43,800 267,389 0.04Porto Seguro SA BRL 87,500 1,193,401 0.17Sul America SA BRL 261,545 1,951,713 0.28Tim Participacoes SA - ADR USD 402,009 6,094,456 0.88Vale SA - ADR USD 500,601 6,577,897 0.95
Total Brazil 39,645,364 5.71
ChileBanco de Chile - ADR USD 91,930 2,687,114 0.39Banco de Credito e Inversiones SA CLP 5,489 353,471 0.05Banco Santander Chile - ADR USD 104,216 3,074,372 0.44Cencosud SA CLP 178,678 308,619 0.04Corpbanca SA CLP 54,276,394 471,813 0.07Empresas CMPC SA CLP 277,454 960,048 0.14Empresas COPEC SA CLP 194,431 2,464,914 0.35Enel Chile SA - ADR USD 45,437 232,637 0.03Enersis SA - ADR USD 111,730 999,984 0.15
Total Chile 11,552,972 1.66
China58.Com Inc - ADR USD 12,354 785,467 0.11Agricultural Bank of China Ltd CNH 1,689,879 938,798 0.13Alibaba Group Holding Ltd - ADR USD 148,706 26,640,680 3.84ANTA Sports Products Ltd HKD 1,113,000 7,580,659 1.09Autohome Inc - ADR USD 6,580 632,930 0.09BAIC Motor Corp Ltd HKD 726,000 474,692 0.07Baidu Inc - ADR USD 35,796 5,859,447 0.84Bank of China Ltd CNH 2,977,960 1,672,032 0.24Bank of China Ltd - H Shares HKD 10,140,000 4,599,771 0.66Bank of Communications Co Ltd CNH 1,018,295 946,535 0.14Beijing Capital International Airport Co Ltd - H Shares HKD 1,872,000 1,776,672 0.26China Communications Services Corp Ltd - H Shares HKD 2,142,000 1,911,671 0.28China Longyuan Power Group Corp Ltd HKD 3,202,000 2,227,477 0.32China Medical System Holdings Ltd HKD 2,678,000 2,596,460 0.38China Mobile Ltd HKD 1,341,500 13,647,617 1.96China National Building Material Co Ltd - H Shares HKD 7,594,000 5,989,628 0.86China Oriental Group Co Ltd HKD 444,000 278,833 0.04China Overseas Land Investment Ltd HKD 1,272,000 4,830,601 0.69China Petroleum Chemical Corp HKD 12,264,000 9,689,762 1.39China Resources Cement Holdings Ltd HKD 4,442,000 4,583,002 0.66China Resources Land Ltd HKD 904,000 4,058,619 0.58China Resources Power Holdings Co Ltd HKD 144,000 216,564 0.03China Shenhua Energy Co Ltd - H Shares HKD 1,154,000 2,632,714 0.38China Taiping Insurance Holdings Co Ltd HKD 1,138,400 3,394,993 0.49China Unicom Hong Kong Ltd HKD 244,000 310,207 0.05China Vanke Co Ltd - H Shares HKD 415,500 1,747,619 0.25CNOOC Ltd HKD 3,378,000 6,273,742 0.90Country Garden Holdings Co Ltd HKD 919,000 1,436,597 0.21CSPC Pharmaceutical Group Ltd HKD 3,706,000 6,897,643 0.99Ctrip.com International Ltd - ADR USD 54,371 2,385,799 0.34ENN Energy Holdings Ltd HKD 336,300 3,254,819 0.47Evergrande Real Estate Group Ltd HKD 1,660,000 5,522,338 0.79Far East Horizon Ltd HKD 231,000 245,096 0.04Guangdong Investment Ltd HKD 454,000 876,761 0.13Haitian International Holdings Ltd HKD 461,000 1,047,292 0.15Huaneng Renewables Corp Ltd HKD 1,776,000 493,046 0.07Huazhu Group Ltd - ADR USD 16,605 691,266 0.10Industrial Bank Co Ltd CNH 197,600 534,824 0.08JD.com Inc - ADR USD 95,637 2,864,328 0.41MMG Ltd HKD 1,296,000 527,169 0.08Momo Inc - ADR USD 15,168 577,142 0.08NetEase Inc - ADR USD 9,751 2,333,902 0.34New Oriental Education Technology Group Inc - ADR USD 21,458 1,921,778 0.28PetroChina Co Ltd HKD 4,480,000 2,913,639 0.42PICC Property Casualty Co Ltd - H Shares HKD 6,099,000 6,934,837 1.00Shandong Weigao Group Medical Polymer Co Ltd HKD 652,000 623,783 0.09SINA Corp USD 9,418 544,266 0.08Sinopec Engineering Group Co Ltd HKD 1,319,500 1,288,548 0.19Sinopec Shanghai Petrochemical Co Ltd - H Shares HKD 5,512,000 2,627,095 0.38Sinotrans Ltd HKD 575,000 246,856 0.03Sinotruk Hong Kong Ltd HKD 950,500 2,021,990 0.29TAL Education Group - ADR USD 40,854 1,469,110 0.21Tencent Holdings Ltd HKD 378,300 17,317,834 2.49The People’s Insurance Co Group of China Ltd HKD 1,405,000 601,583 0.09Tingyi Cayman Islands Holding Corp HKD 138,000 227,522 0.03Uni-President China Holdings Ltd HKD 1,360,000 1,333,090 0.19Vipshop Holdings Ltd - ADR USD 65,264 517,870 0.08Weibo Corp - ADR USD 6,274 374,997 0.05Xinjiang Goldwind Science & Technology Co Ltd HKD 588,800 848,714 0.12Yanzhou Coal Mining Co Ltd HKD 1,246,000 1,224,114 0.18Yum China Holdings Inc USD 49,145 2,170,735 0.31YY Inc - ADR USD 6,074 504,324 0.07Zijin Mining Group Co Ltd HKD 888,000 367,988 0.05
Total China 192,065,887 27.64
AQR UCITS FUNDS
AQR Emerging Equities UCITS Fund
Schedule of InvestmentsAs at 31 March 2019
The accompanying notes form an integral part of these audited financial statements. 57

Investments Currency
Shares/PrincipalAmounts
Fair Valuein USD
Percent ofNet Assets
Transferable securities and money market instruments admitted to official exchange listing or dealt in on another regulated market.Common Stocks (continued)Hong KongHaier Electronics Group Co Ltd HKD 1,235,000 3,586,348 0.52Kingboard Laminates Holdings Ltd HKD 1,425,000 1,499,575 0.21Sino Biopharmaceutical Ltd HKD 6,031,000 5,501,003 0.79SSY Group Ltd HKD 208,000 193,462 0.03
Total Hong Kong 10,780,388 1.55
HungaryOTP Bank PLC HUF 31,456 1,391,996 0.20
Total Hungary 1,391,996 0.20
IndiaAshok Leyland Ltd INR 138,261 182,315 0.03Aurobindo Pharma Ltd INR 56,000 634,146 0.09Bharat Heavy Electricals Ltd INR 957,224 1,036,111 0.15Bharat Petroleum Corp Ltd INR 280,279 1,608,474 0.23Coal India Ltd INR 836,128 2,863,198 0.41Dr Reddy’s Laboratories Ltd - ADR USD 10,292 411,783 0.06Glenmark Pharmaceuticals Ltd INR 47,459 443,513 0.06Godrej Consumer Products Ltd INR 27,652 273,866 0.04HCL Technologies Ltd INR 104,402 1,639,127 0.24Hero MotoCorp Ltd INR 68,722 2,533,654 0.36Hindalco Industries Ltd INR 118,414 351,534 0.05Hindustan Petroleum Corp Ltd INR 161,062 660,089 0.10Hindustan Unilever Ltd INR 134,878 3,324,089 0.48ICICI Bank Ltd - ADR USD 146,721 1,671,152 0.24Indiabulls Housing Finance Ltd INR 293,343 3,636,968 0.53Indian Oil Corp Ltd INR 1,240,349 2,916,311 0.42Infosys Ltd - ADR USD 805,228 8,857,508 1.27JSW Steel Ltd INR 97,983 414,726 0.06Marico Ltd INR 57,204 286,345 0.04Oil & Natural Gas Corp Ltd INR 254,155 586,209 0.08Reliance Industries Ltd - GDR USD 4,887 194,258 0.03Tata Consultancy Services Ltd INR 334,648 9,670,201 1.39Tech Mahindra Ltd INR 171,287 1,918,797 0.28Vedanta Ltd - ADR USD 351,804 3,681,629 0.53Wipro Ltd - ADR USD 75,342 299,861 0.04
Total India 50,095,864 7.21
IndonesiaAdaro Energy Tbk PT IDR 22,832,400 2,156,495 0.31Bank Central Asia Tbk PT IDR 1,005,300 1,959,982 0.28Bank Mandiri Persero Tbk PT IDR 4,565,700 2,390,501 0.35Bank Negara Indonesia Persero Tbk PT IDR 7,904,000 5,220,545 0.75Bank Rakyat Indonesia Persero Tbk PT IDR 4,360,300 1,261,693 0.18Indah Kiat Pulp & Paper Corp Tbk PT IDR 324,400 196,043 0.03Perusahaan Gas Negara Persero Tbk PT IDR 1,331,400 220,023 0.03United Tractors Tbk PT IDR 2,908,800 5,530,345 0.80
Total Indonesia 18,935,627 2.73
MalaysiaAirAsia Group Bhd MYR 3,374,600 2,199,700 0.32Dialog Group Bhd MYR 882,400 685,552 0.10Genting Bhd MYR 355,200 577,805 0.08Genting Malaysia Bhd MYR 276,100 216,494 0.03Hong Leong Bank Bhd MYR 295,800 1,470,650 0.21Malayan Banking Bhd MYR 1,237,400 2,809,837 0.41Malaysia Airports Holdings Bhd MYR 1,147,600 2,035,521 0.29Petronas Chemicals Group Bhd MYR 929,500 2,086,235 0.30Petronas Gas Bhd MYR 169,500 732,071 0.10Public Bank Bhd MYR 612,800 3,476,292 0.50Sime Darby Bhd MYR 571,300 312,266 0.05
Total Malaysia 16,602,423 2.39
MexicoAlfa SAB de CV MXN 2,455,200 2,607,081 0.37Arca Continental SAB de CV MXN 78,398 434,017 0.06Banco Santander Mexico SA Institucion de Banca Multiple Grupo FinancieroSantander - ADR USD 71,958 487,156 0.07Fibra Uno Administracion SA de CV (β) MXN 772,300 1,075,174 0.15Gruma SAB de CV MXN 78,215 799,799 0.12Grupo Financiero Banorte SAB de CV MXN 273,800 1,513,933 0.22Grupo Mexico SAB de CV MXN 295,000 815,577 0.12Mexichem SAB de CV MXN 755,300 1,799,567 0.26Wal-Mart de Mexico SAB de CV MXN 5,075,000 13,610,301 1.96
Total Mexico 23,142,605 3.33
PeruCredicorp Ltd USD 10,300 2,453,666 0.35
Total Peru 2,453,666 0.35
PhilippinesAyala Corp PHP 28,970 518,774 0.07Ayala Land Inc PHP 568,400 485,862 0.07BDO Unibank Inc PHP 129,220 329,283 0.05Metro Pacific Investments Corp PHP 531,000 49,057 0.01Philippine Long Distance Telephone Co PHP 8,935 195,576 0.03SM Prime Holdings Inc PHP 466,500 354,316 0.05
Total Philippines 1,932,868 0.28
PolandAlior Bank SA PLN 24,759 386,400 0.06Grupa Lotos SA PLN 31,535 684,565 0.10Jastrzebska Spolka Weglowa SA PLN 111,062 1,757,051 0.25KGHM Polska Miedz SA PLN 20,701 576,716 0.08PGE Polska Grupa Energetyczna SA PLN 1,118,689 2,922,445 0.42Polski Koncern Naftowy Orlen SA PLN 36,252 929,444 0.14
AQR UCITS FUNDS
AQR Emerging Equities UCITS Fund
Schedule of Investments (continued)As at 31 March 2019
The accompanying notes form an integral part of these audited financial statements. 58

Investments Currency
Shares/PrincipalAmounts
Fair Valuein USD
Percent ofNet Assets
Transferable securities and money market instruments admitted to official exchange listing or dealt in on another regulated market.Common Stocks (continued)Poland (continued)Polskie Gornictwo Naftowe i Gazownictwo SA PLN 1,584,661 2,586,822 0.37Powszechny Zaklad Ubezpieczen SA PLN 101,818 1,070,859 0.15
Total Poland 10,914,302 1.57
QatarIndustries Qatar QSC QAR 6,338 215,974 0.03Qatar National Bank QPSC QAR 56,396 2,796,309 0.40
Total Qatar 3,012,283 0.43
RomaniaNEPI Rockcastle PLC ZAR 67,593 566,009 0.08
Total Romania 566,009 0.08
RussiaGazprom PAO - ADR USD 662,595 2,988,303 0.43Lukoil PJSC - ADR USD 58,551 5,246,170 0.75Mobile TeleSystems PJSC - ADR USD 507,188 3,879,988 0.56Novatek OAO - ADR USD 11,767 1,995,683 0.29Novolipetsk Steel PJSC - ADR USD 43,389 1,124,643 0.16Rosneft OAO - GDR USD 152,970 956,674 0.14Severstal PAO - GDR USD 301,209 4,719,945 0.68Surgutneftegas OAO - ADR USD 244,177 907,362 0.13Tatneft PAO - ADR USD 6,009 414,260 0.06
Total Russia 22,233,028 3.20
South AfricaAnglo American Platinum Ltd ZAR 3,513 179,609 0.03Barclays Africa Group Ltd ZAR 55,479 584,123 0.09Bid Corp Ltd ZAR 39,051 800,244 0.11Exxaro Resources Ltd ZAR 303,833 3,452,135 0.50Foschini Group Ltd ZAR 77,058 864,775 0.12Gold Fields Ltd - ADR USD 1,150,610 4,274,516 0.61Growthpoint Properties Ltd (β) ZAR 714,256 1,197,685 0.17Investec Ltd ZAR 102,295 594,387 0.09MMI Holdings Ltd ZAR 417,167 479,027 0.07Mondi Ltd ZAR 111,283 2,450,975 0.35MR PRICE GROUP LTD ZAR 213,946 2,820,783 0.41Naspers Ltd ZAR 30,442 6,987,247 1.01Pick n Pay Stores Ltd ZAR 286,713 1,315,329 0.19Redefine Properties Ltd (β) ZAR 1,289,077 858,568 0.12Remgro Ltd ZAR 64,330 825,673 0.12RMB Holdings Ltd ZAR 93,230 491,150 0.07Sasol Ltd ZAR 42,273 1,314,300 0.19Truworths International Ltd ZAR 334,081 1,597,264 0.23
Total South Africa 31,087,790 4.48
South KoreaBNK Financial Group Inc KRW 110,932 652,911 0.10Daelim Industrial Co Ltd KRW 10,718 910,030 0.13Daewoo International Corp KRW 22,066 345,138 0.05Doosan Bobcat Inc KRW 6,709 182,583 0.03Hana Financial Group Inc KRW 126,371 4,052,102 0.58Hanwha Life Insurance Co Ltd KRW 141,293 497,931 0.07HDC Hyundai Development Co-Engineering & Construction KRW 7,018 313,411 0.05Hyundai Department Store Co Ltd KRW 9,805 872,447 0.12Hyundai Engineering & Construction Co Ltd KRW 121,056 5,694,278 0.82Hyundai Marine & Fire Insurance Co Ltd KRW 31,863 1,063,996 0.15Korea Electric Power Corp KRW 166,728 4,391,107 0.63Korea Gas Corp KRW 9,810 389,819 0.06Korea Investment Holdings Co Ltd KRW 41,670 2,279,275 0.33Korea Zinc Co Ltd KRW 471 192,918 0.03KT Corp - ADR USD 199,498 2,515,670 0.36Kumho Petrochemical Co Ltd KRW 35,566 2,982,628 0.43LG Corp KRW 28,493 1,945,382 0.28LG Electronics Inc KRW 9,983 660,420 0.09Lotte Shopping Co Ltd KRW 3,912 613,344 0.09POSCO KRW 45,079 10,046,207 1.44Samsung Electronics Co Ltd KRW 841,689 33,104,008 4.76SK Hynix Inc KRW 92,612 6,053,216 0.87SK Telecom Co Ltd KRW 1,689 373,970 0.06Woori Financial Group Inc KRW 56,917 689,462 0.10
Total South Korea 80,822,253 11.63
TaiwanAsustek Computer Inc TWD 43,000 311,129 0.05Catcher Technology Co Ltd TWD 455,000 3,500,252 0.50Cathay Financial Holding Co Ltd TWD 754,000 1,099,886 0.16Chailease Holding Co Ltd TWD 797,100 3,259,211 0.47China Airlines Ltd TWD 6,692,000 2,141,161 0.31China Development Financial Holding Corp TWD 4,137,000 1,382,765 0.20China Life Insurance Co Ltd TWD 3,410,650 2,894,133 0.42China Steel Corp TWD 249,000 204,413 0.03CTBC Financial Holding Co Ltd TWD 7,277,927 4,829,681 0.70Delta Electronics Inc TWD 750,000 3,869,443 0.56E.Sun Financial Holding Co Ltd TWD 394,609 304,101 0.04Eva Airways Corp TWD 610,743 299,245 0.04Far Eastern New Century Corp TWD 1,651,000 1,631,330 0.24First Financial Holding Co Ltd TWD 2,764,759 1,892,898 0.27Formosa Chemicals Fibre Corp TWD 632,000 2,297,140 0.33Fubon Financial Holding Co Ltd TWD 143,000 213,465 0.03Globalwafers Co Ltd TWD 151,000 1,483,418 0.21Inventec Corp TWD 521,000 396,459 0.06Lite-On Technology Corp TWD 209,000 304,175 0.04Mega Financial Holding Co Ltd TWD 494,000 449,616 0.06Nien Made Enterprise Co Ltd TWD 57,000 502,251 0.07Phison Electronics Corp TWD 24,000 235,118 0.03
AQR UCITS FUNDS
AQR Emerging Equities UCITS Fund
Schedule of Investments (continued)As at 31 March 2019
The accompanying notes form an integral part of these audited financial statements. 59

Investments Currency
Shares/PrincipalAmounts
Fair Valuein USD
Percent ofNet Assets
Transferable securities and money market instruments admitted to official exchange listing or dealt in on another regulated market.Common Stocks (continued)Taiwan (continued)Pou Chen Corp TWD 304,000 370,419 0.05Powertech Technology Inc TWD 418,555 988,744 0.14President Chain Store Corp TWD 732,000 7,209,178 1.04Realtek Semiconductor Corp TWD 135,000 797,514 0.12Shin Kong Financial Holding Co Ltd TWD 4,690,790 1,382,115 0.20Synnex Technology International Corp TWD 159,000 190,897 0.03Taiwan Cement Corp TWD 405,000 542,092 0.08Taiwan Cooperative Financial Holding Co Ltd TWD 1,682,358 1,064,527 0.15Taiwan Semiconductor Manufacturing Co Ltd - ADR USD 230,052 9,347,013 1.35Uni-President Enterprises Corp TWD 1,968,000 4,777,380 0.69Walsin Technology Corp TWD 544,000 3,531,521 0.51Zhen Ding Technology Holding Ltd TWD 371,000 1,152,095 0.16
Total Taiwan 64,854,785 9.34
ThailandBangkok Bank PCL - NVDR THB 236,400 1,542,525 0.22Bangkok Dusit Medical Services PCL THB 883,800 690,925 0.10Electricity Generating PCL THB 23,400 215,352 0.03Home Product Center PCL - NVDR THB 625,000 301,388 0.04Krung Thai Bank PCL - NVDR THB 423,000 255,967 0.04PTT Exploration Production PCL - NVDR THB 801,700 3,172,333 0.46PTT Global Chemical PCL - NVDR THB 1,278,100 2,709,276 0.39PTT PCL - NVDR THB 5,155,400 7,800,256 1.12Thai Oil PCL - NVDR THB 1,592,800 3,490,806 0.50
Total Thailand 20,178,828 2.90
TurkeyFord Otomotiv Sanayi AS TRY 43,742 375,353 0.05TAV Havalimanlari Holding AS TRY 463,124 1,928,725 0.28Turkiye Halk Bankasi AS TRY 660,864 746,666 0.11Turkiye Is Bankasi AS TRY 189,614 185,982 0.03
Total Turkey 3,236,726 0.47
United Arab EmiratesAbu Dhabi Commercial Bank PJSC AED 141,186 364,606 0.05Emirates Telecom Corp AED 108,459 493,952 0.07First Abu Dhabi Bank PJSC AED 341,374 1,420,287 0.21
Total United Arab Emirates 2,278,845 0.33
United StatesSouthern Copper Corp USD 25,000 991,000 0.14
Total United States 991,000 0.14
Total Common Stocks 608,775,509 87.62
Preferred StocksBrazilCia Brasileira de Distribuicao BRL 20,800 485,286 0.07Gerdau SA BRL 378,600 1,475,753 0.21Itausa - Investimentos Itau SA BRL 1,892,697 5,837,955 0.84Petroleo Brasileiro SA BRL 324,300 2,349,270 0.34
Total Brazil 10,148,264 1.46
Total Preferred Stocks 10,148,264 1.46
RightChinaXinjiang Goldwind Science & Technology Co Ltd HKD 111,872 44,252 0.01
Total China 44,252 0.01
Toal Right 44,252 0.01
Total Transferable securities and money market instruments admitted to official exchange listing or dealt in on another regulated market. 618,968,025 89.09
Total Investments (Total Cost: $596,902,878) 618,968,025 89.09
Other Assets/(Liabilities) 75,820,518 10.91
Total Net Assets 694,788,543 100.00
(β) Real Estate Investment TrustADR-American Depositary ReceiptGDR-Global Depositary ReceiptNVDR-Non-Voting Depository Receipt
AQR UCITS FUNDS
AQR Emerging Equities UCITS Fund
Schedule of Investments (continued)As at 31 March 2019
The accompanying notes form an integral part of these audited financial statements. 60

Economic Classification of InvestmentsAs at 31 March 2019
Industry ClassificationPercent ofNet Assets
Basic Materials 8.11Communications 13.66Consumer Cyclical 8.53Consumer Non-cyclical 5.20Diversified 1.73Energy 11.43Financial 18.52Industrial 6.73Technology 11.27Utilities 3.91Total Investments 89.09
Other Assets/(Liabilities) 10.91Total Net Assets 100.00
AQR UCITS FUNDS
AQR Emerging Equities UCITS Fund
Schedule of Investments (continued)As at 31 March 2019
The accompanying notes form an integral part of these audited financial statements. 61

Derivatives
Futures ContractsExchange-Traded
Description Counterparty†Number ofContracts
ExpirationDate
TradingCurrency
Notional Amountin USD
UnrealisedAppreciation/
(Depreciation)in USD
Percent ofNet Assets
FTSE KLC Index Futures BARC (1) 30/04/2019 MYR (20,159) (28) (0.00)FTSE/JSE TOP 40 Futures BARC (321) 20/06/2019 ZAR (11,261,586) (34,190) (0.01)KOSPI 200 Index Futures BARC 121 13/06/2019 KRW 7,387,278 (38,878) (0.00)MEX BOLSA Index Futures BARC (31) 21/06/2019 MXN (696,471) (19,399) (0.00)SET50 Futures BARC (77) 27/06/2019 THB (525,741) (1,875) (0.00)H-Shares Index Futures BARC 35 29/04/2019 HKD 2,535,621 10,912 0.00MEX BOLSA Index Futures BARC (54) 21/06/2019 MXN (1,213,208) 6,252 0.00
Total Futures Contracts (77,206) (0.01)
Forward Foreign Exchange ContractsOver-the-Counter
Counterparty† Currency Purchased Amount Purchased Currency Sold Amount Sold Settlement Date
UnrealisedAppreciation/
(Depreciation)in USD
Percent ofNet Assets
CITI BRL 43,573,000 USD 11,523,360 19/06/2019* (402,668) (0.06)CITI CLP 420,000,000 USD 636,933 19/06/2019* (19,569) (0.00)CITI CNH 12,850,000 USD 1,919,219 19/06/2019 (6,106) (0.00)CITI CZK 1,500,000 USD 66,643 19/06/2019 (1,274) (0.00)CITI EUR 750,000 USD 857,289 19/06/2019 (9,695) (0.00)CITI HKD 499,364,000 USD 63,842,090 19/06/2019 (77,474) (0.01)CITI HUF 507,338,500 USD 1,825,711 19/06/2019 (42,100) (0.01)CITI IDR 1,500,000,000 USD 104,683 19/06/2019* (730) (0.00)CITI INR 710,500,000 USD 10,181,804 19/06/2019* (45,706) (0.01)CITI KRW 8,085,921,000 USD 7,184,070 19/06/2019* (61,296) (0.01)CITI MXN 489,046,310 USD 25,085,792 19/06/2019 (78,042) (0.01)CITI PEN 150,000 USD 45,302 19/06/2019* (248) (0.00)CITI PHP 443,966,500 USD 8,481,583 19/06/2019* (112,527) (0.02)CITI PLN 41,906,200 USD 11,045,330 19/06/2019 (82,026) (0.01)CITI THB 15,686,000 USD 500,300 19/06/2019 (5,023) (0.00)CITI TWD 26,500,000 USD 863,561 19/06/2019* (2,071) (0.00)CITI USD 429,578 BRL 1,700,000 19/06/2019* (4,295) (0.00)CITI USD 36,484 CLP 25,000,000 19/06/2019* (264) (0.00)CITI USD 8,606,313 CNH 58,226,000 19/06/2019 (62,397) (0.01)CITI USD 420,797 HKD 3,295,500 19/06/2019 (11) (0.00)CITI USD 2,936,862 IDR 42,500,000,000 19/06/2019* (8,483) (0.00)CITI USD 85 INR 6,000 19/06/2019* 0 0.00CITI USD 1,925,999 MXN 38,077,000 19/06/2019 (21,097) (0.00)CITI USD 105,085 PEN 350,000 19/06/2019* (39) (0.00)CITI USD 5,761,059 RUB 384,000,000 19/06/2019* (37,906) (0.01)CITI USD 330,055 THB 10,500,000 19/06/2019 (1,476) (0.00)CITI USD 2,738,360 TWD 84,355,296 19/06/2019* (3,950) (0.00)CITI USD 375,314 ZAR 5,500,000 19/06/2019 (1,152) (0.00)CITI ZAR 54,247,505 USD 3,783,788 19/06/2019 (70,633) (0.01)JPMC BRL 43,573,000 USD 11,523,373 19/06/2019* (402,682) (0.06)JPMC CLP 420,000,000 USD 636,933 19/06/2019* (19,570) (0.00)JPMC CNH 12,850,000 USD 1,919,222 19/06/2019 (6,108) (0.00)JPMC CZK 1,500,000 USD 66,643 19/06/2019 (1,274) (0.00)JPMC EUR 750,000 USD 857,291 19/06/2019 (9,696) (0.00)JPMC HKD 499,364,000 USD 63,842,206 19/06/2019 (77,595) (0.01)JPMC HUF 507,338,500 USD 1,825,714 19/06/2019 (42,102) (0.01)JPMC IDR 1,500,000,000 USD 104,683 19/06/2019* (730) (0.00)JPMC INR 710,500,000 USD 10,181,818 19/06/2019* (45,719) (0.01)JPMC KRW 8,085,921,000 USD 7,184,079 19/06/2019* (61,305) (0.01)JPMC MXN 489,046,310 USD 25,085,823 19/06/2019 (78,073) (0.01)JPMC PEN 150,000 USD 45,302 19/06/2019* (248) (0.00)JPMC PHP 443,966,500 USD 8,481,594 19/06/2019* (112,538) (0.02)JPMC PLN 41,906,194 USD 11,045,340 19/06/2019 (82,040) (0.01)JPMC THB 15,686,000 USD 500,300 19/06/2019 (5,024) (0.00)JPMC TWD 26,500,000 USD 863,562 19/06/2019* (2,073) (0.00)JPMC USD 429,578 BRL 1,700,000 19/06/2019* (4,296) (0.00)JPMC USD 36,484 CLP 25,000,000 19/06/2019* (264) (0.00)JPMC USD 8,606,730 CNH 58,226,000 19/06/2019 (61,979) (0.01)JPMC USD 420,796 HKD 3,295,500 19/06/2019 (11) (0.00)JPMC USD 2,936,859 IDR 42,500,000,000 19/06/2019* (8,487) (0.00)JPMC USD 85 INR 6,000 19/06/2019* 0 0.00JPMC USD 1,925,997 MXN 38,077,000 19/06/2019 (21,099) (0.00)JPMC USD 105,085 PEN 350,000 19/06/2019* (39) (0.00)JPMC USD 5,761,052 RUB 384,000,000 19/06/2019* (37,913) (0.01)JPMC USD 330,055 THB 10,500,000 19/06/2019 (1,476) (0.00)JPMC USD 2,738,357 TWD 84,355,296 19/06/2019* (3,953) (0.00)JPMC USD 375,314 ZAR 5,500,000 19/06/2019 (1,153) (0.00)JPMC ZAR 54,247,495 USD 3,783,794 19/06/2019 (70,637) (0.01)CITI CLP 95,000,000 USD 139,616 19/06/2019* 26 0.00CITI CNH 26,577,500 USD 3,951,171 19/06/2019 5,698 0.00CITI HKD 23,000 USD 2,936 19/06/2019 0 0.00CITI IDR 11,781,099,500 USD 815,925 19/06/2019* 532 0.00CITI INR 2,251,690,000 USD 31,420,887 19/06/2019* 702,058 0.10CITI MXN 562,551,688 USD 28,592,851 19/06/2019 173,651 0.02CITI PHP 3,091,000 USD 57,844 19/06/2019* 423 0.00CITI PLN 1,917,303 USD 500,845 19/06/2019 751 0.00CITI RUB 1,427,261,500 USD 21,353,856 19/06/2019* 199,893 0.03CITI THB 1,500,000 USD 47,233 19/06/2019 129 0.00CITI TWD 12,431,500 USD 403,623 19/06/2019* 513 0.00CITI USD 35,111,369 BRL 134,503,500 19/06/2019* 783,414 0.11CITI USD 5,943,749 CLP 3,908,668,000 19/06/2019* 198,345 0.03CITI USD 32,046,203 CNH 214,488,500 19/06/2019 113,073 0.02CITI USD 56,728 EUR 50,000 19/06/2019 222 0.00CITI USD 16,827,331 HKD 131,704,600 19/06/2019 9,755 0.00CITI USD 6,702,700 IDR 95,963,884,500 19/06/2019* 52,188 0.01CITI USD 46,491,034 KRW 52,136,775,765 19/06/2019* 564,477 0.08CITI USD 3,513,893 MXN 68,000,000 19/06/2019 36,662 0.01
AQR UCITS FUNDS
AQR Emerging Equities UCITS Fund
Schedule of Investments (continued)As at 31 March 2019
The accompanying notes form an integral part of these audited financial statements. 62

Counterparty† Currency Purchased Amount Purchased Currency Sold Amount Sold Settlement Date
UnrealisedAppreciation/
(Depreciation)in USD
Percent ofNet Assets
CITI USD 150,741 PEN 500,000 19/06/2019* 563 0.00CITI USD 1,840,658 PHP 97,500,000 19/06/2019* 2,719 0.00CITI USD 243,312 PLN 923,500 19/06/2019 1,711 0.00CITI USD 2,075,107 RUB 135,000,000 19/06/2019* 36,409 0.01CITI USD 1,948,451 THB 61,094,500 19/06/2019 19,427 0.00CITI USD 10,578,064 TWD 324,586,704 19/06/2019* 26,063 0.00CITI USD 18,450,138 ZAR 262,500,000 19/06/2019 482,420 0.07JPMC CLP 95,000,000 USD 139,616 19/06/2019* 26 0.00JPMC CNH 26,577,500 USD 3,951,175 19/06/2019 5,693 0.00JPMC HKD 23,000 USD 2,936 19/06/2019 0 0.00JPMC IDR 11,781,099,500 USD 815,926 19/06/2019* 531 0.00JPMC INR 2,251,690,000 USD 31,420,927 19/06/2019* 702,019 0.10JPMC MXN 562,551,692 USD 28,592,888 19/06/2019 173,616 0.02JPMC PHP 3,091,000 USD 57,844 19/06/2019* 423 0.00JPMC PLN 1,917,303 USD 500,846 19/06/2019 750 0.00JPMC RUB 1,427,261,500 USD 21,353,882 19/06/2019* 199,866 0.03JPMC THB 1,500,000 USD 47,233 19/06/2019 129 0.00JPMC TWD 12,431,500 USD 403,624 19/06/2019* 512 0.00JPMC USD 35,111,326 BRL 134,503,500 19/06/2019* 783,370 0.11JPMC USD 5,943,743 CLP 3,908,668,000 19/06/2019* 198,338 0.03JPMC USD 32,046,162 CNH 214,488,500 19/06/2019 113,033 0.02JPMC USD 56,728 EUR 50,000 19/06/2019 221 0.00JPMC USD 14,575,529 HKD 114,079,600 19/06/2019 8,515 0.00JPMC USD 6,702,693 IDR 95,963,884,500 19/06/2019* 52,179 0.01JPMC USD 45,531,805 KRW 51,058,834,772 19/06/2019* 554,792 0.08JPMC USD 3,513,890 MXN 68,000,000 19/06/2019 36,658 0.01JPMC USD 150,741 PEN 500,000 19/06/2019* 562 0.00JPMC USD 1,840,655 PHP 97,500,000 19/06/2019* 2,717 0.00JPMC USD 243,312 PLN 923,500 19/06/2019 1,710 0.00JPMC USD 2,075,105 RUB 135,000,000 19/06/2019* 36,406 0.01JPMC USD 1,948,447 THB 61,094,500 19/06/2019 19,425 0.00JPMC USD 9,805,111 TWD 300,828,704 19/06/2019* 25,459 0.00JPMC USD 18,450,114 ZAR 262,500,000 19/06/2019 482,397 0.07
Total Forward Foreign Exchange Contracts 4,494,127 0.64
* Non-deliverable forwards (See Note 4)
Total Return Swap ContractsOver-the-Counter
Reference Entity (�RE�)PaymentsMade By Sub-Fund‡
Payments ReceivedBy Sub-Fund‡ Counterparty† Maturity Date
TradingCurrency
NotionalAmountin USD
UnrealisedAppreciation/
(Depreciation)in USD
Percent ofNet Assets
MSCI Brazil Net Return BRL Index Increases in RE Decreases in RE andreceives BZDIOVRA plus orminus a specified spread of-0.75%
GSIN 24/06/2019 BRL (1,229,237) (5,936) (0.00)
MSCI China Net Return HKD Index Decreases in RE andpays 1-month HIBOR plusor minus a specifiedspread of +0.15%
Increases in RE GSIN 21/06/2019 HKD 24,569,708 (269,582) (0.04)
MSCI Mexico Net Return MXN Index Increases in RE Decreases in RE andreceives 1-month TIIE plus orminus a specified spread of+0.00%
GSIN 21/06/2019 MXN (653,361) (11,919) (0.00)
MSCI Poland Net Return PLN Index Increases in RE Decreases in RE andreceives 1-month WIBORplus or minus a specifiedspread of +0.15%
GSIN 24/06/2019 PLN (376,938) (1,195) (0.00)
MSCI Emerging Markets ThailandNet Total Return USD Index
Increases in RE Decreases in RE andreceives 1-month LIBOR plusor minus a specified spreadof +0.20%
JPMC 08/01/2020 USD (382,953) 1,133 0.00
MSCI Poland Net Return PLN Index Increases in RE Decreases in RE andreceives 1-month WIBORplus or minus a specifiedspread of +0.15%
GSIN 24/06/2019 PLN (1,114,856) 5,161 0.00
BIST 30 Futures Apr19 Increases in RE Decreases in RE GSIN 30/04/2019 TRY (1,988,159) 221,171 0.04BOVESPA Index Futures Apr19 Increases in RE Decreases in RE MLIN 17/04/2019 BRL (16,422,689) 217,997 0.03DTOP Index Futures Jun19 Increases in RE Decreases in RE MLIN 20/06/2019 ZAR (1,103,484) 2,437 0.00H-Shares Index Futures Apr19 Decreases in RE Increases in RE GSIN 29/04/2019 HKD 47,090,109 280,824 0.04H-Shares Index Futures Apr19 Decreases in RE Increases in RE MLIN 29/04/2019 HKD 22,241,021 212,924 0.03TAIEX Futures Apr19 Decreases in RE Increases in RE GSIN 17/04/2019 TWD 1,856,855 25,476 0.00WIG20 Index Futures Jun19 Increases in RE Decreases in RE GSIN 21/06/2019 PLN (3,847,898) (5,307) (0.00)
Total of Total Return Swap Contracts 673,184 0.10
AQR UCITS FUNDS
AQR Emerging Equities UCITS Fund
Schedule of Investments (continued)As at 31 March 2019
The accompanying notes form an integral part of these audited financial statements. 63

Investments CouponMaturityDate Currency
Shares/PrincipalAmounts
Fair Valuein USD
Percentof Net
Assets
Transferable securities and money market instruments admitted to official exchange listing or dealt in on another regulated market.Government BondsAustraliaAustralia Government Bond 2.750% 21/06/2035 AUD 140,000 108,869 0.02Australia Government Bond 2.750% 21/05/2041 AUD 2,600,000 1,984,278 0.26Australia Government Bond 3.000% 21/03/2047 AUD 1,380,000 1,097,538 0.14Australia Government Bond 3.750% 21/04/2037 AUD 550,000 484,842 0.06
Total Australia 3,675,527 0.48
BelgiumKingdom of Belgium Government Bond 0.200% 23/10/2023 EUR 6,290,000 7,224,399 0.94Kingdom of Belgium Government Bond 0.500% 22/10/2024 EUR 2,280,000 2,655,412 0.35Kingdom of Belgium Government Bond 0.800% 23/06/2025 EUR 2,240,000 2,652,649 0.34Kingdom of Belgium Government Bond 0.800% 22/06/2028 EUR 460,000 540,259 0.07Kingdom of Belgium Government Bond 1.000% 22/06/2026 EUR 16,280,000 19,533,198 2.54Kingdom of Belgium Government Bond 4.250% 28/03/2041 EUR 8,580,000 15,393,663 2.00Kingdom of Belgium Government Bond 5.500% 28/03/2028 EUR 12,440,000 20,484,590 2.66
Total Belgium 68,484,170 8.90
FranceFrench Republic Government Bond OAT 0.000% 25/03/2024 EUR 6,960,000 7,915,698 1.03French Republic Government Bond OAT 1.000% 25/05/2027 EUR 38,340,000 46,280,299 6.02French Republic Government Bond OAT 1.250% 26/05/2036 EUR 8,010,000 9,563,173 1.24French Republic Government Bond OAT 1.750% 25/11/2024 EUR 540,000 674,356 0.09French Republic Government Bond OAT 4.500% 25/04/2041 EUR 1,960,000 3,718,936 0.48French Republic Government Bond OAT 6.000% 25/10/2025 EUR 5,760,000 9,079,375 1.18
Total France 77,231,837 10.04
GermanyBundesrepublik Deutschland Bundesanleihe 0.500% 16/08/2027 EUR 1,340,000 1,595,832 0.21Bundesrepublik Deutschland Bundesanleihe 0.500% 15/02/2028 EUR 15,470,000 18,407,223 2.39Bundesrepublik Deutschland Bundesanleihe 1.000% 15/08/2025 EUR 30,000 36,682 0.00Bundesrepublik Deutschland Bundesanleihe 4.750% 04/07/2040 EUR 2,480,000 5,275,223 0.69
Total Germany 25,314,960 3.29
ItalyItaly Buoni Poliennali Del Tesoro 0.900% 01/08/2022 EUR 1,540,000 1,717,123 0.22Italy Buoni Poliennali Del Tesoro 1.200% 01/04/2022 EUR 3,360,000 3,794,845 0.49Italy Buoni Poliennali Del Tesoro 1.850% 15/05/2024 EUR 11,580,000 13,112,308 1.71Italy Buoni Poliennali Del Tesoro 2.300% 15/10/2021 EUR 16,980,000 19,770,532 2.57Italy Buoni Poliennali Del Tesoro 4.000% 02/02/2037 EUR 4,560,000 5,713,046 0.74Italy Buoni Poliennali Del Tesoro 5.750% 01/02/2033 EUR 40,000 59,137 0.01Italy Buoni Poliennali Del Tesoro 6.500% 01/11/2027 EUR 30,990,000 45,951,039 5.98
Total Italy 90,118,030 11.72
JapanJapan Government Forty Year Bond 2.400% 23/03/2048 JPY 36,100,000 492,634 0.06Japan Government Thirty Year Bond 2.300% 22/03/2039 JPY 739,400,000 9,189,094 1.19Japan Government Thirty Year Bond 2.400% 23/03/2037 JPY 350,000 4,338 0.00Japan Government Thirty Year Bond 2.500% 22/03/2038 JPY 904,900,000 11,452,305 1.49Japan Government Twenty Year Bond 0.500% 21/06/2038 JPY 2,955,950,000 27,575,211 3.59Japan Government Twenty Year Bond 0.600% 22/12/2036 JPY 569,450,000 5,441,181 0.71Japan Government Twenty Year Bond 0.700% 23/03/2037 JPY 793,150,000 7,699,285 1.00
Total Japan 61,854,048 8.04
NetherlandsNetherlands Government Bond 0.250% 15/07/2025 EUR 520,000 602,751 0.08Netherlands Government Bond 0.750% 15/07/2027 EUR 13,400,000 16,050,794 2.09
Total Netherlands 16,653,545 2.17
SpainSpain Government Bond 0.050% 01/02/2021 EUR 6,350,000 7,177,351 0.93Spain Government Bond 0.350% 31/07/2023 EUR 9,020,000 10,258,292 1.33Spain Government Bond 1.150% 30/07/2020 EUR 8,620,000 9,875,219 1.28Spain Government Bond 4.000% 30/04/2020 EUR 70,000 82,290 0.01Spain Government Bond 4.700% 30/07/2041 EUR 3,010,000 5,054,928 0.66Spain Government Bond 5.150% 31/10/2028 EUR 13,580,000 21,044,409 2.74Spain Government Bond 5.150% 31/10/2044 EUR 2,960,000 5,341,531 0.70Spain Government Bond 5.900% 30/07/2026 EUR 6,430,000 9,932,043 1.29Spain Government Bond 6.000% 31/01/2029 EUR 5,670,000 9,353,623 1.22
Total Spain 78,119,686 10.16
SwedenSweden Government Bond 0.750% 12/05/2028 SEK 119,090,000 13,516,686 1.76Sweden Government Bond 0.750% 12/11/2029 SEK 23,380,000 2,638,053 0.34Sweden Government Bond 1.000% 12/11/2026 SEK 127,100,000 14,694,093 1.91Sweden Government Bond 3.500% 30/03/2039 SEK 5,400,000 874,213 0.11
Total Sweden 31,723,045 4.12
United StatesUnited States Treasury Note 2.875% 15/05/2043 USD 21,960,000 22,276,962 2.90United States Treasury Note 3.125% 17/02/2043 USD 510,000 539,913 0.07
Total United States 22,816,875 2.97
Total Government Bonds 475,991,723 61.89
Corporate BondsAustriaErste Group Bank AG 7.125% 10/10/2022 EUR 1,050,000 1,436,236 0.19Raiffeisen Bank International AG 6.000% 16/10/2023 EUR 900,000 1,179,355 0.15
Total Austria 2,615,591 0.34
BelgiumAG Insurance 3.500% 01/07/2047 EUR 300,000 348,732 0.05KBC Group NV 0.750% 01/03/2022 EUR 1,500,000 1,711,180 0.22
Total Belgium 2,059,912 0.27
CanadaAlimentation Couche-Tard 2.700% 26/07/2022 USD 3,398,000 3,356,235 0.44Bank of Montreal 3.803% 15/12/2032 USD 1,980,000 1,916,511 0.25
AQR UCITS FUNDS
AQR Global Aggregate Bond UCITS Fund
Schedule of InvestmentsAs at 31 March 2019
The accompanying notes form an integral part of these audited financial statements. 64

Investments CouponMaturityDate Currency
Shares/PrincipalAmounts
Fair Valuein USD
Percentof Net
Assets
Corporate Bonds (continued)Canada (continued)Kinross Gold Corporation 5.950% 15/03/2024 USD 2,510,000 2,691,975 0.35Methanex Corp 4.250% 02/12/2024 USD 1,540,000 1,538,375 0.20Rogers Communications Inc 5.000% 15/03/2044 USD 500,000 555,629 0.07
Total Canada 10,058,725 1.31
DenmarkAP Moller - Maersk A/S 1.750% 16/03/2026 EUR 1,300,000 1,447,108 0.19Carlsberg A/S 2.500% 28/05/2024 EUR 400,000 494,032 0.06
Total Denmark 1,941,140 0.25
FranceCNP Assurances 1.875% 20/10/2022 EUR 300,000 349,387 0.04Co-entreprise de Transport d Electricite 2.125% 29/07/2032 EUR 300,000 357,457 0.05Edenred 1.875% 06/03/2026 EUR 1,500,000 1,754,679 0.23Peugeot SA 2.000% 25/03/2024 EUR 1,500,000 1,740,774 0.23SCOR SE 3.000% 08/06/2046 EUR 1,500,000 1,785,934 0.23Societe Fonciere Lyonnaise 1.500% 29/05/2025 EUR 1,400,000 1,591,042 0.21Teleperformance SE 1.875% 02/07/2025 EUR 1,400,000 1,626,023 0.21Terega SA 4.339% 07/07/2021 EUR 1,400,000 1,716,637 0.22Thales SA 0.750% 23/01/2025 EUR 1,500,000 1,699,619 0.22
Total France 12,621,552 1.64
GermanyLEG Immobilien AG 1.250% 23/01/2024 EUR 500,000 569,707 0.07Merck KGaA 2.625% 12/12/2074 EUR 1,450,000 1,699,555 0.22Metro AG 1.125% 06/03/2023 EUR 1,600,000 1,748,867 0.23
Total Germany 4,018,129 0.52
ItalyACEA SpA 1.500% 08/06/2027 EUR 625,000 683,118 0.09Hera SpA 2.375% 04/07/2024 EUR 550,000 662,934 0.09Mediobanca SpA 0.625% 27/09/2022 EUR 1,550,000 1,720,882 0.22Terna SpA 1.000% 24/07/2023 EUR 1,650,000 1,888,987 0.25
Total Italy 4,955,921 0.65
LuxembourgAroundtown SA 1.625% 31/01/2028 EUR 1,000,000 1,078,584 0.14
Total Luxembourg 1,078,584 0.14
NetherlandsKoninklijke KPN NV 5.750% 17/09/2029 GBP 1,200,000 1,844,475 0.24Wolters Kluwer NV 2.875% 21/03/2023 EUR 850,000 1,055,056 0.14
Total Netherlands 2,899,531 0.38
NorwayDNB Bank ASA 1.125% 20/03/2028 EUR 1,650,000 1,855,811 0.24SpareBank 1 SMN 0.750% 03/07/2023 EUR 1,450,000 1,648,104 0.21SpareBank 1 SR-Bank ASA 2.125% 14/04/2021 EUR 1,350,000 1,580,071 0.21
Total Norway 5,083,986 0.66
South AfricaAnglo American Capital PLC 1.625% 18/09/2025 EUR 1,500,000 1,706,413 0.22
Total South Africa 1,706,413 0.22
SpainCaixaBank SA 1.125% 12/01/2023 EUR 700,000 786,148 0.10FCC Aqualia SA 1.413% 08/06/2022 EUR 1,400,000 1,602,823 0.21
Total Spain 2,388,971 0.31
SwedenSvenska Handelsbanken AB 1.625% 05/03/2029 EUR 1,650,000 1,871,982 0.25Swedbank AB 1.000% 22/11/2027 EUR 1,650,000 1,792,854 0.23Telia Company AB 3.000% 04/04/2078 EUR 1,700,000 1,946,824 0.25Vattenfall AB 3.000% 19/03/2077 EUR 200,000 223,674 0.03Volvo Treasury AB 4.200% 10/06/2075 EUR 1,600,000 1,871,584 0.24
Total Sweden 7,706,918 1.00
United KingdomFirstgroup PLC 8.750% 08/04/2021 GBP 1,300,000 1,895,157 0.25GKN Holdings plc 5.375% 19/09/2022 GBP 1,200,000 1,673,723 0.22Imperial Brands Finance PLC 3.375% 26/02/2026 EUR 450,000 562,068 0.07InterContinental Hotels Group 2.125% 24/08/2026 GBP 1,350,000 1,686,880 0.22Marks & Spencer PLC 3.000% 08/12/2023 GBP 1,250,000 1,647,085 0.21NatWest Markets PLC 0.625% 02/03/2022 EUR 150,000 167,259 0.02Pension Insurance Corporation 5.625% 20/09/2030 GBP 450,000 578,904 0.08Phoenix Group Holdings 4.375% 24/01/2029 EUR 300,000 324,361 0.04Rolls-Royce PLC 0.875% 09/05/2024 EUR 1,450,000 1,646,537 0.21Sky PLC 2.500% 15/09/2026 EUR 1,400,000 1,758,971 0.23Trinity Acquisition Plc 2.125% 26/05/2022 EUR 250,000 292,010 0.04Western Power Distribution 3.625% 06/11/2023 GBP 950,000 1,301,386 0.17Whitbread PLC 3.375% 16/10/2025 GBP 1,250,000 1,676,901 0.22
Total United Kingdom 15,211,242 1.98
United StatesAES Corp 7.250% 15/10/2021 USD 2,770,000 2,987,584 0.39Altria Group Inc 3.875% 17/09/2046 USD 1,090,000 895,770 0.12American Express Co 2.500% 01/08/2022 USD 3,310,000 3,273,389 0.43Anthem Inc 4.625% 15/05/2042 USD 3,300,000 3,408,428 0.44Ares Capital Corp 3.500% 10/02/2023 USD 2,810,000 2,734,937 0.36AutoZone Inc 3.125% 17/07/2023 USD 2,000,000 2,006,539 0.26Barrick North America Finance LLC 5.750% 01/05/2043 USD 690,000 795,974 0.10Baxter International Inc 2.600% 17/08/2026 USD 500,000 477,900 0.06Biogen Inc 5.200% 15/09/2045 USD 1,920,000 2,028,153 0.26
AQR UCITS FUNDS
AQR Global Aggregate Bond UCITS Fund
Schedule of Investments (continued)As at 31 March 2019
The accompanying notes form an integral part of these audited financial statements. 65

Investments CouponMaturityDate Currency
Shares/PrincipalAmounts
Fair Valuein USD
Percentof Net
Assets
Corporate Bonds (continued)United States (continued)CA Inc 4.700% 15/03/2027 USD 2,010,000 1,973,349 0.26Church & Dwight Co Inc 3.150% 02/08/2027 USD 2,000,000 1,941,644 0.25Citrix Systems Inc 4.500% 01/12/2027 USD 2,790,000 2,747,911 0.36Crown Castle International Corp 3.650% 01/09/2027 USD 3,350,000 3,297,419 0.43CSX Corp 4.300% 02/03/2048 USD 690,000 701,977 0.09Dollar General Corp 3.250% 17/04/2023 USD 3,020,000 3,039,305 0.39DTE Energy Co 2.850% 01/10/2026 USD 2,320,000 2,206,913 0.29Exelon Corp 3.497% 01/06/2022 USD 3,370,000 3,403,448 0.44FirstEnergy Corp 3.900% 15/07/2027 USD 2,830,000 2,874,050 0.37HollyFrontier Corp 5.875% 01/04/2026 USD 2,700,000 2,883,237 0.37Host Hotels & Resorts LP 3.750% 16/10/2023 USD 420,000 421,942 0.05Humana Inc 4.950% 03/10/2044 USD 1,650,000 1,762,778 0.23Huntington Bancshares Inc 2.300% 14/01/2022 USD 3,400,000 3,350,635 0.44IHS Markit Ltd 4.750% 18/02/2025 USD 2,650,000 2,763,897 0.36Interpublic Group of Cos Inc 4.200% 15/04/2024 USD 2,500,000 2,573,702 0.33JPMorgan Chase & Co 2.950% 01/10/2026 USD 1,430,000 1,397,344 0.18Keysight Technologies Inc 4.600% 06/04/2027 USD 2,840,000 2,938,451 0.38Kohl’s Corp 4.250% 17/07/2025 USD 500,000 512,915 0.07Marathon Petroleum Corp 4.750% 15/09/2044 USD 760,000 752,731 0.10Marsh & McLennan Cos Inc 4.200% 02/03/2048 USD 780,000 774,028 0.10McDonalds Corp 4.875% 11/12/2045 USD 1,480,000 1,599,130 0.21Motorola Solutions Inc 3.750% 16/05/2022 USD 520,000 529,304 0.07National Fuel Gas Company 4.750% 01/09/2028 USD 2,890,000 2,930,377 0.38Nestle Holdings Inc 0.875% 18/07/2025 EUR 1,500,000 1,748,241 0.23NetApp Inc 3.300% 30/09/2024 USD 870,000 860,561 0.11Nordstrom Inc 5.000% 15/01/2044 USD 439,000 397,165 0.05ONEOK Inc 4.950% 15/07/2047 USD 2,620,000 2,583,773 0.34OReilly Automotive Inc 4.350% 01/06/2028 USD 2,780,000 2,904,203 0.38Progressive Corp 4.125% 15/04/2047 USD 510,000 530,770 0.07QVC Inc 4.375% 15/03/2023 USD 1,410,000 1,431,309 0.19Regions Financial Corp 2.750% 15/08/2022 USD 2,620,000 2,602,362 0.34Roper Technologies Inc 3.800% 15/12/2026 USD 2,870,000 2,906,330 0.38RPM International Inc 3.750% 15/03/2027 USD 2,970,000 2,873,842 0.37SunTrust Banks Inc 2.700% 27/01/2022 USD 3,350,000 3,339,906 0.43SVB Financial Group 3.500% 29/01/2025 USD 2,000,000 1,978,111 0.26Synchrony Financial 3.950% 01/12/2027 USD 500,000 471,660 0.06Tapestry Inc 4.125% 15/07/2027 USD 1,570,000 1,501,418 0.20Total System Services Inc 4.800% 01/04/2026 USD 2,610,000 2,744,637 0.36Verisk Analytics Inc 4.000% 16/06/2025 USD 2,740,000 2,860,732 0.37VMware Inc 3.900% 23/08/2027 USD 3,100,000 2,983,156 0.39Voya Financial Inc 4.800% 15/06/2046 USD 1,270,000 1,327,766 0.17Western Gas Partners LP 5.300% 02/03/2048 USD 1,270,000 1,185,401 0.15Xerox Corp 4.125% 15/03/2023 USD 810,000 791,775 0.10
Total United States 104,008,279 13.52
Total Corporate Bonds 178,354,894 23.19
Total Transferable securities and money market instruments admitted to official exchange listing or dealt in on another regulated market. 654,346,617 85.08
Short Term InvestmentsU.S. Treasury ObligationsUnited StatesUnited States Treasury Bill1 0.000%δ 06/06/2019 USD 445,000 443,075 0.06United States Treasury Bill2 0.000%δ 13/06/2019 USD 4,293,000 4,272,366 0.56United States Treasury Bill2 0.000%δ 20/06/2019 USD 9,058,000 9,010,224 1.17United States Treasury Bill3 0.000%δ 18/07/2019 USD 11,801,000 11,717,272 1.52United States Treasury Bill3 0.000%δ 25/07/2019 USD 6,107,000 6,061,077 0.79United States Treasury Bill4 0.000%δ 08/08/2019 USD 3,523,000 3,493,078 0.45United States Treasury Bill5 0.000%δ 15/08/2019 USD 3,759,000 3,725,362 0.49United States Treasury Bill5 0.000%δ 29/08/2019 USD 6,243,000 6,181,539 0.80United States Treasury Bill6 0.000%δ 05/09/2019 USD 7,746,000 7,666,141 1.00United States Treasury Bill6 0.000%δ 12/09/2019 USD 6,243,000 6,175,596 0.80United States Treasury Bill7 0.000%δ 19/09/2019 USD 3,808,000 3,765,240 0.49
Total United States 62,510,970 8.13
Total U.S. Treasury Obligations 62,510,970 8.13
Other Investment FundsUnited StatesJPMorgan Liquidity Funds – USD Treasury CNAV Fund^ 0.000% USD 45,000,000 45,000,000 5.85
Total United States 45,000,000 5.85
Total Other Investment Funds 45,000,000 5.85
Total Short Term Investments 107,510,970 13.98
Total Investments (Total Cost: $752,558,003) 761,857,587 99.06
Other Assets/(Liabilities) 7,197,603 0.94
Total Net Assets 769,055,190 100.00
1Effective yield at 31 March 2019 was 2.50%.2Effective yield at 31 March 2019 was 2.49%.3Effective yield at 31 March 2019 was 2.46%.4Effective yield at 31 March 2019 was 2.47%.5Effective yield at 31 March 2019 was 2.48%.6Effective yield at 31 March 2019 was 2.53%.7Effective yield at 31 March 2019 was 2.52%.δThe rate shown was the effective yield at the date of the purchase.^Seven-day effective yield at 31 March 2019 was 2.24%.
AQR UCITS FUNDS
AQR Global Aggregate Bond UCITS Fund
Schedule of Investments (continued)As at 31 March 2019
The accompanying notes form an integral part of these audited financial statements. 66

Economic Classification of InvestmentsAs at 31 March 2019
Industry ClassificationPercent ofNet Assets
Basic Materials 0.80Communications 1.08Consumer Cyclical 3.52Consumer Non-cyclical 3.49Energy 1.18Financial 12.47Government 70.02Industrial 1.72Metals 0.35Technology 1.43Utilities 3.00Total Investments 99.06
Other Assets/(Liabilities) 0.94Total Net Assets 100.00
AQR UCITS FUNDS
AQR Global Aggregate Bond UCITS Fund
Schedule of Investments (continued)As at 31 March 2019
The accompanying notes form an integral part of these audited financial statements. 67

Derivatives
Credit Default Swap Contracts - Sell ProtectionCentrally Cleared
Counterparty† Reference Entity
FinancingRateReceived
TerminationDate
CreditSpread
TradingCurrency
Notional Amountin USD
UpfrontPayments(Receipts)
UnrealisedAppreciation/
(Depreciation)in USD
Percent ofNet Assets
CITGEuropean iTraxx Indices CDX Spreads -Series 31 1.00 21/06/2024 0.0068 EUR (10,001,043) 176,959 178,955 0.03
CITGNorth American Investment Grade CDXSpreads - Series 32 1.00 21/06/2024 0.0066 USD (22,692,079) 393,345 405,618 0.05
Total Credit Default Swap Contracts - Sell Protection 584,573 0.08
Futures ContractsExchange-Traded
Description Counterparty†Number ofContracts
ExpirationDate
TradingCurrency
Notional Amountin USD
UnrealisedAppreciation/
(Depreciation)in USD
Percent ofNet Assets
Euro-Bobl Futures JPPC 31 06/06/2019 EUR 4,633,623 37,174 0.00Euro-Bund Futures JPPC 143 06/06/2019 EUR 26,698,401 500,718 0.07Euro-Buxl 30 Year Bond Futures JPPC 9 06/06/2019 EUR 1,936,878 97,955 0.0110 Year US Treasury Note (CBT) Futures JPPC (265) 19/06/2019 USD (32,922,111) (500,106) (0.07)5 Year US Treasury Note (CBT) Futures JPPC (969) 28/06/2019 USD (112,260,163) (1,096,622) (0.13)Long Gilt Futures JPPC (19) 26/06/2019 GBP (3,197,046) (53,371) (0.01)
Total Futures Contracts (1,014,252) (0.13)
Forward Foreign Exchange ContractsOver-the-Counter
Counterparty† Currency Purchased Amount Purchased Currency Sold Amount Sold Settlement Date
UnrealisedAppreciation/
(Depreciation)in USD
Percent ofNet Assets
CITI AUD 11,909,295 USD 8,505,884 19/06/2019 (52,563) (0.01)CITI CAD 8,004,614 USD 6,064,702 19/06/2019 (60,771) (0.01)CITI COP 300,000,000 USD 96,805 19/06/2019* (2,617) (0.00)CITI EUR 11,296,169 USD 12,891,293 19/06/2019 (125,198) (0.02)CITI HUF 69,606,500 USD 251,431 19/06/2019 (6,721) (0.00)CITI INR 55,000,000 USD 789,074 19/06/2019* (4,437) (0.00)CITI JPY 103,130,250 USD 940,354 19/06/2019 (4,459) (0.00)CITI KRW 3,522,595,500 USD 3,140,066 19/06/2019* (37,061) (0.00)CITI MXN 112,236,346 USD 5,763,125 19/06/2019 (23,836) (0.00)CITI NZD 14,036,549 USD 9,630,163 19/06/2019 (55,798) (0.01)CITI PLN 18,990,984 USD 5,006,513 19/06/2019 (38,181) (0.00)CITI SGD 4,390,000 USD 3,256,770 19/06/2019 (11,841) (0.00)CITI TWD 3,514,500 USD 114,572 19/06/2019* (319) (0.00)CITI USD 469,687 AUD 662,111 19/06/2019 (285) (0.00)CITI USD 1,344,145 CAD 1,799,198 19/06/2019 (5,359) (0.00)CITI USD 8,936,402 CHF 8,878,603 19/06/2019 (46,853) (0.01)CITI USD 72,967 CLP 50,000,000 19/06/2019* (528) (0.00)CITI USD 666,862 GBP 513,093 19/06/2019 (2,663) (0.00)CITI USD 68,877 IDR 1,000,000,000 19/06/2019* (425) (0.00)CITI USD 23,460,694 JPY 2,597,563,729 19/06/2019 (111,905) (0.01)CITI USD 364,968 NOK 3,160,710 19/06/2019 (2,711) (0.00)CITI USD 11,808,034 SEK 109,395,283 19/06/2019 (59,754) (0.01)JPMC AUD 11,909,295 USD 8,505,894 19/06/2019 (52,573) (0.01)JPMC CAD 8,004,613 USD 6,064,711 19/06/2019 (60,778) (0.01)JPMC COP 300,000,000 USD 96,805 19/06/2019* (2,617) (0.00)JPMC EUR 11,296,167 USD 12,891,307 19/06/2019 (125,214) (0.02)JPMC HUF 69,606,500 USD 251,431 19/06/2019 (6,722) (0.00)JPMC INR 55,000,000 USD 789,076 19/06/2019* (4,438) (0.00)JPMC JPY 103,130,250 USD 940,355 19/06/2019 (4,460) (0.00)JPMC KRW 3,522,595,500 USD 3,140,069 19/06/2019* (37,065) (0.00)JPMC MXN 112,236,350 USD 5,763,133 19/06/2019 (23,843) (0.00)JPMC NZD 14,036,565 USD 9,630,188 19/06/2019 (55,810) (0.01)JPMC PLN 18,990,977 USD 5,006,516 19/06/2019 (38,187) (0.01)JPMC SGD 4,390,000 USD 3,256,774 19/06/2019 (11,845) (0.00)JPMC TWD 3,514,500 USD 114,573 19/06/2019* (320) (0.00)JPMC USD 469,687 AUD 662,112 19/06/2019 (286) (0.00)JPMC USD 1,344,013 CAD 1,799,194 19/06/2019 (5,489) (0.00)JPMC USD 8,936,372 CHF 8,878,584 19/06/2019 (46,864) (0.01)JPMC USD 72,967 CLP 50,000,000 19/06/2019* (529) (0.00)JPMC USD 666,862 GBP 513,094 19/06/2019 (2,664) (0.00)JPMC USD 68,877 IDR 1,000,000,000 19/06/2019* (425) (0.00)JPMC USD 23,460,664 JPY 2,597,563,729 19/06/2019 (111,935) (0.01)JPMC USD 364,968 NOK 3,160,710 19/06/2019 (2,712) (0.00)JPMC USD 11,808,019 SEK 109,395,283 19/06/2019 (59,769) (0.01)CITI AUD 4,678,827 USD 3,312,484 19/06/2019 8,589 0.00CITI CAD 6,287,598 USD 4,697,030 19/06/2019 19,040 0.00CITI INR 204,028,000 USD 2,834,081 19/06/2019* 76,613 0.01CITI JPY 40,376,750 USD 364,683 19/06/2019 1,732 0.00CITI MXN 94,962,765 USD 4,826,644 19/06/2019 29,350 0.00CITI NZD 4,216,441 USD 2,861,382 19/06/2019 14,663 0.00CITI PLN 2,256,020 USD 589,326 19/06/2019 883 0.00CITI SEK 905,338 USD 97,839 19/06/2019 377 0.00CITI TWD 985,500 USD 32,002 19/06/2019* 35 0.00CITI USD 2,397,024 AUD 3,350,682 19/06/2019 18,680 0.00CITI USD 2,976,221 CAD 3,923,019 19/06/2019 33,729 0.01CITI USD 3,880,235 CHF 3,827,909 19/06/2019 7,207 0.00CITI USD 3,033,367 CLP 2,005,000,000 19/06/2019* 86,189 0.01CITI USD 177,003 COP 550,000,000 19/06/2019* 4,324 0.00CITI USD 643,105 CZK 14,500,000 19/06/2019 11,204 0.00CITI USD 237,361,048 EUR 207,604,502 19/06/2019 2,741,795 0.36CITI USD 8,122,657 GBP 6,150,452 19/06/2019 97,048 0.01CITI USD 1,480,048 HUF 409,500,000 19/06/2019 40,400 0.01
AQR UCITS FUNDS
AQR Global Aggregate Bond UCITS Fund
Schedule of Investments (continued)As at 31 March 2019
The accompanying notes form an integral part of these audited financial statements. 68

Counterparty† Currency Purchased Amount Purchased Currency Sold Amount Sold Settlement Date
UnrealisedAppreciation/
(Depreciation)in USD
Percent ofNet Assets
CITI USD 126,860 IDR 1,812,500,000 19/06/2019* 1,249 0.00CITI USD 2,089,461 ILS 7,500,000 19/06/2019 11,730 0.00CITI USD 16,394,210 JPY 1,798,086,400 19/06/2019 76,778 0.01CITI USD 11,208,397 KRW 12,578,527,000 19/06/2019* 128,149 0.02CITI USD 1,567,863 MXN 30,149,500 19/06/2019 26,145 0.00CITI USD 967,229 NOK 8,271,790 19/06/2019 4,986 0.00CITI USD 9,545 PHP 500,000 19/06/2019* 120 0.00CITI USD 7,964,971 SEK 73,063,751 19/06/2019 38,623 0.01CITI USD 1,076,078 SGD 1,450,000 19/06/2019 4,291 0.00JPMC AUD 4,678,827 USD 3,312,487 19/06/2019 8,585 0.00JPMC CAD 6,287,599 USD 4,697,036 19/06/2019 19,034 0.00JPMC INR 204,028,000 USD 2,834,082 19/06/2019* 76,610 0.01JPMC JPY 40,376,750 USD 364,683 19/06/2019 1,732 0.00JPMC MXN 94,962,769 USD 4,826,651 19/06/2019 29,344 0.00JPMC NZD 4,216,445 USD 2,861,388 19/06/2019 14,660 0.00JPMC PLN 2,256,019 USD 589,327 19/06/2019 882 0.00JPMC SEK 905,338 USD 97,839 19/06/2019 377 0.00JPMC TWD 985,500 USD 32,002 19/06/2019* 34 0.00JPMC USD 2,397,026 AUD 3,350,689 19/06/2019 18,677 0.00JPMC USD 2,975,974 CAD 3,923,013 19/06/2019 33,482 0.01JPMC USD 3,880,225 CHF 3,827,904 19/06/2019 7,202 0.00JPMC USD 3,033,361 CLP 2,005,000,000 19/06/2019* 86,185 0.01JPMC USD 177,003 COP 550,000,000 19/06/2019* 4,324 0.00JPMC USD 643,104 CZK 14,500,000 19/06/2019 11,203 0.00JPMC USD 237,360,744 EUR 207,604,497 19/06/2019 2,741,499 0.36JPMC USD 8,122,662 GBP 6,150,464 19/06/2019 97,038 0.01JPMC USD 1,480,047 HUF 409,500,000 19/06/2019 40,398 0.01JPMC USD 126,860 IDR 1,812,500,000 19/06/2019* 1,249 0.00JPMC USD 2,089,457 ILS 7,500,000 19/06/2019 11,728 0.00JPMC USD 16,394,189 JPY 1,798,086,399 19/06/2019 76,758 0.01JPMC USD 11,208,388 KRW 12,578,527,000 19/06/2019* 128,139 0.02JPMC USD 1,567,860 MXN 30,149,500 19/06/2019 26,143 0.00JPMC USD 967,229 NOK 8,271,790 19/06/2019 4,985 0.00JPMC USD 9,545 PHP 500,000 19/06/2019* 120 0.00JPMC USD 7,964,961 SEK 73,063,752 19/06/2019 38,613 0.01JPMC USD 1,076,077 SGD 1,450,000 19/06/2019 4,290 0.00
Total Forward Foreign Exchange Contracts 5,658,390 0.73
* Non-deliverable forwards (See Note 4)
Hedge Forward Foreign Exchange ContractsOver-the-Counter
Counterparty† Currency Purchased Amount Purchased Currency Sold Amount Sold Settlement Date
UnrealisedAppreciation/
(Depreciation)in USD
Percent ofNet Assets
CITI EUR 16,843,526 USD 19,254,696 19/06/2019 (219,389) (0.03)CITI GBP 169,037,009 USD 223,311,306 19/06/2019 (2,738,120) (0.35)CITI NOK 494,384,454 USD 57,876,509 19/06/2019 (365,610) (0.05)JPMC EUR 16,843,509 USD 19,254,703 19/06/2019 (219,413) (0.03)JPMC GBP 169,037,026 USD 223,311,610 19/06/2019 (2,738,399) (0.35)JPMC NOK 494,384,450 USD 57,888,316 19/06/2019 (377,419) (0.05)CITI GBP 13,879,030 USD 18,029,448 19/06/2019 81,035 0.01CITI NOK 297,180,441 USD 34,333,576 19/06/2019 236,918 0.03CITI USD 12,483,306 GBP 9,394,123 19/06/2019 225,092 0.03JPMC GBP 13,879,032 USD 18,029,473 19/06/2019 81,012 0.01JPMC NOK 297,180,440 USD 34,320,966 19/06/2019 249,527 0.03JPMC USD 12,483,285 GBP 9,394,120 19/06/2019 225,077 0.03
Total Hedge Forward Foreign Exchange Contracts (5,559,689) (0.72)
To Be Announced Commitments
Description Counterparty†TradingCurrency
PrincipalAmounts
Fair Valuein USD
UnrealisedAppreciation/
(Depreciation)in USD
Percent ofNet Assets
Fannie Mae 2.500%, 15/04/2019 CITI USD 4,250,000 4,225,098 53,789 0.01Fannie Mae 3.000%, 15/04/2019 JPMC USD 3,600,000 3,632,906 37,406 0.00Fannie Mae 3.500%, 15/04/2019 MSMP USD 1,950,000 1,994,256 14,016 0.00Fannie Mae 3.000%, 10/04/2019 JPMC USD 19,550,000 19,465,996 322,270 0.04Fannie Mae 3.500%, 10/04/2019 JPMC USD 28,800,000 29,204,332 345,832 0.05Fannie Mae 4.000%, 10/04/2019 CITI USD 21,500,000 22,121,904 175,947 0.02Fannie Mae 4.500%, 10/04/2019 MSMP USD 9,650,000 10,057,675 68,040 0.01Fannie Mae 5.000%, 10/04/2019 MSMP USD 4,650,000 4,918,828 45,955 0.01
Total To Be Announced Commitments 95,620,995 1,063,255 0.14
AQR UCITS FUNDS
AQR Global Aggregate Bond UCITS Fund
Schedule of Investments (continued)As at 31 March 2019
The accompanying notes form an integral part of these audited financial statements. 69

Investments Currency
Shares/PrincipalAmounts
Fair Valuein USD
Percent ofNet Assets
Transferable securities and money market instruments admitted to official exchange listing or dealt in on another regulated market.Common StocksAustraliaAGL Energy Ltd AUD 8,968 138,408 0.11BHP Billiton Ltd AUD 8,991 244,991 0.20BHP Billiton PLC GBP 2,673 64,212 0.05BlueScope Steel Ltd AUD 18,188 179,923 0.14Coca-Cola Amatil Ltd AUD 8,961 54,975 0.05Crown Resorts Ltd AUD 16,122 131,613 0.10Dexus Property Group (β) AUD 14,575 131,628 0.11Flight Centre Travel Group Ltd AUD 7,361 219,517 0.18Harvey Norman Holdings Ltd AUD 65,533 186,792 0.15Scentre Group (β) AUD 23,466 68,360 0.05South32 Ltd AUD 14,709 38,914 0.03Telstra Corp Ltd AUD 122,232 287,852 0.23The GPT Group (β) AUD 10,598 46,652 0.04
Total Australia 1,793,837 1.44
BelgiumAgeas EUR 5,977 288,693 0.23KBC Group NV EUR 511 35,502 0.03
Total Belgium 324,195 0.26
CanadaBank of Montreal CAD 2,214 165,893 0.13Canadian Imperial Bank of Commerce CAD 1,765 140,415 0.11CGI Group Inc CAD 7,746 531,342 0.43CI Financial Corp CAD 5,727 78,201 0.06Empire Co Ltd CAD 15,624 340,130 0.27Great-West Lifeco Inc CAD 2,476 60,000 0.05Intact Financial Corp CAD 2,014 170,266 0.14Magna International Inc CAD 7,035 344,746 0.28National Bank of Canada CAD 1,925 86,897 0.07Royal Bank of Canada CAD 4,338 328,419 0.26Seven Generations Energy Ltd CAD 9,314 68,262 0.05The Bank of Nova Scotia CAD 3,297 175,710 0.14The Toronto-Dominion Bank CAD 5,856 318,227 0.26West Fraser Timber Co Ltd CAD 2,310 111,834 0.09
Total Canada 2,920,342 2.34
ChinaYangzijiang Shipbuilding Holdings Ltd SGD 238,600 264,429 0.21
Total China 264,429 0.21
DenmarkAP Moeller - Maersk A/S DKK 38 48,043 0.04Novo Nordisk A/S DKK 3,647 190,475 0.15Orsted A/S DKK 748 56,971 0.04Pandora A/S DKK 4,000 185,900 0.15Vestas Wind Systems A/S DKK 6,650 559,105 0.45
Total Denmark 1,040,494 0.83
FinlandSampo OYJ EUR 6,063 275,829 0.22
Total Finland 275,829 0.22
FranceAXA SA EUR 19,892 499,494 0.40BNP Paribas SA EUR 4,839 230,304 0.19CNP Assurances EUR 3,891 85,756 0.07Electricite de France SA EUR 44,629 607,800 0.49Engie SA EUR 43,299 645,836 0.52Peugeot SA EUR 26,815 649,699 0.52Renault SA EUR 1,778 117,260 0.09Sanofi EUR 4,683 412,425 0.33Societe BIC SA EUR 675 59,984 0.05Societe Generale SA EUR 9,185 263,947 0.21Thales SA EUR 764 91,525 0.07TOTAL SA EUR 14,527 804,663 0.65Unibail-Rodamco-Westfield EUR 325 53,253 0.04
Total France 4,521,946 3.63
GermanyAllianz SE EUR 3,342 742,116 0.59Bayer AG EUR 1,151 73,686 0.06Covestro AG EUR 5,209 285,285 0.23Daimler AG EUR 1,577 91,787 0.07Deutsche Lufthansa AG EUR 24,286 529,527 0.43Deutsche Wohnen AG EUR 2,209 107,788 0.09E.ON SE EUR 74,123 826,141 0.66Hannover Rueck SE EUR 3,226 463,977 0.37Muenchener Rueckversicherungs-Gesellschaft AG EUR 478 112,809 0.09
Total Germany 3,233,116 2.59
Hong KongCLP Holdings Ltd HKD 29,500 341,967 0.27Henderson Land Development Co Ltd HKD 24,640 156,722 0.13Hong Kong Exchanges & Clearing Ltd HKD 3,500 122,007 0.10Kerry Properties Ltd HKD 12,000 53,575 0.04Link REIT (β) HKD 7,500 87,740 0.07NWS Holdings Ltd HKD 106,000 231,902 0.19PCCW Ltd HKD 12,000 7,458 0.01Sino Land Co Ltd HKD 50,000 96,770 0.08Sun Hung Kai Properties Ltd HKD 7,000 120,201 0.10Swire Properties Ltd HKD 99,800 429,413 0.34WH Group Ltd HKD 248,500 266,496 0.21Yue Yuen Industrial Holdings Ltd HKD 84,500 290,915 0.23
Total Hong Kong 2,205,166 1.77
AQR UCITS FUNDS
AQR Global Core Equity UCITS Fund
Schedule of InvestmentsAs at 31 March 2019
The accompanying notes form an integral part of these audited financial statements. 70

Investments Currency
Shares/PrincipalAmounts
Fair Valuein USD
Percent ofNet Assets
Transferable securities and money market instruments admitted to official exchange listing or dealt in on another regulated market.Common Stocks (continued)ItalyAssicurazioni Generali SpA EUR 35,043 646,627 0.52Enel SpA EUR 44,773 286,231 0.23Eni SpA EUR 2,500 43,922 0.03Poste Italiane SpA EUR 40,638 392,751 0.31UniCredit SpA EUR 5,526 70,543 0.06
Total Italy 1,440,074 1.15
JapanAstellas Pharma Inc JPY 6,200 92,852 0.07Central Japan Railway Co JPY 1,900 440,931 0.35Dai-ichi Life Insurance Co Ltd JPY 28,600 397,752 0.32East Japan Railway Co JPY 3,400 327,862 0.26Fujitsu Ltd JPY 6,300 454,131 0.37Hitachi Ltd JPY 11,200 362,809 0.29Idemitsu Kosan Co Ltd JPY 4,200 140,567 0.11ITOCHU Corp JPY 19,800 357,944 0.29Japan Post Holdings Co Ltd JPY 12,400 144,970 0.12JTEKT Corp JPY 4,200 51,714 0.04JXTG Holdings Inc JPY 132,700 607,349 0.49Kajima Corp JPY 14,900 219,805 0.18Kamigumi Co Ltd JPY 5,200 120,372 0.10KDDI Corp JPY 19,400 417,122 0.33Kobe Steel Ltd JPY 6,400 48,020 0.04Konica Minolta Inc JPY 20,100 197,784 0.16Kyushu Railway Co JPY 24,200 795,335 0.64Marubeni Corp JPY 99,400 686,952 0.55Mazda Motor Corp JPY 12,400 138,758 0.11Medipal Holdings Corp JPY 2,500 59,336 0.05Mitsubishi Chemical Holdings Corp JPY 6,700 47,157 0.04Mitsubishi Corp JPY 12,600 349,707 0.28Mitsubishi UFJ Financial Group Inc JPY 67,700 335,160 0.27Mitsui & Co Ltd JPY 9,600 148,974 0.12Mizuho Financial Group Inc JPY 326,100 504,497 0.40Nippon Telegraph & Telephone Corp JPY 13,100 557,329 0.45Nomura Real Estate Master Fund Inc (β) JPY 36 53,006 0.04NTT DOCOMO Inc JPY 4,000 88,460 0.07Obayashi Corp JPY 25,600 257,489 0.21Resona Holdings Inc JPY 74,600 323,255 0.26SoftBank Group Corp JPY 1,400 135,762 0.11Sumitomo Corp JPY 4,300 59,442 0.05Sumitomo Heavy Industries Ltd JPY 1,300 42,118 0.03Sumitomo Mitsui Financial Group Inc JPY 10,000 349,937 0.28Suzuken Co Ltd JPY 2,600 150,365 0.12Tokyo Electric Power Co Inc JPY 166,600 1,052,641 0.84Tosoh Corp JPY 2,800 43,557 0.03Toyota Motor Corp JPY 6,100 357,864 0.28Toyota Tsusho Corp JPY 2,200 71,677 0.06West Japan Railway Co JPY 900 67,733 0.05
Total Japan 11,058,495 8.86
LuxembourgSES SA - GDR EUR 2,957 45,533 0.04
Total Luxembourg 45,533 0.04
MacauGalaxy Entertainment Group Ltd HKD 29,000 197,623 0.16SJM Holdings Ltd HKD 203,000 231,879 0.18Wynn Macau Ltd HKD 26,400 62,312 0.05
Total Macau 491,814 0.39
NetherlandsAegon NV EUR 80,488 387,317 0.31ING Groep NV - GDR EUR 11,092 133,701 0.11Koninklijke Ahold Delhaize NV EUR 27,404 726,121 0.58NN Group NV EUR 6,857 283,389 0.23Royal Dutch Shell PLC - A Shares GBP 7,975 249,983 0.20Royal Dutch Shell PLC - B Shares GBP 11,494 362,605 0.29Wolters Kluwer NV EUR 2,418 164,029 0.13
Total Netherlands 2,307,145 1.85
SingaporeAscendas Real Estate Investment Trust (β) SGD 44,800 96,244 0.08ComfortDelGro Corp Ltd SGD 21,800 41,395 0.03SATS Ltd SGD 29,300 110,593 0.09Suntec Real Estate Investment Trust (β) SGD 76,000 109,441 0.09
Total Singapore 357,673 0.29
South AfricaAnglo American PLC GBP 20,118 536,998 0.43Investec PLC GBP 21,794 125,072 0.10
Total South Africa 662,070 0.53
SpainBanco Bilbao Vizcaya Argentaria SA EUR 40,173 228,453 0.18Mapfre SA EUR 69,707 191,433 0.16
Total Spain 419,886 0.34
SwedenInvestor AB SEK 1,306 58,767 0.05Sandvik AB SEK 3,847 62,342 0.05Telefonaktiebolaget LM Ericsson SEK 106,433 975,290 0.78
Total Sweden 1,096,399 0.88
SwitzerlandCoca-Cola HBC AG GBP 4,091 138,951 0.11
AQR UCITS FUNDS
AQR Global Core Equity UCITS Fund
Schedule of Investments (continued)As at 31 March 2019
The accompanying notes form an integral part of these audited financial statements. 71

Investments Currency
Shares/PrincipalAmounts
Fair Valuein USD
Percent ofNet Assets
Transferable securities and money market instruments admitted to official exchange listing or dealt in on another regulated market.Common Stocks (continued)Switzerland (continued)Nestle SA CHF 682 64,909 0.05Novartis AG CHF 11,014 1,054,441 0.84Roche Holding AG CHF 5,786 1,581,830 1.27SGS SA CHF 114 282,467 0.23Sonova Holding AG CHF 2,101 415,283 0.33Swiss Life Holding AG CHF 2,029 888,917 0.71Swiss Re AG CHF 466 45,325 0.04Zurich Insurance Group AG CHF 1,770 584,874 0.47
Total Switzerland 5,056,997 4.05
United Kingdom3i Group PLC GBP 2,830 36,146 0.03BAE Systems PLC GBP 18,510 115,248 0.09Barratt Developments PLC GBP 86,532 669,923 0.54Berkeley Group Holdings PLC GBP 7,711 372,360 0.30British Land Co PLC (β) GBP 10,052 76,776 0.06BT Group PLC GBP 85,231 246,060 0.20Burberry Group PLC GBP 5,100 129,635 0.10Fiat Chrysler Automobiles NV EUR 53,385 793,579 0.64HSBC Holdings PLC GBP 69,327 562,226 0.45International Consolidated Airlines Group SA EUR 124,701 822,687 0.66J Sainsbury PLC GBP 122,261 373,623 0.30Kingfisher PLC GBP 17,950 54,854 0.04Land Securities Group PLC (β) GBP 4,229 50,166 0.04Linde PLC EUR 842 146,672 0.12Lloyds Banking Group PLC GBP 343,132 274,079 0.22Meggitt PLC GBP 26,228 171,690 0.14Persimmon PLC GBP 3,637 102,399 0.08RELX PLC GBP 5,843 124,710 0.10Royal Mail PLC GBP 115,789 359,859 0.29Segro PLC (β) GBP 22,951 200,238 0.16Taylor Wimpey PLC GBP 29,136 66,371 0.05Unilever PLC GBP 3,705 211,902 0.17Vodafone Group PLC GBP 34,687 62,761 0.05
Total United Kingdom 6,023,964 4.83
United StatesAbbott Laboratories USD 6,283 498,305 0.40AbbVie Inc USD 5,365 431,480 0.35Accenture PLC USD 634 111,267 0.09Adobe Systems Inc USD 3,231 858,315 0.69Advance Auto Parts Inc USD 3,269 556,482 0.45Aflac Inc USD 7,386 367,823 0.30Akamai Technologies Inc USD 10,020 715,628 0.57Alexion Pharmaceuticals Inc USD 1,831 245,391 0.20Alphabet Inc - Class A USD 2,367 2,765,011 2.22Alphabet Inc - Class C USD 884 1,030,357 0.83Amazon.com Inc USD 1,248 2,221,814 1.78American Tower Corp (β) USD 1,401 272,845 0.22Ameriprise Financial Inc USD 1,417 181,178 0.15Amgen Inc USD 5,600 1,063,860 0.85Anthem Inc USD 3,299 934,838 0.75Apple Inc USD 14,390 2,716,688 2.18Athene Holding Ltd USD 1,286 52,353 0.04AutoZone Inc USD 177 179,347 0.14AvalonBay Communities Inc (β) USD 440 88,374 0.07Bank of America Corp USD 1,745 47,761 0.04Baxter International Inc USD 3,480 280,592 0.22Berkshire Hathaway Inc USD 4,030 808,096 0.65Best Buy Co Inc USD 4,071 289,245 0.23Biogen Inc USD 5,432 1,276,683 1.02Booking Holdings Inc USD 170 296,444 0.24Boston Properties Inc (β) USD 508 68,077 0.05Bristol-Myers Squibb Co USD 2,894 136,134 0.11Cadence Design Systems Inc USD 4,406 277,930 0.22CDW Corp USD 2,185 209,760 0.17Celgene Corp USD 2,152 200,287 0.16Cigna Corp USD 1,271 202,280 0.16Cisco Systems Inc USD 35,138 1,876,721 1.50Coach Inc USD 2,240 74,010 0.06Cognizant Technology Solutions Corp USD 3,305 239,051 0.19CommScope Holding Co Inc USD 8,026 172,720 0.14Consolidated Edison Inc USD 3,120 264,014 0.21Costco Wholesale Corp USD 1,053 253,647 0.20Crown Castle International Corp (β) USD 1,116 141,699 0.11Danaher Corp USD 4,552 594,218 0.48Darden Restaurants Inc USD 5,531 674,727 0.54Delta Air Lines Inc USD 1,668 85,518 0.07Digital Realty Trust Inc (β) USD 492 58,715 0.05DXC Technology Co USD 3,901 252,395 0.20Eaton Corp PLC USD 3,411 274,142 0.22Edwards Lifesciences Corp USD 2,039 387,063 0.31Eli Lilly & Co USD 7,729 1,001,292 0.80Equinix Inc (β) USD 184 82,178 0.07Equity Residential (β) USD 1,215 91,635 0.07Everest Re Group Ltd USD 612 131,831 0.11Exelon Corp USD 2,344 117,153 0.10F5 Networks Inc USD 2,782 436,830 0.35Facebook Inc USD 13,826 2,282,811 1.83Fiserv Inc USD 1,430 125,954 0.10Fortinet Inc USD 5,793 482,557 0.39Fox Corp USD 1,044 37,814 0.03Gilead Sciences Inc USD 3,171 207,035 0.17H&R Block Inc USD 130 3,123 0.00HCA Holdings Inc USD 3,180 412,478 0.33HollyFrontier Corp USD 17,362 866,017 0.69HP Inc USD 15,513 299,323 0.24Humana Inc USD 1,328 349,184 0.28
AQR UCITS FUNDS
AQR Global Core Equity UCITS Fund
Schedule of Investments (continued)As at 31 March 2019
The accompanying notes form an integral part of these audited financial statements. 72

Investments Currency
Shares/PrincipalAmounts
Fair Valuein USD
Percent ofNet Assets
Transferable securities and money market instruments admitted to official exchange listing or dealt in on another regulated market.Common Stocks (continued)United States (continued)Huntington Ingalls Industries Inc USD 4,428 916,640 0.73IAC/InterActiveCorp USD 1,093 229,147 0.18Illumina Inc USD 1,006 308,409 0.25Intel Corp USD 28,469 1,525,369 1.22International Business Machines Corp USD 4,062 570,305 0.46IQVIA Holdings Inc USD 7,455 1,064,127 0.85Jazz Pharmaceuticals PLC USD 1,482 209,562 0.17Johnson & Johnson USD 11,022 1,533,270 1.23JPMorgan Chase & Co USD 10,110 1,019,897 0.82Kohl’s Corp USD 17,282 1,194,013 0.96L3 Technologies Inc USD 231 47,764 0.04Lam Research Corp USD 1,095 195,129 0.16Lowe’s Cos Inc USD 2,445 267,287 0.21Lululemon athletica Inc USD 3,864 637,444 0.51Macy’s Inc USD 24,051 577,705 0.46MasterCard Inc USD 852 199,888 0.16McDonald’s Corp USD 819 155,610 0.12Medtronic PLC USD 6,906 622,990 0.50Merck & Co Inc USD 16,875 1,401,469 1.12Michael Kors Holdings Ltd USD 11,611 542,001 0.43Micron Technology Inc USD 30,208 1,238,528 0.99Microsoft Corp USD 32,422 3,798,237 3.04Mylan NV USD 4,576 129,867 0.10Nektar Therapeutics USD 5,632 187,658 0.15NIKE Inc USD 6,197 524,700 0.42Oracle Corp USD 12,490 666,966 0.54Pfizer Inc USD 29,822 1,259,980 1.01Phillips 66 USD 501 47,425 0.04Prologis Inc (β) USD 1,732 124,565 0.10Public Storage (β) USD 705 154,014 0.12PulteGroup Inc USD 12,459 352,465 0.28Raytheon Co USD 5,546 1,006,710 0.81Realty Income Corp (β) USD 1,206 88,520 0.07Regeneron Pharmaceuticals Inc USD 825 337,945 0.27Reinsurance Group of America Inc USD 2,752 390,096 0.31Republic Services Inc USD 770 61,769 0.05Robert Half International Inc USD 15,254 995,324 0.80Ross Stores Inc USD 4,716 437,362 0.35Simon Property Group Inc (β) USD 1,035 189,581 0.15Skyworks Solutions Inc USD 930 76,018 0.06Southwest Airlines Co USD 3,316 169,448 0.14Spirit AeroSystems Holdings Inc USD 3,549 324,804 0.26Symantec Corp USD 2,358 53,975 0.04TE Connectivity Ltd USD 2,582 207,541 0.17Texas Instruments Inc USD 1,138 120,105 0.10The Allstate Corp USD 6,881 646,264 0.52The Bank of New York Mellon Corp USD 688 34,655 0.03The Estee Lauder Cos Inc USD 10,118 1,662,792 1.33The Gap Inc USD 20,720 544,107 0.44The Home Depot Inc USD 4,615 881,465 0.71The Kroger Co USD 12,094 297,391 0.24The Procter & Gamble Co USD 12,786 1,319,515 1.06The TJX Cos Inc USD 9,638 512,067 0.41The Travelers Cos Inc USD 3,372 462,099 0.37The Walt Disney Co USD 5,687 628,982 0.50Thermo Fisher Scientific Inc USD 4,542 1,230,655 0.99T-Mobile US Inc USD 505 34,517 0.03TripAdvisor Inc USD 7,623 393,804 0.32Twitter Inc USD 8,111 264,986 0.21Union Pacific Corp USD 1,313 219,205 0.17United Continental Holdings Inc USD 11,527 916,742 0.74United Therapeutics Corp USD 8,354 985,772 0.79UnitedHealth Group Inc USD 3,270 797,847 0.64Valero Energy Corp USD 783 65,694 0.05Ventas Inc (β) USD 1,096 70,221 0.06VeriSign Inc USD 776 140,960 0.11Verizon Communications Inc USD 13,397 788,146 0.63Viacom Inc - Class B USD 10,068 277,273 0.22Visa Inc USD 578 89,630 0.07VMware Inc USD 3,911 698,114 0.56Walgreens Boots Alliance Inc USD 10,713 680,597 0.55WalMart Inc USD 16,730 1,627,494 1.30Welltower Inc (β) USD 1,162 90,601 0.07WW Grainger Inc USD 245 72,454 0.06Zoetis Inc USD 1,021 102,171 0.08
Total United States 74,358,349 59.60
Total Common Stocks 119,897,753 96.10
Preferred StockGermanyVolkswagen AG EUR 4,553 715,050 0.57
Total Germany 715,050 0.57
Total Preferred Stock 715,050 0.57
Total Transferable securities and money market instruments admitted to official exchange listing or dealt in on another regulated market. 120,612,803 96.67
Total Investments (Total Cost: $109,500,490) 120,612,803 96.67
Other Assets/(Liabilities) 4,152,734 3.33
Total Net Assets 124,765,537 100.00
(β) Real Estate Investment TrustGDR-Global Depositary Receipt
AQR UCITS FUNDS
AQR Global Core Equity UCITS Fund
Schedule of Investments (continued)As at 31 March 2019
The accompanying notes form an integral part of these audited financial statements. 73

Economic Classification of InvestmentsAs at 31 March 2019
Industry ClassificationPercent ofNet Assets
Basic Materials 1.37Communications 14.19Consumer Cyclical 17.13Consumer Non-cyclical 22.55Diversified 0.19Energy 3.05Financial 15.59Industrial 6.72Technology 12.41Utilities 3.47Total Investments 96.67
Other Assets/(Liabilities) 3.33Total Net Assets 100.00
AQR UCITS FUNDS
AQR Global Core Equity UCITS Fund
Schedule of Investments (continued)As at 31 March 2019
The accompanying notes form an integral part of these audited financial statements. 74

Derivatives
Futures ContractsExchange-Traded
Description Counterparty†Number ofContracts
ExpirationDate
TradingCurrency
Notional Amountin USD
UnrealisedAppreciation/
(Depreciation)in USD
Percent ofNet Assets
S&P 500 E-mini Futures JPPC 16 21/06/2019 USD 2,261,200 47,787 0.04S&P TSX 60 Index Futures JPPC 3 20/06/2019 CAD 429,765 1,201 0.00
Total Futures Contracts 48,988 0.04
AQR UCITS FUNDS
AQR Global Core Equity UCITS Fund
Schedule of Investments (continued)As at 31 March 2019
The accompanying notes form an integral part of these audited financial statements. 75

Investments Currency
Shares/PrincipalAmounts
Fair Valuein USD
Percent ofNet Assets
Transferable securities and money market instruments admitted to official exchange listing or dealt in on another regulated market.Common StocksAustraliaAGL Energy Ltd AUD 15,511 239,389 0.52Amcor Ltd AUD 801 8,737 0.02APA Group AUD 1,467 10,380 0.02Aristocrat Leisure Ltd AUD 2,757 47,902 0.10Aurizon Holdings Ltd AUD 12,097 39,019 0.09AusNet Services AUD 5,563 6,997 0.02BlueScope Steel Ltd AUD 1,708 16,896 0.04Brambles Ltd AUD 5,939 49,506 0.11Caltex Australia Ltd AUD 9,089 168,917 0.37CIMIC Group Ltd AUD 2,213 75,732 0.16Coca-Cola Amatil Ltd AUD 12,311 75,526 0.16Cochlear Ltd AUD 1,792 220,214 0.48Coles Group Ltd AUD 8,299 69,694 0.15Crown Resorts Ltd AUD 5,035 41,103 0.09CSL Ltd AUD 885 122,325 0.27Flight Centre Travel Group Ltd AUD 3,323 99,097 0.22Fortescue Metals Group Ltd AUD 4,675 23,562 0.05Harvey Norman Holdings Ltd AUD 3,404 9,703 0.02Incitec Pivot Ltd AUD 14,252 31,523 0.07Medibank Pvt Ltd AUD 8,718 17,058 0.03Newcrest Mining Ltd AUD 12,354 223,239 0.48REA Group Ltd AUD 943 49,962 0.11Rio Tinto PLC GBP 152 8,819 0.02Sonic Healthcare Ltd AUD 4,773 83,119 0.18South32 Ltd AUD 34,960 92,489 0.20Telstra Corp Ltd AUD 95,210 224,216 0.49Treasury Wine Estates Ltd AUD 3,663 38,796 0.08Washington H Soul Pattinson & Co Ltd AUD 653 12,184 0.03Wesfarmers Ltd AUD 8,299 203,892 0.44Woolworths Group Ltd AUD 19,953 429,967 0.94
Total Australia 2,739,963 5.96
BelgiumAnheuser-Busch InBev SA EUR 616 51,594 0.11Colruyt SA EUR 4,576 338,575 0.74KBC Group NV EUR 1,182 82,120 0.18Proximus SADP EUR 3,591 103,133 0.22UCB SA EUR 268 22,934 0.05Umicore SA EUR 562 25,082 0.06
Total Belgium 623,438 1.36
CanadaAgnico Eagle Mines Ltd CAD 3,545 155,011 0.34Alimentation Couche-Tard Inc CAD 262 15,418 0.03Atco Ltd CAD 618 20,912 0.05Bank of Montreal CAD 1,302 97,557 0.21Barrick Gold Corp CAD 12,440 173,031 0.38BCE Inc CAD 8,697 385,434 0.84Canadian Imperial Bank of Commerce CAD 1,483 117,981 0.26Canadian National Railway Co CAD 1,837 164,035 0.36Canadian Tire Corp Ltd CAD 991 106,519 0.23Canadian Utilities Ltd CAD 6,460 177,386 0.39CGI Group Inc CAD 480 32,926 0.07Constellation Software Inc CAD 31 26,270 0.06Emera Inc CAD 923 34,535 0.07Empire Co Ltd CAD 2,299 50,049 0.11Fortis Inc CAD 3,662 135,070 0.29Franco-Nevada Corp CAD 2,587 194,887 0.42George Weston Ltd CAD 664 47,685 0.10Hydro One Ltd CAD 13,012 201,638 0.44Imperial Oil Ltd CAD 844 23,049 0.05Intact Financial Corp CAD 1,946 164,517 0.36Kinross Gold Corp CAD 48,886 167,979 0.36Loblaw Cos Ltd CAD 1,652 81,301 0.18Metro Inc CAD 252 9,278 0.02Power Financial Corp CAD 3,670 85,610 0.19Rogers Communications Inc CAD 2,617 141,155 0.30Royal Bank of Canada CAD 2,119 160,424 0.35Saputo Inc CAD 3,689 125,627 0.27Seven Generations Energy Ltd CAD 3,055 22,390 0.05Shaw Communications Inc CAD 3,757 78,048 0.17Sun Life Financial Inc CAD 317 12,157 0.03The Bank of Nova Scotia CAD 3,395 180,933 0.39The Toronto-Dominion Bank CAD 2,060 111,944 0.24Thomson Reuters Corp CAD 768 45,121 0.10Wheaton Precious Metals Corp CAD 6,150 147,235 0.32
Total Canada 3,693,112 8.03
ChileAntofagasta PLC GBP 5,023 63,215 0.14
Total Chile 63,215 0.14
ChinaBOC Hong Kong Holdings Ltd HKD 28,000 115,972 0.25Yangzijiang Shipbuilding Holdings Ltd SGD 10,400 11,526 0.03
Total China 127,498 0.28
DenmarkChr Hansen Holding A/S DKK 204 20,809 0.04Coloplast A/S DKK 1,155 126,952 0.28DSV A/S DKK 1,044 86,017 0.19H Lundbeck A/S DKK 1,290 55,936 0.12Novo Nordisk A/S DKK 3,374 176,217 0.38Novozymes A/S DKK 331 15,284 0.03Orsted A/S DKK 1,856 141,362 0.31
Total Denmark 622,577 1.35
AQR UCITS FUNDS
AQR Global Defensive Equity UCITS Fund
Schedule of InvestmentsAs at 31 March 2019
The accompanying notes form an integral part of these audited financial statements. 76

Investments Currency
Shares/PrincipalAmounts
Fair Valuein USD
Percent ofNet Assets
Transferable securities and money market instruments admitted to official exchange listing or dealt in on another regulated market.Common Stocks (continued)FinlandElisa OYJ EUR 2,673 119,984 0.26Fortum OYJ EUR 3,676 76,354 0.17Kone OYJ EUR 2,847 143,617 0.31Neste OYJ EUR 1,844 196,559 0.43Nokia OYJ EUR 6,459 36,752 0.08Nokian Renkaat OYJ EUR 2,380 79,683 0.17Orion OYJ EUR 1,286 48,210 0.10Sampo OYJ EUR 2,493 113,416 0.25
Total Finland 814,575 1.77
FranceAeroports de Paris EUR 70 13,400 0.03Cie Generale des Etablissements Michelin SCA EUR 273 32,199 0.07Danone SA EUR 886 67,912 0.15Dassault Systemes SE EUR 639 94,594 0.21Electricite de France SA EUR 1,295 17,637 0.04Engie SA EUR 1,554 23,179 0.05Hermes International EUR 299 197,527 0.43Ipsen SA EUR 88 11,955 0.03L’Oreal SA EUR 1,355 362,988 0.79LVMH Moet Hennessy Louis Vuitton SE EUR 137 50,283 0.11Pernod Ricard SA EUR 522 93,655 0.20Peugeot SA EUR 906 21,951 0.05Sanofi EUR 517 45,531 0.10Societe BIC SA EUR 1,014 90,110 0.19Societe Generale SA EUR 376 10,805 0.02Sodexo SA EUR 234 25,736 0.05Suez EUR 17,312 229,260 0.50Thales SA EUR 545 65,290 0.14TOTAL SA EUR 2,164 119,866 0.26Vinci SA EUR 140 13,556 0.03
Total France 1,587,434 3.45
GermanyAdidas AG EUR 36 8,747 0.02BASF SE EUR 1,363 99,960 0.22Beiersdorf AG EUR 1,781 184,845 0.40Delivery Hero SE EUR 174 6,193 0.01Hannover Rueck SE EUR 169 24,306 0.05HUGO BOSS AG EUR 252 17,242 0.04SAP SE EUR 1,231 141,942 0.31Siemens Healthineers AG EUR 8,526 354,903 0.77TUI AG GBP 2,043 19,402 0.04
Total Germany 857,540 1.86
Hong KongCK Hutchison Holdings Ltd HKD 4,000 42,009 0.09CLP Holdings Ltd HKD 20,000 231,842 0.50Hang Seng Bank Ltd HKD 6,700 165,414 0.36HK Electric Investments & HK Electric Investments Ltd HKD 115,500 117,982 0.26HKT Trust & HKT Ltd HKD 89,000 143,031 0.31Hong Kong & China Gas Co Ltd HKD 159,266 381,845 0.83MTR Corp Ltd HKD 29,000 179,564 0.39Power Assets Holdings Ltd HKD 14,000 97,101 0.21Techtronic Industries Co Ltd HKD 8,000 53,771 0.12
Total Hong Kong 1,412,559 3.07
ItalyAssicurazioni Generali SpA EUR 4,365 80,545 0.18Enel SpA EUR 1,333 8,522 0.02Moncler SpA EUR 603 24,298 0.05
Total Italy 113,365 0.25
JapanABC-Mart Inc JPY 1,200 71,336 0.16Ajinomoto Co Inc JPY 900 14,370 0.03ANA Holdings Inc JPY 400 14,653 0.03Asahi Group Holdings Ltd JPY 1,700 75,686 0.16Asahi Kasei Corp JPY 7,700 79,459 0.17Astellas Pharma Inc JPY 13,500 202,178 0.44Bandai Namco Holdings Inc JPY 1,800 84,307 0.18Benesse Holdings Inc JPY 500 12,980 0.03Bridgestone Corp JPY 4,000 154,021 0.34Brother Industries Ltd JPY 500 9,252 0.02Calbee Inc JPY 4,300 115,764 0.25Canon Inc JPY 3,900 113,042 0.25Chugai Pharmaceutical Co Ltd JPY 1,000 68,728 0.15Dai-ichi Life Insurance Co Ltd JPY 2,600 36,159 0.08Daiichi Sankyo Co Ltd JPY 300 13,810 0.03Eisai Co Ltd JPY 100 5,608 0.01Hakuhodo DY Holdings Inc JPY 6,900 110,806 0.24Hisamitsu Pharmaceutical Co Inc JPY 800 36,782 0.08Hitachi Ltd JPY 1,500 48,590 0.11Hoshizaki Corp JPY 600 37,161 0.08Hoya Corp JPY 2,200 145,201 0.32ITOCHU Corp JPY 1,900 34,348 0.08Japan Airlines Co Ltd JPY 7,700 270,918 0.59Japan Post Holdings Co Ltd JPY 2,200 25,720 0.06Japan Tobacco Inc JPY 4,000 99,095 0.22Kakaku.com Inc JPY 6,300 120,987 0.26Kamigumi Co Ltd JPY 2,000 46,297 0.10Kaneka Corp JPY 200 7,489 0.02Kao Corp JPY 1,600 126,003 0.27KDDI Corp JPY 10,600 227,912 0.50Kirin Holdings Co Ltd JPY 1,500 35,788 0.08Kose Corp JPY 400 73,451 0.16Kyushu Electric Power Co Inc JPY 1,700 20,056 0.04
AQR UCITS FUNDS
AQR Global Defensive Equity UCITS Fund
Schedule of Investments (continued)As at 31 March 2019
The accompanying notes form an integral part of these audited financial statements. 77

Investments Currency
Shares/PrincipalAmounts
Fair Valuein USD
Percent ofNet Assets
Transferable securities and money market instruments admitted to official exchange listing or dealt in on another regulated market.Common Stocks (continued)Japan (continued)Kyushu Railway Co JPY 4,800 157,752 0.34Lawson Inc JPY 1,100 60,940 0.13Lion Corp JPY 1,900 39,967 0.09Makita Corp JPY 500 17,411 0.04Mazda Motor Corp JPY 6,700 74,974 0.16McDonald’s Holdings Co Japan Ltd JPY 3,400 157,091 0.34Medipal Holdings Corp JPY 4,600 109,179 0.24MEIJI Holdings Co Ltd JPY 800 64,925 0.14Mitsubishi Corp JPY 500 13,877 0.03Mitsubishi Tanabe Pharma Corp JPY 4,200 56,078 0.12Mizuho Financial Group Inc JPY 22,100 34,190 0.07Nexon Co Ltd JPY 8,400 131,519 0.29NH Foods Ltd JPY 1,700 61,147 0.13Nikon Corp JPY 1,300 18,322 0.04Nippon Express Co Ltd JPY 200 11,127 0.02Nippon Paint Holdings Co Ltd JPY 300 11,791 0.02Nippon Telegraph & Telephone Corp JPY 4,300 182,940 0.40Nissan Motor Co Ltd JPY 10,800 88,543 0.19Nisshin Seifun Group Inc JPY 1,600 36,695 0.08Nissin Foods Holdings Co Ltd JPY 2,000 137,239 0.30Nitori Holdings Co Ltd JPY 500 64,561 0.14Nitto Denko Corp JPY 600 31,523 0.07Nomura Research Institute Ltd JPY 361 16,391 0.04Obic Co Ltd JPY 200 20,158 0.04Omron Corp JPY 200 9,370 0.02Oracle Corp Japan JPY 1,800 120,805 0.26Oriental Land Co Ltd JPY 1,900 215,642 0.47Osaka Gas Co Ltd JPY 13,400 264,229 0.58Otsuka Corp JPY 2,600 97,066 0.21Otsuka Holdings Co Ltd JPY 2,300 90,306 0.20Recruit Holdings Co Ltd JPY 5,000 142,743 0.31Rinnai Corp JPY 100 7,066 0.01Ryohin Keikaku Co Ltd JPY 100 25,300 0.06Sankyo Co Ltd JPY 1,600 60,948 0.13Secom Co Ltd JPY 1,200 102,720 0.22Seven & i Holdings Co Ltd JPY 5,500 207,232 0.45Shimamura Co Ltd JPY 400 33,841 0.07Shimano Inc JPY 100 16,247 0.04Shin-Etsu Chemical Co Ltd JPY 200 16,771 0.04Shionogi & Co Ltd JPY 1,700 105,170 0.23Shiseido Co Ltd JPY 300 21,659 0.05Sony Financial Holdings Inc JPY 4,000 75,500 0.16Start Today Co Ltd JPY 2,000 37,694 0.08Sumitomo Dainippon Pharma Co Ltd JPY 1,300 32,139 0.07Sumitomo Mitsui Financial Group Inc JPY 500 17,497 0.04Sundrug Co Ltd JPY 4,300 118,358 0.26Suntory Beverage & Food Ltd JPY 3,900 183,058 0.40Suzuken Co Ltd JPY 2,300 133,015 0.29Suzuki Motor Corp JPY 200 8,849 0.02Sysmex Corp JPY 800 48,314 0.11Taisei Corp JPY 600 27,838 0.06Taisho Pharmaceutical Holdings Co Ltd JPY 100 9,526 0.02TD Holdings Inc JPY 9,400 98,935 0.21Terumo Corp JPY 800 24,426 0.05The Bank of Kyoto Ltd JPY 300 12,551 0.03Toho Co Ltd JPY 600 24,074 0.05Toho Gas Co Ltd JPY 3,900 174,960 0.38Tokyo Gas Co Ltd JPY 10,100 272,936 0.59Toyo Suisan Kaisha Ltd JPY 4,800 182,623 0.40Trend Micro Inc JPY 700 34,074 0.08Tsuruha Holdings Inc JPY 300 24,372 0.05Unicharm Corp JPY 1,700 56,225 0.12USS Co Ltd JPY 1,600 29,676 0.06West Japan Railway Co JPY 100 7,526 0.02Yahoo Japan Corp JPY 6,100 14,924 0.03Yakult Honsha Co Ltd JPY 1,400 97,856 0.21Yamada Denki Co Ltd JPY 6,800 33,506 0.07Yamaguchi Financial Group Inc JPY 4,400 37,293 0.08Yamaha Corp JPY 800 39,955 0.09Yamazaki Baking Co Ltd JPY 2,200 35,664 0.08
Total Japan 7,566,776 16.46
MacauGalaxy Entertainment Group Ltd HKD 8,000 54,517 0.12Sands China Ltd HKD 8,400 42,252 0.09
Total Macau 96,769 0.21
NetherlandsKoninklijke Ahold Delhaize NV EUR 1,524 40,381 0.09Royal Dutch Shell PLC - A Shares GBP 3,915 122,719 0.26
Total Netherlands 163,100 0.35
NorwayGjensidige Forsikring ASA NOK 1,333 23,051 0.05Marine Harvest ASA NOK 6,101 137,238 0.30Norsk Hydro ASA NOK 16,132 65,541 0.14Orkla ASA NOK 17,285 132,512 0.29Statoil ASA NOK 1,938 42,650 0.09Telenor ASA NOK 9,479 190,247 0.42
Total Norway 591,239 1.29
SingaporeComfortDelGro Corp Ltd SGD 76,300 144,882 0.32DBS Group Holdings Ltd SGD 10,900 203,221 0.44Genting Singapore PLC SGD 50,200 38,566 0.08Jardine Cycle & Carriage Ltd SGD 700 16,803 0.04Oversea-Chinese Banking Corp Ltd SGD 17,200 140,472 0.31
AQR UCITS FUNDS
AQR Global Defensive Equity UCITS Fund
Schedule of Investments (continued)As at 31 March 2019
The accompanying notes form an integral part of these audited financial statements. 78
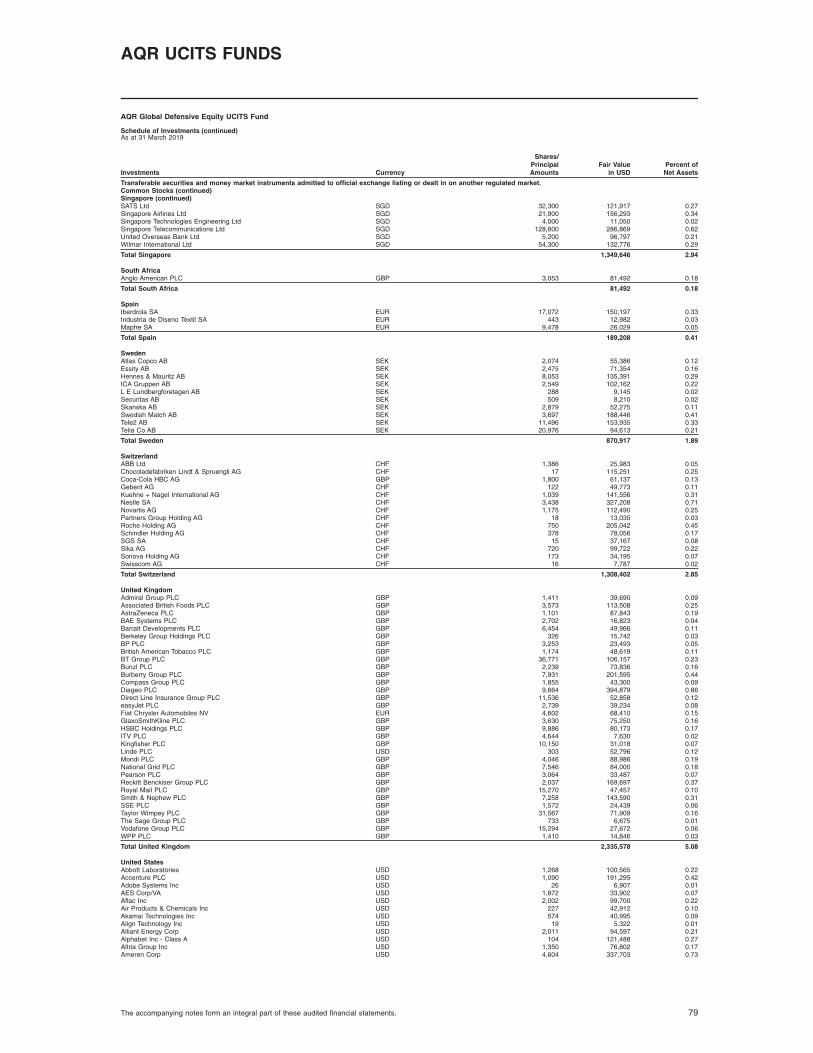
Investments Currency
Shares/PrincipalAmounts
Fair Valuein USD
Percent ofNet Assets
Transferable securities and money market instruments admitted to official exchange listing or dealt in on another regulated market.Common Stocks (continued)Singapore (continued)SATS Ltd SGD 32,300 121,917 0.27Singapore Airlines Ltd SGD 21,900 156,293 0.34Singapore Technologies Engineering Ltd SGD 4,000 11,050 0.02Singapore Telecommunications Ltd SGD 128,600 286,869 0.62United Overseas Bank Ltd SGD 5,200 96,797 0.21Wilmar International Ltd SGD 54,300 132,776 0.29
Total Singapore 1,349,646 2.94
South AfricaAnglo American PLC GBP 3,053 81,492 0.18
Total South Africa 81,492 0.18
SpainIberdrola SA EUR 17,072 150,197 0.33Industria de Diseno Textil SA EUR 443 12,982 0.03Mapfre SA EUR 9,478 26,029 0.05
Total Spain 189,208 0.41
SwedenAtlas Copco AB SEK 2,074 55,386 0.12Essity AB SEK 2,475 71,354 0.16Hennes & Mauritz AB SEK 8,053 135,391 0.29ICA Gruppen AB SEK 2,549 102,162 0.22L E Lundbergforetagen AB SEK 288 9,145 0.02Securitas AB SEK 509 8,210 0.02Skanska AB SEK 2,879 52,275 0.11Swedish Match AB SEK 3,697 188,446 0.41Tele2 AB SEK 11,496 153,935 0.33Telia Co AB SEK 20,976 94,613 0.21
Total Sweden 870,917 1.89
SwitzerlandABB Ltd CHF 1,386 25,983 0.05Chocoladefabriken Lindt & Spruengli AG CHF 17 115,251 0.25Coca-Cola HBC AG GBP 1,800 61,137 0.13Geberit AG CHF 122 49,773 0.11Kuehne + Nagel International AG CHF 1,039 141,556 0.31Nestle SA CHF 3,438 327,208 0.71Novartis AG CHF 1,175 112,490 0.25Partners Group Holding AG CHF 18 13,035 0.03Roche Holding AG CHF 750 205,042 0.45Schindler Holding AG CHF 378 78,056 0.17SGS SA CHF 15 37,167 0.08Sika AG CHF 720 99,722 0.22Sonova Holding AG CHF 173 34,195 0.07Swisscom AG CHF 16 7,787 0.02
Total Switzerland 1,308,402 2.85
United KingdomAdmiral Group PLC GBP 1,411 39,690 0.09Associated British Foods PLC GBP 3,573 113,508 0.25AstraZeneca PLC GBP 1,101 87,843 0.19BAE Systems PLC GBP 2,702 16,823 0.04Barratt Developments PLC GBP 6,454 49,966 0.11Berkeley Group Holdings PLC GBP 326 15,742 0.03BP PLC GBP 3,253 23,493 0.05British American Tobacco PLC GBP 1,174 48,619 0.11BT Group PLC GBP 36,771 106,157 0.23Bunzl PLC GBP 2,239 73,836 0.16Burberry Group PLC GBP 7,931 201,595 0.44Compass Group PLC GBP 1,855 43,300 0.09Diageo PLC GBP 9,664 394,879 0.86Direct Line Insurance Group PLC GBP 11,536 52,858 0.12easyJet PLC GBP 2,739 39,234 0.08Fiat Chrysler Automobiles NV EUR 4,602 68,410 0.15GlaxoSmithKline PLC GBP 3,630 75,250 0.16HSBC Holdings PLC GBP 9,886 80,173 0.17ITV PLC GBP 4,644 7,630 0.02Kingfisher PLC GBP 10,150 31,018 0.07Linde PLC USD 303 52,796 0.12Mondi PLC GBP 4,046 88,986 0.19National Grid PLC GBP 7,546 84,000 0.18Pearson PLC GBP 3,064 33,487 0.07Reckitt Benckiser Group PLC GBP 2,037 169,697 0.37Royal Mail PLC GBP 15,270 47,457 0.10Smith & Nephew PLC GBP 7,258 143,590 0.31SSE PLC GBP 1,572 24,439 0.06Taylor Wimpey PLC GBP 31,567 71,909 0.16The Sage Group PLC GBP 733 6,675 0.01Vodafone Group PLC GBP 15,294 27,672 0.06WPP PLC GBP 1,410 14,846 0.03
Total United Kingdom 2,335,578 5.08
United StatesAbbott Laboratories USD 1,268 100,565 0.22Accenture PLC USD 1,090 191,295 0.42Adobe Systems Inc USD 26 6,907 0.01AES Corp/VA USD 1,872 33,902 0.07Aflac Inc USD 2,002 99,700 0.22Air Products & Chemicals Inc USD 227 42,912 0.10Akamai Technologies Inc USD 574 40,995 0.09Align Technology Inc USD 19 5,322 0.01Alliant Energy Corp USD 2,011 94,597 0.21Alphabet Inc - Class A USD 104 121,488 0.27Altria Group Inc USD 1,350 76,802 0.17Ameren Corp USD 4,604 337,703 0.73
AQR UCITS FUNDS
AQR Global Defensive Equity UCITS Fund
Schedule of Investments (continued)As at 31 March 2019
The accompanying notes form an integral part of these audited financial statements. 79

Investments Currency
Shares/PrincipalAmounts
Fair Valuein USD
Percent ofNet Assets
Transferable securities and money market instruments admitted to official exchange listing or dealt in on another regulated market.Common Stocks (continued)United States (continued)American Electric Power Co Inc USD 2,096 175,645 0.38American Financial Group Inc USD 148 14,190 0.03American Water Works Co Inc USD 796 83,071 0.18Amgen Inc USD 226 42,934 0.09Anthem Inc USD 524 148,486 0.32Apple Inc USD 135 25,487 0.06Arch Capital Group Ltd USD 1,410 45,346 0.10Archer-Daniels-Midland Co USD 3,245 139,113 0.30AT&T Inc USD 5,748 179,050 0.39Athene Holding Ltd USD 1,098 44,700 0.10Atmos Energy Corp USD 1,519 156,108 0.34Automatic Data Processing Inc USD 588 93,451 0.20Avery Dennison Corp USD 685 77,398 0.17Baxter International Inc USD 622 50,152 0.11Becton Dickinson and Co USD 470 116,569 0.25Biogen Inc USD 607 142,663 0.31Bristol-Myers Squibb Co USD 587 27,612 0.06Brown-Forman Corp USD 2,813 147,598 0.32Bunge Ltd USD 489 25,819 0.06Cadence Design Systems Inc USD 515 32,486 0.07CenterPoint Energy Inc USD 3,427 104,866 0.23CH Robinson Worldwide Inc USD 2,420 209,935 0.46Chevron Corp USD 698 85,631 0.18Chubb Ltd USD 482 67,331 0.15Church & Dwight Co Inc USD 203 14,372 0.03Cigna Corp USD 501 79,734 0.17Cintas Corp USD 21 4,207 0.01Cisco Systems Inc USD 1,839 98,221 0.21CME Group Inc USD 143 23,352 0.05CMS Energy Corp USD 1,111 61,449 0.13Cognex Corp USD 852 43,273 0.09Cognizant Technology Solutions Corp USD 1,965 142,128 0.31Colgate-Palmolive Co USD 2,503 169,190 0.37Comcast Corp USD 219 8,701 0.02Consolidated Edison Inc USD 2,480 209,858 0.46Costco Wholesale Corp USD 824 198,485 0.43Danaher Corp USD 1,325 172,966 0.38Dollar General Corp USD 188 22,430 0.05Dominion Energy Inc USD 1,681 127,319 0.28DTE Energy Co USD 1,383 171,616 0.37Duke Energy Corp USD 1,415 126,628 0.28Ecolab Inc USD 58 10,184 0.02Edwards Lifesciences Corp USD 312 59,227 0.13Eli Lilly & Co USD 607 78,637 0.17Everest Re Group Ltd USD 284 61,176 0.13Eversource Energy USD 744 52,564 0.11Exelon Corp USD 4,526 226,209 0.49Expeditors International of Washington Inc USD 1,189 89,877 0.20Exxon Mobil Corp USD 2,444 197,133 0.43F5 Networks Inc USD 887 139,277 0.30Facebook Inc USD 595 98,240 0.21Ferguson PLC GBP 181 11,480 0.02Fidelity National Information Services Inc USD 82 9,216 0.02FLIR Systems Inc USD 208 9,853 0.02FNF Group USD 2,107 77,390 0.17Fortinet Inc USD 370 30,821 0.07Fortive Corp USD 306 25,560 0.06General Mills Inc USD 340 17,500 0.04Genuine Parts Co USD 192 21,468 0.05Gilead Sciences Inc USD 905 59,087 0.13Hasbro Inc USD 1,781 152,151 0.33Henry Schein Inc USD 1,222 72,819 0.16Honeywell International Inc USD 738 116,648 0.25Hormel Foods Corp USD 4,158 184,283 0.40Humana Inc USD 692 181,954 0.40IDEXX Laboratories Inc USD 109 24,132 0.05Illinois Tool Works Inc USD 349 50,075 0.11Illumina Inc USD 218 66,832 0.14Ingredion Inc USD 413 38,694 0.08Intel Corp USD 1,377 73,780 0.16International Business Machines Corp USD 526 73,850 0.16Intuit Inc USD 589 153,128 0.33Intuitive Surgical Inc USD 194 109,513 0.24Jack Henry & Associates Inc USD 238 32,970 0.07Johnson & Johnson USD 2,521 350,696 0.76JPMorgan Chase & Co USD 75 7,566 0.02Kansas City Southern USD 992 116,471 0.25Kellogg Co USD 376 21,455 0.05Kimberly-Clark Corp USD 524 64,635 0.14Las Vegas Sands Corp USD 967 58,639 0.13Lowe’s Cos Inc USD 831 90,845 0.20Lululemon athletica Inc USD 334 55,100 0.12LyondellBasell Industries NV USD 454 37,963 0.08MasterCard Inc USD 1,077 252,675 0.55Maxim Integrated Products Inc USD 790 41,902 0.09McCormick Co Inc USD 676 101,163 0.22McDonald’s Corp USD 1,056 200,640 0.44Medtronic PLC USD 487 43,937 0.10Merck & Co Inc USD 2,559 212,525 0.46Mettler-Toledo International Inc USD 180 128,668 0.28Michael Kors Holdings Ltd USD 979 45,700 0.10Microsoft Corp USD 454 53,186 0.12Monster Beverage Corp USD 2,965 160,080 0.35NextEra Energy Inc USD 1,424 274,148 0.60NIKE Inc USD 1,329 112,526 0.24Nordstrom Inc USD 162 7,232 0.01Northrop Grumman Corp USD 45 12,076 0.03OGE Energy Corp USD 1,152 49,559 0.11Oracle Corp USD 175 9,345 0.02
AQR UCITS FUNDS
AQR Global Defensive Equity UCITS Fund
Schedule of Investments (continued)As at 31 March 2019
The accompanying notes form an integral part of these audited financial statements. 80
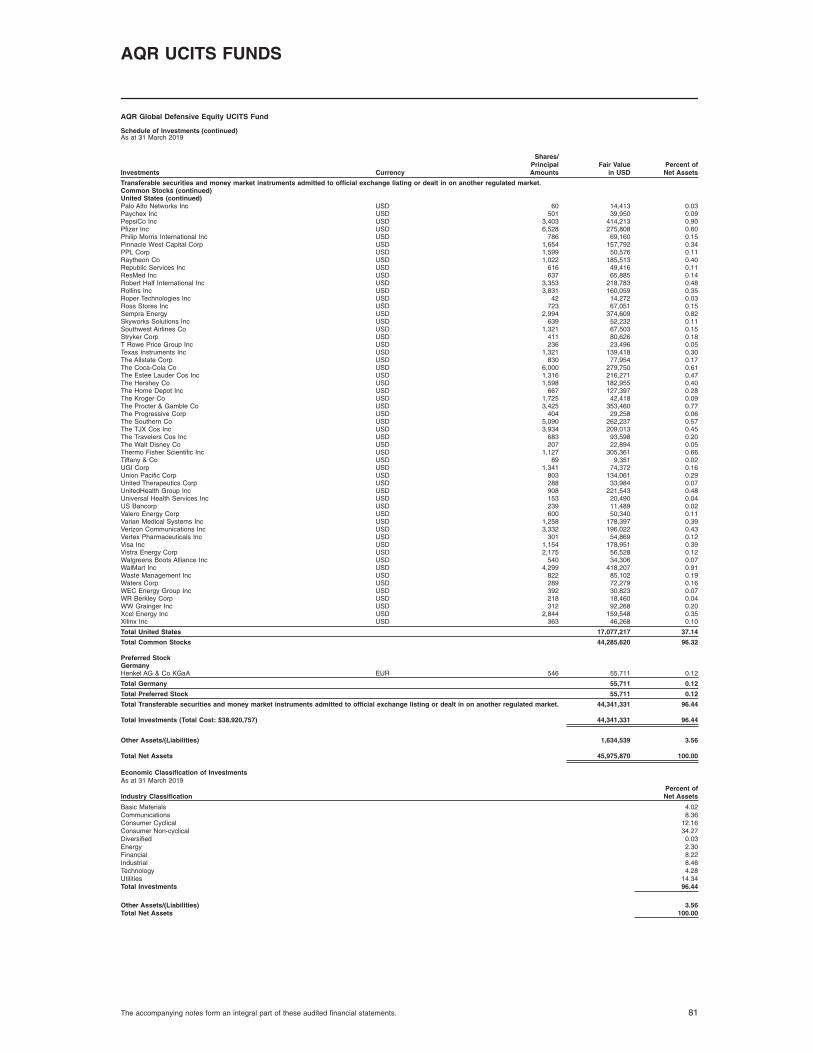
Investments Currency
Shares/PrincipalAmounts
Fair Valuein USD
Percent ofNet Assets
Transferable securities and money market instruments admitted to official exchange listing or dealt in on another regulated market.Common Stocks (continued)United States (continued)Palo Alto Networks Inc USD 60 14,413 0.03Paychex Inc USD 501 39,950 0.09PepsiCo Inc USD 3,403 414,213 0.90Pfizer Inc USD 6,528 275,808 0.60Philip Morris International Inc USD 786 69,160 0.15Pinnacle West Capital Corp USD 1,654 157,792 0.34PPL Corp USD 1,599 50,576 0.11Raytheon Co USD 1,022 185,513 0.40Republic Services Inc USD 616 49,416 0.11ResMed Inc USD 637 65,885 0.14Robert Half International Inc USD 3,353 218,783 0.48Rollins Inc USD 3,831 160,059 0.35Roper Technologies Inc USD 42 14,272 0.03Ross Stores Inc USD 723 67,051 0.15Sempra Energy USD 2,994 374,609 0.82Skyworks Solutions Inc USD 639 52,232 0.11Southwest Airlines Co USD 1,321 67,503 0.15Stryker Corp USD 411 80,626 0.18T Rowe Price Group Inc USD 236 23,496 0.05Texas Instruments Inc USD 1,321 139,418 0.30The Allstate Corp USD 830 77,954 0.17The Coca-Cola Co USD 6,000 279,750 0.61The Estee Lauder Cos Inc USD 1,316 216,271 0.47The Hershey Co USD 1,598 182,955 0.40The Home Depot Inc USD 667 127,397 0.28The Kroger Co USD 1,725 42,418 0.09The Procter & Gamble Co USD 3,425 353,460 0.77The Progressive Corp USD 404 29,258 0.06The Southern Co USD 5,090 262,237 0.57The TJX Cos Inc USD 3,934 209,013 0.45The Travelers Cos Inc USD 683 93,598 0.20The Walt Disney Co USD 207 22,894 0.05Thermo Fisher Scientific Inc USD 1,127 305,361 0.66Tiffany & Co USD 89 9,351 0.02UGI Corp USD 1,341 74,372 0.16Union Pacific Corp USD 803 134,061 0.29United Therapeutics Corp USD 288 33,984 0.07UnitedHealth Group Inc USD 908 221,543 0.48Universal Health Services Inc USD 153 20,490 0.04US Bancorp USD 239 11,489 0.02Valero Energy Corp USD 600 50,340 0.11Varian Medical Systems Inc USD 1,258 178,397 0.39Verizon Communications Inc USD 3,332 196,022 0.43Vertex Pharmaceuticals Inc USD 301 54,869 0.12Visa Inc USD 1,154 178,951 0.39Vistra Energy Corp USD 2,175 56,528 0.12Walgreens Boots Alliance Inc USD 540 34,306 0.07WalMart Inc USD 4,299 418,207 0.91Waste Management Inc USD 822 85,102 0.19Waters Corp USD 289 72,279 0.16WEC Energy Group Inc USD 392 30,823 0.07WR Berkley Corp USD 218 18,460 0.04WW Grainger Inc USD 312 92,268 0.20Xcel Energy Inc USD 2,844 159,548 0.35Xilinx Inc USD 363 46,268 0.10
Total United States 17,077,217 37.14
Total Common Stocks 44,285,620 96.32
Preferred StockGermanyHenkel AG & Co KGaA EUR 546 55,711 0.12
Total Germany 55,711 0.12
Total Preferred Stock 55,711 0.12
Total Transferable securities and money market instruments admitted to official exchange listing or dealt in on another regulated market. 44,341,331 96.44
Total Investments (Total Cost: $38,920,757) 44,341,331 96.44
Other Assets/(Liabilities) 1,634,539 3.56
Total Net Assets 45,975,870 100.00
Economic Classification of InvestmentsAs at 31 March 2019
Industry ClassificationPercent ofNet Assets
Basic Materials 4.02Communications 8.36Consumer Cyclical 12.16Consumer Non-cyclical 34.27Diversified 0.03Energy 2.30Financial 8.22Industrial 8.46Technology 4.28Utilities 14.34Total Investments 96.44
Other Assets/(Liabilities) 3.56Total Net Assets 100.00
AQR UCITS FUNDS
AQR Global Defensive Equity UCITS Fund
Schedule of Investments (continued)As at 31 March 2019
The accompanying notes form an integral part of these audited financial statements. 81

Derivatives
Futures ContractsExchange-Traded
Description Counterparty†Number ofContracts
ExpirationDate
TradingCurrency
Notional Amountin USD
UnrealisedAppreciation/
(Depreciation)in USD
Percent ofNet Assets
mini MSCI EAFE Futures JPPC 4 21/06/2019 USD 372,240 7,040 0.01S&P 500 E-mini Futures JPPC 5 21/06/2019 USD 706,625 14,785 0.04
Total Futures Contracts 21,825 0.05
AQR UCITS FUNDS
AQR Global Defensive Equity UCITS Fund
Schedule of Investments (continued)As at 31 March 2019
The accompanying notes form an integral part of these audited financial statements. 82

Investments Currency
Shares/PrincipalAmounts
Fair Valuein USD
Percent ofNet Assets
Transferable securities and money market instruments admitted to official exchange listing or dealt in on another regulated market.Common StocksAustraliaBHP Billiton Ltd AUD 4,878 132,918 0.20BHP Billiton PLC GBP 20,116 483,232 0.71BlueScope Steel Ltd AUD 2,297 22,723 0.03CIMIC Group Ltd AUD 12,888 441,043 0.65Dexus Property Group (β) AUD 6,897 62,287 0.09Goodman Group (β) AUD 12,639 119,605 0.18Mirvac Group (β) AUD 11,471 22,359 0.03Newcrest Mining Ltd AUD 6,320 114,203 0.17Origin Energy Ltd AUD 6,925 35,381 0.05Rio Tinto PLC GBP 11,959 693,847 1.02Santos Ltd AUD 18,117 87,794 0.13Scentre Group (β) AUD 25,629 74,661 0.11South32 Ltd AUD 8,742 23,128 0.03The GPT Group (β) AUD 9,995 43,997 0.07Woodside Petroleum Ltd AUD 2,774 68,100 0.10
Total Australia 2,425,278 3.57
BelgiumAgeas EUR 5,666 273,672 0.40
Total Belgium 273,672 0.40
CanadaAlimentation Couche-Tard Inc CAD 2,084 122,641 0.18Aurora Cannabis Inc CAD 15,738 140,674 0.21Canopy Growth Corp CAD 2,935 125,327 0.18CGI Group Inc CAD 4,011 275,137 0.40Constellation Software Inc CAD 279 236,427 0.35Empire Co Ltd CAD 3,634 79,111 0.12Finning International Inc CAD 1,333 23,710 0.03HR Real Estate Investment Trust (β) CAD 4,968 87,362 0.13Husky Energy Inc CAD 10,792 107,694 0.16Magna International Inc CAD 4,175 204,593 0.30Open Text Corp CAD 3,540 135,314 0.20Smart Real Estate Investment Trust (β) CAD 1,396 36,473 0.05West Fraser Timber Co Ltd CAD 1,054 51,027 0.08
Total Canada 1,625,490 2.39
ChinaYangzijiang Shipbuilding Holdings Ltd SGD 279,400 309,645 0.46
Total China 309,645 0.46
DenmarkDanske Bank A/S DKK 2,386 41,987 0.06H Lundbeck A/S DKK 5,429 235,410 0.35Novo Nordisk A/S DKK 5,648 294,983 0.43Orsted A/S DKK 442 33,665 0.05Pandora A/S DKK 8,976 417,159 0.62
Total Denmark 1,023,204 1.51
FinlandNeste OYJ EUR 1,093 116,507 0.17Orion OYJ EUR 870 32,615 0.05Sampo OYJ EUR 988 44,948 0.07
Total Finland 194,070 0.29
FranceAXA SA EUR 9,861 247,613 0.36BNP Paribas SA EUR 1,846 87,857 0.13CNP Assurances EUR 10,023 220,903 0.33Electricite de France SA EUR 29,338 399,553 0.59Engie SA EUR 40,634 606,086 0.89Gecina SA (β) EUR 421 62,204 0.09Peugeot SA EUR 1,313 31,813 0.05Societe Generale SA EUR 2,165 62,215 0.09TOTAL SA EUR 9,457 523,831 0.77Unibail-Rodamco-Westfield EUR 437 71,604 0.11
Total France 2,313,679 3.41
GermanyAllianz SE EUR 2,986 663,064 0.98Commerzbank AG EUR 1,608 12,399 0.02Covestro AG EUR 13,057 715,102 1.06Deutsche Lufthansa AG EUR 20,317 442,988 0.65E.ON SE EUR 7,459 83,135 0.12SAP SE EUR 491 56,615 0.08Wirecard AG EUR 1,362 171,728 0.25
Total Germany 2,145,031 3.16
Hong KongCheung Kong Property Holdings Ltd HKD 2,500 22,236 0.03Hong Kong Exchanges & Clearing Ltd HKD 1,900 66,232 0.10Kerry Properties Ltd HKD 121,000 540,212 0.80Link REIT (β) HKD 7,000 81,890 0.12Sun Hung Kai Properties Ltd HKD 8,000 137,373 0.20Swire Properties Ltd HKD 59,400 255,583 0.38The Wharf Holdings Ltd HKD 11,000 33,233 0.05Wheelock & Co Ltd HKD 16,000 117,184 0.17
Total Hong Kong 1,253,943 1.85
ItalyEnel SpA EUR 88,898 568,319 0.84Eni SpA EUR 26,800 470,844 0.69UniCredit SpA EUR 6,333 80,845 0.12
Total Italy 1,120,008 1.65
AQR UCITS FUNDS
AQR Global Enhanced Equity UCITS Fund
Schedule of InvestmentsAs at 31 March 2019
The accompanying notes form an integral part of these audited financial statements. 83

Investments Currency
Shares/PrincipalAmounts
Fair Valuein USD
Percent ofNet Assets
Transferable securities and money market instruments admitted to official exchange listing or dealt in on another regulated market.Common Stocks (continued)JapanAstellas Pharma Inc JPY 26,100 390,878 0.58Dai-ichi Life Insurance Co Ltd JPY 8,900 123,776 0.18Daiwa House REIT Investment Corp (β) JPY 14 31,030 0.04Fuji Electric Co Ltd JPY 1,400 39,738 0.06Fujitsu Ltd JPY 500 36,042 0.05Hitachi High-Technologies Corp JPY 1,700 69,667 0.10Hitachi Ltd JPY 7,800 252,670 0.37ITOCHU Corp JPY 4,300 77,735 0.12Japan Airlines Co Ltd JPY 6,500 228,697 0.34Japan Post Holdings Co Ltd JPY 12,700 148,477 0.22Japan Real Estate Investment Corp (β) JPY 7 41,241 0.06JFE Holdings Inc JPY 1,900 32,241 0.05JXTG Holdings Inc JPY 23,100 105,725 0.16Kajima Corp JPY 4,900 72,285 0.11Kamigumi Co Ltd JPY 10,500 243,060 0.36Kose Corp JPY 600 110,177 0.16Marubeni Corp JPY 14,300 98,827 0.15Mitsubishi Corp JPY 5,000 138,773 0.20Mitsubishi UFJ Financial Group Inc JPY 28,300 140,104 0.21Mitsui & Co Ltd JPY 10,200 158,285 0.23Mizuho Financial Group Inc JPY 16,400 25,372 0.04Nikon Corp JPY 2,100 29,598 0.04Nippon Building Fund Inc (β) JPY 12 81,201 0.12Nippon Express Co Ltd JPY 1,800 100,147 0.15Nippon Telegraph & Telephone Corp JPY 11,300 480,749 0.71Nomura Real Estate Master Fund Inc (β) JPY 38 55,951 0.08NTT DOCOMO Inc JPY 900 19,904 0.03Olympus Corp JPY 4,400 47,777 0.07Oracle Corp Japan JPY 300 20,134 0.03Resona Holdings Inc JPY 44,800 194,126 0.29Shinsei Bank Ltd JPY 3,900 55,494 0.08Shionogi & Co Ltd JPY 2,300 142,289 0.21SoftBank Group Corp JPY 800 77,578 0.11Sony Corp JPY 1,900 79,818 0.12Sumitomo Corp JPY 5,100 70,501 0.10Sumitomo Dainippon Pharma Co Ltd JPY 4,300 106,307 0.16Sumitomo Heavy Industries Ltd JPY 3,600 116,634 0.17Sumitomo Mitsui Financial Group Inc JPY 5,500 192,465 0.28Sysmex Corp JPY 500 30,196 0.04Taisei Corp JPY 700 32,478 0.05THK Co Ltd JPY 2,100 51,907 0.07Tokio Marine Holdings Inc JPY 2,200 106,528 0.16Tokyo Electric Power Co Inc JPY 4,800 30,328 0.04United Urban Investment Corp (β) JPY 20 31,561 0.05
Total Japan 4,718,471 6.95
LuxembourgSES SA - GDR EUR 14,592 224,695 0.33
Total Luxembourg 224,695 0.33
NetherlandsING Groep NV - GDR EUR 11,254 135,654 0.20Koninklijke Ahold Delhaize NV EUR 37,182 985,208 1.45Royal Dutch Shell PLC - A Shares GBP 8,033 251,801 0.37Royal Dutch Shell PLC - B Shares GBP 6,303 198,843 0.30
Total Netherlands 1,571,506 2.32
South AfricaAnglo American PLC GBP 3,593 95,906 0.14Investec PLC GBP 4,954 28,430 0.04
Total South Africa 124,336 0.18
SpainACS Actividades de Construccion y Servicios SA EUR 840 36,876 0.05Banco Bilbao Vizcaya Argentaria SA EUR 46,634 265,195 0.39Iberdrola SA EUR 23,576 207,419 0.31Mapfre SA EUR 31,409 86,257 0.13
Total Spain 595,747 0.88
SwedenSandvik AB SEK 1,194 19,349 0.03Swedish Match AB SEK 8,938 455,593 0.67Tele2 AB SEK 1,408 18,854 0.03Telefonaktiebolaget LM Ericsson SEK 26,408 241,988 0.35Volvo AB SEK 11,383 175,810 0.26
Total Sweden 911,594 1.34
SwitzerlandCoca-Cola HBC AG GBP 936 31,791 0.05Nestle SA CHF 1,294 123,155 0.18Novartis AG CHF 5,536 529,997 0.78Roche Holding AG CHF 4,125 1,127,731 1.66Sonova Holding AG CHF 1,440 284,630 0.42Zurich Insurance Group AG CHF 915 302,350 0.45
Total Switzerland 2,399,654 3.54
United KingdomBarclays PLC GBP 147,857 294,707 0.44BP PLC GBP 60,057 433,730 0.64BT Group PLC GBP 15,741 45,444 0.07Burberry Group PLC GBP 21,318 541,873 0.80Centrica PLC GBP 98,174 147,174 0.22Direct Line Insurance Group PLC GBP 37,192 170,413 0.25Fiat Chrysler Automobiles NV EUR 4,293 63,816 0.09International Consolidated Airlines Group SA EUR 48,346 318,952 0.47Linde PLC EUR 853 148,588 0.22
AQR UCITS FUNDS
AQR Global Enhanced Equity UCITS Fund
Schedule of Investments (continued)As at 31 March 2019
The accompanying notes form an integral part of these audited financial statements. 84

Investments Currency
Shares/PrincipalAmounts
Fair Valuein USD
Percent ofNet Assets
Transferable securities and money market instruments admitted to official exchange listing or dealt in on another regulated market.Common Stocks (continued)United Kingdom (continued)Meggitt PLC GBP 9,171 60,034 0.09Segro PLC (β) GBP 10,382 90,579 0.13Unilever PLC GBP 1,855 106,094 0.15
Total United Kingdom 2,421,404 3.57
United StatesAbbVie Inc USD 5,609 451,104 0.67ABIOMED Inc USD 205 58,708 0.09Accenture PLC USD 1,472 258,336 0.38Activision Blizzard Inc USD 1,243 56,022 0.08Adobe Systems Inc USD 2,778 737,976 1.09AES Corp/VA USD 8,229 149,027 0.22Aflac Inc USD 3,908 194,618 0.29Alphabet Inc - Class A USD 739 863,263 1.27Alphabet Inc - Class C USD 515 600,258 0.89Altria Group Inc USD 4,641 264,026 0.39Amazon.com Inc USD 815 1,450,945 2.14American Electric Power Co Inc USD 385 32,263 0.05American Tower Corp (β) USD 461 89,780 0.13Anthem Inc USD 1,864 528,202 0.78Apple Inc USD 11,302 2,133,705 3.14Applied Materials Inc USD 8,111 319,330 0.47Athene Holding Ltd USD 1,709 69,573 0.10Autodesk Inc USD 491 76,213 0.11AutoZone Inc USD 223 225,957 0.33AvalonBay Communities Inc (β) USD 460 92,391 0.14Berkshire Hathaway Inc USD 2,129 426,907 0.63Best Buy Co Inc USD 3,026 214,997 0.32Biogen Inc USD 2,207 518,711 0.76Boston Properties Inc (β) USD 153 20,504 0.03Bristol-Myers Squibb Co USD 11,675 549,192 0.81Broadridge Financial Solutions Inc USD 1,721 176,919 0.26Cadence Design Systems Inc USD 319 20,123 0.03Cardinal Health Inc USD 2,749 131,017 0.19Caterpillar Inc USD 149 20,105 0.03CDW Corp USD 1,488 142,848 0.21Celgene Corp USD 1,150 107,031 0.16Centene Corp USD 5,358 281,349 0.41Chevron Corp USD 1,791 219,720 0.32Cigna Corp USD 2,005 319,096 0.47Cisco Systems Inc USD 9,198 491,265 0.73Cognizant Technology Solutions Corp USD 4,096 296,264 0.44Comcast Corp USD 7,875 312,874 0.46CommScope Holding Co Inc USD 1,000 21,520 0.03ConocoPhillips USD 8,453 567,365 0.84Costco Wholesale Corp USD 1,340 322,779 0.48Crown Castle International Corp (β) USD 552 70,087 0.10Cummins Inc USD 330 51,846 0.08Devon Energy Corp USD 8,043 255,767 0.38DexCom Inc USD 823 97,493 0.14Digital Realty Trust Inc (β) USD 429 51,197 0.08Discover Financial Services USD 1,060 75,822 0.11DXC Technology Co USD 839 54,283 0.08Eaton Corp PLC USD 567 45,570 0.07Electronic Arts Inc USD 1,251 126,776 0.19Eli Lilly & Co USD 2,351 304,572 0.45Emerson Electric Co USD 1,906 129,551 0.19Equinix Inc (β) USD 108 48,235 0.07Equity Residential (β) USD 2,155 162,530 0.24Exelon Corp USD 21,313 1,065,224 1.57Exxon Mobil Corp USD 1,463 118,006 0.17Facebook Inc USD 4,861 802,600 1.18FedEx Corp USD 158 28,598 0.04Fortinet Inc USD 4,068 338,864 0.50Fox Corp USD 1,189 43,066 0.06General Electric Co USD 2,373 23,659 0.03Gilead Sciences Inc USD 6,609 431,502 0.64HCA Holdings Inc USD 2,345 304,170 0.45HollyFrontier Corp USD 4,652 232,042 0.34Honeywell International Inc USD 266 42,044 0.06HP Inc USD 19,102 368,573 0.54Humana Inc USD 1,913 503,004 0.74Intel Corp USD 14,948 800,914 1.18International Business Machines Corp USD 3,363 472,165 0.70Intuit Inc USD 2,121 551,418 0.81Johnson & Johnson USD 5,349 744,099 1.10JPMorgan Chase & Co USD 1,883 189,957 0.28Keysight Technologies Inc USD 1,552 134,698 0.20KLA-Tencor Corp USD 241 28,510 0.04Lam Research Corp USD 385 68,607 0.10Las Vegas Sands Corp USD 1,225 74,284 0.11Lululemon athletica Inc USD 1,037 171,074 0.25ManpowerGroup Inc USD 3,397 281,204 0.41Marathon Oil Corp USD 11,929 199,572 0.30MasterCard Inc USD 3,318 778,436 1.15McKesson Corp USD 2,557 296,970 0.44Medtronic PLC USD 2,768 249,701 0.37Merck & Co Inc USD 12,254 1,017,695 1.50MetLife Inc USD 7,017 298,994 0.44Michael Kors Holdings Ltd USD 10,499 490,093 0.72Micron Technology Inc USD 3,905 160,105 0.24Microsoft Corp USD 20,434 2,393,843 3.53Monster Beverage Corp USD 5,899 318,487 0.47Mylan NV USD 4,860 137,927 0.20NetApp Inc USD 507 34,689 0.05NextEra Energy Inc USD 600 115,512 0.17NIKE Inc USD 5,628 476,523 0.70Oracle Corp USD 3,549 189,517 0.28
AQR UCITS FUNDS
AQR Global Enhanced Equity UCITS Fund
Schedule of Investments (continued)As at 31 March 2019
The accompanying notes form an integral part of these audited financial statements. 85

Investments Currency
Shares/PrincipalAmounts
Fair Valuein USD
Percent ofNet Assets
Transferable securities and money market instruments admitted to official exchange listing or dealt in on another regulated market.Common Stocks (continued)United States (continued)PayPal Holdings Inc USD 2,116 219,493 0.32PepsiCo Inc USD 1,653 201,203 0.30Pfizer Inc USD 29,240 1,235,390 1.82Philip Morris International Inc USD 5,813 511,486 0.75Phillips 66 USD 3,310 313,325 0.46Prologis Inc (β) USD 1,537 110,541 0.16Public Service Enterprise Group Inc USD 3,641 214,783 0.31Public Storage (β) USD 504 110,104 0.16Ralph Lauren Corp USD 2,806 364,892 0.54Raytheon Co USD 859 155,926 0.23Realty Income Corp (β) USD 1,562 114,651 0.17Robert Half International Inc USD 2,580 168,345 0.25Ross Stores Inc USD 2,105 195,218 0.29salesforce.com inc USD 207 32,646 0.05Skyworks Solutions Inc USD 1,695 138,549 0.20Southwest Airlines Co USD 5,088 259,997 0.38SP Global Inc USD 413 86,643 0.13Spirit AeroSystems Holdings Inc USD 855 78,250 0.12Starbucks Corp USD 4,105 303,688 0.45Steel Dynamics Inc USD 5,522 194,319 0.28Symantec Corp USD 10,686 244,603 0.36Synchrony Financial USD 16,477 527,264 0.78Texas Instruments Inc USD 2,047 216,040 0.32The Allstate Corp USD 1,415 132,897 0.20The Home Depot Inc USD 2,002 382,382 0.57The Kroger Co USD 4,676 114,983 0.17The PNC Financial Services Group Inc USD 254 31,219 0.05The Procter & Gamble Co USD 3,331 343,759 0.51The Progressive Corp USD 2,642 191,334 0.28The TJX Cos Inc USD 7,322 389,018 0.57The Walt Disney Co USD 1,187 131,282 0.19TripAdvisor Inc USD 384 19,837 0.03Tyson Foods Inc USD 4,031 277,333 0.41UGI Corp USD 576 31,945 0.05United Therapeutics Corp USD 1,162 137,116 0.20UnitedHealth Group Inc USD 1,500 365,985 0.54Valero Energy Corp USD 2,134 179,043 0.26Ventas Inc (β) USD 523 33,509 0.05Verizon Communications Inc USD 3,909 229,966 0.34WalMart Inc USD 2,528 245,924 0.36Waste Management Inc USD 327 33,854 0.05Wells Fargo & Co USD 2,148 103,362 0.15Welltower Inc (β) USD 1,264 98,554 0.14Xerox Corp USD 2,479 79,551 0.12Xilinx Inc USD 1,899 242,047 0.36Zoetis Inc USD 369 36,926 0.05
Total United States 40,091,540 59.09
Total Common Stocks 65,742,967 96.89
Total Transferable securities and money market instruments admitted to official exchange listing or dealt in on another regulated market. 65,742,967 96.89
Total Investments (Total Cost: $64,122,914) 65,742,967 96.89
Other Assets/(Liabilities) 2,107,786 3.11
Total Net Assets 67,850,753 100.00
(β) Real Estate Investment TrustGDR-Global Depositary Receipt
Economic Classification of InvestmentsAs at 31 March 2019
Industry ClassificationPercent ofNet Assets
Basic Materials 3.96Communications 10.09Consumer Cyclical 10.85Consumer Non-cyclical 25.29Diversified 0.05Energy 6.56Financial 14.92Industrial 3.79Technology 15.90Utilities 5.48Total Investments 96.89
Other Assets/(Liabilities) 3.11Total Net Assets 100.00
AQR UCITS FUNDS
AQR Global Enhanced Equity UCITS Fund
Schedule of Investments (continued)As at 31 March 2019
The accompanying notes form an integral part of these audited financial statements. 86

Derivatives
Futures ContractsExchange-Traded
Description Counterparty†Number ofContracts
ExpirationDate
TradingCurrency
Notional Amountin USD
UnrealisedAppreciation/
(Depreciation)in USD
Percent ofNet Assets
S&P 500 E-mini Futures JPPC 6 21/06/2019 USD 847,950 20,170 0.03S&P TSX 60 Index Futures GSCO 3 20/06/2019 CAD 429,765 1,155 0.00
Total Futures Contracts 21,325 0.03
AQR UCITS FUNDS
AQR Global Enhanced Equity UCITS Fund
Schedule of Investments (continued)As at 31 March 2019
The accompanying notes form an integral part of these audited financial statements. 87

Investments CouponMaturityDate Currency
Shares/PrincipalAmounts
Fair Valuein USD
Percentof Net
Assets
Short Term InvestmentsAustraliaAustralia & New Zealand Banking Group Ltd 0.000% 08/05/2019 USD 1,000,000 997,280 1.08Australia & New Zealand Banking Group Ltd 0.000% 09/05/2019 USD 1,000,000 997,209 1.07
Total Australia 1,994,489 2.15
CanadaTotal Capital Canada Ltd 0.000% 28/05/2019 USD 1,500,000 1,493,713 1.61
Total Canada 1,493,713 1.61
FinlandNordea Bank AB 0.000% 13/05/2019 USD 1,250,000 1,246,188 1.34
Total Finland 1,246,188 1.34
FranceAntalis SA 0.000% 02/04/2019 USD 2,000,000 1,999,457 2.15
Total France 1,999,457 2.15
NorwayDNB Bank ASA 0.000% 15/05/2019 USD 2,000,000 1,993,632 2.15
Total Norway 1,993,632 2.15
SingaporeDBS Bank Ltd 0.000% 14/05/2019 USD 400,000 398,714 0.43
Total Singapore 398,714 0.43
SwedenSkandinaviska Enskilda Banken AB 0.000% 04/04/2019 USD 1,250,000 1,249,515 1.35Skandinaviska Enskilda Banken AB 0.000% 22/05/2019 USD 700,000 697,437 0.75Swedbank AB 0.000% 10/05/2019 USD 1,000,000 997,201 1.07Swedbank AB 0.000% 21/05/2019 USD 900,000 896,816 0.97
Total Sweden 3,840,969 4.14
United KingdomASB Finance Ltd 0.000% 14/05/2019 USD 1,300,000 1,295,902 1.40
Total United Kingdom 1,295,902 1.40
United StatesAmerican Honda Finance Corporation 0.000% 04/04/2019 USD 500,000 499,798 0.54Atlantic Asset Securitization LLC 0.000% 04/04/2019 USD 1,500,000 1,499,389 1.62Atlantic Asset Securitization LLC 0.000% 14/06/2019 USD 1,000,000 994,584 1.07Bank of Montreal 2.430% 02/04/2019 USD 1,000,000 1,000,001 1.08Chevron Corporation 0.000% 26/04/2019 USD 1,900,000 1,896,470 2.04DZ Bank Deutsche Zentral 2.720% 17/06/2019 USD 400,000 400,149 0.43Fairway Finance Co LLC 0.000% 01/07/2019 USD 1,500,000 1,489,981 1.61Gotham Funding Corp 0.000% 13/05/2019 USD 1,900,000 1,894,086 2.04LMA Americas LLC 0.000% 01/04/2019 USD 1,000,000 999,798 1.08LMA Americas LLC 0.000% 11/04/2019 USD 1,500,000 1,498,686 1.61Mizuho Bank Ltd 0.000% 13/06/2019 USD 900,000 895,220 0.96Mizuho Bank Ltd 2.730% 15/04/2019 USD 1,000,000 1,000,142 1.08Nestle Capital Corp 0.000% 18/07/2019 USD 1,400,000 1,389,213 1.50Nieuw Amsterdam Receivables Corp 0.000% 03/05/2019 USD 1,000,000 997,589 1.07Nieuw Amsterdam Receivables Corp 0.000% 04/06/2019 USD 1,500,000 1,493,029 1.61Novartis Finance Corp 0.000% 01/04/2019 USD 1,000,000 999,802 1.08Novartis Finance Corp 0.000% 07/05/2019 USD 800,000 797,863 0.86Oversea-Chinese Banking Corp Ltd 2.560% 14/05/2019 USD 1,000,000 1,000,046 1.08Oversea-Chinese Banking Corp Ltd 2.660% 06/08/2019 USD 500,000 500,147 0.54PACCAR Financial Corp 0.000% 02/05/2019 USD 1,000,000 997,674 1.07Pfizer Inc 0.000% 06/05/2019 USD 1,000,000 997,427 1.07Regency Markets No. 1 LLC 0.000% 04/04/2019 USD 1,500,000 1,499,389 1.62Siemens Capital Co LLC 0.000% 15/04/2019 USD 1,900,000 1,897,839 2.04Starbird Funding Corp 0.000% 13/06/2019 USD 1,000,000 994,555 1.07Sumitomo Mitsui Trust Bank Limited 2.800% 25/04/2019 USD 1,000,000 1,000,259 1.08The Bank of Nova Scotia 2.600% 22/08/2019 USD 500,000 500,023 0.54The Coca-Cola Co 0.000% 23/05/2019 USD 2,000,000 1,992,401 2.15The Coca-Cola Co 0.000% 17/06/2019 USD 500,000 497,213 0.54The Toronto-Dominion Bank 2.710% 08/04/2019 USD 1,900,000 1,900,137 2.05Toyota Motor Credit Corp 0.000% 30/04/2019 USD 1,300,000 1,297,207 1.40Toyota Motor Credit Corp 0.000% 13/05/2019 USD 600,000 598,178 0.64Walmart Inc 0.000% 28/05/2019 USD 900,000 896,288 0.97Walmart Inc 0.000% 17/06/2019 USD 1,000,000 994,471 1.07
Total United States 37,309,054 40.21
Other Investment FundsUnited StatesUBS (Irl) Select Money Market Fund^ 0.000% USD 7,514,903 7,514,903 8.10
Total United States 7,514,903 8.10
Total Other Investment Funds 7,514,903 8.10
Total Short Term Investments 59,087,021 63.68
Total Investments (Total Cost: $59,092,039) 59,087,021 63.68
Other Assets/(Liabilities) 33,703,277 36.32
Total Net Assets 92,790,298 100.00
^Seven-day effective yield at 31 March 2019 was 2.29%.
AQR UCITS FUNDS
AQR Global Macro Opportunities UCITS Fund
Schedule of InvestmentsAs at 31 March 2019
The accompanying notes form an integral part of these audited financial statements. 88

Economic Classification of InvestmentsAs at 31 March 2019
Industry ClassificationPercent ofNet Assets
Consumer Cyclical 6.66Consumer Non-cyclical 5.26Financial 49.71Industrial 2.05Total Investments 63.68
Other Assets/(Liabilities) 36.32Total Net Assets 100.00
AQR UCITS FUNDS
AQR Global Macro Opportunities UCITS Fund
Schedule of Investments (continued)As at 31 March 2019
The accompanying notes form an integral part of these audited financial statements. 89

Derivatives
Credit Default Swap Contracts - Buy ProtectionCentrally Cleared
Counterparty† Reference Entity
FinancingRatePaid
TerminationDate
CreditSpread
TradingCurrency
Notional Amountin USD
UpfrontPayments(Receipts)
UnrealisedAppreciation/
(Depreciation)in USD
Percent ofNet Assets
CITGiTraxx Europe Crossover Indices CDXSpreads - Series 31 5.00 21/06/2024 0.0279 EUR 8,412,251 (1,029,312) (1,017,698) (1.09)
Interest Rate Swap ContractsCentrally Cleared
Counterparty†TradingCurrency Payments Made‡ Payments Received‡
Notional Amountin USD
UpfrontPayments(Receipts) Termination Date
UnrealisedAppreciation/
(Depreciation)in USD
Percent ofNet Assets
CSSL AUD Fixed 1.50% Floating AUD 3-month BBSW 10,049,425 35,693 09/09/2021 (15,535) (0.02)CSSL AUD Floating AUD 6-month BBSW Fixed 2.50% 441,993 1,451 13/09/2029 16,713 0.02CSSL AUD Floating AUD 3-month BBSW Fixed 2.00% 1,647,925 1,403 06/10/2021 17,685 0.02CSSL AUD Floating AUD 6-month BBSW Fixed 2.50% 516,766 0 06/07/2029 20,606 0.02CSSL CAD Fixed 2.50% Floating CAD 3-month CDOR 24,256,362 (92,787) 16/06/2021 (298,212) (0.32)CSSL CAD Fixed 2.50% Floating CAD 3-month CDOR 9,462,236 (68,966) 16/09/2021 (120,036) (0.13)CSSL CAD Floating CAD 3-month CDOR Fixed 3.00% 162,206 5,302 20/06/2029 12,483 0.01CSSL CAD Floating CAD 3-month CDOR Fixed 2.75% 2,932,725 81,427 19/09/2029 162,850 0.18CSSL CAD Floating CAD 3-month CDOR Fixed 2.50% 6,058,452 0 20/06/2029 219,254 0.24CSSL CHF Fixed 0.50% Floating CHF 6-month LIBOR 7,845,926 (77,601) 20/06/2029 (389,900) (0.42)CSSL CHF Floating CHF 6-month LIBOR Fixed (0.50)% 58,103,373 (14,309) 16/06/2021 151,281 0.16CITG CZK Fixed 2.50% Floating CZK 6-month PRIBOR 3,427,050 (21,932) 16/06/2021 (34,588) (0.04)CITG CZK Floating CZK 6-month PRIBOR Fixed 2.00% 1,745,320 (9,187) 15/09/2021 1,455 0.00CSSL EUR Fixed 1.00% Floating EUR 6-month EURIBOR 1,710,383 (12,428) 19/06/2029 (86,017) (0.09)CSSL EUR Fixed 0.00% Floating EUR 6-month EURIBOR 2,350,091 (5,074) 20/09/2021 (7,684) (0.01)CSSL EUR Floating EUR 6-month EURIBOR Fixed 0.00% 32,117,773 50,659 21/06/2021 119,398 0.13CSSL GBP Fixed 1.50% Floating GBP 6-month LIBOR 3,540,841 (519) 19/06/2029 (98,739) (0.11)CSSL GBP Fixed 1.50% Floating GBP 6-month LIBOR 2,406,106 6,164 18/09/2029 (63,609) (0.07)CSSL GBP Floating GBP 6-month LIBOR Fixed 1.25% 2,353,594 688 21/06/2021 13,864 0.02CSSL GBP Floating GBP 6-month LIBOR Fixed 1.25% 12,026,796 12,358 20/09/2021 68,176 0.07CITG HKD Fixed 2.50% Floating HKD 3-month HIBOR 4,116,564 (6,830) 16/06/2021 (49,068) (0.05)CITG HKD Fixed 2.00% Floating HKD 3-month HIBOR 2,136,019 9,939 15/09/2021 (4,122) (0.00)CITG HUF Fixed 1.50% Floating HUF 6-month BUBOR 21,894,784 (95,704) 16/06/2021 (343,494) (0.37)CITG HUF Fixed 1.00% Floating HUF 6-month BUBOR 6,454,292 49,385 15/09/2021 (22,042) (0.02)CSSL JPY Floating JPY 6-month LIBOR Fixed 0.00% 14,310,022 10,777 15/09/2021 17,865 0.02CSSL JPY Fixed 0.00% Floating JPY 6-month LIBOR 2,972,952 55,891 19/09/2029 34,243 0.04CSSL JPY Floating JPY 6-month LIBOR Fixed 0.00% 253,502,981 (59,024) 16/06/2021 259,847 0.28CSSL JPY Fixed 0.00% Floating JPY 6-month LIBOR 33,347,714 721,353 20/06/2029 346,316 0.37CITG KRW Fixed 2.00% Floating KRW 3-month KSDA 1,793,239 (7,968) 15/09/2021 (13,386) (0.01)CITG KRW Fixed 2.00% Floating KRW 3-month KSDA 264,068 (1,199) 16/06/2021 (1,812) (0.00)CITG MXN Floating MXN 1-month TIIE Fixed 8.00% 10,943,825 6,352 15/09/2021 50,821 0.05CITG MXN Floating MXN 1-month TIIE Fixed 8.50% 53,996,221 (189,544) 16/06/2021 618,432 0.67CSSL NOK Floating NOK 6-month NIBOR Fixed 1.50% 45,860,397 (108,915) 16/06/2021 (183,803) (0.20)CSSL NOK Floating NOK 6-month NIBOR Fixed 1.50% 6,627,117 (19,019) 15/09/2021 (30,155) (0.03)CSSL NOK Fixed 2.00% Floating NOK 6-month NIBOR 7,203,106 113,071 20/06/2029 (10,872) (0.01)CSSL NOK Fixed 2.00% Floating NOK 6-month NIBOR 1,484,973 19,538 19/09/2029 424 0.00CSSL NZD Fixed 2.00% Floating NZD 3-month BKBM 33,855,584 (70,435) 16/06/2021 (267,526) (0.29)CSSL NZD Fixed 2.00% Floating NZD 3-month BKBM 20,804,422 (59,369) 15/09/2021 (173,458) (0.19)CSSL NZD Floating NZD 3-month BKBM Fixed 2.50% 1,048,378 (4,460) 19/09/2029 26,728 0.03CSSL NZD Floating NZD 3-month BKBM Fixed 3.00% 1,901,757 59,502 20/06/2029 130,897 0.14CITG PLN Fixed 2.00% Floating PLN 6-month WIBOR 5,250,964 (9,062) 16/06/2021 (20,779) (0.02)CSSL SEK Floating SEK 3-month STIBOR Fixed 1.00% 7,750,514 (26,220) 19/09/2029 60,405 0.07CSSL SEK Fixed 0.00% Floating SEK 3-month STIBOR 38,649,028 151,045 15/09/2021 133,769 0.14CSSL SEK Floating SEK 3-month STIBOR Fixed 1.00% 15,675,644 (320,531) 20/06/2029 187,571 0.20CSSL SEK Fixed 0.00% Floating SEK 3-month STIBOR 131,717,300 487,842 16/06/2021 359,883 0.39CITG SGD Fixed 2.00% Floating SGD 6-month SOR 2,356,838 (4,380) 16/06/2021 (5,047) (0.01)CSSL USD Fixed 3.00% Floating USD 3-month LIBOR 49,254,587 (347,058) 21/06/2021 (645,413) (0.70)CSSL USD Floating USD 3-month LIBOR Fixed 3.00% 17,845,521 149,620 20/09/2021 245,521 0.26CSSL USD Floating USD 3-month LIBOR Fixed 3.00% 14,307,694 0 19/06/2029 707,694 0.76CITG ZAR Fixed 7.50% Floating ZAR 3-month JIBAR 6,549,745 4,189 17/06/2021 (41,498) (0.04)
Total Interest Rate Swap Contracts 1,057,386 1.14
Futures ContractsExchange-Traded
Description Counterparty†Number ofContracts
ExpirationDate
TradingCurrency
Notional Amountin USD
UnrealisedAppreciation/
(Depreciation)in USD
Percent ofNet Assets
10 Year Australian Treasury Bond Futures JPPC 18 17/06/2019 AUD 1,767,760 (477) (0.00)10 Year Canadian Treasury Bonds Futures JPPC 21 19/06/2019 CAD 2,188,037 (9,134) (0.01)10 Year Japan Treasury Bonds Futures JPPC (10) 13/06/2019 JPY (13,825,823) (47,548) (0.05)10 Year US Treasury Note (CBT) Futures JPPC 1 19/06/2019 USD 124,234 (420) (0.00)Amsterdam Index Futures JPPC (70) 18/04/2019 EUR (8,576,014) (196,330) (0.21)CAC40 10 Euro Futures JPPC 23 18/04/2019 EUR 1,373,926 (24,907) (0.03)DAX Index Futures JPPC (1) 21/06/2019 EUR (322,847) (2,855) (0.00)EURO STOXX 50 Futures JPPC 143 21/06/2019 EUR 5,234,036 (106,851) (0.12)Euro-Bund Futures JPPC (94) 06/06/2019 EUR (17,549,996) (317,963) (0.34)Euro-Buxl 30 Year Bond Futures JPPC (20) 06/06/2019 EUR (4,304,175) (210,843) (0.23)FTSE KLC Index Futures JPPC (2) 30/04/2019 MYR (40,318) (36) (0.00)FTSE/JSE TOP 40 Futures JPPC (8) 20/06/2019 ZAR (280,663) (1,967) (0.00)HANG SENG Index Futures GSCO (17) 29/04/2019 HKD (3,148,485) (43,573) (0.05)KOSPI 200 Index Futures JPPC 2 13/06/2019 KRW 122,104 (639) (0.00)Long Gilt Futures JPPC (224) 26/06/2019 GBP (37,691,490) (630,059) (0.68)MEX BOLSA Index Futures GSCO (4) 21/06/2019 MXN (89,868) (2,450) (0.00)mini-10 year JGB Futures JPPC (1) 12/06/2019 JPY (138,258) (353) (0.00)MSCI Singapore Index Futures JPPC (78) 29/04/2019 SGD (2,070,827) (6,903) (0.01)NIKKEI 225 (OSE) Futures GSCO 17 13/06/2019 JPY 3,252,335 (49,576) (0.05)Russell 2000 Mini Futures JPPC (103) 21/06/2019 USD (7,953,145) (75,780) (0.08)S&P 500 E-mini Futures JPPC (371) 21/06/2019 USD (52,431,575) (1,098,190) (1.19)
AQR UCITS FUNDS
AQR Global Macro Opportunities UCITS Fund
Schedule of Investments (continued)As at 31 March 2019
The accompanying notes form an integral part of these audited financial statements. 90

Description Counterparty†Number ofContracts
ExpirationDate
TradingCurrency
Notional Amountin USD
UnrealisedAppreciation/
(Depreciation)in USD
Percent ofNet Assets
S&P TSX 60 Index Futures GSCO 2 20/06/2019 CAD 286,510 (110) (0.00)SET50 Futures JPPC (10) 27/06/2019 THB (68,278) (366) (0.00)SPI 200 Futures JPPC 81 20/06/2019 AUD 8,857,360 (11,951) (0.01)TOPIX Index Futures JPPC (4) 13/06/2019 JPY (574,392) (2,616) (0.00)10 Year Australian Treasury Bond Futures JPPC 126 17/06/2019 AUD 12,374,317 228,047 0.2510 Year Canadian Treasury Bonds Futures JPPC 58 19/06/2019 CAD 6,043,149 93,428 0.0910 Year US Treasury Note (CBT) Futures JPPC 128 19/06/2019 USD 15,902,000 233,280 0.242 Year US Treasury Note (CBT) Futures JPPC (296) 28/06/2019 USD (63,078,062) 49,959 0.05CAC40 10 Euro Futures JPPC 81 18/04/2019 EUR 4,838,609 62,730 0.07DAX Index Futures JPPC (26) 21/06/2019 EUR (8,394,015) 117,393 0.13EURO STOXX 50 Futures JPPC 334 21/06/2019 EUR 12,224,951 155,610 0.17FTSE 100 Index Futures GSCO 224 21/06/2019 GBP 20,961,069 454,239 0.49FTSE KLC Index Futures JPPC (1) 30/04/2019 MYR (20,159) 7 0.00FTSE/JSE TOP 40 Futures JPPC (10) 20/06/2019 ZAR (350,828) 152 0.00FTSE/MIB Index Futures JPPC 69 21/06/2019 EUR 8,008,435 241,470 0.27H-Shares Index Futures GSCO 10 29/04/2019 HKD 724,463 3,153 0.00IBEX 35 Index Futures JPPC 4 18/04/2019 EUR 411,376 1,706 0.00KOSPI 200 Index Futures JPPC 55 13/06/2019 KRW 3,357,854 13,930 0.02OMXS30 Index Futures GSCO 245 17/04/2019 SEK 4,070,715 15,270 0.02Russell 2000 Mini Futures JPPC (53) 21/06/2019 USD (4,092,395) 23,320 0.03S&P 500 E-mini Futures JPPC (9) 21/06/2019 USD (1,271,925) 8,721 0.01S&P MID 400 E-mini Index Futures JPPC 163 21/06/2019 USD 31,002,600 439,707 0.47S&P TSX 60 Index Futures GSCO 40 20/06/2019 CAD 5,730,200 25,401 0.02SPI 200 Futures JPPC 2 20/06/2019 AUD 218,700 2,197 0.00Swiss Market Index Futures GSCO 82 21/06/2019 CHF 7,629,669 134,525 0.15TOPIX Index Futures JPPC (127) 13/06/2019 JPY (18,236,955) 157,449 0.17
Total Futures Contracts (380,203) (0.41)
Forward Foreign Exchange ContractsOver-the-Counter
Counterparty† Currency Purchased Amount Purchased Currency Sold Amount Sold Settlement Date
UnrealisedAppreciation/
(Depreciation)in USD
Percent ofNet Assets
CITI AUD 11,761,276 USD 8,406,448 19/06/2019 (58,194) (0.06)CITI BRL 15,098,733 USD 3,987,003 19/06/2019* (133,509) (0.14)CITI CAD 6,903,006 USD 5,237,599 19/06/2019 (59,940) (0.07)CITI CLP 642,931,250 USD 967,182 19/06/2019* (22,129) (0.02)CITI CNH 366,500 USD 54,761 19/06/2019 (197) (0.00)CITI COP 7,801,417,415 USD 2,506,981 19/06/2019* (57,641) (0.06)CITI CZK 23,169,010 USD 1,021,703 19/06/2019 (12,011) (0.01)CITI EUR 6,787,590 USD 7,747,572 19/06/2019 (76,739) (0.08)CITI GBP 1,589,150 USD 2,088,985 19/06/2019 (15,333) (0.02)CITI HKD 10,001,000 USD 1,278,693 19/06/2019 (1,650) (0.00)CITI HUF 3,290,537,622 USD 11,893,268 19/06/2019 (324,974) (0.35)CITI IDR 7,205,000,000 USD 504,338 19/06/2019* (5,015) (0.01)CITI ILS 3,809,658 USD 1,060,755 19/06/2019 (5,365) (0.01)CITI INR 150,547,000 USD 2,158,191 19/06/2019* (10,465) (0.01)CITI JPY 65,279,810 USD 595,229 19/06/2019 (2,822) (0.00)CITI KRW 3,481,747,050 USD 3,093,806 19/06/2019* (26,783) (0.03)CITI MXN 112,601,593 USD 5,785,389 19/06/2019 (27,422) (0.03)CITI NOK 13,346,597 USD 1,567,509 19/06/2019 (14,923) (0.02)CITI NZD 15,684,515 USD 10,760,796 19/06/2019 (62,349) (0.07)CITI PHP 35,700,000 USD 678,192 19/06/2019* (5,224) (0.01)CITI PLN 5,254,675 USD 1,384,754 19/06/2019 (10,051) (0.01)CITI SEK 37,215,206 USD 4,072,256 19/06/2019 (34,950) (0.04)CITI SGD 6,660,000 USD 4,940,793 19/06/2019 (17,964) (0.02)CITI THB 147,000 USD 4,706 19/06/2019 (64) (0.00)CITI TRY 29,095,030 USD 5,178,453 19/06/2019 (358,566) (0.39)CITI USD 73,091 AUD 103,035 19/06/2019 (44) (0.00)CITI USD 140,069 CAD 187,482 19/06/2019 (553) (0.00)CITI USD 12,455,507 CHF 12,375,014 19/06/2019 (65,366) (0.07)CITI USD 306,566 CNH 2,072,900 19/06/2019 (2,049) (0.00)CITI USD 298,740 GBP 229,855 19/06/2019 (1,193) (0.00)CITI USD 10,407 HKD 81,500 19/06/2019 0 0.00CITI USD 196,837 IDR 2,850,000,000 19/06/2019* (673) (0.00)CITI USD 7,499,134 INR 529,460,204 19/06/2019* (54,224) (0.06)CITI USD 7,619,366 JPY 842,396,828 19/06/2019 (25,291) (0.03)CITI USD 3,161,328 MXN 62,034,920 19/06/2019 (10,874) (0.01)CITI USD 2,600,654 NOK 22,522,235 19/06/2019 (19,319) (0.02)CITI USD 136,942 NZD 201,901 19/06/2019 (775) (0.00)CITI USD 44,977 RUB 3,000,000 19/06/2019* (327) (0.00)CITI USD 819,550 SGD 1,110,000 19/06/2019 (922) (0.00)CITI USD 366,101 TWD 11,277,757 19/06/2019* (528) (0.00)CITI USD 378,447 ZAR 5,552,000 19/06/2019 (1,580) (0.00)CITI ZAR 6,994,503 USD 491,523 19/06/2019 (12,760) (0.01)JPMC AUD 11,761,274 USD 8,406,457 19/06/2019 (58,204) (0.06)JPMC BRL 15,098,719 USD 3,987,005 19/06/2019* (133,514) (0.14)JPMC CAD 6,902,993 USD 5,237,597 19/06/2019 (59,946) (0.07)JPMC CLP 642,931,250 USD 967,183 19/06/2019* (22,130) (0.02)JPMC CNH 366,500 USD 54,761 19/06/2019 (197) (0.00)JPMC COP 7,801,417,410 USD 2,506,986 19/06/2019* (57,644) (0.06)JPMC CZK 23,169,010 USD 1,021,704 19/06/2019 (12,012) (0.01)JPMC EUR 6,787,611 USD 7,747,604 19/06/2019 (76,749) (0.08)JPMC GBP 1,589,142 USD 2,088,976 19/06/2019 (15,335) (0.02)JPMC HKD 10,001,000 USD 1,278,694 19/06/2019 (1,651) (0.00)JPMC HUF 3,290,537,621 USD 11,893,281 19/06/2019 (324,989) (0.35)JPMC IDR 7,205,000,000 USD 504,338 19/06/2019* (5,015) (0.01)JPMC ILS 3,809,660 USD 1,060,762 19/06/2019 (5,369) (0.01)JPMC INR 150,547,000 USD 2,158,195 19/06/2019* (10,468) (0.01)JPMC JPY 65,279,814 USD 595,230 19/06/2019 (2,823) (0.00)JPMC KRW 3,481,747,050 USD 3,093,808 19/06/2019* (26,787) (0.03)JPMC MXN 112,601,586 USD 5,785,396 19/06/2019 (27,430) (0.03)JPMC NOK 13,346,580 USD 1,567,614 19/06/2019 (15,031) (0.02)JPMC NZD 15,684,524 USD 10,760,816 19/06/2019 (62,362) (0.07)
AQR UCITS FUNDS
AQR Global Macro Opportunities UCITS Fund
Schedule of Investments (continued)As at 31 March 2019
The accompanying notes form an integral part of these audited financial statements. 91

Counterparty† Currency Purchased Amount Purchased Currency Sold Amount Sold Settlement Date
UnrealisedAppreciation/
(Depreciation)in USD
Percent ofNet Assets
JPMC PHP 35,700,000 USD 678,254 19/06/2019* (5,285) (0.01)JPMC PLN 5,254,676 USD 1,384,755 19/06/2019 (10,053) (0.01)JPMC SEK 37,215,202 USD 4,072,734 19/06/2019 (35,429) (0.04)JPMC SGD 6,660,000 USD 4,940,800 19/06/2019 (17,971) (0.02)JPMC THB 147,000 USD 4,706 19/06/2019 (64) (0.00)JPMC TRY 29,095,030 USD 5,178,460 19/06/2019 (358,573) (0.39)JPMC USD 73,091 AUD 103,035 19/06/2019 (45) (0.00)JPMC USD 140,060 CAD 187,487 19/06/2019 (567) (0.00)JPMC USD 12,455,483 CHF 12,375,003 19/06/2019 (65,381) (0.07)JPMC USD 306,565 CNH 2,072,900 19/06/2019 (2,049) (0.00)JPMC USD 298,740 GBP 229,855 19/06/2019 (1,194) (0.00)JPMC USD 10,407 HKD 81,500 19/06/2019 0 0.00JPMC USD 196,837 IDR 2,850,000,000 19/06/2019* (673) (0.00)JPMC USD 7,499,125 INR 529,460,199 19/06/2019* (54,234) (0.06)JPMC USD 7,619,356 JPY 842,396,828 19/06/2019 (25,300) (0.03)JPMC USD 3,161,329 MXN 62,034,914 19/06/2019 (10,873) (0.01)JPMC USD 2,600,652 NOK 22,522,247 19/06/2019 (19,323) (0.02)JPMC USD 136,944 NZD 201,903 19/06/2019 (775) (0.00)JPMC USD 44,977 RUB 3,000,000 19/06/2019* (327) (0.00)JPMC USD 819,549 SGD 1,110,000 19/06/2019 (923) (0.00)JPMC USD 366,101 TWD 11,277,753 19/06/2019* (529) (0.00)JPMC USD 378,446 ZAR 5,552,000 19/06/2019 (1,580) (0.00)JPMC ZAR 6,994,497 USD 491,523 19/06/2019 (12,761) (0.01)CITI AUD 1,828,689 USD 1,297,919 19/06/2019 100 0.00CITI BRL 24,000 USD 6,098 19/06/2019* 28 0.00CITI CAD 2,246,138 USD 1,677,827 19/06/2019 6,909 0.01CITI CNH 340,000 USD 50,589 19/06/2019 29 0.00CITI COP 605,000,000 USD 189,032 19/06/2019* 914 0.00CITI EUR 330,000 USD 372,841 19/06/2019 101 0.00CITI GBP 47,564 USD 61,788 19/06/2019 278 0.00CITI INR 269,792,996 USD 3,787,349 19/06/2019* 61,558 0.07CITI JPY 21,759,938 USD 196,614 19/06/2019 855 0.00CITI MXN 141,884,643 USD 7,217,705 19/06/2019 37,673 0.04CITI NOK 2,513,707 USD 290,282 19/06/2019 2,132 0.00CITI NZD 4,711,473 USD 3,197,323 19/06/2019 16,385 0.02CITI PHP 14,900,000 USD 280,195 19/06/2019* 679 0.00CITI PLN 452,824 USD 118,288 19/06/2019 177 0.00CITI RUB 89,250,000 USD 1,335,224 19/06/2019* 12,582 0.01CITI SEK 136,533,890 USD 14,724,687 19/06/2019 87,245 0.09CITI SGD 1,308,009 USD 965,985 19/06/2019 847 0.00CITI TWD 29,815,122 USD 968,027 19/06/2019* 1,234 0.00CITI USD 1,214,012 AUD 1,695,249 19/06/2019 10,709 0.01CITI USD 7,655,032 BRL 29,279,622 19/06/2019* 182,290 0.20CITI USD 327,065 CAD 431,267 19/06/2019 3,590 0.00CITI USD 2,886,204 CHF 2,849,482 19/06/2019 3,136 0.00CITI USD 8,106,667 CLP 5,339,749,075 19/06/2019* 257,696 0.28CITI USD 980,947 CNH 6,566,100 19/06/2019 3,384 0.00CITI USD 428,668 COP 1,332,000,000 19/06/2019* 10,472 0.01CITI USD 10,215,473 CZK 230,326,892 19/06/2019 177,965 0.19CITI USD 25,846,595 EUR 22,605,765 19/06/2019 299,231 0.32CITI USD 3,638,781 GBP 2,755,275 19/06/2019 43,475 0.05CITI USD 83,432 HKD 653,000 19/06/2019 49 0.00CITI USD 1,267,967 HUF 350,919,033 19/06/2019 34,268 0.04CITI USD 13,956 IDR 200,000,000 19/06/2019* 96 0.00CITI USD 246,906 ILS 886,258 19/06/2019 1,386 0.00CITI USD 4,677,612 JPY 512,776,228 19/06/2019 24,226 0.03CITI USD 13,468,688 KRW 15,113,259,460 19/06/2019* 155,629 0.17CITI USD 264,719 MXN 5,164,160 19/06/2019 645 0.00CITI USD 5,744,986 NOK 49,112,194 19/06/2019 31,850 0.04CITI USD 328,710 NZD 479,296 19/06/2019 1,779 0.00CITI USD 330,264 PHP 17,300,000 19/06/2019* 4,147 0.01CITI USD 880,999 PLN 3,340,500 19/06/2019 7,074 0.01CITI USD 2,821,477 SGD 3,807,400 19/06/2019 7,187 0.01CITI USD 1,310,882 TWD 40,218,850 19/06/2019* 3,405 0.00CITI USD 3,245,331 ZAR 46,523,479 19/06/2019 60,871 0.07CITI ZAR 3,956,500 USD 268,408 19/06/2019 2,409 0.00JPMC AUD 1,828,689 USD 1,297,921 19/06/2019 99 0.00JPMC BRL 24,000 USD 6,098 19/06/2019* 28 0.00JPMC CAD 2,246,133 USD 1,677,825 19/06/2019 6,907 0.01JPMC CNH 340,000 USD 50,590 19/06/2019 29 0.00JPMC COP 605,000,000 USD 189,032 19/06/2019* 914 0.00JPMC EUR 330,000 USD 372,841 19/06/2019 100 0.00JPMC GBP 47,563 USD 61,786 19/06/2019 278 0.00JPMC INR 269,793,004 USD 3,787,356 19/06/2019* 61,553 0.07JPMC JPY 21,759,938 USD 196,615 19/06/2019 854 0.00JPMC MXN 141,884,631 USD 7,217,713 19/06/2019 37,664 0.04JPMC NOK 2,513,700 USD 290,168 19/06/2019 2,246 0.00JPMC NZD 4,711,476 USD 3,197,329 19/06/2019 16,381 0.02JPMC PHP 14,900,000 USD 280,197 19/06/2019* 678 0.00JPMC PLN 452,825 USD 118,289 19/06/2019 177 0.00JPMC RUB 89,250,000 USD 1,335,225 19/06/2019* 12,581 0.01JPMC SEK 136,533,877 USD 14,726,094 19/06/2019 85,836 0.09JPMC SGD 1,308,009 USD 965,987 19/06/2019 846 0.00JPMC TWD 29,815,123 USD 968,028 19/06/2019* 1,233 0.00JPMC USD 1,214,009 AUD 1,695,248 19/06/2019 10,707 0.01JPMC USD 7,655,021 BRL 29,279,623 19/06/2019* 182,281 0.20JPMC USD 327,043 CAD 431,274 19/06/2019 3,563 0.00JPMC USD 2,886,199 CHF 2,849,480 19/06/2019 3,132 0.00JPMC USD 8,106,657 CLP 5,339,749,080 19/06/2019* 257,686 0.28JPMC USD 980,946 CNH 6,566,100 19/06/2019 3,383 0.00JPMC USD 428,668 COP 1,332,000,000 19/06/2019* 10,472 0.01JPMC USD 10,215,461 CZK 230,326,891 19/06/2019 177,953 0.19JPMC USD 25,846,557 EUR 22,605,761 19/06/2019 299,199 0.32JPMC USD 3,638,765 GBP 2,755,266 19/06/2019 43,471 0.05JPMC USD 83,432 HKD 653,000 19/06/2019 49 0.00JPMC USD 1,267,965 HUF 350,919,030 19/06/2019 34,266 0.04
AQR UCITS FUNDS
AQR Global Macro Opportunities UCITS Fund
Schedule of Investments (continued)As at 31 March 2019
The accompanying notes form an integral part of these audited financial statements. 92

Counterparty† Currency Purchased Amount Purchased Currency Sold Amount Sold Settlement Date
UnrealisedAppreciation/
(Depreciation)in USD
Percent ofNet Assets
JPMC USD 13,956 IDR 200,000,000 19/06/2019* 96 0.00JPMC USD 246,905 ILS 886,257 19/06/2019 1,386 0.00JPMC USD 4,677,606 JPY 512,776,224 19/06/2019 24,220 0.03JPMC USD 13,468,671 KRW 15,113,259,462 19/06/2019* 155,612 0.17JPMC USD 264,714 MXN 5,164,153 19/06/2019 641 0.00JPMC USD 5,744,983 NOK 49,112,225 19/06/2019 31,842 0.03JPMC USD 328,700 NZD 479,293 19/06/2019 1,773 0.00JPMC USD 330,262 PHP 17,300,000 19/06/2019* 4,146 0.01JPMC USD 880,999 PLN 3,340,500 19/06/2019 7,073 0.01JPMC USD 2,821,475 SGD 3,807,398 19/06/2019 7,186 0.01JPMC USD 1,310,878 TWD 40,218,837 19/06/2019* 3,404 0.00JPMC USD 3,245,335 ZAR 46,523,487 19/06/2019 60,876 0.07JPMC ZAR 3,956,500 USD 268,408 19/06/2019 2,408 0.00
Total Forward Foreign Exchange Contracts 29,601 0.03
* Non-deliverable forwards (See Note 4)
Hedge Forward Foreign Exchange ContractsOver-the-Counter
Counterparty† Currency Purchased Amount Purchased Currency Sold Amount Sold Settlement Date
UnrealisedAppreciation/
(Depreciation)in USD
Percent ofNet Assets
CITI EUR 35,074,521 USD 40,103,176 19/06/2019 (464,546) (0.50)CITI GBP 4,099,654 USD 5,414,365 19/06/2019 (64,804) (0.07)JPMC EUR 35,074,506 USD 40,103,208 19/06/2019 (464,595) (0.50)JPMC GBP 4,099,664 USD 5,414,385 19/06/2019 (64,811) (0.07)CITI GBP 312,367 USD 405,778 19/06/2019 1,824 0.00JPMC GBP 312,367 USD 405,778 19/06/2019 1,823 0.00
Total Hedge Forward Foreign Exchange Contracts (1,055,109) (1.14)
Total Return Swap ContractsOver-the-Counter
Reference Entity (�RE�)PaymentsMade By Sub-Fund‡
Payments ReceivedBy Sub-Fund‡ Counterparty† Maturity Date
TradingCurrency
NotionalAmountin USD
UnrealisedAppreciation/
(Depreciation)in USD
Percent ofNet Assets
Bloomberg Commodity Index 1Month Forward
Increases in RE Decreases in RE andreceives financing of +0.10%
MLIN 04/04/2019 USD (17,294,360) (115,749) (0.12)
MSCI Canada Net Return CAD Index Decreases in RE andpays CDOR plus or minusa specified spread of-0.24%
Increases in RE CITI 21/06/2019 CAD 4,892 (55) (0.00)
MSCI Emerging Markets ThailandNet Total Return USD Index
Increases in RE Decreases in RE andreceives 1-month LIBOR plusor minus a specified spreadof +0.20%
CITI 21/06/2019 USD (9,643) (10) (0.00)
MSCI Australia Net Return AUDIndex
Decreases in RE andpays 1-month BBSW plusor minus a specifiedspread of +0.30%
Increases in RE CITI 21/06/2019 AUD 4,267 2 0.00
MSCI Italy Net Return EUR Index Decreases in RE andpays 1-month EURIBORplus or minus a specifiedspread of -1.60%
Increases in RE CITI 24/06/2019 EUR 230 4 0.00
MSCI Japan Net Return JPY Index Increases in RE Decreases in RE andreceives 1-month LIBOR plusor minus a specified spreadof -0.60%
CITI 24/06/2019 JPY (104,535) 630 0.00
MSCI Spain Net Return EUR Index Decreases in RE andpays 1-month EURIBORplus or minus a specifiedspread of +0.30%
Increases in RE CITI 24/06/2019 EUR 219 0 0.00
BIST 30 Futures Apr19 Increases in RE Decreases in RE GSIN 30/04/2019 TRY (595,807) 66,099 0.07BIST 30 Futures Apr19 Increases in RE Decreases in RE MSIP 30/04/2019 TRY (12,813) 292 0.00BOVESPA Index Futures Apr19 Decreases in RE Increases in RE MSIP 17/04/2019 BRL 122,557 859 0.00DTOP Index Futures Jun19 Increases in RE Decreases in RE JPMC 20/06/2019 ZAR (52,547) 142 0.00H-Shares Index Futures Apr19 Decreases in RE Increases in RE JPMC 29/04/2019 HKD 579,571 6,253 0.01H-Shares Index Futures Apr19 Decreases in RE Increases in RE MSIP 29/04/2019 HKD 1,521,373 17,778 0.02H-Shares Index Futures Apr19 Decreases in RE Increases in RE MLIN 29/04/2019 HKD 289,786 2,691 0.00KOSPI 200 Index Futures Jun19 Increases in RE Decreases in RE MSIP 13/06/2019 KRW (1,343,142) 7,002 0.01TAIEX Futures Apr19 Decreases in RE Increases in RE MSIP 17/04/2019 TWD 137,545 1,214 0.00Tel Aviv 35 Index Futures Apr19 Increases in RE Decreases in RE MLIN 24/04/2019 ILS (2,104,429) 31,474 0.0310 Year Canadian Treasury BondsFutures Jun19
Increases in RE Decreases in RE BANA 19/06/2019 CAD (104,192) (2,226) (0.00)
DTOP Index Futures Jun19 Increases in RE Decreases in RE JPMC 20/06/2019 ZAR (7,507) (138) (0.00)
Total of Total Return Swap Contracts 16,262 0.02
AQR UCITS FUNDS
AQR Global Macro Opportunities UCITS Fund
Schedule of Investments (continued)As at 31 March 2019
The accompanying notes form an integral part of these audited financial statements. 93

Total Return Basket Swap ContractsOver-the-Counter
Counterparty† Description‡ Termination DateFair Value in
USDJPMC The Sub-Fund receives the total return on a portfolio of long positions and pays 1-month LIBOR plus or minus a
specified spread, which is denominated in JPY based on the local currency of the positions within the swap.14.01.2021 (182,593)
The following table represents the long positions and related values within the total return equity basket swap as at 31 March 2019
Reference Entity Currency Shares Notional Amount
UnrealisedAppreciation/
(Depreciation)in USD
Percent ofNet Assets
Long PositionsCommon StocksJapanAozora Bank Ltd JPY 10,700 264,348 (34,845) (0.04)Concordia Financial Group Ltd JPY 86,500 333,742 (10,338) (0.01)Fukuoka Financial Group Inc JPY 15,800 350,604 (8,108) (0.01)Japan Post Bank Co Ltd JPY 36,000 392,956 (10,670) (0.01)Mebuki Financial Group Inc JPY 109,300 279,533 (10,316) (0.01)Mitsubishi UFJ Financial Group Inc JPY 308,400 1,526,786 (61,878) (0.07)Mizuho Financial Group Inc JPY 691,400 1,069,639 (13,002) (0.01)Resona Holdings Inc JPY 105,500 457,150 (13,420) (0.01)Seven Bank Ltd JPY 103,000 304,192 (10,759) (0.01)Shinsei Bank Ltd JPY 22,700 323,005 723 0.00Sumitomo Mitsui Financial Group Inc JPY 37,200 1,301,766 (36,380) (0.04)Sumitomo Mitsui Trust Holdings Inc JPY 14,500 520,450 (28,867) (0.03)The Bank of Kyoto Ltd JPY 6,900 288,675 (35,585) (0.04)The Chiba Bank Ltd JPY 60,600 329,070 (15,295) (0.02)The Shizuoka Bank Ltd JPY 41,700 317,835 (10,906) (0.01)Yamaguchi Financial Group Inc JPY 31,600 267,835 (20,902) (0.02)
(320,548) (0.34)
Total Long Positions (320,548) (0.34)
Net Cash and Other Receivables/(Payables) 137,955 0.15
Total of Total Return Basket Swap Contract - JPMC - JPY (182,593) (0.19)
AQR UCITS FUNDS
AQR Global Macro Opportunities UCITS Fund
Schedule of Investments (continued)As at 31 March 2019
The accompanying notes form an integral part of these audited financial statements. 94

Investments Currency
Shares/PrincipalAmounts
Fair Valuein USD
Percent ofNet Assets
Transferable securities and money market instruments admitted to official exchange listing or dealt in on another regulated market.Common StocksUnited StatesAbbott Laboratories USD 22 1,745 0.03AbbVie Inc USD 461 37,076 0.74ABIOMED Inc USD 51 14,605 0.29Activision Blizzard Inc USD 191 8,608 0.17Adobe Systems Inc USD 215 57,115 1.13Aflac Inc USD 279 13,894 0.28Agilent Technologies Inc USD 107 8,562 0.17Akamai Technologies Inc USD 148 10,570 0.21Alexion Pharmaceuticals Inc USD 71 9,515 0.19Align Technology Inc USD 41 11,485 0.23Alkermes PLC USD 211 7,545 0.15Alphabet Inc - Class A USD 39 45,558 0.90Alphabet Inc - Class C USD 37 43,126 0.86Amazon.com Inc USD 62 110,379 2.19American Eagle Outfitters Inc USD 706 15,694 0.31American Tower Corp (β) USD 35 6,816 0.14Amgen Inc USD 66 12,538 0.25Anadarko Petroleum Corp USD 377 17,135 0.34Anthem Inc USD 7 1,984 0.04Apple Inc USD 780 147,256 2.93Applied Materials Inc USD 524 20,630 0.41Arista Networks Inc USD 5 1,563 0.03Aspen Technology Inc USD 113 11,760 0.23Athene Holding Ltd USD 58 2,361 0.05Autodesk Inc USD 72 11,176 0.22AutoZone Inc USD 13 13,172 0.26Avnet Inc USD 49 2,118 0.04Bank of America Corp USD 449 12,289 0.24Baxter International Inc USD 201 16,207 0.32Bed Bath & Beyond Inc USD 180 3,117 0.06Berkshire Hathaway Inc USD 154 30,880 0.61Best Buy Co Inc USD 257 18,260 0.36Biogen Inc USD 197 46,301 0.92Booking Holdings Inc USD 10 17,438 0.35Boston Scientific Corp USD 360 13,732 0.27Bristol-Myers Squibb Co USD 863 40,596 0.81Broadridge Financial Solutions Inc USD 197 20,252 0.40Bruker Corp USD 423 16,277 0.32Cardinal Health Inc USD 367 17,491 0.35CBS Corp USD 314 14,880 0.30CDW Corp USD 298 28,608 0.57Celgene Corp USD 66 6,143 0.12Centene Corp USD 146 7,666 0.15Charles River Laboratories International Inc USD 64 9,251 0.18Chevron Corp USD 174 21,346 0.42Ciena Corp USD 154 5,738 0.11Cigna Corp USD 10 1,592 0.03Cisco Systems Inc USD 954 50,953 1.01Citigroup Inc USD 219 13,635 0.27Cognizant Technology Solutions Corp USD 474 34,284 0.68Comcast Corp USD 1,395 55,423 1.10CommScope Holding Co Inc USD 366 7,876 0.16CommVault Systems Inc USD 73 4,738 0.09Conduent Inc USD 1,097 15,303 0.30ConocoPhillips USD 919 61,683 1.23Costco Wholesale Corp USD 136 32,760 0.65Crown Castle International Corp (β) USD 33 4,190 0.08CVS Health Corp USD 62 3,317 0.07Danaher Corp USD 203 26,500 0.53Deckers Outdoor Corp USD 145 21,437 0.43Devon Energy Corp USD 213 6,773 0.13DexCom Inc USD 111 13,149 0.26Dick’s Sporting Goods Inc USD 67 2,457 0.05Dollar General Corp USD 51 6,085 0.12DXC Technology Co USD 361 23,357 0.46eBay Inc USD 230 8,485 0.17Edwards Lifesciences Corp USD 82 15,566 0.31Electronic Arts Inc USD 296 29,997 0.60Eli Lilly & Co USD 109 14,121 0.28EPAM Systems Inc USD 27 4,580 0.09Exelixis Inc USD 2,178 52,011 1.03Exelon Corp USD 1,452 72,571 1.44Exxon Mobil Corp USD 99 7,985 0.16F5 Networks Inc USD 41 6,438 0.13Facebook Inc USD 494 81,564 1.62Federated Investors Inc USD 79 2,326 0.05FNF Group USD 58 2,130 0.04Foot Locker Inc USD 590 35,459 0.71Fortinet Inc USD 320 26,656 0.53Fox Corp USD 27 978 0.02Gilead Sciences Inc USD 793 51,775 1.03Globus Medical Inc USD 103 5,009 0.10GrafTech International Ltd USD 969 12,519 0.25H&R Block Inc USD 206 4,949 0.10Haemonetics Corp USD 199 17,420 0.35HollyFrontier Corp USD 568 28,332 0.56HP Inc USD 961 18,543 0.37Humana Inc USD 45 11,832 0.24Huntsman Corp USD 101 2,237 0.04IAC/InterActiveCorp USD 48 10,063 0.20Illumina Inc USD 32 9,810 0.20Incyte Corp USD 73 6,285 0.13Inogen Inc USD 19 1,785 0.04Insperity Inc USD 70 8,609 0.17Intel Corp USD 1,156 61,938 1.23International Business Machines Corp USD 475 66,690 1.33International Paper Co USD 46 2,113 0.04Intuit Inc USD 249 64,735 1.29Intuitive Surgical Inc USD 18 10,161 0.20
AQR UCITS FUNDS
AQR Global Relaxed Constraint Equity UCITS Fund
Schedule of InvestmentsAs at 31 March 2019
The accompanying notes form an integral part of these audited financial statements. 95

Investments Currency
Shares/PrincipalAmounts
Fair Valuein USD
Percent ofNet Assets
Transferable securities and money market instruments admitted to official exchange listing or dealt in on another regulated market.Common Stocks (continued)United States (continued)Ionis Pharmaceuticals Inc USD 72 5,773 0.11IQVIA Holdings Inc USD 57 8,136 0.16Johnson & Johnson USD 303 42,150 0.84JPMorgan Chase & Co USD 13 1,311 0.03Juniper Networks Inc USD 72 1,896 0.04Keysight Technologies Inc USD 74 6,422 0.13Kohl’s Corp USD 87 6,011 0.12Lam Research Corp USD 63 11,227 0.22Las Vegas Sands Corp USD 441 26,742 0.53Lear Corp USD 17 2,311 0.05Lowe’s Cos Inc USD 159 17,382 0.35Lululemon athletica Inc USD 138 22,766 0.45LyondellBasell Industries NV USD 334 27,929 0.56Macy’s Inc USD 744 17,871 0.36Manhattan Associates Inc USD 168 9,252 0.18Marathon Petroleum Corp USD 379 22,664 0.45Masimo Corp USD 133 18,180 0.36McKesson Corp USD 226 26,248 0.52Medtronic PLC USD 504 45,466 0.90Merck & Co Inc USD 840 69,762 1.39Michael Kors Holdings Ltd USD 477 22,266 0.44Micron Technology Inc USD 1,271 52,111 1.04Microsoft Corp USD 1,438 168,462 3.35Mylan NV USD 419 11,891 0.24NetApp Inc USD 174 11,905 0.24NIKE Inc USD 265 22,438 0.45Oracle Corp USD 645 34,443 0.68PayPal Holdings Inc USD 38 3,942 0.08Pfizer Inc USD 1,955 82,599 1.64Phillips 66 USD 168 15,903 0.32PRA Health Sciences Inc USD 90 9,815 0.20Prologis Inc (β) USD 50 3,596 0.07Ralph Lauren Corp USD 20 2,601 0.05ResMed Inc USD 84 8,688 0.17Ross Stores Inc USD 358 33,201 0.66Sally Beauty Holdings Inc USD 129 2,363 0.05Schneider National Inc USD 212 4,477 0.09Simon Property Group Inc (β) USD 25 4,579 0.09Skyworks Solutions Inc USD 78 6,376 0.13Southwestern Energy Co USD 749 3,524 0.07SP Global Inc USD 20 4,196 0.08Square Inc USD 19 1,422 0.03Steel Dynamics Inc USD 443 15,589 0.31Symantec Corp USD 1,604 36,716 0.73Synchrony Financial USD 664 21,248 0.42Target Corp USD 478 38,426 0.76Tech Data Corp USD 209 21,235 0.42TEGNA Inc USD 818 11,517 0.23Texas Instruments Inc USD 184 19,419 0.39The Allstate Corp USD 308 28,927 0.57The Gap Inc USD 304 7,983 0.16The Home Depot Inc USD 19 3,629 0.07The Kroger Co USD 398 9,787 0.19The Michaels Cos Inc USD 289 3,384 0.07The PNC Financial Services Group Inc USD 166 20,403 0.41The TJX Cos Inc USD 314 16,683 0.33The Walt Disney Co USD 27 2,986 0.06T-Mobile US Inc USD 67 4,579 0.09TripAdvisor Inc USD 48 2,480 0.05Tupperware Brands Corp USD 161 4,146 0.08Twilio Inc USD 158 20,328 0.40Tyson Foods Inc USD 594 40,867 0.81United Therapeutics Corp USD 167 19,706 0.39Urban Outfitters Inc USD 596 17,755 0.35Valero Energy Corp USD 304 25,506 0.51Vertex Pharmaceuticals Inc USD 67 12,213 0.24Viacom Inc - Class B USD 460 12,668 0.25Vishay Intertechnology Inc USD 146 2,695 0.05WalMart Inc USD 798 77,629 1.54Weight Watchers International Inc USD 630 12,827 0.25Wells Fargo & Co USD 193 9,287 0.18World Fuel Services Corp USD 266 7,767 0.15Xerox Corp USD 193 6,193 0.12Xilinx Inc USD 116 14,785 0.29Zebra Technologies Corp USD 93 19,460 0.39Zoetis Inc USD 33 3,302 0.07Zynga Inc USD 277 1,447 0.03
Total United States 3,605,511 71.63
Total Common Stocks 3,605,511 71.63
Total Transferable securities and money market instruments admitted to official exchange listing or dealt in on another regulated market. 3,605,511 71.63
Total Investments (Total Cost: $3,661,259) 3,605,511 71.63
Other Assets/(Liabilities) 1,427,851 28.37
Total Net Assets 5,033,362 100.00
(β) Real Estate Investment Trust
AQR UCITS FUNDS
AQR Global Relaxed Constraint Equity UCITS Fund
Schedule of Investments (continued)As at 31 March 2019
The accompanying notes form an integral part of these audited financial statements. 96

Economic Classification of InvestmentsAs at 31 March 2019
Industry ClassificationPercent ofNet Assets
Basic Materials 0.95Communications 12.10Consumer Cyclical 10.04Consumer Non-cyclical 19.12Energy 4.19Financial 3.53Industrial 1.54Technology 18.72Utilities 1.44Total Investments 71.63
Other Assets/(Liabilities) 28.37Total Net Assets 100.00
AQR UCITS FUNDS
AQR Global Relaxed Constraint Equity UCITS Fund
Schedule of Investments (continued)As at 31 March 2019
The accompanying notes form an integral part of these audited financial statements. 97

Derivatives
Futures ContractsExchange-Traded
Description Counterparty†Number ofContracts
ExpirationDate
TradingCurrency
Notional Amountin USD
UnrealisedAppreciation/
(Depreciation)in USD
Percent ofNet Assets
S&P 500 E-mini Futures JPPC 1 21/06/2019 USD 141,325 1,875 0.04
Forward Foreign Exchange ContractsOver-the-Counter
Counterparty† Currency Purchased Amount Purchased Currency Sold Amount Sold Settlement Date
UnrealisedAppreciation/
(Depreciation)in USD
Percent ofNet Assets
CITI AUD 30,899 USD 22,096 19/06/2019 (165) (0.01)CITI CAD 63,216 USD 47,953 19/06/2019 (538) (0.01)CITI CHF 7,273 USD 7,378 19/06/2019 (19) (0.00)CITI DKK 269,000 USD 41,251 19/06/2019 (507) (0.01)CITI EUR 250,493 USD 286,362 19/06/2019 (3,274) (0.07)CITI GBP 89,599 USD 118,306 19/06/2019 (1,389) (0.03)CITI HKD 305,000 USD 38,995 19/06/2019 (48) (0.00)CITI JPY 13,508,125 USD 123,168 19/06/2019 (583) (0.01)CITI NOK 184,860 USD 21,611 19/06/2019 (107) (0.00)CITI SEK 70,900 USD 7,763 19/06/2019 (72) (0.00)CITI SGD 35,500 USD 26,308 19/06/2019 (69) (0.00)CITI USD 709 AUD 1,000 19/06/2019 (1) (0.00)CITI USD 375 CAD 500 19/06/2019 0 0.00CITI USD 4,505 CHF 4,500 19/06/2019 (47) (0.00)CITI USD 3,290 SEK 30,500 19/06/2019 (19) (0.00)JPMC AUD 30,891 USD 22,091 19/06/2019 (164) (0.00)JPMC CAD 63,221 USD 47,958 19/06/2019 (538) (0.01)JPMC CHF 7,883 USD 7,996 19/06/2019 (19) (0.00)JPMC DKK 269,000 USD 41,272 19/06/2019 (528) (0.01)JPMC EUR 250,507 USD 286,379 19/06/2019 (3,274) (0.07)JPMC GBP 89,619 USD 118,330 19/06/2019 (1,390) (0.03)JPMC HKD 305,000 USD 38,995 19/06/2019 (48) (0.00)JPMC JPY 13,508,125 USD 123,169 19/06/2019 (584) (0.01)JPMC NOK 184,860 USD 21,615 19/06/2019 (110) (0.00)JPMC SEK 70,900 USD 7,764 19/06/2019 (73) (0.00)JPMC SGD 35,500 USD 26,308 19/06/2019 (69) (0.00)JPMC USD 709 AUD 1,000 19/06/2019 (1) (0.00)JPMC USD 375 CAD 500 19/06/2019 0 0.00JPMC USD 4,505 CHF 4,500 19/06/2019 (47) (0.00)JPMC USD 3,290 SEK 30,500 19/06/2019 (19) (0.00)CITI AUD 29,605 USD 20,973 19/06/2019 41 0.00CITI CAD 28,280 USD 21,124 19/06/2019 87 0.00CITI CHF 41,715 USD 42,009 19/06/2019 200 0.00CITI GBP 6,390 USD 8,301 19/06/2019 37 0.00CITI HKD 16,000 USD 2,043 19/06/2019 0 0.00CITI JPY 5,070,875 USD 45,836 19/06/2019 181 0.00CITI NOK 84,640 USD 9,775 19/06/2019 72 0.00CITI SEK 306,600 USD 33,049 19/06/2019 213 0.01CITI USD 2,660 CAD 3,500 19/06/2019 35 0.00CITI USD 305 DKK 2,000 19/06/2019 3 0.00CITI USD 1,713 EUR 1,500 19/06/2019 18 0.00CITI USD 2,628 GBP 2,000 19/06/2019 19 0.00CITI USD 704 HKD 5,500 19/06/2019 1 0.00JPMC AUD 29,605 USD 20,973 19/06/2019 41 0.00JPMC CAD 28,283 USD 21,127 19/06/2019 87 0.00JPMC CHF 41,129 USD 41,413 19/06/2019 202 0.01JPMC GBP 6,392 USD 8,303 19/06/2019 37 0.00JPMC HKD 16,000 USD 2,043 19/06/2019 0 0.00JPMC JPY 5,070,875 USD 45,836 19/06/2019 181 0.00JPMC NOK 84,640 USD 9,769 19/06/2019 75 0.00JPMC SEK 306,600 USD 33,051 19/06/2019 210 0.01JPMC USD 2,660 CAD 3,500 19/06/2019 35 0.00JPMC USD 305 DKK 2,000 19/06/2019 3 0.00JPMC USD 1,713 EUR 1,500 19/06/2019 18 0.00JPMC USD 2,628 GBP 2,000 19/06/2019 19 0.00JPMC USD 704 HKD 5,500 19/06/2019 1 0.00
Total Forward Foreign Exchange Contracts (11,886) (0.24)
AQR UCITS FUNDS
AQR Global Relaxed Constraint Equity UCITS Fund
Schedule of Investments (continued)As at 31 March 2019
The accompanying notes form an integral part of these audited financial statements. 98

Total Return Basket Swap ContractsOver-the-Counter
Counterparty† Description‡ Termination DateFair Value in
USDJPMC The Sub-Fund receives the total return on a portfolio of long and short positions and pays 1-month BBSW plus or
minus a specified spread, which is denominated in AUD based on the local currency of the positions within theswap.
22.12.2020 (1,903)
The following table represents the long and short positions and related values within the total return equity basket swap as at 31 March 2019
Reference Entity Currency Shares Notional Amount
UnrealisedAppreciation/
(Depreciation)in USD
Percent ofNet Assets
Long PositionsCommon StocksAustraliaAurizon Holdings Ltd AUD 3,649 11,770 209 0.01BHP Billiton Ltd AUD 245 6,676 254 0.01BlueScope Steel Ltd AUD 2,394 23,682 181 0.00Caltex Australia Ltd AUD 628 11,671 (1,037) (0.02)Iluka Resources Ltd AUD 2,353 15,019 92 0.00Leighton Holdings Ltd AUD 484 16,563 (710) (0.01)LendLease Group AUD 200 1,756 (16) (0.00)Newcrest Mining Ltd AUD 1,647 29,762 635 0.01Qantas Airways Ltd AUD 4,304 17,265 59 0.00Santos Ltd AUD 5,583 27,055 (923) (0.02)South32 AUD 9,402 24,874 (850) (0.02)Woodside Petroleum Ltd AUD 1,075 26,391 (491) (0.01)
(2,597) (0.05)
Total Long Positions (2,597) (0.05)
Short PositionsCommon StocksAustraliaAMP Ltd AUD (7,258) (10,807) 922 0.02Challenger Ltd AUD (5,706) (33,476) (2,172) (0.04)Dominos Pizza Enterprises Ltd AUD (117) (3,602) (166) (0.00)Magellan Financial Group Ltd AUD (94) (2,428) 14 0.00SEEK Ltd AUD (1,267) (15,761) 736 0.01Tabcorp Holdings Ltd AUD (1,198) (3,924) 67 0.00
(599) (0.01)IrelandJames Hardie Industries PLC AUD (3,765) (48,409) (507) (0.01)
(507) (0.01)
Total Short Positions (1,106) (0.02)
Total of Long and Short Equity Positions (3,703) (0.07)Net Cash and Other Receivables/(Payables) 1,800 0.04
Total of Total Return Basket Swap Contract - JPMC - AUD (1,903) (0.03)
Counterparty† Description‡ Termination DateFair Value in
USDJPMC The Sub-Fund receives the total return on a portfolio of long and short positions and pays CDOR plus or minus a
specified spread, which is denominated in CAD based on the local currency of the positions within the swap.22.12.2020 (3,603)
The following table represents the long and short positions and related values within the total return equity basket swap as at 31 March 2019
Reference Entity Currency Shares Notional Amount
UnrealisedAppreciation/
(Depreciation)in USD
Percent ofNet Assets
Long PositionsCommon StocksCanadaAurora Cannabis Inc CAD 2,787 24,912 (2,754) (0.06)Canadian Imperial Bank Of Commerce CAD 144 11,456 (800) (0.02)Canadian Natural Resources Ltd CAD 427 11,738 (214) (0.00)Canopy Growth Corp CAD 415 17,721 (1,230) (0.02)CGI Group Inc CAD 488 33,475 420 0.01Constellation Software Inc CAD 2 1,695 34 0.00Empire Co Ltd CAD 462 10,058 252 0.00Finning International Inc CAD 118 2,099 9 0.00Husky Energy Inc CAD 1,748 17,443 (654) (0.01)Kinross Gold Corp CAD 1,223 4,202 146 0.00Magna International Inc CAD 530 25,972 (151) (0.00)Methanex Corp CAD 283 16,050 (117) (0.00)Open Text Corp CAD 311 11,888 35 0.00Suncor Energy Inc CAD 78 2,529 (137) (0.00)Teck Resources Ltd CAD 490 11,401 609 0.01West Fraser Timber Co Ltd CAD 520 25,175 (440) (0.01)
(4,992) (0.10)United StatesValeant Pharmaceuticals International Inc CAD 268 6,551 (26) (0.00)
(26) (0.00)
Total Long Positions (5,018) (0.10)
Short PositionsCommon StocksCanadaEncana Corp CAD (2,490) (18,100) 597 0.01IGM Financial Inc CAD (92) (2,374) (39) (0.00)Onex Corp CAD (92) (5,199) (171) (0.00)PrairieSky Royalty Ltd CAD (2,013) (27,382) 1,552 0.03Silver Wheaton Corp CAD (146) (3,495) (221) (0.00)
AQR UCITS FUNDS
AQR Global Relaxed Constraint Equity UCITS Fund
Schedule of Investments (continued)As at 31 March 2019
The accompanying notes form an integral part of these audited financial statements. 99

Reference Entity Currency Shares Notional Amount
UnrealisedAppreciation/
(Depreciation)in USD
Percent ofNet Assets
Short Positions (continued)Common Stocks (continued)Canada (continued)The Stars Group Inc CAD (416) (7,275) (212) (0.00)Vermilion Energy Inc CAD (325) (8,063) 214 0.00
1,720 0.04ZambiaFirst Quantum Minerals Ltd CAD (3,891) (43,460) (816) (0.02)
(816) (0.02)
Total Short Positions 904 0.02
Total of Long and Short Equity Positions (4,114) (0.08)Net Cash and Other Receivables/(Payables) 511 0.01
Total of Total Return Basket Swap Contract - JPMC - CAD (3,603) (0.07)
Counterparty† Description‡ Termination DateFair Value in
USDJPMC The Sub-Fund receives the total return on a portfolio of long and short positions and pays 1-month LIBOR plus or
minus a specified spread, which is denominated in CHF based on the local currency of the positions within theswap.
22.12.2020 (1,181)
The following table represents the long and short positions and related values within the total return equity basket swap as at 31 March 2019
Reference Entity Currency Shares Notional Amount
UnrealisedAppreciation/
(Depreciation)in USD
Percent ofNet Assets
Long PositionsCommon StocksSwitzerlandAdecco Group AG CHF 69 3,667 (49) (0.00)Novartis AG CHF 26 2,489 53 0.00Roche Holding AG CHF 156 42,649 188 0.00Sonova Holding AG CHF 49 9,685 20 0.00Swiss Life Holding AG CHF 8 3,505 (67) (0.00)Zurich Insurance Group AG CHF 160 52,870 (1,607) (0.03)
(1,462) (0.03)
Total Long Positions (1,462) (0.03)
Short PositionsCommon StocksAustriaams AG CHF (82) (2,174) 182 0.01
182 0.01SwitzerlandIdorsia Ltd CHF (562) (9,855) 90 0.00
90 0.00
Total Short Positions 272 0.01
Total of Long and Short Equity Positions (1,190) (0.02)Net Cash and Other Receivables/(Payables) 9 0.00
Total of Total Return Basket Swap Contract - JPMC - CHF (1,181) (0.02)
Counterparty† Description‡ Termination DateFair Value in
USDJPMC The Sub-Fund receives the total return on a portfolio of long and short positions and pays 1-month CIBOR plus
or minus a specified spread, which is denominated in DKK based on the local currency of the positions within theswap.
22.12.2020 594
The following table represents the long and short positions and related values within the total return equity basket swap as at 31 March 2019
Reference Entity Currency Shares Notional Amount
UnrealisedAppreciation/
(Depreciation)in USD
Percent ofNet Assets
Long PositionsCommon StocksDenmarkColoplast A/S DKK 60 6,595 242 0.00GN Store Nord A/S DKK 221 10,311 33 0.00H Lundbeck A/S DKK 301 13,052 (199) (0.00)Novo Nordisk A/S DKK 316 16,504 402 0.01Pandora A/S DKK 905 42,060 (939) (0.02)Rockwool International A/S DKK 26 6,073 (313) (0.01)
(774) (0.02)
Total Long Positions (774) (0.02)
Short PositionsCommon StocksDenmarkAP Moeller - Maersk A/S DKK (14) (17,700) 762 0.02
762 0.02
Total Short Positions 762 0.02
Total of Long and Short Equity Positions (12) 0.00Net Cash and Other Receivables/(Payables) 606 0.01
Total of Total Return Basket Swap Contract - JPMC - DKK 594 0.01
AQR UCITS FUNDS
AQR Global Relaxed Constraint Equity UCITS Fund
Schedule of Investments (continued)As at 31 March 2019
The accompanying notes form an integral part of these audited financial statements. 100

Counterparty† Description‡ Termination DateFair Value in
USDJPMC The Sub-Fund receives the total return on a portfolio of long and short positions and pays 1-month EURIBOR
plus or minus a specified spread, which is denominated in EUR based on the local currency of the positionswithin the swap.
22.12.2020 825
The following table represents the long and short positions and related values within the total return equity basket swap as at 31 March 2019
Reference Entity Currency Shares Notional Amount
UnrealisedAppreciation/
(Depreciation)in USD
Percent ofNet Assets
Long PositionsCommon StocksFinlandNeste OYJ EUR 496 52,871 (278) (0.01)UPM-Kymmene OYJ EUR 247 7,149 (363) (0.01)
(641) (0.02)FranceAtoS EUR 218 20,986 (245) (0.01)AXA SA EUR 2,058 51,677 (1,005) (0.03)BNP Paribas SA EUR 88 4,188 (268) (0.01)Cap Gemini SA EUR 12 1,455 9 0.00CNP Assurances EUR 394 8,684 (464) (0.01)Electricite de France SA EUR 4,542 61,857 (3,544) (0.10)GDF Suez EUR 1,996 29,772 (482) (0.01)Peugeot SA EUR 1,415 34,284 (1,112) (0.03)Sanofi EUR 114 10,040 (100) (0.00)Societe Generale SA EUR 113 3,247 (301) (0.01)TOTAL SA EUR 466 25,812 (1,536) (0.04)
(9,048) (0.25)Germanyadidas AG EUR 76 18,465 768 0.02Allianz SE EUR 145 32,198 (394) (0.01)Covestro AG EUR 559 30,615 879 0.02E.ON SE EUR 6,150 68,545 2,258 0.06Salzgitter AG EUR 170 4,930 (288) (0.01)Software AG EUR 65 2,181 (98) (0.00)Talanx AG EUR 140 5,398 (135) (0.00)Wirecard AG EUR 188 23,704 1,055 0.03
4,045 0.11ItalyBanca Popolare dell’Emilia Romagna SC EUR 4,893 19,931 (418) (0.01)Enel SpA EUR 8,177 52,275 1,799 0.05Eni SpA EUR 1,692 29,726 (182) (0.00)Unipol Gruppo SpA EUR 1,644 8,153 148 0.00
1,347 0.04LuxembourgArcelorMittal EUR 463 9,404 (759) (0.02)SES SA EUR 998 15,368 (1,888) (0.05)
(2,647) (0.07)NetherlandsAegon NV EUR 2,508 12,069 (1,233) (0.03)ING Groep NV EUR 303 3,652 (80) (0.00)Koninklijke Ahold NV EUR 1,447 38,341 179 0.00NN Group NV EUR 579 23,929 (1,489) (0.04)
(2,623) (0.07)SpainBBVA EUR 3,638 20,688 (1,454) (0.04)Distribuidora Internacional de Alimentacion SA EUR 3,932 2,872 301 0.01Endesa SA EUR 1,089 27,914 110 0.00Iberdrola SA EUR 4,616 40,611 591 0.02Red Electrica Corp SA EUR 321 6,860 (77) (0.00)
(529) (0.01)United KingdomFiat Chrysler Automobiles NV EUR 1,221 18,150 680 0.02Linde PLC EUR 21 3,658 44 0.00
724 0.02
Total Long Positions (9,372) (0.26)
Short PositionsCommon StocksBelgiumUmicore SA EUR (123) (5,489) 83 0.00
83 0.00FinlandHuhtamaki OYJ EUR (205) (7,586) (76) (0.00)
(76) (0.00)FranceAltran Technologies SA EUR (2,260) (24,714) 609 0.02Elior Participations SCA EUR (978) (13,067) 1,406 0.04Iliad SA EUR (213) (21,241) 402 0.01Plastic Omnium SA EUR (84) (2,213) 109 0.00Remy Cointreau SA EUR (15) (1,994) (12) (0.00)SEB SA EUR (19) (3,159) (26) (0.00)Valeo SA EUR (1,025) (29,657) 1,623 0.04
4,111 0.11Germany1&1 Drillisch AG EUR (346) (12,291) 2,362 0.06Delivery Hero SE EUR (420) (14,948) 1,905 0.05Deutsche Bank AG EUR (765) (6,199) 793 0.02OSRAM Licht AG EUR (284) (9,741) 2,076 0.06United Internet AG EUR (203) (7,373) 312 0.01Zalando SE EUR (508) (19,809) 308 0.01
7,756 0.21ItalyBrembo SpA EUR (143) (1,612) 120 0.00
AQR UCITS FUNDS
AQR Global Relaxed Constraint Equity UCITS Fund
Schedule of Investments (continued)As at 31 March 2019
The accompanying notes form an integral part of these audited financial statements. 101

Reference Entity Currency Shares Notional Amount
UnrealisedAppreciation/
(Depreciation)in USD
Percent ofNet Assets
Short Positions (continued)Common Stocks (continued)Italy (continued)Ferrari NV EUR (18) (2,400) (49) (0.00)Pirelli & C SpA EUR (2,827) (18,219) 736 0.02Prysmian SpA EUR (647) (12,120) (171) (0.00)Telecom Italia SpA EUR (3,021) (1,880) (14) (0.00)Unione di Banche Italiane SpA EUR (566) (1,491) 121 0.00
743 0.02LuxembourgEurofins Scientific SE EUR (16) (6,582) 47 0.00
47 0.00SpainCellnex Telecom SAU EUR (762) (22,398) (2,361) (0.06)
(2,361) (0.06)
Total Short Positions 10,303 0.28
Total of Long and Short Equity Positions 931 0.02Net Cash and Other Receivables/(Payables) (106) (0.00)
Total of Total Return Basket Swap Contract - JPMC - EUR 825 0.02
Counterparty† Description‡ Termination DateFair Value in
USDJPMC The Sub-Fund receives the total return on a portfolio of long and short positions and pays 1-month LIBOR plus or
minus a specified spread, which is denominated in GBP based on the local currency of the positions within theswap.
22.12.2020 14,296
The following table represents the long and short positions and related values within the total return equity basket swap as at 31 March 2019
Reference Entity Currency Shares Notional Amount
UnrealisedAppreciation/
(Depreciation)in USD
Percent ofNet Assets
Long PositionsCommon StocksAustraliaBHP Billiton PLC GBP 2,067 49,654 2,141 0.04Rio Tinto PLC GBP 709 41,135 1,811 0.04
3,952 0.08NetherlandsRoyal Dutch Shell PLC - A Shares GBP 161 5,047 (13) (0.00)Royal Dutch Shell PLC - B Shares GBP 445 14,039 (17) (0.00)
(30) (0.00)RussiaEvraz PLC GBP 4,310 34,701 (594) (0.01)
(594) (0.01)South AfricaAnglo American PLC GBP 512 13,667 494 0.01
494 0.01United KingdomBarclays PLC GBP 840 1,674 (141) (0.00)BP PLC GBP 2,008 14,502 42 0.00BT Group PLC GBP 9,951 28,728 (530) (0.01)Burberry Group PLC GBP 476 12,099 563 0.01Centrica PLC GBP 10,770 16,145 (878) (0.02)Drax Group PLC GBP 7,657 37,901 179 0.00Hays PLC GBP 3,357 6,537 (257) (0.01)Indivior PLC GBP 10,947 13,632 (2,127) (0.04)Man Group PLC GBP 1,457 2,578 (63) (0.00)Meggitt PLC GBP 1,727 11,305 (557) (0.01)Moneysupermarket.com Group PLC GBP 2,434 11,675 278 0.01National Grid PLC GBP 1,217 13,547 (459) (0.01)Provident Financial PLC GBP 985 6,578 (735) (0.02)Unilever PLC GBP 98 5,605 171 0.00WH Smith PLC GBP 157 4,331 (53) (0.00)William Hill PLC GBP 1,416 2,868 (57) (0.00)
(4,624) (0.10)
Total Long Positions (802) (0.02)
Short PositionsCommon StocksUnited Arab EmiratesNMC Health PLC GBP (2,209) (65,467) 9,878 0.20
9,878 0.20United KingdomGVC Holdings PLC GBP (563) (4,032) 11 0.00Inmarsat PLC GBP (248) (1,785) (396) (0.01)John Wood Group PLC GBP (589) (3,920) 663 0.01Micro Focus International PLC GBP (412) (10,657) (469) (0.01)The Weir Group PLC GBP (507) (10,165) 468 0.01Thomas Cook Group PLC GBP (14,433) (4,573) 1,408 0.03
1,685 0.03
Total Short Positions 11,563 0.23
Total of Long and Short Equity Positions 10,761 0.21Net Cash and Other Receivables/(Payables) 3,535 0.07
Total of Total Return Basket Swap Contract - JPMC - GBP 14,296 0.28
AQR UCITS FUNDS
AQR Global Relaxed Constraint Equity UCITS Fund
Schedule of Investments (continued)As at 31 March 2019
The accompanying notes form an integral part of these audited financial statements. 102

Counterparty† Description‡ Termination DateFair Value in
USDJPMC The Sub-Fund receives the total return on a portfolio of long positions and pays 1-month HIBOR plus or minus a
specified spread, which is denominated in HKD based on the local currency of the positions within the swap.22.12.2020 3,911
The following table represents the long positions and related values within the total return equity basket swap as at 31 March 2019
Reference Entity Currency Shares Notional Amount
UnrealisedAppreciation/
(Depreciation)in USD
Percent ofNet Assets
Long PositionsCommon StocksHong KongCK Asset Holdings Ltd HKD 2,500 22,236 1,137 0.02Clp Holdings Ltd HKD 500 5,796 (45) (0.00)Hong Kong Exchanges & Clearing Ltd HKD 100 3,486 (89) (0.00)Kerry Properties Ltd HKD 5,500 24,555 1,784 0.03Swire Properties Ltd HKD 4,600 19,793 601 0.01The Wharf Holdings Ltd HKD 5,000 15,106 137 0.00Wheelock & Co Ltd HKD 1,000 7,324 318 0.01
3,843 0.07
Total Long Positions 3,843 0.07
Net Cash and Other Receivables/(Payables) 68 0.00
Total of Total Return Basket Swap Contract - JPMC - HKD 3,911 0.07
Counterparty† Description‡ Termination DateFair Value in
USDJPMC The Sub-Fund receives the total return on a portfolio of long and short positions and pays 1-month LIBOR plus or
minus a specified spread, which is denominated in JPY based on the local currency of the positions within theswap.
22.12.2020 (4,790)
The following table represents the long and short positions and related values within the total return equity basket swap as at 31 March 2019
Reference Entity Currency Shares Notional Amount
UnrealisedAppreciation/
(Depreciation)in USD
Percent ofNet Assets
Long PositionsCommon StocksJapanAlfresa Holdings Corp JPY 200 5,687 (248) (0.01)Astellas Pharma Inc JPY 800 11,981 (604) (0.01)Dai-ichi Life Holdings Inc JPY 1,000 13,907 (700) (0.01)Fuji Electric Co Ltd JPY 200 5,677 (303) (0.01)Fujitsu Ltd JPY 100 7,208 309 0.01Haseko Corp JPY 400 5,028 (175) (0.00)Hitachi Ltd JPY 200 6,479 289 0.00Idemitsu Kosan Co Ltd JPY 300 10,040 (1,122) (0.02)Inpex Corp JPY 1,400 13,349 (93) (0.00)ITOCHU Corp JPY 600 10,847 (83) (0.00)JFE Holdings Inc JPY 1,000 16,969 (598) (0.01)JX Holdings Inc JPY 4,600 21,054 (1,514) (0.03)Kamigumi Co Ltd JPY 300 6,945 42 0.00Kobe Steel Ltd JPY 1,200 9,004 (359) (0.01)Marubeni Corp JPY 900 6,220 (106) (0.00)Mitsubishi Gas Chemical Co Inc JPY 600 8,558 (452) (0.01)Mitsubishi UFJ Financial Group Inc JPY 3,700 18,317 (742) (0.02)Mitsui & Co Ltd JPY 300 4,655 (119) (0.00)Mixi Inc JPY 300 6,927 (206) (0.01)Olympus Corp JPY 400 4,343 (85) (0.00)Resona Holdings Inc JPY 500 2,167 (64) (0.00)Shinsei Bank Ltd JPY 1,000 14,229 32 0.00Sojitz Corp JPY 5,500 19,370 (425) (0.01)Sony Corp JPY 100 4,201 (442) (0.01)Sumitomo Corp JPY 300 4,147 (159) (0.00)Sumitomo Dainippon Pharma Co Ltd JPY 1,000 24,723 (200) (0.00)Sumitomo Heavy Industries Ltd JPY 200 6,480 (123) (0.00)Sumitomo Mitsui Financial Group Inc JPY 800 27,995 (782) (0.02)Taiheiyo Cement Corp JPY 100 3,332 (46) (0.00)The Hachijuni Bank Ltd JPY 1,500 6,220 (125) (0.00)The Iyo Bank Ltd JPY 300 1,588 (87) (0.00)Tokyo Electric Power Co Inc JPY 4,300 27,169 (291) (0.01)Tosoh Corp JPY 300 4,667 (98) (0.00)
(9,679) (0.19)
Total Long Positions (9,679) (0.19)
Short PositionsCommon StocksJapanM3 Inc JPY (100) (1,676) (10) (0.00)
(10) (0.00)
Total Short Positions (10) (0.00)
Total of Long and Short Equity Positions (9,689) (0.19)Net Cash and Other Receivables/(Payables) 4,899 0.10
Total of Total Return Basket Swap Contract - JPMC - JPY (4,790) (0.09)
AQR UCITS FUNDS
AQR Global Relaxed Constraint Equity UCITS Fund
Schedule of Investments (continued)As at 31 March 2019
The accompanying notes form an integral part of these audited financial statements. 103

Counterparty† Description‡ Termination DateFair Value in
USDJPMC The Sub-Fund receives the total return on a portfolio of long positions and pays 1-month NIBOR plus or minus a
specified spread, which is denominated in NOK based on the local currency of the positions within the swap.22.12.2020 (915)
The following table represents the long positions and related values within the total return equity basket swap as at 31 March 2019
Reference Entity Currency Shares Notional Amount
UnrealisedAppreciation/
(Depreciation)in USD
Percent ofNet Assets
Long PositionsCommon StocksNorwayLeroy Seafood Group ASA NOK 1,446 10,505 57 0.00Norsk Hydro ASA NOK 555 2,255 (52) (0.00)Salmar ASA NOK 312 14,945 (58) (0.00)Statoil ASA NOK 1,431 31,492 (838) (0.02)
(891) (0.02)
Total Long Positions (891) (0.02)
Net Cash and Other Receivables/(Payables) (24) (0.00)
Total of Total Return Basket Swap Contract - JPMC - NOK (915) (0.02)
Counterparty† Description‡ Termination DateFair Value in
USDJPMC The Sub-Fund receives the total return on a portfolio of long positions and pays 1-month STIBOR plus or minus a
specified spread, which is denominated in SEK based on the local currency of the positions within the swap.14.01.2021 282
The following table represents the long positions and related values within the total return equity basket swap as at 31 March 2019
Reference Entity Currency Shares Notional Amount
UnrealisedAppreciation/
(Depreciation)in USD
Percent ofNet Assets
Long PositionsCommon StocksMaltaUnibet Group PLC SEK 1,069 10,651 (212) (0.00)
(212) (0.00)SwedenBoliden AB SEK 221 6,287 374 0.01Elekta AB SEK 645 8,018 (153) (0.00)Getinge AB SEK 442 5,149 74 0.00Swedish Orphan Biovitrum AB SEK 1,708 39,828 203 0.00
498 0.01
Total Long Positions 286 0.01
Net Cash and Other Receivables/(Payables) (4) (0.00)
Total of Total Return Basket Swap Contract - JPMC - SEK 282 0.01
Counterparty† Description‡ Termination DateFair Value in
USDJPMC The Sub-Fund receives the total return on a portfolio of long positions and pays 1-month SIBOR plus or minus a
specified spread, which is denominated in SGD based on the local currency of the positions within the swap.22.12.2020 2,221
The following table represents the long positions and related values within the total return equity basket swap as at 31 March 2019
Reference Entity Currency Shares Notional Amount
UnrealisedAppreciation/
(Depreciation)in USD
Percent ofNet Assets
Long PositionsCommon StocksChinaYangzijiang Shipbuilding Holdings Ltd SGD 34,500 38,235 1,312 0.02
1,312 0.02SingaporeComfortDelGro Corp Ltd SGD 11,300 21,457 940 0.02
940 0.02
Total Long Positions 2,252 0.04
Net Cash and Other Receivables/(Payables) (31) (0.00)
Total of Total Return Basket Swap Contract - JPMC - SGD 2,221 0.04
AQR UCITS FUNDS
AQR Global Relaxed Constraint Equity UCITS Fund
Schedule of Investments (continued)As at 31 March 2019
The accompanying notes form an integral part of these audited financial statements. 104

Counterparty† Description‡ Termination DateFair Value in
USDJPMC The Sub-Fund receives the total return on a portfolio of long and short positions and pays FFR plus or minus a
specified spread, which is denominated in USD based on the local currency of the positions within the swap.22.12.2020 4,751
The following table represents the long and short positions and related values within the total return equity basket swap as at 31 March 2019
Reference Entity Currency Shares Notional Amount
UnrealisedAppreciation/
(Depreciation)in USD
Percent ofNet Assets
Long PositionsCommon StocksUnited StatesCrane Co USD 27 2,286 (3) (0.00)Csx Corp USD 56 4,192 55 0.00Cummins Inc USD 15 2,357 (52) (0.00)Curtiss-Wright Corp USD 206 23,266 (449) (0.01)Deluxe Corp USD 138 6,021 14 0.00Emerson Electric Co USD 123 8,360 (101) (0.00)FedEx Corp USD 85 15,385 (119) (0.00)General Dynamics Corp USD 43 7,255 (126) (0.00)General Electric Co USD 797 7,946 (183) (0.00)Honeywell International Inc USD 83 13,119 94 0.00Huntington Ingalls Industries Inc USD 56 11,593 (22) (0.00)Ingersoll-Rand PLC USD 40 4,298 16 0.00L3 Technologies Inc USD 6 1,241 (21) (0.00)ManpowerGroup Inc USD 113 9,354 (301) (0.01)MSA Safety Inc USD 66 6,863 71 0.00Norfolk Southern Corp USD 27 5,049 120 0.00nVent Electric PLC USD 302 8,193 (39) (0.00)Parker-Hannifin Corp USD 35 5,991 (101) (0.00)Raytheon Co USD 143 25,957 184 0.00Robert Half International Inc USD 239 15,595 (327) (0.01)Spirit AeroSystems Holdings Inc USD 190 17,389 (186) (0.00)Teledyne Technologies Inc USD 17 3,992 2 0.00Waste Management Inc USD 39 4,038 83 0.00WESCO International Inc USD 271 14,414 (146) (0.00)WW Grainger Inc USD 49 14,491 (310) (0.01)
(1,847) (0.04)
Total Long Positions (1,847) (0.04)
Short PositionsCommon StocksGhanaKosmos Energy Ltd USD (1,405) (8,669) (239) (0.00)
(239) (0.00)United States2U Inc USD (28) (2,024) (103) (0.00)Acadia Healthcare Co Inc USD (396) (11,642) 420 0.01Adient plc USD (1,496) (19,583) 1,915 0.04Advanced Micro Devices Inc USD (321) (8,144) (681) (0.01)Agios Pharmaceuticals Inc USD (356) (23,574) (491) (0.01)Albemarle Corp USD (208) (16,906) 1,071 0.02Allegheny Technologies Inc USD (398) (10,177) 175 0.00Bluebird Bio Inc USD (201) (31,153) 237 0.01Caesars Entertainment Corp USD (2,240) (19,555) (627) (0.01)Callon Petroleum Co USD (3,154) (23,939) 189 0.00Catalent Inc USD (48) (1,956) 87 0.00Centennial Resource Development Inc USD (1,380) (12,268) 524 0.01Cognex Corp USD (142) (7,212) 470 0.01Compass Minerals International Inc USD (67) (3,625) (86) (0.00)ConAgra Foods Inc USD (2,010) (55,416) (9,045) (0.18)Concho Resources Inc USD (20) (2,231) (86) (0.00)Core Laboratories NV USD (29) (1,991) 66 0.00Cree Inc USD (114) (6,516) (26) (0.00)Diamond Offshore Drilling Inc USD (948) (9,774) 796 0.02Discovery Communications Inc USD (219) (5,911) 53 0.00Dril-Quip Inc USD (206) (9,342) 33 0.00Ensco PLC USD (1,622) (6,358) 908 0.02EQT Corp USD (247) (5,101) (151) (0.00)Exact Sciences Corp USD (27) (2,308) 174 0.00Extraction Oil Gas Inc USD (877) (3,692) 26 0.00Floor & Decor Holdings Inc USD (448) (18,740) (1,537) (0.03)GCI Liberty Inc USD (212) (11,730) 123 0.00Granite Construction Inc USD (135) (5,858) 466 0.01Graphic Packaging Holding Co USD (192) (2,406) 50 0.00Hess Corp USD (157) (9,563) (279) (0.01)Insulet Corp USD (252) (23,925) 638 0.01International Flavors & Fragrances Inc USD (30) (3,857) (109) (0.00)International Game Technology PLC USD (384) (5,007) 92 0.00Knight-Swift Transportation Holdings Inc USD (97) (3,173) 182 0.00LendingTree Inc USD (38) (13,319) (406) (0.01)Ligand Pharmaceuticals Inc USD (108) (13,467) (6) (0.00)Manitowoc Foodservice Inc USD (500) (8,130) (140) (0.00)Marvell Technology Group Ltd USD (886) (17,490) 186 0.00MasTec Inc USD (321) (15,463) (42) (0.00)Matador Resources Co USD (913) (17,676) (210) (0.00)Mattel Inc USD (1,366) (17,772) 2,281 0.05Meredith Corp USD (520) (29,078) 707 0.01Microchip Technology Inc USD (181) (14,894) 550 0.01Nabors Industries Ltd USD (1,085) (3,743) 98 0.00Newell Rubbermaid Inc USD (1,939) (29,570) 1,415 0.03NOW Inc USD (234) (3,316) (12) (0.00)Oceaneering International Inc USD (174) (2,739) 197 0.00ONEOK Inc USD (196) (13,620) (220) (0.00)Penn National Gaming Inc USD (104) (2,074) 237 0.00Platform Specialty Products Corp USD (2,208) (22,257) 1,104 0.02Sage Therapeutics Inc USD (22) (3,541) (89) (0.00)Sanderson Farms Inc USD (251) (32,773) (783) (0.02)Scientific Games Corp USD (124) (2,544) 248 0.01
AQR UCITS FUNDS
AQR Global Relaxed Constraint Equity UCITS Fund
Schedule of Investments (continued)As at 31 March 2019
The accompanying notes form an integral part of these audited financial statements. 105

Reference Entity Currency Shares Notional Amount
UnrealisedAppreciation/
(Depreciation)in USD
Percent ofNet Assets
Short Positions (continued)Common Stocks (continued)United States (continued)Sensient Technologies Corp USD (57) (3,879) (100) (0.00)Sterling Bancorp USD (1,087) (20,360) 1,652 0.03Switch Inc USD (1,407) (14,450) 70 0.00Tesla Motors Inc USD (104) (28,909) (882) (0.02)The Hain Celestial Group Inc USD (230) (5,345) (117) (0.00)The Middleby Corp USD (16) (2,064) 30 0.00Transocean Ltd USD (3,200) (27,888) 2,480 0.05Universal Display Corp USD (162) (24,750) 782 0.02ViaSat Inc USD (176) (13,605) 100 0.00Virtu Financial Inc USD (254) (6,109) 224 0.00Visteon Corp USD (191) (13,085) 1,219 0.02Wabtec Corp USD (179) (13,090) (184) (0.00)Weatherford International PLC USD (10,336) (7,235) 930 0.02
6,793 0.13
Total Short Positions 6,554 0.13
Total of Long and Short Equity Positions 4,707 0.09Net Cash and Other Receivables/(Payables) 44 0.00
Total of Total Return Basket Swap Contract - JPMC - USD 4,751 0.09
AQR UCITS FUNDS
AQR Global Relaxed Constraint Equity UCITS Fund
Schedule of Investments (continued)As at 31 March 2019
The accompanying notes form an integral part of these audited financial statements. 106

Investments CouponMaturityDate Currency
Shares/PrincipalAmounts
Fair Valuein USD
Percentof Net
Assets
Transferable securities and money market instruments admitted to official exchange listing or dealt in on another regulated market.Government BondsFranceFrench Republic Government Bond OAT 0.100% 03/03/2025 EUR 14,800,000 18,272,585 1.26French Republic Government Bond OAT 0.100% 01/03/2028 EUR 9,900,000 12,347,446 0.85French Republic Government Bond OAT 0.250% 25/07/2024 EUR 15,980,000 20,427,338 1.40French Republic Government Bond OAT 0.700% 25/07/2030 EUR 7,300,000 9,911,363 0.68French Republic Government Bond OAT 1.850% 26/07/2027 EUR 11,940,000 18,482,811 1.27
Total France 79,441,543 5.46
GermanyDeutsche Bundesrepublik Inflation Linked Bond 0.100% 17/04/2023 EUR 41,800,000 53,331,848 3.67Deutsche Bundesrepublik Inflation Linked Bond 0.100% 15/04/2026 EUR 39,900,000 51,401,073 3.53
Total Germany 104,732,921 7.20
United KingdomUnited Kingdom Gilt Inflation Linked 0.125% 22/03/2024 GBP 42,000,000 72,613,765 4.99United Kingdom Gilt Inflation Linked 0.125% 23/03/2026 GBP 30,700,000 52,170,230 3.59
Total United Kingdom 124,783,995 8.58
United StatesUnited States Treasury Inflation Indexed Bonds 0.125% 18/04/2022 USD 113,020,000 115,800,069 7.96United States Treasury Inflation Indexed Bonds 0.125% 15/07/2026 USD 58,780,000 60,395,263 4.15United States Treasury Inflation Indexed Bonds 0.375% 15/07/2025 USD 28,230,000 29,954,810 2.06United States Treasury Inflation Indexed Bonds 0.375% 15/07/2027 USD 30,090,000 30,742,178 2.12United States Treasury Inflation Indexed Bonds 0.625% 17/04/2023 USD 86,519,000 88,335,109 6.07United States Treasury Inflation Indexed Bonds 0.625% 15/01/2026 USD 52,600,000 56,373,413 3.87
Total United States 381,600,842 26.23
Total Government Bonds 690,559,301 47.47
Total Transferable securities and money market instruments admitted to official exchange listing or dealt in on another regulated market. 690,559,301 47.47
Short Term InvestmentsAustraliaAustralia & New Zealand Banking Group Ltd 0.000% 08/05/2019 USD 7,500,000 7,479,600 0.51
Total Australia 7,479,600 0.51
CanadaThe Toronto-Dominion Bank 2.710% 08/04/2019 USD 11,000,000 11,000,794 0.76Total Capital Canada Ltd 0.000% 04/04/2019 USD 10,000,000 9,995,987 0.69Total Capital Canada Ltd 0.000% 01/05/2019 USD 4,000,000 3,990,877 0.27Total Capital Canada Ltd 0.000% 28/05/2019 USD 2,500,000 2,489,521 0.17
Total Canada 27,477,179 1.89
FinlandNordea Bank AB 0.000% 13/05/2019 USD 12,000,000 11,963,400 0.82
Total Finland 11,963,400 0.82
FranceAntalis SA 0.000% 02/04/2019 USD 6,000,000 5,998,370 0.41Antalis SA 0.000% 11/04/2019 USD 3,000,000 2,997,351 0.21Societe Generale SA 0.000% 08/04/2019 USD 5,325,000 5,321,432 0.37Societe Generale SA 0.000% 22/04/2019 USD 5,000,000 4,991,930 0.34
Total France 19,309,083 1.33
JapanSumitomo Mitsui Banking Corp 0.000% 09/04/2019 USD 15,000,000 14,988,986 1.03
Total Japan 14,988,986 1.03
NorwayDNB Bank ASA 0.000% 07/05/2019 USD 10,000,000 9,973,751 0.69DNB Bank ASA 0.000% 15/05/2019 USD 7,000,000 6,977,710 0.48
Total Norway 16,951,461 1.17
SingaporeDBS Bank Ltd 0.000% 14/05/2019 USD 13,400,000 13,356,920 0.92DBS Bank Ltd 0.000% 07/06/2019 USD 3,600,000 3,582,234 0.25Mitsubishi UFJ Trust & Banking Corp 0.000% 09/04/2019 USD 4,000,000 3,997,046 0.27Mitsubishi UFJ Trust & Banking Corp 0.000% 17/04/2019 USD 7,000,000 6,991,059 0.48Sumitomo Mitsui Trust Bank Ltd 0.000% 03/06/2019 USD 14,000,000 13,935,346 0.96
Total Singapore 41,862,605 2.88
SwedenSkandinaviska Enskilda Banken AB 0.000% 22/05/2019 USD 15,000,000 14,945,078 1.03Svenska Handelsbanken AB 0.000% 16/04/2019 USD 7,600,000 7,590,808 0.52Swedbank AB 0.000% 10/05/2019 USD 8,500,000 8,476,210 0.58Swedbank AB 0.000% 21/05/2019 USD 9,500,000 9,466,391 0.65
Total Sweden 40,478,487 2.78
United KingdomASB Finance Ltd 0.000% 14/05/2019 USD 12,200,000 12,161,542 0.84
Total United Kingdom 12,161,542 0.84
United StatesAlbion Capital LLC 0.000% 23/04/2019 USD 5,500,000 5,490,650 0.38American Honda Finance Corporation 0.000% 04/04/2019 USD 15,000,000 14,993,937 1.03Apple Inc 0.000% 06/05/2019 USD 15,000,000 14,961,477 1.03Atlantic Asset Securitization LLC 0.000% 04/04/2019 USD 6,000,000 5,997,555 0.41Atlantic Asset Securitization LLC 0.000% 22/04/2019 USD 6,000,000 5,990,172 0.41Bank of Montreal 2.430% 02/04/2019 USD 5,000,000 5,000,003 0.34Bank of Montreal 2.620% 12/08/2019 USD 10,000,000 10,005,192 0.69Chevron Corporation 0.000% 02/04/2019 USD 1,250,000 1,249,671 0.09Chevron Corporation 0.000% 26/04/2019 USD 15,750,000 15,720,735 1.08DZ Bank Deutsche Zentral 2.720% 17/06/2019 USD 7,600,000 7,602,825 0.52Fairway Finance Co LLC 0.000% 01/07/2019 USD 8,000,000 7,946,566 0.55Fairway Finance Co LLC 0.000% 02/07/2019 USD 4,000,000 3,972,999 0.27
AQR UCITS FUNDS
AQR Global Risk Parity UCITS Fund
Schedule of InvestmentsAs at 31 March 2019
The accompanying notes form an integral part of these audited financial statements. 107

Investments CouponMaturityDate Currency
Shares/PrincipalAmounts
Fair Valuein USD
Percentof Net
Assets
Short Term Investments (continued)United States (continued)Gotham Funding Corp 0.000% 13/05/2019 USD 3,000,000 2,990,663 0.21Liberty Street Funding LLC 0.000% 20/05/2019 USD 4,000,000 3,985,544 0.27Liberty Street Funding LLC 0.000% 04/06/2019 USD 5,000,000 4,976,662 0.34Liberty Street Funding LLC 0.000% 02/07/2019 USD 5,000,000 4,967,080 0.34LMA Americas LLC 0.000% 01/04/2019 USD 2,500,000 2,499,495 0.17LMA Americas LLC 0.000% 10/06/2019 USD 2,000,000 1,989,812 0.14LMA Americas LLC 0.000% 12/07/2019 USD 4,000,000 3,970,308 0.27LMA Americas LLC 0.000% 06/08/2019 USD 4,500,000 4,458,367 0.31LMA Americas LLC 0.000% 14/08/2019 USD 4,000,000 3,960,639 0.27Mitsubishi UFJ Trust & Banking Corp 0.000% 04/04/2019 USD 7,000,000 6,997,183 0.48Mizuho Bank Ltd 0.000% 15/05/2019 USD 11,000,000 10,964,672 0.75Mizuho Bank Ltd 0.000% 13/06/2019 USD 2,000,000 1,989,377 0.14Mizuho Bank Ltd 2.620% 10/05/2019 USD 4,000,000 4,000,763 0.28Nestle Capital Corp 0.000% 18/07/2019 USD 11,900,000 11,808,308 0.81Nieuw Amsterdam Receivables Corp 0.000% 05/04/2019 USD 2,000,000 1,999,010 0.14Nieuw Amsterdam Receivables Corp 0.000% 04/06/2019 USD 1,165,000 1,159,586 0.08Nieuw Amsterdam Receivables Corp 0.000% 14/06/2019 USD 5,500,000 5,470,437 0.38Norinchukin Bank 2.450% 08/04/2019 USD 6,500,000 6,500,039 0.45Norinchukin Bank 2.450% 12/04/2019 USD 8,000,000 8,000,031 0.55Novartis Finance Corp 0.000% 07/05/2019 USD 6,800,000 6,781,834 0.47Oversea-Chinese Banking Corp Ltd 2.560% 14/05/2019 USD 5,000,000 5,000,231 0.34Oversea-Chinese Banking Corp Ltd 2.660% 06/08/2019 USD 5,000,000 5,001,473 0.34PACCAR Financial Corp 0.000% 02/05/2019 USD 7,500,000 7,482,554 0.52Pfizer Inc 0.000% 06/05/2019 USD 10,000,000 9,974,266 0.69Roche Holdings Inc 0.000% 09/04/2019 USD 1,600,000 1,598,829 0.11Roche Holdings Inc 0.000% 23/04/2019 USD 1,000,000 998,321 0.07Starbird Funding Corp 0.000% 13/06/2019 USD 5,000,000 4,972,777 0.34Sumitomo Mitsui Trust Bank Limited 2.800% 25/04/2019 USD 10,000,000 10,002,590 0.69The Bank of Nova Scotia 2.600% 22/08/2019 USD 5,000,000 5,000,230 0.34The Coca-Cola Co 0.000% 01/05/2019 USD 1,300,000 1,297,080 0.09The Coca-Cola Co 0.000% 23/05/2019 USD 12,000,000 11,954,405 0.82The Coca-Cola Co 0.000% 17/06/2019 USD 5,250,000 5,220,740 0.36The Toronto-Dominion Bank 2.650% 20/05/2019 USD 5,000,000 5,000,770 0.34Toyota Motor Credit Corp 0.000% 11/04/2019 USD 2,000,000 1,998,268 0.14Toyota Motor Credit Corp 0.000% 13/05/2019 USD 12,000,000 11,963,550 0.82Victory Receivables Corp 0.000% 14/06/2019 USD 5,000,000 4,972,922 0.34Walmart Inc 0.000% 08/04/2019 USD 10,250,000 10,243,189 0.70Walmart Inc 0.000% 15/04/2019 USD 7,000,000 6,992,040 0.48Walmart Inc 0.000% 29/04/2019 USD 9,500,000 9,480,146 0.65
Total United States 317,555,973 21.83
Other Investment FundsUnited StatesUBS (Irl) Select Money Market Fund^ 0.000% USD 37,116,324 37,116,324 2.55
Total United States 37,116,324 2.55
Total Other Investment Funds 37,116,324 2.55
Total Short Term Investments 547,344,640 37.63
Total Investments (Total Cost: $1,236,040,414) 1,237,903,941 85.10
Other Assets/(Liabilities) 216,803,824 14.90
Total Net Assets 1,454,707,765 100.00
^Seven-day effective yield at 31 March 2019 was 2.29%.
Economic Classification of InvestmentsAs at 31 March 2019
Industry ClassificationPercent ofNet Assets
Consumer Cyclical 4.05Consumer Non-cyclical 4.78Financial 28.80Government 47.47Total Investments 85.10
Other Assets/(Liabilities) 14.90Total Net Assets 100.00
AQR UCITS FUNDS
AQR Global Risk Parity UCITS Fund
Schedule of Investments (continued)As at 31 March 2019
The accompanying notes form an integral part of these audited financial statements. 108

Derivatives
Futures ContractsExchange-Traded
Description Counterparty†Number ofContracts
ExpirationDate
TradingCurrency
Notional Amountin USD
UnrealisedAppreciation/
(Depreciation)in USD
Percent ofNet Assets
10 Year Australian Treasury Bond Futures JPPC 494 17/06/2019 AUD 48,515,183 902,318 0.0610 Year Canadian Treasury Bonds Futures JPPC 593 19/06/2019 CAD 61,786,000 1,330,597 0.1010 Year Japan Treasury Bonds Futures JPPC 140 13/06/2019 JPY 193,561,539 706,674 0.0510 Year US Treasury Note (CBT) Futures JPPC 7,554 19/06/2019 USD 938,466,506 14,080,638 0.97Amsterdam Index Futures GSCO 24 18/04/2019 EUR 2,940,348 68,173 0.00CAC40 10 Euro Futures GSCO 161 18/04/2019 EUR 9,617,482 107,102 0.01EURO STOXX 50 Futures GSCO 656 21/06/2019 EUR 24,010,683 208,988 0.02Euro-Bund Futures JPPC 2,265 06/06/2019 EUR 422,880,251 7,869,001 0.54FTSE 100 Index Futures GSCO 311 21/06/2019 GBP 29,102,199 654,819 0.05FTSE/JSE TOP 40 Futures JPPC 139 20/06/2019 ZAR 4,876,512 34,182 0.00FTSE/MIB Index Futures GSCO 17 21/06/2019 EUR 1,973,093 58,352 0.00HANG SENG Index Futures GSCO 15 29/04/2019 HKD 2,778,075 40,902 0.00H-Shares Index Futures GSCO 171 29/04/2019 HKD 12,388,320 46,226 0.00IBEX 35 Index Futures GSCO 25 18/04/2019 EUR 2,571,098 6,610 0.00KOSPI 200 Index Futures BARC 144 13/06/2019 KRW 8,791,471 39,230 0.00Long Gilt Futures JPPC 518 26/06/2019 GBP 87,161,572 1,435,430 0.10Russell 2000 Mini Futures GSCO 227 21/06/2019 USD 17,527,805 167,535 0.02S&P 500 E-mini Futures GSCO 2,218 21/06/2019 USD 313,458,850 6,785,137 0.47S&P MID 400 E-mini Index Futures GSCO 156 21/06/2019 USD 29,671,200 421,635 0.02S&P TSX 60 Index Futures GSCO 115 20/06/2019 CAD 16,474,322 60,173 0.00SPI 200 Futures GSCO 36 20/06/2019 AUD 3,936,604 3,190 0.00Swiss Market Index Futures BARC 160 21/06/2019 CHF 14,887,159 273,893 0.02DAX Index Futures GSCO 23 21/06/2019 EUR 7,425,476 (54,998) (0.00)FTSE/JSE TOP 40 Futures JPPC 139 20/06/2019 ZAR 4,876,512 (2,113) (0.00)KOSPI 200 Index Futures BARC 39 13/06/2019 KRW 2,381,024 (13,784) (0.00)Russell 2000 Mini Futures GSCO 144 21/06/2019 USD 11,118,960 (78,068) (0.00)S&P MID 400 E-mini Index Futures GSCO 15 21/06/2019 USD 2,853,000 (4,228) (0.00)SPI 200 Futures GSCO 72 20/06/2019 AUD 7,873,208 (13,396) (0.00)TOPIX Index Futures GSCO 285 13/06/2019 JPY 40,925,451 (217,013) (0.03)
Total Futures Contracts 34,917,205 2.40
Forward Foreign Exchange ContractsOver-the-Counter
Counterparty† Currency Purchased Amount Purchased Currency Sold Amount Sold Settlement Date
UnrealisedAppreciation/
(Depreciation)in USD
Percent ofNet Assets
CITI USD 86,967 BRL 330,000 19/06/2019* 2,745 0.00CITI USD 93,155,098 EUR 81,480,893 19/06/2019 1,071,420 0.07CITI USD 58,146,378 GBP 44,019,249 19/06/2019 706,495 0.05CITI USD 1,205,015 HKD 9,426,000 19/06/2019 1,393 0.00JPMC USD 86,967 BRL 330,000 19/06/2019* 2,744 0.00JPMC USD 93,154,984 EUR 81,480,895 19/06/2019 1,071,303 0.07JPMC USD 58,146,303 GBP 44,019,247 19/06/2019 706,423 0.05JPMC USD 1,205,013 HKD 9,426,000 19/06/2019 1,392 0.00CITI HKD 12,360,000 USD 1,578,752 19/06/2019 (483) (0.00)CITI USD 4,596,197 GBP 3,536,379 19/06/2019 (18,357) (0.00)JPMC HKD 12,360,000 USD 1,578,753 19/06/2019 (485) (0.00)JPMC USD 4,596,190 GBP 3,536,378 19/06/2019 (18,363) (0.00)
Total Forward Foreign Exchange Contracts 3,526,227 0.24
* Non-deliverable forwards (See Note 4)
Hedge Forward Foreign Exchange ContractsOver-the-Counter
Counterparty† Currency Purchased Amount Purchased Currency Sold Amount Sold Settlement Date
UnrealisedAppreciation/
(Depreciation)in USD
Percent ofNet Assets
CITI CHF 1,545,369 USD 1,567,579 19/06/2019 (3,995) (0.00)CITI EUR 199,350,025 USD 227,873,710 19/06/2019 (2,583,057) (0.18)CITI GBP 325,850,654 USD 430,522,828 19/06/2019 (5,326,490) (0.36)CITI USD 179,326 CHF 177,565 19/06/2019 (332) (0.00)JPMC CHF 1,671,286 USD 1,694,983 19/06/2019 (3,998) (0.00)JPMC EUR 199,350,038 USD 227,874,010 19/06/2019 (2,583,342) (0.18)JPMC GBP 325,850,648 USD 430,523,359 19/06/2019 (5,327,028) (0.37)JPMC USD 179,327 CHF 177,567 19/06/2019 (333) (0.00)CITI CHF 8,986,358 USD 9,050,252 19/06/2019 42,026 0.00CITI GBP 26,580,670 USD 34,529,417 19/06/2019 155,195 0.01CITI USD 4,220 CHF 4,161 19/06/2019 10 0.00CITI USD 10,725,913 EUR 9,410,135 19/06/2019 91,275 0.01CITI USD 3,410,616 GBP 2,577,360 19/06/2019 47,468 0.01JPMC CHF 8,860,435 USD 8,922,498 19/06/2019 42,373 0.00JPMC GBP 26,580,669 USD 34,529,459 19/06/2019 155,152 0.01JPMC USD 4,221 CHF 4,161 19/06/2019 10 0.00JPMC USD 10,725,897 EUR 9,410,133 19/06/2019 91,261 0.01JPMC USD 3,410,612 GBP 2,577,360 19/06/2019 47,464 0.00
Total Hedge Forward Foreign Exchange Contracts (15,156,341) (1.04)
Total Return Swap ContractsOver-the-Counter
Reference Entity (�RE�)PaymentsMade By Sub-Fund‡
Payments ReceivedBy Sub-Fund‡ Counterparty† Maturity Date
TradingCurrency
NotionalAmountin USD
UnrealisedAppreciation/
(Depreciation)in USD
Percent ofNet Assets
Bloomberg Commodity Index 1Month Forward
Decreases in RE andpays financing of +0.09%
Increases in RE BARB 04/04/2019 USD 519,896,441 3,357,589 0.23
Bloomberg Commodity Index 1Month Forward
Decreases in RE andpays financing of +0.09%
Increases in RE BARB 04/04/2019 USD 25,996,592 (56,695) (0.00)
BOVESPA Index Futures Apr19 Decreases in RE Increases in RE MLIN 17/04/2019 BRL 11,765,509 (88,109) (0.01)
AQR UCITS FUNDS
AQR Global Risk Parity UCITS Fund
Schedule of Investments (continued)As at 31 March 2019
The accompanying notes form an integral part of these audited financial statements. 109
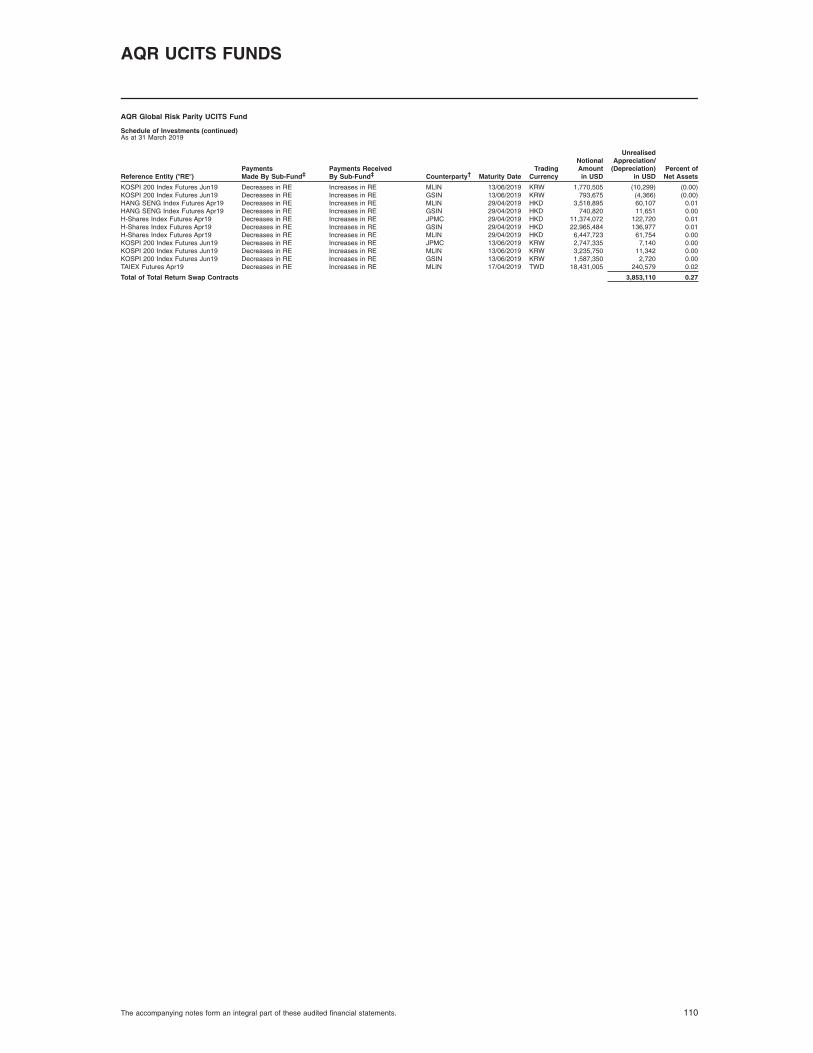
Reference Entity (�RE�)PaymentsMade By Sub-Fund‡
Payments ReceivedBy Sub-Fund‡ Counterparty† Maturity Date
TradingCurrency
NotionalAmountin USD
UnrealisedAppreciation/
(Depreciation)in USD
Percent ofNet Assets
KOSPI 200 Index Futures Jun19 Decreases in RE Increases in RE MLIN 13/06/2019 KRW 1,770,505 (10,299) (0.00)KOSPI 200 Index Futures Jun19 Decreases in RE Increases in RE GSIN 13/06/2019 KRW 793,675 (4,366) (0.00)HANG SENG Index Futures Apr19 Decreases in RE Increases in RE MLIN 29/04/2019 HKD 3,518,895 60,107 0.01HANG SENG Index Futures Apr19 Decreases in RE Increases in RE GSIN 29/04/2019 HKD 740,820 11,651 0.00H-Shares Index Futures Apr19 Decreases in RE Increases in RE JPMC 29/04/2019 HKD 11,374,072 122,720 0.01H-Shares Index Futures Apr19 Decreases in RE Increases in RE GSIN 29/04/2019 HKD 22,965,484 136,977 0.01H-Shares Index Futures Apr19 Decreases in RE Increases in RE MLIN 29/04/2019 HKD 6,447,723 61,754 0.00KOSPI 200 Index Futures Jun19 Decreases in RE Increases in RE JPMC 13/06/2019 KRW 2,747,335 7,140 0.00KOSPI 200 Index Futures Jun19 Decreases in RE Increases in RE MLIN 13/06/2019 KRW 3,235,750 11,342 0.00KOSPI 200 Index Futures Jun19 Decreases in RE Increases in RE GSIN 13/06/2019 KRW 1,587,350 2,720 0.00TAIEX Futures Apr19 Decreases in RE Increases in RE MLIN 17/04/2019 TWD 18,431,005 240,579 0.02
Total of Total Return Swap Contracts 3,853,110 0.27
AQR UCITS FUNDS
AQR Global Risk Parity UCITS Fund
Schedule of Investments (continued)As at 31 March 2019
The accompanying notes form an integral part of these audited financial statements. 110
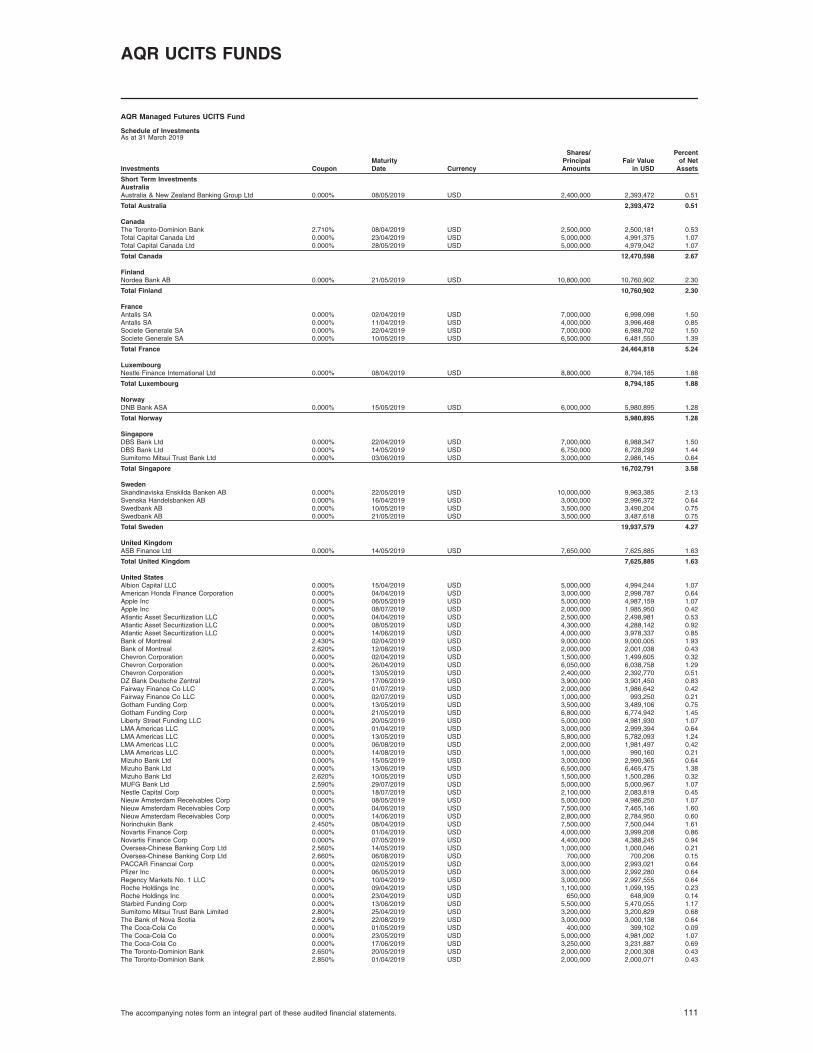
Investments CouponMaturityDate Currency
Shares/PrincipalAmounts
Fair Valuein USD
Percentof Net
Assets
Short Term InvestmentsAustraliaAustralia & New Zealand Banking Group Ltd 0.000% 08/05/2019 USD 2,400,000 2,393,472 0.51
Total Australia 2,393,472 0.51
CanadaThe Toronto-Dominion Bank 2.710% 08/04/2019 USD 2,500,000 2,500,181 0.53Total Capital Canada Ltd 0.000% 23/04/2019 USD 5,000,000 4,991,375 1.07Total Capital Canada Ltd 0.000% 28/05/2019 USD 5,000,000 4,979,042 1.07
Total Canada 12,470,598 2.67
FinlandNordea Bank AB 0.000% 21/05/2019 USD 10,800,000 10,760,902 2.30
Total Finland 10,760,902 2.30
FranceAntalis SA 0.000% 02/04/2019 USD 7,000,000 6,998,098 1.50Antalis SA 0.000% 11/04/2019 USD 4,000,000 3,996,468 0.85Societe Generale SA 0.000% 22/04/2019 USD 7,000,000 6,988,702 1.50Societe Generale SA 0.000% 10/05/2019 USD 6,500,000 6,481,550 1.39
Total France 24,464,818 5.24
LuxembourgNestle Finance International Ltd 0.000% 08/04/2019 USD 8,800,000 8,794,185 1.88
Total Luxembourg 8,794,185 1.88
NorwayDNB Bank ASA 0.000% 15/05/2019 USD 6,000,000 5,980,895 1.28
Total Norway 5,980,895 1.28
SingaporeDBS Bank Ltd 0.000% 22/04/2019 USD 7,000,000 6,988,347 1.50DBS Bank Ltd 0.000% 14/05/2019 USD 6,750,000 6,728,299 1.44Sumitomo Mitsui Trust Bank Ltd 0.000% 03/06/2019 USD 3,000,000 2,986,145 0.64
Total Singapore 16,702,791 3.58
SwedenSkandinaviska Enskilda Banken AB 0.000% 22/05/2019 USD 10,000,000 9,963,385 2.13Svenska Handelsbanken AB 0.000% 16/04/2019 USD 3,000,000 2,996,372 0.64Swedbank AB 0.000% 10/05/2019 USD 3,500,000 3,490,204 0.75Swedbank AB 0.000% 21/05/2019 USD 3,500,000 3,487,618 0.75
Total Sweden 19,937,579 4.27
United KingdomASB Finance Ltd 0.000% 14/05/2019 USD 7,650,000 7,625,885 1.63
Total United Kingdom 7,625,885 1.63
United StatesAlbion Capital LLC 0.000% 15/04/2019 USD 5,000,000 4,994,244 1.07American Honda Finance Corporation 0.000% 04/04/2019 USD 3,000,000 2,998,787 0.64Apple Inc 0.000% 06/05/2019 USD 5,000,000 4,987,159 1.07Apple Inc 0.000% 08/07/2019 USD 2,000,000 1,985,950 0.42Atlantic Asset Securitization LLC 0.000% 04/04/2019 USD 2,500,000 2,498,981 0.53Atlantic Asset Securitization LLC 0.000% 08/05/2019 USD 4,300,000 4,288,142 0.92Atlantic Asset Securitization LLC 0.000% 14/06/2019 USD 4,000,000 3,978,337 0.85Bank of Montreal 2.430% 02/04/2019 USD 9,000,000 9,000,005 1.93Bank of Montreal 2.620% 12/08/2019 USD 2,000,000 2,001,038 0.43Chevron Corporation 0.000% 02/04/2019 USD 1,500,000 1,499,605 0.32Chevron Corporation 0.000% 26/04/2019 USD 6,050,000 6,038,758 1.29Chevron Corporation 0.000% 13/05/2019 USD 2,400,000 2,392,770 0.51DZ Bank Deutsche Zentral 2.720% 17/06/2019 USD 3,900,000 3,901,450 0.83Fairway Finance Co LLC 0.000% 01/07/2019 USD 2,000,000 1,986,642 0.42Fairway Finance Co LLC 0.000% 02/07/2019 USD 1,000,000 993,250 0.21Gotham Funding Corp 0.000% 13/05/2019 USD 3,500,000 3,489,106 0.75Gotham Funding Corp 0.000% 21/05/2019 USD 6,800,000 6,774,942 1.45Liberty Street Funding LLC 0.000% 20/05/2019 USD 5,000,000 4,981,930 1.07LMA Americas LLC 0.000% 01/04/2019 USD 3,000,000 2,999,394 0.64LMA Americas LLC 0.000% 13/05/2019 USD 5,800,000 5,782,093 1.24LMA Americas LLC 0.000% 06/08/2019 USD 2,000,000 1,981,497 0.42LMA Americas LLC 0.000% 14/08/2019 USD 1,000,000 990,160 0.21Mizuho Bank Ltd 0.000% 15/05/2019 USD 3,000,000 2,990,365 0.64Mizuho Bank Ltd 0.000% 13/06/2019 USD 6,500,000 6,465,475 1.38Mizuho Bank Ltd 2.620% 10/05/2019 USD 1,500,000 1,500,286 0.32MUFG Bank Ltd 2.590% 29/07/2019 USD 5,000,000 5,000,967 1.07Nestle Capital Corp 0.000% 18/07/2019 USD 2,100,000 2,083,819 0.45Nieuw Amsterdam Receivables Corp 0.000% 08/05/2019 USD 5,000,000 4,986,250 1.07Nieuw Amsterdam Receivables Corp 0.000% 04/06/2019 USD 7,500,000 7,465,146 1.60Nieuw Amsterdam Receivables Corp 0.000% 14/06/2019 USD 2,800,000 2,784,950 0.60Norinchukin Bank 2.450% 08/04/2019 USD 7,500,000 7,500,044 1.61Novartis Finance Corp 0.000% 01/04/2019 USD 4,000,000 3,999,208 0.86Novartis Finance Corp 0.000% 07/05/2019 USD 4,400,000 4,388,245 0.94Oversea-Chinese Banking Corp Ltd 2.560% 14/05/2019 USD 1,000,000 1,000,046 0.21Oversea-Chinese Banking Corp Ltd 2.660% 06/08/2019 USD 700,000 700,206 0.15PACCAR Financial Corp 0.000% 02/05/2019 USD 3,000,000 2,993,021 0.64Pfizer Inc 0.000% 06/05/2019 USD 3,000,000 2,992,280 0.64Regency Markets No. 1 LLC 0.000% 10/04/2019 USD 3,000,000 2,997,555 0.64Roche Holdings Inc 0.000% 09/04/2019 USD 1,100,000 1,099,195 0.23Roche Holdings Inc 0.000% 23/04/2019 USD 650,000 648,909 0.14Starbird Funding Corp 0.000% 13/06/2019 USD 5,500,000 5,470,055 1.17Sumitomo Mitsui Trust Bank Limited 2.800% 25/04/2019 USD 3,200,000 3,200,829 0.68The Bank of Nova Scotia 2.600% 22/08/2019 USD 3,000,000 3,000,138 0.64The Coca-Cola Co 0.000% 01/05/2019 USD 400,000 399,102 0.09The Coca-Cola Co 0.000% 23/05/2019 USD 5,000,000 4,981,002 1.07The Coca-Cola Co 0.000% 17/06/2019 USD 3,250,000 3,231,887 0.69The Toronto-Dominion Bank 2.650% 20/05/2019 USD 2,000,000 2,000,308 0.43The Toronto-Dominion Bank 2.850% 01/04/2019 USD 2,000,000 2,000,071 0.43
AQR UCITS FUNDS
AQR Managed Futures UCITS Fund
Schedule of InvestmentsAs at 31 March 2019
The accompanying notes form an integral part of these audited financial statements. 111

Investments CouponMaturityDate Currency
Shares/PrincipalAmounts
Fair Valuein USD
Percentof Net
Assets
Short Term Investments (continued)United States (continued)Toyota Motor Credit Corp 0.000% 30/04/2019 USD 2,000,000 1,995,703 0.43Toyota Motor Credit Corp 0.000% 13/05/2019 USD 2,000,000 1,993,925 0.43Victory Receivables Corp 0.000% 06/05/2019 USD 1,000,000 997,384 0.21Victory Receivables Corp 0.000% 20/05/2019 USD 9,300,000 9,266,390 1.98Victory Receivables Corp 0.000% 14/06/2019 USD 500,000 497,292 0.11Walmart Inc 0.000% 08/04/2019 USD 2,700,000 2,698,206 0.58Walmart Inc 0.000% 29/04/2019 USD 10,800,000 10,777,429 2.31
Total United States 194,649,928 41.66
Other Investment FundsUnited StatesUBS (Irl) Select Money Market Fund^ 0.000% USD 37,116,324 37,116,324 7.95
Total United States 37,116,324 7.95
Total Other Investment Funds 37,116,324 7.95
Total Short Term Investments 340,897,377 72.97
Total Investments (Total Cost: $340,927,665) 340,897,377 72.97
Other Assets/(Liabilities) 126,284,594 27.03
Total Net Assets 467,181,971 100.00
^Seven-day effective yield at 31 March 2019 was 2.29%.
Economic Classification of InvestmentsAs at 31 March 2019
Industry ClassificationPercent ofNet Assets
Consumer Cyclical 4.18Consumer Non-cyclical 8.07Energy 0.51Financial 59.79Technology 0.42Total Investments 72.97
Other Assets/(Liabilities) 27.03Total Net Assets 100.00
AQR UCITS FUNDS
AQR Managed Futures UCITS Fund
Schedule of Investments (continued)As at 31 March 2019
The accompanying notes form an integral part of these audited financial statements. 112

Derivatives
Futures ContractsExchange-Traded
Description Counterparty†Number ofContracts
ExpirationDate
TradingCurrency
Notional Amountin USD
UnrealisedAppreciation/
(Depreciation)in USD
Percent ofNet Assets
10 Year Australian Treasury Bond Futures JPPC 256 17/06/2019 AUD 25,141,471 459,780 0.1010 Year Canadian Treasury Bonds Futures JPPC 72 19/06/2019 CAD 7,501,839 147,008 0.0310 Year Japan Treasury Bonds Futures JPPC 77 13/06/2019 JPY 106,458,846 381,759 0.0810 Year US Treasury Note (CBT) Futures JPPC 308 19/06/2019 USD 38,264,188 530,970 0.142 Year US Treasury Note (CBT) Futures JPPC 613 28/06/2019 USD 130,631,260 454,391 0.083 Month Euro EURIBOR Futures JPPC 31 16/09/2019 EUR 8,727,854 1,466 0.003 Month Euro EURIBOR Futures JPPC 99 16/12/2019 EUR 27,872,820 15,147 0.003 Month Euro EURIBOR Futures JPPC 85 15/03/2021 EUR 23,897,809 27,389 0.003 Month Euro EURIBOR Futures JPPC 149 16/03/2020 EUR 41,945,818 38,323 0.003 Month Euro EURIBOR Futures JPPC 179 14/09/2020 EUR 50,363,646 54,153 0.013 Month Euro EURIBOR Futures JPPC 180 15/06/2020 EUR 50,662,691 59,302 0.013 Month Euro EURIBOR Futures JPPC 153 14/12/2020 EUR 43,033,229 69,400 0.013 Month Euro Swiss Franc ICE Futures JPPC 7 16/12/2019 CHF 1,770,653 766 0.003 Month Euro Swiss Franc ICE Futures JPPC 16 16/03/2020 CHF 4,046,400 1,841 0.003 Year Australian Treasury Bond Futures JPPC 1,270 17/06/2019 AUD 102,297,896 509,727 0.125 Year US Treasury Note (CBT) Futures JPPC 554 28/06/2019 USD 64,181,765 554,440 0.1290-DAY Australian Bank Bill Futures JPPC 56 12/12/2019 AUD 39,550,412 20,148 0.0090-DAY Australian Bank Bill Futures JPPC 57 12/09/2019 AUD 40,249,753 26,123 0.0090-DAY Euro Dollar Futures JPPC 494 16/09/2019 USD 120,449,550 174,628 0.0290-DAY Euro Dollar Futures JPPC 413 16/12/2019 USD 100,741,025 213,389 0.0290-DAY Euro Dollar Futures JPPC 354 16/03/2020 USD 86,460,081 223,081 0.0390-DAY Euro Dollar Futures JPPC 446 15/06/2020 USD 109,030,281 288,149 0.0690-DAY Euro Dollar Futures JPPC 541 14/09/2020 USD 132,342,125 402,773 0.1090-DAY Euro Dollar Futures JPPC 645 15/03/2021 USD 157,839,569 488,090 0.1490-DAY Euro Dollar Futures JPPC 627 14/12/2020 USD 153,395,550 502,893 0.0890-DAY Sterling Futures JPPC 105 16/12/2020 GBP 16,904,428 27,197 0.0190-DAY Sterling Futures JPPC 110 16/09/2020 GBP 17,715,654 29,898 0.0190-DAY Sterling Futures JPPC 84 17/03/2021 GBP 13,520,130 30,114 0.0090-DAY Sterling Futures JPPC 120 17/06/2020 GBP 19,332,020 31,406 0.0190-DAY Sterling Futures JPPC 134 18/03/2020 GBP 21,591,777 34,850 0.0090-DAY Sterling Futures JPPC 183 18/09/2019 GBP 29,485,793 35,187 0.0090-DAY Sterling Futures JPPC 150 18/12/2019 GBP 24,167,459 37,107 0.00Amsterdam Index Futures BARC 47 18/04/2019 EUR 5,758,180 103,561 0.02CAC40 10 Euro Futures BARC 297 18/04/2019 EUR 17,741,567 214,712 0.05Canadian Bank Accept Futures JPPC 50 16/12/2019 CAD 9,176,616 12,524 0.00Canadian Bank Accept Futures JPPC 54 16/09/2019 CAD 9,908,226 18,928 0.00DAX Index Futures BARC (4) 21/06/2019 EUR (1,291,387) 3,725 0.00DJIA MINI e-CBOT Futures JPPC 49 21/06/2019 USD 6,325,900 40,591 0.02EURO STOXX 50 Futures BARC 233 21/06/2019 EUR 8,528,184 98,037 0.03Euro-Bobl Futures JPPC 580 06/06/2019 EUR 86,693,589 674,965 0.14Euro-BTP Futures JPPC 118 06/06/2019 EUR 17,134,220 183,740 0.04Euro-Bund Futures JPPC 209 06/06/2019 EUR 39,020,738 738,563 0.17Euro-Buxl 30 Year Bond Futures JPPC 15 06/06/2019 EUR 3,228,131 158,548 0.03Euro-Oat Futures JPPC 144 06/06/2019 EUR 26,286,901 721,284 0.16Euro-Schatz Futures JPPC 640 06/06/2019 EUR 80,457,164 127,120 0.03FTSE 100 Index Futures BARC 412 21/06/2019 GBP 38,553,393 688,156 0.15FTSE CHINA A50 JPPC 221 29/04/2019 USD 2,900,625 132,324 0.03FTSE/JSE TOP 40 Futures BARC 33 20/06/2019 ZAR 1,157,734 5,030 0.00FTSE/MIB Index Futures BARC 1 21/06/2019 EUR 116,064 199 0.00HANG SENG Index Futures BARC 3 29/04/2019 HKD 555,615 6,731 0.00H-Shares Index Futures BARC 23 29/04/2019 HKD 1,666,266 11,762 0.00IBEX 35 Index Futures BARC 40 18/04/2019 EUR 4,113,756 15,802 0.01KOSPI 200 Index Futures BARC (14) 13/06/2019 KRW (854,727) 4,701 0.00Long Gilt Futures JPPC 273 26/06/2019 GBP 45,936,505 496,607 0.12MSCI Emerging Markets Index Futures JPPC 11 21/06/2019 USD 579,865 5,245 0.00NASDAQ 100 E-mini Index Futures JPPC 121 21/06/2019 USD 17,826,325 569,718 0.13NIKKEI 225 (OSE) Futures JPPC (3) 13/06/2019 JPY (573,941) 11,106 0.00OMXS30 Index Futures JPPC 604 17/04/2019 SEK 10,035,560 27,805 0.01S&P 500 E-mini Futures JPPC 55 21/06/2019 USD 7,772,875 136,470 0.04S&P MID 400 E-mini Index Futures JPPC 2 21/06/2019 USD 380,400 2,456 0.00S&P TSX 60 Index Futures JPPC 427 20/06/2019 CAD 61,169,875 231,905 0.05Swiss Market Index Futures BARC 58 21/06/2019 CHF 5,396,595 93,960 0.02TOPIX Index Futures BARC (59) 13/06/2019 JPY (8,472,287) 25,423 0.01US LONG Bond (CBT) Futures JPPC 145 19/06/2019 USD 21,691,098 525,622 0.12US ULTRA Bond (CBT) Futures JPPC 65 19/06/2019 USD 10,905,784 309,804 0.072 Year US Treasury Note (CBT) Futures JPPC 15 28/06/2019 USD 3,196,523 (2,152) (0.00)3 Month Euro Swiss Franc ICE Futures JPPC (5) 16/09/2019 CHF (1,264,752) (254) (0.00)3 Month Euro Swiss Franc ICE Futures JPPC 1 16/03/2020 CHF 252,900 (57) (0.00)90-DAY Euro Dollar Futures JPPC 37 15/06/2020 USD 9,045,113 (6,828) (0.00)90-DAY Euro Dollar Futures JPPC 34 14/09/2020 USD 8,317,250 (6,477) (0.00)90-DAY Euro Dollar Futures JPPC 30 16/03/2020 USD 7,327,126 (5,410) (0.00)90-DAY Euro Dollar Futures JPPC 9 14/12/2020 USD 2,201,850 (2,112) (0.00)90-DAY Euro Dollar Futures JPPC 6 15/03/2021 USD 1,468,276 (1,800) (0.00)90-DAY Euro Dollar Futures JPPC 7 16/12/2019 USD 1,707,475 (1,300) (0.00)90-DAY Euro Dollar Futures JPPC 7 16/09/2019 USD 1,706,775 (297) (0.00)90-DAY Sterling Futures JPPC 5 17/03/2021 GBP 804,770 (76) (0.00)CAC40 10 Euro Futures BARC 11 18/04/2019 EUR 657,095 (5,551) (0.00)DAX Index Futures BARC (10) 21/06/2019 EUR (3,228,467) (26,143) (0.01)EURO STOXX 50 Futures BARC 63 21/06/2019 EUR 2,305,904 (30,229) (0.00)Euro-BTP Futures JPPC 18 06/06/2019 EUR 2,613,695 (5,383) (0.00)FTSE 100 Index Futures BARC 66 21/06/2019 GBP 6,176,029 (40,364) (0.01)FTSE/JSE TOP 40 Futures BARC 26 20/06/2019 ZAR 912,153 (2,851) (0.00)IBEX 35 Index Futures BARC 29 18/04/2019 EUR 2,982,473 (58,490) (0.03)KOSPI 200 Index Futures BARC (8) 13/06/2019 KRW (488,415) (1,436) (0.00)mini MSCI EAFE Futures JPPC 2 21/06/2019 USD 186,120 (922) (0.00)MSCI Emerging Markets Index Futures JPPC 25 21/06/2019 USD 1,317,875 (20,281) (0.00)MSCI Singapore Index Futures JPPC (29) 29/04/2019 SGD (769,923) (2,400) (0.00)NASDAQ 100 E-mini Index Futures JPPC 9 21/06/2019 USD 1,325,925 (3,695) (0.00)NIKKEI 225 (OSE) Futures JPPC (2) 13/06/2019 JPY (382,628) (2,285) (0.00)OMXS30 Index Futures JPPC 139 17/04/2019 SEK 2,309,508 (40,313) (0.00)Russell 2000 Mini Futures JPPC 26 21/06/2019 USD 2,007,590 (11,440) (0.00)S&P TSX 60 Index Futures JPPC 19 20/06/2019 CAD 2,721,845 (8,520) (0.00)SPI 200 Futures JPPC 209 20/06/2019 AUD 22,854,175 (30,837) (0.01)
AQR UCITS FUNDS
AQR Managed Futures UCITS Fund
Schedule of Investments (continued)As at 31 March 2019
The accompanying notes form an integral part of these audited financial statements. 113

Description Counterparty†Number ofContracts
ExpirationDate
TradingCurrency
Notional Amountin USD
UnrealisedAppreciation/
(Depreciation)in USD
Percent ofNet Assets
TOPIX Index Futures BARC (32) 13/06/2019 JPY (4,595,139) (53,488) (0.02)
Total Futures Contracts 11,896,628 2.55
Forward Foreign Exchange ContractsOver-the-Counter
Counterparty† Currency Purchased Amount Purchased Currency Sold Amount Sold Settlement Date
UnrealisedAppreciation/
(Depreciation)in USD
Percent ofNet Assets
CITI AUD 2,000 USD 1,425 19/06/2019 (5) (0.00)CITI BRL 4,033,000 USD 1,061,438 19/06/2019* (32,137) (0.01)CITI CAD 34,601,284 USD 26,254,261 19/06/2019 (301,263) (0.07)CITI CHF 9,886,551 USD 10,022,392 19/06/2019 (19,310) (0.01)CITI CLP 31,656,457 USD 48,227 19/06/2019* (1,694) (0.00)CITI COP 1,263,293,500 USD 405,850 19/06/2019* (9,224) (0.00)CITI EUR 14,579,500 USD 16,664,886 19/06/2019 (188,214) (0.04)CITI GBP 25,425,267 USD 33,490,136 19/06/2019 (313,186) (0.07)CITI HUF 2,749,358,520 USD 9,962,998 19/06/2019 (297,287) (0.06)CITI IDR 104,937,985,303 USD 7,347,855 19/06/2019* (75,416) (0.02)CITI ILS 1,864,500 USD 520,050 19/06/2019 (3,526) (0.00)CITI INR 92,448,000 USD 1,330,003 19/06/2019* (11,125) (0.00)CITI JPY 392,318,195 USD 3,578,848 19/06/2019 (18,604) (0.00)CITI MXN 186,108,464 USD 9,582,036 19/06/2019 (65,238) (0.01)CITI NOK 104,867,000 USD 12,300,171 19/06/2019 (101,172) (0.02)CITI NZD 69,986,525 USD 48,116,618 19/06/2019 (378,632) (0.08)CITI PHP 195,216,000 USD 3,724,410 19/06/2019* (44,464) (0.01)CITI PLN 75,661,004 USD 20,007,639 19/06/2019 (213,565) (0.05)CITI SEK 124,071,000 USD 13,548,857 19/06/2019 (88,968) (0.02)CITI SGD 5,456,500 USD 4,046,166 19/06/2019 (12,922) (0.00)CITI TWD 65,953,500 USD 2,149,250 19/06/2019* (5,166) (0.00)CITI USD 5,024,527 AUD 7,093,053 19/06/2019 (10,182) (0.00)CITI USD 179,074 BRL 706,000 19/06/2019* (1,112) (0.00)CITI USD 7,987,568 CAD 10,690,000 19/06/2019 (30,560) (0.01)CITI USD 359,449 CHF 357,500 19/06/2019 (2,266) (0.00)CITI USD 191,949 CLP 131,098,500 19/06/2019* (755) (0.00)CITI USD 11,890 COP 38,005,000 19/06/2019* (42) (0.00)CITI USD 885,141 IDR 12,816,009,000 19/06/2019* (3,037) (0.00)CITI USD 19,242 ILS 69,500 19/06/2019 (11) (0.00)CITI USD 1,964,948 INR 142,002,500 19/06/2019* (60,881) (0.01)CITI USD 17,816,949 JPY 1,974,510,000 19/06/2019 (101,508) (0.02)CITI USD 2,319,770 MXN 45,724,000 19/06/2019 (18,361) (0.00)CITI USD 5,703,734 NOK 49,439,915 19/06/2019 (47,527) (0.01)CITI USD 211,222 NZD 311,500 19/06/2019 (1,253) (0.00)CITI USD 865,858 PHP 46,114,000 19/06/2019* (3,421) (0.00)CITI USD 20,321,017 SEK 188,004,200 19/06/2019 (74,689) (0.02)CITI USD 1,407,203 TWD 43,330,393 19/06/2019* (1,427) (0.00)CITI USD 4,754,512 ZAR 69,586,000 19/06/2019 (8,542) (0.00)CITI ZAR 97,470,001 USD 6,837,418 19/06/2019 (165,749) (0.04)JPMC AUD 2,000 USD 1,425 19/06/2019 (5) (0.00)JPMC BRL 4,033,000 USD 1,061,440 19/06/2019* (32,138) (0.01)JPMC CAD 34,601,278 USD 26,254,290 19/06/2019 (301,295) (0.07)JPMC CHF 9,924,761 USD 10,061,065 19/06/2019 (19,323) (0.01)JPMC CLP 31,656,447 USD 48,227 19/06/2019* (1,695) (0.00)JPMC COP 1,263,293,508 USD 405,850 19/06/2019* (9,224) (0.00)JPMC EUR 14,579,500 USD 16,664,910 19/06/2019 (188,235) (0.04)JPMC GBP 25,425,278 USD 33,490,193 19/06/2019 (313,228) (0.07)JPMC HUF 2,749,358,528 USD 9,963,012 19/06/2019 (297,300) (0.06)JPMC IDR 104,937,985,305 USD 7,347,866 19/06/2019* (75,426) (0.02)JPMC ILS 1,864,500 USD 520,050 19/06/2019 (3,527) (0.00)JPMC INR 92,448,000 USD 1,329,923 19/06/2019* (11,046) (0.00)JPMC JPY 392,318,196 USD 3,578,852 19/06/2019 (18,609) (0.00)JPMC MXN 186,108,461 USD 9,582,045 19/06/2019 (65,250) (0.01)JPMC NOK 104,867,000 USD 12,300,188 19/06/2019 (101,187) (0.02)JPMC NZD 69,986,528 USD 48,116,677 19/06/2019 (378,692) (0.08)JPMC PHP 195,216,000 USD 3,724,415 19/06/2019* (44,468) (0.01)JPMC PLN 75,661,004 USD 20,007,660 19/06/2019 (213,590) (0.05)JPMC SEK 124,071,000 USD 13,548,873 19/06/2019 (88,985) (0.02)JPMC SGD 5,456,500 USD 4,046,174 19/06/2019 (12,927) (0.00)JPMC TWD 65,953,500 USD 2,149,254 19/06/2019* (5,169) (0.00)JPMC USD 5,024,521 AUD 7,093,052 19/06/2019 (10,189) (0.00)JPMC USD 179,073 BRL 706,000 19/06/2019* (1,112) (0.00)JPMC USD 7,987,558 CAD 10,690,000 19/06/2019 (30,570) (0.01)JPMC USD 359,448 CHF 357,500 19/06/2019 (2,266) (0.00)JPMC USD 191,948 CLP 131,098,500 19/06/2019* (755) (0.00)JPMC USD 11,890 COP 38,005,000 19/06/2019* (42) (0.00)JPMC USD 885,141 IDR 12,816,009,000 19/06/2019* (3,038) (0.00)JPMC USD 19,242 ILS 69,500 19/06/2019 (11) (0.00)JPMC USD 1,964,946 INR 142,002,500 19/06/2019* (60,883) (0.01)JPMC USD 17,816,927 JPY 1,974,510,000 19/06/2019 (101,530) (0.02)JPMC USD 2,319,768 MXN 45,724,000 19/06/2019 (18,364) (0.00)JPMC USD 5,703,727 NOK 49,439,910 19/06/2019 (47,534) (0.01)JPMC USD 211,221 NZD 311,500 19/06/2019 (1,253) (0.00)JPMC USD 865,877 PHP 46,114,000 19/06/2019* (3,401) (0.00)JPMC USD 20,320,993 SEK 188,004,200 19/06/2019 (74,714) (0.02)JPMC USD 1,155,721 TWD 35,594,393 19/06/2019* (1,418) (0.00)JPMC USD 4,754,506 ZAR 69,586,000 19/06/2019 (8,548) (0.00)JPMC ZAR 97,469,999 USD 6,837,426 19/06/2019 (165,757) (0.04)CITI BRL 186,500 USD 47,272 19/06/2019* 327 0.00CITI CAD 7,539,220 USD 5,631,669 19/06/2019 23,189 0.01CITI CHF 9,698,457 USD 9,767,922 19/06/2019 44,849 0.01CITI EUR 261,000 USD 294,949 19/06/2019 14 0.00CITI GBP 637,227 USD 828,335 19/06/2019 3,171 0.00CITI INR 227,467,004 USD 3,196,120 19/06/2019* 48,958 0.01CITI JPY 609,845,733 USD 5,523,453 19/06/2019 10,829 0.00CITI MXN 61,166,034 USD 3,108,878 19/06/2019 18,893 0.00
AQR UCITS FUNDS
AQR Managed Futures UCITS Fund
Schedule of Investments (continued)As at 31 March 2019
The accompanying notes form an integral part of these audited financial statements. 114

Counterparty† Currency Purchased Amount Purchased Currency Sold Amount Sold Settlement Date
UnrealisedAppreciation/
(Depreciation)in USD
Percent ofNet Assets
CITI NOK 4,607,000 USD 533,958 19/06/2019 1,966 0.00CITI NZD 9,556,474 USD 6,486,562 19/06/2019 31,932 0.01CITI PLN 1,748,496 USD 456,417 19/06/2019 1,016 0.00CITI SEK 28,561,000 USD 3,070,811 19/06/2019 27,640 0.01CITI SGD 2,994,500 USD 2,210,117 19/06/2019 3,308 0.00CITI TWD 32,152,000 USD 1,044,031 19/06/2019* 1,201 0.00CITI USD 52,906,943 AUD 73,815,950 19/06/2019 511,744 0.11CITI USD 4,202,591 BRL 16,144,500 19/06/2019* 82,195 0.02CITI USD 1,239,271 CAD 1,643,000 19/06/2019 6,925 0.00CITI USD 790,189 CHF 780,000 19/06/2019 996 0.00CITI USD 1,020,796 CLP 681,311,500 19/06/2019* 19,326 0.00CITI USD 270,469 COP 854,003,500 19/06/2019* 2,344 0.00CITI USD 131,756,146 EUR 115,188,004 19/06/2019 1,579,185 0.34CITI USD 3,285,000 GBP 2,489,000 19/06/2019 37,152 0.01CITI USD 105,135 HKD 823,000 19/06/2019 45 0.00CITI USD 1,493,150 HUF 419,087,000 19/06/2019 19,797 0.01CITI USD 831,875 IDR 11,983,449,500 19/06/2019* 1,395 0.00CITI USD 502,561 ILS 1,804,498 19/06/2019 2,661 0.00CITI USD 49,567,060 JPY 5,441,761,000 19/06/2019 183,693 0.04CITI USD 39,762,804 KRW 44,578,123,237 19/06/2019* 494,558 0.11CITI USD 208,151 MXN 4,036,500 19/06/2019 1,741 0.00CITI USD 4,144,305 NOK 35,473,093 19/06/2019 17,781 0.00CITI USD 16,225 PHP 855,000 19/06/2019* 108 0.00CITI USD 1,996,556 PLN 7,599,500 19/06/2019 8,410 0.00CITI USD 3,641,189 SEK 33,281,800 19/06/2019 30,600 0.01CITI USD 1,079,700 SGD 1,457,500 19/06/2019 2,370 0.00CITI USD 5,258,228 TWD 161,357,103 19/06/2019* 12,663 0.00CITI USD 17,879,484 ZAR 256,842,500 19/06/2019 299,016 0.06CITI ZAR 5,355,500 USD 363,737 19/06/2019 2,838 0.00JPMC BRL 186,500 USD 47,272 19/06/2019* 327 0.00JPMC CAD 7,539,218 USD 5,631,674 19/06/2019 23,182 0.01JPMC CHF 9,660,231 USD 9,729,149 19/06/2019 44,945 0.01JPMC EUR 261,000 USD 294,950 19/06/2019 13 0.00JPMC GBP 637,228 USD 828,337 19/06/2019 3,169 0.00JPMC INR 227,466,996 USD 3,196,125 19/06/2019* 48,954 0.01JPMC JPY 609,845,732 USD 5,523,459 19/06/2019 10,822 0.00JPMC MXN 61,166,033 USD 3,108,882 19/06/2019 18,889 0.00JPMC NOK 4,607,000 USD 533,959 19/06/2019 1,966 0.00JPMC NZD 9,556,473 USD 6,486,571 19/06/2019 31,924 0.01JPMC PLN 1,748,496 USD 456,418 19/06/2019 1,016 0.00JPMC SEK 28,561,000 USD 3,070,814 19/06/2019 27,636 0.01JPMC SGD 2,994,500 USD 2,210,120 19/06/2019 3,306 0.00JPMC TWD 32,152,000 USD 1,044,031 19/06/2019* 1,200 0.00JPMC USD 52,906,870 AUD 73,815,945 19/06/2019 511,678 0.11JPMC USD 4,202,586 BRL 16,144,500 19/06/2019* 82,189 0.02JPMC USD 1,239,270 CAD 1,643,000 19/06/2019 6,924 0.00JPMC USD 790,189 CHF 780,000 19/06/2019 995 0.00JPMC USD 1,020,795 CLP 681,311,500 19/06/2019* 19,325 0.00JPMC USD 270,469 COP 854,003,500 19/06/2019* 2,344 0.00JPMC USD 131,755,975 EUR 115,187,996 19/06/2019 1,579,020 0.34JPMC USD 3,284,995 GBP 2,489,000 19/06/2019 37,147 0.01JPMC USD 105,135 HKD 823,000 19/06/2019 45 0.00JPMC USD 1,493,149 HUF 419,087,000 19/06/2019 19,795 0.00JPMC USD 831,887 IDR 11,983,449,500 19/06/2019* 1,407 0.00JPMC USD 502,562 ILS 1,804,502 19/06/2019 2,660 0.00JPMC USD 49,566,668 JPY 5,441,761,000 19/06/2019 183,300 0.04JPMC USD 39,762,641 KRW 44,578,123,235 19/06/2019* 494,396 0.11JPMC USD 208,151 MXN 4,036,500 19/06/2019 1,741 0.00JPMC USD 4,144,299 NOK 35,473,082 19/06/2019 17,775 0.00JPMC USD 16,225 PHP 855,000 19/06/2019* 108 0.00JPMC USD 1,996,552 PLN 7,599,500 19/06/2019 8,407 0.00JPMC USD 3,641,185 SEK 33,281,800 19/06/2019 30,596 0.01JPMC USD 1,079,699 SGD 1,457,500 19/06/2019 2,369 0.00JPMC USD 5,509,720 TWD 169,093,103 19/06/2019* 12,665 0.00JPMC USD 17,879,463 ZAR 256,842,500 19/06/2019 298,994 0.06JPMC ZAR 5,355,500 USD 363,738 19/06/2019 2,838 0.00
Total Forward Foreign Exchange Contracts 1,643,758 0.35
* Non-deliverable forwards (See Note 4)
Hedge Forward Foreign Exchange ContractsOver-the-Counter
Counterparty† Currency Purchased Amount Purchased Currency Sold Amount Sold Settlement Date
UnrealisedAppreciation/
(Depreciation)in USD
Percent ofNet Assets
CITI CHF 30,192 USD 30,618 19/06/2019 (71) (0.00)CITI EUR 15,964,269 USD 18,251,545 19/06/2019 (209,908) (0.04)CITI GBP 60,511,074 USD 79,930,935 19/06/2019 (971,181) (0.21)CITI NOK 12,791,765 USD 1,497,026 19/06/2019 (8,981) (0.00)JPMC CHF 32,358 USD 32,811 19/06/2019 (71) (0.00)JPMC EUR 15,964,250 USD 18,251,545 19/06/2019 (209,930) (0.05)JPMC GBP 60,511,059 USD 79,931,013 19/06/2019 (971,280) (0.21)JPMC NOK 12,791,775 USD 1,497,347 19/06/2019 (9,300) (0.00)CITI CHF 147,359 USD 148,385 19/06/2019 710 0.00CITI GBP 4,502,574 USD 5,849,035 19/06/2019 26,289 0.01CITI NOK 7,927,575 USD 914,945 19/06/2019 7,258 0.00CITI USD 233,686 EUR 205,065 19/06/2019 1,937 0.00CITI USD 1,075,295 GBP 813,108 19/06/2019 14,286 0.00CITI USD 181,927 NOK 1,558,350 19/06/2019 647 0.00JPMC CHF 145,185 USD 146,182 19/06/2019 716 0.00JPMC GBP 4,502,573 USD 5,849,041 19/06/2019 26,282 0.01JPMC NOK 7,927,581 USD 914,604 19/06/2019 7,599 0.00
AQR UCITS FUNDS
AQR Managed Futures UCITS Fund
Schedule of Investments (continued)As at 31 March 2019
The accompanying notes form an integral part of these audited financial statements. 115

Counterparty† Currency Purchased Amount Purchased Currency Sold Amount Sold Settlement Date
UnrealisedAppreciation/
(Depreciation)in USD
Percent ofNet Assets
JPMC USD 233,685 EUR 205,065 19/06/2019 1,936 0.00JPMC USD 1,075,285 GBP 813,101 19/06/2019 14,285 0.00JPMC USD 181,927 NOK 1,558,350 19/06/2019 646 0.00
Total Hedge Forward Foreign Exchange Contracts (2,278,131) (0.49)
Total Return Swap ContractsOver-the-Counter
Reference Entity (�RE�)PaymentsMade By Sub-Fund
Payments ReceivedBy Sub-Fund Counterparty† Maturity Date
TradingCurrency
NotionalAmountin USD
UnrealisedAppreciation/
(Depreciation)in USD
Percent ofNet Assets
Bloomberg Commodity Index Increases in RE Decreases in RE andreceives financing of +0.03%
GSIN 04/04/2019 USD (40,657,632) (377,175) (0.08)
BOVESPA Index Futures Apr19 Decreases in RE Increases in RE MLIN 17/04/2019 BRL 4,902,294 (165,689) (0.03)KOSPI 200 Index Futures Jun19 Decreases in RE Increases in RE MLIN 13/06/2019 KRW 183,156 (1,065) (0.00)TAIEX Futures Apr19 Decreases in RE Increases in RE GSIN 17/04/2019 TWD 68,772 (70) (0.00)HANG SENG Index Futures Apr19 Decreases in RE Increases in RE MLIN 29/04/2019 HKD 1,666,845 28,584 0.01H-Shares Index Futures Apr19 Decreases in RE Increases in RE JPMC 29/04/2019 HKD 17,604,456 189,944 0.04TAIEX Futures Apr19 Decreases in RE Increases in RE GSIN 17/04/2019 TWD 2,269,487 32,753 0.00TAIEX Futures Apr19 Decreases in RE Increases in RE JPMC 17/04/2019 TWD 137,545 1,892 0.00
Total of Total Return Swap Contracts (290,826) (0.06)
AQR UCITS FUNDS
AQR Managed Futures UCITS Fund
Schedule of Investments (continued)As at 31 March 2019
The accompanying notes form an integral part of these audited financial statements. 116

Investments CouponMaturityDate Currency
Shares/PrincipalAmounts
Fair Valuein USD
Percentof Net
Assets
Short Term InvestmentsAustraliaAustralia & New Zealand Banking Group Ltd 0.000% 08/05/2019 USD 5,000,000 4,986,400 0.90
Total Australia 4,986,400 0.90
CanadaThe Toronto-Dominion Bank 2.710% 08/04/2019 USD 4,000,000 4,000,289 0.72Total Capital Canada Ltd 0.000% 04/04/2019 USD 9,000,000 8,996,388 1.62Total Capital Canada Ltd 0.000% 28/05/2019 USD 3,500,000 3,485,329 0.63
Total Canada 16,482,006 2.97
FinlandNordea Bank AB 0.000% 13/05/2019 USD 2,000,000 1,993,900 0.36
Total Finland 1,993,900 0.36
FranceAntalis SA 0.000% 02/04/2019 USD 12,500,000 12,496,604 2.25Societe Generale SA 0.000% 22/04/2019 USD 12,500,000 12,479,825 2.25
Total France 24,976,429 4.50
NorwayDNB Bank ASA 0.000% 07/05/2019 USD 7,000,000 6,981,626 1.26DNB Bank ASA 0.000% 15/05/2019 USD 5,000,000 4,984,079 0.90
Total Norway 11,965,705 2.16
SingaporeDBS Bank Ltd 0.000% 14/05/2019 USD 9,400,000 9,369,780 1.69DBS Bank Ltd 0.000% 07/06/2019 USD 2,600,000 2,587,169 0.47Mitsubishi UFJ Trust & Banking Corp 0.000% 09/04/2019 USD 4,000,000 3,997,046 0.72Sumitomo Mitsui Trust Bank Ltd 0.000% 03/06/2019 USD 7,500,000 7,465,364 1.34
Total Singapore 23,419,359 4.22
SwedenSkandinaviska Enskilda Banken AB 0.000% 22/05/2019 USD 11,000,000 10,959,724 1.97Svenska Handelsbanken AB 0.000% 16/04/2019 USD 5,300,000 5,293,590 0.95Swedbank AB 0.000% 10/05/2019 USD 6,500,000 6,481,808 1.17Swedbank AB 0.000% 21/05/2019 USD 6,500,000 6,477,005 1.17
Total Sweden 29,212,127 5.26
United KingdomASB Finance Ltd 0.000% 14/05/2019 USD 8,200,000 8,174,151 1.47
Total United Kingdom 8,174,151 1.47
United StatesAlbion Capital LLC 0.000% 15/04/2019 USD 3,000,000 2,996,546 0.54Apple Inc 0.000% 06/05/2019 USD 12,000,000 11,969,182 2.16Atlantic Asset Securitization LLC 0.000% 04/04/2019 USD 2,000,000 1,999,185 0.36Atlantic Asset Securitization LLC 0.000% 14/06/2019 USD 10,000,000 9,945,843 1.79Bank of Montreal 2.430% 02/04/2019 USD 8,000,000 8,000,004 1.44Chevron Corporation 0.000% 02/04/2019 USD 2,000,000 1,999,474 0.36Chevron Corporation 0.000% 26/04/2019 USD 10,000,000 9,981,419 1.80DZ Bank Deutsche Zentral 2.720% 17/06/2019 USD 3,500,000 3,501,301 0.63Fairway Finance Co LLC 0.000% 01/07/2019 USD 6,000,000 5,959,925 1.07Gotham Funding Corp 0.000% 13/05/2019 USD 7,000,000 6,978,213 1.26Liberty Street Funding LLC 0.000% 20/05/2019 USD 3,000,000 2,989,158 0.54Liberty Street Funding LLC 0.000% 04/06/2019 USD 4,000,000 3,981,329 0.72Liberty Street Funding LLC 0.000% 02/07/2019 USD 3,000,000 2,980,248 0.54LMA Americas LLC 0.000% 01/04/2019 USD 3,000,000 2,999,394 0.54LMA Americas LLC 0.000% 13/05/2019 USD 2,900,000 2,891,046 0.52LMA Americas LLC 0.000% 06/08/2019 USD 3,000,000 2,972,245 0.53LMA Americas LLC 0.000% 14/08/2019 USD 3,000,000 2,970,479 0.53Mizuho Bank Ltd 0.000% 15/05/2019 USD 7,000,000 6,977,518 1.26Mizuho Bank Ltd 0.000% 13/06/2019 USD 1,000,000 994,688 0.18Mizuho Bank Ltd 2.620% 10/05/2019 USD 4,000,000 4,000,763 0.72MUFG Bank Ltd 2.590% 29/07/2019 USD 8,000,000 8,001,547 1.44Nestle Capital Corp 0.000% 18/07/2019 USD 8,400,000 8,335,276 1.50Nieuw Amsterdam Receivables Corp 0.000% 08/05/2019 USD 4,000,000 3,989,000 0.72Nieuw Amsterdam Receivables Corp 0.000% 03/06/2019 USD 4,500,000 4,479,416 0.81Nieuw Amsterdam Receivables Corp 0.000% 04/06/2019 USD 3,500,000 3,483,735 0.63Norinchukin Bank 2.450% 08/04/2019 USD 5,000,000 5,000,030 0.90Novartis Finance Corp 0.000% 01/04/2019 USD 3,000,000 2,999,406 0.54Novartis Finance Corp 0.000% 07/05/2019 USD 4,800,000 4,787,177 0.86Oversea-Chinese Banking Corp Ltd 2.560% 14/05/2019 USD 1,000,000 1,000,046 0.18Oversea-Chinese Banking Corp Ltd 2.660% 06/08/2019 USD 4,000,000 4,001,178 0.72PACCAR Financial Corp 0.000% 02/05/2019 USD 5,500,000 5,487,206 0.99Pfizer Inc 0.000% 06/05/2019 USD 7,000,000 6,981,986 1.26Roche Holdings Inc 0.000% 09/04/2019 USD 1,200,000 1,199,122 0.22Roche Holdings Inc 0.000% 23/04/2019 USD 700,000 698,825 0.13Starbird Funding Corp 0.000% 13/06/2019 USD 6,000,000 5,967,333 1.07Sumitomo Mitsui Trust Bank Limited 2.800% 25/04/2019 USD 5,000,000 5,001,295 0.90The Bank of Nova Scotia 2.600% 22/08/2019 USD 4,000,000 4,000,184 0.72The Coca-Cola Co 0.000% 01/05/2019 USD 1,000,000 997,754 0.18The Coca-Cola Co 0.000% 23/05/2019 USD 8,000,000 7,969,603 1.44The Toronto-Dominion Bank 2.650% 20/05/2019 USD 5,000,000 5,000,770 0.90Toyota Motor Credit Corp 0.000% 30/04/2019 USD 4,000,000 3,991,406 0.72Toyota Motor Credit Corp 0.000% 13/05/2019 USD 3,000,000 2,990,888 0.54Victory Receivables Corp 0.000% 06/05/2019 USD 2,000,000 1,994,769 0.36Victory Receivables Corp 0.000% 14/06/2019 USD 6,000,000 5,967,506 1.07Walmart Inc 0.000% 08/04/2019 USD 5,200,000 5,196,545 0.94Walmart Inc 0.000% 29/04/2019 USD 12,000,000 11,974,921 2.16
Total United States 218,584,884 39.39
AQR UCITS FUNDS
AQR Style Premia: Equity Market Neutral UCITS Fund
Schedule of InvestmentsAs at 31 March 2019
The accompanying notes form an integral part of these audited financial statements. 117

Investments CouponMaturityDate Currency
Shares/PrincipalAmounts
Fair Valuein USD
Percentof Net
Assets
Short Term Investments (continued)
Other Investment FundsUnited StatesUBS (Irl) Select Money Market Fund^ 0.000% USD 37,116,324 37,116,324 6.69
Total United States 37,116,324 6.69
Total Other Investment Funds 37,116,324 6.69
Total Short Term Investments 376,911,285 67.92
Total Investments (Total Cost: $376,934,519) 376,911,285 67.92
Other Assets/(Liabilities) 178,053,100 32.08
Total Net Assets 554,964,385 100.00
^Seven-day effective yield at 31 March 2019 was 2.29%.
Economic Classification of InvestmentsAs at 31 March 2019
Industry ClassificationPercent ofNet Assets
Consumer Cyclical 5.58Consumer Non-cyclical 7.81Financial 54.53Total Investments 67.92
Other Assets/(Liabilities) 32.08Total Net Assets 100.00
AQR UCITS FUNDS
AQR Style Premia: Equity Market Neutral UCITS Fund
Schedule of Investments (continued)As at 31 March 2019
The accompanying notes form an integral part of these audited financial statements. 118

Derivatives
Hedge Forward Foreign Exchange ContractsOver-the-Counter
Counterparty† Currency Purchased Amount Purchased Currency Sold Amount Sold Settlement Date
UnrealisedAppreciation/
(Depreciation)in USD
Percent ofNet Assets
CITI EUR 256,036,057 USD 292,744,090 19/06/2019 (3,391,078) (0.61)JPMC EUR 256,036,054 USD 292,744,455 19/06/2019 (3,391,444) (0.61)CITI USD 6,712,941 EUR 5,885,566 19/06/2019 61,510 0.01JPMC USD 6,712,932 EUR 5,885,566 19/06/2019 61,501 0.01
Total Hedge Forward Foreign Exchange Contracts (6,659,511) (1.20)
AQR UCITS FUNDS
AQR Style Premia: Equity Market Neutral UCITS Fund
Schedule of Investments (continued)As at 31 March 2019
The accompanying notes form an integral part of these audited financial statements. 119

Total Return Basket Swap ContractsOver-the-Counter
Counterparty† Description‡ Termination DateFair Value in
USDJPMC The Sub-Fund receives the total return on a portfolio of long and short positions and pays 1-month BBSW
plus or minus a specified spread, which is denominated in AUD based on the local currency of thepositions within the swap.
08.12.2022 - 12.03.2024 122,205
The following table represents the long and short positions and related values within the total return equity basket swap as at 31 March 2019
Reference Entity Currency Shares Notional Amount
UnrealisedAppreciation/
(Depreciation)in USD
Percent ofNet Assets
Long PositionsCommon StocksAustraliaAGL Energy Ltd AUD 127,440 1,966,845 (7,757) (0.00)Alumina Ltd AUD 45,941 78,830 (4,857) (0.00)BlueScope Steel Ltd AUD 192,375 1,903,053 16,237 0.00Crown Resorts Ltd AUD 14,278 116,559 (3,164) (0.00)Flight Centre Travel Group Ltd AUD 3,864 115,231 (6,673) (0.00)Fortescue Metals Group Ltd AUD 67,747 341,451 13,480 0.00Harvey Norman Holdings Ltd AUD 38,828 110,673 7,469 0.00Leighton Holdings Ltd AUD 8,846 302,721 (12,976) (0.00)Newcrest Mining Ltd AUD 58,909 1,064,495 21,867 0.00Santos Ltd AUD 132,063 639,972 (21,825) (0.00)South32 AUD 430,928 1,140,052 (38,676) (0.01)Telstra Corp Ltd AUD 579,732 1,365,247 25,667 0.01Wesfarmers Ltd AUD 4,057 99,673 120 0.00Woodside Petroleum Ltd AUD 90,242 2,215,397 (41,236) (0.01)
(52,324) (0.01)
Total Long Positions (52,324) (0.01)
Short PositionsCommon StocksAustraliaAMP Ltd AUD (1,000,751) (1,490,129) 119,531 0.02APA Group AUD (29,963) (211,999) (3,232) (0.00)Challenger Ltd AUD (170,524) (1,000,431) (66,397) (0.01)Dominos Pizza Enterprises Ltd AUD (27,269) (839,557) (38,787) (0.01)LendLease Group AUD (52,418) (460,225) 648 0.00Medibank Pvt Ltd AUD (266,625) (521,703) (11,447) (0.00)Origin Energy Ltd AUD (293,851) (1,501,347) 39,936 0.01Qantas Airways Ltd AUD (102,453) (410,984) (1,415) (0.00)QBE Insurance Group Ltd AUD (161,979) (1,413,536) 26,190 0.00SEEK Ltd AUD (69,053) (858,980) 40,135 0.01Transurban Group AUD (18,358) (171,770) (6,386) (0.00)Treasury Wine Estates Ltd AUD (39,370) (416,978) 33,416 0.00
132,192 0.02IrelandJames Hardie Industries PLC AUD (166,611) (2,142,218) (29,756) (0.00)
(29,756) (0.00)
Total Short Positions 102,436 0.02
Total of Long and Short Equity Positions 50,112 0.01Net Cash and Other Receivables/(Payables) 72,093 0.01
Total of Total Return Basket Swap Contract - JPMC - AUD 122,205 0.02
Counterparty† Description‡ Termination DateFair Value in
USDJPMC The Sub-Fund receives the total return on a portfolio of long and short positions and pays CDOR plus or
minus a specified spread, which is denominated in CAD based on the local currency of the positions withinthe swap.
30.11.2022 - 25.03.2024 (237,337)
The following table represents the long and short positions and related values within the total return equity basket swap as at 31 March 2019
Reference Entity Currency Shares Notional Amount
UnrealisedAppreciation/
(Depreciation)in USD
Percent ofNet Assets
Long PositionsCommon StocksCanadaAir Canada CAD 146,464 3,539,346 94,295 0.02Arc Resources Ltd CAD 27,458 190,960 (8,839) (0.00)Bank of Montreal CAD 10,350 775,514 (31,148) (0.01)Canadian Imperial Bank Of Commerce CAD 32,044 2,549,271 (177,996) (0.03)Canadian Natural Resources Ltd CAD 73,779 2,028,122 (37,005) (0.01)Canadian Tire Corp Ltd CAD 4,147 445,745 (3,229) (0.00)CGI Group Inc CAD 20,909 1,434,265 18,001 0.00Fortis Inc CAD 4,774 176,085 1,287 0.00Hydro One Ltd CAD 10,536 163,269 2,130 0.00Intact Financial Corp CAD 4,358 368,430 9,820 0.00Kinross Gold Corp CAD 160,637 551,972 19,241 0.00Linamar Corp CAD 4,698 168,288 (1,161) (0.00)Magna International Inc CAD 8,059 394,926 (2,293) (0.00)Methanex Corp CAD 11,995 680,297 (4,939) (0.00)National Bank of Canada CAD 11,505 519,353 (20,240) (0.00)Peyto Exploration Development Corp CAD 69,684 369,339 (30,778) (0.00)Quebecor Inc CAD 29,264 712,212 21,469 0.00Rogers Communications Inc CAD 2,072 111,759 (1,241) (0.00)Royal Bank of Canada CAD 1,083 81,991 (2,465) (0.00)Seven Generations Energy Ltd CAD 78,653 576,443 (30,618) (0.00)Teck Resources Ltd CAD 5,779 134,460 7,182 0.00The Toronto-Dominion Bank CAD 41,261 2,242,204 (113,052) (0.02)
AQR UCITS FUNDS
AQR Style Premia: Equity Market Neutral UCITS Fund
Schedule of Investments (continued)As at 31 March 2019
The accompanying notes form an integral part of these audited financial statements. 120

Reference Entity Currency Shares Notional Amount
UnrealisedAppreciation/
(Depreciation)in USD
Percent ofNet Assets
Long Positions (continued)Common Stocks (continued)Canada (continued)Tourmaline Oil Corp CAD 68,950 1,069,504 (36,132) (0.01)West Fraser Timber Co Ltd CAD 26,731 1,294,126 (22,613) (0.00)
(350,324) (0.06)United StatesBRP Inc CAD 21,966 607,938 (3,618) (0.00)Valeant Pharmaceuticals International Inc CAD 15,819 386,652 (1,540) (0.00)
(5,158) (0.00)
Total Long Positions (355,482) (0.06)
Short PositionsCommon StocksCanadaAltaGas Ltd CAD (135,798) (1,797,356) 22,757 0.01Barrick Gold Corp CAD (47,081) (654,862) (46,172) (0.01)Blackberry Ltd CAD (62,478) (628,615) (41,017) (0.01)Bombardier Inc CAD (426,348) (820,268) 84,908 0.02Cameco Corp CAD (72,312) (857,480) 30,856 0.01Cenovus Energy Inc CAD (190,247) (1,635,002) 58,393 0.01Dollarama Inc CAD (37,318) (980,582) (13,963) (0.00)Element Fleet Management Corp CAD (88,678) (565,606) (5,975) (0.00)Enbridge Inc CAD (106,675) (3,894,700) 34,339 0.01Inter Pipeline Ltd CAD (17,562) (289,895) 920 0.00Keyera Corp CAD (15,292) (356,027) 17,172 0.00Pembina Pipeline Corp CAD (27,826) (1,019,884) 18,540 0.00PrairieSky Royalty Ltd CAD (15,931) (216,699) 12,284 0.00Shopify Inc CAD (4,858) (998,112) 1,709 0.00Silver Wheaton Corp CAD (59,604) (1,426,962) (90,133) (0.02)SNC-Lavalin Group Inc CAD (7,670) (196,200) 4,106 0.00The Stars Group Inc CAD (6,665) (116,555) (3,393) (0.00)Transcanada Corp CAD (56,819) (2,533,418) 65,930 0.01
151,261 0.03ChileLundin Mining Corp CAD (19,877) (93,299) 893 0.00
893 0.00ZambiaFirst Quantum Minerals Ltd CAD (242,386) (2,707,291) (50,807) (0.01)
(50,807) (0.01)
Total Short Positions 101,347 0.02
Total of Long and Short Equity Positions (254,135) (0.04)Net Cash and Other Receivables/(Payables) 16,798 0.00
Total of Total Return Basket Swap Contract - JPMC - CAD (237,337) (0.04)
Counterparty† Description‡ Termination DateFair Value in
USDJPMC The Sub-Fund receives the total return on a portfolio of long and short positions and pays 1-month HIBOR
plus or minus a specified spread, which is denominated in HKD based on the local currency of thepositions within the swap.
08.12.2022 - 25.03.2024 298,948
The following table represents the long and short positions and related values within the total return equity basket swap as at 31 March 2019
Reference Entity Currency Shares Notional Amount
UnrealisedAppreciation/
(Depreciation)in USD
Percent ofNet Assets
Long PositionsCommon StocksHong KongCK Hutchison Holdings Ltd HKD 82,500 866,436 15,682 0.00Clp Holdings Ltd HKD 199,500 2,312,621 (17,859) (0.00)Henderson Land Development Co HKD 163,300 1,038,666 93,184 0.02Hkt Trust Hkt Ltd HKD 88,000 141,424 4,434 0.00Hong Kong & China Gas Co Ltd HKD 644,700 1,545,687 36,176 0.01Kerry Properties Ltd HKD 28,500 127,240 9,246 0.00Li & Fung Ltd HKD 790,000 141,889 (1,016) (0.00)Lifestyle International Holdings Ltd HKD 189,000 327,693 (9,861) (0.00)Melco International Development Ltd HKD 203,000 475,956 3,752 0.00New World Development Co Ltd HKD 84,000 139,439 3,155 0.00Sino Land Co Ltd HKD 66,000 127,736 4,479 0.00Sun Hung Kai Properties Ltd HKD 27,000 463,634 14,434 0.00Swire Properties Ltd HKD 103,000 443,182 13,466 0.00WH Group Ltd HKD 355,500 381,245 6,989 0.00Yue Yuen Industrial Holdings Ltd HKD 209,500 721,263 (2,544) (0.00)
173,717 0.03MacauGalaxy Entertainment Group Ltd HKD 21,000 143,106 (818) (0.00)Sands China Ltd HKD 61,600 309,848 9,693 0.00SJM Holdings Ltd HKD 459,000 524,297 975 0.00Wynn Macau Ltd HKD 192,000 453,180 (1,264) (0.00)
8,586 0.00
Total Long Positions 182,303 0.03
Short PositionsCommon StocksChinaMinth Group Ltd HKD (256,000) (806,546) 72,339 0.01
72,339 0.01Hong KongAIA Group Ltd HKD (606,000) (6,041,925) 60,573 0.01
AQR UCITS FUNDS
AQR Style Premia: Equity Market Neutral UCITS Fund
Schedule of Investments (continued)As at 31 March 2019
The accompanying notes form an integral part of these audited financial statements. 121
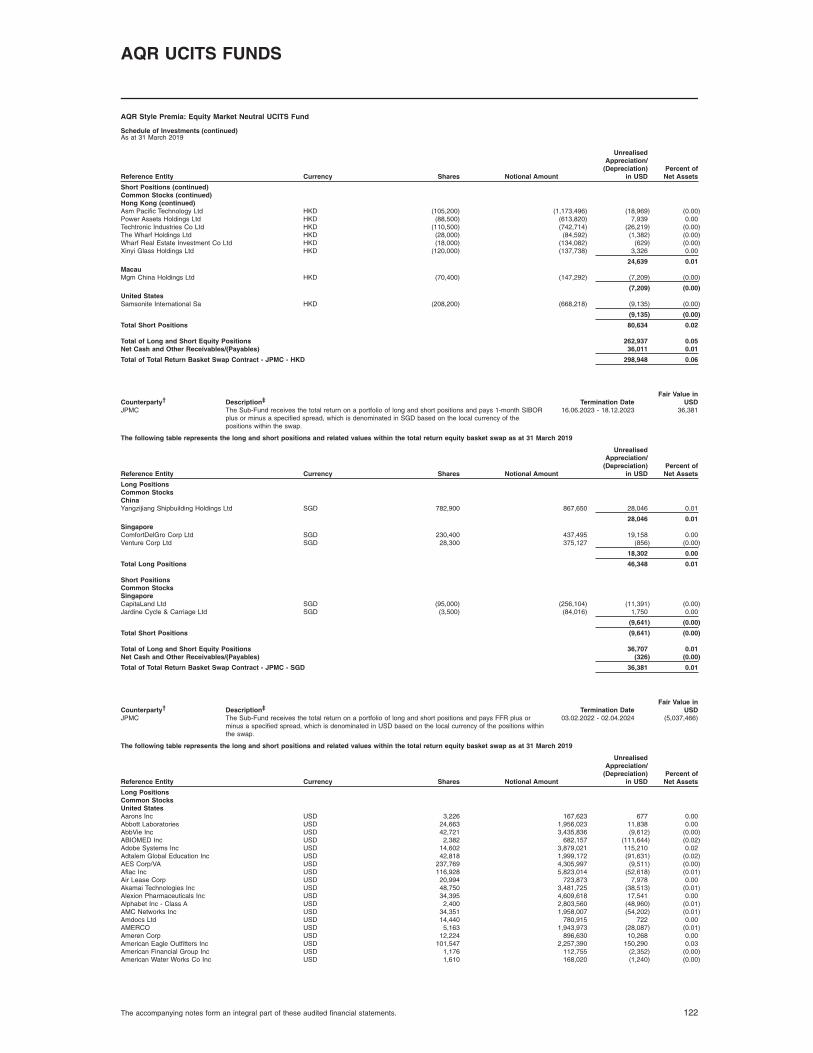
Reference Entity Currency Shares Notional Amount
UnrealisedAppreciation/
(Depreciation)in USD
Percent ofNet Assets
Short Positions (continued)Common Stocks (continued)Hong Kong (continued)Asm Pacific Technology Ltd HKD (105,200) (1,173,496) (18,969) (0.00)Power Assets Holdings Ltd HKD (88,500) (613,820) 7,939 0.00Techtronic Industries Co Ltd HKD (110,500) (742,714) (26,219) (0.00)The Wharf Holdings Ltd HKD (28,000) (84,592) (1,382) (0.00)Wharf Real Estate Investment Co Ltd HKD (18,000) (134,082) (629) (0.00)Xinyi Glass Holdings Ltd HKD (120,000) (137,738) 3,326 0.00
24,639 0.01MacauMgm China Holdings Ltd HKD (70,400) (147,292) (7,209) (0.00)
(7,209) (0.00)United StatesSamsonite International Sa HKD (208,200) (668,218) (9,135) (0.00)
(9,135) (0.00)
Total Short Positions 80,634 0.02
Total of Long and Short Equity Positions 262,937 0.05Net Cash and Other Receivables/(Payables) 36,011 0.01
Total of Total Return Basket Swap Contract - JPMC - HKD 298,948 0.06
Counterparty† Description‡ Termination DateFair Value in
USDJPMC The Sub-Fund receives the total return on a portfolio of long and short positions and pays 1-month SIBOR
plus or minus a specified spread, which is denominated in SGD based on the local currency of thepositions within the swap.
16.06.2023 - 18.12.2023 36,381
The following table represents the long and short positions and related values within the total return equity basket swap as at 31 March 2019
Reference Entity Currency Shares Notional Amount
UnrealisedAppreciation/
(Depreciation)in USD
Percent ofNet Assets
Long PositionsCommon StocksChinaYangzijiang Shipbuilding Holdings Ltd SGD 782,900 867,650 28,046 0.01
28,046 0.01SingaporeComfortDelGro Corp Ltd SGD 230,400 437,495 19,158 0.00Venture Corp Ltd SGD 28,300 375,127 (856) (0.00)
18,302 0.00
Total Long Positions 46,348 0.01
Short PositionsCommon StocksSingaporeCapitaLand Ltd SGD (95,000) (256,104) (11,391) (0.00)Jardine Cycle & Carriage Ltd SGD (3,500) (84,016) 1,750 0.00
(9,641) (0.00)
Total Short Positions (9,641) (0.00)
Total of Long and Short Equity Positions 36,707 0.01Net Cash and Other Receivables/(Payables) (326) (0.00)
Total of Total Return Basket Swap Contract - JPMC - SGD 36,381 0.01
Counterparty† Description‡ Termination DateFair Value in
USDJPMC The Sub-Fund receives the total return on a portfolio of long and short positions and pays FFR plus or
minus a specified spread, which is denominated in USD based on the local currency of the positions withinthe swap.
03.02.2022 - 02.04.2024 (5,037,466)
The following table represents the long and short positions and related values within the total return equity basket swap as at 31 March 2019
Reference Entity Currency Shares Notional Amount
UnrealisedAppreciation/
(Depreciation)in USD
Percent ofNet Assets
Long PositionsCommon StocksUnited StatesAarons Inc USD 3,226 167,623 677 0.00Abbott Laboratories USD 24,663 1,956,023 11,838 0.00AbbVie Inc USD 42,721 3,435,836 (9,612) (0.00)ABIOMED Inc USD 2,382 682,157 (111,644) (0.02)Adobe Systems Inc USD 14,602 3,879,021 115,210 0.02Adtalem Global Education Inc USD 42,818 1,999,172 (91,631) (0.02)AES Corp/VA USD 237,769 4,305,997 (9,511) (0.00)Aflac Inc USD 116,928 5,823,014 (52,618) (0.01)Air Lease Corp USD 20,994 723,873 7,978 0.00Akamai Technologies Inc USD 48,750 3,481,725 (38,513) (0.01)Alexion Pharmaceuticals Inc USD 34,395 4,609,618 17,541 0.00Alphabet Inc - Class A USD 2,400 2,803,560 (48,960) (0.01)AMC Networks Inc USD 34,351 1,958,007 (54,202) (0.01)Amdocs Ltd USD 14,440 780,915 722 0.00AMERCO USD 5,163 1,943,973 (28,087) (0.01)Ameren Corp USD 12,224 896,630 10,268 0.00American Eagle Outfitters Inc USD 101,547 2,257,390 150,290 0.03American Financial Group Inc USD 1,176 112,755 (2,352) (0.00)American Water Works Co Inc USD 1,610 168,020 (1,240) (0.00)
AQR UCITS FUNDS
AQR Style Premia: Equity Market Neutral UCITS Fund
Schedule of Investments (continued)As at 31 March 2019
The accompanying notes form an integral part of these audited financial statements. 122

Reference Entity Currency Shares Notional Amount
UnrealisedAppreciation/
(Depreciation)in USD
Percent ofNet Assets
Long Positions (continued)Common Stocks (continued)United States (continued)Ameriprise Financial Inc USD 17,796 2,275,397 (44,490) (0.01)Amgen Inc USD 46,519 8,837,447 (62,103) (0.01)Anthem Inc USD 25,128 7,120,521 (623,992) (0.11)Apple Inc USD 821 154,997 632 0.00Archer-Daniels-Midland Co USD 8,819 378,071 3,439 0.00Arrow Electronics Inc USD 51,714 3,991,804 (58,437) (0.01)Aspen Technology Inc USD 2,121 220,732 5,303 0.00Assured Guaranty Ltd USD 82,529 3,670,065 (56,120) (0.01)Athene Holding Ltd USD 84,007 3,419,925 (257,019) (0.05)ATT & Inc USD 27,837 867,123 9,743 0.00Avnet Inc USD 24,959 1,078,728 (15,225) (0.00)AXA Equitable Holdings Inc USD 30,672 616,047 (23,499) (0.00)Baxter International Inc USD 43,479 3,505,712 160,003 0.03Becton Dickinson and Co USD 1,087 269,598 3,641 0.00Bed Bath & Beyond Inc USD 158,261 2,740,289 524,635 0.09Best Buy Co Inc USD 17,709 1,258,224 14,344 0.00Biogen Inc USD 41,145 9,670,309 (3,607,348) (0.65)Bio-Techne Corp USD 10,326 2,046,613 14,973 0.00Booking Holdings Inc USD 4,048 7,058,862 (50,762) (0.01)Booz Allen Hamilton Holding Corp USD 8,726 506,893 8,726 0.00Boston Scientific Corp USD 2,220 84,682 195 0.00Boyd Gaming Corp USD 4,540 123,987 (3,059) (0.00)Brinker International Inc USD 2,989 131,636 (329) (0.00)Bristol-Myers Squibb Co USD 19,656 924,618 (55,430) (0.01)Brunswick Corp USD 9,238 464,764 (24,296) (0.00)Cadence Design Systems Inc USD 69,433 4,379,834 140,255 0.03Cardinal Health Inc USD 11,536 549,806 (26,648) (0.00)Carnival Corp USD 26,655 1,345,278 (183,386) (0.03)CDK Global Inc USD 23,036 1,343,690 (4,607) (0.00)CDW Corp USD 15,224 1,461,504 (15,681) (0.00)Centene Corp USD 32,214 1,691,557 (220,666) (0.04)CenturyLink Inc USD 128,940 1,545,346 (10,960) (0.00)Charles River Laboratories International Inc USD 45,490 6,575,125 (16,376) (0.00)Chesapeake Energy Corp USD 720,580 2,248,210 (21,617) (0.00)Churchill Downs Inc USD 1,164 104,516 4,994 0.00Ciena Corp USD 52,544 1,957,789 (97,732) (0.02)Cigna Corp USD 20,502 3,262,893 (163,196) (0.03)Cinemark Holdings Inc USD 7,638 306,207 (5,347) (0.00)Cirrus Logic Inc USD 69,718 2,917,001 20,915 0.00Cisco Systems Inc USD 119,983 6,408,292 (11,998) (0.00)Citrix Systems Inc USD 9,828 981,915 (16,216) (0.00)Coach Inc USD 20,334 671,835 2,033 0.00Cognizant Technology Solutions Corp USD 6,139 444,034 2,763 0.00Columbia Sportswear Co USD 4,106 429,939 (1,232) (0.00)Comcast Corp USD 21,857 868,379 (4,153) (0.00)Commerce Bancshares Inc USD 4,851 283,250 (17,027) (0.00)CommScope Holding Co Inc USD 83,689 1,800,987 (28,604) (0.01)ConocoPhillips USD 25,486 1,710,620 (12,488) (0.00)CONSOL Energy Inc USD 84,832 916,610 (1,836) (0.00)Consolidated Edison Inc USD 97,005 8,208,563 (7,760) (0.00)Curtiss-Wright Corp USD 18,342 2,071,545 (39,986) (0.01)Danaher Corp USD 28,486 3,718,562 70,360 0.01Deckers Outdoor Corp USD 18,352 2,713,160 58,823 0.01Deluxe Corp USD 17,514 764,136 1,751 0.00DexCom Inc USD 1,234 146,180 (34,169) (0.01)Dicks Sporting Goods Inc USD 47,742 1,750,699 98,349 0.02Dillards Inc USD 26,030 1,861,926 (34,880) (0.01)DTE Energy Co USD 19,170 2,378,805 14,378 0.00DXT Technology Co USD 44,524 2,880,703 (62,334) (0.01)Eaton Corp PLC USD 41,592 3,342,749 (71,954) (0.01)eBay Inc USD 31,858 1,175,242 15,071 0.00Edwards Lifesciences Corp USD 13,415 2,546,569 (14,220) (0.00)Eldorado Resorts Inc USD 43,352 2,024,538 14,225 0.00Electronic Arts Inc USD 11,092 1,124,063 18,635 0.00Eli Lilly Co USD 32,276 4,181,356 135,496 0.02EMCOR Group Inc USD 9,115 671,137 (638) (0.00)Encompass Health Corp USD 1,871 109,248 (3,368) (0.00)ENERSYS USD 1,625 107,136 (3,023) (0.00)EPAM Systems Inc USD 809 137,223 461 0.00Everest Re Group Ltd USD 20,322 4,377,562 (101,204) (0.02)Exelixis Inc USD 270,094 6,449,845 (74,535) (0.01)Exelon Corp USD 183,428 9,167,731 56,863 0.01Expedia Group Inc USD 1,131 135,505 (1,516) (0.00)F5 Networks Inc USD 25,812 4,053,000 68,660 0.01Facebook Inc USD 34,962 5,772,576 159,782 0.03Fair Isaac Corp USD 5,133 1,375,644 19,608 0.00Federated Investors Inc USD 36,148 1,064,197 (34,702) (0.01)First American Financial Corp USD 16,145 833,405 23,249 0.00FLIR Systems Inc USD 26,684 1,264,021 (49,899) (0.01)Foot Locker Inc USD 72,450 4,354,245 18,113 0.00Fortinet Inc USD 43,078 3,588,397 (52,124) (0.01)GATX Corp USD 12,957 985,639 (8,163) (0.00)Gilead Sciences Inc USD 117,663 7,682,217 31,769 0.01Globus Medical Inc USD 55,740 2,710,636 64,101 0.01GrafTech International Ltd USD 23,383 302,108 (10,205) (0.00)Graham Holdings Co USD 2,489 1,705,712 32,681 0.01GrubHub Inc USD 7,355 504,921 (61,782) (0.01)Haemonetics Corp USD 4,754 416,165 11,647 0.00Harris Corp USD 6,506 1,042,196 (20,234) (0.00)Hawaiian Electric Industries Inc USD 11,767 479,152 1,530 0.00HCA Holdings Inc USD 55,359 7,180,616 (286,004) (0.05)Helmerich Payne Inc USD 34,039 1,901,419 (13,956) (0.00)Herman Miller Inc USD 9,454 331,930 (8,603) (0.00)Hewlett Packard Enterprise Co USD 29,235 450,658 (12,425) (0.00)Hill-Rom Holdings Inc USD 2,054 215,280 3,143 0.00
AQR UCITS FUNDS
AQR Style Premia: Equity Market Neutral UCITS Fund
Schedule of Investments (continued)As at 31 March 2019
The accompanying notes form an integral part of these audited financial statements. 123

Reference Entity Currency Shares Notional Amount
UnrealisedAppreciation/
(Depreciation)in USD
Percent ofNet Assets
Long Positions (continued)Common Stocks (continued)United States (continued)HollyFrontier Corp USD 142,558 7,110,793 (411,993) (0.07)Honeywell International Inc USD 552 87,249 624 0.00HP Inc USD 96,076 1,853,786 (62,930) (0.01)HR Block Inc USD 41,293 992,064 (12,181) (0.00)Humana Inc USD 15,798 4,153,926 (303,796) (0.05)Huntington Ingalls Industries Inc USD 31,855 6,594,304 (12,742) (0.00)IAC/InterActiveCorp USD 14,246 2,986,674 (64,392) (0.01)ICU Medical Inc USD 5,630 1,344,782 (1,239) (0.00)Ingredion Inc USD 2,489 233,194 (1,120) (0.00)Inogen Inc USD 3,108 291,997 (2,115) (0.00)Insperity Inc USD 1,588 195,308 (2,334) (0.00)Intel Corp USD 87,708 4,699,395 (45,608) (0.01)International Business Machines Corp USD 32,150 4,513,860 6,109 0.00International Paper Co USD 37,571 1,725,636 (11,271) (0.00)Intuit Inc USD 8,805 2,289,124 19,899 0.00Intuitive Surgical Inc USD 756 426,762 3,788 0.00ITT Inc USD 1,879 109,114 (1,372) (0.00)j2 Global Inc USD 27,715 2,399,565 20,232 0.00Jabil Circuit Inc USD 95,621 2,537,781 (33,467) (0.01)Jacobs Engineering Group Inc USD 5,121 385,355 4,660 0.00Jazz Pharmaceuticals PLC USD 1,618 228,793 11,253 0.00JetBlue Airways Corp USD 98,654 1,610,527 (30,089) (0.01)John Wiley Sons Inc USD 10,768 470,669 (19,598) (0.00)Juniper Networks Inc USD 83,428 2,196,659 (2,503) (0.00)KB Home USD 25,617 630,178 37,913 0.01Keysight Technologies Inc USD 10,966 951,739 11,514 0.00KLA-Tencor Corp USD 1,554 183,838 (2,455) (0.00)Kohl’s Corp USD 124,556 8,605,574 2,266 0.00Laboratory Corp of America Holdings USD 35,302 5,357,432 (117,257) (0.02)Lam Research Corp USD 20,407 3,636,527 (40,814) (0.01)Lear Corp USD 7,200 978,984 (41,400) (0.01)Liberty Interactive Corp QVC Group USD 182,964 2,924,680 (234,423) (0.04)Lincoln National Corp USD 13,207 774,855 (60,620) (0.01)LogMeIn Inc USD 11,052 885,818 (17,241) (0.00)lululemon athletica Inc USD 23,679 3,906,325 488,735 0.09Lumentum Holdings Inc USD 49,020 2,748,061 165,688 0.03LyondellBasell Industries NV USD 34,791 2,909,223 (126,987) (0.02)Macys Inc USD 269,393 6,470,820 35,223 0.01Mallinckrodt PLC USD 63,829 1,379,983 (69,574) (0.01)Manhattan Associates Inc USD 16,754 922,643 (7,539) (0.00)ManpowerGroup Inc USD 29,383 2,432,325 (78,159) (0.01)Marathon Petroleum Corp USD 69,081 4,131,044 (157,505) (0.03)Masimo Corp USD 4,000 546,760 15,771 0.00Match Group Inc USD 54,370 3,064,837 34,434 0.01McDermott International Inc USD 284,363 2,095,755 (150,712) (0.03)McKesson Corp USD 7,822 908,447 (42,126) (0.01)MEDNAX Inc USD 5,555 150,985 (20,665) (0.00)Medtronic Plc USD 31,791 2,867,866 (53,409) (0.01)Merck & Co Inc USD 68,646 5,701,050 116,698 0.02MetLife Inc USD 2,789 118,839 (8,674) (0.00)Michael Kors Holdings Ltd USD 99,106 4,626,268 (39,642) (0.01)Micron Technology Inc USD 342,979 14,062,139 444,270 0.08Microsoft Corp USD 51,132 5,990,114 (21,475) (0.00)MKS Instruments Inc USD 17,649 1,610,648 64,242 0.01Molina Healthcare Inc USD 21,978 3,108,568 (64,869) (0.01)Molson Coors Brewing Co USD 4,035 241,777 (3,702) (0.00)MSA Safety Inc USD 2,096 217,942 2,264 0.00Murphy USA Inc USD 8,515 727,692 35,252 0.01Mylan NV USD 89,786 2,548,127 17,957 0.00Nektar Therapeutics USD 40,449 1,347,761 (65,123) (0.01)NetApp Inc USD 3,059 209,297 4,619 0.00New Jersey Resources Corp USD 4,540 226,682 318 0.00NIKE Inc USD 33,424 2,830,010 (105,286) (0.02)Northrop Grumman Corp USD 8,246 2,212,897 (53,846) (0.01)NorthWestern Corp USD 11,973 843,498 1,556 0.00Norwegian Cruise Line Holdings Ltd USD 4,279 233,548 (6,864) (0.00)NRG Energy Inc USD 115,500 4,920,300 83,160 0.01Oasis Petroleum Inc USD 18,316 111,087 2,106 0.00Okta Inc USD 1,042 86,434 83 0.00Old Republic International Corp USD 12,463 262,159 (1,059) (0.00)ON Semiconductor Corp USD 73,883 1,515,340 (103,436) (0.02)Oracle Corp USD 93,011 4,966,787 (5,581) (0.00)Oshkosh Corp USD 7,496 559,951 (12,069) (0.00)Owens-Illinois Inc USD 6,217 118,683 (4,912) (0.00)Packaging Corp of America USD 3,332 327,969 2,899 0.00Patterson Cos Inc USD 16,580 358,957 (11,772) (0.00)Patterson-UTI Energy Inc USD 106,064 1,498,684 (30,759) (0.01)Paycom Software Inc USD 3,055 576,815 21,752 0.00PBF Energy Inc USD 211,081 6,594,170 (481,265) (0.09)Penske Automotive Group Inc USD 3,091 138,260 4,266 0.00Pfizer Inc USD 167,746 7,087,269 73,808 0.01Phillips 66 USD 42,137 3,988,688 (169,870) (0.03)Pilgrims Pride Corp USD 59,428 1,305,633 64,777 0.01PRA Health Sciences Inc USD 45,298 4,939,747 97,948 0.02Public Service Enterprise Group Inc USD 29,254 1,725,693 (18,137) (0.00)PulteGroup Inc USD 177,435 5,019,636 290,653 0.05PVH Corp USD 4,222 518,208 47,666 0.01QIAGEN NV USD 32,478 1,313,735 20,599 0.00Quanta Services Inc USD 37,453 1,407,109 5,992 0.00Quest Diagnostics Inc USD 4,107 368,357 4,066 0.00Quintiles Transnational Holdings Inc USD 79,824 11,394,078 (36,470) (0.01)Ralph Lauren Corp USD 2,039 265,152 11,887 0.00Raytheon Co USD 38,487 6,986,160 49,648 0.01Regal-Beloit Corp USD 1,500 121,650 (2,400) (0.00)Regeneron Pharmaceuticals Inc USD 8,294 3,397,471 25,639 0.00
AQR UCITS FUNDS
AQR Style Premia: Equity Market Neutral UCITS Fund
Schedule of Investments (continued)As at 31 March 2019
The accompanying notes form an integral part of these audited financial statements. 124

Reference Entity Currency Shares Notional Amount
UnrealisedAppreciation/
(Depreciation)in USD
Percent ofNet Assets
Long Positions (continued)Common Stocks (continued)United States (continued)Reinsurance Group of America Inc USD 29,838 4,229,537 (153,069) (0.03)Resideo Technologies Inc USD 4,178 79,925 (5,323) (0.00)ResMed Inc USD 5,688 588,310 34,299 0.01Robert Half International Inc USD 66,430 4,334,558 (91,009) (0.02)Royal Caribbean Cruises Ltd USD 958 108,781 (4,551) (0.00)RPC Inc USD 139,218 1,577,340 148,963 0.03Ryder System Inc USD 8,666 541,712 8,319 0.00Sally Beauty Holdings Inc USD 60,083 1,100,420 10,515 0.00Santander Consumer USA Holding Inc USD 15,595 329,990 (2,651) (0.00)Science Applications International Corp USD 9,877 775,838 50,274 0.01Seagate Technology PLC USD 94,179 4,469,735 (65,925) (0.01)Service Corp International USD 33,533 1,343,835 11,904 0.00Skechers U.S.A. Inc USD 33,309 1,124,179 21,651 0.00Skyworks Solutions Inc USD 29,029 2,372,830 (24,675) (0.00)SM Energy Co USD 49,381 865,155 68,331 0.01Snap-on Inc USD 10,873 1,691,621 (36,642) (0.01)Sonoco Products Co USD 7,727 471,502 8,500 0.00Southwestern Energy Co USD 977,487 4,599,076 151,042 0.03Spirit AeroSystems Holdings Inc USD 61,441 5,623,080 (57,657) (0.01)Springleaf Holdings Inc USD 12,373 395,565 (25,723) (0.00)STERIS PLC USD 886 112,744 3,562 0.00Symantec Corp USD 128,045 2,930,950 (23,048) (0.00)Synchrony Financial USD 4,906 156,992 (6,083) (0.00)SYNNEX Corp USD 3,950 375,487 (3,042) (0.00)Synopsys Inc USD 9,359 1,067,675 44,642 0.01TE Connectivity Ltd USD 20,369 1,637,260 (60,292) (0.01)Tech Data Corp USD 36,550 3,713,663 (56,470) (0.01)TEGNA Inc USD 56,395 794,042 (25,656) (0.00)Teledyne Technologies Inc USD 6,963 1,635,052 836 0.00Telephone Data Systems Inc USD 45,434 1,391,643 (69,321) (0.01)Textron Inc USD 56,024 2,838,176 (104,765) (0.02)The Allstate Corp USD 16,145 1,516,338 (17,760) (0.00)The Bank of New York Mellon Corp USD 10,225 515,033 (36,912) (0.01)The Boston Beer Co Inc USD 8,647 2,526,308 (176,745) (0.03)The Cheesecake Factory Inc USD 11,572 562,978 27,889 0.01The Cooper Cos Inc USD 7,316 2,160,122 15,217 0.00The Estee Lauder Cos Inc USD 18,522 3,043,905 22,967 0.00The Goldman Sachs Group Inc USD 431 82,545 (4,719) (0.00)The Hanover Insurance Group Inc USD 735 84,209 (1,154) (0.00)The Kroger Co USD 147,116 3,617,582 5,885 0.00The TJX Cos Inc USD 13,089 695,419 10,209 0.00The Walt Disney Co USD 1,253 138,582 (3,158) (0.00)Thermo Fisher Scientific Inc USD 6,336 1,716,739 47,013 0.01T-Mobile US Inc USD 24,880 1,700,548 (132,610) (0.02)Toll Brothers Inc USD 16,195 589,822 6,802 0.00Torchmark Corp USD 9,064 742,704 (18,762) (0.00)TRI Pointe Group Inc USD 38,375 496,956 4,451 0.00TripAdvisor Inc USD 52,572 2,715,870 3,718 0.00Twilio Inc USD 10,464 1,346,298 (7,220) (0.00)Twitter Inc USD 25,078 819,298 38,133 0.01Tyson Foods Inc USD 39,869 2,742,987 138,345 0.02Ubiquiti Networks Inc USD 3,661 545,892 19,806 0.00UGI Corp USD 23,088 1,280,460 6,926 0.00United Rentals Inc USD 4,167 474,871 (37,628) (0.01)United States Cellular Corp USD 4,918 223,621 (11,929) (0.00)United Therapeutics Corp USD 43,119 5,088,042 (36,651) (0.01)UnitedHealth Group Inc USD 829 202,268 (9,127) (0.00)Universal Health Services Inc USD 17,534 2,348,153 (33,665) (0.01)Urban Outfitters Inc USD 49,733 1,481,546 33,818 0.01Valero Energy Corp USD 83,008 6,964,371 (236,573) (0.04)Varian Medical Systems Inc USD 2,551 361,757 15,918 0.00Veeva Systems Inc USD 27,264 3,433,628 34,675 0.01VeriSign Inc USD 11,207 2,035,752 8,293 0.00Verizon Communications Inc USD 191,585 11,270,946 145,605 0.03Vertex Pharmaceuticals Inc USD 2,959 539,396 (15,357) (0.00)Viacom Inc USD 296,284 8,159,661 15,436 0.00Vishay Intertechnology Inc USD 89,547 1,653,038 (140,589) (0.03)Vistra Energy Corp USD 245,136 6,371,085 49,027 0.01VMware Inc USD 13,995 2,498,108 (58,359) (0.01)Walgreens Boots Alliance Inc USD 27,564 1,751,141 12,404 0.00Wayfair Inc USD 5,798 878,919 (118,257) (0.02)Weight Watchers International Inc USD 19,515 397,325 4,204 0.00Werner Enterprises Inc USD 12,750 436,688 (7,268) (0.00)Western Digital Corp USD 25,225 1,207,269 (10,847) (0.00)Westlake Chemical Corp USD 13,549 916,725 (33,195) (0.01)Whiting Petroleum Corp USD 16,328 427,794 14,369 0.00Williams-Sonoma Inc USD 31,792 1,797,838 3,497 0.00Woodward Inc USD 22,653 2,145,466 (31,488) (0.01)Xerox Corp USD 24,607 789,639 (13,620) (0.00)Zebra Technologies Corp USD 5,144 1,076,382 (20,370) (0.00)Zimmer Biomet Holdings Inc USD 741 93,848 986 0.00Zoetis Inc USD 36,867 3,689,281 84,794 0.02
(6,879,373) (1.24)
Total Long Positions (6,879,373) (1.24)
Short PositionsCommon StocksArgentinaMercadoLibre Inc USD (1,198) (605,266) (24,271) (0.00)
(24,271) (0.00)GhanaKosmos Energy Ltd USD (431,538) (2,662,589) (72,980) (0.01)
(72,980) (0.01)
AQR UCITS FUNDS
AQR Style Premia: Equity Market Neutral UCITS Fund
Schedule of Investments (continued)As at 31 March 2019
The accompanying notes form an integral part of these audited financial statements. 125

Reference Entity Currency Shares Notional Amount
UnrealisedAppreciation/
(Depreciation)in USD
Percent ofNet Assets
Short Positions (continued)Common Stocks (continued)PanamaCopa Holdings SA USD (39,806) (3,159,800) 127,114 0.02
127,114 0.02SwedenAutoliv Inc USD (3,687) (270,884) 13,077 0.00
13,077 0.00United KingdomLinde PLC USD (1,881) (327,755) 574 0.00
574 0.00United States2U Inc USD (16,133) (1,166,335) (59,611) (0.01)Acadia Healthcare Co Inc USD (41,712) (1,226,333) 44,215 0.01ACI Worldwide Inc USD (2,544) (83,291) 1,654 0.00Adient plc USD (148,616) (1,945,383) 159,426 0.03Advanced Micro Devices Inc USD (107,046) (2,715,757) (226,938) (0.04)Agios Pharmaceuticals Inc USD (58,794) (3,893,339) (81,136) (0.01)Akorn Inc USD (95,294) (331,623) (3,812) (0.00)Alaska Air Group Inc USD (28,410) (1,585,846) (2,920) (0.00)Albemarle Corp USD (44,480) (3,615,334) 229,072 0.04Alcoa Corp USD (98,256) (2,755,098) 60,388 0.01Alkermes PLC USD (39,568) (1,414,952) (45,503) (0.01)Allegheny Technologies Inc USD (122,439) (3,130,765) 53,873 0.01Allscripts Healthcare Solution Inc USD (89,043) (856,594) 73,906 0.01Alnylam Pharmaceuticals Inc USD (56,698) (5,296,727) (180,717) (0.03)Altria Group Inc USD (110,677) (6,296,415) 45,378 0.01American Airlines Group Inc USD (87,425) (2,744,271) (5,185) (0.00)American International Group Inc USD (156,593) (6,741,329) 192,609 0.03AmerisourceBergen Corp USD (13,573) (1,065,345) 25,789 0.00Anadarko Petroleum Corp USD (45,355) (2,061,385) (16,116) (0.00)Antero Resources Corp USD (9,534) (83,804) (90) (0.00)Aon PLC USD (2,453) (416,446) (1,398) (0.00)Apache Corp USD (112,601) (3,937,657) 18,893 0.00AptarGroup Inc USD (1,181) (124,891) (2,409) (0.00)Arconic Inc USD (18,881) (362,421) 661 0.00Arthur J Gallagher & Co USD (1,945) (150,718) 3,968 0.00Ashland Inc USD (20,917) (1,645,331) 7,739 0.00Atlassian Corp PLC USD (18,338) (2,035,151) 4,401 0.00Avanos Medical Inc USD (4,346) (183,836) 3,086 0.00Axalta Coating Systems Ltd USD (153,406) (3,871,967) 133,463 0.02Axis Capital Holdings Ltd USD (5,562) (306,411) 10,290 0.00Baker Hughes a GE Co USD (148,389) (4,065,859) 115,743 0.02Ball Corp USD (23,517) (1,365,162) (3,998) (0.00)Bancorpsouth Bank USD (21,779) (621,573) 37,024 0.01Bank of Hawaii Corp USD (1,340) (106,543) 4,060 0.00Berry Plastics Group Inc USD (4,258) (228,868) 7,792 0.00BGC Partners Inc USD (97,365) (522,850) 40,893 0.01BioMarin Pharmaceutical Inc USD (11,745) (1,038,258) 58,255 0.01Blackbaud Inc USD (1,762) (139,568) (1,885) (0.00)Bluebird Bio Inc USD (22,564) (3,497,194) 24,950 0.00BorgWarner Inc USD (24,286) (934,525) (971) (0.00)Brighthouse Financial Inc USD (9,047) (327,954) 39,174 0.01Brown-Forman Corp USD (31,856) (1,671,484) (45,236) (0.01)Bunge Ltd USD (20,787) (1,097,554) (12,056) (0.00)Cabot Corp USD (11,276) (471,224) 14,997 0.00Cabot Oil Gas Corp USD (144,828) (3,781,459) (23,172) (0.00)Campbell Soup Co USD (79,404) (3,003,853) (100,843) (0.02)CarMax Inc USD (40,197) (2,775,201) (343,684) (0.06)Carpenter Technology Corp USD (26,162) (1,190,109) 10,988 0.00Catalent Inc USD (2,325) (94,744) 4,232 0.00CBOE Holdings Inc USD (25,428) (2,416,169) 20,597 0.00Charter Communications Inc USD (18,585) (6,436,915) 204,435 0.04Cheniere Energy Inc USD (145,686) (9,785,729) 368,586 0.07Cincinnati Financial Corp USD (1,739) (148,719) 696 0.00CIT Group Inc USD (17,843) (860,746) 48,711 0.01Clean Harbors Inc USD (15,130) (1,081,341) (31,470) (0.01)CNO Financial Group Inc USD (51,621) (842,971) 31,313 0.01Cognex Corp USD (29,356) (1,490,991) 97,168 0.02Coherent Inc USD (2,855) (397,131) 143 0.00Commercial Metals Co USD (26,420) (452,310) (24,835) (0.00)CommVault Systems Inc USD (4,812) (312,299) 914 0.00Compass Minerals International Inc USD (18,409) (995,927) (19,019) (0.00)ConAgra Foods Inc USD (191,268) (5,273,259) (860,706) (0.15)Concho Resources Inc USD (15,911) (1,774,713) (68,576) (0.01)Conduent Inc USD (53,480) (746,046) 13,905 0.00Core Laboratories NV USD (14,159) (972,157) 32,283 0.01CoStar Group Inc USD (1,948) (905,781) 6,136 0.00Cree Inc USD (95,268) (5,445,519) (21,912) (0.00)Crown Holdings Inc USD (134,737) (7,397,061) 4,042 0.00Cullen/Frost Bankers Inc USD (2,298) (224,721) 13,811 0.00Cypress Semiconductor Corp USD (56,049) (832,888) 17,375 0.00Delphi Automotive PLC USD (61,465) (4,866,799) 111,556 0.02Delta Air Lines Inc USD (22,229) (1,139,681) (19,047) (0.00)DENTSPLY International Inc USD (19,743) (973,527) 3,949 0.00Devon Energy Corp USD (132,558) (4,215,344) (171,000) (0.03)Diamond Offshore Drilling Inc USD (57,424) (592,041) 48,236 0.01Dollar Tree Inc USD (43,113) (4,465,213) (109,507) (0.02)DowDuPont Inc USD (47,813) (2,468,107) 171,649 0.03Dril-Quip Inc USD (22,779) (1,033,028) 3,645 0.00Eagle Materials Inc USD (1,669) (135,573) (14,086) (0.00)Energizer Holdings Inc USD (25,447) (1,124,757) (11,706) (0.00)Energizer Holdings Inc USD (21,164) (946,454) 34,776 0.01Ensco PLC USD (404,024) (1,583,774) 226,253 0.04EQT Corp USD (197,788) (4,084,322) (119,665) (0.02)Equitrans Midstream Corp USD (53,862) (1,157,494) (71,325) (0.01)Extended Stay America Inc USD (7,958) (143,483) 0 0.00
AQR UCITS FUNDS
AQR Style Premia: Equity Market Neutral UCITS Fund
Schedule of Investments (continued)As at 31 March 2019
The accompanying notes form an integral part of these audited financial statements. 126

Reference Entity Currency Shares Notional Amount
UnrealisedAppreciation/
(Depreciation)in USD
Percent ofNet Assets
Short Positions (continued)Common Stocks (continued)United States (continued)Extraction Oil Gas Inc USD (33,177) (139,675) 995 0.00Fastenal Co USD (58,228) (3,731,250) (53,570) (0.01)FedEx Corp USD (5,794) (1,048,714) 8,112 0.00FireEye Inc USD (249,660) (4,164,329) 65,648 0.01First Hawaiian Inc USD (28,218) (733,950) 27,936 0.01First Horizon National Corp USD (88,395) (1,239,298) 107,842 0.02First Republic Bank USD (14,873) (1,507,230) 60,682 0.01FirstEnergy Corp USD (209,233) (8,678,985) (50,216) (0.01)Five Below Inc USD (6,577) (832,648) (67,283) (0.01)Floor & Decor Holdings Inc USD (53,189) (2,224,896) (182,438) (0.03)Flowserve Corp USD (53,224) (2,409,450) (4,258) (0.00)FMC Corp USD (20,741) (1,589,590) 5,807 0.00FNB Corp USD (68,357) (736,547) 84,421 0.02Fortune Brands Home & Security Inc USD (2,656) (125,815) (2,470) (0.00)Freeport-McMoRan Inc USD (520,607) (6,676,785) (83,092) (0.01)Fulton Financial Corp USD (5,834) (90,894) 4,959 0.00Gartner Inc USD (25,138) (3,807,401) (106,837) (0.02)GCI Liberty Inc USD (34,541) (1,911,154) 20,034 0.00General Electric Co USD (511,455) (5,099,206) 117,635 0.02General Mills Inc USD (18,199) (936,703) (70,066) (0.01)Genesee Wyoming Inc USD (27,882) (2,428,243) 1,673 0.00Gentex Corp USD (6,379) (131,918) 0 0.00Genuine Parts Co USD (4,689) (524,277) (21,101) (0.00)Global Payments Inc USD (1,985) (269,881) (3,811) (0.00)Granite Construction Inc USD (20,035) (869,319) 69,121 0.01Graphic Packaging Holding Co USD (274,226) (3,436,052) 71,299 0.01Guidewire Software Inc USD (23,276) (2,248,694) (36,543) (0.01)Hancock Holding Co USD (3,302) (134,259) 8,123 0.00Hanesbrands Inc USD (122,396) (2,192,112) (31,823) (0.01)Harley-Davidson Inc USD (68,525) (2,464,844) 4,932 0.00Healthcare Services Group Inc USD (36,984) (1,223,061) (74,708) (0.01)HealthEquity Inc USD (21,392) (1,569,531) 203,224 0.04Hershey Co USD (1,135) (129,946) (4,351) (0.00)Hess Corp USD (130,896) (7,972,875) (232,995) (0.04)Hilton Grand Vacations Inc USD (3,990) (123,530) 3,751 0.00Home BancShares Inc USD (15,160) (266,437) 25,545 0.00INC Research Holdings Inc USD (14,723) (759,265) (61,100) (0.01)Incyte Corp USD (5,874) (505,751) (2,820) (0.00)Insulet Corp USD (28,108) (2,668,574) 71,113 0.01International Flavors & Fragrances Inc USD (12,559) (1,614,585) (43,507) (0.01)International Game Technology PLC USD (156,848) (2,045,298) 37,355 0.01IPG Photonics Corp USD (8,277) (1,249,248) (11,836) (0.00)Jefferies Financial Group Inc USD (32,575) (612,410) 35,833 0.01Kansas City Southern USD (803) (94,280) (1,084) (0.00)L Brands Inc USD (115,199) (3,197,924) (35,712) (0.01)Leggett Platt Inc USD (17,086) (725,472) 11,789 0.00Lennox International Inc USD (3,892) (1,027,449) (45,692) (0.01)Liberty Broadband Corp USD (36,316) (3,324,003) 54,474 0.01Lions Gate Entertainment Corp USD (81,130) (1,264,005) 38,942 0.01Live Nation Entertainment Inc USD (9,042) (575,162) (4,792) (0.00)LKQ Corp USD (155,272) (4,397,303) 0 0.00Loews Corp USD (21,060) (1,010,038) 9,477 0.00Macquarie Infrastructure Corp USD (76,592) (3,154,059) (37,530) (0.01)Manitowoc Foodservice Inc USD (121,598) (1,977,183) (34,047) (0.01)Markel Corp USD (232) (231,756) (1,033) (0.00)Marriott Vacations Worldwide Corp USD (3,173) (302,228) 2,602 0.00Marsh & McLennan Cos Inc USD (3,701) (345,340) (1,221) (0.00)Martin Marietta Materials Inc USD (42,448) (8,569,402) (293,740) (0.05)Marvell Technology Group Ltd USD (144,124) (2,845,008) 37,066 0.01Masco Corp USD (11,239) (442,367) (2,360) (0.00)Matador Resources Co USD (19,140) (370,550) (4,402) (0.00)Mattel Inc USD (471,524) (6,134,527) 787,445 0.14Medidata Solutions Inc USD (12,107) (886,838) 50,002 0.01Mercury General Corp USD (16,653) (830,652) 25,479 0.00Meredith Corp USD (2,657) (148,579) 3,614 0.00MGM Resorts International USD (42,686) (1,105,141) 15,367 0.00Microchip Technology Inc USD (26,209) (2,156,739) 79,675 0.01Mohawk Industries Inc USD (1,128) (142,737) 3,350 0.00Monolithic Power Systems Inc USD (10,211) (1,374,809) 64,125 0.01Monster Beverage Corp USD (73,211) (3,952,662) 483,925 0.09Nabors Industries Ltd USD (304,884) (1,051,850) 27,440 0.01National Fuel Gas Co USD (39,618) (2,403,228) 9,112 0.00National Oilwell Varco Inc USD (67,727) (1,794,088) 110,395 0.02NCR Corp USD (78,040) (2,113,323) 121,742 0.02Newell Rubbermaid Inc USD (508,720) (7,757,980) 359,575 0.07Newmont Mining Corp USD (29,581) (1,062,550) (55,351) (0.01)News Corp USD (241,096) (2,982,358) 60,274 0.01Nielsen Holdings PLC USD (75,097) (1,774,542) 272,602 0.05NiSource Inc USD (60,624) (1,741,728) (41,224) (0.01)Noble Energy Inc USD (87,299) (2,178,110) (41,520) (0.01)NOW Inc USD (74,395) (1,054,177) (3,720) (0.00)Nutanix Inc USD (9,125) (343,739) 6,114 0.00NVIDIA Corp USD (26,863) (4,794,777) (214,162) (0.04)Occidental Petroleum Corp USD (62,502) (4,145,133) 43,126 0.01Oceaneering International Inc USD (47,264) (743,935) 51,331 0.01Olin Corp USD (17,073) (395,069) 9,219 0.00Ollie’s Bargain Outlet Holdings Inc USD (3,194) (274,620) (15,299) (0.00)ONEOK Inc USD (121,582) (8,448,733) (136,172) (0.02)PacWest Bancorp USD (57,135) (2,156,846) 138,838 0.03Papa John’s International Inc USD (14,567) (768,118) (78,516) (0.01)Pegasystems Inc USD (3,592) (232,366) 1,114 0.00Penn National Gaming Inc USD (9,364) (186,718) 17,751 0.00Philip Morris International In USD (21,236) (1,868,556) 58,187 0.01Pinnacle Financial Partners Inc USD (10,429) (575,159) 41,612 0.01Plantronics Inc USD (27,769) (1,285,705) 99,691 0.02
AQR UCITS FUNDS
AQR Style Premia: Equity Market Neutral UCITS Fund
Schedule of Investments (continued)As at 31 March 2019
The accompanying notes form an integral part of these audited financial statements. 127

Reference Entity Currency Shares Notional Amount
UnrealisedAppreciation/
(Depreciation)in USD
Percent ofNet Assets
Short Positions (continued)Common Stocks (continued)United States (continued)Platform Specialty Products Corp USD (47,515) (478,951) 21,895 0.00PNM Resources Inc USD (11,541) (548,544) (1,039) (0.00)PolyOne Corp USD (4,414) (129,286) 6,842 0.00Pool Corp USD (1,451) (240,706) (10,244) (0.00)Post Holdings Inc USD (2,038) (222,855) (11,963) (0.00)PPG Industries Inc USD (1,134) (127,462) (1,644) (0.00)Premier Inc USD (67,478) (2,311,796) 20,918 0.00Progressive Waste Solutions Ltd USD (7,948) (702,683) (27,818) (0.00)Proofpoint Inc USD (4,579) (548,976) 19,232 0.00Prosperity Bancshares Inc USD (7,600) (527,516) 35,264 0.01Pure Storage Inc USD (187,836) (4,059,136) (136,128) (0.02)QUALCOMM Inc USD (105,268) (6,011,855) (29,475) (0.01)Range Resources Corp USD (7,508) (84,765) 980 0.00RingCentral Inc USD (20,854) (2,252,858) (35,452) (0.01)Rockwell Automation Inc USD (1,459) (255,442) 8,331 0.00Royal Gold Inc USD (46,974) (4,314,562) (93,478) (0.02)Sage Therapeutics Inc USD (20,051) (3,227,008) (75,715) (0.01)Sanderson Farms Inc USD (2,827) (369,121) (8,968) (0.00)Schlumberger Ltd USD (146,066) (6,353,871) (20,449) (0.00)Scientific Games Corp USD (45,911) (942,094) 88,438 0.02Sealed Air Corp USD (219,920) (10,202,089) (153,944) (0.03)Seattle Genetics Inc USD (7,571) (547,308) 8,782 0.00SEI Investments Co USD (1,969) (103,018) 807 0.00Sempra Energy USD (18,514) (2,316,472) (8,702) (0.00)Sensient Technologies Corp USD (2,941) (200,135) (5,176) (0.00)Signature Bank USD (12,000) (1,553,520) 85,200 0.02Signet Jewelers Ltd USD (16,592) (452,298) (2,821) (0.00)Silicon Laboratories Inc USD (1,521) (122,288) 1,962 0.00Six Flags Entertainment Corp USD (27,557) (1,360,489) 33,068 0.01SLM Corp USD (28,325) (282,967) 19,544 0.00Sothebys USD (26,179) (995,064) 47,646 0.01Southwest Airlines Co USD (23,402) (1,195,842) (9,040) (0.00)Southwest Gas Corp USD (8,622) (709,591) 8,967 0.00Splunk Inc USD (1,644) (204,678) 6,708 0.00Stericycle Inc USD (61,860) (3,347,863) (301,258) (0.05)Sterling Bancorp USD (78,244) (1,465,510) 118,931 0.02Switch Inc USD (45,843) (470,808) 5,382 0.00Synaptics Inc USD (3,788) (147,126) (20,409) (0.00)Synovus Financial Corp USD (63,101) (2,184,872) 294,997 0.05Tableau Software Inc USD (2,125) (267,453) 13,196 0.00Targa Resources Corp USD (179,797) (7,427,414) (100,686) (0.02)Tempur Sealy International Inc USD (59,601) (3,511,095) (140,062) (0.03)Tenet Healthcare Corp USD (75,111) (2,164,699) 60,089 0.01Teradata Corp USD (26,197) (1,147,953) 102,954 0.02Tesla Motors Inc USD (62,436) (17,355,335) (451,206) (0.08)Texas Capital Bancshares Inc USD (13,763) (751,735) 71,568 0.01The Babcock & Wilcox Co USD (26,743) (1,336,615) 10,587 0.00The Brink’s Co USD (13,674) (1,033,754) 23,930 0.00The Charles Schwab Corp USD (48,713) (2,085,891) 150,036 0.03The Chemours Co USD (6,850) (252,149) 15,139 0.00The Coca-Cola Co USD (9,080) (423,355) (11,032) (0.00)The Hain Celestial Group Inc USD (81,464) (1,893,223) (41,547) (0.01)The Howard Hughes Corp USD (5,722) (631,365) 9,613 0.00The Kraft Heinz Co USD (259,179) (8,462,194) (140,377) (0.03)The Madison Square Garden Co USD (4,215) (1,235,079) 6,154 0.00The Middleby Corp USD (6,811) (878,551) 12,873 0.00The Mosaic Co USD (7,917) (217,401) 9,342 0.00The Scotts Miracle-Gro Co USD (19,978) (1,558,684) 77,845 0.01The Toro Co USD (1,329) (91,276) (452) (0.00)The Ultimate Software Group Inc USD (3,409) (1,123,709) 4,670 0.00The Wendy’s Co USD (7,929) (142,524) (9,951) (0.00)The Williams Cos Inc USD (228,436) (6,530,985) (182,749) (0.03)Thor Industries Inc USD (5,012) (312,047) 8,069 0.00Transocean Ltd USD (435,038) (3,791,356) 337,458 0.06TransUnion USD (3,758) (249,644) (4,472) (0.00)TreeHouse Foods Inc USD (42,999) (2,744,626) (107,498) (0.02)Trimble Navigation Ltd USD (27,823) (1,122,936) (5,843) (0.00)Tupperware Brands Corp USD (56,104) (1,444,678) 76,301 0.01UMB Financial Corp USD (2,188) (141,936) 7,111 0.00Umpqua Holdings Corp USD (19,769) (328,758) 25,700 0.00Under Armour Inc USD (68,332) (1,469,821) 57,399 0.01United Bankshares Inc USD (28,728) (1,048,285) 43,954 0.01United Parcel Service Inc USD (37,931) (4,231,962) (33,379) (0.01)Univar Inc USD (119,204) (2,608,184) 134,701 0.02Universal Display Corp USD (38,179) (5,832,988) 184,405 0.03Vail Resorts Inc USD (4,237) (926,674) (8,516) (0.00)Valley National Bancorp USD (35,862) (350,013) 22,234 0.00Valmont Industries Inc USD (1,631) (213,808) 8,237 0.00Valvoline Inc USD (43,573) (805,229) 3,050 0.00ViaSat Inc USD (20,036) (1,548,783) 11,421 0.00Virtu Financial Inc USD (7,905) (190,115) 6,956 0.00Visteon Corp USD (33,165) (2,272,134) 211,593 0.04Vulcan Materials Co USD (84,309) (9,945,933) (337,236) (0.06)WABCO Holdings Inc USD (3,859) (509,118) 37,625 0.01Wabtec Corp USD (2,747) (200,888) (2,829) (0.00)Weatherford International PLC USD (185,743) (130,020) 16,717 0.00Webster Financial Corp USD (1,853) (94,355) 10,358 0.00Western Alliance Bancorp USD (2,150) (88,946) 9,052 0.00Whirlpool Corp USD (18,615) (2,471,514) 10,052 0.00Willis Towers Watson PLC USD (14,553) (2,558,417) (25,031) (0.00)World Fuel Services Corp USD (29,505) (861,546) 26,555 0.00WPX Energy Inc USD (328,556) (4,304,084) (128,137) (0.02)WR Grace Co USD (32,618) (2,534,419) 3,914 0.00XPO Logistics Inc USD (74,773) (4,055,688) (203,383) (0.04)Yum! Brands Inc USD (3,512) (350,217) 1,826 0.00
AQR UCITS FUNDS
AQR Style Premia: Equity Market Neutral UCITS Fund
Schedule of Investments (continued)As at 31 March 2019
The accompanying notes form an integral part of these audited financial statements. 128

Reference Entity Currency Shares Notional Amount
UnrealisedAppreciation/
(Depreciation)in USD
Percent ofNet Assets
Short Positions (continued)Common Stocks (continued)United States (continued)Zayo Group Holdings Inc USD (238,004) (6,754,554) (17,570) (0.00)Zillow Group Inc USD (99,242) (3,423,849) 329,483 0.06Zions Bancorporation USD (8,865) (402,737) 40,868 0.01
2,246,907 0.40
Total Short Positions 2,290,421 0.41
Total of Long and Short Equity Positions (4,588,952) (0.83)Net Cash and Other Receivables/(Payables) (448,514) (0.08)
Total of Total Return Basket Swap Contract - JPMC - USD (5,037,466) (0.91)
Counterparty† Description‡ Termination DateFair Value in
USDMLIN The Sub-Fund receives the total return on a portfolio of long and short positions and pays 1-month LIBOR
plus or minus a specified spread, which is denominated in CHF based on the local currency of thepositions within the swap.
25.07.2019 - 25.03.2021 755,121
The following table represents the long and short positions and related values within the total return equity basket swap as at 31 March 2019
Reference Entity Currency Shares Notional Amount
UnrealisedAppreciation/
(Depreciation)in USD
Percent ofNet Assets
Long PositionsCommon StocksSwitzerlandBaloise Holding AG CHF 691 113,750 1,180 0.00DKSH Holding AG CHF 1,902 109,938 1,051 0.00Helvetia Holding AG CHF 773 470,873 (3,106) (0.00)Roche Holding AG CHF 11,441 3,127,846 39,644 0.01Sonova Holding AG CHF 2,277 450,071 8,004 0.00Sulzer AG CHF 1,070 103,975 3,170 0.00Swiss Life Holding AG CHF 10,475 4,589,158 56,812 0.01Temenos Group AG CHF 16,162 2,366,715 94,149 0.02Zurich Insurance Group AG CHF 1,952 645,014 1,568 0.00
202,472 0.04
Total Long Positions 202,472 0.04
Short PositionsCommon StocksAustriaams AG CHF (73,191) (1,940,684) 121,293 0.02
121,293 0.02SwitzerlandBucher Industries AG CHF (376) (124,924) (2,190) (0.00)Cie Financiere Richemont SA CHF (5,596) (405,347) (5,283) (0.00)Credit Suisse Group AG CHF (130,570) (1,515,984) (20,982) (0.00)dormakaba Holding AG CHF (332) (237,250) (3,835) (0.00)GAM Holding AG CHF (47,619) (147,499) (287) (0.00)Holcim Ltd CHF (40,975) (2,018,605) 1,235 0.00Idorsia Ltd CHF (41,350) (725,125) (29,902) (0.01)Julius Baer Group Ltd CHF (3,275) (131,901) 1,447 0.00OC Oerlikon Corp AG CHF (81,060) (1,032,331) (35,008) (0.01)Vifor Pharma AG CHF (7,239) (974,991) (9,452) (0.00)
(104,257) (0.02)
Total Short Positions 17,036 0.00
Total of Long and Short Equity Positions 219,508 0.04Net Cash and Other Receivables/(Payables) 535,613 0.10
Total of Total Return Basket Swap Contract - MLIN - CHF 755,121 0.14
AQR UCITS FUNDS
AQR Style Premia: Equity Market Neutral UCITS Fund
Schedule of Investments (continued)As at 31 March 2019
The accompanying notes form an integral part of these audited financial statements. 129

Counterparty† Description‡ Termination DateFair Value in
USDMLIN The Sub-Fund receives the total return on a portfolio of long and short positions and pays 1-month CIBOR
plus or minus a specified spread, which is denominated in DKK based on the local currency of thepositions within the swap.
27.01.2020 - 25.03.2021 437,262
The following table represents the long and short positions and related values within the total return equity basket swap as at 31 March 2019
Reference Entity Currency Shares Notional Amount
UnrealisedAppreciation/
(Depreciation)in USD
Percent ofNet Assets
Long PositionsCommon StocksDenmarkCarlsberg A/S DKK 709 88,892 2,538 0.00Coloplast A/S DKK 3,194 351,070 7,878 0.00DONG Energy A/S DKK 19,067 1,452,232 (4,588) (0.00)GN Store Nord A/S DKK 46,317 2,160,938 (5,573) (0.00)H Lundbeck A/S DKK 21,596 936,436 (16,565) (0.00)Novo Nordisk A/S DKK 22,173 1,158,048 29,347 0.00Pandora A/S DKK 17,425 809,825 4,455 0.00Rockwool International A/S DKK 3,241 757,025 10,237 0.00Tryg A/S DKK 15,537 427,874 1,168 0.00Vestas Wind Systems A/S DKK 2,473 207,920 8,406 0.00William Demant Holding A/S DKK 6,038 177,632 (8,718) (0.00)
28,585 0.00
Total Long Positions 28,585 0.00
Short PositionsCommon StocksDenmarkAP Moeller - Maersk A/S DKK (2,791) (3,528,655) 90,672 0.02Chr Hansen Holding A/S DKK (4,087) (416,891) 8,237 0.00FLSmidth & Co A/S DKK (7,032) (302,697) 4,654 0.00Genmab A/S DKK (21,107) (3,658,705) (14,286) (0.00)Novozymes A/S DKK (10,730) (495,448) 10,329 0.00
99,606 0.02
Total Short Positions 99,606 0.02
Total of Long and Short Equity Positions 128,191 0.02Net Cash and Other Receivables/(Payables) 309,071 0.06
Total of Total Return Basket Swap Contract - MLIN - DKK 437,262 0.08
Counterparty† Description‡ Termination DateFair Value in
USDMLIN The Sub-Fund receives the total return on a portfolio of long and short positions and pays 1-month
EURIBOR plus or minus a specified spread, which is denominated in EUR based on the local currency ofthe positions within the swap.
27.01.2020 - 26.04.2021 (506,173)
The following table represents the long and short positions and related values within the total return equity basket swap as at 31 March 2019
Reference Entity Currency Shares Notional Amount
UnrealisedAppreciation/
(Depreciation)in USD
Percent ofNet Assets
Long PositionsCommon StocksBelgiumAgeas EUR 19,802 956,451 12,006 0.00bpost SA EUR 21,766 232,770 18,939 0.01Colruyt SA EUR 7,140 528,283 7,696 0.00KBC Groep NV EUR 15,646 1,087,018 15,107 0.00Proximus SADP EUR 9,435 270,973 7,733 0.00Solvay SA EUR 2,404 258,897 2,159 0.00UCB SA EUR 13,068 1,118,307 12,618 0.00
76,258 0.01FinlandKesko OYJ EUR 3,007 183,525 608 0.00Neste Oil OYJ EUR 43,271 4,612,424 69,959 0.01Sampo OYJ EUR 12,270 558,209 (20,113) (0.00)UPM-Kymmene OYJ EUR 31,691 917,280 13,165 0.00
63,619 0.01FranceAir France-KLM EUR 40,347 452,181 4,258 0.00AXA SA EUR 243,476 6,113,756 19,135 0.00BNP Paribas SA EUR 1,673 79,624 1,625 0.00Casino Guichard Perrachon SA EUR 4,718 203,410 2,172 0.00CNP Assurances EUR 41,259 909,331 3,706 0.00Electricite de France SA EUR 207,271 2,822,815 (34,907) (0.00)Elior Participations SCA EUR 6,977 93,218 (2,663) (0.00)Engie SA EUR 301,890 4,502,911 (5,084) (0.00)Eutelsat Communications SA EUR 15,439 270,326 (3,380) (0.00)Peugeot SA EUR 229,105 5,550,972 118,325 0.02Renault SA EUR 34,262 2,259,590 86,168 0.02Societe Generale SA EUR 34,592 994,063 7,573 0.00Suez Environnement Co EUR 29,284 387,803 4,767 0.00TOTAL SA EUR 168,640 9,341,117 16,094 0.00
217,789 0.04GermanyAllianz SE EUR 31,449 6,983,486 55,789 0.01Aurubis AG EUR 16,906 904,265 21,069 0.00Bayerische Motoren Werke AG EUR 28,599 2,190,833 (22,156) (0.00)Covestro AG EUR 20,185 1,105,487 53,257 0.01Daimler AG EUR 18,160 1,056,973 22,224 0.00Deutsche Lufthansa AG EUR 183,543 4,001,936 (19,577) (0.00)E.ON SE EUR 429,709 4,789,339 (26,053) (0.01)
AQR UCITS FUNDS
AQR Style Premia: Equity Market Neutral UCITS Fund
Schedule of Investments (continued)As at 31 March 2019
The accompanying notes form an integral part of these audited financial statements. 130

Reference Entity Currency Shares Notional Amount
UnrealisedAppreciation/
(Depreciation)in USD
Percent ofNet Assets
Long Positions (continued)Common Stocks (continued)Germany (continued)Evonik Industries AG EUR 15,847 432,351 6,405 0.00Hannover Rueck SE EUR 11,457 1,647,795 32,158 0.00Hella KGaA Hueck & Co EUR 2,911 127,595 (981) (0.00)Metro Wholesale & Food Specialist AG EUR 6,425 106,329 1,443 0.00Muenchener Rueckversicherungs-Gesellschaft AG EUR 12,247 2,890,317 34,376 0.01ProSiebenSat.1 Media SE EUR 24,811 351,271 (21,728) (0.00)Rheinmetall AG EUR 1,479 153,468 (2,790) (0.00)Salzgitter AG EUR 25,533 740,473 1,720 0.00Software AG EUR 17,215 577,525 773 0.00Suedzucker AG EUR 7,281 92,947 (13,447) (0.00)Talanx AG EUR 11,807 455,222 3,977 0.00Volkswagen AG EUR 32,227 5,061,259 2,171 0.00
128,630 0.02ItalyA2A SpA EUR 1,045,583 1,912,329 18,196 0.00Assicurazioni Generali SpA EUR 368,237 6,794,855 39,277 0.01Autogrill SpA EUR 13,240 126,726 5,574 0.00Banca Popolare dell’Emilia Romagna SC EUR 139,409 567,860 (939) (0.00)Enel SpA EUR 1,403,573 8,972,956 116,614 0.02Eni SpA EUR 397,081 6,976,234 10,700 0.00Hera SpA EUR 192,471 698,857 20,313 0.01Italgas SpA EUR 69,148 426,998 (621) (0.00)Poste Italiane SpA EUR 370,831 3,583,945 7,494 0.00Terna Rete Elettrica Nazionale SpA EUR 136,851 868,427 6,761 0.00UnipolSai SpA EUR 466,961 1,255,652 5,243 0.00
228,612 0.04LuxembourgArcelorMittal EUR 39,218 796,539 (5,548) (0.00)SES SA EUR 7,071 108,883 (1,945) (0.00)
(7,493) (0.00)NetherlandsAegon NV EUR 739,429 3,558,211 (30,717) (0.00)ASM International NV EUR 2,240 120,467 1,257 0.00ASR Nederland NV EUR 43,402 1,793,249 (8,771) (0.00)Koninklijke Ahold NV EUR 302,254 8,008,794 57,690 0.01NN Group NV EUR 73,365 3,032,060 37,890 0.01Philips Lighting NV EUR 20,313 540,968 18,017 0.00Wolters Kluwer NV EUR 1,264 85,745 2,554 0.00
77,920 0.02SpainBBVA EUR 239,812 1,363,746 (36,349) (0.00)Distribuidora Internacional de Alimentacion SA EUR 475,796 347,551 15,705 0.00Endesa SA EUR 176,646 4,527,858 (53,549) (0.01)Gas Natural SDG SA EUR 24,002 676,131 7,007 0.00Mapfre SA EUR 119,838 329,105 (4,171) (0.00)Repsol SA EUR 402,478 6,861,831 40,669 0.01
(30,688) (0.00)United KingdomDialog Semiconductor PLC EUR 20,164 609,219 (11,320) (0.00)Fiat Chrysler Automobiles NV EUR 368,972 5,484,846 85,338 0.01
74,018 0.01
Total Long Positions 828,665 0.15
Short PositionsCommon StocksBelgiumAnheuser-Busch InBev SA EUR (21,471) (1,798,350) (81,721) (0.02)Galapagos NV EUR (18,739) (2,110,233) (329,053) (0.06)Telenet Group Holding NV EUR (16,647) (799,202) (14,205) (0.00)
(424,979) (0.08)FinlandHuhtamaki OYJ EUR (10,542) (390,116) (7,220) (0.00)Metso OYJ EUR (2,379) (81,493) (1,389) (0.00)Orion OYJ EUR (4,241) (158,989) 3,809 0.00Wartsila OYJ Abp EUR (5,072) (81,831) (3,929) (0.00)
(8,729) (0.00)FranceAccor SA EUR (58,973) (2,380,319) 60,915 0.01Airbus SE EUR (36,039) (4,741,429) (127,053) (0.02)Altran Technologies SA EUR (79,711) (871,686) (15,214) (0.00)Bollore NV EUR (629) (2,794) (32) (0.00)Bollore SA EUR (156,844) (707,908) (10,214) (0.00)Bureau Veritas SA EUR (10,756) (253,723) (4,227) (0.00)Dassault Systemes EUR (1,662) (246,033) (4,945) (0.00)Edenred EUR (60,223) (2,739,099) (18,256) (0.00)Groupe Eurotunnel SE EUR (105,831) (1,599,935) (34,458) (0.01)Iliad SA EUR (24,971) (2,490,174) (54,390) (0.01)Ingenico Group EUR (40,016) (2,843,940) (6,290) (0.00)JCDecaux SA EUR (17,272) (526,303) (13,187) (0.00)Orpea EUR (3,151) (376,951) (21,934) (0.00)Plastic Omnium SA EUR (14,815) (390,389) 1,164 0.00Remy Cointreau SA EUR (9,556) (1,270,313) (33,260) (0.01)Rexel SA EUR (10,150) (114,301) (1,915) (0.00)Safran SA EUR (1,495) (203,687) (5,875) (0.00)SEB SA EUR (2,810) (467,245) (11,989) (0.00)Technicolor SA EUR (170,521) (194,324) 8,998 0.00Valeo SA EUR (96,640) (2,796,111) 17,360 0.00Vivendi SA EUR (85,099) (2,464,103) (31,530) (0.01)
(306,332) (0.05)GermanyBeiersdorf AG EUR (875) (90,814) (1,886) (0.00)
AQR UCITS FUNDS
AQR Style Premia: Equity Market Neutral UCITS Fund
Schedule of Investments (continued)As at 31 March 2019
The accompanying notes form an integral part of these audited financial statements. 131

Reference Entity Currency Shares Notional Amount
UnrealisedAppreciation/
(Depreciation)in USD
Percent ofNet Assets
Short Positions (continued)Common Stocks (continued)Germany (continued)CECONOMY AG EUR (121,753) (643,575) (2,871) (0.00)Continental AG EUR (4,977) (747,665) 18,999 0.00Delivery Hero SE EUR (23,951) (852,444) 39,261 0.01Deutsche Bank AG EUR (968,280) (7,845,863) 8,697 0.00Deutsche Post AG EUR (3,257) (105,974) (1,646) (0.00)Fielmann AG EUR (4,614) (317,298) (8,289) (0.00)Fraport AG Frankfurt Airport Services Worldwide EUR (1,255) (95,421) (28) (0.00)GEA Group AG EUR (43,618) (1,145,947) (40,647) (0.01)HUGO BOSS AG EUR (1,766) (120,830) (397) (0.00)Infineon Technologies AG EUR (157,525) (3,118,063) 204,275 0.04KION Group AG EUR (9,254) (481,677) (935) (0.00)OSRAM Licht AG EUR (81,597) (2,798,778) 398,517 0.07Telefonica Deutschland Holding AG EUR (217,275) (681,340) 35,372 0.01United Internet AG EUR (22,938) (833,130) 40,433 0.01Zalando SE EUR (45,022) (1,755,548) (27,296) (0.01)
661,559 0.12ItalyAtlantia SpA EUR (55,757) (1,434,819) (40,691) (0.01)Banca Generali SpA EUR (13,257) (329,538) (3,870) (0.00)Brembo SpA EUR (35,290) (397,803) 1,585 0.00Buzzi Unicem SpA EUR (64,044) (1,299,331) (39,188) (0.01)Ferrari NV EUR (42,069) (5,608,915) (134,614) (0.02)FinecoBank Banca Fineco SpA EUR (54,471) (710,036) (15,901) (0.00)Leonardo-Finmeccanica SpA EUR (75,003) (870,306) (20,210) (0.00)Pirelli & C SpA EUR (38,381) (247,350) 4,568 0.00Prysmian SpA EUR (98,962) (1,853,863) 14,444 0.00Recordati SpA EUR (8,885) (345,356) 11,272 0.00Unipol Gruppo Finanziario SpA EUR (49,666) (246,303) (5,465) (0.00)
(228,070) (0.04)LuxembourgTenaris SA EUR (11,777) (165,283) 3,438 0.00
3,438 0.00NetherlandsAalberts Industries NV EUR (3,967) (136,469) (2,227) (0.00)Altice NV EUR (488,469) (1,258,644) (202,370) (0.04)ASML Holding NV EUR (10,443) (1,939,529) (3,752) (0.00)Boskalis Westminster NV EUR (23,824) (621,098) 10,699 0.00Koninklijke KPN NV EUR (888,218) (2,794,285) 55,846 0.01Koninklijke Vopak NV EUR (9,073) (430,694) (9,576) (0.00)OCI NV EUR (23,614) (645,317) (18,029) (0.00)SBM Offshore NV EUR (19,712) (375,574) 1,217 0.00
(168,192) (0.03)SpainBankia SA EUR (315,311) (814,235) 16,993 0.00Cellnex Telecom SAU EUR (73,299) (2,154,521) (95,464) (0.02)Ferrovial SA EUR (83,309) (1,945,532) (32,737) (0.00)Grifols SA EUR (23,524) (661,610) (41,994) (0.01)Inditex SA EUR (252,069) (7,386,573) (50,942) (0.01)Melia Hotels International SA EUR (10,681) (98,215) (1,619) (0.00)
(205,763) (0.04)SwitzerlandSTMicroelectronics NV EUR (235,455) (3,457,791) 231,312 0.04
231,312 0.04United KingdomCNH Industrial NV EUR (153,994) (1,574,052) 11,757 0.00
11,757 0.00
Total Short Positions (433,999) (0.08)
Total of Long and Short Equity Positions 394,666 0.07Net Cash and Other Receivables/(Payables) (900,839) (0.16)
Total of Total Return Basket Swap Contract - MLIN - EUR (506,173) (0.09)
AQR UCITS FUNDS
AQR Style Premia: Equity Market Neutral UCITS Fund
Schedule of Investments (continued)As at 31 March 2019
The accompanying notes form an integral part of these audited financial statements. 132

Counterparty† Description‡ Termination DateFair Value in
USDMLIN The Sub-Fund receives the total return on a portfolio of long and short positions and pays 1-month LIBOR
plus or minus a specified spread, which is denominated in GBP based on the local currency of thepositions within the swap.
27.01.2020 - 25.03.2021 (99,738)
The following table represents the long and short positions and related values within the total return equity basket swap as at 31 March 2019
Reference Entity Currency Shares Notional Amount
UnrealisedAppreciation/
(Depreciation)in USD
Percent ofNet Assets
Long PositionsCommon StocksRussiaEvraz PLC GBP 193,347 1,556,689 61,825 0.01
61,825 0.01South AfricaAnglo American PLC GBP 3,809 101,671 4,778 0.00Investec PLC GBP 72,234 414,539 8,357 0.00
13,135 0.00United KingdomAggreko PLC GBP 23,697 241,800 5,852 0.00Barratt Developments PLC GBP 297,924 2,306,500 21,686 0.00BBA Aviation PLC GBP 32,437 103,637 4,807 0.00Bellway PLC GBP 49,479 1,950,039 46,307 0.01Berkeley Group Holdings PLC GBP 61,211 2,955,844 (58,083) (0.01)BT Group PLC GBP 538,613 1,554,965 4,208 0.00Centrica PLC GBP 628,083 941,570 (22,206) 0.00Close Brothers Group PLC GBP 9,919 185,534 2,450 0.00Daily Mail & General Trust PLC GBP 29,973 250,515 584 0.00Drax Group PLC GBP 143,428 709,944 14,169 0.00Greene King PLC GBP 59,347 511,527 3,160 0.00Hays PLC GBP 72,065 140,323 3,653 0.00Howden Joinery Group PLC GBP 99,734 628,491 (1,296) 0.00Inchcape PLC GBP 15,721 117,399 1,022 0.00Indivior PLC GBP 156,554 194,950 (11,294) 0.00J Sainsbury PLC GBP 42,313 129,306 165 0.00JD Sports Fashion PLC GBP 47,797 306,420 8,325 0.00Moneysupermarket.com Group PLC GBP 108,607 520,928 12,423 0.00National Grid PLC GBP 290,013 3,228,363 (89,003) (0.02)Pennon Group PLC GBP 28,537 278,649 (5,787) 0.00Persimmon PLC GBP 30,045 845,909 4,296 0.00Playtech Plc GBP 24,190 134,641 6,100 0.00Royal Mail PLC GBP 476,425 1,480,676 9,884 0.00Severn Trent PLC GBP 19,434 503,963 (8,589) 0.00Tate & Lyle PLC GBP 57,256 535,259 8,187 0.00Taylor Wimpey PLC GBP 638,813 1,455,208 (1,661) 0.00United Utilities Group PLC GBP 78,309 839,767 (12,622) 0.00WH Smith PLC GBP 31,204 860,694 5,678 0.00William Hill PLC GBP 137,356 278,169 11,248 0.00
(36,337) (0.02)
Total Long Positions 38,623 (0.01)
Short PositionsCommon StocksChileAntofagasta PLC GBP (24,797) (312,074) (9,670) 0.00
(9,670) 0.00South AfricaOld Mutual Ltd GBP (681,061) (1,028,161) (27,798) (0.01)
(27,798) (0.01)SwitzerlandGlencore PLC GBP (205,532) (851,292) (22,826) 0.00
(22,826) 0.00United Arab EmiratesNMC Health PLC GBP (48,115) (1,425,964) 41,278 0.01
41,278 0.01United KingdomAA PLC GBP (250,283) (295,075) 8,328 0.00Ashmore Group PLC GBP (28,922) (160,076) (3,308) 0.00Ashtead Group PLC GBP (44,825) (1,080,539) (15,732) 0.00ASOS PLC GBP (19,092) (787,435) (28,043) (0.01)Aviva PLC GBP (40,560) (216,897) (1,265) 0.00B&M European Value Retail SA GBP (41,250) (200,910) (3,056) 0.00Barclays PLC GBP (68,388) (136,310) 1,956 0.00British American Tobacco PLC GBP (38,541) (1,596,107) (56,360) (0.01)Bunzl PLC GBP (3,044) (100,383) (3,482) 0.00Capita PLC GBP (709,267) (1,136,753) (11,985) 0.00Cobham PLC GBP (505,609) (715,379) (2,957) 0.00ConvaTec Group PLC GBP (87,296) (161,073) (9,134) 0.00CYBG PLC GBP (84,843) (217,148) (9,595) 0.00Halma PLC GBP (28,242) (611,228) (3,304) 0.00Hargreaves Lansdown PLC GBP (25,463) (615,128) (29,126) (0.01)Hiscox Ltd GBP (20,845) (422,146) 542 0.00IMI PLC GBP (12,790) (158,188) (2,161) 0.00Informa PLC GBP (23,485) (227,487) (6,411) 0.00Intertek Group PLC GBP (1,464) (92,237) (1,941) 0.00Man Group PLC GBP (262,598) (464,561) (15,702) 0.00Melrose Industries PLC GBP (1,356,531) (3,214,472) (51,135) (0.01)Ocado Group PLC GBP (10,272) (181,121) (13,486) 0.00Prudential PLC GBP (59,019) (1,181,424) 3,069 0.00Rentokil Initial PLC GBP (163,645) (746,626) (8,509) 0.00Rotork PLC GBP (42,508) (156,037) (6,962) 0.00RSA Insurance Group PLC GBP (49,390) (326,006) (3,082) 0.00Smiths Group PLC GBP (8,212) (151,591) (1,936) 0.00Spirax-Sarco Engineering PLC GBP (1,896) (176,459) (4,190) 0.00St James’s Place PLC GBP (20,192) (267,190) (6,719) 0.00Standard Chartered PLC GBP (140,076) (1,076,990) (19,664) 0.00
AQR UCITS FUNDS
AQR Style Premia: Equity Market Neutral UCITS Fund
Schedule of Investments (continued)As at 31 March 2019
The accompanying notes form an integral part of these audited financial statements. 133

Reference Entity Currency Shares Notional Amount
UnrealisedAppreciation/
(Depreciation)in USD
Percent ofNet Assets
Short Positions (continued)Common Stocks (continued)United Kingdom (continued)Standard Life PLC GBP (81,046) (277,486) (5,952) 0.00The Weir Group PLC GBP (7,249) (145,344) (1,508) 0.00Thomas Cook Group PLC GBP (253,969) (80,461) 6,757 0.00
(306,053) (0.04)
Total Short Positions (325,069) (0.04)
Total of Long and Short Equity Positions (286,446) (0.05)Net Cash and Other Receivables/(Payables) 186,708 0.03
Total of Total Return Basket Swap Contract - MLIN - GBP (99,738) (0.02)
Counterparty† Description‡ Termination DateFair Value in
USDMLIN The Sub-Fund receives the total return on a portfolio of long and short positions and pays 1-month LIBOR
plus or minus a specified spread, which is denominated in JPY based on the local currency of the positionswithin the swap.
25.12.2019 - 08.03.2021 (3,276,307)
The following table represents the long and short positions and related values within the total return equity basket swap as at 31 March 2019
Reference Entity Currency Shares Notional Amount
UnrealisedAppreciation/
(Depreciation)in USD
Percent ofNet Assets
Long PositionsCommon StocksJapanABC-Mart Inc JPY 1,800 107,004 1,632 0.00Alfresa Holdings Corp JPY 3,400 96,679 1,915 0.00Amada Holdings Co Ltd JPY 11,000 108,773 3,601 0.00Aozora Bank Ltd JPY 21,900 541,048 (30,231) (0.01)Asahi Glass Co Ltd JPY 20,700 725,428 21,518 0.00Astellas Pharma Inc JPY 106,800 1,599,455 27,776 0.00Bandai Namco Holdings Inc JPY 6,700 313,811 3,181 0.00Central Japan Railway Co JPY 7,000 1,624,483 72,505 0.01Chubu Electric Power Co Inc JPY 20,000 312,051 (5,633) (0.00)Dai-ichi Life Insurance Co Ltd JPY 74,100 1,030,539 (9,795) (0.00)East Japan Railway Co JPY 1,100 106,073 1,595 0.00Electric Power Development Co Ltd JPY 35,400 861,433 (14,426) (0.00)Fujitsu Ltd JPY 18,400 1,326,352 29,481 0.01Fukuoka Financial Group Inc JPY 5,400 119,827 (1,505) (0.00)GungHo Online Entertainment Inc JPY 144,800 526,630 4,193 0.00Hakuhodo DY Holdings Inc JPY 7,300 117,230 2,790 0.00Haseko Corp JPY 129,000 1,621,515 (38,910) (0.01)Hitachi Ltd JPY 17,500 566,889 11,416 0.00Idemitsu Kosan Co Ltd JPY 81,100 2,714,280 (189,855) (0.03)Inpex Corp JPY 476,100 4,539,680 92,817 0.02ITOCHU Corp JPY 285,400 5,159,461 (49,639) (0.01)Japan Airlines Co Ltd JPY 50,200 1,766,242 32,913 0.01JFE Holdings Inc JPY 26,500 449,674 (3,526) (0.00)JTEKT Corp JPY 37,100 456,805 3,366 0.00JX Holdings Inc JPY 1,634,300 7,479,961 (285,784) (0.05)Kajima Corp JPY 104,200 1,537,158 32,407 0.01Kamigumi Co Ltd JPY 26,500 613,436 11,082 0.00Kansai Electric Power Co Inc JPY 25,400 374,254 (17,519) (0.00)KDDI Corp JPY 106,300 2,285,573 (60,190) (0.01)Kobe Steel Ltd JPY 61,300 459,943 (3,961) (0.00)Konica Minolta Inc JPY 24,000 236,160 3,661 0.00Kuraray Co Ltd JPY 30,600 389,162 2,194 0.00Kyushu Railway Co JPY 22,800 749,324 (291) (0.00)Marubeni Corp JPY 603,200 4,168,705 (104,540) (0.02)Mazda Motor Corp JPY 139,800 1,564,381 1,380 0.00Medipal Holdings Corp JPY 20,200 479,437 11,903 0.00Mitsubishi Chemical Holdings Corp JPY 15,400 108,392 (3,443) (0.00)Mitsubishi Corp JPY 198,100 5,498,173 (187,609) (0.03)Mitsubishi Gas Chemical Co Inc JPY 30,700 437,909 (5,153) (0.00)Mitsubishi Tanabe Pharma Corp JPY 6,300 84,116 (1,009) (0.00)Mitsubishi UFJ Financial Group Inc JPY 242,300 1,199,547 (9,932) (0.00)Mitsui & Co Ltd JPY 190,100 2,950,003 (73,009) (0.01)Mixi Inc JPY 28,600 660,359 (9,851) (0.00)Mizuho Financial Group Inc JPY 748,700 1,158,286 (14,080) (0.00)Nexon Co Ltd JPY 17,100 267,735 10,152 0.00NH Foods Ltd JPY 12,900 463,997 2,639 0.00NHK Spring Co Ltd JPY 47,300 424,751 8,346 0.00Nippon Electric Glass Co Ltd JPY 3,400 90,104 2,945 0.00Nippon Express Co Ltd JPY 11,800 656,520 7,262 0.00Nippon Telegraph & Telephone Corp JPY 134,700 5,730,704 (52,654) (0.01)Nissan Motor Co Ltd JPY 191,100 1,566,723 (62,880) (0.01)Obayashi Corp JPY 163,800 1,647,527 25,262 0.00Oracle Corp Japan JPY 8,900 597,316 (10,387) (0.00)Osaka Gas Co Ltd JPY 37,600 741,419 (36,933) (0.01)Resona Holdings Inc JPY 471,200 2,041,792 (26,787) (0.00)Sawai Pharmaceutical Co Ltd JPY 3,300 190,968 466 0.00Shimamura Co Ltd JPY 6,500 549,918 4,661 0.00Shimizu Corp JPY 48,900 424,642 2,531 0.00Shionogi & Co Ltd JPY 4,800 296,951 17,779 0.00Showa Denko KK JPY 62,400 2,194,546 123,270 0.02Sojitz Corp JPY 989,600 3,485,144 (67,472) (0.01)Sumitomo Chemical Co Ltd JPY 31,500 146,471 (2,412) (0.00)Sumitomo Corp JPY 161,100 2,227,007 (55,842) (0.01)Sumitomo Heavy Industries Ltd JPY 15,500 502,175 8,647 0.00Sumitomo Mitsui Financial Group Inc JPY 13,000 454,918 (4,153) (0.00)Suzuken Co Ltd JPY 3,400 196,631 8,024 0.00Taiheiyo Cement Corp JPY 8,100 269,924 5,074 0.00
AQR UCITS FUNDS
AQR Style Premia: Equity Market Neutral UCITS Fund
Schedule of Investments (continued)As at 31 March 2019
The accompanying notes form an integral part of these audited financial statements. 134

Reference Entity Currency Shares Notional Amount
UnrealisedAppreciation/
(Depreciation)in USD
Percent ofNet Assets
Long Positions (continued)Common Stocks (continued)Japan (continued)Taisei Corp JPY 21,400 992,903 16,183 0.00Teijin Ltd JPY 12,200 201,166 (4,175) (0.00)Tohoku Electric Power Co Inc JPY 10,600 135,112 (3,907) (0.00)Tokyo Electric Power Co Inc JPY 1,790,100 11,310,519 (40,587) (0.01)Tokyo Gas Co Ltd JPY 53,000 1,432,238 (36,359) (0.01)Tosoh Corp JPY 80,900 1,258,472 15,035 0.00Toyo Seikan Group Holdings Ltd JPY 26,100 534,460 (6,774) (0.00)Toyo Suisan Kaisha Ltd JPY 8,000 304,372 5,631 0.00Toyota Tsusho Corp JPY 9,600 312,771 (1,557) (0.00)West Japan Railway Co JPY 1,900 142,992 1,638 0.00Yamada Denki Co Ltd JPY 129,700 639,082 (16,057) (0.00)Yamaguchi Financial Group Inc JPY 58,000 491,596 (18,484) (0.00)
(928,440) (0.17)
Total Long Positions (928,440) (0.17)
Short PositionsCommon StocksJapanAcom Co Ltd JPY (215,900) (770,210) (14,613) (0.00)Aeon Co Ltd JPY (130,800) (2,734,868) (82,648) (0.02)AEON Financial Service Co Ltd JPY (37,400) (760,961) 3,805 0.00ANA Holdings Inc JPY (11,400) (417,606) (9,380) (0.00)Asics Corp JPY (81,700) (1,096,099) (67,342) (0.01)Benesse Holdings Inc JPY (6,700) (173,926) (299) (0.00)Calbee Inc JPY (33,200) (893,803) (2,001) (0.00)Casio Computer Co Ltd JPY (10,400) (135,748) (665) (0.00)Coca-Cola West Co Ltd JPY (16,800) (426,369) (17,525) (0.00)Cosmos Pharmaceutical Corp JPY (7,900) (1,365,064) (30,405) (0.01)Credit Saison Co Ltd JPY (9,800) (129,388) 4,532 0.00CyberAgent Inc JPY (68,200) (2,778,654) (210,350) (0.04)Daifuku Co Ltd JPY (77,400) (4,029,892) (92,346) (0.02)Daikin Industries Ltd JPY (25,700) (3,011,797) (177,878) (0.03)Disco Corp JPY (7,500) (1,068,535) (50,404) (0.01)Don Quijote Holdings Co Ltd JPY (5,000) (331,063) (13,560) (0.00)Eisai Co Ltd JPY (6,000) (336,486) (8,249) (0.00)FamilyMart Co Ltd JPY (99,200) (2,527,058) 46,335 0.01FANUC Corp JPY (5,300) (901,752) (3,001) (0.00)Fast Retailing Co Ltd JPY (7,700) (3,619,141) 36,215 0.01Hikari Tsushin Inc JPY (1,900) (359,649) (8,150) (0.00)Hirose Electric Co Ltd JPY (3,200) (336,027) (7,267) (0.00)Hisamitsu Pharmaceutical Co Inc JPY (3,300) (151,726) (9,743) (0.00)Hitachi Chemical Co Ltd JPY (6,800) (150,716) (137) (0.00)Hokuriku Electric Power Co JPY (33,400) (261,755) 5,771 0.00Ibiden Co Ltd JPY (39,200) (595,618) (10,438) (0.00)Isetan Mitsukoshi Holdings Ltd JPY (185,000) (1,868,763) 177 0.00Izumi Co Ltd JPY (3,600) (167,715) (6,817) (0.00)J Front Retailing Co Ltd JPY (51,400) (611,264) (26,167) (0.01)Japan Airport Terminal Co Ltd JPY (10,400) (439,179) 4,063 0.00JGC Corp JPY (71,300) (947,349) (6,458) (0.00)Kakaku.com Inc JPY (94,000) (1,805,199) (118,770) (0.02)Kansai Paint Co Ltd JPY (57,000) (1,087,493) 2,481 0.00Keihan Electric Railway Co Ltd JPY (4,300) (180,709) (7,724) (0.00)Keikyu Corp JPY (61,800) (1,048,242) (37,055) (0.01)Keio Corp JPY (12,100) (781,507) (25,155) (0.01)Keisei Electric Railway Co Ltd JPY (2,900) (105,287) (3,664) (0.00)Keyence Corp JPY (4,300) (2,679,523) 196 0.00Kikkoman Corp JPY (20,500) (1,005,255) (28,932) (0.01)Kintetsu Group Holdings Co Ltd JPY (15,500) (721,934) (11,700) (0.00)Koito Manufacturing Co Ltd JPY (8,700) (492,720) (13,245) (0.00)Kose Corp JPY (5,600) (1,028,316) (71,115) (0.01)LIXIL Group Corp JPY (87,200) (1,163,825) (9,968) (0.00)M3 Inc JPY (135,100) (2,264,147) (107,226) (0.02)Makita Corp JPY (3,200) (111,430) (6,510) (0.00)Marui Group Co Ltd JPY (106,800) (2,155,259) (22,438) (0.00)MISUMI Group Inc JPY (67,700) (1,682,996) (86,139) (0.02)Mitsubishi Logistics Corp JPY (11,900) (332,083) (12,968) (0.00)Mitsui OSK Lines Ltd JPY (38,100) (819,581) (980) (0.00)MonotaRO Co Ltd JPY (64,300) (1,425,134) (51,730) (0.01)Nabtesco Corp JPY (30,600) (892,214) (37,958) (0.01)Nankai Electric Railway Co Ltd JPY (12,100) (333,694) (1,903) (0.00)Nidec Corp JPY (48,400) (6,132,995) (300,460) (0.05)Nifco Inc JPY (5,600) (142,606) (4,052) (0.00)Nintendo Co Ltd JPY (20,800) (5,945,180) (232,286) (0.04)Nippon Paint Holdings Co Ltd JPY (45,600) (1,792,285) (23,648) (0.01)Nippon Shinyaku Co Ltd JPY (19,900) (1,448,649) (114,982) (0.02)Nippon Yusen KK JPY (19,500) (285,678) (1,089) (0.00)Nitori Holdings Co Ltd JPY (2,000) (258,245) (14,706) (0.00)Nomura Research Institute Ltd JPY (2,600) (118,050) (3,370) (0.00)Odakyu Electric Railway Co Ltd JPY (41,100) (995,872) (30,514) (0.01)Oji Holdings Corp JPY (24,500) (152,074) 1,293 0.00Ono Pharmaceutical Co Ltd JPY (27,900) (546,454) (2,244) (0.00)Oriental Land Co Ltd JPY (5,800) (658,275) (14,790) (0.00)Panasonic Corp JPY (9,900) (85,176) (1,227) (0.00)PeptiDream Inc JPY (31,700) (1,555,121) (48,252) (0.01)Pigeon Corp JPY (23,900) (976,567) 3,233 0.00Rakuten Inc JPY (198,000) (1,876,472) (31,579) (0.01)Recruit Holdings Co Ltd JPY (14,700) (419,664) (19,894) (0.00)Renesas Electronics Corp JPY (259,400) (1,199,871) 12,136 0.00Ricoh Co Ltd JPY (100,500) (1,050,399) (26,951) (0.01)Rohm Co Ltd JPY (5,300) (330,503) (1,598) (0.00)Ryohin Keikaku Co Ltd JPY (500) (126,500) (11,180) (0.00)Santen Pharmaceutical Co Ltd JPY (45,800) (682,015) (22,271) (0.00)Sega Sammy Holdings Inc JPY (18,200) (214,579) 804 0.00Seven Bank Ltd JPY (41,500) (122,563) (157) (0.00)
AQR UCITS FUNDS
AQR Style Premia: Equity Market Neutral UCITS Fund
Schedule of Investments (continued)As at 31 March 2019
The accompanying notes form an integral part of these audited financial statements. 135
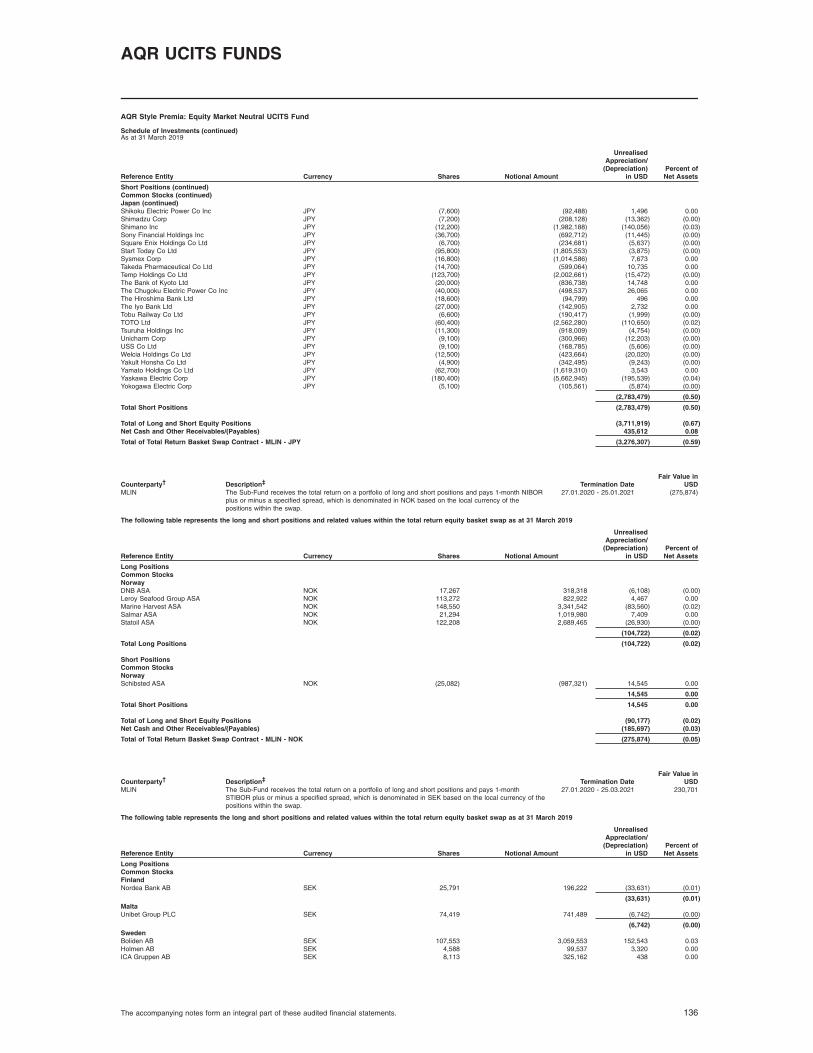
Reference Entity Currency Shares Notional Amount
UnrealisedAppreciation/
(Depreciation)in USD
Percent ofNet Assets
Short Positions (continued)Common Stocks (continued)Japan (continued)Shikoku Electric Power Co Inc JPY (7,600) (92,488) 1,496 0.00Shimadzu Corp JPY (7,200) (208,128) (13,362) (0.00)Shimano Inc JPY (12,200) (1,982,188) (140,056) (0.03)Sony Financial Holdings Inc JPY (36,700) (692,712) (11,445) (0.00)Square Enix Holdings Co Ltd JPY (6,700) (234,681) (5,637) (0.00)Start Today Co Ltd JPY (95,800) (1,805,553) (3,875) (0.00)Sysmex Corp JPY (16,800) (1,014,586) 7,673 0.00Takeda Pharmaceutical Co Ltd JPY (14,700) (599,064) 10,735 0.00Temp Holdings Co Ltd JPY (123,700) (2,002,661) (15,472) (0.00)The Bank of Kyoto Ltd JPY (20,000) (836,738) 14,748 0.00The Chugoku Electric Power Co Inc JPY (40,000) (498,537) 26,065 0.00The Hiroshima Bank Ltd JPY (18,600) (94,799) 496 0.00The Iyo Bank Ltd JPY (27,000) (142,905) 2,732 0.00Tobu Railway Co Ltd JPY (6,600) (190,417) (1,999) (0.00)TOTO Ltd JPY (60,400) (2,562,280) (110,650) (0.02)Tsuruha Holdings Inc JPY (11,300) (918,009) (4,754) (0.00)Unicharm Corp JPY (9,100) (300,966) (12,203) (0.00)USS Co Ltd JPY (9,100) (168,785) (5,606) (0.00)Welcia Holdings Co Ltd JPY (12,500) (423,664) (20,020) (0.00)Yakult Honsha Co Ltd JPY (4,900) (342,495) (9,243) (0.00)Yamato Holdings Co Ltd JPY (62,700) (1,619,310) 3,543 0.00Yaskawa Electric Corp JPY (180,400) (5,662,945) (195,539) (0.04)Yokogawa Electric Corp JPY (5,100) (105,561) (5,874) (0.00)
(2,783,479) (0.50)
Total Short Positions (2,783,479) (0.50)
Total of Long and Short Equity Positions (3,711,919) (0.67)Net Cash and Other Receivables/(Payables) 435,612 0.08
Total of Total Return Basket Swap Contract - MLIN - JPY (3,276,307) (0.59)
Counterparty† Description‡ Termination DateFair Value in
USDMLIN The Sub-Fund receives the total return on a portfolio of long and short positions and pays 1-month NIBOR
plus or minus a specified spread, which is denominated in NOK based on the local currency of thepositions within the swap.
27.01.2020 - 25.01.2021 (275,874)
The following table represents the long and short positions and related values within the total return equity basket swap as at 31 March 2019
Reference Entity Currency Shares Notional Amount
UnrealisedAppreciation/
(Depreciation)in USD
Percent ofNet Assets
Long PositionsCommon StocksNorwayDNB ASA NOK 17,267 318,318 (6,108) (0.00)Leroy Seafood Group ASA NOK 113,272 822,922 4,467 0.00Marine Harvest ASA NOK 148,550 3,341,542 (83,560) (0.02)Salmar ASA NOK 21,294 1,019,980 7,409 0.00Statoil ASA NOK 122,208 2,689,465 (26,930) (0.00)
(104,722) (0.02)
Total Long Positions (104,722) (0.02)
Short PositionsCommon StocksNorwaySchibsted ASA NOK (25,082) (987,321) 14,545 0.00
14,545 0.00
Total Short Positions 14,545 0.00
Total of Long and Short Equity Positions (90,177) (0.02)Net Cash and Other Receivables/(Payables) (185,697) (0.03)
Total of Total Return Basket Swap Contract - MLIN - NOK (275,874) (0.05)
Counterparty† Description‡ Termination DateFair Value in
USDMLIN The Sub-Fund receives the total return on a portfolio of long and short positions and pays 1-month
STIBOR plus or minus a specified spread, which is denominated in SEK based on the local currency of thepositions within the swap.
27.01.2020 - 25.03.2021 230,701
The following table represents the long and short positions and related values within the total return equity basket swap as at 31 March 2019
Reference Entity Currency Shares Notional Amount
UnrealisedAppreciation/
(Depreciation)in USD
Percent ofNet Assets
Long PositionsCommon StocksFinlandNordea Bank AB SEK 25,791 196,222 (33,631) (0.01)
(33,631) (0.01)MaltaUnibet Group PLC SEK 74,419 741,489 (6,742) (0.00)
(6,742) (0.00)SwedenBoliden AB SEK 107,553 3,059,553 152,543 0.03Holmen AB SEK 4,588 99,537 3,320 0.00ICA Gruppen AB SEK 8,113 325,162 438 0.00
AQR UCITS FUNDS
AQR Style Premia: Equity Market Neutral UCITS Fund
Schedule of Investments (continued)As at 31 March 2019
The accompanying notes form an integral part of these audited financial statements. 136

Reference Entity Currency Shares Notional Amount
UnrealisedAppreciation/
(Depreciation)in USD
Percent ofNet Assets
Long Positions (continued)Common Stocks (continued)Sweden (continued)Securitas AB SEK 5,680 91,617 3,584 0.00SSAB AB SEK 209,801 752,841 (1,810) (0.00)Swedbank AB SEK 28,324 404,164 (128,000) (0.02)Swedish Orphan Biovitrum AB SEK 70,820 1,651,409 12,985 0.00Telia Co AB SEK 67,422 304,109 (945) (0.00)
42,115 0.01
Total Long Positions 1,742 0.00
Short PositionsCommon StocksColombiaMillicom International Cellular SA SEK (8,845) (535,185) 477 0.00
477 0.00SwedenAssa Abloy AB SEK (17,567) (378,087) (11,084) (0.00)Atlas Copco AB SEK (12,448) (332,425) (2,551) (0.00)Ericsson SEK (18,552) (170,000) 3,482 0.00Hexpol AB SEK (12,620) (105,624) (1,497) (0.00)Husqvarna AB SEK (10,225) (83,329) (948) (0.00)NCC AB SEK (7,744) (119,146) (793) (0.00)Saab AB SEK (23,176) (742,900) (4,499) (0.00)Svenska Cellulosa AB SCA SEK (212,183) (1,830,811) (43,482) (0.01)
(61,372) (0.01)
Total Short Positions (60,895) (0.01)
Total of Long and Short Equity Positions (59,153) (0.01)Net Cash and Other Receivables/(Payables) 289,854 0.05
Total of Total Return Basket Swap Contract - MLIN - SEK 230,701 0.04
AQR UCITS FUNDS
AQR Style Premia: Equity Market Neutral UCITS Fund
Schedule of Investments (continued)As at 31 March 2019
The accompanying notes form an integral part of these audited financial statements. 137

Investments CouponMaturityDate Currency
Shares/PrincipalAmounts
Fair Valuein USD
Percentof Net
Assets
Short Term InvestmentsAustraliaAustralia & New Zealand Banking Group Ltd 0.000% 08/05/2019 USD 21,500,000 21,441,520 0.76
Total Australia 21,441,520 0.76
CanadaToronto-Dominion Bank 2.710% 08/04/2019 USD 35,000,000 35,002,528 1.25Total Capital Canada Ltd 0.000% 04/04/2019 USD 42,500,000 42,482,943 1.51Total Capital Canada Ltd 0.000% 28/05/2019 USD 10,000,000 9,958,083 0.35
Total Canada 87,443,554 3.11
FranceAntalis SA 0.000% 02/04/2019 USD 54,000,000 53,985,330 1.92Societe Generale SA 0.000% 22/04/2019 USD 55,000,000 54,911,230 1.96
Total France 108,896,560 3.88
NorwayDNB Bank ASA 0.000% 07/05/2019 USD 9,500,000 9,475,063 0.34DNB Bank ASA 0.000% 15/05/2019 USD 44,000,000 43,859,893 1.56
Total Norway 53,334,956 1.90
SingaporeDBS Bank Ltd 0.000% 14/05/2019 USD 40,900,000 40,768,511 1.45DBS Bank Ltd 0.000% 07/06/2019 USD 11,100,000 11,045,222 0.39Mitsubishi UFJ Trust & Banking Corp 0.000% 09/04/2019 USD 15,000,000 14,988,922 0.53Mitsubishi UFJ Trust & Banking Corp 0.000% 17/04/2019 USD 5,000,000 4,993,614 0.18Sumitomo Mitsui Trust Bank Ltd 0.000% 03/06/2019 USD 35,000,000 34,838,364 1.24
Total Singapore 106,634,633 3.79
SwedenSkandinaviska Enskilda Banken AB 0.000% 22/05/2019 USD 44,000,000 43,838,894 1.56Svenska Handelsbanken AB 0.000% 16/04/2019 USD 23,000,000 22,972,182 0.82Swedbank AB 0.000% 10/05/2019 USD 28,000,000 27,921,633 0.99Swedbank AB 0.000% 21/05/2019 USD 27,000,000 26,904,481 0.96
Total Sweden 121,637,190 4.33
United KingdomASB Finance Ltd 0.000% 14/05/2019 USD 36,400,000 36,285,257 1.29
Total United Kingdom 36,285,257 1.29
United StatesAlbion Capital LLC 0.000% 15/04/2019 USD 24,743,000 24,714,514 0.88Albion Capital LLC 0.000% 23/04/2019 USD 15,500,000 15,473,650 0.55American Honda Finance Corporation 0.000% 04/04/2019 USD 25,000,000 24,989,896 0.89Apple Inc 0.000% 06/05/2019 USD 55,000,000 54,858,751 1.95Atlantic Asset Securitization LLC 0.000% 22/04/2019 USD 7,000,000 6,988,534 0.25Atlantic Asset Securitization LLC 0.000% 14/06/2019 USD 27,500,000 27,351,069 0.97Atlantic Asset Securitization LLC 0.000% 15/07/2019 USD 20,000,000 19,846,220 0.71Bank of Montreal 2.430% 02/04/2019 USD 40,000,000 40,000,020 1.42Bank of Montreal 2.620% 12/08/2019 USD 10,000,000 10,005,192 0.36Chevron Corp 0.000% 26/04/2019 USD 14,250,000 14,223,522 0.51Chevron Corporation 0.000% 02/04/2019 USD 38,750,000 38,739,804 1.38DZ Bank Deutsche Zentral 2.720% 17/06/2019 USD 15,100,000 15,105,612 0.54Fairway Finance Co LLC 0.000% 01/07/2019 USD 23,500,000 23,343,038 0.83Fairway Finance Co LLC 0.000% 02/07/2019 USD 20,000,000 19,864,994 0.71Gotham Funding Corp 0.000% 13/05/2019 USD 12,350,000 12,311,561 0.44Liberty Street Funding LLC 0.000% 20/05/2019 USD 9,250,000 9,216,571 0.33Liberty Street Funding LLC 0.000% 04/06/2019 USD 10,000,000 9,953,323 0.35Liberty Street Funding LLC 0.000% 02/07/2019 USD 10,000,000 9,934,160 0.35LMA Americas LLC 0.000% 11/04/2019 USD 10,000,000 9,991,243 0.36LMA Americas LLC 0.000% 13/05/2019 USD 7,600,000 7,576,535 0.27LMA Americas LLC 0.000% 10/06/2019 USD 8,000,000 7,959,250 0.28LMA Americas LLC 0.000% 12/07/2019 USD 1,000,000 992,577 0.04LMA Americas LLC 0.000% 06/08/2019 USD 14,500,000 14,365,851 0.51LMA Americas LLC 0.000% 14/08/2019 USD 12,000,000 11,881,918 0.42Mizuho Bank Ltd 0.000% 15/05/2019 USD 24,000,000 23,922,920 0.85Mizuho Bank Ltd 0.000% 13/06/2019 USD 13,000,000 12,930,950 0.46Mizuho Bank Ltd 2.620% 10/05/2019 USD 16,000,000 16,003,051 0.57MUFG Bank Ltd 2.590% 29/07/2019 USD 30,000,000 30,005,801 1.07Nestle Capital Corp 0.000% 18/07/2019 USD 36,500,000 36,218,758 1.29Nieuw Amsterdam Receivables Corp 0.000% 08/05/2019 USD 10,000,000 9,972,500 0.35Nieuw Amsterdam Receivables Corp 0.000% 03/06/2019 USD 10,500,000 10,451,971 0.37Nieuw Amsterdam Receivables Corp 0.000% 04/06/2019 USD 16,500,000 16,423,321 0.58Nieuw Amsterdam Receivables Corp 0.000% 14/06/2019 USD 15,000,000 14,919,375 0.53Norinchukin Bank 2.450% 08/04/2019 USD 25,000,000 25,000,148 0.89Norinchukin Bank 2.450% 12/04/2019 USD 21,000,000 21,000,082 0.75Novartis Finance Corp 0.000% 01/04/2019 USD 12,000,000 11,997,625 0.43Novartis Finance Corp 0.000% 07/05/2019 USD 20,600,000 20,544,967 0.73Oversea-Chinese Banking Corp Ltd 2.660% 06/08/2019 USD 9,800,000 9,802,887 0.35PACCAR Financial Corp 0.000% 02/05/2019 USD 23,000,000 22,946,498 0.82Pfizer Inc 0.000% 06/05/2019 USD 29,000,000 28,925,370 1.03Regency Markets No. 1 LLC 0.000% 10/04/2019 USD 22,000,000 21,982,070 0.78Roche Holdings Inc 0.000% 09/04/2019 USD 5,100,000 5,096,268 0.18Roche Holdings Inc 0.000% 23/04/2019 USD 3,000,000 2,994,962 0.11Starbird Funding Corp 0.000% 13/06/2019 USD 25,250,000 25,112,525 0.89Sumitomo Mitsui Trust Bank Limited 2.800% 25/04/2019 USD 25,000,000 25,006,476 0.89The Bank of Nova Scotia 2.600% 22/08/2019 USD 18,000,000 18,000,829 0.64The Coca-Cola Co 0.000% 01/05/2019 USD 5,000,000 4,988,771 0.18The Coca-Cola Co 0.000% 23/05/2019 USD 35,000,000 34,867,015 1.24The Coca-Cola Co 0.000% 17/06/2019 USD 15,750,000 15,662,220 0.56Toronto-Dominion Bank 2.650% 20/05/2019 USD 19,750,000 19,753,040 0.70Toyota Motor Credit Corp 0.000% 30/04/2019 USD 20,000,000 19,957,031 0.71Toyota Motor Credit Corp 0.000% 13/05/2019 USD 21,000,000 20,936,213 0.74Victory Receivables Corp 0.000% 06/05/2019 USD 12,000,000 11,968,612 0.43Victory Receivables Corp 0.000% 14/06/2019 USD 29,610,000 29,449,642 1.05Walmart Inc 0.000% 08/04/2019 USD 26,000,000 25,982,725 0.92
AQR UCITS FUNDS
AQR Style Premia UCITS Fund
Schedule of InvestmentsAs at 31 March 2019
The accompanying notes form an integral part of these audited financial statements. 138

Investments CouponMaturityDate Currency
Shares/PrincipalAmounts
Fair Valuein USD
Percentof Net
Assets
Short Term Investments (continued)United States (continued)Walmart Inc 0.000% 29/04/2019 USD 12,000,000 11,974,921 0.43Walmart Inc 0.000% 28/05/2019 USD 35,100,000 34,955,213 1.24
Total United States 1,069,442,562 38.06
Other Investment FundsUnited StatesUBS (Irl) Select Money Market Fund^ 0.000% USD 37,116,324 37,116,324 1.32
Total United States 37,116,324 1.32
Total Other Investment Funds 37,116,324 1.32
Total Short Term Investments 1,642,232,556 58.44
Total Investments (Total Cost: $1,642,347,645) 1,642,232,556 58.44
Other Assets/(Liabilities) 1,167,732,173 41.56
Total Net Assets 2,809,964,729 100.00
^Seven-day effective yield at 31 March 2019 was 2.29%.
Economic Classification of InvestmentsAs at 31 March 2019
Industry ClassificationPercent ofNet Assets
Consumer Cyclical 2.60Consumer Non-cyclical 3.29Energy 1.89Financial 48.71Technology 1.95Total Investments 58.44
Other Assets/(Liabilities) 41.56Total Net Assets 100.00
AQR UCITS FUNDS
AQR Style Premia UCITS Fund
Schedule of Investments (continued)As at 31 March 2019
The accompanying notes form an integral part of these audited financial statements. 139

Derivatives
Futures ContractsExchange-Traded
Description Counterparty†Number ofContracts
ExpirationDate
TradingCurrency
Notional Amountin USD
UnrealisedAppreciation/
(Depreciation)in USD
Percent ofNet Assets
10 Year Canadian Treasury Bonds Futures JPPC 284 19/06/2019 CAD 29,590,597 (96,644) (0.01)10 Year US Treasury Note (CBT) Futures JPPC (16,076) 19/06/2019 USD (1,997,191,894) (29,276,654) (1.06)90-DAY Euro Dollar Futures JPPC (3,673) 16/12/2019 USD (895,936,525) (2,153,560) (0.08)90-DAY Euro Dollar Futures JPPC (3,823) 16/09/2019 USD (932,142,975) (1,816,222) (0.05)90-DAY Euro Dollar Futures JPPC (2,840) 16/03/2020 USD (693,634,512) (1,671,865) (0.04)90-DAY Euro Dollar Futures JPPC (661) 17/06/2019 USD (161,027,864) (221,960) (0.01)90-DAY Sterling Futures JPPC (3,035) 18/12/2019 GBP (488,988,296) (889,242) (0.03)90-DAY Sterling Futures JPPC (3,145) 18/09/2019 GBP (506,736,653) (664,585) (0.02)90-DAY Sterling Futures JPPC (2,196) 18/03/2020 GBP (353,847,311) (633,930) (0.01)90-DAY Sterling Futures JPPC (702) 19/06/2019 GBP (113,098,017) (117,246) (0.00)CAC40 10 Euro Futures JPPC (424) 18/04/2019 EUR (25,328,027) (311,810) (0.01)Canadian Bank Accept Futures JPPC 263 16/12/2019 CAD 48,269,006 (41,871) (0.00)Canadian Bank Accept Futures JPPC 253 16/03/2020 CAD 46,462,092 (40,830) (0.00)Canadian Bank Accept Futures JPPC 265 16/09/2019 CAD 48,623,671 (28,519) (0.00)EURO STOXX 50 Futures BARC 1,232 21/06/2019 EUR 45,093,233 (360,798) (0.01)FTSE KLC Index Futures JPPC (38) 30/04/2019 MYR (766,050) (793) (0.00)FTSE/JSE TOP 40 Futures BARC (891) 20/06/2019 ZAR (31,258,795) (115,162) (0.01)FTSE/MIB Index Futures JPPC (653) 21/06/2019 EUR (75,789,976) (2,547,716) (0.09)KOSPI 200 Index Futures BARC 194 13/06/2019 KRW 11,844,067 (68,566) (0.00)Long Gilt Futures JPPC (8,641) 26/06/2019 GBP (1,453,982,900) (24,487,697) (0.88)MEX BOLSA Index Futures BARC (182) 21/06/2019 MXN (4,088,960) (107,504) (0.00)OMXS30 Index Futures BARC (432) 17/04/2019 SEK (7,177,752) (30,509) (0.00)S&P 500 E-mini Futures JPPC (5,182) 21/06/2019 USD (732,346,150) (15,023,217) (0.55)SET50 Futures JPPC (1,291) 27/06/2019 THB (8,814,680) (45,994) (0.00)SPI 200 Futures JPPC 3,387 20/06/2019 AUD 370,368,856 (499,741) (0.02)TOPIX Index Futures BARC (769) 13/06/2019 JPY (110,426,916) (1,226,311) (0.05)10 Year Australian Treasury Bond Futures JPPC 12,958 17/06/2019 AUD 1,272,590,546 23,610,189 0.8510 Year Canadian Treasury Bonds Futures JPPC 2,326 19/06/2019 CAD 242,351,160 5,000,070 0.1910 Year Japan Treasury Bonds Futures JPPC 1,001 13/06/2019 JPY 1,383,965,002 5,052,718 0.183 Month Euro EURIBOR Futures JPPC 868 17/06/2019 EUR 244,379,843 67,831 0.003 Month Euro EURIBOR Futures JPPC 3,537 16/09/2019 EUR 995,819,702 429,296 0.003 Month Euro EURIBOR Futures JPPC 2,529 16/03/2020 EUR 711,952,770 554,200 0.013 Month Euro EURIBOR Futures JPPC 3,397 16/12/2019 EUR 956,403,601 770,166 0.0190-DAY Australian Bank Bill Futures JPPC 1,114 13/06/2019 AUD 786,423,034 510,482 0.0190-DAY Australian Bank Bill Futures JPPC 2,115 12/03/2020 AUD 1,493,918,074 875,897 0.0190-DAY Australian Bank Bill Futures JPPC 2,678 12/09/2019 AUD 1,891,032,295 1,280,451 0.0490-DAY Australian Bank Bill Futures JPPC 2,617 12/12/2019 AUD 1,848,275,797 1,404,216 0.0590-DAY Euro Dollar Futures JPPC (65) 16/03/2020 USD (15,875,438) 5,101 0.00Amsterdam Index Futures BARC 826 18/04/2019 EUR 101,196,960 2,165,872 0.08Canadian Bank Accept Futures JPPC 524 17/06/2019 CAD 96,082,686 218,728 0.01Canadian Bank Accept Futures JPPC 1,372 16/03/2020 CAD 251,960,435 669,474 0.00Canadian Bank Accept Futures JPPC 1,825 16/09/2019 CAD 334,861,132 872,752 0.05Canadian Bank Accept Futures JPPC 1,872 16/12/2019 CAD 343,572,539 1,052,676 0.04DAX Index Futures BARC (831) 21/06/2019 EUR (268,285,660) 925,450 0.04EURO STOXX 50 Futures BARC 4,928 21/06/2019 EUR 180,372,932 2,028,777 0.07Euro-Bund Futures JPPC 11,623 06/06/2019 EUR 2,170,038,479 40,428,582 1.46FTSE 100 Index Futures BARC 3,604 21/06/2019 GBP 337,248,630 6,479,812 0.24FTSE KLC Index Futures JPPC (23) 30/04/2019 MYR (463,662) 149 0.00HANG SENG Index Futures BARC 587 29/04/2019 HKD 108,715,335 1,564,568 0.06IBEX 35 Index Futures BARC 1,286 18/04/2019 EUR 132,257,255 503,848 0.02KOSPI 200 Index Futures BARC 584 13/06/2019 KRW 35,654,304 161,622 0.01S&P 500 E-mini Futures JPPC (94) 21/06/2019 USD (13,284,550) 102,590 0.01S&P TSX 60 Index Futures JPPC 97 20/06/2019 CAD 13,895,732 50,861 0.00Swiss Market Index Futures BARC 4,991 21/06/2019 CHF 464,386,321 7,202,931 0.26
Total Futures Contracts 21,510,363 0.77
Forward Foreign Exchange ContractsOver-the-Counter
Counterparty† Currency Purchased Amount Purchased Currency Sold Amount Sold Settlement Date
UnrealisedAppreciation/
(Depreciation)in USD
Percent ofNet Assets
CITI AUD 79,754,605 USD 57,035,292 19/06/2019 (424,785) (0.02)CITI BRL 1,375,000 USD 362,434 19/06/2019* (11,507) (0.00)CITI CAD 312,299,534 USD 236,862,476 19/06/2019 (2,619,459) (0.09)CITI CHF 6,717,500 USD 6,817,622 19/06/2019 (20,944) (0.00)CITI CNH 125,415,400 USD 18,749,388 19/06/2019 (77,495) (0.00)CITI EUR 8,814,999 USD 10,078,811 19/06/2019 (116,751) (0.00)CITI GBP 112,261,271 USD 148,327,466 19/06/2019 (1,839,864) (0.07)CITI HKD 412,651,000 USD 52,746,266 19/06/2019 (54,180) (0.00)CITI HUF 1,150,000,000 USD 4,157,153 19/06/2019 (114,185) (0.00)CITI ILS 18,500,000 USD 5,141,105 19/06/2019 (16,038) (0.00)CITI INR 115,000,000 USD 1,651,078 19/06/2019* (10,471) (0.00)CITI JPY 1,686,375,000 USD 15,376,573 19/06/2019 (72,910) (0.00)CITI MXN 1,254,346,300 USD 64,334,580 19/06/2019 (192,641) (0.01)CITI NZD 147,305,407 USD 101,062,952 19/06/2019 (585,566) (0.02)CITI PLN 65,677,445 USD 17,320,100 19/06/2019 (137,878) (0.01)CITI SEK 32,584,000 USD 3,567,839 19/06/2019 (32,952) (0.00)CITI SGD 13,090,000 USD 9,710,958 19/06/2019 (35,309) (0.00)CITI USD 17,791 AUD 25,080 19/06/2019 (11) 0.00CITI USD 320,166,479 CHF 318,064,031 19/06/2019 (1,646,507) (0.06)CITI USD 15,581,108 CNH 104,710,000 19/06/2019 (8,158) (0.00)CITI USD 64,166,471 JPY 7,097,464,500 19/06/2019 (242,219) (0.01)CITI USD 3,827,002 MXN 75,064,560 19/06/2019 (11,481) (0.00)CITI USD 35,400,917 NOK 306,579,732 19/06/2019 (262,980) (0.01)CITI USD 12,100,879 NZD 17,796,000 19/06/2019 (37,817) (0.00)CITI USD 50,788 PLN 194,473 19/06/2019 (89) (0.00)CITI USD 111,405,350 SEK 1,031,917,200 19/06/2019 (542,574) (0.02)CITI USD 57,874 SGD 78,500 19/06/2019 (151) (0.00)CITI USD 4,566,185 TWD 140,661,510 19/06/2019* (6,586) (0.00)CITI USD 299,702 ZAR 4,387,000 19/06/2019 (581) (0.00)CITI ZAR 49,000,000 USD 3,363,648 19/06/2019 (9,675) (0.00)
AQR UCITS FUNDS
AQR Style Premia UCITS Fund
Schedule of Investments (continued)As at 31 March 2019
The accompanying notes form an integral part of these audited financial statements. 140

Counterparty† Currency Purchased Amount Purchased Currency Sold Amount Sold Settlement Date
UnrealisedAppreciation/
(Depreciation)in USD
Percent ofNet Assets
JPMC AUD 79,754,610 USD 57,035,366 19/06/2019 (424,857) (0.02)JPMC BRL 1,375,000 USD 362,434 19/06/2019* (11,507) (0.00)JPMC CAD 312,299,528 USD 236,862,765 19/06/2019 (2,619,755) (0.09)JPMC CHF 6,717,500 USD 6,817,630 19/06/2019 (20,952) (0.00)JPMC CNH 125,415,400 USD 18,749,410 19/06/2019 (77,519) (0.00)JPMC EUR 8,815,001 USD 10,078,827 19/06/2019 (116,763) (0.01)JPMC GBP 112,261,279 USD 148,327,661 19/06/2019 (1,840,049) (0.07)JPMC HKD 412,651,000 USD 52,746,506 19/06/2019 (54,417) (0.00)JPMC HUF 1,150,000,000 USD 4,157,158 19/06/2019 (114,190) (0.00)JPMC ILS 18,500,000 USD 5,141,111 19/06/2019 (16,044) (0.00)JPMC INR 115,000,000 USD 1,651,081 19/06/2019* (10,474) (0.00)JPMC JPY 1,686,375,000 USD 15,376,591 19/06/2019 (72,929) (0.00)JPMC MXN 1,254,346,300 USD 64,334,662 19/06/2019 (192,721) (0.01)JPMC NZD 147,305,414 USD 101,063,084 19/06/2019 (585,692) (0.02)JPMC PLN 65,677,445 USD 17,320,121 19/06/2019 (137,899) (0.01)JPMC SEK 32,584,000 USD 3,568,297 19/06/2019 (33,409) (0.00)JPMC SGD 13,090,000 USD 9,710,970 19/06/2019 (35,321) (0.00)JPMC USD 17,791 AUD 25,080 19/06/2019 (11) 0.00JPMC USD 320,166,079 CHF 318,064,031 19/06/2019 (1,646,908) (0.06)JPMC USD 15,584,189 CNH 104,710,000 19/06/2019 (5,075) (0.00)JPMC USD 64,166,390 JPY 7,097,464,500 19/06/2019 (242,299) (0.01)JPMC USD 3,826,997 MXN 75,064,560 19/06/2019 (11,486) (0.00)JPMC USD 35,400,874 NOK 306,579,738 19/06/2019 (263,024) (0.01)JPMC USD 12,100,864 NZD 17,796,000 19/06/2019 (37,832) (0.00)JPMC USD 50,788 PLN 194,473 19/06/2019 (89) (0.00)JPMC USD 111,405,209 SEK 1,031,917,200 19/06/2019 (542,714) (0.02)JPMC USD 57,873 SGD 78,500 19/06/2019 (151) (0.00)JPMC USD 4,566,179 TWD 140,661,510 19/06/2019* (6,592) (0.00)JPMC USD 299,702 ZAR 4,387,000 19/06/2019 (581) (0.00)JPMC ZAR 49,000,000 USD 3,363,653 19/06/2019 (9,679) (0.00)CITI AUD 15,759,893 USD 11,185,645 19/06/2019 863 0.00CITI CAD 112,435,470 USD 83,987,383 19/06/2019 345,833 0.01CITI CHF 2,643,500 USD 2,652,187 19/06/2019 22,471 0.00CITI CNH 101,026,600 USD 14,985,109 19/06/2019 55,770 0.00CITI GBP 9,234,225 USD 11,995,650 19/06/2019 53,915 0.00CITI HKD 9,719,000 USD 1,241,019 19/06/2019 16 0.00CITI INR 2,394,000,000 USD 33,280,911 19/06/2019* 872,250 0.03CITI JPY 619,221,500 USD 5,594,619 19/06/2019 24,746 0.00CITI MXN 1,439,303,700 USD 73,160,077 19/06/2019 439,799 0.02CITI NZD 44,249,089 USD 30,028,533 19/06/2019 153,882 0.01CITI PLN 6,327,555 USD 1,652,908 19/06/2019 2,477 0.00CITI SEK 249,570,500 USD 26,826,800 19/06/2019 247,950 0.01CITI USD 9,765,347 AUD 13,622,420 19/06/2019 96,036 0.00CITI USD 53,834,949 BRL 205,225,000 19/06/2019* 1,457,467 0.05CITI USD 70,500,465 CHF 69,603,469 19/06/2019 76,594 0.00CITI USD 1,337,763 CNH 8,982,500 19/06/2019 445 0.00CITI USD 199,178,444 EUR 174,207,517 19/06/2019 2,301,993 0.08CITI USD 73,348,069 HKD 573,653,500 19/06/2019 97,307 0.00CITI USD 42,049,690 ILS 150,935,000 19/06/2019 236,066 0.01CITI USD 26,644,744 JPY 2,923,123,000 19/06/2019 117,733 0.00CITI USD 103,282,057 KRW 115,784,245,000 19/06/2019* 1,289,336 0.05CITI USD 8,852,980 MXN 170,055,440 19/06/2019 157,067 0.01CITI USD 77,986,554 NOK 666,689,262 19/06/2019 431,730 0.02CITI USD 413,436 PLN 1,568,030 19/06/2019 3,214 0.00CITI USD 27,350,727 SEK 249,797,300 19/06/2019 251,373 0.01CITI USD 2,112,869 SGD 2,848,500 19/06/2019 7,361 0.00CITI USD 16,349,935 TWD 501,628,490 19/06/2019* 42,473 0.00CITI USD 17,911,295 ZAR 255,500,000 19/06/2019 422,717 0.02JPMC AUD 15,759,892 USD 11,185,658 19/06/2019 849 0.00JPMC CAD 112,435,468 USD 83,987,486 19/06/2019 345,728 0.01JPMC CHF 2,643,500 USD 2,652,190 19/06/2019 22,468 0.00JPMC CNH 101,026,600 USD 14,985,127 19/06/2019 55,752 0.00JPMC GBP 9,234,225 USD 11,995,665 19/06/2019 53,900 0.00JPMC HKD 9,719,000 USD 1,241,021 19/06/2019 15 0.00JPMC INR 2,394,000,000 USD 33,280,953 19/06/2019* 872,208 0.03JPMC JPY 619,221,500 USD 5,594,627 19/06/2019 24,739 0.00JPMC MXN 1,439,303,700 USD 73,160,170 19/06/2019 439,707 0.02JPMC NZD 44,249,090 USD 30,028,570 19/06/2019 153,844 0.01JPMC PLN 6,327,555 USD 1,652,910 19/06/2019 2,475 0.00JPMC SEK 249,570,500 USD 26,828,162 19/06/2019 246,589 0.01JPMC USD 9,765,335 AUD 13,622,420 19/06/2019 96,023 0.00JPMC USD 53,834,880 BRL 205,225,000 19/06/2019* 1,457,400 0.05JPMC USD 70,500,376 CHF 69,603,469 19/06/2019 76,505 0.00JPMC USD 1,337,761 CNH 8,982,500 19/06/2019 443 0.00JPMC USD 199,178,155 EUR 174,207,483 19/06/2019 2,301,743 0.08JPMC USD 73,347,978 HKD 573,653,500 19/06/2019 97,215 0.00JPMC USD 42,049,636 ILS 150,935,000 19/06/2019 236,013 0.01JPMC USD 26,644,711 JPY 2,923,123,000 19/06/2019 117,699 0.00JPMC USD 103,281,928 KRW 115,784,245,000 19/06/2019* 1,289,207 0.05JPMC USD 8,852,969 MXN 170,055,440 19/06/2019 157,056 0.01JPMC USD 77,986,457 NOK 666,689,268 19/06/2019 431,632 0.02JPMC USD 413,455 PLN 1,568,024 19/06/2019 3,236 0.00JPMC USD 27,350,693 SEK 249,797,300 19/06/2019 251,339 0.01JPMC USD 2,112,891 SGD 2,848,500 19/06/2019 7,384 0.00JPMC USD 16,349,913 TWD 501,628,490 19/06/2019* 42,452 0.00JPMC USD 17,911,450 ZAR 255,500,000 19/06/2019 422,874 0.02
Total Forward Foreign Exchange Contracts 152,676 0.01
* Non-deliverable forwards (See Note 4)
AQR UCITS FUNDS
AQR Style Premia UCITS Fund
Schedule of Investments (continued)As at 31 March 2019
The accompanying notes form an integral part of these audited financial statements. 141

Hedge Forward Foreign Exchange ContractsOver-the-Counter
Counterparty† Currency Purchased Amount Purchased Currency Sold Amount Sold Settlement Date
UnrealisedAppreciation/
(Depreciation)in USD
Percent ofNet Assets
CITI CHF 1,116,175 USD 1,132,256 19/06/2019 (2,926) (0.00)CITI EUR 657,718,615 USD 751,839,778 19/06/2019 (8,534,850) (0.30)CITI GBP 443,308,820 USD 585,660,114 19/06/2019 (7,194,841) (0.26)JPMC CHF 1,209,187 USD 1,226,368 19/06/2019 (2,928) (0.00)JPMC EUR 657,718,609 USD 751,840,716 19/06/2019 (8,535,790) (0.30)JPMC GBP 443,308,819 USD 585,660,843 19/06/2019 (7,195,573) (0.26)CITI CHF 6,324,993 USD 6,369,053 19/06/2019 30,491 0.00CITI GBP 36,916,814 USD 47,956,506 19/06/2019 215,544 0.01CITI USD 149,398 CHF 147,214 19/06/2019 449 0.00CITI USD 21,370,303 EUR 18,783,140 19/06/2019 142,985 0.00CITI USD 13,744,038 GBP 10,345,707 19/06/2019 244,121 0.01JPMC CHF 6,231,965 USD 6,274,674 19/06/2019 30,747 0.00JPMC GBP 36,916,814 USD 47,956,566 19/06/2019 215,484 0.01JPMC USD 149,399 CHF 147,215 19/06/2019 449 0.00JPMC USD 21,370,273 EUR 18,783,138 19/06/2019 142,959 0.00JPMC USD 13,744,016 GBP 10,345,703 19/06/2019 244,104 0.01
Total Hedge Forward Foreign Exchange Contracts (30,199,575) (1.08)
Total Return Swap ContractsOver-the-Counter
Reference Entity (�RE�)PaymentsMade By Sub-Fund‡
Payments ReceivedBy Sub-Fund‡ Counterparty† Maturity Date
TradingCurrency
NotionalAmountin USD
UnrealisedAppreciation/
(Depreciation)in USD
Percent ofNet Assets
MSCI Australia Net Return AUDIndex
Decreases in RE andpays 1-month BBSW plusor minus a specifiedspread of +0.20%
Increases in RE GSIN 21/06/2019 AUD 2,124,795 (1,432) (0.00)
MSCI Brazil Net Return BRL Index Increases in RE Decreases in RE andreceives BZDIOVRA plus orminus a specified spread of-0.01%
GSIN 24/06/2019 BRL (2,266,500) (57,824) (0.01)
MSCI Mexico Net Return MXN Index Increases in RE Decreases in RE andreceives TIIE plus or minus aspecified spread of +0.00%
GSIN 21/06/2019 MXN (1,353,327) (29,417) (0.00)
MSCI Poland Net Return PLN Index Decreases in RE andpays 1-month WIBOR plusor minus a specifiedspread of +0.30%
Increases in RE GSIN 24/06/2019 PLN 31,646 (141) (0.00)
MSCI Singapore Net Return SGDIndex
Decreases in RE andpays 1-month SIBOR plusor minus a specifiedspread of +0.05%
Increases in RE GSIN 21/06/2019 SGD 8,437,632 (155) (0.00)
MSCI Spain Net Return EUR Index Decreases in RE andpays 1-month EURIBORplus or minus a specifiedspread of -0.45%
Increases in RE GSIN 21/06/2019 EUR 32,987,760 (8,457) (0.00)
MSCI China Net Return HKD Index Increases in RE Decreases in RE andreceives 1-month HIBOR plusor minus a specified spreadof +0.05%
GSIN 21/06/2019 HKD (15,658,419) 170,897 0.01
MSCI Netherlands Net Return EURIndex
Decreases in RE andpays 1-month EURIBORplus or minus a specifiedspread of -0.45%
Increases in RE GSIN 21/06/2019 EUR 4,187,491 84,418 0.00
MSCI Sweden Net Return SEK Index Increases in RE Decreases in RE andreceives 1-month STIBORplus or minus a specifiedspread of -3.30%
GSIN 24/06/2019 SEK (91,330,559) 796,646 0.03
BIST 30 Futures Apr19 Decreases in RE Increases in RE GSIN 30/04/2019 TRY 15,819,851 (1,761,168) (0.07)BOVESPA Index Futures Apr19 Increases in RE Decreases in RE MLIN 17/04/2019 BRL (3,309,049) (75,113) (0.00)DTOP Index Futures Jun19 Increases in RE Decreases in RE MLIN 20/06/2019 ZAR (225,201) (2,783) (0.00)H-Shares Index Futures Apr19 Increases in RE Decreases in RE JPMC 29/04/2019 HKD (7,317,078) (81,843) (0.00)H-Shares Index Futures Apr19 Increases in RE Decreases in RE MLIN 29/04/2019 HKD (11,084,288) (106,063) (0.00)KOSPI 200 Index Futures Jun19 Decreases in RE Increases in RE MLIN 13/06/2019 KRW 28,938,596 (168,328) (0.01)TAIEX Futures Apr19 Increases in RE Decreases in RE MLIN 17/04/2019 TWD (56,118,284) (733,350) (0.03)TAIEX Futures Apr19 Increases in RE Decreases in RE GSIN 17/04/2019 TWD (13,273,076) (161,940) (0.00)Tel Aviv 35 Index Futures Apr19 Decreases in RE Increases in RE MLIN 24/04/2019 ILS 18,518,978 (293,896) (0.01)DTOP Index Futures Jun19 Increases in RE Decreases in RE JPMC 20/06/2019 ZAR (1,696,513) 4,574 0.00KOSPI 200 Index Futures Jun19 Decreases in RE Increases in RE MLIN 13/06/2019 KRW 53,664,611 189,644 0.01WIG20 Index Futures Jun19 Decreases in RE Increases in RE GSIN 21/06/2019 PLN 458,370 682 0.00
Total of Total Return Swap Contracts (2,235,049) (0.08)
AQR UCITS FUNDS
AQR Style Premia UCITS Fund
Schedule of Investments (continued)As at 31 March 2019
The accompanying notes form an integral part of these audited financial statements. 142

Total Return Basket Swap ContractsOver-the-Counter
Counterparty† Description‡ Termination DateFair Value in
USDGSIN The Sub-Fund receives the total return on a portfolio of long and short positions. The Sub-Fund pays
CDOR for the long positions and CORRA for the short positions, plus or minus a specified spread, which isdenominated in CAD based on the local currency of the positions within the swap.
19.04.2023 - 20.03.2024 (2,941,071)
The following table represents the long and short positions and related values within the total return equity basket swap as at 31 March 2019
Reference Entity Currency Shares Notional Amount
UnrealisedAppreciation/
(Depreciation)in USD
Percent ofNet Assets
Long PositionsCommon StocksBrazilYamana Gold Inc CAD 451,346 1,185,974 6,758 0.00
6,758 0.00CanadaAir Canada CAD 731,825 17,684,766 (591,684) (0.02)Arc Resources Ltd CAD 195,318 1,358,365 45,328 0.00Canadian Imperial Bank Of Commerce CAD 147,440 11,729,637 (683,226) (0.03)Canadian Natural Resources Ltd CAD 374,977 10,307,797 89,828 0.00Canadian Tire Corp Ltd CAD 33,337 3,583,266 (77,365) (0.00)Cgi Group Inc CAD 107,801 7,394,674 171,894 0.01CI Financial Corp CAD 29,577 403,866 (3,321) (0.00)Empire Co Ltd CAD 55,534 1,208,960 (16,629) (0.00)Fairfax Financial Holdings Ltd CAD 2,319 1,051,397 (57,654) (0.00)Fortis Inc CAD 14,471 533,752 11,700 0.00Hydro One Ltd CAD 110,678 1,715,103 12,428 0.00Intact Financial Corp CAD 32,634 2,758,914 63,030 0.00Kinross Gold Corp CAD 1,117,672 3,840,481 75,304 0.00Linamar Corp CAD 56,584 2,026,909 (124,114) (0.01)Magna International Inc CAD 72,758 3,565,458 (117,650) (0.00)Methanex Corp CAD 60,590 3,436,367 (119,747) (0.00)National Bank Of Canada CAD 73,434 3,314,920 (84,110) (0.00)Peyto Exploration Development Corp CAD 462,381 2,450,709 (44,999) (0.00)Quebecor Inc CAD 110,559 2,690,727 57,109 0.00Rogers Communications Inc CAD 11,614 626,433 (4,346) (0.00)Royal Bank of Canada CAD 19,627 1,485,910 (27,182) (0.00)Seven Generations Energy Ltd CAD 406,741 2,980,981 (57,854) (0.00)Teck Resources Ltd CAD 62,774 1,460,560 93,987 0.00The Bank of Nova Scotia CAD 14,209 757,253 (14,254) (0.00)The Toronto-Dominion Bank CAD 129,778 7,052,392 (245,799) (0.01)Thomson Reuters Corp CAD 6,511 382,530 25,541 0.00Tourmaline Oil Corp CAD 347,687 5,393,079 111,922 0.00West Fraser Timber Co Ltd CAD 112,508 5,446,843 (560,097) (0.02)WestJet Airlines Ltd CAD 57,461 828,061 (57,212) (0.00)
(2,129,172) (0.08)United StatesBRP Inc CAD 143,401 3,968,809 (15,079) (0.00)Valeant Pharmaceuticals International Inc CAD 185,616 4,536,879 172,304 0.01
157,225 0.01
Total Long Positions (1,965,189) (0.07)
Short PositionsCommon StocksCanadaAgnico Eagle Mines Ltd CAD (7,975) (348,720) (1,910) (0.00)Altagas Ltd CAD (845,589) (11,191,805) 46,780 0.00Barrick Gold Corp CAD (63,353) (881,194) (42,210) (0.00)Blackberry Ltd CAD (266,524) (2,681,601) (203,110) (0.01)Bombardier Inc CAD (1,507,046) (2,899,467) 314,711 0.01Cameco Corp CAD (494,582) (5,864,784) 22,215 0.00Cenovus Energy Inc CAD (632,640) (5,436,972) (18,944) (0.00)Dollarama Inc CAD (128,141) (3,367,083) 173,471 0.01Element Fleet Management Corp CAD (585,272) (3,732,982) (262,886) (0.01)Enbridge Inc CAD (545,114) (19,902,088) 40,808 0.00Inter Pipeline Ltd CAD (192,895) (3,184,110) (44,765) (0.00)Keyera Corp CAD (108,690) (2,530,513) 69,976 0.00Pembina Pipeline Corp CAD (217,072) (7,956,165) 11,375 0.00PrairieSky Royalty Ltd CAD (74,823) (1,017,768) 50,619 0.00Restaurant Brands International Inc CAD (6,981) (456,707) (19,755) (0.00)Shopify Inc CAD (54,991) (11,298,308) (246,591) (0.01)Silver Wheaton Corp CAD (316,335) (7,573,284) (594,401) (0.02)Snc-Lavalin Group Inc CAD (30,562) (781,781) 31,580 0.00The Stars Group Inc CAD (62,602) (1,094,762) (35,098) (0.00)Transcanada Corp CAD (300,350) (13,391,860) 150,647 0.01
(557,488) (0.02)ZambiaFirst Quantum Minerals Ltd CAD (1,090,377) (12,178,788) (391,811) (0.02)
(391,811) (0.02)
Total Short Positions (949,299) (0.04)
Total of Long and Short Equity Positions (2,914,488) (0.11)Net Cash and Other Receivables/(Payables) (26,583) (0.00)
Total of Total Return Basket Swap Contract - GSIN - CAD (2,941,071) (0.11)
AQR UCITS FUNDS
AQR Style Premia UCITS Fund
Schedule of Investments (continued)As at 31 March 2019
The accompanying notes form an integral part of these audited financial statements. 143

Counterparty† Description‡ Termination DateFair Value in
USDGSIN The Sub-Fund receives the total return on a portfolio of long and short positions. The Sub-Fund pays
SIBOR for the long positions and SOR for the short positions, plus or minus a specified spread, which isdenominated in SGD based on the local currency of the positions within the swap.
20.04.2023 - 12.12.2023 145,187
The following table represents the long and short positions and related values within the total return equity basket swap as at 31 March 2019
Reference Entity Currency Shares Notional Amount
UnrealisedAppreciation/
(Depreciation)in USD
Percent ofNet Assets
Long PositionsCommon StocksChinaYangzijiang Shipbuilding Holdings Ltd SGD 2,186,800 2,423,523 182,616 0.01
182,616 0.01SingaporeComfortDelGro Corp Ltd SGD 730,000 1,386,161 82,253 0.00Venture Corp Ltd SGD 114,300 1,515,087 (25,392) (0.00)
56,861 0.00
Total Long Positions 239,477 0.01
Short PositionsCommon StocksSingaporeCapitaland Ltd SGD (545,600) (1,470,848) (85,556) (0.00)
(85,556) (0.00)
Total Short Positions (85,556) (0.00)
Total of Long and Short Equity Positions 153,921 0.01Net Cash and Other Receivables/(Payables) (8,734) (0.00)
Total of Total Return Basket Swap Contract - GSIN - SGD 145,187 0.01
Counterparty† Description‡ Termination DateFair Value in
USDGSIN The Sub-Fund receives the total return on a portfolio of long and short positions. The Sub-Fund pays
1-month LIBOR for the long positions and FFR for the short postions, plus or minus a specified spreadwhich is denominated in USD based on the local currency of the positions within the swap.
19.04.2023 - 20.03.2024 (17,446,658)
The following table represents the long and short positions and related values within the total return equity basket swap as at 31 March 2019
Reference Entity Currency Shares Notional Amount
UnrealisedAppreciation/
(Depreciation)in USD
Percent ofNet Assets
Long PositionsCommon StocksPuerto RicoPopular Inc USD 7,047 369,122 (11,275) (0.00)
(11,275) (0.00)United StatesAaron’s Inc USD 14,009 727,908 (17,511) (0.00)Abbott Laboratories USD 93,191 7,390,978 127,920 0.01AbbVie Inc USD 206,321 16,593,366 483,823 0.02ABIOMED Inc USD 9,356 2,679,371 (307,064) (0.01)Adobe Systems Inc USD 69,712 18,518,993 326,949 0.01Adtalem Global Education Inc USD 164,298 7,671,074 (248,090) (0.01)AES Corp USD 765,769 13,868,077 98,536 0.00Aflac Inc USD 498,429 24,821,764 363,853 0.01Air Lease Corp USD 112,856 3,891,275 (34,985) (0.00)Akamai Technologies Inc USD 178,558 12,752,612 (92,850) (0.00)Alexion Pharmaceuticals Inc USD 130,394 17,475,404 258,180 0.01Alphabet Inc USD 9,289 10,850,945 (103,201) (0.00)AMC Networks Inc USD 144,784 8,252,688 (594,516) (0.02)Amdocs Ltd USD 92,302 4,991,692 (78,457) (0.00)AMERCO USD 25,457 9,585,070 9,928 0.00Ameren Corp USD 94,695 6,945,878 73,862 0.00American Eagle Outfitters Inc USD 514,100 11,428,443 601,497 0.02American Financial Group Inc USD 38,188 3,661,465 (8,401) (0.00)American Water Works Co Inc USD 23,094 2,410,090 7,621 0.00Ameriprise Financial Inc USD 78,639 10,054,783 275,237 0.01Amgen Inc USD 157,139 29,852,482 916,906 0.03ANSYS Inc USD 16,599 3,019,690 52,951 0.00Anthem Inc USD 102,914 29,162,740 (1,494,376) (0.05)Apple Inc USD 50,516 9,536,916 499,603 0.02Archer-Daniels-Midland Co USD 68,032 2,916,532 2,041 0.00Arista Networks Inc USD 3,584 1,120,251 48,174 0.00Arrow Electronics Inc USD 222,361 17,164,046 (193,454) (0.01)Assured Guaranty Ltd USD 299,050 13,298,754 32,777 0.00AT&T Inc USD 58,767 1,830,592 54,653 0.00Athene Holding Ltd USD 443,748 18,064,981 (528,114) (0.02)Avnet Inc USD 164,399 7,105,325 69,048 0.00AXA Equitable Holdings Inc USD 110,689 2,223,189 (48,635) (0.00)Baxter International Inc USD 166,104 13,392,966 915,233 0.03Bed Bath & Beyond Inc USD 464,190 8,037,450 967,836 0.04Best Buy Co Inc USD 68,070 4,836,374 158,603 0.01Big Lots Inc USD 18,134 685,828 25,750 0.00Biogen Inc USD 147,124 34,578,554 (11,348,479) (0.40)Bio-Rad Laboratories Inc USD 3,109 955,147 (3,264) (0.00)Bio-Techne Corp USD 35,251 6,986,748 219,614 0.01Booking Holdings Inc USD 12,734 22,205,422 431,555 0.02Booz Allen Hamilton Holding Corp USD 22,655 1,316,029 65,020 0.00Boston Scientific Corp USD 45,047 1,718,318 (6,780) (0.00)Boyd Gaming Corp USD 13,386 365,572 (26,906) (0.00)
AQR UCITS FUNDS
AQR Style Premia UCITS Fund
Schedule of Investments (continued)As at 31 March 2019
The accompanying notes form an integral part of these audited financial statements. 144

Reference Entity Currency Shares Notional Amount
UnrealisedAppreciation/
(Depreciation)in USD
Percent ofNet Assets
Long Positions (continued)Common Stocks (continued)United States (continued)Brinker International Inc USD 56,238 2,476,722 61,862 0.00Bristol-Myers Squibb Co USD 101,681 4,783,074 (392,489) (0.01)Broadridge Financial Solutions Inc USD 5,572 572,802 18,443 0.00Bruker Corp USD 19,304 742,818 6,563 0.00Brunswick Corp USD 34,434 1,732,375 (70,934) (0.00)CACI International Inc USD 2,819 518,019 2,171 0.00Cadence Design Systems Inc USD 239,197 15,088,547 737,018 0.03Capital One Financial Corp USD 40,331 3,310,772 (30,652) (0.00)Cardinal Health Inc USD 30,057 1,432,517 (35,768) (0.00)Carnival Corp USD 94,806 4,784,859 (470,238) (0.02)CDK Global Inc USD 45,234 2,638,499 (14,475) (0.00)CDW Corp USD 95,777 9,194,592 119,301 0.00Celanese Corp USD 32,957 3,238,025 (106,781) (0.00)Centene Corp USD 124,835 6,555,086 (653,352) (0.02)CenturyLink Inc USD 493,022 5,908,869 (175,023) (0.01)Cerner Corp USD 52,658 2,989,395 26,856 0.00Charles River Laboratories Int USD 226,077 32,677,170 917,382 0.03Chesapeake Energy Corp USD 2,710,201 8,455,827 919,698 0.03Ciena Corp USD 263,603 9,821,848 (734,862) (0.03)Cigna Corp USD 72,963 11,612,061 (326,874) (0.01)Cimarex Energy Co USD 6,274 439,368 8,093 0.00Cirrus Logic Inc USD 263,677 11,032,246 89,650 0.00Cisco Systems Inc USD 517,530 27,641,277 476,167 0.02Citrix Systems Inc USD 25,989 2,596,561 (5,977) (0.00)Coach Inc USD 101,618 3,357,459 (83,327) (0.00)Cognizant Technology Solutions Corp USD 8,948 647,209 (179) (0.00)CommScope Holding Co Inc USD 331,203 7,127,489 (171,408) (0.01)ConocoPhillips USD 147,042 9,869,459 183,803 0.01CONSOL Energy Inc USD 367,256 3,968,201 103,898 0.00Consolidated Edison Inc USD 537,569 45,489,089 188,149 0.01Costco Wholesale Corp USD 4,942 1,190,429 55,301 0.00Credit Acceptance Corp USD 1,385 624,344 9,390 0.00Curtiss-Wright Corp USD 69,840 7,887,730 (94,284) (0.00)Dana Holding Corp USD 72,765 1,287,213 (76,403) (0.00)Danaher Corp USD 127,836 16,687,711 538,190 0.02Darden Restaurants Inc USD 15,517 1,892,919 204,980 0.01Deckers Outdoor Corp USD 134,999 19,958,252 676,423 0.02Delphi Technologies Plc USD 58,438 1,129,607 (53,179) (0.00)Deluxe Corp USD 103,724 4,525,478 107,873 0.00DexCom Inc USD 17,691 2,095,676 (495,422) (0.02)Dick’s Sporting Goods Inc USD 141,662 5,194,746 (314,490) (0.01)Dillard’s Inc USD 97,639 6,984,118 (49,796) (0.00)Discover Financial Services USD 7,678 549,207 5,067 0.00DTE Energy Co USD 45,776 5,680,344 18,310 0.00DXC Technology Co USD 147,855 9,566,219 (109,413) (0.00)Eaton Corp PLC USD 244,104 19,618,638 14,646 0.00eBay Inc USD 154,774 5,709,613 99,055 0.00Edwards Lifesciences Corp USD 43,829 8,320,059 523,987 0.02Eldorado Resorts Inc USD 132,517 6,188,544 (95,145) (0.00)Electronic Arts Inc USD 49,584 5,024,843 114,043 0.00Eli Lilly & Co USD 229,325 29,709,054 1,208,842 0.04EMCOR Group Inc USD 11,323 833,712 19,589 0.00Encompass Health Corp USD 26,858 1,568,239 (26,858) (0.00)ENERSYS USD 6,604 435,402 (20,010) (0.00)Everest Re Group Ltd USD 101,912 21,952,864 (256,818) (0.01)Exelixis Inc USD 815,354 19,470,654 277,220 0.01Exelon Corp USD 734,317 36,701,164 660,885 0.02Expedia Group Inc USD 10,306 1,234,762 (21,230) (0.00)F5 Networks Inc USD 87,417 13,726,217 (418,136) (0.01)Facebook Inc USD 142,526 23,532,468 (991,981) (0.03)Fair Isaac Corp USD 29,148 7,811,664 444,216 0.02Federated Investors Inc USD 140,667 4,141,236 (56,267) (0.00)First American Financial Corp USD 87,439 4,513,601 97,932 0.00FLIR Systems Inc USD 56,375 2,670,484 (179,273) (0.01)Foot Locker Inc USD 303,155 18,219,616 76,059 0.00Fortinet Inc USD 111,894 9,320,770 77,950 0.00GATX Corp USD 39,559 3,009,253 2,769 0.00General Dynamics Corp USD 17,887 3,018,074 (13,952) (0.00)Gilead Sciences Inc USD 415,320 27,116,243 394,554 0.01Globus Medical Inc USD 169,133 8,224,938 351,797 0.01GrafTech International Ltd USD 62,692 809,981 (16,414) (0.00)Graham Holdings Co USD 10,375 7,109,988 (9,130) (0.00)GrubHub Inc USD 30,529 2,095,816 (235,073) (0.01)H&R Block Inc USD 140,577 3,377,362 (118,788) (0.00)Haemonetics Corp USD 13,184 1,154,127 3,164 0.00Harris Corp USD 18,853 3,020,062 (57,313) (0.00)Hawaiian Electric Industries Inc USD 12,825 522,234 7,050 0.00HCA Holdings Inc USD 223,576 29,000,043 504,807 0.02Helmerich Payne Inc USD 82,769 4,623,476 131,603 0.01Herman Miller Inc USD 27,725 973,425 (32,993) (0.00)Hill-Rom Holdings Inc USD 9,357 980,707 2,994 0.00HollyFrontier Corp USD 556,405 27,753,481 (105,717) (0.00)Honeywell International Inc USD 19,186 3,032,539 93,436 0.00HP Co USD 423,920 8,179,536 108,100 0.00Humana Inc USD 47,512 12,492,805 (482,722) (0.02)Huntington Ingalls Industries Inc USD 130,298 26,972,989 827,982 0.03IAC/InterActiveCorp USD 35,258 7,391,840 59,939 0.00ICU Medical Inc USD 29,149 6,962,530 81,326 0.00Ingredion Inc USD 35,813 3,355,320 52,287 0.00Inogen Inc USD 18,700 1,756,865 (45,247) (0.00)Insperity Inc USD 9,189 1,130,155 (9,209) (0.00)Intel Corp USD 347,589 18,623,819 79,945 0.00International Business Machines Corp USD 128,757 18,077,483 346,356 0.01International Paper Co USD 134,937 6,197,656 (74,215) (0.00)Intuit Inc USD 24,545 6,381,209 231,705 0.01
AQR UCITS FUNDS
AQR Style Premia UCITS Fund
Schedule of Investments (continued)As at 31 March 2019
The accompanying notes form an integral part of these audited financial statements. 145

Reference Entity Currency Shares Notional Amount
UnrealisedAppreciation/
(Depreciation)in USD
Percent ofNet Assets
Long Positions (continued)Common Stocks (continued)United States (continued)Intuitive Surgical Inc USD 7,036 3,971,822 151,626 0.01IQVIA Holdings Inc USD 262,826 37,515,783 801,455 0.03ITT Corp USD 20,148 1,169,994 5,037 0.00j2 Global Inc USD 138,557 11,996,265 308,982 0.01Jabil Circuit Inc USD 418,176 11,098,391 (451,630) (0.02)Jacobs Engineering Group Inc USD 12,193 917,523 26,947 0.00Jazz Pharmaceuticals PLC USD 35,933 5,081,106 302,017 0.01JetBlue Airways Corp USD 440,401 7,189,546 (81,474) (0.00)John Wiley & Sons Inc USD 31,345 1,370,090 (14,419) (0.00)Juniper Networks Inc USD 355,733 9,366,450 53,699 0.00KB Home USD 183,705 4,519,143 91,853 0.00Keysight Technologies Inc USD 18,094 1,570,378 27,861 0.00Kohl’s Corp USD 482,670 33,347,670 (188,060) (0.01)Laboratory Corp of America Holdings USD 126,057 19,130,410 251,772 0.01Lam Research Corp USD 54,029 9,627,968 334,440 0.01Lear Corp USD 41,438 5,634,325 (465,349) (0.02)LogMeIn Inc USD 45,763 3,667,904 (50,797) (0.00)lululemon athletica Inc USD 83,618 13,794,461 1,664,871 0.06Lumentum Holdings Inc USD 194,200 10,886,852 1,262,300 0.05LyondellBasell Industries NV USD 117,791 9,849,683 (598,378) (0.02)Macy’s Inc USD 1,087,720 26,127,034 479,043 0.02Mallinckrodt PLC USD 506,612 10,952,951 111,455 0.00Manhattan Associates Inc USD 74,646 4,110,755 69,421 0.00ManpowerGroup Inc USD 109,654 9,077,158 176,543 0.01Marathon Petroleum Corp USD 224,596 13,430,841 123,196 0.00Masimo Corp USD 13,071 1,786,675 65,132 0.00Match Group Inc USD 141,556 7,979,512 379,963 0.01McKesson Corp USD 27,428 3,185,488 (22,232) (0.00)Medtronic PLC USD 119,161 10,749,514 (213,298) (0.01)Merck & Co Inc USD 272,775 22,653,964 574,923 0.02MetLife Inc USD 28,055 1,195,424 (54,988) (0.00)Michael Kors Holdings Ltd USD 360,725 16,838,643 717,843 0.03Micron Technology Inc USD 1,388,447 56,926,327 2,618,549 0.09Microsoft Corp USD 201,283 23,580,303 869,543 0.03MKS Instruments Inc USD 70,174 6,404,079 767,002 0.03Molina Healthcare Inc USD 80,220 11,346,317 316,063 0.01Molson Coors Brewing Co USD 16,550 991,676 (2,979) (0.00)MSA Safety Inc USD 5,785 601,524 (3,413) (0.00)Murphy USA Inc USD 68,270 5,834,354 451,265 0.02Mylan NV USD 340,203 9,654,961 415,048 0.02Nektar Therapeutics USD 136,980 4,564,174 (291,767) (0.01)NetApp Inc USD 6,300 431,046 19,908 0.00New Jersey Resources Corp USD 38,557 1,925,151 (8,097) (0.00)NIKE Inc USD 83,541 7,073,416 (96,072) (0.00)Northrop Grumman Corp USD 30,576 8,205,375 (332,055) (0.01)NorthWestern Corp USD 48,188 3,394,845 (4,819) (0.00)Norwegian Cruise Line Holdings Ltd USD 16,296 889,436 (14,340) (0.00)NRG Energy Inc USD 545,363 23,232,464 427,540 0.02Nu Skin Enterprises Inc USD 39,156 1,863,826 (444,421) (0.02)Oasis Petroleum Inc USD 183,315 1,111,805 129,237 0.01Okta Inc USD 11,725 972,589 23,685 0.00Old Republic International Corp USD 329,693 6,935,092 54,399 0.00ON Semiconductor Corp USD 286,590 5,877,961 (601,839) (0.02)Oracle Corp USD 291,693 15,576,406 215,853 0.01Oshkosh Corp USD 21,757 1,625,248 (82,677) (0.00)Owens-Illinois Inc USD 52,523 1,002,664 (37,291) (0.00)Packaging Corp of America USD 22,758 2,240,070 14,565 0.00Patterson Cos Inc USD 42,207 913,782 (24,480) (0.00)Patterson-UTI Energy Inc USD 386,657 5,463,463 363,458 0.01Paycom Software Inc USD 10,890 2,056,141 78,432 0.00PBF Energy Inc USD 836,814 26,142,069 803,341 0.03Penske Automotive Group Inc USD 31,365 1,402,956 78,099 0.00Pfizer Inc USD 510,464 21,567,104 382,848 0.01Phillips 66 USD 126,182 11,944,388 (373,197) (0.01)Pilgrim’s Pride Corp USD 266,771 5,860,959 394,821 0.01PRA Health Sciences Inc USD 148,624 16,207,447 938,164 0.03Public Service Enterprise Group Inc USD 195,940 11,558,501 62,701 0.00PulteGroup Inc USD 647,982 18,331,411 90,056 0.00PVH Corp USD 32,059 3,934,922 344,634 0.01QIAGEN NV USD 84,211 3,406,335 91,372 0.00Quanta Services Inc USD 146,414 5,500,774 245,976 0.01Quest Diagnostics Inc USD 6,062 543,701 25,764 0.00Qurate Retail Group Inc QVC Group USD 648,215 10,361,717 (979,609) (0.03)Ralph Lauren Corp USD 14,475 1,882,329 95,246 0.00Raytheon Co USD 137,508 24,960,452 (82,892) (0.00)Regeneron Pharmaceuticals Inc USD 38,323 15,698,250 (82,031) (0.00)Reinsurance Group of America Inc USD 93,868 13,305,789 (179,288) (0.01)Republic Services Inc USD 25,245 2,025,154 43,926 0.00Resideo Technologies Inc USD 39,780 760,991 (50,238) (0.00)ResMed Inc USD 11,447 1,183,963 23,237 0.00Robert Half International Inc USD 315,578 20,591,465 70,494 0.00Ross Stores Inc USD 5,751 533,348 11,306 0.00Royal Caribbean Cruises Ltd USD 11,934 1,355,106 (39,740) (0.00)RPC Inc USD 465,055 5,269,073 720,835 0.03Ryder System Inc USD 48,186 3,012,107 77,098 0.00Sally Beauty Holdings Inc USD 243,571 4,461,003 71,853 0.00Santander Consumer USA Holdings Inc USD 105,369 2,229,608 30,214 0.00Science Applications International Corp USD 17,207 1,351,610 105,823 0.00Seagate Technology PLC USD 334,854 15,892,171 (391,779) (0.01)Service Corp International USD 108,924 4,365,129 63,721 0.00Silgan Holdings Inc USD 20,143 595,629 17,323 0.00Skechers U.S.A. Inc USD 210,917 7,118,449 234,118 0.01Skyworks Solutions Inc USD 145,437 11,888,020 37,814 0.00SM Energy Co USD 178,141 3,121,030 383,723 0.01Snap-on Inc USD 47,900 7,452,282 (205,491) (0.01)
AQR UCITS FUNDS
AQR Style Premia UCITS Fund
Schedule of Investments (continued)As at 31 March 2019
The accompanying notes form an integral part of these audited financial statements. 146

Reference Entity Currency Shares Notional Amount
UnrealisedAppreciation/
(Depreciation)in USD
Percent ofNet Assets
Long Positions (continued)Common Stocks (continued)United States (continued)Sonoco Products Co USD 32,584 1,988,276 56,370 0.00Southwestern Energy Co USD 3,374,915 15,878,975 1,501,353 0.05Spirit AeroSystems Holdings Inc USD 274,616 25,132,856 (326,552) (0.01)Springleaf Holdings Inc USD 67,736 2,165,520 (73,511) (0.00)Square Inc USD 5,262 393,861 (447) (0.00)STERIS Corp USD 5,415 689,059 33,952 0.00Symantec Corp USD 467,515 10,701,418 238,433 0.01Synchrony Financial USD 135,114 4,323,648 (94,580) (0.00)SYNNEX Corp USD 44,787 4,257,452 30,455 0.00Synopsys Inc USD 33,864 3,863,205 293,601 0.01TE Connectivity Ltd USD 104,185 8,374,390 (258,379) (0.01)Tech Data Corp USD 185,593 18,857,177 73,817 0.00TEGNA Inc USD 294,351 4,144,462 (173,667) (0.01)Teledyne Technologies Inc USD 34,773 8,165,396 241,006 0.01Telephone Data Systems Inc USD 146,950 4,501,079 (198,872) (0.01)Textron Inc USD 236,008 11,956,165 (336,585) (0.01)The Allstate Corp USD 121,969 11,455,328 (23,174) (0.00)The Boston Beer Co Inc USD 46,108 13,470,913 (1,241,688) (0.04)The Cheesecake Factory Inc USD 67,011 3,260,085 148,764 0.01The Cooper Cos Inc USD 16,209 4,785,869 104,548 0.00The Estee Lauder Cos Inc USD 68,290 11,222,779 466,421 0.02The Gap Inc USD 32,813 861,669 (1,313) (0.00)The Hanover Insurance Group Inc USD 27,667 3,169,808 (54,504) (0.00)The Kroger Co USD 501,674 12,336,164 (40,134) (0.00)The TJX Cos Inc USD 48,798 2,592,638 69,781 0.00Thermo Fisher Scientific Inc USD 82,740 22,418,403 1,375,966 0.05T-Mobile US Inc USD 107,519 7,348,924 (342,338) (0.01)Toll Brothers Inc USD 32,568 1,186,127 1,303 0.00Torchmark Corp USD 51,163 4,192,296 (7,674) (0.00)TransDigm Group Inc USD 1,638 740,081 9,603 0.00TRI Pointe Group Inc USD 179,445 2,323,813 (43,148) (0.00)TripAdvisor Inc USD 178,840 9,238,874 (14,674) (0.00)Twilio Inc USD 77,299 9,945,289 398,918 0.01Twitter Inc USD 105,801 3,456,519 190,442 0.01Tyson Foods Inc USD 153,511 10,561,557 703,080 0.03Ubiquiti Networks Inc USD 10,034 1,496,170 52,913 0.00UGI Corp USD 94,597 5,246,350 55,812 0.00United Continental Holdings Inc USD 62,403 4,962,911 (177,849) (0.01)United Rentals Inc USD 10,834 1,234,643 (108,882) (0.00)United States Cellular Corp USD 18,978 862,930 (31,904) (0.00)United Technologies Corp USD 10,392 1,328,721 19,225 0.00United Therapeutics Corp USD 191,326 22,576,468 1,180,481 0.04UnitedHealth Group Inc USD 19,225 4,690,708 16,149 0.00Universal Health Services Inc USD 76,610 10,259,611 267,559 0.01Urban Outfitters Inc USD 149,433 4,451,609 (19,426) (0.00)Valero Energy Corp USD 273,880 22,978,532 59,270 0.00Varian Medical Systems Inc USD 18,356 2,603,064 132,347 0.01Veeva Systems Inc USD 63,670 8,018,600 474,978 0.02VeriSign Inc USD 43,522 7,905,771 112,287 0.00Verizon Communications Inc USD 680,843 40,053,994 851,054 0.03Vertex Pharmaceuticals Inc USD 6,131 1,117,620 10,852 0.00Viacom Inc USD 992,253 27,326,648 (1,488,380) (0.05)Vishay Intertechnology Inc USD 405,150 7,479,069 (879,176) (0.03)Vistra Energy Corp USD 1,213,201 31,531,094 885,406 0.03VMware Inc USD 103,071 18,398,174 528,754 0.02Walgreens Boots Alliance Inc USD 66,639 4,233,576 189,921 0.01Wayfair Inc USD 13,133 1,990,831 (209,395) (0.01)Weight Watchers International Inc USD 85,530 1,741,391 20,331 0.00Werner Enterprises Inc USD 209,978 7,191,747 (182,681) (0.01)West Pharmaceutical Services Inc USD 4,777 522,843 30,621 0.00Western Digital Corp USD 43,177 2,066,451 (77,719) (0.00)Westlake Chemical Corp USD 81,914 5,542,301 (90,925) (0.00)Whiting Petroleum Corp USD 55,735 1,460,257 100,809 0.00Williams-Sonoma Inc USD 180,603 10,213,100 (191,439) (0.01)Woodward Inc USD 71,520 6,773,659 56,081 0.00WW Grainger Inc USD 8,607 2,545,348 6,369 0.00Xerox Corp USD 124,837 4,006,019 72,202 0.00Zebra Technologies Corp USD 20,638 4,318,502 (19,171) (0.00)Zoetis Inc USD 140,818 14,091,657 751,968 0.03
15,414,404 0.55
Total Long Positions 15,403,129 0.55
Short PositionsCommon StocksArgentinaMercadoLibre Inc USD (27,132) (13,707,900) (654,424) (0.02)
(654,424) (0.02)GhanaKosmos Energy Ltd USD (1,672,890) (10,321,731) (117,102) (0.01)
(117,102) (0.01)PanamaCopa Holdings SA USD (158,035) (12,544,818) 707,890 0.02
707,890 0.02SwedenAutoliv Inc USD (5,612) (412,314) 27,698 0.00
27,698 0.00United States2U Inc USD (42,376) (3,063,573) (114,627) (0.00)Acadia Healthcare Co Inc USD (143,178) (4,209,433) 40,090 0.00Adient plc USD (424,464) (5,556,234) 829,354 0.03Advanced Micro Devices Inc USD (266,222) (6,754,052) (641,595) (0.02)Agios Pharmaceuticals Inc USD (216,248) (14,319,943) (404,384) (0.01)Akorn Inc USD (154,771) (538,603) 35,597 0.00
AQR UCITS FUNDS
AQR Style Premia UCITS Fund
Schedule of Investments (continued)As at 31 March 2019
The accompanying notes form an integral part of these audited financial statements. 147

Reference Entity Currency Shares Notional Amount
UnrealisedAppreciation/
(Depreciation)in USD
Percent ofNet Assets
Short Positions (continued)Common Stocks (continued)United States (continued)Alaska Air Group Inc USD (130,517) (7,285,459) (47,655) (0.00)Albemarle Corp USD (196,623) (15,981,517) 831,715 0.03Alcoa Corp USD (397,790) (11,154,032) (189,907) (0.01)Alcoa Inc USD (73,463) (1,410,122) (28,283) (0.00)Alkermes PLC USD (138,859) (4,965,598) (350,499) (0.01)Allegheny Technologies Inc USD (427,564) (10,932,811) 42,756 0.00Allscripts Healthcare Solutions Inc USD (357,115) (3,435,446) 245,560 0.01Alnylam Pharmaceuticals Inc USD (217,842) (20,350,800) (1,174,451) (0.04)Altria Group Inc USD (298,068) (16,957,089) (187,950) (0.01)American Airlines Group Inc USD (235,540) (7,393,601) 87,981 0.00American International Group Inc USD (543,865) (23,413,388) (125,089) (0.00)AmerisourceBergen Corp USD (9,857) (773,676) (5,323) (0.00)Anadarko Petroleum Corp USD (226,358) (10,287,971) (354,842) (0.01)Antero Resources Corp USD (163,348) (1,435,829) (25,794) (0.00)Aon PLC USD (22,598) (3,836,462) (114,346) (0.00)Apache Corp USD (441,713) (15,446,704) (752,371) (0.03)Ashland Inc USD (128,930) (10,141,634) 45,126 0.00Atlassian Corp PLC USD (54,792) (6,080,816) (80,544) (0.00)Axalta Coating Systems Ltd USD (575,123) (14,516,105) 661,391 0.02Axis Capital Holdings Ltd USD (64,053) (3,528,680) 36,510 0.00Ball Corp USD (151,486) (8,793,762) (371,141) (0.01)Bancorpsouth Bank USD (99,013) (2,825,831) 147,529 0.01Bank of Hawaii Corp USD (11,611) (923,191) 28,215 0.00Bank of the Ozarks Inc USD (32,585) (944,313) 67,125 0.00BankUnited Inc USD (16,491) (557,396) 23,912 0.00Bear Newco Inc USD (627,555) (17,195,007) (564,800) (0.02)Bgc Partners Inc USD (376,060) (2,019,442) 135,382 0.00BioMarin Pharmaceutical Inc USD (53,367) (4,717,643) 153,163 0.01Bluebird Bio Inc USD (86,832) (13,458,092) (572,230) (0.02)BorgWarner Inc USD (121,033) (4,657,350) 18,155 0.00Brighthouse Financial Inc USD (75,195) (2,725,819) 113,544 0.00Brookdale Senior Living Inc USD (35,747) (234,679) 10,545 0.00Brown-Forman Corp USD (108,728) (5,704,958) (236,148) (0.01)Bunge Ltd USD (95,869) (5,061,883) (76,413) (0.00)BWX Technologies Inc USD (74,255) (3,711,265) (69,057) (0.00)Cabot Corp USD (31,023) (1,296,451) 87,251 0.00Cabot Oil & Gas Corp USD (623,849) (16,288,697) (754,857) (0.03)Caesars Entertainment Corp USD (398,151) (3,475,858) (23,889) (0.00)Campbell Soup Co USD (353,397) (13,369,009) (654,199) (0.02)CarMax Inc USD (155,215) (10,716,044) (1,472,990) (0.05)Carpenter Technology Corp USD (80,136) (3,645,387) 35,260 0.00Cboe Global Markets Inc USD (109,274) (10,383,215) (37,663) (0.00)Charter Communications Inc USD (86,106) (29,822,813) (453,779) (0.02)Chemours Co USD (46,465) (1,710,377) 72,021 0.00Cheniere Energy Inc USD (474,838) (31,894,868) 394,116 0.01Chipotle Mexican Grill Inc USD (13,523) (9,502,544) (1,160,476) (0.04)Cincinnati Financial Corp USD (5,990) (512,265) 307 0.00CIT Group Inc USD (60,949) (2,940,180) 78,015 0.00Clean Harbors Inc USD (71,332) (5,098,098) (211,143) (0.01)CME Group Inc USD (6,547) (1,069,125) 49,233 0.00CNO Financial Group Inc USD (227,351) (3,712,642) 51,372 0.00Cognex Corp USD (152,827) (7,762,083) 262,862 0.01Coherent Inc USD (3,951) (549,584) (4,188) (0.00)Colgate-Palmolive Co USD (9,252) (625,389) (11,035) (0.00)Commercial Metals Co USD (93,802) (1,605,890) (114,294) (0.00)CommVault Systems Inc USD (53,794) (3,491,231) 29,049 0.00Compass Minerals International Inc USD (93,333) (5,049,315) (299,722) (0.01)Conagra Brands Inc USD (914,783) (25,220,567) (4,231,691) (0.15)Concho Resources Inc USD (53,654) (5,984,567) (627,215) (0.02)Conduent Inc USD (232,827) (3,247,937) 67,650 0.00Core Laboratories NV USD (11,070) (760,066) (12,177) (0.00)CoStar Group Inc USD (4,302) (2,000,344) 2,151 0.00Coty Inc USD (76,353) (873,097) (39,322) (0.00)Cree Inc USD (366,669) (20,958,800) (1,265,008) (0.05)Crown Holdings Inc USD (523,816) (28,757,498) (78,572) (0.00)Cullen/Frost Bankers Inc USD (10,965) (1,072,267) 43,202 0.00Cypress Semiconductor Corp USD (284,164) (4,222,677) 76,724 0.00Delphi Automotive PLC USD (263,328) (20,850,311) 886,513 0.03Delta Air Lines Inc USD (27,685) (1,419,410) (13,471) (0.00)DENTSPLY International Inc USD (85,113) (4,196,922) 14,469 0.00Devon Energy Corp USD (422,881) (13,447,616) (1,691,524) (0.06)Diamond Offshore Drilling Inc USD (133,437) (1,375,735) (56,044) (0.00)DISH Network Corp USD (203,793) (6,358,342) 211,945 0.01Dollar Tree Inc USD (166,790) (17,274,440) 31,408 0.00Donaldson Co Inc USD (29,789) (1,489,152) (18,171) (0.00)DowDuPont Inc USD (89,305) (4,609,924) 353,648 0.01Dril-Quip Inc USD (106,914) (4,848,550) (531,506) (0.02)East West Bancorp Inc USD (19,197) (928,751) 71,413 0.00Edgewell Personal Care Co USD (122,391) (5,409,682) (93,017) (0.00)Energizer Holdings Inc USD (73,874) (3,303,645) 53,675 0.00Ensco PLC USD (1,568,666) (6,149,171) 298,047 0.01EQT Corp USD (800,825) (16,537,036) (1,409,670) (0.05)Equitrans Midstream Corp USD (373,553) (8,027,654) (930,147) (0.03)Extended Stay America Inc USD (91,890) (1,656,777) 65,939 0.00Extraction Oil Gas Inc USD (190,714) (802,906) (85,821) (0.00)Fastenal Co USD (137,875) (8,835,030) (325,385) (0.01)FedEx Corp USD (33,111) (5,993,091) (150,655) (0.01)FireEye Inc USD (798,823) (13,324,368) 229,653 0.01First Data Corp USD (353,222) (9,268,545) (240,191) (0.01)First Hawaiian Inc USD (82,093) (2,135,239) 4,105 0.00First Horizon National Corp USD (216,512) (3,035,498) 179,705 0.01First Republic Bank USD (99,887) (10,122,549) 129,853 0.00First Solar Inc USD (6,454) (340,997) 9,472 0.00FirstEnergy Corp USD (691,238) (28,672,552) (82,949) (0.00)Five Below Inc USD (26,270) (3,325,782) (251,929) (0.01)
AQR UCITS FUNDS
AQR Style Premia UCITS Fund
Schedule of Investments (continued)As at 31 March 2019
The accompanying notes form an integral part of these audited financial statements. 148

Reference Entity Currency Shares Notional Amount
UnrealisedAppreciation/
(Depreciation)in USD
Percent ofNet Assets
Short Positions (continued)Common Stocks (continued)United States (continued)Floor & Decor Holdings Inc USD (269,283) (11,264,108) (487,402) (0.02)Flowserve Corp USD (175,490) (7,944,432) (219,363) (0.01)FMC Corp USD (109,867) (8,420,207) 197,761 0.01FNB Corp USD (233,035) (2,510,952) 217,888 0.01Fortune Brands Home & Security Inc USD (30,390) (1,439,574) (35,252) (0.00)Freeport-McMoRan Inc USD (1,813,812) (23,262,139) (806,297) (0.03)Fulton Financial Corp USD (54,804) (853,846) 48,776 0.00Gartner Inc USD (106,080) (16,066,877) (774,384) (0.03)GCI Liberty Inc USD (161,189) (8,918,587) (167,716) (0.01)General Electric Co USD (1,879,228) (18,735,903) (131,546) (0.00)General Mills Inc USD (138,866) (7,147,433) (627,379) (0.02)Genesee & Wyoming Inc USD (83,795) (7,297,707) 36,870 0.00Genuine Parts Co USD (23,853) (2,667,004) (129,999) (0.00)Global Payments Inc USD (5,791) (787,344) (23,569) (0.00)Granite Construction Inc USD (16,648) (722,357) 67,757 0.00Graphic Packaging Holding Co USD (989,859) (12,402,933) (122,804) (0.00)Guidewire Software Inc USD (111,824) (10,803,317) (743,630) (0.03)Halyard Health Inc USD (14,189) (600,195) 11,635 0.00Hancock Holding Co USD (27,711) (1,126,729) 41,289 0.00Hanesbrands Inc USD (456,646) (8,178,530) (9,133) (0.00)Harley-Davidson Inc USD (250,846) (9,022,931) 293,975 0.01Healthcare Services Group Inc USD (188,846) (6,245,137) (100,911) (0.00)HealthEquity Inc USD (56,822) (4,169,030) 265,927 0.01Hess Corp USD (447,641) (27,265,813) (2,229,252) (0.08)Hilton Grand Vacations Inc USD (21,384) (662,049) 15,396 0.00Home Bancshares Inc USD (46,466) (816,640) 55,062 0.00IHS Markit Ltd USD (30,206) (1,631,426) (11,780) (0.00)INC Research Holdings Inc USD (112,770) (5,815,549) (1,027,335) (0.04)Incyte Corp USD (6,002) (516,772) (11,584) (0.00)Insulet Corp USD (88,467) (8,399,057) (85,813) (0.00)Intercontinental Exchange Inc USD (15,885) (1,197,570) (45,113) (0.00)International Flavors & Fragrances Inc USD (53,184) (6,837,335) (171,775) (0.01)International Game Technology PLC USD (761,824) (9,934,185) 532,797 0.02IPG Photonics Corp USD (28,568) (4,311,768) 11,142 0.00Kellogg Co USD (27,777) (1,584,956) (77,721) (0.00)Kemper Corp USD (4,336) (333,785) 13,658 0.00L Brands Inc USD (378,778) (10,514,877) (567,155) (0.02)Legg Mason Inc USD (26,230) (723,948) 25,053 0.00Leggett & Platt Inc USD (34,826) (1,478,712) 54,677 0.00Lennox International Inc USD (16,637) (4,392,002) (301,795) (0.01)Leucadia National Corp USD (212,351) (3,992,199) 78,570 0.00Liberty Broadband Corp USD (158,064) (14,467,598) (305,064) (0.01)Lions Gate Entertainment Corp USD (181,561) (2,828,720) 38,724 0.00Live Nation Entertainment Inc USD (243,836) (15,510,408) (334,055) (0.01)Livent Corp USD (37,589) (456,143) 35,146 0.00LKQ Corp USD (710,902) (20,132,745) (710,902) (0.03)Loews Corp USD (132,535) (6,356,379) (100,727) (0.00)Macquarie Infrastructure Corp USD (336,622) (13,862,094) (323,157) (0.01)Manitowoc Foodservice Inc USD (450,208) (7,320,382) (378,188) (0.01)Markel Corp USD (1,301) (1,299,634) (10,373) (0.00)MarketAxess Holdings Inc USD (1,525) (377,239) (30,820) (0.00)Marriott Vacations Worldwide Corp USD (6,041) (575,405) 1,027 0.00Marsh & McLennan Cos Inc USD (32,233) (3,007,661) (81,549) (0.00)Martin Marietta Materials Inc USD (227,193) (45,865,723) (783,730) (0.03)Marvell Technology Group Ltd USD (625,673) (12,350,785) (112,409) (0.00)Masco Corp USD (73,307) (2,885,364) (1,466) (0.00)Matador Resources Co USD (59,996) (1,161,523) (131,391) (0.00)Mattel Inc USD (1,845,943) (24,015,718) 2,916,590 0.10McCormick Co Inc USD (5,980) (894,907) (60,963) (0.00)Medidata Solutions Inc USD (95,562) (6,999,917) 120,408 0.00Mercury General Corp USD (88,383) (4,408,544) 110,479 0.00Meredith Corp USD (8,720) (487,622) 14,650 0.00MGM Resorts International USD (181,131) (4,689,482) 95,262 0.00Microchip Technology Inc USD (99,084) (8,153,622) 446,869 0.02Mohawk Industries Inc USD (4,039) (511,095) 26,536 0.00Monolithic Power Systems Inc USD (53,124) (7,152,615) 151,935 0.01Monster Beverage Corp USD (371,609) (20,063,170) 2,675,585 0.10Mosaic Co USD (108,140) (2,969,524) 135,175 0.00Nabors Industries Ltd USD (1,275,514) (4,400,523) (216,837) (0.01)National Fuel Gas Co USD (186,479) (11,311,816) (152,913) (0.01)National Oilwell Varco Inc USD (290,793) (7,703,107) 64,520 0.00NCR Corp USD (274,900) (7,444,292) 127,707 0.00Netflix Inc USD (2,633) (934,689) 10,190 0.00Newell Rubbermaid Inc USD (1,605,867) (24,489,472) 655,333 0.02Newmont Mining Corp USD (204,129) (7,332,314) (579,998) (0.02)News Corp USD (950,013) (11,751,661) 614,676 0.02Nielsen Holdings PLC USD (336,350) (7,947,951) 1,025,658 0.04NiSource Inc USD (274,624) (7,889,948) (259,320) (0.01)Noble Energy Inc USD (294,188) (7,339,991) (611,680) (0.02)NOW Inc USD (341,535) (4,839,551) (61,476) (0.00)Nutanix Inc USD (39,462) (1,486,534) (81,292) (0.00)NuVasive Inc USD (6,312) (360,731) 9,847 0.00NVIDIA Corp USD (107,987) (19,274,600) (1,619,084) (0.06)Occidental Petroleum Corp USD (116,795) (7,745,844) (284,980) (0.01)Oceaneering International Inc USD (105,864) (1,666,299) (76,538) (0.00)Olin Corp USD (40,583) (939,091) 44,235 0.00Ollie’s Bargain Outlet Holdings Inc USD (16,309) (1,402,248) (88,232) (0.00)ONEOK Inc USD (441,074) (30,650,232) (1,411,437) (0.05)PacWest Bancorp USD (191,419) (7,226,067) 237,360 0.01Penn National Gaming Inc USD (44,350) (884,339) 147,686 0.01Perrigo Co PLC USD (21,817) (1,047,652) 15,391 0.00Philip Morris International Inc USD (72,855) (6,410,511) 103,915 0.00Pinnacle Financial Partners Inc USD (49,220) (2,714,483) 108,776 0.00Plantronics Inc USD (77,912) (3,607,326) 143,358 0.00Platform Specialty Products Corp USD (156,194) (1,574,436) 132,386 0.00
AQR UCITS FUNDS
AQR Style Premia UCITS Fund
Schedule of Investments (continued)As at 31 March 2019
The accompanying notes form an integral part of these audited financial statements. 149

Reference Entity Currency Shares Notional Amount
UnrealisedAppreciation/
(Depreciation)in USD
Percent ofNet Assets
Short Positions (continued)Common Stocks (continued)United States (continued)PNM Resources Inc USD (17,125) (813,951) (7,193) (0.00)Polaris Industries Inc USD (4,025) (341,240) 9,050 0.00PolyOne Corp USD (12,061) (353,267) 30,032 0.00Pool Corp USD (17,107) (2,837,880) (126,126) (0.00)Post Holdings Inc USD (13,700) (1,498,095) (113,025) (0.00)PPG Industries Inc USD (3,371) (378,900) (3,708) (0.00)Premier Inc USD (251,593) (8,619,576) (95,605) (0.00)Prestige Brands Holdings Inc USD (12,736) (379,023) (37,826) (0.00)ProAssurance Corp USD (3,353) (116,986) 12,373 0.00Progressive Waste Solutions Ltd USD (26,257) (2,321,381) (75,620) (0.00)Proofpoint Inc USD (33,885) (4,062,473) (100,300) (0.00)Prosperity Bancshares Inc USD (31,374) (2,177,669) 122,359 0.00Pure Storage Inc USD (735,739) (15,899,320) (1,188,533) (0.04)QUALCOMM Inc USD (403,869) (23,064,959) (951,404) (0.03)Range Resources Corp USD (93,355) (1,053,978) (48,641) (0.00)RingCentral Inc USD (27,113) (2,929,017) (94,082) (0.00)Royal Gold Inc USD (213,032) (19,566,989) (507,016) (0.02)Sage Therapeutics Inc USD (73,313) (11,798,994) (376,081) (0.01)Sanderson Farms Inc USD (14,915) (1,947,452) (57,014) (0.00)Schlumberger Ltd USD (629,147) (27,367,895) (865,480) (0.03)Scientific Games Corp USD (167,560) (3,438,331) 540,798 0.02Sealed Air Corp USD (1,034,277) (47,980,110) (1,603,129) (0.06)Sempra Energy USD (159,826) (19,997,429) (308,464) (0.01)Sensient Technologies Corp USD (12,455) (847,563) (27,745) (0.00)Signature Bank/New York NY USD (46,873) (6,068,179) 244,208 0.01Signet Jewelers Ltd USD (77,321) (2,107,770) 2,910 0.00Silicon Laboratories Inc USD (13,321) (1,071,008) 15,623 0.00Six Flags Entertainment Corp USD (53,452) (2,638,925) 45,203 0.00SLM Corp USD (672,679) (6,720,063) 423,788 0.01Sotheby’s USD (144,376) (5,487,732) 431,684 0.02Southwest Gas Corp USD (65,114) (5,358,882) 39,068 0.00Splunk Inc USD (6,465) (804,893) 8,469 0.00Stericycle Inc USD (184,194) (9,968,579) (1,115,419) (0.04)Sterling Bancorp USD (458,615) (8,589,859) 261,411 0.01Stifel Financial Corp USD (59,577) (3,165,326) 56,002 0.00Switch Inc USD (192,185) (1,973,740) (306,637) (0.01)Synovus Financial Corp USD (164,336) (5,690,134) 551,347 0.02Tableau Software Inc USD (5,151) (648,305) 6,181 0.00Targa Resources Corp USD (656,244) (27,109,440) (635,332) (0.02)Tempur Sealy International Inc USD (199,589) (11,757,788) (333,314) (0.01)Tenet Healthcare Corp USD (380,478) (10,965,376) (327,211) (0.01)Teradata Corp USD (66,416) (2,910,349) 270,977 0.01Tesla Motors Inc USD (231,154) (64,253,877) 1,145,230 0.04Texas Capital Bancshares Inc USD (56,170) (3,068,005) 260,629 0.01The Brink’s Co USD (84,199) (6,365,444) (18,524) (0.00)The Charles Schwab Corp USD (347,095) (14,862,608) 336,682 0.01The Coca-Cola Co USD (214,296) (9,991,551) (131,094) (0.00)The Hain Celestial Group Inc USD (393,440) (9,143,546) (531,144) (0.02)The Hershey Co USD (3,885) (444,794) (15,650) (0.00)The Howard Hughes Corp USD (37,180) (4,102,441) (135,553) (0.01)The JM Smucker Co USD (4,677) (543,280) (43,923) (0.00)The Kraft Heinz Co USD (933,701) (30,485,338) (542,955) (0.02)The Madison Square Garden Co USD (24,788) (7,263,380) 91,837 0.00The Middleby Corp USD (54,896) (7,081,035) (77,952) (0.00)The Scotts Miracle-Gro Co USD (66,093) (5,156,576) 260,658 0.01The Wendy’s Co USD (116,898) (2,101,242) (158,397) (0.01)The Williams Cos Inc USD (767,775) (21,950,687) (944,363) (0.03)Thor Industries Inc USD (26,034) (1,620,877) 100,491 0.00Tiffany & Co USD (6,706) (704,599) (58,946) (0.00)Transocean Ltd USD (1,271,690) (11,082,778) 148,499 0.01TreeHouse Foods Inc USD (221,270) (14,123,664) (964,737) (0.03)Trimble Ltd USD (123,733) (4,993,864) (197,973) (0.01)Tupperware Brands Corp USD (189,911) (4,890,208) 396,489 0.01UMB Financial Corp USD (17,153) (1,112,715) 30,361 0.00Umpqua Holdings Corp USD (114,275) (1,900,393) 113,132 0.00Under Armour Inc USD (297,797) (6,405,613) 154,854 0.01United Bankshares Inc USD (181,130) (6,609,434) 170,262 0.01United Parcel Service Inc USD (125,059) (13,952,833) (342,662) (0.01)Univar Inc USD (449,712) (9,839,699) 202,370 0.01Universal Display Corp USD (170,588) (26,062,435) (134,765) (0.00)Vail Resorts Inc USD (12,858) (2,812,173) 18,400 0.00Valley National Bancorp USD (276,409) (2,697,752) 171,374 0.01Valmont Industries Inc USD (5,131) (672,623) 25,604 0.00Valvoline Inc USD (211,776) (3,913,620) 50,826 0.00ViaSat Inc USD (97,569) (7,542,084) (166,843) (0.01)Virtu Financial Inc USD (34,690) (834,295) 39,894 0.00Visteon Corp USD (151,120) (10,353,231) 1,394,838 0.05Vulcan Materials Co USD (340,069) (40,117,940) (1,346,673) (0.05)WABCO Holdings Inc USD (28,164) (3,715,677) 256,011 0.01Wabtec Corp USD (19,233) (1,406,509) (33,377) (0.00)Watsco Inc USD (2,484) (352,629) 1,731 0.00Weatherford International PLC USD (3,873,348) (2,711,344) (206,169) (0.01)Webster Financial Corp USD (55,578) (2,830,032) 259,549 0.01Western Alliance Bancorp USD (15,165) (627,376) 42,765 0.00WestRock Co USD (13,677) (519,042) 1,545 0.00Whirlpool Corp USD (74,688) (9,916,326) 282,655 0.01Willis Towers Watson PLC USD (91,918) (16,159,184) (495,438) (0.02)Wintrust Financial Corp USD (6,232) (422,218) 23,121 0.00World Fuel Services Corp USD (125,230) (3,656,716) 12,523 0.00World Wrestling Entertainment Inc USD (8,681) (743,701) 20,574 0.00WPX Energy Inc USD (1,390,570) (18,216,467) (2,099,761) (0.07)WR Grace & Co USD (146,278) (11,365,801) 38,032 0.00Wyndham Worldwide Corp USD (11,486) (463,920) 21,022 0.00Wynn Resorts Ltd USD (5,465) (655,527) (23,094) (0.00)XPO Logistics Inc USD (301,173) (16,335,624) (1,299,316) (0.05)
AQR UCITS FUNDS
AQR Style Premia UCITS Fund
Schedule of Investments (continued)As at 31 March 2019
The accompanying notes form an integral part of these audited financial statements. 150

Reference Entity Currency Shares Notional Amount
UnrealisedAppreciation/
(Depreciation)in USD
Percent ofNet Assets
Short Positions (continued)Common Stocks (continued)United States (continued)Yelp Inc USD (14,393) (499,725) 10,706 0.00Yum! Brands Inc USD (8,210) (818,701) (15,845) (0.00)Zayo Group Holdings Inc USD (979,721) (27,804,482) (161,972) (0.01)Zillow Group Inc USD (397,738) (13,721,961) 2,102,227 0.07Zions Bancorporation USD (36,656) (1,665,282) 125,730 0.00
(30,087,000) (1.07)
Total Short Positions (30,122,938) (1.08)
Total of Long and Short Equity Positions (14,719,809) (0.53)Net Cash and Other Receivables/(Payables) (2,726,849) (0.10)
Total of Total Return Basket Swap Contract - GSIN - USD (17,446,658) (0.63)
Counterparty† Description‡ Termination DateFair Value in
USDMLIN The Sub-Fund receives the total return on a portfolio of long and short positions and 1-month BBSW plus
or minus a specified spread, which is denominated in AUD based on the local currency of the positionswithin the swap.
25.12.2020 - 26.03.2021 1,201,801
The following table represents the long and short positions and related values within the total return equity basket swap as at 31 March 2019
Reference Entity Currency Shares Notional Amount
UnrealisedAppreciation/
(Depreciation)in USD
Percent ofNet Assets
Long PositionsCommon StocksAustraliaAGL Energy Ltd AUD 597,161 9,216,283 14,442 0.00BlueScope Steel Ltd AUD 770,752 7,624,599 309,521 0.01CIMIC Group Ltd AUD 13,860 474,306 (14,338) (0.00)Coca-Cola Amatil Ltd AUD 80,060 491,159 13,920 0.00Crown Resorts Ltd AUD 68,069 555,684 840 0.00Fortescue Metals Group Ltd AUD 331,056 1,668,550 140,962 0.00Harvey Norman Holdings Ltd AUD 1,099,213 3,133,141 203,642 0.01Newcrest Mining Ltd AUD 279,270 5,046,451 (139,749) (0.01)South32 Ltd AUD 1,644,775 4,351,375 (32,095) (0.00)Telstra Corp Ltd AUD 714,066 1,681,598 11,369 0.00Wesfarmers Ltd AUD 59,593 1,464,096 (15,554) (0.00)Woodside Petroleum Ltd AUD 270,726 6,646,191 (29,682) (0.00)
463,278 0.01
Total Long Positions 463,278 0.01
Short PositionsCommon StocksAustraliaAMP Ltd AUD (3,626,153) (5,399,381) 126,586 0.00APA Group AUD (321,808) (2,276,910) 20,032 0.00Challenger Ltd AUD (780,742) (4,580,462) (547,387) (0.02)CSL Ltd AUD (12,939) (1,788,430) 2,698 0.00Domino’s Pizza Enterprises Ltd AUD (14,450) (444,886) (27,006) (0.00)Lendlease Group AUD (194,507) (1,707,753) (65,762) (0.00)Medibank Pvt Ltd AUD (1,121,399) (2,194,232) (71,989) (0.00)Origin Energy Ltd AUD (671,606) (3,431,378) 5,590 0.00QBE Insurance Group Ltd AUD (733,474) (6,400,781) 40,611 0.00SEEK Ltd AUD (305,466) (3,799,824) 49,800 0.00Sydney Airport AUD (102,329) (539,090) (19,044) (0.00)Transurban Group AUD (60,191) (563,190) (13,259) (0.00)Treasury Wine Estates Ltd AUD (135,439) (1,434,470) 12,238 0.00
(486,892) (0.02)IrelandJames Hardie Industries PLC AUD (540,903) (6,954,715) (118,835) (0.00)
(118,835) (0.00)
Total Short Positions (605,727) (0.02)
Total of Long and Short Equity Positions (142,449) (0.01)Net Cash and Other Receivables/(Payables) 1,344,250 0.05
Total of Total Return Basket Swap Contract - MLIN - AUD 1,201,801 0.04
AQR UCITS FUNDS
AQR Style Premia UCITS Fund
Schedule of Investments (continued)As at 31 March 2019
The accompanying notes form an integral part of these audited financial statements. 151

Counterparty† Description‡ Termination DateFair Value in
USDMLIN The Sub-Fund receives the total return on a portfolio of long and short positions and pays 1-month LIBOR
plus or minus a specified spread, which is denominated in CHF based on the local currency of thepositions within the swap.
25.09.2020 - 25.03.2021 2,912,018
The following table represents the long and short positions and related values within the total return equity basket swap as at 31 March 2019
Reference Entity Currency Shares Notional Amount
UnrealisedAppreciation/
(Depreciation)in USD
Percent ofNet Assets
Long PositionsCommon StocksSwitzerlandBaloise Holding AG CHF 3,235 532,533 5,524 0.00DKSH Holding AG CHF 6,706 387,616 3,704 0.00Helvetia Holding AG CHF 3,968 2,417,106 (15,941) (0.00)Roche Holding AG CHF 69,421 18,978,955 240,549 0.01Sonova Holding AG CHF 3,382 668,486 11,889 0.00Swiss Life Holding AG CHF 54,763 23,991,986 297,012 0.01Temenos Group AG CHF 13,150 1,925,647 76,603 0.00Zurich Insurance Group AG CHF 1,775 586,526 1,426 0.00
620,766 0.02
Total Long Positions 620,766 0.02
Short PositionsCommon StocksAustriaams AG CHF (272,872) (7,235,294) 452,206 0.02
452,206 0.02SwitzerlandBucher Industries AG CHF (1,273) (422,948) (7,416) (0.00)Credit Suisse Group AG CHF (1,193,231) (13,854,015) (191,751) (0.01)dormakaba Holding AG CHF (735) (525,237) (8,489) (0.00)Galenica AG CHF (32,111) (4,324,898) (41,927) (0.00)Holcim Ltd CHF (101,017) (4,976,532) 3,044 0.00Idorsia Ltd CHF (195,109) (3,421,487) (141,092) (0.01)OC Oerlikon Corp AG CHF (237,141) (3,020,085) (102,416) (0.00)
(490,047) (0.02)
Total Short Positions (37,841) (0.00)
Total of Long and Short Equity Positions 582,925 0.02Net Cash and Other Receivables/(Payables) 2,329,093 0.08
Total of Total Return Basket Swap Contract - MLIN - CHF 2,912,018 0.10
Counterparty† Description‡ Termination DateFair Value in
USDMLIN The Sub-Fund receives the total return on a portfolio of long and short positions and pays 1-month CIBOR
plus or minus a specified spread, which is denominated in DKK based on the local currency of thepositions within the swap.
25.09.2020 - 25.03.2021 1,038,855
The following table represents the long and short positions and related values within the total return equity basket swap as at 31 March 2019
Reference Entity Currency Shares Notional Amount
UnrealisedAppreciation/
(Depreciation)in USD
Percent ofNet Assets
Long PositionsCommon StocksDenmarkCarlsberg A/S DKK 2,955 370,489 10,578 0.00Coloplast A/S DKK 12,476 1,371,305 30,774 0.00DONG Energy A/S DKK 62,259 4,741,938 (14,982) (0.00)GN Store Nord A/S DKK 70,575 3,292,704 (8,492) (0.00)H Lundbeck A/S DKK 50,079 2,171,502 (38,414) (0.00)Jyske Bank A/S DKK 9,184 354,445 10,636 0.00Novo Nordisk A/S DKK 49,093 2,564,022 64,977 0.01Pandora A/S DKK 108,184 5,027,841 27,661 0.00Rockwool International A/S DKK 15,982 3,733,039 50,479 0.00Tryg A/S DKK 75,532 2,080,077 5,680 0.00Vestas Wind Systems A/S DKK 10,061 845,888 34,199 0.00William Demant Holding A/S DKK 35,531 1,045,289 (51,303) (0.00)
121,793 0.01
Total Long Positions 121,793 0.01
Short PositionsCommon StocksDenmarkAP Moeller - Maersk A/S DKK (11,295) (14,280,244) 366,944 0.01FLSmidth & Co A/S DKK (49,883) (2,147,248) 33,012 0.00Genmab A/S DKK (64,794) (11,231,447) (43,854) (0.00)
356,102 0.01
Total Short Positions 356,102 0.01
Total of Long and Short Equity Positions 477,895 0.02Net Cash and Other Receivables/(Payables) 560,960 0.02
Total of Total Return Basket Swap Contract - MLIN - DKK 1,038,855 0.04
AQR UCITS FUNDS
AQR Style Premia UCITS Fund
Schedule of Investments (continued)As at 31 March 2019
The accompanying notes form an integral part of these audited financial statements. 152

Counterparty† Description‡ Termination DateFair Value in
USDMLIN The Sub-Fund receives the total return on a portfolio of long and short positions and pays 1-month
EURIBOR plus or minus a specified spread, which is denominated in EUR based on the local currency ofthe positions within the swap.
25.09.2020 - 25.03.2021 (5,591,402)
The following table represents the long and short positions and related values within the total return equity basket swap as at 31 March 2019
Reference Entity Currency Shares Notional Amount
UnrealisedAppreciation/
(Depreciation)in USD
Percent ofNet Assets
Long PositionsCommon StocksBelgiumAgeas EUR 141,699 6,844,162 85,910 0.00Belgacom SA EUR 14,345 411,988 11,757 0.00bpost SA EUR 83,959 897,874 73,055 0.00Colruyt SA EUR 16,505 1,221,192 17,790 0.00KBC Groep NV EUR 114,069 7,925,032 110,141 0.01UCB SA EUR 44,495 3,807,704 42,963 0.00
341,616 0.01FinlandFortum OYJ EUR 15,519 322,343 (23,000) (0.00)Neste Oil OYJ EUR 141,655 15,099,557 229,022 0.01Sampo OYJ EUR 88,464 4,024,566 (145,012) (0.01)UPM-Kymmene OYJ EUR 146,338 4,235,680 60,791 0.00
121,801 0.00FranceAir France-KLM EUR 146,389 1,640,624 15,450 0.00AXA SA EUR 768,427 19,295,435 60,393 0.00BNP Paribas SA EUR 16,758 797,570 16,275 0.00Casino Guichard Perrachon SA EUR 18,849 812,648 8,677 0.00CNP Assurances EUR 174,394 3,843,571 15,664 0.00Electricite de France SA EUR 799,093 10,882,814 (134,577) (0.00)Eutelsat Communications SA EUR 23,398 409,682 (5,123) (0.00)GDF Suez EUR 1,427,872 21,297,759 (24,047) (0.00)Peugeot SA EUR 824,921 19,986,966 426,043 0.02Renault SA EUR 222,121 14,648,954 558,625 0.02Societe BIC SA EUR 4,558 405,050 2,815 0.00Societe Generale SA EUR 261,580 7,516,969 57,269 0.00Suez Environnement Co EUR 129,993 1,721,476 21,163 0.00TOTAL SA EUR 500,291 27,711,554 47,745 0.00
1,066,372 0.04GermanyAllianz SE EUR 111,211 24,695,236 197,282 0.01Aurubis AG EUR 75,509 4,038,811 94,103 0.00Bayerische Motoren Werke AG EUR 148,633 11,386,066 (115,146) (0.00)Covestro AG EUR 131,203 7,185,692 346,174 0.01Daimler AG EUR 81,477 4,742,235 99,711 0.00Deutsche Lufthansa AG EUR 843,744 18,396,830 (89,995) (0.00)E.ON SE EUR 1,739,631 19,389,126 (105,471) (0.00)Evonik Industries AG EUR 65,005 1,773,520 26,274 0.00Hannover Rueck SE EUR 47,401 6,817,414 133,049 0.01Hella KGaA Hueck & Co EUR 12,478 546,938 (4,203) (0.00)Metro Wholesale & Food Specialist AG EUR 95,601 1,582,133 21,467 0.00Muenchener Rueckversicherungs-Gesellschaft AG EUR 43,108 10,173,576 120,999 0.00ProSiebenSat.1 Media SE EUR 76,505 1,083,148 (66,999) (0.00)RWE AG EUR 64,401 1,722,334 (36,876) (0.00)Salzgitter AG EUR 67,684 1,962,879 4,560 0.00Software AG EUR 55,478 1,861,163 2,492 0.00Suedzucker AG EUR 84,473 1,078,354 (156,015) (0.01)Talanx AG EUR 63,379 2,443,592 21,348 0.00Volkswagen AG EUR 135,962 21,352,869 9,159 0.00
501,913 0.02ItalyA2A SpA EUR 3,570,555 6,530,401 62,137 0.00Assicurazioni Generali SpA EUR 1,340,590 24,737,098 142,989 0.01Autogrill SpA EUR 46,576 445,800 19,610 0.00Banca Popolare dell’Emilia Romagna SC EUR 644,780 2,626,406 (4,344) (0.00)Enel SpA EUR 5,108,809 32,660,302 424,458 0.02Eni SpA EUR 1,329,315 23,354,459 35,820 0.00Hera SpA EUR 937,205 3,402,967 98,911 0.00Italgas SpA EUR 146,231 902,995 (1,313) (0.00)Poste Italiane SpA EUR 1,811,799 17,510,371 36,616 0.00Terna Rete Elettrica Nazionale EUR 252,854 1,604,557 12,491 0.00Unipol Gruppo Finanziario SpA EUR 305,926 1,517,144 33,661 0.00UnipolSai SpA EUR 2,292,870 6,165,496 25,743 0.00
886,779 0.03LuxembourgArcelorMittal EUR 203,583 4,134,882 (28,800) (0.00)
(28,800) (0.00)NetherlandsAegon NV EUR 2,435,061 11,717,773 (101,157) (0.01)ASR Nederland NV EUR 180,729 7,467,216 (36,524) (0.00)Koninklijke Ahold NV EUR 1,145,502 30,352,252 218,639 0.01NN Group NV EUR 391,399 16,175,905 202,144 0.01Philips Lighting NV EUR 114,984 3,062,211 101,988 0.00Wolters Kluwer NV EUR 7,653 519,153 15,466 0.00
400,556 0.01SpainAcciona SA EUR 5,895 663,185 17,076 0.00Acerinox SA EUR 49,644 493,502 6,020 0.00BBVA EUR 1,302,794 7,408,636 (197,466) (0.01)CaixaBank SA EUR 882,224 2,745,713 (7,924) (0.00)Distribuidora Internacional de Alimentacion SA EUR 2,708,627 1,978,547 89,409 0.00Endesa SA EUR 512,206 13,129,060 (155,271) (0.00)Gas Natural SDG SA EUR 86,732 2,443,223 25,318 0.00Iberdrola SA EUR 341,053 3,000,540 25,273 0.00
AQR UCITS FUNDS
AQR Style Premia UCITS Fund
Schedule of Investments (continued)As at 31 March 2019
The accompanying notes form an integral part of these audited financial statements. 153

Reference Entity Currency Shares Notional Amount
UnrealisedAppreciation/
(Depreciation)in USD
Percent ofNet Assets
Long Positions (continued)Common Stocks (continued)Spain (continued)Mapfre SA EUR 572,658 1,572,660 (19,932) (0.00)Red Electrica Corp SA EUR 16,126 344,638 (3,531) (0.00)Repsol SA EUR 1,664,468 28,377,446 168,190 0.01Telefonica SA EUR 112,508 935,640 (17,306) (0.00)
(70,144) (0.00)United KingdomDialog Semiconductor PLC EUR 150,599 4,550,078 (84,543) (0.00)Fiat Chrysler Automobiles NV EUR 1,736,812 25,818,075 401,701 0.01
317,158 0.01
Total Long Positions 3,537,251 0.12
Short PositionsCommon StocksBelgiumAnheuser-Busch InBev SA EUR (89,646) (7,508,493) (341,204) (0.01)Galapagos NV EUR (95,937) (10,803,641) (1,684,635) (0.06)Telenet Group Holding NV EUR (94,961) (4,558,963) (81,029) (0.01)
(2,106,868) (0.08)FinlandHuhtamaki OYJ EUR (10,387) (384,380) (7,114) (0.00)Orion OYJ EUR (46,425) (1,740,409) 41,699 0.00Stora Enso OYJ EUR (38,496) (469,600) (12,102) (0.00)
22,483 0.00FranceAccor SA EUR (132,523) (5,349,008) 136,887 0.00Airbus Group NV EUR (186,060) (24,478,769) (655,942) (0.02)Altran Technologies SA EUR (239,123) (2,614,950) (45,641) (0.00)BioMerieux EUR (6,460) (529,466) (7,978) (0.00)Bollore NV EUR (2,083) (9,252) (108) (0.00)Bollore SA EUR (687,826) (3,104,472) (44,791) (0.00)Bureau Veritas SA EUR (20,652) (487,160) (8,115) (0.00)Edenred EUR (298,759) (13,588,337) (90,567) (0.00)Faurecia EUR (46,215) (1,943,720) 1,038 0.00Groupe Eurotunnel SE EUR (420,252) (6,353,298) (136,833) (0.00)Iliad SA EUR (110,030) (10,972,484) (239,660) (0.01)Ingenico EUR (125,836) (8,943,174) (19,780) (0.00)JCDecaux SA EUR (51,901) (1,581,498) (39,625) (0.00)Orpea EUR (14,150) (1,692,751) (98,499) (0.00)Plastic Omnium SA EUR (37,250) (981,573) 2,928 0.00Remy Cointreau SA EUR (44,248) (5,882,046) (154,006) (0.01)SEB SA EUR (10,269) (1,707,522) (43,812) (0.00)Valeo SA EUR (314,532) (9,100,438) 56,503 0.00Vivendi SA EUR (407,699) (11,805,219) (151,056) (0.01)
(1,539,057) (0.05)GermanyBayer AG EUR (5,487) (351,273) 3,512 0.00Beiersdorf AG EUR (6,726) (698,071) (14,499) (0.00)CECONOMY AG EUR (401,876) (2,124,279) (9,475) (0.00)Commerzbank AG EUR (627,204) (4,836,400) (22,534) (0.00)Continental AG EUR (28,885) (4,339,219) 110,264 0.00CTS Eventim AG & Co KGaA EUR (20,521) (974,590) (21,197) (0.00)Delivery Hero SE EUR (118,516) (4,218,124) 194,273 0.01Deutsche Bank AG EUR (3,381,737) (27,401,832) 30,375 0.00Duerr AG EUR (16,094) (624,845) (8,493) (0.00)GEA Group AG EUR (105,847) (2,780,849) (98,637) (0.00)Infineon Technologies AG EUR (531,258) (10,515,765) 688,923 0.02KION Group AG EUR (11,805) (614,458) (1,193) (0.00)LANXESS AG EUR (18,692) (993,918) 6,506 0.00OSRAM Licht AG EUR (319,293) (10,951,754) 1,559,415 0.05Telefonica Deutschland Holding AG EUR (1,221,971) (3,831,906) 198,935 0.01United Internet AG EUR (80,475) (2,922,929) 141,855 0.00Zalando SE EUR (143,619) (5,600,151) (87,074) (0.00)
2,670,956 0.09ItalyAtlantia SpA EUR (176,258) (4,535,723) (128,631) (0.00)Azimut Holding SpA EUR (22,224) (376,526) (10,106) (0.00)Banca Generali SpA EUR (75,155) (1,868,179) (21,939) (0.00)Brembo SpA EUR (248,698) (2,803,426) 11,169 0.00Buzzi Unicem SpA EUR (223,567) (4,535,748) (136,800) (0.00)Davide Campari-Milano SpA EUR (130,241) (1,278,765) (731) (0.00)Ferrari NV EUR (164,354) (21,912,754) (525,906) (0.02)FinecoBank Banca Fineco SpA EUR (172,301) (2,245,966) (50,297) (0.00)Leonardo-Finmeccanica SpA EUR (570,614) (6,621,189) (153,758) (0.01)Moncler SpA EUR (15,639) (630,181) (19,139) (0.00)Pirelli & C SpA EUR (104,389) (672,744) 12,423 0.00Prysmian SpA EUR (380,126) (7,120,932) 55,482 0.00Recordati SpA EUR (43,366) (1,685,619) 55,019 0.00Telecom Italia SpA EUR (1,009,391) (628,298) (31,052) (0.00)
(944,266) (0.03)LuxembourgTenaris SA EUR (86,611) (1,215,531) 25,283 0.00
25,283 0.00NetherlandsAalberts Industries NV EUR (26,575) (914,208) (14,919) (0.00)Akzo Nobel NV EUR (5,844) (520,315) 328 0.00Altice NV EUR (1,238,200) (3,190,484) (512,980) (0.02)ASML Holding NV EUR (46,756) (8,683,772) (16,799) (0.00)Boskalis Westminster NV EUR (93,794) (2,445,234) 42,123 0.00Koninklijke KPN NV EUR (4,673,420) (14,702,325) 293,837 0.01Koninklijke Vopak NV EUR (51,627) (2,450,727) (54,486) (0.00)OCI NV EUR (48,511) (1,325,696) (37,037) (0.00)
AQR UCITS FUNDS
AQR Style Premia UCITS Fund
Schedule of Investments (continued)As at 31 March 2019
The accompanying notes form an integral part of these audited financial statements. 154

Reference Entity Currency Shares Notional Amount
UnrealisedAppreciation/
(Depreciation)in USD
Percent ofNet Assets
Short Positions (continued)Common Stocks (continued)Netherlands (continued)SBM Offshore NV EUR (70,873) (1,350,348) 4,377 0.00
(295,556) (0.01)SpainBankia SA EUR (496,309) (1,281,631) 26,747 0.00Cellnex Telecom SAU EUR (367,555) (10,803,763) (478,700) (0.02)Ferrovial SA EUR (299,084) (6,984,568) (117,529) (0.00)Grifols SA EUR (93,038) (2,616,683) (166,089) (0.00)Inditex SA EUR (933,153) (27,344,906) (188,586) (0.01)
(924,157) (0.03)SwitzerlandSTMicroelectronics NV EUR (746,745) (10,966,376) 733,607 0.03
733,607 0.03United KingdomCNH Industrial NV EUR (616,781) (6,304,437) 47,089 0.00
47,089 0.00United StatesQIAGEN NV EUR (17,354) (702,016) (14,613) (0.00)
(14,613) (0.00)
Total Short Positions (2,325,099) (0.08)
Total of Long and Short Equity Positions 1,212,152 0.04Net Cash and Other Receivables/(Payables) (6,803,554) (0.24)
Total of Total Return Basket Swap Contract - MLIN - EUR (5,591,402) (0.20)
Counterparty† Description‡ Termination DateFair Value in
USDMLIN The Sub-Fund receives the total return on a portfolio of long and short positions and pays 1-month LIBOR
plus or minus a specified spread, which is denominated in GBP based on the local currency of thepositions within the swap.
25.09.2020 - 25.03.2021 (1,032,335)
The following table represents the long and short positions and related values within the total return equity basket swap as at 31 March 2019
Reference Entity Currency Shares Notional Amount
UnrealisedAppreciation/
(Depreciation)in USD
Percent ofNet Assets
Long PositionsCommon StocksRussiaEvraz PLC GBP 567,028 4,565,296 181,315 0.01
181,315 0.01South AfricaAnglo American PLC GBP 17,137 457,428 21,496 0.00Investec PLC GBP 103,831 595,869 12,012 0.00
33,508 0.00United KingdomAggreko PLC GBP 98,798 1,008,117 24,400 0.00Barratt Developments PLC GBP 906,593 7,018,758 65,992 0.00Bellway PLC GBP 180,559 7,116,092 168,984 0.01Berkeley Group Holdings PLC GBP 190,224 9,185,808 (180,502) (0.01)Britvic PLC GBP 58,853 725,603 21,803 0.00BT Group PLC GBP 1,868,357 5,393,909 14,596 0.00Centrica PLC GBP 2,555,376 3,830,808 (90,348) 0.00Close Brothers Group PLC GBP 43,865 820,491 10,837 0.00Daily Mail & General Trust PLC GBP 41,152 343,950 802 0.00Drax Group PLC GBP 640,223 3,168,994 63,247 0.00Greene King PLC GBP 357,338 3,079,987 19,025 0.00Hays PLC GBP 222,393 433,038 11,274 0.00Howden Joinery Group PLC GBP 202,928 1,278,786 (2,638) 0.00Indivior PLC GBP 477,264 594,316 (34,431) 0.00JD Sports Fashion PLC GBP 59,138 379,125 10,301 0.00Marks & Spencer Group PLC GBP 307,488 1,110,334 38,370 0.00Moneysupermarket.com Group PLC GBP 87,295 418,706 9,985 0.00National Grid PLC GBP 1,399,262 15,576,288 (429,422) (0.02)Pennon Group PLC GBP 109,153 1,065,822 (22,134) 0.00Persimmon PLC GBP 247,804 6,976,860 35,432 0.00Playtech Plc GBP 84,986 473,028 21,431 0.00Royal Mail PLC GBP 1,050,273 3,264,132 21,788 0.00Severn Trent PLC GBP 50,703 1,314,831 (22,408) 0.00Taylor Wimpey PLC GBP 2,604,173 5,932,273 (6,770) 0.00United Utilities Group PLC GBP 360,699 3,868,050 (58,138) 0.00WH Smith PLC GBP 48,790 1,345,766 8,879 0.00William Hill PLC GBP 619,733 1,255,062 50,750 0.00
(248,895) (0.02)
Total Long Positions (34,072) (0.01)
AQR UCITS FUNDS
AQR Style Premia UCITS Fund
Schedule of Investments (continued)As at 31 March 2019
The accompanying notes form an integral part of these audited financial statements. 155

Reference Entity Currency Shares Notional Amount
UnrealisedAppreciation/
(Depreciation)in USD
Percent ofNet Assets
Short PositionsCommon StocksChileAntofagasta PLC GBP (169,024) (2,127,192) (65,912) 0.00
(65,912) 0.00South AfricaOld Mutual Ltd GBP (3,192,313) (4,819,262) (130,295) 0.00
(130,295) 0.00SwitzerlandGlencore PLC GBP (583,092) (2,415,105) (64,758) 0.00
(64,758) 0.00United Arab EmiratesNMC Health PLC GBP (176,328) (5,225,759) 151,272 0.01
151,272 0.01United KingdomAA PLC GBP (720,761) (849,751) 23,984 0.00ASOS PLC GBP (69,950) (2,885,035) (102,745) 0.00Aviva PLC GBP (109,776) (587,035) (3,423) 0.00B&M European Value Retail SA GBP (183,174) (892,156) (13,572) 0.00Barclays PLC GBP (691,244) (1,377,781) 19,767 0.00British American Tobacco PLC GBP (176,508) (7,309,765) (258,113) (0.01)Capita PLC GBP (3,124,778) (5,008,129) (52,803) 0.00Cobham PLC GBP (1,244,824) (1,761,285) (7,281) 0.00ConvaTec Group PLC GBP (1,233,888) (2,276,693) (129,111) 0.00CYBG PLC GBP (210,622) (539,067) (23,819) 0.00easyJet PLC GBP (102,168) (1,463,490) 70,386 0.00Hargreaves Lansdown PLC GBP (84,965) (2,052,560) (97,189) 0.00Hiscox Ltd GBP (60,090) (1,216,922) 1,562 0.00HSBC Holdings PLC GBP (62,916) (510,234) (7,933) 0.00IMI PLC GBP (61,297) (758,126) (10,358) 0.00Informa PLC GBP (69,211) (670,411) (18,892) 0.00Man Group PLC GBP (211,605) (374,350) (12,653) 0.00Melrose Industries PLC GBP (6,683,970) (15,838,513) (251,957) (0.01)Micro Focus International PLC GBP (25,771) (666,619) (17,587) 0.00Ocado Group PLC GBP (78,817) (1,389,738) (103,475) 0.00Prudential PLC GBP (302,620) (6,057,753) 15,734 0.00Reckitt Benckiser Group PLC GBP (15,060) (1,254,609) (18,401) 0.00Rentokil Initial PLC GBP (383,898) (1,751,524) (19,960) 0.00RSA Insurance Group PLC GBP (278,803) (1,840,278) (17,395) 0.00Schroders PLC GBP (9,623) (336,978) (2,627) 0.00Spirax-Sarco Engineering PLC GBP (8,990) (836,693) (19,866) 0.00St James’s Place PLC GBP (109,588) (1,450,120) (36,467) 0.00Standard Chartered PLC GBP (788,382) (6,061,564) (110,676) 0.00Standard Life PLC GBP (803,144) (2,749,808) (58,984) 0.00The Weir Group PLC GBP (24,019) (481,585) (4,995) 0.00Thomas Cook Group PLC GBP (950,694) (301,193) 25,295 0.00
(1,243,554) (0.02)
Total Short Positions (1,353,247) (0.01)
Total of Long and Short Equity Positions (1,387,319) (0.02)Net Cash and Other Receivables/(Payables) 354,984 0.01
Total of Total Return Basket Swap Contract - MLIN - GBP (1,032,335) (0.01)
Counterparty† Description‡ Termination DateFair Value in
USDMLIN The Sub-Fund receives the total return on a portfolio of long and short positions and pays 1-month HIBOR
plus or minus a specified spread, which is denominated in HKD based on the local currency of thepositions within the swap.
27.08.2020 - 19.03.2021 750,406
The following table represents the long and short positions and related values within the total return equity basket swap as at 31 March 2019
Reference Entity Currency Shares Notional Amount
UnrealisedAppreciation/
(Depreciation)in USD
Percent ofNet Assets
Long PositionsCommon StocksHong KongCK Asset Holdings Ltd HKD 41,500 369,115 10,944 0.00CK Hutchison Holdings Ltd HKD 727,000 7,635,139 (47,031) (0.00)CLP Holdings Ltd HKD 942,000 10,919,745 77,676 0.00Henderson Land Development Co Ltd HKD 704,900 4,483,499 222,644 0.01HKT Trust & HKT Ltd HKD 786,000 1,263,173 11,572 0.00Hong Kong & China Gas Co Ltd HKD 1,513,900 3,629,619 115,806 0.01Kerry Properties Ltd HKD 139,500 622,807 27,484 0.00Li & Fung Ltd HKD 6,742,000 1,210,906 (34,439) (0.00)Lifestyle International Holdings Ltd HKD 512,000 887,718 15,029 0.00Melco International Development Ltd HKD 1,173,000 2,750,228 87,426 0.01New World Development Co Ltd HKD 241,000 400,057 26,120 0.00Sino Land Co Ltd HKD 964,000 1,865,720 82,615 0.00Sun Hung Kai Properties Ltd HKD 65,500 1,124,742 40,022 0.00Swire Properties Ltd HKD 595,200 2,560,991 85,398 0.00WH Group Ltd HKD 1,632,500 1,750,722 14,230 0.00Yue Yuen Industrial Holdings Ltd HKD 1,149,500 3,957,479 3,760 0.00
739,256 0.03MacauGalaxy Entertainment Group Ltd HKD 90,000 613,313 22,290 0.00Sands China Ltd HKD 169,600 853,088 46,133 0.00SJM Holdings Ltd HKD 1,591,000 1,817,335 54,050 0.00Wynn Macau Ltd HKD 487,600 1,150,888 5,486 0.00
127,959 0.00
Total Long Positions 867,215 0.03
AQR UCITS FUNDS
AQR Style Premia UCITS Fund
Schedule of Investments (continued)As at 31 March 2019
The accompanying notes form an integral part of these audited financial statements. 156

Reference Entity Currency Shares Notional Amount
UnrealisedAppreciation/
(Depreciation)in USD
Percent ofNet Assets
Short PositionsCommon StocksChinaMinth Group Ltd HKD (1,320,000) (4,158,751) (257,580) (0.01)
(257,580) (0.01)Hong KongAIA Group Ltd HKD (2,772,400) (27,641,307) (1,011,970) (0.04)ASM Pacific Technology Ltd HKD (356,500) (3,976,725) (46,117) (0.00)Power Assets Holdings Ltd HKD (403,500) (2,798,603) (35,767) (0.00)Techtronic Industries Co Ltd HKD (589,000) (3,958,901) (211,036) (0.01)The Wharf Holdings Ltd HKD (136,000) (410,875) (4,605) (0.00)Wharf Real Estate Investment Co Ltd HKD (175,000) (1,303,574) (28,407) (0.00)Xinyi Glass Holdings Ltd HKD (516,000) (592,272) (8,564) (0.00)
(1,346,466) (0.05)MacauMGM China Holdings Ltd HKD (200,000) (418,444) (25,066) (0.00)
(25,066) (0.00)United StatesSamsonite International SA HKD (948,300) (3,043,570) (156,371) (0.00)
(156,371) (0.00)
Total Short Positions (1,785,483) (0.06)
Total of Long and Short Equity Positions (918,268) (0.03)Net Cash and Other Receivables/(Payables) 1,668,674 0.06
Total of Total Return Basket Swap Contract - MLIN - HKD 750,406 0.03
Counterparty† Description‡ Termination DateFair Value in
USDMLIN The Sub-Fund receives the total return on a portfolio of long and short positions and pays 1-month LIBOR
plus or minus a specified spread, which is denominated in JPY based on the local currency of the positionswithin the swap.
25.12.2019 - 29.03.2021 (11,460,338)
The following table represents the long and short positions and related values within the total return equity basket swap as at 31 March 2019
Reference Entity Currency Shares Notional Amount
UnrealisedAppreciation/
(Depreciation)in USD
Percent ofNet Assets
Long PositionsCommon StocksJapanAdvantest Corp JPY 16,300 378,398 11,128 0.00Alfresa Holdings Corp JPY 133,500 3,796,055 75,179 0.00Aozora Bank Ltd JPY 101,200 2,500,184 (139,697) (0.00)Asahi Glass Co Ltd JPY 130,900 4,587,368 136,071 0.00Bandai Namco Holdings Inc JPY 31,400 1,470,694 14,906 0.00Central Japan Railway Co JPY 42,500 9,862,932 440,211 0.02Chubu Electric Power Co Inc JPY 180,600 2,817,817 (50,867) (0.00)Dai-ichi Life Insurance Co Ltd JPY 236,500 3,289,103 (31,262) (0.00)East Japan Railway Co JPY 30,000 2,892,902 43,491 0.00Electric Power Development Co Ltd JPY 249,200 6,064,102 (101,556) (0.00)GungHo Online Entertainment Inc JPY 656,200 2,386,566 19,002 0.00Gunma Bank Ltd JPY 119,700 453,221 (49,915) (0.00)Haseko Corp JPY 525,600 6,606,730 (158,536) (0.01)Hitachi Capital Corp JPY 22,200 514,742 (10,296) (0.00)Hitachi Ltd JPY 162,400 5,260,726 105,938 0.00Idemitsu Kosan Co Ltd JPY 350,300 11,723,950 (820,054) (0.03)Inpex Corp JPY 1,079,800 10,296,045 210,509 0.01ITOCHU Corp JPY 1,312,300 23,723,760 (228,245) (0.01)Japan Airlines Co Ltd JPY 246,200 8,662,329 161,417 0.01Japan Post Holdings Co Ltd JPY 110,700 1,294,208 (12,844) (0.00)JFE Holdings Inc JPY 269,100 4,566,310 (35,807) (0.00)JTEKT Corp JPY 147,600 1,817,370 13,392 0.00JX Holdings Inc JPY 5,533,400 25,325,592 (967,604) (0.03)Kajima Corp JPY 459,900 6,784,444 143,034 0.01Kaken Pharmaceutical Co Ltd JPY 8,900 404,127 (2,882) (0.00)Kamigumi Co Ltd JPY 76,500 1,770,864 31,992 0.00Kansai Electric Power Co Inc JPY 181,200 2,669,878 (124,980) (0.00)KDDI Corp JPY 540,000 11,610,624 (305,760) (0.01)Kobe Steel Ltd JPY 247,100 1,854,027 (15,967) (0.00)Konica Minolta Inc JPY 62,400 614,017 9,520 0.00Kyushu Railway Co JPY 135,700 4,459,790 (1,731) (0.00)Marubeni Corp JPY 2,758,900 19,066,711 (478,141) (0.02)Maruichi Steel Tube Ltd JPY 15,500 451,616 (3,464) (0.00)Mazda Motor Corp JPY 740,700 8,288,531 7,309 0.00Medipal Holdings Corp JPY 136,300 3,235,016 80,316 0.00Mitsubishi Chemical Holdings Corp JPY 191,000 1,344,339 (42,700) (0.00)Mitsubishi Corp JPY 924,500 25,659,066 (875,539) (0.03)Mitsubishi Gas Chemical Co Inc JPY 128,300 1,830,088 (21,534) (0.00)Mitsubishi UFJ Financial Group Inc JPY 912,000 4,515,009 (37,382) (0.00)Mitsui & Co Ltd JPY 1,065,800 16,539,261 (409,329) (0.01)Mitsui Chemicals Inc JPY 110,500 2,666,561 (10,596) (0.00)Mixi Inc JPY 134,500 3,105,535 (46,325) (0.00)Mizuho Financial Group Inc JPY 2,227,000 3,445,309 (41,880) (0.00)MS&AD Insurance Group Holdings Inc JPY 14,600 444,476 2,913 0.00Nexon Co Ltd JPY 197,800 3,096,959 117,426 0.00NHK Spring Co Ltd JPY 240,300 2,157,881 42,400 0.00Nippon Electric Glass Co Ltd JPY 32,000 848,035 27,722 0.00Nippon Express Co Ltd JPY 21,900 1,218,457 13,478 0.00Nippon Steel & Sumitomo Metal Corp JPY 31,300 552,437 (1,485) (0.00)Nippon Telegraph & Telephone Corp JPY 553,700 23,556,723 (216,442) (0.01)Nissan Motor Co Ltd JPY 519,900 4,262,371 (171,070) (0.01)Obayashi Corp JPY 645,000 6,487,513 99,473 0.00Osaka Gas Co Ltd JPY 241,600 4,764,014 (237,312) (0.01)
AQR UCITS FUNDS
AQR Style Premia UCITS Fund
Schedule of Investments (continued)As at 31 March 2019
The accompanying notes form an integral part of these audited financial statements. 157

Reference Entity Currency Shares Notional Amount
UnrealisedAppreciation/
(Depreciation)in USD
Percent ofNet Assets
Long Positions (continued)Common Stocks (continued)Japan (continued)Resona Holdings Inc JPY 2,483,600 10,761,873 (141,190) (0.00)Shimamura Co Ltd JPY 19,600 1,658,216 14,054 0.00Shimizu Corp JPY 131,000 1,137,589 6,782 0.00Showa Denko KK JPY 298,600 10,501,463 589,877 0.02SoftBank Group Corp JPY 52,100 5,052,274 21,556 0.00Sojitz Corp JPY 5,274,000 18,573,820 (359,586) (0.01)Sompo Japan Nipponkoa Holdings Inc JPY 9,800 362,705 8,238 0.00Sugi Holdings Co Ltd JPY 11,200 493,098 6,164 0.00Sumitomo Chemical Co Ltd JPY 321,000 1,492,614 (24,583) (0.00)Sumitomo Corp JPY 737,000 10,188,109 (255,467) (0.01)Sumitomo Heavy Industries Ltd JPY 66,300 2,148,012 36,985 0.00Sumitomo Mitsui Financial Group Inc JPY 98,600 3,450,381 (31,503) (0.00)Sumitomo Mitsui Trust Holdings Inc JPY 9,500 340,984 (6,316) (0.00)Suzuken Co Ltd JPY 22,470 1,299,503 53,027 0.00Taiheiyo Cement Corp JPY 53,000 1,766,166 33,203 0.00Taisei Corp JPY 156,900 7,279,739 118,651 0.00Teijin Ltd JPY 56,800 936,578 (19,439) (0.00)Toho Gas Co Ltd JPY 26,300 1,179,860 (6,267) (0.00)Tohoku Electric Power Co Inc JPY 142,600 1,817,640 (52,567) (0.00)Tokio Marine Holdings Inc JPY 30,300 1,467,174 71 0.00Tokyo Broadcasting System Holdings Inc JPY 31,800 582,139 150 0.00Tokyo Electric Power Co Inc JPY 7,296,200 46,100,109 (165,427) (0.01)Tokyo Gas Co Ltd JPY 232,400 6,280,229 (159,430) (0.01)Tosoh Corp JPY 286,000 4,448,986 53,154 0.00Toyo Seikan Group Holdings Ltd JPY 160,400 3,284,576 (41,628) (0.00)Toyo Suisan Kaisha Ltd JPY 13,700 521,237 9,642 0.00Toyoda Gosei Co Ltd JPY 18,400 389,431 237 0.00West Japan Railway Co JPY 39,700 2,987,783 34,230 0.00Yamada Denki Co Ltd JPY 142,300 701,167 (17,617) (0.00)Yamaguchi Financial Group Inc JPY 292,500 2,479,168 (93,217) (0.00)
(4,232,591) (0.15)
Total Long Positions (4,232,591) (0.15)
Short PositionsCommon StocksJapanAcom Co Ltd JPY (687,400) (2,452,257) (46,527) (0.00)Aeon Co Ltd JPY (457,100) (9,557,402) (288,825) (0.01)AEON Financial Service Co Ltd JPY (91,300) (1,857,641) 9,288 0.00Asahi Intecc Co Ltd JPY (56,800) (2,666,285) (94,365) (0.00)Asics Corp JPY (329,800) (4,424,645) (271,839) (0.01)Benesse Holdings Inc JPY (34,600) (898,183) (1,545) (0.00)Calbee Inc JPY (134,100) (3,610,209) (8,082) (0.00)Casio Computer Co Ltd JPY (148,100) (1,933,109) (9,472) (0.00)Coca-Cola West Co Ltd JPY (74,100) (1,880,590) (77,299) (0.00)Cosmos Pharmaceutical Corp JPY (38,300) (6,617,970) (147,407) (0.01)CyberAgent Inc JPY (292,600) (11,921,322) (902,470) (0.03)Daifuku Co Ltd JPY (309,800) (16,129,981) (369,623) (0.01)Daiichi Sankyo Co Ltd JPY (44,600) (2,053,027) (343,290) (0.01)Daikin Industries Ltd JPY (122,000) (14,297,247) (844,399) (0.03)Disco Corp JPY (33,100) (4,715,800) (222,452) (0.01)Don Quijote Holdings Co Ltd JPY (8,200) (542,943) (22,238) (0.00)Eisai Co Ltd JPY (12,500) (701,013) (17,186) (0.00)FamilyMart Co Ltd JPY (406,800) (10,362,976) 190,010 0.01FANUC Corp JPY (16,000) (2,722,271) (9,061) (0.00)Fast Retailing Co Ltd JPY (23,600) (11,092,432) 110,995 0.00Hamamatsu Photonics KK JPY (13,800) (533,617) (15,176) (0.00)Hikari Tsushin Inc JPY (7,400) (1,400,739) (31,741) (0.00)Hisamitsu Pharmaceutical Co Inc JPY (14,100) (648,285) (41,629) (0.00)Hokuriku Electric Power Co JPY (106,500) (834,637) 18,400 0.00Isetan Mitsukoshi Holdings Ltd JPY (646,200) (6,527,539) 617 0.00J Front Retailing Co Ltd JPY (136,500) (1,623,298) (69,489) (0.00)Japan Airport Terminal Co Ltd JPY (63,900) (2,698,416) 24,963 0.00JGC Corp JPY (360,600) (4,791,220) (32,659) (0.00)Kakaku.com Inc JPY (242,800) (4,662,792) (306,780) (0.01)Kansai Paint Co Ltd JPY (248,200) (4,735,364) 10,805 0.00Keikyu Corp JPY (275,100) (4,666,202) (164,949) (0.01)Keio Corp JPY (13,900) (897,765) (28,897) (0.00)Keyence Corp JPY (27,700) (17,261,114) 1,259 0.00Kikkoman Corp JPY (190,400) (9,336,610) (268,716) (0.01)Kintetsu Group Holdings Co Ltd JPY (11,900) (554,259) (8,983) (0.00)Koito Manufacturing Co Ltd JPY (27,500) (1,557,447) (41,865) (0.00)Kose Corp JPY (34,200) (6,280,070) (434,311) (0.02)Lawson Inc JPY (6,100) (337,939) (104) (0.00)LIXIL Group Corp JPY (370,400) (4,943,589) (42,341) (0.00)M3 Inc JPY (579,800) (9,716,894) (460,176) (0.02)Makita Corp JPY (17,400) (605,901) (35,396) (0.00)Marui Group Co Ltd JPY (487,700) (9,841,944) (102,461) (0.00)MISUMI Group Inc JPY (308,800) (7,676,649) (392,907) (0.02)Mitsubishi Logistics Corp JPY (61,200) (1,707,856) (66,693) (0.00)Mitsui OSK Lines Ltd JPY (170,800) (3,674,133) (4,394) (0.00)MonotaRO Co Ltd JPY (438,800) (9,725,486) (353,020) (0.01)Nabtesco Corp JPY (136,400) (3,977,057) (169,200) (0.01)Nidec Corp JPY (241,100) (30,550,930) (1,496,711) (0.05)Nintendo Co Ltd JPY (95,500) (27,296,380) (1,066,506) (0.04)Nippon Paint Holdings Co Ltd JPY (235,300) (9,248,349) (122,024) (0.01)Nippon Shinyaku Co Ltd JPY (88,300) (6,427,925) (510,196) (0.02)Nippon Yusen KK JPY (31,400) (460,015) (1,753) (0.00)Nitori Holdings Co Ltd JPY (7,300) (942,595) (53,676) (0.00)Nomura Research Institute Ltd JPY (12,100) (549,388) (15,685) (0.00)Obic Co Ltd JPY (4,500) (453,546) (13,552) (0.00)Odakyu Electric Railway Co Ltd JPY (99,600) (2,413,353) (73,946) (0.00)Oji Holdings Corp JPY (61,200) (379,875) 3,229 0.00Ono Pharmaceutical Co Ltd JPY (136,200) (2,667,633) (10,956) (0.00)
AQR UCITS FUNDS
AQR Style Premia UCITS Fund
Schedule of Investments (continued)As at 31 March 2019
The accompanying notes form an integral part of these audited financial statements. 158

Reference Entity Currency Shares Notional Amount
UnrealisedAppreciation/
(Depreciation)in USD
Percent ofNet Assets
Short Positions (continued)Common Stocks (continued)Japan (continued)Oriental Land Co Ltd JPY (11,800) (1,339,250) (30,090) (0.00)Panasonic Corp JPY (54,500) (468,897) (6,754) (0.00)PeptiDream Inc JPY (95,700) (4,694,798) (145,671) (0.01)Pigeon Corp JPY (209,700) (8,568,453) 28,368 0.00Pola Orbis Holdings Inc JPY (29,900) (953,677) (28,615) (0.00)Rakuten Inc JPY (234,000) (2,217,648) (37,321) (0.00)Recruit Holdings Co Ltd JPY (190,600) (5,441,364) (257,952) (0.01)Renesas Electronics Corp JPY (1,252,900) (5,795,370) 58,617 0.00Ricoh Co Ltd JPY (569,600) (5,953,305) (152,751) (0.01)Rohm Co Ltd JPY (14,700) (916,678) (4,434) (0.00)Ryohin Keikaku Co Ltd JPY (2,900) (733,701) (64,842) (0.00)Santen Pharmaceutical Co Ltd JPY (31,600) (470,561) (15,366) (0.00)Sega Sammy Holdings Inc JPY (55,200) (650,812) 2,437 0.00Shimadzu Corp JPY (43,500) (1,257,443) (80,728) (0.00)Shimano Inc JPY (56,400) (9,163,560) (647,473) (0.02)Shiseido Co Ltd JPY (19,900) (1,436,705) (35,188) (0.00)SMC Corp JPY (50,100) (551,097) (17,402) (0.00)Sony Financial Holdings Inc JPY (293,500) (5,539,806) (91,532) (0.00)Square Enix Holdings Co Ltd JPY (21,600) (756,585) (18,173) (0.00)Start Today Co Ltd JPY (523,800) (9,872,115) (21,189) (0.00)Sysmex Corp JPY (80,500) (4,861,560) 36,767 0.00Takeda Pharmaceutical Co Ltd JPY (174,300) (7,103,185) 127,282 0.00Temp Holdings Co Ltd JPY (534,100) (8,646,899) (66,805) (0.00)Terumo Corp JPY (56,000) (1,709,851) 1,239 0.00The Bank of Kyoto Ltd JPY (69,200) (2,895,115) 51,027 0.00The Iyo Bank Ltd JPY (73,400) (388,490) 7,426 0.00Tobu Railway Co Ltd JPY (20,200) (582,793) (6,118) (0.00)TOTO Ltd JPY (235,300) (9,981,863) (431,058) (0.02)Tsuruha Holdings Inc JPY (47,800) (3,883,260) (20,111) (0.00)Unicharm Corp JPY (21,400) (707,767) (28,696) (0.00)Welcia Holdings Co Ltd JPY (66,100) (2,240,335) (105,865) (0.00)Yahoo Japan Corp JPY (140,000) (342,510) (1,555) (0.00)Yakult Honsha Co Ltd JPY (75,200) (5,256,248) (141,848) (0.01)Yamato Holdings Co Ltd JPY (311,700) (8,050,063) 17,615 0.00Yaskawa Electric Corp JPY (636,100) (19,967,847) (689,481) (0.03)Yokogawa Electric Corp JPY (59,700) (1,235,680) (68,766) (0.00)
(12,628,412) (0.45)
Total Short Positions (12,628,412) (0.45)
Total of Long and Short Equity Positions (16,861,003) (0.60)Net Cash and Other Receivables/(Payables) 5,400,665 0.19
Total of Total Return Basket Swap Contract - MLIN - JPY (11,460,338) (0.41)
Counterparty† Description‡ Termination DateFair Value in
USDMLIN The Sub-Fund receives the total return on a portfolio of long and short positions and pays 1-month NIBOR
plus or minus a specified spread, which is denominated in NOK based on the local currency of thepositions within the swap.
25.09.2020 - 25.01.2021 (1,086,157)
The following table represents the long and short positions and related values within the total return equity basket swap as at 31 March 2019
Reference Entity Currency Shares Notional Amount
UnrealisedAppreciation/
(Depreciation)in USD
Percent ofNet Assets
Long PositionsCommon StocksNorwayDNB ASA NOK 184,651 3,404,055 (65,318) (0.00)Leroy Seafood Group ASA NOK 502,298 3,649,200 19,807 0.00Marine Harvest ASA NOK 563,330 12,671,764 (316,876) (0.01)Salmar ASA NOK 68,056 3,259,875 23,679 0.00Statoil ASA NOK 396,782 8,732,089 (87,436) (0.00)
(426,144) (0.01)
Total Long Positions (426,144) (0.01)
Short PositionsCommon StocksNorwaySchibsted ASA NOK (101,109) (3,980,028) 58,633 0.00
58,633 0.00
Total Short Positions 58,633 0.00
Total of Long and Short Equity Positions (367,511) (0.01)Net Cash and Other Receivables/(Payables) (718,646) (0.03)
Total of Total Return Basket Swap Contract - MLIN - NOK (1,086,157) (0.04)
AQR UCITS FUNDS
AQR Style Premia UCITS Fund
Schedule of Investments (continued)As at 31 March 2019
The accompanying notes form an integral part of these audited financial statements. 159

Counterparty† Description‡ Termination DateFair Value in
USDMLIN The Sub-Fund receives the total return on a portfolio of long and short positions and pays 1-month
STIBOR plus or minus a specified spread, which is denominated in SEK based on the local currency of thepositions within the swap.
25.09.2020 - 25.03.2021 881,940
The following table represents the long and short positions and related values within the total return equity basket swap as at 31 March 2019
Reference Entity Currency Shares Notional Amount
UnrealisedAppreciation/
(Depreciation)in USD
Percent ofNet Assets
Long PositionsCommon StocksFinlandNordea Bank AB SEK 220,887 1,680,539 (288,031) (0.01)
(288,031) (0.01)MaltaUnibet Group PLC SEK 224,378 2,235,637 (20,328) (0.00)
(20,328) (0.00)SwedenAxfood AB SEK 29,144 540,498 12,573 0.00Boliden AB SEK 344,871 9,810,522 489,131 0.02Securitas AB SEK 94,117 1,518,090 59,384 0.00SSAB AB SEK 751,140 2,695,359 (6,481) (0.00)Swedish Orphan Biovitrum AB SEK 207,917 4,848,291 38,123 0.00Telia Co AB SEK 79,945 360,594 (1,121) (0.00)Volvo AB SEK 38,825 599,649 42,712 0.00
634,321 0.02
Total Long Positions 325,962 0.01
Short PositionsCommon StocksColombiaMillicom International Cellular SA SEK (29,253) (1,770,012) 1,578 0.00
1,578 0.00SwedenAssa Abloy AB SEK (28,112) (605,043) (17,737) (0.00)Saab AB SEK (106,437) (3,411,807) (20,664) (0.00)Svenska Cellulosa AB SCA SEK (590,834) (5,097,984) (121,077) (0.00)
(159,478) (0.00)
Total Short Positions (157,900) (0.00)
Total of Long and Short Equity Positions 168,062 0.01Net Cash and Other Receivables/(Payables) 713,878 0.03
Total of Total Return Basket Swap Contract - MLIN - SEK 881,940 0.04
Counterparty† Description‡ Termination DateFair Value in
USDBANA The Sub-Fund receives the total return on a portfolio of long positions and pays 1-month LIBOR plus or minus a
specified spread, which is denominated in USD based on the local currency of the positions within the swap.26.05.2020 152,778
The following table represents the long positions and related values within the total return equity basket swap as at 31 March 2019
Reference Entity Currency Shares Notional Amount
UnrealisedAppreciation/
(Depreciation)in USD
Percent ofNet Assets
Long PositionsCommon StocksUnited StatesMcDermott International Inc USD 591,313 4,357,977 153,741 0.01
153,741 0.01
Total Long Positions 153,741 0.01
Net Cash and Other Receivables/(Payables) (963) (0.00)
Total of Total Return Basket Swap Contract - BANA - USD 152,778 0.01
AQR UCITS FUNDS
AQR Style Premia UCITS Fund
Schedule of Investments (continued)As at 31 March 2019
The accompanying notes form an integral part of these audited financial statements. 160

Investments CouponMaturityDate Currency
Shares/PrincipalAmounts
Fair Valuein USD
Percentof Net
Assets
Transferable securities and money market instruments admitted to official exchange listing or dealt in on another regulated market.Corporate BondsBasic MaterialsAllegheny Technologies 5.950% 15/01/2021 USD 1,000,000 1,030,000 0.18CVR Partners LP / CVR Nitrogen Finance Corp 9.250% 15/06/2023 USD 5,300,000 5,571,625 0.96Ferroglobe PLC 9.375% 01/03/2022 USD 4,600,000 3,973,250 0.69Ingevity Corp 4.500% 02/02/2026 USD 5,286,000 5,182,024 0.89Kaiser Aluminum Corp 5.875% 15/05/2024 USD 4,800,000 4,944,000 0.85
Total Basic Materials 20,700,899 3.57
CommunicationsCable One Inc 5.750% 15/06/2022 USD 5,050,000 5,138,375 0.89Cogent Communications Group Inc 5.375% 01/03/2022 USD 112,000 115,080 0.02EIG Investors Corp 10.875% 01/02/2024 USD 3,600,000 3,807,000 0.66Frontier Communications Corp 11.000% 15/09/2025 USD 6,400,000 4,240,000 0.73Gray Television Inc 5.875% 15/07/2026 USD 6,300,000 6,427,260 1.11Hughes Satellite Systems Corp 6.625% 03/08/2026 USD 6,900,000 6,779,250 1.17Intelsat Jackson Holdings SA 8.500% 15/10/2024 USD 9,600,000 9,408,000 1.62Iridium Communications Inc 10.250% 17/04/2023 USD 4,750,000 5,253,310 0.91Lee Enterprises Inc 9.500% 15/03/2022 USD 4,750,000 4,874,688 0.84Liberty Interactive Llc 8.250% 01/02/2030 USD 3,650,000 3,741,250 0.65Nexstar Broadcasting Inc 5.625% 01/08/2024 USD 6,050,000 6,155,875 1.06Sirius XM Radio Inc 5.000% 02/08/2027 USD 3,850,000 3,835,563 0.66TEGNA Inc 6.375% 16/10/2023 USD 2,150,000 2,230,625 0.39The EW Scripps Company 5.125% 15/05/2025 USD 5,550,000 5,300,250 0.91VeriSign Inc 4.750% 15/07/2027 USD 6,400,000 6,424,768 1.11ViaSat Inc 5.625% 15/09/2025 USD 5,000,000 4,812,500 0.83
Total Communications 78,543,794 13.56
Consumer CyclicalAllison Transmission Inc 5.000% 01/10/2024 USD 5,000,000 5,012,500 0.87Brinker International Inc 5.000% 01/10/2024 USD 3,050,000 2,981,375 0.51Churchill Downs Inc 4.750% 18/01/2028 USD 5,100,000 4,876,875 0.84Cinemark USA Inc 4.875% 01/06/2023 USD 5,200,000 5,265,000 0.91DescriptionTenneco Inc 5.000% 15/07/2026 USD 5,958,000 4,796,190 0.83KAR Auction Services Inc 5.125% 02/06/2025 USD 5,100,000 5,068,125 0.88LGI Homes Inc 6.875% 15/07/2026 USD 5,500,000 5,486,250 0.95Live Nation Entertainment 4.875% 01/11/2024 USD 5,800,000 5,843,500 1.01M/I Homes Inc 5.625% 01/08/2025 USD 1,952,000 1,878,800 0.32Mattel Inc 6.750% 31/12/2025 USD 5,700,000 5,628,750 0.97Meritage Homes Corporation 6.000% 02/06/2025 USD 3,000,000 3,165,000 0.55Meritor Inc 6.250% 15/02/2024 USD 4,400,000 4,543,000 0.78Performance Food Group Inc 5.500% 03/06/2024 USD 3,750,000 3,782,813 0.65PulteGroup Inc 5.000% 15/01/2027 USD 7,350,000 7,322,438 1.26Suburban Propane Partners LP 5.500% 03/06/2024 USD 3,950,000 3,861,125 0.67Tempur Sealy International Inc 5.500% 15/06/2026 USD 5,000,000 4,981,250 0.86Tesla Inc 5.300% 15/08/2025 USD 6,600,000 5,725,500 0.99TRI Pointe Group Inc 5.250% 01/06/2027 USD 3,700,000 3,408,625 0.59Under Armour Inc 3.250% 15/06/2026 USD 5,469,000 5,000,240 0.86
Total Consumer Cyclical 88,627,356 15.30
Consumer Non-cyclicalAlliance One International Inc 9.875% 15/07/2021 USD 5,450,000 4,823,250 0.83Avon International Operations Inc 7.875% 15/08/2022 USD 3,050,000 3,175,813 0.55Cardtronics Inc / Cardtronics USA Inc 5.500% 01/05/2025 USD 3,100,000 3,045,750 0.53Darling Ingredients Inc 5.250% 15/04/2027 USD 1,000,000 1,015,625 0.18Darling Ingredients Inc 5.375% 18/01/2022 USD 3,000,000 3,055,350 0.53Encompass Health Corp 5.750% 01/11/2024 USD 5,900,000 5,995,875 1.03Endo Dac / Endo Finance LLC / Endo Finco Inc 6.000% 17/07/2023 USD 7,400,000 5,698,000 0.98Graham Holdings Co 5.750% 01/06/2026 USD 5,350,000 5,604,125 0.97Hill-Rom Holdings Inc 5.750% 01/09/2023 USD 4,300,000 4,445,125 0.77Hologic Inc 4.375% 15/10/2025 USD 5,000,000 4,962,500 0.86Horizon Pharma Inc 6.625% 01/05/2023 USD 4,850,000 5,009,616 0.86Lamb Weston Holdings Inc 4.625% 01/11/2024 USD 1,950,000 1,979,250 0.34Laureate Education Inc 8.250% 01/05/2025 USD 2,056,000 2,241,040 0.39Post Holdings Inc 5.000% 17/08/2026 USD 1,800,000 1,755,000 0.30Revlon Consumer Products Corporation 5.750% 16/02/2021 USD 2,000,000 1,730,000 0.30Syneos Health Inc 7.500% 01/10/2024 USD 1,000,000 1,057,500 0.18Teleflex Inc 4.625% 15/11/2027 USD 1,000,000 995,630 0.17The ServiceMaster Co LLC 5.125% 15/11/2024 USD 1,000,000 1,006,880 0.17US Foods Inc 5.875% 17/06/2024 USD 5,400,000 5,541,750 0.96Valeant Pharmaceuticals International Inc 6.125% 15/04/2025 USD 11,600,000 11,484,000 1.98Vector Group Ltd 6.125% 03/02/2025 USD 5,950,000 5,273,188 0.91
Total Consumer Non-cyclical 79,895,267 13.79
EnergyAlliance Resource Operating Partners LP 7.500% 01/05/2025 USD 4,800,000 5,016,000 0.87California Resources Corp 8.000% 15/12/2022 USD 6,850,000 5,411,500 0.93CONSOL Energy Inc 11.000% 17/11/2025 USD 4,250,000 4,834,375 0.83CSI Compressco LP / CSI Compressco Finance Inc 7.250% 15/08/2022 USD 1,404,000 1,235,520 0.21CVR Refining LLC / Coffeyville Finance Inc 6.500% 01/11/2022 USD 5,000,000 5,075,000 0.88Diamond Offshore Drilling Inc 7.875% 15/08/2025 USD 3,650,000 3,559,845 0.61Eclipse Resources Corp 8.875% 17/07/2023 USD 5,000,000 4,775,000 0.82Exterran Energy Solutions LP / EES Finance Corp 8.125% 01/05/2025 USD 1,850,000 1,887,000 0.33Foresight Energy LLC / Foresight Energy Finance Corp 11.500% 03/04/2023 USD 5,900,000 4,808,500 0.83FTS International Inc 6.250% 02/05/2022 USD 3,750,000 3,646,875 0.63Genesis Energy LP 6.750% 01/08/2022 USD 6,300,000 6,449,625 1.11Holly Energy Partners LP 6.000% 01/08/2024 USD 5,303,000 5,501,863 0.95Kosmos Energy Ltd 7.875% 02/08/2021 USD 1,300,000 1,327,560 0.23Magnolia Oil & Gas Corporation/ Magnolia Oil & GasFinance Corp 6.000% 03/08/2026 USD 3,000,000 3,030,000 0.52Martin Midstream Partners LP / Martin Midstream FinanceCorp 6.500% 16/03/2026 USD 5,300,000 5,141,000 0.89Mrt Mid Part/Mrt Mid Fin 7.250% 16/02/2021 USD 4,750,000 4,631,250 0.80Murphy Oil USA Inc 6.000% 15/08/2023 USD 3,000,000 3,090,000 0.53Natural Resource Partners LP / NRP Finance Corp 10.500% 15/03/2022 USD 4,800,000 5,070,000 0.88Nine Energy Service Inc 8.750% 01/11/2023 USD 3,100,000 3,216,250 0.56Par Petroleum LLC/Fin Corp 7.750% 15/12/2025 USD 1,650,000 1,540,275 0.27PBF Holding Co LLC / PBF Finance Corp 7.250% 16/06/2025 USD 5,350,000 5,503,813 0.95Pbf Logistics LP 6.875% 15/05/2023 USD 4,700,000 4,805,750 0.83Peabody Energy Corp 6.000% 31/03/2022 USD 2,500,000 2,528,125 0.44
AQR UCITS FUNDS
AQR Systematic Fixed Income: US High Yield UCITS Fund
Schedule of InvestmentsAs at 31 March 2019
The accompanying notes form an integral part of these audited financial statements. 161

Investments CouponMaturityDate Currency
Shares/PrincipalAmounts
Fair Valuein USD
Percentof Net
Assets
Corporate Bonds (continued)Energy (continued)Pioneer Energy Services Corp 6.125% 15/03/2022 USD 5,200,000 3,276,000 0.57Resolute Energy Corp 8.500% 01/05/2020 USD 1,050,000 1,050,000 0.18SunCoke Energy Partners LP 7.500% 16/06/2025 USD 1,000,000 1,015,000 0.18W&T Offshore Inc 9.750% 01/11/2023 USD 5,750,000 5,735,625 0.99Warrior Met Coal Inc 8.000% 01/11/2024 USD 3,353,000 3,503,885 0.60
Total Energy 106,665,636 18.42
FinancialCNG Holdings Inc 9.375% 15/05/2020 USD 1,000,000 985,000 0.17Compass Diversified Holdings 8.000% 01/05/2026 USD 2,850,000 2,969,344 0.51Credit Acceptance Corp 7.375% 15/03/2023 USD 5,500,000 5,726,875 0.99Enova International Inc 8.500% 15/09/2025 USD 3,546,000 3,319,943 0.58ESH Hospitality Inc 5.250% 01/05/2025 USD 1,000,000 997,500 0.17Felcor Lodging LP 6.000% 02/06/2025 USD 2,850,000 2,946,188 0.51Icahn Enterprises 5.875% 01/02/2022 USD 9,250,000 9,400,313 1.62MPT Operating Partnership LP 5.000% 15/10/2027 USD 6,500,000 6,621,875 1.15York Risk Services Holding Corp 8.500% 03/10/2022 USD 2,000,000 1,640,000 0.28
Total Financial 34,607,038 5.98
IndustrialAdvanced Disposal Services Inc 5.625% 15/11/2024 USD 1,146,000 1,174,650 0.20Bmc East LLC 5.500% 01/10/2024 USD 5,500,000 5,424,375 0.94Covanta Holding Corp 5.875% 01/07/2025 USD 5,150,000 5,259,438 0.91EnPro Industries Inc 5.750% 15/10/2026 USD 570,000 575,700 0.10frontdoor Inc 6.750% 17/08/2026 USD 5,000,000 5,137,500 0.89Global Ship Lease Inc 9.875% 15/11/2022 USD 775,000 767,250 0.13Great Lakes Dredge and Dock Company 8.000% 16/05/2022 USD 5,050,000 5,302,500 0.92Kratos Defense Security Solutions Inc 6.500% 01/12/2025 USD 4,550,000 4,777,500 0.82Louisiana-Pacific Corp 4.875% 16/09/2024 USD 4,750,000 4,750,000 0.82LSB Industries 9.625% 01/05/2023 USD 2,294,000 2,386,219 0.41Navios Acquisition Finance US Inc 8.125% 15/11/2021 USD 5,000,000 3,950,000 0.68PGT Escrow Issuer Inc. 6.750% 03/08/2026 USD 3,000,000 3,127,500 0.54TriMas Corp 4.875% 15/10/2025 USD 1,950,000 1,924,406 0.33
Total Industrial 44,557,038 7.69
TechnologyACI Worldwide Inc 5.750% 17/08/2026 USD 2,100,000 2,157,750 0.37Booz Allen Hamilton Inc 5.125% 01/05/2025 USD 4,850,000 4,874,250 0.84CDW LLC / CDW Finance Corp 5.000% 02/09/2025 USD 5,898,000 6,067,568 1.05Diebold Nixdorf Inc 8.500% 15/04/2024 USD 5,350,000 4,788,250 0.83Entegris Inc 4.625% 10/02/2026 USD 2,000,000 1,990,000 0.34Exela Intermediate LLC / Exela Finance Inc 10.000% 17/07/2023 USD 5,500,000 5,616,875 0.97Fair Isaac Corp 5.250% 15/05/2026 USD 2,950,000 3,053,250 0.53j2 Cloud Services LLC / j2 Global Co-Obligor Inc 6.000% 15/07/2025 USD 1,850,000 1,910,125 0.33Lexmark International Inc 7.125% 16/03/2020 USD 4,286,000 4,050,270 0.70PTC Inc 6.000% 15/05/2024 USD 4,700,000 4,917,375 0.85Qorvo Inc 5.500% 15/07/2026 USD 4,300,000 4,434,375 0.76Unisys Corp 10.750% 18/04/2022 USD 4,250,000 4,701,563 0.81
Total Technology 48,561,651 8.38
UtilitiesAES Corp 4.875% 15/05/2023 USD 3,100,000 3,146,500 0.55NRG Energy Inc 6.625% 15/01/2027 USD 6,800,000 7,310,000 1.26
Total Utilities 10,456,500 1.81
Total Corporate Bonds 512,615,179 88.50
Short Term Investments
U.S. Treasury Obligations
GovernmentUnited States Treasury Bill1 0.000%δ 25/04/2019 USD 13,690,000 13,668,849 2.36United States Treasury Bill2 0.000%δ 16/05/2019 USD 9,800,000 9,770,922 1.69United States Treasury Bill3 0.000%δ 29/08/2019 USD 3,580,000 3,544,756 0.61United States Treasury Bill4 0.000%δ 22/08/2019 USD 3,580,000 3,546,188 0.61
Total Government 30,530,715 5.27
Total U.S. Treasury Obligations 30,530,715 5.27
Other Investment Funds
FinancialJPMorgan Liquidity Funds – USD Treasury CNAV Fund^ 0.000% USD 24,290,189 24,290,189 4.20
Total Financial 24,290,189 4.20
Total Other Investment Funds 24,290,189 4.20
Total Short Term Investments 54,820,904 9.47
Total Investments (Total Cost: $569,902,962) 567,436,083 97.97
Other Assets/(Liabilities) 11,772,023 2.03
Total Net Assets 579,208,106 100.00
1Effective yield at 31 March 2019 was 2.39%.2Effective yield at 31 March 2019 was 2.45%.3Effective yield at 31 March 2019 was 2.51%.4Effective yield at 31 March 2019 was 2.48%.δThe rate shown was the effective yield at the date of the purchase.^Seven-day effective yield at 31 March 2019 was 2.24%.
AQR UCITS FUNDS
AQR Systematic Fixed Income: US High Yield UCITS Fund
Schedule of Investments (continued)As at 31 March 2019
The accompanying notes form an integral part of these audited financial statements. 162

Economic Classification of InvestmentsAs at 31 March 2019
Country ClassificationPercent ofNet Assets
Canada 1.98Ghana 0.23Ireland 0.98Luxembourg 1.63United Kingdom 0.82United States 92.33Total Investments 97.97
Other Assets/(Liabilities) 2.03Total Net Assets 100.00
AQR UCITS FUNDS
AQR Systematic Fixed Income: US High Yield UCITS Fund
Schedule of Investments (continued)As at 31 March 2019
The accompanying notes form an integral part of these audited financial statements. 163

Derivatives
Credit Default Swap Contracts - Sell ProtectionCentrally Cleared
Counterparty† Reference Entity
FinancingRateReceived
TerminationDate
CreditSpread
TradingCurrency
Notional Amountin USD
UpfrontPayments(Receipts)
UnrealisedAppreciation/
(Depreciation)in USD
Percent ofNet Assets
CITGNorth America High Yield CDX Spreads -Series 31 5.00 21/12/2023 0.0346 USD (21,893,222) 1,432,615 1,572,576 0.27
CITGNorth America High Yield CDX Spreads -Series 32 5.00 21/06/2024 0.0361 USD (46,577,121) 2,998,060 3,309,886 0.57
Total Credit Default Swap Contracts - Sell Protection 4,882,462 0.84
Futures ContractsExchange-Traded
Description Counterparty†Number ofContracts
ExpirationDate
TradingCurrency
Notional Amountin USD
UnrealisedAppreciation/
(Depreciation)in USD
Percent ofNet Assets
10 Year US Treasury Note (CBT) Futures JPPC 146 19/06/2019 USD 18,138,220 277,639 0.052 Year US Treasury Note (CBT) Futures JPPC 73 28/06/2019 USD 15,556,413 58,256 0.015 Year US Treasury Note (CBT) Futures JPPC 133 28/06/2019 USD 15,408,256 148,913 0.03US ULTRA Bond (CBT) Futures JPPC 49 19/06/2019 USD 8,221,282 294,105 0.05
Total Futures Contracts 778,913 0.14
Hedge Forward Foreign Exchange ContractsOver-the-Counter
Counterparty† Currency Purchased Amount Purchased Currency Sold Amount Sold Settlement Date
UnrealisedAppreciation/
(Depreciation)in USD
Percent ofNet Assets
CITI GBP 2,464,059 USD 3,255,972 19/06/2019 (40,669) (0.01)CITI GBP 201,029 USD 261,145 19/06/2019 1,174 0.00
Total Hedge Forward Foreign Exchange Contracts (39,495) (0.01)
AQR UCITS FUNDS
AQR Systematic Fixed Income: US High Yield UCITS Fund
Schedule of Investments (continued)As at 31 March 2019
The accompanying notes form an integral part of these audited financial statements. 164

Investments CouponMaturityDate Currency
Shares/PrincipalAmounts
Fair Valuein USD
Percentof Net
Assets
Short Term InvestmentsAustraliaAustralia & New Zealand Banking Group Ltd 0.000% 08/05/2019 USD 10,200,000 10,172,256 1.02
Total Australia 10,172,256 1.02
CanadaThe Toronto-Dominion Bank 2.710% 08/04/2019 USD 12,000,000 12,000,867 1.21Total Capital Canada Ltd 0.000% 03/04/2019 USD 5,000,000 4,998,333 0.50Total Capital Canada Ltd 0.000% 04/04/2019 USD 15,000,000 14,993,980 1.51Total Capital Canada Ltd 0.000% 28/05/2019 USD 1,000,000 995,808 0.10
Total Canada 32,988,988 3.32
FinlandNordea Bank AB 0.000% 13/05/2019 USD 12,000,000 11,963,400 1.20
Total Finland 11,963,400 1.20
FranceAntalis SA 0.000% 02/04/2019 USD 21,000,000 20,994,295 2.11Societe Generale SA 0.000% 08/04/2019 USD 10,000,000 9,993,300 1.01Societe Generale SA 0.000% 22/04/2019 USD 11,500,000 11,481,439 1.16
Total France 42,469,034 4.28
JapanSumitomo Mitsui Banking Corp 0.000% 09/04/2019 USD 10,500,000 10,492,290 1.06
Total Japan 10,492,290 1.06
NorwayDNB Bank ASA 0.000% 07/05/2019 USD 4,500,000 4,488,188 0.45DNB Bank ASA 0.000% 15/05/2019 USD 17,000,000 16,945,868 1.71
Total Norway 21,434,056 2.16
SingaporeDBS Bank Ltd 0.000% 14/05/2019 USD 15,675,000 15,624,607 1.58DBS Bank Ltd 0.000% 07/06/2019 USD 4,325,000 4,303,656 0.43Mitsubishi UFJ Trust & Banking Corp 0.000% 09/04/2019 USD 10,000,000 9,992,615 1.01Sumitomo Mitsui Trust Bank Ltd 0.000% 03/06/2019 USD 12,000,000 11,944,582 1.20
Total Singapore 41,865,460 4.22
SwedenSkandinaviska Enskilda Banken AB 0.000% 22/05/2019 USD 15,000,000 14,945,078 1.51Svenska Handelsbanken AB 0.000% 16/04/2019 USD 9,000,000 8,989,115 0.91Swedbank AB 0.000% 10/05/2019 USD 11,000,000 10,969,213 1.10Swedbank AB 0.000% 21/05/2019 USD 11,000,000 10,961,085 1.10
Total Sweden 45,864,491 4.62
United KingdomASB Finance Ltd 0.000% 14/05/2019 USD 14,000,000 13,955,868 1.41
Total United Kingdom 13,955,868 1.41
United StatesAlbion Capital LLC 0.000% 23/04/2019 USD 7,000,000 6,988,100 0.70American Honda Finance Corporation 0.000% 04/04/2019 USD 21,500,000 21,491,310 2.17Apple Inc 0.000% 06/05/2019 USD 21,000,000 20,946,068 2.11Atlantic Asset Securitization LLC 0.000% 22/04/2019 USD 4,000,000 3,993,448 0.40Bank of Montreal 2.430% 02/04/2019 USD 10,000,000 10,000,005 1.01Bank of Montreal 2.620% 12/08/2019 USD 10,000,000 10,005,192 1.01Chevron Corporation 0.000% 02/04/2019 USD 14,500,000 14,496,185 1.46Chevron Corporation 0.000% 26/04/2019 USD 5,500,000 5,489,780 0.55DZ Bank Deutsche Zentral 2.720% 17/06/2019 USD 7,500,000 7,502,788 0.76Fairway Finance Co LLC 0.000% 01/07/2019 USD 9,000,000 8,939,887 0.90Fairway Finance Co LLC 0.000% 02/07/2019 USD 5,000,000 4,966,249 0.50Gotham Funding Corp 0.000% 13/05/2019 USD 11,000,000 10,965,763 1.11Liberty Street Funding LLC 0.000% 02/07/2019 USD 5,000,000 4,967,080 0.50LMA Americas LLC 0.000% 12/07/2019 USD 9,000,000 8,933,194 0.90LMA Americas LLC 0.000% 06/08/2019 USD 6,000,000 5,944,490 0.60LMA Americas LLC 0.000% 14/08/2019 USD 5,000,000 4,950,799 0.50Mizuho Bank Ltd 0.000% 10/05/2019 USD 8,000,000 7,977,161 0.80Mizuho Bank Ltd 0.000% 15/05/2019 USD 7,000,000 6,977,518 0.70Mizuho Bank Ltd 2.730% 15/04/2019 USD 5,000,000 5,000,711 0.50MUFG Bank Ltd 2.590% 29/07/2019 USD 10,000,000 10,001,934 1.01Nestle Capital Corp 0.000% 18/07/2019 USD 14,700,000 14,586,733 1.47Nieuw Amsterdam Receivables Corp 0.000% 08/05/2019 USD 4,000,000 3,989,000 0.40Nieuw Amsterdam Receivables Corp 0.000% 03/06/2019 USD 4,000,000 3,981,703 0.40Nieuw Amsterdam Receivables Corp 0.000% 14/06/2019 USD 7,000,000 6,962,375 0.70Norinchukin Bank 2.450% 08/04/2019 USD 11,000,000 11,000,065 1.11Norinchukin Bank 2.450% 12/04/2019 USD 6,000,000 6,000,023 0.60Novartis Finance Corp 0.000% 01/04/2019 USD 10,000,000 9,998,021 1.01Novartis Finance Corp 0.000% 07/05/2019 USD 8,200,000 8,178,094 0.82Oversea-Chinese Banking Corp Ltd 2.560% 14/05/2019 USD 5,000,000 5,000,231 0.50Oversea-Chinese Banking Corp Ltd 2.660% 06/08/2019 USD 5,000,000 5,001,473 0.50PACCAR Financial Corp 0.000% 02/05/2019 USD 9,150,000 9,128,716 0.92Pfizer Inc 0.000% 06/05/2019 USD 10,000,000 9,974,266 1.01Roche Holdings Inc 0.000% 09/04/2019 USD 2,000,000 1,998,536 0.20Roche Holdings Inc 0.000% 23/04/2019 USD 1,200,000 1,197,985 0.12Starbird Funding Corp 0.000% 13/06/2019 USD 5,000,000 4,972,777 0.50Sumitomo Mitsui Trust Bank Limited 2.800% 25/04/2019 USD 10,000,000 10,002,590 1.01The Bank of Nova Scotia 2.600% 22/08/2019 USD 15,000,000 15,000,691 1.51The Coca-Cola Co 0.000% 01/05/2019 USD 1,800,000 1,795,958 0.18The Coca-Cola Co 0.000% 23/05/2019 USD 14,000,000 13,946,806 1.41The Toronto-Dominion Bank 2.650% 20/05/2019 USD 10,000,000 10,001,539 1.01Toyota Motor Credit Corp 0.000% 30/04/2019 USD 8,000,000 7,982,812 0.80Toyota Motor Credit Corp 0.000% 13/05/2019 USD 11,400,000 11,365,373 1.15Victory Receivables Corp 0.000% 06/05/2019 USD 5,000,000 4,986,922 0.50Victory Receivables Corp 0.000% 14/06/2019 USD 15,000,000 14,918,765 1.50Walmart Inc 0.000% 08/04/2019 USD 9,400,000 9,393,754 0.95Walmart Inc 0.000% 29/04/2019 USD 6,000,000 5,987,460 0.60
AQR UCITS FUNDS
AQR Systematic Total Return UCITS Fund
Schedule of InvestmentsAs at 31 March 2019
The accompanying notes form an integral part of these audited financial statements. 165

Investments CouponMaturityDate Currency
Shares/PrincipalAmounts
Fair Valuein USD
Percentof Net
Assets
Short Term Investments (continued)United States (continued)Walmart Inc 0.000% 28/05/2019 USD 14,000,000 13,942,250 1.41
Total United States 401,832,580 40.48
Other Investment FundsUnited StatesUBS (Irl) Select Money Market Fund^ 0.000% USD 37,116,324 37,116,324 3.74
Total United States 37,116,324 3.74
Total Other Investment Funds 37,116,324 3.74
Total Short Term Investments 670,154,747 67.51
Total Investments (Total Cost: $670,185,379) 670,154,747 67.51
Other Assets/(Liabilities) 322,503,187 32.49
Total Net Assets 992,657,934 100.00
^Seven-day effective yield at 31 March 2019 was 2.29%.
Economic Classification of InvestmentsAs at 31 March 2019
Industry ClassificationPercent ofNet Assets
Consumer Cyclical 8.24Consumer Non-cyclical 7.33Financial 51.94Total Investments 67.51
Other Assets/(Liabilities) 32.49Total Net Assets 100.00
AQR UCITS FUNDS
AQR Systematic Total Return UCITS Fund
Schedule of Investments (continued)As at 31 March 2019
The accompanying notes form an integral part of these audited financial statements. 166

Derivatives
Interest Rate SwapCentrally Cleared
Counterparty†TradingCurrency Payments Made‡ Payments Received‡
Notional Amountin USD
UpfrontPayments(Receipts) Termination Date
UnrealisedAppreciation/
(Depreciation)in USD
Percent ofNet Assets
CITG USD Fixed 3.00% Floating USD 3-month LIBOR 100,918,258 (2,845,086) 18/09/2029 (5,481,742) (0.55)
Futures ContractsExchange-Traded
Description Counterparty†Number ofContracts
ExpirationDate
TradingCurrency
Notional Amountin USD
UnrealisedAppreciation/
(Depreciation)in USD
Percent ofNet Assets
10 Year Australian Treasury Bond Futures JPPC 579 17/06/2019 AUD 56,862,936 1,057,235 0.1110 Year Canadian Treasury Bonds Futures JPPC 419 19/06/2019 CAD 43,656,551 940,775 0.1110 Year Japan Treasury Bonds Futures JPPC 112 13/06/2019 JPY 154,849,232 562,150 0.0610 Year US Treasury Note (CBT) Futures JPPC 3,054 19/06/2019 USD 379,411,795 5,650,804 0.572 Year US Treasury Note (CBT) Futures JPPC 460 28/06/2019 USD 98,026,718 359,148 0.053 Month Euro EURIBOR Futures JPPC 213 16/12/2019 EUR 59,968,788 51,583 0.003 Month Euro EURIBOR Futures JPPC 284 15/03/2021 EUR 79,846,782 123,770 0.013 Month Euro EURIBOR Futures JPPC 477 16/03/2020 EUR 134,282,911 280,391 0.033 Month Euro EURIBOR Futures JPPC 510 14/12/2020 EUR 143,444,088 299,933 0.033 Month Euro EURIBOR Futures JPPC 464 15/06/2020 EUR 130,597,152 320,664 0.033 Month Euro EURIBOR Futures JPPC 526 14/09/2020 EUR 147,995,961 403,568 0.043 Month Euro Swiss Franc ICE Futures JPPC (1) 16/12/2019 CHF (252,950) 8 0.003 Month Euro Swiss Franc ICE Futures JPPC (4) 16/03/2020 CHF (1,011,600) 166 0.003 Year Australian Treasury Bond Futures JPPC 1,450 17/06/2019 AUD 116,796,810 576,431 0.075 Year US Treasury Note (CBT) Futures JPPC 639 28/06/2019 USD 74,029,148 679,373 0.0990-DAY Australian Bank Bill Futures JPPC 19 12/09/2019 AUD 13,416,585 13,043 0.0090-DAY Australian Bank Bill Futures JPPC 110 12/12/2019 AUD 77,688,321 23,725 0.0090-DAY Euro Dollar Futures JPPC 142 16/09/2019 USD 34,623,150 65,877 0.0090-DAY Euro Dollar Futures JPPC 157 16/03/2020 USD 38,345,289 97,543 0.0090-DAY Euro Dollar Futures JPPC 189 16/12/2019 USD 46,101,825 99,479 0.0090-DAY Euro Dollar Futures JPPC 178 15/06/2020 USD 43,514,328 129,169 0.0090-DAY Euro Dollar Futures JPPC 197 14/09/2020 USD 48,191,125 161,587 0.0190-DAY Euro Dollar Futures JPPC 204 15/03/2021 USD 49,921,351 178,603 0.0290-DAY Euro Dollar Futures JPPC 213 14/12/2020 USD 52,110,450 180,203 0.0190-DAY Sterling Futures JPPC 338 18/09/2019 GBP 54,460,092 91,767 0.0090-DAY Sterling Futures JPPC 365 17/03/2021 GBP 58,748,183 111,485 0.0190-DAY Sterling Futures JPPC 372 18/12/2019 GBP 59,935,303 137,042 0.0190-DAY Sterling Futures JPPC 352 18/03/2020 GBP 56,718,696 144,955 0.0090-DAY Sterling Futures JPPC 405 16/12/2020 GBP 65,202,792 147,886 0.0190-DAY Sterling Futures JPPC 433 16/09/2020 GBP 69,735,262 155,134 0.0190-DAY Sterling Futures JPPC 398 17/06/2020 GBP 64,117,862 168,325 0.01Amsterdam Index Futures JPPC 51 18/04/2019 EUR 6,248,238 134,534 0.02CAC40 10 Euro Futures BARC 258 18/04/2019 EUR 15,411,866 212,002 0.02Canadian Bank Accept Futures JPPC 242 16/12/2019 CAD 44,414,827 72,746 0.00Canadian Bank Accept Futures JPPC 244 16/09/2019 CAD 44,770,476 100,668 0.01DJIA MINI e-CBOT Futures JPPC 53 21/06/2019 USD 6,842,300 54,301 0.01EURO STOXX 50 Futures BARC 356 21/06/2019 EUR 13,030,187 168,389 0.02Euro-Bobl Futures JPPC 824 06/06/2019 EUR 123,164,687 968,000 0.10Euro-BTP Futures JPPC 82 06/06/2019 EUR 11,906,832 189,412 0.02Euro-Bund Futures JPPC 1,146 06/06/2019 EUR 213,960,603 3,995,833 0.40Euro-Buxl 30 Year Bond Futures JPPC 30 06/06/2019 EUR 6,456,262 313,918 0.04Euro-Oat Futures JPPC 188 06/06/2019 EUR 34,319,010 950,993 0.10FTSE 100 Index Futures GSCO 302 21/06/2019 GBP 28,260,013 640,087 0.06FTSE CHINA A50 JPPC 279 29/04/2019 USD 3,661,875 167,051 0.02FTSE/JSE TOP 40 Futures BARC 163 20/06/2019 ZAR 5,718,501 22,366 0.00HANG SENG Index Futures BARC 27 29/04/2019 HKD 5,000,535 72,391 0.00H-Shares Index Futures GSCO 108 29/04/2019 HKD 7,824,204 29,196 0.00IBEX 35 Index Futures BARC 44 18/04/2019 EUR 4,525,132 17,222 0.00KOSPI 200 Index Futures BARC 64 13/06/2019 KRW 3,907,321 17,691 0.00Long Gilt Futures JPPC 465 26/06/2019 GBP 78,243,496 1,127,735 0.11mini MSCI EAFE Futures JPPC (13) 21/06/2019 USD (1,209,780) 3,326 0.00MSCI Emerging Markets Index Futures JPPC 42 21/06/2019 USD 2,214,030 61,950 0.01MSCI Singapore Index Futures JPPC 76 29/04/2019 SGD 2,017,729 5,370 0.00NASDAQ 100 E-mini Index Futures JPPC 93 21/06/2019 USD 13,701,225 476,965 0.05NIKKEI 225 (OSE) Futures BARC (20) 13/06/2019 JPY (3,826,275) 42,190 0.01OMXS30 Index Futures BARC 590 17/04/2019 SEK 9,802,948 55,143 0.01Russell 2000 Mini Futures JPPC 56 21/06/2019 USD 4,324,040 38,220 0.01S&P 500 E-mini Futures JPPC 667 21/06/2019 USD 94,263,775 1,888,121 0.19S&P MID 400 E-mini Index Futures JPPC 64 21/06/2019 USD 12,172,800 161,180 0.03S&P TSX 60 Index Futures GSCO 217 20/06/2019 CAD 31,086,329 113,439 0.02SPI 200 Futures BARC 74 20/06/2019 AUD 8,091,909 21,945 0.00Swiss Market Index Futures BARC 192 21/06/2019 CHF 17,864,591 326,479 0.03TOPIX Index Futures BARC 14 13/06/2019 JPY 2,010,373 1,193 0.00US LONG Bond (CBT) Futures JPPC 156 19/06/2019 USD 23,336,627 585,205 0.063 Month Euro EURIBOR Futures JPPC (419) 16/09/2019 EUR (117,966,768) (23,626) (0.00)3 Month Euro Swiss Franc ICE Futures JPPC (224) 16/09/2019 CHF (56,660,874) (14,789) (0.00)3 Month Euro Swiss Franc ICE Futures JPPC (89) 16/12/2019 CHF (22,512,577) (11,763) (0.00)3 Month Euro Swiss Franc ICE Futures JPPC (56) 16/03/2020 CHF (14,162,405) (9,710) (0.00)90-DAY Sterling Futures JPPC 59 17/03/2021 GBP 9,496,281 (979) (0.00)90-DAY Sterling Futures JPPC 43 16/12/2020 GBP 6,922,766 (472) (0.00)DAX Index Futures BARC (1) 21/06/2019 EUR (322,847) (1,481) (0.00)Euro-Schatz Futures JPPC (1,122) 06/06/2019 EUR (141,051,466) (217,400) (0.02)FTSE/MIB Index Futures BARC (19) 21/06/2019 EUR (2,205,221) (66,663) (0.01)KOSPI 200 Index Futures BARC 23 13/06/2019 KRW 1,404,194 (7,979) (0.00)Russell 2000 Mini Futures JPPC 71 21/06/2019 USD 5,482,265 (32,594) (0.01)S&P MID 400 E-mini Index Futures JPPC 2 21/06/2019 USD 380,400 (331) (0.00)S&P TSX 60 Index Futures GSCO 3 20/06/2019 CAD 429,765 (950) (0.00)SPI 200 Futures BARC 150 20/06/2019 AUD 16,402,518 (23,934) (0.00)TOPIX Index Futures BARC 9 13/06/2019 JPY 1,292,383 (1,175) (0.00)US ULTRA Bond (CBT) Futures JPPC (2) 19/06/2019 USD (335,563) (8,083) (0.00)
Total Futures Contracts 25,825,154 2.60
AQR UCITS FUNDS
AQR Systematic Total Return UCITS Fund
Schedule of Investments (continued)As at 31 March 2019
The accompanying notes form an integral part of these audited financial statements. 167

Forward Foreign Exchange ContractsOver-the-Counter
Counterparty† Currency Purchased Amount Purchased Currency Sold Amount Sold Settlement Date
UnrealisedAppreciation/
(Depreciation)in USD
Percent ofNet Assets
CITI AUD 31,091,000 USD 22,159,399 19/06/2019 (90,739) (0.01)CITI CAD 54,830,914 USD 41,688,251 19/06/2019 (561,840) (0.06)CITI CLP 7,390,624,000 USD 11,133,952 19/06/2019* (270,373) (0.03)CITI COP 35,052,127,000 USD 11,209,121 19/06/2019* (204,123) (0.02)CITI EUR 5,402,000 USD 6,188,856 19/06/2019 (83,915) (0.01)CITI GBP 30,560,993 USD 40,405,446 19/06/2019 (526,986) (0.05)CITI HUF 2,033,322,500 USD 7,377,401 19/06/2019 (229,002) (0.02)CITI IDR 85,209,915,000 USD 5,962,441 19/06/2019* (57,203) (0.01)CITI ILS 35,128,500 USD 9,779,329 19/06/2019 (47,655) (0.01)CITI JPY 2,756,761,000 USD 25,199,684 19/06/2019 (182,389) (0.02)CITI MXN 98,036,732 USD 5,056,754 19/06/2019 (43,571) (0.00)CITI NOK 230,946,500 USD 27,184,067 19/06/2019 (318,455) (0.03)CITI NZD 103,813,645 USD 71,234,984 19/06/2019 (423,437) (0.04)CITI PHP 297,615,791 USD 5,676,382 19/06/2019* (66,132) (0.01)CITI PLN 26,439,000 USD 7,006,709 19/06/2019 (89,863) (0.01)CITI SEK 38,308,500 USD 4,199,228 19/06/2019 (43,316) (0.00)CITI SGD 20,672,500 USD 15,319,887 19/06/2019 (39,530) (0.00)CITI TWD 81,635,500 USD 2,658,351 19/06/2019* (4,460) (0.00)CITI USD 15,533,266 AUD 21,926,135 19/06/2019 (30,094) (0.00)CITI USD 522,949 BRL 2,069,500 19/06/2019* (5,229) (0.00)CITI USD 27,914,286 CAD 37,362,500 19/06/2019 (109,786) (0.01)CITI USD 344,434 CLP 236,020,000 19/06/2019* (2,495) (0.00)CITI USD 324,599 COP 1,037,634,000 19/06/2019* (1,177) (0.00)CITI USD 590,892 ILS 2,136,500 19/06/2019 (984) (0.00)CITI USD 5,532,122 INR 398,004,000 19/06/2019* (145,863) (0.02)CITI USD 53,906,758 JPY 5,971,544,500 19/06/2019 (284,335) (0.03)CITI USD 1,600,398 MXN 31,449,000 19/06/2019 (7,770) (0.00)CITI USD 3,131,515 NOK 27,119,610 19/06/2019 (23,263) (0.00)CITI USD 1,127,155 NZD 1,656,500 19/06/2019 (2,748) (0.00)CITI USD 2,491,576 PHP 132,659,500 19/06/2019* (9,141) (0.00)CITI USD 42,832 PLN 164,003 19/06/2019 (74) (0.00)CITI USD 17,971,831 SEK 166,443,500 19/06/2019 (84,855) (0.01)CITI USD 1,360,786 SGD 1,843,500 19/06/2019 (1,862) (0.00)CITI USD 4,553,593 TWD 140,181,756 19/06/2019* (3,582) (0.00)CITI USD 2,263,898 ZAR 33,300,000 19/06/2019 (15,436) (0.00)CITI ZAR 55,546,505 USD 3,859,700 19/06/2019 (57,628) (0.01)JPMC AUD 31,091,000 USD 22,162,870 19/06/2019 (94,210) (0.01)JPMC CAD 54,830,898 USD 41,688,290 19/06/2019 (561,893) (0.06)JPMC CLP 7,390,624,000 USD 11,133,967 19/06/2019* (270,387) (0.03)JPMC COP 35,052,127,000 USD 11,209,134 19/06/2019* (204,137) (0.02)JPMC EUR 5,402,000 USD 6,188,863 19/06/2019 (83,922) (0.01)JPMC GBP 30,560,998 USD 40,405,503 19/06/2019 (527,036) (0.05)JPMC HUF 2,033,322,500 USD 7,377,409 19/06/2019 (229,011) (0.02)JPMC IDR 85,209,915,000 USD 5,962,450 19/06/2019* (57,210) (0.01)JPMC ILS 35,128,500 USD 9,779,339 19/06/2019 (47,668) (0.01)JPMC JPY 2,756,761,000 USD 25,199,716 19/06/2019 (182,420) (0.02)JPMC MXN 98,036,732 USD 5,056,759 19/06/2019 (43,577) (0.00)JPMC NOK 230,946,500 USD 27,184,101 19/06/2019 (318,489) (0.03)JPMC NZD 103,813,648 USD 71,235,075 19/06/2019 (423,526) (0.04)JPMC PHP 297,615,788 USD 5,676,689 19/06/2019* (66,438) (0.01)JPMC PLN 26,439,000 USD 7,006,717 19/06/2019 (89,872) (0.01)JPMC SEK 38,308,500 USD 4,199,233 19/06/2019 (43,321) (0.00)JPMC SGD 20,672,500 USD 15,319,907 19/06/2019 (39,550) (0.00)JPMC TWD 81,635,500 USD 2,658,354 19/06/2019* (4,463) (0.00)JPMC USD 15,533,247 AUD 21,926,135 19/06/2019 (30,113) (0.00)JPMC USD 522,948 BRL 2,069,500 19/06/2019* (5,229) (0.00)JPMC USD 27,914,251 CAD 37,362,500 19/06/2019 (109,821) (0.01)JPMC USD 344,434 CLP 236,020,000 19/06/2019* (2,495) (0.00)JPMC USD 324,599 COP 1,037,634,000 19/06/2019* (1,178) (0.00)JPMC USD 590,891 ILS 2,136,500 19/06/2019 (985) (0.00)JPMC USD 5,532,115 INR 398,004,000 19/06/2019* (145,870) (0.02)JPMC USD 53,907,534 JPY 5,971,544,500 19/06/2019 (283,559) (0.03)JPMC USD 1,600,396 MXN 31,449,000 19/06/2019 (7,772) (0.00)JPMC USD 3,131,512 NOK 27,119,610 19/06/2019 (23,267) (0.00)JPMC USD 1,127,154 NZD 1,656,500 19/06/2019 (2,749) (0.00)JPMC USD 2,491,816 PHP 132,659,500 19/06/2019* (8,901) (0.00)JPMC USD 42,831 PLN 164,002 19/06/2019 (74) (0.00)JPMC USD 17,971,808 SEK 166,443,500 19/06/2019 (84,878) (0.01)JPMC USD 1,360,784 SGD 1,843,500 19/06/2019 (1,864) (0.00)JPMC USD 4,553,587 TWD 140,181,755 19/06/2019* (3,588) (0.00)JPMC USD 2,263,895 ZAR 33,300,000 19/06/2019 (15,438) (0.00)JPMC ZAR 55,546,495 USD 3,859,705 19/06/2019 (57,632) (0.01)CITI AUD 12,576,500 USD 8,912,881 19/06/2019 14,027 0.00CITI CAD 7,121,098 USD 5,319,339 19/06/2019 21,903 0.00CITI GBP 312,504 USD 405,956 19/06/2019 1,825 0.00CITI INR 851,472,003 USD 11,985,600 19/06/2019* 161,628 0.02CITI JPY 1,291,012,000 USD 11,680,520 19/06/2019 35,269 0.00CITI MXN 67,161,768 USD 3,413,284 19/06/2019 21,083 0.00CITI NZD 32,338,854 USD 21,944,755 19/06/2019 113,659 0.01CITI PHP 4,201,000 USD 78,796 19/06/2019* 395 0.00CITI SGD 2,313,500 USD 1,704,764 19/06/2019 5,292 0.00CITI TWD 179,110,500 USD 5,814,380 19/06/2019* 8,331 0.00CITI USD 55,266,305 AUD 77,308,867 19/06/2019 391,805 0.04CITI USD 3,579,615 BRL 13,741,000 19/06/2019* 72,640 0.01CITI USD 11,252,172 CLP 7,492,636,002 19/06/2019* 238,645 0.03CITI USD 10,656,670 COP 33,362,040,000 19/06/2019* 182,293 0.02CITI USD 153,826,870 EUR 134,542,500 19/06/2019 1,776,886 0.18CITI USD 6,073,963 GBP 4,586,000 19/06/2019 89,779 0.01CITI USD 162,909 HKD 1,275,000 19/06/2019 101 0.00CITI USD 10,697,013 HUF 2,967,878,000 19/06/2019 263,068 0.03CITI USD 444,452 IDR 6,362,360,500 19/06/2019* 3,527 0.00CITI USD 8,124,066 ILS 29,204,000 19/06/2019 33,663 0.00CITI USD 3,196,754 INR 223,406,000 19/06/2019* 9,611 0.00CITI USD 29,151,391 JPY 3,199,853,500 19/06/2019 113,082 0.01
AQR UCITS FUNDS
AQR Systematic Total Return UCITS Fund
Schedule of Investments (continued)As at 31 March 2019
The accompanying notes form an integral part of these audited financial statements. 168

Counterparty† Currency Purchased Amount Purchased Currency Sold Amount Sold Settlement Date
UnrealisedAppreciation/
(Depreciation)in USD
Percent ofNet Assets
CITI USD 32,080,448 KRW 36,042,865,500 19/06/2019* 330,793 0.03CITI USD 6,898,579 NOK 58,974,390 19/06/2019 38,190 0.01CITI USD 4,010,045 NZD 5,825,500 19/06/2019 36,456 0.00CITI USD 1,020,485 PHP 53,661,500 19/06/2019* 8,931 0.00CITI USD 8,257,763 PLN 31,412,001 19/06/2019 39,907 0.01CITI USD 4,078,565 SEK 37,250,000 19/06/2019 37,485 0.00CITI USD 7,871,538 SGD 10,619,000 19/06/2019 22,362 0.00CITI USD 9,033,369 TWD 277,261,249 19/06/2019* 19,872 0.00CITI USD 15,244,424 ZAR 218,500,000 19/06/2019 288,439 0.03JPMC AUD 12,576,500 USD 8,913,096 19/06/2019 13,813 0.00JPMC CAD 7,121,090 USD 5,319,339 19/06/2019 21,897 0.00JPMC GBP 312,505 USD 405,958 19/06/2019 1,824 0.00JPMC INR 851,471,997 USD 11,985,615 19/06/2019* 161,613 0.02JPMC JPY 1,291,012,000 USD 11,680,533 19/06/2019 35,254 0.00JPMC MXN 67,161,768 USD 3,413,289 19/06/2019 21,079 0.00JPMC NZD 32,338,853 USD 21,944,781 19/06/2019 113,632 0.01JPMC PHP 4,201,000 USD 78,796 19/06/2019* 395 0.00JPMC SGD 2,313,500 USD 1,704,765 19/06/2019 5,289 0.00JPMC TWD 179,110,500 USD 5,814,388 19/06/2019* 8,324 0.00JPMC USD 55,266,234 AUD 77,308,863 19/06/2019 391,735 0.04JPMC USD 3,579,611 BRL 13,741,000 19/06/2019* 72,635 0.01JPMC USD 11,252,157 CLP 7,492,635,998 19/06/2019* 238,631 0.03JPMC USD 10,656,656 COP 33,362,040,000 19/06/2019* 182,279 0.02JPMC USD 153,826,674 EUR 134,542,500 19/06/2019 1,776,693 0.18JPMC USD 6,073,957 GBP 4,586,000 19/06/2019 89,771 0.01JPMC USD 162,909 HKD 1,275,000 19/06/2019 101 0.00JPMC USD 10,696,999 HUF 2,967,878,000 19/06/2019 263,055 0.03JPMC USD 444,452 IDR 6,362,360,500 19/06/2019* 3,526 0.00JPMC USD 8,124,056 ILS 29,204,000 19/06/2019 33,653 0.00JPMC USD 3,196,750 INR 223,406,000 19/06/2019* 9,607 0.00JPMC USD 29,151,355 JPY 3,199,853,500 19/06/2019 113,046 0.01JPMC USD 32,080,407 KRW 36,042,865,500 19/06/2019* 330,753 0.03JPMC USD 6,898,570 NOK 58,974,390 19/06/2019 38,181 0.01JPMC USD 4,010,039 NZD 5,825,500 19/06/2019 36,451 0.00JPMC USD 1,020,484 PHP 53,661,500 19/06/2019* 8,930 0.00JPMC USD 8,257,774 PLN 31,411,994 19/06/2019 39,915 0.01JPMC USD 4,078,560 SEK 37,250,000 19/06/2019 37,480 0.00JPMC USD 7,871,593 SGD 10,619,000 19/06/2019 22,417 0.00JPMC USD 9,033,372 TWD 277,261,240 19/06/2019* 19,876 0.00JPMC USD 15,244,404 ZAR 218,500,000 19/06/2019 288,420 0.03
Total Forward Foreign Exchange Contracts 619,368 0.06
* Non-deliverable forwards (See Note 4)
Hedge Forward Foreign Exchange ContractsOver-the-Counter
Counterparty† Currency Purchased Amount Purchased Currency Sold Amount Sold Settlement Date
UnrealisedAppreciation/
(Depreciation)in USD
Percent ofNet Assets
CITI CHF 281,209 USD 285,261 19/06/2019 (737) (0.00)CITI EUR 326,933,668 USD 373,830,322 19/06/2019 (4,354,071) (0.44)CITI GBP 59,290,149 USD 78,327,333 19/06/2019 (960,742) (0.09)CITI USD 278,304 CHF 278,843 19/06/2019 (3,826) (0.00)JPMC CHF 304,647 USD 308,976 19/06/2019 (738) (0.00)JPMC EUR 326,933,688 USD 373,830,810 19/06/2019 (4,354,539) (0.44)JPMC GBP 59,290,136 USD 78,327,416 19/06/2019 (960,840) (0.10)JPMC USD 278,303 CHF 278,843 19/06/2019 (3,826) (0.00)CITI CHF 1,593,517 USD 1,604,619 19/06/2019 7,682 0.00CITI GBP 4,872,974 USD 6,330,200 19/06/2019 28,451 0.00CITI USD 3,069,674 EUR 2,691,030 19/06/2019 28,470 0.01CITI USD 1,093,794 GBP 828,816 19/06/2019 12,286 0.00JPMC CHF 1,570,103 USD 1,580,864 19/06/2019 7,747 0.00JPMC GBP 4,872,973 USD 6,330,206 19/06/2019 28,444 0.00JPMC USD 3,069,668 EUR 2,691,029 19/06/2019 28,466 0.01JPMC USD 1,093,795 GBP 828,819 19/06/2019 12,285 0.00
Total Hedge Forward Foreign Exchange Contracts (10,485,488) (1.05)
Total Return Swap ContractsOver-the-Counter
Reference Entity (�RE�)PaymentsMade By Sub-Fund
Payments ReceivedBy Sub-Fund Counterparty† Maturity Date
TradingCurrency
NotionalAmountin USD
UnrealisedAppreciation/
(Depreciation)in USD
Percent ofNet Assets
Bloomberg Commodity Index 1Month Forward
Decreases in RE andpays financing of +0.10%
Increases in RE MLIN 04/04/2019 USD 110,020,568 755,572 0.08
Bloomberg Commodity Index 1Month Forward
Decreases in RE andpays financing of +0.10%
Increases in RE MLIN 04/04/2019 USD 81,590,539 (800,418) (0.08)
BOVESPA Index Futures Apr19 Decreases in RE Increases in RE MLIN 17/04/2019 BRL 6,863,213 (69,829) (0.01)KOSPI 200 Index Futures Jun19 Decreases in RE Increases in RE MLIN 13/06/2019 KRW 1,098,934 (6,392) (0.00)KOSPI 200 Index Futures Jun19 Decreases in RE Increases in RE GSIN 13/06/2019 KRW 366,311 (2,015) (0.00)HANG SENG Index Futures Apr19 Decreases in RE Increases in RE MLIN 29/04/2019 HKD 185,205 3,133 0.00HANG SENG Index Futures Apr19 Decreases in RE Increases in RE GSIN 29/04/2019 HKD 370,410 5,165 0.00H-Shares Index Futures Apr19 Decreases in RE Increases in RE GSIN 29/04/2019 HKD 9,200,682 54,820 0.00H-Shares Index Futures Apr19 Decreases in RE Increases in RE MLIN 29/04/2019 HKD 7,027,293 67,387 0.01KOSPI 200 Index Futures Jun19 Decreases in RE Increases in RE MLIN 13/06/2019 KRW 2,014,712 7,152 0.00KOSPI 200 Index Futures Jun19 Decreases in RE Increases in RE GSIN 13/06/2019 KRW 610,518 1,046 0.00TAIEX Futures Apr19 Decreases in RE Increases in RE MLIN 17/04/2019 TWD 3,163,531 41,479 0.01TAIEX Futures Apr19 Decreases in RE Increases in RE GSIN 17/04/2019 TWD 5,089,159 71,423 0.00
Total of Total Return Swap Contracts 128,523 0.01
AQR UCITS FUNDS
AQR Systematic Total Return UCITS Fund
Schedule of Investments (continued)As at 31 March 2019
The accompanying notes form an integral part of these audited financial statements. 169

Total Return Basket Swap ContractsOver-the-Counter
Counterparty† Description‡ Termination DateFair Value in
USDMLIN The Sub-Fund receives the total return on a portfolio of long and short positions and pays 1-month LIBOR
plus or minus a specified spread, which is denominated in CHF based on the local currency of thepositions within the swap.
25.07.2019 - 26.04.2021 898,501
The following table represents the long and short positions and related values within the total return equity basket swap as at 31 March 2019
Reference Entity Currency Shares Notional Amount
UnrealisedAppreciation/
(Depreciation)in USD
Percent ofNet Assets
Long PositionsCommon StocksSwitzerlandAdecco SA CHF 93,534 4,971,445 134,261 0.01Barry Callebaut AG CHF 383 689,719 10,002 0.00DKSH Holding AG CHF 2,413 139,475 (497) (0.00)Flughafen Zuerich AG CHF 772 141,040 1,444 0.00GAM Holding AG CHF 142,343 440,904 858 0.00Georg Fischer AG CHF 730 662,437 13,564 0.00Helvetia Holding AG CHF 1,248 760,219 (4,909) (0.00)Nestle SA CHF 53,256 5,068,587 37,442 0.01Roche Holding AG CHF 19,285 5,272,312 66,824 0.01Sonova Holding AG CHF 10,025 1,981,540 34,116 0.00Swiss Life Holding AG CHF 3,879 1,699,412 21,038 0.00Temenos Group AG CHF 16,161 2,366,568 94,143 0.01Zurich Insurance Group AG CHF 2,219 733,241 1,783 0.00
410,069 0.04
Total Long Positions 410,069 0.04
Short PositionsCommon StocksAustriaams AG CHF (93,217) (2,471,681) 154,480 0.02
154,480 0.02SwitzerlandCie Financiere Richemont SA CHF (45,362) (3,285,801) (42,827) (0.01)Credit Suisse Group AG CHF (217,121) (2,520,885) (34,891) (0.01)dormakaba Holding AG CHF (321) (229,389) (3,708) (0.00)EMS-Chemie Holding AG CHF (530) (287,450) 10,114 0.00Geberit AG CHF (536) (218,674) (485) (0.00)Givaudan SA CHF (268) (684,232) 538 0.00Holcim Ltd CHF (12,850) (633,046) 387 0.00Idorsia Ltd CHF (34,414) (603,494) (22,691) (0.00)Julius Baer Group Ltd CHF (46,018) (1,853,384) 20,336 0.00Kuehne + Nagel International AG CHF (1,535) (209,132) (4,394) (0.00)Lonza Group AG CHF (15,156) (4,676,265) (325,755) (0.03)OC Oerlikon Corp AG CHF (27,519) (350,465) (11,885) (0.00)Partners Group Holding AG CHF (196) (141,933) (5,217) (0.00)Sika AG CHF (4,718) (653,455) (2,369) (0.00)Straumann Holding AG CHF (2,039) (1,657,782) (34,814) (0.00)Sunrise Communications Group AG CHF (5,144) (374,311) 1,292 0.00Swisscom AG CHF (2,584) (1,257,677) (8,824) (0.00)The Swatch Group AG CHF (1,348) (387,348) (5,621) (0.00)Vifor Pharma AG CHF (10,210) (1,375,143) (13,331) (0.00)
(484,145) (0.05)
Total Short Positions (329,665) (0.03)
Total of Long and Short Equity Positions 80,404 0.01Net Cash and Other Receivables/(Payables) 818,097 0.08
Total of Total Return Basket Swap Contract - MLIN - CHF 898,501 0.09
Counterparty† Description‡ Termination DateFair Value in
USDMLIN The Sub-Fund receives the total return on a portfolio of long and short positions and pays 1-month CIBOR
plus or minus a specified spread, which is denominated in DKK based on the local currency of thepositions within the swap.
27.01.2020 - 26.04.2021 558,619
The following table represents the long and short positions and related values within the total return equity basket swap as at 31 March 2019
Reference Entity Currency Shares Notional Amount
UnrealisedAppreciation/
(Depreciation)in USD
Percent ofNet Assets
Long PositionsCommon StocksDenmarkCarlsberg A/S DKK 24,357 3,053,806 78,137 0.01Dfds A/S DKK 3,954 163,899 (9,277) (0.00)DONG Energy A/S DKK 45,673 3,478,670 (10,991) (0.00)GN Store Nord A/S DKK 72,371 3,376,497 (8,708) (0.00)H Lundbeck A/S DKK 47,654 2,066,351 (36,554) (0.00)Novo Nordisk A/S DKK 39,509 2,063,471 52,292 0.00Pandora A/S DKK 78,385 3,642,935 12,184 0.00Rockwool International A/S DKK 7,601 1,775,424 23,974 0.00
101,057 0.01
Total Long Positions 101,057 0.01
AQR UCITS FUNDS
AQR Systematic Total Return UCITS Fund
Schedule of Investments (continued)As at 31 March 2019
The accompanying notes form an integral part of these audited financial statements. 170

Reference Entity Currency Shares Notional Amount
UnrealisedAppreciation/
(Depreciation)in USD
Percent ofNet Assets
Short PositionsCommon StocksDenmarkAP Moeller - Maersk A/S DKK (3,780) (4,779,046) 122,802 0.01Chr Hansen Holding A/S DKK (11,147) (1,137,040) 22,466 0.00FLSmidth & Co A/S DKK (4,398) (189,315) 2,911 0.00Genmab A/S DKK (31,027) (5,378,247) (21,000) (0.00)ISS A/S DKK (18,766) (573,247) (3,105) (0.00)Novozymes A/S DKK (4,548) (210,000) 4,378 0.00Tryg A/S DKK (20,458) (563,393) (1,538) (0.00)Vestas Wind Systems A/S DKK (8,890) (747,435) (30,218) (0.00)
96,696 0.01
Total Short Positions 96,696 0.01
Total of Long and Short Equity Positions 197,753 0.02Net Cash and Other Receivables/(Payables) 360,866 0.04
Total of Total Return Basket Swap Contract - MLIN - DKK 558,619 0.06
Counterparty† Description‡ Termination DateFair Value in
USDMLIN The Sub-Fund receives the total return on a portfolio of long and short positions and pays 1-month
EURIBOR plus or minus a specified spread, which is denominated in EUR based on the local currency ofthe positions within the swap.
27.01.2020 - 26.04.2021 (416,849)
The following table represents the long and short positions and related values within the total return equity basket swap as at 31 March 2019
Reference Entity Currency Shares Notional Amount
UnrealisedAppreciation/
(Depreciation)in USD
Percent ofNet Assets
Long PositionsCommon StocksBelgiumAgeas EUR 46,533 2,247,577 28,212 0.00bpost SA EUR 41,501 443,820 33,195 0.00Proximus SADP EUR 9,569 274,821 5,420 0.00Solvay SA EUR 18,121 1,951,526 16,276 0.00UCB SA EUR 44,339 3,794,354 42,812 0.01
125,915 0.01FinlandFortum OYJ EUR 89,061 1,849,875 (131,991) (0.01)Kesko OYJ EUR 13,415 818,754 2,896 0.00Neste Oil OYJ EUR 61,802 6,587,715 99,919 0.01Nokia OYJ EUR 531,317 3,023,245 (49,713) (0.01)Nokian Renkaat OYJ EUR 5,985 200,380 (3,668) (0.00)Orion OYJ EUR 18,106 678,769 (16,263) (0.00)Sampo OYJ EUR 12,440 565,943 (20,392) (0.00)Stora Enso OYJ EUR 25,315 308,810 7,926 0.00UPM-Kymmene OYJ EUR 118,836 3,439,648 49,367 0.00
(61,919) (0.01)FranceArkema SA EUR 5,059 481,095 568 0.00AtoS EUR 26,868 2,586,437 47,662 0.01AXA SA EUR 205,811 5,167,977 16,175 0.00Bouygues SA EUR 6,407 227,601 1,223 0.00Bureau Veritas SA EUR 11,302 266,603 4,441 0.00Cap Gemini SA EUR 12,857 1,559,001 91,664 0.01Carrefour SA EUR 52,280 972,028 (2,297) (0.00)Cie de Saint-Gobain EUR 16,678 604,825 29,399 0.00Dassault Aviation SA EUR 100 147,978 (1,010) (0.00)Electricite de France SA EUR 212,548 2,894,682 (35,948) (0.00)Engie SA EUR 525,688 7,841,022 (8,853) (0.00)Eutelsat Communications SA EUR 86,502 1,514,588 (22,036) (0.00)Peugeot SA EUR 228,068 5,525,847 104,636 0.01Renault SA EUR 6,001 395,768 15,092 0.00Sanofi EUR 18,306 1,612,182 9,865 0.00Sartorius Stedim Biotech EUR 1,440 179,622 2,102 0.00SCOR SE EUR 4,791 203,760 (1,721) (0.00)Societe BIC SA EUR 1,565 139,075 1,900 0.00Sopra Steria Group EUR 1,850 213,940 9,347 0.00Teleperformance EUR 4,389 786,962 3,449 0.00TOTAL SA EUR 111,959 6,201,507 10,685 0.00Veolia Environnement SA EUR 17,253 386,157 3,487 0.00
279,830 0.03Germanyadidas AG EUR 9,340 2,269,275 38,800 0.00Allianz SE EUR 34,125 7,577,712 60,536 0.01Aurubis AG EUR 18,634 996,692 23,223 0.00Carl Zeiss Meditec AG EUR 9,045 764,692 (25,595) (0.00)CECONOMY AG EUR 26,542 140,299 (398) (0.00)Covestro AG EUR 101,019 5,532,583 266,535 0.03CTS Eventim AG & Co KGaA EUR 2,973 141,195 2,096 0.00Deutsche Lufthansa AG EUR 156,544 3,413,255 (16,697) (0.00)E.ON SE EUR 757,973 8,448,018 (45,955) (0.00)Evonik Industries AG EUR 33,964 926,634 12,509 0.00Freenet AG EUR 6,268 133,640 (4,805) (0.00)Hannover Rueck SE EUR 1,439 206,963 4,039 0.00HeidelbergCement AG EUR 22,823 1,632,282 (22,701) (0.00)Hella KGaA Hueck & Co EUR 3,655 160,207 (1,231) (0.00)HOCHTIEF AG EUR 4,906 702,848 (75,092) (0.01)HUGO BOSS AG EUR 4,383 299,887 984 0.00KION Group AG EUR 4,354 226,629 (3,578) (0.00)Metro Wholesale & Food Specialist AG EUR 12,126 200,677 2,723 0.00Muenchener Rueckversicherungs-Gesellschaft AG EUR 7,371 1,739,571 20,689 0.00
AQR UCITS FUNDS
AQR Systematic Total Return UCITS Fund
Schedule of Investments (continued)As at 31 March 2019
The accompanying notes form an integral part of these audited financial statements. 171

Reference Entity Currency Shares Notional Amount
UnrealisedAppreciation/
(Depreciation)in USD
Percent ofNet Assets
Long Positions (continued)Common Stocks (continued)Germany (continued)ProSiebenSat.1 Media SE EUR 70,950 1,004,501 (52,159) (0.01)Puma SE EUR 1,000 580,462 13,552 0.00Rheinmetall AG EUR 19,423 2,015,419 (36,636) (0.00)Salzgitter AG EUR 37,256 1,080,448 2,510 0.00SAP SE EUR 32,773 3,778,937 149,391 0.02Schaeffler AG EUR 42,284 339,537 760 0.00Siemens AG EUR 5,653 607,462 5,141 0.00Siemens Healthineers AG EUR 7,820 325,515 (2,107) (0.00)Software AG EUR 42,021 1,409,711 (53) (0.00)Talanx AG EUR 15,035 579,678 5,064 0.00Wirecard AG EUR 16,406 2,068,548 244,984 0.02
566,529 0.06ItalyA2A SpA EUR 1,428,854 2,613,316 24,866 0.00Assicurazioni Generali SpA EUR 56,505 1,042,653 6,027 0.00Atlantia SpA EUR 11,086 285,281 8,090 0.00Autogrill SpA EUR 18,517 177,234 7,796 0.00Banca Popolare dell’Emilia Romagna SC EUR 451,463 1,838,961 (3,041) (0.00)Enel SpA EUR 1,811,814 11,582,815 150,532 0.02Eni SpA EUR 735,948 12,929,717 19,831 0.00Hera SpA EUR 417,079 1,514,403 36,701 0.00Italgas SpA EUR 340,665 2,103,649 (1,142) (0.00)Poste Italiane SpA EUR 122,425 1,183,193 2,474 0.00Saipem SpA EUR 221,437 1,169,501 12,117 0.00Snam SpA EUR 328,112 1,697,899 8,897 0.00Terna Rete Elettrica Nazionale SpA EUR 125,048 793,527 6,178 0.00UniCredit SpA EUR 69,660 889,256 (2,033) (0.00)Unipol Gruppo Finanziario SpA EUR 512,478 2,541,474 51,627 0.01UnipolSai SpA EUR 173,049 465,326 1,943 0.00
330,863 0.03LuxembourgAPERAM SA EUR 15,245 433,556 (3,594) (0.00)ArcelorMittal EUR 37,500 761,646 (5,305) (0.00)SES SA EUR 217,518 3,349,454 (60,316) (0.01)
(69,215) (0.01)NetherlandsAegon NV EUR 516,393 2,484,938 (21,452) (0.00)ASM International NV EUR 13,396 720,433 7,520 0.00ASR Nederland NV EUR 62,653 2,588,647 (12,662) (0.00)Koninklijke Ahold NV EUR 416,548 11,037,231 79,505 0.01Koninklijke DSM NV EUR 19,957 2,171,211 20,166 0.00NN Group NV EUR 55,534 2,295,133 28,681 0.00Philips Lighting NV EUR 79,885 2,127,468 70,856 0.01Wolters Kluwer NV EUR 19,125 1,297,374 38,651 0.00
211,265 0.02SpainAcciona SA EUR 1,470 165,374 4,258 0.00Acerinox SA EUR 57,972 576,290 7,030 0.00ACS Actividades de Construccion y Servicios SA EUR 37,033 1,625,731 12,791 0.00Almirall SA EUR 11,910 202,318 2,674 0.00Amadeus IT Holding SA EUR 34,531 2,739,466 131,042 0.01BBVA EUR 136,029 773,560 (20,618) (0.00)CaixaBank SA EUR 160,061 498,152 (1,438) (0.00)Enagas SA EUR 20,657 603,473 (6,576) (0.00)Endesa SA EUR 245,630 6,296,082 (74,461) (0.01)Gas Natural SDG SA EUR 52,818 1,487,872 15,418 0.00Iberdrola SA EUR 833,224 7,330,596 61,743 0.01Mapfre SA EUR 169,594 465,747 (5,903) (0.00)Mediaset Espana Comunicacion SA EUR 97,301 721,015 (8,996) (0.00)Melia Hotels International SA EUR 38,516 354,167 2,441 0.00Red Electrica Corp SA EUR 178,579 3,816,509 (37,632) (0.00)Repsol SA EUR 365,789 6,236,322 36,962 0.00Telefonica SA EUR 16,313 135,662 (2,509) (0.00)
116,226 0.01United KingdomDialog Semiconductor PLC EUR 46,740 1,412,165 (18,171) (0.00)Fiat Chrysler Automobiles NV EUR 327,345 4,866,052 75,710 0.01
57,539 0.01
Total Long Positions 1,557,033 0.15
Short PositionsCommon StocksBelgiumAnheuser-Busch InBev SA EUR (64,073) (5,366,572) (243,870) (0.02)Umicore SA EUR (76,828) (3,428,781) 19,732 0.00
(224,138) (0.02)FinlandCargotec OYJ EUR (4,084) (150,031) (1,742) (0.00)Elisa OYJ EUR (19,865) (891,691) 8,698 0.00Huhtamaki OYJ EUR (47,233) (1,747,897) (32,349) (0.01)Kone OYJ EUR (8,627) (435,190) (7,749) (0.00)Outokumpu OYJ EUR (607,645) (2,206,343) 72,613 0.01Wartsila OYJ Abp EUR (23,454) (378,405) (18,170) (0.00)
21,301 0.00FranceAccor SA EUR (22,931) (925,561) 23,686 0.00Air France-KLM EUR (19,949) (223,574) (2,105) (0.00)Altran Technologies SA EUR (155,160) (1,696,765) (29,615) (0.00)BioMerieux EUR (7,330) (600,772) (9,053) (0.00)Bollore NV EUR (784) (3,482) (40) (0.00)Bollore SA EUR (199,165) (898,922) (12,970) (0.00)Cie Generale des Etablissements Michelin EUR (3,881) (457,744) (3,701) (0.00)
AQR UCITS FUNDS
AQR Systematic Total Return UCITS Fund
Schedule of Investments (continued)As at 31 March 2019
The accompanying notes form an integral part of these audited financial statements. 172

Reference Entity Currency Shares Notional Amount
UnrealisedAppreciation/
(Depreciation)in USD
Percent ofNet Assets
Short Positions (continued)Common Stocks (continued)France (continued)Elior Participations SCA EUR (57,530) (768,643) 21,961 0.00Essilor International SA EUR (34,022) (3,693,766) 44,897 0.00Faurecia EUR (4,725) (198,725) 502 0.00Groupe Eurotunnel SE EUR (19,903) (300,890) (6,480) (0.00)Iliad SA EUR (38,187) (3,808,109) (83,176) (0.01)Ingenico Group EUR (37,912) (2,694,409) (5,959) (0.00)JCDecaux SA EUR (26,764) (815,537) (20,434) (0.00)LVMH Moet Hennessy Louis Vuitton SE EUR (1,692) (621,010) (7,301) (0.00)Orpea EUR (23,619) (2,825,518) (159,337) (0.02)Plastic Omnium SA EUR (17,323) (456,477) 4,754 0.00Remy Cointreau SA EUR (10,090) (1,341,300) (34,525) (0.00)Safran SA EUR (1,571) (214,042) (6,173) (0.00)SEB SA EUR (4,667) (776,025) (18,332) (0.00)Sodexo SA EUR (8,982) (987,882) (11,900) (0.00)SPIE SA EUR (43,563) (762,023) (8,804) (0.00)Suez Environnement Co EUR (14,348) (190,008) (2,336) (0.00)Technicolor SA EUR (241,465) (275,171) 12,742 0.00Ubisoft Entertainment SA EUR (20,555) (1,835,173) (3,267) (0.00)Valeo SA EUR (283,750) (8,209,815) 56,040 0.01Vivendi SA EUR (170,359) (4,932,868) (63,119) (0.01)Worldline SA EUR (8,036) (477,286) (5,234) (0.00)
(329,279) (0.03)Germany1&1 Drillisch AG EUR (42,297) (1,502,551) 292,668 0.03Axel Springer SE EUR (4,599) (236,696) (4,131) (0.00)Bayer AG EUR (12,546) (803,185) 8,029 0.00Bayerische Motoren Werke AG EUR (1,999) (153,134) 91 0.00Continental AG EUR (19,352) (2,907,134) 73,873 0.01Daimler AG EUR (81,968) (4,770,813) (98,331) (0.01)Delivery Hero SE EUR (43,218) (1,538,179) 63,096 0.01Deutsche Bank AG EUR (862,908) (6,992,046) 7,751 0.00Fraport AG Frankfurt Airport Services Worldwide EUR (18,116) (1,377,407) (407) (0.00)GEA Group AG EUR (62,199) (1,634,114) (57,962) (0.01)Infineon Technologies AG EUR (138,846) (2,748,329) 180,052 0.02MTU Aero Engines AG EUR (944) (212,823) (5,193) (0.00)OSRAM Licht AG EUR (90,070) (3,089,402) 439,899 0.04RWE AG EUR (65,455) (1,750,522) 37,480 0.00Sartorius AG EUR (9,139) (1,563,748) (47,200) (0.00)Scout24 AG EUR (6,499) (336,380) (292) (0.00)ThyssenKrupp AG EUR (315,616) (4,332,025) 2,161 0.00United Internet AG EUR (68,604) (2,491,763) 125,496 0.01Volkswagen AG EUR (2,593) (407,231) (1,208) (0.00)Zalando SE EUR (98,357) (3,835,245) (47,397) (0.00)
968,475 0.10ItalyBanco BPM SpA EUR (1,340,638) (2,758,733) 41,544 0.00Brembo SpA EUR (146,006) (1,645,839) 8,679 0.00Buzzi Unicem SpA EUR (85,653) (1,737,736) (52,411) (0.00)Davide Campari-Milano SpA EUR (165,226) (1,622,263) (928) (0.00)Ferrari NV EUR (56,733) (7,564,016) (181,536) (0.02)Intesa Sanpaolo SpA EUR (1,680,446) (4,090,411) (35,848) (0.00)Leonardo-Finmeccanica SpA EUR (12,021) (139,487) (3,239) (0.00)Pirelli & C SpA EUR (415,429) (2,677,268) 48,148 0.01Prysmian SpA EUR (140,070) (2,623,943) 20,977 0.00Recordati SpA EUR (31,224) (1,213,665) 39,614 0.00Salvatore Ferragamo SpA EUR (9,550) (204,581) (4,986) (0.00)Unione di Banche Italiane SCpA EUR (892,055) (2,349,647) (30,047) (0.00)
(150,033) (0.01)LuxembourgEurofins Scientific SE EUR (5,327) (2,191,398) (98,087) (0.01)Tenaris SA EUR (282,012) (3,957,862) 80,614 0.01
(17,473) (0.00)NetherlandsAltice NV EUR (714,782) (1,841,787) (296,130) (0.03)ASML Holding NV EUR (19,543) (3,629,630) (7,021) (0.00)Boskalis Westminster NV EUR (50,594) (1,318,998) 22,722 0.00OCI NV EUR (7,379) (201,651) (5,634) (0.00)SBM Offshore NV EUR (114,003) (2,172,107) 7,040 0.00
(279,023) (0.03)SpainAena SA EUR (3,529) (634,148) (1,189) (0.00)Banco Santander SA EUR (545,031) (2,518,107) 19,276 0.00Bankia SA EUR (1,025,805) (2,648,962) 55,283 0.00Bankinter SA EUR (73,437) (556,712) 17,480 0.00Cellnex Telecom SAU EUR (96,636) (2,840,479) (125,858) (0.01)Ferrovial SA EUR (134,497) (3,140,935) (52,852) (0.01)Grifols SA EUR (128,909) (3,625,551) (224,407) (0.02)Inditex SA EUR (189,561) (5,554,853) (38,309) (0.00)
(350,576) (0.04)SwitzerlandSTMicroelectronics NV EUR (24,617) (361,515) 24,184 0.00
24,184 0.00United StatesQIAGEN NV EUR (86,833) (3,512,628) (73,119) (0.01)
(73,119) (0.01)
Total Short Positions (409,681) (0.04)
Total of Long and Short Equity Positions 1,147,352 0.11Net Cash and Other Receivables/(Payables) (1,564,201) (0.16)
Total of Total Return Basket Swap Contract - MLIN - EUR (416,849) (0.05)
AQR UCITS FUNDS
AQR Systematic Total Return UCITS Fund
Schedule of Investments (continued)As at 31 March 2019
The accompanying notes form an integral part of these audited financial statements. 173

Counterparty† Description‡ Termination DateFair Value in
USDMLIN The Sub-Fund receives the total return on a portfolio of long and short positions and pays 1-month LIBOR
plus or minus a specified spread, which is denominated in GBP based on the local currency of thepositions within the swap.
27.01.2020 - 26.04.2021 (1,698,855)
The following table represents the long and short positions and related values within the total return equity basket swap as at 31 March 2019
Reference Entity Currency Shares Notional Amount
UnrealisedAppreciation/
(Depreciation)in USD
Percent ofNet Assets
Long PositionsCommon StocksAustraliaBHP Billiton PLC GBP 165,023 3,964,227 161,908 0.02Rio Tinto PLC GBP 68,727 3,987,458 146,509 0.01
308,417 0.03NetherlandsRoyal Dutch Shell PLC GBP 84,338 2,643,649 31,244 0.00
31,244 0.00RussiaEvraz PLC GBP 325,103 2,617,492 103,956 0.01
103,956 0.01South AfricaAnglo American PLC GBP 41,645 1,111,606 51,010 0.01Investec PLC GBP 111,339 638,956 12,428 0.00
63,438 0.01SwitzerlandCoca-Cola HBC AG GBP 30,136 1,023,572 3,410 0.00IWG PLC GBP 240,614 778,778 0 0.00
3,410 0.00United KingdomAggreko PLC GBP 47,615 485,855 12,094 0.00Ashtead Group PLC GBP 16,056 387,041 5,635 0.00Associated British Foods PLC GBP 10,742 341,255 18,152 0.00BAE Systems PLC GBP 60,549 376,995 17,158 0.00Barclays PLC GBP 433,254 863,558 (12,066) 0.00Barratt Developments PLC GBP 69,451 537,683 5,055 0.00Bellway PLC GBP 18,927 745,941 17,714 0.00Berkeley Group Holdings PLC GBP 14,519 701,114 (13,713) 0.00BP PLC GBP 317,042 2,289,667 30,496 0.00Britvic PLC GBP 35,645 439,470 10,132 0.00BT Group PLC GBP 1,440,297 4,158,108 11,252 0.00Burberry Group PLC GBP 235,596 5,988,513 339,926 0.03Centrica PLC GBP 3,977,688 5,963,020 (140,635) (0.01)Close Brothers Group PLC GBP 32,683 611,333 8,074 0.00Cobham PLC GBP 161,685 228,766 946 0.00Dixons Carphone PLC GBP 317,081 603,193 20,196 0.00Drax Group PLC GBP 316,533 1,566,784 31,270 0.00Hays PLC GBP 419,289 816,429 20,515 0.00Howden Joinery Group PLC GBP 39,519 249,036 (514) 0.00Imperial Brands PLC GBP 21,366 730,697 20,325 0.00Inchcape PLC GBP 136,687 1,020,729 8,884 0.00Indivior PLC GBP 570,827 710,826 (41,180) 0.00International Consolidated Airlines Group SA GBP 49,763 328,209 (8,797) 0.00J Sainsbury PLC GBP 568,304 1,736,707 (2,886) 0.00JD Sports Fashion PLC GBP 25,110 160,977 4,374 0.00Man Group PLC GBP 836,577 1,479,985 50,022 0.00Marks & Spencer Group PLC GBP 81,149 293,028 8,872 0.00Meggitt PLC GBP 251,479 1,646,193 25,497 0.00Mondi PLC GBP 51,701 1,137,084 13,441 0.00Moneysupermarket.com Group PLC GBP 452,607 2,170,905 51,772 0.01National Grid PLC GBP 566,014 6,300,748 (173,705) (0.02)Persimmon PLC GBP 26,716 752,182 (1,325) 0.00Playtech Plc GBP 66,113 367,982 11,365 0.00Reckitt Benckiser Group PLC GBP 10,551 878,976 12,892 0.00Rolls-Royce Holdings PLC GBP 30,854 363,453 4,508 0.00Royal Mail PLC GBP 349,738 1,086,947 7,255 0.00Spectris PLC GBP 14,156 458,361 (18,217) 0.00Standard Chartered PLC GBP 43,392 333,624 6,092 0.00Standard Life PLC GBP 242,714 831,005 17,825 0.00Tate & Lyle PLC GBP 42,913 401,173 6,136 0.00Tesco PLC GBP 218,562 663,084 1,705 0.00United Utilities Group PLC GBP 12,944 138,808 (2,086) 0.00Vodafone Group PLC GBP 2,084,196 3,771,018 (67,295) (0.01)WH Smith PLC GBP 38,784 1,069,772 5,942 0.00William Hill PLC GBP 745,182 1,509,117 61,023 0.01WM Morrison Supermarkets PLC GBP 115,542 340,850 1,033 0.00WPP PLC GBP 19,277 202,963 1,235 0.00
386,394 0.01United StatesWolseley PLC GBP 4,581 290,555 (17,298) 0.00
(17,298) 0.00
Total Long Positions 879,561 0.06
Short PositionsCommon StocksGermanyTUI AG GBP (124,652) (1,183,783) 78,172 0.01
78,172 0.01South AfricaOld Mutual Ltd GBP (148,444) (224,098) (6,059) 0.00
(6,059) 0.00
AQR UCITS FUNDS
AQR Systematic Total Return UCITS Fund
Schedule of Investments (continued)As at 31 March 2019
The accompanying notes form an integral part of these audited financial statements. 174

Reference Entity Currency Shares Notional Amount
UnrealisedAppreciation/
(Depreciation)in USD
Percent ofNet Assets
Short Positions (continued)Common Stocks (continued)United Arab EmiratesNMC Health PLC GBP (131,618) (3,900,707) 78,472 0.01
78,472 0.01United KingdomAA PLC GBP (410,829) (484,353) 13,671 0.00Admiral Group PLC GBP (50,101) (1,409,279) (11,071) 0.00Ashmore Group PLC GBP (48,102) (266,233) (5,502) 0.00ASOS PLC GBP (129,351) (5,334,984) (189,995) (0.02)Auto Trader Group PLC GBP (63,636) (431,288) (7,279) 0.00Babcock International Group PLC GBP (133,580) (864,176) (695) 0.00Balfour Beatty PLC GBP (48,374) (163,548) 0 0.00Beazley PLC GBP (74,570) (499,189) (10,178) 0.00Bunzl PLC GBP (50,944) (1,679,990) (58,273) (0.01)Capita PLC GBP (117,548) (188,396) (1,986) 0.00Compass Group PLC GBP (43,202) (1,008,429) (29,909) 0.00ConvaTec Group PLC GBP (357,692) (659,991) (37,428) 0.00Croda International PLC GBP (2,154) (141,170) (4,256) 0.00CYBG PLC GBP (106,401) (272,323) (12,033) 0.00Daily Mail & General Trust PLC GBP (24,868) (207,848) (485) 0.00GVC Holdings PLC GBP (274,348) (1,964,928) (155,126) (0.02)Halma PLC GBP (29,977) (648,777) (3,507) 0.00Hargreaves Lansdown PLC GBP (130,148) (3,144,078) (147,600) (0.01)Hiscox Ltd GBP (10,163) (205,818) 264 0.00HSBC Holdings PLC GBP (844,248) (6,846,652) (106,447) (0.01)IMI PLC GBP (14,003) (173,190) (2,366) 0.00Informa PLC GBP (174,574) (1,691,008) (47,653) 0.00Inmarsat PLC GBP (34,474) (248,163) 538 0.00Intertek Group PLC GBP (7,864) (495,461) (10,426) 0.00ITV PLC GBP (203,821) (334,880) 56 0.00John Wood Group PLC GBP (546,670) (3,638,216) (56,847) (0.01)Johnson Matthey PLC GBP (6,838) (278,295) (5,155) 0.00Jupiter Fund Management PLC GBP (74,714) (351,369) (24,571) 0.00Just Eat PLC GBP (183,099) (1,789,769) (52,777) (0.01)Legal & General Group PLC GBP (218,448) (779,158) (16,753) 0.00Lloyds Banking Group PLC GBP (1,302,065) (1,040,035) 9,816 0.00Melrose Industries PLC GBP (2,075,906) (4,919,122) (78,253) (0.01)Merlin Entertainments PLC GBP (360,572) (1,600,106) (14,529) 0.00Micro Focus International PLC GBP (212,071) (5,485,644) (144,722) (0.01)Ocado Group PLC GBP (121,314) (2,139,065) (159,267) (0.02)Pearson PLC GBP (50,905) (556,348) (9,925) 0.00Prudential PLC GBP (115,363) (2,309,301) 5,998 0.00Quilter PLC GBP (118,389) (224,953) (10,495) 0.00Rentokil Initial PLC GBP (241,113) (1,100,072) (12,536) 0.00Rightmove PLC GBP (47,131) (311,217) (4,656) 0.00Rotork PLC GBP (58,659) (215,324) (9,607) 0.00Royal Bank of Scotland Group PLC GBP (388,201) (1,236,782) 14,129 0.00Schroders PLC GBP (13,314) (466,229) (3,634) 0.00Smith & Nephew PLC GBP (7,099) (140,445) (2,445) 0.00Spirax-Sarco Engineering PLC GBP (10,930) (1,017,247) (24,153) 0.00SSE PLC GBP (96,953) (1,507,251) 27,042 0.00St James’s Place PLC GBP (135,786) (1,796,785) (43,901) 0.00The Sage Group PLC GBP (123,414) (1,123,900) (31,121) 0.00The Weir Group PLC GBP (172,056) (3,449,755) (39,910) 0.00Travis Perkins PLC GBP (10,944) (194,392) (71) 0.00Whitbread PLC GBP (48,532) (3,208,469) (81,379) (0.01)
(1,597,408) (0.14)
Total Short Positions (1,446,823) (0.12)
Total of Long and Short Equity Positions (567,262) (0.06)Net Cash and Other Receivables/(Payables) (1,131,593) (0.11)
Total of Total Return Basket Swap Contract - MLIN - GBP (1,698,855) (0.17)
Counterparty† Description‡ Termination DateFair Value in
USDMLIN The Sub-Fund receives the total return on a portfolio of long and short positions and pays 1-month LIBOR
plus or minus a specified spread, which is denominated in JPY based on the local currency of the positionswithin the swap.
25.12.2019 - 29.03.2021 (3,754,307)
The following table represents the long and short positions and related values within the total return equity basket swap as at 31 March 2019
Reference Entity Currency Shares Notional Amount
UnrealisedAppreciation/
(Depreciation)in USD
Percent ofNet Assets
Long PositionsCommon StocksJapanAisin Seiki Co Ltd JPY 27,000 964,775 (20,342) (0.00)Ajinomoto Co Inc JPY 36,800 587,591 3,495 0.00Alfresa Holdings Corp JPY 80,200 2,280,477 45,164 0.00Alps Electric Co Ltd JPY 60,700 1,266,564 34,896 0.00ANA Holdings Inc JPY 23,600 864,519 19,419 0.00Asahi Glass Co Ltd JPY 7,000 245,314 7,277 0.00Asahi Kasei Corp JPY 41,800 431,350 (3,937) (0.00)Ashikaga Holdings Co Ltd JPY 452,200 1,156,496 (13,556) (0.00)Astellas Pharma Inc JPY 267,900 4,012,116 69,674 0.01Bandai Namco Holdings Inc JPY 45,100 2,112,366 20,579 0.00Brother Industries Ltd JPY 24,300 449,625 10,611 0.00Chubu Electric Power Co Inc JPY 110,500 1,724,079 (31,123) (0.00)Chugoku Bank Ltd JPY 46,800 439,350 (18,245) (0.00)Citizen Holdings Co Ltd JPY 96,200 536,004 5,418 0.00Concordia Financial Group Ltd JPY 177,500 684,847 4,499 0.00Credit Saison Co Ltd JPY 27,600 364,398 (12,763) (0.00)
AQR UCITS FUNDS
AQR Systematic Total Return UCITS Fund
Schedule of Investments (continued)As at 31 March 2019
The accompanying notes form an integral part of these audited financial statements. 175

Reference Entity Currency Shares Notional Amount
UnrealisedAppreciation/
(Depreciation)in USD
Percent ofNet Assets
Long Positions (continued)Common Stocks (continued)Japan (continued)Dai Nippon Printing Co Ltd JPY 18,000 430,207 32,751 0.00Daicel Corp JPY 131,800 1,430,894 39,865 0.00Dai-ichi Life Insurance Co Ltd JPY 84,400 1,173,786 (11,156) (0.00)DeNA Co Ltd JPY 34,300 516,152 (2,741) (0.00)Dentsu Inc JPY 4,300 181,474 4,029 0.00East Japan Railway Co JPY 10,000 964,301 14,497 0.00Eisai Co Ltd JPY 5,300 297,229 875 0.00Electric Power Development Co Ltd JPY 34,000 827,365 (13,856) (0.00)Fuji Electric Co Ltd JPY 60,200 1,708,735 (36,807) (0.00)FUJIFILM Holdings Corp JPY 14,400 654,485 4,527 0.00Fujitsu Ltd JPY 37,300 2,688,746 52,662 0.01GungHo Online Entertainment Inc JPY 433,200 1,575,527 (12,415) (0.00)Gunma Bank Ltd JPY 193,300 731,893 (80,607) (0.01)Hachijuni Bank Ltd JPY 209,500 868,780 10,863 0.00Hakuhodo DY Holdings Inc JPY 71,000 1,140,181 16,220 0.00Hankyu Hanshin Holdings Inc JPY 3,800 142,399 3,581 0.00Haseko Corp JPY 237,500 2,985,347 (68,414) (0.01)Hikari Tsushin Inc JPY 700 132,502 (462) (0.00)Hitachi Capital Corp JPY 14,700 340,843 (6,700) (0.00)Hitachi High-Technologies Corp JPY 33,800 1,385,144 468 0.00Hitachi Ltd JPY 129,400 4,191,736 84,411 0.01Hoshizaki Electric Co Ltd JPY 21,800 1,350,193 6,839 0.00Ibiden Co Ltd JPY 12,900 196,007 3,435 0.00Idemitsu Kosan Co Ltd JPY 80,500 2,694,199 (188,451) (0.02)IHI Corp JPY 32,700 785,715 16,339 0.00Inpex Corp JPY 360,300 3,435,511 70,241 0.01ITOCHU Corp JPY 16,300 294,671 (2,835) (0.00)Itochu Techno-Solutions Corp JPY 79,300 1,848,567 32,475 0.00Japan Airlines Co Ltd JPY 243,300 8,560,295 159,515 0.02Japan Post Holdings Co Ltd JPY 45,200 528,439 (5,244) (0.00)JFE Holdings Inc JPY 268,600 4,557,825 (35,740) (0.00)JTEKT Corp JPY 40,300 496,206 3,657 0.00JX Holdings Inc JPY 883,100 4,041,824 (154,424) (0.02)Kajima Corp JPY 244,600 3,608,339 76,073 0.01Kakaku.com Inc JPY 11,900 228,531 3,321 0.00Kaken Pharmaceutical Co Ltd JPY 12,800 581,216 (7,988) (0.00)Kamigumi Co Ltd JPY 75,900 1,756,974 23,837 0.00Kaneka Corp JPY 17,700 662,751 3,851 0.00Kobe Steel Ltd JPY 156,000 1,170,491 (10,080) (0.00)Kose Corp JPY 20,100 3,690,918 229,890 0.02Kyushu Railway Co JPY 22,100 726,318 (1,485) (0.00)Lion Corp JPY 30,400 639,473 3,312 0.00LIXIL Group Corp JPY 15,300 204,203 1,749 0.00Mabuchi Motor Co Ltd JPY 19,500 678,314 922 0.00Marubeni Corp JPY 422,600 2,920,581 (73,240) (0.01)Matsumotokiyoshi Holdings Co Ltd JPY 52,600 1,749,838 46,560 0.00Mazda Motor Corp JPY 126,200 1,412,195 647 0.00Medipal Holdings Corp JPY 52,000 1,234,195 30,641 0.00Mitsubishi Chemical Holdings Corp JPY 111,700 786,192 (24,972) (0.00)Mitsubishi Corp JPY 24,100 668,884 (22,824) (0.00)Mitsubishi Gas Chemical Co Inc JPY 161,100 2,297,951 (33,675) (0.00)Mitsubishi Motors Corp JPY 57,400 304,807 (664) (0.00)Mitsubishi Tanabe Pharma Corp JPY 20,400 272,377 (3,267) (0.00)Mitsubishi UFJ Financial Group Inc JPY 770,600 3,814,985 (31,586) (0.00)Mitsubishi UFJ Lease & Finance JPY 40,500 206,366 3,985 0.00Mitsui & Co Ltd JPY 93,100 1,444,741 (35,756) (0.00)Mitsui Chemicals Inc JPY 40,800 984,577 (3,912) (0.00)Mixi Inc JPY 64,100 1,480,036 (22,078) (0.00)Mizuho Financial Group Inc JPY 468,200 724,335 (8,805) (0.00)NHK Spring Co Ltd JPY 108,900 977,916 19,215 0.00Nikon Corp JPY 179,600 2,531,299 42,002 0.00Nippon Express Co Ltd JPY 42,400 2,359,022 19,423 0.00Nippon Shokubai Co Ltd JPY 10,700 697,702 (7,162) (0.00)Nippon Telegraph & Telephone Corp JPY 115,500 4,913,855 (45,149) (0.00)Nitto Denko Corp JPY 23,700 1,245,159 10,093 0.00Nomura Research Institute Ltd JPY 17,400 790,029 22,556 0.00NSK Ltd JPY 21,500 201,481 5,612 0.00NTT Data Corp JPY 55,000 606,598 23,681 0.00Obayashi Corp JPY 361,400 3,635,019 55,736 0.01Obic Co Ltd JPY 1,400 141,103 (1,288) (0.00)Oji Holdings Corp JPY 140,400 871,478 (8,101) (0.00)Olympus Corp JPY 146,400 1,589,673 31,453 0.00Oracle Corp Japan JPY 19,700 1,322,149 (22,992) (0.00)Osaka Gas Co Ltd JPY 38,000 749,307 (37,326) (0.00)Otsuka Corp JPY 61,500 2,295,981 149,181 0.01Pola Orbis Holdings Inc JPY 79,400 2,532,506 66,395 0.01Renesas Electronics Corp JPY 317,000 1,466,304 (19,126) (0.00)Resona Holdings Inc JPY 331,500 1,436,447 (18,845) (0.00)Rinnai Corp JPY 5,700 402,770 6,883 0.00Sankyo Co Ltd JPY 15,200 579,003 4,425 0.00Santen Pharmaceutical Co Ltd JPY 9,200 136,999 (1,898) (0.00)Sawai Pharmaceutical Co Ltd JPY 5,100 295,132 (3,343) (0.00)SCSK Corp JPY 30,700 1,366,816 28,927 0.00Sega Sammy Holdings Inc JPY 16,300 192,178 (720) (0.00)Seibu Holdings Inc JPY 15,000 262,404 4,032 0.00SG Holdings Co Ltd JPY 56,700 1,650,990 17,434 0.00Shimadzu Corp JPY 15,100 436,492 28,023 0.00Shimizu Corp JPY 90,600 786,760 4,690 0.00Shinsei Bank Ltd JPY 127,800 1,818,506 15,207 0.00Shionogi & Co Ltd JPY 39,600 2,449,848 104,718 0.01Showa Denko KK JPY 21,800 766,684 7,871 0.00SoftBank Group Corp JPY 16,300 1,580,654 15,310 0.00Sojitz Corp JPY 1,157,400 4,076,098 (72,906) (0.01)Sompo Japan Nipponkoa Holdings Inc JPY 5,200 192,456 4,371 0.00Sony Corp JPY 88,300 3,709,442 394 0.00
AQR UCITS FUNDS
AQR Systematic Total Return UCITS Fund
Schedule of Investments (continued)As at 31 March 2019
The accompanying notes form an integral part of these audited financial statements. 176

Reference Entity Currency Shares Notional Amount
UnrealisedAppreciation/
(Depreciation)in USD
Percent ofNet Assets
Long Positions (continued)Common Stocks (continued)Japan (continued)Square Enix Holdings Co Ltd JPY 74,400 2,606,015 62,597 0.01Stanley Electric Co Ltd JPY 12,100 325,094 6,727 0.00Sugi Holdings Co Ltd JPY 9,000 396,240 3,591 0.00Sumco Corp JPY 16,800 187,045 (103) (0.00)Sumitomo Chemical Co Ltd JPY 197,700 919,283 (15,140) (0.00)Sumitomo Corp JPY 146,100 2,019,651 (50,643) (0.01)Sumitomo Dainippon Pharma Co Ltd JPY 185,500 4,586,023 112,856 0.01Sumitomo Heavy Industries Ltd JPY 49,700 1,610,199 27,518 0.00Sumitomo Mitsui Financial Group Inc JPY 75,200 2,631,528 (24,026) (0.00)Sumitomo Mitsui Trust Holdings Inc JPY 17,200 617,361 (11,436) (0.00)Sundrug Co Ltd JPY 39,800 1,095,495 (20,522) (0.00)Suzuken Co Ltd JPY 33,600 1,943,181 61,766 0.01Taiheiyo Cement Corp JPY 111,300 3,708,949 69,726 0.01Taisei Corp JPY 108,900 5,052,668 82,353 0.01Taisho Pharmaceutical Holdings Co Ltd JPY 6,700 638,226 7,807 0.00Teijin Ltd JPY 93,200 1,536,779 (29,505) (0.00)Temp Holdings Co Ltd JPY 48,900 791,675 2,488 0.00The Hiroshima Bank Ltd JPY 120,900 616,191 (3,221) (0.00)The Iyo Bank Ltd JPY 112,400 594,908 (11,371) (0.00)THK Co Ltd JPY 57,300 1,416,320 20,323 0.00Tohoku Electric Power Co Inc JPY 103,200 1,315,431 (38,574) (0.00)Tokyo Broadcasting System Holdings Inc JPY 63,300 1,158,786 (3,657) (0.00)Tokyo Electric Power Co Inc JPY 697,300 4,405,801 (15,810) (0.00)Tokyo Gas Co Ltd JPY 66,800 1,805,160 (45,826) (0.00)Toppan Printing Co Ltd JPY 13,500 203,726 3,536 0.00Tosoh Corp JPY 244,900 3,809,639 45,515 0.00Toyo Seikan Group Holdings Ltd JPY 59,400 1,216,358 (22,661) (0.00)Toyo Suisan Kaisha Ltd JPY 8,800 334,809 51 0.00Toyota Boshoku Corp JPY 55,400 838,345 (4,680) (0.00)Toyota Tsusho Corp JPY 37,800 1,231,538 (6,130) (0.00)West Japan Railway Co JPY 8,200 617,124 7,070 0.00Yamaguchi Financial Group Inc JPY 15,000 127,137 (7,490) (0.00)
854,825 0.09
Total Long Positions 854,825 0.09
Short PositionsCommon StocksJapanAcom Co Ltd JPY (113,100) (403,477) (7,655) (0.00)Aeon Co Ltd JPY (125,100) (2,615,688) (79,046) (0.01)AEON Financial Service Co Ltd JPY (28,000) (569,704) 2,699 0.00Asahi Intecc Co Ltd JPY (65,600) (3,079,372) (108,985) (0.01)Asics Corp JPY (75,200) (1,008,894) (61,984) (0.01)Bridgestone Corp JPY (59,000) (2,271,804) (30,261) (0.00)Calbee Inc JPY (37,900) (1,020,335) (2,284) (0.00)Canon Inc JPY (130,300) (3,776,778) (62,487) (0.01)Casio Computer Co Ltd JPY (63,800) (832,764) (4,080) (0.00)Chiba Bank Ltd JPY (107,000) (581,031) 2,877 0.00Chugai Pharmaceutical Co Ltd JPY (35,900) (2,467,329) (96,987) (0.01)Coca-Cola West Co Ltd JPY (18,000) (456,823) (18,777) (0.00)Cosmos Pharmaceutical Corp JPY (900) (155,514) (3,464) (0.00)CyberAgent Inc JPY (37,900) (1,544,149) (102,793) (0.01)Daifuku Co Ltd JPY (109,100) (5,680,377) (130,168) (0.01)Daiichi Sankyo Co Ltd JPY (95,500) (4,396,056) (735,072) (0.07)Daiwa Securities Group Inc JPY (248,200) (1,208,048) 18,148 0.00Denso Corp JPY (55,200) (2,151,490) 36,295 0.00Disco Corp JPY (11,500) (1,638,420) (72,046) (0.01)Don Quijote Holdings Co Ltd JPY (43,700) (2,893,490) (118,511) (0.01)FamilyMart Co Ltd JPY (244,800) (6,236,127) 114,342 0.01FANUC Corp JPY (22,100) (3,760,136) (9,443) (0.00)Fast Retailing Co Ltd JPY (20,300) (9,541,372) 95,475 0.01Fukuoka Financial Group Inc JPY (17,600) (390,546) 4,904 0.00Hamamatsu Photonics KK JPY (8,100) (313,210) (8,908) (0.00)Hirose Electric Co Ltd JPY (15,100) (1,585,628) (28,627) (0.00)Hitachi Metals Ltd JPY (88,300) (1,026,378) 9,508 0.00Hokuriku Electric Power Co JPY (25,300) (198,275) 4,371 0.00Hoya Corp JPY (29,300) (1,933,817) (5,590) (0.00)Isetan Mitsukoshi Holdings Ltd JPY (103,700) (1,047,518) 99 0.00J Front Retailing Co Ltd JPY (51,200) (608,885) (26,065) (0.00)Japan Airport Terminal Co Ltd JPY (44,800) (1,891,847) 17,502 0.00Japan Post Bank Co Ltd JPY (102,300) (1,116,651) 24,293 0.00JGC Corp JPY (130,200) (1,729,941) (11,792) (0.00)Kansai Paint Co Ltd JPY (117,500) (2,241,762) 5,115 0.00Kao Corp JPY (4,400) (346,508) (11,463) (0.00)Kawasaki Heavy Industries Ltd JPY (26,500) (653,838) (19,931) (0.00)Keihan Electric Railway Co Ltd JPY (14,100) (592,557) (25,327) (0.00)Keikyu Corp JPY (94,200) (1,597,805) (56,482) (0.01)Keio Corp JPY (27,200) (1,756,777) (56,547) (0.01)Keisei Electric Railway Co Ltd JPY (9,100) (330,385) (11,497) (0.00)Keyence Corp JPY (8,800) (5,483,675) 400 0.00Kikkoman Corp JPY (51,000) (2,500,878) (71,978) (0.01)Kintetsu Group Holdings Co Ltd JPY (26,700) (1,243,589) (20,155) (0.00)Koito Manufacturing Co Ltd JPY (31,400) (1,778,322) (44,982) (0.00)Komatsu Ltd JPY (40,100) (931,306) (6,895) (0.00)Konica Minolta Inc JPY (14,000) (137,760) (2,136) (0.00)Kubota Corp JPY (37,600) (543,578) (17,724) (0.00)Kuraray Co Ltd JPY (71,800) (913,131) (5,148) (0.00)Kyowa Hakko Kirin Co Ltd JPY (37,900) (824,704) (43,588) (0.00)Kyushu Electric Power Co Inc JPY (57,100) (673,646) 7,238 0.00Lawson Inc JPY (9,500) (526,298) (163) (0.00)M3 Inc JPY (281,100) (4,710,967) (223,104) (0.02)Makita Corp JPY (32,800) (1,142,157) (63,382) (0.01)Marui Group Co Ltd JPY (190,400) (3,842,334) (40,001) (0.00)McDonald’s Holdings Co Japan Ltd JPY (8,000) (369,627) (4,498) (0.00)
AQR UCITS FUNDS
AQR Systematic Total Return UCITS Fund
Schedule of Investments (continued)As at 31 March 2019
The accompanying notes form an integral part of these audited financial statements. 177

Reference Entity Currency Shares Notional Amount
UnrealisedAppreciation/
(Depreciation)in USD
Percent ofNet Assets
Short Positions (continued)Common Stocks (continued)Japan (continued)MISUMI Group Inc JPY (144,600) (3,594,700) (181,068) (0.02)Mitsubishi Materials Corp JPY (14,600) (385,162) (1,676) (0.00)MonotaRO Co Ltd JPY (12,800) (283,697) (10,298) (0.00)MS&AD Insurance Group Holdings Inc JPY (10,500) (319,657) (1,514) (0.00)Murata Manufacturing Co Ltd JPY (106,500) (5,300,503) (172,351) (0.02)Nabtesco Corp JPY (47,300) (1,379,141) (56,353) (0.01)Nagoya Railroad Co Ltd JPY (43,000) (1,190,175) (26,598) (0.00)Nidec Corp JPY (41,500) (5,258,663) (257,625) (0.03)Nifco Inc JPY (16,600) (422,725) (10,711) (0.00)Nintendo Co Ltd JPY (11,300) (3,229,833) (126,194) (0.01)Nippon Paint Holdings Co Ltd JPY (85,000) (3,340,882) (39,606) (0.00)Nippon Shinyaku Co Ltd JPY (15,000) (1,091,946) (86,670) (0.01)Nippon Yusen KK JPY (34,200) (501,035) (1,909) (0.00)Nissan Chemical Industries Ltd JPY (13,000) (595,429) (9,130) (0.00)Nissan Motor Co Ltd JPY (313,000) (2,566,113) 75,655 0.01Nitori Holdings Co Ltd JPY (23,100) (2,982,733) (169,853) (0.02)NOK Corp JPY (16,100) (250,492) 1,032 0.00Nomura Holdings Inc JPY (875,700) (3,159,178) 7,188 0.00Odakyu Electric Railway Co Ltd JPY (75,400) (1,826,976) (55,979) (0.01)Omron Corp JPY (6,000) (281,093) 94 0.00Oriental Land Co Ltd JPY (13,200) (1,498,144) (33,660) (0.00)Otsuka Holdings Co Ltd JPY (44,400) (1,743,290) (2,773) (0.00)Park24 Co Ltd JPY (36,800) (797,992) 7,282 0.00PeptiDream Inc JPY (54,500) (2,673,631) (82,958) (0.01)Pigeon Corp JPY (32,200) (1,315,709) 4,356 0.00Rakuten Inc JPY (16,500) (156,373) (2,632) (0.00)Recruit Holdings Co Ltd JPY (7,400) (211,260) (10,015) (0.00)Ricoh Co Ltd JPY (430,600) (4,500,514) (115,475) (0.01)Seven Bank Ltd JPY (118,700) (350,559) (449) (0.00)Shimano Inc JPY (21,500) (3,493,201) (246,820) (0.03)Shiseido Co Ltd JPY (6,900) (498,154) (12,201) (0.00)Shizuoka Bank Ltd JPY (31,300) (238,567) 1,410 0.00SMC Corp JPY (4,700) (1,763,828) (65,952) (0.01)SMC Corp JPY (35,000) (384,998) (12,157) (0.00)Sony Financial Holdings Inc JPY (16,600) (313,325) (5,662) (0.00)Sumitomo Electric Industries Ltd JPY (27,900) (370,117) 1,833 0.00Sumitomo Metal Mining Co Ltd JPY (53,500) (1,580,529) (50,786) (0.01)Suntory Beverage & Food Ltd JPY (22,400) (1,051,409) (47,233) (0.00)Suzuki Motor Corp JPY (28,400) (1,256,506) 18,696 0.00T&D Holdings Inc JPY (40,300) (424,159) (9,945) (0.00)Taiyo Nippon Sanso Corp JPY (14,200) (216,237) (10,279) (0.00)Takeda Pharmaceutical Co Ltd JPY (62,800) (2,559,266) 65,438 0.01TDK Corp JPY (43,000) (3,369,674) (65,114) (0.01)Terumo Corp JPY (279,200) (8,524,829) 6,177 0.00The Bank of Kyoto Ltd JPY (3,300) (138,062) 2,433 0.00The Chugoku Electric Power Co Inc JPY (52,900) (659,315) 34,471 0.00Toho Co Ltd JPY (5,700) (228,699) (10,961) (0.00)Tokio Marine Holdings Inc JPY (53,500) (2,590,555) (793) (0.00)Tokyo Electron Ltd JPY (4,000) (578,063) 8,170 0.00Toray Industries Inc JPY (255,400) (1,629,195) 28,780 0.00TOTO Ltd JPY (40,500) (1,718,085) (70,874) (0.01)Toyota Industries Corp JPY (40,600) (2,035,363) 9,808 0.00Toyota Motor Corp JPY (89,600) (5,256,496) 86,871 0.01Tsuruha Holdings Inc JPY (2,500) (203,099) (1,052) (0.00)Welcia Holdings Co Ltd JPY (20,500) (694,809) (32,833) (0.00)Yahoo Japan Corp JPY (106,300) (260,063) (1,181) (0.00)Yamaha Corp JPY (28,700) (1,433,375) (17,337) (0.00)Yamaha Motor Co Ltd JPY (93,200) (1,828,644) (40,757) (0.00)Yamato Holdings Co Ltd JPY (70,200) (1,813,008) 3,967 0.00Yaskawa Electric Corp JPY (236,800) (7,433,401) (256,672) (0.03)Yokohama Rubber Co Ltd JPY (51,700) (960,276) (18,283) (0.00)
(4,175,488) (0.42)
Total Short Positions (4,175,488) (0.42)
Total of Long and Short Equity Positions (3,320,663) (0.33)Net Cash and Other Receivables/(Payables) (433,644) (0.04)
Total of Total Return Basket Swap Contract - MLIN - JPY (3,754,307) (0.37)
Counterparty† Description‡ Termination DateFair Value in
USDMLIN The Sub-Fund receives the total return on a portfolio of long and short positions and pays 1-month NIBOR
plus or minus a specified spread, which is denominated in NOK based on the local currency of thepositions within the swap.
27.01.2020 - 26.04.2021 (536,710)
The following table represents the long and short positions and related values within the total return equity basket swap as at 31 March 2019
Reference Entity Currency Shares Notional Amount
UnrealisedAppreciation/
(Depreciation)in USD
Percent ofNet Assets
Long PositionsCommon StocksNorwayLeroy Seafood Group ASA NOK 169,816 1,233,715 6,696 0.00Norsk Hydro ASA NOK 209,505 851,175 12,149 0.00Salmar ASA NOK 39,753 1,904,164 13,832 0.00Statoil ASA NOK 270,974 5,963,399 (59,235) (0.00)
(26,558) (0.00)
Total Long Positions (26,558) (0.00)
AQR UCITS FUNDS
AQR Systematic Total Return UCITS Fund
Schedule of Investments (continued)As at 31 March 2019
The accompanying notes form an integral part of these audited financial statements. 178

Reference Entity Currency Shares Notional Amount
UnrealisedAppreciation/
(Depreciation)in USD
Percent ofNet Assets
Short PositionsCommon StocksNorwayGjensidige Forsikring ASA NOK (84,718) (1,465,000) 102,186 0.01Schibsted ASA NOK (39,421) (1,551,758) 22,790 0.00Yara International ASA NOK (62,068) (2,544,009) 0 0.00
124,976 0.01United KingdomSubsea 7 SA NOK (231,840) (2,871,733) (60,500) (0.01)
(60,500) (0.01)
Total Short Positions 64,476 0.00
Total of Long and Short Equity Positions 37,918 0.00Net Cash and Other Receivables/(Payables) (574,628) (0.06)
Total of Total Return Basket Swap Contract - MLIN - NOK (536,710) (0.06)
Counterparty† Description‡ Termination DateFair Value in
USDMLIN The Sub-Fund receives the total return on a portfolio of long and short positions and pays 1-month
STIBOR plus or minus a specified spread, which is denominated in SEK based on the local currency of thepositions within the swap.
27.01.2020 - 26.04.2021 374,402
The following table represents the long and short positions and related values within the total return equity basket swap as at 31 March 2019
Reference Entity Currency Shares Notional Amount
UnrealisedAppreciation/
(Depreciation)in USD
Percent ofNet Assets
Long PositionsCommon StocksMaltaUnibet Group PLC SEK 180,217 1,795,629 (16,327) (0.00)
(16,327) (0.00)SwedenAAK AB SEK 20,989 313,172 8,439 0.00Axfood AB SEK 19,258 357,155 7,885 0.00Boliden AB SEK 104,436 2,970,884 148,122 0.01Electrolux AB SEK 99,683 2,559,903 (48,381) (0.01)Essity AB SEK 31,924 920,363 (2,208) (0.00)Fingerprint Cards AB SEK 471,376 672,926 (32,920) (0.00)Holmen AB SEK 8,805 191,026 6,372 0.00Modern Times Group MTG AB SEK 25,632 325,665 (5,072) (0.00)Sandvik AB SEK 44,045 713,763 475 0.00Securitas AB SEK 46,516 750,294 29,350 0.00Skanska AB SEK 21,739 394,726 (9,144) (0.00)SKF AB SEK 18,232 303,321 98 0.00SSAB AB SEK 185,020 663,918 (1,596) (0.00)Swedish Match AB SEK 49,379 2,516,975 57,519 0.01Swedish Orphan Biovitrum AB SEK 124,108 2,893,999 22,756 0.00Telia Co AB SEK 451,591 2,036,912 (6,332) (0.00)Volvo AB SEK 83,916 1,296,077 92,318 0.01
267,681 0.02
Total Long Positions 251,354 0.02
Short PositionsCommon StocksColombiaMillicom International Cellular SA SEK (12,074) (730,562) 651 0.00
651 0.00FinlandNordea Bank AB SEK (178,455) (1,357,710) 232,507 0.02
232,507 0.02SwedenAssa Abloy AB SEK (66,388) (1,428,842) (39,207) (0.00)Atlas Copco AB SEK (12,733) (340,036) (2,172) (0.00)BillerudKorsnas AB SEK (43,024) (568,447) (24,553) (0.00)Epiroc AB SEK (38,171) (383,330) (11,222) (0.00)Ericsson SEK (25,612) (234,693) 4,807 0.00Getinge AB SEK (64,527) (751,637) (12,179) (0.00)Hennes & Mauritz AB SEK (30,847) (518,616) (59,886) (0.01)Hexagon AB SEK (4,116) (213,799) (2,042) (0.00)Husqvarna AB SEK (157,359) (1,282,409) (14,624) (0.00)Nibe Industrier AB SEK (11,729) (149,970) (6,009) (0.00)Saab AB SEK (47,967) (1,537,568) (10,571) (0.00)Svenska Cellulosa AB SCA SEK (72,503) (625,589) (14,632) (0.00)Svenska Handelsbanken AB SEK (388,209) (4,110,850) 201,816 0.02Tele2 AB SEK (87,306) (1,169,052) 33,831 0.00
43,357 0.01
Total Short Positions 276,515 0.03
Total of Long and Short Equity Positions 527,869 0.05Net Cash and Other Receivables/(Payables) (153,467) (0.02)
Total of Total Return Basket Swap Contract - MLIN - SEK 374,402 0.03
AQR UCITS FUNDS
AQR Systematic Total Return UCITS Fund
Schedule of Investments (continued)As at 31 March 2019
The accompanying notes form an integral part of these audited financial statements. 179

Counterparty† Description‡ Termination DateFair Value in
USDMSIP The Sub-Fund receives the total return on a portfolio of long and short positions and pays RBACR-1D plus or
minus a specified spread, which is denominated in AUD based on the local currency of the positions within theswap.
06.02.2020 (78,252)
The following table represents the long and short positions and related values within the total return equity basket swap as at 31 March 2019
Reference Entity Currency Shares Notional Amount
UnrealisedAppreciation/
(Depreciation)in USD
Percent ofNet Assets
Long PositionsCommon StocksAustraliaAGL Energy Ltd AUD 46,359 715,481 (2,822) (0.00)Aurizon Holdings Ltd AUD 410,161 1,322,975 19,713 0.00Bank of Queensland Ltd AUD 21,471 138,517 (49) (0.00)Bendigo Adelaide Bank Ltd AUD 70,274 482,381 4,896 0.00BlueScope Steel Ltd AUD 215,746 2,134,249 17,863 0.00Boral Ltd AUD 56,058 182,368 (12,328) (0.00)Caltex Australia Ltd AUD 33,544 623,408 (55,397) (0.01)Coca-Cola Amatil Ltd AUD 23,311 143,010 5,715 0.00Flight Centre Travel Group Ltd AUD 12,267 365,822 (5,878) (0.00)Fortescue Metals Group Ltd AUD 29,579 149,081 7,169 0.00Iluka Resources Ltd AUD 145,463 928,490 10,949 0.00Incitec Pivot Ltd AUD 128,961 285,244 (13,986) (0.00)Leighton Holdings Ltd AUD 33,485 1,145,897 (49,119) (0.00)Newcrest Mining Ltd AUD 53,165 960,700 20,500 0.00Origin Energy Ltd AUD 106,592 544,601 (14,487) (0.00)Qantas Airways Ltd AUD 421,245 1,689,799 5,816 0.00Santos Ltd AUD 300,864 1,457,974 (47,737) (0.00)South32 AUD 603,666 1,597,043 (54,568) (0.01)Woodside Petroleum Ltd AUD 81,391 1,998,109 (25,601) (0.00)
(189,351) (0.02)
Total Long Positions (189,351) (0.02)
Short PositionsCommon StocksAustraliaAmcor Ltd AUD (32,771) (357,451) (13,211) (0.00)AMP Ltd AUD (364,193) (542,287) 41,040 0.00Challenger Ltd AUD (269,894) (1,583,416) (101,884) (0.01)Cochlear Ltd AUD (2,485) (305,375) 16,391 0.00CSL Ltd AUD (30,008) (4,147,709) (4,935) (0.00)Dominos Pizza Enterprises Ltd AUD (8,703) (267,948) (12,379) (0.00)Macquarie Group Ltd AUD (2,335) (214,239) (2,581) (0.00)Magellan Financial Group Ltd AUD (6,569) (169,663) 983 0.00Medibank Pvt Ltd AUD (141,826) (277,510) (6,089) (0.00)Ramsay Health Care Ltd AUD (48,528) (2,213,767) 44,268 0.00SEEK Ltd AUD (175,186) (2,179,215) 101,822 0.01Sonic Healthcare Ltd AUD (25,665) (446,943) (3,074) (0.00)Sydney Airport AUD (65,550) (345,331) 1,275 0.00Tabcorp Holdings Ltd AUD (44,780) (146,675) 2,503 0.00Transurban Group AUD (115,377) (1,079,549) (40,135) (0.00)Treasury Wine Estates Ltd AUD (13,453) (142,484) 11,419 0.00Vocus Communications Ltd AUD (271,484) (710,417) (33,071) (0.00)Woolworths Ltd AUD (6,503) (140,133) (470) (0.00)
1,872 0.00IrelandJames Hardie Industries PLC AUD (119,633) (1,538,193) (15,707) (0.00)
(15,707) (0.00)
Total Short Positions (13,835) (0.00)
Total of Long and Short Equity Positions (203,186) (0.02)Net Cash and Other Receivables/(Payables) 124,934 0.01
Total of Total Return Basket Swap Contract - MSIP - AUD (78,252) (0.01)
AQR UCITS FUNDS
AQR Systematic Total Return UCITS Fund
Schedule of Investments (continued)As at 31 March 2019
The accompanying notes form an integral part of these audited financial statements. 180

Counterparty† Description‡ Termination DateFair Value in
USDMSIP The Sub-Fund receives the total return on a portfolio of long and short positions and pays DISC-1D plus or minus
a specified spread, which is denominated in CAD based on the local currency of the positions within the swap.10.02.2020 246,589
The following table represents the long and short positions and related values within the total return equity basket swap as at 31 March 2019
Reference Entity Currency Shares Notional Amount
UnrealisedAppreciation/
(Depreciation)in USD
Percent ofNet Assets
Long PositionsCommon StocksCanadaAir Canada CAD 206,373 4,987,064 132,865 0.01Alimentation Couche-Tard Inc CAD 23,498 1,382,825 77,838 0.01Bank of Montreal CAD 14,903 1,116,665 (42,543) (0.00)CAE Inc CAD 16,206 360,322 5,217 0.00Canadian Imperial Bank of Commerce CAD 36,373 2,893,666 (202,042) (0.02)Canadian National Railway Co CAD 10,490 936,703 6,911 0.00Canadian Pacific Railway Ltd CAD 4,244 873,391 (3,495) (0.00)Canadian Tire Corp Ltd CAD 17,266 1,855,856 (13,443) (0.00)CGI Group Inc CAD 19,571 1,342,484 16,849 0.00CI Financial Corp CAD 10,694 146,024 (1,201) (0.00)Constellation Software Inc CAD 565 478,787 9,542 0.00Dollarama Inc CAD 33,645 884,069 13,097 0.00Empire Co Ltd CAD 67,676 1,473,288 34,883 0.00Finning International Inc CAD 62,201 1,106,375 4,656 0.00Genworth MI Canada Inc CAD 12,036 362,035 (18,922) (0.00)George Weston Ltd CAD 4,198 301,478 7,999 0.00Gildan Activewear Inc CAD 34,586 1,238,136 (10,350) (0.00)Husky Energy Inc CAD 44,888 447,939 (16,802) (0.00)Hydro One Ltd CAD 13,144 203,684 2,657 0.00Industrial Alliance Insurance Financial Services Inc CAD 4,842 179,391 (6,996) (0.00)Linamar Corp CAD 21,093 755,577 (5,211) (0.00)Loblaw Cos Ltd CAD 12,680 624,033 660 0.00Magna International Inc CAD 78,866 3,864,776 (22,435) (0.00)Manulife Financial Corp CAD 14,887 251,200 (8,581) (0.00)Maple Leaf Foods Inc CAD 7,594 175,950 21,830 0.00Methanex Corp CAD 54,693 3,101,918 (22,519) (0.00)Metro Inc CAD 3,820 140,641 (67) (0.00)National Bank of Canada CAD 29,328 1,323,910 (45,968) (0.01)Quebecor Inc CAD 38,975 948,553 25,232 0.00Royal Bank of Canada CAD 2,691 203,729 (6,124) (0.00)Teck Resources Ltd CAD 43,552 1,013,322 54,122 0.01The Bank of Nova Scotia CAD 3,659 195,002 (6,875) (0.00)The Toronto-Dominion Bank CAD 5,621 305,456 (15,401) (0.00)Thomson Reuters Corp CAD 3,142 184,597 7,550 0.00Tourmaline Oil Corp CAD 10,175 157,828 (5,332) (0.00)West Fraser Timber Co Ltd CAD 55,038 2,664,551 (46,559) (0.01)WestJet Airlines Ltd CAD 16,492 237,664 (4,198) (0.00)WSP Global Inc CAD 7,160 390,965 6,968 0.00
(76,188) (0.01)United StatesBRP Inc CAD 45,014 1,245,821 (7,414) (0.00)Valeant Pharmaceuticals International Inc CAD 31,144 761,230 (2,863) (0.00)
(10,277) (0.00)
Total Long Positions (86,465) (0.01)
Short PositionsCommon StocksBrazilYamana Gold Inc CAD (65,055) (170,941) (6,818) (0.00)
(6,818) (0.00)CanadaAgnico Eagle Mines Ltd CAD (35,734) (1,562,527) (20,331) (0.00)AltaGas Ltd CAD (143,022) (1,892,970) 23,555 0.00Barrick Gold Corp CAD (21,890) (304,474) (21,467) (0.00)Bombardier Inc CAD (202,686) (389,956) 40,968 0.00Brookfield Asset Management Inc CAD (21,814) (1,014,601) (2,123) (0.00)Cameco Corp CAD (45,408) (538,451) 19,376 0.00CCL Industries Inc CAD (5,153) (206,961) 733 0.00Cenovus Energy Inc CAD (270,001) (2,320,416) 82,872 0.01Element Financial Corp CAD (120,862) (770,882) (8,143) (0.00)Enbridge Inc CAD (146,477) (5,347,869) 47,152 0.01Encana Corp CAD (164,450) (1,195,396) 39,395 0.00Franco-Nevada Corp CAD (12,747) (960,271) 2,767 0.00Inter Pipeline Ltd CAD (57,474) (948,721) 3,012 0.00Keyera Corp CAD (75,667) (1,761,674) 84,968 0.01Onex Corp CAD (6,522) (368,529) (12,157) (0.00)Pembina Pipeline Corp CAD (46,419) (1,701,358) 30,927 0.00Peyto Exploration Development Corp CAD (48,191) (255,422) 21,285 0.00PrairieSky Royalty Ltd CAD (83,726) (1,138,869) 64,559 0.01Restaurant Brands International Inc CAD (8,591) (562,036) (17,558) (0.00)Ritchie Bros Auctioneers Inc CAD (6,440) (219,697) (1,350) (0.00)Saputo Inc CAD (9,066) (308,738) (6,380) (0.00)Shopify Inc CAD (4,384) (900,725) 1,543 0.00Silver Wheaton Corp CAD (126,300) (3,023,712) (190,991) (0.02)SNC-Lavalin Group Inc CAD (15,863) (405,778) 6,249 0.00The Stars Group Inc CAD (24,511) (428,640) (7,245) (0.00)TransCanada Corp CAD (148,259) (6,610,500) 172,033 0.02Vermilion Energy Inc CAD (22,291) (553,020) 14,685 0.00Whitecap Resources Inc CAD (74,730) (259,021) 559 0.00
368,893 0.04ChileLundin Mining Corp CAD (49,518) (232,428) 2,224 0.00
2,224 0.00
AQR UCITS FUNDS
AQR Systematic Total Return UCITS Fund
Schedule of Investments (continued)As at 31 March 2019
The accompanying notes form an integral part of these audited financial statements. 181
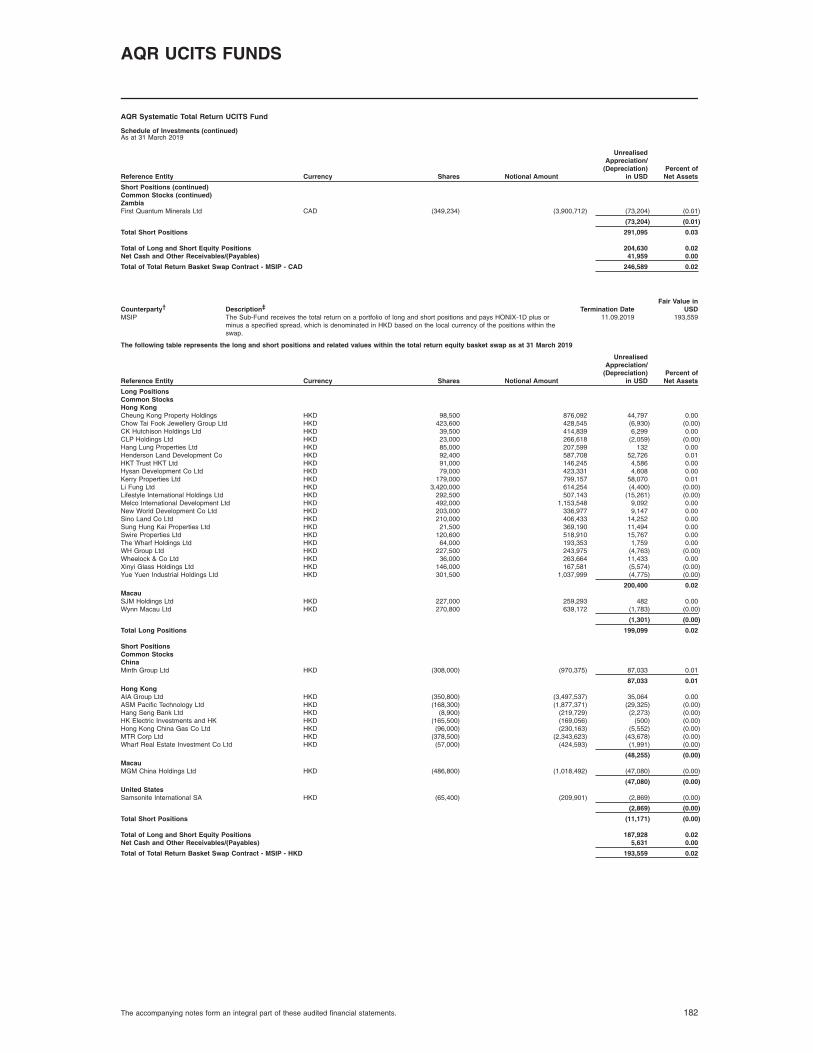
Reference Entity Currency Shares Notional Amount
UnrealisedAppreciation/
(Depreciation)in USD
Percent ofNet Assets
Short Positions (continued)Common Stocks (continued)ZambiaFirst Quantum Minerals Ltd CAD (349,234) (3,900,712) (73,204) (0.01)
(73,204) (0.01)
Total Short Positions 291,095 0.03
Total of Long and Short Equity Positions 204,630 0.02Net Cash and Other Receivables/(Payables) 41,959 0.00
Total of Total Return Basket Swap Contract - MSIP - CAD 246,589 0.02
Counterparty† Description‡ Termination DateFair Value in
USDMSIP The Sub-Fund receives the total return on a portfolio of long and short positions and pays HONIX-1D plus or
minus a specified spread, which is denominated in HKD based on the local currency of the positions within theswap.
11.09.2019 193,559
The following table represents the long and short positions and related values within the total return equity basket swap as at 31 March 2019
Reference Entity Currency Shares Notional Amount
UnrealisedAppreciation/
(Depreciation)in USD
Percent ofNet Assets
Long PositionsCommon StocksHong KongCheung Kong Property Holdings HKD 98,500 876,092 44,797 0.00Chow Tai Fook Jewellery Group Ltd HKD 423,600 428,545 (6,930) (0.00)CK Hutchison Holdings Ltd HKD 39,500 414,839 6,299 0.00CLP Holdings Ltd HKD 23,000 266,618 (2,059) (0.00)Hang Lung Properties Ltd HKD 85,000 207,599 132 0.00Henderson Land Development Co HKD 92,400 587,708 52,726 0.01HKT Trust HKT Ltd HKD 91,000 146,245 4,586 0.00Hysan Development Co Ltd HKD 79,000 423,331 4,608 0.00Kerry Properties Ltd HKD 179,000 799,157 58,070 0.01Li Fung Ltd HKD 3,420,000 614,254 (4,400) (0.00)Lifestyle International Holdings Ltd HKD 292,500 507,143 (15,261) (0.00)Melco International Development Ltd HKD 492,000 1,153,548 9,092 0.00New World Development Co Ltd HKD 203,000 336,977 9,147 0.00Sino Land Co Ltd HKD 210,000 406,433 14,252 0.00Sung Hung Kai Properties Ltd HKD 21,500 369,190 11,494 0.00Swire Properties Ltd HKD 120,600 518,910 15,767 0.00The Wharf Holdings Ltd HKD 64,000 193,353 1,759 0.00WH Group Ltd HKD 227,500 243,975 (4,763) (0.00)Wheelock & Co Ltd HKD 36,000 263,664 11,433 0.00Xinyi Glass Holdings Ltd HKD 146,000 167,581 (5,574) (0.00)Yue Yuen Industrial Holdings Ltd HKD 301,500 1,037,999 (4,775) (0.00)
200,400 0.02MacauSJM Holdings Ltd HKD 227,000 259,293 482 0.00Wynn Macau Ltd HKD 270,800 639,172 (1,783) (0.00)
(1,301) (0.00)
Total Long Positions 199,099 0.02
Short PositionsCommon StocksChinaMinth Group Ltd HKD (308,000) (970,375) 87,033 0.01
87,033 0.01Hong KongAIA Group Ltd HKD (350,800) (3,497,537) 35,064 0.00ASM Pacific Technology Ltd HKD (168,300) (1,877,371) (29,325) (0.00)Hang Seng Bank Ltd HKD (8,900) (219,729) (2,273) (0.00)HK Electric Investments and HK HKD (165,500) (169,056) (500) (0.00)Hong Kong China Gas Co Ltd HKD (96,000) (230,163) (5,552) (0.00)MTR Corp Ltd HKD (378,500) (2,343,623) (43,678) (0.00)Wharf Real Estate Investment Co Ltd HKD (57,000) (424,593) (1,991) (0.00)
(48,255) (0.00)MacauMGM China Holdings Ltd HKD (486,800) (1,018,492) (47,080) (0.00)
(47,080) (0.00)United StatesSamsonite International SA HKD (65,400) (209,901) (2,869) (0.00)
(2,869) (0.00)
Total Short Positions (11,171) (0.00)
Total of Long and Short Equity Positions 187,928 0.02Net Cash and Other Receivables/(Payables) 5,631 0.00
Total of Total Return Basket Swap Contract - MSIP - HKD 193,559 0.02
AQR UCITS FUNDS
AQR Systematic Total Return UCITS Fund
Schedule of Investments (continued)As at 31 March 2019
The accompanying notes form an integral part of these audited financial statements. 182

Counterparty† Description‡ Termination DateFair Value in
USDMSIP The Sub-Fund receives the total return on a portfolio of long and short positions. The Sub-Fund pays 1-day
SORF1-1D for the long positions and 1-month SIBOR for the short positions, plus or minus a specified spread,which is denominated in SGD based on the local currency of the positions within the swap.
07.02.2020 45,121
The following table represents the long and short positions and related values within the total return equity basket swap as at 31 March 2019
Reference Entity Currency Shares Notional Amount
UnrealisedAppreciation/
(Depreciation)in USD
Percent ofNet Assets
Long PositionsCommon StocksChinaYangzijiang Shipbuilding Holdings Ltd SGD 725,500 804,036 24,376 0.00
24,376 0.00SingaporeComfortDelGro Corp Ltd SGD 345,700 656,433 25,600 0.00Genting Singapore PLC SGD 205,300 157,720 4,675 0.00
30,275 0.00
Total Long Positions 54,651 0.00
Short PositionsCommon StocksSingaporeCapitaLand Ltd SGD (57,400) (154,741) (6,883) (0.00)SATS Ltd SGD (51,600) (194,765) 994 0.00SingTel SGD (342,500) (764,017) (3,732) (0.00)Venture Corp Ltd SGD (19,400) (257,154) 587 0.00Wilmar International Ltd SGD (107,300) (262,373) (231) (0.00)
(9,265) (0.00)
Total Short Positions (9,265) (0.00)
Total of Long and Short Equity Positions 45,386 0.00Net Cash and Other Receivables/(Payables) (265) (0.00)
Total of Total Return Basket Swap Contract - MSIP - SGD 45,121 (0.00)
Counterparty† Description‡ Termination DateFair Value in
USDMSIP The Sub-Fund receives the total return on a portfolio of long and short positions and pays FEDEF-1D plus or
minus a specified spread, which is denominated in USD based on the local currency of the positions within theswap.
10.02.2020 (3,922,682)
The following table represents the long and short positions and related values within the total return equity basket swap as at 31 March 2019
Reference Entity Currency Shares Notional Amount
UnrealisedAppreciation/
(Depreciation)in USD
Percent ofNet Assets
Long PositionsCommon StocksPuerto RicoPopular Inc USD 17,743 929,378 (20,409) (0.00)
(20,409) (0.00)United States3M Co USD 8,838 1,827,610 (15,025) (0.00)Abbott Laboratories USD 12,796 1,014,851 6,142 0.00AbbVie Inc USD 74,415 5,984,826 (16,743) (0.00)ABIOMED Inc USD 4,458 1,276,682 (208,946) (0.02)Accenture PLC USD 10,812 1,897,506 98,065 0.01Actavis plc USD 17,533 2,559,993 (84,684) (0.01)Activision Blizzard Inc USD 16,916 762,404 1,692 0.00Adobe Systems Inc USD 28,529 7,578,729 225,094 0.02Adtalem Global Education Inc USD 10,479 489,265 (17,359) (0.00)AES Corp/VA USD 35,226 637,943 (1,409) (0.00)Aflac Inc USD 87,106 4,337,879 (39,198) (0.00)AGCO Corp USD 10,108 701,293 17,184 0.00Agilent Technologies Inc USD 87,713 7,018,794 (83,327) (0.01)Akamai Technologies Inc USD 26,242 1,874,204 (18,981) (0.00)Alcoa Corp USD 55,599 1,558,996 (33,359) (0.00)Alexander & Baldwin Inc USD 8,257 210,719 16,927 0.00Alexion Pharmaceuticals Inc USD 31,242 4,187,053 15,933 0.00Align Technology Inc USD 1,378 386,005 36,365 0.00Alkermes PLC USD 4,794 171,433 9,224 0.00ALLETE Inc USD 6,479 532,768 (5,570) (0.00)Alphabet Inc - Class A USD 1,893 2,211,308 (38,617) (0.00)Altria Group Inc USD 38,736 2,203,691 (15,882) (0.00)Amazon.com Inc USD 2,265 4,032,380 86,410 0.01AMC Networks Inc USD 23,920 1,363,440 (30,934) (0.00)Amdocs Ltd USD 64,053 3,463,986 3,082 0.00Ameren Corp USD 5,605 411,127 4,708 0.00American Eagle Outfitters Inc USD 80,794 1,796,051 119,575 0.01American Electric Power Co Inc USD 21,688 1,817,454 6,940 0.00American Financial Group Inc USD 2,111 202,403 (4,222) (0.00)Ameriprise Financial Inc USD 14,337 1,833,129 (35,843) (0.00)Amgen Inc USD 11,686 2,220,048 (15,601) (0.00)Anadarko Petroleum Corp USD 43,946 1,997,346 15,821 0.00ANSYS Inc USD 3,840 698,573 3,917 0.00Anthem Inc USD 2,592 734,495 (64,437) (0.01)Apple Inc USD 21,822 4,119,775 16,803 0.00Applied Materials Inc USD 94,195 3,708,457 (59,343) (0.01)Archer-Daniels-Midland Co USD 37,411 1,603,810 14,590 0.00Arrow Electronics Inc USD 19,906 1,536,544 (18,264) (0.00)Aspen Technology Inc USD 14,695 1,529,309 32,545 0.00
AQR UCITS FUNDS
AQR Systematic Total Return UCITS Fund
Schedule of Investments (continued)As at 31 March 2019
The accompanying notes form an integral part of these audited financial statements. 183

Reference Entity Currency Shares Notional Amount
UnrealisedAppreciation/
(Depreciation)in USD
Percent ofNet Assets
Long Positions (continued)Common Stocks (continued)United States (continued)Associated Banc-Corp USD 80,174 1,714,922 (105,701) (0.01)Assured Guaranty Ltd USD 55,804 2,481,604 (37,383) (0.00)Athene Holding Ltd USD 94,971 3,866,269 (294,410) (0.03)Autodesk Inc USD 11,945 1,854,103 16,365 0.00Automatic Data Processing Inc USD 2,962 470,751 12,559 0.00AutoZone Inc USD 4,951 5,016,650 186,504 0.02AvalonBay Communities Inc USD 6,199 1,245,069 22,626 0.00Avangrid Inc USD 9,155 458,208 5,035 0.00Avery Dennison Corp USD 24,270 2,742,267 33,735 0.00Avnet Inc USD 63,868 2,760,375 (38,959) (0.00)Axis Capital Holdings Ltd USD 20,031 1,103,508 (34,299) (0.00)Bank of America Corp USD 77,651 2,125,308 (190,245) (0.02)Baxter International Inc USD 64,149 5,172,334 236,068 0.02Bed Bath Beyond Inc USD 95,212 1,648,596 315,628 0.03Berry Plastics Group Inc USD 14,817 796,414 (25,611) (0.00)Best Buy Co Inc USD 39,670 2,818,554 32,133 0.00Biogen Idec Inc USD 46,327 10,888,235 (3,435,411) (0.35)Bio-Rad Laboratories Inc USD 10,600 3,256,532 (68,370) (0.01)Booz Allen Hamilton Holding Corp USD 24,444 1,419,952 24,444 0.00Boston Properties Inc USD 3,910 523,979 4,379 0.00Boston Scientific Corp USD 64,594 2,463,938 18,057 0.00Brandywine Realty Trust USD 17,039 269,898 4,601 0.00Brinker International Inc USD 36,063 1,588,215 (3,967) (0.00)Bristol-Myers Squibb Co USD 122,725 5,772,984 (346,085) (0.03)Brixmor Property Group Inc USD 36,922 682,688 42,460 0.00Broadridge Financial Solutions Inc USD 33,349 3,428,277 (16,058) (0.00)Bruker Corp USD 84,078 3,235,321 (54,265) (0.01)Brunswick Corp USD 50,563 2,543,825 (132,981) (0.01)Cable One Inc USD 143 139,541 (646) (0.00)Cabot Corp USD 5,733 239,582 (7,625) (0.00)Cadence Design Systems Inc USD 71,728 4,524,602 144,891 0.01Capital One Financial Corp USD 3,945 323,845 (11,085) (0.00)Cardinal Health Inc USD 110,256 5,254,801 (254,691) (0.03)Carlisle Cos Inc USD 1,160 142,726 3,932 0.00Caterpillar Inc USD 4,412 595,311 3,662 0.00CBS Corp USD 125,442 5,944,696 (31,361) (0.00)CDK Global Inc USD 39,369 2,296,394 (3,327) (0.00)CDW Corp USD 85,486 8,206,656 (88,051) (0.01)Celanese Corp USD 32,774 3,220,046 (101,599) (0.01)Centene Corp USD 24,112 1,266,121 (97,851) (0.01)CenterPoint Energy Inc USD 135,760 4,154,256 2,715 0.00Cerner Corp USD 24,261 1,377,297 (21,835) (0.00)CF Industries Holdings Inc USD 22,720 916,752 (48,166) (0.00)CH Robinson Worldwide Inc USD 5,415 469,751 (18,086) (0.00)Charles River Laboratories Int USD 45,567 6,586,254 (16,404) (0.00)Chevron Corp USD 6,668 818,030 (21,338) (0.00)Ciena Corp USD 46,454 1,730,876 (74,867) (0.01)Cigna Corp USD 1,509 240,157 (12,012) (0.00)Cimarex Energy Co USD 6,379 446,721 (8,096) (0.00)Cirrus Logic Inc USD 39,386 1,647,910 11,354 0.00Cisco Systems Inc USD 113,591 6,066,895 (11,359) (0.00)Citizens Financial Group Inc USD 29,799 969,808 (114,875) (0.01)Citrix Systems Inc USD 3,493 348,986 (5,763) (0.00)Clean Harbors Inc USD 26,738 1,910,965 51,239 0.01CNA Financial Corp USD 5,555 240,143 (4,555) (0.00)Coach Inc USD 41,970 1,386,689 4,197 0.00Cognizant Technology Solutions USD 53,939 3,901,408 24,273 0.00Colgate-Palmolive Co USD 76,449 5,167,570 99,766 0.01Columbia Sportswear Co USD 6,894 721,871 1,353 0.00Comcast Corp USD 158,233 6,286,597 (30,064) (0.00)Comerica Inc USD 13,109 958,399 (128,337) (0.01)CommScope Holding Co Inc USD 100,464 2,161,985 (23,929) (0.00)CommVault Systems Inc USD 31,006 2,012,289 (1,280) (0.00)Conduent Inc USD 148,656 2,073,751 (38,651) (0.00)ConocoPhillips USD 94,686 6,355,324 (46,396) (0.00)Consolidated Edison Inc USD 60,793 5,144,304 (4,863) (0.00)Constellation Brands Inc USD 3,607 625,923 8,837 0.00CoreLogic Inc USD 8,402 311,042 1,428 0.00Crane Co USD 19,126 1,619,207 (2,295) (0.00)Cummins Inc USD 28,814 4,526,968 (99,120) (0.01)Curtiss-Wright Corp USD 20,486 2,313,689 (44,659) (0.00)Dana Holding Corp USD 36,105 638,697 (32,856) (0.00)Danaher Corp USD 5,103 666,146 12,604 0.00DaVita HealthCare Partners Inc USD 4,788 258,217 8,906 0.00Deckers Outdoor Corp USD 31,652 4,679,432 102,552 0.01Dell Technologies Inc USD 4,059 234,367 (11,162) (0.00)Deluxe Corp USD 30,746 1,341,448 12,612 0.00DENTSPLY International Inc USD 12,831 632,697 (2,566) (0.00)Devon Energy Corp USD 39,366 1,251,839 50,782 0.01DexCom Inc USD 10,888 1,289,792 (301,489) (0.03)Dicks Sporting Goods Inc USD 23,779 871,976 48,985 0.00Discover Financial Services USD 2,365 169,168 (5,037) (0.00)Dollar General Corp USD 1,186 141,502 3,297 0.00Dominion Resources Inc USD 2,801 212,148 (2,437) (0.00)Domtar Corp USD 19,094 945,153 (663) (0.00)Douglas Emmett Inc USD 8,370 338,901 (3,097) (0.00)Dover Corp USD 14,796 1,386,681 17,607 0.00DTE Energy Co USD 5,460 677,531 4,095 0.00Eastman Chemical Co USD 24,616 1,864,416 (66,956) (0.01)Eaton Corp PLC USD 42,284 3,398,365 (73,151) (0.01)eBay Inc USD 149,751 5,524,314 92,846 0.01Edwards Lifesciences Corp USD 6,212 1,179,224 (6,585) (0.00)Electronic Arts Inc USD 29,546 2,994,192 49,637 0.00Eli Lilly Co USD 1,161 150,408 5,004 0.00EMCOR Group Inc USD 6,522 480,215 (457) (0.00)
AQR UCITS FUNDS
AQR Systematic Total Return UCITS Fund
Schedule of Investments (continued)As at 31 March 2019
The accompanying notes form an integral part of these audited financial statements. 184

Reference Entity Currency Shares Notional Amount
UnrealisedAppreciation/
(Depreciation)in USD
Percent ofNet Assets
Long Positions (continued)Common Stocks (continued)United States (continued)Emerson Electric Co USD 69,103 4,696,931 (56,664) (0.01)Entergy Corp USD 1,480 141,088 1,243 0.00EPAM Systems Inc USD 1,892 320,921 1,078 0.00Equinix Inc USD 2,970 1,326,461 7,484 0.00Equity Residential USD 8,334 628,550 12,001 0.00Everest Re Group Ltd USD 1,745 375,890 (8,690) (0.00)Everett Spinco Inc USD 61,460 3,976,462 (86,044) (0.01)Exelixis Inc USD 229,424 5,478,645 (59,650) (0.01)Exelon Corp USD 192,249 9,608,605 59,597 0.01Expeditors International of Washington Inc USD 6,321 477,804 (6,005) (0.00)Extended Stay America Inc USD 22,959 413,951 (610) (0.00)F5 Networks Inc USD 15,249 2,394,398 40,562 0.00Facebook Inc USD 17,307 2,857,559 80,304 0.01Fair Isaac Corp USD 7,356 1,971,408 28,255 0.00Federated Investors Inc USD 65,217 1,919,988 (62,608) (0.01)FedEx Corp USD 4,337 784,997 (6,072) (0.00)Fifth Third Bancorp USD 82,814 2,102,233 (279,497) (0.03)First American Financial Corp USD 14,298 738,063 20,589 0.00Flextronics International Ltd USD 228,256 2,279,136 (78,748) (0.01)FLIR Systems Inc USD 46,621 2,208,437 (87,181) (0.01)Fluor Corp USD 15,263 565,647 (15,874) (0.00)FNF Group USD 81,724 3,001,723 127,489 0.01Foot Locker Inc USD 70,094 4,212,649 17,524 0.00Fortinet Inc USD 52,852 4,402,572 (63,951) (0.01)Franklin Resources Inc USD 6,308 209,205 (3,375) (0.00)Gannett Co Inc USD 198,859 2,799,935 (105,395) (0.01)Gardner Denver Holdings Inc USD 47,467 1,308,665 (29,904) (0.00)General Dynamics Corp USD 1,266 213,612 (3,722) (0.00)General Electric Co USD 61,385 612,008 (14,119) (0.00)Genpact Ltd USD 7,369 258,505 5,469 0.00Gilead Sciences Inc USD 148,583 9,700,984 40,117 0.00Globus Medical Inc USD 28,706 1,395,973 33,012 0.00GrafTech International Ltd USD 64,495 833,275 (18,192) (0.00)Graham Holdings Co USD 2,042 1,399,383 21,999 0.00Greif Inc USD 9,281 384,048 3,248 0.00Haemonetics Corp USD 24,455 2,140,791 59,117 0.01Halliburton Co USD 17,754 518,417 5,859 0.00HCA Holdings Inc USD 25,553 3,314,480 (117,128) (0.01)HD Supply Holdings Inc USD 22,601 968,227 (6,328) (0.00)Helen of Troy Ltd USD 2,467 286,468 617 0.00Herman Miller Inc USD 24,566 862,512 (21,160) (0.00)Hewlett Packard Enterprise Co USD 18,509 285,316 (7,866) (0.00)Hewlett-Packard Co USD 286,962 5,536,932 (187,960) (0.02)Hill-Rom Holdings Inc USD 9,658 1,012,255 12,340 0.00HollyFrontier Corp USD 77,922 3,886,749 (225,195) (0.02)Hologic Inc USD 5,049 240,534 2,323 0.00Honeywell International Inc USD 52,045 8,226,233 58,811 0.01HR Block Inc USD 88,350 2,122,609 (26,063) (0.00)Humana Inc USD 14,440 3,796,854 (277,681) (0.03)Huntington Ingalls Industries Inc USD 27,047 5,598,999 (10,819) (0.00)Huntsman Corp USD 41,726 924,231 (12,518) (0.00)IAC/InterActiveCorp USD 9,937 2,083,292 (44,915) (0.00)IBM USD 57,393 8,057,977 10,905 0.00ICU Medical Inc USD 3,204 765,307 (705) (0.00)IDACORP Inc USD 9,479 940,886 (7,174) (0.00)IDEXX Laboratories Inc USD 3,104 687,195 17,538 0.00Illumina Inc USD 3,811 1,168,338 3,011 0.00Incyte Corp USD 20,536 1,768,150 9,857 0.00Ingersoll-Rand PLC USD 23,819 2,559,113 9,289 0.00Ingredion Inc USD 9,432 883,684 (3,193) (0.00)Inogen Inc USD 6,039 567,364 4,884 0.00Insperity Inc USD 13,445 1,653,601 (11,421) (0.00)Intel Corp USD 64,622 3,462,447 (33,603) (0.00)International Paper Co USD 135,638 6,229,853 (40,691) (0.00)Interpublic Group of Cos Inc USD 56,764 1,189,773 (70,955) (0.01)Intuit Inc USD 38,686 10,057,586 87,430 0.01Isis Pharmaceuticals Inc USD 8,276 663,570 5,462 0.00ITT Inc USD 12,877 747,767 (7,028) (0.00)Jabil Circuit Inc USD 9,288 246,504 (3,251) (0.00)Jazz Pharmaceuticals PLC USD 12,455 1,761,199 73,542 0.01JetBlue Airways Corp USD 8,854 144,542 (2,700) (0.00)John Wiley Sons Inc USD 9,843 430,238 (17,914) (0.00)Johnson Johnson USD 39,317 5,469,388 76,275 0.01JPMorgan Chase Co USD 20,979 2,116,362 (132,377) (0.01)Juniper Networks Inc USD 87,563 2,305,534 (2,627) (0.00)KAR Auction Services Inc USD 4,890 247,825 10,318 0.00KeyCorp USD 94,999 1,497,659 (185,723) (0.02)Keysight Technologies Inc USD 57,221 4,966,211 60,536 0.01Kimberly-Clark Corp USD 52,571 6,484,633 198,718 0.02KLA-Tencor Corp USD 16,685 1,973,836 (26,362) (0.00)Kohls Corp USD 24,866 1,717,992 (497) (0.00)Laboratory Corp of America Holdings USD 14,397 2,184,889 (45,063) (0.00)Lam Research Corp USD 16,065 2,862,783 (32,130) (0.00)Lamb Weston Holdings Inc USD 1,921 142,942 3,843 0.00Landstar System Inc USD 4,415 485,341 (6,225) (0.00)Las Vegas Sands Corp USD 67,578 4,097,930 37,844 0.00Lear Corp USD 12,996 1,767,066 (74,727) (0.01)Liberty Media Corp-Liberty SiriusXM USD 26,581 1,000,775 (86,634) (0.01)Lincoln National Corp USD 29,021 1,702,662 (133,206) (0.01)LivaNova PLC USD 2,168 211,684 4,921 0.00LogMeIn Inc USD 1,725 138,259 (1,320) (0.00)Louisiana-Pacific Corp USD 22,568 556,978 (1,354) (0.00)Lowes Cos Inc USD 16,263 1,777,871 120,997 0.01lululemon athletica Inc USD 23,810 3,927,936 491,001 0.05LyondellBasell Industries NV USD 61,426 5,136,442 (224,205) (0.02)
AQR UCITS FUNDS
AQR Systematic Total Return UCITS Fund
Schedule of Investments (continued)As at 31 March 2019
The accompanying notes form an integral part of these audited financial statements. 185

Reference Entity Currency Shares Notional Amount
UnrealisedAppreciation/
(Depreciation)in USD
Percent ofNet Assets
Long Positions (continued)Common Stocks (continued)United States (continued)Macys Inc USD 139,803 3,358,068 18,174 0.00Manhattan Associates Inc USD 19,242 1,059,657 (8,659) (0.00)ManpowerGroup Inc USD 35,137 2,908,641 (93,464) (0.01)Marathon Oil Corp USD 27,888 466,566 (16,269) (0.00)Marathon Petroleum Corp USD 51,399 3,073,660 (117,190) (0.01)Masco Corp USD 5,327 209,671 2,123 0.00Masimo Corp USD 25,996 3,553,393 108,369 0.01MAXIMUS Inc USD 22,656 1,618,092 14,500 0.00McKesson Corp USD 53,463 6,209,193 (279,611) (0.03)MEDNAX Inc USD 32,230 876,011 (119,896) (0.01)Medtronic PLC USD 85,254 7,690,763 (143,227) (0.01)Merck Co Inc USD 93,634 7,776,304 159,178 0.02Michael Kors Holdings Ltd USD 93,766 4,376,997 (37,506) (0.00)Micron Technology Inc USD 88,179 3,615,339 122,569 0.01Microsoft Corp USD 70,016 8,202,374 (29,407) (0.00)MKS Instruments Inc USD 27,840 2,540,678 101,338 0.01Molson Coors Brewing Co USD 5,043 302,177 (5,194) (0.00)Monster Beverage Corp USD 43,013 2,322,272 (183,664) (0.02)Motorola Solutions Inc USD 11,079 1,549,177 (7,423) (0.00)MSA Safety Inc USD 28,249 2,937,331 32,239 0.00MSC Industrial Direct Co Inc USD 13,460 1,119,064 269 0.00Murphy USA Inc USD 8,957 765,465 33,551 0.00Mylan Inc/PA USD 119,699 3,397,058 23,940 0.00National Instruments Corp USD 37,931 1,691,343 (12,517) (0.00)NetApp Inc USD 42,271 2,892,182 63,829 0.01NIKE Inc USD 51,664 4,374,391 (162,742) (0.02)Norfolk Southern Corp USD 3,526 659,327 15,726 0.00NorthWestern Corp USD 23,866 1,681,360 (737) (0.00)Norwegian Cruise Line Holdings Ltd USD 23,604 1,288,306 (26,572) (0.00)Nu Skin Enterprises Inc USD 24,958 1,188,001 (226,868) (0.02)Nuance Communications Inc USD 41,590 700,376 5,612 0.00Nucor Corp USD 25,834 1,505,864 (12,095) (0.00)NuVasive Inc USD 15,397 879,939 18,753 0.00nVent Electric PLC USD 50,919 1,381,432 3,800 0.00NVR Inc USD 241 676,085 10,910 0.00OGE Energy Corp USD 19,070 820,391 3,242 0.00Omnicom Group Inc USD 19,137 1,399,297 (27,940) (0.00)ON Semiconductor Corp USD 34,655 710,774 (48,517) (0.01)Oracle Corp USD 87,346 4,664,276 (5,241) (0.00)OReilly Automotive Inc USD 3,623 1,405,724 41,299 0.00Oshkosh Corp USD 13,411 1,001,802 (18,857) (0.00)Outfront Media Inc USD 6,429 148,960 5,015 0.00Owens-Illinois Inc USD 10,329 197,181 (8,883) (0.00)Packaging Corp of America USD 33,537 3,301,047 26,899 0.00Palo Alto Networks Inc USD 1,349 324,057 (1,066) (0.00)Parker-Hannifin Corp USD 10,086 1,726,521 (29,048) (0.00)Patterson-UTI Energy Inc USD 70,890 1,001,676 (20,558) (0.00)Paycom Software Inc USD 3,247 613,066 22,249 0.00PayPal Holdings Inc USD 3,923 406,933 13,574 0.00Pentair PLC USD 30,597 1,355,447 21,724 0.00PepsiCo Inc USD 30,916 3,763,096 137,576 0.01Pfizer Inc USD 179,863 7,599,212 79,140 0.01Philip Morris International Inc USD 31,285 2,752,767 (85,721) (0.01)Phillips 66 USD 66,789 6,322,247 (271,163) (0.03)Pilgrims Pride Corp USD 34,125 749,726 37,196 0.00Pinnacle West Capital Corp USD 15,382 1,467,443 1,846 0.00Pitney Bowes Inc USD 82,388 562,710 (4,119) (0.00)PolyOne Corp USD 14,286 418,437 (22,143) (0.00)PRA Health Sciences Inc USD 28,688 3,128,426 73,474 0.01Proofpoint Inc USD 1,736 208,129 (7,291) (0.00)Prudential Financial Inc USD 4,816 442,350 (26,006) (0.00)Public Service Enterprise Group Inc USD 107,732 6,355,111 (66,794) (0.01)PulteGroup Inc USD 50,231 1,421,035 60,150 0.01PVH Corp USD 7,839 962,159 88,502 0.01QIAGEN NV USD 91,567 3,703,885 69,591 0.01Qorvo Inc USD 17,439 1,242,180 24,415 0.00QUALCOMM Inc USD 20,025 1,143,628 5,607 0.00Quintiles Transnational Holdings Inc USD 24,311 3,470,152 (5,870) (0.00)Ralph Lauren Corp USD 20,733 2,696,119 120,227 0.01Raytheon Co USD 42,198 7,659,781 54,435 0.01Regal-Beloit Corp USD 10,933 886,666 (12,579) (0.00)Regeneron Pharmaceuticals Inc USD 430 176,141 2,637 0.00Regions Financial Corp USD 66,329 939,550 (119,724) (0.01)Reinsurance Group of America Inc USD 19,668 2,787,939 (100,897) (0.01)Reliance Steel Aluminum Co USD 18,923 1,704,962 30,383 0.00Republic Services Inc USD 11,743 942,023 14,561 0.00Resideo Technologies Inc USD 44,879 858,535 (15,128) (0.00)ResMed Inc USD 2,564 265,195 15,461 0.00Robert Half International Inc USD 45,203 2,949,496 (61,928) (0.01)Ross Stores Inc USD 22,487 2,085,444 36,204 0.00Sabre Corp USD 25,298 540,871 1,990 0.00salesforce.com inc USD 2,367 373,300 (10,036) (0.00)Sally Beauty Holdings Inc USD 49,071 898,735 8,587 0.00Schneider National Inc USD 25,256 533,407 (19,952) (0.00)Science Applications International Corp USD 8,419 661,312 43,571 0.00Seagate Technology PLC USD 18,682 886,648 (13,077) (0.00)Service Corp International USD 39,330 1,576,150 13,962 0.00Signet Jewelers Ltd USD 13,586 370,354 2,310 0.00Silgan Holdings Inc USD 28,915 855,017 9,800 0.00Simon Property Group Inc USD 5,123 938,380 45,287 0.00Skechers U.S.A. Inc USD 12,439 419,816 8,085 0.00Skyworks Solutions Inc USD 28,059 2,293,543 (22,181) (0.00)SM Energy Co USD 14,251 249,678 5,928 0.00Snap-on Inc USD 4,769 741,961 (16,072) (0.00)SolarWinds Corp USD 16,289 312,749 (21,827) (0.00)
AQR UCITS FUNDS
AQR Systematic Total Return UCITS Fund
Schedule of Investments (continued)As at 31 March 2019
The accompanying notes form an integral part of these audited financial statements. 186

Reference Entity Currency Shares Notional Amount
UnrealisedAppreciation/
(Depreciation)in USD
Percent ofNet Assets
Long Positions (continued)Common Stocks (continued)United States (continued)Sonoco Products Co USD 12,180 743,224 9,658 0.00Southwestern Energy Co USD 178,620 840,407 31,259 0.00Spirit AeroSystems Holdings Inc USD 67,713 6,197,094 (49,596) (0.01)Starbucks Corp USD 25,293 1,871,176 79,420 0.01State Street Corp USD 4,962 327,988 (23,421) (0.00)Steel Dynamics Inc USD 100,498 3,536,525 28,511 0.00Stryker Corp USD 4,174 818,814 10,811 0.00Symantec Corp USD 260,710 5,967,652 (46,928) (0.00)Synchrony Financial USD 159,855 5,115,360 (198,220) (0.02)Synopsys Inc USD 6,189 706,041 29,522 0.00Sysco Corp USD 10,048 665,981 (1,809) (0.00)Target Corp USD 32,515 2,613,881 81,613 0.01TE Connectivity Ltd USD 36,294 2,917,312 (107,430) (0.01)Tech Data Corp USD 33,081 3,361,195 (29,693) (0.00)Teledyne Technologies Inc USD 9,102 2,137,332 6,397 0.00Telephone Data Systems Inc USD 19,659 602,155 (22,362) (0.00)Texas Instruments Inc USD 28,700 3,028,998 (122,549) (0.01)Textron Inc USD 11,457 580,412 (21,425) (0.00)The Allstate Corp USD 76,310 7,167,035 (83,941) (0.01)The Boston Beer Co Inc USD 5,853 1,710,012 (107,746) (0.01)The Estee Lauder Cos Inc USD 1,673 274,941 2,075 0.00The Gap Inc USD 32,929 864,716 23,050 0.00The Goldman Sachs Group Inc USD 8,221 1,574,486 (90,020) (0.01)The Hartford Financial Services Group Inc USD 10,388 513,790 1,350 0.00The Home Depot Inc USD 9,915 1,893,765 75,156 0.01The Kroger Co USD 109,530 2,693,343 4,381 0.00The Michaels Cos Inc USD 66,569 779,523 (6,047) (0.00)The PNC Financial Services Group Inc USD 17,930 2,203,776 (160,832) (0.02)The Priceline Group USD 933 1,626,956 (11,700) (0.00)The Procter Gamble Co USD 84,721 8,743,207 143,178 0.01The Progressive Corp USD 15,709 1,137,646 (10,054) (0.00)The Timken Co USD 11,125 483,048 (3,634) (0.00)The Ultimate Software Group Inc USD 3,834 1,263,801 (2,831) (0.00)The Walt Disney Co USD 8,326 920,856 (20,982) (0.00)Thermo Fisher Scientific Inc USD 3,854 1,044,241 28,597 0.00T-Mobile US Inc USD 13,611 930,312 (70,385) (0.01)Toll Brothers Inc USD 55,843 2,033,802 23,454 0.00Tractor Supply Co USD 17,634 1,710,674 108,586 0.01TripAdvisor Inc USD 32,589 1,683,548 18,379 0.00Tupperware Brands Corp USD 91,128 2,346,546 (118,638) (0.01)Twilio Inc USD 3,846 494,826 3,845 0.00Tyson Foods Inc USD 70,768 4,868,838 245,565 0.02UGI Corp USD 33,749 1,871,720 10,125 0.00United States Cellular Corp USD 5,453 247,948 (12,077) (0.00)United Technologies Corp USD 13,445 1,719,078 12,907 0.00United Therapeutics Corp USD 34,884 4,116,312 (29,651) (0.00)Univar Inc USD 16,933 370,494 (19,134) (0.00)Unum Group USD 50,557 1,710,849 (148,132) (0.02)Urban Outfitters Inc USD 86,710 2,583,091 58,963 0.01US Foods Holding Corp USD 7,146 249,252 1,787 0.00Valero Energy Corp USD 69,044 5,792,792 (196,775) (0.02)Varian Medical Systems Inc USD 14,537 2,061,492 90,711 0.01Veeva Systems Inc USD 7,249 912,939 25,299 0.00VeriSign Inc USD 4,476 813,065 4,301 0.00Verizon Communications Inc USD 70,772 4,163,517 53,787 0.01Vertex Pharmaceuticals Inc USD 12,821 2,337,140 (66,541) (0.01)VF Corp USD 12,722 1,114,447 19,592 0.00Viacom Inc USD 99,718 2,746,234 (27,020) (0.00)Vishay Intertechnology Inc USD 44,929 829,389 (35,761) (0.00)Vistra Energy Corp USD 30,808 800,700 6,162 0.00VMware Inc USD 4,185 747,023 (17,451) (0.00)Walgreens Boots Alliance Inc USD 2,842 180,552 1,279 0.00Wal-Mart Stores Inc USD 14,900 1,449,472 (35,462) (0.00)Waste Management Inc USD 30,378 3,145,034 58,792 0.01Waters Corp USD 1,296 324,130 6,260 0.00Weight Watchers International Inc USD 91,598 1,864,935 12,824 0.00Weingarten Realty Investors USD 10,603 312,789 21,100 0.00Wells Fargo Co USD 41,922 2,017,287 (151,338) (0.02)Werner Enterprises Inc USD 5,922 202,829 (3,376) (0.00)WESCO International Inc USD 76,057 4,045,472 (31,278) (0.00)West Pharmaceutical Services Inc USD 3,477 380,558 12,025 0.00WestRock Co USD 9,134 346,635 (3,014) (0.00)Whirlpool Corp USD 5,064 672,347 (2,735) (0.00)World Fuel Services Corp USD 41,112 1,200,470 (29,949) (0.00)WR Grace Co USD 4,153 322,688 5,669 0.00WW Grainger Inc USD 10,385 3,071,156 (65,737) (0.01)Xerox Corp USD 123,617 3,966,870 9,889 0.00Xilinx Inc USD 23,811 3,034,950 51,941 0.01Yelp Inc USD 3,979 138,151 634 0.00Zebra Technologies Corp USD 19,232 4,024,296 (76,159) (0.01)Zendesk Inc USD 5,428 459,643 10,376 0.00Zimmer Biomet Holdings Inc USD 4,942 625,904 6,573 0.00Zoetis Inc USD 13,482 1,349,144 31,009 0.00Zynga Inc USD 557,251 2,911,636 (43,030) (0.00)
(7,752,459) (0.78)
Total Long Positions (7,772,868) (0.78)
Short PositionsCommon StocksArgentinaMercadoLibre Inc USD (382) (192,998) (7,739) (0.00)
(7,739) (0.00)
AQR UCITS FUNDS
AQR Systematic Total Return UCITS Fund
Schedule of Investments (continued)As at 31 March 2019
The accompanying notes form an integral part of these audited financial statements. 187

Reference Entity Currency Shares Notional Amount
UnrealisedAppreciation/
(Depreciation)in USD
Percent ofNet Assets
Short Positions (continued)Common Stocks (continued)BermudaRenaissanceRe Holdings Ltd USD (4,773) (683,494) 13,508 0.00
13,508 0.00GhanaKosmos Energy Ltd USD (118,532) (731,342) (20,150) (0.00)
(20,150) (0.00)PanamaCopa Holdings SA USD (18,745) (1,487,978) 45,880 0.00
45,880 0.00SwedenAutoliv Inc USD (24,895) (1,829,036) 64,293 0.01
64,293 0.01United KingdomJanus Henderson Group PLC USD (5,840) (145,942) 2,803 0.00Linde PLC USD (20,326) (3,541,704) (98,179) (0.01)
(95,376) (0.01)United States2U Inc USD (40,549) (2,931,490) (149,829) (0.02)Aarons Inc USD (11,518) (598,475) (2,419) (0.00)Acadia Healthcare Co Inc USD (137,560) (4,044,264) 145,814 0.01ACE Ltd USD (3,216) (449,243) (7,429) (0.00)ACI Worldwide Inc USD (15,735) (515,164) 10,228 0.00Acxiom Corp USD (9,398) (512,003) 68,042 0.01Adient plc USD (198,043) (2,592,383) 217,946 0.02Advanced Micro Devices Inc USD (103,959) (2,637,440) (220,393) (0.02)AECOM USD (71,811) (2,134,223) 56,013 0.01Agios Pharmaceuticals Inc USD (41,378) (2,740,051) (57,102) (0.01)Alaska Air Group Inc USD (54,154) (3,022,876) (542) (0.00)Albemarle Corp USD (80,164) (6,515,730) 412,845 0.04Allegheny Technologies Inc USD (110,923) (2,836,301) 48,806 0.00Allegion PLC USD (15,006) (1,352,191) (18,157) (0.00)Alliant Energy Corp USD (27,035) (1,271,726) 1,622 0.00Allscripts Healthcare Solution Inc USD (28,572) (274,863) 23,715 0.00Ally Financial Inc USD (68,611) (1,886,803) (12,350) (0.00)Alnylam Pharmaceuticals Inc USD (16,616) (1,552,267) (52,839) (0.01)AMERCO USD (502) (189,013) 2,731 0.00American Airlines Group Inc USD (88,970) (2,792,768) (7,246) (0.00)American Express Co USD (1,270) (139,548) (979) (0.00)American Homes 4 Rent USD (8,986) (204,791) (1,528) (0.00)American International Group Inc USD (41,292) (1,777,621) 50,789 0.00American Tower Corp USD (3,518) (685,131) (20,615) (0.00)AmerisourceBergen Corp USD (43,060) (3,379,779) 81,814 0.01Amphenol Corp USD (5,488) (516,092) 7,628 0.00Analog Devices Inc USD (1,940) (203,487) 8,264 0.00Antero Resources Corp USD (16,470) (144,771) (5,749) (0.00)AO Smith Corp USD (4,781) (254,779) (5,689) (0.00)Apache Corp USD (25,197) (881,139) 1,008 0.00AptarGroup Inc USD (4,004) (423,423) (8,168) (0.00)Arch Capital Group Ltd USD (12,662) (407,210) 8,610 0.00ASGN Inc USD (6,111) (389,271) 10,205 0.00Atlassian Corp PLC USD (1,322) (146,716) 317 0.00AutoNation Inc USD (6,429) (230,094) (11,077) (0.00)Avis Budget Group Inc USD (9,392) (326,466) 3,851 0.00Baker Hughes a GE Co USD (93,030) (2,549,022) 72,563 0.01Ball Corp USD (29,490) (1,711,895) (5,013) (0.00)BancorpSouth Bank USD (62,582) (1,786,090) 106,389 0.01Bank of Hawaii Corp USD (12,341) (981,233) 37,393 0.00Bank of the Ozarks Inc USD (87,595) (2,538,503) 280,304 0.03BB&T Corp USD (36,350) (1,691,002) 143,946 0.01Becton Dickinson and Co USD (5,743) (1,424,379) (19,239) (0.00)Belden Inc USD (17,095) (916,976) 60,858 0.01BGC Partners Inc USD (116,647) (626,394) 48,992 0.00BioMarin Pharmaceutical Inc USD (22,883) (2,022,857) 113,500 0.01Black Hills Corp USD (12,720) (938,609) (13,356) (0.00)Bluebird Bio Inc USD (24,113) (3,737,274) 28,453 0.00BOK Financial Corp USD (2,668) (218,749) 14,167 0.00Brink’s Co USD (23,295) (1,761,102) 40,766 0.00Broadcom Inc USD (2,715) (815,097) (17,322) (0.00)Brown-Forman Corp USD (18,514) (971,430) (26,290) (0.00)Bunge Ltd USD (14,912) (787,354) (8,649) (0.00)Burlington Stores Inc USD (953) (148,687) (7,212) (0.00)Cabot Oil & Gas Corp USD (18,561) (484,628) (2,970) (0.00)Caesars Entertainment Corp USD (202,767) (1,770,156) (56,775) (0.01)Callon Petroleum Co USD (484,798) (3,679,617) 29,088 0.00Campbell Soup Co USD (35,720) (1,351,288) (45,364) (0.00)CarMax Inc USD (62,113) (4,288,282) (531,066) (0.05)Carpenter Technology Corp USD (26,804) (1,219,314) 11,258 0.00Cars.com Inc USD (21,437) (488,549) 1,715 0.00Caseys General Stores Inc USD (14,406) (1,858,806) (15,414) (0.00)Catalent Inc USD (41,552) (1,693,244) 75,625 0.01Cathay General Bancorp USD (25,761) (877,420) 69,039 0.01CBOE Holdings Inc USD (3,403) (323,353) 2,756 0.00CBRE Group Inc USD (9,424) (464,603) 14,984 0.00Centennial Resource Development Inc USD (198,678) (1,766,247) 75,498 0.01CenturyLink Inc USD (43,731) (524,116) 3,717 0.00Charter Communications Inc USD (17,646) (6,111,692) 194,106 0.02Chemical Financial Corp USD (11,129) (458,737) 40,287 0.00Cheniere Energy Inc USD (56,412) (3,789,194) 142,722 0.01Chipotle Mexican Grill Inc USD (219) (153,890) (10,270) (0.00)Choice Hotels International Inc USD (1,953) (152,061) 488 0.00Church & Dwight Co Inc USD (12,325) (872,610) (48,561) (0.01)Cincinnati Financial Corp USD (17,992) (1,538,676) 6,520 0.00CIT Group Inc USD (16,596) (800,591) 45,307 0.00CMS Energy Corp USD (9,159) (506,584) 92 0.00
AQR UCITS FUNDS
AQR Systematic Total Return UCITS Fund
Schedule of Investments (continued)As at 31 March 2019
The accompanying notes form an integral part of these audited financial statements. 188

Reference Entity Currency Shares Notional Amount
UnrealisedAppreciation/
(Depreciation)in USD
Percent ofNet Assets
Short Positions (continued)Common Stocks (continued)United States (continued)CNO Financial Group Inc USD (13,586) (221,859) 9,238 0.00Cognex Corp USD (105,797) (5,373,430) 350,188 0.04Coherent Inc USD (14,713) (2,046,578) 736 0.00Colony NorthStar Inc USD (490,289) (2,588,726) (17,277) (0.00)Commerce Bancshares Inc USD (21,316) (1,244,641) 74,819 0.01Commercial Metals Co USD (128,582) (2,201,324) (112,514) (0.01)Communications Sales Leasing Inc USD (161,412) (1,777,146) (253,417) (0.03)Compass Minerals International USD (24,060) (1,301,646) (30,797) (0.00)ConAgra Foods Inc USD (282,674) (7,793,322) (1,272,033) (0.13)Concho Resources Inc USD (38,412) (4,284,474) (165,556) (0.02)CONSOL Energy Inc USD (20,065) (216,802) 100 0.00Copart Inc USD (68,355) (4,116,338) (77,241) (0.01)Core Laboratories NV USD (16,303) (1,119,364) 37,171 0.00CoreSite Realty Corp USD (1,817) (194,673) (7,050) (0.00)CoStar Group Inc USD (3,417) (1,588,837) 10,764 0.00Cousins Properties Inc USD (98,597) (955,405) 22,677 0.00Cree Inc USD (81,190) (4,640,820) (18,674) (0.00)Crown Castle International Corp USD (7,099) (901,360) (16,399) (0.00)Crown Holdings Inc USD (36,881) (2,024,767) 1,106 0.00Cullen/Frost Bankers Inc USD (18,358) (1,795,229) 86,226 0.01CVS Health Corp USD (15,197) (813,040) 3,113 0.00Cypress Semiconductor Corp USD (90,338) (1,342,423) 28,005 0.00CyrusOne Inc USD (58,316) (3,062,756) (34,406) (0.00)DDR Corp USD (169,807) (2,350,129) (173,203) (0.02)Deere & Co USD (28,769) (4,611,383) 288 0.00Delphi Automotive PLC USD (94,121) (7,452,501) 142,196 0.01Delphi Technologies PLC USD (22,615) (437,148) 4,167 0.00Diamond Offshore Drilling Inc USD (81,301) (838,213) 68,293 0.01Digital Realty Trust Inc USD (31,765) (3,790,835) (117,848) (0.01)Discovery Communications Inc USD (40,742) (1,099,627) 9,778 0.00Dolby Laboratories Inc USD (5,031) (316,802) 6,842 0.00Dominos Pizza Inc USD (8,042) (2,079,902) (122,399) (0.01)Donaldson Co Inc USD (8,933) (446,561) (4,377) (0.00)DowDuPont Inc USD (93,143) (4,808,042) 295,799 0.03DR Horton Inc USD (77,734) (3,239,953) (94,835) (0.01)Dril-Quip Inc USD (47,857) (2,170,315) 8,334 0.00Duke Energy Corp USD (14,155) (1,266,731) 8,068 0.00Duke Realty Corp USD (6,866) (210,924) (2,609) (0.00)Dunkin Brands Group Inc USD (65,364) (4,956,552) (264,724) (0.03)Dycom Industries Inc USD (36,428) (1,654,195) 157,369 0.02E*TRADE Financial Corp USD (30,549) (1,418,085) 96,840 0.01Eagle Materials Inc USD (13,079) (1,062,407) (111,166) (0.01)Eaton Vance Corp USD (34,327) (1,388,527) 49,774 0.00Eldorado Resorts Inc USD (3,381) (157,893) (3,719) (0.00)Energizer Holdings Inc USD (46,621) (2,084,891) 83,452 0.01ENERSYS USD (8,316) (548,274) 15,468 0.00Ensco PLC USD (464,171) (1,819,550) 248,098 0.02EOG Resources Inc USD (1,683) (160,188) (5,487) (0.00)EQT Corp USD (53,622) (1,107,294) (32,709) (0.00)Equifax Inc USD (3,176) (373,561) (15,594) (0.00)Equitrans Midstream Corp USD (54,370) (1,168,411) (72,856) (0.01)Euronet Worldwide Inc USD (27,926) (3,942,034) (39,934) (0.00)Evercore Inc USD (2,288) (207,156) 3,037 0.00Exact Sciences Corp USD (12,350) (1,055,802) 79,534 0.01Expedia Inc USD (2,369) (283,830) 3,174 0.00Extra Space Storage Inc USD (2,107) (215,335) (6,426) (0.00)Extraction Oil Gas Inc USD (132,077) (556,044) 3,962 0.00Fastenal Co USD (44,807) (2,871,233) (41,222) (0.00)First Hawaiian Inc USD (20,775) (540,358) 20,567 0.00First Horizon National Corp USD (99,665) (1,397,303) 121,591 0.01First Republic Bank USD (90,023) (9,122,931) 367,294 0.04First Solar Inc USD (33,251) (1,756,817) 47,879 0.00FirstEnergy Corp USD (78,605) (3,260,535) (18,865) (0.00)Fiserv Inc USD (9,201) (810,424) (27,511) (0.00)Five Below Inc USD (4,772) (604,135) (48,818) (0.01)FleetCor Technologies Inc USD (3,341) (821,786) (17,440) (0.00)Floor & Decor Holdings Inc USD (70,969) (2,968,633) (243,424) (0.02)Flowers Foods Inc USD (13,342) (283,384) (12,408) (0.00)Flowserve Corp USD (38,861) (1,759,237) (3,109) (0.00)FMC Corp USD (10,290) (788,626) 2,881 0.00FNB Corp/PA USD (351,981) (3,792,595) 434,697 0.04Ford Motor Co USD (152,981) (1,337,819) (16,184) (0.00)Fortive Corp USD (11,373) (949,987) (1,365) (0.00)Freeport-McMoRan Inc USD (164,520) (2,109,969) (33,727) (0.00)Fulton Financial Corp USD (43,275) (674,225) 36,784 0.00Gartner Inc USD (25,559) (3,871,166) (108,626) (0.01)GATX Corp USD (3,636) (276,591) 2,291 0.00GCI Liberty Inc USD (44,952) (2,487,194) 26,072 0.00General Mills Inc USD (26,330) (1,355,205) (101,371) (0.01)Genesee Wyoming Inc USD (4,081) (355,414) 245 0.00Gentex Corp USD (24,045) (497,251) (787) (0.00)Global Payments Inc USD (70,747) (9,618,762) (135,834) (0.01)GoDaddy Inc USD (21,339) (1,602,346) (8,322) (0.00)Grand Canyon Education Inc USD (10,272) (1,173,371) 9,450 0.00Granite Construction Inc USD (58,338) (2,531,286) 201,266 0.02Graphic Packaging Holding Co USD (288,764) (3,618,213) 75,079 0.01GrubHub Inc USD (26,802) (1,839,957) 225,137 0.02Guidewire Software Inc USD (24,305) (2,348,106) (38,159) (0.00)Halyard Health Inc USD (24,897) (1,053,143) 17,677 0.00Hancock Holding Co USD (8,482) (344,878) 20,866 0.00Hanesbrands Inc USD (140,325) (2,513,221) (36,485) (0.00)Harley-Davidson Inc USD (35,514) (1,277,439) 5,327 0.00Harris Corp USD (7,887) (1,263,419) 24,529 0.00Hasbro Inc USD (28,055) (2,396,739) 46,852 0.00Health Care REIT Inc USD (21,293) (1,660,215) (46,845) (0.00)
AQR UCITS FUNDS
AQR Systematic Total Return UCITS Fund
Schedule of Investments (continued)As at 31 March 2019
The accompanying notes form an integral part of these audited financial statements. 189

Reference Entity Currency Shares Notional Amount
UnrealisedAppreciation/
(Depreciation)in USD
Percent ofNet Assets
Short Positions (continued)Common Stocks (continued)United States (continued)Healthcare Realty Trust Inc USD (6,541) (211,274) (4,579) (0.00)Healthcare Services Group Inc USD (77,389) (2,559,254) (156,326) (0.02)HealthEquity Inc USD (37,640) (2,761,647) 357,580 0.04HEICO Corp USD (17,555) (1,660,352) (29,141) (0.00)Helmerich & Payne Inc USD (11,810) (659,707) 4,842 0.00Henry Schein Inc USD (29,724) (1,771,253) 5,648 0.00Hess Corp USD (63,581) (3,872,719) (113,174) (0.01)Hilton Grand Vacations Inc USD (8,306) (257,154) 7,808 0.00Home BancShares Inc USD (152,701) (2,683,720) 229,425 0.02Hormel Foods Corp USD (25,002) (1,108,089) (44,254) (0.00)Hudson Pacific Properties Inc USD (5,406) (186,777) (3,135) (0.00)Huntington Bancshares Inc USD (43,935) (561,270) 50,306 0.00IHS Markit Ltd USD (47,152) (2,546,680) 60,355 0.01INC Research Holdings Inc USD (34,190) (1,763,178) (141,889) (0.01)Insulet Corp USD (75,606) (7,178,034) 191,283 0.02Integra LifeSciences Holdings Corp USD (4,215) (234,818) (42) (0.00)International Flavors & Fragrances Inc USD (47,311) (6,082,302) (145,538) (0.01)International Game Technology PLC USD (82,805) (1,079,777) 19,873 0.00Invesco Ltd USD (35,645) (691,691) 10,706 0.00Invitation Homes Inc USD (30,811) (748,707) (23,416) (0.00)IPG Photonics Corp USD (30,146) (4,549,936) (43,109) (0.00)Iron Mountain Inc USD (5,800) (207,234) (5,278) (0.00)Jack in the Box Inc USD (20,380) (1,655,671) (53,803) (0.01)Jacobs Engineering Group Inc USD (45,976) (3,459,694) (44,894) (0.00)Jones Lang LaSalle Inc USD (4,219) (655,422) 32,360 0.00Kansas City Southern USD (1,308) (153,572) (1,766) (0.00)KB Home USD (44,644) (1,098,242) (66,073) (0.01)KBR Inc USD (10,982) (209,646) (753) (0.00)Kemper Corp USD (38,191) (2,939,943) 90,131 0.01Kilroy Realty Corp USD (3,119) (238,198) (4,679) (0.00)Kimco Realty Corp USD (16,414) (304,808) (17,071) (0.00)Kirby Corp USD (1,842) (141,060) 254 0.00Knight-Swift Transportation Holdings Inc USD (128,121) (4,190,838) 240,867 0.02L Brands Inc USD (22,496) (624,489) (6,974) (0.00)Legg Mason Inc USD (31,252) (862,555) 8,740 0.00Leggett Platt Inc USD (30,487) (1,294,478) 21,036 0.00Leidos Holdings Inc USD (6,364) (409,523) (5,473) (0.00)LendingTree Inc USD (9,581) (3,358,236) (102,325) (0.01)Lennar Corp USD (31,588) (1,562,658) (50,857) (0.01)Leucadia National Corp USD (9,286) (174,577) 10,215 0.00Liberty Broadband Corp USD (8,168) (747,617) 12,252 0.00Ligand Pharmaceuticals Inc USD (9,602) (1,197,273) (576) (0.00)Lions Gate Entertainment Corp USD (109,228) (1,701,772) 52,429 0.01Littelfuse Inc USD (13,397) (2,446,292) 97,175 0.01Live Nation Entertainment Inc USD (25,751) (1,638,021) (13,648) (0.00)LKQ Corp USD (47,652) (1,349,505) 0 0.00Loews Corp USD (3,097) (148,532) 1,394 0.00Lumentum Holdings Inc USD (38,757) (2,172,717) (130,999) (0.01)M&T Bank Corp USD (1,006) (158,465) 17,313 0.00Mack-Cali Realty Corp USD (16,710) (372,299) (12,867) (0.00)Macquarie Infrastructure Corp USD (81,523) (3,357,117) (39,946) (0.00)Manitowoc Foodservice Inc USD (149,114) (2,424,594) (41,752) (0.00)Markel Corp USD (1,590) (1,588,331) (3,310) (0.00)MarketAxess Holdings Inc USD (19,643) (4,859,089) (191,126) (0.02)Marriott Vacations Worldwide Corp USD (2,994) (285,179) 2,455 0.00Marsh & McLennan Cos Inc USD (19,451) (1,814,973) (6,419) (0.00)Martin Marietta Materials Inc USD (24,435) (4,932,938) (169,090) (0.02)Marvell Technology Group Ltd USD (261,440) (5,160,826) 54,902 0.01MasTec Inc USD (55,551) (2,675,892) (7,222) (0.00)Matador Resources Co USD (163,728) (3,169,774) (37,657) (0.00)Match Group Inc USD (2,467) (139,065) (1,678) (0.00)Mattel Inc USD (179,267) (2,332,264) 299,376 0.03McCormick Co Inc USD (47,224) (7,067,072) (422,183) (0.04)McDonalds Corp USD (6,312) (1,199,280) (38,188) (0.00)Medidata Solutions Inc USD (44,251) (3,241,386) 182,757 0.02Meredith Corp USD (61,075) (3,415,314) 83,062 0.01Microchip Technology Inc USD (56,029) (4,610,626) 170,328 0.02Mohawk Industries Inc USD (5,853) (740,639) 5,790 0.00Molina Healthcare Inc USD (8,556) (1,210,161) 13,518 0.00Monolithic Power Systems Inc USD (11,526) (1,551,861) 72,383 0.01Murphy Oil Corp USD (4,756) (140,254) 3,615 0.00Nabors Industries Ltd USD (313,807) (1,082,634) 28,243 0.00National Fuel Gas Co USD (32,940) (1,998,140) 7,576 0.00National Oilwell Varco Inc USD (53,961) (1,429,427) 63,286 0.01NCR Corp USD (57,880) (1,567,390) 90,293 0.01Nektar Therapeutics USD (10,976) (365,720) 17,671 0.00Netflix Inc USD (8,617) (3,058,949) 72,814 0.01NetScout Systems Inc USD (48,845) (1,354,472) 977 0.00New York Community Bancorp Inc USD (842,188) (9,853,600) 429,516 0.04Newell Rubbermaid Inc USD (338,365) (5,160,066) 247,006 0.02NewMarket Corp USD (3,421) (1,497,201) 11,392 0.00Newmont Mining Corp USD (62,956) (2,261,380) (15,811) (0.00)News Corp USD (43,301) (535,633) 10,825 0.00NextEra Energy Inc USD (6,444) (1,240,599) (10,633) (0.00)NiSource Inc USD (272,849) (7,838,952) (185,537) (0.02)Noble Energy Inc USD (116,813) (2,914,484) (115,616) (0.01)Nordson Corp USD (3,043) (403,106) 1,522 0.00Northern Trust Corp USD (19,466) (1,758,753) 101,696 0.01NOW Inc USD (151,476) (2,146,415) (7,574) (0.00)NRG Energy Inc USD (35,143) (1,497,092) (25,303) (0.00)NVIDIA Corp USD (10,708) (1,911,271) (90,941) (0.01)Oasis Petroleum Inc USD (122,650) (743,872) (13,593) (0.00)Occidental Petroleum Corp USD (2,147) (142,389) 1,481 0.00Oceaneering International Inc USD (60,494) (952,176) 46,041 0.00Okta Inc USD (1,710) (141,845) (137) (0.00)
AQR UCITS FUNDS
AQR Systematic Total Return UCITS Fund
Schedule of Investments (continued)As at 31 March 2019
The accompanying notes form an integral part of these audited financial statements. 190

Reference Entity Currency Shares Notional Amount
UnrealisedAppreciation/
(Depreciation)in USD
Percent ofNet Assets
Short Positions (continued)Common Stocks (continued)United States (continued)Olin Corp USD (12,291) (284,414) 6,637 0.00Ollie’s Bargain Outlet Holdings Inc USD (23,885) (2,053,632) (114,409) (0.01)Omega Healthcare Investors Inc USD (41,214) (1,576,848) (98,089) (0.01)ONEOK Inc USD (117,312) (8,152,011) (131,389) (0.01)Owens Corning USD (32,729) (1,546,118) 7,558 0.00PacWest Bancorp USD (121,681) (4,593,458) 295,685 0.03Park Hotels & Resorts Inc USD (117,481) (3,653,659) 32,895 0.00Parsley Energy Inc USD (20,523) (397,633) (21,241) (0.00)Pebblebrook Hotel Trust USD (29,609) (921,136) 27,001 0.00Penn National Gaming Inc USD (62,292) (1,242,102) 59,198 0.01Penske Automotive Group Inc USD (35,677) (1,595,832) (49,234) (0.01)Penumbra Inc USD (11,111) (1,645,761) 45,444 0.00Peoples United Financial Inc USD (170,446) (2,817,472) 182,377 0.02PerkinElmer Inc USD (23,421) (2,249,353) (47,076) (0.00)Perrigo Co PLC USD (3,063) (147,085) (160) (0.00)Pinnacle Financial Partners Inc USD (80,398) (4,433,950) 302,303 0.03Plantronics Inc USD (29,796) (1,379,555) 106,968 0.01Platform Specialty Products Corp USD (251,801) (2,538,154) 65,445 0.01Polaris Industries Inc USD (21,863) (1,853,545) 53,066 0.01Pool Corp USD (9,520) (1,579,273) (67,211) (0.01)Post Holdings Inc USD (34,931) (3,819,705) (205,045) (0.02)Potlatch Corp USD (8,455) (318,923) (10,231) (0.00)PPG Industries Inc USD (6,665) (749,146) (9,664) (0.00)PPL Corp USD (68,811) (2,176,492) 75,004 0.01Premier Inc USD (55,621) (1,905,575) 17,243 0.00Prestige Brands Holdings Inc USD (81,009) (2,410,828) (106,122) (0.01)Primerica Inc USD (2,427) (298,594) 11,553 0.00Principal Financial Group Inc USD (69,313) (3,475,354) 133,085 0.01Prosperity Bancshares Inc USD (54,747) (3,799,989) 235,918 0.02Pure Storage Inc USD (27,938) (603,740) (20,674) (0.00)Quest Diagnostics Inc USD (9,156) (821,202) (9,064) (0.00)Range Resources Corp USD (164,967) (1,862,477) (68,282) (0.01)RealPage Inc USD (12,861) (786,322) 14,533 0.00Realty Income Corp USD (6,702) (491,927) (16,018) (0.00)Regency Centers Corp USD (3,765) (255,907) (13,178) (0.00)RingCentral Inc USD (4,135) (446,704) (7,030) (0.00)Rollins Inc USD (5,233) (218,635) (4,134) (0.00)Royal Gold Inc USD (28,095) (2,580,526) (55,909) (0.01)Sabra Health Care REIT Inc USD (18,417) (361,894) (27,994) (0.00)Sage Therapeutics Inc USD (7,988) (1,285,589) (32,431) (0.00)Sanderson Farms Inc USD (40,837) (5,332,087) (127,411) (0.01)SBA Communications Corp USD (8,737) (1,711,491) (37,831) (0.00)Schlumberger Ltd USD (4,492) (195,402) (3,172) (0.00)Scientific Games Corp USD (51,605) (1,058,935) 92,773 0.01Seattle Genetics Inc USD (46,166) (3,337,340) 53,553 0.01SEI Investments Co USD (3,249) (169,988) (3,666) (0.00)Sempra Energy USD (97,617) (12,213,839) (45,880) (0.00)Sensient Technologies Corp USD (20,749) (1,411,969) (36,518) (0.00)Sentasa Technologies Holding PLC USD (34,462) (1,546,310) 100,974 0.01Signature Bank/New York NY USD (8,880) (1,149,605) 63,048 0.01Silicon Laboratories Inc USD (4,453) (358,021) 5,744 0.00Sirius XM Holdings Inc USD (161,300) (910,539) 66,940 0.01Six Flags Entertainment Corp USD (24,976) (1,233,065) 29,971 0.00SLM Corp USD (146,219) (1,460,728) 100,891 0.01Sothebys USD (49,653) (1,887,311) 90,368 0.01Southwest Gas Corp USD (21,889) (1,801,465) 22,765 0.00Spectrum Brands Holdings Inc USD (14,752) (804,132) 27,291 0.00Sprouts Farmers Market Inc USD (84,059) (1,827,443) 66,407 0.01Square Inc USD (20,989) (1,571,027) 7,976 0.00SSC Technologies Holdings Inc USD (3,979) (251,632) (2,547) (0.00)Stanley Black & Decker Inc USD (7,132) (968,740) (11,696) (0.00)Stericycle Inc USD (51,184) (2,770,078) (244,083) (0.02)Sterling Bancorp USD (461,839) (8,650,244) 701,995 0.07Stifel Financial Corp USD (47,131) (2,504,070) 155,061 0.02SVB Financial Group USD (12,912) (2,881,055) 340,356 0.03Switch Inc USD (87,985) (903,606) 745 0.00Synaptics Inc USD (10,995) (427,046) (59,153) (0.01)SYNNEX Corp USD (11,175) (1,062,296) 8,605 0.00Synovus Financial Corp USD (29,444) (1,019,499) 137,651 0.01Take-Two Interactive Software Inc USD (2,466) (233,604) (2,219) (0.00)Targa Resources Corp USD (49,629) (2,050,174) (27,792) (0.00)Taubman Centers Inc USD (3,628) (193,445) (10,957) (0.00)TCF Financial Corp USD (13,302) (276,017) 20,352 0.00Teleflex Inc USD (4,824) (1,445,512) 6,947 0.00Tempur Sealy International Inc USD (27,590) (1,625,327) (64,837) (0.01)Tenet Healthcare Corp USD (27,197) (783,818) 21,758 0.00Tesla Motors Inc USD (31,308) (8,702,685) (254,353) (0.03)Texas Capital Bancshares Inc USD (25,853) (1,412,091) 134,436 0.01Texas Roadhouse Inc USD (4,966) (308,786) (6,803) (0.00)The Babcock & Wilcox Co USD (64,507) (3,224,060) 12,245 0.00The Bank of New York Mellon Corp USD (25,417) (1,280,254) 91,755 0.01The Charles Schwab Corp USD (101,130) (4,330,387) 311,480 0.03The Chemours Co USD (47,146) (1,735,444) 104,193 0.01The Goodyear Tire & Rubber Co USD (25,475) (462,626) (8,530) (0.00)The Hain Celestial Group Inc USD (151,803) (3,527,902) (77,420) (0.01)The Hanover Insurance Group Inc USD (3,941) (451,520) 6,187 0.00The JM Smucker Co USD (1,343) (156,003) (12,275) (0.00)The Kraft Heinz Co USD (116,594) (3,806,794) (72,288) (0.01)The Macerich Co USD (16,475) (717,981) (15,816) (0.00)The Madison Square Garden Co USD (4,240) (1,242,405) 6,190 0.00The Middleby Corp USD (39,698) (5,120,645) 75,029 0.01The NASDAQ OMX Group Inc USD (7,020) (612,846) (21,481) (0.00)The New York Times Co USD (75,930) (2,476,837) 113,895 0.01The Scotts Miracle-Gro Co USD (5,401) (421,386) 21,550 0.00The Southern Co USD (11,419) (588,307) 2,969 0.00
AQR UCITS FUNDS
AQR Systematic Total Return UCITS Fund
Schedule of Investments (continued)As at 31 March 2019
The accompanying notes form an integral part of these audited financial statements. 191

Reference Entity Currency Shares Notional Amount
UnrealisedAppreciation/
(Depreciation)in USD
Percent ofNet Assets
Short Positions (continued)Common Stocks (continued)United States (continued)The Toro Co USD (2,203) (151,302) (749) (0.00)The Wendy’s Co USD (98,383) (1,768,434) (123,471) (0.01)The Western Union Co USD (56,206) (1,049,366) (27,541) (0.00)The Williams Cos Inc USD (175,088) (5,005,766) (140,070) (0.01)Thor Industries Inc USD (20,642) (1,285,171) 26,759 0.00Tiffany & Co USD (33,233) (3,491,791) (193,887) (0.02)Total System Services Inc USD (30,756) (2,930,739) (46,749) (0.00)TransDigm Group Inc USD (8,576) (3,874,808) (23,584) (0.00)Transocean Ltd USD (405,603) (3,534,830) 309,279 0.03TransUnion USD (30,867) (2,050,495) (36,732) (0.00)TreeHouse Foods Inc USD (32,272) (2,059,922) (80,680) (0.01)TRI Pointe Group Inc USD (153,089) (1,982,503) (10,716) (0.00)Trimble Navigation Ltd USD (11,779) (475,400) (2,998) (0.00)Trinity Industries Inc USD (84,331) (1,829,983) 85,174 0.01Trustmark Corp USD (30,711) (1,041,717) 32,623 0.00Twitter Inc USD (21,796) (712,075) (34,656) (0.00)UDR Inc USD (4,604) (209,850) (4,466) (0.00)UMB Financial Corp USD (9,988) (647,922) 32,461 0.00Under Armour Inc USD (147,334) (3,169,154) 123,761 0.01United Bankshares Inc/WV USD (89,241) (3,256,404) 136,539 0.01United Parcel Service Inc USD (16,040) (1,789,583) (14,115) (0.00)United Rentals Inc USD (5,204) (593,048) 46,992 0.00United States Steel Corp USD (53,720) (1,045,391) 17,728 0.00Universal Display Corp USD (29,886) (4,565,983) 144,349 0.01Urban Edge Properties USD (21,241) (404,216) (9,983) (0.00)US Bancorp USD (3,312) (159,208) 14,507 0.00Vail Resorts Inc USD (12,359) (2,703,037) (24,842) (0.00)Valley National Bancorp USD (128,459) (1,253,760) 79,645 0.01Valmont Industries Inc USD (5,156) (675,900) 26,038 0.00Valvoline Inc USD (50,827) (939,283) 3,558 0.00VEREIT Inc USD (911,507) (7,656,659) (209,647) (0.02)ViaSat Inc USD (41,400) (3,200,220) 23,598 0.00Virtu Financial Inc USD (128,263) (3,084,725) 93,794 0.01Visa Inc USD (46,543) (7,217,423) (12,466) (0.00)Visteon Corp USD (59,083) (4,047,776) 376,950 0.04Vulcan Materials Co USD (20,604) (2,430,654) (82,416) (0.01)WABCO Holdings Inc USD (5,778) (762,292) 56,336 0.01Wabtec Corp USD (50,660) (3,704,766) (50,578) (0.01)Washington Federal Inc USD (72,721) (2,122,726) 78,370 0.01Wayfair Inc USD (1,228) (186,153) 21,686 0.00Weatherford International PLC USD (273,997) (191,798) 24,660 0.00Webster Financial Corp USD (69,857) (3,557,118) 390,501 0.04WEC Energy Group Inc USD (8,504) (668,670) 422 0.00WellCare Health Plans Inc USD (30,992) (8,348,935) (756,825) (0.08)Western Alliance Bancorp USD (11,149) (461,234) 46,937 0.00Western Digital Corp USD (18,100) (866,266) (4,971) (0.00)Weyerhaeuser Co USD (48,636) (1,292,745) (47,911) (0.00)White Mountains Insurance Group Ltd USD (185) (171,588) (261) (0.00)Willis Towers Watson PLC USD (15,759) (2,770,432) (27,105) (0.00)Woodward Inc USD (2,375) (224,936) 3,301 0.00Workday Inc USD (8,361) (1,615,763) (47,992) (0.00)World Wrestling Entertainment Inc USD (23,859) (2,044,001) 106,888 0.01WP Carey Inc USD (7,553) (591,022) (11,934) (0.00)WPX Energy Inc USD (134,234) (1,758,465) (52,351) (0.01)WR Berkley Corp USD (4,984) (422,045) (3,090) (0.00)XPO Logistics Inc USD (28,713) (1,557,393) (78,099) (0.01)Xylem Inc USD (19,604) (1,542,639) (7,057) (0.00)Zayo Group Holdings Inc USD (62,371) (1,770,089) (4,990) (0.00)Zillow Group Inc USD (64,574) (2,227,803) 214,386 0.02Zions Bancorporation USD (5,278) (239,780) 24,332 0.00
4,688,021 0.47
Total Short Positions 4,688,437 0.47
Total of Long and Short Equity Positions (3,084,431) (0.31)Net Cash and Other Receivables/(Payables) (838,251) (0.08)
Total of Total Return Basket Swap Contract - MSIP - USD (3,922,682) (0.39)
AQR UCITS FUNDS
AQR Systematic Total Return UCITS Fund
Schedule of Investments (continued)As at 31 March 2019
The accompanying notes form an integral part of these audited financial statements. 192

† The following abbreviations are used for counterparty descriptions:
BANA - Bank of America, N.A. GSIN - Goldman Sachs InternationalBARB - Barclays Bank PLC JPMC - JPMorgan Chase Bank, N.A.BARC - Barclays Capital Inc. JPPC - J.P. Morgan Securities PLCCITG - Citigroup Global Markets Inc. MLIN - Merrill Lynch InternationalCITI - Citibank, N.A. MSIP - Morgan Stanley & Co. International PLCCSSL - Credit Suisse Securities (USA) LLC MSMP - Morgan Stanley Market Products Inc.GSCO - Goldman Sachs & Co.
‡ The following abbreviations are used for the benchmarks on derivative contracts:
BBSW - Australian Bank Bill Swap Rate KSDA - Korea Securities Dealers Association RateBKBM – New Zealand Bank Bill Benchmark Rate LIBOR - London Interbank Offered RateBUBOR - Budapest Interbank Offered Rate MUTSC-1D - Bank of Japan Estimate Unsecured Overnight Call RateBZDIOVRA - Brazil Interbank Deposit Rate NIBOR - Norwegian Interbank Offered RateCDOR - Canadian Dollar Offered Rate PRIBOR - Prague Inter Bank Offered RateCIBOR - Copenhagen Interbank Offered Rate RBACR-1D - Reserve Bank of Australia Overnight RateCORRA - Canadian Overnight Repo Rate Average SARON-1D - Swiss Average Rate OvernightDISC-1D - Canadian Interbank Offered Rate SIBOR - Singapore Interbank Offered RateEONIA-1D - Euro Overnight Index Average SONIA-1D - Sterling Overnight Index AverageEURIBOR - Euro Interbank Offered Rate SOR - Swap Offer RateFEDEF-1D - US Federal Reserve Overnight Rate SORF1-1D - Association of Banks in Singapore Swap Offer RateFFR - Federal Fund Rate STIBOR - Stockholm Interbank Offered RateHIBOR - Hong Kong Interbank Offered Rate TIIE - Mexico Interbank Equilibrium Interest RateHONIX-1D - Hong Kong Brokers Association Overnight Rate WIBOR - Warsaw Interbank Offered RateJIBAR - Johannesburg Interbank Average Rate
AQR UCITS FUNDS
AQR Systematic Total Return UCITS Fund
Schedule of Investments (continued)As at 31 March 2019
The accompanying notes form an integral part of these audited financial statements. 193

Statements of Assets and LiabilitiesAs at 31 March 2019
AQR DelphiLong-Short
Equity UCITSFund*
AQR EmergingEquities UCITS
Fund
AQR GlobalAggregate Bond
UCITS Fund
AQR Global CoreEquity UCITS
Fund
AQR GlobalDefensive Equity
UCITS Fund
Notes USD USD USD USD USD
AssetsInvestments, at cost 4,676,180 596,902,878 752,558,003 109,500,490 38,920,757Investments, at fair value 5(b) 4,675,792 618,968,025 761,857,587 120,612,803 44,341,331Cash 2(e) 817,094 48,547,795 5,725,165 3,744,245 1,440,653Due from brokers 2(f) 6,300,792 21,736,071 - - -Deposits with brokers for exchange-traded and centrally cleared derivatives 2(g) - 2,035,710 2,504,466 126,707 54,395Variation margin receivable on exchange-traded and centrally cleared derivatives 4(e) - - 182,876 10,360 2,699Unrealised appreciation on forward foreign exchange contracts 4(a) 1,426 6,810,469 8,065,881 - -Fair value of to be announced commitments 4(d) - - 95,620,995 - -Unrealised appreciation on OTC swap contracts 4(c) 156,963 967,123 - - -Subscriptions receivable 1(c) 150,655 - 4,700,089 - -Dividends receivable 2(i) 1,511 2,167,120 68,397 334,587 221,586Interest receivable 2(i) 2,364 - 5,694,101 - -Due from Investment Manager 6(e) 37,658 - - - -
Total assets 12,144,255 701,232,313 884,419,557 124,828,702 46,060,664
LiabilitiesDue to brokers 2(f) - 3,246,330 12,227,503 - -Variation margin payable on exchange-traded and centrally cleared derivatives 4(e) - 30,100 - - -Unrealised depreciation on forward foreign exchange contracts 4(a) 58,231 2,316,342 7,967,180 - -Unrealised depreciation on OTC swap contracts 4(c) 77,029 293,939 - - -Investment management fees payable 6(a) - 293,470 80,668 4,069 5,391Performance fees payable 6(b) 44,396 - - - -Management Company fees payable 6(c) 1,183 30,950 32,202 5,478 1,845Payable on to be announced commitments purchased 4(d) - - 94,557,740 - -Redemptions payable 1(c) - - 364,134 - -Directors’ fees payable 6(c) 11 2,634 616 98 12,763Accrued expenses and other liabilities 35,490 230,005 134,324 53,520 64,795
Total liabilities 216,340 6,443,770 115,364,367 63,165 84,794Total net assets before swing pricing adjustment 11,927,915 694,788,543 769,055,190 124,765,537 45,975,870Swing pricing adjustment addition/(deduction) 2(d) - (3,473,943) - - -
Total net assets after swing pricing adjustment 11,927,915 691,314,600 769,055,190 124,765,537 45,975,870
* Sub-Fund launched on 26 October 2018.
AQR UCITS FUNDS
The accompanying notes form an integral part of these audited financial statements. 194
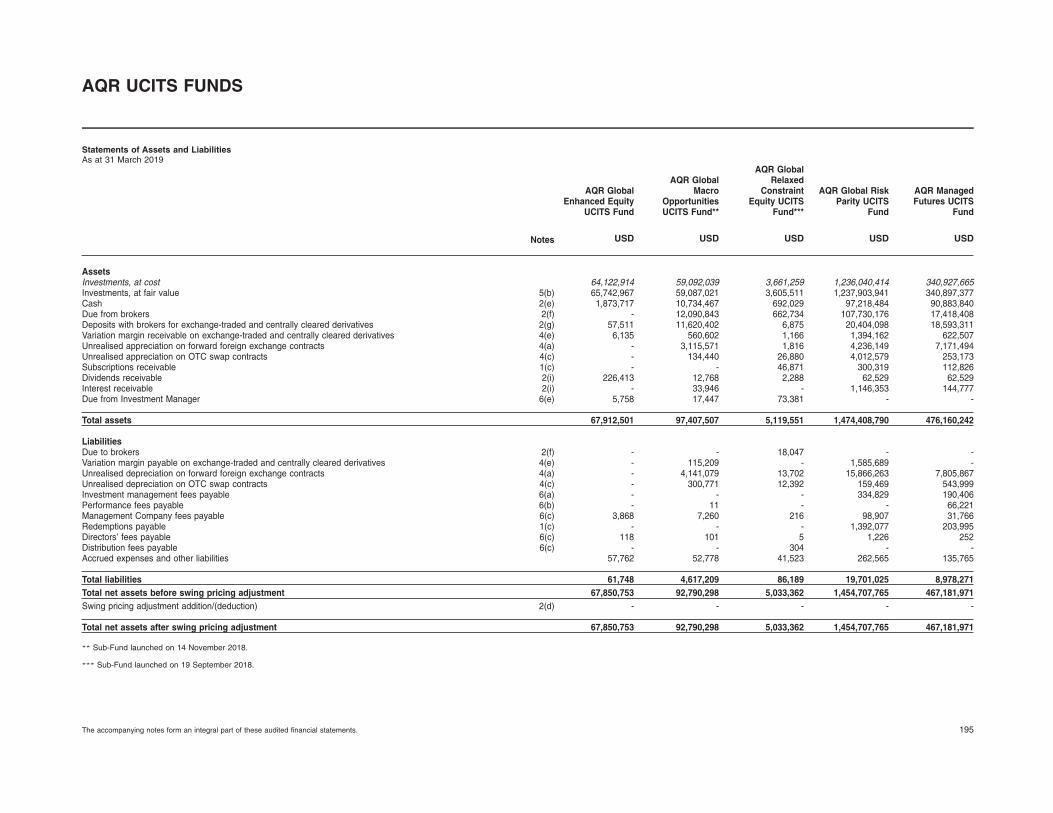
Statements of Assets and LiabilitiesAs at 31 March 2019
AQR GlobalEnhanced Equity
UCITS Fund
AQR GlobalMacro
OpportunitiesUCITS Fund**
AQR GlobalRelaxed
ConstraintEquity UCITS
Fund***
AQR Global RiskParity UCITS
Fund
AQR ManagedFutures UCITS
Fund
Notes USD USD USD USD USD
AssetsInvestments, at cost 64,122,914 59,092,039 3,661,259 1,236,040,414 340,927,665Investments, at fair value 5(b) 65,742,967 59,087,021 3,605,511 1,237,903,941 340,897,377Cash 2(e) 1,873,717 10,734,467 692,029 97,218,484 90,883,840Due from brokers 2(f) - 12,090,843 662,734 107,730,176 17,418,408Deposits with brokers for exchange-traded and centrally cleared derivatives 2(g) 57,511 11,620,402 6,875 20,404,098 18,593,311Variation margin receivable on exchange-traded and centrally cleared derivatives 4(e) 6,135 560,602 1,166 1,394,162 622,507Unrealised appreciation on forward foreign exchange contracts 4(a) - 3,115,571 1,816 4,236,149 7,171,494Unrealised appreciation on OTC swap contracts 4(c) - 134,440 26,880 4,012,579 253,173Subscriptions receivable 1(c) - - 46,871 300,319 112,826Dividends receivable 2(i) 226,413 12,768 2,288 62,529 62,529Interest receivable 2(i) - 33,946 - 1,146,353 144,777Due from Investment Manager 6(e) 5,758 17,447 73,381 - -
Total assets 67,912,501 97,407,507 5,119,551 1,474,408,790 476,160,242
LiabilitiesDue to brokers 2(f) - - 18,047 - -Variation margin payable on exchange-traded and centrally cleared derivatives 4(e) - 115,209 - 1,585,689 -Unrealised depreciation on forward foreign exchange contracts 4(a) - 4,141,079 13,702 15,866,263 7,805,867Unrealised depreciation on OTC swap contracts 4(c) - 300,771 12,392 159,469 543,999Investment management fees payable 6(a) - - - 334,829 190,406Performance fees payable 6(b) - 11 - - 66,221Management Company fees payable 6(c) 3,868 7,260 216 98,907 31,766Redemptions payable 1(c) - - - 1,392,077 203,995Directors’ fees payable 6(c) 118 101 5 1,226 252Distribution fees payable 6(c) - - 304 - -Accrued expenses and other liabilities 57,762 52,778 41,523 262,565 135,765
Total liabilities 61,748 4,617,209 86,189 19,701,025 8,978,271Total net assets before swing pricing adjustment 67,850,753 92,790,298 5,033,362 1,454,707,765 467,181,971Swing pricing adjustment addition/(deduction) 2(d) - - - - -
Total net assets after swing pricing adjustment 67,850,753 92,790,298 5,033,362 1,454,707,765 467,181,971
** Sub-Fund launched on 14 November 2018.
*** Sub-Fund launched on 19 September 2018.
AQR UCITS FUNDS
The accompanying notes form an integral part of these audited financial statements. 195
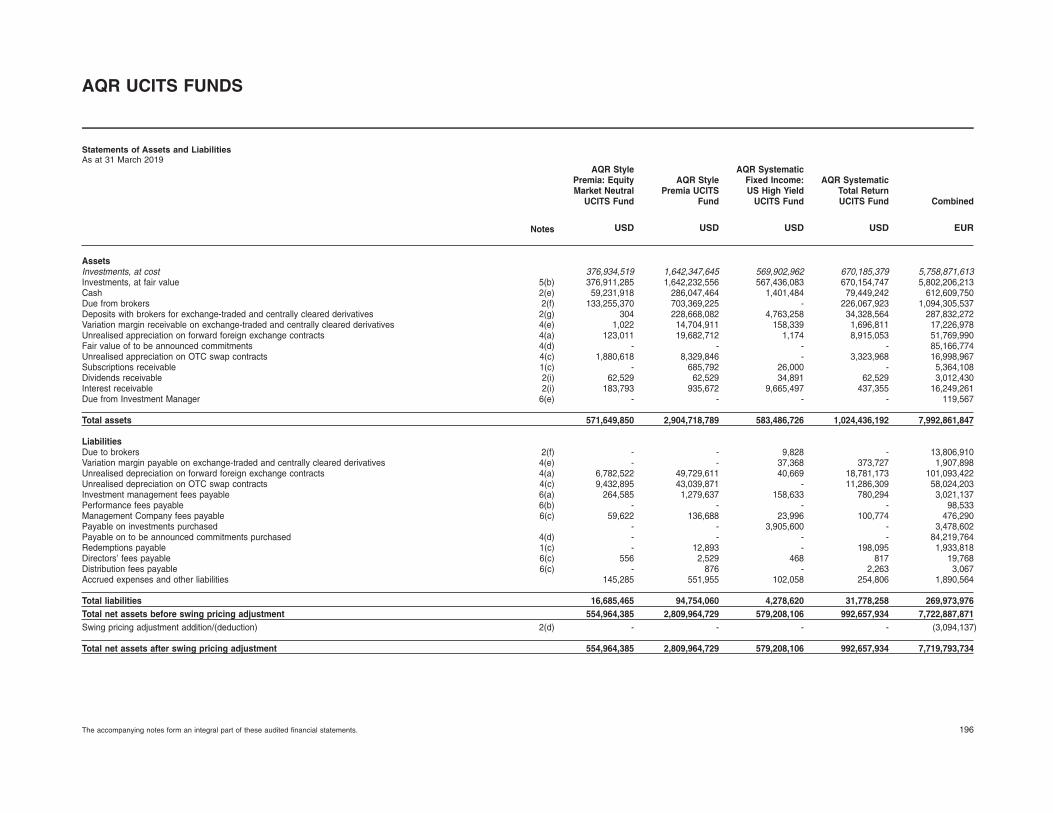
Statements of Assets and LiabilitiesAs at 31 March 2019
AQR StylePremia: EquityMarket Neutral
UCITS Fund
AQR StylePremia UCITS
Fund
AQR SystematicFixed Income:US High Yield
UCITS Fund
AQR SystematicTotal ReturnUCITS Fund Combined
Notes USD USD USD USD EUR
AssetsInvestments, at cost 376,934,519 1,642,347,645 569,902,962 670,185,379 5,758,871,613Investments, at fair value 5(b) 376,911,285 1,642,232,556 567,436,083 670,154,747 5,802,206,213Cash 2(e) 59,231,918 286,047,464 1,401,484 79,449,242 612,609,750Due from brokers 2(f) 133,255,370 703,369,225 - 226,067,923 1,094,305,537Deposits with brokers for exchange-traded and centrally cleared derivatives 2(g) 304 228,668,082 4,763,258 34,328,564 287,832,272Variation margin receivable on exchange-traded and centrally cleared derivatives 4(e) 1,022 14,704,911 158,339 1,696,811 17,226,978Unrealised appreciation on forward foreign exchange contracts 4(a) 123,011 19,682,712 1,174 8,915,053 51,769,990Fair value of to be announced commitments 4(d) - - - - 85,166,774Unrealised appreciation on OTC swap contracts 4(c) 1,880,618 8,329,846 - 3,323,968 16,998,967Subscriptions receivable 1(c) - 685,792 26,000 - 5,364,108Dividends receivable 2(i) 62,529 62,529 34,891 62,529 3,012,430Interest receivable 2(i) 183,793 935,672 9,665,497 437,355 16,249,261Due from Investment Manager 6(e) - - - - 119,567
Total assets 571,649,850 2,904,718,789 583,486,726 1,024,436,192 7,992,861,847
LiabilitiesDue to brokers 2(f) - - 9,828 - 13,806,910Variation margin payable on exchange-traded and centrally cleared derivatives 4(e) - - 37,368 373,727 1,907,898Unrealised depreciation on forward foreign exchange contracts 4(a) 6,782,522 49,729,611 40,669 18,781,173 101,093,422Unrealised depreciation on OTC swap contracts 4(c) 9,432,895 43,039,871 - 11,286,309 58,024,203Investment management fees payable 6(a) 264,585 1,279,637 158,633 780,294 3,021,137Performance fees payable 6(b) - - - - 98,533Management Company fees payable 6(c) 59,622 136,688 23,996 100,774 476,290Payable on investments purchased - - 3,905,600 - 3,478,602Payable on to be announced commitments purchased 4(d) - - - - 84,219,764Redemptions payable 1(c) - 12,893 - 198,095 1,933,818Directors’ fees payable 6(c) 556 2,529 468 817 19,768Distribution fees payable 6(c) - 876 - 2,263 3,067Accrued expenses and other liabilities 145,285 551,955 102,058 254,806 1,890,564
Total liabilities 16,685,465 94,754,060 4,278,620 31,778,258 269,973,976Total net assets before swing pricing adjustment 554,964,385 2,809,964,729 579,208,106 992,657,934 7,722,887,871Swing pricing adjustment addition/(deduction) 2(d) - - - - (3,094,137)
Total net assets after swing pricing adjustment 554,964,385 2,809,964,729 579,208,106 992,657,934 7,719,793,734
AQR UCITS FUNDS
The accompanying notes form an integral part of these audited financial statements. 196

Statements of OperationsFor the year ended 31 March 2019
AQR DelphiLong-Short
Equity UCITSFund*
AQR EmergingEquities UCITS
Fund
AQR GlobalAggregate
Bond UCITSFund
AQR GlobalCore EquityUCITS Fund
AQR GlobalDefensive
Equity UCITSFund
Notes USD USD USD USD USD
IncomeDividend income, net of withholding tax 2(i),7 3,473 18,423,077 558,358 2,503,657 979,294Interest, net of withholding tax 2(i),7 48,547 883,362 11,299,201 30,315 13,042
Total income 52,020 19,306,439 11,857,559 2,533,972 992,336
ExpensesInvestment management fees 6(a) - 4,091,673 1,130,411 227,553 62,860Management Company fees 6(c) 1,429 80,084 75,489 13,486 2,503Directors’ fees 6(c) 31 705 3,325 77 900Performance fees 6(b) 44,891 - - - -Interest 2(i) 1,491 301,758 80,931 3,765 1,356Administration fees 6(c) 2,214 162,596 135,579 26,551 9,422Amortisation of organisational expenses 6(d) - 1,601 - - -Custody and depositary fees 6(c) 2,343 325,252 124,981 22,951 10,731Professional fees 6(c) 80,687 246,756 118,640 66,561 50,108Taxe d’abonnement 7 500 72,036 70,340 12,199 4,387Other expenses 9,186 23,722 21,204 18,945 6,815
Total expenses 142,772 5,306,183 1,760,900 392,088 149,082
Reimbursement of expenses 52,142 - - - -
Net investment income/(loss) (38,610) 14,000,256 10,096,659 2,141,884 843,254
Realised gain/(loss) and change in unrealised appreciation/(depreciation)Net realised gain/(loss) on investments, net of capital gains tax 2(i),7 912 1,673,636 (15,402,098) 1,719,959 907,359Net realised gain/(loss) on futures contracts 4(b) - 323,923 (2,221,144) (60,400) 25,994Net realised gain/(loss) on forward foreign exchange contracts 4(a) (65,356) (12,927,273) (5,321,963) (9,707) 5,955Net realised gain/(loss) on to be announced commitments 4(d) - - 1,618,939 - -Net realised gain/(loss) on swap contracts 4(c) 942,696 (7,074,515) (550,306) - -Net realised gain/(loss) on foreign currency transactions 2(h) 16,234 (880,043) (588,934) (14,537) (18,009)Net change in unrealised appreciation/(depreciation) on investments 5(b) (388) (99,379,840) 7,414,450 (5,715,863) 439,402Net change in unrealised appreciation/(depreciation) on futures contracts 4(b),5(b) - (3,196,266) (828,927) 169,955 60,003Net change in unrealised appreciation/(depreciation) on forward foreign exchange contracts 4(a),5(b) (56,805) 5,304,986 (712,515) - -Net change in unrealised appreciation/(depreciation) on to be announced commitments 4(d) - - 700,066 - -Net change in unrealised appreciation/(depreciation) on swap contracts 4(c),5(b) 79,934 2,393,443 46,168 - -Net change in unrealised appreciation/(depreciation) on foreign currency translation 2(h) 1,093 (215,623) 39,848 (3,784) (250)
Net realised gain/(loss) and net change in unrealised appreciation/(depreciation) 918,320 (113,977,572) (15,806,416) (3,914,377) 1,420,454Net result of operations for the year 879,710 (99,977,316) (5,709,757) (1,772,493) 2,263,708
* Sub-Fund launched on 26 October 2018.
AQR UCITS FUNDS
The accompanying notes form an integral part of these audited financial statements. 197

Statements of OperationsFor the year ended 31 March 2019
AQR GlobalEnhanced
Equity UCITSFund
AQR GlobalMacro
OpportunitiesUCITS Fund**
AQR GlobalRelaxed
ConstraintEquity UCITS
Fund***
AQR GlobalRisk Parity
UCITS Fund
AQR ManagedFutures UCITS
Fund
Notes USD USD USD USD USD
IncomeDividend income, net of withholding tax 2(i),7 2,306,631 41,671 17,538 190,853 190,853Interest, net of withholding tax 2(i),7 31,577 476,980 5,427 26,434,781 5,799,970
Total income 2,338,208 518,651 22,965 26,625,634 5,990,823
ExpensesInvestment management fees 6(a) 356,628 65,894 - 4,830,357 1,413,161Management Company fees 6(c) 13,077 9,558 292 359,470 90,676Directors’ fees 6(c) 172 200 16 8,098 1,484Distribution fees 6(c) - - 1,500 3 -Performance fees 6(b) - 11 - - 66,315Interest 2(i) 4,076 13,286 76 230,742 42,573Administration fees 6(c) 25,583 15,338 414 868,234 179,718Amortisation of organisational expenses 6(d) - - - - 4,127Custody and depositary fees 6(c) 31,808 9,530 3,950 360,995 108,609Professional fees 6(c) 77,939 90,163 118,918 369,830 182,412Taxe d’abonnement 7 11,392 4,578 639 148,542 32,392Other expenses 15,638 23,255 9,311 26,828 16,331
Total expenses 536,313 231,813 135,116 7,203,099 2,137,798
Reimbursement of expenses - - 118,818 - -
Net investment income/(loss) 1,801,895 286,838 6,667 19,422,535 3,853,025
Realised gain/(loss) and change in unrealised appreciation/(depreciation)Net realised gain/(loss) on investments, net of capital gains tax 2(i),7 (769,291) 9,592 (45,092) (4,511,419) 146,376Net realised gain/(loss) on futures contracts 4(b) (35,771) (74,383) 19,104 54,109,945 (4,531,002)Net realised gain/(loss) on forward foreign exchange contracts 4(a) 286,146 15,184 (44,528) (99,124,879) (30,332,812)Net realised gain/(loss) on swap contracts 4(c) - (1,150,268) (83,395) (31,429,231) (2,862,669)Net realised gain/(loss) on foreign currency transactions 2(h) (283,314) (251,103) (345) 736,321 116,600Net change in unrealised appreciation/(depreciation) on investments 5(b) (8,724,816) (5,018) (55,748) (16,108,056) 39,835Net change in unrealised appreciation/(depreciation) on futures contracts 4(b),5(b) 58,164 (380,203) 1,875 38,278,468 12,637,933Net change in unrealised appreciation/(depreciation) on forward foreign exchange contracts 4(a),5(b) - (1,025,508) (11,886) (23,990,774) (763,185)Net change in unrealised appreciation/(depreciation) on swap contracts 4(c),5(b) - 501,538 14,488 1,465,596 (86,127)Net change in unrealised appreciation/(depreciation) on foreign currency translation 2(h) (2,040) (15,991) (145) (32,022) 3,977
Net realised gain/(loss) and net change in unrealised appreciation/(depreciation) (9,470,922) (2,376,160) (205,672) (80,606,051) (25,631,074)Net result of operations for the year (7,669,027) (2,089,322) (199,005) (61,183,516) (21,778,049)
** Sub-Fund launched on 14 November 2018.
*** Sub-Fund launched on 19 September 2018.
AQR UCITS FUNDS
The accompanying notes form an integral part of these audited financial statements. 198

Statements of OperationsFor the year ended 31 March 2019
AQR StylePremia: EquityMarket Neutral
UCITS Fund
AQR StylePremia UCITS
Fund
AQRSystematic
Fixed Income:US High Yield
UCITS Fund
AQRSystematic
Total ReturnUCITS Fund
AQRU.S. Relaxed
ConstraintEquity UCITS
Fund**** Combined
Notes USD USD USD USD USD EUR
IncomeDividend income, net of withholding tax 2(i),7 190,853 190,853 384,675 190,853 - 22,601,315Interest, net of withholding tax 2(i),7 10,558,240 54,584,676 35,272,874 19,854,237 6,692 142,744,323
Total income 10,749,093 54,775,529 35,657,549 20,045,090 6,692 165,345,638
ExpensesInvestment management fees 6(a) 3,960,385 18,444,970 2,407,843 10,869,041 16,557 41,344,348Management Company fees 6(c) 181,508 384,444 65,753 330,593 1,056 1,389,809Directors’ fees 6(c) 1,725 12,335 2,604 4,311 - 31,073Distribution fees 6(c) - 14,865 - 39,369 - 48,132Performance fees 6(b) - 1,746 - - - 97,549Interest 2(i) 70,166 1,141,840 99,849 156,251 579 1,855,538Administration fees 6(c) 353,023 1,679,302 108,426 646,553 1,859 3,639,690Amortisation of organisational expenses 6(d) - 5,178 - - - 9,418Custody and depositary fees 6(c) 135,480 643,998 51,578 294,830 3,451 1,839,777Professional fees 6(c) 173,913 709,386 145,129 295,645 23,845 2,374,697Taxe d’abonnement 7 57,276 303,760 55,031 106,090 670 759,777Other expenses 32,583 138,735 25,948 78,643 8,076 393,104
Total expenses 4,966,059 23,480,559 2,962,161 12,821,326 56,093 53,782,912
Reimbursement of expenses - - - - - 147,632
Net investment income/(loss) 5,783,034 31,294,970 32,695,388 7,223,764 (49,401) 111,710,358
Realised gain/(loss) and change in unrealised appreciation/(depreciation)Net realised gain/(loss) on investments, net of capital gains tax 2(i),7 235,698 1,196,254 (20,585,178) 501,473 155,531 (30,022,339)Net realised gain/(loss) on futures contracts 4(b) 1,374,369 19,019,269 1,287,037 6,800,253 2,792 65,664,135Net realised gain/(loss) on forward foreign exchange contracts 4(a) (68,229,134) (251,458,118) (259,151) (122,263,704) 119 (509,259,158)Net realised gain/(loss) on to be announced commitments 4(d) - - - - - 1,398,031Net realised gain/(loss) on swap contracts 4(c) (77,798,721) (382,177,812) 4,484,371 (189,471,819) 146,916 (593,278,466)Net realised gain/(loss) on foreign currency transactions 2(h) 134,567 (3,066,798) (3,424) 105,033 (311) (3,452,517)Net change in unrealised appreciation/(depreciation) on investments 5(b) 59,670 264,443 3,562,035 130,123 9,521 (101,959,262)Net change in unrealised appreciation/(depreciation) on futures contracts 4(b),5(b) (37,948) (10,666,879) 275,168 29,064,664 16,070 56,520,973Net change in unrealised appreciation/(depreciation) on forward foreign exchange contracts 4(a),5(b) (5,572,981) (70,676,366) (80,677) (9,839,304) - (92,766,597)Net change in unrealised appreciation/(depreciation) on to be announced commitments 4(d) - - - - - 604,540Net change in unrealised appreciation/(depreciation) on swap contracts 4(c),5(b) (9,552,487) (43,597,218) 1,380,798 4,222,600 548,576 (36,772,174)Net change in unrealised appreciation/(depreciation) on foreign currency translation 2(h) 41,597 (226,127) (13,257) 22,558 (224) (345,756)
Net realised gain/(loss) and net change in unrealised appreciation/(depreciation) (159,345,370) (741,389,352) (9,952,278) (280,728,123) 878,990 (1,243,668,590)Net result of operations for the year (153,562,336) (710,094,382) 22,743,110 (273,504,359) 829,589 (1,131,958,232)
**** Sub-Fund fully redeemed on 17 August 2018.
AQR UCITS FUNDS
The accompanying notes form an integral part of these audited financial statements. 199

Statements of Changes in Net AssetsFor the year ended 31 March 2019
AQR DelphiLong-Short
Equity UCITSFund*
AQR EmergingEquities UCITS
Fund
AQR GlobalAggregate
Bond UCITSFund
AQR GlobalCore EquityUCITS Fund
AQR GlobalDefensive
Equity UCITSFund
Notes USD USD USD USD USD
Net assets at the beginning of the year - 854,661,938 327,773,844 122,588,030 40,979,393
Proceeds from subscriptions of shares 11,263,876 98,355,017 514,314,033 3,950,000 3,533,416
Payments for redemptions of shares (215,671) (161,725,039) (67,322,930) - (800,647)
Net result of operations for the year 879,710 (99,977,316) (5,709,757) (1,772,493) 2,263,708
Currency translation adjustment
Net assets at the end of the year 11,927,915 691,314,600 769,055,190 124,765,537 45,975,870
* Sub-Fund launched on 26 October 2018.
AQR UCITS FUNDS
The accompanying notes form an integral part of these audited financial statements. 200

Statements of Changes in Net AssetsFor the year ended 31 March 2019
AQR GlobalEnhanced
Equity UCITSFund
AQR GlobalMacro
OpportunitiesUCITS Fund**
AQR GlobalRelaxed
ConstraintEquity UCITS
Fund***
AQR GlobalRisk Parity
UCITS Fund
AQR ManagedFutures UCITS
Fund
Notes USD USD USD USD USD
Net assets at the beginning of the year 122,886,934 - - 1,850,155,906 418,280,882
Distributions 8 - - - - (33,186)
Proceeds from subscriptions of shares 37,288,646 104,127,593 5,232,367 284,435,052 354,712,643
Payments for redemptions of shares (84,655,800) (9,247,973) - (618,699,677) (284,000,319)
Net result of operations for the year (7,669,027) (2,089,322) (199,005) (61,183,516) (21,778,049)
Currency translation adjustment
Net assets at the end of the year 67,850,753 92,790,298 5,033,362 1,454,707,765 467,181,971
** Sub-Fund launched on 14 November 2018.
*** Sub-Fund launched on 19 September 2018.
AQR UCITS FUNDS
The accompanying notes form an integral part of these audited financial statements. 201

Statements of Changes in Net AssetsFor the year ended 31 March 2019
AQR StylePremia: EquityMarket Neutral
UCITS Fund
AQR StylePremia UCITS
Fund
AQRSystematic
Fixed Income:US High Yield
UCITS Fund
AQRSystematic
Total ReturnUCITS Fund
AQRU.S. Relaxed
ConstraintEquity UCITS
Fund**** Combined
Notes USD USD USD USD USD EUR
Net assets at the beginning of the year 650,924,221 3,401,697,970 514,988,760 1,325,650,845 24,384,168 7,834,602,908
Distributions 8 - - - - - (28,658)
Proceeds from subscriptions of shares 57,602,500 961,990,353 119,346,411 370,172,178 - 2,527,019,668
Payments for redemptions of shares - (843,629,212) (77,870,175) (429,660,730) (25,213,757) (2,247,850,191)
Net result of operations for the year (153,562,336) (710,094,382) 22,743,110 (273,504,359) 829,589 (1,131,958,232)
Currency translation adjustment 738,008,239
Net assets at the end of the year 554,964,385 2,809,964,729 579,208,106 992,657,934 - 7,719,793,734
**** Sub-Fund fully redeemed on 17 August 2018.
AQR UCITS FUNDS
The accompanying notes form an integral part of these audited financial statements. 202

Class
Number of SharesOutstanding as at
31 March 2018
Number ofSharesIssued
Number ofShares
Redeemed
Number ofShares
Exchanged
Number of SharesOutstanding as at
31 March 2019
AQR Delphi Long-Short Equity UCITS Fund*
Class IAC1F - 2,932 - - 2,932
Class IAE1F - 9,500 - - 9,500
Class IAE2 - 36,700 (1,850) - 34,850
Class IAG1 - 75 - - 75
Class IAU1F - 56,793 - - 56,793
AQR Emerging Equities UCITS Fund
Class A1 359,435 - (359,435) - -
Class A2 255,608 - (255,608) - -
Class A3 224,990 77,334 (201,314) - 101,010
Class B3 788,396 64,051 (55,882) - 796,565
Class C2 1,674,681 148,993 (222,094) - 1,601,580
Class C3 377,377 132,813 (119,303) - 390,887
Class E 1,123,823 203,526 - - 1,327,349
AQR Global Aggregate Bond UCITS Fund
Class IAE3F 300,513 30,032 - - 330,545
Class IAG1F - 1,454,258 (199,211) - 1,255,047
Class IAG3F 682,355 1,615,542 (219,917) - 2,077,980
Class IAN4F 10,060,297 5,980,949 (544,418) - 15,496,828
Class IAU1F 100 148,753 - - 148,853
Class IAU3F 640,000 60,618 (39,356) - 661,262
Class IDG1F - 66,278 (6,882) - 59,396
AQR Global Core Equity UCITS Fund
Class A1 - 40,958 - - 40,958
Class B3 785,670 - - - 785,670
AQR Global Defensive Equity UCITS Fund
Class A1 33,127 1,837 (1,964) - 33,000
Class B1 - 1,500 - - 1,500
Class B3 195,122 - - - 195,122
Class C1 35,878 17,789 (3,156) - 50,511
Class D1 1,000 - - - 1,000
AQR Global Enhanced Equity UCITS Fund
Class A1 47,593 3,000 (50,593) - -
Class A2 150,089 39,958 (150,000) - 40,047
Class B2 392,348 236,748 (144,333) - 484,763
Class C2 236,653 - (236,653) - -
AQR Global Macro Opportunities UCITS Fund**
Class IAE3 - 701,500 - - 701,500
Class IAG3 - 83,989 - - 83,989
Class IAG3F - 4,823 - - 4,823
Class IAU1 - 28,545 (3,046) - 25,499
Class IAU1F - 90,100 (89,998) - 102
Class IAU3 - 6,372 - - 6,372
AQR Global Relaxed Constraint Equity UCITS Fund***
Class IAU1F - 30,000 - - 30,000
Class RAU3F - 16,183 - - 16,183
Class RAU3FT - 7,312 - - 7,312
AQR UCITS FUNDS
Statements of Changes in Shares OutstandingFor the year ended 31 March 2019
The accompanying notes form an integral part of these audited financial statements. 203

Class
Number of SharesOutstanding as at
31 March 2018
Number ofSharesIssued
Number ofShares
Redeemed
Number ofShares
Exchanged
Number of SharesOutstanding as at
31 March 2019
AQR Global Risk Parity UCITS Fund
Class A1 1,570 25,213 (4,081) - 22,702
Class A2 1,570,496 806,671 (1,665,037) - 712,130
Class B1 636,612 687,796 (13,429) - 1,310,979
Class B2 909,774 195,230 (133,078) - 971,926
Class C1 362,587 - - - 362,587
Class C2 2,228,364 214,246 (1,518,496) - 924,114
Class C3 4,574,793 43 (142,201) (4,432,635) -
Class C4 - 406,460 (185,257) 5,267,599 5,488,802
Class D2 203,582 26,737 (29,612) - 200,707
Class E2 820 - - - 820
Class F 2,226,514 9,976 (1,138,573) - 1,097,917
Class RAE4F 500 - (500) - -
AQR Managed Futures UCITS Fund
Class A 136,548 250,140 (149,010) - 237,678
Class B 244,304 13,944 (8,577) (241,149) 8,522
Class C 455,669 47,297 (375,154) - 127,812
Class D 39,796 - (35,459) - 4,337
Class E 127,744 - (118,349) 254,031 263,426
Class F 77,712 81,530 (64,184) - 95,058
Class G 2,327,075 70,803 (1,789,272) - 608,606
Class H2 168,196 7,448 (84,917) - 90,727
Class J 2,149 2,794 (469) - 4,474
Class K 209,718 61,455 (101,545) - 169,628
Class L 1,826 315 (1,911) - 230
Class IAE2F 177,236 38,580 (124,629) - 91,187
Class IAG1F 32,581 2,351 (25,965) - 8,967
Class IAG3F - 940,707 (39,888) - 900,819
Class IAU1F 18,807 1,213 (6,738) - 13,282
Class IAU3F - 1,734,143 - - 1,734,143
AQR Style Premia: Equity Market Neutral UCITS Fund
Class A1 100 - - - 100
Class I1 1,800,000 - - - 1,800,000
Class I2 3,345,871 542,330 - - 3,888,201
AQR Style Premia UCITS Fund
Class A 1,015,359 528,436 (543,767) (45,650) 954,378
Class B 4,260,716 2,884,085 (1,450,678) (2,513,004) 3,181,119
Class C 1,075,722 72,472 (748,779) - 399,415
Class D 21,930 5,486 - - 27,416
Class E 3,550,133 3,324,642 (388,709) 2,492,038 8,978,104
Class F 7,054,236 54,018 (252,603) (177,640) 6,678,011
Class G 92 - - (92) -
Class H 210,204 147,000 - - 357,204
Class I 119,998 12,307 (181,903) 49,598 -
Class J 44,708 1,993 (46,701) - -
Class K 3,834,975 114,269 (2,703,438) 195,209 1,441,015
Class M 338,227 161,711 (149,227) - 350,711
Class N 92,149 51,531 (11,187) - 132,493
Class W 136,280 80,565 (216,845) - -
Class IAGF 394,502 53,488 - - 447,990
Class RAE 12,499 9,557 (2,770) - 19,286
Class RAET - 1,802 (1,802) - -
Class RAG 82,381 52,828 (18,708) - 116,501
Class RAU 6,564 16,643 (8,285) - 14,922
AQR UCITS FUNDS
Statements of Changes in Shares Outstanding (continued)For the year ended 31 March 2019
The accompanying notes form an integral part of these audited financial statements. 204

Class
Number of SharesOutstanding as at
31 March 2018
Number ofSharesIssued
Number ofShares
Redeemed
Number ofShares
Exchanged
Number of SharesOutstanding as at
31 March 2019
AQR Systematic Fixed Income: US High Yield UCITS Fund
Class A1 498,895 286,179 (578,778) - 206,296
Class A2 2,500 - (2,421) - 79
Class A3 3,812,954 700,956 (82,216) - 4,431,694
Class C1 25,772 - - - 25,772
AQR Systematic Total Return UCITS Fund
Class A1 651,526 251,791 (379,868) - 523,449
Class A2 592,025 126,900 (243,996) - 474,929
Class B1 921,692 586,659 (815,490) - 692,861
Class B2 5,050,584 212,923 (1,423,555) (3,299,165) 540,787
Class B3 1,495,892 5,408 - - 1,501,300
Class C1 553,294 85,684 (532,204) - 106,774
Class C2 606,075 516,066 (18,428) - 1,103,713
Class C3 416,286 16,393 (432,679) - -
Class D1 107,425 8,020 (78,555) - 36,890
Class IAE3F - 1,176,165 (50) 2,772,411 3,948,526
Class IAEFT 49,781 2,641 (52,290) - 132
Class IDE1F - 14,170 (1,964) - 12,206
Class IDE2F 6,871 4,615 (4,424) - 7,062
Class IDG1F - 178,486 (13,137) - 165,349
Class IDG2F 47,716 41,461 (13,374) - 75,803
Class IDU1F 1,359 6,940 (1,924) - 6,375
Class IDU2F 12,432 7,171 (9,380) - 10,223
Class RACFT 431 115 (446) - 100
Class RAEF 3,000 - - - 3,000
Class RAEFT 7,617 41,336 (22,387) - 26,566
Class RAGF 100 - - - 100
Class RAGFT 3,616 1,400 (5,016) - -
Class RAUF - 1,709 (1,363) - 346
Class RAUFT 13,103 8,271 (7,990) - 13,384
AQR U.S. Relaxed Constraint Equity UCITS Fund****
Class IAU1F 100 - (100) - -
Class IAU3F 253,615 - (253,615) - -
* Sub-Fund launched on 26 October 2018.
** Sub-Fund launched on 14 November 2018.
*** Sub-Fund launched on 19 September 2018.
**** Sub-Fund fully redeemed on 17 August 2018.
AQR UCITS FUNDS
Statements of Changes in Shares Outstanding (continued)For the year ended 31 March 2019
The accompanying notes form an integral part of these audited financial statements. 205

Net Asset Value Currency 31 March 2019 31 March 2018 31 March 2017
AQR Delphi Long-Short Equity UCITS Fund* USD 11,927,915 - -
Class IAC1F CHF 297,062 - -
Class IAE1F EUR 962,384 - -
Class IAE2 EUR 3,784,345 - -
Class IAG1 GBP 7,819 - -
Class IAU1F USD 6,290,001 - -
AQR Emerging Equities UCITS Fund USD 691,314,600 854,661,938 778,748,252
Class A1 USD - 43,669,689 -
Class A2 USD - 32,868,432 93,989,145
Class A3 USD 12,011,919 30,487,521 15,113,599
Class B3 EUR 108,860,935 111,857,092 94,604,320
Class C2 GBP 222,688,762 245,463,778 254,754,791
Class C3 GBP 43,977,338 44,734,425 20,089,462
Class E EUR 187,444,342 163,775,369 211,456,722
AQR Global Aggregate Bond UCITS Fund USD 769,055,190 327,773,844 -
Class IAE3F EUR 33,682,019 30,158,886 -
Class IAG1F GBP 130,277,175 - -
Class IAG3F GBP 216,719,394 69,135,128 -
Class IAN4F NOK 1,609,681,734 1,012,301,797 -
Class IAU1F USD 15,680,199 10,078 -
Class IAU3F USD 69,740,381 64,512,410 -
Class IDG1F GBP 6,218,549 - -
AQR Global Core Equity UCITS Fund USD 124,765,537 122,588,030 106,217,050
Class A1 USD 4,265,631 - -
Class B3 EUR 107,325,680 99,475,011 99,412,279
AQR Global Defensive Equity UCITS Fund USD 45,975,870 40,979,393 283,583,214
Class A1 USD 4,301,268 4,104,790 3,867,529
Class B1 EUR 155,841 - -
Class B3 EUR 28,627,825 24,767,439 260,237,492
Class C1 GBP 7,104,894 4,435,942 1,251,973
Class D1 CHF 121,912 111,199 104,236
AQR Global Enhanced Equity UCITS Fund USD 67,850,753 122,886,934 140,955,009
Class A1 USD - 5,300,222 -
Class A2 USD 5,505,975 21,106,721 24,784,698
Class B2 EUR 55,528,638 41,882,995 32,535,703
Class C2 GBP - 31,914,555 65,301,037
AQR Global Macro Opportunities UCITS Fund** USD 92,790,298 - -
Class IAE3 EUR 69,656,296 - -
Class IAG3 GBP 8,308,884 - -
Class IAG3F GBP 474,907 - -
Class IAU1 USD 2,520,902 - -
Class IAU1F USD 10,329 - -
Class IAU3 USD 634,850 - -
AQR Global Relaxed Constraint Equity UCITS Fund*** USD 5,033,362 - -
Class IAU1F USD 2,802,962 - -
Class RAU3F USD 1,513,055 - -
Class RAU3FT USD 717,345 - -
AQR UCITS FUNDS
Statistical Information
206

Net Asset Value Currency 31 March 2019 31 March 2018 31 March 2017
AQR Global Risk Parity UCITS Fund USD 1,454,707,765 1,850,155,906 736,099,090
Class A1 USD 2,816,068 182,975 173,670
Class A2 USD 79,362,415 164,327,427 -
Class B1 EUR 151,678,222 71,372,789 95,827,715
Class B2 EUR 102,879,854 93,269,865 -
Class C1 GBP 43,528,999 41,614,477 40,038,313
Class C2 GBP 111,316,919 256,480,440 226,893,585
Class C3 GBP - 527,253,502 40,464,613
Class C4 GBP 557,530,653 - -
Class D2 CHF 21,057,877 20,768,114 -
Class E2 EUR 85,159 82,479 -
Class F EUR 124,244,953 243,900,891 234,285,587
Class RAE4F EUR - 49,118 -
AQR Managed Futures UCITS Fund USD 467,181,971 418,280,882 675,684,610
Class A USD 22,873,362 13,657,249 25,307,098
Class B EUR 765,541 23,480,576 93,081,823
Class C GBP 11,072,293 41,705,770 31,396,611
Class D CHF 354,485 3,505,646 3,415,848
Class E EUR 22,409,807 11,635,598 52,787,023
Class F GBP 8,988,586 7,748,352 87,626,331
Class G USD 56,147,445 222,672,431 244,137,246
Class H2 NOK 38,947,739 76,069,621 67,894,354
Class J EUR 387,316 199,106 91,180
Class K GBP 15,195,120 19,872,559 47,316
Class L USD 21,332 176,039 170,619
Class M EUR - - 84,574,969
Class IAE2F EUR 8,240,635 17,164,833 -
Class IAG1F GBP 820,765 3,163,389 -
Class IAG3F GBP 92,787,577 - -
Class IAU1F USD 1,244,837 1,839,240 -
Class IAU3F USD 178,810,322 - -
AQR Style Premia: Equity Market Neutral UCITS Fund USD 554,964,385 650,924,221 433,563,837
Class A1 USD 9,486 10,837 10,144
Class I1 EUR 162,944,011 192,111,817 405,778,177
Class I2 EUR 331,337,796 336,076,915 -
AQR Style Premia UCITS Fund USD 2,809,964,729 3,401,697,970 1,705,124,596
Class A USD 103,124,897 122,416,160 63,991,423
Class B EUR 323,076,763 497,481,424 335,453,229
Class C GBP 42,297,461 129,442,884 61,197,405
Class D CHF 2,760,062 2,545,638 1,533,124
Class E EUR 920,173,921 417,893,728 362,405,160
Class F GBP 708,679,533 849,787,170 120,727,982
Class G EUR - 15,320 122,789,912
Class H EUR 33,231,633 22,460,115 21,244,615
Class I USD - 13,323,499 9,811,529
Class J EUR - 4,649,659 3,742,914
Class K GBP 138,639,536 420,718,409 355,490,250
Class M USD 33,674,132 36,199,036 43,540,340
Class N CHF 11,775,877 9,434,546 12,769,378
Class W EUR - 13,667,679 -
Class IAGF GBP 40,275,785 40,503,297 -
Class RAE EUR 1,683,822 1,256,081 -
Class RAG GBP 10,335,725 8,313,279 -
Class RAU USD 1,349,802 663,155 -
AQR UCITS FUNDS
Statistical Information (Continued)
207

Net Asset Value Currency 31 March 2019 31 March 2018 31 March 2017
AQR Systematic Fixed Income: US High Yield UCITS Fund USD 579,208,106 514,988,760 125,692,029
Class A1 USD 24,670,365 57,168,121 12,090,537
Class A2 USD 9,866 300,159 285,157
Class A3 USD 551,044,353 453,848,082 113,316,335
Class C1 GBP 2,679,941 2,612,318 -
AQR Systematic Total Return UCITS Fund USD 992,657,934 1,325,650,845 247,855,749
Class A1 USD 48,271,607 68,668,189 18,552,900
Class A2 USD 40,467,931 57,509,856 -
Class B1 EUR 60,658,568 94,921,731 28,754,273
Class B2 EUR 46,926,517 514,179,148 225,939
Class B3 EUR 132,604,983 154,806,735 120,445,112
Class C1 GBP 9,496,468 57,170,765 149,229
Class C2 GBP 97,763,223 62,215,959 27,776,668
Class C3 GBP - 43,486,988 18,960,441
Class D1 CHF 3,192,232 10,992,717 11,206,346
Class IAE3F EUR 407,727,134 - -
Class IAEFT EUR 10,854 4,802,000 -
Class IDE1F EUR 1,151,004 - -
Class IDE2F EUR 561,588 641,229 -
Class IDG1F GBP 14,150,302 - -
Class IDG2F GBP 6,326,563 4,615,285 -
Class IDU1F USD 551,602 134,384 -
Class IDU2F USD 836,671 1,159,874 -
Class RACFT CHF 8,030 41,273 -
Class RAEF EUR 245,111 288,621 -
Class RAEFT EUR 2,167,591 736,619 -
Class RAGF GBP 8,483 9,865 -
Class RAGFT GBP - 352,899 -
Class RAUF USD 29,924 - -
Class RAUFT USD 1,143,666 1,289,282 -
AQR U.S. Relaxed Constraint Equity UCITS Fund**** USD - 24,384,168 -
Class IAU1F USD - 9,608 -
Class IAU3F USD - 24,374,560 -
Outstanding Shares 31 March 2019 31 March 2018 31 March 2017
AQR Delphi Long-Short Equity UCITS Fund*
Class IAC1F 2,932 - -
Class IAE1F 9,500 - -
Class IAE2 34,850 - -
Class IAG1 75 - -
Class IAU1F 56,793 - -
AQR Emerging Equities UCITS Fund
Class A1 - 359,435 -
Class A2 - 255,608 901,486
Class A3 101,010 224,990 137,628
Class B3 796,565 788,396 713,359
Class C2 1,601,580 1,674,681 1,900,945
Class C3 390,887 377,377 185,446
Class E 1,327,349 1,123,823 1,562,168
AQR UCITS FUNDS
Statistical Information (Continued)
208

Outstanding Shares 31 March 2019 31 March 2018 31 March 2017
AQR Global Aggregate Bond UCITS Fund
Class IAE3F 330,545 300,513 -
Class IAG1F 1,255,047 - -
Class IAG3F 2,077,980 682,355 -
Class IAN4F 15,496,828 10,060,297 -
Class IAU1F 148,853 100 -
Class IAU3F 661,262 640,000 -
Class IDG1F 59,396 - -
AQR Global Core Equity UCITS Fund
Class A1 40,958 - -
Class B3 785,670 785,670 785,670
AQR Global Defensive Equity UCITS Fund
Class A1 33,000 33,127 34,880
Class B1 1,500 - -
Class B3 195,122 195,122 1,989,352
Class C1 50,511 35,878 10,034
Class D1 1,000 1,000 1,000
AQR Global Enhanced Equity UCITS Fund
Class A1 - 47,593 -
Class A2 40,047 150,089 200,089
Class B2 484,763 392,348 300,000
Class C2 - 236,653 487,506
AQR Global Macro Opportunities UCITS Fund**
Class IAE3 701,500 - -
Class IAG3 83,989 - -
Class IAG3F 4,823 - -
Class IAU1 25,499 - -
Class IAU1F 102 - -
Class IAU3 6,372 - -
AQR Global Relaxed Constraint Equity UCITS Fund***
Class IAU1F 30,000 - -
Class RAU3F 16,183 - -
Class RAU3FT 7,312 - -
AQR Global Risk Parity UCITS Fund
Class A1 22,702 1,570 1,570
Class A2 712,130 1,570,496 -
Class B1 1,310,979 636,612 881,485
Class B2 971,926 909,774 -
Class C1 362,587 362,587 362,587
Class C2 924,114 2,228,364 2,049,933
Class C3 - 4,574,793 365,279
Class C4 5,488,802 - -
Class D2 200,707 203,582 -
Class E2 820 820 -
Class F 1,097,917 2,226,514 2,208,116
Class RAE4F - 500 -
AQR UCITS FUNDS
Statistical Information (Continued)
209

Outstanding Shares 31 March 2019 31 March 2018 31 March 2017
AQR Managed Futures UCITS Fund
Class A 237,678 136,548 249,175
Class B 8,522 244,304 934,787
Class C 127,812 455,669 333,757
Class D 4,337 39,796 37,259
Class E 263,426 127,744 560,159
Class F 95,058 77,712 856,453
Class G 608,606 2,327,075 2,518,631
Class H2 90,727 168,196 146,261
Class J 4,474 2,149 949
Class K 169,628 209,718 486
Class L 230 1,826 1,745
Class M - - 850,000
Class IAE2F 91,187 177,236 -
Class IAG1F 8,967 32,581 -
Class IAG3F 900,819 - -
Class IAU1F 13,282 18,807 -
Class IAU3F 1,734,143 - -
AQR Style Premia: Equity Market Neutral UCITS Fund
Class A1 100 100 100
Class I1 1,800,000 1,800,000 4,005,000
Class I2 3,888,201 3,345,871 -
AQR Style Premia UCITS Fund
Class A 954,378 1,015,359 571,642
Class B 3,181,119 4,260,716 3,034,589
Class C 399,415 1,075,722 542,201
Class D 27,416 21,930 13,893
Class E 8,978,104 3,550,133 3,254,806
Class F 6,678,011 7,054,236 1,069,345
Class G - 92 1,100,592
Class H 357,204 210,204 210,000
Class I - 119,998 94,243
Class J - 44,708 37,627
Class K 1,441,015 3,834,975 3,422,466
Class M 350,711 338,227 438,577
Class N 132,493 92,149 131,318
Class W - 136,280 -
Class IAGF 447,990 394,502 -
Class RAE 19,286 12,499 -
Class RAG 116,501 82,381 -
Class RAU 14,922 6,564 -
AQR Systematic Fixed Income: US High Yield UCITS Fund
Class A1 206,296 498,895 110,722
Class A2 79 2,500 2,500
Class A3 4,431,694 3,812,954 1,000,000
Class C1 25,772 25,772 -
AQR UCITS FUNDS
Statistical Information (Continued)
210

Outstanding Shares 31 March 2019 31 March 2018 31 March 2017
AQR Systematic Total Return UCITS Fund
Class A1 523,449 651,526 185,197
Class A2 474,929 592,025 -
Class B1 692,861 921,692 287,675
Class B2 540,787 5,050,584 2,292
Class B3 1,501,300 1,495,892 1,203,978
Class C1 106,774 553,294 1,500
Class C2 1,103,713 606,075 281,742
Class C3 - 416,286 189,269
Class D1 36,890 107,425 112,201
Class IAE3F 3,948,526 - -
Class IAEFT 132 49,781 -
Class IDE1F 12,206 - -
Class IDE2F 7,062 6,871 -
Class IDG1F 165,349 - -
Class IDG2F 75,803 47,716 -
Class IDU1F 6,375 1,359 -
Class IDU2F 10,223 12,432 -
Class RACFT 100 431 -
Class RAEF 3,000 3,000 -
Class RAEFT 26,566 7,617 -
Class RAGF 100 100 -
Class RAGFT - 3,616 -
Class RAUF 346 - -
Class RAUFT 13,384 13,103 -
AQR U.S. Relaxed Constraint Equity UCITS Fund****
Class IAU1F - 100 -
Class IAU3F - 253,615 -
Net Asset Value per Share Currency 31 March 2019 31 March 2018 31 March 2017
AQR Delphi Long-Short Equity UCITS Fund*
Class IAC1F CHF 101.32 - -
Class IAE1F EUR 101.30 - -
Class IAE2 EUR 108.59 - -
Class IAG1 GBP 104.25 - -
Class IAU1F USD 110.75 - -
AQR Emerging Equities UCITS Fund
Class A1 USD - 121.50 -
Class A2 USD - 128.59 104.26
Class A3 USD 118.92 135.51 109.81
Class B3 EUR 136.66 141.88 132.62
Class C2 GBP 139.04 146.57 134.01
Class C3 GBP 112.51 118.54 108.33
Class E EUR 141.22 145.73 135.36
AQR Global Aggregate Bond UCITS Fund
Class IAE3F EUR 101.90 100.36 -
Class IAG1F GBP 103.80 - -
Class IAG3F GBP 104.29 101.32 -
Class IAN4F NOK 103.87 100.62 -
Class IAU1F USD 105.34 100.78 -
Class IAU3F USD 105.47 100.80 -
Class IDG1F GBP 104.70 - -
AQR Global Core Equity UCITS Fund
Class A1 USD 104.15 - -
Class B3 EUR 136.60 126.61 126.53
AQR UCITS FUNDS
Statistical Information (Continued)
211

Net Asset Value per Share Currency 31 March 2019 31 March 2018 31 March 2017
AQR Global Defensive Equity UCITS Fund
Class A1 USD 130.34 123.91 110.88
Class B1 EUR 103.89 - -
Class B3 EUR 146.72 126.93 130.82
Class C1 GBP 140.66 123.64 124.77
Class D1 CHF 121.91 111.20 104.24
AQR Global Enhanced Equity UCITS Fund
Class A1 USD - 111.37 -
Class A2 USD 137.49 140.63 123.87
Class B2 EUR 114.55 106.75 108.45
Class C2 GBP - 134.86 133.95
AQR Global Macro Opportunities UCITS Fund**
Class IAE3 EUR 99.30 - -
Class IAG3 GBP 98.93 - -
Class IAG3F GBP 98.48 - -
Class IAU1 USD 98.86 - -
Class IAU1F USD 101.26 - -
Class IAU3 USD 99.64 - -
AQR Global Relaxed Constraint Equity UCITS Fund***
Class IAU1F USD 93.43 - -
Class RAU3F USD 93.49 - -
Class RAU3FT USD 98.10 - -
AQR Global Risk Parity UCITS Fund
Class A1 USD 124.04 116.53 110.60
Class A2 USD 111.44 104.63 -
Class B1 EUR 115.70 112.11 108.71
Class B2 EUR 105.85 102.52 -
Class C1 GBP 120.05 114.77 110.42
Class C2 GBP 120.46 115.10 110.68
Class C3 GBP - 115.25 110.78
Class C4 GBP 101.58 - -
Class D2 CHF 104.92 102.01 -
Class E2 EUR 103.85 100.58 -
Class F EUR 113.16 109.54 106.10
Class RAE4F EUR - 98.24 -
AQR Managed Futures UCITS Fund
Class A USD 96.24 100.02 101.56
Class B EUR 89.83 96.11 99.58
Class C GBP 86.63 91.53 94.07
Class D CHF 81.73 88.09 91.68
Class E EUR 85.07 91.09 94.24
Class F GBP 94.56 99.71 102.31
Class G USD 92.26 95.69 96.93
Class H2 NOK 429.29 452.27 464.20
Class J EUR 86.57 92.64 96.06
Class K GBP 89.58 94.76 97.39
Class L USD 92.75 96.39 97.78
Class M EUR - - 99.50
Class IAE2F EUR 90.37 96.85 -
Class IAG1F GBP 91.53 97.09 -
Class IAG3F GBP 103.00 - -
Class IAU1F USD 93.72 97.79 -
Class IAU3F USD 103.11 - -
AQR UCITS FUNDS
Statistical Information (Continued)
212

Net Asset Value per Share Currency 31 March 2019 31 March 2018 31 March 2017
AQR Style Premia: Equity Market Neutral UCITS Fund
Class A1 USD 94.86 108.37 101.44
Class I1 EUR 90.52 106.73 101.32
Class I2 EUR 85.22 100.45 -
AQR Style Premia UCITS Fund
Class A USD 108.05 120.56 111.94
Class B EUR 101.56 116.76 110.54
Class C GBP 105.90 120.33 112.87
Class D CHF 100.67 116.08 110.35
Class E EUR 102.49 117.71 111.34
Class F GBP 106.12 120.46 112.90
Class G EUR - 166.46 111.57
Class H EUR 93.03 106.85 101.16
Class I USD - 111.03 104.11
Class J EUR - 104.00 99.47
Class K GBP 96.21 109.71 103.87
Class M USD 96.02 107.03 99.28
Class N CHF 88.88 102.38 97.24
Class W EUR - 100.29 -
Class IAGF GBP 89.90 102.67 -
Class RAE EUR 87.31 100.49 -
Class RAG GBP 88.72 100.91 -
Class RAU USD 90.46 101.03 -
AQR Systematic Fixed Income: US High Yield UCITS Fund
Class A1 USD 119.59 114.59 109.20
Class A2 USD 125.45 120.06 114.06
Class A3 USD 124.34 119.03 113.32
Class C1 GBP 103.99 101.36 -
AQR Systematic Total Return UCITS Fund
Class A1 USD 92.22 105.40 100.18
Class A2 USD 85.21 97.14 -
Class B1 EUR 87.55 102.99 99.95
Class B2 EUR 86.77 101.81 98.56
Class B3 EUR 88.33 103.49 100.04
Class C1 GBP 88.94 103.33 99.49
Class C2 GBP 88.58 102.65 98.59
Class C3 GBP - 104.46 100.18
Class D1 CHF 86.53 102.33 99.88
Class IAE3F EUR 103.26 - -
Class IAEFT EUR 82.11 96.46 -
Class IDE1F EUR 94.30 - -
Class IDE2F EUR 79.53 93.32 -
Class IDG1F GBP 85.58 - -
Class IDG2F GBP 83.46 96.72 -
Class IDU1F USD 86.52 98.88 -
Class IDU2F USD 81.84 93.30 -
Class RACFT CHF 80.30 95.67 -
Class RAEF EUR 81.70 96.21 -
Class RAEFT EUR 81.59 96.71 -
Class RAGF GBP 84.83 98.65 -
Class RAGFT GBP - 97.59 -
Class RAUF USD 86.44 - -
Class RAUFT USD 85.45 98.40 -
AQR UCITS FUNDS
Statistical Information (Continued)
213

Net Asset Value per Share Currency 31 March 2019 31 March 2018 31 March 2017
AQR U.S. Relaxed Constraint Equity UCITS Fund****
Class IAU1F USD - 96.08 -
Class IAU3F USD - 96.11 -
* Sub-Fund launched on 26 October 2018.
** Sub-Fund launched on 14 November 2018.
*** Sub-Fund launched on 19 September 2018.
**** Sub-Fund fully redeemed on 17 August 2018.
AQR UCITS FUNDS
Statistical Information (Continued)
214

1. General Information
(a) The Company
AQR UCITS Funds (the �Company�) is an investment company incorporated on 12 December 2011 underLuxembourg laws, as a Société d’Investissement à Capital Variable (�SICAV�) for an unlimited period oftime. The Company is governed by the provisions of Part I of the Law of 17 December 2010, as amended,governing Undertakings for Collective Investments (the �Law�). The Articles of the Company werepublished in the Memorial C, Recueil Spécial des Sociétés et Associations of the Grand Duchy ofLuxembourg on 25 January 2012 and the Company is registered with the Luxembourg Trade andCompanies’ Register under the number B 165881.
The Company is structured as an umbrella fund designed to offer investors access to a variety ofinvestment strategies through a range of separate sub-funds (the �Sub-Funds�). Each Sub-Fund maintainsa separate portfolio of investment securities, cash and other assets. Separate classes of shares are issuedwithin each Sub-Fund. The Board of Directors (the �Directors�) may authorise the creation of additionalSub-Funds and classes of shares in the future.
The Directors have appointed FundRock Management Company S.A. as the management company (the�Management Company�). The Management Company has appointed (by way of delegation) AQR CapitalManagement, LLC as the investment manager of the Company (the �Investment Manager�). TheInvestment Manager invests the assets of each of the active Sub-Funds pursuant to their respectiveinvestment objectives and policies.
The Investment Manager has appointed UBS Global Asset Management (Americas) Inc. as a sub-investment manager (the �Sub-Investment Manager�) to AQR Delphi Long-Short Equity UCITS Fund, AQRGlobal Macro Opportunities UCITS Fund, AQR Global Risk Parity UCITS Fund, AQR Managed FuturesUCITS Fund, AQR Style Premia: Equity Market Neutral UCITS Fund, AQR Style Premia UCITS Fund andAQR Systematic Total Return UCITS Fund. The Sub-Investment Manager provides investment manage-ment and advisory services to the Investment Manager with respect to the investment of the cash assetsof these Sub-Funds, and is compensated directly by the Investment Manager pursuant to the Sub-Investment Manager Agreement. None of the fees related to the services provided by the Sub-InvestmentManager are charged to the Sub-Funds.
The Investment Manager is subject to the Securities and Exchange Commission’s amended Rule 206(4)-2under the Investment Advisers Act of 1940 (the �Act”). The Investment Manager did not identify anyUnited States of America investors in the Company for the year ended 31 March 2019 and as such noreconciliation is required between generally accepted accounting principles in the United States of Americaand generally accepted accounting principles in Luxembourg.
(b) The Sub-Funds
As at 31 March 2019, the Company consists of fourteen active and one dormant Sub-Funds:
Sub-Fund Launch DateAQR Delphi Long-Short Equity UCITS Fund 26 October 2018AQR Emerging Equities UCITS Fund 13 December 2013AQR Global Aggregate Bond UCITS Fund 25 January 2018AQR Global Core Equity UCITS Fund 2 December 2014AQR Global Defensive Equity UCITS Fund 2 December 2014AQR Global Enhanced Equity UCITS Fund 15 January 2016AQR Global Macro Opportunities UCITS Fund 14 November 2018AQR Global Relaxed Constraint Equity UCITS Fund 19 September 2018AQR Global Risk Parity UCITS Fund 28 August 2012AQR Managed Futures UCITS Fund 1 October 2014AQR Style Premia: Equity Market Neutral UCITS Fund 1 February 2017AQR Style Premia UCITS Fund 1 October 2014
AQR UCITS FUNDS
Notes to the Financial Statements as at 31 March 2019
215

1. General Information (continued)
(b) The Sub-Funds (continued)
Sub-Fund Launch DateAQR Systematic Fixed Income: US High Yield UCITS Fund 2 June 2016AQR Systematic Total Return UCITS Fund 1 February 2017AQR U.S. Relaxed Constraint Equity UCITS Fund* 19 December 2017
* Sub-Fund fully redeemed on 17 August 2018.
The investment objective of AQR Delphi Long-Short Equity UCITS Fund is to invest on a long basis inattractively valued, high quality, and low beta assets and on a short basis in expensive, low quality, and highbeta assets.
The investment objective of AQR Emerging Equities UCITS Fund is to outperform the Morgan StanleyCapital International Inc. Emerging Markets Total Return Index with Net Dividends Unhedged in USD (the�Benchmark�) by an average of 200 basis points per calendar year (net of fees) over a full market cycle.The Sub-Fund intends to utilise a set of valuation, momentum, economic and additional factors to generatean investment portfolio based on asset allocation and stock selection models. The Sub-Fund will generallybe managed by both underweighting and overweighting securities, industries, countries and currenciesrelative to the Benchmark.
The investment objective of AQR Global Aggregate Bond UCITS Fund is to maximise total return throughcapital growth and income by outperforming the Bloomberg Barclays Global Aggregate Bond Index byinvesting primarily in investment grade global fixed and floating rate debt securities, using derivativestrategies where appropriate, and currency allocation.
The investment objective of AQR Global Core Equity UCITS Fund is to outperform the Morgan StanleyCapital International Inc. World Total Return Index, (Net), U.S. Dollar Unhedged by investing ininternational equities and cash. The Sub-Fund invests its assets in equity or equity-related securities ofattractively valued companies with positive momentum and a stable business.
The investment objective of AQR Global Defensive Equity UCITS Fund is to seek total return. TheSub-Fund pursues a �defensive� strategy, seeking to provide downside protection with upside potentialthrough active stock selection, risk management and diversification.
The investment objective of AQR Global Enhanced Equity UCITS Fund is to outperform the MorganStanley Capital International Inc. World Total Return Index, (Net), U.S. Dollar Unhedged by investing ininternational equities and cash.
The investment objective of AQR Global Macro Opportunities UCITS Fund is to seek positive absolutereturns through the implementation of a Global Macro strategy. Positive absolute returns seek to earn apositive total return over a reasonable period of time regardless of market conditions or general marketdirection.
The investment objective of AQR Global Relaxed Constraint Equity UCITS Fund is to outperform theMorgan Stanley Capital International Inc. World Total Return Index, (Net), U.S. Dollar Unhedged byinvesting mainly in equity securities or equity-related instruments either directly or through derivativeexposure.
The investment objective of AQR Global Risk Parity UCITS Fund is to deliver exposure to a broadlydiversified set of global risk premia covering equities, government bonds and eligible, diversifiedcommodity indices. The Sub-Fund seeks to implement a broadly diversified and higher long-termrisk-adjusted return combination of market exposures and then levers this combination to the desired risklevel.
AQR UCITS FUNDS
Notes to the Financial Statements as at 31 March 2019 (continued)
216

1. General Information (continued)
(b) The Sub-Funds (continued)
The investment objective of AQR Managed Futures UCITS Fund is to produce attractive risk-adjustedreturns while maintaining low-to-zero long-term average correlation to traditional markets. The Sub-Fundintends to invest in a diversified portfolio of equity, currency and fixed income instruments, both long andshort, in an effort to provide exposure and performance that is, on average, lowly correlated to the equitymarkets.
The investment objective of AQR Style Premia: Equity Market Neutral UCITS Fund is to provide investorswith the returns from the potential gains from its long and short equity positions. The Sub-Fund intends tobe market or beta neutral, which means that the Sub-Fund seeks to achieve returns that are not closelycorrelated with the returns of the equity markets in which the Sub-Fund invests. The Sub-Fund intends totarget a portfolio beta of zero over a normal business cycle.
The investment objective of AQR Style Premia UCITS Fund is to produce high risk-adjusted returns whilemaintaining low-to-zero correlation to traditional markets. The Sub-Fund will invest in a broad range ofinstruments, both long and short, within the following asset groups: equities, bonds, interest rates andcurrencies.
The investment objective of AQR Systematic Fixed Income: US High Yield UCITS Fund is to outperformthe Bank of America Merrill Lynch U.S. High Yield Index (�H0A0�). The Sub-Fund intends to invest in creditor credit-related securities of attractively valued companies with positive momentum, attractive carry anda stable business while also providing some downside protection.
The investment objective of AQR Systematic Total Return UCITS Fund is to seek total returnscommensurate with its long-term risk target. The Sub-Fund will invest in a diversified portfolio and allocateits assets to three investment sub-strategies: Risk-Balance Market Exposure Strategy, Multi-Asset TrendStrategy, and Market Neutral Security Selection Strategy.
The investment objective of AQR U.S. Relaxed Constraint Equity UCITS Fund was to outperform theRussell 1000® Index through the implementation of a disciplined set of strategies based on value,momentum, economic and additional factors based on stock and industry selection models.
On 17 August 2018, all outstanding shares were redeemed from AQR U.S. Relaxed Constraint EquityUCITS Fund. Consequently, on 20 August 2018, the Directors of the Sub-Fund resolved to maintain theshare classes inactive. No new share classes were issued and the Sub-Fund remained dormant untilre-purposed to AQR Sustainable Emerging Relaxed Constraint Equity UCITS Fund. See Note 13 for furtherdetails.
(c) The Shares
Each Sub-Fund may offer more than one class of shares. Each class of shares may have different featureswith respect to a number of criteria, including but not limited to subscription, redemption, minimum holding,fee structure, currency and dividend policy. Within each Sub-Fund, individual classes of shares may havea currency of denomination that differs from the reference currency of the Sub-Fund. Subscriptions andredemptions that are recognised in the current year but are received or paid after the year end are reflectedas subscriptions receivable and redemptions payable, respectively, on the Statements of Assets andLiabilities. The Investment Manager may enter into certain transactions to hedge a Sub-Fund’s exposureto foreign exchange risk where classes of shares are denominated in a currency other than the referencecurrency of the respective Sub-Fund. The classes available as at 31 March 2019 for each Sub-Fund areset out in the relevant Supplement to the Prospectus.
AQR UCITS FUNDS
Notes to the Financial Statements as at 31 March 2019 (continued)
217

2. Significant Accounting Policies
(a) Presentation of the Financial Statements
The financial statements of the Company are prepared in accordance with Luxembourg legal andregulatory requirements relating to Undertakings for Collective Investment Funds.
(b) Combined Financial Statements
The accounts of the Company are expressed in Euro (�EUR�) and the accounts of each Sub-Fund isexpressed in the reference currency of the respective Sub-Fund. The Combined Statements of Assets andLiabilities, the Combined Statements of Operations and the Combined Statements of Changes in NetAssets are the sum of the Statements of Assets and Liabilities, the Statements of Operations andStatements of Changes in Net Assets of each Sub-Fund converted into the reference currency of theCompany using the exchange rate prevailing at year end, and average rate for the year, respectively.
(c) Valuation of Investments
All securities and other investments are recorded at their estimated fair value, as described in Note 5.
(d) Swing Pricing
A Sub-Fund may incur dilution of the Net Asset Value (�NAV�) per share due to investors buying or sellingshares in a Sub-Fund at a price that does not reflect dealing and other costs that arise when security tradesare undertaken by the Investment Manager to accommodate cash inflows or outflows.
In order to counter this impact, the Directors have adopted a swing pricing share mechanism to protect theinterests of shareholders in the Sub-Fund. If on any valuation day, the aggregate net transactions in sharesof a Sub-Fund exceed a pre-determined threshold percentage (the �Threshold�), the NAV per share maybe adjusted upward or downward to reflect net inflows and net outflows, respectively. The extent of theprice adjustment (the �Factor�) will be set by the Directors and will reflect estimated dealing and other costswhich would be incurred on the effective acquisition or disposal of assets in the Sub-Fund. The Factor willbe reviewed on a periodic basis by the Directors.
In accordance with the Prospectus, swing pricing is in effect during the year ended 31 March 2019 in AQREmerging Equities UCITS Fund and AQR Systematic Fixed Income: US High Yield UCITS Fund. Swingpricing is included in the net proceeds from share transactions in the Statements of Changes in Net Assets.The NAV per share as disclosed in the Statistical Information represents the published NAV per share. TheStatements of Assets and Liabilities discloses the total net assets before and after swing pricingadjustment.
As at 31 March 2019, swing pricing was applied on the NAV per share of AQR Emerging Equities UCITSFund.
(e) Cash
Cash comprises U.S. Dollar (�USD�) and foreign currency deposits held at a custodian bank which mayexceed insured limits. The Sub-Funds are subject to risk to the extent that the institutions may be unableto fulfill their obligations.
(f) Due from/to Broker(s)
Due from/to broker(s) represents cash balances pledged to, or cash balances received from, theSub-Funds’ prime brokers and counterparties, including cash held for securities trading, as well as cashpledged or received as collateral at counterparties for over-the-counter (�OTC�) derivative transactions.The Sub-Funds are subject to credit risk should the counterparties be unable to meet their obligations tothe Sub-Funds.
AQR UCITS FUNDS
Notes to the Financial Statements as at 31 March 2019 (continued)
218

2. Significant Accounting Policies (continued)
(f) Due from/to Broker(s) (continued)
The table below summarises the cash collateral that is pledged/(received) at each relevant broker for eachSub-Fund as of 31 March 2019. The amounts below do not include any non-cash collateral.
Sub-Fund Broker
Collateral forOTC
DerivativeTransactions*
AQR Delphi Long-Short Equity UCITS FundCITI $78,082**
JPMC 4,195,080**MSIP 2,027,630**
AQR Emerging Equities UCITS Fund
CITI (3,246,330)GSIN 8,756,421**JPMC 9,178,418**MLIN 3,801,232**
AQR Global Aggregate Bond UCITS FundCITI (12,147,324)
JPMC (68,444)**MSIP (11,735)
AQR Global Macro Opportunities UCITS Fund
CITI 2,434,949**GSIN 188,503**JPMC 6,674,278**MLIN 2,401,518**MSIP 391,595**
AQR Global Relaxed Constraint Equity UCITS FundCITI (18,047)
JPMC 662,734**
AQR Global Risk Parity UCITS Fund
BARC 49,760,925CITI 17,328,157**
GSIN 2,638,220**JPMC 32,744,756**MLIN 5,258,118**
AQR Managed Futures UCITS Fund
CITI 3,530,349**GSIN 4,564,798**JPMC 7,992,667**MLIN 1,330,594**
AQR Style Premia: Equity Market Neutral UCITS FundCITI 12,885,384**
JPMC 92,089,379**MLIN 28,280,607**
AQR Style Premia UCITS Fund
CITI 42,239,699**GSIN 442,340,817**JPMC 74,385,576**MLIN 144,403,133**
AQR Systematic Fixed Income: US High Yield UCITS Fund CITI (9,828)
AQR UCITS FUNDS
Notes to the Financial Statements as at 31 March 2019 (continued)
219

2. Significant Accounting Policies (continued)
(f) Due from/to Broker(s) (continued)
Sub-Fund Broker
Collateral forOTC
DerivativeTransactions*
AQR Systematic Total Return UCITS Fund
CITI $14,840,678**GSIN 1,557,259**JPMC 26,725,314**MLIN 70,664,087**MSIP 112,280,585**
*Includes unsettled cash on OTC derivative transactions, if any.**A portion of the collateral is held in a tri-party account.
(g) Deposits with/from Brokers for Exchange-Traded and Centrally Cleared Derivatives
Upon entering into an exchange-traded or centrally cleared derivative contract, a Sub-Fund is required topledge cash or securities as collateral to a central clearinghouse (�CCP�), through a broker, in accordancewith the initial margin requirements of the CCP. At year end, the balances of the initial margin requirementsat each broker, excluding the value of any securities pledged as collateral, are recorded as depositswith/from brokers for exchange-traded and centrally cleared derivatives on the Statements of Assets andLiabilities. Any security that has been pledged as collateral is identified as an asset in the Statements ofAssets and Liabilities as a component of investments, at fair value.
As at 31 March 2019, the Sub-Fund(s) pledged/(received) collateral as follows:
Sub-Fund BrokerDeposits with/from
Broker
AQR Emerging Equities UCITS FundBARC $2,032,650JPPC 3,060
AQR Global Aggregate Bond UCITS FundCITG 713,161JPPC 1,791,305
AQR Global Core Equity UCITS Fund JPPC 126,707AQR Global Defensive Equity UCITS Fund JPPC 54,395
AQR Global Enhanced Equity UCITS FundGSCO 16,261JPPC 41,250
AQR Global Macro Opportunities UCITSFund
CITG 972,275GSCO 2,480,663JPPC 6,575,992CSSL 1,591,472
AQR Global Relaxed Constraint EquityUCITS Fund JPPC 6,875
AQR Global Risk Parity UCITS FundBARC 1,998,558GSCO 1,454,249JPPC 16,951,291
AQR Managed Futures UCITS FundBARC 6,006,569JPPC 12,586,742
AQR Style Premia: Equity Market NeutralUCITS Fund JPPC 304
AQR Style Premia UCITS FundBARC 79,554,873JPPC 149,113,209
AQR UCITS FUNDS
Notes to the Financial Statements as at 31 March 2019 (continued)
220

2. Significant Accounting Policies (continued)
(g) Deposits with/from Brokers for Exchange-Traded and Centrally ClearedDerivatives (continued)
Sub-Fund BrokerDeposits with/from
BrokerAQR Systematic Fixed Income: US HighYield UCITS Fund
CITG $4,348,617JPPC 414,641
AQR Systematic Total Return UCITS Fund
BARC 7,044,253CITG 6,624,185
GSCO 3,397,397JPPC 17,262,729
(h) Foreign Currency Translation
The combined accounts of the Company are maintained in EUR, the reference currency of the Company.The financial statements of the Sub-Funds are expressed in USD, which is the reference currency of theSub-Funds.
Any value not expressed in the reference currency of the relevant Sub-Fund shall be converted into thereference currency of the relevant Sub-Fund at the prevailing exchange rate that the Directors shalldetermine to be appropriate.
Income and expenses expressed in currencies other than the reference currency of the respectiveSub-Fund are converted at exchange rates prevailing at the transaction date. The acquisition cost ofsecurities expressed in a currency other than the reference currency of the respective Sub-Fund istranslated at the exchange rates prevailing on the date of purchase. Assets and liabilities expressed incurrencies other than the reference currency of the respective Sub-Fund are converted at exchange ratesprevailing at the year end.
The respective Sub-Fund does not separately disclose the portion of the results of operations arising fromchanges in the foreign exchange rates on investments and derivatives from the fluctuations that result fromchanges in the market prices of investments and derivatives held or sold during the year. Accordingly, suchforeign currency gains/(losses) are included in the applicable reported net realised gain/(loss) oninvestments and derivatives and net change in unrealised appreciation/(depreciation) on investments andderivatives on the Statements of Operations.
Net realised gain/(loss) on foreign currency transactions recorded on the Statements of Operations arisefrom the disposition of foreign currency, and the difference between the amount of dividends, interest andforeign withholding taxes recorded on each Sub-Fund’s books on the transaction date and the USDequivalent of the amounts actually received or paid. Net changes in unrealised appreciation/(depreciation)on foreign currency translation reported on the Statements of Operations arise from changes (due to thechanges in the exchange rate) in the value of foreign currency and assets and liabilities (other thaninvestments) denominated in foreign currencies, which are held at year end.
AQR UCITS FUNDS
Notes to the Financial Statements as at 31 March 2019 (continued)
221

2. Significant Accounting Policies (continued)
(h) Foreign Currency Translation (continued)
The following exchange rates (against USD) were used to convert the investments denominated incurrencies other than USD.
The exchange rates on 31 March 2019 for the Sub-Funds are as follows:
1 USD = 3.673000 AED – United Arab Emirates Dirham1.410835 AUD – Australian Dollar3.896950 BRL – Brazilian Real1.335800 CAD – Canadian Dollar0.995650 CHF – Swiss Franc
680.335000 CLP – Chilean Peso6.715750 CNH – Chiness Yuan
22.994900 CZK – Czech Koruna6.648750 DKK – Danish Krone0.890670 EUR – Euro0.769320 GBP – British Pound7.849950 HKD – Hong Kong Dollar
286.087800 HUF – Hungarian Forint14,240.000000 IDR – Indonesian Rupiah
3.629250 ILS – Israeli New Shekel69.275000 INR – Indian Rupee
110.865000 JPY – Japanese Yen1,135.100000 KRW – South Korean Won
19.315150 MXN – Mexican Peso4.082500 MYR – Malaysian Ringgit8.622150 NOK – Norwegian Krone1.468213 NZD – New Zealand Dollar
52.510000 PHP – Philippine Peso3.831750 PLN – Polish Zloty3.640750 QAR – Qatari Rial9.271650 SEK – Swedish Krona1.354850 SGD – Singapore Dollar
31.735000 THB – Thai Baht5.638000 TRY – Turkish Lira
30.820500 TWD – New Taiwan Dollar14.473750 ZAR – South African Rand
The following exchange rate (against EUR) is used to calculate the combined total in the Statements ofAssets and Liabilities for all Sub-Funds.
1 EUR = 1.122750 USD
The following average exchange rate (against EUR) is used to calculate the combined total in theStatements of Operations and in the Statements of Changes in Net Assets for all Sub-Funds.
1 EUR = 1.158014 USD
AQR UCITS FUNDS
Notes to the Financial Statements as at 31 March 2019 (continued)
222

2. Significant Accounting Policies (continued)
(i) Investment Transactions and Related Income and Expense
Investment transactions are accounted for on the trade date (the date the order to buy or sell is executed).Realised gains and losses are calculated using the specific identification cost relief methodology andinclude transaction costs. Interest income is recorded on an accrual basis using the effective interestmethod, which results in coupon interest being adjusted for amortisation of premiums and accretion ofdiscounts, where applicable. Interest expense is accrued daily and includes the amortisation of premiumsand accretion of discounts, where applicable. Dividend income/(expense), net of foreign taxes withheld, ifany, is recorded on the ex-dividend date or when a Sub-Fund receives notification of the ex-date dividend.Interest purchased and interest sold on bonds is included in interest receivable and interest payable,respectively, in the Statements of Assets and Liabilities. For inflation-linked bonds, interestincome/(expense) is earned on the principal amount and adjusted for the changes in the relevant consumerprice index.
(j) Multi-Class Operations
In calculating the NAV per share of each class of shares, income, non-class specific expenses, realisedand unrealised gains and losses are allocated daily to each class of shares based on the proportion of netassets of each class at the beginning of each day. Each Sub-Fund is charged for those expenses that aredirectly attributable to that Sub-Fund. Company level expenses are allocated among the Sub-Funds basedon the ratio of average net assets or another reasonable methodology.
The Sub-Funds record distributions received in excess of income from underlying investments as areduction of cost of investments and/or realised gains. Such amounts are based on estimates (if actualamounts are not available) and actual amounts of income, realised gains and returns of capital may differfrom the estimated amounts. The Sub-Funds adjust the estimated amounts of the components ofdistributions (and consequently net investment income) as necessary once the issuers provide informationabout the actual composition of the distributions.
3. Investments and Other Securities
(a) Inflation-Indexed Bonds
Certain Sub-Funds may invest in inflation-indexed bonds which are adjusted for inflation through periodicincreases or decreases in the security’s interest accruals, face amount, or principal redemption value, byamounts corresponding to the rate of inflation as measured by an index.
(b) Defaulted Securities and Distressed Investments
Certain Sub-Funds may hold defaulted securities or other securities which were placed in non-accrualstatus as the collection of a portion or all of the interest has been deemed to be uncollectible. Debtobligations may be placed on non-accrual status and related interest income may be reduced by ceasingcurrent accruals and writing off interest receivable when the collection of a portion of interest has becomedoubtful based on consistently applied procedures. A debt obligation is removed from non-accrual statuswhen the issuer resumes interest payments or when collectability of interest is probable. The Sub-Fundsmay invest in distressed investments, which are issued by companies that are, or might be, involved inreorganisations or financial restructurings, either out of court or in bankruptcy.
4. Derivative Instruments and Activities
(a) Forward Foreign Exchange Contracts
Certain Sub-Funds buy and sell forward foreign exchange contracts, which are agreements between twoparties to buy and sell currencies at a set price on a future date. These contracts are used to protect againsta decline in value relative to the USD of the currencies in which portfolio securities are denominated or
AQR UCITS FUNDS
Notes to the Financial Statements as at 31 March 2019 (continued)
223

4. Derivative Instruments and Activities (continued)
(a) Forward Foreign Exchange Contracts (continued)
quoted (or an increase in the value of a currency in which securities a Sub-Fund intends to buy aredenominated, when a Sub-Fund holds cash reserves and short-term investments), to hedge the exposureto foreign currency risk where classes of shares are denominated in currencies other than USD, or for otherinvestment purposes. The USD value of forward foreign exchange contracts is determined using currentforward currency exchange rates supplied by an independent pricing service. The fair value of the contractwill fluctuate with changes in currency exchange rates. The contract is marked to market daily and thechange in fair value is recorded as unrealised appreciation/(depreciation) on forward foreign exchangecontracts. When the contract is closed, the Sub-Funds record a realised gain/(loss) on forward foreignexchange contracts equal to the difference between the value of the contract at the time it was opened andthe value at the time it was closed.
The Sub-Funds could be exposed to risk if the value of the currency changes unfavourably, if thecounterparties to the contracts are unable to meet the terms of their contracts or if the Sub-Funds areunable to enter into a closing position. Risks may exceed amounts recognised on the Statements of Assetsand Liabilities. Non-deliverable forward foreign exchange contracts are settled with the counterparty inUSD without the delivery of foreign currency. Forward foreign exchange contracts outstanding at year end,if any, are disclosed in each Sub-Fund’s Schedule of Investments.
(b) Futures Contracts
Certain Sub-Funds invest in futures contracts as part of their primary investment strategy and to equitisetheir cash flows. Investments in futures may increase or decrease exposure to a particular market. In theevent of a bankruptcy or insolvency of a futures commission merchant that holds margin on behalf of theSub-Funds, the Sub-Funds may not be entitled to the return of all of the margin owed to the Sub-Funds,potentially resulting in a loss. A change in fair value of an open futures contract is recorded on theStatements of Operations as a net change in unrealised appreciation/(depreciation) on futures contracts.When futures contracts are closed or expire, a net realised gain/(loss) on futures contracts is recorded onthe Statements of Operations which represents the difference between the value of the futures contractsat the time they were opened and the value at the time they closed or expired.
The use of long futures contracts subjects the Sub-Funds to risk of loss in excess of variation margins onthe Statements of Assets and Liabilities. The use of short futures contracts subjects the Sub-Funds tounlimited risk of loss. Futures contracts outstanding at year end, if any, are disclosed in each Sub-Fund’sSchedule of Investments.
(c) Swap Contracts
Certain Sub-Funds engage in various swap transactions to manage risks within their portfolio or as analternative to direct investments. Swap transactions may be privately negotiated in the OTC market wherepayments are settled through direct payments between the Sub-Fund and the counterparty. By contrast,certain swap transactions are subject to mandatory central clearing (�centrally cleared swaps�). Theseswap contracts are executed through a derivatives clearing member (�DCM�), acting in an agency capacity,and submitted to a CCP, in which case all payments are settled with the CCP through the DCM.
A Sub-Fund’s use of swap contracts may create additional risks beyond those that would exist if theSub-Fund invested in the underlying positions directly, including: market risk related to unfavourablechanges in interest rates or in the price(s) of the underlying security(ies); credit risk related to thecounterparty’s failure to perform under contract terms; and liquidity risk related to the lack of a liquid marketfor the swap contracts, which may limit the ability of a Sub-Fund to close out its position(s).
AQR UCITS FUNDS
Notes to the Financial Statements as at 31 March 2019 (continued)
224

4. Derivative Instruments and Activities (continued)
(c) Swap Contracts (continued)
(i) Credit Default Swap Contracts
Certain Sub-Funds enter into credit default swap contracts to provide a measure of protection against riskof loss following a default, or other credit event in respect of issuers within an underlying index or a singleissuer, or to gain credit exposure to an underlying index or issuer. In a credit default contract, the protectionbuyer typically makes an up-front payment and a periodic stream of payments to a counterparty, theprotection seller, in exchange for the right to receive a contingent payment upon the occurrence of a creditevent on the reference obligation or all other equally ranked obligations of the reference entity. Creditevents are contract specific but may include bankruptcy, failure to pay, restructuring and obligationacceleration. The credit default contracts are marked to market daily and the change, if any, is recorded asan unrealised appreciation/(depreciation) on swap contracts on the Statements of Operations. Upon theoccurrence of a credit event, the difference between the par value and fair value of the reference obligation,net of any proportional amount of the up-front payment, is recorded as realised gain/(loss) on swapcontracts in the Statements of Operations.
Implied credit spreads are used to determine the value of credit default swap contracts and reflect the costof buying/selling protection, which may include up-front payments made to enter into the contract.Therefore, higher spreads indicate a greater likelihood that a seller will be obligated to perform (i.e., makepayment) under the swap contract. Implied credit spreads for credit default swap contracts on creditindexes are linked to the weighted average spread across the underlying reference obligations included ina particular index.
Risks of loss may exceed amounts recognised on the Statements of Assets and Liabilities. A Sub-Fund’smaximum risk of loss from counterparty risk, either as the protection seller or as the protection buyer, is thefair value of the contract. This risk may be mitigated by having a master netting arrangement between thespecific Sub-Fund and the counterparty. The CCP acts as the counterparty to each centrally cleared swaptransaction, therefore credit risk is limited to the failure of the clearinghouse. Where a Sub-Fund is a sellerof protection, the maximum potential amount of future payments the Sub-Fund may be required to makeis equal to the notional amount of the relevant credit default contract. The Sub-Fund’s risk of lossassociated with these instruments may exceed their value, as recorded in the Statements of Assets andLiabilities. In certain circumstances, a Sub-Fund may enter into offsetting credit default contracts whichwould mitigate its risk of loss. Credit default contracts outstanding, if any, are disclosed in each Sub-Fund’sSchedule of Investments.
(ii) Interest Rate Swap Contracts
Certain Sub-Funds enter into interest rate swap contracts as part of their investment strategy. Interest rateswap contracts generally involve agreements to exchange fixed and floating payment obligations, withoutthe exchange of the underlying notional amounts. Interest rate swap agreements are privately negotiatedin the OTC market or may be executed in a multilateral or other trade facility platform, such as a registeredexchange (centrally cleared swaps). Periodic payments received (paid) by the Sub-Funds are recorded asrealised gains/(losses). Interest rate swap contracts are marked to market daily and the change is recordedas a change in unrealised appreciation/(depreciation) on swap contracts in the Statements of Operations.The Sub-Funds’ risk of loss associated with these instruments may exceed their value, as recorded in theStatements of Assets and Liabilities. Non-deliverable interest rate swap contracts are settled with thecounterparty in USD without the delivery of foreign currency. Centrally cleared interest rate swap contractsmay have forward effective dates. The amortisation of the upfront premiums (if applicable) and paymentsrelated to these swap contracts begin on the effective date of the contract. Interest rate swap contractsoutstanding, if any, are disclosed in each Sub-Fund’s Schedule of Investments.
(iii) Total Return Swap Contracts
Certain Sub-Funds invest in total return swap contracts to obtain leverage or obtain exposure to the returnsof the underlying referenced instrument without actually owning the underlying position. Total return swapcontracts are two-party contracts that generally obligate one party to pay the positive return and the other
AQR UCITS FUNDS
Notes to the Financial Statements as at 31 March 2019 (continued)
225

4. Derivative Instruments and Activities (continued)
(c) Swap Contracts (continued)
(iii) Total Return Swap Contracts (continued)
party to pay the negative return on a specified reference security, security index or index component duringthe period of the swap. Total return swap contracts are marked to market based on the value of theunderlying reference entity and the change, if any, is recorded as a change in unrealisedappreciation/(depreciation) on swap contracts on the Statements of Operations. Total return swapcontracts normally do not involve the delivery of securities or other underlying assets. If the other party toa total return swap defaults, a Sub-Fund’s risk of loss consists of the net amount of payments that suchSub-Fund is contractually entitled to receive, if any. The use of long total return swap contracts subjects theSub-Funds to risk of loss in excess of the amounts shown on the Statements of Assets and Liabilities. Theuse of short total return swaps subjects the Sub-Funds to unlimited loss. Periodic payments received orpaid by the Sub-Funds are recorded as realised gains or losses. Total return swap contracts outstandingat year end, if any, are disclosed in each Sub-Fund’s Schedule of Investments.
(iv) Total Return Basket Swap Contracts
Certain Sub-Funds may enter into a total return basket swap agreement to obtain exposure to a portfolioof long and/or short securities. Under the terms of the agreement, the swap is designed to function as aportfolio of direct investments in long and short equity or fixed income positions. The notional value of eachcomponent represents the fair value at year end. The Sub-Funds have the ability to trade in and out of longand short positions within the swap and will receive all of the economic benefits and risks equivalent todirect investments in these positions such as: capital appreciation/(depreciation), corporate actions, anddividends and interest received and paid, all of which are reflected in the swap value. The swap value alsoincludes financing charges and credits related to the notional values of the long and short positions andcash balances within the swap. Finance charges and credits are based on defined market rates plus orminus a specified spread. Positions within the swap are reset periodically, and financing costs are resetmonthly. During a reset, any realised gains/(losses) from positions, income, proceeds from corporateactions and accrued financing costs may become available for cash settlement between the Sub-Fundsand the swap counterparty. Prior to the reset, these amounts are included as a component of the fair valuein net cash and other receivables/(payables). Cash settlement in and out of the swap may occur at a resetdate or any other date, at the discretion of the Sub-Funds and the counterparty, over the life of theagreement, and is generally determined based on limits and thresholds established as part of the masteragreement between the Sub-Funds and the counterparty. The maturity dates are measured from thecommencement of investment in each underlying portfolio swap positions. A change in the fair value of atotal return basket swap contract is recognised as net change in unrealised appreciation/(depreciation) onswap contracts in the Statements of Operations. Cash settlements between a Sub-Fund and thecounterparty are recognised as net realised gain/(loss) on swap contracts in the Statements of Operations.Total return basket swap contracts outstanding at year end, if any, are listed after each Sub-Fund’sSchedule of Investments.
(d) To Be Announced Commitments
Certain Sub-Funds may invest in To Be Announced (“TBA”) commitments. TBA commitments are forwardagreements for the purchase or sale of mortgage-backed securities for a fixed price, with payment anddelivery on an agreed upon future settlement date. The term TBA is derived from the fact that the actualmortgage-backed securities that will be delivered to fulfill a TBA commitment are not designated at the timethe trade is made and settlement of the securities often takes place after the customary settlement periodfor mortgage-backed securities. The price and specified terms, including issuer, rate and mortgage termsof the underlying securities, as well as the date when the securities will be delivered and paid for are fixedat the time the transaction is negotiated. The actual pool of mortgage-backed securities to be delivered isannounced 48 hours prior to the established trade settlement date. Settlement of TBA commitments canoccur in two ways: (i) taking or making delivery of mortgage pools/securities; or (ii) pairing-off with anoffsetting trade for cash settlement. The Sub-Funds may receive compensation for interest forgone in thepurchase of a delayed delivery security.
AQR UCITS FUNDS
Notes to the Financial Statements as at 31 March 2019 (continued)
226

4. Derivative Instruments and Activities (continued)
(d) To Be Announced Commitments (continued)
Investing in TBA commitments, which are accounted for as derivative contracts, involve a risk of loss dueto changes in the value of the security prior to the settlement date as well as the risk that the counterpartyto the transaction will not perform its obligations. The Sub-Funds are subject to this risk whether or not theSub-Funds take delivery of the positions on the settlement date for a transaction. TBA commitmentsoutstanding at year end, if any, are disclosed in each Sub-Fund’s Schedule of Investments.
Master Securities Forward Transaction Agreements (each, an “MSFTA”) are entered into in order to governTBA commitments. An MSFTA typically contains, among other things, collateral posting terms and nettingprovisions in the event of default and/or termination event.
(e) Master Futures Client Account Agreements
Master Futures Client Account Agreements including an Addendum for Cleared Derivatives (“FCM MasterAgreements”) govern exchange-traded futures transactions, exchange-traded options transactions andcentrally cleared derivative transactions which are cleared through CCPs. On a daily basis, a CCP clearstrades that it has received from brokers that are clearing members of the respective CCP and areregistered as swap/futures commission merchants with the Commodity Futures Trading Commission(CFTC), or other applicable regulator. The relevant Sub-Funds therefore interface with these brokers inorder to trade exchange-traded or centrally cleared derivatives.
Upon entering into an exchange-traded or centrally cleared derivative contract a Sub-Fund may pledgecash and/or securities to a trading account as collateral to a CCP, through a broker, in accordance with theinitial margin requirements of the CCP. Exchange-traded and centrally cleared derivative contracts arerevalued at least daily, and as such, the net appreciation or depreciation of the derivative contracts causesthe value of the respective trading account to move either above or below the initial margin requirement.In accordance with the FCM Master Agreements, on a daily basis each relevant Sub-Fund will pay orreceive cash in an amount that will bring the total value of each trading account back in line with therespective initial margin requirement. Such receipts or payments of cash are known as variation margin.Variation margin is determined separately for exchange-traded futures and centrally cleared swaps andcannot be netted. The movement of variation margin between each relevant Sub-Fund and the respectivebrokers usually occurs the morning after the close of a trading session, and therefore at the end of eachday, the total value of a trading account is greater than the initial margin requirement by an amount equalto the current day’s net change in unrealised appreciation or depreciation of the derivative contracts. Atreporting year end, the amount that will be paid to, or received from the relevant brokers, on the morningafter the close of a trading session is reflected as a variation margin receivable or variation margin payable,as applicable, on the Statements of Assets and Liabilities.
(f) ISDA Master Agreements
International Swaps and Derivatives Association, Inc. Master Agreements and Credit Support Annexes(“ISDA Master Agreements”) govern OTC derivative transactions entered into between a Sub-Fund and acounterparty. ISDA Master Agreements maintain provisions for general obligations, representations,netting of settlement payments, agreements to deliver supporting documents, collateral transfer andevents of default or termination. ISDA Master Agreements contain termination events applicable to therelevant Sub-Fund or the counterparty. Such events may include a decline in the relevant Sub-Fund’scapital below a specified threshold over a certain period of time or a decline in the counterparty’s long termand short-term credit ratings below a specified level, respectively. In each case, upon occurrence, the otherparty may elect to terminate early and cause settlement of all OTC swap and foreign exchange contractsoutstanding, including the payment of any losses and costs resulting from such early termination, asreasonably determined by the terminating party. Any decision by a party to elect early termination couldimpact a Sub-Fund’s future derivative activity.
AQR UCITS FUNDS
Notes to the Financial Statements as at 31 March 2019 (continued)
227

4. Derivative Instruments and Activities (continued)
(f) ISDA Master Agreements (continued)
Collateral pledged by a Sub-Fund for OTC derivatives pursuant to an ISDA Master Agreement issegregated by the Sub-Fund’s custodian and identified as an asset in the Statements of Assets andLiabilities either as a component of investments, at fair value (securities) or in due from brokers (cash).Segregation of the Sub-Fund’s collateral in the custodian account helps mitigate counterparty risk.
Collateral posted for the benefit of a Sub-Fund for OTC derivatives pursuant to an ISDA Master Agreementis held by a custodian of the Sub-Fund. Cash collateral received is reflected as a liability within due tobrokers in the Statements of Assets and Liabilities.
5. Fair Value Measurement
(a) Investment Valuation Policies
The NAV per share of each class within a Sub-Fund is computed by dividing the total current value of theassets of the Sub-Fund attributable to a class, less class liabilities, by the total number of shares of thatclass of the Sub-Fund outstanding at the time the computation is made. The frequency of the NAV pershare computation of each class within a Sub-Fund is in accordance with each Sub-Fund’s relevantSupplement to the Prospectus. In addition, the NAV per share of each class within a Sub-Fund may becalculated on any other day as the Directors may determine as long as shareholders are notified inadvance. For purposes of calculating the NAV, portfolio securities and other financial derivative instrumentsare valued using valuation methods as adopted by the Directors.
The Directors have delegated responsibility for applying approved valuation policies to the InvestmentManager, subject to oversight by the Directors. The Investment Manager has established a ValuationCommittee (the “VC”) whose function is to administer, implement and oversee the continualappropriateness of valuation approaches applied and the determination of adjustments to the fair valuationof portfolio securities and other financial derivative instruments in good faith after consideration of marketfactor changes and events affecting issuers. The VC is functionally independent from the InvestmentManager. The Investment Manager performs a series of activities to provide reasonable assurance of theaccuracy of prices including: (i) periodic vendor due diligence meetings, review of approaches andtechniques, new developments and processes at vendors, (ii) review of daily comparison of securityvaluation versus prior day for all securities that exceeded established thresholds, (iii) review of third partymodel prices against internal model prices, and (iv) review the results of back testing.
Where market quotes are readily available, fair value is generally determined on the basis of official closingprices or the last reported sales prices, or if no sales are reported, based on quotes obtained from pricingservices or established market makers. Where market quotations are not readily available, or if anavailable market quotation is determined not to reflect fair value, securities or financial derivatives arevalued at fair value, as determined in good faith by the VC in accordance with the valuation proceduresapproved by the Directors. Using fair value to price a security may require subjective determinations aboutthe value of a security that could result in a value that is different from a security’s most recent closing priceand from the prices used by other funds to calculate their net assets. It is possible the estimated valuesmay differ significantly from the values which would have been used had an active ready market for theinvestments existed. These differences could be material.
(b) Valuation Techniques
The following inputs and techniques may be used by the Sub-Funds to value the portfolio securities andother financial derivative instruments held by the Sub-Funds:
Equity securities, rights, exchange options, warrants, exchange-traded funds (“ETFs”) and closed-endinvestment companies, are valued at the last quoted sales prices or official closing prices taken from theprimary market, or composite in which each security trades. Investments in other investment funds that do
AQR UCITS FUNDS
Notes to the Financial Statements as at 31 March 2019 (continued)
228

5. Fair Value Measurement (continued)
(b) Valuation Techniques (continued)
not have readily determinable fair values are fair valued using their net asset value per share. Theinvestment objective of these other investment funds is to maintain liquidity, preserve capital and generatepositive returns. Withdrawals may be made from the other investment funds daily.
Securities listed on a recognised stock exchange or dealt on any other regulated market that operatesregularly and is open to the public, are valued at the last sale price or official market closing price on theprimary exchange on which the instrument is traded before the NAV of each Sub-Fund is calculated on avaluation date (4PM CET).
In accordance with procedures adopted by the Directors, certain Sub-Funds may apply daily fair valuefactors, furnished by an independent pricing service, to certain equity securities that are solely traded ona foreign exchange in the Asian markets to account for the market movement between the close of theforeign market and when the NAV of each Sub-Fund is calculated, unless the Directors determine that theuse of another valuation methodology is appropriate. The pricing service uses statistical analysis andquantitative models to adjust local market prices using factors such as subsequent movement and changesin the pricing of indices, ADR, futures contracts and exchange rates in other markets in determining fairvalue as at the time that the Sub-Funds calculate their NAV.
Fixed income securities (other than certain short-term investments maturing in less than 60 days) and otherinvestments that trade in markets that are not considered to be active, are valued based on quoted marketprices, dealer quotations or alternative pricing sources. These include certain U.S. government andsovereign obligations, most government agency securities, investment-grade corporate bonds, moneymarket funds and less liquid listed equities. Corporate and sovereign bonds and other fixed incomeinstruments are valued at estimated fair value using the latest mid prices or evaluated quotes furnished byindependent pricing services, as well as quotations from counterparties and other market participants.Evaluated quotes are based on a matrix system, which may consider such factors as quoted prices foridentical or similar assets, yields, maturities and ratings and are not necessarily reliant on quoted prices.Certain short-term investment funds, including registered money market mutual funds, and short-term debtinvestments of sufficient credit quality maturing in less than 60 days, are generally valued at amortisedcost, which approximates fair value. Certain other short-term investment funds are valued using quotationsfurnished by independent pricing services, as well as quotations from the underlying fund managers,transfer agents or administrators.
Futures and option contracts that are listed on national exchanges and are freely transferable are valuedat fair value based on their last sales price on the date of determination on the exchange that constitutesthe principal market. For an option contract, if no sales occurred on such date, the contract is valued at thebid price on such exchange at the close of business on such date. Centrally cleared swaps listed or tradedon a multilateral trade facility platform, such as a registered exchange, are valued on a daily basis usingquotations provided by an independent pricing service.
OTC derivatives, including forward contracts and swap contracts, are valued by the Sub-Funds usingobservable inputs, such as quotations provided by an independent pricing service, the counterparty,dealers or brokers, whenever available and considered reliable.
The fair value of each total return swap contract is derived from a combination of (i) the net value of theunderlying positions, which are valued daily using the last sale or closing price on the principal exchangeon which the securities are traded; (ii) financing costs; (iii) the value of dividends or accrued interest; (iv)cash balances within the swap; and (v) other factors, as applicable.
The fair value of forward foreign exchange contracts is determined using current forward currencyexchange rates supplied by an independent pricing service.
AQR UCITS FUNDS
Notes to the Financial Statements as at 31 March 2019 (continued)
229
6. Fees and Expenses
(a) Investment Management Fee
The Sub-Funds pay to the Investment Manager an annual fee (the �Investment Management Fee�)calculated as a percentage of the average net assets of each class. The fee is accrued daily and payablemonthly in arrears at the applicable rate (the �Investment Management Fee Rate�) specified in theSupplements to the Prospectus. Please refer to the most recent Supplement to the Prospectus forapplicable Investment Management Fee Rates.
(b) Performance Fee
The Investment Manager may also be entitled to receive a performance fee (the “Performance Fee”) fromcertain Sub-Funds, the details of which are set out in both the General Section and the relevantSupplement to the Prospectus. The Investment Manager may from time to time, and at its sole discretion,and out of its own resources decide to waive or rebate part or all of the Performance Fee. The PerformanceFee is calculated and accrued daily and will generally be paid to the Investment Manager within 14business days of the month end in which the Performance Fee is crystallised.
The Performance Fee, if any, will be calculated and, if warranted, crystallised at the end of each twelvemonth period ending on 31 March of each year, and unless specified otherwise in the relevant Supplementto the Prospectus, the Performance Fee will be calculated on a “Loss Carryforward” basis effective31 March 2019. In addition, if shares are redeemed from certain Sub-Funds as at a date other than31 March, a Performance Fee (if accrued as at the date of such redemption) shall be crystallised in respectof the shares being redeemed. Furthermore, for the purposes of the calculation of the Performance Fee,a transfer of shares will, unless determined otherwise by the Directors, be treated as if there was aredemption of such shares by the transferor and a subscription (at the most recent price) for such sharesby the transferee on the date of the transfer. However, a transfer will not be treated as a redemption andsubscription where the relevant transfer of shares will not result in a change in the beneficial ownership ofthe shares. Crystallised Performance Fees shall remain in the relevant class (but shall not participate insubsequent gains and losses of the relevant class) until paid to the Investment Manager, and shall not beused or made available to satisfy redemptions or pay any fees and expenses of the relevant class.
(c) Administrative and Operating Fees
Each Sub-Fund accrues certain fees and expenses connected with the establishment, management andoperation of the Company, the Sub-Fund and each share class (the “Administrative and Operating Fees”).The Administrative and Operating Fees include the management company fee (the “ManagementCompany Fee”), the global distribution fee, the expenses paid to the Directors, auditors, legal advisers,administrator, custody and depositary bank, as well as organisational expenses. The Administrative andOperating Fees exclude expenses directly relating to the Investment Management Fee, the PerformanceFee, the taxe d’abonnement and any expenses associated with a Sub-Fund’s trading program, includingbrokerage commissions and any withholding or transfer taxes. Please refer to the Prospectus for additionaldetails on the fees and expenses that are considered Administrative and Operating Fees.
(d) Organisational Expenses
The total expenses of establishing each new Sub-Fund will be payable and borne by the relevantSub-Fund. These costs and expenses are, at the discretion of the Directors, amortised on a straight-linebasis over a period of up to 5 years from the launch date of the respective Sub-Fund. The Directors may,in their absolute discretion, shorten the period over which such costs and expenses are amortised. It isexpected that such accounting treatment will not be material to the financial statements of the Sub-Funds.
AQR UCITS FUNDS
Notes to the Financial Statements as at 31 March 2019 (continued)
230

6. Fees and Expenses (continued)
(e) Expense Arrangements
All expenses are recognised in the Statements of Operations on an accrual basis. Each class of aSub-Fund is subject to either a total expense ratio (“TER”) or an expense cap (“Expense Cap”).
Total Expense Ratio
In a class of a Sub-Fund that is subject to a TER, the actual Administrative and Operating Fees allocatedto the class, expressed as a percentage of the NAV of the class, is evaluated against a rate specified inthe relevant Supplement to the Prospectus (the “Administrative and Operating Fee Rate”). In the event thatthe actual Administrative and Operating Fees exceeds the respective Administrative and Operating FeeRate of a class subject to a TER, the Investment Manager reduces the Investment Management Fee bythe amount of the excess. The Investment Manager will reimburse the Sub-Fund to the extent that theactual Administrative and Operating Fees allocated to a certain class exceed the relevant Administrativeand Operating Fee Rate by more than the Investment Management Fee applicable to such class. Theexpenses reimbursed by the Investment Manager are recorded as reimbursement of expenses on theStatements of Operations. In the event the actual Administrative and Operating Fees are less than theAdministrative and Operating Fee Rate of a class subject to a TER, the excess is paid to the InvestmentManager as additional Investment Management Fee. Please refer to the most recent Supplement to theProspectus for applicable Administrative and Operating Fee Rates for the classes of each Sub-Fundsubject to a TER.
Expense Cap
In any class of a Sub-Fund that is not subject to a TER, the Administrative and Operating Fee is subjectto an Expense Cap. In these cases, the Administrative and Operating Fee borne by the applicable classof a Sub-Fund will be the lower of the actual expenses incurred by the Sub-Fund and the maximum ratedetailed in the relevant Supplement to the Prospectus.
In a class of a Sub-Fund that is subject to an Expense Cap, the combination of Investment ManagementFee and the actual Administrative and Operating Fees allocated to the class (the �Total Expense�),expressed as a percentage of the NAV of the class, is similarly evaluated against the applicable ExpenseCap specified in the relevant Supplement to the Prospectus. In the event the actual Total Expense exceedsthe respective Expense Cap, the Investment Manager reduces the Investment Management Fee by theamount of the excess. In the event the actual Total Expense exceeds the respective Expense Cap by morethan the Investment Management Fee, the Investment Manager reimburses the amount of the excess. Theexpenses reimbursed by the Investment Manager are recorded as reimbursement of expenses on theStatements of Operations. In the event the actual Total Expense is less than the relevant Expense Cap,there is no adjustment made to the Investment Management Fee. Please refer to the most recentSupplement to the Prospectus for applicable Administrative and Operating Fee Rates for the classes ofeach Sub-Fund subject to an Expense Cap.
7. Taxation
Under present Luxembourg law, the Company is not subject to any taxes in Luxembourg on income orcapital gains, nor are dividends distributed by the Company liable to any withholding tax. The Company is,however, liable in Luxembourg for a subscription tax (�taxe d’abonnement�) up to a rate of 0.05% perannum based on the NAV attributed to each share class at the end of the relevant quarter, calculated andpaid quarterly. Institutional investors share classes are subject to the reduced rate of 0.01% per annum.
Each Sub-Fund may be subject to taxation on income, capital gains on investments or currencyrepatriation, a portion of which may be recoverable. It is the policy of each Sub-Fund to accrue for any suchtaxes on dividends and interest when the dividend is declared, interest is earned, or capital gains arerealised. Each Sub-Fund will accrue such taxes and recoveries as applicable, based upon their currentinterpretation of tax rules and regulations that exist in the markets in which they invest.
AQR UCITS FUNDS
Notes to the Financial Statements as at 31 March 2019 (continued)
231

7. Taxation (continued)
No tax is payable on realised or unrealised capital appreciation of the assets of the Company in the GrandDuchy of Luxembourg. The regular income of the Company from some of its securities, as well as interestearned on cash deposits in certain countries, may be subject to non-recoverable withholding taxes atvarying rates.
For the year ended 31 March 2019, the amount of withholding tax expense and capital gains tax incurredby each Sub-Fund on transferable securities is as follows:
Sub-FundWithholding Tax
ExpenseCapital
Gains TaxAQR Emerging Equities UCITS Fund $1,977,838 $5,585AQR Global Aggregate Bond UCITS Fund 387,738 -AQR Global Core Equity UCITS Fund 558,970 -AQR Global Defensive Equity UCITS Fund 197,480 -AQR Global Enhanced Equity UCITS Fund 541,347 -AQR Global Relaxed Constraint Equity UCITS Fund 7,000 -
8. Distribution Policy
The distribution policy applicable to each class of distribution shares in relation to a particular Sub-Fund isdescribed in the relevant Supplement to the Prospectus.
The Directors reserves the right to introduce a distribution policy that may vary between Sub-Funds anddifferent classes of shares in issue.
Subject to the relevant Supplement to the Prospectus, the portion of the year’s net income correspondingto accumulation shares will not be paid to shareholders and instead will be capitalised in the relevantSub-Fund for the benefit of the accumulation shares.
Shareholders should note that, where the dividend rate is in excess of the investment income of the shareclass, dividends will be paid out of the capital attributed to the share class, as well as from realised andunrealised capital gains. This may be tax inefficient for investors in certain countries. Investors shouldconsult their local tax adviser about their own position.
During the year ended 31 March 2019, the Directors decided on 26 June 2018 to distribute the followingdividend for the share class below:
Sub-Fund Share Class Ex-Date Currency
Dividend perShare(Local)
AQR Managed FuturesUCITS Fund Class K 27 June 2018 GBP 0.109442
AQR UCITS FUNDS
Notes to the Financial Statements as at 31 March 2019 (continued)
232

9. Transaction Costs
As at 31 March 2019, the Sub-Funds incurred transaction costs related to the purchases and sales oftransferable securities (excluding OTC, exchange-traded and centrally cleared derivatives) as follows:
Sub-Fund Transaction CostsAQR Emerging Equities UCITS Fund $1,428,432AQR Global Core Equity UCITS Fund 37,976AQR Global Defensive Equity UCITS Fund 5,158AQR Global Enhanced Equity UCITS Fund 64,269AQR Global Relaxed Constraint Equity UCITS Fund 58
The transaction costs include broker commission fees, settlement fees and other charges. Those fees areincluded in the cost of the securities and recorded in the Statements of Operations under the caption netrealised gain/(loss) on investments and net change in unrealised appreciation/(depreciation) oninvestments.
In line with bond market practice, a bid-offer spread is applied when buying and selling these securities.Consequently, in any given transaction, there will be a difference between the purchase and sale pricesquoted by the broker, which represents the broker’s fee included in the cost of these securities.
10. Changes in Investment Portfolio
A copy of the changes in the investment portfolio for each Sub-Fund during the year ended 31 March 2019is available, free of charge, at the registered office of the Company, the Swiss Representative, and thePaying Agent in Germany.
11. Risks and Concentrations
In the normal course of business the Sub-Funds trade financial instruments and enter into financialtransactions where risk of potential loss exists due to changes in the market (market risk). The Sub-Funds’investments in financial derivatives and other financial instruments may expose the Sub-Funds to variouselements of market risks which include interest rate, foreign currency, equity and credit risks.
Each Sub-Fund manages market risk by establishing limits as to the types and degrees of risk that may beundertaken. Additionally, each Sub-Fund monitors the fluctuation in its value and compares thesefluctuations to its established limits.
The investment techniques and strategies utilised by the Sub-Funds, including investments made on ashorter-term basis or in derivative instruments or instruments with a maturity of one year or less at the timeof acquisition, may result in frequent portfolio trading and high portfolio turnover. High portfolio turnoverrates will cause the Sub-Funds to incur higher levels of brokerage fees and commissions, which mayreduce performance, and may cause higher levels of current tax liability to shareholders in the Sub-Funds.
The Sub-Funds may invest in developing market debt securities, foreign exchange instruments andequities. Developing markets are riskier than more developed markets because they tend to developunevenly and may never fully develop. Investments in developing markets may be considered speculative.Developing markets are more likely to experience hyperinflation and currency devaluations. In addition,many developing markets have far lower trading volumes and less liquidity than developed markets.
Currency risk arises from the possibility that fluctuations in foreign exchange rates will affect the value ofcash balances held in foreign currencies and foreign denominated financial instruments. In addition, if theSub-Funds use forward foreign exchange contracts, the Sub-Funds may be exposed to the risk that foreigncurrency exchange rates change unfavourably. Currency rates in foreign countries may fluctuatesignificantly over short periods of time for a number of reasons.
AQR UCITS FUNDS
Notes to the Financial Statements as at 31 March 2019 (continued)
233

11. Risks and Concentrations (continued)
The fair values of equities, such as common stocks and preferred securities or equity related investmentssuch as futures and options, may decline due to general market conditions which are not specificallyrelated to a particular company. They may also decline due to factors which affect a particular industry orindustries. Each Sub-Fund may invest in illiquid investments and may experience difficulty in selling thoseinvestments in a timely manner at the price that it believes the investments are worth. Prices may fluctuatewidely over short or extended periods in response to company, market or economic news. Markets alsotend to move in cycles, with periods of rising and falling prices. This volatility may cause the Sub-Funds toexperience significant gains or losses over short periods of time. If there is a general decline in thesecurities and other markets, the Sub-Funds may experience a loss, regardless of the individual results ofthe securities and other instruments in which the Sub-Funds invest.
Each Sub-Fund may be exposed to the risk that one or more securities in its portfolio will decline in price,or fail to pay interest or principal when due, because the issuer of the security experiences a decline in itsfinancial status (credit risk). Each Sub-Fund may be exposed to the risk that an institution or other entitywith which the relevant Sub-Fund has unsettled or open transactions will default (counterparty credit risk).These risks are measured by the loss each Sub-Fund would record if the issuer of a security, a majorfinancial institution or other counterparties, failed to perform pursuant to terms of their obligations.
In the normal course of business, the Sub-Funds may enter into agreements with certain counterparties forderivative transactions. Each Sub-Fund’s derivative agreements may contain provisions that require it tomaintain a predetermined level of net assets, and/or provide limits regarding the decline of the net assetsover specified time periods. If a certain Sub-Fund was to violate such provisions, the counterparties to thederivative instruments could request immediate payment or demand immediate collateralisation onderivative instruments in net liability positions. If such events are not cured by the Sub-Fund, or waived bythe counterparties, the counterparties may decide to curtail or limit extension of credit, and the Sub-Fundmay be forced to unwind its derivative positions which may result in material losses.
Each Sub-Fund may utilise substantial leverage in its investment program. Such leverage may take theform of trading on margin, investing in derivative instruments that are inherently leveraged and entering intoreverse repurchase transactions. There is no guarantee that each Sub-Fund’s borrowing arrangement orother arrangements for obtaining leverage will continue to be available, or if available, will be available onterms and conditions acceptable to the respective Sub-Fund. Unfavourable economic conditions also couldincrease funding costs, limit access to the capital markets or result in a decision by lenders not to extendcredit to certain Sub-Funds. In addition, a decline in fair value of a certain Sub-Fund’s assets may haveparticular adverse consequences in instances where it has borrowed money based on the fair value of itsassets. A decrease in fair value of its assets may result in the lender (including derivative counterparties)requiring a certain Sub-Fund to post additional collateral or otherwise sell assets at a time when it may notbe in the Sub-Fund’s best interest to do so.
At 31 March 2019, there were shareholders of certain Sub-Funds who individually owned greater than 10%of the respective Sub-Fund’s net assets. If any of these shareholders were to submit a redemption request,the respective Sub-Fund may be forced to dispose of investments during inopportune market conditionswhich could result in losses. Significant redemptions by shareholders may also impact each Sub-Fund’sliquidity and the Directors may temporarily suspend the determination of the NAV and redemption of sharesin such instances.
Periodically, each Sub-Fund may be a party to legal actions arising in the ordinary course of business. TheSub-Funds are currently not subject to any actions that either individually or in the aggregate are expectedto have a material impact on their results of operations or financial condition.
12. Brexit Planning
Unless the United Kingdom (�UK�) and the European Union (�EU�) agree otherwise, the UK is scheduledto formally leave the EU on 31 October 2019 (known as “Brexit”). As at the date of this report, discussionsremain ongoing within the UK Parliament as to the preferred manner of the UK’s anticipated departure fromthe EU. In preparation, the Investment Manager and AQR Capital Management (Europe) LLP (“AQR
AQR UCITS FUNDS
Notes to the Financial Statements as at 31 March 2019 (continued)
234

12. Brexit Planning (continued)
Europe”) (together, the “AQR Group”) have taken a number of steps to mitigate Brexit-related risks andensure business continuity post-Brexit. This includes preparation for the scenario whereby the UK leavesthe EU without a withdrawal agreement and/or transition period (a so-called, “Hard Brexit”). The main risks(and the AQR Group’s contingency plans in relation to these risks) are, in summary, as follows:
Licensing risk to the AQR Group
AQR Europe, an affiliate of the Investment Manager, is authorised and regulated by the UK FinancialConduct Authority (“FCA”). In the event of a Hard Brexit, AQR Europe would lose its cross-border servicespassport into various EU Member States. Many EU financial services firms rely on these passports to carryon investment services into EU Member States. Loss of the cross-border services passport would,therefore, potentially disrupt and/or prevent AQR Europe staff from carrying out their day-to-day distributionand client servicing business functions as normal.
To help address this risk, AQR Group has been exploring ways in which AQR Europe can continue to docross-border business into EU Member States post-Brexit pursuant to individual national licensing regimes(this includes, where possible, seeking appropriate exemptions or permissions from individual EU MemberState regulators). Further, the AQR Group recently established a new affiliate in Germany, AQR CapitalManagement (Germany) GmbH (“AQR Germany”). AQR Germany has a licence from the German FederalFinancial Supervisory Authority to carry on the German regulated activities of “investment broking” and“investment advice”. AQR Germany will additionally have its own cross-border services passport into thesame EU Member States as AQR Europe currently enjoys today. As such, in the event of a Hard Brexit,AQR Germany would facilitate the AQR Group’s continued market access to EU investors.
The Investment Manager, as a United States of America domiciled SEC-registered investment adviser, isnot directly affected by Brexit. As such, the Investment Manager will continue its function as the delegatedportfolio manager in respect of the Company.
Marketing/distribution risk to the Company
The Management Company of the Sub-Funds has submitted a notification to the FCA to enable theSub-Funds to benefit from the UK’s Temporary Permissions Regime. This preserves the continueddistribution of the Sub-Funds to UK investors in the event of a Hard Brexit for at least a period of threeyears.
Market risk
The AQR Group actively monitors the market impact of Brexit and routinely runs various scenario analysesto help identify potential market risk concerns. These scenarios include the estimated market moves in aHard Brexit scenario. In the event that the AQR Group identifies exposures that are undesired orunexpected, the risk management team will circulate the findings with the relevant stakeholders anddiscuss any potential remediation. The AQR Group takes a multi-disciplinary approach to monitoringdeveloping market risks and utilising inputs from risk management, trading and portfolio managementteams to arrive at a consensus conclusion regarding the appropriate risk management action. In additionto this, the AQR Group has worked closely with its counterparties to ensure that there are no materialdisruptions with respect to access to trading venues and markets in a Hard Brexit scenario.
13. Subsequent Events
On 2 May 2019, the AQR Sustainable Emerging Relaxed Constraint Equity UCITS Fund commencedoperations. The Sub-Fund has been re-purposed from the AQR U.S. Relaxed Constraint Equity UCITSFund and consequently the investment objective and policy have been updated. Please refer to the mostrecent Supplement to the Prospectus for a detailed description of the updated investment objective andpolicy as well as the revised fee structure.
AQR UCITS FUNDS
Notes to the Financial Statements as at 31 March 2019 (continued)
235

13. Subsequent Events (continued)
The Directors of the Company have evaluated subsequent events for the Sub-Funds and determined thereare no other material events which would require accrual or disclosure through 20 June 2019, the date ofissuance of this report.
AQR UCITS FUNDS
Notes to the Financial Statements as at 31 March 2019 (continued)
236

Additional Information for Shareholders (Unaudited)
1. Global Risk Exposure
Unless otherwise stated in the relevant Supplement to the Prospectus, each Sub-Fund shall employ aValue-at-Risk (�VaR�) model in determining its global exposure to financial derivative instruments and willensure that such global exposure does not exceed the limits as set out in the Commission de Surveillancedu Secteur Financier (�CSSF�) circular 11/512 of 30 May 2011, as may be amended or restated from timeto time.
The following Sub-Funds have used the commitment approach in order to monitor and measure theirglobal exposure:
- AQR Global Aggregate Bond UCITS Fund, AQR Global Core Equity UCITS Fund, AQR Global DefensiveEquity UCITS Fund, AQR Global Enhanced Equity UCITS Fund and AQR Systematic Fixed Income: USHigh Yield UCITS Fund.
As part of the risk-management process, the global exposure of the AQR Emerging Equities UCITS Fund,AQR Global Relaxed Constraint Equity UCITS Fund and AQR U.S. Relaxed Constraint Equity UCITS Fundare measured and controlled by the relative VaR approach, by reference to each Sub-Fund’s benchmark,the Morgan Stanley Capital International Inc. Emerging Markets Total Return Index with Net DividendsUnhedged in USD, Morgan Stanley Capital International Inc. World Total Return Index, (Net), U.S. DollarUnhedged and Russell 1000® Index, respectively.
AQR UCITS FUNDS
237

Additional Information for Shareholders (Unaudited) (continued)
1. Global Risk Exposure (continued)
The following table summarises the calculation of the global exposure for the Company:
Sub-FundGlobal RiskCalculation
MethodVaR Limit Model Confidence
IntervalHoldingPeriod
ObservationPeriod Min VaR Max VaR Average
VaRMin
LeverageMax
Leverage
Average Levelof Leverage
ReachedDuring the
YearAQR DelphiLong-Short EquityUCITS Fund
AbsoluteVaR 20% Historical 99% 1 year 20 days 7.64% 10.46% 9.54% 421.55% 461.57% 442.76%
AQR EmergingEquities UCITSFund
RelativeVaR 200% Historical 99% 1 year 20 days 91.91% 116.02% 103.77% 110.84% 377.71% 203.03%
AQR Global MacroOpportunitiesUCITS Fund
AbsoluteVaR 20% Historical 99% 1 year 20 days 0.85% 9.85% 7.55% 1,982.05% 2,879.51% 2,214.69%
AQR GlobalRelaxed ConstraintEquity UCITS Fund
RelativeVaR 200% Historical 99% 1 year 20 days 82.63% 128.51% 115.01% 118.94% 205.74% 144.13%
AQR Global RiskParity UCITS Fund
AbsoluteVaR 20% Historical 99% 1 year 20 days 4.77% 6.17% 5.43% 156.28% 257.24% 220.63%
AQR ManagedFutures UCITSFund
AbsoluteVaR 20% Historical 99% 1 year 20 days 1.63% 6.87% 3.99% 1,279.84% 3,065.25% 2,106.51%
AQR Style Premia:Equity MarketNeutral UCITSFund
AbsoluteVaR 20% Historical 99% 1 year 20 days 4.14% 8.16% 5.36% 289.51% 365.85% 320.69%
AQR Style PremiaUCITS Fund
AbsoluteVaR 20% Historical 99% 1 year 20 days 3.94% 6.42% 5.14% 959.01% 2,590.20% 1,652.44%
AQR SystematicTotal Return UCITSFund
AbsoluteVaR 20% Historical 99% 1 year 20 days 3.24% 6.13% 4.54% 852.65% 1,666.89% 1,260.61%
AQR U.S. RelaxedConstraint EquityUCITS Fund
RelativeVaR 200% Historical 99% 1 year 20 days 0.07% 105.84% 92.42% 151.84% 188.62% 161.88%
The level of leverage disclosed in the above table is calculated based on the sum of notionals. The Management Company is using the notional approach as set outin ESMA Guidelines 10-788.
AQR UCITS FUNDS
238

Additional Information for Shareholders (Unaudited) (continued)
2. Information Related to Security Financing Transactions and Total Return SwapContracts
(a) Security Financing Transactions and Total Return Swap Contracts by Counterparty
There are no security financing transactions held by the Sub-Funds during the year and as at 31 March2019. The table below summarises the total return swap contracts, including total return basket swapcontracts, by counterparty as at 31 March 2019:
Sub-Fund Counterparty
Counterparty’sCountry of
Incorporation
NetUnrealised
Appreciation/(Depreciation)
onTotal Return
SwapContracts
AbsoluteAmount
NetUnrealised
Appreciation/(Depreciation)
as % of netassets
AQR Delphi Long-ShortEquity UCITS Fund
JPMC USA $60,395 $60,395 0.51MSIP USA 19,539 173,597 0.16Total 79,934 233,992 0.67
AQR Emerging EquitiesUCITS Fund
GSIN USA 238,693 826,571 0.03JPMC USA 1,133 1,133 0.00MLIN USA 433,358 433,358 0.06Total 673,184 1,261,062 0.09
AQR Global MacroOpportunities UCITS Fund
BANA USA (2,226) 2,226 (0.00)CITI USA 571 712 0.00GSIN USA 66,099 66,099 0.07JPMC USA (176,336) 189,126 (0.19)MLIN USA (81,584) 149,914 (0.09)MSIP USA 27,145 27,145 0.03Total (166,331) 435,222 (0.18)
AQR Global RelaxedConstraint Equity UCITSFund
JPMC USA 14,488 39,272 0.29
Total 14,488 39,272 0.29
AQR Global Risk ParityUCITS Fund
BARB UnitedKingdom 3,300,894 3,414,284 0.23
GSIN USA 146,982 155,714 0.01JPMC USA 129,860 129,860 0.01MLIN USA 275,374 472,190 0.02Total 3,853,110 4,172,048 0.27
AQR Managed FuturesUCITS Fund
GSIN USA (344,492) 409,998 (0.07)JPMC USA 191,836 191,836 0.04MLIN USA (138,170) 195,338 (0.03)Total (290,826) 797,172 (0.06)
AQR Style Premia: EquityMarket Neutral UCITSFund
JPMC USA (4,817,269) 5,732,337 (0.87)MLIN USA (2,735,008) 5,581,176 (0.49)Total (7,552,277) 11,313,513 (1.36)
AQR Style Premia UCITSFund
BANA USA 152,778 152,778 0.01GSIN USA (21,210,433) 23,606,093 (0.75)JPMC USA (77,269) 86,417 (0.00)MLIN USA (13,575,101) 27,524,429 (0.48)Total (34,710,025) 51,369,717 (1.22)
AQR Systematic TotalReturn UCITS Fund
GSIN USA 130,439 134,469 0.01MLIN USA (4,577,115) 9,989,605 (0.46)MSIP USA (3,515,665) 4,486,203 (0.35)Total (7,962,341) 14,610,277 (0.80)
AQR UCITS FUNDS
239

Additional Information for Shareholders (Unaudited) (continued)
2. Information Related to Security Financing Transactions and Total Return SwapContracts (continued)
(b) Top Ten Collateral Issuers
As at 31 March 2019, the Sub-Funds did not receive or pledge any non-cash collateral from counterpartiesin relation to total return swap contracts.
(c) Type and Maturity of Collateral
As at 31 March 2019, the Sub-Funds pledged cash to segregated accounts, at one or more counterparties,in relation to total return swap contracts. The maturity of the cash collateral amounts are as follows:
Sub-Fund Maturity Tenor
Amount ofCash Collateral
on OTCDerivatives*
AQR Delphi Long-Short Equity UCITS Fund Open maturity $6,222,731AQR Emerging Equities UCITS Fund Open maturity 22,848,026AQR Global Macro Opportunities UCITS Fund Open maturity 12,276,008AQR Global Relaxed Constraint Equity UCITS Fund Open maturity 662,736AQR Global Risk Parity UCITS Fund Open maturity 91,158,305AQR Managed Futures UCITS Fund Open maturity 15,750,008AQR Style Premia: Equity Market Neutral UCITS Fund Open maturity 120,371,138AQR Style Premia UCITS Fund Open maturity 660,991,958AQR Systematic Total Return UCITS Fund Open maturity 184,787,112
*Includes non-total return swap values.
(d) Collateral by Currency
The below table summarises the currency of the cash collateral pledged/(received) by each Sub-Fund,across OTC derivative contracts as at 31 March 2019.
Sub-Fund Currency
Amount ofCash Collateral
on OTCDerivatives*
AQR Delphi Long-Short Equity UCITS Fund USD $6,222,731AQR Emerging Equities UCITS Fund USD 22,848,026AQR Global Macro Opportunities UCITS Fund USD 12,276,008AQR Global Relaxed Constraint Equity UCITS Fund USD 662,736AQR Global Risk Parity UCITS Fund USD 91,158,305AQR Managed Futures UCITS Fund USD 15,750,008AQR Style Premia: Equity Market Neutral UCITS Fund USD 120,371,138AQR Style Premia UCITS Fund USD 660,991,958AQR Systematic Total Return UCITS Fund USD 184,787,112
*Includes non-total return swap values.
AQR UCITS FUNDS
240

Additional Information for Shareholders (Unaudited) (continued)
2. Information Related to Security Financing Transactions and Total Return SwapContracts (continued)
(e) Maturity of Security Financing Transactions and Total Return Swap Contracts
The below table summarises the maturity tenor of outstanding total return swap contracts by Sub-Fund asat 31 March 2019.
Sub-Fund Maturity Tenor
NetUnrealised
Appreciation/(Depreciation)
on TotalReturn Swap
Contracts Total
AQR Delphi Long-Short Equity UCITSFund
Three months to oneyear $(18,283) $(18,283)Above one year 98,217 98,217Total 79,934 79,934
AQR Emerging Equities UCITS Fund
One week to onemonth 958,392 958,392One to three months (286,341) (286,341)Three months to oneyear 1,133 1,133Total 673,184 673,184
AQR Global Macro Opportunities UCITSFund
One day to one week (115,749) (115,749)One week to onemonth 126,660 126,660One to three months 5,351 5,351Above one year (182,593) (182,593)Total (166,331) (166,331)
AQR Global Relaxed Constraint EquityUCITS Fund
Above one year 14,488 14,488Total 14,488 14,488
AQR Global Risk Parity UCITS Fund
One day to one week 3,300,894 3,300,894One week to onemonth 545,679 545,679One to three months 6,537 6,537Total 3,853,110 3,853,110
AQR Managed Futures UCITS Fund
One day to one week (377,175) (377,175)One week to onemonth 87,414 87,414One to three months (1,065) (1,065)Total (290,826) (290,826)
AQR Style Premia: Equity Market NeutralUCITS Fund
Above one year (7,552,277) (7,552,277)Total (7,552,277) (7,552,277)
AQR Style Premia UCITS Fund
One week to onemonth (3,213,373) (3,213,373)One to three months 978,324 978,324Above one year (32,474,976) (32,474,976)Total (34,710,025) (34,710,025)
AQR UCITS FUNDS
241

Additional Information for Shareholders (Unaudited) (continued)
2. Information Related to Security Financing Transactions and Total Return SwapContracts (continued)
(e) Maturity of Security Financing Transactions and Total Return Swap Contracts(continued)
Sub-Fund Maturity Tenor
NetUnrealised
Appreciation/(Depreciation)
on TotalReturn Swap
Contracts Total
AQR Systematic Total Return UCITS Fund
One day to one week $(44,846) $(44,846)One week to onemonth 173,578 173,578One to three months (209) (209)Three months to oneyear (3,515,665) (3,515,665)Above one year (4,575,199) (4,575,199)Total (7,962,341) (7,962,341)
(f) Data on Re-use of Collateral
Cash collateral received by the relevant Sub-Funds in relation to total return swap transactions is notreused or reinvested.
(g) Returns on OTC Derivatives
All returns from OTC derivative transactions will accrue to the Sub-Funds and are not subject to any returnsharing agreements with the Investment Manager or any other third parties. For total return swap contracts,transaction costs are not separately identifiable as they are included in the purchase and sales price uponentering and exiting.
Returns are reported as net realised gain/(loss) on swap contracts and net change in unrealisedappreciation/(depreciation) on swap contracts on the Statements of Operations.
AQR UCITS FUNDS
242

Additional Information for Shareholders (Unaudited) (continued)
3. Remuneration Policy
The Management Company has established and applies a remuneration policy in accordance with theprinciples laid out under the Alternative Investment Fund Managers Directive 2011/61/EU (the �AIFMD�)and UCITS V directive, and any related legal and regulatory provisions applicable in Luxembourg. Theremuneration policy is aligned with the business strategy, objectives, values and interests of theManagement Company and the funds that it manages and of the investors in such funds, and whichincludes, inter alia, measures to avoid conflicts of interest; and it is consistent with and promotes sound andeffective risk management and does not encourage risk taking which is inconsistent with the risk profiles,rules or instruments of incorporation of the funds that the Management Company manages.
As an independent management company relying on a full-delegation model (i.e. delegation of thecollective portfolio management function), the Management Company ensures that its remuneration policyadequately reflects the predominance of its oversight activity within its core activities. As such, it should benoted that Management Company’s employees who are identified as risk-takers under UCITS V are notremunerated based on the performance of the funds under management.
A paper version of the remuneration policy is made available free of charge to investors at the ManagementCompany’s registered office.
The amount of remuneration, including social charges and benefits, for the financial year ended31 December 2018 was: EUR 6,459,595.
Fixed remuneration: EUR 6,271,345
Variable remuneration: EUR 188,250
This does not include the remuneration to SEB Fund Services/FundRock Nordics for the period from1 January 2018 to 21 December 2018 prior to the merger of SEB Fund Services/FundRock Nordics withthe Management Company on 21 December 2018.
Number of beneficiaries: 64
The aggregated amount of remuneration for the financial year ended 31 December 2018 of identifiedstaff/risk takers is as follows:
Identified staff/risk takers: EUR 1,069,358
Other risk takers: Nil
The remuneration to SEB Fund Services/FundRock Nordics for the period from 1 January 2018 to21 December 2018 prior to the merger of SEB Fund Services/FundRock Nordics with the ManagementCompany on 21 December 2018, including social charges and benefits was: EUR 2,286,193.
Fixed remuneration: EUR 2,245,970
Variable remuneration: EUR 40,223
Number of beneficiaries: 19
The aggregated amount of remuneration for the period from 1 January 2018 to 21 December 2018 priorto the merger of SEB Fund Services/Fund Rock Nordics with the Management Company of identifiedstaff/risk takers is as follows:
Identified staff/risk takers: EUR 489,625
Other risk takers: Nil
AQR UCITS FUNDS
243
Additional Information for Shareholders (Unaudited) (continued)
3. Remuneration Policy (continued)
The total amount of remuneration is based on a combination of the assessment of the performance of theindividual, the overall results of the Management Company, and when assessing individual performance,financial as well as non-financial criteria are taken into account.
The policy is subject to annual review by the compliance officer and the update is performed by the humanresources department of the Management Company and is presented for review to the remunerationcommittee and approval by the Board of Directors of the Management Company.
AQR UCITS FUNDS
244

Additional Information for Shareholders Domiciled in Switzerland(Unaudited)
1. Swiss Representative and Paying Agent
Swiss Representative:Carnegie Fund Services S.A.11, rue du Général-DufourCH-1204 GenevaSwitzerland
Paying Agent in Switzerland:Banque Cantonale de Genève17, quai de l’IleCH-1204 GenevaSwitzerland
The full Prospectus for Switzerland, the Key Investor Information Documents, the Articles of Incorporation,the annual and semi-annual reports, the list of changes in the portfolio during the year and furtherinformation can be obtained free of charge from the Swiss Representative: Carnegie Fund Services S.A.,11, rue du Général-Dufour, CH-1204 Geneva, Switzerland, Tel.: +41 22 7051177, Fax: + 41 22 7051179,web: www.carnegie-fundservices.ch.
2. Total Net Expense Ratio
The Total Net Expense Ratio (�TNER�) is the total expenses paid by the Sub-Fund in the year against itsaverage net assets. For any class that has been launched during the year, the TNER has been annualised.The TNER disclosed in the following table has been presented before and after impact of PerformanceFee, if any. Performance Fee is expressed as a percentage of the average net assets. The TNER werecalculated in accordance with the applicable Swiss Funds and Asset Management Association guidelines(�SFAMA�).
For each Sub-Fund, the TNER before Performance Fee, the Performance Fee and the TNER afterPerformance Fee for each class of share is presented in the following table:
Sub-Fund***Classes of
Shares
TNER beforePerformance Feeas at 31 March
2019
PerformanceFee as at 31 March
2019
TNER afterPerformance
Fee as at 31 March2019**
AQR DelphiLong-Short EquityUCITS Fund
Class IAC1F 1.55% - 1.55%Class IAE1F 1.55% - 1.55%Class IAE2 0.65% 1.12% 1.77%Class IAG1 0.75% 0.64% 1.39%Class IAU1F 1.55% - 1.55%
AQR EmergingEquities UCITSFund
Class A1 0.95% - 0.95%Class A2 0.85% - 0.85%Class A3 0.80% - 0.80%Class B3 0.80% - 0.80%Class C2 0.85% - 0.85%Class C3 0.80% - 0.80%Class E 0.20% - 0.20%
AQR GlobalAggregate BondUCITS Fund
Class IAE3F 0.27% - 0.27%Class IAG1F 0.37% - 0.37%Class IAG3F 0.27% - 0.27%Class IAN4F 0.17% - 0.17%Class IAU1F 0.37% - 0.37%Class IAU3F 0.27% - 0.27%Class IDG1F 0.37% - 0.37%
AQR Global CoreEquity UCITS Fund
Class A1 0.35% - 0.35%Class B3 0.32% - 0.32%
AQR UCITS FUNDS
245

Additional Information for Shareholders Domiciled in Switzerland(Unaudited) (continued)
2. Total Net Expense Ratio (continued)
Sub-Fund***Classes of
Shares
TNER beforePerformance Feeas at 31 March
2019
PerformanceFee as at 31 March
2019
TNER afterPerformance
Fee as at 31 March2019**
AQR GlobalDefensive EquityUCITS Fund
Class A1 0.42% - 0.42%Class B1 0.37% - 0.37%Class B3 0.31% - 0.31%Class C1 0.41% - 0.41%Class D1 0.42% - 0.42%
AQR GlobalEnhanced EquityUCITS Fund
Class A1 0.54% - 0.54%Class A2 0.45% - 0.45%Class B2 0.45% - 0.45%Class C2 0.45% - 0.45%
AQR Global MacroOpportunities UCITSFund
Class IAE3 0.75% - 0.75%Class IAG3 0.75% - 0.75%Class IAG3F 1.35% - 1.35%Class IAU1 1.05% 0.00% 1.05%Class IAU1F 1.65% - 1.65%Class IAU3 0.75% - 0.75%
AQR Global RelaxedConstraint EquityUCITS Fund
Class IAU1F 0.75% - 0.75%Class RAU3F 0.60% - 0.60%Class RAU3FT 1.10% - 1.10%
AQR Global RiskParity UCITS Fund
Class A1 0.52% - 0.52%Class A2 0.49% - 0.49%Class B1 0.54% - 0.54%Class B2 0.49% - 0.49%Class C1 0.54% - 0.54%Class C2 0.49% - 0.49%Class C3 0.45% - 0.45%Class C4 0.40% - 0.40%Class D2 0.49% - 0.49%Class E2 0.49% - 0.49%Class F* 0.44% - 0.44%Class RAE4F 0.55% - 0.55%
AQR ManagedFutures UCITS Fund
Class A 0.75% - 0.75%Class B 0.75% - 0.75%Class C 0.75% 0.00% 0.75%Class D 0.75% - 0.75%Class E 0.55% 0.69% 1.24%Class F 0.55% 0.00% 0.55%Class G 0.55% 0.00% 0.55%Class H2 0.90% - 0.90%Class J 0.75% - 0.75%Class K 0.75% - 0.75%Class L 0.75% - 0.75%Class IAE2F 0.90% - 0.90%Class IAG1F 1.15% - 1.15%Class IAG3F 0.80% - 0.80%Class IAU1F 1.15% - 1.15%Class IAU3F 0.80% - 0.80%
AQR Style Premia:Equity MarketNeutral UCITS Fund
Class A1 0.70% - 0.70%Class I1 0.85% - 0.85%Class I2 0.82% - 0.82%
AQR UCITS FUNDS
246

Additional Information for Shareholders Domiciled in Switzerland(Unaudited) (continued)
2. Total Net Expense Ratio (continued)
Sub-Fund***Classes of
Shares
TNER beforePerformance Feeas at 31 March
2019
PerformanceFee as at 31 March
2019
TNER afterPerformance
Fee as at 31 March2019**
AQR Style PremiaUCITS Fund
Class A 0.75% 0.00% 0.75%Class B 0.75% 0.00% 0.75%Class C 0.75% 0.00% 0.75%Class D 0.75% - 0.75%Class E 0.65% 0.00% 0.65%Class F 0.65% - 0.65%Class G 1.10% - 1.10%Class H 0.65% - 0.65%Class I 1.10% - 1.10%Class J 1.10% - 1.10%Class K 1.10% - 1.10%Class M 0.65% 0.00% 0.65%Class N 0.65% - 0.65%Class W 0.80% 0.00% 0.80%Class IAGF 1.25% - 1.25%Class RAE 0.85% - 0.85%Class RAET 1.40% - 1.40%Class RAG 0.85% 0.00% 0.85%Class RAU 0.85% - 0.85%
AQR SystematicFixed Income: USHigh Yield UCITSFund
Class A1 0.62% - 0.62%Class A2 0.57% - 0.57%Class A3 0.52% - 0.52%Class C1 0.62% - 0.62%
AQR SystematicTotal Return UCITSFund
Class A1 1.40% - 1.40%Class A2 1.15% - 1.15%Class B1 1.40% - 1.40%Class B2 1.15% - 1.15%Class B3 1.00% - 1.00%Class C1 1.40% - 1.40%Class C2 1.15% - 1.15%Class C3 1.00% - 1.00%Class D1 1.40% - 1.40%Class IAE3F 1.10% - 1.10%Class IAEFT 1.45% - 1.45%Class IDE1F 1.40% - 1.40%Class IDE2F 1.15% - 1.15%Class IDG1F 1.40% - 1.40%Class IDG2F 1.15% - 1.15%Class IDU1F 1.40% - 1.40%Class IDU2F 1.15% - 1.15%Class RACFT 2.15% - 2.15%Class RAEF 1.50% - 1.50%Class RAEFT 2.15% - 2.15%Class RAGF 1.50% - 1.50%Class RAGFT 2.15% - 2.15%Class RAUF 1.50% - 1.50%Class RAUFT 2.15% - 2.15%
*The expense cap for the Class F Shares for the year is 0.45%.
**Certain TNER disclosed in the above table may vary from the TNER charged to the Sub-Fund and disclosed in the relevant Supplement to the Prospectusdue to annualisation of share classes opened during the year and/or due to updates made to certain components of the TNER during the year.
***AQR U.S. Relaxed Constraint Equity UCITS Fund shares were fully redeemed on 17 August 2018 and therefore are excluded from the table.
AQR UCITS FUNDS
247

Additional Information for Shareholders Domiciled in Switzerland (Unaudited) (continued)
3. Performance of the Sub-Fund and respective Classes of Shares
For each Sub-Fund, the last calendar year and the last three calendar years (�CY�) for each class of shares, and their respective benchmark returns are presentedin the following table:
Sub-FundClasses of
Shares CurrencyLast CY
Performance*Last Three CYPerformance** Benchmark
Last CYBenchmark*
Last Three YearBenchmark**
AQR Delphi Long-Short Equity UCITS FundClass IAE2 EUR 1.50% 1.50% (1) - -Class IAG1 GBP (2.75)% (2.75)% (1) - -Class IAU1F USD 2.87% 2.87% (1) - -
AQR Emerging Equities UCITS Fund
Class A1 USD (18.06)% (2.49)% (2) (14.57)% 2.51%Class A2 USD 1.45% 52.48% (2) 0.93% 54.06%Class A3 USD (17.93)% 8.88% (2) (14.57)% 14.00%Class B3 EUR (13.92)% 17.51% (2) (14.57)% 30.40%Class C2 GBP (13.38)% 42.53% (2) (14.57)% 30.40%Class C3 GBP (13.34)% 4.60% (2) (14.57)% 14.00%Class E EUR (13.41)% 19.74% (2) (14.57)% 30.40%
AQR Global Aggregate Bond UCITS Fund
Class IAE3F EUR (1.07)% (1.07)% (6) 2.23% 2.23%Class IAG1F GBP 0.45% 0.45% (6) 2.01% 2.01%Class IAG3F GBP 0.90% 0.90% (6) 3.08% 3.08%Class IAN4F NOK 0.44% 0.44% (6) 2.23% 2.23%Class IAU1F USD 1.54% 1.54% (6) 2.23% 2.23%Class IAU3F USD 1.64% 1.64% (6) 2.23% 2.23%Class IDG1F GBP 1.32% 1.32% (6) 2.22% 2.22%
AQR Global Core Equity UCITS FundClass A1 USD (5.10)% (5.10)% (3) (5.63)% (5.63)%Class B3 EUR (7.19)% 8.34% (3) (8.71)% 20.13%
AQR Global Defensive Equity UCITS Fund
Class A1 USD (5.86)% 18.56% (1) - -Class B1 EUR (7.21)% (7.21)% (1) - -Class B3 EUR (1.13)% 16.60% (1) - -Class C1 GBP (0.59)% 29.92% (1) - -Class D1 CHF (4.85)% 9.91% (1) - -
AQR Global Enhanced Equity UCITS Fund
Class A1 USD (14.75)% (2.81)% (3) (8.71)% 3.34%Class A2 USD (14.68)% 22.80% (3) (8.71)% 31.28%Class B2 EUR (10.52)% 0.46% (3) (8.71)% 14.62%Class C2 GBP (9.91)% 29.32% (3) (8.71)% 18.63%
AQR Global Macro Opportunities UCITS Fund
Class IAE3 EUR (0.33)% (0.33)% (1) - -Class IAG3 GBP (1.02)% (1.02)% (1) - -Class IAU1F USD 1.09% 1.09% (1) - -Class IAU3 USD (0.75)% (0.75)% (1) - -
AQR UCITS FUNDS
248

Additional Information for Shareholders Domiciled in Switzerland (Unaudited) (continued)
3. Performance of the Sub-Fund and respective Classes of Shares (continued)
Sub-FundClasses of
Shares CurrencyLast CY
Performance*Last Three CYPerformance** Benchmark
Last CYBenchmark*
Last Three YearBenchmark**
AQR Global Relaxed Constraint Equity UCITS FundClass IAU1F USD (15.01)% (15.01)% (3) (13.09)% (13.09)%Class RAU3F USD (14.99)% (14.99)% (3) (13.09)% (13.09)%Class RAU3FT USD (10.69)% (10.69)% (3) (8.46)% (8.46)%
AQR Global Risk Parity UCITS Fund
Class A1 USD (5.72)% 15.51% (1) - -Class A2 USD (5.67)% 1.21% (1) - -Class B1 EUR (8.46)% 8.29% (1) - -Class B2 EUR (8.41)% (3.10)% (1) - -Class C1 GBP (7.30)% 11.74% (1) - -Class C2 GBP (7.25)% 11.91% (1) - -Class C3 GBP 0.15% 20.96% (1) - -Class C4 GBP (7.32)% (7.32)% (1) - -Class D2 CHF (8.77)% (3.86)% (1) - -Class E2 EUR (4.93)% (4.93)% (1) - -Class F* EUR (8.36)% 8.64% (1) - -Class RAE4F EUR (1.86)% (0.49)% (1) - -
AQR Managed Futures UCITS Fund
Class A USD (7.81)% (8.52)% (1) - -Class B EUR (10.42)% (13.66)% (1) - -Class C GBP (9.36)% (10.58)% (1) - -Class D CHF (11.06)% (19.00)% (1) - -Class E EUR (10.22)% (13.42)% (1) - -Class F GBP (9.20)% (10.18)% (1) - -Class G USD (7.56)% (9.39)% (1) - -Class H2 NOK (9.19)% (10.47)% (1) - -Class J EUR (10.48)% (14.32)% (1) - -Class K GBP (9.40)% (11.53)% (1) - -Class L USD (7.76)% (8.86)% (1) - -Class IAE2F EUR (10.54)% (10.53)% (1) - -Class IAG1F GBP (9.76)% (9.62)% (1) - -Class IAG3F GBP 1.62% 1.62% (1) - -Class IAU1F USD (8.17)% (7.81)% (1) - -
AQR Style Premia: Equity Market Neutral UCITS FundClass A1 USD (6.53)% 0.85% (1) - -Class I1 EUR (9.20)% (2.97)% (1) - -Class I2 EUR (9.18)% (8.66)% (1) - -
AQR UCITS FUNDS
249

Additional Information for Shareholders Domiciled in Switzerland (Unaudited) (continued)
3. Performance of the Sub-Fund and respective Classes of Shares (continued)
Sub-FundClasses of
Shares CurrencyLast CY
Performance*Last Three CYPerformance** Benchmark
Last CYBenchmark*
Last Three YearBenchmark**
AQR Style Premia UCITS Fund
Class A USD (9.67)% (2.57)% (1) - -Class B EUR (12.15)% (7.91)% (1) - -Class C GBP (11.16)% (5.78)% (1) - -Class D CHF (12.47)% (9.14)% (1) - -Class E EUR (12.06)% (7.70)% (1) - -Class F GBP (11.08)% (4.99)% (1) - -Class G EUR 34.35% 40.84% (1) - -Class H EUR (12.06)% (5.92)% (1) - -Class I USD (9.96)% (2.45)% (1) - -Class J EUR (9.53)% (5.08)% (1) - -Class K GBP (11.47)% (5.02)% (1) - -Class M USD (9.58)% (3.74)% (1) - -Class N CHF (12.39)% (10.15)% (1) - -Class W EUR 2.61% 3.00% (1) - -Class IAGF GBP (11.60)% (9.30)% (1) - -Class RAE EUR (12.26)% (11.75)% (1) - -Class RAET EUR (8.83)% (8.83)% (1) - -Class RAG GBP (11.26)% (10.58)% (1) - -Class RAU USD (9.76)% (9.27)% (1) - -
AQR Systematic Fixed Income: US High Yield UCITSFund
Class A1 USD (3.28)% 12.15% (4) (2.25)% 9.66%Class A2 USD (2.92)% 17.63% (4) (2.25)% 14.22%Class A3 USD (3.19)% 16.58% (4) (2.25)% 13.65%Class C1 GBP (4.81)% (1.99)% (4) (2.25)% (0.34)%
AQR UCITS FUNDS
250

Additional Information for Shareholders Domiciled in Switzerland (Unaudited) (continued)
3. Performance of the Sub-Fund and respective Classes of Shares (continued)
Sub-FundClasses of
Shares CurrencyLast CY
Performance*Last Three CYPerformance** Benchmark
Last CYBenchmark*
Last Three YearBenchmark**
AQR Systematic Total Return UCITS Fund
Class A1 USD (16.88)% (9.57)% (1) - -Class A2 USD (16.68)% (16.50)% (1) - -Class B1 EUR (19.21)% (13.50)% (1) - -Class B2 EUR (19.00)% (14.32)% (1) - -Class B3 EUR (18.89)% (12.82)% (1) - -Class C1 GBP (18.36)% (12.44)% (1) - -Class C2 GBP (18.16)% (12.85)% (1) - -Class C3 GBP (6.43)% 1.35% (1) - -Class D1 CHF (19.64)% (14.41)% (1) - -Class IAE3F EUR 1.94% 1.94% (1) - -Class IAEFT EUR (19.10)% (18.86)% (1) - -Class IDE1F EUR (6.84)% (6.84)% (1) - -Class IDE2F EUR (21.48)% (21.48)% (1) - -Class IDG1F GBP (15.75)% (15.75)% (1) - -Class IDG2F GBP (17.89)% (17.89)% (1) - -Class IDU1F USD (15.16)% (15.16)% (1) - -Class IDU2F USD (19.80)% (19.80)% (1) - -Class RACFT CHF (20.24)% (20.43)% (1) - -Class RAEF EUR (19.29)% (19.26)% (1) - -Class RAEFT EUR (19.82)% (19.24)% (1) - -Class RAGF GBP (16.47)% (16.47)% (1) - -Class RAGFT GBP (18.98)% (17.77)% (1) - -Class RAUF USD (15.22)% (15.22)% (1) - -Class RAUFT USD (17.51)% (16.05)% (1) - -
AQR U.S. Relaxed Constraint Equity UCITS FundClass IAU1F USD (0.40)% (1.01)% (5) 7.94% 7.76%Class IAU3F USD (0.34)% (0.94)% (5) 7.94% 7.76%
*The last CY performance and last CY benchmark are presented for the year ended 31 December 2018. For classes that were launched during the year, the last CY performance and last CY benchmark are presented from the launch date through
31 December 2018. For classes that ceased during the year, the last CY performance and last CY benchmark are presented from 1 January 2018 to cessation date. Classes that were launched after 31 December 2018 are not presented.
**The last three CY performance and last three CY benchmark are presented on the basis of the last three calendar years or since inception if the class was active for less than three calendar years.
(1) The class is not managed to a specified benchmark.
(2) Morgan Stanley Capital International Inc. Emerging Markets Total Return Index with Net Dividends Unhedged in USD
(3) Morgan Stanley Capital International Inc. World Total Return Index, (Net), U.S. Dollar Unhedged
AQR UCITS FUNDS
251

Additional Information for Shareholders Domiciled in Switzerland (Unaudited) (continued)
3. Performance of the Sub-Fund and respective Classes of Shares (continued)
(4) Bank of America Merrill Lynch U.S. High Yield Index (�H0A0�)
(5) Russell 1000® Index
(6) Bloomberg Barclays Global Aggregate Bond Index
Past performance is not an indication of the current or future performance. The performance data does not take into account the commissions on the issue and theredemption of shares.
Performance figures were calculated in accordance with the applicable SFAMA guidelines.
AQR UCITS FUNDS
252

AQR UCITS FUNDS
w: https://ucits.aqr.com/