Challenge Funds
338
Challenge Funds Interim Report - 30th June 2021
-
Upload
khangminh22 -
Category
Documents
-
view
1 -
download
0
Transcript of Challenge Funds

Challenge FundsInterim Report - 30th June 2021

CHALLENGE FUNDS
UNAUDITED
CONDENSED SEMI-ANNUAL REPORT
FOR THE FINANCIAL PERIOD ENDED
JUNE 30, 2021
TABLE OF CONTENTS
2
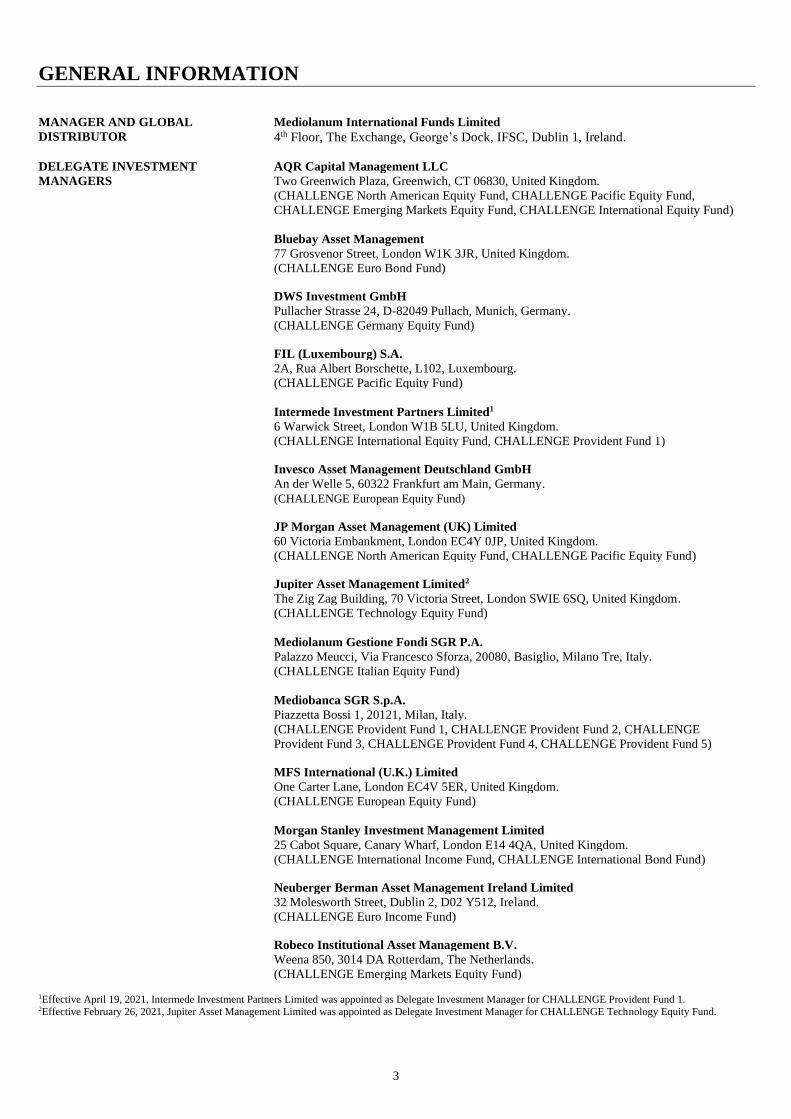
General Information 3 - 4
Condensed Statement of Financial Position 5 - 21
Condensed Statement of Comprehensive Income 22 - 35
Condensed Statement of Changes in Net Assets Attributable to Holders of Redeemable
Participating Units 36 - 40
Condensed Changes in the Number of Units 41 - 51
Notes to the Condensed Financial Statements 52 - 107
Appendix – Additional Information 108 - 111
Schedule of Investments 112 - 302
CHALLENGE North American Equity Fund 112 - 119
CHALLENGE European Equity Fund 120 - 129
CHALLENGE Italian Equity Fund 130 - 134
CHALLENGE Germany Equity Fund 135 - 137
CHALLENGE Spain Equity Fund 138 - 141
CHALLENGE Pacific Equity Fund 142 - 154
CHALLENGE Emerging Markets Equity Fund 155 - 166
CHALLENGE Energy Equity Fund 167 - 170
CHALLENGE Cyclical Equity Fund 171 - 175
CHALLENGE Counter Cyclical Equity Fund 176 - 180
CHALLENGE Financial Equity Fund 181 - 185
CHALLENGE Technology Equity Fund 186 - 190
CHALLENGE Liquidity Euro Fund 191 - 197
CHALLENGE Liquidity US Dollar Fund 198 - 200
CHALLENGE Euro Income Fund 201 - 208
CHALLENGE International Income Fund 209 - 216
CHALLENGE Euro Bond Fund 217 - 222
CHALLENGE International Bond Fund 223 - 239
CHALLENGE International Equity Fund 240 - 256
CHALLENGE Solidity & Return 257 - 263
CHALLENGE Provident Fund 1 264 - 280
CHALLENGE Provident Fund 2 281 - 290
CHALLENGE Provident Fund 3 291 - 294
CHALLENGE Provident Fund 4 295 - 298
CHALLENGE Provident Fund 5 299 - 302
Significant Portfolio Changes 303 - 336
GENERAL INFORMATION
3
1Effective April 19, 2021, Intermede Investment Partners Limited was appointed as Delegate Investment Manager for CHALLENGE Provident Fund 1. 2Effective February 26, 2021, Jupiter Asset Management Limited was appointed as Delegate Investment Manager for CHALLENGE Technology Equity Fund.
MANAGER AND GLOBAL Mediolanum International Funds Limited
DISTRIBUTOR 4th Floor, The Exchange, George’s Dock, IFSC, Dublin 1, Ireland.
DELEGATE INVESTMENT AQR Capital Management LLC
MANAGERS Two Greenwich Plaza, Greenwich, CT 06830, United Kingdom.
(CHALLENGE North American Equity Fund, CHALLENGE Pacific Equity Fund,
CHALLENGE Emerging Markets Equity Fund, CHALLENGE International Equity Fund)
Bluebay Asset Management
77 Grosvenor Street, London W1K 3JR, United Kingdom.
(CHALLENGE Euro Bond Fund)
DWS Investment GmbH
Pullacher Strasse 24, D-82049 Pullach, Munich, Germany.
(CHALLENGE Germany Equity Fund)
FIL (Luxembourg) S.A.
2A, Rua Albert Borschette, L102, Luxembourg.
(CHALLENGE Pacific Equity Fund)
Intermede Investment Partners Limited1
6 Warwick Street, London W1B 5LU, United Kingdom.
(CHALLENGE International Equity Fund, CHALLENGE Provident Fund 1)
Invesco Asset Management Deutschland GmbH
An der Welle 5, 60322 Frankfurt am Main, Germany.
(CHALLENGE European Equity Fund)
JP Morgan Asset Management (UK) Limited
60 Victoria Embankment, London EC4Y 0JP, United Kingdom.
(CHALLENGE North American Equity Fund, CHALLENGE Pacific Equity Fund)
Jupiter Asset Management Limited2
The Zig Zag Building, 70 Victoria Street, London SWIE 6SQ, United Kingdom.
(CHALLENGE Technology Equity Fund)
Mediolanum Gestione Fondi SGR P.A.
Palazzo Meucci, Via Francesco Sforza, 20080, Basiglio, Milano Tre, Italy.
(CHALLENGE Italian Equity Fund)
Mediobanca SGR S.p.A.
Piazzetta Bossi 1, 20121, Milan, Italy.
(CHALLENGE Provident Fund 1, CHALLENGE Provident Fund 2, CHALLENGE
Provident Fund 3, CHALLENGE Provident Fund 4, CHALLENGE Provident Fund 5)
MFS International (U.K.) Limited One Carter Lane, London EC4V 5ER, United Kingdom. (CHALLENGE European Equity Fund) Morgan Stanley Investment Management Limited
25 Cabot Square, Canary Wharf, London E14 4QA, United Kingdom. (CHALLENGE International Income Fund, CHALLENGE International Bond Fund)
Neuberger Berman Asset Management Ireland Limited
32 Molesworth Street, Dublin 2, D02 Y512, Ireland. (CHALLENGE Euro Income Fund)
Robeco Institutional Asset Management B.V.
Weena 850, 3014 DA Rotterdam, The Netherlands.
(CHALLENGE Emerging Markets Equity Fund)
GENERAL INFORMATION (continued)
4
*Executive Director **Non Executive Director
***Independent Non Executive Director
1Effective February 8, 2021, Sustainable Growth Advisers was appointed as Delegate Investment Manager for CHALLENGE Emerging Markets Equity Fund.
DELEGATE INVESTMENT Schroders Investment Management Limited
MANAGERS (continued) 1 London Wall Place, London EC2Y 5AU, United Kingdom.
(CHALLENGE Provident Fund 1)
Sustainable Growth Advisers1
301 Tresser Boulevard, Suite 1310, Stamford, CT 06901, United States.
(CHALLENGE Emerging Markets Equity Fund)
Tenax Capital Limited
Dominican House, 4 Priory Court, Pilgrim Street, London EC4V 6DE, United Kingdom.
(CHALLENGE Financial Equity Fund)
TREA Asset Management SGIIC S.A.
C/Agustina Saragossa, 3-5, 08017 Barcelona, Spain.
(CHALLENGE Spain Equity Fund)
Wellington Management International Limited Cardinal Place, 80 Victoria Street, London SW1E 5JL, United Kingdom.
(CHALLENGE Energy Equity Fund, CHALLENGE Cyclical Equity Fund,
CHALLENGE Counter Cyclical Equity Fund, CHALLENGE Technology Equity Fund,
CHALLENGE International Equity Fund, CHALLENGE Provident Fund 1)
TRUSTEE/DEPOSITARY RBC Investor Services Bank S.A., Dublin Branch
4th Floor, One George's Quay Plaza, George's Quay, Dublin 2, Ireland.
ADMINISTRATOR, REGISTRAR RBC Investor Services Ireland Limited
AND TRANSFER AGENT 4th Floor, One George's Quay Plaza, George's Quay, Dublin 2, Ireland.
CORRESPONDENT BANK/ State Street Bank International GmbH - Succursale Italia
PAYING AGENT IN ITALY Via Ferrante Aporti 10, 20125 Milan, Italy.
PAYING AGENT IN SPAIN Banco Mediolanum S.A.
c/Roger de Lauria 19, 2º, 46002 Valencia, Spain.
PAYING AGENT IN GERMANY Marcard, Stein & Co. AG
Ballindamm 36, 20095 Hamburg, Germany.
INDEPENDENT AUDITORS PricewaterhouseCoopers
Chartered Accountants & Statutory Audit Firm,
One Spencer Dock, North Wall Quay, Dublin 1, Ireland.
PROMOTER Banca Mediolanum S.p.A.,
Palazzo Meucci, Via Francesco Sforza 15, 20080, Basiglio, Milano Tre, Italy.
LEGAL ADVISERS Dillon Eustace
33 Sir John Rogerson’s Quay, Dublin 2, Ireland.
CASH MANAGER Mediolanum International Funds Limited
4th Floor, The Exchange, George’s Dock, IFSC, Dublin 1, Ireland.
DIRECTORS OF THE MANAGER Andrew Bates (Irish) (Chairperson)** (until April 28, 2021)
Karen Zachary (Irish) (Chairperson)*** (effective April 28, 2021)
Furio Pietribiasi (Italian) (Managing Director)*
Corrado Bocca (Italian) **
Paul O’Faherty (Irish) ***
Martin Nolan (Irish) ***
Gianmarco Gessi (Italian) **
Christophe Jaubert (French)*
John Corrigan (Irish)***
Michael Hodson (Irish)*** (effective January 1, 2021)
CONDENSED STATEMENT OF FINANCIAL POSITION AS AT JUNE 30, 2021
5
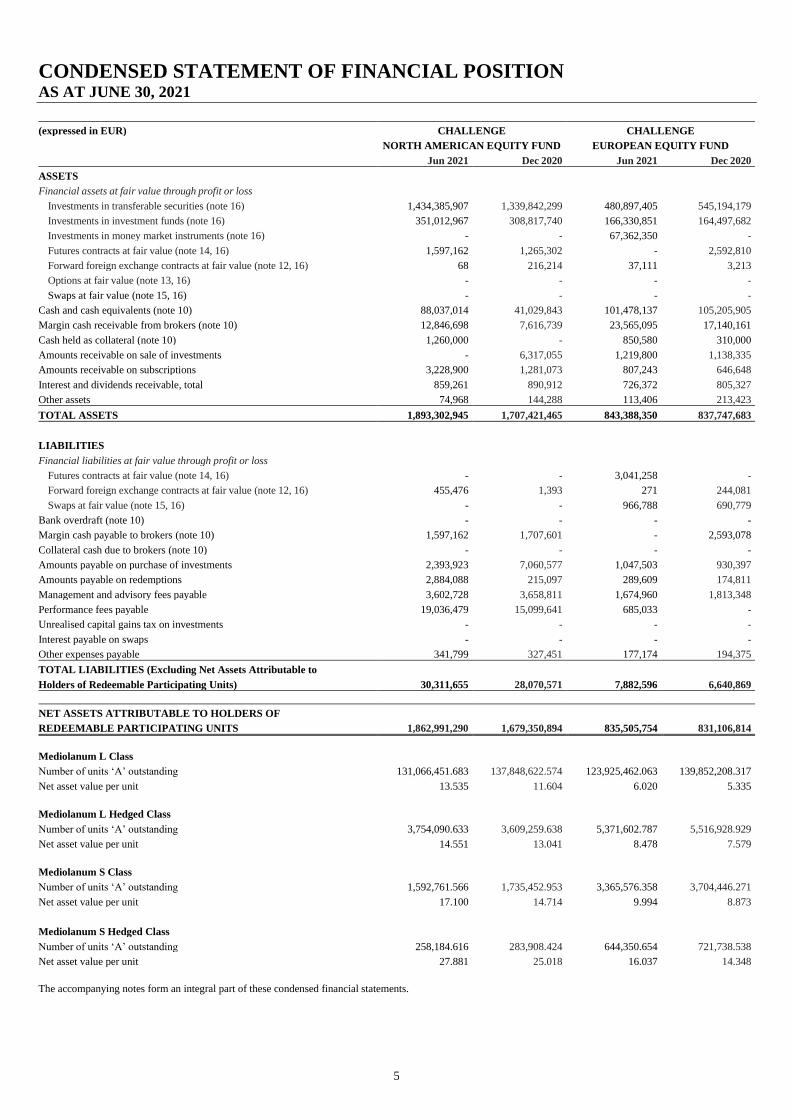
(expressed in EUR) CHALLENGE CHALLENGE
NORTH AMERICAN EQUITY FUND EUROPEAN EQUITY FUND
Jun 2021 Dec 2020 Jun 2021 Dec 2020
ASSETS
Financial assets at fair value through profit or loss
Investments in transferable securities (note 16) 1,434,385,907 1,339,842,299 480,897,405 545,194,179
Investments in investment funds (note 16) 351,012,967 308,817,740 166,330,851 164,497,682
Investments in money market instruments (note 16) - - 67,362,350 -
Futures contracts at fair value (note 14, 16) 1,597,162 1,265,302 - 2,592,810
Forward foreign exchange contracts at fair value (note 12, 16) 68 216,214 37,111 3,213
Options at fair value (note 13, 16) - - - -
Swaps at fair value (note 15, 16) - - - -
Cash and cash equivalents (note 10) 88,037,014 41,029,843 101,478,137 105,205,905
Margin cash receivable from brokers (note 10) 12,846,698 7,616,739 23,565,095 17,140,161
Cash held as collateral (note 10) 1,260,000 - 850,580 310,000
Amounts receivable on sale of investments - 6,317,055 1,219,800 1,138,335
Amounts receivable on subscriptions 3,228,900 1,281,073 807,243 646,648
Interest and dividends receivable, total 859,261 890,912 726,372 805,327
Other assets 74,968 144,288 113,406 213,423
TOTAL ASSETS 1,893,302,945 1,707,421,465 843,388,350 837,747,683
LIABILITIES
Financial liabilities at fair value through profit or loss
Futures contracts at fair value (note 14, 16) - - 3,041,258 -
Forward foreign exchange contracts at fair value (note 12, 16) 455,476 1,393 271 244,081
Swaps at fair value (note 15, 16) - - 966,788 690,779
Bank overdraft (note 10) - - - -
Margin cash payable to brokers (note 10) 1,597,162 1,707,601 - 2,593,078
Collateral cash due to brokers (note 10) - - - -
Amounts payable on purchase of investments 2,393,923 7,060,577 1,047,503 930,397
Amounts payable on redemptions 2,884,088 215,097 289,609 174,811
Management and advisory fees payable 3,602,728 3,658,811 1,674,960 1,813,348
Performance fees payable 19,036,479 15,099,641 685,033 -
Unrealised capital gains tax on investments - - - -
Interest payable on swaps - - - -
Other expenses payable 341,799 327,451 177,174 194,375
TOTAL LIABILITIES (Excluding Net Assets Attributable to
Holders of Redeemable Participating Units) 30,311,655 28,070,571 7,882,596 6,640,869
NET ASSETS ATTRIBUTABLE TO HOLDERS OF
REDEEMABLE PARTICIPATING UNITS 1,862,991,290 1,679,350,894 835,505,754 831,106,814
Mediolanum L Class
Number of units ‘A’ outstanding 131,066,451.683 137,848,622.574 123,925,462.063 139,852,208.317
Net asset value per unit 13.535 11.604 6.020 5.335
Mediolanum L Hedged Class
Number of units ‘A’ outstanding 3,754,090.633 3,609,259.638 5,371,602.787 5,516,928.929
Net asset value per unit 14.551 13.041 8.478 7.579
Mediolanum S Class
Number of units ‘A’ outstanding 1,592,761.566 1,735,452.953 3,365,576.358 3,704,446.271
Net asset value per unit 17.100 14.714 9.994 8.873
Mediolanum S Hedged Class
Number of units ‘A’ outstanding 258,184.616 283,908.424 644,350.654 721,738.538
Net asset value per unit 27.881 25.018 16.037 14.348
The accompanying notes form an integral part of these condensed financial statements.
CONDENSED STATEMENT OF FINANCIAL POSITION AS AT JUNE 30, 2021 (continued)
6
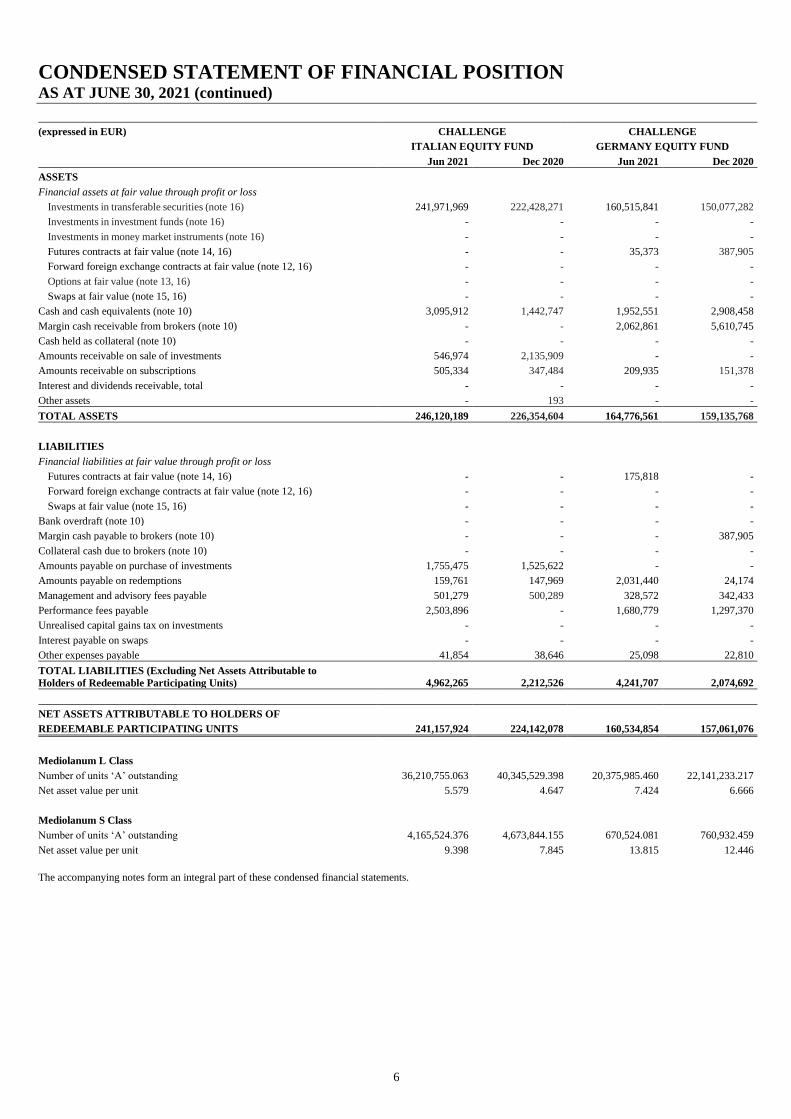
(expressed in EUR) CHALLENGE CHALLENGE
ITALIAN EQUITY FUND GERMANY EQUITY FUND
Jun 2021 Dec 2020 Jun 2021 Dec 2020
ASSETS
Financial assets at fair value through profit or loss
Investments in transferable securities (note 16) 241,971,969 222,428,271 160,515,841 150,077,282
Investments in investment funds (note 16) - - - -
Investments in money market instruments (note 16) - - - -
Futures contracts at fair value (note 14, 16) - - 35,373 387,905
Forward foreign exchange contracts at fair value (note 12, 16) - - - -
Options at fair value (note 13, 16) - - - -
Swaps at fair value (note 15, 16) - - - -
Cash and cash equivalents (note 10) 3,095,912 1,442,747 1,952,551 2,908,458
Margin cash receivable from brokers (note 10) - - 2,062,861 5,610,745
Cash held as collateral (note 10) - - - -
Amounts receivable on sale of investments 546,974 2,135,909 - -
Amounts receivable on subscriptions 505,334 347,484 209,935 151,378
Interest and dividends receivable, total - - - -
Other assets - 193 - -
TOTAL ASSETS 246,120,189 226,354,604 164,776,561 159,135,768
LIABILITIES
Financial liabilities at fair value through profit or loss
Futures contracts at fair value (note 14, 16) - - 175,818 -
Forward foreign exchange contracts at fair value (note 12, 16) - - - -
Swaps at fair value (note 15, 16) - - - -
Bank overdraft (note 10) - - - -
Margin cash payable to brokers (note 10) - - - 387,905
Collateral cash due to brokers (note 10) - - - -
Amounts payable on purchase of investments 1,755,475 1,525,622 - -
Amounts payable on redemptions 159,761 147,969 2,031,440 24,174
Management and advisory fees payable 501,279 500,289 328,572 342,433
Performance fees payable 2,503,896 - 1,680,779 1,297,370
Unrealised capital gains tax on investments - - - -
Interest payable on swaps - - - -
Other expenses payable 41,854 38,646 25,098 22,810
TOTAL LIABILITIES (Excluding Net Assets Attributable to
Holders of Redeemable Participating Units) 4,962,265 2,212,526 4,241,707 2,074,692
NET ASSETS ATTRIBUTABLE TO HOLDERS OF
REDEEMABLE PARTICIPATING UNITS 241,157,924 224,142,078 160,534,854 157,061,076
Mediolanum L Class
Number of units ‘A’ outstanding 36,210,755.063 40,345,529.398 20,375,985.460 22,141,233.217
Net asset value per unit 5.579 4.647 7.424 6.666
Mediolanum S Class
Number of units ‘A’ outstanding 4,165,524.376 4,673,844.155 670,524.081 760,932.459
Net asset value per unit 9.398 7.845 13.815 12.446
The accompanying notes form an integral part of these condensed financial statements.
CONDENSED STATEMENT OF FINANCIAL POSITION AS AT JUNE 30, 2021 (continued)
7
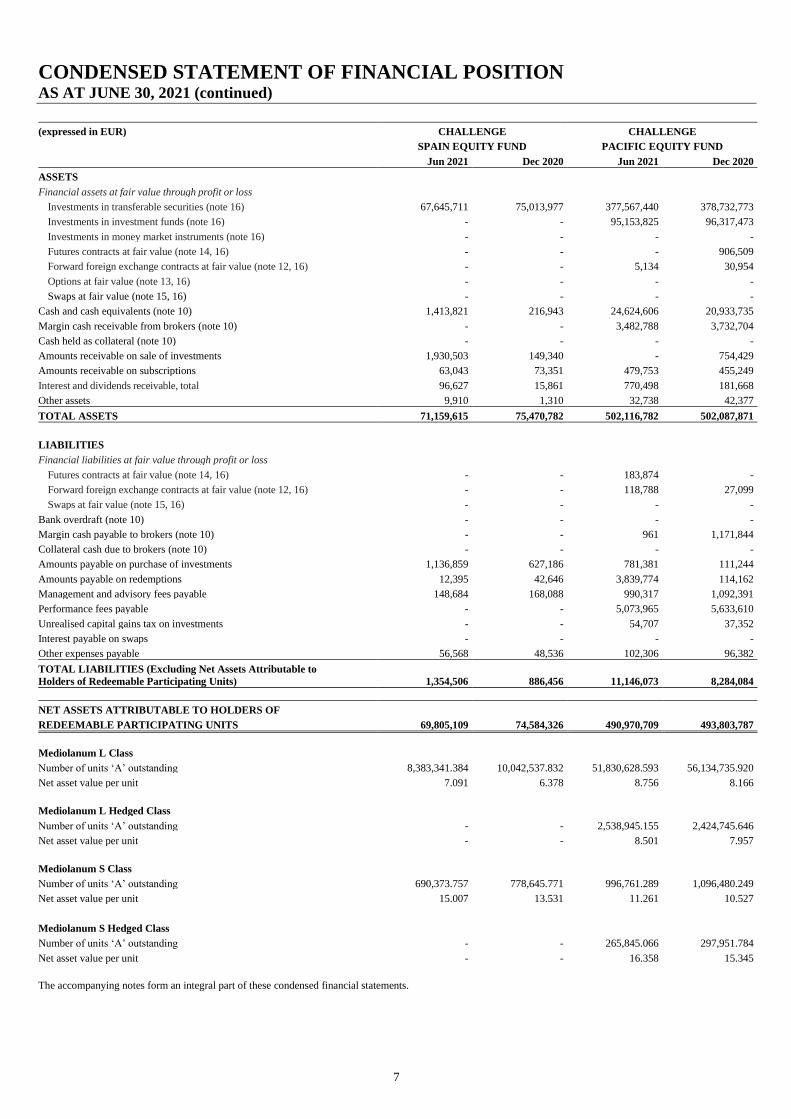
(expressed in EUR) CHALLENGE CHALLENGE
SPAIN EQUITY FUND PACIFIC EQUITY FUND
Jun 2021 Dec 2020 Jun 2021 Dec 2020
ASSETS
Financial assets at fair value through profit or loss
Investments in transferable securities (note 16) 67,645,711 75,013,977 377,567,440 378,732,773
Investments in investment funds (note 16) - - 95,153,825 96,317,473
Investments in money market instruments (note 16) - - - -
Futures contracts at fair value (note 14, 16) - - - 906,509
Forward foreign exchange contracts at fair value (note 12, 16) - - 5,134 30,954
Options at fair value (note 13, 16) - - - -
Swaps at fair value (note 15, 16) - - - -
Cash and cash equivalents (note 10) 1,413,821 216,943 24,624,606 20,933,735
Margin cash receivable from brokers (note 10) - - 3,482,788 3,732,704
Cash held as collateral (note 10) - - - -
Amounts receivable on sale of investments 1,930,503 149,340 - 754,429
Amounts receivable on subscriptions 63,043 73,351 479,753 455,249
Interest and dividends receivable, total 96,627 15,861 770,498 181,668
Other assets 9,910 1,310 32,738 42,377
TOTAL ASSETS 71,159,615 75,470,782 502,116,782 502,087,871
LIABILITIES
Financial liabilities at fair value through profit or loss
Futures contracts at fair value (note 14, 16) - - 183,874 -
Forward foreign exchange contracts at fair value (note 12, 16) - - 118,788 27,099
Swaps at fair value (note 15, 16) - - - -
Bank overdraft (note 10) - - - -
Margin cash payable to brokers (note 10) - - 961 1,171,844
Collateral cash due to brokers (note 10) - - - -
Amounts payable on purchase of investments 1,136,859 627,186 781,381 111,244
Amounts payable on redemptions 12,395 42,646 3,839,774 114,162
Management and advisory fees payable 148,684 168,088 990,317 1,092,391
Performance fees payable - - 5,073,965 5,633,610
Unrealised capital gains tax on investments - - 54,707 37,352
Interest payable on swaps - - - -
Other expenses payable 56,568 48,536 102,306 96,382
TOTAL LIABILITIES (Excluding Net Assets Attributable to
Holders of Redeemable Participating Units) 1,354,506 886,456 11,146,073 8,284,084
NET ASSETS ATTRIBUTABLE TO HOLDERS OF
REDEEMABLE PARTICIPATING UNITS 69,805,109 74,584,326 490,970,709 493,803,787
Mediolanum L Class
Number of units ‘A’ outstanding 8,383,341.384 10,042,537.832 51,830,628.593 56,134,735.920
Net asset value per unit 7.091 6.378 8.756 8.166
Mediolanum L Hedged Class
Number of units ‘A’ outstanding - - 2,538,945.155 2,424,745.646
Net asset value per unit - - 8.501 7.957
Mediolanum S Class
Number of units ‘A’ outstanding 690,373.757 778,645.771 996,761.289 1,096,480.249
Net asset value per unit 15.007 13.531 11.261 10.527
Mediolanum S Hedged Class
Number of units ‘A’ outstanding - - 265,845.066 297,951.784
Net asset value per unit - - 16.358 15.345
The accompanying notes form an integral part of these condensed financial statements.
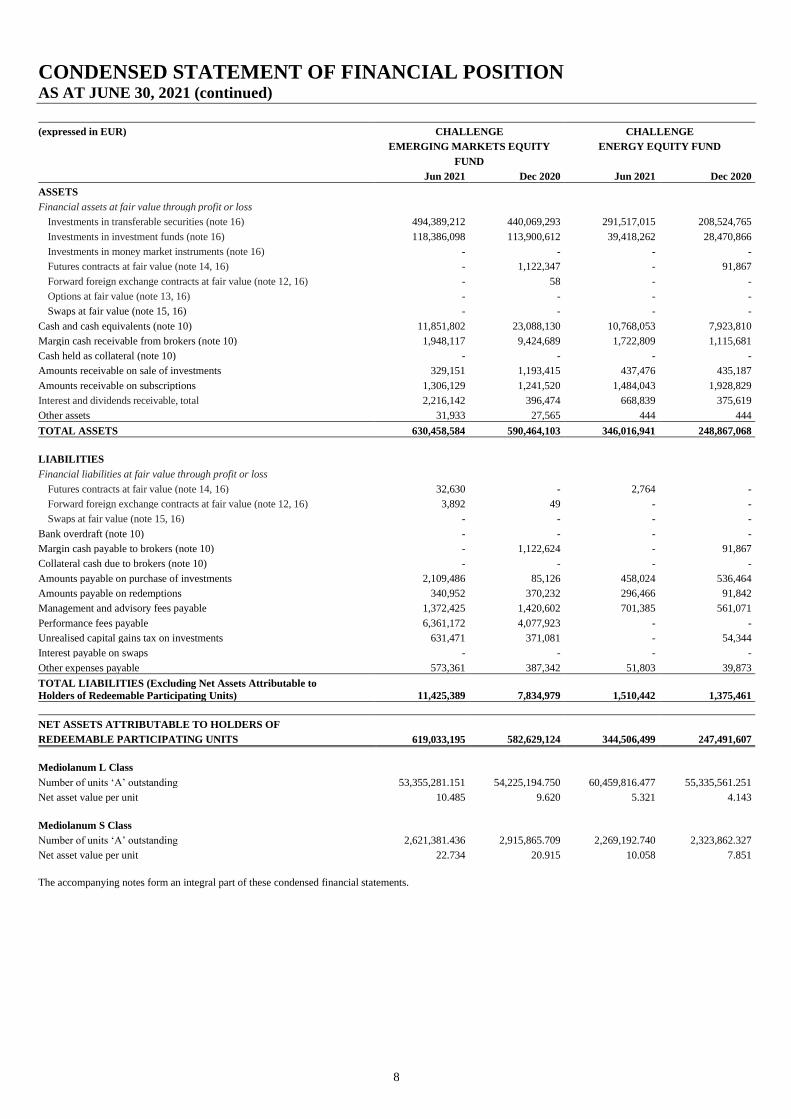
CONDENSED STATEMENT OF FINANCIAL POSITION AS AT JUNE 30, 2021 (continued)
8
(expressed in EUR) CHALLENGE CHALLENGE
EMERGING MARKETS EQUITY ENERGY EQUITY FUND
FUND
Jun 2021 Dec 2020 Jun 2021 Dec 2020
ASSETS
Financial assets at fair value through profit or loss
Investments in transferable securities (note 16) 494,389,212 440,069,293 291,517,015 208,524,765
Investments in investment funds (note 16) 118,386,098 113,900,612 39,418,262 28,470,866
Investments in money market instruments (note 16) - - - -
Futures contracts at fair value (note 14, 16) - 1,122,347 - 91,867
Forward foreign exchange contracts at fair value (note 12, 16) - 58 - -
Options at fair value (note 13, 16) - - - -
Swaps at fair value (note 15, 16) - - - -
Cash and cash equivalents (note 10) 11,851,802 23,088,130 10,768,053 7,923,810
Margin cash receivable from brokers (note 10) 1,948,117 9,424,689 1,722,809 1,115,681
Cash held as collateral (note 10) - - - -
Amounts receivable on sale of investments 329,151 1,193,415 437,476 435,187
Amounts receivable on subscriptions 1,306,129 1,241,520 1,484,043 1,928,829
Interest and dividends receivable, total 2,216,142 396,474 668,839 375,619
Other assets 31,933 27,565 444 444
TOTAL ASSETS 630,458,584 590,464,103 346,016,941 248,867,068
LIABILITIES
Financial liabilities at fair value through profit or loss
Futures contracts at fair value (note 14, 16) 32,630 - 2,764 -
Forward foreign exchange contracts at fair value (note 12, 16) 3,892 49 - -
Swaps at fair value (note 15, 16) - - - -
Bank overdraft (note 10) - - - -
Margin cash payable to brokers (note 10) - 1,122,624 - 91,867
Collateral cash due to brokers (note 10) - - - -
Amounts payable on purchase of investments 2,109,486 85,126 458,024 536,464
Amounts payable on redemptions 340,952 370,232 296,466 91,842
Management and advisory fees payable 1,372,425 1,420,602 701,385 561,071
Performance fees payable 6,361,172 4,077,923 - -
Unrealised capital gains tax on investments 631,471 371,081 - 54,344
Interest payable on swaps - - - -
Other expenses payable 573,361 387,342 51,803 39,873
TOTAL LIABILITIES (Excluding Net Assets Attributable to
Holders of Redeemable Participating Units) 11,425,389 7,834,979 1,510,442 1,375,461
NET ASSETS ATTRIBUTABLE TO HOLDERS OF
REDEEMABLE PARTICIPATING UNITS 619,033,195 582,629,124 344,506,499 247,491,607
Mediolanum L Class
Number of units ‘A’ outstanding 53,355,281.151 54,225,194.750 60,459,816.477 55,335,561.251
Net asset value per unit 10.485 9.620 5.321 4.143
Mediolanum S Class
Number of units ‘A’ outstanding 2,621,381.436 2,915,865.709 2,269,192.740 2,323,862.327
Net asset value per unit 22.734 20.915 10.058 7.851
The accompanying notes form an integral part of these condensed financial statements.
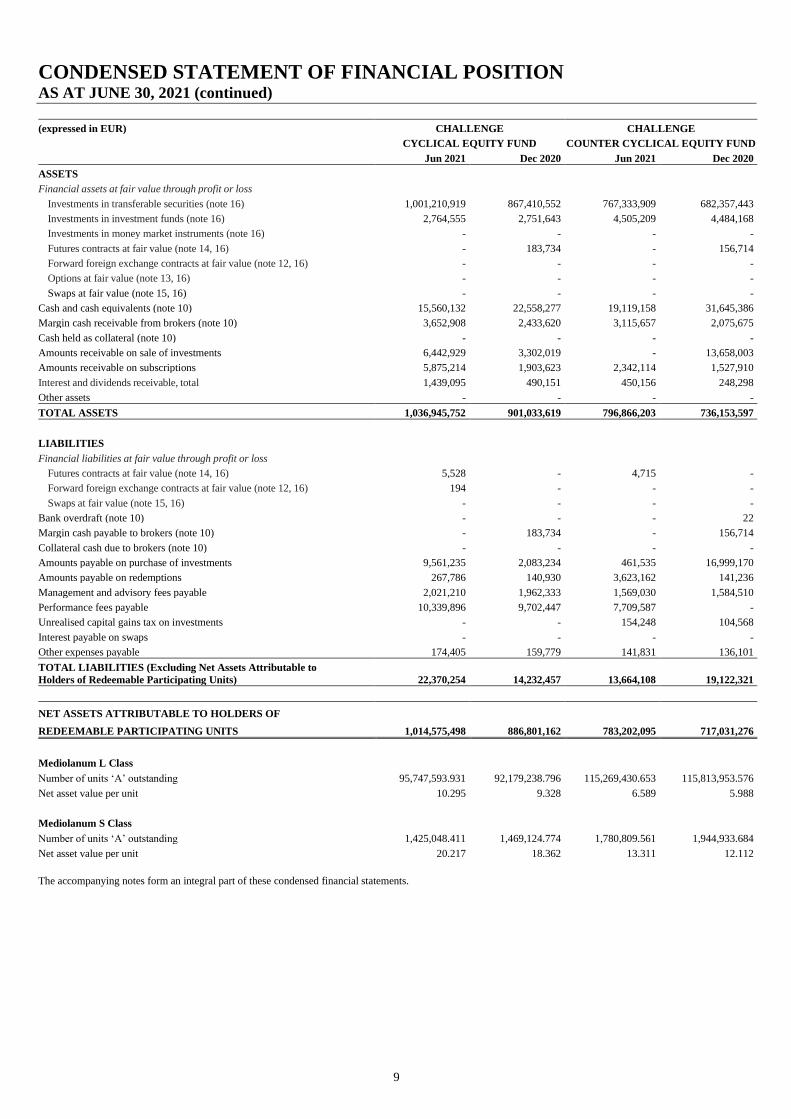
CONDENSED STATEMENT OF FINANCIAL POSITION AS AT JUNE 30, 2021 (continued)
9
(expressed in EUR) CHALLENGE CHALLENGE
CYCLICAL EQUITY FUND COUNTER CYCLICAL EQUITY FUND
Jun 2021 Dec 2020 Jun 2021 Dec 2020
ASSETS
Financial assets at fair value through profit or loss
Investments in transferable securities (note 16) 1,001,210,919 867,410,552 767,333,909 682,357,443
Investments in investment funds (note 16) 2,764,555 2,751,643 4,505,209 4,484,168
Investments in money market instruments (note 16) - - - -
Futures contracts at fair value (note 14, 16) - 183,734 - 156,714
Forward foreign exchange contracts at fair value (note 12, 16) - - - -
Options at fair value (note 13, 16) - - - -
Swaps at fair value (note 15, 16) - - - -
Cash and cash equivalents (note 10) 15,560,132 22,558,277 19,119,158 31,645,386
Margin cash receivable from brokers (note 10) 3,652,908 2,433,620 3,115,657 2,075,675
Cash held as collateral (note 10) - - - -
Amounts receivable on sale of investments 6,442,929 3,302,019 - 13,658,003
Amounts receivable on subscriptions 5,875,214 1,903,623 2,342,114 1,527,910
Interest and dividends receivable, total 1,439,095 490,151 450,156 248,298
Other assets - - - -
TOTAL ASSETS 1,036,945,752 901,033,619 796,866,203 736,153,597
LIABILITIES
Financial liabilities at fair value through profit or loss
Futures contracts at fair value (note 14, 16) 5,528 - 4,715 -
Forward foreign exchange contracts at fair value (note 12, 16) 194 - - -
Swaps at fair value (note 15, 16) - - - -
Bank overdraft (note 10) - - - 22
Margin cash payable to brokers (note 10) - 183,734 - 156,714
Collateral cash due to brokers (note 10) - - - -
Amounts payable on purchase of investments 9,561,235 2,083,234 461,535 16,999,170
Amounts payable on redemptions 267,786 140,930 3,623,162 141,236
Management and advisory fees payable 2,021,210 1,962,333 1,569,030 1,584,510
Performance fees payable 10,339,896 9,702,447 7,709,587 -
Unrealised capital gains tax on investments - - 154,248 104,568
Interest payable on swaps - - - -
Other expenses payable 174,405 159,779 141,831 136,101
TOTAL LIABILITIES (Excluding Net Assets Attributable to
Holders of Redeemable Participating Units) 22,370,254 14,232,457 13,664,108 19,122,321
NET ASSETS ATTRIBUTABLE TO HOLDERS OF
REDEEMABLE PARTICIPATING UNITS 1,014,575,498 886,801,162 783,202,095 717,031,276
Mediolanum L Class
Number of units ‘A’ outstanding 95,747,593.931 92,179,238.796 115,269,430.653 115,813,953.576
Net asset value per unit 10.295 9.328 6.589 5.988
Mediolanum S Class
Number of units ‘A’ outstanding 1,425,048.411 1,469,124.774 1,780,809.561 1,944,933.684
Net asset value per unit 20.217 18.362 13.311 12.112
The accompanying notes form an integral part of these condensed financial statements.
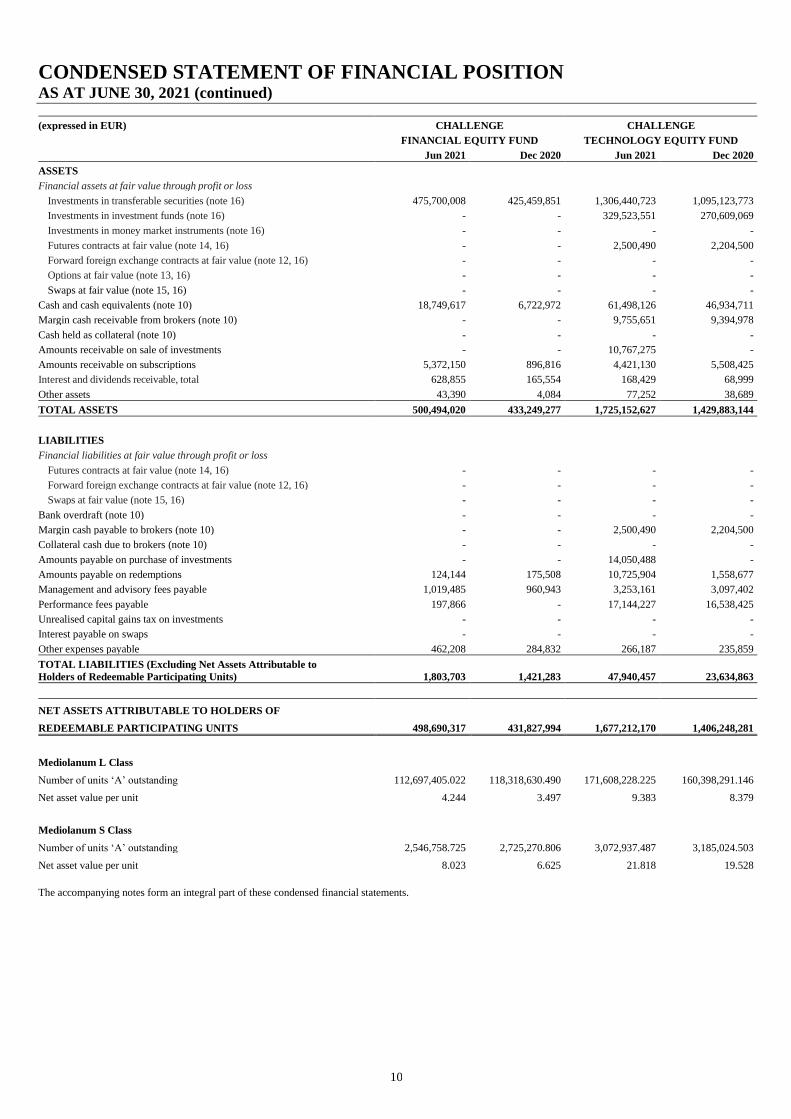
CONDENSED STATEMENT OF FINANCIAL POSITION AS AT JUNE 30, 2021 (continued)
10
(expressed in EUR) CHALLENGE CHALLENGE
FINANCIAL EQUITY FUND TECHNOLOGY EQUITY FUND
Jun 2021 Dec 2020 Jun 2021 Dec 2020
ASSETS
Financial assets at fair value through profit or loss
Investments in transferable securities (note 16) 475,700,008 425,459,851 1,306,440,723 1,095,123,773
Investments in investment funds (note 16) - - 329,523,551 270,609,069
Investments in money market instruments (note 16) - - - -
Futures contracts at fair value (note 14, 16) - - 2,500,490 2,204,500
Forward foreign exchange contracts at fair value (note 12, 16) - - - -
Options at fair value (note 13, 16) - - - -
Swaps at fair value (note 15, 16) - - - -
Cash and cash equivalents (note 10) 18,749,617 6,722,972 61,498,126 46,934,711
Margin cash receivable from brokers (note 10) - - 9,755,651 9,394,978
Cash held as collateral (note 10) - - - -
Amounts receivable on sale of investments - - 10,767,275 -
Amounts receivable on subscriptions 5,372,150 896,816 4,421,130 5,508,425
Interest and dividends receivable, total 628,855 165,554 168,429 68,999
Other assets 43,390 4,084 77,252 38,689
TOTAL ASSETS 500,494,020 433,249,277 1,725,152,627 1,429,883,144
LIABILITIES
Financial liabilities at fair value through profit or loss
Futures contracts at fair value (note 14, 16) - - - -
Forward foreign exchange contracts at fair value (note 12, 16) - - - -
Swaps at fair value (note 15, 16) - - - -
Bank overdraft (note 10) - - - -
Margin cash payable to brokers (note 10) - - 2,500,490 2,204,500
Collateral cash due to brokers (note 10) - - - -
Amounts payable on purchase of investments - - 14,050,488 -
Amounts payable on redemptions 124,144 175,508 10,725,904 1,558,677
Management and advisory fees payable 1,019,485 960,943 3,253,161 3,097,402
Performance fees payable 197,866 - 17,144,227 16,538,425
Unrealised capital gains tax on investments - - - -
Interest payable on swaps - - - -
Other expenses payable 462,208 284,832 266,187 235,859
TOTAL LIABILITIES (Excluding Net Assets Attributable to
Holders of Redeemable Participating Units) 1,803,703 1,421,283 47,940,457 23,634,863
NET ASSETS ATTRIBUTABLE TO HOLDERS OF
REDEEMABLE PARTICIPATING UNITS 498,690,317 431,827,994 1,677,212,170 1,406,248,281
Mediolanum L Class
Number of units ‘A’ outstanding 112,697,405.022 118,318,630.490 171,608,228.225 160,398,291.146
Net asset value per unit 4.244 3.497 9.383 8.379
Mediolanum S Class
Number of units ‘A’ outstanding 2,546,758.725 2,725,270.806 3,072,937.487 3,185,024.503
Net asset value per unit 8.023 6.625 21.818 19.528
The accompanying notes form an integral part of these condensed financial statements.
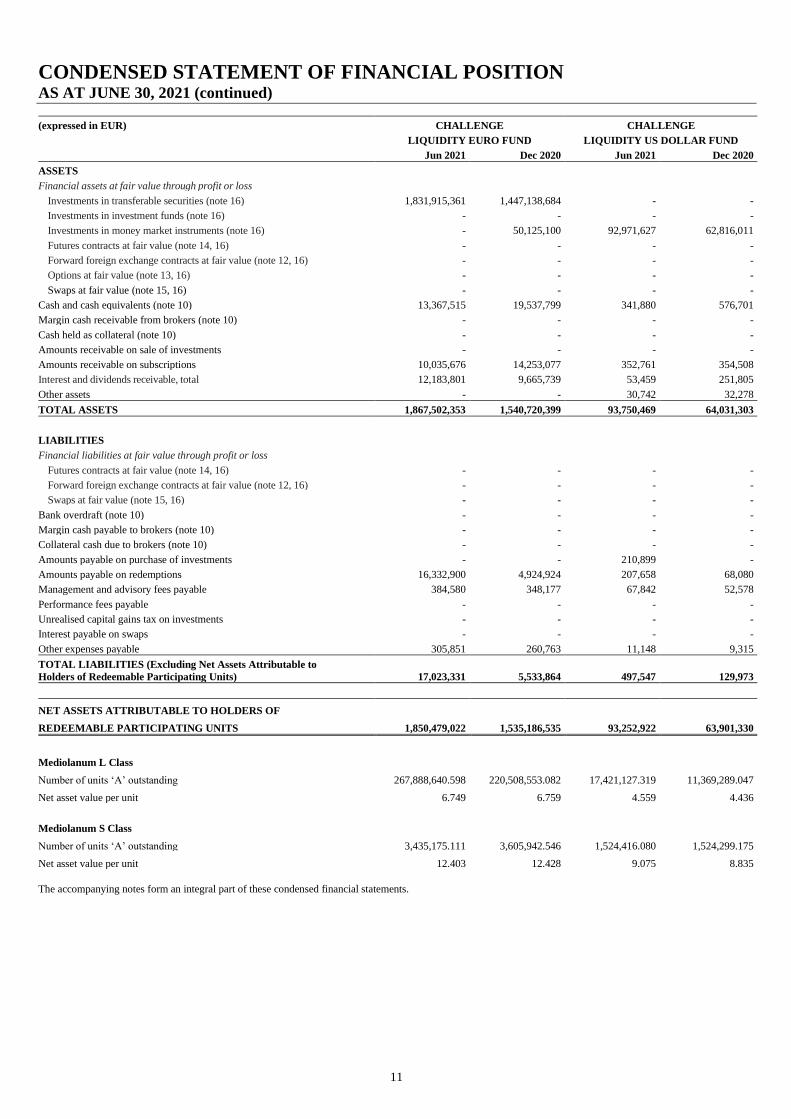
CONDENSED STATEMENT OF FINANCIAL POSITION AS AT JUNE 30, 2021 (continued)
11
(expressed in EUR) CHALLENGE CHALLENGE
LIQUIDITY EURO FUND LIQUIDITY US DOLLAR FUND
Jun 2021 Dec 2020 Jun 2021 Dec 2020
ASSETS
Financial assets at fair value through profit or loss
Investments in transferable securities (note 16) 1,831,915,361 1,447,138,684 - -
Investments in investment funds (note 16) - - - -
Investments in money market instruments (note 16) - 50,125,100 92,971,627 62,816,011
Futures contracts at fair value (note 14, 16) - - - -
Forward foreign exchange contracts at fair value (note 12, 16) - - - -
Options at fair value (note 13, 16) - - - -
Swaps at fair value (note 15, 16) - - - -
Cash and cash equivalents (note 10) 13,367,515 19,537,799 341,880 576,701
Margin cash receivable from brokers (note 10) - - - -
Cash held as collateral (note 10) - - - -
Amounts receivable on sale of investments - - - -
Amounts receivable on subscriptions 10,035,676 14,253,077 352,761 354,508
Interest and dividends receivable, total 12,183,801 9,665,739 53,459 251,805
Other assets - - 30,742 32,278
TOTAL ASSETS 1,867,502,353 1,540,720,399 93,750,469 64,031,303
LIABILITIES
Financial liabilities at fair value through profit or loss
Futures contracts at fair value (note 14, 16) - - - -
Forward foreign exchange contracts at fair value (note 12, 16) - - - -
Swaps at fair value (note 15, 16) - - - -
Bank overdraft (note 10) - - - -
Margin cash payable to brokers (note 10) - - - -
Collateral cash due to brokers (note 10) - - - -
Amounts payable on purchase of investments - - 210,899 -
Amounts payable on redemptions 16,332,900 4,924,924 207,658 68,080
Management and advisory fees payable 384,580 348,177 67,842 52,578
Performance fees payable - - - -
Unrealised capital gains tax on investments - - - -
Interest payable on swaps - - - -
Other expenses payable 305,851 260,763 11,148 9,315
TOTAL LIABILITIES (Excluding Net Assets Attributable to
Holders of Redeemable Participating Units) 17,023,331 5,533,864 497,547 129,973
NET ASSETS ATTRIBUTABLE TO HOLDERS OF
REDEEMABLE PARTICIPATING UNITS 1,850,479,022 1,535,186,535 93,252,922 63,901,330
Mediolanum L Class
Number of units ‘A’ outstanding 267,888,640.598 220,508,553.082 17,421,127.319 11,369,289.047
Net asset value per unit 6.749 6.759 4.559 4.436
Mediolanum S Class
Number of units ‘A’ outstanding 3,435,175.111 3,605,942.546 1,524,416.080 1,524,299.175
Net asset value per unit 12.403 12.428 9.075 8.835
The accompanying notes form an integral part of these condensed financial statements.

CONDENSED STATEMENT OF FINANCIAL POSITION AS AT JUNE 30, 2021 (continued)
12
(expressed in EUR) CHALLENGE CHALLENGE
EURO INCOME FUND INTERNATIONAL INCOME FUND
Jun 2021 Dec 2020 Jun 2021 Dec 2020
ASSETS
Financial assets at fair value through profit or loss
Investments in transferable securities (note 16) 602,717,673 532,446,367 157,165,496 124,357,899
Investments in investment funds (note 16) - - - -
Investments in money market instruments (note 16) - - 45,855,465 41,890,485
Futures contracts at fair value (note 14, 16) 42,960 33,910 33,445 4,945
Forward foreign exchange contracts at fair value (note 12, 16) - 570,479 406,198
Options at fair value (note 13, 16) 29,580 119,340 - -
Swaps at fair value (note 15, 16) - - - -
Cash and cash equivalents (note 10) 8,655,960 18,105,540 2,560,834 9,869,589
Margin cash receivable from brokers (note 10) 2,508,800 1,998,317 137,947 168,242
Cash held as collateral (note 10) - - 1,450,000 140,000
Amounts receivable on sale of investments 921,917 - - 1,703,531
Amounts receivable on subscriptions 9,944,692 85,287 6,147,484 76,014
Interest and dividends receivable, total 1,628,143 1,692,717 724,445 546,741
Other assets - - 19 2,238
TOTAL ASSETS 626,449,725 554,481,478 214,645,614 179,165,882
LIABILITIES
Financial liabilities at fair value through profit or loss
Futures contracts at fair value (note 14, 16) 349,410 199,180 1,800 25,122
Forward foreign exchange contracts at fair value (note 12, 16) - - 1,003,573 473,043
Swaps at fair value (note 15, 16) - - - -
Bank overdraft (note 10) - - 16 60
Margin cash payable to brokers (note 10) 1,156,686 231,487 76,905 76,209
Collateral cash due to brokers (note 10) - - - -
Amounts payable on purchase of investments 2,382,367 112,130 - 5,629,098
Amounts payable on redemptions 108,110 29,123 20,982 47,567
Management and advisory fees payable 760,905 753,317 258,648 224,839
Performance fees payable - - - -
Unrealised capital gains tax on investments - - - -
Interest payable on swaps - - - -
Other expenses payable 104,576 98,154 28,330 26,057
TOTAL LIABILITIES (Excluding Net Assets Attributable to
Holders of Redeemable Participating Units) 4,862,054 1,423,391 1,390,254 6,501,995
NET ASSETS ATTRIBUTABLE TO HOLDERS OF
REDEEMABLE PARTICIPATING UNITS 621,587,671 553,058,087 213,255,360 172,663,887
Mediolanum L Class
Number of units ‘A’ outstanding 87,438,337.392 77,375,250.834 13,983,997.097 13,271,446.073
Net asset value per unit 7.011 7.035 5.094 5.077
Number of units ‘B’ outstanding 495,026.424 480,000.297 349,482.948 366,837.196
Net asset value per unit 4.588 4.606 4.799 4.797
Mediolanum L Hedged Class
Number of units ‘A’ outstanding - - 21,183,518.079 14,883,859.147
Net asset value per unit - - 6.163 6.223
Number of units ‘B’ outstanding - - 202,959.409 219,856.629
Net asset value per unit - - 4.516 4.574

CONDENSED STATEMENT OF FINANCIAL POSITION AS AT JUNE 30, 2021 (continued)
13
(expressed in EUR) CHALLENGE CHALLENGE
EURO INCOME FUND INTERNATIONAL INCOME FUND
Jun 2021 Dec 2020 Jun 2021 Dec 2020
Mediolanum S Class
Number of units ‘A’ outstanding 316,617.792 312,846.176 273,037.911 293,863.685
Net asset value per unit 12.243 12.298 9.936 9.914
Number of units ‘B’ outstanding 273,877.126 301,220.834 312,914.961 350,822.297
Net asset value per unit 8.815 8.859 9.375 9.382
Mediolanum S Hedged Class
Number of units ‘A’ outstanding - - 157,327.275 180,301.010
Net asset value per unit - - 10.713 10.834
Number of units ‘B’ outstanding - - 176,704.911 196,489.229
Net asset value per unit - - 8.713 8.841
The accompanying notes form an integral part of these condensed financial statements.
CONDENSED STATEMENT OF FINANCIAL POSITION AS AT JUNE 30, 2021 (continued)
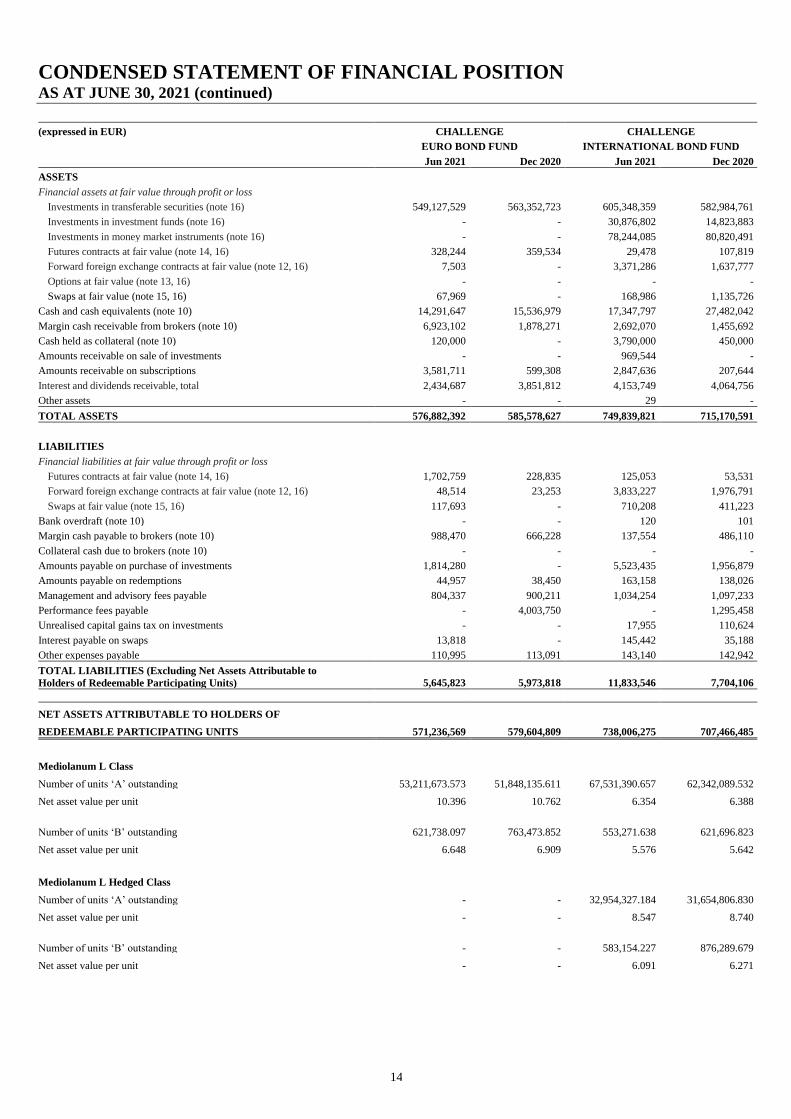
14
(expressed in EUR) CHALLENGE CHALLENGE
EURO BOND FUND INTERNATIONAL BOND FUND
Jun 2021 Dec 2020 Jun 2021 Dec 2020
ASSETS
Financial assets at fair value through profit or loss
Investments in transferable securities (note 16) 549,127,529 563,352,723 605,348,359 582,984,761
Investments in investment funds (note 16) - - 30,876,802 14,823,883
Investments in money market instruments (note 16) - - 78,244,085 80,820,491
Futures contracts at fair value (note 14, 16) 328,244 359,534 29,478 107,819
Forward foreign exchange contracts at fair value (note 12, 16) 7,503 - 3,371,286 1,637,777
Options at fair value (note 13, 16) - - - -
Swaps at fair value (note 15, 16) 67,969 - 168,986 1,135,726
Cash and cash equivalents (note 10) 14,291,647 15,536,979 17,347,797 27,482,042
Margin cash receivable from brokers (note 10) 6,923,102 1,878,271 2,692,070 1,455,692
Cash held as collateral (note 10) 120,000 - 3,790,000 450,000
Amounts receivable on sale of investments - - 969,544 -
Amounts receivable on subscriptions 3,581,711 599,308 2,847,636 207,644
Interest and dividends receivable, total 2,434,687 3,851,812 4,153,749 4,064,756
Other assets - - 29 -
TOTAL ASSETS 576,882,392 585,578,627 749,839,821 715,170,591
LIABILITIES
Financial liabilities at fair value through profit or loss
Futures contracts at fair value (note 14, 16) 1,702,759 228,835 125,053 53,531
Forward foreign exchange contracts at fair value (note 12, 16) 48,514 23,253 3,833,227 1,976,791
Swaps at fair value (note 15, 16) 117,693 - 710,208 411,223
Bank overdraft (note 10) - - 120 101
Margin cash payable to brokers (note 10) 988,470 666,228 137,554 486,110
Collateral cash due to brokers (note 10) - - - -
Amounts payable on purchase of investments 1,814,280 - 5,523,435 1,956,879
Amounts payable on redemptions 44,957 38,450 163,158 138,026
Management and advisory fees payable 804,337 900,211 1,034,254 1,097,233
Performance fees payable - 4,003,750 - 1,295,458
Unrealised capital gains tax on investments - - 17,955 110,624
Interest payable on swaps 13,818 - 145,442 35,188
Other expenses payable 110,995 113,091 143,140 142,942
TOTAL LIABILITIES (Excluding Net Assets Attributable to
Holders of Redeemable Participating Units) 5,645,823 5,973,818 11,833,546 7,704,106
NET ASSETS ATTRIBUTABLE TO HOLDERS OF
REDEEMABLE PARTICIPATING UNITS 571,236,569 579,604,809 738,006,275 707,466,485
Mediolanum L Class
Number of units ‘A’ outstanding 53,211,673.573 51,848,135.611 67,531,390.657 62,342,089.532
Net asset value per unit 10.396 10.762 6.354 6.388
Number of units ‘B’ outstanding 621,738.097 763,473.852 553,271.638 621,696.823
Net asset value per unit 6.648 6.909 5.576 5.642
Mediolanum L Hedged Class
Number of units ‘A’ outstanding - - 32,954,327.184 31,654,806.830
Net asset value per unit - - 8.547 8.740
Number of units ‘B’ outstanding - - 583,154.227 876,289.679
Net asset value per unit - - 6.091 6.271

CONDENSED STATEMENT OF FINANCIAL POSITION AS AT JUNE 30, 2021 (continued)
15
(expressed in EUR) CHALLENGE CHALLENGE
EURO BOND FUND INTERNATIONAL BOND FUND
Jun 2021 Dec 2020 Jun 2021 Dec 2020
Mediolanum S Class
Number of units ‘A’ outstanding 295,255.134 322,088.535 237,773.079 241,220.695
Net asset value per unit 17.986 18.639 12.385 12.465
Number of units ‘B’ outstanding 689,666.602 795,099.880 445,002.985 519,490.680
Net asset value per unit 12.475 12.977 10.927 11.066
Mediolanum S Hedged Class
Number of units ‘A’ outstanding - - 513,734.449 558,225.949
Net asset value per unit - - 14.624 14.974
Number of units ‘B’ outstanding - - 465,907.627 546,928.549
Net asset value per unit - - 11.382 11.726
The accompanying notes form an integral part of these condensed financial statements.

CONDENSED STATEMENT OF FINANCIAL POSITION AS AT JUNE 30, 2021 (continued)
16
(expressed in EUR) CHALLENGE CHALLENGE
INTERNATIONAL EQUITY FUND SOLIDITY & RETURN
Jun 2021 Dec 2020 Jun 2021 Dec 2020
ASSETS
Financial assets at fair value through profit or loss
Investments in transferable securities (note 16) 1,338,555,070 1,182,646,060 595,765,791 530,938,286
Investments in investment funds (note 16) 168,148,828 187,320,868 8,579,819 19,644,972
Investments in money market instruments (note 16) - - - 16,865,943
Futures contracts at fair value (note 14, 16) - 1,167,253 - 161,533
Forward foreign exchange contracts at fair value (note 12, 16) 50,751 556,245 414,472 616,914
Options at fair value (note 13, 16) - - - -
Swaps at fair value (note 15, 16) - - 268,885 3,281,570
Cash and cash equivalents (note 10) 46,073,253 67,021,959 4,905,895 8,061,944
Margin cash receivable from brokers (note 10) 9,750,926 12,616,930 4,414,669 1,371,754
Cash held as collateral (note 10) 3,210,000 - 5,810,000 950,000
Amounts receivable on sale of investments 3,154,807 14,135,356 8,526,248 -
Amounts receivable on subscriptions 3,203,582 2,999,513 917,179 1,741,427
Interest and dividends receivable, total 1,241,176 715,902 5,763,254 4,784,920
Other assets 21,302 92,022 29,155 34,328
TOTAL ASSETS 1,573,409,695 1,469,272,108 635,395,367 588,453,591
LIABILITIES
Financial liabilities at fair value through profit or loss
Futures contracts at fair value (note 14, 16) 35,117 - 200,611 -
Forward foreign exchange contracts at fair value (note 12, 16) 1,227,369 288,808 1,903,968 -
Swaps at fair value (note 15, 16) - - 4,464,555 715,087
Bank overdraft (note 10) - - - -
Margin cash payable to brokers (note 10) 3,192,950 1,167,253 - 161,532
Collateral cash due to brokers (note 10) - - 300,000 -
Amounts payable on purchase of investments 6,730,463 12,950,971 2,469,600 -
Amounts payable on redemptions 6,275,110 535,298 817,514 401,587
Management and advisory fees payable 3,473,710 3,629,301 917,617 950,604
Performance fees payable 16,261,466 7,149,552 - 1,509,244
Unrealised capital gains tax on investments 44,031 38,860 - -
Interest payable on swaps - - 390,040 -
Other expenses payable 322,747 273,911 120,065 181,026
TOTAL LIABILITIES (Excluding Net Assets Attributable to
Holders of Redeemable Participating Units) 37,562,963 26,033,954 11,583,970 3,919,080
NET ASSETS ATTRIBUTABLE TO HOLDERS OF
REDEEMABLE PARTICIPATING UNITS 1,535,846,732 1,443,238,154 623,811,397 584,534,511
Mediolanum L Class
Number of units ‘A’ outstanding 110,857,418.886 119,165,954.485 51,404,810.303 32,944,832.406
Net asset value per unit 11.025 9.658 5.326 5.331
Number of units ‘B’ outstanding - - 3,685,429.663 3,447,744.856
Net asset value per unit - - 5.181 5.204
Mediolanum L Hedged Class
Number of units ‘A’ outstanding 18,796,868.379 19,011,770.708 - -
Net asset value per unit 11.317 10.220 - -
Number of units ‘B’ outstanding - - - -
Net asset value per unit - - - -
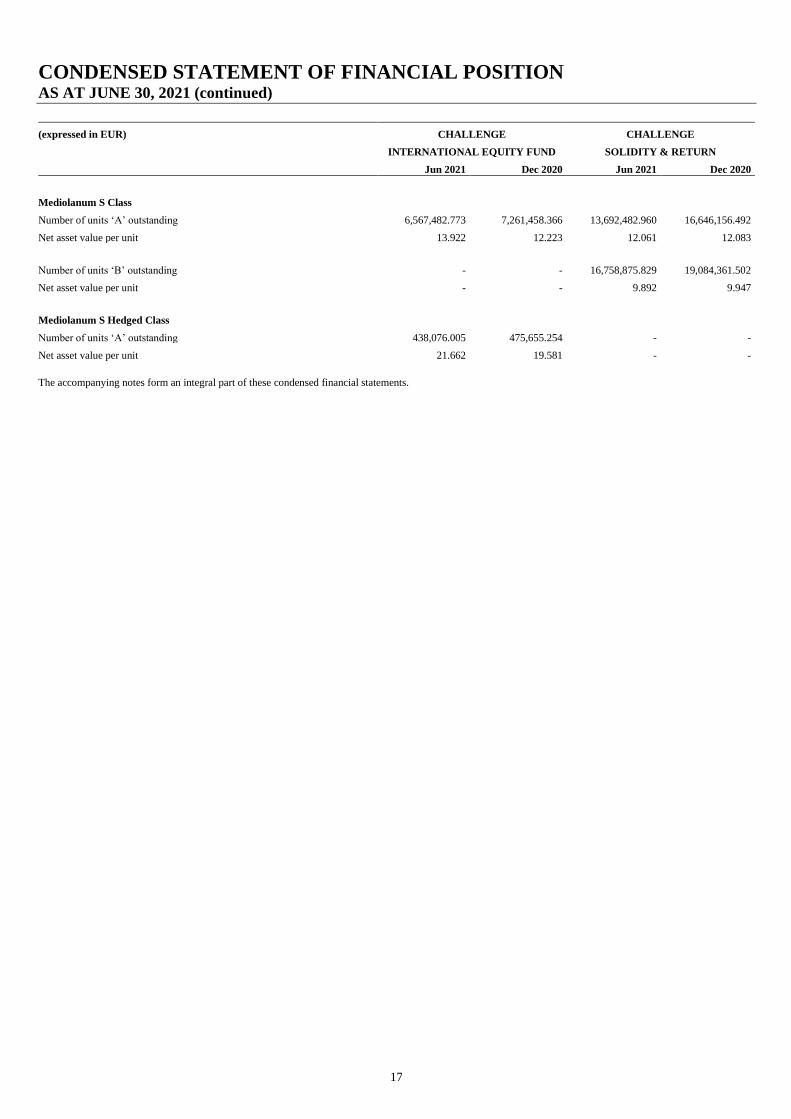
CONDENSED STATEMENT OF FINANCIAL POSITION AS AT JUNE 30, 2021 (continued)
17
(expressed in EUR) CHALLENGE CHALLENGE
INTERNATIONAL EQUITY FUND SOLIDITY & RETURN
Jun 2021 Dec 2020 Jun 2021 Dec 2020
Mediolanum S Class
Number of units ‘A’ outstanding 6,567,482.773 7,261,458.366 13,692,482.960 16,646,156.492
Net asset value per unit 13.922 12.223 12.061 12.083
Number of units ‘B’ outstanding - - 16,758,875.829 19,084,361.502
Net asset value per unit - - 9.892 9.947
Mediolanum S Hedged Class
Number of units ‘A’ outstanding 438,076.005 475,655.254 - -
Net asset value per unit 21.662 19.581 - -
The accompanying notes form an integral part of these condensed financial statements.
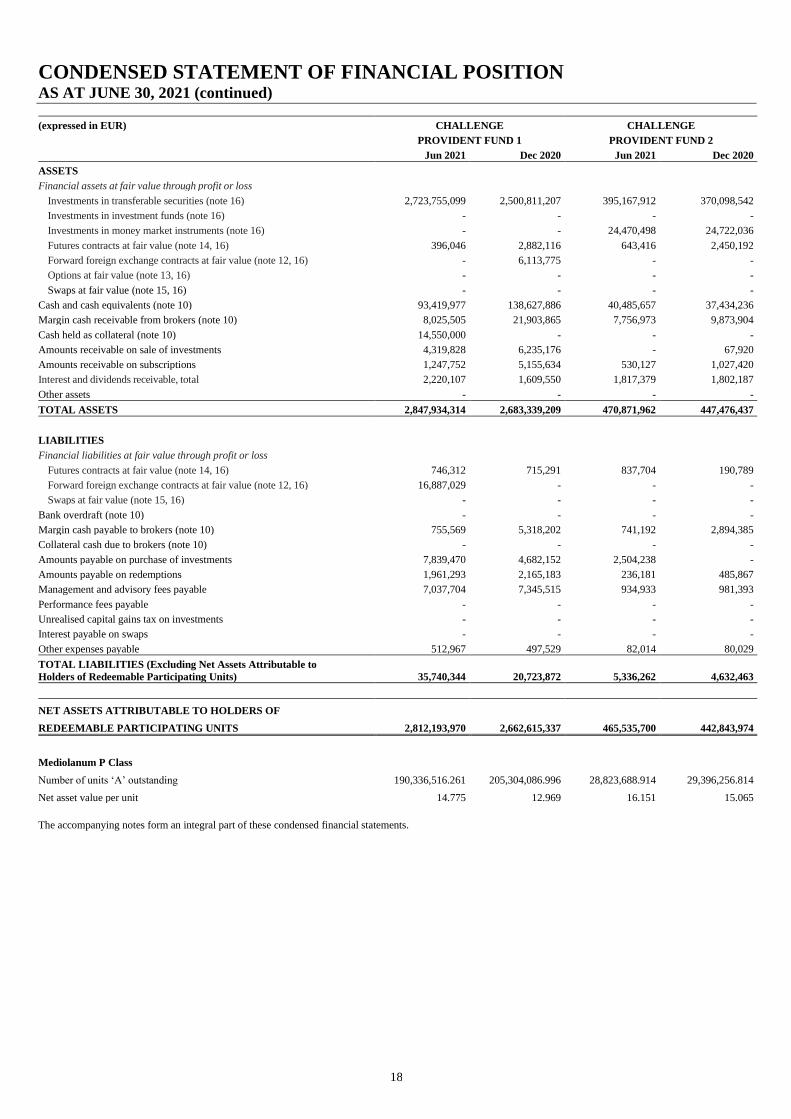
CONDENSED STATEMENT OF FINANCIAL POSITION AS AT JUNE 30, 2021 (continued)
18
(expressed in EUR) CHALLENGE CHALLENGE
PROVIDENT FUND 1 PROVIDENT FUND 2
Jun 2021 Dec 2020 Jun 2021 Dec 2020
ASSETS
Financial assets at fair value through profit or loss
Investments in transferable securities (note 16) 2,723,755,099 2,500,811,207 395,167,912 370,098,542
Investments in investment funds (note 16) - - - -
Investments in money market instruments (note 16) - - 24,470,498 24,722,036
Futures contracts at fair value (note 14, 16) 396,046 2,882,116 643,416 2,450,192
Forward foreign exchange contracts at fair value (note 12, 16) - 6,113,775 - -
Options at fair value (note 13, 16) - - - -
Swaps at fair value (note 15, 16) - - - -
Cash and cash equivalents (note 10) 93,419,977 138,627,886 40,485,657 37,434,236
Margin cash receivable from brokers (note 10) 8,025,505 21,903,865 7,756,973 9,873,904
Cash held as collateral (note 10) 14,550,000 - - -
Amounts receivable on sale of investments 4,319,828 6,235,176 - 67,920
Amounts receivable on subscriptions 1,247,752 5,155,634 530,127 1,027,420
Interest and dividends receivable, total 2,220,107 1,609,550 1,817,379 1,802,187
Other assets - - - -
TOTAL ASSETS 2,847,934,314 2,683,339,209 470,871,962 447,476,437
LIABILITIES
Financial liabilities at fair value through profit or loss
Futures contracts at fair value (note 14, 16) 746,312 715,291 837,704 190,789
Forward foreign exchange contracts at fair value (note 12, 16) 16,887,029 - - -
Swaps at fair value (note 15, 16) - - - -
Bank overdraft (note 10) - - - -
Margin cash payable to brokers (note 10) 755,569 5,318,202 741,192 2,894,385
Collateral cash due to brokers (note 10) - - - -
Amounts payable on purchase of investments 7,839,470 4,682,152 2,504,238 -
Amounts payable on redemptions 1,961,293 2,165,183 236,181 485,867
Management and advisory fees payable 7,037,704 7,345,515 934,933 981,393
Performance fees payable - - - -
Unrealised capital gains tax on investments - - - -
Interest payable on swaps - - - -
Other expenses payable 512,967 497,529 82,014 80,029
TOTAL LIABILITIES (Excluding Net Assets Attributable to
Holders of Redeemable Participating Units) 35,740,344 20,723,872 5,336,262 4,632,463
NET ASSETS ATTRIBUTABLE TO HOLDERS OF
REDEEMABLE PARTICIPATING UNITS 2,812,193,970 2,662,615,337 465,535,700 442,843,974
Mediolanum P Class
Number of units ‘A’ outstanding 190,336,516.261 205,304,086.996 28,823,688.914 29,396,256.814
Net asset value per unit 14.775 12.969 16.151 15.065
The accompanying notes form an integral part of these condensed financial statements.

CONDENSED STATEMENT OF FINANCIAL POSITION AS AT JUNE 30, 2021 (continued)
19
(expressed in EUR) CHALLENGE CHALLENGE
PROVIDENT FUND 3 PROVIDENT FUND 4
Jun 2021 Dec 2020 Jun 2021 Dec 2020
ASSETS
Financial assets at fair value through profit or loss
Investments in transferable securities (note 16) 211,397,915 203,671,424 197,684,619 167,375,532
Investments in investment funds (note 16) - - - -
Investments in money market instruments (note 16) 20,242,083 17,245,757 - 9,773,887
Futures contracts at fair value (note 14, 16) - - - -
Forward foreign exchange contracts at fair value (note 12, 16) - - - -
Options at fair value (note 13, 16) - - - -
Swaps at fair value (note 15, 16) - - - -
Cash and cash equivalents (note 10) 33,596,146 37,520,843 14,129,987 22,875,287
Margin cash receivable from brokers (note 10) 185,308 - - -
Cash held as collateral (note 10) - - - -
Amounts receivable on sale of investments - - - -
Amounts receivable on subscriptions 303,656 626,010 142,888 772,829
Interest and dividends receivable, total 1,684,401 1,851,484 736,887 787,645
Other assets - - - -
TOTAL ASSETS 267,409,509 260,915,518 212,694,381 201,585,180
LIABILITIES
Financial liabilities at fair value through profit or loss
Futures contracts at fair value (note 14, 16) 120,378 - - -
Forward foreign exchange contracts at fair value (note 12, 16) - - - -
Swaps at fair value (note 15, 16) - - - -
Bank overdraft (note 10) - - - -
Margin cash payable to brokers (note 10) 28,407 - - -
Collateral cash due to brokers (note 10) - - - -
Amounts payable on purchase of investments 4,985,808 - 9,971,616 -
Amounts payable on redemptions 179,034 448,623 156,330 527,507
Management and advisory fees payable 339,990 373,044 186,711 202,863
Performance fees payable - - - -
Unrealised capital gains tax on investments - - - -
Interest payable on swaps - - - -
Other expenses payable 40,288 40,160 38,381 39,417
TOTAL LIABILITIES (Excluding Net Assets Attributable to
Holders of Redeemable Participating Units) 5,693,905 861,827 10,353,038 769,787
NET ASSETS ATTRIBUTABLE TO HOLDERS OF
REDEEMABLE PARTICIPATING UNITS 261,715,604 260,053,691 202,341,343 200,815,393
Mediolanum P Class
Number of units ‘A’ outstanding 18,255,401.401 17,960,549.236 16,766,062.115 16,606,601.870
Net asset value per unit 14.336 14.479 12.069 12.093
The accompanying notes form an integral part of these condensed financial statements.
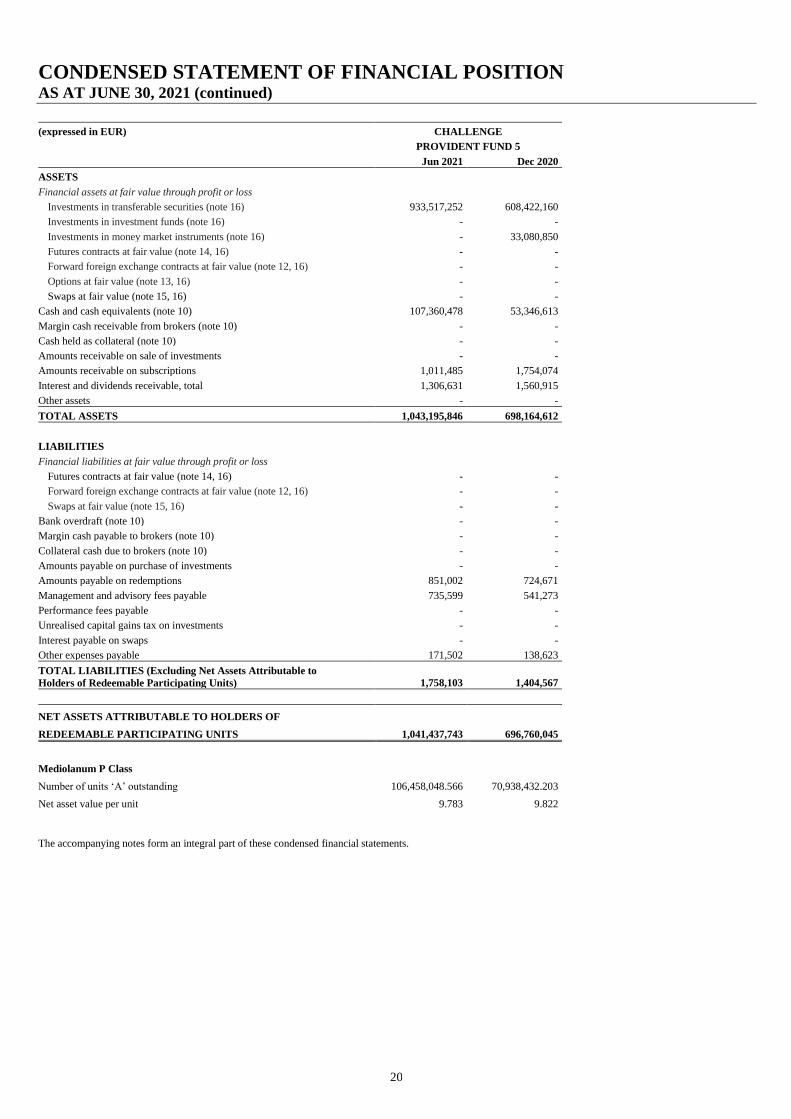
CONDENSED STATEMENT OF FINANCIAL POSITION AS AT JUNE 30, 2021 (continued)
20
(expressed in EUR) CHALLENGE
PROVIDENT FUND 5
Jun 2021 Dec 2020
ASSETS
Financial assets at fair value through profit or loss
Investments in transferable securities (note 16) 933,517,252 608,422,160
Investments in investment funds (note 16) - -
Investments in money market instruments (note 16) - 33,080,850
Futures contracts at fair value (note 14, 16) - -
Forward foreign exchange contracts at fair value (note 12, 16) - -
Options at fair value (note 13, 16) - -
Swaps at fair value (note 15, 16) - -
Cash and cash equivalents (note 10) 107,360,478 53,346,613
Margin cash receivable from brokers (note 10) - -
Cash held as collateral (note 10) - -
Amounts receivable on sale of investments - -
Amounts receivable on subscriptions 1,011,485 1,754,074
Interest and dividends receivable, total 1,306,631 1,560,915
Other assets - -
TOTAL ASSETS 1,043,195,846 698,164,612
LIABILITIES
Financial liabilities at fair value through profit or loss
Futures contracts at fair value (note 14, 16) - -
Forward foreign exchange contracts at fair value (note 12, 16) - -
Swaps at fair value (note 15, 16) - -
Bank overdraft (note 10) - -
Margin cash payable to brokers (note 10) - -
Collateral cash due to brokers (note 10) - -
Amounts payable on purchase of investments - -
Amounts payable on redemptions 851,002 724,671
Management and advisory fees payable 735,599 541,273
Performance fees payable - -
Unrealised capital gains tax on investments - -
Interest payable on swaps - -
Other expenses payable 171,502 138,623
TOTAL LIABILITIES (Excluding Net Assets Attributable to
Holders of Redeemable Participating Units) 1,758,103 1,404,567
NET ASSETS ATTRIBUTABLE TO HOLDERS OF
REDEEMABLE PARTICIPATING UNITS 1,041,437,743 696,760,045
Mediolanum P Class
Number of units ‘A’ outstanding 106,458,048.566 70,938,432.203
Net asset value per unit 9.783 9.822
The accompanying notes form an integral part of these condensed financial statements.
CONDENSED STATEMENT OF FINANCIAL POSITION AS AT JUNE 30, 2021 (continued)
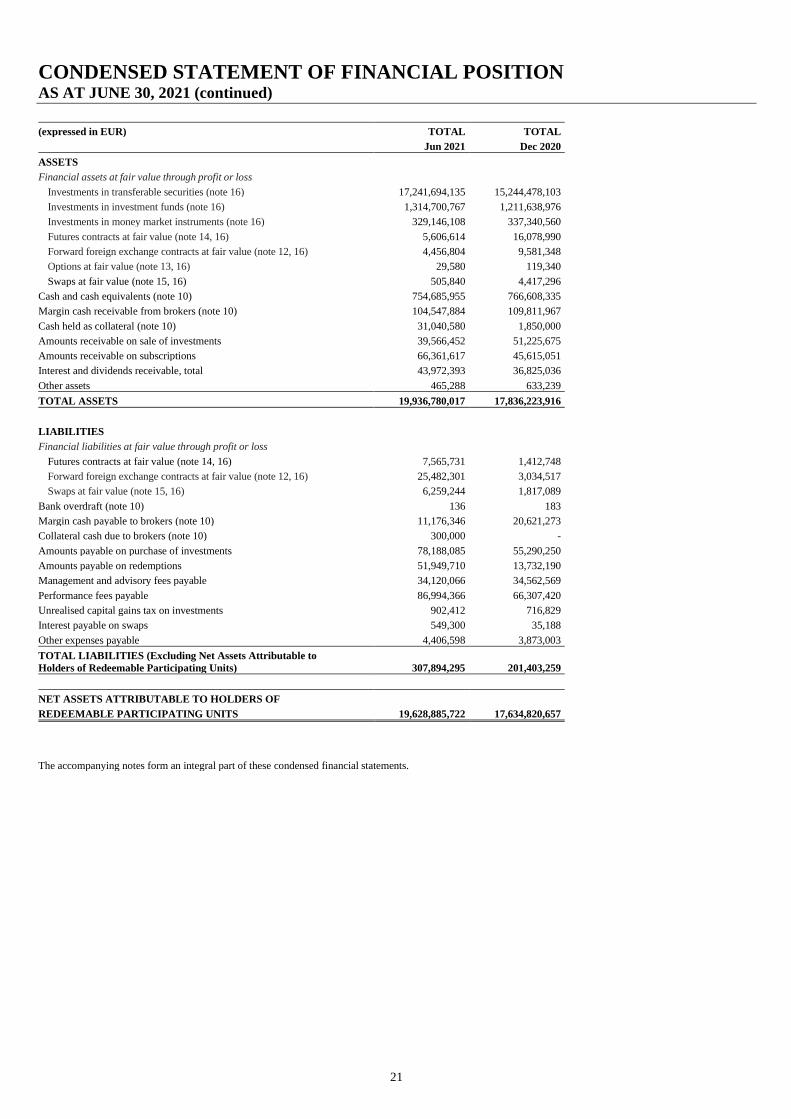
21
(expressed in EUR) TOTAL TOTAL
Jun 2021 Dec 2020
ASSETS
Financial assets at fair value through profit or loss
Investments in transferable securities (note 16) 17,241,694,135 15,244,478,103
Investments in investment funds (note 16) 1,314,700,767 1,211,638,976
Investments in money market instruments (note 16) 329,146,108 337,340,560
Futures contracts at fair value (note 14, 16) 5,606,614 16,078,990
Forward foreign exchange contracts at fair value (note 12, 16) 4,456,804 9,581,348
Options at fair value (note 13, 16) 29,580 119,340
Swaps at fair value (note 15, 16) 505,840 4,417,296
Cash and cash equivalents (note 10) 754,685,955 766,608,335
Margin cash receivable from brokers (note 10) 104,547,884 109,811,967
Cash held as collateral (note 10) 31,040,580 1,850,000
Amounts receivable on sale of investments 39,566,452 51,225,675
Amounts receivable on subscriptions 66,361,617 45,615,051
Interest and dividends receivable, total 43,972,393 36,825,036
Other assets 465,288 633,239
TOTAL ASSETS 19,936,780,017 17,836,223,916
LIABILITIES
Financial liabilities at fair value through profit or loss
Futures contracts at fair value (note 14, 16) 7,565,731 1,412,748
Forward foreign exchange contracts at fair value (note 12, 16) 25,482,301 3,034,517
Swaps at fair value (note 15, 16) 6,259,244 1,817,089
Bank overdraft (note 10) 136 183
Margin cash payable to brokers (note 10) 11,176,346 20,621,273
Collateral cash due to brokers (note 10) 300,000 -
Amounts payable on purchase of investments 78,188,085 55,290,250
Amounts payable on redemptions 51,949,710 13,732,190
Management and advisory fees payable 34,120,066 34,562,569
Performance fees payable 86,994,366 66,307,420
Unrealised capital gains tax on investments 902,412 716,829
Interest payable on swaps 549,300 35,188
Other expenses payable 4,406,598 3,873,003
TOTAL LIABILITIES (Excluding Net Assets Attributable to
Holders of Redeemable Participating Units) 307,894,295 201,403,259
NET ASSETS ATTRIBUTABLE TO HOLDERS OF
REDEEMABLE PARTICIPATING UNITS 19,628,885,722 17,634,820,657
The accompanying notes form an integral part of these condensed financial statements.
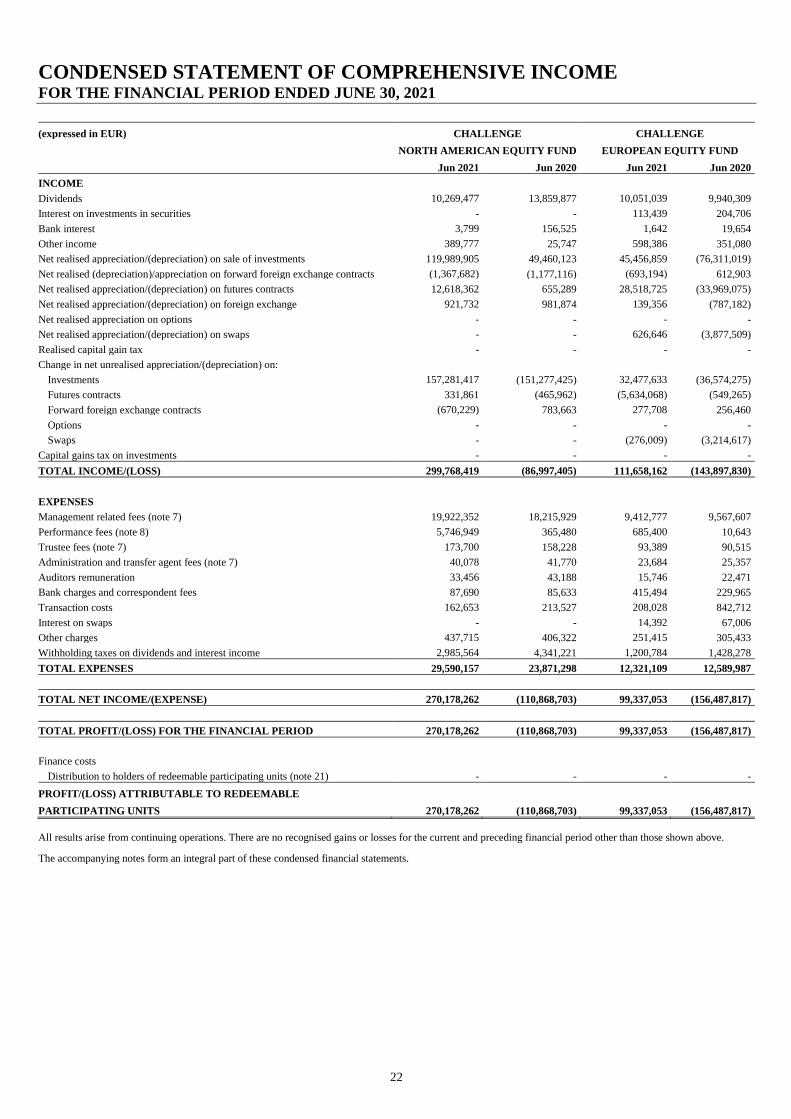
CONDENSED STATEMENT OF COMPREHENSIVE INCOME FOR THE FINANCIAL PERIOD ENDED JUNE 30, 2021
22
(expressed in EUR) CHALLENGE CHALLENGE
NORTH AMERICAN EQUITY FUND EUROPEAN EQUITY FUND
Jun 2021 Jun 2020 Jun 2021 Jun 2020
INCOME
Dividends 10,269,477 13,859,877 10,051,039 9,940,309
Interest on investments in securities - - 113,439 204,706
Bank interest 3,799 156,525 1,642 19,654
Other income 389,777 25,747 598,386 351,080
Net realised appreciation/(depreciation) on sale of investments 119,989,905 49,460,123 45,456,859 (76,311,019)
Net realised (depreciation)/appreciation on forward foreign exchange contracts (1,367,682) (1,177,116) (693,194) 612,903
Net realised appreciation/(depreciation) on futures contracts 12,618,362 655,289 28,518,725 (33,969,075)
Net realised appreciation/(depreciation) on foreign exchange 921,732 981,874 139,356 (787,182)
Net realised appreciation on options - - - -
Net realised appreciation/(depreciation) on swaps - - 626,646 (3,877,509)
Realised capital gain tax - - - -
Change in net unrealised appreciation/(depreciation) on:
Investments 157,281,417 (151,277,425) 32,477,633 (36,574,275)
Futures contracts 331,861 (465,962) (5,634,068) (549,265)
Forward foreign exchange contracts (670,229) 783,663 277,708 256,460
Options - - - -
Swaps - - (276,009) (3,214,617)
Capital gains tax on investments - - - -
TOTAL INCOME/(LOSS) 299,768,419 (86,997,405) 111,658,162 (143,897,830)
EXPENSES
Management related fees (note 7) 19,922,352 18,215,929 9,412,777 9,567,607
Performance fees (note 8) 5,746,949 365,480 685,400 10,643
Trustee fees (note 7) 173,700 158,228 93,389 90,515
Administration and transfer agent fees (note 7) 40,078 41,770 23,684 25,357
Auditors remuneration 33,456 43,188 15,746 22,471
Bank charges and correspondent fees 87,690 85,633 415,494 229,965
Transaction costs 162,653 213,527 208,028 842,712
Interest on swaps - - 14,392 67,006
Other charges 437,715 406,322 251,415 305,433
Withholding taxes on dividends and interest income 2,985,564 4,341,221 1,200,784 1,428,278
TOTAL EXPENSES 29,590,157 23,871,298 12,321,109 12,589,987
TOTAL NET INCOME/(EXPENSE) 270,178,262 (110,868,703) 99,337,053 (156,487,817)
TOTAL PROFIT/(LOSS) FOR THE FINANCIAL PERIOD 270,178,262 (110,868,703) 99,337,053 (156,487,817)
Finance costs
Distribution to holders of redeemable participating units (note 21) - - - -
PROFIT/(LOSS) ATTRIBUTABLE TO REDEEMABLE
PARTICIPATING UNITS 270,178,262 (110,868,703) 99,337,053 (156,487,817)
All results arise from continuing operations. There are no recognised gains or losses for the current and preceding financial period other than those shown above.
The accompanying notes form an integral part of these condensed financial statements.

CONDENSED STATEMENT OF COMPREHENSIVE INCOME FOR THE FINANCIAL PERIOD ENDED JUNE 30, 2021 (continued)
23
(expressed in EUR) CHALLENGE CHALLENGE
ITALIAN EQUITY FUND GERMANY EQUITY FUND
Jun 2021 Jun 2020 Jun 2021 Jun 2020
INCOME
Dividends 5,652,125 2,456,304 2,686,772 2,243,414
Interest on investments in securities - - - -
Bank interest - 419 - -
Other income 87,860 160,409 - 12,473
Net realised appreciation/(depreciation) on sale of investments 23,944,275 (11,710,310) 8,666,180 (8,789,657)
Net realised appreciation on forward foreign exchange contracts - - - -
Net realised (depreciation)/appreciation on futures contracts (1,134,145) 125,454 3,610,040 (1,136,396)
Net realised (depreciation)/appreciation on foreign exchange (7,801) (638) - 44
Net realised appreciation on options - - - -
Net realised appreciation on swaps - - - -
Realised capital gains tax - - - -
Change in net unrealised appreciation/(depreciation) on:
Investments 19,668,603 (38,255,012) 5,687,438 (5,154,282)
Futures contracts - (31,125) (528,351) 113,881
Forward foreign exchange contracts - - - -
Options - - - -
Swaps - - - -
Capital gains tax on investments - - - -
TOTAL INCOME/(LOSS) 48,210,917 (47,254,499) 20,122,079 (12,710,523)
EXPENSES
Management related fees (note 7) 2,698,119 2,473,469 1,825,049 1,538,506
Performance fees (note 8) 2,523,505 21,742 526,545 33,504
Trustee fees (note 7) 43,237 32,083 17,171 14,538
Administration and transfer agent fees (note 7) 9,637 8,986 7,749 6,952
Auditors remuneration 4,400 5,648 3,047 3,595
Bank charges and correspondent fees 16,311 25,469 23,221 27,497
Transaction costs 499,297 542,088 20,017 16,042
Interest on swaps - - - -
Other charges 61,505 61,454 42,640 43,718
Withholding taxes on dividends and interest income 58,882 347,668 403,016 336,512
TOTAL EXPENSES 5,914,893 3,518,607 2,868,455 2,020,864
TOTAL NET INCOME/(EXPENSE) 42,296,024 (50,773,106) 17,253,624 (14,731,387)
TOTAL PROFIT/(LOSS) FOR THE FINANCIAL PERIOD 42,296,024 (50,773,106) 17,253,624 (14,731,387)
Finance costs
Distribution to holders of redeemable participating units (note 21) - - - -
PROFIT/(LOSS) ATTRIBUTABLE TO REDEEMABLE
PARTICIPATING UNITS 42,296,024 (50,773,106) 17,253,624 (14,731,387)
All results arise from continuing operations. There are no recognised gains or losses for the current and preceding financial period other than those shown above.
The accompanying notes form an integral part of these condensed financial statements.
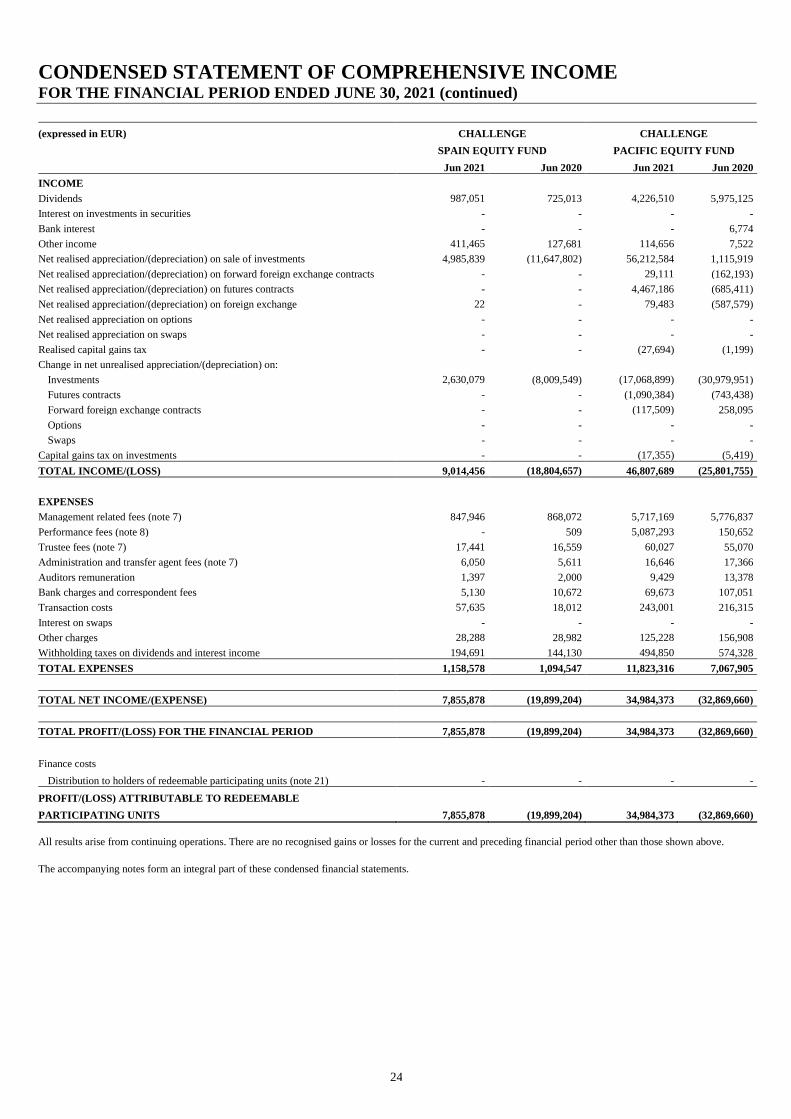
CONDENSED STATEMENT OF COMPREHENSIVE INCOME FOR THE FINANCIAL PERIOD ENDED JUNE 30, 2021 (continued)
24
(expressed in EUR) CHALLENGE CHALLENGE
SPAIN EQUITY FUND PACIFIC EQUITY FUND
Jun 2021 Jun 2020 Jun 2021 Jun 2020
INCOME
Dividends 987,051 725,013 4,226,510 5,975,125
Interest on investments in securities - - - -
Bank interest - - - 6,774
Other income 411,465 127,681 114,656 7,522
Net realised appreciation/(depreciation) on sale of investments 4,985,839 (11,647,802) 56,212,584 1,115,919
Net realised appreciation/(depreciation) on forward foreign exchange contracts - - 29,111 (162,193)
Net realised appreciation/(depreciation) on futures contracts - - 4,467,186 (685,411)
Net realised appreciation/(depreciation) on foreign exchange 22 - 79,483 (587,579)
Net realised appreciation on options - - - -
Net realised appreciation on swaps - - - -
Realised capital gains tax - - (27,694) (1,199)
Change in net unrealised appreciation/(depreciation) on:
Investments 2,630,079 (8,009,549) (17,068,899) (30,979,951)
Futures contracts - - (1,090,384) (743,438)
Forward foreign exchange contracts - - (117,509) 258,095
Options - - - -
Swaps - - - -
Capital gains tax on investments - - (17,355) (5,419)
TOTAL INCOME/(LOSS) 9,014,456 (18,804,657) 46,807,689 (25,801,755)
EXPENSES
Management related fees (note 7) 847,946 868,072 5,717,169 5,776,837
Performance fees (note 8) - 509 5,087,293 150,652
Trustee fees (note 7) 17,441 16,559 60,027 55,070
Administration and transfer agent fees (note 7) 6,050 5,611 16,646 17,366
Auditors remuneration 1,397 2,000 9,429 13,378
Bank charges and correspondent fees 5,130 10,672 69,673 107,051
Transaction costs 57,635 18,012 243,001 216,315
Interest on swaps - - - -
Other charges 28,288 28,982 125,228 156,908
Withholding taxes on dividends and interest income 194,691 144,130 494,850 574,328
TOTAL EXPENSES 1,158,578 1,094,547 11,823,316 7,067,905
TOTAL NET INCOME/(EXPENSE) 7,855,878 (19,899,204) 34,984,373 (32,869,660)
TOTAL PROFIT/(LOSS) FOR THE FINANCIAL PERIOD 7,855,878 (19,899,204) 34,984,373 (32,869,660)
Finance costs
Distribution to holders of redeemable participating units (note 21) - - - -
PROFIT/(LOSS) ATTRIBUTABLE TO REDEEMABLE
PARTICIPATING UNITS 7,855,878 (19,899,204) 34,984,373 (32,869,660)
All results arise from continuing operations. There are no recognised gains or losses for the current and preceding financial period other than those shown above.
The accompanying notes form an integral part of these condensed financial statements.
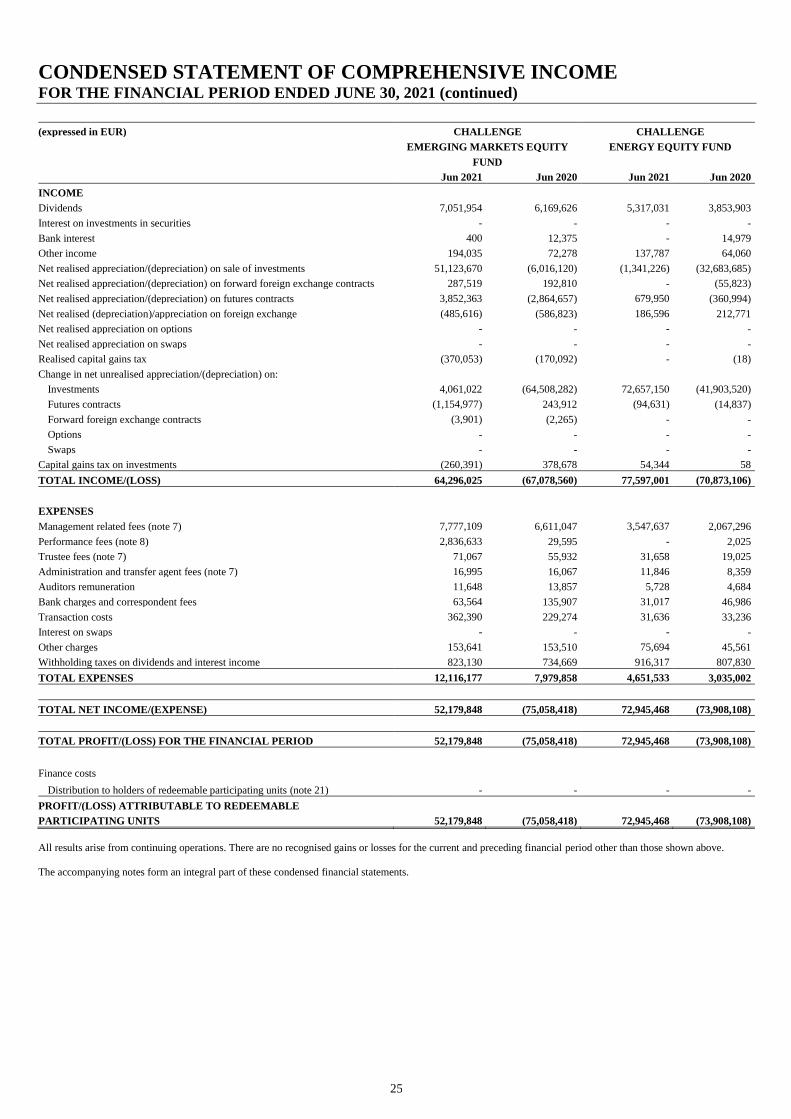
CONDENSED STATEMENT OF COMPREHENSIVE INCOME FOR THE FINANCIAL PERIOD ENDED JUNE 30, 2021 (continued)
25
(expressed in EUR) CHALLENGE CHALLENGE
EMERGING MARKETS EQUITY ENERGY EQUITY FUND
FUND
Jun 2021 Jun 2020 Jun 2021 Jun 2020
INCOME
Dividends 7,051,954 6,169,626 5,317,031 3,853,903
Interest on investments in securities - - - -
Bank interest 400 12,375 - 14,979
Other income 194,035 72,278 137,787 64,060
Net realised appreciation/(depreciation) on sale of investments 51,123,670 (6,016,120) (1,341,226) (32,683,685)
Net realised appreciation/(depreciation) on forward foreign exchange contracts 287,519 192,810 - (55,823)
Net realised appreciation/(depreciation) on futures contracts 3,852,363 (2,864,657) 679,950 (360,994)
Net realised (depreciation)/appreciation on foreign exchange (485,616) (586,823) 186,596 212,771
Net realised appreciation on options - - - -
Net realised appreciation on swaps - - - -
Realised capital gains tax (370,053) (170,092) - (18)
Change in net unrealised appreciation/(depreciation) on:
Investments 4,061,022 (64,508,282) 72,657,150 (41,903,520)
Futures contracts (1,154,977) 243,912 (94,631) (14,837)
Forward foreign exchange contracts (3,901) (2,265) - -
Options - - - -
Swaps - - - -
Capital gains tax on investments (260,391) 378,678 54,344 58
TOTAL INCOME/(LOSS) 64,296,025 (67,078,560) 77,597,001 (70,873,106)
EXPENSES
Management related fees (note 7) 7,777,109 6,611,047 3,547,637 2,067,296
Performance fees (note 8) 2,836,633 29,595 - 2,025
Trustee fees (note 7) 71,067 55,932 31,658 19,025
Administration and transfer agent fees (note 7) 16,995 16,067 11,846 8,359
Auditors remuneration 11,648 13,857 5,728 4,684
Bank charges and correspondent fees 63,564 135,907 31,017 46,986
Transaction costs 362,390 229,274 31,636 33,236
Interest on swaps - - - -
Other charges 153,641 153,510 75,694 45,561
Withholding taxes on dividends and interest income 823,130 734,669 916,317 807,830
TOTAL EXPENSES 12,116,177 7,979,858 4,651,533 3,035,002
TOTAL NET INCOME/(EXPENSE) 52,179,848 (75,058,418) 72,945,468 (73,908,108)
TOTAL PROFIT/(LOSS) FOR THE FINANCIAL PERIOD 52,179,848 (75,058,418) 72,945,468 (73,908,108)
Finance costs
Distribution to holders of redeemable participating units (note 21) - - - -
PROFIT/(LOSS) ATTRIBUTABLE TO REDEEMABLE
PARTICIPATING UNITS 52,179,848 (75,058,418) 72,945,468 (73,908,108)
All results arise from continuing operations. There are no recognised gains or losses for the current and preceding financial period other than those shown above.
The accompanying notes form an integral part of these condensed financial statements.
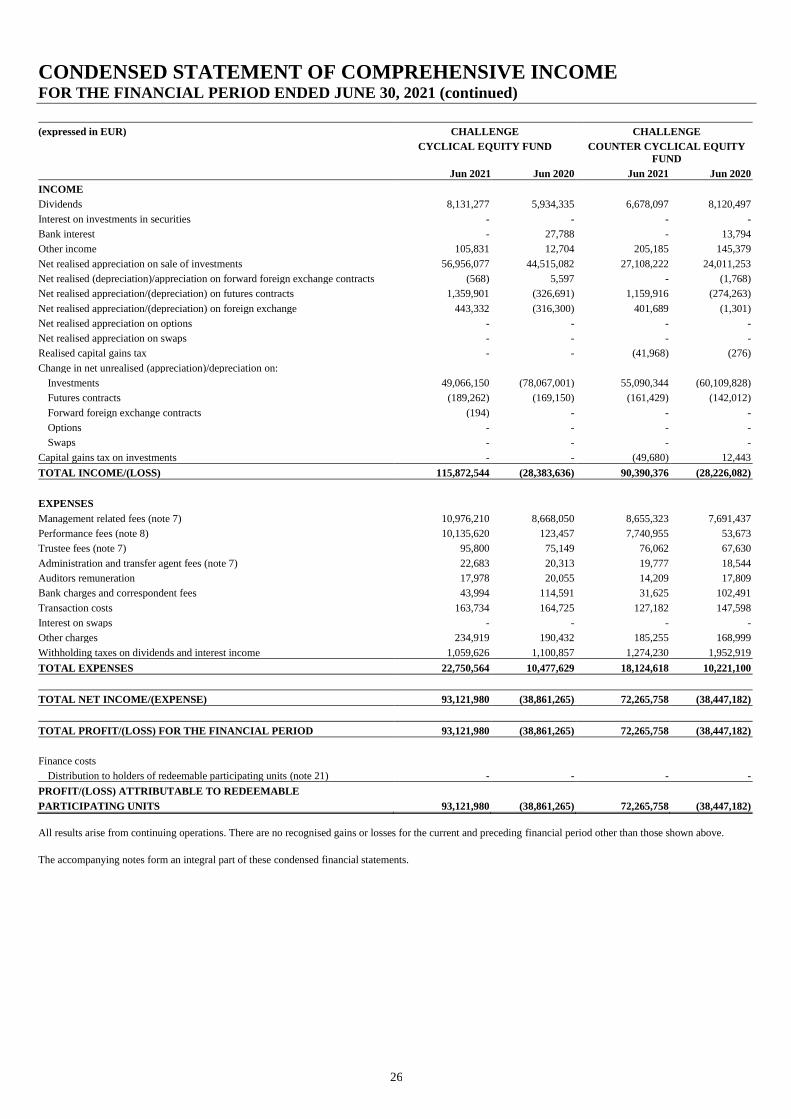
CONDENSED STATEMENT OF COMPREHENSIVE INCOME FOR THE FINANCIAL PERIOD ENDED JUNE 30, 2021 (continued)
26
(expressed in EUR) CHALLENGE CHALLENGE
CYCLICAL EQUITY FUND COUNTER CYCLICAL EQUITY
FUND
Jun 2021 Jun 2020 Jun 2021 Jun 2020
INCOME
Dividends 8,131,277 5,934,335 6,678,097 8,120,497
Interest on investments in securities - - - -
Bank interest - 27,788 - 13,794
Other income 105,831 12,704 205,185 145,379
Net realised appreciation on sale of investments 56,956,077 44,515,082 27,108,222 24,011,253
Net realised (depreciation)/appreciation on forward foreign exchange contracts (568) 5,597 - (1,768)
Net realised appreciation/(depreciation) on futures contracts 1,359,901 (326,691) 1,159,916 (274,263)
Net realised appreciation/(depreciation) on foreign exchange 443,332 (316,300) 401,689 (1,301)
Net realised appreciation on options - - - -
Net realised appreciation on swaps - - - -
Realised capital gains tax - - (41,968) (276)
Change in net unrealised (appreciation)/depreciation on:
Investments 49,066,150 (78,067,001) 55,090,344 (60,109,828)
Futures contracts (189,262) (169,150) (161,429) (142,012)
Forward foreign exchange contracts (194) - - -
Options - - - -
Swaps - - - -
Capital gains tax on investments - - (49,680) 12,443
TOTAL INCOME/(LOSS) 115,872,544 (28,383,636) 90,390,376 (28,226,082)
EXPENSES
Management related fees (note 7) 10,976,210 8,668,050 8,655,323 7,691,437
Performance fees (note 8) 10,135,620 123,457 7,740,955 53,673
Trustee fees (note 7) 95,800 75,149 76,062 67,630
Administration and transfer agent fees (note 7) 22,683 20,313 19,777 18,544
Auditors remuneration 17,978 20,055 14,209 17,809
Bank charges and correspondent fees 43,994 114,591 31,625 102,491
Transaction costs 163,734 164,725 127,182 147,598
Interest on swaps - - - -
Other charges 234,919 190,432 185,255 168,999
Withholding taxes on dividends and interest income 1,059,626 1,100,857 1,274,230 1,952,919
TOTAL EXPENSES 22,750,564 10,477,629 18,124,618 10,221,100
TOTAL NET INCOME/(EXPENSE) 93,121,980 (38,861,265) 72,265,758 (38,447,182)
TOTAL PROFIT/(LOSS) FOR THE FINANCIAL PERIOD 93,121,980 (38,861,265) 72,265,758 (38,447,182)
Finance costs
Distribution to holders of redeemable participating units (note 21) - - - -
PROFIT/(LOSS) ATTRIBUTABLE TO REDEEMABLE
PARTICIPATING UNITS 93,121,980 (38,861,265) 72,265,758 (38,447,182)
All results arise from continuing operations. There are no recognised gains or losses for the current and preceding financial period other than those shown above.
The accompanying notes form an integral part of these condensed financial statements.
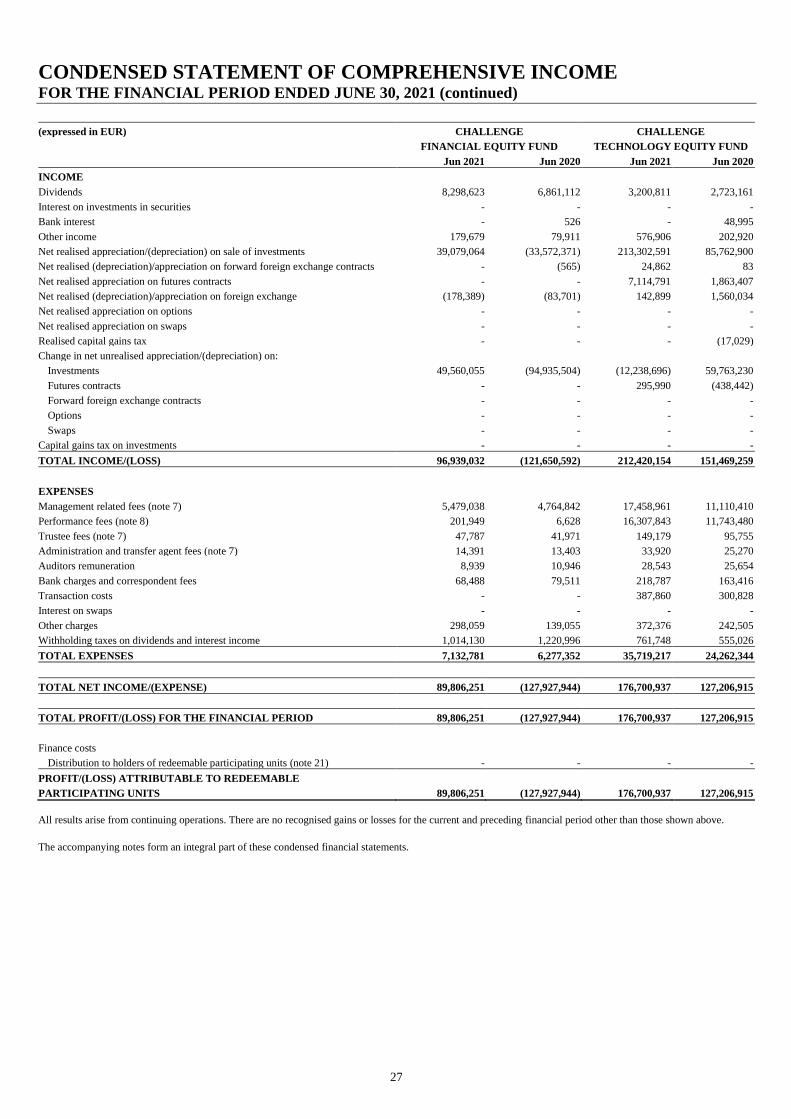
CONDENSED STATEMENT OF COMPREHENSIVE INCOME FOR THE FINANCIAL PERIOD ENDED JUNE 30, 2021 (continued)
27
(expressed in EUR) CHALLENGE CHALLENGE
FINANCIAL EQUITY FUND TECHNOLOGY EQUITY FUND
Jun 2021 Jun 2020 Jun 2021 Jun 2020
INCOME
Dividends 8,298,623 6,861,112 3,200,811 2,723,161
Interest on investments in securities - - - -
Bank interest - 526 - 48,995
Other income 179,679 79,911 576,906 202,920
Net realised appreciation/(depreciation) on sale of investments 39,079,064 (33,572,371) 213,302,591 85,762,900
Net realised (depreciation)/appreciation on forward foreign exchange contracts - (565) 24,862 83
Net realised appreciation on futures contracts - - 7,114,791 1,863,407
Net realised (depreciation)/appreciation on foreign exchange (178,389) (83,701) 142,899 1,560,034
Net realised appreciation on options - - - -
Net realised appreciation on swaps - - - -
Realised capital gains tax - - - (17,029)
Change in net unrealised appreciation/(depreciation) on:
Investments 49,560,055 (94,935,504) (12,238,696) 59,763,230
Futures contracts - - 295,990 (438,442)
Forward foreign exchange contracts - - - -
Options - - - -
Swaps - - - -
Capital gains tax on investments - - - -
TOTAL INCOME/(LOSS) 96,939,032 (121,650,592) 212,420,154 151,469,259
EXPENSES
Management related fees (note 7) 5,479,038 4,764,842 17,458,961 11,110,410
Performance fees (note 8) 201,949 6,628 16,307,843 11,743,480
Trustee fees (note 7) 47,787 41,971 149,179 95,755
Administration and transfer agent fees (note 7) 14,391 13,403 33,920 25,270
Auditors remuneration 8,939 10,946 28,543 25,654
Bank charges and correspondent fees 68,488 79,511 218,787 163,416
Transaction costs - - 387,860 300,828
Interest on swaps - - - -
Other charges 298,059 139,055 372,376 242,505
Withholding taxes on dividends and interest income 1,014,130 1,220,996 761,748 555,026
TOTAL EXPENSES 7,132,781 6,277,352 35,719,217 24,262,344
TOTAL NET INCOME/(EXPENSE) 89,806,251 (127,927,944) 176,700,937 127,206,915
TOTAL PROFIT/(LOSS) FOR THE FINANCIAL PERIOD 89,806,251 (127,927,944) 176,700,937 127,206,915
Finance costs
Distribution to holders of redeemable participating units (note 21) - - - -
PROFIT/(LOSS) ATTRIBUTABLE TO REDEEMABLE
PARTICIPATING UNITS 89,806,251 (127,927,944) 176,700,937 127,206,915
All results arise from continuing operations. There are no recognised gains or losses for the current and preceding financial period other than those shown above.
The accompanying notes form an integral part of these condensed financial statements.
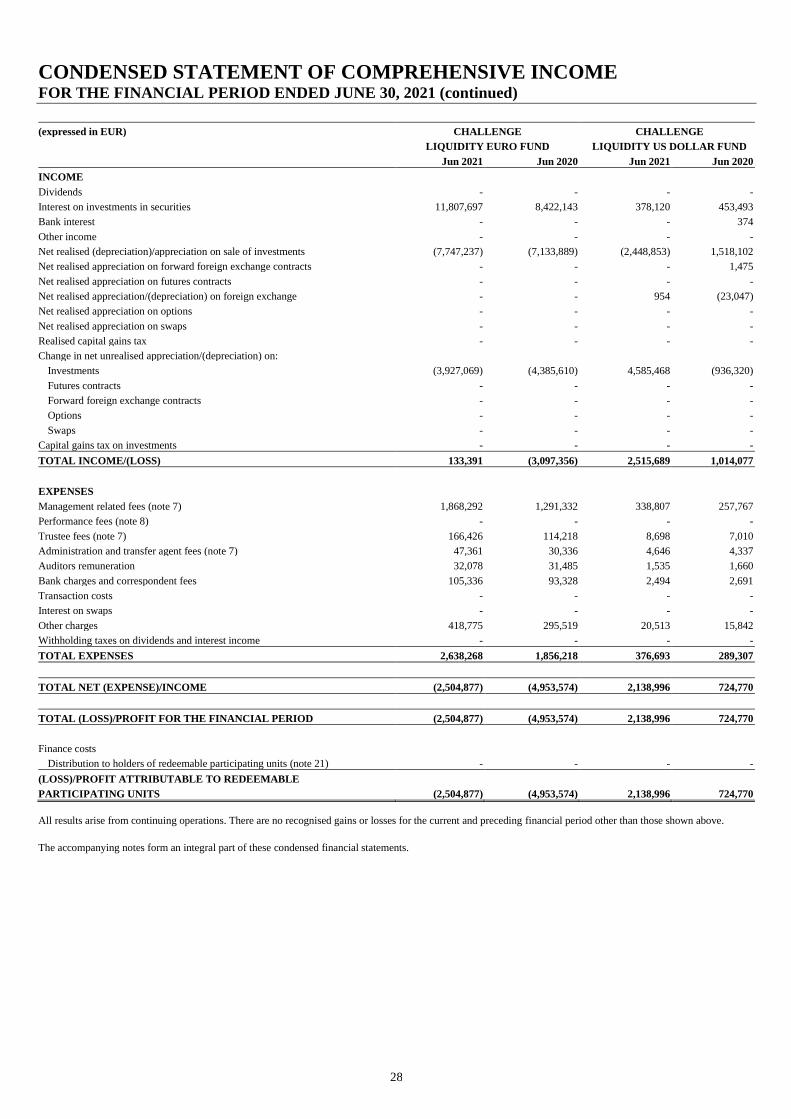
CONDENSED STATEMENT OF COMPREHENSIVE INCOME FOR THE FINANCIAL PERIOD ENDED JUNE 30, 2021 (continued)
28
(expressed in EUR) CHALLENGE CHALLENGE
LIQUIDITY EURO FUND LIQUIDITY US DOLLAR FUND
Jun 2021 Jun 2020 Jun 2021 Jun 2020
INCOME
Dividends - - - -
Interest on investments in securities 11,807,697 8,422,143 378,120 453,493
Bank interest - - - 374
Other income - - - -
Net realised (depreciation)/appreciation on sale of investments (7,747,237) (7,133,889) (2,448,853) 1,518,102
Net realised appreciation on forward foreign exchange contracts - - - 1,475
Net realised appreciation on futures contracts - - - -
Net realised appreciation/(depreciation) on foreign exchange - - 954 (23,047)
Net realised appreciation on options - - - -
Net realised appreciation on swaps - - - -
Realised capital gains tax - - - -
Change in net unrealised appreciation/(depreciation) on:
Investments (3,927,069) (4,385,610) 4,585,468 (936,320)
Futures contracts - - - -
Forward foreign exchange contracts - - - -
Options - - - -
Swaps - - - -
Capital gains tax on investments - - - -
TOTAL INCOME/(LOSS) 133,391 (3,097,356) 2,515,689 1,014,077
EXPENSES
Management related fees (note 7) 1,868,292 1,291,332 338,807 257,767
Performance fees (note 8) - - - -
Trustee fees (note 7) 166,426 114,218 8,698 7,010
Administration and transfer agent fees (note 7) 47,361 30,336 4,646 4,337
Auditors remuneration 32,078 31,485 1,535 1,660
Bank charges and correspondent fees 105,336 93,328 2,494 2,691
Transaction costs - - - -
Interest on swaps - - - -
Other charges 418,775 295,519 20,513 15,842
Withholding taxes on dividends and interest income - - - -
TOTAL EXPENSES 2,638,268 1,856,218 376,693 289,307
TOTAL NET (EXPENSE)/INCOME (2,504,877) (4,953,574) 2,138,996 724,770
TOTAL (LOSS)/PROFIT FOR THE FINANCIAL PERIOD (2,504,877) (4,953,574) 2,138,996 724,770
Finance costs
Distribution to holders of redeemable participating units (note 21) - - - -
(LOSS)/PROFIT ATTRIBUTABLE TO REDEEMABLE
PARTICIPATING UNITS (2,504,877) (4,953,574) 2,138,996 724,770
All results arise from continuing operations. There are no recognised gains or losses for the current and preceding financial period other than those shown above.
The accompanying notes form an integral part of these condensed financial statements.
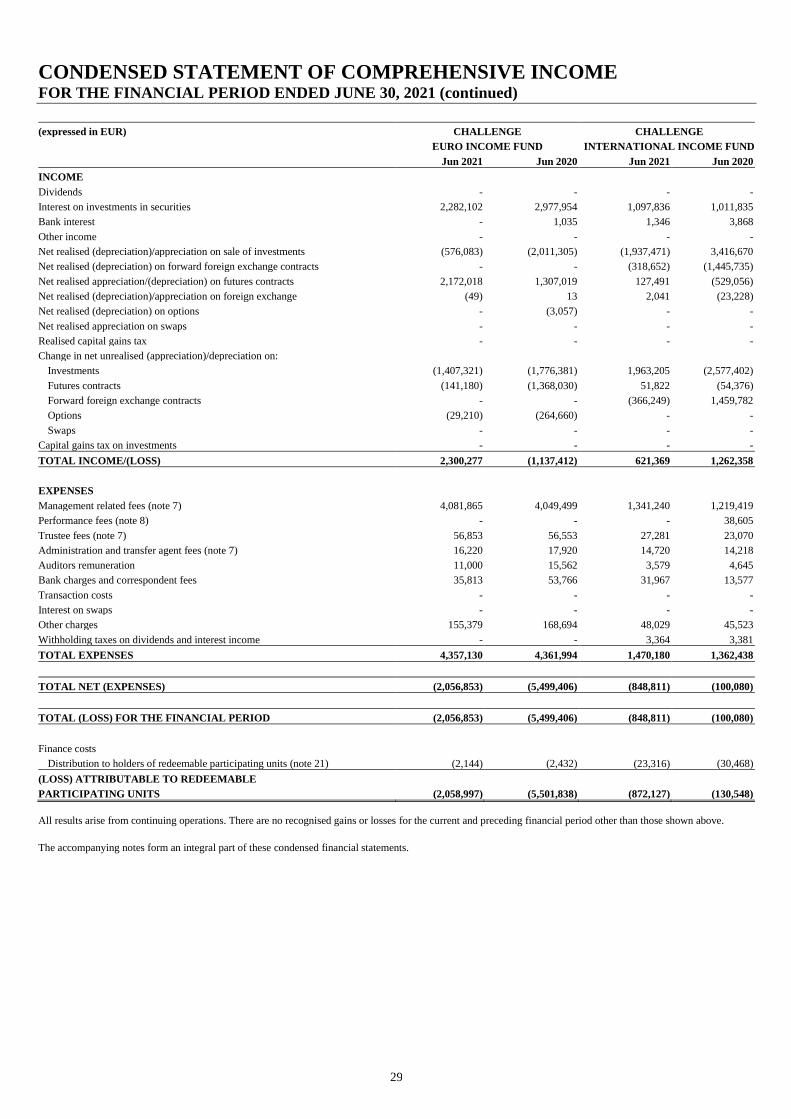
CONDENSED STATEMENT OF COMPREHENSIVE INCOME FOR THE FINANCIAL PERIOD ENDED JUNE 30, 2021 (continued)
29
(expressed in EUR) CHALLENGE CHALLENGE
EURO INCOME FUND INTERNATIONAL INCOME FUND
Jun 2021 Jun 2020 Jun 2021 Jun 2020
INCOME
Dividends - - - -
Interest on investments in securities 2,282,102 2,977,954 1,097,836 1,011,835
Bank interest - 1,035 1,346 3,868
Other income - - - -
Net realised (depreciation)/appreciation on sale of investments (576,083) (2,011,305) (1,937,471) 3,416,670
Net realised (depreciation) on forward foreign exchange contracts - - (318,652) (1,445,735)
Net realised appreciation/(depreciation) on futures contracts 2,172,018 1,307,019 127,491 (529,056)
Net realised (depreciation)/appreciation on foreign exchange (49) 13 2,041 (23,228)
Net realised (depreciation) on options - (3,057) - -
Net realised appreciation on swaps - - - -
Realised capital gains tax - - - -
Change in net unrealised (appreciation)/depreciation on:
Investments (1,407,321) (1,776,381) 1,963,205 (2,577,402)
Futures contracts (141,180) (1,368,030) 51,822 (54,376)
Forward foreign exchange contracts - - (366,249) 1,459,782
Options (29,210) (264,660) - -
Swaps - - - -
Capital gains tax on investments - - - -
TOTAL INCOME/(LOSS) 2,300,277 (1,137,412) 621,369 1,262,358
EXPENSES
Management related fees (note 7) 4,081,865 4,049,499 1,341,240 1,219,419
Performance fees (note 8) - - - 38,605
Trustee fees (note 7) 56,853 56,553 27,281 23,070
Administration and transfer agent fees (note 7) 16,220 17,920 14,720 14,218
Auditors remuneration 11,000 15,562 3,579 4,645
Bank charges and correspondent fees 35,813 53,766 31,967 13,577
Transaction costs - - - -
Interest on swaps - - - -
Other charges 155,379 168,694 48,029 45,523
Withholding taxes on dividends and interest income - - 3,364 3,381
TOTAL EXPENSES 4,357,130 4,361,994 1,470,180 1,362,438
TOTAL NET (EXPENSES) (2,056,853) (5,499,406) (848,811) (100,080)
TOTAL (LOSS) FOR THE FINANCIAL PERIOD (2,056,853) (5,499,406) (848,811) (100,080)
Finance costs
Distribution to holders of redeemable participating units (note 21) (2,144) (2,432) (23,316) (30,468)
(LOSS) ATTRIBUTABLE TO REDEEMABLE
PARTICIPATING UNITS (2,058,997) (5,501,838) (872,127) (130,548)
All results arise from continuing operations. There are no recognised gains or losses for the current and preceding financial period other than those shown above.
The accompanying notes form an integral part of these condensed financial statements.
CONDENSED STATEMENT OF COMPREHENSIVE INCOME FOR THE FINANCIAL PERIOD ENDED JUNE 30, 2021 (continued)
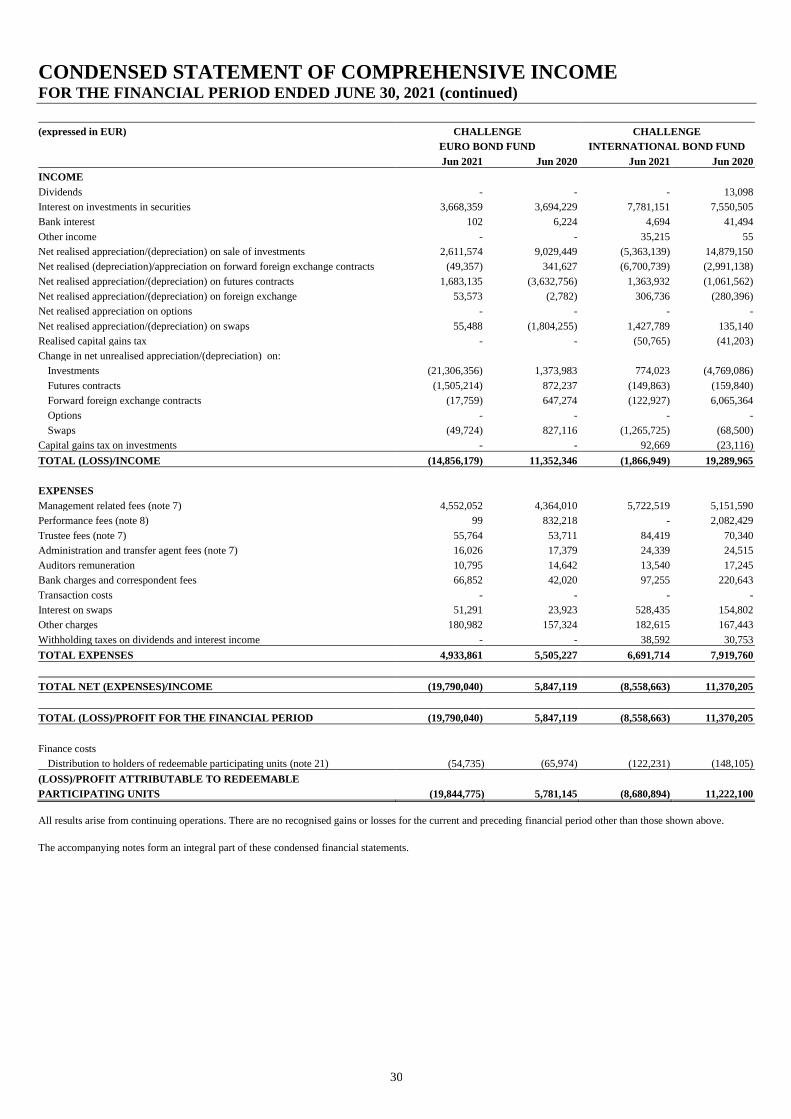
30
(expressed in EUR) CHALLENGE CHALLENGE
EURO BOND FUND INTERNATIONAL BOND FUND
Jun 2021 Jun 2020 Jun 2021 Jun 2020
INCOME
Dividends - - - 13,098
Interest on investments in securities 3,668,359 3,694,229 7,781,151 7,550,505
Bank interest 102 6,224 4,694 41,494
Other income - - 35,215 55
Net realised appreciation/(depreciation) on sale of investments 2,611,574 9,029,449 (5,363,139) 14,879,150
Net realised (depreciation)/appreciation on forward foreign exchange contracts (49,357) 341,627 (6,700,739) (2,991,138)
Net realised appreciation/(depreciation) on futures contracts 1,683,135 (3,632,756) 1,363,932 (1,061,562)
Net realised appreciation/(depreciation) on foreign exchange 53,573 (2,782) 306,736 (280,396)
Net realised appreciation on options - - - -
Net realised appreciation/(depreciation) on swaps 55,488 (1,804,255) 1,427,789 135,140
Realised capital gains tax - - (50,765) (41,203)
Change in net unrealised appreciation/(depreciation) on:
Investments (21,306,356) 1,373,983 774,023 (4,769,086)
Futures contracts (1,505,214) 872,237 (149,863) (159,840)
Forward foreign exchange contracts (17,759) 647,274 (122,927) 6,065,364
Options - - - -
Swaps (49,724) 827,116 (1,265,725) (68,500)
Capital gains tax on investments - - 92,669 (23,116)
TOTAL (LOSS)/INCOME (14,856,179) 11,352,346 (1,866,949) 19,289,965
EXPENSES
Management related fees (note 7) 4,552,052 4,364,010 5,722,519 5,151,590
Performance fees (note 8) 99 832,218 - 2,082,429
Trustee fees (note 7) 55,764 53,711 84,419 70,340
Administration and transfer agent fees (note 7) 16,026 17,379 24,339 24,515
Auditors remuneration 10,795 14,642 13,540 17,245
Bank charges and correspondent fees 66,852 42,020 97,255 220,643
Transaction costs - - - -
Interest on swaps 51,291 23,923 528,435 154,802
Other charges 180,982 157,324 182,615 167,443
Withholding taxes on dividends and interest income - - 38,592 30,753
TOTAL EXPENSES 4,933,861 5,505,227 6,691,714 7,919,760
TOTAL NET (EXPENSES)/INCOME (19,790,040) 5,847,119 (8,558,663) 11,370,205
TOTAL (LOSS)/PROFIT FOR THE FINANCIAL PERIOD (19,790,040) 5,847,119 (8,558,663) 11,370,205
Finance costs
Distribution to holders of redeemable participating units (note 21) (54,735) (65,974) (122,231) (148,105)
(LOSS)/PROFIT ATTRIBUTABLE TO REDEEMABLE
PARTICIPATING UNITS (19,844,775) 5,781,145 (8,680,894) 11,222,100
All results arise from continuing operations. There are no recognised gains or losses for the current and preceding financial period other than those shown above.
The accompanying notes form an integral part of these condensed financial statements.
CONDENSED STATEMENT OF COMPREHENSIVE INCOME FOR THE FINANCIAL PERIOD ENDED JUNE 30, 2021 (continued)
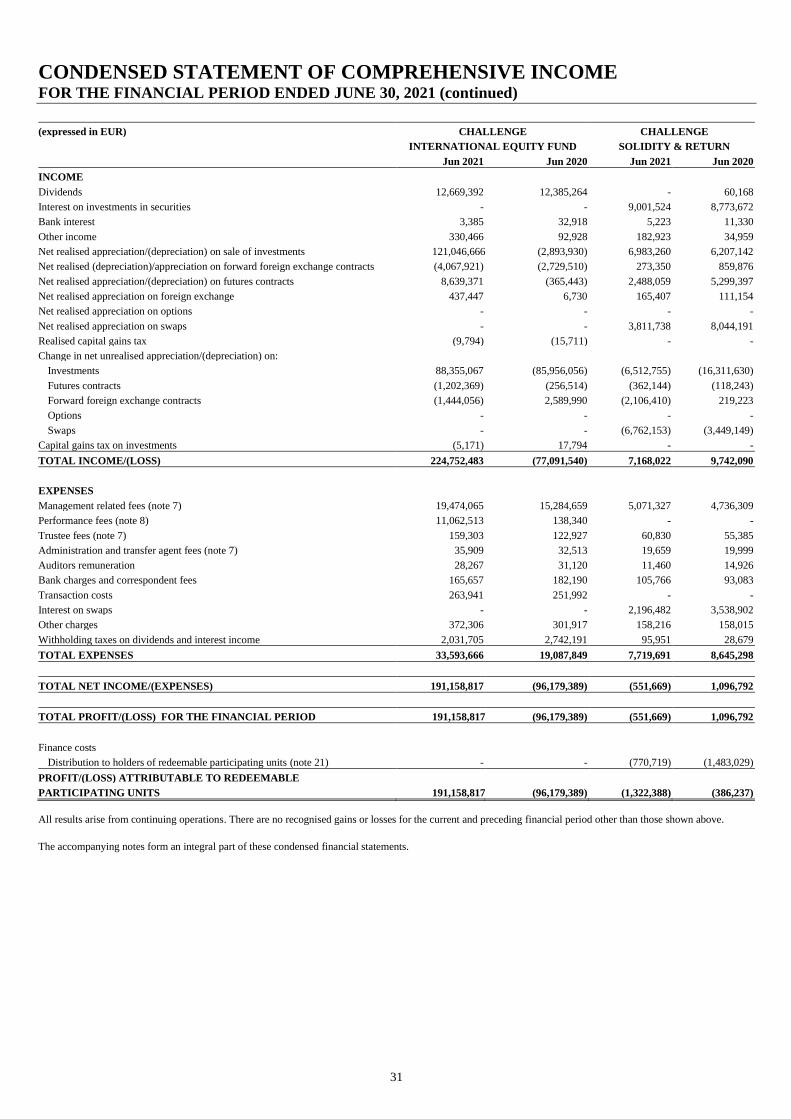
31
(expressed in EUR) CHALLENGE CHALLENGE
INTERNATIONAL EQUITY FUND SOLIDITY & RETURN
Jun 2021 Jun 2020 Jun 2021 Jun 2020
INCOME
Dividends 12,669,392 12,385,264 - 60,168
Interest on investments in securities - - 9,001,524 8,773,672
Bank interest 3,385 32,918 5,223 11,330
Other income 330,466 92,928 182,923 34,959
Net realised appreciation/(depreciation) on sale of investments 121,046,666 (2,893,930) 6,983,260 6,207,142
Net realised (depreciation)/appreciation on forward foreign exchange contracts (4,067,921) (2,729,510) 273,350 859,876
Net realised appreciation/(depreciation) on futures contracts 8,639,371 (365,443) 2,488,059 5,299,397
Net realised appreciation on foreign exchange 437,447 6,730 165,407 111,154
Net realised appreciation on options - - - -
Net realised appreciation on swaps - - 3,811,738 8,044,191
Realised capital gains tax (9,794) (15,711) - -
Change in net unrealised appreciation/(depreciation) on:
Investments 88,355,067 (85,956,056) (6,512,755) (16,311,630)
Futures contracts (1,202,369) (256,514) (362,144) (118,243)
Forward foreign exchange contracts (1,444,056) 2,589,990 (2,106,410) 219,223
Options - - - -
Swaps - - (6,762,153) (3,449,149)
Capital gains tax on investments (5,171) 17,794 - -
TOTAL INCOME/(LOSS) 224,752,483 (77,091,540) 7,168,022 9,742,090
EXPENSES
Management related fees (note 7) 19,474,065 15,284,659 5,071,327 4,736,309
Performance fees (note 8) 11,062,513 138,340 - -
Trustee fees (note 7) 159,303 122,927 60,830 55,385
Administration and transfer agent fees (note 7) 35,909 32,513 19,659 19,999
Auditors remuneration 28,267 31,120 11,460 14,926
Bank charges and correspondent fees 165,657 182,190 105,766 93,083
Transaction costs 263,941 251,992 - -
Interest on swaps - - 2,196,482 3,538,902
Other charges 372,306 301,917 158,216 158,015
Withholding taxes on dividends and interest income 2,031,705 2,742,191 95,951 28,679
TOTAL EXPENSES 33,593,666 19,087,849 7,719,691 8,645,298
TOTAL NET INCOME/(EXPENSES) 191,158,817 (96,179,389) (551,669) 1,096,792
TOTAL PROFIT/(LOSS) FOR THE FINANCIAL PERIOD 191,158,817 (96,179,389) (551,669) 1,096,792
Finance costs
Distribution to holders of redeemable participating units (note 21) - - (770,719) (1,483,029)
PROFIT/(LOSS) ATTRIBUTABLE TO REDEEMABLE
PARTICIPATING UNITS 191,158,817 (96,179,389) (1,322,388) (386,237)
All results arise from continuing operations. There are no recognised gains or losses for the current and preceding financial period other than those shown above.
The accompanying notes form an integral part of these condensed financial statements.
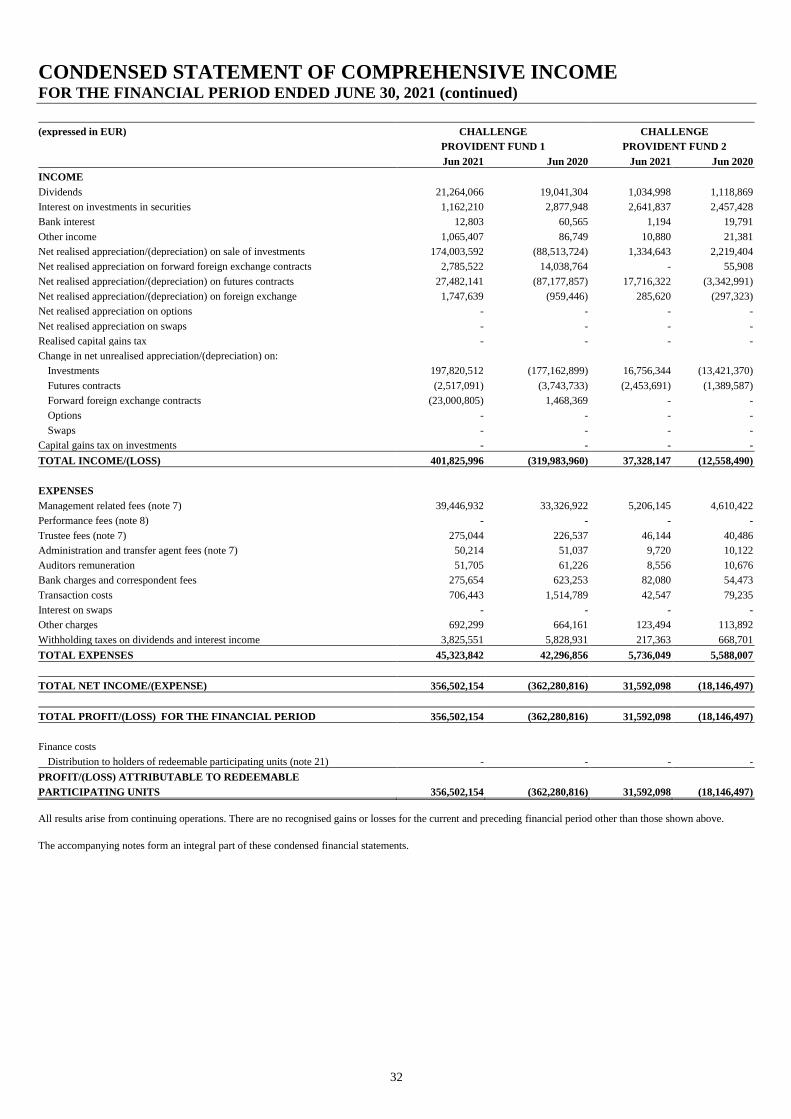
CONDENSED STATEMENT OF COMPREHENSIVE INCOME FOR THE FINANCIAL PERIOD ENDED JUNE 30, 2021 (continued)
32
(expressed in EUR) CHALLENGE CHALLENGE
PROVIDENT FUND 1 PROVIDENT FUND 2
Jun 2021 Jun 2020 Jun 2021 Jun 2020
INCOME
Dividends 21,264,066 19,041,304 1,034,998 1,118,869
Interest on investments in securities 1,162,210 2,877,948 2,641,837 2,457,428
Bank interest 12,803 60,565 1,194 19,791
Other income 1,065,407 86,749 10,880 21,381
Net realised appreciation/(depreciation) on sale of investments 174,003,592 (88,513,724) 1,334,643 2,219,404
Net realised appreciation on forward foreign exchange contracts 2,785,522 14,038,764 - 55,908
Net realised appreciation/(depreciation) on futures contracts 27,482,141 (87,177,857) 17,716,322 (3,342,991)
Net realised appreciation/(depreciation) on foreign exchange 1,747,639 (959,446) 285,620 (297,323)
Net realised appreciation on options - - - -
Net realised appreciation on swaps - - - -
Realised capital gains tax - - - -
Change in net unrealised appreciation/(depreciation) on:
Investments 197,820,512 (177,162,899) 16,756,344 (13,421,370)
Futures contracts (2,517,091) (3,743,733) (2,453,691) (1,389,587)
Forward foreign exchange contracts (23,000,805) 1,468,369 - -
Options - - - -
Swaps - - - -
Capital gains tax on investments - - - -
TOTAL INCOME/(LOSS) 401,825,996 (319,983,960) 37,328,147 (12,558,490)
EXPENSES
Management related fees (note 7) 39,446,932 33,326,922 5,206,145 4,610,422
Performance fees (note 8) - - - -
Trustee fees (note 7) 275,044 226,537 46,144 40,486
Administration and transfer agent fees (note 7) 50,214 51,037 9,720 10,122
Auditors remuneration 51,705 61,226 8,556 10,676
Bank charges and correspondent fees 275,654 623,253 82,080 54,473
Transaction costs 706,443 1,514,789 42,547 79,235
Interest on swaps - - - -
Other charges 692,299 664,161 123,494 113,892
Withholding taxes on dividends and interest income 3,825,551 5,828,931 217,363 668,701
TOTAL EXPENSES 45,323,842 42,296,856 5,736,049 5,588,007
TOTAL NET INCOME/(EXPENSE) 356,502,154 (362,280,816) 31,592,098 (18,146,497)
TOTAL PROFIT/(LOSS) FOR THE FINANCIAL PERIOD 356,502,154 (362,280,816) 31,592,098 (18,146,497)
Finance costs
Distribution to holders of redeemable participating units (note 21) - - - -
PROFIT/(LOSS) ATTRIBUTABLE TO REDEEMABLE
PARTICIPATING UNITS 356,502,154 (362,280,816) 31,592,098 (18,146,497)
All results arise from continuing operations. There are no recognised gains or losses for the current and preceding financial period other than those shown above.
The accompanying notes form an integral part of these condensed financial statements.

CONDENSED STATEMENT OF COMPREHENSIVE INCOME FOR THE FINANCIAL PERIOD ENDED JUNE 30, 2021 (continued)
33
(expressed in EUR) CHALLENGE CHALLENGE
PROVIDENT FUND 3 PROVIDENT FUND 4
Jun 2021 Jun 2020 Jun 2021 Jun 2020
INCOME
Dividends - - - -
Interest on investments in securities 2,413,607 2,483,798 1,079,648 1,359,554
Bank interest 35 2,371 - -
Other income - - - -
Net realised (depreciation)/appreciation on sale of investments (1,330,981) 379,685 (1,025,619) (719,339)
Net realised depreciation on forward foreign exchange contracts - - - -
Net realised appreciation on futures contracts 41,188 - - -
Net realised (depreciation) on foreign exchange (147,060) (81,559) - -
Net realised appreciation on options - - - -
Net realised appreciation on swaps - - - -
Realised capital gains tax - - - -
Change in net unrealised appreciation/(depreciation) on:
Investments (1,312,533) 1,456,527 719,893 (951,933)
Futures contracts (120,378) - - -
Forward foreign exchange contracts - - - -
Options - - - -
Swaps - - - -
Capital gains tax on investments - - - -
TOTAL (LOSS)/INCOME (456,122) 4,240,822 773,922 (311,718)
EXPENSES
Management related fees (note 7) 1,905,253 1,872,390 1,038,707 995,048
Performance fees (note 8) - - - -
Trustee fees (note 7) 25,021 24,862 19,440 18,896
Administration and transfer agent fees (note 7) 6,095 6,871 5,074 5,540
Auditors remuneration 4,906 6,815 3,817 5,173
Bank charges and correspondent fees 100,676 75,707 56,845 27,736
Transaction costs - 18 - 501
Interest on swaps - - - -
Other charges 63,963 64,230 49,624 48,816
Withholding taxes on dividends and interest income - 416,267 - -
TOTAL EXPENSES 2,105,914 2,467,160 1,173,507 1,101,710
TOTAL NET (EXPENSES)/INCOME (2,562,036) 1,773,662 (399,585) (1,413,428)
TOTAL (LOSS)/ PROFIT FOR THE FINANCIAL PERIOD (2,562,036) 1,773,662 (399,585) (1,413,428)
Finance costs
Distribution to holders of redeemable participating units (note 21) - - - -
(LOSS)/ PROFIT ATTRIBUTABLE TO REDEEMABLE
PARTICIPATING UNITS (2,562,036) 1,773,662 (399,585) (1,413,428)
All results arise from continuing operations. There are no recognised gains or losses for the current and preceding financial period other than those shown above.
The accompanying notes form an integral part of these condensed financial statements.
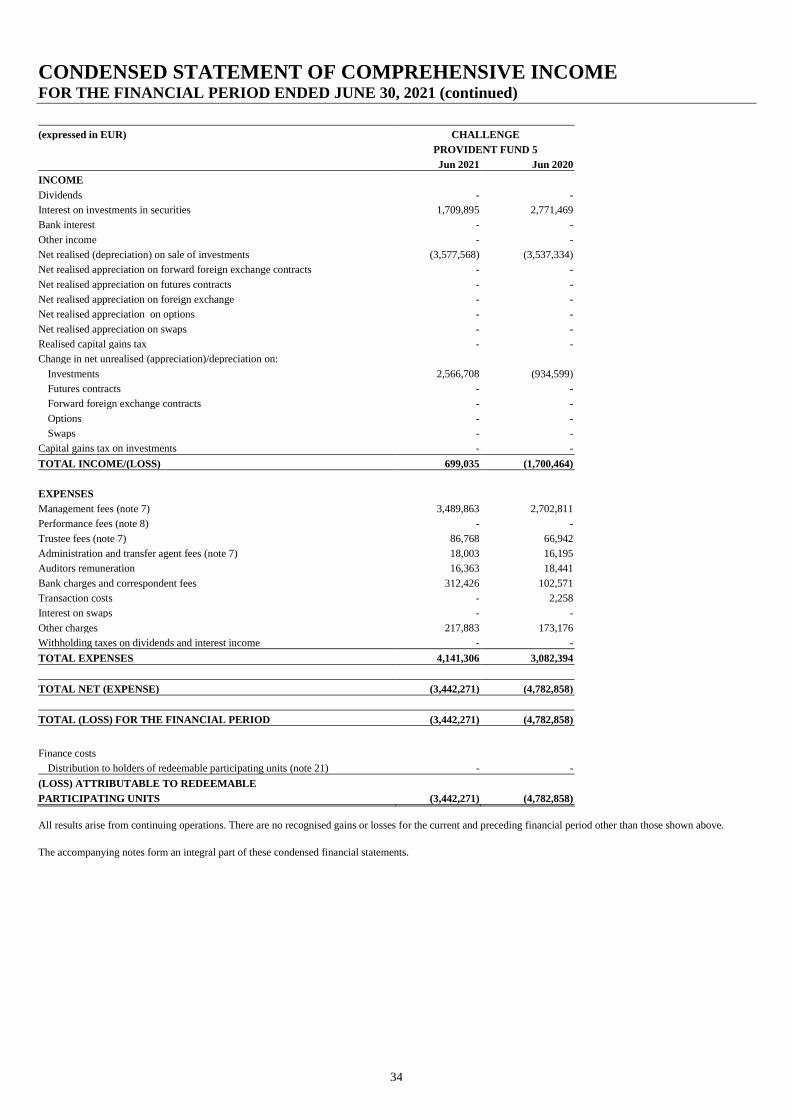
CONDENSED STATEMENT OF COMPREHENSIVE INCOME FOR THE FINANCIAL PERIOD ENDED JUNE 30, 2021 (continued)
34
(expressed in EUR) CHALLENGE
PROVIDENT FUND 5
Jun 2021 Jun 2020
INCOME
Dividends - -
Interest on investments in securities 1,709,895 2,771,469
Bank interest - -
Other income - -
Net realised (depreciation) on sale of investments (3,577,568) (3,537,334)
Net realised appreciation on forward foreign exchange contracts - -
Net realised appreciation on futures contracts - -
Net realised appreciation on foreign exchange - -
Net realised appreciation on options - -
Net realised appreciation on swaps - -
Realised capital gains tax - -
Change in net unrealised (appreciation)/depreciation on:
Investments 2,566,708 (934,599)
Futures contracts - -
Forward foreign exchange contracts - -
Options - -
Swaps - -
Capital gains tax on investments - -
TOTAL INCOME/(LOSS) 699,035 (1,700,464)
EXPENSES
Management fees (note 7) 3,489,863 2,702,811
Performance fees (note 8) - -
Trustee fees (note 7) 86,768 66,942
Administration and transfer agent fees (note 7) 18,003 16,195
Auditors remuneration 16,363 18,441
Bank charges and correspondent fees 312,426 102,571
Transaction costs - 2,258
Interest on swaps - -
Other charges 217,883 173,176
Withholding taxes on dividends and interest income - -
TOTAL EXPENSES 4,141,306 3,082,394
TOTAL NET (EXPENSE) (3,442,271) (4,782,858)
TOTAL (LOSS) FOR THE FINANCIAL PERIOD (3,442,271) (4,782,858)
Finance costs
Distribution to holders of redeemable participating units (note 21) - -
(LOSS) ATTRIBUTABLE TO REDEEMABLE
PARTICIPATING UNITS (3,442,271) (4,782,858)
All results arise from continuing operations. There are no recognised gains or losses for the current and preceding financial period other than those shown above.
The accompanying notes form an integral part of these condensed financial statements.
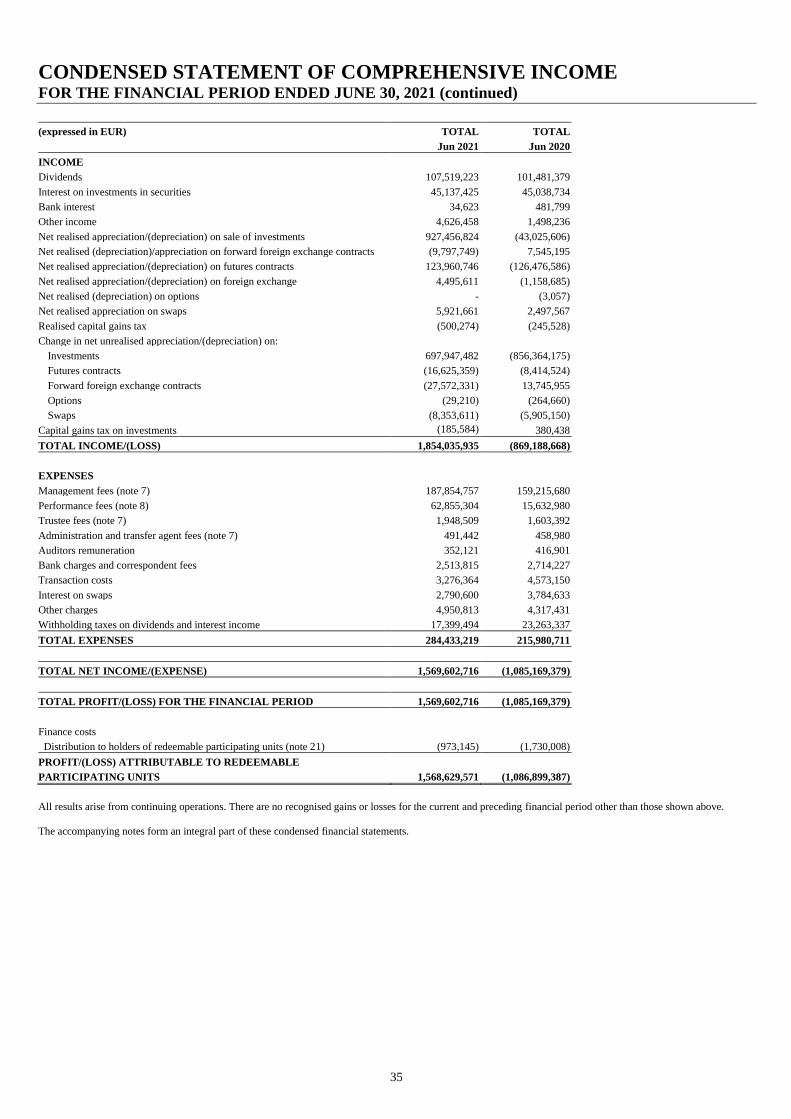
CONDENSED STATEMENT OF COMPREHENSIVE INCOME FOR THE FINANCIAL PERIOD ENDED JUNE 30, 2021 (continued)
35
(expressed in EUR) TOTAL TOTAL
Jun 2021 Jun 2020
INCOME
Dividends 107,519,223 101,481,379
Interest on investments in securities 45,137,425 45,038,734
Bank interest 34,623 481,799
Other income 4,626,458 1,498,236
Net realised appreciation/(depreciation) on sale of investments 927,456,824 (43,025,606)
Net realised (depreciation)/appreciation on forward foreign exchange contracts (9,797,749) 7,545,195
Net realised appreciation/(depreciation) on futures contracts 123,960,746 (126,476,586)
Net realised appreciation/(depreciation) on foreign exchange 4,495,611 (1,158,685)
Net realised (depreciation) on options - (3,057)
Net realised appreciation on swaps 5,921,661 2,497,567
Realised capital gains tax (500,274) (245,528)
Change in net unrealised appreciation/(depreciation) on:
Investments 697,947,482 (856,364,175)
Futures contracts (16,625,359) (8,414,524)
Forward foreign exchange contracts (27,572,331) 13,745,955
Options (29,210) (264,660)
Swaps (8,353,611) (5,905,150)
Capital gains tax on investments (185,584) 380,438
TOTAL INCOME/(LOSS) 1,854,035,935 (869,188,668)
EXPENSES
Management fees (note 7) 187,854,757 159,215,680
Performance fees (note 8) 62,855,304 15,632,980
Trustee fees (note 7) 1,948,509 1,603,392
Administration and transfer agent fees (note 7) 491,442 458,980
Auditors remuneration 352,121 416,901
Bank charges and correspondent fees 2,513,815 2,714,227
Transaction costs 3,276,364 4,573,150
Interest on swaps 2,790,600 3,784,633
Other charges 4,950,813 4,317,431
Withholding taxes on dividends and interest income 17,399,494 23,263,337
TOTAL EXPENSES 284,433,219 215,980,711
TOTAL NET INCOME/(EXPENSE) 1,569,602,716 (1,085,169,379)
TOTAL PROFIT/(LOSS) FOR THE FINANCIAL PERIOD 1,569,602,716 (1,085,169,379)
Finance costs
Distribution to holders of redeemable participating units (note 21) (973,145) (1,730,008)
PROFIT/(LOSS) ATTRIBUTABLE TO REDEEMABLE
PARTICIPATING UNITS 1,568,629,571 (1,086,899,387)
All results arise from continuing operations. There are no recognised gains or losses for the current and preceding financial period other than those shown above.
The accompanying notes form an integral part of these condensed financial statements.
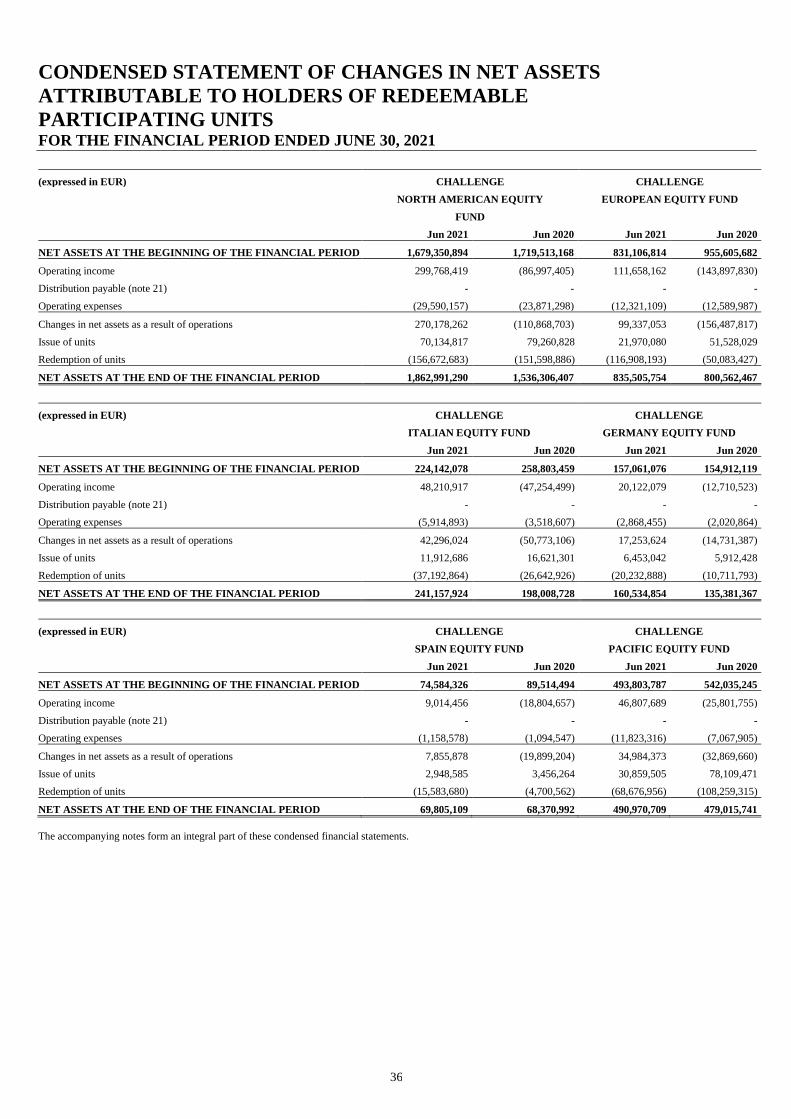
CONDENSED STATEMENT OF CHANGES IN NET ASSETS
ATTRIBUTABLE TO HOLDERS OF REDEEMABLE
PARTICIPATING UNITS FOR THE FINANCIAL PERIOD ENDED JUNE 30, 2021
36
(expressed in EUR) CHALLENGE CHALLENGE
NORTH AMERICAN EQUITY EUROPEAN EQUITY FUND
FUND
Jun 2021 Jun 2020 Jun 2021 Jun 2020
NET ASSETS AT THE BEGINNING OF THE FINANCIAL PERIOD 1,679,350,894 1,719,513,168 831,106,814 955,605,682
Operating income 299,768,419 (86,997,405) 111,658,162 (143,897,830)
Distribution payable (note 21) - - - -
Operating expenses (29,590,157) (23,871,298) (12,321,109) (12,589,987)
Changes in net assets as a result of operations 270,178,262 (110,868,703) 99,337,053 (156,487,817)
Issue of units 70,134,817 79,260,828 21,970,080 51,528,029
Redemption of units (156,672,683) (151,598,886) (116,908,193) (50,083,427)
NET ASSETS AT THE END OF THE FINANCIAL PERIOD 1,862,991,290 1,536,306,407 835,505,754 800,562,467
(expressed in EUR) CHALLENGE CHALLENGE
ITALIAN EQUITY FUND GERMANY EQUITY FUND
Jun 2021 Jun 2020 Jun 2021 Jun 2020
NET ASSETS AT THE BEGINNING OF THE FINANCIAL PERIOD 224,142,078 258,803,459 157,061,076 154,912,119
Operating income 48,210,917 (47,254,499) 20,122,079 (12,710,523)
Distribution payable (note 21) - - - -
Operating expenses (5,914,893) (3,518,607) (2,868,455) (2,020,864)
Changes in net assets as a result of operations 42,296,024 (50,773,106) 17,253,624 (14,731,387)
Issue of units 11,912,686 16,621,301 6,453,042 5,912,428
Redemption of units (37,192,864) (26,642,926) (20,232,888) (10,711,793)
NET ASSETS AT THE END OF THE FINANCIAL PERIOD 241,157,924 198,008,728 160,534,854 135,381,367
(expressed in EUR) CHALLENGE CHALLENGE
SPAIN EQUITY FUND PACIFIC EQUITY FUND
Jun 2021 Jun 2020 Jun 2021 Jun 2020
NET ASSETS AT THE BEGINNING OF THE FINANCIAL PERIOD 74,584,326 89,514,494 493,803,787 542,035,245
Operating income 9,014,456 (18,804,657) 46,807,689 (25,801,755)
Distribution payable (note 21) - - - -
Operating expenses (1,158,578) (1,094,547) (11,823,316) (7,067,905)
Changes in net assets as a result of operations 7,855,878 (19,899,204) 34,984,373 (32,869,660)
Issue of units 2,948,585 3,456,264 30,859,505 78,109,471
Redemption of units (15,583,680) (4,700,562) (68,676,956) (108,259,315)
NET ASSETS AT THE END OF THE FINANCIAL PERIOD 69,805,109 68,370,992 490,970,709 479,015,741
The accompanying notes form an integral part of these condensed financial statements.
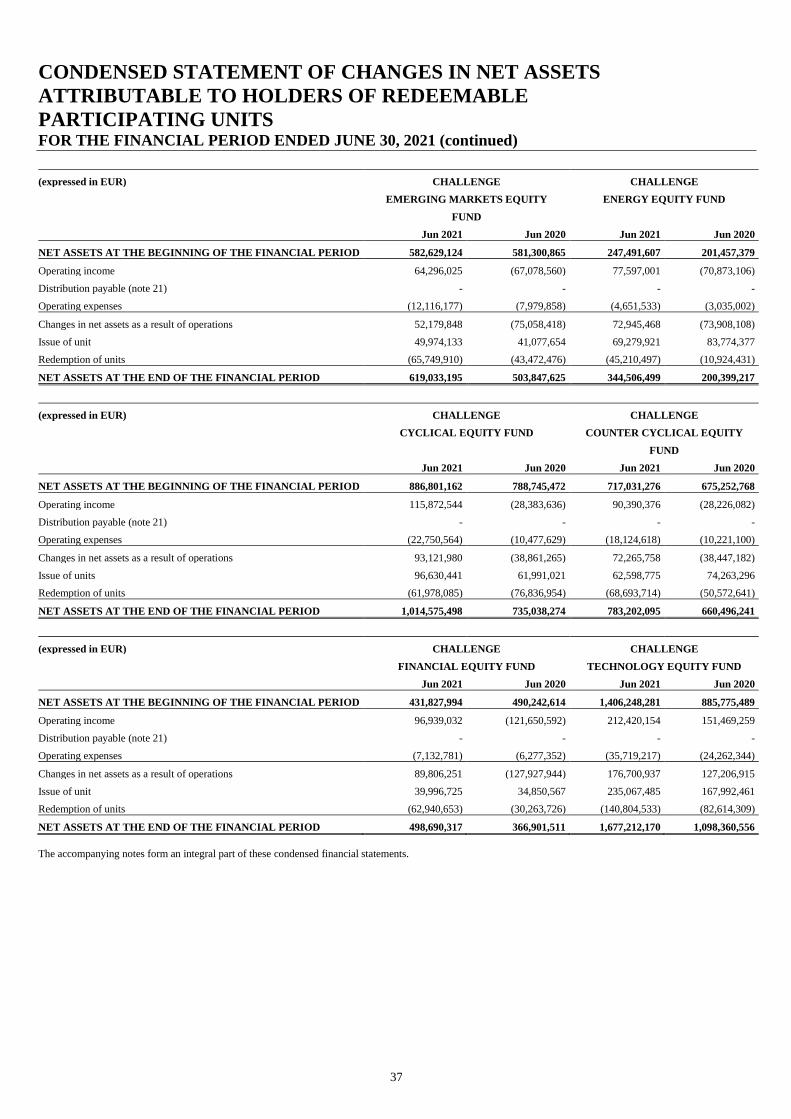
CONDENSED STATEMENT OF CHANGES IN NET ASSETS
ATTRIBUTABLE TO HOLDERS OF REDEEMABLE
PARTICIPATING UNITS FOR THE FINANCIAL PERIOD ENDED JUNE 30, 2021 (continued)
37
(expressed in EUR) CHALLENGE CHALLENGE
EMERGING MARKETS EQUITY ENERGY EQUITY FUND
FUND
Jun 2021 Jun 2020 Jun 2021 Jun 2020
NET ASSETS AT THE BEGINNING OF THE FINANCIAL PERIOD 582,629,124 581,300,865 247,491,607 201,457,379
Operating income 64,296,025 (67,078,560) 77,597,001 (70,873,106)
Distribution payable (note 21) - - - -
Operating expenses (12,116,177) (7,979,858) (4,651,533) (3,035,002)
Changes in net assets as a result of operations 52,179,848 (75,058,418) 72,945,468 (73,908,108)
Issue of unit 49,974,133 41,077,654 69,279,921 83,774,377
Redemption of units (65,749,910) (43,472,476) (45,210,497) (10,924,431)
NET ASSETS AT THE END OF THE FINANCIAL PERIOD 619,033,195 503,847,625 344,506,499 200,399,217
(expressed in EUR) CHALLENGE CHALLENGE
CYCLICAL EQUITY FUND COUNTER CYCLICAL EQUITY
FUND
Jun 2021 Jun 2020 Jun 2021 Jun 2020
NET ASSETS AT THE BEGINNING OF THE FINANCIAL PERIOD 886,801,162 788,745,472 717,031,276 675,252,768
Operating income 115,872,544 (28,383,636) 90,390,376 (28,226,082)
Distribution payable (note 21) - - - -
Operating expenses (22,750,564) (10,477,629) (18,124,618) (10,221,100)
Changes in net assets as a result of operations 93,121,980 (38,861,265) 72,265,758 (38,447,182)
Issue of units 96,630,441 61,991,021 62,598,775 74,263,296
Redemption of units (61,978,085) (76,836,954) (68,693,714) (50,572,641)
NET ASSETS AT THE END OF THE FINANCIAL PERIOD 1,014,575,498 735,038,274 783,202,095 660,496,241
(expressed in EUR) CHALLENGE CHALLENGE
FINANCIAL EQUITY FUND TECHNOLOGY EQUITY FUND
Jun 2021 Jun 2020 Jun 2021 Jun 2020
NET ASSETS AT THE BEGINNING OF THE FINANCIAL PERIOD 431,827,994 490,242,614 1,406,248,281 885,775,489
Operating income 96,939,032 (121,650,592) 212,420,154 151,469,259
Distribution payable (note 21) - - - -
Operating expenses (7,132,781) (6,277,352) (35,719,217) (24,262,344)
Changes in net assets as a result of operations 89,806,251 (127,927,944) 176,700,937 127,206,915
Issue of unit 39,996,725 34,850,567 235,067,485 167,992,461
Redemption of units (62,940,653) (30,263,726) (140,804,533) (82,614,309)
NET ASSETS AT THE END OF THE FINANCIAL PERIOD 498,690,317 366,901,511 1,677,212,170 1,098,360,556
The accompanying notes form an integral part of these condensed financial statements.
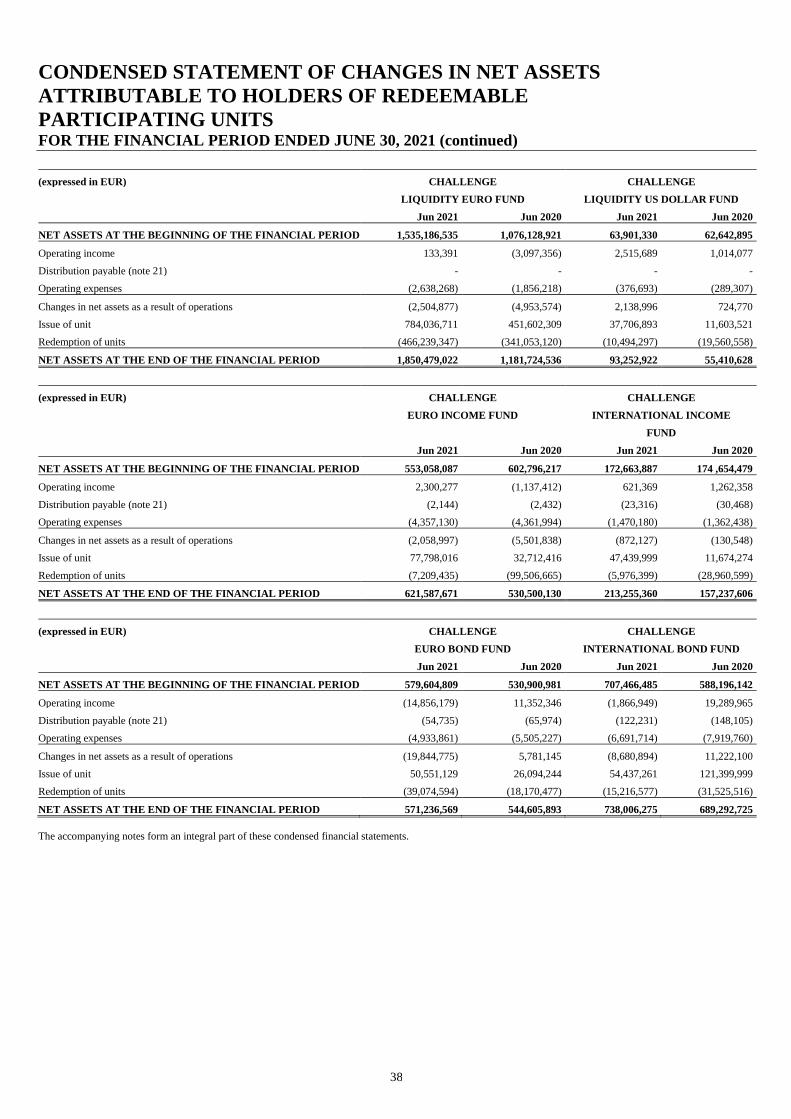
CONDENSED STATEMENT OF CHANGES IN NET ASSETS
ATTRIBUTABLE TO HOLDERS OF REDEEMABLE
PARTICIPATING UNITS FOR THE FINANCIAL PERIOD ENDED JUNE 30, 2021 (continued)
38
(expressed in EUR) CHALLENGE CHALLENGE
LIQUIDITY EURO FUND LIQUIDITY US DOLLAR FUND
Jun 2021 Jun 2020 Jun 2021 Jun 2020
NET ASSETS AT THE BEGINNING OF THE FINANCIAL PERIOD 1,535,186,535 1,076,128,921 63,901,330 62,642,895
Operating income 133,391 (3,097,356) 2,515,689 1,014,077
Distribution payable (note 21) - - - -
Operating expenses (2,638,268) (1,856,218) (376,693) (289,307)
Changes in net assets as a result of operations (2,504,877) (4,953,574) 2,138,996 724,770
Issue of unit 784,036,711 451,602,309 37,706,893 11,603,521
Redemption of units (466,239,347) (341,053,120) (10,494,297) (19,560,558)
NET ASSETS AT THE END OF THE FINANCIAL PERIOD 1,850,479,022 1,181,724,536 93,252,922 55,410,628
(expressed in EUR) CHALLENGE CHALLENGE
EURO INCOME FUND INTERNATIONAL INCOME
FUND
Jun 2021 Jun 2020 Jun 2021 Jun 2020
NET ASSETS AT THE BEGINNING OF THE FINANCIAL PERIOD 553,058,087 602,796,217 172,663,887 174 ,654,479
Operating income 2,300,277 (1,137,412) 621,369 1,262,358
Distribution payable (note 21) (2,144) (2,432) (23,316) (30,468)
Operating expenses (4,357,130) (4,361,994) (1,470,180) (1,362,438)
Changes in net assets as a result of operations (2,058,997) (5,501,838) (872,127) (130,548)
Issue of unit 77,798,016 32,712,416 47,439,999 11,674,274
Redemption of units (7,209,435) (99,506,665) (5,976,399) (28,960,599)
NET ASSETS AT THE END OF THE FINANCIAL PERIOD 621,587,671 530,500,130 213,255,360 157,237,606
(expressed in EUR) CHALLENGE CHALLENGE
EURO BOND FUND INTERNATIONAL BOND FUND
Jun 2021 Jun 2020 Jun 2021 Jun 2020
NET ASSETS AT THE BEGINNING OF THE FINANCIAL PERIOD 579,604,809 530,900,981 707,466,485 588,196,142
Operating income (14,856,179) 11,352,346 (1,866,949) 19,289,965
Distribution payable (note 21) (54,735) (65,974) (122,231) (148,105)
Operating expenses (4,933,861) (5,505,227) (6,691,714) (7,919,760)
Changes in net assets as a result of operations (19,844,775) 5,781,145 (8,680,894) 11,222,100
Issue of unit 50,551,129 26,094,244 54,437,261 121,399,999
Redemption of units (39,074,594) (18,170,477) (15,216,577) (31,525,516)
NET ASSETS AT THE END OF THE FINANCIAL PERIOD 571,236,569 544,605,893 738,006,275 689,292,725
The accompanying notes form an integral part of these condensed financial statements.
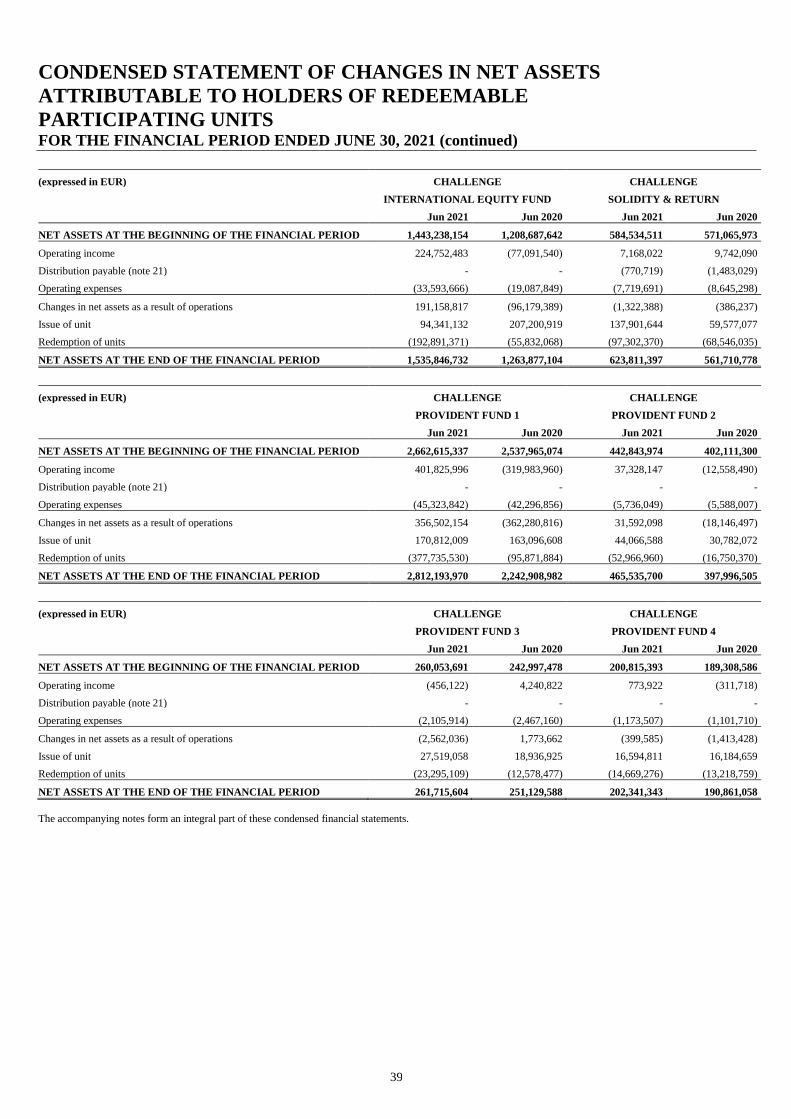
CONDENSED STATEMENT OF CHANGES IN NET ASSETS
ATTRIBUTABLE TO HOLDERS OF REDEEMABLE
PARTICIPATING UNITS FOR THE FINANCIAL PERIOD ENDED JUNE 30, 2021 (continued)
39
(expressed in EUR) CHALLENGE CHALLENGE
INTERNATIONAL EQUITY FUND SOLIDITY & RETURN
Jun 2021 Jun 2020 Jun 2021 Jun 2020
NET ASSETS AT THE BEGINNING OF THE FINANCIAL PERIOD 1,443,238,154 1,208,687,642 584,534,511 571,065,973
Operating income 224,752,483 (77,091,540) 7,168,022 9,742,090
Distribution payable (note 21) - - (770,719) (1,483,029)
Operating expenses (33,593,666) (19,087,849) (7,719,691) (8,645,298)
Changes in net assets as a result of operations 191,158,817 (96,179,389) (1,322,388) (386,237)
Issue of unit 94,341,132 207,200,919 137,901,644 59,577,077
Redemption of units (192,891,371) (55,832,068) (97,302,370) (68,546,035)
NET ASSETS AT THE END OF THE FINANCIAL PERIOD 1,535,846,732 1,263,877,104 623,811,397 561,710,778
(expressed in EUR) CHALLENGE CHALLENGE
PROVIDENT FUND 1 PROVIDENT FUND 2
Jun 2021 Jun 2020 Jun 2021 Jun 2020
NET ASSETS AT THE BEGINNING OF THE FINANCIAL PERIOD 2,662,615,337 2,537,965,074 442,843,974 402,111,300
Operating income 401,825,996 (319,983,960) 37,328,147 (12,558,490)
Distribution payable (note 21) - - - -
Operating expenses (45,323,842) (42,296,856) (5,736,049) (5,588,007)
Changes in net assets as a result of operations 356,502,154 (362,280,816) 31,592,098 (18,146,497)
Issue of unit 170,812,009 163,096,608 44,066,588 30,782,072
Redemption of units (377,735,530) (95,871,884) (52,966,960) (16,750,370)
NET ASSETS AT THE END OF THE FINANCIAL PERIOD 2,812,193,970 2,242,908,982 465,535,700 397,996,505
(expressed in EUR) CHALLENGE CHALLENGE
PROVIDENT FUND 3 PROVIDENT FUND 4
Jun 2021 Jun 2020 Jun 2021 Jun 2020
NET ASSETS AT THE BEGINNING OF THE FINANCIAL PERIOD 260,053,691 242,997,478 200,815,393 189,308,586
Operating income (456,122) 4,240,822 773,922 (311,718)
Distribution payable (note 21) - - - -
Operating expenses (2,105,914) (2,467,160) (1,173,507) (1,101,710)
Changes in net assets as a result of operations (2,562,036) 1,773,662 (399,585) (1,413,428)
Issue of unit 27,519,058 18,936,925 16,594,811 16,184,659
Redemption of units (23,295,109) (12,578,477) (14,669,276) (13,218,759)
NET ASSETS AT THE END OF THE FINANCIAL PERIOD 261,715,604 251,129,588 202,341,343 190,861,058
The accompanying notes form an integral part of these condensed financial statements.
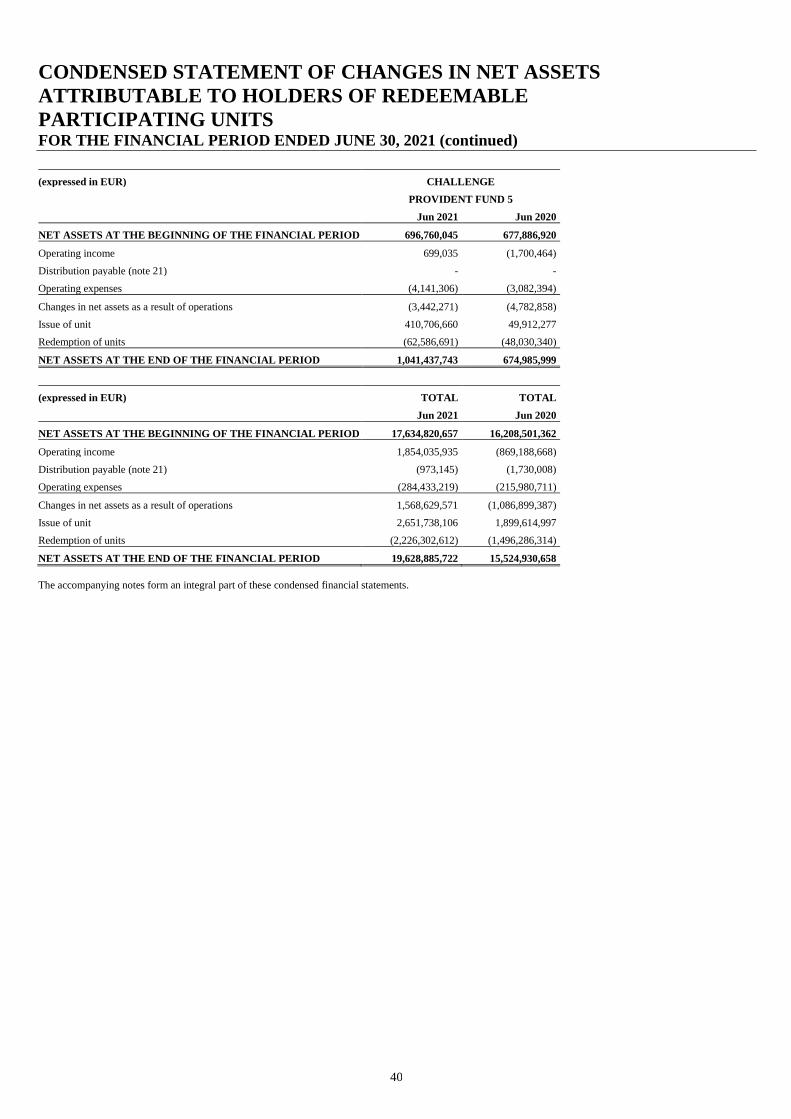
CONDENSED STATEMENT OF CHANGES IN NET ASSETS
ATTRIBUTABLE TO HOLDERS OF REDEEMABLE
PARTICIPATING UNITS FOR THE FINANCIAL PERIOD ENDED JUNE 30, 2021 (continued)
40
(expressed in EUR) CHALLENGE
PROVIDENT FUND 5
Jun 2021 Jun 2020
NET ASSETS AT THE BEGINNING OF THE FINANCIAL PERIOD 696,760,045 677,886,920
Operating income 699,035 (1,700,464)
Distribution payable (note 21) - -
Operating expenses (4,141,306) (3,082,394)
Changes in net assets as a result of operations (3,442,271) (4,782,858)
Issue of unit 410,706,660 49,912,277
Redemption of units (62,586,691) (48,030,340)
NET ASSETS AT THE END OF THE FINANCIAL PERIOD 1,041,437,743 674,985,999
(expressed in EUR) TOTAL TOTAL
Jun 2021 Jun 2020
NET ASSETS AT THE BEGINNING OF THE FINANCIAL PERIOD 17,634,820,657 16,208,501,362
Operating income 1,854,035,935 (869,188,668)
Distribution payable (note 21) (973,145) (1,730,008)
Operating expenses (284,433,219) (215,980,711)
Changes in net assets as a result of operations 1,568,629,571 (1,086,899,387)
Issue of unit 2,651,738,106 1,899,614,997
Redemption of units (2,226,302,612) (1,496,286,314)
NET ASSETS AT THE END OF THE FINANCIAL PERIOD 19,628,885,722 15,524,930,658
The accompanying notes form an integral part of these condensed financial statements.
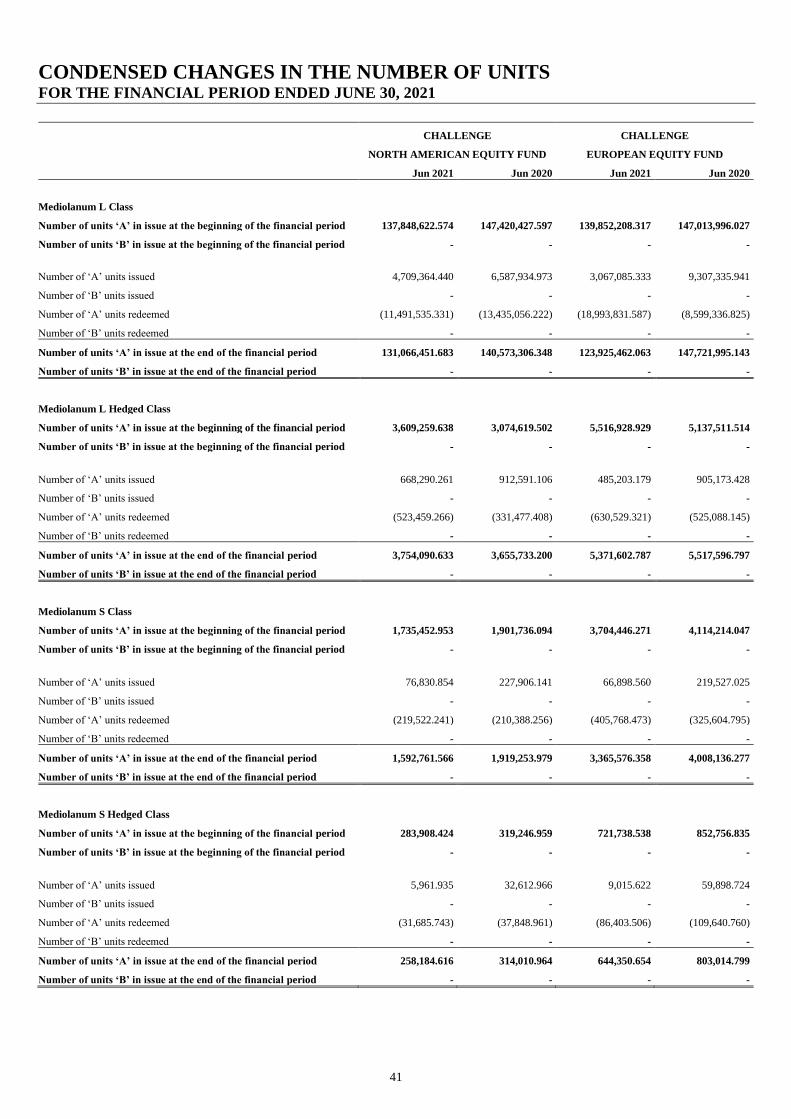
CONDENSED CHANGES IN THE NUMBER OF UNITS FOR THE FINANCIAL PERIOD ENDED JUNE 30, 2021
41
CHALLENGE CHALLENGE
NORTH AMERICAN EQUITY FUND EUROPEAN EQUITY FUND
Jun 2021 Jun 2020 Jun 2021 Jun 2020
Mediolanum L Class
Number of units ‘A’ in issue at the beginning of the financial period 137,848,622.574 147,420,427.597 139,852,208.317 147,013,996.027
Number of units ‘B’ in issue at the beginning of the financial period - - - -
Number of ‘A’ units issued 4,709,364.440 6,587,934.973 3,067,085.333 9,307,335.941
Number of ‘B’ units issued - - - -
Number of ‘A’ units redeemed (11,491,535.331) (13,435,056.222) (18,993,831.587) (8,599,336.825)
Number of ‘B’ units redeemed - - - -
Number of units ‘A’ in issue at the end of the financial period 131,066,451.683 140,573,306.348 123,925,462.063 147,721,995.143
Number of units ‘B’ in issue at the end of the financial period - - - -
Mediolanum L Hedged Class
Number of units ‘A’ in issue at the beginning of the financial period 3,609,259.638 3,074,619.502 5,516,928.929 5,137,511.514
Number of units ‘B’ in issue at the beginning of the financial period - - - -
Number of ‘A’ units issued 668,290.261 912,591.106 485,203.179 905,173.428
Number of ‘B’ units issued - - - -
Number of ‘A’ units redeemed (523,459.266) (331,477.408) (630,529.321) (525,088.145)
Number of ‘B’ units redeemed - - - -
Number of units ‘A’ in issue at the end of the financial period 3,754,090.633 3,655,733.200 5,371,602.787 5,517,596.797
Number of units ‘B’ in issue at the end of the financial period - - - -
Mediolanum S Class
Number of units ‘A’ in issue at the beginning of the financial period 1,735,452.953 1,901,736.094 3,704,446.271 4,114,214.047
Number of units ‘B’ in issue at the beginning of the financial period - - - -
Number of ‘A’ units issued 76,830.854 227,906.141 66,898.560 219,527.025
Number of ‘B’ units issued - - - -
Number of ‘A’ units redeemed (219,522.241) (210,388.256) (405,768.473) (325,604.795)
Number of ‘B’ units redeemed - - - -
Number of units ‘A’ in issue at the end of the financial period 1,592,761.566 1,919,253.979 3,365,576.358 4,008,136.277
Number of units ‘B’ in issue at the end of the financial period - - - -
Mediolanum S Hedged Class
Number of units ‘A’ in issue at the beginning of the financial period 283,908.424 319,246.959 721,738.538 852,756.835
Number of units ‘B’ in issue at the beginning of the financial period - - - -
Number of ‘A’ units issued 5,961.935 32,612.966 9,015.622 59,898.724
Number of ‘B’ units issued - - - -
Number of ‘A’ units redeemed (31,685.743) (37,848.961) (86,403.506) (109,640.760)
Number of ‘B’ units redeemed - - - -
Number of units ‘A’ in issue at the end of the financial period 258,184.616 314,010.964 644,350.654 803,014.799
Number of units ‘B’ in issue at the end of the financial period - - - -

CONDENSED CHANGES IN THE NUMBER OF UNITS FOR THE FINANCIAL PERIOD ENDED JUNE 30, 2021 (continued)
42
CHALLENGE CHALLENGE
ITALIAN EQUITY FUND GERMANY EQUITY FUND
Jun 2021 Jun 2020 Jun 2021 Jun 2020
Mediolanum L Class
Number of units ‘A’ in issue at the beginning of the financial period 40,345,529.398 41,737,056.142 22,141,233.217 22,339,580.232
Number of units ‘B’ in issue at the beginning of the financial period - - - -
Number of ‘A’ units issued 2,186,006.147 3,866,052.262 852,678.625 1,025,003.176
Number of ‘B’ units issued - - - -
Number of ‘A’ units redeemed (6,320,780.482) (5,451,479.449) (2,617,926.382) (1,431,572.712)
Number of ‘B’ units redeemed - - - -
Number of units ‘A’ in issue at the end of the financial period 36,210,755.063 40,151,628.955 20,375,985.460 21,933,010.696
Number of units ‘B’ in issue at the end of the financial period - - - -
Mediolanum S Class
Number of units ‘A’ in issue at the beginning of the financial period 4,673,844.155 5,331,400.306 760,932.459 914,961.764
Number of units ‘B’ in issue at the beginning of the financial period - - - -
Number of ‘A’ units issued 66,019.579 276,149.969 29,808.844 80,771.298
Number of ‘B’ units issued - - - -
Number of ‘A’ units redeemed (574,339.358) (587,432.238) (120,217.222) (165,057.202)
Number of ‘B’ units redeemed - - - -
Number of units ‘A’ in issue at the end of the financial period 4,165,524.376 5,020,118.037 670,524.081 830,675.860
Number of units ‘B’ in issue at the end of the financial period - - - -
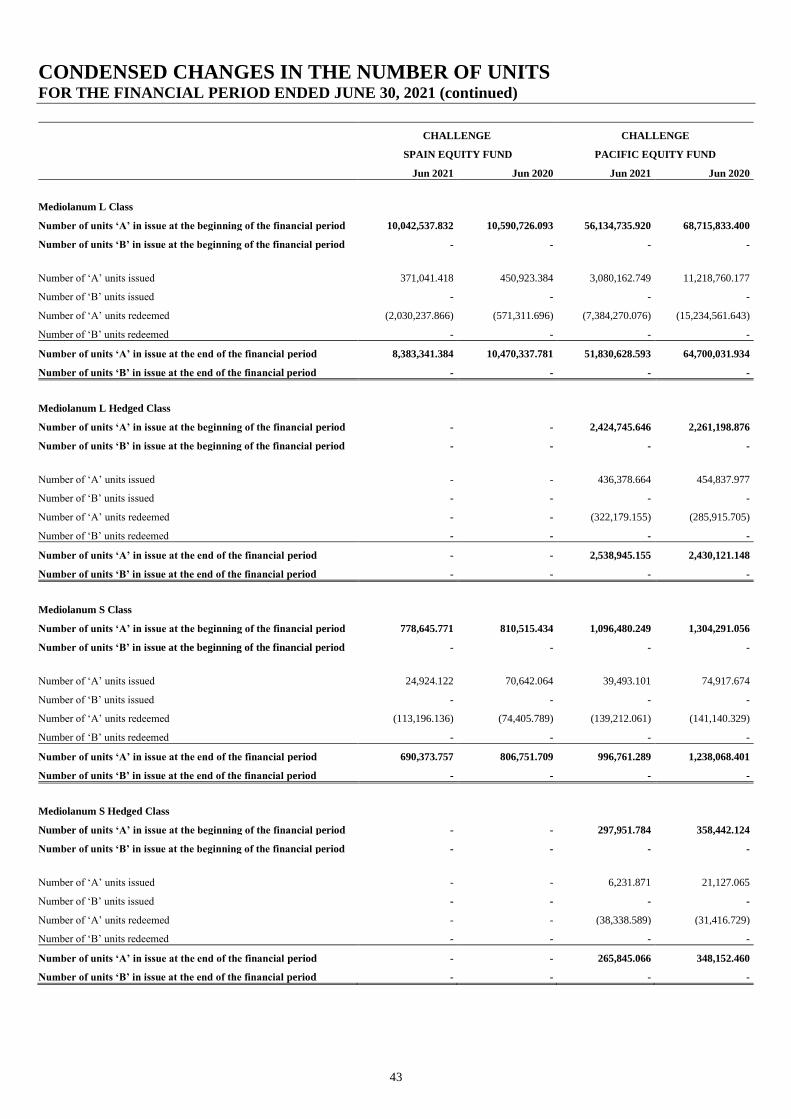
CONDENSED CHANGES IN THE NUMBER OF UNITS FOR THE FINANCIAL PERIOD ENDED JUNE 30, 2021 (continued)
43
CHALLENGE CHALLENGE
SPAIN EQUITY FUND PACIFIC EQUITY FUND
Jun 2021 Jun 2020 Jun 2021 Jun 2020
Mediolanum L Class
Number of units ‘A’ in issue at the beginning of the financial period 10,042,537.832 10,590,726.093 56,134,735.920 68,715,833.400
Number of units ‘B’ in issue at the beginning of the financial period - - - -
Number of ‘A’ units issued 371,041.418 450,923.384 3,080,162.749 11,218,760.177
Number of ‘B’ units issued - - - -
Number of ‘A’ units redeemed (2,030,237.866) (571,311.696) (7,384,270.076) (15,234,561.643)
Number of ‘B’ units redeemed - - - -
Number of units ‘A’ in issue at the end of the financial period 8,383,341.384 10,470,337.781 51,830,628.593 64,700,031.934
Number of units ‘B’ in issue at the end of the financial period - - - -
Mediolanum L Hedged Class
Number of units ‘A’ in issue at the beginning of the financial period - - 2,424,745.646 2,261,198.876
Number of units ‘B’ in issue at the beginning of the financial period - - - -
Number of ‘A’ units issued - - 436,378.664 454,837.977
Number of ‘B’ units issued - - - -
Number of ‘A’ units redeemed - - (322,179.155) (285,915.705)
Number of ‘B’ units redeemed - - - -
Number of units ‘A’ in issue at the end of the financial period - - 2,538,945.155 2,430,121.148
Number of units ‘B’ in issue at the end of the financial period - - - -
Mediolanum S Class
Number of units ‘A’ in issue at the beginning of the financial period 778,645.771 810,515.434 1,096,480.249 1,304,291.056
Number of units ‘B’ in issue at the beginning of the financial period - - - -
Number of ‘A’ units issued 24,924.122 70,642.064 39,493.101 74,917.674
Number of ‘B’ units issued - - - -
Number of ‘A’ units redeemed (113,196.136) (74,405.789) (139,212.061) (141,140.329)
Number of ‘B’ units redeemed - - - -
Number of units ‘A’ in issue at the end of the financial period 690,373.757 806,751.709 996,761.289 1,238,068.401
Number of units ‘B’ in issue at the end of the financial period - - - -
Mediolanum S Hedged Class
Number of units ‘A’ in issue at the beginning of the financial period - - 297,951.784 358,442.124
Number of units ‘B’ in issue at the beginning of the financial period - - - -
Number of ‘A’ units issued - - 6,231.871 21,127.065
Number of ‘B’ units issued - - - -
Number of ‘A’ units redeemed - - (38,338.589) (31,416.729)
Number of ‘B’ units redeemed - - - -
Number of units ‘A’ in issue at the end of the financial period - - 265,845.066 348,152.460
Number of units ‘B’ in issue at the end of the financial period - - - -
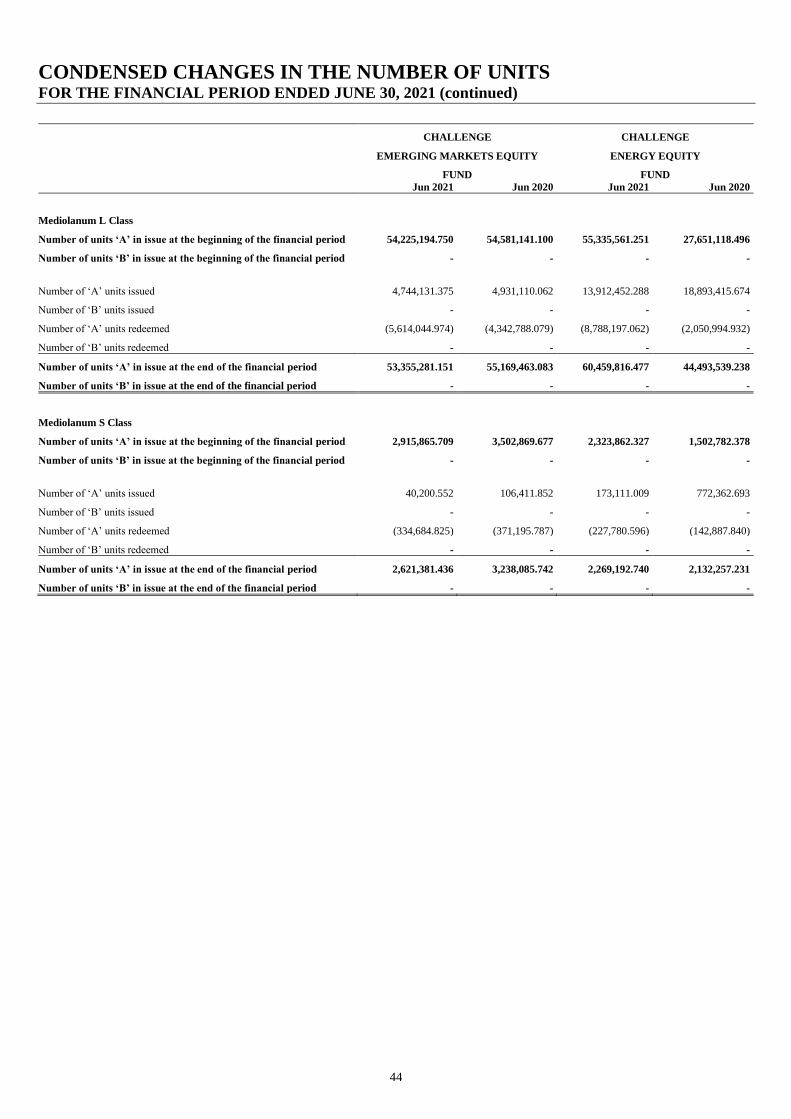
CONDENSED CHANGES IN THE NUMBER OF UNITS FOR THE FINANCIAL PERIOD ENDED JUNE 30, 2021 (continued)
44
CHALLENGE CHALLENGE
EMERGING MARKETS EQUITY ENERGY EQUITY
FUND FUND
Jun 2021 Jun 2020 Jun 2021 Jun 2020
Mediolanum L Class
Number of units ‘A’ in issue at the beginning of the financial period 54,225,194.750 54,581,141.100 55,335,561.251 27,651,118.496
Number of units ‘B’ in issue at the beginning of the financial period - - - -
Number of ‘A’ units issued 4,744,131.375 4,931,110.062 13,912,452.288 18,893,415.674
Number of ‘B’ units issued - - - -
Number of ‘A’ units redeemed (5,614,044.974) (4,342,788.079) (8,788,197.062) (2,050,994.932)
Number of ‘B’ units redeemed - - - -
Number of units ‘A’ in issue at the end of the financial period 53,355,281.151 55,169,463.083 60,459,816.477 44,493,539.238
Number of units ‘B’ in issue at the end of the financial period - - - -
Mediolanum S Class
Number of units ‘A’ in issue at the beginning of the financial period 2,915,865.709 3,502,869.677 2,323,862.327 1,502,782.378
Number of units ‘B’ in issue at the beginning of the financial period - - - -
Number of ‘A’ units issued 40,200.552 106,411.852 173,111.009 772,362.693
Number of ‘B’ units issued - - - -
Number of ‘A’ units redeemed (334,684.825) (371,195.787) (227,780.596) (142,887.840)
Number of ‘B’ units redeemed - - - -
Number of units ‘A’ in issue at the end of the financial period 2,621,381.436 3,238,085.742 2,269,192.740 2,132,257.231
Number of units ‘B’ in issue at the end of the financial period - - - -
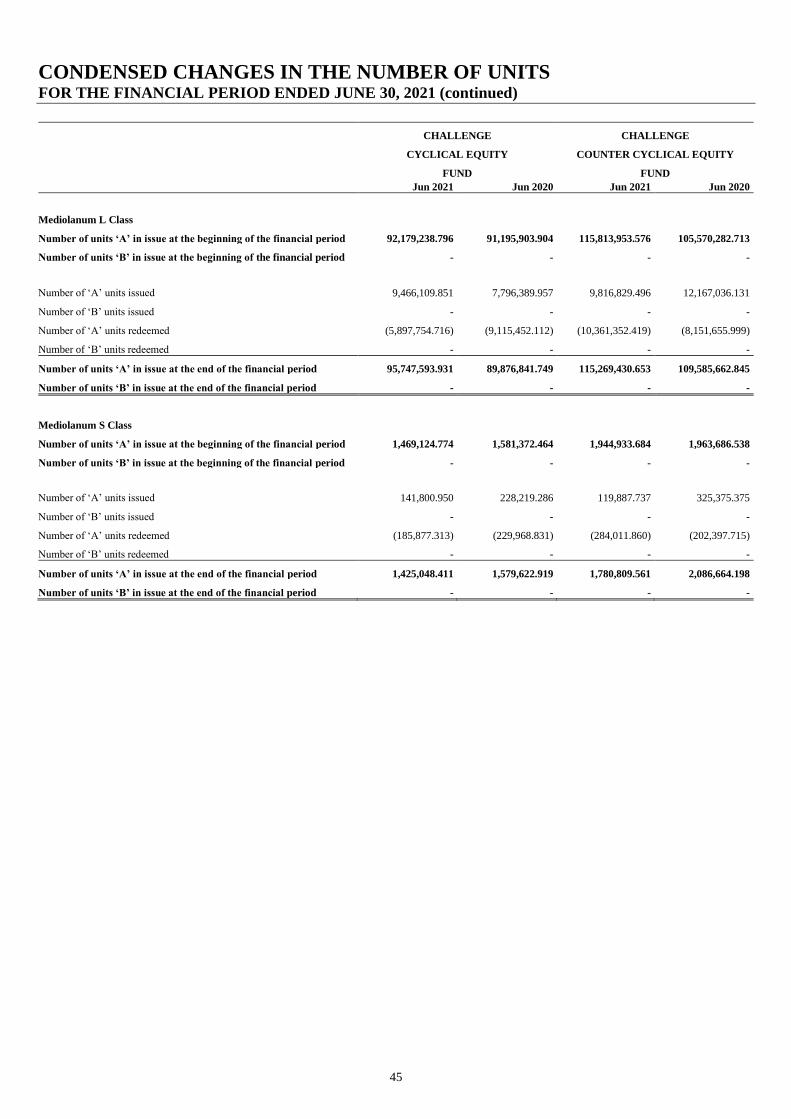
CONDENSED CHANGES IN THE NUMBER OF UNITS FOR THE FINANCIAL PERIOD ENDED JUNE 30, 2021 (continued)
45
CHALLENGE CHALLENGE
CYCLICAL EQUITY COUNTER CYCLICAL EQUITY
FUND FUND
Jun 2021 Jun 2020 Jun 2021 Jun 2020
Mediolanum L Class
Number of units ‘A’ in issue at the beginning of the financial period 92,179,238.796 91,195,903.904 115,813,953.576 105,570,282.713
Number of units ‘B’ in issue at the beginning of the financial period - - - -
Number of ‘A’ units issued 9,466,109.851 7,796,389.957 9,816,829.496 12,167,036.131
Number of ‘B’ units issued - - - -
Number of ‘A’ units redeemed (5,897,754.716) (9,115,452.112) (10,361,352.419) (8,151,655.999)
Number of ‘B’ units redeemed - - - -
Number of units ‘A’ in issue at the end of the financial period 95,747,593.931 89,876,841.749 115,269,430.653 109,585,662.845
Number of units ‘B’ in issue at the end of the financial period - - - -
Mediolanum S Class
Number of units ‘A’ in issue at the beginning of the financial period 1,469,124.774 1,581,372.464 1,944,933.684 1,963,686.538
Number of units ‘B’ in issue at the beginning of the financial period - - - -
Number of ‘A’ units issued 141,800.950 228,219.286 119,887.737 325,375.375
Number of ‘B’ units issued - - - -
Number of ‘A’ units redeemed (185,877.313) (229,968.831) (284,011.860) (202,397.715)
Number of ‘B’ units redeemed - - - -
Number of units ‘A’ in issue at the end of the financial period 1,425,048.411 1,579,622.919 1,780,809.561 2,086,664.198
Number of units ‘B’ in issue at the end of the financial period - - - -
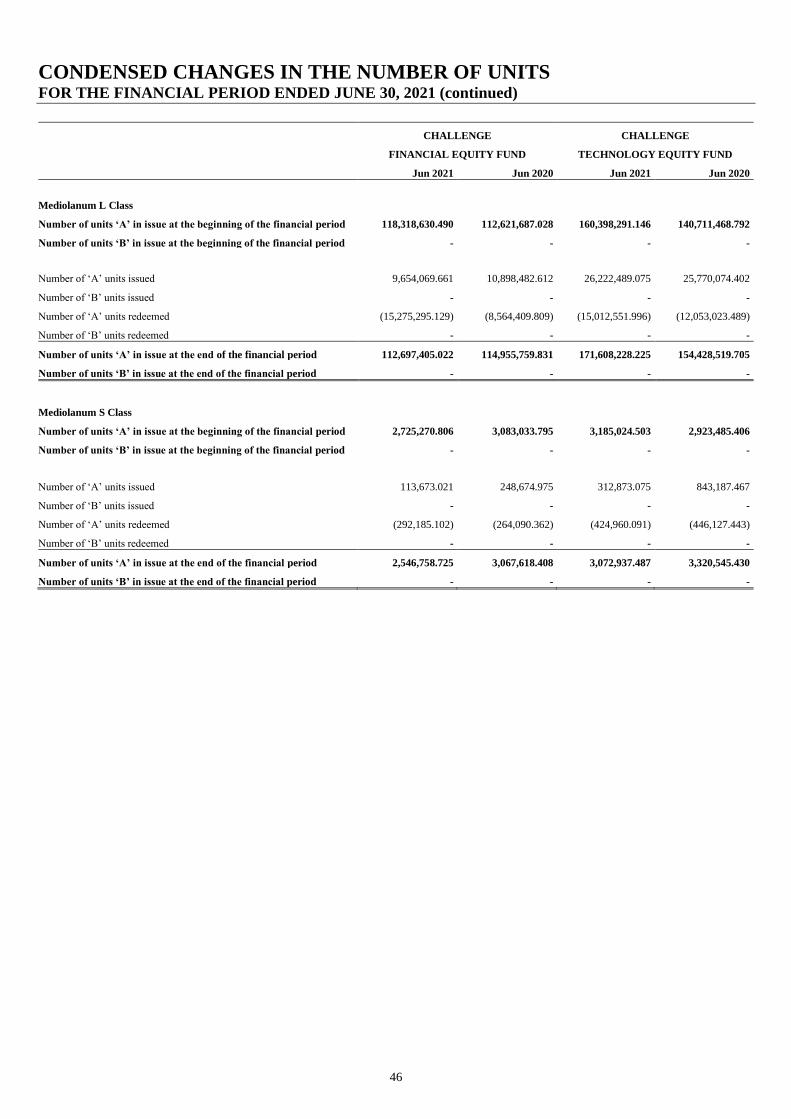
CONDENSED CHANGES IN THE NUMBER OF UNITS FOR THE FINANCIAL PERIOD ENDED JUNE 30, 2021 (continued)
46
CHALLENGE CHALLENGE
FINANCIAL EQUITY FUND TECHNOLOGY EQUITY FUND
Jun 2021 Jun 2020 Jun 2021 Jun 2020
Mediolanum L Class
Number of units ‘A’ in issue at the beginning of the financial period 118,318,630.490 112,621,687.028 160,398,291.146 140,711,468.792
Number of units ‘B’ in issue at the beginning of the financial period - - - -
Number of ‘A’ units issued 9,654,069.661 10,898,482.612 26,222,489.075 25,770,074.402
Number of ‘B’ units issued - - - -
Number of ‘A’ units redeemed (15,275,295.129) (8,564,409.809) (15,012,551.996) (12,053,023.489)
Number of ‘B’ units redeemed - - - -
Number of units ‘A’ in issue at the end of the financial period 112,697,405.022 114,955,759.831 171,608,228.225 154,428,519.705
Number of units ‘B’ in issue at the end of the financial period - - - -
Mediolanum S Class
Number of units ‘A’ in issue at the beginning of the financial period 2,725,270.806 3,083,033.795 3,185,024.503 2,923,485.406
Number of units ‘B’ in issue at the beginning of the financial period - - - -
Number of ‘A’ units issued 113,673.021 248,674.975 312,873.075 843,187.467
Number of ‘B’ units issued - - - -
Number of ‘A’ units redeemed (292,185.102) (264,090.362) (424,960.091) (446,127.443)
Number of ‘B’ units redeemed - - - -
Number of units ‘A’ in issue at the end of the financial period 2,546,758.725 3,067,618.408 3,072,937.487 3,320,545.430
Number of units ‘B’ in issue at the end of the financial period - - - -
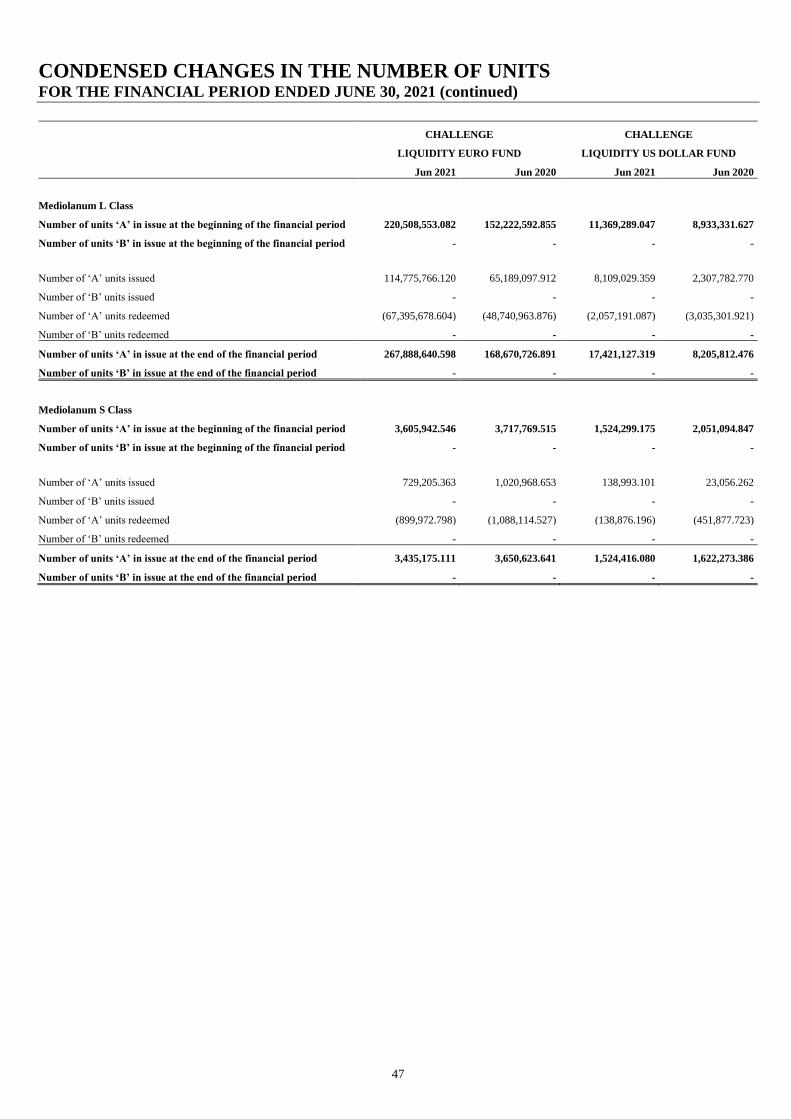
CONDENSED CHANGES IN THE NUMBER OF UNITS FOR THE FINANCIAL PERIOD ENDED JUNE 30, 2021 (continued)
47
CHALLENGE CHALLENGE
LIQUIDITY EURO FUND LIQUIDITY US DOLLAR FUND
Jun 2021 Jun 2020 Jun 2021 Jun 2020
Mediolanum L Class
Number of units ‘A’ in issue at the beginning of the financial period 220,508,553.082 152,222,592.855 11,369,289.047 8,933,331.627
Number of units ‘B’ in issue at the beginning of the financial period - - - -
Number of ‘A’ units issued 114,775,766.120 65,189,097.912 8,109,029.359 2,307,782.770
Number of ‘B’ units issued - - - -
Number of ‘A’ units redeemed (67,395,678.604) (48,740,963.876) (2,057,191.087) (3,035,301.921)
Number of ‘B’ units redeemed - - - -
Number of units ‘A’ in issue at the end of the financial period 267,888,640.598 168,670,726.891 17,421,127.319 8,205,812.476
Number of units ‘B’ in issue at the end of the financial period - - - -
Mediolanum S Class
Number of units ‘A’ in issue at the beginning of the financial period 3,605,942.546 3,717,769.515 1,524,299.175 2,051,094.847
Number of units ‘B’ in issue at the beginning of the financial period - - - -
Number of ‘A’ units issued 729,205.363 1,020,968.653 138,993.101 23,056.262
Number of ‘B’ units issued - - - -
Number of ‘A’ units redeemed (899,972.798) (1,088,114.527) (138,876.196) (451,877.723)
Number of ‘B’ units redeemed - - - -
Number of units ‘A’ in issue at the end of the financial period 3,435,175.111 3,650,623.641 1,524,416.080 1,622,273.386
Number of units ‘B’ in issue at the end of the financial period - - - -
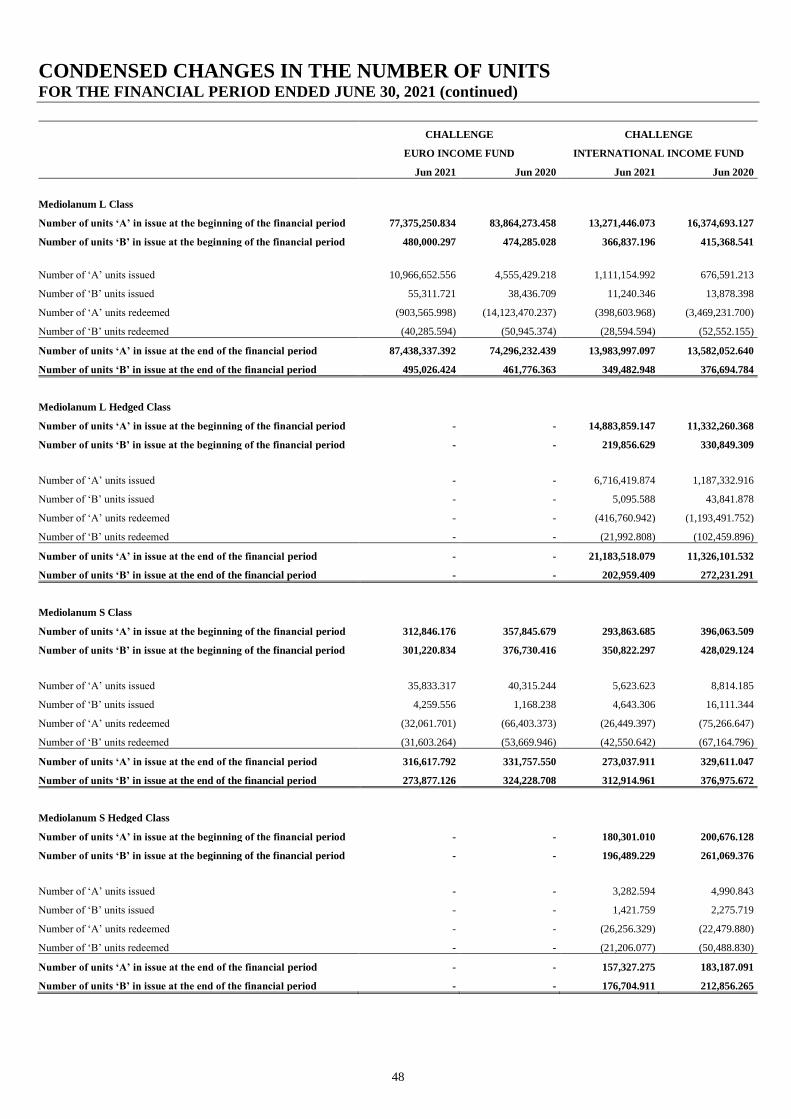
CONDENSED CHANGES IN THE NUMBER OF UNITS FOR THE FINANCIAL PERIOD ENDED JUNE 30, 2021 (continued)
48
CHALLENGE CHALLENGE
EURO INCOME FUND INTERNATIONAL INCOME FUND
Jun 2021 Jun 2020 Jun 2021 Jun 2020
Mediolanum L Class
Number of units ‘A’ in issue at the beginning of the financial period 77,375,250.834 83,864,273.458 13,271,446.073 16,374,693.127
Number of units ‘B’ in issue at the beginning of the financial period 480,000.297 474,285.028 366,837.196 415,368.541
Number of ‘A’ units issued 10,966,652.556 4,555,429.218 1,111,154.992 676,591.213
Number of ‘B’ units issued 55,311.721 38,436.709 11,240.346 13,878.398
Number of ‘A’ units redeemed (903,565.998) (14,123,470.237) (398,603.968) (3,469,231.700)
Number of ‘B’ units redeemed (40,285.594) (50,945.374) (28,594.594) (52,552.155)
Number of units ‘A’ in issue at the end of the financial period 87,438,337.392 74,296,232.439 13,983,997.097 13,582,052.640
Number of units ‘B’ in issue at the end of the financial period 495,026.424 461,776.363 349,482.948 376,694.784
Mediolanum L Hedged Class
Number of units ‘A’ in issue at the beginning of the financial period - - 14,883,859.147 11,332,260.368
Number of units ‘B’ in issue at the beginning of the financial period - - 219,856.629 330,849.309
Number of ‘A’ units issued - - 6,716,419.874 1,187,332.916
Number of ‘B’ units issued - - 5,095.588 43,841.878
Number of ‘A’ units redeemed - - (416,760.942) (1,193,491.752)
Number of ‘B’ units redeemed - - (21,992.808) (102,459.896)
Number of units ‘A’ in issue at the end of the financial period - - 21,183,518.079 11,326,101.532
Number of units ‘B’ in issue at the end of the financial period - - 202,959.409 272,231.291
Mediolanum S Class
Number of units ‘A’ in issue at the beginning of the financial period 312,846.176 357,845.679 293,863.685 396,063.509
Number of units ‘B’ in issue at the beginning of the financial period 301,220.834 376,730.416 350,822.297 428,029.124
Number of ‘A’ units issued 35,833.317 40,315.244 5,623.623 8,814.185
Number of ‘B’ units issued 4,259.556 1,168.238 4,643.306 16,111.344
Number of ‘A’ units redeemed (32,061.701) (66,403.373) (26,449.397) (75,266.647)
Number of ‘B’ units redeemed (31,603.264) (53,669.946) (42,550.642) (67,164.796)
Number of units ‘A’ in issue at the end of the financial period 316,617.792 331,757.550 273,037.911 329,611.047
Number of units ‘B’ in issue at the end of the financial period 273,877.126 324,228.708 312,914.961 376,975.672
Mediolanum S Hedged Class
Number of units ‘A’ in issue at the beginning of the financial period - - 180,301.010 200,676.128
Number of units ‘B’ in issue at the beginning of the financial period - - 196,489.229 261,069.376
Number of ‘A’ units issued - - 3,282.594 4,990.843
Number of ‘B’ units issued - - 1,421.759 2,275.719
Number of ‘A’ units redeemed - - (26,256.329) (22,479.880)
Number of ‘B’ units redeemed - - (21,206.077) (50,488.830)
Number of units ‘A’ in issue at the end of the financial period - - 157,327.275 183,187.091
Number of units ‘B’ in issue at the end of the financial period - - 176,704.911 212,856.265

CONDENSED CHANGES IN THE NUMBER OF UNITS FOR THE FINANCIAL PERIOD ENDED JUNE 30, 2021 (continued)
49
CHALLENGE CHALLENGE
EURO BOND FUND INTERNATIONAL BOND FUND
Jun 2021 Jun 2020 Jun 2021 Jun 2020
Mediolanum L Class
Number of units ‘A’ in issue at the beginning of the financial period 51,848,135.611 48,784,100.002 62,342,089.532 58,280,357.661
Number of units ‘B’ in issue at the beginning of the financial period 763,473.852 1,004,382.720 621,696.823 694,668.330
Number of ‘A’ units issued 4,746,444.215 2,426,111.857 5,802,860.697 3,880,406.471
Number of ‘B’ units issued 47,121.185 51,671.820 58,426.263 87,018.497
Number of ‘A’ units redeemed (3,382,906.253) (1,365,734.508) (613,559.572) (2,545,549.030)
Number of ‘B’ units redeemed (188,856.940) (299,037.589) (126,851.448) (135,105.385)
Number of units ‘A’ in issue at the end of the financial period 53,211,673.573 49,844,477.351 67,531,390.657 59,615,215.102
Number of units ‘B’ in issue at the end of the financial period 621,738.097 757,016.951 553,271.638 646,581.442
Mediolanum L Hedged Class
Number of units ‘A’ in issue at the beginning of the financial period - - 31,654,806.830 20,823,504.554
Number of units ‘B’ in issue at the beginning of the financial period - - 876,289.679 1,159,923.486
Number of ‘A’ units issued - - 1,897,859.038 11,134,697.777
Number of ‘B’ units issued - - 22,338.414 33,227.472
Number of ‘A’ units redeemed - - (598,338.684) (1,065,056.853)
Number of ‘B’ units redeemed - - (315,473.866) (388,643.457)
Number of units ‘A’ in issue at the end of the financial period - - 32,954,327.184 30,893,145.478
Number of units ‘B’ in issue at the end of the financial period - - 583,154.227 804,507.501
Mediolanum S Class
Number of units ‘A’ in issue at the beginning of the financial period 322,088.535 377,072.629 241,220.695 256,619.649
Number of units ‘B’ in issue at the beginning of the financial period 795,099.880 939,532.218 519,490.680 621,109.797
Number of ‘A’ units issued 14,768.053 22,215.659 34,567.950 19,769.116
Number of ‘B’ units issued 5,603.730 16,418.661 5,484.977 9,829.327
Number of ‘A’ units redeemed (41,601.454) (46,429.421) (38,015.566) (20,125.145)
Number of ‘B’ units redeemed (111,037.008) (104,107.666) (79,972.672) (63,375.422)
Number of units ‘A’ in issue at the end of the financial period 295,255.134 352,858.867 237,773.079 256,263.620
Number of units ‘B’ in issue at the end of the financial period 689,666.602 851,843.213 445,002.985 567,563.702
Mediolanum S Hedged Class
Number of units ‘A’ in issue at the beginning of the financial period - - 558,225.949 647,651.292
Number of units ‘B’ in issue at the beginning of the financial period - - 546,928.549 643,006.871
Number of ‘A’ units issued - - 41,639.419 40,820.706
Number of ‘B’ units issued - - 3,227.364 3,566.126
Number of ‘A’ units redeemed - - (86,130.919) (89,648.231)
Number of ‘B’ units redeemed - - (84,248.286) (52,618.776)
Number of units ‘A’ in issue at the end of the financial period - - 513,734.449 598,823.767
Number of units ‘B’ in issue at the end of the financial period - - 465,907.627 593,954.221
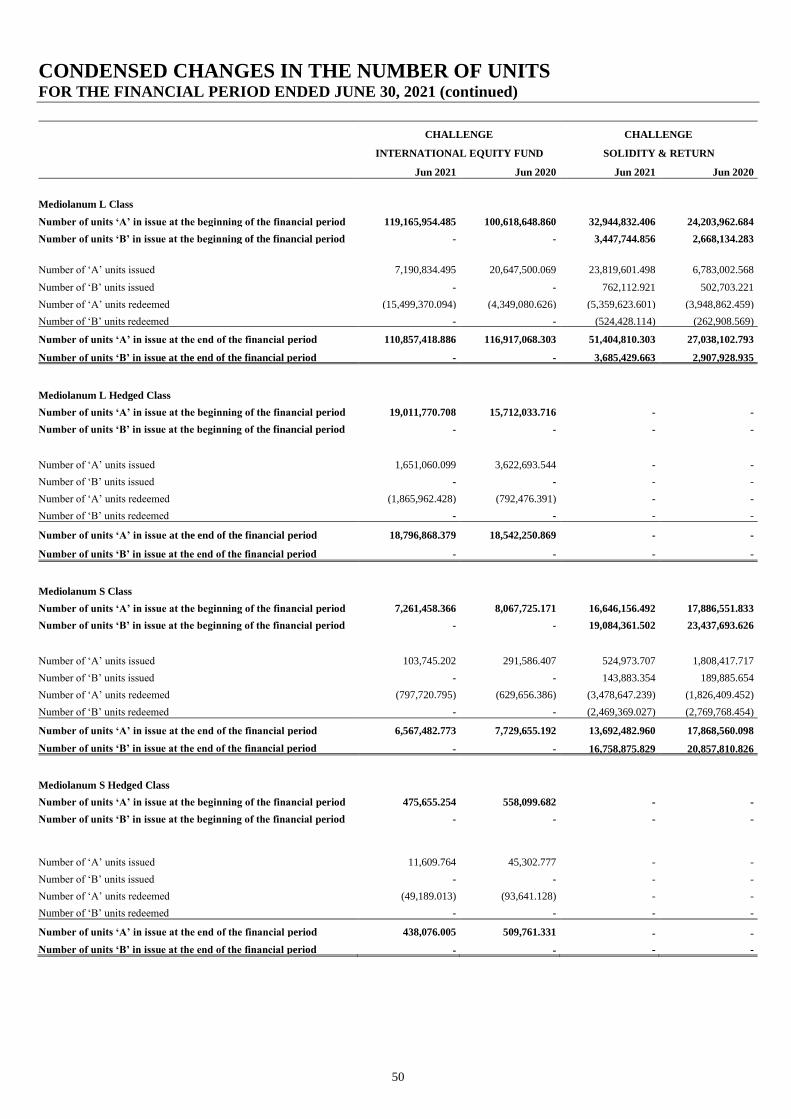
CONDENSED CHANGES IN THE NUMBER OF UNITS FOR THE FINANCIAL PERIOD ENDED JUNE 30, 2021 (continued)
50
CHALLENGE CHALLENGE
INTERNATIONAL EQUITY FUND SOLIDITY & RETURN
Jun 2021 Jun 2020 Jun 2021 Jun 2020
Mediolanum L Class
Number of units ‘A’ in issue at the beginning of the financial period 119,165,954.485 100,618,648.860 32,944,832.406 24,203,962.684
Number of units ‘B’ in issue at the beginning of the financial period - - 3,447,744.856 2,668,134.283
Number of ‘A’ units issued 7,190,834.495 20,647,500.069 23,819,601.498 6,783,002.568
Number of ‘B’ units issued - - 762,112.921 502,703.221
Number of ‘A’ units redeemed (15,499,370.094) (4,349,080.626) (5,359,623.601) (3,948,862.459)
Number of ‘B’ units redeemed - - (524,428.114) (262,908.569)
Number of units ‘A’ in issue at the end of the financial period 110,857,418.886 116,917,068.303 51,404,810.303 27,038,102.793
Number of units ‘B’ in issue at the end of the financial period - - 3,685,429.663 2,907,928.935
Mediolanum L Hedged Class
Number of units ‘A’ in issue at the beginning of the financial period 19,011,770.708 15,712,033.716 - -
Number of units ‘B’ in issue at the beginning of the financial period - - - -
Number of ‘A’ units issued 1,651,060.099 3,622,693.544 - -
Number of ‘B’ units issued - - - -
Number of ‘A’ units redeemed (1,865,962.428) (792,476.391) - -
Number of ‘B’ units redeemed - - - -
Number of units ‘A’ in issue at the end of the financial period 18,796,868.379 18,542,250.869 - -
Number of units ‘B’ in issue at the end of the financial period - - - -
Mediolanum S Class
Number of units ‘A’ in issue at the beginning of the financial period 7,261,458.366 8,067,725.171 16,646,156.492 17,886,551.833
Number of units ‘B’ in issue at the beginning of the financial period - - 19,084,361.502 23,437,693.626
Number of ‘A’ units issued 103,745.202 291,586.407 524,973.707 1,808,417.717
Number of ‘B’ units issued - - 143,883.354 189,885.654
Number of ‘A’ units redeemed (797,720.795) (629,656.386) (3,478,647.239) (1,826,409.452)
Number of ‘B’ units redeemed - - (2,469,369.027) (2,769,768.454)
Number of units ‘A’ in issue at the end of the financial period 6,567,482.773 7,729,655.192 13,692,482.960 17,868,560.098
Number of units ‘B’ in issue at the end of the financial period - - 16,758,875.829 20,857,810.826
Mediolanum S Hedged Class
Number of units ‘A’ in issue at the beginning of the financial period 475,655.254 558,099.682 - -
Number of units ‘B’ in issue at the beginning of the financial period - - - -
Number of ‘A’ units issued 11,609.764 45,302.777 - -
Number of ‘B’ units issued - - - -
Number of ‘A’ units redeemed (49,189.013) (93,641.128) - -
Number of ‘B’ units redeemed - - - -
Number of units ‘A’ in issue at the end of the financial period 438,076.005 509,761.331 - -
Number of units ‘B’ in issue at the end of the financial period - - - -
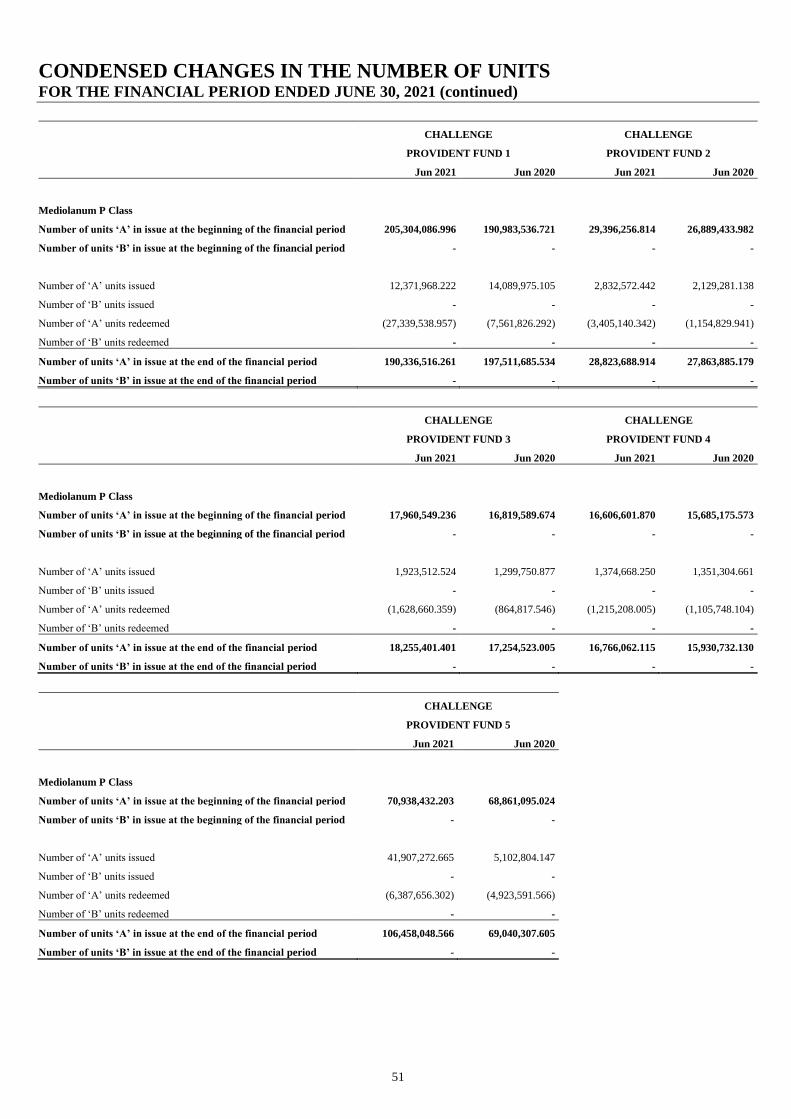
CONDENSED CHANGES IN THE NUMBER OF UNITS FOR THE FINANCIAL PERIOD ENDED JUNE 30, 2021 (continued)
51
CHALLENGE CHALLENGE
PROVIDENT FUND 1 PROVIDENT FUND 2
Jun 2021 Jun 2020 Jun 2021 Jun 2020
Mediolanum P Class
Number of units ‘A’ in issue at the beginning of the financial period 205,304,086.996 190,983,536.721 29,396,256.814 26,889,433.982
Number of units ‘B’ in issue at the beginning of the financial period - - - -
Number of ‘A’ units issued 12,371,968.222 14,089,975.105 2,832,572.442 2,129,281.138
Number of ‘B’ units issued - - - -
Number of ‘A’ units redeemed (27,339,538.957) (7,561,826.292) (3,405,140.342) (1,154,829.941)
Number of ‘B’ units redeemed - - - -
Number of units ‘A’ in issue at the end of the financial period 190,336,516.261 197,511,685.534 28,823,688.914 27,863,885.179
Number of units ‘B’ in issue at the end of the financial period - - - -
CHALLENGE CHALLENGE
PROVIDENT FUND 3 PROVIDENT FUND 4
Jun 2021 Jun 2020 Jun 2021 Jun 2020
Mediolanum P Class
Number of units ‘A’ in issue at the beginning of the financial period 17,960,549.236 16,819,589.674 16,606,601.870 15,685,175.573
Number of units ‘B’ in issue at the beginning of the financial period - - - -
Number of ‘A’ units issued 1,923,512.524 1,299,750.877 1,374,668.250 1,351,304.661
Number of ‘B’ units issued - - - -
Number of ‘A’ units redeemed (1,628,660.359) (864,817.546) (1,215,208.005) (1,105,748.104)
Number of ‘B’ units redeemed - - - -
Number of units ‘A’ in issue at the end of the financial period 18,255,401.401 17,254,523.005 16,766,062.115 15,930,732.130
Number of units ‘B’ in issue at the end of the financial period - - - -
CHALLENGE
PROVIDENT FUND 5
Jun 2021 Jun 2020
Mediolanum P Class
Number of units ‘A’ in issue at the beginning of the financial period 70,938,432.203 68,861,095.024
Number of units ‘B’ in issue at the beginning of the financial period - -
Number of ‘A’ units issued 41,907,272.665 5,102,804.147
Number of ‘B’ units issued - -
Number of ‘A’ units redeemed (6,387,656.302) (4,923,591.566)
Number of ‘B’ units redeemed - -
Number of units ‘A’ in issue at the end of the financial period 106,458,048.566 69,040,307.605
Number of units ‘B’ in issue at the end of the financial period - -

NOTES TO THE CONDENSED FINANCIAL STATEMENTS
52
Note 1 – Establishment and Organisation
The Fund is an open-ended umbrella unit trust established in Ireland as a UCITS pursuant to the UCITS Regulations. The Fund was constituted on February 24, 1998 and commenced trading on March 2, 1998. It was initially established as the Mediolanum Long-term Fund. The name was changed to the Mediolanum CHALLENGE Fund on March 5, 1999 and to CHALLENGE Funds on January 25, 2000. These condensed financial statements cover the financial period January 1, 2021 to June 30, 2021. Mediolanum Asset Management Limited acted as Investment Manager to the Fund until March 31, 2019. From April 1, 2019 onwards, Mediolanum Asset Management Limited merged with Mediolanum International Funds Limited (the “Manager”) and consequently the Manager took over investment management duties for the Fund. “Delegate Investment Manager” means any one or more persons or companies or any successor person or company appointed by the Manager in accordance with the requirements of the Central Bank of Ireland to act as delegate investment manager of some or all of the assets of a Sub-Fund. The Delegate Investment Managers for each Sub-Fund are listed in the ‘General Information’ section of these financial statements. As at June 30, 2021, the Fund had twenty five active Sub-Funds, denominated in Euro - CHALLENGE North American Equity Fund, CHALLENGE European Equity Fund, CHALLENGE Italian Equity Fund, CHALLENGE Germany Equity Fund, CHALLENGE Spain Equity Fund, CHALLENGE Pacific Equity Fund, CHALLENGE Emerging Markets Equity Fund, CHALLENGE Energy Equity Fund, CHALLENGE Cyclical Equity Fund, CHALLENGE Counter Cyclical Equity Fund, CHALLENGE Financial Equity Fund, CHALLENGE Technology Equity Fund, CHALLENGE Liquidity Euro Fund, CHALLENGE Liquidity US Dollar Fund, CHALLENGE Euro Income Fund, CHALLENGE International Income Fund, CHALLENGE Euro Bond Fund, CHALLENGE International Bond Fund, CHALLENGE International Equity Fund, CHALLENGE Solidity & Return, CHALLENGE Provident Fund 1, CHALLENGE Provident Fund 2, CHALLENGE Provident Fund 3, CHALLENGE Provident Fund 4 and CHALLENGE Provident Fund 5.
As at June 30, 2021, CHALLENGE Global Smaller Cap Equity Fund has not yet been launched. The assets of a Sub-Fund will be invested separately in accordance with the investment objectives and policies of the Sub-Fund as set out in the Sub-Fund Information Card attached to the Prospectus. Note 2 – Significant Accounting Policies
(a) Basis of Accounting
The Fund’s financial statements for the financial period ended June 30, 2021 have been prepared in compliance with Financial Reporting Standard 104 Interim Financial Reporting (“FRS 104”) applicable in the UK and Republic of Ireland, the European Communities (Undertakings for Collective Investment in Transferable Securities) Regulations, 2011 (as amended) (“UCITS Regulations”), Central Bank (Supervision and Enforcement) Act 2013 (Section 48(1)) (Undertakings for Collective Investment in Transferable Securities) Regulations, 2019 (“CBI UCITS Regulations”) and the Trust Deed. The Fund has not applied the full disclosure requirements of FRS 102 as according to FRS 104, issued by the Financial
Reporting Council, disclosures demanded by Financial Reporting Standards are generally not required for semi-annual
reports.
(b) Accounting policies
The same accounting policies, presentation and methods of computation are followed in these condensed financial statements
as were applied in the preparation of the Fund’s financial statements for the financial year ended December 31, 2020.
Note 3 – Units
Units of each Sub-Fund are all freely transferable and, subject to the differences between units of different Classes as outlined below,
are all entitled to participate equally in the profits and distributions (if any) of that Sub-Fund and in its assets in the event of
termination. The units, which are of no par value and which must be fully paid for upon issue other than in certain circumstances
which are at the discretion of the Manager, carry no preferential or pre-emptive rights. Fractions of units may be issued up to three
decimal places.
A unit in a Sub-Fund represents the beneficial ownership of one undivided share in the assets of the relevant Sub-Fund attributable to
the relevant Class.
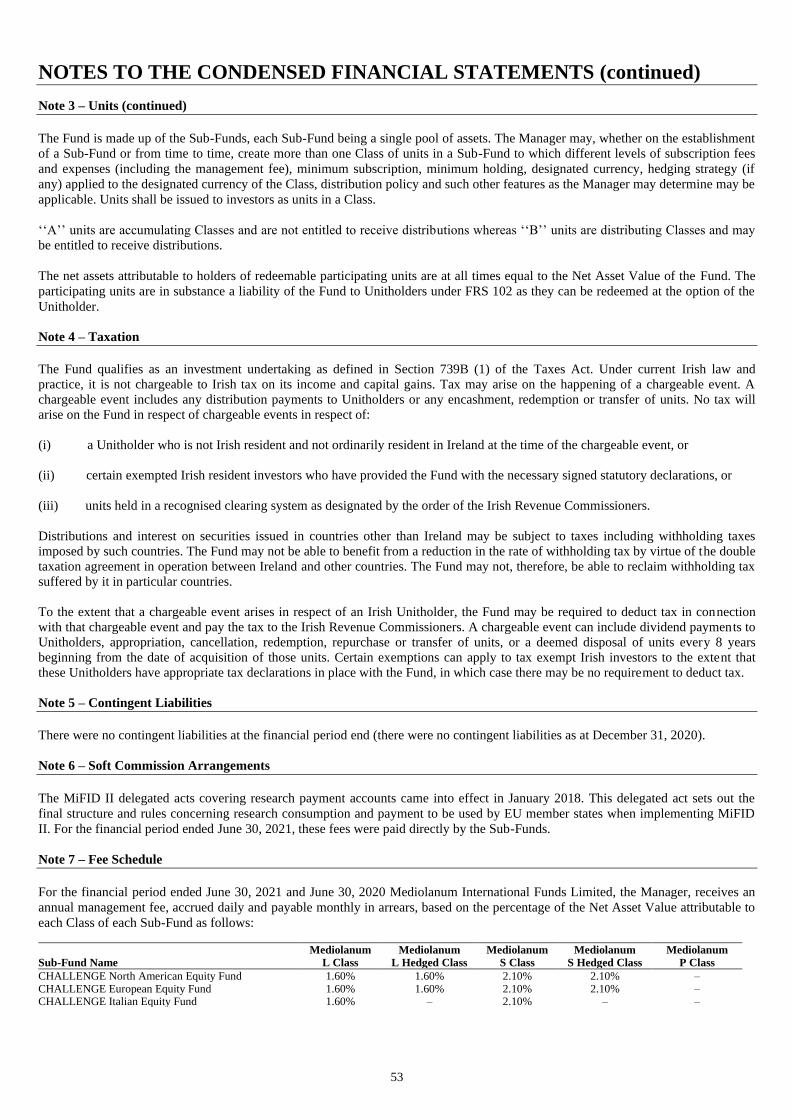
NOTES TO THE CONDENSED FINANCIAL STATEMENTS (continued)
53
Note 3 – Units (continued)
The Fund is made up of the Sub-Funds, each Sub-Fund being a single pool of assets. The Manager may, whether on the establishment
of a Sub-Fund or from time to time, create more than one Class of units in a Sub-Fund to which different levels of subscription fees
and expenses (including the management fee), minimum subscription, minimum holding, designated currency, hedging strategy (if
any) applied to the designated currency of the Class, distribution policy and such other features as the Manager may determine may be
applicable. Units shall be issued to investors as units in a Class.
‘‘A’’ units are accumulating Classes and are not entitled to receive distributions whereas ‘‘B’’ units are distributing Classes and may
be entitled to receive distributions.
The net assets attributable to holders of redeemable participating units are at all times equal to the Net Asset Value of the Fund. The
participating units are in substance a liability of the Fund to Unitholders under FRS 102 as they can be redeemed at the option of the
Unitholder.
Note 4 – Taxation
The Fund qualifies as an investment undertaking as defined in Section 739B (1) of the Taxes Act. Under current Irish law and
practice, it is not chargeable to Irish tax on its income and capital gains. Tax may arise on the happening of a chargeable event. A
chargeable event includes any distribution payments to Unitholders or any encashment, redemption or transfer of units. No tax will
arise on the Fund in respect of chargeable events in respect of:
(i) a Unitholder who is not Irish resident and not ordinarily resident in Ireland at the time of the chargeable event, or
(ii) certain exempted Irish resident investors who have provided the Fund with the necessary signed statutory declarations, or
(iii) units held in a recognised clearing system as designated by the order of the Irish Revenue Commissioners.
Distributions and interest on securities issued in countries other than Ireland may be subject to taxes including withholding taxes
imposed by such countries. The Fund may not be able to benefit from a reduction in the rate of withholding tax by virtue of the double
taxation agreement in operation between Ireland and other countries. The Fund may not, therefore, be able to reclaim withholding tax
suffered by it in particular countries.
To the extent that a chargeable event arises in respect of an Irish Unitholder, the Fund may be required to deduct tax in connection
with that chargeable event and pay the tax to the Irish Revenue Commissioners. A chargeable event can include dividend payments to
Unitholders, appropriation, cancellation, redemption, repurchase or transfer of units, or a deemed disposal of units every 8 years
beginning from the date of acquisition of those units. Certain exemptions can apply to tax exempt Irish investors to the extent that
these Unitholders have appropriate tax declarations in place with the Fund, in which case there may be no requirement to deduct tax.
Note 5 – Contingent Liabilities
There were no contingent liabilities at the financial period end (there were no contingent liabilities as at December 31, 2020).
Note 6 – Soft Commission Arrangements
The MiFID II delegated acts covering research payment accounts came into effect in January 2018. This delegated act sets out the
final structure and rules concerning research consumption and payment to be used by EU member states when implementing MiFID
II. For the financial period ended June 30, 2021, these fees were paid directly by the Sub-Funds.
Note 7 – Fee Schedule
For the financial period ended June 30, 2021 and June 30, 2020 Mediolanum International Funds Limited, the Manager, receives an
annual management fee, accrued daily and payable monthly in arrears, based on the percentage of the Net Asset Value attributable to
each Class of each Sub-Fund as follows:
Mediolanum Mediolanum Mediolanum Mediolanum Mediolanum
Sub-Fund Name L Class L Hedged Class S Class S Hedged Class P Class
CHALLENGE North American Equity Fund 1.60% 1.60% 2.10% 2.10% – CHALLENGE European Equity Fund 1.60% 1.60% 2.10% 2.10% – CHALLENGE Italian Equity Fund 1.60% – 2.10% – –
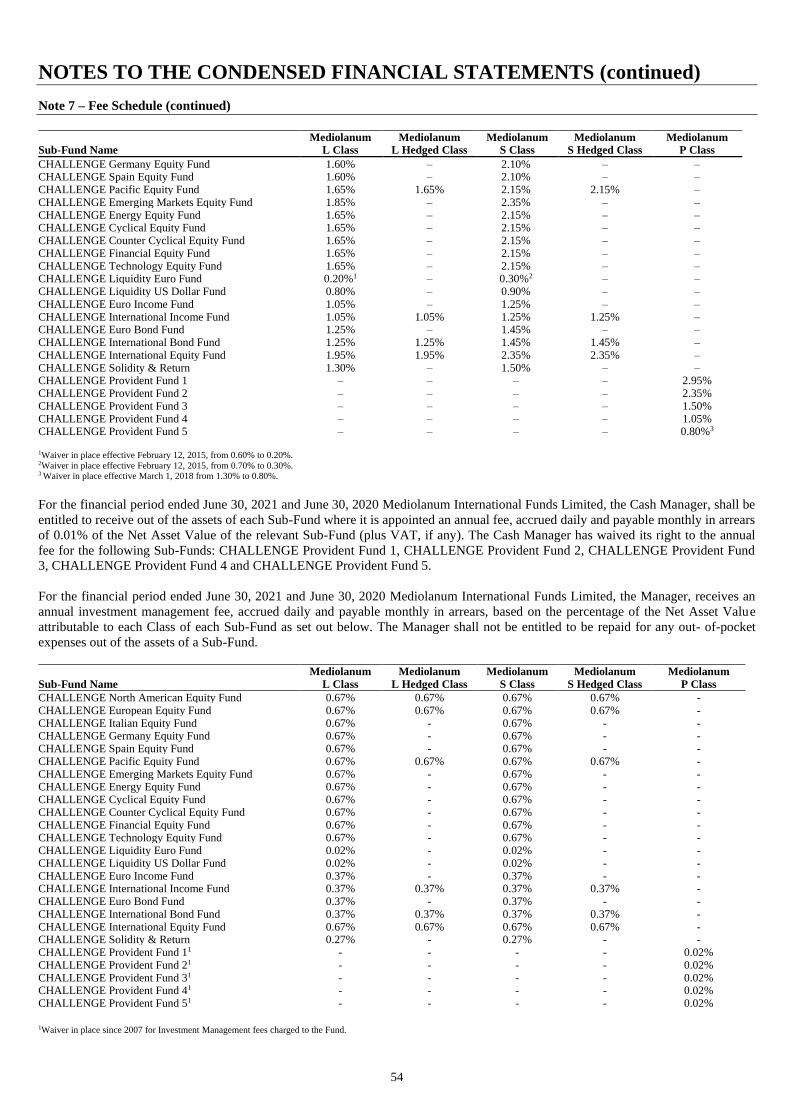
NOTES TO THE CONDENSED FINANCIAL STATEMENTS (continued)
54
Note 7 – Fee Schedule (continued)
Mediolanum Mediolanum Mediolanum Mediolanum Mediolanum Sub-Fund Name L Class L Hedged Class S Class S Hedged Class P Class
CHALLENGE Germany Equity Fund 1.60% – 2.10% – – CHALLENGE Spain Equity Fund 1.60% – 2.10% – – CHALLENGE Pacific Equity Fund 1.65% 1.65% 2.15% 2.15% – CHALLENGE Emerging Markets Equity Fund 1.85% – 2.35% – – CHALLENGE Energy Equity Fund 1.65% – 2.15% – – CHALLENGE Cyclical Equity Fund 1.65% – 2.15% – – CHALLENGE Counter Cyclical Equity Fund 1.65% – 2.15% – – CHALLENGE Financial Equity Fund 1.65% – 2.15% – – CHALLENGE Technology Equity Fund 1.65% – 2.15% – – CHALLENGE Liquidity Euro Fund 0.20%1 – 0.30%2 – – CHALLENGE Liquidity US Dollar Fund 0.80% – 0.90% – – CHALLENGE Euro Income Fund 1.05% – 1.25% – – CHALLENGE International Income Fund 1.05% 1.05% 1.25% 1.25% – CHALLENGE Euro Bond Fund 1.25% – 1.45% – – CHALLENGE International Bond Fund 1.25% 1.25% 1.45% 1.45% – CHALLENGE International Equity Fund 1.95% 1.95% 2.35% 2.35% – CHALLENGE Solidity & Return 1.30% – 1.50% – – CHALLENGE Provident Fund 1 – – – – 2.95% CHALLENGE Provident Fund 2 – – – – 2.35% CHALLENGE Provident Fund 3 – – – – 1.50% CHALLENGE Provident Fund 4 – – – – 1.05% CHALLENGE Provident Fund 5 – – – – 0.80%3 1Waiver in place effective February 12, 2015, from 0.60% to 0.20%. 2Waiver in place effective February 12, 2015, from 0.70% to 0.30%. 3 Waiver in place effective March 1, 2018 from 1.30% to 0.80%.
For the financial period ended June 30, 2021 and June 30, 2020 Mediolanum International Funds Limited, the Cash Manager, shall be
entitled to receive out of the assets of each Sub-Fund where it is appointed an annual fee, accrued daily and payable monthly in arrears
of 0.01% of the Net Asset Value of the relevant Sub-Fund (plus VAT, if any). The Cash Manager has waived its right to the annual
fee for the following Sub-Funds: CHALLENGE Provident Fund 1, CHALLENGE Provident Fund 2, CHALLENGE Provident Fund
3, CHALLENGE Provident Fund 4 and CHALLENGE Provident Fund 5.
For the financial period ended June 30, 2021 and June 30, 2020 Mediolanum International Funds Limited, the Manager, receives an
annual investment management fee, accrued daily and payable monthly in arrears, based on the percentage of the Net Asset Value
attributable to each Class of each Sub-Fund as set out below. The Manager shall not be entitled to be repaid for any out- of-pocket
expenses out of the assets of a Sub-Fund. Mediolanum Mediolanum Mediolanum Mediolanum Mediolanum
Sub-Fund Name L Class L Hedged Class S Class S Hedged Class P Class
CHALLENGE North American Equity Fund 0.67% 0.67% 0.67% 0.67% - CHALLENGE European Equity Fund 0.67% 0.67% 0.67% 0.67% - CHALLENGE Italian Equity Fund 0.67% - 0.67% - - CHALLENGE Germany Equity Fund 0.67% - 0.67% - - CHALLENGE Spain Equity Fund 0.67% - 0.67% - - CHALLENGE Pacific Equity Fund 0.67% 0.67% 0.67% 0.67% - CHALLENGE Emerging Markets Equity Fund 0.67% - 0.67% - - CHALLENGE Energy Equity Fund 0.67% - 0.67% - - CHALLENGE Cyclical Equity Fund 0.67% - 0.67% - - CHALLENGE Counter Cyclical Equity Fund 0.67% - 0.67% - - CHALLENGE Financial Equity Fund 0.67% - 0.67% - - CHALLENGE Technology Equity Fund 0.67% - 0.67% - - CHALLENGE Liquidity Euro Fund 0.02% - 0.02% - - CHALLENGE Liquidity US Dollar Fund 0.02% - 0.02% - - CHALLENGE Euro Income Fund 0.37% - 0.37% - - CHALLENGE International Income Fund 0.37% 0.37% 0.37% 0.37% - CHALLENGE Euro Bond Fund 0.37% - 0.37% - - CHALLENGE International Bond Fund 0.37% 0.37% 0.37% 0.37% - CHALLENGE International Equity Fund 0.67% 0.67% 0.67% 0.67% - CHALLENGE Solidity & Return 0.27% - 0.27% - - CHALLENGE Provident Fund 11 - - - - 0.02% CHALLENGE Provident Fund 21 - - - - 0.02% CHALLENGE Provident Fund 31 - - - - 0.02% CHALLENGE Provident Fund 41 - - - - 0.02% CHALLENGE Provident Fund 51 - - - - 0.02%
1Waiver in place since 2007 for Investment Management fees charged to the Fund.
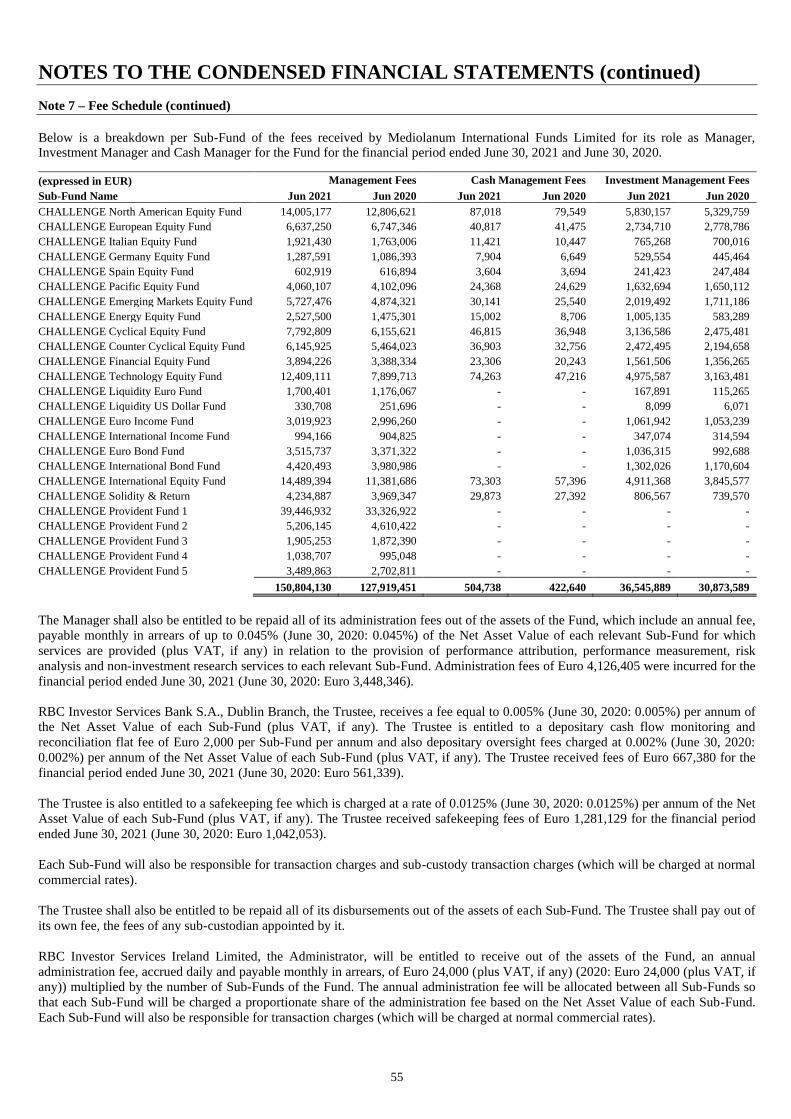
NOTES TO THE CONDENSED FINANCIAL STATEMENTS (continued)
55
Note 7 – Fee Schedule (continued)
Below is a breakdown per Sub-Fund of the fees received by Mediolanum International Funds Limited for its role as Manager, Investment Manager and Cash Manager for the Fund for the financial period ended June 30, 2021 and June 30, 2020.
(expressed in EUR) Management Fees Cash Management Fees Investment Management Fees
Sub-Fund Name Jun 2021 Jun 2020 Jun 2021 Jun 2020 Jun 2021 Jun 2020
CHALLENGE North American Equity Fund 14,005,177 12,806,621 87,018 79,549 5,830,157 5,329,759
CHALLENGE European Equity Fund 6,637,250 6,747,346 40,817 41,475 2,734,710 2,778,786
CHALLENGE Italian Equity Fund 1,921,430 1,763,006 11,421 10,447 765,268 700,016
CHALLENGE Germany Equity Fund 1,287,591 1,086,393 7,904 6,649 529,554 445,464
CHALLENGE Spain Equity Fund 602,919 616,894 3,604 3,694 241,423 247,484
CHALLENGE Pacific Equity Fund 4,060,107 4,102,096 24,368 24,629 1,632,694 1,650,112
CHALLENGE Emerging Markets Equity Fund 5,727,476 4,874,321 30,141 25,540 2,019,492 1,711,186
CHALLENGE Energy Equity Fund 2,527,500 1,475,301 15,002 8,706 1,005,135 583,289
CHALLENGE Cyclical Equity Fund 7,792,809 6,155,621 46,815 36,948 3,136,586 2,475,481
CHALLENGE Counter Cyclical Equity Fund 6,145,925 5,464,023 36,903 32,756 2,472,495 2,194,658
CHALLENGE Financial Equity Fund 3,894,226 3,388,334 23,306 20,243 1,561,506 1,356,265
CHALLENGE Technology Equity Fund 12,409,111 7,899,713 74,263 47,216 4,975,587 3,163,481
CHALLENGE Liquidity Euro Fund 1,700,401 1,176,067 - - 167,891 115,265
CHALLENGE Liquidity US Dollar Fund 330,708 251,696 - - 8,099 6,071
CHALLENGE Euro Income Fund 3,019,923 2,996,260 - - 1,061,942 1,053,239
CHALLENGE International Income Fund 994,166 904,825 - - 347,074 314,594
CHALLENGE Euro Bond Fund 3,515,737 3,371,322 - - 1,036,315 992,688
CHALLENGE International Bond Fund 4,420,493 3,980,986 - - 1,302,026 1,170,604
CHALLENGE International Equity Fund 14,489,394 11,381,686 73,303 57,396 4,911,368 3,845,577
CHALLENGE Solidity & Return 4,234,887 3,969,347 29,873 27,392 806,567 739,570
CHALLENGE Provident Fund 1 39,446,932 33,326,922 - - - -
CHALLENGE Provident Fund 2 5,206,145 4,610,422 - - - -
CHALLENGE Provident Fund 3 1,905,253 1,872,390 - - - -
CHALLENGE Provident Fund 4 1,038,707 995,048 - - - -
CHALLENGE Provident Fund 5 3,489,863 2,702,811 - - - -
150,804,130 127,919,451 504,738 422,640 36,545,889 30,873,589
The Manager shall also be entitled to be repaid all of its administration fees out of the assets of the Fund, which include an annual fee,
payable monthly in arrears of up to 0.045% (June 30, 2020: 0.045%) of the Net Asset Value of each relevant Sub-Fund for which
services are provided (plus VAT, if any) in relation to the provision of performance attribution, performance measurement, risk
analysis and non-investment research services to each relevant Sub-Fund. Administration fees of Euro 4,126,405 were incurred for the
financial period ended June 30, 2021 (June 30, 2020: Euro 3,448,346).
RBC Investor Services Bank S.A., Dublin Branch, the Trustee, receives a fee equal to 0.005% (June 30, 2020: 0.005%) per annum of
the Net Asset Value of each Sub-Fund (plus VAT, if any). The Trustee is entitled to a depositary cash flow monitoring and
reconciliation flat fee of Euro 2,000 per Sub-Fund per annum and also depositary oversight fees charged at 0.002% (June 30, 2020:
0.002%) per annum of the Net Asset Value of each Sub-Fund (plus VAT, if any). The Trustee received fees of Euro 667,380 for the
financial period ended June 30, 2021 (June 30, 2020: Euro 561,339).
The Trustee is also entitled to a safekeeping fee which is charged at a rate of 0.0125% (June 30, 2020: 0.0125%) per annum of the Net
Asset Value of each Sub-Fund (plus VAT, if any). The Trustee received safekeeping fees of Euro 1,281,129 for the financial period
ended June 30, 2021 (June 30, 2020: Euro 1,042,053).
Each Sub-Fund will also be responsible for transaction charges and sub-custody transaction charges (which will be charged at normal
commercial rates).
The Trustee shall also be entitled to be repaid all of its disbursements out of the assets of each Sub-Fund. The Trustee shall pay out of
its own fee, the fees of any sub-custodian appointed by it.
RBC Investor Services Ireland Limited, the Administrator, will be entitled to receive out of the assets of the Fund, an annual
administration fee, accrued daily and payable monthly in arrears, of Euro 24,000 (plus VAT, if any) (2020: Euro 24,000 (plus VAT, if
any)) multiplied by the number of Sub-Funds of the Fund. The annual administration fee will be allocated between all Sub-Funds so
that each Sub-Fund will be charged a proportionate share of the administration fee based on the Net Asset Value of each Sub-Fund.
Each Sub-Fund will also be responsible for transaction charges (which will be charged at normal commercial rates).
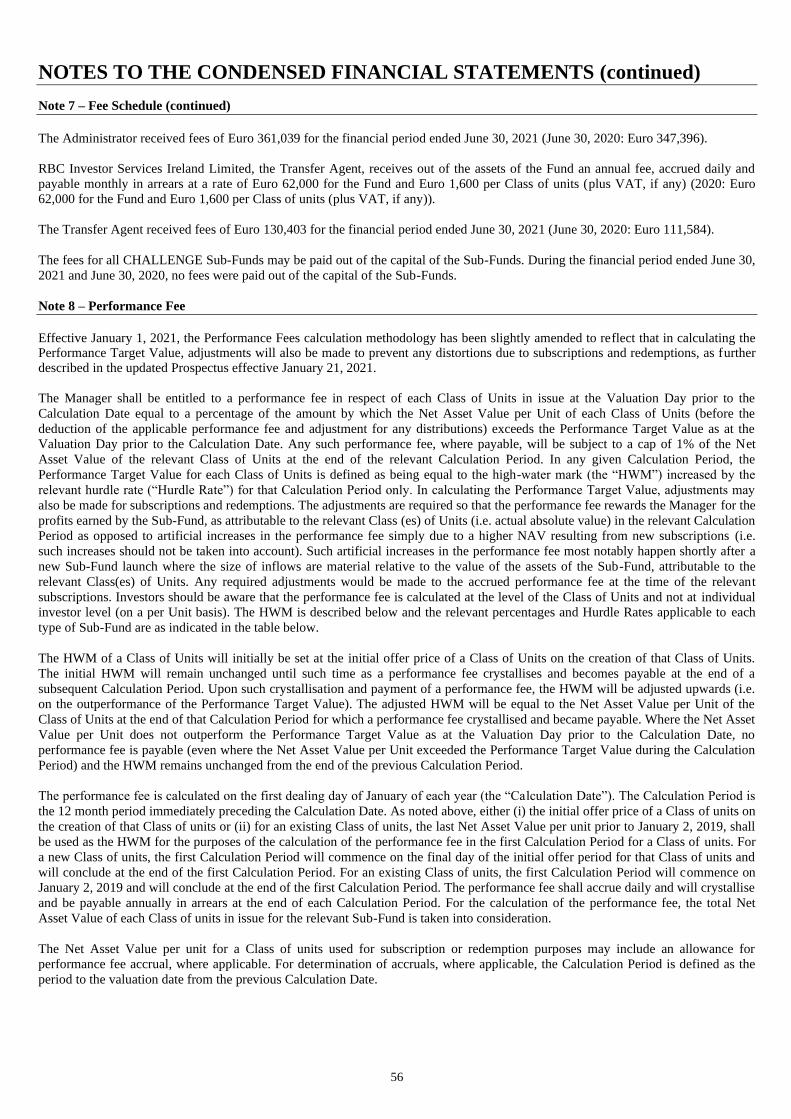
NOTES TO THE CONDENSED FINANCIAL STATEMENTS (continued)
56
Note 7 – Fee Schedule (continued)
The Administrator received fees of Euro 361,039 for the financial period ended June 30, 2021 (June 30, 2020: Euro 347,396).
RBC Investor Services Ireland Limited, the Transfer Agent, receives out of the assets of the Fund an annual fee, accrued daily and
payable monthly in arrears at a rate of Euro 62,000 for the Fund and Euro 1,600 per Class of units (plus VAT, if any) (2020: Euro
62,000 for the Fund and Euro 1,600 per Class of units (plus VAT, if any)).
The Transfer Agent received fees of Euro 130,403 for the financial period ended June 30, 2021 (June 30, 2020: Euro 111,584).
The fees for all CHALLENGE Sub-Funds may be paid out of the capital of the Sub-Funds. During the financial period ended June 30,
2021 and June 30, 2020, no fees were paid out of the capital of the Sub-Funds.
Note 8 – Performance Fee
Effective January 1, 2021, the Performance Fees calculation methodology has been slightly amended to reflect that in calculating the Performance Target Value, adjustments will also be made to prevent any distortions due to subscriptions and redemptions, as further described in the updated Prospectus effective January 21, 2021.
The Manager shall be entitled to a performance fee in respect of each Class of Units in issue at the Valuation Day prior to the
Calculation Date equal to a percentage of the amount by which the Net Asset Value per Unit of each Class of Units (before the
deduction of the applicable performance fee and adjustment for any distributions) exceeds the Performance Target Value as at the
Valuation Day prior to the Calculation Date. Any such performance fee, where payable, will be subject to a cap of 1% of the Net
Asset Value of the relevant Class of Units at the end of the relevant Calculation Period. In any given Calculation Period, the
Performance Target Value for each Class of Units is defined as being equal to the high-water mark (the “HWM”) increased by the
relevant hurdle rate (“Hurdle Rate”) for that Calculation Period only. In calculating the Performance Target Value, adjustments may
also be made for subscriptions and redemptions. The adjustments are required so that the performance fee rewards the Manager for the
profits earned by the Sub-Fund, as attributable to the relevant Class (es) of Units (i.e. actual absolute value) in the relevant Calculation
Period as opposed to artificial increases in the performance fee simply due to a higher NAV resulting from new subscriptions (i.e.
such increases should not be taken into account). Such artificial increases in the performance fee most notably happen shortly after a
new Sub-Fund launch where the size of inflows are material relative to the value of the assets of the Sub-Fund, attributable to the
relevant Class(es) of Units. Any required adjustments would be made to the accrued performance fee at the time of the relevant
subscriptions. Investors should be aware that the performance fee is calculated at the level of the Class of Units and not at individual
investor level (on a per Unit basis). The HWM is described below and the relevant percentages and Hurdle Rates applicable to each
type of Sub-Fund are as indicated in the table below.
The HWM of a Class of Units will initially be set at the initial offer price of a Class of Units on the creation of that Class of Units.
The initial HWM will remain unchanged until such time as a performance fee crystallises and becomes payable at the end of a
subsequent Calculation Period. Upon such crystallisation and payment of a performance fee, the HWM will be adjusted upwards (i.e.
on the outperformance of the Performance Target Value). The adjusted HWM will be equal to the Net Asset Value per Unit of the
Class of Units at the end of that Calculation Period for which a performance fee crystallised and became payable. Where the Net Asset
Value per Unit does not outperform the Performance Target Value as at the Valuation Day prior to the Calculation Date, no
performance fee is payable (even where the Net Asset Value per Unit exceeded the Performance Target Value during the Calculation
Period) and the HWM remains unchanged from the end of the previous Calculation Period.
The performance fee is calculated on the first dealing day of January of each year (the “Calculation Date”). The Calculation Period is
the 12 month period immediately preceding the Calculation Date. As noted above, either (i) the initial offer price of a Class of units on
the creation of that Class of units or (ii) for an existing Class of units, the last Net Asset Value per unit prior to January 2, 2019, shall
be used as the HWM for the purposes of the calculation of the performance fee in the first Calculation Period for a Class of units. For
a new Class of units, the first Calculation Period will commence on the final day of the initial offer period for that Class of units and
will conclude at the end of the first Calculation Period. For an existing Class of units, the first Calculation Period will commence on
January 2, 2019 and will conclude at the end of the first Calculation Period. The performance fee shall accrue daily and will crystallise
and be payable annually in arrears at the end of each Calculation Period. For the calculation of the performance fee, the total Net
Asset Value of each Class of units in issue for the relevant Sub-Fund is taken into consideration.
The Net Asset Value per unit for a Class of units used for subscription or redemption purposes may include an allowance for
performance fee accrual, where applicable. For determination of accruals, where applicable, the Calculation Period is defined as the
period to the valuation date from the previous Calculation Date.

NOTES TO THE CONDENSED FINANCIAL STATEMENTS (continued)
57
Note 8 – Performance Fee (continued)
In the event that a Unitholder redeems during a Calculation Period, any performance fee accrued up until the time of their redemption will be payable on a pro rata basis. For purpose of the calculation of such performance fee, the Hurdle Rate set out in the table below will be applied on a pro rata basis up until the time of redemption during the Calculation Period.
Sub-Fund Type Hurdle Rate* Percentage to be applied on the amount by which the Net Asset Value per
unit exceeds the Performance Target Value
Equity 5% 20%
Multi-Asset 3% 20%
Fixed Income 1% 20%
*Where a performance fee is not payable at the end of a Calculation Period the Hurdle Rate for the following Calculation Period will be applicable for that Calculation Period only at the rates set out in the table above and will not be a cumulative rate including the previous Calculation Period in which a performance fee was not payable. For example, if no performance fee is payable at the end of the first Calculation Period for an Equity Sub-Fund, the Hurdle Rate for the following Calculation Period will remain at 5% for that Calculation Period and will not be cumulative of both the first and second Calculation Periods (i.e. 10%).
The performance fee shall be calculated by the Administrator (subject to verification by the Trustee) and shall be due and payable 10 Business Days following the Calculation Date. The Manager is only entitled to and shall only be paid a performance fee if the percentage difference between the Net Asset Value per unit and the performance target value is a positive figure as at the relevant valuation day at the end of the relevant Calculation Period. Included in that calculation shall be net realised and unrealised capital gains plus net realised and unrealised capital losses as at the relevant Dealing Day at the end of the relevant Calculation Period. As a result, performance fees may be paid on unrealised gains which may subsequently never be realised.
Reference to “Equity” Sub-Funds in the above table was to CHALLENGE North American Equity Fund, the CHALLENGE
European Equity Fund, the CHALLENGE Italian Equity Fund, the CHALLENGE Germany Equity Fund, the CHALLENGE Spain
Equity Fund, the CHALLENGE Pacific Equity Fund, the CHALLENGE Emerging Markets Equity Fund, the CHALLENGE Energy
Equity Fund, the CHALLENGE Cyclical Equity Fund, the CHALLENGE Counter Cyclical Equity Fund, the CHALLENGE
Financial Equity Fund, the CHALLENGE Technology Equity Fund and the CHALLENGE International Equity Fund.
Reference to "Multi-Asset" Sub-Funds in the above table was to the CHALLENGE Solidity & Return.
Reference to "Fixed Income" Sub-Funds in the above table was to the CHALLENGE Euro Income Fund, the CHALLENGE
International Income Fund, the CHALLENGE Euro Bond Fund and the CHALLENGE International Bond Fund.
Performance fees crystallised on redemption amounted to Euro 6,783,259 (June 30, 2020: Euro 1,786,069). The amount due to be paid
to the Manager as at June 30, 2021 is Euro 1,858,711 (December 31, 2020: Euro 1,174,498).
Performance fees accrued as at June 30, 2021 amounted to Euro 62,855,304 (June 30, 2020: Euro 15,632,980). However, the amount
payable to the Manager is only what is accrued at the date of redemption or at December 31, 2021.
The Performance Fees are not calculated using an equalisation or series accounting methodology. As a result, the impact of the
Performance Fee on a Unitholder will be different than if performance fees were individually calculated for each Unitholder based on
the performance of that Unitholder’s investment. Whether a Unitholder is disadvantaged or advantaged by this will depend on the
timing of investments by that Unitholder and on the performance of the relevant Share Class.
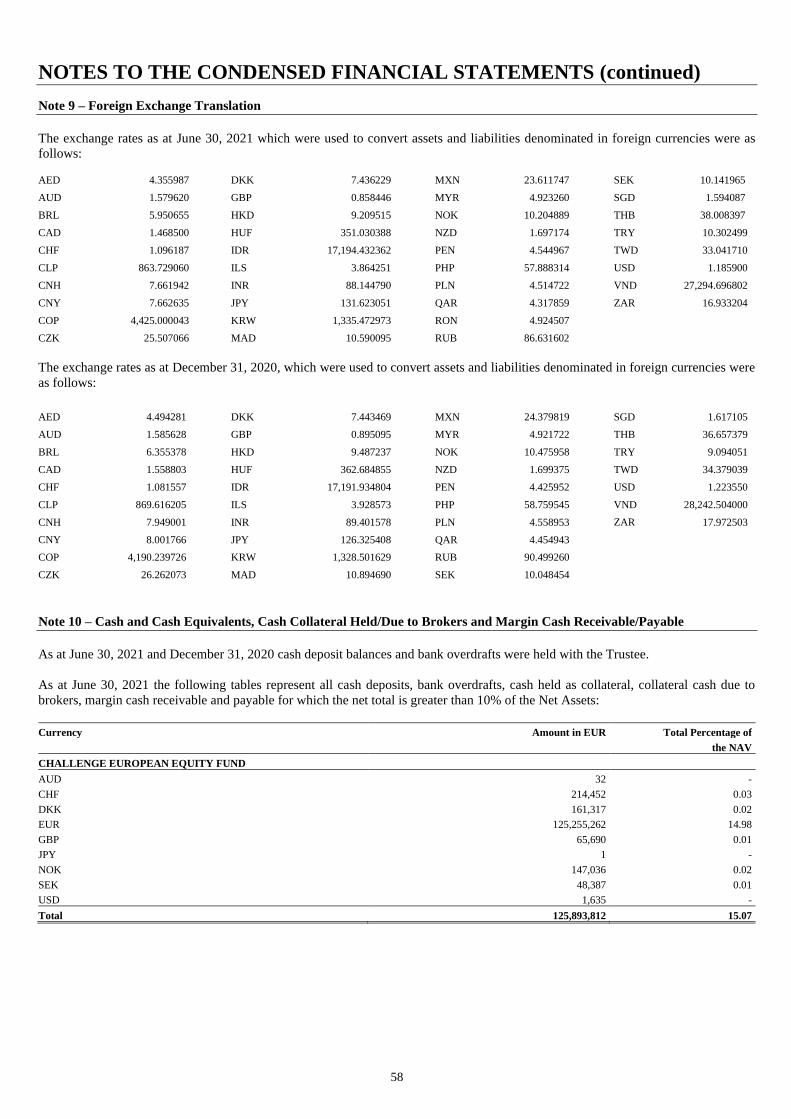
NOTES TO THE CONDENSED FINANCIAL STATEMENTS (continued)
58
Note 9 – Foreign Exchange Translation
The exchange rates as at June 30, 2021 which were used to convert assets and liabilities denominated in foreign currencies were as
follows:
AED 4.355987 DKK 7.436229 MXN 23.611747 SEK 10.141965
AUD 1.579620 GBP 0.858446 MYR 4.923260 SGD 1.594087
BRL 5.950655 HKD 9.209515 NOK 10.204889 THB 38.008397
CAD 1.468500 HUF 351.030388 NZD 1.697174 TRY 10.302499
CHF 1.096187 IDR 17,194.432362 PEN 4.544967 TWD 33.041710
CLP 863.729060 ILS 3.864251 PHP 57.888314 USD 1.185900
CNH 7.661942 INR 88.144790 PLN 4.514722 VND 27,294.696802
CNY 7.662635 JPY 131.623051 QAR 4.317859 ZAR 16.933204
COP 4,425.000043 KRW 1,335.472973 RON 4.924507
CZK 25.507066 MAD 10.590095 RUB 86.631602
The exchange rates as at December 31, 2020, which were used to convert assets and liabilities denominated in foreign currencies were
as follows:
AED 4.494281 DKK 7.443469 MXN 24.379819 SGD 1.617105
AUD 1.585628 GBP 0.895095 MYR 4.921722 THB 36.657379
BRL 6.355378 HKD 9.487237 NOK 10.475958 TRY 9.094051
CAD 1.558803 HUF 362.684855 NZD 1.699375 TWD 34.379039
CHF 1.081557 IDR 17,191.934804 PEN 4.425952 USD 1.223550
CLP 869.616205 ILS 3.928573 PHP 58.759545 VND 28,242.504000
CNH 7.949001 INR 89.401578 PLN 4.558953 ZAR 17.972503
CNY 8.001766 JPY 126.325408 QAR 4.454943
COP 4,190.239726 KRW 1,328.501629 RUB 90.499260
CZK 26.262073 MAD 10.894690 SEK 10.048454
Note 10 – Cash and Cash Equivalents, Cash Collateral Held/Due to Brokers and Margin Cash Receivable/Payable
As at June 30, 2021 and December 31, 2020 cash deposit balances and bank overdrafts were held with the Trustee.
As at June 30, 2021 the following tables represent all cash deposits, bank overdrafts, cash held as collateral, collateral cash due to
brokers, margin cash receivable and payable for which the net total is greater than 10% of the Net Assets:
Currency Amount in EUR Total Percentage of
the NAV
CHALLENGE EUROPEAN EQUITY FUND
AUD 32 -
CHF 214,452 0.03
DKK 161,317 0.02
EUR 125,255,262 14.98
GBP 65,690 0.01
JPY 1 -
NOK 147,036 0.02
SEK 48,387 0.01
USD 1,635 -
Total 125,893,812 15.07
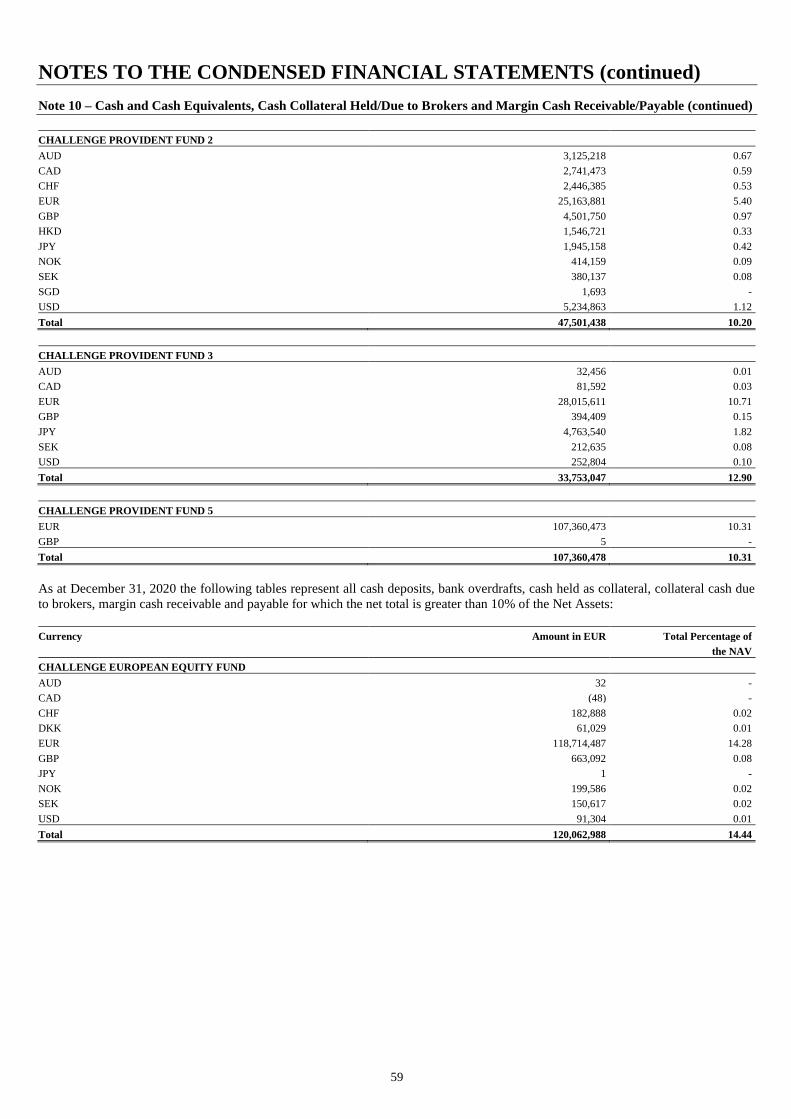
NOTES TO THE CONDENSED FINANCIAL STATEMENTS (continued)
59
Note 10 – Cash and Cash Equivalents, Cash Collateral Held/Due to Brokers and Margin Cash Receivable/Payable (continued)
CHALLENGE PROVIDENT FUND 2
AUD 3,125,218 0.67
CAD 2,741,473 0.59
CHF 2,446,385 0.53
EUR 25,163,881 5.40
GBP 4,501,750 0.97
HKD 1,546,721 0.33
JPY 1,945,158 0.42
NOK 414,159 0.09
SEK 380,137 0.08
SGD 1,693 -
USD 5,234,863 1.12
Total 47,501,438 10.20
CHALLENGE PROVIDENT FUND 3
AUD 32,456 0.01
CAD 81,592 0.03
EUR 28,015,611 10.71
GBP 394,409 0.15
JPY 4,763,540 1.82
SEK 212,635 0.08
USD 252,804 0.10
Total 33,753,047 12.90
CHALLENGE PROVIDENT FUND 5
EUR 107,360,473 10.31
GBP 5 -
Total 107,360,478 10.31
As at December 31, 2020 the following tables represent all cash deposits, bank overdrafts, cash held as collateral, collateral cash due
to brokers, margin cash receivable and payable for which the net total is greater than 10% of the Net Assets:
Currency Amount in EUR Total Percentage of
the NAV
CHALLENGE EUROPEAN EQUITY FUND
AUD 32 -
CAD (48) -
CHF 182,888 0.02
DKK 61,029 0.01
EUR 118,714,487 14.28
GBP 663,092 0.08
JPY 1 -
NOK 199,586 0.02
SEK 150,617 0.02
USD 91,304 0.01
Total 120,062,988 14.44
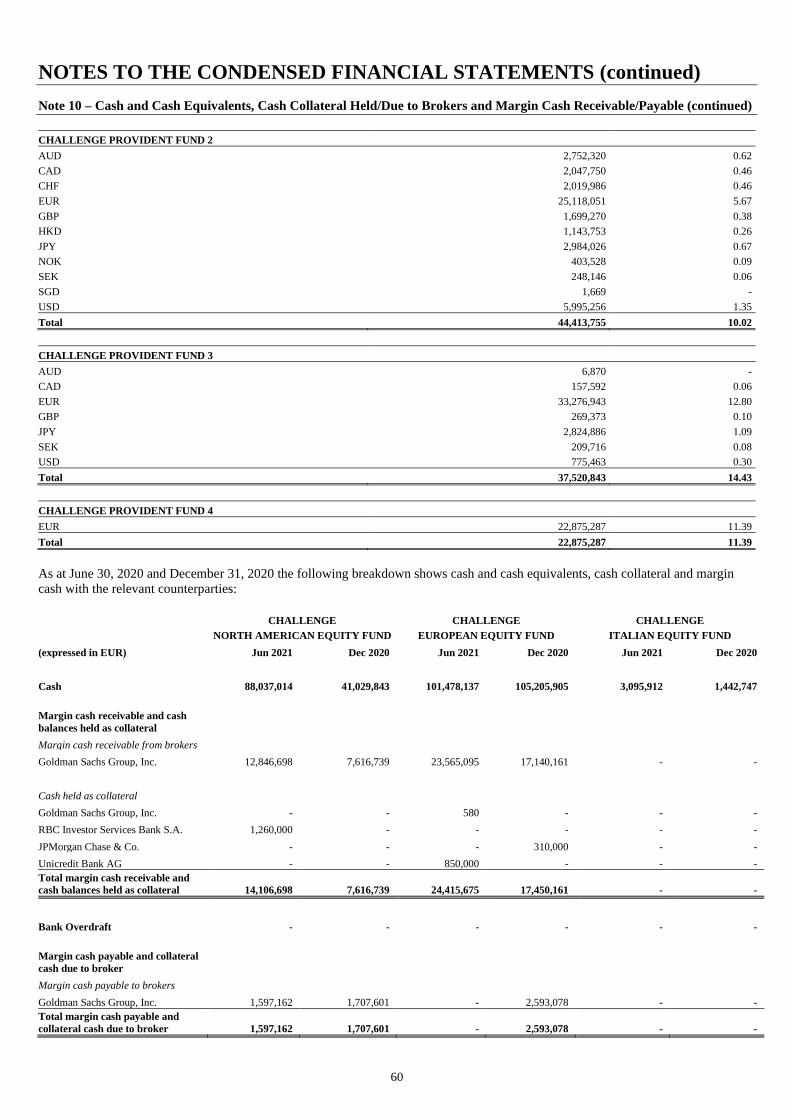
NOTES TO THE CONDENSED FINANCIAL STATEMENTS (continued)
60
Note 10 – Cash and Cash Equivalents, Cash Collateral Held/Due to Brokers and Margin Cash Receivable/Payable (continued)
CHALLENGE PROVIDENT FUND 2
AUD 2,752,320 0.62
CAD 2,047,750 0.46
CHF 2,019,986 0.46
EUR 25,118,051 5.67
GBP 1,699,270 0.38
HKD 1,143,753 0.26
JPY 2,984,026 0.67
NOK 403,528 0.09
SEK 248,146 0.06
SGD 1,669 -
USD 5,995,256 1.35
Total 44,413,755 10.02
CHALLENGE PROVIDENT FUND 3
AUD 6,870 -
CAD 157,592 0.06
EUR 33,276,943 12.80
GBP 269,373 0.10
JPY 2,824,886 1.09
SEK 209,716 0.08
USD 775,463 0.30
Total 37,520,843 14.43
CHALLENGE PROVIDENT FUND 4
EUR 22,875,287 11.39
Total 22,875,287 11.39
As at June 30, 2020 and December 31, 2020 the following breakdown shows cash and cash equivalents, cash collateral and margin
cash with the relevant counterparties:
CHALLENGE CHALLENGE CHALLENGE
NORTH AMERICAN EQUITY FUND EUROPEAN EQUITY FUND ITALIAN EQUITY FUND
(expressed in EUR) Jun 2021 Dec 2020 Jun 2021 Dec 2020 Jun 2021 Dec 2020
Cash 88,037,014 41,029,843 101,478,137 105,205,905 3,095,912 1,442,747
Margin cash receivable and cash
balances held as collateral
Margin cash receivable from brokers
Goldman Sachs Group, Inc. 12,846,698 7,616,739 23,565,095 17,140,161 - -
Cash held as collateral
Goldman Sachs Group, Inc. - - 580 - - -
RBC Investor Services Bank S.A. 1,260,000 - - - - -
JPMorgan Chase & Co. - - - 310,000 - -
Unicredit Bank AG - - 850,000 - - -
Total margin cash receivable and
cash balances held as collateral 14,106,698 7,616,739 24,415,675 17,450,161 - -
Bank Overdraft - - - - - -
Margin cash payable and collateral
cash due to broker
Margin cash payable to brokers
Goldman Sachs Group, Inc. 1,597,162 1,707,601 - 2,593,078 - -
Total margin cash payable and
collateral cash due to broker 1,597,162 1,707,601 - 2,593,078 - -
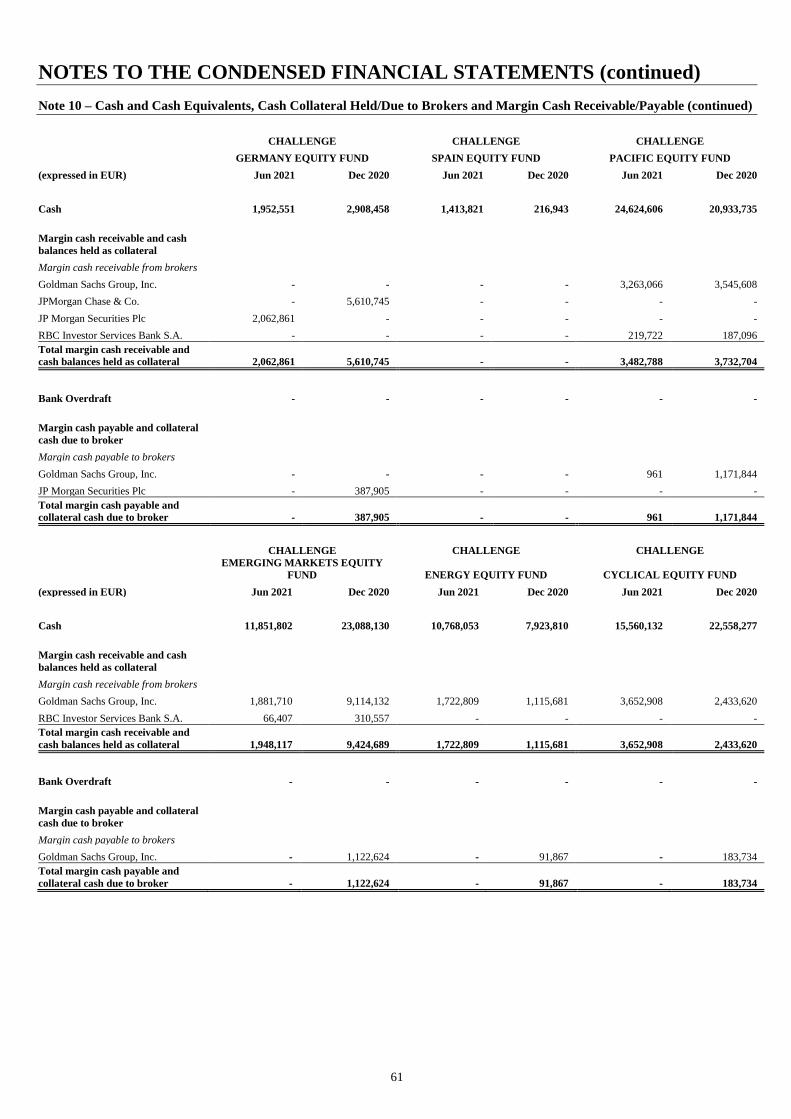
NOTES TO THE CONDENSED FINANCIAL STATEMENTS (continued)
61
Note 10 – Cash and Cash Equivalents, Cash Collateral Held/Due to Brokers and Margin Cash Receivable/Payable (continued)
CHALLENGE CHALLENGE CHALLENGE
GERMANY EQUITY FUND SPAIN EQUITY FUND PACIFIC EQUITY FUND
(expressed in EUR) Jun 2021 Dec 2020 Jun 2021 Dec 2020 Jun 2021 Dec 2020
Cash 1,952,551 2,908,458 1,413,821 216,943 24,624,606 20,933,735
Margin cash receivable and cash
balances held as collateral
Margin cash receivable from brokers
Goldman Sachs Group, Inc. - - - - 3,263,066 3,545,608
JPMorgan Chase & Co. - 5,610,745 - - - -
JP Morgan Securities Plc 2,062,861 - - - - -
RBC Investor Services Bank S.A. - - - - 219,722 187,096
Total margin cash receivable and
cash balances held as collateral 2,062,861 5,610,745 - - 3,482,788 3,732,704
Bank Overdraft - - - - - -
Margin cash payable and collateral
cash due to broker
Margin cash payable to brokers
Goldman Sachs Group, Inc. - - - - 961 1,171,844
JP Morgan Securities Plc - 387,905 - - - -
Total margin cash payable and
collateral cash due to broker - 387,905 - - 961 1,171,844
CHALLENGE CHALLENGE CHALLENGE
EMERGING MARKETS EQUITY
FUND ENERGY EQUITY FUND CYCLICAL EQUITY FUND
(expressed in EUR) Jun 2021 Dec 2020 Jun 2021 Dec 2020 Jun 2021 Dec 2020
Cash 11,851,802 23,088,130 10,768,053 7,923,810 15,560,132 22,558,277
Margin cash receivable and cash
balances held as collateral
Margin cash receivable from brokers
Goldman Sachs Group, Inc. 1,881,710 9,114,132 1,722,809 1,115,681 3,652,908 2,433,620
RBC Investor Services Bank S.A. 66,407 310,557 - - - -
Total margin cash receivable and
cash balances held as collateral 1,948,117 9,424,689 1,722,809 1,115,681 3,652,908 2,433,620
Bank Overdraft - - - - - -
Margin cash payable and collateral
cash due to broker
Margin cash payable to brokers
Goldman Sachs Group, Inc. - 1,122,624 - 91,867 - 183,734
Total margin cash payable and
collateral cash due to broker - 1,122,624 - 91,867 - 183,734
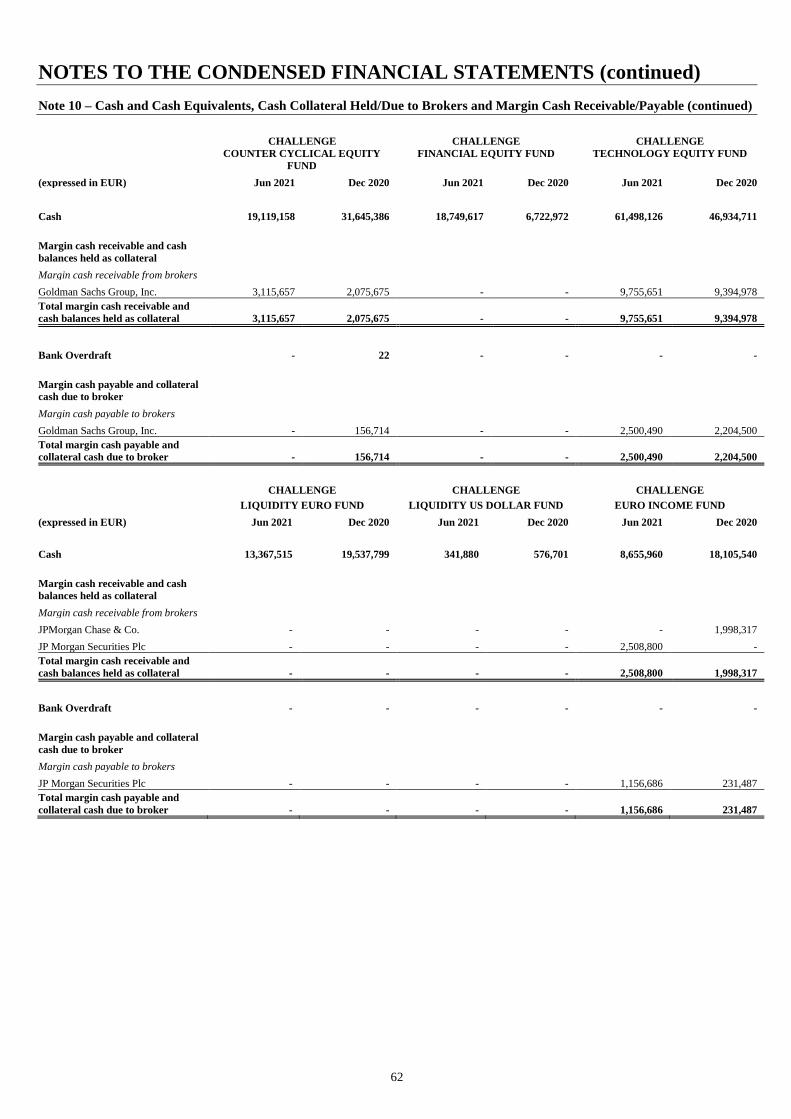
NOTES TO THE CONDENSED FINANCIAL STATEMENTS (continued)
62
Note 10 – Cash and Cash Equivalents, Cash Collateral Held/Due to Brokers and Margin Cash Receivable/Payable (continued)
CHALLENGE CHALLENGE CHALLENGE
COUNTER CYCLICAL EQUITY
FUND
FINANCIAL EQUITY FUND TECHNOLOGY EQUITY FUND
(expressed in EUR) Jun 2021 Dec 2020 Jun 2021 Dec 2020 Jun 2021 Dec 2020
Cash 19,119,158 31,645,386 18,749,617 6,722,972 61,498,126 46,934,711
Margin cash receivable and cash
balances held as collateral
Margin cash receivable from brokers
Goldman Sachs Group, Inc. 3,115,657 2,075,675 - - 9,755,651 9,394,978
Total margin cash receivable and
cash balances held as collateral 3,115,657 2,075,675 - - 9,755,651 9,394,978
Bank Overdraft - 22 - - - -
Margin cash payable and collateral
cash due to broker
Margin cash payable to brokers
Goldman Sachs Group, Inc. - 156,714 - - 2,500,490 2,204,500
Total margin cash payable and
collateral cash due to broker - 156,714 - - 2,500,490 2,204,500
CHALLENGE CHALLENGE CHALLENGE
LIQUIDITY EURO FUND LIQUIDITY US DOLLAR FUND EURO INCOME FUND
(expressed in EUR) Jun 2021 Dec 2020 Jun 2021 Dec 2020 Jun 2021 Dec 2020
Cash 13,367,515 19,537,799 341,880 576,701 8,655,960 18,105,540
Margin cash receivable and cash
balances held as collateral
Margin cash receivable from brokers
JPMorgan Chase & Co. - - - - - 1,998,317
JP Morgan Securities Plc - - - - 2,508,800 -
Total margin cash receivable and
cash balances held as collateral - - - - 2,508,800 1,998,317
Bank Overdraft - - - - - -
Margin cash payable and collateral
cash due to broker
Margin cash payable to brokers
JP Morgan Securities Plc - - - - 1,156,686 231,487
Total margin cash payable and
collateral cash due to broker - - - - 1,156,686 231,487
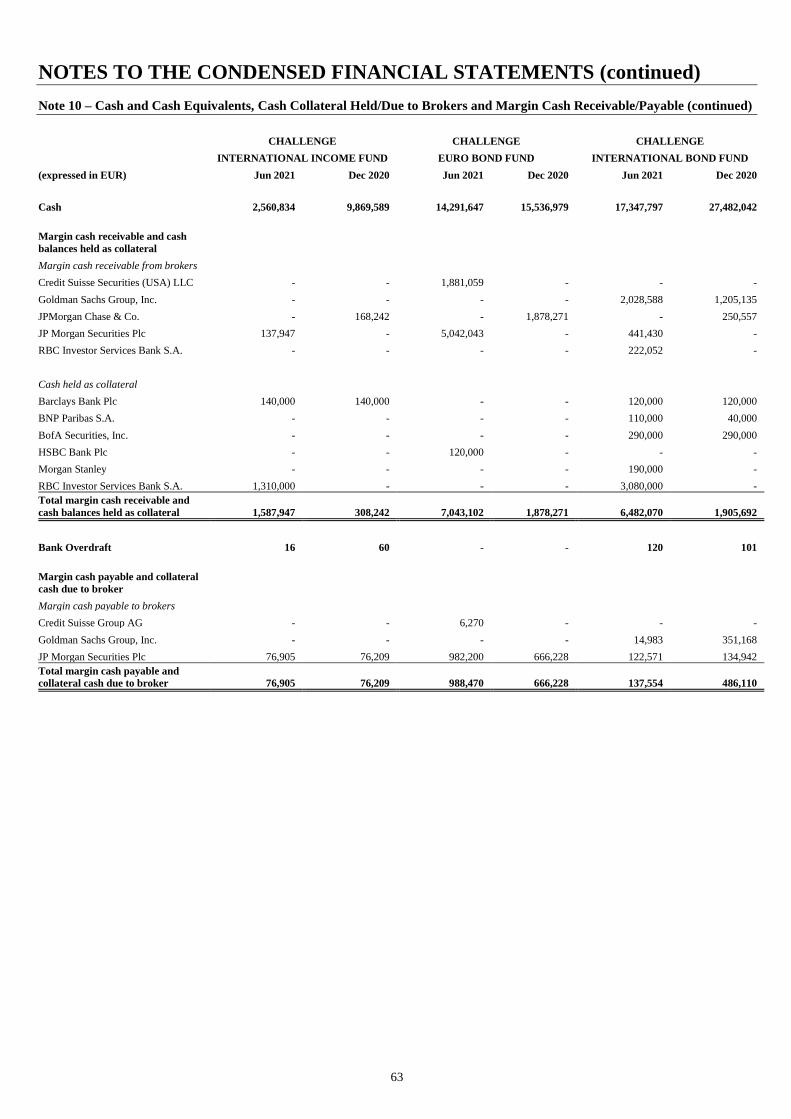
NOTES TO THE CONDENSED FINANCIAL STATEMENTS (continued)
63
Note 10 – Cash and Cash Equivalents, Cash Collateral Held/Due to Brokers and Margin Cash Receivable/Payable (continued)
CHALLENGE CHALLENGE CHALLENGE
INTERNATIONAL INCOME FUND EURO BOND FUND INTERNATIONAL BOND FUND
(expressed in EUR) Jun 2021 Dec 2020 Jun 2021 Dec 2020 Jun 2021 Dec 2020
Cash 2,560,834 9,869,589 14,291,647 15,536,979 17,347,797 27,482,042
Margin cash receivable and cash
balances held as collateral
Margin cash receivable from brokers
Credit Suisse Securities (USA) LLC - - 1,881,059 - - -
Goldman Sachs Group, Inc. - - - - 2,028,588 1,205,135
JPMorgan Chase & Co. - 168,242 - 1,878,271 - 250,557
JP Morgan Securities Plc 137,947 - 5,042,043 - 441,430 -
RBC Investor Services Bank S.A. - - - - 222,052 -
Cash held as collateral
Barclays Bank Plc 140,000 140,000 - - 120,000 120,000
BNP Paribas S.A. - - - - 110,000 40,000
BofA Securities, Inc. - - - - 290,000 290,000
HSBC Bank Plc - - 120,000 - - -
Morgan Stanley - - - - 190,000 -
RBC Investor Services Bank S.A. 1,310,000 - - - 3,080,000 -
Total margin cash receivable and
cash balances held as collateral 1,587,947 308,242 7,043,102 1,878,271 6,482,070 1,905,692
Bank Overdraft 16 60 - - 120 101
Margin cash payable and collateral
cash due to broker
Margin cash payable to brokers
Credit Suisse Group AG - - 6,270 - - -
Goldman Sachs Group, Inc. - - - - 14,983 351,168
JP Morgan Securities Plc 76,905 76,209 982,200 666,228 122,571 134,942
Total margin cash payable and
collateral cash due to broker 76,905 76,209 988,470 666,228 137,554 486,110
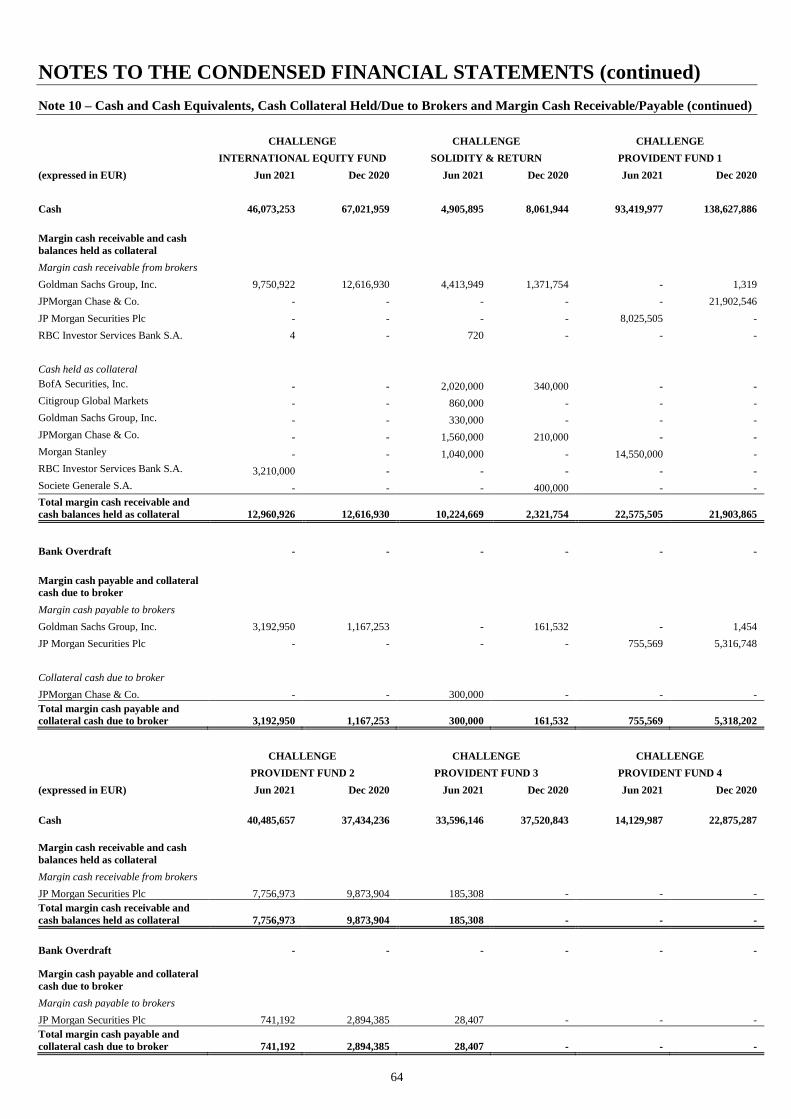
NOTES TO THE CONDENSED FINANCIAL STATEMENTS (continued)
64
Note 10 – Cash and Cash Equivalents, Cash Collateral Held/Due to Brokers and Margin Cash Receivable/Payable (continued)
CHALLENGE CHALLENGE CHALLENGE
INTERNATIONAL EQUITY FUND SOLIDITY & RETURN PROVIDENT FUND 1
(expressed in EUR) Jun 2021 Dec 2020 Jun 2021 Dec 2020 Jun 2021 Dec 2020
Cash 46,073,253 67,021,959 4,905,895 8,061,944 93,419,977 138,627,886
Margin cash receivable and cash
balances held as collateral
Margin cash receivable from brokers
Goldman Sachs Group, Inc. 9,750,922 12,616,930 4,413,949 1,371,754 - 1,319
JPMorgan Chase & Co. - - - - - 21,902,546
JP Morgan Securities Plc - - - - 8,025,505 -
RBC Investor Services Bank S.A. 4 - 720 - - -
Cash held as collateral
BofA Securities, Inc. - - 2,020,000 340,000 - -
Citigroup Global Markets - - 860,000 - - -
Goldman Sachs Group, Inc. - - 330,000 - - -
JPMorgan Chase & Co. - - 1,560,000 210,000 - -
Morgan Stanley - - 1,040,000 - 14,550,000 -
RBC Investor Services Bank S.A. 3,210,000 - - - - -
Societe Generale S.A. - - - 400,000 - -
Total margin cash receivable and
cash balances held as collateral 12,960,926 12,616,930 10,224,669 2,321,754 22,575,505 21,903,865
Bank Overdraft - - - - - -
Margin cash payable and collateral
cash due to broker
Margin cash payable to brokers
Goldman Sachs Group, Inc. 3,192,950 1,167,253 - 161,532 - 1,454
JP Morgan Securities Plc - - - - 755,569 5,316,748
Collateral cash due to broker
JPMorgan Chase & Co. - - 300,000 - - -
Total margin cash payable and
collateral cash due to broker 3,192,950 1,167,253 300,000 161,532 755,569 5,318,202
CHALLENGE CHALLENGE CHALLENGE
PROVIDENT FUND 2 PROVIDENT FUND 3 PROVIDENT FUND 4
(expressed in EUR) Jun 2021 Dec 2020 Jun 2021 Dec 2020 Jun 2021 Dec 2020
Cash 40,485,657 37,434,236 33,596,146 37,520,843 14,129,987 22,875,287
Margin cash receivable and cash
balances held as collateral
Margin cash receivable from brokers
JP Morgan Securities Plc 7,756,973 9,873,904 185,308 - - -
Total margin cash receivable and
cash balances held as collateral 7,756,973 9,873,904 185,308 - - -
Bank Overdraft - - - - - -
Margin cash payable and collateral
cash due to broker
Margin cash payable to brokers
JP Morgan Securities Plc 741,192 2,894,385 28,407 - - -
Total margin cash payable and
collateral cash due to broker 741,192 2,894,385 28,407 - - -
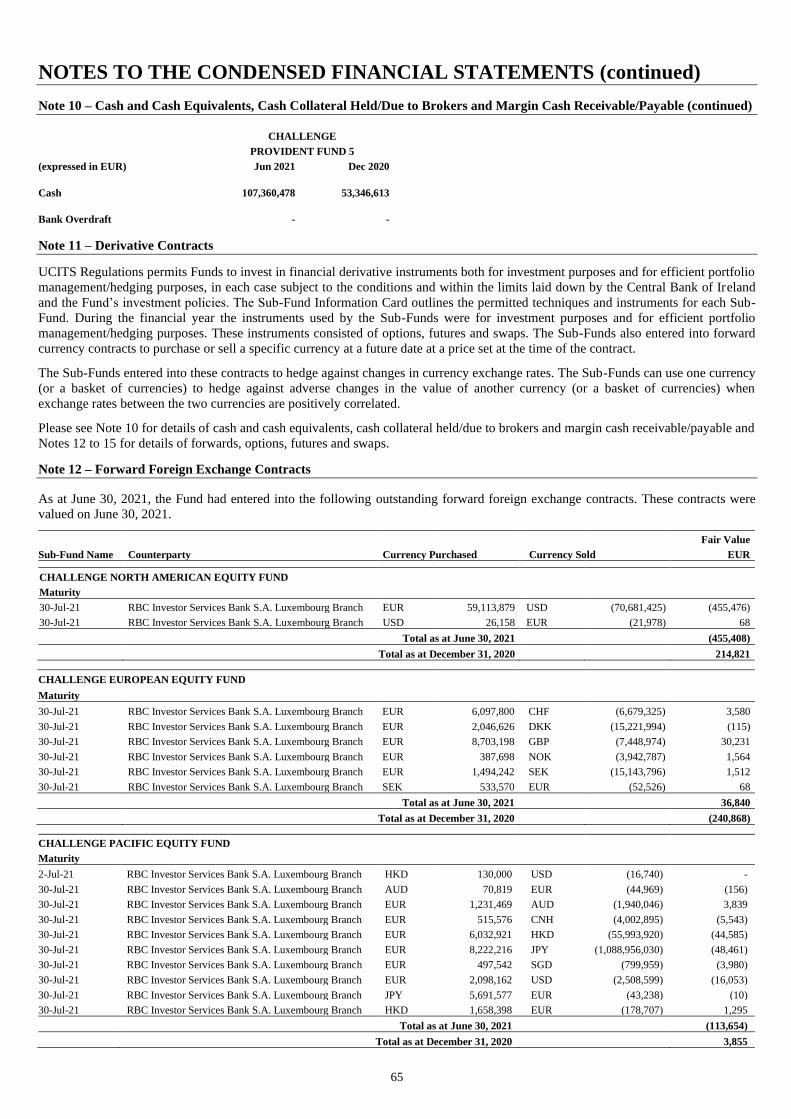
NOTES TO THE CONDENSED FINANCIAL STATEMENTS (continued)
65
Note 10 – Cash and Cash Equivalents, Cash Collateral Held/Due to Brokers and Margin Cash Receivable/Payable (continued)
CHALLENGE
PROVIDENT FUND 5
(expressed in EUR) Jun 2021 Dec 2020
Cash 107,360,478 53,346,613
Bank Overdraft - -
Note 11 – Derivative Contracts
UCITS Regulations permits Funds to invest in financial derivative instruments both for investment purposes and for efficient portfolio
management/hedging purposes, in each case subject to the conditions and within the limits laid down by the Central Bank of Ireland
and the Fund’s investment policies. The Sub-Fund Information Card outlines the permitted techniques and instruments for each Sub-
Fund. During the financial year the instruments used by the Sub-Funds were for investment purposes and for efficient portfolio
management/hedging purposes. These instruments consisted of options, futures and swaps. The Sub-Funds also entered into forward
currency contracts to purchase or sell a specific currency at a future date at a price set at the time of the contract.
The Sub-Funds entered into these contracts to hedge against changes in currency exchange rates. The Sub-Funds can use one currency
(or a basket of currencies) to hedge against adverse changes in the value of another currency (or a basket of currencies) when
exchange rates between the two currencies are positively correlated.
Please see Note 10 for details of cash and cash equivalents, cash collateral held/due to brokers and margin cash receivable/payable and
Notes 12 to 15 for details of forwards, options, futures and swaps.
Note 12 – Forward Foreign Exchange Contracts
As at June 30, 2021, the Fund had entered into the following outstanding forward foreign exchange contracts. These contracts were
valued on June 30, 2021.
Fair Value
Sub-Fund Name Counterparty Currency Purchased Currency Sold EUR
CHALLENGE NORTH AMERICAN EQUITY FUND
Maturity
30-Jul-21 RBC Investor Services Bank S.A. Luxembourg Branch EUR 59,113,879 USD (70,681,425) (455,476)
30-Jul-21 RBC Investor Services Bank S.A. Luxembourg Branch USD 26,158 EUR (21,978) 68
Total as at June 30, 2021 (455,408)
Total as at December 31, 2020 214,821
CHALLENGE EUROPEAN EQUITY FUND
Maturity
30-Jul-21 RBC Investor Services Bank S.A. Luxembourg Branch EUR 6,097,800 CHF (6,679,325) 3,580
30-Jul-21 RBC Investor Services Bank S.A. Luxembourg Branch EUR 2,046,626 DKK (15,221,994) (115)
30-Jul-21 RBC Investor Services Bank S.A. Luxembourg Branch EUR 8,703,198 GBP (7,448,974) 30,231
30-Jul-21 RBC Investor Services Bank S.A. Luxembourg Branch EUR 387,698 NOK (3,942,787) 1,564
30-Jul-21 RBC Investor Services Bank S.A. Luxembourg Branch EUR 1,494,242 SEK (15,143,796) 1,512
30-Jul-21 RBC Investor Services Bank S.A. Luxembourg Branch SEK 533,570 EUR (52,526) 68
Total as at June 30, 2021 36,840
Total as at December 31, 2020 (240,868)
CHALLENGE PACIFIC EQUITY FUND
Maturity
2-Jul-21 RBC Investor Services Bank S.A. Luxembourg Branch HKD 130,000 USD (16,740) -
30-Jul-21 RBC Investor Services Bank S.A. Luxembourg Branch AUD 70,819 EUR (44,969) (156)
30-Jul-21 RBC Investor Services Bank S.A. Luxembourg Branch EUR 1,231,469 AUD (1,940,046) 3,839
30-Jul-21 RBC Investor Services Bank S.A. Luxembourg Branch EUR 515,576 CNH (4,002,895) (5,543)
30-Jul-21 RBC Investor Services Bank S.A. Luxembourg Branch EUR 6,032,921 HKD (55,993,920) (44,585)
30-Jul-21 RBC Investor Services Bank S.A. Luxembourg Branch EUR 8,222,216 JPY (1,088,956,030) (48,461)
30-Jul-21 RBC Investor Services Bank S.A. Luxembourg Branch EUR 497,542 SGD (799,959) (3,980)
30-Jul-21 RBC Investor Services Bank S.A. Luxembourg Branch EUR 2,098,162 USD (2,508,599) (16,053)
30-Jul-21 RBC Investor Services Bank S.A. Luxembourg Branch JPY 5,691,577 EUR (43,238) (10)
30-Jul-21 RBC Investor Services Bank S.A. Luxembourg Branch HKD 1,658,398 EUR (178,707) 1,295
Total as at June 30, 2021 (113,654)
Total as at December 31, 2020 3,855

NOTES TO THE CONDENSED FINANCIAL STATEMENTS (continued)
66
Note 12 – Forward Foreign Exchange Contracts (continued)
Fair Value
Sub-Fund Name Counterparty Currency Purchased Currency Sold EUR
CHALLENGE EMERGING MARKET EQUITY FUND
Maturity
1-Jul-21 RBC Investor Services Bank S.A. Luxembourg Branch MXN 2,000 USD (101) -
1-Jul-21 RBC Investor Services Bank S.A. Luxembourg Branch USD 262 PLN (1,000) -
1-Jul-21 RBC Investor Services Bank S.A. Luxembourg Branch ZAR 21,014,000 USD (1,476,309) (3,892)
2-Jul-21 RBC Investor Services Bank S.A. Luxembourg Branch HKD 259,000 USD (33,352) -
Total as at June 30, 2021 (3,892)
Total as at December 31, 2020 9
CHALLENGE CYCLICAL EQUITY FUND
Maturity
06-Jul-21 Morgan Stanley and Co. International Plc USD 2,357,635 HKD (18,310,521) (194)
Total as at June 30, 2021 (194)
Total as at December 31, 2020 -
CHALLENGE INTERNATIONAL INCOME FUND
Maturity
14-Jul-21 Australia and New Zealand Banking Group Limited USD 2,462,765 EUR (2,021,045) 55,180
14-Jul-21 State Street Bank and Trust Company EUR 4,409,343 USD (5,392,000) (136,396)
14-Jul-21 UBS AG London Branch USD 13,468,000 EUR (11,053,043) 301,109
14-Jul-21 UBS AG Stamford Branch USD 2,051,319 EUR (1,687,398) 41,960
19-Jul-21 BNP Paribas Paris USD 5,417,292 EUR (4,570,000) (3,417)
20-Jul-21 BNP Paribas Paris CAD 3,964,000 EUR (2,702,203) (3,813)
20-Jul-21 Canadian Imperial Bank of Commerce EUR 2,030,060 CAD (2,987,334) (3,492)
20-Jul-21 HSBC Bank Plc EUR 181,189 MXN (4,393,791) (4,329)
20-Jul-21 State Street Bank and Trust Company EUR 308,666 CAD (455,000) (1,064)
20-Jul-21 UBS AG London Branch MXN 1,099,000 EUR (44,757) 1,643
20-Jul-21 Westpac Banking Corporation CAD 480,720 EUR (327,052) 185
20-Jul-21 Westpac Banking Corporation EUR 49,488 CAD (72,666) 22
21-Jul-21 Canadian Imperial Bank of Commerce NOK 2,807,817 EUR (278,084) (3,043)
21-Jul-21 Canadian Imperial Bank of Commerce SEK 6,394,000 EUR (630,193) 129
21-Jul-21 Goldman Sachs International DKK 1,947,000 EUR (261,778) 31
21-Jul-21 Goldman Sachs International EUR 408,666 DKK (3,039,455) (43)
21-Jul-21 HSBC Bank Plc EUR 347,599 SEK (3,524,000) 202
21-Jul-21 State Street Bank and Trust Company DKK 273,704 EUR (36,798) 7
21-Jul-21 State Street Bank and Trust Company EUR 522,809 NOK (5,249,630) 8,583
21-Jul-21 UBS AG London Branch NOK 1,681,000 EUR (167,108) (2,445)
21-Jul-21 UBS AG Stamford Branch NOK 310,384 EUR (31,007) (603)
21-Jul-21 UBS AG Stamford Branch SEK 116,190 EUR (11,474) (20)
26-Jul-21 BNP Paribas Paris AUD 755,734 EUR (478,126) 121
26-Jul-21 BNP Paribas Paris SGD 949,000 EUR (588,126) 6,892
26-Jul-21 Canadian Imperial Bank of Commerce EUR 45,032 NZD (76,000) 271
26-Jul-21 Westpac Banking Corporation EUR 1,071,952 AUD (1,680,111) 8,739
26-Jul-21 Westpac Banking Corporation NZD 326,823 EUR (192,869) (385)
27-Jul-21 Barclays Bank Plc HUF 105,123,000 EUR (298,931) 297
27-Jul-21 BNP Paribas Paris RON 2,447,000 EUR (494,893) 1,364
27-Jul-21 State Street Bank and Trust Company CHF 270,000 EUR (246,383) (41)
27-Jul-21 State Street Bank and Trust Company CZK 3,036,414 EUR (119,623) (695)
27-Jul-21 UBS AG London Branch CZK 6,493,000 EUR (254,998) (685)
27-Jul-21 UBS AG London Branch EUR 240,840 PLN (1,092,000) (941)
27-Jul-21 UBS AG Stamford Branch EUR 112,846 CHF (123,589) 86
28-Jul-21 BNP Paribas Paris GBP 2,221,000 EUR (2,575,237) 10,809
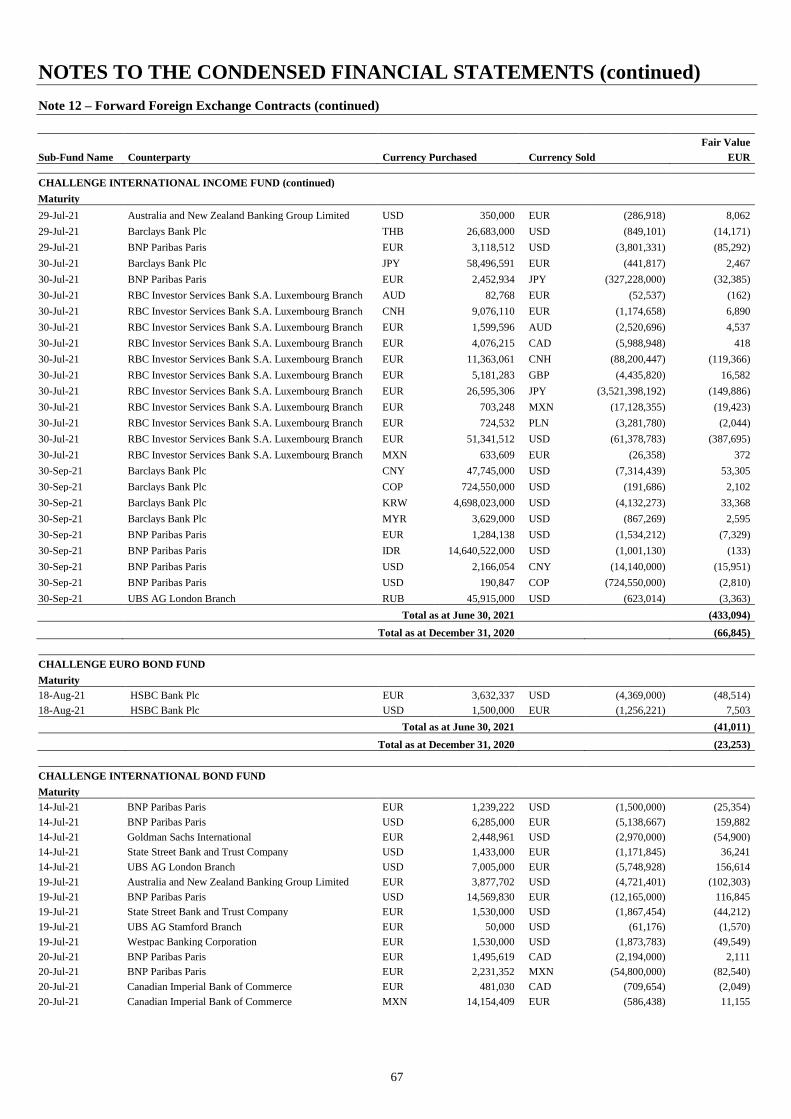
NOTES TO THE CONDENSED FINANCIAL STATEMENTS (continued)
67
Note 12 – Forward Foreign Exchange Contracts (continued)
Fair Value
Sub-Fund Name Counterparty Currency Purchased Currency Sold EUR
CHALLENGE INTERNATIONAL INCOME FUND (continued)
Maturity
29-Jul-21 Australia and New Zealand Banking Group Limited USD 350,000 EUR (286,918) 8,062
29-Jul-21 Barclays Bank Plc THB 26,683,000 USD (849,101) (14,171)
29-Jul-21 BNP Paribas Paris EUR 3,118,512 USD (3,801,331) (85,292)
30-Jul-21 Barclays Bank Plc JPY 58,496,591 EUR (441,817) 2,467
30-Jul-21 BNP Paribas Paris EUR 2,452,934 JPY (327,228,000) (32,385)
30-Jul-21 RBC Investor Services Bank S.A. Luxembourg Branch AUD 82,768 EUR (52,537) (162)
30-Jul-21 RBC Investor Services Bank S.A. Luxembourg Branch CNH 9,076,110 EUR (1,174,658) 6,890
30-Jul-21 RBC Investor Services Bank S.A. Luxembourg Branch EUR 1,599,596 AUD (2,520,696) 4,537
30-Jul-21 RBC Investor Services Bank S.A. Luxembourg Branch EUR 4,076,215 CAD (5,988,948) 418
30-Jul-21 RBC Investor Services Bank S.A. Luxembourg Branch EUR 11,363,061 CNH (88,200,447) (119,366)
30-Jul-21 RBC Investor Services Bank S.A. Luxembourg Branch EUR 5,181,283 GBP (4,435,820) 16,582
30-Jul-21 RBC Investor Services Bank S.A. Luxembourg Branch EUR 26,595,306 JPY (3,521,398,192) (149,886)
30-Jul-21 RBC Investor Services Bank S.A. Luxembourg Branch EUR 703,248 MXN (17,128,355) (19,423)
30-Jul-21 RBC Investor Services Bank S.A. Luxembourg Branch EUR 724,532 PLN (3,281,780) (2,044)
30-Jul-21 RBC Investor Services Bank S.A. Luxembourg Branch EUR 51,341,512 USD (61,378,783) (387,695)
30-Jul-21 RBC Investor Services Bank S.A. Luxembourg Branch MXN 633,609 EUR (26,358) 372
30-Sep-21 Barclays Bank Plc CNY 47,745,000 USD (7,314,439) 53,305
30-Sep-21 Barclays Bank Plc COP 724,550,000 USD (191,686) 2,102
30-Sep-21 Barclays Bank Plc KRW 4,698,023,000 USD (4,132,273) 33,368
30-Sep-21 Barclays Bank Plc MYR 3,629,000 USD (867,269) 2,595
30-Sep-21 BNP Paribas Paris EUR 1,284,138 USD (1,534,212) (7,329)
30-Sep-21 BNP Paribas Paris IDR 14,640,522,000 USD (1,001,130) (133)
30-Sep-21 BNP Paribas Paris USD 2,166,054 CNY (14,140,000) (15,951)
30-Sep-21 BNP Paribas Paris USD 190,847 COP (724,550,000) (2,810)
30-Sep-21 UBS AG London Branch RUB 45,915,000 USD (623,014) (3,363)
Total as at June 30, 2021 (433,094)
Total as at December 31, 2020
(66,845)
CHALLENGE EURO BOND FUND
Maturity
18-Aug-21 HSBC Bank Plc EUR 3,632,337 USD (4,369,000) (48,514)
18-Aug-21 HSBC Bank Plc USD 1,500,000 EUR (1,256,221) 7,503
Total as at June 30, 2021 (41,011)
Total as at December 31, 2020
(23,253)
CHALLENGE INTERNATIONAL BOND FUND
Maturity
14-Jul-21 BNP Paribas Paris EUR 1,239,222 USD (1,500,000) (25,354)
14-Jul-21 BNP Paribas Paris USD 6,285,000 EUR (5,138,667) 159,882
14-Jul-21 Goldman Sachs International EUR 2,448,961 USD (2,970,000) (54,900)
14-Jul-21 State Street Bank and Trust Company USD 1,433,000 EUR (1,171,845) 36,241
14-Jul-21 UBS AG London Branch USD 7,005,000 EUR (5,748,928) 156,614
19-Jul-21 Australia and New Zealand Banking Group Limited EUR 3,877,702 USD (4,721,401) (102,303)
19-Jul-21 BNP Paribas Paris USD 14,569,830 EUR (12,165,000) 116,845
19-Jul-21 State Street Bank and Trust Company EUR 1,530,000 USD (1,867,454) (44,212)
19-Jul-21 UBS AG Stamford Branch EUR 50,000 USD (61,176) (1,570)
19-Jul-21 Westpac Banking Corporation EUR 1,530,000 USD (1,873,783) (49,549)
20-Jul-21 BNP Paribas Paris EUR 1,495,619 CAD (2,194,000) 2,111
20-Jul-21 BNP Paribas Paris EUR 2,231,352 MXN (54,800,000) (82,540)
20-Jul-21 Canadian Imperial Bank of Commerce EUR 481,030 CAD (709,654) (2,049)
20-Jul-21 Canadian Imperial Bank of Commerce MXN 14,154,409 EUR (586,438) 11,155
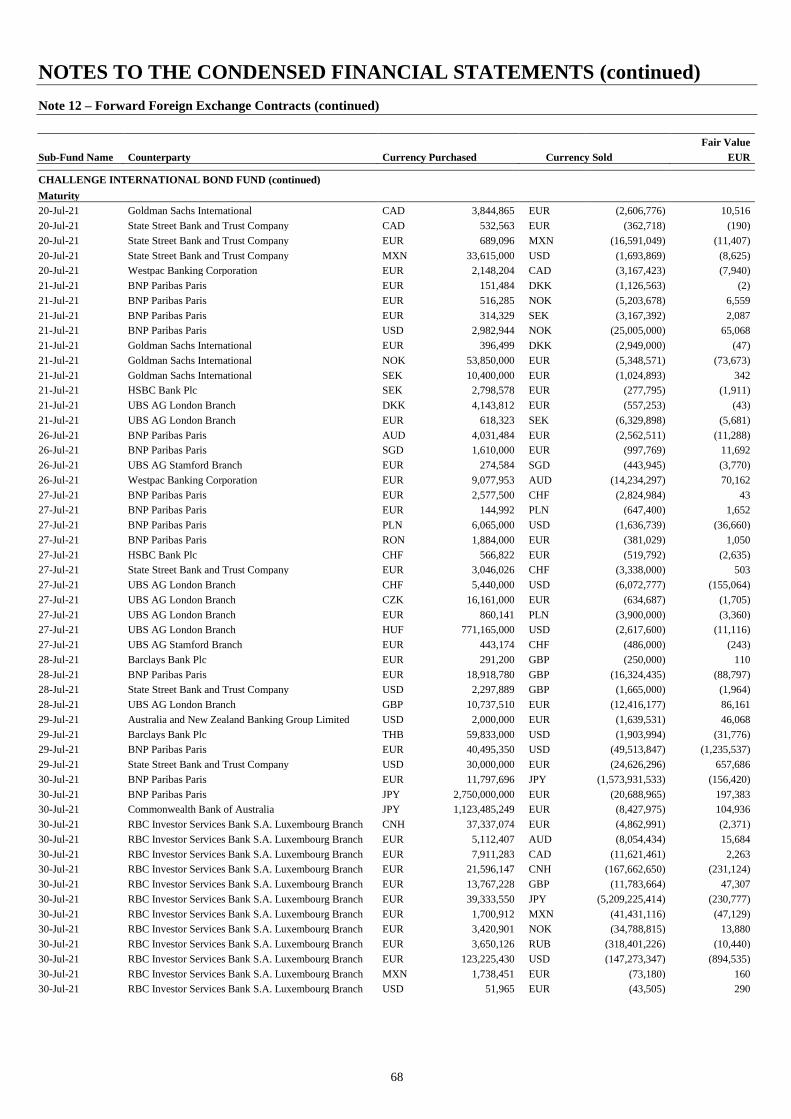
NOTES TO THE CONDENSED FINANCIAL STATEMENTS (continued)
68
Note 12 – Forward Foreign Exchange Contracts (continued)
Fair Value
Sub-Fund Name Counterparty Currency Purchased Currency Sold EUR
CHALLENGE INTERNATIONAL BOND FUND (continued)
Maturity
20-Jul-21 Goldman Sachs International CAD 3,844,865 EUR (2,606,776) 10,516
20-Jul-21 State Street Bank and Trust Company CAD 532,563 EUR (362,718) (190)
20-Jul-21 State Street Bank and Trust Company EUR 689,096 MXN (16,591,049) (11,407)
20-Jul-21 State Street Bank and Trust Company MXN 33,615,000 USD (1,693,869) (8,625)
20-Jul-21 Westpac Banking Corporation EUR 2,148,204 CAD (3,167,423) (7,940)
21-Jul-21 BNP Paribas Paris EUR 151,484 DKK (1,126,563) (2)
21-Jul-21 BNP Paribas Paris EUR 516,285 NOK (5,203,678) 6,559
21-Jul-21 BNP Paribas Paris EUR 314,329 SEK (3,167,392) 2,087
21-Jul-21 BNP Paribas Paris USD 2,982,944 NOK (25,005,000) 65,068
21-Jul-21 Goldman Sachs International EUR 396,499 DKK (2,949,000) (47)
21-Jul-21 Goldman Sachs International NOK 53,850,000 EUR (5,348,571) (73,673)
21-Jul-21 Goldman Sachs International SEK 10,400,000 EUR (1,024,893) 342
21-Jul-21 HSBC Bank Plc SEK 2,798,578 EUR (277,795) (1,911)
21-Jul-21 UBS AG London Branch DKK 4,143,812 EUR (557,253) (43)
21-Jul-21 UBS AG London Branch EUR 618,323 SEK (6,329,898) (5,681)
26-Jul-21 BNP Paribas Paris AUD 4,031,484 EUR (2,562,511) (11,288)
26-Jul-21 BNP Paribas Paris SGD 1,610,000 EUR (997,769) 11,692
26-Jul-21 UBS AG Stamford Branch EUR 274,584 SGD (443,945) (3,770)
26-Jul-21 Westpac Banking Corporation EUR 9,077,953 AUD (14,234,297) 70,162
27-Jul-21 BNP Paribas Paris EUR 2,577,500 CHF (2,824,984) 43
27-Jul-21 BNP Paribas Paris EUR 144,992 PLN (647,400) 1,652
27-Jul-21 BNP Paribas Paris PLN 6,065,000 USD (1,636,739) (36,660)
27-Jul-21 BNP Paribas Paris RON 1,884,000 EUR (381,029) 1,050
27-Jul-21 HSBC Bank Plc CHF 566,822 EUR (519,792) (2,635)
27-Jul-21 State Street Bank and Trust Company EUR 3,046,026 CHF (3,338,000) 503
27-Jul-21 UBS AG London Branch CHF 5,440,000 USD (6,072,777) (155,064)
27-Jul-21 UBS AG London Branch CZK 16,161,000 EUR (634,687) (1,705)
27-Jul-21 UBS AG London Branch EUR 860,141 PLN (3,900,000) (3,360)
27-Jul-21 UBS AG London Branch HUF 771,165,000 USD (2,617,600) (11,116)
27-Jul-21 UBS AG Stamford Branch EUR 443,174 CHF (486,000) (243)
28-Jul-21 Barclays Bank Plc EUR 291,200 GBP (250,000) 110
28-Jul-21 BNP Paribas Paris EUR 18,918,780 GBP (16,324,435) (88,797)
28-Jul-21 State Street Bank and Trust Company USD 2,297,889 GBP (1,665,000) (1,964)
28-Jul-21 UBS AG London Branch GBP 10,737,510 EUR (12,416,177) 86,161
29-Jul-21 Australia and New Zealand Banking Group Limited USD 2,000,000 EUR (1,639,531) 46,068
29-Jul-21 Barclays Bank Plc THB 59,833,000 USD (1,903,994) (31,776)
29-Jul-21 BNP Paribas Paris EUR 40,495,350 USD (49,513,847) (1,235,537)
29-Jul-21 State Street Bank and Trust Company USD 30,000,000 EUR (24,626,296) 657,686
30-Jul-21 BNP Paribas Paris EUR 11,797,696 JPY (1,573,931,533) (156,420)
30-Jul-21 BNP Paribas Paris JPY 2,750,000,000 EUR (20,688,965) 197,383
30-Jul-21 Commonwealth Bank of Australia JPY 1,123,485,249 EUR (8,427,975) 104,936
30-Jul-21 RBC Investor Services Bank S.A. Luxembourg Branch CNH 37,337,074 EUR (4,862,991) (2,371)
30-Jul-21 RBC Investor Services Bank S.A. Luxembourg Branch EUR 5,112,407 AUD (8,054,434) 15,684
30-Jul-21 RBC Investor Services Bank S.A. Luxembourg Branch EUR 7,911,283 CAD (11,621,461) 2,263
30-Jul-21 RBC Investor Services Bank S.A. Luxembourg Branch EUR 21,596,147 CNH (167,662,650) (231,124)
30-Jul-21 RBC Investor Services Bank S.A. Luxembourg Branch EUR 13,767,228 GBP (11,783,664) 47,307
30-Jul-21 RBC Investor Services Bank S.A. Luxembourg Branch EUR 39,333,550 JPY (5,209,225,414) (230,777)
30-Jul-21 RBC Investor Services Bank S.A. Luxembourg Branch EUR 1,700,912 MXN (41,431,116) (47,129)
30-Jul-21 RBC Investor Services Bank S.A. Luxembourg Branch EUR 3,420,901 NOK (34,788,815) 13,880
30-Jul-21 RBC Investor Services Bank S.A. Luxembourg Branch EUR 3,650,126 RUB (318,401,226) (10,440)
30-Jul-21 RBC Investor Services Bank S.A. Luxembourg Branch EUR 123,225,430 USD (147,273,347) (894,535)
30-Jul-21 RBC Investor Services Bank S.A. Luxembourg Branch MXN 1,738,451 EUR (73,180) 160
30-Jul-21 RBC Investor Services Bank S.A. Luxembourg Branch USD 51,965 EUR (43,505) 290
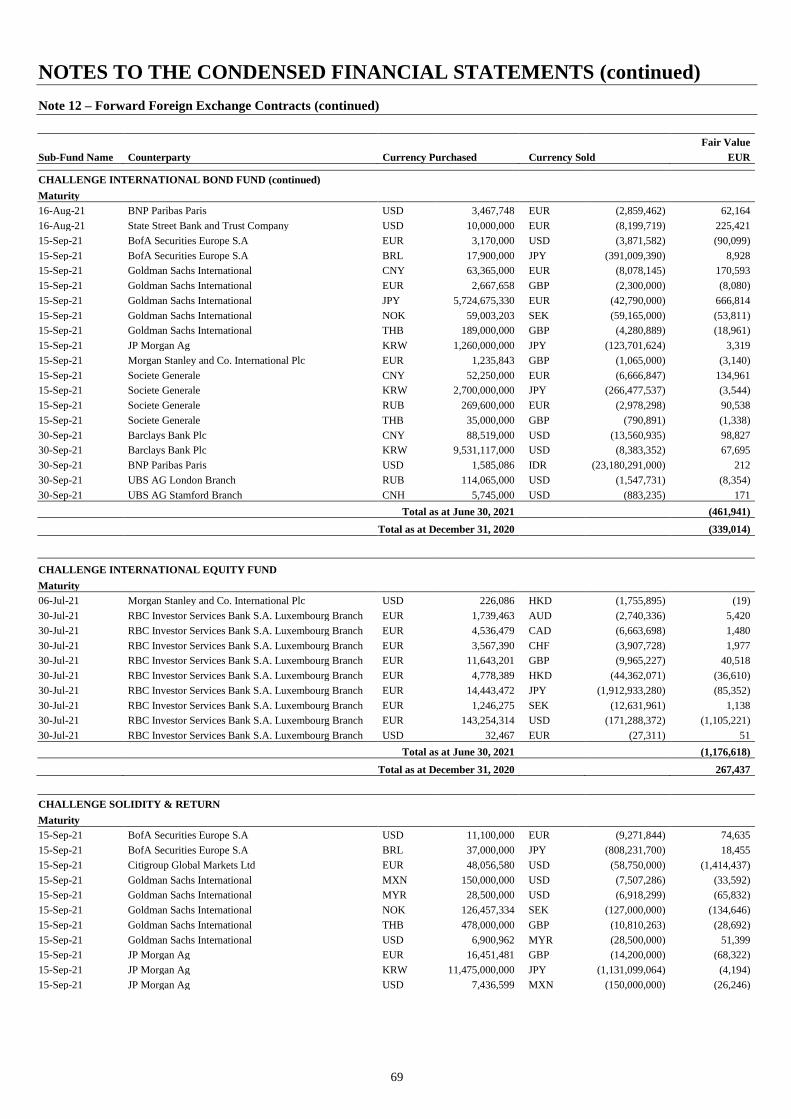
NOTES TO THE CONDENSED FINANCIAL STATEMENTS (continued)
69
Note 12 – Forward Foreign Exchange Contracts (continued)
Fair Value
Sub-Fund Name Counterparty Currency Purchased Currency Sold EUR
CHALLENGE INTERNATIONAL BOND FUND (continued)
Maturity
16-Aug-21 BNP Paribas Paris USD 3,467,748 EUR (2,859,462) 62,164
16-Aug-21 State Street Bank and Trust Company USD 10,000,000 EUR (8,199,719) 225,421
15-Sep-21 BofA Securities Europe S.A EUR 3,170,000 USD (3,871,582) (90,099)
15-Sep-21 BofA Securities Europe S.A BRL 17,900,000 JPY (391,009,390) 8,928
15-Sep-21 Goldman Sachs International CNY 63,365,000 EUR (8,078,145) 170,593
15-Sep-21 Goldman Sachs International EUR 2,667,658 GBP (2,300,000) (8,080)
15-Sep-21 Goldman Sachs International JPY 5,724,675,330 EUR (42,790,000) 666,814
15-Sep-21 Goldman Sachs International NOK 59,003,203 SEK (59,165,000) (53,811)
15-Sep-21 Goldman Sachs International THB 189,000,000 GBP (4,280,889) (18,961)
15-Sep-21 JP Morgan Ag KRW 1,260,000,000 JPY (123,701,624) 3,319
15-Sep-21 Morgan Stanley and Co. International Plc EUR 1,235,843 GBP (1,065,000) (3,140)
15-Sep-21 Societe Generale CNY 52,250,000 EUR (6,666,847) 134,961
15-Sep-21 Societe Generale KRW 2,700,000,000 JPY (266,477,537) (3,544)
15-Sep-21 Societe Generale RUB 269,600,000 EUR (2,978,298) 90,538
15-Sep-21 Societe Generale THB 35,000,000 GBP (790,891) (1,338)
30-Sep-21 Barclays Bank Plc CNY 88,519,000 USD (13,560,935) 98,827
30-Sep-21 Barclays Bank Plc KRW 9,531,117,000 USD (8,383,352) 67,695
30-Sep-21 BNP Paribas Paris USD 1,585,086 IDR (23,180,291,000) 212
30-Sep-21 UBS AG London Branch RUB 114,065,000 USD (1,547,731) (8,354)
30-Sep-21 UBS AG Stamford Branch CNH 5,745,000 USD (883,235) 171
Total as at June 30, 2021 (461,941)
Total as at December 31, 2020 (339,014)
CHALLENGE INTERNATIONAL EQUITY FUND
Maturity
06-Jul-21 Morgan Stanley and Co. International Plc USD 226,086 HKD (1,755,895) (19)
30-Jul-21 RBC Investor Services Bank S.A. Luxembourg Branch EUR 1,739,463 AUD (2,740,336) 5,420
30-Jul-21 RBC Investor Services Bank S.A. Luxembourg Branch EUR 4,536,479 CAD (6,663,698) 1,480
30-Jul-21 RBC Investor Services Bank S.A. Luxembourg Branch EUR 3,567,390 CHF (3,907,728) 1,977
30-Jul-21 RBC Investor Services Bank S.A. Luxembourg Branch EUR 11,643,201 GBP (9,965,227) 40,518
30-Jul-21 RBC Investor Services Bank S.A. Luxembourg Branch EUR 4,778,389 HKD (44,362,071) (36,610)
30-Jul-21 RBC Investor Services Bank S.A. Luxembourg Branch EUR 14,443,472 JPY (1,912,933,280) (85,352)
30-Jul-21 RBC Investor Services Bank S.A. Luxembourg Branch EUR 1,246,275 SEK (12,631,961) 1,138
30-Jul-21 RBC Investor Services Bank S.A. Luxembourg Branch EUR 143,254,314 USD (171,288,372) (1,105,221)
30-Jul-21 RBC Investor Services Bank S.A. Luxembourg Branch USD 32,467 EUR (27,311) 51
Total as at June 30, 2021 (1,176,618)
Total as at December 31, 2020
267,437
CHALLENGE SOLIDITY & RETURN
Maturity
15-Sep-21 BofA Securities Europe S.A USD 11,100,000 EUR (9,271,844) 74,635
15-Sep-21 BofA Securities Europe S.A BRL 37,000,000 JPY (808,231,700) 18,455
15-Sep-21 Citigroup Global Markets Ltd EUR 48,056,580 USD (58,750,000) (1,414,437)
15-Sep-21 Goldman Sachs International MXN 150,000,000 USD (7,507,286) (33,592)
15-Sep-21 Goldman Sachs International MYR 28,500,000 USD (6,918,299) (65,832)
15-Sep-21 Goldman Sachs International NOK 126,457,334 SEK (127,000,000) (134,646)
15-Sep-21 Goldman Sachs International THB 478,000,000 GBP (10,810,263) (28,692)
15-Sep-21 Goldman Sachs International USD 6,900,962 MYR (28,500,000) 51,399
15-Sep-21 JP Morgan Ag EUR 16,451,481 GBP (14,200,000) (68,322)
15-Sep-21 JP Morgan Ag KRW 11,475,000,000 JPY (1,131,099,064) (4,194)
15-Sep-21 JP Morgan Ag USD 7,436,599 MXN (150,000,000) (26,246)
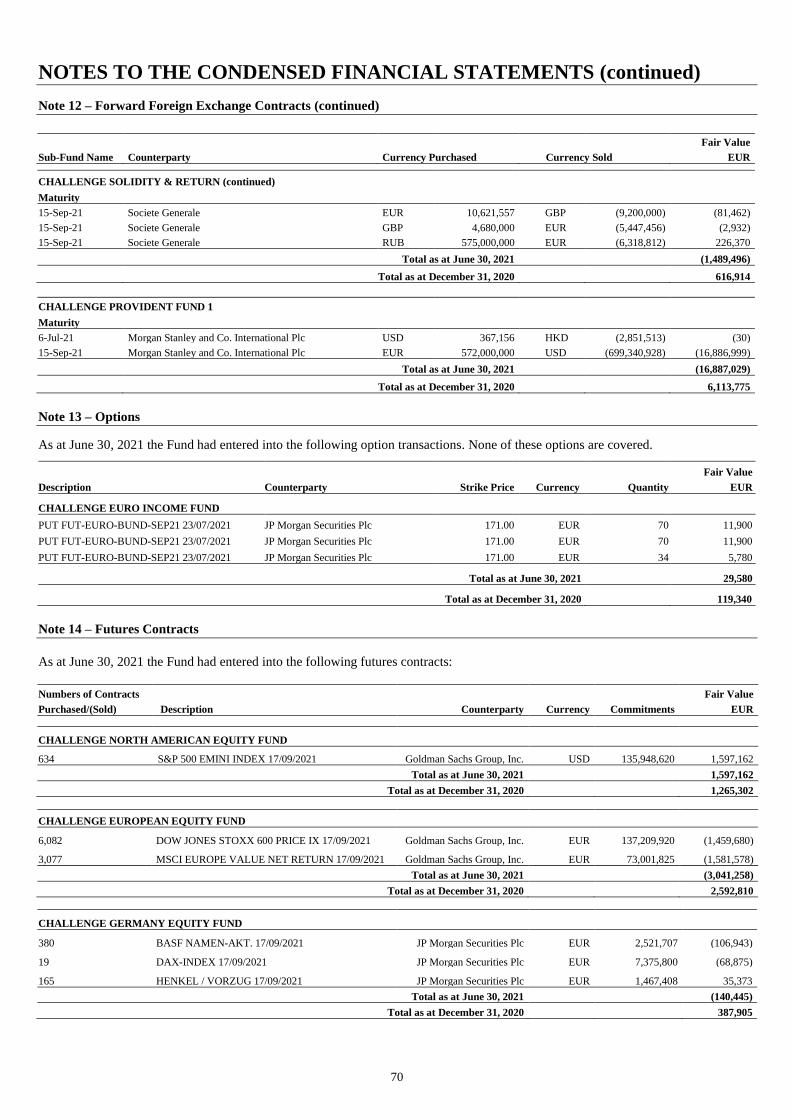
NOTES TO THE CONDENSED FINANCIAL STATEMENTS (continued)
70
Note 12 – Forward Foreign Exchange Contracts (continued)
Fair Value
Sub-Fund Name Counterparty Currency Purchased Currency Sold EUR
CHALLENGE SOLIDITY & RETURN (continued)
Maturity
15-Sep-21 Societe Generale EUR 10,621,557 GBP (9,200,000) (81,462)
15-Sep-21 Societe Generale GBP 4,680,000 EUR (5,447,456) (2,932)
15-Sep-21 Societe Generale RUB 575,000,000 EUR (6,318,812) 226,370
Total as at June 30, 2021 (1,489,496)
Total as at December 31, 2020 616,914
CHALLENGE PROVIDENT FUND 1
Maturity
6-Jul-21 Morgan Stanley and Co. International Plc USD 367,156 HKD (2,851,513) (30)
15-Sep-21 Morgan Stanley and Co. International Plc EUR 572,000,000 USD (699,340,928) (16,886,999)
Total as at June 30, 2021 (16,887,029)
Total as at December 31, 2020
6,113,775
Note 13 – Options
As at June 30, 2021 the Fund had entered into the following option transactions. None of these options are covered.
Fair Value
Description Counterparty Strike Price Currency Quantity EUR
CHALLENGE EURO INCOME FUND
PUT FUT-EURO-BUND-SEP21 23/07/2021 JP Morgan Securities Plc 171.00 EUR 70 11,900
PUT FUT-EURO-BUND-SEP21 23/07/2021 JP Morgan Securities Plc 171.00 EUR 70 11,900
PUT FUT-EURO-BUND-SEP21 23/07/2021 JP Morgan Securities Plc 171.00 EUR 34 5,780
Total as at June 30, 2021 29,580
Total as at December 31, 2020 119,340
Note 14 – Futures Contracts
As at June 30, 2021 the Fund had entered into the following futures contracts:
Numbers of Contracts Fair Value
Purchased/(Sold) Description Counterparty Currency Commitments EUR
CHALLENGE NORTH AMERICAN EQUITY FUND
634 S&P 500 EMINI INDEX 17/09/2021 Goldman Sachs Group, Inc. USD 135,948,620 1,597,162
Total as at June 30, 2021 1,597,162
Total as at December 31, 2020 1,265,302
CHALLENGE EUROPEAN EQUITY FUND
6,082 DOW JONES STOXX 600 PRICE IX 17/09/2021 Goldman Sachs Group, Inc. EUR 137,209,920 (1,459,680)
3,077 MSCI EUROPE VALUE NET RETURN 17/09/2021 Goldman Sachs Group, Inc. EUR 73,001,825 (1,581,578)
Total as at June 30, 2021 (3,041,258)
Total as at December 31, 2020 2,592,810
CHALLENGE GERMANY EQUITY FUND
380 BASF NAMEN-AKT. 17/09/2021 JP Morgan Securities Plc EUR 2,521,707 (106,943)
19 DAX-INDEX 17/09/2021 JP Morgan Securities Plc EUR 7,375,800 (68,875)
165 HENKEL / VORZUG 17/09/2021 JP Morgan Securities Plc EUR 1,467,408 35,373
Total as at June 30, 2021 (140,445)
Total as at December 31, 2020 387,905

NOTES TO THE CONDENSED FINANCIAL STATEMENTS (continued)
71
Note 14 – Futures Contracts
As at June 30, 2021 the Fund had entered into the following futures contracts:
Numbers of Contracts Fair Value
Purchased/(Sold) Description Counterparty Currency Commitments EUR
CHALLENGE PACIFIC EQUITY FUND
90 S&P / ASX 200 INDEX 16/09/2021 Goldman Sachs Group, Inc. AUD 16,251,750 (32,761)
102 TOPIX INDEX (TOKYO) 09/09/2021 Goldman Sachs Group, Inc. JPY 1,981,860,000 (151,113)
Total as at June 30, 2021 (183,874)
Total as at December 31, 2020 906,509
CHALLENGE EMERGING MARKETS EQUITY FUND
218 MSEMI - MSCI EMER MKTS INDEX 17/09/2021 Goldman Sachs Group, Inc. USD 14,876,320 (32,630)
Total as at June 30, 2021 (32,630)
Total as at December 31, 2020 1,122,347
CHALLENGE ENERGY EQUITY FUND
68 MSCI WORL NET INDEX - M1WO 17/09/2021 Goldman Sachs Group, Inc. USD 6,154,680 (2,764)
Total as at June 30, 2021 (2,764)
Total as at December 31, 2020 91,867
CHALLENGE CYCLICAL EQUITY FUND
136 MSCI WORL NET INDEX - M1WO 17/09/2021 Goldman Sachs Group, Inc. USD 12,309,360 (5,528)
Total as at June 30, 2021 (5,528)
Total as at December 31, 2020 183,734
CHALLENGE COUNTER CYCLICAL EQUITY FUND
116 MSCI WORL NET INDEX - M1WO 17/09/2021 Goldman Sachs Group, Inc. USD 10,499,160 (4,715)
Total as at June 30, 2021 (4,715)
Total as at December 31, 2020 156,714
CHALLENGE TECHNOLOGY EQUITY FUND
263 NDX-NASDAQ 100 INDEX 100-IND 17/09/2021 Goldman Sachs Group, Inc. USD 76,527,740 2,500,490
Total as at June 30, 2021 2,500,490
Total as at December 31, 2020 2,204,500
CHALLENGE EURO INCOME FUND
(24) 10Y BTP ITALIAN BOND 08/09/2021 JP Morgan Securities Plc EUR (21,076) (20,880)
42 EURO BOBL 08/09/2021 JP Morgan Securities Plc EUR 3,381 3,360
(76) EURO BUND 08/09/2021 JP Morgan Securities Plc EUR (72,864) (72,120)
(196) EURO OAT FUT FRENCH GVT BDS 08/09/2021 JP Morgan Securities Plc EUR (112,691) (111,510)
(65) EURO-BUXL-FUTURES 08/09/2021 JP Morgan Securities Plc EUR (106,335) (105,300)
Total as at June 30, 2021 (306,450)
Total as at December 31, 2020 (165,270)
CHALLENGE INTERNATIONAL INCOME FUND
(114) 5Y TREASURY NOTES USA 30/09/2021 JP Morgan Securities Plc USD 39,821 33,295
(11) EURO BOBL 08/09/2021 JP Morgan Securities Plc EUR (1,673) (1,650)
Total as at June 30, 2021 31,645
Total as at December 31, 2020 (20,177)
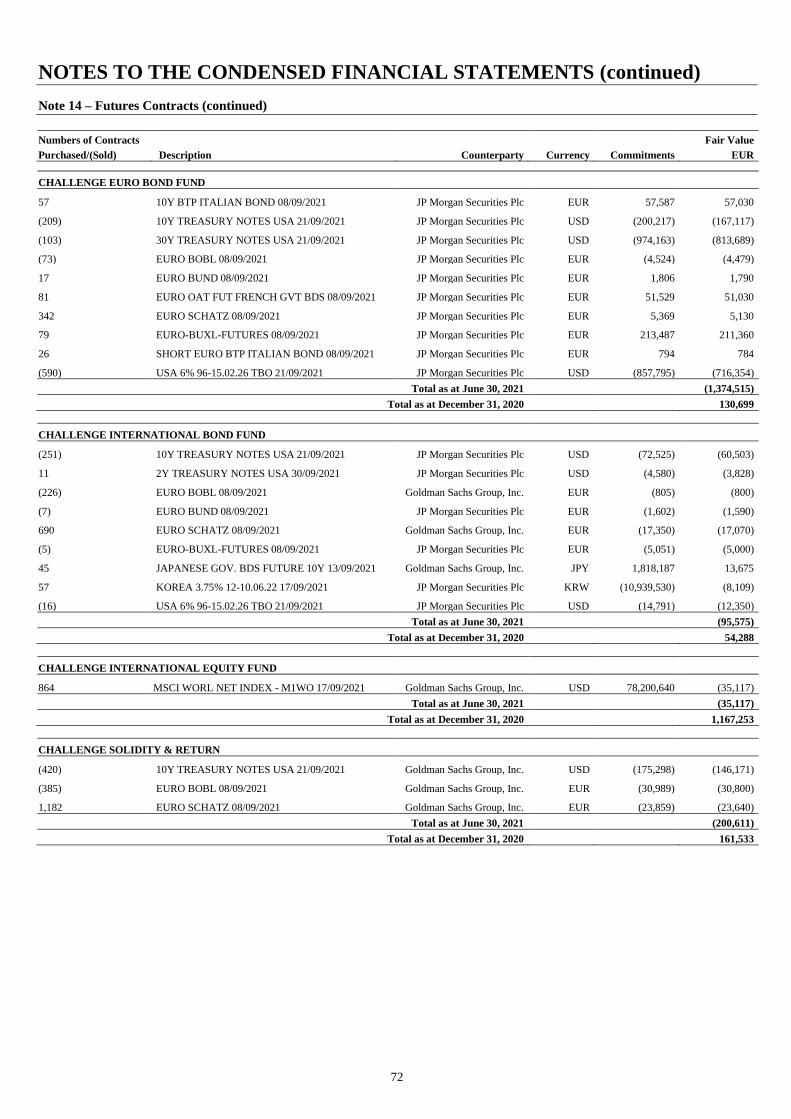
NOTES TO THE CONDENSED FINANCIAL STATEMENTS (continued)
72
Note 14 – Futures Contracts (continued)
Numbers of Contracts Fair Value
Purchased/(Sold) Description Counterparty Currency Commitments EUR
CHALLENGE EURO BOND FUND
57 10Y BTP ITALIAN BOND 08/09/2021 JP Morgan Securities Plc EUR 57,587 57,030
(209) 10Y TREASURY NOTES USA 21/09/2021 JP Morgan Securities Plc USD (200,217) (167,117)
(103) 30Y TREASURY NOTES USA 21/09/2021 JP Morgan Securities Plc USD (974,163) (813,689)
(73) EURO BOBL 08/09/2021 JP Morgan Securities Plc EUR (4,524) (4,479)
17 EURO BUND 08/09/2021 JP Morgan Securities Plc EUR 1,806 1,790
81 EURO OAT FUT FRENCH GVT BDS 08/09/2021 JP Morgan Securities Plc EUR 51,529 51,030
342 EURO SCHATZ 08/09/2021 JP Morgan Securities Plc EUR 5,369 5,130
79 EURO-BUXL-FUTURES 08/09/2021 JP Morgan Securities Plc EUR 213,487 211,360
26 SHORT EURO BTP ITALIAN BOND 08/09/2021 JP Morgan Securities Plc EUR 794 784
(590) USA 6% 96-15.02.26 TBO 21/09/2021 JP Morgan Securities Plc USD (857,795) (716,354)
Total as at June 30, 2021 (1,374,515)
Total as at December 31, 2020 130,699
CHALLENGE INTERNATIONAL BOND FUND
(251) 10Y TREASURY NOTES USA 21/09/2021 JP Morgan Securities Plc USD (72,525) (60,503)
11 2Y TREASURY NOTES USA 30/09/2021 JP Morgan Securities Plc USD (4,580) (3,828)
(226) EURO BOBL 08/09/2021 Goldman Sachs Group, Inc. EUR (805) (800)
(7) EURO BUND 08/09/2021 JP Morgan Securities Plc EUR (1,602) (1,590)
690 EURO SCHATZ 08/09/2021 Goldman Sachs Group, Inc. EUR (17,350) (17,070)
(5) EURO-BUXL-FUTURES 08/09/2021 JP Morgan Securities Plc EUR (5,051) (5,000)
45 JAPANESE GOV. BDS FUTURE 10Y 13/09/2021 Goldman Sachs Group, Inc. JPY 1,818,187 13,675
57 KOREA 3.75% 12-10.06.22 17/09/2021 JP Morgan Securities Plc KRW (10,939,530) (8,109)
(16) USA 6% 96-15.02.26 TBO 21/09/2021 JP Morgan Securities Plc USD (14,791) (12,350)
Total as at June 30, 2021 (95,575)
Total as at December 31, 2020 54,288
CHALLENGE INTERNATIONAL EQUITY FUND
864 MSCI WORL NET INDEX - M1WO 17/09/2021 Goldman Sachs Group, Inc. USD 78,200,640 (35,117)
Total as at June 30, 2021 (35,117)
Total as at December 31, 2020 1,167,253
CHALLENGE SOLIDITY & RETURN
(420) 10Y TREASURY NOTES USA 21/09/2021 Goldman Sachs Group, Inc. USD (175,298) (146,171)
(385) EURO BOBL 08/09/2021 Goldman Sachs Group, Inc. EUR (30,989) (30,800)
1,182 EURO SCHATZ 08/09/2021 Goldman Sachs Group, Inc. EUR (23,859) (23,640)
Total as at June 30, 2021 (200,611)
Total as at December 31, 2020 161,533

NOTES TO THE CONDENSED FINANCIAL STATEMENTS (continued)
73
Note 14 – Futures Contracts (continued)
Numbers of Contracts Fair Value
Purchased/(Sold) Description Counterparty Currency Commitments EUR
CHALLENGE PROVIDENT FUND 1
(39) EUR/CHF SPOT CROSS 13/09/2021 JP Morgan Securities Plc CHF (5,473,223) (18,678)
37 EUR/GBP SPOT - CROSS RATES 13/09/2021 JP Morgan Securities Plc GBP 3,983,281 (17,510)
347 EURO STOXX 50 PR 17/09/2021 JP Morgan Securities Plc EUR 14,072,585 (249,840)
38 HONG KONG HANG SENG INDICES 29/07/2021 JP Morgan Securities Plc HKD 54,397,000 (41,211)
7 MSCI EAFE 17/09/2021 JP Morgan Securities Plc USD 806,435 (17,383)
91 S&P / ASX 200 INDEX 16/09/2021 JP Morgan Securities Plc AUD 16,432,325 (50,408)
141 S&P 500 EMINI INDEX 17/09/2021 JP Morgan Securities Plc USD 30,234,630 256,554
91 S&P INDICES S&P/TSX 60 INDEX 16/09/2021 JP Morgan Securities Plc CAD 21,889,140 99,645
112 SMI INDEX/OHNE DIVIDENDENKOR 17/09/2021 JP Morgan Securities Plc CHF 13,356,000 39,847
10 SWED OPTI OMX STOCKHOLM 30 I 16/07/2021 JP Morgan Securities Plc SEK 2,266,000 (2,687)
266 UKX FTSE 100 INDEX 17/09/2021 JP Morgan Securities Plc GBP 18,568,130 (348,595)
Total as at June 30, 2021 (350,266)
Total as at December 31, 2020 2,166,825
CHALLENGE PROVIDENT FUND 2
(24) EUR/CHF SPOT CROSS 13/09/2021 JP Morgan Securities Plc CHF (3,316,320) (11,494)
67 EUR/USD SPOT -CROSS RATES 13/09/2021 JP Morgan Securities Plc USD 9,920,303 (230,438)
270 EURO STOXX 50 PR 17/09/2021 JP Morgan Securities Plc EUR 10,949,850 (194,400)
29 HONG KONG HANG SENG INDICES 29/07/2021 JP Morgan Securities Plc HKD 41,513,500 (31,450)
49 S&P / ASX 200 INDEX 16/09/2021 JP Morgan Securities Plc AUD 8,848,175 (27,142)
314 S&P 500 EMINI INDEX 17/09/2021 JP Morgan Securities Plc USD 67,331,020 567,948
53 S&P INDICES S&P/TSX 60 INDEX 16/09/2021 JP Morgan Securities Plc CAD 12,748,620 58,035
49 SMI INDEX/OHNE DIVIDENDENKOR 17/09/2021 JP Morgan Securities Plc CHF 5,843,250 17,433
58 SWED OPTI OMX STOCKHOLM 30 I 16/07/2021 JP Morgan Securities Plc SEK 13,142,800 (15,584)
74 TOPIX INDEX (TOKYO) 09/09/2021 JP Morgan Securities Plc JPY 1,437,820,000 (129,309)
151 UKX FTSE 100 INDEX 17/09/2021 JP Morgan Securities Plc GBP 10,540,555 (197,887)
Total as at June 30, 2021 (194,288)
Total as at December 31, 2020 2,259,403
CHALLENGE PROVIDENT FUND 3
35 EUR/USD SPOT -CROSS RATES 13/09/2021 JP Morgan Securities Plc USD 5,200,585 (120,378)
Total as at June 30, 2021 (120,378)
Total as at December 31, 2020 -
Note 15 – Swaps
The Fund may enter into various swap contracts including, but not limited to, credit default swaps (including credit default swap on
indices such as CDX), equity swaps, total return swaps, inflation link swaps and interest rate swaps. The purpose is to create, manage
or reduce the Fund’s exposure to interest rate movements, defaults of corporate and sovereign debts, or other markets, as appropriate.
Credit default swap contracts involve an arrangement between the Fund and a counterparty which allow the Fund to protect against
losses incurred as a result of default on certain designated bonds by a specified reference entity. A credit default swap index is a credit
derivative used to hedge credit risk or to take a position on a basket of credit entities. Unlike a credit default swap, which is an OTC
credit derivative, a credit default swap index is a completely standardised credit security and may therefore be more liquid and trade at
a smaller bid-offer spread.
A Sub-Fund may utilise total return swap contracts where the Sub-Fund may exchange interest rate cash flows for cash flows based on
the return of, for example, an equity or fixed income instrument or a securities index. These contracts allow a Sub-Fund to manage its
exposures to certain securities or securities indexes. For these instruments, the Sub-Fund’s return is based on the movement of interest
rates relative to the return on the relevant security or index.
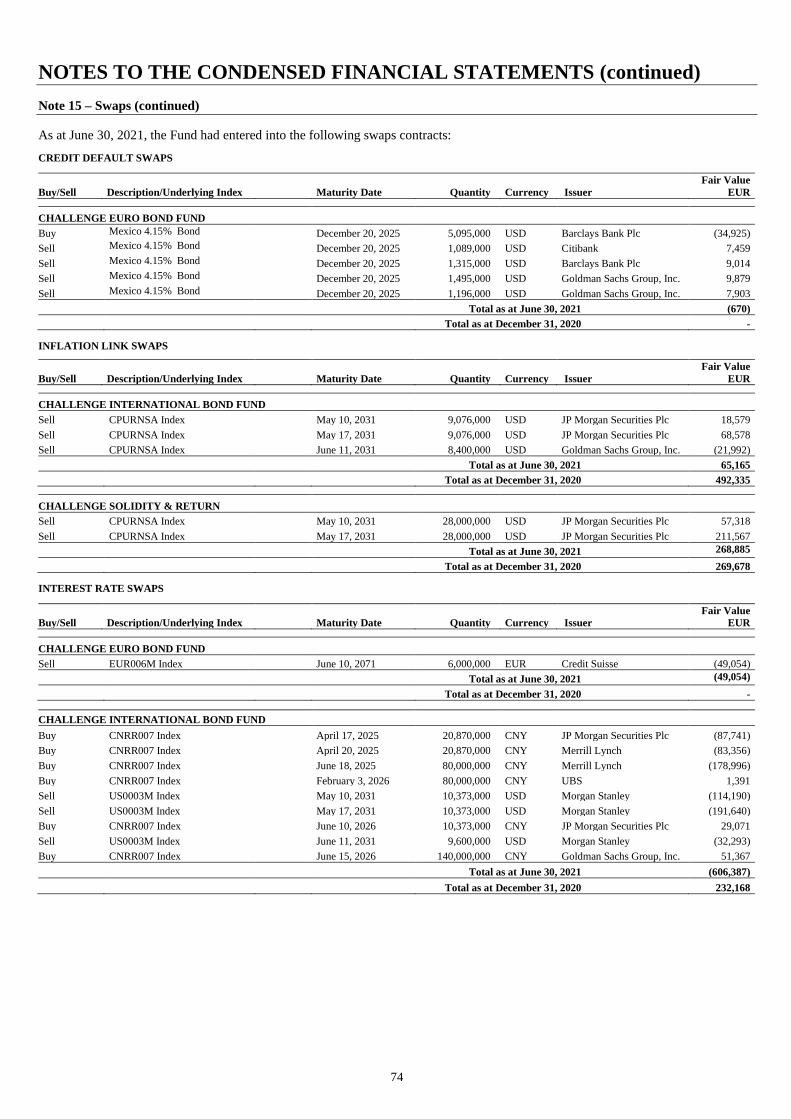
NOTES TO THE CONDENSED FINANCIAL STATEMENTS (continued)
74
Note 15 – Swaps (continued)
As at June 30, 2021, the Fund had entered into the following swaps contracts:
CREDIT DEFAULT SWAPS
Buy/Sell Description/Underlying Index Maturity Date Quantity Currency Issuer
Fair Value
EUR
CHALLENGE EURO BOND FUND
Buy Mexico 4.15% Bond
4.15% December 20, 2025 5,095,000 USD Barclays Bank Plc (34,925)
Sell Mexico 4.15% Bond
December 20, 2025 1,089,000 USD Citibank 7,459
Sell Mexico 4.15% Bond
December 20, 2025 1,315,000 USD Barclays Bank Plc 9,014
Sell Mexico 4.15% Bond
December 20, 2025 1,495,000 USD Goldman Sachs Group, Inc. 9,879
Sell Mexico 4.15% Bond
December 20, 2025 1,196,000 USD Goldman Sachs Group, Inc. 7,903
Total as at June 30, 2021 (670)
Total as at December 31, 2020 -
INFLATION LINK SWAPS
Buy/Sell Description/Underlying Index Maturity Date Quantity Currency Issuer
Fair Value
EUR
CHALLENGE INTERNATIONAL BOND FUND
Sell CPURNSA Index May 10, 2031 9,076,000 USD JP Morgan Securities Plc 18,579
Sell CPURNSA Index May 17, 2031 9,076,000 USD JP Morgan Securities Plc 68,578
Sell CPURNSA Index June 11, 2031 8,400,000 USD Goldman Sachs Group, Inc. (21,992)
Total as at June 30, 2021 65,165
Total as at December 31, 2020 492,335
CHALLENGE SOLIDITY & RETURN
Sell CPURNSA Index May 10, 2031 28,000,000 USD JP Morgan Securities Plc 57,318
Sell CPURNSA Index May 17, 2031 28,000,000 USD JP Morgan Securities Plc 211,567
Total as at June 30, 2021 268,885
Total as at December 31, 2020 269,678
INTEREST RATE SWAPS
Buy/Sell Description/Underlying Index Maturity Date Quantity Currency Issuer
Fair Value
EUR
CHALLENGE EURO BOND FUND
Sell EUR006M Index June 10, 2071 6,000,000 EUR Credit Suisse (49,054)
Total as at June 30, 2021 (49,054)
Total as at December 31, 2020 -
CHALLENGE INTERNATIONAL BOND FUND
Buy CNRR007 Index April 17, 2025 20,870,000 CNY JP Morgan Securities Plc (87,741)
Buy CNRR007 Index April 20, 2025 20,870,000 CNY Merrill Lynch (83,356)
Buy CNRR007 Index June 18, 2025 80,000,000 CNY Merrill Lynch (178,996)
Buy CNRR007 Index February 3, 2026 80,000,000 CNY UBS 1,391
Sell US0003M Index May 10, 2031 10,373,000 USD Morgan Stanley (114,190)
Sell US0003M Index May 17, 2031 10,373,000 USD Morgan Stanley (191,640)
Buy CNRR007 Index June 10, 2026 10,373,000 CNY JP Morgan Securities Plc 29,071
Sell US0003M Index June 11, 2031 9,600,000 USD Morgan Stanley (32,293)
Buy CNRR007 Index June 15, 2026 140,000,000 CNY Goldman Sachs Group, Inc. 51,367
Total as at June 30, 2021 (606,387)
Total as at December 31, 2020 232,168
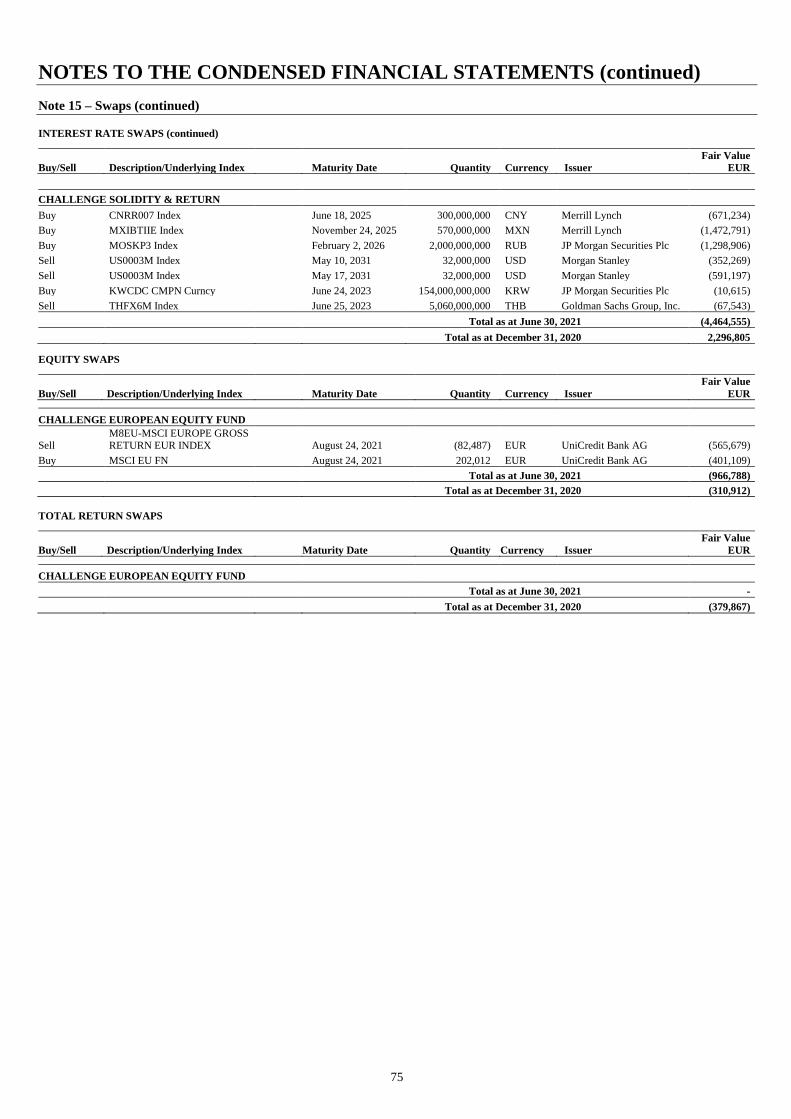
NOTES TO THE CONDENSED FINANCIAL STATEMENTS (continued)
75
Note 15 – Swaps (continued)
INTEREST RATE SWAPS (continued)
Buy/Sell Description/Underlying Index Maturity Date Quantity Currency Issuer
Fair Value
EUR
CHALLENGE SOLIDITY & RETURN
Buy CNRR007 Index June 18, 2025 300,000,000 CNY Merrill Lynch (671,234)
Buy MXIBTIIE Index November 24, 2025 570,000,000 MXN Merrill Lynch (1,472,791)
Buy MOSKP3 Index February 2, 2026 2,000,000,000 RUB JP Morgan Securities Plc (1,298,906)
Sell US0003M Index May 10, 2031 32,000,000 USD Morgan Stanley (352,269)
Sell US0003M Index May 17, 2031 32,000,000 USD Morgan Stanley (591,197)
Buy KWCDC CMPN Curncy June 24, 2023 154,000,000,000 KRW JP Morgan Securities Plc (10,615)
Sell THFX6M Index June 25, 2023 5,060,000,000 THB Goldman Sachs Group, Inc. (67,543)
Total as at June 30, 2021 (4,464,555)
Total as at December 31, 2020 2,296,805
EQUITY SWAPS
Buy/Sell Description/Underlying Index Maturity Date Quantity Currency Issuer
Fair Value
EUR
CHALLENGE EUROPEAN EQUITY FUND
Sell M8EU-MSCI EUROPE GROSS RETURN EUR INDEX August 24, 2021 (82,487) EUR UniCredit Bank AG (565,679)
Buy MSCI EU FN August 24, 2021 202,012 EUR UniCredit Bank AG (401,109)
Total as at June 30, 2021 (966,788)
Total as at December 31, 2020 (310,912)
TOTAL RETURN SWAPS
Buy/Sell Description/Underlying Index Maturity Date Quantity Currency Issuer
Fair Value
EUR
CHALLENGE EUROPEAN EQUITY FUND
Total as at June 30, 2021 -
Total as at December 31, 2020 (379,867)
NOTES TO THE CONDENSED FINANCIAL STATEMENTS (continued)
76
Note 16 – Risks Associated with Financial Instruments
The Fund is exposed to risk, which includes market risk, currency risk, liquidity risk, credit risk and interest rate risk arising from the
financial instruments it holds. The Fund may use derivatives and other instruments in connection with its risk management activities.
The Fund has in place guidelines that set out its overall business strategies and its general risk management philosophy and has
established processes to monitor and control economic hedging transactions in a timely and accurate manner. The Manager employs a
risk management process to monitor and control position risk in a timely and accurate manner.
The Fund’s accounting policies in relation to derivatives are set out in Note 2 to the condensed financial statements.
The Sub-Funds utilise various methods to value investments measured at fair value on a recurring and non-recurring basis.
Inputs are used in applying the various valuation techniques and broadly refer to the assumptions that market participants use to make
valuation decisions, including assumptions about risk. Inputs may include price information, volatility statistics, specific and broad
credit data, liquidity statistics, and other factors. A financial instrument’s level within the fair value hierarchy is based on the lowest
level of any input that is significant to the fair value measurement (lowest being level 3).
Observable inputs are those that market participants would use in pricing the asset or liability based on market data obtained from
sources independent of the Fund. Unobservable inputs reflect the Manager’s assumptions, made in good faith, about the inputs market
participants would use in pricing the asset or liability developed based on the best information available in the circumstances. The
determination of what constitutes _observable_ requires significant judgment by the Manager. The Manager considers observable data
to be that market data which is readily available, regularly distributed or updated, reliable and verifiable, not proprietary, and provided
by independent sources that are actively involved in the relevant market.
The categorisation of a financial instrument within the hierarchy is based upon the pricing transparency of the instrument and does not
necessarily correspond to the Manager’s perceived risk of that instrument.
Fair value is a market-based measure considered from the perspective of a market participant rather than an entity-specific measure.
Therefore, even when market assumptions are not readily available, the Manager’s own assumptions are set to reflect those that
market participants would use in pricing the asset or liability at the measurement date. The Manager uses prices and inputs that are
current as of the measurement date, including periods of market dislocation. In periods of market dislocation, the observability of
prices and inputs may be reduced for many securities. This condition could cause a security to be reclassified to a lower level within
the fair value hierarchy.
The three levels of inputs are defined as follows:
Level 1 - The unadjusted quoted price in active markets for identical assets or liabilities that the entity can access at the measurement
date;
Level 2 - Inputs other than quoted prices included within level 1 that are observable (i.e. developed using market data) for the asset or
liability, either directly or indirectly; and
Level 3 - Inputs that are unobservable (i.e. for which market data is unavailable) for the asset or liability.
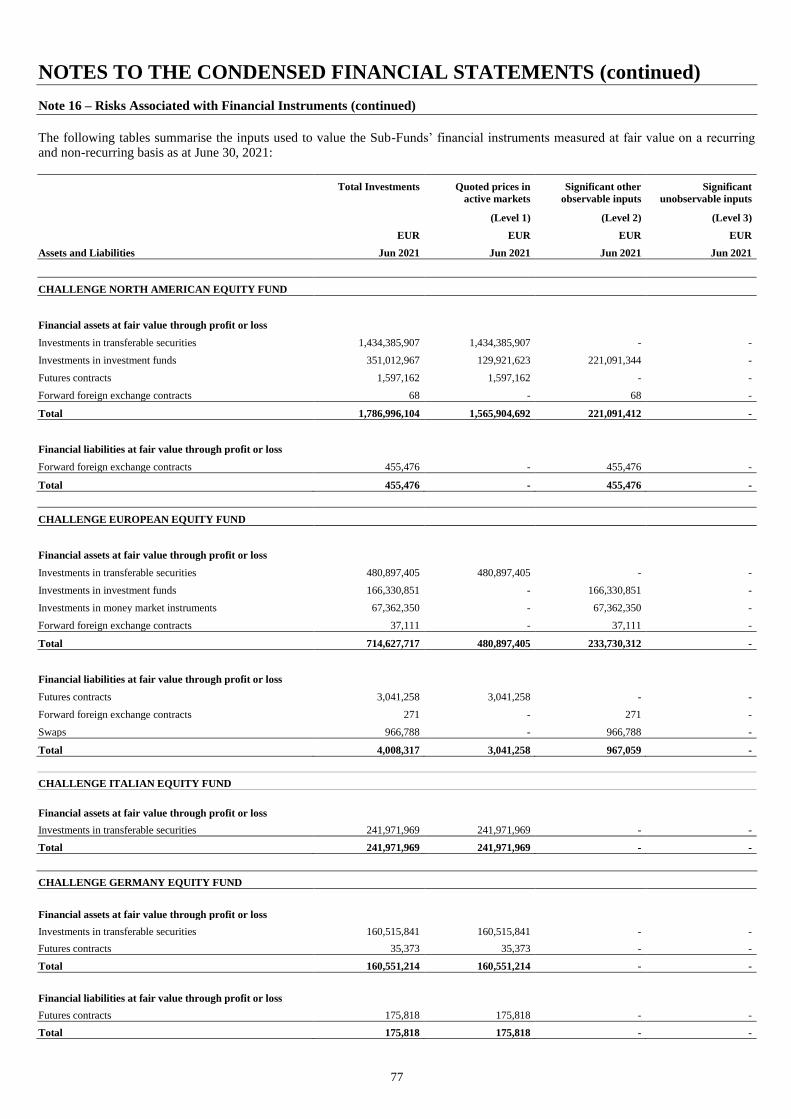
NOTES TO THE CONDENSED FINANCIAL STATEMENTS (continued)
77
Note 16 – Risks Associated with Financial Instruments (continued)
The following tables summarise the inputs used to value the Sub-Funds’ financial instruments measured at fair value on a recurring and non-recurring basis as at June 30, 2021:
Total Investments Quoted prices in
active markets
Significant other
observable inputs
Significant
unobservable inputs
(Level 1) (Level 2) (Level 3)
EUR EUR EUR EUR
Assets and Liabilities Jun 2021 Jun 2021 Jun 2021 Jun 2021
CHALLENGE NORTH AMERICAN EQUITY FUND
Financial assets at fair value through profit or loss
Investments in transferable securities 1,434,385,907 1,434,385,907 - -
Investments in investment funds 351,012,967 129,921,623 221,091,344 -
Futures contracts 1,597,162 1,597,162 - -
Forward foreign exchange contracts 68 - 68 -
Total 1,786,996,104 1,565,904,692 221,091,412 -
Financial liabilities at fair value through profit or loss
Forward foreign exchange contracts 455,476 - 455,476 -
Total 455,476 - 455,476 -
CHALLENGE EUROPEAN EQUITY FUND
Financial assets at fair value through profit or loss
Investments in transferable securities 480,897,405 480,897,405 - -
Investments in investment funds 166,330,851 - 166,330,851 -
Investments in money market instruments 67,362,350 - 67,362,350 -
Forward foreign exchange contracts 37,111 - 37,111 -
Total 714,627,717 480,897,405 233,730,312 -
Financial liabilities at fair value through profit or loss
Futures contracts 3,041,258 3,041,258 - -
Forward foreign exchange contracts 271 - 271 -
Swaps 966,788 - 966,788 -
Total 4,008,317 3,041,258 967,059 -
CHALLENGE ITALIAN EQUITY FUND
Financial assets at fair value through profit or loss
Investments in transferable securities 241,971,969 241,971,969 - -
Total 241,971,969 241,971,969 - -
CHALLENGE GERMANY EQUITY FUND
Financial assets at fair value through profit or loss
Investments in transferable securities 160,515,841 160,515,841 - -
Futures contracts 35,373 35,373 - -
Total 160,551,214 160,551,214 - -
Financial liabilities at fair value through profit or loss
Futures contracts 175,818 175,818 - -
Total 175,818 175,818 - -
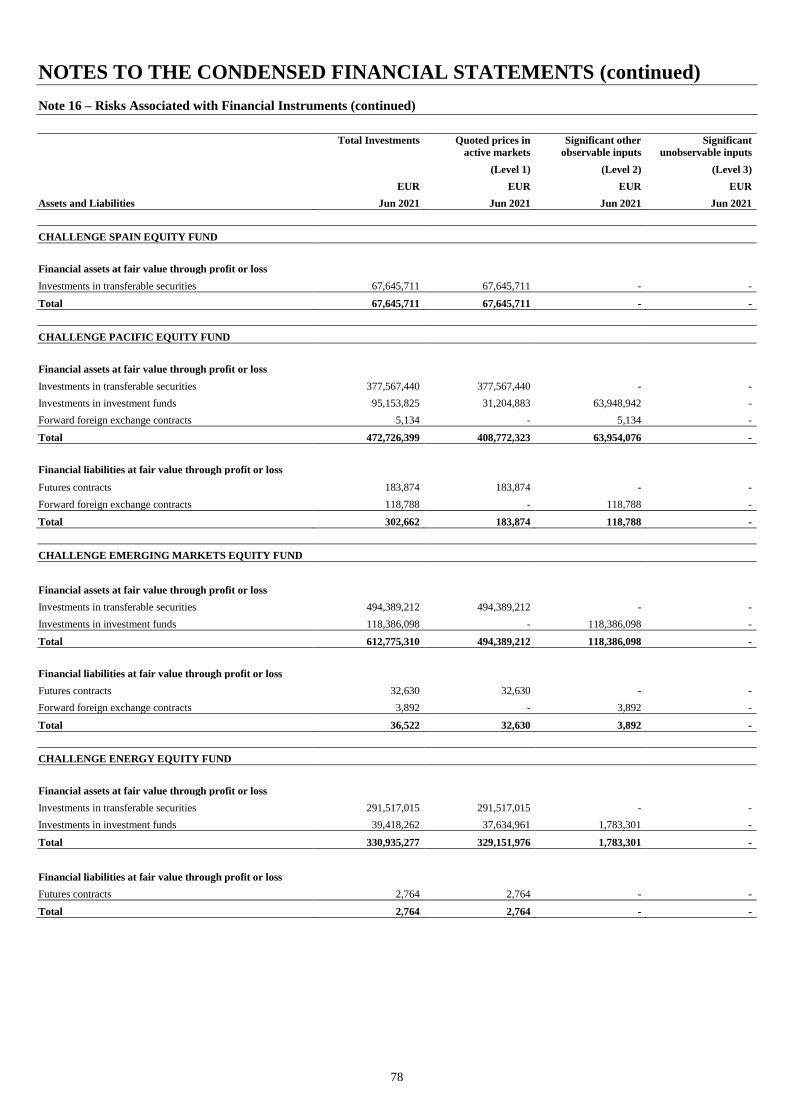
NOTES TO THE CONDENSED FINANCIAL STATEMENTS (continued)
78
Note 16 – Risks Associated with Financial Instruments (continued)
Total Investments Quoted prices in
active markets
Significant other
observable inputs
Significant
unobservable inputs
(Level 1) (Level 2) (Level 3)
EUR EUR EUR EUR
Assets and Liabilities Jun 2021 Jun 2021 Jun 2021 Jun 2021
CHALLENGE SPAIN EQUITY FUND
Financial assets at fair value through profit or loss
Investments in transferable securities 67,645,711 67,645,711 - -
Total 67,645,711 67,645,711 - -
CHALLENGE PACIFIC EQUITY FUND
Financial assets at fair value through profit or loss
Investments in transferable securities 377,567,440 377,567,440 - -
Investments in investment funds 95,153,825 31,204,883 63,948,942 -
Forward foreign exchange contracts 5,134 - 5,134 -
Total 472,726,399 408,772,323 63,954,076 -
Financial liabilities at fair value through profit or loss
Futures contracts 183,874 183,874 - -
Forward foreign exchange contracts 118,788 - 118,788 -
Total 302,662 183,874 118,788 -
CHALLENGE EMERGING MARKETS EQUITY FUND
Financial assets at fair value through profit or loss
Investments in transferable securities 494,389,212 494,389,212 - -
Investments in investment funds 118,386,098 - 118,386,098 -
Total 612,775,310 494,389,212 118,386,098 -
Financial liabilities at fair value through profit or loss
Futures contracts 32,630 32,630 - -
Forward foreign exchange contracts 3,892 - 3,892 -
Total 36,522 32,630 3,892 -
CHALLENGE ENERGY EQUITY FUND
Financial assets at fair value through profit or loss
Investments in transferable securities 291,517,015 291,517,015 - -
Investments in investment funds 39,418,262 37,634,961 1,783,301 -
Total 330,935,277 329,151,976 1,783,301 -
Financial liabilities at fair value through profit or loss
Futures contracts 2,764 2,764 - -
Total 2,764 2,764 - -
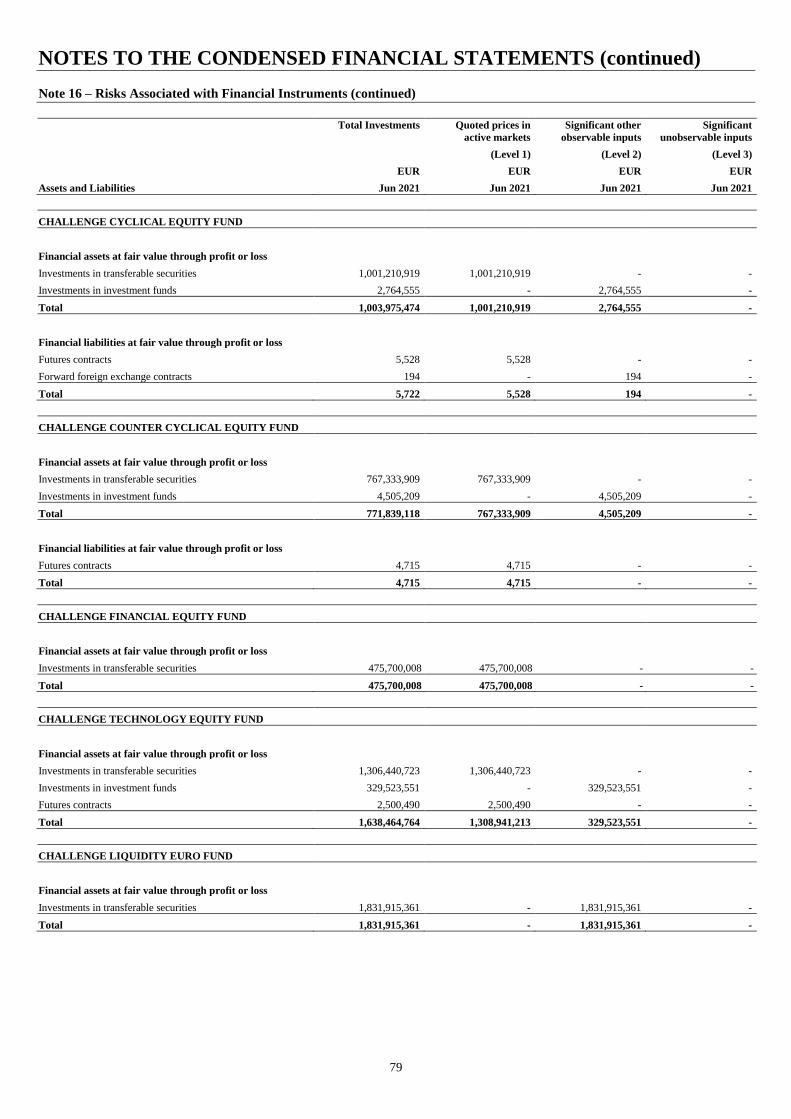
NOTES TO THE CONDENSED FINANCIAL STATEMENTS (continued)
79
Note 16 – Risks Associated with Financial Instruments (continued)
Total Investments Quoted prices in
active markets
Significant other
observable inputs
Significant
unobservable inputs
(Level 1) (Level 2) (Level 3)
EUR EUR EUR EUR
Assets and Liabilities Jun 2021 Jun 2021 Jun 2021 Jun 2021
CHALLENGE CYCLICAL EQUITY FUND
Financial assets at fair value through profit or loss
Investments in transferable securities 1,001,210,919 1,001,210,919 - -
Investments in investment funds 2,764,555 - 2,764,555 -
Total 1,003,975,474 1,001,210,919 2,764,555 -
Financial liabilities at fair value through profit or loss
Futures contracts 5,528 5,528 - -
Forward foreign exchange contracts 194 - 194 -
Total 5,722 5,528 194 -
CHALLENGE COUNTER CYCLICAL EQUITY FUND
Financial assets at fair value through profit or loss
Investments in transferable securities 767,333,909 767,333,909 - -
Investments in investment funds 4,505,209 - 4,505,209 -
Total 771,839,118 767,333,909 4,505,209 -
Financial liabilities at fair value through profit or loss
Futures contracts 4,715 4,715 - -
Total 4,715 4,715 - -
CHALLENGE FINANCIAL EQUITY FUND
Financial assets at fair value through profit or loss
Investments in transferable securities 475,700,008 475,700,008 - -
Total 475,700,008 475,700,008 - -
CHALLENGE TECHNOLOGY EQUITY FUND
Financial assets at fair value through profit or loss
Investments in transferable securities 1,306,440,723 1,306,440,723 - -
Investments in investment funds 329,523,551 - 329,523,551 -
Futures contracts 2,500,490 2,500,490 - -
Total 1,638,464,764 1,308,941,213 329,523,551 -
CHALLENGE LIQUIDITY EURO FUND
Financial assets at fair value through profit or loss
Investments in transferable securities 1,831,915,361 - 1,831,915,361 -
Total 1,831,915,361 - 1,831,915,361 -
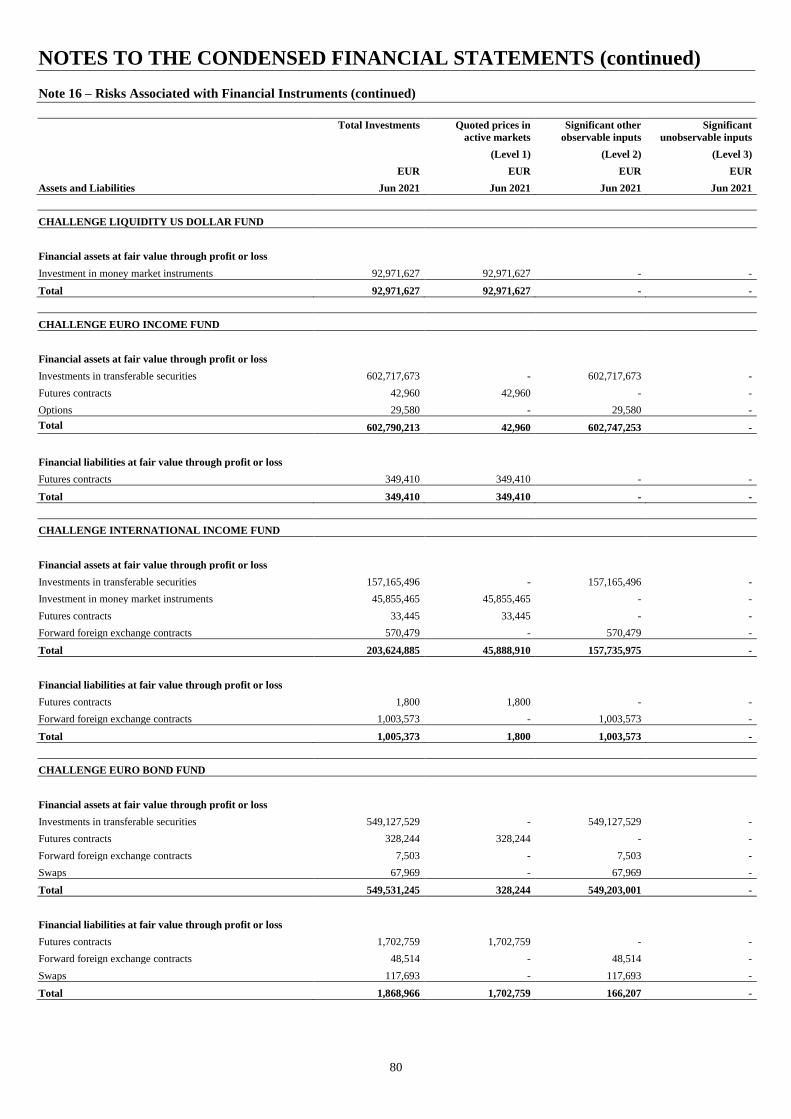
NOTES TO THE CONDENSED FINANCIAL STATEMENTS (continued)
80
Note 16 – Risks Associated with Financial Instruments (continued)
Total Investments Quoted prices in
active markets
Significant other
observable inputs
Significant
unobservable inputs
(Level 1) (Level 2) (Level 3)
EUR EUR EUR EUR
Assets and Liabilities Jun 2021 Jun 2021 Jun 2021 Jun 2021
CHALLENGE LIQUIDITY US DOLLAR FUND
Financial assets at fair value through profit or loss
Investment in money market instruments 92,971,627 92,971,627 - -
Total 92,971,627 92,971,627 - -
CHALLENGE EURO INCOME FUND
Financial assets at fair value through profit or loss
Investments in transferable securities 602,717,673 - 602,717,673 -
Futures contracts 42,960 42,960 - -
Options 29,580 - 29,580 -
Total 602,790,213 42,960 602,747,253 -
Financial liabilities at fair value through profit or loss
Futures contracts 349,410 349,410 - -
Total 349,410 349,410 - -
CHALLENGE INTERNATIONAL INCOME FUND
Financial assets at fair value through profit or loss
Investments in transferable securities 157,165,496 - 157,165,496 -
Investment in money market instruments 45,855,465 45,855,465 - -
Futures contracts 33,445 33,445 - -
Forward foreign exchange contracts 570,479 - 570,479 -
Total 203,624,885 45,888,910 157,735,975 -
Financial liabilities at fair value through profit or loss
Futures contracts 1,800 1,800 - -
Forward foreign exchange contracts 1,003,573 - 1,003,573 -
Total 1,005,373 1,800 1,003,573 -
CHALLENGE EURO BOND FUND
Financial assets at fair value through profit or loss
Investments in transferable securities 549,127,529 - 549,127,529 -
Futures contracts 328,244 328,244 - -
Forward foreign exchange contracts 7,503 - 7,503 -
Swaps 67,969 - 67,969 -
Total 549,531,245 328,244 549,203,001 -
Financial liabilities at fair value through profit or loss
Futures contracts 1,702,759 1,702,759 - -
Forward foreign exchange contracts 48,514 - 48,514 -
Swaps 117,693 - 117,693 -
Total 1,868,966 1,702,759 166,207 -
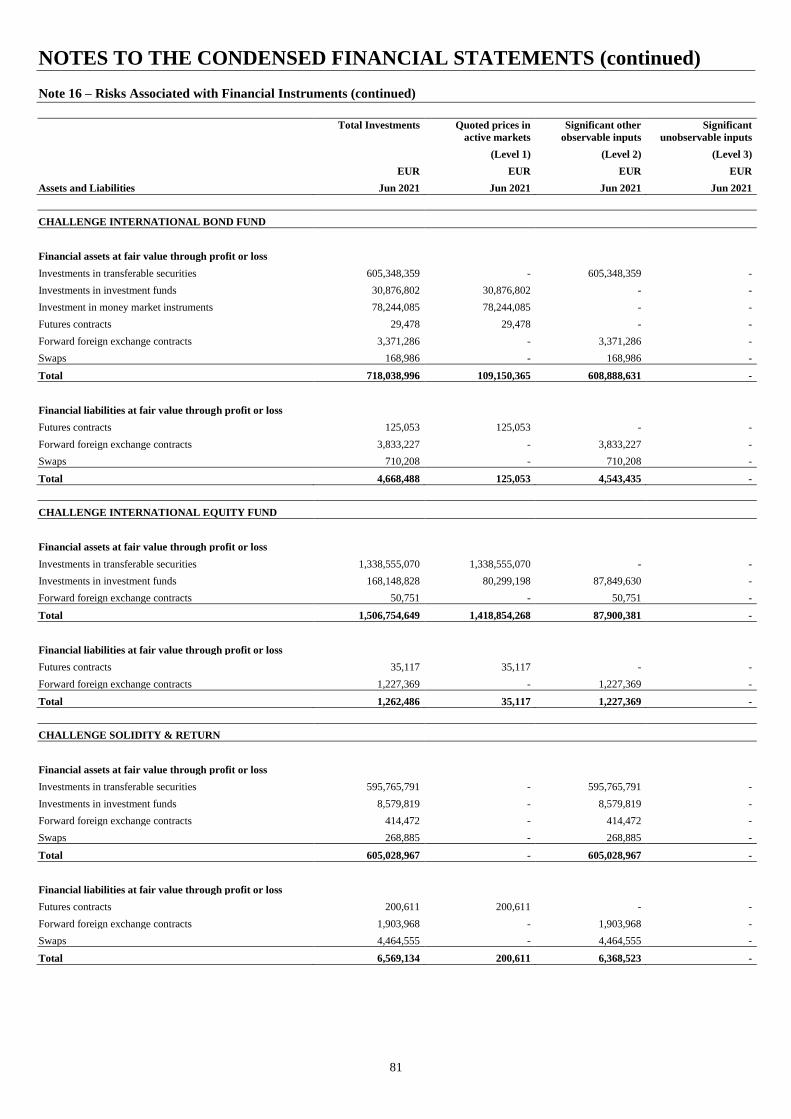
NOTES TO THE CONDENSED FINANCIAL STATEMENTS (continued)
81
Note 16 – Risks Associated with Financial Instruments (continued)
Total Investments Quoted prices in
active markets
Significant other
observable inputs
Significant
unobservable inputs
(Level 1) (Level 2) (Level 3)
EUR EUR EUR EUR
Assets and Liabilities Jun 2021 Jun 2021 Jun 2021 Jun 2021
CHALLENGE INTERNATIONAL BOND FUND
Financial assets at fair value through profit or loss
Investments in transferable securities 605,348,359 - 605,348,359 -
Investments in investment funds 30,876,802 30,876,802 - -
Investment in money market instruments 78,244,085 78,244,085 - -
Futures contracts 29,478 29,478 - -
Forward foreign exchange contracts 3,371,286 - 3,371,286 -
Swaps 168,986 - 168,986 -
Total 718,038,996 109,150,365 608,888,631 -
Financial liabilities at fair value through profit or loss
Futures contracts 125,053 125,053 - -
Forward foreign exchange contracts 3,833,227 - 3,833,227 -
Swaps 710,208 - 710,208 -
Total 4,668,488 125,053 4,543,435 -
CHALLENGE INTERNATIONAL EQUITY FUND
Financial assets at fair value through profit or loss
Investments in transferable securities 1,338,555,070 1,338,555,070 - -
Investments in investment funds 168,148,828 80,299,198 87,849,630 -
Forward foreign exchange contracts 50,751 - 50,751 -
Total 1,506,754,649 1,418,854,268 87,900,381 -
Financial liabilities at fair value through profit or loss
Futures contracts 35,117 35,117 - -
Forward foreign exchange contracts 1,227,369 - 1,227,369 -
Total 1,262,486 35,117 1,227,369 -
CHALLENGE SOLIDITY & RETURN
Financial assets at fair value through profit or loss
Investments in transferable securities 595,765,791 - 595,765,791 -
Investments in investment funds 8,579,819 - 8,579,819 -
Forward foreign exchange contracts 414,472 - 414,472 -
Swaps 268,885 - 268,885 -
Total 605,028,967 - 605,028,967 -
Financial liabilities at fair value through profit or loss
Futures contracts 200,611 200,611 - -
Forward foreign exchange contracts 1,903,968 - 1,903,968 -
Swaps 4,464,555 - 4,464,555 -
Total 6,569,134 200,611 6,368,523 -
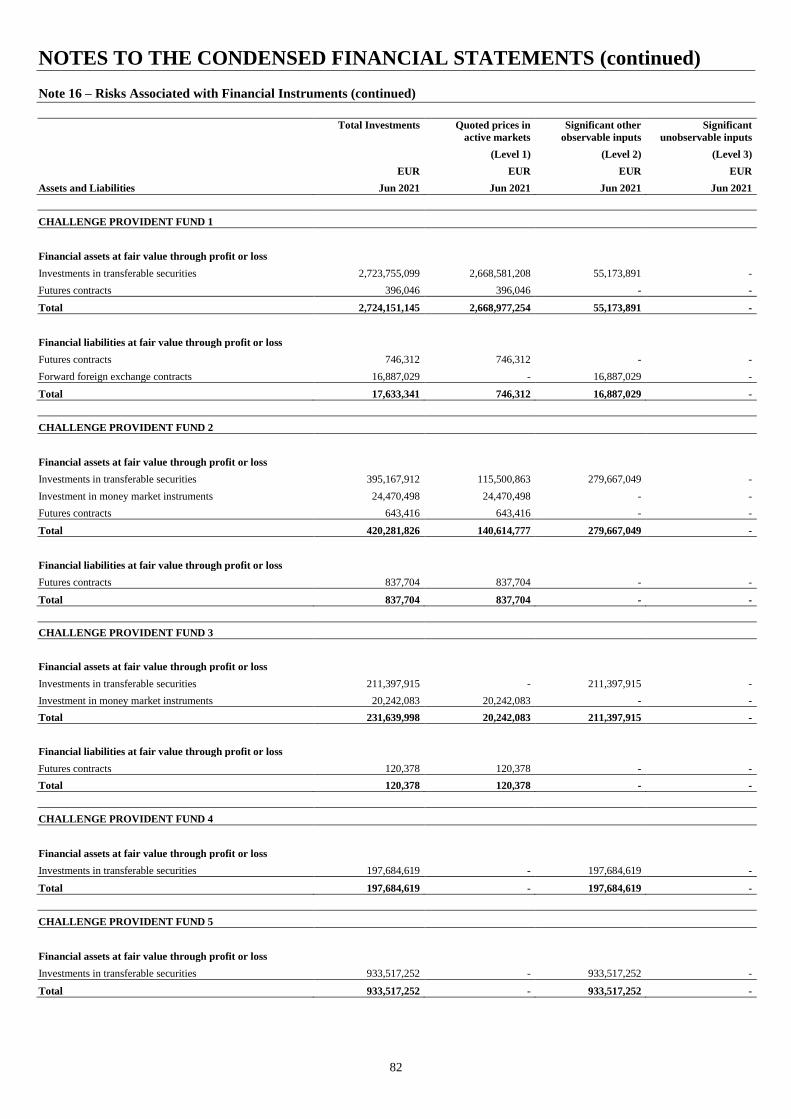
NOTES TO THE CONDENSED FINANCIAL STATEMENTS (continued)
82
Note 16 – Risks Associated with Financial Instruments (continued)
Total Investments Quoted prices in
active markets
Significant other
observable inputs
Significant
unobservable inputs
(Level 1) (Level 2) (Level 3)
EUR EUR EUR EUR
Assets and Liabilities Jun 2021 Jun 2021 Jun 2021 Jun 2021
CHALLENGE PROVIDENT FUND 1
Financial assets at fair value through profit or loss
Investments in transferable securities 2,723,755,099 2,668,581,208 55,173,891 -
Futures contracts 396,046 396,046 - -
Total 2,724,151,145 2,668,977,254 55,173,891 -
Financial liabilities at fair value through profit or loss
Futures contracts 746,312 746,312 - -
Forward foreign exchange contracts 16,887,029 - 16,887,029 -
Total 17,633,341 746,312 16,887,029 -
CHALLENGE PROVIDENT FUND 2
Financial assets at fair value through profit or loss
Investments in transferable securities 395,167,912 115,500,863 279,667,049 -
Investment in money market instruments 24,470,498 24,470,498 - -
Futures contracts 643,416 643,416 - -
Total 420,281,826 140,614,777 279,667,049 -
Financial liabilities at fair value through profit or loss
Futures contracts 837,704 837,704 - -
Total 837,704 837,704 - -
CHALLENGE PROVIDENT FUND 3
Financial assets at fair value through profit or loss
Investments in transferable securities 211,397,915 - 211,397,915 -
Investment in money market instruments 20,242,083 20,242,083 - -
Total 231,639,998 20,242,083 211,397,915 -
Financial liabilities at fair value through profit or loss
Futures contracts 120,378 120,378 - -
Total 120,378 120,378 - -
CHALLENGE PROVIDENT FUND 4
Financial assets at fair value through profit or loss
Investments in transferable securities 197,684,619 - 197,684,619 -
Total 197,684,619 - 197,684,619 -
CHALLENGE PROVIDENT FUND 5
Financial assets at fair value through profit or loss
Investments in transferable securities 933,517,252 - 933,517,252 -
Total 933,517,252 - 933,517,252 -
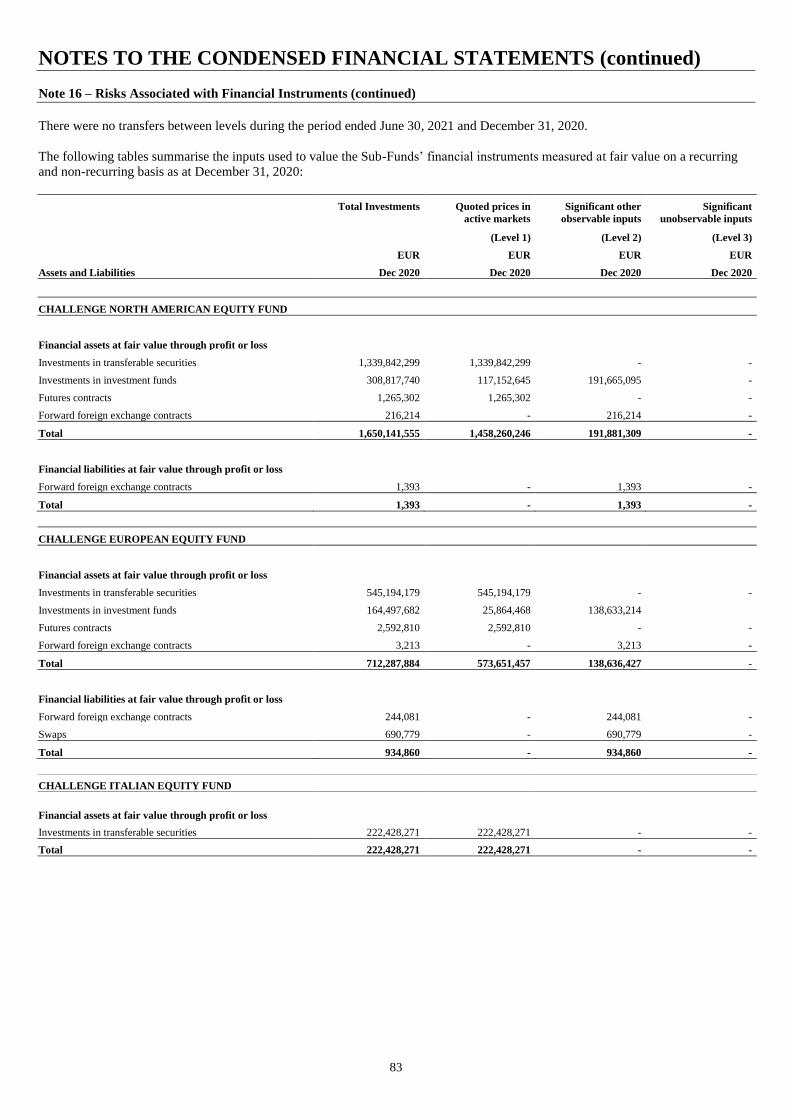
NOTES TO THE CONDENSED FINANCIAL STATEMENTS (continued)
83
Note 16 – Risks Associated with Financial Instruments (continued)
There were no transfers between levels during the period ended June 30, 2021 and December 31, 2020.
The following tables summarise the inputs used to value the Sub-Funds’ financial instruments measured at fair value on a recurring
and non-recurring basis as at December 31, 2020:
Total Investments Quoted prices in
active markets
Significant other
observable inputs
Significant
unobservable inputs
(Level 1) (Level 2) (Level 3)
EUR EUR EUR EUR
Assets and Liabilities Dec 2020 Dec 2020 Dec 2020 Dec 2020
CHALLENGE NORTH AMERICAN EQUITY FUND
Financial assets at fair value through profit or loss
Investments in transferable securities 1,339,842,299 1,339,842,299 - -
Investments in investment funds 308,817,740 117,152,645 191,665,095 -
Futures contracts 1,265,302 1,265,302 - -
Forward foreign exchange contracts 216,214 - 216,214 -
Total 1,650,141,555 1,458,260,246 191,881,309 -
Financial liabilities at fair value through profit or loss
Forward foreign exchange contracts 1,393 - 1,393 -
Total 1,393 - 1,393 -
CHALLENGE EUROPEAN EQUITY FUND
Financial assets at fair value through profit or loss
Investments in transferable securities 545,194,179 545,194,179 - -
Investments in investment funds 164,497,682 25,864,468 138,633,214
Futures contracts 2,592,810 2,592,810 - -
Forward foreign exchange contracts 3,213 - 3,213 -
Total 712,287,884 573,651,457 138,636,427 -
Financial liabilities at fair value through profit or loss
Forward foreign exchange contracts 244,081 - 244,081 -
Swaps 690,779 - 690,779 -
Total 934,860 - 934,860 -
CHALLENGE ITALIAN EQUITY FUND
Financial assets at fair value through profit or loss
Investments in transferable securities 222,428,271 222,428,271 - -
Total 222,428,271 222,428,271 - -
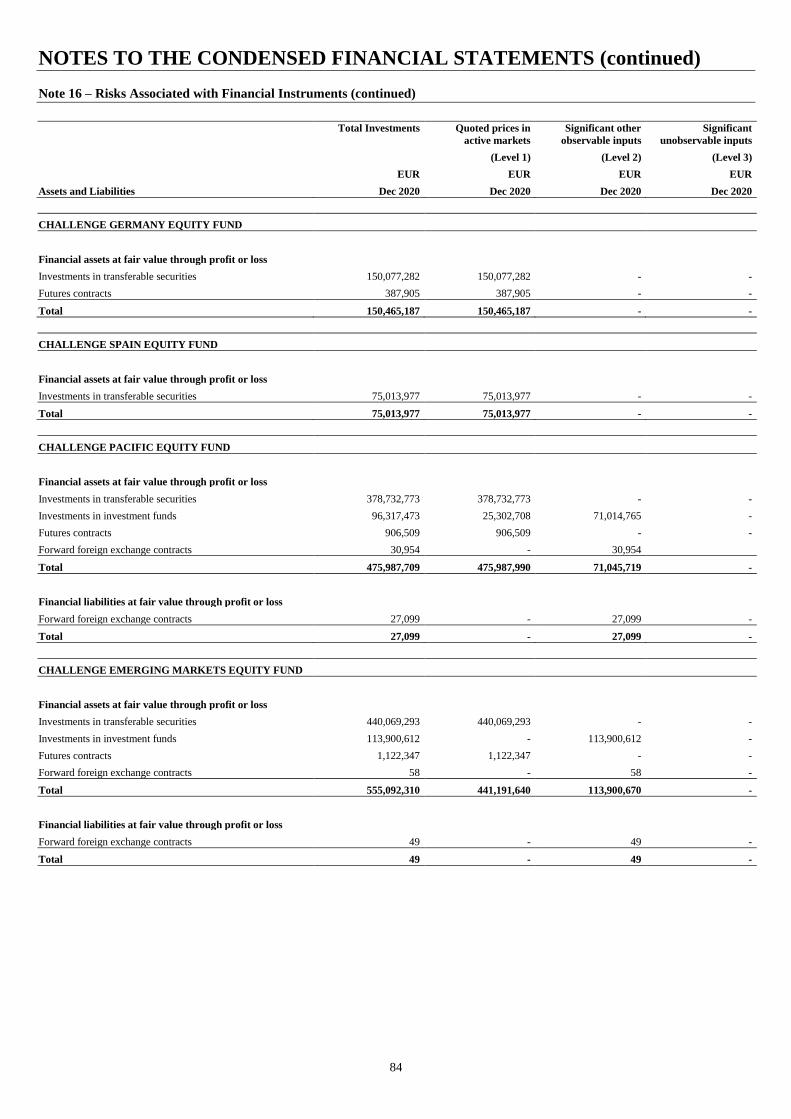
NOTES TO THE CONDENSED FINANCIAL STATEMENTS (continued)
84
Note 16 – Risks Associated with Financial Instruments (continued)
Total Investments Quoted prices in
active markets
Significant other
observable inputs
Significant
unobservable inputs
(Level 1) (Level 2) (Level 3)
EUR EUR EUR EUR
Assets and Liabilities Dec 2020 Dec 2020 Dec 2020 Dec 2020
CHALLENGE GERMANY EQUITY FUND
Financial assets at fair value through profit or loss
Investments in transferable securities 150,077,282 150,077,282 - -
Futures contracts 387,905 387,905 - -
Total 150,465,187 150,465,187 - -
CHALLENGE SPAIN EQUITY FUND
Financial assets at fair value through profit or loss
Investments in transferable securities 75,013,977 75,013,977 - -
Total 75,013,977 75,013,977 - -
CHALLENGE PACIFIC EQUITY FUND
Financial assets at fair value through profit or loss
Investments in transferable securities 378,732,773 378,732,773 - -
Investments in investment funds 96,317,473 25,302,708 71,014,765 -
Futures contracts 906,509 906,509 - -
Forward foreign exchange contracts 30,954 - 30,954
Total 475,987,709 475,987,990 71,045,719 -
Financial liabilities at fair value through profit or loss
Forward foreign exchange contracts 27,099 - 27,099 -
Total 27,099 - 27,099 -
CHALLENGE EMERGING MARKETS EQUITY FUND
Financial assets at fair value through profit or loss
Investments in transferable securities 440,069,293 440,069,293 - -
Investments in investment funds 113,900,612 - 113,900,612 -
Futures contracts 1,122,347 1,122,347 - -
Forward foreign exchange contracts 58 - 58 -
Total 555,092,310 441,191,640 113,900,670 -
Financial liabilities at fair value through profit or loss
Forward foreign exchange contracts 49 - 49 -
Total 49 - 49 -
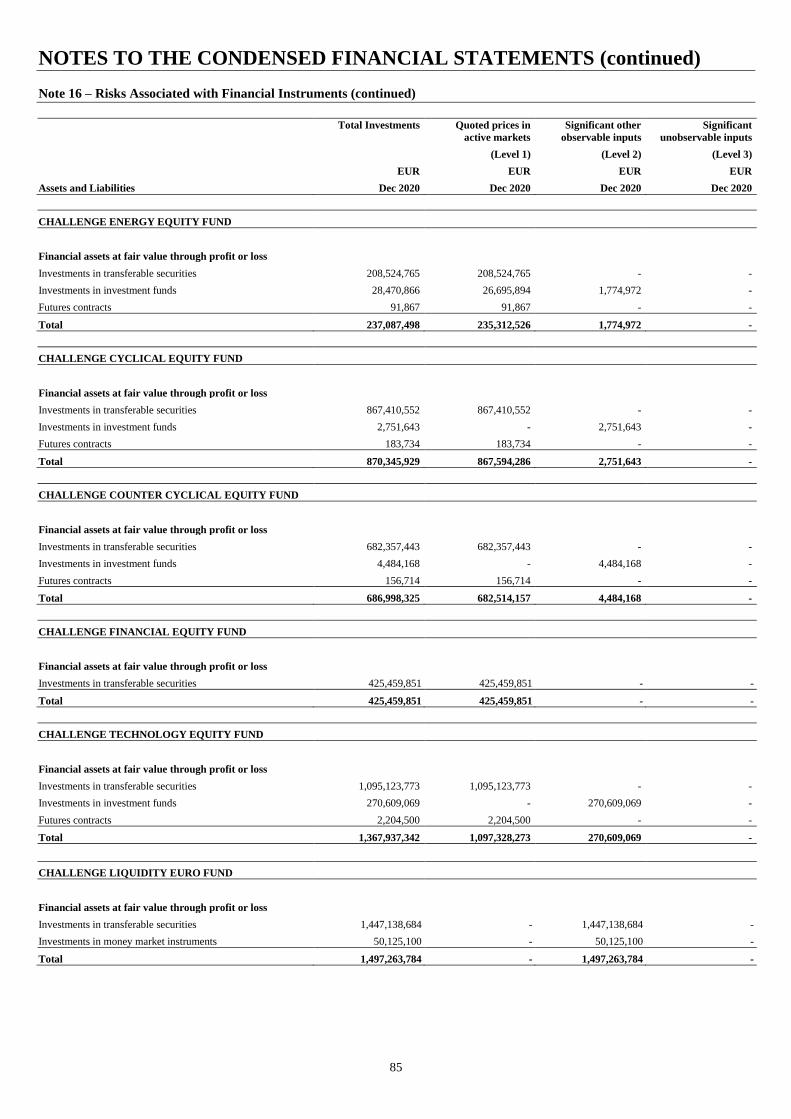
NOTES TO THE CONDENSED FINANCIAL STATEMENTS (continued)
85
Note 16 – Risks Associated with Financial Instruments (continued)
Total Investments Quoted prices in
active markets
Significant other
observable inputs
Significant
unobservable inputs
(Level 1) (Level 2) (Level 3)
EUR EUR EUR EUR
Assets and Liabilities Dec 2020 Dec 2020 Dec 2020 Dec 2020
CHALLENGE ENERGY EQUITY FUND
Financial assets at fair value through profit or loss
Investments in transferable securities 208,524,765 208,524,765 - -
Investments in investment funds 28,470,866 26,695,894 1,774,972 -
Futures contracts 91,867 91,867 - -
Total 237,087,498 235,312,526 1,774,972 -
CHALLENGE CYCLICAL EQUITY FUND
Financial assets at fair value through profit or loss
Investments in transferable securities 867,410,552 867,410,552 - -
Investments in investment funds 2,751,643 - 2,751,643 -
Futures contracts 183,734 183,734 - -
Total 870,345,929 867,594,286 2,751,643 -
CHALLENGE COUNTER CYCLICAL EQUITY FUND
Financial assets at fair value through profit or loss
Investments in transferable securities 682,357,443 682,357,443 - -
Investments in investment funds 4,484,168 - 4,484,168 -
Futures contracts 156,714 156,714 - -
Total 686,998,325 682,514,157 4,484,168 -
CHALLENGE FINANCIAL EQUITY FUND
Financial assets at fair value through profit or loss
Investments in transferable securities 425,459,851 425,459,851 - -
Total 425,459,851 425,459,851 - -
CHALLENGE TECHNOLOGY EQUITY FUND
Financial assets at fair value through profit or loss
Investments in transferable securities 1,095,123,773 1,095,123,773 - -
Investments in investment funds 270,609,069 - 270,609,069 -
Futures contracts 2,204,500 2,204,500 - -
Total 1,367,937,342 1,097,328,273 270,609,069 -
CHALLENGE LIQUIDITY EURO FUND
Financial assets at fair value through profit or loss
Investments in transferable securities 1,447,138,684 - 1,447,138,684 -
Investments in money market instruments 50,125,100 - 50,125,100 -
Total 1,497,263,784 - 1,497,263,784 -
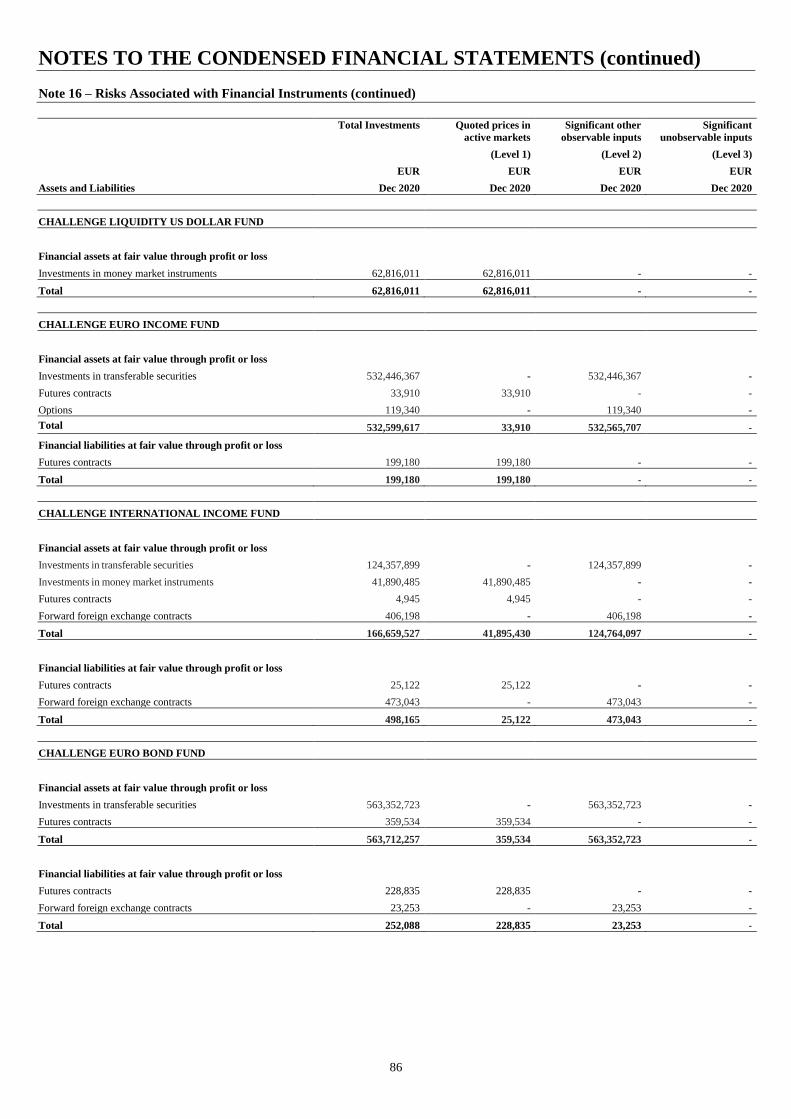
NOTES TO THE CONDENSED FINANCIAL STATEMENTS (continued)
86
Note 16 – Risks Associated with Financial Instruments (continued)
Total Investments Quoted prices in
active markets
Significant other
observable inputs
Significant
unobservable inputs
(Level 1) (Level 2) (Level 3)
EUR EUR EUR EUR
Assets and Liabilities Dec 2020 Dec 2020 Dec 2020 Dec 2020
CHALLENGE LIQUIDITY US DOLLAR FUND
Financial assets at fair value through profit or loss
Investments in money market instruments 62,816,011 62,816,011 - -
Total 62,816,011 62,816,011 - -
CHALLENGE EURO INCOME FUND
Financial assets at fair value through profit or loss
Investments in transferable securities 532,446,367 - 532,446,367 -
Futures contracts 33,910 33,910 - -
Options 119,340 - 119,340 -
Total 532,599,617 33,910 532,565,707 -
Financial liabilities at fair value through profit or loss
Futures contracts 199,180 199,180 - -
Total 199,180 199,180 - -
CHALLENGE INTERNATIONAL INCOME FUND
Financial assets at fair value through profit or loss
Investments in transferable securities 124,357,899 - 124,357,899 -
Investments in money market instruments 41,890,485 41,890,485 - -
Futures contracts 4,945 4,945 - -
Forward foreign exchange contracts 406,198 - 406,198 -
Total 166,659,527 41,895,430 124,764,097 -
Financial liabilities at fair value through profit or loss
Futures contracts 25,122 25,122 - -
Forward foreign exchange contracts 473,043 - 473,043 -
Total 498,165 25,122 473,043 -
CHALLENGE EURO BOND FUND
Financial assets at fair value through profit or loss
Investments in transferable securities 563,352,723 - 563,352,723 -
Futures contracts 359,534 359,534 - -
Total 563,712,257 359,534 563,352,723 -
Financial liabilities at fair value through profit or loss
Futures contracts 228,835 228,835 - -
Forward foreign exchange contracts 23,253 - 23,253 -
Total 252,088 228,835 23,253 -

NOTES TO THE CONDENSED FINANCIAL STATEMENTS (continued)
87
Note 16 – Risks Associated with Financial Instruments (continued)
Total Investments Quoted prices in
active markets
Significant other
observable inputs
Significant
unobservable inputs
(Level 1) (Level 2) (Level 3)
EUR EUR EUR EUR
Assets and Liabilities Dec 2020 Dec 2020 Dec 2020 Dec 2020
CHALLENGE INTERNATIONAL BOND FUND
Financial assets at fair value through profit or loss
Investments in transferable securities 582,984,761 - 582,984,761 -
Investments in investment funds 14,823,883 14,823,883 - -
Investments in money market instruments 80,820,491 80,820,491 - -
Futures contracts 107,819 107,819 - -
Forward foreign exchange contracts 1,637,777 - 1,637,777 -
Swaps 1,135,726 - 1,135,726 -
Total 681,510,457 95,752,193 585,758,264 -
Financial liabilities at fair value through profit or loss
Futures contracts 53,531 53,531 - -
Forward foreign exchange contracts 1,976,791 - 1,976,791 -
Swaps 411,223 - 411,223 -
Total 2,441,545 53,531 2,388,014 -
CHALLENGE INTERNATIONAL EQUITY FUND
Financial assets at fair value through profit or loss
Investments in transferable securities 1,182,646,060 1,182,646,060 - -
Investments in investment funds 187,320,868 32,076,175 155,244,693 -
Futures contracts 1,167,253 1,167,253 - -
Forward foreign exchange contracts 556,245 - 556,245 -
Total 1,371,690,426 1,215,889,488 155,800,938 -
Financial liabilities at fair value through profit or loss
Forward foreign exchange contracts 288,808 - 288,808 -
Total 288,808 - 288,808 -
CHALLENGE SOLIDITY & RETURN
Financial assets at fair value through profit or loss
Investments in transferable securities 530,938,286 - 530,938,286 -
Investments in investment funds 19,644,972 11,465,228 8,179,744 -
Investments in money market instruments 16,865,943 16,865,943 - -
Futures contracts 161,533 161,533 - -
Forward foreign exchange contracts 616,914 - 616,914 -
Swaps 3,281,570 - 3,281,570 -
Total 571,509,218 28,492,704 543,016,514 -
Financial liabilities at fair value through profit or loss
Swaps 715,087 - 715,087 -
Total 715,087 - 715,087 -

NOTES TO THE CONDENSED FINANCIAL STATEMENTS (continued)
88
Note 16 – Risks Associated with Financial Instruments (continued)
Total Investments Quoted prices in
active markets
Significant other
observable inputs
Significant
unobservable inputs
(Level 1) (Level 2) (Level 3)
EUR EUR EUR EUR
Assets and Liabilities Dec 2020 Dec 2020 Dec 2020 Dec 2020
CHALLENGE PROVIDENT FUND 1
Financial assets at fair value through profit or loss
Investments in transferable securities 2,500,811,207 2,360,600,931 140,210,276 -
Futures contracts 2,882,116 2,882,116 - -
Forward foreign exchange contracts 6,113,775 - 6,113,775 -
Total 2,509,807,098 2,363,483,047 146,324,051 -
Financial liabilities at fair value through profit or loss
Futures contracts 715,291 715,291 - -
Total 715,291 715,291 - -
CHALLENGE PROVIDENT FUND 2
Financial assets at fair value through profit or loss
Investments in transferable securities 370,098,542 97,633,031 272,465,511 -
Investments in money market instruments 24,722,036 23,218,362 1,503,674 -
Futures contracts 2,450,192 2,450,192 - -
Total 397,270,770 123,301,585 273,969,185 -
Financial liabilities at fair value through profit or loss
Futures contracts 190,789 190,789 - -
Total 190,789 190,789 - -
CHALLENGE PROVIDENT FUND 3
Financial assets at fair value through profit or loss
Investments in transferable securities 203,671,424 - 203,671,424 -
Investments in money market instruments 17,245,757 17,245,757 - -
Total 220,917,181 17,245,757 203,671,424 -
CHALLENGE PROVIDENT FUND 4
Financial assets at fair value through profit or loss
Investments in transferable securities 167,375,532 - 167,375,532 -
Investments in money market instruments 9,773,887 - 9,773,887 -
Total 177,149,419 - 177,149,419 -
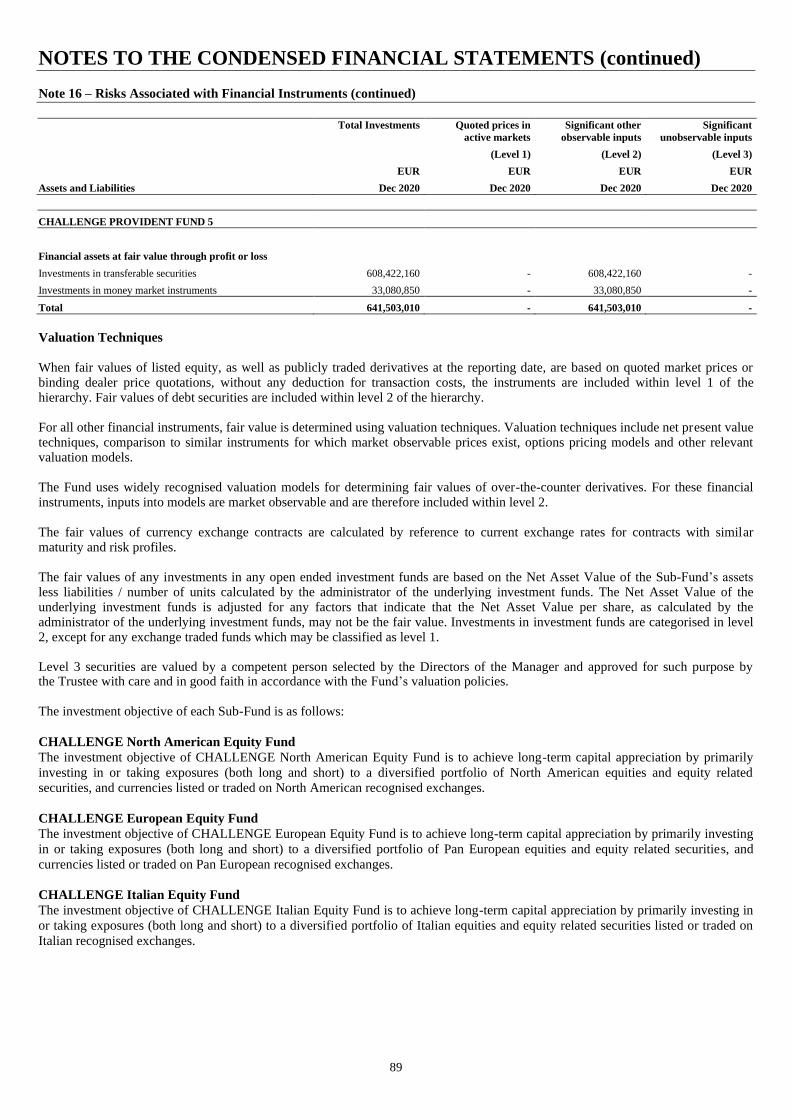
NOTES TO THE CONDENSED FINANCIAL STATEMENTS (continued)
89
Note 16 – Risks Associated with Financial Instruments (continued)
Total Investments Quoted prices in
active markets
Significant other
observable inputs
Significant
unobservable inputs
(Level 1) (Level 2) (Level 3)
EUR EUR EUR EUR
Assets and Liabilities Dec 2020 Dec 2020 Dec 2020 Dec 2020
CHALLENGE PROVIDENT FUND 5
Financial assets at fair value through profit or loss
Investments in transferable securities 608,422,160 - 608,422,160 -
Investments in money market instruments 33,080,850 - 33,080,850 -
Total 641,503,010 - 641,503,010 -
Valuation Techniques
When fair values of listed equity, as well as publicly traded derivatives at the reporting date, are based on quoted market prices or binding dealer price quotations, without any deduction for transaction costs, the instruments are included within level 1 of the hierarchy. Fair values of debt securities are included within level 2 of the hierarchy. For all other financial instruments, fair value is determined using valuation techniques. Valuation techniques include net present value techniques, comparison to similar instruments for which market observable prices exist, options pricing models and other relevant valuation models. The Fund uses widely recognised valuation models for determining fair values of over-the-counter derivatives. For these financial instruments, inputs into models are market observable and are therefore included within level 2. The fair values of currency exchange contracts are calculated by reference to current exchange rates for contracts with similar maturity and risk profiles. The fair values of any investments in any open ended investment funds are based on the Net Asset Value of the Sub-Fund’s assets less liabilities / number of units calculated by the administrator of the underlying investment funds. The Net Asset Value of the underlying investment funds is adjusted for any factors that indicate that the Net Asset Value per share, as calculated by the administrator of the underlying investment funds, may not be the fair value. Investments in investment funds are categorised in level 2, except for any exchange traded funds which may be classified as level 1. Level 3 securities are valued by a competent person selected by the Directors of the Manager and approved for such purpose by the Trustee with care and in good faith in accordance with the Fund’s valuation policies.
The investment objective of each Sub-Fund is as follows:
CHALLENGE North American Equity Fund
The investment objective of CHALLENGE North American Equity Fund is to achieve long-term capital appreciation by primarily
investing in or taking exposures (both long and short) to a diversified portfolio of North American equities and equity related
securities, and currencies listed or traded on North American recognised exchanges.
CHALLENGE European Equity Fund
The investment objective of CHALLENGE European Equity Fund is to achieve long-term capital appreciation by primarily investing
in or taking exposures (both long and short) to a diversified portfolio of Pan European equities and equity related securities, and
currencies listed or traded on Pan European recognised exchanges.
CHALLENGE Italian Equity Fund
The investment objective of CHALLENGE Italian Equity Fund is to achieve long-term capital appreciation by primarily investing in
or taking exposures (both long and short) to a diversified portfolio of Italian equities and equity related securities listed or traded on
Italian recognised exchanges.

NOTES TO THE CONDENSED FINANCIAL STATEMENTS (continued)
90
Note 16 – Risks Associated with Financial Instruments (continued)
CHALLENGE Germany Equity Fund
The investment objective of CHALLENGE Germany Equity Fund is to achieve long-term capital appreciation by primarily investing
in or taking exposures (both long and short) to a diversified portfolio of German equities and equity related securities listed or traded
on German recognised exchanges.
CHALLENGE Spain Equity Fund
The investment objective of CHALLENGE Spain Equity Fund is to achieve long-term capital appreciation by primarily investing in
or taking exposures (both long and short) to a diversified portfolio of Spanish equities and equity related securities listed or traded on
Spanish recognised exchanges.
CHALLENGE Pacific Equity Fund
The investment objective of CHALLENGE Pacific Equity Fund is to achieve long-term capital appreciation by primarily investing in
or taking exposures (both long and short) to a diversified portfolio of Asia/Pacific equities and equity related securities, and
currencies listed or traded on recognised exchanges in the Asia/Pacific region.
CHALLENGE Emerging Markets Equity Fund
The investment objective of CHALLENGE Emerging Markets Equity Fund is to achieve long-term capital appreciation by primarily
investing in or taking exposures (both long and short) on a global basis to a diversified portfolio of emerging market equities and
equity related securities, and currencies listed or traded on recognised exchanges in the emerging markets.
CHALLENGE Energy Equity Fund
The investment objective of CHALLENGE Energy Equity Fund is to achieve long-term capital appreciation by primarily investing in
or taking exposures (both long and short) on a global basis to a diversified portfolio of equities and equity related securities in the
energy sector or related industries, including but not limited to oil, gas, electricity and the "new" energies (such as renewable and
alternative energies) sectors and currencies listed or traded on recognised exchanges worldwide.
CHALLENGE Cyclical Equity Fund
The investment objective of CHALLENGE Cyclical Equity Fund is to achieve long term capital appreciation by primarily investing
in or taking exposures (both long and short) on a global basis to a diversified portfolio of equities and equity related securities in
sectors which in normal market conditions tend to be sensitive to the economic cycle, including but not limited to the consumer,
media, industrial, agricultural, precious metals, mineral and commodities sectors and currencies listed or traded on recognised
exchanges worldwide.
CHALLENGE Counter Cyclical Equity Fund
The investment objective of CHALLENGE Counter Cyclical Equity Fund is to achieve long term capital appreciation by primarily
investing in or taking exposures (both long and short) on a global basis in a diversified portfolio of equities and equity related
securities in sectors which in normal market conditions may not be sensitive to the economic cycle, including but not limited to the
healthcare, food & beverage and utilities sectors and currencies listed or traded on recognised exchanges worldwide.
CHALLENGE Financial Equity Fund
The investment objective of CHALLENGE Financial Equity Fund is to achieve long term capital appreciation by investing primarily
on a global basis in a diversified portfolio of equities and equity related securities in the financial sector including but not limited to
banks, insurance, financial services as well as equity securities and securities of issuers that are principally engaged in or related to
property and infrastructure and also Real Estate Investment Trust schemes (REITs) and currencies listed or traded on recognised
exchanges worldwide.
CHALLENGE Technology Equity Fund
The investment objective of CHALLENGE Technology Equity Fund is to achieve long term capital appreciation by investing
primarily on a global basis in a diversified portfolio of equities and equity related securities in the technology sector, including but not
limited to the I.T., telecoms and biotechnology sectors and currencies listed or traded on recognised exchanges worldwide.
CHALLENGE Liquidity Euro Fund
The investment objective of CHALLENGE Liquidity Euro Fund is to provide capital stability from a diversified portfolio of
worldwide high quality fixed income securities denominated in Euro listed and/or traded on recognised exchanges worldwide while
limiting fluctuations in principal value.
NOTES TO THE CONDENSED FINANCIAL STATEMENTS (continued)
91
Note 16 – Risks Associated with Financial Instruments (continued)
CHALLENGE Liquidity US Dollar Fund
The investment objective of CHALLENGE Liquidity US Dollar Fund is to provide capital stability from a diversified portfolio of
worldwide high quality fixed income securities denominated in US Dollar listed and/or traded on recognised exchanges worldwide
while limiting fluctuations in principal value.
CHALLENGE Euro Income Fund
The investment objective of CHALLENGE Euro Income Fund is to provide short-medium term capital appreciation from a
diversified portfolio of worldwide high quality fixed income securities denominated in Euro and/or hedged into Euro listed and/or
traded on recognised exchanges worldwide while limiting fluctuations in principal value.
CHALLENGE International Income Fund
The investment objective of CHALLENGE International Income Fund is to provide short-medium term capital appreciation from a
diversified portfolio of worldwide high quality fixed income securities listed and/or traded on recognised exchanges worldwide while
limiting fluctuations in principal value.
CHALLENGE Euro Bond Fund
The investment objective of CHALLENGE Euro Bond Fund is to provide medium-long term capital appreciation from a diversified
portfolio of worldwide high quality fixed income securities denominated in Euro and/or hedged into Euro listed and/or traded on
recognised exchanges worldwide while limiting fluctuations in principal value.
CHALLENGE International Bond Fund
The investment objective of CHALLENGE International Bond Fund is to provide medium-long term capital appreciation from a
diversified portfolio of worldwide high quality fixed income securities listed and/or traded on recognised exchanges worldwide while
limiting fluctuations in principal value.
CHALLENGE International Equity Fund
The investment objective of CHALLENGE International Equity Fund is to achieve long-term capital appreciation by primarily
investing in or taking exposures (both long and short) on a global basis to a diversified portfolio of equities and equity related
securities and currencies, listed or traded on recognised exchanges worldwide.
CHALLENGE Solidity & Return
The investment objective of CHALLENGE Solidity & Return is to achieve consistent risk-adjusted absolute returns, irrespective of
prevailing market conditions and to pay periodic dividends while simultaneously aiming to achieve capital preservation over a
medium term investment horizon.
CHALLENGE Provident Fund 1
The investment objective of CHALLENGE Provident Fund 1 is to achieve long-term capital appreciation by investing in a diversified
portfolio of equities and equity related securities, listed or traded on any regulated exchanges worldwide, and UCITS investment
funds.
CHALLENGE Provident Fund 2
The investment objective of CHALLENGE Provident Fund 2 is to achieve long-term capital appreciation by primarily investing into
a diversified portfolio of equities and equity related securities, fixed income securities listed or traded on any regulated exchanges
worldwide, and UCITS investment funds.
CHALLENGE Provident Fund 3
The investment objective of CHALLENGE Provident Fund 3 is to achieve long-term capital appreciation by primarily investing in a
diversified portfolio of fixed income securities listed or traded on any regulated exchanges worldwide, and UCITS investment funds.
CHALLENGE Provident Fund 4
The investment objective of CHALLENGE Provident Fund 4 is to achieve medium/long-term capital appreciation by primarily
investing in a diversified portfolio of Euro denominated fixed income securities listed or traded on any regulated exchanges
worldwide, and UCITS investment funds. The Sub-Fund may also invest in fixed income securities which are denominated in a
currency other than the Euro where though the use of FDIs the Sub-Fund's currency exposure of such securities is converted to Euro.
CHALLENGE Provident Fund 5
The investment objective of CHALLENGE Provident Fund 5 is to achieve consistent risk-adjusted absolute returns, irrespective of
prevailing market conditions over a medium/long-term investment horizon by investing in a diversified portfolio of equities and
equity related securities, fixed income securities, money market instruments and listed or traded on any regulated exchange
worldwide, and UCITS investment funds.
NOTES TO THE CONDENSED FINANCIAL STATEMENTS (continued)
92
Note 16 – Risks Associated with Financial Instruments (continued)
The Schedules of Investments on pages 112 to 302 are representative of the type of investments held during the financial period.
The Fund has investment guidelines that set out its overall business strategies, its tolerance for risk and its general risk management
philosophy and has established processes to monitor and control economic hedging transactions in a timely and accurate manner. The
Fund has a Risk Management Process in place for the use of financial derivative investments which has been approved by the
Directors of the Manager and the Central Bank of Ireland.
Set out below is a description of some of the more important types of risk and an outline of the processes the Manager has implemented to assess, monitor and control these specific risks.
The main risks arising from the Sub-Funds financial instruments are market price, foreign currency, liquidity, credit and interest rate
risks.
(a) Market Price Risk
Market price risk arises mainly from uncertainty about future prices of financial instruments held. It represents the potential loss the Sub-Funds might suffer through holding market positions in the face of price movements. Certain Sub-Funds may invest in emerging markets. Such securities may involve a high degree of risk and may be considered speculative. Risks include (i) greater risk of expropriation, confiscatory taxation, nationalisation, and social, political and economic instability; (ii) the small current size of the markets for securities of emerging markets issuers and the currently low or non-existent volume of trading, resulting in lack of liquidity and in price volatility; (iii) certain national policies which may restrict a Sub-Fund’s investment opportunities including restrictions on investing in issuers or industries deemed sensitive to relevant national interests; and (iv) the absence of developed legal structures governing private or foreign investment and private property. The Manager considers the asset allocation of the portfolios of the Sub-Funds to minimise the risk associated with particular market sectors whilst continuing to follow the investment objectives.
Global Exposure to Financial Derivative Instruments
The Manager’s risk management department has assessed the risk profile of the Fund and the related Sub-Funds on the basis
of the investment policy, strategy and the use of financial derivative instruments. Based on the risk profile and where the
Sub-Fund holds financial derivative instruments, risk management has determined that the method for the calculation of the
global exposure to financial derivative instruments for all Sub-Funds will be the commitment approach. The exceptions to
using the commitment approach are CHALLENGE Solidity & Return Fund and CHALLENGE Euro Bond Fund where the
absolute VaR approach is used; the Sub-Funds changed from Parametic to a Historical methodology on September 1, 2020.
(b) Currency Risk
The value of the assets of the Sub-Fund will be affected by fluctuations in the value of the currencies in which the Sub-
Fund’s portfolio securities are quoted or denominated relative to the base currency. Currency exchange rates may fluctuate
significantly over short periods of time, causing together with other factors the Sub-Fund’s Net Asset Value to fluctuate.
Sub-Funds that invest in investment funds have indirect exposure to the currencies of the underlying investments within
those investment funds.
As disclosed in Note 11, Sub-Funds may invest in financial derivative instruments, including currency derivatives, for
investment and efficient portfolio management purposes which will increase or decrease the relevant Sub-Fund’s exposure to
individual currencies relative to the portfolio of investments held.
The Manager or the Delegate Investment Manager, as appropriate, may try to mitigate currency risk for hedged unit Classes
by using financial instruments such as currency forwards. If the Manager or the Delegate Investment Manager, as
appropriate, enters into such transactions, then the gains/losses on and the resultant costs of the relevant transactions will be
solely attributable to the relevant Class of units and may not be combined or offset against the exposures of other Classes or
specific assets.
As at June 30, 2021 the following Sub-Funds have hedged unit Classes:
CHALLENGE North American Equity Fund
CHALLENGE European Equity Fund
CHALLENGE Pacific Equity Fund
CHALLENGE International Income Fund
CHALLENGE International Bond Fund
CHALLENGE International Equity Fund
NOTES TO THE CONDENSED FINANCIAL STATEMENTS (continued)
93
Note 16 – Risks Associated with Financial Instruments (continued)
(b) Currency Risk (continued)
In executing Class hedging, the Manager employs a look through approach in respect of currency exposure of investment
funds.
Where the Manager or the Delegate Investment Manager, as appropriate, seeks to hedge against currency fluctuations, while
not intended, this could result in over-hedged or under-hedged positions due to external factors outside the control of the
Manager or the Delegate Investment Manager. However over-hedged positions will not exceed 105% of the Net Asset Value
and hedged positions will be under review by the Manager or the Delegate Investment Manager to ensure that positions in
excess of 100% of Net Asset Value will not be carried forward from month to month.
(c) Liquidity Risk
Liquidity risk is the risk that an entity will encounter difficulty in realising assets or otherwise raising funds to meet
commitments associated with financial instruments.
Generally the Sub-Funds’ assets are composed of actively traded and highly liquid securities. The liquidity risks associated
with the need to satisfy Unitholders’ requests for redemptions are mitigated by maintaining a constant pool of cash to satisfy
usual levels of demand.
The Sub-Funds avoid entering into derivative contractual arrangements that produce an exposure not covered by sufficient
liquid assets or a total investment exposure in excess of total Unitholders’ funds. The risk management guidelines adopted by
the Manager require coverage to be composed of cash reserves or physical securities.
Concentration Risk
Certain Sub-Funds may have a concentrated Unitholder base where large institutional type Unitholders hold a significant
portion of the net assets of a Sub-Fund. This exposes other Unitholders in the Sub-Fund to certain risks. These risks include
the risk that a large portion of the assets of a Sub-Fund may be redeemed on any day which could impact the overall viability
of the Sub-Fund or could impact the ability of other Unitholders, who have not submitted redemption requests on that day, to
redeem from the Sub-Fund.
(d) Credit Risk
Credit risk arises where there exists a possibility that a loss may occur from the failure of another party to perform according
to the terms of a contract. Each Sub-Fund will have credit exposure to counterparties by virtue of investment positions in
bonds, swaps, options, repurchase transactions and forward exchange rate and other contracts held by the Sub-Fund.
To the extent that a counterparty defaults on its obligation and the Sub-Fund is delayed or prevented from exercising its
rights with respect to the investments in its portfolio, it may experience a decline in the value of its position, lose income and
incur costs associated with asserting its rights. A Sub-Fund’s exposure to any one counterparty in respect of any of the
techniques or instruments employed by the Sub-Fund for the purpose of efficient portfolio management or for protection
against exchange risks may not exceed 5% of the Net Asset Value of the Sub-Fund. This limit is raised to 10% of the Net
Asset Value of the Sub-Fund where the counterparty is a credit institution that falls into certain categories as outlined in the
UCITS Regulations. Please see the categories below:
i) a credit institution authorised in the European Economic Area (EEA) (European Union Member States, Norway,
Iceland, Liechtenstein);
ii) a credit institution authorised within a signatory state, other than a Member State of the EEA, to the Basel Capital
Convergence Agreement of July 1988 (Switzerland, Canada, Japan, United States);
iii) a credit institution authorised in United Kingdom, Jersey, Guernsey, the Isle of Man, Australia or New Zealand.
Credit risk also arises when the Sub-Fund holds cash or deposits with a credit institution or the Trustee; credit risk
crystallises when the counterparty fails to repay the amount as required. According to UCITS Regulations, a Sub-Fund may
not invest more than 20% of its net assets in deposits made with the same credit institution. Deposits made with any one
credit institution that is not included in the above mentioned categories must not exceed 10% of net assets.
Where necessary, a Sub-Fund will accept collateral from its counterparties in order to reduce counterparty risk exposure
generated through the use of over the counter FDIs and efficient portfolio management techniques. Any collateral received
by a Sub-Fund shall comprise of cash collateral and/or government backed securities of varying maturity which satisfy the
requirements of the Central Bank of Ireland relating to non-cash collateral which may be received by a UCITS.
NOTES TO THE CONDENSED FINANCIAL STATEMENTS (continued)
94
Note 16 – Risks Associated with Financial Instruments (continued)
(d) Credit Risk (continued)
Any cash collateral received will not be reinvested and all collateral received by a Sub-Fund on a title transfer basis shall be
held by the Trustee. For other types of collateral arrangements, the collateral may be held with a third party custodian which
is subject to prudential supervision and which is unrelated to the collateral provider.
Collateral received, other than cash, will be highly liquid and traded on a regulated market or multilateral trading facility
with transparent pricing in order that it can be sold quickly at a price that is close to pre-sale valuation. Collateral received
will be issued by an entity that is independent from the counterparty and is not expected to display a high correlation with the
performance of the counterparty. Collateral will be sufficiently diversified in terms of country, markets and issuers with a
maximum exposure to a given issuer of 20% of the relevant Sub-Fund’s Net Asset Value. If a Sub-Fund is exposed to
different counterparties, the different baskets of collateral will be aggregated to calculate the 20% limit of exposure to a
single issuer. Furthermore, a Sub-Fund may be fully collateralised in different transferable securities and Money Market
Instruments issued or guaranteed by a Member State, one or more of its local authorities, a third country, or a public
international body to which one or more Member State belongs. In this instance, the relevant Sub-Fund will receive
securities from at least 6 different issues, but securities from any single issue will not account for more than 30% of the
relevant Sub-Fund‘s Net Asset Value.
The level of collateral required to be posted may vary by counterparty with which a Sub-Fund trades and shall be in
accordance with the requirements of the Central Bank of Ireland. The haircut policy applied to posted collateral will be
negotiated on a counterparty basis and will vary depending on the class of asset received by the Sub-Fund, taking into
account the characteristics of the assets received as collateral such as the credit standing or the price volatility and the
outcome of any liquidity stress testing policy.
As at June 30, 2021, RBC Investor Services Bank S.A., Dublin Branch has a long-term credit rating of AA- with S&P (as at
December 31, 2020: AA- with S&P).
As at June 30, 2021 and December 31, 2020 financial assets exposed to credit risk included financial derivative instruments
as disclosed in Notes 12 to 15, as well as cash and cash equivalents, cash collateral held/due to brokers and margin cash
receivable/payable as disclosed in Note 10. Details on the valuation of financial derivative instruments are disclosed in Note
16. The carrying amounts of these financial assets represent the maximum credit risk exposure at the reporting date. Details
of collateral accepted in respect of securities lending are outlined in Note 19.
(e) Custody and Title Risk
The duties of the Trustee are to provide safekeeping, oversight and asset verification services in respect of the assets of the
Fund and each Sub-Fund in accordance with the provisions of the UCITS Regulations. The Trustee will also provide cash
monitoring services in respect of each Sub-Funds’ cash flows and subscriptions.
The Trustee will be liable to the relevant Sub-Fund and its Unitholders for loss of a financial instrument held in custody (i.e.
those assets which are required to be held in custody pursuant to the UCITS Regulations) or in the custody of any sub-
custodian appointed by the Trustee. However the Trustee shall not be liable for the loss of a financial instrument held in
custody by the Trustee or any sub-custodian if it can prove that loss has arisen as a result of an external event beyond its
reasonable control, the consequences of which would have been unavoidable despite all reasonable efforts to the contrary.
The Trustee shall also be liable to the relevant Sub-Fund and its Unitholders for all other losses suffered by them as a result
of the Trustee’s negligent or intentional failure to properly fulfil its obligations under the UCITS Regulations.
However, it should be noted that not all jurisdictions have the same rules and regulations as Ireland regarding the custody of
assets and the recognition of the interests of a beneficial owner such as a Sub-Fund. Therefore, in such jurisdictions, there is
a risk that, if a sub-custodian becomes bankrupt or insolvent, the Sub-Fund’s beneficial ownership of the assets held by such
sub-custodian may not be recognised and consequently the creditors of the sub-custodian may seek to have recourse to the
assets of the Sub-Fund.
In those jurisdictions where the Sub-Fund’s beneficial ownership of its assets is ultimately recognised, the Sub-Fund may
suffer delay and cost in recovering those assets. The Sub-Funds may invest in markets where custodial and/or settlement
systems are not fully developed, such as Russia and Argentina, the assets of a Sub-Fund which are traded in such markets
and which have been entrusted to sub-custodians, in circumstances where the use of such sub-custodians is necessary, may
be exposed to risk. When the Trustee employs a sub-custodian, the Trustee retains responsibility for the assets of the Sub-
Funds.
NOTES TO THE CONDENSED FINANCIAL STATEMENTS (continued)
95
Note 16 – Risks Associated with Financial Instruments (continued)
(f) Interest Rate Risk
Interest rate risk is the risk that the value of a financial instrument will fluctuate because of changes in market interest rates.
The Sub-Funds may invest in interest bearing securities, which may in particular be exposed to interest rate risk.
(g) Fair Value of Financial Assets and Financial Liabilities
All of the financial assets and financial liabilities of the Fund are stated at fair value in the financial statements.
(h) Emerging Markets Risk
Due to the developing nature of the countries in which the Sub-Funds may invest, their markets are similarly of a developing
nature. Accordingly, these markets may be insufficiently liquid and levels of volatility in price movements may be greater
than those experienced in more developed economies and markets. In addition, reporting standards and market practices may
not provide the same degree of information as would generally apply internationally and therefore may increase risk. In
addition, an issuer may default on payments and such circumstances could mean that investors may not receive back on
redemption or otherwise the amount originally invested.
As the Sub-Funds may invest in markets where custodial and/or settlement systems are not fully developed, the assets of the
Sub-Funds which are traded in such markets and which have been entrusted to sub-custodians, in circumstances where the
use of such sub-custodians is necessary, may be exposed to risk. When the Trustee employs a sub-custodian, the Trustee
retains responsibility for the assets of the Sub-Funds.
(i) Default Risk
Certain Sub-Funds may invest in securities which have low credit status (be they rated or unrated) and may therefore be
exposed to a higher credit risk than Sub-Funds which do not invest in such securities. The lower ratings of certain securities
held by a Sub-Fund and the unrated nature of others reflect a greater possibility that adverse changes in the financial
condition of the issuer, or in general economic conditions, or both, or an unanticipated rise in interest rates, may impair the
ability of the issuer to make payments of interest and principal. Such securities carry a higher degree of default risk which
may affect the capital value of an investment.
(j) Securities Lending Risk
Certain Sub-Funds may engage in securities lending activities. As with any extensions of credit, there are risks of delay and
recovery. Should the borrower of securities fail financially or default in any of its obligations under any securities lending
transaction, the collateral will be called upon. The value of the collateral will be maintained to exceed the value of the
securities transferred. In the event of a sudden market movement, there is a risk that the value of the collateral may fall
below the value of the securities transferred. For details on securities lending please see Note 19.
(k) Performance Fee Risk
Where a performance fee is payable by a Sub-Fund, this will be based on net realised and net unrealised gains and losses as
at the end of each performance period. As a result, performance fees may be paid on unrealised gains which may
subsequently never be realised.
In addition, the payment of the performance fee to the Manager based on the performance of the Sub-Fund may provide the
Manager with an incentive to cause the Sub-Fund to make more speculative investments than might otherwise be the case.
The Manager will have discretion as to the timing and the terms of the Sub-Fund’s transactions in investments and may
therefore have an incentive to arrange such transactions to maximise its fees. Please see Note 8 for details on performance
fees.
(l) Futures and Options Risk
The Manager may engage in various portfolio strategies on behalf of the Sub-Funds through the use of futures and options.
Due to the nature of futures, cash to meet margin monies will be held by a broker with whom each Sub-Fund has an open
position. In the event of the insolvency or bankruptcy of the broker, there can be no guarantee that such monies will be
returned to each Sub-Fund. On execution of an option, the Sub-Funds may pay a premium to counterparty. In the event of
the insolvency or bankruptcy of the counterparty, the option premium may be lost in addition to any unrealised gains where
the contract is in the money.

NOTES TO THE CONDENSED FINANCIAL STATEMENTS (continued)
96
Note 16 – Risks Associated with Financial Instruments (continued)
(m) Counterparty Risk
Each Sub-Fund will have credit exposure to counterparties by virtue of investment positions in swaps, options, repurchase
transactions and forward exchange rate and other contracts held by the Sub-Fund. To the extent that a counterparty defaults
on its obligation and the Sub-Fund is delayed or prevented from exercising its rights with respect to the investments in its
portfolio, it may experience a decline in the value of its position, lose income and incur costs associated with asserting its
rights.
(n) Pandemic Risk
With globalisation, urbanisation and environmental change, infectious disease outbreaks and epidemics have become global
threats requiring a collective response.
In addition to the substantial burden on healthcare systems, a pandemic has major economic consequences for the affected
countries. Pandemics are currently a risk factor for all industries. They cause material risks with the potential to affect all
lines of investments through impacts on financial markets and business disruption. The impacts may be both direct and
indirect, for example supply chain disruption, new ways of working and changes in customer behaviours. Additionally,
market risk and heightened volatility arise due to the macroeconomic impact of rolling lockdowns.
It is important to note that the Sub-Funds are susceptible to a variety of additional risks in addition to those described above. For
further information and a non-exhaustive description of risk factors refer to the Prospectus of the Fund in the section entitled 'Risk
Factors'.
Note 17 – Comparative Net Assets Information
(expressed in EUR)
CHALLENGE NORTH AMERICAN EQUITY FUND
Jun 2021 Dec 2020 Dec 2019
Net Assets 1,862,991,290 1,679,350,894 1,719,513,168
Net Asset Value per unit:
Mediolanum L Class - ‘A’ units 13.535 11.604 11.181
Mediolanum L Hedged Class - ‘A’ units 14.551 13.041 11.946
Mediolanum S Class - ‘A’ units 17.100 14.714 14.238
Mediolanum S Hedged Class - ‘A’ units 27.881 25.018 23.013
CHALLENGE EUROPEAN EQUITY FUND
Jun 2021 Dec 2020 Dec 2019
Net Assets 835,505,754 831,106,814 955,605,682
Net Asset Value per unit:
Mediolanum L Class - ‘A’ units 6.020 5.335 5.847
Mediolanum L Hedged Class - ‘A’ units 8.478 7.579 8.245
Mediolanum S Class - ‘A’ units 9.994 8.873 9.776
Mediolanum S Hedged Class - ‘A’ units 16.037 14.348 15.694
CHALLENGE ITALIAN EQUITY FUND
Jun 2021 Dec 2020 Dec 2019
Net Assets 241,157,924 224,142,078 258,803,459
Net Asset Value per unit:
Mediolanum L Class - ‘A’ units 5.579 4.647 5.096
Mediolanum S Class - ‘A’ units 9.398 7.845 8.649
CHALLENGE GERMANY EQUITY FUND
Jun 2021 Dec 2020 Dec 2019
Net Assets 160,534,854 157,061,076 154,912,119
Net Asset Value per unit:
Mediolanum L Class - ‘A’ units 7.424 6.666 6.440
Mediolanum S Class - ‘A’ units 13.815 12.446 12.075
NOTES TO THE CONDENSED FINANCIAL STATEMENTS (continued)
97
Note 17 – Comparative Net Assets Information (continued)
(expressed in EUR)
CHALLENGE SPAIN EQUITY FUND
Jun 2021 Dec 2020 Dec 2019
Net Assets 69,805,109 74,584,326 89,514,494
Net Asset Value per unit:
Mediolanum L Class - ‘A’ units 7.091 6.378 7.266
Mediolanum S Class - ‘A’ units 15.007 13.531 15.496
CHALLENGE PACIFIC EQUITY FUND
Jun 2021 Dec 2020 Dec 2019
Net Assets 490,970,709 493,803,787 542,035,245
Net Asset Value per unit:
Mediolanum L Class - ‘A’ units 8.756 8.166 7.403
Mediolanum L Hedged Class - ‘A’ units 8.501 7.957 7.048
Mediolanum S Class - ‘A’ units 11.261 10.527 9.588
Mediolanum S Hedged Class - ‘A’ units 16.358 15.345 13.643
CHALLENGE EMERGING MARKETS EQUITY FUND
Jun 2021 Dec 2020 Dec 2019
Net Assets 619,033,195 582,629,124 581,300,865
Net Asset Value per unit:
Mediolanum L Class - ‘A’ units 10.485 9.620 9.341
Mediolanum S Class - ‘A’ units 22.734 20.915 20.394
CHALLENGE ENERGY EQUITY FUND
Jun 2021 Dec 2020 Dec 2019
Net Assets 344,506,499 247,491,607 201,457,379
Net Asset Value per unit:
Mediolanum L Class - ‘A’ units 5.321 4.143 6.602
Mediolanum S Class - ‘A’ units 10.058 7.851 12.576
CHALLENGE CYCLICAL EQUITY FUND
Jun 2021 Dec 2020 Dec 2019
Net Assets 1,014,575,498 886,801,162 788,745,472
Net Asset Value per unit:
Mediolanum L Class - ‘A’ units 10.295 9.328 8.362
Mediolanum S Class - ‘A’ units 20.217 18.362 16.546
CHALLENGE COUNTER CYCLICAL EQUITY FUND
Jun 2021 Dec 2020 Dec 2019
Net Assets 783,202,095 717,031,276 675,252,768
Net Asset Value per unit:
Mediolanum L Class - ‘A’ units 6.589 5.988 6.163
Mediolanum S Class - ‘A’ units 13.311 12.112 12.532
CHALLENGE FINANCIAL EQUITY FUND
Jun 2021 Dec 2020 Dec 2019
Net Assets 498,690,317 431,827,994 490,242,614
Net Asset Value per unit:
Mediolanum L Class - ‘A’ units 4.244 3.497 4.137
Mediolanum S Class - ‘A’ units 8.023 6.625 7.879
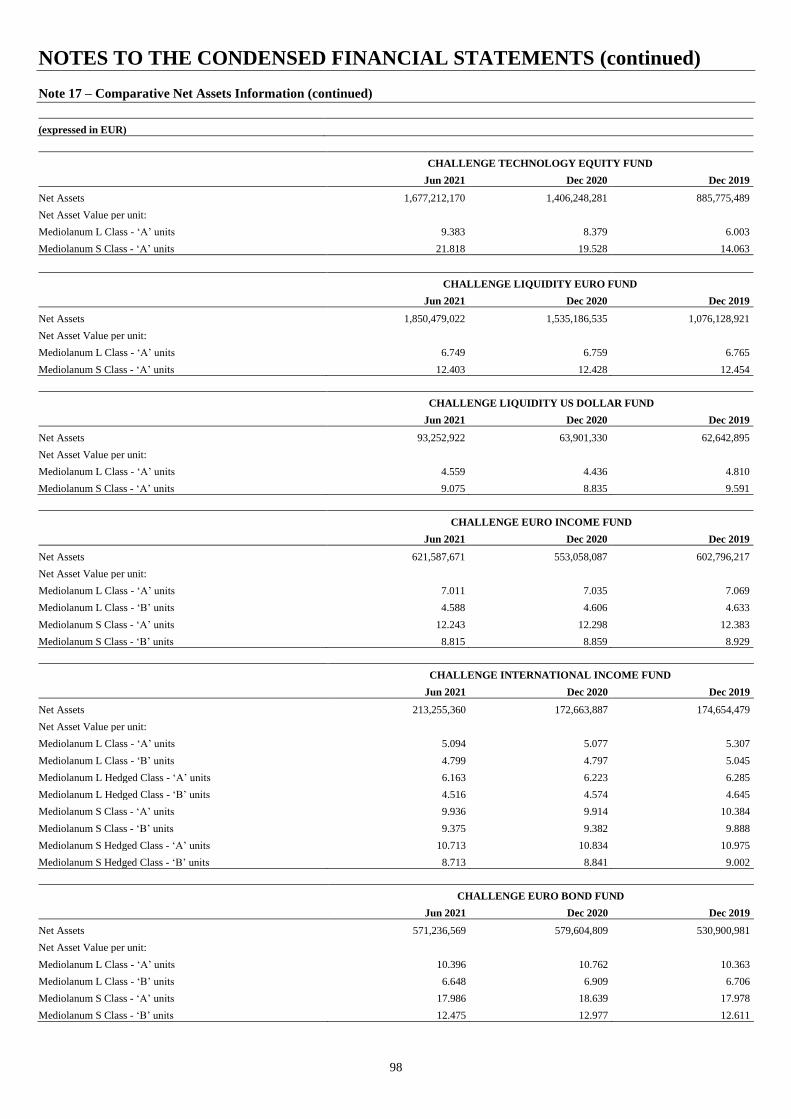
NOTES TO THE CONDENSED FINANCIAL STATEMENTS (continued)
98
Note 17 – Comparative Net Assets Information (continued)
(expressed in EUR)
CHALLENGE TECHNOLOGY EQUITY FUND
Jun 2021 Dec 2020 Dec 2019
Net Assets 1,677,212,170 1,406,248,281 885,775,489
Net Asset Value per unit:
Mediolanum L Class - ‘A’ units 9.383 8.379 6.003
Mediolanum S Class - ‘A’ units 21.818 19.528 14.063
CHALLENGE LIQUIDITY EURO FUND
Jun 2021 Dec 2020 Dec 2019
Net Assets 1,850,479,022 1,535,186,535 1,076,128,921
Net Asset Value per unit:
Mediolanum L Class - ‘A’ units 6.749 6.759 6.765
Mediolanum S Class - ‘A’ units 12.403 12.428 12.454
CHALLENGE LIQUIDITY US DOLLAR FUND
Jun 2021 Dec 2020 Dec 2019
Net Assets 93,252,922 63,901,330 62,642,895
Net Asset Value per unit:
Mediolanum L Class - ‘A’ units 4.559 4.436 4.810
Mediolanum S Class - ‘A’ units 9.075 8.835 9.591
CHALLENGE EURO INCOME FUND
Jun 2021 Dec 2020 Dec 2019
Net Assets 621,587,671 553,058,087 602,796,217
Net Asset Value per unit:
Mediolanum L Class - ‘A’ units 7.011 7.035 7.069
Mediolanum L Class - ‘B’ units 4.588 4.606 4.633
Mediolanum S Class - ‘A’ units 12.243 12.298 12.383
Mediolanum S Class - ‘B’ units 8.815 8.859 8.929
CHALLENGE INTERNATIONAL INCOME FUND
Jun 2021 Dec 2020 Dec 2019
Net Assets 213,255,360 172,663,887 174,654,479
Net Asset Value per unit:
Mediolanum L Class - ‘A’ units 5.094 5.077 5.307
Mediolanum L Class - ‘B’ units 4.799 4.797 5.045
Mediolanum L Hedged Class - ‘A’ units 6.163 6.223 6.285
Mediolanum L Hedged Class - ‘B’ units 4.516 4.574 4.645
Mediolanum S Class - ‘A’ units 9.936 9.914 10.384
Mediolanum S Class - ‘B’ units 9.375 9.382 9.888
Mediolanum S Hedged Class - ‘A’ units 10.713 10.834 10.975
Mediolanum S Hedged Class - ‘B’ units 8.713 8.841 9.002
CHALLENGE EURO BOND FUND
Jun 2021 Dec 2020 Dec 2019
Net Assets 571,236,569 579,604,809 530,900,981
Net Asset Value per unit:
Mediolanum L Class - ‘A’ units 10.396 10.762 10.363
Mediolanum L Class - ‘B’ units 6.648 6.909 6.706
Mediolanum S Class - ‘A’ units 17.986 18.639 17.978
Mediolanum S Class - ‘B’ units 12.475 12.977 12.611
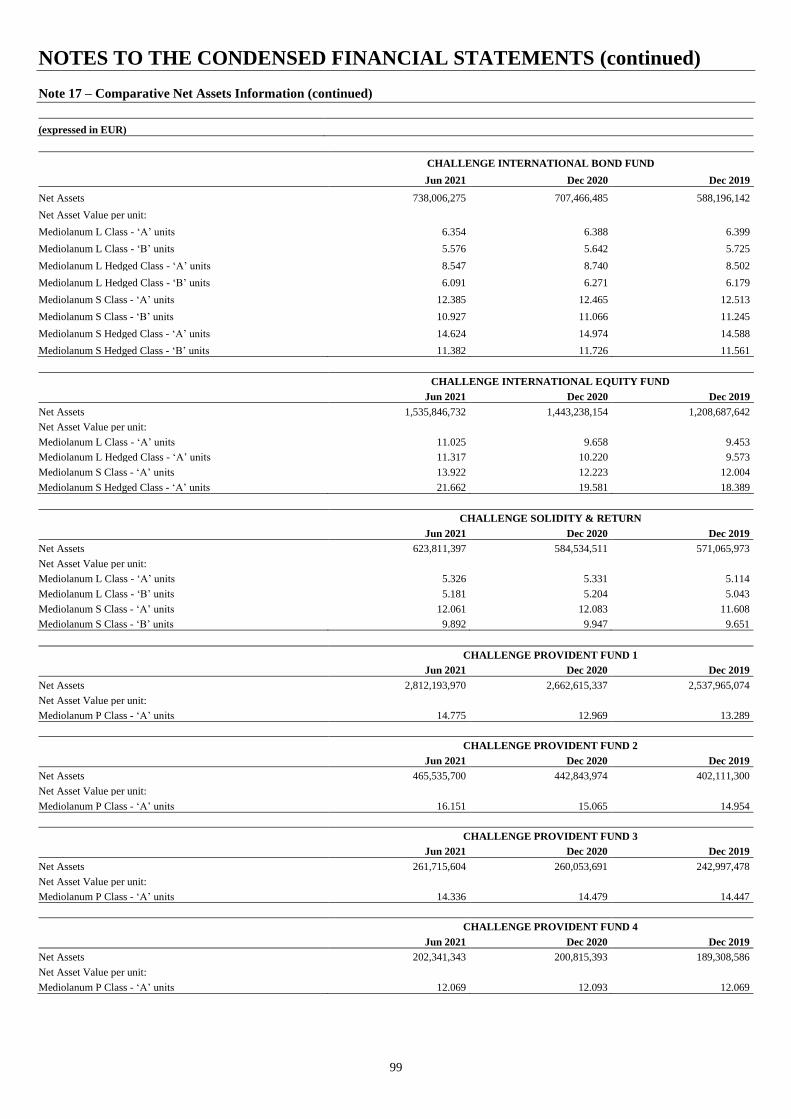
NOTES TO THE CONDENSED FINANCIAL STATEMENTS (continued)
99
Note 17 – Comparative Net Assets Information (continued)
(expressed in EUR)
CHALLENGE INTERNATIONAL BOND FUND
Jun 2021 Dec 2020 Dec 2019
Net Assets 738,006,275 707,466,485 588,196,142
Net Asset Value per unit:
Mediolanum L Class - ‘A’ units 6.354 6.388 6.399
Mediolanum L Class - ‘B’ units 5.576 5.642 5.725
Mediolanum L Hedged Class - ‘A’ units 8.547 8.740 8.502
Mediolanum L Hedged Class - ‘B’ units 6.091 6.271 6.179
Mediolanum S Class - ‘A’ units 12.385 12.465 12.513
Mediolanum S Class - ‘B’ units 10.927 11.066 11.245
Mediolanum S Hedged Class - ‘A’ units 14.624 14.974 14.588
Mediolanum S Hedged Class - ‘B’ units 11.382 11.726 11.561
CHALLENGE INTERNATIONAL EQUITY FUND
Jun 2021 Dec 2020 Dec 2019
Net Assets 1,535,846,732 1,443,238,154 1,208,687,642
Net Asset Value per unit:
Mediolanum L Class - ‘A’ units 11.025 9.658 9.453
Mediolanum L Hedged Class - ‘A’ units 11.317 10.220 9.573
Mediolanum S Class - ‘A’ units 13.922 12.223 12.004
Mediolanum S Hedged Class - ‘A’ units 21.662 19.581 18.389
CHALLENGE SOLIDITY & RETURN
Jun 2021 Dec 2020 Dec 2019
Net Assets 623,811,397 584,534,511 571,065,973
Net Asset Value per unit:
Mediolanum L Class - ‘A’ units 5.326 5.331 5.114
Mediolanum L Class - ‘B’ units 5.181 5.204 5.043
Mediolanum S Class - ‘A’ units 12.061 12.083 11.608
Mediolanum S Class - ‘B’ units 9.892 9.947 9.651
CHALLENGE PROVIDENT FUND 1
Jun 2021 Dec 2020 Dec 2019
Net Assets 2,812,193,970 2,662,615,337 2,537,965,074
Net Asset Value per unit:
Mediolanum P Class - ‘A’ units 14.775 12.969 13.289
CHALLENGE PROVIDENT FUND 2
Jun 2021 Dec 2020 Dec 2019
Net Assets 465,535,700 442,843,974 402,111,300
Net Asset Value per unit:
Mediolanum P Class - ‘A’ units 16.151 15.065 14.954
CHALLENGE PROVIDENT FUND 3
Jun 2021 Dec 2020 Dec 2019
Net Assets 261,715,604 260,053,691 242,997,478
Net Asset Value per unit:
Mediolanum P Class - ‘A’ units 14.336 14.479 14.447
CHALLENGE PROVIDENT FUND 4
Jun 2021 Dec 2020 Dec 2019
Net Assets 202,341,343 200,815,393 189,308,586
Net Asset Value per unit:
Mediolanum P Class - ‘A’ units 12.069 12.093 12.069
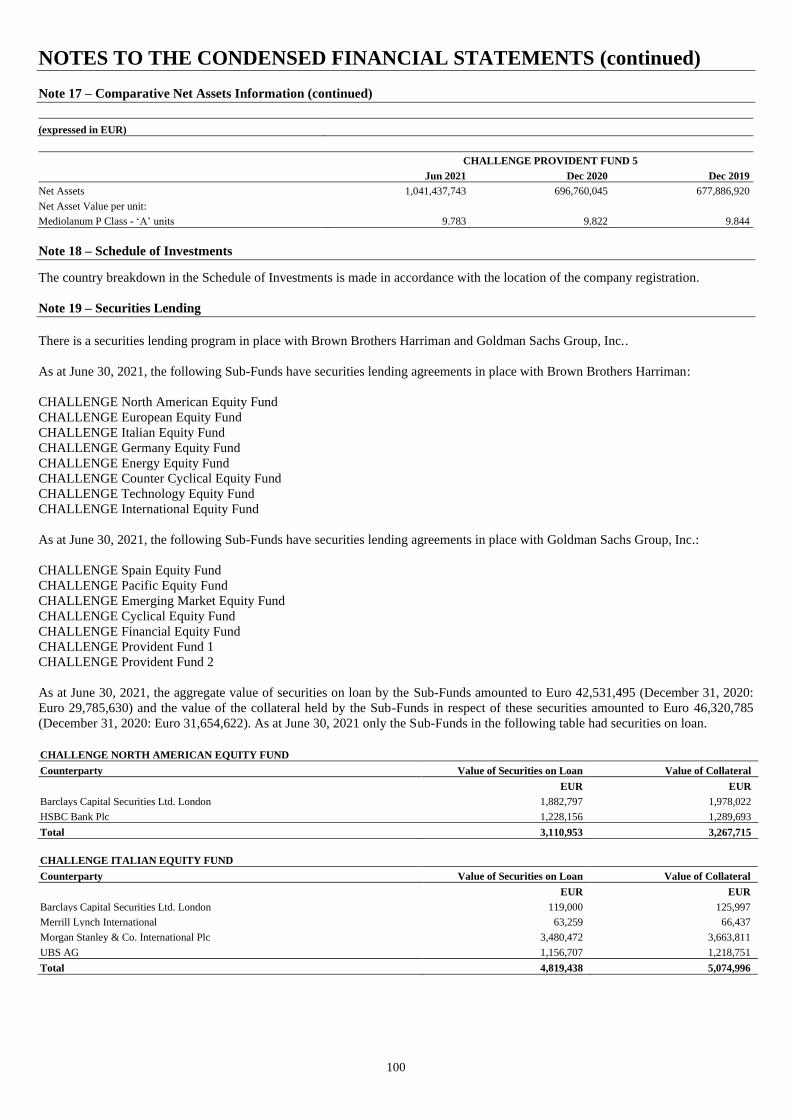
NOTES TO THE CONDENSED FINANCIAL STATEMENTS (continued)
100
Note 17 – Comparative Net Assets Information (continued)
(expressed in EUR)
CHALLENGE PROVIDENT FUND 5
Jun 2021 Dec 2020 Dec 2019
Net Assets 1,041,437,743 696,760,045 677,886,920
Net Asset Value per unit:
Mediolanum P Class - ‘A’ units 9.783 9.822 9.844
Note 18 – Schedule of Investments
The country breakdown in the Schedule of Investments is made in accordance with the location of the company registration.
Note 19 – Securities Lending
There is a securities lending program in place with Brown Brothers Harriman and Goldman Sachs Group, Inc..
As at June 30, 2021, the following Sub-Funds have securities lending agreements in place with Brown Brothers Harriman:
CHALLENGE North American Equity Fund
CHALLENGE European Equity Fund
CHALLENGE Italian Equity Fund
CHALLENGE Germany Equity Fund
CHALLENGE Energy Equity Fund
CHALLENGE Counter Cyclical Equity Fund
CHALLENGE Technology Equity Fund
CHALLENGE International Equity Fund
As at June 30, 2021, the following Sub-Funds have securities lending agreements in place with Goldman Sachs Group, Inc.:
CHALLENGE Spain Equity Fund
CHALLENGE Pacific Equity Fund
CHALLENGE Emerging Market Equity Fund
CHALLENGE Cyclical Equity Fund
CHALLENGE Financial Equity Fund
CHALLENGE Provident Fund 1
CHALLENGE Provident Fund 2
As at June 30, 2021, the aggregate value of securities on loan by the Sub-Funds amounted to Euro 42,531,495 (December 31, 2020:
Euro 29,785,630) and the value of the collateral held by the Sub-Funds in respect of these securities amounted to Euro 46,320,785
(December 31, 2020: Euro 31,654,622). As at June 30, 2021 only the Sub-Funds in the following table had securities on loan.
CHALLENGE NORTH AMERICAN EQUITY FUND
Counterparty Value of Securities on Loan Value of Collateral
EUR EUR
Barclays Capital Securities Ltd. London 1,882,797 1,978,022
HSBC Bank Plc 1,228,156 1,289,693
Total 3,110,953 3,267,715
CHALLENGE ITALIAN EQUITY FUND
Counterparty Value of Securities on Loan Value of Collateral
EUR EUR
Barclays Capital Securities Ltd. London 119,000 125,997
Merrill Lynch International 63,259 66,437
Morgan Stanley & Co. International Plc 3,480,472 3,663,811
UBS AG 1,156,707 1,218,751
Total 4,819,438 5,074,996
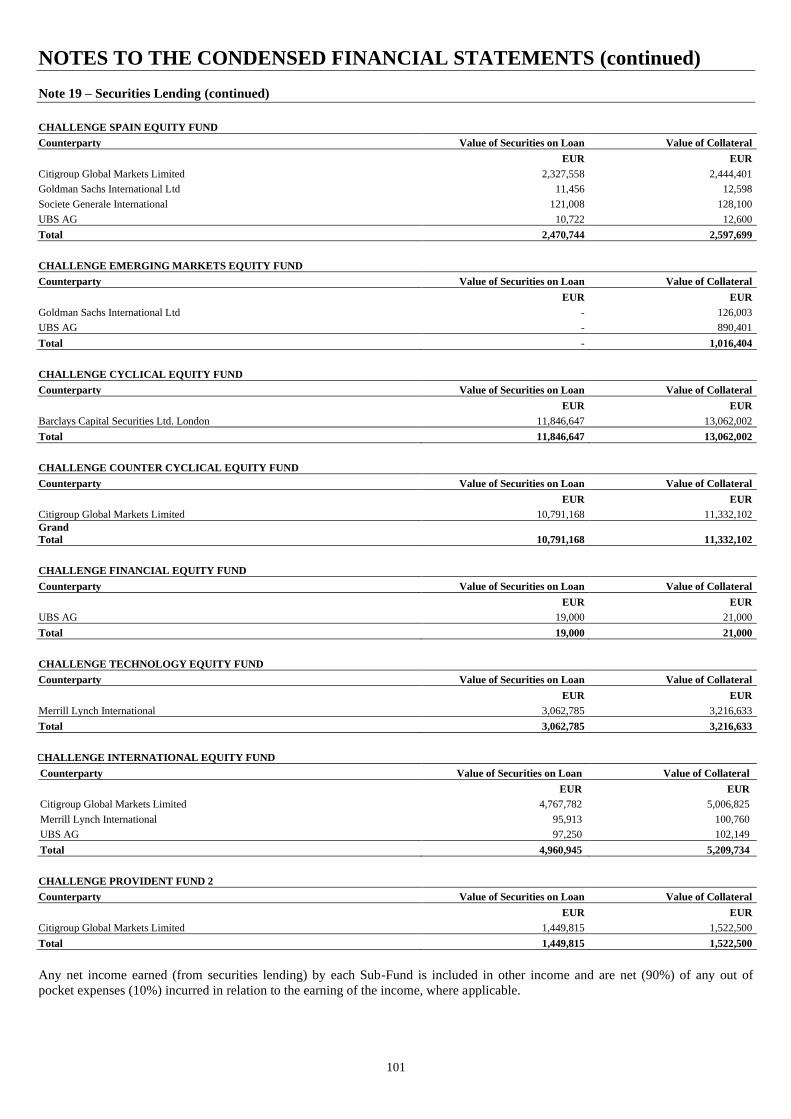
NOTES TO THE CONDENSED FINANCIAL STATEMENTS (continued)
101
Note 19 – Securities Lending (continued)
CHALLENGE SPAIN EQUITY FUND
Counterparty Value of Securities on Loan Value of Collateral
EUR EUR
Citigroup Global Markets Limited 2,327,558 2,444,401
Goldman Sachs International Ltd 11,456 12,598
Societe Generale International 121,008 128,100
UBS AG 10,722 12,600
Total 2,470,744 2,597,699
CHALLENGE EMERGING MARKETS EQUITY FUND
Counterparty Value of Securities on Loan Value of Collateral
EUR EUR
Goldman Sachs International Ltd - 126,003
UBS AG - 890,401
Total - 1,016,404
CHALLENGE CYCLICAL EQUITY FUND
Counterparty Value of Securities on Loan Value of Collateral
EUR EUR
Barclays Capital Securities Ltd. London 11,846,647 13,062,002
Total 11,846,647 13,062,002
CHALLENGE COUNTER CYCLICAL EQUITY FUND
Counterparty Value of Securities on Loan Value of Collateral
EUR EUR
Citigroup Global Markets Limited 10,791,168 11,332,102
Grand
Total 10,791,168 11,332,102
CHALLENGE FINANCIAL EQUITY FUND
Counterparty Value of Securities on Loan Value of Collateral
EUR EUR
UBS AG 19,000 21,000
Total 19,000 21,000
CHALLENGE TECHNOLOGY EQUITY FUND
Counterparty Value of Securities on Loan Value of Collateral
EUR EUR
Merrill Lynch International 3,062,785 3,216,633
Total 3,062,785 3,216,633
CHALLENGE INTERNATIONAL EQUITY FUND
Counterparty Value of Securities on Loan Value of Collateral
EUR EUR
Citigroup Global Markets Limited 4,767,782 5,006,825
Merrill Lynch International 95,913 100,760
UBS AG 97,250 102,149
Total 4,960,945 5,209,734
CHALLENGE PROVIDENT FUND 2
Counterparty Value of Securities on Loan Value of Collateral
EUR EUR
Citigroup Global Markets Limited 1,449,815 1,522,500
Total 1,449,815 1,522,500
Any net income earned (from securities lending) by each Sub-Fund is included in other income and are net (90%) of any out of
pocket expenses (10%) incurred in relation to the earning of the income, where applicable.

NOTES TO THE CONDENSED FINANCIAL STATEMENTS (continued)
102
Note 19 – Securities Lending (continued)
The following tables are a breakdown of gross and net income earned (from securities lending) and direct and indirect costs
associated with securities lending by each Sub-Fund for the financial periods ended June 30, 2021 and June 30, 2020.
June 30, 2021
Name of Sub-Fund (expressed in EUR)
Gross Income Costs Net Income Direct Costs Indirect Costs
CHALLENGE North American Equity Fund 1,545 1,013 532 154 -
CHALLENGE European Equity Fund 36,329 3,602 32,727 3,633 -
CHALLENGE Italian Equity Fund 86,251 5,756 80,495 8,625 -
CHALLENGE Germany Equity Fund - 900 (900) - -
CHALLENGE Spain Equity Fund 30,002 4,860 25,142 3,000 -
CHALLENGE Pacific Equity Fund 4,454 1,962 2,492 445 -
CHALLENGE Emerging Markets Equity Fund 4,095 1,069 3,026 410 -
CHALLENGE Energy Equity Fund 4,210 2,257 1,953 421 -
CHALLENGE Cyclical Equity Fund 8,381 1,252 7,129 838 -
CHALLENGE Counter Cyclical Equity Fund 41,013 1,562 39,451 4,101 -
CHALLENGE Financial Equity Fund 36,993 1,457 35,536 3,699 -
CHALLENGE Technology Equity Fund 67 681 (614) 7 -
CHALLENGE International Equity Fund 36,496 3,096 33,400 3,650 -
CHALLENGE Provident Fund 1 2,428 1,446 982 243 -
CHALLENGE Provident Fund 2 1,195 - 1,195 119 -
Total 293,459 30,913 262,546 29,345 -
June 30, 2020
Name of Sub-Fund (expressed in EUR)
Gross Income Costs Net Income Direct Costs Indirect Costs
CHALLENGE North American Equity Fund 15,798 932 14,866 1,580 -
CHALLENGE European Equity Fund 75,436 5,004 70,432 7,544 -
CHALLENGE Italian Equity Fund 151,223 10,139 141,084 15,122 -
CHALLENGE Germany Equity Fund 53,776 1,004 52,772 5,378 -
CHALLENGE Spain Equity Fund 1,034 2,097 (1,063) 103 -
CHALLENGE Pacific Equity Fund 7,680 1,284 6,396 768 -
CHALLENGE Emerging Markets Equity Fund 2,176 1,260 916 218 -
CHALLENGE Energy Equity Fund 12,702 1,292 11,410 1,270 -
CHALLENGE Cyclical Equity Fund - 900 (900) - -
CHALLENGE Counter Cyclical Equity Fund 93,905 1,091 92,814 9,391 -
CHALLENGE Financial Equity Fund 34,439 1,159 33,280 3,444 -
CHALLENGE Technology Equity Fund 124,351 1,636 122,715 12,435 -
CHALLENGE International Equity Fund 69,912 5,739 64,173 6,991 -
CHALLENGE Provident Fund 1 104,421 1,870 102,551 10,442 -
CHALLENGE Provident Fund 2 27,041 1,108 25,933 2,704 -
Total 773,894 36,515 737,379 77,390 -
Please note the costs incurred in this period have not only been generated during this period, but partially from the prior period, where
volumes may have been greater.

NOTES TO THE CONDENSED FINANCIAL STATEMENTS (continued)
103
Note 20 – Management Fees Incurred on Investments into Other Funds
Please note where the Manager has negotiated a rebate on the management fee charged on its investment into other funds, this rebate
is paid directly to the relevant CHALLENGE Sub-Fund.
CHALLENGE North American Equity Fund Management Fee
Mediolanum Fondcuenta FI*^ 0.50%
Mediolanum Fondcuenta FI*^ 1.00%
Wellington US Research Equity Fund 0.60%
T Rowe Price Funds SICAV - US Large-Cap Growth Equity Fund 0.65%
CHALLENGE European Equity Fund Management Fee
BlackRock Global Funds - Continental European Flexible Fund 0.75%
Eleva UCITS Fund - Eleva European Selection Fund 0.90%
Mediolanum Fondcuenta FI* 0.50%
Memnon Fund - European 0.45%
CHALLENGE Pacific Equity Fund Management Fee
Alma Capital Investment Funds - Alma Eikoh Japan Large Cap Equity 0.90%
Comgest Growth Plc- Comgest Growth Japan 0.60%
Mediolanum Fondcuenta FI* 0.50%
Ninety One Global Strategy Fund - Asia Pacific Equity Opportunities Fund 0.75%
CHALLENGE Emerging Markets Equity Fund Management Fee
Macquarie Fund Solutions - Macquarie Emerging Markets Fund 0.95%
Mediolanum Fondcuenta FI* 0.50%
RBC Funds Lux - Emerging Markets Equity Focus Fund 0.85%
RBC Funds Lux - Emerging Markets Equity Fund 0.85%
RWC Funds - RWC Global Emerging Markets Fund 0.75%
CHALLENGE Energy Equity Fund Management Fee
Mediolanum Fondcuenta FI* 0.50%
CHALLENGE Cyclical Equity Fund Management Fee
Mediolanum Fondcuenta FI* 0.50%
CHALLENGE Counter Cyclical Equity Fund Management Fee
Mediolanum Fondcuenta FI* 0.50%
CHALLENGE Technology Fund Management Fee
BlackRock Global Funds - World Technology Fund 0.75%
Franklin Templeton Investment Funds - Franklin Technology Fund 0.70%
Mediolanum Fondcuenta FI* 0.50%
CHALLENGE International Equity Fund Management Fee
Mediolanum Fondcuenta FI* 0.50%
Schroder ISF Global Equity Alpha 0.65%
CHALLENGE Solidity & Return Management Fee
Trea SICAV - Trea Emerging Markets Credit Opportunities 1.25%
* This is a related party per Note 22.
^ Different share class - rates not same.
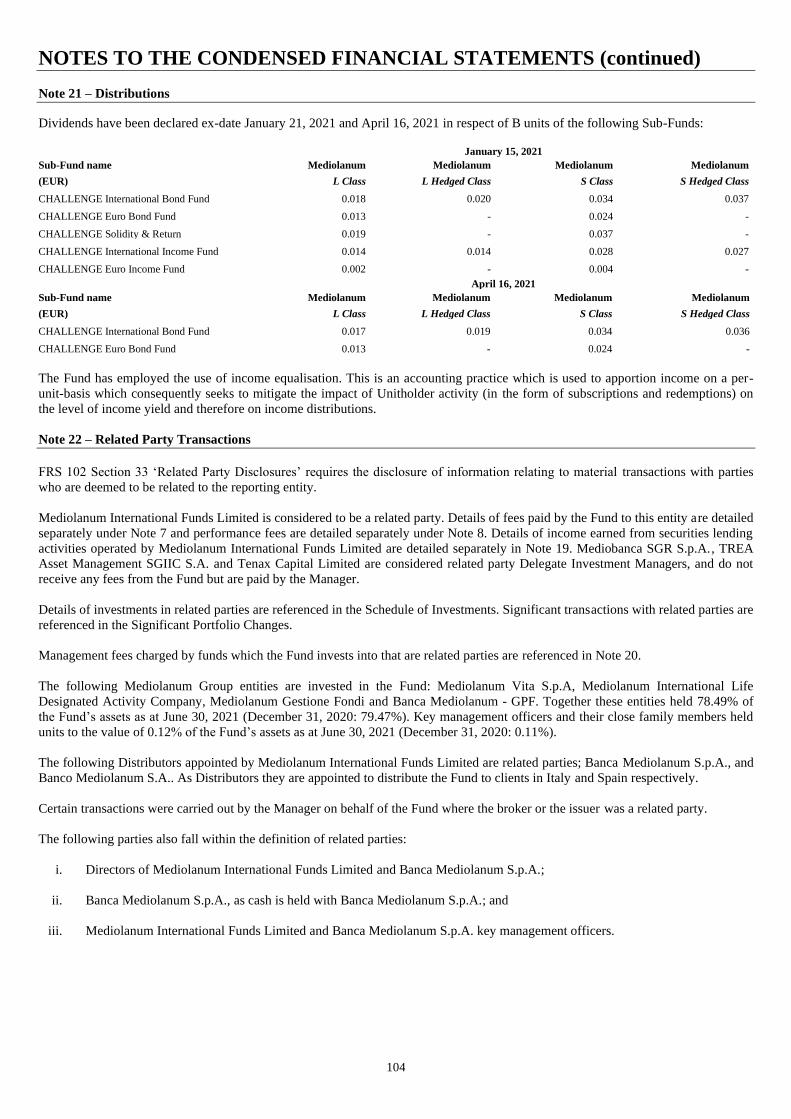
NOTES TO THE CONDENSED FINANCIAL STATEMENTS (continued)
104
Note 21 – Distributions
Dividends have been declared ex-date January 21, 2021 and April 16, 2021 in respect of B units of the following Sub-Funds:
January 15, 2021
Sub-Fund name Mediolanum Mediolanum Mediolanum Mediolanum
(EUR) L Class L Hedged Class S Class S Hedged Class
CHALLENGE International Bond Fund 0.018 0.020 0.034 0.037
CHALLENGE Euro Bond Fund 0.013 - 0.024 -
CHALLENGE Solidity & Return 0.019 - 0.037 -
CHALLENGE International Income Fund 0.014 0.014 0.028 0.027
CHALLENGE Euro Income Fund 0.002 - 0.004 -
April 16, 2021
Sub-Fund name Mediolanum Mediolanum Mediolanum Mediolanum
(EUR) L Class L Hedged Class S Class S Hedged Class
CHALLENGE International Bond Fund 0.017 0.019 0.034 0.036
CHALLENGE Euro Bond Fund 0.013 - 0.024 -
The Fund has employed the use of income equalisation. This is an accounting practice which is used to apportion income on a per-
unit-basis which consequently seeks to mitigate the impact of Unitholder activity (in the form of subscriptions and redemptions) on
the level of income yield and therefore on income distributions.
Note 22 – Related Party Transactions
FRS 102 Section 33 ‘Related Party Disclosures’ requires the disclosure of information relating to material transactions with parties
who are deemed to be related to the reporting entity.
Mediolanum International Funds Limited is considered to be a related party. Details of fees paid by the Fund to this entity are detailed
separately under Note 7 and performance fees are detailed separately under Note 8. Details of income earned from securities lending
activities operated by Mediolanum International Funds Limited are detailed separately in Note 19. Mediobanca SGR S.p.A., TREA
Asset Management SGIIC S.A. and Tenax Capital Limited are considered related party Delegate Investment Managers, and do not
receive any fees from the Fund but are paid by the Manager.
Details of investments in related parties are referenced in the Schedule of Investments. Significant transactions with related parties are
referenced in the Significant Portfolio Changes.
Management fees charged by funds which the Fund invests into that are related parties are referenced in Note 20.
The following Mediolanum Group entities are invested in the Fund: Mediolanum Vita S.p.A, Mediolanum International Life
Designated Activity Company, Mediolanum Gestione Fondi and Banca Mediolanum - GPF. Together these entities held 78.49% of
the Fund’s assets as at June 30, 2021 (December 31, 2020: 79.47%). Key management officers and their close family members held
units to the value of 0.12% of the Fund’s assets as at June 30, 2021 (December 31, 2020: 0.11%).
The following Distributors appointed by Mediolanum International Funds Limited are related parties; Banca Mediolanum S.p.A., and
Banco Mediolanum S.A.. As Distributors they are appointed to distribute the Fund to clients in Italy and Spain respectively.
Certain transactions were carried out by the Manager on behalf of the Fund where the broker or the issuer was a related party.
The following parties also fall within the definition of related parties:
i. Directors of Mediolanum International Funds Limited and Banca Mediolanum S.p.A.;
ii. Banca Mediolanum S.p.A., as cash is held with Banca Mediolanum S.p.A.; and
iii. Mediolanum International Funds Limited and Banca Mediolanum S.p.A. key management officers.
NOTES TO THE CONDENSED FINANCIAL STATEMENTS (continued)
105
Note 22 – Related Party Transactions (continued)
Andrew Bates was a Director of the Manager until April 28, 2021. Andrew Bates is a Consultant in Dillon Eustace. Dillon Eustace
was considered to be a related party during the financial period by virtue of the employment of Andrew Bates. Legal fees paid to
Dillon Eustace until April 28, 2021 amounted to Euro 21,461 (December 31, 2020: Euro 31,194).
Furio Pietribiasi is a Director of the Manager and is a non-executive Director of Tenax Capital Limited, Delegate Investment
Manager of CHALLENGE Financial Equity Fund. The Manager and Tenax Capital Limited are considered to be related parties by
virtue of the common directorship of Mr Furio Pietribiasi.
Furio Pietribiasi is a shareholder of Globe Refund GB which is the appointed tax reclaim agent and Globe Refund GB is considered a
related party by virtue of shareholding.
Note 23 – Connected Persons
The Directors of the Manager are satisfied that transactions with connected parties entered into during the financial period complied
with the obligations set out in Chapter 10 Sections 42 and 43(1) of CBI UCITS Regulations, namely any such transaction must be
conducted at arm’s length and in the best interests of the Unitholders.
Note 24 – Changes to the Prospectus/Trust Deed
On January 21, 2021, the Prospectus was updated with several non-material changes including an amendment to performance fee
calculation methodology introducing adjustments to be made for subscriptions. Other non-material updates were removing reference
to Bankhaus August Lenz (“BAL”) from the “Manager and Global Distributor” section; amending split of transaction fee (0.10%
maximum fee payable by a Unitholder for each subscription, redemption or switch subject to cap) as 75% Banca Mediolanum and
25% State Street Bank Italy under the “Correspondent Banks / Paying Agents and Distributors” charges section; addition of
disclosure on the new regulation on EU Mandatory Disclosure Regime (“MDR”) also known as DAC 6; updating the Directors and
the Auditors; and removing Lebanon from the List of Stock Exchanges and Sub-Custodians.
On March 3, 2021, the Prospectus was updated with non-material changes related to SFDR Level 1 disclosure requirements via an
Addendum on the Integration of Sustainability Risks.
Copies of the most recent Prospectus and Trust Deed are available at www.mifl.ie.
Note 25 – Significant Events that Took Place During the Financial Period
COVID-19 Impact
Since the start of the year COVID-19 has continued to dominate the headlines, and at the mid-way point of the year the World Health
Organisation (‘‘WHO’’) are warning about the onset of a fourth wave due to the spread of the Delta variant. That said, financial
markets have broadly looked past the risk of COVID-19 and have focused on the economic re-opening that is underway and the
improvement in corporate profits. At the end of June, global equities (MSCI World Index) are up 16% in euro terms, while global
sovereign bonds are down 2% (Bloomberg Barclays Global Agg Treasuries Index).
To deal with the fallout from the virus, central banks around the world have stepped in to provide unprecedented monetary support to
their respective economies, while governments have put in place the necessary fiscal supports in terms of pandemic unemployment
benefits to help support those hit hardest from the economic fallout of the pandemic. Financial markets responded favourably to the
stimulus with most equity and bond markets now back above their pre-pandemic highs.
Vaccination rates continue to rise across the world and, while COVID-19 cases are rising again in some nations, hospitalisations and
– more importantly – the death rate remain low compared to previous outbreaks. As a result, governments around the world are
gradually re-opening their economies, and the economic backdrop continues to improve as economies open back up. This can be seen
across a range of economic indicators from falling unemployment to improving business and consumer confidence surveys.
One consequence, however, is that inflation, as measured by US Consumer Price Inflation (“CPI”) jumped to 5.4% in June compared
to a year ago, while US core CPI (excluding volatile food and energy prices) hit 4.5%, the highest rate in 30 years, as the combination
of supply chain bottlenecks and improving demand have caused prices to move higher. That said, it is evident that most price pressure
is due to re-opening with the biggest drivers in areas like airfares, hotels and other leisure and hospitality sectors. Central banks have
reiterated they are willing to let inflation move higher before they start to think about raising interest rates to ensure the recovery
takes hold. It is not expected rate hikes until 2023 at the earliest, but central banks will need to signal the end to their extraordinary
asset purchases (‘‘QE’’) before the year end which may test the markets’ nerves.
NOTES TO THE CONDENSED FINANCIAL STATEMENTS (continued)
106
Note 25 – Significant Events that Took Place During the Financial Period (continued)
COVID-19 Impact (continued)
Ultimately, however the pace of the recovery is still largely dependent on the ability to control COVID-19 and given the
unpredictable nature of the virus, there remains a high degree of risk. Should another wave or variant of COVID-19 emerge that
proves resistant to the current vaccines, it could delay the re-opening of the global economy and in turn could lead to another period
of high volatility.
In this environment it could potentially have an adverse impact on the value of the Fund’s investments and the ability of the Manager
to access markets or implement the Fund’s investment policy in the manner originally contemplated. Government interventions or
other limitations or bans introduced by regulatory authorities or exchanges and trading venues as temporary measures in light of
significant market volatility, may also negatively impact on the Manager’s ability to implement the Fund’s investment policy. The
Fund’s access to liquidity could also be impaired in circumstances where the need for liquidity to meet redemption requests may rise
significantly. Services required for the operation of the Fund may in certain circumstances be interrupted as a result of the pandemic.
Appointment/Resignation of Directors and Chairperson
Michael Hodson was appointed as a Director of the Manager effective January 1, 2021.
Karen Zachary was appointed as a Director and Chairperson of the Manager effective April 28, 2021.
Andrew Bates resigned as a Director and Chairperson of the Manager effective April 28, 2021.
Change in Performance Fee Methodology
Effective January 1, 2021, the Performance Fees calculation methodology has been slightly amended to reflect that in calculating the
Performance Target Value, adjustments will also be made to prevent any distortions due to subscriptions and redemptions, as further
described in the updated Prospectus effective January 21, 2021.
Changes in Delegate Investment Managers
Effective February 8, 2021, Sustainable Growth Advisers was appointed as Delegate Investment Manager for CHALLENGE
Emerging Markets Equity Fund.
Effective February 26, 2021, Jupiter Asset Management Limited was appointed as Delegate Investment Manager for CHALLENGE
Technology Equity Fund.
Effective April 19, 2021, Intermede Investment Partners Limited was appointed as Delegate Investment Manager for CHALLENGE
Provident Fund 1.
Updates on Extraordinary General Meetings
On May 28, 2021, at the Extraordinary General Meetings of the CHALLENGE Counter Cyclical Equity Fund and CHALLENGE
Cyclical Equity Fund, the resolutions regarding the proposed change of investment objective and policies of each of the Sub-Funds
(full details of which are set out in a circular to Unitholders of the Sub-Funds dated May 11, 2021) were passed. These changes (as
well as the changes to the name of each of the Sub-Funds and classes in the Sub-Funds and certain other non-material changes, also
as detailed in the circular to Unitholders) will take effect after the period end.
Note 26 – Subsequent Events
Effective from July 5, 2021, MIFL is implementing the below temporary fee waivers in respect of a portion of its management fee,
for the benefit of the investors in light of the current fixed income market conditions and interest rate levels.
• 0.35% for CHALLENGE Euro Bond Fund;
• 0.30% for CHALLENGE Euro Income Fund; and
• 0.10% for CHALLENGE International Bond Fund.

NOTES TO THE CONDENSED FINANCIAL STATEMENTS (continued)
107
Note 26 – Subsequent Events (continued)
The changes approved at the Extraordinary General Meetings of the CHALLENGE Counter Cyclical Equity Fund and CHALLENGE
Cyclical Equity Fund, the resolutions regarding the proposed change of investment objective and policies of each of the Sub-Funds
(as well as the changes to the name of each of the Sub-Funds and classes in the Sub-Funds and certain other non-material changes,
also as detailed in the circular to Unitholders) took effect on July 14, 2021 and a copy of the updated Prospectus of the Fund to be
dated on or about July 14, 2021 is available at http://www.mifl.ie/products/challenge-funds.
On July 14, 2021, the Prospectus was updated with the new names for CHALLENGE Sub-Funds as noted below. The Manager
considers the new names of the Sub-Funds better reflect the long-term nature of the investment objectives of the Sub-Funds (i.e. long-
term capital appreciation).
Existing Name of Sub-Fund New Name of Sub-Fund
CHALLENGE Cyclical Equity Fund CHALLENGE Industrials and Materials Equity Evolution
CHALLENGE Counter Cyclical Equity Fund CHALLENGE Healthcare Equity Evolution
CHALLENGE Energy Equity Fund CHALLENGE Energy Equity Evolution
CHALLENGE Technology Equity Fund CHALLENGE Technology Equity Evolution
CHALLENGE Financial Equity Fund CHALLENGE Financial Equity Evolution
In addition, the Prospectus update on July 14, 2021 included a non-material enhancement of investment policy of CHALLENGE
Energy Equity Fund whereby the Sub-Fund, in addition to its primary investment in or exposure to the energy sector (as detailed
below), may also invest in or take exposures to equities and equity related securities issued by companies not operating in the energy
sector or related industries, including but not limited to non-energy related sub-sectors of the utilities sector such as water utilities.
The Sub-Fund’s primary investments and exposures will be equities and equity related securities issued by companies operating in the
energy sector or related industries in addition to energy related sub-sectors of the utilities sector such as electric utilities, gas utilities
and multi-utilities (whereby a company operates in more than one utility sub-sector).
Effective July 15, 2021, Wellington Management International Limited was appointed as Delegate Investment Manager for
CHALLENGE Financial Equity Fund.
Dividends have been declared ex-date July 16, 2021 in respect of B units of the following Sub-Funds.
July 16, 2021
Sub-Fund name Mediolanum Mediolanum Mediolanum Mediolanum
(EUR) L Class L Hedged Class S Class S Hedged Class
CHALLENGE International Bond Fund 0.017 0.019 0.034 0.036
CHALLENGE Euro Bond Fund 0.012 - 0.023 -
CHALLENGE Solidity & Return 0.019 - 0.037 -
CHALLENGE International Income Fund 0.014 0.014 0.028 0.026
CHALLENGE Euro Income Fund 0.002 - 0.004 -
Effective August 16, 2021, AQR Capital Management LLC was appointed as Delegate Investment Manager for CHALLENGE
Provident Fund 1.
Effective August 30, 2021, Goldman Sachs Group, Inc. will no longer act as Security Lending Agent. From quarter 3, 2021, Brown
Brothers Harriman will be the sole Securities Lending Agent in relation to the Sub-Funds entered in this program.
There were no other subsequent events which require disclosure in the condensed financial statements.
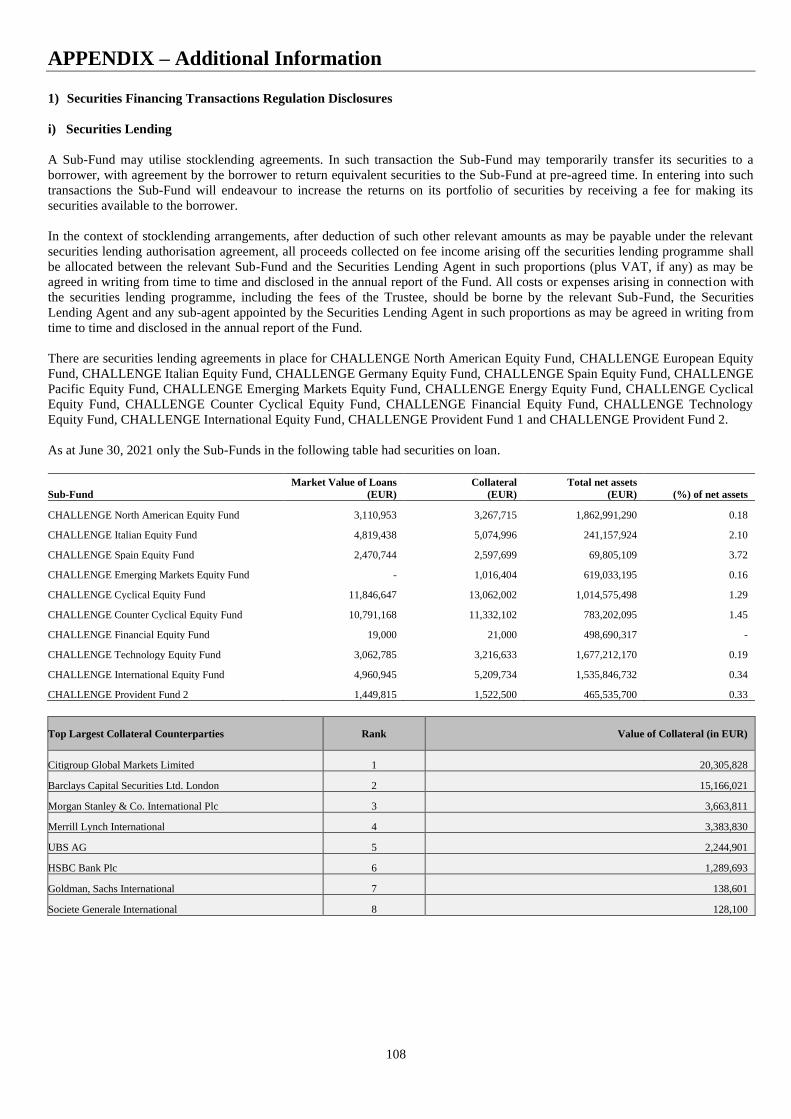
APPENDIX – Additional Information
108
1) Securities Financing Transactions Regulation Disclosures
i) Securities Lending
A Sub-Fund may utilise stocklending agreements. In such transaction the Sub-Fund may temporarily transfer its securities to a
borrower, with agreement by the borrower to return equivalent securities to the Sub-Fund at pre-agreed time. In entering into such
transactions the Sub-Fund will endeavour to increase the returns on its portfolio of securities by receiving a fee for making its
securities available to the borrower.
In the context of stocklending arrangements, after deduction of such other relevant amounts as may be payable under the relevant
securities lending authorisation agreement, all proceeds collected on fee income arising off the securities lending programme shall
be allocated between the relevant Sub-Fund and the Securities Lending Agent in such proportions (plus VAT, if any) as may be
agreed in writing from time to time and disclosed in the annual report of the Fund. All costs or expenses arising in connection with
the securities lending programme, including the fees of the Trustee, should be borne by the relevant Sub-Fund, the Securities
Lending Agent and any sub-agent appointed by the Securities Lending Agent in such proportions as may be agreed in writing from
time to time and disclosed in the annual report of the Fund.
There are securities lending agreements in place for CHALLENGE North American Equity Fund, CHALLENGE European Equity
Fund, CHALLENGE Italian Equity Fund, CHALLENGE Germany Equity Fund, CHALLENGE Spain Equity Fund, CHALLENGE
Pacific Equity Fund, CHALLENGE Emerging Markets Equity Fund, CHALLENGE Energy Equity Fund, CHALLENGE Cyclical
Equity Fund, CHALLENGE Counter Cyclical Equity Fund, CHALLENGE Financial Equity Fund, CHALLENGE Technology
Equity Fund, CHALLENGE International Equity Fund, CHALLENGE Provident Fund 1 and CHALLENGE Provident Fund 2.
As at June 30, 2021 only the Sub-Funds in the following table had securities on loan.
Sub-Fund
Market Value of Loans
(EUR)
Collateral
(EUR)
Total net assets
(EUR) (%) of net assets
CHALLENGE North American Equity Fund 3,110,953 3,267,715 1,862,991,290 0.18
CHALLENGE Italian Equity Fund 4,819,438 5,074,996 241,157,924 2.10
CHALLENGE Spain Equity Fund 2,470,744 2,597,699 69,805,109 3.72
CHALLENGE Emerging Markets Equity Fund - 1,016,404 619,033,195 0.16
CHALLENGE Cyclical Equity Fund 11,846,647 13,062,002 1,014,575,498 1.29
CHALLENGE Counter Cyclical Equity Fund 10,791,168 11,332,102 783,202,095 1.45
CHALLENGE Financial Equity Fund 19,000 21,000 498,690,317 -
CHALLENGE Technology Equity Fund 3,062,785 3,216,633 1,677,212,170 0.19
CHALLENGE International Equity Fund 4,960,945 5,209,734 1,535,846,732 0.34
CHALLENGE Provident Fund 2 1,449,815 1,522,500 465,535,700 0.33
Top Largest Collateral Counterparties Rank Value of Collateral (in EUR)
Citigroup Global Markets Limited 1 20,305,828
Barclays Capital Securities Ltd. London 2 15,166,021
Morgan Stanley & Co. International Plc 3 3,663,811
Merrill Lynch International 4 3,383,830
UBS AG 5 2,244,901
HSBC Bank Plc 6 1,289,693
Goldman, Sachs International 7 138,601
Societe Generale International 8 128,100

APPENDIX – Additional Information (continued)
109
1) Securities Financing Transactions Regulation Disclosures (continued)
i) Securities Lending (continued)
Top Largest Collateral Issuers Rank Value of Collateral (in EUR)
United Kingdom Gilt 1 18,505,004
United Kingdom Inflation-Linked Gilt 2 11,837,663
United States Treasury Note/Bond 3 8,910,856
French Republic Government Bond OAT 4 3,366,035
Kingdom of Belgium Government Bond 5 2,319,876
Deutsche Bundesrepublik Coupon Strips 6 632,859
Deutsche Bundesrepublik Principal Strips 7 423,988
German Treasury Bill 8 102,149
United States Treasury Inflation Indexed Bonds 9 71,842
Bundesrepublik Deutschland Bundesanleihe 10 66,444
Type of Collateral Value (in EUR) Proportion (%)
Government Bond 46,320,785 100.00
Collateral Maturity Value (in EUR) Proportion (%)
1 day - -
less than 1 week - -
less than 1 month 1,391,829 3.00
less than 3 months 5,994 0.01
less than 1 year 11,128 0.02
more than 1 year 44,911,834 96.97
Currencies of Collateral Value (in EUR) Proportion (%)
EUR 6,934,515 14.97
GBP 30,342,667 65.51
USD 9,043,603 19.52
Securities Lending Maturity
There is no maturity on the securities lending as all securities are equities.
Countries of Counterparties Value (in EUR) Proportion (%)
France 128,100 0.28
Switzerland 2,244,901 4.85
United Kingdom 43,947,784 94.87
Settlement & Clearing Value (in EUR) Proportion (%)
Tri-party 46,320,785 100.00
Central Counterparty - -
Bilateral - -
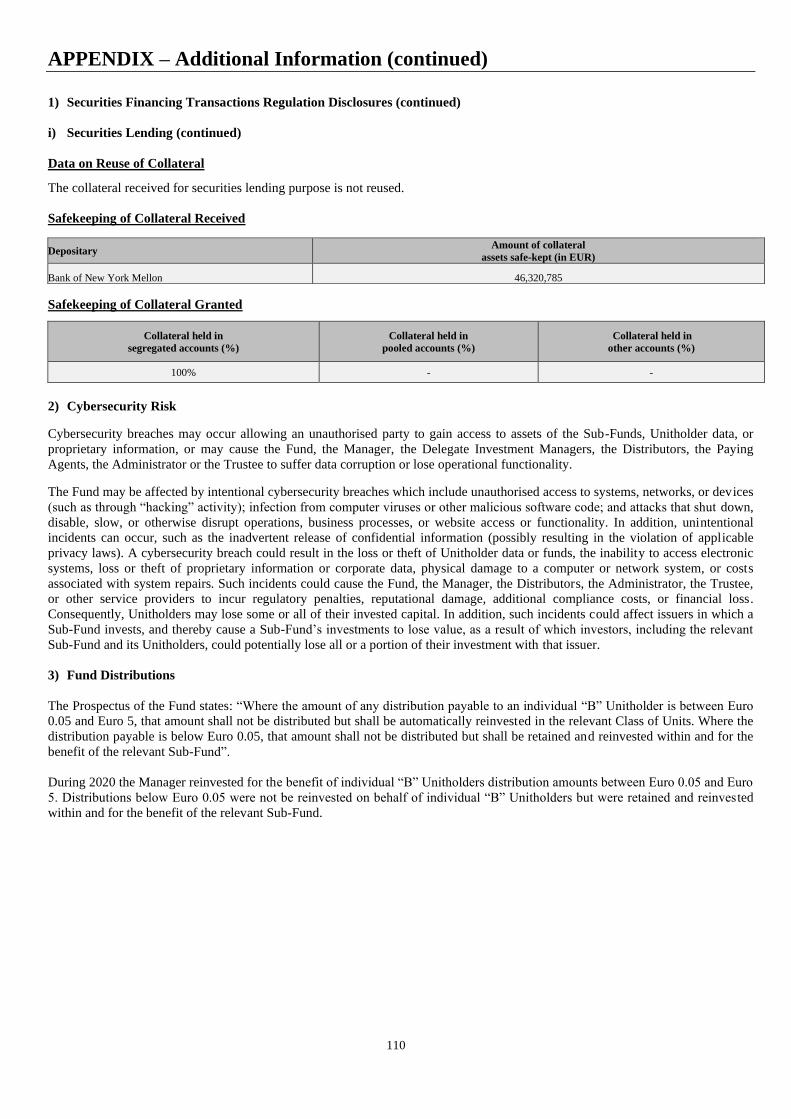
APPENDIX – Additional Information (continued)
110
1) Securities Financing Transactions Regulation Disclosures (continued)
i) Securities Lending (continued)
Data on Reuse of Collateral
The collateral received for securities lending purpose is not reused.
Safekeeping of Collateral Received
Safekeeping of Collateral Granted
Collateral held in
segregated accounts (%)
Collateral held in
pooled accounts (%)
Collateral held in
other accounts (%)
100% - -
2) Cybersecurity Risk
Cybersecurity breaches may occur allowing an unauthorised party to gain access to assets of the Sub-Funds, Unitholder data, or
proprietary information, or may cause the Fund, the Manager, the Delegate Investment Managers, the Distributors, the Paying
Agents, the Administrator or the Trustee to suffer data corruption or lose operational functionality.
The Fund may be affected by intentional cybersecurity breaches which include unauthorised access to systems, networks, or devices
(such as through “hacking” activity); infection from computer viruses or other malicious software code; and attacks that shut down,
disable, slow, or otherwise disrupt operations, business processes, or website access or functionality. In addition, unintentional
incidents can occur, such as the inadvertent release of confidential information (possibly resulting in the violation of applicable
privacy laws). A cybersecurity breach could result in the loss or theft of Unitholder data or funds, the inability to access electronic
systems, loss or theft of proprietary information or corporate data, physical damage to a computer or network system, or costs
associated with system repairs. Such incidents could cause the Fund, the Manager, the Distributors, the Administrator, the Trustee,
or other service providers to incur regulatory penalties, reputational damage, additional compliance costs, or financial loss.
Consequently, Unitholders may lose some or all of their invested capital. In addition, such incidents could affect issuers in which a
Sub-Fund invests, and thereby cause a Sub-Fund’s investments to lose value, as a result of which investors, including the relevant
Sub-Fund and its Unitholders, could potentially lose all or a portion of their investment with that issuer.
3) Fund Distributions
The Prospectus of the Fund states: “Where the amount of any distribution payable to an individual “B” Unitholder is between Euro
0.05 and Euro 5, that amount shall not be distributed but shall be automatically reinvested in the relevant Class of Units. Where the
distribution payable is below Euro 0.05, that amount shall not be distributed but shall be retained and reinvested within and for the
benefit of the relevant Sub-Fund”.
During 2020 the Manager reinvested for the benefit of individual “B” Unitholders distribution amounts between Euro 0.05 and Euro
5. Distributions below Euro 0.05 were not be reinvested on behalf of individual “B” Unitholders but were retained and reinves ted
within and for the benefit of the relevant Sub-Fund.
Depositary Amount of collateral
assets safe-kept (in EUR)
Bank of New York Mellon 46,320,785

APPENDIX – Additional Information (continued)
111
4) Mediolanum International Funds Ltd - CRS Data Protection Information Notice
The Fund hereby provides the following data protection information notice to all Unitholders in the Fund either as at 31 December
2015 or at any point of time since this date.
For the avoidance of doubt, this notice applies equally to any Unitholders that have ceased to hold units in the Fund since January 1,
2016. Furthermore, it should be noted that this notice may be applicable to Controlling Persons of certain Unitholders.
The Fund hereby confirm that they intend to take such steps as may be required to satisfy any obligations imposed by (i) the
OECD’s Standard for Automatic Exchange of Financial Account Information in Tax Matters (“the Standard”), which therein
contains the Common Reporting Standard (“CRS”), as applied in Ireland by means of the relevant international legal framework
and Irish tax legislation and (ii) EU Council Directive 2014/107/EU, amending Directive 2011/16/EU as regards mandatory
automatic exchange information in the field of taxation (“DAC2”), as applied in Ireland by means of the relevant Irish tax
legislation, so as to ensure compliance or deemed compliance (as the case may be) with the Standard/CRS and the DAC2 from 1
January 2016.
In this regard, the Manager on behalf of the Fund is obliged under Section 891F and Section 891G of the Irish Taxes Consolidation
Act, 1997 (as amended) and regulations made pursuant to those sections to collect certain information about each Unitholder’s tax
arrangements (and also collect information in relation to relevant Controlling Persons of specific Unitholders).
In certain circumstances, the Manager on behalf of the Fund may be legally obliged to share this information and other financial
information with respect to a Unitholder’s interests in the Fund with the Irish Revenue Commissioners (and, in particular situations,
also share information in relation to relevant Controlling Persons of specific Unitholders). In turn, and to the extent the account has
been identified as a Reportable Account, the Irish Revenue Commissioners will exchange this information with the country of
residence of the Reportable Person(s) in respect of that Reportable Account.
In particular, information that may be reported in respect of a Unitholder (and relevant Controlling Persons, if applicable) includes
name, address, date of birth, place of birth, account number, account balance or value at year end (or, if the account was closed
during such year, the balance or value at the date of closure of the account), any payments (including redemption and
dividend/interest payments) made with respect to the account during the calendar year, tax residency(ies) and tax identification
number(s).
Unitholders (and relevant Controlling Persons) can obtain more information on the Fund’s tax reporting obligations on the website
of the Irish Revenue Commissioners (which is available at http://www.revenue.ie/en/business/aeoi/index.html) or the following link
in the case of CRS only: http://www.oecd.org/tax/automatic-exchange/.
All capitalised terms above, unless otherwise defined above, shall have the same meaning as they have in the Standard or DAC2 (as
applicable).
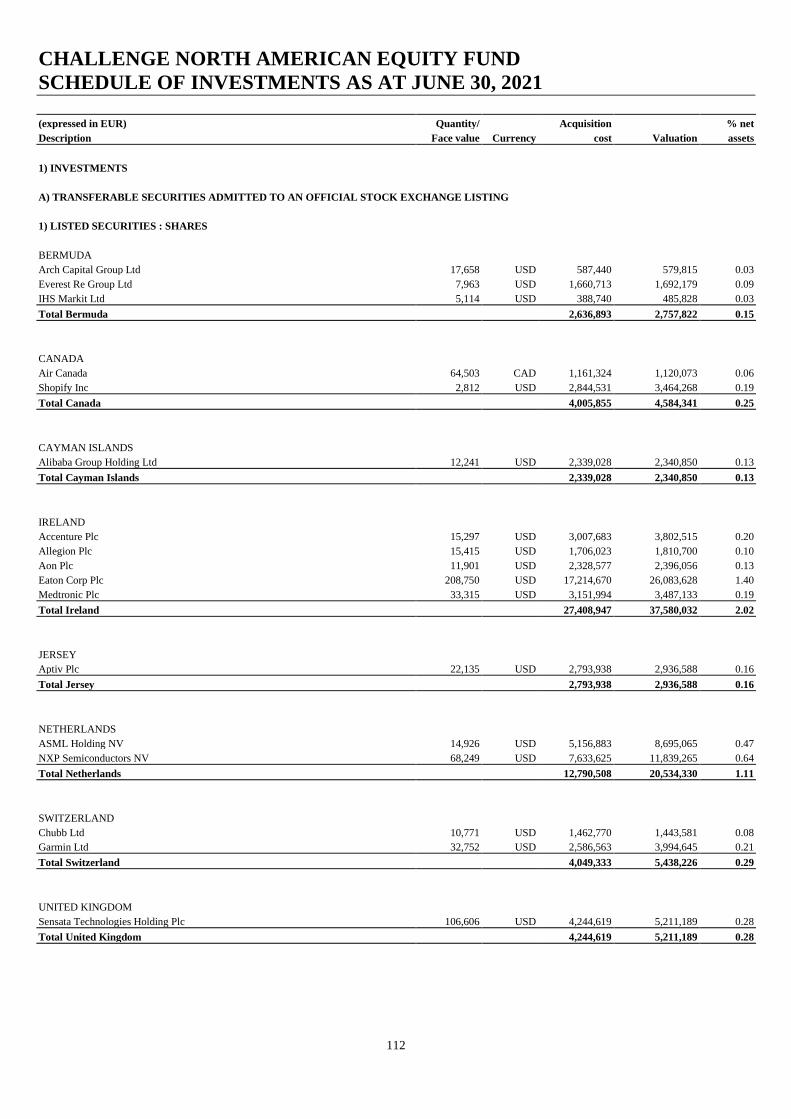
CHALLENGE NORTH AMERICAN EQUITY FUND
SCHEDULE OF INVESTMENTS AS AT JUNE 30, 2021
112
(expressed in EUR) Quantity/ Acquisition % net
Description Face value Currency cost Valuation assets
1) INVESTMENTS
A) TRANSFERABLE SECURITIES ADMITTED TO AN OFFICIAL STOCK EXCHANGE LISTING
1) LISTED SECURITIES : SHARES
BERMUDA
Arch Capital Group Ltd 17,658 USD 587,440 579,815 0.03
Everest Re Group Ltd 7,963 USD 1,660,713 1,692,179 0.09
IHS Markit Ltd 5,114 USD 388,740 485,828 0.03
Total Bermuda 2,636,893 2,757,822 0.15
CANADA
Air Canada 64,503 CAD 1,161,324 1,120,073 0.06
Shopify Inc 2,812 USD 2,844,531 3,464,268 0.19
Total Canada 4,005,855 4,584,341 0.25
CAYMAN ISLANDS
Alibaba Group Holding Ltd 12,241 USD 2,339,028 2,340,850 0.13
Total Cayman Islands 2,339,028 2,340,850 0.13
IRELAND
Accenture Plc 15,297 USD 3,007,683 3,802,515 0.20
Allegion Plc 15,415 USD 1,706,023 1,810,700 0.10
Aon Plc 11,901 USD 2,328,577 2,396,056 0.13
Eaton Corp Plc 208,750 USD 17,214,670 26,083,628 1.40
Medtronic Plc 33,315 USD 3,151,994 3,487,133 0.19
Total Ireland 27,408,947 37,580,032 2.02
JERSEY
Aptiv Plc 22,135 USD 2,793,938 2,936,588 0.16
Total Jersey 2,793,938 2,936,588 0.16
NETHERLANDS
ASML Holding NV 14,926 USD 5,156,883 8,695,065 0.47
NXP Semiconductors NV 68,249 USD 7,633,625 11,839,265 0.64
Total Netherlands 12,790,508 20,534,330 1.11
SWITZERLAND
Chubb Ltd 10,771 USD 1,462,770 1,443,581 0.08
Garmin Ltd 32,752 USD 2,586,563 3,994,645 0.21
Total Switzerland 4,049,333 5,438,226 0.29
UNITED KINGDOM
Sensata Technologies Holding Plc 106,606 USD 4,244,619 5,211,189 0.28
Total United Kingdom 4,244,619 5,211,189 0.28
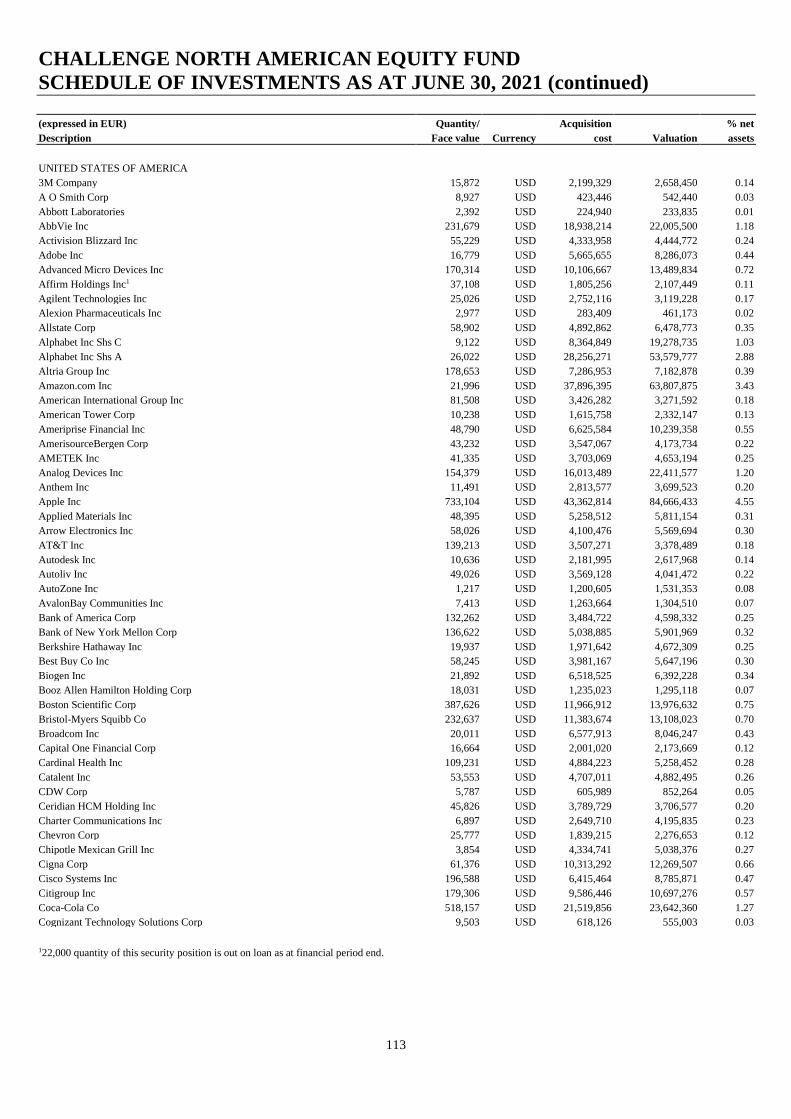
CHALLENGE NORTH AMERICAN EQUITY FUND
SCHEDULE OF INVESTMENTS AS AT JUNE 30, 2021 (continued)
113
(expressed in EUR) Quantity/ Acquisition % net
Description Face value Currency cost Valuation assets
UNITED STATES OF AMERICA
3M Company 15,872 USD 2,199,329 2,658,450 0.14
A O Smith Corp 8,927 USD 423,446 542,440 0.03
Abbott Laboratories 2,392 USD 224,940 233,835 0.01
AbbVie Inc 231,679 USD 18,938,214 22,005,500 1.18
Activision Blizzard Inc 55,229 USD 4,333,958 4,444,772 0.24
Adobe Inc 16,779 USD 5,665,655 8,286,073 0.44
Advanced Micro Devices Inc 170,314 USD 10,106,667 13,489,834 0.72
Affirm Holdings Inc1 37,108 USD 1,805,256 2,107,449 0.11
Agilent Technologies Inc 25,026 USD 2,752,116 3,119,228 0.17
Alexion Pharmaceuticals Inc 2,977 USD 283,409 461,173 0.02
Allstate Corp 58,902 USD 4,892,862 6,478,773 0.35
Alphabet Inc Shs C 9,122 USD 8,364,849 19,278,735 1.03
Alphabet Inc Shs A 26,022 USD 28,256,271 53,579,777 2.88
Altria Group Inc 178,653 USD 7,286,953 7,182,878 0.39
Amazon.com Inc 21,996 USD 37,896,395 63,807,875 3.43
American International Group Inc 81,508 USD 3,426,282 3,271,592 0.18
American Tower Corp 10,238 USD 1,615,758 2,332,147 0.13
Ameriprise Financial Inc 48,790 USD 6,625,584 10,239,358 0.55
AmerisourceBergen Corp 43,232 USD 3,547,067 4,173,734 0.22
AMETEK Inc 41,335 USD 3,703,069 4,653,194 0.25
Analog Devices Inc 154,379 USD 16,013,489 22,411,577 1.20
Anthem Inc 11,491 USD 2,813,577 3,699,523 0.20
Apple Inc 733,104 USD 43,362,814 84,666,433 4.55
Applied Materials Inc 48,395 USD 5,258,512 5,811,154 0.31
Arrow Electronics Inc 58,026 USD 4,100,476 5,569,694 0.30
AT&T Inc 139,213 USD 3,507,271 3,378,489 0.18
Autodesk Inc 10,636 USD 2,181,995 2,617,968 0.14
Autoliv Inc 49,026 USD 3,569,128 4,041,472 0.22
AutoZone Inc 1,217 USD 1,200,605 1,531,353 0.08
AvalonBay Communities Inc 7,413 USD 1,263,664 1,304,510 0.07
Bank of America Corp 132,262 USD 3,484,722 4,598,332 0.25
Bank of New York Mellon Corp 136,622 USD 5,038,885 5,901,969 0.32
Berkshire Hathaway Inc 19,937 USD 1,971,642 4,672,309 0.25
Best Buy Co Inc 58,245 USD 3,981,167 5,647,196 0.30
Biogen Inc 21,892 USD 6,518,525 6,392,228 0.34
Booz Allen Hamilton Holding Corp 18,031 USD 1,235,023 1,295,118 0.07
Boston Scientific Corp 387,626 USD 11,966,912 13,976,632 0.75
Bristol-Myers Squibb Co 232,637 USD 11,383,674 13,108,023 0.70
Broadcom Inc 20,011 USD 6,577,913 8,046,247 0.43
Capital One Financial Corp 16,664 USD 2,001,020 2,173,669 0.12
Cardinal Health Inc 109,231 USD 4,884,223 5,258,452 0.28
Catalent Inc 53,553 USD 4,707,011 4,882,495 0.26
CDW Corp 5,787 USD 605,989 852,264 0.05
Ceridian HCM Holding Inc 45,826 USD 3,789,729 3,706,577 0.20
Charter Communications Inc 6,897 USD 2,649,710 4,195,835 0.23
Chevron Corp 25,777 USD 1,839,215 2,276,653 0.12
Chipotle Mexican Grill Inc 3,854 USD 4,334,741 5,038,376 0.27
Cigna Corp 61,376 USD 10,313,292 12,269,507 0.66
Cisco Systems Inc 196,588 USD 6,415,464 8,785,871 0.47
Citigroup Inc 179,306 USD 9,586,446 10,697,276 0.57
Coca-Cola Co 518,157 USD 21,519,856 23,642,360 1.27
Cognizant Technology Solutions Corp 9,503 USD 618,126 555,003 0.03
122,000 quantity of this security position is out on loan as at financial period end.
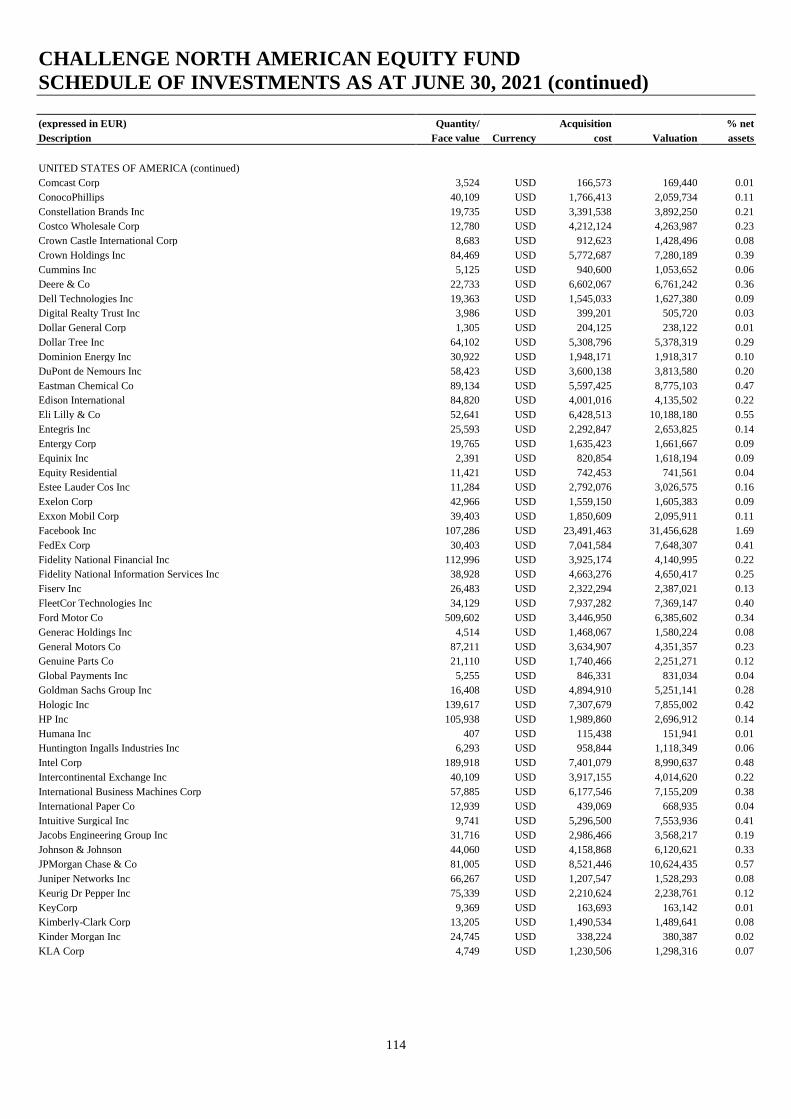
CHALLENGE NORTH AMERICAN EQUITY FUND
SCHEDULE OF INVESTMENTS AS AT JUNE 30, 2021 (continued)
114
(expressed in EUR) Quantity/ Acquisition % net
Description Face value Currency cost Valuation assets
UNITED STATES OF AMERICA (continued)
Comcast Corp 3,524 USD 166,573 169,440 0.01
ConocoPhillips 40,109 USD 1,766,413 2,059,734 0.11
Constellation Brands Inc 19,735 USD 3,391,538 3,892,250 0.21
Costco Wholesale Corp 12,780 USD 4,212,124 4,263,987 0.23
Crown Castle International Corp 8,683 USD 912,623 1,428,496 0.08
Crown Holdings Inc 84,469 USD 5,772,687 7,280,189 0.39
Cummins Inc 5,125 USD 940,600 1,053,652 0.06
Deere & Co 22,733 USD 6,602,067 6,761,242 0.36
Dell Technologies Inc 19,363 USD 1,545,033 1,627,380 0.09
Digital Realty Trust Inc 3,986 USD 399,201 505,720 0.03
Dollar General Corp 1,305 USD 204,125 238,122 0.01
Dollar Tree Inc 64,102 USD 5,308,796 5,378,319 0.29
Dominion Energy Inc 30,922 USD 1,948,171 1,918,317 0.10
DuPont de Nemours Inc 58,423 USD 3,600,138 3,813,580 0.20
Eastman Chemical Co 89,134 USD 5,597,425 8,775,103 0.47
Edison International 84,820 USD 4,001,016 4,135,502 0.22
Eli Lilly & Co 52,641 USD 6,428,513 10,188,180 0.55
Entegris Inc 25,593 USD 2,292,847 2,653,825 0.14
Entergy Corp 19,765 USD 1,635,423 1,661,667 0.09
Equinix Inc 2,391 USD 820,854 1,618,194 0.09
Equity Residential 11,421 USD 742,453 741,561 0.04
Estee Lauder Cos Inc 11,284 USD 2,792,076 3,026,575 0.16
Exelon Corp 42,966 USD 1,559,150 1,605,383 0.09
Exxon Mobil Corp 39,403 USD 1,850,609 2,095,911 0.11
Facebook Inc 107,286 USD 23,491,463 31,456,628 1.69
FedEx Corp 30,403 USD 7,041,584 7,648,307 0.41
Fidelity National Financial Inc 112,996 USD 3,925,174 4,140,995 0.22
Fidelity National Information Services Inc 38,928 USD 4,663,276 4,650,417 0.25
Fiserv Inc 26,483 USD 2,322,294 2,387,021 0.13
FleetCor Technologies Inc 34,129 USD 7,937,282 7,369,147 0.40
Ford Motor Co 509,602 USD 3,446,950 6,385,602 0.34
Generac Holdings Inc 4,514 USD 1,468,067 1,580,224 0.08
General Motors Co 87,211 USD 3,634,907 4,351,357 0.23
Genuine Parts Co 21,110 USD 1,740,466 2,251,271 0.12
Global Payments Inc 5,255 USD 846,331 831,034 0.04
Goldman Sachs Group Inc 16,408 USD 4,894,910 5,251,141 0.28
Hologic Inc 139,617 USD 7,307,679 7,855,002 0.42
HP Inc 105,938 USD 1,989,860 2,696,912 0.14
Humana Inc 407 USD 115,438 151,941 0.01
Huntington Ingalls Industries Inc 6,293 USD 958,844 1,118,349 0.06
Intel Corp 189,918 USD 7,401,079 8,990,637 0.48
Intercontinental Exchange Inc 40,109 USD 3,917,155 4,014,620 0.22
International Business Machines Corp 57,885 USD 6,177,546 7,155,209 0.38
International Paper Co 12,939 USD 439,069 668,935 0.04
Intuitive Surgical Inc 9,741 USD 5,296,500 7,553,936 0.41
Jacobs Engineering Group Inc 31,716 USD 2,986,466 3,568,217 0.19
Johnson & Johnson 44,060 USD 4,158,868 6,120,621 0.33
JPMorgan Chase & Co 81,005 USD 8,521,446 10,624,435 0.57
Juniper Networks Inc 66,267 USD 1,207,547 1,528,293 0.08
Keurig Dr Pepper Inc 75,339 USD 2,210,624 2,238,761 0.12
KeyCorp 9,369 USD 163,693 163,142 0.01
Kimberly-Clark Corp 13,205 USD 1,490,534 1,489,641 0.08
Kinder Morgan Inc 24,745 USD 338,224 380,387 0.02
KLA Corp 4,749 USD 1,230,506 1,298,316 0.07

CHALLENGE NORTH AMERICAN EQUITY FUND
SCHEDULE OF INVESTMENTS AS AT JUNE 30, 2021 (continued)
115
(expressed in EUR) Quantity/ Acquisition % net
Description Face value Currency cost Valuation assets
UNITED STATES OF AMERICA (continued)
Knight-Swift Transportation Holdings Inc 127,263 USD 4,410,825 4,878,469 0.26
L Brands Inc 10,499 USD 611,572 637,961 0.03
L3Harris Technologies Inc 3,101 USD 513,637 565,209 0.03
Lam Research Corp 9,924 USD 3,656,175 5,445,271 0.29
Leidos Holdings Inc 123,040 USD 9,453,672 10,489,370 0.56
Lennar Corp 67,235 USD 5,626,583 5,632,682 0.30
LKQ Corp 43,173 USD 1,091,498 1,791,867 0.10
Lockheed Martin Corp 10,526 USD 3,385,095 3,358,219 0.18
Lowe's Cos Inc 124,350 USD 16,730,682 20,339,126 1.09
M&T Bank Corp 11,009 USD 1,428,687 1,348,948 0.07
Markel Corp 5,654 USD 5,607,267 5,657,862 0.30
Marriott International Inc 109,399 USD 13,481,419 12,593,938 0.68
Masco Corp 11,812 USD 568,905 586,765 0.03
Mastercard Inc 117,982 USD 28,231,648 36,321,822 1.95
Maxim Integrated Products Inc 4,998 USD 268,415 444,042 0.02
McDonald's Corp 90,764 USD 16,264,520 17,679,042 0.95
McKesson Corp 33,414 USD 4,209,768 5,388,391 0.29
Merck & Co Inc 146,231 USD 8,501,947 9,589,666 0.51
Micron Technology Inc 2,704 USD 108,288 193,765 0.01
Microsoft Corp 366,057 USD 33,711,502 83,619,901 4.49
Moderna Inc 8,671 USD 1,591,230 1,718,114 0.09
Mondelez International Inc 53,166 USD 2,695,178 2,799,296 0.15
Morgan Stanley 234,500 USD 11,085,308 18,130,791 0.97
Mosaic Co 56,676 USD 1,258,559 1,525,028 0.08
Nasdaq Inc 17,047 USD 2,267,517 2,527,079 0.14
Netflix Inc 3,550 USD 1,200,259 1,581,200 0.09
NextEra Energy Inc 314,184 USD 16,071,293 19,414,288 1.04
NIKE Inc 17,898 USD 2,033,157 2,331,615 0.13
Nordson Corp 3,147 USD 532,012 582,509 0.03
Norfolk Southern Corp 100,996 USD 16,073,248 22,603,380 1.21
Northern Trust Corp 15,207 USD 1,429,244 1,482,615 0.08
Northrop Grumman Corp 35,399 USD 9,804,139 10,848,350 0.58
NVR Inc 514 USD 2,022,034 2,155,558 0.12
Omnicom Group Inc 17,650 USD 828,804 1,190,508 0.06
Oracle Corp1 114,276 USD 5,244,796 7,500,838 0.40
O'Reilly Automotive Inc 17,030 USD 6,203,692 8,131,003 0.44
Organon & Co 9,242 USD 251,183 235,823 0.01
Oshkosh Corp 23,329 USD 2,513,385 2,451,915 0.13
Owens Corning 15,047 USD 1,267,471 1,242,180 0.07
PACCAR Inc 60,254 USD 4,536,539 4,534,674 0.24
Packaging Corp of America 2,287 USD 197,742 261,157 0.01
PayPal Holdings Inc 1,094 USD 221,203 268,892 0.01
PepsiCo Inc 7,491 USD 898,363 935,949 0.05
Pfizer Inc 77,514 USD 2,332,349 2,559,616 0.14
Philip Morris International Inc 88,120 USD 6,665,999 7,364,511 0.40
Pioneer Natural Resources Co 16,197 USD 1,281,308 2,219,695 0.12
PPG Industries Inc 62,988 USD 7,635,395 9,017,179 0.48
Procter & Gamble Co 32,571 USD 2,944,750 3,705,882 0.20
Progressive Corp 110,109 USD 8,362,891 9,118,648 0.49
Prologis Inc 223,105 USD 15,762,507 22,487,344 1.21
Public Storage 4,601 USD 865,985 1,166,603 0.06
PulteGroup Inc 136,132 USD 5,201,928 6,264,207 0.34
Qorvo Inc 5,028 USD 495,361 829,520 0.04
128,700 quantity of this security position is out on loan as at financial period end.

CHALLENGE NORTH AMERICAN EQUITY FUND
SCHEDULE OF INVESTMENTS AS AT JUNE 30, 2021 (continued)
116
(expressed in EUR) Quantity/ Acquisition % net
Description Face value Currency cost Valuation assets
UNITED STATES OF AMERICA (continued)
QUALCOMM Inc 52,352 USD 5,954,588 6,309,699 0.34
Realty Income Corp 9,776 USD 597,189 550,173 0.03
Regeneron Pharmaceuticals Inc 10,632 USD 4,531,438 5,007,503 0.27
Ross Stores Inc 84,081 USD 8,252,520 8,791,672 0.47
S&P Global Inc 32,034 USD 10,216,289 11,087,238 0.60
SBA Communications Corp 2,604 USD 477,536 699,802 0.04
SEI Investments Co 3,060 USD 149,443 159,902 0.01
Sempra Energy 7,311 USD 797,012 816,731 0.04
ServiceNow Inc 3,669 USD 1,622,583 1,700,227 0.09
Simon Property Group Inc 5,928 USD 955,599 652,235 0.04
Skyworks Solutions Inc 17,080 USD 1,502,582 2,761,692 0.15
SS&C Technologies Holdings Inc 11,755 USD 620,363 714,281 0.04
Stanley Black & Decker Inc 23,480 USD 2,487,575 4,058,660 0.22
Starbucks Corp 35,148 USD 2,965,802 3,313,853 0.18
State Street Corp 22,581 USD 1,565,229 1,566,713 0.08
Steel Dynamics Inc 3,473 USD 84,218 174,543 0.01
SVB Financial Group 7,138 USD 3,074,344 3,349,184 0.18
Synopsys Inc 15,251 USD 3,119,947 3,546,735 0.19
Target Corp 36,932 USD 5,148,458 7,528,410 0.40
Teledyne Technologies Inc 10,473 USD 3,549,289 3,698,800 0.20
Tesla Inc 31,641 USD 13,489,515 18,135,077 0.97
Texas Instruments Inc 23,254 USD 3,229,479 3,770,760 0.20
Thermo Fisher Scientific Inc 17,787 USD 6,971,578 7,566,412 0.41
TJX Cos Inc 37,762 USD 2,076,414 2,146,820 0.12
TransUnion 38,158 USD 3,416,191 3,533,291 0.19
Travelers Cos Inc 9,517 USD 1,237,229 1,201,442 0.06
Truist Financial Corp 430,208 USD 15,645,627 20,133,691 1.08
Tyson Foods Inc 91,711 USD 5,154,285 5,704,194 0.31
United Parcel Service Inc 8,230 USD 1,138,167 1,443,286 0.08
UnitedHealth Group Inc 13,963 USD 4,265,584 4,714,853 0.25
US Bancorp 468,444 USD 21,065,578 22,503,799 1.21
VeriSign Inc 11,845 USD 1,928,711 2,274,212 0.12
Verizon Communications Inc 90,316 USD 4,338,575 4,267,144 0.23
Vertex Pharmaceuticals Inc 10,436 USD 2,139,443 1,774,358 0.10
VF Corp 31,923 USD 2,125,856 2,208,418 0.12
Visa Inc 24,243 USD 4,662,090 4,779,913 0.26
Walgreens Boots Alliance Inc 29,335 USD 1,198,505 1,301,387 0.07
Walmart Inc 75,156 USD 9,139,631 8,937,093 0.48
Wells Fargo & Co 110,620 USD 3,443,170 4,224,622 0.23
Welltower Inc 7,153 USD 488,614 501,235 0.03
Western Union Co 11,235 USD 215,210 217,614 0.01
Westinghouse Air Brake Technologies Corp 3,521 USD 227,142 244,353 0.01
Westrock Co 44,384 USD 1,245,965 1,991,834 0.11
Weyerhaeuser Co 21,583 USD 474,803 626,433 0.03
Whirlpool Corp 5,471 USD 798,257 1,005,808 0.05
Xcel Energy Inc 220,351 USD 11,184,911 12,241,103 0.66
Xilinx Inc 3,986 USD 448,617 486,158 0.03
Yum! Brands Inc 48,111 USD 4,135,054 4,666,674 0.25
Total United States of America 1,030,050,272 1,353,002,529 72.61
TOTAL LISTED SECURITIES : SHARES 1,090,319,393 1,434,385,907 77.00
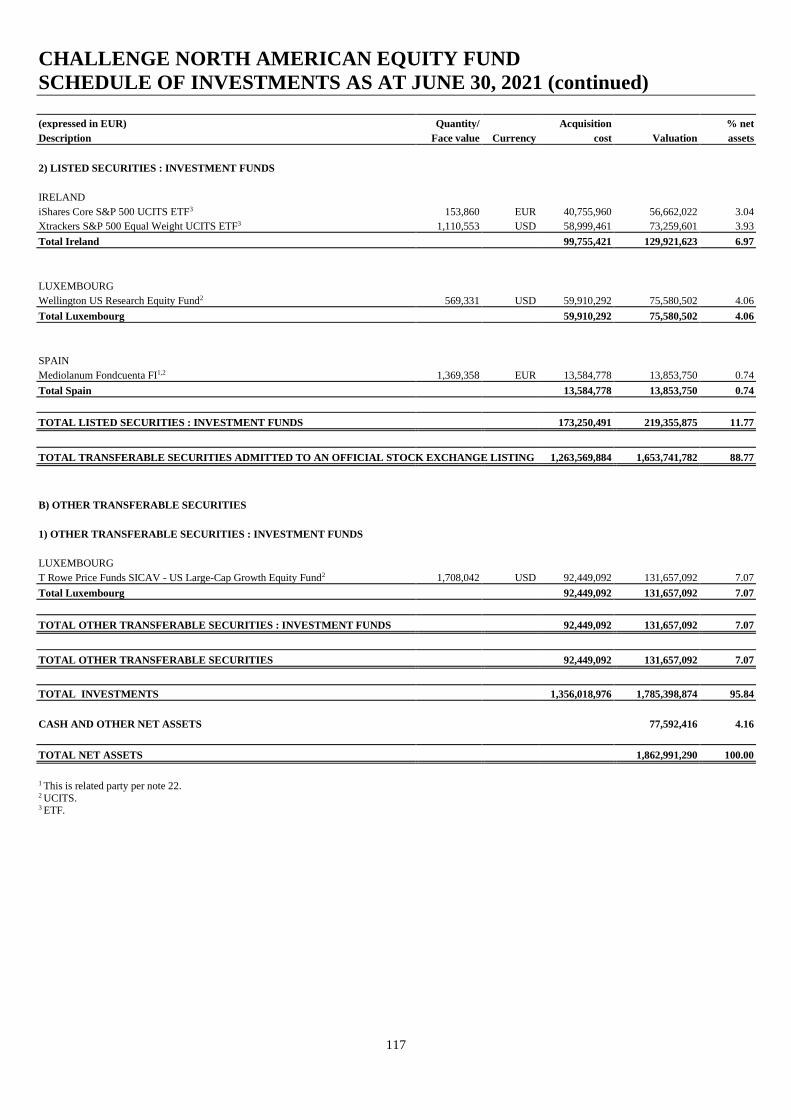
CHALLENGE NORTH AMERICAN EQUITY FUND
SCHEDULE OF INVESTMENTS AS AT JUNE 30, 2021 (continued)
117
(expressed in EUR) Quantity/ Acquisition % net
Description Face value Currency cost Valuation assets
2) LISTED SECURITIES : INVESTMENT FUNDS
IRELAND
iShares Core S&P 500 UCITS ETF3 153,860 EUR 40,755,960 56,662,022 3.04
Xtrackers S&P 500 Equal Weight UCITS ETF3 1,110,553 USD 58,999,461 73,259,601 3.93
Total Ireland 99,755,421 129,921,623 6.97
LUXEMBOURG
Wellington US Research Equity Fund2 569,331 USD 59,910,292 75,580,502 4.06
Total Luxembourg 59,910,292 75,580,502 4.06
SPAIN
Mediolanum Fondcuenta FI1,2 1,369,358 EUR 13,584,778 13,853,750 0.74
Total Spain 13,584,778 13,853,750 0.74
TOTAL LISTED SECURITIES : INVESTMENT FUNDS 173,250,491 219,355,875 11.77
TOTAL TRANSFERABLE SECURITIES ADMITTED TO AN OFFICIAL STOCK EXCHANGE LISTING 1,263,569,884 1,653,741,782 88.77
B) OTHER TRANSFERABLE SECURITIES
1) OTHER TRANSFERABLE SECURITIES : INVESTMENT FUNDS
LUXEMBOURG
T Rowe Price Funds SICAV - US Large-Cap Growth Equity Fund2 1,708,042 USD 92,449,092 131,657,092 7.07
Total Luxembourg 92,449,092 131,657,092 7.07
TOTAL OTHER TRANSFERABLE SECURITIES : INVESTMENT FUNDS 92,449,092 131,657,092 7.07
TOTAL OTHER TRANSFERABLE SECURITIES 92,449,092 131,657,092 7.07
TOTAL INVESTMENTS 1,356,018,976 1,785,398,874 95.84
CASH AND OTHER NET ASSETS 77,592,416 4.16
TOTAL NET ASSETS 1,862,991,290 100.00
1 This is related party per note 22. 2 UCITS. 3 ETF.
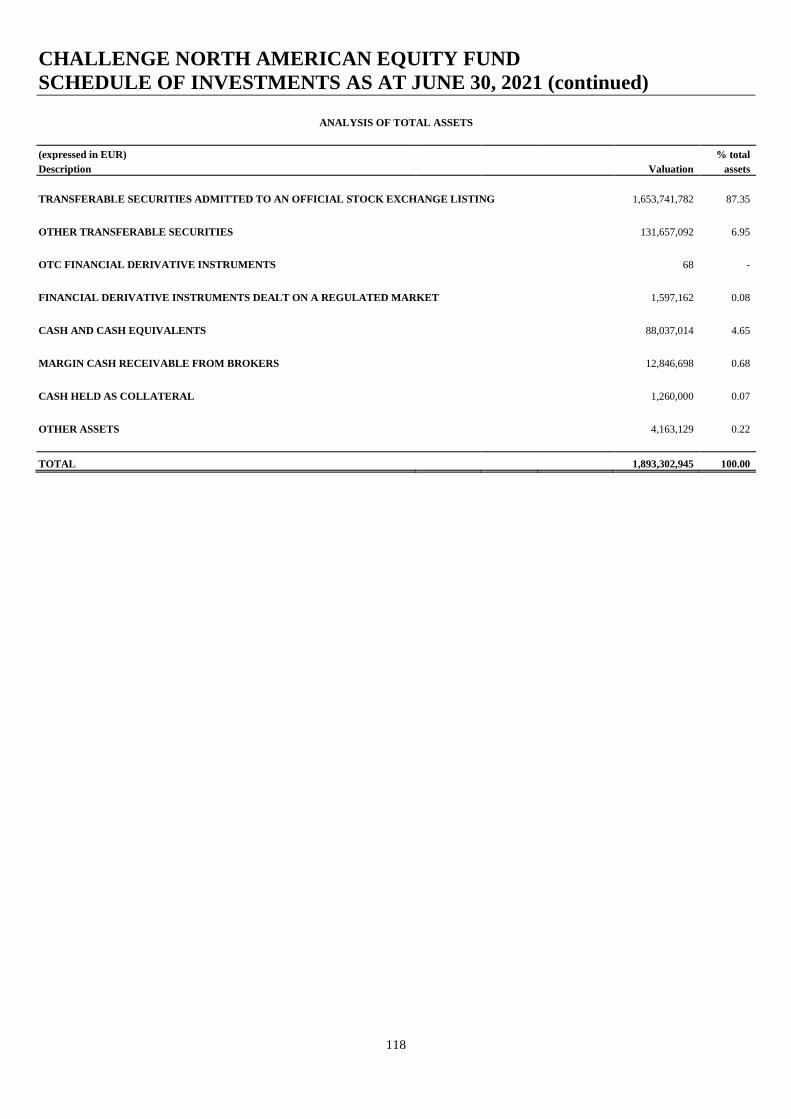
CHALLENGE NORTH AMERICAN EQUITY FUND
SCHEDULE OF INVESTMENTS AS AT JUNE 30, 2021 (continued)
118
ANALYSIS OF TOTAL ASSETS
(expressed in EUR) % total
Description Valuation assets
TRANSFERABLE SECURITIES ADMITTED TO AN OFFICIAL STOCK EXCHANGE LISTING 1,653,741,782 87.35
OTHER TRANSFERABLE SECURITIES 131,657,092 6.95
OTC FINANCIAL DERIVATIVE INSTRUMENTS 68 -
FINANCIAL DERIVATIVE INSTRUMENTS DEALT ON A REGULATED MARKET 1,597,162 0.08
CASH AND CASH EQUIVALENTS 88,037,014 4.65
MARGIN CASH RECEIVABLE FROM BROKERS 12,846,698 0.68
CASH HELD AS COLLATERAL 1,260,000 0.07
OTHER ASSETS 4,163,129 0.22
TOTAL 1,893,302,945 100.00

CHALLENGE NORTH AMERICAN EQUITY FUND
ECONOMIC BREAKDOWN OF INVESTMENTS (expressed as a percentage of net assets)
119
% net
assets
Investment Funds 18.84
Internet Software 12.75
Banks and Financial Institutions 7.56
Retail 7.00
Pharmaceuticals and Cosmetics 6.14
Office Equipment and Computers 6.02
Electronic Semiconductor 5.76
Holding and Finance Companies 4.68
Mechanics and Machinery 2.29
Insurance 2.26
Public Services 2.24
Automobile Industry 2.17
Food and Distilleries 2.17
Leisure 2.06
Real Estate Companies 1.88
Transportation 1.70
Biotechnology 1.25
Chemicals 1.24
Construction and Building Material 1.02
News Transmission 1.01
Tobacco and Spirits 1.00
Aerospace Technology 0.82
Consumer Goods 0.74
Other Services 0.60
Graphic Art and Publishing 0.61
Electronics and Electrical Equipment 0.53
Petrol 0.48
Healthcare Education and Social Services 0.46
Textile 0.25
Forest Products and Paper Industry 0.23
Miscellaneous 0.06
Mines and Heavy Industries 0.01
Package and Container Industry 0.01
TOTAL INVESTMENTS 95.84
CASH AND OTHER NET ASSETS 4.16
TOTAL NET ASSETS 100.00

CHALLENGE EUROPEAN EQUITY FUND SCHEDULE OF INVESTMENTS AS AT JUNE 30, 2021
120
(expressed in EUR) Quantity/ Acquisition % net
Description Face value Currency cost Valuation assets
1) INVESTMENTS
A) TRANSFERABLE SECURITIES AND MONEY MARKET INSTRUMENTS ADMITTED TO AN OFFICIAL STOCK EXCHANGE LISTING
1) LISTED SECURITIES : SHARES
AUSTRIA
OMV AG 3,316 EUR 144,820 159,069 0.02
voestalpine AG 5,545 EUR 190,826 190,415 0.02
Total Austria 335,646 349,484 0.04
BELGIUM
Anheuser-Busch InBev SA 12,346 EUR 657,541 750,760 0.09
D'ieteren Group 1,700 EUR 158,128 173,400 0.02
Etablissements Franz Colruyt NV 15,980 EUR 811,612 753,616 0.09
KBC Group NV 50,820 EUR 2,938,424 3,267,727 0.39
Proximus SADP 40,294 EUR 842,493 656,389 0.08
Telenet Group Holding NV 5,464 EUR 229,946 173,427 0.02
UCB SA 9,229 EUR 794,686 813,629 0.10
Total Belgium 6,432,830 6,588,948 0.79
BERMUDA
Hiscox Ltd 215,229 GBP 2,327,161 2,084,982 0.25
Total Bermuda 2,327,161 2,084,982 0.25
DENMARK
AP Moller - Maersk A/S Shs A 227 DKK 418,869 531,767 0.06
AP Moller - Maersk A/S Shs B 304 DKK 350,740 736,879 0.09
Carlsberg AS 5,863 DKK 579,099 921,683 0.11
Coloplast A/S 7,078 DKK 904,533 979,430 0.12
Danske Bank A/S 12,122 DKK 196,454 179,885 0.02
Demant A/S 5,028 DKK 179,539 238,681 0.03
Genmab A/S 1,621 DKK 475,805 559,354 0.07
GN Store Nord AS 18,804 DKK 1,331,334 1,385,223 0.17
Netcompany Group A/S 3,005 DKK 239,257 287,923 0.03
Novo Nordisk A/S 103,994 DKK 5,256,324 7,347,601 0.88
Novozymes A/S 7,444 DKK 401,967 473,194 0.06
Orsted AS 28,352 DKK 2,979,307 3,355,163 0.40
Pandora A/S 4,868 DKK 183,919 551,856 0.07
Royal Unibrew A/S 7,299 DKK 507,616 784,059 0.09
Total Denmark 14,004,763 18,332,698 2.20
FINLAND
Elisa Oyj 18,720 EUR 1,024,917 941,990 0.11
Fortum Oyj 50,040 EUR 1,153,689 1,163,930 0.14
Kesko Oyj 28,437 EUR 494,518 885,813 0.11
Kone Oyj 4,765 EUR 332,697 327,832 0.04
Nordea Bank Abp 17,265 SEK 146,200 162,164 0.02
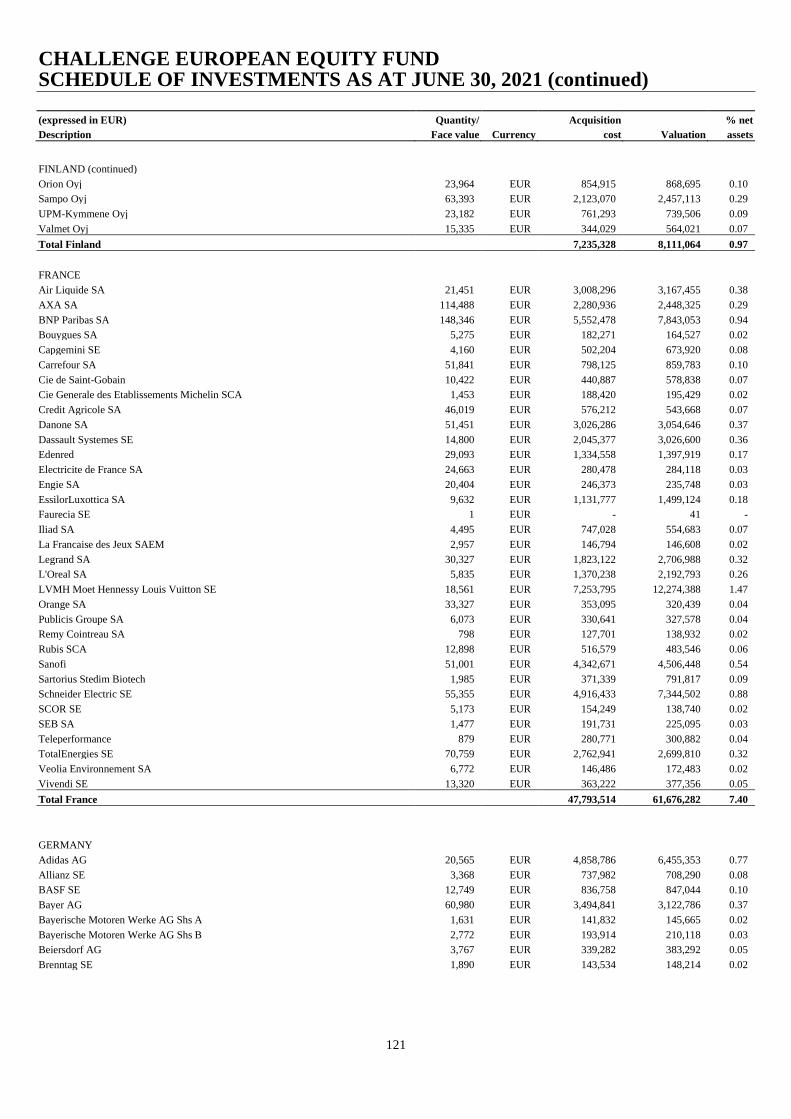
CHALLENGE EUROPEAN EQUITY FUND SCHEDULE OF INVESTMENTS AS AT JUNE 30, 2021 (continued)
121
(expressed in EUR) Quantity/ Acquisition % net
Description Face value Currency cost Valuation assets
FINLAND (continued)
Orion Oyj 23,964 EUR 854,915 868,695 0.10
Sampo Oyj 63,393 EUR 2,123,070 2,457,113 0.29
UPM-Kymmene Oyj 23,182 EUR 761,293 739,506 0.09
Valmet Oyj 15,335 EUR 344,029 564,021 0.07
Total Finland 7,235,328 8,111,064 0.97
FRANCE
Air Liquide SA 21,451 EUR 3,008,296 3,167,455 0.38
AXA SA 114,488 EUR 2,280,936 2,448,325 0.29
BNP Paribas SA 148,346 EUR 5,552,478 7,843,053 0.94
Bouygues SA 5,275 EUR 182,271 164,527 0.02
Capgemini SE 4,160 EUR 502,204 673,920 0.08
Carrefour SA 51,841 EUR 798,125 859,783 0.10
Cie de Saint-Gobain 10,422 EUR 440,887 578,838 0.07
Cie Generale des Etablissements Michelin SCA 1,453 EUR 188,420 195,429 0.02
Credit Agricole SA 46,019 EUR 576,212 543,668 0.07
Danone SA 51,451 EUR 3,026,286 3,054,646 0.37
Dassault Systemes SE 14,800 EUR 2,045,377 3,026,600 0.36
Edenred 29,093 EUR 1,334,558 1,397,919 0.17
Electricite de France SA 24,663 EUR 280,478 284,118 0.03
Engie SA 20,404 EUR 246,373 235,748 0.03
EssilorLuxottica SA 9,632 EUR 1,131,777 1,499,124 0.18
Faurecia SE 1 EUR - 41 -
Iliad SA 4,495 EUR 747,028 554,683 0.07
La Francaise des Jeux SAEM 2,957 EUR 146,794 146,608 0.02
Legrand SA 30,327 EUR 1,823,122 2,706,988 0.32
L'Oreal SA 5,835 EUR 1,370,238 2,192,793 0.26
LVMH Moet Hennessy Louis Vuitton SE 18,561 EUR 7,253,795 12,274,388 1.47
Orange SA 33,327 EUR 353,095 320,439 0.04
Publicis Groupe SA 6,073 EUR 330,641 327,578 0.04
Remy Cointreau SA 798 EUR 127,701 138,932 0.02
Rubis SCA 12,898 EUR 516,579 483,546 0.06
Sanofi 51,001 EUR 4,342,671 4,506,448 0.54
Sartorius Stedim Biotech 1,985 EUR 371,339 791,817 0.09
Schneider Electric SE 55,355 EUR 4,916,433 7,344,502 0.88
SCOR SE 5,173 EUR 154,249 138,740 0.02
SEB SA 1,477 EUR 191,731 225,095 0.03
Teleperformance 879 EUR 280,771 300,882 0.04
TotalEnergies SE 70,759 EUR 2,762,941 2,699,810 0.32
Veolia Environnement SA 6,772 EUR 146,486 172,483 0.02
Vivendi SE 13,320 EUR 363,222 377,356 0.05
Total France 47,793,514 61,676,282 7.40
GERMANY
Adidas AG 20,565 EUR 4,858,786 6,455,353 0.77
Allianz SE 3,368 EUR 737,982 708,290 0.08
BASF SE 12,749 EUR 836,758 847,044 0.10
Bayer AG 60,980 EUR 3,494,841 3,122,786 0.37
Bayerische Motoren Werke AG Shs A 1,631 EUR 141,832 145,665 0.02
Bayerische Motoren Werke AG Shs B 2,772 EUR 193,914 210,118 0.03
Beiersdorf AG 3,767 EUR 339,282 383,292 0.05
Brenntag SE 1,890 EUR 143,534 148,214 0.02
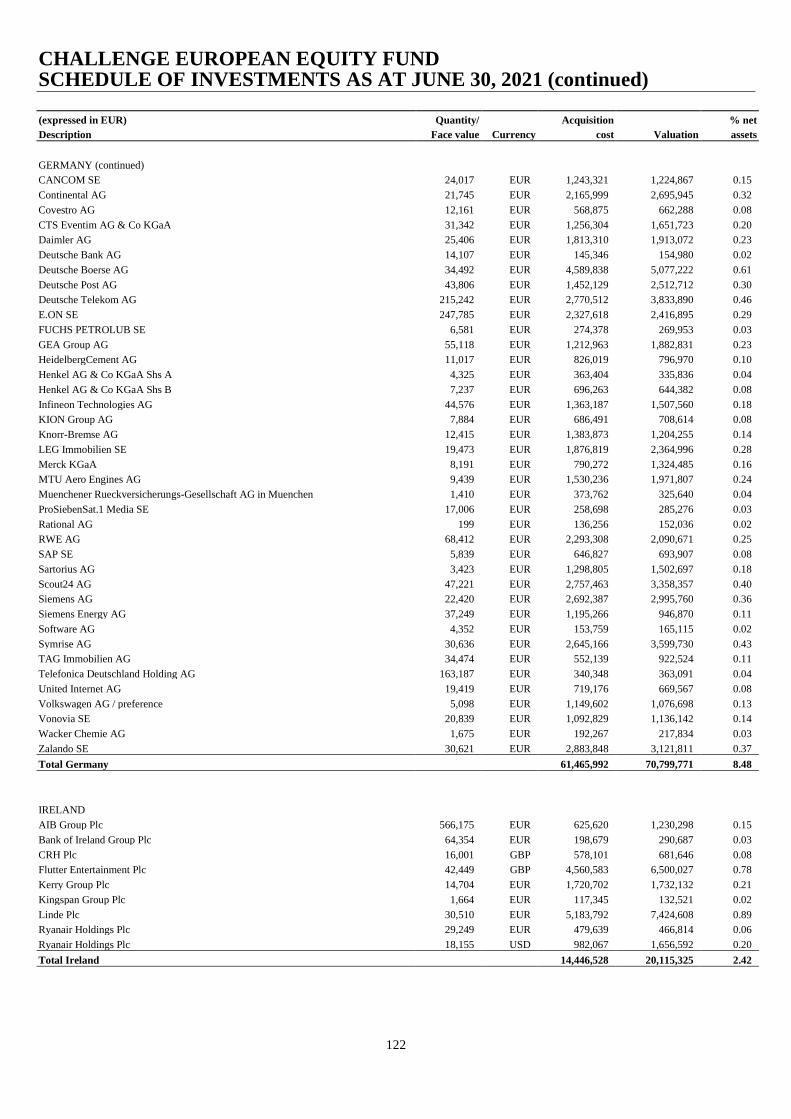
CHALLENGE EUROPEAN EQUITY FUND SCHEDULE OF INVESTMENTS AS AT JUNE 30, 2021 (continued)
122
(expressed in EUR) Quantity/ Acquisition % net
Description Face value Currency cost Valuation assets
GERMANY (continued)
CANCOM SE 24,017 EUR 1,243,321 1,224,867 0.15
Continental AG 21,745 EUR 2,165,999 2,695,945 0.32
Covestro AG 12,161 EUR 568,875 662,288 0.08
CTS Eventim AG & Co KGaA 31,342 EUR 1,256,304 1,651,723 0.20
Daimler AG 25,406 EUR 1,813,310 1,913,072 0.23
Deutsche Bank AG 14,107 EUR 145,346 154,980 0.02
Deutsche Boerse AG 34,492 EUR 4,589,838 5,077,222 0.61
Deutsche Post AG 43,806 EUR 1,452,129 2,512,712 0.30
Deutsche Telekom AG 215,242 EUR 2,770,512 3,833,890 0.46
E.ON SE 247,785 EUR 2,327,618 2,416,895 0.29
FUCHS PETROLUB SE 6,581 EUR 274,378 269,953 0.03
GEA Group AG 55,118 EUR 1,212,963 1,882,831 0.23
HeidelbergCement AG 11,017 EUR 826,019 796,970 0.10
Henkel AG & Co KGaA Shs A 4,325 EUR 363,404 335,836 0.04
Henkel AG & Co KGaA Shs B 7,237 EUR 696,263 644,382 0.08
Infineon Technologies AG 44,576 EUR 1,363,187 1,507,560 0.18
KION Group AG 7,884 EUR 686,491 708,614 0.08
Knorr-Bremse AG 12,415 EUR 1,383,873 1,204,255 0.14
LEG Immobilien SE 19,473 EUR 1,876,819 2,364,996 0.28
Merck KGaA 8,191 EUR 790,272 1,324,485 0.16
MTU Aero Engines AG 9,439 EUR 1,530,236 1,971,807 0.24
Muenchener Rueckversicherungs-Gesellschaft AG in Muenchen 1,410 EUR 373,762 325,640 0.04
ProSiebenSat.1 Media SE 17,006 EUR 258,698 285,276 0.03
Rational AG 199 EUR 136,256 152,036 0.02
RWE AG 68,412 EUR 2,293,308 2,090,671 0.25
SAP SE 5,839 EUR 646,827 693,907 0.08
Sartorius AG 3,423 EUR 1,298,805 1,502,697 0.18
Scout24 AG 47,221 EUR 2,757,463 3,358,357 0.40
Siemens AG 22,420 EUR 2,692,387 2,995,760 0.36
Siemens Energy AG 37,249 EUR 1,195,266 946,870 0.11
Software AG 4,352 EUR 153,759 165,115 0.02
Symrise AG 30,636 EUR 2,645,166 3,599,730 0.43
TAG Immobilien AG 34,474 EUR 552,139 922,524 0.11
Telefonica Deutschland Holding AG 163,187 EUR 340,348 363,091 0.04
United Internet AG 19,419 EUR 719,176 669,567 0.08
Volkswagen AG / preference 5,098 EUR 1,149,602 1,076,698 0.13
Vonovia SE 20,839 EUR 1,092,829 1,136,142 0.14
Wacker Chemie AG 1,675 EUR 192,267 217,834 0.03
Zalando SE 30,621 EUR 2,883,848 3,121,811 0.37
Total Germany 61,465,992 70,799,771 8.48
IRELAND
AIB Group Plc 566,175 EUR 625,620 1,230,298 0.15
Bank of Ireland Group Plc 64,354 EUR 198,679 290,687 0.03
CRH Plc 16,001 GBP 578,101 681,646 0.08
Flutter Entertainment Plc 42,449 GBP 4,560,583 6,500,027 0.78
Kerry Group Plc 14,704 EUR 1,720,702 1,732,132 0.21
Kingspan Group Plc 1,664 EUR 117,345 132,521 0.02
Linde Plc 30,510 EUR 5,183,792 7,424,608 0.89
Ryanair Holdings Plc 29,249 EUR 479,639 466,814 0.06
Ryanair Holdings Plc 18,155 USD 982,067 1,656,592 0.20
Total Ireland 14,446,528 20,115,325 2.42
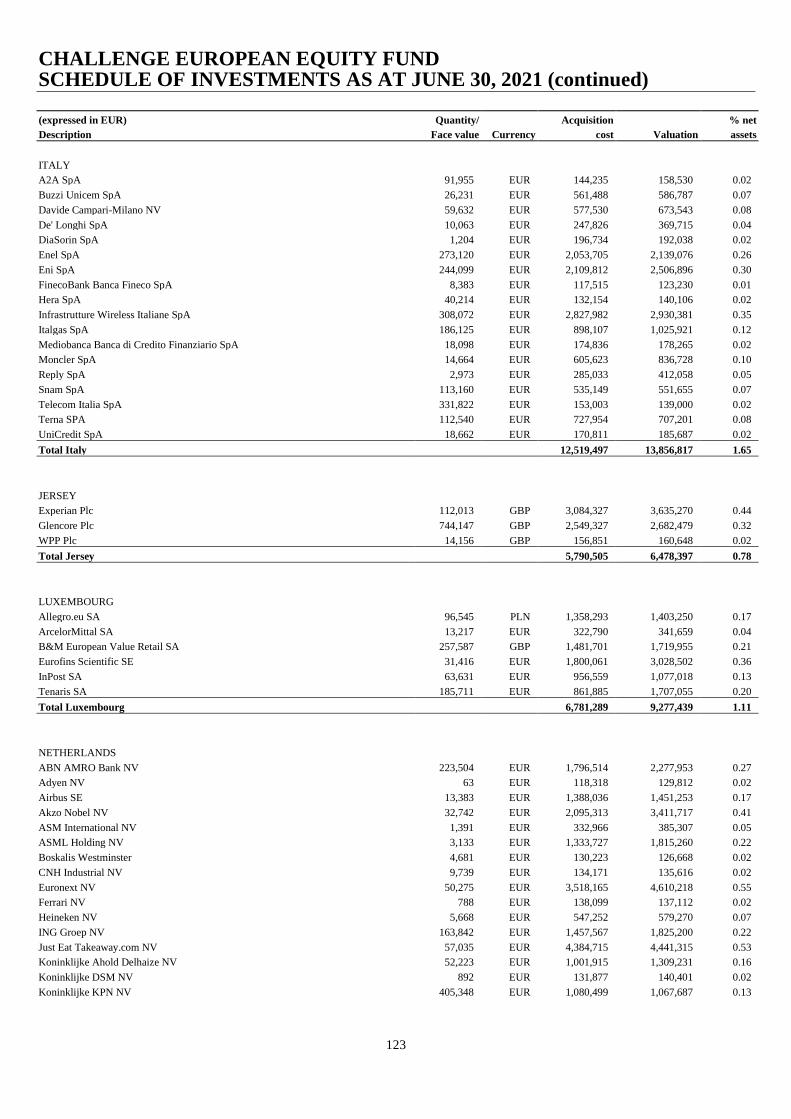
CHALLENGE EUROPEAN EQUITY FUND SCHEDULE OF INVESTMENTS AS AT JUNE 30, 2021 (continued)
123
(expressed in EUR) Quantity/ Acquisition % net
Description Face value Currency cost Valuation assets
ITALY
A2A SpA 91,955 EUR 144,235 158,530 0.02
Buzzi Unicem SpA 26,231 EUR 561,488 586,787 0.07
Davide Campari-Milano NV 59,632 EUR 577,530 673,543 0.08
De' Longhi SpA 10,063 EUR 247,826 369,715 0.04
DiaSorin SpA 1,204 EUR 196,734 192,038 0.02
Enel SpA 273,120 EUR 2,053,705 2,139,076 0.26
Eni SpA 244,099 EUR 2,109,812 2,506,896 0.30
FinecoBank Banca Fineco SpA 8,383 EUR 117,515 123,230 0.01
Hera SpA 40,214 EUR 132,154 140,106 0.02
Infrastrutture Wireless Italiane SpA 308,072 EUR 2,827,982 2,930,381 0.35
Italgas SpA 186,125 EUR 898,107 1,025,921 0.12
Mediobanca Banca di Credito Finanziario SpA 18,098 EUR 174,836 178,265 0.02
Moncler SpA 14,664 EUR 605,623 836,728 0.10
Reply SpA 2,973 EUR 285,033 412,058 0.05
Snam SpA 113,160 EUR 535,149 551,655 0.07
Telecom Italia SpA 331,822 EUR 153,003 139,000 0.02
Terna SPA 112,540 EUR 727,954 707,201 0.08
UniCredit SpA 18,662 EUR 170,811 185,687 0.02
Total Italy 12,519,497 13,856,817 1.65
JERSEY
Experian Plc 112,013 GBP 3,084,327 3,635,270 0.44
Glencore Plc 744,147 GBP 2,549,327 2,682,479 0.32
WPP Plc 14,156 GBP 156,851 160,648 0.02
Total Jersey 5,790,505 6,478,397 0.78
LUXEMBOURG
Allegro.eu SA 96,545 PLN 1,358,293 1,403,250 0.17
ArcelorMittal SA 13,217 EUR 322,790 341,659 0.04
B&M European Value Retail SA 257,587 GBP 1,481,701 1,719,955 0.21
Eurofins Scientific SE 31,416 EUR 1,800,061 3,028,502 0.36
InPost SA 63,631 EUR 956,559 1,077,018 0.13
Tenaris SA 185,711 EUR 861,885 1,707,055 0.20
Total Luxembourg 6,781,289 9,277,439 1.11
NETHERLANDS
ABN AMRO Bank NV 223,504 EUR 1,796,514 2,277,953 0.27
Adyen NV 63 EUR 118,318 129,812 0.02
Airbus SE 13,383 EUR 1,388,036 1,451,253 0.17
Akzo Nobel NV 32,742 EUR 2,095,313 3,411,717 0.41
ASM International NV 1,391 EUR 332,966 385,307 0.05
ASML Holding NV 3,133 EUR 1,333,727 1,815,260 0.22
Boskalis Westminster 4,681 EUR 130,223 126,668 0.02
CNH Industrial NV 9,739 EUR 134,171 135,616 0.02
Euronext NV 50,275 EUR 3,518,165 4,610,218 0.55
Ferrari NV 788 EUR 138,099 137,112 0.02
Heineken NV 5,668 EUR 547,252 579,270 0.07
ING Groep NV 163,842 EUR 1,457,567 1,825,200 0.22
Just Eat Takeaway.com NV 57,035 EUR 4,384,715 4,441,315 0.53
Koninklijke Ahold Delhaize NV 52,223 EUR 1,001,915 1,309,231 0.16
Koninklijke DSM NV 892 EUR 131,877 140,401 0.02
Koninklijke KPN NV 405,348 EUR 1,080,499 1,067,687 0.13
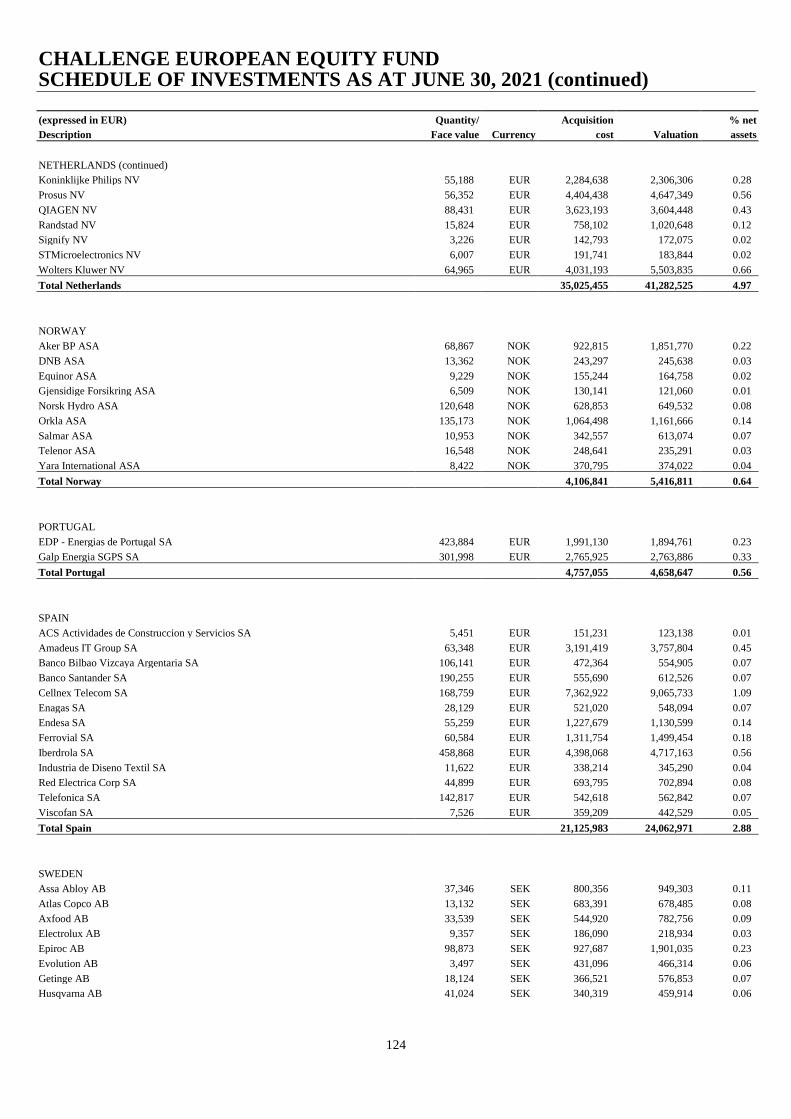
CHALLENGE EUROPEAN EQUITY FUND SCHEDULE OF INVESTMENTS AS AT JUNE 30, 2021 (continued)
124
(expressed in EUR) Quantity/ Acquisition % net
Description Face value Currency cost Valuation assets
NETHERLANDS (continued)
Koninklijke Philips NV 55,188 EUR 2,284,638 2,306,306 0.28
Prosus NV 56,352 EUR 4,404,438 4,647,349 0.56
QIAGEN NV 88,431 EUR 3,623,193 3,604,448 0.43
Randstad NV 15,824 EUR 758,102 1,020,648 0.12
Signify NV 3,226 EUR 142,793 172,075 0.02
STMicroelectronics NV 6,007 EUR 191,741 183,844 0.02
Wolters Kluwer NV 64,965 EUR 4,031,193 5,503,835 0.66
Total Netherlands 35,025,455 41,282,525 4.97
NORWAY
Aker BP ASA 68,867 NOK 922,815 1,851,770 0.22
DNB ASA 13,362 NOK 243,297 245,638 0.03
Equinor ASA 9,229 NOK 155,244 164,758 0.02
Gjensidige Forsikring ASA 6,509 NOK 130,141 121,060 0.01
Norsk Hydro ASA 120,648 NOK 628,853 649,532 0.08
Orkla ASA 135,173 NOK 1,064,498 1,161,666 0.14
Salmar ASA 10,953 NOK 342,557 613,074 0.07
Telenor ASA 16,548 NOK 248,641 235,291 0.03
Yara International ASA 8,422 NOK 370,795 374,022 0.04
Total Norway 4,106,841 5,416,811 0.64
PORTUGAL
EDP - Energias de Portugal SA 423,884 EUR 1,991,130 1,894,761 0.23
Galp Energia SGPS SA 301,998 EUR 2,765,925 2,763,886 0.33
Total Portugal 4,757,055 4,658,647 0.56
SPAIN
ACS Actividades de Construccion y Servicios SA 5,451 EUR 151,231 123,138 0.01
Amadeus IT Group SA 63,348 EUR 3,191,419 3,757,804 0.45
Banco Bilbao Vizcaya Argentaria SA 106,141 EUR 472,364 554,905 0.07
Banco Santander SA 190,255 EUR 555,690 612,526 0.07
Cellnex Telecom SA 168,759 EUR 7,362,922 9,065,733 1.09
Enagas SA 28,129 EUR 521,020 548,094 0.07
Endesa SA 55,259 EUR 1,227,679 1,130,599 0.14
Ferrovial SA 60,584 EUR 1,311,754 1,499,454 0.18
Iberdrola SA 458,868 EUR 4,398,068 4,717,163 0.56
Industria de Diseno Textil SA 11,622 EUR 338,214 345,290 0.04
Red Electrica Corp SA 44,899 EUR 693,795 702,894 0.08
Telefonica SA 142,817 EUR 542,618 562,842 0.07
Viscofan SA 7,526 EUR 359,209 442,529 0.05
Total Spain 21,125,983 24,062,971 2.88
SWEDEN
Assa Abloy AB 37,346 SEK 800,356 949,303 0.11
Atlas Copco AB 13,132 SEK 683,391 678,485 0.08
Axfood AB 33,539 SEK 544,920 782,756 0.09
Electrolux AB 9,357 SEK 186,090 218,934 0.03
Epiroc AB 98,873 SEK 927,687 1,901,035 0.23
Evolution AB 3,497 SEK 431,096 466,314 0.06
Getinge AB 18,124 SEK 366,521 576,853 0.07
Husqvarna AB 41,024 SEK 340,319 459,914 0.06

CHALLENGE EUROPEAN EQUITY FUND SCHEDULE OF INVESTMENTS AS AT JUNE 30, 2021 (continued)
125
(expressed in EUR) Quantity/ Acquisition % net
Description Face value Currency cost Valuation assets
SWEDEN (continued)
ICA Gruppen AB 17,278 SEK 681,375 678,550 0.08
Nordic Entertainment Group AB 25,715 SEK 958,477 955,885 0.11
Sandvik AB 60,899 SEK 1,361,794 1,312,617 0.16
Securitas AB 13,642 SEK 170,959 181,724 0.02
Swedbank AB 8,109 SEK 122,851 127,320 0.02
Swedish Match AB 103,260 SEK 467,297 743,043 0.09
Tele2 AB 36,008 SEK 412,845 413,976 0.05
Telefonaktiebolaget LM Ericsson 145,708 SEK 1,570,190 1,545,297 0.18
Telia Co AB 206,384 SEK 760,147 772,874 0.09
Thule Group AB 3,771 SEK 151,032 141,069 0.02
Volvo AB 30,519 SEK 516,667 619,590 0.07
Total Sweden 11,454,014 13,525,539 1.62
SWITZERLAND
ABB Ltd 25,207 CHF 556,309 721,818 0.09
Adecco Group AG 13,068 CHF 556,738 749,374 0.09
Alcon Inc 3,171 CHF 190,992 187,393 0.02
Bachem Holding AG 732 CHF 261,051 365,938 0.04
Baloise Holding AG 2,541 CHF 375,722 334,492 0.04
Banque Cantonale Vaudoise 5,953 CHF 504,452 451,286 0.05
Bucher Industries AG 1,197 CHF 297,224 528,294 0.06
Cie Financiere Richemont SA 32,447 CHF 1,764,757 3,313,706 0.40
Credit Suisse Group AG 264,464 CHF 2,668,919 2,338,274 0.28
EMS-Chemie Holding AG 1,041 CHF 583,067 863,237 0.10
Galenica AG 6,460 CHF 320,523 384,823 0.05
Geberit AG 2,631 CHF 1,299,411 1,665,696 0.20
Georg Fischer AG 244 CHF 221,840 305,616 0.04
Holcim Ltd 45,003 CHF 2,076,336 2,278,504 0.27
Julius Baer Group Ltd 30,631 CHF 1,007,610 1,687,212 0.20
Kuehne + Nagel International AG 2,989 CHF 498,661 863,281 0.10
Logitech International SA 7,433 CHF 422,313 760,125 0.09
Lonza Group AG 4,813 CHF 2,445,422 2,879,405 0.34
Nestle SA 187,728 CHF 17,894,065 19,732,053 2.36
Novartis AG 51,127 CHF 3,896,068 3,932,749 0.47
Partners Group Holding AG 668 CHF 737,324 854,053 0.10
PSP Swiss Property AG 6,635 CHF 667,535 711,204 0.08
Roche Holding AG 42,403 CHF 11,931,517 13,482,704 1.61
Schindler Holding AG 10,536 CHF 2,215,201 2,720,054 0.33
SGS SA 427 CHF 1,036,880 1,111,725 0.13
SIG Combibloc Group AG 7,459 CHF 111,877 171,065 0.02
Sika AG 1,617 CHF 392,790 446,222 0.05
Sonova Holding AG 3,786 CHF 780,748 1,201,919 0.14
Straumann Holding AG 343 CHF 357,658 461,532 0.05
Swatch Group AG 2,578 CHF 633,498 746,458 0.09
Swiss Life Holding AG 1,135 CHF 482,639 465,519 0.06
Swiss Prime Site AG 4,942 CHF 394,199 413,867 0.05
Swiss Re AG 4,543 CHF 388,503 345,972 0.04
Swisscom AG 2,793 CHF 1,196,653 1,345,813 0.16
Tecan Group AG 1,399 CHF 414,400 585,029 0.07
UBS Group AG 214,502 CHF 1,958,117 2,770,831 0.33
VAT Group AG 3,227 CHF 762,683 905,525 0.11
Vifor Pharma AG 2,409 CHF 281,804 263,165 0.03
Zurich Insurance Group AG 5,981 CHF 2,092,083 2,025,336 0.24
Total Switzerland 64,677,589 75,371,269 8.98
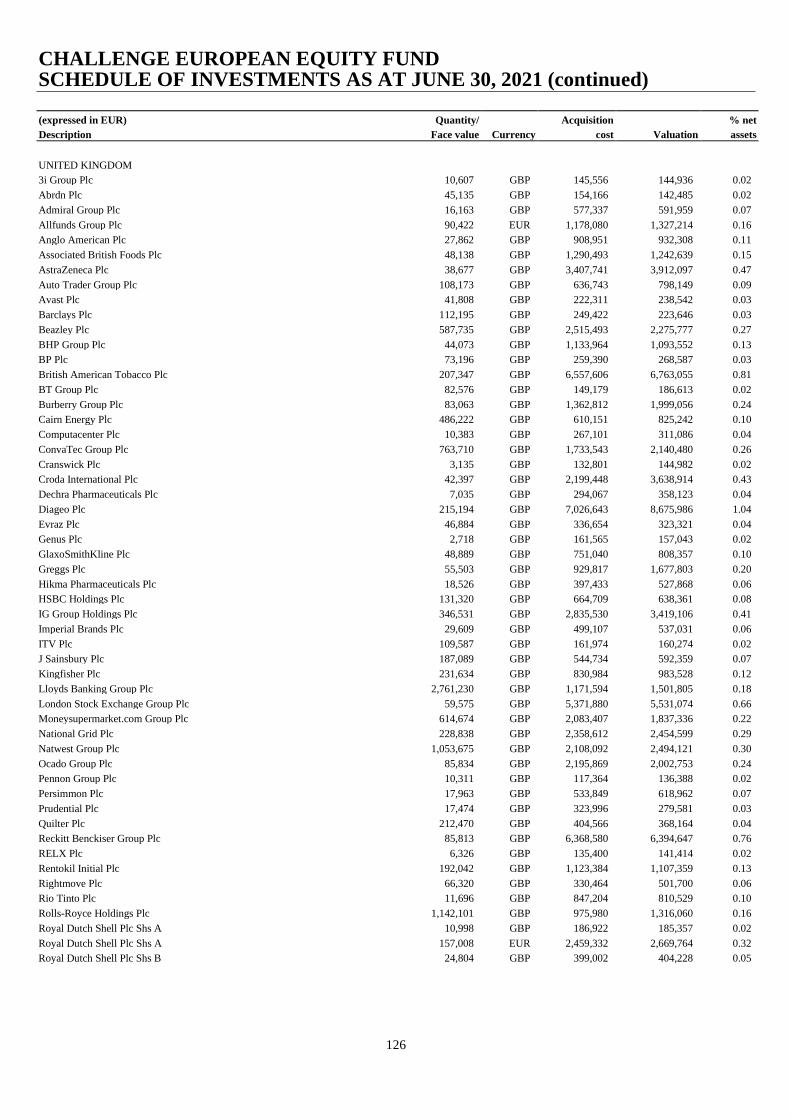
CHALLENGE EUROPEAN EQUITY FUND SCHEDULE OF INVESTMENTS AS AT JUNE 30, 2021 (continued)
126
(expressed in EUR) Quantity/ Acquisition % net
Description Face value Currency cost Valuation assets
UNITED KINGDOM
3i Group Plc 10,607 GBP 145,556 144,936 0.02
Abrdn Plc 45,135 GBP 154,166 142,485 0.02
Admiral Group Plc 16,163 GBP 577,337 591,959 0.07
Allfunds Group Plc 90,422 EUR 1,178,080 1,327,214 0.16
Anglo American Plc 27,862 GBP 908,951 932,308 0.11
Associated British Foods Plc 48,138 GBP 1,290,493 1,242,639 0.15
AstraZeneca Plc 38,677 GBP 3,407,741 3,912,097 0.47
Auto Trader Group Plc 108,173 GBP 636,743 798,149 0.09
Avast Plc 41,808 GBP 222,311 238,542 0.03
Barclays Plc 112,195 GBP 249,422 223,646 0.03
Beazley Plc 587,735 GBP 2,515,493 2,275,777 0.27
BHP Group Plc 44,073 GBP 1,133,964 1,093,552 0.13
BP Plc 73,196 GBP 259,390 268,587 0.03
British American Tobacco Plc 207,347 GBP 6,557,606 6,763,055 0.81
BT Group Plc 82,576 GBP 149,179 186,613 0.02
Burberry Group Plc 83,063 GBP 1,362,812 1,999,056 0.24
Cairn Energy Plc 486,222 GBP 610,151 825,242 0.10
Computacenter Plc 10,383 GBP 267,101 311,086 0.04
ConvaTec Group Plc 763,710 GBP 1,733,543 2,140,480 0.26
Cranswick Plc 3,135 GBP 132,801 144,982 0.02
Croda International Plc 42,397 GBP 2,199,448 3,638,914 0.43
Dechra Pharmaceuticals Plc 7,035 GBP 294,067 358,123 0.04
Diageo Plc 215,194 GBP 7,026,643 8,675,986 1.04
Evraz Plc 46,884 GBP 336,654 323,321 0.04
Genus Plc 2,718 GBP 161,565 157,043 0.02
GlaxoSmithKline Plc 48,889 GBP 751,040 808,357 0.10
Greggs Plc 55,503 GBP 929,817 1,677,803 0.20
Hikma Pharmaceuticals Plc 18,526 GBP 397,433 527,868 0.06
HSBC Holdings Plc 131,320 GBP 664,709 638,361 0.08
IG Group Holdings Plc 346,531 GBP 2,835,530 3,419,106 0.41
Imperial Brands Plc 29,609 GBP 499,107 537,031 0.06
ITV Plc 109,587 GBP 161,974 160,274 0.02
J Sainsbury Plc 187,089 GBP 544,734 592,359 0.07
Kingfisher Plc 231,634 GBP 830,984 983,528 0.12
Lloyds Banking Group Plc 2,761,230 GBP 1,171,594 1,501,805 0.18
London Stock Exchange Group Plc 59,575 GBP 5,371,880 5,531,074 0.66
Moneysupermarket.com Group Plc 614,674 GBP 2,083,407 1,837,336 0.22
National Grid Plc 228,838 GBP 2,358,612 2,454,599 0.29
Natwest Group Plc 1,053,675 GBP 2,108,092 2,494,121 0.30
Ocado Group Plc 85,834 GBP 2,195,869 2,002,753 0.24
Pennon Group Plc 10,311 GBP 117,364 136,388 0.02
Persimmon Plc 17,963 GBP 533,849 618,962 0.07
Prudential Plc 17,474 GBP 323,996 279,581 0.03
Quilter Plc 212,470 GBP 404,566 368,164 0.04
Reckitt Benckiser Group Plc 85,813 GBP 6,368,580 6,394,647 0.76
RELX Plc 6,326 GBP 135,400 141,414 0.02
Rentokil Initial Plc 192,042 GBP 1,123,384 1,107,359 0.13
Rightmove Plc 66,320 GBP 330,464 501,700 0.06
Rio Tinto Plc 11,696 GBP 847,204 810,529 0.10
Rolls-Royce Holdings Plc 1,142,101 GBP 975,980 1,316,060 0.16
Royal Dutch Shell Plc Shs A 10,998 GBP 186,922 185,357 0.02
Royal Dutch Shell Plc Shs A 157,008 EUR 2,459,332 2,669,764 0.32
Royal Dutch Shell Plc Shs B 24,804 GBP 399,002 404,228 0.05
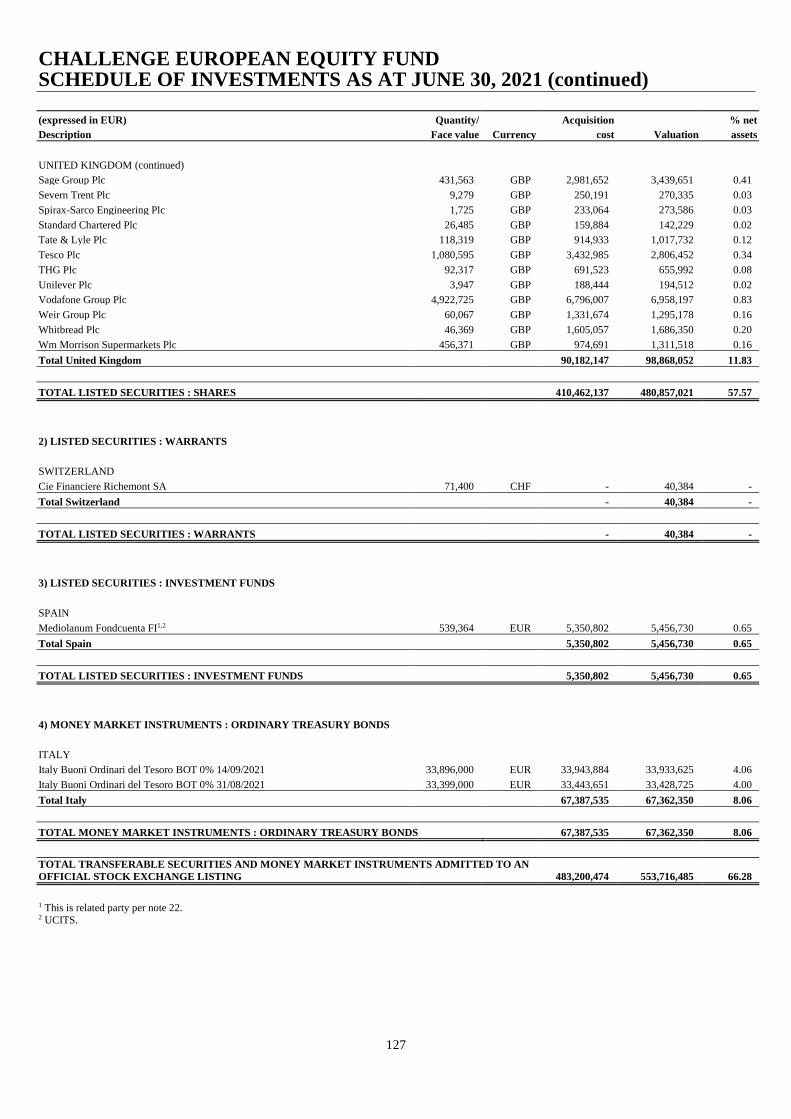
CHALLENGE EUROPEAN EQUITY FUND SCHEDULE OF INVESTMENTS AS AT JUNE 30, 2021 (continued)
127
(expressed in EUR) Quantity/ Acquisition % net
Description Face value Currency cost Valuation assets
UNITED KINGDOM (continued)
Sage Group Plc 431,563 GBP 2,981,652 3,439,651 0.41
Severn Trent Plc 9,279 GBP 250,191 270,335 0.03
Spirax-Sarco Engineering Plc 1,725 GBP 233,064 273,586 0.03
Standard Chartered Plc 26,485 GBP 159,884 142,229 0.02
Tate & Lyle Plc 118,319 GBP 914,933 1,017,732 0.12
Tesco Plc 1,080,595 GBP 3,432,985 2,806,452 0.34
THG Plc 92,317 GBP 691,523 655,992 0.08
Unilever Plc 3,947 GBP 188,444 194,512 0.02
Vodafone Group Plc 4,922,725 GBP 6,796,007 6,958,197 0.83
Weir Group Plc 60,067 GBP 1,331,674 1,295,178 0.16
Whitbread Plc 46,369 GBP 1,605,057 1,686,350 0.20
Wm Morrison Supermarkets Plc 456,371 GBP 974,691 1,311,518 0.16
Total United Kingdom 90,182,147 98,868,052 11.83
TOTAL LISTED SECURITIES : SHARES 410,462,137 480,857,021 57.57
2) LISTED SECURITIES : WARRANTS
SWITZERLAND
Cie Financiere Richemont SA 71,400 CHF - 40,384 -
Total Switzerland - 40,384 -
TOTAL LISTED SECURITIES : WARRANTS - 40,384 -
3) LISTED SECURITIES : INVESTMENT FUNDS
SPAIN
Mediolanum Fondcuenta FI1,2 539,364 EUR 5,350,802 5,456,730 0.65
Total Spain 5,350,802 5,456,730 0.65
TOTAL LISTED SECURITIES : INVESTMENT FUNDS 5,350,802 5,456,730 0.65
4) MONEY MARKET INSTRUMENTS : ORDINARY TREASURY BONDS
ITALY
Italy Buoni Ordinari del Tesoro BOT 0% 14/09/2021 33,896,000 EUR 33,943,884 33,933,625 4.06
Italy Buoni Ordinari del Tesoro BOT 0% 31/08/2021 33,399,000 EUR 33,443,651 33,428,725 4.00
Total Italy 67,387,535 67,362,350 8.06
TOTAL MONEY MARKET INSTRUMENTS : ORDINARY TREASURY BONDS 67,387,535 67,362,350 8.06
TOTAL TRANSFERABLE SECURITIES AND MONEY MARKET INSTRUMENTS ADMITTED TO AN
OFFICIAL STOCK EXCHANGE LISTING 483,200,474 553,716,485 66.28
1 This is related party per note 22.
2 UCITS.
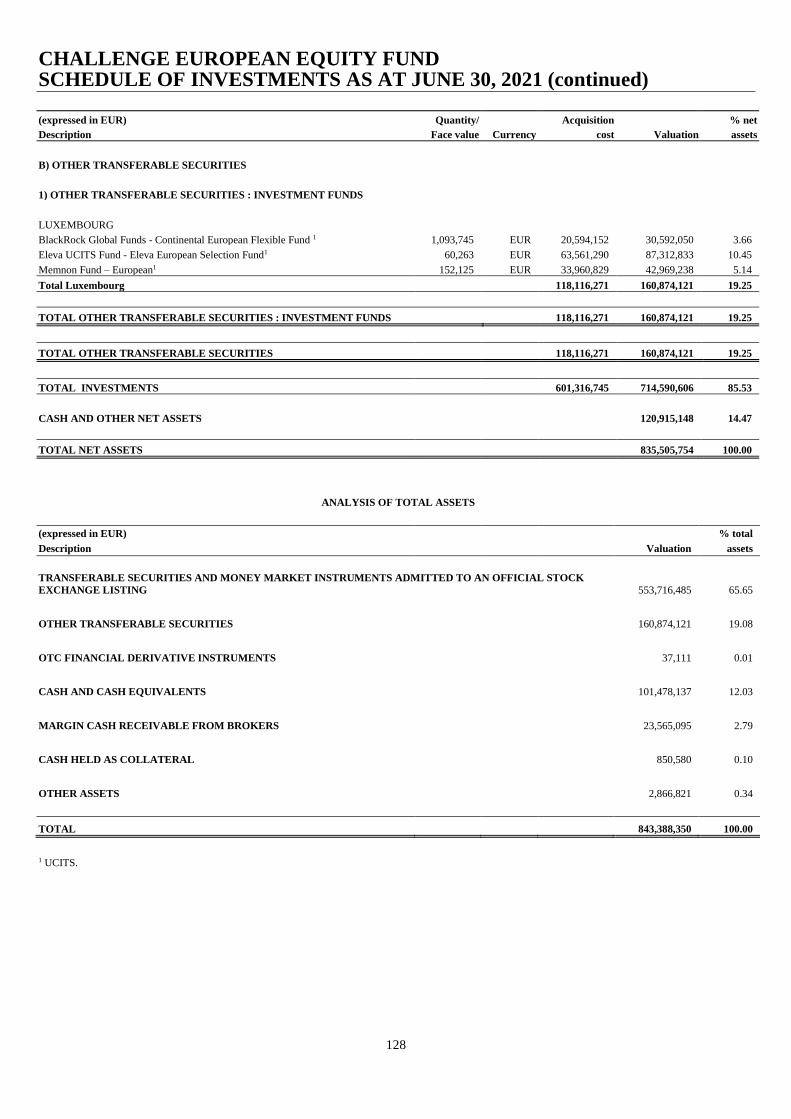
CHALLENGE EUROPEAN EQUITY FUND SCHEDULE OF INVESTMENTS AS AT JUNE 30, 2021 (continued)
128
(expressed in EUR) Quantity/ Acquisition % net
Description Face value Currency cost Valuation assets
B) OTHER TRANSFERABLE SECURITIES
1) OTHER TRANSFERABLE SECURITIES : INVESTMENT FUNDS
LUXEMBOURG
BlackRock Global Funds - Continental European Flexible Fund 1 1,093,745 EUR 20,594,152 30,592,050 3.66
Eleva UCITS Fund - Eleva European Selection Fund1 60,263 EUR 63,561,290 87,312,833 10.45
Memnon Fund – European1 152,125 EUR 33,960,829 42,969,238 5.14
Total Luxembourg 118,116,271 160,874,121 19.25
TOTAL OTHER TRANSFERABLE SECURITIES : INVESTMENT FUNDS 118,116,271 160,874,121 19.25
TOTAL OTHER TRANSFERABLE SECURITIES 118,116,271 160,874,121 19.25
TOTAL INVESTMENTS 601,316,745 714,590,606 85.53
CASH AND OTHER NET ASSETS 120,915,148 14.47
TOTAL NET ASSETS 835,505,754 100.00
ANALYSIS OF TOTAL ASSETS
(expressed in EUR) % total
Description Valuation assets
TRANSFERABLE SECURITIES AND MONEY MARKET INSTRUMENTS ADMITTED TO AN OFFICIAL STOCK
EXCHANGE LISTING 553,716,485 65.65
OTHER TRANSFERABLE SECURITIES 160,874,121 19.08
OTC FINANCIAL DERIVATIVE INSTRUMENTS 37,111 0.01
CASH AND CASH EQUIVALENTS 101,478,137 12.03
MARGIN CASH RECEIVABLE FROM BROKERS 23,565,095 2.79
CASH HELD AS COLLATERAL 850,580 0.10
OTHER ASSETS 2,866,821 0.34
TOTAL 843,388,350 100.00
1 UCITS.
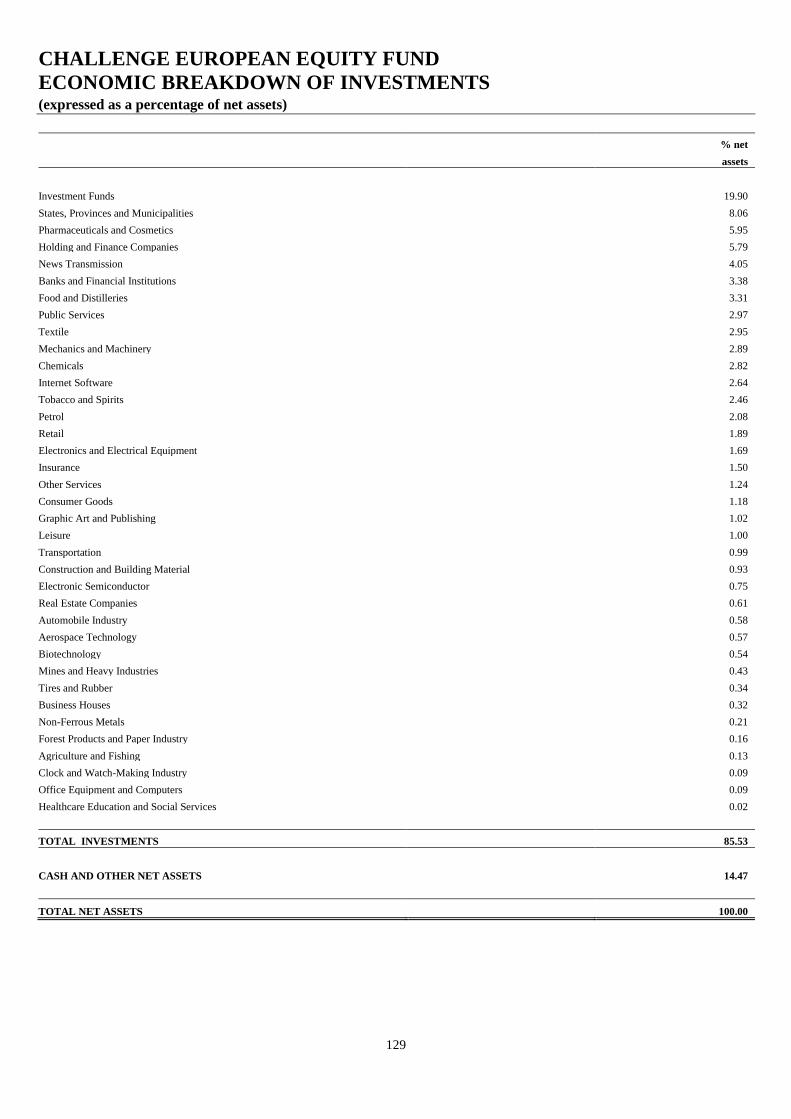
CHALLENGE EUROPEAN EQUITY FUND
ECONOMIC BREAKDOWN OF INVESTMENTS (expressed as a percentage of net assets)
129
% net
assets
Investment Funds 19.90
States, Provinces and Municipalities 8.06
Pharmaceuticals and Cosmetics 5.95
Holding and Finance Companies 5.79
News Transmission 4.05
Banks and Financial Institutions 3.38
Food and Distilleries 3.31
Public Services 2.97
Textile 2.95
Mechanics and Machinery 2.89
Chemicals 2.82
Internet Software 2.64
Tobacco and Spirits 2.46
Petrol 2.08
Retail 1.89
Electronics and Electrical Equipment 1.69
Insurance 1.50
Other Services 1.24
Consumer Goods 1.18
Graphic Art and Publishing 1.02
Leisure 1.00
Transportation 0.99
Construction and Building Material 0.93
Electronic Semiconductor 0.75
Real Estate Companies 0.61
Automobile Industry 0.58
Aerospace Technology 0.57
Biotechnology 0.54
Mines and Heavy Industries 0.43
Tires and Rubber 0.34
Business Houses 0.32
Non-Ferrous Metals 0.21
Forest Products and Paper Industry 0.16
Agriculture and Fishing 0.13
Clock and Watch-Making Industry 0.09
Office Equipment and Computers 0.09
Healthcare Education and Social Services 0.02
TOTAL INVESTMENTS 85.53
CASH AND OTHER NET ASSETS 14.47
TOTAL NET ASSETS 100.00
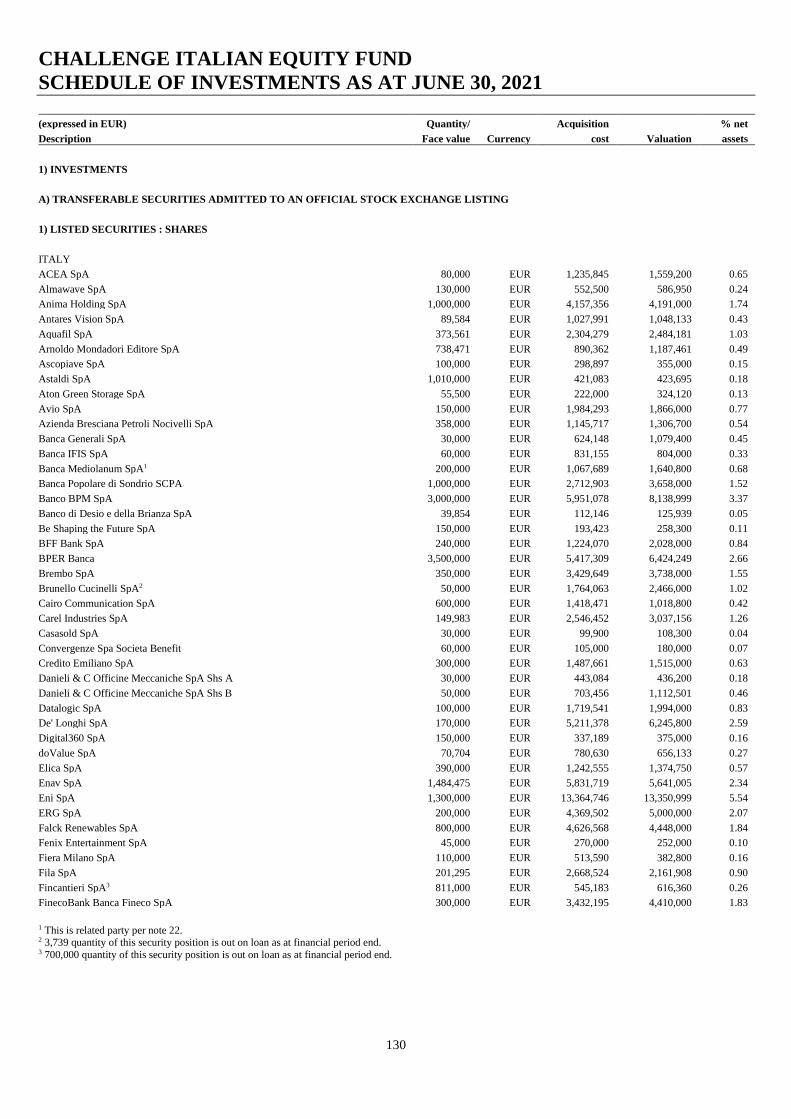
CHALLENGE ITALIAN EQUITY FUND
SCHEDULE OF INVESTMENTS AS AT JUNE 30, 2021
130
(expressed in EUR) Quantity/ Acquisition % net
Description Face value Currency cost Valuation assets
1) INVESTMENTS
A) TRANSFERABLE SECURITIES ADMITTED TO AN OFFICIAL STOCK EXCHANGE LISTING
1) LISTED SECURITIES : SHARES
ITALY
ACEA SpA 80,000 EUR 1,235,845 1,559,200 0.65
Almawave SpA 130,000 EUR 552,500 586,950 0.24
Anima Holding SpA 1,000,000 EUR 4,157,356 4,191,000 1.74
Antares Vision SpA 89,584 EUR 1,027,991 1,048,133 0.43
Aquafil SpA 373,561 EUR 2,304,279 2,484,181 1.03
Arnoldo Mondadori Editore SpA 738,471 EUR 890,362 1,187,461 0.49
Ascopiave SpA 100,000 EUR 298,897 355,000 0.15
Astaldi SpA 1,010,000 EUR 421,083 423,695 0.18
Aton Green Storage SpA 55,500 EUR 222,000 324,120 0.13
Avio SpA 150,000 EUR 1,984,293 1,866,000 0.77
Azienda Bresciana Petroli Nocivelli SpA 358,000 EUR 1,145,717 1,306,700 0.54
Banca Generali SpA 30,000 EUR 624,148 1,079,400 0.45
Banca IFIS SpA 60,000 EUR 831,155 804,000 0.33
Banca Mediolanum SpA1 200,000 EUR 1,067,689 1,640,800 0.68
Banca Popolare di Sondrio SCPA 1,000,000 EUR 2,712,903 3,658,000 1.52
Banco BPM SpA 3,000,000 EUR 5,951,078 8,138,999 3.37
Banco di Desio e della Brianza SpA 39,854 EUR 112,146 125,939 0.05
Be Shaping the Future SpA 150,000 EUR 193,423 258,300 0.11
BFF Bank SpA 240,000 EUR 1,224,070 2,028,000 0.84
BPER Banca 3,500,000 EUR 5,417,309 6,424,249 2.66
Brembo SpA 350,000 EUR 3,429,649 3,738,000 1.55
Brunello Cucinelli SpA2 50,000 EUR 1,764,063 2,466,000 1.02
Cairo Communication SpA 600,000 EUR 1,418,471 1,018,800 0.42
Carel Industries SpA 149,983 EUR 2,546,452 3,037,156 1.26
Casasold SpA 30,000 EUR 99,900 108,300 0.04
Convergenze Spa Societa Benefit 60,000 EUR 105,000 180,000 0.07
Credito Emiliano SpA 300,000 EUR 1,487,661 1,515,000 0.63
Danieli & C Officine Meccaniche SpA Shs A 30,000 EUR 443,084 436,200 0.18
Danieli & C Officine Meccaniche SpA Shs B 50,000 EUR 703,456 1,112,501 0.46
Datalogic SpA 100,000 EUR 1,719,541 1,994,000 0.83
De' Longhi SpA 170,000 EUR 5,211,378 6,245,800 2.59
Digital360 SpA 150,000 EUR 337,189 375,000 0.16
doValue SpA 70,704 EUR 780,630 656,133 0.27
Elica SpA 390,000 EUR 1,242,555 1,374,750 0.57
Enav SpA 1,484,475 EUR 5,831,719 5,641,005 2.34
Eni SpA 1,300,000 EUR 13,364,746 13,350,999 5.54
ERG SpA 200,000 EUR 4,369,502 5,000,000 2.07
Falck Renewables SpA 800,000 EUR 4,626,568 4,448,000 1.84
Fenix Entertainment SpA 45,000 EUR 270,000 252,000 0.10
Fiera Milano SpA 110,000 EUR 513,590 382,800 0.16
Fila SpA 201,295 EUR 2,668,524 2,161,908 0.90
Fincantieri SpA3 811,000 EUR 545,183 616,360 0.26
FinecoBank Banca Fineco SpA 300,000 EUR 3,432,195 4,410,000 1.83
1 This is related party per note 22. 2 3,739 quantity of this security position is out on loan as at financial period end. 3 700,000 quantity of this security position is out on loan as at financial period end.
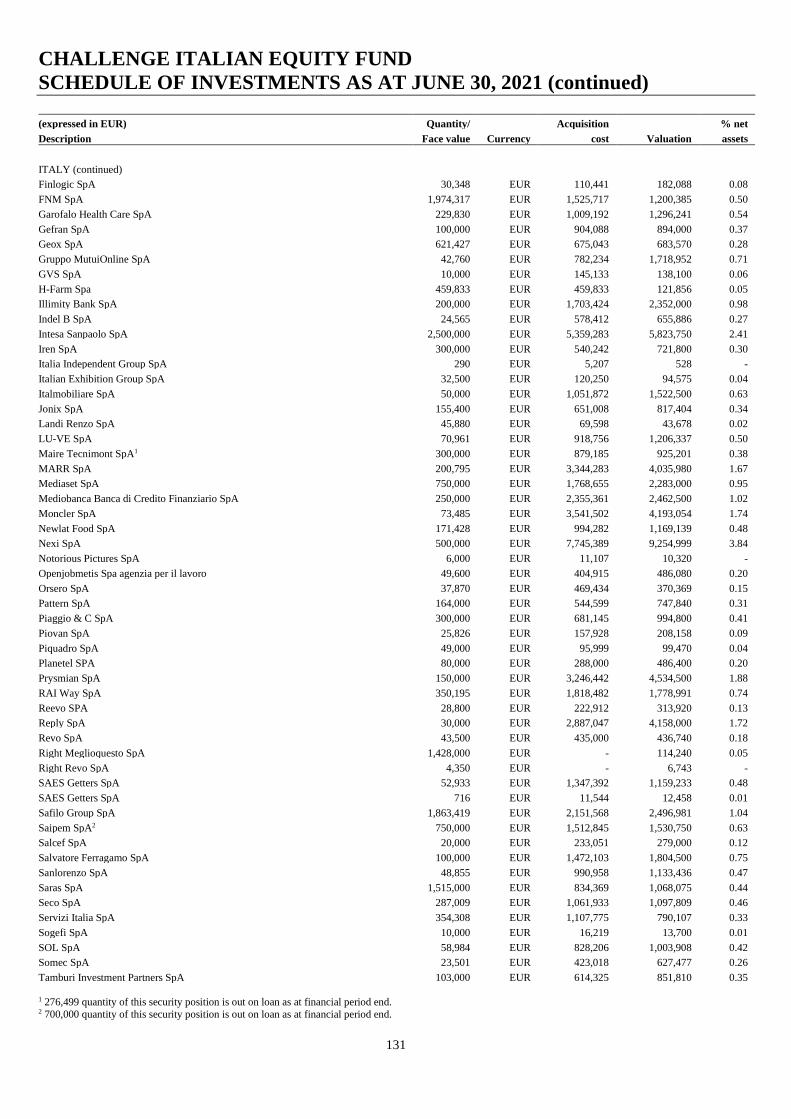
CHALLENGE ITALIAN EQUITY FUND
SCHEDULE OF INVESTMENTS AS AT JUNE 30, 2021 (continued)
131
(expressed in EUR) Quantity/ Acquisition % net
Description Face value Currency cost Valuation assets
ITALY (continued)
Finlogic SpA 30,348 EUR 110,441 182,088 0.08
FNM SpA 1,974,317 EUR 1,525,717 1,200,385 0.50
Garofalo Health Care SpA 229,830 EUR 1,009,192 1,296,241 0.54
Gefran SpA 100,000 EUR 904,088 894,000 0.37
Geox SpA 621,427 EUR 675,043 683,570 0.28
Gruppo MutuiOnline SpA 42,760 EUR 782,234 1,718,952 0.71
GVS SpA 10,000 EUR 145,133 138,100 0.06
H-Farm Spa 459,833 EUR 459,833 121,856 0.05
Illimity Bank SpA 200,000 EUR 1,703,424 2,352,000 0.98
Indel B SpA 24,565 EUR 578,412 655,886 0.27
Intesa Sanpaolo SpA 2,500,000 EUR 5,359,283 5,823,750 2.41
Iren SpA 300,000 EUR 540,242 721,800 0.30
Italia Independent Group SpA 290 EUR 5,207 528 -
Italian Exhibition Group SpA 32,500 EUR 120,250 94,575 0.04
Italmobiliare SpA 50,000 EUR 1,051,872 1,522,500 0.63
Jonix SpA 155,400 EUR 651,008 817,404 0.34
Landi Renzo SpA 45,880 EUR 69,598 43,678 0.02
LU-VE SpA 70,961 EUR 918,756 1,206,337 0.50
Maire Tecnimont SpA1 300,000 EUR 879,185 925,201 0.38
MARR SpA 200,795 EUR 3,344,283 4,035,980 1.67
Mediaset SpA 750,000 EUR 1,768,655 2,283,000 0.95
Mediobanca Banca di Credito Finanziario SpA 250,000 EUR 2,355,361 2,462,500 1.02
Moncler SpA 73,485 EUR 3,541,502 4,193,054 1.74
Newlat Food SpA 171,428 EUR 994,282 1,169,139 0.48
Nexi SpA 500,000 EUR 7,745,389 9,254,999 3.84
Notorious Pictures SpA 6,000 EUR 11,107 10,320 -
Openjobmetis Spa agenzia per il lavoro 49,600 EUR 404,915 486,080 0.20
Orsero SpA 37,870 EUR 469,434 370,369 0.15
Pattern SpA 164,000 EUR 544,599 747,840 0.31
Piaggio & C SpA 300,000 EUR 681,145 994,800 0.41
Piovan SpA 25,826 EUR 157,928 208,158 0.09
Piquadro SpA 49,000 EUR 95,999 99,470 0.04
Planetel SPA 80,000 EUR 288,000 486,400 0.20
Prysmian SpA 150,000 EUR 3,246,442 4,534,500 1.88
RAI Way SpA 350,195 EUR 1,818,482 1,778,991 0.74
Reevo SPA 28,800 EUR 222,912 313,920 0.13
Reply SpA 30,000 EUR 2,887,047 4,158,000 1.72
Revo SpA 43,500 EUR 435,000 436,740 0.18
Right Meglioquesto SpA 1,428,000 EUR - 114,240 0.05
Right Revo SpA 4,350 EUR - 6,743 -
SAES Getters SpA 52,933 EUR 1,347,392 1,159,233 0.48
SAES Getters SpA 716 EUR 11,544 12,458 0.01
Safilo Group SpA 1,863,419 EUR 2,151,568 2,496,981 1.04
Saipem SpA2 750,000 EUR 1,512,845 1,530,750 0.63
Salcef SpA 20,000 EUR 233,051 279,000 0.12
Salvatore Ferragamo SpA 100,000 EUR 1,472,103 1,804,500 0.75
Sanlorenzo SpA 48,855 EUR 990,958 1,133,436 0.47
Saras SpA 1,515,000 EUR 834,369 1,068,075 0.44
Seco SpA 287,009 EUR 1,061,933 1,097,809 0.46
Servizi Italia SpA 354,308 EUR 1,107,775 790,107 0.33
Sogefi SpA 10,000 EUR 16,219 13,700 0.01
SOL SpA 58,984 EUR 828,206 1,003,908 0.42
Somec SpA 23,501 EUR 423,018 627,477 0.26
Tamburi Investment Partners SpA 103,000 EUR 614,325 851,810 0.35
1 276,499 quantity of this security position is out on loan as at financial period end. 2 700,000 quantity of this security position is out on loan as at financial period end.

CHALLENGE ITALIAN EQUITY FUND
SCHEDULE OF INVESTMENTS AS AT JUNE 30, 2021 (continued)
132
(expressed in EUR) Quantity/ Acquisition % net
Description Face value Currency cost Valuation assets
ITALY (continued)
Technogym SpA 500,000 EUR 5,129,935 5,380,000 2.23
Tesmec SpA1 4,243,800 EUR 359,299 494,827 0.21
Tinexta Spa 140,000 EUR 1,543,212 4,594,800 1.91
Tod's SpA 21,000 EUR 1,012,986 1,203,300 0.50
TXT e-solutions SpA 68,000 EUR 630,231 529,040 0.22
Unieuro SpA 60,000 EUR 1,439,204 1,464,000 0.61
Unipol Gruppo SpA 300,000 EUR 1,200,618 1,377,600 0.57
UnipolSai Assicurazioni SpA 1,400,000 EUR 3,262,629 3,427,200 1.42
Webuild SpA2 795,920 EUR 1,197,949 1,781,269 0.74
Wiit SpA 149,123 EUR 2,537,626 2,830,355 1.17
Zignago Vetro SpA 21,656 EUR 189,549 363,821 0.15
Total Italy 168,895,244 195,870,389 81.21
LUXEMBOURG
Tenaris SA 200,000 EUR 1,811,039 1,838,400 0.76
Total Luxembourg 1,811,039 1,838,400 0.76
NETHERLANDS
Cementir Holding NV 201,000 EUR 1,368,591 1,728,600 0.72
EXOR NV 50,000 EUR 2,968,067 3,378,000 1.40
Ferrari NV 50,000 EUR 8,641,885 8,699,999 3.61
Stellantis NV 600,000 EUR 7,810,548 9,932,399 4.12
STMicroelectronics NV 550,000 EUR 16,772,648 16,832,749 6.99
Total Netherlands 37,561,739 40,571,747 16.84
TOTAL LISTED SECURITIES : SHARES 208,268,022 238,280,536 98.81
2) LISTED SECURITIES : WARRANTS
ITALY
Convergenze Spa Societa Benefit 95,000 EUR - 40,641 0.02
Meglioquesto SpA 714,000 EUR - 466,956 0.19
Vantea Smart Spa % 10/31/2022/ perpetual 130,000 EUR - 134,420 0.06
Total Italy - 642,017 0.27
TOTAL LISTED SECURITIES : WARRANTS - 642,017 0.27
TOTAL TRANSFERABLE SECURITIES ADMITTED TO AN OFFICIAL STOCK EXCHANGE LISTING 208,268,022 238,922,553 99.08
1 1,354,237 quantity of this security position is out on loan as at financial period end. 2 756,124 quantity of this security position is out on loan as at financial period end.
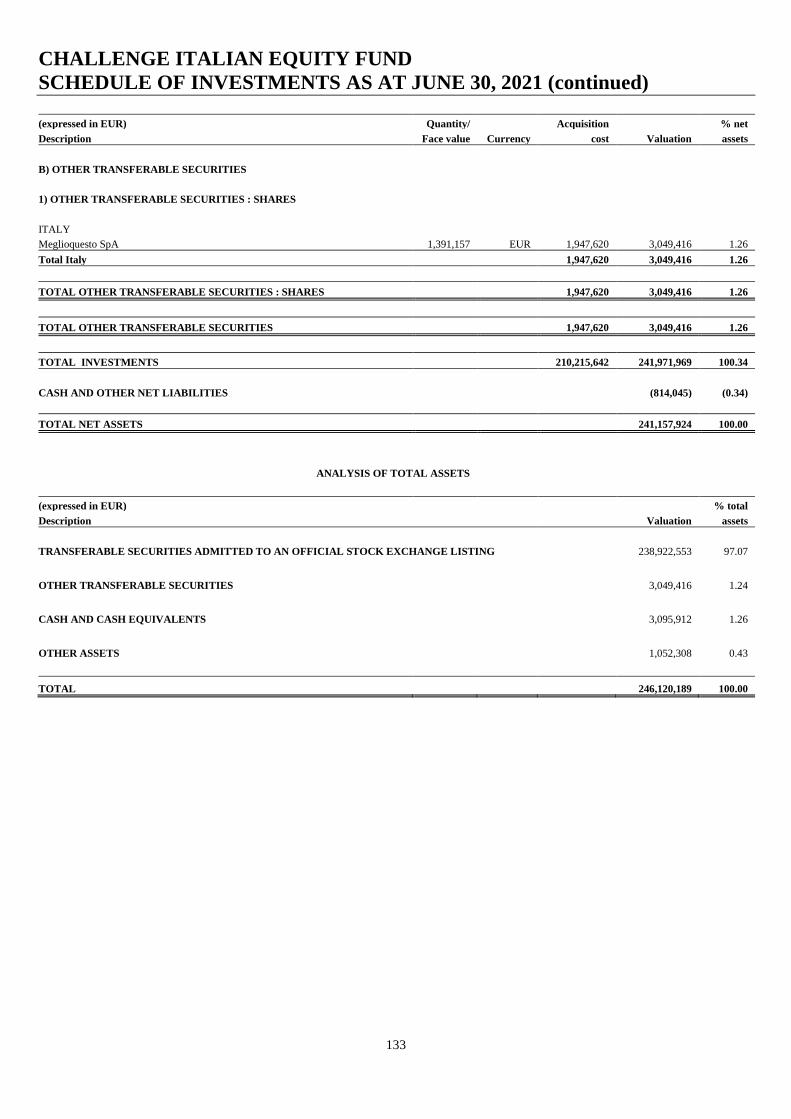
CHALLENGE ITALIAN EQUITY FUND
SCHEDULE OF INVESTMENTS AS AT JUNE 30, 2021 (continued)
133
(expressed in EUR) Quantity/ Acquisition % net
Description Face value Currency cost Valuation assets
B) OTHER TRANSFERABLE SECURITIES
1) OTHER TRANSFERABLE SECURITIES : SHARES
ITALY
Meglioquesto SpA 1,391,157 EUR 1,947,620 3,049,416 1.26
Total Italy 1,947,620 3,049,416 1.26
TOTAL OTHER TRANSFERABLE SECURITIES : SHARES 1,947,620 3,049,416 1.26
TOTAL OTHER TRANSFERABLE SECURITIES 1,947,620 3,049,416 1.26
TOTAL INVESTMENTS 210,215,642 241,971,969 100.34
CASH AND OTHER NET LIABILITIES (814,045) (0.34)
TOTAL NET ASSETS 241,157,924 100.00
ANALYSIS OF TOTAL ASSETS
(expressed in EUR) % total
Description Valuation assets
TRANSFERABLE SECURITIES ADMITTED TO AN OFFICIAL STOCK EXCHANGE LISTING 238,922,553 97.07
OTHER TRANSFERABLE SECURITIES
3,049,416 1.24
CASH AND CASH EQUIVALENTS
3,095,912 1.26
OTHER ASSETS
1,052,308 0.43
TOTAL 246,120,189 100.00
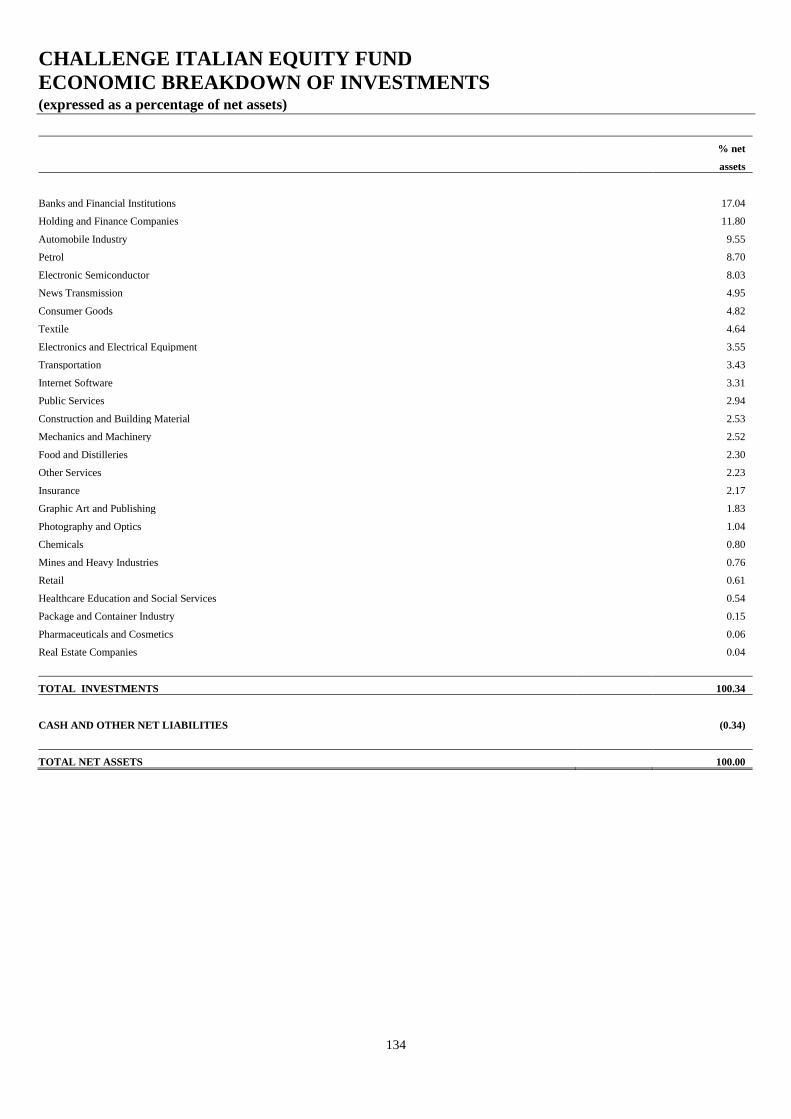
CHALLENGE ITALIAN EQUITY FUND
ECONOMIC BREAKDOWN OF INVESTMENTS (expressed as a percentage of net assets)
134
% net
assets
Banks and Financial Institutions 17.04
Holding and Finance Companies 11.80
Automobile Industry 9.55
Petrol 8.70
Electronic Semiconductor 8.03
News Transmission 4.95
Consumer Goods 4.82
Textile 4.64
Electronics and Electrical Equipment 3.55
Transportation 3.43
Internet Software 3.31
Public Services 2.94
Construction and Building Material 2.53
Mechanics and Machinery 2.52
Food and Distilleries 2.30
Other Services 2.23
Insurance 2.17
Graphic Art and Publishing 1.83
Photography and Optics 1.04
Chemicals 0.80
Mines and Heavy Industries 0.76
Retail 0.61
Healthcare Education and Social Services 0.54
Package and Container Industry 0.15
Pharmaceuticals and Cosmetics 0.06
Real Estate Companies 0.04
TOTAL INVESTMENTS 100.34
CASH AND OTHER NET LIABILITIES (0.34)
TOTAL NET ASSETS 100.00
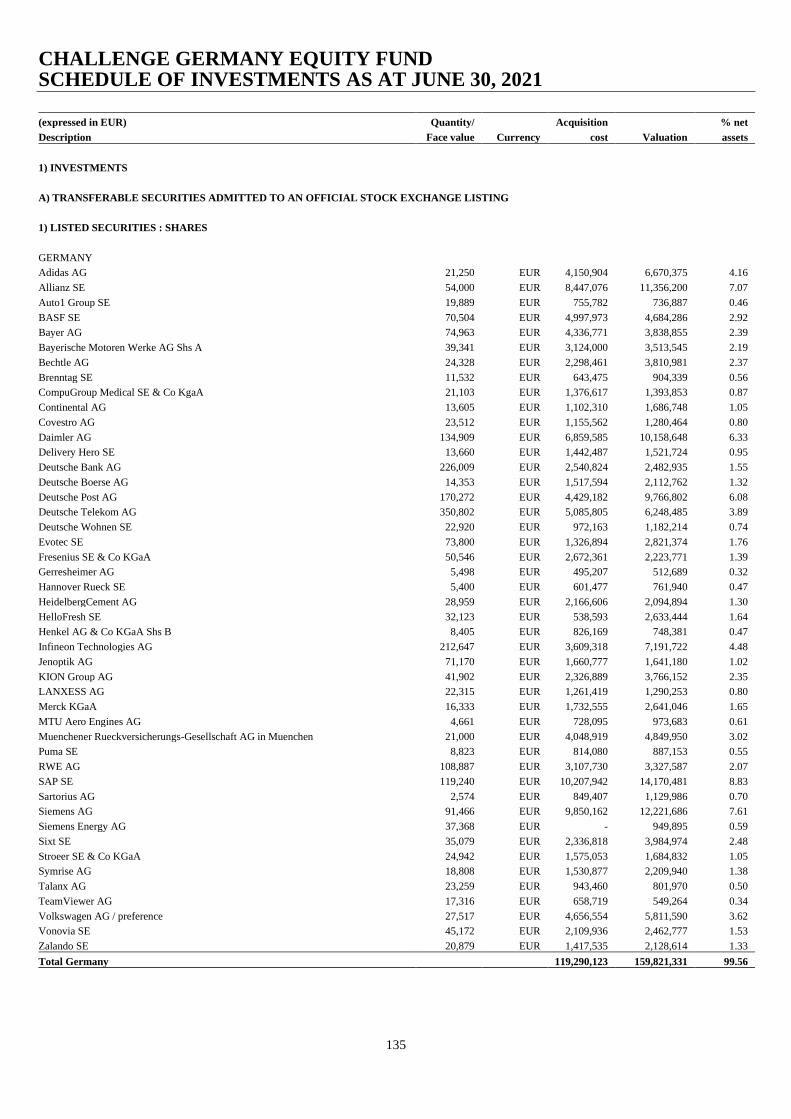
CHALLENGE GERMANY EQUITY FUND SCHEDULE OF INVESTMENTS AS AT JUNE 30, 2021
135
(expressed in EUR) Quantity/ Acquisition % net
Description Face value Currency cost Valuation assets
1) INVESTMENTS
A) TRANSFERABLE SECURITIES ADMITTED TO AN OFFICIAL STOCK EXCHANGE LISTING
1) LISTED SECURITIES : SHARES
GERMANY
Adidas AG 21,250 EUR 4,150,904 6,670,375 4.16
Allianz SE 54,000 EUR 8,447,076 11,356,200 7.07
Auto1 Group SE 19,889 EUR 755,782 736,887 0.46
BASF SE 70,504 EUR 4,997,973 4,684,286 2.92
Bayer AG 74,963 EUR 4,336,771 3,838,855 2.39
Bayerische Motoren Werke AG Shs A 39,341 EUR 3,124,000 3,513,545 2.19
Bechtle AG 24,328 EUR 2,298,461 3,810,981 2.37
Brenntag SE 11,532 EUR 643,475 904,339 0.56
CompuGroup Medical SE & Co KgaA 21,103 EUR 1,376,617 1,393,853 0.87
Continental AG 13,605 EUR 1,102,310 1,686,748 1.05
Covestro AG 23,512 EUR 1,155,562 1,280,464 0.80
Daimler AG 134,909 EUR 6,859,585 10,158,648 6.33
Delivery Hero SE 13,660 EUR 1,442,487 1,521,724 0.95
Deutsche Bank AG 226,009 EUR 2,540,824 2,482,935 1.55
Deutsche Boerse AG 14,353 EUR 1,517,594 2,112,762 1.32
Deutsche Post AG 170,272 EUR 4,429,182 9,766,802 6.08
Deutsche Telekom AG 350,802 EUR 5,085,805 6,248,485 3.89
Deutsche Wohnen SE 22,920 EUR 972,163 1,182,214 0.74
Evotec SE 73,800 EUR 1,326,894 2,821,374 1.76
Fresenius SE & Co KGaA 50,546 EUR 2,672,361 2,223,771 1.39
Gerresheimer AG 5,498 EUR 495,207 512,689 0.32
Hannover Rueck SE 5,400 EUR 601,477 761,940 0.47
HeidelbergCement AG 28,959 EUR 2,166,606 2,094,894 1.30
HelloFresh SE 32,123 EUR 538,593 2,633,444 1.64
Henkel AG & Co KGaA Shs B 8,405 EUR 826,169 748,381 0.47
Infineon Technologies AG 212,647 EUR 3,609,318 7,191,722 4.48
Jenoptik AG 71,170 EUR 1,660,777 1,641,180 1.02
KION Group AG 41,902 EUR 2,326,889 3,766,152 2.35
LANXESS AG 22,315 EUR 1,261,419 1,290,253 0.80
Merck KGaA 16,333 EUR 1,732,555 2,641,046 1.65
MTU Aero Engines AG 4,661 EUR 728,095 973,683 0.61
Muenchener Rueckversicherungs-Gesellschaft AG in Muenchen 21,000 EUR 4,048,919 4,849,950 3.02
Puma SE 8,823 EUR 814,080 887,153 0.55
RWE AG 108,887 EUR 3,107,730 3,327,587 2.07
SAP SE 119,240 EUR 10,207,942 14,170,481 8.83
Sartorius AG 2,574 EUR 849,407 1,129,986 0.70
Siemens AG 91,466 EUR 9,850,162 12,221,686 7.61
Siemens Energy AG 37,368 EUR - 949,895 0.59
Sixt SE 35,079 EUR 2,336,818 3,984,974 2.48
Stroeer SE & Co KGaA 24,942 EUR 1,575,053 1,684,832 1.05
Symrise AG 18,808 EUR 1,530,877 2,209,940 1.38
Talanx AG 23,259 EUR 943,460 801,970 0.50
TeamViewer AG 17,316 EUR 658,719 549,264 0.34
Volkswagen AG / preference 27,517 EUR 4,656,554 5,811,590 3.62
Vonovia SE 45,172 EUR 2,109,936 2,462,777 1.53
Zalando SE 20,879 EUR 1,417,535 2,128,614 1.33
Total Germany 119,290,123 159,821,331 99.56
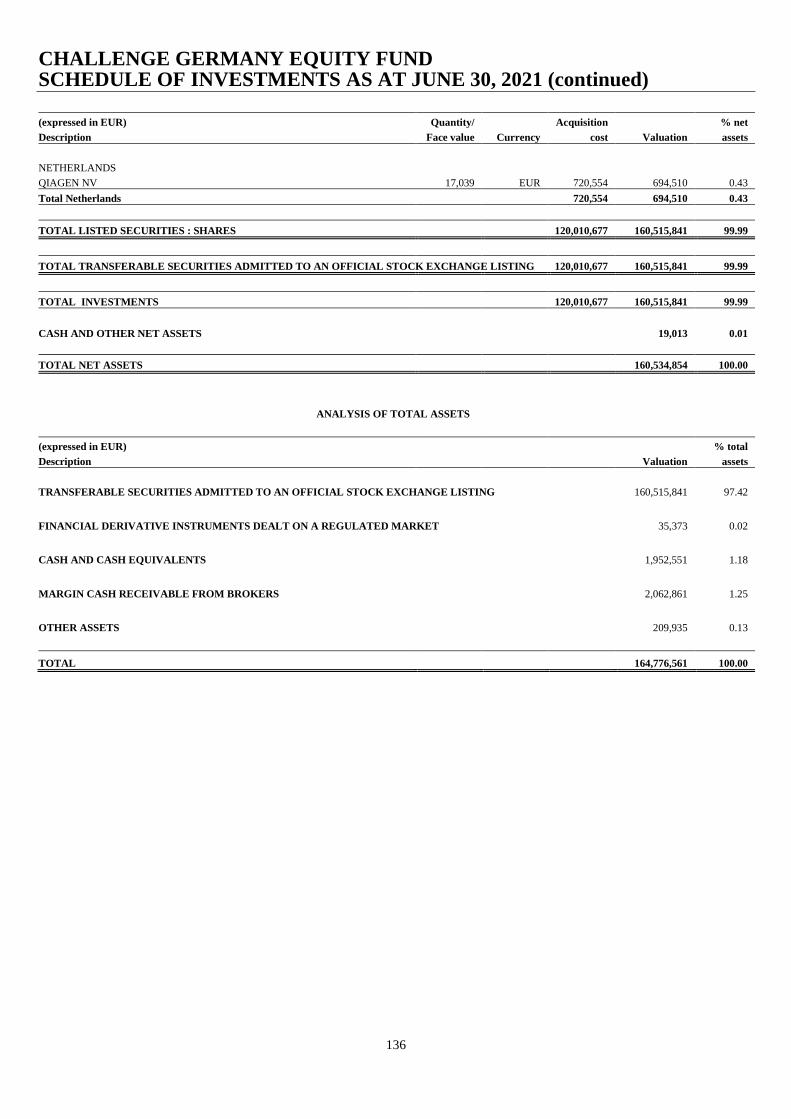
CHALLENGE GERMANY EQUITY FUND SCHEDULE OF INVESTMENTS AS AT JUNE 30, 2021 (continued)
136
(expressed in EUR) Quantity/ Acquisition % net
Description Face value Currency cost Valuation assets
NETHERLANDS
QIAGEN NV 17,039 EUR 720,554 694,510 0.43
Total Netherlands 720,554 694,510 0.43
TOTAL LISTED SECURITIES : SHARES 120,010,677 160,515,841 99.99
TOTAL TRANSFERABLE SECURITIES ADMITTED TO AN OFFICIAL STOCK EXCHANGE LISTING 120,010,677 160,515,841 99.99
TOTAL INVESTMENTS 120,010,677 160,515,841 99.99
CASH AND OTHER NET ASSETS 19,013 0.01
TOTAL NET ASSETS 160,534,854 100.00
ANALYSIS OF TOTAL ASSETS
(expressed in EUR) % total
Description Valuation assets
TRANSFERABLE SECURITIES ADMITTED TO AN OFFICIAL STOCK EXCHANGE LISTING
160,515,841 97.42
FINANCIAL DERIVATIVE INSTRUMENTS DEALT ON A REGULATED MARKET
35,373 0.02
CASH AND CASH EQUIVALENTS
1,952,551 1.18
MARGIN CASH RECEIVABLE FROM BROKERS
2,062,861 1.25
OTHER ASSETS
209,935 0.13
TOTAL 164,776,561 100.00
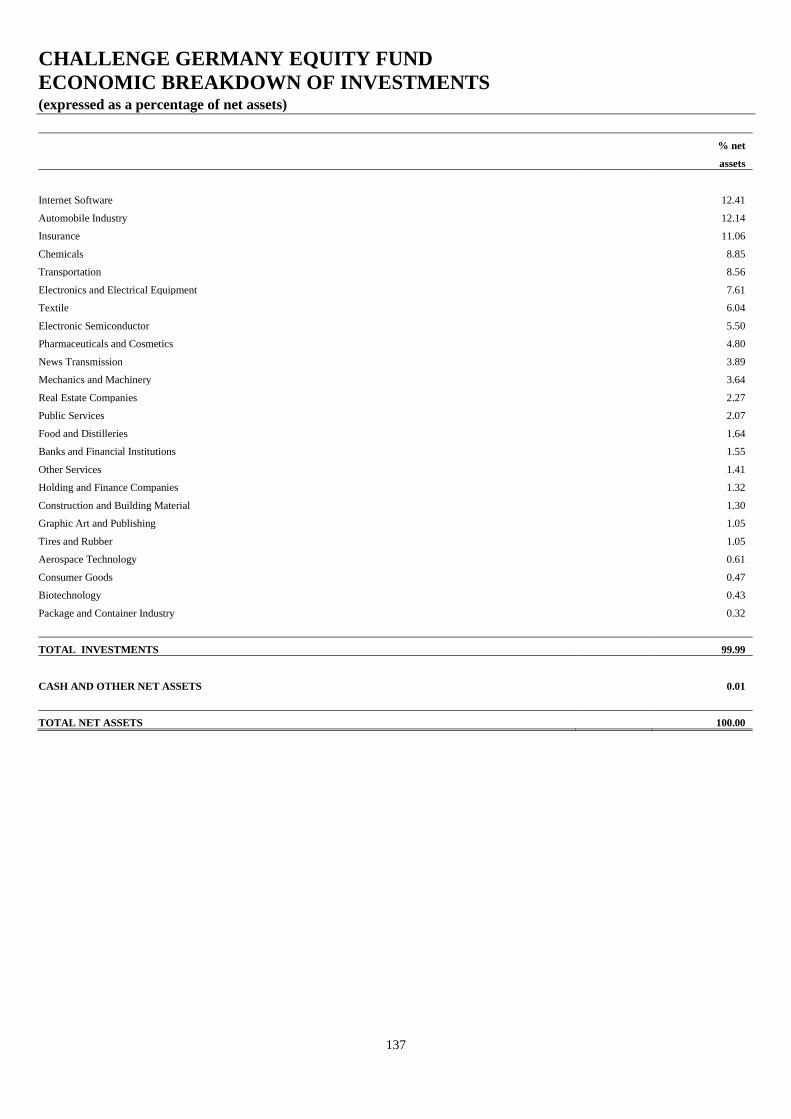
CHALLENGE GERMANY EQUITY FUND
ECONOMIC BREAKDOWN OF INVESTMENTS (expressed as a percentage of net assets)
137
% net
assets
Internet Software 12.41
Automobile Industry 12.14
Insurance 11.06
Chemicals 8.85
Transportation 8.56
Electronics and Electrical Equipment 7.61
Textile 6.04
Electronic Semiconductor 5.50
Pharmaceuticals and Cosmetics 4.80
News Transmission 3.89
Mechanics and Machinery 3.64
Real Estate Companies 2.27
Public Services 2.07
Food and Distilleries 1.64
Banks and Financial Institutions 1.55
Other Services 1.41
Holding and Finance Companies 1.32
Construction and Building Material 1.30
Graphic Art and Publishing 1.05
Tires and Rubber 1.05
Aerospace Technology 0.61
Consumer Goods 0.47
Biotechnology 0.43
Package and Container Industry 0.32
TOTAL INVESTMENTS 99.99
CASH AND OTHER NET ASSETS 0.01
TOTAL NET ASSETS 100.00
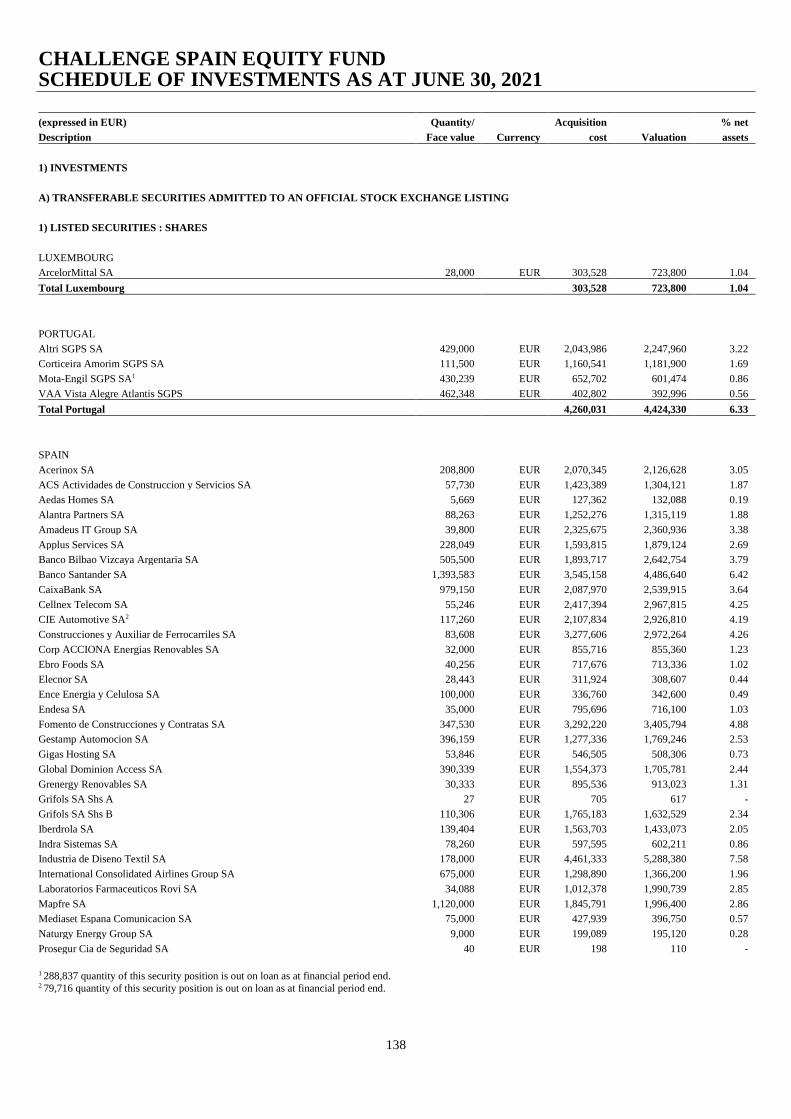
CHALLENGE SPAIN EQUITY FUND SCHEDULE OF INVESTMENTS AS AT JUNE 30, 2021
138
(expressed in EUR) Quantity/ Acquisition % net
Description Face value Currency cost Valuation assets
1) INVESTMENTS
A) TRANSFERABLE SECURITIES ADMITTED TO AN OFFICIAL STOCK EXCHANGE LISTING
1) LISTED SECURITIES : SHARES
LUXEMBOURG
ArcelorMittal SA 28,000 EUR 303,528 723,800 1.04
Total Luxembourg 303,528 723,800 1.04
PORTUGAL
Altri SGPS SA 429,000 EUR 2,043,986 2,247,960 3.22
Corticeira Amorim SGPS SA 111,500 EUR 1,160,541 1,181,900 1.69
Mota-Engil SGPS SA1 430,239 EUR 652,702 601,474 0.86
VAA Vista Alegre Atlantis SGPS 462,348 EUR 402,802 392,996 0.56
Total Portugal 4,260,031 4,424,330 6.33
SPAIN
Acerinox SA 208,800 EUR 2,070,345 2,126,628 3.05
ACS Actividades de Construccion y Servicios SA 57,730 EUR 1,423,389 1,304,121 1.87
Aedas Homes SA 5,669 EUR 127,362 132,088 0.19
Alantra Partners SA 88,263 EUR 1,252,276 1,315,119 1.88
Amadeus IT Group SA 39,800 EUR 2,325,675 2,360,936 3.38
Applus Services SA 228,049 EUR 1,593,815 1,879,124 2.69
Banco Bilbao Vizcaya Argentaria SA 505,500 EUR 1,893,717 2,642,754 3.79
Banco Santander SA 1,393,583 EUR 3,545,158 4,486,640 6.42
CaixaBank SA 979,150 EUR 2,087,970 2,539,915 3.64
Cellnex Telecom SA 55,246 EUR 2,417,394 2,967,815 4.25
CIE Automotive SA2 117,260 EUR 2,107,834 2,926,810 4.19
Construcciones y Auxiliar de Ferrocarriles SA 83,608 EUR 3,277,606 2,972,264 4.26
Corp ACCIONA Energias Renovables SA 32,000 EUR 855,716 855,360 1.23
Ebro Foods SA 40,256 EUR 717,676 713,336 1.02
Elecnor SA 28,443 EUR 311,924 308,607 0.44
Ence Energia y Celulosa SA 100,000 EUR 336,760 342,600 0.49
Endesa SA 35,000 EUR 795,696 716,100 1.03
Fomento de Construcciones y Contratas SA 347,530 EUR 3,292,220 3,405,794 4.88
Gestamp Automocion SA 396,159 EUR 1,277,336 1,769,246 2.53
Gigas Hosting SA 53,846 EUR 546,505 508,306 0.73
Global Dominion Access SA 390,339 EUR 1,554,373 1,705,781 2.44
Grenergy Renovables SA 30,333 EUR 895,536 913,023 1.31
Grifols SA Shs A 27 EUR 705 617 -
Grifols SA Shs B 110,306 EUR 1,765,183 1,632,529 2.34
Iberdrola SA 139,404 EUR 1,563,703 1,433,073 2.05
Indra Sistemas SA 78,260 EUR 597,595 602,211 0.86
Industria de Diseno Textil SA 178,000 EUR 4,461,333 5,288,380 7.58
International Consolidated Airlines Group SA 675,000 EUR 1,298,890 1,366,200 1.96
Laboratorios Farmaceuticos Rovi SA 34,088 EUR 1,012,378 1,990,739 2.85
Mapfre SA 1,120,000 EUR 1,845,791 1,996,400 2.86
Mediaset Espana Comunicacion SA 75,000 EUR 427,939 396,750 0.57
Naturgy Energy Group SA 9,000 EUR 199,089 195,120 0.28
Prosegur Cia de Seguridad SA 40 EUR 198 110 -
1 288,837 quantity of this security position is out on loan as at financial period end. 2 79,716 quantity of this security position is out on loan as at financial period end.
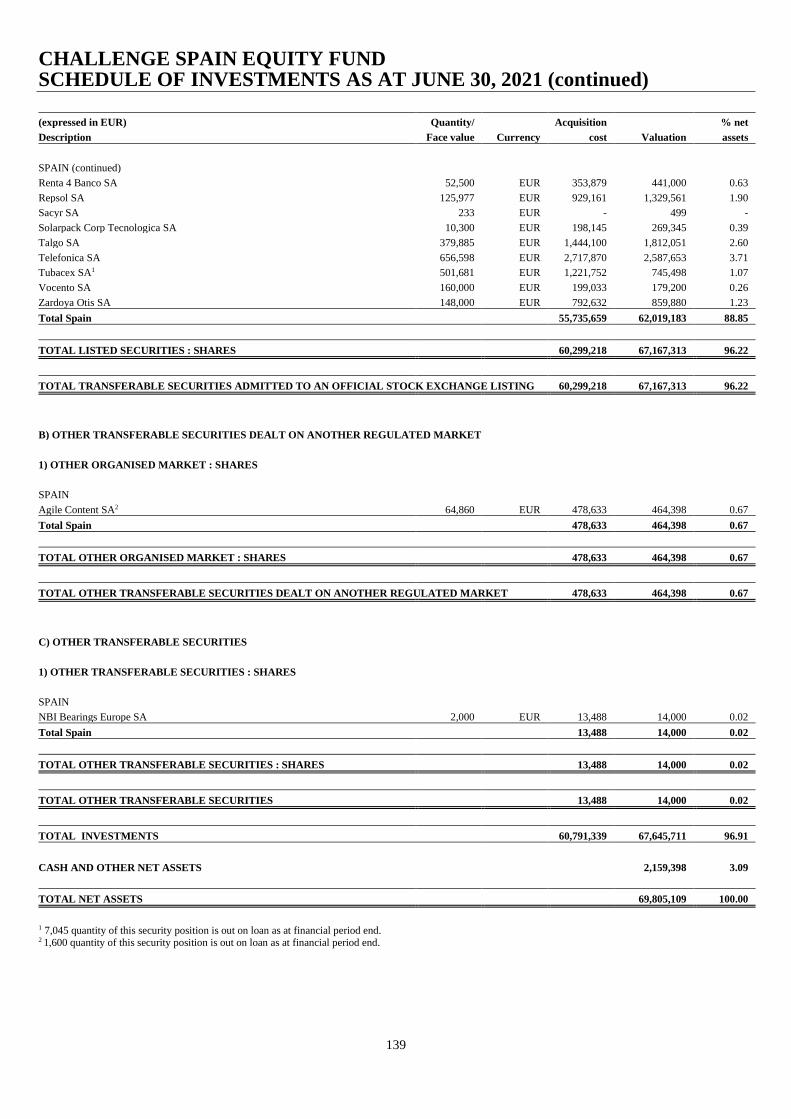
CHALLENGE SPAIN EQUITY FUND SCHEDULE OF INVESTMENTS AS AT JUNE 30, 2021 (continued)
139
(expressed in EUR) Quantity/ Acquisition % net
Description Face value Currency cost Valuation assets
SPAIN (continued)
Renta 4 Banco SA 52,500 EUR 353,879 441,000 0.63
Repsol SA 125,977 EUR 929,161 1,329,561 1.90
Sacyr SA 233 EUR - 499 -
Solarpack Corp Tecnologica SA 10,300 EUR 198,145 269,345 0.39
Talgo SA 379,885 EUR 1,444,100 1,812,051 2.60
Telefonica SA 656,598 EUR 2,717,870 2,587,653 3.71
Tubacex SA1 501,681 EUR 1,221,752 745,498 1.07
Vocento SA 160,000 EUR 199,033 179,200 0.26
Zardoya Otis SA 148,000 EUR 792,632 859,880 1.23
Total Spain 55,735,659 62,019,183 88.85
TOTAL LISTED SECURITIES : SHARES 60,299,218 67,167,313 96.22
TOTAL TRANSFERABLE SECURITIES ADMITTED TO AN OFFICIAL STOCK EXCHANGE LISTING 60,299,218 67,167,313 96.22
B) OTHER TRANSFERABLE SECURITIES DEALT ON ANOTHER REGULATED MARKET
1) OTHER ORGANISED MARKET : SHARES
SPAIN
Agile Content SA2 64,860 EUR 478,633 464,398 0.67
Total Spain 478,633 464,398 0.67
TOTAL OTHER ORGANISED MARKET : SHARES 478,633 464,398 0.67
TOTAL OTHER TRANSFERABLE SECURITIES DEALT ON ANOTHER REGULATED MARKET 478,633 464,398 0.67
C) OTHER TRANSFERABLE SECURITIES
1) OTHER TRANSFERABLE SECURITIES : SHARES
SPAIN
NBI Bearings Europe SA 2,000 EUR 13,488 14,000 0.02
Total Spain 13,488 14,000 0.02
TOTAL OTHER TRANSFERABLE SECURITIES : SHARES 13,488 14,000 0.02
TOTAL OTHER TRANSFERABLE SECURITIES 13,488 14,000 0.02
TOTAL INVESTMENTS 60,791,339 67,645,711 96.91
CASH AND OTHER NET ASSETS 2,159,398 3.09
TOTAL NET ASSETS 69,805,109 100.00
1 7,045 quantity of this security position is out on loan as at financial period end. 2 1,600 quantity of this security position is out on loan as at financial period end.

CHALLENGE SPAIN EQUITY FUND SCHEDULE OF INVESTMENTS AS AT JUNE 30, 2021 (continued)
140
ANALYSIS OF TOTAL ASSETS
(expressed in EUR) % total
Description Valuation assets
TRANSFERABLE SECURITIES ADMITTED TO AN OFFICIAL STOCK EXCHANGE LISTING 67,167,313 94.39
OTHER TRANSFERABLE SECURITIES DEALT ON ANOTHER REGULATED MARKET 464,398 0.65
OTHER TRANSFERABLE SECURITIES 14,000 0.02
CASH AND CASH EQUIVALENTS 1,413,821 1.99
OTHER ASSETS 2,100,083 2.95
TOTAL 71,159,615 100.00
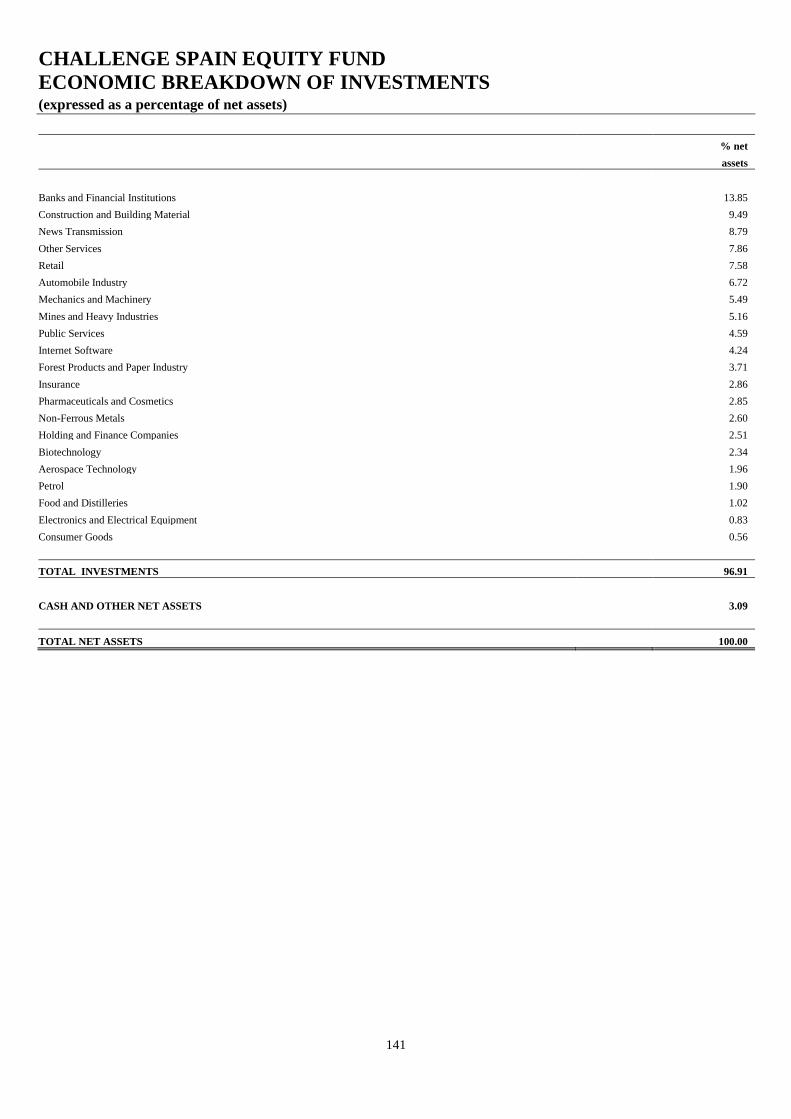
CHALLENGE SPAIN EQUITY FUND
ECONOMIC BREAKDOWN OF INVESTMENTS (expressed as a percentage of net assets)
141
% net
assets
Banks and Financial Institutions 13.85
Construction and Building Material 9.49
News Transmission 8.79
Other Services 7.86
Retail 7.58
Automobile Industry 6.72
Mechanics and Machinery 5.49
Mines and Heavy Industries 5.16
Public Services 4.59
Internet Software 4.24
Forest Products and Paper Industry 3.71
Insurance 2.86
Pharmaceuticals and Cosmetics 2.85
Non-Ferrous Metals 2.60
Holding and Finance Companies 2.51
Biotechnology 2.34
Aerospace Technology 1.96
Petrol 1.90
Food and Distilleries 1.02
Electronics and Electrical Equipment 0.83
Consumer Goods 0.56
TOTAL INVESTMENTS 96.91
CASH AND OTHER NET ASSETS 3.09
TOTAL NET ASSETS 100.00
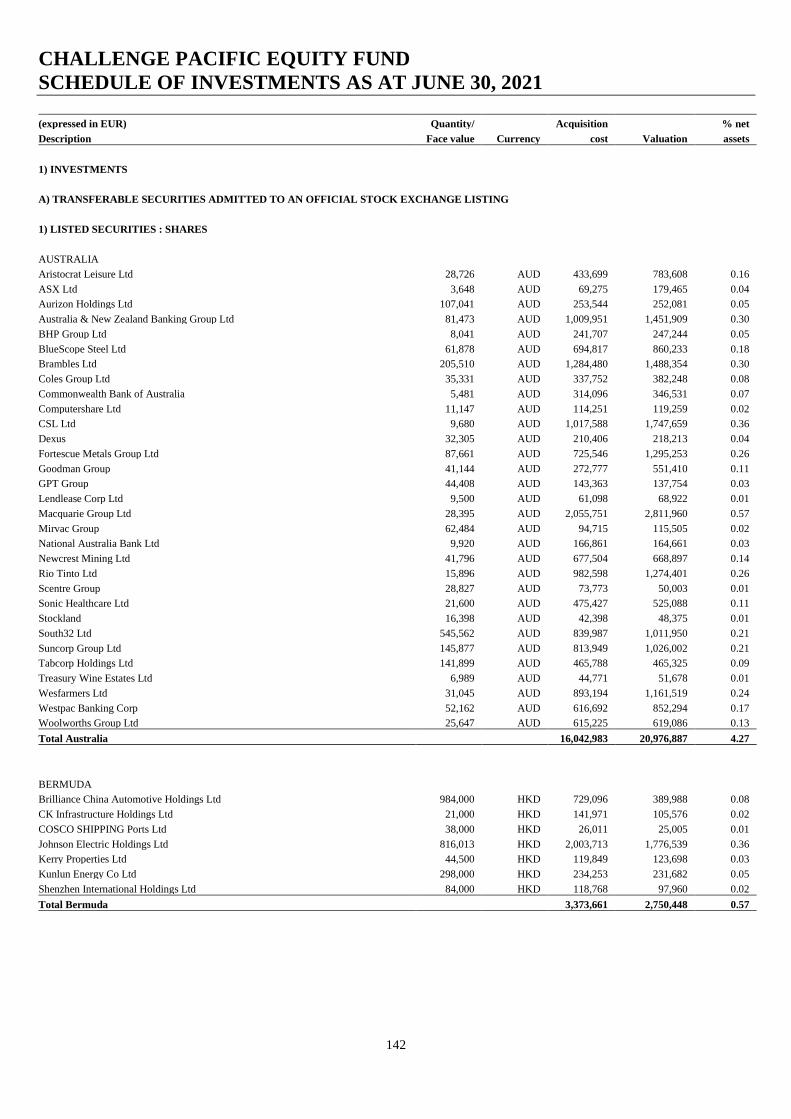
CHALLENGE PACIFIC EQUITY FUND
SCHEDULE OF INVESTMENTS AS AT JUNE 30, 2021
142
(expressed in EUR) Quantity/ Acquisition % net
Description Face value Currency cost Valuation assets
1) INVESTMENTS
A) TRANSFERABLE SECURITIES ADMITTED TO AN OFFICIAL STOCK EXCHANGE LISTING
1) LISTED SECURITIES : SHARES
AUSTRALIA
Aristocrat Leisure Ltd 28,726 AUD 433,699 783,608 0.16
ASX Ltd 3,648 AUD 69,275 179,465 0.04
Aurizon Holdings Ltd 107,041 AUD 253,544 252,081 0.05
Australia & New Zealand Banking Group Ltd 81,473 AUD 1,009,951 1,451,909 0.30
BHP Group Ltd 8,041 AUD 241,707 247,244 0.05
BlueScope Steel Ltd 61,878 AUD 694,817 860,233 0.18
Brambles Ltd 205,510 AUD 1,284,480 1,488,354 0.30
Coles Group Ltd 35,331 AUD 337,752 382,248 0.08
Commonwealth Bank of Australia 5,481 AUD 314,096 346,531 0.07
Computershare Ltd 11,147 AUD 114,251 119,259 0.02
CSL Ltd 9,680 AUD 1,017,588 1,747,659 0.36
Dexus 32,305 AUD 210,406 218,213 0.04
Fortescue Metals Group Ltd 87,661 AUD 725,546 1,295,253 0.26
Goodman Group 41,144 AUD 272,777 551,410 0.11
GPT Group 44,408 AUD 143,363 137,754 0.03
Lendlease Corp Ltd 9,500 AUD 61,098 68,922 0.01
Macquarie Group Ltd 28,395 AUD 2,055,751 2,811,960 0.57
Mirvac Group 62,484 AUD 94,715 115,505 0.02
National Australia Bank Ltd 9,920 AUD 166,861 164,661 0.03
Newcrest Mining Ltd 41,796 AUD 677,504 668,897 0.14
Rio Tinto Ltd 15,896 AUD 982,598 1,274,401 0.26
Scentre Group 28,827 AUD 73,773 50,003 0.01
Sonic Healthcare Ltd 21,600 AUD 475,427 525,088 0.11
Stockland 16,398 AUD 42,398 48,375 0.01
South32 Ltd 545,562 AUD 839,987 1,011,950 0.21
Suncorp Group Ltd 145,877 AUD 813,949 1,026,002 0.21
Tabcorp Holdings Ltd 141,899 AUD 465,788 465,325 0.09
Treasury Wine Estates Ltd 6,989 AUD 44,771 51,678 0.01
Wesfarmers Ltd 31,045 AUD 893,194 1,161,519 0.24
Westpac Banking Corp 52,162 AUD 616,692 852,294 0.17
Woolworths Group Ltd 25,647 AUD 615,225 619,086 0.13
Total Australia 16,042,983 20,976,887 4.27
BERMUDA
Brilliance China Automotive Holdings Ltd 984,000 HKD 729,096 389,988 0.08
CK Infrastructure Holdings Ltd 21,000 HKD 141,971 105,576 0.02
COSCO SHIPPING Ports Ltd 38,000 HKD 26,011 25,005 0.01
Johnson Electric Holdings Ltd 816,013 HKD 2,003,713 1,776,539 0.36
Kerry Properties Ltd 44,500 HKD 119,849 123,698 0.03
Kunlun Energy Co Ltd 298,000 HKD 234,253 231,682 0.05
Shenzhen International Holdings Ltd 84,000 HKD 118,768 97,960 0.02
Total Bermuda 3,373,661 2,750,448 0.57
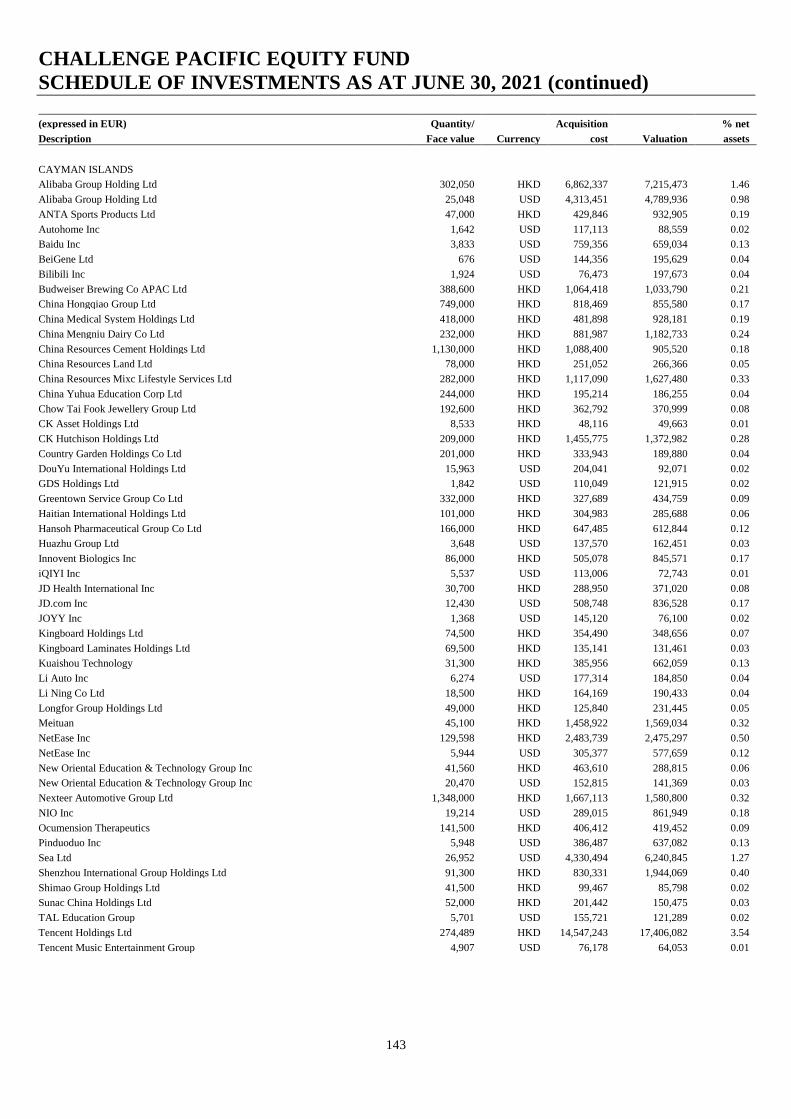
CHALLENGE PACIFIC EQUITY FUND
SCHEDULE OF INVESTMENTS AS AT JUNE 30, 2021 (continued)
143
(expressed in EUR) Quantity/ Acquisition % net
Description Face value Currency cost Valuation assets
CAYMAN ISLANDS
Alibaba Group Holding Ltd 302,050 HKD 6,862,337 7,215,473 1.46
Alibaba Group Holding Ltd 25,048 USD 4,313,451 4,789,936 0.98
ANTA Sports Products Ltd 47,000 HKD 429,846 932,905 0.19
Autohome Inc 1,642 USD 117,113 88,559 0.02
Baidu Inc 3,833 USD 759,356 659,034 0.13
BeiGene Ltd 676 USD 144,356 195,629 0.04
Bilibili Inc 1,924 USD 76,473 197,673 0.04
Budweiser Brewing Co APAC Ltd 388,600 HKD 1,064,418 1,033,790 0.21
China Hongqiao Group Ltd 749,000 HKD 818,469 855,580 0.17
China Medical System Holdings Ltd 418,000 HKD 481,898 928,181 0.19
China Mengniu Dairy Co Ltd 232,000 HKD 881,987 1,182,733 0.24
China Resources Cement Holdings Ltd 1,130,000 HKD 1,088,400 905,520 0.18
China Resources Land Ltd 78,000 HKD 251,052 266,366 0.05
China Resources Mixc Lifestyle Services Ltd 282,000 HKD 1,117,090 1,627,480 0.33
China Yuhua Education Corp Ltd 244,000 HKD 195,214 186,255 0.04
Chow Tai Fook Jewellery Group Ltd 192,600 HKD 362,792 370,999 0.08
CK Asset Holdings Ltd 8,533 HKD 48,116 49,663 0.01
CK Hutchison Holdings Ltd 209,000 HKD 1,455,775 1,372,982 0.28
Country Garden Holdings Co Ltd 201,000 HKD 333,943 189,880 0.04
DouYu International Holdings Ltd 15,963 USD 204,041 92,071 0.02
GDS Holdings Ltd 1,842 USD 110,049 121,915 0.02
Greentown Service Group Co Ltd 332,000 HKD 327,689 434,759 0.09
Haitian International Holdings Ltd 101,000 HKD 304,983 285,688 0.06
Hansoh Pharmaceutical Group Co Ltd 166,000 HKD 647,485 612,844 0.12
Huazhu Group Ltd 3,648 USD 137,570 162,451 0.03
Innovent Biologics Inc 86,000 HKD 505,078 845,571 0.17
iQIYI Inc 5,537 USD 113,006 72,743 0.01
JD Health International Inc 30,700 HKD 288,950 371,020 0.08
JD.com Inc 12,430 USD 508,748 836,528 0.17
JOYY Inc 1,368 USD 145,120 76,100 0.02
Kingboard Holdings Ltd 74,500 HKD 354,490 348,656 0.07
Kingboard Laminates Holdings Ltd 69,500 HKD 135,141 131,461 0.03
Kuaishou Technology 31,300 HKD 385,956 662,059 0.13
Li Auto Inc 6,274 USD 177,314 184,850 0.04
Li Ning Co Ltd 18,500 HKD 164,169 190,433 0.04
Longfor Group Holdings Ltd 49,000 HKD 125,840 231,445 0.05
Meituan 45,100 HKD 1,458,922 1,569,034 0.32
NetEase Inc 129,598 HKD 2,483,739 2,475,297 0.50
NetEase Inc 5,944 USD 305,377 577,659 0.12
New Oriental Education & Technology Group Inc 41,560 HKD 463,610 288,815 0.06
New Oriental Education & Technology Group Inc 20,470 USD 152,815 141,369 0.03
Nexteer Automotive Group Ltd 1,348,000 HKD 1,667,113 1,580,800 0.32
NIO Inc 19,214 USD 289,015 861,949 0.18
Ocumension Therapeutics 141,500 HKD 406,412 419,452 0.09
Pinduoduo Inc 5,948 USD 386,487 637,082 0.13
Sea Ltd 26,952 USD 4,330,494 6,240,845 1.27
Shenzhou International Group Holdings Ltd 91,300 HKD 830,331 1,944,069 0.40
Shimao Group Holdings Ltd 41,500 HKD 99,467 85,798 0.02
Sunac China Holdings Ltd 52,000 HKD 201,442 150,475 0.03
TAL Education Group 5,701 USD 155,721 121,289 0.02
Tencent Holdings Ltd 274,489 HKD 14,547,243 17,406,082 3.54
Tencent Music Entertainment Group 4,907 USD 76,178 64,053 0.01
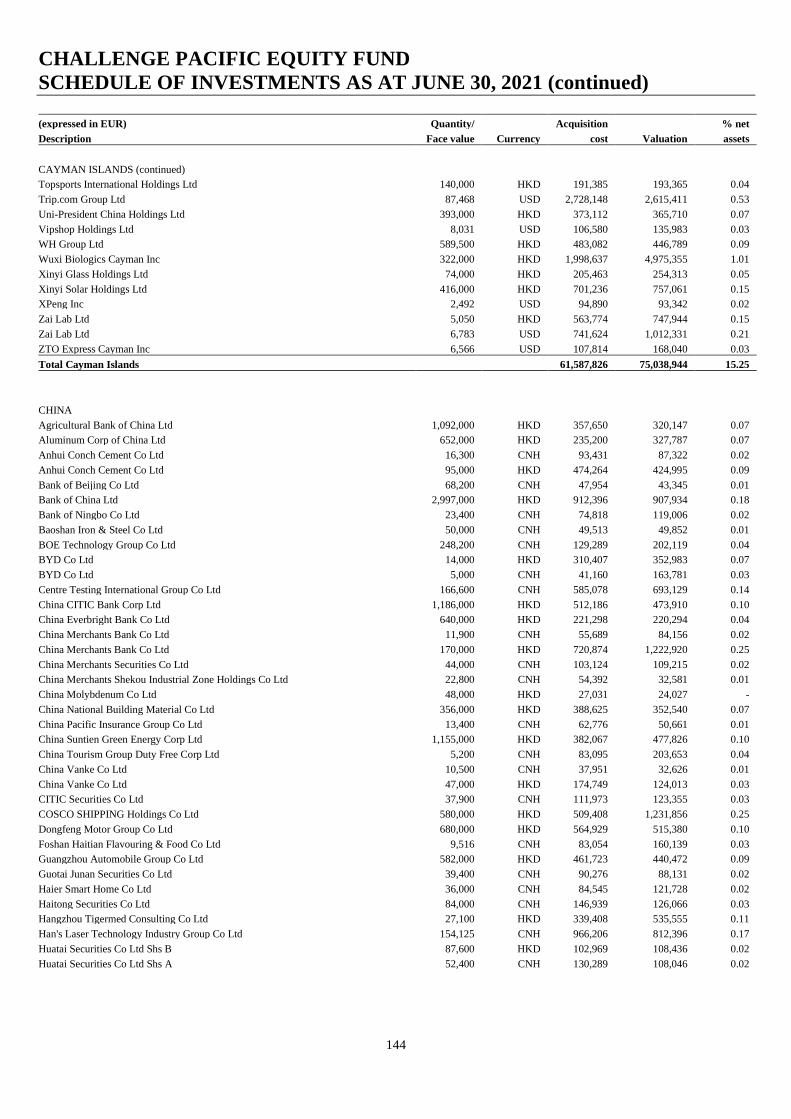
CHALLENGE PACIFIC EQUITY FUND
SCHEDULE OF INVESTMENTS AS AT JUNE 30, 2021 (continued)
144
(expressed in EUR) Quantity/ Acquisition % net
Description Face value Currency cost Valuation assets
CAYMAN ISLANDS (continued)
Topsports International Holdings Ltd 140,000 HKD 191,385 193,365 0.04
Trip.com Group Ltd 87,468 USD 2,728,148 2,615,411 0.53
Uni-President China Holdings Ltd 393,000 HKD 373,112 365,710 0.07
Vipshop Holdings Ltd 8,031 USD 106,580 135,983 0.03
WH Group Ltd 589,500 HKD 483,082 446,789 0.09
Wuxi Biologics Cayman Inc 322,000 HKD 1,998,637 4,975,355 1.01
Xinyi Glass Holdings Ltd 74,000 HKD 205,463 254,313 0.05
Xinyi Solar Holdings Ltd 416,000 HKD 701,236 757,061 0.15
XPeng Inc 2,492 USD 94,890 93,342 0.02
Zai Lab Ltd 5,050 HKD 563,774 747,944 0.15
Zai Lab Ltd 6,783 USD 741,624 1,012,331 0.21
ZTO Express Cayman Inc 6,566 USD 107,814 168,040 0.03
Total Cayman Islands 61,587,826 75,038,944 15.25
CHINA
Agricultural Bank of China Ltd 1,092,000 HKD 357,650 320,147 0.07
Aluminum Corp of China Ltd 652,000 HKD 235,200 327,787 0.07
Anhui Conch Cement Co Ltd 16,300 CNH 93,431 87,322 0.02
Anhui Conch Cement Co Ltd 95,000 HKD 474,264 424,995 0.09
Bank of Beijing Co Ltd 68,200 CNH 47,954 43,345 0.01
Bank of China Ltd 2,997,000 HKD 912,396 907,934 0.18
Bank of Ningbo Co Ltd 23,400 CNH 74,818 119,006 0.02
Baoshan Iron & Steel Co Ltd 50,000 CNH 49,513 49,852 0.01
BOE Technology Group Co Ltd 248,200 CNH 129,289 202,119 0.04
BYD Co Ltd 14,000 HKD 310,407 352,983 0.07
BYD Co Ltd 5,000 CNH 41,160 163,781 0.03
Centre Testing International Group Co Ltd 166,600 CNH 585,078 693,129 0.14
China CITIC Bank Corp Ltd 1,186,000 HKD 512,186 473,910 0.10
China Everbright Bank Co Ltd 640,000 HKD 221,298 220,294 0.04
China Merchants Bank Co Ltd 11,900 CNH 55,689 84,156 0.02
China Merchants Bank Co Ltd 170,000 HKD 720,874 1,222,920 0.25
China Merchants Securities Co Ltd 44,000 CNH 103,124 109,215 0.02
China Merchants Shekou Industrial Zone Holdings Co Ltd 22,800 CNH 54,392 32,581 0.01
China Molybdenum Co Ltd 48,000 HKD 27,031 24,027 -
China National Building Material Co Ltd 356,000 HKD 388,625 352,540 0.07
China Pacific Insurance Group Co Ltd 13,400 CNH 62,776 50,661 0.01
China Suntien Green Energy Corp Ltd 1,155,000 HKD 382,067 477,826 0.10
China Tourism Group Duty Free Corp Ltd 5,200 CNH 83,095 203,653 0.04
China Vanke Co Ltd 10,500 CNH 37,951 32,626 0.01
China Vanke Co Ltd 47,000 HKD 174,749 124,013 0.03
CITIC Securities Co Ltd 37,900 CNH 111,973 123,355 0.03
COSCO SHIPPING Holdings Co Ltd 580,000 HKD 509,408 1,231,856 0.25
Dongfeng Motor Group Co Ltd 680,000 HKD 564,929 515,380 0.10
Foshan Haitian Flavouring & Food Co Ltd 9,516 CNH 83,054 160,139 0.03
Guangzhou Automobile Group Co Ltd 582,000 HKD 461,723 440,472 0.09
Guotai Junan Securities Co Ltd 39,400 CNH 90,276 88,131 0.02
Haier Smart Home Co Ltd 36,000 CNH 84,545 121,728 0.02
Haitong Securities Co Ltd 84,000 CNH 146,939 126,066 0.03
Hangzhou Tigermed Consulting Co Ltd 27,100 HKD 339,408 535,555 0.11
Han's Laser Technology Industry Group Co Ltd 154,125 CNH 966,206 812,396 0.17
Huatai Securities Co Ltd Shs B 87,600 HKD 102,969 108,436 0.02
Huatai Securities Co Ltd Shs A 52,400 CNH 130,289 108,046 0.02
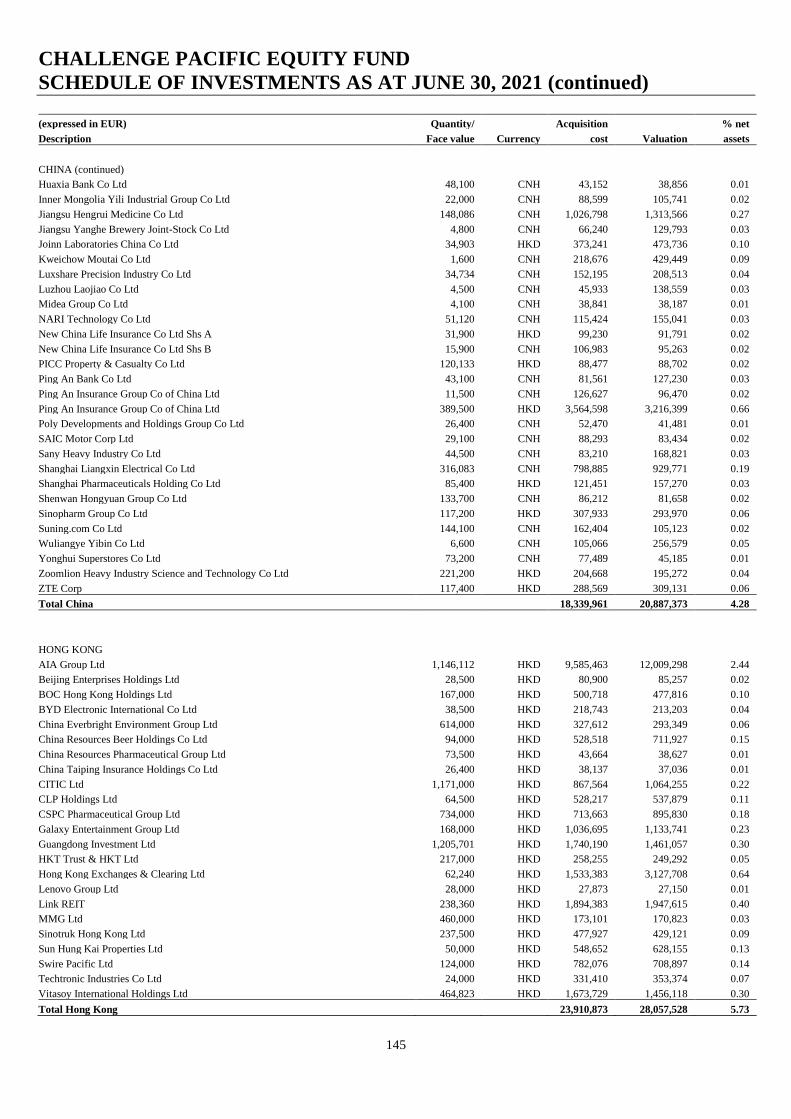
CHALLENGE PACIFIC EQUITY FUND
SCHEDULE OF INVESTMENTS AS AT JUNE 30, 2021 (continued)
145
(expressed in EUR) Quantity/ Acquisition % net
Description Face value Currency cost Valuation assets
CHINA (continued)
Huaxia Bank Co Ltd 48,100 CNH 43,152 38,856 0.01
Inner Mongolia Yili Industrial Group Co Ltd 22,000 CNH 88,599 105,741 0.02
Jiangsu Hengrui Medicine Co Ltd 148,086 CNH 1,026,798 1,313,566 0.27
Jiangsu Yanghe Brewery Joint-Stock Co Ltd 4,800 CNH 66,240 129,793 0.03
Joinn Laboratories China Co Ltd 34,903 HKD 373,241 473,736 0.10
Kweichow Moutai Co Ltd 1,600 CNH 218,676 429,449 0.09
Luxshare Precision Industry Co Ltd 34,734 CNH 152,195 208,513 0.04
Luzhou Laojiao Co Ltd 4,500 CNH 45,933 138,559 0.03
Midea Group Co Ltd 4,100 CNH 38,841 38,187 0.01
NARI Technology Co Ltd 51,120 CNH 115,424 155,041 0.03
New China Life Insurance Co Ltd Shs A 31,900 HKD 99,230 91,791 0.02
New China Life Insurance Co Ltd Shs B 15,900 CNH 106,983 95,263 0.02
PICC Property & Casualty Co Ltd 120,133 HKD 88,477 88,702 0.02
Ping An Bank Co Ltd 43,100 CNH 81,561 127,230 0.03
Ping An Insurance Group Co of China Ltd 11,500 CNH 126,627 96,470 0.02
Ping An Insurance Group Co of China Ltd 389,500 HKD 3,564,598 3,216,399 0.66
Poly Developments and Holdings Group Co Ltd 26,400 CNH 52,470 41,481 0.01
SAIC Motor Corp Ltd 29,100 CNH 88,293 83,434 0.02
Sany Heavy Industry Co Ltd 44,500 CNH 83,210 168,821 0.03
Shanghai Liangxin Electrical Co Ltd 316,083 CNH 798,885 929,771 0.19
Shanghai Pharmaceuticals Holding Co Ltd 85,400 HKD 121,451 157,270 0.03
Shenwan Hongyuan Group Co Ltd 133,700 CNH 86,212 81,658 0.02
Sinopharm Group Co Ltd 117,200 HKD 307,933 293,970 0.06
Suning.com Co Ltd 144,100 CNH 162,404 105,123 0.02
Wuliangye Yibin Co Ltd 6,600 CNH 105,066 256,579 0.05
Yonghui Superstores Co Ltd 73,200 CNH 77,489 45,185 0.01
Zoomlion Heavy Industry Science and Technology Co Ltd 221,200 HKD 204,668 195,272 0.04
ZTE Corp 117,400 HKD 288,569 309,131 0.06
Total China 18,339,961 20,887,373 4.28
HONG KONG
AIA Group Ltd 1,146,112 HKD 9,585,463 12,009,298 2.44
Beijing Enterprises Holdings Ltd 28,500 HKD 80,900 85,257 0.02
BOC Hong Kong Holdings Ltd 167,000 HKD 500,718 477,816 0.10
BYD Electronic International Co Ltd 38,500 HKD 218,743 213,203 0.04
China Everbright Environment Group Ltd 614,000 HKD 327,612 293,349 0.06
China Resources Beer Holdings Co Ltd 94,000 HKD 528,518 711,927 0.15
China Resources Pharmaceutical Group Ltd 73,500 HKD 43,664 38,627 0.01
China Taiping Insurance Holdings Co Ltd 26,400 HKD 38,137 37,036 0.01
CITIC Ltd 1,171,000 HKD 867,564 1,064,255 0.22
CLP Holdings Ltd 64,500 HKD 528,217 537,879 0.11
CSPC Pharmaceutical Group Ltd 734,000 HKD 713,663 895,830 0.18
Galaxy Entertainment Group Ltd 168,000 HKD 1,036,695 1,133,741 0.23
Guangdong Investment Ltd 1,205,701 HKD 1,740,190 1,461,057 0.30
HKT Trust & HKT Ltd 217,000 HKD 258,255 249,292 0.05
Hong Kong Exchanges & Clearing Ltd 62,240 HKD 1,533,383 3,127,708 0.64
Lenovo Group Ltd 28,000 HKD 27,873 27,150 0.01
Link REIT 238,360 HKD 1,894,383 1,947,615 0.40
MMG Ltd 460,000 HKD 173,101 170,823 0.03
Sinotruk Hong Kong Ltd 237,500 HKD 477,927 429,121 0.09
Sun Hung Kai Properties Ltd 50,000 HKD 548,652 628,155 0.13
Swire Pacific Ltd 124,000 HKD 782,076 708,897 0.14
Techtronic Industries Co Ltd 24,000 HKD 331,410 353,374 0.07
Vitasoy International Holdings Ltd 464,823 HKD 1,673,729 1,456,118 0.30
Total Hong Kong 23,910,873 28,057,528 5.73
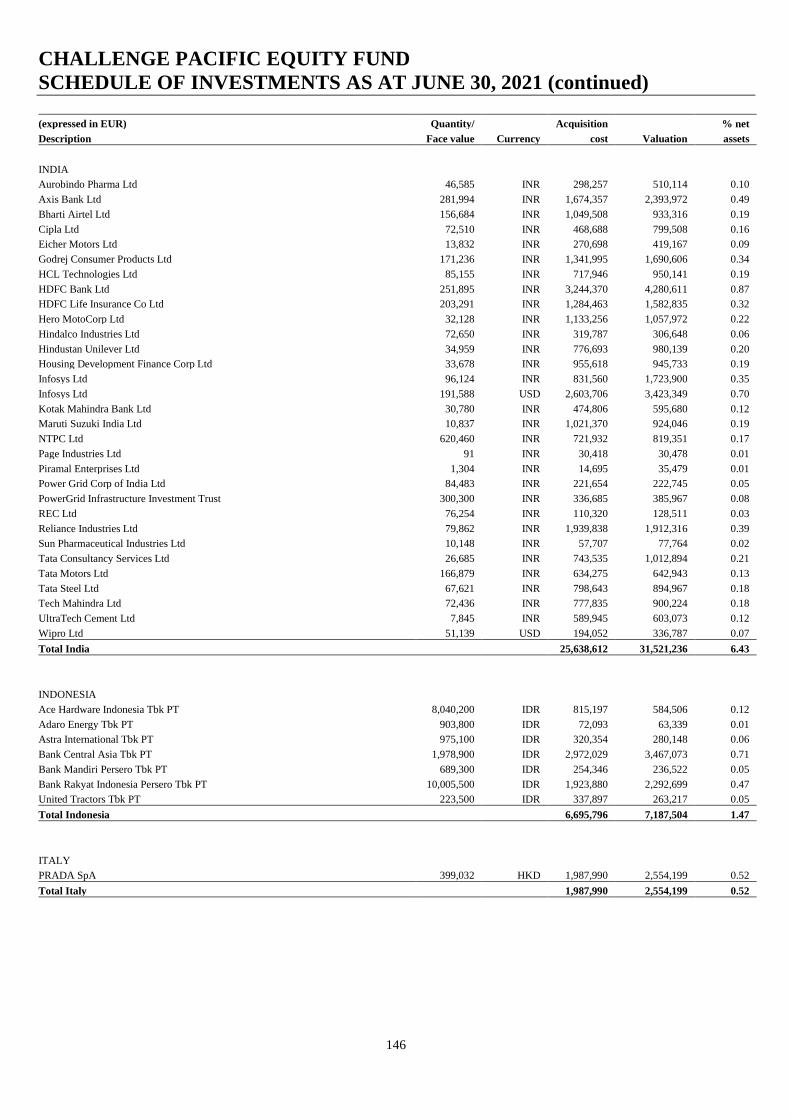
CHALLENGE PACIFIC EQUITY FUND
SCHEDULE OF INVESTMENTS AS AT JUNE 30, 2021 (continued)
146
(expressed in EUR) Quantity/ Acquisition % net
Description Face value Currency cost Valuation assets
INDIA
Aurobindo Pharma Ltd 46,585 INR 298,257 510,114 0.10
Axis Bank Ltd 281,994 INR 1,674,357 2,393,972 0.49
Bharti Airtel Ltd 156,684 INR 1,049,508 933,316 0.19
Cipla Ltd 72,510 INR 468,688 799,508 0.16
Eicher Motors Ltd 13,832 INR 270,698 419,167 0.09
Godrej Consumer Products Ltd 171,236 INR 1,341,995 1,690,606 0.34
HCL Technologies Ltd 85,155 INR 717,946 950,141 0.19
HDFC Bank Ltd 251,895 INR 3,244,370 4,280,611 0.87
HDFC Life Insurance Co Ltd 203,291 INR 1,284,463 1,582,835 0.32
Hero MotoCorp Ltd 32,128 INR 1,133,256 1,057,972 0.22
Hindalco Industries Ltd 72,650 INR 319,787 306,648 0.06
Hindustan Unilever Ltd 34,959 INR 776,693 980,139 0.20
Housing Development Finance Corp Ltd 33,678 INR 955,618 945,733 0.19
Infosys Ltd 96,124 INR 831,560 1,723,900 0.35
Infosys Ltd 191,588 USD 2,603,706 3,423,349 0.70
Kotak Mahindra Bank Ltd 30,780 INR 474,806 595,680 0.12
Maruti Suzuki India Ltd 10,837 INR 1,021,370 924,046 0.19
NTPC Ltd 620,460 INR 721,932 819,351 0.17
Page Industries Ltd 91 INR 30,418 30,478 0.01
Piramal Enterprises Ltd 1,304 INR 14,695 35,479 0.01
Power Grid Corp of India Ltd 84,483 INR 221,654 222,745 0.05
PowerGrid Infrastructure Investment Trust 300,300 INR 336,685 385,967 0.08
REC Ltd 76,254 INR 110,320 128,511 0.03
Reliance Industries Ltd 79,862 INR 1,939,838 1,912,316 0.39
Sun Pharmaceutical Industries Ltd 10,148 INR 57,707 77,764 0.02
Tata Consultancy Services Ltd 26,685 INR 743,535 1,012,894 0.21
Tata Motors Ltd 166,879 INR 634,275 642,943 0.13
Tata Steel Ltd 67,621 INR 798,643 894,967 0.18
Tech Mahindra Ltd 72,436 INR 777,835 900,224 0.18
UltraTech Cement Ltd 7,845 INR 589,945 603,073 0.12
Wipro Ltd 51,139 USD 194,052 336,787 0.07
Total India 25,638,612 31,521,236 6.43
INDONESIA
Ace Hardware Indonesia Tbk PT 8,040,200 IDR 815,197 584,506 0.12
Adaro Energy Tbk PT 903,800 IDR 72,093 63,339 0.01
Astra International Tbk PT 975,100 IDR 320,354 280,148 0.06
Bank Central Asia Tbk PT 1,978,900 IDR 2,972,029 3,467,073 0.71
Bank Mandiri Persero Tbk PT 689,300 IDR 254,346 236,522 0.05
Bank Rakyat Indonesia Persero Tbk PT 10,005,500 IDR 1,923,880 2,292,699 0.47
United Tractors Tbk PT 223,500 IDR 337,897 263,217 0.05
Total Indonesia 6,695,796 7,187,504 1.47
ITALY
PRADA SpA 399,032 HKD 1,987,990 2,554,199 0.52
Total Italy 1,987,990 2,554,199 0.52

CHALLENGE PACIFIC EQUITY FUND
SCHEDULE OF INVESTMENTS AS AT JUNE 30, 2021 (continued)
147
(expressed in EUR) Quantity/ Acquisition % net
Description Face value Currency cost Valuation assets
JAPAN
Advantest Corp 4,700 JPY 360,680 357,437 0.07
Aisin Corp 34,200 JPY 993,507 1,234,206 0.25
Brother Industries Ltd 66,000 JPY 1,084,461 1,111,675 0.23
Casio Computer Co Ltd 105,600 JPY 1,654,335 1,489,855 0.30
Dai Nippon Printing Co Ltd 3,300 JPY 68,538 58,893 0.01
Daikin Industries Ltd 7,700 JPY 690,337 1,210,373 0.25
Daito Trust Construction Co Ltd 1,300 JPY 50,621 120,002 0.02
Daiwa House Industry Co Ltd 7,600 JPY 73,686 192,565 0.04
Daiwa House REIT Investment Corp 69 JPY 138,418 171,683 0.03
Disco Corp 3,400 JPY 800,424 876,974 0.18
Eisai Co Ltd 6,100 JPY 526,424 506,313 0.10
ENEOS Holdings Inc 344,600 JPY 992,335 1,217,147 0.25
Fast Retailing Co Ltd 1,100 JPY 576,206 698,913 0.14
FUJIFILM Holdings Corp 400 JPY 16,661 25,038 0.01
Hino Motors Ltd 38,700 JPY 271,607 287,259 0.06
Hirose Electric Co Ltd 1,500 JPY 191,019 185,188 0.04
Hitachi Ltd 1,300 JPY 63,958 62,826 0.01
Honda Motor Co Ltd 52,800 JPY 1,221,294 1,424,067 0.29
Hoya Corp 31,400 JPY 2,675,497 3,513,989 0.72
Ibiden Co Ltd 11,600 JPY 458,253 527,901 0.11
Iida Group Holdings Co Ltd 20,000 JPY 406,839 434,574 0.09
Isuzu Motors Ltd 4,900 JPY 34,055 54,613 0.01
Japan Metropolitan Fund Invest 174 JPY 135,908 159,164 0.03
Japan Post Holdings Co Ltd 12,200 JPY 72,121 84,375 0.02
Japan Post Insurance Co Ltd 56,800 JPY 662,689 886,374 0.18
Japan Real Estate Investment Corp 21 JPY 96,470 108,970 0.02
Kajima Corp 109,600 JPY 1,252,907 1,171,582 0.24
Kansai Paint Co Ltd 61,400 JPY 1,180,643 1,320,615 0.27
Kao Corp 3,100 JPY 175,074 160,979 0.03
KDDI Corp 30,000 JPY 770,989 789,755 0.16
Keyence Corp 11,900 JPY 3,113,526 5,069,272 1.03
Kyowa Kirin Co Ltd 33,000 JPY 803,227 987,821 0.20
Lion Corp 28,900 JPY 544,024 413,224 0.08
Marubeni Corp 94,400 JPY 600,938 692,887 0.14
Mazda Motor Corp 41,400 JPY 283,587 328,374 0.07
McDonald's Holdings Co Japan Ltd 7,200 JPY 289,246 268,038 0.05
Medipal Holdings Corp 42,700 JPY 720,730 688,401 0.14
MISUMI Group Inc 2,300 JPY 55,719 65,703 0.01
Mitsubishi Corp 5,800 JPY 105,218 133,430 0.03
Mitsubishi Electric Corp 14,600 JPY 173,830 178,863 0.04
Mitsubishi Estate Co Ltd 15,900 JPY 187,280 217,016 0.04
Mitsubishi Gas Chemical Co Inc 36,700 JPY 476,993 656,915 0.13
Mitsubishi HC Capital Inc 8,700 JPY 33,822 39,328 0.01
Mitsubishi Heavy Industries Ltd 1,200 JPY 26,720 29,803 0.01
Mitsui Chemicals Inc 8,200 JPY 228,387 238,917 0.05
Mitsui Fudosan Co Ltd 13,300 JPY 183,275 259,992 0.05
Mizuho Financial Group Inc 69,200 JPY 838,760 834,618 0.17
Murata Manufacturing Co Ltd 9,200 JPY 539,094 592,863 0.12
NGK Spark Plug Co Ltd 45,500 JPY 611,156 568,996 0.12
Nintendo Co Ltd 8,200 JPY 2,837,879 4,025,769 0.82
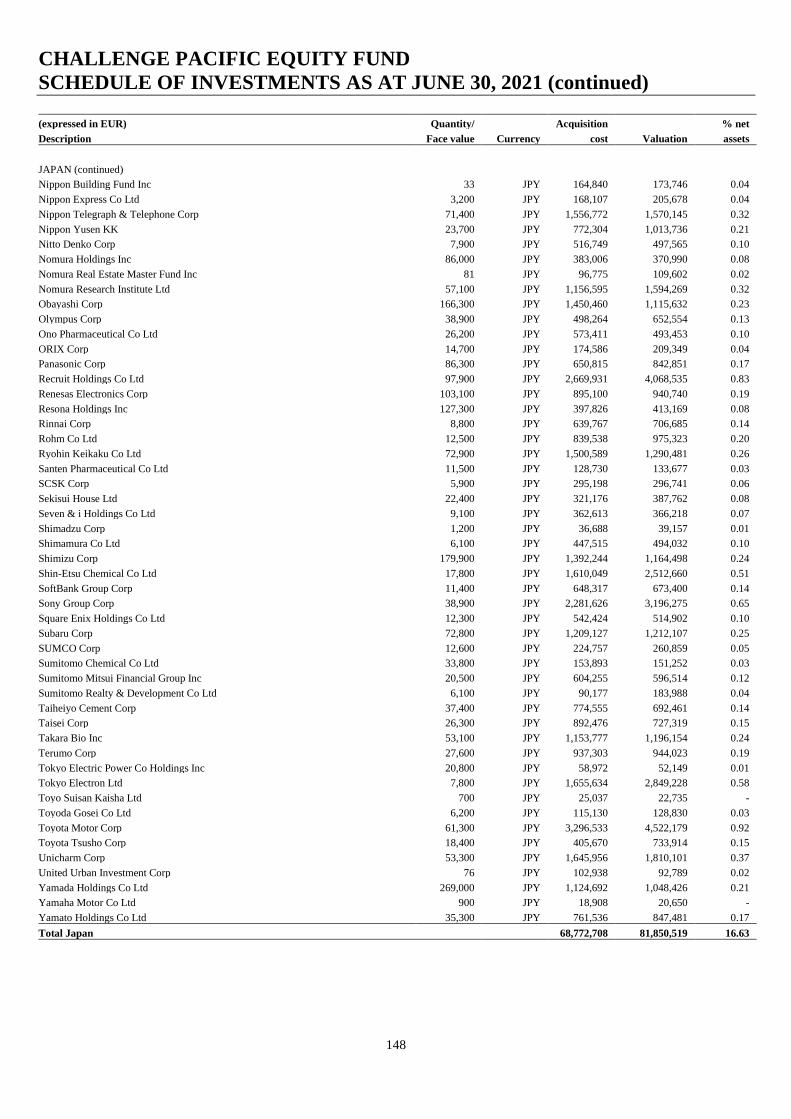
CHALLENGE PACIFIC EQUITY FUND
SCHEDULE OF INVESTMENTS AS AT JUNE 30, 2021 (continued)
148
(expressed in EUR) Quantity/ Acquisition % net
Description Face value Currency cost Valuation assets
JAPAN (continued)
Nippon Building Fund Inc 33 JPY 164,840 173,746 0.04
Nippon Express Co Ltd 3,200 JPY 168,107 205,678 0.04
Nippon Telegraph & Telephone Corp 71,400 JPY 1,556,772 1,570,145 0.32
Nippon Yusen KK 23,700 JPY 772,304 1,013,736 0.21
Nitto Denko Corp 7,900 JPY 516,749 497,565 0.10
Nomura Holdings Inc 86,000 JPY 383,006 370,990 0.08
Nomura Real Estate Master Fund Inc 81 JPY 96,775 109,602 0.02
Nomura Research Institute Ltd 57,100 JPY 1,156,595 1,594,269 0.32
Obayashi Corp 166,300 JPY 1,450,460 1,115,632 0.23
Olympus Corp 38,900 JPY 498,264 652,554 0.13
Ono Pharmaceutical Co Ltd 26,200 JPY 573,411 493,453 0.10
ORIX Corp 14,700 JPY 174,586 209,349 0.04
Panasonic Corp 86,300 JPY 650,815 842,851 0.17
Recruit Holdings Co Ltd 97,900 JPY 2,669,931 4,068,535 0.83
Renesas Electronics Corp 103,100 JPY 895,100 940,740 0.19
Resona Holdings Inc 127,300 JPY 397,826 413,169 0.08
Rinnai Corp 8,800 JPY 639,767 706,685 0.14
Rohm Co Ltd 12,500 JPY 839,538 975,323 0.20
Ryohin Keikaku Co Ltd 72,900 JPY 1,500,589 1,290,481 0.26
Santen Pharmaceutical Co Ltd 11,500 JPY 128,730 133,677 0.03
SCSK Corp 5,900 JPY 295,198 296,741 0.06
Sekisui House Ltd 22,400 JPY 321,176 387,762 0.08
Seven & i Holdings Co Ltd 9,100 JPY 362,613 366,218 0.07
Shimadzu Corp 1,200 JPY 36,688 39,157 0.01
Shimamura Co Ltd 6,100 JPY 447,515 494,032 0.10
Shimizu Corp 179,900 JPY 1,392,244 1,164,498 0.24
Shin-Etsu Chemical Co Ltd 17,800 JPY 1,610,049 2,512,660 0.51
SoftBank Group Corp 11,400 JPY 648,317 673,400 0.14
Sony Group Corp 38,900 JPY 2,281,626 3,196,275 0.65
Square Enix Holdings Co Ltd 12,300 JPY 542,424 514,902 0.10
Subaru Corp 72,800 JPY 1,209,127 1,212,107 0.25
SUMCO Corp 12,600 JPY 224,757 260,859 0.05
Sumitomo Chemical Co Ltd 33,800 JPY 153,893 151,252 0.03
Sumitomo Mitsui Financial Group Inc 20,500 JPY 604,255 596,514 0.12
Sumitomo Realty & Development Co Ltd 6,100 JPY 90,177 183,988 0.04
Taiheiyo Cement Corp 37,400 JPY 774,555 692,461 0.14
Taisei Corp 26,300 JPY 892,476 727,319 0.15
Takara Bio Inc 53,100 JPY 1,153,777 1,196,154 0.24
Terumo Corp 27,600 JPY 937,303 944,023 0.19
Tokyo Electric Power Co Holdings Inc 20,800 JPY 58,972 52,149 0.01
Tokyo Electron Ltd 7,800 JPY 1,655,634 2,849,228 0.58
Toyo Suisan Kaisha Ltd 700 JPY 25,037 22,735 -
Toyoda Gosei Co Ltd 6,200 JPY 115,130 128,830 0.03
Toyota Motor Corp 61,300 JPY 3,296,533 4,522,179 0.92
Toyota Tsusho Corp 18,400 JPY 405,670 733,914 0.15
Unicharm Corp 53,300 JPY 1,645,956 1,810,101 0.37
United Urban Investment Corp 76 JPY 102,938 92,789 0.02
Yamada Holdings Co Ltd 269,000 JPY 1,124,692 1,048,426 0.21
Yamaha Motor Co Ltd 900 JPY 18,908 20,650 -
Yamato Holdings Co Ltd 35,300 JPY 761,536 847,481 0.17
Total Japan 68,772,708 81,850,519 16.63
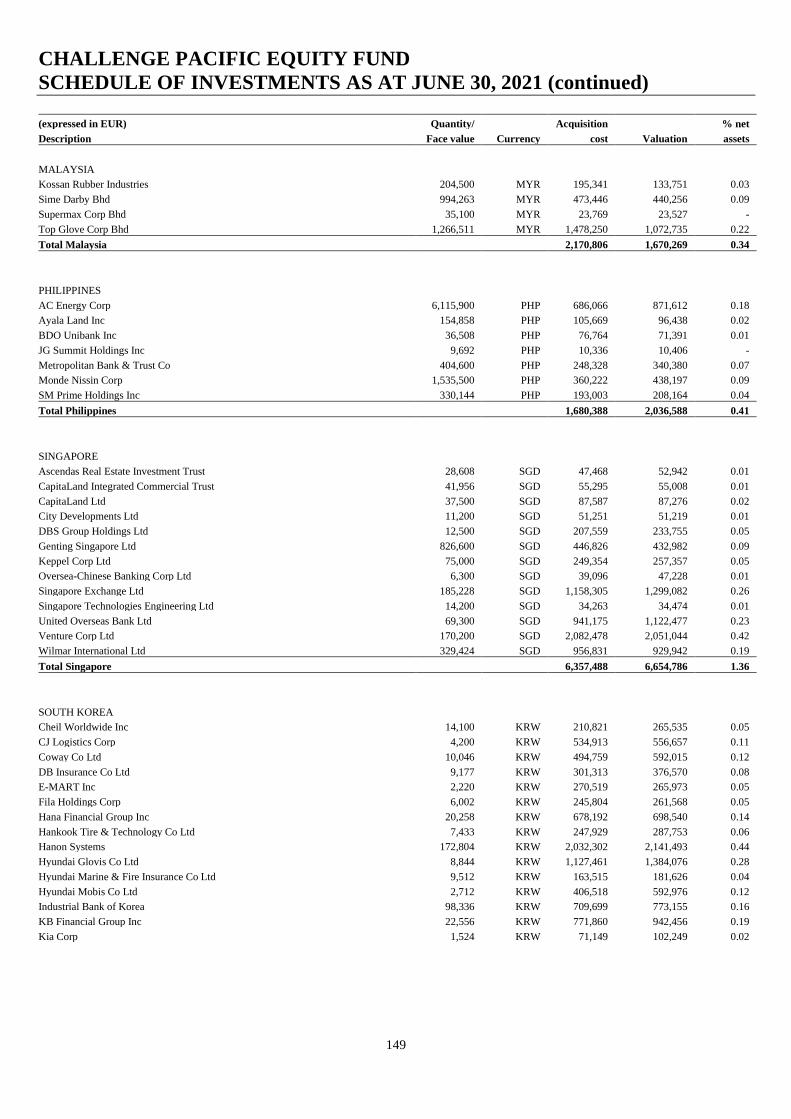
CHALLENGE PACIFIC EQUITY FUND
SCHEDULE OF INVESTMENTS AS AT JUNE 30, 2021 (continued)
149
(expressed in EUR) Quantity/ Acquisition % net
Description Face value Currency cost Valuation assets
MALAYSIA
Kossan Rubber Industries 204,500 MYR 195,341 133,751 0.03
Sime Darby Bhd 994,263 MYR 473,446 440,256 0.09
Supermax Corp Bhd 35,100 MYR 23,769 23,527 -
Top Glove Corp Bhd 1,266,511 MYR 1,478,250 1,072,735 0.22
Total Malaysia 2,170,806 1,670,269 0.34
PHILIPPINES
AC Energy Corp 6,115,900 PHP 686,066 871,612 0.18
Ayala Land Inc 154,858 PHP 105,669 96,438 0.02
BDO Unibank Inc 36,508 PHP 76,764 71,391 0.01
JG Summit Holdings Inc 9,692 PHP 10,336 10,406 -
Metropolitan Bank & Trust Co 404,600 PHP 248,328 340,380 0.07
Monde Nissin Corp 1,535,500 PHP 360,222 438,197 0.09
SM Prime Holdings Inc 330,144 PHP 193,003 208,164 0.04
Total Philippines 1,680,388 2,036,588 0.41
SINGAPORE
Ascendas Real Estate Investment Trust 28,608 SGD 47,468 52,942 0.01
CapitaLand Integrated Commercial Trust 41,956 SGD 55,295 55,008 0.01
CapitaLand Ltd 37,500 SGD 87,587 87,276 0.02
City Developments Ltd 11,200 SGD 51,251 51,219 0.01
DBS Group Holdings Ltd 12,500 SGD 207,559 233,755 0.05
Genting Singapore Ltd 826,600 SGD 446,826 432,982 0.09
Keppel Corp Ltd 75,000 SGD 249,354 257,357 0.05
Oversea-Chinese Banking Corp Ltd 6,300 SGD 39,096 47,228 0.01
Singapore Exchange Ltd 185,228 SGD 1,158,305 1,299,082 0.26
Singapore Technologies Engineering Ltd 14,200 SGD 34,263 34,474 0.01
United Overseas Bank Ltd 69,300 SGD 941,175 1,122,477 0.23
Venture Corp Ltd 170,200 SGD 2,082,478 2,051,044 0.42
Wilmar International Ltd 329,424 SGD 956,831 929,942 0.19
Total Singapore 6,357,488 6,654,786 1.36
SOUTH KOREA
Cheil Worldwide Inc 14,100 KRW 210,821 265,535 0.05
CJ Logistics Corp 4,200 KRW 534,913 556,657 0.11
Coway Co Ltd 10,046 KRW 494,759 592,015 0.12
DB Insurance Co Ltd 9,177 KRW 301,313 376,570 0.08
E-MART Inc 2,220 KRW 270,519 265,973 0.05
Fila Holdings Corp 6,002 KRW 245,804 261,568 0.05
Hana Financial Group Inc 20,258 KRW 678,192 698,540 0.14
Hankook Tire & Technology Co Ltd 7,433 KRW 247,929 287,753 0.06
Hanon Systems 172,804 KRW 2,032,302 2,141,493 0.44
Hyundai Glovis Co Ltd 8,844 KRW 1,127,461 1,384,076 0.28
Hyundai Marine & Fire Insurance Co Ltd 9,512 KRW 163,515 181,626 0.04
Hyundai Mobis Co Ltd 2,712 KRW 406,518 592,976 0.12
Industrial Bank of Korea 98,336 KRW 709,699 773,155 0.16
KB Financial Group Inc 22,556 KRW 771,860 942,456 0.19
Kia Corp 1,524 KRW 71,149 102,249 0.02
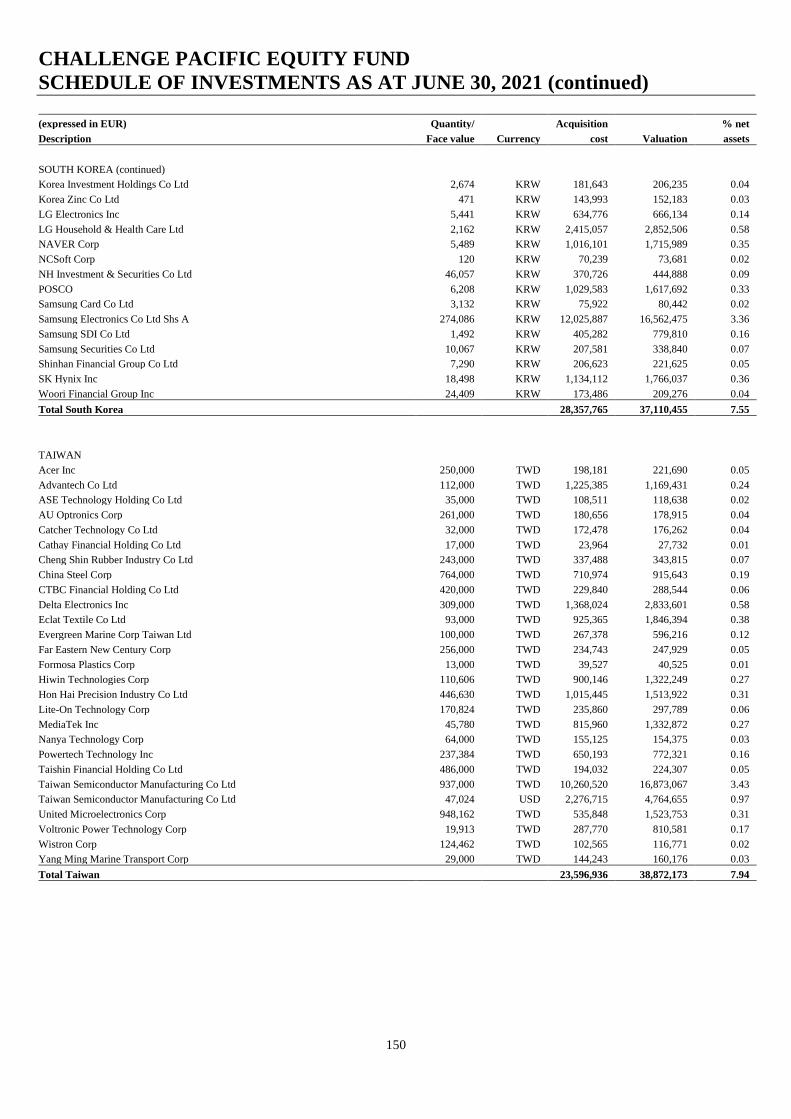
CHALLENGE PACIFIC EQUITY FUND
SCHEDULE OF INVESTMENTS AS AT JUNE 30, 2021 (continued)
150
(expressed in EUR) Quantity/ Acquisition % net
Description Face value Currency cost Valuation assets
SOUTH KOREA (continued)
Korea Investment Holdings Co Ltd 2,674 KRW 181,643 206,235 0.04
Korea Zinc Co Ltd 471 KRW 143,993 152,183 0.03
LG Electronics Inc 5,441 KRW 634,776 666,134 0.14
LG Household & Health Care Ltd 2,162 KRW 2,415,057 2,852,506 0.58
NAVER Corp 5,489 KRW 1,016,101 1,715,989 0.35
NCSoft Corp 120 KRW 70,239 73,681 0.02
NH Investment & Securities Co Ltd 46,057 KRW 370,726 444,888 0.09
POSCO 6,208 KRW 1,029,583 1,617,692 0.33
Samsung Card Co Ltd 3,132 KRW 75,922 80,442 0.02
Samsung Electronics Co Ltd Shs A 274,086 KRW 12,025,887 16,562,475 3.36
Samsung SDI Co Ltd 1,492 KRW 405,282 779,810 0.16
Samsung Securities Co Ltd 10,067 KRW 207,581 338,840 0.07
Shinhan Financial Group Co Ltd 7,290 KRW 206,623 221,625 0.05
SK Hynix Inc 18,498 KRW 1,134,112 1,766,037 0.36
Woori Financial Group Inc 24,409 KRW 173,486 209,276 0.04
Total South Korea 28,357,765 37,110,455 7.55
TAIWAN
Acer Inc 250,000 TWD 198,181 221,690 0.05
Advantech Co Ltd 112,000 TWD 1,225,385 1,169,431 0.24
ASE Technology Holding Co Ltd 35,000 TWD 108,511 118,638 0.02
AU Optronics Corp 261,000 TWD 180,656 178,915 0.04
Catcher Technology Co Ltd 32,000 TWD 172,478 176,262 0.04
Cathay Financial Holding Co Ltd 17,000 TWD 23,964 27,732 0.01
Cheng Shin Rubber Industry Co Ltd 243,000 TWD 337,488 343,815 0.07
China Steel Corp 764,000 TWD 710,974 915,643 0.19
CTBC Financial Holding Co Ltd 420,000 TWD 229,840 288,544 0.06
Delta Electronics Inc 309,000 TWD 1,368,024 2,833,601 0.58
Eclat Textile Co Ltd 93,000 TWD 925,365 1,846,394 0.38
Evergreen Marine Corp Taiwan Ltd 100,000 TWD 267,378 596,216 0.12
Far Eastern New Century Corp 256,000 TWD 234,743 247,929 0.05
Formosa Plastics Corp 13,000 TWD 39,527 40,525 0.01
Hiwin Technologies Corp 110,606 TWD 900,146 1,322,249 0.27
Hon Hai Precision Industry Co Ltd 446,630 TWD 1,015,445 1,513,922 0.31
Lite-On Technology Corp 170,824 TWD 235,860 297,789 0.06
MediaTek Inc 45,780 TWD 815,960 1,332,872 0.27
Nanya Technology Corp 64,000 TWD 155,125 154,375 0.03
Powertech Technology Inc 237,384 TWD 650,193 772,321 0.16
Taishin Financial Holding Co Ltd 486,000 TWD 194,032 224,307 0.05
Taiwan Semiconductor Manufacturing Co Ltd 937,000 TWD 10,260,520 16,873,067 3.43
Taiwan Semiconductor Manufacturing Co Ltd 47,024 USD 2,276,715 4,764,655 0.97
United Microelectronics Corp 948,162 TWD 535,848 1,523,753 0.31
Voltronic Power Technology Corp 19,913 TWD 287,770 810,581 0.17
Wistron Corp 124,462 TWD 102,565 116,771 0.02
Yang Ming Marine Transport Corp 29,000 TWD 144,243 160,176 0.03
Total Taiwan 23,596,936 38,872,173 7.94
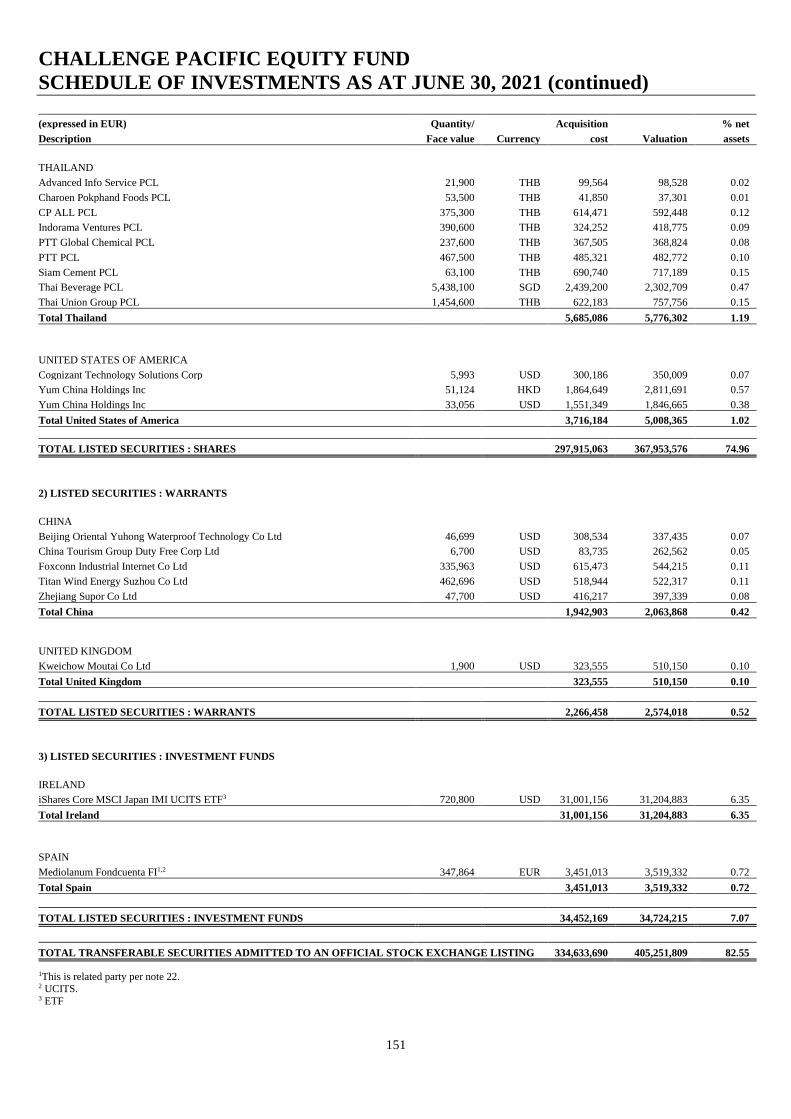
CHALLENGE PACIFIC EQUITY FUND
SCHEDULE OF INVESTMENTS AS AT JUNE 30, 2021 (continued)
151
(expressed in EUR) Quantity/ Acquisition % net
Description Face value Currency cost Valuation assets
THAILAND
Advanced Info Service PCL 21,900 THB 99,564 98,528 0.02
Charoen Pokphand Foods PCL 53,500 THB 41,850 37,301 0.01
CP ALL PCL 375,300 THB 614,471 592,448 0.12
Indorama Ventures PCL 390,600 THB 324,252 418,775 0.09
PTT Global Chemical PCL 237,600 THB 367,505 368,824 0.08
PTT PCL 467,500 THB 485,321 482,772 0.10
Siam Cement PCL 63,100 THB 690,740 717,189 0.15
Thai Beverage PCL 5,438,100 SGD 2,439,200 2,302,709 0.47
Thai Union Group PCL 1,454,600 THB 622,183 757,756 0.15
Total Thailand 5,685,086 5,776,302 1.19
UNITED STATES OF AMERICA
Cognizant Technology Solutions Corp 5,993 USD 300,186 350,009 0.07
Yum China Holdings Inc 51,124 HKD 1,864,649 2,811,691 0.57
Yum China Holdings Inc 33,056 USD 1,551,349 1,846,665 0.38
Total United States of America 3,716,184 5,008,365 1.02
TOTAL LISTED SECURITIES : SHARES 297,915,063 367,953,576 74.96
2) LISTED SECURITIES : WARRANTS
CHINA
Beijing Oriental Yuhong Waterproof Technology Co Ltd 46,699 USD 308,534 337,435 0.07
China Tourism Group Duty Free Corp Ltd 6,700 USD 83,735 262,562 0.05
Foxconn Industrial Internet Co Ltd 335,963 USD 615,473 544,215 0.11
Titan Wind Energy Suzhou Co Ltd 462,696 USD 518,944 522,317 0.11
Zhejiang Supor Co Ltd 47,700 USD 416,217 397,339 0.08
Total China 1,942,903 2,063,868 0.42
UNITED KINGDOM
Kweichow Moutai Co Ltd 1,900 USD 323,555 510,150 0.10
Total United Kingdom 323,555 510,150 0.10
TOTAL LISTED SECURITIES : WARRANTS 2,266,458 2,574,018 0.52
3) LISTED SECURITIES : INVESTMENT FUNDS
IRELAND
iShares Core MSCI Japan IMI UCITS ETF3 720,800 USD 31,001,156 31,204,883 6.35
Total Ireland 31,001,156 31,204,883 6.35
SPAIN
Mediolanum Fondcuenta FI1,2 347,864 EUR 3,451,013 3,519,332 0.72
Total Spain 3,451,013 3,519,332 0.72
TOTAL LISTED SECURITIES : INVESTMENT FUNDS 34,452,169 34,724,215 7.07
TOTAL TRANSFERABLE SECURITIES ADMITTED TO AN OFFICIAL STOCK EXCHANGE LISTING 334,633,690 405,251,809 82.55
1This is related party per note 22. 2 UCITS. 3 ETF

CHALLENGE PACIFIC EQUITY FUND
SCHEDULE OF INVESTMENTS AS AT JUNE 30, 2021 (continued)
152
(expressed in EUR) Quantity/ Acquisition % net
Description Face value Currency cost Valuation assets
B) OTHER TRANSFERABLE SECURITIES DEALT ON ANOTHER REGULATED MARKET
1) OTHER ORGANISED MARKET : SHARES
SOUTH KOREA
AfreecaTV Co Ltd 8,506 KRW 370,973 757,944 0.15
CJ ENM Co Ltd 3,814 KRW 402,160 521,776 0.11
Hugel Inc 3,497 KRW 570,398 627,404 0.13
JYP Entertainment Corp 23,517 KRW 705,001 713,184 0.15
Total South Korea 2,048,532 2,620,308 0.54
VIETNAM
Vietnam Dairy Products JSC 278,884 VND 1,157,240 924,685 0.19
Total Vietnam 1,157,240 924,685 0.19
TOTAL OTHER ORGANISED MARKET : SHARES 3,205,772 3,544,993 0.73
TOTAL OTHER TRANSFERABLE SECURITIES DEALT ON ANOTHER REGULATED MARKET 3,205,772 3,544,993 0.73
C) OTHER TRANSFERABLE SECURITIES
1) OTHER TRANSFERABLE SECURITIES : SHARES
CAYMAN ISLANDS
JD.com Inc 47,700 HKD 1,642,138 1,581,797 0.32
Smoore International Holdings Ltd 16,000 HKD 78,305 74,792 0.02
Total Cayman Islands 1,720,443 1,656,589 0.34
MALTA
BGP Holdings Plc1 1,781,520 EUR - - -
Total Malta - - -
TOTAL OTHER TRANSFERABLE SECURITIES : SHARES 1,720,443 1,656,589 0.34
2) OTHER TRANSFERABLE SECURITIES : WARRANTS
CHINA
Estun Automation Co Ltd 102,800 USD 359,792 523,405 0.11
Skshu Paint Co Ltd 17,350 USD 245,714 398,645 0.08
Total China 605,506 922,050 0.19
UNITED KINGDOM
China Tourism Group Duty Free Corp Ltd 7,300 USD 279,371 285,953 0.06
Gree Electric Appliances Inc of Zhuhai 92,696 USD 632,961 630,261 0.13
Total United Kingdom 912,332 916,214 0.19
TOTAL OTHER TRANSFERABLE SECURITIES : WARRANTS 1,517,838 1,838,264 0.38
1This security is unlisted and non-transferable.
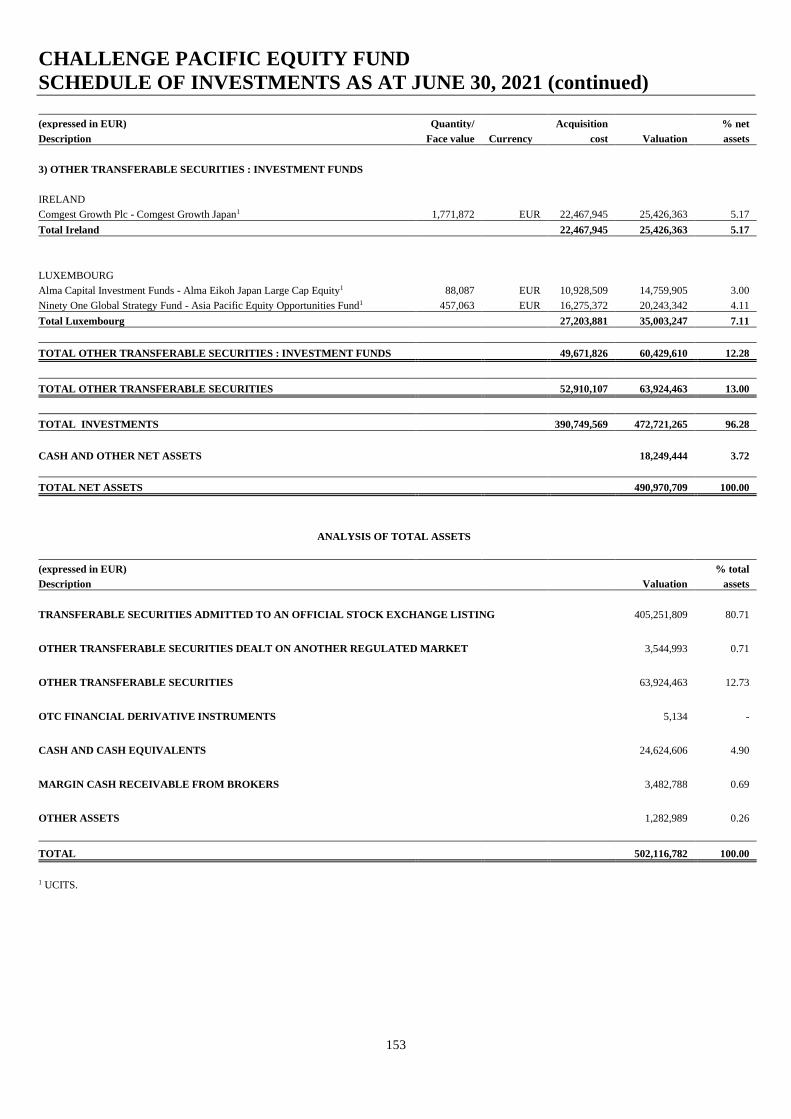
CHALLENGE PACIFIC EQUITY FUND
SCHEDULE OF INVESTMENTS AS AT JUNE 30, 2021 (continued)
153
(expressed in EUR) Quantity/ Acquisition % net
Description Face value Currency cost Valuation assets
3) OTHER TRANSFERABLE SECURITIES : INVESTMENT FUNDS
IRELAND
Comgest Growth Plc - Comgest Growth Japan1 1,771,872 EUR 22,467,945 25,426,363 5.17
Total Ireland 22,467,945 25,426,363 5.17
LUXEMBOURG
Alma Capital Investment Funds - Alma Eikoh Japan Large Cap Equity1 88,087 EUR 10,928,509 14,759,905 3.00
Ninety One Global Strategy Fund - Asia Pacific Equity Opportunities Fund1 457,063 EUR 16,275,372 20,243,342 4.11
Total Luxembourg 27,203,881 35,003,247 7.11
TOTAL OTHER TRANSFERABLE SECURITIES : INVESTMENT FUNDS 49,671,826 60,429,610 12.28
TOTAL OTHER TRANSFERABLE SECURITIES 52,910,107 63,924,463 13.00
TOTAL INVESTMENTS 390,749,569 472,721,265 96.28
CASH AND OTHER NET ASSETS 18,249,444 3.72
TOTAL NET ASSETS 490,970,709 100.00
ANALYSIS OF TOTAL ASSETS
(expressed in EUR) % total
Description Valuation assets
TRANSFERABLE SECURITIES ADMITTED TO AN OFFICIAL STOCK EXCHANGE LISTING 405,251,809 80.71
OTHER TRANSFERABLE SECURITIES DEALT ON ANOTHER REGULATED MARKET
3,544,993 0.71
OTHER TRANSFERABLE SECURITIES
63,924,463 12.73
OTC FINANCIAL DERIVATIVE INSTRUMENTS
5,134 -
CASH AND CASH EQUIVALENTS
24,624,606 4.90
MARGIN CASH RECEIVABLE FROM BROKERS
3,482,788 0.69
OTHER ASSETS
1,282,989 0.26
TOTAL 502,116,782 100.00
1 UCITS.
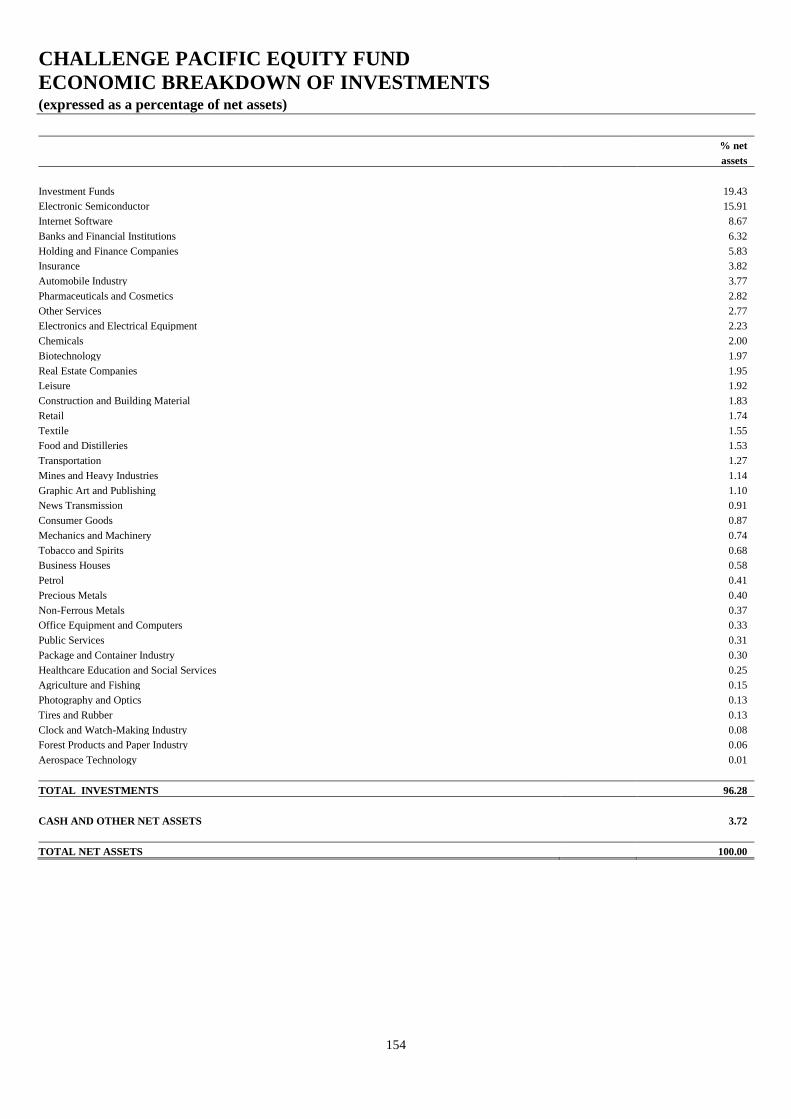
CHALLENGE PACIFIC EQUITY FUND
ECONOMIC BREAKDOWN OF INVESTMENTS (expressed as a percentage of net assets)
154
% net
assets
Investment Funds 19.43
Electronic Semiconductor 15.91
Internet Software 8.67
Banks and Financial Institutions 6.32
Holding and Finance Companies 5.83
Insurance 3.82
Automobile Industry 3.77
Pharmaceuticals and Cosmetics 2.82
Other Services 2.77
Electronics and Electrical Equipment 2.23
Chemicals 2.00
Biotechnology 1.97
Real Estate Companies 1.95
Leisure 1.92
Construction and Building Material 1.83
Retail 1.74
Textile 1.55
Food and Distilleries 1.53
Transportation 1.27
Mines and Heavy Industries 1.14
Graphic Art and Publishing 1.10
News Transmission 0.91
Consumer Goods 0.87
Mechanics and Machinery 0.74
Tobacco and Spirits 0.68
Business Houses 0.58
Petrol 0.41
Precious Metals 0.40
Non-Ferrous Metals 0.37
Office Equipment and Computers 0.33
Public Services 0.31
Package and Container Industry 0.30
Healthcare Education and Social Services 0.25
Agriculture and Fishing 0.15
Photography and Optics 0.13
Tires and Rubber 0.13
Clock and Watch-Making Industry 0.08
Forest Products and Paper Industry 0.06
Aerospace Technology 0.01
TOTAL INVESTMENTS 96.28
CASH AND OTHER NET ASSETS 3.72
TOTAL NET ASSETS 100.00
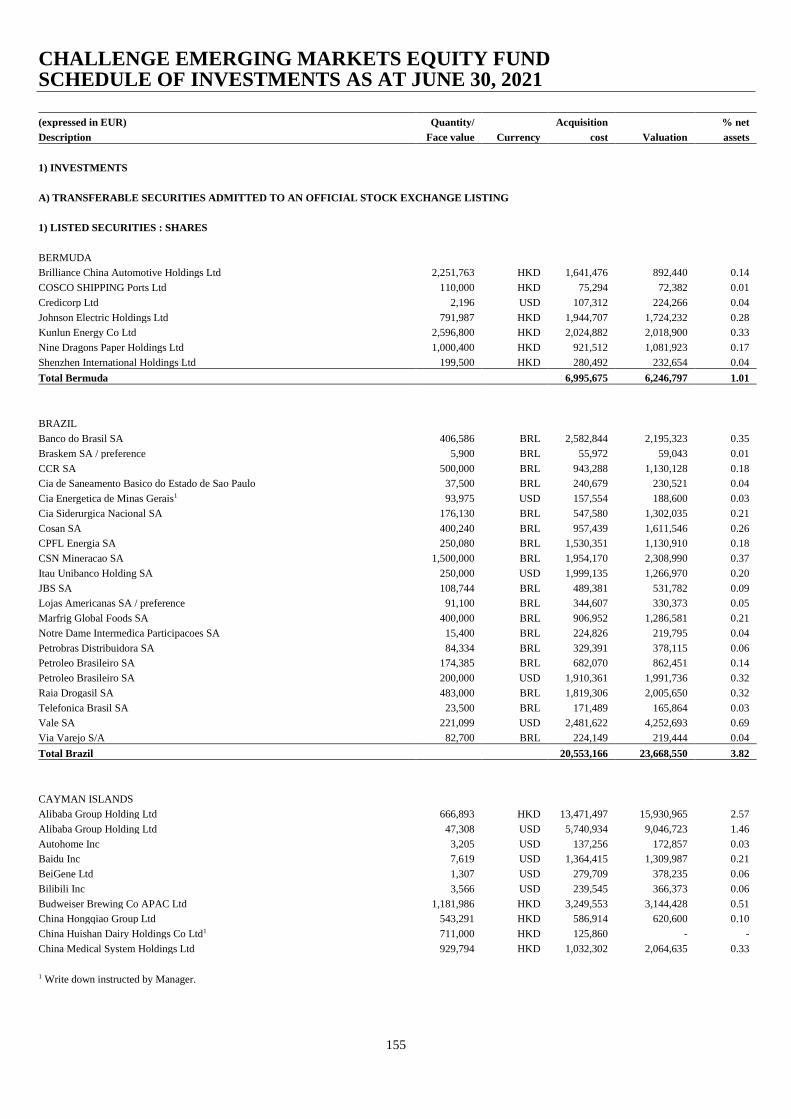
CHALLENGE EMERGING MARKETS EQUITY FUND SCHEDULE OF INVESTMENTS AS AT JUNE 30, 2021
155
(expressed in EUR) Quantity/ Acquisition % net
Description Face value Currency cost Valuation assets
1) INVESTMENTS
A) TRANSFERABLE SECURITIES ADMITTED TO AN OFFICIAL STOCK EXCHANGE LISTING
1) LISTED SECURITIES : SHARES
BERMUDA
Brilliance China Automotive Holdings Ltd 2,251,763 HKD 1,641,476 892,440 0.14
COSCO SHIPPING Ports Ltd 110,000 HKD 75,294 72,382 0.01
Credicorp Ltd 2,196 USD 107,312 224,266 0.04
Johnson Electric Holdings Ltd 791,987 HKD 1,944,707 1,724,232 0.28
Kunlun Energy Co Ltd 2,596,800 HKD 2,024,882 2,018,900 0.33
Nine Dragons Paper Holdings Ltd 1,000,400 HKD 921,512 1,081,923 0.17
Shenzhen International Holdings Ltd 199,500 HKD 280,492 232,654 0.04
Total Bermuda 6,995,675 6,246,797 1.01
BRAZIL
Banco do Brasil SA 406,586 BRL 2,582,844 2,195,323 0.35
Braskem SA / preference 5,900 BRL 55,972 59,043 0.01
CCR SA 500,000 BRL 943,288 1,130,128 0.18
Cia de Saneamento Basico do Estado de Sao Paulo 37,500 BRL 240,679 230,521 0.04
Cia Energetica de Minas Gerais1 93,975 USD 157,554 188,600 0.03
Cia Siderurgica Nacional SA 176,130 BRL 547,580 1,302,035 0.21
Cosan SA 400,240 BRL 957,439 1,611,546 0.26
CPFL Energia SA 250,080 BRL 1,530,351 1,130,910 0.18
CSN Mineracao SA 1,500,000 BRL 1,954,170 2,308,990 0.37
Itau Unibanco Holding SA 250,000 USD 1,999,135 1,266,970 0.20
JBS SA 108,744 BRL 489,381 531,782 0.09
Lojas Americanas SA / preference 91,100 BRL 344,607 330,373 0.05
Marfrig Global Foods SA 400,000 BRL 906,952 1,286,581 0.21
Notre Dame Intermedica Participacoes SA 15,400 BRL 224,826 219,795 0.04
Petrobras Distribuidora SA 84,334 BRL 329,391 378,115 0.06
Petroleo Brasileiro SA 174,385 BRL 682,070 862,451 0.14
Petroleo Brasileiro SA 200,000 USD 1,910,361 1,991,736 0.32
Raia Drogasil SA 483,000 BRL 1,819,306 2,005,650 0.32
Telefonica Brasil SA 23,500 BRL 171,489 165,864 0.03
Vale SA 221,099 USD 2,481,622 4,252,693 0.69
Via Varejo S/A 82,700 BRL 224,149 219,444 0.04
Total Brazil 20,553,166 23,668,550 3.82
CAYMAN ISLANDS
Alibaba Group Holding Ltd 666,893 HKD 13,471,497 15,930,965 2.57
Alibaba Group Holding Ltd 47,308 USD 5,740,934 9,046,723 1.46
Autohome Inc 3,205 USD 137,256 172,857 0.03
Baidu Inc 7,619 USD 1,364,415 1,309,987 0.21
BeiGene Ltd 1,307 USD 279,709 378,235 0.06
Bilibili Inc 3,566 USD 239,545 366,373 0.06
Budweiser Brewing Co APAC Ltd 1,181,986 HKD 3,249,553 3,144,428 0.51
China Hongqiao Group Ltd 543,291 HKD 586,914 620,600 0.10
China Huishan Dairy Holdings Co Ltd1 711,000 HKD 125,860 - -
China Medical System Holdings Ltd 929,794 HKD 1,032,302 2,064,635 0.33
1 Write down instructed by Manager.
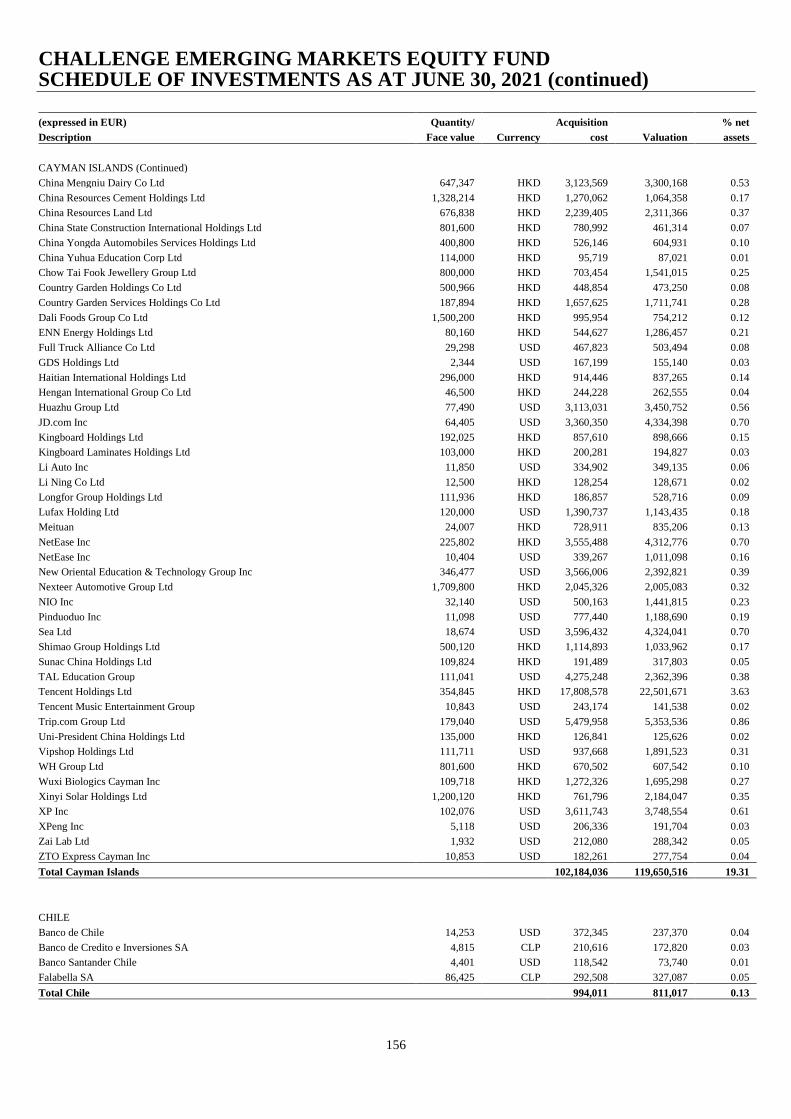
CHALLENGE EMERGING MARKETS EQUITY FUND SCHEDULE OF INVESTMENTS AS AT JUNE 30, 2021 (continued)
156
(expressed in EUR) Quantity/ Acquisition % net
Description Face value Currency cost Valuation assets
CAYMAN ISLANDS (Continued)
China Mengniu Dairy Co Ltd 647,347 HKD 3,123,569 3,300,168 0.53
China Resources Cement Holdings Ltd 1,328,214 HKD 1,270,062 1,064,358 0.17
China Resources Land Ltd 676,838 HKD 2,239,405 2,311,366 0.37
China State Construction International Holdings Ltd 801,600 HKD 780,992 461,314 0.07
China Yongda Automobiles Services Holdings Ltd 400,800 HKD 526,146 604,931 0.10
China Yuhua Education Corp Ltd 114,000 HKD 95,719 87,021 0.01
Chow Tai Fook Jewellery Group Ltd 800,000 HKD 703,454 1,541,015 0.25
Country Garden Holdings Co Ltd 500,966 HKD 448,854 473,250 0.08
Country Garden Services Holdings Co Ltd 187,894 HKD 1,657,625 1,711,741 0.28
Dali Foods Group Co Ltd 1,500,200 HKD 995,954 754,212 0.12
ENN Energy Holdings Ltd 80,160 HKD 544,627 1,286,457 0.21
Full Truck Alliance Co Ltd 29,298 USD 467,823 503,494 0.08
GDS Holdings Ltd 2,344 USD 167,199 155,140 0.03
Haitian International Holdings Ltd 296,000 HKD 914,446 837,265 0.14
Hengan International Group Co Ltd 46,500 HKD 244,228 262,555 0.04
Huazhu Group Ltd 77,490 USD 3,113,031 3,450,752 0.56
JD.com Inc 64,405 USD 3,360,350 4,334,398 0.70
Kingboard Holdings Ltd 192,025 HKD 857,610 898,666 0.15
Kingboard Laminates Holdings Ltd 103,000 HKD 200,281 194,827 0.03
Li Auto Inc 11,850 USD 334,902 349,135 0.06
Li Ning Co Ltd 12,500 HKD 128,254 128,671 0.02
Longfor Group Holdings Ltd 111,936 HKD 186,857 528,716 0.09
Lufax Holding Ltd 120,000 USD 1,390,737 1,143,435 0.18
Meituan 24,007 HKD 728,911 835,206 0.13
NetEase Inc 225,802 HKD 3,555,488 4,312,776 0.70
NetEase Inc 10,404 USD 339,267 1,011,098 0.16
New Oriental Education & Technology Group Inc 346,477 USD 3,566,006 2,392,821 0.39
Nexteer Automotive Group Ltd 1,709,800 HKD 2,045,326 2,005,083 0.32
NIO Inc 32,140 USD 500,163 1,441,815 0.23
Pinduoduo Inc 11,098 USD 777,440 1,188,690 0.19
Sea Ltd 18,674 USD 3,596,432 4,324,041 0.70
Shimao Group Holdings Ltd 500,120 HKD 1,114,893 1,033,962 0.17
Sunac China Holdings Ltd 109,824 HKD 191,489 317,803 0.05
TAL Education Group 111,041 USD 4,275,248 2,362,396 0.38
Tencent Holdings Ltd 354,845 HKD 17,808,578 22,501,671 3.63
Tencent Music Entertainment Group 10,843 USD 243,174 141,538 0.02
Trip.com Group Ltd 179,040 USD 5,479,958 5,353,536 0.86
Uni-President China Holdings Ltd 135,000 HKD 126,841 125,626 0.02
Vipshop Holdings Ltd 111,711 USD 937,668 1,891,523 0.31
WH Group Ltd 801,600 HKD 670,502 607,542 0.10
Wuxi Biologics Cayman Inc 109,718 HKD 1,272,326 1,695,298 0.27
Xinyi Solar Holdings Ltd 1,200,120 HKD 761,796 2,184,047 0.35
XP Inc 102,076 USD 3,611,743 3,748,554 0.61
XPeng Inc 5,118 USD 206,336 191,704 0.03
Zai Lab Ltd 1,932 USD 212,080 288,342 0.05
ZTO Express Cayman Inc 10,853 USD 182,261 277,754 0.04
Total Cayman Islands 102,184,036 119,650,516 19.31
CHILE
Banco de Chile 14,253 USD 372,345 237,370 0.04
Banco de Credito e Inversiones SA 4,815 CLP 210,616 172,820 0.03
Banco Santander Chile 4,401 USD 118,542 73,740 0.01
Falabella SA 86,425 CLP 292,508 327,087 0.05
Total Chile 994,011 811,017 0.13
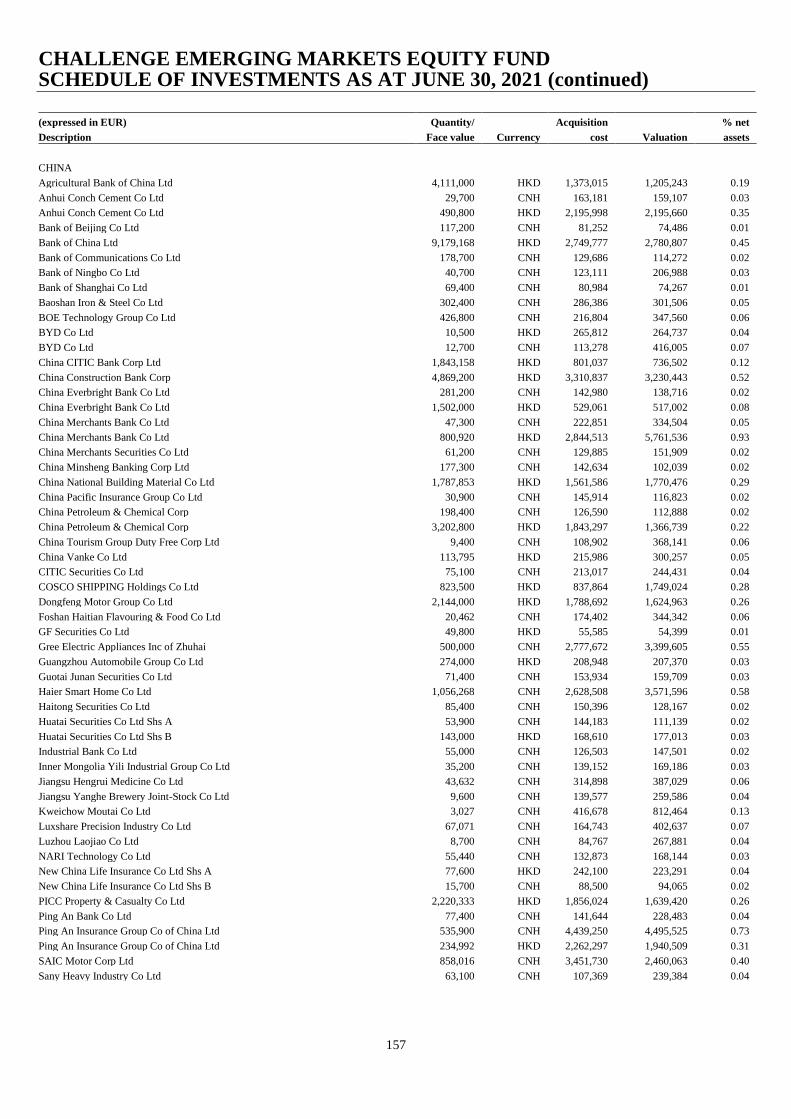
CHALLENGE EMERGING MARKETS EQUITY FUND SCHEDULE OF INVESTMENTS AS AT JUNE 30, 2021 (continued)
157
(expressed in EUR) Quantity/ Acquisition % net
Description Face value Currency cost Valuation assets
CHINA
Agricultural Bank of China Ltd 4,111,000 HKD 1,373,015 1,205,243 0.19
Anhui Conch Cement Co Ltd 29,700 CNH 163,181 159,107 0.03
Anhui Conch Cement Co Ltd 490,800 HKD 2,195,998 2,195,660 0.35
Bank of Beijing Co Ltd 117,200 CNH 81,252 74,486 0.01
Bank of China Ltd 9,179,168 HKD 2,749,777 2,780,807 0.45
Bank of Communications Co Ltd 178,700 CNH 129,686 114,272 0.02
Bank of Ningbo Co Ltd 40,700 CNH 123,111 206,988 0.03
Bank of Shanghai Co Ltd 69,400 CNH 80,984 74,267 0.01
Baoshan Iron & Steel Co Ltd 302,400 CNH 286,386 301,506 0.05
BOE Technology Group Co Ltd 426,800 CNH 216,804 347,560 0.06
BYD Co Ltd 10,500 HKD 265,812 264,737 0.04
BYD Co Ltd 12,700 CNH 113,278 416,005 0.07
China CITIC Bank Corp Ltd 1,843,158 HKD 801,037 736,502 0.12
China Construction Bank Corp 4,869,200 HKD 3,310,837 3,230,443 0.52
China Everbright Bank Co Ltd 281,200 CNH 142,980 138,716 0.02
China Everbright Bank Co Ltd 1,502,000 HKD 529,061 517,002 0.08
China Merchants Bank Co Ltd 47,300 CNH 222,851 334,504 0.05
China Merchants Bank Co Ltd 800,920 HKD 2,844,513 5,761,536 0.93
China Merchants Securities Co Ltd 61,200 CNH 129,885 151,909 0.02
China Minsheng Banking Corp Ltd 177,300 CNH 142,634 102,039 0.02
China National Building Material Co Ltd 1,787,853 HKD 1,561,586 1,770,476 0.29
China Pacific Insurance Group Co Ltd 30,900 CNH 145,914 116,823 0.02
China Petroleum & Chemical Corp 198,400 CNH 126,590 112,888 0.02
China Petroleum & Chemical Corp 3,202,800 HKD 1,843,297 1,366,739 0.22
China Tourism Group Duty Free Corp Ltd 9,400 CNH 108,902 368,141 0.06
China Vanke Co Ltd 113,795 HKD 215,986 300,257 0.05
CITIC Securities Co Ltd 75,100 CNH 213,017 244,431 0.04
COSCO SHIPPING Holdings Co Ltd 823,500 HKD 837,864 1,749,024 0.28
Dongfeng Motor Group Co Ltd 2,144,000 HKD 1,788,692 1,624,963 0.26
Foshan Haitian Flavouring & Food Co Ltd 20,462 CNH 174,402 344,342 0.06
GF Securities Co Ltd 49,800 HKD 55,585 54,399 0.01
Gree Electric Appliances Inc of Zhuhai 500,000 CNH 2,777,672 3,399,605 0.55
Guangzhou Automobile Group Co Ltd 274,000 HKD 208,948 207,370 0.03
Guotai Junan Securities Co Ltd 71,400 CNH 153,934 159,709 0.03
Haier Smart Home Co Ltd 1,056,268 CNH 2,628,508 3,571,596 0.58
Haitong Securities Co Ltd 85,400 CNH 150,396 128,167 0.02
Huatai Securities Co Ltd Shs A 53,900 CNH 144,183 111,139 0.02
Huatai Securities Co Ltd Shs B 143,000 HKD 168,610 177,013 0.03
Industrial Bank Co Ltd 55,000 CNH 126,503 147,501 0.02
Inner Mongolia Yili Industrial Group Co Ltd 35,200 CNH 139,152 169,186 0.03
Jiangsu Hengrui Medicine Co Ltd 43,632 CNH 314,898 387,029 0.06
Jiangsu Yanghe Brewery Joint-Stock Co Ltd 9,600 CNH 139,577 259,586 0.04
Kweichow Moutai Co Ltd 3,027 CNH 416,678 812,464 0.13
Luxshare Precision Industry Co Ltd 67,071 CNH 164,743 402,637 0.07
Luzhou Laojiao Co Ltd 8,700 CNH 84,767 267,881 0.04
NARI Technology Co Ltd 55,440 CNH 132,873 168,144 0.03
New China Life Insurance Co Ltd Shs A 77,600 HKD 242,100 223,291 0.04
New China Life Insurance Co Ltd Shs B 15,700 CNH 88,500 94,065 0.02
PICC Property & Casualty Co Ltd 2,220,333 HKD 1,856,024 1,639,420 0.26
Ping An Bank Co Ltd 77,400 CNH 141,644 228,483 0.04
Ping An Insurance Group Co of China Ltd 535,900 CNH 4,439,250 4,495,525 0.73
Ping An Insurance Group Co of China Ltd 234,992 HKD 2,262,297 1,940,509 0.31
SAIC Motor Corp Ltd 858,016 CNH 3,451,730 2,460,063 0.40
Sany Heavy Industry Co Ltd 63,100 CNH 107,369 239,384 0.04
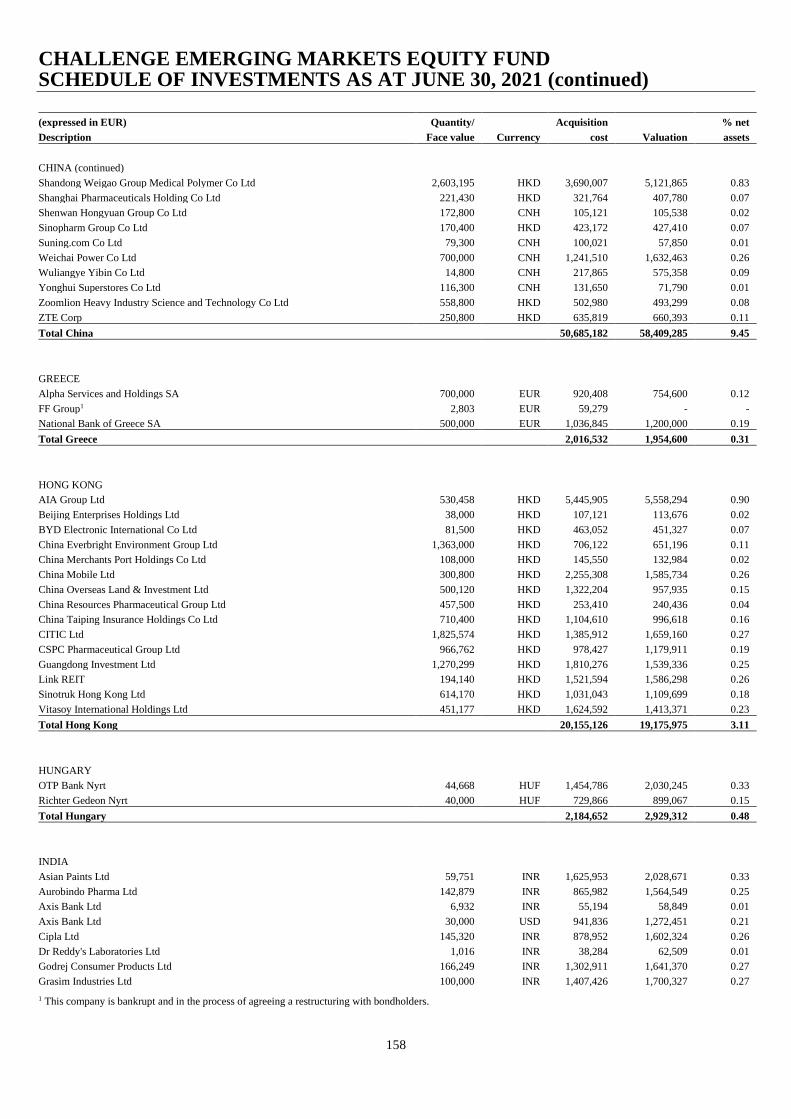
CHALLENGE EMERGING MARKETS EQUITY FUND SCHEDULE OF INVESTMENTS AS AT JUNE 30, 2021 (continued)
158
(expressed in EUR) Quantity/ Acquisition % net
Description Face value Currency cost Valuation assets
CHINA (continued)
Shandong Weigao Group Medical Polymer Co Ltd 2,603,195 HKD 3,690,007 5,121,865 0.83
Shanghai Pharmaceuticals Holding Co Ltd 221,430 HKD 321,764 407,780 0.07
Shenwan Hongyuan Group Co Ltd 172,800 CNH 105,121 105,538 0.02
Sinopharm Group Co Ltd 170,400 HKD 423,172 427,410 0.07
Suning.com Co Ltd 79,300 CNH 100,021 57,850 0.01
Weichai Power Co Ltd 700,000 CNH 1,241,510 1,632,463 0.26
Wuliangye Yibin Co Ltd 14,800 CNH 217,865 575,358 0.09
Yonghui Superstores Co Ltd 116,300 CNH 131,650 71,790 0.01
Zoomlion Heavy Industry Science and Technology Co Ltd 558,800 HKD 502,980 493,299 0.08
ZTE Corp 250,800 HKD 635,819 660,393 0.11
Total China 50,685,182 58,409,285 9.45
GREECE
Alpha Services and Holdings SA 700,000 EUR 920,408 754,600 0.12
FF Group1 2,803 EUR 59,279 - -
National Bank of Greece SA 500,000 EUR 1,036,845 1,200,000 0.19
Total Greece 2,016,532 1,954,600 0.31
HONG KONG
AIA Group Ltd 530,458 HKD 5,445,905 5,558,294 0.90
Beijing Enterprises Holdings Ltd 38,000 HKD 107,121 113,676 0.02
BYD Electronic International Co Ltd 81,500 HKD 463,052 451,327 0.07
China Everbright Environment Group Ltd 1,363,000 HKD 706,122 651,196 0.11
China Merchants Port Holdings Co Ltd 108,000 HKD 145,550 132,984 0.02
China Mobile Ltd 300,800 HKD 2,255,308 1,585,734 0.26
China Overseas Land & Investment Ltd 500,120 HKD 1,322,204 957,935 0.15
China Resources Pharmaceutical Group Ltd 457,500 HKD 253,410 240,436 0.04
China Taiping Insurance Holdings Co Ltd 710,400 HKD 1,104,610 996,618 0.16
CITIC Ltd 1,825,574 HKD 1,385,912 1,659,160 0.27
CSPC Pharmaceutical Group Ltd 966,762 HKD 978,427 1,179,911 0.19
Guangdong Investment Ltd 1,270,299 HKD 1,810,276 1,539,336 0.25
Link REIT 194,140 HKD 1,521,594 1,586,298 0.26
Sinotruk Hong Kong Ltd 614,170 HKD 1,031,043 1,109,699 0.18
Vitasoy International Holdings Ltd 451,177 HKD 1,624,592 1,413,371 0.23
Total Hong Kong 20,155,126 19,175,975 3.11
HUNGARY
OTP Bank Nyrt 44,668 HUF 1,454,786 2,030,245 0.33
Richter Gedeon Nyrt 40,000 HUF 729,866 899,067 0.15
Total Hungary 2,184,652 2,929,312 0.48
INDIA
Asian Paints Ltd 59,751 INR 1,625,953 2,028,671 0.33
Aurobindo Pharma Ltd 142,879 INR 865,982 1,564,549 0.25
Axis Bank Ltd 6,932 INR 55,194 58,849 0.01
Axis Bank Ltd 30,000 USD 941,836 1,272,451 0.21
Cipla Ltd 145,320 INR 878,952 1,602,324 0.26
Dr Reddy's Laboratories Ltd 1,016 INR 38,284 62,509 0.01
Godrej Consumer Products Ltd 166,249 INR 1,302,911 1,641,370 0.27
Grasim Industries Ltd 100,000 INR 1,407,426 1,700,327 0.27 1 This company is bankrupt and in the process of agreeing a restructuring with bondholders.
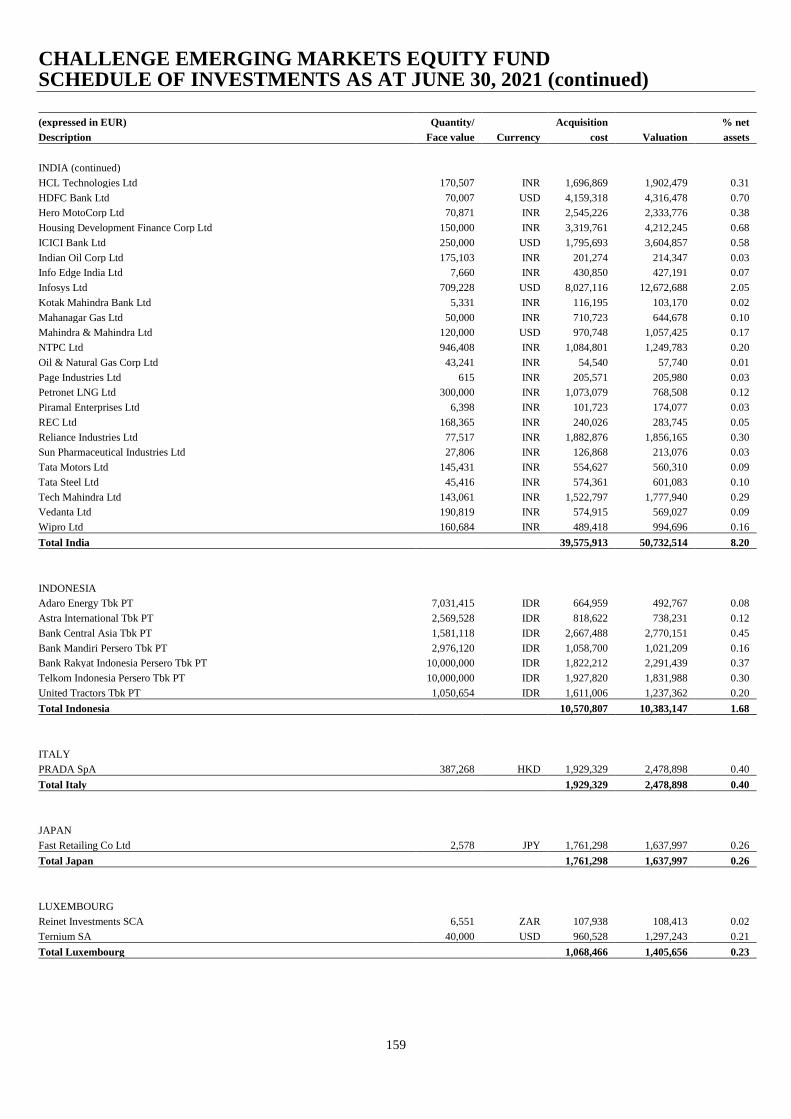
CHALLENGE EMERGING MARKETS EQUITY FUND SCHEDULE OF INVESTMENTS AS AT JUNE 30, 2021 (continued)
159
(expressed in EUR) Quantity/ Acquisition % net
Description Face value Currency cost Valuation assets
INDIA (continued)
HCL Technologies Ltd 170,507 INR 1,696,869 1,902,479 0.31
HDFC Bank Ltd 70,007 USD 4,159,318 4,316,478 0.70
Hero MotoCorp Ltd 70,871 INR 2,545,226 2,333,776 0.38
Housing Development Finance Corp Ltd 150,000 INR 3,319,761 4,212,245 0.68
ICICI Bank Ltd 250,000 USD 1,795,693 3,604,857 0.58
Indian Oil Corp Ltd 175,103 INR 201,274 214,347 0.03
Info Edge India Ltd 7,660 INR 430,850 427,191 0.07
Infosys Ltd 709,228 USD 8,027,116 12,672,688 2.05
Kotak Mahindra Bank Ltd 5,331 INR 116,195 103,170 0.02
Mahanagar Gas Ltd 50,000 INR 710,723 644,678 0.10
Mahindra & Mahindra Ltd 120,000 USD 970,748 1,057,425 0.17
NTPC Ltd 946,408 INR 1,084,801 1,249,783 0.20
Oil & Natural Gas Corp Ltd 43,241 INR 54,540 57,740 0.01
Page Industries Ltd 615 INR 205,571 205,980 0.03
Petronet LNG Ltd 300,000 INR 1,073,079 768,508 0.12
Piramal Enterprises Ltd 6,398 INR 101,723 174,077 0.03
REC Ltd 168,365 INR 240,026 283,745 0.05
Reliance Industries Ltd 77,517 INR 1,882,876 1,856,165 0.30
Sun Pharmaceutical Industries Ltd 27,806 INR 126,868 213,076 0.03
Tata Motors Ltd 145,431 INR 554,627 560,310 0.09
Tata Steel Ltd 45,416 INR 574,361 601,083 0.10
Tech Mahindra Ltd 143,061 INR 1,522,797 1,777,940 0.29
Vedanta Ltd 190,819 INR 574,915 569,027 0.09
Wipro Ltd 160,684 INR 489,418 994,696 0.16
Total India 39,575,913 50,732,514 8.20
INDONESIA
Adaro Energy Tbk PT 7,031,415 IDR 664,959 492,767 0.08
Astra International Tbk PT 2,569,528 IDR 818,622 738,231 0.12
Bank Central Asia Tbk PT 1,581,118 IDR 2,667,488 2,770,151 0.45
Bank Mandiri Persero Tbk PT 2,976,120 IDR 1,058,700 1,021,209 0.16
Bank Rakyat Indonesia Persero Tbk PT 10,000,000 IDR 1,822,212 2,291,439 0.37
Telkom Indonesia Persero Tbk PT 10,000,000 IDR 1,927,820 1,831,988 0.30
United Tractors Tbk PT 1,050,654 IDR 1,611,006 1,237,362 0.20
Total Indonesia 10,570,807 10,383,147 1.68
ITALY
PRADA SpA 387,268 HKD 1,929,329 2,478,898 0.40
Total Italy 1,929,329 2,478,898 0.40
JAPAN
Fast Retailing Co Ltd 2,578 JPY 1,761,298 1,637,997 0.26
Total Japan 1,761,298 1,637,997 0.26
LUXEMBOURG
Reinet Investments SCA 6,551 ZAR 107,938 108,413 0.02
Ternium SA 40,000 USD 960,528 1,297,243 0.21
Total Luxembourg 1,068,466 1,405,656 0.23
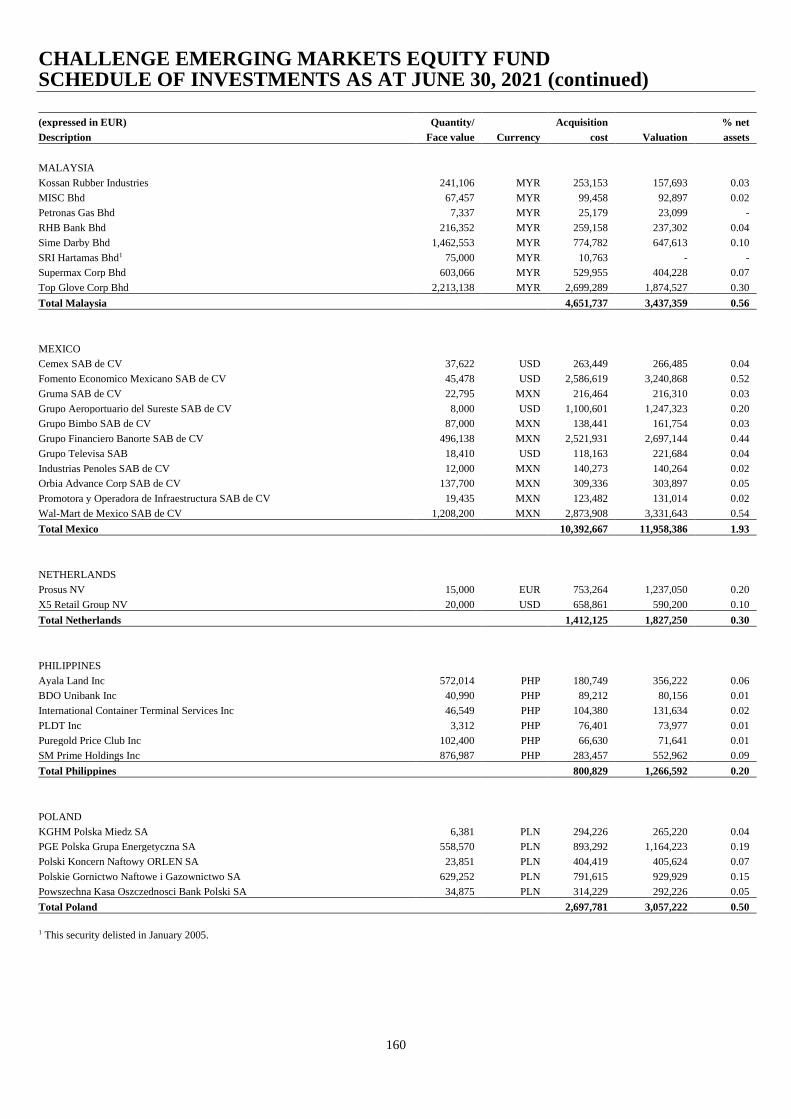
CHALLENGE EMERGING MARKETS EQUITY FUND SCHEDULE OF INVESTMENTS AS AT JUNE 30, 2021 (continued)
160
(expressed in EUR) Quantity/ Acquisition % net
Description Face value Currency cost Valuation assets
MALAYSIA
Kossan Rubber Industries 241,106 MYR 253,153 157,693 0.03
MISC Bhd 67,457 MYR 99,458 92,897 0.02
Petronas Gas Bhd 7,337 MYR 25,179 23,099 -
RHB Bank Bhd 216,352 MYR 259,158 237,302 0.04
Sime Darby Bhd 1,462,553 MYR 774,782 647,613 0.10
SRI Hartamas Bhd1 75,000 MYR 10,763 - -
Supermax Corp Bhd 603,066 MYR 529,955 404,228 0.07
Top Glove Corp Bhd 2,213,138 MYR 2,699,289 1,874,527 0.30
Total Malaysia 4,651,737 3,437,359 0.56
MEXICO
Cemex SAB de CV 37,622 USD 263,449 266,485 0.04
Fomento Economico Mexicano SAB de CV 45,478 USD 2,586,619 3,240,868 0.52
Gruma SAB de CV 22,795 MXN 216,464 216,310 0.03
Grupo Aeroportuario del Sureste SAB de CV 8,000 USD 1,100,601 1,247,323 0.20
Grupo Bimbo SAB de CV 87,000 MXN 138,441 161,754 0.03
Grupo Financiero Banorte SAB de CV 496,138 MXN 2,521,931 2,697,144 0.44
Grupo Televisa SAB 18,410 USD 118,163 221,684 0.04
Industrias Penoles SAB de CV 12,000 MXN 140,273 140,264 0.02
Orbia Advance Corp SAB de CV 137,700 MXN 309,336 303,897 0.05
Promotora y Operadora de Infraestructura SAB de CV 19,435 MXN 123,482 131,014 0.02
Wal-Mart de Mexico SAB de CV 1,208,200 MXN 2,873,908 3,331,643 0.54
Total Mexico 10,392,667 11,958,386 1.93
NETHERLANDS
Prosus NV 15,000 EUR 753,264 1,237,050 0.20
X5 Retail Group NV 20,000 USD 658,861 590,200 0.10
Total Netherlands 1,412,125 1,827,250 0.30
PHILIPPINES
Ayala Land Inc 572,014 PHP 180,749 356,222 0.06
BDO Unibank Inc 40,990 PHP 89,212 80,156 0.01
International Container Terminal Services Inc 46,549 PHP 104,380 131,634 0.02
PLDT Inc 3,312 PHP 76,401 73,977 0.01
Puregold Price Club Inc 102,400 PHP 66,630 71,641 0.01
SM Prime Holdings Inc 876,987 PHP 283,457 552,962 0.09
Total Philippines 800,829 1,266,592 0.20
POLAND
KGHM Polska Miedz SA 6,381 PLN 294,226 265,220 0.04
PGE Polska Grupa Energetyczna SA 558,570 PLN 893,292 1,164,223 0.19
Polski Koncern Naftowy ORLEN SA 23,851 PLN 404,419 405,624 0.07
Polskie Gornictwo Naftowe i Gazownictwo SA 629,252 PLN 791,615 929,929 0.15
Powszechna Kasa Oszczednosci Bank Polski SA 34,875 PLN 314,229 292,226 0.05
Total Poland 2,697,781 3,057,222 0.50
1 This security delisted in January 2005.
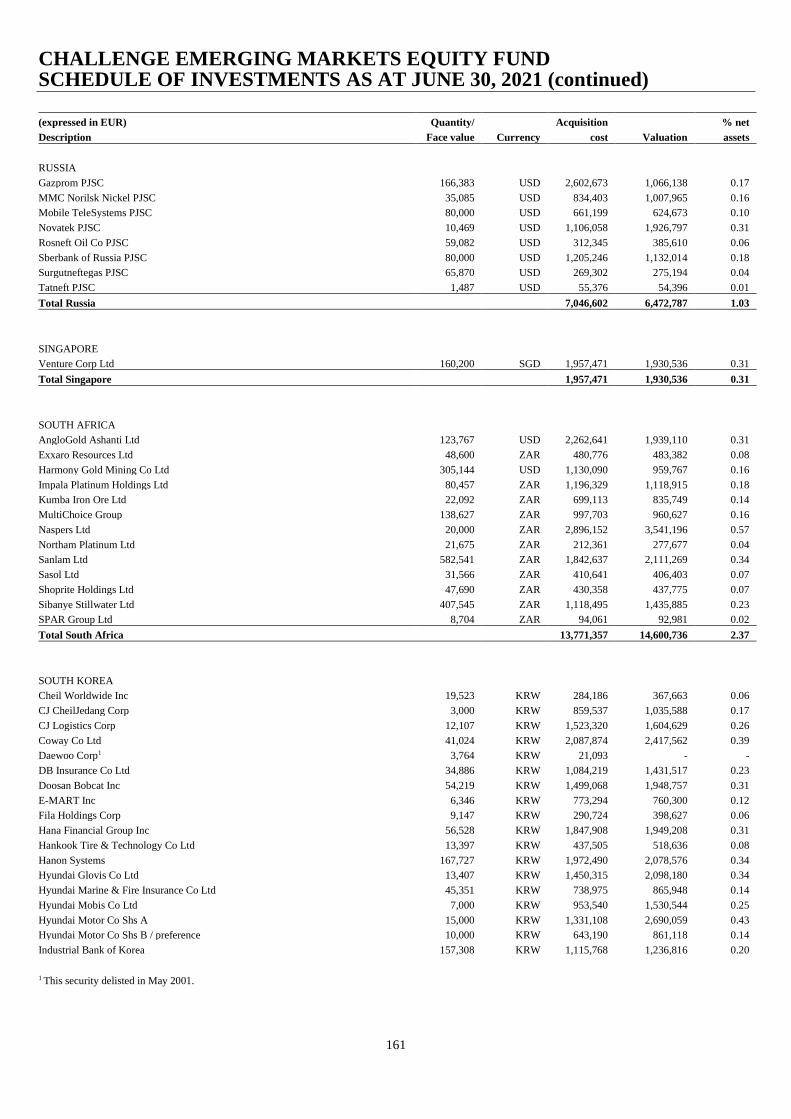
CHALLENGE EMERGING MARKETS EQUITY FUND SCHEDULE OF INVESTMENTS AS AT JUNE 30, 2021 (continued)
161
(expressed in EUR) Quantity/ Acquisition % net
Description Face value Currency cost Valuation assets
RUSSIA
Gazprom PJSC 166,383 USD 2,602,673 1,066,138 0.17
MMC Norilsk Nickel PJSC 35,085 USD 834,403 1,007,965 0.16
Mobile TeleSystems PJSC 80,000 USD 661,199 624,673 0.10
Novatek PJSC 10,469 USD 1,106,058 1,926,797 0.31
Rosneft Oil Co PJSC 59,082 USD 312,345 385,610 0.06
Sberbank of Russia PJSC 80,000 USD 1,205,246 1,132,014 0.18
Surgutneftegas PJSC 65,870 USD 269,302 275,194 0.04
Tatneft PJSC 1,487 USD 55,376 54,396 0.01
Total Russia 7,046,602 6,472,787 1.03
SINGAPORE
Venture Corp Ltd 160,200 SGD 1,957,471 1,930,536 0.31
Total Singapore 1,957,471 1,930,536 0.31
SOUTH AFRICA
AngloGold Ashanti Ltd 123,767 USD 2,262,641 1,939,110 0.31
Exxaro Resources Ltd 48,600 ZAR 480,776 483,382 0.08
Harmony Gold Mining Co Ltd 305,144 USD 1,130,090 959,767 0.16
Impala Platinum Holdings Ltd 80,457 ZAR 1,196,329 1,118,915 0.18
Kumba Iron Ore Ltd 22,092 ZAR 699,113 835,749 0.14
MultiChoice Group 138,627 ZAR 997,703 960,627 0.16
Naspers Ltd 20,000 ZAR 2,896,152 3,541,196 0.57
Northam Platinum Ltd 21,675 ZAR 212,361 277,677 0.04
Sanlam Ltd 582,541 ZAR 1,842,637 2,111,269 0.34
Sasol Ltd 31,566 ZAR 410,641 406,403 0.07
Shoprite Holdings Ltd 47,690 ZAR 430,358 437,775 0.07
Sibanye Stillwater Ltd 407,545 ZAR 1,118,495 1,435,885 0.23
SPAR Group Ltd 8,704 ZAR 94,061 92,981 0.02
Total South Africa 13,771,357 14,600,736 2.37
SOUTH KOREA
Cheil Worldwide Inc 19,523 KRW 284,186 367,663 0.06
CJ CheilJedang Corp 3,000 KRW 859,537 1,035,588 0.17
CJ Logistics Corp 12,107 KRW 1,523,320 1,604,629 0.26
Coway Co Ltd 41,024 KRW 2,087,874 2,417,562 0.39
Daewoo Corp1 3,764 KRW 21,093 - -
DB Insurance Co Ltd 34,886 KRW 1,084,219 1,431,517 0.23
Doosan Bobcat Inc 54,219 KRW 1,499,068 1,948,757 0.31
E-MART Inc 6,346 KRW 773,294 760,300 0.12
Fila Holdings Corp 9,147 KRW 290,724 398,627 0.06
Hana Financial Group Inc 56,528 KRW 1,847,908 1,949,208 0.31
Hankook Tire & Technology Co Ltd 13,397 KRW 437,505 518,636 0.08
Hanon Systems 167,727 KRW 1,972,490 2,078,576 0.34
Hyundai Glovis Co Ltd 13,407 KRW 1,450,315 2,098,180 0.34
Hyundai Marine & Fire Insurance Co Ltd 45,351 KRW 738,975 865,948 0.14
Hyundai Mobis Co Ltd 7,000 KRW 953,540 1,530,544 0.25
Hyundai Motor Co Shs A 15,000 KRW 1,331,108 2,690,059 0.43
Hyundai Motor Co Shs B / preference 10,000 KRW 643,190 861,118 0.14
Industrial Bank of Korea 157,308 KRW 1,115,768 1,236,816 0.20
1 This security delisted in May 2001.

CHALLENGE EMERGING MARKETS EQUITY FUND SCHEDULE OF INVESTMENTS AS AT JUNE 30, 2021 (continued)
162
(expressed in EUR) Quantity/ Acquisition % net
Description Face value Currency cost Valuation assets
SOUTH KOREA (continued)
Kakao Corp 21,264 KRW 1,381,066 2,595,359 0.42
Kia Corp 10,339 KRW 363,978 693,667 0.11
Korea Investment Holdings Co Ltd 6,504 KRW 473,659 501,629 0.08
LG Chem Ltd Shs A 4,000 KRW 909,474 2,545,915 0.41
LG Chem Ltd Shs B / preference 4,000 KRW 651,455 1,148,657 0.19
LG Electronics Inc 8,924 KRW 1,060,003 1,092,552 0.18
LG Household & Health Care Ltd 1,445 KRW 1,674,264 1,906,508 0.31
LG Innotek Co Ltd 924 KRW 101,661 154,291 0.02
LG Uplus Corp 22,236 KRW 245,792 255,582 0.04
Mando Corp 20,000 KRW 575,564 995,902 0.16
Meritz Securities Co Ltd 43,030 KRW 109,790 152,565 0.02
NCSoft Corp 2,000 KRW 861,011 1,228,029 0.20
NH Investment & Securities Co Ltd 66,580 KRW 565,004 643,129 0.10
POSCO 20,808 KRW 4,103,968 5,422,188 0.88
Samsung Card Co Ltd 5,741 KRW 135,735 147,450 0.02
Samsung Electronics Co Ltd Shs A 339,589 KRW 9,784,446 20,520,694 3.31
Samsung Electronics Co Ltd Shs B / preference 35,000 KRW 617,079 1,931,525 0.31
Samsung Fire & Marine Insurance Co Ltd 1,931 KRW 274,763 318,827 0.05
Samsung Life Insurance Co Ltd 10,085 KRW 593,078 602,620 0.10
Shinhan Financial Group Co Ltd 6,581 KRW 194,723 200,070 0.03
SK Hynix Inc 35,000 KRW 1,584,459 3,341,513 0.54
Woori Financial Group Inc 32,766 KRW 220,586 280,927 0.05
Total South Korea 45,395,672 70,473,327 11.36
TAIWAN
Acer Inc 198,963 TWD 148,121 176,432 0.03
ASE Technology Holding Co Ltd 95,774 TWD 235,754 324,641 0.05
AU Optronics Corp 127,000 TWD 83,194 87,058 0.01
Catcher Technology Co Ltd 158,808 TWD 985,814 874,745 0.14
Cathay Financial Holding Co Ltd 363,264 TWD 429,335 592,582 0.10
Cheng Shin Rubber Industry Co Ltd 558,000 TWD 751,590 789,502 0.13
China Life Insurance Co Ltd 254,000 TWD 175,203 202,559 0.03
China Steel Corp 1,750,000 TWD 1,488,436 2,097,349 0.34
CTBC Financial Holding Co Ltd 547,717 TWD 296,328 376,287 0.06
Far Eastern New Century Corp 248,000 TWD 219,277 240,181 0.04
Formosa Plastics Corp 283,000 TWD 879,322 882,188 0.14
Fubon Financial Holding Co Ltd 1,000,600 TWD 1,326,395 2,237,909 0.36
Giant Manufacturing Co Ltd 150,320 TWD 604,187 1,448,984 0.23
Hon Hai Precision Industry Co Ltd 997,322 TWD 2,412,999 3,380,578 0.55
Lite-On Technology Corp 87,970 TWD 121,824 153,354 0.02
MediaTek Inc 30,482 TWD 582,163 887,474 0.14
Mega Financial Holding Co Ltd 1,000,400 TWD 637,358 994,596 0.16
Merida Industry Co Ltd 150,320 TWD 561,529 1,423,963 0.23
Micro-Star International Co Ltd 200,480 TWD 807,711 955,629 0.15
Nanya Technology Corp 104,000 TWD 229,441 250,859 0.04
Pacific Electric Wire & Cable Co Ltd1 39,537 TWD 114,425 - -
Picvue Electronics2 60 TWD 24 - -
Pou Chen Corp 385,000 TWD 409,944 457,921 0.07
Powertech Technology Inc 415,605 TWD 1,153,532 1,352,155 0.22
Taishin Financial Holding Co Ltd 1,316,000 TWD 508,197 607,384 0.10
1This security delisted in August 2003. 2This security delisted in December 2003.
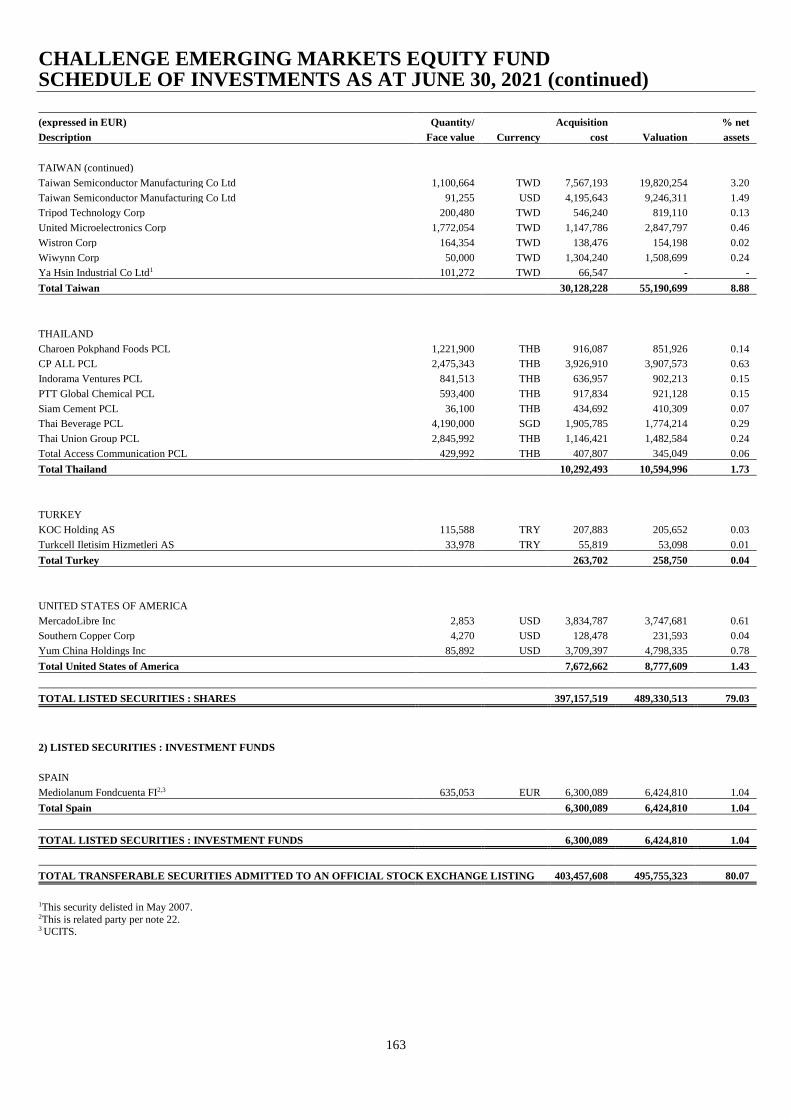
CHALLENGE EMERGING MARKETS EQUITY FUND SCHEDULE OF INVESTMENTS AS AT JUNE 30, 2021 (continued)
163
(expressed in EUR) Quantity/ Acquisition % net
Description Face value Currency cost Valuation assets
TAIWAN (continued)
Taiwan Semiconductor Manufacturing Co Ltd 1,100,664 TWD 7,567,193 19,820,254 3.20
Taiwan Semiconductor Manufacturing Co Ltd 91,255 USD 4,195,643 9,246,311 1.49
Tripod Technology Corp 200,480 TWD 546,240 819,110 0.13
United Microelectronics Corp 1,772,054 TWD 1,147,786 2,847,797 0.46
Wistron Corp 164,354 TWD 138,476 154,198 0.02
Wiwynn Corp 50,000 TWD 1,304,240 1,508,699 0.24
Ya Hsin Industrial Co Ltd1 101,272 TWD 66,547 - -
Total Taiwan 30,128,228 55,190,699 8.88
THAILAND
Charoen Pokphand Foods PCL 1,221,900 THB 916,087 851,926 0.14
CP ALL PCL 2,475,343 THB 3,926,910 3,907,573 0.63
Indorama Ventures PCL 841,513 THB 636,957 902,213 0.15
PTT Global Chemical PCL 593,400 THB 917,834 921,128 0.15
Siam Cement PCL 36,100 THB 434,692 410,309 0.07
Thai Beverage PCL 4,190,000 SGD 1,905,785 1,774,214 0.29
Thai Union Group PCL 2,845,992 THB 1,146,421 1,482,584 0.24
Total Access Communication PCL 429,992 THB 407,807 345,049 0.06
Total Thailand 10,292,493 10,594,996 1.73
TURKEY
KOC Holding AS 115,588 TRY 207,883 205,652 0.03
Turkcell Iletisim Hizmetleri AS 33,978 TRY 55,819 53,098 0.01
Total Turkey 263,702 258,750 0.04
UNITED STATES OF AMERICA
MercadoLibre Inc 2,853 USD 3,834,787 3,747,681 0.61
Southern Copper Corp 4,270 USD 128,478 231,593 0.04
Yum China Holdings Inc 85,892 USD 3,709,397 4,798,335 0.78
Total United States of America 7,672,662 8,777,609 1.43
TOTAL LISTED SECURITIES : SHARES 397,157,519 489,330,513 79.03
2) LISTED SECURITIES : INVESTMENT FUNDS
SPAIN
Mediolanum Fondcuenta FI2,3 635,053 EUR 6,300,089 6,424,810 1.04
Total Spain 6,300,089 6,424,810 1.04
TOTAL LISTED SECURITIES : INVESTMENT FUNDS 6,300,089 6,424,810 1.04
TOTAL TRANSFERABLE SECURITIES ADMITTED TO AN OFFICIAL STOCK EXCHANGE LISTING 403,457,608 495,755,323 80.07
1This security delisted in May 2007. 2This is related party per note 22. 3 UCITS.
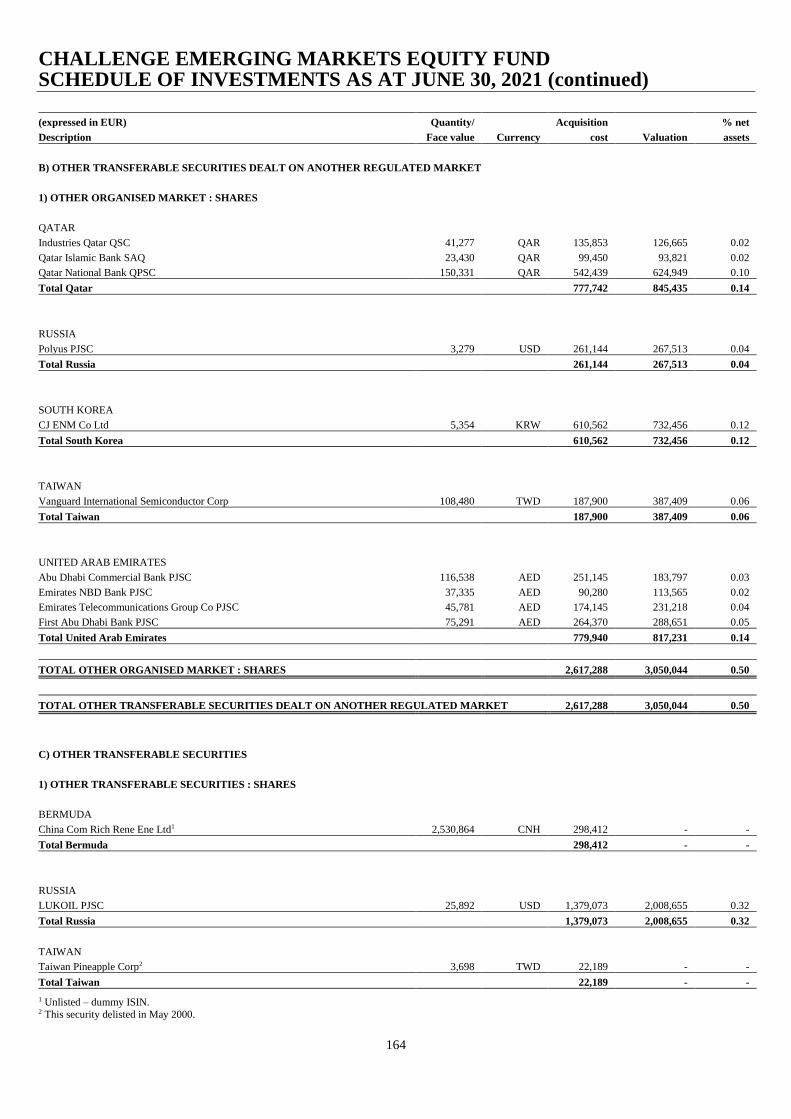
CHALLENGE EMERGING MARKETS EQUITY FUND SCHEDULE OF INVESTMENTS AS AT JUNE 30, 2021 (continued)
164
(expressed in EUR) Quantity/ Acquisition % net
Description Face value Currency cost Valuation assets
B) OTHER TRANSFERABLE SECURITIES DEALT ON ANOTHER REGULATED MARKET
1) OTHER ORGANISED MARKET : SHARES
QATAR
Industries Qatar QSC 41,277 QAR 135,853 126,665 0.02
Qatar Islamic Bank SAQ 23,430 QAR 99,450 93,821 0.02
Qatar National Bank QPSC 150,331 QAR 542,439 624,949 0.10
Total Qatar 777,742 845,435 0.14
RUSSIA
Polyus PJSC 3,279 USD 261,144 267,513 0.04
Total Russia 261,144 267,513 0.04
SOUTH KOREA
CJ ENM Co Ltd 5,354 KRW 610,562 732,456 0.12
Total South Korea 610,562 732,456 0.12
TAIWAN
Vanguard International Semiconductor Corp 108,480 TWD 187,900 387,409 0.06
Total Taiwan 187,900 387,409 0.06
UNITED ARAB EMIRATES
Abu Dhabi Commercial Bank PJSC 116,538 AED 251,145 183,797 0.03
Emirates NBD Bank PJSC 37,335 AED 90,280 113,565 0.02
Emirates Telecommunications Group Co PJSC 45,781 AED 174,145 231,218 0.04
First Abu Dhabi Bank PJSC 75,291 AED 264,370 288,651 0.05
Total United Arab Emirates 779,940 817,231 0.14
TOTAL OTHER ORGANISED MARKET : SHARES 2,617,288 3,050,044 0.50
TOTAL OTHER TRANSFERABLE SECURITIES DEALT ON ANOTHER REGULATED MARKET 2,617,288 3,050,044 0.50
C) OTHER TRANSFERABLE SECURITIES
1) OTHER TRANSFERABLE SECURITIES : SHARES
BERMUDA
China Com Rich Rene Ene Ltd1 2,530,864 CNH 298,412 - -
Total Bermuda 298,412 - -
RUSSIA
LUKOIL PJSC 25,892 USD 1,379,073 2,008,655 0.32
Total Russia 1,379,073 2,008,655 0.32
TAIWAN
Taiwan Pineapple Corp2 3,698 TWD 22,189 - -
Total Taiwan 22,189 - - 1 Unlisted – dummy ISIN. 2 This security delisted in May 2000.
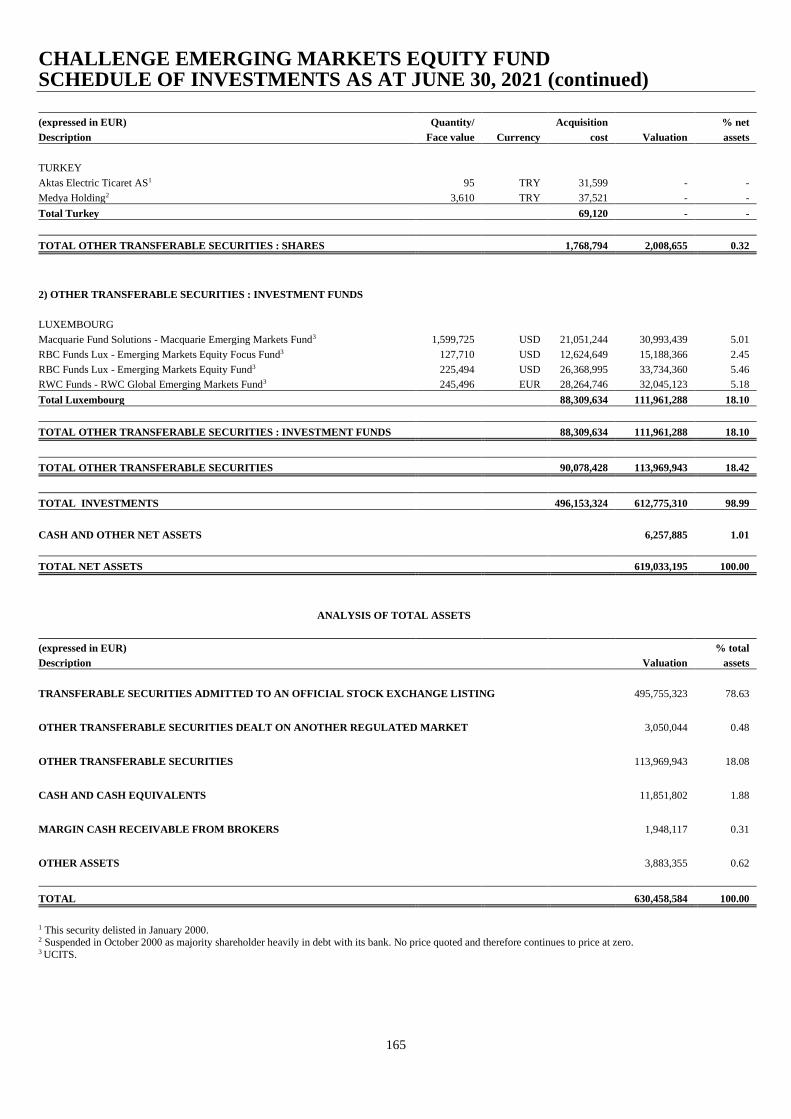
CHALLENGE EMERGING MARKETS EQUITY FUND SCHEDULE OF INVESTMENTS AS AT JUNE 30, 2021 (continued)
165
(expressed in EUR) Quantity/ Acquisition % net
Description Face value Currency cost Valuation assets
TURKEY
Aktas Electric Ticaret AS1 95 TRY 31,599 - -
Medya Holding2 3,610 TRY 37,521 - -
Total Turkey 69,120 - -
TOTAL OTHER TRANSFERABLE SECURITIES : SHARES 1,768,794 2,008,655 0.32
2) OTHER TRANSFERABLE SECURITIES : INVESTMENT FUNDS
LUXEMBOURG
Macquarie Fund Solutions - Macquarie Emerging Markets Fund3 1,599,725 USD 21,051,244 30,993,439 5.01
RBC Funds Lux - Emerging Markets Equity Focus Fund3 127,710 USD 12,624,649 15,188,366 2.45
RBC Funds Lux - Emerging Markets Equity Fund3 225,494 USD 26,368,995 33,734,360 5.46
RWC Funds - RWC Global Emerging Markets Fund3 245,496 EUR 28,264,746 32,045,123 5.18
Total Luxembourg 88,309,634 111,961,288 18.10
TOTAL OTHER TRANSFERABLE SECURITIES : INVESTMENT FUNDS 88,309,634 111,961,288 18.10
TOTAL OTHER TRANSFERABLE SECURITIES 90,078,428 113,969,943 18.42
TOTAL INVESTMENTS 496,153,324 612,775,310 98.99
CASH AND OTHER NET ASSETS 6,257,885 1.01
TOTAL NET ASSETS 619,033,195 100.00
ANALYSIS OF TOTAL ASSETS
(expressed in EUR) % total
Description Valuation assets
TRANSFERABLE SECURITIES ADMITTED TO AN OFFICIAL STOCK EXCHANGE LISTING 495,755,323 78.63
OTHER TRANSFERABLE SECURITIES DEALT ON ANOTHER REGULATED MARKET 3,050,044 0.48
OTHER TRANSFERABLE SECURITIES 113,969,943 18.08
CASH AND CASH EQUIVALENTS 11,851,802 1.88
MARGIN CASH RECEIVABLE FROM BROKERS 1,948,117 0.31
OTHER ASSETS 3,883,355 0.62
TOTAL 630,458,584 100.00
1 This security delisted in January 2000. 2 Suspended in October 2000 as majority shareholder heavily in debt with its bank. No price quoted and therefore continues to price at zero. 3 UCITS.
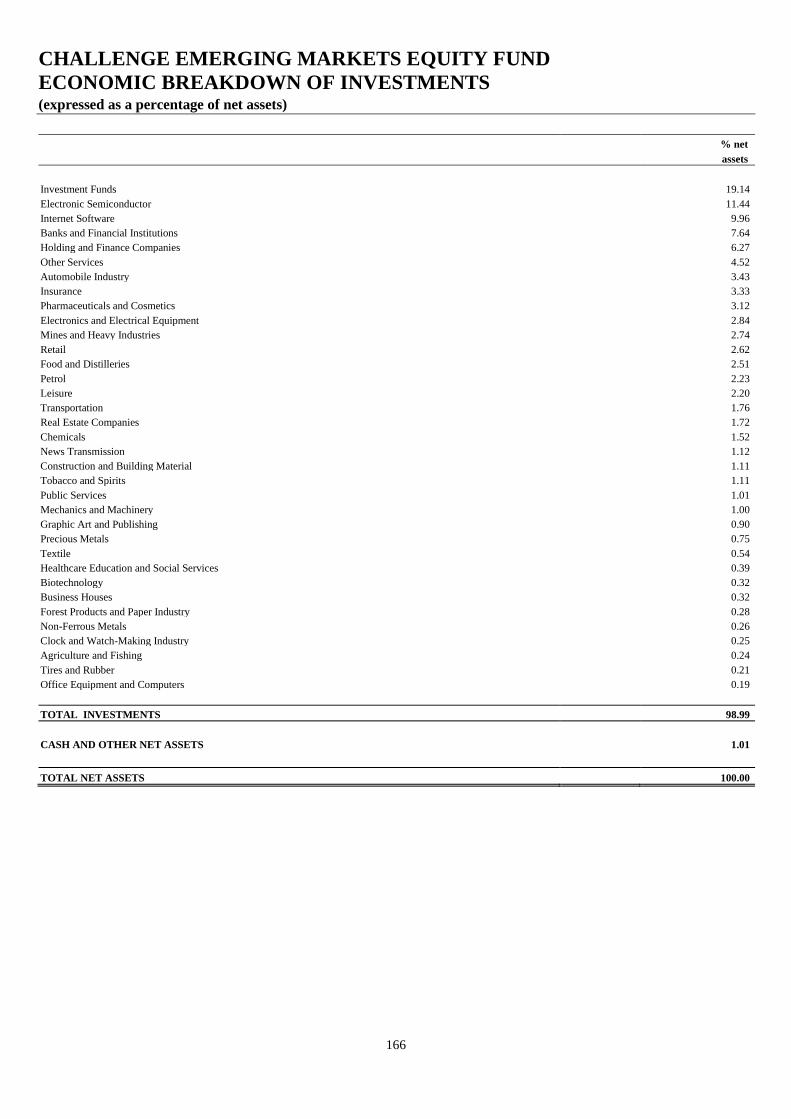
CHALLENGE EMERGING MARKETS EQUITY FUND
ECONOMIC BREAKDOWN OF INVESTMENTS (expressed as a percentage of net assets)
166
% net
assets
Investment Funds 19.14
Electronic Semiconductor 11.44
Internet Software 9.96
Banks and Financial Institutions 7.64
Holding and Finance Companies 6.27
Other Services 4.52
Automobile Industry 3.43
Insurance 3.33
Pharmaceuticals and Cosmetics 3.12
Electronics and Electrical Equipment 2.84
Mines and Heavy Industries 2.74
Retail 2.62
Food and Distilleries 2.51
Petrol 2.23
Leisure 2.20
Transportation 1.76
Real Estate Companies 1.72
Chemicals 1.52
News Transmission 1.12
Construction and Building Material 1.11
Tobacco and Spirits 1.11
Public Services 1.01
Mechanics and Machinery 1.00
Graphic Art and Publishing 0.90
Precious Metals 0.75
Textile 0.54
Healthcare Education and Social Services 0.39
Biotechnology 0.32
Business Houses 0.32
Forest Products and Paper Industry 0.28
Non-Ferrous Metals 0.26
Clock and Watch-Making Industry 0.25
Agriculture and Fishing 0.24
Tires and Rubber 0.21
Office Equipment and Computers 0.19
TOTAL INVESTMENTS 98.99
CASH AND OTHER NET ASSETS 1.01
TOTAL NET ASSETS 100.00
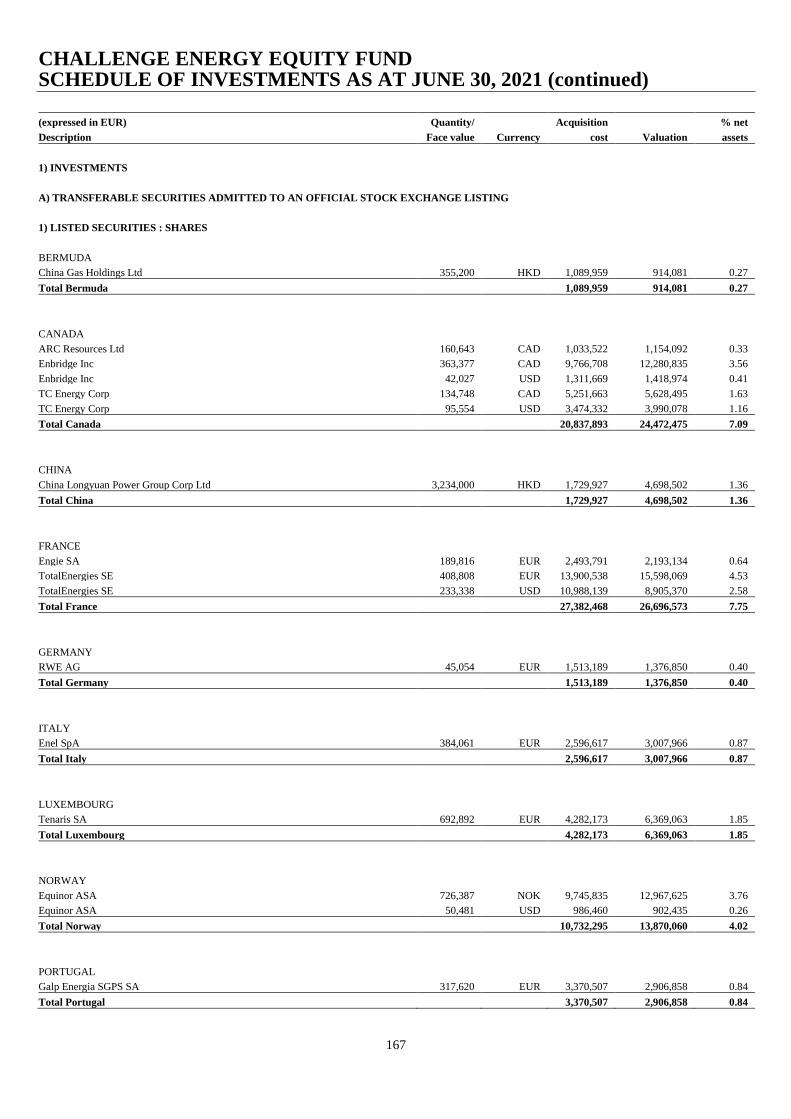
CHALLENGE ENERGY EQUITY FUND SCHEDULE OF INVESTMENTS AS AT JUNE 30, 2021 (continued)
167
(expressed in EUR) Quantity/ Acquisition % net
Description Face value Currency cost Valuation assets
1) INVESTMENTS
A) TRANSFERABLE SECURITIES ADMITTED TO AN OFFICIAL STOCK EXCHANGE LISTING
1) LISTED SECURITIES : SHARES
BERMUDA
China Gas Holdings Ltd 355,200 HKD 1,089,959 914,081 0.27
Total Bermuda 1,089,959 914,081 0.27
CANADA
ARC Resources Ltd 160,643 CAD 1,033,522 1,154,092 0.33
Enbridge Inc 363,377 CAD 9,766,708 12,280,835 3.56
Enbridge Inc 42,027 USD 1,311,669 1,418,974 0.41
TC Energy Corp 134,748 CAD 5,251,663 5,628,495 1.63
TC Energy Corp 95,554 USD 3,474,332 3,990,078 1.16
Total Canada 20,837,893 24,472,475 7.09
CHINA
China Longyuan Power Group Corp Ltd 3,234,000 HKD 1,729,927 4,698,502 1.36
Total China 1,729,927 4,698,502 1.36
FRANCE
Engie SA 189,816 EUR 2,493,791 2,193,134 0.64
TotalEnergies SE 408,808 EUR 13,900,538 15,598,069 4.53
TotalEnergies SE 233,338 USD 10,988,139 8,905,370 2.58
Total France 27,382,468 26,696,573 7.75
GERMANY
RWE AG 45,054 EUR 1,513,189 1,376,850 0.40
Total Germany 1,513,189 1,376,850 0.40
ITALY
Enel SpA 384,061 EUR 2,596,617 3,007,966 0.87
Total Italy 2,596,617 3,007,966 0.87
LUXEMBOURG
Tenaris SA 692,892 EUR 4,282,173 6,369,063 1.85
Total Luxembourg 4,282,173 6,369,063 1.85
NORWAY
Equinor ASA 726,387 NOK 9,745,835 12,967,625 3.76
Equinor ASA 50,481 USD 986,460 902,435 0.26
Total Norway 10,732,295 13,870,060 4.02
PORTUGAL
Galp Energia SGPS SA 317,620 EUR 3,370,507 2,906,858 0.84
Total Portugal 3,370,507 2,906,858 0.84
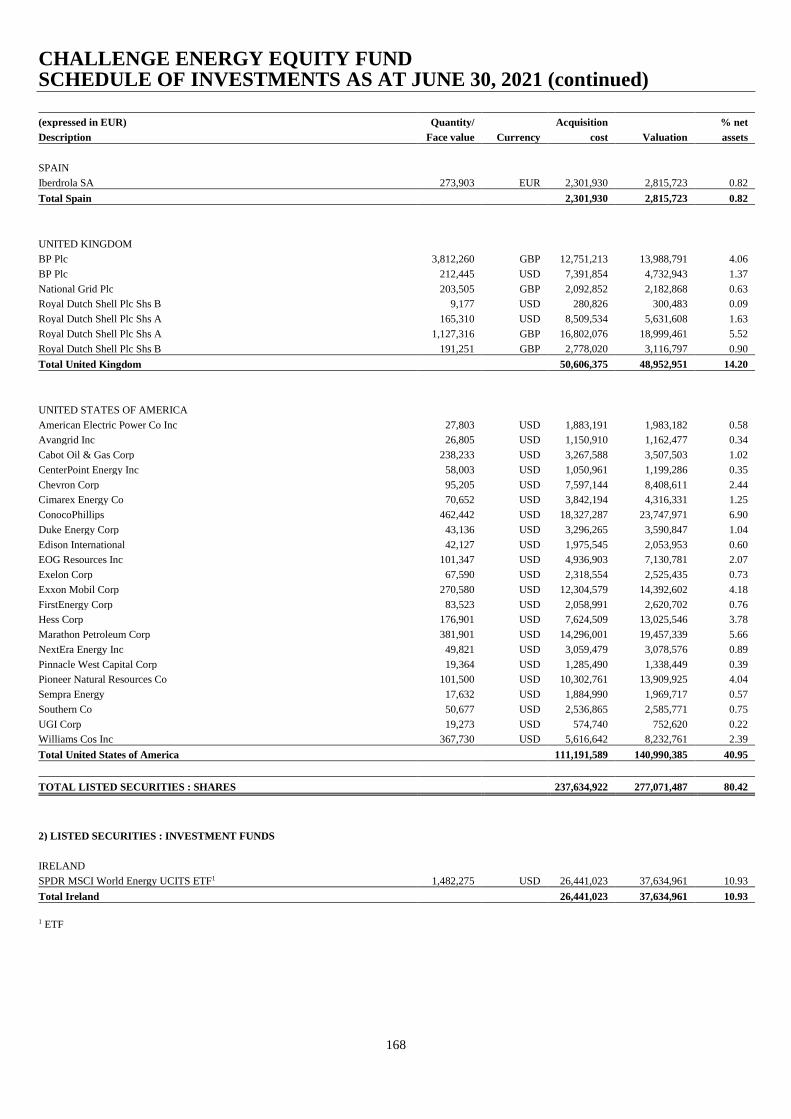
CHALLENGE ENERGY EQUITY FUND SCHEDULE OF INVESTMENTS AS AT JUNE 30, 2021 (continued)
168
(expressed in EUR) Quantity/ Acquisition % net
Description Face value Currency cost Valuation assets
SPAIN
Iberdrola SA 273,903 EUR 2,301,930 2,815,723 0.82
Total Spain 2,301,930 2,815,723 0.82
UNITED KINGDOM
BP Plc 3,812,260 GBP 12,751,213 13,988,791 4.06
BP Plc 212,445 USD 7,391,854 4,732,943 1.37
National Grid Plc 203,505 GBP 2,092,852 2,182,868 0.63
Royal Dutch Shell Plc Shs B 9,177 USD 280,826 300,483 0.09
Royal Dutch Shell Plc Shs A 165,310 USD 8,509,534 5,631,608 1.63
Royal Dutch Shell Plc Shs A 1,127,316 GBP 16,802,076 18,999,461 5.52
Royal Dutch Shell Plc Shs B 191,251 GBP 2,778,020 3,116,797 0.90
Total United Kingdom 50,606,375 48,952,951 14.20
UNITED STATES OF AMERICA
American Electric Power Co Inc 27,803 USD 1,883,191 1,983,182 0.58
Avangrid Inc 26,805 USD 1,150,910 1,162,477 0.34
Cabot Oil & Gas Corp 238,233 USD 3,267,588 3,507,503 1.02
CenterPoint Energy Inc 58,003 USD 1,050,961 1,199,286 0.35
Chevron Corp 95,205 USD 7,597,144 8,408,611 2.44
Cimarex Energy Co 70,652 USD 3,842,194 4,316,331 1.25
ConocoPhillips 462,442 USD 18,327,287 23,747,971 6.90
Duke Energy Corp 43,136 USD 3,296,265 3,590,847 1.04
Edison International 42,127 USD 1,975,545 2,053,953 0.60
EOG Resources Inc 101,347 USD 4,936,903 7,130,781 2.07
Exelon Corp 67,590 USD 2,318,554 2,525,435 0.73
Exxon Mobil Corp 270,580 USD 12,304,579 14,392,602 4.18
FirstEnergy Corp 83,523 USD 2,058,991 2,620,702 0.76
Hess Corp 176,901 USD 7,624,509 13,025,546 3.78
Marathon Petroleum Corp 381,901 USD 14,296,001 19,457,339 5.66
NextEra Energy Inc 49,821 USD 3,059,479 3,078,576 0.89
Pinnacle West Capital Corp 19,364 USD 1,285,490 1,338,449 0.39
Pioneer Natural Resources Co 101,500 USD 10,302,761 13,909,925 4.04
Sempra Energy 17,632 USD 1,884,990 1,969,717 0.57
Southern Co 50,677 USD 2,536,865 2,585,771 0.75
UGI Corp 19,273 USD 574,740 752,620 0.22
Williams Cos Inc 367,730 USD 5,616,642 8,232,761 2.39
Total United States of America 111,191,589 140,990,385 40.95
TOTAL LISTED SECURITIES : SHARES 237,634,922 277,071,487 80.42
2) LISTED SECURITIES : INVESTMENT FUNDS
IRELAND
SPDR MSCI World Energy UCITS ETF1 1,482,275 USD 26,441,023 37,634,961 10.93
Total Ireland 26,441,023 37,634,961 10.93
1 ETF

CHALLENGE ENERGY EQUITY FUND SCHEDULE OF INVESTMENTS AS AT JUNE 30, 2021 (continued)
169
(expressed in EUR) Quantity/ Acquisition % net
Description Face value Currency cost Valuation assets
SPAIN
Mediolanum Fondcuenta FI1,2 176,268 EUR 1,748,678 1,783,301 0.52
Total Spain 1,748,678 1,783,301 0.52
TOTAL LISTED SECURITIES : INVESTMENT FUNDS 28,189,701 39,418,262 11.45
TOTAL TRANSFERABLE SECURITIES ADMITTED TO AN OFFICIAL STOCK EXCHANGE LISTING 265,824,623 316,489,749 91.87
B) OTHER TRANSFERABLE SECURITIES
1) OTHER TRANSFERABLE SECURITIES : SHARES
RUSSIA
LUKOIL PJSC 186,206 USD 11,465,831 14,445,528 4.19
Total Russia 11,465,831 14,445,528 4.19
TOTAL OTHER TRANSFERABLE SECURITIES : SHARES 11,465,831 14,445,528 4.19
TOTAL OTHER TRANSFERABLE SECURITIES 11,465,831 14,445,528 4.19
TOTAL INVESTMENTS 277,290,454 330,935,277 96.06
CASH AND OTHER NET ASSETS 13,571,222 3.94
TOTAL NET ASSETS 344,506,499 100.00
ANALYSIS OF TOTAL ASSETS
(expressed in EUR) % total
Description Valuation assets
TRANSFERABLE SECURITIES ADMITTED TO AN OFFICIAL STOCK EXCHANGE LISTING
316,489,749 91.47
OTHER TRANSFERABLE SECURITIES
14,445,528 4.17
CASH AND CASH EQUIVALENTS
10,768,053 3.11
MARGIN CASH RECEIVABLE FROM BROKERS
1,722,809 0.50
OTHER ASSETS
2,590,802 0.75
TOTAL 346,016,941 100.00
1This is related party per note 22. 2 UCITS.

CHALLENGE ENERGY EQUITY FUND
ECONOMIC BREAKDOWN OF INVESTMENTS (expressed as a percentage of net assets)
170
% net
assets
Petrol 61.67
Public Services 20.05
Investment Funds 11.45
Mines and Heavy Industries 1.85
Holding and Finance Companies 1.04
TOTAL INVESTMENTS 96.06
CASH AND OTHER NET ASSETS 3.94
TOTAL NET ASSETS 100.00
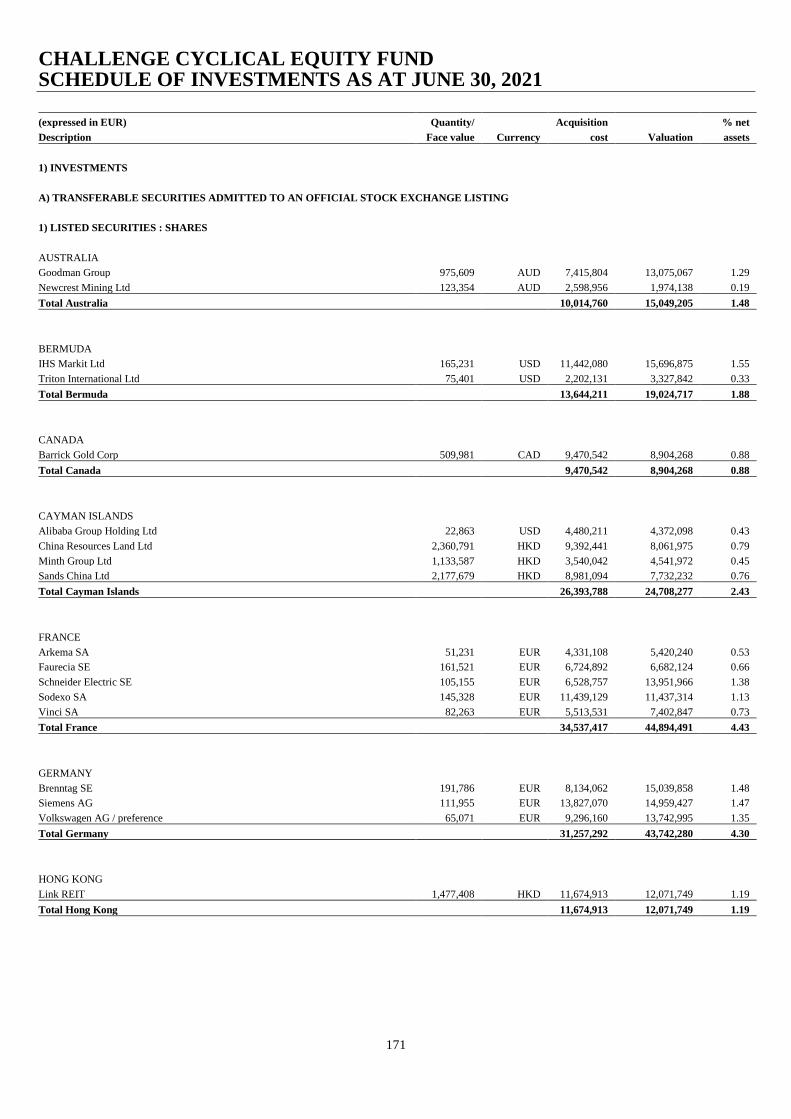
CHALLENGE CYCLICAL EQUITY FUND SCHEDULE OF INVESTMENTS AS AT JUNE 30, 2021
171
(expressed in EUR) Quantity/ Acquisition % net
Description Face value Currency cost Valuation assets
1) INVESTMENTS
A) TRANSFERABLE SECURITIES ADMITTED TO AN OFFICIAL STOCK EXCHANGE LISTING
1) LISTED SECURITIES : SHARES
AUSTRALIA
Goodman Group 975,609 AUD 7,415,804 13,075,067 1.29
Newcrest Mining Ltd 123,354 AUD 2,598,956 1,974,138 0.19
Total Australia 10,014,760 15,049,205 1.48
BERMUDA
IHS Markit Ltd 165,231 USD 11,442,080 15,696,875 1.55
Triton International Ltd 75,401 USD 2,202,131 3,327,842 0.33
Total Bermuda 13,644,211 19,024,717 1.88
CANADA
Barrick Gold Corp 509,981 CAD 9,470,542 8,904,268 0.88
Total Canada 9,470,542 8,904,268 0.88
CAYMAN ISLANDS
Alibaba Group Holding Ltd 22,863 USD 4,480,211 4,372,098 0.43
China Resources Land Ltd 2,360,791 HKD 9,392,441 8,061,975 0.79
Minth Group Ltd 1,133,587 HKD 3,540,042 4,541,972 0.45
Sands China Ltd 2,177,679 HKD 8,981,094 7,732,232 0.76
Total Cayman Islands 26,393,788 24,708,277 2.43
FRANCE
Arkema SA 51,231 EUR 4,331,108 5,420,240 0.53
Faurecia SE 161,521 EUR 6,724,892 6,682,124 0.66
Schneider Electric SE 105,155 EUR 6,528,757 13,951,966 1.38
Sodexo SA 145,328 EUR 11,439,129 11,437,314 1.13
Vinci SA 82,263 EUR 5,513,531 7,402,847 0.73
Total France 34,537,417 44,894,491 4.43
GERMANY
Brenntag SE 191,786 EUR 8,134,062 15,039,858 1.48
Siemens AG 111,955 EUR 13,827,070 14,959,427 1.47
Volkswagen AG / preference 65,071 EUR 9,296,160 13,742,995 1.35
Total Germany 31,257,292 43,742,280 4.30
HONG KONG
Link REIT 1,477,408 HKD 11,674,913 12,071,749 1.19
Total Hong Kong 11,674,913 12,071,749 1.19
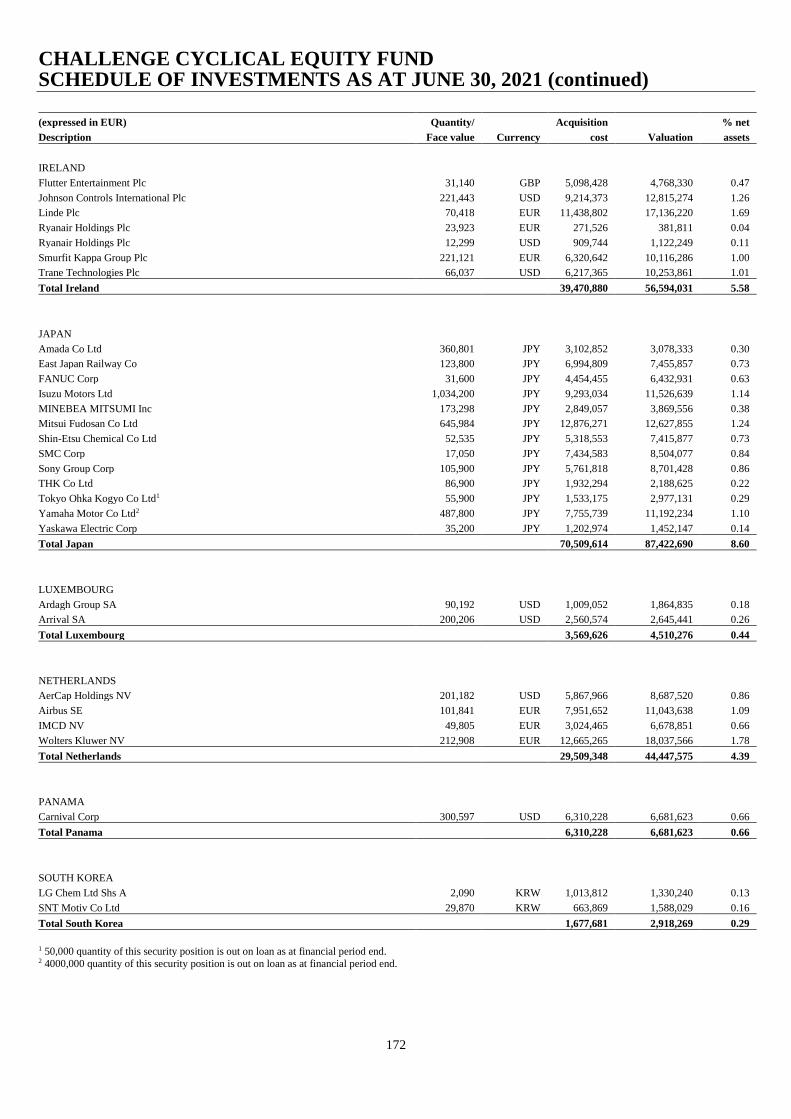
CHALLENGE CYCLICAL EQUITY FUND SCHEDULE OF INVESTMENTS AS AT JUNE 30, 2021 (continued)
172
(expressed in EUR) Quantity/ Acquisition % net
Description Face value Currency cost Valuation assets
IRELAND
Flutter Entertainment Plc 31,140 GBP 5,098,428 4,768,330 0.47
Johnson Controls International Plc 221,443 USD 9,214,373 12,815,274 1.26
Linde Plc 70,418 EUR 11,438,802 17,136,220 1.69
Ryanair Holdings Plc 23,923 EUR 271,526 381,811 0.04
Ryanair Holdings Plc 12,299 USD 909,744 1,122,249 0.11
Smurfit Kappa Group Plc 221,121 EUR 6,320,642 10,116,286 1.00
Trane Technologies Plc 66,037 USD 6,217,365 10,253,861 1.01
Total Ireland 39,470,880 56,594,031 5.58
JAPAN
Amada Co Ltd 360,801 JPY 3,102,852 3,078,333 0.30
East Japan Railway Co 123,800 JPY 6,994,809 7,455,857 0.73
FANUC Corp 31,600 JPY 4,454,455 6,432,931 0.63
Isuzu Motors Ltd 1,034,200 JPY 9,293,034 11,526,639 1.14
MINEBEA MITSUMI Inc 173,298 JPY 2,849,057 3,869,556 0.38
Mitsui Fudosan Co Ltd 645,984 JPY 12,876,271 12,627,855 1.24
Shin-Etsu Chemical Co Ltd 52,535 JPY 5,318,553 7,415,877 0.73
SMC Corp 17,050 JPY 7,434,583 8,504,077 0.84
Sony Group Corp 105,900 JPY 5,761,818 8,701,428 0.86
THK Co Ltd 86,900 JPY 1,932,294 2,188,625 0.22
Tokyo Ohka Kogyo Co Ltd1 55,900 JPY 1,533,175 2,977,131 0.29
Yamaha Motor Co Ltd2 487,800 JPY 7,755,739 11,192,234 1.10
Yaskawa Electric Corp 35,200 JPY 1,202,974 1,452,147 0.14
Total Japan 70,509,614 87,422,690 8.60
LUXEMBOURG
Ardagh Group SA 90,192 USD 1,009,052 1,864,835 0.18
Arrival SA 200,206 USD 2,560,574 2,645,441 0.26
Total Luxembourg 3,569,626 4,510,276 0.44
NETHERLANDS
AerCap Holdings NV 201,182 USD 5,867,966 8,687,520 0.86
Airbus SE 101,841 EUR 7,951,652 11,043,638 1.09
IMCD NV 49,805 EUR 3,024,465 6,678,851 0.66
Wolters Kluwer NV 212,908 EUR 12,665,265 18,037,566 1.78
Total Netherlands 29,509,348 44,447,575 4.39
PANAMA
Carnival Corp 300,597 USD 6,310,228 6,681,623 0.66
Total Panama 6,310,228 6,681,623 0.66
SOUTH KOREA
LG Chem Ltd Shs A 2,090 KRW 1,013,812 1,330,240 0.13
SNT Motiv Co Ltd 29,870 KRW 663,869 1,588,029 0.16
Total South Korea 1,677,681 2,918,269 0.29
1 50,000 quantity of this security position is out on loan as at financial period end. 2 4000,000 quantity of this security position is out on loan as at financial period end.
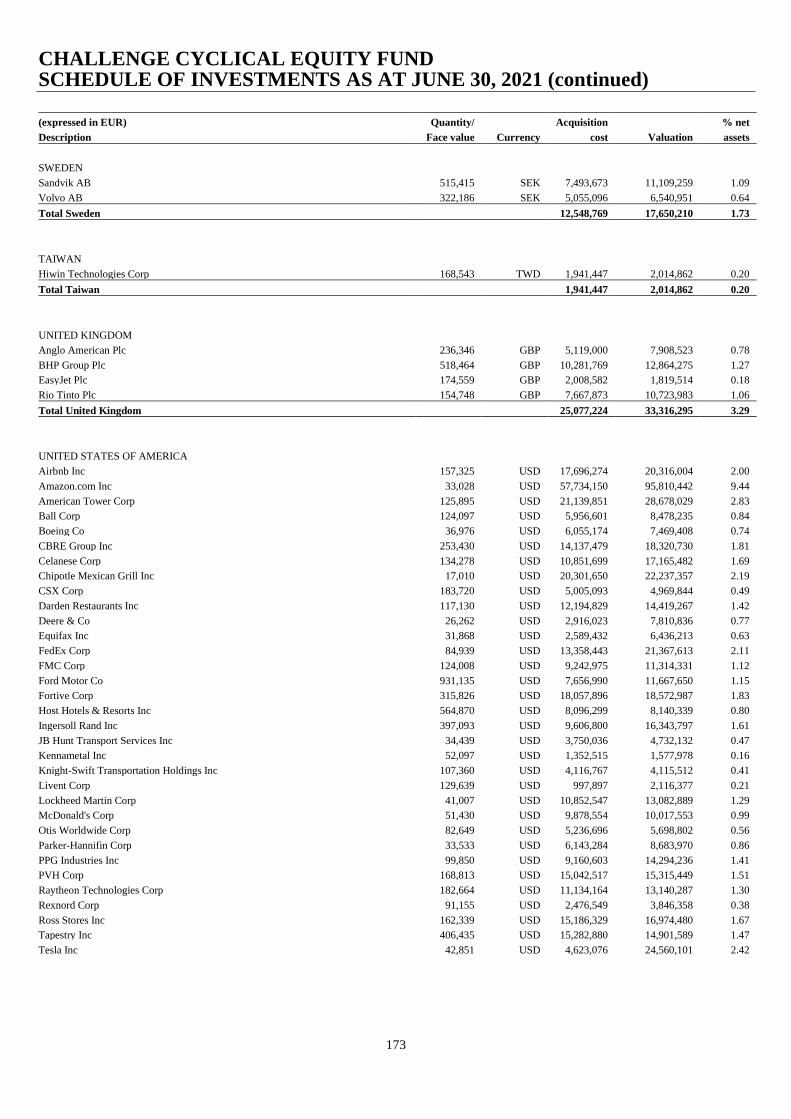
CHALLENGE CYCLICAL EQUITY FUND SCHEDULE OF INVESTMENTS AS AT JUNE 30, 2021 (continued)
173
(expressed in EUR) Quantity/ Acquisition % net
Description Face value Currency cost Valuation assets
SWEDEN
Sandvik AB 515,415 SEK 7,493,673 11,109,259 1.09
Volvo AB 322,186 SEK 5,055,096 6,540,951 0.64
Total Sweden 12,548,769 17,650,210 1.73
TAIWAN
Hiwin Technologies Corp 168,543 TWD 1,941,447 2,014,862 0.20
Total Taiwan 1,941,447 2,014,862 0.20
UNITED KINGDOM
Anglo American Plc 236,346 GBP 5,119,000 7,908,523 0.78
BHP Group Plc 518,464 GBP 10,281,769 12,864,275 1.27
EasyJet Plc 174,559 GBP 2,008,582 1,819,514 0.18
Rio Tinto Plc 154,748 GBP 7,667,873 10,723,983 1.06
Total United Kingdom 25,077,224 33,316,295 3.29
UNITED STATES OF AMERICA
Airbnb Inc 157,325 USD 17,696,274 20,316,004 2.00
Amazon.com Inc 33,028 USD 57,734,150 95,810,442 9.44
American Tower Corp 125,895 USD 21,139,851 28,678,029 2.83
Ball Corp 124,097 USD 5,956,601 8,478,235 0.84
Boeing Co 36,976 USD 6,055,174 7,469,408 0.74
CBRE Group Inc 253,430 USD 14,137,479 18,320,730 1.81
Celanese Corp 134,278 USD 10,851,699 17,165,482 1.69
Chipotle Mexican Grill Inc 17,010 USD 20,301,650 22,237,357 2.19
CSX Corp 183,720 USD 5,005,093 4,969,844 0.49
Darden Restaurants Inc 117,130 USD 12,194,829 14,419,267 1.42
Deere & Co 26,262 USD 2,916,023 7,810,836 0.77
Equifax Inc 31,868 USD 2,589,432 6,436,213 0.63
FedEx Corp 84,939 USD 13,358,443 21,367,613 2.11
FMC Corp 124,008 USD 9,242,975 11,314,331 1.12
Ford Motor Co 931,135 USD 7,656,990 11,667,650 1.15
Fortive Corp 315,826 USD 18,057,896 18,572,987 1.83
Host Hotels & Resorts Inc 564,870 USD 8,096,299 8,140,339 0.80
Ingersoll Rand Inc 397,093 USD 9,606,800 16,343,797 1.61
JB Hunt Transport Services Inc 34,439 USD 3,750,036 4,732,132 0.47
Kennametal Inc 52,097 USD 1,352,515 1,577,978 0.16
Knight-Swift Transportation Holdings Inc 107,360 USD 4,116,767 4,115,512 0.41
Livent Corp 129,639 USD 997,897 2,116,377 0.21
Lockheed Martin Corp 41,007 USD 10,852,547 13,082,889 1.29
McDonald's Corp 51,430 USD 9,878,554 10,017,553 0.99
Otis Worldwide Corp 82,649 USD 5,236,696 5,698,802 0.56
Parker-Hannifin Corp 33,533 USD 6,143,284 8,683,970 0.86
PPG Industries Inc 99,850 USD 9,160,603 14,294,236 1.41
PVH Corp 168,813 USD 15,042,517 15,315,449 1.51
Raytheon Technologies Corp 182,664 USD 11,134,164 13,140,287 1.30
Rexnord Corp 91,155 USD 2,476,549 3,846,358 0.38
Ross Stores Inc 162,339 USD 15,186,329 16,974,480 1.67
Tapestry Inc 406,435 USD 15,282,880 14,901,589 1.47
Tesla Inc 42,851 USD 4,623,076 24,560,101 2.42
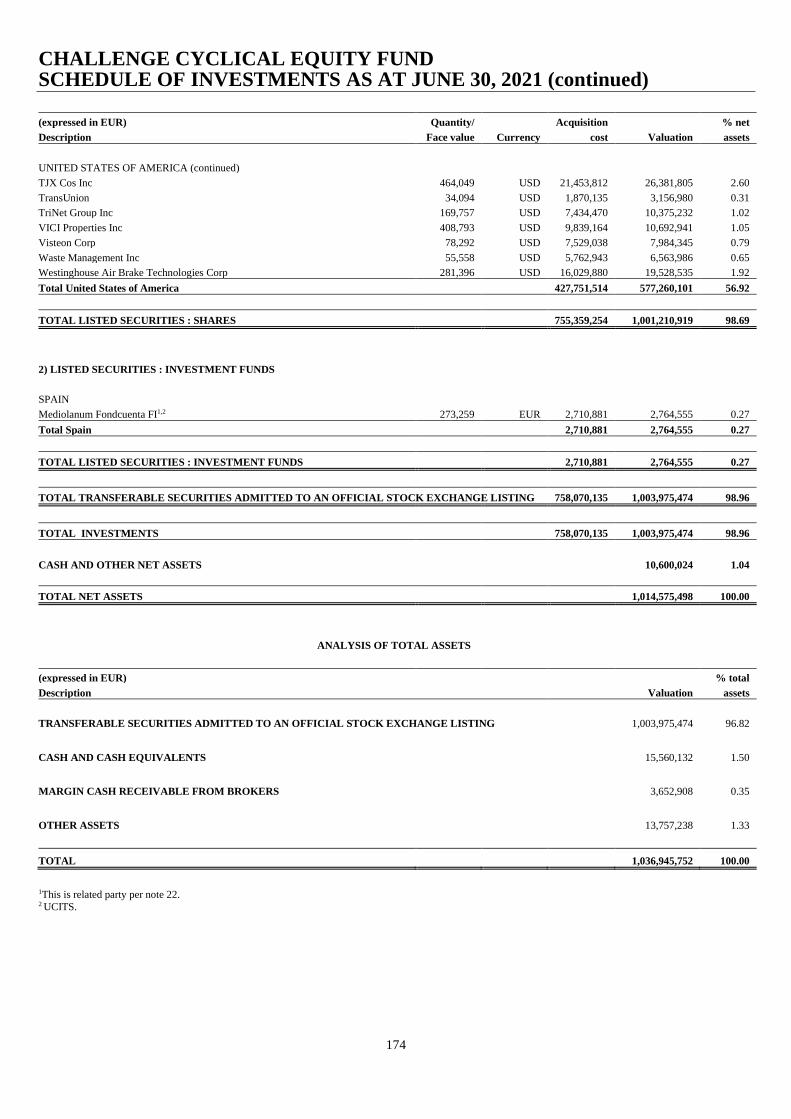
CHALLENGE CYCLICAL EQUITY FUND SCHEDULE OF INVESTMENTS AS AT JUNE 30, 2021 (continued)
174
(expressed in EUR) Quantity/ Acquisition % net
Description Face value Currency cost Valuation assets
UNITED STATES OF AMERICA (continued)
TJX Cos Inc 464,049 USD 21,453,812 26,381,805 2.60
TransUnion 34,094 USD 1,870,135 3,156,980 0.31
TriNet Group Inc 169,757 USD 7,434,470 10,375,232 1.02
VICI Properties Inc 408,793 USD 9,839,164 10,692,941 1.05
Visteon Corp 78,292 USD 7,529,038 7,984,345 0.79
Waste Management Inc 55,558 USD 5,762,943 6,563,986 0.65
Westinghouse Air Brake Technologies Corp 281,396 USD 16,029,880 19,528,535 1.92
Total United States of America 427,751,514 577,260,101 56.92
TOTAL LISTED SECURITIES : SHARES 755,359,254 1,001,210,919 98.69
2) LISTED SECURITIES : INVESTMENT FUNDS
SPAIN
Mediolanum Fondcuenta FI1,2 273,259 EUR 2,710,881 2,764,555 0.27
Total Spain 2,710,881 2,764,555 0.27
TOTAL LISTED SECURITIES : INVESTMENT FUNDS 2,710,881 2,764,555 0.27
TOTAL TRANSFERABLE SECURITIES ADMITTED TO AN OFFICIAL STOCK EXCHANGE LISTING 758,070,135 1,003,975,474 98.96
TOTAL INVESTMENTS 758,070,135 1,003,975,474 98.96
CASH AND OTHER NET ASSETS 10,600,024 1.04
TOTAL NET ASSETS 1,014,575,498 100.00
ANALYSIS OF TOTAL ASSETS
(expressed in EUR) % total
Description Valuation assets
TRANSFERABLE SECURITIES ADMITTED TO AN OFFICIAL STOCK EXCHANGE LISTING
1,003,975,474 96.82
CASH AND CASH EQUIVALENTS
15,560,132 1.50
MARGIN CASH RECEIVABLE FROM BROKERS
3,652,908 0.35
OTHER ASSETS
13,757,238 1.33
TOTAL 1,036,945,752 100.00
1This is related party per note 22. 2 UCITS.
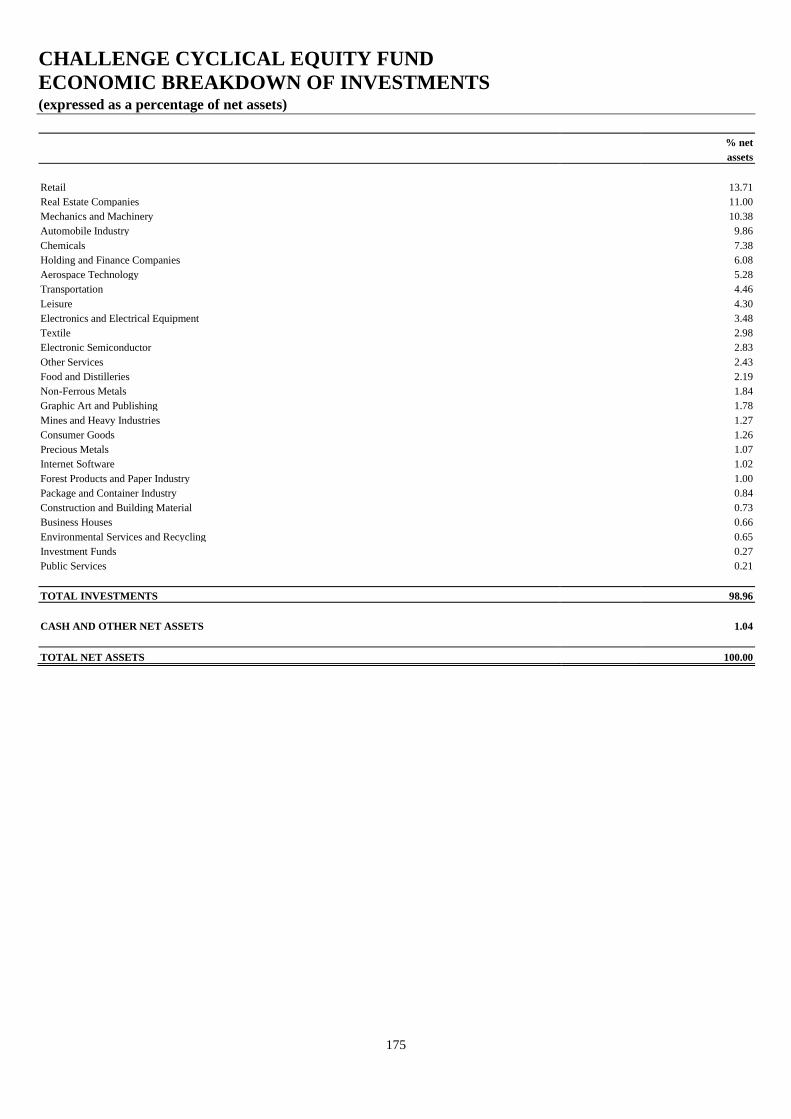
CHALLENGE CYCLICAL EQUITY FUND
ECONOMIC BREAKDOWN OF INVESTMENTS (expressed as a percentage of net assets)
175
% net
assets
Retail 13.71
Real Estate Companies 11.00
Mechanics and Machinery 10.38
Automobile Industry 9.86
Chemicals 7.38
Holding and Finance Companies 6.08
Aerospace Technology 5.28
Transportation 4.46
Leisure 4.30
Electronics and Electrical Equipment 3.48
Textile 2.98
Electronic Semiconductor 2.83
Other Services 2.43
Food and Distilleries 2.19
Non-Ferrous Metals 1.84
Graphic Art and Publishing 1.78
Mines and Heavy Industries 1.27
Consumer Goods 1.26
Precious Metals 1.07
Internet Software 1.02
Forest Products and Paper Industry 1.00
Package and Container Industry 0.84
Construction and Building Material 0.73
Business Houses 0.66
Environmental Services and Recycling 0.65
Investment Funds 0.27
Public Services 0.21
TOTAL INVESTMENTS 98.96
CASH AND OTHER NET ASSETS 1.04
TOTAL NET ASSETS 100.00
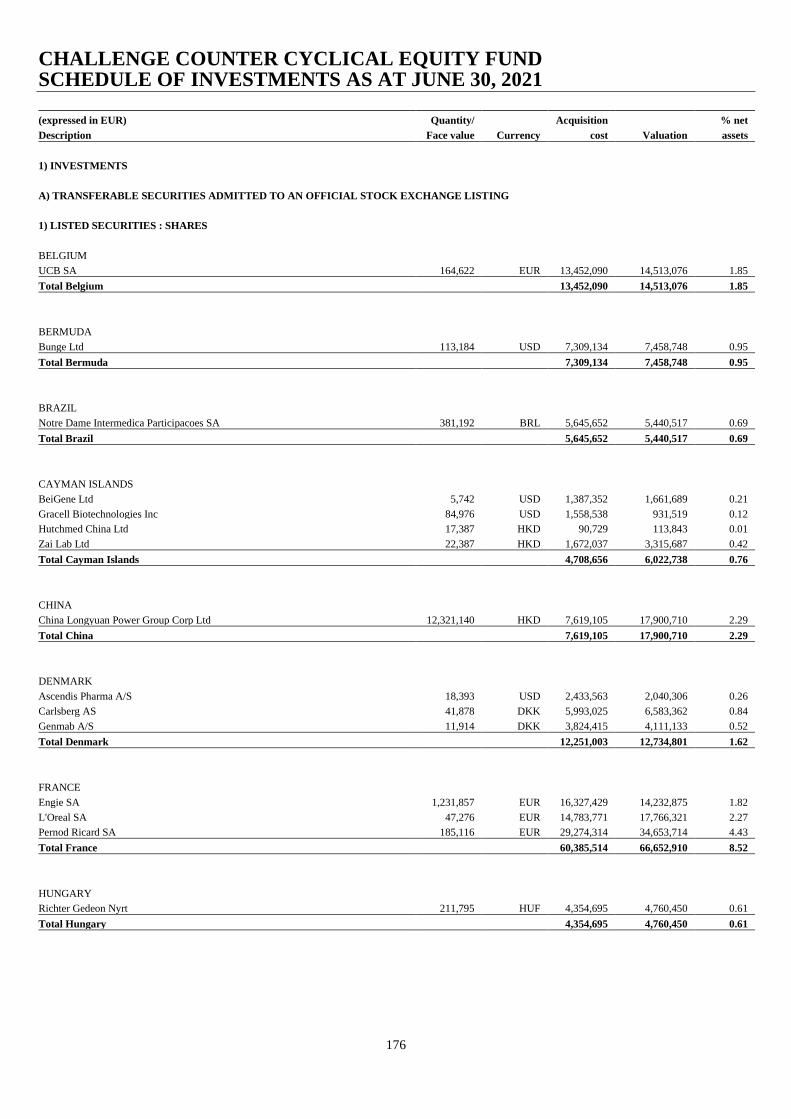
CHALLENGE COUNTER CYCLICAL EQUITY FUND SCHEDULE OF INVESTMENTS AS AT JUNE 30, 2021
176
(expressed in EUR) Quantity/ Acquisition % net
Description Face value Currency cost Valuation assets
1) INVESTMENTS
A) TRANSFERABLE SECURITIES ADMITTED TO AN OFFICIAL STOCK EXCHANGE LISTING
1) LISTED SECURITIES : SHARES
BELGIUM
UCB SA 164,622 EUR 13,452,090 14,513,076 1.85
Total Belgium 13,452,090 14,513,076 1.85
BERMUDA
Bunge Ltd 113,184 USD 7,309,134 7,458,748 0.95
Total Bermuda 7,309,134 7,458,748 0.95
BRAZIL
Notre Dame Intermedica Participacoes SA 381,192 BRL 5,645,652 5,440,517 0.69
Total Brazil 5,645,652 5,440,517 0.69
CAYMAN ISLANDS
BeiGene Ltd 5,742 USD 1,387,352 1,661,689 0.21
Gracell Biotechnologies Inc 84,976 USD 1,558,538 931,519 0.12
Hutchmed China Ltd 17,387 HKD 90,729 113,843 0.01
Zai Lab Ltd 22,387 HKD 1,672,037 3,315,687 0.42
Total Cayman Islands 4,708,656 6,022,738 0.76
CHINA
China Longyuan Power Group Corp Ltd 12,321,140 HKD 7,619,105 17,900,710 2.29
Total China 7,619,105 17,900,710 2.29
DENMARK
Ascendis Pharma A/S 18,393 USD 2,433,563 2,040,306 0.26
Carlsberg AS 41,878 DKK 5,993,025 6,583,362 0.84
Genmab A/S 11,914 DKK 3,824,415 4,111,133 0.52
Total Denmark 12,251,003 12,734,801 1.62
FRANCE
Engie SA 1,231,857 EUR 16,327,429 14,232,875 1.82
L'Oreal SA 47,276 EUR 14,783,771 17,766,321 2.27
Pernod Ricard SA 185,116 EUR 29,274,314 34,653,714 4.43
Total France 60,385,514 66,652,910 8.52
HUNGARY
Richter Gedeon Nyrt 211,795 HUF 4,354,695 4,760,450 0.61
Total Hungary 4,354,695 4,760,450 0.61

CHALLENGE COUNTER CYCLICAL EQUITY FUND SCHEDULE OF INVESTMENTS AS AT JUNE 30, 2021 (continued)
177
(expressed in EUR) Quantity/ Acquisition % net
Description Face value Currency cost Valuation assets
ITALY
Davide Campari-Milano NV 444,835 EUR 4,060,286 5,024,411 0.64
Total Italy 4,060,286 5,024,411 0.64
JAPAN
Asahi Group Holdings Ltd1 329,576 JPY 11,807,532 12,997,944 1.66
Astellas Pharma Inc 784,900 JPY 10,767,296 11,535,890 1.47
Chugai Pharmaceutical Co Ltd 185,475 JPY 6,481,388 6,203,024 0.79
Daiichi Sankyo Co Ltd 656,700 JPY 15,918,327 11,946,754 1.53
Eisai Co Ltd 136,664 JPY 10,158,512 11,343,410 1.45
Hoya Corp 29,500 JPY 2,604,704 3,301,359 0.42
Kyowa Kirin Co Ltd 171,800 JPY 3,931,343 5,142,655 0.66
Ono Pharmaceutical Co Ltd 142,900 JPY 2,690,271 2,691,391 0.34
Seven & i Holdings Co Ltd 218,900 JPY 7,341,674 8,809,348 1.12
Total Japan 71,701,047 73,971,775 9.44
NETHERLANDS
Argenx SE 2,999 EUR 843,186 765,045 0.10
Koninklijke Philips NV 253,402 EUR 8,322,794 10,589,670 1.35
Total Netherlands 9,165,980 11,354,715 1.45
SPAIN
Iberdrola SA 888,310 EUR 5,479,486 9,131,827 1.17
Total Spain 5,479,486 9,131,827 1.17
SWITZERLAND
Coca-Cola HBC AG 319,487 GBP 8,364,370 9,728,500 1.24
Roche Holding AG 23,906 CHF 7,508,790 7,601,291 0.97
Total Switzerland 15,873,160 17,329,791 2.21
UNITED KINGDOM
AstraZeneca Plc 375,541 GBP 26,903,669 37,985,185 4.86
Centessa Pharmaceuticals Plc 58,300 USD 957,189 1,091,865 0.14
Coca-Cola Europacific Partners Plc 233,195 USD 9,586,196 11,664,666 1.49
Diageo Plc 647,320 GBP 22,177,712 26,098,029 3.33
Genus Plc 88,173 GBP 4,033,420 5,094,533 0.65
Hikma Pharmaceuticals Plc 252,136 GBP 7,320,253 7,184,200 0.92
Total United Kingdom 70,978,439 89,118,478 11.39
UNITED STATES OF AMERICA
Acceleron Pharma Inc 11,091 USD 1,050,918 1,173,632 0.15
Align Technology Inc 15,384 USD 7,493,709 7,926,152 1.01
Alnylam Pharmaceuticals Inc 28,621 USD 3,510,726 4,091,266 0.52
Anthem Inc 29,279 USD 7,775,085 9,426,362 1.20
Arena Pharmaceuticals Inc 16,335 USD 1,056,890 939,411 0.12
Becton Dickinson and Co 83,374 USD 17,215,022 17,097,330 2.18
Biogen Inc 22,073 USD 5,180,350 6,445,078 0.82
1 273,482 quantity of this security position is out on loan as at financial period end.
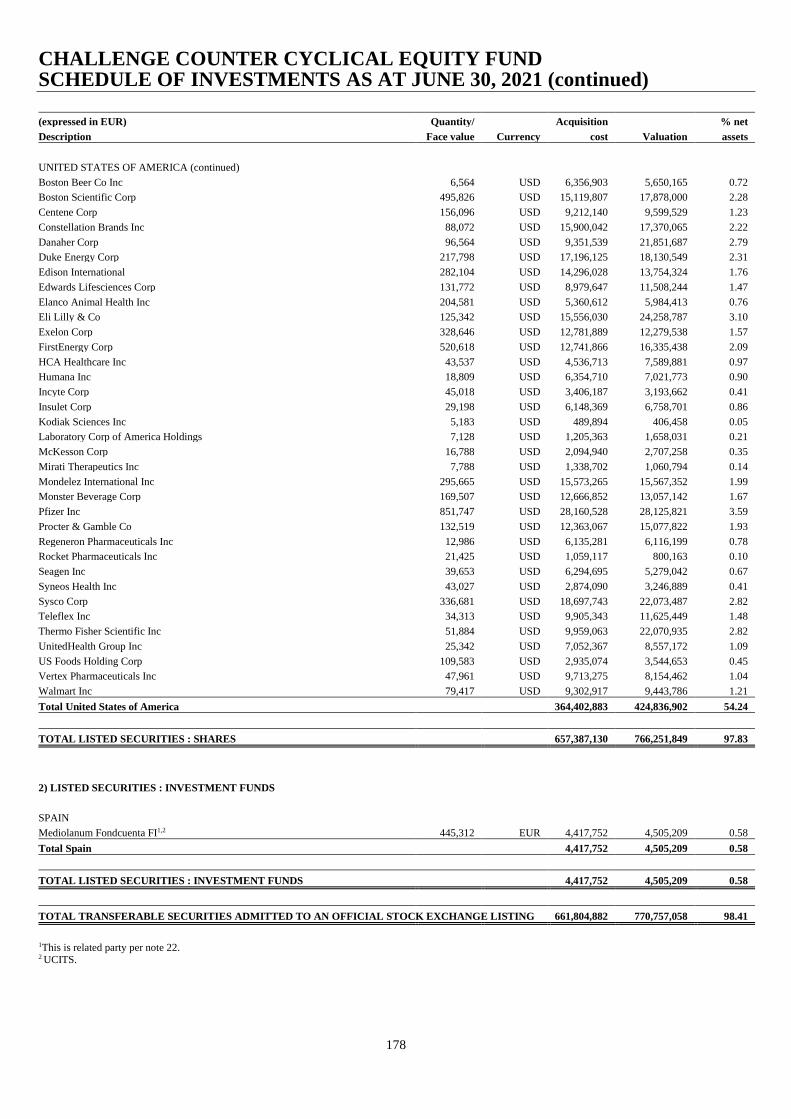
CHALLENGE COUNTER CYCLICAL EQUITY FUND SCHEDULE OF INVESTMENTS AS AT JUNE 30, 2021 (continued)
178
(expressed in EUR) Quantity/ Acquisition % net
Description Face value Currency cost Valuation assets
UNITED STATES OF AMERICA (continued)
Boston Beer Co Inc 6,564 USD 6,356,903 5,650,165 0.72
Boston Scientific Corp 495,826 USD 15,119,807 17,878,000 2.28
Centene Corp 156,096 USD 9,212,140 9,599,529 1.23
Constellation Brands Inc 88,072 USD 15,900,042 17,370,065 2.22
Danaher Corp 96,564 USD 9,351,539 21,851,687 2.79
Duke Energy Corp 217,798 USD 17,196,125 18,130,549 2.31
Edison International 282,104 USD 14,296,028 13,754,324 1.76
Edwards Lifesciences Corp 131,772 USD 8,979,647 11,508,244 1.47
Elanco Animal Health Inc 204,581 USD 5,360,612 5,984,413 0.76
Eli Lilly & Co 125,342 USD 15,556,030 24,258,787 3.10
Exelon Corp 328,646 USD 12,781,889 12,279,538 1.57
FirstEnergy Corp 520,618 USD 12,741,866 16,335,438 2.09
HCA Healthcare Inc 43,537 USD 4,536,713 7,589,881 0.97
Humana Inc 18,809 USD 6,354,710 7,021,773 0.90
Incyte Corp 45,018 USD 3,406,187 3,193,662 0.41
Insulet Corp 29,198 USD 6,148,369 6,758,701 0.86
Kodiak Sciences Inc 5,183 USD 489,894 406,458 0.05
Laboratory Corp of America Holdings 7,128 USD 1,205,363 1,658,031 0.21
McKesson Corp 16,788 USD 2,094,940 2,707,258 0.35
Mirati Therapeutics Inc 7,788 USD 1,338,702 1,060,794 0.14
Mondelez International Inc 295,665 USD 15,573,265 15,567,352 1.99
Monster Beverage Corp 169,507 USD 12,666,852 13,057,142 1.67
Pfizer Inc 851,747 USD 28,160,528 28,125,821 3.59
Procter & Gamble Co 132,519 USD 12,363,067 15,077,822 1.93
Regeneron Pharmaceuticals Inc 12,986 USD 6,135,281 6,116,199 0.78
Rocket Pharmaceuticals Inc 21,425 USD 1,059,117 800,163 0.10
Seagen Inc 39,653 USD 6,294,695 5,279,042 0.67
Syneos Health Inc 43,027 USD 2,874,090 3,246,889 0.41
Sysco Corp 336,681 USD 18,697,743 22,073,487 2.82
Teleflex Inc 34,313 USD 9,905,343 11,625,449 1.48
Thermo Fisher Scientific Inc 51,884 USD 9,959,063 22,070,935 2.82
UnitedHealth Group Inc 25,342 USD 7,052,367 8,557,172 1.09
US Foods Holding Corp 109,583 USD 2,935,074 3,544,653 0.45
Vertex Pharmaceuticals Inc 47,961 USD 9,713,275 8,154,462 1.04
Walmart Inc 79,417 USD 9,302,917 9,443,786 1.21
Total United States of America 364,402,883 424,836,902 54.24
TOTAL LISTED SECURITIES : SHARES 657,387,130 766,251,849 97.83
2) LISTED SECURITIES : INVESTMENT FUNDS
SPAIN
Mediolanum Fondcuenta FI1,2 445,312 EUR 4,417,752 4,505,209 0.58
Total Spain 4,417,752 4,505,209 0.58
TOTAL LISTED SECURITIES : INVESTMENT FUNDS 4,417,752 4,505,209 0.58
TOTAL TRANSFERABLE SECURITIES ADMITTED TO AN OFFICIAL STOCK EXCHANGE LISTING 661,804,882 770,757,058 98.41
1This is related party per note 22. 2 UCITS.
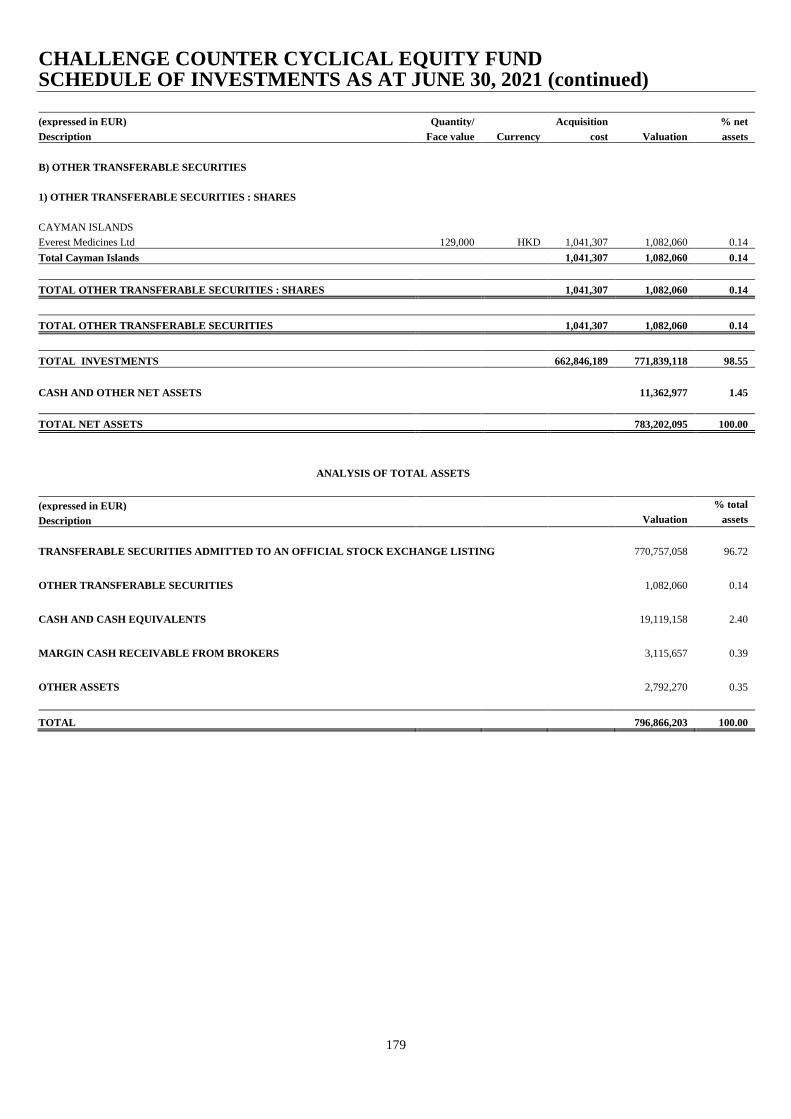
CHALLENGE COUNTER CYCLICAL EQUITY FUND SCHEDULE OF INVESTMENTS AS AT JUNE 30, 2021 (continued)
179
(expressed in EUR) Quantity/ Acquisition % net
Description Face value Currency cost Valuation assets
B) OTHER TRANSFERABLE SECURITIES
1) OTHER TRANSFERABLE SECURITIES : SHARES
CAYMAN ISLANDS
Everest Medicines Ltd 129,000 HKD 1,041,307 1,082,060 0.14
Total Cayman Islands 1,041,307 1,082,060 0.14
TOTAL OTHER TRANSFERABLE SECURITIES : SHARES 1,041,307 1,082,060 0.14
TOTAL OTHER TRANSFERABLE SECURITIES 1,041,307 1,082,060 0.14
TOTAL INVESTMENTS 662,846,189 771,839,118 98.55
CASH AND OTHER NET ASSETS 11,362,977 1.45
TOTAL NET ASSETS 783,202,095 100.00
ANALYSIS OF TOTAL ASSETS
(expressed in EUR) % total
Description Valuation assets
TRANSFERABLE SECURITIES ADMITTED TO AN OFFICIAL STOCK EXCHANGE LISTING
770,757,058 96.72
OTHER TRANSFERABLE SECURITIES
1,082,060 0.14
CASH AND CASH EQUIVALENTS
19,119,158 2.40
MARGIN CASH RECEIVABLE FROM BROKERS
3,115,657 0.39
OTHER ASSETS
2,792,270 0.35
TOTAL 796,866,203 100.00
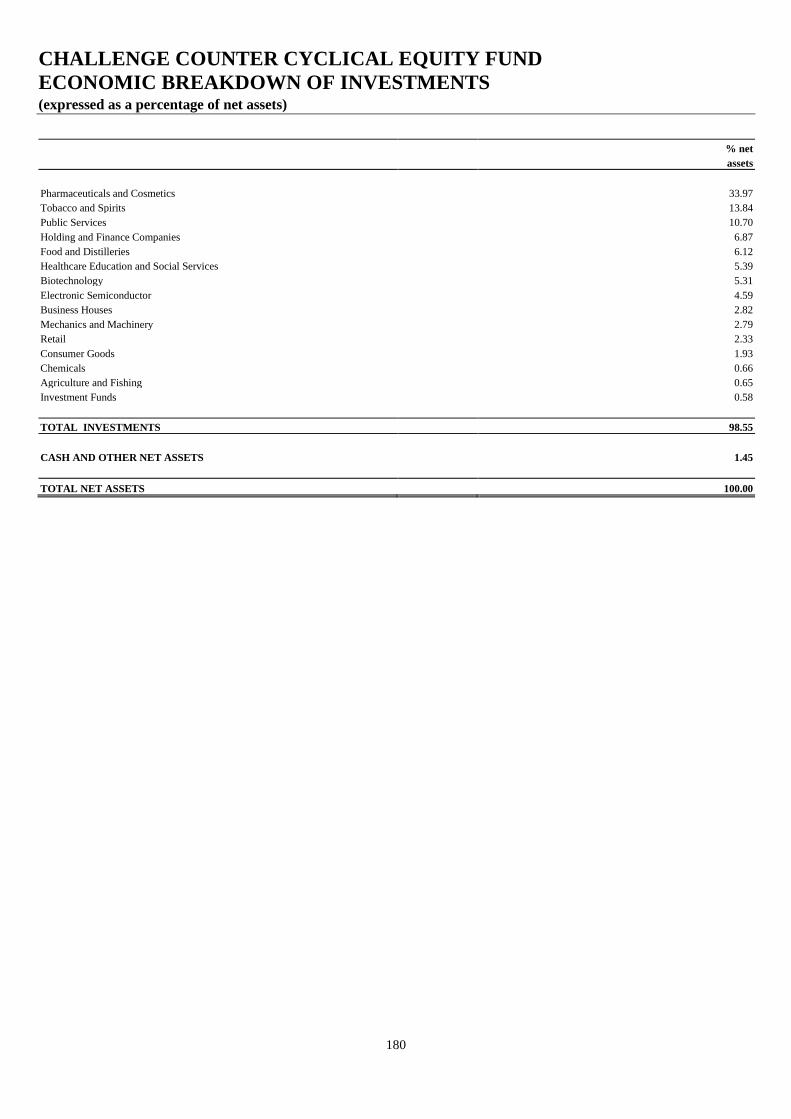
CHALLENGE COUNTER CYCLICAL EQUITY FUND
ECONOMIC BREAKDOWN OF INVESTMENTS (expressed as a percentage of net assets)
180
% net
assets
Pharmaceuticals and Cosmetics 33.97
Tobacco and Spirits 13.84
Public Services 10.70
Holding and Finance Companies 6.87
Food and Distilleries 6.12
Healthcare Education and Social Services 5.39
Biotechnology 5.31
Electronic Semiconductor 4.59
Business Houses 2.82
Mechanics and Machinery 2.79
Retail 2.33
Consumer Goods 1.93
Chemicals 0.66
Agriculture and Fishing 0.65
Investment Funds 0.58
TOTAL INVESTMENTS 98.55
CASH AND OTHER NET ASSETS 1.45
TOTAL NET ASSETS 100.00
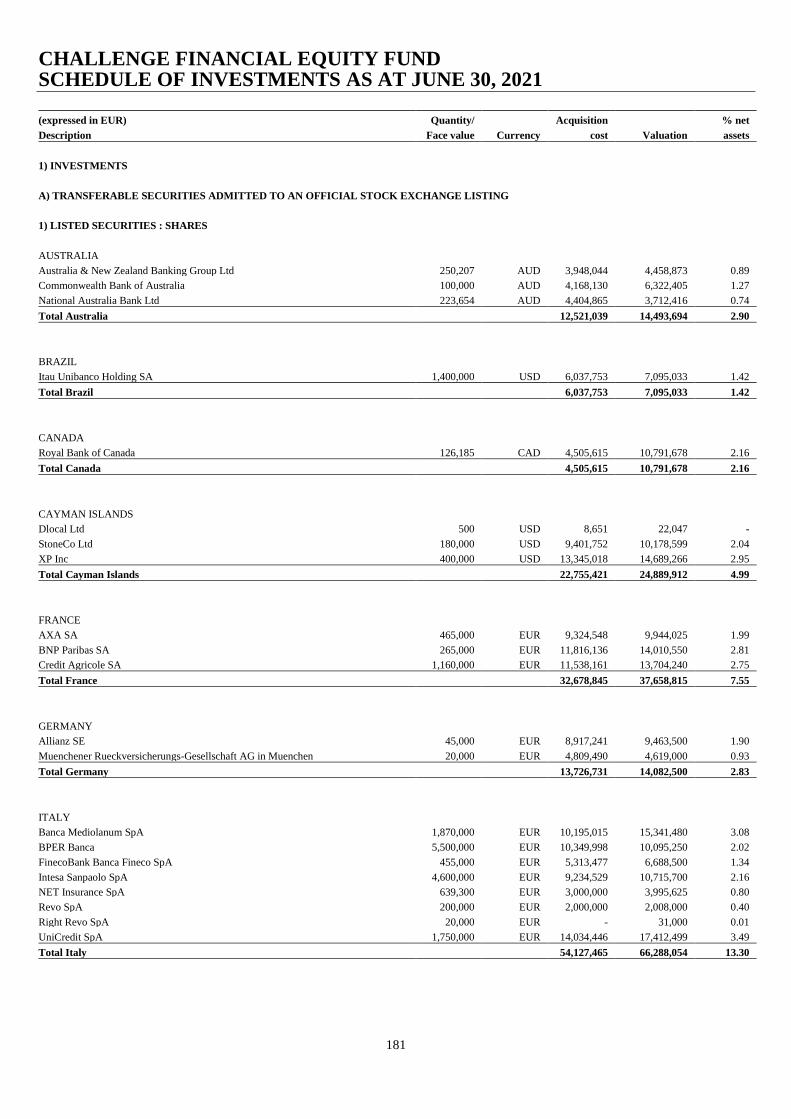
CHALLENGE FINANCIAL EQUITY FUND SCHEDULE OF INVESTMENTS AS AT JUNE 30, 2021
181
(expressed in EUR) Quantity/ Acquisition % net
Description Face value Currency cost Valuation assets
1) INVESTMENTS
A) TRANSFERABLE SECURITIES ADMITTED TO AN OFFICIAL STOCK EXCHANGE LISTING
1) LISTED SECURITIES : SHARES
AUSTRALIA
Australia & New Zealand Banking Group Ltd 250,207 AUD 3,948,044 4,458,873 0.89
Commonwealth Bank of Australia 100,000 AUD 4,168,130 6,322,405 1.27
National Australia Bank Ltd 223,654 AUD 4,404,865 3,712,416 0.74
Total Australia 12,521,039 14,493,694 2.90
BRAZIL
Itau Unibanco Holding SA 1,400,000 USD 6,037,753 7,095,033 1.42
Total Brazil 6,037,753 7,095,033 1.42
CANADA
Royal Bank of Canada 126,185 CAD 4,505,615 10,791,678 2.16
Total Canada 4,505,615 10,791,678 2.16
CAYMAN ISLANDS
Dlocal Ltd 500 USD 8,651 22,047 -
StoneCo Ltd 180,000 USD 9,401,752 10,178,599 2.04
XP Inc 400,000 USD 13,345,018 14,689,266 2.95
Total Cayman Islands 22,755,421 24,889,912 4.99
FRANCE
AXA SA 465,000 EUR 9,324,548 9,944,025 1.99
BNP Paribas SA 265,000 EUR 11,816,136 14,010,550 2.81
Credit Agricole SA 1,160,000 EUR 11,538,161 13,704,240 2.75
Total France 32,678,845 37,658,815 7.55
GERMANY
Allianz SE 45,000 EUR 8,917,241 9,463,500 1.90
Muenchener Rueckversicherungs-Gesellschaft AG in Muenchen 20,000 EUR 4,809,490 4,619,000 0.93
Total Germany 13,726,731 14,082,500 2.83
ITALY
Banca Mediolanum SpA 1,870,000 EUR 10,195,015 15,341,480 3.08
BPER Banca 5,500,000 EUR 10,349,998 10,095,250 2.02
FinecoBank Banca Fineco SpA 455,000 EUR 5,313,477 6,688,500 1.34
Intesa Sanpaolo SpA 4,600,000 EUR 9,234,529 10,715,700 2.16
NET Insurance SpA 639,300 EUR 3,000,000 3,995,625 0.80
Revo SpA 200,000 EUR 2,000,000 2,008,000 0.40
Right Revo SpA 20,000 EUR - 31,000 0.01
UniCredit SpA 1,750,000 EUR 14,034,446 17,412,499 3.49
Total Italy 54,127,465 66,288,054 13.30
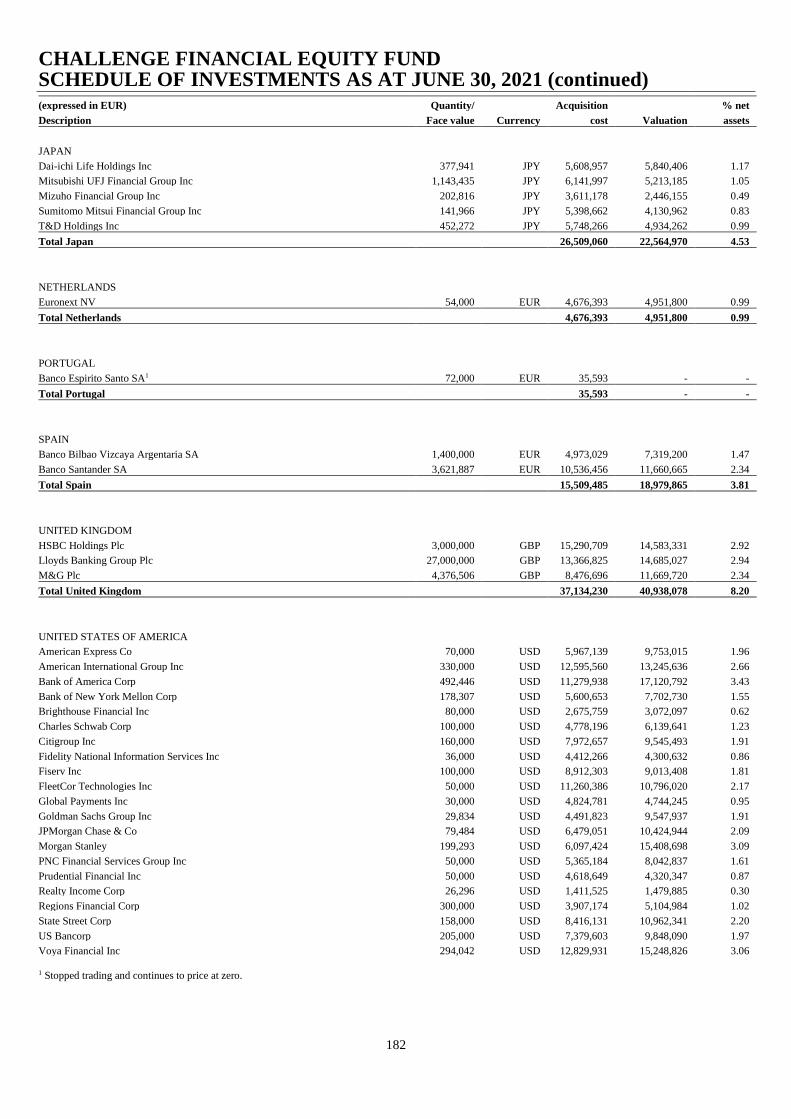
CHALLENGE FINANCIAL EQUITY FUND SCHEDULE OF INVESTMENTS AS AT JUNE 30, 2021 (continued)
182
(expressed in EUR) Quantity/ Acquisition % net
Description Face value Currency cost Valuation assets
JAPAN
Dai-ichi Life Holdings Inc 377,941 JPY 5,608,957 5,840,406 1.17
Mitsubishi UFJ Financial Group Inc 1,143,435 JPY 6,141,997 5,213,185 1.05
Mizuho Financial Group Inc 202,816 JPY 3,611,178 2,446,155 0.49
Sumitomo Mitsui Financial Group Inc 141,966 JPY 5,398,662 4,130,962 0.83
T&D Holdings Inc 452,272 JPY 5,748,266 4,934,262 0.99
Total Japan 26,509,060 22,564,970 4.53
NETHERLANDS
Euronext NV 54,000 EUR 4,676,393 4,951,800 0.99
Total Netherlands 4,676,393 4,951,800 0.99
PORTUGAL
Banco Espirito Santo SA1 72,000 EUR 35,593 - -
Total Portugal 35,593 - -
SPAIN
Banco Bilbao Vizcaya Argentaria SA 1,400,000 EUR 4,973,029 7,319,200 1.47
Banco Santander SA 3,621,887 EUR 10,536,456 11,660,665 2.34
Total Spain 15,509,485 18,979,865 3.81
UNITED KINGDOM
HSBC Holdings Plc 3,000,000 GBP 15,290,709 14,583,331 2.92
Lloyds Banking Group Plc 27,000,000 GBP 13,366,825 14,685,027 2.94
M&G Plc 4,376,506 GBP 8,476,696 11,669,720 2.34
Total United Kingdom 37,134,230 40,938,078 8.20
UNITED STATES OF AMERICA
American Express Co 70,000 USD 5,967,139 9,753,015 1.96
American International Group Inc 330,000 USD 12,595,560 13,245,636 2.66
Bank of America Corp 492,446 USD 11,279,938 17,120,792 3.43
Bank of New York Mellon Corp 178,307 USD 5,600,653 7,702,730 1.55
Brighthouse Financial Inc 80,000 USD 2,675,759 3,072,097 0.62
Charles Schwab Corp 100,000 USD 4,778,196 6,139,641 1.23
Citigroup Inc 160,000 USD 7,972,657 9,545,493 1.91
Fidelity National Information Services Inc 36,000 USD 4,412,266 4,300,632 0.86
Fiserv Inc 100,000 USD 8,912,303 9,013,408 1.81
FleetCor Technologies Inc 50,000 USD 11,260,386 10,796,020 2.17
Global Payments Inc 30,000 USD 4,824,781 4,744,245 0.95
Goldman Sachs Group Inc 29,834 USD 4,491,823 9,547,937 1.91
JPMorgan Chase & Co 79,484 USD 6,479,051 10,424,944 2.09
Morgan Stanley 199,293 USD 6,097,424 15,408,698 3.09
PNC Financial Services Group Inc 50,000 USD 5,365,184 8,042,837 1.61
Prudential Financial Inc 50,000 USD 4,618,649 4,320,347 0.87
Realty Income Corp 26,296 USD 1,411,525 1,479,885 0.30
Regions Financial Corp 300,000 USD 3,907,174 5,104,984 1.02
State Street Corp 158,000 USD 8,416,131 10,962,341 2.20
US Bancorp 205,000 USD 7,379,603 9,848,090 1.97
Voya Financial Inc 294,042 USD 12,829,931 15,248,826 3.06
1 Stopped trading and continues to price at zero.
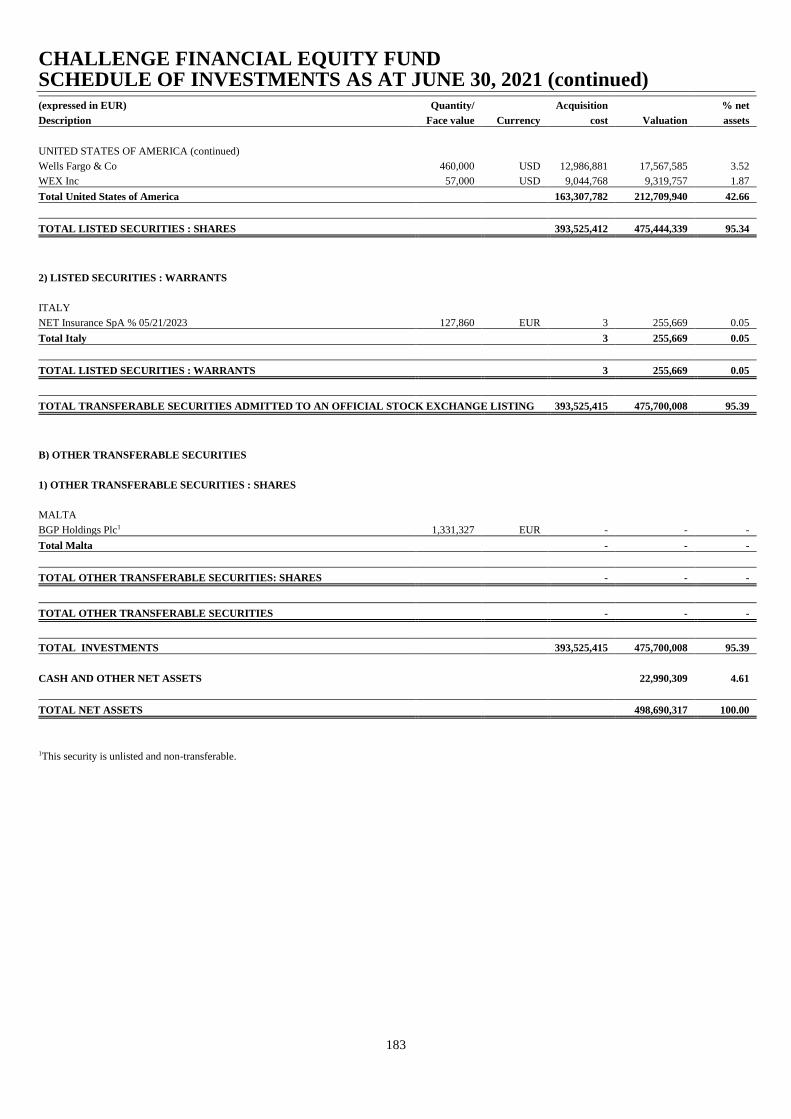
CHALLENGE FINANCIAL EQUITY FUND SCHEDULE OF INVESTMENTS AS AT JUNE 30, 2021 (continued)
183
(expressed in EUR) Quantity/ Acquisition % net
Description Face value Currency cost Valuation assets
UNITED STATES OF AMERICA (continued)
Wells Fargo & Co 460,000 USD 12,986,881 17,567,585 3.52
WEX Inc 57,000 USD 9,044,768 9,319,757 1.87
Total United States of America 163,307,782 212,709,940 42.66
TOTAL LISTED SECURITIES : SHARES 393,525,412 475,444,339 95.34
2) LISTED SECURITIES : WARRANTS
ITALY
NET Insurance SpA % 05/21/2023 127,860 EUR 3 255,669 0.05
Total Italy 3 255,669 0.05
TOTAL LISTED SECURITIES : WARRANTS 3 255,669 0.05
TOTAL TRANSFERABLE SECURITIES ADMITTED TO AN OFFICIAL STOCK EXCHANGE LISTING 393,525,415 475,700,008 95.39
B) OTHER TRANSFERABLE SECURITIES
1) OTHER TRANSFERABLE SECURITIES : SHARES
MALTA
BGP Holdings Plc1 1,331,327 EUR - - -
Total Malta - - -
TOTAL OTHER TRANSFERABLE SECURITIES: SHARES - - -
TOTAL OTHER TRANSFERABLE SECURITIES - - -
TOTAL INVESTMENTS 393,525,415 475,700,008 95.39
CASH AND OTHER NET ASSETS 22,990,309 4.61
TOTAL NET ASSETS 498,690,317 100.00
1This security is unlisted and non-transferable.
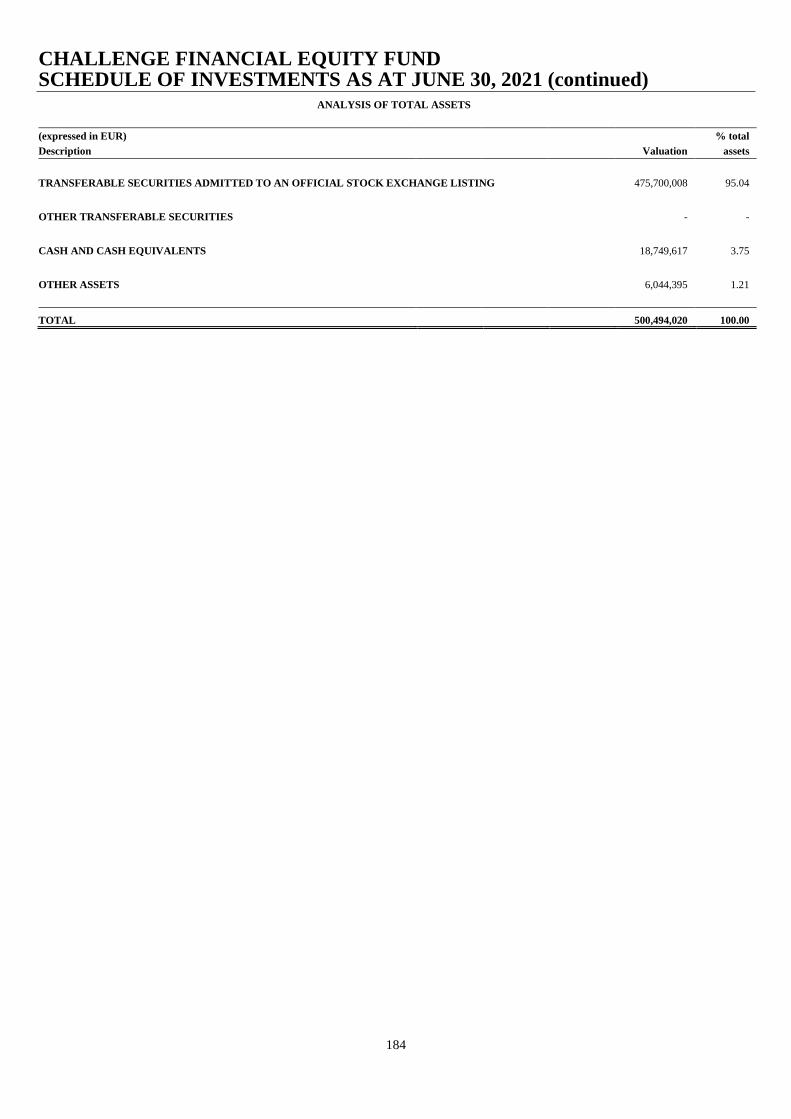
CHALLENGE FINANCIAL EQUITY FUND SCHEDULE OF INVESTMENTS AS AT JUNE 30, 2021 (continued)
184
ANALYSIS OF TOTAL ASSETS
(expressed in EUR) % total
Description Valuation assets
TRANSFERABLE SECURITIES ADMITTED TO AN OFFICIAL STOCK EXCHANGE LISTING 475,700,008 95.04
OTHER TRANSFERABLE SECURITIES - -
CASH AND CASH EQUIVALENTS 18,749,617 3.75
OTHER ASSETS 6,044,395 1.21
TOTAL 500,494,020 100.00
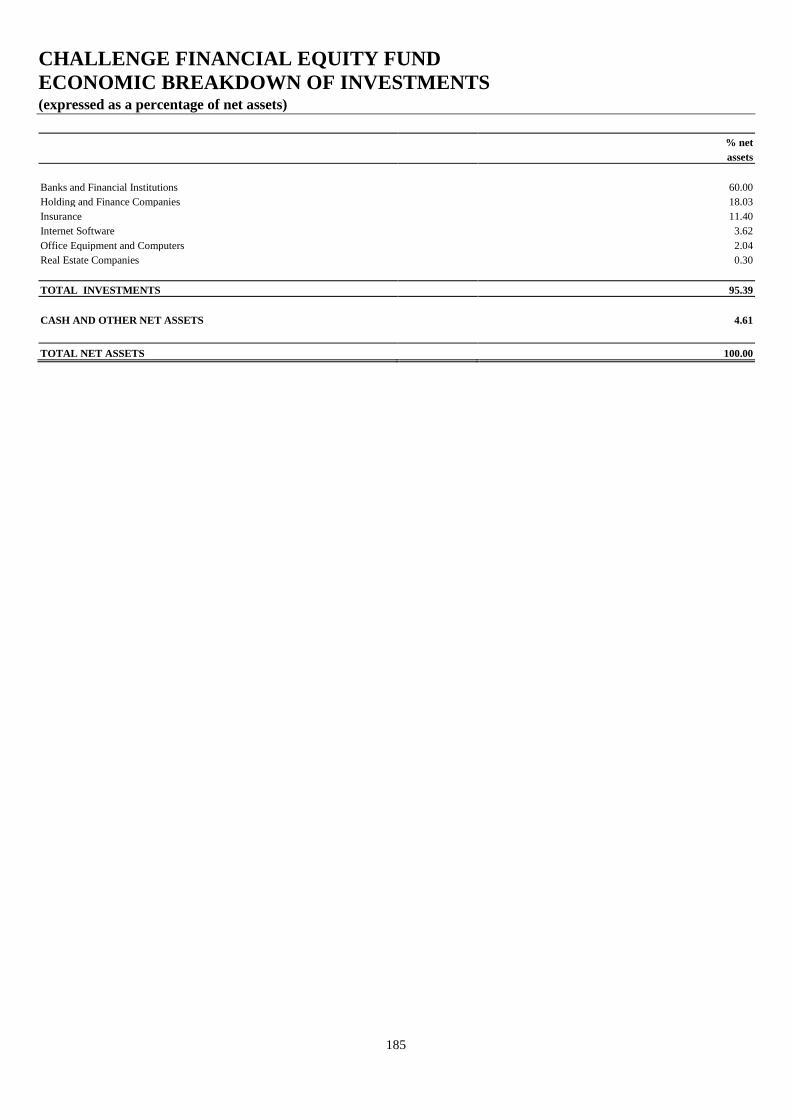
CHALLENGE FINANCIAL EQUITY FUND
ECONOMIC BREAKDOWN OF INVESTMENTS (expressed as a percentage of net assets)
185
% net
assets
Banks and Financial Institutions 60.00
Holding and Finance Companies 18.03
Insurance 11.40
Internet Software 3.62
Office Equipment and Computers 2.04
Real Estate Companies 0.30
TOTAL INVESTMENTS 95.39
CASH AND OTHER NET ASSETS 4.61
TOTAL NET ASSETS 100.00

CHALLENGE TECHNOLOGY EQUITY FUND SCHEDULE OF INVESTMENTS AS AT JUNE 30, 2021
186
(expressed in EUR) Quantity/ Acquisition % net
Description Face value Currency cost Valuation assets
1) INVESTMENTS
A) TRANSFERABLE SECURITIES ADMITTED TO AN OFFICIAL STOCK EXCHANGE LISTING
1) LISTED SECURITIES : SHARES
BERMUDA
Genpact Ltd 607,554 USD 20,572,336 23,274,457 1.39
Total Bermuda 20,572,336 23,274,457 1.39
CANADA
Shopify Inc 2,967 USD 3,369,751 3,655,222 0.22
Total Canada 3,369,751 3,655,222 0.22
CAYMAN ISLANDS
Farfetch Ltd 23,585 USD 1,005,548 1,001,552 0.06
Total Cayman Islands 1,005,548 1,001,552 0.06
FRANCE
SOITEC 17,348 EUR 3,280,532 3,224,993 0.19
Total France 3,280,532 3,224,993 0.19
GERMANY
SAP SE 37,181 EUR 3,918,428 4,418,590 0.26
Total Germany 3,918,428 4,418,590 0.26
IRELAND
Seagate Technology Holdings Plc 254,290 USD 16,794,700 18,854,642 1.12
Total Ireland 16,794,700 18,854,642 1.12
ISRAEL
CyberArk Software Ltd 28,913 USD 3,629,767 3,176,066 0.19
Total Israel 3,629,767 3,176,066 0.19
JAPAN
Nexon Co Ltd1 166,000 JPY 4,542,939 3,122,675 0.19
Sony Group Corp 49,900 JPY 4,626,304 4,100,106 0.24
Total Japan 9,169,243 7,222,781 0.43
NETHERLANDS
Adyen NV 2,110 EUR 4,609,133 4,347,655 0.26
ASM International NV 15,441 EUR 4,095,900 4,277,157 0.26
ASML Holding NV 17,474 EUR 8,662,352 10,124,436 0.60
BE Semiconductor Industries NV 242,863 EUR 9,114,043 17,374,419 1.04
Total Netherlands 26,481,428 36,123,667 2.16
1 157,700 quantity of this security position is out on loan as at financial period end.
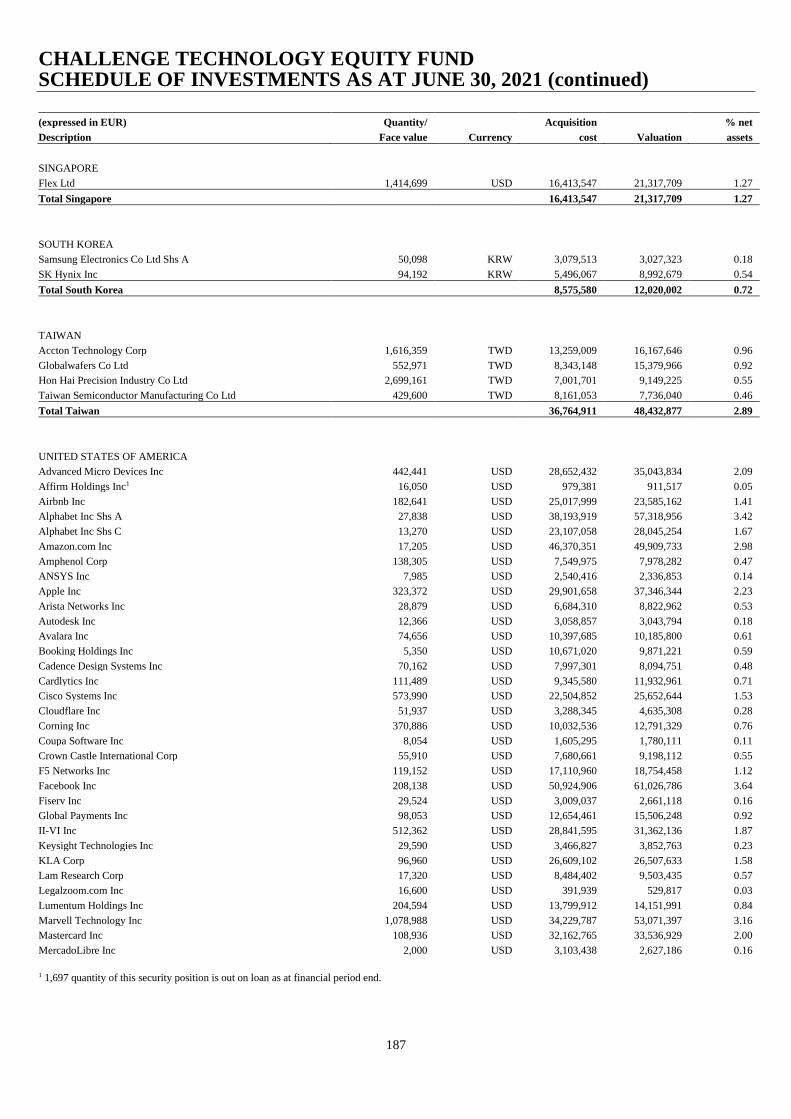
CHALLENGE TECHNOLOGY EQUITY FUND SCHEDULE OF INVESTMENTS AS AT JUNE 30, 2021 (continued)
187
(expressed in EUR) Quantity/ Acquisition % net
Description Face value Currency cost Valuation assets
SINGAPORE
Flex Ltd 1,414,699 USD 16,413,547 21,317,709 1.27
Total Singapore 16,413,547 21,317,709 1.27
SOUTH KOREA
Samsung Electronics Co Ltd Shs A 50,098 KRW 3,079,513 3,027,323 0.18
SK Hynix Inc 94,192 KRW 5,496,067 8,992,679 0.54
Total South Korea 8,575,580 12,020,002 0.72
TAIWAN
Accton Technology Corp 1,616,359 TWD 13,259,009 16,167,646 0.96
Globalwafers Co Ltd 552,971 TWD 8,343,148 15,379,966 0.92
Hon Hai Precision Industry Co Ltd 2,699,161 TWD 7,001,701 9,149,225 0.55
Taiwan Semiconductor Manufacturing Co Ltd 429,600 TWD 8,161,053 7,736,040 0.46
Total Taiwan 36,764,911 48,432,877 2.89
UNITED STATES OF AMERICA
Advanced Micro Devices Inc 442,441 USD 28,652,432 35,043,834 2.09
Affirm Holdings Inc1 16,050 USD 979,381 911,517 0.05
Airbnb Inc 182,641 USD 25,017,999 23,585,162 1.41
Alphabet Inc Shs A 27,838 USD 38,193,919 57,318,956 3.42
Alphabet Inc Shs C 13,270 USD 23,107,058 28,045,254 1.67
Amazon.com Inc 17,205 USD 46,370,351 49,909,733 2.98
Amphenol Corp 138,305 USD 7,549,975 7,978,282 0.47
ANSYS Inc 7,985 USD 2,540,416 2,336,853 0.14
Apple Inc 323,372 USD 29,901,658 37,346,344 2.23
Arista Networks Inc 28,879 USD 6,684,310 8,822,962 0.53
Autodesk Inc 12,366 USD 3,058,857 3,043,794 0.18
Avalara Inc 74,656 USD 10,397,685 10,185,800 0.61
Booking Holdings Inc 5,350 USD 10,671,020 9,871,221 0.59
Cadence Design Systems Inc 70,162 USD 7,997,301 8,094,751 0.48
Cardlytics Inc 111,489 USD 9,345,580 11,932,961 0.71
Cisco Systems Inc 573,990 USD 22,504,852 25,652,644 1.53
Cloudflare Inc 51,937 USD 3,288,345 4,635,308 0.28
Corning Inc 370,886 USD 10,032,536 12,791,329 0.76
Coupa Software Inc 8,054 USD 1,605,295 1,780,111 0.11
Crown Castle International Corp 55,910 USD 7,680,661 9,198,112 0.55
F5 Networks Inc 119,152 USD 17,110,960 18,754,458 1.12
Facebook Inc 208,138 USD 50,924,906 61,026,786 3.64
Fiserv Inc 29,524 USD 3,009,037 2,661,118 0.16
Global Payments Inc 98,053 USD 12,654,461 15,506,248 0.92
II-VI Inc 512,362 USD 28,841,595 31,362,136 1.87
Keysight Technologies Inc 29,590 USD 3,466,827 3,852,763 0.23
KLA Corp 96,960 USD 26,609,102 26,507,633 1.58
Lam Research Corp 17,320 USD 8,484,402 9,503,435 0.57
Legalzoom.com Inc 16,600 USD 391,939 529,817 0.03
Lumentum Holdings Inc 204,594 USD 13,799,912 14,151,991 0.84
Marvell Technology Inc 1,078,988 USD 34,229,787 53,071,397 3.16
Mastercard Inc 108,936 USD 32,162,765 33,536,929 2.00
MercadoLibre Inc 2,000 USD 3,103,438 2,627,186 0.16
1 1,697 quantity of this security position is out on loan as at financial period end.
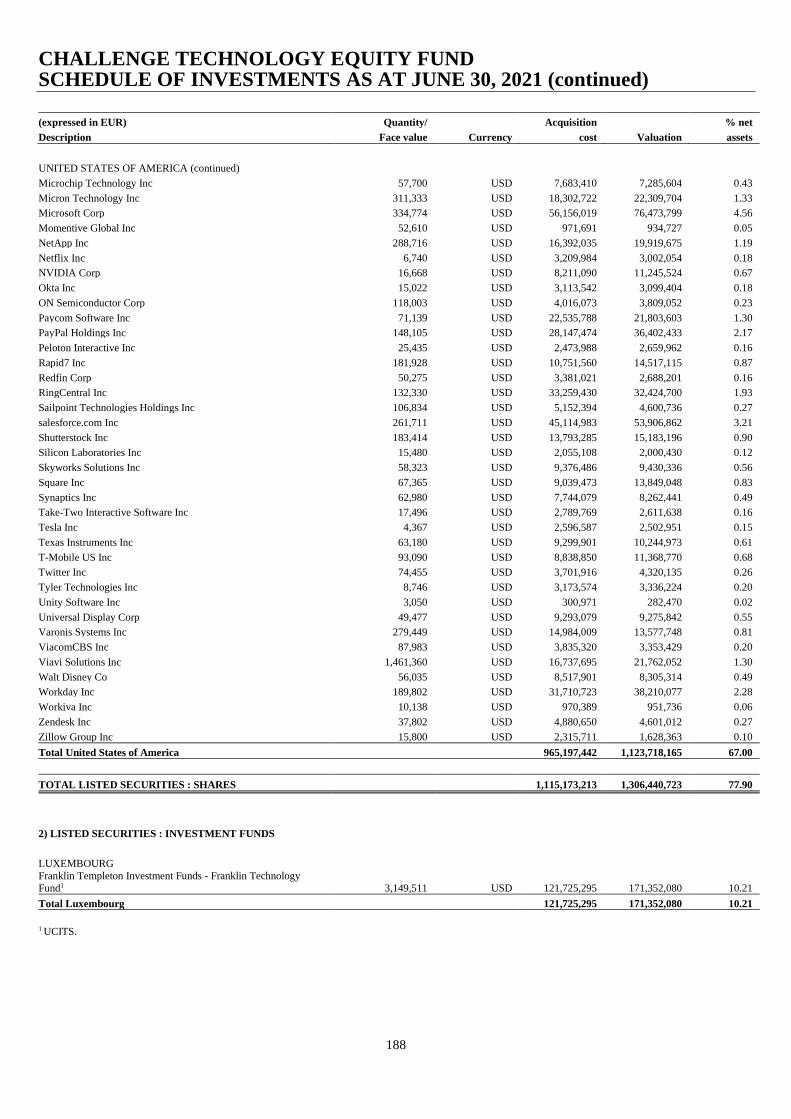
CHALLENGE TECHNOLOGY EQUITY FUND SCHEDULE OF INVESTMENTS AS AT JUNE 30, 2021 (continued)
188
(expressed in EUR) Quantity/ Acquisition % net
Description Face value Currency cost Valuation assets
UNITED STATES OF AMERICA (continued)
Microchip Technology Inc 57,700 USD 7,683,410 7,285,604 0.43
Micron Technology Inc 311,333 USD 18,302,722 22,309,704 1.33
Microsoft Corp 334,774 USD 56,156,019 76,473,799 4.56
Momentive Global Inc 52,610 USD 971,691 934,727 0.05
NetApp Inc 288,716 USD 16,392,035 19,919,675 1.19
Netflix Inc 6,740 USD 3,209,984 3,002,054 0.18
NVIDIA Corp 16,668 USD 8,211,090 11,245,524 0.67
Okta Inc 15,022 USD 3,113,542 3,099,404 0.18
ON Semiconductor Corp 118,003 USD 4,016,073 3,809,052 0.23
Paycom Software Inc 71,139 USD 22,535,788 21,803,603 1.30
PayPal Holdings Inc 148,105 USD 28,147,474 36,402,433 2.17
Peloton Interactive Inc 25,435 USD 2,473,988 2,659,962 0.16
Rapid7 Inc 181,928 USD 10,751,560 14,517,115 0.87
Redfin Corp 50,275 USD 3,381,021 2,688,201 0.16
RingCentral Inc 132,330 USD 33,259,430 32,424,700 1.93
Sailpoint Technologies Holdings Inc 106,834 USD 5,152,394 4,600,736 0.27
salesforce.com Inc 261,711 USD 45,114,983 53,906,862 3.21
Shutterstock Inc 183,414 USD 13,793,285 15,183,196 0.90
Silicon Laboratories Inc 15,480 USD 2,055,108 2,000,430 0.12
Skyworks Solutions Inc 58,323 USD 9,376,486 9,430,336 0.56
Square Inc 67,365 USD 9,039,473 13,849,048 0.83
Synaptics Inc 62,980 USD 7,744,079 8,262,441 0.49
Take-Two Interactive Software Inc 17,496 USD 2,789,769 2,611,638 0.16
Tesla Inc 4,367 USD 2,596,587 2,502,951 0.15
Texas Instruments Inc 63,180 USD 9,299,901 10,244,973 0.61
T-Mobile US Inc 93,090 USD 8,838,850 11,368,770 0.68
Twitter Inc 74,455 USD 3,701,916 4,320,135 0.26
Tyler Technologies Inc 8,746 USD 3,173,574 3,336,224 0.20
Unity Software Inc 3,050 USD 300,971 282,470 0.02
Universal Display Corp 49,477 USD 9,293,079 9,275,842 0.55
Varonis Systems Inc 279,449 USD 14,984,009 13,577,748 0.81
ViacomCBS Inc 87,983 USD 3,835,320 3,353,429 0.20
Viavi Solutions Inc 1,461,360 USD 16,737,695 21,762,052 1.30
Walt Disney Co 56,035 USD 8,517,901 8,305,314 0.49
Workday Inc 189,802 USD 31,710,723 38,210,077 2.28
Workiva Inc 10,138 USD 970,389 951,736 0.06
Zendesk Inc 37,802 USD 4,880,650 4,601,012 0.27
Zillow Group Inc 15,800 USD 2,315,711 1,628,363 0.10
Total United States of America 965,197,442 1,123,718,165 67.00
TOTAL LISTED SECURITIES : SHARES 1,115,173,213 1,306,440,723 77.90
2) LISTED SECURITIES : INVESTMENT FUNDS
LUXEMBOURG Franklin Templeton Investment Funds - Franklin Technology
Fund1 3,149,511 USD 121,725,295 171,352,080 10.21
Total Luxembourg 121,725,295 171,352,080 10.21
1 UCITS.
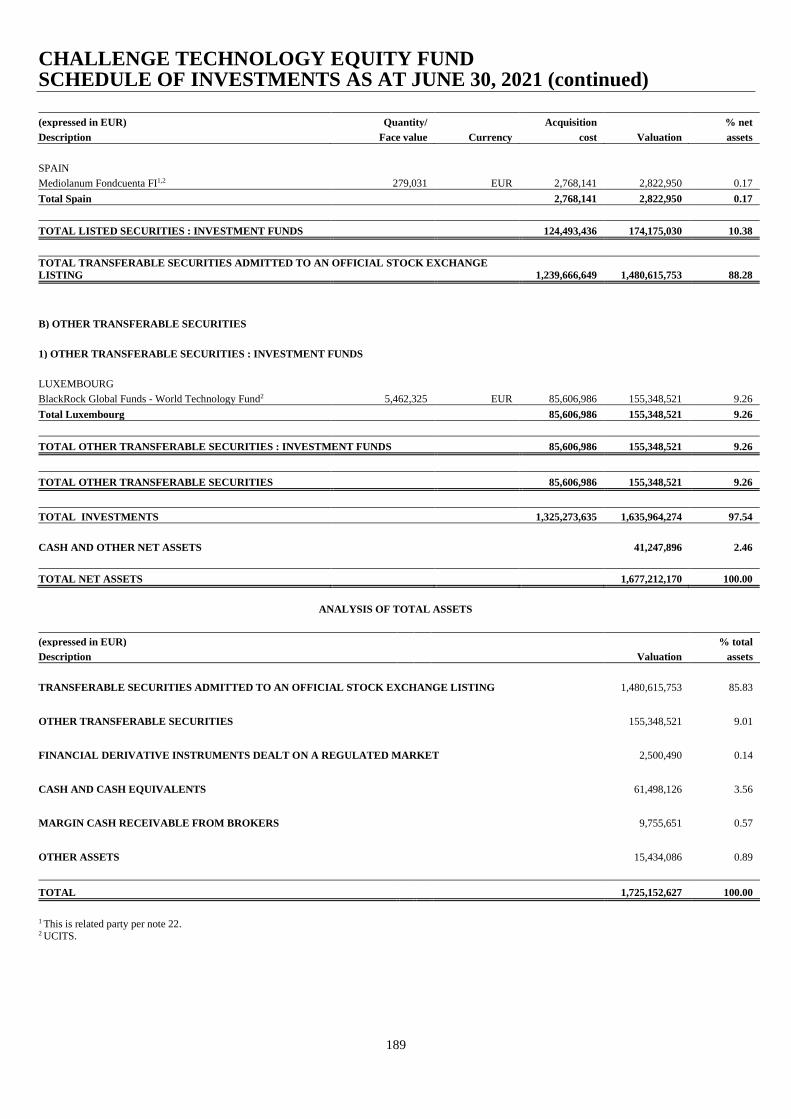
CHALLENGE TECHNOLOGY EQUITY FUND SCHEDULE OF INVESTMENTS AS AT JUNE 30, 2021 (continued)
189
(expressed in EUR) Quantity/ Acquisition % net
Description Face value Currency cost Valuation assets
SPAIN
Mediolanum Fondcuenta FI1,2 279,031 EUR 2,768,141 2,822,950 0.17
Total Spain 2,768,141 2,822,950 0.17
TOTAL LISTED SECURITIES : INVESTMENT FUNDS 124,493,436 174,175,030 10.38
TOTAL TRANSFERABLE SECURITIES ADMITTED TO AN OFFICIAL STOCK EXCHANGE
LISTING 1,239,666,649 1,480,615,753 88.28
B) OTHER TRANSFERABLE SECURITIES
1) OTHER TRANSFERABLE SECURITIES : INVESTMENT FUNDS
LUXEMBOURG
BlackRock Global Funds - World Technology Fund2 5,462,325 EUR 85,606,986 155,348,521 9.26
Total Luxembourg 85,606,986 155,348,521 9.26
TOTAL OTHER TRANSFERABLE SECURITIES : INVESTMENT FUNDS 85,606,986 155,348,521 9.26
TOTAL OTHER TRANSFERABLE SECURITIES 85,606,986 155,348,521 9.26
TOTAL INVESTMENTS 1,325,273,635 1,635,964,274 97.54
CASH AND OTHER NET ASSETS 41,247,896 2.46
TOTAL NET ASSETS 1,677,212,170 100.00
ANALYSIS OF TOTAL ASSETS
(expressed in EUR) % total
Description Valuation assets
TRANSFERABLE SECURITIES ADMITTED TO AN OFFICIAL STOCK EXCHANGE LISTING 1,480,615,753 85.83
OTHER TRANSFERABLE SECURITIES
155,348,521 9.01
FINANCIAL DERIVATIVE INSTRUMENTS DEALT ON A REGULATED MARKET 2,500,490 0.14
CASH AND CASH EQUIVALENTS
61,498,126 3.56
MARGIN CASH RECEIVABLE FROM BROKERS
9,755,651 0.57
OTHER ASSETS
15,434,086 0.89
TOTAL 1,725,152,627 100.00
1 This is related party per note 22. 2 UCITS.
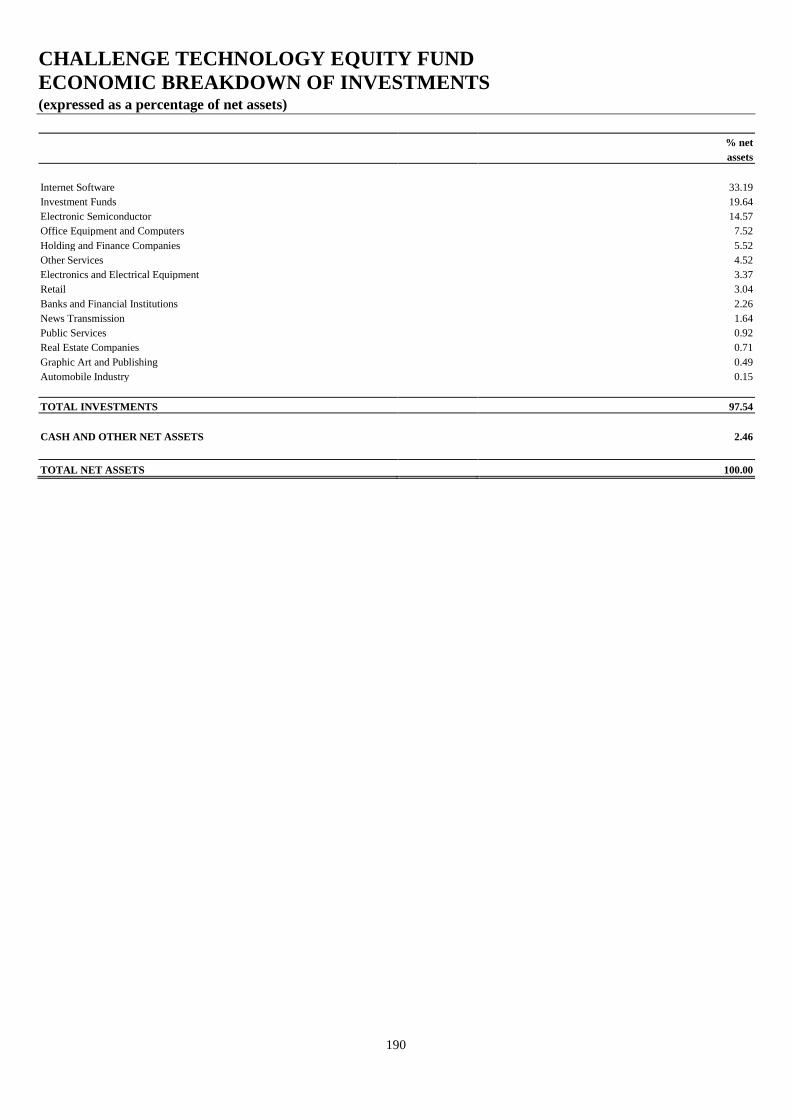
CHALLENGE TECHNOLOGY EQUITY FUND
ECONOMIC BREAKDOWN OF INVESTMENTS (expressed as a percentage of net assets)
190
% net
assets
Internet Software 33.19
Investment Funds 19.64
Electronic Semiconductor 14.57
Office Equipment and Computers 7.52
Holding and Finance Companies 5.52
Other Services 4.52
Electronics and Electrical Equipment 3.37
Retail 3.04
Banks and Financial Institutions 2.26
News Transmission 1.64
Public Services 0.92
Real Estate Companies 0.71
Graphic Art and Publishing 0.49
Automobile Industry 0.15
TOTAL INVESTMENTS 97.54
CASH AND OTHER NET ASSETS 2.46
TOTAL NET ASSETS 100.00
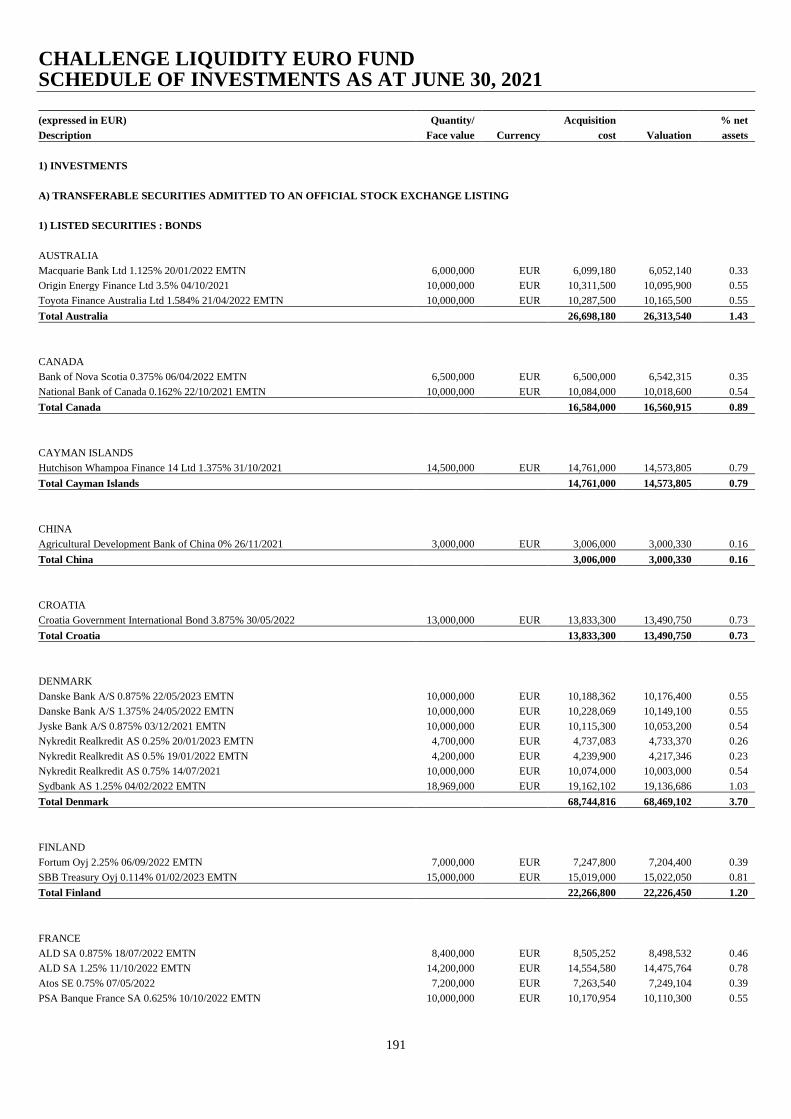
CHALLENGE LIQUIDITY EURO FUND SCHEDULE OF INVESTMENTS AS AT JUNE 30, 2021
191
(expressed in EUR) Quantity/ Acquisition % net
Description Face value Currency cost Valuation assets
1) INVESTMENTS
A) TRANSFERABLE SECURITIES ADMITTED TO AN OFFICIAL STOCK EXCHANGE LISTING
1) LISTED SECURITIES : BONDS
AUSTRALIA
Macquarie Bank Ltd 1.125% 20/01/2022 EMTN 6,000,000 EUR 6,099,180 6,052,140 0.33
Origin Energy Finance Ltd 3.5% 04/10/2021 10,000,000 EUR 10,311,500 10,095,900 0.55
Toyota Finance Australia Ltd 1.584% 21/04/2022 EMTN 10,000,000 EUR 10,287,500 10,165,500 0.55
Total Australia 26,698,180 26,313,540 1.43
CANADA
Bank of Nova Scotia 0.375% 06/04/2022 EMTN 6,500,000 EUR 6,500,000 6,542,315 0.35
National Bank of Canada 0.162% 22/10/2021 EMTN 10,000,000 EUR 10,084,000 10,018,600 0.54
Total Canada 16,584,000 16,560,915 0.89
CAYMAN ISLANDS
Hutchison Whampoa Finance 14 Ltd 1.375% 31/10/2021 14,500,000 EUR 14,761,000 14,573,805 0.79
Total Cayman Islands 14,761,000 14,573,805 0.79
CHINA
Agricultural Development Bank of China 0% 26/11/2021 3,000,000 EUR 3,006,000 3,000,330 0.16
Total China 3,006,000 3,000,330 0.16
CROATIA
Croatia Government International Bond 3.875% 30/05/2022 13,000,000 EUR 13,833,300 13,490,750 0.73
Total Croatia 13,833,300 13,490,750 0.73
DENMARK
Danske Bank A/S 0.875% 22/05/2023 EMTN 10,000,000 EUR 10,188,362 10,176,400 0.55
Danske Bank A/S 1.375% 24/05/2022 EMTN 10,000,000 EUR 10,228,069 10,149,100 0.55
Jyske Bank A/S 0.875% 03/12/2021 EMTN 10,000,000 EUR 10,115,300 10,053,200 0.54
Nykredit Realkredit AS 0.25% 20/01/2023 EMTN 4,700,000 EUR 4,737,083 4,733,370 0.26
Nykredit Realkredit AS 0.5% 19/01/2022 EMTN 4,200,000 EUR 4,239,900 4,217,346 0.23
Nykredit Realkredit AS 0.75% 14/07/2021 10,000,000 EUR 10,074,000 10,003,000 0.54
Sydbank AS 1.25% 04/02/2022 EMTN 18,969,000 EUR 19,162,102 19,136,686 1.03
Total Denmark 68,744,816 68,469,102 3.70
FINLAND
Fortum Oyj 2.25% 06/09/2022 EMTN 7,000,000 EUR 7,247,800 7,204,400 0.39
SBB Treasury Oyj 0.114% 01/02/2023 EMTN 15,000,000 EUR 15,019,000 15,022,050 0.81
Total Finland 22,266,800 22,226,450 1.20
FRANCE
ALD SA 0.875% 18/07/2022 EMTN 8,400,000 EUR 8,505,252 8,498,532 0.46
ALD SA 1.25% 11/10/2022 EMTN 14,200,000 EUR 14,554,580 14,475,764 0.78
Atos SE 0.75% 07/05/2022 7,200,000 EUR 7,263,540 7,249,104 0.39
PSA Banque France SA 0.625% 10/10/2022 EMTN 10,000,000 EUR 10,170,954 10,110,300 0.55

CHALLENGE LIQUIDITY EURO FUND SCHEDULE OF INVESTMENTS AS AT JUNE 30, 2021 (continued)
192
(expressed in EUR) Quantity/ Acquisition % net
Description Face value Currency cost Valuation assets
FRANCE (continued)
RCI Banque SA 0.25% 08/03/2023 EMTN 10,000,000 EUR 10,060,250 10,050,800 0.54
RCI Banque SA 0.75% 12/01/2022 EMTN 5,000,000 EUR 5,062,500 5,013,650 0.27
Societe Generale SA 0.309% 01/04/2022 EMTN 10,000,000 EUR 10,021,300 10,057,300 0.54
TDF Infrastructure SASU 2.875% 19/10/2022 15,000,000 EUR 15,561,000 15,451,500 0.84
Valeo 0.375% 12/09/2022 EMTN 7,000,000 EUR 7,008,750 7,024,360 0.38
Valeo 0.625% 11/01/2023 EMTN 3,000,000 EUR 3,031,200 3,018,330 0.16
Total France 91,239,326 90,949,640 4.91
GERMANY
Commerzbank AG 1.5% 21/09/2022 EMTN 5,260,000 EUR 5,425,615 5,371,985 0.29
Deutsche Bank AG 1.25% 08/09/2021 EMTN 10,000,000 EUR 10,105,620 10,027,000 0.54
Deutsche Bank AG 2.375% 11/01/2023 EMTN 10,000,000 EUR 10,444,940 10,391,300 0.56
Deutsche Pfandbriefbank AG 0.625% 23/02/2022 EMTN 5,000,000 EUR 5,064,000 5,019,600 0.27
Hamburg Commercial Bank AG 0.5% 23/05/2022 EMTN 20,000,000 EUR 20,143,470 20,136,800 1.09
Santander Consumer Bank AG 0.75% 17/10/2022 EMTN 8,000,000 EUR 8,128,400 8,100,240 0.44
Volkswagen Bank GmbH 0.375% 05/07/2022 EMTN 10,000,000 EUR 10,075,000 10,064,400 0.54
Volkswagen Bank GmbH 1.25% 01/08/2022 EMTN 5,000,000 EUR 5,125,220 5,079,600 0.27
Volkswagen Financial Services AG 0.75% 14/10/2021 EMTN 1,100,000 EUR 1,114,740 1,103,311 0.06
Volkswagen Leasing GmbH 0.5% 20/06/2022 EMTN 5,000,000 EUR 5,048,000 5,035,250 0.27
Total Germany 80,675,005 80,329,486 4.33
GUERNSEY
Credit Suisse Group Funding Guernsey Ltd 1.25% 14/04/2022 EMTN 25,000,000 EUR 25,379,200 25,264,250 1.37
Globalworth Real Estate Investments Ltd 2.875% 20/06/2022 21,100,000 EUR 21,749,022 21,660,205 1.17
Total Guernsey 47,128,222 46,924,455 2.54
HONG KONG
CNAC HK Finbridge Co Ltd 1.75% 14/06/2022 5,000,000 EUR 5,049,400 5,052,050 0.27
Total Hong Kong 5,049,400 5,052,050 0.27
ICELAND
Arion Banki HF 1% 20/03/2023 EMTN 6,298,000 EUR 6,400,972 6,388,439 0.35
Arion Banki HF 1.625% 01/12/2021 EMTN 5,000,000 EUR 5,146,980 5,036,550 0.27
Islandsbanki HF 1.125% 12/04/2022 EMTN 5,000,000 EUR 5,074,500 5,046,450 0.27
Total Iceland 16,622,452 16,471,439 0.89
INDONESIA
Indonesia Government International Bond 2.625% 14/06/2023 EMTN 3,000,000 EUR 3,159,600 3,146,640 0.17
Indonesia Government International Bond 2.875% 08/07/2021 EMTN 12,000,000 EUR 12,422,513 12,004,800 0.65
Total Indonesia 15,582,113 15,151,440 0.82
IRELAND
AIB Group Plc 1.5% 29/03/2023 EMTN 10,977,000 EUR 11,297,883 11,276,672 0.61
Dell Bank International DAC 0.625% 17/10/2022 23,776,000 EUR 24,047,633 24,026,599 1.30
FCA Bank SpA 1% 15/11/2021 EMTN 7,000,000 EUR 7,091,980 7,036,050 0.38
Russian Railways Via RZD Capital Plc 4.6% 06/03/2023 2,000,000 EUR 2,155,000 2,139,160 0.12
Ryanair DAC 1.125% 10/03/2023 EMTN 7,000,000 EUR 7,134,660 7,125,090 0.39
Willow No 2 Ireland Plc for Zurich Insurance Co Ltd 3.375% 27/06/2022 EMTN 5,000,000 EUR 5,295,000 5,184,050 0.28
Total Ireland 57,022,156 56,787,621 3.08
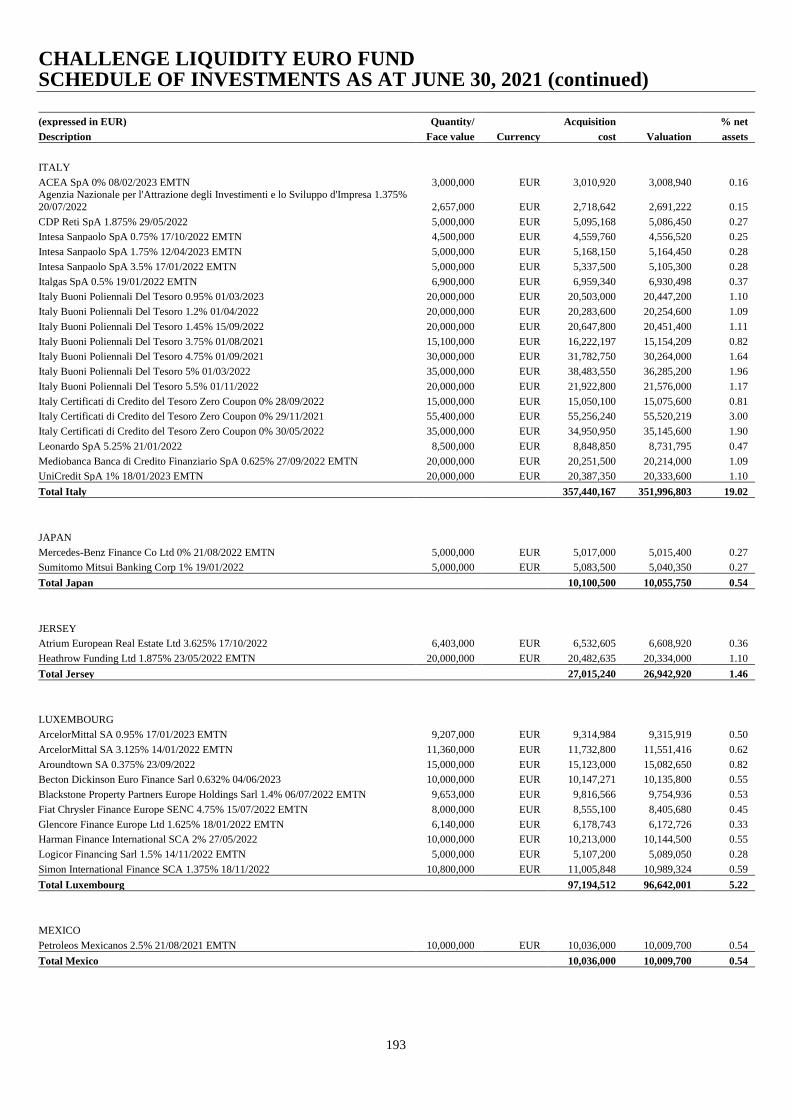
CHALLENGE LIQUIDITY EURO FUND SCHEDULE OF INVESTMENTS AS AT JUNE 30, 2021 (continued)
193
(expressed in EUR) Quantity/ Acquisition % net
Description Face value Currency cost Valuation assets
ITALY
ACEA SpA 0% 08/02/2023 EMTN 3,000,000 EUR 3,010,920 3,008,940 0.16 Agenzia Nazionale per l'Attrazione degli Investimenti e lo Sviluppo d'Impresa 1.375%
20/07/2022 2,657,000 EUR 2,718,642 2,691,222 0.15
CDP Reti SpA 1.875% 29/05/2022 5,000,000 EUR 5,095,168 5,086,450 0.27
Intesa Sanpaolo SpA 0.75% 17/10/2022 EMTN 4,500,000 EUR 4,559,760 4,556,520 0.25
Intesa Sanpaolo SpA 1.75% 12/04/2023 EMTN 5,000,000 EUR 5,168,150 5,164,450 0.28
Intesa Sanpaolo SpA 3.5% 17/01/2022 EMTN 5,000,000 EUR 5,337,500 5,105,300 0.28
Italgas SpA 0.5% 19/01/2022 EMTN 6,900,000 EUR 6,959,340 6,930,498 0.37
Italy Buoni Poliennali Del Tesoro 0.95% 01/03/2023 20,000,000 EUR 20,503,000 20,447,200 1.10
Italy Buoni Poliennali Del Tesoro 1.2% 01/04/2022 20,000,000 EUR 20,283,600 20,254,600 1.09
Italy Buoni Poliennali Del Tesoro 1.45% 15/09/2022 20,000,000 EUR 20,647,800 20,451,400 1.11
Italy Buoni Poliennali Del Tesoro 3.75% 01/08/2021 15,100,000 EUR 16,222,197 15,154,209 0.82
Italy Buoni Poliennali Del Tesoro 4.75% 01/09/2021 30,000,000 EUR 31,782,750 30,264,000 1.64
Italy Buoni Poliennali Del Tesoro 5% 01/03/2022 35,000,000 EUR 38,483,550 36,285,200 1.96
Italy Buoni Poliennali Del Tesoro 5.5% 01/11/2022 20,000,000 EUR 21,922,800 21,576,000 1.17
Italy Certificati di Credito del Tesoro Zero Coupon 0% 28/09/2022 15,000,000 EUR 15,050,100 15,075,600 0.81
Italy Certificati di Credito del Tesoro Zero Coupon 0% 29/11/2021 55,400,000 EUR 55,256,240 55,520,219 3.00
Italy Certificati di Credito del Tesoro Zero Coupon 0% 30/05/2022 35,000,000 EUR 34,950,950 35,145,600 1.90
Leonardo SpA 5.25% 21/01/2022 8,500,000 EUR 8,848,850 8,731,795 0.47
Mediobanca Banca di Credito Finanziario SpA 0.625% 27/09/2022 EMTN 20,000,000 EUR 20,251,500 20,214,000 1.09
UniCredit SpA 1% 18/01/2023 EMTN 20,000,000 EUR 20,387,350 20,333,600 1.10
Total Italy 357,440,167 351,996,803 19.02
JAPAN
Mercedes-Benz Finance Co Ltd 0% 21/08/2022 EMTN 5,000,000 EUR 5,017,000 5,015,400 0.27
Sumitomo Mitsui Banking Corp 1% 19/01/2022 5,000,000 EUR 5,083,500 5,040,350 0.27
Total Japan 10,100,500 10,055,750 0.54
JERSEY
Atrium European Real Estate Ltd 3.625% 17/10/2022 6,403,000 EUR 6,532,605 6,608,920 0.36
Heathrow Funding Ltd 1.875% 23/05/2022 EMTN 20,000,000 EUR 20,482,635 20,334,000 1.10
Total Jersey 27,015,240 26,942,920 1.46
LUXEMBOURG
ArcelorMittal SA 0.95% 17/01/2023 EMTN 9,207,000 EUR 9,314,984 9,315,919 0.50
ArcelorMittal SA 3.125% 14/01/2022 EMTN 11,360,000 EUR 11,732,800 11,551,416 0.62
Aroundtown SA 0.375% 23/09/2022 15,000,000 EUR 15,123,000 15,082,650 0.82
Becton Dickinson Euro Finance Sarl 0.632% 04/06/2023 10,000,000 EUR 10,147,271 10,135,800 0.55
Blackstone Property Partners Europe Holdings Sarl 1.4% 06/07/2022 EMTN 9,653,000 EUR 9,816,566 9,754,936 0.53
Fiat Chrysler Finance Europe SENC 4.75% 15/07/2022 EMTN 8,000,000 EUR 8,555,100 8,405,680 0.45
Glencore Finance Europe Ltd 1.625% 18/01/2022 EMTN 6,140,000 EUR 6,178,743 6,172,726 0.33
Harman Finance International SCA 2% 27/05/2022 10,000,000 EUR 10,213,000 10,144,500 0.55
Logicor Financing Sarl 1.5% 14/11/2022 EMTN 5,000,000 EUR 5,107,200 5,089,050 0.28
Simon International Finance SCA 1.375% 18/11/2022 10,800,000 EUR 11,005,848 10,989,324 0.59
Total Luxembourg 97,194,512 96,642,001 5.22
MEXICO
Petroleos Mexicanos 2.5% 21/08/2021 EMTN 10,000,000 EUR 10,036,000 10,009,700 0.54
Total Mexico 10,036,000 10,009,700 0.54
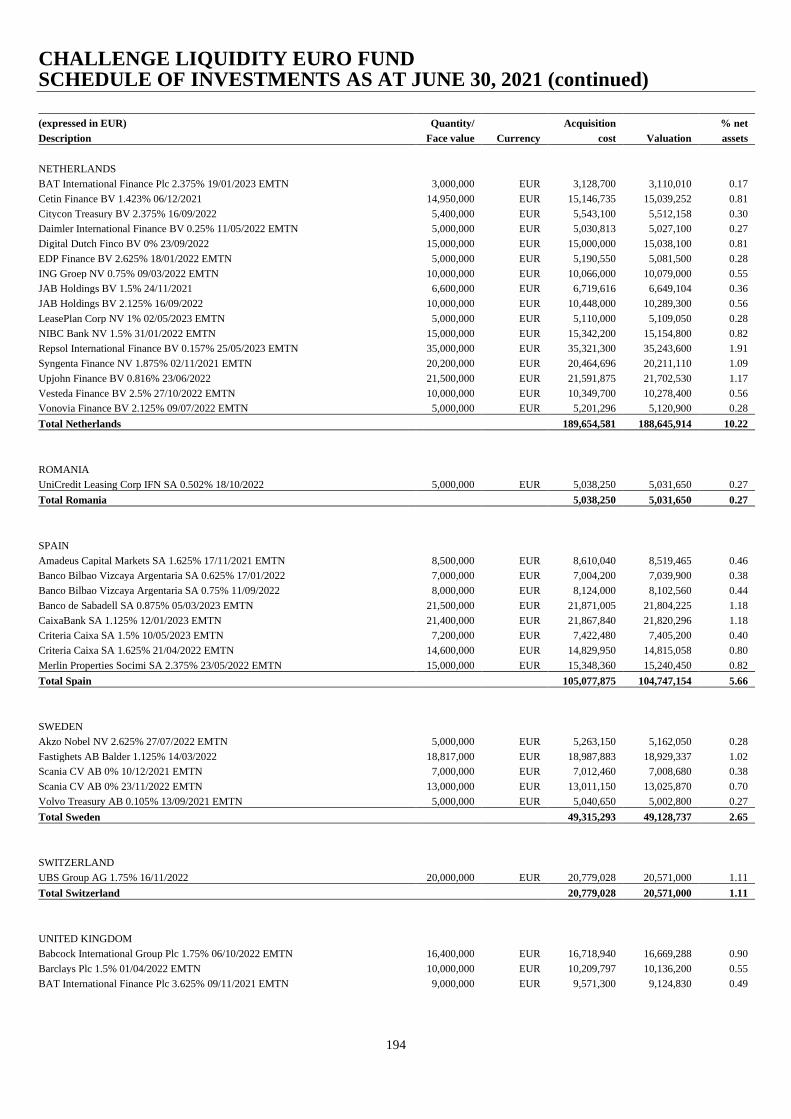
CHALLENGE LIQUIDITY EURO FUND SCHEDULE OF INVESTMENTS AS AT JUNE 30, 2021 (continued)
194
(expressed in EUR) Quantity/ Acquisition % net
Description Face value Currency cost Valuation assets
NETHERLANDS
BAT International Finance Plc 2.375% 19/01/2023 EMTN 3,000,000 EUR 3,128,700 3,110,010 0.17
Cetin Finance BV 1.423% 06/12/2021 14,950,000 EUR 15,146,735 15,039,252 0.81
Citycon Treasury BV 2.375% 16/09/2022 5,400,000 EUR 5,543,100 5,512,158 0.30
Daimler International Finance BV 0.25% 11/05/2022 EMTN 5,000,000 EUR 5,030,813 5,027,100 0.27
Digital Dutch Finco BV 0% 23/09/2022 15,000,000 EUR 15,000,000 15,038,100 0.81
EDP Finance BV 2.625% 18/01/2022 EMTN 5,000,000 EUR 5,190,550 5,081,500 0.28
ING Groep NV 0.75% 09/03/2022 EMTN 10,000,000 EUR 10,066,000 10,079,000 0.55
JAB Holdings BV 1.5% 24/11/2021 6,600,000 EUR 6,719,616 6,649,104 0.36
JAB Holdings BV 2.125% 16/09/2022 10,000,000 EUR 10,448,000 10,289,300 0.56
LeasePlan Corp NV 1% 02/05/2023 EMTN 5,000,000 EUR 5,110,000 5,109,050 0.28
NIBC Bank NV 1.5% 31/01/2022 EMTN 15,000,000 EUR 15,342,200 15,154,800 0.82
Repsol International Finance BV 0.157% 25/05/2023 EMTN 35,000,000 EUR 35,321,300 35,243,600 1.91
Syngenta Finance NV 1.875% 02/11/2021 EMTN 20,200,000 EUR 20,464,696 20,211,110 1.09
Upjohn Finance BV 0.816% 23/06/2022 21,500,000 EUR 21,591,875 21,702,530 1.17
Vesteda Finance BV 2.5% 27/10/2022 EMTN 10,000,000 EUR 10,349,700 10,278,400 0.56
Vonovia Finance BV 2.125% 09/07/2022 EMTN 5,000,000 EUR 5,201,296 5,120,900 0.28
Total Netherlands 189,654,581 188,645,914 10.22
ROMANIA
UniCredit Leasing Corp IFN SA 0.502% 18/10/2022 5,000,000 EUR 5,038,250 5,031,650 0.27
Total Romania 5,038,250 5,031,650 0.27
SPAIN
Amadeus Capital Markets SA 1.625% 17/11/2021 EMTN 8,500,000 EUR 8,610,040 8,519,465 0.46
Banco Bilbao Vizcaya Argentaria SA 0.625% 17/01/2022 7,000,000 EUR 7,004,200 7,039,900 0.38
Banco Bilbao Vizcaya Argentaria SA 0.75% 11/09/2022 8,000,000 EUR 8,124,000 8,102,560 0.44
Banco de Sabadell SA 0.875% 05/03/2023 EMTN 21,500,000 EUR 21,871,005 21,804,225 1.18
CaixaBank SA 1.125% 12/01/2023 EMTN 21,400,000 EUR 21,867,840 21,820,296 1.18
Criteria Caixa SA 1.5% 10/05/2023 EMTN 7,200,000 EUR 7,422,480 7,405,200 0.40
Criteria Caixa SA 1.625% 21/04/2022 EMTN 14,600,000 EUR 14,829,950 14,815,058 0.80
Merlin Properties Socimi SA 2.375% 23/05/2022 EMTN 15,000,000 EUR 15,348,360 15,240,450 0.82
Total Spain 105,077,875 104,747,154 5.66
SWEDEN
Akzo Nobel NV 2.625% 27/07/2022 EMTN 5,000,000 EUR 5,263,150 5,162,050 0.28
Fastighets AB Balder 1.125% 14/03/2022 18,817,000 EUR 18,987,883 18,929,337 1.02
Scania CV AB 0% 10/12/2021 EMTN 7,000,000 EUR 7,012,460 7,008,680 0.38
Scania CV AB 0% 23/11/2022 EMTN 13,000,000 EUR 13,011,150 13,025,870 0.70
Volvo Treasury AB 0.105% 13/09/2021 EMTN 5,000,000 EUR 5,040,650 5,002,800 0.27
Total Sweden 49,315,293 49,128,737 2.65
SWITZERLAND
UBS Group AG 1.75% 16/11/2022 20,000,000 EUR 20,779,028 20,571,000 1.11
Total Switzerland 20,779,028 20,571,000 1.11
UNITED KINGDOM
Babcock International Group Plc 1.75% 06/10/2022 EMTN 16,400,000 EUR 16,718,940 16,669,288 0.90
Barclays Plc 1.5% 01/04/2022 EMTN 10,000,000 EUR 10,209,797 10,136,200 0.55
BAT International Finance Plc 3.625% 09/11/2021 EMTN 9,000,000 EUR 9,571,300 9,124,830 0.49

CHALLENGE LIQUIDITY EURO FUND SCHEDULE OF INVESTMENTS AS AT JUNE 30, 2021 (continued)
195
(expressed in EUR) Quantity/ Acquisition % net
Description Face value Currency cost Valuation assets
UNITED KINGDOM (continued)
Coca-Cola Europacific Partners Plc 0.75% 24/02/2022 19,000,000 EUR 19,213,300 19,116,850 1.03
DS Smith Plc 2.25% 16/09/2022 EMTN 7,124,000 EUR 7,369,448 7,283,079 0.39
EasyJet Plc 1.75% 09/02/2023 EMTN 10,000,000 EUR 10,223,500 10,200,000 0.55
FCE Bank Plc 0.869% 13/09/2021 EMTN 6,100,000 EUR 6,100,000 6,102,257 0.33
FCE Bank Plc 1.134% 10/02/2022 EMTN 6,100,000 EUR 6,141,480 6,126,962 0.33
HSBC Holdings Plc 1.5% 15/03/2022 EMTN 15,000,000 EUR 15,328,000 15,202,800 0.82
ITV Plc 2.125% 21/09/2022 10,901,000 EUR 11,195,436 11,135,153 0.60
Leeds Building Society 1.375% 05/05/2022 EMTN 3,000,000 EUR 3,064,890 3,039,990 0.17
Lloyds Banking Group Plc 0.75% 09/11/2021 EMTN 3,000,000 EUR 3,028,500 3,012,000 0.16
Natwest Group Plc 2.5% 22/03/2023 EMTN 10,000,000 EUR 10,504,600 10,446,000 0.57
NatWest Markets Plc 0.362% 27/09/2021 EMTN 5,000,000 EUR 5,045,000 5,009,600 0.27
NatWest Markets Plc 0.625% 02/03/2022 EMTN 5,000,000 EUR 5,041,250 5,035,650 0.27
OTE Plc 2.375% 18/07/2022 EMTN 11,139,000 EUR 11,460,249 11,417,364 0.62
Trinity Acquisition Plc 2.125% 26/05/2022 11,632,000 EUR 11,828,668 11,800,897 0.64
Vodafone Group Plc 0.375% 22/11/2021 EMTN 5,000,000 EUR 4,999,833 5,015,050 0.27
Total United Kingdom 167,044,191 165,873,970 8.96
UNITED STATES OF AMERICA
Altria Group Inc 1% 15/02/2023 13,000,000 EUR 13,237,850 13,194,870 0.71
American Express Credit Corp 0.625% 22/11/2021 10,000,000 EUR 10,142,000 10,032,200 0.54
American Honda Finance Corp 1.6% 20/04/2022 10,000,000 EUR 10,276,500 10,160,600 0.55
Amgen Inc 1.25% 25/02/2022 1,600,000 EUR 1,627,520 1,610,464 0.09
AT&T Inc 1.45% 01/06/2022 10,000,000 EUR 10,157,000 10,114,000 0.55
BAT Capital Corp 0% 16/08/2021 EMTN 8,000,000 EUR 8,005,200 8,002,400 0.43
Becton Dickinson and Co 1% 15/12/2022 9,000,000 EUR 9,167,900 9,142,830 0.49
Booking Holdings Inc 0.8% 10/03/2022 14,966,000 EUR 15,168,068 15,067,320 0.82
Citigroup Inc 0.5% 29/01/2022 EMTN 5,000,000 EUR 4,997,500 5,024,050 0.27
Citigroup Inc 1.375% 27/10/2021 EMTN 10,000,000 EUR 10,286,351 10,059,000 0.54
Expedia Group Inc 2.5% 03/06/2022 23,000,000 EUR 23,544,562 23,370,530 1.26
Fidelity National Information Services Inc 0.125% 03/12/2022 10,000,000 EUR 10,048,600 10,044,900 0.54
Fidelity National Information Services Inc 0.75% 21/05/2023 15,000,000 EUR 15,254,450 15,238,350 0.82
Fluor Corp 1.75% 21/03/2023 10,000,000 EUR 10,006,625 10,181,300 0.55
General Electric Co 0.375% 17/05/2022 10,000,000 EUR 10,059,500 10,046,300 0.54
General Motors Financial Co Inc 0.2% 02/09/2022 EMTN 20,000,000 EUR 20,093,200 20,076,400 1.09
Goldman Sachs Group Inc 1.375% 26/07/2022 EMTN 10,000,000 EUR 10,272,765 10,178,100 0.55
Goldman Sachs Group Inc 3.25% 01/02/2023 EMTN 9,000,000 EUR 9,547,540 9,488,250 0.51
International Business Machines Corp 0.5% 07/09/2021 10,000,000 EUR 10,114,592 10,016,600 0.54
International Flavors & Fragrances Inc 0.5% 25/09/2021 9,690,000 EUR 9,740,952 9,700,271 0.52
Kinder Morgan Inc 1.5% 16/03/2022 8,400,000 EUR 8,510,040 8,503,488 0.46
Mohawk Industries Inc 2% 14/01/2022 10,000,000 EUR 10,350,000 10,064,900 0.54
Morgan Stanley 1% 02/12/2022 7,000,000 EUR 7,142,800 7,126,630 0.39
MPT Operating Partnership LP / MPT Finance Corp 4% 19/08/2022 21,000,000 EUR 22,008,440 21,706,440 1.17
Southern Power Co 1% 20/06/2022 10,000,000 EUR 10,192,500 10,123,800 0.55
Wells Fargo & Co 1.125% 29/10/2021 EMTN 5,000,000 EUR 5,110,750 5,025,900 0.27
Wells Fargo & Co 1.5% 12/09/2022 EMTN 5,000,000 EUR 5,150,500 5,109,850 0.28
Wells Fargo & Co 2.625% 16/08/2022 EMTN 5,000,000 EUR 5,247,550 5,167,650 0.28
Zimmer Biomet Holdings Inc 1.414% 13/12/2022 12,290,000 EUR 12,601,552 12,563,944 0.68
Total United States of America 308,062,807 306,141,337 16.53
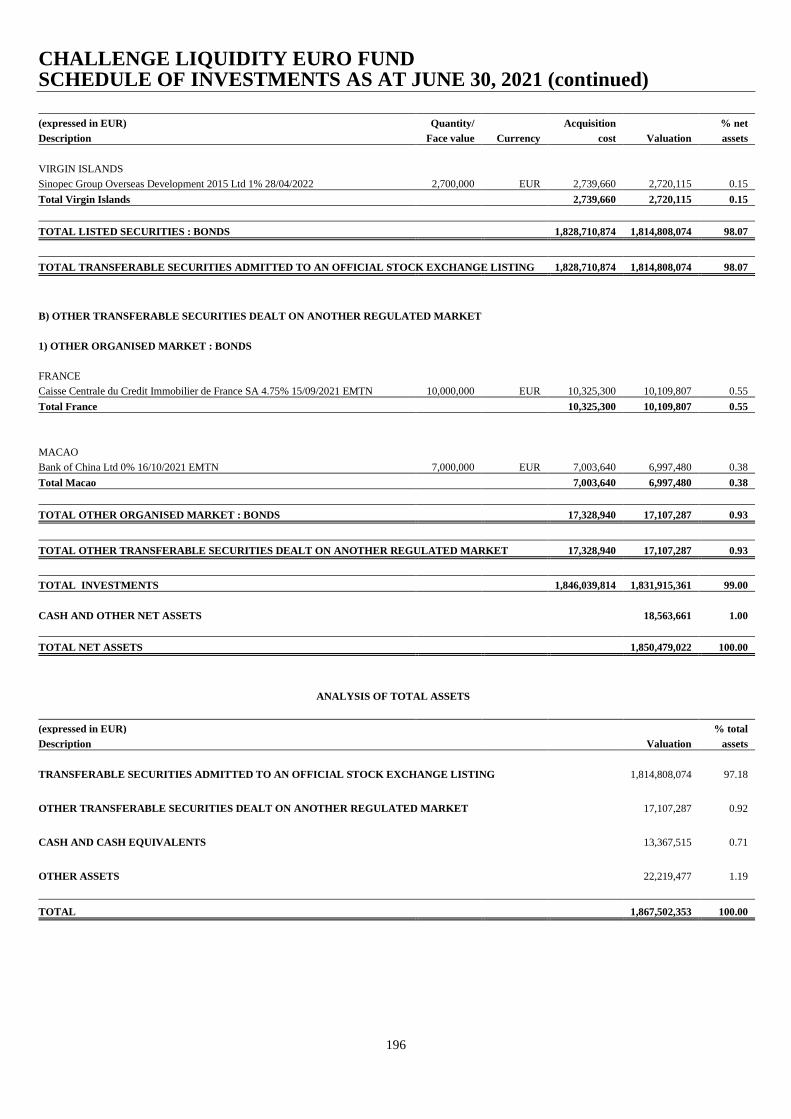
CHALLENGE LIQUIDITY EURO FUND SCHEDULE OF INVESTMENTS AS AT JUNE 30, 2021 (continued)
196
(expressed in EUR) Quantity/ Acquisition % net
Description Face value Currency cost Valuation assets
VIRGIN ISLANDS
Sinopec Group Overseas Development 2015 Ltd 1% 28/04/2022 2,700,000 EUR 2,739,660 2,720,115 0.15
Total Virgin Islands 2,739,660 2,720,115 0.15
TOTAL LISTED SECURITIES : BONDS 1,828,710,874 1,814,808,074 98.07
TOTAL TRANSFERABLE SECURITIES ADMITTED TO AN OFFICIAL STOCK EXCHANGE LISTING 1,828,710,874 1,814,808,074 98.07
B) OTHER TRANSFERABLE SECURITIES DEALT ON ANOTHER REGULATED MARKET
1) OTHER ORGANISED MARKET : BONDS
FRANCE
Caisse Centrale du Credit Immobilier de France SA 4.75% 15/09/2021 EMTN 10,000,000 EUR 10,325,300 10,109,807 0.55
Total France 10,325,300 10,109,807 0.55
MACAO
Bank of China Ltd 0% 16/10/2021 EMTN 7,000,000 EUR 7,003,640 6,997,480 0.38
Total Macao 7,003,640 6,997,480 0.38
TOTAL OTHER ORGANISED MARKET : BONDS 17,328,940 17,107,287 0.93
TOTAL OTHER TRANSFERABLE SECURITIES DEALT ON ANOTHER REGULATED MARKET 17,328,940 17,107,287 0.93
TOTAL INVESTMENTS 1,846,039,814 1,831,915,361 99.00
CASH AND OTHER NET ASSETS 18,563,661 1.00
TOTAL NET ASSETS 1,850,479,022 100.00
ANALYSIS OF TOTAL ASSETS
(expressed in EUR) % total
Description Valuation assets
TRANSFERABLE SECURITIES ADMITTED TO AN OFFICIAL STOCK EXCHANGE LISTING 1,814,808,074 97.18
OTHER TRANSFERABLE SECURITIES DEALT ON ANOTHER REGULATED MARKET
17,107,287 0.92
CASH AND CASH EQUIVALENTS
13,367,515 0.71
OTHER ASSETS
22,219,477 1.19
TOTAL 1,867,502,353 100.00
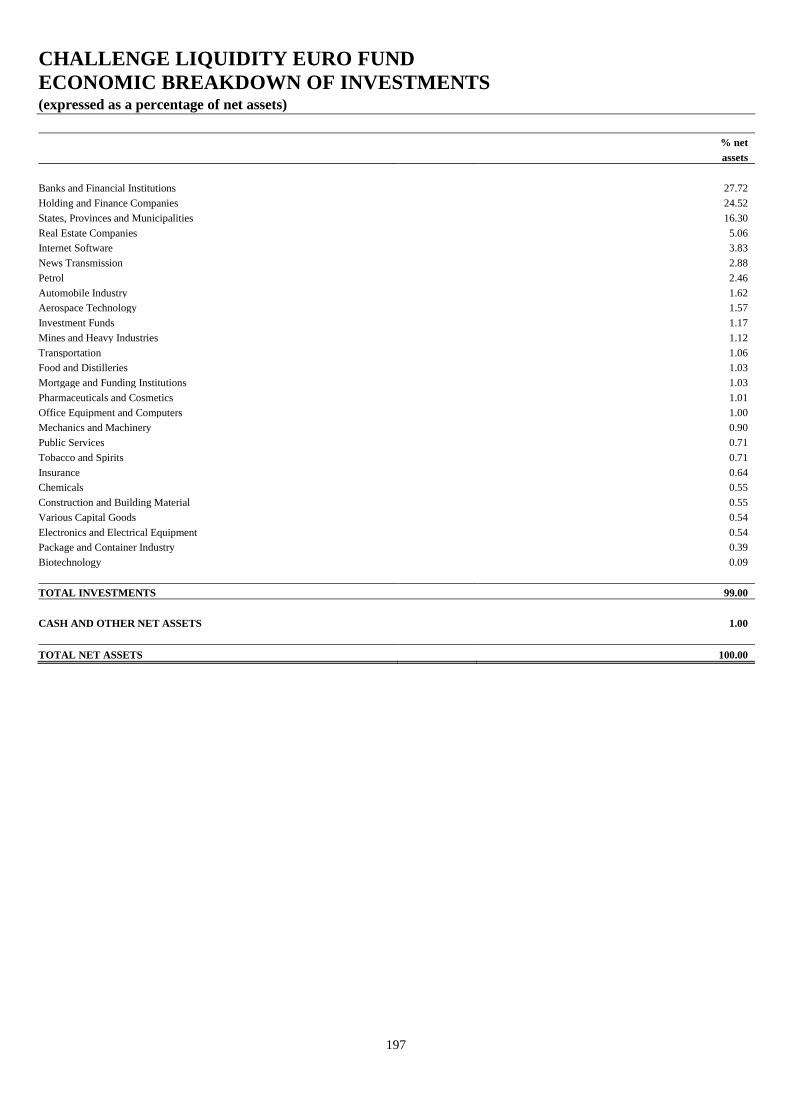
CHALLENGE LIQUIDITY EURO FUND
ECONOMIC BREAKDOWN OF INVESTMENTS (expressed as a percentage of net assets)
197
% net
assets
Banks and Financial Institutions 27.72
Holding and Finance Companies 24.52
States, Provinces and Municipalities 16.30
Real Estate Companies 5.06
Internet Software 3.83
News Transmission 2.88
Petrol 2.46
Automobile Industry 1.62
Aerospace Technology 1.57
Investment Funds 1.17
Mines and Heavy Industries 1.12
Transportation 1.06
Food and Distilleries 1.03
Mortgage and Funding Institutions 1.03
Pharmaceuticals and Cosmetics 1.01
Office Equipment and Computers 1.00
Mechanics and Machinery 0.90
Public Services 0.71
Tobacco and Spirits 0.71
Insurance 0.64
Chemicals 0.55
Construction and Building Material 0.55
Various Capital Goods 0.54
Electronics and Electrical Equipment 0.54
Package and Container Industry 0.39
Biotechnology 0.09
TOTAL INVESTMENTS 99.00
CASH AND OTHER NET ASSETS 1.00
TOTAL NET ASSETS 100.00
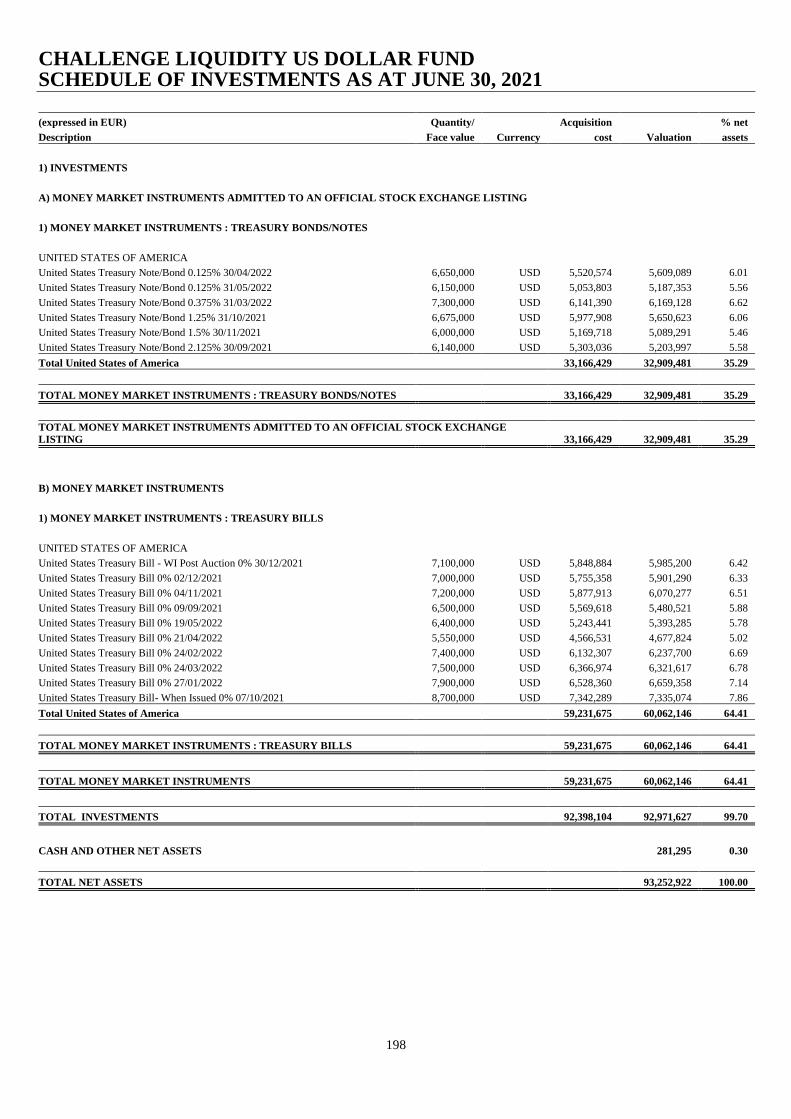
CHALLENGE LIQUIDITY US DOLLAR FUND SCHEDULE OF INVESTMENTS AS AT JUNE 30, 2021
198
(expressed in EUR) Quantity/ Acquisition % net
Description Face value Currency cost Valuation assets
1) INVESTMENTS
A) MONEY MARKET INSTRUMENTS ADMITTED TO AN OFFICIAL STOCK EXCHANGE LISTING
1) MONEY MARKET INSTRUMENTS : TREASURY BONDS/NOTES
UNITED STATES OF AMERICA
United States Treasury Note/Bond 0.125% 30/04/2022 6,650,000 USD 5,520,574 5,609,089 6.01
United States Treasury Note/Bond 0.125% 31/05/2022 6,150,000 USD 5,053,803 5,187,353 5.56
United States Treasury Note/Bond 0.375% 31/03/2022 7,300,000 USD 6,141,390 6,169,128 6.62
United States Treasury Note/Bond 1.25% 31/10/2021 6,675,000 USD 5,977,908 5,650,623 6.06
United States Treasury Note/Bond 1.5% 30/11/2021 6,000,000 USD 5,169,718 5,089,291 5.46
United States Treasury Note/Bond 2.125% 30/09/2021 6,140,000 USD 5,303,036 5,203,997 5.58
Total United States of America 33,166,429 32,909,481 35.29
TOTAL MONEY MARKET INSTRUMENTS : TREASURY BONDS/NOTES 33,166,429 32,909,481 35.29
TOTAL MONEY MARKET INSTRUMENTS ADMITTED TO AN OFFICIAL STOCK EXCHANGE
LISTING 33,166,429 32,909,481 35.29
B) MONEY MARKET INSTRUMENTS
1) MONEY MARKET INSTRUMENTS : TREASURY BILLS
UNITED STATES OF AMERICA
United States Treasury Bill - WI Post Auction 0% 30/12/2021 7,100,000 USD 5,848,884 5,985,200 6.42
United States Treasury Bill 0% 02/12/2021 7,000,000 USD 5,755,358 5,901,290 6.33
United States Treasury Bill 0% 04/11/2021 7,200,000 USD 5,877,913 6,070,277 6.51
United States Treasury Bill 0% 09/09/2021 6,500,000 USD 5,569,618 5,480,521 5.88
United States Treasury Bill 0% 19/05/2022 6,400,000 USD 5,243,441 5,393,285 5.78
United States Treasury Bill 0% 21/04/2022 5,550,000 USD 4,566,531 4,677,824 5.02
United States Treasury Bill 0% 24/02/2022 7,400,000 USD 6,132,307 6,237,700 6.69
United States Treasury Bill 0% 24/03/2022 7,500,000 USD 6,366,974 6,321,617 6.78
United States Treasury Bill 0% 27/01/2022 7,900,000 USD 6,528,360 6,659,358 7.14
United States Treasury Bill- When Issued 0% 07/10/2021 8,700,000 USD 7,342,289 7,335,074 7.86
Total United States of America 59,231,675 60,062,146 64.41
TOTAL MONEY MARKET INSTRUMENTS : TREASURY BILLS 59,231,675 60,062,146 64.41
TOTAL MONEY MARKET INSTRUMENTS 59,231,675 60,062,146 64.41
TOTAL INVESTMENTS 92,398,104 92,971,627 99.70
CASH AND OTHER NET ASSETS 281,295 0.30
TOTAL NET ASSETS 93,252,922 100.00
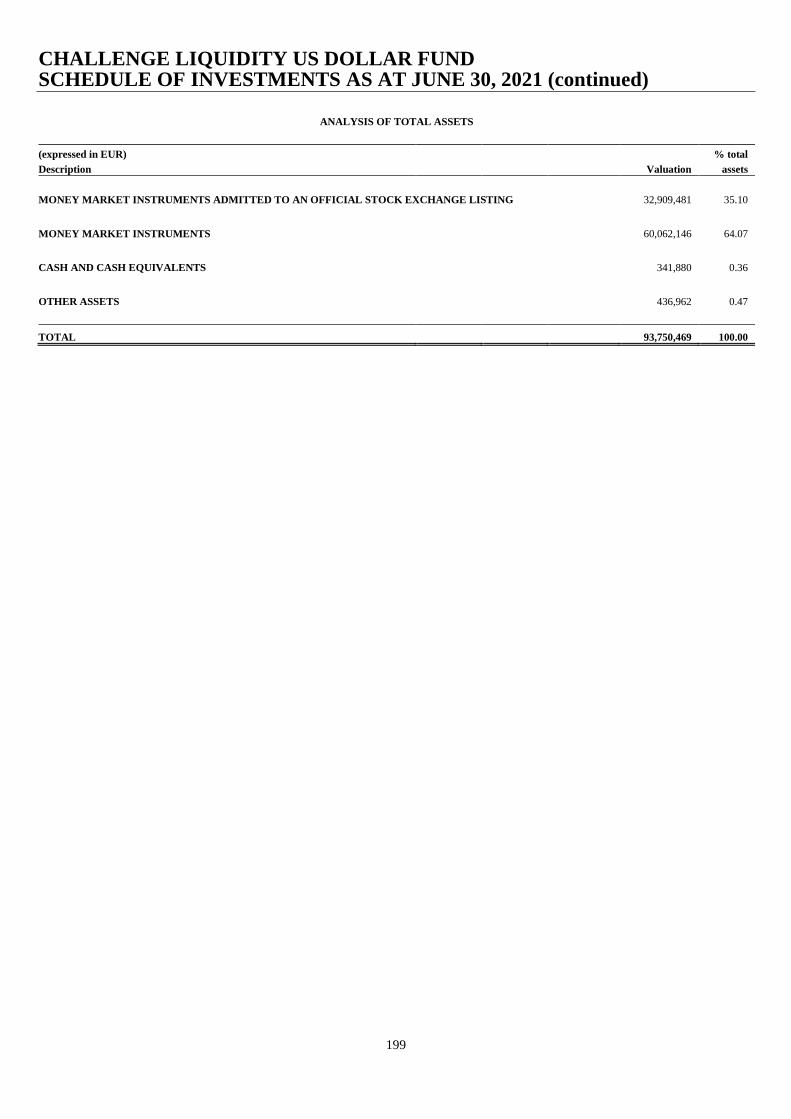
CHALLENGE LIQUIDITY US DOLLAR FUND SCHEDULE OF INVESTMENTS AS AT JUNE 30, 2021 (continued)
199
ANALYSIS OF TOTAL ASSETS
(expressed in EUR) % total
Description Valuation assets
MONEY MARKET INSTRUMENTS ADMITTED TO AN OFFICIAL STOCK EXCHANGE LISTING
32,909,481 35.10
MONEY MARKET INSTRUMENTS
60,062,146 64.07
CASH AND CASH EQUIVALENTS
341,880 0.36
OTHER ASSETS
436,962 0.47
TOTAL 93,750,469 100.00
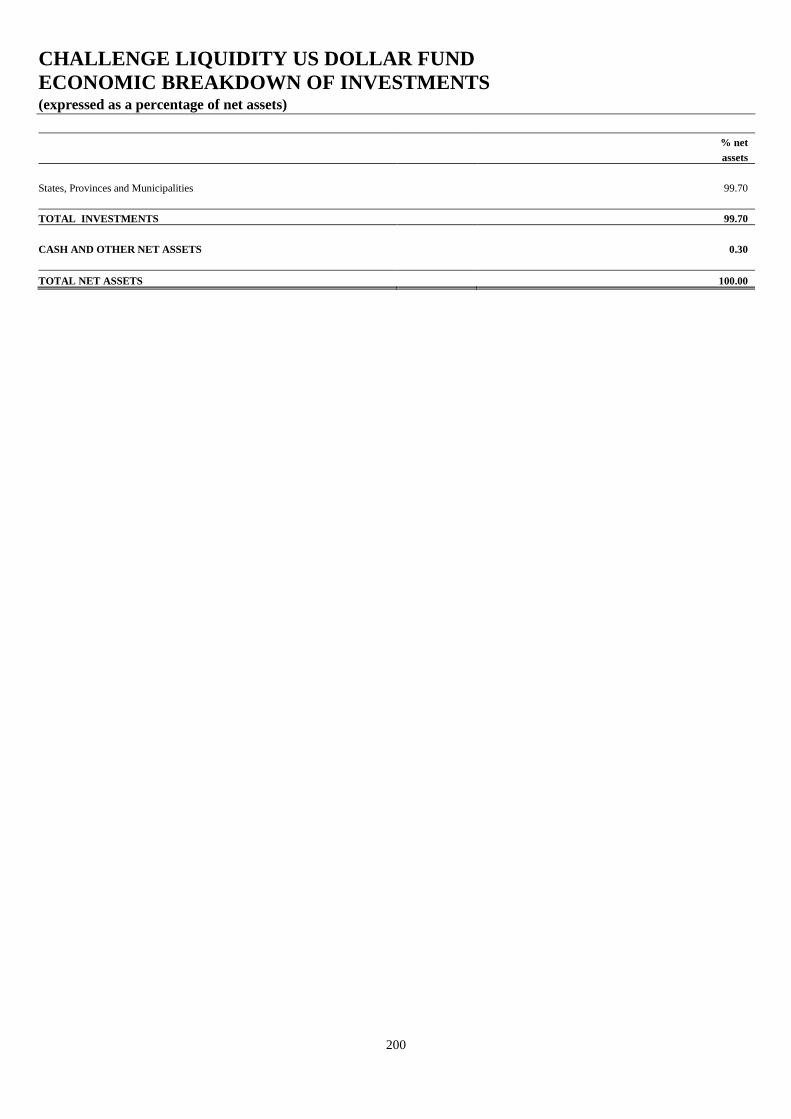
CHALLENGE LIQUIDITY US DOLLAR FUND
ECONOMIC BREAKDOWN OF INVESTMENTS (expressed as a percentage of net assets)
200
% net
assets
States, Provinces and Municipalities 99.70
TOTAL INVESTMENTS 99.70
CASH AND OTHER NET ASSETS 0.30
TOTAL NET ASSETS 100.00
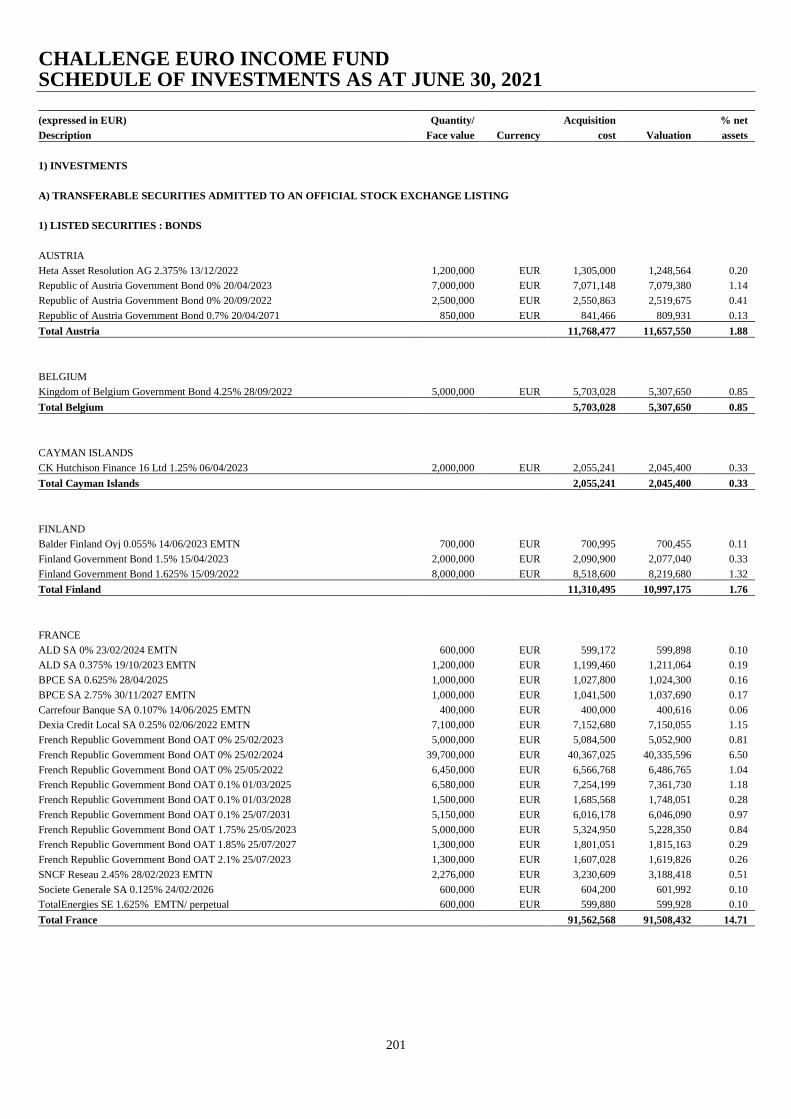
CHALLENGE EURO INCOME FUND SCHEDULE OF INVESTMENTS AS AT JUNE 30, 2021
201
(expressed in EUR) Quantity/ Acquisition % net
Description Face value Currency cost Valuation assets
1) INVESTMENTS
A) TRANSFERABLE SECURITIES ADMITTED TO AN OFFICIAL STOCK EXCHANGE LISTING
1) LISTED SECURITIES : BONDS
AUSTRIA
Heta Asset Resolution AG 2.375% 13/12/2022 1,200,000 EUR 1,305,000 1,248,564 0.20
Republic of Austria Government Bond 0% 20/04/2023 7,000,000 EUR 7,071,148 7,079,380 1.14
Republic of Austria Government Bond 0% 20/09/2022 2,500,000 EUR 2,550,863 2,519,675 0.41
Republic of Austria Government Bond 0.7% 20/04/2071 850,000 EUR 841,466 809,931 0.13
Total Austria 11,768,477 11,657,550 1.88
BELGIUM
Kingdom of Belgium Government Bond 4.25% 28/09/2022 5,000,000 EUR 5,703,028 5,307,650 0.85
Total Belgium 5,703,028 5,307,650 0.85
CAYMAN ISLANDS
CK Hutchison Finance 16 Ltd 1.25% 06/04/2023 2,000,000 EUR 2,055,241 2,045,400 0.33
Total Cayman Islands 2,055,241 2,045,400 0.33
FINLAND
Balder Finland Oyj 0.055% 14/06/2023 EMTN 700,000 EUR 700,995 700,455 0.11
Finland Government Bond 1.5% 15/04/2023 2,000,000 EUR 2,090,900 2,077,040 0.33
Finland Government Bond 1.625% 15/09/2022 8,000,000 EUR 8,518,600 8,219,680 1.32
Total Finland 11,310,495 10,997,175 1.76
FRANCE
ALD SA 0% 23/02/2024 EMTN 600,000 EUR 599,172 599,898 0.10
ALD SA 0.375% 19/10/2023 EMTN 1,200,000 EUR 1,199,460 1,211,064 0.19
BPCE SA 0.625% 28/04/2025 1,000,000 EUR 1,027,800 1,024,300 0.16
BPCE SA 2.75% 30/11/2027 EMTN 1,000,000 EUR 1,041,500 1,037,690 0.17
Carrefour Banque SA 0.107% 14/06/2025 EMTN 400,000 EUR 400,000 400,616 0.06
Dexia Credit Local SA 0.25% 02/06/2022 EMTN 7,100,000 EUR 7,152,680 7,150,055 1.15
French Republic Government Bond OAT 0% 25/02/2023 5,000,000 EUR 5,084,500 5,052,900 0.81
French Republic Government Bond OAT 0% 25/02/2024 39,700,000 EUR 40,367,025 40,335,596 6.50
French Republic Government Bond OAT 0% 25/05/2022 6,450,000 EUR 6,566,768 6,486,765 1.04
French Republic Government Bond OAT 0.1% 01/03/2025 6,580,000 EUR 7,254,199 7,361,730 1.18
French Republic Government Bond OAT 0.1% 01/03/2028 1,500,000 EUR 1,685,568 1,748,051 0.28
French Republic Government Bond OAT 0.1% 25/07/2031 5,150,000 EUR 6,016,178 6,046,090 0.97
French Republic Government Bond OAT 1.75% 25/05/2023 5,000,000 EUR 5,324,950 5,228,350 0.84
French Republic Government Bond OAT 1.85% 25/07/2027 1,300,000 EUR 1,801,051 1,815,163 0.29
French Republic Government Bond OAT 2.1% 25/07/2023 1,300,000 EUR 1,607,028 1,619,826 0.26
SNCF Reseau 2.45% 28/02/2023 EMTN 2,276,000 EUR 3,230,609 3,188,418 0.51
Societe Generale SA 0.125% 24/02/2026 600,000 EUR 604,200 601,992 0.10
TotalEnergies SE 1.625% EMTN/ perpetual 600,000 EUR 599,880 599,928 0.10
Total France 91,562,568 91,508,432 14.71
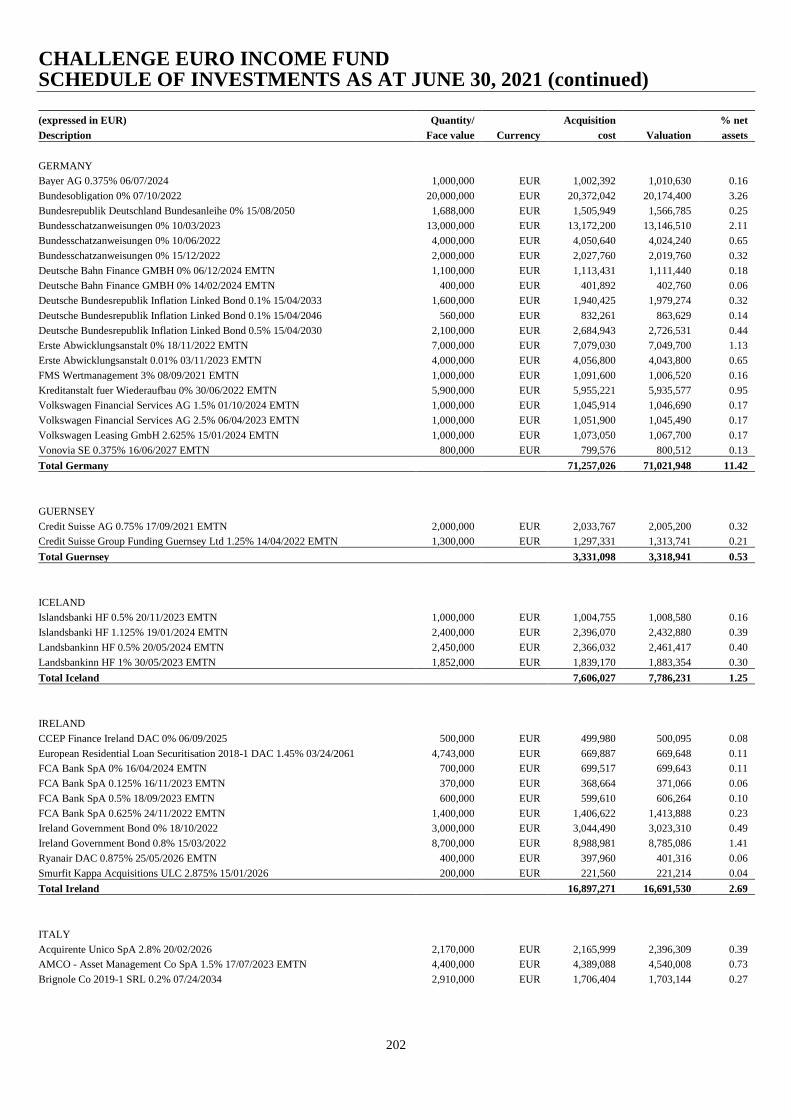
CHALLENGE EURO INCOME FUND SCHEDULE OF INVESTMENTS AS AT JUNE 30, 2021 (continued)
202
(expressed in EUR) Quantity/ Acquisition % net
Description Face value Currency cost Valuation assets
GERMANY
Bayer AG 0.375% 06/07/2024 1,000,000 EUR 1,002,392 1,010,630 0.16
Bundesobligation 0% 07/10/2022 20,000,000 EUR 20,372,042 20,174,400 3.26
Bundesrepublik Deutschland Bundesanleihe 0% 15/08/2050 1,688,000 EUR 1,505,949 1,566,785 0.25
Bundesschatzanweisungen 0% 10/03/2023 13,000,000 EUR 13,172,200 13,146,510 2.11
Bundesschatzanweisungen 0% 10/06/2022 4,000,000 EUR 4,050,640 4,024,240 0.65
Bundesschatzanweisungen 0% 15/12/2022 2,000,000 EUR 2,027,760 2,019,760 0.32
Deutsche Bahn Finance GMBH 0% 06/12/2024 EMTN 1,100,000 EUR 1,113,431 1,111,440 0.18
Deutsche Bahn Finance GMBH 0% 14/02/2024 EMTN 400,000 EUR 401,892 402,760 0.06
Deutsche Bundesrepublik Inflation Linked Bond 0.1% 15/04/2033 1,600,000 EUR 1,940,425 1,979,274 0.32
Deutsche Bundesrepublik Inflation Linked Bond 0.1% 15/04/2046 560,000 EUR 832,261 863,629 0.14
Deutsche Bundesrepublik Inflation Linked Bond 0.5% 15/04/2030 2,100,000 EUR 2,684,943 2,726,531 0.44
Erste Abwicklungsanstalt 0% 18/11/2022 EMTN 7,000,000 EUR 7,079,030 7,049,700 1.13
Erste Abwicklungsanstalt 0.01% 03/11/2023 EMTN 4,000,000 EUR 4,056,800 4,043,800 0.65
FMS Wertmanagement 3% 08/09/2021 EMTN 1,000,000 EUR 1,091,600 1,006,520 0.16
Kreditanstalt fuer Wiederaufbau 0% 30/06/2022 EMTN 5,900,000 EUR 5,955,221 5,935,577 0.95
Volkswagen Financial Services AG 1.5% 01/10/2024 EMTN 1,000,000 EUR 1,045,914 1,046,690 0.17
Volkswagen Financial Services AG 2.5% 06/04/2023 EMTN 1,000,000 EUR 1,051,900 1,045,490 0.17
Volkswagen Leasing GmbH 2.625% 15/01/2024 EMTN 1,000,000 EUR 1,073,050 1,067,700 0.17
Vonovia SE 0.375% 16/06/2027 EMTN 800,000 EUR 799,576 800,512 0.13
Total Germany 71,257,026 71,021,948 11.42
GUERNSEY
Credit Suisse AG 0.75% 17/09/2021 EMTN 2,000,000 EUR 2,033,767 2,005,200 0.32
Credit Suisse Group Funding Guernsey Ltd 1.25% 14/04/2022 EMTN 1,300,000 EUR 1,297,331 1,313,741 0.21
Total Guernsey 3,331,098 3,318,941 0.53
ICELAND
Islandsbanki HF 0.5% 20/11/2023 EMTN 1,000,000 EUR 1,004,755 1,008,580 0.16
Islandsbanki HF 1.125% 19/01/2024 EMTN 2,400,000 EUR 2,396,070 2,432,880 0.39
Landsbankinn HF 0.5% 20/05/2024 EMTN 2,450,000 EUR 2,366,032 2,461,417 0.40
Landsbankinn HF 1% 30/05/2023 EMTN 1,852,000 EUR 1,839,170 1,883,354 0.30
Total Iceland 7,606,027 7,786,231 1.25
IRELAND
CCEP Finance Ireland DAC 0% 06/09/2025 500,000 EUR 499,980 500,095 0.08
European Residential Loan Securitisation 2018-1 DAC 1.45% 03/24/2061 4,743,000 EUR 669,887 669,648 0.11
FCA Bank SpA 0% 16/04/2024 EMTN 700,000 EUR 699,517 699,643 0.11
FCA Bank SpA 0.125% 16/11/2023 EMTN 370,000 EUR 368,664 371,066 0.06
FCA Bank SpA 0.5% 18/09/2023 EMTN 600,000 EUR 599,610 606,264 0.10
FCA Bank SpA 0.625% 24/11/2022 EMTN 1,400,000 EUR 1,406,622 1,413,888 0.23
Ireland Government Bond 0% 18/10/2022 3,000,000 EUR 3,044,490 3,023,310 0.49
Ireland Government Bond 0.8% 15/03/2022 8,700,000 EUR 8,988,981 8,785,086 1.41
Ryanair DAC 0.875% 25/05/2026 EMTN 400,000 EUR 397,960 401,316 0.06
Smurfit Kappa Acquisitions ULC 2.875% 15/01/2026 200,000 EUR 221,560 221,214 0.04
Total Ireland 16,897,271 16,691,530 2.69
ITALY
Acquirente Unico SpA 2.8% 20/02/2026 2,170,000 EUR 2,165,999 2,396,309 0.39
AMCO - Asset Management Co SpA 1.5% 17/07/2023 EMTN 4,400,000 EUR 4,389,088 4,540,008 0.73
Brignole Co 2019-1 SRL 0.2% 07/24/2034 2,910,000 EUR 1,706,404 1,703,144 0.27
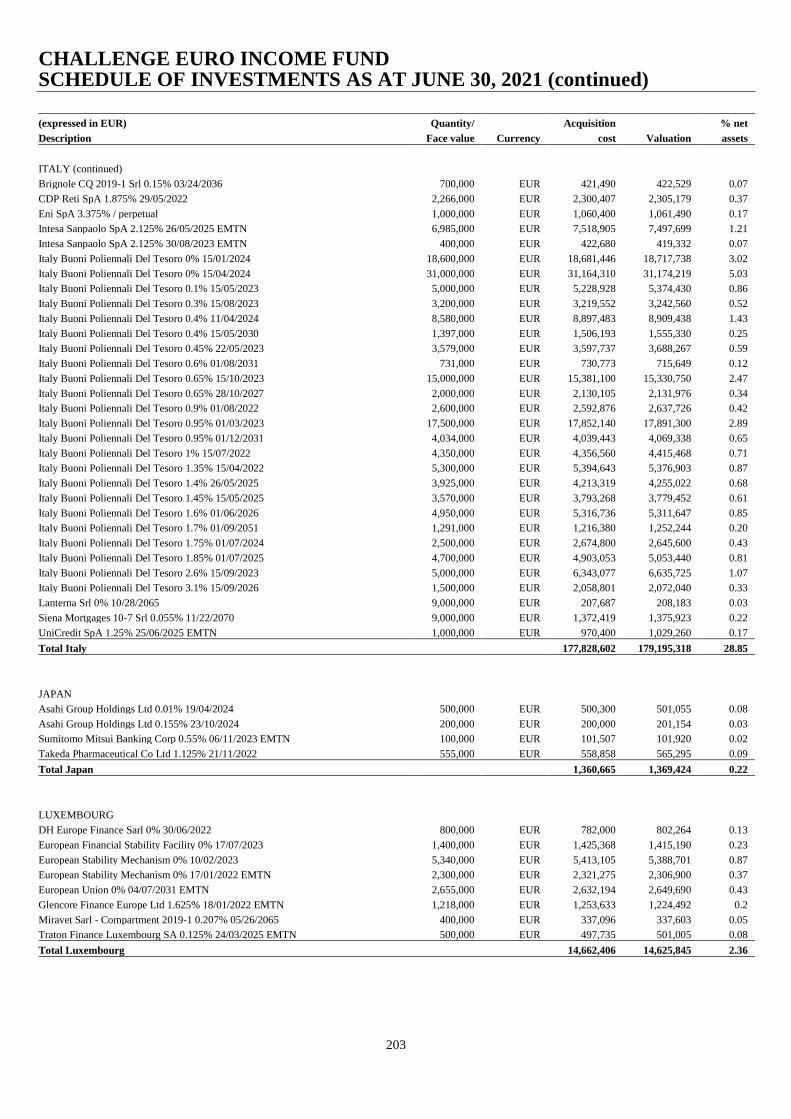
CHALLENGE EURO INCOME FUND SCHEDULE OF INVESTMENTS AS AT JUNE 30, 2021 (continued)
203
(expressed in EUR) Quantity/ Acquisition % net
Description Face value Currency cost Valuation assets
ITALY (continued)
Brignole CQ 2019-1 Srl 0.15% 03/24/2036 700,000 EUR 421,490 422,529 0.07
CDP Reti SpA 1.875% 29/05/2022 2,266,000 EUR 2,300,407 2,305,179 0.37
Eni SpA 3.375% / perpetual 1,000,000 EUR 1,060,400 1,061,490 0.17
Intesa Sanpaolo SpA 2.125% 26/05/2025 EMTN 6,985,000 EUR 7,518,905 7,497,699 1.21
Intesa Sanpaolo SpA 2.125% 30/08/2023 EMTN 400,000 EUR 422,680 419,332 0.07
Italy Buoni Poliennali Del Tesoro 0% 15/01/2024 18,600,000 EUR 18,681,446 18,717,738 3.02
Italy Buoni Poliennali Del Tesoro 0% 15/04/2024 31,000,000 EUR 31,164,310 31,174,219 5.03
Italy Buoni Poliennali Del Tesoro 0.1% 15/05/2023 5,000,000 EUR 5,228,928 5,374,430 0.86
Italy Buoni Poliennali Del Tesoro 0.3% 15/08/2023 3,200,000 EUR 3,219,552 3,242,560 0.52
Italy Buoni Poliennali Del Tesoro 0.4% 11/04/2024 8,580,000 EUR 8,897,483 8,909,438 1.43
Italy Buoni Poliennali Del Tesoro 0.4% 15/05/2030 1,397,000 EUR 1,506,193 1,555,330 0.25
Italy Buoni Poliennali Del Tesoro 0.45% 22/05/2023 3,579,000 EUR 3,597,737 3,688,267 0.59
Italy Buoni Poliennali Del Tesoro 0.6% 01/08/2031 731,000 EUR 730,773 715,649 0.12
Italy Buoni Poliennali Del Tesoro 0.65% 15/10/2023 15,000,000 EUR 15,381,100 15,330,750 2.47
Italy Buoni Poliennali Del Tesoro 0.65% 28/10/2027 2,000,000 EUR 2,130,105 2,131,976 0.34
Italy Buoni Poliennali Del Tesoro 0.9% 01/08/2022 2,600,000 EUR 2,592,876 2,637,726 0.42
Italy Buoni Poliennali Del Tesoro 0.95% 01/03/2023 17,500,000 EUR 17,852,140 17,891,300 2.89
Italy Buoni Poliennali Del Tesoro 0.95% 01/12/2031 4,034,000 EUR 4,039,443 4,069,338 0.65
Italy Buoni Poliennali Del Tesoro 1% 15/07/2022 4,350,000 EUR 4,356,560 4,415,468 0.71
Italy Buoni Poliennali Del Tesoro 1.35% 15/04/2022 5,300,000 EUR 5,394,643 5,376,903 0.87
Italy Buoni Poliennali Del Tesoro 1.4% 26/05/2025 3,925,000 EUR 4,213,319 4,255,022 0.68
Italy Buoni Poliennali Del Tesoro 1.45% 15/05/2025 3,570,000 EUR 3,793,268 3,779,452 0.61
Italy Buoni Poliennali Del Tesoro 1.6% 01/06/2026 4,950,000 EUR 5,316,736 5,311,647 0.85
Italy Buoni Poliennali Del Tesoro 1.7% 01/09/2051 1,291,000 EUR 1,216,380 1,252,244 0.20
Italy Buoni Poliennali Del Tesoro 1.75% 01/07/2024 2,500,000 EUR 2,674,800 2,645,600 0.43
Italy Buoni Poliennali Del Tesoro 1.85% 01/07/2025 4,700,000 EUR 4,903,053 5,053,440 0.81
Italy Buoni Poliennali Del Tesoro 2.6% 15/09/2023 5,000,000 EUR 6,343,077 6,635,725 1.07
Italy Buoni Poliennali Del Tesoro 3.1% 15/09/2026 1,500,000 EUR 2,058,801 2,072,040 0.33
Lanterna Srl 0% 10/28/2065 9,000,000 EUR 207,687 208,183 0.03
Siena Mortgages 10-7 Srl 0.055% 11/22/2070 9,000,000 EUR 1,372,419 1,375,923 0.22
UniCredit SpA 1.25% 25/06/2025 EMTN 1,000,000 EUR 970,400 1,029,260 0.17
Total Italy 177,828,602 179,195,318 28.85
JAPAN
Asahi Group Holdings Ltd 0.01% 19/04/2024 500,000 EUR 500,300 501,055 0.08
Asahi Group Holdings Ltd 0.155% 23/10/2024 200,000 EUR 200,000 201,154 0.03
Sumitomo Mitsui Banking Corp 0.55% 06/11/2023 EMTN 100,000 EUR 101,507 101,920 0.02
Takeda Pharmaceutical Co Ltd 1.125% 21/11/2022 555,000 EUR 558,858 565,295 0.09
Total Japan 1,360,665 1,369,424 0.22
LUXEMBOURG
DH Europe Finance Sarl 0% 30/06/2022 800,000 EUR 782,000 802,264 0.13
European Financial Stability Facility 0% 17/07/2023 1,400,000 EUR 1,425,368 1,415,190 0.23
European Stability Mechanism 0% 10/02/2023 5,340,000 EUR 5,413,105 5,388,701 0.87
European Stability Mechanism 0% 17/01/2022 EMTN 2,300,000 EUR 2,321,275 2,306,900 0.37
European Union 0% 04/07/2031 EMTN 2,655,000 EUR 2,632,194 2,649,690 0.43
Glencore Finance Europe Ltd 1.625% 18/01/2022 EMTN 1,218,000 EUR 1,253,633 1,224,492 0.2
Miravet Sarl - Compartment 2019-1 0.207% 05/26/2065 400,000 EUR 337,096 337,603 0.05
Traton Finance Luxembourg SA 0.125% 24/03/2025 EMTN 500,000 EUR 497,735 501,005 0.08
Total Luxembourg 14,662,406 14,625,845 2.36
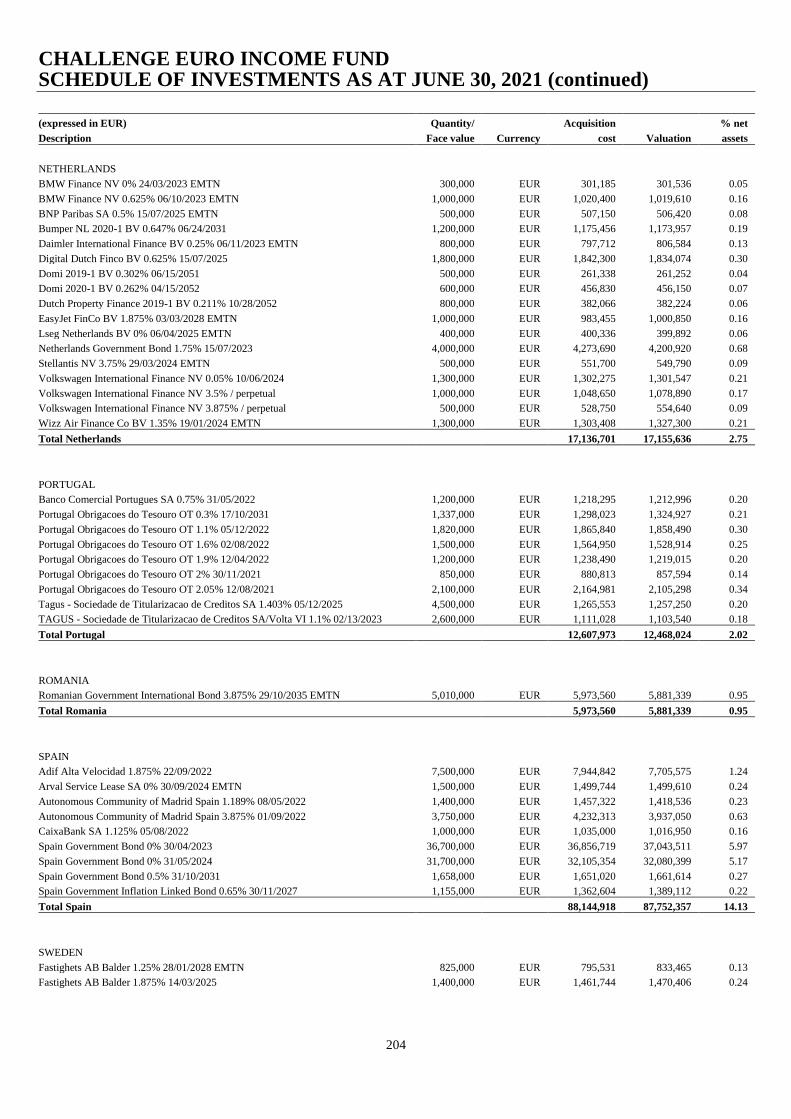
CHALLENGE EURO INCOME FUND SCHEDULE OF INVESTMENTS AS AT JUNE 30, 2021 (continued)
204
(expressed in EUR) Quantity/ Acquisition % net
Description Face value Currency cost Valuation assets
NETHERLANDS
BMW Finance NV 0% 24/03/2023 EMTN 300,000 EUR 301,185 301,536 0.05
BMW Finance NV 0.625% 06/10/2023 EMTN 1,000,000 EUR 1,020,400 1,019,610 0.16
BNP Paribas SA 0.5% 15/07/2025 EMTN 500,000 EUR 507,150 506,420 0.08
Bumper NL 2020-1 BV 0.647% 06/24/2031 1,200,000 EUR 1,175,456 1,173,957 0.19
Daimler International Finance BV 0.25% 06/11/2023 EMTN 800,000 EUR 797,712 806,584 0.13
Digital Dutch Finco BV 0.625% 15/07/2025 1,800,000 EUR 1,842,300 1,834,074 0.30
Domi 2019-1 BV 0.302% 06/15/2051 500,000 EUR 261,338 261,252 0.04
Domi 2020-1 BV 0.262% 04/15/2052 600,000 EUR 456,830 456,150 0.07
Dutch Property Finance 2019-1 BV 0.211% 10/28/2052 800,000 EUR 382,066 382,224 0.06
EasyJet FinCo BV 1.875% 03/03/2028 EMTN 1,000,000 EUR 983,455 1,000,850 0.16
Lseg Netherlands BV 0% 06/04/2025 EMTN 400,000 EUR 400,336 399,892 0.06
Netherlands Government Bond 1.75% 15/07/2023 4,000,000 EUR 4,273,690 4,200,920 0.68
Stellantis NV 3.75% 29/03/2024 EMTN 500,000 EUR 551,700 549,790 0.09
Volkswagen International Finance NV 0.05% 10/06/2024 1,300,000 EUR 1,302,275 1,301,547 0.21
Volkswagen International Finance NV 3.5% / perpetual 1,000,000 EUR 1,048,650 1,078,890 0.17
Volkswagen International Finance NV 3.875% / perpetual 500,000 EUR 528,750 554,640 0.09
Wizz Air Finance Co BV 1.35% 19/01/2024 EMTN 1,300,000 EUR 1,303,408 1,327,300 0.21
Total Netherlands 17,136,701 17,155,636 2.75
PORTUGAL
Banco Comercial Portugues SA 0.75% 31/05/2022 1,200,000 EUR 1,218,295 1,212,996 0.20
Portugal Obrigacoes do Tesouro OT 0.3% 17/10/2031 1,337,000 EUR 1,298,023 1,324,927 0.21
Portugal Obrigacoes do Tesouro OT 1.1% 05/12/2022 1,820,000 EUR 1,865,840 1,858,490 0.30
Portugal Obrigacoes do Tesouro OT 1.6% 02/08/2022 1,500,000 EUR 1,564,950 1,528,914 0.25
Portugal Obrigacoes do Tesouro OT 1.9% 12/04/2022 1,200,000 EUR 1,238,490 1,219,015 0.20
Portugal Obrigacoes do Tesouro OT 2% 30/11/2021 850,000 EUR 880,813 857,594 0.14
Portugal Obrigacoes do Tesouro OT 2.05% 12/08/2021 2,100,000 EUR 2,164,981 2,105,298 0.34
Tagus - Sociedade de Titularizacao de Creditos SA 1.403% 05/12/2025 4,500,000 EUR 1,265,553 1,257,250 0.20
TAGUS - Sociedade de Titularizacao de Creditos SA/Volta VI 1.1% 02/13/2023 2,600,000 EUR 1,111,028 1,103,540 0.18
Total Portugal 12,607,973 12,468,024 2.02
ROMANIA
Romanian Government International Bond 3.875% 29/10/2035 EMTN 5,010,000 EUR 5,973,560 5,881,339 0.95
Total Romania 5,973,560 5,881,339 0.95
SPAIN
Adif Alta Velocidad 1.875% 22/09/2022 7,500,000 EUR 7,944,842 7,705,575 1.24
Arval Service Lease SA 0% 30/09/2024 EMTN 1,500,000 EUR 1,499,744 1,499,610 0.24
Autonomous Community of Madrid Spain 1.189% 08/05/2022 1,400,000 EUR 1,457,322 1,418,536 0.23
Autonomous Community of Madrid Spain 3.875% 01/09/2022 3,750,000 EUR 4,232,313 3,937,050 0.63
CaixaBank SA 1.125% 05/08/2022 1,000,000 EUR 1,035,000 1,016,950 0.16
Spain Government Bond 0% 30/04/2023 36,700,000 EUR 36,856,719 37,043,511 5.97
Spain Government Bond 0% 31/05/2024 31,700,000 EUR 32,105,354 32,080,399 5.17
Spain Government Bond 0.5% 31/10/2031 1,658,000 EUR 1,651,020 1,661,614 0.27
Spain Government Inflation Linked Bond 0.65% 30/11/2027 1,155,000 EUR 1,362,604 1,389,112 0.22
Total Spain 88,144,918 87,752,357 14.13
SWEDEN
Fastighets AB Balder 1.25% 28/01/2028 EMTN 825,000 EUR 795,531 833,465 0.13
Fastighets AB Balder 1.875% 14/03/2025 1,400,000 EUR 1,461,744 1,470,406 0.24
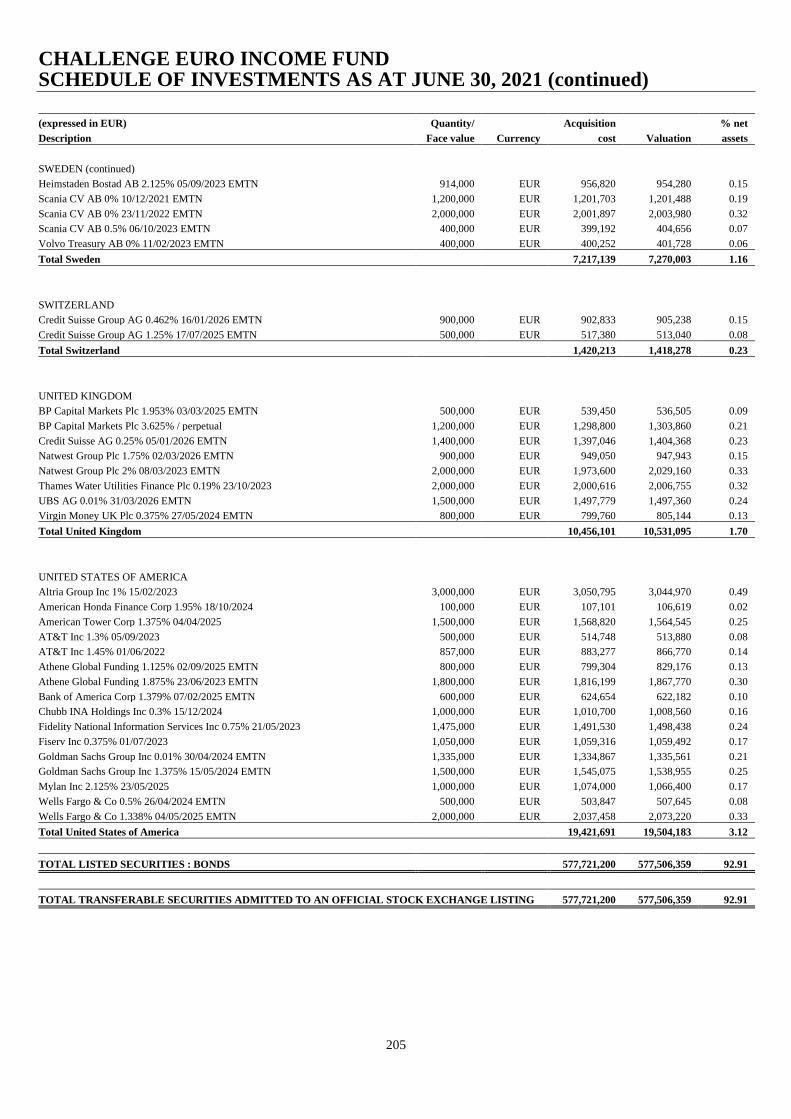
CHALLENGE EURO INCOME FUND SCHEDULE OF INVESTMENTS AS AT JUNE 30, 2021 (continued)
205
(expressed in EUR) Quantity/ Acquisition % net
Description Face value Currency cost Valuation assets
SWEDEN (continued)
Heimstaden Bostad AB 2.125% 05/09/2023 EMTN 914,000 EUR 956,820 954,280 0.15
Scania CV AB 0% 10/12/2021 EMTN 1,200,000 EUR 1,201,703 1,201,488 0.19
Scania CV AB 0% 23/11/2022 EMTN 2,000,000 EUR 2,001,897 2,003,980 0.32
Scania CV AB 0.5% 06/10/2023 EMTN 400,000 EUR 399,192 404,656 0.07
Volvo Treasury AB 0% 11/02/2023 EMTN 400,000 EUR 400,252 401,728 0.06
Total Sweden 7,217,139 7,270,003 1.16
SWITZERLAND
Credit Suisse Group AG 0.462% 16/01/2026 EMTN 900,000 EUR 902,833 905,238 0.15
Credit Suisse Group AG 1.25% 17/07/2025 EMTN 500,000 EUR 517,380 513,040 0.08
Total Switzerland 1,420,213 1,418,278 0.23
UNITED KINGDOM
BP Capital Markets Plc 1.953% 03/03/2025 EMTN 500,000 EUR 539,450 536,505 0.09
BP Capital Markets Plc 3.625% / perpetual 1,200,000 EUR 1,298,800 1,303,860 0.21
Credit Suisse AG 0.25% 05/01/2026 EMTN 1,400,000 EUR 1,397,046 1,404,368 0.23
Natwest Group Plc 1.75% 02/03/2026 EMTN 900,000 EUR 949,050 947,943 0.15
Natwest Group Plc 2% 08/03/2023 EMTN 2,000,000 EUR 1,973,600 2,029,160 0.33
Thames Water Utilities Finance Plc 0.19% 23/10/2023 2,000,000 EUR 2,000,616 2,006,755 0.32
UBS AG 0.01% 31/03/2026 EMTN 1,500,000 EUR 1,497,779 1,497,360 0.24
Virgin Money UK Plc 0.375% 27/05/2024 EMTN 800,000 EUR 799,760 805,144 0.13
Total United Kingdom 10,456,101 10,531,095 1.70
UNITED STATES OF AMERICA
Altria Group Inc 1% 15/02/2023 3,000,000 EUR 3,050,795 3,044,970 0.49
American Honda Finance Corp 1.95% 18/10/2024 100,000 EUR 107,101 106,619 0.02
American Tower Corp 1.375% 04/04/2025 1,500,000 EUR 1,568,820 1,564,545 0.25
AT&T Inc 1.3% 05/09/2023 500,000 EUR 514,748 513,880 0.08
AT&T Inc 1.45% 01/06/2022 857,000 EUR 883,277 866,770 0.14
Athene Global Funding 1.125% 02/09/2025 EMTN 800,000 EUR 799,304 829,176 0.13
Athene Global Funding 1.875% 23/06/2023 EMTN 1,800,000 EUR 1,816,199 1,867,770 0.30
Bank of America Corp 1.379% 07/02/2025 EMTN 600,000 EUR 624,654 622,182 0.10
Chubb INA Holdings Inc 0.3% 15/12/2024 1,000,000 EUR 1,010,700 1,008,560 0.16
Fidelity National Information Services Inc 0.75% 21/05/2023 1,475,000 EUR 1,491,530 1,498,438 0.24
Fiserv Inc 0.375% 01/07/2023 1,050,000 EUR 1,059,316 1,059,492 0.17
Goldman Sachs Group Inc 0.01% 30/04/2024 EMTN 1,335,000 EUR 1,334,867 1,335,561 0.21
Goldman Sachs Group Inc 1.375% 15/05/2024 EMTN 1,500,000 EUR 1,545,075 1,538,955 0.25
Mylan Inc 2.125% 23/05/2025 1,000,000 EUR 1,074,000 1,066,400 0.17
Wells Fargo & Co 0.5% 26/04/2024 EMTN 500,000 EUR 503,847 507,645 0.08
Wells Fargo & Co 1.338% 04/05/2025 EMTN 2,000,000 EUR 2,037,458 2,073,220 0.33
Total United States of America 19,421,691 19,504,183 3.12
TOTAL LISTED SECURITIES : BONDS 577,721,200 577,506,359 92.91
TOTAL TRANSFERABLE SECURITIES ADMITTED TO AN OFFICIAL STOCK EXCHANGE LISTING 577,721,200 577,506,359 92.91
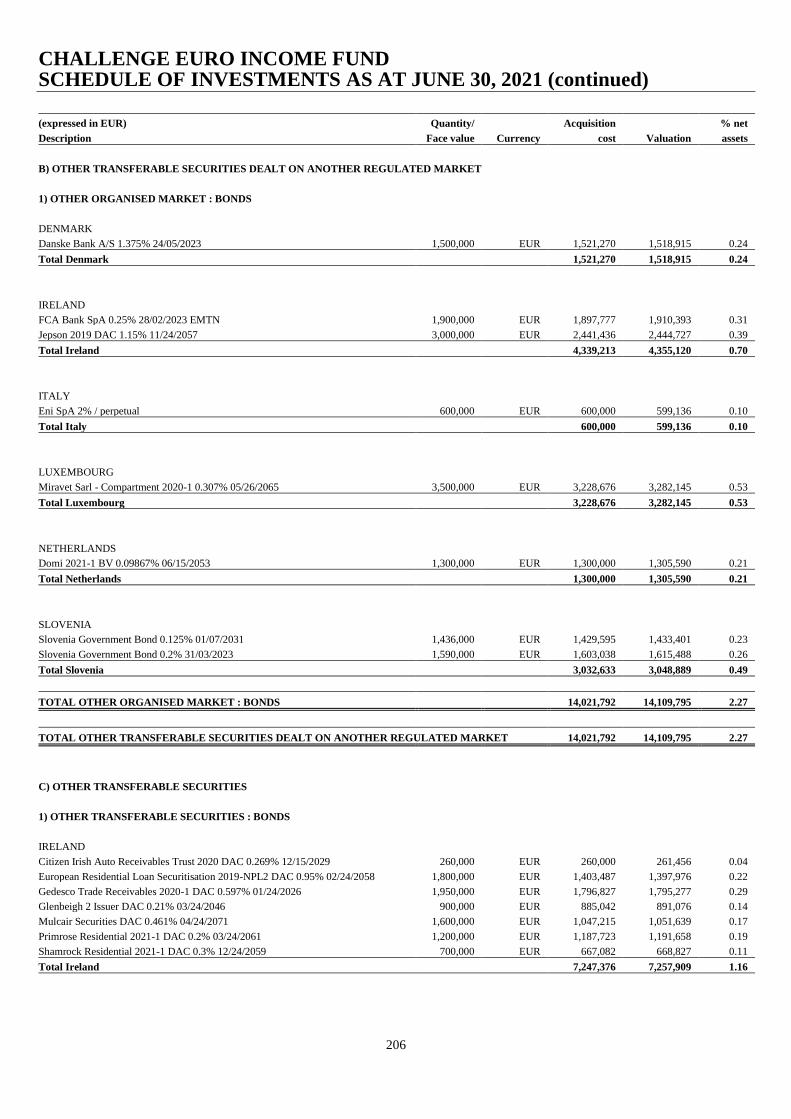
CHALLENGE EURO INCOME FUND SCHEDULE OF INVESTMENTS AS AT JUNE 30, 2021 (continued)
206
(expressed in EUR) Quantity/ Acquisition % net
Description Face value Currency cost Valuation assets
B) OTHER TRANSFERABLE SECURITIES DEALT ON ANOTHER REGULATED MARKET
1) OTHER ORGANISED MARKET : BONDS
DENMARK
Danske Bank A/S 1.375% 24/05/2023 1,500,000 EUR 1,521,270 1,518,915 0.24
Total Denmark 1,521,270 1,518,915 0.24
IRELAND
FCA Bank SpA 0.25% 28/02/2023 EMTN 1,900,000 EUR 1,897,777 1,910,393 0.31
Jepson 2019 DAC 1.15% 11/24/2057 3,000,000 EUR 2,441,436 2,444,727 0.39
Total Ireland 4,339,213 4,355,120 0.70
ITALY
Eni SpA 2% / perpetual 600,000 EUR 600,000 599,136 0.10
Total Italy 600,000 599,136 0.10
LUXEMBOURG
Miravet Sarl - Compartment 2020-1 0.307% 05/26/2065 3,500,000 EUR 3,228,676 3,282,145 0.53
Total Luxembourg 3,228,676 3,282,145 0.53
NETHERLANDS
Domi 2021-1 BV 0.09867% 06/15/2053 1,300,000 EUR 1,300,000 1,305,590 0.21
Total Netherlands 1,300,000 1,305,590 0.21
SLOVENIA
Slovenia Government Bond 0.125% 01/07/2031 1,436,000 EUR 1,429,595 1,433,401 0.23
Slovenia Government Bond 0.2% 31/03/2023 1,590,000 EUR 1,603,038 1,615,488 0.26
Total Slovenia 3,032,633 3,048,889 0.49
TOTAL OTHER ORGANISED MARKET : BONDS 14,021,792 14,109,795 2.27
TOTAL OTHER TRANSFERABLE SECURITIES DEALT ON ANOTHER REGULATED MARKET 14,021,792 14,109,795 2.27
C) OTHER TRANSFERABLE SECURITIES
1) OTHER TRANSFERABLE SECURITIES : BONDS
IRELAND
Citizen Irish Auto Receivables Trust 2020 DAC 0.269% 12/15/2029 260,000 EUR 260,000 261,456 0.04
European Residential Loan Securitisation 2019-NPL2 DAC 0.95% 02/24/2058 1,800,000 EUR 1,403,487 1,397,976 0.22
Gedesco Trade Receivables 2020-1 DAC 0.597% 01/24/2026 1,950,000 EUR 1,796,827 1,795,277 0.29
Glenbeigh 2 Issuer DAC 0.21% 03/24/2046 900,000 EUR 885,042 891,076 0.14
Mulcair Securities DAC 0.461% 04/24/2071 1,600,000 EUR 1,047,215 1,051,639 0.17
Primrose Residential 2021-1 DAC 0.2% 03/24/2061 1,200,000 EUR 1,187,723 1,191,658 0.19
Shamrock Residential 2021-1 DAC 0.3% 12/24/2059 700,000 EUR 667,082 668,827 0.11
Total Ireland 7,247,376 7,257,909 1.16
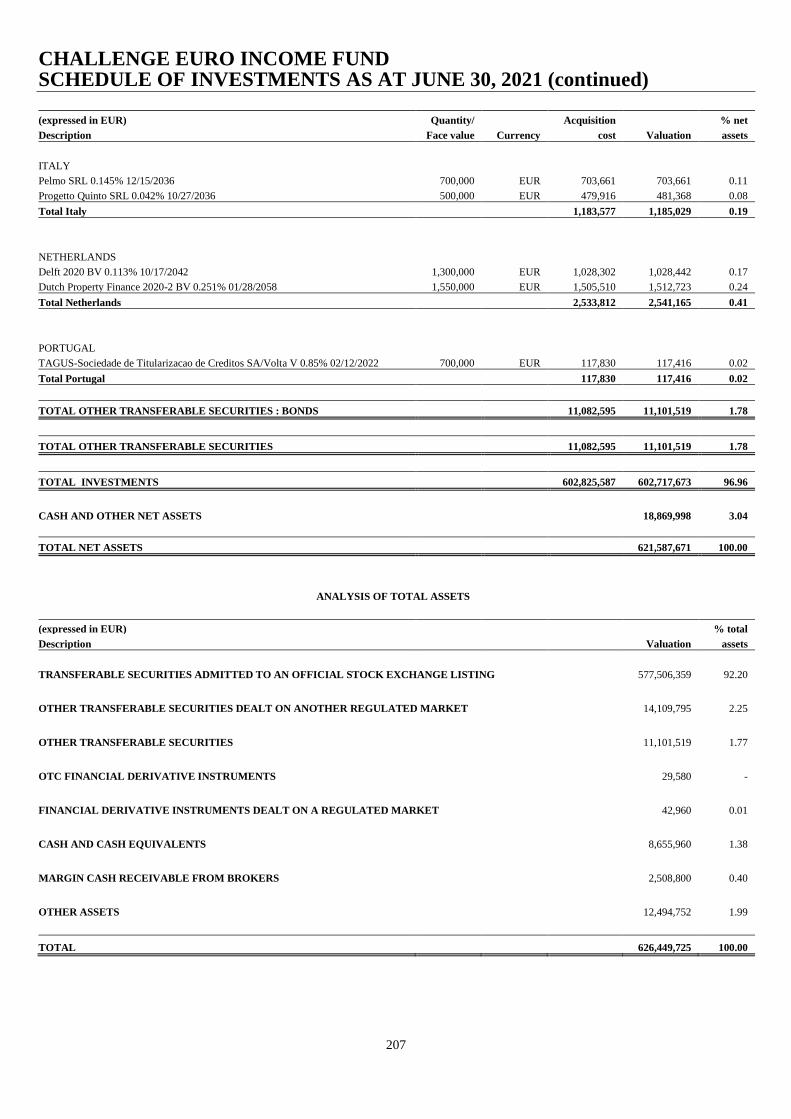
CHALLENGE EURO INCOME FUND SCHEDULE OF INVESTMENTS AS AT JUNE 30, 2021 (continued)
207
(expressed in EUR) Quantity/ Acquisition % net
Description Face value Currency cost Valuation assets
ITALY
Pelmo SRL 0.145% 12/15/2036 700,000 EUR 703,661 703,661 0.11
Progetto Quinto SRL 0.042% 10/27/2036 500,000 EUR 479,916 481,368 0.08
Total Italy 1,183,577 1,185,029 0.19
NETHERLANDS
Delft 2020 BV 0.113% 10/17/2042 1,300,000 EUR 1,028,302 1,028,442 0.17
Dutch Property Finance 2020-2 BV 0.251% 01/28/2058 1,550,000 EUR 1,505,510 1,512,723 0.24
Total Netherlands 2,533,812 2,541,165 0.41
PORTUGAL
TAGUS-Sociedade de Titularizacao de Creditos SA/Volta V 0.85% 02/12/2022 700,000 EUR 117,830 117,416 0.02
Total Portugal 117,830 117,416 0.02
TOTAL OTHER TRANSFERABLE SECURITIES : BONDS 11,082,595 11,101,519 1.78
TOTAL OTHER TRANSFERABLE SECURITIES 11,082,595 11,101,519 1.78
TOTAL INVESTMENTS 602,825,587 602,717,673 96.96
CASH AND OTHER NET ASSETS 18,869,998 3.04
TOTAL NET ASSETS 621,587,671 100.00
ANALYSIS OF TOTAL ASSETS
(expressed in EUR) % total
Description Valuation assets
TRANSFERABLE SECURITIES ADMITTED TO AN OFFICIAL STOCK EXCHANGE LISTING 577,506,359 92.20
OTHER TRANSFERABLE SECURITIES DEALT ON ANOTHER REGULATED MARKET
14,109,795 2.25
OTHER TRANSFERABLE SECURITIES
11,101,519 1.77
OTC FINANCIAL DERIVATIVE INSTRUMENTS
29,580 -
FINANCIAL DERIVATIVE INSTRUMENTS DEALT ON A REGULATED MARKET
42,960 0.01
CASH AND CASH EQUIVALENTS
8,655,960 1.38
MARGIN CASH RECEIVABLE FROM BROKERS
2,508,800 0.40
OTHER ASSETS
12,494,752 1.99
TOTAL 626,449,725 100.00
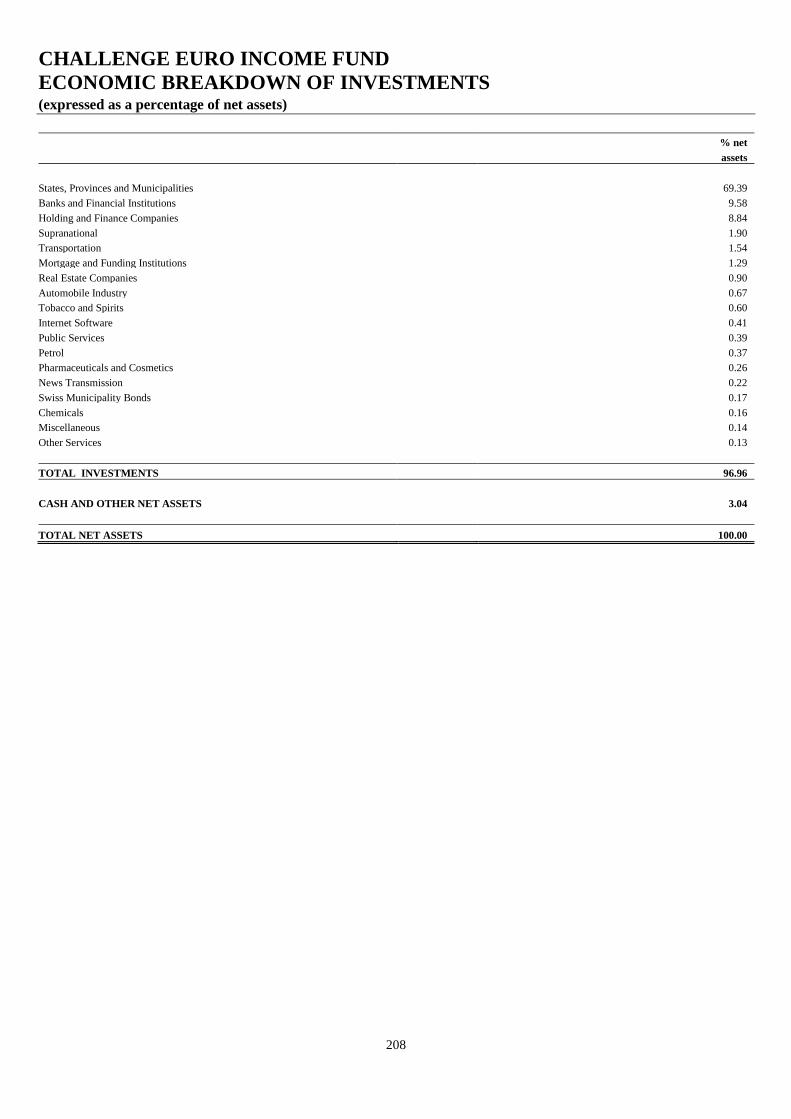
CHALLENGE EURO INCOME FUND
ECONOMIC BREAKDOWN OF INVESTMENTS (expressed as a percentage of net assets)
208
% net
assets
States, Provinces and Municipalities 69.39
Banks and Financial Institutions 9.58
Holding and Finance Companies 8.84
Supranational 1.90
Transportation 1.54
Mortgage and Funding Institutions 1.29
Real Estate Companies 0.90
Automobile Industry 0.67
Tobacco and Spirits 0.60
Internet Software 0.41
Public Services 0.39
Petrol 0.37
Pharmaceuticals and Cosmetics 0.26
News Transmission 0.22
Swiss Municipality Bonds 0.17
Chemicals 0.16
Miscellaneous 0.14
Other Services 0.13
TOTAL INVESTMENTS 96.96
CASH AND OTHER NET ASSETS 3.04
TOTAL NET ASSETS 100.00
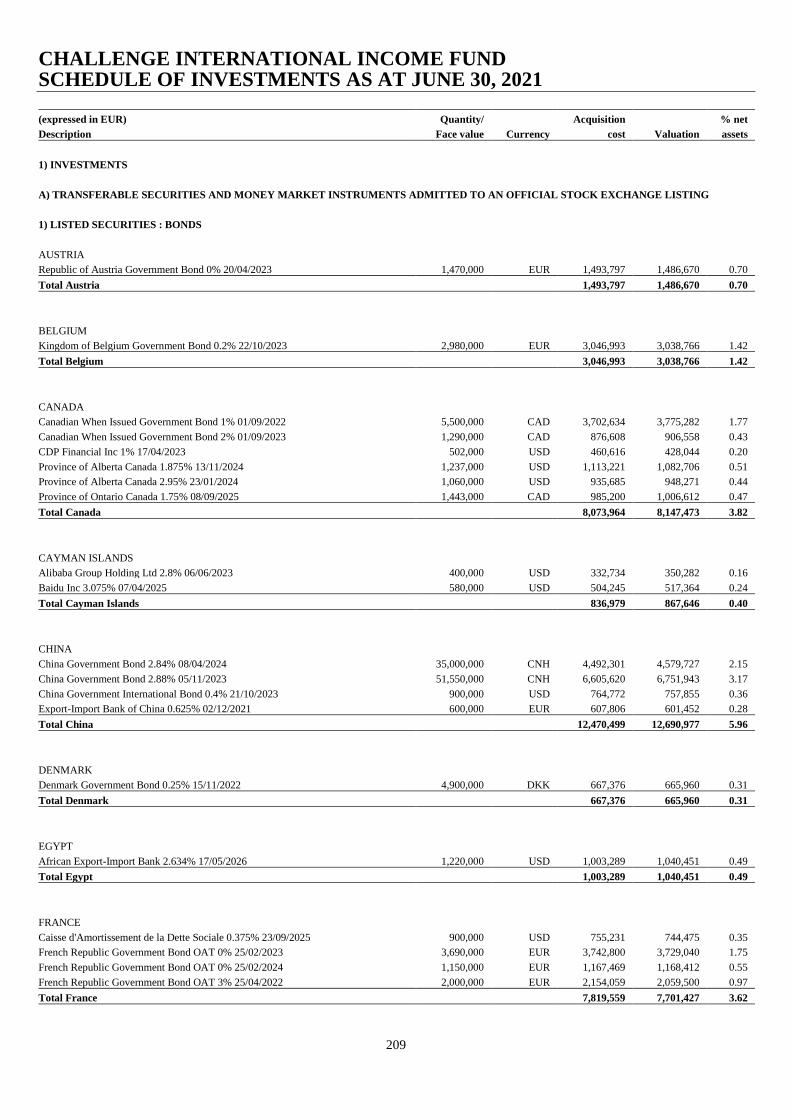
CHALLENGE INTERNATIONAL INCOME FUND SCHEDULE OF INVESTMENTS AS AT JUNE 30, 2021
209
(expressed in EUR) Quantity/ Acquisition % net
Description Face value Currency cost Valuation assets
1) INVESTMENTS
A) TRANSFERABLE SECURITIES AND MONEY MARKET INSTRUMENTS ADMITTED TO AN OFFICIAL STOCK EXCHANGE LISTING
1) LISTED SECURITIES : BONDS
AUSTRIA
Republic of Austria Government Bond 0% 20/04/2023 1,470,000 EUR 1,493,797 1,486,670 0.70
Total Austria 1,493,797 1,486,670 0.70
BELGIUM
Kingdom of Belgium Government Bond 0.2% 22/10/2023 2,980,000 EUR 3,046,993 3,038,766 1.42
Total Belgium 3,046,993 3,038,766 1.42
CANADA
Canadian When Issued Government Bond 1% 01/09/2022 5,500,000 CAD 3,702,634 3,775,282 1.77
Canadian When Issued Government Bond 2% 01/09/2023 1,290,000 CAD 876,608 906,558 0.43
CDP Financial Inc 1% 17/04/2023 502,000 USD 460,616 428,044 0.20
Province of Alberta Canada 1.875% 13/11/2024 1,237,000 USD 1,113,221 1,082,706 0.51
Province of Alberta Canada 2.95% 23/01/2024 1,060,000 USD 935,685 948,271 0.44
Province of Ontario Canada 1.75% 08/09/2025 1,443,000 CAD 985,200 1,006,612 0.47
Total Canada 8,073,964 8,147,473 3.82
CAYMAN ISLANDS
Alibaba Group Holding Ltd 2.8% 06/06/2023 400,000 USD 332,734 350,282 0.16
Baidu Inc 3.075% 07/04/2025 580,000 USD 504,245 517,364 0.24
Total Cayman Islands 836,979 867,646 0.40
CHINA
China Government Bond 2.84% 08/04/2024 35,000,000 CNH 4,492,301 4,579,727 2.15
China Government Bond 2.88% 05/11/2023 51,550,000 CNH 6,605,620 6,751,943 3.17
China Government International Bond 0.4% 21/10/2023 900,000 USD 764,772 757,855 0.36
Export-Import Bank of China 0.625% 02/12/2021 600,000 EUR 607,806 601,452 0.28
Total China 12,470,499 12,690,977 5.96
DENMARK
Denmark Government Bond 0.25% 15/11/2022 4,900,000 DKK 667,376 665,960 0.31
Total Denmark 667,376 665,960 0.31
EGYPT
African Export-Import Bank 2.634% 17/05/2026 1,220,000 USD 1,003,289 1,040,451 0.49
Total Egypt 1,003,289 1,040,451 0.49
FRANCE
Caisse d'Amortissement de la Dette Sociale 0.375% 23/09/2025 900,000 USD 755,231 744,475 0.35
French Republic Government Bond OAT 0% 25/02/2023 3,690,000 EUR 3,742,800 3,729,040 1.75
French Republic Government Bond OAT 0% 25/02/2024 1,150,000 EUR 1,167,469 1,168,412 0.55
French Republic Government Bond OAT 3% 25/04/2022 2,000,000 EUR 2,154,059 2,059,500 0.97
Total France 7,819,559 7,701,427 3.62
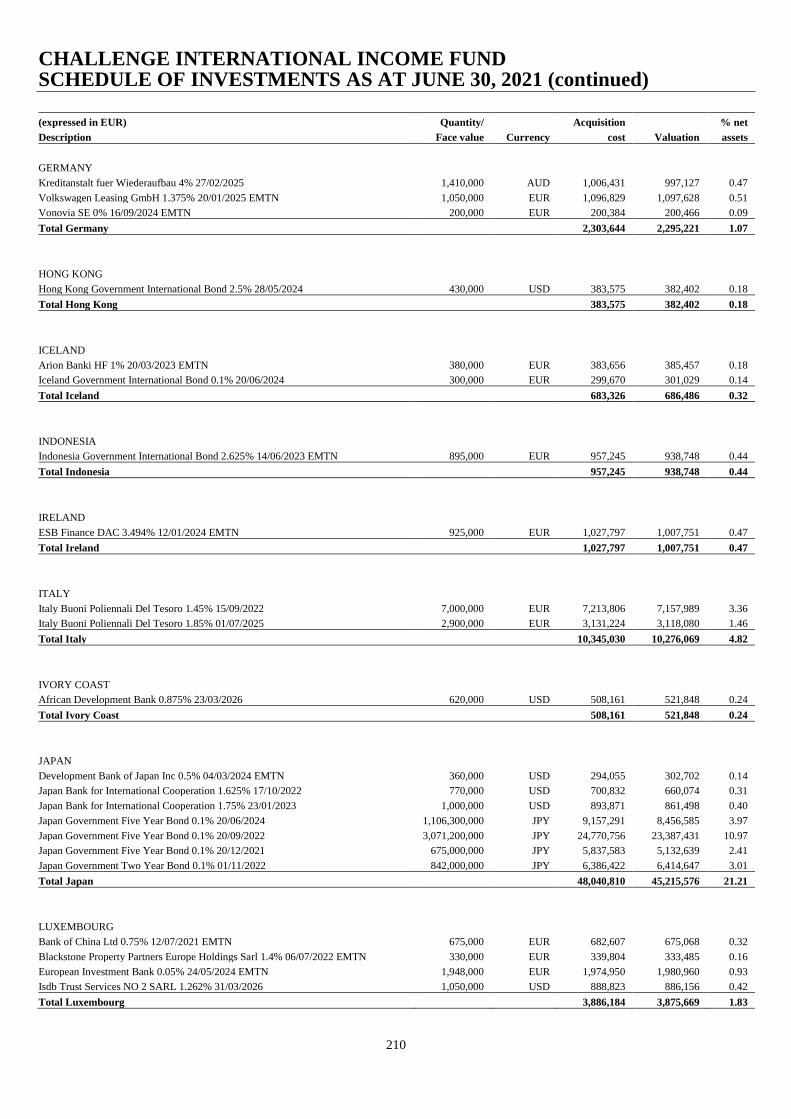
CHALLENGE INTERNATIONAL INCOME FUND SCHEDULE OF INVESTMENTS AS AT JUNE 30, 2021 (continued)
210
(expressed in EUR) Quantity/ Acquisition % net
Description Face value Currency cost Valuation assets
GERMANY
Kreditanstalt fuer Wiederaufbau 4% 27/02/2025 1,410,000 AUD 1,006,431 997,127 0.47
Volkswagen Leasing GmbH 1.375% 20/01/2025 EMTN 1,050,000 EUR 1,096,829 1,097,628 0.51
Vonovia SE 0% 16/09/2024 EMTN 200,000 EUR 200,384 200,466 0.09
Total Germany 2,303,644 2,295,221 1.07
HONG KONG
Hong Kong Government International Bond 2.5% 28/05/2024 430,000 USD 383,575 382,402 0.18
Total Hong Kong 383,575 382,402 0.18
ICELAND
Arion Banki HF 1% 20/03/2023 EMTN 380,000 EUR 383,656 385,457 0.18
Iceland Government International Bond 0.1% 20/06/2024 300,000 EUR 299,670 301,029 0.14
Total Iceland 683,326 686,486 0.32
INDONESIA
Indonesia Government International Bond 2.625% 14/06/2023 EMTN 895,000 EUR 957,245 938,748 0.44
Total Indonesia 957,245 938,748 0.44
IRELAND
ESB Finance DAC 3.494% 12/01/2024 EMTN 925,000 EUR 1,027,797 1,007,751 0.47
Total Ireland 1,027,797 1,007,751 0.47
ITALY
Italy Buoni Poliennali Del Tesoro 1.45% 15/09/2022 7,000,000 EUR 7,213,806 7,157,989 3.36
Italy Buoni Poliennali Del Tesoro 1.85% 01/07/2025 2,900,000 EUR 3,131,224 3,118,080 1.46
Total Italy 10,345,030 10,276,069 4.82
IVORY COAST
African Development Bank 0.875% 23/03/2026 620,000 USD 508,161 521,848 0.24
Total Ivory Coast 508,161 521,848 0.24
JAPAN
Development Bank of Japan Inc 0.5% 04/03/2024 EMTN 360,000 USD 294,055 302,702 0.14
Japan Bank for International Cooperation 1.625% 17/10/2022 770,000 USD 700,832 660,074 0.31
Japan Bank for International Cooperation 1.75% 23/01/2023 1,000,000 USD 893,871 861,498 0.40
Japan Government Five Year Bond 0.1% 20/06/2024 1,106,300,000 JPY 9,157,291 8,456,585 3.97
Japan Government Five Year Bond 0.1% 20/09/2022 3,071,200,000 JPY 24,770,756 23,387,431 10.97
Japan Government Five Year Bond 0.1% 20/12/2021 675,000,000 JPY 5,837,583 5,132,639 2.41
Japan Government Two Year Bond 0.1% 01/11/2022 842,000,000 JPY 6,386,422 6,414,647 3.01
Total Japan 48,040,810 45,215,576 21.21
LUXEMBOURG
Bank of China Ltd 0.75% 12/07/2021 EMTN 675,000 EUR 682,607 675,068 0.32
Blackstone Property Partners Europe Holdings Sarl 1.4% 06/07/2022 EMTN 330,000 EUR 339,804 333,485 0.16
European Investment Bank 0.05% 24/05/2024 EMTN 1,948,000 EUR 1,974,950 1,980,960 0.93
Isdb Trust Services NO 2 SARL 1.262% 31/03/2026 1,050,000 USD 888,823 886,156 0.42
Total Luxembourg 3,886,184 3,875,669 1.83

CHALLENGE INTERNATIONAL INCOME FUND SCHEDULE OF INVESTMENTS AS AT JUNE 30, 2021 (continued)
211
(expressed in EUR) Quantity/ Acquisition % net
Description Face value Currency cost Valuation assets
MEXICO
Mexican Bonos 7.25% 09/12/2021 110,000 MXN 494,237 470,510 0.22
Mexican Bonos 8% 07/12/2023 160,000 MXN 703,644 710,392 0.33
Total Mexico 1,197,881 1,180,902 0.55
NETHERLANDS
Digital Dutch Finco BV 0.125% 15/10/2022 150,000 EUR 149,865 150,542 0.07 Nederlandse Financierings-Maatschappij voor Ontwikkelingslanden NV 1.75%
12/12/2024 EMTN 1,500,000 USD 1,347,733 1,308,310 0.61
Nederlandse Financierings-Maatschappij voor Ontwikkelingslanden NV 2.25%
21/10/2022 400,000 USD 355,979 345,719 0.16
Total Netherlands 1,853,577 1,804,571 0.84
NEW ZEALAND
New Zealand Government Bond 0.5% 15/05/2024 600,000 NZD 340,255 350,966 0.16
Total New Zealand 340,255 350,966 0.16
NORWAY
Kommunalbanken AS 0.375% 11/09/2025 670,000 USD 563,649 554,689 0.26
Norway Government Bond 2% 24/05/2023 5,000,000 NOK 514,985 502,147 0.24
Total Norway 1,078,634 1,056,836 0.50
PHILIPPINES
Asian Development Bank 1.5% 18/10/2024 1,598,000 USD 1,441,252 1,386,726 0.65
Total Philippines 1,441,252 1,386,726 0.65
POLAND
Republic of Poland Government Bond 2.25% 25/04/2022 3,410,000 PLN 804,005 769,363 0.36
Republic of Poland Government Bond 4% 25/10/2023 2,370,000 PLN 565,561 568,210 0.27
Republic of Poland Government International Bond 0% 07/07/2023 EMTN 285,000 EUR 285,943 286,918 0.13
Republic of Poland Government International Bond 0.5% 20/12/2021 EMTN 660,000 EUR 673,200 661,907 0.31
Total Poland 2,328,709 2,286,398 1.07
PORTUGAL
Portugal Obrigacoes do Tesouro OT 2.875% 15/10/2025 620,000 EUR 712,797 708,245 0.33
Total Portugal 712,797 708,245 0.33
SAUDI ARABIA
Saudi Government International Bond 0% 03/03/2024 EMTN 770,000 EUR 771,292 768,252 0.36
Total Saudi Arabia 771,292 768,252 0.36
SOUTH KOREA
Export-Import Bank of Korea 0.625% 29/06/2024 1,420,000 USD 1,192,745 1,199,642 0.56
Export-Import Bank of Korea 1.875% 12/02/2025 1,170,000 USD 1,060,263 1,015,875 0.48
Industrial Bank of Korea 1.04% 22/06/2025 850,000 USD 706,679 713,931 0.33
Kookmin Bank 1.375% 06/05/2026 EMTN 1,240,000 USD 1,019,707 1,046,351 0.49
Korea Development Bank 1.25% 03/06/2025 260,000 USD 236,900 221,065 0.10
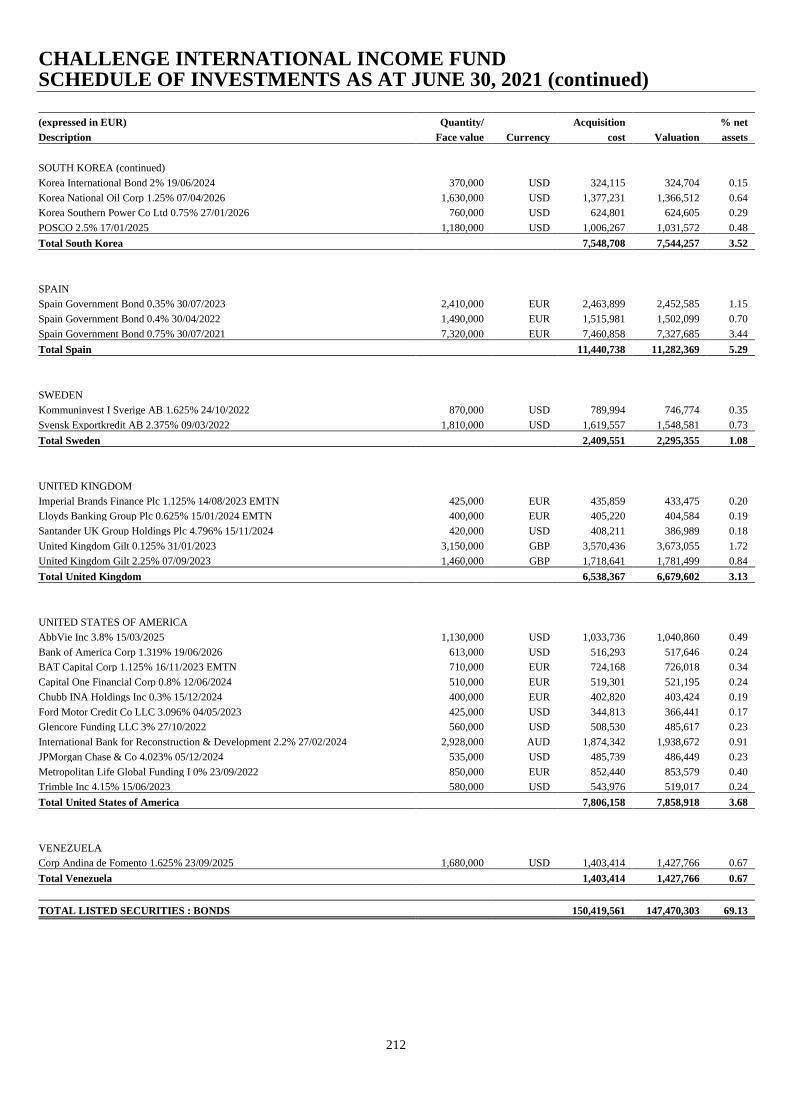
CHALLENGE INTERNATIONAL INCOME FUND SCHEDULE OF INVESTMENTS AS AT JUNE 30, 2021 (continued)
212
(expressed in EUR) Quantity/ Acquisition % net
Description Face value Currency cost Valuation assets
SOUTH KOREA (continued)
Korea International Bond 2% 19/06/2024 370,000 USD 324,115 324,704 0.15
Korea National Oil Corp 1.25% 07/04/2026 1,630,000 USD 1,377,231 1,366,512 0.64
Korea Southern Power Co Ltd 0.75% 27/01/2026 760,000 USD 624,801 624,605 0.29
POSCO 2.5% 17/01/2025 1,180,000 USD 1,006,267 1,031,572 0.48
Total South Korea 7,548,708 7,544,257 3.52
SPAIN
Spain Government Bond 0.35% 30/07/2023 2,410,000 EUR 2,463,899 2,452,585 1.15
Spain Government Bond 0.4% 30/04/2022 1,490,000 EUR 1,515,981 1,502,099 0.70
Spain Government Bond 0.75% 30/07/2021 7,320,000 EUR 7,460,858 7,327,685 3.44
Total Spain 11,440,738 11,282,369 5.29
SWEDEN
Kommuninvest I Sverige AB 1.625% 24/10/2022 870,000 USD 789,994 746,774 0.35
Svensk Exportkredit AB 2.375% 09/03/2022 1,810,000 USD 1,619,557 1,548,581 0.73
Total Sweden 2,409,551 2,295,355 1.08
UNITED KINGDOM
Imperial Brands Finance Plc 1.125% 14/08/2023 EMTN 425,000 EUR 435,859 433,475 0.20
Lloyds Banking Group Plc 0.625% 15/01/2024 EMTN 400,000 EUR 405,220 404,584 0.19
Santander UK Group Holdings Plc 4.796% 15/11/2024 420,000 USD 408,211 386,989 0.18
United Kingdom Gilt 0.125% 31/01/2023 3,150,000 GBP 3,570,436 3,673,055 1.72
United Kingdom Gilt 2.25% 07/09/2023 1,460,000 GBP 1,718,641 1,781,499 0.84
Total United Kingdom 6,538,367 6,679,602 3.13
UNITED STATES OF AMERICA
AbbVie Inc 3.8% 15/03/2025 1,130,000 USD 1,033,736 1,040,860 0.49
Bank of America Corp 1.319% 19/06/2026 613,000 USD 516,293 517,646 0.24
BAT Capital Corp 1.125% 16/11/2023 EMTN 710,000 EUR 724,168 726,018 0.34
Capital One Financial Corp 0.8% 12/06/2024 510,000 EUR 519,301 521,195 0.24
Chubb INA Holdings Inc 0.3% 15/12/2024 400,000 EUR 402,820 403,424 0.19
Ford Motor Credit Co LLC 3.096% 04/05/2023 425,000 USD 344,813 366,441 0.17
Glencore Funding LLC 3% 27/10/2022 560,000 USD 508,530 485,617 0.23
International Bank for Reconstruction & Development 2.2% 27/02/2024 2,928,000 AUD 1,874,342 1,938,672 0.91
JPMorgan Chase & Co 4.023% 05/12/2024 535,000 USD 485,739 486,449 0.23
Metropolitan Life Global Funding I 0% 23/09/2022 850,000 EUR 852,440 853,579 0.40
Trimble Inc 4.15% 15/06/2023 580,000 USD 543,976 519,017 0.24
Total United States of America 7,806,158 7,858,918 3.68
VENEZUELA
Corp Andina de Fomento 1.625% 23/09/2025 1,680,000 USD 1,403,414 1,427,766 0.67
Total Venezuela 1,403,414 1,427,766 0.67
TOTAL LISTED SECURITIES : BONDS 150,419,561 147,470,303 69.13

CHALLENGE INTERNATIONAL INCOME FUND SCHEDULE OF INVESTMENTS AS AT JUNE 30, 2021 (continued)
213
(expressed in EUR) Quantity/ Acquisition % net
Description Face value Currency cost Valuation assets
2) MONEY MARKET INSTRUMENTS: BONDS
UNITED STATES OF AMERICA
United States Treasury Note/Bond 1.375% 30/06/2023 20,480,000 USD 18,231,820 17,657,476 8.29
United States Treasury Note/Bond 1.625% 15/12/2022 2,180,000 USD 2,052,235 1,877,114 0.88
United States Treasury Note/Bond 1.75% 15/05/2023 14,500,000 USD 12,890,551 12,571,840 5.90
United States Treasury Note/Bond 1.75% 28/02/2022 5,110,000 USD 4,515,839 4,356,935 2.04
United States Treasury Note/Bond 1.75% 30/04/2022 9,820,000 USD 8,929,335 8,395,136 3.94
United States Treasury Note/Bond 2.125% 15/05/2025 1,120,000 USD 993,336 996,964 0.47
Total United States of America 47,613,116 45,855,465 21.52
TOTAL MONEY MARKET INSTRUMENTS: BONDS 47,613,116 45,855,465 21.52
TOTAL TRANSFERABLE SECURITIES AND MONEY MARKET INSTRUMENTS ADMITTED TO AN
OFFICIAL STOCK EXCHANGE LISTING 198,032,677 193,325,768 90.65
B) OTHER TRANSFERABLE SECURITIES DEALT ON ANOTHER REGULATED MARKET
1) OTHER ORGANISED MARKET : BONDS
CAYMAN ISLANDS
Avolon Holdings Funding Ltd 2.875% 15/02/2025 480,000 USD 420,301 416,872 0.20
Total Cayman Islands 420,301 416,872 0.20
CHILE
Banco del Estado de Chile 2.704% 09/01/2025 810,000 USD 717,657 710,210 0.33
Total Chile 717,657 710,210 0.33
DENMARK
Danske Bank A/S 5% 12/01/2023 600,000 USD 550,277 516,978 0.24
Total Denmark 550,277 516,978 0.24
FRANCE
Societe Generale SA 2.625% 22/01/2025 675,000 USD 604,631 594,044 0.28
Total France 604,631 594,044 0.28
JAPAN
NTT Finance Corp 1.591% 03/04/2028 850,000 USD 688,870 711,595 0.33
Total Japan 688,870 711,595 0.33
LUXEMBOURG
China Construction Bank Europe SA 0% 28/06/2024 EMTN 700,000 EUR 698,803 698,796 0.33
Total Luxembourg 698,803 698,796 0.33
SOUTH KOREA
Korea Development Bank 0.29341% 09/03/2024 550,000 USD 455,959 462,888 0.22
Shinhan Financial Group Co Ltd 1.35% 10/01/2026 EMTN 1,360,000 USD 1,153,179 1,144,182 0.54
Total South Korea 1,609,138 1,607,070 0.76
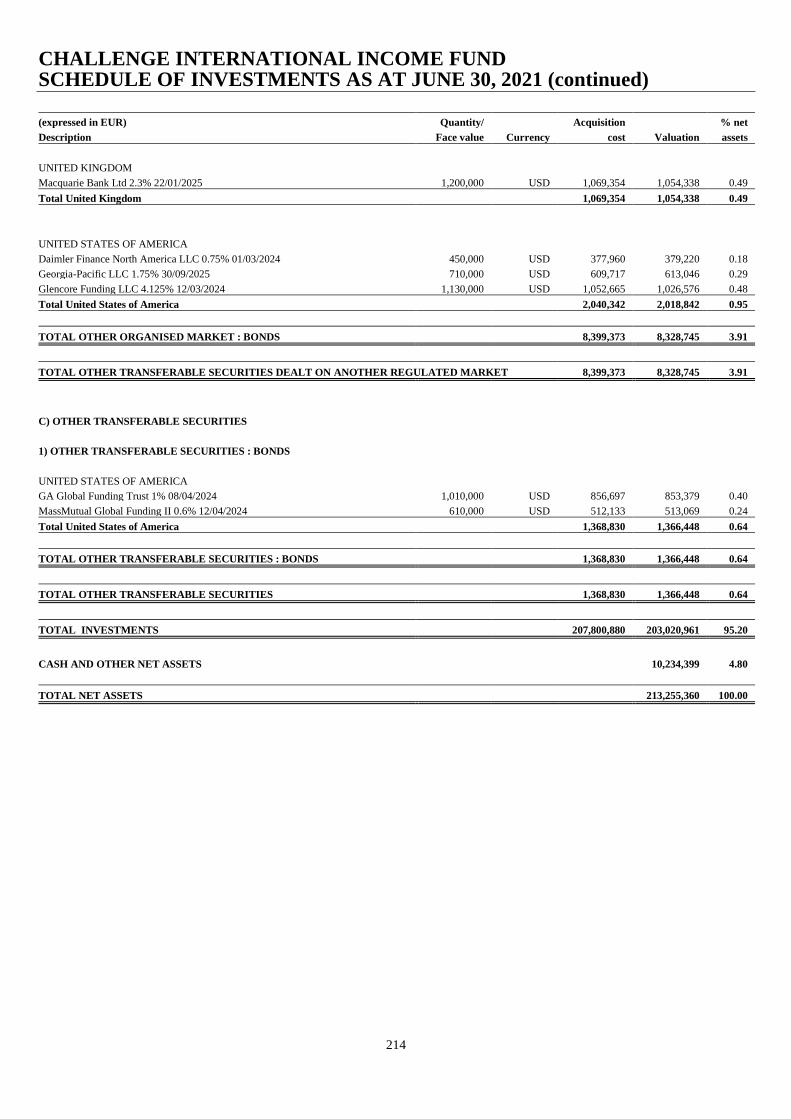
CHALLENGE INTERNATIONAL INCOME FUND SCHEDULE OF INVESTMENTS AS AT JUNE 30, 2021 (continued)
214
(expressed in EUR) Quantity/ Acquisition % net
Description Face value Currency cost Valuation assets
UNITED KINGDOM
Macquarie Bank Ltd 2.3% 22/01/2025 1,200,000 USD 1,069,354 1,054,338 0.49
Total United Kingdom 1,069,354 1,054,338 0.49
UNITED STATES OF AMERICA
Daimler Finance North America LLC 0.75% 01/03/2024 450,000 USD 377,960 379,220 0.18
Georgia-Pacific LLC 1.75% 30/09/2025 710,000 USD 609,717 613,046 0.29
Glencore Funding LLC 4.125% 12/03/2024 1,130,000 USD 1,052,665 1,026,576 0.48
Total United States of America 2,040,342 2,018,842 0.95
TOTAL OTHER ORGANISED MARKET : BONDS 8,399,373 8,328,745 3.91
TOTAL OTHER TRANSFERABLE SECURITIES DEALT ON ANOTHER REGULATED MARKET 8,399,373 8,328,745 3.91
C) OTHER TRANSFERABLE SECURITIES
1) OTHER TRANSFERABLE SECURITIES : BONDS
UNITED STATES OF AMERICA
GA Global Funding Trust 1% 08/04/2024 1,010,000 USD 856,697 853,379 0.40
MassMutual Global Funding II 0.6% 12/04/2024 610,000 USD 512,133 513,069 0.24
Total United States of America 1,368,830 1,366,448 0.64
TOTAL OTHER TRANSFERABLE SECURITIES : BONDS 1,368,830 1,366,448 0.64
TOTAL OTHER TRANSFERABLE SECURITIES 1,368,830 1,366,448 0.64
TOTAL INVESTMENTS 207,800,880 203,020,961 95.20
CASH AND OTHER NET ASSETS 10,234,399 4.80
TOTAL NET ASSETS 213,255,360 100.00

CHALLENGE INTERNATIONAL INCOME FUND SCHEDULE OF INVESTMENTS AS AT JUNE 30, 2021 (continued)
215
ANALYSIS OF TOTAL ASSETS
(expressed in EUR) % total
Description Valuation assets
TRANSFERABLE SECURITIES AND MONEY MARKET INSTRUMENTS ADMITTED TO AN OFFICIAL STOCK
EXCHANGE LISTING 193,325,768 90.06
OTHER TRANSFERABLE SECURITIES DEALT ON ANOTHER REGULATED MARKET
8,328,745 3.88
OTHER TRANSFERABLE SECURITIES
1,366,448 0.64
OTC FINANCIAL DERIVATIVE INSTRUMENTS
570,479 0.27
FINANCIAL DERIVATIVE INSTRUMENTS DEALT ON A REGULATED MARKET
33,445 0.02
CASH AND CASH EQUIVALENTS
2,560,834 1.19
MARGIN CASH RECEIVABLE FROM BROKERS
137,947 0.06
CASH HELD AS COLLATERAL
1,450,000 0.68
OTHER ASSETS
6,871,948 3.20
TOTAL 214,645,614 100.00
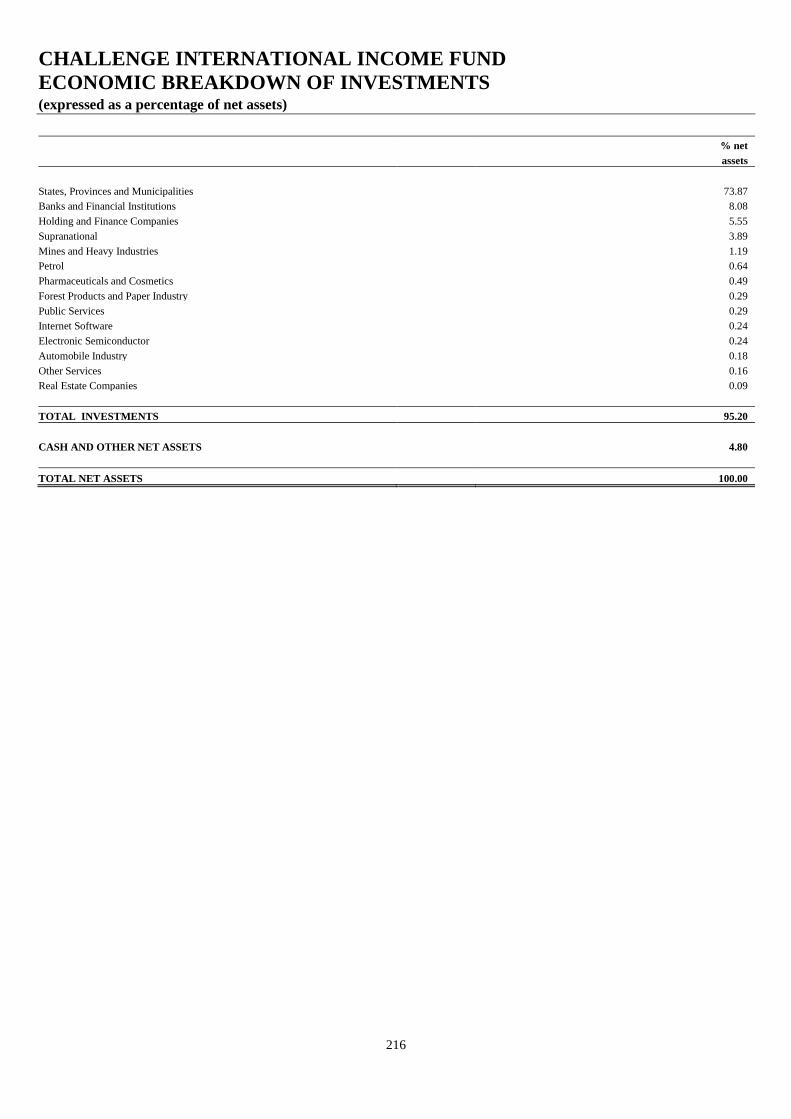
CHALLENGE INTERNATIONAL INCOME FUND
ECONOMIC BREAKDOWN OF INVESTMENTS (expressed as a percentage of net assets)
216
% net
assets
States, Provinces and Municipalities 73.87
Banks and Financial Institutions 8.08
Holding and Finance Companies 5.55
Supranational 3.89
Mines and Heavy Industries 1.19
Petrol 0.64
Pharmaceuticals and Cosmetics 0.49
Forest Products and Paper Industry 0.29
Public Services 0.29
Internet Software 0.24
Electronic Semiconductor 0.24
Automobile Industry 0.18
Other Services 0.16
Real Estate Companies 0.09
TOTAL INVESTMENTS 95.20
CASH AND OTHER NET ASSETS 4.80
TOTAL NET ASSETS 100.00
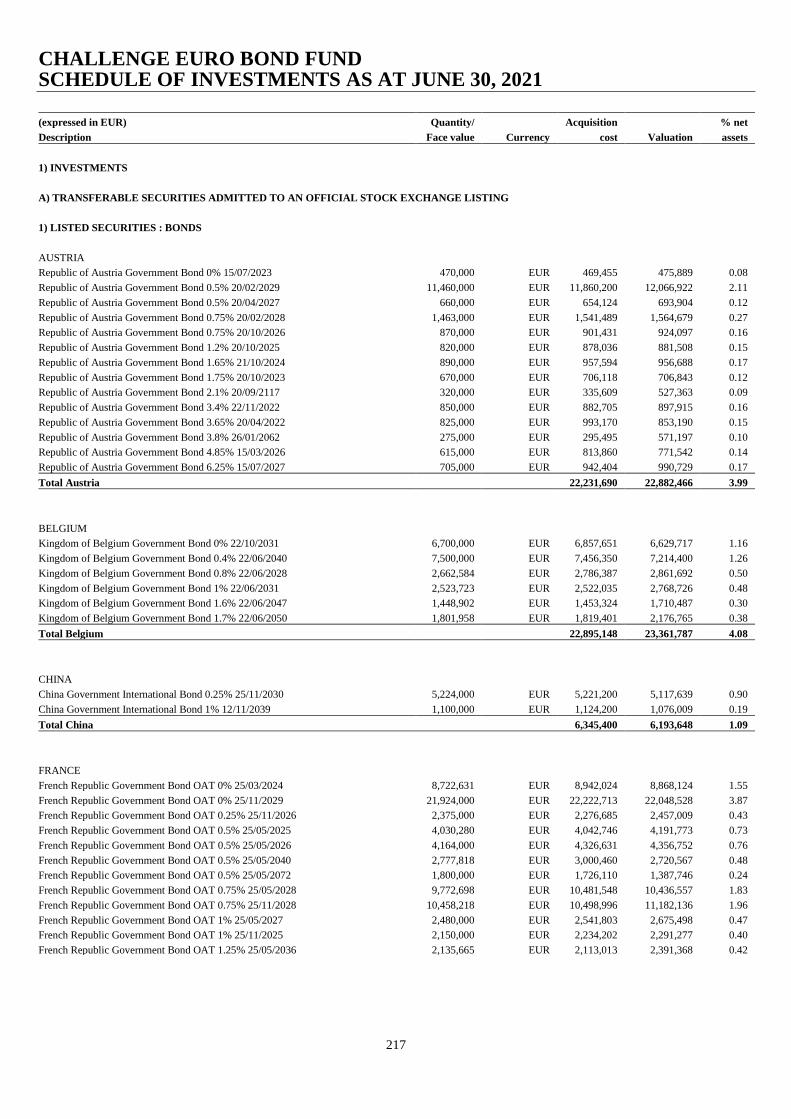
CHALLENGE EURO BOND FUND SCHEDULE OF INVESTMENTS AS AT JUNE 30, 2021
217
(expressed in EUR) Quantity/ Acquisition % net
Description Face value Currency cost Valuation assets
1) INVESTMENTS
A) TRANSFERABLE SECURITIES ADMITTED TO AN OFFICIAL STOCK EXCHANGE LISTING
1) LISTED SECURITIES : BONDS
AUSTRIA
Republic of Austria Government Bond 0% 15/07/2023 470,000 EUR 469,455 475,889 0.08
Republic of Austria Government Bond 0.5% 20/02/2029 11,460,000 EUR 11,860,200 12,066,922 2.11
Republic of Austria Government Bond 0.5% 20/04/2027 660,000 EUR 654,124 693,904 0.12
Republic of Austria Government Bond 0.75% 20/02/2028 1,463,000 EUR 1,541,489 1,564,679 0.27
Republic of Austria Government Bond 0.75% 20/10/2026 870,000 EUR 901,431 924,097 0.16
Republic of Austria Government Bond 1.2% 20/10/2025 820,000 EUR 878,036 881,508 0.15
Republic of Austria Government Bond 1.65% 21/10/2024 890,000 EUR 957,594 956,688 0.17
Republic of Austria Government Bond 1.75% 20/10/2023 670,000 EUR 706,118 706,843 0.12
Republic of Austria Government Bond 2.1% 20/09/2117 320,000 EUR 335,609 527,363 0.09
Republic of Austria Government Bond 3.4% 22/11/2022 850,000 EUR 882,705 897,915 0.16
Republic of Austria Government Bond 3.65% 20/04/2022 825,000 EUR 993,170 853,190 0.15
Republic of Austria Government Bond 3.8% 26/01/2062 275,000 EUR 295,495 571,197 0.10
Republic of Austria Government Bond 4.85% 15/03/2026 615,000 EUR 813,860 771,542 0.14
Republic of Austria Government Bond 6.25% 15/07/2027 705,000 EUR 942,404 990,729 0.17
Total Austria 22,231,690 22,882,466 3.99
BELGIUM
Kingdom of Belgium Government Bond 0% 22/10/2031 6,700,000 EUR 6,857,651 6,629,717 1.16
Kingdom of Belgium Government Bond 0.4% 22/06/2040 7,500,000 EUR 7,456,350 7,214,400 1.26
Kingdom of Belgium Government Bond 0.8% 22/06/2028 2,662,584 EUR 2,786,387 2,861,692 0.50
Kingdom of Belgium Government Bond 1% 22/06/2031 2,523,723 EUR 2,522,035 2,768,726 0.48
Kingdom of Belgium Government Bond 1.6% 22/06/2047 1,448,902 EUR 1,453,324 1,710,487 0.30
Kingdom of Belgium Government Bond 1.7% 22/06/2050 1,801,958 EUR 1,819,401 2,176,765 0.38
Total Belgium 22,895,148 23,361,787 4.08
CHINA
China Government International Bond 0.25% 25/11/2030 5,224,000 EUR 5,221,200 5,117,639 0.90
China Government International Bond 1% 12/11/2039 1,100,000 EUR 1,124,200 1,076,009 0.19
Total China 6,345,400 6,193,648 1.09
FRANCE
French Republic Government Bond OAT 0% 25/03/2024 8,722,631 EUR 8,942,024 8,868,124 1.55
French Republic Government Bond OAT 0% 25/11/2029 21,924,000 EUR 22,222,713 22,048,528 3.87
French Republic Government Bond OAT 0.25% 25/11/2026 2,375,000 EUR 2,276,685 2,457,009 0.43
French Republic Government Bond OAT 0.5% 25/05/2025 4,030,280 EUR 4,042,746 4,191,773 0.73
French Republic Government Bond OAT 0.5% 25/05/2026 4,164,000 EUR 4,326,631 4,356,752 0.76
French Republic Government Bond OAT 0.5% 25/05/2040 2,777,818 EUR 3,000,460 2,720,567 0.48
French Republic Government Bond OAT 0.5% 25/05/2072 1,800,000 EUR 1,726,110 1,387,746 0.24
French Republic Government Bond OAT 0.75% 25/05/2028 9,772,698 EUR 10,481,548 10,436,557 1.83
French Republic Government Bond OAT 0.75% 25/11/2028 10,458,218 EUR 10,498,996 11,182,136 1.96
French Republic Government Bond OAT 1% 25/05/2027 2,480,000 EUR 2,541,803 2,675,498 0.47
French Republic Government Bond OAT 1% 25/11/2025 2,150,000 EUR 2,234,202 2,291,277 0.40
French Republic Government Bond OAT 1.25% 25/05/2036 2,135,665 EUR 2,113,013 2,391,368 0.42
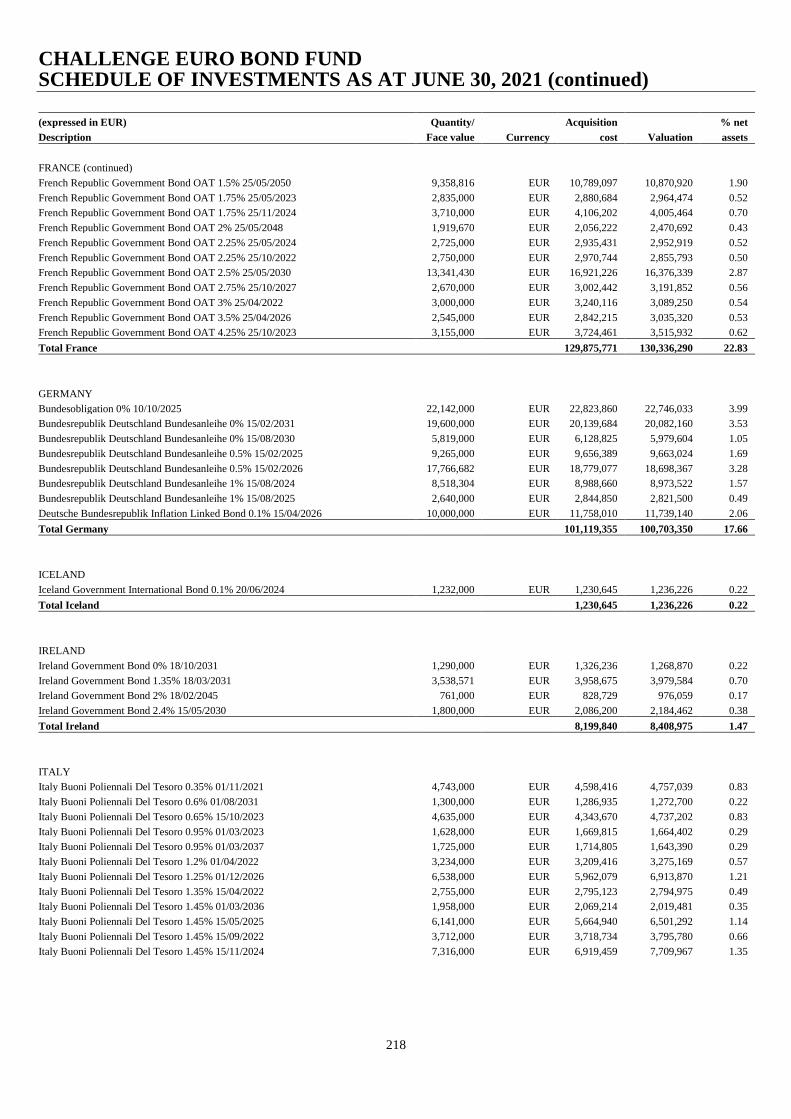
CHALLENGE EURO BOND FUND SCHEDULE OF INVESTMENTS AS AT JUNE 30, 2021 (continued)
218
(expressed in EUR) Quantity/ Acquisition % net
Description Face value Currency cost Valuation assets
FRANCE (continued)
French Republic Government Bond OAT 1.5% 25/05/2050 9,358,816 EUR 10,789,097 10,870,920 1.90
French Republic Government Bond OAT 1.75% 25/05/2023 2,835,000 EUR 2,880,684 2,964,474 0.52
French Republic Government Bond OAT 1.75% 25/11/2024 3,710,000 EUR 4,106,202 4,005,464 0.70
French Republic Government Bond OAT 2% 25/05/2048 1,919,670 EUR 2,056,222 2,470,692 0.43
French Republic Government Bond OAT 2.25% 25/05/2024 2,725,000 EUR 2,935,431 2,952,919 0.52
French Republic Government Bond OAT 2.25% 25/10/2022 2,750,000 EUR 2,970,744 2,855,793 0.50
French Republic Government Bond OAT 2.5% 25/05/2030 13,341,430 EUR 16,921,226 16,376,339 2.87
French Republic Government Bond OAT 2.75% 25/10/2027 2,670,000 EUR 3,002,442 3,191,852 0.56
French Republic Government Bond OAT 3% 25/04/2022 3,000,000 EUR 3,240,116 3,089,250 0.54
French Republic Government Bond OAT 3.5% 25/04/2026 2,545,000 EUR 2,842,215 3,035,320 0.53
French Republic Government Bond OAT 4.25% 25/10/2023 3,155,000 EUR 3,724,461 3,515,932 0.62
Total France 129,875,771 130,336,290 22.83
GERMANY
Bundesobligation 0% 10/10/2025 22,142,000 EUR 22,823,860 22,746,033 3.99
Bundesrepublik Deutschland Bundesanleihe 0% 15/02/2031 19,600,000 EUR 20,139,684 20,082,160 3.53
Bundesrepublik Deutschland Bundesanleihe 0% 15/08/2030 5,819,000 EUR 6,128,825 5,979,604 1.05
Bundesrepublik Deutschland Bundesanleihe 0.5% 15/02/2025 9,265,000 EUR 9,656,389 9,663,024 1.69
Bundesrepublik Deutschland Bundesanleihe 0.5% 15/02/2026 17,766,682 EUR 18,779,077 18,698,367 3.28
Bundesrepublik Deutschland Bundesanleihe 1% 15/08/2024 8,518,304 EUR 8,988,660 8,973,522 1.57
Bundesrepublik Deutschland Bundesanleihe 1% 15/08/2025 2,640,000 EUR 2,844,850 2,821,500 0.49
Deutsche Bundesrepublik Inflation Linked Bond 0.1% 15/04/2026 10,000,000 EUR 11,758,010 11,739,140 2.06
Total Germany 101,119,355 100,703,350 17.66
ICELAND
Iceland Government International Bond 0.1% 20/06/2024 1,232,000 EUR 1,230,645 1,236,226 0.22
Total Iceland 1,230,645 1,236,226 0.22
IRELAND
Ireland Government Bond 0% 18/10/2031 1,290,000 EUR 1,326,236 1,268,870 0.22
Ireland Government Bond 1.35% 18/03/2031 3,538,571 EUR 3,958,675 3,979,584 0.70
Ireland Government Bond 2% 18/02/2045 761,000 EUR 828,729 976,059 0.17
Ireland Government Bond 2.4% 15/05/2030 1,800,000 EUR 2,086,200 2,184,462 0.38
Total Ireland 8,199,840 8,408,975 1.47
ITALY
Italy Buoni Poliennali Del Tesoro 0.35% 01/11/2021 4,743,000 EUR 4,598,416 4,757,039 0.83
Italy Buoni Poliennali Del Tesoro 0.6% 01/08/2031 1,300,000 EUR 1,286,935 1,272,700 0.22
Italy Buoni Poliennali Del Tesoro 0.65% 15/10/2023 4,635,000 EUR 4,343,670 4,737,202 0.83
Italy Buoni Poliennali Del Tesoro 0.95% 01/03/2023 1,628,000 EUR 1,669,815 1,664,402 0.29
Italy Buoni Poliennali Del Tesoro 0.95% 01/03/2037 1,725,000 EUR 1,714,805 1,643,390 0.29
Italy Buoni Poliennali Del Tesoro 1.2% 01/04/2022 3,234,000 EUR 3,209,416 3,275,169 0.57
Italy Buoni Poliennali Del Tesoro 1.25% 01/12/2026 6,538,000 EUR 5,962,079 6,913,870 1.21
Italy Buoni Poliennali Del Tesoro 1.35% 15/04/2022 2,755,000 EUR 2,795,123 2,794,975 0.49
Italy Buoni Poliennali Del Tesoro 1.45% 01/03/2036 1,958,000 EUR 2,069,214 2,019,481 0.35
Italy Buoni Poliennali Del Tesoro 1.45% 15/05/2025 6,141,000 EUR 5,664,940 6,501,292 1.14
Italy Buoni Poliennali Del Tesoro 1.45% 15/09/2022 3,712,000 EUR 3,718,734 3,795,780 0.66
Italy Buoni Poliennali Del Tesoro 1.45% 15/11/2024 7,316,000 EUR 6,919,459 7,709,967 1.35
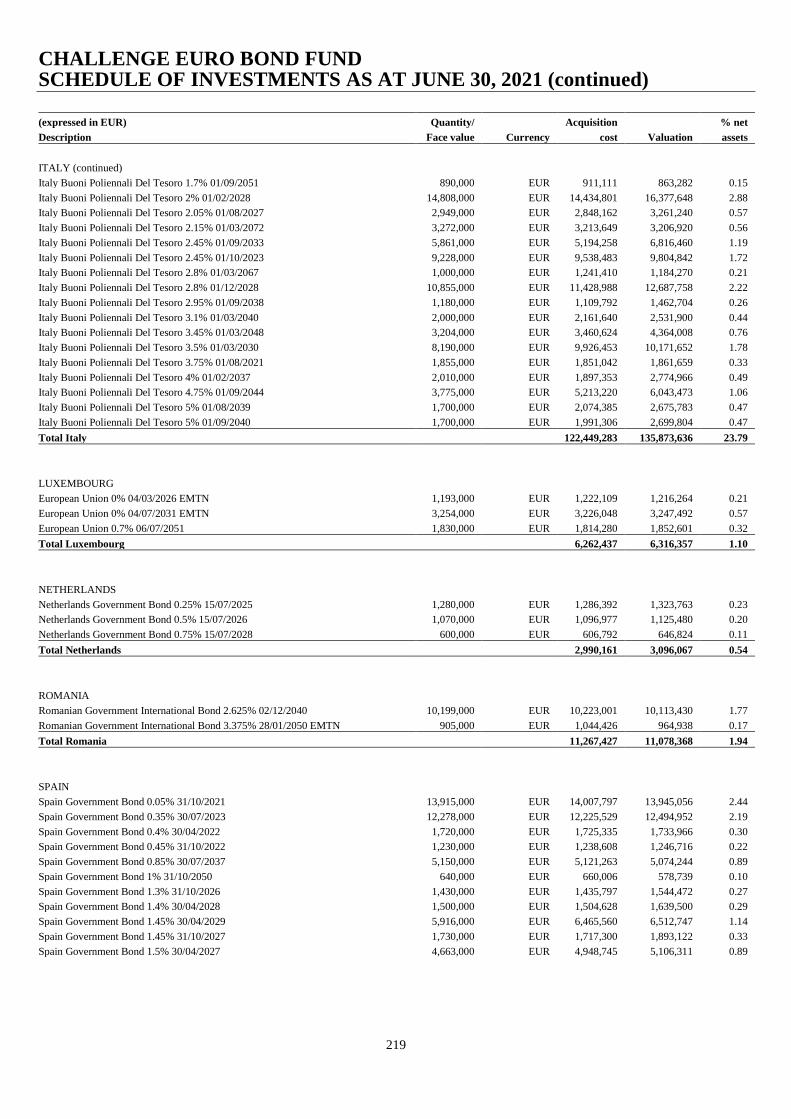
CHALLENGE EURO BOND FUND SCHEDULE OF INVESTMENTS AS AT JUNE 30, 2021 (continued)
219
(expressed in EUR) Quantity/ Acquisition % net
Description Face value Currency cost Valuation assets
ITALY (continued)
Italy Buoni Poliennali Del Tesoro 1.7% 01/09/2051 890,000 EUR 911,111 863,282 0.15
Italy Buoni Poliennali Del Tesoro 2% 01/02/2028 14,808,000 EUR 14,434,801 16,377,648 2.88
Italy Buoni Poliennali Del Tesoro 2.05% 01/08/2027 2,949,000 EUR 2,848,162 3,261,240 0.57
Italy Buoni Poliennali Del Tesoro 2.15% 01/03/2072 3,272,000 EUR 3,213,649 3,206,920 0.56
Italy Buoni Poliennali Del Tesoro 2.45% 01/09/2033 5,861,000 EUR 5,194,258 6,816,460 1.19
Italy Buoni Poliennali Del Tesoro 2.45% 01/10/2023 9,228,000 EUR 9,538,483 9,804,842 1.72
Italy Buoni Poliennali Del Tesoro 2.8% 01/03/2067 1,000,000 EUR 1,241,410 1,184,270 0.21
Italy Buoni Poliennali Del Tesoro 2.8% 01/12/2028 10,855,000 EUR 11,428,988 12,687,758 2.22
Italy Buoni Poliennali Del Tesoro 2.95% 01/09/2038 1,180,000 EUR 1,109,792 1,462,704 0.26
Italy Buoni Poliennali Del Tesoro 3.1% 01/03/2040 2,000,000 EUR 2,161,640 2,531,900 0.44
Italy Buoni Poliennali Del Tesoro 3.45% 01/03/2048 3,204,000 EUR 3,460,624 4,364,008 0.76
Italy Buoni Poliennali Del Tesoro 3.5% 01/03/2030 8,190,000 EUR 9,926,453 10,171,652 1.78
Italy Buoni Poliennali Del Tesoro 3.75% 01/08/2021 1,855,000 EUR 1,851,042 1,861,659 0.33
Italy Buoni Poliennali Del Tesoro 4% 01/02/2037 2,010,000 EUR 1,897,353 2,774,966 0.49
Italy Buoni Poliennali Del Tesoro 4.75% 01/09/2044 3,775,000 EUR 5,213,220 6,043,473 1.06
Italy Buoni Poliennali Del Tesoro 5% 01/08/2039 1,700,000 EUR 2,074,385 2,675,783 0.47
Italy Buoni Poliennali Del Tesoro 5% 01/09/2040 1,700,000 EUR 1,991,306 2,699,804 0.47
Total Italy 122,449,283 135,873,636 23.79
LUXEMBOURG
European Union 0% 04/03/2026 EMTN 1,193,000 EUR 1,222,109 1,216,264 0.21
European Union 0% 04/07/2031 EMTN 3,254,000 EUR 3,226,048 3,247,492 0.57
European Union 0.7% 06/07/2051 1,830,000 EUR 1,814,280 1,852,601 0.32
Total Luxembourg 6,262,437 6,316,357 1.10
NETHERLANDS
Netherlands Government Bond 0.25% 15/07/2025 1,280,000 EUR 1,286,392 1,323,763 0.23
Netherlands Government Bond 0.5% 15/07/2026 1,070,000 EUR 1,096,977 1,125,480 0.20
Netherlands Government Bond 0.75% 15/07/2028 600,000 EUR 606,792 646,824 0.11
Total Netherlands 2,990,161 3,096,067 0.54
ROMANIA
Romanian Government International Bond 2.625% 02/12/2040 10,199,000 EUR 10,223,001 10,113,430 1.77
Romanian Government International Bond 3.375% 28/01/2050 EMTN 905,000 EUR 1,044,426 964,938 0.17
Total Romania 11,267,427 11,078,368 1.94
SPAIN
Spain Government Bond 0.05% 31/10/2021 13,915,000 EUR 14,007,797 13,945,056 2.44
Spain Government Bond 0.35% 30/07/2023 12,278,000 EUR 12,225,529 12,494,952 2.19
Spain Government Bond 0.4% 30/04/2022 1,720,000 EUR 1,725,335 1,733,966 0.30
Spain Government Bond 0.45% 31/10/2022 1,230,000 EUR 1,238,608 1,246,716 0.22
Spain Government Bond 0.85% 30/07/2037 5,150,000 EUR 5,121,263 5,074,244 0.89
Spain Government Bond 1% 31/10/2050 640,000 EUR 660,006 578,739 0.10
Spain Government Bond 1.3% 31/10/2026 1,430,000 EUR 1,435,797 1,544,472 0.27
Spain Government Bond 1.4% 30/04/2028 1,500,000 EUR 1,504,628 1,639,500 0.29
Spain Government Bond 1.45% 30/04/2029 5,916,000 EUR 6,465,560 6,512,747 1.14
Spain Government Bond 1.45% 31/10/2027 1,730,000 EUR 1,717,300 1,893,122 0.33
Spain Government Bond 1.5% 30/04/2027 4,663,000 EUR 4,948,745 5,106,311 0.89
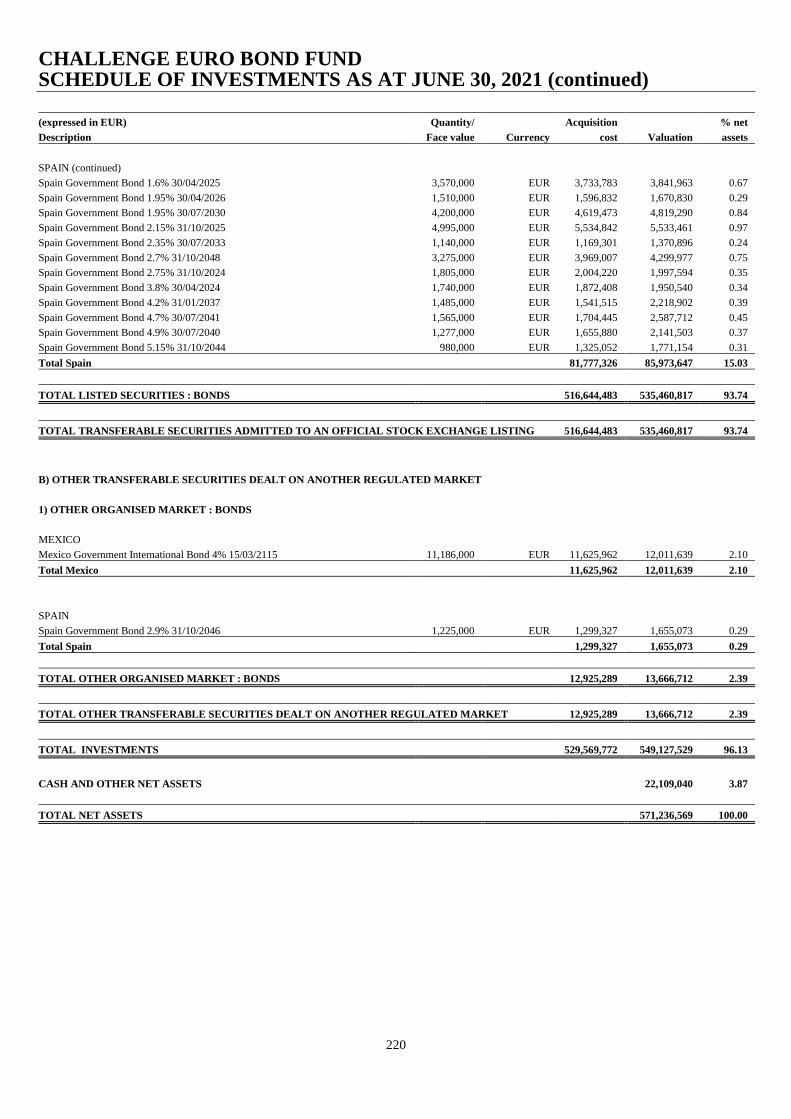
CHALLENGE EURO BOND FUND SCHEDULE OF INVESTMENTS AS AT JUNE 30, 2021 (continued)
220
(expressed in EUR) Quantity/ Acquisition % net
Description Face value Currency cost Valuation assets
SPAIN (continued)
Spain Government Bond 1.6% 30/04/2025 3,570,000 EUR 3,733,783 3,841,963 0.67
Spain Government Bond 1.95% 30/04/2026 1,510,000 EUR 1,596,832 1,670,830 0.29
Spain Government Bond 1.95% 30/07/2030 4,200,000 EUR 4,619,473 4,819,290 0.84
Spain Government Bond 2.15% 31/10/2025 4,995,000 EUR 5,534,842 5,533,461 0.97
Spain Government Bond 2.35% 30/07/2033 1,140,000 EUR 1,169,301 1,370,896 0.24
Spain Government Bond 2.7% 31/10/2048 3,275,000 EUR 3,969,007 4,299,977 0.75
Spain Government Bond 2.75% 31/10/2024 1,805,000 EUR 2,004,220 1,997,594 0.35
Spain Government Bond 3.8% 30/04/2024 1,740,000 EUR 1,872,408 1,950,540 0.34
Spain Government Bond 4.2% 31/01/2037 1,485,000 EUR 1,541,515 2,218,902 0.39
Spain Government Bond 4.7% 30/07/2041 1,565,000 EUR 1,704,445 2,587,712 0.45
Spain Government Bond 4.9% 30/07/2040 1,277,000 EUR 1,655,880 2,141,503 0.37
Spain Government Bond 5.15% 31/10/2044 980,000 EUR 1,325,052 1,771,154 0.31
Total Spain 81,777,326 85,973,647 15.03
TOTAL LISTED SECURITIES : BONDS 516,644,483 535,460,817 93.74
TOTAL TRANSFERABLE SECURITIES ADMITTED TO AN OFFICIAL STOCK EXCHANGE LISTING 516,644,483 535,460,817 93.74
B) OTHER TRANSFERABLE SECURITIES DEALT ON ANOTHER REGULATED MARKET
1) OTHER ORGANISED MARKET : BONDS
MEXICO
Mexico Government International Bond 4% 15/03/2115 11,186,000 EUR 11,625,962 12,011,639 2.10
Total Mexico 11,625,962 12,011,639 2.10
SPAIN
Spain Government Bond 2.9% 31/10/2046 1,225,000 EUR 1,299,327 1,655,073 0.29
Total Spain 1,299,327 1,655,073 0.29
TOTAL OTHER ORGANISED MARKET : BONDS 12,925,289 13,666,712 2.39
TOTAL OTHER TRANSFERABLE SECURITIES DEALT ON ANOTHER REGULATED MARKET 12,925,289 13,666,712 2.39
TOTAL INVESTMENTS 529,569,772 549,127,529 96.13
CASH AND OTHER NET ASSETS 22,109,040 3.87
TOTAL NET ASSETS 571,236,569 100.00
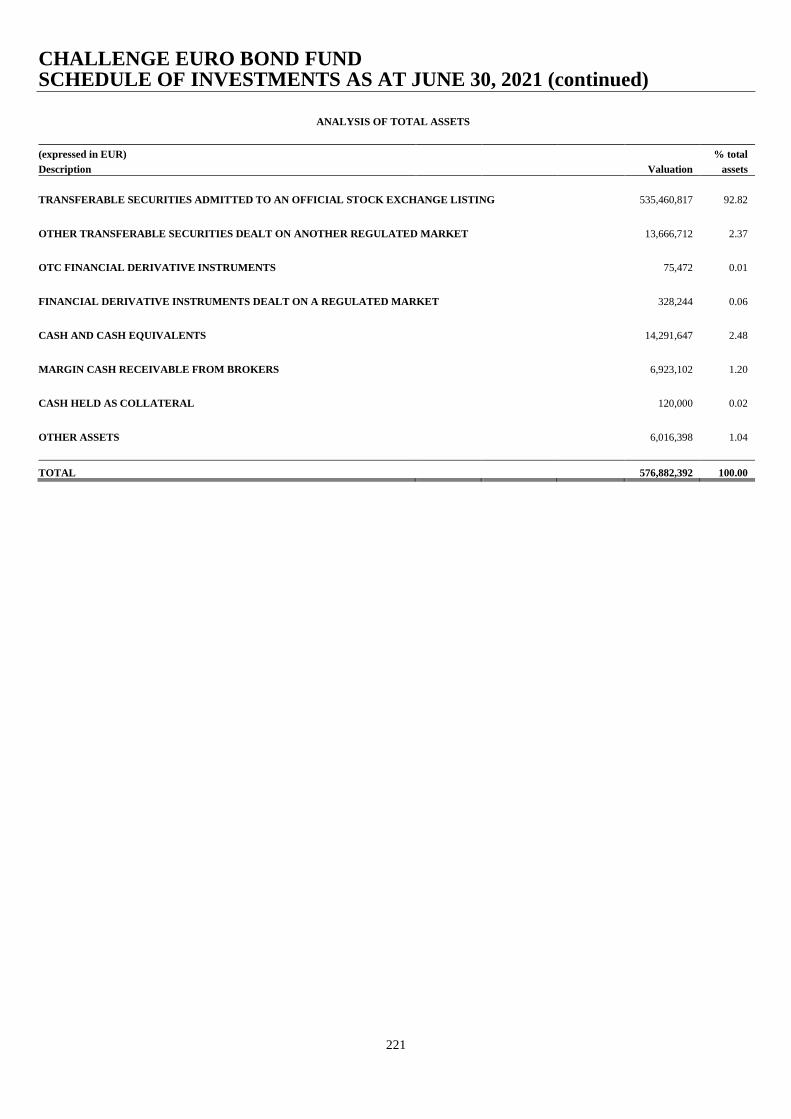
CHALLENGE EURO BOND FUND SCHEDULE OF INVESTMENTS AS AT JUNE 30, 2021 (continued)
221
ANALYSIS OF TOTAL ASSETS
(expressed in EUR) % total
Description Valuation assets
TRANSFERABLE SECURITIES ADMITTED TO AN OFFICIAL STOCK EXCHANGE LISTING 535,460,817 92.82
OTHER TRANSFERABLE SECURITIES DEALT ON ANOTHER REGULATED MARKET
13,666,712 2.37
OTC FINANCIAL DERIVATIVE INSTRUMENTS
75,472 0.01
FINANCIAL DERIVATIVE INSTRUMENTS DEALT ON A REGULATED MARKET
328,244 0.06
CASH AND CASH EQUIVALENTS
14,291,647 2.48
MARGIN CASH RECEIVABLE FROM BROKERS
6,923,102 1.20
CASH HELD AS COLLATERAL
120,000 0.02
OTHER ASSETS
6,016,398 1.04
TOTAL 576,882,392 100.00
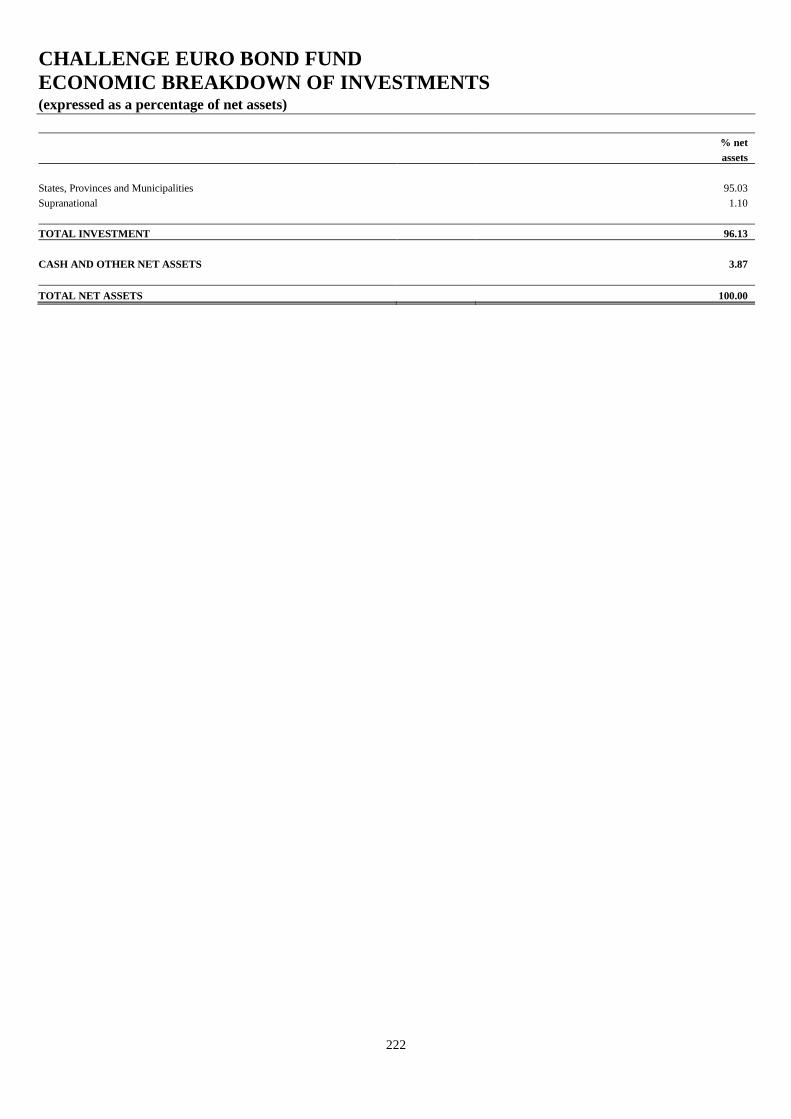
CHALLENGE EURO BOND FUND
ECONOMIC BREAKDOWN OF INVESTMENTS (expressed as a percentage of net assets)
222
% net
assets
States, Provinces and Municipalities 95.03
Supranational 1.10
TOTAL INVESTMENT 96.13
CASH AND OTHER NET ASSETS 3.87
TOTAL NET ASSETS 100.00
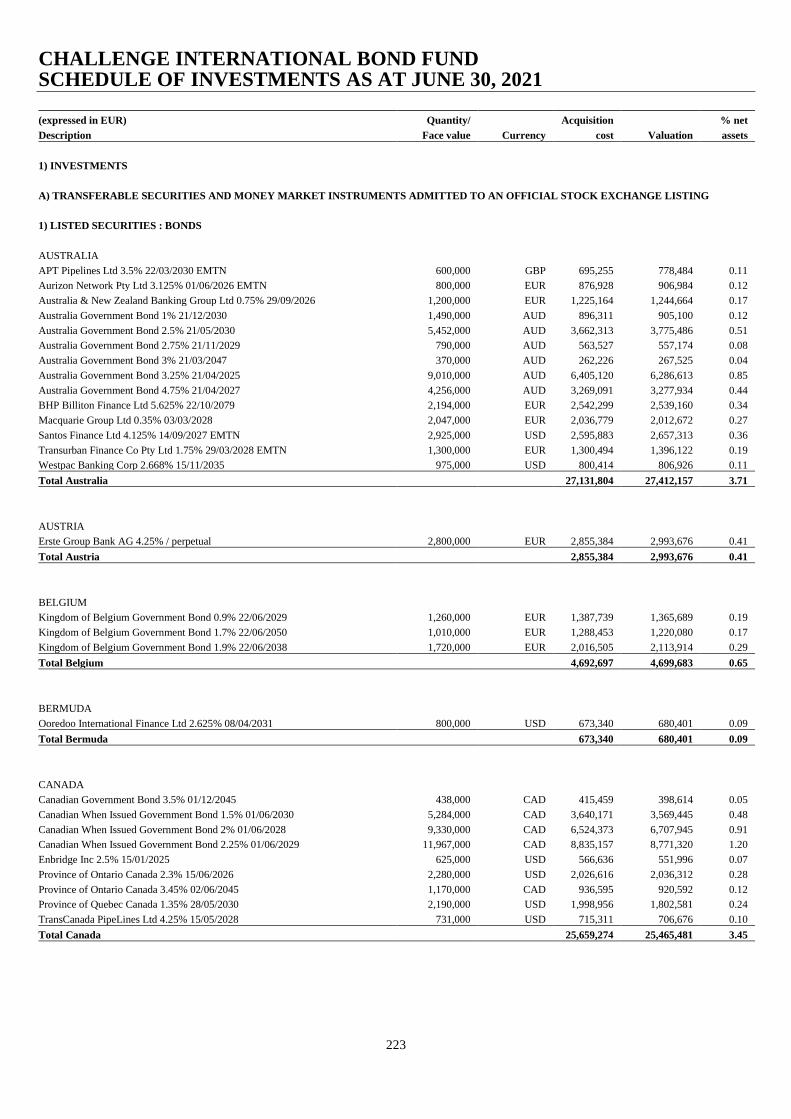
CHALLENGE INTERNATIONAL BOND FUND SCHEDULE OF INVESTMENTS AS AT JUNE 30, 2021
223
(expressed in EUR) Quantity/ Acquisition % net
Description Face value Currency cost Valuation assets
1) INVESTMENTS
A) TRANSFERABLE SECURITIES AND MONEY MARKET INSTRUMENTS ADMITTED TO AN OFFICIAL STOCK EXCHANGE LISTING
1) LISTED SECURITIES : BONDS
AUSTRALIA
APT Pipelines Ltd 3.5% 22/03/2030 EMTN 600,000 GBP 695,255 778,484 0.11
Aurizon Network Pty Ltd 3.125% 01/06/2026 EMTN 800,000 EUR 876,928 906,984 0.12
Australia & New Zealand Banking Group Ltd 0.75% 29/09/2026 1,200,000 EUR 1,225,164 1,244,664 0.17
Australia Government Bond 1% 21/12/2030 1,490,000 AUD 896,311 905,100 0.12
Australia Government Bond 2.5% 21/05/2030 5,452,000 AUD 3,662,313 3,775,486 0.51
Australia Government Bond 2.75% 21/11/2029 790,000 AUD 563,527 557,174 0.08
Australia Government Bond 3% 21/03/2047 370,000 AUD 262,226 267,525 0.04
Australia Government Bond 3.25% 21/04/2025 9,010,000 AUD 6,405,120 6,286,613 0.85
Australia Government Bond 4.75% 21/04/2027 4,256,000 AUD 3,269,091 3,277,934 0.44
BHP Billiton Finance Ltd 5.625% 22/10/2079 2,194,000 EUR 2,542,299 2,539,160 0.34
Macquarie Group Ltd 0.35% 03/03/2028 2,047,000 EUR 2,036,779 2,012,672 0.27
Santos Finance Ltd 4.125% 14/09/2027 EMTN 2,925,000 USD 2,595,883 2,657,313 0.36
Transurban Finance Co Pty Ltd 1.75% 29/03/2028 EMTN 1,300,000 EUR 1,300,494 1,396,122 0.19
Westpac Banking Corp 2.668% 15/11/2035 975,000 USD 800,414 806,926 0.11
Total Australia 27,131,804 27,412,157 3.71
AUSTRIA
Erste Group Bank AG 4.25% / perpetual 2,800,000 EUR 2,855,384 2,993,676 0.41
Total Austria 2,855,384 2,993,676 0.41
BELGIUM
Kingdom of Belgium Government Bond 0.9% 22/06/2029 1,260,000 EUR 1,387,739 1,365,689 0.19
Kingdom of Belgium Government Bond 1.7% 22/06/2050 1,010,000 EUR 1,288,453 1,220,080 0.17
Kingdom of Belgium Government Bond 1.9% 22/06/2038 1,720,000 EUR 2,016,505 2,113,914 0.29
Total Belgium 4,692,697 4,699,683 0.65
BERMUDA
Ooredoo International Finance Ltd 2.625% 08/04/2031 800,000 USD 673,340 680,401 0.09
Total Bermuda 673,340 680,401 0.09
CANADA
Canadian Government Bond 3.5% 01/12/2045 438,000 CAD 415,459 398,614 0.05
Canadian When Issued Government Bond 1.5% 01/06/2030 5,284,000 CAD 3,640,171 3,569,445 0.48
Canadian When Issued Government Bond 2% 01/06/2028 9,330,000 CAD 6,524,373 6,707,945 0.91
Canadian When Issued Government Bond 2.25% 01/06/2029 11,967,000 CAD 8,835,157 8,771,320 1.20
Enbridge Inc 2.5% 15/01/2025 625,000 USD 566,636 551,996 0.07
Province of Ontario Canada 2.3% 15/06/2026 2,280,000 USD 2,026,616 2,036,312 0.28
Province of Ontario Canada 3.45% 02/06/2045 1,170,000 CAD 936,595 920,592 0.12
Province of Quebec Canada 1.35% 28/05/2030 2,190,000 USD 1,998,956 1,802,581 0.24
TransCanada PipeLines Ltd 4.25% 15/05/2028 731,000 USD 715,311 706,676 0.10
Total Canada 25,659,274 25,465,481 3.45

CHALLENGE INTERNATIONAL BOND FUND SCHEDULE OF INVESTMENTS AS AT JUNE 30, 2021 (continued)
224
(expressed in EUR) Quantity/ Acquisition % net
Description Face value Currency cost Valuation assets
CAYMAN ISLANDS
Alibaba Group Holding Ltd 2.125% 09/02/2031 750,000 USD 605,827 620,465 0.08
DP World Crescent Ltd 3.875% 18/07/2029 EMTN 600,000 USD 528,131 547,700 0.07
QNB Finance Ltd 2.75% 12/02/2027 EMTN 700,000 USD 635,001 616,276 0.08
Southern Water Services Finance Ltd 1.625% 30/03/2027 EMTN 2,300,000 GBP 2,637,152 2,668,356 0.36
Total Cayman Islands 4,406,111 4,452,797 0.59
CHILE
Chile Government International Bond 1.44% 01/02/2029 1,462,000 EUR 1,508,573 1,561,284 0.21
Corp Nacional del Cobre de Chile 4.5% 16/09/2025 940,000 USD 917,056 892,925 0.12
Total Chile 2,425,629 2,454,209 0.33
CHINA
China Development Bank 3.7% 20/10/2030 21,000,000 CNH 2,708,004 2,779,383 0.38
China Government Bond 3.27% 19/11/2030 41,000,000 CNH 5,284,522 5,421,705 0.73
China Government Bond 3.81% 14/09/2050 23,000,000 CNH 2,998,541 3,077,197 0.42
Total China 10,991,067 11,278,285 1.53
DENMARK
Danske Bank A/S 5.875% EMTN/ perpetual 2,925,000 EUR 3,047,731 3,023,251 0.41
Denmark Government Bond 0.5% 15/11/2029 5,900,000 DKK 833,352 832,774 0.11
Total Denmark 3,881,083 3,856,025 0.52
FRANCE
AXA SA 3.25% 28/05/2049 EMTN 1,500,000 EUR 1,477,095 1,716,120 0.23
Banque Federative du Credit Mutuel SA 0.75% 17/07/2025 EMTN 1,200,000 EUR 1,220,820 1,236,576 0.17
BNP Paribas SA 2.375% 17/02/2025 EMTN 1,300,000 EUR 1,340,768 1,398,345 0.19
BPCE SA 5.15% 21/07/2024 2,100,000 USD 1,848,756 1,972,573 0.27
Credit Agricole Assurances SA 2.625% 29/01/2048 1,400,000 EUR 1,283,784 1,497,202 0.20
French Republic Government Bond OAT 0% 25/11/2029 5,320,000 EUR 5,319,433 5,350,217 0.72
French Republic Government Bond OAT 0% 25/11/2030 6,480,000 EUR 6,574,096 6,462,050 0.88
French Republic Government Bond OAT 2% 25/05/2048 2,270,000 EUR 2,876,675 2,921,581 0.40
Mutuelle Assurance Des Commercants et Industriels de France et Des Cadres et
Sal 2.125% 21/06/2052 4,300,000 EUR 4,269,212 4,335,647 0.59
Orange SA 5.25% / perpetual 1,960,000 EUR 2,232,153 2,198,355 0.30
Societe Generale SA 5% 17/01/2024 600,000 USD 524,960 550,514 0.07
Unibail-Rodamco-Westfield SE 2.125% / perpetual 500,000 EUR 493,900 495,030 0.07
Total France 29,461,652 30,134,210 4.09
GERMANY
Bundesrepublik Deutschland Bundesanleihe 0.25% 15/02/2029 5,110,000 EUR 5,472,562 5,371,223 0.73
Bundesrepublik Deutschland Bundesanleihe 4.25% 04/07/2039 900,000 EUR 1,649,149 1,585,692 0.21
Bundesrepublik Deutschland Bundesanleihe 4.75% 04/07/2034 840,000 EUR 1,461,671 1,383,194 0.19
State of North Rhine-Westphalia Germany 1.65% 22/02/2038 EMTN 2,580,000 EUR 3,163,544 3,066,382 0.42
Vonovia SE 0.625% 14/12/2029 EMTN 400,000 EUR 398,420 400,188 0.05
Total Germany 12,145,346 11,806,679 1.60
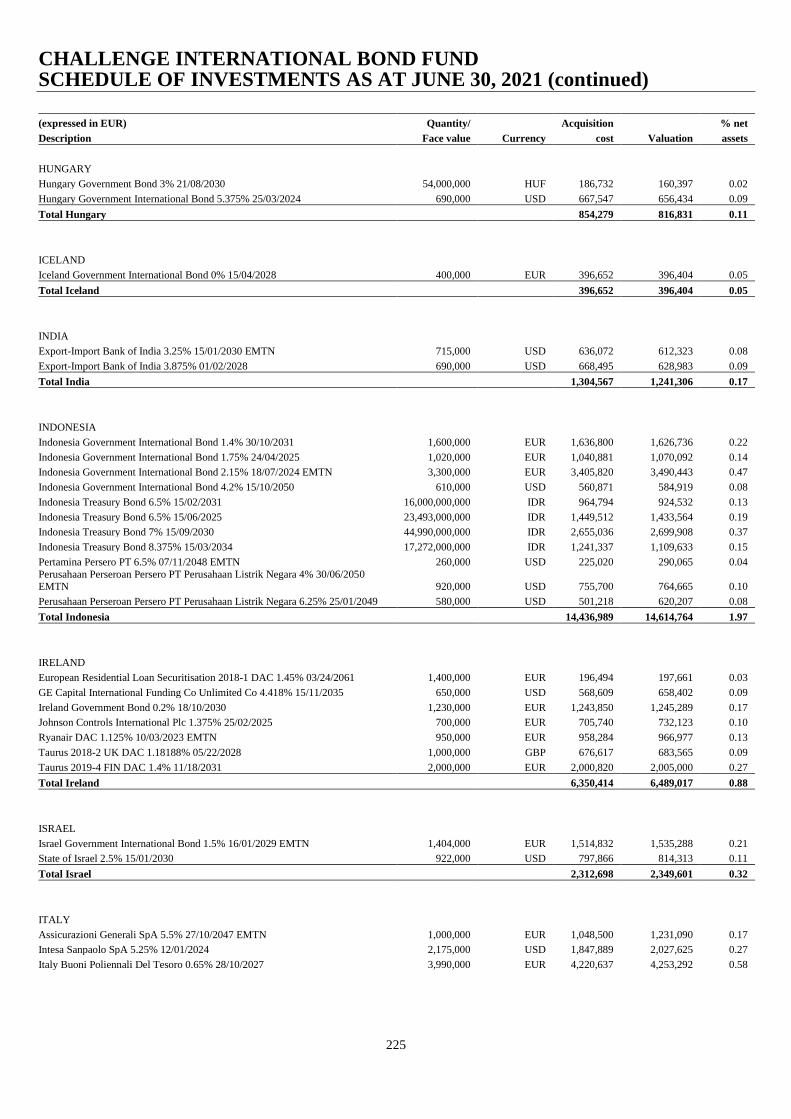
CHALLENGE INTERNATIONAL BOND FUND SCHEDULE OF INVESTMENTS AS AT JUNE 30, 2021 (continued)
225
(expressed in EUR) Quantity/ Acquisition % net
Description Face value Currency cost Valuation assets
HUNGARY
Hungary Government Bond 3% 21/08/2030 54,000,000 HUF 186,732 160,397 0.02
Hungary Government International Bond 5.375% 25/03/2024 690,000 USD 667,547 656,434 0.09
Total Hungary 854,279 816,831 0.11
ICELAND
Iceland Government International Bond 0% 15/04/2028 400,000 EUR 396,652 396,404 0.05
Total Iceland 396,652 396,404 0.05
INDIA
Export-Import Bank of India 3.25% 15/01/2030 EMTN 715,000 USD 636,072 612,323 0.08
Export-Import Bank of India 3.875% 01/02/2028 690,000 USD 668,495 628,983 0.09
Total India 1,304,567 1,241,306 0.17
INDONESIA
Indonesia Government International Bond 1.4% 30/10/2031 1,600,000 EUR 1,636,800 1,626,736 0.22
Indonesia Government International Bond 1.75% 24/04/2025 1,020,000 EUR 1,040,881 1,070,092 0.14
Indonesia Government International Bond 2.15% 18/07/2024 EMTN 3,300,000 EUR 3,405,820 3,490,443 0.47
Indonesia Government International Bond 4.2% 15/10/2050 610,000 USD 560,871 584,919 0.08
Indonesia Treasury Bond 6.5% 15/02/2031 16,000,000,000 IDR 964,794 924,532 0.13
Indonesia Treasury Bond 6.5% 15/06/2025 23,493,000,000 IDR 1,449,512 1,433,564 0.19
Indonesia Treasury Bond 7% 15/09/2030 44,990,000,000 IDR 2,655,036 2,699,908 0.37
Indonesia Treasury Bond 8.375% 15/03/2034 17,272,000,000 IDR 1,241,337 1,109,633 0.15
Pertamina Persero PT 6.5% 07/11/2048 EMTN 260,000 USD 225,020 290,065 0.04
Perusahaan Perseroan Persero PT Perusahaan Listrik Negara 4% 30/06/2050 EMTN 920,000 USD 755,700 764,665 0.10
Perusahaan Perseroan Persero PT Perusahaan Listrik Negara 6.25% 25/01/2049 580,000 USD 501,218 620,207 0.08
Total Indonesia 14,436,989 14,614,764 1.97
IRELAND
European Residential Loan Securitisation 2018-1 DAC 1.45% 03/24/2061 1,400,000 EUR 196,494 197,661 0.03
GE Capital International Funding Co Unlimited Co 4.418% 15/11/2035 650,000 USD 568,609 658,402 0.09
Ireland Government Bond 0.2% 18/10/2030 1,230,000 EUR 1,243,850 1,245,289 0.17
Johnson Controls International Plc 1.375% 25/02/2025 700,000 EUR 705,740 732,123 0.10
Ryanair DAC 1.125% 10/03/2023 EMTN 950,000 EUR 958,284 966,977 0.13
Taurus 2018-2 UK DAC 1.18188% 05/22/2028 1,000,000 GBP 676,617 683,565 0.09
Taurus 2019-4 FIN DAC 1.4% 11/18/2031 2,000,000 EUR 2,000,820 2,005,000 0.27
Total Ireland 6,350,414 6,489,017 0.88
ISRAEL
Israel Government International Bond 1.5% 16/01/2029 EMTN 1,404,000 EUR 1,514,832 1,535,288 0.21
State of Israel 2.5% 15/01/2030 922,000 USD 797,866 814,313 0.11
Total Israel 2,312,698 2,349,601 0.32
ITALY
Assicurazioni Generali SpA 5.5% 27/10/2047 EMTN 1,000,000 EUR 1,048,500 1,231,090 0.17
Intesa Sanpaolo SpA 5.25% 12/01/2024 2,175,000 USD 1,847,889 2,027,625 0.27
Italy Buoni Poliennali Del Tesoro 0.65% 28/10/2027 3,990,000 EUR 4,220,637 4,253,292 0.58
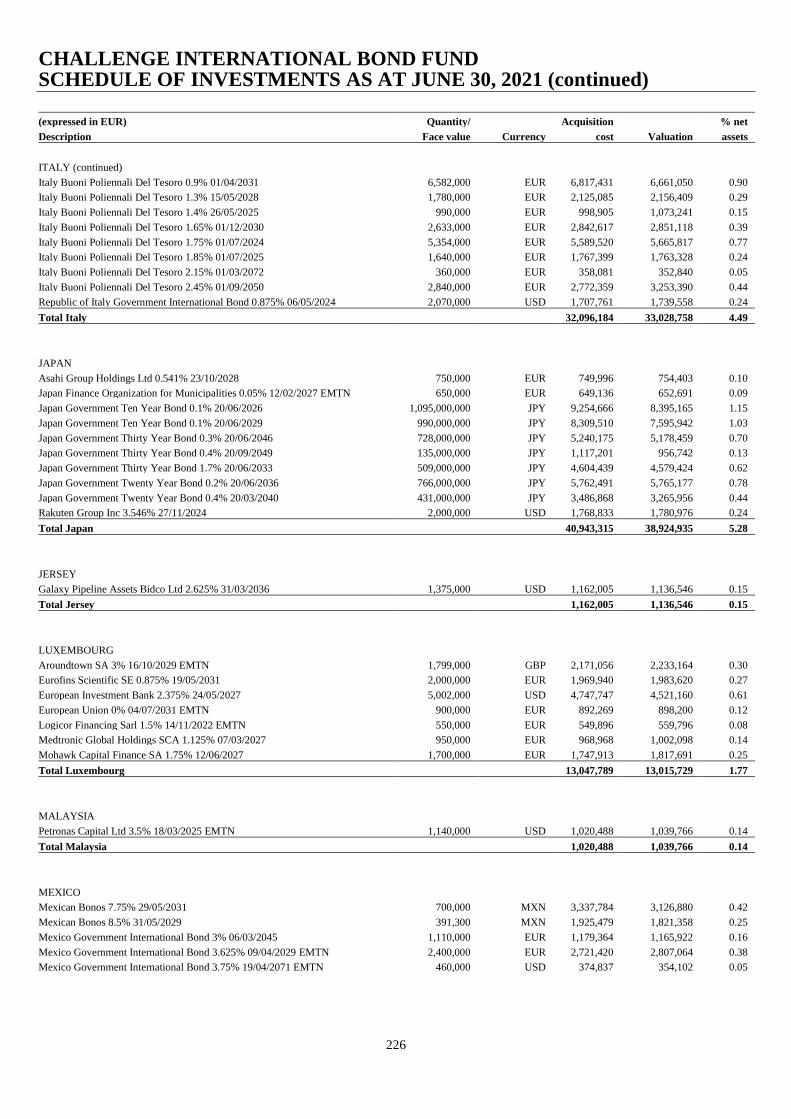
CHALLENGE INTERNATIONAL BOND FUND SCHEDULE OF INVESTMENTS AS AT JUNE 30, 2021 (continued)
226
(expressed in EUR) Quantity/ Acquisition % net
Description Face value Currency cost Valuation assets
ITALY (continued)
Italy Buoni Poliennali Del Tesoro 0.9% 01/04/2031 6,582,000 EUR 6,817,431 6,661,050 0.90
Italy Buoni Poliennali Del Tesoro 1.3% 15/05/2028 1,780,000 EUR 2,125,085 2,156,409 0.29
Italy Buoni Poliennali Del Tesoro 1.4% 26/05/2025 990,000 EUR 998,905 1,073,241 0.15
Italy Buoni Poliennali Del Tesoro 1.65% 01/12/2030 2,633,000 EUR 2,842,617 2,851,118 0.39
Italy Buoni Poliennali Del Tesoro 1.75% 01/07/2024 5,354,000 EUR 5,589,520 5,665,817 0.77
Italy Buoni Poliennali Del Tesoro 1.85% 01/07/2025 1,640,000 EUR 1,767,399 1,763,328 0.24
Italy Buoni Poliennali Del Tesoro 2.15% 01/03/2072 360,000 EUR 358,081 352,840 0.05
Italy Buoni Poliennali Del Tesoro 2.45% 01/09/2050 2,840,000 EUR 2,772,359 3,253,390 0.44
Republic of Italy Government International Bond 0.875% 06/05/2024 2,070,000 USD 1,707,761 1,739,558 0.24
Total Italy 32,096,184 33,028,758 4.49
JAPAN
Asahi Group Holdings Ltd 0.541% 23/10/2028 750,000 EUR 749,996 754,403 0.10
Japan Finance Organization for Municipalities 0.05% 12/02/2027 EMTN 650,000 EUR 649,136 652,691 0.09
Japan Government Ten Year Bond 0.1% 20/06/2026 1,095,000,000 JPY 9,254,666 8,395,165 1.15
Japan Government Ten Year Bond 0.1% 20/06/2029 990,000,000 JPY 8,309,510 7,595,942 1.03
Japan Government Thirty Year Bond 0.3% 20/06/2046 728,000,000 JPY 5,240,175 5,178,459 0.70
Japan Government Thirty Year Bond 0.4% 20/09/2049 135,000,000 JPY 1,117,201 956,742 0.13
Japan Government Thirty Year Bond 1.7% 20/06/2033 509,000,000 JPY 4,604,439 4,579,424 0.62
Japan Government Twenty Year Bond 0.2% 20/06/2036 766,000,000 JPY 5,762,491 5,765,177 0.78
Japan Government Twenty Year Bond 0.4% 20/03/2040 431,000,000 JPY 3,486,868 3,265,956 0.44
Rakuten Group Inc 3.546% 27/11/2024 2,000,000 USD 1,768,833 1,780,976 0.24
Total Japan 40,943,315 38,924,935 5.28
JERSEY
Galaxy Pipeline Assets Bidco Ltd 2.625% 31/03/2036 1,375,000 USD 1,162,005 1,136,546 0.15
Total Jersey 1,162,005 1,136,546 0.15
LUXEMBOURG
Aroundtown SA 3% 16/10/2029 EMTN 1,799,000 GBP 2,171,056 2,233,164 0.30
Eurofins Scientific SE 0.875% 19/05/2031 2,000,000 EUR 1,969,940 1,983,620 0.27
European Investment Bank 2.375% 24/05/2027 5,002,000 USD 4,747,747 4,521,160 0.61
European Union 0% 04/07/2031 EMTN 900,000 EUR 892,269 898,200 0.12
Logicor Financing Sarl 1.5% 14/11/2022 EMTN 550,000 EUR 549,896 559,796 0.08
Medtronic Global Holdings SCA 1.125% 07/03/2027 950,000 EUR 968,968 1,002,098 0.14
Mohawk Capital Finance SA 1.75% 12/06/2027 1,700,000 EUR 1,747,913 1,817,691 0.25
Total Luxembourg 13,047,789 13,015,729 1.77
MALAYSIA
Petronas Capital Ltd 3.5% 18/03/2025 EMTN 1,140,000 USD 1,020,488 1,039,766 0.14
Total Malaysia 1,020,488 1,039,766 0.14
MEXICO
Mexican Bonos 7.75% 29/05/2031 700,000 MXN 3,337,784 3,126,880 0.42
Mexican Bonos 8.5% 31/05/2029 391,300 MXN 1,925,479 1,821,358 0.25
Mexico Government International Bond 3% 06/03/2045 1,110,000 EUR 1,179,364 1,165,922 0.16
Mexico Government International Bond 3.625% 09/04/2029 EMTN 2,400,000 EUR 2,721,420 2,807,064 0.38
Mexico Government International Bond 3.75% 19/04/2071 EMTN 460,000 USD 374,837 354,102 0.05
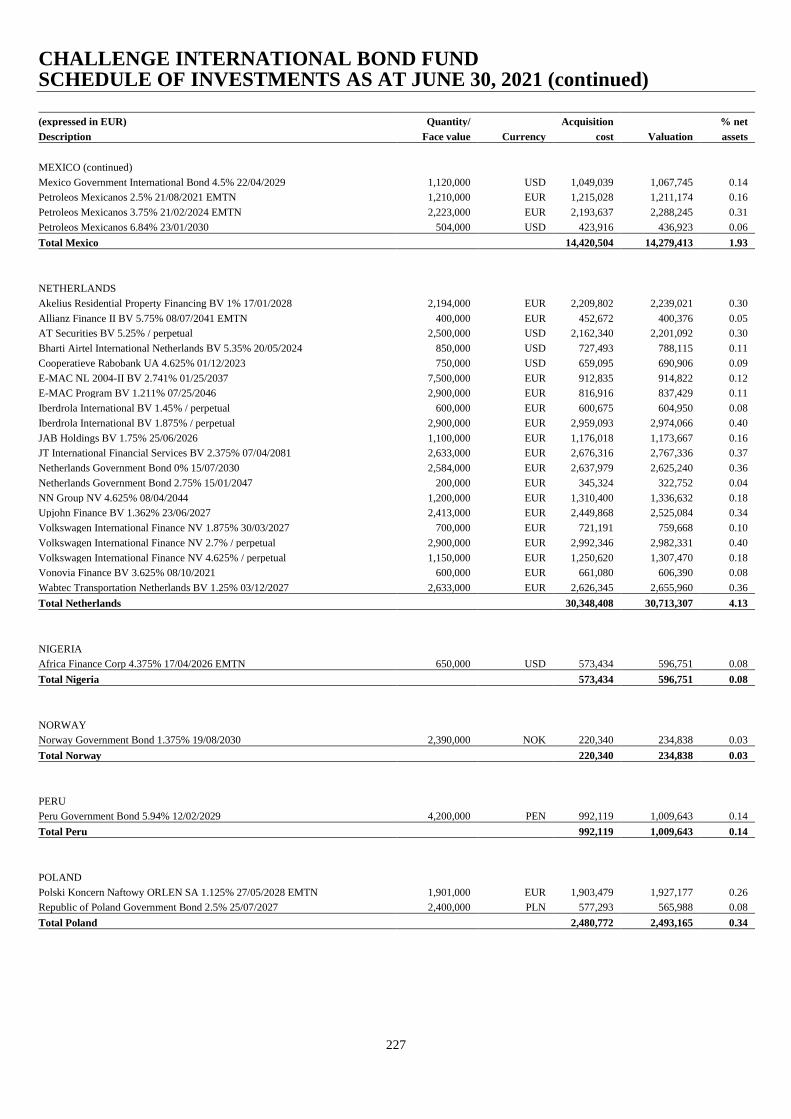
CHALLENGE INTERNATIONAL BOND FUND SCHEDULE OF INVESTMENTS AS AT JUNE 30, 2021 (continued)
227
(expressed in EUR) Quantity/ Acquisition % net
Description Face value Currency cost Valuation assets
MEXICO (continued)
Mexico Government International Bond 4.5% 22/04/2029 1,120,000 USD 1,049,039 1,067,745 0.14
Petroleos Mexicanos 2.5% 21/08/2021 EMTN 1,210,000 EUR 1,215,028 1,211,174 0.16
Petroleos Mexicanos 3.75% 21/02/2024 EMTN 2,223,000 EUR 2,193,637 2,288,245 0.31
Petroleos Mexicanos 6.84% 23/01/2030 504,000 USD 423,916 436,923 0.06
Total Mexico 14,420,504 14,279,413 1.93
NETHERLANDS
Akelius Residential Property Financing BV 1% 17/01/2028 2,194,000 EUR 2,209,802 2,239,021 0.30
Allianz Finance II BV 5.75% 08/07/2041 EMTN 400,000 EUR 452,672 400,376 0.05
AT Securities BV 5.25% / perpetual 2,500,000 USD 2,162,340 2,201,092 0.30
Bharti Airtel International Netherlands BV 5.35% 20/05/2024 850,000 USD 727,493 788,115 0.11
Cooperatieve Rabobank UA 4.625% 01/12/2023 750,000 USD 659,095 690,906 0.09
E-MAC NL 2004-II BV 2.741% 01/25/2037 7,500,000 EUR 912,835 914,822 0.12
E-MAC Program BV 1.211% 07/25/2046 2,900,000 EUR 816,916 837,429 0.11
Iberdrola International BV 1.45% / perpetual 600,000 EUR 600,675 604,950 0.08
Iberdrola International BV 1.875% / perpetual 2,900,000 EUR 2,959,093 2,974,066 0.40
JAB Holdings BV 1.75% 25/06/2026 1,100,000 EUR 1,176,018 1,173,667 0.16
JT International Financial Services BV 2.375% 07/04/2081 2,633,000 EUR 2,676,316 2,767,336 0.37
Netherlands Government Bond 0% 15/07/2030 2,584,000 EUR 2,637,979 2,625,240 0.36
Netherlands Government Bond 2.75% 15/01/2047 200,000 EUR 345,324 322,752 0.04
NN Group NV 4.625% 08/04/2044 1,200,000 EUR 1,310,400 1,336,632 0.18
Upjohn Finance BV 1.362% 23/06/2027 2,413,000 EUR 2,449,868 2,525,084 0.34
Volkswagen International Finance NV 1.875% 30/03/2027 700,000 EUR 721,191 759,668 0.10
Volkswagen International Finance NV 2.7% / perpetual 2,900,000 EUR 2,992,346 2,982,331 0.40
Volkswagen International Finance NV 4.625% / perpetual 1,150,000 EUR 1,250,620 1,307,470 0.18
Vonovia Finance BV 3.625% 08/10/2021 600,000 EUR 661,080 606,390 0.08
Wabtec Transportation Netherlands BV 1.25% 03/12/2027 2,633,000 EUR 2,626,345 2,655,960 0.36
Total Netherlands 30,348,408 30,713,307 4.13
NIGERIA
Africa Finance Corp 4.375% 17/04/2026 EMTN 650,000 USD 573,434 596,751 0.08
Total Nigeria 573,434 596,751 0.08
NORWAY
Norway Government Bond 1.375% 19/08/2030 2,390,000 NOK 220,340 234,838 0.03
Total Norway 220,340 234,838 0.03
PERU
Peru Government Bond 5.94% 12/02/2029 4,200,000 PEN 992,119 1,009,643 0.14
Total Peru 992,119 1,009,643 0.14
POLAND
Polski Koncern Naftowy ORLEN SA 1.125% 27/05/2028 EMTN 1,901,000 EUR 1,903,479 1,927,177 0.26
Republic of Poland Government Bond 2.5% 25/07/2027 2,400,000 PLN 577,293 565,988 0.08
Total Poland 2,480,772 2,493,165 0.34
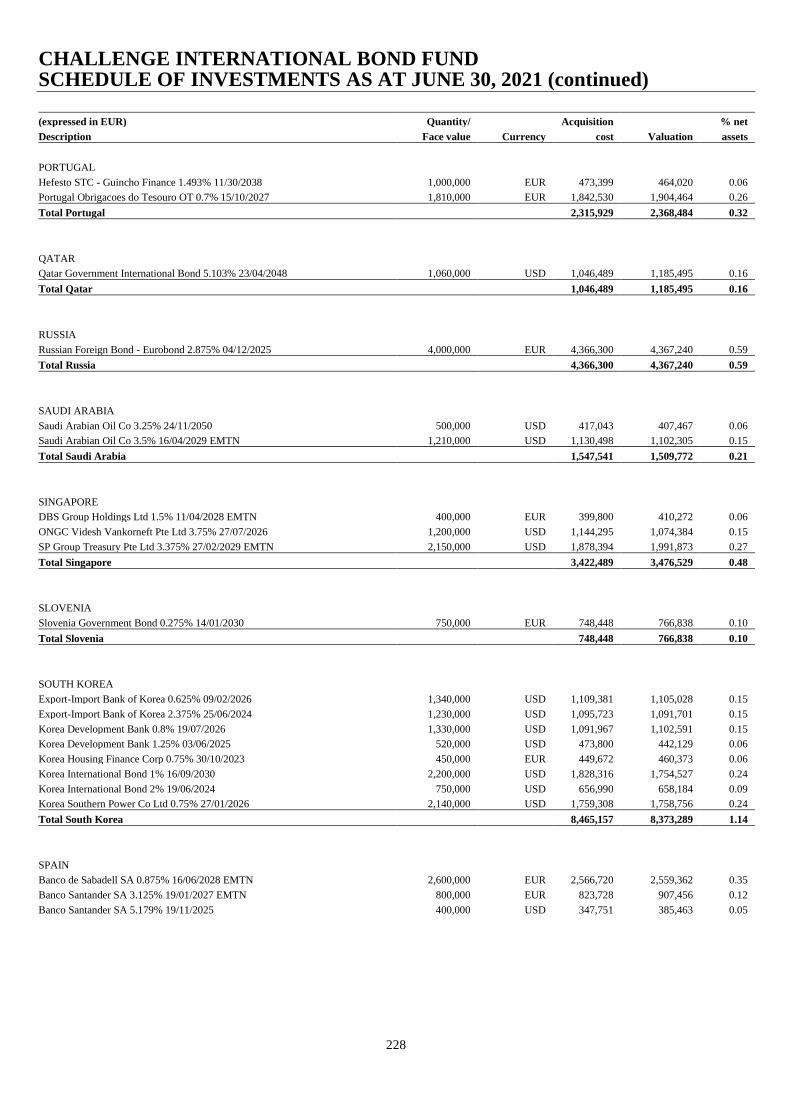
CHALLENGE INTERNATIONAL BOND FUND SCHEDULE OF INVESTMENTS AS AT JUNE 30, 2021 (continued)
228
(expressed in EUR) Quantity/ Acquisition % net
Description Face value Currency cost Valuation assets
PORTUGAL
Hefesto STC - Guincho Finance 1.493% 11/30/2038 1,000,000 EUR 473,399 464,020 0.06
Portugal Obrigacoes do Tesouro OT 0.7% 15/10/2027 1,810,000 EUR 1,842,530 1,904,464 0.26
Total Portugal 2,315,929 2,368,484 0.32
QATAR
Qatar Government International Bond 5.103% 23/04/2048 1,060,000 USD 1,046,489 1,185,495 0.16
Total Qatar 1,046,489 1,185,495 0.16
RUSSIA
Russian Foreign Bond - Eurobond 2.875% 04/12/2025 4,000,000 EUR 4,366,300 4,367,240 0.59
Total Russia 4,366,300 4,367,240 0.59
SAUDI ARABIA
Saudi Arabian Oil Co 3.25% 24/11/2050 500,000 USD 417,043 407,467 0.06
Saudi Arabian Oil Co 3.5% 16/04/2029 EMTN 1,210,000 USD 1,130,498 1,102,305 0.15
Total Saudi Arabia 1,547,541 1,509,772 0.21
SINGAPORE
DBS Group Holdings Ltd 1.5% 11/04/2028 EMTN 400,000 EUR 399,800 410,272 0.06
ONGC Videsh Vankorneft Pte Ltd 3.75% 27/07/2026 1,200,000 USD 1,144,295 1,074,384 0.15
SP Group Treasury Pte Ltd 3.375% 27/02/2029 EMTN 2,150,000 USD 1,878,394 1,991,873 0.27
Total Singapore 3,422,489 3,476,529 0.48
SLOVENIA
Slovenia Government Bond 0.275% 14/01/2030 750,000 EUR 748,448 766,838 0.10
Total Slovenia 748,448 766,838 0.10
SOUTH KOREA
Export-Import Bank of Korea 0.625% 09/02/2026 1,340,000 USD 1,109,381 1,105,028 0.15
Export-Import Bank of Korea 2.375% 25/06/2024 1,230,000 USD 1,095,723 1,091,701 0.15
Korea Development Bank 0.8% 19/07/2026 1,330,000 USD 1,091,967 1,102,591 0.15
Korea Development Bank 1.25% 03/06/2025 520,000 USD 473,800 442,129 0.06
Korea Housing Finance Corp 0.75% 30/10/2023 450,000 EUR 449,672 460,373 0.06
Korea International Bond 1% 16/09/2030 2,200,000 USD 1,828,316 1,754,527 0.24
Korea International Bond 2% 19/06/2024 750,000 USD 656,990 658,184 0.09
Korea Southern Power Co Ltd 0.75% 27/01/2026 2,140,000 USD 1,759,308 1,758,756 0.24
Total South Korea 8,465,157 8,373,289 1.14
SPAIN
Banco de Sabadell SA 0.875% 16/06/2028 EMTN 2,600,000 EUR 2,566,720 2,559,362 0.35
Banco Santander SA 3.125% 19/01/2027 EMTN 800,000 EUR 823,728 907,456 0.12
Banco Santander SA 5.179% 19/11/2025 400,000 USD 347,751 385,463 0.05
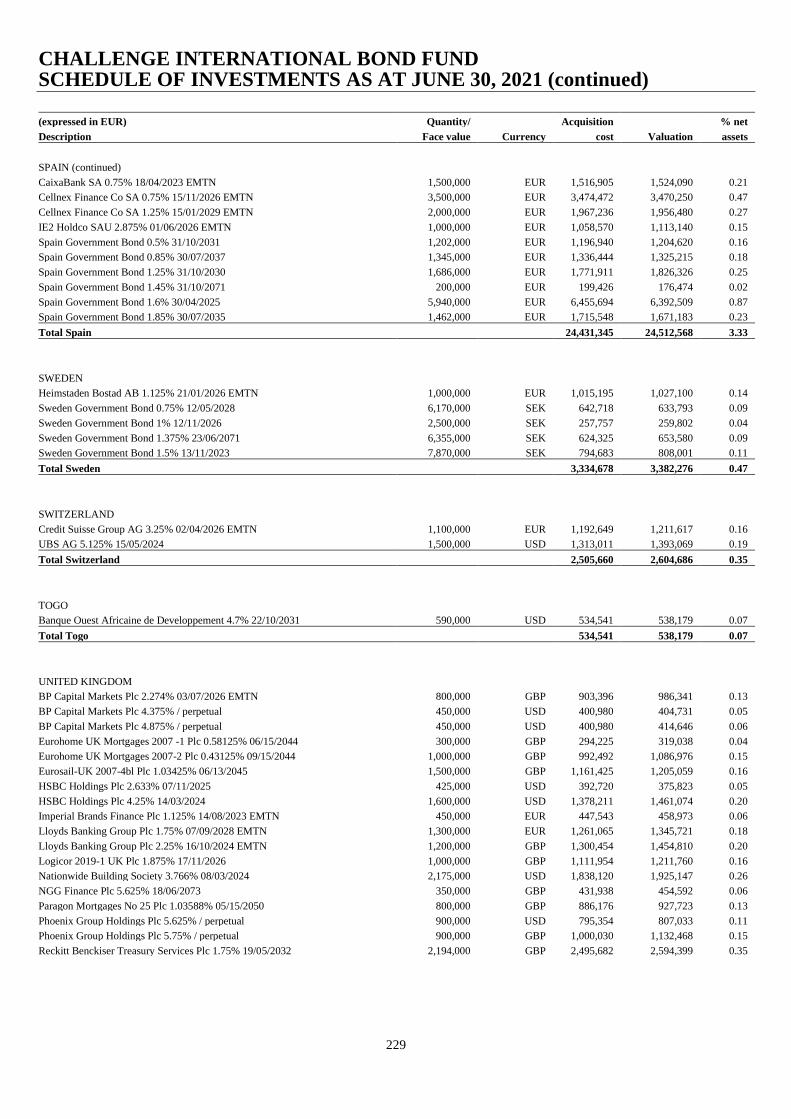
CHALLENGE INTERNATIONAL BOND FUND SCHEDULE OF INVESTMENTS AS AT JUNE 30, 2021 (continued)
229
(expressed in EUR) Quantity/ Acquisition % net
Description Face value Currency cost Valuation assets
SPAIN (continued)
CaixaBank SA 0.75% 18/04/2023 EMTN 1,500,000 EUR 1,516,905 1,524,090 0.21
Cellnex Finance Co SA 0.75% 15/11/2026 EMTN 3,500,000 EUR 3,474,472 3,470,250 0.47
Cellnex Finance Co SA 1.25% 15/01/2029 EMTN 2,000,000 EUR 1,967,236 1,956,480 0.27
IE2 Holdco SAU 2.875% 01/06/2026 EMTN 1,000,000 EUR 1,058,570 1,113,140 0.15
Spain Government Bond 0.5% 31/10/2031 1,202,000 EUR 1,196,940 1,204,620 0.16
Spain Government Bond 0.85% 30/07/2037 1,345,000 EUR 1,336,444 1,325,215 0.18
Spain Government Bond 1.25% 31/10/2030 1,686,000 EUR 1,771,911 1,826,326 0.25
Spain Government Bond 1.45% 31/10/2071 200,000 EUR 199,426 176,474 0.02
Spain Government Bond 1.6% 30/04/2025 5,940,000 EUR 6,455,694 6,392,509 0.87
Spain Government Bond 1.85% 30/07/2035 1,462,000 EUR 1,715,548 1,671,183 0.23
Total Spain 24,431,345 24,512,568 3.33
SWEDEN
Heimstaden Bostad AB 1.125% 21/01/2026 EMTN 1,000,000 EUR 1,015,195 1,027,100 0.14
Sweden Government Bond 0.75% 12/05/2028 6,170,000 SEK 642,718 633,793 0.09
Sweden Government Bond 1% 12/11/2026 2,500,000 SEK 257,757 259,802 0.04
Sweden Government Bond 1.375% 23/06/2071 6,355,000 SEK 624,325 653,580 0.09
Sweden Government Bond 1.5% 13/11/2023 7,870,000 SEK 794,683 808,001 0.11
Total Sweden 3,334,678 3,382,276 0.47
SWITZERLAND
Credit Suisse Group AG 3.25% 02/04/2026 EMTN 1,100,000 EUR 1,192,649 1,211,617 0.16
UBS AG 5.125% 15/05/2024 1,500,000 USD 1,313,011 1,393,069 0.19
Total Switzerland 2,505,660 2,604,686 0.35
TOGO
Banque Ouest Africaine de Developpement 4.7% 22/10/2031 590,000 USD 534,541 538,179 0.07
Total Togo 534,541 538,179 0.07
UNITED KINGDOM
BP Capital Markets Plc 2.274% 03/07/2026 EMTN 800,000 GBP 903,396 986,341 0.13
BP Capital Markets Plc 4.375% / perpetual 450,000 USD 400,980 404,731 0.05
BP Capital Markets Plc 4.875% / perpetual 450,000 USD 400,980 414,646 0.06
Eurohome UK Mortgages 2007 -1 Plc 0.58125% 06/15/2044 300,000 GBP 294,225 319,038 0.04
Eurohome UK Mortgages 2007-2 Plc 0.43125% 09/15/2044 1,000,000 GBP 992,492 1,086,976 0.15
Eurosail-UK 2007-4bl Plc 1.03425% 06/13/2045 1,500,000 GBP 1,161,425 1,205,059 0.16
HSBC Holdings Plc 2.633% 07/11/2025 425,000 USD 392,720 375,823 0.05
HSBC Holdings Plc 4.25% 14/03/2024 1,600,000 USD 1,378,211 1,461,074 0.20
Imperial Brands Finance Plc 1.125% 14/08/2023 EMTN 450,000 EUR 447,543 458,973 0.06
Lloyds Banking Group Plc 1.75% 07/09/2028 EMTN 1,300,000 EUR 1,261,065 1,345,721 0.18
Lloyds Banking Group Plc 2.25% 16/10/2024 EMTN 1,200,000 GBP 1,300,454 1,454,810 0.20
Logicor 2019-1 UK Plc 1.875% 17/11/2026 1,000,000 GBP 1,111,954 1,211,760 0.16
Nationwide Building Society 3.766% 08/03/2024 2,175,000 USD 1,838,120 1,925,147 0.26
NGG Finance Plc 5.625% 18/06/2073 350,000 GBP 431,938 454,592 0.06
Paragon Mortgages No 25 Plc 1.03588% 05/15/2050 800,000 GBP 886,176 927,723 0.13
Phoenix Group Holdings Plc 5.625% / perpetual 900,000 USD 795,354 807,033 0.11
Phoenix Group Holdings Plc 5.75% / perpetual 900,000 GBP 1,000,030 1,132,468 0.15
Reckitt Benckiser Treasury Services Plc 1.75% 19/05/2032 2,194,000 GBP 2,495,682 2,594,399 0.35
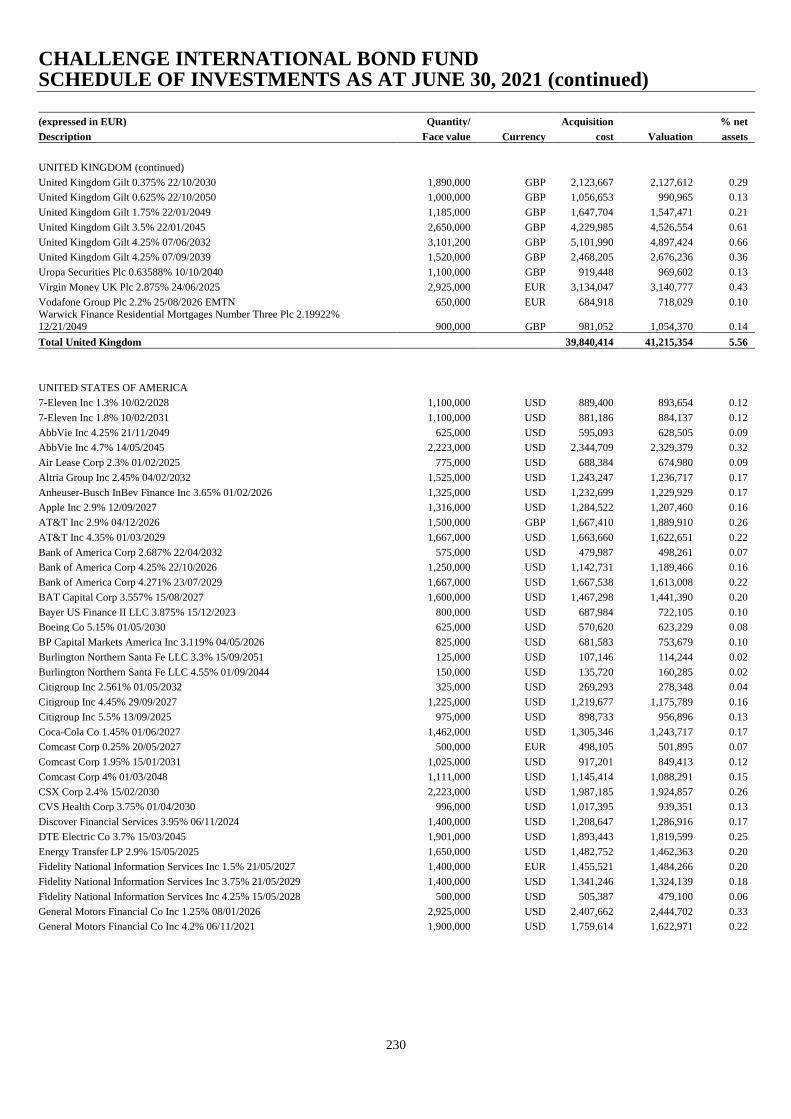
CHALLENGE INTERNATIONAL BOND FUND SCHEDULE OF INVESTMENTS AS AT JUNE 30, 2021 (continued)
230
(expressed in EUR) Quantity/ Acquisition % net
Description Face value Currency cost Valuation assets
UNITED KINGDOM (continued)
United Kingdom Gilt 0.375% 22/10/2030 1,890,000 GBP 2,123,667 2,127,612 0.29
United Kingdom Gilt 0.625% 22/10/2050 1,000,000 GBP 1,056,653 990,965 0.13
United Kingdom Gilt 1.75% 22/01/2049 1,185,000 GBP 1,647,704 1,547,471 0.21
United Kingdom Gilt 3.5% 22/01/2045 2,650,000 GBP 4,229,985 4,526,554 0.61
United Kingdom Gilt 4.25% 07/06/2032 3,101,200 GBP 5,101,990 4,897,424 0.66
United Kingdom Gilt 4.25% 07/09/2039 1,520,000 GBP 2,468,205 2,676,236 0.36
Uropa Securities Plc 0.63588% 10/10/2040 1,100,000 GBP 919,448 969,602 0.13
Virgin Money UK Plc 2.875% 24/06/2025 2,925,000 EUR 3,134,047 3,140,777 0.43
Vodafone Group Plc 2.2% 25/08/2026 EMTN 650,000 EUR 684,918 718,029 0.10
Warwick Finance Residential Mortgages Number Three Plc 2.19922%
12/21/2049 900,000 GBP 981,052 1,054,370 0.14
Total United Kingdom 39,840,414 41,215,354 5.56
UNITED STATES OF AMERICA
7-Eleven Inc 1.3% 10/02/2028 1,100,000 USD 889,400 893,654 0.12
7-Eleven Inc 1.8% 10/02/2031 1,100,000 USD 881,186 884,137 0.12
AbbVie Inc 4.25% 21/11/2049 625,000 USD 595,093 628,505 0.09
AbbVie Inc 4.7% 14/05/2045 2,223,000 USD 2,344,709 2,329,379 0.32
Air Lease Corp 2.3% 01/02/2025 775,000 USD 688,384 674,980 0.09
Altria Group Inc 2.45% 04/02/2032 1,525,000 USD 1,243,247 1,236,717 0.17
Anheuser-Busch InBev Finance Inc 3.65% 01/02/2026 1,325,000 USD 1,232,699 1,229,929 0.17
Apple Inc 2.9% 12/09/2027 1,316,000 USD 1,284,522 1,207,460 0.16
AT&T Inc 2.9% 04/12/2026 1,500,000 GBP 1,667,410 1,889,910 0.26
AT&T Inc 4.35% 01/03/2029 1,667,000 USD 1,663,660 1,622,651 0.22
Bank of America Corp 2.687% 22/04/2032 575,000 USD 479,987 498,261 0.07
Bank of America Corp 4.25% 22/10/2026 1,250,000 USD 1,142,731 1,189,466 0.16
Bank of America Corp 4.271% 23/07/2029 1,667,000 USD 1,667,538 1,613,008 0.22
BAT Capital Corp 3.557% 15/08/2027 1,600,000 USD 1,467,298 1,441,390 0.20
Bayer US Finance II LLC 3.875% 15/12/2023 800,000 USD 687,984 722,105 0.10
Boeing Co 5.15% 01/05/2030 625,000 USD 570,620 623,229 0.08
BP Capital Markets America Inc 3.119% 04/05/2026 825,000 USD 681,583 753,679 0.10
Burlington Northern Santa Fe LLC 3.3% 15/09/2051 125,000 USD 107,146 114,244 0.02
Burlington Northern Santa Fe LLC 4.55% 01/09/2044 150,000 USD 135,720 160,285 0.02
Citigroup Inc 2.561% 01/05/2032 325,000 USD 269,293 278,348 0.04
Citigroup Inc 4.45% 29/09/2027 1,225,000 USD 1,219,677 1,175,789 0.16
Citigroup Inc 5.5% 13/09/2025 975,000 USD 898,733 956,896 0.13
Coca-Cola Co 1.45% 01/06/2027 1,462,000 USD 1,305,346 1,243,717 0.17
Comcast Corp 0.25% 20/05/2027 500,000 EUR 498,105 501,895 0.07
Comcast Corp 1.95% 15/01/2031 1,025,000 USD 917,201 849,413 0.12
Comcast Corp 4% 01/03/2048 1,111,000 USD 1,145,414 1,088,291 0.15
CSX Corp 2.4% 15/02/2030 2,223,000 USD 1,987,185 1,924,857 0.26
CVS Health Corp 3.75% 01/04/2030 996,000 USD 1,017,395 939,351 0.13
Discover Financial Services 3.95% 06/11/2024 1,400,000 USD 1,208,647 1,286,916 0.17
DTE Electric Co 3.7% 15/03/2045 1,901,000 USD 1,893,443 1,819,599 0.25
Energy Transfer LP 2.9% 15/05/2025 1,650,000 USD 1,482,752 1,462,363 0.20
Fidelity National Information Services Inc 1.5% 21/05/2027 1,400,000 EUR 1,455,521 1,484,266 0.20
Fidelity National Information Services Inc 3.75% 21/05/2029 1,400,000 USD 1,341,246 1,324,139 0.18
Fidelity National Information Services Inc 4.25% 15/05/2028 500,000 USD 505,387 479,100 0.06
General Motors Financial Co Inc 1.25% 08/01/2026 2,925,000 USD 2,407,662 2,444,702 0.33
General Motors Financial Co Inc 4.2% 06/11/2021 1,900,000 USD 1,759,614 1,622,971 0.22
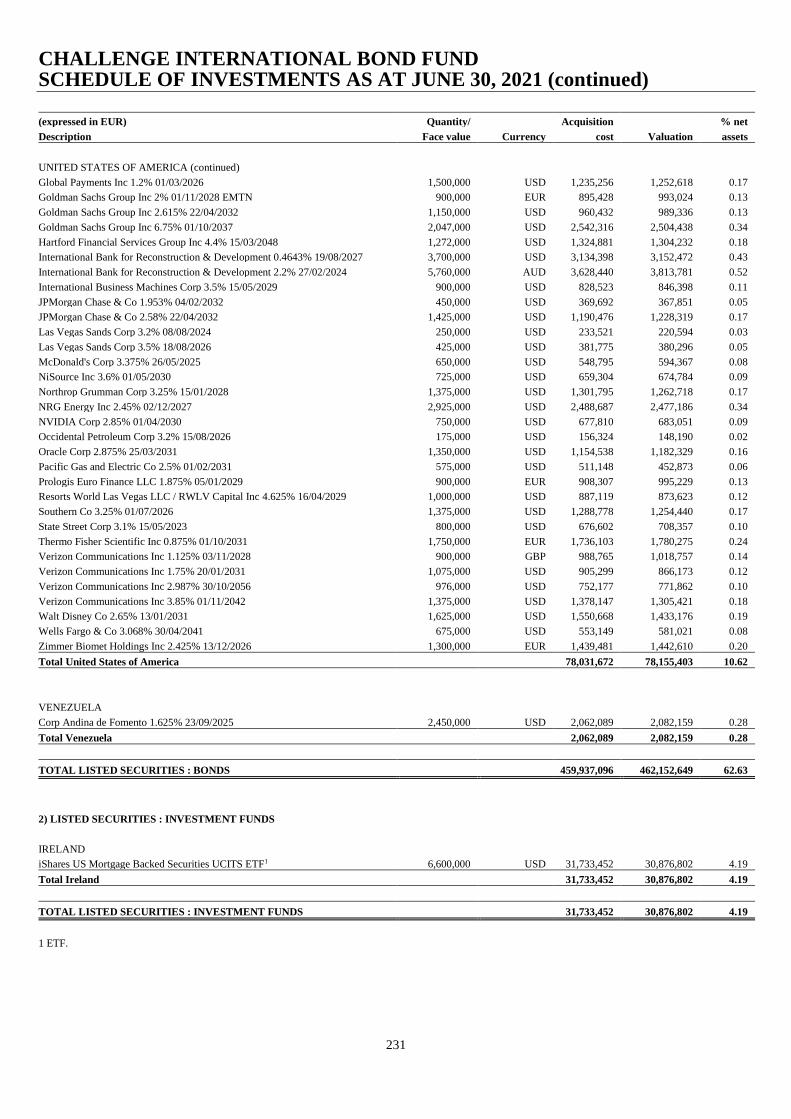
CHALLENGE INTERNATIONAL BOND FUND SCHEDULE OF INVESTMENTS AS AT JUNE 30, 2021 (continued)
231
(expressed in EUR) Quantity/ Acquisition % net
Description Face value Currency cost Valuation assets
UNITED STATES OF AMERICA (continued)
Global Payments Inc 1.2% 01/03/2026 1,500,000 USD 1,235,256 1,252,618 0.17
Goldman Sachs Group Inc 2% 01/11/2028 EMTN 900,000 EUR 895,428 993,024 0.13
Goldman Sachs Group Inc 2.615% 22/04/2032 1,150,000 USD 960,432 989,336 0.13
Goldman Sachs Group Inc 6.75% 01/10/2037 2,047,000 USD 2,542,316 2,504,438 0.34
Hartford Financial Services Group Inc 4.4% 15/03/2048 1,272,000 USD 1,324,881 1,304,232 0.18
International Bank for Reconstruction & Development 0.4643% 19/08/2027 3,700,000 USD 3,134,398 3,152,472 0.43
International Bank for Reconstruction & Development 2.2% 27/02/2024 5,760,000 AUD 3,628,440 3,813,781 0.52
International Business Machines Corp 3.5% 15/05/2029 900,000 USD 828,523 846,398 0.11
JPMorgan Chase & Co 1.953% 04/02/2032 450,000 USD 369,692 367,851 0.05
JPMorgan Chase & Co 2.58% 22/04/2032 1,425,000 USD 1,190,476 1,228,319 0.17
Las Vegas Sands Corp 3.2% 08/08/2024 250,000 USD 233,521 220,594 0.03
Las Vegas Sands Corp 3.5% 18/08/2026 425,000 USD 381,775 380,296 0.05
McDonald's Corp 3.375% 26/05/2025 650,000 USD 548,795 594,367 0.08
NiSource Inc 3.6% 01/05/2030 725,000 USD 659,304 674,784 0.09
Northrop Grumman Corp 3.25% 15/01/2028 1,375,000 USD 1,301,795 1,262,718 0.17
NRG Energy Inc 2.45% 02/12/2027 2,925,000 USD 2,488,687 2,477,186 0.34
NVIDIA Corp 2.85% 01/04/2030 750,000 USD 677,810 683,051 0.09
Occidental Petroleum Corp 3.2% 15/08/2026 175,000 USD 156,324 148,190 0.02
Oracle Corp 2.875% 25/03/2031 1,350,000 USD 1,154,538 1,182,329 0.16
Pacific Gas and Electric Co 2.5% 01/02/2031 575,000 USD 511,148 452,873 0.06
Prologis Euro Finance LLC 1.875% 05/01/2029 900,000 EUR 908,307 995,229 0.13
Resorts World Las Vegas LLC / RWLV Capital Inc 4.625% 16/04/2029 1,000,000 USD 887,119 873,623 0.12
Southern Co 3.25% 01/07/2026 1,375,000 USD 1,288,778 1,254,440 0.17
State Street Corp 3.1% 15/05/2023 800,000 USD 676,602 708,357 0.10
Thermo Fisher Scientific Inc 0.875% 01/10/2031 1,750,000 EUR 1,736,103 1,780,275 0.24
Verizon Communications Inc 1.125% 03/11/2028 900,000 GBP 988,765 1,018,757 0.14
Verizon Communications Inc 1.75% 20/01/2031 1,075,000 USD 905,299 866,173 0.12
Verizon Communications Inc 2.987% 30/10/2056 976,000 USD 752,177 771,862 0.10
Verizon Communications Inc 3.85% 01/11/2042 1,375,000 USD 1,378,147 1,305,421 0.18
Walt Disney Co 2.65% 13/01/2031 1,625,000 USD 1,550,668 1,433,176 0.19
Wells Fargo & Co 3.068% 30/04/2041 675,000 USD 553,149 581,021 0.08
Zimmer Biomet Holdings Inc 2.425% 13/12/2026 1,300,000 EUR 1,439,481 1,442,610 0.20
Total United States of America 78,031,672 78,155,403 10.62
VENEZUELA
Corp Andina de Fomento 1.625% 23/09/2025 2,450,000 USD 2,062,089 2,082,159 0.28
Total Venezuela 2,062,089 2,082,159 0.28
TOTAL LISTED SECURITIES : BONDS 459,937,096 462,152,649 62.63
2) LISTED SECURITIES : INVESTMENT FUNDS
IRELAND
iShares US Mortgage Backed Securities UCITS ETF1 6,600,000 USD 31,733,452 30,876,802 4.19
Total Ireland 31,733,452 30,876,802 4.19
TOTAL LISTED SECURITIES : INVESTMENT FUNDS 31,733,452 30,876,802 4.19
1 ETF.

CHALLENGE INTERNATIONAL BOND FUND SCHEDULE OF INVESTMENTS AS AT JUNE 30, 2021 (continued)
232
(expressed in EUR) Quantity/ Acquisition % net
Description Face value Currency cost Valuation assets
3) MONEY MARKET INSTRUMENTS : TREASURY BONDS/NOTES
UNITED STATES OF AMERICA
United States Treasury Note/Bond 1.125% 15/05/2040 12,440,000 USD 10,104,985 9,024,612 1.23
United States Treasury Note/Bond 1.25% 15/05/2050 3,170,000 USD 2,226,213 2,172,709 0.29
United States Treasury Note/Bond 1.5% 15/02/2030 2,000,000 USD 1,704,336 1,701,240 0.23
United States Treasury Note/Bond 1.625% 30/09/2026 3,481,500 USD 3,199,639 3,039,643 0.41
United States Treasury Note/Bond 1.625% 31/10/2026 702,100 USD 618,989 612,854 0.08
United States Treasury Note/Bond 1.75% 15/05/2023 8,310,000 USD 7,310,841 7,204,965 0.98
United States Treasury Note/Bond 1.875% 31/05/2022 5,397,800 USD 4,857,090 4,625,613 0.63
United States Treasury Note/Bond 2.125% 15/05/2025 3,430,000 USD 3,049,204 3,053,203 0.41
United States Treasury Note/Bond 2.25% 15/08/2027 1,462,800 USD 1,341,246 1,318,104 0.18
United States Treasury Note/Bond 2.25% 15/11/2027 6,729,000 USD 6,456,600 6,065,157 0.82
United States Treasury Note/Bond 2.5% 15/02/2045 1,420,000 USD 1,082,407 1,290,202 0.17
United States Treasury Note/Bond 2.75% 15/08/2047 10,130,000 USD 9,356,409 9,676,525 1.32
United States Treasury Note/Bond 2.875% 30/11/2023 10,854,300 USD 9,856,532 9,711,258 1.33
United States Treasury Note/Bond 3.125% 15/11/2028 8,279,700 USD 8,419,779 7,890,509 1.07
United States Treasury Note/Bond 4.5% 15/02/2036 2,896,400 USD 3,630,001 3,344,513 0.45
United States Treasury Note/Bond 4.5% 15/05/2038 2,837,900 USD 3,642,568 3,331,553 0.45
United States Treasury Note/Bond 4.75% 15/02/2041 731,400 USD 922,234 901,221 0.12
United States Treasury Note/Bond 5.375% 15/02/2031 1,404,300 USD 1,741,670 1,607,132 0.22
United States Treasury Note/Bond 7.5% 15/11/2024 1,609,100 USD 1,787,533 1,673,072 0.23
Total United States of America 81,308,276 78,244,085 10.62
TOTAL MONEY MARKET INSTRUMENTS : TREASURY BONDS/NOTES 81,308,276 78,244,085 10.62
TOTAL TRANSFERABLE SECURITIES AND MONEY MARKET INSTRUMENTS ADMITTED TO AN
OFFICIAL STOCK EXCHANGE LISTING 572,978,824 571,273,536 77.44
B) OTHER TRANSFERABLE SECURITIES DEALT ON ANOTHER REGULATED MARKET
1) OTHER ORGANISED MARKET : BONDS
AUSTRALIA
NBN Co Ltd 2.625% 05/05/2031 1,180,000 USD 976,111 1,015,463 0.14
Total Australia 976,111 1,015,463 0.14
CANADA
Inter Pipeline Ltd 2.734% 18/04/2024 700,000 CAD 475,650 491,983 0.07
Toronto-Dominion Bank 1.943% 13/03/2025 424,000 CAD 282,880 294,453 0.04
Total Canada 758,530 786,436 0.11
CAYMAN ISLANDS
ADCB Finance Cayman Ltd 4% 29/03/2023 830,000 USD 723,059 738,321 0.10
Avolon Holdings Funding Ltd 2.875% 15/02/2025 775,000 USD 697,210 673,074 0.09
Total Cayman Islands 1,420,269 1,411,395 0.19
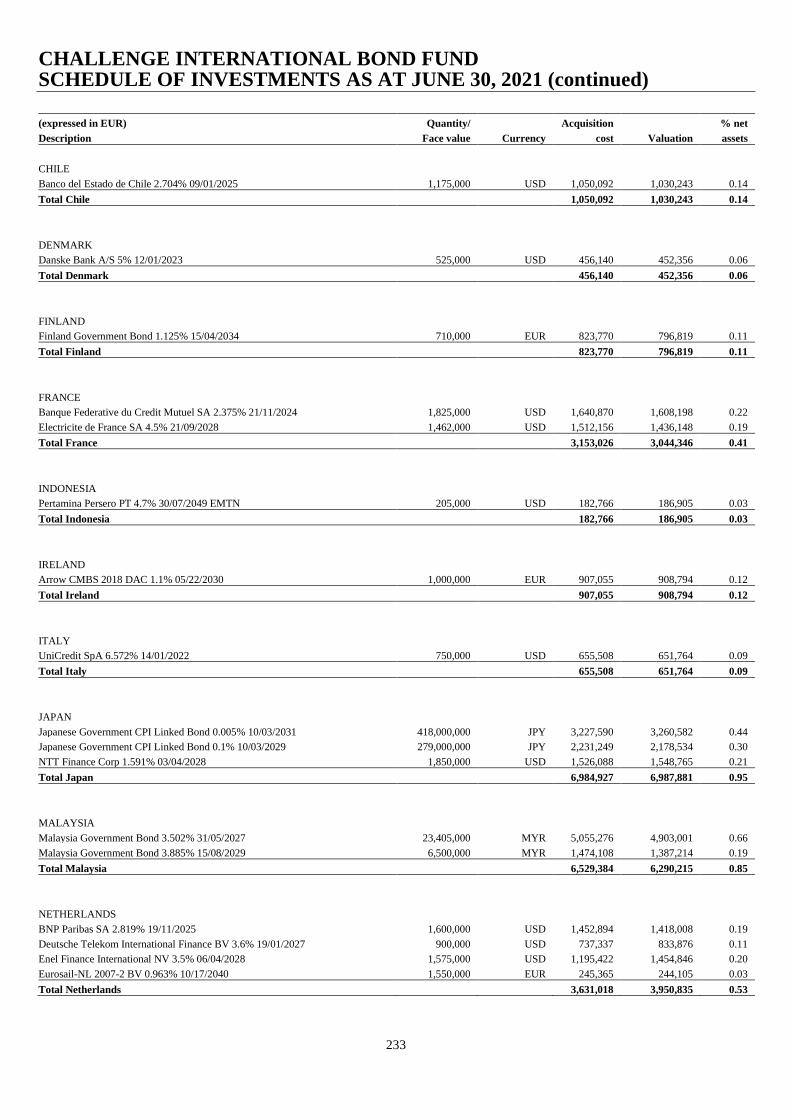
CHALLENGE INTERNATIONAL BOND FUND SCHEDULE OF INVESTMENTS AS AT JUNE 30, 2021 (continued)
233
(expressed in EUR) Quantity/ Acquisition % net
Description Face value Currency cost Valuation assets
CHILE
Banco del Estado de Chile 2.704% 09/01/2025 1,175,000 USD 1,050,092 1,030,243 0.14
Total Chile 1,050,092 1,030,243 0.14
DENMARK
Danske Bank A/S 5% 12/01/2023 525,000 USD 456,140 452,356 0.06
Total Denmark 456,140 452,356 0.06
FINLAND
Finland Government Bond 1.125% 15/04/2034 710,000 EUR 823,770 796,819 0.11
Total Finland 823,770 796,819 0.11
FRANCE
Banque Federative du Credit Mutuel SA 2.375% 21/11/2024 1,825,000 USD 1,640,870 1,608,198 0.22
Electricite de France SA 4.5% 21/09/2028 1,462,000 USD 1,512,156 1,436,148 0.19
Total France 3,153,026 3,044,346 0.41
INDONESIA
Pertamina Persero PT 4.7% 30/07/2049 EMTN 205,000 USD 182,766 186,905 0.03
Total Indonesia 182,766 186,905 0.03
IRELAND
Arrow CMBS 2018 DAC 1.1% 05/22/2030 1,000,000 EUR 907,055 908,794 0.12
Total Ireland 907,055 908,794 0.12
ITALY
UniCredit SpA 6.572% 14/01/2022 750,000 USD 655,508 651,764 0.09
Total Italy 655,508 651,764 0.09
JAPAN
Japanese Government CPI Linked Bond 0.005% 10/03/2031 418,000,000 JPY 3,227,590 3,260,582 0.44
Japanese Government CPI Linked Bond 0.1% 10/03/2029 279,000,000 JPY 2,231,249 2,178,534 0.30
NTT Finance Corp 1.591% 03/04/2028 1,850,000 USD 1,526,088 1,548,765 0.21
Total Japan 6,984,927 6,987,881 0.95
MALAYSIA
Malaysia Government Bond 3.502% 31/05/2027 23,405,000 MYR 5,055,276 4,903,001 0.66
Malaysia Government Bond 3.885% 15/08/2029 6,500,000 MYR 1,474,108 1,387,214 0.19
Total Malaysia 6,529,384 6,290,215 0.85
NETHERLANDS
BNP Paribas SA 2.819% 19/11/2025 1,600,000 USD 1,452,894 1,418,008 0.19
Deutsche Telekom International Finance BV 3.6% 19/01/2027 900,000 USD 737,337 833,876 0.11
Enel Finance International NV 3.5% 06/04/2028 1,575,000 USD 1,195,422 1,454,846 0.20
Eurosail-NL 2007-2 BV 0.963% 10/17/2040 1,550,000 EUR 245,365 244,105 0.03
Total Netherlands 3,631,018 3,950,835 0.53
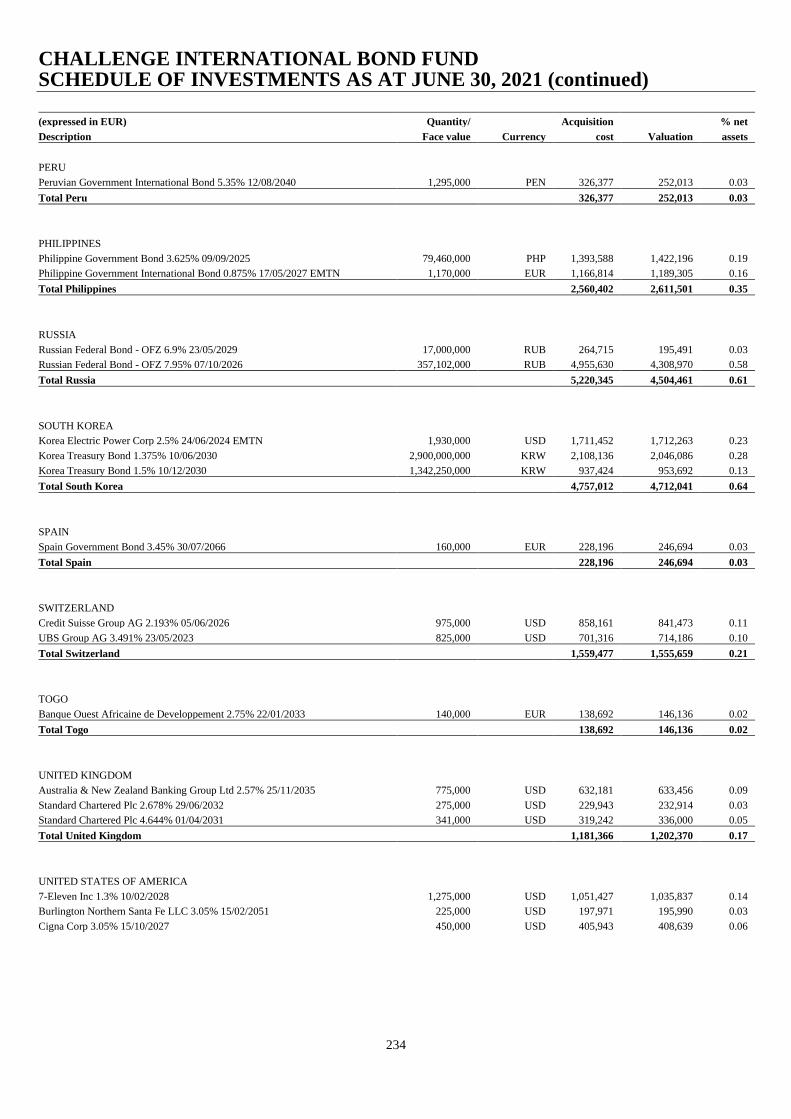
CHALLENGE INTERNATIONAL BOND FUND SCHEDULE OF INVESTMENTS AS AT JUNE 30, 2021 (continued)
234
(expressed in EUR) Quantity/ Acquisition % net
Description Face value Currency cost Valuation assets
PERU
Peruvian Government International Bond 5.35% 12/08/2040 1,295,000 PEN 326,377 252,013 0.03
Total Peru 326,377 252,013 0.03
PHILIPPINES
Philippine Government Bond 3.625% 09/09/2025 79,460,000 PHP 1,393,588 1,422,196 0.19
Philippine Government International Bond 0.875% 17/05/2027 EMTN 1,170,000 EUR 1,166,814 1,189,305 0.16
Total Philippines 2,560,402 2,611,501 0.35
RUSSIA
Russian Federal Bond - OFZ 6.9% 23/05/2029 17,000,000 RUB 264,715 195,491 0.03
Russian Federal Bond - OFZ 7.95% 07/10/2026 357,102,000 RUB 4,955,630 4,308,970 0.58
Total Russia 5,220,345 4,504,461 0.61
SOUTH KOREA
Korea Electric Power Corp 2.5% 24/06/2024 EMTN 1,930,000 USD 1,711,452 1,712,263 0.23
Korea Treasury Bond 1.375% 10/06/2030 2,900,000,000 KRW 2,108,136 2,046,086 0.28
Korea Treasury Bond 1.5% 10/12/2030 1,342,250,000 KRW 937,424 953,692 0.13
Total South Korea 4,757,012 4,712,041 0.64
SPAIN
Spain Government Bond 3.45% 30/07/2066 160,000 EUR 228,196 246,694 0.03
Total Spain 228,196 246,694 0.03
SWITZERLAND
Credit Suisse Group AG 2.193% 05/06/2026 975,000 USD 858,161 841,473 0.11
UBS Group AG 3.491% 23/05/2023 825,000 USD 701,316 714,186 0.10
Total Switzerland 1,559,477 1,555,659 0.21
TOGO
Banque Ouest Africaine de Developpement 2.75% 22/01/2033 140,000 EUR 138,692 146,136 0.02
Total Togo 138,692 146,136 0.02
UNITED KINGDOM
Australia & New Zealand Banking Group Ltd 2.57% 25/11/2035 775,000 USD 632,181 633,456 0.09
Standard Chartered Plc 2.678% 29/06/2032 275,000 USD 229,943 232,914 0.03
Standard Chartered Plc 4.644% 01/04/2031 341,000 USD 319,242 336,000 0.05
Total United Kingdom 1,181,366 1,202,370 0.17
UNITED STATES OF AMERICA
7-Eleven Inc 1.3% 10/02/2028 1,275,000 USD 1,051,427 1,035,837 0.14
Burlington Northern Santa Fe LLC 3.05% 15/02/2051 225,000 USD 197,971 195,990 0.03
Cigna Corp 3.05% 15/10/2027 450,000 USD 405,943 408,639 0.06
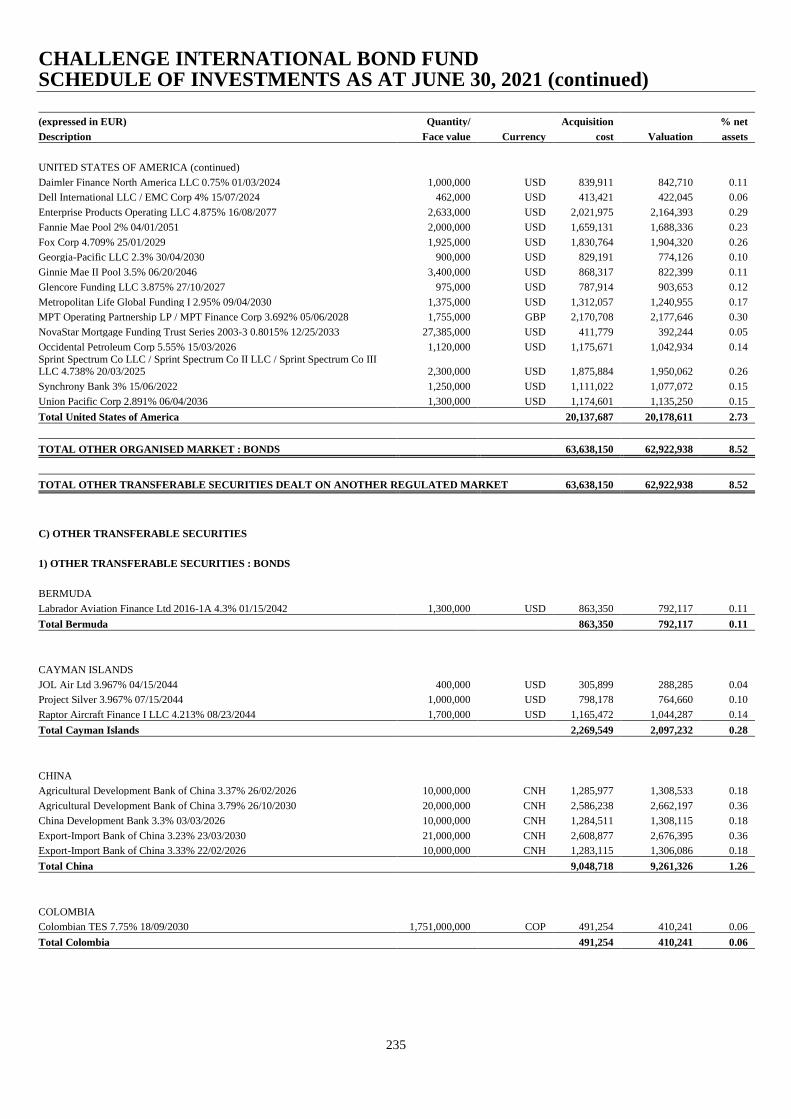
CHALLENGE INTERNATIONAL BOND FUND SCHEDULE OF INVESTMENTS AS AT JUNE 30, 2021 (continued)
235
(expressed in EUR) Quantity/ Acquisition % net
Description Face value Currency cost Valuation assets
UNITED STATES OF AMERICA (continued)
Daimler Finance North America LLC 0.75% 01/03/2024 1,000,000 USD 839,911 842,710 0.11
Dell International LLC / EMC Corp 4% 15/07/2024 462,000 USD 413,421 422,045 0.06
Enterprise Products Operating LLC 4.875% 16/08/2077 2,633,000 USD 2,021,975 2,164,393 0.29
Fannie Mae Pool 2% 04/01/2051 2,000,000 USD 1,659,131 1,688,336 0.23
Fox Corp 4.709% 25/01/2029 1,925,000 USD 1,830,764 1,904,320 0.26
Georgia-Pacific LLC 2.3% 30/04/2030 900,000 USD 829,191 774,126 0.10
Ginnie Mae II Pool 3.5% 06/20/2046 3,400,000 USD 868,317 822,399 0.11
Glencore Funding LLC 3.875% 27/10/2027 975,000 USD 787,914 903,653 0.12
Metropolitan Life Global Funding I 2.95% 09/04/2030 1,375,000 USD 1,312,057 1,240,955 0.17
MPT Operating Partnership LP / MPT Finance Corp 3.692% 05/06/2028 1,755,000 GBP 2,170,708 2,177,646 0.30
NovaStar Mortgage Funding Trust Series 2003-3 0.8015% 12/25/2033 27,385,000 USD 411,779 392,244 0.05
Occidental Petroleum Corp 5.55% 15/03/2026 1,120,000 USD 1,175,671 1,042,934 0.14
Sprint Spectrum Co LLC / Sprint Spectrum Co II LLC / Sprint Spectrum Co III LLC 4.738% 20/03/2025 2,300,000 USD 1,875,884 1,950,062 0.26
Synchrony Bank 3% 15/06/2022 1,250,000 USD 1,111,022 1,077,072 0.15
Union Pacific Corp 2.891% 06/04/2036 1,300,000 USD 1,174,601 1,135,250 0.15
Total United States of America 20,137,687 20,178,611 2.73
TOTAL OTHER ORGANISED MARKET : BONDS 63,638,150 62,922,938 8.52
TOTAL OTHER TRANSFERABLE SECURITIES DEALT ON ANOTHER REGULATED MARKET 63,638,150 62,922,938 8.52
C) OTHER TRANSFERABLE SECURITIES
1) OTHER TRANSFERABLE SECURITIES : BONDS
BERMUDA
Labrador Aviation Finance Ltd 2016-1A 4.3% 01/15/2042 1,300,000 USD 863,350 792,117 0.11
Total Bermuda 863,350 792,117 0.11
CAYMAN ISLANDS
JOL Air Ltd 3.967% 04/15/2044 400,000 USD 305,899 288,285 0.04
Project Silver 3.967% 07/15/2044 1,000,000 USD 798,178 764,660 0.10
Raptor Aircraft Finance I LLC 4.213% 08/23/2044 1,700,000 USD 1,165,472 1,044,287 0.14
Total Cayman Islands 2,269,549 2,097,232 0.28
CHINA
Agricultural Development Bank of China 3.37% 26/02/2026 10,000,000 CNH 1,285,977 1,308,533 0.18
Agricultural Development Bank of China 3.79% 26/10/2030 20,000,000 CNH 2,586,238 2,662,197 0.36
China Development Bank 3.3% 03/03/2026 10,000,000 CNH 1,284,511 1,308,115 0.18
Export-Import Bank of China 3.23% 23/03/2030 21,000,000 CNH 2,608,877 2,676,395 0.36
Export-Import Bank of China 3.33% 22/02/2026 10,000,000 CNH 1,283,115 1,306,086 0.18
Total China 9,048,718 9,261,326 1.26
COLOMBIA
Colombian TES 7.75% 18/09/2030 1,751,000,000 COP 491,254 410,241 0.06
Total Colombia 491,254 410,241 0.06

CHALLENGE INTERNATIONAL BOND FUND SCHEDULE OF INVESTMENTS AS AT JUNE 30, 2021 (continued)
236
(expressed in EUR) Quantity/ Acquisition % net
Description Face value Currency cost Valuation assets
IRELAND
Arrow CMBS 2018 DAC 2.05% 05/22/2030 1,000,000 EUR 907,055 904,892 0.12
Berg Finance 2021 DAC 1.45% 04/22/2033 1,800,000 EUR 1,800,000 1,803,060 0.24
Dilosk RMBS No. 2 DAC 1.457% 12/20/2057 1,100,000 EUR 1,096,645 1,103,688 0.15
European Residential Loan Securitisation 2019-NPL2 DAC 0.95% 02/24/2058 1,500,000 EUR 1,168,550 1,164,980 0.16
Pembroke Property Finance DAC 0.66% 06/01/2037 1,000,000 EUR 374,287 377,541 0.05
Small Business Origination Loan Trust 2019-2 DAC 2.80525% 03/15/2028 2,000,000 GBP 1,351,254 1,403,380 0.19
Small Business Origination Loan Trust 2019-3 DAC 3.04963% 10/15/2028 1,510,000 GBP 1,175,858 1,172,855 0.16
Taurus 2020-2 UK DAC 1.74872% 08/17/2030 1,000,000 GBP 1,084,347 1,151,555 0.16
Total Ireland 8,957,996 9,081,951 1.23
ITALY
Taurus 2020-1 NL DAC 0.9% 02/20/2030 1,100,000 EUR 989,850 1,046,008 0.14
Taurus 2020-1 NL DAC 1.55% 02/20/2030 1,000,000 EUR 949,793 946,753 0.13
Total Italy 1,939,643 1,992,761 0.27
MACAO
Bank of China Ltd 3.08% 28/04/2026 EMTN 45,000,000 CNH 5,764,534 5,877,883 0.80
Total Macao 5,764,534 5,877,883 0.80
PHILIPPINES
Asian Development Bank 2.125% 19/05/2031 740,000 NZD 438,606 432,278 0.06
Total Philippines 438,606 432,278 0.06
UNITED KINGDOM
European Bank for Reconstruction & Development 2.7% 25/08/2023 EMTN 23,000,000,000 VND 833,271 834,228 0.11
Newday Funding 2018-2 Plc 1.70525% 12/15/2026 1,150,000 GBP 1,296,601 1,341,756 0.18
Residential Mortgage Securities 31 Plc 2.08113% 09/20/2065 1,000,000 GBP 1,123,642 1,167,930 0.16
RMAC NO 2 Plc 1.53425% 06/12/2046 333,000 GBP 378,954 390,184 0.05
Stratton Mortgage Funding 2019-1 Plc 2.54881% 05/25/2051 1,000,000 GBP 1,095,693 1,178,142 0.16
Total United Kingdom 4,728,161 4,912,240 0.66
UNITED STATES OF AMERICA
1345 Avenue of the Americas & Park Avenue Plaza Trust 5.278% 08/10/2035 300,000 USD 289,913 249,959 0.03
Argent Securities Inc Asset-Backed Pass-Through Certificates Series 2003-W6 0.9515% 01/25/2034 100,000,000 USD 1,157,015 1,073,340 0.15
Ashford Hospitality Trust 2018-KEYS 1.92288% 06/15/2035 1,300,000 USD 1,175,046 1,094,104 0.15
COMM 2014-CR14 Mortgage Trust 4.762117% 02/10/2047 1,100,000 USD 891,406 883,095 0.12
COMM 2015-CCRE24 Mortgage Trust 3.463% 08/10/2048 1,100,000 USD 822,452 842,275 0.11
Dell International LLC / EMC Corp 4% 15/07/2024 1,000,000 USD 947,121 915,001 0.12
Fannie Mae Pool 2% 10/01/2050 3,020,000 USD 2,470,926 2,395,743 0.32
Fannie Mae Pool 2% 12/01/2050 1,000,000 USD 838,105 823,335 0.11
Fannie Mae Pool 2.5% 03/01/2050 1,090,000 USD 845,870 799,386 0.11
Fannie Mae Pool 2.5% 03/01/2050 1,720,000 USD 1,094,180 1,020,760 0.14
Fannie Mae Pool 2.5% 05/01/2051 2,500,000 USD 2,120,126 2,174,118 0.29

CHALLENGE INTERNATIONAL BOND FUND SCHEDULE OF INVESTMENTS AS AT JUNE 30, 2021 (continued)
237
(expressed in EUR) Quantity/ Acquisition % net
Description Face value Currency cost Valuation assets
UNITED STATES OF AMERICA (continued)
Fannie Mae Pool 3% 02/01/2050 370,000 USD 255,882 239,817 0.03
Fannie Mae Pool 3% 03/01/2048 3,000,000 USD 631,906 672,993 0.09
Fannie Mae Pool 3% 03/01/2050 2,400,000 USD 709,853 667,443 0.09
Fannie Mae Pool 3% 04/01/2050 2,500,000 USD 697,700 652,856 0.09
Fannie Mae Pool 3% 08/01/2046 1,600,000 USD 313,852 317,907 0.04
Fannie Mae Pool 3% 08/01/2049 2,545,000 USD 1,620,528 1,560,127 0.21
Fannie Mae Pool 3.5% 04/01/2049 500,000 USD 42,317 40,918 0.01
Fannie Mae Pool 3.5% 11/01/2051 5,000,000 USD 2,582,930 2,493,040 0.34
Fannie Mae Pool 4% 08/01/2048 2,000,000 USD 731,199 753,278 0.10
Fannie Mae Pool 4% 08/01/2049 1,000,000 USD 228,706 218,856 0.03
Fannie Mae Pool 4% 09/01/2048 2,000,000 USD 405,688 417,599 0.06
Fannie Mae Pool 4.5% 06/01/2049 1,500,000 USD 390,280 375,006 0.05
Fannie Mae Pool 4.5% 08/01/2049 1,800,000 USD 372,094 358,491 0.05
Fannie Mae Pool 4.5% 10/01/2048 1,700,000 USD 523,980 525,293 0.07
Freddie Mac Gold Pool 3% 06/01/2049 1,000,000 USD 232,316 226,917 0.03
Freddie Mac Gold Pool 3.5% 03/01/2048 3,000,000 USD 514,975 537,499 0.07
Freddie Mac Gold Pool 3.5% 04/01/2048 3,000,000 USD 389,560 404,697 0.05
Freddie Mac Gold Pool 4% 06/01/2038 2,000,000 USD 692,311 664,664 0.09
Freddie Mac Pool 2.5% 03/01/2050 1,000,000 USD 230,109 220,626 0.03
Freddie Mac Pool 2.5% 04/01/2050 2,000,000 USD 481,958 476,260 0.06
Freddie Mac Pool 2.5% 09/01/2050 6,417,886 USD 5,286,889 5,175,605 0.70
Freddie Mac Pool 2.5% 09/01/2050 3,360,883 USD 2,952,912 2,888,318 0.39
Freddie Mac Pool 2.5% 09/01/2050 1,013,991 USD 604,156 598,997 0.08
Freddie Mac Pool 2.5% 10/01/2050 2,000,000 USD 1,590,400 1,553,133 0.21
Freddie Mac Pool 3% 04/01/2050 1,000,000 USD 308,855 291,166 0.04
Freddie Mac Whole Loan Securities Trust 3% 12/25/2046 2,300,000 USD 461,502 458,645 0.06
Ginnie Mae II Pool 2.5% 04/20/2050 1,700,000 USD 564,870 580,775 0.08
Ginnie Mae II Pool 3% 11/20/2049 2,000,000 USD 483,223 449,929 0.06
Ginnie Mae II Pool 5% 12/20/2048 1,500,000 USD 44,136 42,830 0.01
GS Mortgage Securities Corp Trust 2018-HULA 0.993% 07/15/2025 1,500,000 USD 1,261,783 1,191,418 0.16
Invitation Homes 2017-SFR2 Trust 1.915% 12/17/20361 1,167,000 USD - - -
Invitation Homes 2018-SFR2 Trust 1.523% 06/17/2037 2,000,000 USD 1,695,768 1,687,660 0.23
Invitation Homes 2018-SFR3 Trust 1.732% 07/17/2037 2,000,000 USD 1,210,306 1,177,333 0.16
Invitation Homes 2018-SFR4 Trust 1.732% 01/17/2038 1,750,000 USD 1,537,423 1,476,888 0.20
Newtek Small Business Loan Trust 2018-1 2.7% 02/25/2044 1,250,000 USD 663,381 624,903 0.08
Seasoned Credit Risk Transfer Trust Series 2017-3 3.25% 07/25/2056 2,000,000 USD 1,123,084 1,206,613 0.16
Seasoned Credit Risk Transfer Trust Series 2019-2 4% 08/25/2058 600,000 USD 373,956 371,677 0.05
Seasoned Credit Risk Transfer Trust Series 2019-3 3% 10/25/2058 311,000 USD 226,448 220,452 0.03
Seasoned Credit Risk Transfer Trust Series 2019-3 4% 10/25/2058 397,000 USD 251,663 244,982 0.03
WAVE 2019-1 LLC 3.597% 09/15/2044 1,400,000 USD 1,167,222 1,078,016 0.15
Total United States of America 46,508,281 45,414,743 6.12
TOTAL OTHER TRANSFERABLE SECURITIES : BONDS 81,010,092 80,272,772 10.85
TOTAL OTHER TRANSFERABLE SECURITIES 81,010,092 80,272,772 10.85
TOTAL INVESTMENTS 717,627,066 714,469,246 96.81
CASH AND OTHER NET ASSETS 23,537,029 3.19
TOTAL NET ASSETS 738,006,275 100.00
1 Sold bond accruing interest until SD only (zero holding).
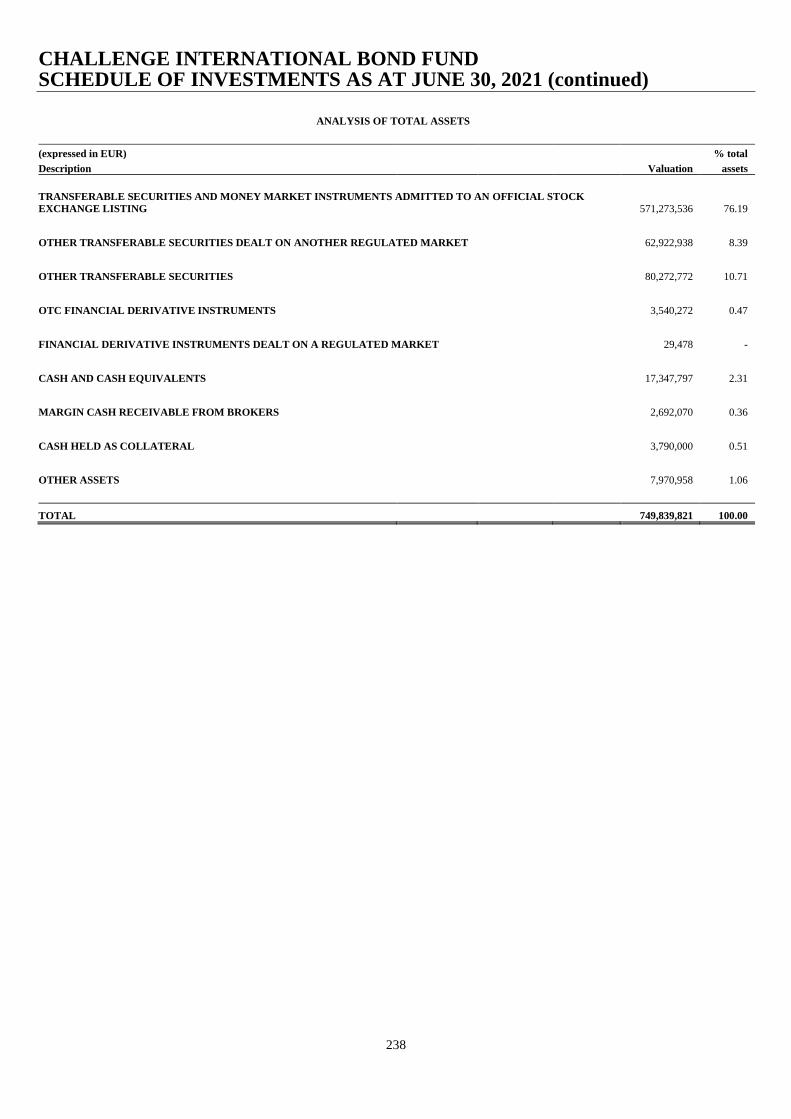
CHALLENGE INTERNATIONAL BOND FUND SCHEDULE OF INVESTMENTS AS AT JUNE 30, 2021 (continued)
238
ANALYSIS OF TOTAL ASSETS
(expressed in EUR) % total
Description Valuation assets
TRANSFERABLE SECURITIES AND MONEY MARKET INSTRUMENTS ADMITTED TO AN OFFICIAL STOCK
EXCHANGE LISTING 571,273,536 76.19
OTHER TRANSFERABLE SECURITIES DEALT ON ANOTHER REGULATED MARKET
62,922,938 8.39
OTHER TRANSFERABLE SECURITIES
80,272,772 10.71
OTC FINANCIAL DERIVATIVE INSTRUMENTS
3,540,272 0.47
FINANCIAL DERIVATIVE INSTRUMENTS DEALT ON A REGULATED MARKET
29,478 -
CASH AND CASH EQUIVALENTS
17,347,797 2.31
MARGIN CASH RECEIVABLE FROM BROKERS
2,692,070 0.36
CASH HELD AS COLLATERAL
3,790,000 0.51
OTHER ASSETS
7,970,958 1.06
TOTAL 749,839,821 100.00
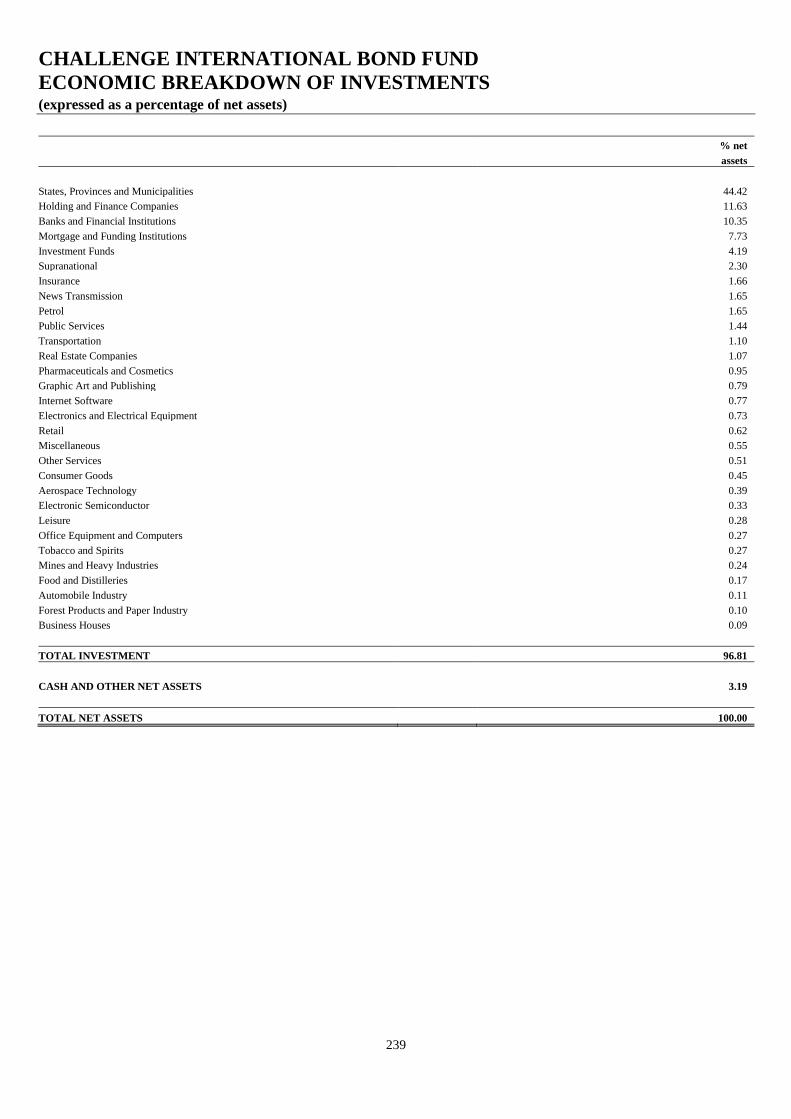
CHALLENGE INTERNATIONAL BOND FUND
ECONOMIC BREAKDOWN OF INVESTMENTS (expressed as a percentage of net assets)
239
% net
assets
States, Provinces and Municipalities 44.42
Holding and Finance Companies 11.63
Banks and Financial Institutions 10.35
Mortgage and Funding Institutions 7.73
Investment Funds 4.19
Supranational 2.30
Insurance 1.66
News Transmission 1.65
Petrol 1.65
Public Services 1.44
Transportation 1.10
Real Estate Companies 1.07
Pharmaceuticals and Cosmetics 0.95
Graphic Art and Publishing 0.79
Internet Software 0.77
Electronics and Electrical Equipment 0.73
Retail 0.62
Miscellaneous 0.55
Other Services 0.51
Consumer Goods 0.45
Aerospace Technology 0.39
Electronic Semiconductor 0.33
Leisure 0.28
Office Equipment and Computers 0.27
Tobacco and Spirits 0.27
Mines and Heavy Industries 0.24
Food and Distilleries 0.17
Automobile Industry 0.11
Forest Products and Paper Industry 0.10
Business Houses 0.09
TOTAL INVESTMENT 96.81
CASH AND OTHER NET ASSETS 3.19
TOTAL NET ASSETS 100.00

CHALLENGE INTERNATIONAL EQUITY FUND SCHEDULE OF INVESTMENTS AS AT JUNE 30, 2021
240
(expressed in EUR) Quantity/ Acquisition % net
Description Face value Currency cost Valuation assets
1) INVESTMENTS
A) TRANSFERABLE SECURITIES ADMITTED TO AN OFFICIAL STOCK EXCHANGE LISTING
1) LISTED SECURITIES : SHARES
AUSTRALIA
Aurizon Holdings Ltd 226,079 AUD 584,359 532,415 0.03
Australia & New Zealand Banking Group Ltd 116,298 AUD 1,210,982 2,072,516 0.13
BHP Group Ltd 25,937 AUD 516,454 797,508 0.05
BlueScope Steel Ltd 65,125 AUD 678,403 905,373 0.06
Fortescue Metals Group Ltd 184,280 AUD 1,182,590 2,722,866 0.18
Goodman Group 162,425 AUD 963,040 2,176,813 0.14
Newcrest Mining Ltd 35,072 AUD 672,369 561,287 0.04
Origin Energy Ltd 40,984 AUD 125,850 117,014 0.01
Scentre Group 176,648 AUD 319,110 306,413 0.02
South32 Ltd 666,485 AUD 925,677 1,236,247 0.08
Suncorp Group Ltd 26,946 AUD 178,200 189,520 0.01
Total Australia 7,357,034 11,617,972 0.75
BELGIUM
KBC Group NV 55,568 EUR 3,556,707 3,573,023 0.23
Proximus SADP 26,838 EUR 441,286 437,191 0.03
UCB SA 25,521 EUR 1,979,446 2,249,931 0.15
Total Belgium 5,977,439 6,260,145 0.41
BERMUDA
Arch Capital Group Ltd 48,460 USD 1,411,018 1,591,224 0.10
Brookfield Asset Management Reinsurance Partners Ltd 278 USD 11,825 12,195 -
Bunge Ltd 23,305 USD 1,487,380 1,535,784 0.10
Everest Re Group Ltd 5,781 USD 1,259,732 1,228,493 0.08
Genpact Ltd 43,430 USD 1,241,196 1,663,736 0.11
IHS Markit Ltd 20,617 USD 1,379,596 1,958,606 0.13
RenaissanceRe Holdings Ltd 1,558 USD 197,651 195,515 0.01
Triton International Ltd 7,105 USD 219,454 313,581 0.02
Total Bermuda 7,207,852 8,499,134 0.55
BRAZIL
Notre Dame Intermedica Participacoes SA 83,300 BRL 1,100,533 1,188,889 0.08
Total Brazil 1,100,533 1,188,889 0.08
CANADA
Agnico Eagle Mines Ltd 4,748 CAD 257,376 242,363 0.02
Air Canada 4 CAD 52 69 -
ARC Resources Ltd 53,160 CAD 226,476 381,912 0.02
Barrick Gold Corp 172,295 CAD 3,165,017 3,008,271 0.20
Brookfield Asset Management Inc 40,324 USD 1,435,704 1,733,466 0.11

CHALLENGE INTERNATIONAL EQUITY FUND SCHEDULE OF INVESTMENTS AS AT JUNE 30, 2021 (continued)
241
(expressed in EUR) Quantity/ Acquisition % net
Description Face value Currency cost Valuation assets
CANADA (continued)
CAE Inc 173,323 CAD 3,691,065 4,506,281 0.29
Canadian National Railway Co 58,464 CAD 5,285,108 5,207,020 0.34
Canadian Natural Resources Ltd 15,244 USD 290,371 466,357 0.03
Canadian Tire Corp Ltd 4,731 CAD 516,476 631,960 0.04
CGI Inc 8,252 CAD 436,052 631,558 0.04
First Quantum Minerals Ltd 13,261 CAD 256,217 257,996 0.02
Intact Financial Corp 13,677 CAD 894,737 1,568,501 0.10
Kinross Gold Corp 636,944 CAD 3,298,180 3,409,180 0.22
Manulife Financial Corp 57,036 CAD 777,071 947,687 0.06
Onex Corp 13,925 CAD 715,484 853,517 0.06
Open Text Corp 6,596 CAD 217,532 282,750 0.02
Power Corp of Canada 7,284 CAD 143,480 194,339 0.01
Ritchie Bros Auctioneers Inc 3,326 CAD 150,681 166,447 0.01
Rogers Communications Inc 8,721 CAD 349,279 391,361 0.03
Royal Bank of Canada 32,147 CAD 1,721,465 2,749,297 0.18
Shopify Inc 284 CAD 356,107 350,599 0.02
Suncor Energy Inc 40,564 CAD 954,172 820,120 0.05
TC Energy Corp 23,514 CAD 909,946 982,192 0.06
Toromont Industries Ltd 2,282 CAD 130,626 167,828 0.01
Tourmaline Oil Corp 13,529 CAD 114,287 326,410 0.02
Yamana Gold Inc 612,049 CAD 2,796,615 2,175,619 0.14
Total Canada 29,089,576 32,453,100 2.10
CAYMAN ISLANDS
Alibaba Group Holding Ltd 233,300 HKD 6,269,931 5,573,149 0.36
Alibaba Group Holding Ltd 16,343 USD 3,142,361 3,125,277 0.20
BeiGene Ltd 843 USD 203,604 243,957 0.02
China Resources Land Ltd 297,787 HKD 1,184,948 1,016,927 0.07
CK Hutchison Holdings Ltd 574,149 HKD 3,625,372 3,771,753 0.25
Diversey Holdings Ltd 192,514 USD 2,717,684 2,907,434 0.19
Gracell Biotechnologies Inc 12,719 USD 197,178 139,427 0.01
Hutchmed China Ltd 6,659 HKD 29,072 43,600 -
Kingboard Holdings Ltd 59,500 HKD 142,606 278,457 0.02
Minth Group Ltd 162,901 HKD 476,553 652,700 0.04
NetEase Inc 25,978 USD 2,521,941 2,524,635 0.16
Precision Tsugami China Corp Ltd 208,317 HKD 162,895 254,698 0.02
Sands China Ltd 165,160 HKD 670,740 586,430 0.04
StoneCo Ltd 28,967 USD 1,876,106 1,638,019 0.11
Tencent Holdings Ltd 6,307 HKD 262,711 399,944 0.03
WH Group Ltd 3,202,949 HKD 2,511,601 2,427,553 0.16
XP Inc 50,900 USD 1,475,642 1,869,209 0.12
Zai Lab Ltd 3,009 USD 188,281 449,079 0.03
Total Cayman Islands 27,659,226 27,902,248 1.83
CHINA
China Longyuan Power Group Corp Ltd 2,491,470 HKD 1,838,075 3,619,720 0.24
Total China 1,838,075 3,619,720 0.24
CURACAO
Schlumberger NV 36,468 USD 1,275,137 984,350 0.06
Total Curacao 1,275,137 984,350 0.06
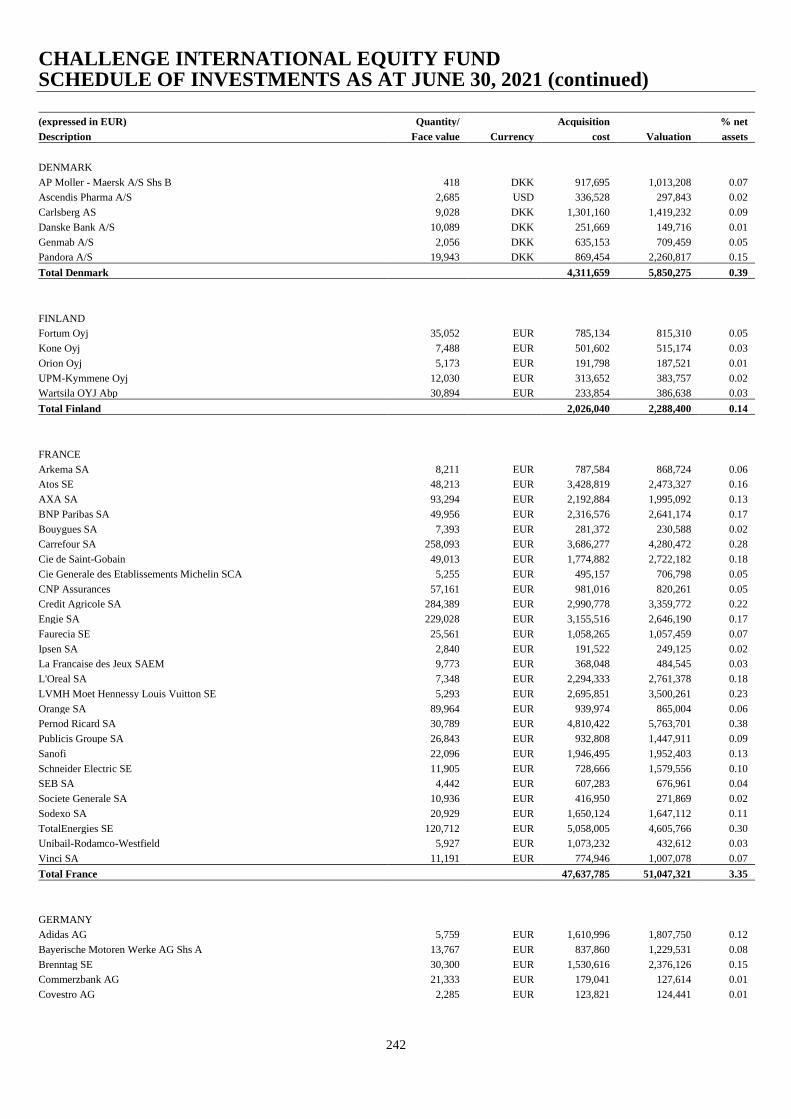
CHALLENGE INTERNATIONAL EQUITY FUND SCHEDULE OF INVESTMENTS AS AT JUNE 30, 2021 (continued)
242
(expressed in EUR) Quantity/ Acquisition % net
Description Face value Currency cost Valuation assets
DENMARK
AP Moller - Maersk A/S Shs B 418 DKK 917,695 1,013,208 0.07
Ascendis Pharma A/S 2,685 USD 336,528 297,843 0.02
Carlsberg AS 9,028 DKK 1,301,160 1,419,232 0.09
Danske Bank A/S 10,089 DKK 251,669 149,716 0.01
Genmab A/S 2,056 DKK 635,153 709,459 0.05
Pandora A/S 19,943 DKK 869,454 2,260,817 0.15
Total Denmark 4,311,659 5,850,275 0.39
FINLAND
Fortum Oyj 35,052 EUR 785,134 815,310 0.05
Kone Oyj 7,488 EUR 501,602 515,174 0.03
Orion Oyj 5,173 EUR 191,798 187,521 0.01
UPM-Kymmene Oyj 12,030 EUR 313,652 383,757 0.02
Wartsila OYJ Abp 30,894 EUR 233,854 386,638 0.03
Total Finland 2,026,040 2,288,400 0.14
FRANCE
Arkema SA 8,211 EUR 787,584 868,724 0.06
Atos SE 48,213 EUR 3,428,819 2,473,327 0.16
AXA SA 93,294 EUR 2,192,884 1,995,092 0.13
BNP Paribas SA 49,956 EUR 2,316,576 2,641,174 0.17
Bouygues SA 7,393 EUR 281,372 230,588 0.02
Carrefour SA 258,093 EUR 3,686,277 4,280,472 0.28
Cie de Saint-Gobain 49,013 EUR 1,774,882 2,722,182 0.18
Cie Generale des Etablissements Michelin SCA 5,255 EUR 495,157 706,798 0.05
CNP Assurances 57,161 EUR 981,016 820,261 0.05
Credit Agricole SA 284,389 EUR 2,990,778 3,359,772 0.22
Engie SA 229,028 EUR 3,155,516 2,646,190 0.17
Faurecia SE 25,561 EUR 1,058,265 1,057,459 0.07
Ipsen SA 2,840 EUR 191,522 249,125 0.02
La Francaise des Jeux SAEM 9,773 EUR 368,048 484,545 0.03
L'Oreal SA 7,348 EUR 2,294,333 2,761,378 0.18
LVMH Moet Hennessy Louis Vuitton SE 5,293 EUR 2,695,851 3,500,261 0.23
Orange SA 89,964 EUR 939,974 865,004 0.06
Pernod Ricard SA 30,789 EUR 4,810,422 5,763,701 0.38
Publicis Groupe SA 26,843 EUR 932,808 1,447,911 0.09
Sanofi 22,096 EUR 1,946,495 1,952,403 0.13
Schneider Electric SE 11,905 EUR 728,666 1,579,556 0.10
SEB SA 4,442 EUR 607,283 676,961 0.04
Societe Generale SA 10,936 EUR 416,950 271,869 0.02
Sodexo SA 20,929 EUR 1,650,124 1,647,112 0.11
TotalEnergies SE 120,712 EUR 5,058,005 4,605,766 0.30
Unibail-Rodamco-Westfield 5,927 EUR 1,073,232 432,612 0.03
Vinci SA 11,191 EUR 774,946 1,007,078 0.07
Total France 47,637,785 51,047,321 3.35
GERMANY
Adidas AG 5,759 EUR 1,610,996 1,807,750 0.12
Bayerische Motoren Werke AG Shs A 13,767 EUR 837,860 1,229,531 0.08
Brenntag SE 30,300 EUR 1,530,616 2,376,126 0.15
Commerzbank AG 21,333 EUR 179,041 127,614 0.01
Covestro AG 2,285 EUR 123,821 124,441 0.01
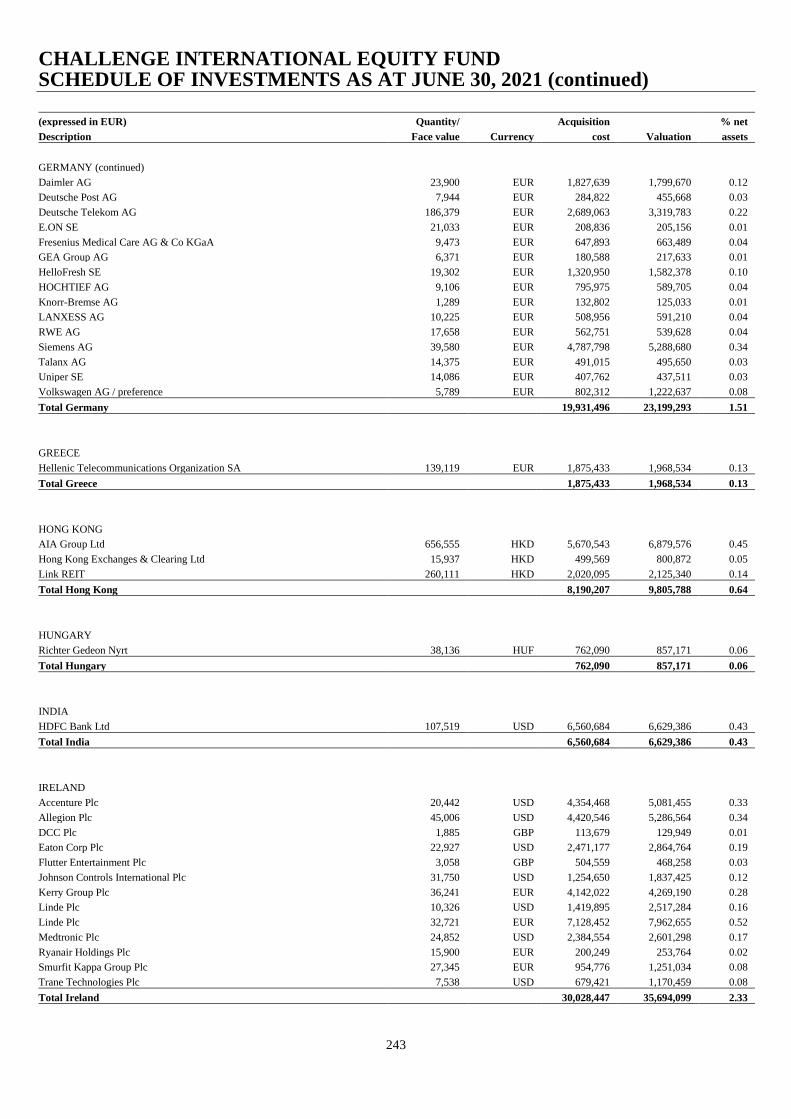
CHALLENGE INTERNATIONAL EQUITY FUND SCHEDULE OF INVESTMENTS AS AT JUNE 30, 2021 (continued)
243
(expressed in EUR) Quantity/ Acquisition % net
Description Face value Currency cost Valuation assets
GERMANY (continued)
Daimler AG 23,900 EUR 1,827,639 1,799,670 0.12
Deutsche Post AG 7,944 EUR 284,822 455,668 0.03
Deutsche Telekom AG 186,379 EUR 2,689,063 3,319,783 0.22
E.ON SE 21,033 EUR 208,836 205,156 0.01
Fresenius Medical Care AG & Co KGaA 9,473 EUR 647,893 663,489 0.04
GEA Group AG 6,371 EUR 180,588 217,633 0.01
HelloFresh SE 19,302 EUR 1,320,950 1,582,378 0.10
HOCHTIEF AG 9,106 EUR 795,975 589,705 0.04
Knorr-Bremse AG 1,289 EUR 132,802 125,033 0.01
LANXESS AG 10,225 EUR 508,956 591,210 0.04
RWE AG 17,658 EUR 562,751 539,628 0.04
Siemens AG 39,580 EUR 4,787,798 5,288,680 0.34
Talanx AG 14,375 EUR 491,015 495,650 0.03
Uniper SE 14,086 EUR 407,762 437,511 0.03
Volkswagen AG / preference 5,789 EUR 802,312 1,222,637 0.08
Total Germany 19,931,496 23,199,293 1.51
GREECE
Hellenic Telecommunications Organization SA 139,119 EUR 1,875,433 1,968,534 0.13
Total Greece 1,875,433 1,968,534 0.13
HONG KONG
AIA Group Ltd 656,555 HKD 5,670,543 6,879,576 0.45
Hong Kong Exchanges & Clearing Ltd 15,937 HKD 499,569 800,872 0.05
Link REIT 260,111 HKD 2,020,095 2,125,340 0.14
Total Hong Kong 8,190,207 9,805,788 0.64
HUNGARY
Richter Gedeon Nyrt 38,136 HUF 762,090 857,171 0.06
Total Hungary 762,090 857,171 0.06
INDIA
HDFC Bank Ltd 107,519 USD 6,560,684 6,629,386 0.43
Total India 6,560,684 6,629,386 0.43
IRELAND
Accenture Plc 20,442 USD 4,354,468 5,081,455 0.33
Allegion Plc 45,006 USD 4,420,546 5,286,564 0.34
DCC Plc 1,885 GBP 113,679 129,949 0.01
Eaton Corp Plc 22,927 USD 2,471,177 2,864,764 0.19
Flutter Entertainment Plc 3,058 GBP 504,559 468,258 0.03
Johnson Controls International Plc 31,750 USD 1,254,650 1,837,425 0.12
Kerry Group Plc 36,241 EUR 4,142,022 4,269,190 0.28
Linde Plc 10,326 USD 1,419,895 2,517,284 0.16
Linde Plc 32,721 EUR 7,128,452 7,962,655 0.52
Medtronic Plc 24,852 USD 2,384,554 2,601,298 0.17
Ryanair Holdings Plc 15,900 EUR 200,249 253,764 0.02
Smurfit Kappa Group Plc 27,345 EUR 954,776 1,251,034 0.08
Trane Technologies Plc 7,538 USD 679,421 1,170,459 0.08
Total Ireland 30,028,447 35,694,099 2.33

CHALLENGE INTERNATIONAL EQUITY FUND SCHEDULE OF INVESTMENTS AS AT JUNE 30, 2021 (continued)
244
(expressed in EUR) Quantity/ Acquisition % net
Description Face value Currency cost Valuation assets
ITALY
Assicurazioni Generali SpA 17,018 EUR 237,142 287,689 0.02
Atlantia SpA 10,714 EUR 171,878 163,603 0.01
Davide Campari-Milano NV 83,291 EUR 758,150 940,772 0.06
DiaSorin SpA 4,656 EUR 734,552 742,632 0.05
Prysmian SpA 7,712 EUR 198,430 233,134 0.02
Telecom Italia SpA 5,890,646 EUR 2,368,970 2,467,592 0.16
UniCredit SpA 313,722 EUR 3,021,068 3,121,534 0.20
Total Italy 7,490,190 7,956,956 0.52
JAPAN
Advantest Corp 6,982 JPY 342,726 530,985 0.03
Aisin Corp 47,274 JPY 1,262,208 1,706,020 0.11
Amada Co Ltd 62,500 JPY 535,454 533,246 0.03
Asahi Group Holdings Ltd1 64,800 JPY 2,379,402 2,555,607 0.17
Astellas Pharma Inc 283,900 JPY 3,776,844 4,172,556 0.27
Brother Industries Ltd 52,684 JPY 880,745 887,386 0.06
Chugai Pharmaceutical Co Ltd 31,400 JPY 1,089,048 1,050,141 0.07
Daiichi Sankyo Co Ltd 113,600 JPY 2,689,911 2,066,623 0.13
Disco Corp 1,413 JPY 342,644 364,460 0.02
East Japan Railway Co 15,250 JPY 893,051 918,431 0.06
Eisai Co Ltd 23,800 JPY 1,873,529 1,975,452 0.13
ENEOS Holdings Inc 200,488 JPY 660,330 708,135 0.05
FANUC Corp 4,367 JPY 624,290 889,007 0.06
Fujitsu Ltd 2,755 JPY 244,478 435,364 0.03
GMO Payment Gateway Inc 3,243 JPY 253,648 356,520 0.02
Honda Motor Co Ltd 49,534 JPY 1,024,149 1,335,980 0.09
Hoya Corp 5,968 JPY 481,807 667,882 0.04
Ibiden Co Ltd 3,200 JPY 144,846 145,628 0.01
Isuzu Motors Ltd 114,000 JPY 1,040,392 1,270,583 0.08
Japan Post Insurance Co Ltd 11,018 JPY 166,533 171,938 0.01
Kajima Corp 68,650 JPY 759,912 733,842 0.05
KDDI Corp 141,300 JPY 3,442,077 3,719,747 0.24
Keyence Corp 8,624 JPY 3,162,032 3,673,731 0.24
Kurita Water Industries Ltd 51,500 JPY 1,755,363 2,085,463 0.14
Kyowa Kirin Co Ltd 29,200 JPY 658,271 874,072 0.06
Lasertec Corp 2,705 JPY 324,729 443,699 0.03
Lion Corp 9,512 JPY 163,987 136,006 0.01
Marubeni Corp 16,500 JPY 124,462 121,108 0.01
Medipal Holdings Corp 12,324 JPY 207,355 198,685 0.01
MINEBEA MITSUMI Inc 18,399 JPY 303,863 410,830 0.03
Mitsubishi UFJ Financial Group Inc 438,900 JPY 1,925,437 2,001,047 0.13
Mitsui Fudosan Co Ltd 98,400 JPY 1,937,128 1,923,548 0.13
NGK Spark Plug Co Ltd 28,188 JPY 401,893 352,502 0.02
Nintendo Co Ltd 7,606 JPY 2,798,185 3,734,146 0.24
Nippon Building Fund Inc 49 JPY 329,392 257,987 0.02
Nippon Telegraph & Telephone Corp 8,500 JPY 187,600 186,922 0.01
Nippon Yusen KK 18,532 JPY 417,488 792,682 0.05
Nitto Denko Corp 4,239 JPY 187,936 266,984 0.02
Nomura Holdings Inc 112,702 JPY 507,160 486,178 0.03
1 52,820 quantity of this security position is out on loan as at financial period end.
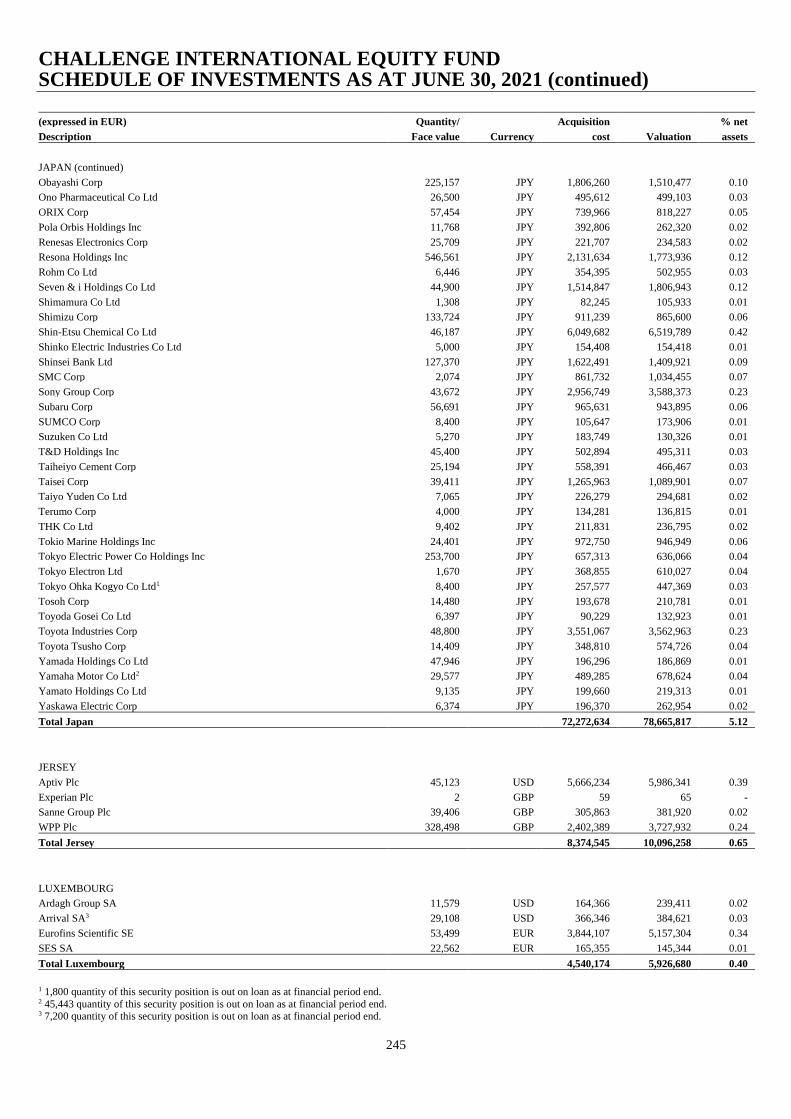
CHALLENGE INTERNATIONAL EQUITY FUND SCHEDULE OF INVESTMENTS AS AT JUNE 30, 2021 (continued)
245
(expressed in EUR) Quantity/ Acquisition % net
Description Face value Currency cost Valuation assets
JAPAN (continued)
Obayashi Corp 225,157 JPY 1,806,260 1,510,477 0.10
Ono Pharmaceutical Co Ltd 26,500 JPY 495,612 499,103 0.03
ORIX Corp 57,454 JPY 739,966 818,227 0.05
Pola Orbis Holdings Inc 11,768 JPY 392,806 262,320 0.02
Renesas Electronics Corp 25,709 JPY 221,707 234,583 0.02
Resona Holdings Inc 546,561 JPY 2,131,634 1,773,936 0.12
Rohm Co Ltd 6,446 JPY 354,395 502,955 0.03
Seven & i Holdings Co Ltd 44,900 JPY 1,514,847 1,806,943 0.12
Shimamura Co Ltd 1,308 JPY 82,245 105,933 0.01
Shimizu Corp 133,724 JPY 911,239 865,600 0.06
Shin-Etsu Chemical Co Ltd 46,187 JPY 6,049,682 6,519,789 0.42
Shinko Electric Industries Co Ltd 5,000 JPY 154,408 154,418 0.01
Shinsei Bank Ltd 127,370 JPY 1,622,491 1,409,921 0.09
SMC Corp 2,074 JPY 861,732 1,034,455 0.07
Sony Group Corp 43,672 JPY 2,956,749 3,588,373 0.23
Subaru Corp 56,691 JPY 965,631 943,895 0.06
SUMCO Corp 8,400 JPY 105,647 173,906 0.01
Suzuken Co Ltd 5,270 JPY 183,749 130,326 0.01
T&D Holdings Inc 45,400 JPY 502,894 495,311 0.03
Taiheiyo Cement Corp 25,194 JPY 558,391 466,467 0.03
Taisei Corp 39,411 JPY 1,265,963 1,089,901 0.07
Taiyo Yuden Co Ltd 7,065 JPY 226,279 294,681 0.02
Terumo Corp 4,000 JPY 134,281 136,815 0.01
THK Co Ltd 9,402 JPY 211,831 236,795 0.02
Tokio Marine Holdings Inc 24,401 JPY 972,750 946,949 0.06
Tokyo Electric Power Co Holdings Inc 253,700 JPY 657,313 636,066 0.04
Tokyo Electron Ltd 1,670 JPY 368,855 610,027 0.04
Tokyo Ohka Kogyo Co Ltd1 8,400 JPY 257,577 447,369 0.03
Tosoh Corp 14,480 JPY 193,678 210,781 0.01
Toyoda Gosei Co Ltd 6,397 JPY 90,229 132,923 0.01
Toyota Industries Corp 48,800 JPY 3,551,067 3,562,963 0.23
Toyota Tsusho Corp 14,409 JPY 348,810 574,726 0.04
Yamada Holdings Co Ltd 47,946 JPY 196,296 186,869 0.01
Yamaha Motor Co Ltd2 29,577 JPY 489,285 678,624 0.04
Yamato Holdings Co Ltd 9,135 JPY 199,660 219,313 0.01
Yaskawa Electric Corp 6,374 JPY 196,370 262,954 0.02
Total Japan 72,272,634 78,665,817 5.12
JERSEY
Aptiv Plc 45,123 USD 5,666,234 5,986,341 0.39
Experian Plc 2 GBP 59 65 -
Sanne Group Plc 39,406 GBP 305,863 381,920 0.02
WPP Plc 328,498 GBP 2,402,389 3,727,932 0.24
Total Jersey 8,374,545 10,096,258 0.65
LUXEMBOURG
Ardagh Group SA 11,579 USD 164,366 239,411 0.02
Arrival SA3 29,108 USD 366,346 384,621 0.03
Eurofins Scientific SE 53,499 EUR 3,844,107 5,157,304 0.34
SES SA 22,562 EUR 165,355 145,344 0.01
Total Luxembourg 4,540,174 5,926,680 0.40
1 1,800 quantity of this security position is out on loan as at financial period end. 2 45,443 quantity of this security position is out on loan as at financial period end. 3 7,200 quantity of this security position is out on loan as at financial period end.
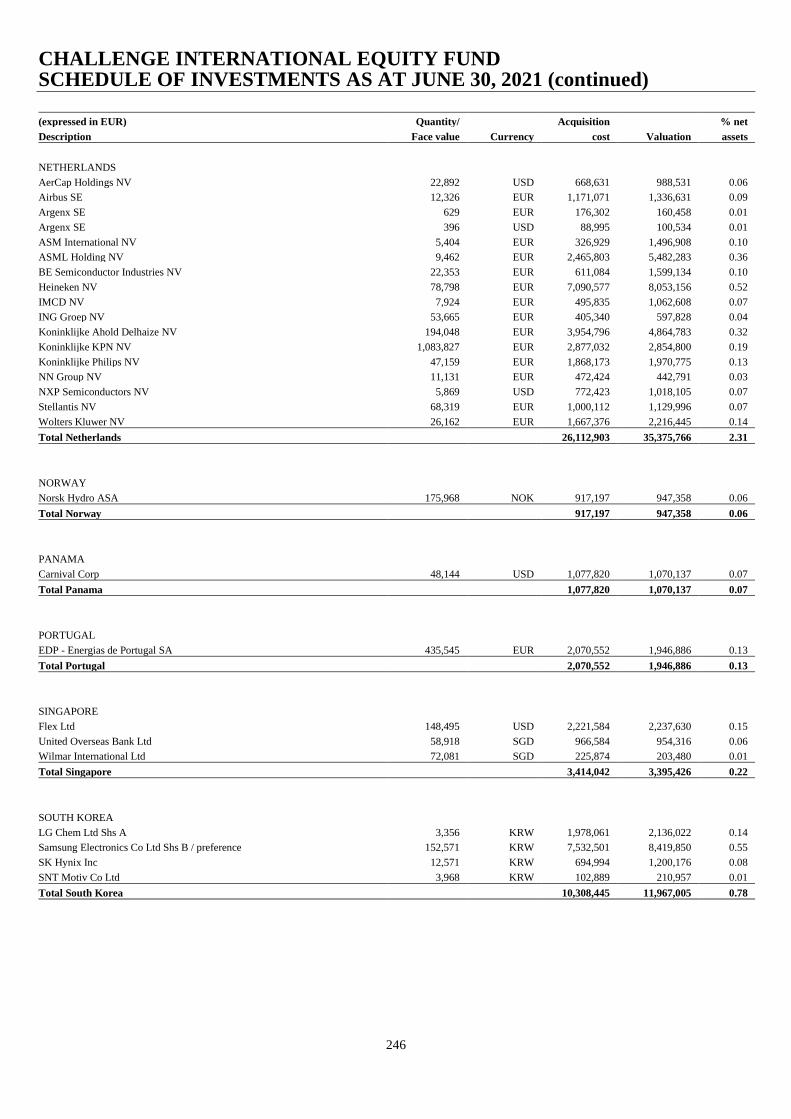
CHALLENGE INTERNATIONAL EQUITY FUND SCHEDULE OF INVESTMENTS AS AT JUNE 30, 2021 (continued)
246
(expressed in EUR) Quantity/ Acquisition % net
Description Face value Currency cost Valuation assets
NETHERLANDS
AerCap Holdings NV 22,892 USD 668,631 988,531 0.06
Airbus SE 12,326 EUR 1,171,071 1,336,631 0.09
Argenx SE 629 EUR 176,302 160,458 0.01
Argenx SE 396 USD 88,995 100,534 0.01
ASM International NV 5,404 EUR 326,929 1,496,908 0.10
ASML Holding NV 9,462 EUR 2,465,803 5,482,283 0.36
BE Semiconductor Industries NV 22,353 EUR 611,084 1,599,134 0.10
Heineken NV 78,798 EUR 7,090,577 8,053,156 0.52
IMCD NV 7,924 EUR 495,835 1,062,608 0.07
ING Groep NV 53,665 EUR 405,340 597,828 0.04
Koninklijke Ahold Delhaize NV 194,048 EUR 3,954,796 4,864,783 0.32
Koninklijke KPN NV 1,083,827 EUR 2,877,032 2,854,800 0.19
Koninklijke Philips NV 47,159 EUR 1,868,173 1,970,775 0.13
NN Group NV 11,131 EUR 472,424 442,791 0.03
NXP Semiconductors NV 5,869 USD 772,423 1,018,105 0.07
Stellantis NV 68,319 EUR 1,000,112 1,129,996 0.07
Wolters Kluwer NV 26,162 EUR 1,667,376 2,216,445 0.14
Total Netherlands 26,112,903 35,375,766 2.31
NORWAY
Norsk Hydro ASA 175,968 NOK 917,197 947,358 0.06
Total Norway 917,197 947,358 0.06
PANAMA
Carnival Corp 48,144 USD 1,077,820 1,070,137 0.07
Total Panama 1,077,820 1,070,137 0.07
PORTUGAL
EDP - Energias de Portugal SA 435,545 EUR 2,070,552 1,946,886 0.13
Total Portugal 2,070,552 1,946,886 0.13
SINGAPORE
Flex Ltd 148,495 USD 2,221,584 2,237,630 0.15
United Overseas Bank Ltd 58,918 SGD 966,584 954,316 0.06
Wilmar International Ltd 72,081 SGD 225,874 203,480 0.01
Total Singapore 3,414,042 3,395,426 0.22
SOUTH KOREA
LG Chem Ltd Shs A 3,356 KRW 1,978,061 2,136,022 0.14
Samsung Electronics Co Ltd Shs B / preference 152,571 KRW 7,532,501 8,419,850 0.55
SK Hynix Inc 12,571 KRW 694,994 1,200,176 0.08
SNT Motiv Co Ltd 3,968 KRW 102,889 210,957 0.01
Total South Korea 10,308,445 11,967,005 0.78
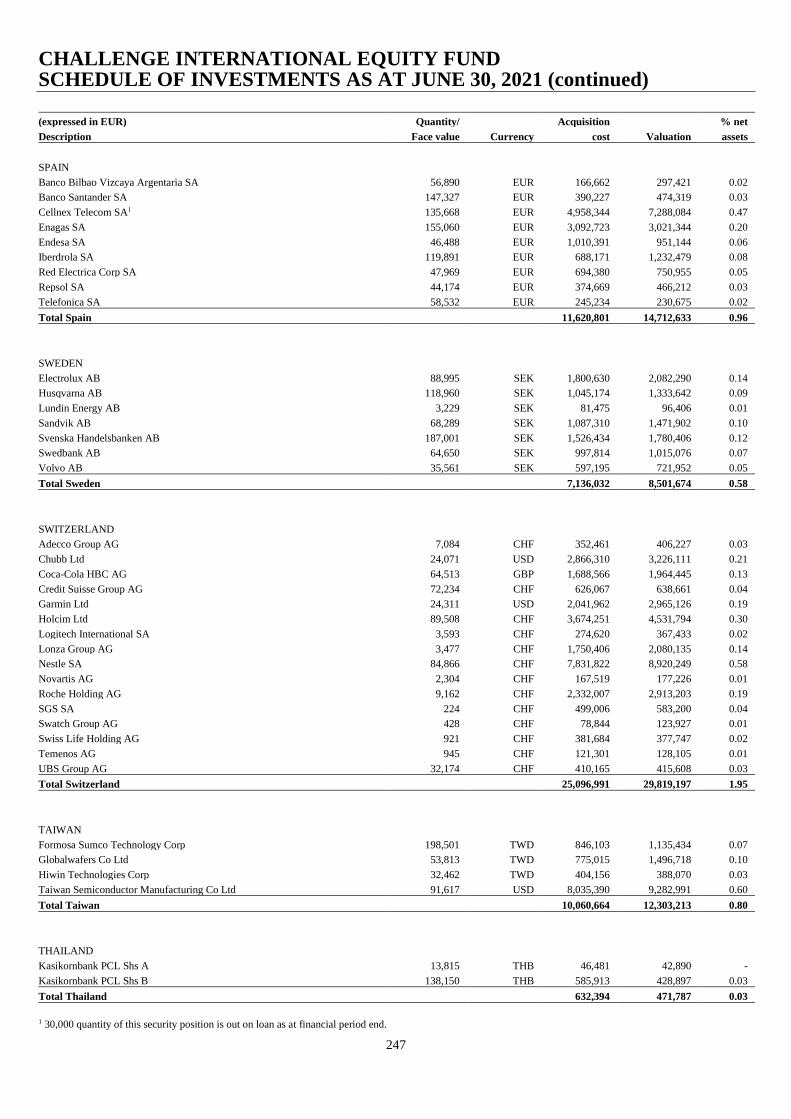
CHALLENGE INTERNATIONAL EQUITY FUND SCHEDULE OF INVESTMENTS AS AT JUNE 30, 2021 (continued)
247
(expressed in EUR) Quantity/ Acquisition % net
Description Face value Currency cost Valuation assets
SPAIN
Banco Bilbao Vizcaya Argentaria SA 56,890 EUR 166,662 297,421 0.02
Banco Santander SA 147,327 EUR 390,227 474,319 0.03
Cellnex Telecom SA1 135,668 EUR 4,958,344 7,288,084 0.47
Enagas SA 155,060 EUR 3,092,723 3,021,344 0.20
Endesa SA 46,488 EUR 1,010,391 951,144 0.06
Iberdrola SA 119,891 EUR 688,171 1,232,479 0.08
Red Electrica Corp SA 47,969 EUR 694,380 750,955 0.05
Repsol SA 44,174 EUR 374,669 466,212 0.03
Telefonica SA 58,532 EUR 245,234 230,675 0.02
Total Spain 11,620,801 14,712,633 0.96
SWEDEN
Electrolux AB 88,995 SEK 1,800,630 2,082,290 0.14
Husqvarna AB 118,960 SEK 1,045,174 1,333,642 0.09
Lundin Energy AB 3,229 SEK 81,475 96,406 0.01
Sandvik AB 68,289 SEK 1,087,310 1,471,902 0.10
Svenska Handelsbanken AB 187,001 SEK 1,526,434 1,780,406 0.12
Swedbank AB 64,650 SEK 997,814 1,015,076 0.07
Volvo AB 35,561 SEK 597,195 721,952 0.05
Total Sweden 7,136,032 8,501,674 0.58
SWITZERLAND
Adecco Group AG 7,084 CHF 352,461 406,227 0.03
Chubb Ltd 24,071 USD 2,866,310 3,226,111 0.21
Coca-Cola HBC AG 64,513 GBP 1,688,566 1,964,445 0.13
Credit Suisse Group AG 72,234 CHF 626,067 638,661 0.04
Garmin Ltd 24,311 USD 2,041,962 2,965,126 0.19
Holcim Ltd 89,508 CHF 3,674,251 4,531,794 0.30
Logitech International SA 3,593 CHF 274,620 367,433 0.02
Lonza Group AG 3,477 CHF 1,750,406 2,080,135 0.14
Nestle SA 84,866 CHF 7,831,822 8,920,249 0.58
Novartis AG 2,304 CHF 167,519 177,226 0.01
Roche Holding AG 9,162 CHF 2,332,007 2,913,203 0.19
SGS SA 224 CHF 499,006 583,200 0.04
Swatch Group AG 428 CHF 78,844 123,927 0.01
Swiss Life Holding AG 921 CHF 381,684 377,747 0.02
Temenos AG 945 CHF 121,301 128,105 0.01
UBS Group AG 32,174 CHF 410,165 415,608 0.03
Total Switzerland 25,096,991 29,819,197 1.95
TAIWAN
Formosa Sumco Technology Corp 198,501 TWD 846,103 1,135,434 0.07
Globalwafers Co Ltd 53,813 TWD 775,015 1,496,718 0.10
Hiwin Technologies Corp 32,462 TWD 404,156 388,070 0.03
Taiwan Semiconductor Manufacturing Co Ltd 91,617 USD 8,035,390 9,282,991 0.60
Total Taiwan 10,060,664 12,303,213 0.80
THAILAND
Kasikornbank PCL Shs A 13,815 THB 46,481 42,890 -
Kasikornbank PCL Shs B 138,150 THB 585,913 428,897 0.03
Total Thailand 632,394 471,787 0.03
1 30,000 quantity of this security position is out on loan as at financial period end.
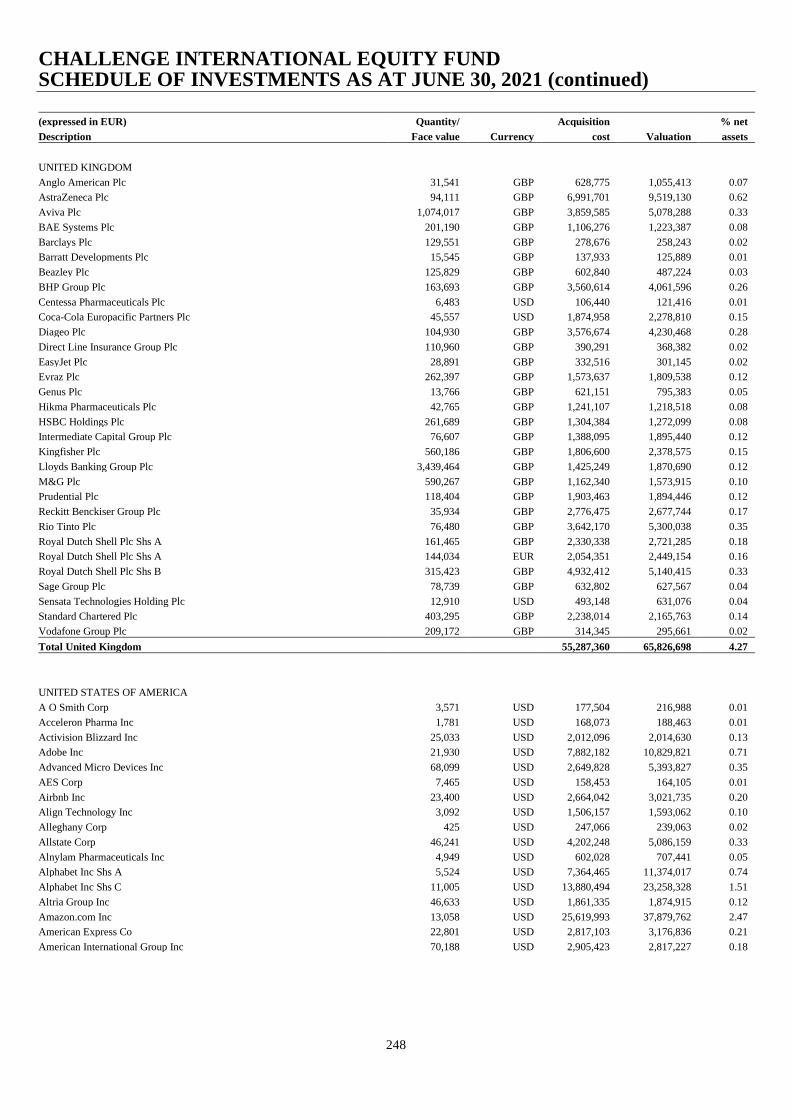
CHALLENGE INTERNATIONAL EQUITY FUND SCHEDULE OF INVESTMENTS AS AT JUNE 30, 2021 (continued)
248
(expressed in EUR) Quantity/ Acquisition % net
Description Face value Currency cost Valuation assets
UNITED KINGDOM
Anglo American Plc 31,541 GBP 628,775 1,055,413 0.07
AstraZeneca Plc 94,111 GBP 6,991,701 9,519,130 0.62
Aviva Plc 1,074,017 GBP 3,859,585 5,078,288 0.33
BAE Systems Plc 201,190 GBP 1,106,276 1,223,387 0.08
Barclays Plc 129,551 GBP 278,676 258,243 0.02
Barratt Developments Plc 15,545 GBP 137,933 125,889 0.01
Beazley Plc 125,829 GBP 602,840 487,224 0.03
BHP Group Plc 163,693 GBP 3,560,614 4,061,596 0.26
Centessa Pharmaceuticals Plc 6,483 USD 106,440 121,416 0.01
Coca-Cola Europacific Partners Plc 45,557 USD 1,874,958 2,278,810 0.15
Diageo Plc 104,930 GBP 3,576,674 4,230,468 0.28
Direct Line Insurance Group Plc 110,960 GBP 390,291 368,382 0.02
EasyJet Plc 28,891 GBP 332,516 301,145 0.02
Evraz Plc 262,397 GBP 1,573,637 1,809,538 0.12
Genus Plc 13,766 GBP 621,151 795,383 0.05
Hikma Pharmaceuticals Plc 42,765 GBP 1,241,107 1,218,518 0.08
HSBC Holdings Plc 261,689 GBP 1,304,384 1,272,099 0.08
Intermediate Capital Group Plc 76,607 GBP 1,388,095 1,895,440 0.12
Kingfisher Plc 560,186 GBP 1,806,600 2,378,575 0.15
Lloyds Banking Group Plc 3,439,464 GBP 1,425,249 1,870,690 0.12
M&G Plc 590,267 GBP 1,162,340 1,573,915 0.10
Prudential Plc 118,404 GBP 1,903,463 1,894,446 0.12
Reckitt Benckiser Group Plc 35,934 GBP 2,776,475 2,677,744 0.17
Rio Tinto Plc 76,480 GBP 3,642,170 5,300,038 0.35
Royal Dutch Shell Plc Shs A 161,465 GBP 2,330,338 2,721,285 0.18
Royal Dutch Shell Plc Shs A 144,034 EUR 2,054,351 2,449,154 0.16
Royal Dutch Shell Plc Shs B 315,423 GBP 4,932,412 5,140,415 0.33
Sage Group Plc 78,739 GBP 632,802 627,567 0.04
Sensata Technologies Holding Plc 12,910 USD 493,148 631,076 0.04
Standard Chartered Plc 403,295 GBP 2,238,014 2,165,763 0.14
Vodafone Group Plc 209,172 GBP 314,345 295,661 0.02
Total United Kingdom 55,287,360 65,826,698 4.27
UNITED STATES OF AMERICA
A O Smith Corp 3,571 USD 177,504 216,988 0.01
Acceleron Pharma Inc 1,781 USD 168,073 188,463 0.01
Activision Blizzard Inc 25,033 USD 2,012,096 2,014,630 0.13
Adobe Inc 21,930 USD 7,882,182 10,829,821 0.71
Advanced Micro Devices Inc 68,099 USD 2,649,828 5,393,827 0.35
AES Corp 7,465 USD 158,453 164,105 0.01
Airbnb Inc 23,400 USD 2,664,042 3,021,735 0.20
Align Technology Inc 3,092 USD 1,506,157 1,593,062 0.10
Alleghany Corp 425 USD 247,066 239,063 0.02
Allstate Corp 46,241 USD 4,202,248 5,086,159 0.33
Alnylam Pharmaceuticals Inc 4,949 USD 602,028 707,441 0.05
Alphabet Inc Shs A 5,524 USD 7,364,465 11,374,017 0.74
Alphabet Inc Shs C 11,005 USD 13,880,494 23,258,328 1.51
Altria Group Inc 46,633 USD 1,861,335 1,874,915 0.12
Amazon.com Inc 13,058 USD 25,619,993 37,879,762 2.47
American Express Co 22,801 USD 2,817,103 3,176,836 0.21
American International Group Inc 70,188 USD 2,905,423 2,817,227 0.18
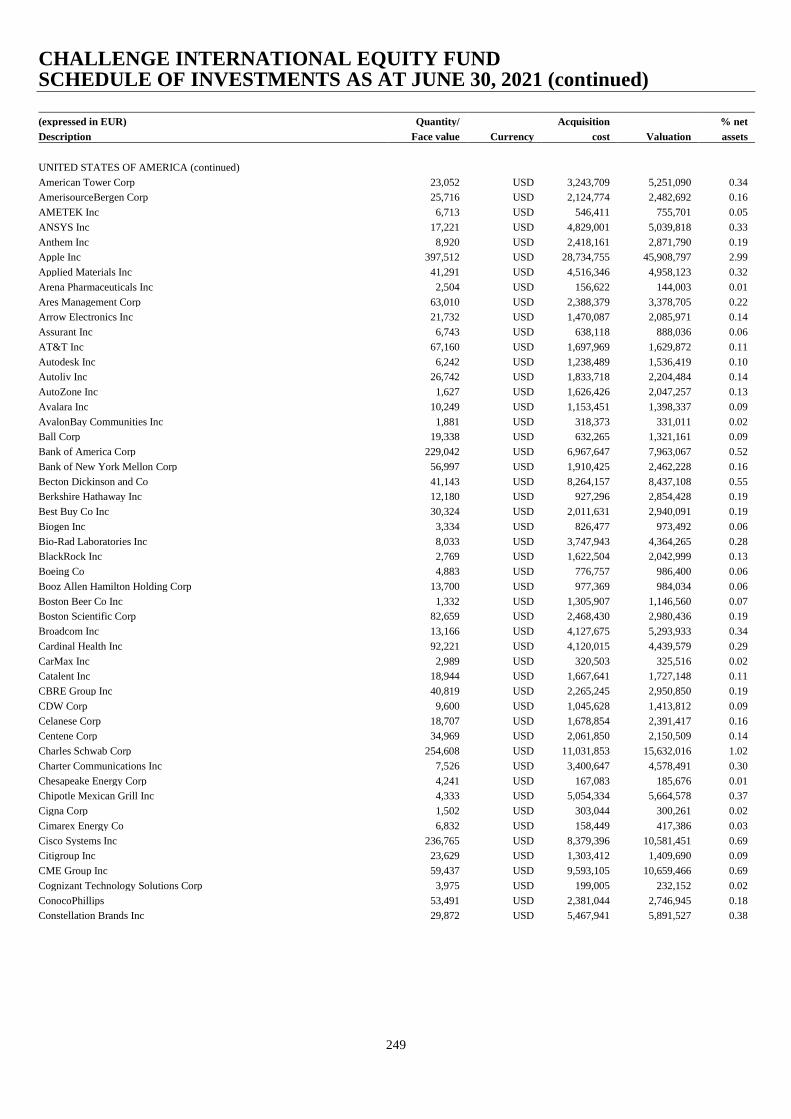
CHALLENGE INTERNATIONAL EQUITY FUND SCHEDULE OF INVESTMENTS AS AT JUNE 30, 2021 (continued)
249
(expressed in EUR) Quantity/ Acquisition % net
Description Face value Currency cost Valuation assets
UNITED STATES OF AMERICA (continued)
American Tower Corp 23,052 USD 3,243,709 5,251,090 0.34
AmerisourceBergen Corp 25,716 USD 2,124,774 2,482,692 0.16
AMETEK Inc 6,713 USD 546,411 755,701 0.05
ANSYS Inc 17,221 USD 4,829,001 5,039,818 0.33
Anthem Inc 8,920 USD 2,418,161 2,871,790 0.19
Apple Inc 397,512 USD 28,734,755 45,908,797 2.99
Applied Materials Inc 41,291 USD 4,516,346 4,958,123 0.32
Arena Pharmaceuticals Inc 2,504 USD 156,622 144,003 0.01
Ares Management Corp 63,010 USD 2,388,379 3,378,705 0.22
Arrow Electronics Inc 21,732 USD 1,470,087 2,085,971 0.14
Assurant Inc 6,743 USD 638,118 888,036 0.06
AT&T Inc 67,160 USD 1,697,969 1,629,872 0.11
Autodesk Inc 6,242 USD 1,238,489 1,536,419 0.10
Autoliv Inc 26,742 USD 1,833,718 2,204,484 0.14
AutoZone Inc 1,627 USD 1,626,426 2,047,257 0.13
Avalara Inc 10,249 USD 1,153,451 1,398,337 0.09
AvalonBay Communities Inc 1,881 USD 318,373 331,011 0.02
Ball Corp 19,338 USD 632,265 1,321,161 0.09
Bank of America Corp 229,042 USD 6,967,647 7,963,067 0.52
Bank of New York Mellon Corp 56,997 USD 1,910,425 2,462,228 0.16
Becton Dickinson and Co 41,143 USD 8,264,157 8,437,108 0.55
Berkshire Hathaway Inc 12,180 USD 927,296 2,854,428 0.19
Best Buy Co Inc 30,324 USD 2,011,631 2,940,091 0.19
Biogen Inc 3,334 USD 826,477 973,492 0.06
Bio-Rad Laboratories Inc 8,033 USD 3,747,943 4,364,265 0.28
BlackRock Inc 2,769 USD 1,622,504 2,042,999 0.13
Boeing Co 4,883 USD 776,757 986,400 0.06
Booz Allen Hamilton Holding Corp 13,700 USD 977,369 984,034 0.06
Boston Beer Co Inc 1,332 USD 1,305,907 1,146,560 0.07
Boston Scientific Corp 82,659 USD 2,468,430 2,980,436 0.19
Broadcom Inc 13,166 USD 4,127,675 5,293,933 0.34
Cardinal Health Inc 92,221 USD 4,120,015 4,439,579 0.29
CarMax Inc 2,989 USD 320,503 325,516 0.02
Catalent Inc 18,944 USD 1,667,641 1,727,148 0.11
CBRE Group Inc 40,819 USD 2,265,245 2,950,850 0.19
CDW Corp 9,600 USD 1,045,628 1,413,812 0.09
Celanese Corp 18,707 USD 1,678,854 2,391,417 0.16
Centene Corp 34,969 USD 2,061,850 2,150,509 0.14
Charles Schwab Corp 254,608 USD 11,031,853 15,632,016 1.02
Charter Communications Inc 7,526 USD 3,400,647 4,578,491 0.30
Chesapeake Energy Corp 4,241 USD 167,083 185,676 0.01
Chipotle Mexican Grill Inc 4,333 USD 5,054,334 5,664,578 0.37
Cigna Corp 1,502 USD 303,044 300,261 0.02
Cimarex Energy Co 6,832 USD 158,449 417,386 0.03
Cisco Systems Inc 236,765 USD 8,379,396 10,581,451 0.69
Citigroup Inc 23,629 USD 1,303,412 1,409,690 0.09
CME Group Inc 59,437 USD 9,593,105 10,659,466 0.69
Cognizant Technology Solutions Corp 3,975 USD 199,005 232,152 0.02
ConocoPhillips 53,491 USD 2,381,044 2,746,945 0.18
Constellation Brands Inc 29,872 USD 5,467,941 5,891,527 0.38

CHALLENGE INTERNATIONAL EQUITY FUND SCHEDULE OF INVESTMENTS AS AT JUNE 30, 2021 (continued)
250
(expressed in EUR) Quantity/ Acquisition % net
Description Face value Currency cost Valuation assets
UNITED STATES OF AMERICA (continued)
Cooper Cos Inc 8,017 USD 2,580,734 2,678,891 0.17
Crown Castle International Corp 6,301 USD 612,158 1,036,618 0.07
Crown Holdings Inc 33,171 USD 2,612,464 2,858,932 0.19
CSX Corp 23,997 USD 656,443 649,147 0.04
Cummins Inc 766 USD 146,748 157,482 0.01
CVS Health Corp 2,337 USD 147,683 164,431 0.01
Danaher Corp 55,750 USD 8,811,089 12,615,793 0.82
Darden Restaurants Inc 18,491 USD 1,957,725 2,276,331 0.15
Deere & Co 3,528 USD 289,121 1,049,297 0.07
Dell Technologies Inc 7,362 USD 494,796 618,746 0.04
Diamondback Energy Inc 2,895 USD 154,788 229,203 0.01
Digital Realty Trust Inc 9,079 USD 1,025,081 1,151,890 0.08
DISH Network Corp 32,878 USD 1,037,340 1,158,867 0.08
Dollar General Corp 2,305 USD 382,868 420,591 0.03
Dollar Tree Inc 59,667 USD 5,130,152 5,006,212 0.33
Dominion Energy Inc 15,385 USD 984,799 954,443 0.06
Dover Corp 5,228 USD 541,386 663,915 0.04
Duke Energy Corp 37,058 USD 2,959,029 3,084,886 0.20
Edison International 75,549 USD 3,873,720 3,683,484 0.24
Edwards Lifesciences Corp 30,256 USD 2,142,892 2,642,393 0.17
Elanco Animal Health Inc 36,731 USD 961,512 1,074,457 0.07
Eli Lilly & Co 18,210 USD 2,284,046 3,524,377 0.23
Entegris Inc 16,125 USD 1,428,027 1,672,056 0.11
Entergy Corp 11,518 USD 983,852 968,332 0.06
EOG Resources Inc 4,363 USD 226,060 306,981 0.02
Equifax Inc 4,153 USD 427,763 838,760 0.05
Equinix Inc 722 USD 339,562 488,639 0.03
Equitable Holdings Inc 70,882 USD 1,513,557 1,820,016 0.12
Equity Residential 4,846 USD 283,201 314,649 0.02
Estee Lauder Cos Inc 6,519 USD 1,377,792 1,748,515 0.11
Exelon Corp 83,961 USD 3,252,411 3,137,121 0.20
Exxon Mobil Corp 8,997 USD 384,377 478,565 0.03
Facebook Inc 98,020 USD 22,851,607 28,739,803 1.87
FedEx Corp 21,412 USD 3,974,609 5,386,493 0.35
Fidelity National Financial Inc 55,685 USD 1,903,639 2,040,703 0.13
Fidelity National Information Services Inc 74,893 USD 8,961,208 8,946,868 0.58
FirstEnergy Corp 78,965 USD 1,875,483 2,477,686 0.16
Fiserv Inc 21,748 USD 1,977,865 1,960,236 0.13
FleetCor Technologies Inc 9,977 USD 1,824,367 2,154,238 0.14
FMC Corp 18,697 USD 1,308,275 1,705,890 0.11
Ford Motor Co 279,324 USD 2,116,246 3,500,089 0.23
Fortive Corp 43,110 USD 2,488,289 2,535,198 0.17
Generac Holdings Inc 6,402 USD 2,191,122 2,241,159 0.15
General Motors Co 43,679 USD 1,881,874 2,179,346 0.14
Genuine Parts Co 18,572 USD 1,526,800 1,980,606 0.13
Global Payments Inc 48,857 USD 5,638,972 7,726,319 0.50
Goldman Sachs Group Inc 7,371 USD 2,175,372 2,358,981 0.15
Guidewire Software Inc 12,257 USD 992,303 1,165,030 0.08
Hamilton Lane Inc 11,941 USD 446,421 917,501 0.06
HCA Healthcare Inc 7,677 USD 693,113 1,338,345 0.09
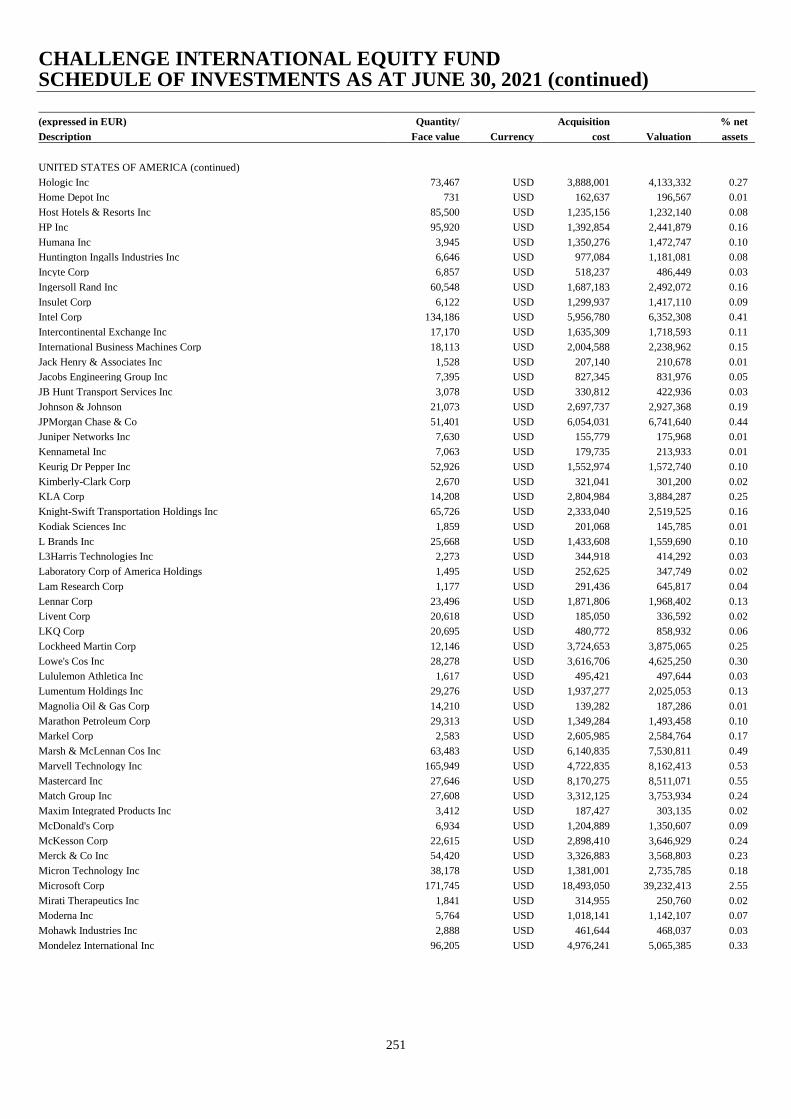
CHALLENGE INTERNATIONAL EQUITY FUND SCHEDULE OF INVESTMENTS AS AT JUNE 30, 2021 (continued)
251
(expressed in EUR) Quantity/ Acquisition % net
Description Face value Currency cost Valuation assets
UNITED STATES OF AMERICA (continued)
Hologic Inc 73,467 USD 3,888,001 4,133,332 0.27
Home Depot Inc 731 USD 162,637 196,567 0.01
Host Hotels & Resorts Inc 85,500 USD 1,235,156 1,232,140 0.08
HP Inc 95,920 USD 1,392,854 2,441,879 0.16
Humana Inc 3,945 USD 1,350,276 1,472,747 0.10
Huntington Ingalls Industries Inc 6,646 USD 977,084 1,181,081 0.08
Incyte Corp 6,857 USD 518,237 486,449 0.03
Ingersoll Rand Inc 60,548 USD 1,687,183 2,492,072 0.16
Insulet Corp 6,122 USD 1,299,937 1,417,110 0.09
Intel Corp 134,186 USD 5,956,780 6,352,308 0.41
Intercontinental Exchange Inc 17,170 USD 1,635,309 1,718,593 0.11
International Business Machines Corp 18,113 USD 2,004,588 2,238,962 0.15
Jack Henry & Associates Inc 1,528 USD 207,140 210,678 0.01
Jacobs Engineering Group Inc 7,395 USD 827,345 831,976 0.05
JB Hunt Transport Services Inc 3,078 USD 330,812 422,936 0.03
Johnson & Johnson 21,073 USD 2,697,737 2,927,368 0.19
JPMorgan Chase & Co 51,401 USD 6,054,031 6,741,640 0.44
Juniper Networks Inc 7,630 USD 155,779 175,968 0.01
Kennametal Inc 7,063 USD 179,735 213,933 0.01
Keurig Dr Pepper Inc 52,926 USD 1,552,974 1,572,740 0.10
Kimberly-Clark Corp 2,670 USD 321,041 301,200 0.02
KLA Corp 14,208 USD 2,804,984 3,884,287 0.25
Knight-Swift Transportation Holdings Inc 65,726 USD 2,333,040 2,519,525 0.16
Kodiak Sciences Inc 1,859 USD 201,068 145,785 0.01
L Brands Inc 25,668 USD 1,433,608 1,559,690 0.10
L3Harris Technologies Inc 2,273 USD 344,918 414,292 0.03
Laboratory Corp of America Holdings 1,495 USD 252,625 347,749 0.02
Lam Research Corp 1,177 USD 291,436 645,817 0.04
Lennar Corp 23,496 USD 1,871,806 1,968,402 0.13
Livent Corp 20,618 USD 185,050 336,592 0.02
LKQ Corp 20,695 USD 480,772 858,932 0.06
Lockheed Martin Corp 12,146 USD 3,724,653 3,875,065 0.25
Lowe's Cos Inc 28,278 USD 3,616,706 4,625,250 0.30
Lululemon Athletica Inc 1,617 USD 495,421 497,644 0.03
Lumentum Holdings Inc 29,276 USD 1,937,277 2,025,053 0.13
Magnolia Oil & Gas Corp 14,210 USD 139,282 187,286 0.01
Marathon Petroleum Corp 29,313 USD 1,349,284 1,493,458 0.10
Markel Corp 2,583 USD 2,605,985 2,584,764 0.17
Marsh & McLennan Cos Inc 63,483 USD 6,140,835 7,530,811 0.49
Marvell Technology Inc 165,949 USD 4,722,835 8,162,413 0.53
Mastercard Inc 27,646 USD 8,170,275 8,511,071 0.55
Match Group Inc 27,608 USD 3,312,125 3,753,934 0.24
Maxim Integrated Products Inc 3,412 USD 187,427 303,135 0.02
McDonald's Corp 6,934 USD 1,204,889 1,350,607 0.09
McKesson Corp 22,615 USD 2,898,410 3,646,929 0.24
Merck & Co Inc 54,420 USD 3,326,883 3,568,803 0.23
Micron Technology Inc 38,178 USD 1,381,001 2,735,785 0.18
Microsoft Corp 171,745 USD 18,493,050 39,232,413 2.55
Mirati Therapeutics Inc 1,841 USD 314,955 250,760 0.02
Moderna Inc 5,764 USD 1,018,141 1,142,107 0.07
Mohawk Industries Inc 2,888 USD 461,644 468,037 0.03
Mondelez International Inc 96,205 USD 4,976,241 5,065,385 0.33
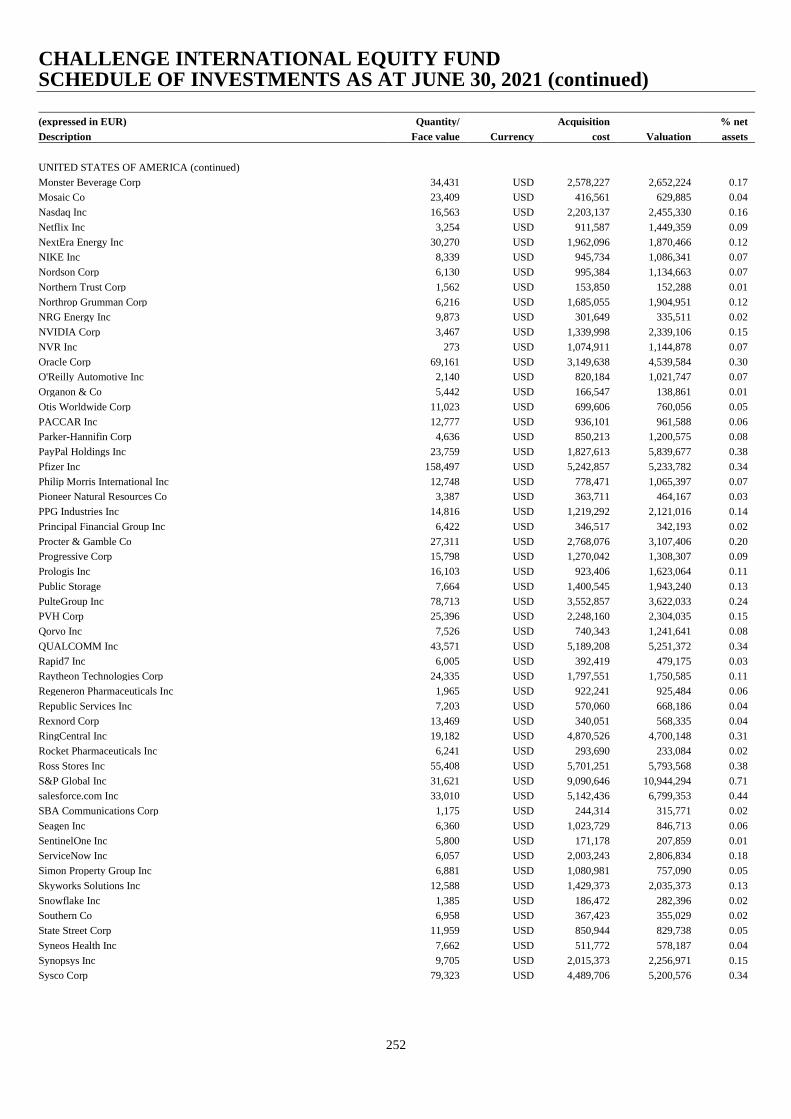
CHALLENGE INTERNATIONAL EQUITY FUND SCHEDULE OF INVESTMENTS AS AT JUNE 30, 2021 (continued)
252
(expressed in EUR) Quantity/ Acquisition % net
Description Face value Currency cost Valuation assets
UNITED STATES OF AMERICA (continued)
Monster Beverage Corp 34,431 USD 2,578,227 2,652,224 0.17
Mosaic Co 23,409 USD 416,561 629,885 0.04
Nasdaq Inc 16,563 USD 2,203,137 2,455,330 0.16
Netflix Inc 3,254 USD 911,587 1,449,359 0.09
NextEra Energy Inc 30,270 USD 1,962,096 1,870,466 0.12
NIKE Inc 8,339 USD 945,734 1,086,341 0.07
Nordson Corp 6,130 USD 995,384 1,134,663 0.07
Northern Trust Corp 1,562 USD 153,850 152,288 0.01
Northrop Grumman Corp 6,216 USD 1,685,055 1,904,951 0.12
NRG Energy Inc 9,873 USD 301,649 335,511 0.02
NVIDIA Corp 3,467 USD 1,339,998 2,339,106 0.15
NVR Inc 273 USD 1,074,911 1,144,878 0.07
Oracle Corp 69,161 USD 3,149,638 4,539,584 0.30
O'Reilly Automotive Inc 2,140 USD 820,184 1,021,747 0.07
Organon & Co 5,442 USD 166,547 138,861 0.01
Otis Worldwide Corp 11,023 USD 699,606 760,056 0.05
PACCAR Inc 12,777 USD 936,101 961,588 0.06
Parker-Hannifin Corp 4,636 USD 850,213 1,200,575 0.08
PayPal Holdings Inc 23,759 USD 1,827,613 5,839,677 0.38
Pfizer Inc 158,497 USD 5,242,857 5,233,782 0.34
Philip Morris International Inc 12,748 USD 778,471 1,065,397 0.07
Pioneer Natural Resources Co 3,387 USD 363,711 464,167 0.03
PPG Industries Inc 14,816 USD 1,219,292 2,121,016 0.14
Principal Financial Group Inc 6,422 USD 346,517 342,193 0.02
Procter & Gamble Co 27,311 USD 2,768,076 3,107,406 0.20
Progressive Corp 15,798 USD 1,270,042 1,308,307 0.09
Prologis Inc 16,103 USD 923,406 1,623,064 0.11
Public Storage 7,664 USD 1,400,545 1,943,240 0.13
PulteGroup Inc 78,713 USD 3,552,857 3,622,033 0.24
PVH Corp 25,396 USD 2,248,160 2,304,035 0.15
Qorvo Inc 7,526 USD 740,343 1,241,641 0.08
QUALCOMM Inc 43,571 USD 5,189,208 5,251,372 0.34
Rapid7 Inc 6,005 USD 392,419 479,175 0.03
Raytheon Technologies Corp 24,335 USD 1,797,551 1,750,585 0.11
Regeneron Pharmaceuticals Inc 1,965 USD 922,241 925,484 0.06
Republic Services Inc 7,203 USD 570,060 668,186 0.04
Rexnord Corp 13,469 USD 340,051 568,335 0.04
RingCentral Inc 19,182 USD 4,870,526 4,700,148 0.31
Rocket Pharmaceuticals Inc 6,241 USD 293,690 233,084 0.02
Ross Stores Inc 55,408 USD 5,701,251 5,793,568 0.38
S&P Global Inc 31,621 USD 9,090,646 10,944,294 0.71
salesforce.com Inc 33,010 USD 5,142,436 6,799,353 0.44
SBA Communications Corp 1,175 USD 244,314 315,771 0.02
Seagen Inc 6,360 USD 1,023,729 846,713 0.06
SentinelOne Inc 5,800 USD 171,178 207,859 0.01
ServiceNow Inc 6,057 USD 2,003,243 2,806,834 0.18
Simon Property Group Inc 6,881 USD 1,080,981 757,090 0.05
Skyworks Solutions Inc 12,588 USD 1,429,373 2,035,373 0.13
Snowflake Inc 1,385 USD 186,472 282,396 0.02
Southern Co 6,958 USD 367,423 355,029 0.02
State Street Corp 11,959 USD 850,944 829,738 0.05
Syneos Health Inc 7,662 USD 511,772 578,187 0.04
Synopsys Inc 9,705 USD 2,015,373 2,256,971 0.15
Sysco Corp 79,323 USD 4,489,706 5,200,576 0.34
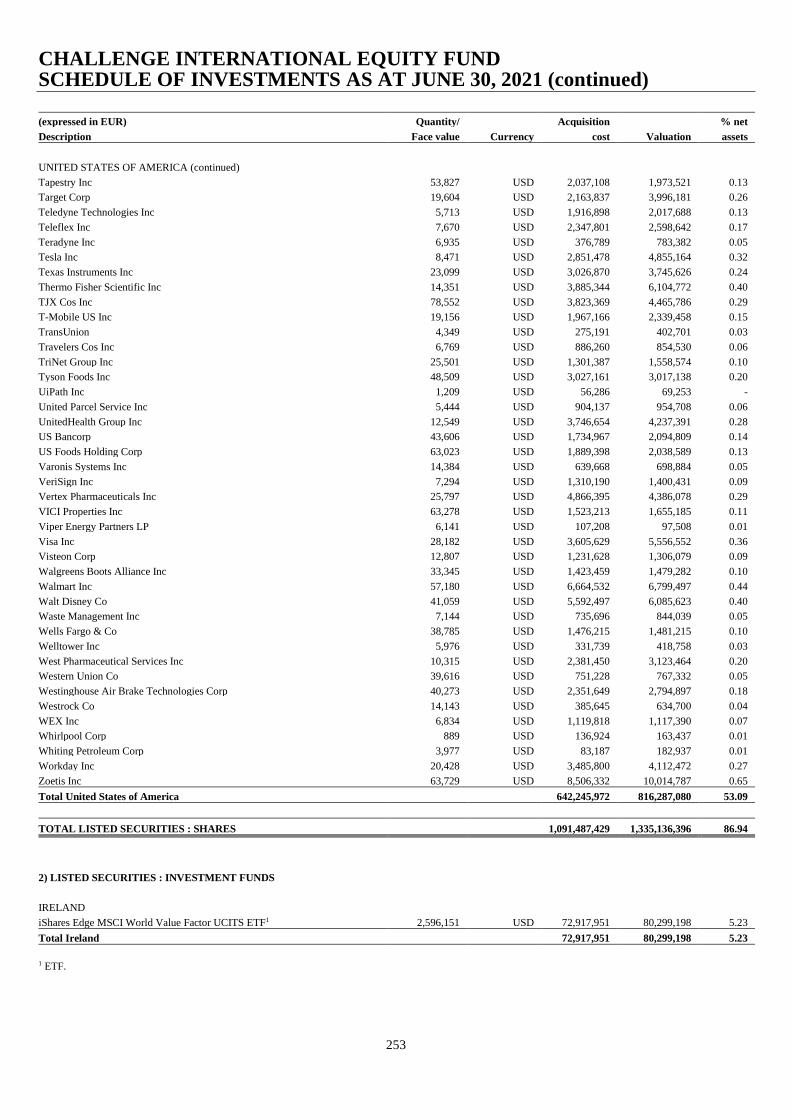
CHALLENGE INTERNATIONAL EQUITY FUND SCHEDULE OF INVESTMENTS AS AT JUNE 30, 2021 (continued)
253
(expressed in EUR) Quantity/ Acquisition % net
Description Face value Currency cost Valuation assets
UNITED STATES OF AMERICA (continued)
Tapestry Inc 53,827 USD 2,037,108 1,973,521 0.13
Target Corp 19,604 USD 2,163,837 3,996,181 0.26
Teledyne Technologies Inc 5,713 USD 1,916,898 2,017,688 0.13
Teleflex Inc 7,670 USD 2,347,801 2,598,642 0.17
Teradyne Inc 6,935 USD 376,789 783,382 0.05
Tesla Inc 8,471 USD 2,851,478 4,855,164 0.32
Texas Instruments Inc 23,099 USD 3,026,870 3,745,626 0.24
Thermo Fisher Scientific Inc 14,351 USD 3,885,344 6,104,772 0.40
TJX Cos Inc 78,552 USD 3,823,369 4,465,786 0.29
T-Mobile US Inc 19,156 USD 1,967,166 2,339,458 0.15
TransUnion 4,349 USD 275,191 402,701 0.03
Travelers Cos Inc 6,769 USD 886,260 854,530 0.06
TriNet Group Inc 25,501 USD 1,301,387 1,558,574 0.10
Tyson Foods Inc 48,509 USD 3,027,161 3,017,138 0.20
UiPath Inc 1,209 USD 56,286 69,253 -
United Parcel Service Inc 5,444 USD 904,137 954,708 0.06
UnitedHealth Group Inc 12,549 USD 3,746,654 4,237,391 0.28
US Bancorp 43,606 USD 1,734,967 2,094,809 0.14
US Foods Holding Corp 63,023 USD 1,889,398 2,038,589 0.13
Varonis Systems Inc 14,384 USD 639,668 698,884 0.05
VeriSign Inc 7,294 USD 1,310,190 1,400,431 0.09
Vertex Pharmaceuticals Inc 25,797 USD 4,866,395 4,386,078 0.29
VICI Properties Inc 63,278 USD 1,523,213 1,655,185 0.11
Viper Energy Partners LP 6,141 USD 107,208 97,508 0.01
Visa Inc 28,182 USD 3,605,629 5,556,552 0.36
Visteon Corp 12,807 USD 1,231,628 1,306,079 0.09
Walgreens Boots Alliance Inc 33,345 USD 1,423,459 1,479,282 0.10
Walmart Inc 57,180 USD 6,664,532 6,799,497 0.44
Walt Disney Co 41,059 USD 5,592,497 6,085,623 0.40
Waste Management Inc 7,144 USD 735,696 844,039 0.05
Wells Fargo & Co 38,785 USD 1,476,215 1,481,215 0.10
Welltower Inc 5,976 USD 331,739 418,758 0.03
West Pharmaceutical Services Inc 10,315 USD 2,381,450 3,123,464 0.20
Western Union Co 39,616 USD 751,228 767,332 0.05
Westinghouse Air Brake Technologies Corp 40,273 USD 2,351,649 2,794,897 0.18
Westrock Co 14,143 USD 385,645 634,700 0.04
WEX Inc 6,834 USD 1,119,818 1,117,390 0.07
Whirlpool Corp 889 USD 136,924 163,437 0.01
Whiting Petroleum Corp 3,977 USD 83,187 182,937 0.01
Workday Inc 20,428 USD 3,485,800 4,112,472 0.27
Zoetis Inc 63,729 USD 8,506,332 10,014,787 0.65
Total United States of America 642,245,972 816,287,080 53.09
TOTAL LISTED SECURITIES : SHARES 1,091,487,429 1,335,136,396 86.94
2) LISTED SECURITIES : INVESTMENT FUNDS
IRELAND
iShares Edge MSCI World Value Factor UCITS ETF1 2,596,151 USD 72,917,951 80,299,198 5.23
Total Ireland 72,917,951 80,299,198 5.23
1 ETF.
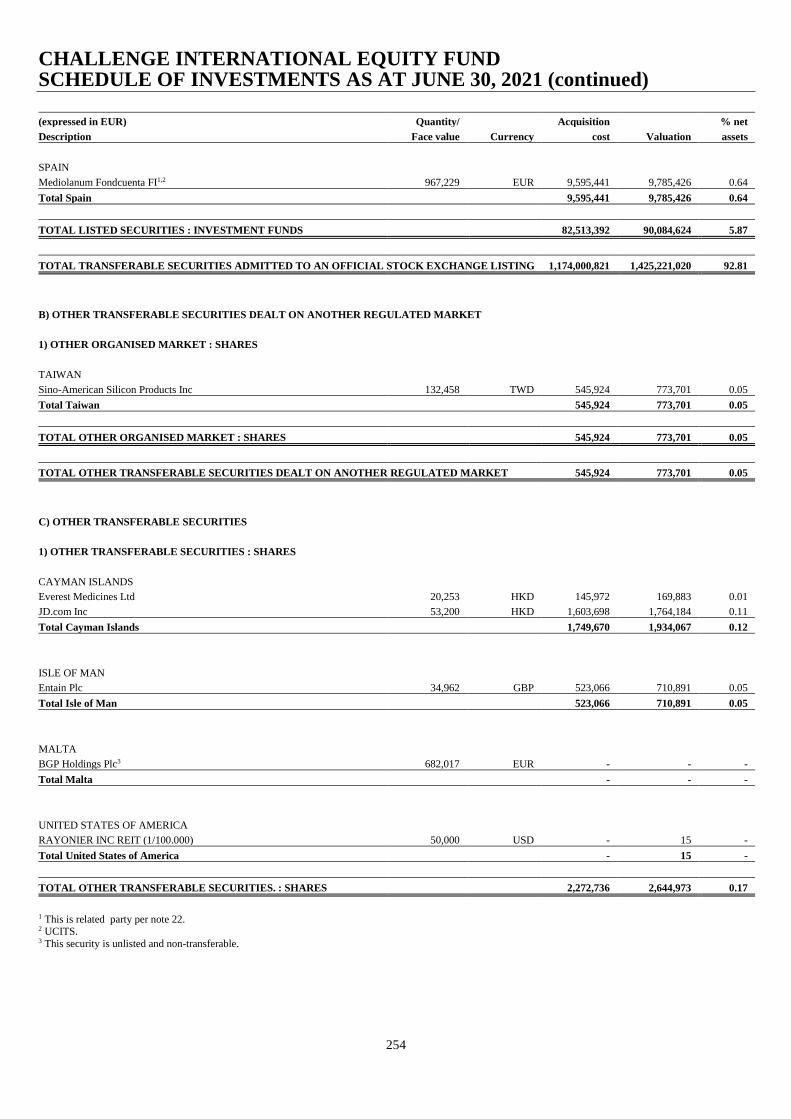
CHALLENGE INTERNATIONAL EQUITY FUND SCHEDULE OF INVESTMENTS AS AT JUNE 30, 2021 (continued)
254
(expressed in EUR) Quantity/ Acquisition % net
Description Face value Currency cost Valuation assets
SPAIN
Mediolanum Fondcuenta FI1,2 967,229 EUR 9,595,441 9,785,426 0.64
Total Spain 9,595,441 9,785,426 0.64
TOTAL LISTED SECURITIES : INVESTMENT FUNDS 82,513,392 90,084,624 5.87
TOTAL TRANSFERABLE SECURITIES ADMITTED TO AN OFFICIAL STOCK EXCHANGE LISTING 1,174,000,821 1,425,221,020 92.81
B) OTHER TRANSFERABLE SECURITIES DEALT ON ANOTHER REGULATED MARKET
1) OTHER ORGANISED MARKET : SHARES
TAIWAN
Sino-American Silicon Products Inc 132,458 TWD 545,924 773,701 0.05
Total Taiwan 545,924 773,701 0.05
TOTAL OTHER ORGANISED MARKET : SHARES 545,924 773,701 0.05
TOTAL OTHER TRANSFERABLE SECURITIES DEALT ON ANOTHER REGULATED MARKET 545,924 773,701 0.05
C) OTHER TRANSFERABLE SECURITIES
1) OTHER TRANSFERABLE SECURITIES : SHARES
CAYMAN ISLANDS
Everest Medicines Ltd 20,253 HKD 145,972 169,883 0.01
JD.com Inc 53,200 HKD 1,603,698 1,764,184 0.11
Total Cayman Islands 1,749,670 1,934,067 0.12
ISLE OF MAN
Entain Plc 34,962 GBP 523,066 710,891 0.05
Total Isle of Man 523,066 710,891 0.05
MALTA
BGP Holdings Plc3 682,017 EUR - - -
Total Malta - - -
UNITED STATES OF AMERICA
RAYONIER INC REIT (1/100.000) 50,000 USD - 15 -
Total United States of America - 15 -
TOTAL OTHER TRANSFERABLE SECURITIES. : SHARES 2,272,736 2,644,973 0.17
1 This is related party per note 22. 2 UCITS. 3 This security is unlisted and non-transferable.
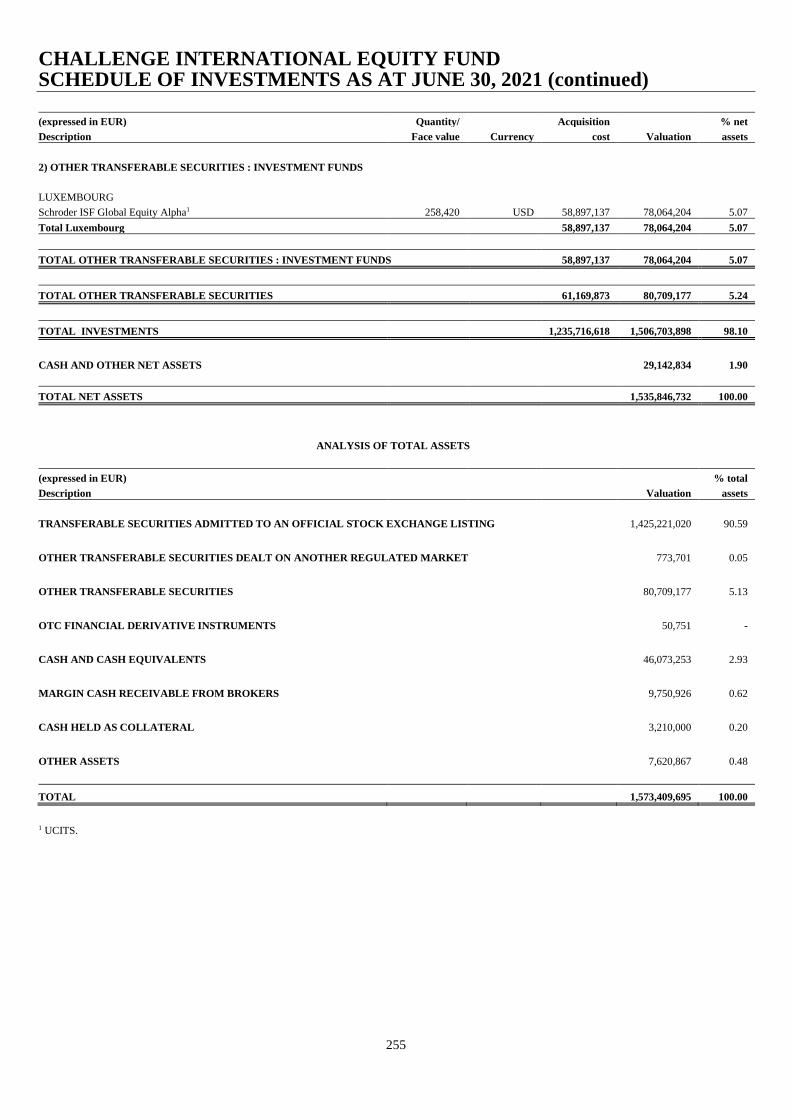
CHALLENGE INTERNATIONAL EQUITY FUND SCHEDULE OF INVESTMENTS AS AT JUNE 30, 2021 (continued)
255
(expressed in EUR) Quantity/ Acquisition % net
Description Face value Currency cost Valuation assets
2) OTHER TRANSFERABLE SECURITIES : INVESTMENT FUNDS
LUXEMBOURG
Schroder ISF Global Equity Alpha1 258,420 USD 58,897,137 78,064,204 5.07
Total Luxembourg 58,897,137 78,064,204 5.07
TOTAL OTHER TRANSFERABLE SECURITIES : INVESTMENT FUNDS 58,897,137 78,064,204 5.07
TOTAL OTHER TRANSFERABLE SECURITIES 61,169,873 80,709,177 5.24
TOTAL INVESTMENTS 1,235,716,618 1,506,703,898 98.10
CASH AND OTHER NET ASSETS 29,142,834 1.90
TOTAL NET ASSETS 1,535,846,732 100.00
ANALYSIS OF TOTAL ASSETS
(expressed in EUR) % total
Description Valuation assets
TRANSFERABLE SECURITIES ADMITTED TO AN OFFICIAL STOCK EXCHANGE LISTING
1,425,221,020 90.59
OTHER TRANSFERABLE SECURITIES DEALT ON ANOTHER REGULATED MARKET
773,701 0.05
OTHER TRANSFERABLE SECURITIES
80,709,177 5.13
OTC FINANCIAL DERIVATIVE INSTRUMENTS
50,751 -
CASH AND CASH EQUIVALENTS
46,073,253 2.93
MARGIN CASH RECEIVABLE FROM BROKERS
9,750,926 0.62
CASH HELD AS COLLATERAL
3,210,000 0.20
OTHER ASSETS
7,620,867 0.48
TOTAL 1,573,409,695 100.00
1 UCITS.

CHALLENGE INTERNATIONAL EQUITY FUND
ECONOMIC BREAKDOWN OF INVESTMENTS (expressed as a percentage of net assets)
256
% net
assets
Internet Software 11.86
Investment Funds 10.94
Holding and Finance Companies 8.28
Pharmaceuticals and Cosmetics 7.44
Electronic Semiconductor 6.37
Retail 6.03
Banks and Financial Institutions 5.20
Office Equipment and Computers 4.58
Insurance 2.93
Mechanics and Machinery 2.26
News Transmission 2.75
Automobile Industry 2.67
Food and Distilleries 2.35
Public Services 2.18
Tobacco and Spirits 2.14
Real Estate Companies 1.94
Other Services 1.93
Petrol 1.68
Graphic Art and Publishing 1.58
Construction and Building Material 1.57
Chemicals 1.54
Electronics and Electrical Equipment 1.19
Consumer Goods 1.18
Transportation 1.13
Biotechnology 0.82
Healthcare Education and Social Services 0.80
Aerospace Technology 0.77
Textile 0.73
Non-Ferrous Metals 0.64
Mines and Heavy Industries 0.59
Precious Metals 0.58
Business Houses 0.47
Leisure 0.41
Forest Products and Paper Industry 0.16
Package and Container Industry 0.09
Environmental Services and Recycling 0.09
Tires and Rubber 0.09
Agriculture and Fishing 0.05
Miscellaneous 0.05
Various Capital Goods 0.03
Clock and Watch-Making Industry 0.01
TOTAL INVESTMENTS 98.10
CASH AND OTHER NET ASSETS 1.90
TOTAL NET ASSETS 100.00
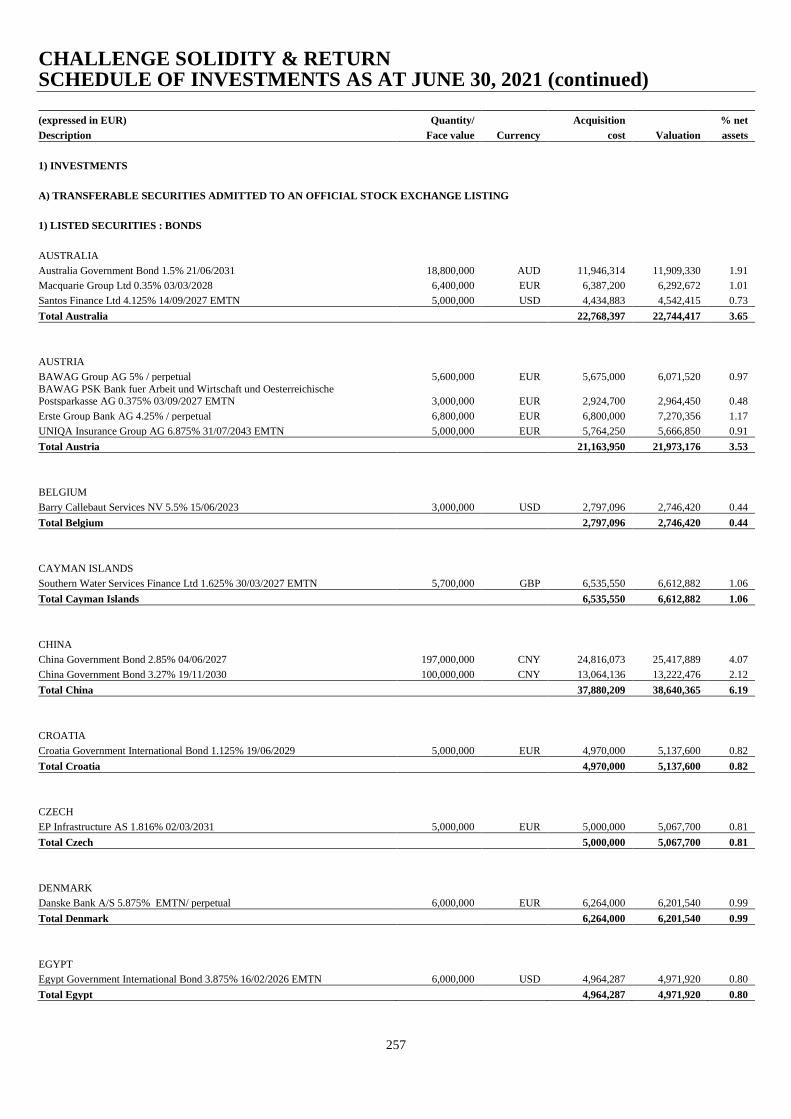
CHALLENGE SOLIDITY & RETURN SCHEDULE OF INVESTMENTS AS AT JUNE 30, 2021 (continued)
257
(expressed in EUR) Quantity/ Acquisition % net
Description Face value Currency cost Valuation assets
1) INVESTMENTS
A) TRANSFERABLE SECURITIES ADMITTED TO AN OFFICIAL STOCK EXCHANGE LISTING
1) LISTED SECURITIES : BONDS
AUSTRALIA
Australia Government Bond 1.5% 21/06/2031 18,800,000 AUD 11,946,314 11,909,330 1.91
Macquarie Group Ltd 0.35% 03/03/2028 6,400,000 EUR 6,387,200 6,292,672 1.01
Santos Finance Ltd 4.125% 14/09/2027 EMTN 5,000,000 USD 4,434,883 4,542,415 0.73
Total Australia 22,768,397 22,744,417 3.65
AUSTRIA
BAWAG Group AG 5% / perpetual 5,600,000 EUR 5,675,000 6,071,520 0.97
BAWAG PSK Bank fuer Arbeit und Wirtschaft und Oesterreichische Postsparkasse AG 0.375% 03/09/2027 EMTN 3,000,000 EUR 2,924,700 2,964,450 0.48
Erste Group Bank AG 4.25% / perpetual 6,800,000 EUR 6,800,000 7,270,356 1.17
UNIQA Insurance Group AG 6.875% 31/07/2043 EMTN 5,000,000 EUR 5,764,250 5,666,850 0.91
Total Austria 21,163,950 21,973,176 3.53
BELGIUM
Barry Callebaut Services NV 5.5% 15/06/2023 3,000,000 USD 2,797,096 2,746,420 0.44
Total Belgium 2,797,096 2,746,420 0.44
CAYMAN ISLANDS
Southern Water Services Finance Ltd 1.625% 30/03/2027 EMTN 5,700,000 GBP 6,535,550 6,612,882 1.06
Total Cayman Islands 6,535,550 6,612,882 1.06
CHINA
China Government Bond 2.85% 04/06/2027 197,000,000 CNY 24,816,073 25,417,889 4.07
China Government Bond 3.27% 19/11/2030 100,000,000 CNY 13,064,136 13,222,476 2.12
Total China 37,880,209 38,640,365 6.19
CROATIA
Croatia Government International Bond 1.125% 19/06/2029 5,000,000 EUR 4,970,000 5,137,600 0.82
Total Croatia 4,970,000 5,137,600 0.82
CZECH
EP Infrastructure AS 1.816% 02/03/2031 5,000,000 EUR 5,000,000 5,067,700 0.81
Total Czech 5,000,000 5,067,700 0.81
DENMARK
Danske Bank A/S 5.875% EMTN/ perpetual 6,000,000 EUR 6,264,000 6,201,540 0.99
Total Denmark 6,264,000 6,201,540 0.99
EGYPT
Egypt Government International Bond 3.875% 16/02/2026 EMTN 6,000,000 USD 4,964,287 4,971,920 0.80
Total Egypt 4,964,287 4,971,920 0.80
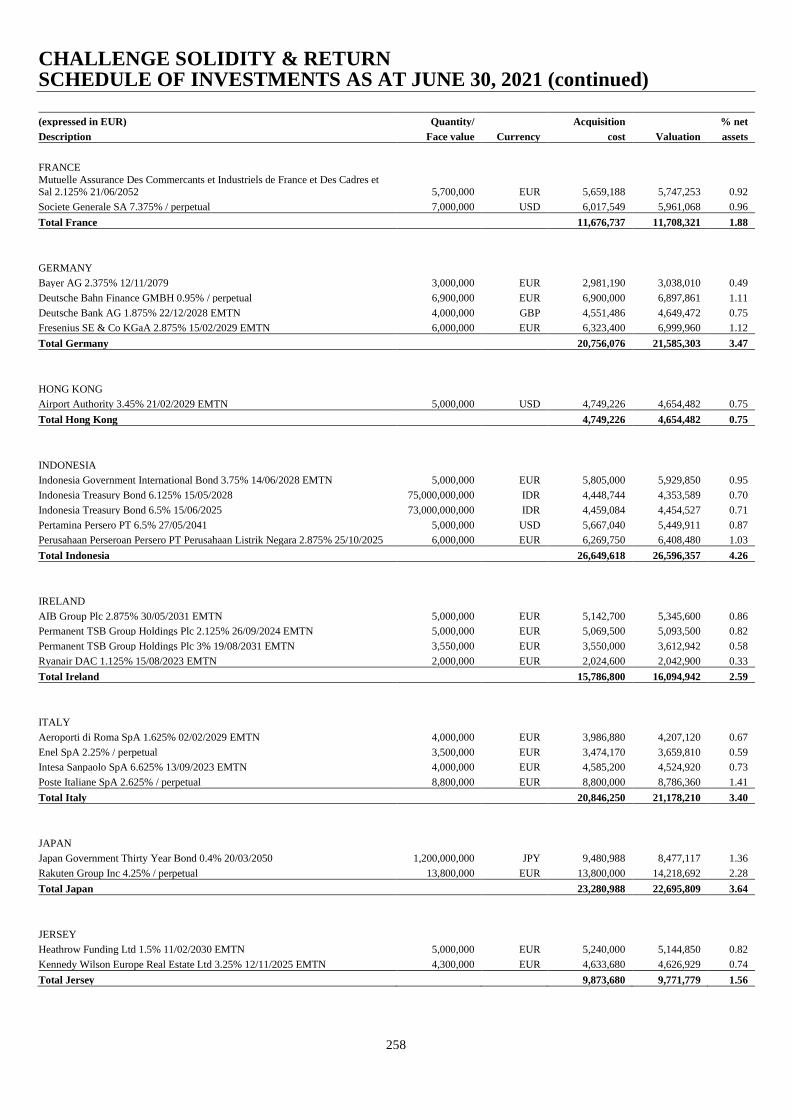
CHALLENGE SOLIDITY & RETURN SCHEDULE OF INVESTMENTS AS AT JUNE 30, 2021 (continued)
258
(expressed in EUR) Quantity/ Acquisition % net
Description Face value Currency cost Valuation assets
FRANCE Mutuelle Assurance Des Commercants et Industriels de France et Des Cadres et Sal 2.125% 21/06/2052 5,700,000 EUR 5,659,188 5,747,253 0.92
Societe Generale SA 7.375% / perpetual 7,000,000 USD 6,017,549 5,961,068 0.96
Total France 11,676,737 11,708,321 1.88
GERMANY
Bayer AG 2.375% 12/11/2079 3,000,000 EUR 2,981,190 3,038,010 0.49
Deutsche Bahn Finance GMBH 0.95% / perpetual 6,900,000 EUR 6,900,000 6,897,861 1.11
Deutsche Bank AG 1.875% 22/12/2028 EMTN 4,000,000 GBP 4,551,486 4,649,472 0.75
Fresenius SE & Co KGaA 2.875% 15/02/2029 EMTN 6,000,000 EUR 6,323,400 6,999,960 1.12
Total Germany 20,756,076 21,585,303 3.47
HONG KONG
Airport Authority 3.45% 21/02/2029 EMTN 5,000,000 USD 4,749,226 4,654,482 0.75
Total Hong Kong 4,749,226 4,654,482 0.75
INDONESIA
Indonesia Government International Bond 3.75% 14/06/2028 EMTN 5,000,000 EUR 5,805,000 5,929,850 0.95
Indonesia Treasury Bond 6.125% 15/05/2028 75,000,000,000 IDR 4,448,744 4,353,589 0.70
Indonesia Treasury Bond 6.5% 15/06/2025 73,000,000,000 IDR 4,459,084 4,454,527 0.71
Pertamina Persero PT 6.5% 27/05/2041 5,000,000 USD 5,667,040 5,449,911 0.87
Perusahaan Perseroan Persero PT Perusahaan Listrik Negara 2.875% 25/10/2025 6,000,000 EUR 6,269,750 6,408,480 1.03
Total Indonesia 26,649,618 26,596,357 4.26
IRELAND
AIB Group Plc 2.875% 30/05/2031 EMTN 5,000,000 EUR 5,142,700 5,345,600 0.86
Permanent TSB Group Holdings Plc 2.125% 26/09/2024 EMTN 5,000,000 EUR 5,069,500 5,093,500 0.82
Permanent TSB Group Holdings Plc 3% 19/08/2031 EMTN 3,550,000 EUR 3,550,000 3,612,942 0.58
Ryanair DAC 1.125% 15/08/2023 EMTN 2,000,000 EUR 2,024,600 2,042,900 0.33
Total Ireland 15,786,800 16,094,942 2.59
ITALY
Aeroporti di Roma SpA 1.625% 02/02/2029 EMTN 4,000,000 EUR 3,986,880 4,207,120 0.67
Enel SpA 2.25% / perpetual 3,500,000 EUR 3,474,170 3,659,810 0.59
Intesa Sanpaolo SpA 6.625% 13/09/2023 EMTN 4,000,000 EUR 4,585,200 4,524,920 0.73
Poste Italiane SpA 2.625% / perpetual 8,800,000 EUR 8,800,000 8,786,360 1.41
Total Italy 20,846,250 21,178,210 3.40
JAPAN
Japan Government Thirty Year Bond 0.4% 20/03/2050 1,200,000,000 JPY 9,480,988 8,477,117 1.36
Rakuten Group Inc 4.25% / perpetual 13,800,000 EUR 13,800,000 14,218,692 2.28
Total Japan 23,280,988 22,695,809 3.64
JERSEY
Heathrow Funding Ltd 1.5% 11/02/2030 EMTN 5,000,000 EUR 5,240,000 5,144,850 0.82
Kennedy Wilson Europe Real Estate Ltd 3.25% 12/11/2025 EMTN 4,300,000 EUR 4,633,680 4,626,929 0.74
Total Jersey 9,873,680 9,771,779 1.56
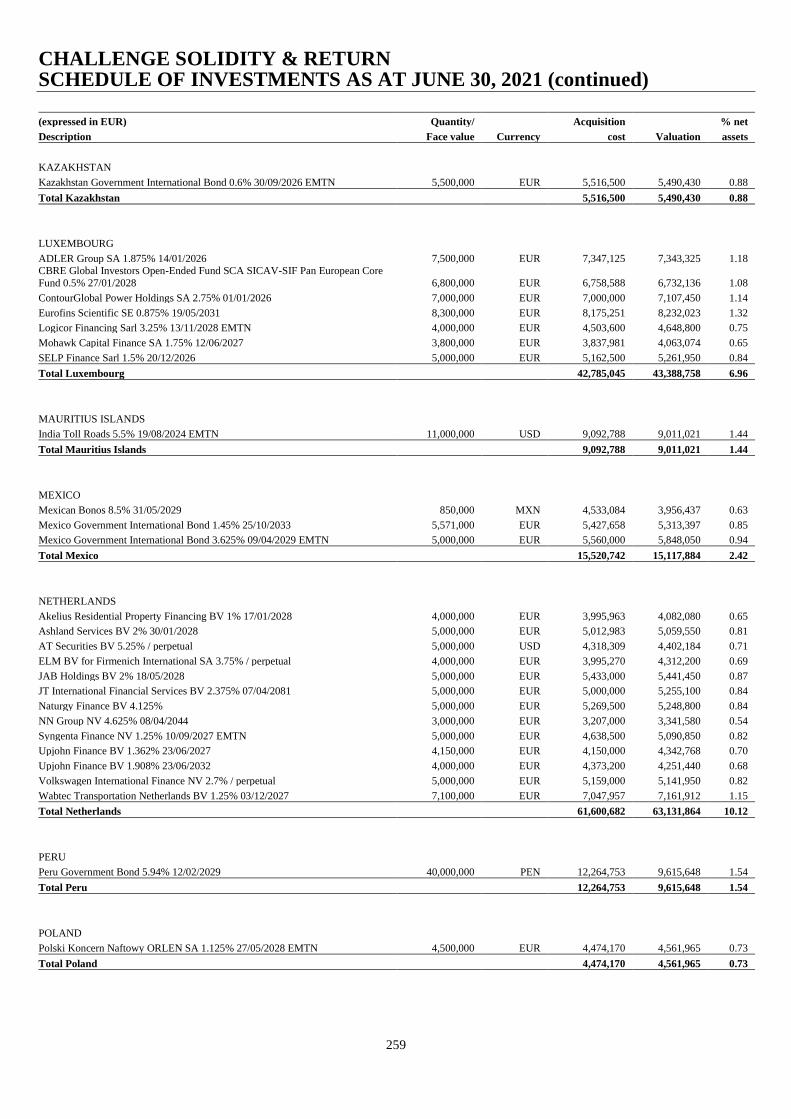
CHALLENGE SOLIDITY & RETURN SCHEDULE OF INVESTMENTS AS AT JUNE 30, 2021 (continued)
259
(expressed in EUR) Quantity/ Acquisition % net
Description Face value Currency cost Valuation assets
KAZAKHSTAN
Kazakhstan Government International Bond 0.6% 30/09/2026 EMTN 5,500,000 EUR 5,516,500 5,490,430 0.88
Total Kazakhstan 5,516,500 5,490,430 0.88
LUXEMBOURG
ADLER Group SA 1.875% 14/01/2026 7,500,000 EUR 7,347,125 7,343,325 1.18 CBRE Global Investors Open-Ended Fund SCA SICAV-SIF Pan European Core
Fund 0.5% 27/01/2028 6,800,000 EUR 6,758,588 6,732,136 1.08
ContourGlobal Power Holdings SA 2.75% 01/01/2026 7,000,000 EUR 7,000,000 7,107,450 1.14
Eurofins Scientific SE 0.875% 19/05/2031 8,300,000 EUR 8,175,251 8,232,023 1.32
Logicor Financing Sarl 3.25% 13/11/2028 EMTN 4,000,000 EUR 4,503,600 4,648,800 0.75
Mohawk Capital Finance SA 1.75% 12/06/2027 3,800,000 EUR 3,837,981 4,063,074 0.65
SELP Finance Sarl 1.5% 20/12/2026 5,000,000 EUR 5,162,500 5,261,950 0.84
Total Luxembourg 42,785,045 43,388,758 6.96
MAURITIUS ISLANDS
India Toll Roads 5.5% 19/08/2024 EMTN 11,000,000 USD 9,092,788 9,011,021 1.44
Total Mauritius Islands 9,092,788 9,011,021 1.44
MEXICO
Mexican Bonos 8.5% 31/05/2029 850,000 MXN 4,533,084 3,956,437 0.63
Mexico Government International Bond 1.45% 25/10/2033 5,571,000 EUR 5,427,658 5,313,397 0.85
Mexico Government International Bond 3.625% 09/04/2029 EMTN 5,000,000 EUR 5,560,000 5,848,050 0.94
Total Mexico 15,520,742 15,117,884 2.42
NETHERLANDS
Akelius Residential Property Financing BV 1% 17/01/2028 4,000,000 EUR 3,995,963 4,082,080 0.65
Ashland Services BV 2% 30/01/2028 5,000,000 EUR 5,012,983 5,059,550 0.81
AT Securities BV 5.25% / perpetual 5,000,000 USD 4,318,309 4,402,184 0.71
ELM BV for Firmenich International SA 3.75% / perpetual 4,000,000 EUR 3,995,270 4,312,200 0.69
JAB Holdings BV 2% 18/05/2028 5,000,000 EUR 5,433,000 5,441,450 0.87
JT International Financial Services BV 2.375% 07/04/2081 5,000,000 EUR 5,000,000 5,255,100 0.84
Naturgy Finance BV 4.125% 5,000,000 EUR 5,269,500 5,248,800 0.84
NN Group NV 4.625% 08/04/2044 3,000,000 EUR 3,207,000 3,341,580 0.54
Syngenta Finance NV 1.25% 10/09/2027 EMTN 5,000,000 EUR 4,638,500 5,090,850 0.82
Upjohn Finance BV 1.362% 23/06/2027 4,150,000 EUR 4,150,000 4,342,768 0.70
Upjohn Finance BV 1.908% 23/06/2032 4,000,000 EUR 4,373,200 4,251,440 0.68
Volkswagen International Finance NV 2.7% / perpetual 5,000,000 EUR 5,159,000 5,141,950 0.82
Wabtec Transportation Netherlands BV 1.25% 03/12/2027 7,100,000 EUR 7,047,957 7,161,912 1.15
Total Netherlands 61,600,682 63,131,864 10.12
PERU
Peru Government Bond 5.94% 12/02/2029 40,000,000 PEN 12,264,753 9,615,648 1.54
Total Peru 12,264,753 9,615,648 1.54
POLAND
Polski Koncern Naftowy ORLEN SA 1.125% 27/05/2028 EMTN 4,500,000 EUR 4,474,170 4,561,965 0.73
Total Poland 4,474,170 4,561,965 0.73
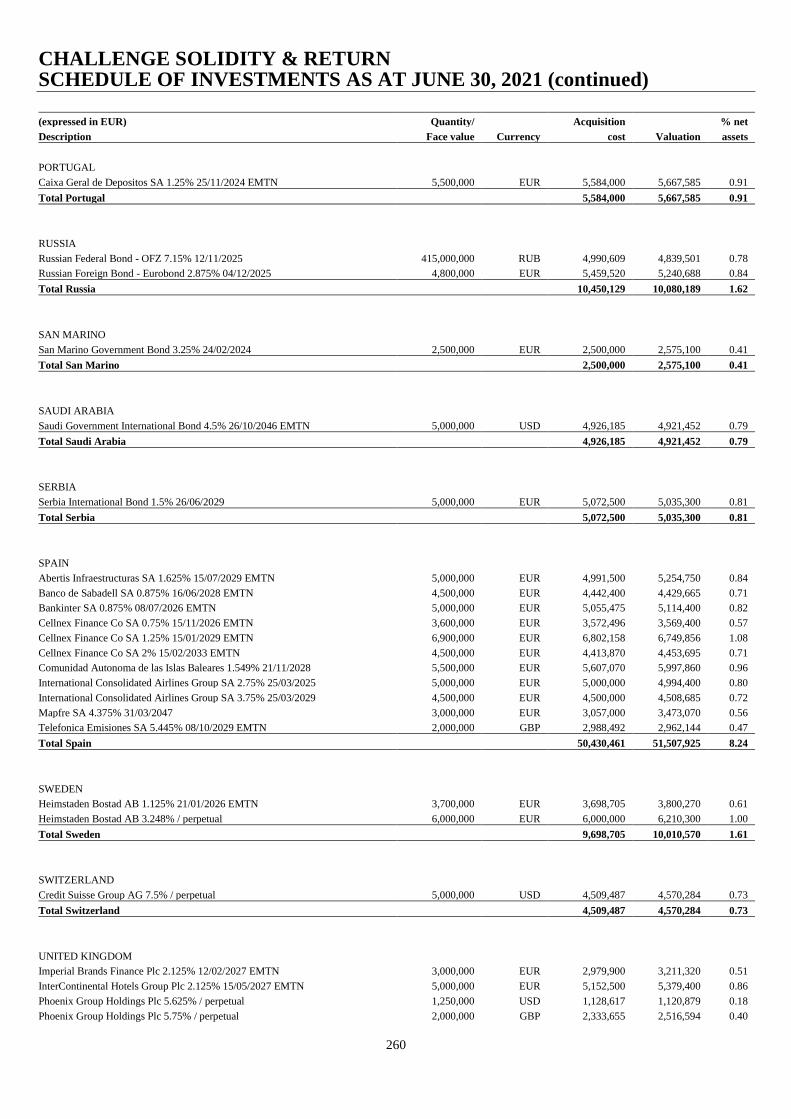
CHALLENGE SOLIDITY & RETURN SCHEDULE OF INVESTMENTS AS AT JUNE 30, 2021 (continued)
260
(expressed in EUR) Quantity/ Acquisition % net
Description Face value Currency cost Valuation assets
PORTUGAL
Caixa Geral de Depositos SA 1.25% 25/11/2024 EMTN 5,500,000 EUR 5,584,000 5,667,585 0.91
Total Portugal 5,584,000 5,667,585 0.91
RUSSIA
Russian Federal Bond - OFZ 7.15% 12/11/2025 415,000,000 RUB 4,990,609 4,839,501 0.78
Russian Foreign Bond - Eurobond 2.875% 04/12/2025 4,800,000 EUR 5,459,520 5,240,688 0.84
Total Russia 10,450,129 10,080,189 1.62
SAN MARINO
San Marino Government Bond 3.25% 24/02/2024 2,500,000 EUR 2,500,000 2,575,100 0.41
Total San Marino 2,500,000 2,575,100 0.41
SAUDI ARABIA
Saudi Government International Bond 4.5% 26/10/2046 EMTN 5,000,000 USD 4,926,185 4,921,452 0.79
Total Saudi Arabia 4,926,185 4,921,452 0.79
SERBIA
Serbia International Bond 1.5% 26/06/2029 5,000,000 EUR 5,072,500 5,035,300 0.81
Total Serbia 5,072,500 5,035,300 0.81
SPAIN
Abertis Infraestructuras SA 1.625% 15/07/2029 EMTN 5,000,000 EUR 4,991,500 5,254,750 0.84
Banco de Sabadell SA 0.875% 16/06/2028 EMTN 4,500,000 EUR 4,442,400 4,429,665 0.71
Bankinter SA 0.875% 08/07/2026 EMTN 5,000,000 EUR 5,055,475 5,114,400 0.82
Cellnex Finance Co SA 0.75% 15/11/2026 EMTN 3,600,000 EUR 3,572,496 3,569,400 0.57
Cellnex Finance Co SA 1.25% 15/01/2029 EMTN 6,900,000 EUR 6,802,158 6,749,856 1.08
Cellnex Finance Co SA 2% 15/02/2033 EMTN 4,500,000 EUR 4,413,870 4,453,695 0.71
Comunidad Autonoma de las Islas Baleares 1.549% 21/11/2028 5,500,000 EUR 5,607,070 5,997,860 0.96
International Consolidated Airlines Group SA 2.75% 25/03/2025 5,000,000 EUR 5,000,000 4,994,400 0.80
International Consolidated Airlines Group SA 3.75% 25/03/2029 4,500,000 EUR 4,500,000 4,508,685 0.72
Mapfre SA 4.375% 31/03/2047 3,000,000 EUR 3,057,000 3,473,070 0.56
Telefonica Emisiones SA 5.445% 08/10/2029 EMTN 2,000,000 GBP 2,988,492 2,962,144 0.47
Total Spain 50,430,461 51,507,925 8.24
SWEDEN
Heimstaden Bostad AB 1.125% 21/01/2026 EMTN 3,700,000 EUR 3,698,705 3,800,270 0.61
Heimstaden Bostad AB 3.248% / perpetual 6,000,000 EUR 6,000,000 6,210,300 1.00
Total Sweden 9,698,705 10,010,570 1.61
SWITZERLAND
Credit Suisse Group AG 7.5% / perpetual 5,000,000 USD 4,509,487 4,570,284 0.73
Total Switzerland 4,509,487 4,570,284 0.73
UNITED KINGDOM
Imperial Brands Finance Plc 2.125% 12/02/2027 EMTN 3,000,000 EUR 2,979,900 3,211,320 0.51
InterContinental Hotels Group Plc 2.125% 15/05/2027 EMTN 5,000,000 EUR 5,152,500 5,379,400 0.86
Phoenix Group Holdings Plc 5.625% / perpetual 1,250,000 USD 1,128,617 1,120,879 0.18
Phoenix Group Holdings Plc 5.75% / perpetual 2,000,000 GBP 2,333,655 2,516,594 0.40
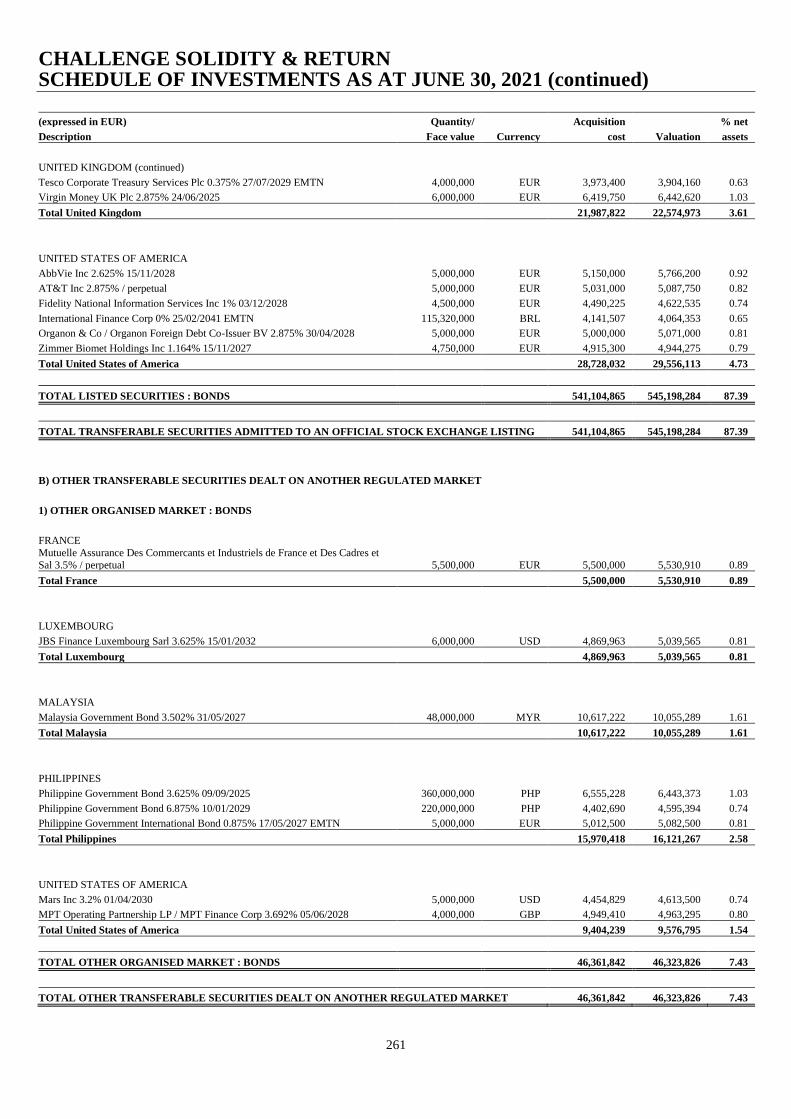
CHALLENGE SOLIDITY & RETURN SCHEDULE OF INVESTMENTS AS AT JUNE 30, 2021 (continued)
261
(expressed in EUR) Quantity/ Acquisition % net
Description Face value Currency cost Valuation assets
UNITED KINGDOM (continued)
Tesco Corporate Treasury Services Plc 0.375% 27/07/2029 EMTN 4,000,000 EUR 3,973,400 3,904,160 0.63
Virgin Money UK Plc 2.875% 24/06/2025 6,000,000 EUR 6,419,750 6,442,620 1.03
Total United Kingdom 21,987,822 22,574,973 3.61
UNITED STATES OF AMERICA
AbbVie Inc 2.625% 15/11/2028 5,000,000 EUR 5,150,000 5,766,200 0.92
AT&T Inc 2.875% / perpetual 5,000,000 EUR 5,031,000 5,087,750 0.82
Fidelity National Information Services Inc 1% 03/12/2028 4,500,000 EUR 4,490,225 4,622,535 0.74
International Finance Corp 0% 25/02/2041 EMTN 115,320,000 BRL 4,141,507 4,064,353 0.65
Organon & Co / Organon Foreign Debt Co-Issuer BV 2.875% 30/04/2028 5,000,000 EUR 5,000,000 5,071,000 0.81
Zimmer Biomet Holdings Inc 1.164% 15/11/2027 4,750,000 EUR 4,915,300 4,944,275 0.79
Total United States of America 28,728,032 29,556,113 4.73
TOTAL LISTED SECURITIES : BONDS 541,104,865 545,198,284 87.39
TOTAL TRANSFERABLE SECURITIES ADMITTED TO AN OFFICIAL STOCK EXCHANGE LISTING 541,104,865 545,198,284 87.39
B) OTHER TRANSFERABLE SECURITIES DEALT ON ANOTHER REGULATED MARKET
1) OTHER ORGANISED MARKET : BONDS
FRANCE Mutuelle Assurance Des Commercants et Industriels de France et Des Cadres et
Sal 3.5% / perpetual 5,500,000 EUR 5,500,000 5,530,910 0.89
Total France 5,500,000 5,530,910 0.89
LUXEMBOURG
JBS Finance Luxembourg Sarl 3.625% 15/01/2032 6,000,000 USD 4,869,963 5,039,565 0.81
Total Luxembourg 4,869,963 5,039,565 0.81
MALAYSIA
Malaysia Government Bond 3.502% 31/05/2027 48,000,000 MYR 10,617,222 10,055,289 1.61
Total Malaysia 10,617,222 10,055,289 1.61
PHILIPPINES
Philippine Government Bond 3.625% 09/09/2025 360,000,000 PHP 6,555,228 6,443,373 1.03
Philippine Government Bond 6.875% 10/01/2029 220,000,000 PHP 4,402,690 4,595,394 0.74
Philippine Government International Bond 0.875% 17/05/2027 EMTN 5,000,000 EUR 5,012,500 5,082,500 0.81
Total Philippines 15,970,418 16,121,267 2.58
UNITED STATES OF AMERICA
Mars Inc 3.2% 01/04/2030 5,000,000 USD 4,454,829 4,613,500 0.74
MPT Operating Partnership LP / MPT Finance Corp 3.692% 05/06/2028 4,000,000 GBP 4,949,410 4,963,295 0.80
Total United States of America 9,404,239 9,576,795 1.54
TOTAL OTHER ORGANISED MARKET : BONDS 46,361,842 46,323,826 7.43
TOTAL OTHER TRANSFERABLE SECURITIES DEALT ON ANOTHER REGULATED MARKET 46,361,842 46,323,826 7.43
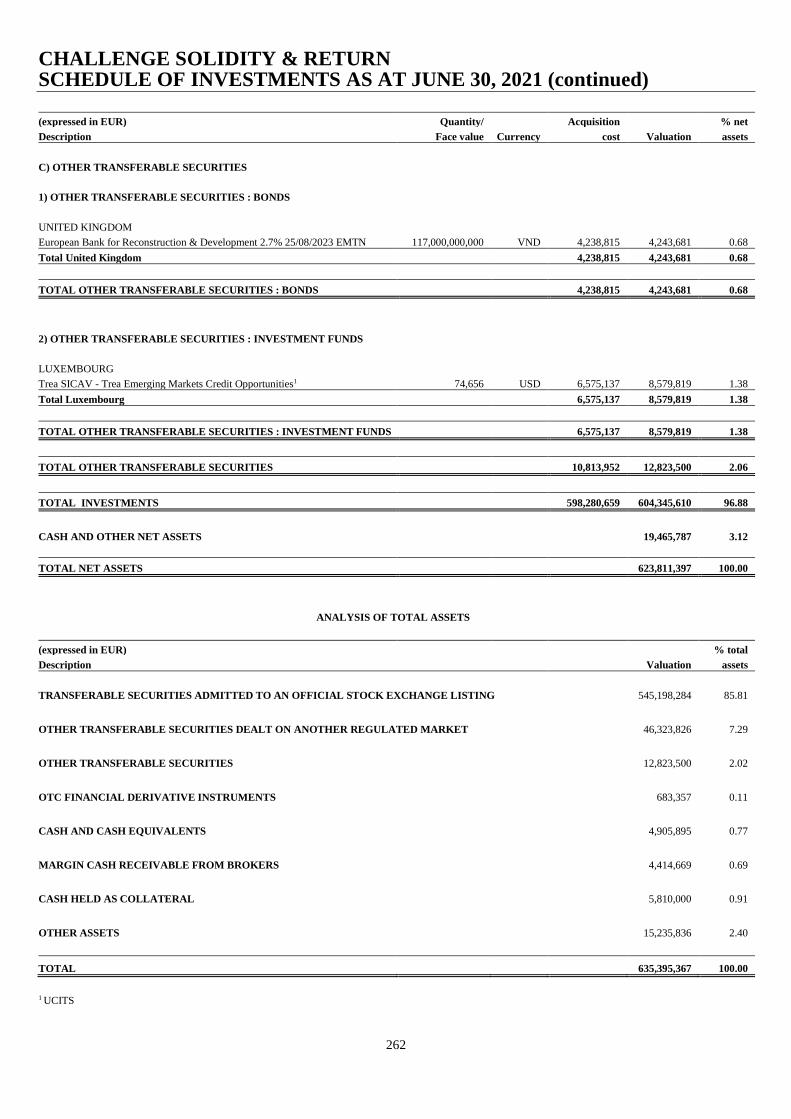
CHALLENGE SOLIDITY & RETURN SCHEDULE OF INVESTMENTS AS AT JUNE 30, 2021 (continued)
262
(expressed in EUR) Quantity/ Acquisition % net
Description Face value Currency cost Valuation assets
C) OTHER TRANSFERABLE SECURITIES
1) OTHER TRANSFERABLE SECURITIES : BONDS
UNITED KINGDOM
European Bank for Reconstruction & Development 2.7% 25/08/2023 EMTN 117,000,000,000 VND 4,238,815 4,243,681 0.68
Total United Kingdom 4,238,815 4,243,681 0.68
TOTAL OTHER TRANSFERABLE SECURITIES : BONDS 4,238,815 4,243,681 0.68
2) OTHER TRANSFERABLE SECURITIES : INVESTMENT FUNDS
LUXEMBOURG
Trea SICAV - Trea Emerging Markets Credit Opportunities1 74,656 USD 6,575,137 8,579,819 1.38
Total Luxembourg 6,575,137 8,579,819 1.38
TOTAL OTHER TRANSFERABLE SECURITIES : INVESTMENT FUNDS 6,575,137 8,579,819 1.38
TOTAL OTHER TRANSFERABLE SECURITIES 10,813,952 12,823,500 2.06
TOTAL INVESTMENTS 598,280,659 604,345,610 96.88
CASH AND OTHER NET ASSETS 19,465,787 3.12
TOTAL NET ASSETS 623,811,397 100.00
ANALYSIS OF TOTAL ASSETS
(expressed in EUR) % total
Description Valuation assets
TRANSFERABLE SECURITIES ADMITTED TO AN OFFICIAL STOCK EXCHANGE LISTING 545,198,284 85.81
OTHER TRANSFERABLE SECURITIES DEALT ON ANOTHER REGULATED MARKET 46,323,826 7.29
OTHER TRANSFERABLE SECURITIES
12,823,500 2.02
OTC FINANCIAL DERIVATIVE INSTRUMENTS
683,357 0.11
CASH AND CASH EQUIVALENTS
4,905,895 0.77
MARGIN CASH RECEIVABLE FROM BROKERS
4,414,669 0.69
CASH HELD AS COLLATERAL
5,810,000 0.91
OTHER ASSETS
15,235,836 2.40
TOTAL 635,395,367 100.00
1 UCITS
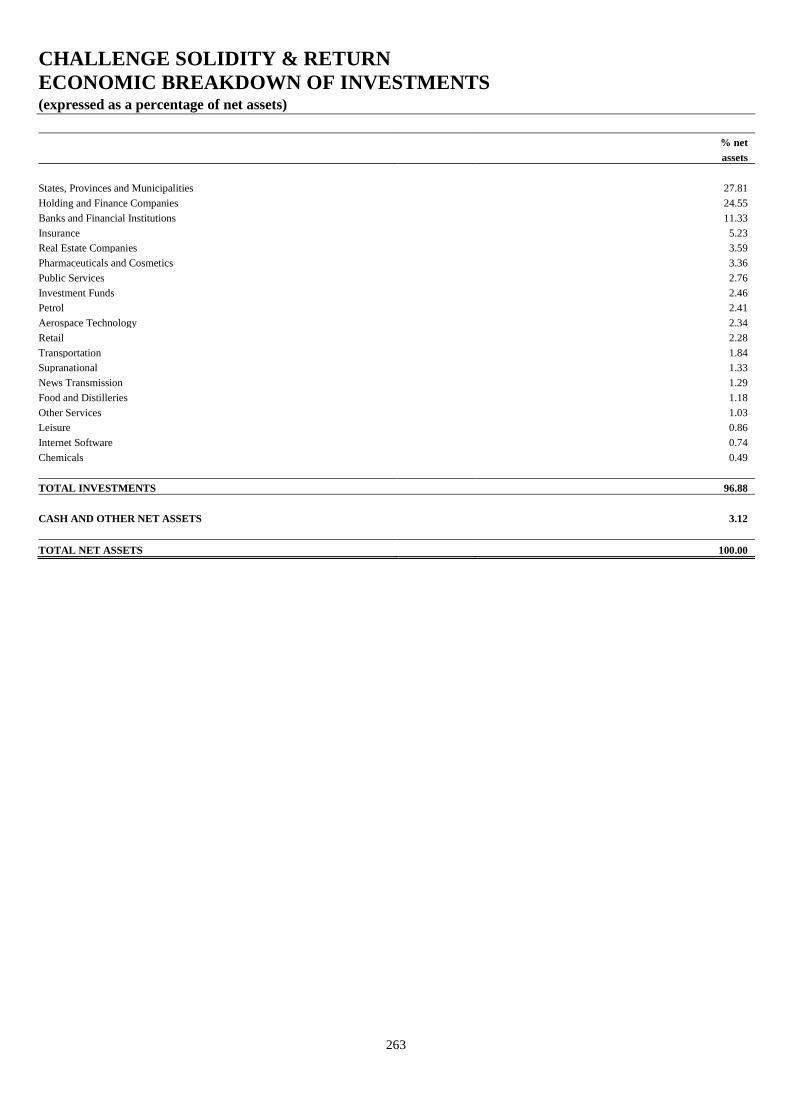
CHALLENGE SOLIDITY & RETURN
ECONOMIC BREAKDOWN OF INVESTMENTS (expressed as a percentage of net assets)
263
% net
assets
States, Provinces and Municipalities 27.81
Holding and Finance Companies 24.55
Banks and Financial Institutions 11.33
Insurance 5.23
Real Estate Companies 3.59
Pharmaceuticals and Cosmetics 3.36
Public Services 2.76
Investment Funds 2.46
Petrol 2.41
Aerospace Technology 2.34
Retail 2.28
Transportation 1.84
Supranational 1.33
News Transmission 1.29
Food and Distilleries 1.18
Other Services 1.03
Leisure 0.86
Internet Software 0.74
Chemicals 0.49
TOTAL INVESTMENTS 96.88
CASH AND OTHER NET ASSETS 3.12
TOTAL NET ASSETS 100.00
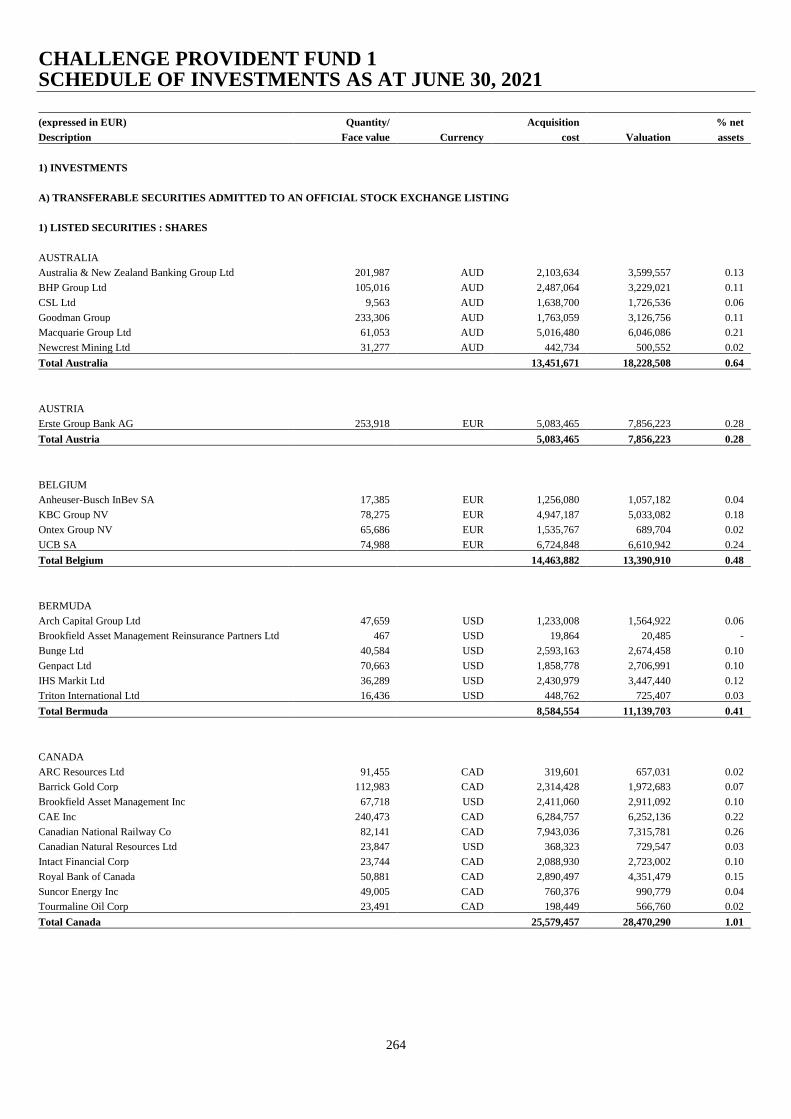
CHALLENGE PROVIDENT FUND 1 SCHEDULE OF INVESTMENTS AS AT JUNE 30, 2021
264
(expressed in EUR) Quantity/ Acquisition % net
Description Face value Currency cost Valuation assets
1) INVESTMENTS
A) TRANSFERABLE SECURITIES ADMITTED TO AN OFFICIAL STOCK EXCHANGE LISTING
1) LISTED SECURITIES : SHARES
AUSTRALIA
Australia & New Zealand Banking Group Ltd 201,987 AUD 2,103,634 3,599,557 0.13
BHP Group Ltd 105,016 AUD 2,487,064 3,229,021 0.11
CSL Ltd 9,563 AUD 1,638,700 1,726,536 0.06
Goodman Group 233,306 AUD 1,763,059 3,126,756 0.11
Macquarie Group Ltd 61,053 AUD 5,016,480 6,046,086 0.21
Newcrest Mining Ltd 31,277 AUD 442,734 500,552 0.02
Total Australia 13,451,671 18,228,508 0.64
AUSTRIA
Erste Group Bank AG 253,918 EUR 5,083,465 7,856,223 0.28
Total Austria 5,083,465 7,856,223 0.28
BELGIUM
Anheuser-Busch InBev SA 17,385 EUR 1,256,080 1,057,182 0.04
KBC Group NV 78,275 EUR 4,947,187 5,033,082 0.18
Ontex Group NV 65,686 EUR 1,535,767 689,704 0.02
UCB SA 74,988 EUR 6,724,848 6,610,942 0.24
Total Belgium 14,463,882 13,390,910 0.48
BERMUDA
Arch Capital Group Ltd 47,659 USD 1,233,008 1,564,922 0.06
Brookfield Asset Management Reinsurance Partners Ltd 467 USD 19,864 20,485 -
Bunge Ltd 40,584 USD 2,593,163 2,674,458 0.10
Genpact Ltd 70,663 USD 1,858,778 2,706,991 0.10
IHS Markit Ltd 36,289 USD 2,430,979 3,447,440 0.12
Triton International Ltd 16,436 USD 448,762 725,407 0.03
Total Bermuda 8,584,554 11,139,703 0.41
CANADA
ARC Resources Ltd 91,455 CAD 319,601 657,031 0.02
Barrick Gold Corp 112,983 CAD 2,314,428 1,972,683 0.07
Brookfield Asset Management Inc 67,718 USD 2,411,060 2,911,092 0.10
CAE Inc 240,473 CAD 6,284,757 6,252,136 0.22
Canadian National Railway Co 82,141 CAD 7,943,036 7,315,781 0.26
Canadian Natural Resources Ltd 23,847 USD 368,323 729,547 0.03
Intact Financial Corp 23,744 CAD 2,088,930 2,723,002 0.10
Royal Bank of Canada 50,881 CAD 2,890,497 4,351,479 0.15
Suncor Energy Inc 49,005 CAD 760,376 990,779 0.04
Tourmaline Oil Corp 23,491 CAD 198,449 566,760 0.02
Total Canada 25,579,457 28,470,290 1.01
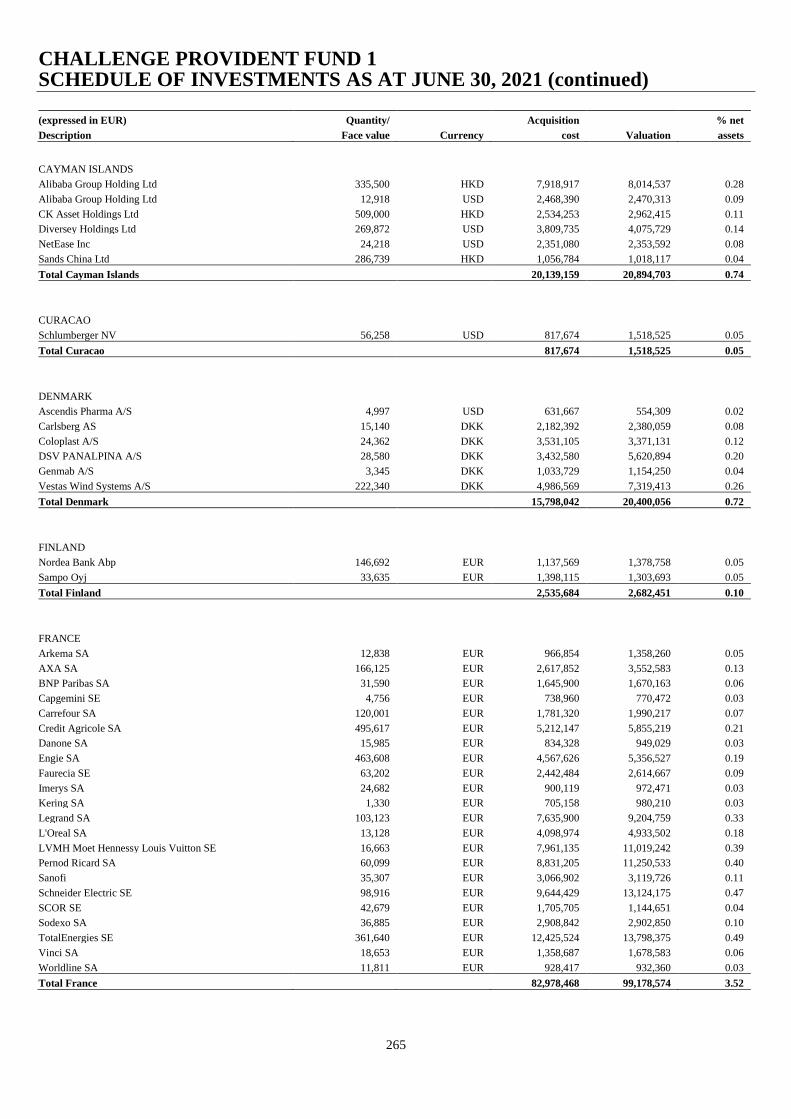
CHALLENGE PROVIDENT FUND 1 SCHEDULE OF INVESTMENTS AS AT JUNE 30, 2021 (continued)
265
(expressed in EUR) Quantity/ Acquisition % net
Description Face value Currency cost Valuation assets
CAYMAN ISLANDS
Alibaba Group Holding Ltd 335,500 HKD 7,918,917 8,014,537 0.28
Alibaba Group Holding Ltd 12,918 USD 2,468,390 2,470,313 0.09
CK Asset Holdings Ltd 509,000 HKD 2,534,253 2,962,415 0.11
Diversey Holdings Ltd 269,872 USD 3,809,735 4,075,729 0.14
NetEase Inc 24,218 USD 2,351,080 2,353,592 0.08
Sands China Ltd 286,739 HKD 1,056,784 1,018,117 0.04
Total Cayman Islands 20,139,159 20,894,703 0.74
CURACAO
Schlumberger NV 56,258 USD 817,674 1,518,525 0.05
Total Curacao 817,674 1,518,525 0.05
DENMARK
Ascendis Pharma A/S 4,997 USD 631,667 554,309 0.02
Carlsberg AS 15,140 DKK 2,182,392 2,380,059 0.08
Coloplast A/S 24,362 DKK 3,531,105 3,371,131 0.12
DSV PANALPINA A/S 28,580 DKK 3,432,580 5,620,894 0.20
Genmab A/S 3,345 DKK 1,033,729 1,154,250 0.04
Vestas Wind Systems A/S 222,340 DKK 4,986,569 7,319,413 0.26
Total Denmark 15,798,042 20,400,056 0.72
FINLAND
Nordea Bank Abp 146,692 EUR 1,137,569 1,378,758 0.05
Sampo Oyj 33,635 EUR 1,398,115 1,303,693 0.05
Total Finland 2,535,684 2,682,451 0.10
FRANCE
Arkema SA 12,838 EUR 966,854 1,358,260 0.05
AXA SA 166,125 EUR 2,617,852 3,552,583 0.13
BNP Paribas SA 31,590 EUR 1,645,900 1,670,163 0.06
Capgemini SE 4,756 EUR 738,960 770,472 0.03
Carrefour SA 120,001 EUR 1,781,320 1,990,217 0.07
Credit Agricole SA 495,617 EUR 5,212,147 5,855,219 0.21
Danone SA 15,985 EUR 834,328 949,029 0.03
Engie SA 463,608 EUR 4,567,626 5,356,527 0.19
Faurecia SE 63,202 EUR 2,442,484 2,614,667 0.09
Imerys SA 24,682 EUR 900,119 972,471 0.03
Kering SA 1,330 EUR 705,158 980,210 0.03
Legrand SA 103,123 EUR 7,635,900 9,204,759 0.33
L'Oreal SA 13,128 EUR 4,098,974 4,933,502 0.18
LVMH Moet Hennessy Louis Vuitton SE 16,663 EUR 7,961,135 11,019,242 0.39
Pernod Ricard SA 60,099 EUR 8,831,205 11,250,533 0.40
Sanofi 35,307 EUR 3,066,902 3,119,726 0.11
Schneider Electric SE 98,916 EUR 9,644,429 13,124,175 0.47
SCOR SE 42,679 EUR 1,705,705 1,144,651 0.04
Sodexo SA 36,885 EUR 2,908,842 2,902,850 0.10
TotalEnergies SE 361,640 EUR 12,425,524 13,798,375 0.49
Vinci SA 18,653 EUR 1,358,687 1,678,583 0.06
Worldline SA 11,811 EUR 928,417 932,360 0.03
Total France 82,978,468 99,178,574 3.52
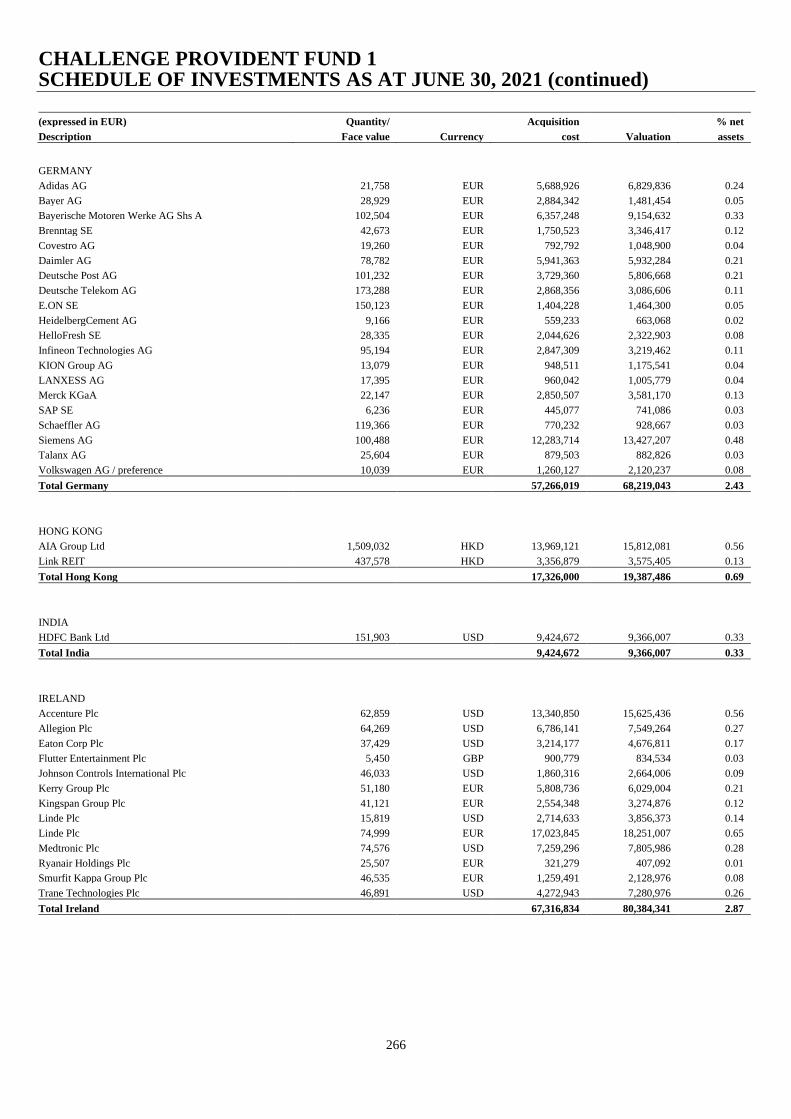
CHALLENGE PROVIDENT FUND 1 SCHEDULE OF INVESTMENTS AS AT JUNE 30, 2021 (continued)
266
(expressed in EUR) Quantity/ Acquisition % net
Description Face value Currency cost Valuation assets
GERMANY
Adidas AG 21,758 EUR 5,688,926 6,829,836 0.24
Bayer AG 28,929 EUR 2,884,342 1,481,454 0.05
Bayerische Motoren Werke AG Shs A 102,504 EUR 6,357,248 9,154,632 0.33
Brenntag SE 42,673 EUR 1,750,523 3,346,417 0.12
Covestro AG 19,260 EUR 792,792 1,048,900 0.04
Daimler AG 78,782 EUR 5,941,363 5,932,284 0.21
Deutsche Post AG 101,232 EUR 3,729,360 5,806,668 0.21
Deutsche Telekom AG 173,288 EUR 2,868,356 3,086,606 0.11
E.ON SE 150,123 EUR 1,404,228 1,464,300 0.05
HeidelbergCement AG 9,166 EUR 559,233 663,068 0.02
HelloFresh SE 28,335 EUR 2,044,626 2,322,903 0.08
Infineon Technologies AG 95,194 EUR 2,847,309 3,219,462 0.11
KION Group AG 13,079 EUR 948,511 1,175,541 0.04
LANXESS AG 17,395 EUR 960,042 1,005,779 0.04
Merck KGaA 22,147 EUR 2,850,507 3,581,170 0.13
SAP SE 6,236 EUR 445,077 741,086 0.03
Schaeffler AG 119,366 EUR 770,232 928,667 0.03
Siemens AG 100,488 EUR 12,283,714 13,427,207 0.48
Talanx AG 25,604 EUR 879,503 882,826 0.03
Volkswagen AG / preference 10,039 EUR 1,260,127 2,120,237 0.08
Total Germany 57,266,019 68,219,043 2.43
HONG KONG
AIA Group Ltd 1,509,032 HKD 13,969,121 15,812,081 0.56
Link REIT 437,578 HKD 3,356,879 3,575,405 0.13
Total Hong Kong 17,326,000 19,387,486 0.69
INDIA
HDFC Bank Ltd 151,903 USD 9,424,672 9,366,007 0.33
Total India 9,424,672 9,366,007 0.33
IRELAND
Accenture Plc 62,859 USD 13,340,850 15,625,436 0.56
Allegion Plc 64,269 USD 6,786,141 7,549,264 0.27
Eaton Corp Plc 37,429 USD 3,214,177 4,676,811 0.17
Flutter Entertainment Plc 5,450 GBP 900,779 834,534 0.03
Johnson Controls International Plc 46,033 USD 1,860,316 2,664,006 0.09
Kerry Group Plc 51,180 EUR 5,808,736 6,029,004 0.21
Kingspan Group Plc 41,121 EUR 2,554,348 3,274,876 0.12
Linde Plc 15,819 USD 2,714,633 3,856,373 0.14
Linde Plc 74,999 EUR 17,023,845 18,251,007 0.65
Medtronic Plc 74,576 USD 7,259,296 7,805,986 0.28
Ryanair Holdings Plc 25,507 EUR 321,279 407,092 0.01
Smurfit Kappa Group Plc 46,535 EUR 1,259,491 2,128,976 0.08
Trane Technologies Plc 46,891 USD 4,272,943 7,280,976 0.26
Total Ireland 67,316,834 80,384,341 2.87
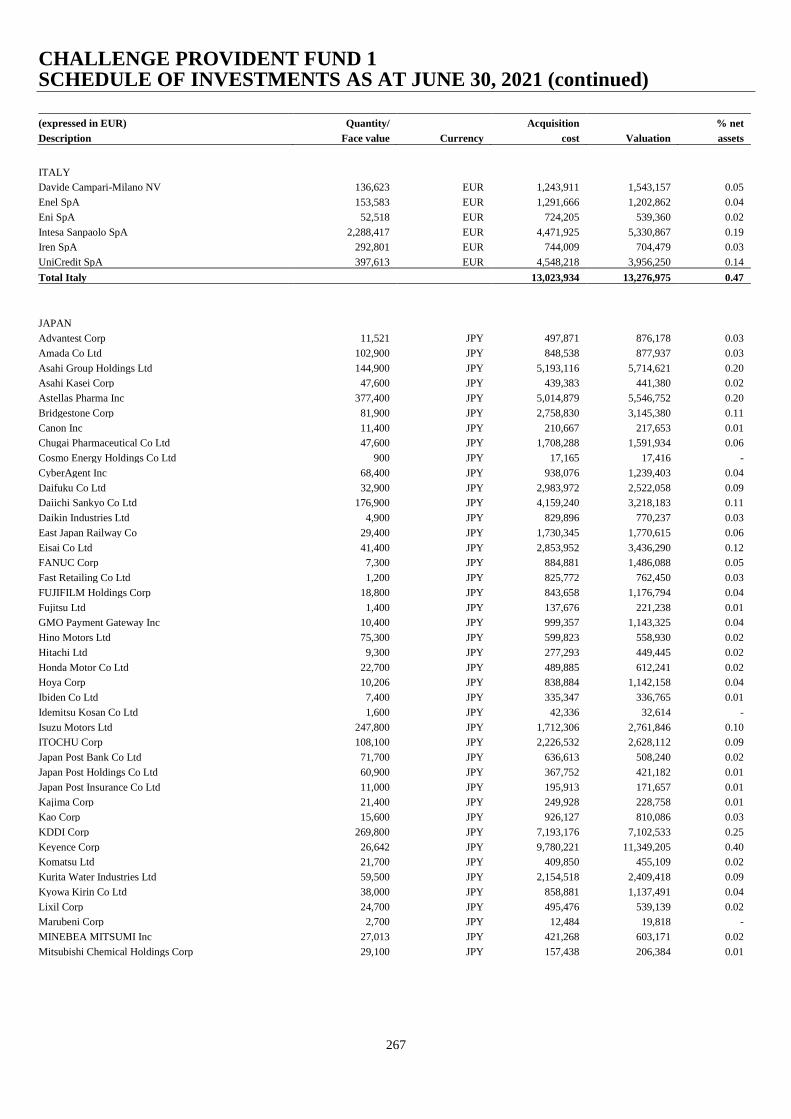
CHALLENGE PROVIDENT FUND 1 SCHEDULE OF INVESTMENTS AS AT JUNE 30, 2021 (continued)
267
(expressed in EUR) Quantity/ Acquisition % net
Description Face value Currency cost Valuation assets
ITALY
Davide Campari-Milano NV 136,623 EUR 1,243,911 1,543,157 0.05
Enel SpA 153,583 EUR 1,291,666 1,202,862 0.04
Eni SpA 52,518 EUR 724,205 539,360 0.02
Intesa Sanpaolo SpA 2,288,417 EUR 4,471,925 5,330,867 0.19
Iren SpA 292,801 EUR 744,009 704,479 0.03
UniCredit SpA 397,613 EUR 4,548,218 3,956,250 0.14
Total Italy 13,023,934 13,276,975 0.47
JAPAN
Advantest Corp 11,521 JPY 497,871 876,178 0.03
Amada Co Ltd 102,900 JPY 848,538 877,937 0.03
Asahi Group Holdings Ltd 144,900 JPY 5,193,116 5,714,621 0.20
Asahi Kasei Corp 47,600 JPY 439,383 441,380 0.02
Astellas Pharma Inc 377,400 JPY 5,014,879 5,546,752 0.20
Bridgestone Corp 81,900 JPY 2,758,830 3,145,380 0.11
Canon Inc 11,400 JPY 210,667 217,653 0.01
Chugai Pharmaceutical Co Ltd 47,600 JPY 1,708,288 1,591,934 0.06
Cosmo Energy Holdings Co Ltd 900 JPY 17,165 17,416 -
CyberAgent Inc 68,400 JPY 938,076 1,239,403 0.04
Daifuku Co Ltd 32,900 JPY 2,983,972 2,522,058 0.09
Daiichi Sankyo Co Ltd 176,900 JPY 4,159,240 3,218,183 0.11
Daikin Industries Ltd 4,900 JPY 829,896 770,237 0.03
East Japan Railway Co 29,400 JPY 1,730,345 1,770,615 0.06
Eisai Co Ltd 41,400 JPY 2,853,952 3,436,290 0.12
FANUC Corp 7,300 JPY 884,881 1,486,088 0.05
Fast Retailing Co Ltd 1,200 JPY 825,772 762,450 0.03
FUJIFILM Holdings Corp 18,800 JPY 843,658 1,176,794 0.04
Fujitsu Ltd 1,400 JPY 137,676 221,238 0.01
GMO Payment Gateway Inc 10,400 JPY 999,357 1,143,325 0.04
Hino Motors Ltd 75,300 JPY 599,823 558,930 0.02
Hitachi Ltd 9,300 JPY 277,293 449,445 0.02
Honda Motor Co Ltd 22,700 JPY 489,885 612,241 0.02
Hoya Corp 10,206 JPY 838,884 1,142,158 0.04
Ibiden Co Ltd 7,400 JPY 335,347 336,765 0.01
Idemitsu Kosan Co Ltd 1,600 JPY 42,336 32,614 -
Isuzu Motors Ltd 247,800 JPY 1,712,306 2,761,846 0.10
ITOCHU Corp 108,100 JPY 2,226,532 2,628,112 0.09
Japan Post Bank Co Ltd 71,700 JPY 636,613 508,240 0.02
Japan Post Holdings Co Ltd 60,900 JPY 367,752 421,182 0.01
Japan Post Insurance Co Ltd 11,000 JPY 195,913 171,657 0.01
Kajima Corp 21,400 JPY 249,928 228,758 0.01
Kao Corp 15,600 JPY 926,127 810,086 0.03
KDDI Corp 269,800 JPY 7,193,176 7,102,533 0.25
Keyence Corp 26,642 JPY 9,780,221 11,349,205 0.40
Komatsu Ltd 21,700 JPY 409,850 455,109 0.02
Kurita Water Industries Ltd 59,500 JPY 2,154,518 2,409,418 0.09
Kyowa Kirin Co Ltd 38,000 JPY 858,881 1,137,491 0.04
Lixil Corp 24,700 JPY 495,476 539,139 0.02
Marubeni Corp 2,700 JPY 12,484 19,818 -
MINEBEA MITSUMI Inc 27,013 JPY 421,268 603,171 0.02
Mitsubishi Chemical Holdings Corp 29,100 JPY 157,438 206,384 0.01
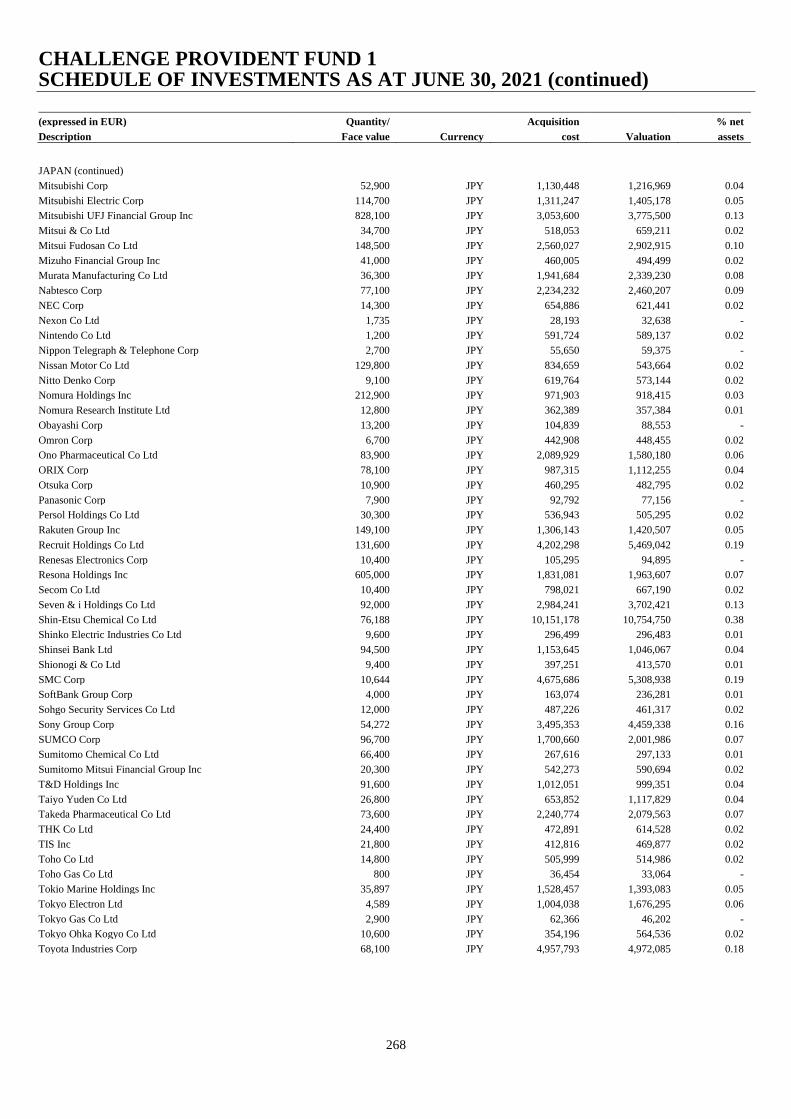
CHALLENGE PROVIDENT FUND 1 SCHEDULE OF INVESTMENTS AS AT JUNE 30, 2021 (continued)
268
(expressed in EUR) Quantity/ Acquisition % net
Description Face value Currency cost Valuation assets
JAPAN (continued)
Mitsubishi Corp 52,900 JPY 1,130,448 1,216,969 0.04
Mitsubishi Electric Corp 114,700 JPY 1,311,247 1,405,178 0.05
Mitsubishi UFJ Financial Group Inc 828,100 JPY 3,053,600 3,775,500 0.13
Mitsui & Co Ltd 34,700 JPY 518,053 659,211 0.02
Mitsui Fudosan Co Ltd 148,500 JPY 2,560,027 2,902,915 0.10
Mizuho Financial Group Inc 41,000 JPY 460,005 494,499 0.02
Murata Manufacturing Co Ltd 36,300 JPY 1,941,684 2,339,230 0.08
Nabtesco Corp 77,100 JPY 2,234,232 2,460,207 0.09
NEC Corp 14,300 JPY 654,886 621,441 0.02
Nexon Co Ltd 1,735 JPY 28,193 32,638 -
Nintendo Co Ltd 1,200 JPY 591,724 589,137 0.02
Nippon Telegraph & Telephone Corp 2,700 JPY 55,650 59,375 -
Nissan Motor Co Ltd 129,800 JPY 834,659 543,664 0.02
Nitto Denko Corp 9,100 JPY 619,764 573,144 0.02
Nomura Holdings Inc 212,900 JPY 971,903 918,415 0.03
Nomura Research Institute Ltd 12,800 JPY 362,389 357,384 0.01
Obayashi Corp 13,200 JPY 104,839 88,553 -
Omron Corp 6,700 JPY 442,908 448,455 0.02
Ono Pharmaceutical Co Ltd 83,900 JPY 2,089,929 1,580,180 0.06
ORIX Corp 78,100 JPY 987,315 1,112,255 0.04
Otsuka Corp 10,900 JPY 460,295 482,795 0.02
Panasonic Corp 7,900 JPY 92,792 77,156 -
Persol Holdings Co Ltd 30,300 JPY 536,943 505,295 0.02
Rakuten Group Inc 149,100 JPY 1,306,143 1,420,507 0.05
Recruit Holdings Co Ltd 131,600 JPY 4,202,298 5,469,042 0.19
Renesas Electronics Corp 10,400 JPY 105,295 94,895 -
Resona Holdings Inc 605,000 JPY 1,831,081 1,963,607 0.07
Secom Co Ltd 10,400 JPY 798,021 667,190 0.02
Seven & i Holdings Co Ltd 92,000 JPY 2,984,241 3,702,421 0.13
Shin-Etsu Chemical Co Ltd 76,188 JPY 10,151,178 10,754,750 0.38
Shinko Electric Industries Co Ltd 9,600 JPY 296,499 296,483 0.01
Shinsei Bank Ltd 94,500 JPY 1,153,645 1,046,067 0.04
Shionogi & Co Ltd 9,400 JPY 397,251 413,570 0.01
SMC Corp 10,644 JPY 4,675,686 5,308,938 0.19
SoftBank Group Corp 4,000 JPY 163,074 236,281 0.01
Sohgo Security Services Co Ltd 12,000 JPY 487,226 461,317 0.02
Sony Group Corp 54,272 JPY 3,495,353 4,459,338 0.16
SUMCO Corp 96,700 JPY 1,700,660 2,001,986 0.07
Sumitomo Chemical Co Ltd 66,400 JPY 267,616 297,133 0.01
Sumitomo Mitsui Financial Group Inc 20,300 JPY 542,273 590,694 0.02
T&D Holdings Inc 91,600 JPY 1,012,051 999,351 0.04
Taiyo Yuden Co Ltd 26,800 JPY 653,852 1,117,829 0.04
Takeda Pharmaceutical Co Ltd 73,600 JPY 2,240,774 2,079,563 0.07
THK Co Ltd 24,400 JPY 472,891 614,528 0.02
TIS Inc 21,800 JPY 412,816 469,877 0.02
Toho Co Ltd 14,800 JPY 505,999 514,986 0.02
Toho Gas Co Ltd 800 JPY 36,454 33,064 -
Tokio Marine Holdings Inc 35,897 JPY 1,528,457 1,393,083 0.05
Tokyo Electron Ltd 4,589 JPY 1,004,038 1,676,295 0.06
Tokyo Gas Co Ltd 2,900 JPY 62,366 46,202 -
Tokyo Ohka Kogyo Co Ltd 10,600 JPY 354,196 564,536 0.02
Toyota Industries Corp 68,100 JPY 4,957,793 4,972,085 0.18

CHALLENGE PROVIDENT FUND 1 SCHEDULE OF INVESTMENTS AS AT JUNE 30, 2021 (continued)
269
(expressed in EUR) Quantity/ Acquisition % net
Description Face value Currency cost Valuation assets
JAPAN (continued)
Toyota Motor Corp 29,700 JPY 1,664,075 2,191,007 0.08
Toyota Tsusho Corp 4,600 JPY 168,702 183,479 0.01
Yamaha Motor Co Ltd 58,600 JPY 748,484 1,344,537 0.05
Yaskawa Electric Corp 16,848 JPY 532,115 695,050 0.02
Total Japan 137,213,701 151,983,521 5.38
JERSEY
Aptiv Plc 53,683 USD 6,545,124 7,121,972 0.25
Sanne Group Plc 80,463 GBP 561,352 779,842 0.03
WPP Plc 599,639 GBP 4,472,882 6,804,953 0.24
Total Jersey 11,579,358 14,706,767 0.52
LUXEMBOURG
Ardagh Group SA 32,200 USD 366,189 665,776 0.02
Arrival SA 50,836 USD 640,679 671,726 0.02
Eurofins Scientific SE 75,540 EUR 6,526,836 7,282,056 0.26
Spotify Technology SA 16,132 USD 3,431,695 3,748,898 0.13
Total Luxembourg 10,965,399 12,368,456 0.43
NETHERLANDS
AerCap Holdings NV 43,820 USD 916,712 1,892,252 0.07
Airbus SE 74,398 EUR 6,148,590 8,067,719 0.29
Argenx SE 849 EUR 237,777 216,580 0.01
Argenx SE 631 USD 141,809 160,195 0.01
ASM International NV 9,990 EUR 1,006,116 2,767,230 0.10
ASML Holding NV 40,936 EUR 12,156,102 23,718,319 0.84
BE Semiconductor Industries NV 41,913 EUR 1,331,833 2,998,456 0.11
Heineken NV 105,552 EUR 9,732,152 10,787,414 0.38
IMCD NV 17,044 EUR 1,198,475 2,285,600 0.08
ING Groep NV 84,294 EUR 793,624 939,035 0.03
Koninklijke DSM NV 15,132 EUR 1,944,851 2,381,777 0.08
Koninklijke KPN NV 2,124,593 EUR 5,143,696 5,596,178 0.20
Koninklijke Philips NV 85,593 EUR 3,350,161 3,576,931 0.13
LyondellBasell Industries NV 50,349 USD 4,518,744 4,367,486 0.16
Stellantis NV 329,331 EUR 4,408,602 5,451,746 0.19
STMicroelectronics NV 172,499 EUR 4,902,423 5,279,332 0.19
Wolters Kluwer NV 53,424 EUR 3,671,807 4,526,081 0.16
Total Netherlands 61,603,474 85,012,331 3.03
NORWAY
DNB ASA 198,329 NOK 2,629,917 3,645,950 0.13
Equinor ASA 647,371 NOK 8,856,337 11,557,014 0.41
Norsk Hydro ASA 165,550 NOK 864,720 891,271 0.03
Total Norway 12,350,974 16,094,235 0.57

CHALLENGE PROVIDENT FUND 1 SCHEDULE OF INVESTMENTS AS AT JUNE 30, 2021 (continued)
270
(expressed in EUR) Quantity/ Acquisition % net
Description Face value Currency cost Valuation assets
PANAMA
Carnival Corp 85,655 USD 1,923,214 1,903,926 0.07
Total Panama 1,923,214 1,903,926 0.07
PORTUGAL
EDP - Energias de Portugal SA 406,081 EUR 1,930,482 1,815,182 0.06
Total Portugal 1,930,482 1,815,182 0.06
SINGAPORE
Flex Ltd 252,399 USD 3,775,598 3,803,331 0.14
United Overseas Bank Ltd 116,800 SGD 1,476,371 1,891,852 0.07
Total Singapore 5,251,969 5,695,183 0.21
SOUTH KOREA
LG Chem Ltd Shs A 2,975 KRW 1,813,795 1,893,524 0.07
Samsung Electronics Co Ltd Shs B / preference 209,417 KRW 11,828,657 11,556,979 0.41
Total South Korea 13,642,452 13,450,503 0.48
SPAIN
Amadeus IT Group SA 12,110 EUR 692,313 718,365 0.03
Cellnex Telecom SA 260,730 EUR 11,519,963 14,006,415 0.50
Corp ACCIONA Energias Renovables SA 917 EUR 24,511 24,511 -
Iberdrola SA 522,169 EUR 5,104,436 5,367,897 0.19
International Consolidated Airlines Group SA 221,966 EUR 617,700 449,259 0.02
Repsol SA 52,363 EUR 590,420 552,639 0.02
Total Spain 18,549,343 21,119,086 0.76
SWEDEN
Hexagon AB 358,232 SEK 2,950,527 4,478,798 0.16
Investor AB 265,720 SEK 1,328,789 5,167,960 0.18
Lundin Energy AB 6,812 SEK 136,801 203,380 0.01
Sandvik AB 293,589 SEK 5,756,833 6,328,019 0.23
Swedish Match AB 513,380 SEK 3,461,729 3,694,202 0.13
Volvo AB 277,607 SEK 4,426,758 5,635,917 0.20
Total Sweden 18,061,437 25,508,276 0.91
SWITZERLAND
Chubb Ltd 54,404 USD 6,855,768 7,291,485 0.26
Coca-Cola HBC AG 111,879 GBP 2,930,616 3,406,758 0.12
Holcim Ltd 30,464 CHF 1,554,229 1,542,394 0.05
Lonza Group AG 3,253 CHF 1,645,808 1,946,126 0.07
Nestle SA 247,865 CHF 24,798,258 26,053,042 0.93
Roche Holding AG 30,310 CHF 9,139,729 9,637,544 0.34
Sika AG 22,315 CHF 4,208,292 6,157,971 0.22
Straumann Holding AG 1,922 CHF 1,619,435 2,586,192 0.09
Total Switzerland 52,752,135 58,621,512 2.08
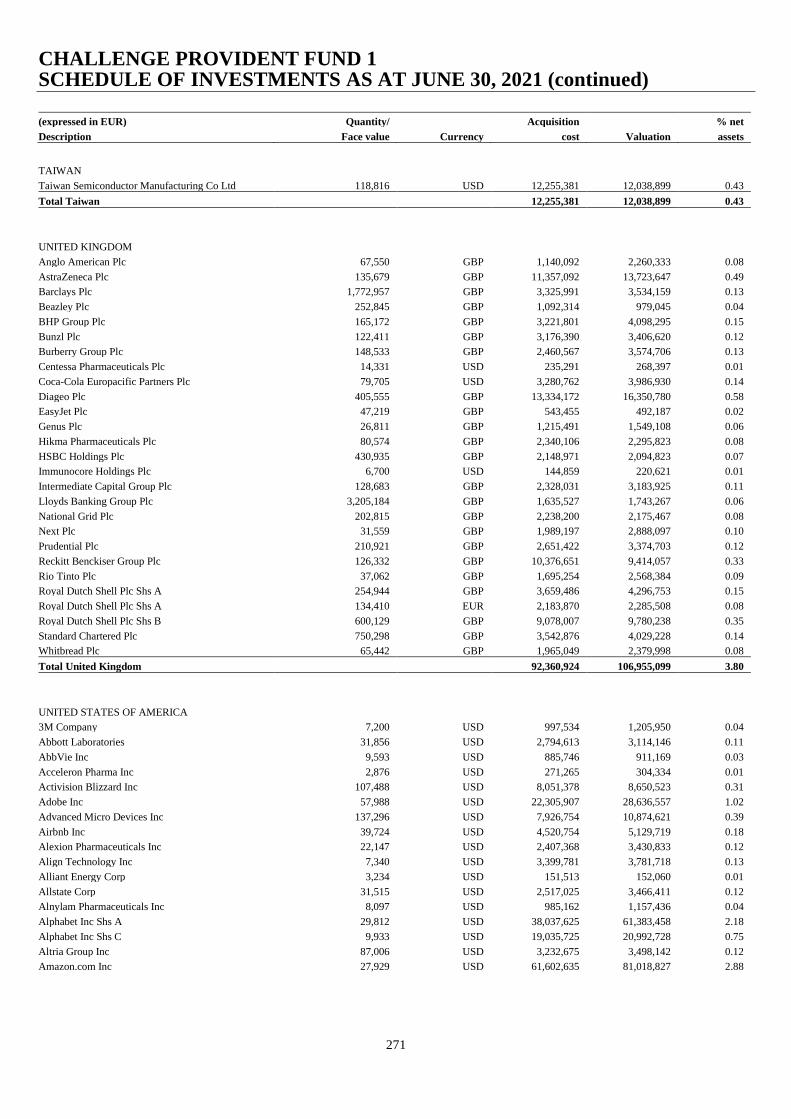
CHALLENGE PROVIDENT FUND 1 SCHEDULE OF INVESTMENTS AS AT JUNE 30, 2021 (continued)
271
(expressed in EUR) Quantity/ Acquisition % net
Description Face value Currency cost Valuation assets
TAIWAN
Taiwan Semiconductor Manufacturing Co Ltd 118,816 USD 12,255,381 12,038,899 0.43
Total Taiwan 12,255,381 12,038,899 0.43
UNITED KINGDOM
Anglo American Plc 67,550 GBP 1,140,092 2,260,333 0.08
AstraZeneca Plc 135,679 GBP 11,357,092 13,723,647 0.49
Barclays Plc 1,772,957 GBP 3,325,991 3,534,159 0.13
Beazley Plc 252,845 GBP 1,092,314 979,045 0.04
BHP Group Plc 165,172 GBP 3,221,801 4,098,295 0.15
Bunzl Plc 122,411 GBP 3,176,390 3,406,620 0.12
Burberry Group Plc 148,533 GBP 2,460,567 3,574,706 0.13
Centessa Pharmaceuticals Plc 14,331 USD 235,291 268,397 0.01
Coca-Cola Europacific Partners Plc 79,705 USD 3,280,762 3,986,930 0.14
Diageo Plc 405,555 GBP 13,334,172 16,350,780 0.58
EasyJet Plc 47,219 GBP 543,455 492,187 0.02
Genus Plc 26,811 GBP 1,215,491 1,549,108 0.06
Hikma Pharmaceuticals Plc 80,574 GBP 2,340,106 2,295,823 0.08
HSBC Holdings Plc 430,935 GBP 2,148,971 2,094,823 0.07
Immunocore Holdings Plc 6,700 USD 144,859 220,621 0.01
Intermediate Capital Group Plc 128,683 GBP 2,328,031 3,183,925 0.11
Lloyds Banking Group Plc 3,205,184 GBP 1,635,527 1,743,267 0.06
National Grid Plc 202,815 GBP 2,238,200 2,175,467 0.08
Next Plc 31,559 GBP 1,989,197 2,888,097 0.10
Prudential Plc 210,921 GBP 2,651,422 3,374,703 0.12
Reckitt Benckiser Group Plc 126,332 GBP 10,376,651 9,414,057 0.33
Rio Tinto Plc 37,062 GBP 1,695,254 2,568,384 0.09
Royal Dutch Shell Plc Shs A 254,944 GBP 3,659,486 4,296,753 0.15
Royal Dutch Shell Plc Shs A 134,410 EUR 2,183,870 2,285,508 0.08
Royal Dutch Shell Plc Shs B 600,129 GBP 9,078,007 9,780,238 0.35
Standard Chartered Plc 750,298 GBP 3,542,876 4,029,228 0.14
Whitbread Plc 65,442 GBP 1,965,049 2,379,998 0.08
Total United Kingdom 92,360,924 106,955,099 3.80
UNITED STATES OF AMERICA
3M Company 7,200 USD 997,534 1,205,950 0.04
Abbott Laboratories 31,856 USD 2,794,613 3,114,146 0.11
AbbVie Inc 9,593 USD 885,746 911,169 0.03
Acceleron Pharma Inc 2,876 USD 271,265 304,334 0.01
Activision Blizzard Inc 107,488 USD 8,051,378 8,650,523 0.31
Adobe Inc 57,988 USD 22,305,907 28,636,557 1.02
Advanced Micro Devices Inc 137,296 USD 7,926,754 10,874,621 0.39
Airbnb Inc 39,724 USD 4,520,754 5,129,719 0.18
Alexion Pharmaceuticals Inc 22,147 USD 2,407,368 3,430,833 0.12
Align Technology Inc 7,340 USD 3,399,781 3,781,718 0.13
Alliant Energy Corp 3,234 USD 151,513 152,060 0.01
Allstate Corp 31,515 USD 2,517,025 3,466,411 0.12
Alnylam Pharmaceuticals Inc 8,097 USD 985,162 1,157,436 0.04
Alphabet Inc Shs A 29,812 USD 38,037,625 61,383,458 2.18
Alphabet Inc Shs C 9,933 USD 19,035,725 20,992,728 0.75
Altria Group Inc 87,006 USD 3,232,675 3,498,142 0.12
Amazon.com Inc 27,929 USD 61,602,635 81,018,827 2.88

CHALLENGE PROVIDENT FUND 1 SCHEDULE OF INVESTMENTS AS AT JUNE 30, 2021 (continued)
272
(expressed in EUR) Quantity/ Acquisition % net
Description Face value Currency cost Valuation assets
UNITED STATES OF AMERICA (continued)
Ameren Corp 36,464 USD 2,496,383 2,461,066 0.09
American Express Co 98,772 USD 10,764,117 13,761,782 0.49
American International Group Inc 84,740 USD 2,753,268 3,401,319 0.12
American Tower Corp 30,862 USD 6,698,605 7,030,155 0.25
Ameriprise Financial Inc 21,010 USD 3,358,449 4,409,283 0.16
AMETEK Inc 25,493 USD 2,171,433 2,869,817 0.10
ANSYS Inc 23,475 USD 7,241,687 6,870,085 0.24
Anthem Inc 20,285 USD 4,891,668 6,530,748 0.23
Apple Inc 619,817 USD 41,739,156 71,582,878 2.55
Applied Materials Inc 19,881 USD 2,349,335 2,387,262 0.08
Arena Pharmaceuticals Inc 6,098 USD 383,658 350,690 0.01
Ares Management Corp 107,451 USD 3,768,074 5,761,708 0.20
Aspen Technology Inc 23,968 USD 2,349,394 2,779,795 0.10
Assurant Inc 11,701 USD 1,164,247 1,540,992 0.06
Atmos Energy Corp 16,649 USD 1,416,540 1,349,300 0.05
Avalara Inc 18,067 USD 2,038,732 2,464,998 0.09
Avery Dennison Corp 38,040 USD 5,070,944 6,743,848 0.24
Ball Corp 28,487 USD 1,742,911 1,946,215 0.07
Bank of America Corp 388,636 USD 13,081,675 13,511,647 0.48
Becton Dickinson and Co 63,486 USD 13,172,009 13,018,940 0.46
Berkshire Hathaway Inc 2,609 USD 559,132 611,429 0.02
Biogen Inc 12,704 USD 3,007,573 3,709,431 0.13
Bio-Rad Laboratories Inc 13,919 USD 6,960,092 7,562,081 0.27
Black Knight Inc 29,614 USD 1,913,839 1,947,297 0.07
BlackRock Inc 16,456 USD 8,617,714 12,141,417 0.43
Boeing Co 8,021 USD 1,300,468 1,620,297 0.06
Booking Holdings Inc 6,210 USD 9,923,212 11,457,998 0.41
Boston Beer Co Inc 2,399 USD 2,346,579 2,065,013 0.07
Boston Scientific Corp 143,277 USD 4,287,923 5,166,139 0.18
Bristol-Myers Squibb Co 111,273 USD 5,730,175 6,269,721 0.22
Broadcom Inc 8,530 USD 2,741,566 3,429,838 0.12
Broadridge Financial Solutions Inc 20,806 USD 2,428,689 2,833,960 0.10
Cabot Oil & Gas Corp 283,808 USD 4,531,130 4,178,504 0.15
Catalent Inc 17,661 USD 1,554,721 1,610,176 0.06
Cboe Global Markets Inc 9,223 USD 684,326 925,878 0.03
CBRE Group Inc 74,556 USD 4,133,683 5,389,734 0.19
Celanese Corp 36,181 USD 2,850,529 4,625,213 0.16
Centene Corp 60,987 USD 3,596,055 3,750,554 0.13
Charles Schwab Corp 404,961 USD 19,620,075 24,863,151 0.88
Charter Communications Inc 25,023 USD 11,912,784 15,222,905 0.54
Chesapeake Energy Corp 6,851 USD 269,937 299,944 0.01
Chipotle Mexican Grill Inc 5,948 USD 7,008,138 7,775,885 0.28
Church & Dwight Co Inc 73,172 USD 5,444,409 5,258,216 0.19
Churchill Downs Inc 18,016 USD 3,299,611 3,011,934 0.11
Cimarex Energy Co 13,065 USD 325,921 798,178 0.03
Cintas Corp 10,091 USD 2,707,516 3,250,495 0.12
Cisco Systems Inc 183,441 USD 7,246,095 8,198,307 0.29
Citigroup Inc 21,791 USD 1,410,580 1,300,036 0.05
CME Group Inc 90,595 USD 15,776,530 16,247,360 0.58
CMS Energy Corp 22,249 USD 1,168,733 1,108,416 0.04
Coca-Cola Co 79,575 USD 3,576,077 3,630,832 0.13
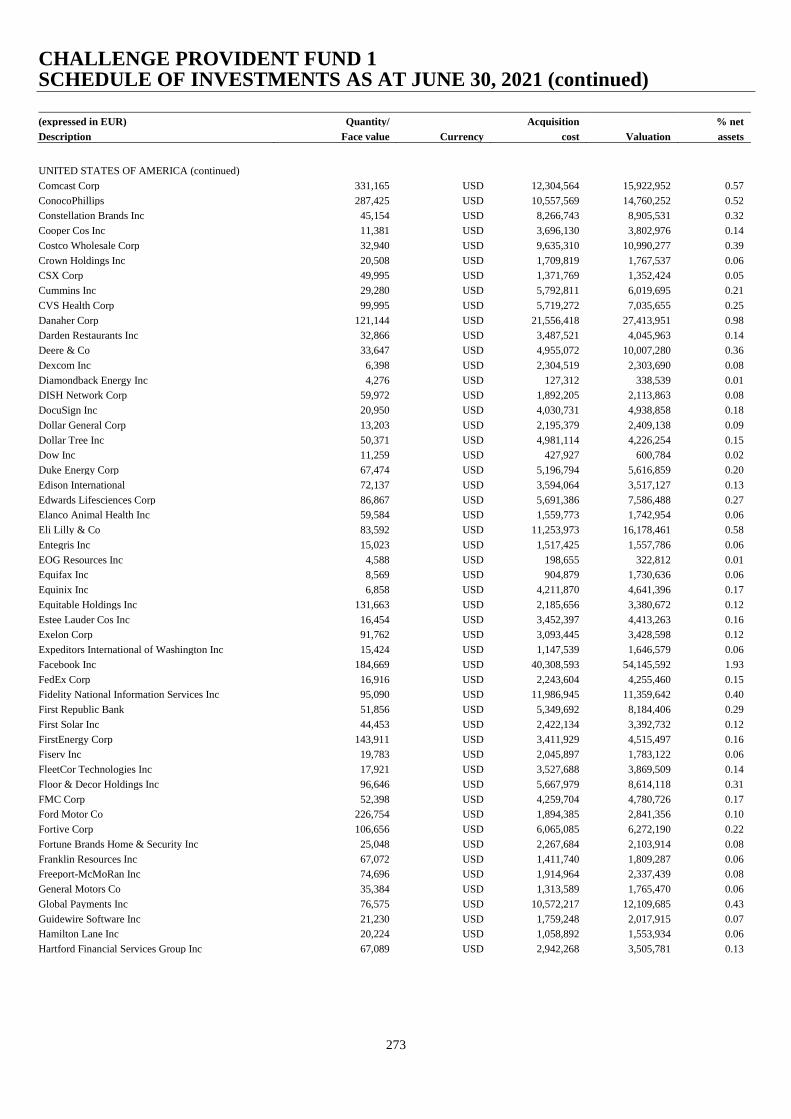
CHALLENGE PROVIDENT FUND 1 SCHEDULE OF INVESTMENTS AS AT JUNE 30, 2021 (continued)
273
(expressed in EUR) Quantity/ Acquisition % net
Description Face value Currency cost Valuation assets
UNITED STATES OF AMERICA (continued)
Comcast Corp 331,165 USD 12,304,564 15,922,952 0.57
ConocoPhillips 287,425 USD 10,557,569 14,760,252 0.52
Constellation Brands Inc 45,154 USD 8,266,743 8,905,531 0.32
Cooper Cos Inc 11,381 USD 3,696,130 3,802,976 0.14
Costco Wholesale Corp 32,940 USD 9,635,310 10,990,277 0.39
Crown Holdings Inc 20,508 USD 1,709,819 1,767,537 0.06
CSX Corp 49,995 USD 1,371,769 1,352,424 0.05
Cummins Inc 29,280 USD 5,792,811 6,019,695 0.21
CVS Health Corp 99,995 USD 5,719,272 7,035,655 0.25
Danaher Corp 121,144 USD 21,556,418 27,413,951 0.98
Darden Restaurants Inc 32,866 USD 3,487,521 4,045,963 0.14
Deere & Co 33,647 USD 4,955,072 10,007,280 0.36
Dexcom Inc 6,398 USD 2,304,519 2,303,690 0.08
Diamondback Energy Inc 4,276 USD 127,312 338,539 0.01
DISH Network Corp 59,972 USD 1,892,205 2,113,863 0.08
DocuSign Inc 20,950 USD 4,030,731 4,938,858 0.18
Dollar General Corp 13,203 USD 2,195,379 2,409,138 0.09
Dollar Tree Inc 50,371 USD 4,981,114 4,226,254 0.15
Dow Inc 11,259 USD 427,927 600,784 0.02
Duke Energy Corp 67,474 USD 5,196,794 5,616,859 0.20
Edison International 72,137 USD 3,594,064 3,517,127 0.13
Edwards Lifesciences Corp 86,867 USD 5,691,386 7,586,488 0.27
Elanco Animal Health Inc 59,584 USD 1,559,773 1,742,954 0.06
Eli Lilly & Co 83,592 USD 11,253,973 16,178,461 0.58
Entegris Inc 15,023 USD 1,517,425 1,557,786 0.06
EOG Resources Inc 4,588 USD 198,655 322,812 0.01
Equifax Inc 8,569 USD 904,879 1,730,636 0.06
Equinix Inc 6,858 USD 4,211,870 4,641,396 0.17
Equitable Holdings Inc 131,663 USD 2,185,656 3,380,672 0.12
Estee Lauder Cos Inc 16,454 USD 3,452,397 4,413,263 0.16
Exelon Corp 91,762 USD 3,093,445 3,428,598 0.12
Expeditors International of Washington Inc 15,424 USD 1,147,539 1,646,579 0.06
Facebook Inc 184,669 USD 40,308,593 54,145,592 1.93
FedEx Corp 16,916 USD 2,243,604 4,255,460 0.15
Fidelity National Information Services Inc 95,090 USD 11,986,945 11,359,642 0.40
First Republic Bank 51,856 USD 5,349,692 8,184,406 0.29
First Solar Inc 44,453 USD 2,422,134 3,392,732 0.12
FirstEnergy Corp 143,911 USD 3,411,929 4,515,497 0.16
Fiserv Inc 19,783 USD 2,045,897 1,783,122 0.06
FleetCor Technologies Inc 17,921 USD 3,527,688 3,869,509 0.14
Floor & Decor Holdings Inc 96,646 USD 5,667,979 8,614,118 0.31
FMC Corp 52,398 USD 4,259,704 4,780,726 0.17
Ford Motor Co 226,754 USD 1,894,385 2,841,356 0.10
Fortive Corp 106,656 USD 6,065,085 6,272,190 0.22
Fortune Brands Home & Security Inc 25,048 USD 2,267,684 2,103,914 0.08
Franklin Resources Inc 67,072 USD 1,411,740 1,809,287 0.06
Freeport-McMoRan Inc 74,696 USD 1,914,964 2,337,439 0.08
General Motors Co 35,384 USD 1,313,589 1,765,470 0.06
Global Payments Inc 76,575 USD 10,572,217 12,109,685 0.43
Guidewire Software Inc 21,230 USD 1,759,248 2,017,915 0.07
Hamilton Lane Inc 20,224 USD 1,058,892 1,553,934 0.06
Hartford Financial Services Group Inc 67,089 USD 2,942,268 3,505,781 0.13

CHALLENGE PROVIDENT FUND 1 SCHEDULE OF INVESTMENTS AS AT JUNE 30, 2021 (continued)
274
(expressed in EUR) Quantity/ Acquisition % net
Description Face value Currency cost Valuation assets
UNITED STATES OF AMERICA (continued)
HCA Healthcare Inc 65,194 USD 7,101,469 11,365,383 0.40
Hershey Co 22,910 USD 2,800,772 3,364,924 0.12
Hologic Inc 43,152 USD 2,255,676 2,427,778 0.09
Home Depot Inc 11,274 USD 2,436,453 3,031,593 0.11
Honeywell International Inc 21,649 USD 3,630,018 4,004,307 0.14
Host Hotels & Resorts Inc 147,342 USD 2,128,490 2,123,345 0.08
Humana Inc 6,146 USD 2,102,868 2,294,424 0.08
Incyte Corp 11,203 USD 846,744 794,762 0.03
Ingersoll Rand Inc 93,825 USD 2,698,238 3,861,707 0.14
Insulet Corp 10,886 USD 2,313,369 2,519,872 0.09
Intel Corp 30,692 USD 1,449,321 1,452,946 0.05
Intercontinental Exchange Inc 94,156 USD 7,893,129 9,424,334 0.34
International Business Machines Corp 19,798 USD 2,269,697 2,447,246 0.09
Intuit Inc 16,512 USD 4,404,138 6,824,932 0.24
Jacobs Engineering Group Inc 6,894 USD 771,293 775,611 0.03
JB Hunt Transport Services Inc 14,309 USD 1,553,830 1,966,145 0.07
Johnson & Johnson 46,693 USD 5,848,767 6,486,386 0.23
JPMorgan Chase & Co 160,648 USD 14,190,048 21,070,234 0.75
Kennametal Inc 14,600 USD 350,834 442,223 0.02
Keurig Dr Pepper Inc 49,663 USD 1,470,933 1,475,777 0.05
KLA Corp 10,038 USD 1,409,329 2,744,262 0.10
Knight-Swift Transportation Holdings Inc 29,200 USD 1,176,750 1,119,346 0.04
Kodiak Sciences Inc 3,352 USD 319,602 262,869 0.01
Kroger Co 79,951 USD 2,162,756 2,582,783 0.09
Laboratory Corp of America Holdings 2,871 USD 484,697 667,818 0.02
Lam Research Corp 13,356 USD 4,374,594 7,328,400 0.26
Lamb Weston Holdings Inc 25,797 USD 1,669,563 1,754,605 0.06
Lennar Corp 3,347 USD 207,265 280,398 0.01
Livent Corp 50,885 USD 458,905 830,705 0.03
Lockheed Martin Corp 15,244 USD 4,969,699 4,863,452 0.17
Lowe's Cos Inc 53,890 USD 7,745,926 8,814,439 0.31
Lumentum Holdings Inc 42,539 USD 3,008,494 2,942,469 0.10
Magnolia Oil & Gas Corp 16,200 USD 58,751 213,514 0.01
Marathon Petroleum Corp 60,308 USD 1,361,913 3,072,611 0.11
Marsh & McLennan Cos Inc 96,778 USD 9,914,207 11,480,503 0.41
Marvell Technology Inc 285,457 USD 8,586,186 14,040,566 0.50
Masco Corp 47,210 USD 2,226,621 2,345,173 0.08
Mastercard Inc 72,359 USD 21,437,954 22,276,369 0.79
Match Group Inc 38,128 USD 4,614,637 5,184,366 0.18
McDonald's Corp 10,576 USD 1,936,753 2,059,997 0.07
McKesson Corp 4,097 USD 510,799 660,688 0.02
MercadoLibre Inc 2,240 USD 3,283,867 2,942,448 0.10
Merck & Co Inc 49,215 USD 3,195,123 3,227,465 0.12
MetLife Inc 49,935 USD 1,969,468 2,520,120 0.09
Micron Technology Inc 101,672 USD 4,478,890 7,285,679 0.26
Microsoft Corp 373,982 USD 58,767,754 85,430,241 3.04
Mirati Therapeutics Inc 2,593 USD 440,941 353,189 0.01
Mondelez International Inc 128,531 USD 6,693,863 6,767,414 0.24
Monster Beverage Corp 60,755 USD 4,549,003 4,679,964 0.17
Morgan Stanley 218,860 USD 10,365,525 16,921,556 0.60
MSCI Inc 10,038 USD 3,111,800 4,512,233 0.16
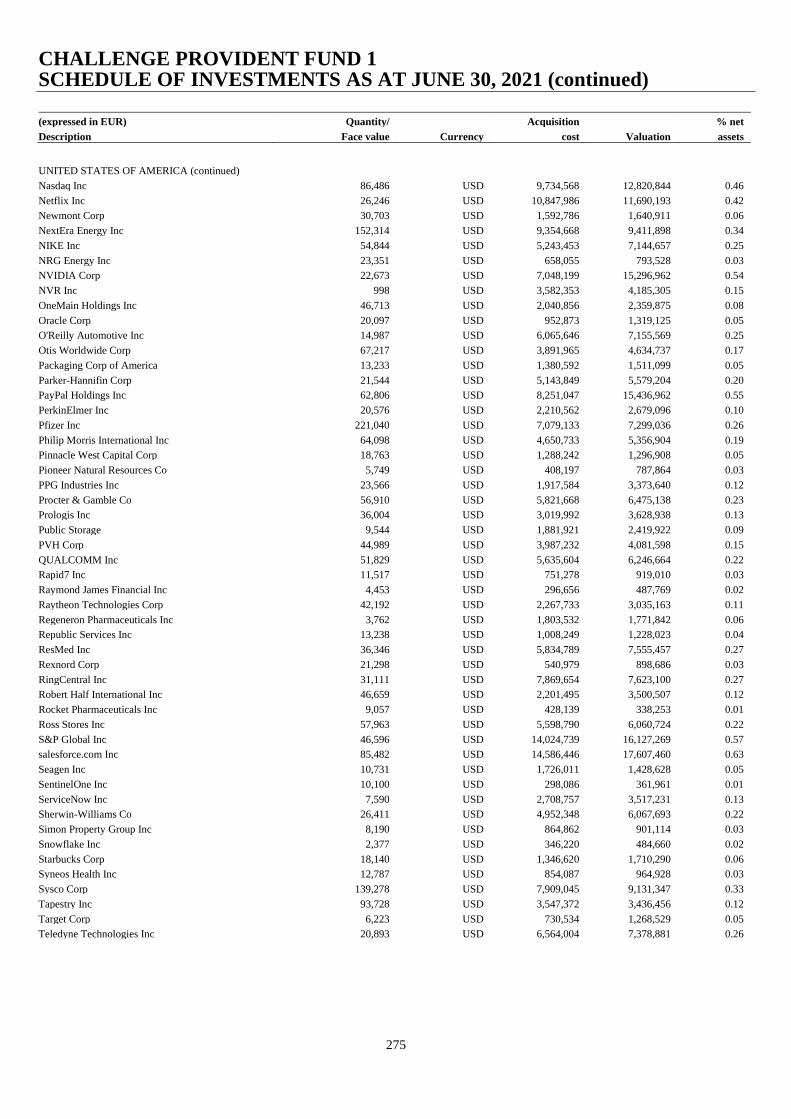
CHALLENGE PROVIDENT FUND 1 SCHEDULE OF INVESTMENTS AS AT JUNE 30, 2021 (continued)
275
(expressed in EUR) Quantity/ Acquisition % net
Description Face value Currency cost Valuation assets
UNITED STATES OF AMERICA (continued)
Nasdaq Inc 86,486 USD 9,734,568 12,820,844 0.46
Netflix Inc 26,246 USD 10,847,986 11,690,193 0.42
Newmont Corp 30,703 USD 1,592,786 1,640,911 0.06
NextEra Energy Inc 152,314 USD 9,354,668 9,411,898 0.34
NIKE Inc 54,844 USD 5,243,453 7,144,657 0.25
NRG Energy Inc 23,351 USD 658,055 793,528 0.03
NVIDIA Corp 22,673 USD 7,048,199 15,296,962 0.54
NVR Inc 998 USD 3,582,353 4,185,305 0.15
OneMain Holdings Inc 46,713 USD 2,040,856 2,359,875 0.08
Oracle Corp 20,097 USD 952,873 1,319,125 0.05
O'Reilly Automotive Inc 14,987 USD 6,065,646 7,155,569 0.25
Otis Worldwide Corp 67,217 USD 3,891,965 4,634,737 0.17
Packaging Corp of America 13,233 USD 1,380,592 1,511,099 0.05
Parker-Hannifin Corp 21,544 USD 5,143,849 5,579,204 0.20
PayPal Holdings Inc 62,806 USD 8,251,047 15,436,962 0.55
PerkinElmer Inc 20,576 USD 2,210,562 2,679,096 0.10
Pfizer Inc 221,040 USD 7,079,133 7,299,036 0.26
Philip Morris International Inc 64,098 USD 4,650,733 5,356,904 0.19
Pinnacle West Capital Corp 18,763 USD 1,288,242 1,296,908 0.05
Pioneer Natural Resources Co 5,749 USD 408,197 787,864 0.03
PPG Industries Inc 23,566 USD 1,917,584 3,373,640 0.12
Procter & Gamble Co 56,910 USD 5,821,668 6,475,138 0.23
Prologis Inc 36,004 USD 3,019,992 3,628,938 0.13
Public Storage 9,544 USD 1,881,921 2,419,922 0.09
PVH Corp 44,989 USD 3,987,232 4,081,598 0.15
QUALCOMM Inc 51,829 USD 5,635,604 6,246,664 0.22
Rapid7 Inc 11,517 USD 751,278 919,010 0.03
Raymond James Financial Inc 4,453 USD 296,656 487,769 0.02
Raytheon Technologies Corp 42,192 USD 2,267,733 3,035,163 0.11
Regeneron Pharmaceuticals Inc 3,762 USD 1,803,532 1,771,842 0.06
Republic Services Inc 13,238 USD 1,008,249 1,228,023 0.04
ResMed Inc 36,346 USD 5,834,789 7,555,457 0.27
Rexnord Corp 21,298 USD 540,979 898,686 0.03
RingCentral Inc 31,111 USD 7,869,654 7,623,100 0.27
Robert Half International Inc 46,659 USD 2,201,495 3,500,507 0.12
Rocket Pharmaceuticals Inc 9,057 USD 428,139 338,253 0.01
Ross Stores Inc 57,963 USD 5,598,790 6,060,724 0.22
S&P Global Inc 46,596 USD 14,024,739 16,127,269 0.57
salesforce.com Inc 85,482 USD 14,586,446 17,607,460 0.63
Seagen Inc 10,731 USD 1,726,011 1,428,628 0.05
SentinelOne Inc 10,100 USD 298,086 361,961 0.01
ServiceNow Inc 7,590 USD 2,708,757 3,517,231 0.13
Sherwin-Williams Co 26,411 USD 4,952,348 6,067,693 0.22
Simon Property Group Inc 8,190 USD 864,862 901,114 0.03
Snowflake Inc 2,377 USD 346,220 484,660 0.02
Starbucks Corp 18,140 USD 1,346,620 1,710,290 0.06
Syneos Health Inc 12,787 USD 854,087 964,928 0.03
Sysco Corp 139,278 USD 7,909,045 9,131,347 0.33
Tapestry Inc 93,728 USD 3,547,372 3,436,456 0.12
Target Corp 6,223 USD 730,534 1,268,529 0.05
Teledyne Technologies Inc 20,893 USD 6,564,004 7,378,881 0.26

CHALLENGE PROVIDENT FUND 1 SCHEDULE OF INVESTMENTS AS AT JUNE 30, 2021 (continued)
276
(expressed in EUR) Quantity/ Acquisition % net
Description Face value Currency cost Valuation assets
UNITED STATES OF AMERICA (continued)
Teleflex Inc 13,453 USD 4,286,504 4,557,957 0.16
Teradyne Inc 35,462 USD 2,452,739 4,005,810 0.14
Tesla Inc 10,516 USD 2,762,618 6,027,258 0.21
Texas Instruments Inc 87,642 USD 9,594,531 14,211,617 0.51
Thermo Fisher Scientific Inc 31,299 USD 10,282,754 13,314,281 0.47
TJX Cos Inc 137,182 USD 6,631,442 7,798,980 0.28
T-Mobile US Inc 93,783 USD 9,123,780 11,453,404 0.41
Tractor Supply Co 36,929 USD 4,791,969 5,793,920 0.21
TransUnion 7,510 USD 450,196 695,399 0.02
Travelers Cos Inc 4,574 USD 465,942 577,429 0.02
Trimble Inc 36,351 USD 1,952,203 2,508,308 0.09
TriNet Group Inc 44,755 USD 1,662,666 2,735,342 0.10
Tyler Technologies Inc 10,576 USD 3,292,889 4,034,291 0.14
UiPath Inc 2,016 USD 93,857 115,479 -
Union Pacific Corp 59,293 USD 8,959,670 10,996,129 0.39
UnitedHealth Group Inc 68,429 USD 18,359,639 23,106,256 0.82
US Bancorp 125,099 USD 4,947,442 6,009,689 0.21
US Foods Holding Corp 111,264 USD 3,370,639 3,599,028 0.13
Varonis Systems Inc 24,407 USD 1,077,935 1,185,877 0.04
Verizon Communications Inc 72,088 USD 3,684,135 3,405,929 0.12
Vertex Pharmaceuticals Inc 31,999 USD 6,767,113 5,440,559 0.19
VICI Properties Inc 114,303 USD 2,751,550 2,989,863 0.11
Visa Inc 163,309 USD 27,308,471 32,199,098 1.15
Visteon Corp 24,010 USD 2,414,350 2,448,579 0.09
Vulcan Materials Co 41,889 USD 5,013,002 6,148,594 0.22
Walt Disney Co 118,399 USD 15,776,441 17,548,690 0.62
Waste Management Inc 13,248 USD 1,362,636 1,565,206 0.06
Welltower Inc 12,051 USD 805,095 844,454 0.03
West Pharmaceutical Services Inc 44,851 USD 10,631,227 13,581,241 0.48
Westinghouse Air Brake Technologies Corp 75,351 USD 4,417,259 5,229,267 0.19
WEX Inc 12,809 USD 1,405,219 2,094,329 0.07
Weyerhaeuser Co 16,646 USD 363,933 483,140 0.02
Whiting Petroleum Corp 5,417 USD 113,309 249,176 0.01
Williams Cos Inc 35,539 USD 705,541 795,649 0.03
Workday Inc 39,739 USD 6,985,833 8,000,075 0.28
WW Grainger Inc 3,564 USD 1,052,136 1,316,327 0.05
Wyndham Hotels & Resorts Inc 78,320 USD 3,191,400 4,774,224 0.17
Zebra Technologies Corp 6,987 USD 1,689,950 3,119,611 0.11
Zimmer Biomet Holdings Inc 16,479 USD 1,856,171 2,234,719 0.08
Zoetis Inc 105,919 USD 14,378,934 16,644,797 0.59
Total United States of America 1,370,144,866 1,725,269,634 61.37
TOTAL LISTED SECURITIES : SHARES 2,174,374,624 2,666,936,405 94.84

CHALLENGE PROVIDENT FUND 1 SCHEDULE OF INVESTMENTS AS AT JUNE 30, 2021 (continued)
277
(expressed in EUR) Quantity/ Acquisition % net
Description Face value Currency cost Valuation assets
2) LISTED SECURITIES : BONDS
CANADA
Canadian When Issued Government Bond 0.5% 01/09/2021 9,935,000 CAD 6,445,295 6,764,733 0.24
Canadian When Issued Government Bond 1.5% 01/11/2021 14,902,000 CAD 9,690,733 10,182,884 0.36
Total Canada 16,136,028 16,947,617 0.60
FRANCE Caisse des Depots et Consignations 0.875% 15/12/2021
EMTN 2,400,000 GBP 2,669,180 2,803,886 0.10
Total France 2,669,180 2,803,886 0.10
GERMANY
Kreditanstalt fuer Wiederaufbau 0.875% 15/03/2022 EMTN 4,000,000 GBP 4,677,426 4,684,093 0.17
Kreditanstalt fuer Wiederaufbau 1.125% 07/12/2021 EMTN 4,222,000 GBP 4,938,149 4,938,060 0.18
Kreditanstalt fuer Wiederaufbau 2% 07/02/2022 993,000 CAD 661,443 683,010 0.02
Kreditanstalt fuer Wiederaufbau 2.5% 15/02/2022 3,725,000 USD 3,174,286 3,186,934 0.11
Kreditanstalt fuer Wiederaufbau 5.5% 09/02/2022 4,500,000 AUD 2,995,409 2,940,460 0.11
Total Germany 16,446,713 16,432,557 0.59
LUXEMBOURG
European Investment Bank 1.125% 07/09/2021 EMTN 497,000 GBP 558,511 579,966 0.02
European Investment Bank 2.25% 15/03/2022 4,967,000 USD 4,285,924 4,249,991 0.15
Total Luxembourg 4,844,435 4,829,957 0.17
UNITED KINGDOM
United Kingdom Gilt 3.75% 07/09/2021 2,484,000 GBP 2,817,374 2,913,191 0.10
United Kingdom Gilt 4% 07/03/2022 4,967,000 GBP 6,016,872 5,943,187 0.21
Total United Kingdom 8,834,246 8,856,378 0.31
UNITED STATES OF AMERICA International Bank for Reconstruction & Development
1.375% 20/09/2021 1,242,000 USD 1,032,676 1,050,186 0.04 International Bank for Reconstruction & Development
1.625% 10/02/2022 5,000,000 USD 4,145,196 4,253,310 0.15
Total United States of America 5,177,872 5,303,496 0.19
TOTAL LISTED SECURITIES : BONDS 54,108,474 55,173,891 1.96
TOTAL TRANSFERABLE SECURITIES ADMITTED TO AN OFFICIAL STOCK
EXCHANGE LISTING 2,228,483,098 2,722,110,296 96.80
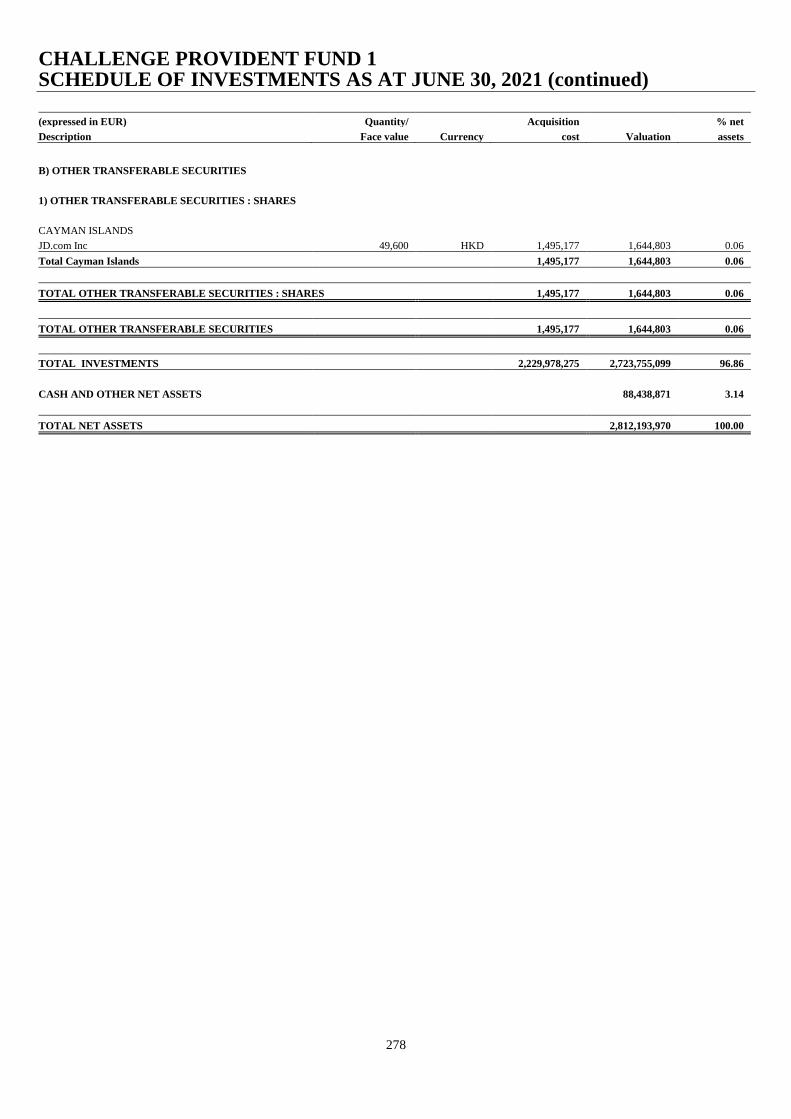
CHALLENGE PROVIDENT FUND 1 SCHEDULE OF INVESTMENTS AS AT JUNE 30, 2021 (continued)
278
(expressed in EUR) Quantity/ Acquisition % net
Description Face value Currency cost Valuation assets
B) OTHER TRANSFERABLE SECURITIES
1) OTHER TRANSFERABLE SECURITIES : SHARES
CAYMAN ISLANDS
JD.com Inc 49,600 HKD 1,495,177 1,644,803 0.06
Total Cayman Islands 1,495,177 1,644,803 0.06
TOTAL OTHER TRANSFERABLE SECURITIES : SHARES 1,495,177 1,644,803 0.06
TOTAL OTHER TRANSFERABLE SECURITIES 1,495,177 1,644,803 0.06
TOTAL INVESTMENTS 2,229,978,275 2,723,755,099 96.86
CASH AND OTHER NET ASSETS 88,438,871 3.14
TOTAL NET ASSETS 2,812,193,970 100.00
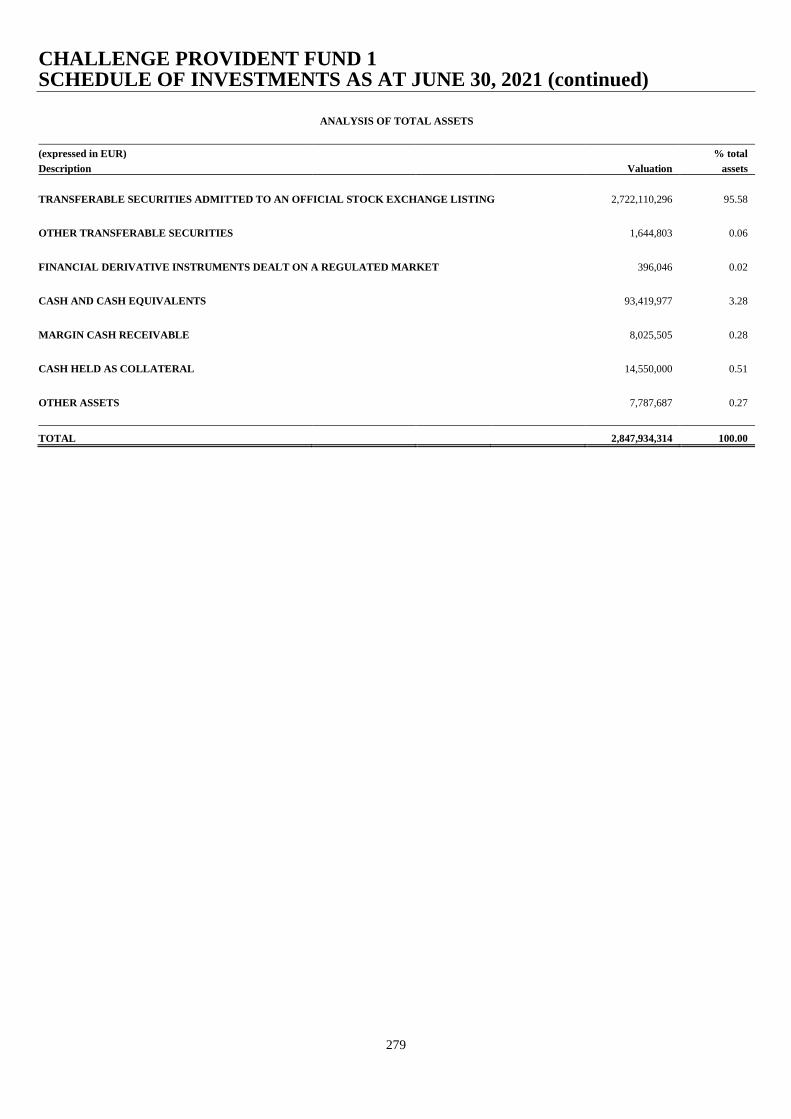
CHALLENGE PROVIDENT FUND 1 SCHEDULE OF INVESTMENTS AS AT JUNE 30, 2021 (continued)
279
ANALYSIS OF TOTAL ASSETS
(expressed in EUR) % total
Description Valuation assets
TRANSFERABLE SECURITIES ADMITTED TO AN OFFICIAL STOCK EXCHANGE LISTING 2,722,110,296 95.58
OTHER TRANSFERABLE SECURITIES 1,644,803 0.06
FINANCIAL DERIVATIVE INSTRUMENTS DEALT ON A REGULATED MARKET 396,046 0.02
CASH AND CASH EQUIVALENTS 93,419,977 3.28
MARGIN CASH RECEIVABLE 8,025,505 0.28
CASH HELD AS COLLATERAL 14,550,000 0.51
OTHER ASSETS 7,787,687 0.27
TOTAL 2,847,934,314 100.00
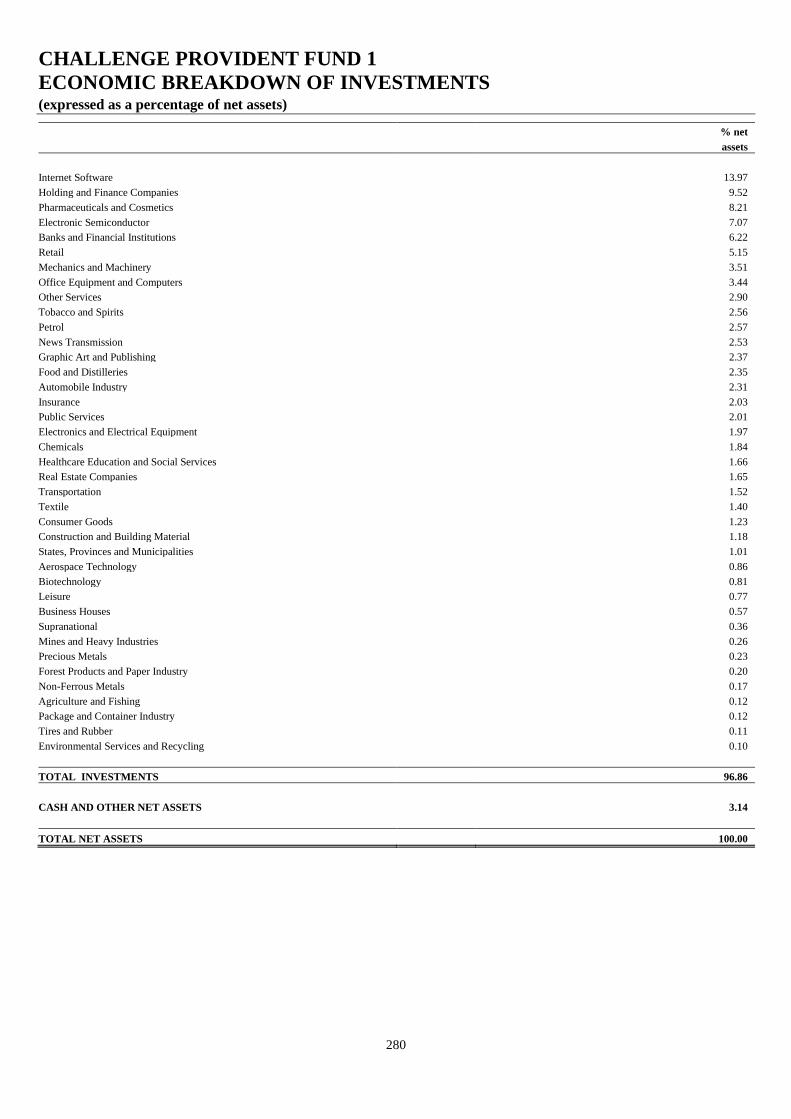
CHALLENGE PROVIDENT FUND 1
ECONOMIC BREAKDOWN OF INVESTMENTS (expressed as a percentage of net assets)
280
% net
assets
Internet Software 13.97
Holding and Finance Companies 9.52
Pharmaceuticals and Cosmetics 8.21
Electronic Semiconductor 7.07
Banks and Financial Institutions 6.22
Retail 5.15
Mechanics and Machinery 3.51
Office Equipment and Computers 3.44
Other Services 2.90
Tobacco and Spirits 2.56
Petrol 2.57
News Transmission 2.53
Graphic Art and Publishing 2.37
Food and Distilleries 2.35
Automobile Industry 2.31
Insurance 2.03
Public Services 2.01
Electronics and Electrical Equipment 1.97
Chemicals 1.84
Healthcare Education and Social Services 1.66
Real Estate Companies 1.65
Transportation 1.52
Textile 1.40
Consumer Goods 1.23
Construction and Building Material 1.18
States, Provinces and Municipalities 1.01
Aerospace Technology 0.86
Biotechnology 0.81
Leisure 0.77
Business Houses 0.57
Supranational 0.36
Mines and Heavy Industries 0.26
Precious Metals 0.23
Forest Products and Paper Industry 0.20
Non-Ferrous Metals 0.17
Agriculture and Fishing 0.12
Package and Container Industry 0.12
Tires and Rubber 0.11
Environmental Services and Recycling 0.10
TOTAL INVESTMENTS 96.86
CASH AND OTHER NET ASSETS 3.14
TOTAL NET ASSETS 100.00
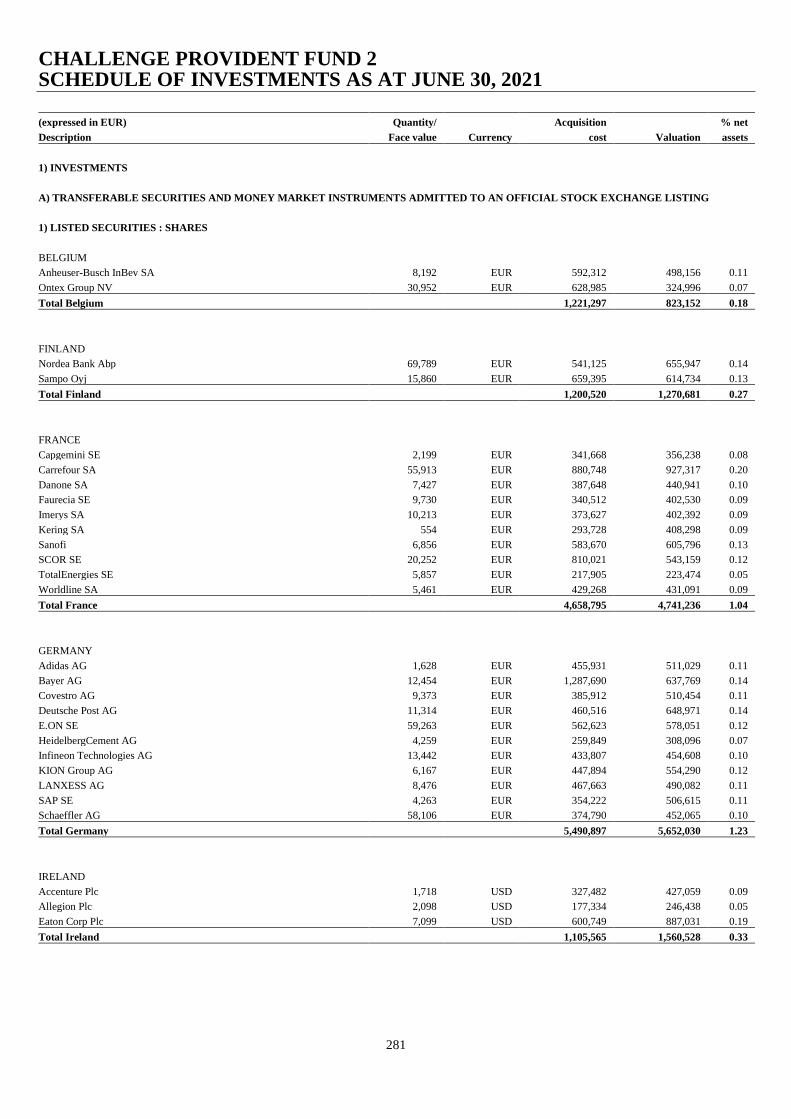
CHALLENGE PROVIDENT FUND 2 SCHEDULE OF INVESTMENTS AS AT JUNE 30, 2021
281
(expressed in EUR) Quantity/ Acquisition % net
Description Face value Currency cost Valuation assets
1) INVESTMENTS
A) TRANSFERABLE SECURITIES AND MONEY MARKET INSTRUMENTS ADMITTED TO AN OFFICIAL STOCK EXCHANGE LISTING
1) LISTED SECURITIES : SHARES
BELGIUM
Anheuser-Busch InBev SA 8,192 EUR 592,312 498,156 0.11
Ontex Group NV 30,952 EUR 628,985 324,996 0.07
Total Belgium 1,221,297 823,152 0.18
FINLAND
Nordea Bank Abp 69,789 EUR 541,125 655,947 0.14
Sampo Oyj 15,860 EUR 659,395 614,734 0.13
Total Finland 1,200,520 1,270,681 0.27
FRANCE
Capgemini SE 2,199 EUR 341,668 356,238 0.08
Carrefour SA 55,913 EUR 880,748 927,317 0.20
Danone SA 7,427 EUR 387,648 440,941 0.10
Faurecia SE 9,730 EUR 340,512 402,530 0.09
Imerys SA 10,213 EUR 373,627 402,392 0.09
Kering SA 554 EUR 293,728 408,298 0.09
Sanofi 6,856 EUR 583,670 605,796 0.13
SCOR SE 20,252 EUR 810,021 543,159 0.12
TotalEnergies SE 5,857 EUR 217,905 223,474 0.05
Worldline SA 5,461 EUR 429,268 431,091 0.09
Total France 4,658,795 4,741,236 1.04
GERMANY
Adidas AG 1,628 EUR 455,931 511,029 0.11
Bayer AG 12,454 EUR 1,287,690 637,769 0.14
Covestro AG 9,373 EUR 385,912 510,454 0.11
Deutsche Post AG 11,314 EUR 460,516 648,971 0.14
E.ON SE 59,263 EUR 562,623 578,051 0.12
HeidelbergCement AG 4,259 EUR 259,849 308,096 0.07
Infineon Technologies AG 13,442 EUR 433,807 454,608 0.10
KION Group AG 6,167 EUR 447,894 554,290 0.12
LANXESS AG 8,476 EUR 467,663 490,082 0.11
SAP SE 4,263 EUR 354,222 506,615 0.11
Schaeffler AG 58,106 EUR 374,790 452,065 0.10
Total Germany 5,490,897 5,652,030 1.23
IRELAND
Accenture Plc 1,718 USD 327,482 427,059 0.09
Allegion Plc 2,098 USD 177,334 246,438 0.05
Eaton Corp Plc 7,099 USD 600,749 887,031 0.19
Total Ireland 1,105,565 1,560,528 0.33
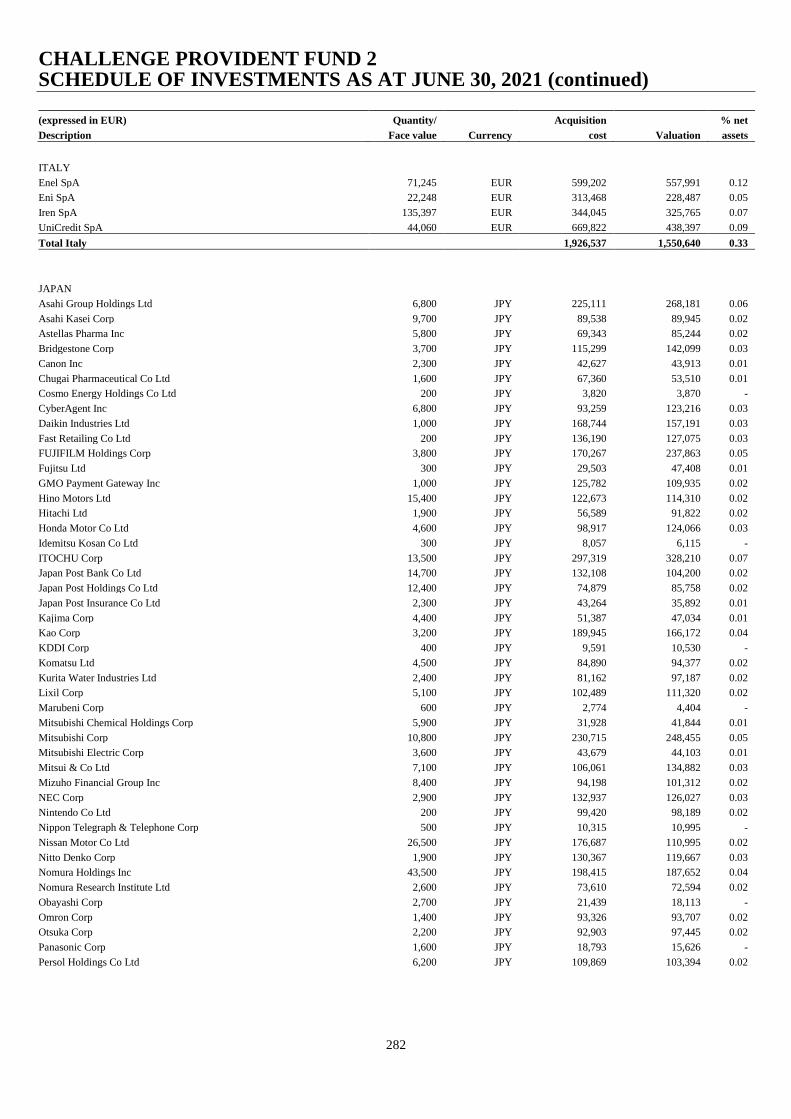
CHALLENGE PROVIDENT FUND 2 SCHEDULE OF INVESTMENTS AS AT JUNE 30, 2021 (continued)
282
(expressed in EUR) Quantity/ Acquisition % net
Description Face value Currency cost Valuation assets
ITALY
Enel SpA 71,245 EUR 599,202 557,991 0.12
Eni SpA 22,248 EUR 313,468 228,487 0.05
Iren SpA 135,397 EUR 344,045 325,765 0.07
UniCredit SpA 44,060 EUR 669,822 438,397 0.09
Total Italy 1,926,537 1,550,640 0.33
JAPAN
Asahi Group Holdings Ltd 6,800 JPY 225,111 268,181 0.06
Asahi Kasei Corp 9,700 JPY 89,538 89,945 0.02
Astellas Pharma Inc 5,800 JPY 69,343 85,244 0.02
Bridgestone Corp 3,700 JPY 115,299 142,099 0.03
Canon Inc 2,300 JPY 42,627 43,913 0.01
Chugai Pharmaceutical Co Ltd 1,600 JPY 67,360 53,510 0.01
Cosmo Energy Holdings Co Ltd 200 JPY 3,820 3,870 -
CyberAgent Inc 6,800 JPY 93,259 123,216 0.03
Daikin Industries Ltd 1,000 JPY 168,744 157,191 0.03
Fast Retailing Co Ltd 200 JPY 136,190 127,075 0.03
FUJIFILM Holdings Corp 3,800 JPY 170,267 237,863 0.05
Fujitsu Ltd 300 JPY 29,503 47,408 0.01
GMO Payment Gateway Inc 1,000 JPY 125,782 109,935 0.02
Hino Motors Ltd 15,400 JPY 122,673 114,310 0.02
Hitachi Ltd 1,900 JPY 56,589 91,822 0.02
Honda Motor Co Ltd 4,600 JPY 98,917 124,066 0.03
Idemitsu Kosan Co Ltd 300 JPY 8,057 6,115 -
ITOCHU Corp 13,500 JPY 297,319 328,210 0.07
Japan Post Bank Co Ltd 14,700 JPY 132,108 104,200 0.02
Japan Post Holdings Co Ltd 12,400 JPY 74,879 85,758 0.02
Japan Post Insurance Co Ltd 2,300 JPY 43,264 35,892 0.01
Kajima Corp 4,400 JPY 51,387 47,034 0.01
Kao Corp 3,200 JPY 189,945 166,172 0.04
KDDI Corp 400 JPY 9,591 10,530 -
Komatsu Ltd 4,500 JPY 84,890 94,377 0.02
Kurita Water Industries Ltd 2,400 JPY 81,162 97,187 0.02
Lixil Corp 5,100 JPY 102,489 111,320 0.02
Marubeni Corp 600 JPY 2,774 4,404 -
Mitsubishi Chemical Holdings Corp 5,900 JPY 31,928 41,844 0.01
Mitsubishi Corp 10,800 JPY 230,715 248,455 0.05
Mitsubishi Electric Corp 3,600 JPY 43,679 44,103 0.01
Mitsui & Co Ltd 7,100 JPY 106,061 134,882 0.03
Mizuho Financial Group Inc 8,400 JPY 94,198 101,312 0.02
NEC Corp 2,900 JPY 132,937 126,027 0.03
Nintendo Co Ltd 200 JPY 99,420 98,189 0.02
Nippon Telegraph & Telephone Corp 500 JPY 10,315 10,995 -
Nissan Motor Co Ltd 26,500 JPY 176,687 110,995 0.02
Nitto Denko Corp 1,900 JPY 130,367 119,667 0.03
Nomura Holdings Inc 43,500 JPY 198,415 187,652 0.04
Nomura Research Institute Ltd 2,600 JPY 73,610 72,594 0.02
Obayashi Corp 2,700 JPY 21,439 18,113 -
Omron Corp 1,400 JPY 93,326 93,707 0.02
Otsuka Corp 2,200 JPY 92,903 97,445 0.02
Panasonic Corp 1,600 JPY 18,793 15,626 -
Persol Holdings Co Ltd 6,200 JPY 109,869 103,394 0.02
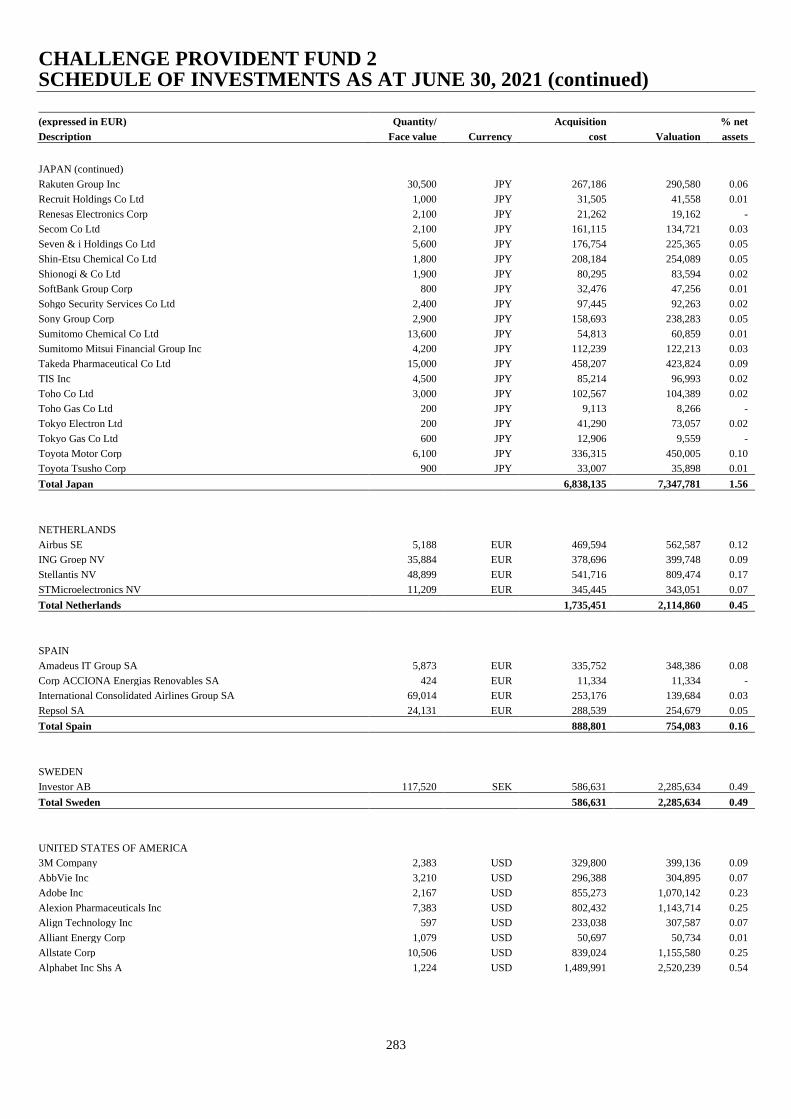
CHALLENGE PROVIDENT FUND 2 SCHEDULE OF INVESTMENTS AS AT JUNE 30, 2021 (continued)
283
(expressed in EUR) Quantity/ Acquisition % net
Description Face value Currency cost Valuation assets
JAPAN (continued)
Rakuten Group Inc 30,500 JPY 267,186 290,580 0.06
Recruit Holdings Co Ltd 1,000 JPY 31,505 41,558 0.01
Renesas Electronics Corp 2,100 JPY 21,262 19,162 -
Secom Co Ltd 2,100 JPY 161,115 134,721 0.03
Seven & i Holdings Co Ltd 5,600 JPY 176,754 225,365 0.05
Shin-Etsu Chemical Co Ltd 1,800 JPY 208,184 254,089 0.05
Shionogi & Co Ltd 1,900 JPY 80,295 83,594 0.02
SoftBank Group Corp 800 JPY 32,476 47,256 0.01
Sohgo Security Services Co Ltd 2,400 JPY 97,445 92,263 0.02
Sony Group Corp 2,900 JPY 158,693 238,283 0.05
Sumitomo Chemical Co Ltd 13,600 JPY 54,813 60,859 0.01
Sumitomo Mitsui Financial Group Inc 4,200 JPY 112,239 122,213 0.03
Takeda Pharmaceutical Co Ltd 15,000 JPY 458,207 423,824 0.09
TIS Inc 4,500 JPY 85,214 96,993 0.02
Toho Co Ltd 3,000 JPY 102,567 104,389 0.02
Toho Gas Co Ltd 200 JPY 9,113 8,266 -
Tokyo Electron Ltd 200 JPY 41,290 73,057 0.02
Tokyo Gas Co Ltd 600 JPY 12,906 9,559 -
Toyota Motor Corp 6,100 JPY 336,315 450,005 0.10
Toyota Tsusho Corp 900 JPY 33,007 35,898 0.01
Total Japan 6,838,135 7,347,781 1.56
NETHERLANDS
Airbus SE 5,188 EUR 469,594 562,587 0.12
ING Groep NV 35,884 EUR 378,696 399,748 0.09
Stellantis NV 48,899 EUR 541,716 809,474 0.17
STMicroelectronics NV 11,209 EUR 345,445 343,051 0.07
Total Netherlands 1,735,451 2,114,860 0.45
SPAIN
Amadeus IT Group SA 5,873 EUR 335,752 348,386 0.08
Corp ACCIONA Energias Renovables SA 424 EUR 11,334 11,334 -
International Consolidated Airlines Group SA 69,014 EUR 253,176 139,684 0.03
Repsol SA 24,131 EUR 288,539 254,679 0.05
Total Spain 888,801 754,083 0.16
SWEDEN
Investor AB 117,520 SEK 586,631 2,285,634 0.49
Total Sweden 586,631 2,285,634 0.49
UNITED STATES OF AMERICA
3M Company 2,383 USD 329,800 399,136 0.09
AbbVie Inc 3,210 USD 296,388 304,895 0.07
Adobe Inc 2,167 USD 855,273 1,070,142 0.23
Alexion Pharmaceuticals Inc 7,383 USD 802,432 1,143,714 0.25
Align Technology Inc 597 USD 233,038 307,587 0.07
Alliant Energy Corp 1,079 USD 50,697 50,734 0.01
Allstate Corp 10,506 USD 839,024 1,155,580 0.25
Alphabet Inc Shs A 1,224 USD 1,489,991 2,520,239 0.54

CHALLENGE PROVIDENT FUND 2 SCHEDULE OF INVESTMENTS AS AT JUNE 30, 2021 (continued)
284
(expressed in EUR) Quantity/ Acquisition % net
Description Face value Currency cost Valuation assets
UNITED STATES OF AMERICA (continued)
Alphabet Inc Shs C 92 USD 158,645 194,436 0.04
Altria Group Inc 28,997 USD 1,070,593 1,165,846 0.25
Amazon.com Inc 852 USD 1,809,556 2,471,554 0.53
Ameren Corp 12,159 USD 832,369 820,648 0.18
Ameriprise Financial Inc 7,004 USD 1,112,570 1,469,901 0.32
Apple Inc 46,239 USD 2,961,288 5,340,158 1.15
Atmos Energy Corp 5,536 USD 469,187 448,659 0.10
Avery Dennison Corp 12,681 USD 1,690,985 2,248,127 0.48
Berkshire Hathaway Inc 879 USD 188,377 205,997 0.04
Biogen Inc 2,299 USD 524,046 671,283 0.14
Bio-Rad Laboratories Inc 885 USD 439,903 480,813 0.10
Black Knight Inc 9,872 USD 638,027 649,143 0.14
Booking Holdings Inc 79 USD 132,979 145,762 0.03
Broadcom Inc 1,521 USD 398,669 611,581 0.13
Cboe Global Markets Inc 3,066 USD 227,592 307,789 0.07
Celanese Corp 2,907 USD 278,378 371,618 0.08
Church & Dwight Co Inc 24,374 USD 1,811,053 1,751,541 0.38
Cintas Corp 3,364 USD 904,714 1,083,606 0.23
Cisco Systems Inc 9,671 USD 420,934 432,214 0.09
Citigroup Inc 7,248 USD 469,135 432,411 0.09
CMS Energy Corp 7,423 USD 389,868 369,804 0.08
Comcast Corp 21,996 USD 851,990 1,057,603 0.23
Cummins Inc 9,761 USD 1,938,744 2,006,771 0.43
CVS Health Corp 33,335 USD 1,890,656 2,345,453 0.50
DocuSign Inc 6,984 USD 1,343,894 1,646,443 0.35
Dow Inc 3,767 USD 143,151 201,008 0.04
Equinix Inc 1,190 USD 685,290 805,375 0.17
Expeditors International of Washington Inc 5,142 USD 385,071 548,931 0.12
Facebook Inc 9,296 USD 1,804,048 2,725,620 0.59
FMC Corp 7,339 USD 662,032 669,601 0.14
Franklin Resources Inc 22,050 USD 468,884 594,805 0.13
General Motors Co 3,923 USD 116,266 195,737 0.04
Hartford Financial Services Group Inc 22,365 USD 967,232 1,168,698 0.25
HCA Healthcare Inc 10,171 USD 1,140,572 1,773,128 0.38
Hershey Co 7,648 USD 934,973 1,123,306 0.24
Home Depot Inc 3,758 USD 814,571 1,010,531 0.22
Intel Corp 10,232 USD 483,330 484,379 0.10
International Business Machines Corp 6,600 USD 766,479 815,831 0.18
JB Hunt Transport Services Inc 2,781 USD 315,710 382,127 0.08
Kroger Co 26,595 USD 719,422 859,140 0.18
Lamb Weston Holdings Inc 8,600 USD 556,585 584,936 0.13
Lennar Corp 1,115 USD 69,047 93,410 0.02
Lowe's Cos Inc 921 USD 103,417 150,642 0.03
Masco Corp 15,738 USD 740,635 781,791 0.17
Mastercard Inc 5,595 USD 1,622,263 1,722,471 0.37
McDonald's Corp 3,513 USD 643,322 684,263 0.15
MercadoLibre Inc 747 USD 1,096,872 981,254 0.21
MetLife Inc 16,622 USD 639,701 838,879 0.18
Micron Technology Inc 4,407 USD 226,234 315,800 0.07
Microsoft Corp 21,279 USD 3,358,454 4,860,849 1.04
Morgan Stanley 6,074 USD 425,699 469,622 0.10
Nasdaq Inc 4,890 USD 522,384 724,903 0.16
Netflix Inc 2,701 USD 1,120,564 1,203,048 0.26
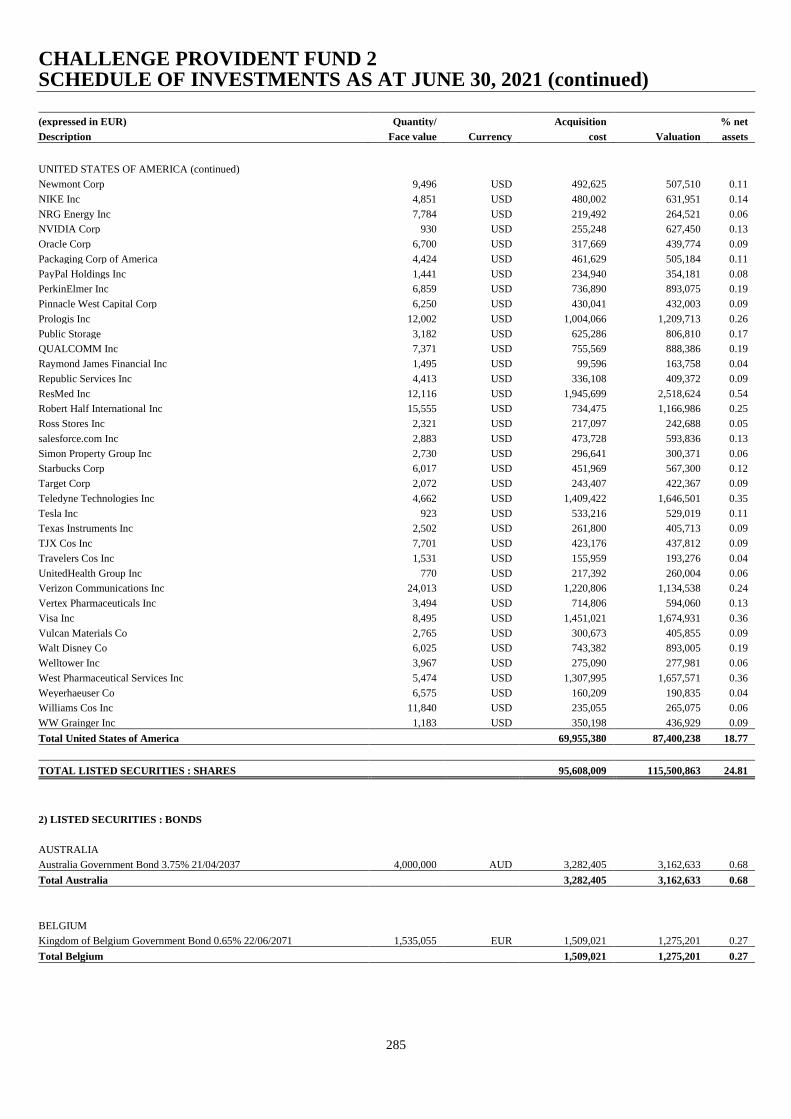
CHALLENGE PROVIDENT FUND 2 SCHEDULE OF INVESTMENTS AS AT JUNE 30, 2021 (continued)
285
(expressed in EUR) Quantity/ Acquisition % net
Description Face value Currency cost Valuation assets
UNITED STATES OF AMERICA (continued)
Newmont Corp 9,496 USD 492,625 507,510 0.11
NIKE Inc 4,851 USD 480,002 631,951 0.14
NRG Energy Inc 7,784 USD 219,492 264,521 0.06
NVIDIA Corp 930 USD 255,248 627,450 0.13
Oracle Corp 6,700 USD 317,669 439,774 0.09
Packaging Corp of America 4,424 USD 461,629 505,184 0.11
PayPal Holdings Inc 1,441 USD 234,940 354,181 0.08
PerkinElmer Inc 6,859 USD 736,890 893,075 0.19
Pinnacle West Capital Corp 6,250 USD 430,041 432,003 0.09
Prologis Inc 12,002 USD 1,004,066 1,209,713 0.26
Public Storage 3,182 USD 625,286 806,810 0.17
QUALCOMM Inc 7,371 USD 755,569 888,386 0.19
Raymond James Financial Inc 1,495 USD 99,596 163,758 0.04
Republic Services Inc 4,413 USD 336,108 409,372 0.09
ResMed Inc 12,116 USD 1,945,699 2,518,624 0.54
Robert Half International Inc 15,555 USD 734,475 1,166,986 0.25
Ross Stores Inc 2,321 USD 217,097 242,688 0.05
salesforce.com Inc 2,883 USD 473,728 593,836 0.13
Simon Property Group Inc 2,730 USD 296,641 300,371 0.06
Starbucks Corp 6,017 USD 451,969 567,300 0.12
Target Corp 2,072 USD 243,407 422,367 0.09
Teledyne Technologies Inc 4,662 USD 1,409,422 1,646,501 0.35
Tesla Inc 923 USD 533,216 529,019 0.11
Texas Instruments Inc 2,502 USD 261,800 405,713 0.09
TJX Cos Inc 7,701 USD 423,176 437,812 0.09
Travelers Cos Inc 1,531 USD 155,959 193,276 0.04
UnitedHealth Group Inc 770 USD 217,392 260,004 0.06
Verizon Communications Inc 24,013 USD 1,220,806 1,134,538 0.24
Vertex Pharmaceuticals Inc 3,494 USD 714,806 594,060 0.13
Visa Inc 8,495 USD 1,451,021 1,674,931 0.36
Vulcan Materials Co 2,765 USD 300,673 405,855 0.09
Walt Disney Co 6,025 USD 743,382 893,005 0.19
Welltower Inc 3,967 USD 275,090 277,981 0.06
West Pharmaceutical Services Inc 5,474 USD 1,307,995 1,657,571 0.36
Weyerhaeuser Co 6,575 USD 160,209 190,835 0.04
Williams Cos Inc 11,840 USD 235,055 265,075 0.06
WW Grainger Inc 1,183 USD 350,198 436,929 0.09
Total United States of America 69,955,380 87,400,238 18.77
TOTAL LISTED SECURITIES : SHARES 95,608,009 115,500,863 24.81
2) LISTED SECURITIES : BONDS
AUSTRALIA
Australia Government Bond 3.75% 21/04/2037 4,000,000 AUD 3,282,405 3,162,633 0.68
Total Australia 3,282,405 3,162,633 0.68
BELGIUM
Kingdom of Belgium Government Bond 0.65% 22/06/2071 1,535,055 EUR 1,509,021 1,275,201 0.27
Total Belgium 1,509,021 1,275,201 0.27

CHALLENGE PROVIDENT FUND 2 SCHEDULE OF INVESTMENTS AS AT JUNE 30, 2021 (continued)
286
(expressed in EUR) Quantity/ Acquisition % net
Description Face value Currency cost Valuation assets
CANADA
Canadian Government Bond 1.5% 01/02/2022 3,000,000 CAD 1,959,497 2,058,223 0.44
Canadian When Issued Government Bond 1.5% 01/11/2021 4,000,000 CAD 2,594,707 2,733,293 0.59
Canadian When Issued Government Bond 2.25% 01/06/2025 2,500,000 CAD 1,705,430 1,797,924 0.39
Canadian When Issued Government Bond 2.75% 01/12/2048 5,000,000 CAD 4,436,797 4,082,739 0.88
Province of Ontario Canada 1.125% 07/10/2030 2,500,000 USD 2,038,289 2,001,096 0.43
Total Canada 12,734,720 12,673,275 2.73
FRANCE
BNP Paribas Cardif SA 4.032% / perpetual 500,000 EUR 499,375 564,530 0.12
French Republic Government Bond OAT 0.25% 25/07/2024 25,000,000 EUR 28,515,622 28,888,475 6.21
La Mondiale SAM 4.375% / perpetual 100,000 EUR 100,000 109,916 0.02
RCI Banque SA 0.035% 04/11/2024 EMTN 1,000,000 EUR 985,470 1,002,820 0.22
Total France 30,100,467 30,565,741 6.57
GERMANY
Bundesrepublik Deutschland Bundesanleihe 4% 04/01/2037 500,000 EUR 727,912 814,400 0.17
Bundesrepublik Deutschland Bundesanleihe 4.75% 04/07/2028 500,000 EUR 670,290 688,050 0.15
Bundesrepublik Deutschland Bundesanleihe 5.625% 04/01/2028 400,000 EUR 494,448 563,960 0.12
Bundesrepublik Deutschland Bundesanleihe 6.5% 04/07/2027 500,000 EUR 821,585 716,315 0.15
Kreditanstalt fuer Wiederaufbau 0.875% 15/03/2022 EMTN 5,000,000 GBP 5,846,782 5,855,116 1.26
Kreditanstalt fuer Wiederaufbau 2% 07/02/2022 4,000,000 CAD 2,717,680 2,751,298 0.59
Kreditanstalt fuer Wiederaufbau 2.05% 16/02/2026 700,000,000 JPY 5,976,580 5,875,620 1.26
Kreditanstalt fuer Wiederaufbau 2.5% 15/02/2022 5,000,000 USD 4,307,978 4,277,764 0.92
Kreditanstalt fuer Wiederaufbau 2.625% 25/01/2022 10,000,000 USD 8,447,980 8,551,311 1.84
Total Germany 30,011,235 30,093,834 6.46
IRELAND
Ireland Government Bond 1.5% 15/05/2050 1,000,000 EUR 993,130 1,162,900 0.25
Total Ireland 993,130 1,162,900 0.25
ITALY
AMCO - Asset Management Co SpA 1.5% 17/07/2023 EMTN 200,000 EUR 199,504 206,364 0.04
Assicurazioni Generali SpA 4.596% EMTN/ perpetual 1,000,000 EUR 961,500 1,124,300 0.24
Eni SpA 1.625% 17/05/2028 EMTN 300,000 EUR 296,196 327,741 0.07
Eni SpA 1.75% 18/01/2024 EMTN 100,000 EUR 99,192 104,852 0.02
Eni SpA 2.625% / perpetual 332,000 EUR 330,018 348,427 0.07
Intesa Sanpaolo SpA 1% 04/07/2024 EMTN 2,000,000 EUR 2,060,320 2,058,720 0.44
Intesa Sanpaolo Vita SpA 4.75% / perpetual 1,500,000 EUR 1,611,000 1,647,765 0.35
Italy Buoni Poliennali Del Tesoro 0.4% 11/04/2024 12,500,000 EUR 12,628,984 12,979,950 2.79
Italy Buoni Poliennali Del Tesoro 1.4% 26/05/2025 10,000,000 EUR 10,120,845 10,840,820 2.33
Italy Buoni Poliennali Del Tesoro 2.3% 15/10/2021 5,000,000 EUR 5,115,800 5,040,700 1.08
Italy Buoni Poliennali Del Tesoro 2.55% 15/09/2041 5,500,000 EUR 8,276,677 9,453,235 2.03
Italy Buoni Poliennali Del Tesoro 4.75% 01/09/2028 3,500,000 EUR 4,230,978 4,557,700 0.98
Italy Buoni Poliennali Del Tesoro 5.25% 01/11/2029 2,000,000 EUR 2,708,372 2,761,180 0.59
Italy Buoni Poliennali Del Tesoro 5.5% 01/11/2022 1,000,000 EUR 1,074,060 1,078,800 0.23
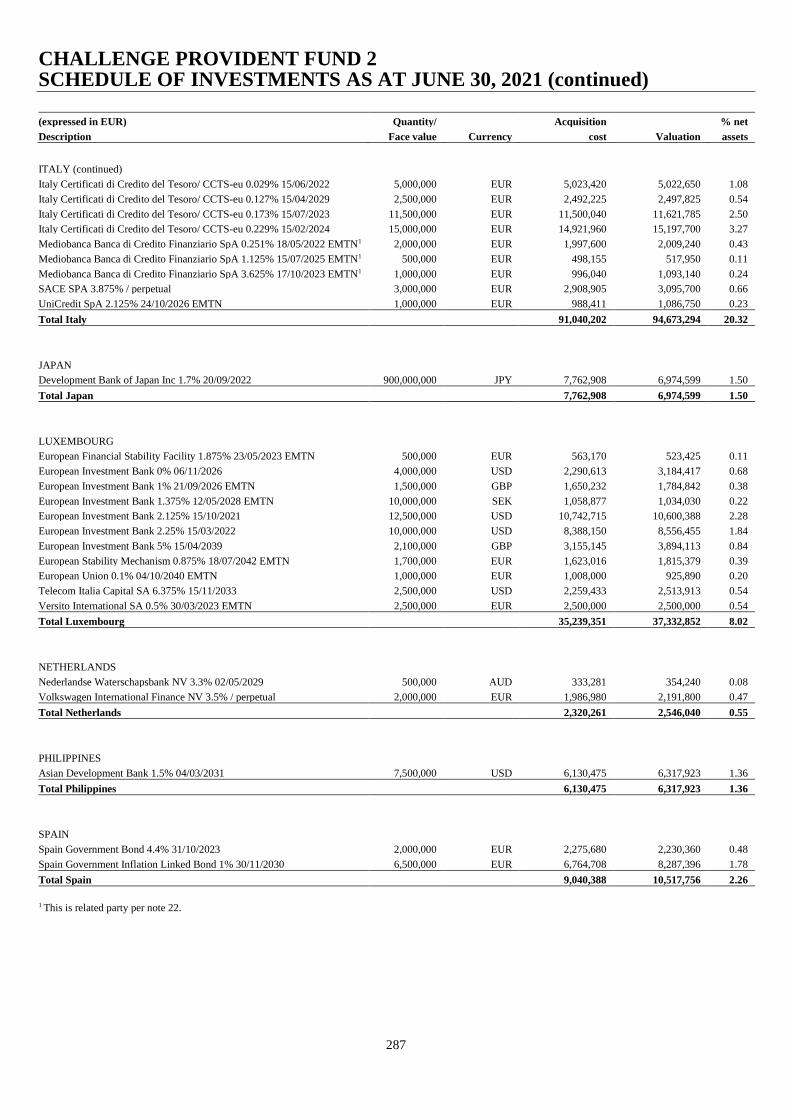
CHALLENGE PROVIDENT FUND 2 SCHEDULE OF INVESTMENTS AS AT JUNE 30, 2021 (continued)
287
(expressed in EUR) Quantity/ Acquisition % net
Description Face value Currency cost Valuation assets
ITALY (continued)
Italy Certificati di Credito del Tesoro/ CCTS-eu 0.029% 15/06/2022 5,000,000 EUR 5,023,420 5,022,650 1.08
Italy Certificati di Credito del Tesoro/ CCTS-eu 0.127% 15/04/2029 2,500,000 EUR 2,492,225 2,497,825 0.54
Italy Certificati di Credito del Tesoro/ CCTS-eu 0.173% 15/07/2023 11,500,000 EUR 11,500,040 11,621,785 2.50
Italy Certificati di Credito del Tesoro/ CCTS-eu 0.229% 15/02/2024 15,000,000 EUR 14,921,960 15,197,700 3.27
Mediobanca Banca di Credito Finanziario SpA 0.251% 18/05/2022 EMTN1 2,000,000 EUR 1,997,600 2,009,240 0.43
Mediobanca Banca di Credito Finanziario SpA 1.125% 15/07/2025 EMTN1 500,000 EUR 498,155 517,950 0.11
Mediobanca Banca di Credito Finanziario SpA 3.625% 17/10/2023 EMTN1 1,000,000 EUR 996,040 1,093,140 0.24
SACE SPA 3.875% / perpetual 3,000,000 EUR 2,908,905 3,095,700 0.66
UniCredit SpA 2.125% 24/10/2026 EMTN 1,000,000 EUR 988,411 1,086,750 0.23
Total Italy 91,040,202 94,673,294 20.32
JAPAN
Development Bank of Japan Inc 1.7% 20/09/2022 900,000,000 JPY 7,762,908 6,974,599 1.50
Total Japan 7,762,908 6,974,599 1.50
LUXEMBOURG
European Financial Stability Facility 1.875% 23/05/2023 EMTN 500,000 EUR 563,170 523,425 0.11
European Investment Bank 0% 06/11/2026 4,000,000 USD 2,290,613 3,184,417 0.68
European Investment Bank 1% 21/09/2026 EMTN 1,500,000 GBP 1,650,232 1,784,842 0.38
European Investment Bank 1.375% 12/05/2028 EMTN 10,000,000 SEK 1,058,877 1,034,030 0.22
European Investment Bank 2.125% 15/10/2021 12,500,000 USD 10,742,715 10,600,388 2.28
European Investment Bank 2.25% 15/03/2022 10,000,000 USD 8,388,150 8,556,455 1.84
European Investment Bank 5% 15/04/2039 2,100,000 GBP 3,155,145 3,894,113 0.84
European Stability Mechanism 0.875% 18/07/2042 EMTN 1,700,000 EUR 1,623,016 1,815,379 0.39
European Union 0.1% 04/10/2040 EMTN 1,000,000 EUR 1,008,000 925,890 0.20
Telecom Italia Capital SA 6.375% 15/11/2033 2,500,000 USD 2,259,433 2,513,913 0.54
Versito International SA 0.5% 30/03/2023 EMTN 2,500,000 EUR 2,500,000 2,500,000 0.54
Total Luxembourg 35,239,351 37,332,852 8.02
NETHERLANDS
Nederlandse Waterschapsbank NV 3.3% 02/05/2029 500,000 AUD 333,281 354,240 0.08
Volkswagen International Finance NV 3.5% / perpetual 2,000,000 EUR 1,986,980 2,191,800 0.47
Total Netherlands 2,320,261 2,546,040 0.55
PHILIPPINES
Asian Development Bank 1.5% 04/03/2031 7,500,000 USD 6,130,475 6,317,923 1.36
Total Philippines 6,130,475 6,317,923 1.36
SPAIN
Spain Government Bond 4.4% 31/10/2023 2,000,000 EUR 2,275,680 2,230,360 0.48
Spain Government Inflation Linked Bond 1% 30/11/2030 6,500,000 EUR 6,764,708 8,287,396 1.78
Total Spain 9,040,388 10,517,756 2.26
1 This is related party per note 22.
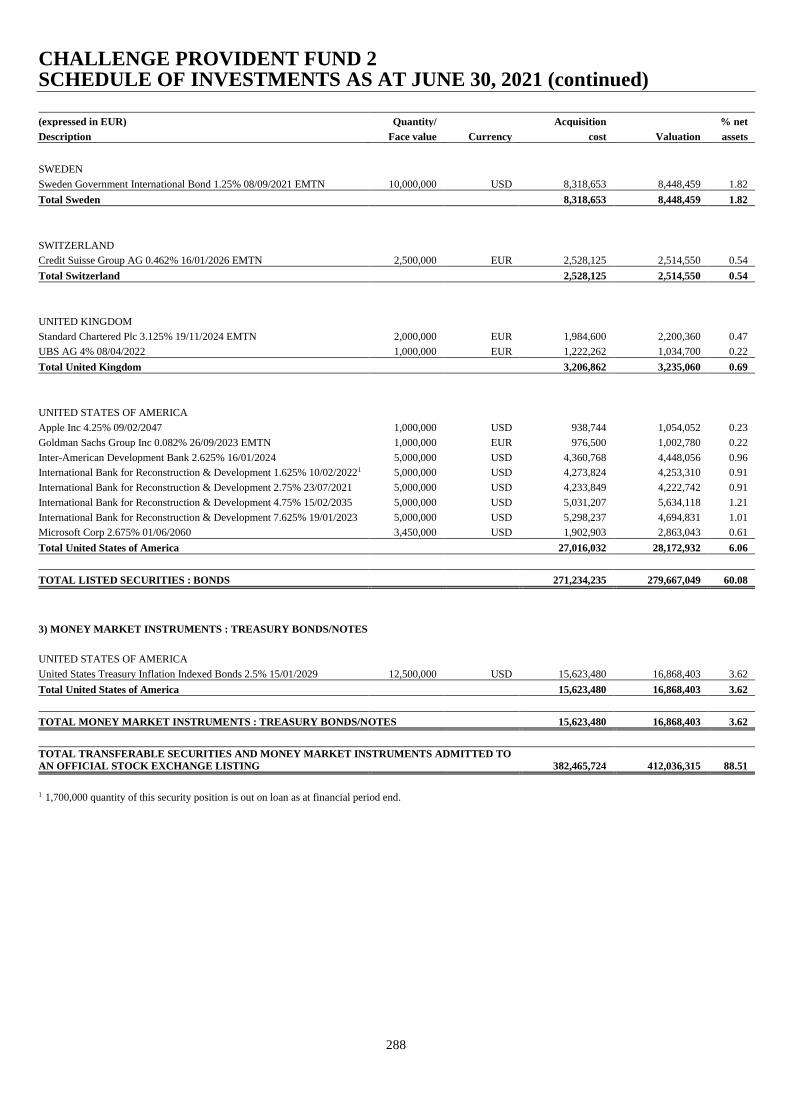
CHALLENGE PROVIDENT FUND 2 SCHEDULE OF INVESTMENTS AS AT JUNE 30, 2021 (continued)
288
(expressed in EUR) Quantity/ Acquisition % net
Description Face value Currency cost Valuation assets
SWEDEN
Sweden Government International Bond 1.25% 08/09/2021 EMTN 10,000,000 USD 8,318,653 8,448,459 1.82
Total Sweden 8,318,653 8,448,459 1.82
SWITZERLAND
Credit Suisse Group AG 0.462% 16/01/2026 EMTN 2,500,000 EUR 2,528,125 2,514,550 0.54
Total Switzerland 2,528,125 2,514,550 0.54
UNITED KINGDOM
Standard Chartered Plc 3.125% 19/11/2024 EMTN 2,000,000 EUR 1,984,600 2,200,360 0.47
UBS AG 4% 08/04/2022 1,000,000 EUR 1,222,262 1,034,700 0.22
Total United Kingdom 3,206,862 3,235,060 0.69
UNITED STATES OF AMERICA
Apple Inc 4.25% 09/02/2047 1,000,000 USD 938,744 1,054,052 0.23
Goldman Sachs Group Inc 0.082% 26/09/2023 EMTN 1,000,000 EUR 976,500 1,002,780 0.22
Inter-American Development Bank 2.625% 16/01/2024 5,000,000 USD 4,360,768 4,448,056 0.96
International Bank for Reconstruction & Development 1.625% 10/02/20221 5,000,000 USD 4,273,824 4,253,310 0.91
International Bank for Reconstruction & Development 2.75% 23/07/2021 5,000,000 USD 4,233,849 4,222,742 0.91
International Bank for Reconstruction & Development 4.75% 15/02/2035 5,000,000 USD 5,031,207 5,634,118 1.21
International Bank for Reconstruction & Development 7.625% 19/01/2023 5,000,000 USD 5,298,237 4,694,831 1.01
Microsoft Corp 2.675% 01/06/2060 3,450,000 USD 1,902,903 2,863,043 0.61
Total United States of America 27,016,032 28,172,932 6.06
TOTAL LISTED SECURITIES : BONDS 271,234,235 279,667,049 60.08
3) MONEY MARKET INSTRUMENTS : TREASURY BONDS/NOTES
UNITED STATES OF AMERICA
United States Treasury Inflation Indexed Bonds 2.5% 15/01/2029 12,500,000 USD 15,623,480 16,868,403 3.62
Total United States of America 15,623,480 16,868,403 3.62
TOTAL MONEY MARKET INSTRUMENTS : TREASURY BONDS/NOTES 15,623,480 16,868,403 3.62
TOTAL TRANSFERABLE SECURITIES AND MONEY MARKET INSTRUMENTS ADMITTED TO
AN OFFICIAL STOCK EXCHANGE LISTING 382,465,724 412,036,315 88.51
1 1,700,000 quantity of this security position is out on loan as at financial period end.

CHALLENGE PROVIDENT FUND 2 SCHEDULE OF INVESTMENTS AS AT JUNE 30, 2021 (continued)
289
(expressed in EUR) Quantity/ Acquisition % net
Description Face value Currency cost Valuation assets
B) MONEY MARKET INSTRUMENTS
1) MONEY MARKET INSTRUMENTS : TREASURY BILLS
JAPAN
Japan Treasury Discount Bill 0% 20/12/2021 1,000,000,000 JPY 7,935,459 7,602,095 1.63
Total Japan 7,935,459 7,602,095 1.63
TOTAL MONEY MARKET INSTRUMENTS : TREASURY BILLS 7,935,459 7,602,095 1.63
TOTAL MONEY MARKET INSTRUMENTS 7,935,459 7,602,095 1.63
TOTAL INVESTMENTS 390,401,183 419,638,410 90.14
CASH AND OTHER NET ASSETS 45,897,290 9.86
TOTAL NET ASSETS 465,535,700 100.00
ANALYSIS OF TOTAL ASSETS
(expressed in EUR) % total
Description Valuation assets
TRANSFERABLE SECURITIES AND MONEY MARKET INSTRUMENTS ADMITTED TO AN OFFICIAL STOCK
EXCHANGE LISTING 412,036,315 87.50
MONEY MARKET INSTRUMENTS 7,602,095 1.61
FINANCIAL DERIVATIVE INSTRUMENTS DEALT ON A REGULATED MARKET
643,416 0.14
CASH AND CASH EQUIVALENTS 40,485,657 8.60
MARGIN CASH RECEIVABLE
7,756,973 1.65
OTHER ASSETS 2,347,506 0.50
TOTAL 470,871,962 100.00
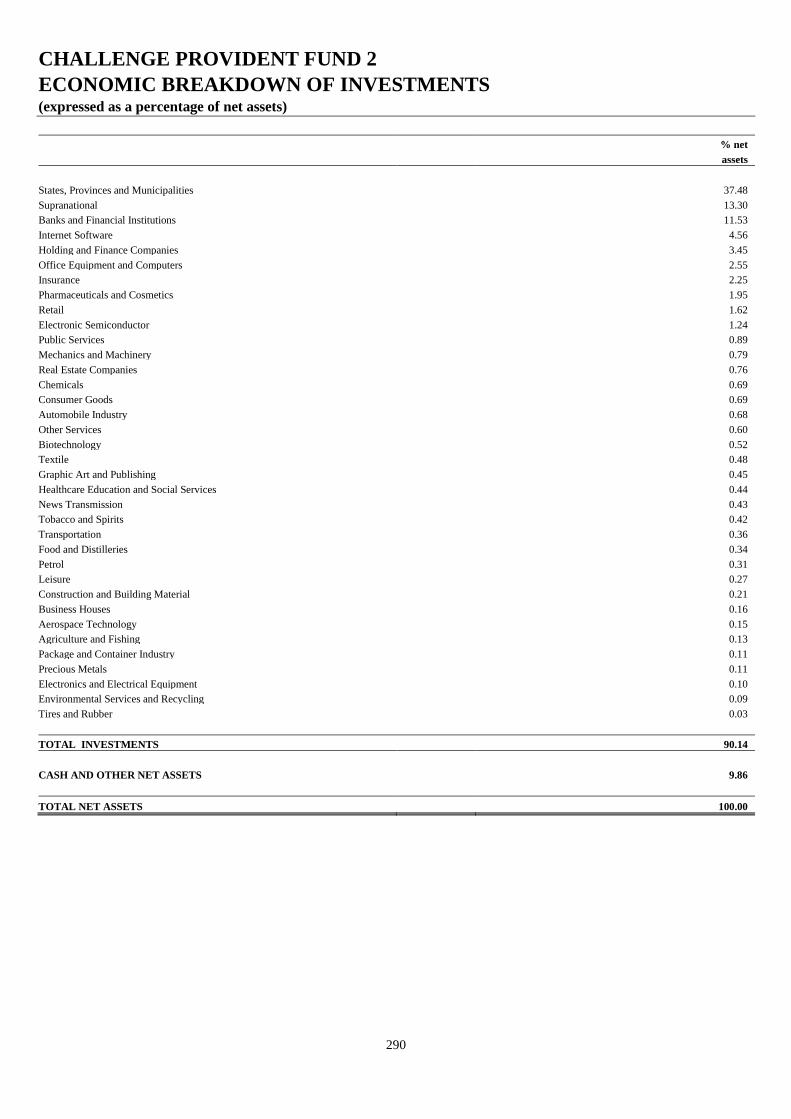
CHALLENGE PROVIDENT FUND 2
ECONOMIC BREAKDOWN OF INVESTMENTS (expressed as a percentage of net assets)
290
% net
assets
States, Provinces and Municipalities 37.48
Supranational 13.30
Banks and Financial Institutions 11.53
Internet Software 4.56
Holding and Finance Companies 3.45
Office Equipment and Computers 2.55
Insurance 2.25
Pharmaceuticals and Cosmetics 1.95
Retail 1.62
Electronic Semiconductor 1.24
Public Services 0.89
Mechanics and Machinery 0.79
Real Estate Companies 0.76
Chemicals 0.69
Consumer Goods 0.69
Automobile Industry 0.68
Other Services 0.60
Biotechnology 0.52
Textile 0.48
Graphic Art and Publishing 0.45
Healthcare Education and Social Services 0.44
News Transmission 0.43
Tobacco and Spirits 0.42
Transportation 0.36
Food and Distilleries 0.34
Petrol 0.31
Leisure 0.27
Construction and Building Material 0.21
Business Houses 0.16
Aerospace Technology 0.15
Agriculture and Fishing 0.13
Package and Container Industry 0.11
Precious Metals 0.11
Electronics and Electrical Equipment 0.10
Environmental Services and Recycling 0.09
Tires and Rubber 0.03
TOTAL INVESTMENTS 90.14
CASH AND OTHER NET ASSETS 9.86
TOTAL NET ASSETS 100.00
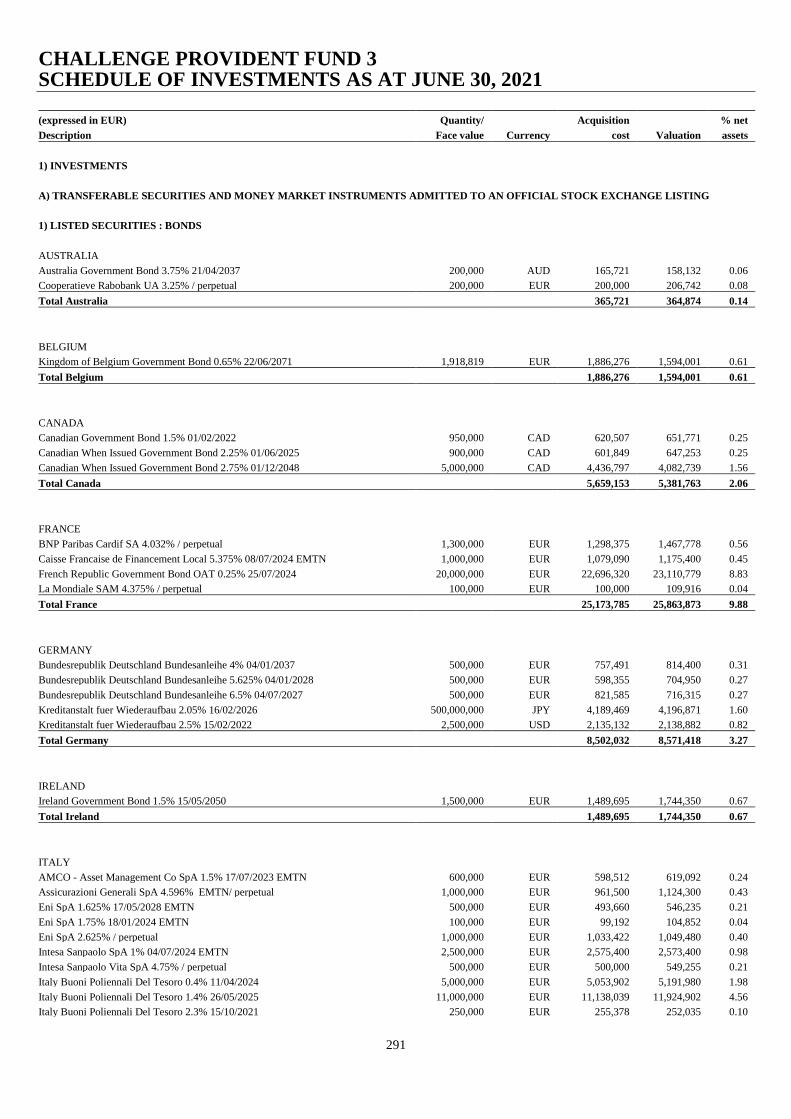
CHALLENGE PROVIDENT FUND 3 SCHEDULE OF INVESTMENTS AS AT JUNE 30, 2021
291
(expressed in EUR) Quantity/ Acquisition % net
Description Face value Currency cost Valuation assets
1) INVESTMENTS
A) TRANSFERABLE SECURITIES AND MONEY MARKET INSTRUMENTS ADMITTED TO AN OFFICIAL STOCK EXCHANGE LISTING
1) LISTED SECURITIES : BONDS
AUSTRALIA
Australia Government Bond 3.75% 21/04/2037 200,000 AUD 165,721 158,132 0.06
Cooperatieve Rabobank UA 3.25% / perpetual 200,000 EUR 200,000 206,742 0.08
Total Australia 365,721 364,874 0.14
BELGIUM
Kingdom of Belgium Government Bond 0.65% 22/06/2071 1,918,819 EUR 1,886,276 1,594,001 0.61
Total Belgium 1,886,276 1,594,001 0.61
CANADA
Canadian Government Bond 1.5% 01/02/2022 950,000 CAD 620,507 651,771 0.25
Canadian When Issued Government Bond 2.25% 01/06/2025 900,000 CAD 601,849 647,253 0.25
Canadian When Issued Government Bond 2.75% 01/12/2048 5,000,000 CAD 4,436,797 4,082,739 1.56
Total Canada 5,659,153 5,381,763 2.06
FRANCE
BNP Paribas Cardif SA 4.032% / perpetual 1,300,000 EUR 1,298,375 1,467,778 0.56
Caisse Francaise de Financement Local 5.375% 08/07/2024 EMTN 1,000,000 EUR 1,079,090 1,175,400 0.45
French Republic Government Bond OAT 0.25% 25/07/2024 20,000,000 EUR 22,696,320 23,110,779 8.83
La Mondiale SAM 4.375% / perpetual 100,000 EUR 100,000 109,916 0.04
Total France 25,173,785 25,863,873 9.88
GERMANY
Bundesrepublik Deutschland Bundesanleihe 4% 04/01/2037 500,000 EUR 757,491 814,400 0.31
Bundesrepublik Deutschland Bundesanleihe 5.625% 04/01/2028 500,000 EUR 598,355 704,950 0.27
Bundesrepublik Deutschland Bundesanleihe 6.5% 04/07/2027 500,000 EUR 821,585 716,315 0.27
Kreditanstalt fuer Wiederaufbau 2.05% 16/02/2026 500,000,000 JPY 4,189,469 4,196,871 1.60
Kreditanstalt fuer Wiederaufbau 2.5% 15/02/2022 2,500,000 USD 2,135,132 2,138,882 0.82
Total Germany 8,502,032 8,571,418 3.27
IRELAND
Ireland Government Bond 1.5% 15/05/2050 1,500,000 EUR 1,489,695 1,744,350 0.67
Total Ireland 1,489,695 1,744,350 0.67
ITALY
AMCO - Asset Management Co SpA 1.5% 17/07/2023 EMTN 600,000 EUR 598,512 619,092 0.24
Assicurazioni Generali SpA 4.596% EMTN/ perpetual 1,000,000 EUR 961,500 1,124,300 0.43
Eni SpA 1.625% 17/05/2028 EMTN 500,000 EUR 493,660 546,235 0.21
Eni SpA 1.75% 18/01/2024 EMTN 100,000 EUR 99,192 104,852 0.04
Eni SpA 2.625% / perpetual 1,000,000 EUR 1,033,422 1,049,480 0.40
Intesa Sanpaolo SpA 1% 04/07/2024 EMTN 2,500,000 EUR 2,575,400 2,573,400 0.98
Intesa Sanpaolo Vita SpA 4.75% / perpetual 500,000 EUR 500,000 549,255 0.21
Italy Buoni Poliennali Del Tesoro 0.4% 11/04/2024 5,000,000 EUR 5,053,902 5,191,980 1.98
Italy Buoni Poliennali Del Tesoro 1.4% 26/05/2025 11,000,000 EUR 11,138,039 11,924,902 4.56
Italy Buoni Poliennali Del Tesoro 2.3% 15/10/2021 250,000 EUR 255,378 252,035 0.10
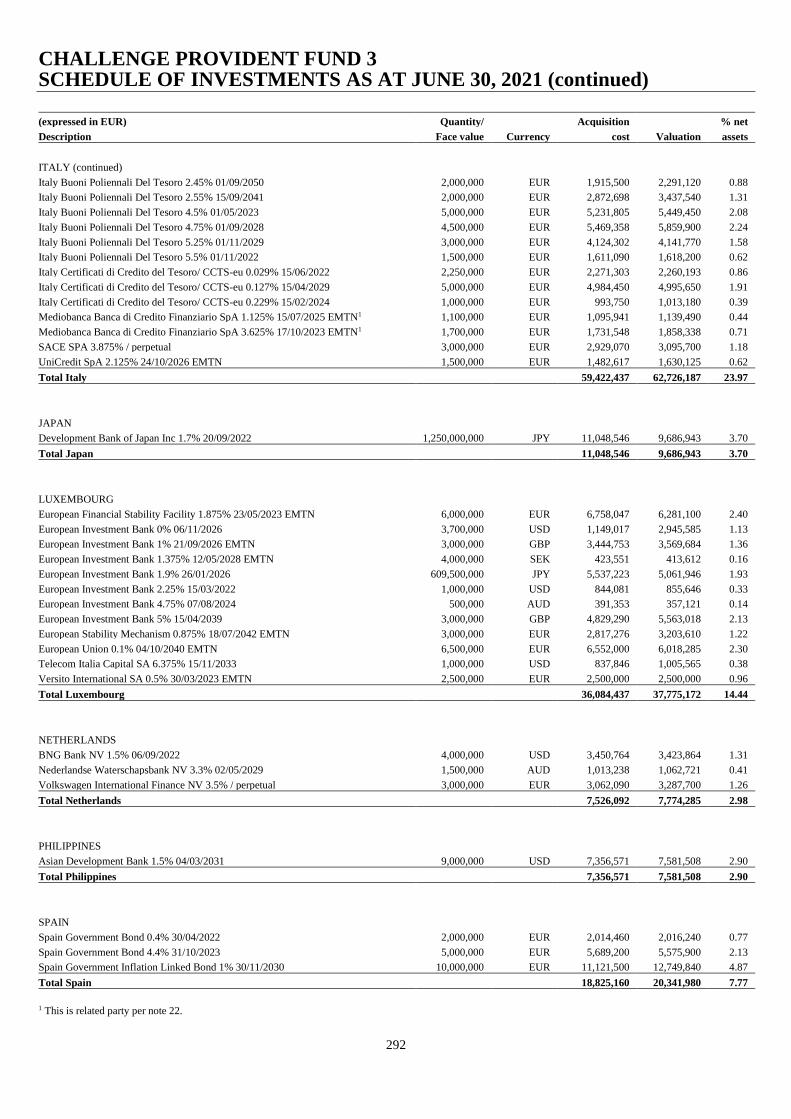
CHALLENGE PROVIDENT FUND 3 SCHEDULE OF INVESTMENTS AS AT JUNE 30, 2021 (continued)
292
(expressed in EUR) Quantity/ Acquisition % net
Description Face value Currency cost Valuation assets
ITALY (continued)
Italy Buoni Poliennali Del Tesoro 2.45% 01/09/2050 2,000,000 EUR 1,915,500 2,291,120 0.88
Italy Buoni Poliennali Del Tesoro 2.55% 15/09/2041 2,000,000 EUR 2,872,698 3,437,540 1.31
Italy Buoni Poliennali Del Tesoro 4.5% 01/05/2023 5,000,000 EUR 5,231,805 5,449,450 2.08
Italy Buoni Poliennali Del Tesoro 4.75% 01/09/2028 4,500,000 EUR 5,469,358 5,859,900 2.24
Italy Buoni Poliennali Del Tesoro 5.25% 01/11/2029 3,000,000 EUR 4,124,302 4,141,770 1.58
Italy Buoni Poliennali Del Tesoro 5.5% 01/11/2022 1,500,000 EUR 1,611,090 1,618,200 0.62
Italy Certificati di Credito del Tesoro/ CCTS-eu 0.029% 15/06/2022 2,250,000 EUR 2,271,303 2,260,193 0.86
Italy Certificati di Credito del Tesoro/ CCTS-eu 0.127% 15/04/2029 5,000,000 EUR 4,984,450 4,995,650 1.91
Italy Certificati di Credito del Tesoro/ CCTS-eu 0.229% 15/02/2024 1,000,000 EUR 993,750 1,013,180 0.39
Mediobanca Banca di Credito Finanziario SpA 1.125% 15/07/2025 EMTN1 1,100,000 EUR 1,095,941 1,139,490 0.44
Mediobanca Banca di Credito Finanziario SpA 3.625% 17/10/2023 EMTN1 1,700,000 EUR 1,731,548 1,858,338 0.71
SACE SPA 3.875% / perpetual 3,000,000 EUR 2,929,070 3,095,700 1.18
UniCredit SpA 2.125% 24/10/2026 EMTN 1,500,000 EUR 1,482,617 1,630,125 0.62
Total Italy 59,422,437 62,726,187 23.97
JAPAN
Development Bank of Japan Inc 1.7% 20/09/2022 1,250,000,000 JPY 11,048,546 9,686,943 3.70
Total Japan 11,048,546 9,686,943 3.70
LUXEMBOURG
European Financial Stability Facility 1.875% 23/05/2023 EMTN 6,000,000 EUR 6,758,047 6,281,100 2.40
European Investment Bank 0% 06/11/2026 3,700,000 USD 1,149,017 2,945,585 1.13
European Investment Bank 1% 21/09/2026 EMTN 3,000,000 GBP 3,444,753 3,569,684 1.36
European Investment Bank 1.375% 12/05/2028 EMTN 4,000,000 SEK 423,551 413,612 0.16
European Investment Bank 1.9% 26/01/2026 609,500,000 JPY 5,537,223 5,061,946 1.93
European Investment Bank 2.25% 15/03/2022 1,000,000 USD 844,081 855,646 0.33
European Investment Bank 4.75% 07/08/2024 500,000 AUD 391,353 357,121 0.14
European Investment Bank 5% 15/04/2039 3,000,000 GBP 4,829,290 5,563,018 2.13
European Stability Mechanism 0.875% 18/07/2042 EMTN 3,000,000 EUR 2,817,276 3,203,610 1.22
European Union 0.1% 04/10/2040 EMTN 6,500,000 EUR 6,552,000 6,018,285 2.30
Telecom Italia Capital SA 6.375% 15/11/2033 1,000,000 USD 837,846 1,005,565 0.38
Versito International SA 0.5% 30/03/2023 EMTN 2,500,000 EUR 2,500,000 2,500,000 0.96
Total Luxembourg 36,084,437 37,775,172 14.44
NETHERLANDS
BNG Bank NV 1.5% 06/09/2022 4,000,000 USD 3,450,764 3,423,864 1.31
Nederlandse Waterschapsbank NV 3.3% 02/05/2029 1,500,000 AUD 1,013,238 1,062,721 0.41
Volkswagen International Finance NV 3.5% / perpetual 3,000,000 EUR 3,062,090 3,287,700 1.26
Total Netherlands 7,526,092 7,774,285 2.98
PHILIPPINES
Asian Development Bank 1.5% 04/03/2031 9,000,000 USD 7,356,571 7,581,508 2.90
Total Philippines 7,356,571 7,581,508 2.90
SPAIN
Spain Government Bond 0.4% 30/04/2022 2,000,000 EUR 2,014,460 2,016,240 0.77
Spain Government Bond 4.4% 31/10/2023 5,000,000 EUR 5,689,200 5,575,900 2.13
Spain Government Inflation Linked Bond 1% 30/11/2030 10,000,000 EUR 11,121,500 12,749,840 4.87
Total Spain 18,825,160 20,341,980 7.77
1 This is related party per note 22.

CHALLENGE PROVIDENT FUND 3 SCHEDULE OF INVESTMENTS AS AT JUNE 30, 2021 (continued)
293
(expressed in EUR) Quantity/ Acquisition % net
Description Face value Currency cost Valuation assets
SWITZERLAND
Credit Suisse Group AG 0.462% 16/01/2026 EMTN 1,000,000 EUR 998,000 1,005,820 0.38
Total Switzerland 998,000 1,005,820 0.38
UNITED KINGDOM
UBS AG 4% 08/04/2022 1,000,000 EUR 1,222,262 1,034,700 0.40
Total United Kingdom 1,222,262 1,034,700 0.40
UNITED STATES OF AMERICA
Apple Inc 4.25% 09/02/2047 1,000,000 USD 938,744 1,054,052 0.40
Goldman Sachs Group Inc 0.082% 26/09/2023 EMTN 1,200,000 EUR 1,177,830 1,203,336 0.46
International Bank for Reconstruction & Development 4.75% 15/02/2035 6,000,000 USD 5,612,688 6,760,941 2.58
International Bank for Reconstruction & Development 7.625% 19/01/2023 7,000,000 USD 6,784,879 6,572,763 2.51
Microsoft Corp 2.675% 01/06/2060 4,650,000 USD 2,673,588 3,858,884 1.47
Morgan Stanley 0.168% 08/11/2022 500,000 EUR 503,035 501,065 0.19
Total United States of America 17,690,764 19,951,041 7.61
TOTAL LISTED SECURITIES : BONDS 203,250,931 211,397,915 80.78
2) MONEY MARKET INSTRUMENTS : BONDS
UNITED STATES OF AMERICA
United States Treasury Inflation Indexed Bonds 2.5% 15/01/2029 15,000,000 USD 17,604,797 20,242,083 7.73
Total United States of America 17,604,797 20,242,083 7.73
TOTAL MONEY MARKET INSTRUMENTS : BONDS 17,604,797 20,242,083 7.73
TOTAL TRANSFERABLE SECURITIES AND MONEY MARKET INSTRUMENTS ADMITTED TO AN
OFFICIAL STOCK EXCHANGE LISTING 220,855,728 231,639,998 88.51
TOTAL INVESTMENTS 220,855,728 231,639,998 88.51
CASH AND OTHER NET ASSETS 30,075,606 11.49
TOTAL NET ASSETS 261,715,604 100.00
ANALYSIS OF TOTAL ASSETS
(expressed in EUR) % total
Description Valuation assets
TRANSFERABLE SECURITIES AND MONEY MARKET INSTRUMENTS ADMITTED TO AN OFFICIAL STOCK
EXCHANGE LISTING 231,639,998 86.63
CASH AND CASH EQUIVALENTS
33,596,146 12.56
MARGIN CASH RECEIVABLE FROM BROKERS
185,308 0.07
OTHER ASSETS
1,988,057 0.74
TOTAL 267,409,509 100.00

CHALLENGE PROVIDENT FUND 3
ECONOMIC BREAKDOWN OF INVESTMENTS (expressed as a percentage of net assets)
294
% net
assets
States, Provinces and Municipalities 47.10
Supranational 21.08
Banks and Financial Institutions 12.92
Holding and Finance Companies 3.03
Insurance 1.86
Internet Software 1.47
Petrol 0.65
Office Equipment and Computers 0.40
TOTAL INVESTMENTS 88.51
CASH AND OTHER NET ASSETS 11.49
TOTAL NET ASSETS 100.00

CHALLENGE PROVIDENT FUND 4 SCHEDULE OF INVESTMENTS AS AT JUNE 30, 2021
295
(expressed in EUR) Quantity/ Acquisition % net
Description Face value Currency cost Valuation assets
1) INVESTMENTS
A) TRANSFERABLE SECURITIES ADMITTED TO AN OFFICIAL STOCK EXCHANGE LISTING
1) LISTED SECURITIES : BONDS
BELGIUM
Kingdom of Belgium Government Bond 0.65% 22/06/2071 767,528 EUR 754,510 637,601 0.32
Total Belgium 754,510 637,601 0.32
FRANCE
BNP Paribas SA 0.306% 22/09/2022 EMTN 2,800,000 EUR 2,860,480 2,825,340 1.40
French Republic Government Bond OAT 0.25% 25/07/2024 15,000,000 EUR 16,783,968 17,333,084 8.57
French Republic Government Bond OAT 3.4% 25/07/2029 5,500,000 EUR 10,364,290 10,264,859 5.07
NN Group NV 1% 18/03/2022 EMTN 200,000 EUR 201,720 201,912 0.10
Wendel SE 2.75% 02/10/2024 3,000,000 EUR 3,298,200 3,243,180 1.60
Total France 33,508,658 33,868,375 16.74
GERMANY
Deutsche Bank AG 1.25% 08/09/2021 EMTN 2,500,000 EUR 2,490,045 2,506,750 1.24
Deutsche Bundesrepublik Inflation Linked Bond 0.5% 15/04/2030 2,500,000 EUR 3,093,606 3,245,870 1.60
Total Germany 5,583,651 5,752,620 2.84
IRELAND
Ireland Government Bond 1.5% 15/05/2050 1,000,000 EUR 1,158,730 1,162,900 0.57
Total Ireland 1,158,730 1,162,900 0.57
ITALY
AMCO - Asset Management Co SpA 1.5% 17/07/2023 EMTN 1,400,000 EUR 1,396,528 1,444,548 0.71
Assicurazioni Generali SpA 4.596% EMTN/ perpetual 1,000,000 EUR 1,002,250 1,124,300 0.56
Azimut Holding SpA 2% 28/03/2022 700,000 EUR 700,000 709,156 0.35
Enel SpA 3.5% 24/05/2080 2,000,000 EUR 2,124,105 2,184,740 1.08
Intesa Sanpaolo SpA 0.75% 17/10/2022 EMTN 400,000 EUR 381,448 405,024 0.20
Intesa Sanpaolo SpA 1% 04/07/2024 EMTN 2,000,000 EUR 2,060,320 2,058,720 1.02
Intesa Sanpaolo SpA 4.45% 15/09/2027 EMTN 800,000 EUR 798,280 839,040 0.41
Intesa Sanpaolo Vita SpA 4.75% / perpetual 500,000 EUR 512,500 549,255 0.27
Italy Buoni Poliennali Del Tesoro 0.4% 11/04/2024 5,000,000 EUR 5,053,902 5,191,980 2.57
Italy Buoni Poliennali Del Tesoro 1.4% 26/05/2025 8,000,000 EUR 8,101,054 8,672,656 4.29
Italy Buoni Poliennali Del Tesoro 2.3% 15/10/2021 1,250,000 EUR 1,276,888 1,260,175 0.62
Italy Buoni Poliennali Del Tesoro 4.5% 01/05/2023 10,000,000 EUR 10,472,340 10,898,900 5.39
Italy Buoni Poliennali Del Tesoro 5.25% 01/11/2029 2,000,000 EUR 2,623,449 2,761,180 1.36
Italy Buoni Poliennali Del Tesoro 5.5% 01/11/2022 6,000,000 EUR 6,729,310 6,472,800 3.20
Italy Certificati di Credito del Tesoro Zero Coupon 0% 28/09/2022 12,500,000 EUR 12,559,000 12,563,000 6.21
Italy Certificati di Credito del Tesoro Zero Coupon 0% 29/11/2021 10,000,000 EUR 10,022,960 10,021,700 4.95
Italy Certificati di Credito del Tesoro/ CCTS-eu 0.029% 15/06/2022 17,250,000 EUR 17,367,531 17,328,143 8.56
Italy Certificati di Credito del Tesoro/ CCTS-eu 0.029% 15/12/2023 10,000,000 EUR 10,040,250 10,076,000 4.98
Italy Certificati di Credito del Tesoro/ CCTS-eu 0.127% 15/04/2029 10,000,000 EUR 9,968,900 9,991,300 4.94
Italy Certificati di Credito del Tesoro/ CCTS-eu 0.577% 15/10/2024 10,500,000 EUR 10,443,950 10,784,760 5.33
Mediobanca Banca di Credito Finanziario SpA 0.251% 18/05/2022 EMTN1 4,300,000 EUR 4,189,359 4,319,866 2.13
Mediobanca Banca di Credito Finanziario SpA 1.125% 15/07/2025 EMTN1 700,000 EUR 697,417 725,130 0.36
SACE SPA 3.875% / perpetual 2,000,000 EUR 2,086,100 2,063,800 1.02
Total Italy 120,607,841 122,446,173 60.51
1 This is related party per note 22.
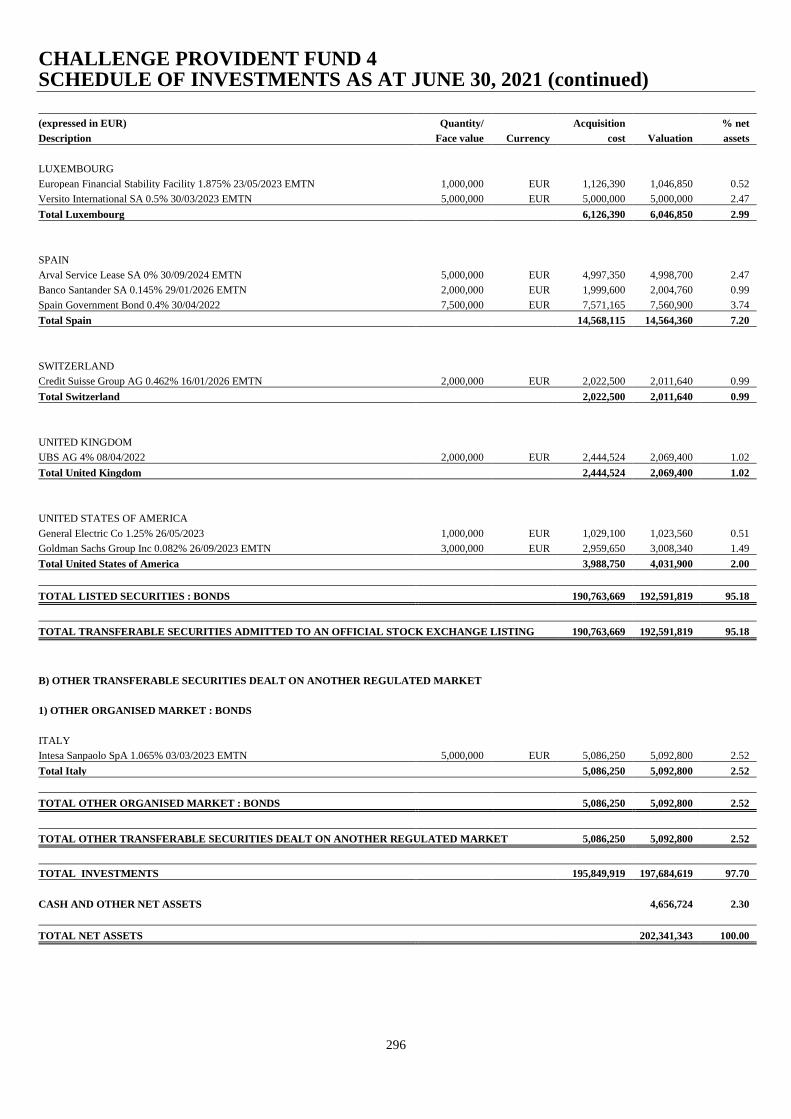
CHALLENGE PROVIDENT FUND 4 SCHEDULE OF INVESTMENTS AS AT JUNE 30, 2021 (continued)
296
(expressed in EUR) Quantity/ Acquisition % net
Description Face value Currency cost Valuation assets
LUXEMBOURG
European Financial Stability Facility 1.875% 23/05/2023 EMTN 1,000,000 EUR 1,126,390 1,046,850 0.52
Versito International SA 0.5% 30/03/2023 EMTN 5,000,000 EUR 5,000,000 5,000,000 2.47
Total Luxembourg 6,126,390 6,046,850 2.99
SPAIN
Arval Service Lease SA 0% 30/09/2024 EMTN 5,000,000 EUR 4,997,350 4,998,700 2.47
Banco Santander SA 0.145% 29/01/2026 EMTN 2,000,000 EUR 1,999,600 2,004,760 0.99
Spain Government Bond 0.4% 30/04/2022 7,500,000 EUR 7,571,165 7,560,900 3.74
Total Spain 14,568,115 14,564,360 7.20
SWITZERLAND
Credit Suisse Group AG 0.462% 16/01/2026 EMTN 2,000,000 EUR 2,022,500 2,011,640 0.99
Total Switzerland 2,022,500 2,011,640 0.99
UNITED KINGDOM
UBS AG 4% 08/04/2022 2,000,000 EUR 2,444,524 2,069,400 1.02
Total United Kingdom 2,444,524 2,069,400 1.02
UNITED STATES OF AMERICA
General Electric Co 1.25% 26/05/2023 1,000,000 EUR 1,029,100 1,023,560 0.51
Goldman Sachs Group Inc 0.082% 26/09/2023 EMTN 3,000,000 EUR 2,959,650 3,008,340 1.49
Total United States of America 3,988,750 4,031,900 2.00
TOTAL LISTED SECURITIES : BONDS 190,763,669 192,591,819 95.18
TOTAL TRANSFERABLE SECURITIES ADMITTED TO AN OFFICIAL STOCK EXCHANGE LISTING 190,763,669 192,591,819 95.18
B) OTHER TRANSFERABLE SECURITIES DEALT ON ANOTHER REGULATED MARKET
1) OTHER ORGANISED MARKET : BONDS
ITALY
Intesa Sanpaolo SpA 1.065% 03/03/2023 EMTN 5,000,000 EUR 5,086,250 5,092,800 2.52
Total Italy 5,086,250 5,092,800 2.52
TOTAL OTHER ORGANISED MARKET : BONDS 5,086,250 5,092,800 2.52
TOTAL OTHER TRANSFERABLE SECURITIES DEALT ON ANOTHER REGULATED MARKET 5,086,250 5,092,800 2.52
TOTAL INVESTMENTS 195,849,919 197,684,619 97.70
CASH AND OTHER NET ASSETS 4,656,724 2.30
TOTAL NET ASSETS 202,341,343 100.00
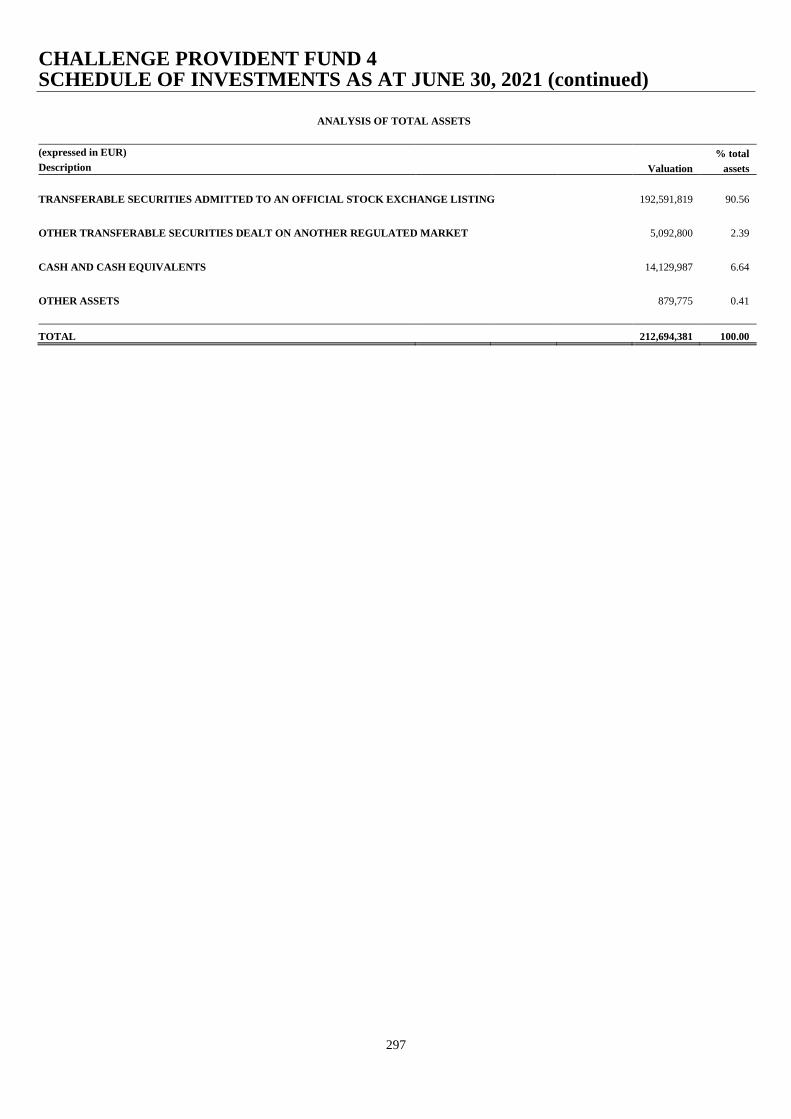
CHALLENGE PROVIDENT FUND 4 SCHEDULE OF INVESTMENTS AS AT JUNE 30, 2021 (continued)
297
ANALYSIS OF TOTAL ASSETS
(expressed in EUR) % total
Description Valuation assets
TRANSFERABLE SECURITIES ADMITTED TO AN OFFICIAL STOCK EXCHANGE LISTING
192,591,819 90.56
OTHER TRANSFERABLE SECURITIES DEALT ON ANOTHER REGULATED MARKET
5,092,800 2.39
CASH AND CASH EQUIVALENTS
14,129,987 6.64
OTHER ASSETS
879,775 0.41
TOTAL 212,694,381 100.00
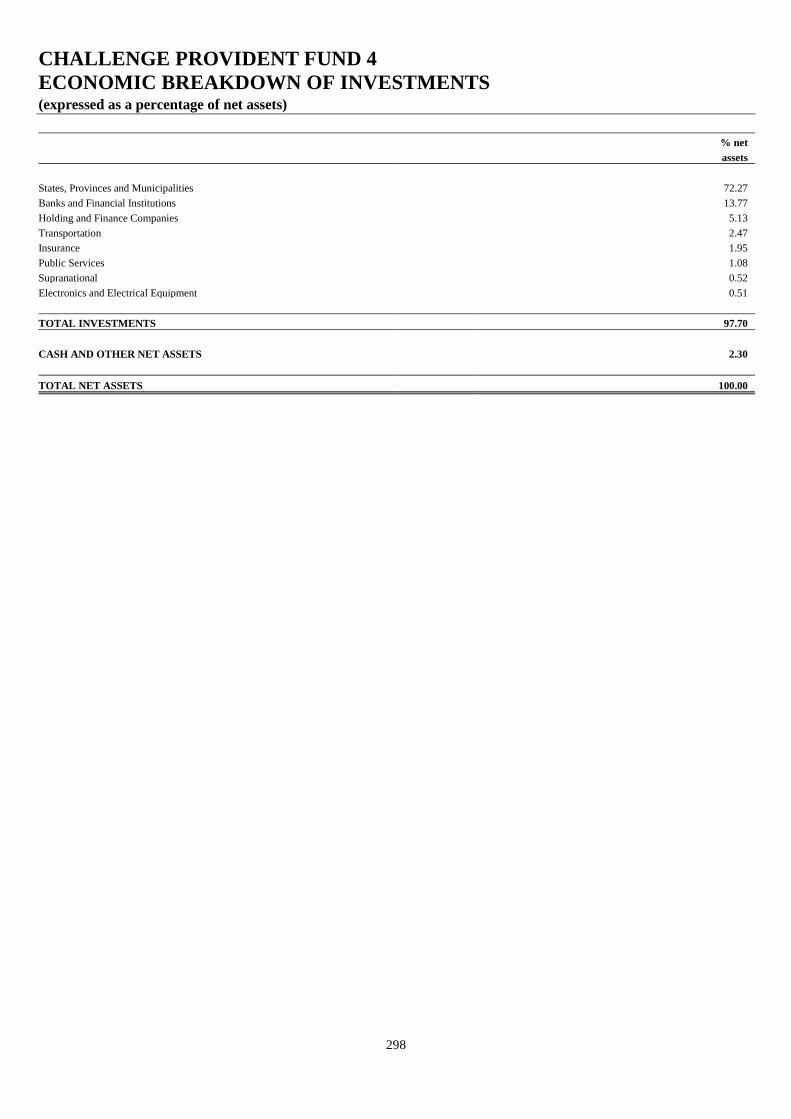
CHALLENGE PROVIDENT FUND 4
ECONOMIC BREAKDOWN OF INVESTMENTS (expressed as a percentage of net assets)
298
% net
assets
States, Provinces and Municipalities 72.27
Banks and Financial Institutions 13.77
Holding and Finance Companies 5.13
Transportation 2.47
Insurance 1.95
Public Services 1.08
Supranational 0.52
Electronics and Electrical Equipment 0.51
TOTAL INVESTMENTS 97.70
CASH AND OTHER NET ASSETS 2.30
TOTAL NET ASSETS 100.00

CHALLENGE PROVIDENT FUND 5 SCHEDULE OF INVESTMENTS AS AT JUNE 30, 2021
299
(expressed in EUR) Quantity/ Acquisition % net
Description Face value Currency cost Valuation assets
1) INVESTMENTS
A) TRANSFERABLE SECURITIES ADMITTED TO AN OFFICIAL STOCK EXCHANGE LISTING
1) LISTED SECURITIES : BONDS
DENMARK
Nykredit Realkredit AS 0.462% 25/03/2024 EMTN 10,000,000 EUR 10,137,000 10,131,500 0.97
Total Denmark 10,137,000 10,131,500 0.97
FRANCE
Accor SA 3.625% 17/09/2023 2,500,000 EUR 2,656,250 2,666,325 0.26
BNP Paribas SA 0.208% 07/06/2024 EMTN 2,500,000 EUR 2,530,300 2,534,575 0.24
BNP Paribas SA 0.306% 22/09/2022 EMTN 5,000,000 EUR 5,018,999 5,045,250 0.48
RCI Banque SA 0.035% 04/11/2024 EMTN 500,000 EUR 490,010 501,410 0.05
Renault SA 1% 18/04/2024 EMTN 2,000,000 EUR 1,993,250 1,989,700 0.19
Total France 12,688,809 12,737,260 1.22
GERMANY
Deutsche Bank AG 0.259% 16/05/2022 EMTN 9,000,000 EUR 8,864,781 9,033,840 0.87
METRO AG 1.125% 06/03/2023 EMTN 2,500,000 EUR 2,550,000 2,546,425 0.24
Total Germany 11,414,781 11,580,265 1.11
IRELAND
FCA Bank SpA 0.207% 10/06/2023 EMTN 10,000,000 EUR 10,055,000 10,010,000 0.96
Ryanair DAC 1.125% 10/03/2023 EMTN 2,500,000 EUR 2,542,450 2,544,675 0.24
Total Ireland 12,597,450 12,554,675 1.20
ITALY
AMCO - Asset Management Co SpA 1.5% 17/07/2023 EMTN 5,000,000 EUR 5,111,977 5,159,100 0.50
Azimut Holding SpA 2% 28/03/2022 3,000,000 EUR 3,067,500 3,039,240 0.29
Banco BPM SpA 2% 08/03/2022 EMTN 2,500,000 EUR 2,546,750 2,532,625 0.24
Cassa Depositi e Prestiti SpA 0% 20/03/2022 EMTN 3,000,000 EUR 3,007,800 3,004,530 0.29
Italy Buoni Poliennali Del Tesoro 0.1% 15/05/2022 20,000,000 EUR 21,335,982 21,720,640 2.09
Italy Buoni Poliennali Del Tesoro 2.3% 15/10/2021 20,000,000 EUR 20,341,100 20,162,800 1.94
Italy Buoni Poliennali Del Tesoro 2.6% 15/09/2023 25,000,000 EUR 33,099,737 33,178,625 3.19
Italy Certificati di Credito del Tesoro Zero Coupon 0% 28/09/2022 100,000,000 EUR 100,509,400 100,504,000 9.65
Italy Certificati di Credito del Tesoro Zero Coupon 0% 29/11/2021 25,000,000 EUR 25,105,100 25,054,250 2.41
Italy Certificati di Credito del Tesoro Zero Coupon 0% 30/05/2022 75,000,000 EUR 75,237,900 75,312,000 7.23
Italy Certificati di Credito del Tesoro/ CCTS-eu 0.029% 15/06/2022 50,000,000 EUR 50,489,100 50,226,500 4.82
Italy Certificati di Credito del Tesoro/ CCTS-eu 0.029% 15/12/2023 35,000,000 EUR 35,035,500 35,266,000 3.39
Italy Certificati di Credito del Tesoro/ CCTS-eu 0.173% 15/07/2023 35,000,000 EUR 35,238,100 35,370,650 3.40
Italy Certificati di Credito del Tesoro/ CCTS-eu 0.179% 15/12/2022 50,000,000 EUR 50,853,700 50,411,500 4.84
Italy Certificati di Credito del Tesoro/ CCTS-eu 0.229% 15/02/2024 50,000,000 EUR 50,263,809 50,659,000 4.86
Italy Certificati di Credito del Tesoro/ CCTS-eu 0.427% 15/04/2025 20,000,000 EUR 20,339,600 20,463,600 1.97
Italy Certificati di Credito del Tesoro/ CCTS-eu 0.577% 15/10/2024 50,000,000 EUR 50,634,550 51,356,000 4.93
Italy Certificati di Credito del Tesoro/ CCTS-eu 1.323% 15/01/2025 40,000,000 EUR 42,219,100 42,186,800 4.05
Mediobanca Banca di Credito Finanziario SpA 0.251% 18/05/2022 EMTN1 24,200,000 EUR 24,064,912 24,311,804 2.33
Mediobanca Banca di Credito Finanziario SpA 5.75% 18/04/20231 8,066,000 EUR 8,923,064 8,865,260 0.85
Total Italy 657,424,681 658,784,924 63.27
1 This is related party per note 22.
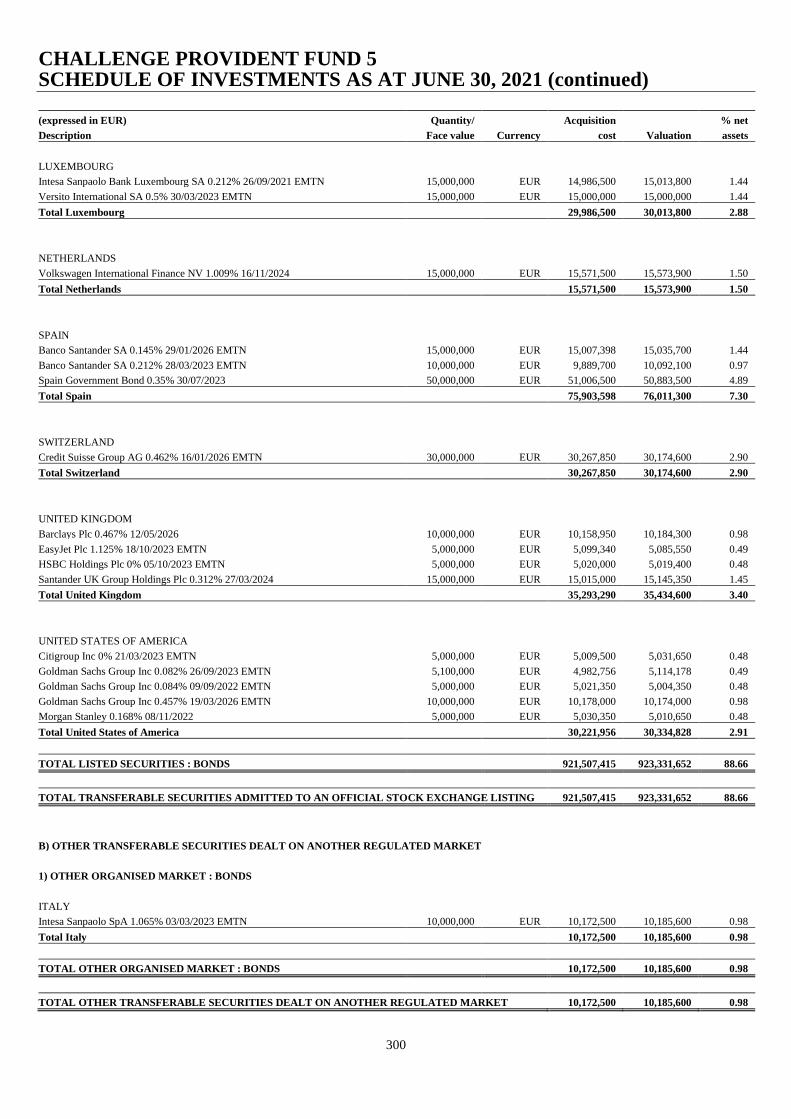
CHALLENGE PROVIDENT FUND 5 SCHEDULE OF INVESTMENTS AS AT JUNE 30, 2021 (continued)
300
(expressed in EUR) Quantity/ Acquisition % net
Description Face value Currency cost Valuation assets
LUXEMBOURG
Intesa Sanpaolo Bank Luxembourg SA 0.212% 26/09/2021 EMTN 15,000,000 EUR 14,986,500 15,013,800 1.44
Versito International SA 0.5% 30/03/2023 EMTN 15,000,000 EUR 15,000,000 15,000,000 1.44
Total Luxembourg 29,986,500 30,013,800 2.88
NETHERLANDS
Volkswagen International Finance NV 1.009% 16/11/2024 15,000,000 EUR 15,571,500 15,573,900 1.50
Total Netherlands 15,571,500 15,573,900 1.50
SPAIN
Banco Santander SA 0.145% 29/01/2026 EMTN 15,000,000 EUR 15,007,398 15,035,700 1.44
Banco Santander SA 0.212% 28/03/2023 EMTN 10,000,000 EUR 9,889,700 10,092,100 0.97
Spain Government Bond 0.35% 30/07/2023 50,000,000 EUR 51,006,500 50,883,500 4.89
Total Spain 75,903,598 76,011,300 7.30
SWITZERLAND
Credit Suisse Group AG 0.462% 16/01/2026 EMTN 30,000,000 EUR 30,267,850 30,174,600 2.90
Total Switzerland 30,267,850 30,174,600 2.90
UNITED KINGDOM
Barclays Plc 0.467% 12/05/2026 10,000,000 EUR 10,158,950 10,184,300 0.98
EasyJet Plc 1.125% 18/10/2023 EMTN 5,000,000 EUR 5,099,340 5,085,550 0.49
HSBC Holdings Plc 0% 05/10/2023 EMTN 5,000,000 EUR 5,020,000 5,019,400 0.48
Santander UK Group Holdings Plc 0.312% 27/03/2024 15,000,000 EUR 15,015,000 15,145,350 1.45
Total United Kingdom 35,293,290 35,434,600 3.40
UNITED STATES OF AMERICA
Citigroup Inc 0% 21/03/2023 EMTN 5,000,000 EUR 5,009,500 5,031,650 0.48
Goldman Sachs Group Inc 0.082% 26/09/2023 EMTN 5,100,000 EUR 4,982,756 5,114,178 0.49
Goldman Sachs Group Inc 0.084% 09/09/2022 EMTN 5,000,000 EUR 5,021,350 5,004,350 0.48
Goldman Sachs Group Inc 0.457% 19/03/2026 EMTN 10,000,000 EUR 10,178,000 10,174,000 0.98
Morgan Stanley 0.168% 08/11/2022 5,000,000 EUR 5,030,350 5,010,650 0.48
Total United States of America 30,221,956 30,334,828 2.91
TOTAL LISTED SECURITIES : BONDS 921,507,415 923,331,652 88.66
TOTAL TRANSFERABLE SECURITIES ADMITTED TO AN OFFICIAL STOCK EXCHANGE LISTING 921,507,415 923,331,652 88.66
B) OTHER TRANSFERABLE SECURITIES DEALT ON ANOTHER REGULATED MARKET
1) OTHER ORGANISED MARKET : BONDS
ITALY
Intesa Sanpaolo SpA 1.065% 03/03/2023 EMTN 10,000,000 EUR 10,172,500 10,185,600 0.98
Total Italy 10,172,500 10,185,600 0.98
TOTAL OTHER ORGANISED MARKET : BONDS 10,172,500 10,185,600 0.98
TOTAL OTHER TRANSFERABLE SECURITIES DEALT ON ANOTHER REGULATED MARKET 10,172,500 10,185,600 0.98
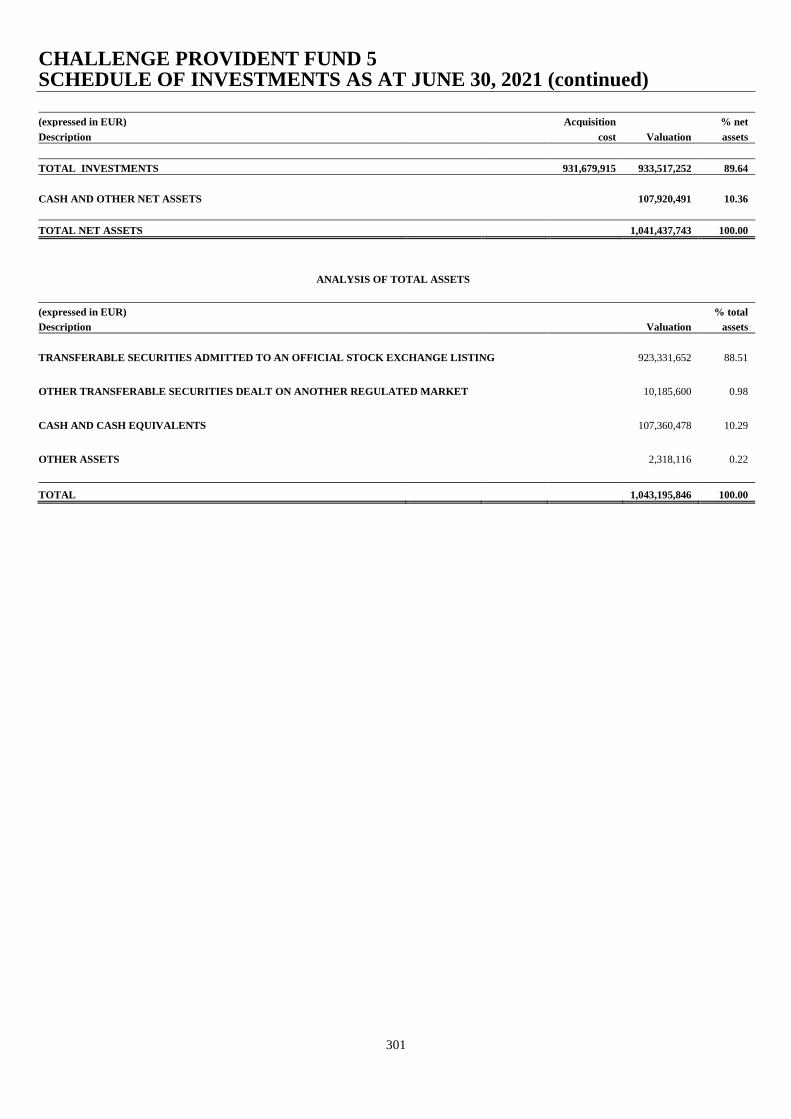
CHALLENGE PROVIDENT FUND 5 SCHEDULE OF INVESTMENTS AS AT JUNE 30, 2021 (continued)
301
(expressed in EUR) Acquisition % net
Description cost Valuation assets
TOTAL INVESTMENTS 931,679,915 933,517,252 89.64
CASH AND OTHER NET ASSETS 107,920,491 10.36
TOTAL NET ASSETS 1,041,437,743 100.00
ANALYSIS OF TOTAL ASSETS
(expressed in EUR) % total
Description Valuation assets
TRANSFERABLE SECURITIES ADMITTED TO AN OFFICIAL STOCK EXCHANGE LISTING
923,331,652 88.51
OTHER TRANSFERABLE SECURITIES DEALT ON ANOTHER REGULATED MARKET
10,185,600 0.98
CASH AND CASH EQUIVALENTS
107,360,478 10.29
OTHER ASSETS
2,318,116 0.22
TOTAL 1,043,195,846 100.00

CHALLENGE PROVIDENT FUND 5
ECONOMIC BREAKDOWN OF INVESTMENTS (expressed as a percentage of net assets)
302
%net
assets
States, Provinces and Municipalities 63.66
Banks and Financial Institutions 17.16
Holding and Finance Companies 6.43
Mortgage and Funding Institutions 0.97
Transportation 0.73
Leisure 0.26
Food and Distilleries 0.24
Automobile Industry 0.19
TOTAL INVESTMENTS 89.64
CASH AND OTHER NET ASSETS 10.36
TOTAL NET ASSETS 100.00

SIGNIFICANT PORTFOLIO CHANGES (expressed in EUR)
303
CHALLENGE NORTH AMERICAN EQUITY FUND
Purchase
Security Cost % of Total Purchases
US Bancorp 22,678,195 2.80
Apple Inc 21,350,908 2.63
Facebook Inc 17,757,861 2.19
Wellington US Research Equity Fund 15,605,561 1.92
Marriott International Inc 14,912,669 1.84
S&P Global Inc 13,421,457 1.65
Lowe's Cos Inc 12,643,929 1.56
NVIDIA Corp 11,592,670 1.43
Amazon.com Inc 10,689,286 1.32
Coca-Cola Co 10,384,747 1.28
Microsoft Corp 10,079,645 1.24
AbbVie Inc 9,842,533 1.21
McDonald's Corp 9,810,071 1.21
General Motors Co 8,915,212 1.10
Tesla Inc 8,808,739 1.09
DuPont de Nemours Inc 8,795,489 1.08
JPMorgan Chase & Co 8,424,576 1.04
Mastercard Inc 8,340,882 1.03
Alphabet Inc Shs A 8,165,028 1.01
Citigroup Inc 8,120,539 1.00
Sales
Security Proceeds % of Total Sales
Microsoft Corp 17,894,433 1.88
NXP Semiconductors NV 15,431,443 1.62
Amazon.com Inc 15,329,322 1.61
NVIDIA Corp 14,657,767 1.54
Constellation Brands Inc 14,371,496 1.51
T Rowe Price Funds SICAV - US Large-Cap Growth Equity Fund 13,676,096 1.44
Bristol-Myers Squibb Co 13,617,660 1.43
AbbVie Inc 13,377,856 1.41
Coca-Cola Co 12,641,808 1.33
Facebook Inc 12,597,924 1.32
Newmont Corp 12,364,945 1.30
Morgan Stanley 12,095,850 1.27
DuPont de Nemours Inc 10,466,104 1.10
Chevron Corp 10,428,454 1.10
Northrop Grumman Corp 10,347,099 1.09
Vertex Pharmaceuticals Inc 10,306,657 1.08
Exxon Mobil Corp 10,170,871 1.07
Netflix Inc 10,160,937 1.07
Becton Dickinson and Co 9,267,784 0.97
Eli Lilly & Co 8,864,087 0.93
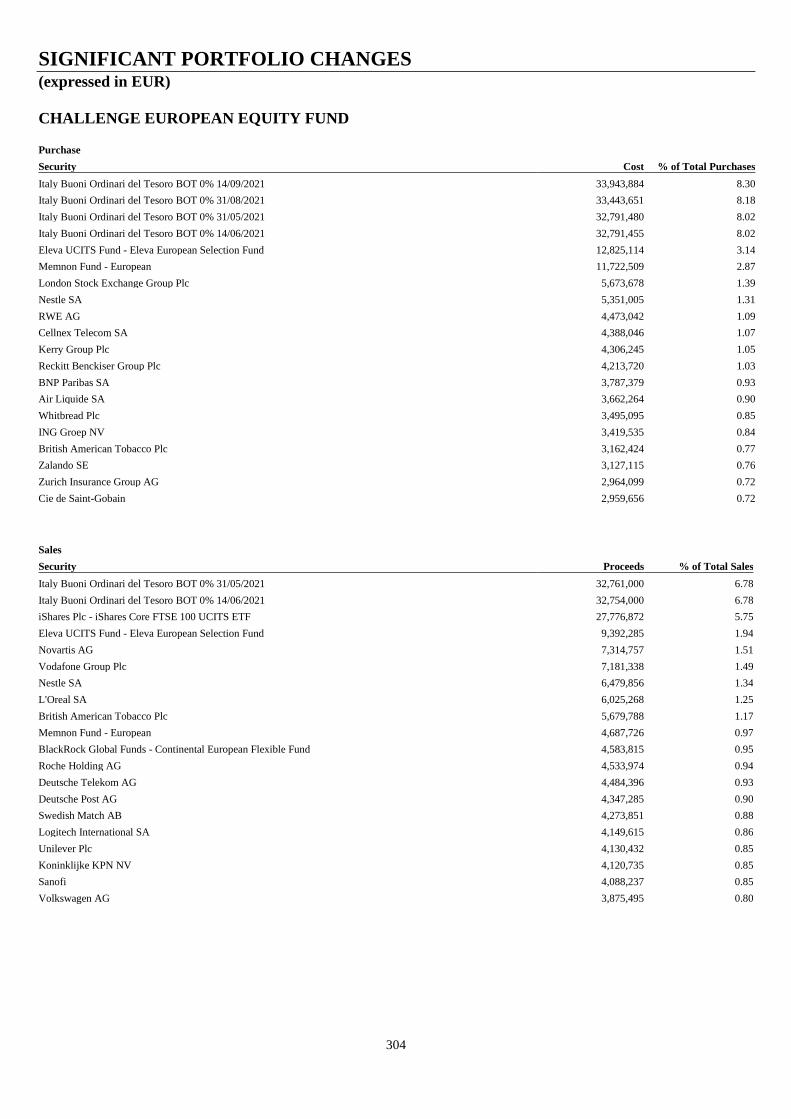
SIGNIFICANT PORTFOLIO CHANGES (expressed in EUR)
304
CHALLENGE EUROPEAN EQUITY FUND
Purchase
Security Cost % of Total Purchases
Italy Buoni Ordinari del Tesoro BOT 0% 14/09/2021 33,943,884 8.30
Italy Buoni Ordinari del Tesoro BOT 0% 31/08/2021 33,443,651 8.18
Italy Buoni Ordinari del Tesoro BOT 0% 31/05/2021 32,791,480 8.02
Italy Buoni Ordinari del Tesoro BOT 0% 14/06/2021 32,791,455 8.02
Eleva UCITS Fund - Eleva European Selection Fund 12,825,114 3.14
Memnon Fund - European 11,722,509 2.87
London Stock Exchange Group Plc 5,673,678 1.39
Nestle SA 5,351,005 1.31
RWE AG 4,473,042 1.09
Cellnex Telecom SA 4,388,046 1.07
Kerry Group Plc 4,306,245 1.05
Reckitt Benckiser Group Plc 4,213,720 1.03
BNP Paribas SA 3,787,379 0.93
Air Liquide SA 3,662,264 0.90
Whitbread Plc 3,495,095 0.85
ING Groep NV 3,419,535 0.84
British American Tobacco Plc 3,162,424 0.77
Zalando SE 3,127,115 0.76
Zurich Insurance Group AG 2,964,099 0.72
Cie de Saint-Gobain 2,959,656 0.72
Sales
Security Proceeds % of Total Sales
Italy Buoni Ordinari del Tesoro BOT 0% 31/05/2021 32,761,000 6.78
Italy Buoni Ordinari del Tesoro BOT 0% 14/06/2021 32,754,000 6.78
iShares Plc - iShares Core FTSE 100 UCITS ETF 27,776,872 5.75
Eleva UCITS Fund - Eleva European Selection Fund 9,392,285 1.94
Novartis AG 7,314,757 1.51
Vodafone Group Plc 7,181,338 1.49
Nestle SA 6,479,856 1.34
L'Oreal SA 6,025,268 1.25
British American Tobacco Plc 5,679,788 1.17
Memnon Fund - European 4,687,726 0.97
BlackRock Global Funds - Continental European Flexible Fund 4,583,815 0.95
Roche Holding AG 4,533,974 0.94
Deutsche Telekom AG 4,484,396 0.93
Deutsche Post AG 4,347,285 0.90
Swedish Match AB 4,273,851 0.88
Logitech International SA 4,149,615 0.86
Unilever Plc 4,130,432 0.85
Koninklijke KPN NV 4,120,735 0.85
Sanofi 4,088,237 0.85
Volkswagen AG 3,875,495 0.80
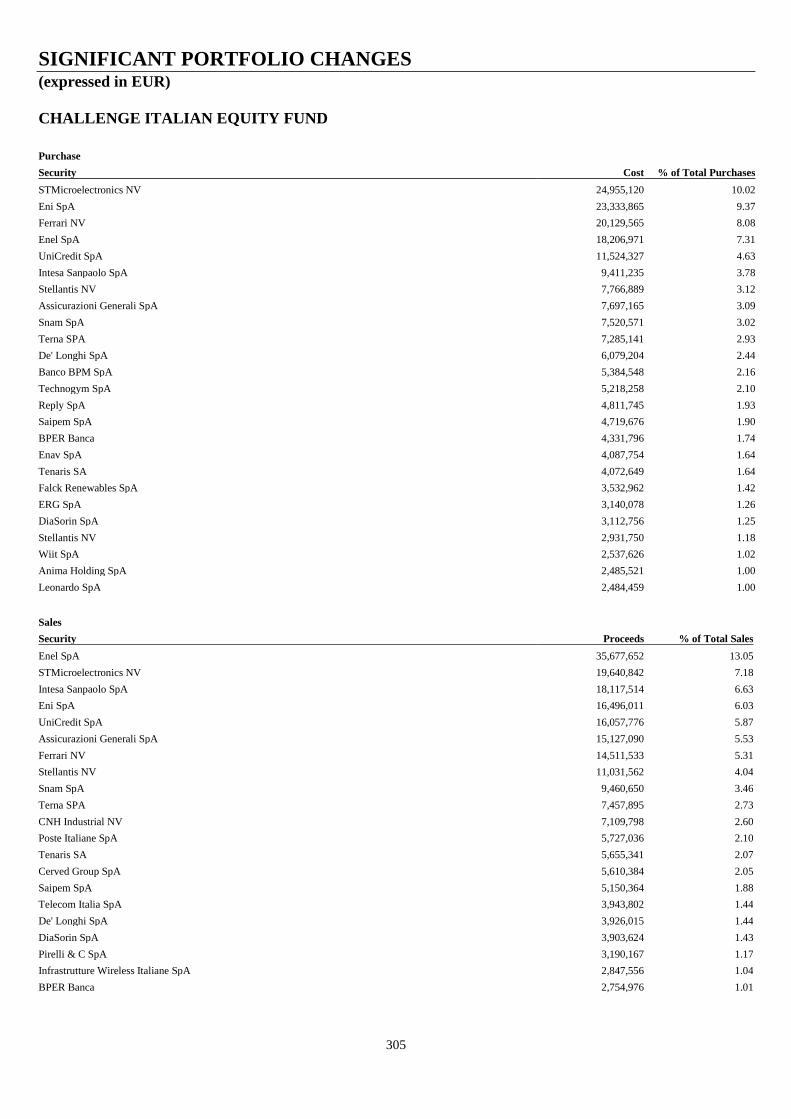
SIGNIFICANT PORTFOLIO CHANGES (expressed in EUR)
305
CHALLENGE ITALIAN EQUITY FUND
Purchase
Security Cost % of Total Purchases
STMicroelectronics NV 24,955,120 10.02
Eni SpA 23,333,865 9.37
Ferrari NV 20,129,565 8.08
Enel SpA 18,206,971 7.31
UniCredit SpA 11,524,327 4.63
Intesa Sanpaolo SpA 9,411,235 3.78
Stellantis NV 7,766,889 3.12
Assicurazioni Generali SpA 7,697,165 3.09
Snam SpA 7,520,571 3.02
Terna SPA 7,285,141 2.93
De' Longhi SpA 6,079,204 2.44
Banco BPM SpA 5,384,548 2.16
Technogym SpA 5,218,258 2.10
Reply SpA 4,811,745 1.93
Saipem SpA 4,719,676 1.90
BPER Banca 4,331,796 1.74
Enav SpA 4,087,754 1.64
Tenaris SA 4,072,649 1.64
Falck Renewables SpA 3,532,962 1.42
ERG SpA 3,140,078 1.26
DiaSorin SpA 3,112,756 1.25
Stellantis NV 2,931,750 1.18
Wiit SpA 2,537,626 1.02
Anima Holding SpA 2,485,521 1.00
Leonardo SpA 2,484,459 1.00
Sales
Security Proceeds % of Total Sales
Enel SpA 35,677,652 13.05
STMicroelectronics NV 19,640,842 7.18
Intesa Sanpaolo SpA 18,117,514 6.63
Eni SpA 16,496,011 6.03
UniCredit SpA 16,057,776 5.87
Assicurazioni Generali SpA 15,127,090 5.53
Ferrari NV 14,511,533 5.31
Stellantis NV 11,031,562 4.04
Snam SpA 9,460,650 3.46
Terna SPA 7,457,895 2.73
CNH Industrial NV 7,109,798 2.60
Poste Italiane SpA 5,727,036 2.10
Tenaris SA 5,655,341 2.07
Cerved Group SpA 5,610,384 2.05
Saipem SpA 5,150,364 1.88
Telecom Italia SpA 3,943,802 1.44
De' Longhi SpA 3,926,015 1.44
DiaSorin SpA 3,903,624 1.43
Pirelli & C SpA 3,190,167 1.17
Infrastrutture Wireless Italiane SpA 2,847,556 1.04
BPER Banca 2,754,976 1.01
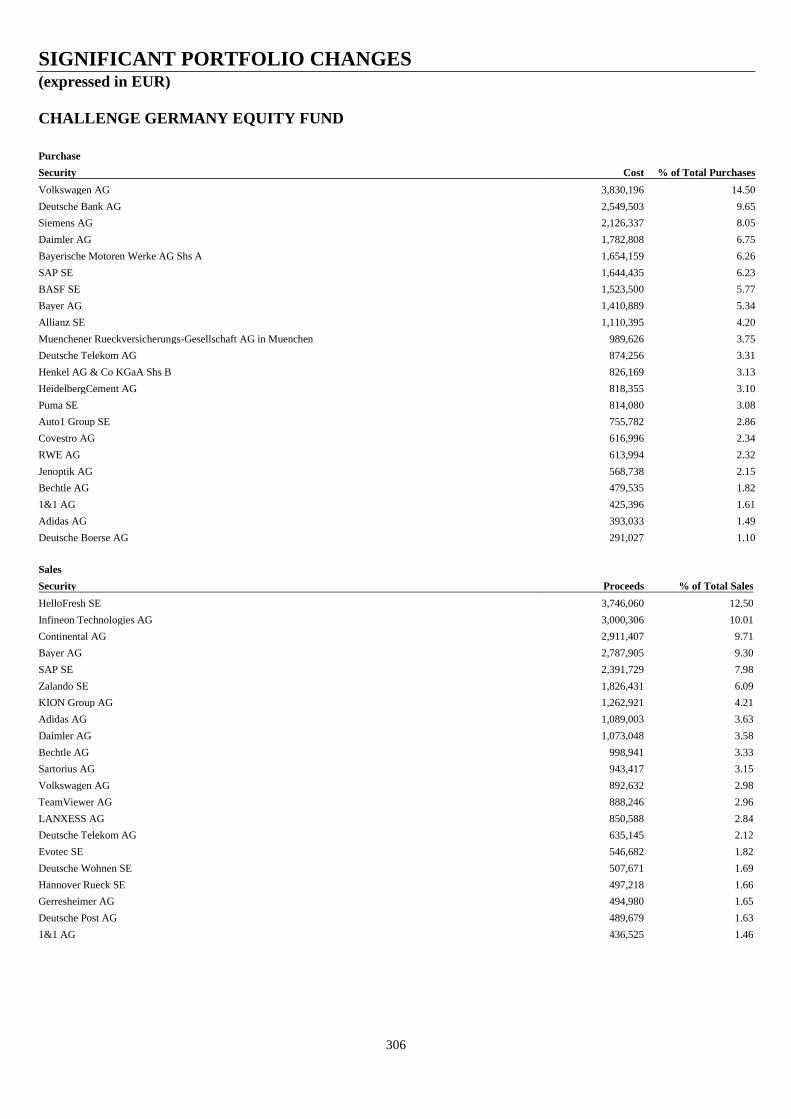
SIGNIFICANT PORTFOLIO CHANGES (expressed in EUR)
306
CHALLENGE GERMANY EQUITY FUND
Purchase
Security Cost % of Total Purchases
Volkswagen AG 3,830,196 14.50
Deutsche Bank AG 2,549,503 9.65
Siemens AG 2,126,337 8.05
Daimler AG 1,782,808 6.75
Bayerische Motoren Werke AG Shs A 1,654,159 6.26
SAP SE 1,644,435 6.23
BASF SE 1,523,500 5.77
Bayer AG 1,410,889 5.34
Allianz SE 1,110,395 4.20
Muenchener Rueckversicherungs-Gesellschaft AG in Muenchen 989,626 3.75
Deutsche Telekom AG 874,256 3.31
Henkel AG & Co KGaA Shs B 826,169 3.13
HeidelbergCement AG 818,355 3.10
Puma SE 814,080 3.08
Auto1 Group SE 755,782 2.86
Covestro AG 616,996 2.34
RWE AG 613,994 2.32
Jenoptik AG 568,738 2.15
Bechtle AG 479,535 1.82
1&1 AG 425,396 1.61
Adidas AG 393,033 1.49
Deutsche Boerse AG 291,027 1.10
Sales
Security Proceeds % of Total Sales
HelloFresh SE 3,746,060 12.50
Infineon Technologies AG 3,000,306 10.01
Continental AG 2,911,407 9.71
Bayer AG 2,787,905 9.30
SAP SE 2,391,729 7.98
Zalando SE 1,826,431 6.09
KION Group AG 1,262,921 4.21
Adidas AG 1,089,003 3.63
Daimler AG 1,073,048 3.58
Bechtle AG 998,941 3.33
Sartorius AG 943,417 3.15
Volkswagen AG 892,632 2.98
TeamViewer AG 888,246 2.96
LANXESS AG 850,588 2.84
Deutsche Telekom AG 635,145 2.12
Evotec SE 546,682 1.82
Deutsche Wohnen SE 507,671 1.69
Hannover Rueck SE 497,218 1.66
Gerresheimer AG 494,980 1.65
Deutsche Post AG 489,679 1.63
1&1 AG 436,525 1.46

SIGNIFICANT PORTFOLIO CHANGES (expressed in EUR)
307
CHALLENGE SPAIN EQUITY FUND
Purchase
Security Cost % of Total Purchases
Amadeus IT Group SA 2,921,641 8.16
Banco Santander SA 2,806,981 7.84
Cellnex Telecom SA 2,623,135 7.32
Iberdrola SA 2,484,083 6.93
Banco Bilbao Vizcaya Argentaria SA 1,636,995 4.57
Acerinox SA 1,553,265 4.34
Corp Financiera Alba SA 1,546,280 4.32
Fomento de Construcciones y Contratas SA 1,422,817 3.97
CaixaBank SA 1,152,134 3.22
Red Electrica Corp SA 1,138,881 3.18
Endesa SA 1,136,708 3.17
EDP - Energias de Portugal SA 1,117,126 3.12
Grenergy Renovables SA 895,536 2.50
Corp ACCIONA Energias Renovables SA 855,716 2.39
Indra Sistemas SA 838,129 2.34
Melia Hotels International SA 833,293 2.33
Mediaset Espana Comunicacion SA 782,606 2.18
Ebro Foods SA 717,676 2.00
CIE Automotive SA 610,487 1.70
Industria de Diseno Textil SA 586,085 1.64
Agile Content SA 562,922 1.57
Gigas Hosting SA 546,505 1.53
Repsol SA 538,131 1.50
Mota-Engil SGPS SA 499,188 1.39
International Consolidated Airlines Group SA 499,030 1.39
Laboratorios Farmaceuticos Rovi SA 412,545 1.15
Mapfre SA 388,248 1.08
Grifols SA Shs B 383,766 1.07
Alantra Partners SA 369,465 1.03
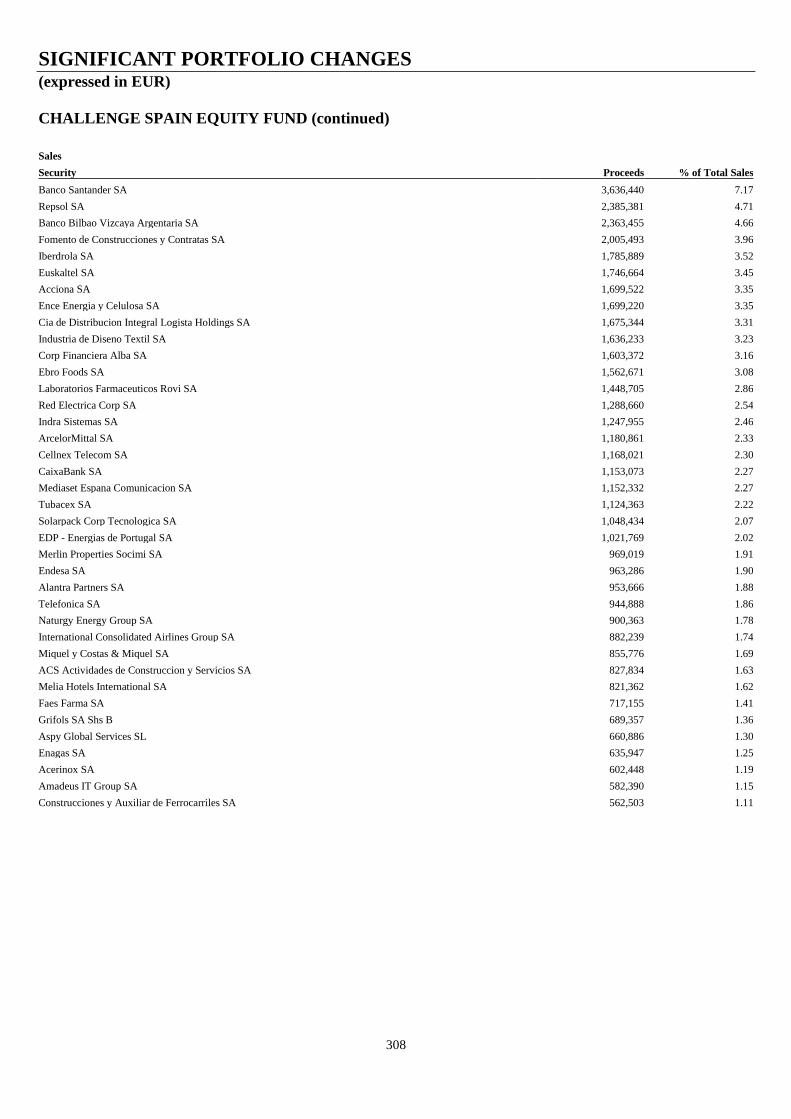
SIGNIFICANT PORTFOLIO CHANGES (expressed in EUR)
308
CHALLENGE SPAIN EQUITY FUND (continued)
Sales
Security Proceeds % of Total Sales
Banco Santander SA 3,636,440 7.17
Repsol SA 2,385,381 4.71
Banco Bilbao Vizcaya Argentaria SA 2,363,455 4.66
Fomento de Construcciones y Contratas SA 2,005,493 3.96
Iberdrola SA 1,785,889 3.52
Euskaltel SA 1,746,664 3.45
Acciona SA 1,699,522 3.35
Ence Energia y Celulosa SA 1,699,220 3.35
Cia de Distribucion Integral Logista Holdings SA 1,675,344 3.31
Industria de Diseno Textil SA 1,636,233 3.23
Corp Financiera Alba SA 1,603,372 3.16
Ebro Foods SA 1,562,671 3.08
Laboratorios Farmaceuticos Rovi SA 1,448,705 2.86
Red Electrica Corp SA 1,288,660 2.54
Indra Sistemas SA 1,247,955 2.46
ArcelorMittal SA 1,180,861 2.33
Cellnex Telecom SA 1,168,021 2.30
CaixaBank SA 1,153,073 2.27
Mediaset Espana Comunicacion SA 1,152,332 2.27
Tubacex SA 1,124,363 2.22
Solarpack Corp Tecnologica SA 1,048,434 2.07
EDP - Energias de Portugal SA 1,021,769 2.02
Merlin Properties Socimi SA 969,019 1.91
Endesa SA 963,286 1.90
Alantra Partners SA 953,666 1.88
Telefonica SA 944,888 1.86
Naturgy Energy Group SA 900,363 1.78
International Consolidated Airlines Group SA 882,239 1.74
Miquel y Costas & Miquel SA 855,776 1.69
ACS Actividades de Construccion y Servicios SA 827,834 1.63
Melia Hotels International SA 821,362 1.62
Faes Farma SA 717,155 1.41
Grifols SA Shs B 689,357 1.36
Aspy Global Services SL 660,886 1.30
Enagas SA 635,947 1.25
Acerinox SA 602,448 1.19
Amadeus IT Group SA 582,390 1.15
Construcciones y Auxiliar de Ferrocarriles SA 562,503 1.11
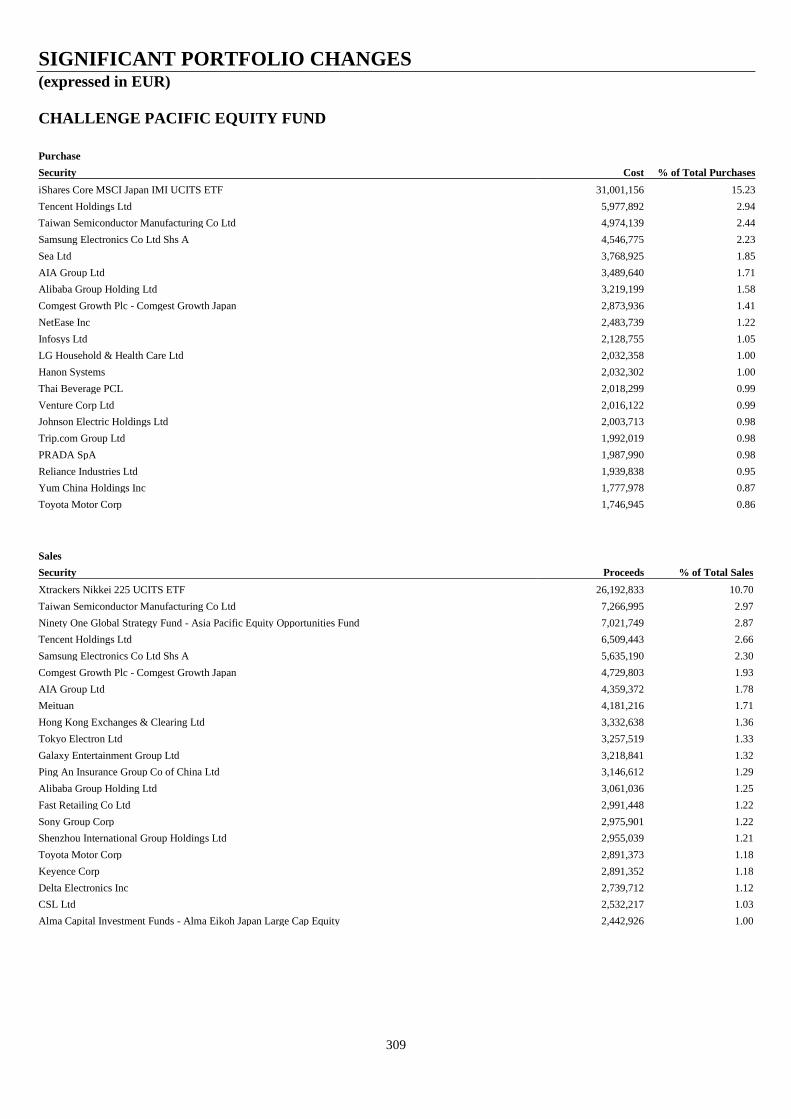
SIGNIFICANT PORTFOLIO CHANGES (expressed in EUR)
309
CHALLENGE PACIFIC EQUITY FUND
Purchase
Security Cost % of Total Purchases
iShares Core MSCI Japan IMI UCITS ETF 31,001,156 15.23
Tencent Holdings Ltd 5,977,892 2.94
Taiwan Semiconductor Manufacturing Co Ltd 4,974,139 2.44
Samsung Electronics Co Ltd Shs A 4,546,775 2.23
Sea Ltd 3,768,925 1.85
AIA Group Ltd 3,489,640 1.71
Alibaba Group Holding Ltd 3,219,199 1.58
Comgest Growth Plc - Comgest Growth Japan 2,873,936 1.41
NetEase Inc 2,483,739 1.22
Infosys Ltd 2,128,755 1.05
LG Household & Health Care Ltd 2,032,358 1.00
Hanon Systems 2,032,302 1.00
Thai Beverage PCL 2,018,299 0.99
Venture Corp Ltd 2,016,122 0.99
Johnson Electric Holdings Ltd 2,003,713 0.98
Trip.com Group Ltd 1,992,019 0.98
PRADA SpA 1,987,990 0.98
Reliance Industries Ltd 1,939,838 0.95
Yum China Holdings Inc 1,777,978 0.87
Toyota Motor Corp 1,746,945 0.86
Sales
Security Proceeds % of Total Sales
Xtrackers Nikkei 225 UCITS ETF 26,192,833 10.70
Taiwan Semiconductor Manufacturing Co Ltd 7,266,995 2.97
Ninety One Global Strategy Fund - Asia Pacific Equity Opportunities Fund 7,021,749 2.87
Tencent Holdings Ltd 6,509,443 2.66
Samsung Electronics Co Ltd Shs A 5,635,190 2.30
Comgest Growth Plc - Comgest Growth Japan 4,729,803 1.93
AIA Group Ltd 4,359,372 1.78
Meituan 4,181,216 1.71
Hong Kong Exchanges & Clearing Ltd 3,332,638 1.36
Tokyo Electron Ltd 3,257,519 1.33
Galaxy Entertainment Group Ltd 3,218,841 1.32
Ping An Insurance Group Co of China Ltd 3,146,612 1.29
Alibaba Group Holding Ltd 3,061,036 1.25
Fast Retailing Co Ltd 2,991,448 1.22
Sony Group Corp 2,975,901 1.22
Shenzhou International Group Holdings Ltd 2,955,039 1.21
Toyota Motor Corp 2,891,373 1.18
Keyence Corp 2,891,352 1.18
Delta Electronics Inc 2,739,712 1.12
CSL Ltd 2,532,217 1.03
Alma Capital Investment Funds - Alma Eikoh Japan Large Cap Equity 2,442,926 1.00
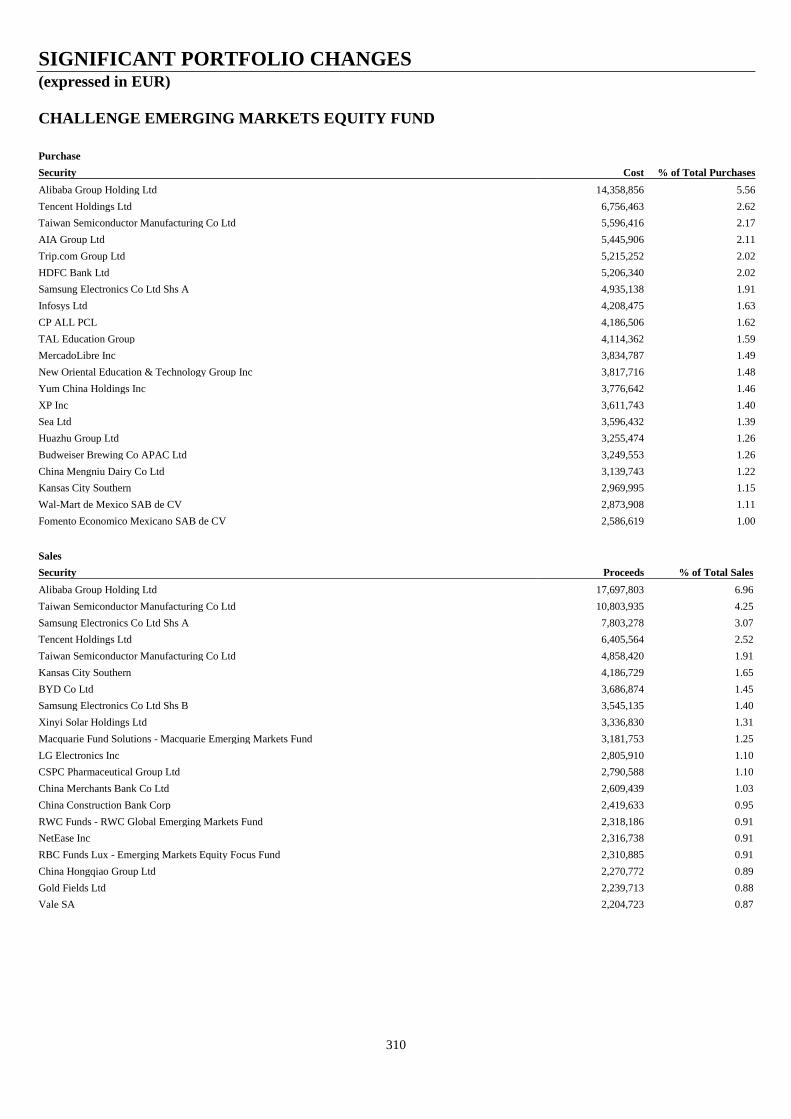
SIGNIFICANT PORTFOLIO CHANGES (expressed in EUR)
310
CHALLENGE EMERGING MARKETS EQUITY FUND
Purchase
Security Cost % of Total Purchases
Alibaba Group Holding Ltd 14,358,856 5.56
Tencent Holdings Ltd 6,756,463 2.62
Taiwan Semiconductor Manufacturing Co Ltd 5,596,416 2.17
AIA Group Ltd 5,445,906 2.11
Trip.com Group Ltd 5,215,252 2.02
HDFC Bank Ltd 5,206,340 2.02
Samsung Electronics Co Ltd Shs A 4,935,138 1.91
Infosys Ltd 4,208,475 1.63
CP ALL PCL 4,186,506 1.62
TAL Education Group 4,114,362 1.59
MercadoLibre Inc 3,834,787 1.49
New Oriental Education & Technology Group Inc 3,817,716 1.48
Yum China Holdings Inc 3,776,642 1.46
XP Inc 3,611,743 1.40
Sea Ltd 3,596,432 1.39
Huazhu Group Ltd 3,255,474 1.26
Budweiser Brewing Co APAC Ltd 3,249,553 1.26
China Mengniu Dairy Co Ltd 3,139,743 1.22
Kansas City Southern 2,969,995 1.15
Wal-Mart de Mexico SAB de CV 2,873,908 1.11
Fomento Economico Mexicano SAB de CV 2,586,619 1.00
Sales
Security Proceeds % of Total Sales
Alibaba Group Holding Ltd 17,697,803 6.96
Taiwan Semiconductor Manufacturing Co Ltd 10,803,935 4.25
Samsung Electronics Co Ltd Shs A 7,803,278 3.07
Tencent Holdings Ltd 6,405,564 2.52
Taiwan Semiconductor Manufacturing Co Ltd 4,858,420 1.91
Kansas City Southern 4,186,729 1.65
BYD Co Ltd 3,686,874 1.45
Samsung Electronics Co Ltd Shs B 3,545,135 1.40
Xinyi Solar Holdings Ltd 3,336,830 1.31
Macquarie Fund Solutions - Macquarie Emerging Markets Fund 3,181,753 1.25
LG Electronics Inc 2,805,910 1.10
CSPC Pharmaceutical Group Ltd 2,790,588 1.10
China Merchants Bank Co Ltd 2,609,439 1.03
China Construction Bank Corp 2,419,633 0.95
RWC Funds - RWC Global Emerging Markets Fund 2,318,186 0.91
NetEase Inc 2,316,738 0.91
RBC Funds Lux - Emerging Markets Equity Focus Fund 2,310,885 0.91
China Hongqiao Group Ltd 2,270,772 0.89
Gold Fields Ltd 2,239,713 0.88
Vale SA 2,204,723 0.87

SIGNIFICANT PORTFOLIO CHANGES (expressed in EUR)
311
CHALLENGE ENERGY EQUITY FUND
Purchase
Security Cost % of Total Purchases
Exxon Mobil Corp 12,304,579 22.65
Chevron Corp 4,055,678 7.46
Cimarex Energy Co 3,842,194 7.07
Cabot Oil & Gas Corp 3,267,588 6.01
SPDR MSCI World Energy UCITS ETF 2,670,412 4.91
Petroleo Brasileiro SA 2,545,960 4.69
Royal Dutch Shell Plc Shs B 2,135,383 3.93
TotalEnergies SE 2,051,092 3.78
Royal Dutch Shell Plc Shs A 2,000,892 3.68
ConocoPhillips 1,669,298 3.07
BP Plc 1,527,802 2.81
Marathon Petroleum Corp 1,519,153 2.80
Equinor ASA 1,392,221 2.56
TC Energy Corp 1,160,297 2.14
EOG Resources Inc 1,095,899 2.02
LUKOIL PJSC 1,090,252 2.01
Pioneer Natural Resources Co 1,040,137 1.91
ARC Resources Ltd 1,033,522 1.90
Hess Corp 881,852 1.62
Enbridge Inc 867,622 1.60
China Gas Holdings Ltd 853,619 1.57
Williams Cos Inc 625,657 1.15
Sales1
Security Proceeds % of Total Sales
EOG Resources Inc 7,750,238 24.46
Petroleo Brasileiro SA 6,012,105 18.98
Galp Energia SGPS SA 3,005,124 9.49
Marathon Petroleum Corp 2,560,312 8.08
Pioneer Natural Resources Co 1,866,481 5.89
SPDR MSCI World Energy UCITS ETF 1,603,223 5.06
BP Plc 1,531,324 4.83
ConocoPhillips 1,523,931 4.81
CNOOC Ltd 1,231,155 3.89
CNOOC Ltd 1,111,539 3.51
ENN Energy Holdings Ltd 862,490 2.72
Petroleo Brasileiro SA 833,074 2.63
LUKOIL PJSC 762,209 2.41
Tenaris SA 730,682 2.31
CenterPoint Energy Inc 245,611 0.78
Tenaris SA 48,020 0.15
1 Represents all aggregate sales during the financial period.

SIGNIFICANT PORTFOLIO CHANGES (expressed in EUR)
312
CHALLENGE CYCLICAL EQUITY FUND
Purchase
Security Cost % of Total Purchases
Booking Holdings Inc 22,121,445 5.99
Amazon.com Inc 18,754,378 5.08
Airbnb Inc 17,696,274 4.79
Flutter Entertainment Plc 15,697,381 4.25
Tapestry Inc 15,282,880 4.14
PVH Corp 15,042,517 4.07
CBRE Group Inc 14,137,479 3.83
Chipotle Mexican Grill Inc 13,266,775 3.59
Sodexo SA 12,364,489 3.35
VICI Properties Inc 9,839,164 2.66
Alibaba Group Holding Ltd 9,709,754 2.63
American Tower Corp 9,609,405 2.60
China Resources Land Ltd 9,392,441 2.54
Dollar General Corp 9,319,939 2.52
Siemens AG 8,590,443 2.33
Accor SA 8,484,816 2.30
Host Hotels & Resorts Inc 8,096,299 2.19
Ford Motor Co 7,656,990 2.07
Carnival Corp 7,565,435 2.05
Darden Restaurants Inc 6,004,368 1.63
Sands China Ltd 5,785,316 1.57
Waste Management Inc 5,762,943 1.56
Johnson Controls International Plc 5,722,725 1.55
TJX Cos Inc 5,712,020 1.55
Otis Worldwide Corp 5,236,696 1.42
CSX Corp 5,005,093 1.35
Westinghouse Air Brake Technologies Corp 4,943,708 1.34
Wolters Kluwer NV 4,562,463 1.23
Visteon Corp 4,522,934 1.22
Fortive Corp 4,198,046 1.14
DraftKings Inc 3,960,784 1.07
Farfetch Ltd 3,727,482 1.01
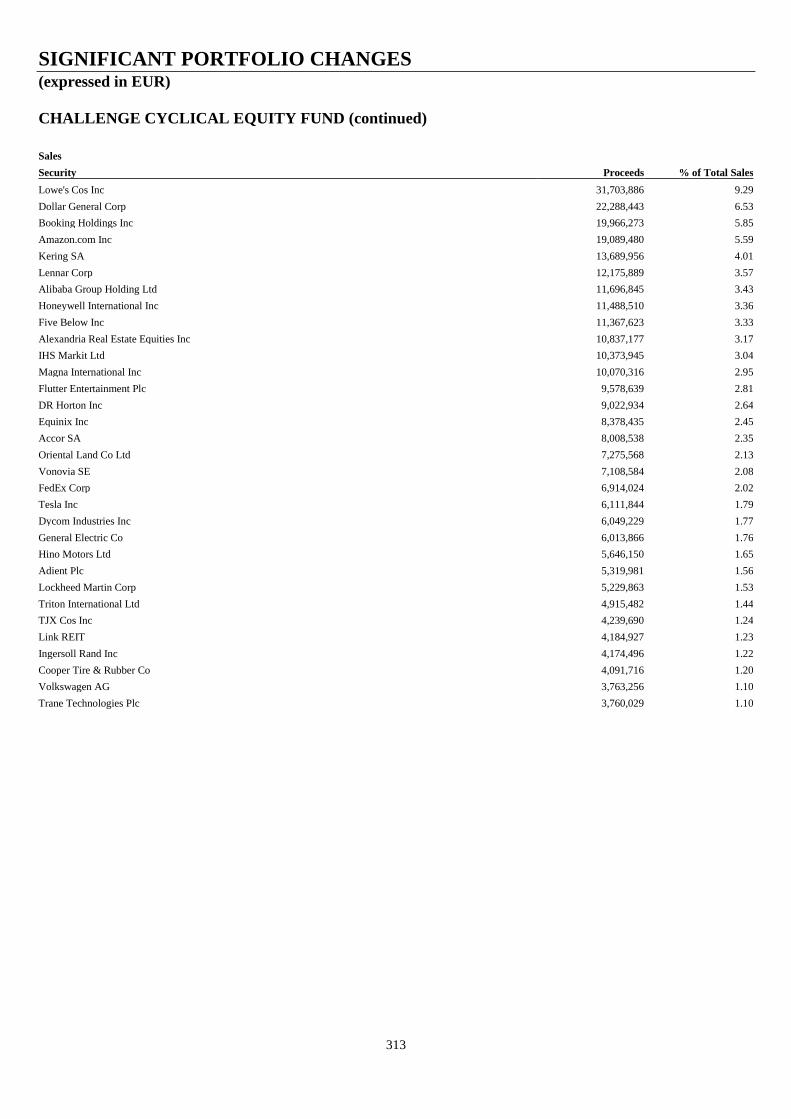
SIGNIFICANT PORTFOLIO CHANGES (expressed in EUR)
313
CHALLENGE CYCLICAL EQUITY FUND (continued)
Sales
Security Proceeds % of Total Sales
Lowe's Cos Inc 31,703,886 9.29
Dollar General Corp 22,288,443 6.53
Booking Holdings Inc 19,966,273 5.85
Amazon.com Inc 19,089,480 5.59
Kering SA 13,689,956 4.01
Lennar Corp 12,175,889 3.57
Alibaba Group Holding Ltd 11,696,845 3.43
Honeywell International Inc 11,488,510 3.36
Five Below Inc 11,367,623 3.33
Alexandria Real Estate Equities Inc 10,837,177 3.17
IHS Markit Ltd 10,373,945 3.04
Magna International Inc 10,070,316 2.95
Flutter Entertainment Plc 9,578,639 2.81
DR Horton Inc 9,022,934 2.64
Equinix Inc 8,378,435 2.45
Accor SA 8,008,538 2.35
Oriental Land Co Ltd 7,275,568 2.13
Vonovia SE 7,108,584 2.08
FedEx Corp 6,914,024 2.02
Tesla Inc 6,111,844 1.79
Dycom Industries Inc 6,049,229 1.77
General Electric Co 6,013,866 1.76
Hino Motors Ltd 5,646,150 1.65
Adient Plc 5,319,981 1.56
Lockheed Martin Corp 5,229,863 1.53
Triton International Ltd 4,915,482 1.44
TJX Cos Inc 4,239,690 1.24
Link REIT 4,184,927 1.23
Ingersoll Rand Inc 4,174,496 1.22
Cooper Tire & Rubber Co 4,091,716 1.20
Volkswagen AG 3,763,256 1.10
Trane Technologies Plc 3,760,029 1.10

SIGNIFICANT PORTFOLIO CHANGES (expressed in EUR)
314
CHALLENGE COUNTER CYCLICAL EQUITY FUND
Purchase
Security Cost % of Total Purchases
Diageo Plc 22,521,416 9.58
Mondelez International Inc 15,573,265 6.62
Monster Beverage Corp 13,092,110 5.57
Boston Beer Co Inc 11,026,471 4.69
Astellas Pharma Inc 10,795,490 4.59
L'Oreal SA 10,446,738 4.44
Centene Corp 9,329,849 3.97
Estee Lauder Cos Inc 9,094,798 3.87
Coca-Cola Europacific Partners Plc 9,065,377 3.85
Daiichi Sankyo Co Ltd 8,311,803 3.53
Constellation Brands Inc 7,654,639 3.26
Align Technology Inc 7,609,641 3.24
Seven & i Holdings Co Ltd 7,433,252 3.16
Bunge Ltd 7,399,191 3.15
Chugai Pharmaceutical Co Ltd 6,582,728 2.80
Pernod Ricard SA 6,535,535 2.78
Insulet Corp 6,148,369 2.61
Carlsberg AS 6,085,901 2.59
Elanco Animal Health Inc 5,443,701 2.31
Asahi Group Holdings Ltd 5,417,773 2.30
Coca-Cola HBC AG 5,284,053 2.25
Davide Campari-Milano NV 4,123,212 1.75
Swedish Match AB 3,613,074 1.54
Kyowa Kirin Co Ltd 3,377,769 1.44
Eisai Co Ltd 3,220,940 1.37
UCB SA 2,944,235 1.25
Syneos Health Inc 2,918,643 1.24
Ono Pharmaceutical Co Ltd 2,690,271 1.14
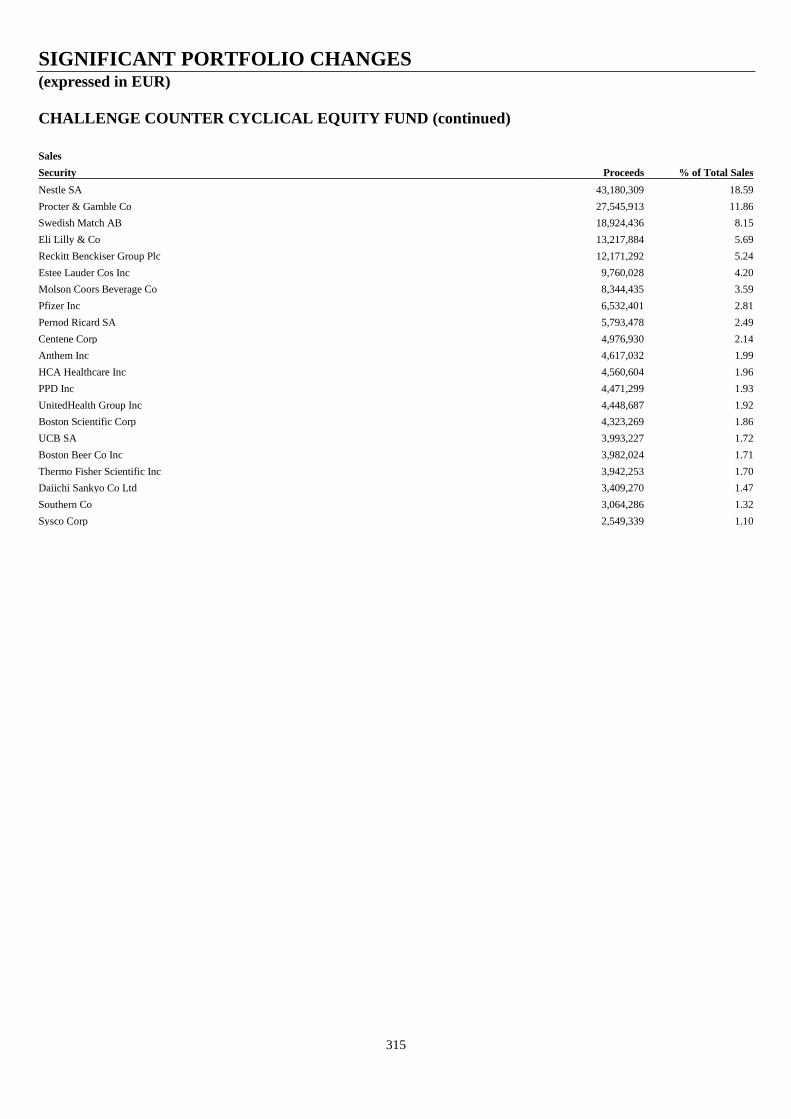
SIGNIFICANT PORTFOLIO CHANGES (expressed in EUR)
315
CHALLENGE COUNTER CYCLICAL EQUITY FUND (continued)
Sales
Security Proceeds % of Total Sales
Nestle SA 43,180,309 18.59
Procter & Gamble Co 27,545,913 11.86
Swedish Match AB 18,924,436 8.15
Eli Lilly & Co 13,217,884 5.69
Reckitt Benckiser Group Plc 12,171,292 5.24
Estee Lauder Cos Inc 9,760,028 4.20
Molson Coors Beverage Co 8,344,435 3.59
Pfizer Inc 6,532,401 2.81
Pernod Ricard SA 5,793,478 2.49
Centene Corp 4,976,930 2.14
Anthem Inc 4,617,032 1.99
HCA Healthcare Inc 4,560,604 1.96
PPD Inc 4,471,299 1.93
UnitedHealth Group Inc 4,448,687 1.92
Boston Scientific Corp 4,323,269 1.86
UCB SA 3,993,227 1.72
Boston Beer Co Inc 3,982,024 1.71
Thermo Fisher Scientific Inc 3,942,253 1.70
Daiichi Sankyo Co Ltd 3,409,270 1.47
Southern Co 3,064,286 1.32
Sysco Corp 2,549,339 1.10
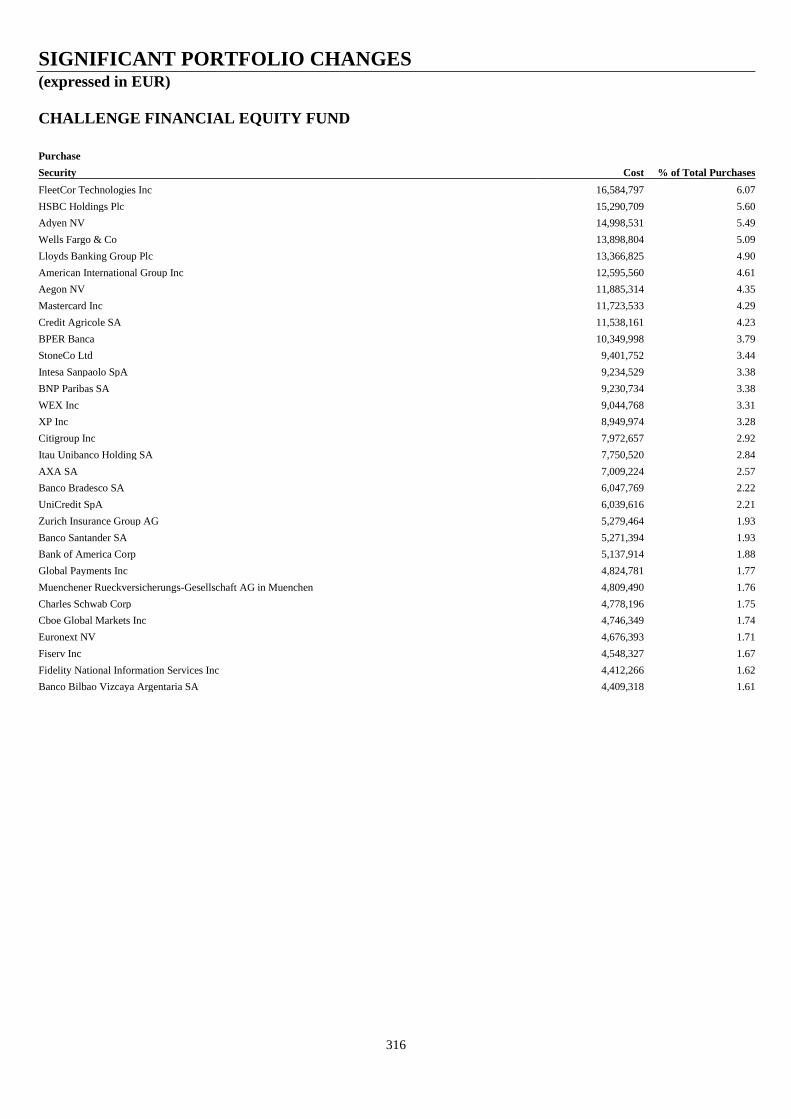
SIGNIFICANT PORTFOLIO CHANGES (expressed in EUR)
316
CHALLENGE FINANCIAL EQUITY FUND
Purchase
Security Cost % of Total Purchases
FleetCor Technologies Inc 16,584,797 6.07
HSBC Holdings Plc 15,290,709 5.60
Adyen NV 14,998,531 5.49
Wells Fargo & Co 13,898,804 5.09
Lloyds Banking Group Plc 13,366,825 4.90
American International Group Inc 12,595,560 4.61
Aegon NV 11,885,314 4.35
Mastercard Inc 11,723,533 4.29
Credit Agricole SA 11,538,161 4.23
BPER Banca 10,349,998 3.79
StoneCo Ltd 9,401,752 3.44
Intesa Sanpaolo SpA 9,234,529 3.38
BNP Paribas SA 9,230,734 3.38
WEX Inc 9,044,768 3.31
XP Inc 8,949,974 3.28
Citigroup Inc 7,972,657 2.92
Itau Unibanco Holding SA 7,750,520 2.84
AXA SA 7,009,224 2.57
Banco Bradesco SA 6,047,769 2.22
UniCredit SpA 6,039,616 2.21
Zurich Insurance Group AG 5,279,464 1.93
Banco Santander SA 5,271,394 1.93
Bank of America Corp 5,137,914 1.88
Global Payments Inc 4,824,781 1.77
Muenchener Rueckversicherungs-Gesellschaft AG in Muenchen 4,809,490 1.76
Charles Schwab Corp 4,778,196 1.75
Cboe Global Markets Inc 4,746,349 1.74
Euronext NV 4,676,393 1.71
Fiserv Inc 4,548,327 1.67
Fidelity National Information Services Inc 4,412,266 1.62
Banco Bilbao Vizcaya Argentaria SA 4,409,318 1.61
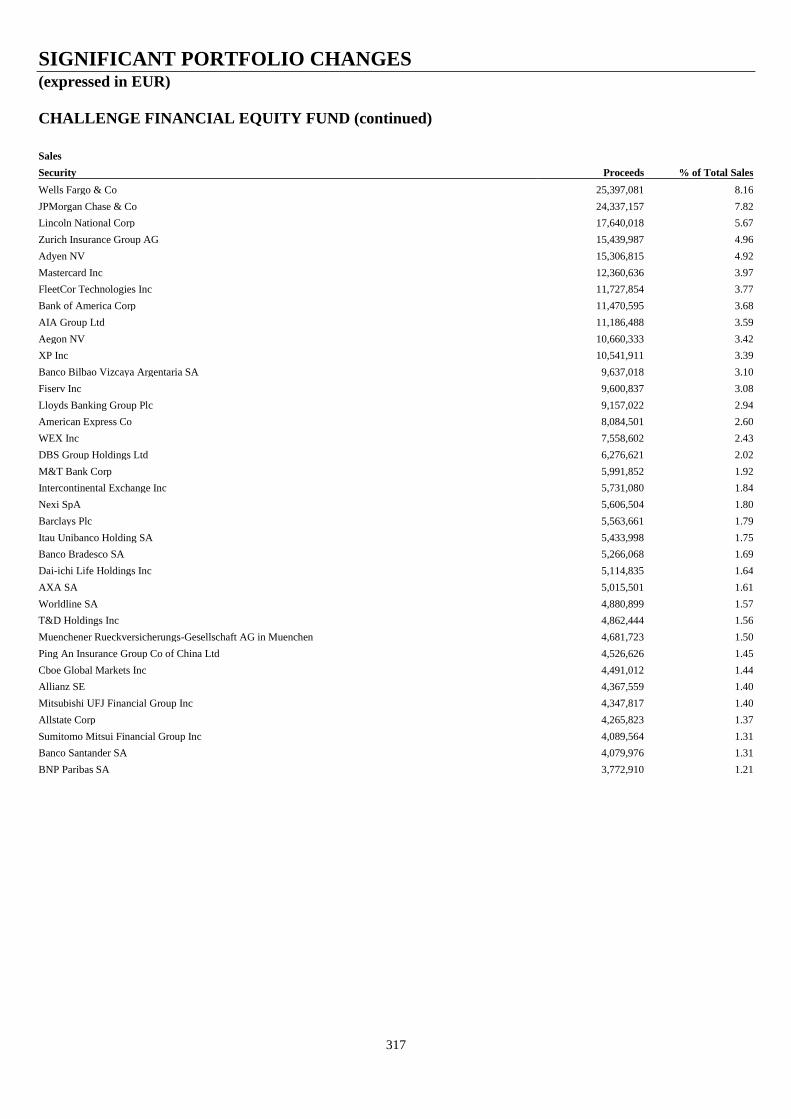
SIGNIFICANT PORTFOLIO CHANGES (expressed in EUR)
317
CHALLENGE FINANCIAL EQUITY FUND (continued)
Sales
Security Proceeds % of Total Sales
Wells Fargo & Co 25,397,081 8.16
JPMorgan Chase & Co 24,337,157 7.82
Lincoln National Corp 17,640,018 5.67
Zurich Insurance Group AG 15,439,987 4.96
Adyen NV 15,306,815 4.92
Mastercard Inc 12,360,636 3.97
FleetCor Technologies Inc 11,727,854 3.77
Bank of America Corp 11,470,595 3.68
AIA Group Ltd 11,186,488 3.59
Aegon NV 10,660,333 3.42
XP Inc 10,541,911 3.39
Banco Bilbao Vizcaya Argentaria SA 9,637,018 3.10
Fiserv Inc 9,600,837 3.08
Lloyds Banking Group Plc 9,157,022 2.94
American Express Co 8,084,501 2.60
WEX Inc 7,558,602 2.43
DBS Group Holdings Ltd 6,276,621 2.02
M&T Bank Corp 5,991,852 1.92
Intercontinental Exchange Inc 5,731,080 1.84
Nexi SpA 5,606,504 1.80
Barclays Plc 5,563,661 1.79
Itau Unibanco Holding SA 5,433,998 1.75
Banco Bradesco SA 5,266,068 1.69
Dai-ichi Life Holdings Inc 5,114,835 1.64
AXA SA 5,015,501 1.61
Worldline SA 4,880,899 1.57
T&D Holdings Inc 4,862,444 1.56
Muenchener Rueckversicherungs-Gesellschaft AG in Muenchen 4,681,723 1.50
Ping An Insurance Group Co of China Ltd 4,526,626 1.45
Cboe Global Markets Inc 4,491,012 1.44
Allianz SE 4,367,559 1.40
Mitsubishi UFJ Financial Group Inc 4,347,817 1.40
Allstate Corp 4,265,823 1.37
Sumitomo Mitsui Financial Group Inc 4,089,564 1.31
Banco Santander SA 4,079,976 1.31
BNP Paribas SA 3,772,910 1.21
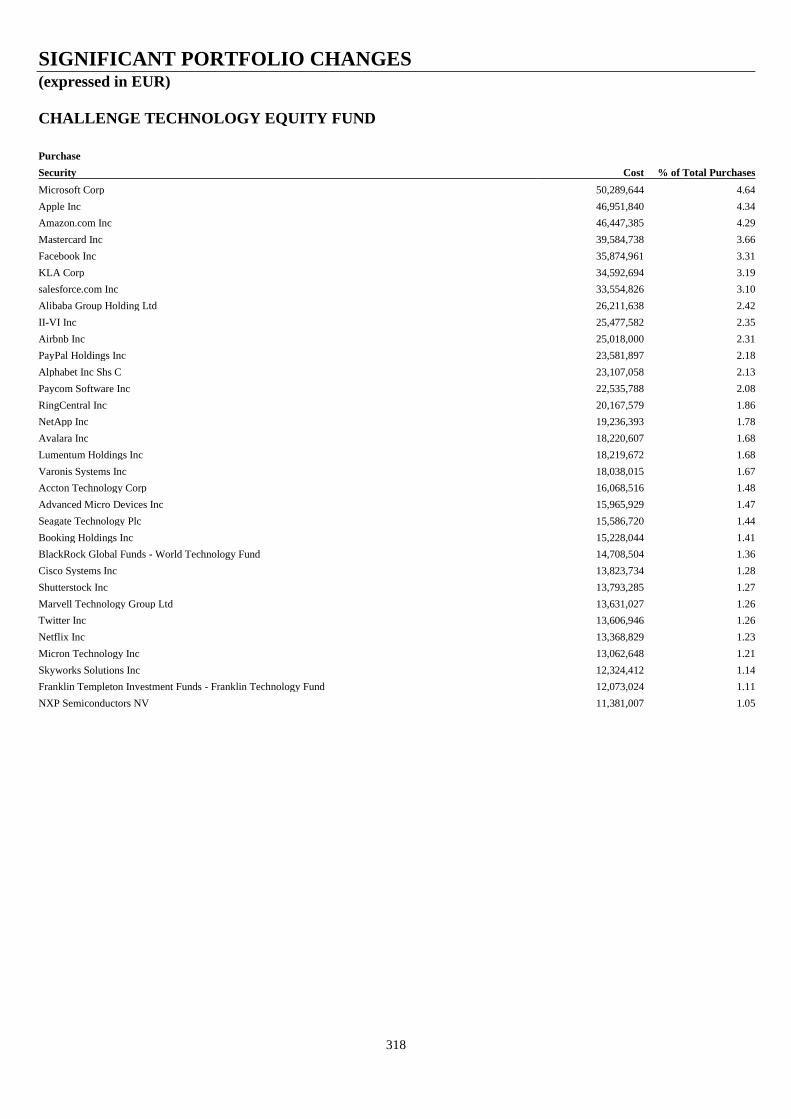
SIGNIFICANT PORTFOLIO CHANGES (expressed in EUR)
318
CHALLENGE TECHNOLOGY EQUITY FUND
Purchase
Security Cost % of Total Purchases
Microsoft Corp 50,289,644 4.64
Apple Inc 46,951,840 4.34
Amazon.com Inc 46,447,385 4.29
Mastercard Inc 39,584,738 3.66
Facebook Inc 35,874,961 3.31
KLA Corp 34,592,694 3.19
salesforce.com Inc 33,554,826 3.10
Alibaba Group Holding Ltd 26,211,638 2.42
II-VI Inc 25,477,582 2.35
Airbnb Inc 25,018,000 2.31
PayPal Holdings Inc 23,581,897 2.18
Alphabet Inc Shs C 23,107,058 2.13
Paycom Software Inc 22,535,788 2.08
RingCentral Inc 20,167,579 1.86
NetApp Inc 19,236,393 1.78
Avalara Inc 18,220,607 1.68
Lumentum Holdings Inc 18,219,672 1.68
Varonis Systems Inc 18,038,015 1.67
Accton Technology Corp 16,068,516 1.48
Advanced Micro Devices Inc 15,965,929 1.47
Seagate Technology Plc 15,586,720 1.44
Booking Holdings Inc 15,228,044 1.41
BlackRock Global Funds - World Technology Fund 14,708,504 1.36
Cisco Systems Inc 13,823,734 1.28
Shutterstock Inc 13,793,285 1.27
Marvell Technology Group Ltd 13,631,027 1.26
Twitter Inc 13,606,946 1.26
Netflix Inc 13,368,829 1.23
Micron Technology Inc 13,062,648 1.21
Skyworks Solutions Inc 12,324,412 1.14
Franklin Templeton Investment Funds - Franklin Technology Fund 12,073,024 1.11
NXP Semiconductors NV 11,381,007 1.05
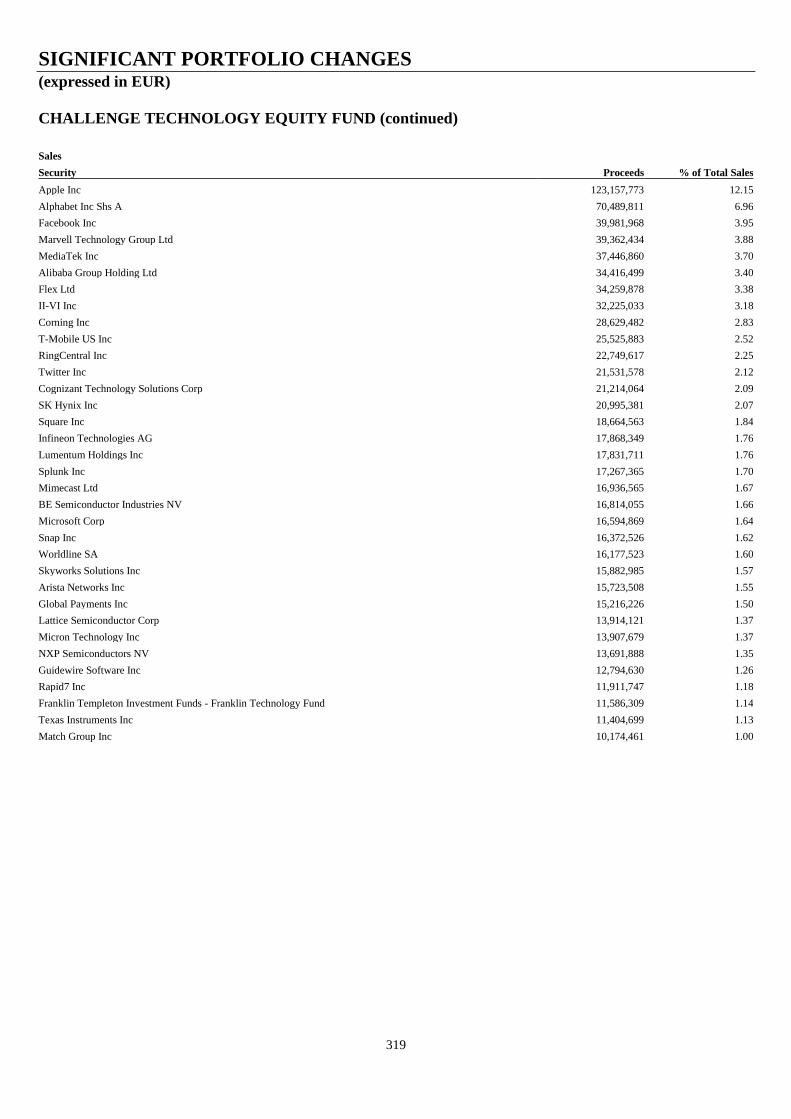
SIGNIFICANT PORTFOLIO CHANGES (expressed in EUR)
319
CHALLENGE TECHNOLOGY EQUITY FUND (continued)
Sales
Security Proceeds % of Total Sales
Apple Inc 123,157,773 12.15
Alphabet Inc Shs A 70,489,811 6.96
Facebook Inc 39,981,968 3.95
Marvell Technology Group Ltd 39,362,434 3.88
MediaTek Inc 37,446,860 3.70
Alibaba Group Holding Ltd 34,416,499 3.40
Flex Ltd 34,259,878 3.38
II-VI Inc 32,225,033 3.18
Corning Inc 28,629,482 2.83
T-Mobile US Inc 25,525,883 2.52
RingCentral Inc 22,749,617 2.25
Twitter Inc 21,531,578 2.12
Cognizant Technology Solutions Corp 21,214,064 2.09
SK Hynix Inc 20,995,381 2.07
Square Inc 18,664,563 1.84
Infineon Technologies AG 17,868,349 1.76
Lumentum Holdings Inc 17,831,711 1.76
Splunk Inc 17,267,365 1.70
Mimecast Ltd 16,936,565 1.67
BE Semiconductor Industries NV 16,814,055 1.66
Microsoft Corp 16,594,869 1.64
Snap Inc 16,372,526 1.62
Worldline SA 16,177,523 1.60
Skyworks Solutions Inc 15,882,985 1.57
Arista Networks Inc 15,723,508 1.55
Global Payments Inc 15,216,226 1.50
Lattice Semiconductor Corp 13,914,121 1.37
Micron Technology Inc 13,907,679 1.37
NXP Semiconductors NV 13,691,888 1.35
Guidewire Software Inc 12,794,630 1.26
Rapid7 Inc 11,911,747 1.18
Franklin Templeton Investment Funds - Franklin Technology Fund 11,586,309 1.14
Texas Instruments Inc 11,404,699 1.13
Match Group Inc 10,174,461 1.00
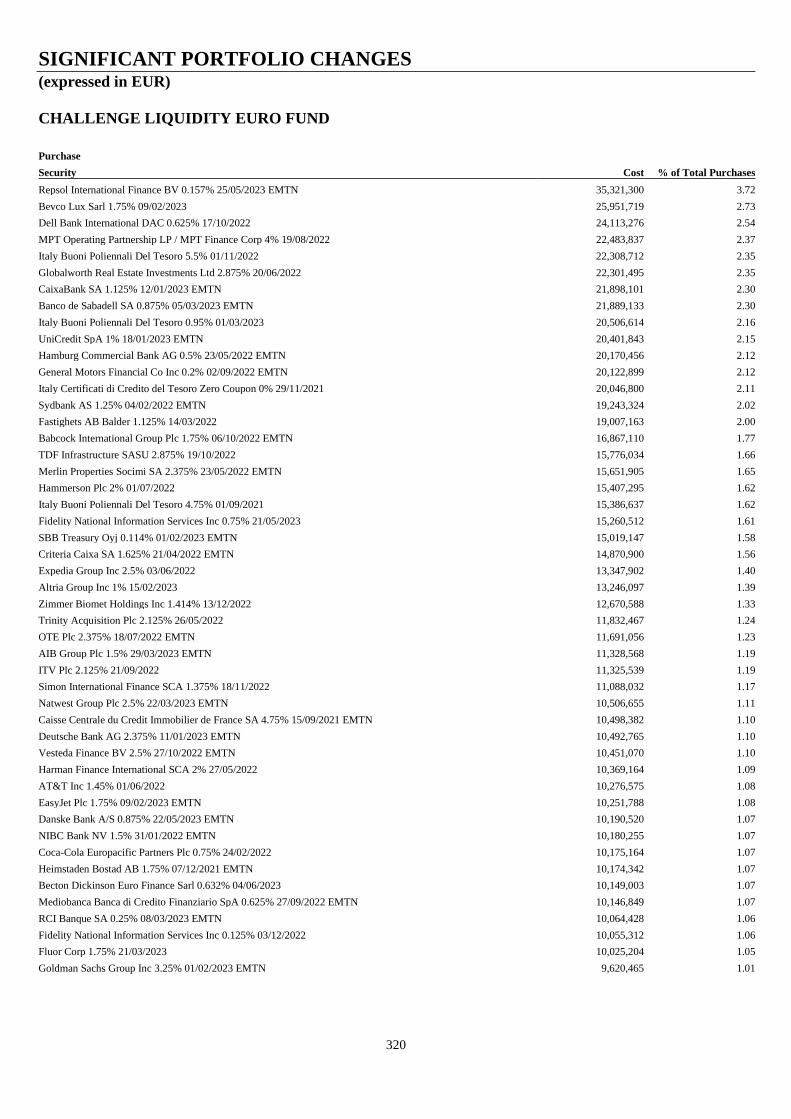
SIGNIFICANT PORTFOLIO CHANGES (expressed in EUR)
320
CHALLENGE LIQUIDITY EURO FUND
Purchase
Security Cost % of Total Purchases
Repsol International Finance BV 0.157% 25/05/2023 EMTN 35,321,300 3.72
Bevco Lux Sarl 1.75% 09/02/2023 25,951,719 2.73
Dell Bank International DAC 0.625% 17/10/2022 24,113,276 2.54
MPT Operating Partnership LP / MPT Finance Corp 4% 19/08/2022 22,483,837 2.37
Italy Buoni Poliennali Del Tesoro 5.5% 01/11/2022 22,308,712 2.35
Globalworth Real Estate Investments Ltd 2.875% 20/06/2022 22,301,495 2.35
CaixaBank SA 1.125% 12/01/2023 EMTN 21,898,101 2.30
Banco de Sabadell SA 0.875% 05/03/2023 EMTN 21,889,133 2.30
Italy Buoni Poliennali Del Tesoro 0.95% 01/03/2023 20,506,614 2.16
UniCredit SpA 1% 18/01/2023 EMTN 20,401,843 2.15
Hamburg Commercial Bank AG 0.5% 23/05/2022 EMTN 20,170,456 2.12
General Motors Financial Co Inc 0.2% 02/09/2022 EMTN 20,122,899 2.12
Italy Certificati di Credito del Tesoro Zero Coupon 0% 29/11/2021 20,046,800 2.11
Sydbank AS 1.25% 04/02/2022 EMTN 19,243,324 2.02
Fastighets AB Balder 1.125% 14/03/2022 19,007,163 2.00
Babcock International Group Plc 1.75% 06/10/2022 EMTN 16,867,110 1.77
TDF Infrastructure SASU 2.875% 19/10/2022 15,776,034 1.66
Merlin Properties Socimi SA 2.375% 23/05/2022 EMTN 15,651,905 1.65
Hammerson Plc 2% 01/07/2022 15,407,295 1.62
Italy Buoni Poliennali Del Tesoro 4.75% 01/09/2021 15,386,637 1.62
Fidelity National Information Services Inc 0.75% 21/05/2023 15,260,512 1.61
SBB Treasury Oyj 0.114% 01/02/2023 EMTN 15,019,147 1.58
Criteria Caixa SA 1.625% 21/04/2022 EMTN 14,870,900 1.56
Expedia Group Inc 2.5% 03/06/2022 13,347,902 1.40
Altria Group Inc 1% 15/02/2023 13,246,097 1.39
Zimmer Biomet Holdings Inc 1.414% 13/12/2022 12,670,588 1.33
Trinity Acquisition Plc 2.125% 26/05/2022 11,832,467 1.24
OTE Plc 2.375% 18/07/2022 EMTN 11,691,056 1.23
AIB Group Plc 1.5% 29/03/2023 EMTN 11,328,568 1.19
ITV Plc 2.125% 21/09/2022 11,325,539 1.19
Simon International Finance SCA 1.375% 18/11/2022 11,088,032 1.17
Natwest Group Plc 2.5% 22/03/2023 EMTN 10,506,655 1.11
Caisse Centrale du Credit Immobilier de France SA 4.75% 15/09/2021 EMTN 10,498,382 1.10
Deutsche Bank AG 2.375% 11/01/2023 EMTN 10,492,765 1.10
Vesteda Finance BV 2.5% 27/10/2022 EMTN 10,451,070 1.10
Harman Finance International SCA 2% 27/05/2022 10,369,164 1.09
AT&T Inc 1.45% 01/06/2022 10,276,575 1.08
EasyJet Plc 1.75% 09/02/2023 EMTN 10,251,788 1.08
Danske Bank A/S 0.875% 22/05/2023 EMTN 10,190,520 1.07
NIBC Bank NV 1.5% 31/01/2022 EMTN 10,180,255 1.07
Coca-Cola Europacific Partners Plc 0.75% 24/02/2022 10,175,164 1.07
Heimstaden Bostad AB 1.75% 07/12/2021 EMTN 10,174,342 1.07
Becton Dickinson Euro Finance Sarl 0.632% 04/06/2023 10,149,003 1.07
Mediobanca Banca di Credito Finanziario SpA 0.625% 27/09/2022 EMTN 10,146,849 1.07
RCI Banque SA 0.25% 08/03/2023 EMTN 10,064,428 1.06
Fidelity National Information Services Inc 0.125% 03/12/2022 10,055,312 1.06
Fluor Corp 1.75% 21/03/2023 10,025,204 1.05
Goldman Sachs Group Inc 3.25% 01/02/2023 EMTN 9,620,465 1.01

SIGNIFICANT PORTFOLIO CHANGES (expressed in EUR)
321
CHALLENGE LIQUIDITY EURO FUND (continued)
Sales
Security Proceeds % of Total Sales
Italy Buoni Poliennali Del Tesoro 0.05% 15/04/2021 35,018,106 5.79
Italy Certificati di Credito del Tesoro Zero Coupon 0% 29/06/2021 30,000,000 4.96
Bevco Lux Sarl 1.75% 09/02/2023 26,039,873 4.31
Italy Buoni Poliennali Del Tesoro 3.75% 01/05/2021 20,389,522 3.37
Italy Buoni Poliennali Del Tesoro 3.75% 01/03/2021 20,375,000 3.37
Italy Buoni Poliennali Del Tesoro 2.3% 15/10/2021 20,265,522 3.35
LeasePlan Corp NV 1% 24/05/2021 EMTN 20,200,000 3.34
Logicor Financing Sarl 0.5% 30/04/2021 EMTN 20,091,600 3.32
Italy Buoni Ordinari del Tesoro BOT 0% 14/06/2021 20,000,000 3.31
General Motors Financial Co Inc 0.144% 10/05/2021 EMTN 19,592,973 3.24
America Movil SAB de CV 3% 12/07/2021 16,496,881 2.73
Hammerson Plc 2% 01/07/2022 15,683,936 2.59
Cassa Depositi e Prestiti SpA 2.75% 31/05/2021 EMTN 15,412,500 2.55
Intesa Sanpaolo SpA 2% 18/06/2021 EMTN 15,300,000 2.53
Ryanair DAC 1.875% 17/06/2021 EMTN 15,281,250 2.53
Italy Buoni Poliennali Del Tesoro 0.35% 01/11/2021 15,097,620 2.50
Italy Buoni Poliennali Del Tesoro 0.45% 01/06/2021 15,033,750 2.49
Corp Andina de Fomento 1.875% 29/05/2021 EMTN 13,766,369 2.28
Fortum Oyj 4% 24/05/2021 EMTN 13,187,200 2.18
Leeds Building Society 2.625% 01/04/2021 EMTN 12,315,000 2.04
Heimstaden Bostad AB 1.75% 07/12/2021 EMTN 12,287,053 2.03
Accor SA 2.625% 05/02/2021 10,262,500 1.70
FCA Bank SpA 1.25% 21/01/2021 EMTN 10,125,000 1.67
RCI Banque SA 0.25% 12/07/2021 EMTN 10,022,945 1.66
Fidelity National Information Services Inc 0.125% 21/05/2021 10,015,872 1.66
JPMorgan Chase Bank NA 0.208% 18/06/2021 EMTN 10,005,316 1.65
Region of Aosta Valley 0% 28/05/2021 EMTN 10,000,000 1.65
Continental AG 0% 11/04/2021 EMTN 10,000,000 1.65
FCE Bank Plc 1.875% 24/06/2021 EMTN 9,117,813 1.51
Akelius Residential Property AB 1.5% 23/01/2022 8,528,536 1.41
Deutsche Bank AG 0.375% 18/01/2021 EMTN 8,331,125 1.38
Bank of China Ltd 0% 17/04/2021 EMTN 8,000,000 1.32
Volvo Treasury AB 0% 08/04/2021 EMTN 7,500,000 1.24
Glencore Finance Europe Ltd 2.75% 01/04/2021 EMTN 7,146,616 1.18
Eurofins Scientific SE 2.25% 27/01/2022 7,075,644 1.17
FedEx Corp 1% 11/01/2023 6,959,868 1.15
PerkinElmer Inc 0.6% 09/04/2021 6,589,300 1.09

SIGNIFICANT PORTFOLIO CHANGES (expressed in EUR)
322
CHALLENGE LIQUIDITY US DOLLAR FUND
Purchase1
Security Cost % of Total Purchases
United States Treasury Bill 0% 27/01/2022 6,528,359 12.43
United States Treasury Bill 0% 24/03/2022 6,366,974 12.13
United States Treasury Note/Bond 0.375% 31/03/2022 6,148,704 11.72
United States Treasury Bill 0% 24/02/2022 6,132,307 11.69
United States Treasury Bill - WI Post Auction 0% 30/12/2021 5,848,884 11.15
United States Treasury Note/Bond 0.125% 30/04/2022 5,523,878 10.53
United States Treasury Bill 0% 19/05/2022 5,243,441 9.99
United States Treasury Note/Bond 0.125% 31/05/2022 5,056,670 9.64
United States Treasury Bill 0% 21/04/2022 4,566,531 8.70
United States Treasury Bill 0% 04/11/2021 1,059,038 2.02
Sales2
Security Proceeds % of Total Sales
United States Treasury Bill 0% 12/08/2021 5,245,230 21.23
United States Treasury Note/Bond 2.625% 15/06/2021 5,058,657 20.48
United States Treasury Note/Bond 8.125% 15/05/2021 4,914,459 19.90
United States Treasury Note/Bond 8.125% 15/08/2021 4,828,782 19.55
United States Treasury Bill 0% 15/07/2021 4,406,058 17.84
United States Treasury Bill 0% 09/09/2021 247,383 1.00
1 Represents all aggregate purchases during the financial period. 2 Represents all aggregate sales during the financial period.
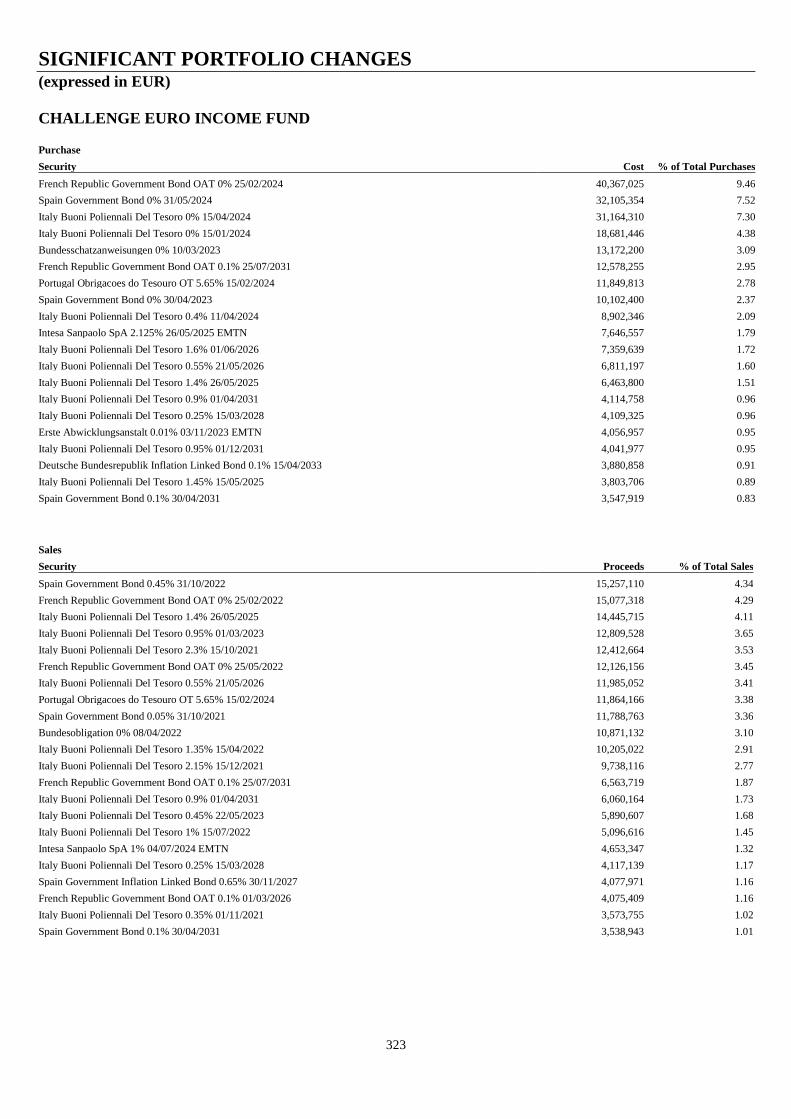
SIGNIFICANT PORTFOLIO CHANGES (expressed in EUR)
323
CHALLENGE EURO INCOME FUND
Purchase
Security Cost % of Total Purchases
French Republic Government Bond OAT 0% 25/02/2024 40,367,025 9.46
Spain Government Bond 0% 31/05/2024 32,105,354 7.52
Italy Buoni Poliennali Del Tesoro 0% 15/04/2024 31,164,310 7.30
Italy Buoni Poliennali Del Tesoro 0% 15/01/2024 18,681,446 4.38
Bundesschatzanweisungen 0% 10/03/2023 13,172,200 3.09
French Republic Government Bond OAT 0.1% 25/07/2031 12,578,255 2.95
Portugal Obrigacoes do Tesouro OT 5.65% 15/02/2024 11,849,813 2.78
Spain Government Bond 0% 30/04/2023 10,102,400 2.37
Italy Buoni Poliennali Del Tesoro 0.4% 11/04/2024 8,902,346 2.09
Intesa Sanpaolo SpA 2.125% 26/05/2025 EMTN 7,646,557 1.79
Italy Buoni Poliennali Del Tesoro 1.6% 01/06/2026 7,359,639 1.72
Italy Buoni Poliennali Del Tesoro 0.55% 21/05/2026 6,811,197 1.60
Italy Buoni Poliennali Del Tesoro 1.4% 26/05/2025 6,463,800 1.51
Italy Buoni Poliennali Del Tesoro 0.9% 01/04/2031 4,114,758 0.96
Italy Buoni Poliennali Del Tesoro 0.25% 15/03/2028 4,109,325 0.96
Erste Abwicklungsanstalt 0.01% 03/11/2023 EMTN 4,056,957 0.95
Italy Buoni Poliennali Del Tesoro 0.95% 01/12/2031 4,041,977 0.95
Deutsche Bundesrepublik Inflation Linked Bond 0.1% 15/04/2033 3,880,858 0.91
Italy Buoni Poliennali Del Tesoro 1.45% 15/05/2025 3,803,706 0.89
Spain Government Bond 0.1% 30/04/2031 3,547,919 0.83
Sales
Security Proceeds % of Total Sales
Spain Government Bond 0.45% 31/10/2022 15,257,110 4.34
French Republic Government Bond OAT 0% 25/02/2022 15,077,318 4.29
Italy Buoni Poliennali Del Tesoro 1.4% 26/05/2025 14,445,715 4.11
Italy Buoni Poliennali Del Tesoro 0.95% 01/03/2023 12,809,528 3.65
Italy Buoni Poliennali Del Tesoro 2.3% 15/10/2021 12,412,664 3.53
French Republic Government Bond OAT 0% 25/05/2022 12,126,156 3.45
Italy Buoni Poliennali Del Tesoro 0.55% 21/05/2026 11,985,052 3.41
Portugal Obrigacoes do Tesouro OT 5.65% 15/02/2024 11,864,166 3.38
Spain Government Bond 0.05% 31/10/2021 11,788,763 3.36
Bundesobligation 0% 08/04/2022 10,871,132 3.10
Italy Buoni Poliennali Del Tesoro 1.35% 15/04/2022 10,205,022 2.91
Italy Buoni Poliennali Del Tesoro 2.15% 15/12/2021 9,738,116 2.77
French Republic Government Bond OAT 0.1% 25/07/2031 6,563,719 1.87
Italy Buoni Poliennali Del Tesoro 0.9% 01/04/2031 6,060,164 1.73
Italy Buoni Poliennali Del Tesoro 0.45% 22/05/2023 5,890,607 1.68
Italy Buoni Poliennali Del Tesoro 1% 15/07/2022 5,096,616 1.45
Intesa Sanpaolo SpA 1% 04/07/2024 EMTN 4,653,347 1.32
Italy Buoni Poliennali Del Tesoro 0.25% 15/03/2028 4,117,139 1.17
Spain Government Inflation Linked Bond 0.65% 30/11/2027 4,077,971 1.16
French Republic Government Bond OAT 0.1% 01/03/2026 4,075,409 1.16
Italy Buoni Poliennali Del Tesoro 0.35% 01/11/2021 3,573,755 1.02
Spain Government Bond 0.1% 30/04/2031 3,538,943 1.01
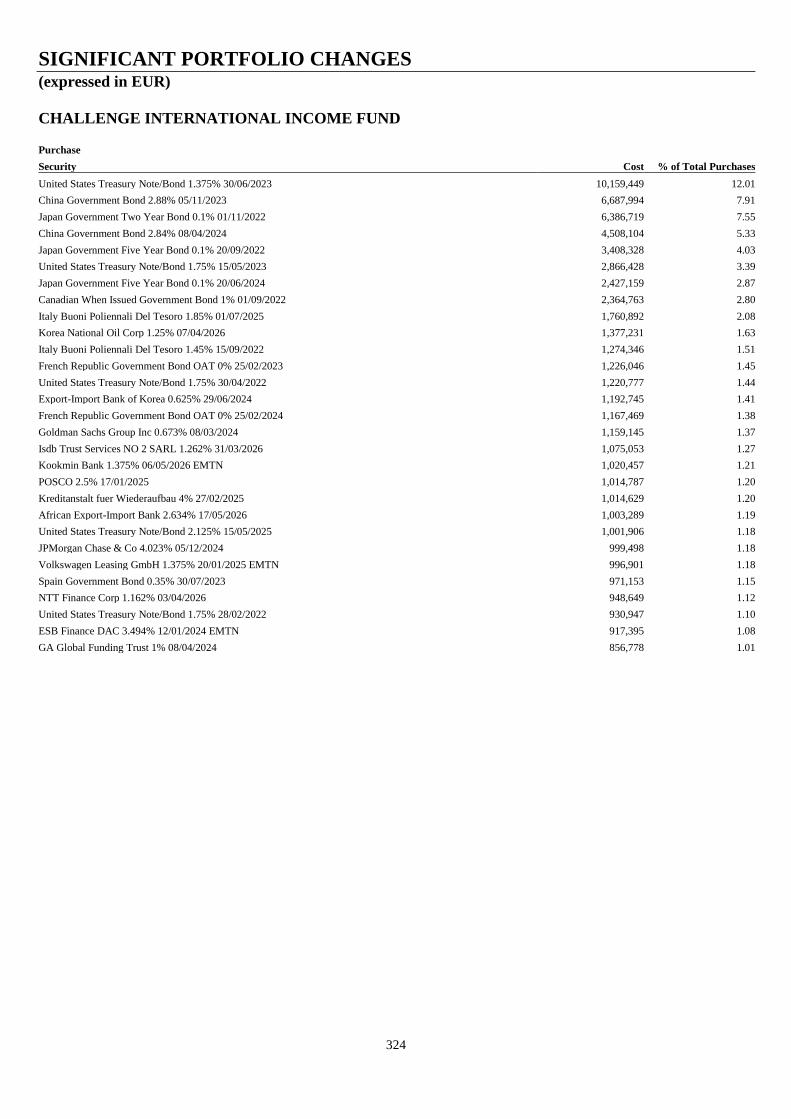
SIGNIFICANT PORTFOLIO CHANGES (expressed in EUR)
324
CHALLENGE INTERNATIONAL INCOME FUND
Purchase
Security Cost % of Total Purchases
United States Treasury Note/Bond 1.375% 30/06/2023 10,159,449 12.01
China Government Bond 2.88% 05/11/2023 6,687,994 7.91
Japan Government Two Year Bond 0.1% 01/11/2022 6,386,719 7.55
China Government Bond 2.84% 08/04/2024 4,508,104 5.33
Japan Government Five Year Bond 0.1% 20/09/2022 3,408,328 4.03
United States Treasury Note/Bond 1.75% 15/05/2023 2,866,428 3.39
Japan Government Five Year Bond 0.1% 20/06/2024 2,427,159 2.87
Canadian When Issued Government Bond 1% 01/09/2022 2,364,763 2.80
Italy Buoni Poliennali Del Tesoro 1.85% 01/07/2025 1,760,892 2.08
Korea National Oil Corp 1.25% 07/04/2026 1,377,231 1.63
Italy Buoni Poliennali Del Tesoro 1.45% 15/09/2022 1,274,346 1.51
French Republic Government Bond OAT 0% 25/02/2023 1,226,046 1.45
United States Treasury Note/Bond 1.75% 30/04/2022 1,220,777 1.44
Export-Import Bank of Korea 0.625% 29/06/2024 1,192,745 1.41
French Republic Government Bond OAT 0% 25/02/2024 1,167,469 1.38
Goldman Sachs Group Inc 0.673% 08/03/2024 1,159,145 1.37
Isdb Trust Services NO 2 SARL 1.262% 31/03/2026 1,075,053 1.27
Kookmin Bank 1.375% 06/05/2026 EMTN 1,020,457 1.21
POSCO 2.5% 17/01/2025 1,014,787 1.20
Kreditanstalt fuer Wiederaufbau 4% 27/02/2025 1,014,629 1.20
African Export-Import Bank 2.634% 17/05/2026 1,003,289 1.19
United States Treasury Note/Bond 2.125% 15/05/2025 1,001,906 1.18
JPMorgan Chase & Co 4.023% 05/12/2024 999,498 1.18
Volkswagen Leasing GmbH 1.375% 20/01/2025 EMTN 996,901 1.18
Spain Government Bond 0.35% 30/07/2023 971,153 1.15
NTT Finance Corp 1.162% 03/04/2026 948,649 1.12
United States Treasury Note/Bond 1.75% 28/02/2022 930,947 1.10
ESB Finance DAC 3.494% 12/01/2024 EMTN 917,395 1.08
GA Global Funding Trust 1% 08/04/2024 856,778 1.01

SIGNIFICANT PORTFOLIO CHANGES (expressed in EUR)
325
CHALLENGE INTERNATIONAL INCOME FUND (continued)
Sales
Security Proceeds % of Total Sales
United States Treasury Note/Bond 1.75% 28/02/2022 6,629,591 13.90
Japan Government Five Year Bond 0.1% 20/09/2022 2,718,673 5.70
Japan Government Five Year Bond 0.1% 20/06/2021 2,676,943 5.61
Italy Buoni Poliennali Del Tesoro 1.45% 15/09/2022 2,607,933 5.47
French Republic Government Bond OAT 3% 25/04/2022 2,043,274 4.28
Japan Government Five Year Bond 0.1% 20/12/2021 2,008,220 4.21
United States Treasury Note/Bond 2.125% 15/05/2025 1,850,607 3.88
United States Treasury Note/Bond 1.125% 30/09/2021 1,791,340 3.76
United States Treasury Note/Bond 1.375% 30/06/2023 1,551,199 3.25
Kreditanstalt fuer Wiederaufbau 2.9% 06/06/2022 1,493,818 3.13
United States Treasury Note/Bond 1.75% 15/05/2023 1,459,819 3.06
Goldman Sachs Group Inc 0.673% 08/03/2024 1,149,259 2.41
CDP Financial Inc 2.125% 11/06/2021 1,018,094 2.13
Japan Government Five Year Bond 0.1% 20/06/2024 977,339 2.05
NTT Finance Corp 1.162% 03/04/2026 942,255 1.98
Hyundai Capital America 2.375% 10/02/2023 824,389 1.73
Corp Andina de Fomento 2.375% 12/05/2023 811,271 1.70
POSCO 2.375% 12/11/2022 779,860 1.64
AerCap Ireland Capital DAC / AerCap Global Aviation Trust 3.3% 23/01/2023 771,153 1.62
European Bank for Reconstruction & Development 0.301429% 15/10/2024 759,667 1.59
Industrial Bank of Korea 2.125% 23/10/2024 EMTN 680,698 1.43
Portugal Obrigacoes do Tesouro OT 4.95% 25/10/2023 583,065 1.22
Mexican Bonos 7.25% 09/12/2021 557,743 1.17
Walt Disney Co 1.75% 30/08/2024 517,575 1.09
Baidu Inc 2.875% 06/07/2022 516,310 1.08
JPMorgan Chase & Co 4.023% 05/12/2024 514,513 1.08
African Development Bank 0.75% 03/04/2023 506,801 1.06
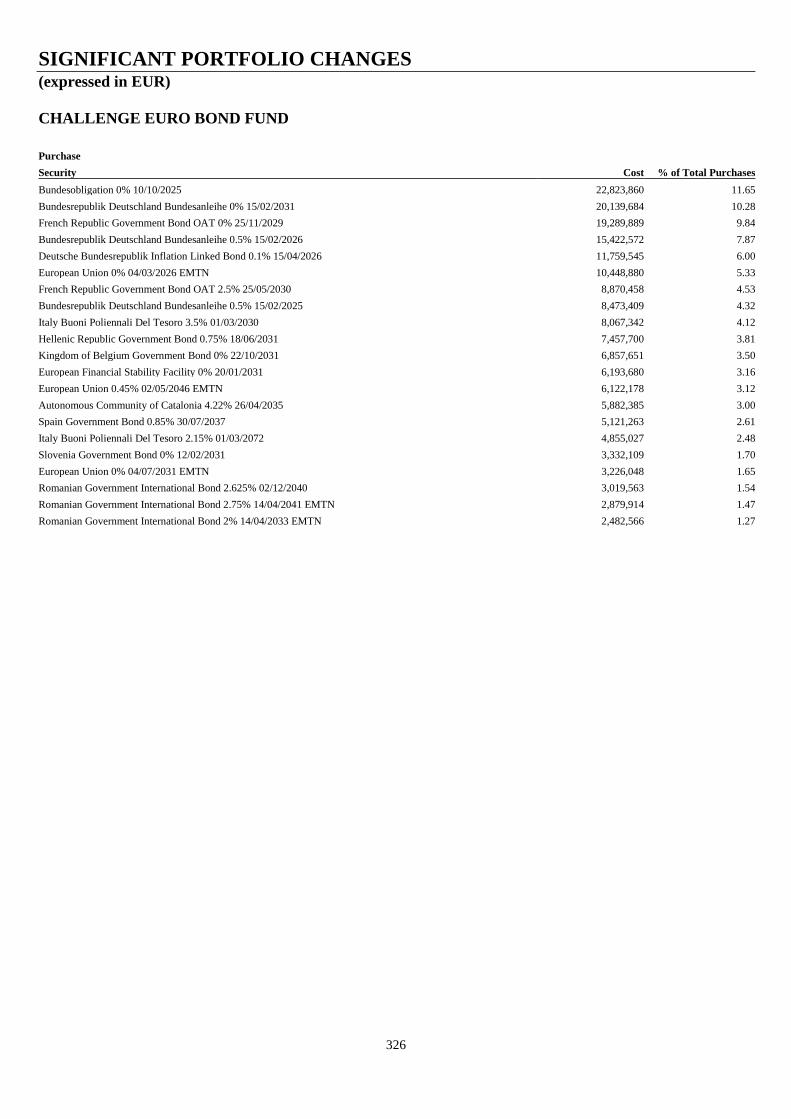
SIGNIFICANT PORTFOLIO CHANGES (expressed in EUR)
326
CHALLENGE EURO BOND FUND
Purchase
Security Cost % of Total Purchases
Bundesobligation 0% 10/10/2025 22,823,860 11.65
Bundesrepublik Deutschland Bundesanleihe 0% 15/02/2031 20,139,684 10.28
French Republic Government Bond OAT 0% 25/11/2029 19,289,889 9.84
Bundesrepublik Deutschland Bundesanleihe 0.5% 15/02/2026 15,422,572 7.87
Deutsche Bundesrepublik Inflation Linked Bond 0.1% 15/04/2026 11,759,545 6.00
European Union 0% 04/03/2026 EMTN 10,448,880 5.33
French Republic Government Bond OAT 2.5% 25/05/2030 8,870,458 4.53
Bundesrepublik Deutschland Bundesanleihe 0.5% 15/02/2025 8,473,409 4.32
Italy Buoni Poliennali Del Tesoro 3.5% 01/03/2030 8,067,342 4.12
Hellenic Republic Government Bond 0.75% 18/06/2031 7,457,700 3.81
Kingdom of Belgium Government Bond 0% 22/10/2031 6,857,651 3.50
European Financial Stability Facility 0% 20/01/2031 6,193,680 3.16
European Union 0.45% 02/05/2046 EMTN 6,122,178 3.12
Autonomous Community of Catalonia 4.22% 26/04/2035 5,882,385 3.00
Spain Government Bond 0.85% 30/07/2037 5,121,263 2.61
Italy Buoni Poliennali Del Tesoro 2.15% 01/03/2072 4,855,027 2.48
Slovenia Government Bond 0% 12/02/2031 3,332,109 1.70
European Union 0% 04/07/2031 EMTN 3,226,048 1.65
Romanian Government International Bond 2.625% 02/12/2040 3,019,563 1.54
Romanian Government International Bond 2.75% 14/04/2041 EMTN 2,879,914 1.47
Romanian Government International Bond 2% 14/04/2033 EMTN 2,482,566 1.27
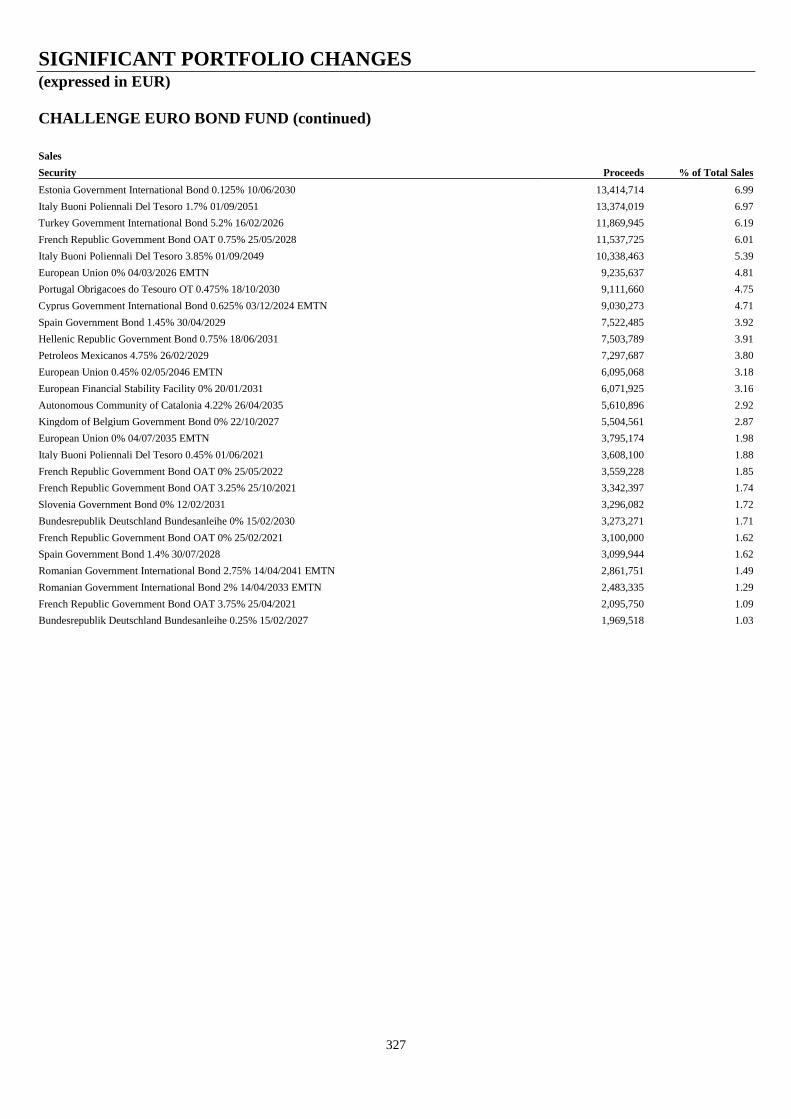
SIGNIFICANT PORTFOLIO CHANGES (expressed in EUR)
327
CHALLENGE EURO BOND FUND (continued)
Sales
Security Proceeds % of Total Sales
Estonia Government International Bond 0.125% 10/06/2030 13,414,714 6.99
Italy Buoni Poliennali Del Tesoro 1.7% 01/09/2051 13,374,019 6.97
Turkey Government International Bond 5.2% 16/02/2026 11,869,945 6.19
French Republic Government Bond OAT 0.75% 25/05/2028 11,537,725 6.01
Italy Buoni Poliennali Del Tesoro 3.85% 01/09/2049 10,338,463 5.39
European Union 0% 04/03/2026 EMTN 9,235,637 4.81
Portugal Obrigacoes do Tesouro OT 0.475% 18/10/2030 9,111,660 4.75
Cyprus Government International Bond 0.625% 03/12/2024 EMTN 9,030,273 4.71
Spain Government Bond 1.45% 30/04/2029 7,522,485 3.92
Hellenic Republic Government Bond 0.75% 18/06/2031 7,503,789 3.91
Petroleos Mexicanos 4.75% 26/02/2029 7,297,687 3.80
European Union 0.45% 02/05/2046 EMTN 6,095,068 3.18
European Financial Stability Facility 0% 20/01/2031 6,071,925 3.16
Autonomous Community of Catalonia 4.22% 26/04/2035 5,610,896 2.92
Kingdom of Belgium Government Bond 0% 22/10/2027 5,504,561 2.87
European Union 0% 04/07/2035 EMTN 3,795,174 1.98
Italy Buoni Poliennali Del Tesoro 0.45% 01/06/2021 3,608,100 1.88
French Republic Government Bond OAT 0% 25/05/2022 3,559,228 1.85
French Republic Government Bond OAT 3.25% 25/10/2021 3,342,397 1.74
Slovenia Government Bond 0% 12/02/2031 3,296,082 1.72
Bundesrepublik Deutschland Bundesanleihe 0% 15/02/2030 3,273,271 1.71
French Republic Government Bond OAT 0% 25/02/2021 3,100,000 1.62
Spain Government Bond 1.4% 30/07/2028 3,099,944 1.62
Romanian Government International Bond 2.75% 14/04/2041 EMTN 2,861,751 1.49
Romanian Government International Bond 2% 14/04/2033 EMTN 2,483,335 1.29
French Republic Government Bond OAT 3.75% 25/04/2021 2,095,750 1.09
Bundesrepublik Deutschland Bundesanleihe 0.25% 15/02/2027 1,969,518 1.03

SIGNIFICANT PORTFOLIO CHANGES (expressed in EUR)
328
CHALLENGE INTERNATIONAL BOND FUND
Purchase
Security Cost % of Total Purchases
iShares US Mortgage Backed Securities UCITS ETF 15,402,381 4.72
United States Treasury Note/Bond 2.75% 15/08/2047 11,006,055 3.37
China Government Bond 3.27% 19/11/2030 7,941,587 2.43
French Republic Government Bond OAT 0% 25/11/2030 7,673,270 2.35
Australia Government Bond 3.25% 21/04/2025 7,664,121 2.35
United Kingdom Gilt 0.375% 22/10/2030 7,646,651 2.34
Australia Government Bond 0.25% 21/11/2024 7,599,281 2.33
United States Treasury Note/Bond 2.875% 30/11/2023 7,481,794 2.29
Italy Buoni Poliennali Del Tesoro 0.9% 01/04/2031 6,836,421 2.10
Bank of China Ltd 3.08% 28/04/2026 EMTN 5,764,534 1.77
Spain Government Bond 1.85% 30/07/2035 5,357,841 1.64
United States Treasury Note/Bond 1.75% 15/05/2023 5,152,007 1.58
Eurofins Scientific SE 0.875% 19/05/2031 4,432,365 1.36
United States Treasury Note/Bond 1.5% 15/02/2030 4,390,280 1.35
Mutuelle Assurance Des Commercants et Industriels de France et Des Cadres et Sal 2.125% 21/06/2052 4,269,212 1.31
Italy Buoni Poliennali Del Tesoro 0.65% 28/10/2027 4,224,752 1.29
Japanese Government CPI Linked Bond 0.005% 10/03/2031 3,860,790 1.18
China Government Bond 3.81% 14/09/2050 3,705,021 1.14
United States Treasury Note/Bond 2.125% 15/05/2025 3,658,156 1.12
Freddie Mac Pool 2.5% 04/01/2051 3,626,117 1.11
Cellnex Finance Co SA 0.75% 15/11/2026 EMTN 3,475,902 1.07
Bundesrepublik Deutschland Bundesanleihe 4.25% 04/07/2039 3,447,521 1.06
China Development Bank 3.7% 20/10/2030 3,275,782 1.00
Sales
Security Proceeds % of Total Sales
United States Treasury Note/Bond 1.125% 30/09/2021 12,509,475 4.56
United States Treasury Note/Bond 3.125% 15/05/2048 9,891,820 3.61
United States Treasury Note/Bond 1.5% 15/02/2030 9,459,297 3.45
Japan Government Ten Year Bond 0.1% 20/06/2029 8,861,052 3.23
United Kingdom Gilt 0.375% 22/10/2030 7,703,299 2.81
Australia Government Bond 0.25% 21/11/2024 7,638,198 2.78
United States Treasury Note/Bond 1.125% 28/02/2021 6,275,366 2.29
Italy Buoni Poliennali Del Tesoro 3.35% 01/03/2035 4,847,420 1.77
Spain Government Bond 1.85% 30/07/2035 4,826,031 1.76
Fannie Mae Pool 2% 11/01/2050 4,153,840 1.51
Spain Government Bond 0.8% 30/07/2027 4,132,439 1.51
Italy Buoni Poliennali Del Tesoro 1.45% 15/09/2022 3,819,724 1.39
Freddie Mac Pool 2.5% 04/01/2051 3,528,121 1.29
United States Treasury Note/Bond 2.125% 31/12/2021 3,192,234 1.16
Australia Government Bond 1% 21/12/2030 3,038,339 1.11
United States Treasury Note/Bond 1.125% 15/05/2040 2,707,490 0.99
New Zealand Government Bond 0.25% 15/05/2028 2,695,002 0.98
Banco de Sabadell SA 0.625% 07/11/2025 2,629,918 0.96
Ryanair DAC 2.875% 15/09/2025 EMTN 2,626,332 0.96
China Government Bond 3.27% 19/11/2030 2,600,641 0.95

SIGNIFICANT PORTFOLIO CHANGES (expressed in EUR)
329
CHALLENGE INTERNATIONAL EQUITY FUND
Purchase
Security Cost % of Total Purchases
iShares Edge MSCI World Value Factor UCITS ETF 41,018,492 5.55
Facebook Inc 16,763,363 2.27
Apple Inc 15,942,152 2.16
Amazon.com Inc 9,606,771 1.30
Bank of America Corp 8,753,564 1.18
Microsoft Corp 8,328,875 1.13
NVIDIA Corp 7,226,795 0.98
Alibaba Group Holding Ltd 7,005,937 0.95
Walmart Inc 6,695,254 0.91
Moderna Inc 6,669,681 0.90
CME Group Inc 6,603,614 0.89
Alphabet Inc Shs C 6,489,859 0.88
Aptiv Plc 5,792,840 0.78
Alphabet Inc Shs A 5,522,448 0.75
Adobe Inc 5,506,119 0.75
Zoetis Inc 5,400,616 0.73
Dollar Tree Inc 5,252,669 0.71
General Motors Co 5,165,630 0.70
Charles Schwab Corp 4,976,275 0.67
Mondelez International Inc 4,976,241 0.67
Sales
Security Proceeds % of Total Sales
BNY Mellon Global Funds Plc - Long-Term Global Equity Fund 74,358,291 9.16
Apple Inc 21,303,574 2.62
Amazon.com Inc 11,623,954 1.43
Procter & Gamble Co 11,264,555 1.39
Facebook Inc 10,393,055 1.28
JPMorgan Chase & Co 10,276,367 1.27
Alphabet Inc Shs A 9,444,961 1.16
NVIDIA Corp 9,442,193 1.16
Schroder ISF Global Equity Alpha 8,723,724 1.07
Microsoft Corp 7,666,583 0.94
Nestle SA 7,515,015 0.93
Newmont Corp 7,183,950 0.88
Volkswagen AG 6,908,163 0.85
Tesla Inc 6,706,775 0.83
DuPont de Nemours Inc 6,353,517 0.78
Marvell Technology Group Ltd 5,882,456 0.72
Anglo American Plc 5,741,155 0.71
Moderna Inc 5,727,168 0.71
General Electric Co 5,620,543 0.69
AbbVie Inc 5,349,211 0.66
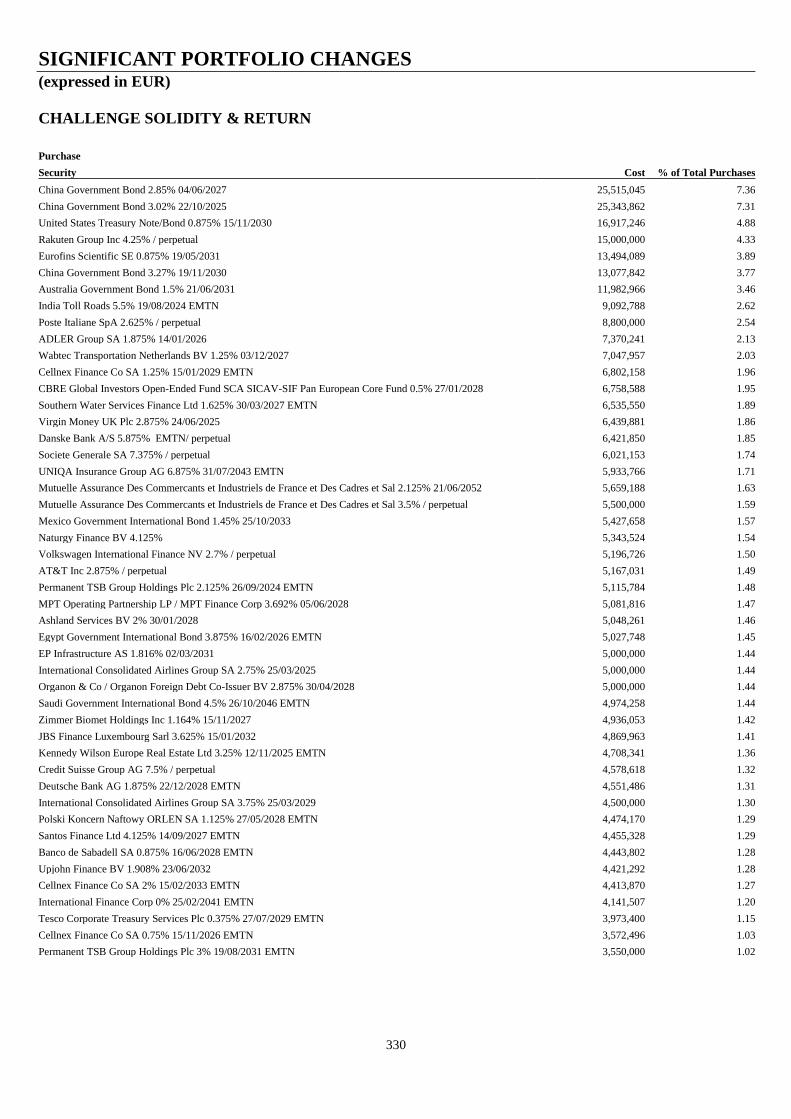
SIGNIFICANT PORTFOLIO CHANGES (expressed in EUR)
330
CHALLENGE SOLIDITY & RETURN
Purchase
Security Cost % of Total Purchases
China Government Bond 2.85% 04/06/2027 25,515,045 7.36
China Government Bond 3.02% 22/10/2025 25,343,862 7.31
United States Treasury Note/Bond 0.875% 15/11/2030 16,917,246 4.88
Rakuten Group Inc 4.25% / perpetual 15,000,000 4.33
Eurofins Scientific SE 0.875% 19/05/2031 13,494,089 3.89
China Government Bond 3.27% 19/11/2030 13,077,842 3.77
Australia Government Bond 1.5% 21/06/2031 11,982,966 3.46
India Toll Roads 5.5% 19/08/2024 EMTN 9,092,788 2.62
Poste Italiane SpA 2.625% / perpetual 8,800,000 2.54
ADLER Group SA 1.875% 14/01/2026 7,370,241 2.13
Wabtec Transportation Netherlands BV 1.25% 03/12/2027 7,047,957 2.03
Cellnex Finance Co SA 1.25% 15/01/2029 EMTN 6,802,158 1.96
CBRE Global Investors Open-Ended Fund SCA SICAV-SIF Pan European Core Fund 0.5% 27/01/2028 6,758,588 1.95
Southern Water Services Finance Ltd 1.625% 30/03/2027 EMTN 6,535,550 1.89
Virgin Money UK Plc 2.875% 24/06/2025 6,439,881 1.86
Danske Bank A/S 5.875% EMTN/ perpetual 6,421,850 1.85
Societe Generale SA 7.375% / perpetual 6,021,153 1.74
UNIQA Insurance Group AG 6.875% 31/07/2043 EMTN 5,933,766 1.71
Mutuelle Assurance Des Commercants et Industriels de France et Des Cadres et Sal 2.125% 21/06/2052 5,659,188 1.63
Mutuelle Assurance Des Commercants et Industriels de France et Des Cadres et Sal 3.5% / perpetual 5,500,000 1.59
Mexico Government International Bond 1.45% 25/10/2033 5,427,658 1.57
Naturgy Finance BV 4.125% 5,343,524 1.54
Volkswagen International Finance NV 2.7% / perpetual 5,196,726 1.50
AT&T Inc 2.875% / perpetual 5,167,031 1.49
Permanent TSB Group Holdings Plc 2.125% 26/09/2024 EMTN 5,115,784 1.48
MPT Operating Partnership LP / MPT Finance Corp 3.692% 05/06/2028 5,081,816 1.47
Ashland Services BV 2% 30/01/2028 5,048,261 1.46
Egypt Government International Bond 3.875% 16/02/2026 EMTN 5,027,748 1.45
EP Infrastructure AS 1.816% 02/03/2031 5,000,000 1.44
International Consolidated Airlines Group SA 2.75% 25/03/2025 5,000,000 1.44
Organon & Co / Organon Foreign Debt Co-Issuer BV 2.875% 30/04/2028 5,000,000 1.44
Saudi Government International Bond 4.5% 26/10/2046 EMTN 4,974,258 1.44
Zimmer Biomet Holdings Inc 1.164% 15/11/2027 4,936,053 1.42
JBS Finance Luxembourg Sarl 3.625% 15/01/2032 4,869,963 1.41
Kennedy Wilson Europe Real Estate Ltd 3.25% 12/11/2025 EMTN 4,708,341 1.36
Credit Suisse Group AG 7.5% / perpetual 4,578,618 1.32
Deutsche Bank AG 1.875% 22/12/2028 EMTN 4,551,486 1.31
International Consolidated Airlines Group SA 3.75% 25/03/2029 4,500,000 1.30
Polski Koncern Naftowy ORLEN SA 1.125% 27/05/2028 EMTN 4,474,170 1.29
Santos Finance Ltd 4.125% 14/09/2027 EMTN 4,455,328 1.29
Banco de Sabadell SA 0.875% 16/06/2028 EMTN 4,443,802 1.28
Upjohn Finance BV 1.908% 23/06/2032 4,421,292 1.28
Cellnex Finance Co SA 2% 15/02/2033 EMTN 4,413,870 1.27
International Finance Corp 0% 25/02/2041 EMTN 4,141,507 1.20
Tesco Corporate Treasury Services Plc 0.375% 27/07/2029 EMTN 3,973,400 1.15
Cellnex Finance Co SA 0.75% 15/11/2026 EMTN 3,572,496 1.03
Permanent TSB Group Holdings Plc 3% 19/08/2031 EMTN 3,550,000 1.02

SIGNIFICANT PORTFOLIO CHANGES (expressed in EUR)
331
CHALLENGE SOLIDITY & RETURN (continued)
Sales
Security Proceeds % of Total Sales
China Government Bond 3.02% 22/10/2025 25,645,263 8.26
United States Treasury Note/Bond 0.875% 15/11/2030 16,614,419 5.35
iShares Diversified Commodity Swap UCITS ETF 13,544,018 4.36
New Zealand Government Bond 3% 20/04/2029 12,632,905 4.07
Norway Government Bond 1.75% 06/09/2029 10,842,872 3.49
United States Treasury Note/Bond 1.375% 31/01/2025 8,618,095 2.78
Italy Buoni Poliennali Del Tesoro 5.25% 01/11/2029 8,464,094 2.73
United States Treasury Note/Bond 2.625% 31/01/2026 8,422,544 2.71
Asian Development Bank 1.75% 19/09/2029 6,949,519 2.24
Takeda Pharmaceutical Co Ltd 2.25% 21/11/2026 6,732,748 2.17
Korea International Bond 1% 16/09/2030 6,215,670 2.00
EDP Finance BV 0.375% 16/09/2026 EMTN 5,683,053 1.83
CRH Finance DAC 1.375% 18/10/2028 EMTN 5,543,058 1.79
Telefonica Emisiones SA 1.788% 12/03/2029 EMTN 5,510,101 1.78
Mexico Government International Bond 1.75% 17/04/2028 EMTN 5,495,683 1.77
Saudi Government International Bond 0.75% 09/07/2027 5,483,002 1.77
Chile Government International Bond 1.75% 20/01/2026 5,438,747 1.75
Indonesia Government International Bond 2.15% 18/07/2024 EMTN 5,399,548 1.74
EDP Finance BV 1.625% 26/01/2026 EMTN 5,383,784 1.73
Fortum Oyj 1.625% 27/02/2026 EMTN 5,360,017 1.73
Anglo American Capital Plc 1.625% 11/03/2026 EMTN 5,326,614 1.72
Eurofins Scientific SE 0.875% 19/05/2031 5,319,016 1.71
Becton Dickinson and Co 1.9% 15/12/2026 5,201,582 1.68
BP Capital Markets Plc 0.831% 08/11/2027 EMTN 5,198,209 1.67
Kazakhstan Government International Bond 1.55% 09/11/2023 EMTN 5,195,336 1.67
Fonterra Co-operative Group Ltd 0.75% 08/11/2024 EMTN 5,150,178 1.66
Blackstone Property Partners Europe Holdings Sarl 0.5% 12/09/2023 EMTN 5,061,404 1.63
Singapore Government Bond 2.875% 01/07/2029 4,976,307 1.60
Czech Republic Government Bond 2.4% 17/09/2025 4,925,085 1.59
Ryanair DAC 2.875% 15/09/2025 EMTN 4,924,372 1.59
Qatar Government International Bond 4% 14/03/2029 4,918,948 1.58
Thailand Government Bond 3.85% 12/12/2025 4,729,070 1.52
Banco de Sabadell SA 0.625% 07/11/2025 4,551,781 1.47
European Bank for Reconstruction & Development 2.55% 14/03/2022 EMTN 4,301,592 1.39
Upjohn Finance BV 1.362% 23/06/2027 4,275,930 1.38
Holcim Finance Luxembourg SA 2.25% 26/05/2028 EMTN 4,266,125 1.37
Credit Suisse Group AG 1.25% 17/07/2025 EMTN 4,179,743 1.35
Brisa-Concessao Rodoviaria SA 1.875% 30/04/2025 EMTN 3,838,781 1.24
Portugal Obrigacoes do Tesouro OT 3.875% 15/02/2030 3,825,901 1.23
AT&T Inc 3.5% 17/12/2025 3,490,949 1.12
Fresenius SE & Co KGaA 4% 01/02/2024 3,428,500 1.10
Wendel SE 2.5% 09/02/2027 3,356,095 1.08
Citigroup Inc 2.125% 10/09/2026 EMTN 3,342,373 1.08
Rolls-Royce Plc 4.625% 16/02/2026 3,277,600 1.06
AT&T Inc 1.8% 05/09/2026 3,271,452 1.05
CK Hutchison Finance 16 II Ltd 0.875% 03/10/2024 3,100,299 1.00
Bank of Ireland Group Plc 1% 25/11/2025 EMTN 3,098,543 1.00
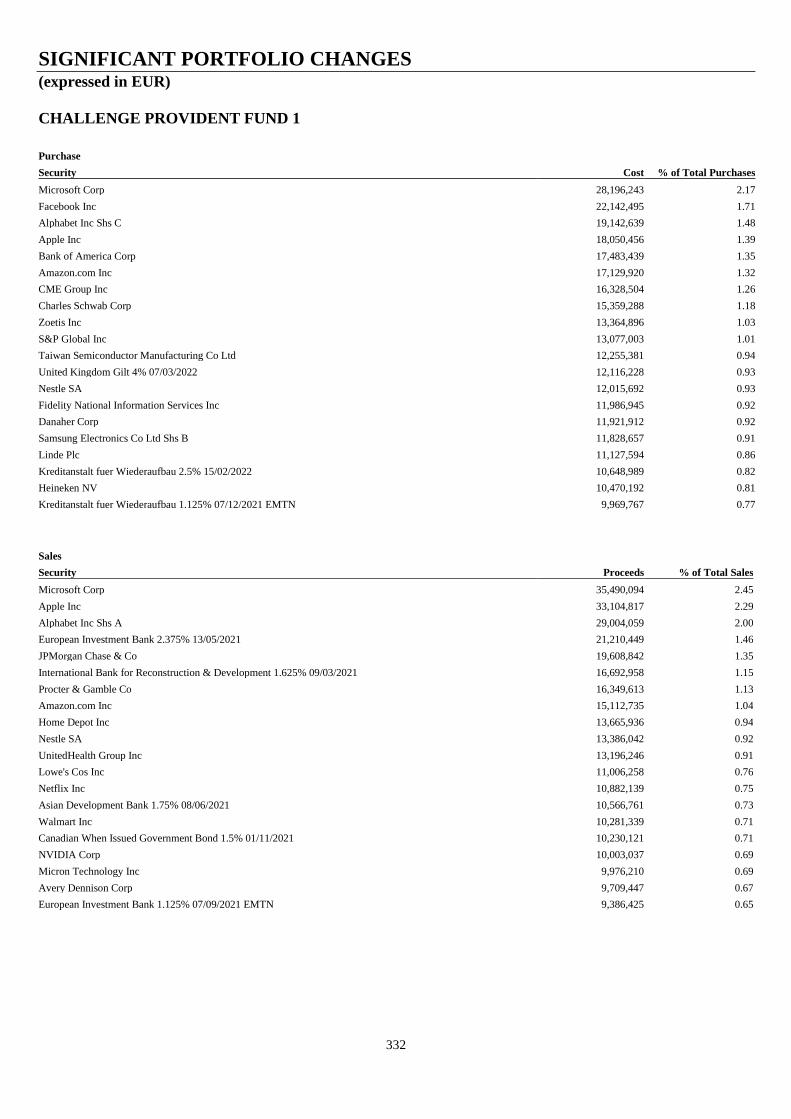
SIGNIFICANT PORTFOLIO CHANGES (expressed in EUR)
332
CHALLENGE PROVIDENT FUND 1
Purchase
Security Cost % of Total Purchases
Microsoft Corp 28,196,243 2.17
Facebook Inc 22,142,495 1.71
Alphabet Inc Shs C 19,142,639 1.48
Apple Inc 18,050,456 1.39
Bank of America Corp 17,483,439 1.35
Amazon.com Inc 17,129,920 1.32
CME Group Inc 16,328,504 1.26
Charles Schwab Corp 15,359,288 1.18
Zoetis Inc 13,364,896 1.03
S&P Global Inc 13,077,003 1.01
Taiwan Semiconductor Manufacturing Co Ltd 12,255,381 0.94
United Kingdom Gilt 4% 07/03/2022 12,116,228 0.93
Nestle SA 12,015,692 0.93
Fidelity National Information Services Inc 11,986,945 0.92
Danaher Corp 11,921,912 0.92
Samsung Electronics Co Ltd Shs B 11,828,657 0.91
Linde Plc 11,127,594 0.86
Kreditanstalt fuer Wiederaufbau 2.5% 15/02/2022 10,648,989 0.82
Heineken NV 10,470,192 0.81
Kreditanstalt fuer Wiederaufbau 1.125% 07/12/2021 EMTN 9,969,767 0.77
Sales
Security Proceeds % of Total Sales
Microsoft Corp 35,490,094 2.45
Apple Inc 33,104,817 2.29
Alphabet Inc Shs A 29,004,059 2.00
European Investment Bank 2.375% 13/05/2021 21,210,449 1.46
JPMorgan Chase & Co 19,608,842 1.35
International Bank for Reconstruction & Development 1.625% 09/03/2021 16,692,958 1.15
Procter & Gamble Co 16,349,613 1.13
Amazon.com Inc 15,112,735 1.04
Home Depot Inc 13,665,936 0.94
Nestle SA 13,386,042 0.92
UnitedHealth Group Inc 13,196,246 0.91
Lowe's Cos Inc 11,006,258 0.76
Netflix Inc 10,882,139 0.75
Asian Development Bank 1.75% 08/06/2021 10,566,761 0.73
Walmart Inc 10,281,339 0.71
Canadian When Issued Government Bond 1.5% 01/11/2021 10,230,121 0.71
NVIDIA Corp 10,003,037 0.69
Micron Technology Inc 9,976,210 0.69
Avery Dennison Corp 9,709,447 0.67
European Investment Bank 1.125% 07/09/2021 EMTN 9,386,425 0.65
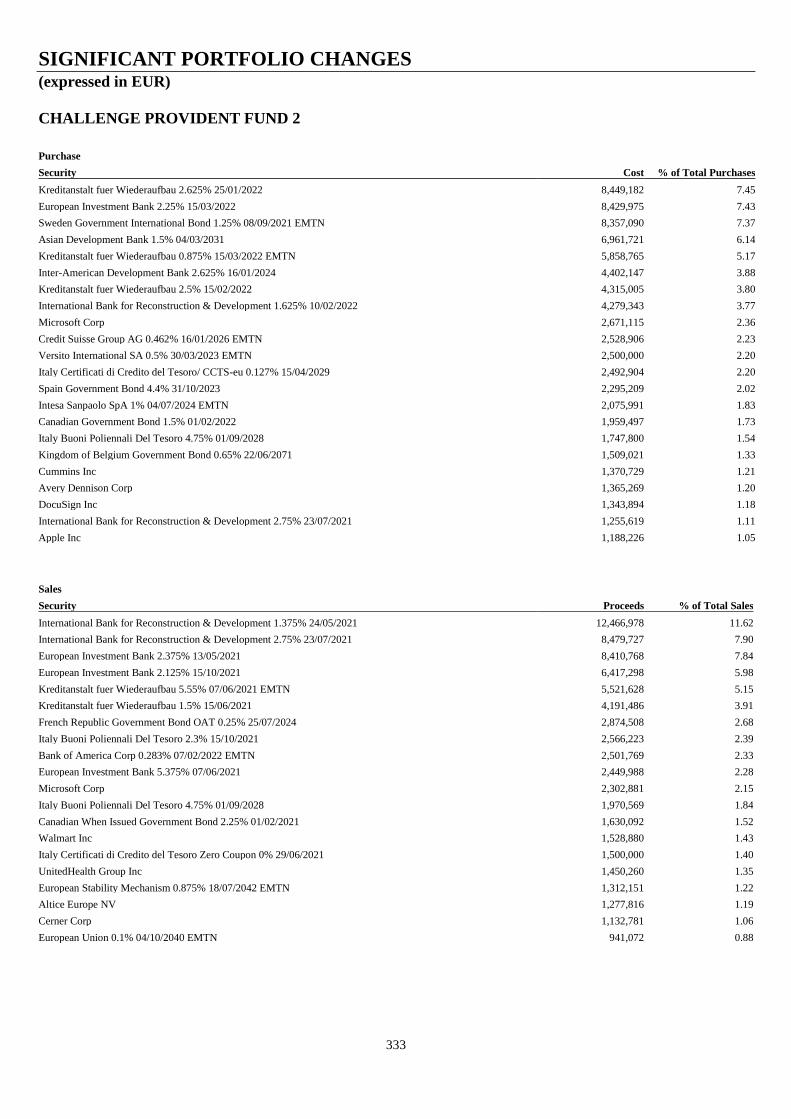
SIGNIFICANT PORTFOLIO CHANGES (expressed in EUR)
333
CHALLENGE PROVIDENT FUND 2
Purchase
Security Cost % of Total Purchases
Kreditanstalt fuer Wiederaufbau 2.625% 25/01/2022 8,449,182 7.45
European Investment Bank 2.25% 15/03/2022 8,429,975 7.43
Sweden Government International Bond 1.25% 08/09/2021 EMTN 8,357,090 7.37
Asian Development Bank 1.5% 04/03/2031 6,961,721 6.14
Kreditanstalt fuer Wiederaufbau 0.875% 15/03/2022 EMTN 5,858,765 5.17
Inter-American Development Bank 2.625% 16/01/2024 4,402,147 3.88
Kreditanstalt fuer Wiederaufbau 2.5% 15/02/2022 4,315,005 3.80
International Bank for Reconstruction & Development 1.625% 10/02/2022 4,279,343 3.77
Microsoft Corp 2,671,115 2.36
Credit Suisse Group AG 0.462% 16/01/2026 EMTN 2,528,906 2.23
Versito International SA 0.5% 30/03/2023 EMTN 2,500,000 2.20
Italy Certificati di Credito del Tesoro/ CCTS-eu 0.127% 15/04/2029 2,492,904 2.20
Spain Government Bond 4.4% 31/10/2023 2,295,209 2.02
Intesa Sanpaolo SpA 1% 04/07/2024 EMTN 2,075,991 1.83
Canadian Government Bond 1.5% 01/02/2022 1,959,497 1.73
Italy Buoni Poliennali Del Tesoro 4.75% 01/09/2028 1,747,800 1.54
Kingdom of Belgium Government Bond 0.65% 22/06/2071 1,509,021 1.33
Cummins Inc 1,370,729 1.21
Avery Dennison Corp 1,365,269 1.20
DocuSign Inc 1,343,894 1.18
International Bank for Reconstruction & Development 2.75% 23/07/2021 1,255,619 1.11
Apple Inc 1,188,226 1.05
Sales
Security Proceeds % of Total Sales
International Bank for Reconstruction & Development 1.375% 24/05/2021 12,466,978 11.62
International Bank for Reconstruction & Development 2.75% 23/07/2021 8,479,727 7.90
European Investment Bank 2.375% 13/05/2021 8,410,768 7.84
European Investment Bank 2.125% 15/10/2021 6,417,298 5.98
Kreditanstalt fuer Wiederaufbau 5.55% 07/06/2021 EMTN 5,521,628 5.15
Kreditanstalt fuer Wiederaufbau 1.5% 15/06/2021 4,191,486 3.91
French Republic Government Bond OAT 0.25% 25/07/2024 2,874,508 2.68
Italy Buoni Poliennali Del Tesoro 2.3% 15/10/2021 2,566,223 2.39
Bank of America Corp 0.283% 07/02/2022 EMTN 2,501,769 2.33
European Investment Bank 5.375% 07/06/2021 2,449,988 2.28
Microsoft Corp 2,302,881 2.15
Italy Buoni Poliennali Del Tesoro 4.75% 01/09/2028 1,970,569 1.84
Canadian When Issued Government Bond 2.25% 01/02/2021 1,630,092 1.52
Walmart Inc 1,528,880 1.43
Italy Certificati di Credito del Tesoro Zero Coupon 0% 29/06/2021 1,500,000 1.40
UnitedHealth Group Inc 1,450,260 1.35
European Stability Mechanism 0.875% 18/07/2042 EMTN 1,312,151 1.22
Altice Europe NV 1,277,816 1.19
Cerner Corp 1,132,781 1.06
European Union 0.1% 04/10/2040 EMTN 941,072 0.88

SIGNIFICANT PORTFOLIO CHANGES (expressed in EUR)
334
CHALLENGE PROVIDENT FUND 3
Purchase1
Security Cost % of Total Purchases
Asian Development Bank 1.5% 04/03/2031 8,190,260 19.56
Spain Government Bond 4.4% 31/10/2023 5,738,022 13.71
Italy Certificati di Credito del Tesoro/ CCTS-eu 0.127% 15/04/2029 4,985,808 11.90
Intesa Sanpaolo SpA 1% 04/07/2024 EMTN 2,594,989 6.19
Versito International SA 0.5% 30/03/2023 EMTN 2,500,000 5.97
European Investment Bank 1% 21/09/2026 EMTN 2,388,563 5.70
United States Treasury Inflation Indexed Bonds 2.5% 15/01/2029 2,318,033 5.53
Italy Buoni Poliennali Del Tesoro 4.5% 01/05/2023 2,238,331 5.34
Kreditanstalt fuer Wiederaufbau 2.5% 15/02/2022 2,139,487 5.11
Italy Buoni Poliennali Del Tesoro 4.75% 01/09/2028 2,016,692 4.81
Kingdom of Belgium Government Bond 0.65% 22/06/2071 1,886,276 4.50
International Bank for Reconstruction & Development 4.75% 15/02/2035 1,101,163 2.63
Credit Suisse Group AG 0.462% 16/01/2026 EMTN 998,913 2.38
International Bank for Reconstruction & Development 7.625% 19/01/2023 902,260 2.15
European Investment Bank 2.25% 15/03/2022 851,869 2.03
Canadian Government Bond 1.5% 01/02/2022 620,507 1.48
BNG Bank NV 1.5% 06/09/2022 422,429 1.01
Sales2
Security Proceeds % of Total Sales
BNG Bank NV 4.375% 16/02/2021 6,324,005 21.86
Bundesrepublik Deutschland Bundesanleihe 4.75% 04/07/2028 4,263,450 14.74
Italy Buoni Poliennali Del Tesoro 4.75% 01/09/2028 2,627,426 9.08
European Investment Bank 2% 15/03/2021 2,542,693 8.79
European Investment Bank 5.375% 07/06/2021 2,327,489 8.04
Italy Buoni Poliennali Del Tesoro 2.3% 15/10/2021 2,052,978 7.10
Bundesrepublik Deutschland Bundesanleihe 4% 04/01/2037 1,690,592 5.84
Spain Government Bond 5.5% 30/04/2021 1,582,500 5.47
European Union 0.1% 04/10/2040 EMTN 1,411,607 4.88
Bundesrepublik Deutschland Bundesanleihe 5.625% 04/01/2028 1,019,484 3.52
Asian Development Bank 1.5% 04/03/2031 809,152 2.80
Kreditanstalt fuer Wiederaufbau 1.5% 15/06/2021 623,119 2.15
Intesa Sanpaolo SpA 7% EMTN 621,000 2.15
European Stability Mechanism 0.875% 18/07/2042 EMTN 546,730 1.89
Canadian When Issued Government Bond 2.25% 01/02/2021 489,028 1.69
1 Represents all aggregate purchases during the financial period. 2 Represents all aggregate sales during the financial period.
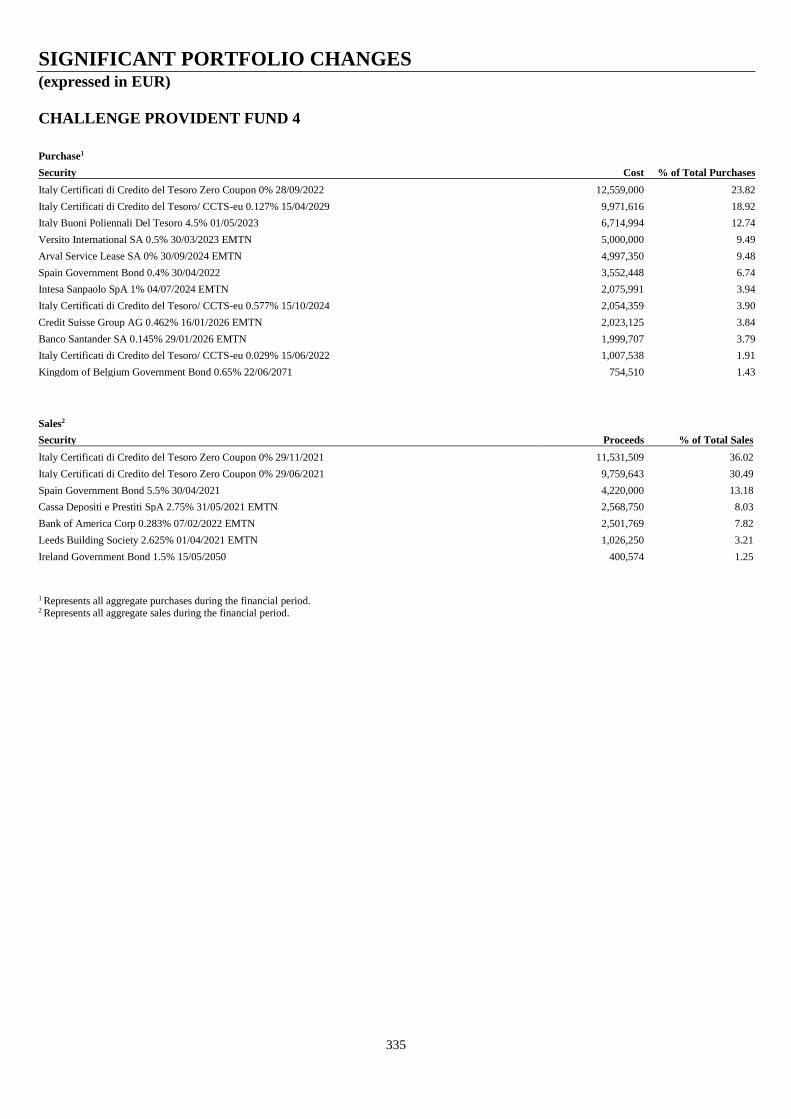
SIGNIFICANT PORTFOLIO CHANGES (expressed in EUR)
335
CHALLENGE PROVIDENT FUND 4
Purchase1
Security Cost % of Total Purchases
Italy Certificati di Credito del Tesoro Zero Coupon 0% 28/09/2022 12,559,000 23.82
Italy Certificati di Credito del Tesoro/ CCTS-eu 0.127% 15/04/2029 9,971,616 18.92
Italy Buoni Poliennali Del Tesoro 4.5% 01/05/2023 6,714,994 12.74
Versito International SA 0.5% 30/03/2023 EMTN 5,000,000 9.49
Arval Service Lease SA 0% 30/09/2024 EMTN 4,997,350 9.48
Spain Government Bond 0.4% 30/04/2022 3,552,448 6.74
Intesa Sanpaolo SpA 1% 04/07/2024 EMTN 2,075,991 3.94
Italy Certificati di Credito del Tesoro/ CCTS-eu 0.577% 15/10/2024 2,054,359 3.90
Credit Suisse Group AG 0.462% 16/01/2026 EMTN 2,023,125 3.84
Banco Santander SA 0.145% 29/01/2026 EMTN 1,999,707 3.79
Italy Certificati di Credito del Tesoro/ CCTS-eu 0.029% 15/06/2022 1,007,538 1.91
Kingdom of Belgium Government Bond 0.65% 22/06/2071 754,510 1.43
Sales2
Security Proceeds % of Total Sales
Italy Certificati di Credito del Tesoro Zero Coupon 0% 29/11/2021 11,531,509 36.02
Italy Certificati di Credito del Tesoro Zero Coupon 0% 29/06/2021 9,759,643 30.49
Spain Government Bond 5.5% 30/04/2021 4,220,000 13.18
Cassa Depositi e Prestiti SpA 2.75% 31/05/2021 EMTN 2,568,750 8.03
Bank of America Corp 0.283% 07/02/2022 EMTN 2,501,769 7.82
Leeds Building Society 2.625% 01/04/2021 EMTN 1,026,250 3.21
Ireland Government Bond 1.5% 15/05/2050 400,574 1.25
1 Represents all aggregate purchases during the financial period. 2 Represents all aggregate sales during the financial period.

SIGNIFICANT PORTFOLIO CHANGES (expressed in EUR)
336
CHALLENGE PROVIDENT FUND 5
Purchase
Security Cost % of Total Purchases
Italy Certificati di Credito del Tesoro Zero Coupon 0% 28/09/2022 100,509,400 18.76
Italy Certificati di Credito del Tesoro Zero Coupon 0% 30/05/2022 60,286,200 11.25
Spain Government Bond 0.35% 30/07/2023 51,120,130 9.54
Italy Buoni Poliennali Del Tesoro 2.6% 15/09/2023 33,167,357 6.19
Italy Certificati di Credito del Tesoro/ CCTS-eu 1.323% 15/01/2025 31,789,170 5.93
Credit Suisse Group AG 0.462% 16/01/2026 EMTN 30,279,913 5.65
Italy Certificati di Credito del Tesoro/ CCTS-eu 0.427% 15/04/2025 20,347,902 3.80
Volkswagen International Finance NV 1.009% 16/11/2024 15,607,795 2.91
Italy Buoni Poliennali Del Tesoro 2.3% 15/10/2021 15,387,095 2.87
Italy Certificati di Credito del Tesoro/ CCTS-eu 0.029% 15/06/2022 15,082,713 2.81
Italy Certificati di Credito del Tesoro/ CCTS-eu 0.029% 15/12/2023 15,062,025 2.81
Banco Santander SA 0.145% 29/01/2026 EMTN 15,007,683 2.80
Versito International SA 0.5% 30/03/2023 EMTN 15,000,000 2.80
Italy Certificati di Credito del Tesoro/ CCTS-eu 0.229% 15/02/2024 13,158,633 2.46
Italy Certificati di Credito del Tesoro/ CCTS-eu 0.577% 15/10/2024 10,252,206 1.91
Goldman Sachs Group Inc 0.457% 19/03/2026 EMTN 10,181,301 1.90
Barclays Plc 0.467% 12/05/2026 10,160,312 1.90
Nykredit Realkredit AS 0.462% 25/03/2024 EMTN 10,139,444 1.89
FCA Bank SpA 0.207% 10/06/2023 EMTN 10,055,057 1.88
Italy Certificati di Credito del Tesoro Zero Coupon 0% 29/11/2021 10,033,700 1.87
Mediobanca Banca di Credito Finanziario SpA 5.75% 18/04/2023 9,346,220 1.74
Sales1
Security Proceeds % of Total Sales
Italy Certificati di Credito del Tesoro Zero Coupon 0% 29/11/2021 92,261,090 37.99
Italy Certificati di Credito del Tesoro Zero Coupon 0% 29/06/2021 35,038,100 14.43
Bank of America Corp 0.283% 07/02/2022 EMTN 30,921,862 12.73
Italy Buoni Poliennali Del Tesoro 2.3% 15/10/2021 30,421,284 12.53
Italy Buoni Poliennali Del Tesoro 3.75% 01/05/2021 20,385,470 8.39
Barclays Bank Plc 6% 14/01/2021 EMTN 11,660,000 4.80
Cassa Depositi e Prestiti SpA 2.75% 31/05/2021 EMTN 7,706,250 3.17
Deutsche Bank AG 1.625% 12/02/2021 EMTN 4,268,250 1.76
Leeds Building Society 2.625% 01/04/2021 EMTN 4,105,000 1.69
Banco BPM SpA 0% 29/01/2021 3,000,000 1.24
Morgan Stanley 0.188% 27/01/2022 2,701,297 1.11
Intesa Sanpaolo SpA 2% 18/06/2021 EMTN 204,000 0.08
Citigroup Inc 0.287% 24/05/2021 EMTN 200,142 0.08
1 Represents all aggregate sales during the financial period.

CONTACTS
IRELAND ITALY
Mediolanum International Funds Limited Exclusive Distributor Address: The Exchange, 4th Floor, George’s Dock Banca Mediolanum S.p.A.
IFSC, Dublin 1, Ireland, D01 P2V6 Address: Pallazo Meucci, Via Francesco Sforza
Telephone: +353 1 2310 800 20080 Basiglio, Milano 3 (MI)
Fax: +353 1 2310 805 Telephone: +39 02 9049 1
E-Mail: [email protected]
Site: www.mifl.ie
SPAIN
Exclusive Distributor Banco Mediolanum S.A
Address: Av. Diagonal 668-670
08034 Barcelona, Spain
E-Mail: [email protected]
Site: www.bancamediolanum.it
Site: www.mediolanuminternationalfunds.it
Telephone: +34 934 453 250
Fax: +34 932 535 526
E-Mail: [email protected]
Site: www.bancomediolanum.es