
PROJECT ON mutual funds
151
INTODUCTION TO FINANCIAL MARKET: In economics, a financial market is a mechanism that allows people and entities to buy and sell (trade) financial securities (such as stocks and bonds),commodities (such as precious metals or agricultural goods), and other fungible items of value at low transaction costs and at prices that reflect supply and demand. Both general markets (where many commodities are traded) and specialized markets (where only one commodity is traded) exist. Markets work by placing many interested buyers and sellers in one "place", thus making it easier for them to find each other. An economy which relies primarily on interactions between buyers and sellers to allocate resources is known as a market economy in contrast either to a command economy or to a non-market economy such as a gift economy. In finance, financial markets facilitate: The raising of capital (in the capital markets) The transfer of risk (in the derivatives markets) The transfer of liquidity (in the money markets) International trade (in the currency markets) 1
Transcript of PROJECT ON mutual funds

INTODUCTION TO FINANCIAL MARKET:
In economics, a financial market is a mechanism that allows
people and entities to buy and sell (trade)
financial securities (such as stocks and
bonds),commodities (such as precious metals or agricultural
goods), and other fungible items of value at low transaction
costs and at prices that reflect supply and demand.
Both general markets (where many commodities are traded) and
specialized markets (where only one commodity is traded)
exist. Markets work by placing many interested buyers and
sellers in one "place", thus making it easier for them to find
each other. An economy which relies primarily on interactions
between buyers and sellers to allocate resources is known as
a market economy in contrast either to a command economy or to
a non-market economy such as a gift economy.
In finance, financial markets facilitate:
The raising of capital (in the capital markets)
The transfer of risk (in the derivatives markets)
The transfer of liquidity (in the money markets)
International trade (in the currency markets)
1
– and are used to match those who want capital to those
who have it.
Typically a borrower issues a receipt to the lender promising
to pay back the capital. These receipts are securities which
may be freely bought or sold. In return for lending money to
the borrower, the lender will expect some compensation in the
form of interest or dividends.
In mathematical finance, the concept continuous-time Brownian
motion stochastic process is sometimes used as a model.
Definition
In economics, typically, the term market means the aggregate
of possible buyers and sellers of a certain good or service
and the transactions between them.
The term "market" is sometimes used for what are more
strictly exchanges, organizations that facilitate the trade in
financial securities, e.g., a stock exchange orcommodity
exchange. This may be a physical location (like the NYSE) or
an electronic system (like NASDAQ). Much trading of stocks
takes place on an exchange; still,corporate actions (merger,
2
spinoff) are outside an exchange, while any two companies or
people, for whatever reason, may agree to sell stock from the
one to the other without using an exchange.
Trading of currencies and bonds is largely on a bilateral
basis, although some bonds trade on a stock exchange, and
people are building electronic systems for these as well,
similar to stock exchanges.
Financial markets can be domestic or they can be
international.
Types of financial markets
The financial markets can be divided into different subtypes:
Capital markets which consist of:
Stock markets, which provide financing through the
issuance of shares or common stock, and enable the
subsequent trading thereof.
Bond markets, which provide financing through the
issuance of bonds, and enable the subsequent trading
thereof.
3

Commodity markets, which facilitate the trading of
commodities.
Money markets, which provide short term debt financing and
investment.
Derivatives markets, which provide instruments for the
management of financial risk.
Futures markets, which provide standardized forward
contracts for trading products at some future date; see
also forward market.
Insurance markets, which facilitate the redistribution of
various risks.
Foreign exchange markets, which facilitate the trading
of foreign exchange.
The capital markets consist of primary markets and secondary
markets. Newly formed (issued) securities are bought or sold
in primary markets. Secondary markets allow investors to sell
securities that they hold or buy existing securities. The
transaction in primary market exist between investors and
public while secondary market its between investors.
[edit]Raising the capital
4

To understand financial markets, let us look at what they are
used for, i.e. what where firms make the capital to invest
Without financial markets, borrowers would have difficulty
finding lenders themselves. Intermediaries such as banks help
in this process. Banks take deposits from those who
have money to save. They can then lend money from this pool of
deposited money to those who seek to borrow. Banks popularly
lend money in the form of loans andmortgages.
More complex transactions than a simple bank deposit require
markets where lenders and their agents can meet borrowers and
their agents, and where existing borrowing or lending
commitments can be sold on to other parties. A good example of
a financial market is a stock exchange. A company can raise
money by selling shares to investors and its existing shares
can be bought or sold.
The following table illustrates where financial markets fit in
the relationship between lenders and borrowers:
Relationship between lenders and borrowers
Lenders Financial Financial Borrowers
5

Intermediaries Markets
Individua
ls
Companies
Banks
Insurance Companies
Pension Funds
Mutual Funds
Interbank
Stock Exchange
Money Market
Bond Market
Foreign
Exchange
Individuals
Companies
Central
Government
Municipalities
Public
Corporations
Lenders
Who have enough money to lend or to give someone money from
own pocket at the condition of getting back the principal
amount or with some interest or charge, is the Lender.
Individuals & Doubles
Many individuals are not aware that they are lenders, but
almost everybody does lend money in many ways. A person lends
money when he or she:
puts money in a savings account at a bank;
contributes to a pension plan;
pays premiums to an insurance company;
6

invests in government bonds; or
invests in company share
Companies
Companies tend to be borrowers of capital. When companies have
surplus cash that is not needed for a short period of time,
they may seek to make money from their cash surplus by lending
it via short term markets called money markets.
There are a few companies that have very strong cash flows.
These companies tend to be lenders rather than borrowers. Such
companies may decide to return cash to lenders (e.g. via
a share buyback.) Alternatively, they may seek to make more
money on their cash by lending it (e.g. investing in bonds and
stocks.)
[edit]Borrowers
Individuals borrow money via bankers' loans for short term
needs or longer term mortgages to help finance a house
purchase.
7

Companies borrow money to aid short term or long term cash
flows. They also borrow to fund modernisation or future
business expansion.
Governments often find their spending requirements exceed
their tax revenues. To make up this difference, they need to
borrow. Governments also borrow on behalf of nationalised
industries, municipalities, local authorities and other public
sector bodies. In the UK, the total borrowing requirement is
often referred to as the Public sector net cash
requirement (PSNCR).
Governments borrow by issuing bonds. In the UK, the government
also borrows from individuals by offering bank accounts
and Premium Bonds. Government debt seems to be permanent.
Indeed the debt seemingly expands rather than being paid off.
One strategy used by governments to reduce the value of the
debt is to influence inflation.
Municipalities and local authorities may borrow in their own
name as well as receiving funding from national governments.
In the UK, this would cover an authority like Hampshire County
Council.
8
Public Corporations typically include nationalised industries.
These may include the postal services, railway companies and
utility companies.
Many borrowers have difficulty raising money locally. They
need to borrow internationally with the aid of Foreign
exchange markets.
Borrowers having similar needs can form into a group of
borrowers. They can also take an organizational form like
Mutual Funds. They can provide mortgage on weight basis. The
main advantage is that this lowers the cost of their
borrowings.
Derivative products
During the 1980s and 1990s, a major growth sector in financial
markets is the trade in so called derivative products,
or derivatives for short.
In the financial markets, stock prices, bond prices, currency
rates, interest rates and dividends go up and down,
creating risk. Derivative products are financial products
which are used to control risk or paradoxically exploit risk.
It is also called financial economics.
9
Derivative products or instruments help the issuers to gain an
unusual profit from issuing the instruments. For using the
help of these products a contract has to be made. Derivative
contracts are mainly 3 types: 1. Future Contracts 2. Forward
Contracts 3. Option Contracts.
Currency markets
Main article: Foreign exchange market
Seemingly, the most obvious buyers and sellers of currency are
importers and exporters of goods. While this may have been
true in the distant past,[when?] when international trade created
the demand for currency markets, importers and exporters now
represent only 1/32 of foreign exchange dealing, according to
the Bank for International Settlements.[1]
The picture of foreign currency transactions today shows:
Banks/Institutions
Speculators
Government spending (for example, military bases abroad)
Importers/Exporters
Tourists
10
Analysis of financial markets
See Statistical analysis of financial
markets, statistical finance---
Much effort has gone into the study of financial markets and
how prices vary with time. Charles Dow, one of the founders
of Dow Jones & Company and The Wall Street Journal,
enunciated a set of ideas on the subject which are now
called Dow Theory. This is the basis of the so-
called technical analysis method of attempting to predict
future changes. One of the tenets of "technical analysis" is
that market trends give an indication of the future, at
least in the short term. The claims of the technical
analysts are disputed by many academics, who claim that the
evidence points rather to therandom walk hypothesis, which
states that the next change is not correlated to the last
change.
The scale of changes in price over some unit of time is
called the volatility. It was discovered by Benoît
Mandelbrot that changes in prices do not follow a Gaussian
distribution, but are rather modeled better by Lévy stable
11
distributions. The scale of change, or volatility, depends
on the length of the time unit to a power a bit more than
1/2. Large changes up or down are more likely than what one
would calculate using a Gaussian distribution with an
estimated standard deviation.
A new area of concern is the proper analysis of
international market effects. As connected as today's global
financial markets are, it is important to realize that there
are both benefits and consequences to a global financial
network. As new opportunities appear due to integration, so
do the possibilities of contagion. This presents unique
issues when attempting to analyze markets, as a problem can
ripple through the entire connected global network very
quickly. For example, a bank failure in one country can
spread quickly to others, which makes proper analysis more
difficult.
Financial market slang
Poison pill, when a company issues more shares to prevent
being bought out by another company, thereby increasing
12

the number of outstanding shares to be bought by the
hostile company making the bid to establish majority.
Quant, a quantitative analyst with a PhD (and above)
level of training in mathematics and statistical methods.
Rocket scientist, a financial consultant at the zenith of
mathematical and computer programming skill. They are
able to invent derivatives of high complexity and
construct sophisticated pricing models. They generally
handle the most advanced computing techniques adopted by
the financial markets since the early 1980s. Typically,
they are physicists and engineers by training; rocket
scientists do not necessarily build rockets for a living.
White Knight, a friendly party in a takeover bid. Used to
describe a party that buys the shares of one organization
to help prevent against a hostile takeover of that
organization by another party.
History
13

Established in 1875, the Bombay Stock Exchange is Asia's first
stock exchange.
In 12th century France the courratiers de change were
concerned with managing and regulating the debts of
agricultural communities on behalf of the banks. Because these
men also traded with debts, they could be called the
first brokers. A common misbelief is that in late 13th
century Bruges commodity traders gathered inside the house of
a man called Van der Beurze, and in 1309 they became the
"Brugse Beurse", institutionalizing what had been, until then,
an informal meeting, but actually, the family Van der Beurze
had a building in Antwerp where those gatherings occurred; the
Van der Beurze had Antwerp, as most of the merchants of that
period, as their primary place for trading. The idea quickly14

spread around Flanders and neighbouring counties and "Beurzen"
soon opened in Ghent and Amsterdam.
In the middle of the 13th century, Venetian bankers began to
trade in government securities. In 1351 the Venetian
government outlawed spreading rumours intended to lower the
price of government funds. Bankers
in Pisa, Verona, Genoa and Florence also began trading in
government securities during the 14th century. This was only
possible because these were independent city states not ruled
by a duke but a council of influential citizens. The Dutch
later started joint stock companies, which
let shareholders invest in business ventures and get a share
of their profits – or losses. In 1602, the Dutch East India
Company issued the first share on the Amsterdam Stock
Exchange. It was the first company to issue stocks and bonds.
The Amsterdam Stock Exchange (or Amsterdam Beurs) is also said
to have been the first stock exchange to introduce continuous
trade in the early 17th century. The Dutch "pioneered short
selling, option trading, debt-equity swaps, merchant banking,
unit trusts and other speculative instruments, much as we know
them". There are now stock markets in virtually every
15
developed and most developing economies, with the world's
biggest market being in the United States, United Kingdom,
Japan, India, China, Canada, Germany's (Frankfurt Stock
Exchange), France, South Korea and the Netherlands.
Importance of stock market
Function and purpose
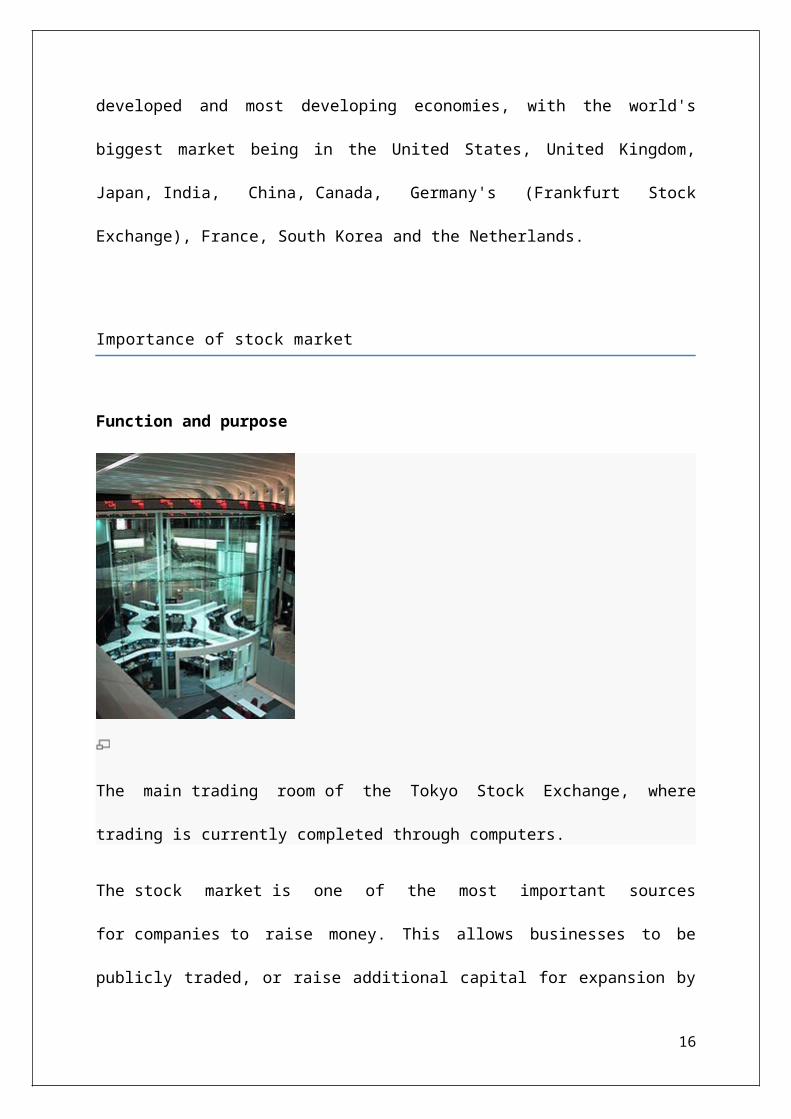
The main trading room of the Tokyo Stock Exchange, where
trading is currently completed through computers.
The stock market is one of the most important sources
for companies to raise money. This allows businesses to be
publicly traded, or raise additional capital for expansion by
16
selling shares of ownership of the company in a public market.
The liquidity that an exchange provides affords investors the
ability to quickly and easily sell securities. This is an
attractive feature of investing in stocks, compared to other
less liquid investments such as real estate.
History has shown that the price of shares and other assets is
an important part of the dynamics of economic activity, and
can influence or be an indicator of social mood. An economy
where the stock market is on the rise is considered to be an
up-and-coming economy. In fact, the stock market is often
considered the primary indicator of a country's economic
strength and development.
Rising share prices, for instance, tend to be associated with
increased business investment and vice versa. Share prices
also affect the wealth of households and their consumption.
Therefore, central banks tend to keep an eye on the control
and behaviour of the stock market and, in general, on the
smooth operation of financial system functions. Financial
stability is the raison d'être of central banks.
Exchanges also act as the clearinghouse for each transaction,
meaning that they collect and deliver the shares, and
17

guarantee payment to the seller of a security. This eliminates
the risk to an individual buyer or seller that
the counterparty could default on the transaction.
The smooth functioning of all these activities
facilitates economic growth in that lower costs and enterprise
risks promote the production of goods and services as well as
employment. In this way the financial system contributes to
increased prosperity.
Relation of the stock market to the modern financial system
The financial system in most western countries has undergone a
remarkable transformation. One feature of this development
is disintermediation. A portion of the funds involved in
saving and financing, flows directly to the financial markets
instead of being routed via the traditional bank lending and
deposit operations. The general public's heightened interest
in investing in the stock market, either directly or
through mutual funds, has been an important component of this
process.
Statistics show that in recent decades shares have made up an
increasingly large proportion of households' financial assets
18
in many countries. In the 1970s, in Sweden, deposit
accounts and other very liquid assets with little risk made up
almost 60 percent of households' financial wealth, compared to
less than 20 percent in the 2000s. The major part of this
adjustment in financial portfolios has gone directly to shares
but a good deal now takes the form of various kinds of
institutional investment for groups of individuals, e.g.,
pension funds, mutual funds, hedge funds, insurance investment
of premiums, etc.
The trend towards forms of saving with a higher risk has been
accentuated by new rules for most funds and insurance,
permitting a higher proportion of shares to bonds. Similar
tendencies are to be found in other industrialized countries.
In all developed economic systems, such as the European Union,
the United States, Japan and other developed nations, the
trend has been the same: saving has moved away from
traditional (government insured) bank deposits to more risky
securities of one sort or another
19
The behaviour of the stock market
From experience we know that investors may 'temporarily' move
financial prices away from their long term aggregate price
'trends'. (Positive or up trends are referred to as bull
markets; negative or down trends are referred to as bear
markets.) Over-reactions may occur—so that excessive optimism
(euphoria) may drive prices unduly high or excessive pessimism
may drive prices unduly low. Economists continue to debate
whether financial markets are 'generally' efficient.
According to one interpretation of the efficient-market
hypothesis (EMH), only changes in fundamental factors, such as
the outlook for margins, profits or dividends, ought to affect
share prices beyond the short term, where random 'noise' in
the system may prevail. (But this largely theoretic academic
viewpoint—known as 'hard' EMH—also predicts that little or no
trading should take place, contrary to fact, since prices are
already at or near equilibrium, having priced in all public
knowledge.) The 'hard' efficient-market hypothesis is sorely
tested by such events as the stock market crash in 1987, when
the Dow Jones index plummeted 22.6 percent—the largest-ever
one-day fall in the United States.
20

This event demonstrated that share prices can fall
dramatically even though, to this day, it is impossible to fix
a generally agreed upon definite cause: a thorough search
failed to detect any 'reasonable' development that might have
accounted for the crash. (But note that such events are
predicted to occur strictly by chance, although very rarely.)
It seems also to be the case more generally that many price
movements (beyond that which are predicted to occur
'randomly') are not occasioned by new information; a study of
the fifty largest one-day share price movements in the United
States in the post-war period seems to confirm this.
However, a 'soft' EMH has emerged which does not require that
prices remain at or near equilibrium, but only that market
participants not be able to systematically profit from any
momentary market 'inefficiencies'. Moreover, while EMH
predicts that all price movement (in the absence of change in
fundamental information) is random (i.e., non-trending), many
studies have shown a marked tendency for the stock market to
trend over time periods of weeks or longer. Various
explanations for such large and apparently non-random price
movements have been promulgated. For instance, some research
21

has shown that changes in estimated risk, and the use of
certain strategies, such as stop-loss limits and Value at
Risk limits, theoretically could cause financial markets to
overreact. But the best explanation seems to be that the
distribution of stock market prices is non-Gaussian (in which
case EMH, in any of its current forms, would not be strictly
applicable).
Other research has shown that psychological factors may result
in exaggerated (statistically anomalous) stock price movements
(contrary to EMH which assumes such behaviors 'cancel out').
Psychological research has demonstrated that people are
predisposed to 'seeing' patterns, and often will perceive a
pattern in what is, in fact, just noise. (Something like
seeing familiar shapes in clouds or ink blots.) In the present
context this means that a succession of good news items about
a company may lead investors to overreact positively
(unjustifiably driving the price up). A period of good returns
also boosts the investor's self-confidence, reducing his
(psychological) risk threshold.
Another phenomenon—also from psychology—that works against
an objective assessment is group thinking. As social animals,
22
it is not easy to stick to an opinion that differs markedly
from that of a majority of the group. An example with which
one may be familiar is the reluctance to enter a restaurant
that is empty; people generally prefer to have their opinion
validated by those of others in the group.
In one paper the authors draw an analogy with gambling. In
normal times the market behaves like a game of roulette; the
probabilities are known and largely independent of the
investment decisions of the different players. In times of
market stress, however, the game becomes more like poker
(herding behavior takes over). The players now must give heavy
weight to the psychology of other investors and how they are
likely to react psychologically.
The stock market, as with any other business, is quite
unforgiving of amateurs. Inexperienced investors rarely get
the assistance and support they need. In the period running up
to the 1987 crash, less than 1 percent of the analyst's
recommendations had been to sell (and even during the 2000–
2002 bear market, the average did not rise above 5 %%). In the
run up to 2000, the media amplified the general euphoria, with
reports of rapidly rising share prices and the notion that
23

large sums of money could be quickly earned in the so-
called new economy stock market. (And later amplified the
gloom which descended during the 2000–2002 bear market, so
that by summer of 2002, predictions of a DOW average below
5000 were quite common.)
Irrational behaviour
Sometimes the market seems to react irrationally to economic
or financial news, even if that news is likely to have no real
effect on the fundamental value of securities itself. But this
may be more apparent than real, since often such news has been
anticipated, and a counter reaction may occur if the news is
better (or worse) than expected. Therefore, the stock market
may be swayed in either direction by press releases,
rumours, euphoria and mass panic; but generally only briefly,
as more experienced investors (especially the hedge funds)
quickly rally to take advantage of even the slightest,
momentary hysteria.
Over the short-term, stocks and other securities can be
battered or buoyed by any number of fast market-changing
24
events, making the stock market behaviour difficult to
predict. Emotions can drive prices up and down, people are
generally not as rational as they think, and the reasons for
buying and selling are generally obscure. Behaviourists argue
that investors often behave 'irrationally' when making
investment decisions thereby incorrectly pricing securities,
which causes market inefficiencies, which, in turn, are
opportunities to make money.]However, the whole notion of EMH
is that these non-rational reactions to information cancel
out, leaving the prices of stocks rationally determined.
The Dow Jones Industrial Average biggest gain in one day was
936.42 points or 11 percent, this occurred on October 13,
2008.
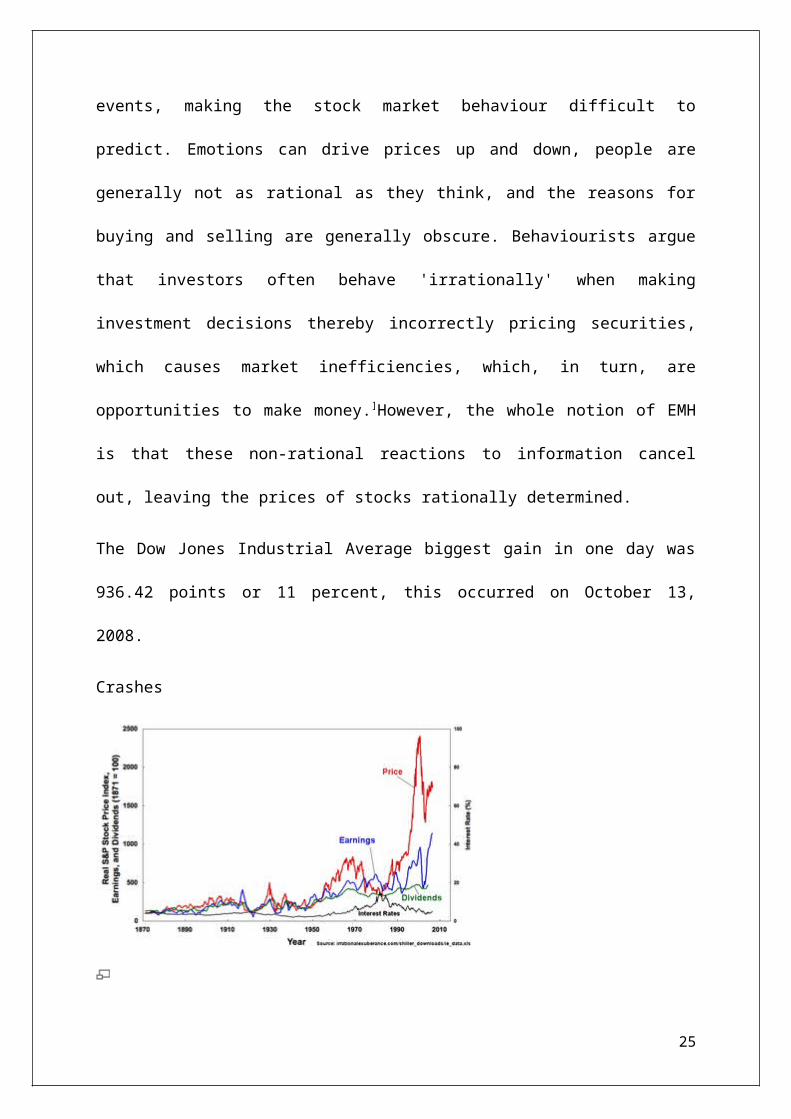
Crashes
25
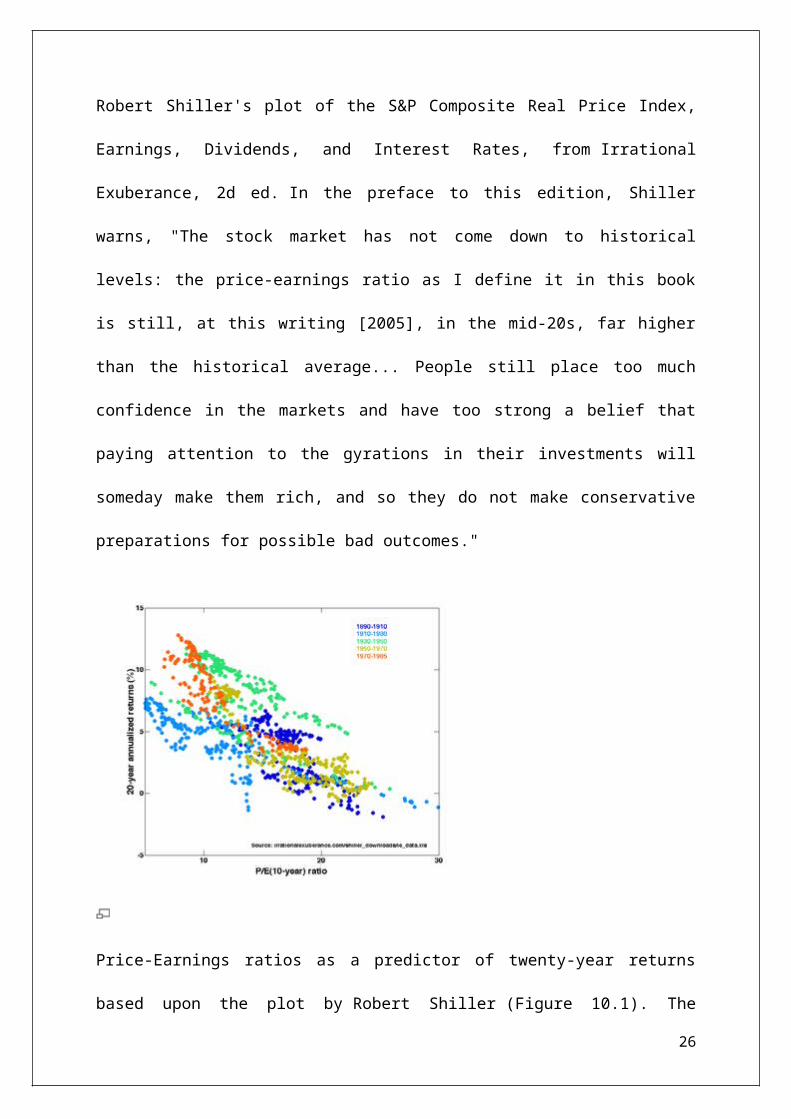
Robert Shiller's plot of the S&P Composite Real Price Index,
Earnings, Dividends, and Interest Rates, from Irrational
Exuberance, 2d ed. In the preface to this edition, Shiller
warns, "The stock market has not come down to historical
levels: the price-earnings ratio as I define it in this book
is still, at this writing [2005], in the mid-20s, far higher
than the historical average... People still place too much
confidence in the markets and have too strong a belief that
paying attention to the gyrations in their investments will
someday make them rich, and so they do not make conservative
preparations for possible bad outcomes."
Price-Earnings ratios as a predictor of twenty-year returns
based upon the plot by Robert Shiller (Figure 10.1). The
26
horizontal axis shows the real price-earnings ratio of the S&P
Composite Stock Price Index as computed in Irrational
Exuberance (inflation adjusted price divided by the prior ten-
year mean of inflation-adjusted earnings). The vertical axis
shows the geometric average real annual return on investing in
the S&P Composite Stock Price Index, reinvesting dividends,
and selling twenty years later. Data from different twenty
year periods is color-coded as shown in the key. See also ten-
year returns. Shiller states that this plot "confirms that
long-term investors—investors who commit their money to an
investment for ten full years—did do well when prices were low
relative to earnings at the beginning of the ten years. Long-
term investors would be well advised, individually, to lower
their exposure to the stock market when it is high, as it has
been recently, and get into the market when it is low."
Stock market index
The movements of the prices in a market or section of a market
are captured in price indices called stock market indices, of
which there are many, e.g., the S&P, the FTSE and
the Euronext indices. Such indices are usually market
27
capitalization weighted, with the weights reflecting the
contribution of the stock to the index. The constituents of
the index are reviewed frequently to include/exclude stocks in
order to reflect the changing business environment.
Derivative instruments
Financial innovation has brought many new financial
instruments whose pay-offs or values depend on the prices of
stocks. Some examples are exchange-traded funds (ETFs), stock
index and stock options, equity swaps, single-stock futures,
and stock index futures. These last two may be traded
on futures exchanges (which are distinct from stock exchanges—
their history traces back to commodities futures exchanges),
or traded over-the-counter. As all of these products are
only derived from stocks, they are sometimes considered to be
traded in a (hypothetical) derivatives market, rather than the
(hypothetical) stock market.
Leveraged strategies
Stock that a trader does not actually own may be traded
using short selling; margin buying may be used to purchase
stock with borrowed funds; or, derivatives may be used to
28
control large blocks of stocks for a much smaller amount of
money than would be required by outright purchase or sale.
Short selling
In short selling, the trader borrows stock (usually from his
brokerage which holds its clients' shares or its own shares on
account to lend to short sellers) then sells it on the market,
hoping for the price to fall. The trader eventually buys back
the stock, making money if the price fell in the meantime and
losing money if it rose. Exiting a short position by buying
back the stock is called "covering a short position." This
strategy may also be used by unscrupulous traders in illiquid
or thinly traded markets to artificially lower the price of a
stock. Hence most markets either prevent short selling or
place restrictions on when and how a short sale can occur. The
practice of naked shorting is illegal in most (but not all)
stock markets.
Margin buying
In margin buying, the trader borrows money (at interest) to
buy a stock and hopes for it to rise. Most industrialized
countries have regulations that require that if the borrowing
29

is based on collateral from other stocks the trader owns
outright, it can be a maximum of a certain percentage of those
other stocks' value. In the United States, the margin
requirements have been 50 %% for many years (that is, if you
want to make a $1000 investment, you need to put up $500, and
there is often a maintenance margin below the $500).
A margin call is made if the total value of the investor's
account cannot support the loss of the trade. (Upon a decline
in the value of the margined securities additional funds may
be required to maintain the account's equity, and with or
without notice the margined security or any others within the
account may be sold by the brokerage to protect its loan
position. The investor is responsible for any shortfall
following such forced sales.)
Regulation of margin requirements (by the Federal Reserve) was
implemented after the Crash of 1929. Before that, speculators
typically only needed to put up as little as 10 percent (or
even less) of the total investment represented by the stocks
purchased. Other rules may include the prohibition of free-
riding: putting in an order to buy stocks without paying
initially (there is normally a three-day grace period for
30
delivery of the stock), but then selling them (before the
three-days are up) and using part of the proceeds to make the
original payment (assuming that the value of the stocks has
not declined in the interim).
New issuance
Global issuance of equity and equity-related instruments
totaled $505 billion in 2004, a 29.8 %% increase over the
$389 billion raised in 2003. Initial public offerings (IPOs)
by US issuers increased 221 %% with 233 offerings that raised
$45 billion, and IPOs in Europe, Middle East and Africa (EMEA)
increased by 333 %%, from $ 9 billion to $39 billion.
Investment strategies
One of the many things people always want to know about the
stock market is, "How do I make money investing?" There are
many different approaches; two basic methods are classified as
either fundamental analysis or technical analysis. Fundamental
analysis refers to analyzing companies by their financial
statements found in SEC Filings, business trends, general
31

economic conditions, etc. Technical analysis studies price
actions in markets through the use of charts and quantitative
techniques to attempt to forecast price trends regardless of
the company's financial prospects. One example of a technical
strategy is the Trend following method, used by John W.
Henry and Ed Seykota, which uses price patterns, utilizes
strict money management and is also rooted in risk
control and diversification.
Additionally, many choose to invest via the index method. In
this method, one holds a weighted or unweighted portfolio
consisting of the entire stock market or some segment of the
stock market (such as the S&P 500 or Wilshire 5000). The
principal aim of this strategy is to maximize diversification,
minimize taxes from too frequent trading, and ride the general
trend of the stock market (which, in the U.S., has averaged
nearly 10 %%/year, compounded annually, since World War II).
Taxation
According to much national or state legislation, a large array
of fiscal obligations are taxed for capital gains. Taxes are
charged by the state over the transactions, dividends
32
and capital gains on the stock market, in particular in
the stock exchanges. However, these fiscal obligations may
vary from jurisdictions to jurisdictions because, among other
reasons, it could be assumed that taxation is already
incorporated into the stock price through the different taxes
companies pay to the state, or that tax free stock market
operations are useful to boost economic growth
INTRODUCTION TO MUTUAL FUNDS:
A mutual fund is a professionally managed type of collective
investment scheme that pools money from many investors to
buy stocks, bonds, short-term money market instruments, and/or
other securities.
Overview
In the United States, a mutual fund is registered with
the Securities and Exchange Commission (SEC) and is overseen
by a board of directors (if organized as a corporation)
or board of trustees (if organized as a trust). The board is
charged with ensuring that the fund is managed in the best
33

interests of the fund's investors and with hiring the fund
manager and other service providers to the fund. The fund
manager, also known as the fund sponsor or fund management
company, trades (buys and sells) the fund's investments in
accordance with the fund's investment objective. A fund
manager must be a registered investment advisor. Funds that
are managed by the same fund manager and that have the same
brand name are known as a "fund family" or "fund complex".
The Investment Company Act of 1940 (the 1940 Act) established
three types of registered investment companies or RICs in the
United States: open-end funds, unit investment trusts (UITs);
and closed-end funds. Recently, exchange-traded funds (ETFs),
which are open-end funds or unit investment trusts that trade
on an exchange, have gained in popularity. While the term
"mutual fund" may refer to all three types of registered
investment companies, it is more commonly used to refer
exclusively to the open-end type.
Hedge funds are not considered a type of mutual fund. While
they are another type of commingled investment scheme, they
are not governed by the Investment Company Act of 1940 and are
not required to register with the Securities and Exchange
34

Commission (though many hedge fund managers now must register
as investment advisors).
Mutual funds are not taxed on their income as long as they
comply with certain requirements established in the Internal
Revenue Code. Specifically, they must diversify their
investments, limit ownership of voting securities, distribute
most of their income to their investors annually, and earn
most of the income by investing in securities and currencies.
[2] Mutual funds pass taxable income on to their investors. The
type of income they earn is unchanged as it passes through to
the shareholders. For example, mutual fund distributions of
dividend income are reported as dividend income by the
investor. There is an exception: net losses incurred by a
mutual fund are not distributed or passed through to fund
investors.
Outside of the United States, mutual fund is used as a generic
term for various types of collective investment vehicles
available to the general public, such as unit trusts, open-
ended investment companies, unitized insurance
funds, Undertakings for Collective Investment in Transferable
Securities, and SICAVs.
35
Advantages of mutual funds
Mutual funds have advantages compared to direct investing in
individual securities. These include:
Increased diversification
Daily liquidity
Professional investment management
Ability to participate in investments that may be available
only to larger investors
Service and convenience
Government oversight
Ease of comparison
Disadvantages of mutual funds
Mutual funds have disadvantages as well, which include]:
Fees
Less control over timing of recognition of gains
Less predictable income
No opportunity to customize
36
History
The first mutual funds were established in Europe. One
researcher credits a Dutch merchant with creating the first
mutual fund in 1774. The first mutual fund outside the
Netherlands was the Foreign & Colonial Government Trust, which
was established in London in 1868. It is now the Foreign &
Colonial Investment Trust and trades on the London stock
exchange.
Mutual funds were introduced into the United States in the
1890s. They became popular during the 1920s. These early funds
were generally of the closed-end type with a fixed number of
shares which often traded at prices above the value of the
portfolio.
The first open-end mutual fund with redeemable shares was
established on March 21, 1924. This fund, the Massachusetts
Investors Trust, is now part of the MFS family of funds.
However, closed-end funds remained more popular than open-end
funds throughout the 1920s. By 1929, open-end funds accounted
for only 5% of the industry's $27 billion in total assets.
37
After the stock market crash of 1929, Congress passed a series
of acts regulating the securities markets in general and
mutual funds in particular. The Securities Act of
1933 requires that all investments sold to the public,
including mutual funds, be registered with the Securities and
Exchange Commission and that they provide prospective
investors with a prospectus that discloses essential facts
about the investment. The Securities and Exchange Act of
1934 requires that issuers of securities, including mutual
funds, report regularly to their investors; this act also
created the Securities and Exchange Commission, which is the
principal regulator of mutual funds. The Revenue Act of
1936 established guidelines for the taxation of mutual funds,
while the Investment Company Act of 1940 governs their
structure.
When confidence in the stock market returned in the 1950s, the
mutual fund industry began to grow again. By 1970, there were
approximately 360 funds with $48 billion in assets. The
introduction of money market funds in the high interest rate
environment of the late 1970s boosted industry growth
dramatically. The first retail index fund, First Index
38

Investment Trust, was formed in 1976 by The Vanguard Group,
headed by John Bogle; it is now called the Vanguard 500 Index
Fund and is one of the world's largest mutual funds, with more
than $100 billion in assets as of January 31, 2011.
Fund industry growth continued into the 1980s and 1990s, as a
result of three factors: a bull market for both stocks and
bonds, new product introductions (including tax-exempt bond,
sector, international and target date funds) and wider
distribution of fund shares. Among the new distribution
channels were retirement plans. Mutual funds are now the
preferred investment option in certain types of fast-growing
retirement plans, specifically in 401(k) and other defined
contribution plans and in individual retirement
accounts (IRAs), all of which surged in popularity in the
1980s. Total mutual fund assets fell in 2008 as a result of
the credit crisis of 2008.
In 2003, the mutual fund industry was involved in
a scandal involving unequal treatment of fund shareholders.
Some fund management companies allowed favored investors to
engage in late trading, which is illegal, or market timing,
which is a practice prohibited by fund policy. The scandal was
39
initially discovered by then-New York State Attorney
General Eliot Spitzer and resulted in significantly increased
regulation of the industry.
At the end of 2010, there were 7,581 mutual funds in the
United States with combined assets of $11.8 trillion,
according to the Investment Company Institute (ICI), a
national trade association of investment companies in the
United States. The ICI reports that worldwide mutual fund
assets were $24.7 trillion on the same date.
Leading mutual fund complexes
At the end of 2010, the top 10 mutual fund complexes in the
United States were:
1.Vanguard
2.Fidelity
3.American Funds (Capital Group)
4.PIMCO
5.JPMorgan Chase
6.Franklin Templeton
7.BlackRock
8.Federated
40

9.T. Rowe Price
10. BNY Mellon
Types of mutual funds
There are three basic types of registered investment companies
defined in the Investment Company Act of 1940: open-end funds,
unit investment trusts, and closed-end funds. Exchange-traded
funds are open-end funds or unit investment trusts that trade
on an exchange.
Open-end funds
Open-end mutual funds must be willing to buy back their shares
from their investors at the end of every business day at the
net asset value computed that day. Most open-end funds also
sell shares to the public every business day; these shares are
also priced at net asset value. A professional investment
manager oversees the portfolio, buying and selling securities
as appropriate. The total investment in the fund will vary
based on share purchases, share redemptions and fluctuation in
market valuation. There is no legal limit on the number of
shares that can be issued.
Closed-end funds
41
Closed-end funds generally issue shares to the public only
once, when they are created through an initial public
offering. Their shares are then listed for trading on a stock
exchange. Investors who no longer wish to invest in the fund
cannot sell their shares back to the fund (as they can with an
open-end fund). Instead, they must sell their shares to
another investor in the market; the price they receive may be
significantly different from net asset value. It may be at a
"premium" to net asset value (meaning that it is higher than
net asset value) or, more commonly, at a "discount" to net
asset value (meaning that it is lower than net asset value). A
professional investment manager oversees the portfolio, buying
and selling securities as appropriate.
Unit investment trusts
Unit investment trusts or UITs issue shares to the public only
once, when they are created. Investors can redeem shares
directly with the fund (as with an open-end fund) or they may
also be able to sell their shares in the market. Unit
investment trusts do not have a professional investment
manager. Their portfolio of securities is established at the
42
creation of the UIT and does not change. UITs generally have a
limited life span, established at creation.
Exchange-traded funds
Main article: Exchange-traded fund
A relatively recent innovation, the exchange-traded fund or
ETF is often structured as an open-end investment company,
though ETFs may also be structured as unit investment trusts,
partnerships, investments trust, grantor trusts or bonds (as
an exchange-traded note). ETFs combine characteristics of both
closed-end funds and open-end funds. Like closed-end funds,
ETFs are traded throughout the day on a stock exchange at a
price determined by the market. However, as with open-end
funds, investors normally receive a price that is close to net
asset value. To keep the market price close to net asset
value, ETFs issue and redeem large blocks of their shares with
institutional investors.
Most ETFs are index funds.
Investments and classification
Mutual funds may invest in many kinds of securities. The types
of securities that a particular fund may invest in are set
43
forth in the fund's prospectus, which describes the fund's
investment objective, investment approach and permitted
investments. The investment objective describes the type of
income that the fund seeks. For example, a "capital
appreciation" fund generally looks to earn most of its returns
from increases in the prices of the securities it holds,
rather than from dividend or interest income. The investment
approach describes the criteria that the fund manager uses to
select investments for the fund.
A mutual fund's investment portfolio is continually monitored
by the fund's portfolio manager or managers, who are employed
by the fund's manager or sponsor.
Mutual funds are classified by their principal investments.
The four largest categories of funds are money market funds,
bond or fixed income funds, stock or equity funds and hybrid
funds. Within these categories, funds may be subclassified by
investment objective, investment approach or specific focus.
The SEC requires that mutual fund names not be inconsistent
with a fund's investments. For example, the "ABC New Jersey
Tax-Exempt Bond Fund" would generally have to invest, under
normal circumstances, at least 80% of its assets in bonds that
44
are exempt from federal income tax, from the alternative
minimum tax and from taxes in the state of New Jersey.
Bond, stock and hybrid funds may be classified as either index
(passively-managed) funds or actively-managed funds.
Money market funds
Money market funds invest in money market instruments, which
are fixed income securities with a very short time to maturity
and high credit quality. Investors often use money market
funds as a substitute for bank savings accounts, though money
market funds are not government insured, unlike bank savings
accounts.
Money market funds strive to maintain a $1.00 per share net
asset value, meaning that investors earn interest income from
the fund but do not experience capital gains or losses. If a
fund fails to maintain that $1.00 per share because its
securities have declined in value, it is said to "break the
buck". Only two money market funds have ever broken the buck:
Community Banker's U.S. Government Money Market Fund in 1994
and the Reserve Primary Fund in 2008.
45

At the end of 2010, money market funds accounted for 24% of
the assets in all U.S. mutual funds.
Bond funds
Bond funds invest in fixed income securities. Bond funds can
be subclassified according to the specific types of bonds
owned (such as high-yield or junk bonds, investment-grade
corporate bonds, government bonds or municipal bonds) or by
the maturity of the bonds held (short-, intermediate- or long-
term). Bond funds may invest in primarily U.S. securities
(domestic or U.S. funds), in both U.S. and foreign securities
(global or world funds), or primarily foreign securities
(international funds).
At the end of 2010, bond funds accounted for 22% of the assets
in all U.S. mutual funds.
Stock or equity funds
Stock or equity funds invest in common stocks. Stock funds may
invest in primarily U.S. securities (domestic or U.S. funds),
in both U.S. and foreign securities (global or world funds),
or primarily foreign securities (international funds). They
may focus on a specific industry or sector.
46

A stock fund may be subclassified along two dimensions: (1)
market capitalization and (2) investment style (i.e., growth
vs. blend/core vs. value). The two dimensions are often
displayed in a grid known as a "style box."
Market capitalization or market cap is the value of a
company's stock and equals the number of shares outstanding
times the market price of the stock. Market capitalizations
are divided into the following categories:
Micro cap
Small cap
Mid cap
Large cap
While the specific definitions of each category vary with
market conditions, large cap stocks generally have market
capitalizations of at least $10 billion, small cap stocks have
market capitalizations below $2 billion, and micro cap stocks
have market capitalizations below $300 million. Funds are also
classified in these categories based on the market caps of the
stocks that it holds.
47

Stock funds are also subclassified according to their
investment style: growth, value or blend (or core). Growth
funds seek to invest in stocks of fast-growing companies.
Value funds seek to invest in stocks that appear cheaply
priced. Blend funds are not biased toward either growth or
value.
At the end of 2010, stock funds accounted for 48% of the
assets in all U.S. mutual funds.
Hybrid funds
Hybrid funds invest in both bonds and stocks or in convertible
securities. Balanced funds, asset allocation funds, target
date or target risk funds and lifecycle or lifestyle funds are
all types of hybrid funds.
Hybrid funds may be structured as funds of funds, meaning that
they invest by buying shares in other mutual funds that invest
in securities. Most fund of funds invest in affiliated funds
(meaning mutual funds managed by the same fund sponsor),
although some invest in unaffiliated funds (meaning those
managed by other fund sponsors) or in a combination of the
two.
48
At the end of 2010, hybrid funds accounted for 6% of the
assets in all U.S. mutual funds.
Index (passively-managed) versus actively-managed
Main articles: Index fund and active management
An index fund or passively-managed fund seeks to match the
performance of a market index, such as the S&P 500 index,
while an actively managed fund seeks to outperform a relevant
index through superior security selection.
Mutual fund expenses
Investors in mutual funds pay fees. These fall into four
categories: distribution charges (sales loads and 12b-1 fees),
the management fee, other fund expenses, shareholder
transaction fees and securities transaction fees. Some of
these expenses reduce the value of an investor's account;
others are paid by the fund and reduce net asset value.
Recurring expenses are included in a fund's expense ratio.
Distribution charges
Main article: Mutual fund fees and expenses
Distribution charges pay for marketing and distribution of the
fund's shares to investors.
49
Front-end load or sales charge
A front-end load or sales charge is a commission paid to
a broker by a mutual fund when shares are purchased. It is
expressed as a percentage of the total amount invested
(including the front-end load), known as the "public offering
price." The front-end load often declines as the amount
invested increases, through breakpoints. Front-end loads are
deducted from an investor's account and reduce the amount
invested.
Back-end load
Some funds have a back-end load, which is paid by the investor
when shares are redeemed depending on how long they are held.
The back-end loads may decline the longer the investor holds
shares. Back-end loads with this structure are called
contingent deferred sales charges (or CDSCs). Like front-end
loads, back-end loads are deducted from an investor's account.
12b-1 fees
A mutual fund may charge an annual fee, known as a 12b-1 fee,
for marketing and distribution services. This fee is computed
as a percentage of a fund's assets, subject to a maximum of 1%
of assets. The 12b-1 fee is included in the expense ratio.50
No-load funds
A no-load fund does not charge a front-end load under any
circumstances, does not charge a back-end load under any
circumstances and does not charge a 12b-1 fee greater than
0.25% of fund assets.
Share classes
A single mutual fund may give investors a choice of different
combinations of front-end loads, back-end loads and 12b-1
fees, by offering several different types of shares, known
as share classes. All of the shares classes invest in the same
portfolio of securities, but each has different expenses and,
therefore, a different net asset value and different
performance results. Some of these share classes may be
available only to certain types of investors.
Typical share classes for funds sold through brokers or other
intermediaries are:
Class A shares usually charge a front-end sales load
together with a small 12b-1 fee.
Class B shares don't have a front-end sales load. Instead
they, have a high contingent deferred sales charge, or CDSC
51
that declines gradually over several years, combined with a
high 12b-1 fee. Class B shares usually convert automatically
to Class A shares after they have been held for a certain
period.
Class C shares have a high 12b-1 fee and a modest contingent
deferred sales charge that is discontinued after one or two
years. Class C shares usually do not convert to another
class. They are often called "level load" shares.
Class I are subject to very high minimum investment
requirements and are, therefore, known as "institutional"
shares. They are no-load shares.
Class R are for use in retirement plans such as 401(k)
plans. They do not charge loads, but do charge a small 12b-1
fee.
No-load funds often have two classes of shares:
Class I shares do not charge a 12b-1 fee.
Class N shares charge a 12b-1 fee of no more than 0.25% of
fund assets.
Neither class of shares charges a front-end or back-end load.
Management fee
52
The management fee is paid to the fund manager or sponsor who
organizes the fund, provides the portfolio management or
investment advisory services and normally lends its brand name
to the fund. The fund manager may also provide other
administrative services. The management fee often has
breakpoints, which means that it declines as assets (in either
the specific fund or in the fund family as a whole) increase.
The management fee is paid by the fund and is included in the
expense ratio.
Other fund expenses
A mutual fund pays for other services including:
Board of directors' (or board of trustees') fees and
expenses
Custody fee: paid to a bank for holding the fund's portfolio
in safekeeping
Fund accounting fee: for computing the net asset value daily
Professional services fees: legal and accounting fees
Registration fees: when making filings with regulatory
agencies
53

Shareholder communications expenses: printing and mailing
required documents to shareholders
Transfer agent services fee: keeping shareholder records and
responding to customer inquiries
These expenses are included in the expense ratio.
Shareholder transaction fees
Shareholders may be required to pay fees for certain
transactions. For example, a fund may charge a flat fee for
maintaining an individual retirement account for an investor.
Some funds charge redemption fees when an investor sells fund
shares shortly after buying them (usually defined as within
30, 60 or 90 days of purchase); redemption fees are computed
as a percentage of the sale amount. Shareholder transaction
fees are not part of the expense ratio.
Securities transaction fees
A mutual fund pays any expenses related to buying or selling
the securities in its portfolio. These expenses may include
brokerage commissions. Securities transaction fees increase
the cost basis of the investments. They do not flow through
the income statement and are not included in the expense
54
ratio. The amount of securities transaction fees paid by a
fund is normally positively correlated with its trading volume
or "turnover".
Expense ratio
The expense ratio allows investors to compare expenses across
funds. The expense ratio equals the 12b-1 fee plus the
management fee plus the other fund expenses divided by average
net assets. The expense ratio is sometimes referred to as the
"total expense ratio" or TER.
Controversy
Critics of the fund industry argue that fund expenses are too
high. They believe that the market for mutual funds is not
competitive and that there are many hidden fees, so that it is
difficult for investors to reduce the fees that they pay.
Many researchers have suggested that the most effective way
for investors to raise the returns they earn from mutual funds
is to reduce the fees that they pay. They suggest that
investors look for no-load funds with low expense ratios.
Definitions
Definitions of key terms.
55
Net asset value or NAV
Main article: Net asset value
A fund's net asset value or NAV equals the current market
value of a fund's holdings minus the fund's liabilities
(sometimes referred to as "net assets"). It is usually
expressed as a per-share amount, computed by dividing by the
number of fund shares outstanding. Funds must compute their
net asset value every day the New York Stock Exchange is open.
Valuing the securities held in a fund's portfolio is often the
most difficult part of calculating net asset value. The fund's
board of directors (or board of trustees) oversees security
valuation.
Average annual total return
The SEC requires that mutual funds report the average annual
compounded rates of return for 1-year, 5-year and 10-year
periods using the following formula]
P(1+T)n = ERV
Where:
P = a hypothetical initial payment of $1,000.
T = average annual total return.
56

n = number of years.
ERV = ending redeemable value of a hypothetical
$1,000 payment made at the beginning of the 1-, 5-,
or 10-year periods at the end of the 1-, 5-, or 10-
year periods (or fractional portion).
Turnover
Turnover is a measure of the volume of a fund's
securities trading. It is expressed as a percentage
of net asset value and is normally annualized.
Turnover equals the lesser of a fund's purchases or
sales during a given period (of no more than a year)
divided by average net assets. If the period is less
than a year, the turnover figure is annualized.
MUTUAL FUNDS IN INDIA:
The first introduction of a mutual fund in India occurred in
1963, when the Government of India launched Unit Trust of
India (UTI). Until 1987, UTI enjoyed a monopoly in the Indian
mutual fund market. Then a host of other government-controlled
Indian financial companies came up with their own funds. These
57

included State Bank of India, Canara Bank, and Punjab National
Bank. This market was made open to private players in 1993, as
a result of the historic constitutional amendments brought
forward by the then Congress-led government under the existing
regime
of Liberalization, Privatizationand Globalization (LPG). The
first private sector fund to operate in India was Kothari
Pioneer, which later merged with Franklin Templeton.
Current Scenario
The major fund houses which have operated in India include:
Fortis
Birla Sunlife
Bank of Baroda
HDFC
ING Vysya
ICICI Prudential
SBI Mutual Fund
Tata
Kotak Mahindra
Unit Trust of India
Reliance
58
IDFC
Franklin Templeton
Sundaram Mutual Fund
Religare Mutual Fund
Principal Mutual Fund
Mutual funds are an under tapped market in India
Despite being available in the market for over two decades now
with assets under management equaling Rs 7,81,71,152 Lakhs (as
of 28 February 2010) (Source: Association of Mutual Funds,
India), less than 10% of Indian households have invested in
mutual funds. A recent report on Mutual Fund Investments in
India published by research and analytics firm, Boston
Analytics, suggests investorsare holding back from putting
their money into mutual funds due to their perceived high risk
and a lack of information on how mutual funds work. This
report is based on a survey of approximately 10,000
respondents in 15 Indian cities and towns as of March 2010.
There are 43 Mutual Funds recently.
The primary reason for not investing appears to be correlated
with city size. Among respondents with a high savings rate,
close to 40% of those who live in metros and Tier I cities
59
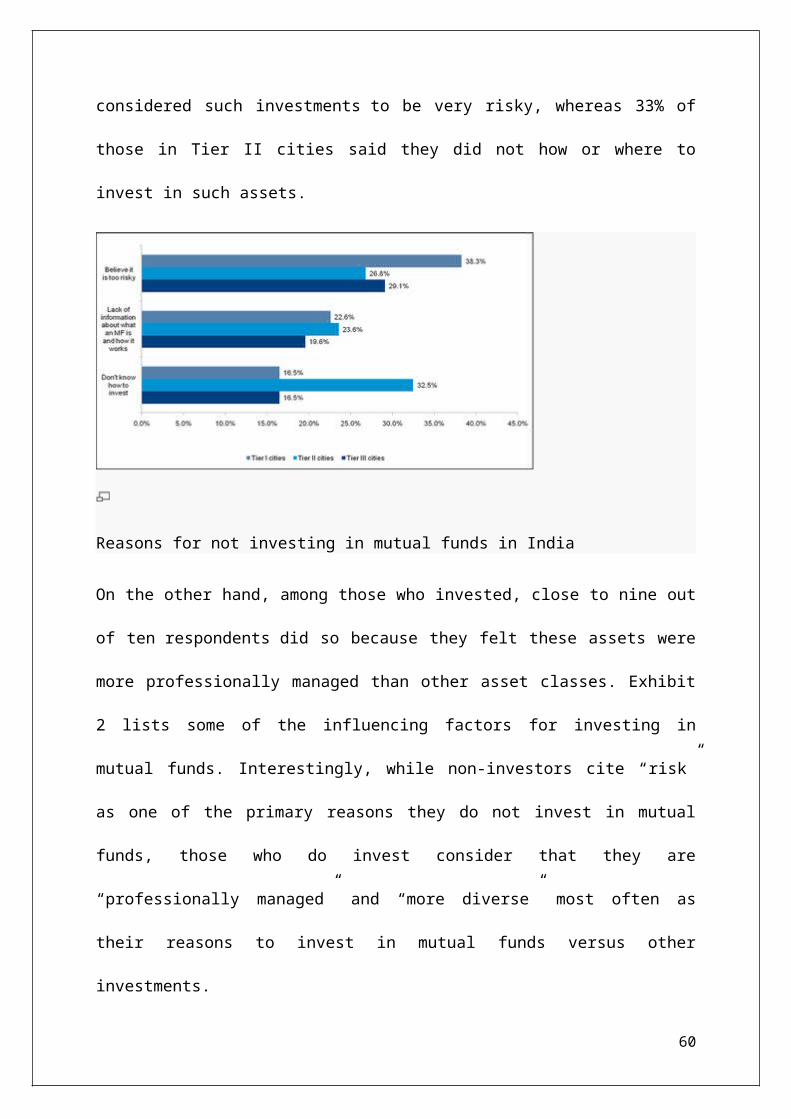
considered such investments to be very risky, whereas 33% of
those in Tier II cities said they did not how or where to
invest in such assets.
Reasons for not investing in mutual funds in India
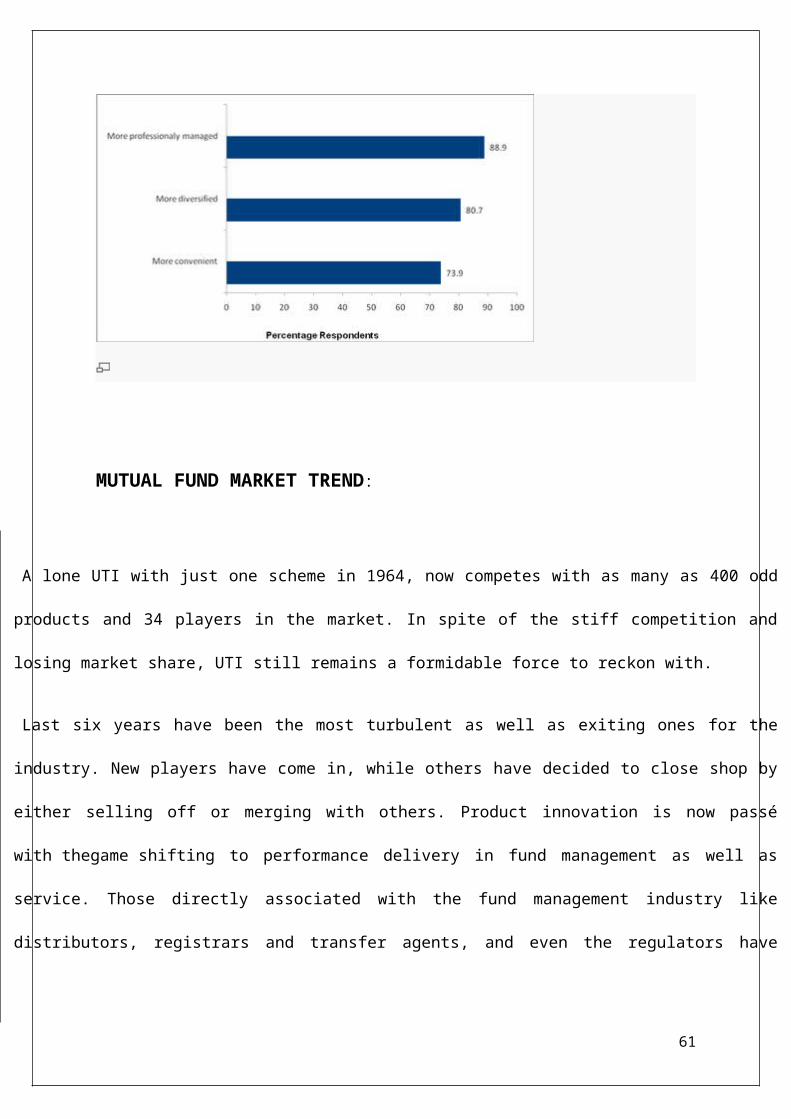
On the other hand, among those who invested, close to nine out
of ten respondents did so because they felt these assets were
more professionally managed than other asset classes. Exhibit
2 lists some of the influencing factors for investing in
mutual funds. Interestingly, while non-investors cite “risk”
as one of the primary reasons they do not invest in mutual
funds, those who do invest consider that they are
“professionally managed” and “more diverse” most often as
their reasons to invest in mutual funds versus other
investments.
60
MUTUAL FUND MARKET TREND:
A lone UTI with just one scheme in 1964, now competes with as many as 400 odd
products and 34 players in the market. In spite of the stiff competition and
losing market share, UTI still remains a formidable force to reckon with.
Last six years have been the most turbulent as well as exiting ones for the
industry. New players have come in, while others have decided to close shop by
either selling off or merging with others. Product innovation is now passé
with thegame shifting to performance delivery in fund management as well as
service. Those directly associated with the fund management industry like
distributors, registrars and transfer agents, and even the regulators have
61
become more mature and responsible.
The industry is also having a profound impact on financial markets. While UTI
has always been a dominant player on the bourses as well as the debt markets,
the new generation of private funds which have gained substantial mass are now
seen flexing their muscles. Fund managers, by their selection criteria for
stocks have forced corporate governance on the industry. By rewarding honest
and transparent management with higher valuations, a system of risk-reward has
been created where the corporate sector is more transparent then before.
Funds have shifted their focus to the recession free sectors like
pharmaceuticals, FMCG and technology sector. Funds performances are improving.
Funds collection, which averaged at less than Rs.100bn per annum over five-year
period spanning 1993-98 doubled to Rs.210bn in 1998-99. In the current year
mobilization till now have exceeded Rs.300bn. Total collection for the current
financial year ending March 2000 is expected to reach Rs.450bn.
What is particularly noteworthy is that bulk of the mobilization has been by
the private sector mutual funds rather than public sector mutual funds. Indeed
private MFs saw a net inflow of Rs.7819.34 crore during the first nine months
of the year as against a net inflow of Rs.604.40 crore in the case of public
62
sector funds.
Mutual funds are now also competing with commercial banks in the race for
retail investor’s savings and corporate float money. The power shift towards
mutual funds has become obvious. The coming few years will show that the
traditional saving avenues are losing out in the current scenario. Many
investors are realizing that investments in savings accounts are as good as
locking up their deposits in a closet. The fund mobilization trend by mutual
funds in the current year indicates that money is going to mutual funds in a
big way. The collection in the first half of the financial year 1999-2000
matches the whole of 1998-99.
India is at the first stage of a revolution that has already peaked in the
U.S. The U.S. boasts of an Asset base that is much higher than its bank
deposits. In India, mutual fund assets are not even 10% of the bank deposits,
but this trend is beginning to change. Recent figures indicate that in the
first quarter of the current fiscal year mutual fund assets went up by 115%
whereas bank deposits rose by only 17%. (Source: Thinktank, The Financial
Express September, 99) This is forcing a large number of banks to adopt the
concept of narrow banking wherein the deposits are kept in Gilts and some other
assets which improves liquidity and reduces risk. The basic fact lies that
63
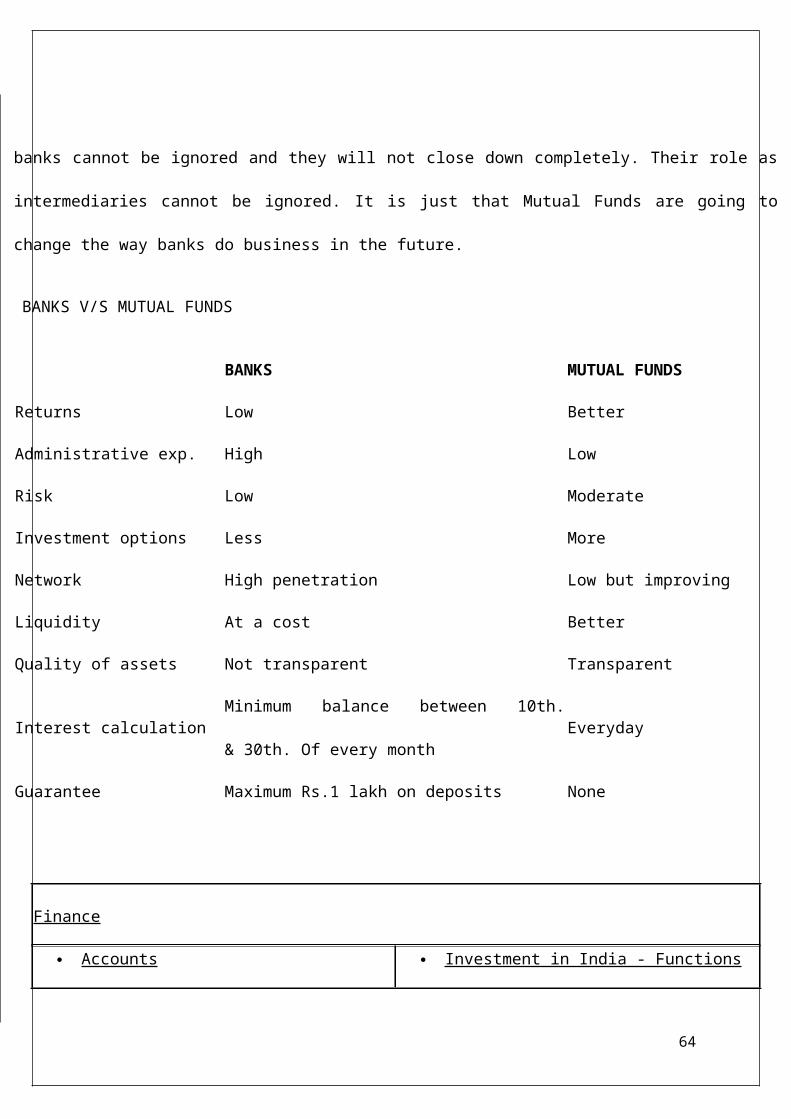
banks cannot be ignored and they will not close down completely. Their role as
intermediaries cannot be ignored. It is just that Mutual Funds are going to
change the way banks do business in the future.
BANKS V/S MUTUAL FUNDS
BANKS MUTUAL FUNDS
Returns Low Better
Administrative exp. High Low
Risk Low Moderate
Investment options Less More
Network High penetration Low but improving
Liquidity At a cost Better
Quality of assets Not transparent Transparent
Interest calculationMinimum balance between 10th.
& 30th. Of every monthEveryday
Guarantee Maximum Rs.1 lakh on deposits None
Finance
Accounts Investment in India - Functions
64

ATM - Automatic Teller Machine
Banks of India
Company Shares / Debentures
Credit card - Costs
Credit Card - Glossary
Credit Card - Hard Facts
Credit Cards - Eligibility
Criteria
Credit Cards
Direct Investment with
Repatriation Benefits
Electronic Banking
Euro Issues by Indian Companies
Financial sector and Banking
Financial Sector Reforms in
India
Credit Card - Find the one that
suits your needs
Fixed Deposits
FIPB - Foreign Investment
Investment in Government
Securities
Investments by Non-Residents
Mutual Funds - Frequently Asked
Questions
Regulatory Aspects Of Mutual
Fund
Benefits Of Investing In Mutual
Funds
Mutual Funds - Glossary
Mutual Funds - History
Types of Mutual Fund
Mutual Funds
Mutualfund - Market Trends
Mutualfunds - Global Scenario
Mutual Funds - Net Asset Value
(NAV)
NRI - FAQ
NRI Investments - Company
65
Promotion Board
IDBI - Industrial Development
Bank of India
Internet Banking
Investing in india
Investment by Foreign Companies
Investment in India - Approval
by FIPB
Investment in India -
Composition
Deposits
NRI Investments - Government
Securities/Units
Overdraft
Portfolio Investment Scheme
Portfolio Investment in
Shares/Debentures
Private Banking
R B I - Reserve Bank of India
Sale / Transfer of Shares /
Securities
Purchase of Shares and
Securities by Non-Residents
Transfer of Shares/Securities by
Non-Residents to Residents
66

RANKING OF MUTUAL FUND:
Mutual funds have become a very common mode to enter into
financial market. Simpler way to enter the market but it can
go all wrong if an investor fails to select the right fund.
The big question is how to select the best mutual fund to
invest? An investor would probably go with the fund which is
the best ranked, one with a good NAV, having a good nav does
not mean the fund is good, it is one the criteria’s to rank a
mutual fund.
Ranking criteria’s:
Scores
Particular 5 4 3 2 1 Rules
67
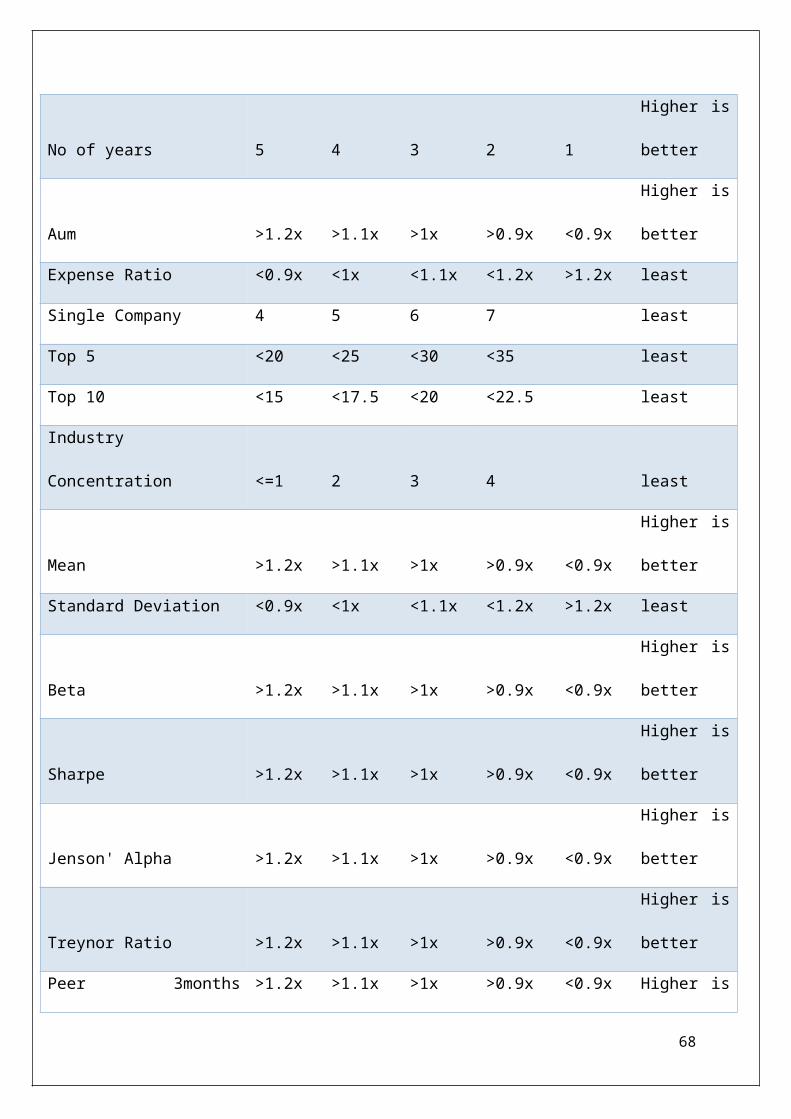
No of years 5 4 3 2 1
Higher is
better
Aum >1.2x >1.1x >1x >0.9x <0.9x
Higher is
better
Expense Ratio <0.9x <1x <1.1x <1.2x >1.2x least
Single Company 4 5 6 7 least
Top 5 <20 <25 <30 <35 least
Top 10 <15 <17.5 <20 <22.5 least
Industry
Concentration <=1 2 3 4 least
Mean >1.2x >1.1x >1x >0.9x <0.9x
Higher is
better
Standard Deviation <0.9x <1x <1.1x <1.2x >1.2x least
Beta >1.2x >1.1x >1x >0.9x <0.9x
Higher is
better
Sharpe >1.2x >1.1x >1x >0.9x <0.9x
Higher is
better
Jenson' Alpha >1.2x >1.1x >1x >0.9x <0.9x
Higher is
better
Treynor Ratio >1.2x >1.1x >1x >0.9x <0.9x
Higher is
better
Peer 3months >1.2x >1.1x >1x >0.9x <0.9x Higher is
68

Annualized better
Peer 6 months
Annualized >1.2x >1.1x >1x >0.9x <0.9x
Higher is
better
Peer 1 years
Annualized >1.2x >1.1x >1x >0.9x <0.9x
Higher is
better
Peer 2 years
Annualized >1.2x >1.1x >1x >0.9x <0.9x
Higher is
better
Peer 3 years
Annualized >1.2x >1.1x >1x >0.9x <0.9x
Higher is
better
Benchmark 3 month
Annualized >1.2x >1.1x >1x >0.9x <0.9x
Higher is
better
Benchmark 6 month
Annualized >1.2x >1.1x >1x >0.9x <0.9x
Higher is
better
Benchmark 1 year
Annualized >1.2x >1.1x >1x >0.9x <0.9x
Higher is
better
Benchmark 2 years
Annualized >1.2x >1.1x >1x >0.9x <0.9x
Higher is
better
Benchmark 3 years
Annualized >1.2x >1.1x >1x >0.9x <0.9x
Higher is
better
Stock liquidity <0.9x <1x <1.1x <1.2x >1.2x least
69

Weightage:
Note: ‘X’ is referred to the peer
group, it is nothing but the
average the peer group funds.
70
Parameters
Weightag
e (%)
Basic 5
Company
concentration 7
Industry
concentration 8
Risk Analysis 15
Performance 60
Liquidity 5
Total 100

COMPANY
PROFILE:
71

CANARA ROBECO:
Robeco is a Dutch asset management firm founded in 1929 as
the Rotterdamsch Beleggings Consortium (Rotterdam Investment
Consortium). By year end 2009, the company had over € 130
billion of assets under management.It was acquired in 2001 by
the Rabobank Groep.
Robeco offers assets management services to
both institutional and private investors. The funds for
private investors are available through Robeco itself and
other financial institutions, a number of these funds are also
listed on major European stock exchanges. Since 1981 the
company also offers savings accounts through its own savings
bank Roparco.
Canara Robeco Asset Management Company Limited (CRAMC), the
investment managers of Canara Robeco Mutual Fund, is a joint
venture between Canara Bank andRobeco of the Netherlands, a
72

global asset management company that manages about US$180
Billion worldwide. The joint venture brings together Canara
Bank's experience in the Indian market and Robeco's global
experience in asset management.
Canara Robeco Mutual Fund is the oldest Mutual Fund in India,
established in December 1987 as Canbank Mutual Fund.
Subsequently, in 2007, Canara Bank partnered Robeco and the
mutual fund was renamed as Canara Robeco Mutual Fund. Since
then, it has consistently been one of the fastest growing
mutual funds in India in terms of AuM, having grown 94% year-
on-year from March 2009 to March 2010. Our solutions offer a
range of investment options, including diversified and
thematic equity schemes, hybrid and monthly income funds and a
wide range of debt and treasury products.
Canara Robeco AMC manages the assets of Canara Robeco Mutual
Fund by virtue of an investment management agreement dated
16th June 1993 (as amended from time to time). As of 31
December 2010, the AMC has Rs. 7,392 crores of average assets
73
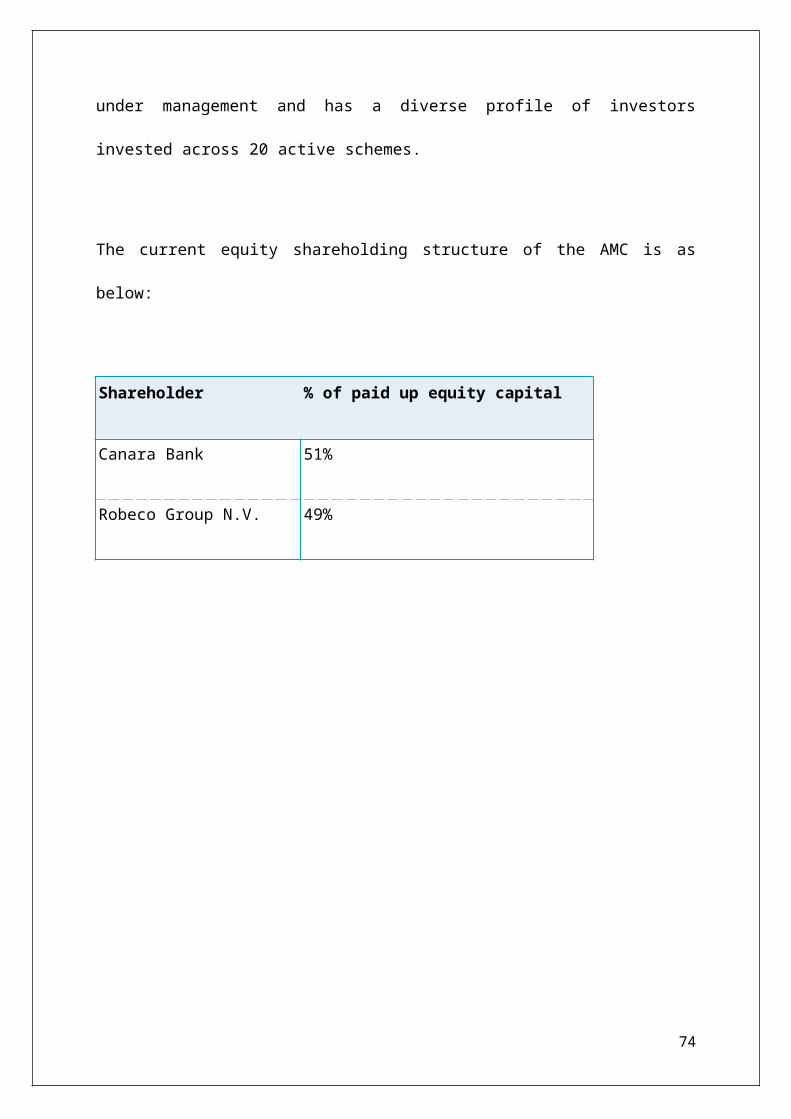
under management and has a diverse profile of investors
invested across 20 active schemes.
The current equity shareholding structure of the AMC is as
below:
Shareholder % of paid up equity capital
Canara Bank 51%
Robeco Group N.V. 49%
74
DSP BLACKROCK:
DSP BlackRock Investment Managers is one of the premier asset
management companies in India. It is a joint venture between
the DSP Group and BlackRock. Currently the firm manages and
advises assets worth INR 41,484 cr (as on Jul 29, 2011).
The DSP Group, headed by Mr. Hemendra Kothari, is one of the
oldest financial services firms in India. It has a track
record of over 145 years and was one of the founding members
of the Bombay Stock Exchange.
BlackRock is the largest listed asset management company in
the world. It is a premier provider of investment solutions
through a variety of product structures, including individual
and institutional separate accounts, mutual funds and other
pooled investment vehicles, and the industry-leading iShares®
ETFs to investors around the world. Currently the firm manages
assets worth USD 3.66 trillion (as on Jun 30, 2011).
BlackRock is a truly global firm that combines the benefits of
worldwide reach with local service and relationships. It has a
deep presence in every major capital market in the world,
which results in greater insights into increasingly
75
interconnected financial markets. Managing assets for
investors in North and South America, Europe, Asia, Australia,
the Middle East and Africa, the firm today employs more than
9,300 talented professionals and maintains offices in 26
countries around the world. BlackRock's investor base includes
corporate, public, union and industry pension plans;
governments; insurance companies; third-party mutual funds;
endowments; foundations; charities; corporations; official
institutions; sovereign wealth funds; banks; financial
professionals; and individuals worldwide.
Culture of Investment Excellence
BlackRock emphasizes a single, globally integrated research &
portfolio management team, relying on the judgement of
experienced portfolio managers that it employs in regional
investment centers around the world. The investment team in
India is well integrated globally and has access to
BlackRock's significant investment expertise, advanced
technology platforms and robust risk management practices to
leverage team resources and facilitate the sharing of ideas in
the best manner possible.
76
DSP BlackRock Investment Managers has an experienced team of
investment professionals with expertise in domestic capital
markets and access to more than 700 investment professionals
worldwide. We continually add to our resources by recruiting
talented individuals and training them alongside our most
experienced investment professionals.
We believe that experienced investment professionals using a
disciplined investment process and sophisticated analytical
tools can consistently add value to investor portfolios. This
philosophy, combined with a strong investment culture –
focused on excellence and teamwork – enables us to navigate
different market conditions, take measured risks and optimize
investment opportunities.
Investment Capabilities - Fixed Income & Equities
BlackRock has long been known among investment industry
professionals for its fixed income expertise. It today offers
investors an array of fixed income products designed to meet a
variety of risk/return profiles. The equity investment
philosophy combines focused portfolio management, proprietary
research and significant firm–wide resources. BlackRock
manages a range of equity strategies targeting opportunities
77
in specific market sectors that span the entire risk/return
spectrum.
DSP BlackRock Investment Managers is committed to providing a
broad set of investment solutions for our investors, while
striving to constantly achieve the best balance between risk
and opportunity. Investors in India enjoy the expertise of an
award winning investment team, which concentrates on rigorous
fundamental and quantitative active management approaches
aimed at maximizing outperformance. Our disciplined and well
researched approach to investing combined with robust risk-
management controls and processes has been recognised by
various reputed financial rating agencies such as Lipper,
CRISIL & ICRA. Access to BlackRock's investment capabilities
only strengthens this expertise further and offers us an
unparalleled investment perspective, both within India as well
as globally.
Global Perspective and Connectivity
BlackRock today has a major presence in most key markets
across the United States, Europe, Asia and Australia and has a
deep understanding of local markets around the world. One
measure of such scale and presence is that it conducts more
78
than 5,000 company research visits across the world, annually.
DSP BlackRock Investment Managers is in a unique position to
gain from such extensive global market knowledge and research
capabilities. This means that our investors benefit from this
extensive global investment perspective that BlackRock's
worldwide presence delivers.
Robust Risk Management and Powerful Investment Technology
DSP BlackRock Investment Managers aims at investment
excellence within the framework of transparent but rigorous
risk controls. The team in India is well supported by
BlackRock's Risk and Quantitative Analysis Group, which is a
global team that supports investment managers across asset
classes, styles and markets. The group ensures that its
investment professionals have the most up-to-date information
available of the portfolios they manage, understand risk and
seize appropriate investment opportunities as they evolve.
The specialized risk management team at BlackRock leads the
endeavor to develop some of the most sophisticated and
powerful investment technologies available anywhere in the
world. They ensure the delivery and management of up-to-date
market knowledge in the hands of all BlackRock fund management
79
teams across the world. DSP BlackRock's investment team has
the advantage of access to such robust risk management
practices and powerful technology expertise in managing our
various products.
Our Core Philosophy
The story of the DSP Group and BlackRock has always been one
of evolution. Since our formative years as distinct
organizations, we have always looked for ways to enhance our
ability to serve investors. Not only have we sought to broaden
and deepen our capabilities, but also capitalized on the key
macro trends that are shaping the future.
We at DSP BlackRock Investment Managers today have assembled a
team of investment professionals with significant expertise in
capital markets. Our investment approach is based on our
conviction that we can combine our market insights, our reach
and scale, our proprietary technology, our culture of
exchanging perspectives and our unwavering focus on risk
management, into an ability to deliver performance in all
market environments. Our focus on investment excellence and
state-of-the-art analytics is complemented by a strong
80

commitment to service; this results in dynamic investor
relationships across a wide range of products and services.
The foundation of our business lies in our belief that our
investors' needs are of paramount importance and that our sole
business is managing assets on their behalf. Our commitment to
investment excellence is anchored in a shared culture that
always places the interests of investors first, from
individuals to institutions. We believe in always acting as a
fiduciary for our investors and our steadfast integrity has
helped us earn their long-term trust.
There is a fine line between just wanting things to happen and
working towards making them happen. That line is called
opportunity. And we at DSP BlackRock Investment Managers
strive to look for it in everything that we do.
BIRLA SUN LIFE MUTUAL FUND:
Birla Sun Life Asset Management Company Ltd. (BSLAMC), the
investment managers of Birla Sun Life Mutual Fund, is a joint
81
venture between the Aditya Birla Group and the Sun Life
Financial Services Inc. of Canada. The joint venture brings
together the Aditya Birla Group's experience in the Indian
market and Sun Life's global experience.
Established in 1994, Birla Sun Life Mutual fund has emerged as
one of India's leading flagships of Mutual Funds business
managing assets of a large investor base. Our solutions offer
a range of investment options, including diversified and
sector specific equity schemes, fund of fund schemes, hybrid
and monthly income funds, a wide range of debt and treasury
products and offshore funds.
Birla Sun Life Asset Management Company has one of the largest
team of research analysts in the industry, dedicated to
tracking down the best companies to invest in. BSLAMC strives
to provide transparent, ethical and research-based investments
and wealth management services.
Heritage
The Aditya Birla Group
82

The Aditya Birla Group is one of India's largest business
houses. Global in vision, rooted in Indian values, the Group
is driven by a performance ethic pegged on value creation for
its multiple stakeholders.
The Group operates in 26 countries – India, UK, Germany,
Hungary, Brazil, Italy, France, Luxembourg, Switzerland,
Australia, USA, Canada, Egypt, China, Thailand, Laos,
Indonesia, Philippines, UAE, Singapore, Myanmar, Bangladesh,
Vietnam, Malaysia, Bahrain and Korea.
A US $29 billion corporation in the League of Fortune 500, the
Aditya Birla Group is anchored by an extraordinary work force
of 130,000 employees, belonging to 40 different nationalities.
Over 60 per cent of its revenues flow from its operations
across the world.
The Aditya Birla Group is a dominant player in all its areas
of operations viz; Aluminium, Copper, Cement, Viscose Staple
Fibre, Carbon Black, Viscose Filament Yarn, Fertilisers,
Insulators, Sponge Iron, Chemicals, Branded Apparels,
Insurance, Mutual Funds, Software and Telecom. The Group has
83

strategic joint ventures with global majors such as Sun Life
(Canada), AT&T (USA), the Tata Group and NGK Insulators
(Japan), and has ventured into the BPO sector with the
acquisition of TransWorks, a leading ITES/BPO company.
Sun Life Financial
Sun Life Financial Inc is a leading international financial
services organization providing a diverse range of wealth
accumulation and protection products and services to
individuals and corporate customers. Chartered in 1865, Sun
Life Financial Inc and its partners today have operations in
key markets worldwide, including Canada, the United States,
the United Kingdom, Hong Kong, the Philippines, Japan,
Indonesia, India, China and Bermuda.
SBI MUTUAL FUND:
84

With over 24 years of rich experience in fund management, we
at SBI Funds Management Pvt. Ltd. bring forward our expertise
by consistently delivering value to our investors. We have a
strong and proud lineage that traces back to the State Bank of
India (SBI) - India's largest bank. We are a Joint Venture
between SBI and AMUNDI (France), one of the world's leading
fund management companies.
With our network of over 222 points of acceptance across
India, we deliver value and nurture the trust of our vast and
varied family of investors.
Excellence has no substitute. And to ensure excellence right
from the first stage of product development to the post-
investment stage, we are ably guided by our philosophy of
‘growth through innovation’ and our stable investment
policies. This dedication is what helps our customers achieve
their financial objectives.
Our Vision
“To be the most preferred and the largest fund house for all
asset classes, with a consistent track record of excellent
returns and best standards in customer service, product
innovation, technology and HR practices.”
85

Our Services
Mutual Funds
Investors are our priority. Our mission has been to establish
Mutual Funds as a viable investment option to the masses in
the country. Working towards it, we developed innovative,
need-specific products and educated the investors about the
added benefits of investing in capital markets via Mutual
Funds.
Today, we have been actively managing our investor's assets
not only through our investment expertise in domestic mutual
funds, but also offshore funds and portfolio management
advisory services for institutional investors.
This makes us one of the largest investment management firms
in India, managing investment mandates of over 4.5 million
investors.
Portfolio Management and Advisory Services
SBI Funds Management has emerged as one of the largest player
in India advising various financial institutions, pension
funds, and local and international asset management companies.
We have excelled by understanding our investor's requirements
and terms of risk / return expectations, based on which we
86

suggest customized asset portfolio recommendations. We also
provide an integrated end-to-end customized asset management
solution for institutions in terms of advisory service,
discretionary and non-discretionary portfolio management
services.
Offshore Funds
SBI Funds Management has been successfully managing and
advising India's dedicated offshore funds since 1988. SBI
Funds Management was the 1st bank sponsored asset management
company fund to launch an offshore fund called 'SBI Resurgent
India Opportunities Fund' with an objective to provide our
investors with opportunities for long-term growth in capital,
through well-researched investments in a diversified basket of
stocks of Indian Companies.
LITERATURE REVIEW:
How Morningstar Ratings for mutual funds are used as
a marketing tool
87
Review: Mutual fund families use ratings as a very useful
instrument for promoting and market their funds. Mutual fund
families only promote those funds which have either 4 or 5
star rating and funds with 3 stars or less than 3 are
completely ignored.
It is easier to promote mutual funds with 4 or 5 star rating
because every investor wants to invest in a fund which has
high rates as compare to other because they find such funds
safe and secure, even if they don’t have returns.
Mutual funds offer fund summary sheets known variously as
“fact sheets,” “sales flyers,” “performance or commentary
sheets,” etc. that are available for downloading from their
websites. If you inspect them, you will notice a common, if
not standard, practice relating to Morningstar Ratings. The
star rating for a fund will be featured prominently at the top
the summary sheet, but only if it has a four- or five-star
rating. These flyers tend to be used by commissioned sales
agents or financial “advisors” to induce their clients to
purchase funds.
88

Instead, they treat the stars as a convenient marketing tool
that exploits investor beliefs about performance prediction.
Do mutual fund Morningstar Ratings changes influence
individual investors?
Summary: An analysis of the flow of investments into and out
of mutual funds demonstrated a direct relationship between
Morningstar Rating changes and investor reactions. Morningstar
ratings upgrades resulted in positive abnormal mutual fund
investment inflows, and downgrades caused lower than
normal inflows or increased outflows. The dollar effects of ratings
involving 4 and 5 stars we the strongest.
In a 2004 article, William Reichenstein cited a study by
Financial Research Corporation.1 He said, “in 1999 funds with
four or five stars took in $233.6 billion, while lower rated
funds had outflows of $132 billion.”2 Do the stars really have
such a direct impact on investor behavior, or is this just a
coincidence?
While Morningstar3 itself largely avoids making performance
prediction claims about its Morningstar Rating* system, there
89

is significant evidence that investors believe that the stars
have predictive powers and they buy accordingly. (See: What
does Morningstar, Inc. say its mutual fund stars can do?
and What does Morningstar, Inc. say its mutual fund stars
cannot do?)
In “Star Power: The Effect of Morningstar Ratings on Mutual
Fund Flows,” Professor Diane Del Guercio of the University of
Oregon and Ms. Paula Tkac of the Federal Reserve Bank of
Atlanta studied investor behavior, when the Morningstar
Ratings of mutual funds changed.4 Through an analysis of the
flow of investments into and out of mutual funds, they
demonstrated a direct relationship between star rating changes
and investor reactions.
Their approach was to study “events,” which were defined as
either 1) first publication of an initial star rating for a
fund with three years of returns or 2) changes in the overall
star rating of a fund that had previously received a star
rating. By focusing on change events and by measuring
subsequent mutual fund investment flows and performance, Del
Guercio and Tkac developed insights about investor behavior
90

and linked these behaviors directly to changes in
Morningstar’s star ratings.
For the period November 1996 to October 1999, Del Guercio and
Tkac analyzed 1,637 initial star rating events and 10,735
changes in star ratings. The data indicated that about 10% of
funds experience a star rating upgrade or downgrade each
month. Del Guercio and Tkac analyzed the impact of these
events on the flow of funds into or out of these mutual funds.
They compared this post-event investment flow with a baseline
of investment flows before the event. By using this method,
they associated ratings change events with “abnormal” changes
in investment flows above or below baseline cash flows in or
out of funds.
Del Guercio and Tkac found different investor behaviors.
Apparently, some investors actively monitored star rating
changes and invested additional money or took money out of
mutual funds very quickly in response to star rating changes.
Morningstar reported that their website traffic picked up
significantly around the beginning of the month, when rating
changes were announced.
91
Other investors took longer to react – probably because they
learned of rating events though other channels. For example,
it takes up to several months for mutual funds to revise their
advertising in publications to include new star rating
information. Del Guercio and Tkac found that “of the 37
domestic equity ads that report a star rating (in June 1999),
only 10% use the most recent rating (as of May 1999), while
32% use a one-month old rating and 54% use a two-month old
rating.”5 Additionally, it can take financial advisors several
months to react to ratings changes and to induce their clients
to make purchases. For advisors, 4 and 5 star funds seem to be
much easier to sell than lower star rated funds.
Del Guercio and Tkac suggested that trustees of defined
contribution retirement plans, such as 401(k)s, might also
affect abnormal fund flows, because they are more likely to
choose funds with higher, particularly 5 star, ratings.
Trustees seem to use star ratings as a naïve means to fulfill
their fiduciary duties to choose the “best” investment
vehicles. For example, John Hancock Funds EVP, Keith
Hartstein, said, “(Morningstar) ratings are a significant part
of marketing. I can’t tell you the number of times we as an
92
industry sit in front of people picking managers for their
401(k) plan and hear them start the conversation saying,
“We’re only selecting four- and five-star funds”.”6
Del Guercio and Tkac found that an initial or new 5 star
rating very significantly affected investment flows. On
average, such funds experienced a $26 million abnormal
increase in investment flows over seven months or about 53%
above normal. More mature funds that experienced an upgrade to
a 4 to a 5 star rating experienced on average a $44 million
increase in investment, which represented a 35% abnormal
increase.
Del Guercio and Tkac said, “in contrast, a downgrade from 5 to
4 stars has a much smaller impact of only -$8 million in
abnormal flow, suggesting that flow response to a downgrade
from 5 star status is not symmetric to an upgrade to 5 stars.
Unlike a downgrade from 5 to 4 stars, we do find a large and
significant response to a downgrade from 4 to 3 stars,
suggesting that investors punish funds whose performance falls
below a 4 star rating.”7
93
Concerning other star ratings changes, Del Guercio and Tkac
determined that for up-grades and downgrades of ratings that
were below 4 stars, the results were also significant. In
general, Morningstar ratings upgrades resulted in positive
abnormal mutual fund investment inflows, and downgrades caused
lower than normal flows. However, the dollar effects of lower
star ratings changes were not as strong as ratings changes
involving 4 and 5 stars.
Del Guercio and Tkac provided very convincing evidence that
Morningstar rating initiations and changes directly and
significantly affect investor behaviors.
Do these investor responses to changes in the star ratings
have a positive, negative, or neutral impact on investors’
financial welfare? To understand how investors who decide to
trade on Morningstar Ratings changes are likely to make
out, see this related article, Does it pay to trade when the
Morningstar Rating of a mutual fund changes?
What might be wrong with buying a mutual fund with a
4 or 5 star Morningstar Rating?
94
Summary: The star ratings are oversimplified. Many investors
and their advisors use the stars as their primary decision
criterion and as shorthand for fund selection. Alternate, more
sophisticated approaches are available, which are more likely
to lead to optimal returns.
Scientific investment studies do not demonstrate that higher
Morningstar Ratings* of mutual funds lead to higher returns.
In general, scientific studies on the performance of mutual
funds indicate that superior past performance is simply not an
indicator of future performance. So, what is wrong with an
investor chosing a fund, because it happens to have a 4 or 5
star rating? Perhaps nothing, unless the illusion that a 4 or
5 star rating predicts superior future performance will cause
him to buy a mutual fund that has, in fact, a greater
likelihood of under-performing in the future.
Here are some of the potential problems with blindly buying 4
and 5 star funds:
If an investor pays a higher management fee for a fund,
because it had a 4 or 5 star rating, then on average this
higher management fee is more likely to drag down future
95
performanceIf an investor pays a front- or back-end load
and/or incurs 12b-1 sales charges for a fund, because it had
a 4 or 5 star rating, then on average these sales fees are
more likely to drag down future performance. If an investor
buys into a high turnover fund with excess trading expenses
and higher market impact, because it had a 4 or 5 star
rating, then on average these higher transaction costs are
more likely to drag down future performance
If an investor buys into a fund with higher accrued capital
gains, because it had a 4 or 5 star-rated fund, then on
average these accrued taxes are more likely to drag down the
investor’s net returns.
In addition, the 4 and 5 star superior performance illusion
might cause investors to:
focus on gross returns rather than net returns
churn their portfolio, as they hop from one fund to another
as ratings fall
believe that active strategies were better and worth paying
more for
96
In summary, the star ratings are oversimplified. Many
investors and their advisors use the stars as their primary
decision criterion and as shorthand for fund selection.
Alternate, more sophisticated approaches are available, which
are more likely to lead to optimal returns.
One of Morningstar’s primary stated themes about its star
rating system is that retail investors require simplification
and ease-of-use in their investment indicators. The Skilled
Investor is sympathetic with this desire for simplification on
the part of individual investors.
However, The Skilled Investor believes that it is incumbent upon
those who simplify the complex subject of investing for
individual investors, to be clear on the limitations of the
simplification methods that are used. This is especially true
when there is evidence that many investors are naive and
either are not knowledgeable enough or have limited
opportunities or time to perform deeper investment due
diligence. When the underlying methods of simplification used
to generate and easy-to-use investment indicators are
97
different from other methods that are scientifically grounded,
then there is a need to provide greater clarity.
Individual investors could benefit from a better understanding
of the likely information value of Morningstar’s stars as an
investment indicator. If investors simply think that mutual
funds with more stars are simply better, which many apparently
do, then their attempts to invest rationally could be
distorted. Investors could make decisions that they believe
are sensible, when in fact their beliefs may fall far short of
reality.
On the one hand, Morningstar cautions investors on the value
of their stars, while on the other hand the stars are very
heavily promoted by the industry – in effect as a seal of
approval. (See: “How Morningstar Ratings are used as a
marketing tool”) Morningstar’s five star rating system has
become a widely recognized brand within the retail financial
services industry. Just as Americans have fallen in love with
The Walt Disney Company’s Mickey Mouse brand, many individual
investors appear to have fallen in love with Morningstar’s
stars.
98
Morningstar allows brokers, investment advisers, mutual funds,
websites, and others to feature the star ratings prominently.
If you search for the information on Morningstar.com, you will
find that Morningstar offers many caveats about the utility of
its star ratings
It is unlikely that these caveats are being repeated
frequently by Morningstar’s business partners. Instead, there
seems to be a clear pattern of promoting funds when they
happen to have a 4 or 5 star rating, while neglecting to
feature the Morningstar Rating information prominently or at
all, when the rating is 3 or fewer stars. While brokers and
investment advisers heavily promote 4 and 5 star funds, one
wonders how many really take the time to explain to their
clients the same caveats that Morningstar offers on its
website
Furthermore, in 2002 the Morningstar Ratings underwent a very
significant change in how they are derived. The visible star
symbols remained the same, but the meaning was altered. One
wonders what portion of retail investors really understood the
investment implications of the star system before the change
99

was made and how many understand the system now. Do they
understand that the “personality” of the stars was altered in
2002, while the look stayed the same?
Do Morningstar Ratings predict risk-adjusted equity
mutual fund performance?
Summary: Morningstar Ratings have demonstrated some modest
predictive information about performance. However, most
individual investors will probably be very surprised about
what kind of predictive information the stars provide. The
stars have been a mild predictor of inferior performance.
However, investors act as if the stars predict superior future
performance, yet they may contain no such information.
Some individual investors seem to use Morningstar Ratings* as
a shorthand selector of superior future mutual fund
performance.1 Mutual funds with 4 and 5 star ratings have
garnered the vast majority of new fund investment money
Furthermore, mutual fund companies promote higher star rated
funds heavily, but not lower star rated funds. In fact, often
the only performance information that many mutual funds supply
100

in their advertising are 4 or 5 star Morningstar Ratings. In
their study, “Morningstar Ratings and Mutual Fund
Performance,” Professor Christopher Blake of Fordham
University and Professor Matthew Morey of Pace University
analyzed the predictive powers of the Morningstar Ratings.2 In
line with other scientific finance studies of mutual fund
performance, Professors Blake and Morey found that mutual
funds with low star ratings – particularly 1 star funds – were
more likely to continue their below average performance in the
future.
However, in the mid- and higher-ranges of fund performance,
there was little statistical evidence of any real differences
in future performance between funds with 5, 4, and 3 star
ratings. Funds rated 3, 4, and 5 stars account for 67.5% or
about 2/3 of all funds. Differences in future performance
between them were trivial.
Professors Blake and Morey used Morningstar’s data for 1992 to
1997 and focused most of their analysis on “seasoned” domestic
equity funds that had at least 10 years of return information
101
for the study period. They also used all star rated funds in
1993 for certain comparisons.
Professors Blake and Morey were careful to ensure that they
included all mutual funds in their analysis. They tracked down
and determined what had happened to any fund that had gone out
of business or was merged into another fund, during the study
period. By doing this, they ensured that the data did not
suffer from “survivorship bias.” Survivorship bias can
significantly distort the conclusions of investment return
studies, if it is not accounted for properly.
They also made appropriate load adjustments to returns, since
Morningstar makes adjustments that allow it to combine loaded
and no-load funds, when it calculates the star ratings. About
half of the funds in the 1993 sample had front-end loads. Note
that sales loads tend to lead to suboptimal fund performance.
Professors Blake and Morey compared the predictive abilities
of the star ratings with four performance predictors that are
commonly used in the scientific investment literature. These
alternate predictors were:
102

average monthly historical returns, which they termed a
“naive predictor”
the Sharpe Ratio
the Jensen single index alpha
a four-index alpha, which was composed of a) the market, b) a
bond index, c) small versus large capitalization, and d)
growth versus value.
For the 1992 to 1997 “seasoned” domestic equity funds sample,
Professors Blake and Morey used several different statistical
tests and concluded that the future performance of 3, 4, and 5
star rated funds did not differ significantly. If anything,
they found that funds with 5 star ratings might slightly
under-perform 3 and 4 star rated funds going forward.
Professors Blake and Morey found that there was some evidence
that funds with a 1 star rating and perhaps a 2 star rating
had a slightly greater tendency to under-perform in the
future.
When the predictive abilities of the Morningstar star ratings
were compared with the alternate predictors using the 1992 to
1997 “seasoned” domestic equity funds sample, in general the
103
stars were similar in predictive ability to all to the other
predictors. All predictors – Morningstar star ratings and the
alternates – were very weak in predicting future high
performing funds, but all predictors had some ability to
predict future low performing funds. Professors Blake and
Morey said, “all predictors with the notable exception of the
Sharpe ratio, have problems in predicting high-performing
funds.”
Professors Blake and Morey concluded that: “First, Morningstar
is able to “predict” low-performing funds. Funds with less
than three stars generally have much worse future performance
than other groups. ... Second, there is only weak statistical
evidence that the five star funds outperform the four- and
three-star funds. ... Third, the Morningstar ratings, at best,
do only slightly better than alternative predictors in
foretelling future fund performance.”3
Professors Blake and Morey noted further that: “Our first two
results are broadly consistent with much of the mutual fund
performance persistence literature: while it is relatively
easy to predict poor performance, it is much more difficult to
104
predict superior performance. Our results also suggest that
investors should be very cautious about associating a highly
rated fund with superior future performance. Although previous
studies have shown that highly rated funds attract the bulk of
investor cash inflows, our results suggest that those cash
inflows are not necessarily justified by subsequent
performance.”4
Finally, you should note that in 2002 Morningstar changed some
aspects of how it defined its stars. In particular, it moved
from 4 to 48 fund categories. Therefore, the “new” stars are
defined across narrower groups of funds. Morningstar also
changed its risk adjustment assumptions to be more similar to
those used in investment science.
In 2004, Morningstar published an article on performance
prediction related to the new stars. While the new stars
appear to have gained some performance predictability about
better performing funds, in its analysis Morningstar did not
control of the effects of fund fees and costs. If the new
stars simply act as a proxy for fund costs, then investors
should instead screen funds directly based on costs and not
105

the stars, which are subject to wide random fluctuations
related to lucky securities selection.
How stable have Morningstar Ratings for mutual funds
been over time?
Summary: Morningstar Ratings have been quite unstable over
time. If an investor buys a 4- or 5-star rated fund and
expects it to stay that way, he is likely to be surprised.
In “The Persistence of Morningstar Ratings,” Mark Warshawsky,
Mary DiCarlantonio, and Lisa Mullin of the TIAA-CREF
Institute1 looked at Morningstar Ratings* to understand star
rating persistence.2 They found that Morningstar Ratings
changed frequently.
Individual investors might find the conclusions of Warshawsky,
et al. to be unexpected. This is particularly true for any
investor who wants to select a “superior” performing mutual
fund to hold for the long-term. Warshawsky, et al. noted that
individual investors increasingly have used mutual funds for
long-term investing purposes. They quoted Federal Reserve
Board data from 1998 indicating that more than 60% of net new
106
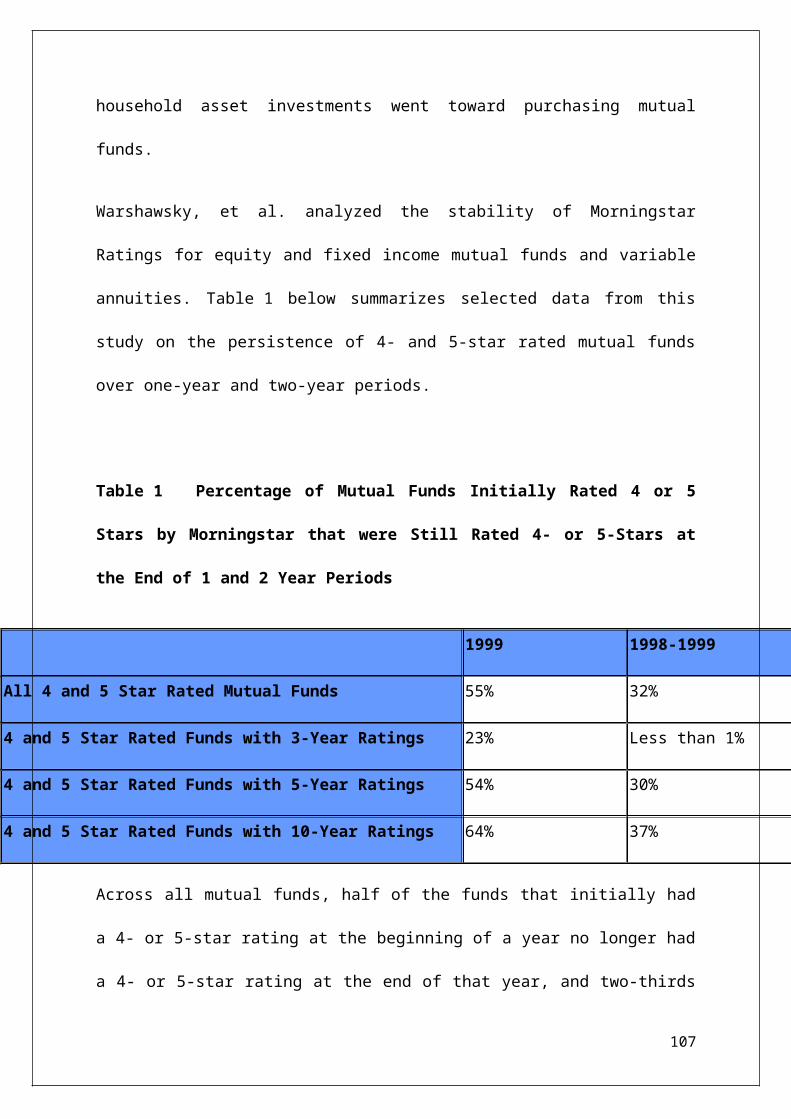
household asset investments went toward purchasing mutual
funds.
Warshawsky, et al. analyzed the stability of Morningstar
Ratings for equity and fixed income mutual funds and variable
annuities. Table 1 below summarizes selected data from this
study on the persistence of 4- and 5-star rated mutual funds
over one-year and two-year periods.
Table 1 Percentage of Mutual Funds Initially Rated 4 or 5
Stars by Morningstar that were Still Rated 4- or 5-Stars at
the End of 1 and 2 Year Periods
1999 1998-1999
All 4 and 5 Star Rated Mutual Funds 55% 32%
4 and 5 Star Rated Funds with 3-Year Ratings 23% Less than 1%
4 and 5 Star Rated Funds with 5-Year Ratings 54% 30%
4 and 5 Star Rated Funds with 10-Year Ratings 64% 37%
Across all mutual funds, half of the funds that initially had
a 4- or 5-star rating at the beginning of a year no longer had
a 4- or 5-star rating at the end of that year, and two-thirds
107
had fallen out after only two years. While there were
variations between the different years studied, both equity
and fixed income funds demonstrated low persistence in their
star ratings.
Among younger funds with 3-year ratings, the decline was more
striking. Only 23% to 31% of funds with 3-year Morningstar
Ratings still had their 4 or 5 star ratings, after one year
had elapsed. Even more incredible, after the two-year period
from January 1998 to December 1999, less that 1% still held
their 4 or 5 star ratings! Out of the 796 three-year rated
funds with 4 or 5 stars at the beginning of 1998, only 3 of
them were still rated 4 or 5 stars at the end of 1999! This
tendency for many apparently superior star ratings to fall
precipitously, should give investors concern when deciding
whether to pay attention to the stars.
To have between 2/3 and 3/4 of highly rated funds with 3 years
of data to drop out of the 4-star and 5-star rating range
after just one year, means that their most recent year’s
performance was inferior to other funds in their peer group.
Previously “mediocre” funds would then have become supposedly
108

“superior” 4- and 5-star rated funds. This ratings instability
might not inspire confidence in an investor looking for a fund
to hold for the long-term.
More mature funds with 5-year and 10-year ratings were
somewhat better able to hold on to their 4 and 5 star ratings
than younger funds, but the fallout rate was still
significant. For example, over the two-year period from 1998
to 1999, the percentage funds with 10-year ratings that
managed to hold on to their 4- and 5-star ratings was only
37%. This apparently higher stability provides little comfort
to individual investors.
The primary reason why older funds seem more stable is that
the Morningstar Rating system includes older data that can
mask higher variability in the more recent performance of a
fund. The same factors causing ratings instability that was
discussed above for 3-year ratings are at play with longer
term ratings. Longer periods of historical data just dampen
recent volatility, but the volatility is still there
Concerning variable annuities, Warshawsky, et al. presented
less comprehensive data, but the pattern of decline was
109
similar and even slightly more pronounced. For example, the
data indicated that the percent of all variable annuities that
held on to their 4 or 5 star rating after one year was 41%
during 1998 and 47% during 1999. This compared to 49% and 55%,
respectively, for all mutual funds.
Warshawsky, et al. concluded by stating: “for those many
investors to whom the overall Morningstar rating is useful
information in deciding which mutual funds and variable
annuities to include in their investment portfolios, the
persistence of a high rating should matter a great deal. The
results of this study indicate that persistence is hardly
assured and is somewhat variable across years and investment
categories.”
The scientific investment literature has long indicated that
apparently superior historical fund performance is not a
predictor of future performance. In fact, thousands of mutual
funds and variable annuities with many trillions of dollars in
assets compete to produce superior results. This competition
ensures that the securities markets will be more efficient and
110

thus be harder to “beat.” The bottom line is that superior
past performance is largely a matter of luck and not skill.
RESEARCH DESIGN AND METHODOLOGY:
111

RESEARCH DESIGN AND METHODOLOGY:
Title of the study:
“RANKING OF THE MUTUAL FUND”
Scope: The scope of the study is to find out the best mutual
fund in the market through ranking.
112

OBJECTIVES OF THE STUDY:
The main objective of the study is to find out the
various factors which contribute toward the ranking of
the mutual fund.
To study the various ranking factors
To rank the mutual funds on the given data using the
ranking factors
LIMITATION OF THE STUDY:
Limited study because only 4 funds are being ranked.
Neglecting the qualitative aspect like management of the
fund, AMC etc.
113

DATA
ANALYSIS
114
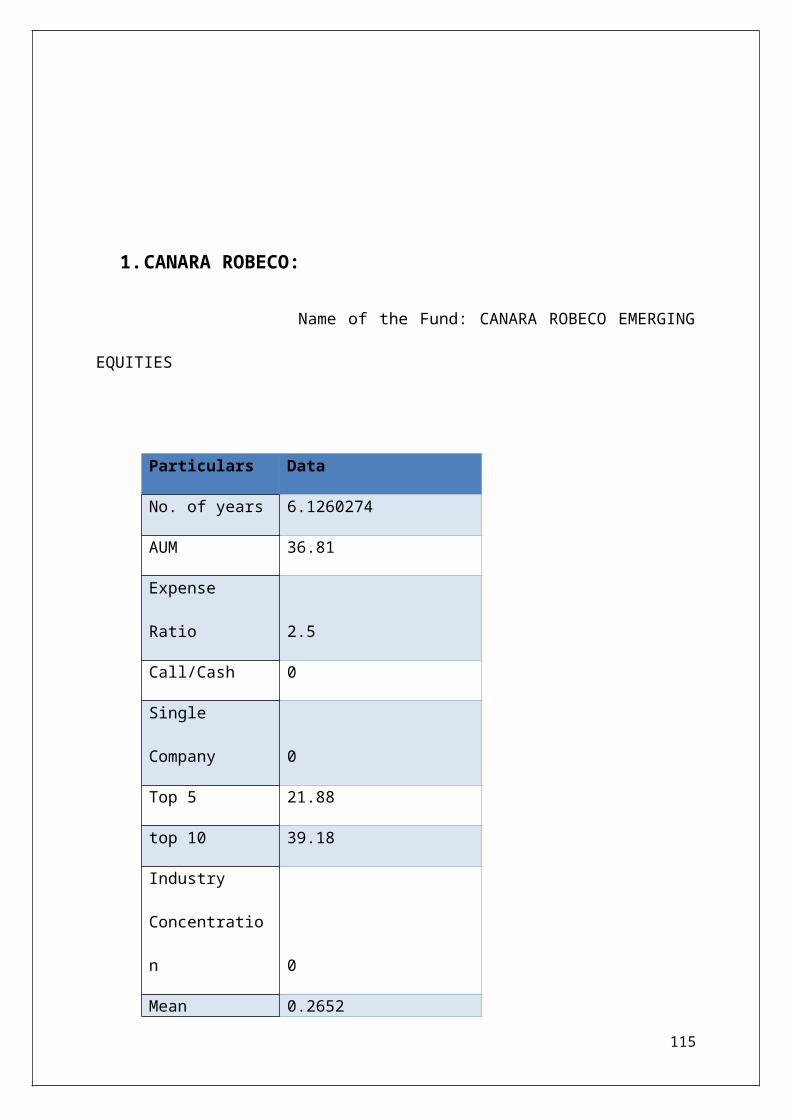
1.CANARA ROBECO:
Name of the Fund: CANARA ROBECO EMERGING
EQUITIES
Particulars Data
No. of years 6.1260274
AUM 36.81
Expense
Ratio 2.5
Call/Cash 0
Single
Company 0
Top 5 21.88
top 10 39.18
Industry
Concentratio
n 0
Mean 0.2652
115

SD 0.672
Beta 0.4208
Sharpe ratio 0.3702
Jenson's
Alpha 0.0806
Treynor
ratio 0.5911
3 Months
Actualized -7.1879
6 Months
Actualized -8.0766
1 Year
Annualized 12.5382
2 Years
Annualized 69.5582
3 Years
Annualized 9.0209
Stock
Liquidity 1463.39593
116

2.DSP BLACKROCK:
Name of the Fund: DSP BLACKROCK MICRO CAP
FUND
Particulars Data
No. of years 3.865753
AUM 438.4206
Expense
Ratio 2.29
Call/Cash 0.914
Single
Company 1
top 5 22.5749
top 10 37.7941
Industry
Concentratio
n 0
Mean 0.2811
SD 0.9036
Beta 0.637
Sharpe ratio 0.2929
117
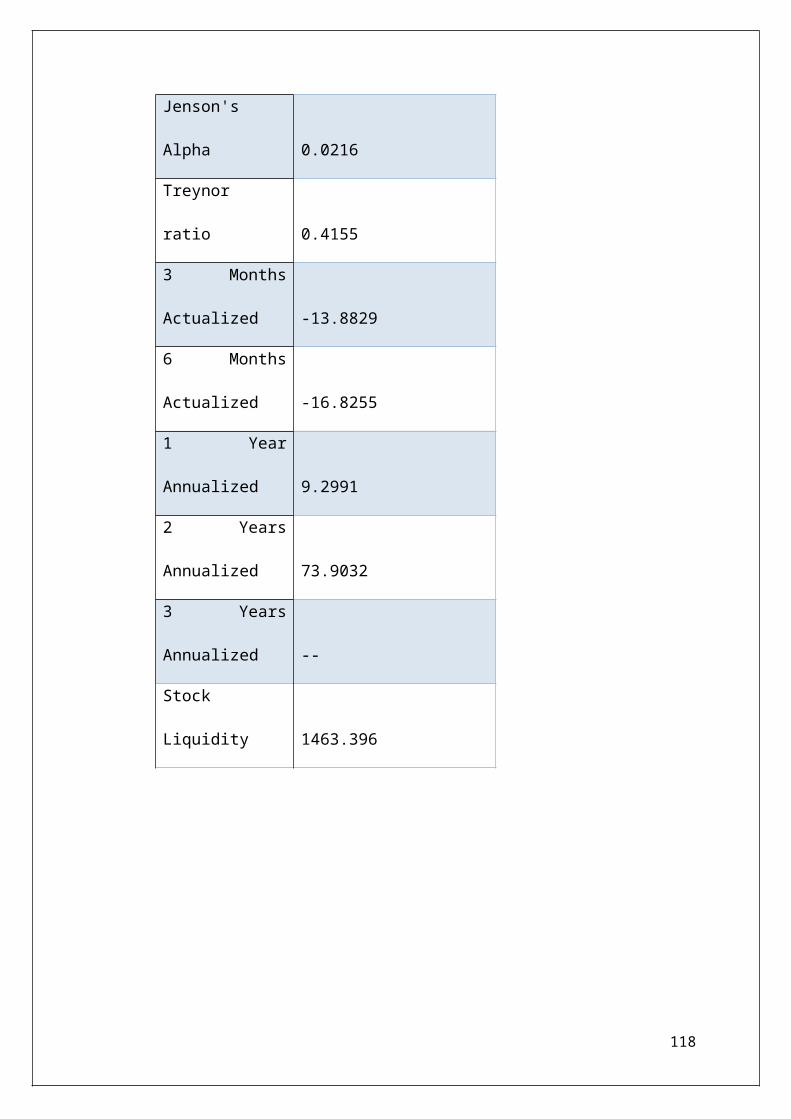
Jenson's
Alpha 0.0216
Treynor
ratio 0.4155
3 Months
Actualized -13.8829
6 Months
Actualized -16.8255
1 Year
Annualized 9.2991
2 Years
Annualized 73.9032
3 Years
Annualized --
Stock
Liquidity 1463.396
118

3. BIRLA SUN
LIFE:
Name of the
fund: BIRLA
SUN LIFE MID CAP
FUND
119
Particulars Data
No. of years 8.564384
AUM 2003.173
Expense
Ratio 1.91
Call/Cash 1.7365
Single
Company 0
top 5 15.6539
top 10 28.4743
Industry
Concentratio
n 0
Mean 0.3898
SD 0.9514
Beta 0.6685
Sharpe ratio 0.3924
Jenson's
Alpha 0.1062
Treynor
ratio 0.5586
3 Months
Actualized -11.214
6 Months
Actualized -11.9111
1 Year
Annualized -1.0509

4.SBI MUTUAL FUND:
Name of the fund: SBI MAGNAM MIDCAP FUND
120

121
Particulars Data
No. of years 6.076712
AUM 255.8052
Expense
Ratio 2.35
Call/Cash 6.8
Single
Company 5
top 5 35.17
top 10 54.38
Industry
Concentratio
n 0
Mean 0.3028
SD 0.8583
Beta 0.5641
Sharpe ratio 0.3337
Jenson's
Alpha 0.061
Treynor
ratio 0.5077
3 Months
Actualized -12.8144
6 Months
Actualized -14.0834
1 Year
Annualized 0.5062
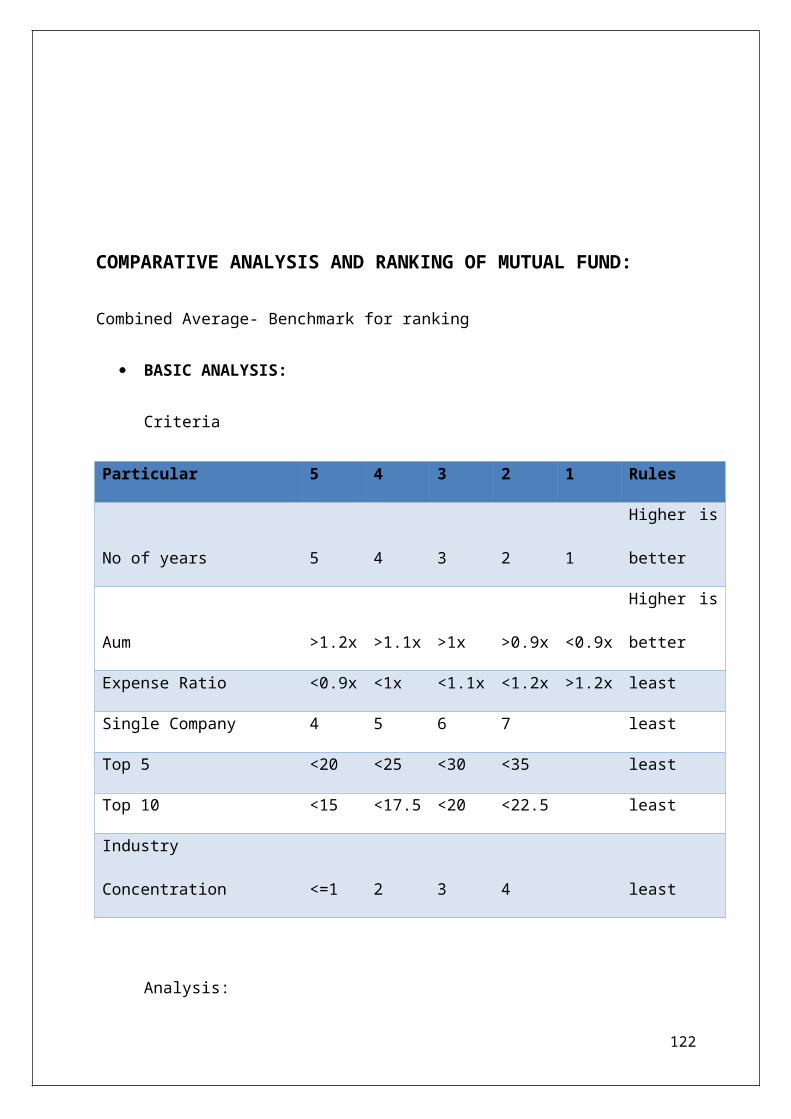
COMPARATIVE ANALYSIS AND RANKING OF MUTUAL FUND:
Combined Average- Benchmark for ranking
BASIC ANALYSIS:
Criteria
Particular 5 4 3 2 1 Rules
No of years 5 4 3 2 1
Higher is
better
Aum >1.2x >1.1x >1x >0.9x <0.9x
Higher is
better
Expense Ratio <0.9x <1x <1.1x <1.2x >1.2x least
Single Company 4 5 6 7 least
Top 5 <20 <25 <30 <35 least
Top 10 <15 <17.5 <20 <22.5 least
Industry
Concentration <=1 2 3 4 least
Analysis:
122

Particulars
Canar
a Dsp Birla SBI AVERAGE
No. of
years
6.126
027
3.865
753
8.564
384
6.076
712
6.15821
9
AUM 36.81
438.4
206
2003.
173
255.8
052
683.552
1
Expense
Ratio 2.5 2.29 1.91 2.35 2.2625
Call/Cash 0 0.914
1.736
5 6.8
2.36262
5
Single
Company 0 1 0 5 1.5
top 5 21.88
22.57
49
15.65
39 35.17 23.8197
top 10 39.18
37.79
41
28.47
43 54.38 39.9571
Industry
Concentrati
on 0 0 0 0 0
123

Note: This is the basic about every mutual fund analysis which
an investor should do before going in for investing. One
should know how old a fund is? How many assets are under its
control and what are its expenses while investing into the
market? Concentration also plays a vital role while analysing
a fund. Concentration here means how many companies and
industries are these funds investing in. Lower is considered
to be better.
Ranks according to basic analysis:
PARTICULAR
S
CANAR
A
ROBEC
O
DSP
BLACKROC
K
BIRLA
SUNLI
FE SBI
No. of
years 5 3 5 5
AUM 1 1 1 1
Expense
Ratio 2 2 5 3
Call/Cash
Single 5 5 5 1
124
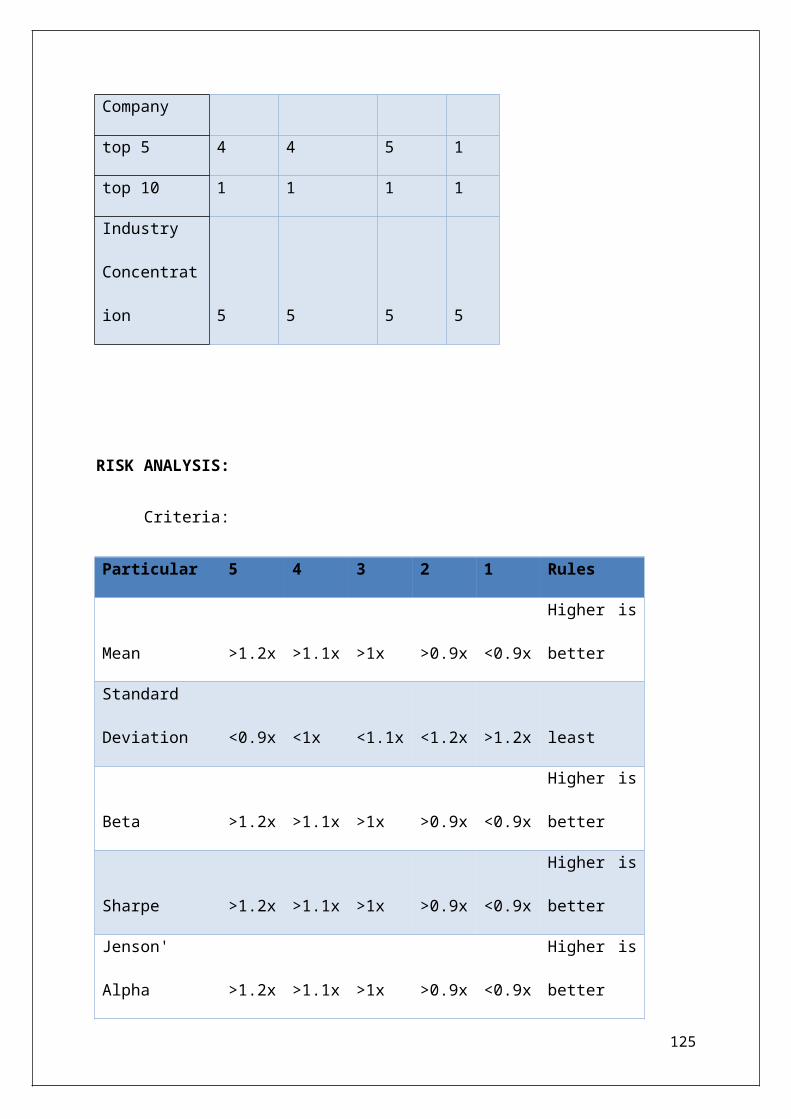
Company
top 5 4 4 5 1
top 10 1 1 1 1
Industry
Concentrat
ion 5 5 5 5
RISK ANALYSIS:
Criteria:
Particular 5 4 3 2 1 Rules
Mean >1.2x >1.1x >1x >0.9x <0.9x
Higher is
better
Standard
Deviation <0.9x <1x <1.1x <1.2x >1.2x least
Beta >1.2x >1.1x >1x >0.9x <0.9x
Higher is
better
Sharpe >1.2x >1.1x >1x >0.9x <0.9x
Higher is
better
Jenson'
Alpha >1.2x >1.1x >1x >0.9x <0.9x
Higher is
better
125
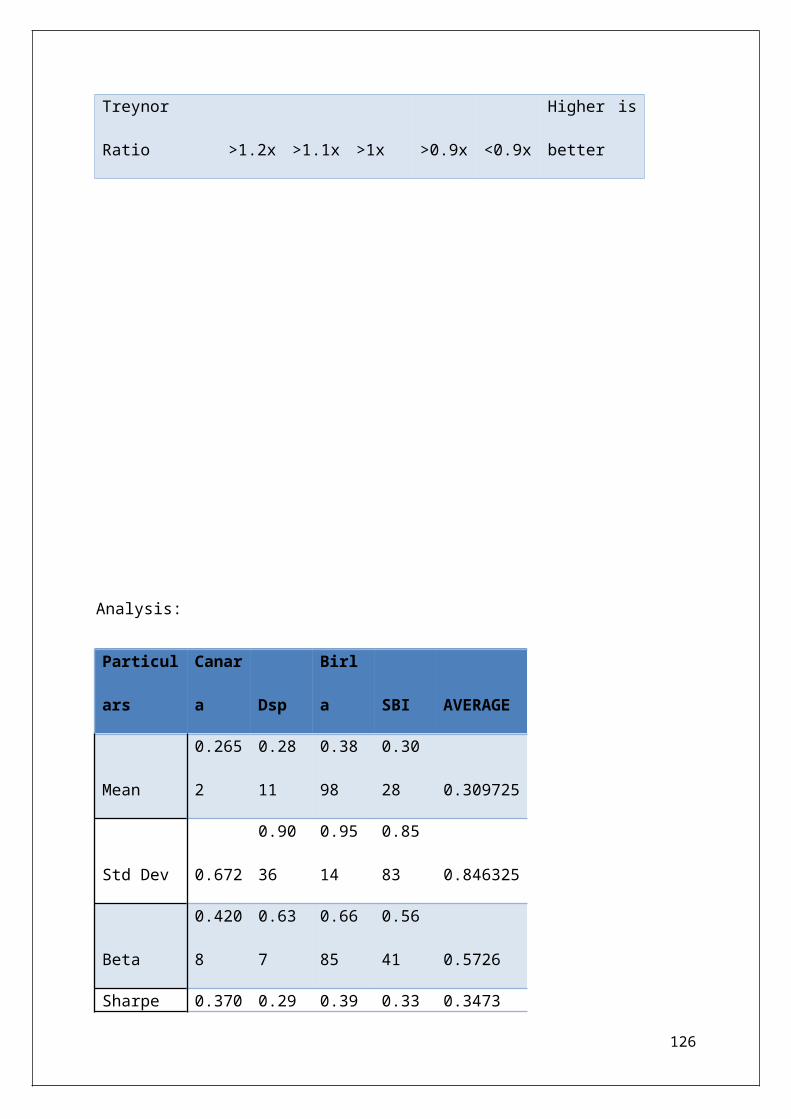
Treynor
Ratio >1.2x >1.1x >1x >0.9x <0.9x
Higher is
better
Analysis:
Particul
ars
Canar
a Dsp
Birl
a SBI AVERAGE
Mean
0.265
2
0.28
11
0.38
98
0.30
28 0.309725
Std Dev 0.672
0.90
36
0.95
14
0.85
83 0.846325
Beta
0.420
8
0.63
7
0.66
85
0.56
41 0.5726
Sharpe 0.370 0.29 0.39 0.33 0.3473
126
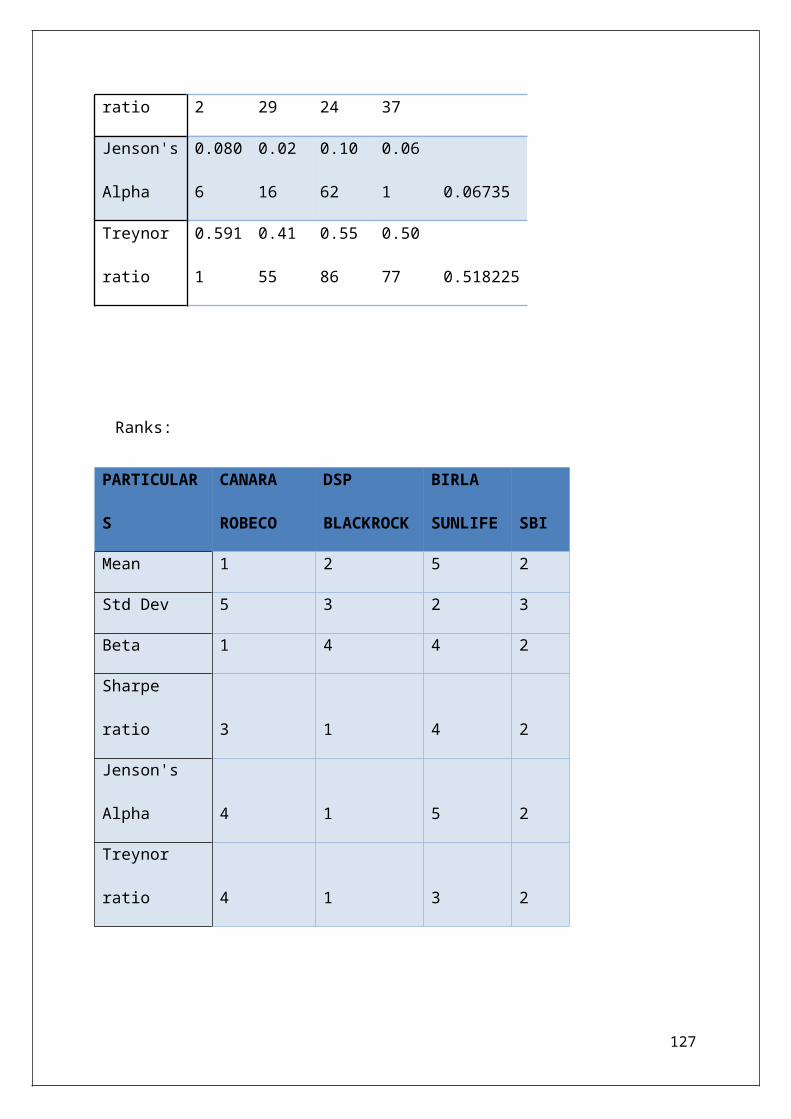
ratio 2 29 24 37
Jenson's
Alpha
0.080
6
0.02
16
0.10
62
0.06
1 0.06735
Treynor
ratio
0.591
1
0.41
55
0.55
86
0.50
77 0.518225
Ranks:
PARTICULAR
S
CANARA
ROBECO
DSP
BLACKROCK
BIRLA
SUNLIFE SBI
Mean 1 2 5 2
Std Dev 5 3 2 3
Beta 1 4 4 2
Sharpe
ratio 3 1 4 2
Jenson's
Alpha 4 1 5 2
Treynor
ratio 4 1 3 2
127
KEY NOTES/TERMS:
Mean: It is the average of the values given.
Standard deviation: Standard deviation is a widely used
measure of variability or diversity used
in statistics and probability theory. It shows how much
variation or "dispersion" exists from the average (mean,
or expected value). A low standard deviation indicates
that the data points tend to be very close to the mean,
whereas high standard deviation indicates that the data
points are spread out over a large range of values.
Beta: the Beta (β) of a stock or portfolio is a number
describing the relation of its returns with those of
the financial market as a whole. An asset has a Beta of
zero if its returns change independently of changes in
the market's returns. A positive beta means that the
asset's returns generally follow the market's returns, in
the sense that they both tend to be above their
respective averages together, or both tend to be below
their respective averages together. A negative beta means
that the asset's returns generally move opposite the
128

market's returns: one will tend to be above its average
when the other is below its average
Formula:
where ra measures the rate of return of the asset, rp measures
the rate of return of the portfolio, and cov(ra,rp) is
the covariance between the rates of return. The portfolio of
interest in the CAPM formulation is the market portfolio that
contains all risky assets, and so the rp terms in the formula
are replaced by rm, the rate of return of the market.
Sharpe ratio: The Sharpe ratio or Sharpe index or Sharpe
measure or reward-to-variability ratio is a measure of
the excess return (or risk premium) per unit of deviation
in an investment asset or a trading strategy, typically
referred to as risk (and is a deviation risk measure),
named after William Forsyth Sharpe. Since its revision by
the original author in 1994, it is defined as:
where R is the asset return, Rf is the return on a benchmark
asset, such as the risk free rate of return, E[R − Rf] is
129

the expected value of the excess of the asset return over
the benchmark return, andσ is the standard deviation of the
excess of the asset return. (This is often confused with the
excess return over the benchmark return; the Sharpe ratio
utilizes the asset standard deviation whereas theinformation
ratio utilizes standard deviation of excess return over the
benchmark, i.e. the tracking error, as the denominator.)
Note, if Rf is a constant risk free return throughout the
period,
Jenson’s Alpha: Jensen's alpha [1] (or Jensen's
Performance Index, ex-post alpha) is used to determine
the abnormal return of a security or portfolio of
securities over the theoretical expected return. Jensen's
alpha = Portfolio Return [Risk Free Rate + Portfolio Beta * (Market−
Return Risk Free Rate)]−
Treynor ratio: The Treynor ratio (sometimes called
the reward-to-volatility ratio or Treynor measure[1]),
named after Jack L. Treynor,[2] is a measurement of the
returns earned in excess of that which could have been130

earned on an investment that has no diversifiable risk
(e.g., Treasury Bills or a completely diversified
portfolio), per each unit of market risk
assumed.
where:
Treynor ratio,
portfolio i's return,
risk free rate
portfolio i' s beta
131
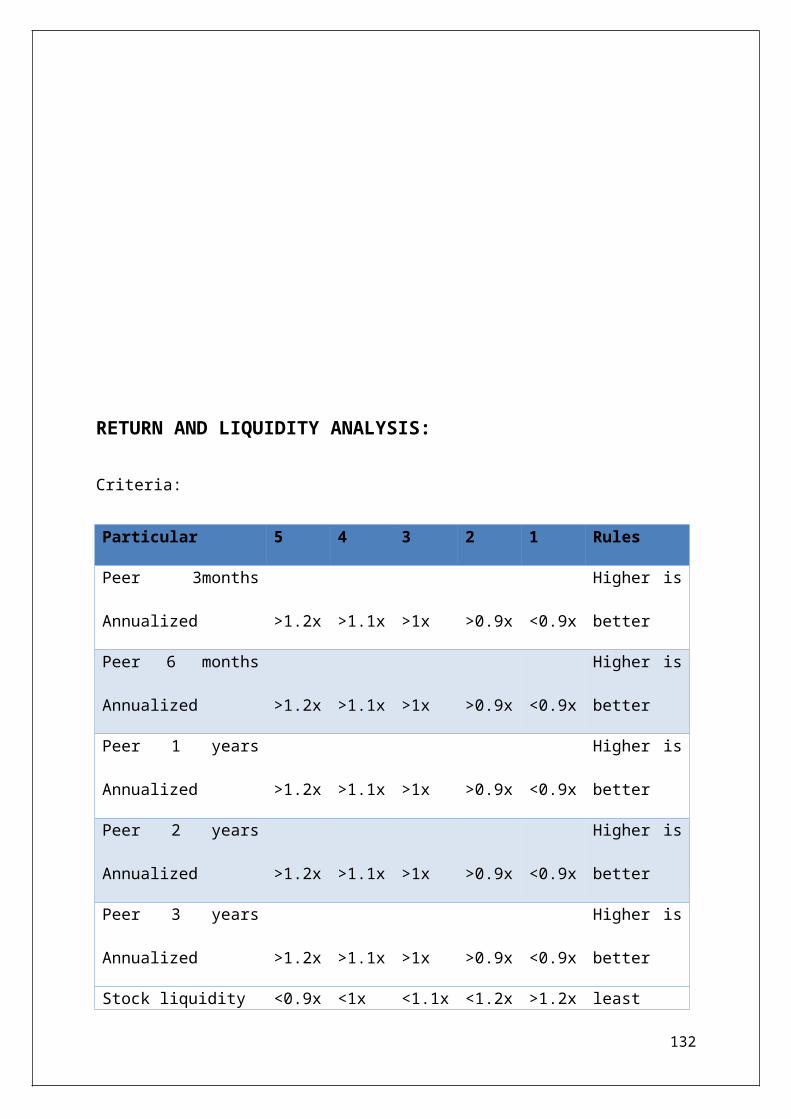
RETURN AND LIQUIDITY ANALYSIS:
Criteria:
Particular 5 4 3 2 1 Rules
Peer 3months
Annualized >1.2x >1.1x >1x >0.9x <0.9x
Higher is
better
Peer 6 months
Annualized >1.2x >1.1x >1x >0.9x <0.9x
Higher is
better
Peer 1 years
Annualized >1.2x >1.1x >1x >0.9x <0.9x
Higher is
better
Peer 2 years
Annualized >1.2x >1.1x >1x >0.9x <0.9x
Higher is
better
Peer 3 years
Annualized >1.2x >1.1x >1x >0.9x <0.9x
Higher is
better
Stock liquidity <0.9x <1x <1.1x <1.2x >1.2x least
132
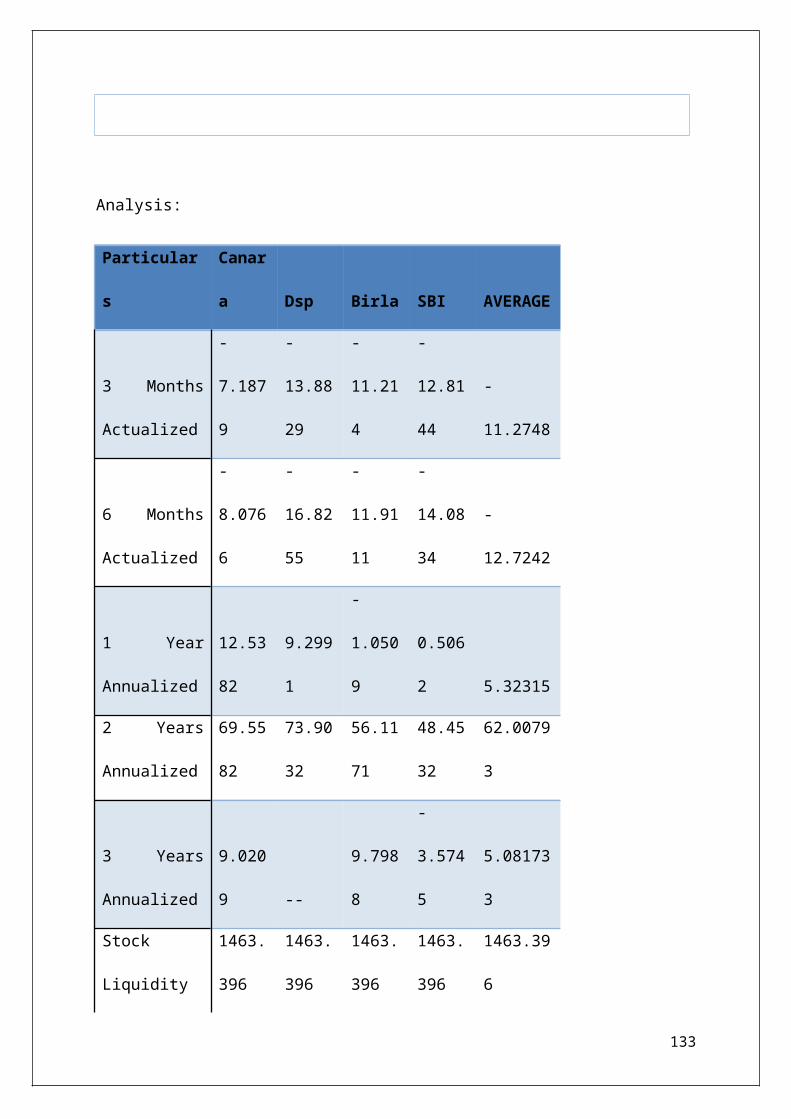
Analysis:
Particular
s
Canar
a Dsp Birla SBI AVERAGE
3 Months
Actualized
-
7.187
9
-
13.88
29
-
11.21
4
-
12.81
44
-
11.2748
6 Months
Actualized
-
8.076
6
-
16.82
55
-
11.91
11
-
14.08
34
-
12.7242
1 Year
Annualized
12.53
82
9.299
1
-
1.050
9
0.506
2 5.32315
2 Years
Annualized
69.55
82
73.90
32
56.11
71
48.45
32
62.0079
3
3 Years
Annualized
9.020
9 --
9.798
8
-
3.574
5
5.08173
3
Stock
Liquidity
1463.
396
1463.
396
1463.
396
1463.
396
1463.39
6
133
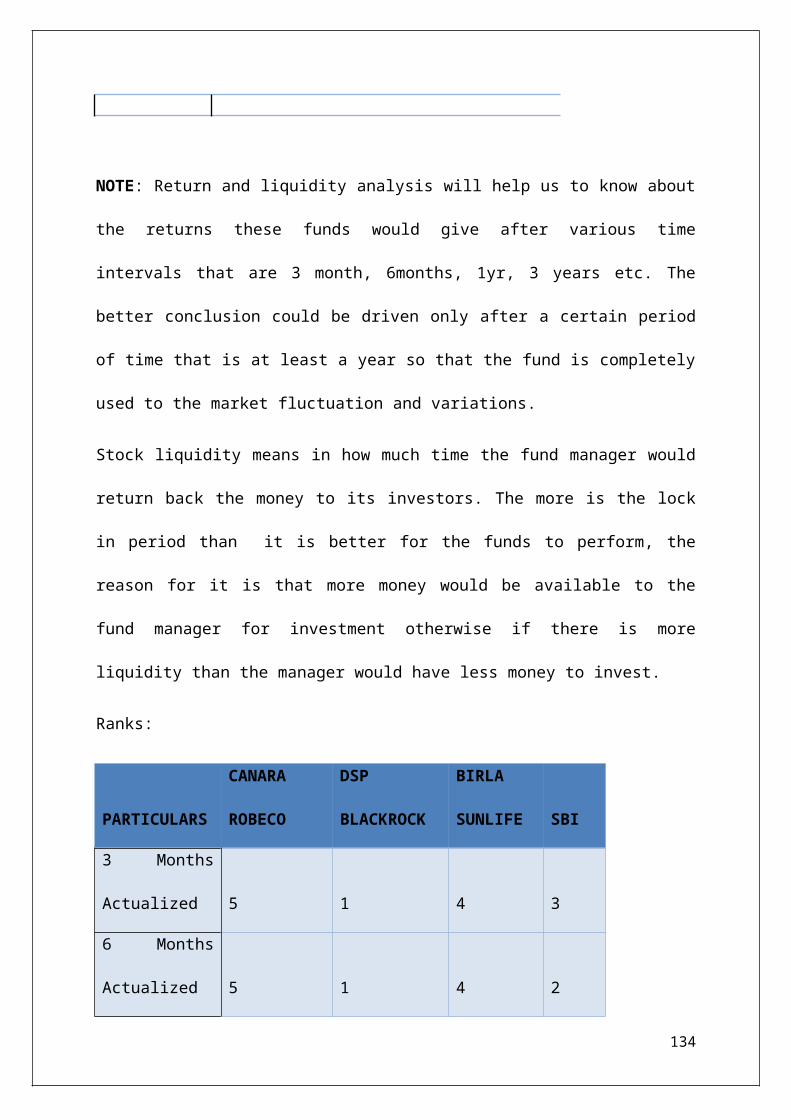
NOTE: Return and liquidity analysis will help us to know about
the returns these funds would give after various time
intervals that are 3 month, 6months, 1yr, 3 years etc. The
better conclusion could be driven only after a certain period
of time that is at least a year so that the fund is completely
used to the market fluctuation and variations.
Stock liquidity means in how much time the fund manager would
return back the money to its investors. The more is the lock
in period than it is better for the funds to perform, the
reason for it is that more money would be available to the
fund manager for investment otherwise if there is more
liquidity than the manager would have less money to invest.
Ranks:
PARTICULARS
CANARA
ROBECO
DSP
BLACKROCK
BIRLA
SUNLIFE SBI
3 Months
Actualized 5 1 4 3
6 Months
Actualized 5 1 4 2
134
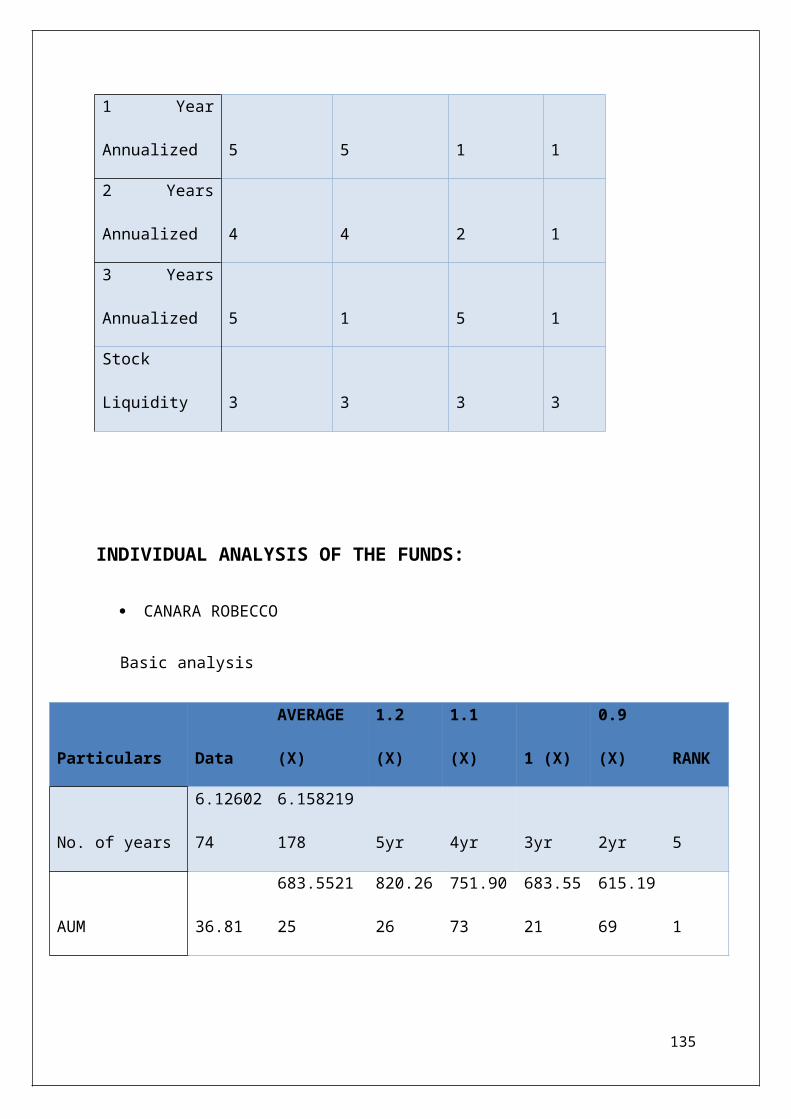
1 Year
Annualized 5 5 1 1
2 Years
Annualized 4 4 2 1
3 Years
Annualized 5 1 5 1
Stock
Liquidity 3 3 3 3
INDIVIDUAL ANALYSIS OF THE FUNDS:
CANARA ROBECCO
Basic analysis
Particulars Data
AVERAGE
(X)
1.2
(X)
1.1
(X) 1 (X)
0.9
(X) RANK
No. of years
6.12602
74
6.158219
178 5yr 4yr 3yr 2yr 5
AUM 36.81
683.5521
25
820.26
26
751.90
73
683.55
21
615.19
69 1
135

Expense
Ratio 2.5 2.2625 2.715
2.4887
5 2.2625
2.0362
5 2
Single
Company 0 1.5 1.8 1.65 1.5 1.35 5
top 5 21.88 23.8197 <20 <25 <30 <35 4
top 10 39.18 39.9571 <15 <17.5 <20 <22.5 1
Industry
Concentratio
n 0 0 0 0 0 0 5
Risk analysis
Particu
lars Data
AVERAGE
(X)
1.2
(X)
1.1
(X) 1 (X)
0.9
(X) RANK
Mean
0.26
52
0.30972
5
0.37
167
0.340
698
0.309
725
0.278
753 1
Std Dev
0.67
2
0.84632
5
1.01
559
0.930
958
0.846
325
0.761
693 5
Beta
0.42
08 0.5726
0.68
712
0.629
86
0.572
6
0.515
34 1
136

Sharpe
ratio
0.37
02 0.3473
0.41
676
0.382
03
0.347
3
0.312
57 3
Jenson'
s Alpha
0.08
06 0.06735
0.08
082
0.074
085
0.067
35
0.060
615 4
Treynor
ratio
0.59
11
0.51822
5
0.62
187
0.570
048
0.518
225
0.466
403 4
Return and liquidity analysis:
Particular
s Data
AVERAGE
(X)
1.2
(X)
1.1
(X) 1 (X)
0.9
(X) RANK
3 Months
Actualized
-
7.187
9
-
11.2748
-
13.52
98
-
12.40
23
-
11.27
48
-
10.14
73 5
6 Months
Actualized
-
8.076
6
-
12.7242
-
15.26
9
-
13.99
66
-
12.72
42
-
11.45
17 5
1 Year
Annualized
12.53
82 5.32315
6.387
78
5.855
465
5.323
15
4.790
835 5
2 Years
Annualized
69.55
82
62.0079
3
74.40
951
68.20
872
62.00
793
55.80
713 4
3 Years
Annualized
9.020
9
5.08173
3
6.098
08
5.589
907
5.081
733
4.573
56 5
Stock 1463. 1463.39 1756. 1609. 1463. 1317. 3137
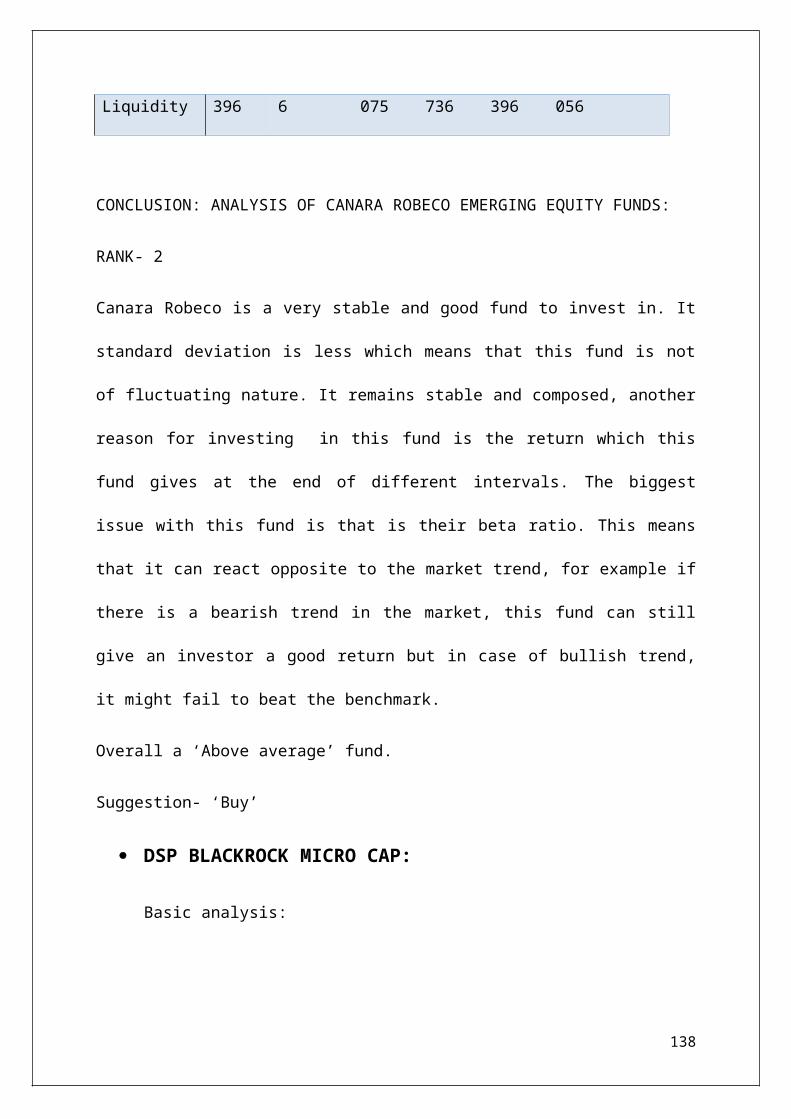
Liquidity 396 6 075 736 396 056
CONCLUSION: ANALYSIS OF CANARA ROBECO EMERGING EQUITY FUNDS:
RANK- 2
Canara Robeco is a very stable and good fund to invest in. It
standard deviation is less which means that this fund is not
of fluctuating nature. It remains stable and composed, another
reason for investing in this fund is the return which this
fund gives at the end of different intervals. The biggest
issue with this fund is that is their beta ratio. This means
that it can react opposite to the market trend, for example if
there is a bearish trend in the market, this fund can still
give an investor a good return but in case of bullish trend,
it might fail to beat the benchmark.
Overall a ‘Above average’ fund.
Suggestion- ‘Buy’
DSP BLACKROCK MICRO CAP:
Basic analysis:
138

Particular
s Data
AVERAGE
(X)
1.2
(X)
1.1
(X) 1 (X)
0.9
(X)
RANK
S
No. of
years
3.865
753
6.15821
9 5yr 4yr 3yr 2yr 3
AUM
438.4
206
683.552
1
820.2
626
751.9
073
683.5
521
615.1
969 1
Expense
Ratio 2.29 2.2625 2.715
2.488
75
2.262
5
2.036
25 2
Single
Company 1 1.5 1.8 1.65 1.5 1.35 5
top 5
22.57
49 23.8197 <20 <25 <30 <35 4
top 10
37.79
41 39.9571 <15 <17.5 <20 <22.5 1
Industry
Concentrat
ion 0 0 0 0 0 0 5
Risk analysis:
Particu
lars Data
AVERAGE
(X)
1.2
(X)
1.1
(X) 1 (X)
0.9
(X) RANKS
Mean 0.28 0.3473 0.41 0.382 0.347 0.312 2
139
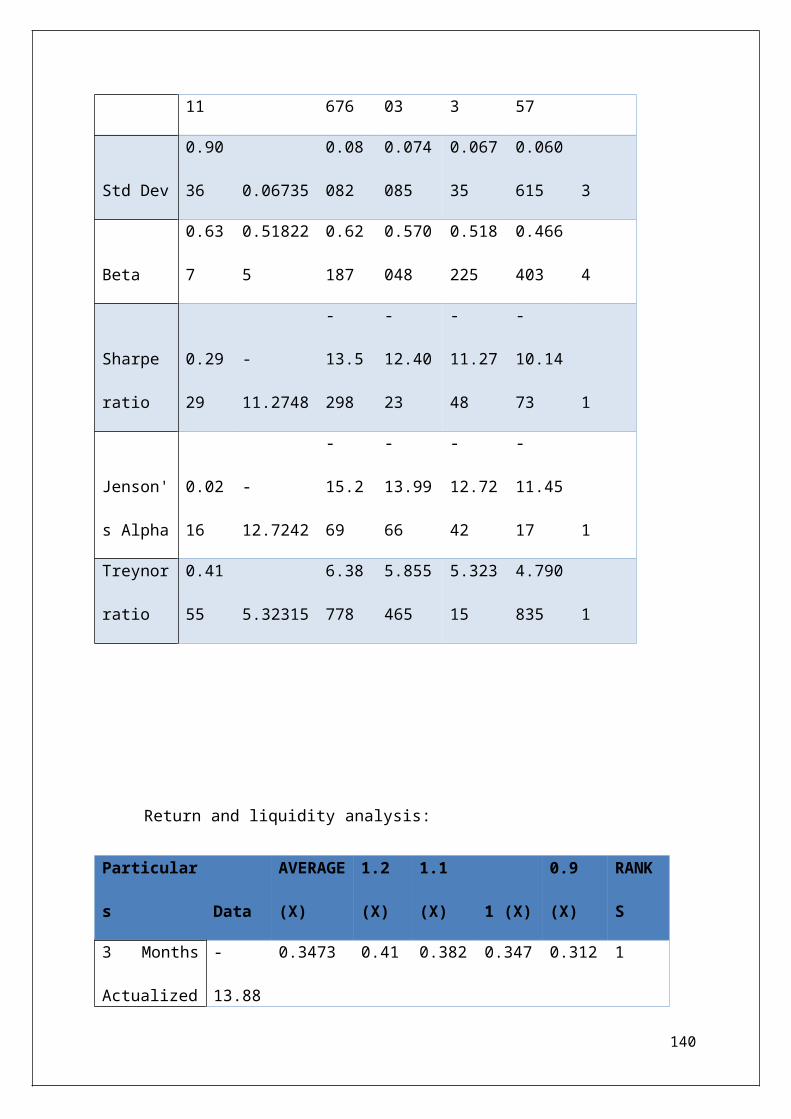
11 676 03 3 57
Std Dev
0.90
36 0.06735
0.08
082
0.074
085
0.067
35
0.060
615 3
Beta
0.63
7
0.51822
5
0.62
187
0.570
048
0.518
225
0.466
403 4
Sharpe
ratio
0.29
29
-
11.2748
-
13.5
298
-
12.40
23
-
11.27
48
-
10.14
73 1
Jenson'
s Alpha
0.02
16
-
12.7242
-
15.2
69
-
13.99
66
-
12.72
42
-
11.45
17 1
Treynor
ratio
0.41
55 5.32315
6.38
778
5.855
465
5.323
15
4.790
835 1
Return and liquidity analysis:
Particular
s Data
AVERAGE
(X)
1.2
(X)
1.1
(X) 1 (X)
0.9
(X)
RANK
S
3 Months
Actualized
-
13.88
0.3473 0.41 0.382 0.347 0.312 1
140
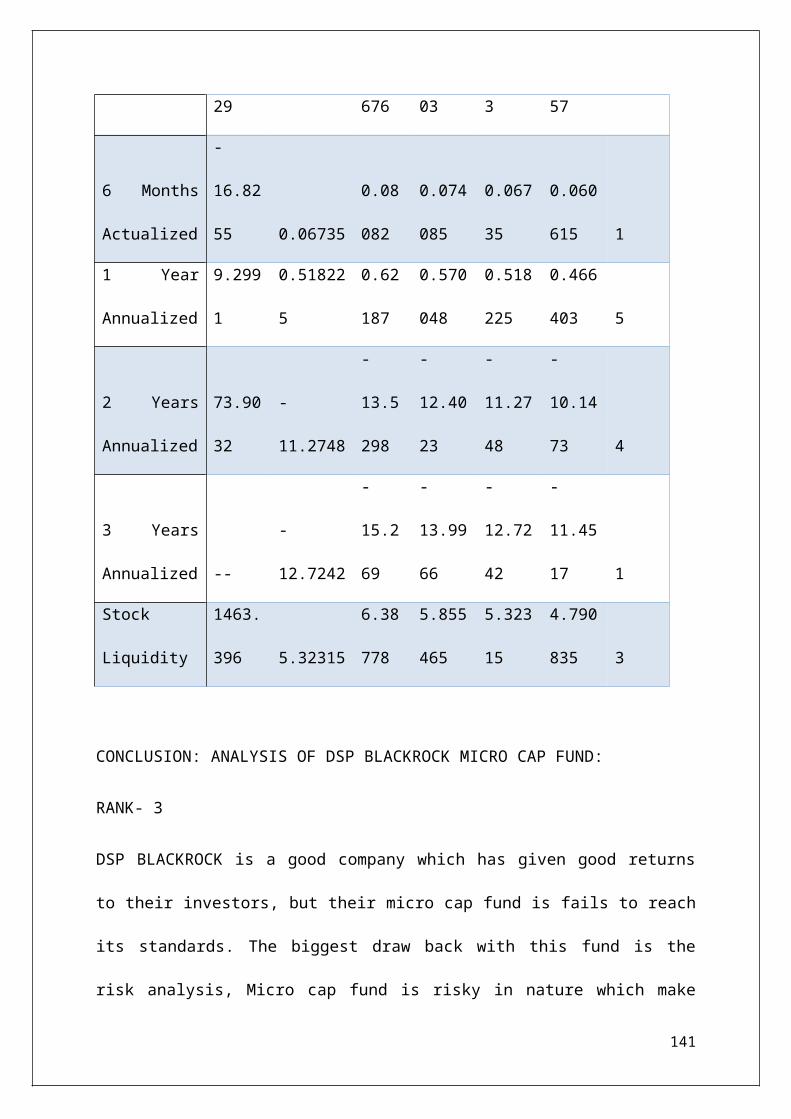
29 676 03 3 57
6 Months
Actualized
-
16.82
55 0.06735
0.08
082
0.074
085
0.067
35
0.060
615 1
1 Year
Annualized
9.299
1
0.51822
5
0.62
187
0.570
048
0.518
225
0.466
403 5
2 Years
Annualized
73.90
32
-
11.2748
-
13.5
298
-
12.40
23
-
11.27
48
-
10.14
73 4
3 Years
Annualized --
-
12.7242
-
15.2
69
-
13.99
66
-
12.72
42
-
11.45
17 1
Stock
Liquidity
1463.
396 5.32315
6.38
778
5.855
465
5.323
15
4.790
835 3
CONCLUSION: ANALYSIS OF DSP BLACKROCK MICRO CAP FUND:
RANK- 3
DSP BLACKROCK is a good company which has given good returns
to their investors, but their micro cap fund is fails to reach
its standards. The biggest draw back with this fund is the
risk analysis, Micro cap fund is risky in nature which make
141
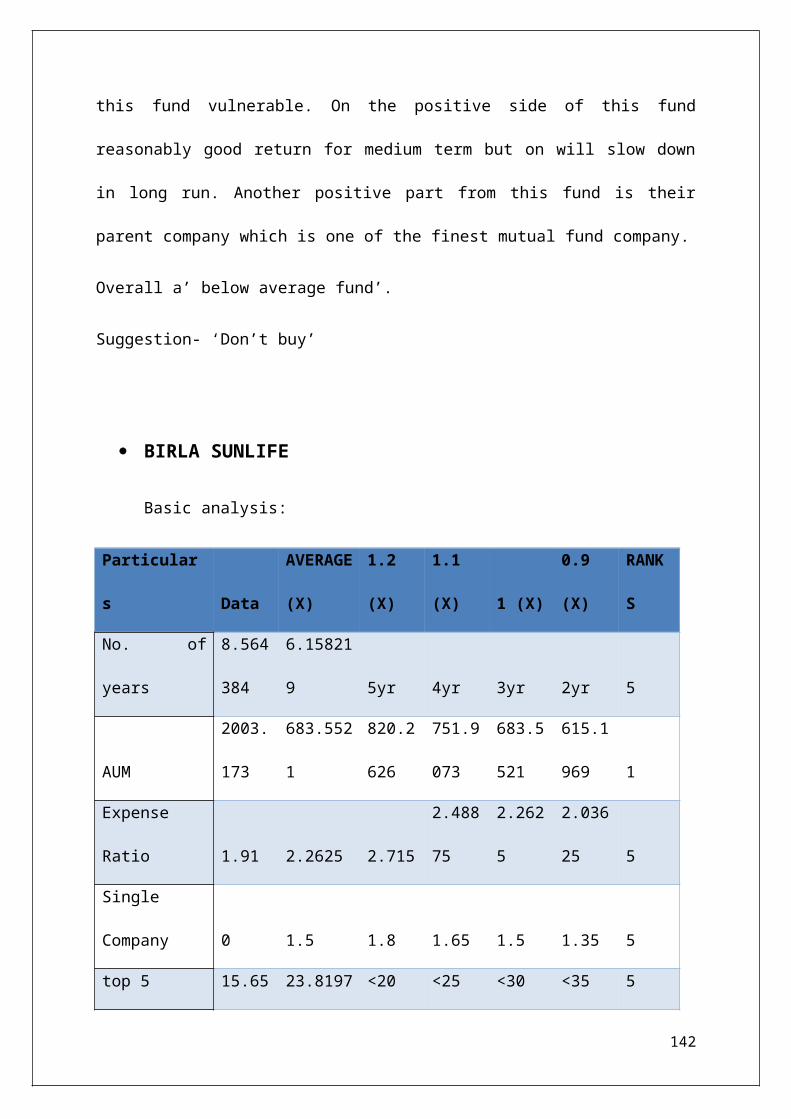
this fund vulnerable. On the positive side of this fund
reasonably good return for medium term but on will slow down
in long run. Another positive part from this fund is their
parent company which is one of the finest mutual fund company.
Overall a’ below average fund’.
Suggestion- ‘Don’t buy’
BIRLA SUNLIFE
Basic analysis:
Particular
s Data
AVERAGE
(X)
1.2
(X)
1.1
(X) 1 (X)
0.9
(X)
RANK
S
No. of
years
8.564
384
6.15821
9 5yr 4yr 3yr 2yr 5
AUM
2003.
173
683.552
1
820.2
626
751.9
073
683.5
521
615.1
969 1
Expense
Ratio 1.91 2.2625 2.715
2.488
75
2.262
5
2.036
25 5
Single
Company 0 1.5 1.8 1.65 1.5 1.35 5
top 5 15.65 23.8197 <20 <25 <30 <35 5
142
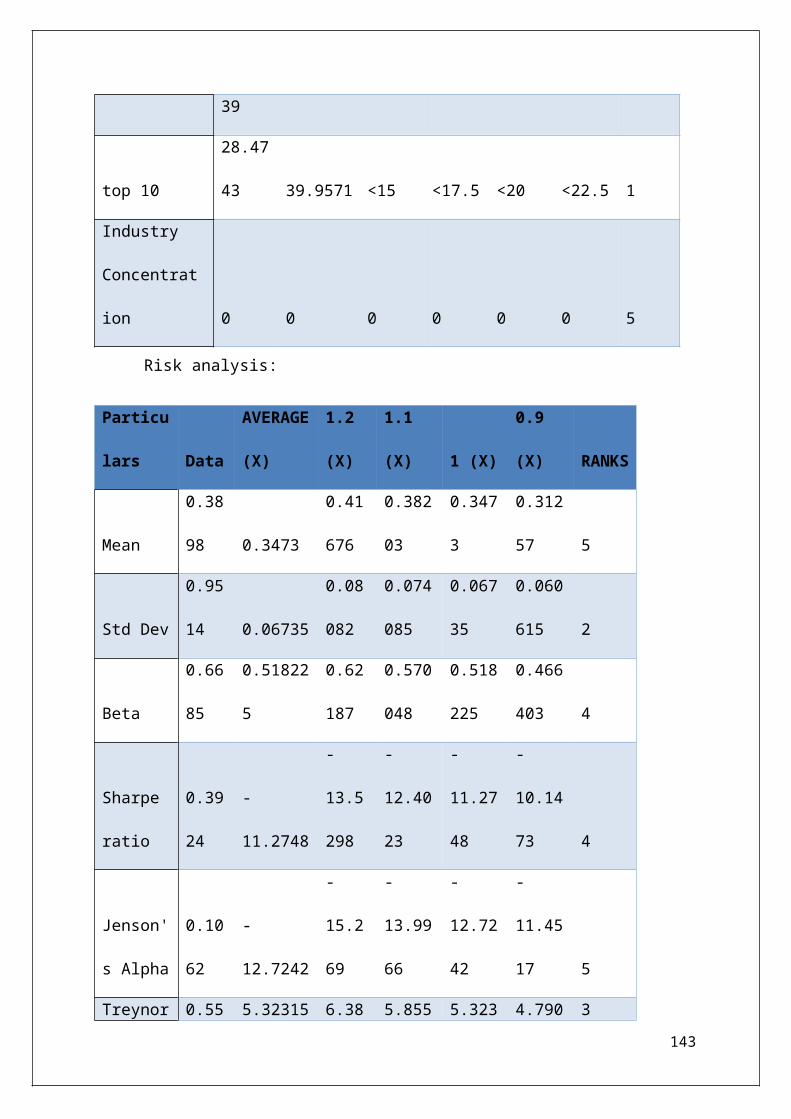
39
top 10
28.47
43 39.9571 <15 <17.5 <20 <22.5 1
Industry
Concentrat
ion 0 0 0 0 0 0 5
Risk analysis:
Particu
lars Data
AVERAGE
(X)
1.2
(X)
1.1
(X) 1 (X)
0.9
(X) RANKS
Mean
0.38
98 0.3473
0.41
676
0.382
03
0.347
3
0.312
57 5
Std Dev
0.95
14 0.06735
0.08
082
0.074
085
0.067
35
0.060
615 2
Beta
0.66
85
0.51822
5
0.62
187
0.570
048
0.518
225
0.466
403 4
Sharpe
ratio
0.39
24
-
11.2748
-
13.5
298
-
12.40
23
-
11.27
48
-
10.14
73 4
Jenson'
s Alpha
0.10
62
-
12.7242
-
15.2
69
-
13.99
66
-
12.72
42
-
11.45
17 5
Treynor 0.55 5.32315 6.38 5.855 5.323 4.790 3143

ratio 86 778 465 15 835
Return and liquidity analysis:
Particular
s Data
AVERAGE
(X)
1.2
(X)
1.1
(X) 1 (X)
0.9
(X)
RANK
S
3 Months
Actualized
-
11.21
4 0.3473
0.41
676
0.382
03
0.347
3
0.312
57 4
6 Months
Actualized
-
11.91
11 0.06735
0.08
082
0.074
085
0.067
35
0.060
615 4
1 Year
Annualized
-
1.050
9
0.51822
5
0.62
187
0.570
048
0.518
225
0.466
403 1
2 Years
Annualized
56.11
71
-
11.2748
-
13.5
298
-
12.40
23
-
11.27
48
-
10.14
73 2
3 Years
Annualized
9.798
8
-
12.7242
-
15.2
69
-
13.99
66
-
12.72
42
-
11.45
17 5
Stock 1463. 5.32315 6.38 5.855 5.323 4.790 3
144
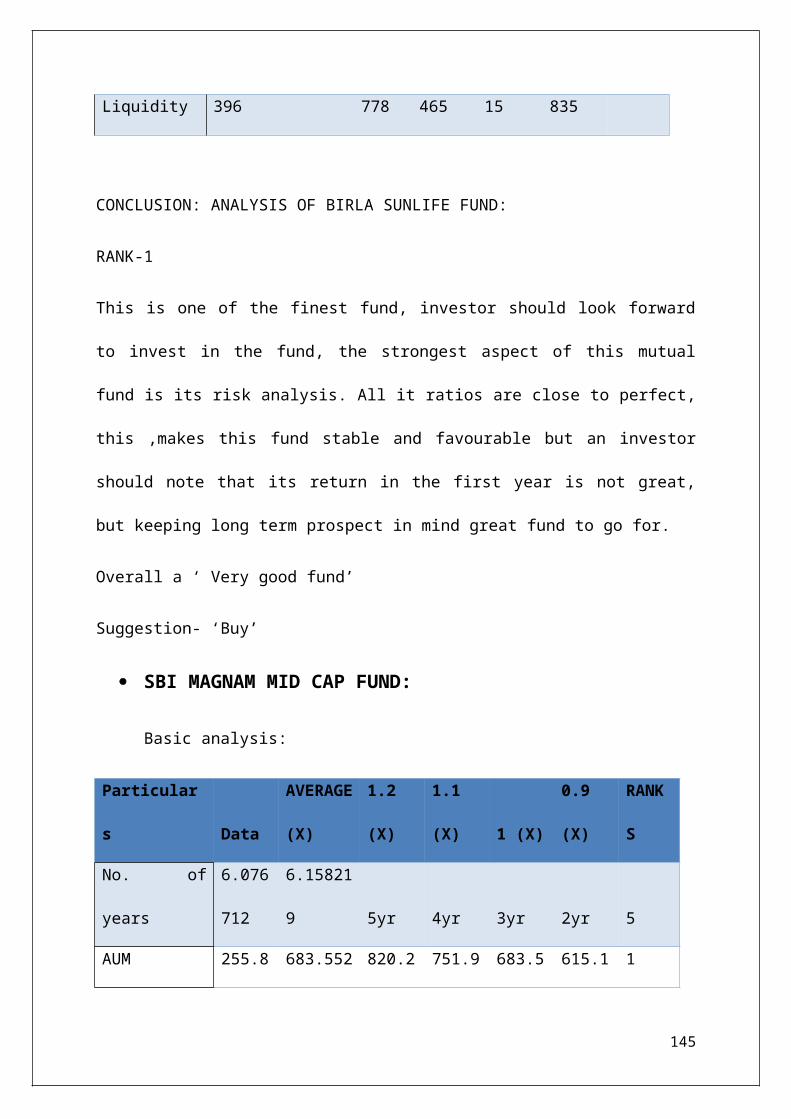
Liquidity 396 778 465 15 835
CONCLUSION: ANALYSIS OF BIRLA SUNLIFE FUND:
RANK-1
This is one of the finest fund, investor should look forward
to invest in the fund, the strongest aspect of this mutual
fund is its risk analysis. All it ratios are close to perfect,
this ,makes this fund stable and favourable but an investor
should note that its return in the first year is not great,
but keeping long term prospect in mind great fund to go for.
Overall a ‘ Very good fund’
Suggestion- ‘Buy’
SBI MAGNAM MID CAP FUND:
Basic analysis:
Particular
s Data
AVERAGE
(X)
1.2
(X)
1.1
(X) 1 (X)
0.9
(X)
RANK
S
No. of
years
6.076
712
6.15821
9 5yr 4yr 3yr 2yr 5
AUM 255.8 683.552 820.2 751.9 683.5 615.1 1
145
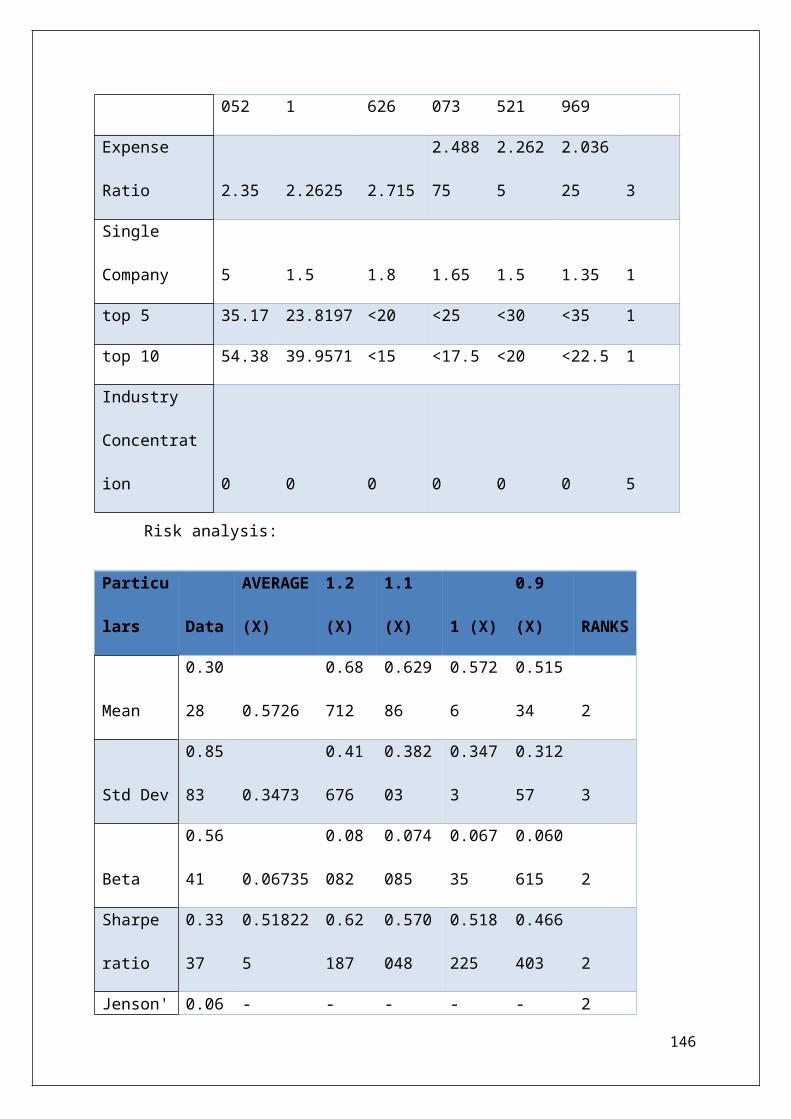
052 1 626 073 521 969
Expense
Ratio 2.35 2.2625 2.715
2.488
75
2.262
5
2.036
25 3
Single
Company 5 1.5 1.8 1.65 1.5 1.35 1
top 5 35.17 23.8197 <20 <25 <30 <35 1
top 10 54.38 39.9571 <15 <17.5 <20 <22.5 1
Industry
Concentrat
ion 0 0 0 0 0 0 5
Risk analysis:
Particu
lars Data
AVERAGE
(X)
1.2
(X)
1.1
(X) 1 (X)
0.9
(X) RANKS
Mean
0.30
28 0.5726
0.68
712
0.629
86
0.572
6
0.515
34 2
Std Dev
0.85
83 0.3473
0.41
676
0.382
03
0.347
3
0.312
57 3
Beta
0.56
41 0.06735
0.08
082
0.074
085
0.067
35
0.060
615 2
Sharpe
ratio
0.33
37
0.51822
5
0.62
187
0.570
048
0.518
225
0.466
403 2
Jenson' 0.06 - - - - - 2
146
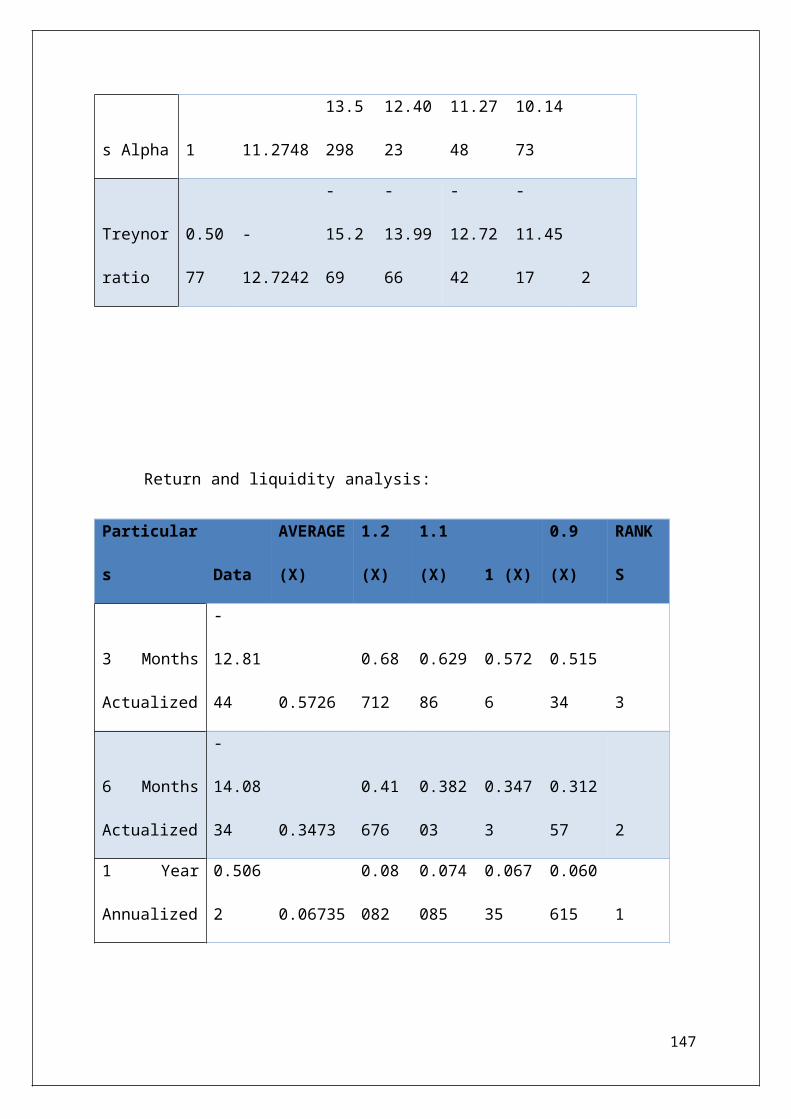
s Alpha 1 11.2748
13.5
298
12.40
23
11.27
48
10.14
73
Treynor
ratio
0.50
77
-
12.7242
-
15.2
69
-
13.99
66
-
12.72
42
-
11.45
17 2
Return and liquidity analysis:
Particular
s Data
AVERAGE
(X)
1.2
(X)
1.1
(X) 1 (X)
0.9
(X)
RANK
S
3 Months
Actualized
-
12.81
44 0.5726
0.68
712
0.629
86
0.572
6
0.515
34 3
6 Months
Actualized
-
14.08
34 0.3473
0.41
676
0.382
03
0.347
3
0.312
57 2
1 Year
Annualized
0.506
2 0.06735
0.08
082
0.074
085
0.067
35
0.060
615 1
147
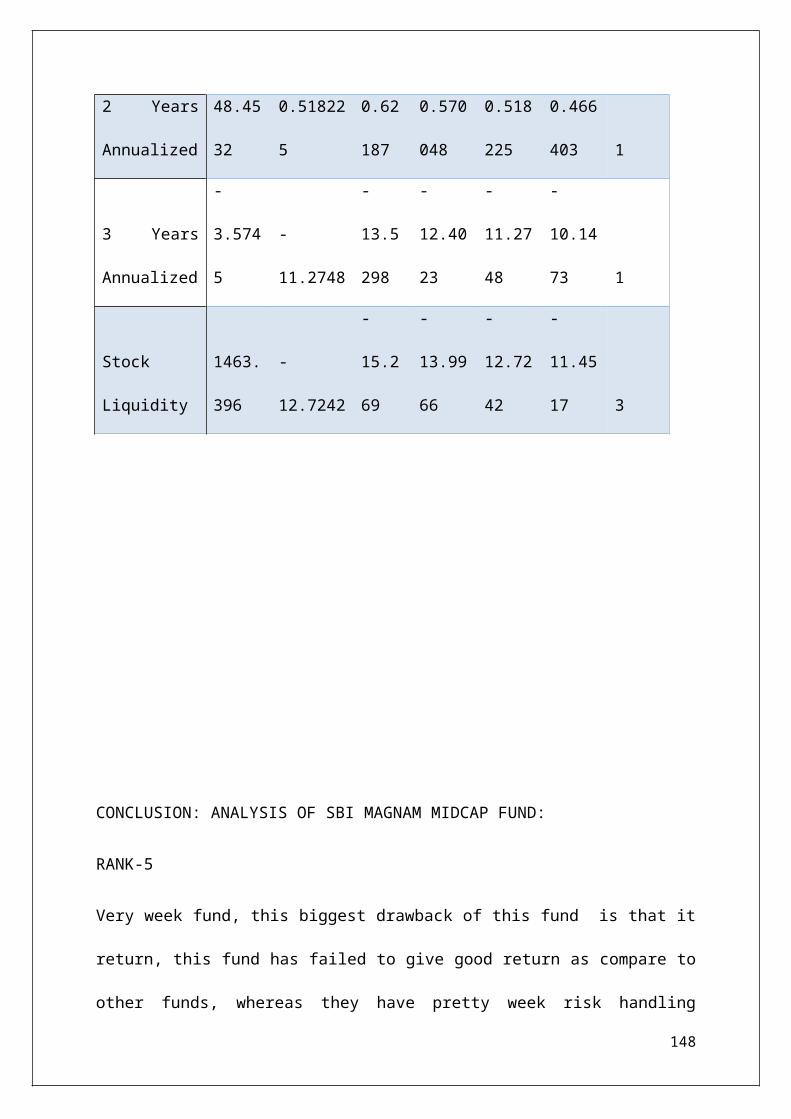
2 Years
Annualized
48.45
32
0.51822
5
0.62
187
0.570
048
0.518
225
0.466
403 1
3 Years
Annualized
-
3.574
5
-
11.2748
-
13.5
298
-
12.40
23
-
11.27
48
-
10.14
73 1
Stock
Liquidity
1463.
396
-
12.7242
-
15.2
69
-
13.99
66
-
12.72
42
-
11.45
17 3
CONCLUSION: ANALYSIS OF SBI MAGNAM MIDCAP FUND:
RANK-5
Very week fund, this biggest drawback of this fund is that it
return, this fund has failed to give good return as compare to
other funds, whereas they have pretty week risk handling
148

capacity. This fund is risky because it is dependent on single
companies, this means that if company does well than is fine
but in case of failure the unit prices will collapse.
Overall a ‘Bad’ fund
Suggestion- ‘Ignore it’
149

CONCLUSION AND RECOMMONDATION
150

To conclude Mutual funds are subject to market risk and all
the document should be read carefully before investing into
it. But an individual can reduce this risk if he does a
thorough study on the mutual fund and look into their rating
and it would be even better if he self ranks it. By doing this
he will know how powerful the fund is?
My recommendation would be to do a detail study about the fund
and understand the basics of the fund. An investor should do a
complete research with regards to fund, study the market trend
and on the basis of the analysis done the appropriate
investment should be done.
151


.png)